
- Many security leaders put off adding metrics to their program because they don't know where to start or how to assess what is worth measuring.
- Sometimes, this uncertainty causes the belief that their security programs are not mature enough for metrics to be worthwhile.
- Because metrics can become very technical and precise,it's easy to think that they're inherently complicated (not true).
Our Advice
Critical Insight
- The best metrics are tied to goals.
- Tying your metrics to goals ensures that you are collecting metrics for a specific purpose rather than just to watch the numbers change.
Impact and Result
- A metric, really, is just a measure of success against a given goal. Gradually, programs will achieve their goals and set new more specific goals, and with them come more-specific metrics.
- It is not necessary to jump into highly technical metrics right away. A lot can be gained from metrics that track behaviors.
- A metrics program can be very simple and still effectively demonstrate the value of security to the organization. The key is to link your metrics to the goals or objectives the security team is pursuing, even if they are simple implementation plans (e.g. percentage of departments that have received security training course).
Build a Security Metrics Program to Drive Maturity Research & Tools
Start here – read the Executive Brief
Read our concise Executive Brief to find out why you should build a security metrics program, review Info-Tech’s methodology, and understand the four ways we can support you in completing this project.Besides the small introduction, subscribers and consulting clients within this management domain have access to:
- Build a Security Metrics Program to Drive Maturity – Phases 1-2
1. Link security metrics to goals to boost maturity
Develop goals and KPIs to measure your progress.
- Build a Security Metrics Program to Drive Maturity – Phase 1: Link Security Metrics to Goals to Boost Maturity
- Security Metrics Determination and Tracking Tool
- KPI Development Worksheets
2. Adapt your reporting strategy for various metric types
Learn how to present different types of metrics.
- Build a Security Metrics Program to Drive Maturity – Phase 2: Adapt Your Reporting Strategy for Various Metric Types
- Security Metrics KPX Dashboard
- Board-Level Security Metrics Presentation Template
Workshop: Build a Security Metrics Program to Drive Maturity
Workshops offer an easy way to accelerate your project. If you are unable to do the project yourself, and a Guided Implementation isn't enough, we offer low-cost delivery of our project workshops. We take you through every phase of your project and ensure that you have a roadmap in place to complete your project successfully.
1 Current State, Initiatives, and Goals
The Purpose
Create a prioritized list of goals to improve the security program’s current state.
Key Benefits Achieved
Insight into the current program and the direct it needs to head in.
Activities
1.1 Discuss current state and existing approach to metrics.
1.2 Review contract metrics already in place (or available).
1.3 Determine security areas that should be measured.
1.4 Determine what stakeholders are involved.
1.5 Review current initiatives to address those risks (security strategy, if in place).
1.6 Begin developing SMART goals for your initiative roadmap.
Outputs
Gap analysis results
SMART goals
2 KPI Development
The Purpose
Develop unique KPIs to measure progress against your security goals.
Key Benefits Achieved
Learn how to develop KPIs
Prioritized list of security goals
Activities
2.1 Continue SMART goal development.
2.2 Sort goals into types.
2.3 Rephrase goals as KPIs and list associated metric(s).
2.4 Continue KPI development.
Outputs
KPI Evolution Worksheet
3 Metrics Prioritization
The Purpose
Determine which metrics will be included in the initial program launch.
Key Benefits Achieved
A set of realistic and manageable goals-based metrics.
Activities
3.1 Lay out prioritization criteria.
3.2 Determine priority metrics (implementation).
3.3 Determine priority metrics (improvement & organizational trend).
Outputs
Prioritized metrics
Tool for tracking and presentation
4 Metrics Reporting
The Purpose
Strategize presentation based around metric type to indicate organization’s risk posture.
Key Benefits Achieved
Develop versatile reporting techniques
Activities
4.1 Review metric types and discuss reporting strategies for each.
4.2 Develop a story about risk.
4.3 Discuss the use of KPXs and how to scale for less mature programs.
Outputs
Key Performance Index Tool and presentation materials
Further reading
Build a Security Metrics Program to Drive Maturity
Good metrics come from good goals.
ANALYST PERSPECTIVE
Metrics are a maturity driver.
"Metrics programs tend to fall into two groups: non-existent and unhelpful.
The reason so many security professionals struggle to develop a meaningful metrics program is because they are unsure of what to measure or why.
The truth is, for metrics to be useful, they need to be tied to something you care about – a state you are trying to achieve. In other words, some kind of goal. Used this way, metrics act as the scoreboard, letting you know if you’re making progress towards your goals, and thus, boosting your overall maturity."
– Logan Rohde, Research Analyst, Security Practice Info-Tech Research Group
Executive summary
Situation
- Many security leaders put off adding metrics to their program because they don't know where to start or how to assess what is worth measuring.
Complication
- Sometimes, this uncertainty causes the belief that their security programs are not mature enough for metrics to be worthwhile.
- Because metrics can become very technical and precise, it's easy to think they're inherently complicated (not true).
Resolution
- A metric, really, is just a measure of success against a given goal. Gradually, programs will achieve their goals and set new, more specific goals, and with them comes more specific metrics.
- It is not necessary to jump into highly technical metrics right away. A lot can be gained from metrics that track behaviors.
- A metrics program can be very simple and still effectively demonstrate the value of security to the organization. The key is to link your metrics to the goals or objectives the security team is pursuing, even if they are simple implementation plans (e.g. percentage of departments that have received security training).
Info-Tech Insight
- Metrics lead to maturity, not vice versa
- Tracking metrics helps you assess progress and regress in your security program. This helps you quantify the maturity gains you’ve made and continue to make informed strategic decisions.
- The best metrics are tied to goals
- Tying your metrics to goals ensures that you are collecting metrics for a specific purpose rather than just to watch the numbers change.
Our understanding of the problem
This Research is Designed For:
- CISO
This Research Will Help You:
- Understand the value of metrics.
- Right-size a metrics program based on your organization’s maturity and risk profile.
- Tie metrics to goals to create meaningful KPIs.
- Develop strategies to effectively communicate the right metrics to stakeholders.
This Research Will Also Assist:
- CIO
- Security Manager
- Business Professionals
This Research Will Help Them:
- Become informed on the metrics that matter to them.
- Understand that investment in security is an investment in the business.
- Feel confident in the progress of the organization’s security strategy.
Info-Tech’s framework integrates several best practices to create a best-of-breed security framework
Information Security Framework
Governance
- Context and Leadership
- Information Security Charter
- Information Security Organizational Structure
- Culture and Awareness
- Evaluation and Direction
- Security Risk Management
- Security Policies
- Security Strategy and Communication
- Compliance, Audit, and Review
- Security Compliance Management
- External Security Audit
- Internal Security Audit
- Management Review of Security
Management
- Prevention
- Identity Security
- Identity and Access Management
- Data Security
- Hardware Asset Management
- Data Security & Privacy
- Infrastructure Security
- Network Security
- Endpoint Security
- Malicious Code
- Application Security
- Vulnerability Management
- Cryptography Management
- Physical Security
- Cloud Security
- HR Security
- HR Security
- Change and Support
- Configuration and Change Management
- Vendor Management
- Identity Security
- Detection
- Security Threat Detection
- Log and Event Management
- Response and Recovery
- Security Incident Management
- Information Security in BCM
- Security eDiscovery and Forensics
- Backup and Recovery
- Measurement
- Metrics Program
- Continuous Improvement
Metrics help to improve security-business alignment
While business leaders are now taking a greater interest in cybersecurity, alignment between the two groups still has room for improvement.
Key statistics show that just...
5% of public companies feel very confident that they are properly secured against a cyberattack.
41% of boards take on cybersecurity directly rather than allocating it to another body (e.g. audit committee).
19% of private companies do not discuss cybersecurity with the board.
(ISACA, 2018)
Info-Tech Insight
Metrics help to level the playing field
Poor alignment between security and the business often stems from difficulties with explaining how security objectives support business goals, which is ultimately a communication problem.
However, metrics help to facilitate these conversations, as long as the metrics are expressed in practical, relatable terms.
Security metrics benefit the business
Executives get just as much out of management metrics as the people running them.
- Metrics assuage executives’ fears
- Metrics help executives (and security leaders) feel more at ease with where the company is security-wise. Metrics help identify areas for improvement and gaps in the organization’s security posture that can be filled. A good metrics program will help identify deficiencies in most areas, even outside the security program, helping to identify what work needs to be done to reduce risk and increase the security posture of the organization.
- Metrics answer executives’ questions
- Numbers either help ease confusion or signify other areas for improvement. Offering quantifiable evidence, in a language that the business can understand, offers better understanding and insight into the information security program. Metrics also help educate on types of threats, staff needed for security, and budget needs to decrease risk based on management’s threat tolerance. Metrics help make an organization more transparent, prepared, and knowledgeable.
- Metrics help to continually prove security’s worth
- Traditionally, the security team has had to fight for a seat at the executive table, with little to no way to communicate with the business. However, the new trend is that the security team is now being invited before they have even asked to join. This trend allows the security team to better communicate on the organization’s security posture, describe threats and vulnerabilities, present a “plan of action,” and get a pulse on the organization’s risk tolerance.
Common myths make security metrics seem challenging
Security professionals have the perception that metrics programs are difficult to create. However, this attitude usually stems from one of the following myths. In reality, security metrics are much simpler than they seem at first, and they usually help resolve existing challenges rather than create new ones.
| Myth | Truth | |
|---|---|---|
| 1 | There are certain metrics that are important to all organizations, based on maturity, industry, etc. | Metrics are indications of change; for a metric to be useful it needs to be tied to a goal, which helps you understand the change you're seeing as either a positive or a negative. Industry and maturity have little bearing here. |
| 2 | Metrics are only worthwhile once a certain maturity level is reached | Metrics are a tool to help an organization along the maturity scale. Metrics help organizations measure progress of their goals by helping them see which tactics are and are not working. |
| 3 | Security metrics should focus on specific, technical details (e.g. of systems) | Metrics are usually a means of demonstrating, objectively, the state of a security program. That is, they are a means of communicating something. For this reason, it is better that metrics be phrased in easily digestible, non-technical terms (even if they are informed by technical security statistics). |
Tie your metrics to goals to make them worthwhile
SMART metrics are really SMART goals.
Specific
Measurable
Achievable
Realistic
Timebound
Achievable: What is an achievable metric?
When we say that a metric is “achievable,” we imply that it is tied to a goal of some kind – the thing we want to achieve.
How do we set a goal?
- Determine what outcome you are trying to achieve.
- This can be small or large (e.g. I want to determine what existing systems can provide metrics, or I want a 90% pass rate on our monthly phishing tests).
- Decide what indicates that you’ve achieved your goal.
- At what point would you be satisfied with the progress made on the initiative(s) you’re working on? What conditions would indicate victory for you and allow you to move on to another goal?
- Develop a key performance indicator (KPI) to measure progress towards that goal.
- Now that you’ve defined what you’re trying to achieve, find a way to indicate progress in relative or relational terms (e.g. percentage change from last quarter, percentage of implementation completed, ratio of programs in place to those still needing implementation).
Info-Tech’s security metrics methodology is repeatable and iterative to help boost maturity
Security Metric Lifecycle
Start:
Review current state and decide on priorities.
Set a SMART goal for improvement.
Develop an appropriate KPI.
Use KPI to monitor program improvement.
Present metrics to the board.
Revise metrics if necessary.
Metrics go hand in hand with your security strategy
A security strategy is ultimately a large goal-setting exercise. You begin by determining your current maturity and how mature you need to be across all areas of information security, i.e. completing a gap analysis.
As such, linking your metrics program to your security strategy is a great way to get your metrics program up and running – but it’s not the only way.
Check out the following Info-Tech resource to get started today:
The value of security metrics goes beyond simply increasing security
This blueprint applies to you whether you need to develop a metrics program from scratch or optimize and update your current strategy.
Value of engaging in security metrics:
- Increased visibility into your operations.
- Improved accountability.
- Better communication with executives as a result of having hard evidence of security performance.
- Improved security posture through better understanding of what is working and what isn’t within the security program.
Value of Info-Tech’s security metrics blueprint:
- Doesn’t overwhelm you and allows you to focus on determining the metrics you need to worry about now without pressuring you to do it all at once.
- Helps you develop a growth plan as your organization and metrics program mature, so you continue to optimize.
- Creates effective communication. Prepares you to present the metrics that truly matter to executives rather than confusing them with unnecessary data. Pay attention to metric accuracy and reproducibility. No management wants inconsistent reporting.
Impact
Short term: Streamline your program. Based on your organization’s specific requirements and risk profile, figure out which metrics are best for now while also planning for future metrics as your organization matures.
Long term: Once the program is in place, improvements will come with increased visibility into operations. Investments in security will be encouraged when more evidence is available to executives, contributing to overall improved security posture. Potential opportunities for eventual cost savings also exist as there is more informed security spending and fewer incidents.
Info-Tech offers various levels of support to best suit your needs
DIY Toolkit
“Our team has already made this critical project a priority, and we have the time and capability, but some guidance along the way would be helpful.”
Guided Implementation
“Our team knows that we need to fix a process, but we need assistance to determine where to focus. Some check-ins along the way would help keep us on track.”
Workshop
“We need to hit the ground running and get this project kicked-off immediately. Our team has the ability to take this over once we get a framework and strategy in place.”
Consulting
“Our team does not have the time or the knowledge to take this project on. We need assistance through the entirety of this project.”
Diagnostics and consistent frameworks used throughout all four options
Link Security Metrics to Goals to Boost Maturity – Project Overview
| 1. Link Security Metrics to Goals to Boost Maturity | 2. Adapt Your Reporting Strategy for Various Metric Types | |
|---|---|---|
| Best-Practice Toolkit |
1.1 Review current state and set your goals 1.2 Develop KPIs and prioritize your goals 1.3 Implement and monitor the KPI to track goal progress |
2.1 Review best practices for presenting metrics 2.2 Strategize your presentation based on metric type 2.3 Tailor presentation to your audience 2.4 Use your metrics to create a story about risk 2.5 Revise your metrics |
| Guided Implementations |
|
|
| Onsite Workshop | Module 1: Current State, Initiatives, Goals, and KPIs | Module 2: Metrics Reporting |
|
Phase 1 Outcome:
|
Phase 2 Outcome:
|
Workshop overview
Contact your account representative or email Workshops@InfoTech.com for more information.
| Workshop Day 1 | Workshop Day 2 | Workshop Day 3 | Workshop Day 4 | Workshop Day 5 | |
|---|---|---|---|---|---|
| Activities |
Current State, Initiatives, and Goals
|
KPI Development
|
Metrics Prioritization
|
Metrics Reporting
|
Offsite Finalization
|
| Deliverables |
|
|
|
|
|
Phase 1
Link Security Metrics to Goals to Boost Maturity
Phase 1
1.1 Review current state and set your goals
1.2 Develop KPIs and prioritize your goals
1.3 Implement and monitor KPIs
This phase will walk you through the following activities:
- Current state assessment
- Setting SMART goals
- KPI development
- Goals prioritization
- KPI implementation
This phase involves the following participants:
- Security Team
Outcomes of this phase
- Goals-based KPIs
- Security Metrics Determination and Tracking Tool
Phase 1 outline
Call 1-888-670-8889 or email GuidedImplementations@InfoTech.com for more information.Complete these steps on your own or call us to complete a guided implementation. A guided implementation is a series of two to three advisory calls that help you execute each phase of a project. They are included in most advisory memberships.
Guided Implementation 1: Link Security Metrics to Goals to Boost Maturity
Proposed Time to Completion: 2-4 weeks
Step 1.1: Setting Goals
Start with an analyst kick-off call:
- Determine current and target maturity for various security programs.
- Develop SMART Goals.
Then complete these activities…
- CMMI Assessment
Step 1.2 – 1.3: KPI Development
Review findings with analyst:
- Prioritize goals
- Develop KPIs to track progress on goals
- Track associated metrics
Then complete these activities…
- KPI Development
With these tools & templates:
- KPI Development Worksheet
- Security Metrics Determination and Tracking Tool
Phase 1 Results & Insights:
- Basic Metrics program
1.1 Review current state and set your goals
120 minutes
Let’s put the security program under the microscope.
Before program improvement can take place, it is necessary to look at where things are at presently (in terms of maturity) and where we need to get them to.
In other words, we need to perform a security program gap analysis.
Info-Tech Best Practice
The most thorough way of performing this gap analysis is by completing Info-Tech’s Build an Information Security Strategy blueprint, as it will provide you with a prioritized list of initiatives to boost your security program maturity.
Completing an abbreviated gap analysis...
- Security Areas
- Network Security
- Endpoint Security
- Vulnerability Management
- Identity Access Management
- Incident Management
- Training & Awareness
- Compliance, Audit, & Review
- Risk Management
- Business Alignment & Governance
- Data Security
- Using the CMMI scale on the next slide, assess your maturity level across the security areas to the left, giving your program a score from 1-5. Record your assessment on a whiteboard.
- Zone in on your areas of greatest concern and choose 3 to 5 areas to prioritize for improvement.
- Set a SMART goal for improvement, using the criteria on goals slides.
Use the CMMI scale to contextualize your current maturity
Use the Capability Maturity Model Integration (CMMI) scale below to help you understand your current level of maturity across the various areas of your security program.
- Initial
- Incident can be managed. Outcomes are unpredictable due to lack of a standard operating procedure.
- Repeatable
- Process in place, but not formally implemented or consistently applied. Outcomes improve but still lack predictability.
- Defined
- Process is formalized and consistently applied. Outcomes become more predictable, due to consistent handling procedure.
- Managed
- Process shows signs of maturity and can be tracked via metrics. Moving towards a predictive approach to incident management.
- Optimizing
- Process reaches a fully reliable level, though improvements still possible. Regularity allows for process to be automated.
(Adapted from the “CMMI Institute Maturity Model”)
Base your goals around the five types of metrics
Choose goals that make sense – even if they seem simple.
The most effective metrics programs are personalized to reflect the goals of the security team and the business they work for. Using goals-based metrics allows you to make incremental improvements that can be measured and reported on, which makes program maturation a natural process.
Info-Tech Best Practice
Before setting a SMART goal, take a moment to consider your maturity for each security area, and which metric type you need to collect first, before moving to more ambitious goals.
Security Areas
- Network Security
- Endpoint Security
- Vulnerability Management
- Identity Access Management
- Incident Management
- Training & Awareness
- Compliance, Audit & Review
- Risk Management
- Business Alignment & Governance
- Data Security
| Metric Type | Description |
|---|---|
| Initial Probe | Determines what can be known (i.e. what sources for metrics exist?). |
| Baseline Testing | Establishes organization’s normal state based on current metrics. |
| Implementation | Focuses on setting up a series of related processes to increase organizational security (i.e. roll out MFA). |
| Improvement | Sets a target to be met and then maintained based on organizational risk tolerance. |
| Organizational Trends | Culls together several metrics to track (sometimes predict) how various trends affect the organization’s overall security. Usually focuses on large-scale issues (e.g. likelihood of a data breach). |
Set SMART goals for your security program
Specific
Measurable
Achievable
Realistic
Timebound
Now that you have determined which security areas you’d like to improve, decide on a goal that meets the SMART criteria.
Examples of possible goals for various maturity levels:
- Perform initial probe to determine number of systems capable of providing metrics by the end of the week.
- Take baseline measurements each month for three months to determine organization’s baseline state.
- Implement a vulnerability management program to improve baseline state by the end of the quarter.
- Improve deployment of critical patches by applying 90% of them within the set window by the end of the year.
- Demonstrate how vulnerability management affects broad organizational trends at quarterly report to senior leadership.
Compare the bolded text in these examples with the metric types on the previous slide
Record and assess your goals in the Security Metrics Determination and Tracking Tool
1.1 Security Metrics Determination and Tracking Tool
Use tab “2. Identify Security Goals” to document and assess your goals.
To increase visibility into the cost, effort, and value of any given goal, assess them using the following criteria:
- Initial Cost
- Ongoing Cost
- Initial Staffing
- Ongoing Staffing
- Alignment w/Business
- Benefit
Use the calculated Cost/Effort Rating, Benefit Rating, and Difference Score later in this project to help with goal prioritization.
Info-Tech Best Practice
If you have already completed a security strategy with Info-Tech resources, this work may likely have already been done. Consult your Information Security Program Gap Analysis Tool from the Build an Information Security Strategy research.
1.2 Develop KPIs and prioritize your goals
There are two paths to success.
At this time, it is necessary to evaluate the priorities of your security program.
Option 1: Progress to KPI Development
- If you would like practice developing KPIs for multiple goals to get used to the process, move to KPI development and then assess which goals you can pursue now based on resources available, saving the rest for later.
Option 2: Progress to Prioritization of Goals
- If you are already comfortable with KPI development and do not wish to create extras for later use, then prioritize your goals first and then develop KPIs for them.
Phase 1 Schematic
- Gap Analysis
- Set SMART Goals (You are here.)
- Develop KPIs
- Prioritize Goals
- Implement KPI & Monitor
- Phase 2
Develop a key performance indicator (KPI)
Find out if you’re meeting your goals.
Terms like “key performance indicator” may make this development practice seem more complicated than it really is. A KPI is just a single metric used to measure success towards a goal. In relational terms (i.e. as a percentage, ratio, etc.) to give it context (e.g. % of improvement over last quarter).
KPI development is about answering the question: what would indicate that I have achieved my goal?
To develop a KPI follow these steps:
- Review the case study on the following slides to get a sense of how KPIs can start simple and general and get more specific and complex over time.
- Using the example to the right, sort your SMART goals from step 1.1 into the various metric types, then determine what success would look like for you. What outcome are you trying to achieve? How will you know when you’ve achieved it?
- Fill out the KPI Development Worksheets to create sample KPIs for each of the SMART goals you have created. Ensure that you complete the accompanying KPI Checklist.
KPIs differ from goal to goal, but their forms follow certain trends
| Metric Type | KPI Form |
|---|---|
| Initial Probe | Progress of probe (e.g. % of systems checked to see if they can supply metrics). |
| Baseline Testing | What current data shows (e.g. % of systems needing attention). |
| Implementation | Progress of the implementation (e.g. % of complete vulnerability management program implementation). |
| Improvement | The threshold or target to be achieved and maintained (e.g. % of incidents responded to within target window). |
| Organizational Trends | The interplay of several KPIs and how they affect the organization’s risk posture (e.g. assessing the likelihood for a data breach). |
Explore the five metric types
1. Initial Probe
Focused on determining how many sources for metrics exist.
- Question: What am I capable of knowing?
- Goal: To determine what level of insight we have into our security processes.
- Possible KPI: % of systems for which metrics are available.
- Decision: Do we have sufficient resources available to collect metrics?
2. Baseline Testing
Focused on gaining initial insights about the state of your security program (what are the measurements?).
- Question: Does this data suggest areas for improvement?
- Goal: To create a roadmap for improvement.
- Possible KPI: % of systems that provide useful metrics to measure improvement.
- Decision: Is it necessary to acquire tools to increase, enhance, or streamline the metrics-gathering process?
Info-Tech Insight
Don't lose hope if you lack resources to move beyond these initial steps. Even if you are struggling to pull data, you can still draw meaningful metrics. The percent or ratio of processes or systems you lack insight into can be very valuable, as it provides a basis to initiate a risk-based discussion with management about the organization's security blind spots.
Explore the five metric types (cont’d)
3. Program Implementation
Focused on developing a basic program to establish basic maturity (e.g. implement an awareness and training program).
- Question: What needs to be implemented to establish basic maturity?
- Goal: To begin closing the gap between current and desired maturity.
- Possible KPI: % of implementation completed.
- Decision: Have we achieved a formalized and repeatable process?
4. Improvement
Focused on attaining operational targets to lower organizational risk.
- Question: What other related activities could help to support this goal (e.g. regular training sessions)?
- Goal: To have metrics operate above or below a certain threshold (e.g. lower phishing-test click rate to an average of 10% across the organization)
- Possible KPI: Phishing click rate %
- Decision: What other metrics should be tracked to provide insight into KPI fluctuations?
Info-Tech Insight
Don't overthink your KPI. In many cases it will simply be your goal rephrased to express a percentage or ratio. In others, like the example above, it makes sense for them to be identical.
5. Organizational Impact
Focused on studying several related KPIs (Key Performance Index, or KPX) in an attempt to predict risks.
- Question: What risks does the organization need to address?
- Goal: To provide high-level summaries of several metrics that suggest emerging or declining risks.
- Possible KPI: Likelihood of a given risk (based on the trends of the KPX).
- Decision: Accept the risk, transfer the risk, mitigate the risk?
Case study: Healthcare example
Let’s take a look at KPI development in action.
Meet Maria, the new CISO at a large hospital that desperately needs security program improvements. Maria’s first move was to learn the true state of the organization’s security. She quickly learned that there was no metrics program in place and that her staff were unaware what, if any, sources were available to pull security metrics from.
After completing her initial probe into available metrics and then investigating the baseline readings, she determined that her areas of greatest concern were around vulnerability and access management. But she also decided it was time to get a security training and awareness program up and running to help mitigate risks in other areas she can’t deal with right away.
See examples of Maria’s KPI development on the next four slides...
Info-Tech Insight
There is very little variation in the kinds of goals people have around initial probes and baseline testing. Metrics in these areas are virtually always about determining what data sources are available to you and what that data actually shows. The real decisions start in determining what you want to do based on the measures you’re seeing.
Metric development example: Vulnerability Management
See examples of Maria’s KPI development on the next four slides...
Implementation
Goal: Implement vulnerability management program
KPI: % increase of insight into existing vulnerabilities
Associated Metric: # of vulnerability detection methods
Improvement
Goal: Improve deployment time for patches
KPI: % of critical patches fully deployed within target window
- Associated Metric 1: # of critical vulnerabilities not patched
- Associated Metric 2: # of patches delayed due to lack of staff
- Associated Metric X
Metric development example: Identity Access Management
Implementation
Goal: Implement MFA for privileged accounts
KPI: % of privileged accounts with MFA applied
Associated Metric: # of privileged accounts
Improvement
Goal: Remove all unnecessary privileged accounts
KPI: % of accounts with unnecessary privileges
- Associated Metric 1: # of privileged accounts
- Associated Metric 2: # of necessary privileged accounts
- Associated Metric X
Metric development example: Training and Awareness
Implementation
Goal: Implement training and awareness program
KPI: % of organization trained
Associated Metric: # of departments trained
Improvement
Goal: Improve time to report phishing
KPI: % of phishing cases reported within target window
- Associated Metric 1: # of phishing tests
- Associated Metric 2: # of training sessions
- Associated Metric X
Metric development example: Key Performance Index
Organizational Trends
Goal: Predict Data Breach Likelihood
- KPX 1: Insider Threat Potential
- % of phishing cases reported within target window
- Associated Metrics:
- # of phishing tests
- # of training sessions
- Associated Metrics:
- % of critical patches fully deployed within target window
- Associated Metrics:
- # of critical vulnerabilities not patched
- # of patches delayed due to lack of staff
- Associated Metrics:
- % of accounts with unnecessary privileges
- Associated Metrics:
- # of privileged accounts
- # of necessary privileged accounts
- Associated Metrics:
- % of phishing cases reported within target window
- KPX 2: Data Leakage Issues
- % of incidents related to unsecured databases
- Associated Metrics:
- # of unsecured databases
- # of business-critical databases
- Associated Metrics:
- % of misclassified data
- Associated Metrics:
- # of misclassified data reports
- # of DLP false positives
- Associated Metrics:
- % of incidents involving data-handling procedure violations.
- Associated Metrics:
- # of data processes with SOP
- # of data processes without SOP
- Associated Metrics:
- % of incidents related to unsecured databases
- KPX 3: Endpoint Vulnerability Issues
- % of unpatched critical systems
- Associated Metrics:
- # of unpatched systems
- # of missed patches
- Associated Metrics:
- % of incidents related to IoT
- Associated Metrics:
- # of IoT devices
- # of IoT unsecure devices
- Associated Metrics:
- % of incidents related to BYOD
- Associated Metrics:
- # of end users doing BYOD
- # of BYOD incidents
- Associated Metrics:
- % of unpatched critical systems
Develop Goals-Based KPIs
1.2 120 minutes
Materials
- Info-Tech KPI Development Worksheets
Participants
- Security Team
Output
- List of KPIs for immediate and future use (can be used to populate Info-Tech’s KPI Development Tool).
It’s your turn.
Follow the example of the CISO in the previous slides and try developing KPIs for the SMART goals set in step 1.1.
- To begin, decide if you are starting with implementation or improvement metrics.
- Enter your goal in the space provided on the left-hand side and work towards the right, assigning a KPI to track progress towards your goal.
- Use the associated metrics boxes to record what raw data will inform or influence your KPI.
- Associated metrics are connected to the KPI box with a segmented line. This is because these associated metrics are not absolutely necessary to track progress towards your goal.
- However, if a KPI starts trending in the wrong direction, these associated metrics would be used to determine where the problem has occurred.
- If desired, bundle together several related KPIs to create a key performance index (KPX), which is used to forecast the likelihood of certain risks that would have a major business impact (e.g. potential for insider threat, or risk for a data breach).
Record KPIs and assign them to goals in the Security Metrics Determination and Tracking Tool
1.2 Security Metrics Determination and Tracking Tool
Document KPI metadata in the tool and optionally assign them to a goal.
Tab “3. Identify Goal KPIs” allows you to record each KPI and its accompanying metadata:
- Source
- Owner
- Audience
- KPI Target
- Effort to Collect
- Frequency of Collection
- Comments
Optionally, each KPI can be mapped to goals defined on tab “2. Identify Security Goals.”
Info-Tech Best Practice
Ensure your metadata is comprehensive, complete, and realistic. A different employee should be able to use only the information outlined in the metadata to continue collecting measurements for the program.
Complete Info-Tech’s KPI Development Worksheets
1.2 KPI Development Worksheet
Use these worksheets to model the maturation of your metrics program.
Follow the examples contained in this slide deck and practice creating KPIs for:
- Implementation metrics
- Improvement metrics
- Organizational trends metrics
As well as drafting associated metrics to inform the KPIs you create.
Info-Tech Best Practice
Keep your metrics program manageable. This exercise may produce more goals, metrics, and KPIs than you deal with all at once. But that doesn’t mean you can’t save some for future use.
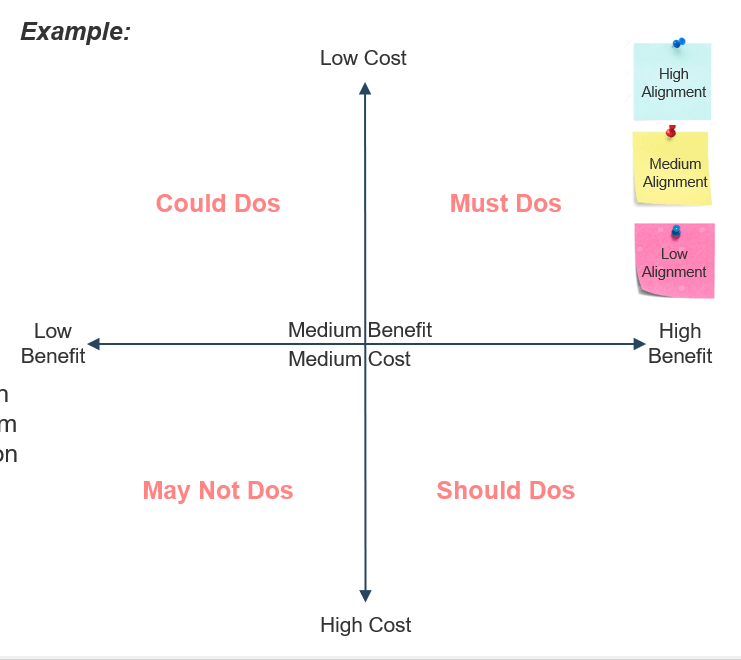
Build an effort map to prioritize your SMART goals
1.2 120 minutes
Materials
- Whiteboard
- Sticky notes
- Laptop
Participants
- Security team
- Other stakeholders
Output
- Prioritized list of SMART goals
An effort map visualizes a cost and benefit analysis. It is a quadrant output that visually shows how your SMART goals were assessed. Use the calculated Cost/Effort Rating and Benefit Rating values from tab “2. Identify Security Goals” of the Security Metrics Determination and Tracking Tool to aid this exercise.
Steps:
- Establish the axes and colors for your effort map:
- X-axis (horizontal) - Security benefit
- Y-axis (vertical) - Overall cost/effort
- Sticky color - Business alignment
- Create sticky notes for each SMART goal and place them onto the effort map based on your determined axes.
- Goal # Example Security Goal - Benefit (1-12) - Cost (1-12)
1.3 Implement and monitor the KPI to track goal progress
Let’s put your KPI into action!
Now that you’ve developed KPIs to monitor progress on your goals, it’s time to use them to drive security program maturation by following these steps:
- Review the KPI Development Worksheets (completed in step 1.2) for your prioritized list of goals. Be sure that you are able to track all of the associated metrics you have identified.
- Track the KPI and associated metrics using Info-Tech’s KPI Development Tool (see following slide).
- Update the data as necessary according to your SMART criteria of your goal.
A Word on Key Risk Indicators...
The term key risk indicator (KRI) gets used in a few different ways. However, in most cases, KRIs are closely associated with KPIs.
- KPIs and KRIs are the same thing
- A KPI, at its core, is really a measure of risk. Sometimes it is more effective to emphasize that risk rather than performance (i.e. the data shows you’re not meeting your goal).
- KRI is KPI going the wrong way
- After achieving the desired threshold for an improvement goal, our new goal is usually to maintain such a state. When this balance is upset, it indicates that settled risk has once again become active.
- KRI as a predictor of emerging risks
- When organizations reach a highly mature state, they often start assessing how events external to the organization can affect the optimal performance of the organization. They monitor such events or trends and try to predict when the organization is likely to face additional risks.
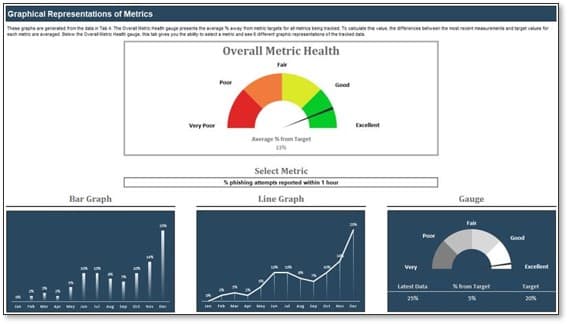
Track KPIs in the Security Metrics Determination and Tracking Tool
1.3 Security Metrics Determination and Tracking Tool
Once a metric has been measured, you have the option of entering that data into tab “4. Track Metrics” of the Tool.
Tracking metric data in Info-Tech's tool provides the following data visualizations:
- Sparklines at the end of each row (on tab “4. Track Metrics”) for a quick sense of metric performance.
- A metrics dashboard (on tab “5. Graphs”) with three graph options in two color variations for each metric tracked in the tool, and an overall metric program health gauge.
Info-Tech Best Practice
Be diligent about measuring and tracking your metrics. Record any potential measurement biases or comments on measurement values to ensure you have a comprehensive record for future use. In the tool, this can be done by adding a comment to a cell with a metric measurement.
If you want additional support, have our analysts guide you through this phase as part of an Info-Tech workshop
Book a workshop with our Info-Tech analysts:
Workshops offer an easy way to accelerate your project. While onsite, our analysts will work with you and your team to facilitate the activities outlined in the blueprint.
Getting key stakeholders together to formalize the program, while getting started on data discovery and classification, allows you to kickstart the overall program.
In addition, leverage over-the-phone support through Guided Implementations included in advisory memberships to ensure the continuous improvement of the classification program even after the workshop.
Logan Rohde
Research Analyst – Security, Risk & Compliance Info-Tech Research Group
Ian Mulholland
Senior Research Analyst – Security, Risk & Compliance Info-Tech Research Group
Call 1-888-670-8889 for more information.
Phase 2
Adapt Your Reporting Strategy for Various Metric Types
Phase 2
2.1 Review best practices for presenting metrics
2.2 Strategize your presentation based on metric type
2.3 Tailor your presentation to your audience
2.4 Use your metrics to create a story about risk
2.5 Revise Metrics
This phase will walk you through the following activities:
- Develop reporting strategy
- Use metrics to create a story about risk
- Metrics revision
This phase involves the following participants:
- Security Team
Outcomes of this phase
- Metrics Dashboard
- Metrics Presentation Deck
Phase 2 outline
Call 1-888-670-8889 or email GuidedImplementations@InfoTech.com for more information.
Complete these steps on your own or call us to complete a guided implementation. A guided implementation is a series of two to three advisory calls that help you execute each phase of a project. They are included in most advisory memberships.
Guided Implementation 2: Adapt Your Reporting Strategy for Various Metric Types
Proposed Time to Completion: 2-4 weeks
Step 2.1 – 2.3: Best Practices and Reporting Strategy
Start with an analyst kick-off call:
- Do’s and Don’ts of reporting metrics.
- Strategize presentation based on metric type.
Then complete these activities…
- Strategy development for 3-5 metrics
Step 2.4 – 2.5: Build a Dashboard and Presentation Deck
Review findings with analyst:
- Review strategies for reporting.
- Compile a Key Performance Index.
- Revise metrics.
Then complete these activities…
- Dashboard creation
- Presentation development
With these tools & templates:
- Security Metrics Determination and Tracking Tool Template
- Security Metrics KPX Dashboard Tool
Phase 2 Results & Insights:
- Completed reporting strategy with presentable dashboard
2.1 Review best practices for presenting metrics
Avoid technical details (i.e. raw data) by focusing on the KPI.
- KPIs add context to understand the behavior and associated risks.
Put things in terms of risk; it's the language you both understand.
- This usually means explaining what will happen if not addressed and what you recommend.
- There are always three options:
- Address it completely
- Address it partially
- Do not address it (i.e. accept the risk)
Explain why you’re monitoring metrics in terms of the goals you’re hoping to achieve.
- This sets you up well to explain what you've been doing and why it's important for you to meet your goals.
Choose between KPI or KRI as the presentation format.
- Base your decision on whether you are trying to emphasize current success or risk.
Match presentation with the audience.
- Board presentations will be short; middle-management ones may be a bit longer.
- Maximize your results by focusing on the minimum possible information to make sure you sufficiently get your point across.
- With the board, plan on showing no more than three slides.
Read between the lines.
- It can be difficult to get time with the board, so you may find yourself in a trial and error position, so pay attention to cues or suggestions that indicate the board is interested in something.
- If you can, make an ally to get the inside scoop on what the board cares about.
Read the news if you’re stuck for content.
- Board members are likely to have awareness (and interest) in large-scale risks like data breaches and ransomware.
Present your metrics as a story.
- Summarize how the security program looks to you and why the metrics lead you to see it this way.
2.2 Strategize your presentation based on metric type (1 of 5)
Metric Type: Initial Probe
Scenario: Implementing your first metrics program.
- All metrics programs start with determining what measurements you are capable of taking.
Decisions: Do you have sufficient insight into the program? (i.e. do you need to acquire additional tools to collect metrics?)
Strategy: If there are no barriers to this (e.g. budget), then focus your presentation on the fact that you are addressing the risk of not knowing what your organization's baseline state is and what potential issues exist but are unknown. This is likely the first phase of an improvement plan, so sketching the overall plan is a good idea too.
- If budget is an issue, explain the risks associated with not knowing and what you would need to make it happen.
Possible KPIs:
- % of project complete.
- % of systems that provide worthwhile metrics.
Strategize your presentation based on metric type (2 of 5)
Metric Type: Baseline Testing
Scenario: You've taken the metrics to determine what your organization’s normal state is and you're now looking towards addressing your gaps or problem areas.
Decisions: What needs to be prioritized first and why? Are additional resources required to make this happen?
Strategy: Explain your impression of the organization's normal state and what you plan to do about it. In other words, what goals are you prioritizing and why? Be sure to note any challenges that may occur along the way (e.g. staffing).
- If the board doesn't like to open their pocketbook, your best play is to explain what stands to happen (or is happening) if risks are not addressed.
Possible KPIs:
- % of goals complete.
- % of metrics indicating urgent attention needed.
Strategize your presentation based on metric type (3 of 5)
Metric Type: Implementation
Scenario: You are now implementing solutions to address your security priorities.
Decisions: What, to you, would establish the basis of a program?
Strategy: Focus on what you're doing to implement a certain security need, why, and what still needs to be done when you’re finished.
- Example: To establish a training and awareness program, a good first step is to actually hold training sessions with each department. A single lecture is simple but something to build from. A good next step would be to hold regular training sessions or implement monthly phishing tests.
Possible KPIs:
- % of implementation complete (e.g. % of departments trained).
Strategize your presentation based on metric type (4 of 5)
Metric Type: Improvement
Scenario: Now that a basic program has been established, you are looking to develop its maturity to boost overall performance (i.e. setting a new development goal).
Decisions: What is a reasonable target, given the organization's risk tolerance and current state?
Strategy: Explain that you're now working to tighten up the security program. Note that although things are improving, risk will always remain, so we need to keep it within a threshold that’s proportionate with our risk tolerance.
- Example: Lower phishing-test click rate to 10% or less. Phishing will always be a risk, and just one slip up can have a huge effect on business (i.e. lost money).
Possible KPIs:
- % of staff passing the phishing test.
- % of employees reporting phishing attempts within time window.
Strategize your presentation based on metric type (5 of 5)
Metric Type: Organizational Trends
Scenario: You've reached a mature state and now how several KPIs being tracked. You begin to look at several KPIs together (i.e. a KPX) to assess the organization's exposure for certain broad risk trends.
Decisions: Which KPIs can be used together to look at broader risks?
Strategy: Focus on the overall likelihood of a certain risk and why you've chosen to assess it with your chosen KPIs. Spend some time discussing what factors affect the movement of these KPIs, demonstrating how smaller behaviors create a ripple effect that affects the organization’s exposure to large-scale risks.
Possible KPX: Insider Threat Risk
- % of phishing test failures.
- % of critical patches missed.
- % of accounts with unnecessary privileges.
Change your strategy to address security challenges
Even challenges can elicit useful metrics.
Not every security program is capable of progressing smoothly through the various metric types. In some cases, it is impossible to move towards goals and metrics for implementation, improvement, or organizational trends because the security program lacks resources.
Info-Tech Insight
When your business is suffering from a lack of resources, acquiring these resources automatically becomes the goal that your metrics should be addressing. To do this, focus on what risks are being created because something is missing.
When your security program is lacking a critical resource, such as staff or technology, your metrics should focus on what security processes are suffering due to this lack. In other words, what critical activities are not getting done?
KPI Examples:
- % of critical patches not deployed due to lack of staff.
- % of budget shortfall to acquire vulnerability scanner.
- % of systems with unknown risk due to lack of vulnerability scanner.
2.3 Tailor presentation to your audience
Metrics come in three forms...
1. Raw Data
- Taken from logs or reports, provides values but not context.
- Useful for those with technical understanding of the organization’s security program.
2. Management-Level
- Raw data that has been contextualized and indicates performance of something (i.e. a KPI).
- Useful for those with familiarity with the overall state of the security program but do not have a hands-on role.
3. Board-Level
- KPI with additional context indicating overall effect on the organization.
- Useful for those removed from the security program but who need to understand the relationship between security, business goals, and cyber risk.
For a metric to be useful it must...
- Be understood by the audience it’s being presented to.
- Using the criteria on the left, choose which metric form is most appropriate.
- Indicate whether or not a certain target or goal is being met.
- Don’t expect metrics to speak for themselves; explain what the indications and implications are.
- Drive some kind of behavioral or strategic change if that target or goal is not being met.
- Metrics should either affirm that things are where you want them to be or compel you to take action to make an improvement. If not, it is not a worthwhile metric.
As a general rule, security metrics should become decreasingly technical and increasingly behavior-based as they are presented up the organizational hierarchy.
"The higher you travel up the corporate chain, the more challenging it becomes to create meaningful security metrics. Security metrics are intimately tied to their underlying technologies, but the last thing the CEO cares about is technical details." – Ben Rothke, Senior Information Security Specialist, Tapad.
Plan for reporting success
The future of your security program may depend on this presentation; make it count.
Reporting metrics is not just another presentation. Rather, it is an opportunity to demonstrate and explain the value of security.
It is also a chance to correct any misconceptions about what security does or how it works.
Use the tips on the right to help make your presentation as relatable as possible.
Info-Tech Insight
There is a difference between data manipulation and strategic presentation: the goal is not to bend the truth, but to present it in a way that allows you to show the board what they need to see and to explain it in terms familiar to them.
General Tips for a Successful Presentation
Avoid jargon; speak in practical terms
- The board won’t receive your message if they can’t understand you.
- Explain things as simply as you can; they only need to know enough to make decisions about addressing cyber risk.
Address compliance
- Boards are often interested in compliance, so be prepared to talk about it, but clarify that it doesn't equal security.
- Instead, use compliance as a bridge to discussing areas of the security program that need attention.
Have solid answers
- Try to avoid answering questions with the answer, “It depends.”
- Depends on what?
- Why?
- What do you recommend?
- The board is relying on you for guidance, so be prepared to clarify what the board is asking (you may have to read between the lines to do this).
- Also address the pain points of board members and have answers to their questions about how to resolve them.
2.4 Use your metrics to create a story about risk
Become the narrator of your organization’s security program.
Security is about managing risk. This is also its primary value to the organization. As such, risk should be the theme of the story you tell.
"Build a cohesive story that people can understand . . . Raw metrics are valuable from an operations standpoint, but at the executive level, it's about a cohesive story that helps executives understand the value of the security program and keeps the company moving forward. "– Adam Ely, CSO and Co-Founder, Bluebox Security, qtd. by Tenable, 2016
How to Develop Your Own Story...
- Review your security program goals and the metrics you’re using to track progress towards them. Then, decide which metrics best tell this story (i.e. what you’re doing and why).
- Less is more when presenting metrics, so be realistic about how much your audience can digest in one sitting.
- Three metrics is usually a safe number; choose the ones that are most representative of your goals.
- Explain why you chose the goals you did (i.e. what risks were you addressing?). Then, make an honest assessment of how the security program is doing as far as meeting those goals:
- What’s going well?
- What still needs improvement?
- What about your metrics suggests this?
- Address how risks have changed and explain your new recommended course of action.
- What risks were present when you started?
- What risks remain despite your progress?
- How do these risks affect the business operation and what can security do to help?
Story arc for security metrics
The following model encapsulates the basic trajectory of all story development.
Use this model to help you put together your story about risk.
Introduction: Overall assessment of security program.
Initial Incident: Determination of the problems and associated risks.
Rising Action: Creation of goals and metrics to measure progress.
Climax: Major development indicated by metrics.
Falling Action: New insights gained about organization’s risks.
Resolution: Recommendations based on observations.
Info-Tech Best Practice
Follow this model to ensure that your metrics presentation follows a coherent storyline that explains how you assessed the problem, why you chose to address it the way you did, what you learned in doing so, and finally what should be done next to boost the security program’s maturity.
Use a nesting-doll approach when presenting metrics
Move from high-level to low-level to support your claims
- Avoid the temptation to emphasize technical details when presenting metrics. The importance of a metric should be clear from just its name.
- This does not mean that technical details should be disregarded entirely. Your digestible, high-level metrics should be a snapshot of what’s taking place on the security ground floor.
- With this in mind, we should think of our metrics like a nesting doll, with each metrics level being supported by the one beneath it.
...How do you know that?
Board-Level KPI
Mgmt.-Level KPI
Raw Data
Think of your lower-level metrics as evidence to back up the story you are telling.
When you’re asked how you arrived at a given conclusion, you know it’s time to go down a level and to explain those results.
Think of this like showing your work.
Info-Tech Insight
This approach is built into the KPX reporting format, but can be used for all metric types by drawing from your associated metrics and goals already achieved.
Use one of Info-Tech’s dashboards to present your metrics
2.4 Security Metrics Determination and Tracking Tool
Choose the dashboard tool that makes the most sense for you.
Info-Tech provides two options for metric dashboards to meet the varying needs of our members.
If you’re just starting out, you’ll likely be inclined towards the dashboard within the Security Metrics Determination and Tracking Tool (seen here).
But if you’ve already got several KPIs to report on, you may prefer the Security Metrics KPX Dashboard Tool, featured on the following slides.
Info-Tech Best Practice
Not all graphs will be needed in all cases. When presenting, consider taking screenshots of the most relevant data and displaying them in Info-Tech’s Board-Level Security Metrics Presentation Template.
Use one of Info-Tech’s dashboards to present your metrics
2.4 Security Metrics KPX Dashboard
Use Info-Tech’s Security Metrics KPX Dashboard to track and show your work.
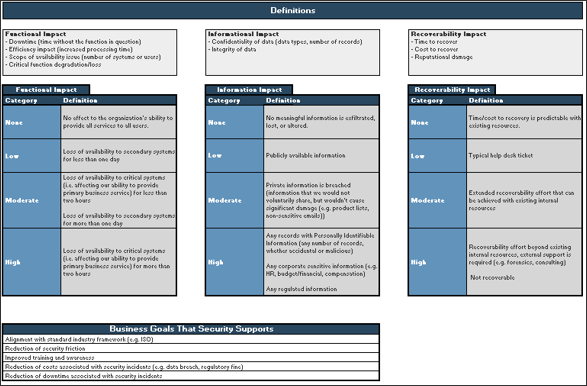
- Start by customizing the definitions on tab 1 to match your organization’s understanding of high, medium, and low risk across the three impact areas (functional, informational, and recoverability).
- Next, enter up to 5 business goals that your security program supports.
Use one of Info-Tech’s dashboards to present your metrics
2.4 Security Metrics KPX Dashboard
Use Info-Tech’s Security Metrics KPX Dashboard to track and show your work.
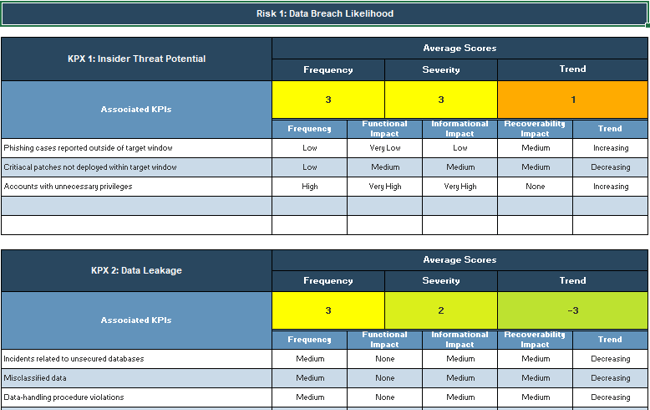
- On tab 2, enter the large-scale risk you are tracking
- Proceed by naming each of your KPXs after three broad risks that – to you – contribute to the large-scale risk.
Use one of Info-Tech’s dashboards to present your metrics
2.4 Security Metrics KPX Dashboard
Use Info-Tech’s Security Metrics KPX Dashboard to track and show your work.
- Then, add up to five KPIs aimed at managing more granular risks that contribute to the broad risk.
- Assess the frequency and impact associated with these more granular risks to determine how likely it is to contribute to the broad risk the KPX is tracking.
Use one of Info-Tech’s dashboards to present your metrics
2.4 Security Metrics KPX Dashboard
Use Info-Tech’s Security Metrics KPX Dashboard to track and show your work.
- Repeat as necessary for the other KPXs on tab 2.
- Repeat steps 3-7 for up to two more large-scale risks and associated KPXs on tabs 3 and 4.
Use one of Info-Tech’s dashboards to present your metrics
2.4 Security Metrics KPX Dashboard
Use Info-Tech’s Security Metrics KPX Dashboard to track and show your work.
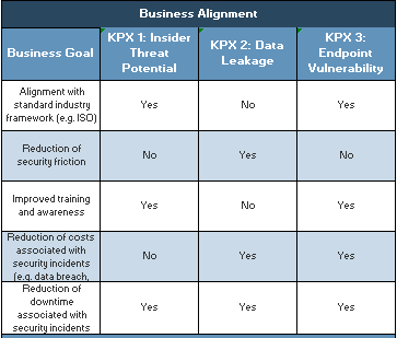
- If desired, complete the Business Alignment evaluation (located to the right of KPX 2 on tabs 2-4) to demonstrate how well security is supporting business goals.
"An important key to remember is to be consistent and stick to one framework once you've chosen it. As you meet with the same audiences repeatedly, having the same framework for reference will ensure that your communications become smoother over time." – Caroline Wong, Chief Strategy Officer, Cobalt.io
Use one of Info-Tech’s dashboards to present your metrics
2.4 Security Metrics KPX Dashboard
Use Info-Tech’s Security Metrics KPX Dashboard to track and show your work.
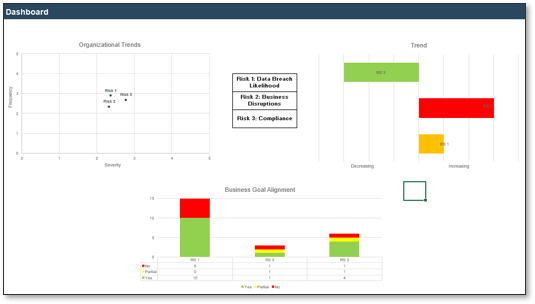
- Use the dashboard on tab 5 to help you present your security metrics to senior leadership.
Use one of Info-Tech’s dashboards to present your metrics
2.4 Security Metrics KPX Dashboard
Use Info-Tech’s Security Metrics KPX Dashboard to track and show your work.
Best Practice:
This tool helps you convert your KPIs into the language of risk by assessing frequency and severity, which helps to make the risk relatable for senior leadership. However, it is still useful to track fluctuations in terms of percentage. To do this, track changes in the frequency, severity, and trend scores from quarter to quarter.
Customize Info-Tech’s Security Metrics Presentation Template
2.4 Board-Level Security Metrics Presentation Template
Use the Board-Level Security Metrics Presentation Template deck to help structure and deliver your metrics presentation to the board.
To make the dashboard slide, simply copy and paste the charts from the dashboard tool and arrange the images as needed.
Adapt the status report and business alignment slides to reflect the story about risk that you are telling.
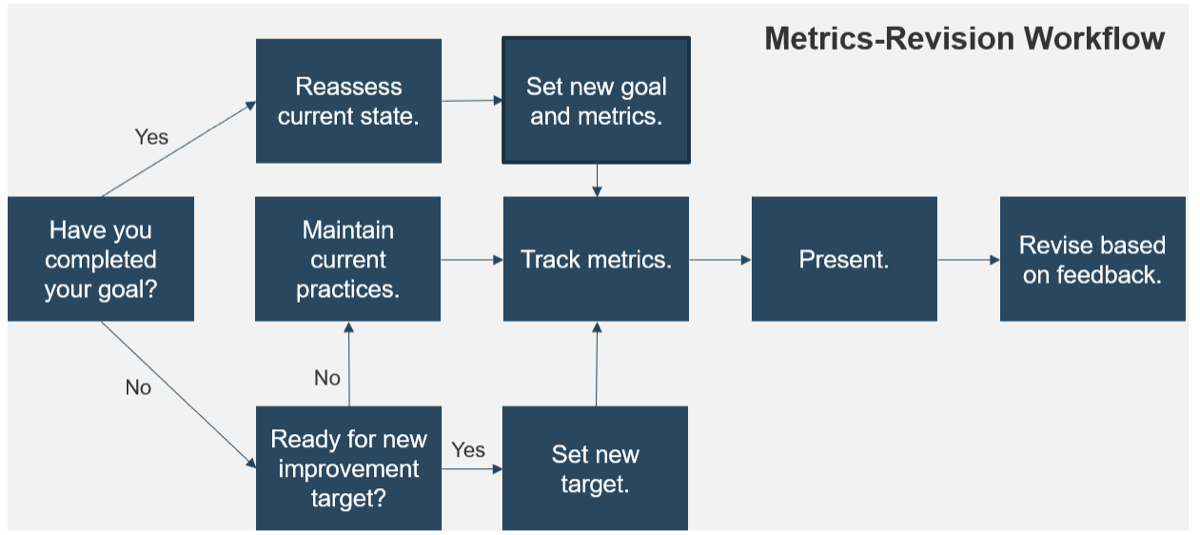
2.5 Revise your metrics
What's next?
Now that you’ve made it through your metrics presentation, it’s important to reassess your goals with feedback from your audience in mind. Use the following workflow.
If you want additional support, have our analysts guide you through this phase as part of an Info-Tech workshop
Book a workshop with our Info-Tech analysts:
Workshops offer an easy way to accelerate your project. While onsite, our analysts will work with you and your team to facilitate the activities outlined in the blueprint.
Getting key stakeholders together to formalize the program, while getting started on data discovery and classification, allows you to kickstart the overall program.
In addition, leverage over-the-phone support through Guided Implementations included in advisory memberships to ensure the continuous improvement of the classification program even after the workshop.
Logan Rohde
Research Analyst – Security, Risk & Compliance Info-Tech Research Group
Ian Mulholland
Senior Research Analyst – Security, Risk & Compliance Info-Tech Research Group
Call 1-888-670-8889 for more information.
Insight breakdown
Metrics lead to maturity, not vice versa.
- Tracking metrics helps you assess progress and regress in your security program, which helps you quantify the maturity gains you’ve made.
Don't lose hope if you lack resources to move beyond baseline testing.
- Even if you are struggling to pull data, you can still draw meaningful metrics. The percent or ratio of processes or systems you lack insight into can be very valuable, as it provides a basis to initiate a risk-based discussion with management about the organization's security blind spots.
The best metrics are tied to goals.
- Tying your metrics to goals ensures that you are collecting metrics for a specific purpose rather than just to watch the numbers change.
Summary of accomplishment
Knowledge Gained
- Current maturity assessment of security areas
- Setting SMART goals
- Metric types
- KPI development
- Goals prioritization
- Reporting and revision strategies
Processes Optimized
- Metrics development
- Metrics collection
- Metrics reporting
Deliverables Completed
- KPI Development Worksheet
- Security Metrics Determination and Tracking Tool
- Security Metrics KPX Dashboard Tool
- Board-Level Security Metrics Presentation Template
Research contributors and experts
Mike Creaney, Senior Security Engineer at Federal Home Loan Bank of Chicago
Peter Chestna, Director, Enterprise Head of Application Security at BMO Financial Group
Zane Lackey, Co-Founder / Chief Security Officer at Signal Sciences
Ben Rothke, Senior Information Security Specialist at Tapad
Caroline Wong, Chief Strategy Officer at Cobalt.io
2 anonymous contributors
Related Info-Tech research
Build an Information Security Strategy
Tailor best practices to effectively manage information security.
Implement a Security Governance and Management Program
Align security and business objectives to get the greatest benefit from both.
Bibliography
Capability Maturity Model Integration (CMMI). ISACA. Carnegie Mellon University.
Ely, Adam. “Choose Security Metrics That Tell a Story.” Using Security Metrics to Drive Action: 33 Experts Share How to Communicate Security Program Effectiveness to Business Executives and the Board Eds. 2016. Web.
https://www.ciosummits.com/Online_Assets_Tenable_eBook-_Using_Security_Metrics_to_Drive_Action.pdf
ISACA. “Board Director Concerns about Cyber and Technology Risk.” CSX. 11 Sep. 2018. Web.
Rothke, Ben. “CEOs Require Security Metrics with a High-Level Focus.” Using Security Metrics to Drive Action: 33 Experts Share How to Communicate Security Program Effectiveness to Business Executives and the Board Eds. 2016. Web.
https://www.ciosummits.com/Online_Assets_Tenable_eBook-_Using_Security_Metrics_to_Drive_Action.pdf
Wong, Caroline. Security Metrics: A Beginner’s Guide. McGraw Hill: New York, 2012.