Further reading
Build a Strong Technology Foundation for Customer Experience Management
Design an end-to-end technology strategy to enhance marketing effectiveness, drive sales, and create compelling customer service experiences.
ANALYST PERSPECTIVE
Technology is the catalyst to create – and keep! – your customers.
"Customers want to interact with your organization on their own terms, and in the channels of their choice (including social media, mobile applications, and connected devices). Regardless of your industry, your customers expect a frictionless experience across the customer lifecycle. They desire personalized and well-targeted marketing messages, straightforward transactions, and effortless service. Research shows that customers value – and will pay more for! – well-designed experiences.
Strong technology enablement is critical for creating customer experiences that drive revenue. However, most organizations struggle with creating a cohesive technology strategy for customer experience management (CXM). IT leaders need to take a proactive approach to developing a strong portfolio of customer interaction applications that are in lockstep with the needs of their marketing, sales, and customer service teams. It is critical to incorporate the voice of the customer into this strategy.
When developing a technology strategy for CXM, don’t just “pave the cow path,” but instead move the needle forward by providing capabilities for customer intelligence, omnichannel interactions, and predictive analytics. This blueprint will help you build an integrated CXM technology roadmap that drives top-line revenue while rationalizing application spend."
Ben Dickie
Research Director, Customer Experience Strategy
Info-Tech Research Group
Framing the CXM project
This Research Is Designed For:
- IT leaders who are responsible for crafting a technology strategy for customer experience management (CXM).
- Applications managers who are involved with the selection and implementation of critical customer-centric applications, such as CRM platforms, marketing automation tools, customer intelligence suites, and customer service solutions.
This Research Will Help You:
- Clearly link your technology-enablement strategy for CXM to strategic business requirements and customer personas.
- Build a rationalized portfolio of enterprise applications that will support customer interaction objectives.
- Adopt standard operating procedures for CXM application deployment that address issues such as end-user adoption and data quality.
This Research Will Also Assist:
- Business leaders in marketing, sales, and customer service who want to deepen their understanding of CXM technologies, and apply best practices for using these technologies to drive competitive advantage.
- Marketing, sales, and customer service managers involved with defining requirements and rolling out CXM applications.
This Research Will Help Them:
- Work hand-in-hand with counterparts in IT to deploy high-value business applications that will improve core customer-facing metrics.
- Understand the changing CXM landscape and use the art of the possible to transform the internal technology ecosystem and drive meaningful customer experiences.
Executive summary
Situation
- Customer expectations for personalization, channel preferences, and speed-to-resolution are at an all-time high.
- Your customers are willing to pay more for high-value experiences, and having a strong customer CXM strategy is a proven path to creating sustainable value for the organization.
Complication
- Technology is a fundamental enabler of an organization’s CXM strategy. However, many IT departments fail to take a systematic approach to building a portfolio of applications to support Marketing, Sales, and Customer Service.
- The result is a costly, ineffective, and piecemeal approach to CXM application deployment (including high profile applications like CRM).
Resolution
- IT must work in lockstep with their counterparts in marketing, sales, and customer service to define a unified vision, strategic requirements and roadmap for enabling strong customer experience capabilities.
- In order to deploy applications that don’t simply follow previously established patterns but are aligned with the specific needs of the organization’s customers, IT leaders must work with the business to define and understand customer personas and common interaction scenarios. CXM applications are mission critical and failing to link them to customer needs can have a detrimental effect on customer satisfaction – and ultimately revenue.
- IT must act as a valued partner to the business in creating a portfolio of CXM applications that are cost effective.
- Organizations should create a repeatable framework for CXM application deployment that addresses critical issues, including the integration ecosystem, customer data quality, dashboards and analytics, and end-user adoption.
Info-Tech Insight
- IT can’t hide behind the firewall. IT must understand the organization’s customers to properly support marketing, sales, and service efforts.
- IT – or Marketing – must not build the CXM strategy in a vacuum if they want to achieve a holistic, consistent, and seamless customer experience.
- IT must get ahead of shadow IT. To be seen as an innovator within the business, IT must be a leading enabler in building a rationalized and integrated CXM application portfolio.
Guide to frequently used acronyms
CXM - Customer Experience Management
CX - Customer Experience
CRM - Customer Relationship Management
CSM - Customer Service Management
MMS - Marketing Management System
SMMP - Social Media Management Platform
RFP - Request for Proposal
SaaS - Software as a Service
Customers’ expectations are on the rise: meet them!
Today’s consumers expect speed, convenience, and tailored experiences at every stage of the customer lifecycle. Successful organizations strive to support these expectations.
67% of end consumers will pay more for a world-class customer experience. 74% of business buyers will pay more for strong B2B experiences. (Salesforce, 2018)
5 CORE CUSTOMER EXPECTATIONS
- More personalization
- More product options
- Constant contact
- Listen closely, respond quickly
- Give front-liners more control
(Customer Experience Insight, 2016)
Customers expect to interact with organizations through the channels of their choice. Now more than ever, you must enable your organization to provide tailored customer experiences.
Realize measurable value by enabling CXM
Providing a seamless customer experience increases the likelihood of cross-sell and up-sell opportunities and boosts customer loyalty and retention. IT can contribute to driving revenue and decreasing costs by providing the business with the right set of tools, applications, and technical support.
Contribute to the bottom line
Cross-sell, up-sell, and drive customer acquisition.
67% of consumers are willing to pay more for an upgraded experience. (Salesforce, 2018)
80%: The margin by which CX leaders outperformer laggards in the S&P 500.(Qualtrics, 2017)
59% of customers say tailored engagement based on past interactions is very important to winning their business. (Salesforce, 2018)
Enable cost savings
Focus on customer retention as well as acquisition.
It is 6-7x more costly to attract a new customer than it is to retain an existing customer. (Salesforce Blog, 2019)
A 5% increase in customer retention has been found to increase profits by 25% to 95%. (Bain & Company, n.d.)
Strategic CXM is gaining traction with your competition
Organizations are prioritizing CXM capabilities (and associated technologies) as a strategic investment. Keep pace with the competition and gain a competitive advantage by creating a cohesive strategy that uses best practices to integrate marketing, sales, and customer support functions.
87% of customers share great experiences they’ve had with a company. (Zendesk, n.d.)
61% of organizations are investing in CXM. (CX Network, 2015)
53% of organizations believe CXM provides a competitive advantage. (Harvard Business Review, 2014)
Top Investment Priorities for Customer Experience
- Voice of the Customer
- Customer Insight Generation
- Customer Experience Governance
- Customer Journey Mapping
- Online Customer Experience
- Experience Personalization
- Emotional Engagement
- Multi-Channel Integration/Omnichannel
- Quality & Customer Satisfaction Management
- Customer/Channel Loyalty & Rewards Programs
(CX Network 2015)
Omnichannel is the way of the future: don’t be left behind
Get ahead of the competition by doing omnichannel right. Devise a CXM strategy that allows you to create and maintain a consistent, seamless customer experience by optimizing operations within an omnichannel framework. Customers want to interact with you on their own terms, and it falls to IT to ensure that applications are in place to support and manage a wide range of interaction channels.
Omnichannel is a “multi-channel approach to sales that seeks to provide the customer with a seamless transactional experience whether the customer is shopping online from a desktop or mobile device, by telephone, or in a bricks and mortar store.” (TechTarget, 2014)
97% of companies say that they are investing in omnichannel. (Huffington Post, 2015)
23% of companies are doing omnichannel well.
CXM applications drive effective multi-channel customer interactions across marketing, sales, and customer service
The success of your CXM strategy depends on the effective interaction of various marketing, sales, and customer support functions. To deliver on customer experience, organizations need to take a customer-centric approach to operations.
From an application perspective, a CRM platform generally serves as the unifying repository of customer information, supported by adjacent solutions as warranted by your CXM objectives.
CXM ECOSYSTEM
Customer Relationship Management Platform
- Web Experience Management Platform
- E-Commerce & Point of Sale Solutions
- Social Media Management Platform
- Customer Intelligence Platform
- Customer Service Management Tools
- Marketing Management Suite
Application spotlight: Customer experience platforms
Description
CXM solutions are a broad range of tools that provide comprehensive feature sets for supporting customer interaction processes. These suites supplant more basic applications for customer interaction management. Popular solutions that fall under the umbrella of CXM include CRM suites, marketing automation tools, and customer service applications.
Features and Capabilities
- Manage sales pipelines, provide quotes, and track client deliverables.
- View all opportunities organized by their current stage in the sales process.
- View all interactions that have occurred between employees and the customer, including purchase order history.
- Manage outbound marketing campaigns via multiple channels (email, phone, social, mobile).
- Build visual workflows with automated trigger points and business rules engine.
- Generate in-depth customer insights, audience segmentation, predictive analytics, and contextual analytics.
- Provide case management, ticketing, and escalation capabilities for customer service.
Highlighted Vendors
Microsoft Dynamics
Adobe
Marketo
sprinklr
Salesforce
SugarCRM
Application spotlight: Customer experience platforms
Key Trends
- CXM applications have decreased their focus on departmental silos to make it easier to share information across the organization as departments demand more data.
- Vendors are developing deeper support of newer channels for customer interaction. This includes providing support for social media channels, native mobile applications, and SMS or text-based services like WhatsApp and Facebook Messenger.
- Predictive campaigns and channel blending are becoming more feasible as vendors integrate machine learning and artificial intelligence into their applications.
- Content blocks are being placed on top of scripting languages to allow for user-friendly interfaces. There is a focus on alleviating bottlenecks where content would have previously needed to go through a specialist.
- Many vendors of CXM applications are placing increased emphasis on strong application integration both within and beyond their portfolios, with systems like ERP and order fulfillment.
Link to Digital Strategy
- For many organizations that are building out a digital strategy, improving customer experience is often a driving factor: CXM apps enable this goal.
- As part of a digital strategy, create a comprehensive CXM application portfolio by leveraging both core CRM suites and point solutions.
- Ensure that a point solution aligns with the digital strategy’s technology drivers and user personas.
CXM KPIs
Strong CXM applications can improve:
- Lead Intake Volume
- Lead Conversion Rate
- Average Time to Resolution
- First-Contact Resolution Rate
- Customer Satisfaction Rate
- Share-of-Mind
- Share-of-Wallet
- Customer Lifetime Value
- Aggregate Reach/Impressions
IT is critical to the success of your CXM strategy
Technology is the key enabler of building strong customer experiences: IT must stand shoulder-to-shoulder with the business to develop a technology framework for CXM.
Top 5 Challenges with CXM for Marketing
- Maximizing customer experience ROI
- Achieving a single view of the customer
- Building new customer experiences
- Cultivating a customer-focused culture
- Measuring CX investments to business outcomes
Top 5 Obstacles to Enabling CXM for IT
- Systems integration
- Multichannel complexity
- Organizational structure
- Data-related issues
- Lack of strategy
(Harvard Business Review, 2014)
Only 19% of organizations have a customer experience team tasked with bridging gaps between departments. (Genesys, 2018)
IT and Marketing can only tackle CXM with the full support of each other. The cooperation of the departments is crucial when trying to improve CXM technology capabilities and customer interaction and drive a strong revenue mandate.
CXM failure: Blockbuster
CASE STUDY
Industry Entertainment
Source Forbes, 2014
Blockbuster
As the leader of the video retail industry, Blockbuster had thousands of retail locations internationally and millions of customers. Blockbuster’s massive marketing budget and efficient operations allowed it to dominate the competition for years.
Situation
Trends in Blockbuster’s consumer market changed in terms of distribution channels and customer experience. As the digital age emerged and developed, consumers were looking for immediacy and convenience. This threatened Blockbuster’s traditional, brick-and-mortar B2C operating model.
The Competition
Netflix entered the video retail market, making itself accessible through non-traditional channels (direct mail, and eventually, the internet).
Results
Despite long-term relationships with customers and competitive standing in the market, Blockbuster’s inability to understand and respond to changing technology trends and customer demands led to its demise. The organization did not effectively leverage internal or external networks or technology to adapt to customer demands. Blockbuster went bankrupt in 2010.
Customer Relationship Management
- Web Experience Management Platform
- E-Commerce & Point of Sale Solutions
- Social Media Management
- Customer Intelligence
- Customer Service
- Marketing Management
Blockbuster did not leverage emerging technologies to effectively respond to trends in its consumer network. It did not optimize organizational effectiveness around customer experience.
CXM success: Netflix
CASE STUDY
Industry Entertainment
Source Forbes, 2014
Netflix
Beginning as a mail-out service, Netflix offered subscribers a catalog of videos to select from and have mailed to them directly. Customers no longer had to go to a retail store to rent a video. However, the lack of immediacy of direct mail as the distribution channel resulted in slow adoption.
The Situation
In response to the increasing presence of tech-savvy consumers on the internet, Netflix invested in developing its online platform as its primary distribution channel. The benefit of doing so was two-fold: passive brand advertising (by being present on the internet) and meeting customer demands for immediacy and convenience. Netflix also recognized the rising demand for personalized service and created an unprecedented, tailored customer experience.
The Competition
Blockbuster was the industry leader in video retail but was lagging in its response to industry, consumer, and technology trends around customer experience.
Results
Netflix’s disruptive innovation is built on the foundation of great CXM. Netflix is now a $28 billion company, which is tenfold what Blockbuster was worth.
Customer Relationship Management Platform
- Web Experience Management Platform
- E-Commerce & Point of Sale Solutions
- Social Media Management Platform
- Customer Intelligence Platform
- Customer Service Management Tools
- Marketing Management Suite
Netflix used disruptive technologies to innovatively build a customer experience that put it ahead of the long-time, video rental industry leader, Blockbuster.
Leverage Info-Tech’s approach to succeed with CXM
Creating an end-to-end technology-enablement strategy for CXM requires a concerted, dedicated effort: Info-Tech can help with our proven approach.
Build the CXM Project Charter
Conduct a Thorough Environmental Scan
Build Customer Personas and Scenarios
Draft Strategic CXM Requirements
Build the CXM Application Portfolio
Implement Operational Best Practices
Why Info-Tech’s Approach?
Info-Tech draws on best-practice research and the experiences of our global member base to develop a methodology for CXM that is driven by rigorous customer-centric analysis.
Our approach uses a unique combination of techniques to ensure that your team has done its due diligence in crafting a forward-thinking technology-enablement strategy for CXM that creates measurable value.
A global professional services firm drives measurable value for CXM by using persona design and scenario development
CASE STUDY
Industry Professionals Services
Source Info-Tech Workshop
The Situation
A global professional services firm in the B2B space was experiencing a fragmented approach to customer engagement, particularly in the pre-sales funnel. Legacy applications weren’t keeping pace with an increased demand for lead evaluation and routing technology. Web experience management was also an area of significant concern, with a lack of ongoing customer engagement through the existing web portal.
The Approach
Working with a team of Info-Tech facilitators, the company was able to develop several internal and external customer personas. These personas formed the basis of strategic requirements for a new CXM application stack, which involved dedicated platforms for core CRM, lead automation, web content management, and site analytics.
Results
Customer “stickiness” metrics increased, and Sales reported significantly higher turnaround times in lead evaluations, resulting in improved rep productivity and faster cycle times.
| Components of a persona |
| Name |
Name personas to reflect a key attribute such as the persona’s primary role or motivation. |
| Demographic |
Include basic descriptors of the persona (e.g. age, geographic location, preferred language, education, job, employer, household income, etc.) |
| Wants, needs, pain points |
Identify surface-level motivations for buying habits. |
| Psychographic/behavioral traits |
Observe persona traits that are representative of the customers’ behaviors (e.g. attitudes, buying patterns, etc.). |
Follow Info-Tech’s approach to build your CXM foundation
Create the Project Vision
- Identify business and IT drivers
- Outputs:
- CXM Strategy Guiding Principles
Structure the Project
- Identify goals and objectives for CXM project
- Form Project Team
- Establish timeline
- Obtain project sponsorship
- Outputs:
- CXM Strategy Project Charter
Scan the External Environment
- Create CXM operating model
- Conduct external analysis
- Create customer personas
- Outputs:
- Conduct PEST analysis
- Create persona scenarios
- Outputs:
- CXM Strategic Requirements
Assess the Current State of CXM
- Conduct SWOT analysis
- Assess application usage and satisfaction
- Conduct VRIO analysis
- Outputs:
- CXM Strategic Requirements
Create an Application Portfolio
- Map current processes
- Assign business process owners
- Create channel map
- Build CXM application portfolio
- Outputs:
- CXM Application Portfolio Map
Develop Deployment Best Practices
- Develop CXM integration map
- Create mitigation plan for poor data quality
- Outputs:
- Data Quality Preservation Map
Create an Initiative Rollout Plan
- Create risk management plan
- Identify work initiative dependencies
- Create roadmap
- Outputs:
Confirm and Finalize the CXM Blueprint
- Identify success metrics
- Create stakeholder communication plan
- Present CXM strategy to stakeholders
- Outputs:
Info-Tech offers various levels of support to suit your needs
DIY Toolkit
“Our team has already made this critical project a priority, and we have the time and capability, but some guidance along the way would be helpful.”
Guided Implementation
“Our team knows that we need to fix a process, but we need assistance to determine where to focus. Some check-ins along the way would help keep us on track.”
Workshop
“We need to hit the ground running and get this project kicked off immediately. Our team has the ability to take this over once we get a framework and strategy in place.”
Consulting
“Our team does not have the time or the knowledge to take this project on. We need assistance through the entirety of this project.”
Diagnostics and consistent frameworks used throughout all four options
Build a Strong Technology Foundation for CXM – project overview
| |
1. Drive Value With CXM |
2. Create the Framework |
3. Finalize the Framework |
| Best-Practice Toolkit |
1.1 Create the Project Vision
1.2 Structure the CXM Project |
2.1 Scan the External Environment
2.2 Assess the Current State of CXM
2.3 Create an Application Portfolio
2.4 Develop Deployment Best Practices |
3.1 Create an Initiative Rollout Plan
3.2 Confirm and Finalize the CXM Blueprint |
| Guided Implementations |
- Determine project vision for CXM.
- Review CXM project charter.
|
- Review environmental scan.
- Review application portfolio for CXM.
|
- Confirm deployment best practices.
- Review initiatives rollout plan.
- Confirm CXM roadmap.
|
| Onsite Workshop |
Module 1: Drive Measurable Value with a World-Class CXM Program |
Module 2: Create the Strategic Framework for CXM |
Module 3: Finalize the CXM Framework |
| |
Phase 1 Outcome:
- Completed drivers
- Completed project charter
|
Phase 2 Outcome:
- Completed personas and scenarios
- CXM application portfolio
|
Phase 3 Outcome:
- Strategic summary blueprint
|
Workshop overview
Contact your account representative or email Workshops@InfoTech.com for more information.
| |
Workshop Day 1 |
Workshop Day 2 |
Workshop Day 3 |
Workshop Day 4 |
Workshop Day 5 |
| Activities |
Create the Vision for CXM Enablement
1.1 CXM Fireside Chat
1.2 CXM Business Drivers
1.3 CXM Vision Statement
1.4 Project Structure |
Conduct the Environmental Scan and Internal Review
2.1 PEST Analysis
2.2 Competitive Analysis
2.3 Market and Trend Analysis
2.4 SWOT Analysis
2.5 VRIO Analysis
2.6 Channel Mapping |
Build Personas and Scenarios
3.1 Persona Development
3.2 Scenario Development
3.3 Requirements Definition for CXM |
Create the CXM Application Portfolio
4.1 Build Business Process Maps
4.2 Review Application Satisfaction
4.3 Create the CXM Application Portfolio
4.4 Prioritize Applications |
Review Best Practices and Confirm Initiatives
5.1 Create Data Integration Map
5.2 Define Adoption Best Practices
5.3 Build Initiatives Roadmap
5.4 Confirm Initiatives Roadmap |
| Deliverables |
- CXM Vision Statement
- CXM Project Charter
|
- Completed External Analysis
- Completed Internal Review
- Channel Interaction Map
- Strategic Requirements (from External Analysis)
|
- Personas and Scenarios
- Strategic Requirements (based on personas)
|
- Business Process Maps
- Application Satisfaction Diagnostic
- Prioritized CXM Application Portfolio
|
- Integration Map for CXM
- End-User Adoption Plan
- Initiatives Roadmap
|
Phase 1
Drive Measurable Value With a World-Class CXM Program
Build a Strong Technology Foundation for Customer Experience Management
Phase 1 outline
Call 1-888-670-8889 or email GuidedImplementations@InfoTech.com for more information.
Complete these steps on your own, or call us to complete a guided implementation. A guided implementation is a series of
2-3 advisory calls that help you execute each phase of a project. They are included in most advisory memberships.
Guided Implementation 1: Drive Measurable Value With a World-Class CXM Program
Proposed Time to Completion: 2 weeks
Step 1.1: Create the Project Vision
Start with an analyst kick-off call:
- Review key drivers from a technology and business perspective for CXM
- Discuss benefits of strong technology enablement for CXM
Then complete these activities…
- CXM Fireside Chat
- CXM Business and Technology Driver Assessment
- CXM Vision Statement
With these tools & templates:
- CXM Strategy Stakeholder Presentation Template
Step 1.2: Structure the Project
Review findings with analyst:
- Assess the CXM vision statement for competitive differentiators
- Determine current alignment disposition of IT with different business units
Then complete these activities…
- Team Composition and Responsibilities
- Metrics Definition
With these tools & templates:
- CXM Strategy Project Charter Template
Phase 1 Results & Insights:
- Defined value of strong technology enablement for CXM
- Completed CXM project charter
Step 1.1: Create the Project Vision
Phase 1
1.1 Create the Project Vision
1.2 Structure the Project
Phase 2
2.1 Scan the External Environment
2.2 Assess the Current State of CXM
2.3 Create an Application Portfolio
2.4 Develop Deployment Best Practices
Phase 3
3.1 Create an Initiative Rollout Plan
3.2 Confirm and Finalize the CXM Blueprint
Activities:
- Fireside Chat: Discuss past challenges and successes with CXM
- Identify business and IT drivers to establish guiding principles for CXM
Outcomes:
- Business benefits of a rationalized technology strategy to support CXM
- Shared lessons learned
- Guiding principles for providing technology enablement for CXM
Building a technology strategy to support customer experience isn’t an option – it’s a mission-critical activity
- Customer-facing departments supply the lifeblood of a company: revenue. In today’s fast-paced and interconnected world, it’s becoming increasingly imperative to enable customer experience processes with a wide range of technologies, from lead automation to social relationship management. CXM is the holistic management of customer interaction processes across marketing, sales, and customer service to create valuable, mutually beneficial customer experiences. Technology is a critical building block for enabling CXM.
- The parallel progress of technology and process improvement is essential to an efficient and effective CXM program. While many executives prefer to remain at the status quo, new technologies have caused major shifts in the CXM environment. If you stay with the status quo, you will fall behind the competition.
- However, many IT departments are struggling to keep up with the pace of change and find themselves more of a firefighter than a strategic partner to marketing, sales, and service teams. This not only hurts the business, but it also tarnishes IT’s reputation.
An aligned, optimized CX strategy is:
Rapid: to intentionally and strategically respond to quickly-changing opportunities and issues.
Outcome-based: to make key decisions based on strong business cases, data, and analytics in addition to intuition and judgment.
Rigorous: to bring discipline and science to bear; to improve operations and results.
Collaborative: to conduct activities in a broader ecosystem of partners, suppliers, vendors, co-developers, and even competitors.
(The Wall Street Journal, 2013)
Info-Tech Insight
If IT fails to adequately support marketing, sales, and customer service teams, the organization’s revenue will be in direct jeopardy. As a result, CIOs and Applications Directors must work with their counterparts in these departments to craft a cohesive and comprehensive strategy for using technology to create meaningful (and profitable) customer experiences.
Fireside Chat, Part 1: When was technology an impediment to customer experience at your organization?
1.1.1 30 minutes
Input
- Past experiences of the team
Output
Materials
Participants
Instructions
- Think about a time when technology was an impediment to a positive customer experience at your organization. Reflect on the following:
- What frustrations did the application or the technology cause to your customers? What was their reaction?
- How did IT (and the business) identify the challenge in the first place?
- What steps were taken to mitigate the impact of the problem? Were these steps successful?
- What were the key lessons learned as part of the challenge?
Fireside Chat, Part 2: What customer success stories has
your organization created by using new technologies?
1.1.2 30 minutes
Input
- Past experiences of the team
Output
Materials
Participants
Instructions
- Think about a time when your organization successfully leveraged a new application or new technology to enhance the experience it provided to customers. Reflect on this experience and consider:
- What were the organizational drivers for rolling out the new application or solution?
- What obstacles had to be overcome in order to successfully deploy the solution?
- How did the application positively impact the customer experience? What metrics improved?
- What were the key lessons learned as part of the deployment? If you had to do it all over again, what would you do differently?
Develop a cohesive, consistent, and forward-looking roadmap that supports each stage of the customer lifecycle
When creating your roadmap, consider the pitfalls you’ll likely encounter in building the IT strategy to provide technology enablement for customer experience.
There’s no silver bullet for developing a strategy. You can encounter pitfalls at a myriad of different points including not involving the right stakeholders from the business, not staying abreast of recent trends in the external environment, and not aligning sales, marketing, and support initiatives with a focus on the delivery of value to prospects and customers.
Common Pitfalls When Creating a Technology-Enablement Strategy for CXM
Senior management is not involved in strategy development.
Not paying attention to the “art of the possible.”
“Paving the cow path” rather than focusing on revising core processes.
Misalignment between objectives and financial/personnel resources.
Inexperienced team on either the business or IT side.
Not paying attention to the actions of competitors.
Entrenched management preferences for legacy systems.
Sales culture that downplays the potential value of technology or new applications.
IT is only one or two degrees of separation from the end customer: so take a customer-centric approach
IT →Marketing, Sales, and Service →External Customers
Internal-Facing Applications
- IT enables, supports, and maintains the applications used by the organization to market to, sell to, and service customers. IT provides the infrastructural and technical foundation to operate the function.
Customer-Facing Applications
- IT supports customer-facing interfaces and channels for customer interaction.
- Channel examples include web pages, mobile device applications and optimization, and interactive voice response for callers.
Info-Tech Insight
IT often overlooks direct customer considerations when devising a technology strategy for CXM. Instead, IT leaders rely on other business stakeholders to simply pass on requirements. By sitting down with their counterparts in marketing and sales, and fully understanding business drivers and customer personas, IT will be much better positioned to roll out supporting applications that drive customer engagement.
A well-aligned CXM strategy recognizes a clear delineation of responsibilities between IT, sales, marketing, and service
- When thinking about CXM, IT must recognize that it is responsible for being a trusted partner for technology enablement. This means that IT has a duty to:
- Develop an in-depth understanding of strategic business requirements for CXM. Base your understanding of these business requirements on a clear conception of the internal and external environment, customer personas, and business processes in marketing, sales, and customer service.
- Assist with shortlisting and supporting different channels for customer interaction (including email, telephony, web presence, and social media).
- Create a rationalized, cohesive application portfolio for CXM that blends different enabling technologies together to support strategic business requirements.
- Provide support for vendor shortlisting, selection, and implementation of CXM applications.
- Assist with end-user adoption of CXM applications (i.e. training and ongoing support).
- Provide initiatives that assist with technical excellence for CXM (such as data quality, integration, analytics, and application maintenance).
- The business (marketing, sales, customer service) owns the business requirements and must be responsible for setting top-level objectives for customer interaction (e.g. product and pricing decisions, marketing collateral, territory management, etc.). IT should not take over decisions on customer experience strategy. However, IT should be working in lockstep with its counterparts in the business to assist with understanding business requirements through a customer-facing lens. For example, persona development is best done in cross-functional teams between IT and Marketing.
Activity: Identify the business drivers for CXM to establish the strategy’s guiding principles
1.1.3 30 minutes
Input
Output
- Guiding principles for CXM strategy
Materials
Participants
Instructions
- Define the assumptions and business drivers that have an impact on technology enablement for CXM. What is driving the current marketing, sales, and service strategy on the business side?
| Business Driver Name |
Driver Assumptions, Capabilities, and Constraints |
Impact on CXM Strategy |
| High degree of customer-centric solution selling |
A technically complex product means that solution selling approaches are employed – sales cycles are long. |
There is a strong need for applications and data quality processes that support longer-term customer relationships rather than transactional selling. |
| High desire to increase scalability of sales processes |
Although sales cycles are long, the organization wishes to increase the effectiveness of rep time via marketing automation where possible. |
Sales is always looking for new ways to leverage their reps for face-to-face solution selling while leaving low-level tasks to automation. Marketing wants to support these tasks. |
| Highly remote sales team and unusual hours are the norm |
Not based around core hours – significant overtime or remote working occurs frequently. |
Misalignment between IT working only core hours and after-hours teams leads to lag times that can delay work. Scheduling of preventative sales maintenance must typically be done on weekends rather than weekday evenings. |
Activity: Identify the IT drivers for CXM to establish the strategy’s guiding principles
1.1.4 30 minutes
Input
Output
- Guiding principles for CXM strategy
Materials
Participants
Instructions
- Define the assumptions and IT drivers that have an impact on technology enablement for CXM. What is driving the current IT strategy for supporting marketing, sales, and service initiatives?
| IT Driver Name |
Driver Assumptions, Capabilities, and Constraints |
Impact on CXM Strategy |
| Sales Application Procurement Methodology |
Strong preference for on-premise COTS deployments over homebrewed applications. |
IT may not be able to support cloud-based sales applications due to security requirements for on premise. |
| Vendor Relations |
Minimal vendor relationships; SLAs not drafted internally but used as part of standard agreement. |
IT may want to investigate tightening up SLAs with vendors to ensure more timely support is available for their sales teams. |
| Development Methodology |
Agile methodology employed, some pockets of Waterfall employed for large-scale deployments. |
Agile development means more perfective maintenance requests come in, but it leads to greater responsiveness for making urgent corrective changes to non-COTS products. |
| Data Quality Approach |
IT sees as Sales’ responsibility |
IT is not standing as a strategic partner for helping to keep data clean, causing dissatisfaction from customer-facing departments. |
| Staffing Availability |
Limited to 9–5 |
Execution of sales support takes place during core hours only, limiting response times and access for on-the-road sales personnel. |
Activity: Use IT and business drivers to create guiding principles for your CXM technology-enablement project
1.1.5 30 minutes
Input
- Business drivers and IT drivers from 1.1.3 and 1.1.4
Output
Materials
Participants
Instructions
1. Based on the IT and business drivers identified, craft guiding principles for CXM technology enablement. Keep guiding principles in mind throughout the project and ensure they support (or reconcile) the business and IT drivers.
| Guiding Principle |
Description |
| Sales processes must be scalable. |
Our sales processes must be able to reach a high number of target customers in a short time without straining systems or personnel. |
| Marketing processes must be high touch. |
Processes must be oriented to support technically sophisticated, solution-selling methodologies. |
2. Summarize the guiding principles above by creating a CXM mission statement. See below for an example.
Example: CXM Mission Statement
To ensure our marketing, sales and service team is equipped with tools that will allow them to reach out to a large volume of contacts while still providing a solution-selling approach. This will be done with secure, on-premise systems to safeguard customer data.
Ensure that now is the right time to take a step back and develop the CXM strategy
Determine if now is the right time to move forward with building (or overhauling) your technology-enablement strategy for CXM.
Not all organizations will be able to proceed immediately to optimize their CXM technology enablement. Determine if the organizational willingness, backbone, and resources are present to commit to overhauling the existing strategy. If you’re not ready to proceed, consider waiting to begin this project until you can procure the right resources.
Do not proceed if:
- Your current strategy for supporting marketing, sales, and service is working well and IT is already viewed as a strategic partner by these groups. Your current strategy is well aligned with customer preferences.
- The current strategy is not working well, but there is no consensus or support from senior management for improving it.
- You cannot secure the resources or time to devote to thoroughly examining the current state and selecting improvement initiatives.
- The strategy has been approved, but there is no budget in place to support it at this time.
Proceed if:
- Senior management has agreed that technology support for CXM should be improved.
- Sub-divisions within IT, sales, marketing, and service are on the same page about the need to improve alignment.
- You have an approximate budget to work with for the project and believe you can secure additional funding to execute at least some improvement initiatives.
- You understand how improving CXM alignment will fit into the broader customer interaction ecosystem in your organization.
If you want additional support, have our analysts guide you through this phase as part of an Info-Tech workshop
Book a workshop with our Info-Tech analysts:
- To accelerate this project, engage your IT team in an Info-Tech workshop with an Info-Tech analyst team.
- Info-Tech analysts will join you and your team onsite at your location or welcome you to Info-Tech’s historic Toronto office to participate in an innovative onsite workshop.
- Contact your account manager (www.infotech.com/account), or email Workshops@InfoTech.com for more information.
The following are sample activities that will be conducted by Info-Tech analysts with your team:
1.1.3; 1.1.4; 1.1.5 - Identify business and IT drivers to create CXM guiding principles
The facilitator will work with stakeholders from both the business and IT to identify implicit or explicit strategic drivers that will support (or pose constraints on) the technology-enablement framework for the CXM strategy. In doing so, guiding principles will be established for the project.
Step 1.2: Structure the Project
Phase 1
1.1 Create the Project Vision
1.2 Structure the Project
Phase 2
2.1 Scan the External Environment
2.2 Assess the Current State of CXM
2.3 Create an Application Portfolio
2.4 Develop Deployment Best Practices
Phase 3
3.1 Create an Initiative Rollout Plan
3.2 Confirm and Finalize the CXM Blueprint
Activities:
- Define the project purpose, objectives, and business metrics
- Define the scope of the CXM strategy
- Create the project team
- Build a RACI chart
- Develop a timeline with project milestones
- Identify risks and create mitigation strategies
- Complete the strategy project charter and obtain approval
Outcomes:
CXM Strategy Project Charter Template
- Purpose, objectives, metrics
- Scope
- Project team & RACI
- Timeline
- Risks & mitigation strategies
- Project sponsorship
Use Info-Tech’s CXM Strategy Project Charter Template to outline critical components of the CXM project
1.2.1 CXM Strategy Project Charter Template
Having a project charter is the first step for any project: it specifies how the project will be resourced from a people, process, and technology perspective, and it clearly outlines major project milestones and timelines for strategy development. CXM technology enablement crosses many organizational boundaries, so a project charter is a very useful tool for ensuring everyone is on the same page.
Sections of the document:
- Project Drivers, Rationale, and Context
- Project Objectives, Metrics, and Purpose
- Project Scope Definition
- Project Team Roles and Responsibilities (RACI)
- Project Timeline
- Risk Mitigation Strategy
- Project Metrics
- Project Review & Approvals
INFO-TECH DELIVERABLE
CXM Strategy Project Charter Template
Populate the relevant sections of your project charter as you complete activities 1.2.2-1.2.8.
Understand the roles necessary to complete your CXM technology-enablement strategy
Understand the role of each player within your project structure. Look for listed participants on the activities slides to determine when each player should be involved.
| Title |
Role Within Project Structure |
| Project Sponsor |
- Owns the project at the management/C-suite level
- Responsible for breaking down barriers and ensuring alignment with organizational strategy
- CIO, CMO, VP of Sales, VP of Customer Care, or similar
|
| Project Manager |
- The IT individual(s) that will oversee day-to-day project operations
- Responsible for preparing and managing the project plan and monitoring the project team’s progress
- Applications or other IT Manager, Business Analyst, Business Process Owner, or similar
|
| Business Lead |
- Works alongside the IT PM to ensure that the strategy is aligned with business needs
- In this case, likely to be a marketing, sales, or customer service lead
- Sales Director, Marketing Director, Customer Care Director, or similar
|
| Project Team |
- Comprised of individuals whose knowledge and skills are crucial to project success
- Responsible for driving day-to-day activities, coordinating communication, and making process and design decisions. Can assist with persona and scenario development for CXM.
- Project Manager, Business Lead, CRM Manager, Integration Manager, Application SMEs, Developers, Business Process Architects, and/or similar SMEs
|
| Steering Committee |
- Comprised of C-suite/management level individuals that act as the project’s decision makers
- Responsible for validating goals and priorities, defining the project scope, enabling adequate resourcing, and managing change
- Project Sponsor, Project Manager, Business Lead, CFO, Business Unit SMEs and similar
|
Info-Tech Insight
Do not limit project input or participation to the aforementioned roles. Include subject matter experts and internal stakeholders at particular stages within the project. Such inputs can be solicited on a one-off basis as needed. This ensures you take a holistic approach to creating your CXM technology-enablement strategy.
Activity: Kick-off the CXM project by defining the project purpose, project objectives, and business metrics
1.2.2 30 minutes
Input
- Activities 1.1.1 to 1.1.5
Output
- Drivers & rationale
- Purpose statement
- Business goals
- Business metrics
- CXM Strategy Project Charter Template, sections 1.0, 2.0, and 2.1
Materials
Participants
- Project Sponsor
- Project Manager
- Business Lead
- Steering Committee
Instructions
Hold a meeting with IT, Marketing, Sales, Service, Operations, and any other impacted business stakeholders that have input into CXM to accomplish the following:
- Discuss the drivers and rationale behind embarking on a CXM strategy.
- Develop and concede on objectives for the CXM project, metrics that will gauge its success, and goals for each metric.
- Create a project purpose statement that is informed by decided-upon objectives and metrics from the steps above. When establishing a project purpose, ask the question, “what are we trying to accomplish?”
- Example: Project Purpose Statement
- The organization is creating a CXM strategy to gather high-level requirements from the business, IT, and Marketing, Sales, and Service, to ensure that the selection and deployment of the CXM meets the needs of the broader organization and provides the greatest return on investment.
Document your project drivers and rationale, purpose statement, project objectives, and business metrics in Info-Tech’s CXM Strategy Project Charter Template in sections 1.0 and 2.0.
Info-Tech Insight
Going forward, set up a quarterly review process to understand changing needs. It is rare that organizations never change their marketing and sales strategy. This will change the way the CXM will be utilized.
Establish baseline metrics for customer engagement
In order to gauge the effectiveness of CXM technology enablement, establish core metrics:
- Marketing Metrics: pertaining to share of voice, share of wallet, market share, lead generation, etc.
- Sales Metrics: pertaining to overall revenue, average deal size, number of accounts, MCV, lead warmth, etc.
- Customer Service Metrics: pertaining to call volumes, average time to resolution, first contact resolution, customer satisfaction, etc.
- IT Metrics: pertaining to end-user satisfaction with CXM applications, number of tickets, contract value, etc.
| Metric Description |
Current Metric |
Future Goal |
| Market Share |
25% |
35% |
| Share of Voice (All Channels) |
40% |
50% |
| Average Deal Size |
$10,500 |
$12,000 |
| Account Volume |
1,400 |
1,800 |
| Average Time to Resolution |
32 min |
25 min |
| First Contact Resolution |
15% |
35% |
| Web Traffic per Month (Unique Visitors) |
10,000 |
15,000 |
| End-User Satisfaction |
62% |
85%+ |
| Other metric |
|
|
| Other metric |
|
|
| Other metric |
|
|
Understand the importance of setting project expectations with a scope statement
Be sure to understand what is in scope for a CXM strategy project. Prevent too wide of a scope to avoid scope creep – for example, we aren’t tackling ERP or BI under CXM.
In Scope
Establishing the parameters of the project in a scope statement helps define expectations and provides a baseline for resource allocation and planning. Future decisions about the strategic direction of CXM will be based on the scope statement.
Scope Creep
Well-executed requirements gathering will help you avoid expanding project parameters, drawing on your resources, and contributing to cost overruns and project delays. Avoid scope creep by gathering high-level requirements that lead to the selection of category-level application solutions (e.g. CRM, MMS, SMMP, etc.), rather than granular requirements that would lead to vendor application selection (e.g. Salesforce, Marketo, Hootsuite, etc.).
Out of Scope
Out-of-scope items should also be defined to alleviate ambiguity, reduce assumptions, and further clarify expectations for stakeholders. Out-of-scope items can be placed in a backlog for later consideration. For example, fulfilment and logistics management is out of scope as it pertains to CXM.
| In Scope |
| Strategy |
| High-Level CXM Application Requirements |
CXM Strategic Direction |
Category Level Application Solutions (e.g. CRM, MMS, etc.) |
| Out of Scope |
| Software Selection |
| Vendor Application Review |
Vendor Application Selection |
Granular Application System Requirements |
Activity: Define the scope of the CXM strategy
1.2.3 30 minutes
Input
Output
- Project scope and parameters
- CXM Strategy Project Charter Template, section 3.0
Materials
Participants
- Project Sponsor
- Project Manager
- Business Lead
Instructions
- Formulate a scope statement. Decide which people, processes, and functions the CXM strategy will address. Generally, the aim of this project is to develop strategic requirements for the CXM application portfolio – not to select individual vendors.
- Document your scope statement in Info-Tech’s CXM Strategy Project Charter Template in section 3.0.
To form your scope statement, ask the following questions:
- What are the major coverage points?
- Who will be using the systems?
- How will different users interact with the systems?
- What are the objectives that need to be addressed?
- Where do we start?
- Where do we draw the line?
Identify the right stakeholders to include on your project team
Consider the core team functions when composing the project team. Form a cross-functional team (i.e. across IT, Marketing, Sales, Service, Operations) to create a well-aligned CXM strategy.
| Required Skills/Knowledge |
Suggested Project Team Members |
| IT |
- Application development
- Enterprise integration
- Business processes
- Data management
|
- CRM Application Manager
- Business Process Manager
- Integration Manager
- Application Developer
- Data Stewards
|
| Business |
- Understanding of the customer
- Departmental processes
|
- Sales Manager
- Marketing Manager
- Customer Service Manager
|
| Other |
- Operations
- Administrative
- Change management
|
- Operations Manager
- CFO
- Change Management Manager
|
Info-Tech Insight
Don’t let your project team become too large when trying to include all relevant stakeholders. Carefully limiting the size of the project team will enable effective decision making while still including functional business units such as marketing, sales, service, and finance, as well as IT.
Activity: Create the project team
1.2.4 45 minutes
Input
- Scope Statement (output of Activity 1.2.3).
Output
- Project Team
- CXM Strategy Project Charter Template, section 4.0
Materials
Participants
- Project Manager
- Business Lead
Instructions
- Review your scope statement. Have a discussion to generate a complete list of key stakeholders that are needed to achieve the scope of work.
- Using the previously generated list, identify a candidate for each role and determine their responsibilities and expected time commitment for the CXM strategy project.
- Document the project team in Info-Tech’s CXM Strategy Project Charter Template in section 4.0.
Define project roles and responsibilities to improve progress tracking
Build a list of the core CXM strategy team members, and then structure a RACI chart with the relevant categories and roles for the overall project.
Responsible - Conducts work to achieve the task
Accountable - Answerable for completeness of task
Consulted - Provides input for the task
Informed - Receives updates on the task
Info-Tech Insight
Avoid missed tasks between inter-functional communications by defining roles and responsibilities for the project as early as possible.
Benefits of Assigning RACI Early:
- Improve project quality by assigning the right people to the right tasks.
- Improve chances of project task completion by assigning clear accountabilities.
- Improve project buy-in by ensuring that stakeholders are kept informed of project progress, risks, and successes.
Activity: Build a RACI chart
1.2.5 30 minutes
Input
- Project Team (output of Activity 1.2.4)
Output
- RACI chart
- CXM Strategy Project Charter Template, section 4.2
Materials
Participants
- Project Manager
- Business Lead
Instructions
- Identify the key stakeholder teams that should be involved in the CXM strategy project. You should have a cross-functional team that encompasses both IT (various units) and the business.
- Determine whether each stakeholder should be responsible, accountable, consulted, and/or informed with respect to each overarching project step.
- Confirm and communicate the results to relevant stakeholders and obtain their approval.
- Document the RACI chart in Info-Tech’s CXM Strategy Project Charter Template in section 4.2.
| Example: RACI Chart |
Project Sponsor (e.g. CMO) |
Project Manager (e.g. Applications Manager) |
Business Lead (e.g. Marketing Director) |
Steering Committee (e.g. PM, CMO, CFO…) |
Project Team (e.g. PM, BL, SMEs…) |
| Assess Project Value |
I |
C |
A |
R |
C |
| Conduct a Current State Assessment |
I |
I |
A |
C |
R |
| Design Application Portfolio |
I |
C |
A |
R |
I |
| Create CXM Roadmap |
R |
R |
A |
I |
I |
| ... |
... |
... |
... |
... |
... |
Activity: Develop a timeline in order to specify concrete project milestones
1.2.6 30 minutes
Input
Output
- Project timeline
- CXM Strategy Project Charter Template, section 5.0
Materials
Participants
- Project Manager
- Business Lead
Instructions
- Assign responsibilities, accountabilities, and other project involvement to each project team role using a RACI chart. Remember to consider dependencies when creating the schedule and identifying appropriate subtasks.
- Document the timeline in Info-Tech’s CXM Strategy Project Charter Template in section 5.0.
| Key Activities |
Start Date |
End Date |
Target |
Status |
Resource(s) |
| Structure the Project and Build the Project Team |
|
|
|
|
|
| Articulate Business Objectives and Define Vision for Future State |
|
|
|
|
|
| Document Current State and Assess Gaps |
|
|
|
|
|
| Identify CXM Technology Solutions |
|
|
|
|
|
| Build the Strategy for CXM |
|
|
|
|
|
| Implement the Strategy |
|
|
|
|
|
Assess project-associated risk by understanding common barriers and enablers
Common Internal Risk Factors
| |
Management Support |
Change Management |
IT Readiness |
| Definition |
The degree of understanding and acceptance of CXM as a concept and necessary portfolio of technologies. |
The degree to which employees are ready to accept change and the organization is ready to manage it. |
The degree to which the organization is equipped with IT resources to handle new systems and processes. |
| Assessment Outcomes |
- Is CXM enablement recognized as a top priority?
- Will management commit time to the project?
|
- Are employees resistant to change?
- Is there an organizational awareness of the importance of customer experience?
- Who are the owners of process and content?
|
- Is there strong technical expertise?
- Is there strong infrastructure?
- What are the important integration points throughout the business?
|
| Risk |
- Low management buy-in
- Lack of funding
- Lack of resources
|
- Low employee motivation
- Lack of ownership
- Low user adoption
|
- Poor implementation
- Reliance on consultants
|
Activity: Identify the risks and create mitigation strategies
1.2.7 45 minutes
Input
Output
- Risk mitigation strategy
- CXM Strategy Project Charter Template, section 6.0
Materials
Participants
- Project Manager
- Business Lead
- Project Team
Instructions
- Brainstorm a list of possible risks that may impede the progress of your CXM project.
- Classify risks as strategy based (related to planning) or systems based (related to technology).
- Brainstorm mitigation strategies to overcome each risk.
- On a scale of 1 to 3, determine the impact of each risk on project success and the likelihood of each risk occurring.
- Document your findings in Info-Tech’s CXM Strategy Project Charter Template in section 6.0.
Likelihood:
1 - High/Needs Focus
2 - Can Be Mitigated
3 - Unlikely
Impact
1 - High Impact
2 - Moderate Impact
3 - Minimal Impact
Example: Risk Register and Mitigation Tactics
| Risk |
Impact |
Likelihood |
Mitigation Effort |
| Cost of time and implementation: designing a robust portfolio of CXM applications can be a time consuming task, representing a heavy investment for the organization |
1 |
1 |
- Have a clear strategic plan and a defined time frame
- Know your end-user requirements
- Put together an effective and diverse strategy project team
|
| Availability of resources: lack of in-house resources (e.g. infrastructure, CXM application developers) may result in the need to insource or outsource resources |
1 |
2 |
- Prepare a plan to insource talent by hiring or transferring talent from other departments – e.g. marketing and customer service
|
Activity: Complete the project charter and obtain approval
1.2.8 45 minutes
Input
Output
- Project approval
- CXM Strategy Project Charter Template, section 8.0
Materials
Participants
- Project Manager
- Business Lead
- Project Team
Instructions
Before beginning to develop the CXM strategy, validate the project charter and metrics with senior sponsors or stakeholders and receive their approval to proceed.
- Schedule a 30-60 minute meeting with senior stakeholders and conduct a live review of your CXM strategy project charter.
- Obtain stakeholder approval to ensure there are no miscommunications or misunderstandings around the scope of the work that needs to be done to reach a successful project outcome. Final sign-off should only take place when mutual consensus has been reached.
- Obtaining approval should be an iterative process; if senior management has concerns over certain aspects of the plan, revise and review again.
Info-Tech Insight
In most circumstances, you should have your CXM strategy project charter validated with the following stakeholders:
- Chief Information Officer
- IT Applications Director
- CFO or Comptroller (for budget approval)
- Chief Marketing Office or Head of Marketing
- Chief Revenue Officer or VP of Sales
- VP Customer Service
If you want additional support, have our analysts guide you through this phase as part of an Info-Tech workshop
Book a workshop with our Info-Tech analysts:
1.2.2 Define project purpose, objectives, and business metrics
Through an in-depth discussion, an analyst will help you prioritize corporate objectives and organizational drivers to establish a distinct project purpose.
1.2.3 Define the scope of the CXM strategy
An analyst will facilitate a discussion to address critical questions to understand your distinct business needs. These questions include: What are the major coverage points? Who will be using the system?
1.2.4; 1.2.5; 1.2.6 Create the CXM project team, build a RACI chart, and establish a timeline
Our analysts will guide you through how to create a designated project team to ensure the success of your CXM strategy and suite selection initiative, including project milestones and team composition, as well as designated duties and responsibilities.
Phase 2
Create a Strategic Framework for CXM Technology Enablement
Build a Strong Technology Foundation for Customer Experience Management
Phase 2 outline: Steps 2.1 and 2.2
Call 1-888-670-8889 or email GuidedImplementations@InfoTech.com for more information.
Complete these steps on your own, or call us to complete a guided implementation. A guided implementation is a series of
2-3 advisory calls that help you execute each phase of a project. They are included in most advisory memberships.
Guided Implementation 2: Create a Strategic Framework for CXM Technology Enablement
Proposed Time to Completion: 4 weeks
Step 2.1: Scan the External Environment
Start with an analyst kick-off call:
- Discuss external drivers
- Assess competitive environment
- Review persona development
- Review scenarios
Then complete these activities…
- Build the CXM operating model
- Conduct a competitive analysis
- Conduct a PEST analysis
- Build personas and scenarios
With these tools & templates:
CXM Strategy Stakeholder Presentation Template
Step 2.2: Assess the Current State for CRM
Review findings with analyst:
- Review SWOT analysis
- Review VRIO analysis
- Discuss strategic requirements for CXM
Then complete these activities…
- Conduct a SWOT analysis
- Conduct a VRIO analysis
- Inventory existing applications
With these tools & templates:
CXM Strategy Stakeholder Presentation Template
Phase 2 outline: Steps 2.3 and 2.4
Call 1-888-670-8889 or email GuidedImplementations@InfoTech.com for more information.
Complete these steps on your own, or call us to complete a guided implementation. A guided implementation is a series of
2-3 advisory calls that help you execute each phase of a project. They are included in most advisory memberships.
Guided Implementation 2: Create a Strategic Framework for CXM Technology Enablement
Proposed Time to Completion: 4 weeks
Step 2.3: Create an Application Portfolio
Start with an analyst kick-off call:
- Discuss possible business process maps
- Discuss strategic requirements
- Review application portfolio results
Then complete these activities…
- Build business maps
- Execute application mapping
With these tools & templates:
CXM Portfolio Designer
CXM Strategy Stakeholder Presentation Template
CXM Business Process Shortlisting Tool
Step 2.4: Develop Deployment Best Practices
Review findings with analyst:
- Review possible integration maps
- Discuss best practices for end-user adoption
- Discuss best practices for customer data quality
Then complete these activities…
- Create CXM integration ecosystem
- Develop adoption game plan
- Create data quality standards
With these tools & templates:
CXM Strategy Stakeholder Presentation Template
Phase 2 Results & Insights:
- Application portfolio for CXM
- Deployment best practices for areas such as integration, data quality, and end-user adoption
Step 2.1: Scan the External Environment
Phase 1
1.1 Create the Project Vision
1.2 Structure the Project
Phase 2
2.1 Scan the External Environment
2.2 Assess the Current State of CXM
2.3 Create an Application Portfolio
2.4 Develop Deployment Best Practices
Phase 3
3.1 Create an Initiative Rollout Plan
3.2 Confirm and Finalize the CXM Blueprint
Activities:
- Inventory CXM drivers and organizational objectives
- Identify CXM challenges and pain points
- Discuss opportunities and benefits
- Align corporate and CXM strategies
- Conduct a competitive analysis
- Conduct a PEST analysis and extract strategic requirements
- Build customer personas and extract strategic requirements
Outcomes:
- CXM operating model
- Organizational drivers
- Environmental factors
- Barriers
- Enablers
- PEST analysis
- External customer personas
- Customer journey scenarios
- Strategic requirements for CXM
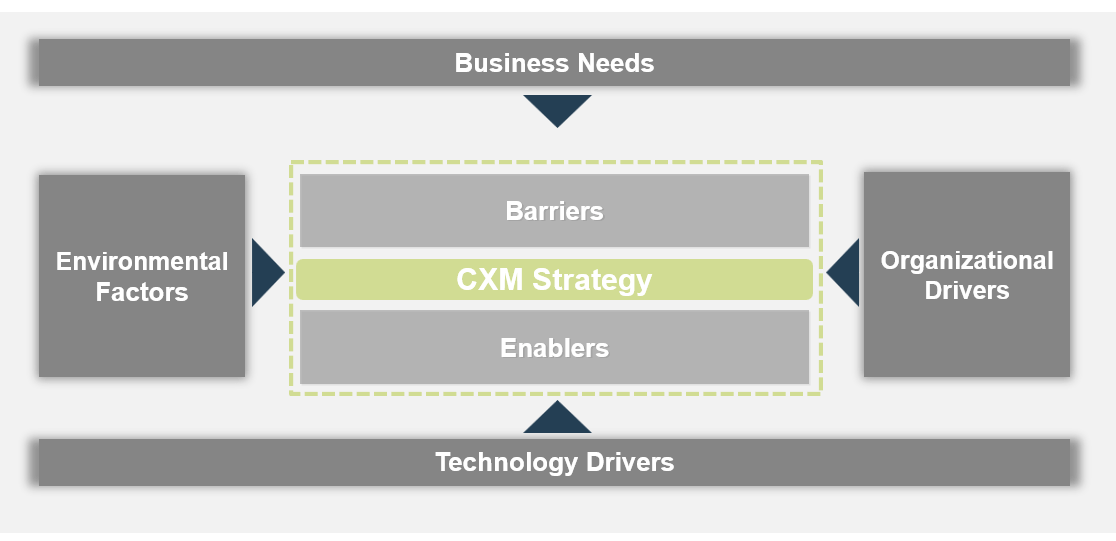
Develop a CXM technology operating model that takes stock of needs, drivers, barriers, and enablers
Establish the drivers, enablers, and barriers to developing a CXM technology enablement strategy. In doing so, consider needs, environmental factors, organizational drivers, and technology drivers as inputs.
CXM Strategy
- Barriers
- Lack of Resources
- Cultural Mindset
- Resistance to Change
- Poor End-User Adoption
- Enablers
- Senior Management Support
- Customer Data Quality
- Current Technology Portfolio
- Business Needs (What are your business drivers? What are current marketing, sales, and customer service pains?)
- Acquisition Pipeline Management
- Live Chat for Support
- Social Media Analytics
- Etc.
- Organizational Goals
- Increase Profitability
- Enhance Customer Experience Consistency
- Reduce Time-to-Resolution
- Increase First Contact Resolution
- Boost Share of Voice
- Environmental Factors (What factors that affect your strategy are out of your control?)
- Customer Buying Habits
- Changing Technology Trends
- Competitive Landscape
- Regulatory Requirements
- Technology Drivers (Why do you need a new system? What is the purpose for becoming an integrated organization?)
- System Integration
- Reporting Capabilities
- Deployment Model
Understand your needs, drivers, and organizational objectives for creating a CXM strategy
| |
Business Needs |
Organizational Drivers |
Technology Drivers |
Environmental Factors |
| Definition |
A business need is a requirement associated with a particular business process (for example, Marketing needs customer insights from the website – the business need would therefore be web analytics capabilities). |
Organizational drivers can be thought of as business-level goals. These are tangible benefits the business can measure such as customer retention, operation excellence, and financial performance. |
Technology drivers are technological changes that have created the need for a new CXM enablement strategy. Many organizations turn to technology systems to help them obtain a competitive edge. |
External considerations are factors taking place outside of the organization that are impacting the way business is conducted inside the organization. These are often outside the control of the business. |
| Examples |
- Web analytics
- Live chat capabilities
- Mobile self-service
- Social media listening
|
- Data quality
- Customer satisfaction
- Branding
- Time-to-resolution
|
- Deployment model (i.e. SaaS)
- Integration
- Reporting capabilities
- Fragmented technologies
|
- Economic factors
- Customer preferences
- Competitive influencers
- Compliance regulations
|
Info-Tech Insight
A common organizational driver is to provide adequate technology enablement across multiple channels, resulting in a consistent customer experience. This driver is a result of external considerations. Many industries today are highly competitive and rapidly changing. To succeed under these pressures, you must have a rationalized portfolio of enterprise applications for customer interaction.
Activity: Inventory and discuss CXM drivers and organizational objectives
2.1.1 30 minutes
Input
- Business needs
- Exercise 1.1.3
- Exercise 1.1.4
- Environmental factors
Output
- CXM operating model inputs
- CXM Strategy Stakeholder Presentation
Materials
- Info-Tech examples
- Whiteboard
- Markers
Participants
Instructions
- Brainstorm the business needs, organizational drivers, technology drivers, and environmental factors that will inform the CXM strategy. Draw from exercises 1.1.3-1.1.5.
- Document your findings in the CXM operating model template. This can be found in the CXM Strategy Stakeholder Presentation Template.
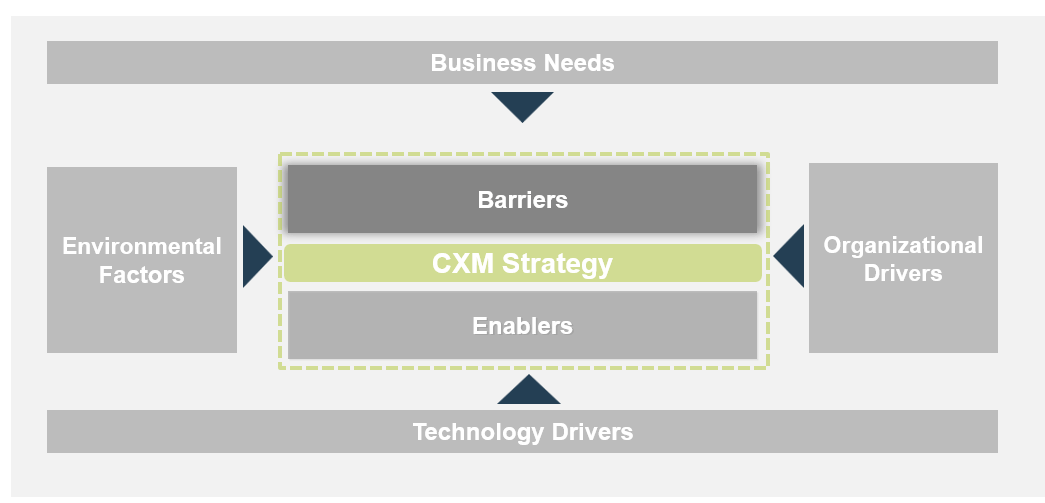
Understand challenges and barriers to creating and executing the CXM technology-enablement strategy
Take stock of internal challenges and barriers to effective CXM strategy execution.
Example: Internal Challenges & Potential Barriers
| |
Understanding the Customer |
Change Management |
IT Readiness |
| Definition |
The degree to which a holistic understanding of the customer can be created, including customer demographic and psychographics. |
The degree to which employees are ready to accept operational and cultural changes and the degree to which the organization is ready to manage it. |
The degree to which IT is ready to support new technologies and processes associated with a portfolio of CXM applications. |
| Questions to Ask |
- As an organization, do we have a true understanding of our customers?
- How might we achieve a complete understanding of the customer throughout different phases of the customer lifecycle?
|
- Are employees resistant to change?
- Are there enough resources to drive an CXM strategy?
- To what degree is the existing organizational culture customer-centric?
|
- Is there strong technical expertise?
- Is there strong infrastructure?
|
| Implications |
- Uninformed creation of CXM strategic requirements
- Inadequate understanding of customer needs and wants
|
- User acceptance
- Lack of ownership
- Lack of accountability
- Lack of sustainability
|
- Poor implementation
- Reliance on expensive external consultants
- Lack of sustainability
|
Activity: Identify CXM challenges and pain points
2.1.2 30 minutes
Input
Output
- CXM operating model barriers
- CXM Strategy Stakeholder Presentation
Materials
- Info-Tech examples
- Whiteboard
- Markers
Participants
Instructions
- Brainstorm the challenges and pain points that may act as barriers to the successful planning and execution of a CXM strategy.
- Document your findings in the CXM operating model template. This can be found in the CXM Strategy Stakeholder Presentation Template.
Identify opportunities that can enable CXM strategy execution
Existing internal conditions, capabilities, and resources can create opportunities to enable the CXM strategy. These opportunities are critical to overcoming challenges and barriers.
Example: Opportunities to Leverage for Strategy Enablement
| |
Management Buy-In |
Customer Data Quality |
Current Technology Portfolio |
| Definition |
The degree to which upper management understands and is willing to enable a CXM project, complete with sponsorship, funding, and resource allocation. |
The degree to which customer data is accurate, consistent, complete, and reliable. Strong customer data quality is an opportunity – poor data quality is a barrier. |
The degree to which the existing portfolio of CXM-supporting enterprise applications can be leveraged to enable the CXM strategy. |
| Questions to Ask |
- Is management informed of changing technology trends and the subsequent need for CXM?
- Are adequate funding and resourcing available to support a CXM project, from strategy creation to implementation?
|
- Are there any data quality issues?
- Is there one source of truth for customer data?
- Are there duplicate or incomplete sets of data?
|
- Does a strong CRM backbone exist?
- What marketing, sales, and customer service applications exist?
- Are CXM-enabling applications rated highly on usage and performance?
|
| Implications |
- Need for CXM clearly demonstrated
- Financial and logistical feasibility
|
- Consolidated data quality governance initiatives
- Informed decision making
|
- Foundation for CXM technology enablement largely in place
- Reduced investment of time and money needed
|
Activity: Discuss opportunities and benefits
2.1.3 30 minutes
Input
Output
- Completed CXM operating model
- CXM Strategy Stakeholder Presentation
Materials
- Info-Tech examples
- Whiteboard
- Markers
Participants
Instructions
- Brainstorm opportunities that should be leveraged or benefits that should be realized to enable the successful planning and execution of a CXM strategy.
- Document your findings in the CXM operating model template. This can be found in the CXM Strategy Stakeholder Presentation Template.
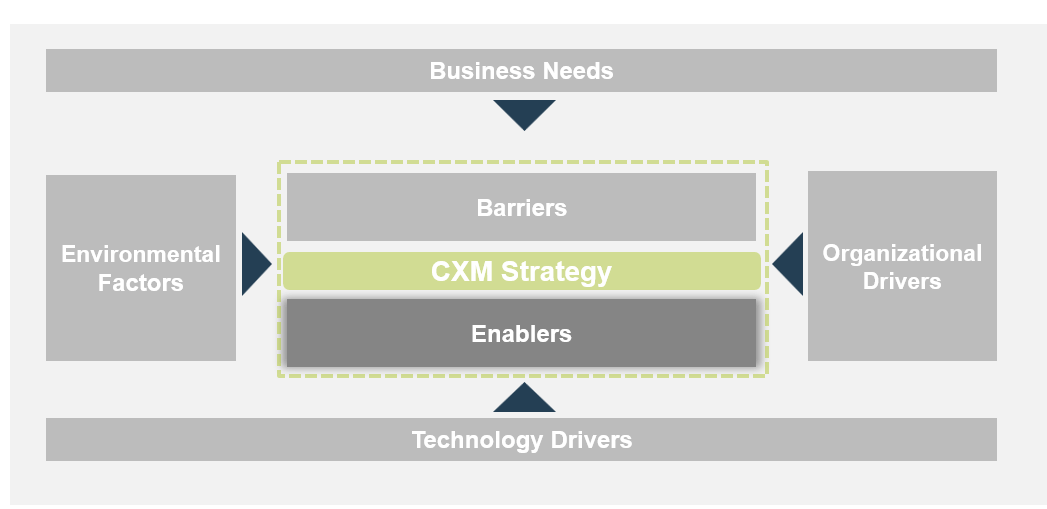
Ensure that you align your CXM technology strategy to the broader corporate strategy
A successful CXM strategy requires a comprehensive understanding of an organization’s overall corporate strategy and its effects on the interrelated departments of marketing, sales, and service, including subsequent technology implications. For example, a CXM strategy that emphasizes tools for omnichannel management and is at odds with a corporate strategy that focuses on only one or two channels will fail.
Corporate Strategy
- Conveys the current state of the organization and the path it wants to take.
- Identifies future goals and business aspirations.
- Communicates the initiatives that are critical for getting the organization from its current state to the future state.
CXM Strategy
- Communicates the company’s budget and spending on CXM applications and initiatives.
- Identifies IT initiatives that will support the business and key CXM objectives, specific to marketing, sales, and service.
- Outlines staffing and resourcing for CXM initiatives.
Unified Strategy
- The CXM implementation can be linked, with metrics, to the corporate strategy and ultimate business objectives.
Info-Tech Insight
Your organization’s corporate strategy is especially important in dictating the direction of the CXM strategy. Corporate strategies are often focused on customer-facing activity and will heavily influence the direction of marketing, sales, customer service, and consequentially, CXM. Corporate strategies will often dictate market targeting, sales tactics, service models, and more.
Review sample organizational objectives to decipher how CXM technologies can support such objectives
Identifying organizational objectives of high priority will assist in breaking down CXM objectives to better align with the overall corporate strategy and achieve buy-in from key stakeholders.
| Corporate Objectives |
Aligned CXM Technology Objectives |
| Increase Revenue |
Enable lead scoring |
Deploy sales collateral management tools |
Improve average cost per lead via a marketing automation tool |
| Enhance Market Share |
Enhance targeting effectiveness with a CRM |
Increase social media presence via an SMMP |
Architect customer intelligence analysis |
| Improve Customer Satisfaction |
Reduce time-to-resolution via better routing |
Increase accessibility to customer service with live chat |
Improve first contact resolution with customer KB |
| Increase Customer Retention |
Use a loyalty management application |
Improve channel options for existing customers |
Use customer analytics to drive targeted offers |
| Create Customer-Centric Culture |
Ensure strong training and user adoption programs |
Use CRM to provide 360-degree view of all customer interaction |
Incorporate the voice of the customer into product development |
Activity: Review your corporate strategy and validate its alignment with the CXM operating model
2.1.4 30 minutes
Input
- Corporate strategy
- CXM operating model (completed in Activity 2.1.3)
Output
- Strategic alignment between the business and CXM strategies
Materials
- Info-Tech examples
- Whiteboard
- Markers
Participants
Instructions
- Brainstorm and create a list of organizational objectives at the corporate strategy level.
- Break down each organizational objective to identify how CXM may support it.
- Validate CXM goals and organizational objectives with your CXM operating model. Be sure to address the validity of each with the business needs, organizational drivers, technology drivers, and environmental factors identified as inputs to the operating model.
Amazon leverages customer data to drive decision making around targeted offers and customer experience
CASE STUDY
Industry E-Commerce
Source Pardot, 2012
Situation
Amazon.com, Inc. is an American electronic commerce and cloud computing company. It is the largest e-commerce retailer in the US.
Amazon originated as an online book store, later diversifying to sell various forms of media, software, games, electronics, apparel, furniture, food, toys, and more.
By taking a data-driven approach to marketing and sales, Amazon was able to understand its customers’ needs and wants, penetrate different product markets, and create a consistently personalized online-shopping customer experience that keeps customers coming back.
Technology Strategy
Use Browsing Data Effectively
Amazon leverages marketing automation suites to view recent activities of prospects on its website. In doing so, a more complete view of the customer is achieved, including insights into purchasing interests and site navigation behaviors.
Optimize Based on Interactions
Using customer intelligence, Amazon surveys and studies standard engagement metrics like open rate, click-through rate, and unsubscribes to ensure the optimal degree of marketing is being targeted to existing and prospective customers, depending on level of engagement.
Results
Insights gained from having a complete understanding of the customer (from basic demographic characteristics provided in customer account profiles to observed psychographic behaviors captured by customer intelligence applications) are used to personalize Amazon’s sales and marketing approaches. This is represented through targeted suggestions in the “recommended for you” section of the browsing experience and tailored email marketing.
It is this capability, partnered with the technological ability to observe and measure customer engagement, that allows Amazon to create individual customer experiences.
Scan the external environment to understand your customers, competitors, and macroenvironmental trends
Do not develop your CXM technology strategy in isolation. Work with Marketing to understand your STP strategy (segmentation, targeting, positioning): this will inform persona development and technology requirements downstream.
Market Segmentation
- Segment target market by demographic, geographic, psychographic, and behavioral characteristics
- What does the competitive market look like?
- Who are the key customer segments?
- What segments are you going to target?
Market Targeting
- Evaluate potential and commercial attractiveness of each segment, considering the dynamics of the competition
- How do you target your customers?
- How should you target them in the future?
- How do your products/services differ from the competition?
Product Positioning
- Develop detailed product positioning and marketing mixes for selected segments
- What is the value of the product/service to each segment of the market?
- How are you positioning your product/service in the market?
Info-Tech Insight
It is at this point that you should consider the need for and viability of an omnichannel approach to CXM. Through which channels do you target your customers? Are your customers present and active on a wide variety of channels? Consider how you can position your products, services, and brand through the use of omnichannel methodologies.
Activity: Conduct a competitive analysis to understand where your market is going
2.1.5 1 hour
Input
- Scan of competitive market
- Existing customer STP strategy
Output
- Strategic CXM requirements
- CXM Strategy Stakeholder Presentation
Materials
Participants
- Project Team
- Marketing SME
Instructions
- Scan the market for direct and indirect competitors.
- Evaluate current and/or future segmentation, targeting, and positioning strategies by answering the following questions:
- What does the competitive market look like?
- Who are the key customer segments?
- What segments are you going to target?
- How do you target your customers?
- How should you target them in the future?
- How do your products/services differ from the competition?
- What is the value of the product/service to each segment of the market?
- How are you positioning your product/service in the market?
- Other helpful questions include:
- How formally do you target customers? (e.g. through direct contact vs. through passive brand marketing)
- Does your organization use the shotgun or rifle approach to marketing?
- Shotgun marketing: targets a broad segment of people, indirectly
- Rifle marketing: targets smaller and more niche market segments using customer intelligence
For each point, identify CXM requirements.
Document your outputs in the CXM Strategy Stakeholder Presentation Template.
Activity: Conduct a competitive analysis (cont’d)
2.1.5 30 minutes
Input
- Scan of competitive market
Output
- Competitive analysis
- CXM Strategy Stakeholder Presentation
Materials
Participants
- Project Team
- Marketing SME (e.g. Market Research Stakeholders)
Instructions
- List recent marketing technology and customer experience-related initiatives that your closest competitors have implemented.
- For each identified initiative, elaborate on what the competitive implications are for your organization.
- Document your outputs in the CXM Strategy Stakeholder Presentation Template.
Example: Competitive Implications
| Competitor Organization |
Recent Initiative |
Associated Technology |
Direction of Impact |
Competitive Implication |
| Organization X |
Multichannel E-Commerce Integration |
WEM – hybrid integration |
Positive |
- Up-to-date e-commerce capabilities
- Automatic product updates via PCM
|
| Organization Y |
Web Social Analytics |
WEM |
Positive |
- Real-time analytics and customer insights
- Allows for more targeted content toward the visitor or customer
|
Conduct a PEST analysis to determine salient political, economic, social, and technological impacts for CXM
A PEST analysis is a structured planning method that identifies external environmental factors that could influence the corporate and IT strategy.
Political - Examine political factors, such as relevant data protection laws and government regulations.
Economic - Examine economic factors, such as funding, cost of web access, and labor shortages for maintaining the site(s).
Technological - Examine technological factors, such as new channels, networks, software and software frameworks, database technologies, wireless capabilities, and availability of software as a service.
Social - Examine social factors, such as gender, race, age, income, and religion.
Info-Tech Insight
When looking at opportunities and threats, PEST analysis can help to ensure that you do not overlook external factors, such as technological changes in your industry. When conducting your PEST analysis specifically for CXM, pay particular attention to the rapid rate of change in the technology bucket. New channels and applications are constantly emerging and evolving, and seeing differential adoption by potential customers.
Activity: Conduct and review the PEST analysis
2.1.6 30 minutes
Input
- Political, economic, social, and technological factors related to CXM
Output
Materials
Participants
Instructions
- Identify your current strengths and weaknesses in managing the customer experience.
- Identify any opportunities to take advantage of and threats to mitigate.
Example: PEST Analysis
Political
- Data privacy for PII
- ADA legislation for accessible design
Economic
- Spending via online increasing
- Focus on share of wallet
Technological
- Rise in mobile
- Geo-location based services
- Internet of Things
- Omnichannel
Social
- Increased spending power by millennials
- Changing channel preferences
- Self-service models
Activity: Translate your PEST analysis into a list of strategic CXM technology requirements to be addressed
2.1.7 30 minutes
Input
- PEST Analysis conducted in Activity 2.1.6.
Output
- Strategic CXM requirements
- CXM Strategy Stakeholder Presentation
Materials
Participants
Instructions
For each PEST quadrant:
- Document the point and relate it to a goal.
- For each point, identify CXM requirements.
- Sort goals and requirements to eliminate duplicates.
- Document your outputs in the CXM Strategy Stakeholder Presentation Template.
Example: Parsing Requirements from PEST Analysis
Technological Trend: There has been a sharp increase in popularity of mobile self-service models for buying habits and customer service access.
Goal: Streamline mobile application to be compatible with all mobile devices. Create consistent branding across all service delivery applications (e.g. website, etc.).
Strategic Requirement: Develop a native mobile application while also ensuring that resources through our web presence are built with responsive design interface.
IT must fully understand the voice of the customer: work with Marketing to develop customer personas
Creating a customer-centric CXM technology strategy requires archetypal customer personas. Creating customer personas will enable you to talk concretely about them as consumers of your customer experience and allow you to build buyer scenarios around them.
A persona (or archetypal user) is an invented person that represents a type of user in a particular use-case scenario. In this case, personas can be based on real customers.
| Components of a persona |
Example – Organization: Grocery Store |
| Name |
Name personas to reflect a key attribute such as the persona’s primary role or motivation |
Brand Loyal Linda: A stay-at-home mother dedicated to maintaining and caring for a household of 5 people |
| Demographic |
Include basic descriptors of the persona (e.g. age, geographic location, preferred language, education, job, employer, household income, etc.) |
Age: 42 years old Geographic location: London Suburbia Language: English Education: Post-secondary Job: Stay-at-home mother Annual Household Income: $100,000+ |
| Wants, needs, pain points |
Identify surface-level motivations for buying habits |
Wants: Local products Needs: Health products; child-safe products
Pain points: Fragmented shopping experience |
| Psychographic/behavioral traits |
Observe persona traits that are representative of the customers’ behaviors (e.g. attitudes, buying patterns, etc.) |
Psychographic: Detail-oriented, creature of habit
Behavioral: Shops at large grocery store twice a week, visits farmers market on Saturdays, buys organic products online |
Activity: Build personas for your customers
2.1.8 2 hours
Input
- Customer demographics and psychographics
Output
- List of prioritized customer personas
- CXM Strategy Stakeholder Presentation
Materials
- Info-Tech examples
- Whiteboard
- Markers
Participants
Project Team
Instructions
- In 2-4 groups, list all the customer personas that need to be built. In doing so, consider the people who interact with your organization most often.
- Build a demographic profile for each customer persona. Include information such as age, geographic location, occupation, annual income, etc.
- Augment the persona with a psychographic profile of each customer. Consider the goals and objectives of each customer persona and how these might inform buyer behaviors.
- Introduce your group’s personas to the entire group, in a round-robin fashion, as if you are introducing your persona at a party.
- Summarize the personas in a persona map. Rank your personas according to importance and remove any duplicates.
Info-Tech Insight
For CXM, persona building is typically used for understanding the external customer; however, if you need to gain a better understanding of the organization’s internal customers (those who will be interacting with CXM applications), personas can also be built for this purpose. Examples of useful internal personas are sales managers, brand managers, customer service directors, etc.
Fred, 40
The Family Man
Post-secondary educated, white-collar professional, three children
Goals & Objectives
- Maintain a stable secure lifestyle
- Progress his career
- Obtain a good future for his children
Behaviors
- Manages household and finances
- Stays actively involved in children’s activities and education
- Seeks potential career development
- Uses a cellphone and email frequently
- Sometimes follows friends Facebook pages
Services of Interest
- SFA, career counselling, job boards, day care, SHHS
- Access to information via in-person, phone, online
Traits
General Literacy - High
Digital Literacy - Mid-High
Detail-Oriented - High
Willing to Try New Things - Mid-High
Motivated and Persistent - Mid-High
Time Flexible - Mid-High
Familiar With [Red.] - Mid
Access to [Red.] Offices - High
Access to Internet - High
Ashley, 35
The Tourist
Single, college educated, planning vacation in [redacted], interested in [redacted] job opportunities
Goals & Objectives
- Relax after finishing a stressful job
- Have adventures and try new things
- Find a new job somewhere in Canada
Behaviors
- Collects information about things to do in [redacted]
- Collects information about life in [redacted]
- Investigates and follows up on potential job opportunities
- Uses multiple social media to keep in touch with friends
- Shops online frequently
Services of Interest
- SFA, job search, road conditions, ferry schedules, hospital, police station, DL requirements, vehicle rental
- Access to information via in-person, phone, website, SMS, email, social media
Traits
General Literacy - Mid
Digital Literacy - High
Detail-Oriented - Mid
Willing to Try New Things - High
Motivated and Persistent - Mid
Time Flexible - Mid-High
Familiar With [Red.] - Low
Access to [Red.] Offices - Low
Access to Internet - High
Bill, 25
The Single Parent
15-year resident of [redacted], high school education, waiter, recently divorced, two children
Goals & Objectives
- Improve his career options so he can support his family
- Find an affordable place to live
- Be a good parent
- Work through remaining divorce issues
Behaviors
- Tries to get training or experience to improve his career
- Stays actively involved in his children’s activities
- Looks for resources and supports to resolve divorce issues
- Has a cellphone and uses the internet occasionally
Services of Interest
- Child care, housing authority, legal aid, parenting resources
- Access to information via in person, word-of mouth, online, phone, email
Traits
General Literacy - Mid
Digital Literacy - Mid-Low
Detail-Oriented - Mid-Low
Willing to Try New Things - Mid
Motivated and Persistent - High
Time Flexible - Mid
Familiar With [Red.] - Mid-High
Access to [Red.] Offices - High
Access to Internet - High
Marie, 19
The Regional Youth
Single, [redacted] resident, high school graduate
Goals & Objectives
- Get a good job
- Maintain ties to family and community
Behaviors
- Looking for work
- Gathering information about long-term career choices
- Trying to get the training or experience that can help her develop a career
- Staying with her parents until she can get established
- Has a new cellphone and is learning how to use it
- Plays videogames and uses the internet at least weekly
Services of Interest
- Job search, career counselling
- Access to information via in-person, online, phone, email, web applications
Traits
General Literacy - Mid
Digital Literacy - Mid
Detail-Oriented - Mid-Low
Willing to Try New Things - Mid-High
Motivated and Persistent - Mid-Low
Time Flexible - High
Familiar With [Red.] - Mid-Low
Access to [Red.] Offices - Mid-Low
Access to Internet - Mid
Build key scenarios for each persona to extract strategic requirements for your CXM application portfolio
A scenario is a story or narrative that helps explore the set of interactions that a customer has with an organization. Scenario mapping will help parse requirements used to design the CXM application portfolio.
A Good Scenario…
- Describes specific task(s) that need to be accomplished
- Describes user goals and motivations
- Describes interactions with a compelling but not overwhelming amount of detail
- Can be rough, as long as it provokes ideas and discussion
Scenarios Are Used To…
- Provide a shared understanding about what a user might want to do, and how they might want to do it
- Help construct the sequence of events that are necessary to address in your user interface(s)
To Create Good Scenarios…
- Keep scenarios high level, not granular in nature
- Identify as many scenarios as possible. If you’re time constrained, try to develop 2-3 key scenarios per persona
- Sketch each scenario out so that stakeholders understand the goal of the scenario
Activity: Build scenarios for each persona and extract strategic requirements for the CXM strategy
2.1.9 1.5 hours
Input
- Customer personas (output of Activity 2.1.5)
Output
- CX scenario maps
- Strategic CXM requirements
- CXM Strategy Stakeholder Presentation
Materials
Participants
Instructions
- For each customer persona created in Activity 2.1.5, build a scenario. Choose and differentiate scenarios based on the customer goal of each scenario (e.g. make online purchase, seek customer support, etc.).
- Think through the narrative of how a customer interacts with your organization, at all points throughout the scenario. List each step in the interaction in a sequential order to form a scenario journey.
- Examine each step in the scenario and brainstorm strategic requirements that will be needed to support the customer’s use of technology throughout the scenario.
- Repeat steps 1-3 for each persona. Document your outputs in the CXM Strategy Stakeholder Presentation Template.
Example: Scenario Map
Persona Name: Brand Loyal Linda
Scenario Goal: File a complaint about in-store customer service
Look up “[Store Name] customer service” on public web. →Reach customer support landing page. →Receive proactive notification prompt for online chat with CSR. →Initiate conversation: provide order #. →CSR receives order context and information. →Customer articulates problem, CSR consults knowledgebase. →Discount on next purchase offered. →Send email with discount code to Brand Loyal Linda.
If you want additional support, have our analysts guide you through this phase as part of an Info-Tech workshop
Book a workshop with our Info-Tech analysts:
- To accelerate this project, engage your IT team in an Info-Tech workshop with an Info-Tech analyst team.
- Info-Tech analysts will join you and your team onsite at your location or welcome you to Info-Tech’s historic Toronto office to participate in an innovative onsite workshop.
- Contact your account manager (www.infotech.com/account), or email Workshops@InfoTech.com for more information.
The following are sample activities that will be conducted by Info-Tech analysts with your team:
2.1.1; 2.1.2; 2.1.3; 2.1.4 - Create a CXM operating model
An analyst will facilitate a discussion to identify what impacts your CXM strategy and how to align it to your corporate strategy. The discussion will take different perspectives into consideration and look at organizational drivers, external environmental factors, as well as internal barriers and enablers.
2.1.5 Conduct a competitive analysis
Calling on their depth of expertise in working with a broad spectrum of organizations, our facilitator will help you work through a structured, systematic evaluation of competitors’ actions when it comes to CXM.
If you want additional support, have our analysts guide you through this phase as part of an Info-Tech workshop
Book a workshop with our Info-Tech analysts:
2.1.6; 2.1.7 - Conduct a PEST analysis
The facilitator will use guided conversation to target each quadrant of the PEST analysis and help your organization fully enumerate political, economic, social, and technological trends that will influence your CXM strategy. Our analysts are deeply familiar with macroenvironmental trends and can provide expert advice in identifying areas of concern in the PEST and drawing strategic requirements as implications.
2.1.8; 2.1.9 - Build customer personas and subsequent persona scenarios
Drawing on the preceding exercises as inputs, the facilitator will help the team create and refine personas, create respective customer interaction scenarios, and parse strategic requirements to support your technology portfolio for CXM.
Step 2.2: Assess the Current State of CXM
Phase 1
1.1 Create the Project Vision
1.2 Structure the Project
Phase 2
2.1 Scan the External Environment
2.2 Assess the Current State of CXM
2.3 Create an Application Portfolio
2.4 Develop Deployment Best Practices
Phase 3
3.1 Create an Initiative Rollout Plan
3.2 Confirm and Finalize the CXM Blueprint
Activities:
- Conduct a SWOT analysis and extract strategic requirements
- Inventory existing CXM applications and assess end-user usage and satisfaction
- Conduct a VRIO analysis and extract strategic requirements
Outcomes:
- SWOT analysis
- VRIO analysis
- Current state application portfolio
- Strategic requirements
Conduct a SWOT analysis to prepare for creating your CXM strategy
A SWOT analysis is a structured planning method that evaluates the strengths, weaknesses, opportunities, and threats involved in a project.
Strengths - Strengths describe the positive attributes that are within your control and internal to your organization (i.e. what do you do better than anyone else?)
Weaknesses - Weaknesses are internal aspects of your business that place you at a competitive disadvantage; think of what you need to enhance to compete with your top competitor.
Opportunities - Opportunities are external factors the project can capitalize on. Think of them as factors that represent reasons your business is likely to prosper.
Threats - Threats are external factors that could jeopardize the project. While you may not have control over these, you will benefit from having contingency plans to address them if they occur.
Info-Tech Insight
When evaluating weaknesses of your current CXM strategy, ensure that you’re taking into account not just existing applications and business processes, but also potential deficits in your organization’s channel strategy and go-to-market messaging.
Activity: Conduct a SWOT analysis
2.2.1 30 minutes
Input
- CXM strengths, weaknesses, opportunities, and threats
Output
Materials
Participants
Instructions
- Identify your current strengths and weaknesses in managing the customer experience. Consider marketing, sales, and customer service aspects of the CX.
- Identify any opportunities to take advantage of and threats to mitigate.
Example: SWOT Analysis
Strengths
- Strong customer service model via telephony
Weaknesses
- Customer service inaccessible in real-time through website or mobile application
Opportunities
- Leverage customer intelligence to measure ongoing customer satisfaction
Threats
- Lack of understanding of customer interaction platforms by staff could hinder adoption
Activity: Translate your SWOT analysis into a list of requirements to be addressed
2.2.2 30 minutes
Input
- SWOT Analysis conducted in Activity 2.2.1.
Output
- Strategic CXM requirements
- CXM Stakeholder Presentation Template
Materials
Participants
Instructions
For each SWOT quadrant:
- Document the point and relate it to a goal.
- For each point, identify CXM requirements.
- Sort goals and requirements to eliminate duplicates.
- Document your outputs in the CXM Stakeholder Presentation Template.
Example: Parsing Requirements from SWOT Analysis
Weakness: Customer service inaccessible in real-time through website or mobile application.
Goal: Increase the ubiquity of access to customer service knowledgebase and agents through a web portal or mobile application.
Strategic Requirement: Provide a live chat portal that matches the customer with the next available and qualified agent.
Inventory your current CXM application portfolio
Applications are the bedrock of technology enablement for CXM. Review your current application portfolio to identify what is working well and what isn’t.
Understand Your CXM Application Portfolio With a Four-Step Approach
Build the CXM Application Inventory →Assess Usage and Satisfaction →Map to Business Processes and Determine Dependencies →Determine Grow/Maintain/ Retire for Each Application
When assessing the CXM applications portfolio, do not cast your net too narrowly; while CRM and MMS applications are often top of mind, applications for digital asset management and social media management are also instrumental for ensuring a well-integrated CX.
Identify dependencies (either technical or licensing) between applications. This dependency tracing will come into play when deciding which applications should be grown (invested in), which applications should be maintained (held static), and which applications should be retired (divested).
Info-Tech Insight
Shadow IT is prominent here! When building your application inventory, ensure you involve Marketing, Sales, and Service to identify any “unofficial” SaaS applications that are being used for CXM. Many organizations fail to take a systematic view of their CXM application portfolio beyond maintaining a rough inventory. To assess the current state of alignment, you must build the application inventory and assess satisfaction metrics.
Understand which of your organization’s existing enterprise applications enable CXM
Review the major enterprise applications in your organization that enable CXM and align your requirements to these applications (net-new or existing). Identify points of integration to capture the big picture.
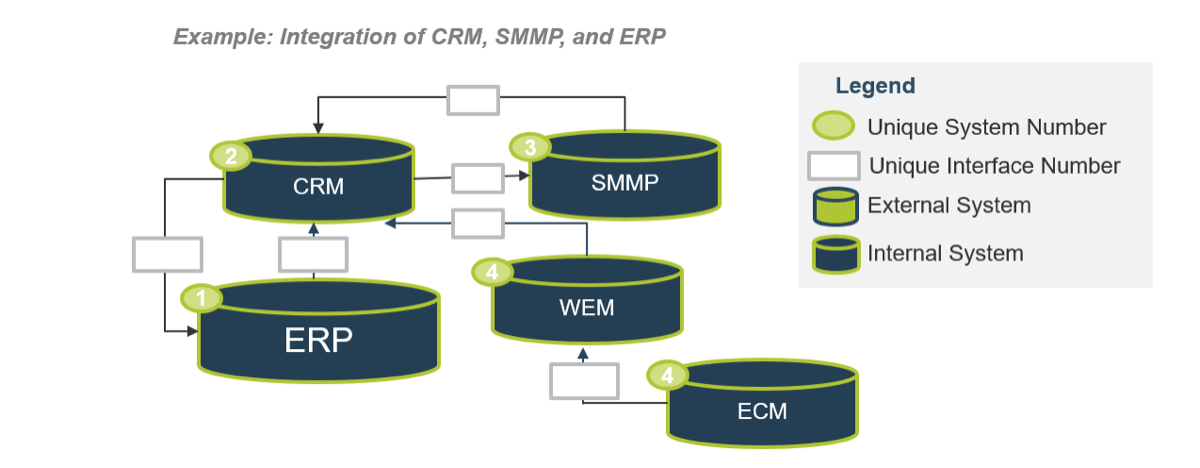
Info-Tech Insight
When assessing the current application portfolio that supports CXM, the tendency will be to focus on the applications under the CXM umbrella, relating mostly to marketing, sales, and customer service. Be sure to include systems that act as input to, or benefit due to outputs from, CRM or similar applications. Examples of these systems are ERP systems, ECM (e.g. SharePoint) applications, and more.
Assess CXM application usage and satisfaction
Having a portfolio but no contextual data will not give you a full understanding of the current state. The next step is to thoroughly assess usage patterns as well as IT, management, and end-user satisfaction with each application.
Example: Application Usage & Satisfaction Assessment
| Application Name |
Level of Usage |
IT Satisfaction |
Management Satisfaction |
End-User Satisfaction |
Potential Business Impact |
| CRM (e.g. Salesforce) |
Medium |
High |
Medium |
Medium |
High |
| CRM (e.g. Salesforce) |
Low |
Medium |
Medium |
High |
Medium |
| ... |
... |
... |
... |
... |
... |
Info-Tech Insight
When evaluating satisfaction with any application, be sure to consult all stakeholders who come into contact with the application or depend on its output. Consider criteria such as ease of use, completeness of information, operational efficiency, data accuracy, etc.
Use Info-Tech’s Application Portfolio Assessment to gather end-user feedback on existing CXM applications
2.2.3 Application Portfolio Assessment: End-User Feedback
Info-Tech’s Application Portfolio Assessment: End-User Feedback diagnostic is a low-effort, high-impact program that will give you detailed report cards on end-user satisfaction with an application. Use these insights to identify problems, develop action plans for improvement, and determine key participants.
Application Portfolio Assessment: End-User Feedback is an 18-question survey that provides valuable insights on user satisfaction with an application by:
- Performing a general assessment of the application portfolio that provides a full view of the effectiveness, criticality, and prevalence of all relevant applications.
- Measuring individual application performance with open-ended user feedback surveys about the application, organized by department to simplify problem resolution.
- Providing targeted department feedback to identify end-user satisfaction and focus improvements on the right group or line of business.
INFO-TECH DIAGNOSTIC
Activity: Inventory your CXM applications, and assess application usage and satisfaction
2.2.4 1 hour
Input
Output
- Complete inventory of CXM applications
- CXM Stakeholder Presentation Template
Materials
Participants
Instructions
- List all existing applications that support the creation, management, and delivery of your customer experience.
- Identify which processes each application supports (e.g. content deployment, analytics, service delivery, etc.).
- Identify technical or licensing dependencies (e.g. data models).
- Assess the level of application usage by IT, management, and internal users (high/medium/low).
- Assess the satisfaction with and performance of each application according to IT, management, and internal users (high/medium/low). Use the Info-Tech Diagnostic to assist.
Example: CXM Application Inventory
| Application Name |
Deployed Date |
Processes Supported |
Technical and Licensing Dependencies |
| Salesforce |
June 2018 |
Customer relationship management |
XXX |
| Hootsuite |
April 2019 |
Social media listening |
XXX |
| ... |
... |
... |
... |
Conduct a VRIO analysis to identify core competencies for CXM applications
A VRIO analysis evaluates the ability of internal resources and capabilities to sustain a competitive advantage by evaluating dimensions of value, rarity, imitability, and organization. For critical applications like your CRM platform, use a VRIO analysis to determine their value.
| Is the resource or capability valuable in exploiting an opportunity or neutralizing a threat? |
Is the resource or capability rare in the sense that few of your competitors have a similar capability? |
Is the resource or capability costly to imitate or replicate? |
Is the organization organized enough to leverage and capture value from the resource or capability? |
|
| NO |
→ |
→ |
→ |
COMPETITIVE DISADVANTAGE |
| YES |
NO→ |
→ |
→ |
COMPETITIVE EQUALITY/PARITY |
| YES |
YES |
NO→ |
→ |
TEMPORARY
COMPETITIVE ADVANTAGE |
| YES |
YES |
YES |
NO→ |
UNUSED COMPETITIVE
ADVANTAGE |
| YES |
YES |
YES |
YES |
LONG-TERM COMPETITIVE ADVANTAGE |
(Strategic Management Insight, 2013)
Activity: Conduct a VRIO analysis on your existing application portfolio
2.2.5 30 minutes
Input
- Inventory of existing CXM applications (output of Activity 2.2.4)
Output
- Completed VRIO analysis
- Strategic CXM requirements
- CXM Stakeholder Presentation Template
Materials
-
VRIO Analysis model
- Whiteboard
- Markers
Participants
Instructions
- Evaluate each CXM application inventoried in Activity 2.2.4 by answering the four VRIO questions in sequential order. Do not proceed to the following question if “no” is answered at any point.
- Record the results. The state of your organization’s competitive advantage, based on each resource/capability, will be determined based on the number of questions with a “yes” answer. For example, if all four questions are answered positively, then your organization is considered to have a long-term competitive advantage.
- Document your outputs in the CXM Stakeholder Presentation Template.
If you want additional support, have our analysts guide your through this phase as part of an Info-Tech workshop
2.2.1; 2.2.2 Conduct a SWOT Analysis
Our facilitator will use a small-team approach to delve deeply into each area, identifying enablers (strengths and opportunities) and challenges (weaknesses and threats) relating to the CXM strategy.
2.2.3; 2.2.4 Inventory your CXM applications, and assess usage and satisfaction
Working with your core team, the facilitator will assist with building a comprehensive inventory of CXM applications that are currently in use and with identifying adjacent systems that need to be identified for integration purposes. The facilitator will work to identify high and low performing applications and analyze this data with the team during the workshop exercise.
2.2.5 Conduct a VRIO analysis
The facilitator will take you through a VRIO analysis to identify which of your internal technological competencies ensure, or can be leveraged to ensure, your competitiveness in the CXM market.
Step 2.3: Create an Application Portfolio
Phase 1
1.1 Create the Project Vision
1.2 Structure the Project
Phase 2
2.1 Scan the External Environment
2.2 Assess the Current State of CXM
2.3 Create an Application Portfolio
2.4 Develop Deployment Best Practices
Phase 3
3.1 Create an Initiative Rollout Plan
3.2 Confirm and Finalize the CXM Blueprint
Activities
- Shortlist and prioritize business processes for improvement and reengineering
- Map current CXM processes
- Identify business process owners and assign job responsibilities
- Identify user interaction channels to extract strategic requirements
- Aggregate and develop strategic requirements
- Determine gaps in current and future state processes
- Build the CXM application portfolio
Outcomes
CXM application portfolio map
- Shortlist of relevant business processes
- Current state map
- Business process ownership assignment
- Channel map
- Complete list of strategic requirements
Understand business process mapping to draft strategy requirements for marketing, sales, and customer service
The interaction between sales, marketing, and customer service is very process-centric. Rethink sales and customer-centric workflows and map the desired workflow, imbedding the improved/reengineered process into the requirements.
Using BPM to Capture Strategic Requirements
Business process modeling facilitates the collaboration between the business and IT, recording the sequence of events, tasks performed, who performed them, and the levels of interaction with the various supporting applications.
By identifying the events and decision points in the process and overlaying the people that perform the functions, the data being interacted with, and the technologies that support them, organizations are better positioned to identify gaps that need to be bridged.
Encourage the analysis by compiling an inventory of business processes that support customer-facing operations that are relevant to achieving the overall organizational strategies.
Outcomes
- Operational effectiveness
- Identification, implementation, and maintenance of reusable enterprise applications
- Identification of gaps that can be addressed by acquisition of additional applications or process improvement/ reengineering
INFO-TECH OPPORTUNITY
Refer to Info-Tech’s Create a Comprehensive BPM Strategy for Successful Process Automation blueprint for further assistance in taking a BPM approach to your sales-IT alignment.
Leverage the APQC framework to help define your inventory of sales, marketing, and service processes
APQC’s Process Classification Framework is a taxonomy of cross-functional business processes intended to allow the objective comparison of organizational performance within and among organizations.
| OPERATING PROCESSES |
| 1.0 Develop Vision and Strategy |
2.0 Develop and Manage Products and Services |
3.0 Market and Sell Products and Services |
4.0 Deliver Products and Services |
5.0 Manage Customer Service |
| MANAGEMENT AND SUPPORT SERVICES |
| 6.0 Develop and Manage Human Capital |
| 7.0 Manage Information Technology |
| 8.0 Manage Financial Resources |
| 9.0 Acquire, Construct, and Manage Assets |
| 10.0 Manage Enterprise Risk, Compliance, and Resiliency |
| 11.0 Manage External Relationships |
| 12.0 Develop and Manage Business Capabilities |
(APQC, 2011)
MORE ABOUT APQC
- APQC serves as a high-level, industry-neutral enterprise model that allows organizations to see activities from a cross-industry process perspective.
- Sales processes have been provided up to Level 3 of the APQC framework.
- The APQC Framework can be accessed through APQC’s Process Classification Framework.
- Note: The framework does not list all processes within a specific organization, nor are the processes that are listed in the framework present in every organization.
Understand APQC’s “Market and Sell Products and Services” framework
3.0 Market and Sell Products
3.1 Understand markets, customers, and capabilities
- 3.1.1 Perform customer and market intelligence analysis
- 3.1.2 Evaluate and prioritize market opportunities
3.2 Develop marketing strategy
- 3.2.1 Define offering and customer value proposition
- 3.2.2 Define pricing strategy to align to value proposition
- 3.2.3 Define and manage channel strategy
3.3 Develop sales strategy
- 3.3.1 Develop sales forecast
- 3.3.2 Develop sales partner/alliance relationships
- 3.3.3 Establish overall sales budgets
- 3.3.4 Establish sales goals and measures
- 3.3.5 Establish customer management measures
3.4 Develop and manage marketing plans
- 3.4.1 Establish goals, objectives, and metrics by products by channels/segments
- 3.4.2 Establish marketing budgets
- 3.4.3 Develop and manage media
- 3.4.4 Develop and manage pricing
- 3.4.5 Develop and manage promotional activities
- 3.4.6 Track customer management measures
- 3.4.7 Develop and manage packaging strategy
3.5 Develop and manage sales plans
- 3.5.1 Generate leads
- 3.5.2 Manage customers and accounts
- 3.5.3 Manage customer sales
- 3.5.4 Manage sales orders
- 3.5.5 Manage sales force
- 3.5.6 Manage sales partners and alliances
Understand APQC’s “Manage Customer Service” framework
5.0 Manage Customer Service
5.1 Develop customer care/customer service strategy
- 5.1.1 Develop customer service segmentation
- 5.1.1.1 Analyze existing customers
- 5.1.1.2 Analyze feedback of customer needs
- 5.1.2 Define customer service policies and procedures
- 5.1.3 Establish service levels for customers
5.2 Plan and manage customer service operations
- 5.2.1 Plan and manage customer service work force
- 5.2.1.1 Forecast volume of customer service contacts
- 5.2.1.2 Schedule customer service work force
- 5.2.1.3 Track work force utilization
- 5.2.1.4 Monitor and evaluate quality of customer interactions with customer service representatives
5.2 Plan and 5.2.3.1 Receive customer complaints 5.2.3.2 Route customer complaints 5.2.3.3 Resolve customer complaints 5.2.3.4 Respond to customer complaints manage customer service operations
- 5.2.2 Manage customer service requests/inquiries
- 5.2.2.1 Receive customer requests/inquiries
- 5.2.2.2 Route customer requests/inquiries
- 5.2.2.3 Respond to customer requests/inquiries
- 5.2.3 Manage customer complaints
- 5.2.3.1 Receive customer complaints
- 5.2.3.2 Route customer complaints
- 5.2.3.3 Resolve customer complaints
- 5.2.3.4 Respond to customer complaints
Leverage the APQC framework to inventory processes
The APQC framework provides levels 1 through 3 for the “Market and Sell Products and Services” framework. Level 4 processes and beyond will need to be defined by your organization as they are more granular (represent the task level) and are often industry-specific.
Level 1 – Category - 1.0 Develop vision and strategy (10002)
Represents the highest level of process in the enterprise, such as manage customer service, supply chain, financial organization, and human resources.
Level 2 – Process Group - 1.1 Define the business concept and long-term vision (10014)
Indicates the next level of processes and represents a group of processes. Examples include perform after sales repairs, procurement, accounts payable, recruit/source, and develop sales strategy.
Level 3 – Process - 1.1.1 Assess the external environment (10017)
A series of interrelated activities that convert input into results (outputs); processes consume resources and require standards for repeatable performance; and processes respond to control systems that direct quality, rate, and cost of performance.
Level 4 – Activity - 1.1.1.1 Analyze and evaluate competition (10021)
Indicates key events performed when executing a process. Examples of activities include receive customer requests, resolve customer complaints, and negotiate purchasing contracts.
Level 5 – Task - 12.2.3.1.1 Identify project requirements and objectives (11117)
Tasks represent the next level of hierarchical decomposition after activities. Tasks are generally much more fine grained and may vary widely across industries. Examples include create business case and obtain funding, and design recognition and reward approaches.
Info-Tech Insight
Define the Level 3 processes in the context of your organization. When creating a CXM strategy, concern yourself with the interrelatedness of processes across existing departmental silos (e.g. marketing, sales, customer service). Reserve the analysis of activities (Level 4) and tasks (Level 3) for granular work initiatives involved in the implementation of applications.
Use Info-Tech’s CXM Business Process Shortlisting Tool to prioritize processes for improvement
2.3.1 CXM Business Process Shortlisting Tool
The CXM Business Process Shortlisting Tool can help you define which marketing, sales, and service processes you should focus on.
Working in concert with stakeholders from the appropriate departments, complete the short questionnaire.
Based on validated responses, the tool will highlight processes of strategic importance to your organization.
These processes can then be mapped, with requirements extracted and used to build the CXM application portfolio.
INFO-TECH DELIVERABLE
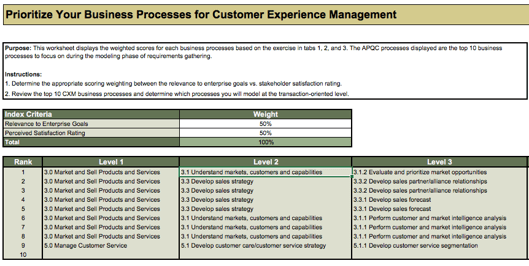
Activity: Define your organization’s top-level processes for reengineering and improvement
2.3.2 1 hour
Input
- Shortlist business processes relating to customer experience (output of Tool 2.3.1)
Output
- Prioritized list of top-level business processes by department
Materials
- APQC Framework
- Whiteboard
- Markers
Participants
Instructions
- Inventory all business processes relating to customer experience.
- Customize the impacted business units and factor weightings on the scorecard below to reflect the structure and priorities of your organization.
- Using the scorecard, identify all processes essential to your customer experience. The scorecard is designed to determine which processes to focus on and to help you understand the impact of the scrutinized process on the different customer-centric groups across the organization.
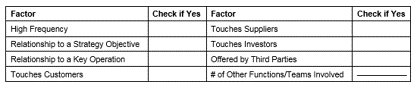
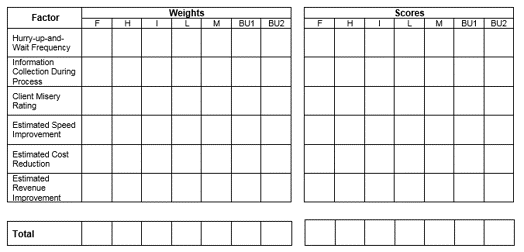
Current legend for Weights and Scores
F – Finance
H – Human Resources
I – IT
L – Legal
M – Marketing
BU1 – Business Unit 1
BU2 – Business Unit 2
Activity: Map top-level business processes to extract strategic requirements for the CXM application portfolio
2.3.3 45 minutes
Input
- Prioritized list of top-level business processes (output of Activity 2.3.2)
Output
- Current state process maps
- CXM Strategy Stakeholder Presentation
Materials
- APQC Framework
- Whiteboard
- Markers
- Sticky notes
Participants
Instructions
- List all prioritized business processes, as identified in Activity 2.3.2. Map your processes in enough detail to capture all relevant activities and system touchpoints, using the legend included in the example. Focus on Level 3 processes, as explained in the APQC framework.
- Record all of the major process steps on sticky notes. Arrange the sticky notes in sequential order.
- On a set of different colored sticky notes, record all of the systems that enable the process. Map these system touchpoints to the process steps.
- Draw arrows in between the steps to represent manual entry or automation.
- Identify effectiveness and gaps in existing processes to determine process technology requirements.
- Document your outputs in the CXM Strategy Stakeholder Presentation Template.
INFO-TECH OPPORTUNITY
Refer to Info-Tech’s Create a Comprehensive BPM Strategy for Successful Process Automation blueprint for further assistance in taking a BPM approach to your sales-IT alignment.
Info-Tech Insight
Analysis of the current state is important in the context of gap analysis. It aids in understanding the discrepancies between your baseline and the future state vision, and ensures that these gaps are documented as part of the overall requirements.
Example: map your current CXM processes to parse strategic requirements (customer acquisition)
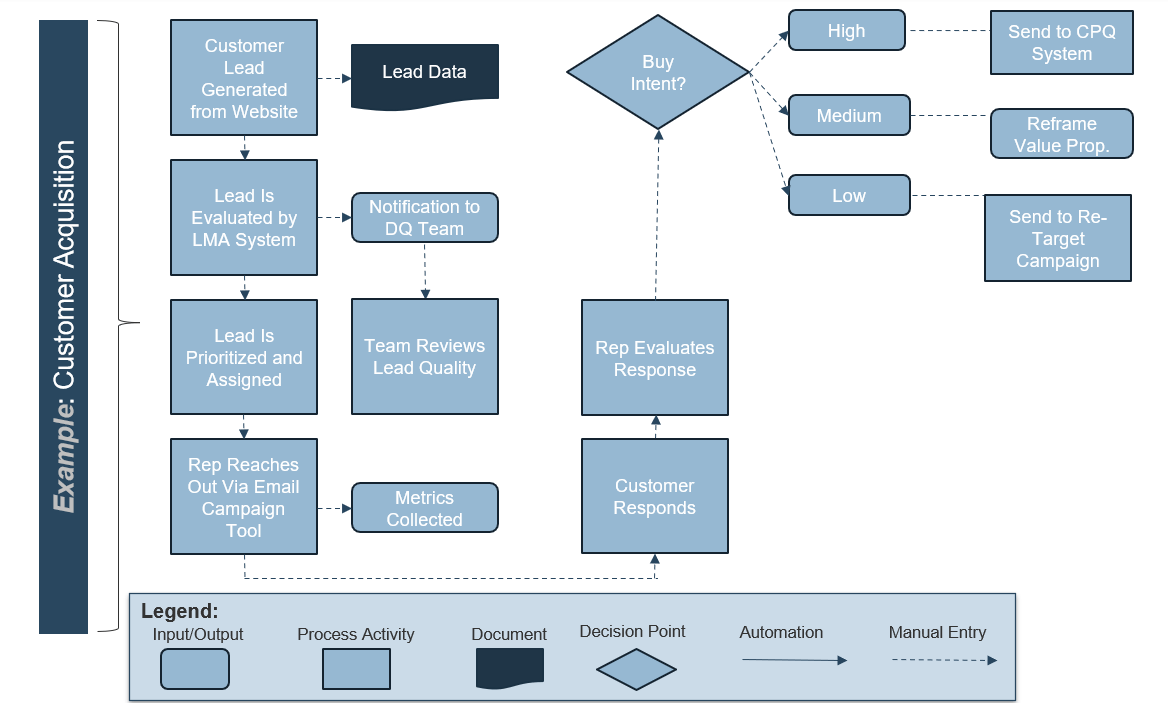
Activity: Extract requirements from your top-level business processes
2.3.4 30 minutes
Input
- Current state process maps (output of Activity 2.3.3)
Output
- Requirements for future state mapping
Materials
- Info-Tech examples
- Whiteboard
- Markers
Participants
Instructions
- Discuss the current state of priority business processes, as mapped in Activity 2.3.3.
- Extract process requirements for business process improvement by asking the following questions:
- What is the input?
- What is the output?
- What are the underlying risks and how can they be mitigated?
- What conditions should be met to mitigate or eliminate each risk?
- What are the improvement opportunities?
- What conditions should be met to enable these opportunities?
- Break business requirements into functional and non-functional requirements, as outlined on this slide.
Info-Tech Insight
The business and IT should work together to evaluate the current state of business processes and the business requirements necessary to support these processes. Develop a full view of organizational needs while still obtaining the level of detail required to make informed decisions about technology.
Establish process owners for each top-level process
Identify the owners of the business processes being evaluated to extract requirements. Process owners will be able to inform business process improvement and assume accountability for reengineered or net-new processes going forward.
Process Owner Responsibilities
Process ownership ensures support, accountability, and governance for CXM and its supporting processes. Process owners must be able to negotiate with business users and other key stakeholders to drive efficiencies within their own process. The process owner must execute tactical process changes and continually optimize the process.
Responsibilities include the following:
- Inform business process improvement
- Introduce KPIs and metrics
- Monitor the success of the process
- Present process findings to key stakeholders within the organization
- Develop policies and procedures for the process
- Implement new methods to manage the process
Info-Tech Insight
Identify the owners of existing processes early so you understand who needs to be involved in process improvement and reengineering. Once implemented, CXM applications are likely to undergo a series of changes. Unstructured data will multiply, the number of users may increase, administrators may change, and functionality could become obsolete. Should business processes be merged or drastically changed, process ownership can be reallocated during CXM implementation. Make sure you have the right roles in place to avoid inefficient processes and poor data quality.
Use Info-Tech’s Process Owner Assignment Guide to aid you in choosing the right candidates
2.3.5 Process Owner Assignment Guide
The Process Owner Assignment Guide will ensure you are taking the appropriate steps to identify process owners for existing and net-new processes created within the scope of the CXM strategy.
The steps in the document will help with important considerations such as key requirements and responsibilities.
Sections of the document:
- Define responsibilities and level of commitment
- Define job requirements
- Receive referrals
- Hold formal interviews
- Determine performance metrics
INFO-TECH DELIVERABLE
Activity: Assign business process owners and identify job responsibilities
2.3.6 30 minutes
Input
- Current state map (output of Activity 2.3.3)
Output
- Process owners assigned
- CXM Strategy Stakeholder Presentation
Materials
Participants
Instructions
- Using Info-Tech’s Process Owner Assignment Guide, assign process owners for each process mapped out in Activity 2.3.3. To assist in doing so, answer the following questions
- What is the level of commitment expected from each process owner?
- How will the process owner role be tied to a formal performance appraisal?
- What metrics can be assigned?
- How much work will be required to train process owners?
- Is there support staff available to assist process owners?
Document your outputs in the CXM Strategy Stakeholder Presentation Template.
Choose the channels that will make your target customers happy – and ensure they’re supported by CXM applications
Traditional Channels
Face-to-Face is efficient and has a positive personalized aspect that many customers desire, be it for sales or customer service.
Telephony (or IVR) has been a mainstay of customer interaction for decades. While not fading, it must be used alongside newer channels.
Postal used to be employed extensively for all domains, but is now used predominantly for e-commerce order fulfillment.
Web 1.0 Channels
Email is an asynchronous interaction channel still preferred by many customers. Email gives organizations flexibility with queuing.
Live Chat is a way for clients to avoid long call center wait times and receive a solution from a quick chat with a service rep.
Web Portals permit transactions for sales and customer service from a central interface. They are a must-have for any large company.
Web 2.0 Channels
Social Media consists of many individual services (like Facebook or Twitter). Social channels are exploding in consumer popularity.
HTML5 Mobile Access allows customers to access resources from their personal device through its integrated web browser.
Dedicated Mobile Apps allow customers to access resources through a dedicated mobile application (e.g. iOS, Android).
Info-Tech Insight
Your channel selections should be driven by customer personas and scenarios. For example, social media may be extensively employed by some persona types (i.e. Millennials) but see limited adoption in other demographics or use cases (i.e. B2B).
Activity: Extract requirements from your channel map
2.3.7 30 minutes
Input
- Current state process maps (output of Activity 2.3.3)
Output
- Channel map
- CXM Strategy Stakeholder Presentation
Materials
- Info-Tech examples
- Whiteboard
- Markers
Participants
Instructions
- Inventory which customer channels are currently used by each department.
- Speak with the department heads for Marketing, Sales, and Customer Service and discuss future channel usage. Identify any channels that will be eliminated or added.
- Document your outputs in the CXM Strategy Stakeholder Presentation Template.
Example: Business Unit Channel Use Survey
| |
Marketing |
Sales |
Customer Service |
| |
Current Used? |
Future Use? |
Current Used? |
Future Use? |
Current Used? |
Future Use? |
| Email |
Yes |
Yes |
No |
No |
No |
No |
| Direct Mail |
Yes |
No |
No |
No |
No |
No |
| Phone |
No |
No |
Yes |
Yes |
Yes |
Yes |
| In-Person |
No |
No |
Yes |
Yes |
Yes |
No |
| Website |
Yes |
Yes |
Yes |
Yes |
Yes |
Yes |
| Social Channels |
No |
Yes |
Yes |
Yes |
No |
Yes |
Bring it together: amalgamate your strategic requirements for CXM technology enablement
Discovering your organizational requirements is vital for choosing the right business-enabling initiative, technology, and success metrics. Sorting the requirements by marketing, sales, and service is a prudent mechanism for clarification.
Strategic Requirements: Marketing
Definition: High-level requirements that will support marketing functions within CXM.
Examples
- Develop a native mobile application while also ensuring that resources for your web presence are built with responsive design interface.
- Consolidate workflows related to content creation to publish all brand marketing from one source of truth.
- Augment traditional web content delivery by providing additional functionality such as omnichannel engagement, e-commerce, dynamic personalization, and social media functionality.
Strategic Requirements: Sales
Definition: High-level requirements that will support sales functions within CXM.
Examples
- Implement a system that reduces data errors and increases sales force efficiency by automating lead management workflows.
- Achieve end-to-end visibility of the sales process by integrating the CRM, inventory, and order processing and shipping system.
- Track sales force success by incorporating sales KPIs with real-time business intelligence feeds.
Strategic Requirements: Customer Service
Definition: High-level requirements that will support customer service functions within CXM.
Examples
- Provide a live chat portal that connects the customer, in real time, with the next available and qualified agent.
- Bridge the gap between the source of truth for sales with customer service suites to ensure a consistent, end-to-end customer experience from acquisition to customer engagement and retention.
- Use customer intelligence to track customer journeys in order to best understand and resolve customer complaints.
Activity: Consolidate your strategic requirements for the CXM application portfolio
2.3.8 30 minutes
Input
- Strategic CXM requirements (outputs of Activities 2.1.5, 2.1.6, and 2.2.2)
Output
- Aggregated strategic CXM requirements
- CXM Strategy Stakeholder Presentation
Materials
Participants
Instructions
- Aggregate strategic CXM requirements that have been gathered thus far in Activities 2.1.5, 2.1.6, and 2.2.2, 2.3.5, and 2.3.7.
- Identify and rectify any obvious gaps in the existing set of strategic CXM requirements. To do so, consider the overall corporate and CXM strategy: are there any objectives that have not been addressed in the requirements gathering process?
- De-duplicate the list. Prioritize the aggregated/augmented list of CXM requirements as “high/critical,” “medium/important,” or “low/desirable.” This will help manage the relative importance and urgency of different requirements to itemize respective initiatives, resources, and the time in which they need to be addressed. In completing the prioritization of requirements, consider the following:
- Requirements prioritization must be completed in collaboration with all key stakeholders (across the business and IT). Stakeholders must ask themselves:
- What are the consequences to the business objectives if this requirement is omitted?
- Is there an existing system or manual process/workaround that could compensate for it?
- What business risk is being introduced if a particular requirement cannot be implemented right away?
Document your outputs in the CXM Strategic Stakeholder Presentation Template.
Info-Tech Insight
Strategic CXM requirements will be used to prioritize specific initiatives for CXM technology enablement and application rollout. Ensure that IT, the business, and executive management are all aligned on a consistent and agreed upon set of initiatives.
Burberry digitizes the retail CX with real-time computing to bring consumers back to the physical storefront
CASE STUDY
Industry Consumer Goods, Clothing
Source Retail Congress, 2017
Burberry London
Situation
Internally, Burberry invested in organizational alignment and sales force brand engagement. The more the sales associate knew about the brand engagement and technology-enabled strategy, the better the store’s performance. Before the efforts went to building relationships with customers, Burberry built engagement with employees.
Burberry embraced “omnichannel,” the hottest buzzword in retailing to provide consumers the most immersive and intuitive brand experience within the store.
Technology Strategy
RFID tags were attached to products to trigger interactive videos on the store’s screens in the common areas or in a fitting room. Consumers are to have instant access to relevant product combinations, ranging from craftsmanship information to catwalk looks. This is equivalent to the rich, immediate information consumers have grown to expect from the online shopping experience.
Another layer of Burberry’s added capabilities includes in-memory-based analytics to gather and analyze data in real-time to better understand customers’ desires. Burberry builds customer profiles based on what items the shoppers try on from the RFID-tagged garments. Although this requires customer privacy consent, customers are willing to provide personal information to trusted brands.
This program, called “Customer 360,” assisted sales associates in providing data-driven shopping experiences that invite customers to digitally share their buying history and preferences via their tablet devices. As the data is stored in Burberry’s customer data warehouse and accessed through an application such as CRM, it is able to arm sales associates with personal fashion advice on the spot.
Lastly, the customer data warehouse/CRM application is linked to Burberry’s ERP system and other custom applications in a cloud environment to achieve real-time inventory visibility and fulfillment.
Burberry digitizes the retail CX with real-time computing to bring consumers back to the physical storefront (cont'd)
CASE STUDY
Industry Consumer Goods, Clothing
Source Retail Congress, 2017
Burberry London
Situation
Internally, Burberry invested in organizational alignment and sales force brand engagement. The more the sales associate knew about the brand engagement and technology-enabled strategy, the better the store’s performance. Before the efforts went to building relationships with customers, Burberry built engagement with employees.
Burberry embraced “omnichannel,” the hottest buzzword in retailing to provide consumers the most immersive and intuitive brand experience within the store.
The Results
Burberry achieved one of the most personalized retail shopping experiences. Immediate personal fashion advice using customer data is only one component of the experience. Not only are historic purchases and preference data analyzed, a customer’s social media posts and fashion industry trend data is proactively incorporated into the interactions between the sales associate and the customer.
Burberry achieved CEO Angela Ahrendts’ vision of “Burberry World,” in which the brand experience is seamlessly integrated across channels, devices, retail locations, products, and services.
The organizational alignment between Sales, Marketing, and IT empowered employees to bring the Burberry brand to life in unique ways that customers appreciated and were willing to advocate.
Burberry is now one of the most beloved and valuable luxury brands in the world. The brand tripled sales in five years, became one of the leading voices on trends, fashion, music, and beauty while redefining what top-tier customer experience should be both digitally and physically.
Leverage both core CRM suites and point solutions to create a comprehensive CXM application portfolio
The debate between best-of-breed point solutions versus comprehensive CRM suites is ongoing. There is no single best answer. In most cases, an effective portfolio will include both types of solutions.
- When the CRM market first evolved, vendors took a heavy “module-centric” approach – offering basic suites with the option to add a number of individual modules. Over time, vendors began to offer suites with a high degree of out-of-the-box functionality. The market has now witnessed the rise of powerful point solutions for the individual business domains.
- Point solutions augment, rather than supplant, the functionality of a CRM suite in the mid-market to large enterprise context. Point solutions do not offer the necessary spectrum of functionality to take the place of a unified CRM suite.
- Point solutions enhance aspects of CRM. For example, most CRM vendors have yet to provide truly impressive social media capabilities. An organization seeking to dominate the social space should consider purchasing a social media management platform to address this deficit in their CRM ecosystem.
Customer Relationship Management (CRM)
Social Media Management Platform (SMMP)
Field Sales/Service Automation (FSA)
Marketing Management Suites
Sales Force Automation
Email Marketing Tools
Lead Management Automation (LMA)
Customer Service Management Suites
Customer Intelligence Systems
Don’t adopt multiple point solutions without a genuine need: choose domains most in need of more functionality
Some may find that the capabilities of a CRM suite are not enough to meet their specific requirements: supplementing a CRM suite with a targeted point solution can get the job done. A variety of CXM point solutions are designed to enhance your business processes and improve productivity.
Sales
Sales Force Automation: Automatically generates, qualifies, tracks, and contacts leads for sales representatives, minimizing time wasted on administrative duties.
Field Sales: Allows field reps to go through the entire sales cycle (from quote to invoice) while offsite.
Sales Compensation Management: Models, analyzes, and dispenses payouts to sales representatives.
Marketing
Social Media Management Platforms (SMMP): Manage and track multiple social media services, with extensive social data analysis and insight capabilities.
Email Marketing Bureaus: Conduct email marketing campaigns and mine results to effectively target customers.
Marketing Intelligence Systems: Perform in-depth searches on various data sources to create predictive models.
Service
Customer Service Management (CSM): Manages the customer support lifecycle with a comprehensive array of tools, usually above and beyond what’s in a CRM suite.
Customer Service Knowledge Management (CSKM): Advanced knowledgebase and resolution tools.
Field Service Automation (FSA): Manages customer support tickets, schedules work orders, tracks inventory and fleets, all on the go.
Info-Tech Insight
CRM and point solution integration is critical. A best-of-breed product that poorly integrates with your CRM suite compromises the value generated by the combined solution, such as a 360-degree customer view. Challenge point solution vendors to demonstrate integration capabilities with CRM packages.
Refer to your use cases to decide whether to add a dedicated point solution alongside your CRM suite
Know your end state and what kind of tool will get you there. Refer to your strategic requirements to evaluate CRM and point solution feature sets.
Standalone CRM Suite
Sales Conditions: Need selling and lead management capabilities for agents to perform the sales process, along with sales dashboards and statistics.
Marketing or Communication Conditions: Need basic campaign management and ability to refresh contact records with information from social networks.
Member Service Conditions: Need to keep basic customer records with multiple fields per record and basic channels such as email and telephony.
Add a Best-of-Breed or Point Solution
Environmental Conditions: An extensive customer base with many different interactions per customer along with industry specific or “niche” needs. Point solutions will benefit firms with deep needs in specific feature areas (e.g. social media or field service).
Sales Conditions: Lengthy sales process and account management requirements for assessing and managing opportunities – in a technically complex sales process.
Marketing Conditions: Need social media functionality for monitoring and social property management.
Customer Service Conditions: Need complex multi-channel service processes and/or need for best-of-breed knowledgebase and service content management.
Info-Tech Insight
The volume and complexity of both customers and interactions have a direct effect on when to employ just a CRM suite and when to supplement with a point solution. Check to see if your CRM suite can perform a specific business requirement before deciding to evaluate potential point solutions.
Use Info-Tech’s CXM Portfolio Designer to create an inventory of high-value customer interaction applications
2.3.9 CXM Portfolio Designer
The CXM Portfolio Designer features a set of questions geared toward understanding your needs for marketing, sales, and customer service enablement.
These results are scored and used to suggest a comprehensive solution-level set of enterprise applications for CXM that can drive your application portfolio and help you make investment decisions in different areas such as CRM, marketing management, and customer intelligence.
Sections of the tool:
- Introduction
- Customer Experience Management Questionnaire
- Business Unit Recommendations
- Enterprise-Level Recommendations
INFO-TECH DELIVERABLE
Understand the art of the possible and how emerging trends will affect your application portfolio (1)
Cloud
- The emergence and maturation of cloud technologies has broken down the barriers of software adoption.
- Cloud has enabled easy-to-implement distributed sales centers for enterprises with global or highly fragmented workforces.
- Cloud offers the agility, scalability, and flexibility needed to accommodate dynamic, evolving customer requirements while minimizing resourcing strain on IT and sales organizations.
- It is now easier for small to medium enterprises to acquire and implement advanced sales capabilities to compete against larger competitors in a business environment where the need for business agility is key.
- Although cost and resource reduction is a prominent view of the impact of cloud computing, it is also seen as an agile way to innovate and deliver a product/service experience that customers are looking for – the key to competitive differentiation.
Mobile
- Smartphones and other mobile devices were adopted faster than the worldwide web in the late 1990s, and the business and sales implications of widespread adoption cannot be ignored – mobile is changing how businesses operate.
- Accenture’s Mobility Research Report states that 87% of companies in the study have been guided by a formal mobility strategy – either one that spans the enterprise or for specific business functions.
- Mobile is now the first point of interaction with businesses. With this trend, gaining visibility into customer insights with mobile analytics is a top priority for organizations.
- Enterprises need to develop and optimize mobile experiences for internal salespeople and customers alike as part of their sales strategy – use mobile to enable a competitive, differentiated sales force.
- The use of mobile platforms by sales managers is becoming a norm. Sales enablement suites should support real-time performance metrics on mobile dashboards.
Understand the art of the possible and how emerging trends will affect your application portfolio (2)
Social
- The rise of social networking brought customers together. Customers are now conversing with each other over a wide range of community channels that businesses neither own nor control.
- The Power Shift: The use of social channels empowered customers to engage in real-time, unstructured conversations for the purpose of product/service evaluations. Those who are active in social environments come to wield considerable influence over the buying decisions of other prospects and customers.
- Organizations need to identify the influencers and strategically engage them as well as developing an active presence in social communities that lead to sales.
- Social media does have an impact on sales, both B2C and B2B. A study conducted in 2012 by Social Centered Selling states that 72.6% of sales people using social media as part of their sales process outperformed their peers and exceeded their quota 23% more often (see charts at right).
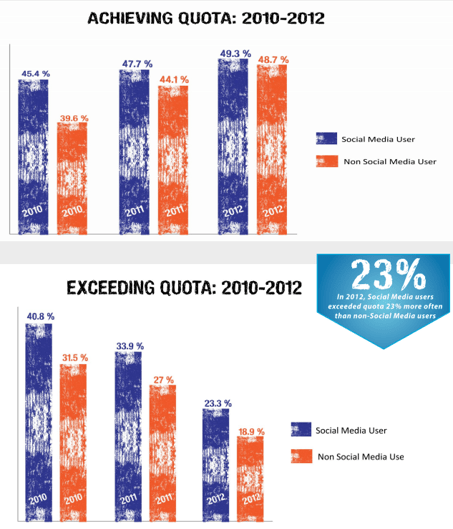
(Social Centered Learning, n.d.)
Understand the art of the possible and how emerging trends will affect your application portfolio (3)
Internet of Things
- Definition: The Internet of Things (IoT) is the network of physical objects accessed through the internet. These objects contain embedded technology to interact with internal states or the external environment.
- Why is this interesting?
- IoT will make it possible for everybody and everything to be connected at all times, processing information in real time. The result will be new ways of making business and sales decisions supported by the availability of information.
- With ubiquitous connectivity, the current product design-centric view of consumers is changing to one of experience design that aims to characterize the customer relationship with a series of integrated interaction touchpoints.
- The above change contributes to the shift in focus from experience and will mean further acceleration of the convergence of customer-centric business functions. IoT will blur the lines between marketing, sales, and customer service.
- Products or systems linked to products are capable of self-operating, learning, updating, and correcting by analyzing real-time data.
- Take for example, an inventory scale in a large warehouse connected to the company’s supply chain management (SCM) system. When a certain inventory weight threshold is reached due to outgoing shipments, the scale automatically sends out a purchase requisition to restock inventory levels to meet upcoming demand.
- The IoT will eventually begin to transform existing business processes and force organizations to fundamentally rethink how they produce, operate, and service their customers.
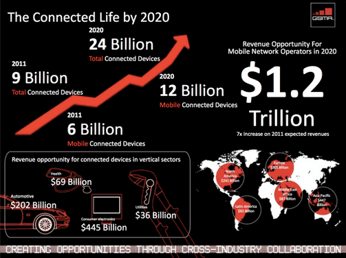
For categories covered by existing applications, determine the disposition for each app: grow it or cut it loose
Use the two-by-two matrix below to structure your optimal CXM application portfolio. For more help, refer to Info-Tech’s blueprint, Use Agile Application Rationalization Instead of Going Big Bang.
| |
1 |
|
|
0
Richness of Functionality
|
INTEGRATE |
RETAIN |
1 |
| REPLACE |
REPLACE OR ENHANCE |
| |
0
Degree of Integration
|
|
Integrate: The application is functionally rich, so spend time and effort integrating it with other modules by building or enhancing interfaces.
Retain: The application satisfies both functionality and integration requirements, so it should be considered for retention.
Replace/Enhance: The module offers poor functionality but is well integrated with other modules. If enhancing for functionality is easy (e.g. through configuration or custom development), consider enhancement or replace it.
Replace: The application neither offers the functionality sought nor is it integrated with other modules, and thus should be considered for replacement.
Activity: Brainstorm the art of the possible, and build and finalize the CXM application portfolio
2.3.10 1-2 hours
Input
- Process gaps identified (output of Activity 2.3.9)
Output
- CXM application portfolio
- CXM Strategy Stakeholder Presentation
Materials
Participants
Instructions
- Review the complete list of strategic requirements identified in the preceding exercises, as well as business process maps.
- Identify which application would link to which process (e.g. customer acquisition, customer service resolution, etc.).
- Use Info-Tech’s CXM Portfolio Designer to create an inventory of high-value customer interaction applications.
- Define rationalization and investment areas.
- Document your outputs in the CXM Strategy Stakeholder Presentation Template.
Example: Brainstorming the Art of the Possible
| Application |
Gap Satisfied |
Related Process |
Number of Linked Requirements |
Do we have the system? |
Priority |
| LMA |
- Lead Generation
- Social Lead Management
- CRM Integration
|
Sales |
8 |
No |
Business Critical |
| Customer Intelligence |
- Web Analytics
- Customer Journey Tracking
|
Customer Service |
6 |
Yes |
Business Enabling |
| ... |
... |
... |
... |
... |
... |
Use Info-Tech’s comprehensive reports to make granular vendor selection decisions
Now that you have developed the CXM application portfolio and identified areas of new investment, you’re well positioned to execute specific vendor selection projects. After you have built out your initiatives roadmap in phase 3, the following reports provide in-depth vendor reviews, feature guides, and tools and templates to assist with selection and implementation.
Info-Tech Insight
Not all applications are created equally well for each use case. The vendor reports help you make informed procurement decisions by segmenting vendor capabilities among major use cases. The strategic requirements identified as part of this project should be used to select the use case that best fits your needs.
If you want additional support, have our analyst guide you through this phase as part of an Info-Tech workshop
Book a workshop with our Info-Tech analysts:
2.3.2; 2.3.3 Shortlist and map the key top-level business processes
Based on experience working with organizations in similar verticals, the facilitator will help your team map out key sample workflows for marketing, sales, and customer service.
2.3.6 Create your strategic requirements for CXM
Drawing on the preceding exercises, the facilitator will work with the team to create a comprehensive list of strategic requirements that will be used to drive technology decisions and roadmap initiatives.
2.3.10 Create and finalize the CXM application portfolio
Using the strategic requirements gathered through internal, external, and technology analysis up to this point, a facilitator will assist you in assembling a categorical technology application portfolio to support CXM.
Step 2.4: Develop Deployment Best Practices
Phase 1
1.1 Create the Project Vision
1.2 Structure the Project
Phase 2
2.1 Scan the External Environment
2.2 Assess the Current State of CXM
2.3 Create an Application Portfolio
2.4 Develop Deployment Best Practices
Phase 3
3.1 Create an Initiative Rollout Plan
3.2 Confirm and Finalize the CXM Blueprint
Activities:
- Develop a CXM integration map
- Develop a mitigation plan for poor quality customer data
- Create a framework for end-user adoption of CXM applications
Outcomes:
- CXM application portfolio integration map
- Data quality preservation plan
- End-user adoption plan
Develop an integration map to specify which applications will interface with each other
Integration is paramount: your CXM application portfolio must work as a unified face to the customer. Create an integration map to reflect a system of record and the exchange of data.
- CRM
- ERP
- Telephony Systems (IVR, CTI)
- Directory Services
- Email
- Content Management
- Point Solutions (SMMP, MMS)
The points of integration that you’ll need to establish must be based on the objectives and requirements that have informed the creation of the CXM application portfolio. For instance, achieving improved customer insights would necessitate a well-integrated portfolio with customer interaction point solutions, business intelligence tools, and customer data warehouses in order to draw the information necessary to build insight. To increase customer engagement, channel integration is a must (i.e. with robust links to unified communications solutions, email, and VoIP telephony systems).
Info-Tech Insight
If the CXM application portfolio is fragmented, it will be nearly impossible to build a cohesive view of the customer and deliver a consistent customer experience. Points of integration (POIs) are the junctions between the applications that make up the CXM portfolio. They are essential to creating value, particularly in customer insight-focused and omnichannel-focused deployments. Be sure to include enterprise applications that are not included in the CXM application portfolio. Popular systems to consider for POIs include billing, directory services, content management, and collaboration tools.
After identifying points of integration, profile them by business significance, complexity, and investment required
- After enumerating points of integration between the CRM platform and other CXM applications and data sources, profile them by business significance and complexity required to determine a rank-ordering of priorities.
- Points of integration that are of high business significance with low complexity are your must do’s – these are your quick wins that deliver maximum value without too much cost. This is typically the case when integrating a vendor-to-vendor solution with available native connectors.
- On the opposite end of the spectrum are your POIs that will require extensive work to deliver but offer negligible value. These are your should not do’s – typically, these are niche requests for integration that will only benefit the workflows of a small (and low priority) group of end users. Only accommodate them if you have slack time and budget built into your implementation timeline.
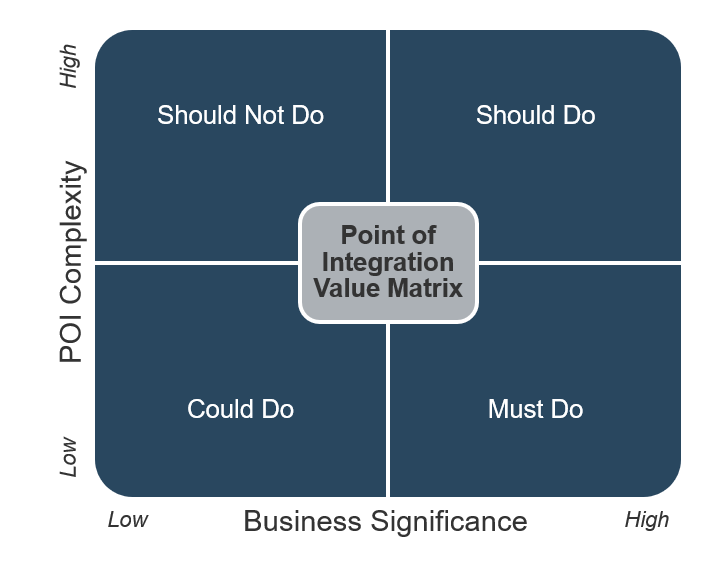
"Find the absolute minimum number of ‘quick wins’ – the POIs you need from day one that are necessary to keep end users happy and deliver value." – Maria Cindric, Australian Catholic University Source: Interview
Activity: Develop a CXM application integration map
2.4.1 1 hour
Input
- CXM application portfolio (output of Activity 2.3.10)
Output
- CXM application portfolio integration map
- CXM Strategy Stakeholder Presentation
Materials
- Sticky notes
- Whiteboard
- Markers
Participants
Instructions
- On sticky notes, record the list of applications that comprise the CXM application portfolio (built in Activity 2.3.10) and all other relevant applications. Post the sticky notes on a whiteboard so you can visualize the portfolio.
- Discuss the key objectives and requirements that will drive the integration design of the CXM application portfolio.
- As deemed necessary by step 2, rearrange the sticky notes and draw connecting arrows between applications to reflect their integration. Allow the point of the arrow to indicate direction of data exchanges.
- Document your outputs in the CXM Strategy Stakeholder Presentation Template.
Example: Mapping the Integration of CXM Applications
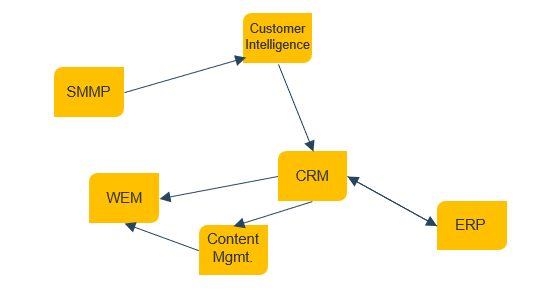
Plug the hole and bail the boat – plan to be preventative and corrective with customer data quality initiatives
Data quality is king: if your customer data is garbage in, it will be garbage out. Enable strategic CXM decision making with effective planning of data quality initiatives.
Identify and Eliminate Dead Weight
Poor data can originate in the firm’s system of record, which is typically the CRM system. Custom queries, stored procedures, or profiling tools can be used to assess the key problem areas.
Loose rules in the CRM system lead to records of no significant value in the database. Those rules need to be fixed, but if changes are made before the data is fixed, users could encounter database or application errors, which will reduce user confidence in the system.
- Conduct a data flow analysis: map the path that data takes through the organization.
- Use a mass cleanup to identify and destroy dead weight data. Merge duplicates either manually or with the aid of software tools. Delete incomplete data, taking care to reassign related data.
- COTS packages typically allow power users to merge records without creating orphaned records in related tables, but custom-built applications typically require IT expertise.
Create and Enforce Standards & Policies
Now that the data has been cleaned, protect the system from relapsing.
Work with business users to find out what types of data require validation and which fields should have changes audited. Whenever possible, implement drop-down lists to standardize values and make programming changes to ensure that truncation ceases.
- Truncated data is usually caused by mismatches in data structures during either one-time data loads or ongoing data integrations.
- Don’t go overboard on assigning required fields – users will just put key data in note fields.
- Discourage the use of unstructured note fields: the data is effectively lost unless it gets subpoenaed.
- To specify policies, use Info-Tech’s Master Data Record Tool.
Profile your customer and sales-related data
Applications are a critical component of how IT supports Sales, but IT also needs to help Sales keep its data current and accurate. Conducting a sales data audit is critical to ensure Sales has the right information at the right time.
Info-Tech Insight
Data is king. More than ever, having accurate data is essential for your organization to win in hyper-competitive marketplaces. Prudent current state analysis looks at both the overall data model and data architecture, as well as assessing data quality within critical sales-related repositories. As the amount of customer data grows exponentially due to the rise of mobility and the Internet of Things, you must have a forward-looking data model and data marts/customer data warehouse to support sales-relevant decisions.
- A current state analysis for sales data follows a multi-step process:
- Determine the location of all sales-relevant and customer data – the sales data inventory. Data can reside in applications, warehouses, and documents (e.g. Excel and Access files) – be sure to take a holistic approach.
- For each data source, assess data quality across the following categories:
- Completeness
- Currency (Relevancy)
- Correctness
- Duplication
- After assessing data quality, determine which repositories need the most attention by IT and Sales. We will look at opportunities for data consolidation later in the blueprint.
INFO-TECH OPPORTUNITY
Refer to Info-Tech’s Develop a Master Data Management Strategy and Roadmap blueprint for further reference and assistance in data management for your sales-IT alignment.
Activity: Develop a mitigation plan for poor quality customer data
2.4.2 30 minutes
Input
- List of departments involved in maintenance of CXM data
Output
- Data quality preservation plan
- CXM Strategy Stakeholder Presentation
Materials
Participants
Instructions
- Inventory a list of departments that will be interacting directly with CXM data.
- Identify data quality cleansing and preservation initiatives, such as those in previous examples.
- Assign accountability to an individual in the department as a data steward. When deciding on a data steward, consider the following:
- Data stewards are designated full-time employees who serve as the go-to resource for all issues pertaining to data quality, including keeping a particular data silo clean and free of errors.
- Data stewards are typically mid-level managers in the business (not IT), preferably with an interest in improving data quality and a relatively high degree of tech-savviness.
- Data stewards can sometimes be created as a new role with a dedicated FTE, but this is not usually cost effective for small and mid-sized firms.
- Instead, diffuse the steward role across several existing positions, including one for CRM and other marketing, sales, and service applications.
Document your outputs in the CXM Strategy Stakeholder Presentation Template.
Example: Data Steward Structure
Department A
- Data Steward (CRM)
- Data Steward (ERP)
Department B
Department C
Determine if a customer data warehouse will add value to
your CXM technology-enablement strategy
A customer data warehouse (CDW) “is a subject-oriented, integrated, time-variant, non-volatile collection of data used to support the strategic decision-making process across marketing, sales, and service. It is the central point of data integration for customer intelligence and is the source of data for the data marts, delivering a common view of customer data” (Corporate Information Factory, n.d.).
Analogy
CDWs are like a buffet. All the food items are in the buffet. Likewise, your corporate data sources are centralized into one repository. There are so many food items in a buffet that you may need to organize them into separate food stations (data marts) for easier access.
Examples/Use Cases
- Time series analyses with historical data
- Enterprise level, common view analyses
- Integrated, comprehensive customer profiles
- One-stop repository of all corporate information
Pros
- Top-down architectural planning
- Subject areas are integrated
- Time-variant, changes to the data are tracked
- Non-volatile, data is never over-written or deleted
Cons
- A massive amount of corporate information
- Slower delivery
- Changes are harder to make
- Data format is not very business friendly
Activity: Assess the need for a customer data warehouse
2.4.3. 30 minutes
Input
- List of data sources
- Data inflows and outflows
Output
- Data quality preservation plan
- CXM Strategy Stakeholder Presentation
Materials
Participants
Instructions
- Create a shortlist of customer data sources.
- Profile the integration points that are necessary to support inflows and outflows of customer data.
- Ask the following questions around the need for a CDW based on these data sources and points of integration:
- What is the volume of customer information that needs to be stored? The greater the capacity, the more likely that you should build a dedicated CDW.
- How complex is the data? The more complex the data, the greater the need for a CDW.
- How often will data interchange happen between various applications and data sources? The greater and more frequent the interchange, the greater the need for a CDW.
- What are your organizational capabilities for building a CDW? Do you have the resources in-house to create a CDW at this time?
Document your outputs in the CXM Strategy Stakeholder Presentation Template.
INFO-TECH OPPORTUNITY
Refer to Info-Tech’s Build an Agile Data Warehouse blueprint for more information on building a centralized and integrated data warehouse.
Create a plan for end-user training on new (or refocused) CXM applications and data quality processes
All training modules will be different, but some will have overlapping areas of interest.
– Assign Project Evangelists – Analytics Training – Mobile Training
Application Training
- Customer Service
- Assign Project Evangelists – Analytics Training – Mobile Training
- Focus training on:
- What to do with inbound tickets.
- Routing and escalation features.
- How to use knowledge management features effectively.
- Call center capabilities.
- Sales – Assign Project Evangelists – Analytics Training – Mobile Training
- Focus training on:
- Recording of opportunities, leads, and deals.
- How to maximize sales with sales support decision tree.
- Marketing - Assign Project Evangelists – Analytics Training
- Focus training on:
- Campaign management features.
- Social media monitoring and engagement capabilities.
- IT
- Focus training on:
- Familiarization with the software.
- Software integration with other enterprise applications.
- The technical support needed to maintain the system in the future.
Info-Tech Insight
Train customers too. Keep the customer-facing sales portals simple and intuitive, have clear explanations/instructions under important functions (e.g. brief directions on how to initiate service inquiries), and provide examples of proper uses (e.g. effective searches). Make sure customers are aware of escalation options available to them if self-service falls short.
Ensure adoption with a formal communication process to keep departments apprised of new application rollouts
The team leading the rollout of new initiatives (be they applications, new governance structures, or data quality procedures) should establish a communication process to ensure management and users are well informed.
CXM-related department groups or designated trainers should take the lead and implement a process for:
- Scheduling application platform/process rollout/kick-off meetings.
- Soliciting preliminary input from the attending groups to develop further training plans.
- Establishing communication paths and the key communication agents from each department who are responsible for keeping lines open moving forward.
The overall objective for inter-departmental kick-off meetings is to confirm that all parties agree on certain key points and understand alignment rationale and new sales app or process functionality.
The kick-off process will significantly improve internal communications by inviting all affected internal IT groups, including business units, to work together to address significant issues before the application process is formally activated.
The kick-off meeting(s) should encompass:
- Target business-user requirements
- The high-level application overview
- Tangible business benefits of alignment
- Special consideration needs
- Other IT department needs
- Target quality of service (QoS) metrics
Info-Tech Insight
Determine who in each department will send out a message about initiative implementation, the tone of the message, the medium, and the delivery date.
Construct a formal communication plan to engage stakeholders through structured channels
Tangible Elements of a Communications Plan
- Stakeholder Group Name
- Stakeholder Description
- Message
- Concerns Relative to Application Maintenance
- Communication Medium
- Role Responsible for Communication
- Frequency
- Start and End Date
Intangible Elements of a Communications Plan
- Establish biweekly meetings with representatives from sales functional groups, who are tasked with reporting on:
- Benefits of revised processes
- Metrics of success
- Resource restructuring
- Establish a monthly interdepartmental meeting, where all representatives from sales and IT leadership discuss pressing bug fixes and minor process improvements.
- Create a webinar series, complete with Q&A, so that stakeholders can reference these changes at their leisure.
Info-Tech Insight
Every piece of information that you give to a stakeholder that is not directly relevant to their interests is a distraction from your core message. Always remember to tailor the message, medium, and timing accordingly.
Carry the CXM value forward with linkage and
relationships between sales, marketing, service, and IT
Once the sales-IT alignment committees have been formed, create organizational cadence through a variety of formal and informal gatherings between the two business functions.
- Organizations typically fall in one of three maturity stages: isolation, collaboration, or synergy. Strive to achieve business-technology synergy at the operational level.
- Although collaboration cannot be mandated, it can be facilitated. Start with a simple gauge of the two functions’ satisfaction with each other, and determine where and how inter-functional communication and synergy can be constructed.
Isolation
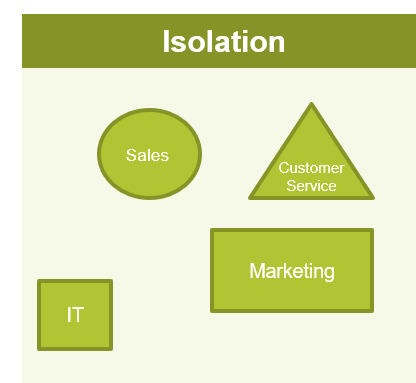
- Point solutions are implemented on an ad-hoc basis by individual departments for specific projects.
- Internal IT is rarely involved in these projects from beginning to end.
Collaboration
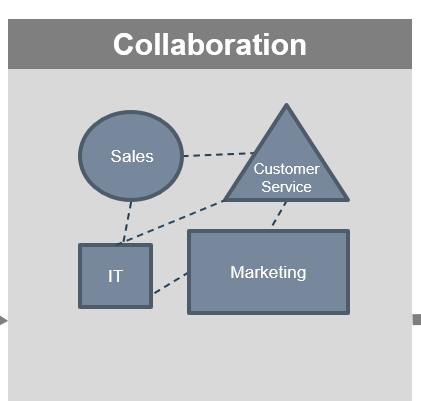
- There is a formal cross-departmental effort to integrate some point solutions.
- Internal IT gets involved to integrate systems and then support system interactions.
Synergy
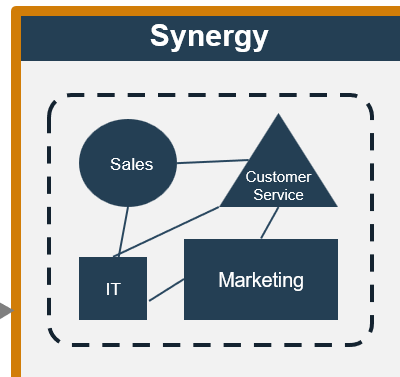
- Cross-functional, business technology teams are established to work on IT-enabled revenue generation initiatives.
- Team members are collocated if possible.
If you want additional support, have our analysts guide you through this phase as part of an Info-Tech workshop
Book a workshop with our Info-Tech analysts:
2.4.1 Develop a CXM application integration map
Using the inventory of existing CXM-supporting applications and the newly formed CXM application portfolio as inputs, your facilitator will assist you in creating an integration map of applications to establish a system of record and flow of data.
2.4.2 Develop a mitigation plan for poor quality customer data
Our facilitator will educate your stakeholders on the importance of quality data and guide you through the creation of a mitigation plan for data preservation.
2.4.3 Assess the need for a customer data warehouse
Addressing important factors such as data volume, complexity, and flow, a facilitator will help you assess whether or not a customer data warehouse for CXM is the right fit for your organization.
Phase 3
Finalize the CXM Framework
Build a Strong Technology Foundation for Customer Experience Management
Phase 3 outline
Call 1-888-670-8889 or email GuidedImplementations@InfoTech.com for more information.
Complete these steps on your own, or call us to complete a guided implementation. A guided implementation is a series of
2-3 advisory calls that help you execute each phase of a project. They are included in most advisory memberships.
Guided Implementation 3: Finalize the CXM Framework
Proposed Time to Completion: 1 week
Step 3.1: Create an Initiative Rollout Plan
Start with an analyst kick-off call:
- Discuss strategic requirements and the associated application portfolio that has been proposed.
Then complete these activities…
- Initiatives prioritization
With these tools & templates:
- CXM Strategy Stakeholder Presentation Template
Step 3.2: Confirm and Finalize the CXM Blueprint
Review findings with analyst:
- Discuss roadmap and next steps in terms of rationalizing and implementing specific technology-centric initiatives or rollouts.
Then complete these activities…
- Confirm stakeholder strategy presentation
With these tools & templates:
- CXM Strategy Stakeholder Presentation Template
Phase 3 Results & Insights:
Step 3.1: Create an Initiative Rollout Plan
Phase 1
1.1 Create the Project Vision
1.2 Structure the Project
Phase 2
2.1 Scan the External Environment
2.2 Assess the Current State of CXM
2.3 Create an Application Portfolio
2.4 Develop Deployment Best Practices
Phase 3
3.1 Create an Initiative Rollout Plan
3.2 Confirm and Finalize the CXM Blueprint
Activities:
- Create a risk management plan
- Brainstorm initiatives for CXM roadmap
- Identify dependencies and enabling projects for your CXM roadmap
- Complete the CXM roadmap
Outcomes:
- Risk management plan
- CXM roadmap
A CXM technology-enablement roadmap will provide smooth and timely implementation of your apps/initiatives
Creating a comprehensive CXM strategy roadmap reduces the risk of rework, misallocation of resources, and project delays or abandonment.
- People
- Processes
- Technology
- Timeline
- Tasks
- Budget
Benefits of a Roadmap
- Prioritize execution of initiatives in alignment with business, IT, and needs.
- Create clearly defined roles and responsibilities for IT and business stakeholders.
- Establish clear timelines for rollout of initiatives.
- Identify key functional areas and processes.
- Highlight dependencies and prerequisites for successful deployment.
- Reduce the risk of rework due to poor execution.
Implement planning and controls for project execution
Risk Management
- Track risks associated with your CXM project.
- Assign owners and create plans for resolving open risks.
- Identify risks associated with related projects.
- Create a plan for effectively communicating project risks.
Change Management
- Brainstorm a high-level training plan for various users of the CXM.
- Create a communication plan to notify stakeholders and impacted users about the tool and how it will alter their workday and performance of role activities.
- Establish a formal change management process that is flexible enough to meet the demands for change.
Project Management
- Conduct a post-mortem to evaluate the completion of the CXM strategy.
- Design the project management process to be adaptive in nature.
- Communication is key to project success, whether it is to external stakeholders or internal project team members..
- Review the project’s performance against metrics and expectations.
INFO-TECH OPPORTUNITIES
Optimize the Change Management Process
You need to design a process that is flexible enough to meet demand for change and strict enough to protect the live environment from change-related incidents.
Create Project Management Success
Investing time up front to plan the project and implementing best practices during project execution to ensure the project is delivered with the planned outcome and quality is critical to project success.
Activity: Create a risk management plan
3.1.1 45 minutes
Input
Output
- Risk management plan
- CXM Strategy Stakeholder Presentation
Materials
Participants
Instructions
- Create a list of possible risks that may hamper the progress of your CXM project.
- Classify risks as strategy-based, related to planning, or systems-based, related to technology.
- Brainstorm mitigation strategies to overcome each listed risk.
- On a score of 1 to 3, determine the impact of each risk on the success of the project.
- On a score of 1 to 3, determine the likelihood of the occurrence for each risk.
- Document your outputs in the CXM Strategy Stakeholder Presentation Template.
Example: Constructing a Risk Management Plan
| |
Risk |
Impact |
Likelihood |
Mitigation Effort |
| Strategy Risks |
Project over budget |
|
|
- Detailed project plan
- Pricing guarantees
|
| Inadequate content governance |
|
|
|
| System Risks |
Integration with additional systems |
|
|
- Develop integration plan and begin testing integration methods early in the project
|
| .... |
... |
... |
... |
Likelihood
1 – High/ Needs Focus
2 – Can Be Mitigated
3 - Unlikely
Impact
1 - High Risk
2 - Moderate Risk
3 - Minimal Risk
Prepare contingency plans to minimize time spent handling unexpected risks
Understanding technical and strategic risks can help you establish contingency measures to reduce the likelihood that risks will occur. Devise mitigation strategies to help offset the impact of risks if contingency measures are not enough.
Remember
The biggest sources of risk in a CXM strategy are lack of planning, poorly defined requirements, and lack of governance.
Apply the following mitigation tips to avoid pitfalls and delays.
Risk Mitigation Tips
- Upfront planning
- Realistic timelines
- Resource support
- Change management
- Executive sponsorship
- Sufficient funding
- Expectation setting
- Project Starts
Project Workload Increases
Pit of Despair
Project Nears Close
- Benefits are being realized
Implementation is Completed
Standardization & Optimization
Identify factors to complete your CXM initiatives roadmap
Completion of initiatives for your CXM project will be contingent upon multiple variables.
Defining Dependencies
Initiative complexity will define the need for enabling projects. Create a process to define dependencies:
- Enabling projects: complex prerequisites.
- Preceding tasks: direct and simplified assignments.
Establishing a Timeline
- Assign realistic timelines for each initiative to ensure smooth progress.
- Use milestones and stage gates to track the progress of your initiatives and tasks.
Defining Importance
- Based on requirements gathering, identify the importance of each initiative to your marketing department.
- Each initiative can be ranked high, medium, or low.
Assigning Ownership
- Owners are responsible for on-time completion of their assigned initiatives.
- Populate a RACI chart to ensure coverage of all initiatives.
Complex....Initiative
- Enabling Project
- Preceding Task
- Preceding Task
- Enabling Project
- Preceding Task
- Preceding Task
Simple....Initiative
- Preceding Task
- Preceding Task
- Preceding Task
Activity: Brainstorm CXM application initiatives for implementation in alignment with business needs
3.1.2 45 minutes
Input
- Inventory of CXM initiatives
Output
- Prioritized and quick-win initiatives
- CXM Strategy Stakeholder Presentation
Materials
Participants
Instructions
- As a team, identify and list CXM initiatives that need to be addressed.
- Plot the initiatives on the complexity-value matrix to determine priority.
- Identify quick wins: initiatives that can realize quick benefits with little effort.
- Document your outputs in the CXM Strategy Stakeholder Presentation Template.
Example: Importance-Capability Matrix
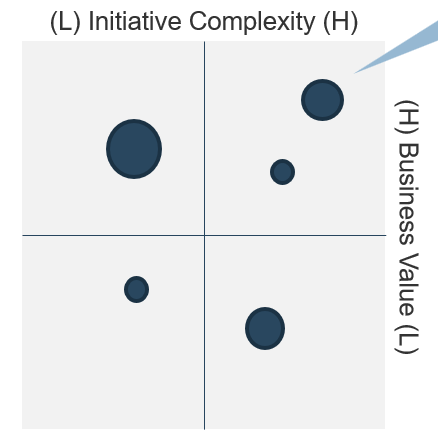
Pinpoint quick wins: high importance, low effort initiatives.
| The size of each plotted initiative must indicate the effort or the complexity and time required to complete. |
| Top Right Quadrant |
Strategic Projects |
| Top Left Quadrant |
Quick Wins |
| Bottom Right Quadrant |
Risky Bets |
| Bottom Left Quadrant |
Discretionary Projects |
Activity: Identify any dependencies or enabling projects for your CXM roadmap
3.1.3 1 hour
Input
- Implementation initiatives
- Dependencies
Output
Materials
- Sticky notes
- Whiteboard
- Markers
Participants
Instructions
- Using sticky notes and a whiteboard, have each team member rank the compiled initiatives in terms of priority.
- Determine preceding tasks or enabling projects that each initiative is dependent upon.
- Determine realistic timelines to complete each quick win, enabling project, and long-term initiative.
- Assign an owner for each initiative.
Example: Project Dependencies
Initiative: Omnichannel E-Commerce
Dependency: WEM Suite Deployment; CRM Suite Deployment; Order Fulfillment Capabilities
Activity: Complete the implementation roadmap
3.1.4 30 minutes
Input
- Implementation initiatives
- Dependencies
Output
- CXM Roadmap
- CXM Strategy Stakeholder Presentation
Materials
Participants
Instructions
- Establish time frames to highlight enabling projects, quick wins, and long-term initiatives.
- Indicate the importance of each initiative as high, medium, or low based on the output in Activity 3.1.2.
- Assign each initiative to a member of the project team. Each owner will be responsible for the execution of a given initiative as planned.
- Document your outputs in the CXM Strategy Stakeholder Presentation Template.
Example: Importance-Capability Matrix
| |
Importance |
Initiative |
Owner |
Completion Date |
| Example Projects |
High |
Gather business requirements. |
Project Manager |
MM/DD/YYYY |
| |
|
|
|
| Quick Wins |
|
|
|
|
| |
|
|
|
| Long Term |
Medium |
Implement e-commerce across all sites. |
CFO & Web Manager |
MM/DD/YYYY |
| |
|
|
|
Importance
If you want additional support, have our analysts guide you through this phase as part of an Info-Tech workshop
Book a workshop with our Info-Tech analysts:
- To accelerate this project, engage your IT team in an Info-Tech workshop with an Info-Tech analyst team.
- Info-Tech analysts will join you and your team onsite at your location or welcome you to Info-Tech’s historic Toronto office to participate in an innovative onsite workshop.
- Contact your account manager (www.infotech.com/account), or email Workshops@InfoTech.com for more information.
The following are sample activities that will be conducted by Info-Tech analysts with your team:
3.1.1 Create a risk management plan
Based on the workshop exercises, the facilitator will work with the core team to design a priority-based risk mitigation plan that enumerates the most salient risks to the CXM project and addresses them.
3.1.2; 3.1.3; 3.1.4 Identify initiative dependencies and create the CXM roadmap
After identifying dependencies, our facilitators will work with your IT SMEs and business stakeholders to create a comprehensive roadmap, outlining the initiatives needed to carry out your CXM strategy roadmap.
Step 3.2: Confirm and Finalize the CXM Blueprint
Phase 1
1.1 Create the Project Vision
1.2 Structure the Project
Phase 2
2.1 Scan the External Environment
2.2 Assess the Current State of CXM
2.3 Create an Application Portfolio
2.4 Develop Deployment Best Practices
Phase 3
3.1 Create an Initiative Rollout Plan
3.2 Confirm and Finalize the CXM Blueprint
Activities:
- Identify success metrics
- Create a stakeholder power map
- Create a stakeholder communication plan
- Complete and present CXM strategy stakeholder presentation
Outcomes:
- Stakeholder communication plan
- CXM strategy stakeholder presentation
Ensure that your CXM applications are improving the performance of targeted processes by establishing metrics
Key Performance Indicators (KPIs)
Key performance indicators (KPIs) are quantifiable measures that demonstrate the effectiveness of a process and its ability to meet business objectives.
Questions to Ask
- What outputs of the process can be used to measure success?
- How do you measure process efficiency and effectiveness?
Creating KPIs
Specific
Measurable
Achievable
Realistic
Time-bound
Follow the SMART methodology when developing KPIs for each process.
Adhering to this methodology is a key component of the Lean management methodology. This framework will help you avoid establishing general metrics that aren’t relevant.
Info-Tech Insight
Metrics are essential to your ability to measure and communicate the success of the CXM strategy to the business. Speak the same language as the business and choose metrics that relate to marketing, sales, and customer service objectives.
Activity: Identify metrics to communicate process success
3.2.1 1 hour
Input
- Key organizational objectives
Output
- Strategic business metrics
- CXM Strategy Stakeholder Presentation
Materials
Participants
Instructions
- Recap the major functions that CXM will focus on (e.g. marketing, sales, customer service, web experience management, social media management, etc.)
- Identify business metrics that reflect organizational objectives for each function.
- Establish goals for each metric (as exemplified below).
- Document your outputs in the CXM Strategy Stakeholder Presentation Template.
- Communicate the chosen metrics and the respective goals to stakeholders.
Example: Metrics for Marketing, Sales, and Customer Service Functions
| |
Metric |
Example |
| Marketing |
Customer acquisition cost |
X% decrease in costs relating to advertising spend |
| Ratio of lifetime customer value |
X% decrease in customer churn |
| Marketing originated customer % |
X% increase in % of customer acquisition driven by marketing |
| Sales |
Conversion rate |
X% increase conversion of lead to sale |
| Lead response time |
X% decrease in response time per lead |
| Opportunity-to-win ratio |
X% increase in monthly/annual opportunity-to-win ratio |
| Customer Service |
First response time |
X% decreased time it takes for customer to receive first response |
| Time-to-resolution |
X% decrease of average time-to-resolution |
| Customer satisfaction |
X% improvement of customer satisfaction ratings on immediate feedback survey |
Use Info-Tech’s Stakeholder Power Map Template to identify stakeholders crucial to CXM application rollouts
3.2.2 Stakeholder Power Map Template
Use this template and its power map to help visualize the importance of various stakeholders and their concerns. Prioritize your time according to the most powerful and most impacted stakeholders.
Answer questions about each stakeholder:
- Power: How much influence does the stakeholder have? Enough to drive the project forward or into the ground?
- Involvement: How interested is the stakeholder? How involved is the stakeholder in the project already?
- Impact: To what degree will the stakeholder be impacted? Will this significantly change how they do their job?
- Support: Is the stakeholder a supporter of the project? Neutral? A resistor?
Focus on key players: relevant stakeholders who have high power, should have high involvement, and are highly impacted.
INFO-TECH DELIVERABLE
Stakeholder Power Map Template
Use Info-Tech’s Stakeholder Communication Planning Template to document initiatives and track communication
3.2.3 Stakeholder Communication Planning Template
Use the Stakeholder Communication Planning Template to document your list of initiative stakeholders so you can track them and plan communication throughout the initiative.
Track the communication methods needed to convey information regarding CXM initiatives. Communicate how a specific initiative will impact the way employees work and the work they do.
Sections of the document:
- Document the Stakeholder Power Map (output of Tool 3.2.2).
- Complete the Communicate Management Plan to aid in the planning and tracking of communication and training.
INFO-TECH DELIVERABLE
Activity: Create a stakeholder power map and communication plan
3.2.4 1 hour
Input
Output
- Stakeholder communication plan
- CXM Strategy Stakeholder Presentation
Materials
- Info-Tech’s Stakeholder Communication Planning Template
- Info-Tech’s Stakeholder Power Map Template
Participants
Instructions
- Using Info-Tech’s Stakeholder Power Map Template, identify key stakeholders for ensuring the success of the CXM strategy (Tool 3.2.2).
- Using Info-Tech’s Stakeholder Communication Plan Template, construct a communication plan to communicate and track CXM initiatives with all CXM stakeholders (Tool 3.2.3).
- Document your outputs in the CXM Strategy Stakeholder Presentation Template.
Use Info-Tech’s CXM Strategy Stakeholder Presentation Template to sell your CXM strategy to the business
3.2.5 CXM Strategy Stakeholder Presentation Template
Complete the presentation template as indicated when you see the green icon throughout this deck. Include the outputs of all activities that are marked with this icon.
Info-Tech has designed the CXM Strategy Stakeholder Presentation Template to capture the most critical aspects of the CXM strategy. Customize it to best convey your message to project stakeholders and to suit your organization.
The presentation should be no longer than one hour. However, additional slides can be added at the discretion of the presenter. Make sure there is adequate time for a question and answer period.
INFO-TECH DELIVERABLE
After the presentation, email the deck to stakeholders to ensure they have it available for their own reference.
Activity: Determine the measured value received from the project
3.2.6 30 minutes
Input
Output
- Measured Value Calculation
Materials
Participants
Instructions
- Review project metrics identified in phase 1 and associated benchmarks.
- After executing the CXM project, compare metrics that were identified in the benchmarks with the revised and assess the delta.
- Calculate the percentage change and quantify dollar impact (i.e. as a result of increased customer acquisition or retention).
If you want additional support, have our analysts guide you through this phase as part of an Info-Tech workshop
Book a workshop with our Info-Tech analysts:
- To accelerate this project, engage your IT team in an Info-Tech workshop with an Info-Tech analyst team.
- Info-Tech analysts will join you and your team onsite at your location or welcome you to Info-Tech’s historic Toronto office to participate in an innovative onsite workshop.
- Contact your account manager (www.infotech.com/account), or email Workshops@InfoTech.com for more information.
The following are sample activities that will be conducted by Info-Tech analysts with your team:
3.2.4 Create a stakeholder power map and communication plan
An analyst will walk the project team through the creation of a communication plan, inclusive of project metrics and their respective goals. If you are planning a variety of CXM initiatives, track how the change will be communicated and to whom. Determine the employees who will be impacted by the change.
Insight breakdown
Insight 1
- IT must work in lockstep with Marketing, Sales, and Customer Service to develop a comprehensive technology-enablement strategy for CXM.
- As IT works with its stakeholders in the business, it must endeavor to capture and use the voice of the customer in driving strategic requirements for CXM portfolio design.
- IT must consider the external environment, customer personas, and internal processes as it designs strategic requirements to build the CXM application portfolio.
Insight 2
- The cloud is bringing significant disruption to the CXM space: to maintain relevancy, IT must become deeply involved in ensuring alignment between vendor capabilities and strategic requirements.
- IT must serve as a trusted advisor on technical implementation challenges related to CXM, such as data quality, integration, and end-user training and adoption.
- IT is responsible for technology enablement and is an indispensable partner in this regard; however, the business must ultimately own the objectives and communication strategy for customer engagement.
Insight 3
- When crafting a portfolio for CXM, be aware of the art of the possible: capabilities are rapidly merging and evolving to support new interaction channels. Social, mobile, and IoT are disrupting the customer experience landscape.
- Big data and analytics-driven decision making is another significant area of value. IT must allow for true customer intelligence by providing an integration framework across customer-facing applications.
Summary of accomplishment
Knowledge Gained
- Voice of the Customer for CXM Portfolio Design
- Understanding of Strategic Requirements for CXM
- Customer Personas and Scenarios
- Environmental Scan
- Deployment Considerations
- Initiatives Roadmap Considerations
Processes Optimized
- CXM Technology Portfolio Design
- Customer Data Quality Processes
- CXM Integrations
Deliverables Completed
- Strategic Summary for CXM
- CXM Project Charter
- Customer Personas
- External and Competitive Analysis
- CXM Application Portfolio
Bibliography
Accenture Digital. “Growing the Digital Business: Accenture Mobility Research 2015.” Accenture. 2015. Web.
Afshar, Vala. “50 Important Customer Experience Stats for Business Leaders.” Huffington Post. 15 Oct. 2015. Web.
APQC. “Marketing and Sales Definitions and Key Measures.” APQC’s Process Classification Framework, Version 1.0.0. APQC. Mar. 2011. Web.
CX Network. “The Evolution of Customer Experience in 2015.” Customer Experience Network. 2015. Web.
Genesys. “State of Customer Experience Research”. Genesys. 2018. Web.
Harvard Business Review and SAS. “Lessons From the Leading Edge of Customer Experience Management.” Harvard Business School Publishing. 2014. Web.
Help Scout. “75 Customer Service Facts, Quotes & Statistics.” Help Scout. n.d. Web.
Inmon Consulting Services. “Corporate Information Factory (CIF) Overview.” Corporate Information Factory. n.d. Web
Jurevicius, Ovidijus. “VRIO Framework.” Strategic Management Insight. 21 Oct. 2013. Web.
Keenan, Jim, and Barbara Giamanco. “Social Media and Sales Quota.” A Sales Guy Consulting and Social Centered Selling. n.d. Web.
Malik, Om. “Internet of Things Will Have 24 Billion Devices by 2020.” Gigaom. 13 Oct. 2011. Web.
McGovern, Michele. “Customers Want More: 5 New Expectations You Must Meet Now.” Customer Experience Insight. 30 July 2015. Web.
McGinnis, Devon. “40 Customer Service Statistics to Move Your Business Forward.” Salesforce Blog. 1 May 2019. Web.
Bibliography
Reichheld, Fred. “Prescription for Cutting Costs”. Bain & Company. n.d. Web.
Retail Congress Asia Pacific. “SAP – Burberry Makes Shopping Personal.” Retail Congress Asia Pacific. 2017. Web.
Rouse, Margaret. “Omnichannel Definition.” TechTarget. Feb. 2014. Web.
Salesforce Research. “Customer Expectations Hit All-Time High.” Salesforce Research. 2018. Web.
Satell, Greg. “A Look Back at Why Blockbuster Really Failed and Why It Didn’t Have To.” Forbes. 5 Sept. 2014. Web.
Social Centered Learning. “Social Media and Sales Quota: The Impact of Social Media on Sales Quota and Corporate Review.” Social Centered Learning. n.d. Web.
Varner, Scott. “Economic Impact of Experience Management”. Qualtrics/Forrester. 16 Aug. 2017. Web.
Wesson, Matt. “How to Use Your Customer Data Like Amazon.” Salesforce Pardot Blog. 27 Aug. 2012. Web.
Winterberry Group. “Taking Cues From the Customer: ‘Omnichannel’ and the Drive For Audience Engagement.” Winterberry Group LLC. June 2013. Web.
Wollan, Robert, and Saideep Raj. “How CIOs Can Support a More Agile Sales Organization.” The Wall Street Journal: The CIO Report. 25 July 2013. Web.
Zendesk. “The Impact of Customer Service on Customer Lifetime Value 2013.” Z Library. n.d. Web.


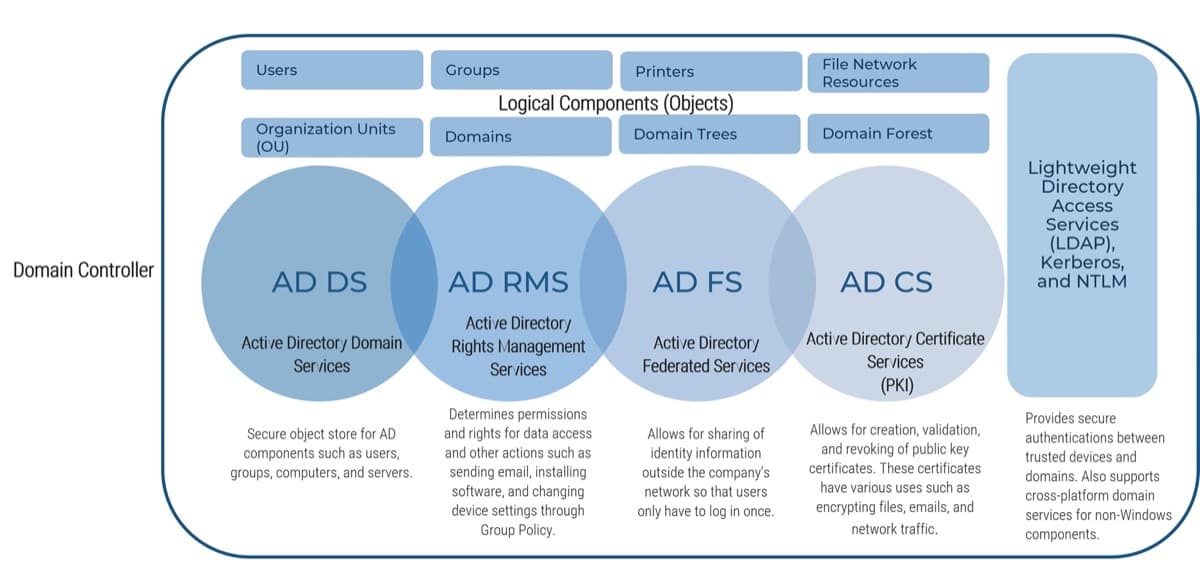
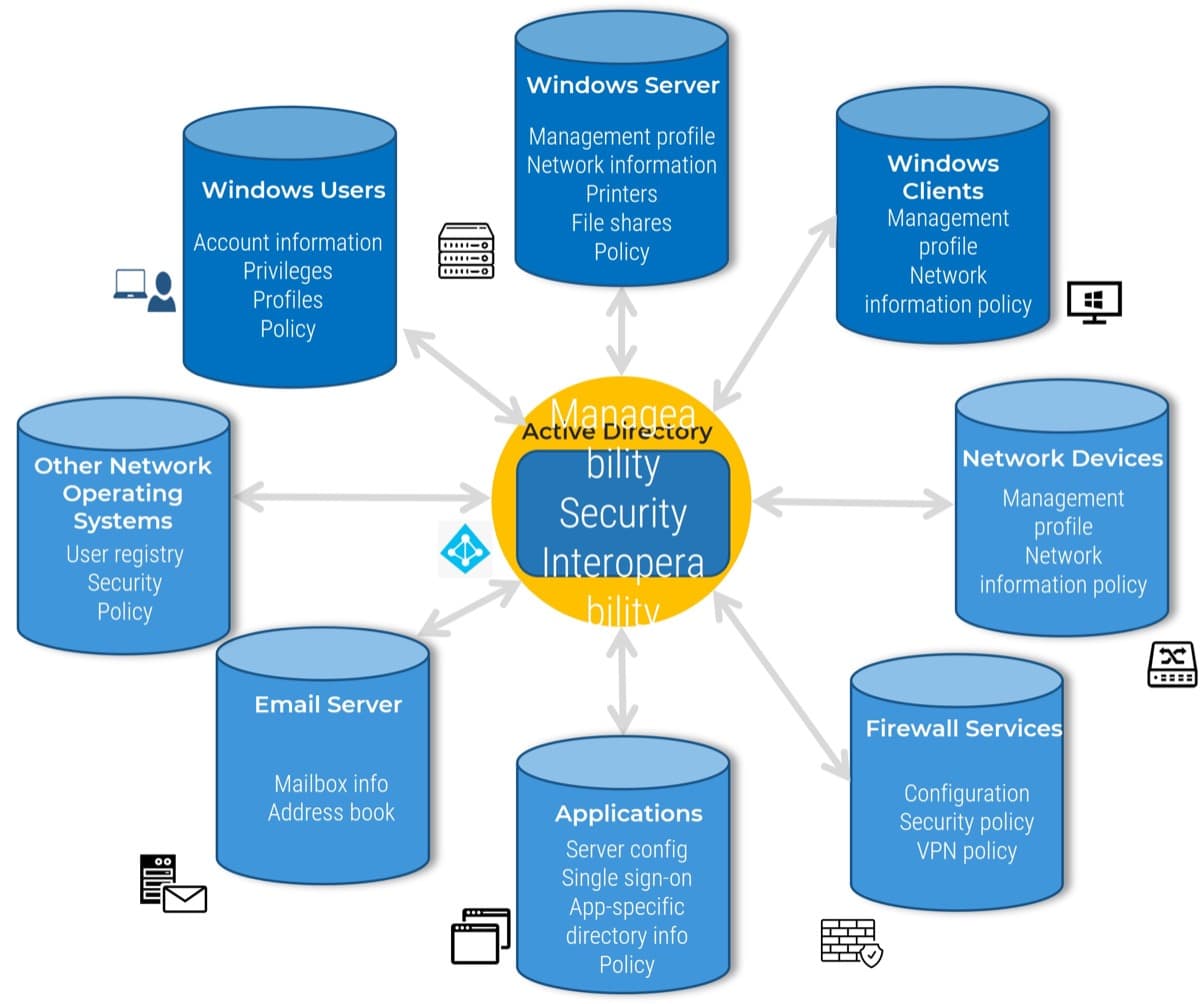
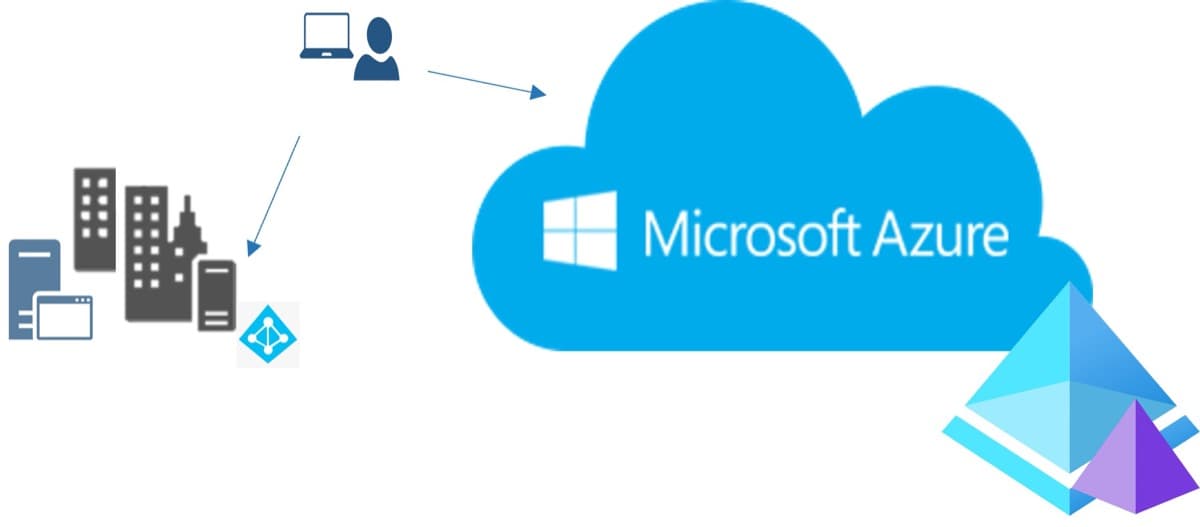
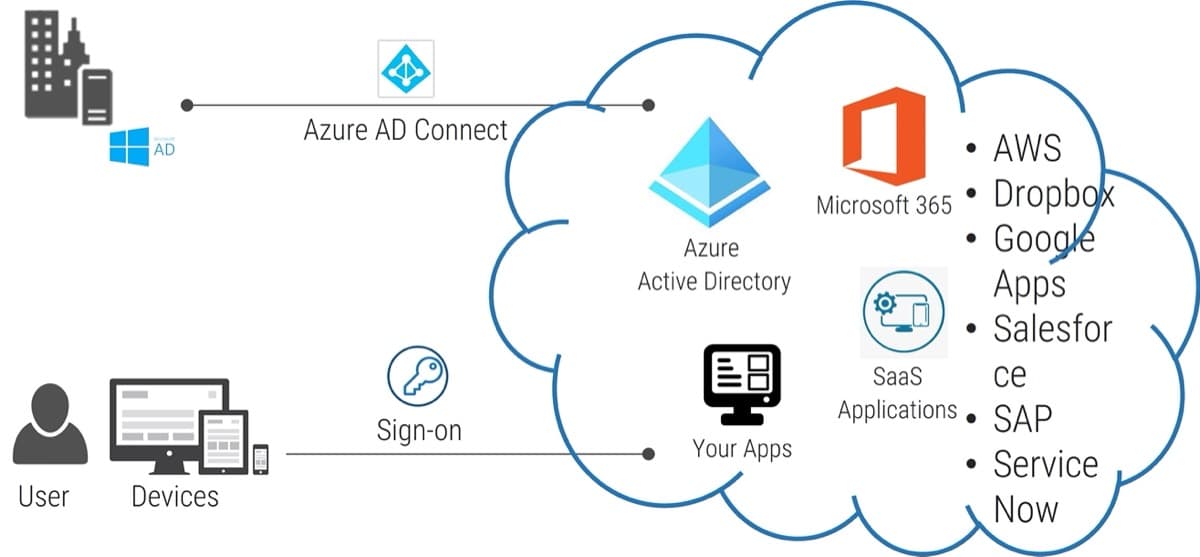

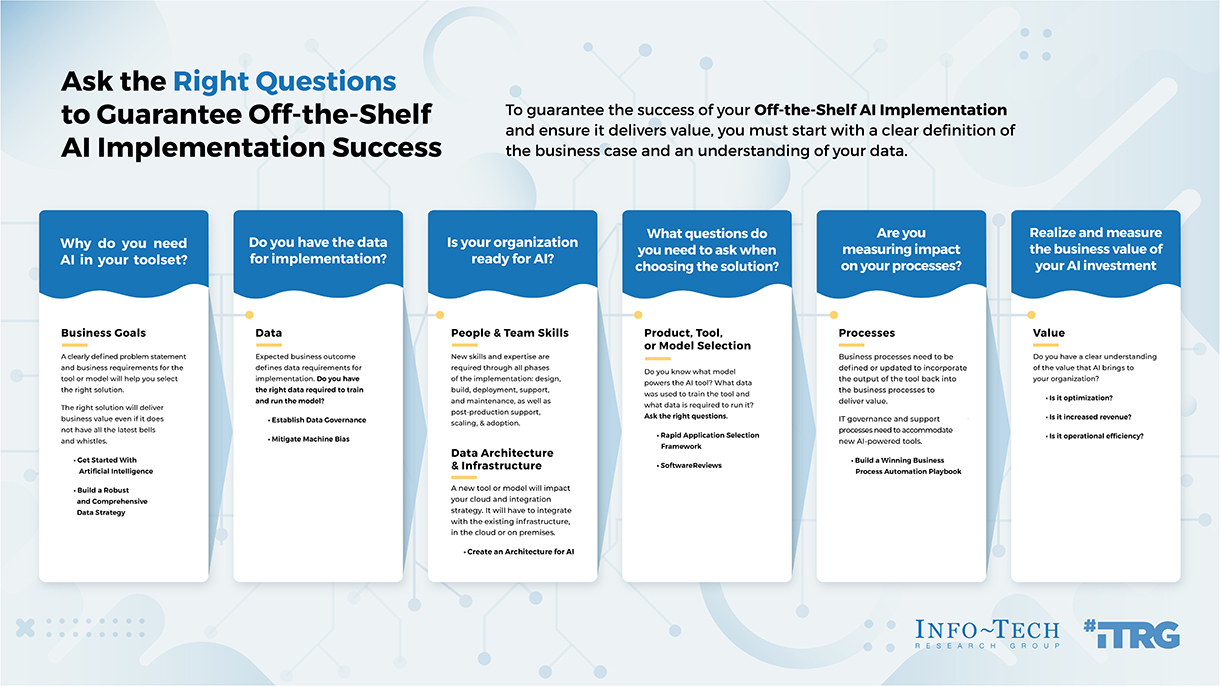

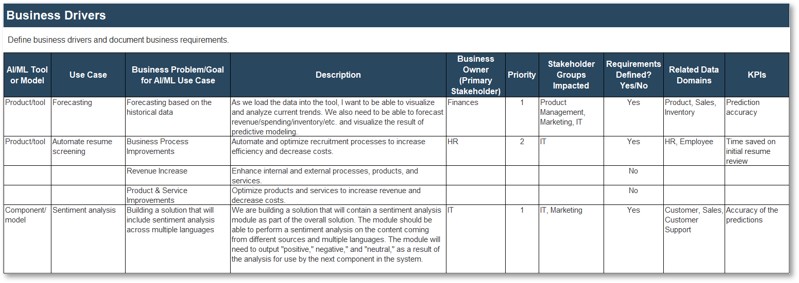
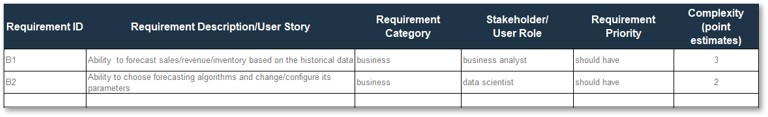
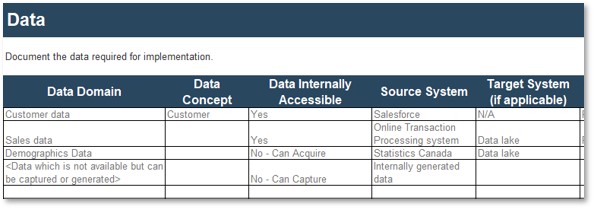
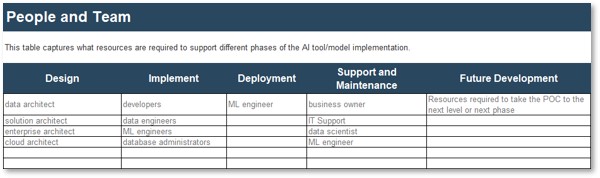
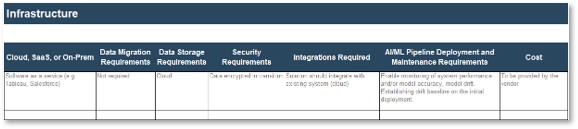
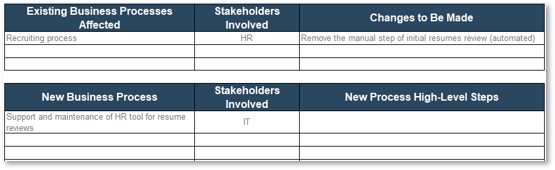


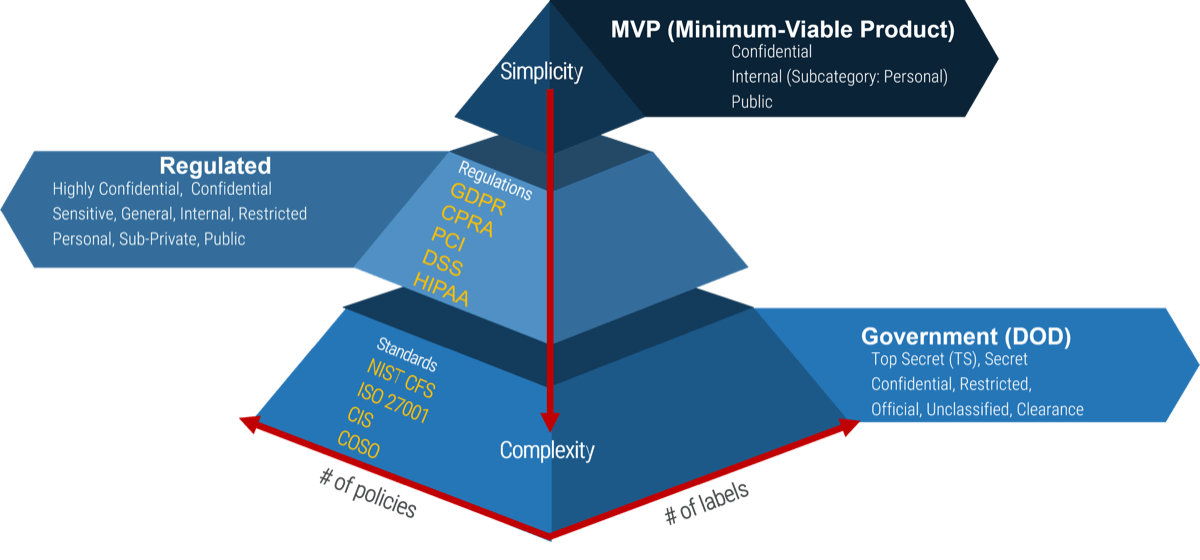
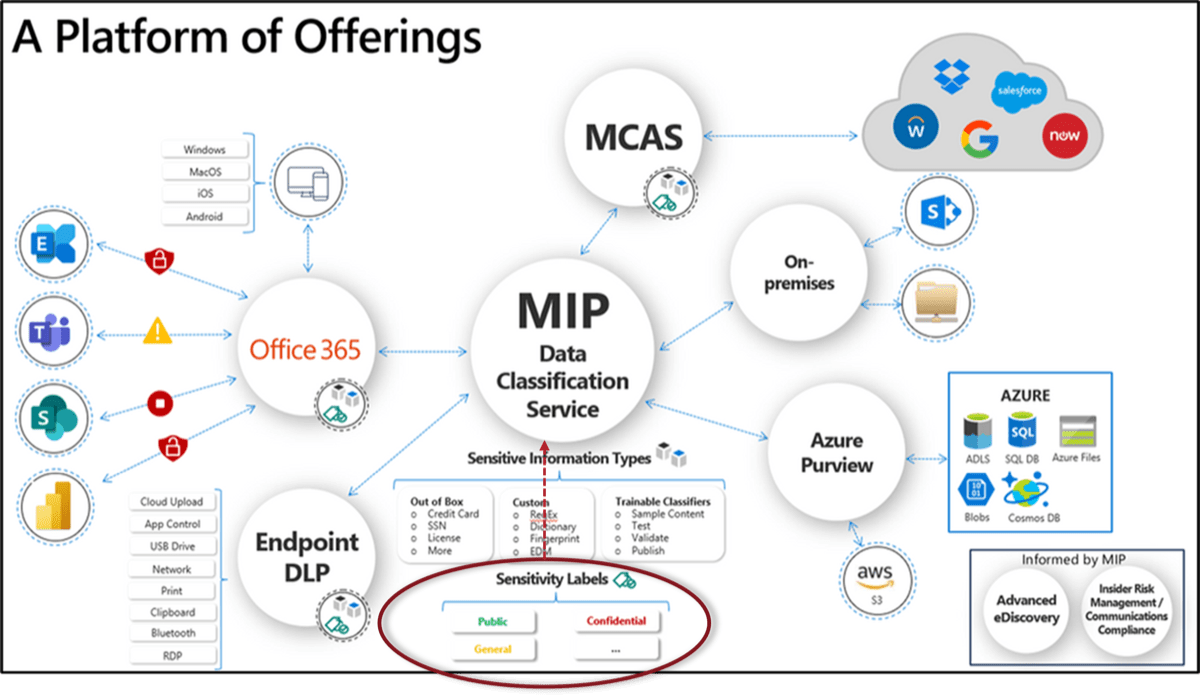

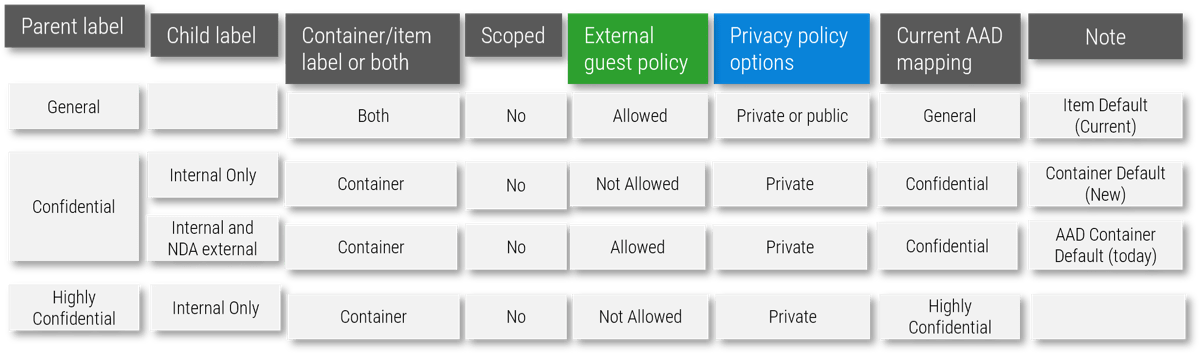


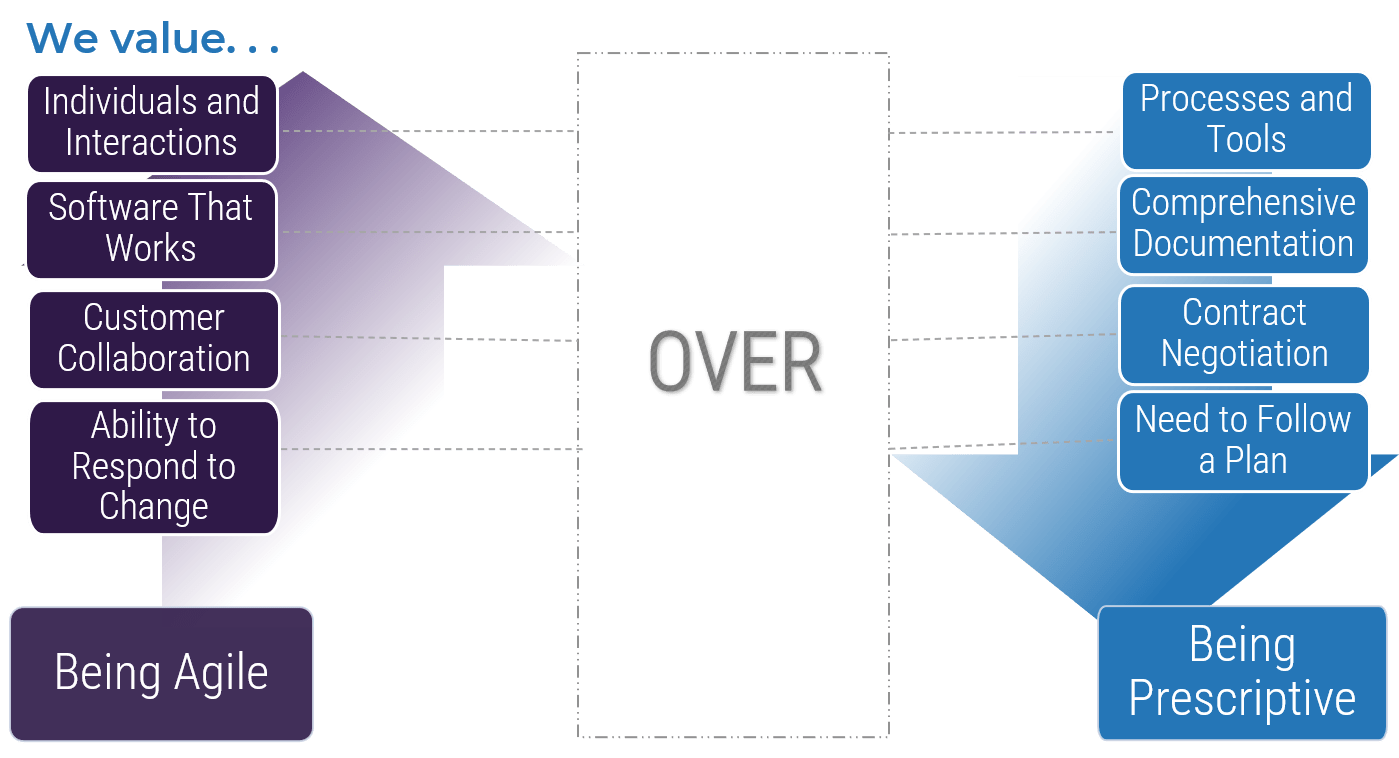
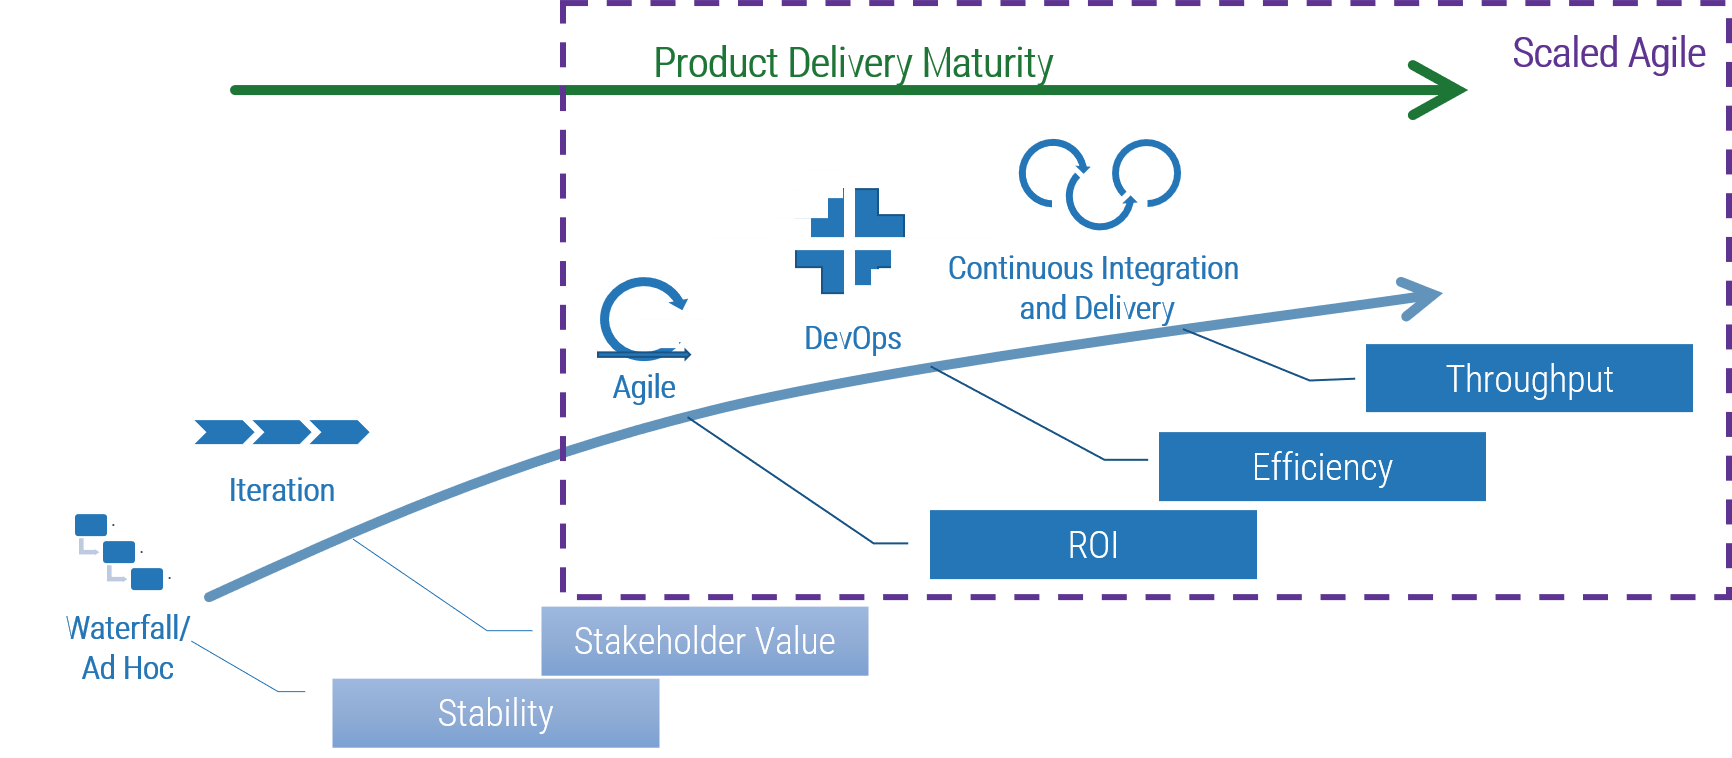


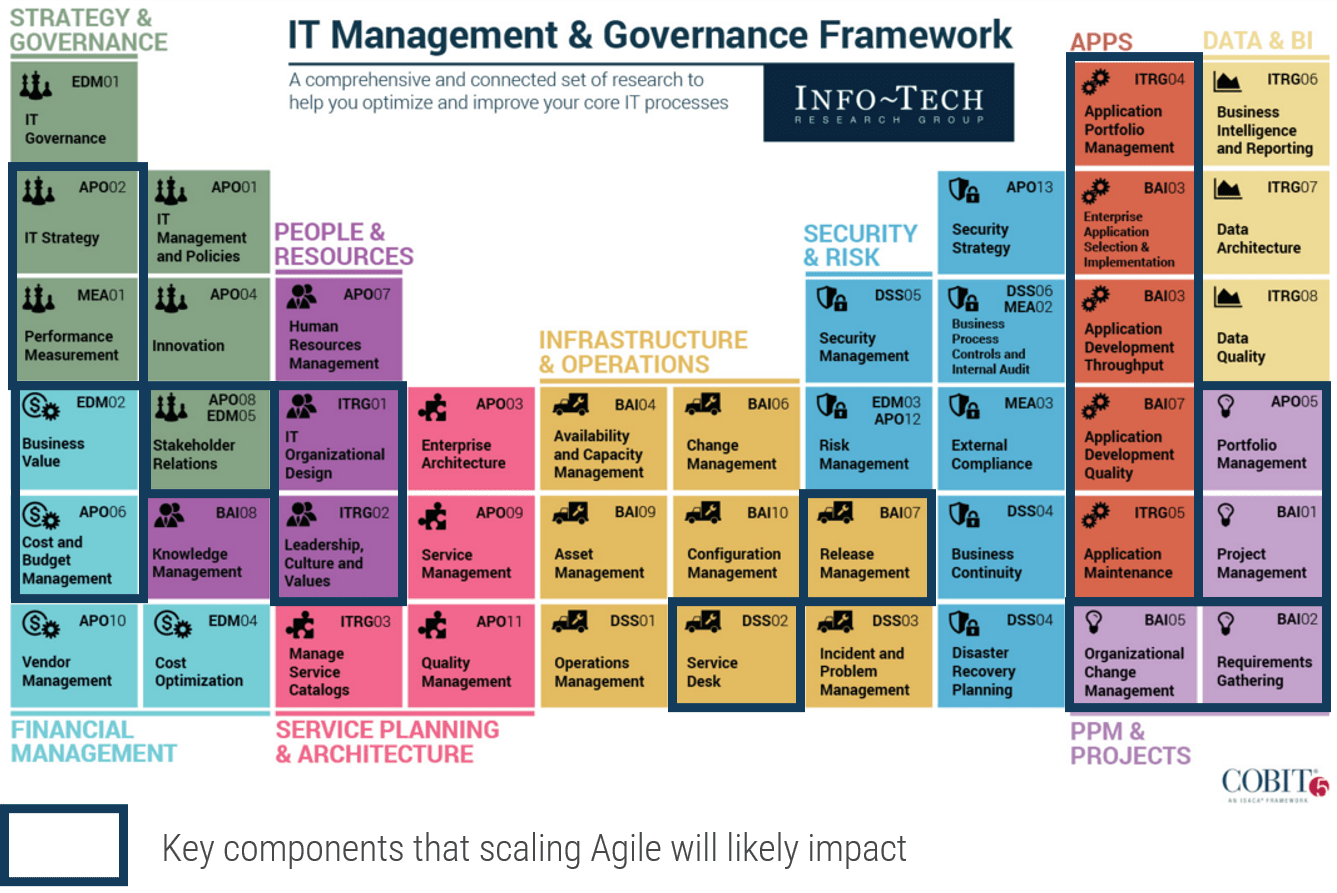
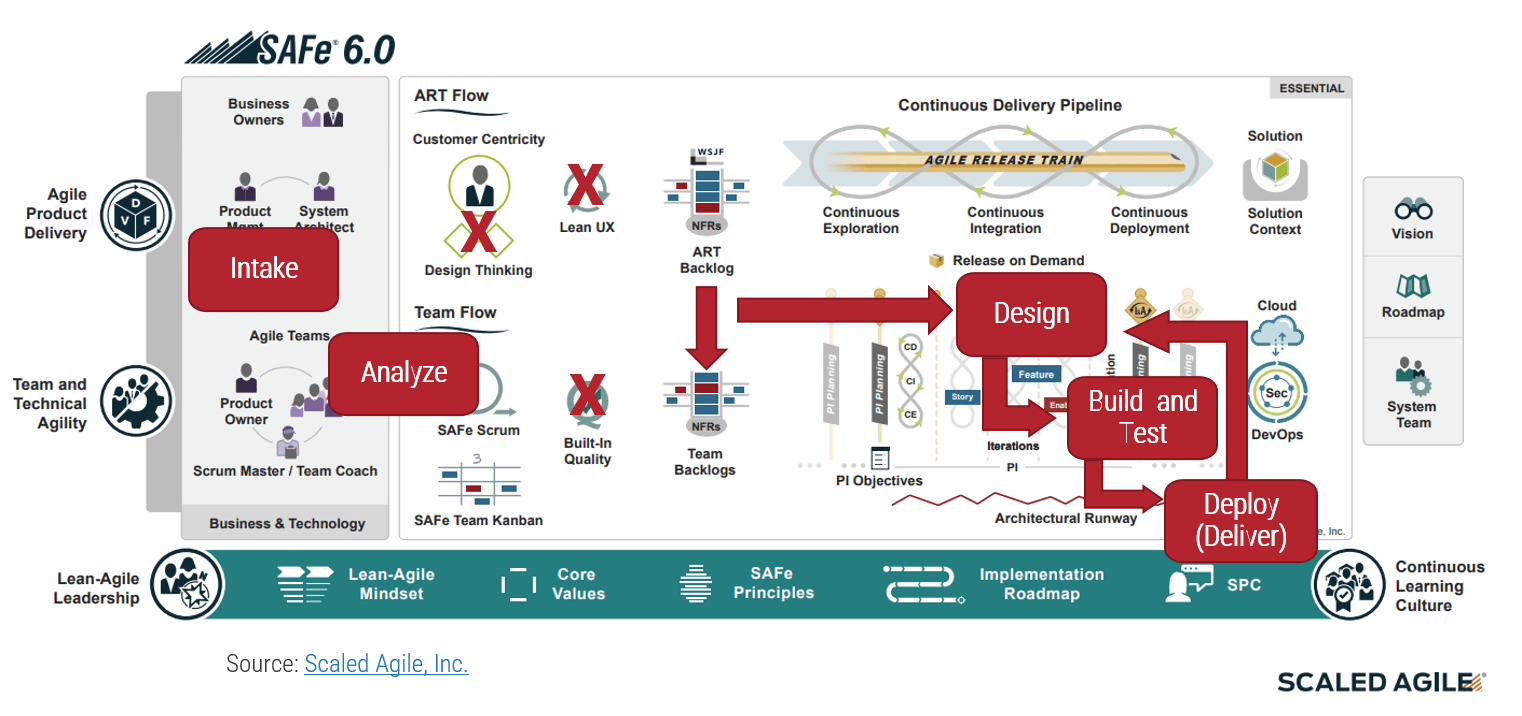


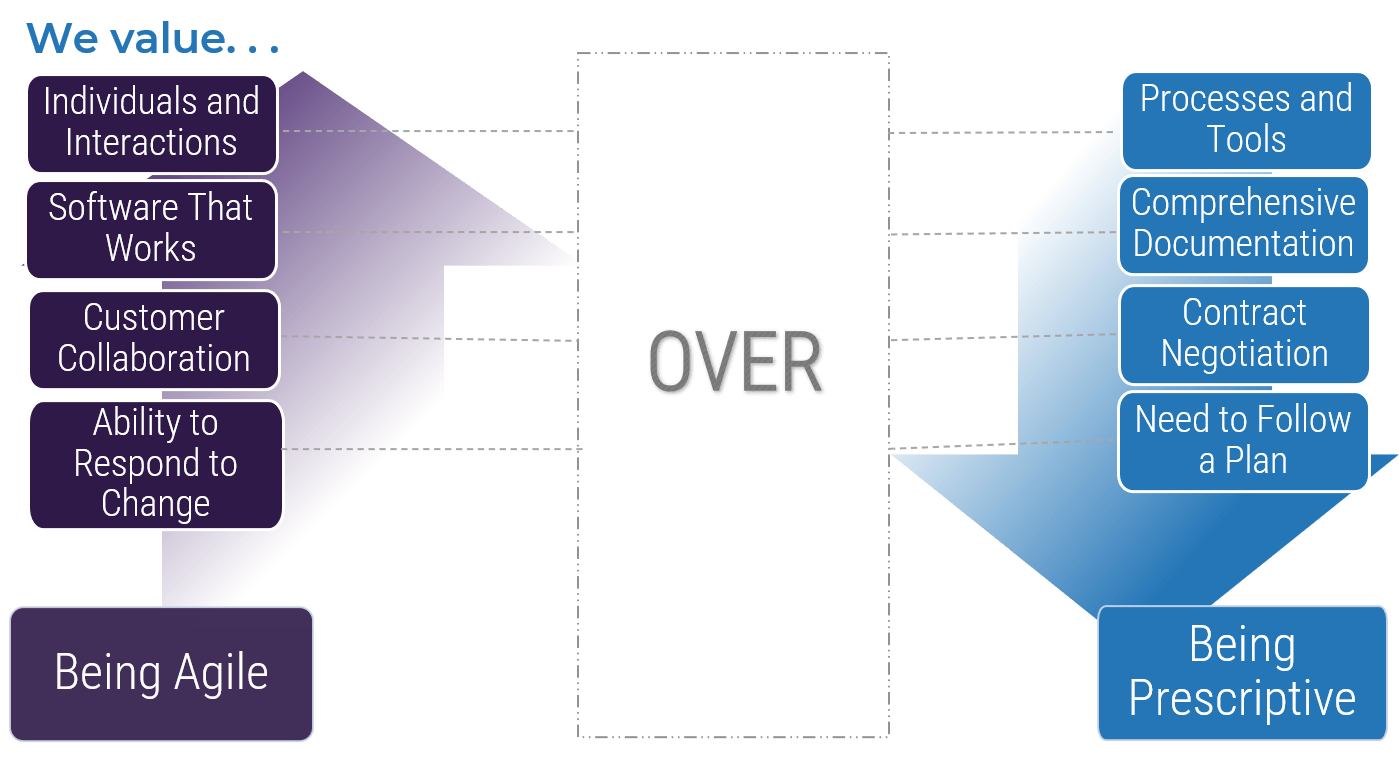
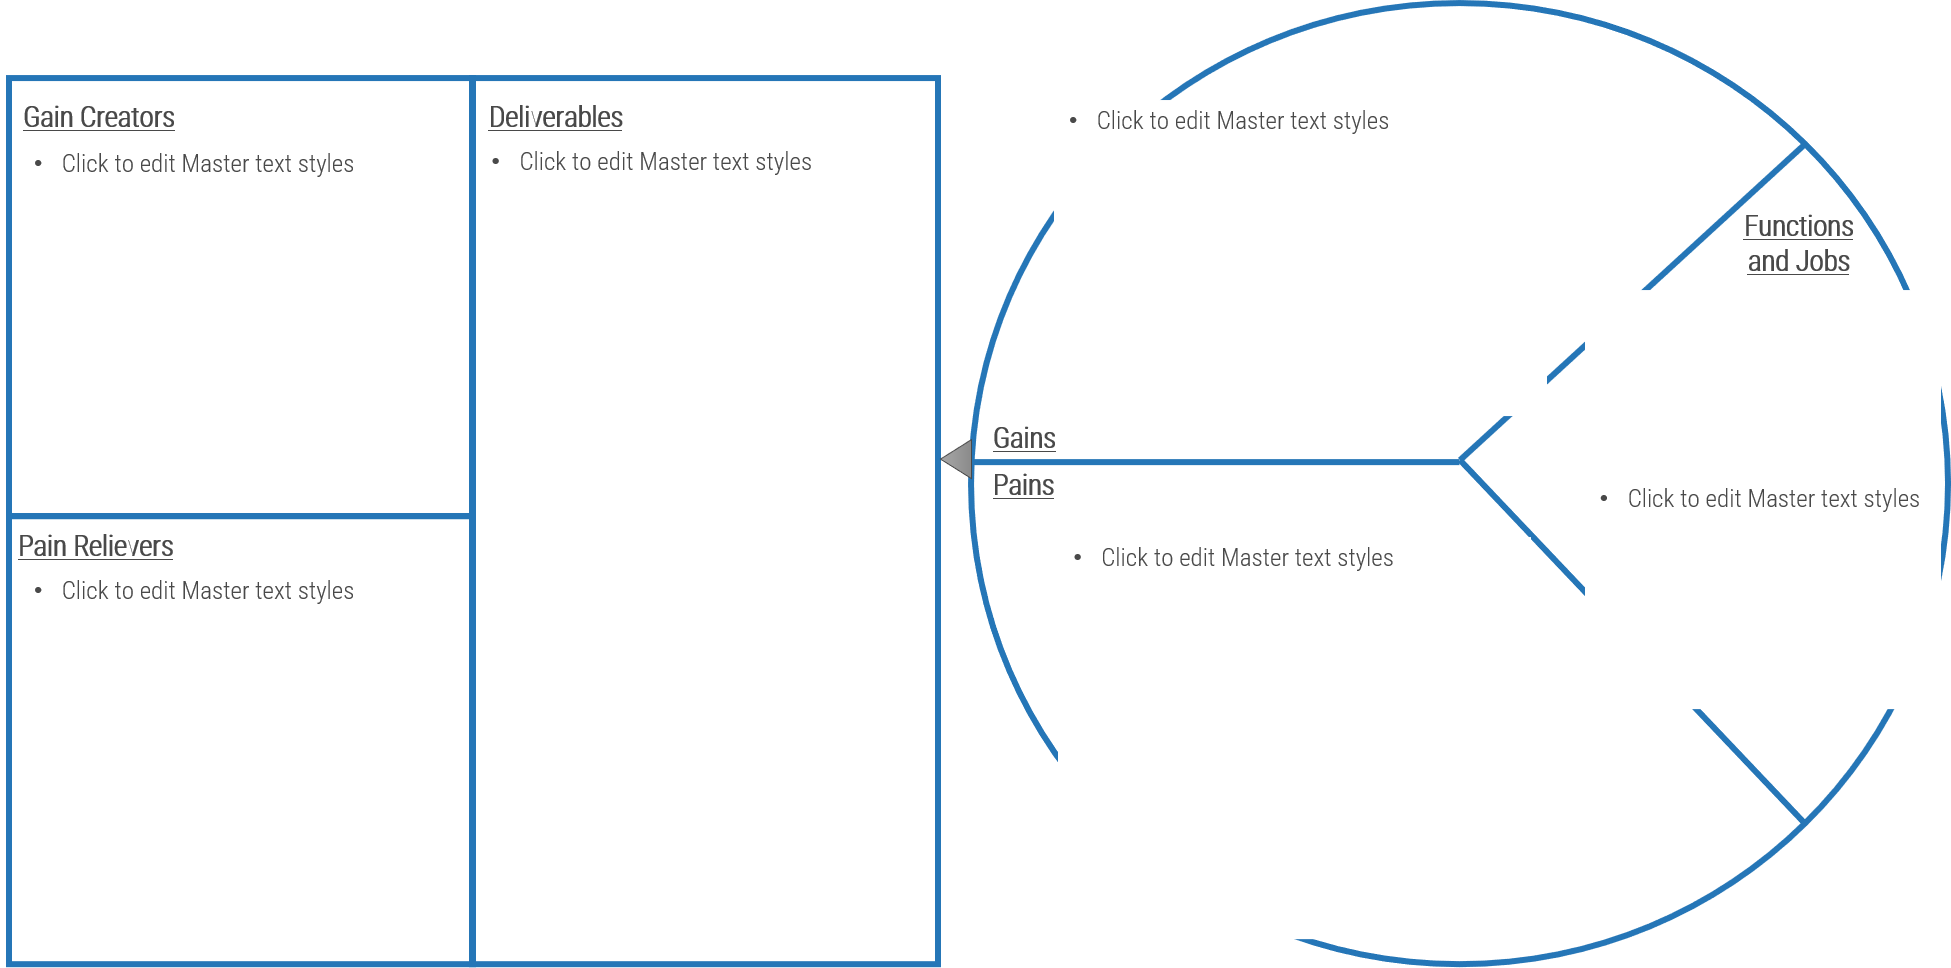
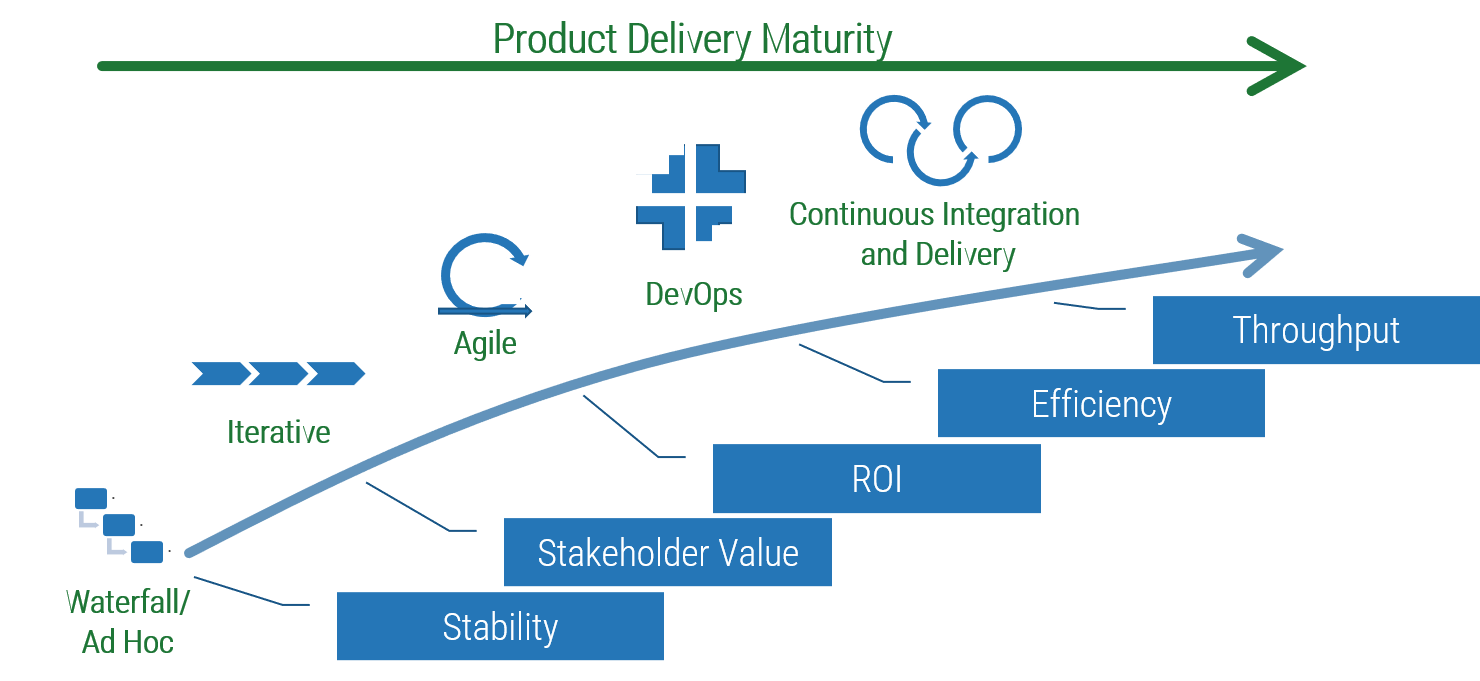
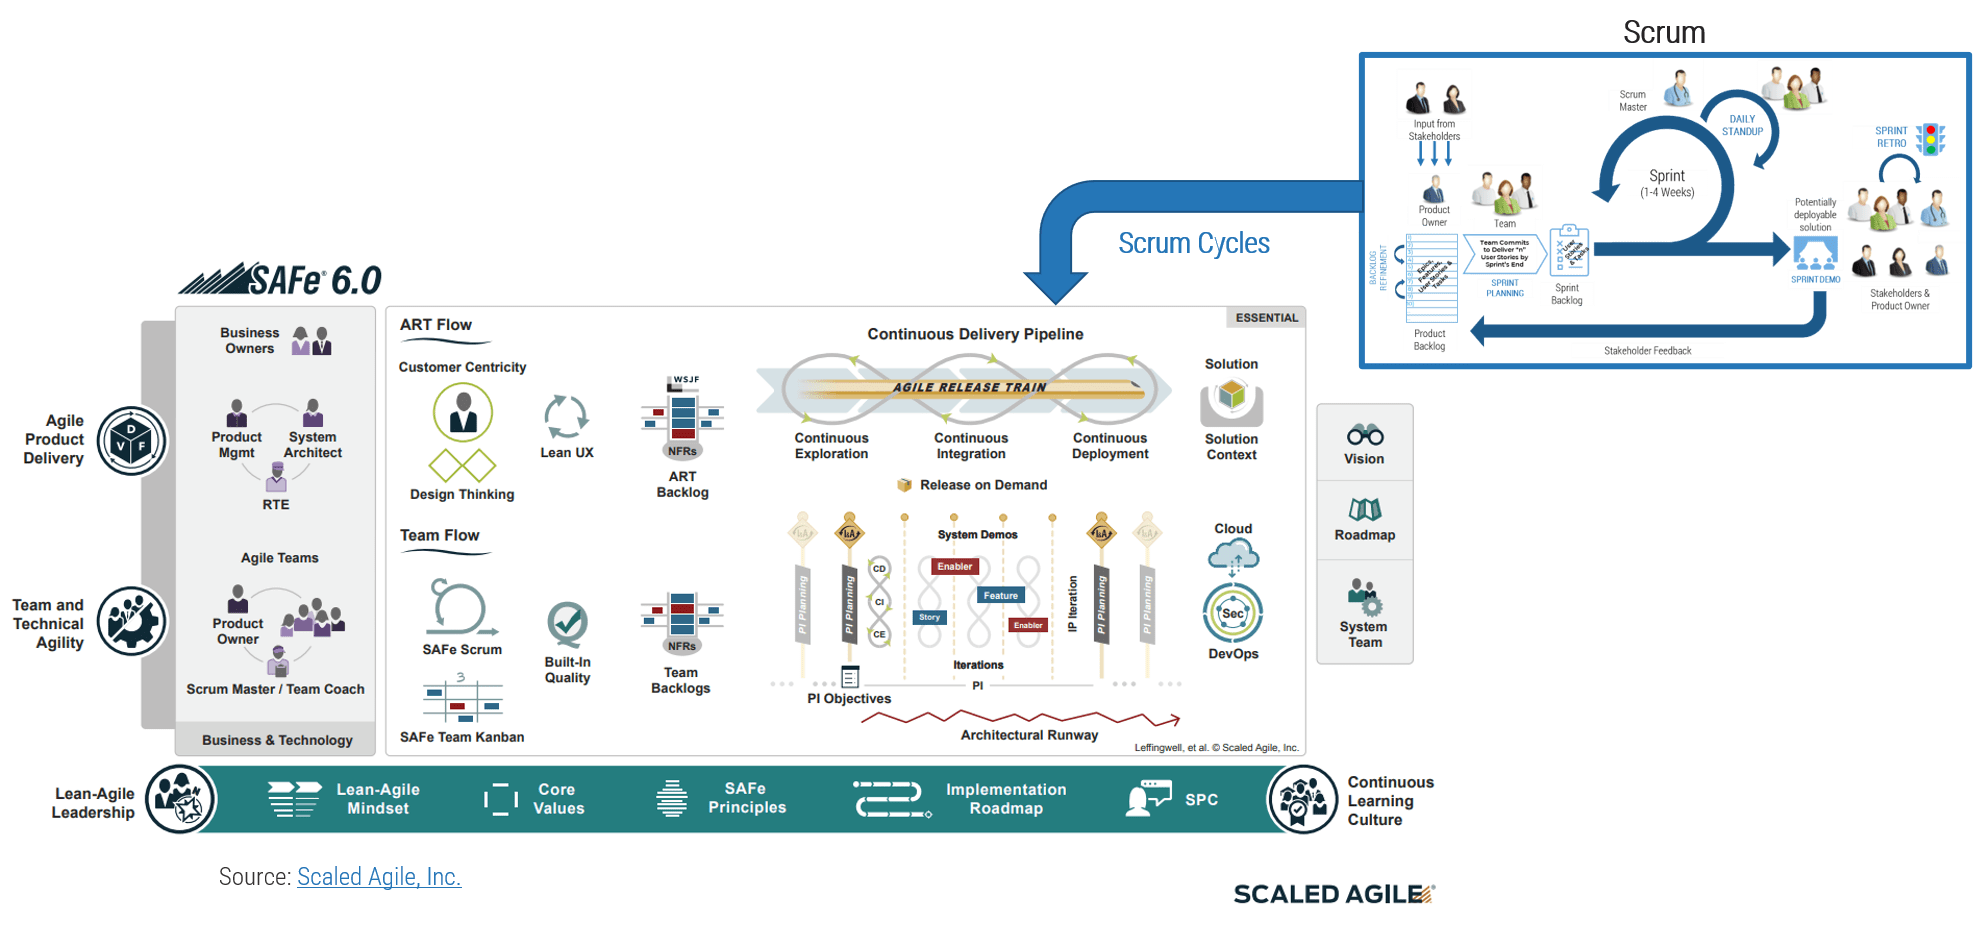
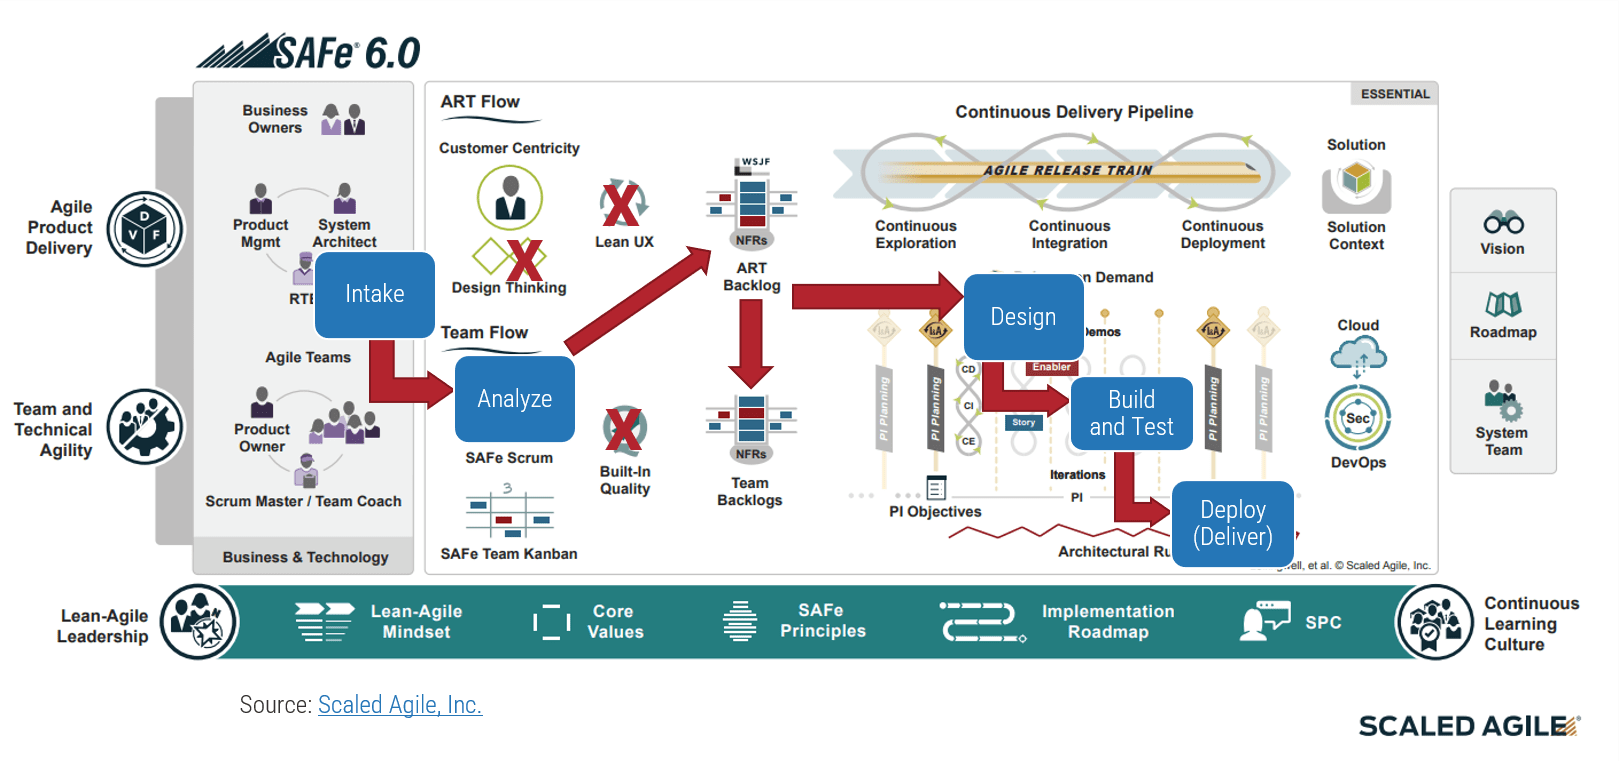
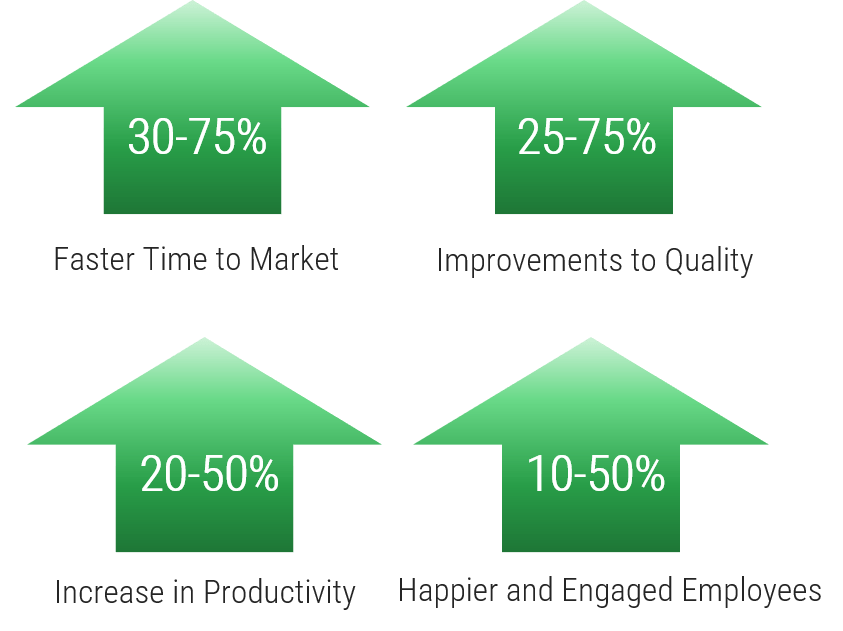
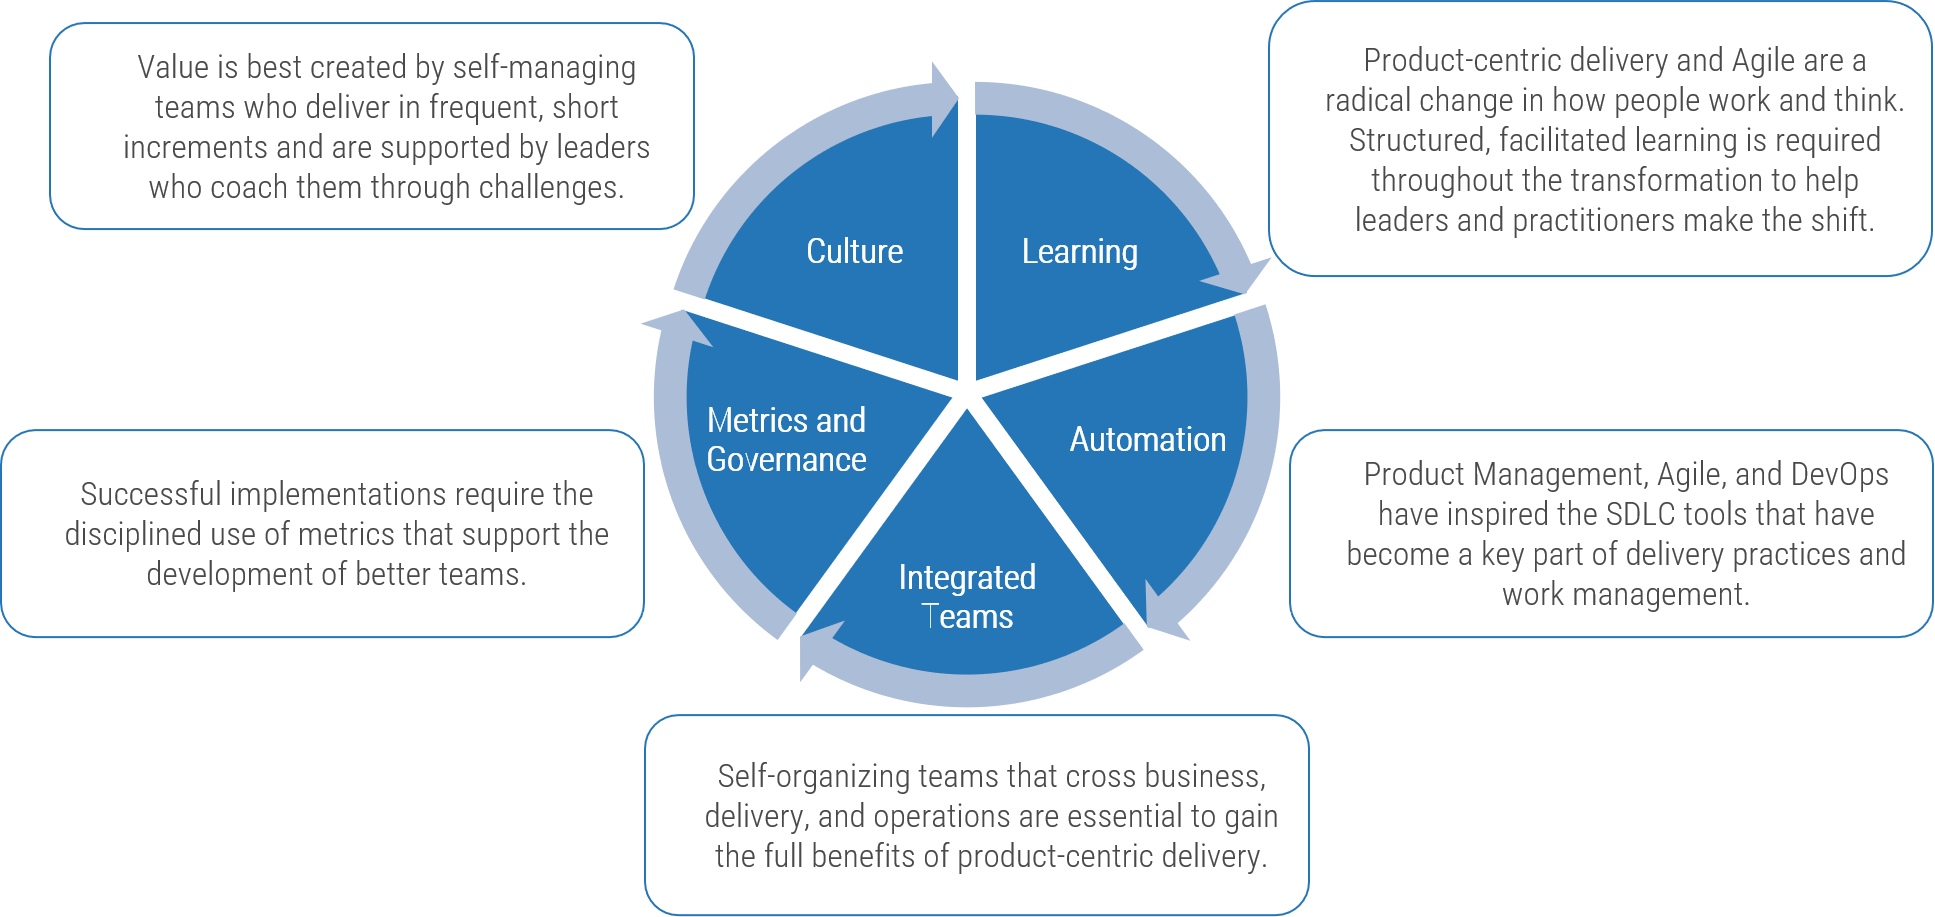
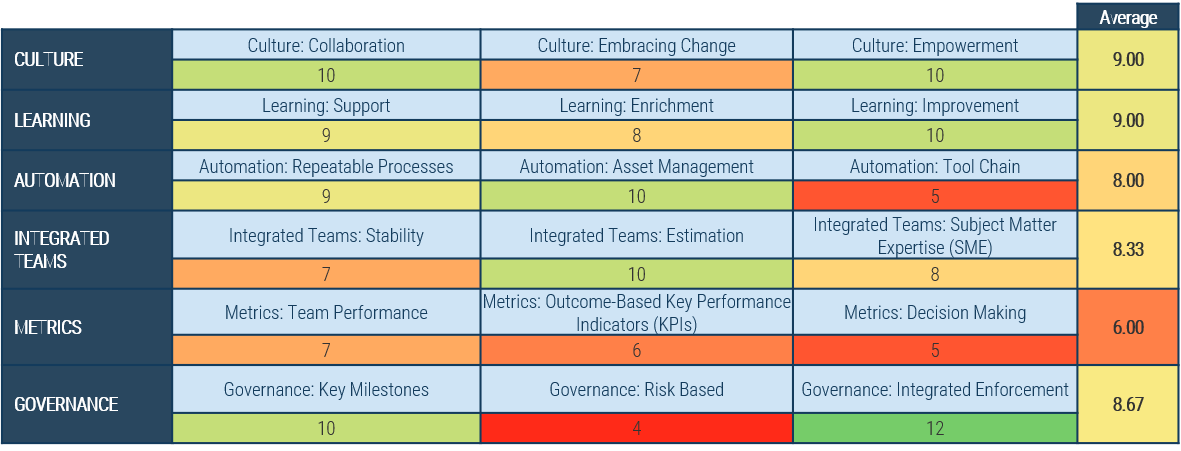
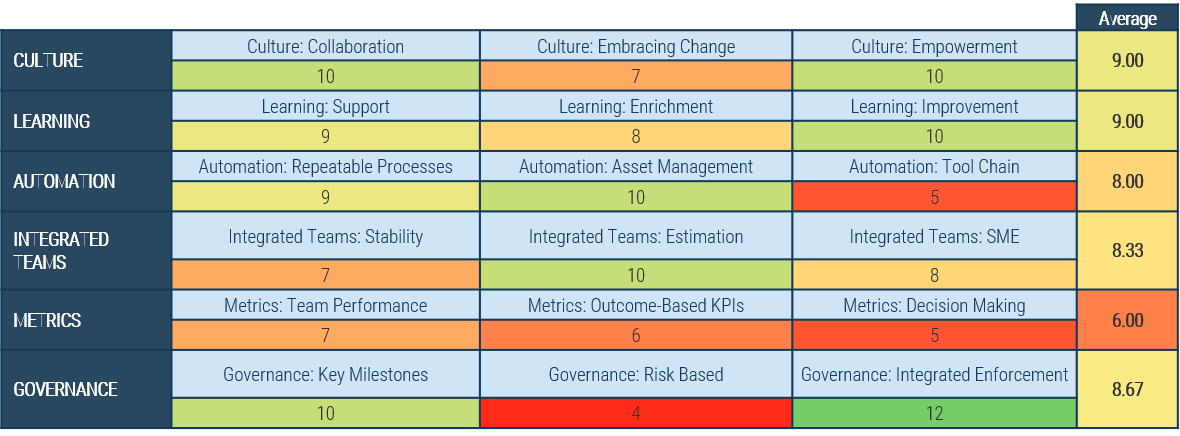
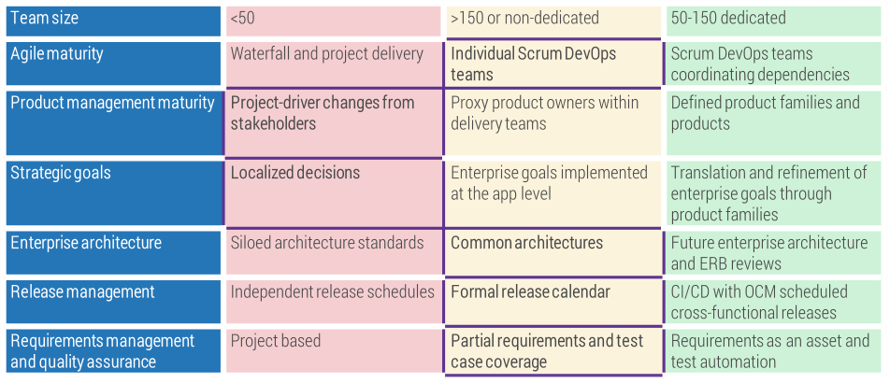
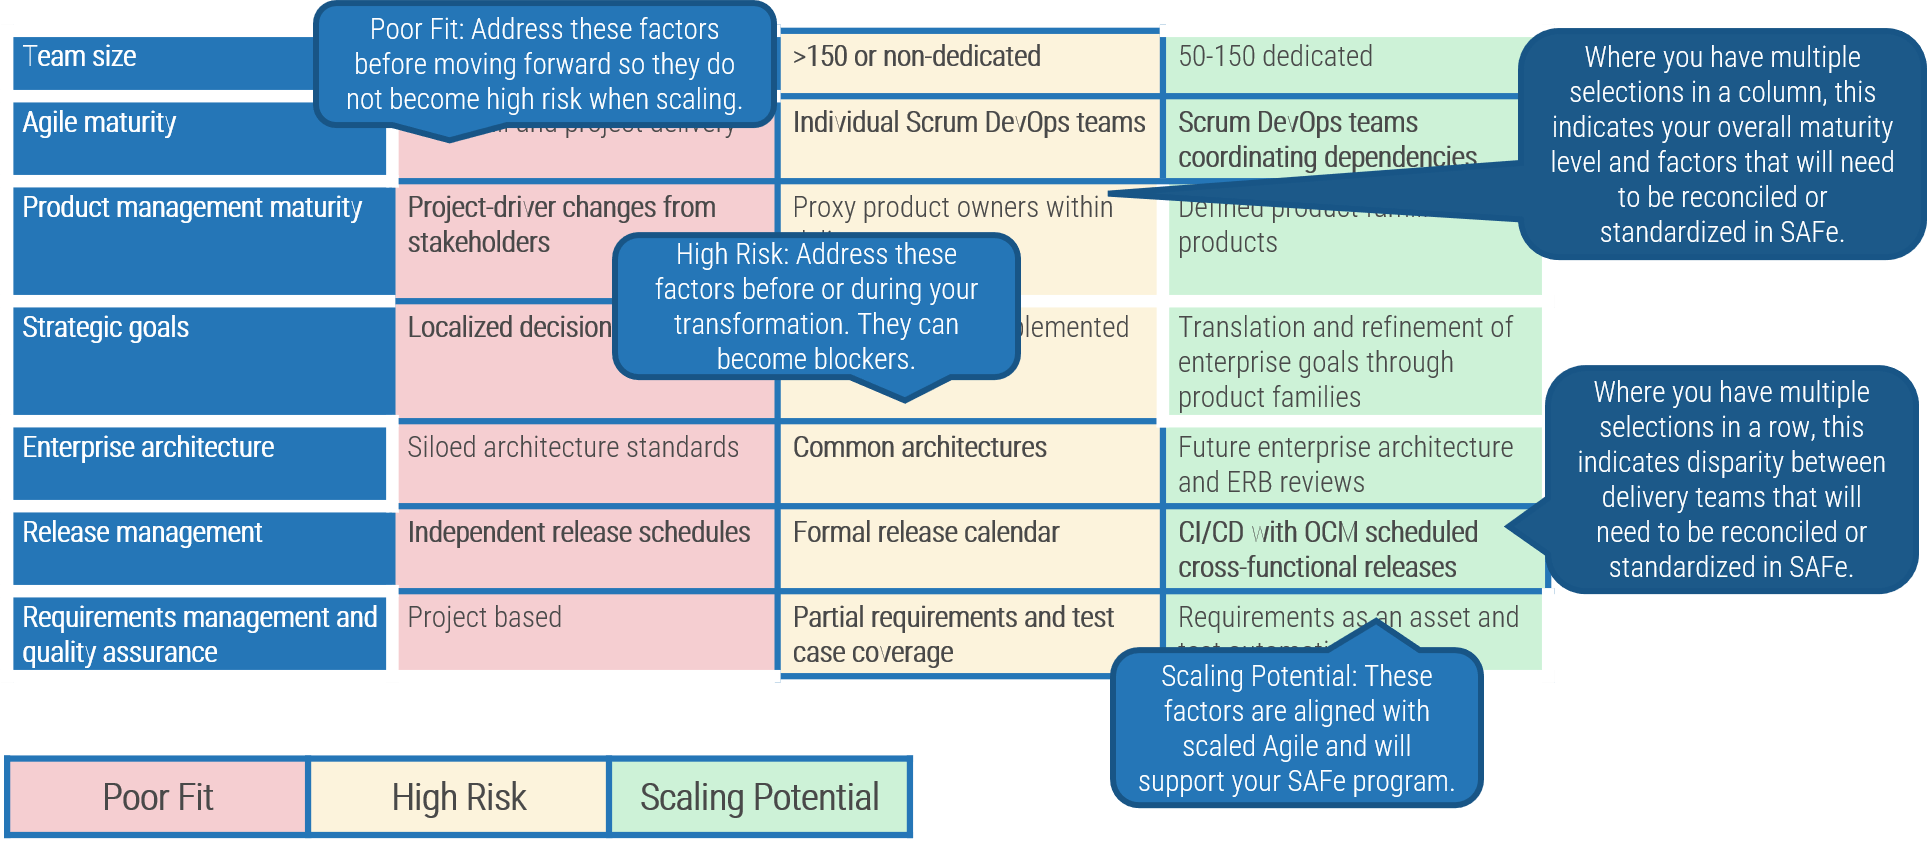
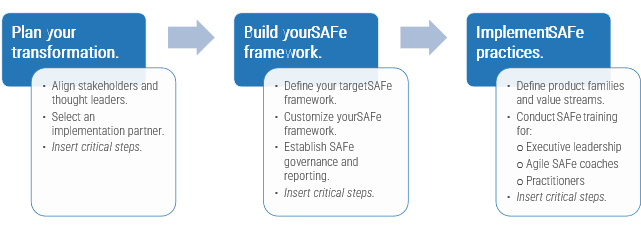
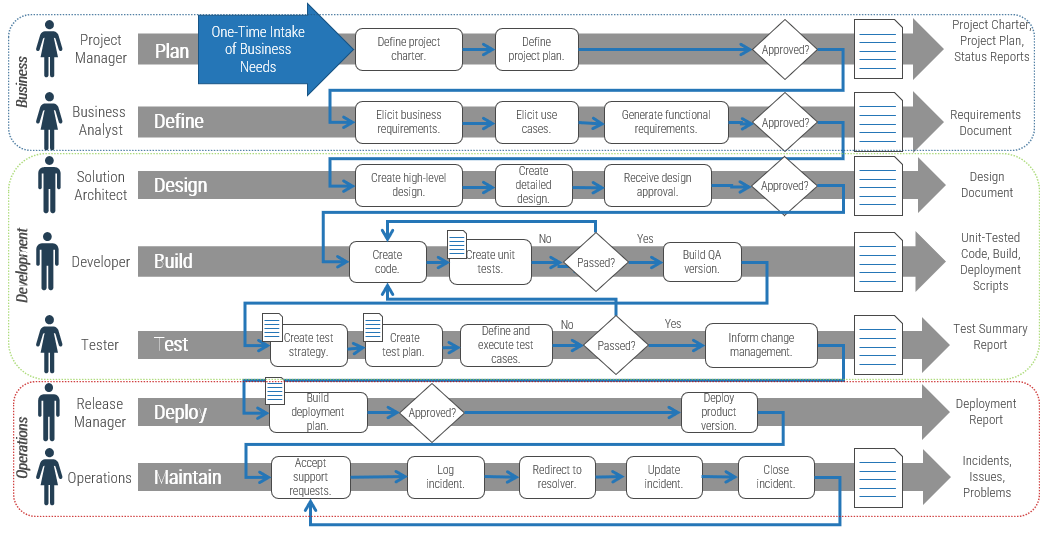
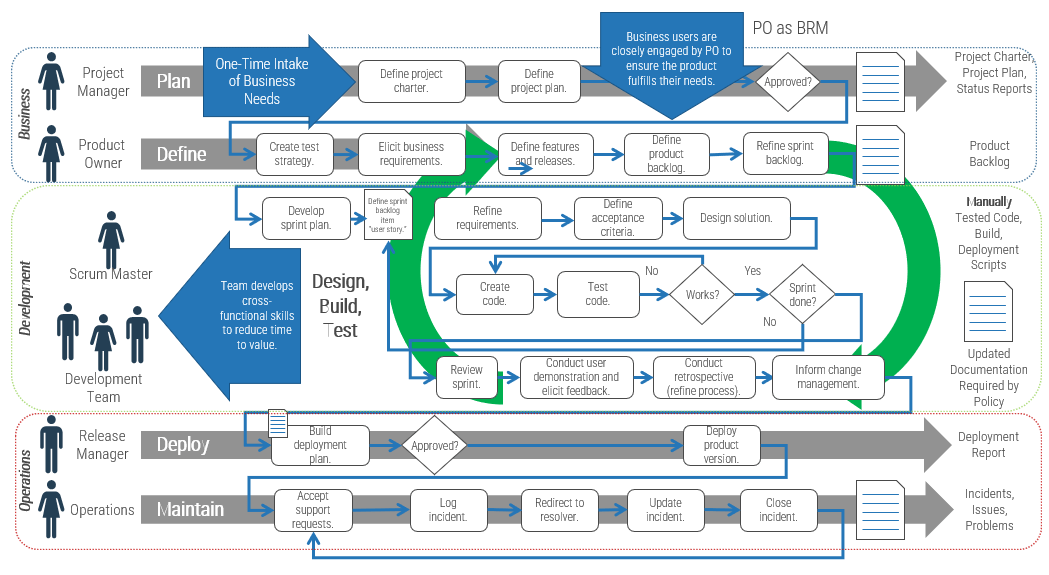
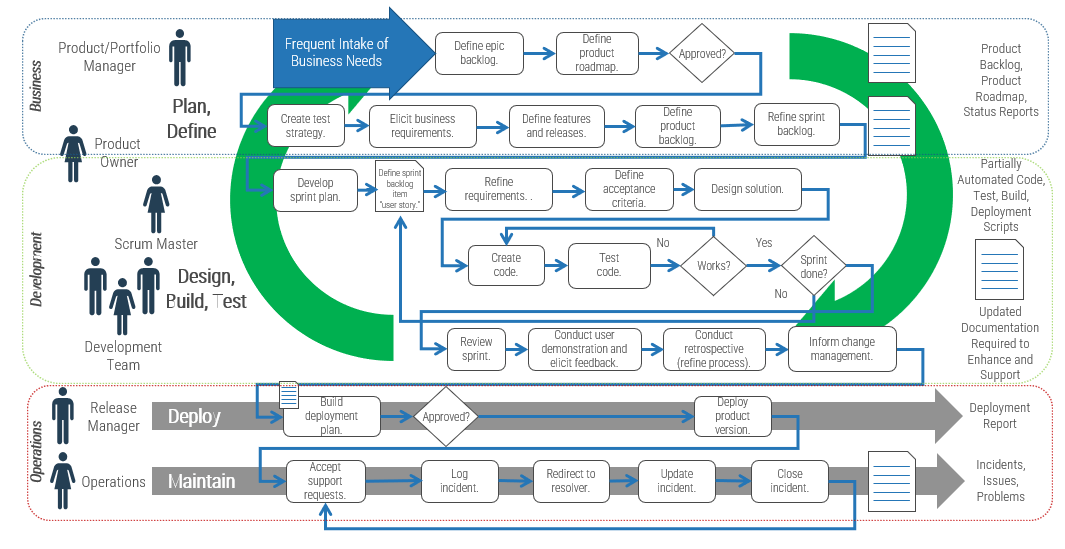
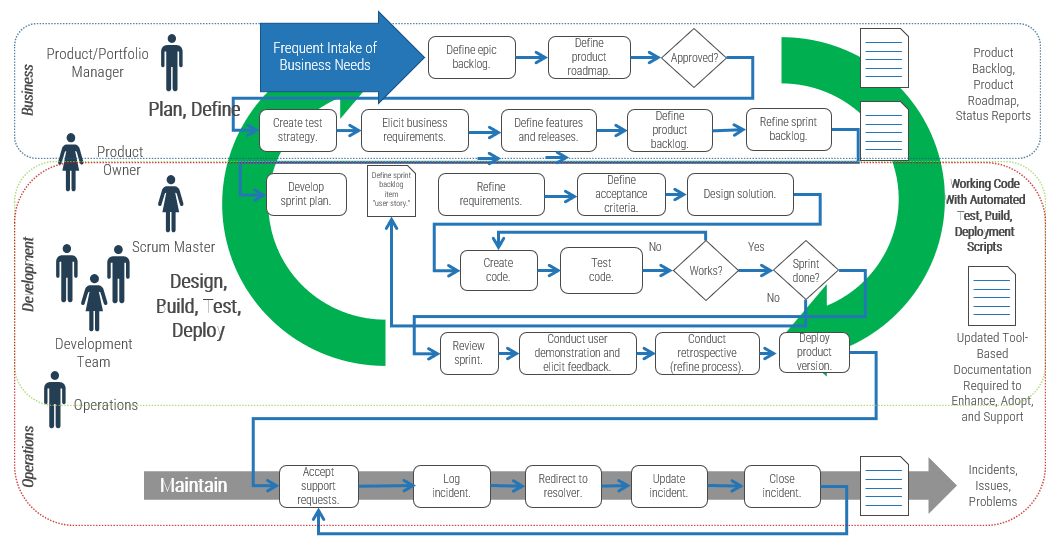
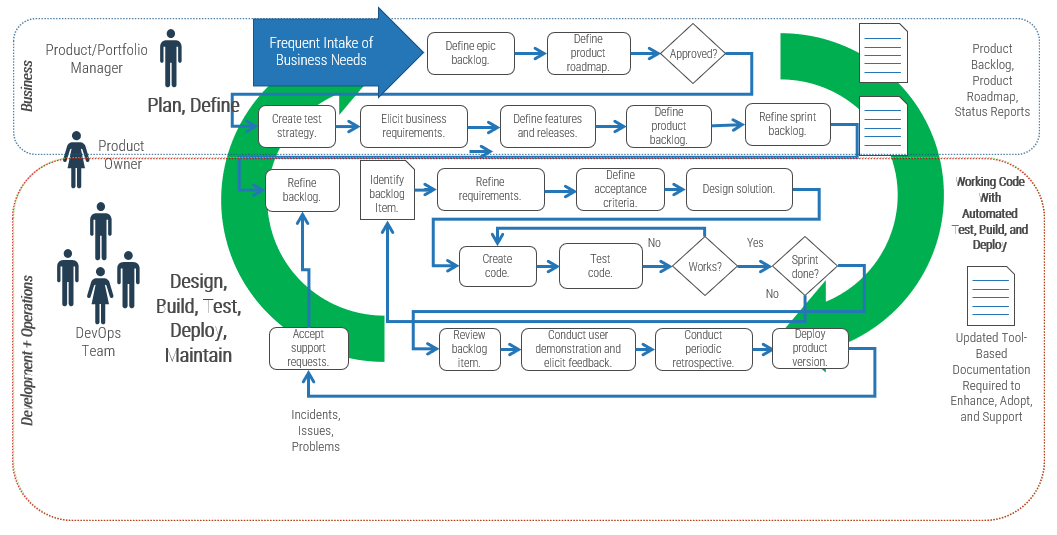
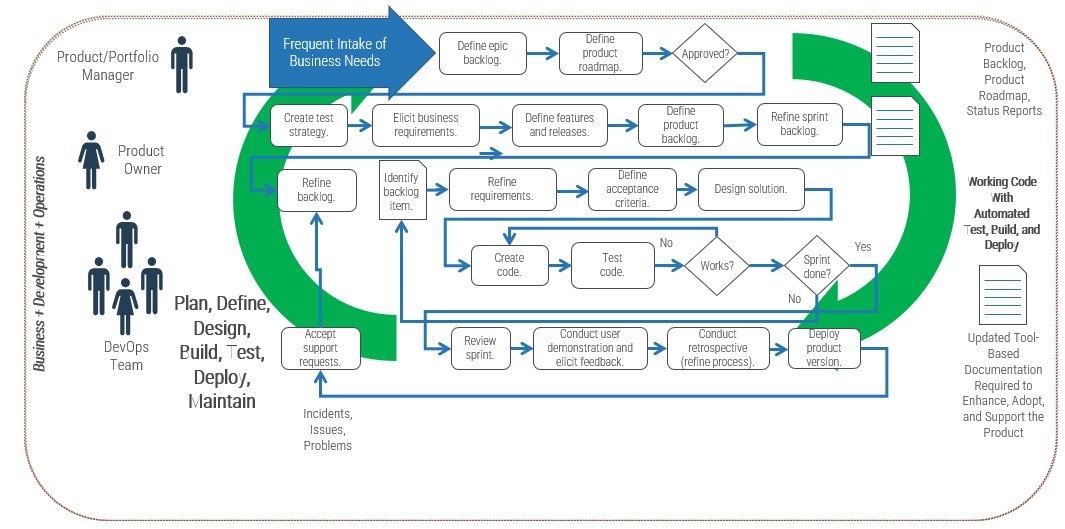
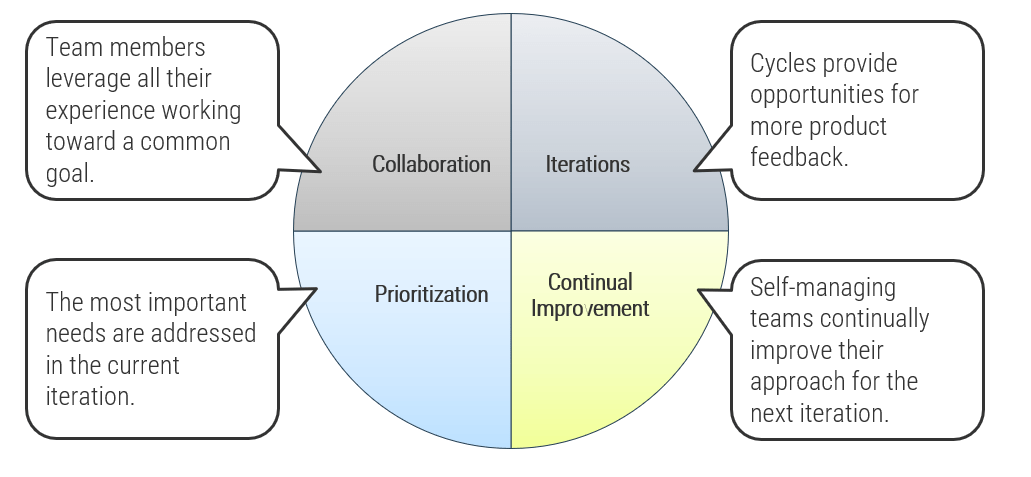
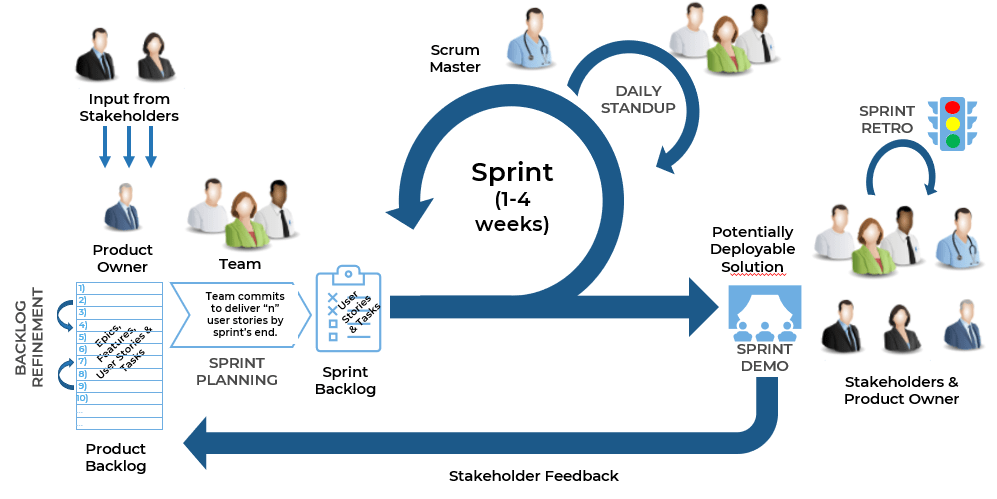
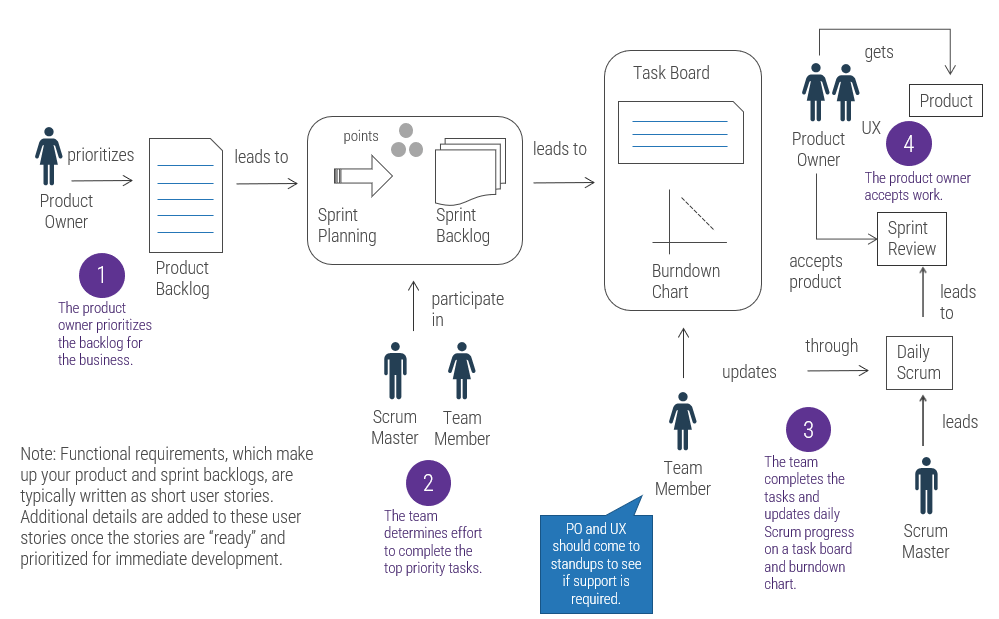
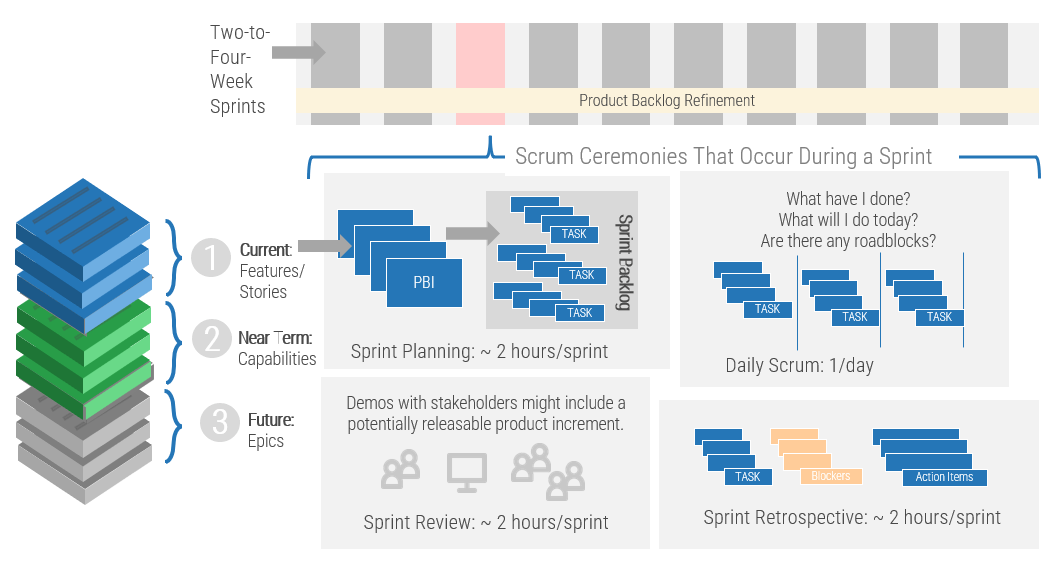
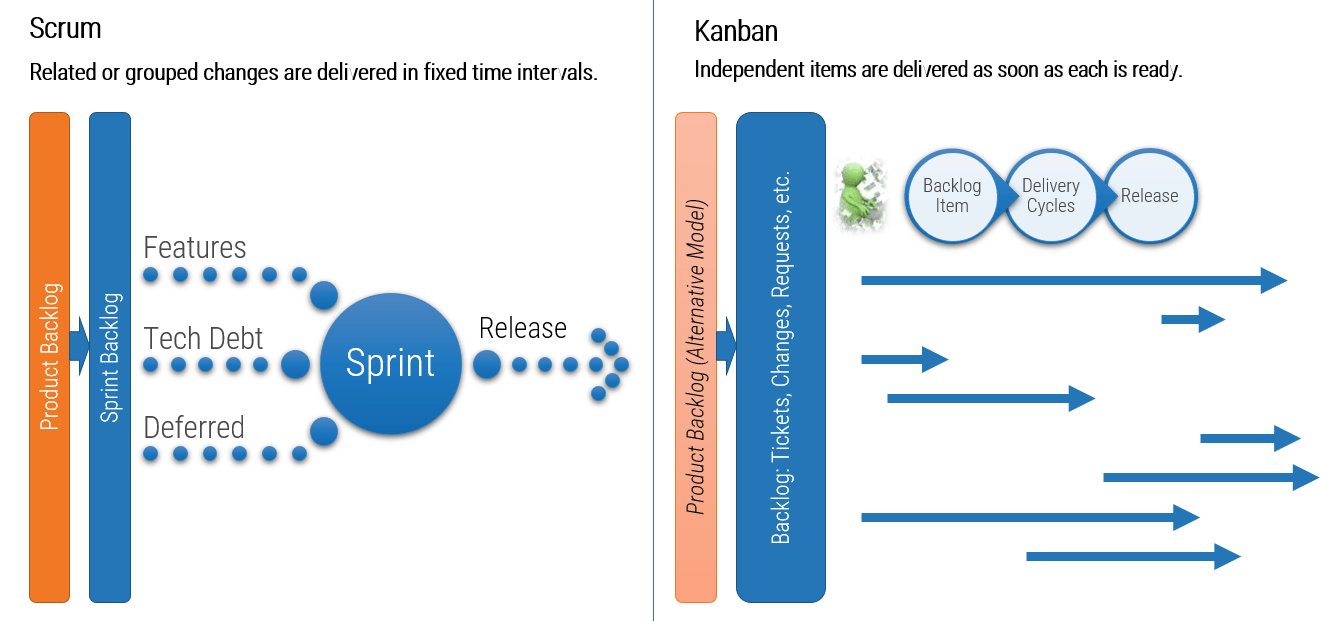
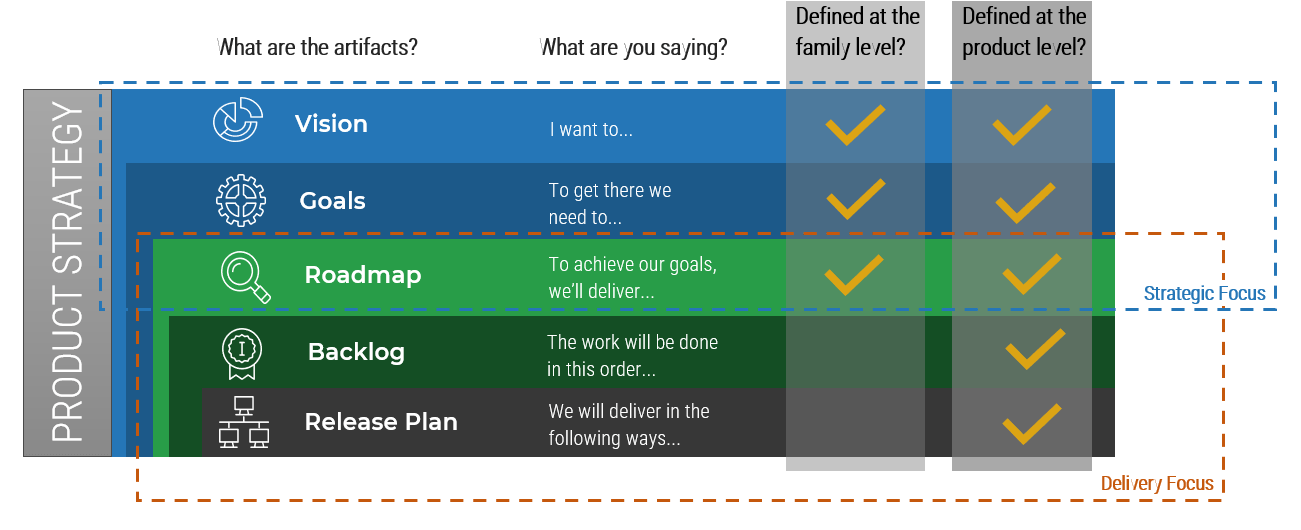
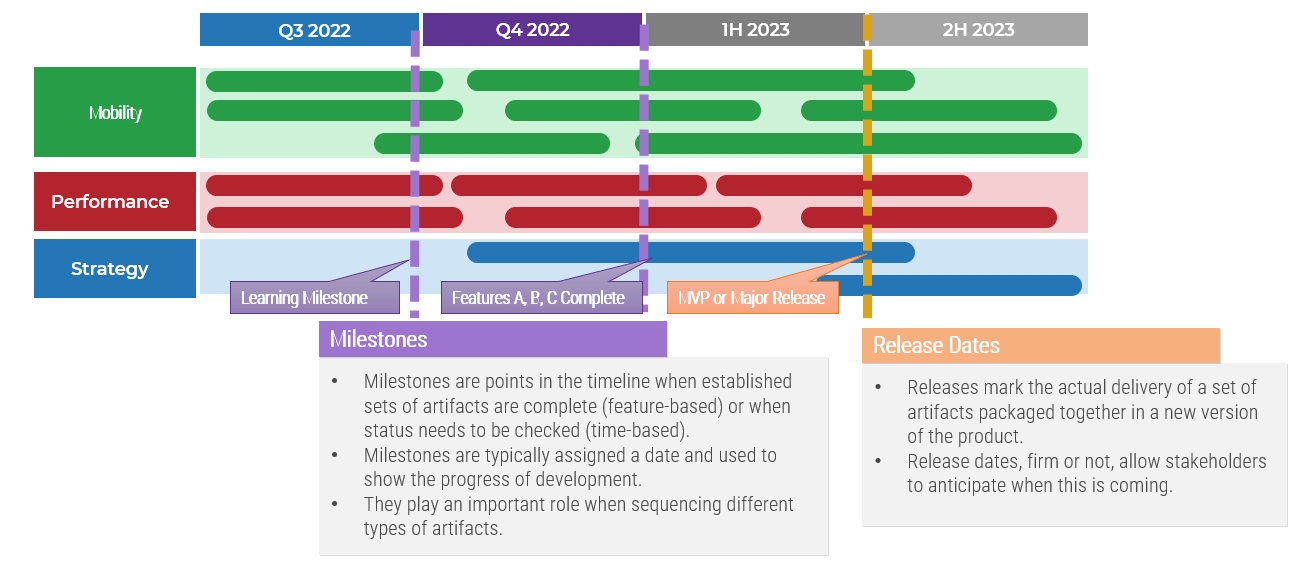
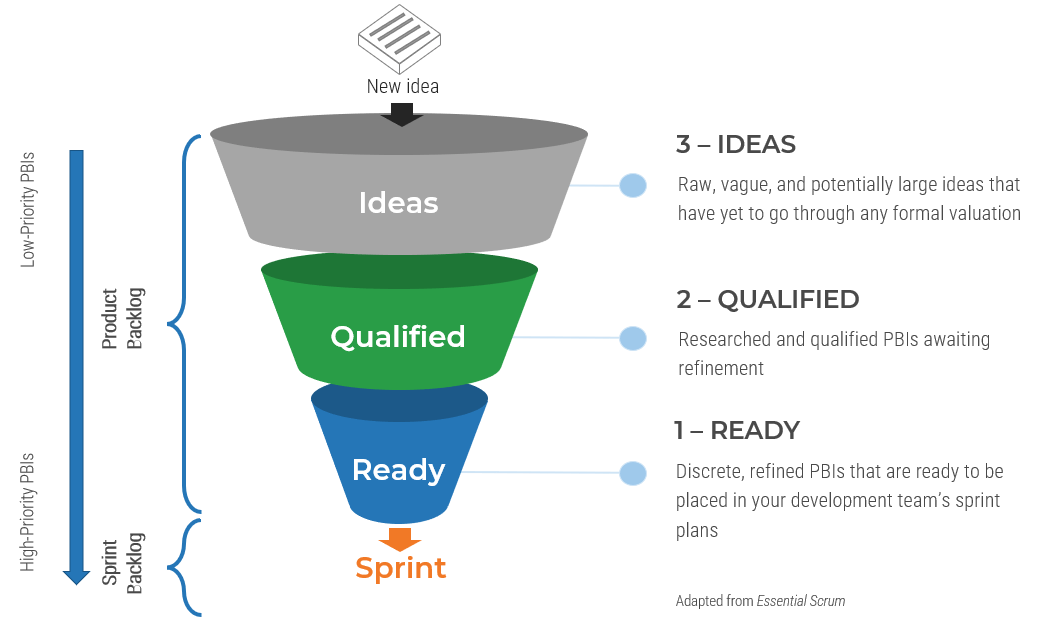
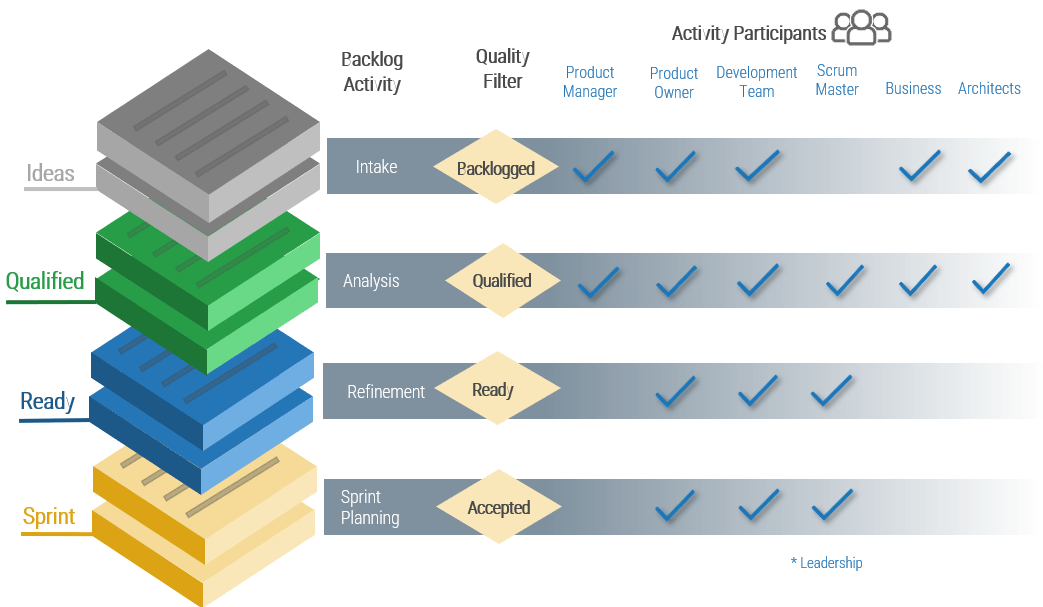
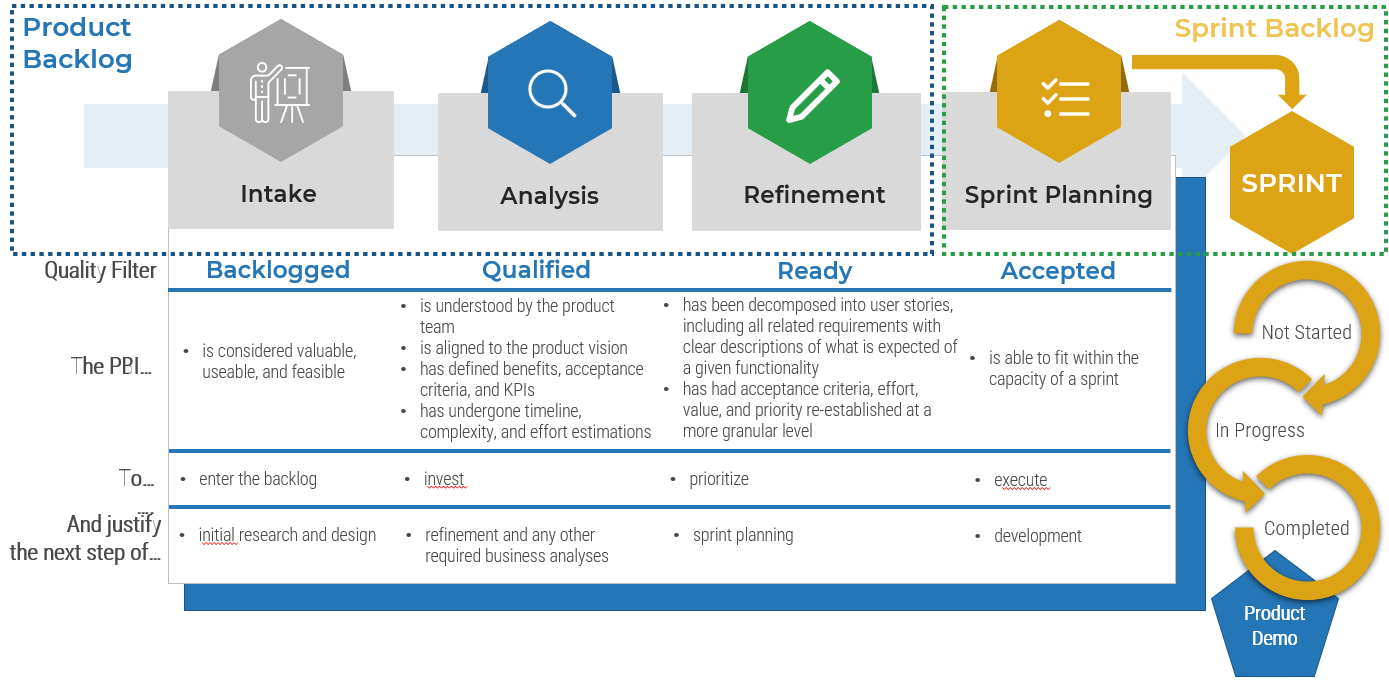
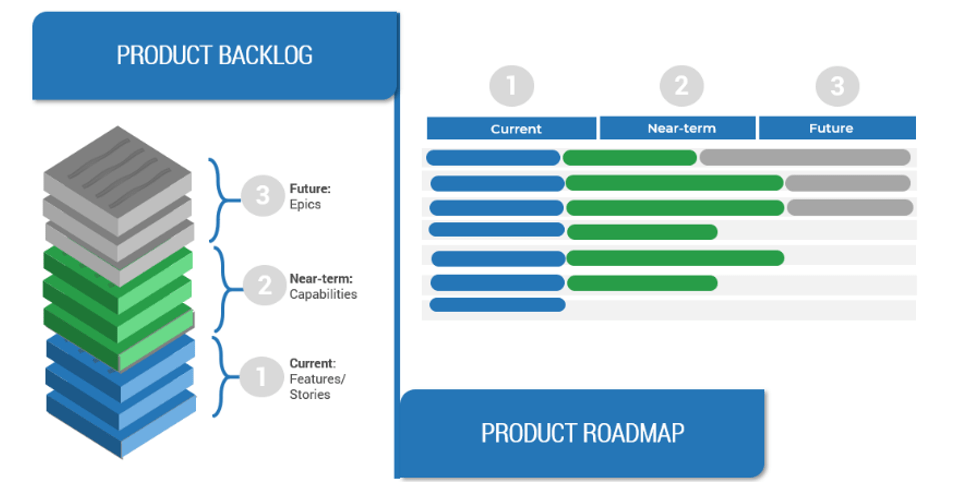
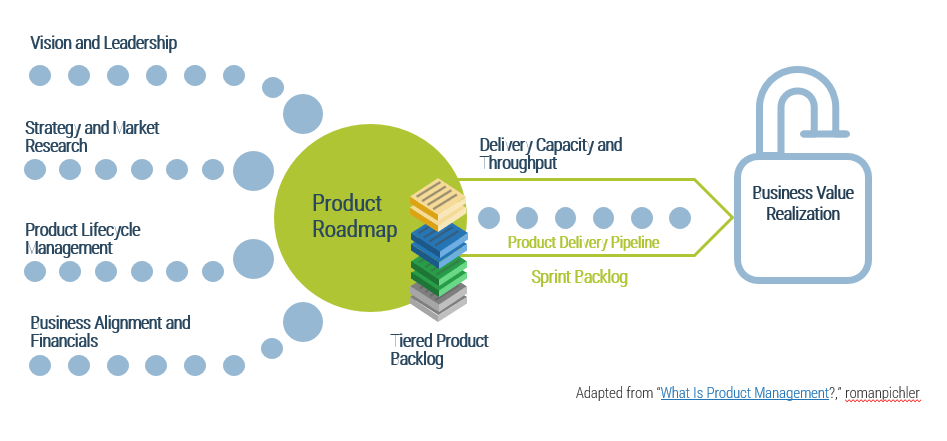
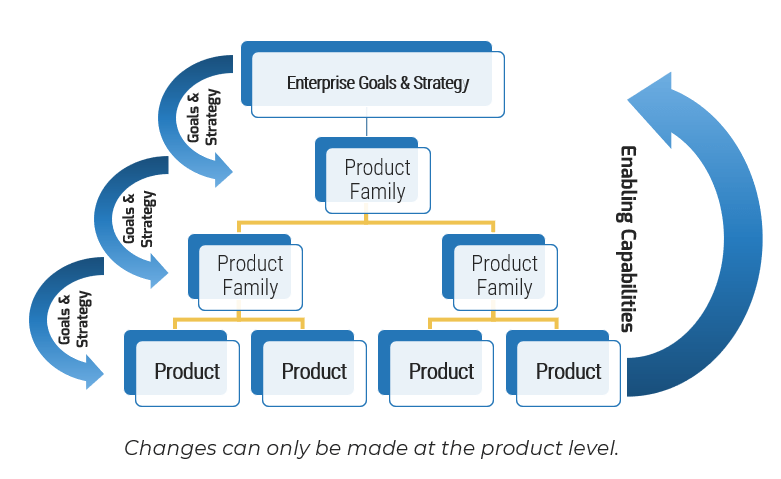


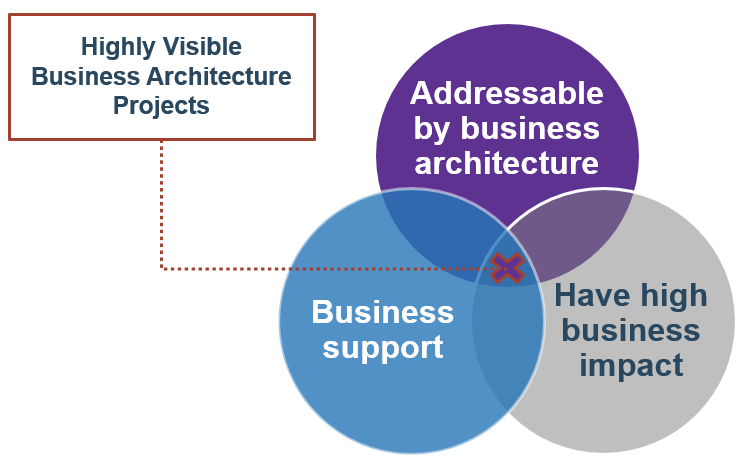
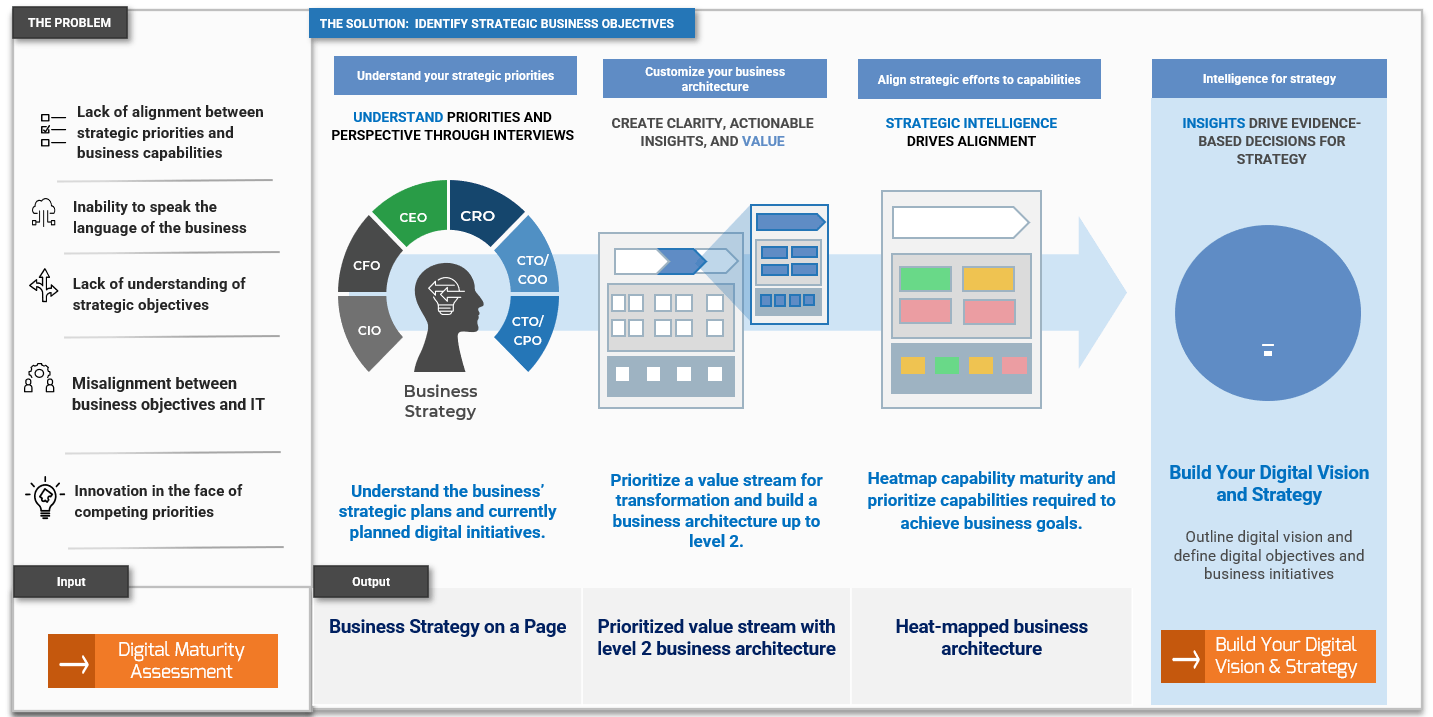
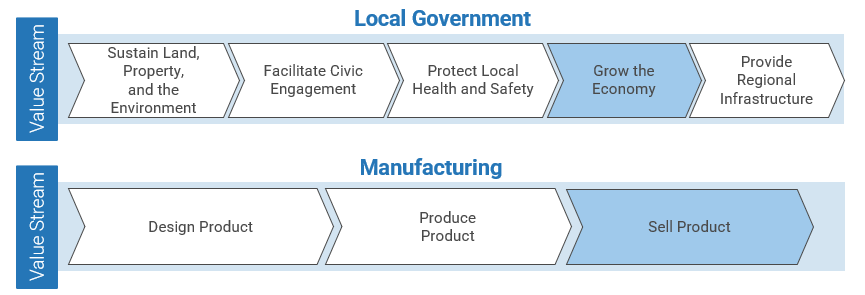
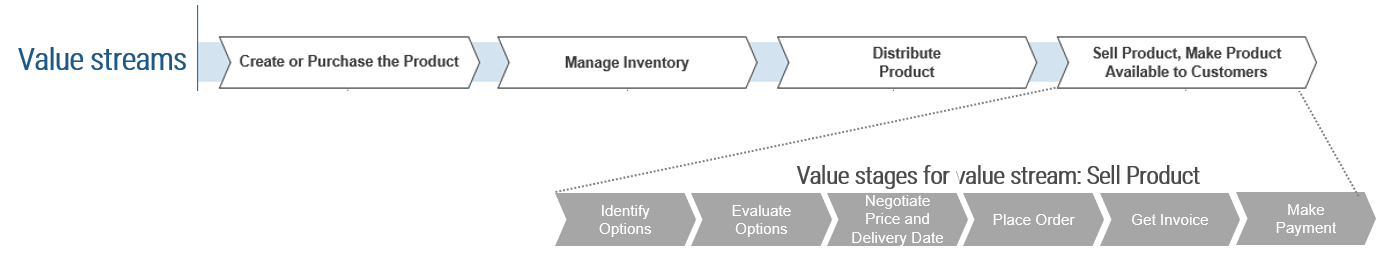
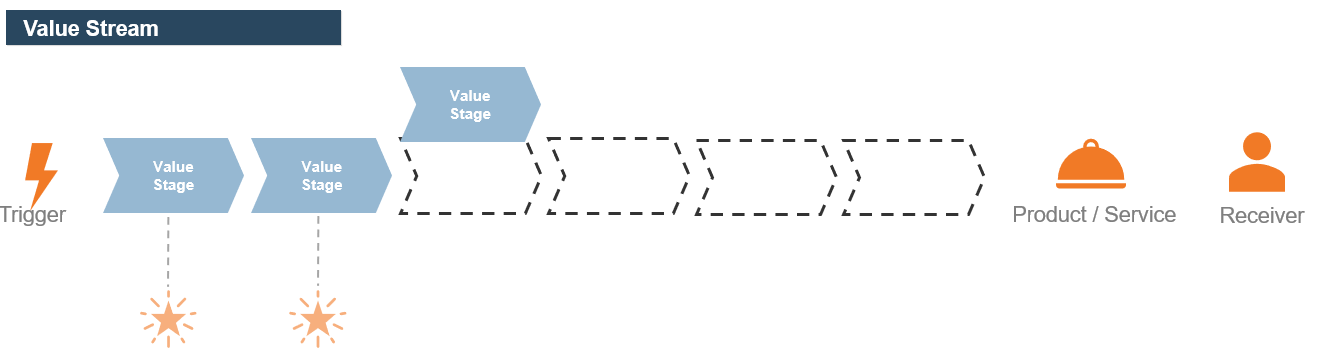
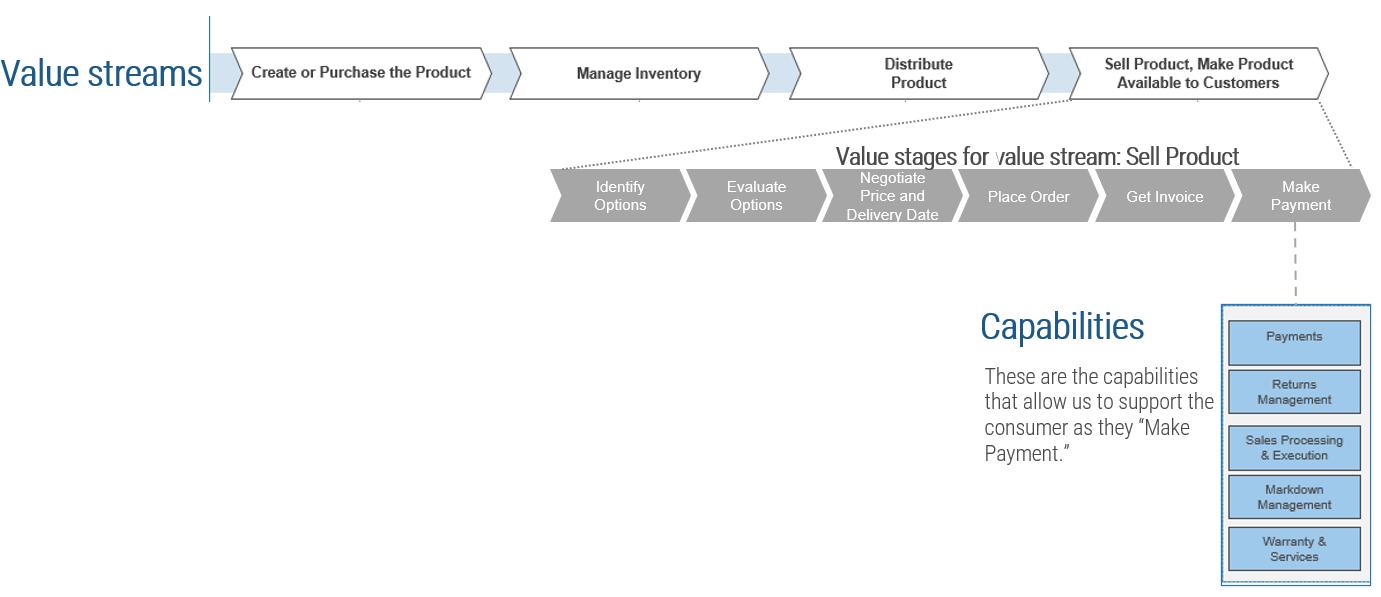

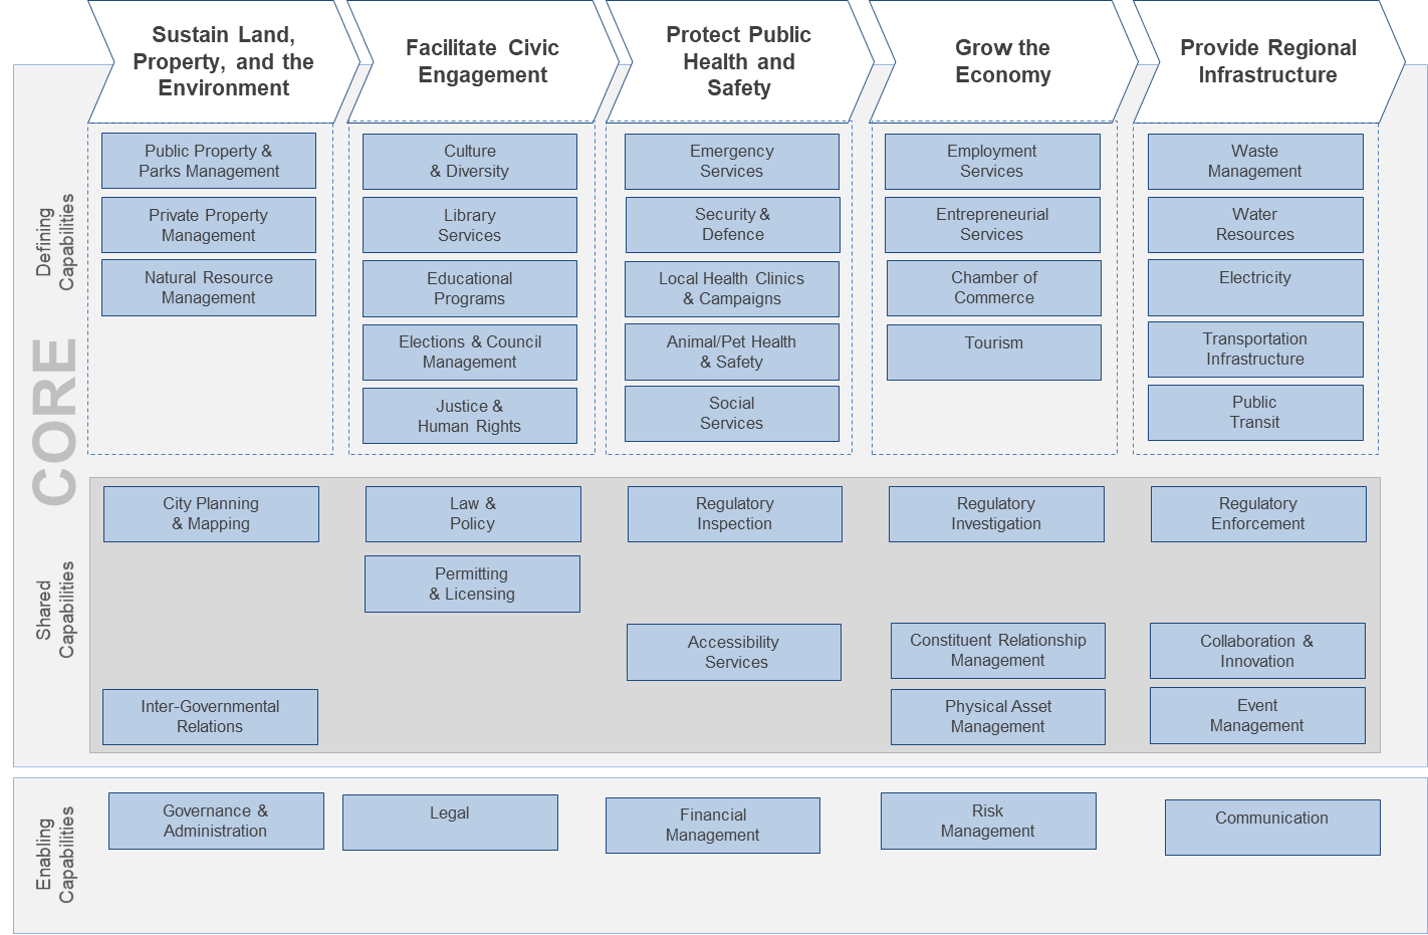
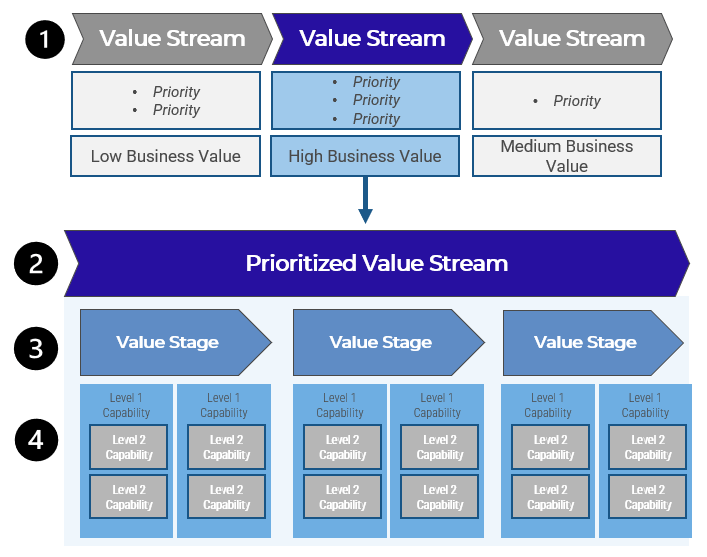
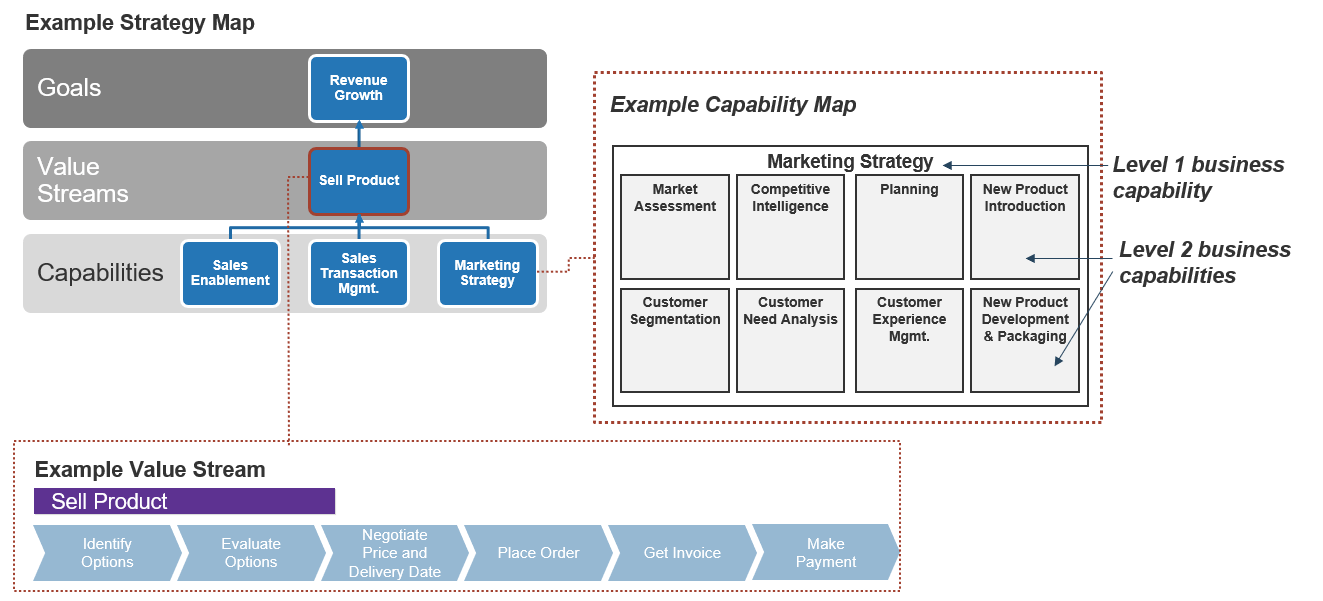
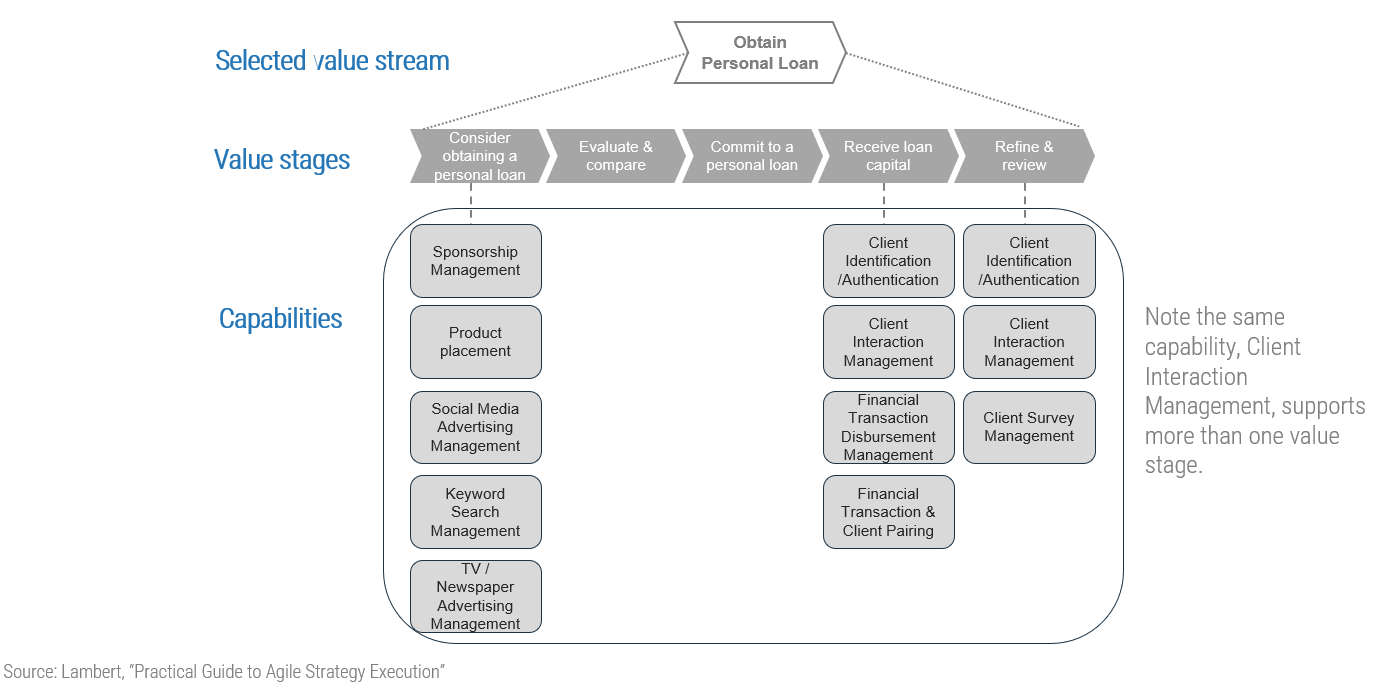
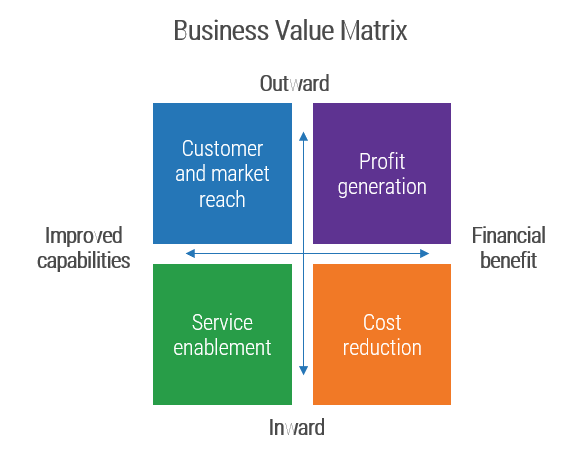
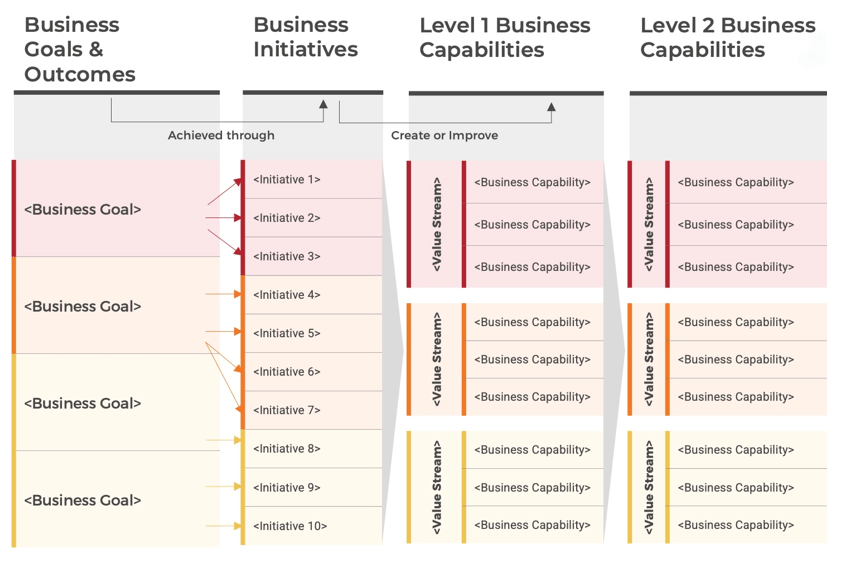
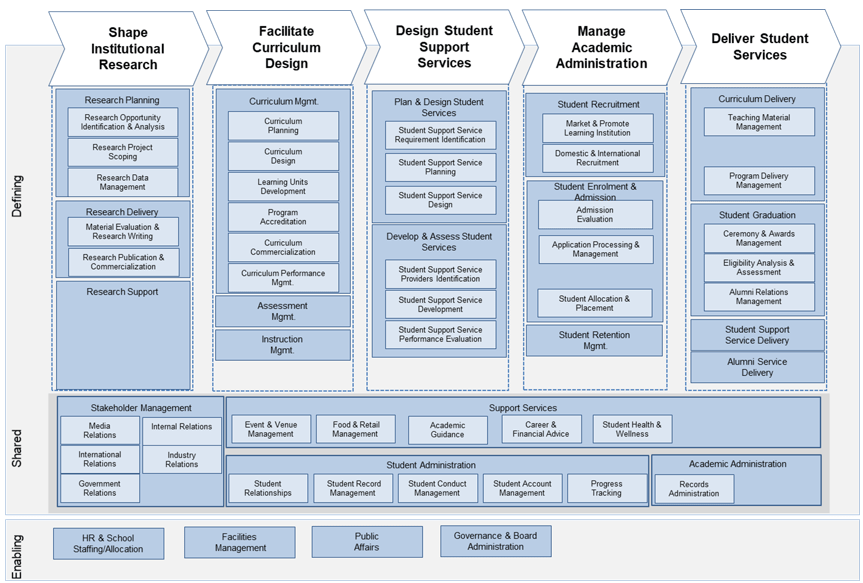
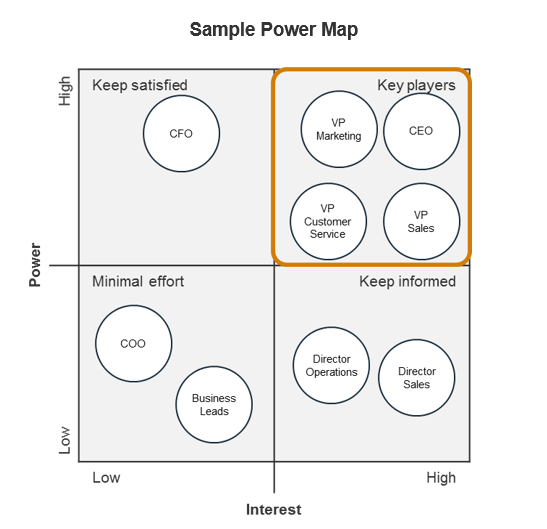
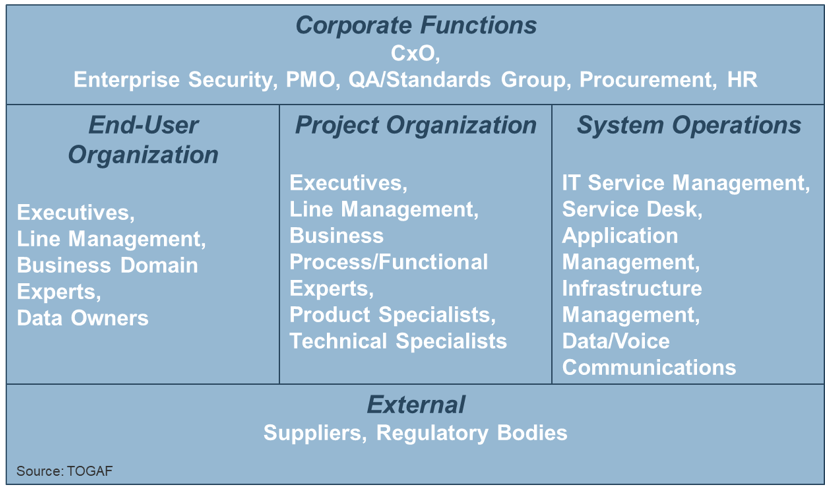
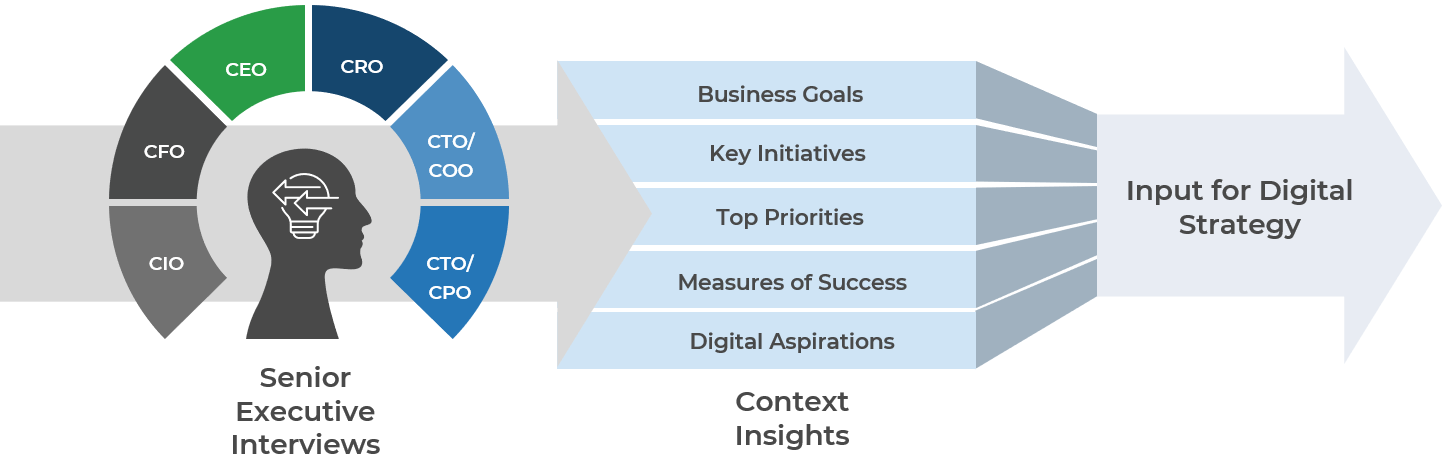
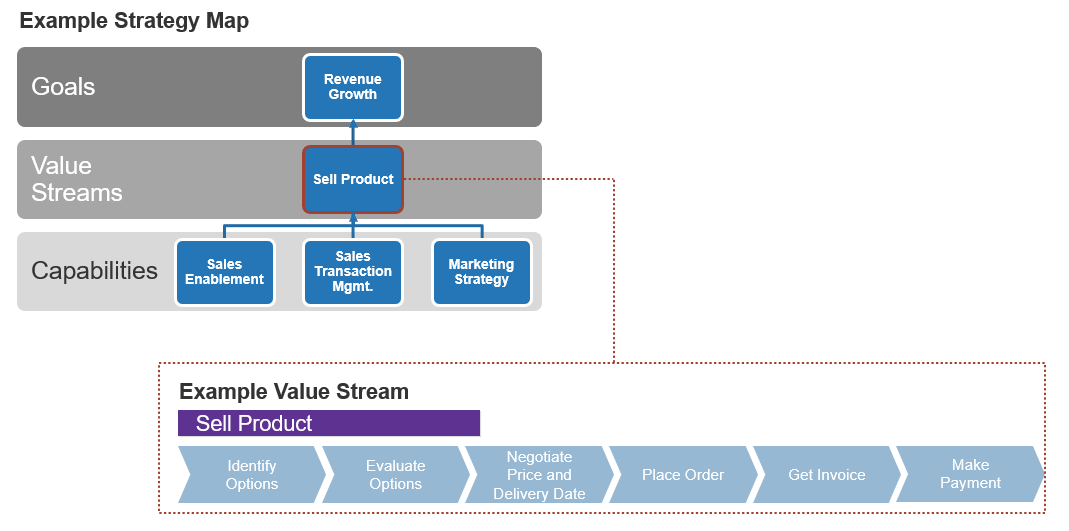
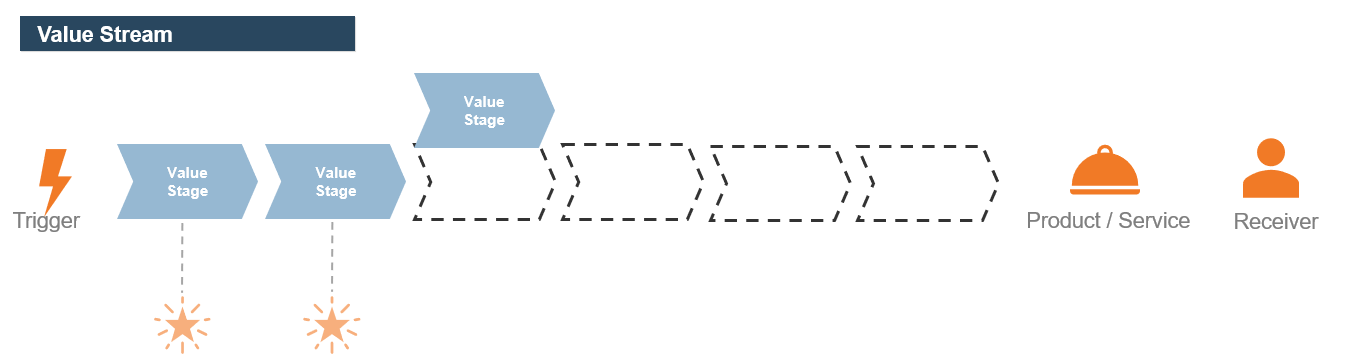
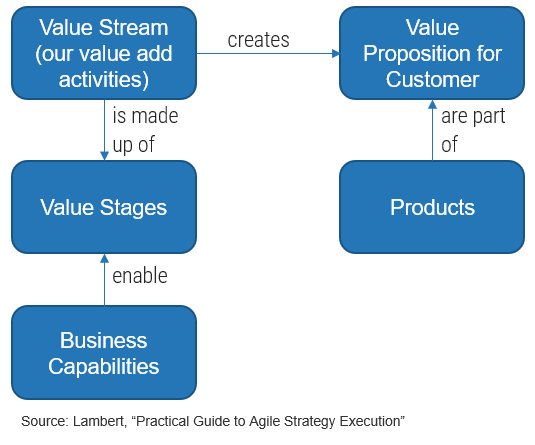
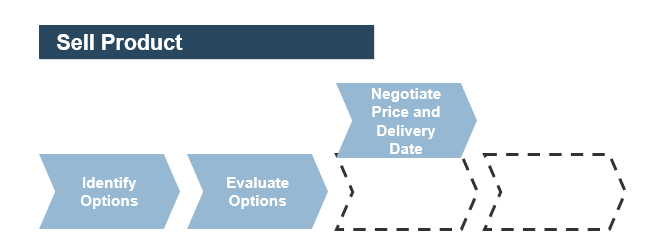
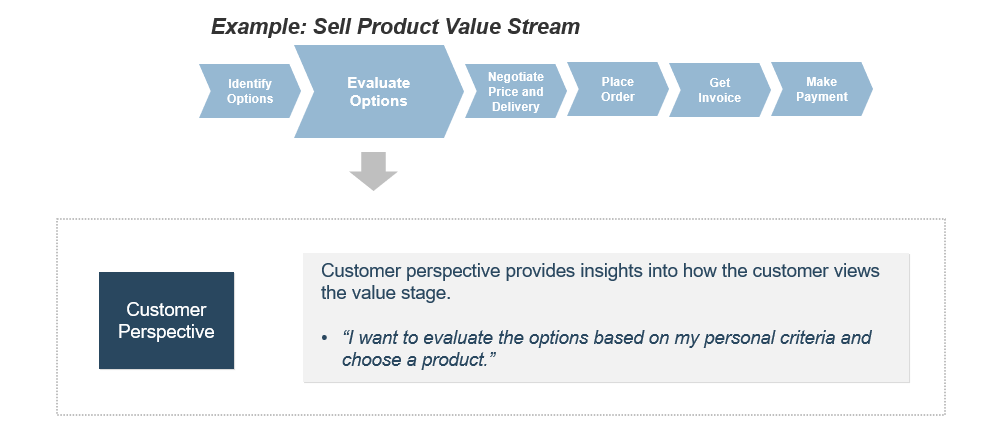
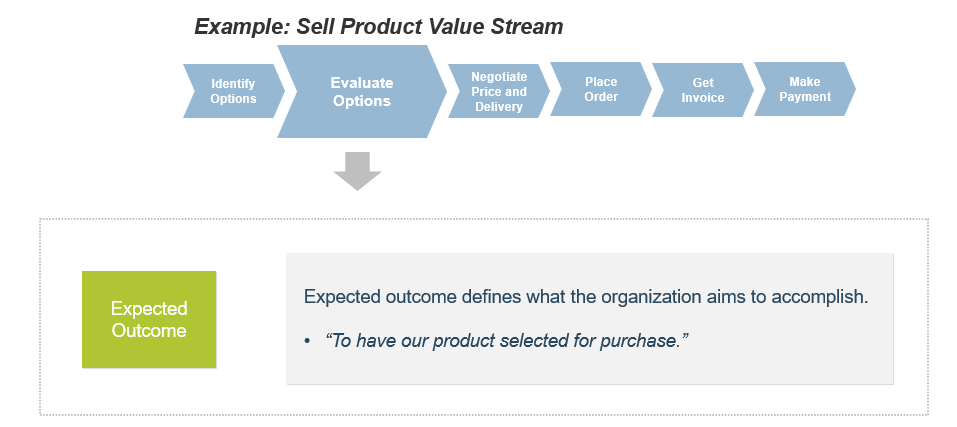
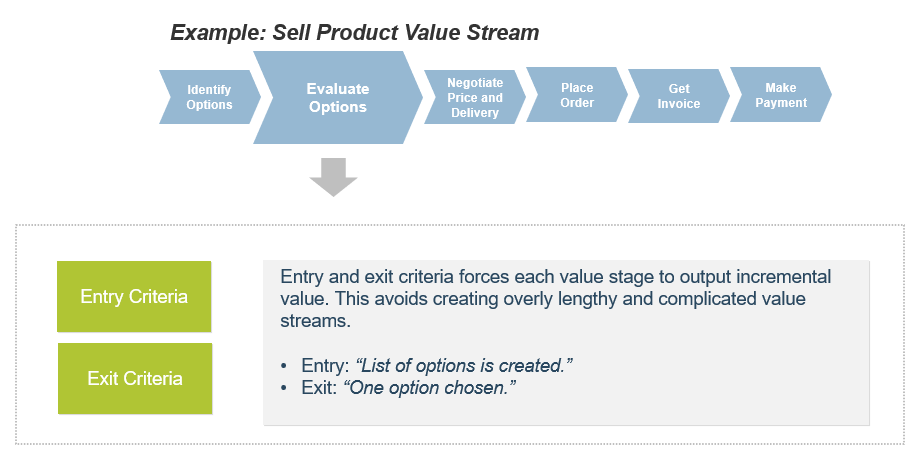
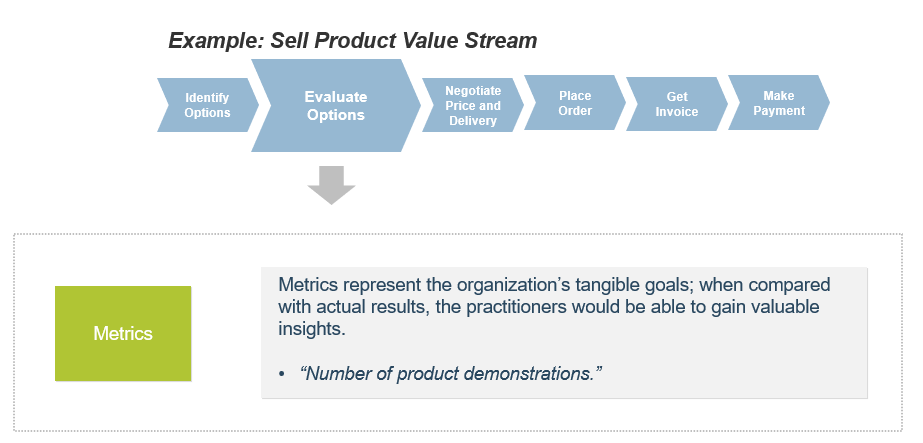
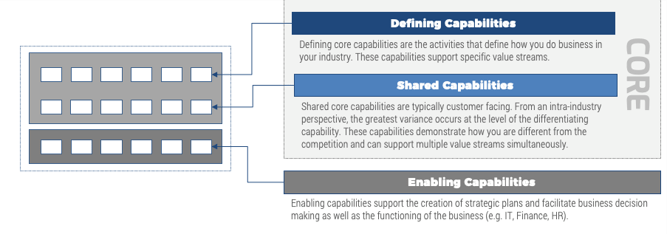
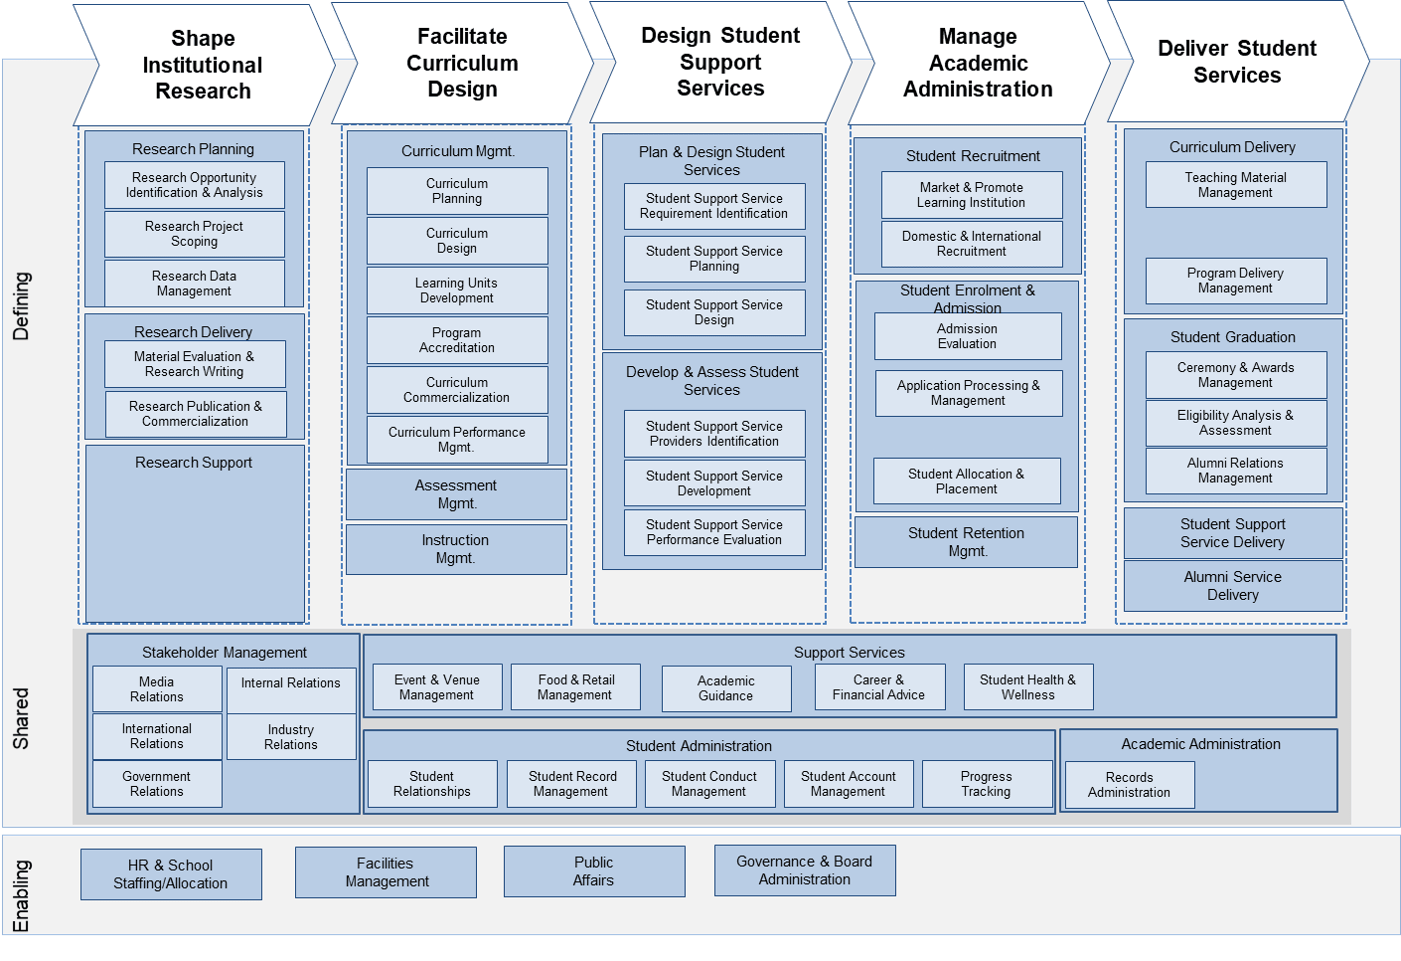

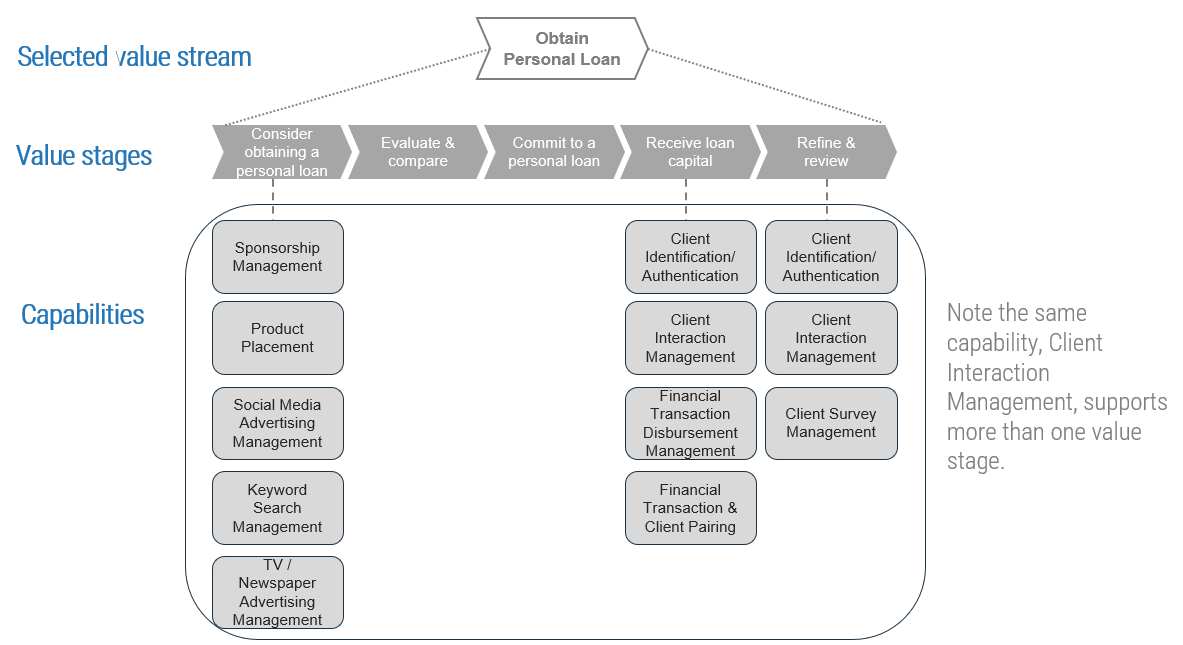
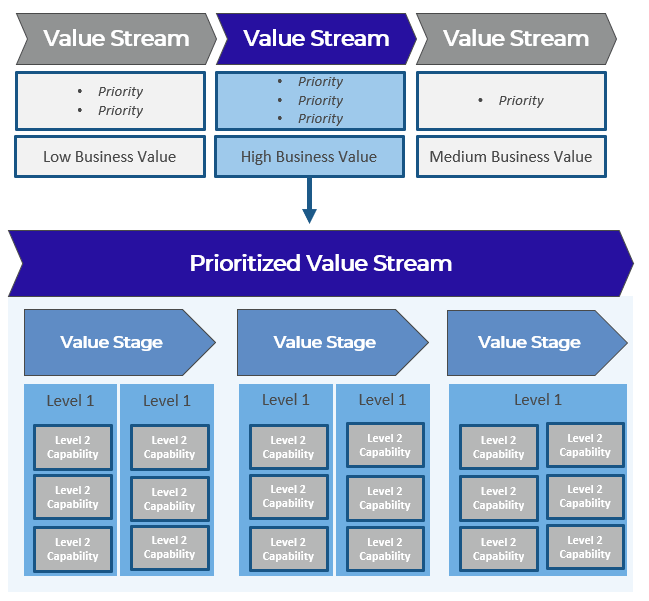
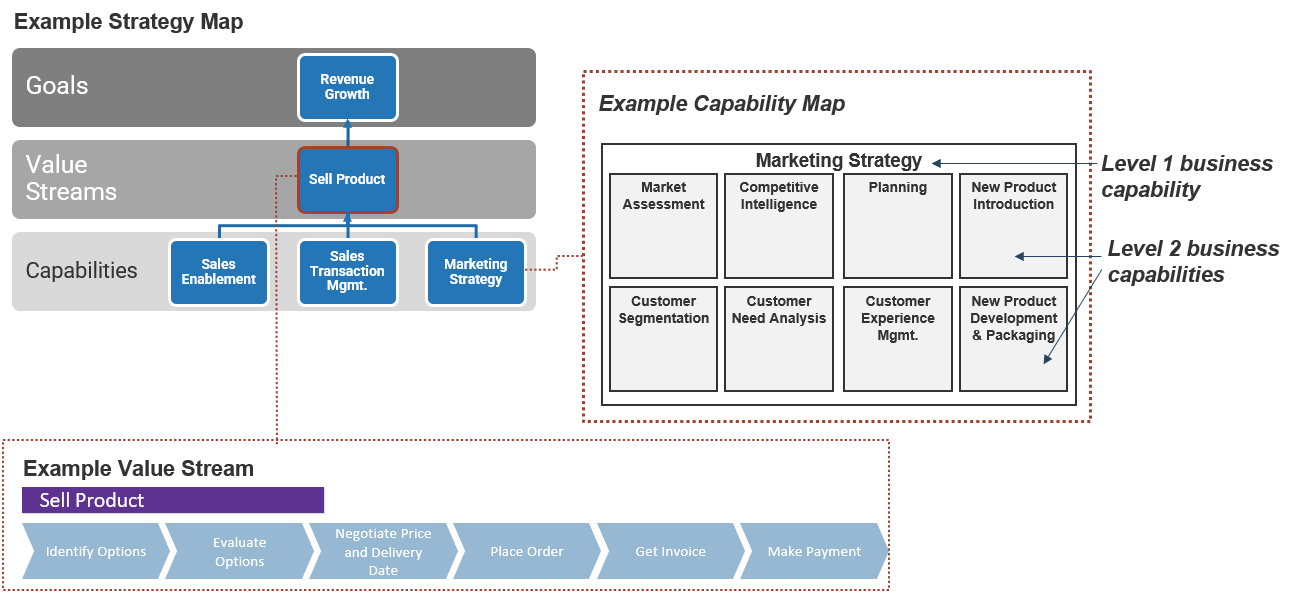
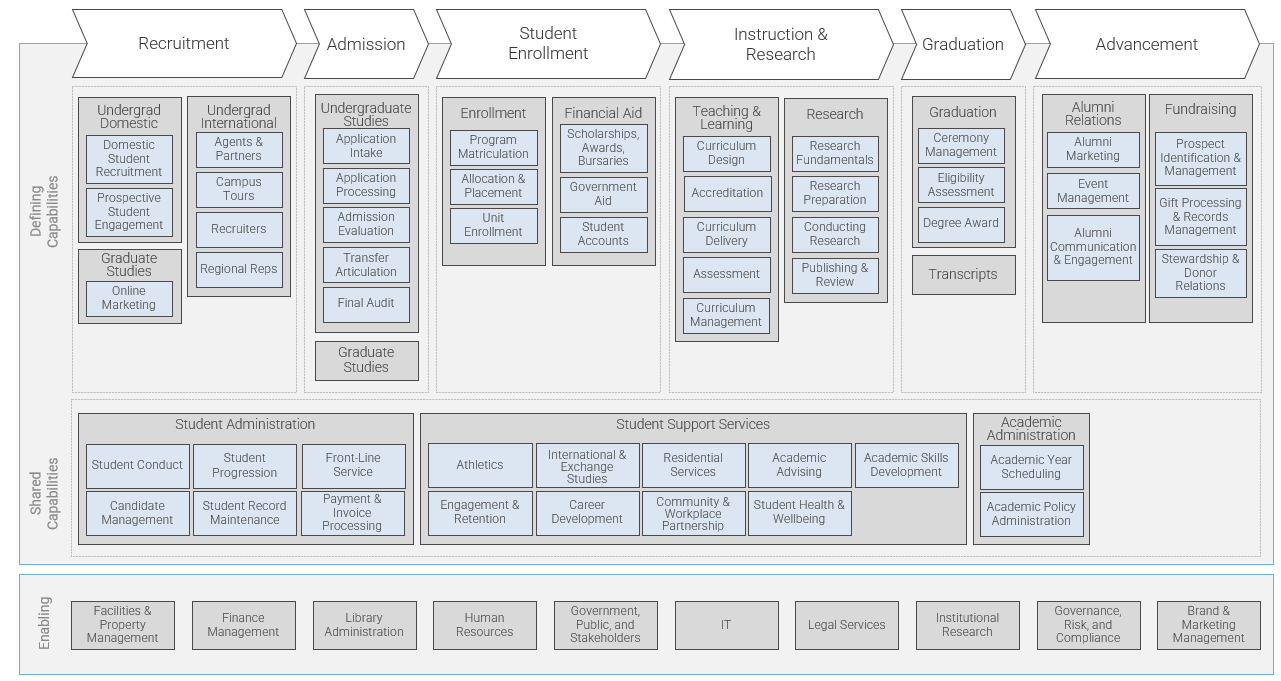
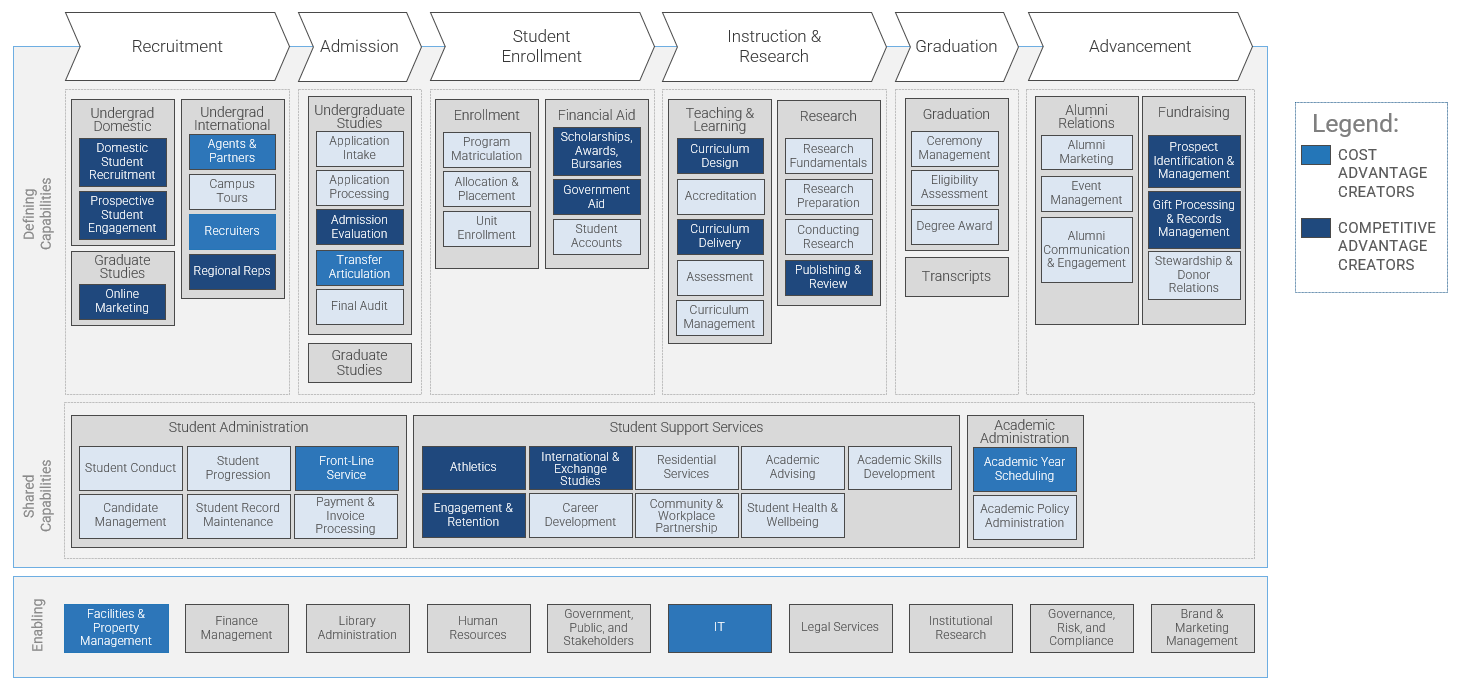
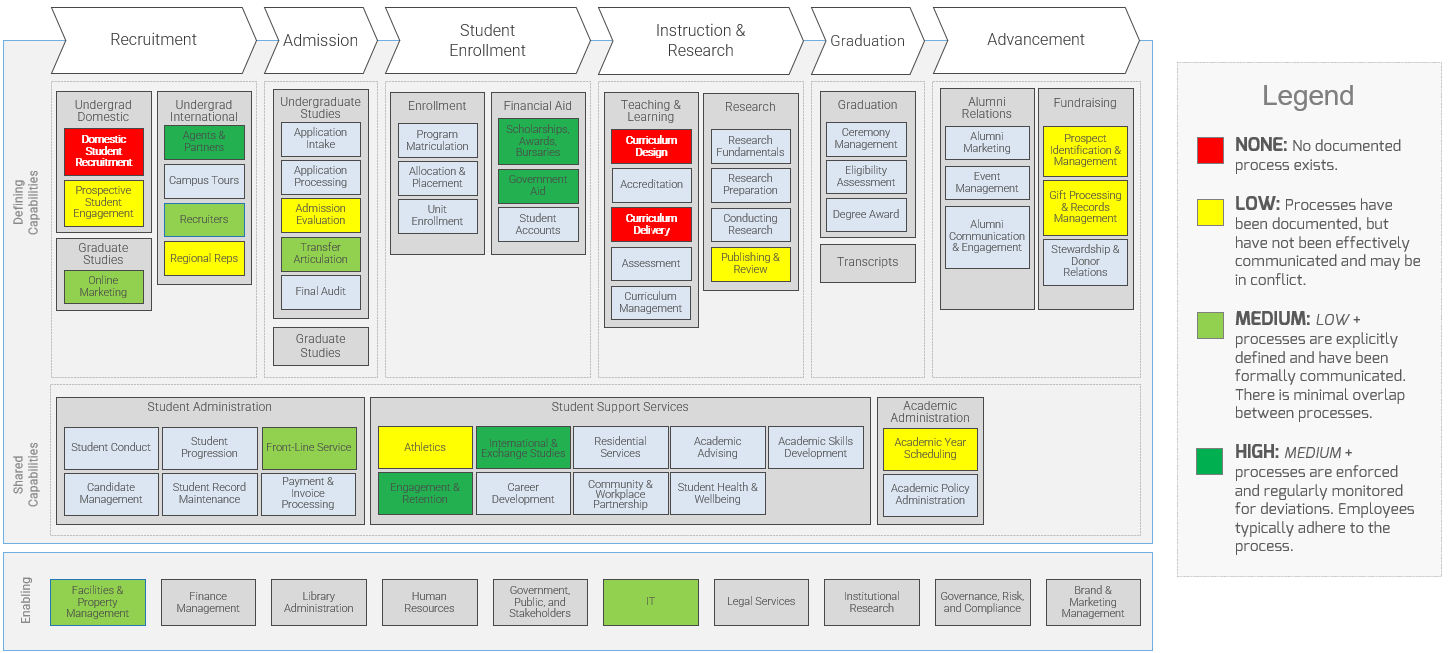
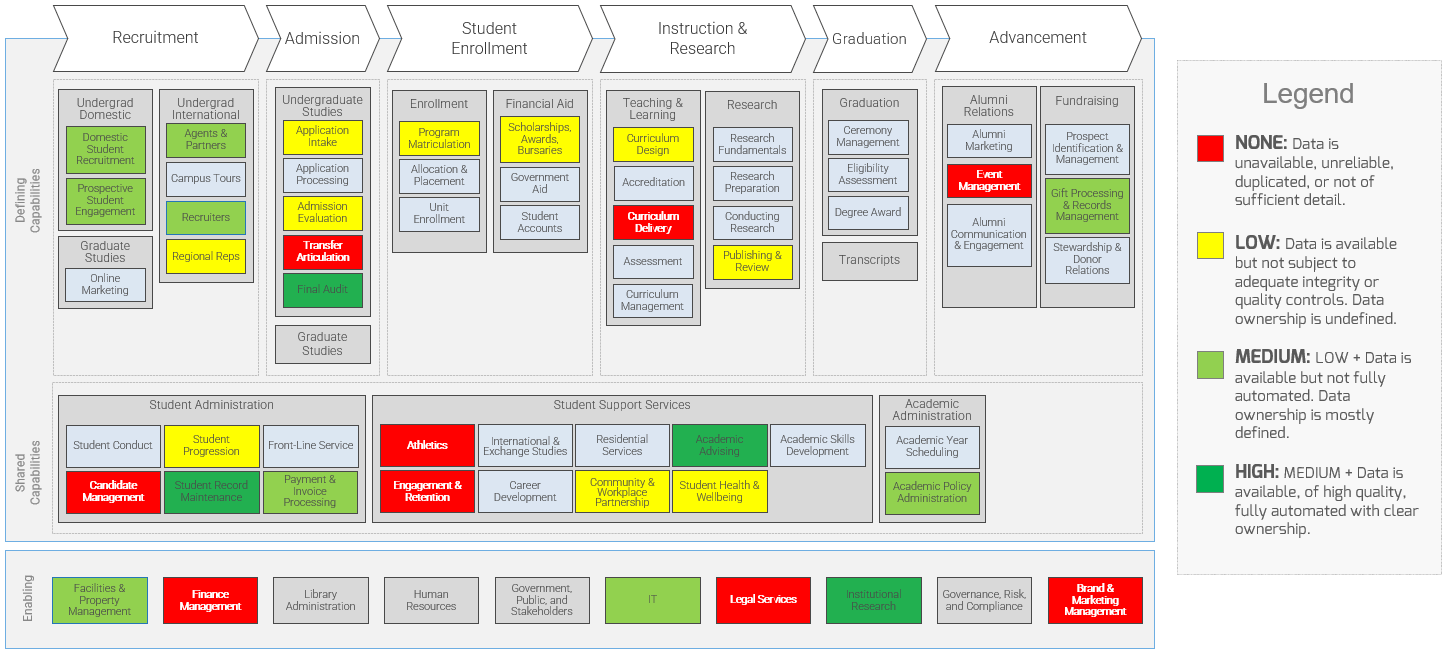
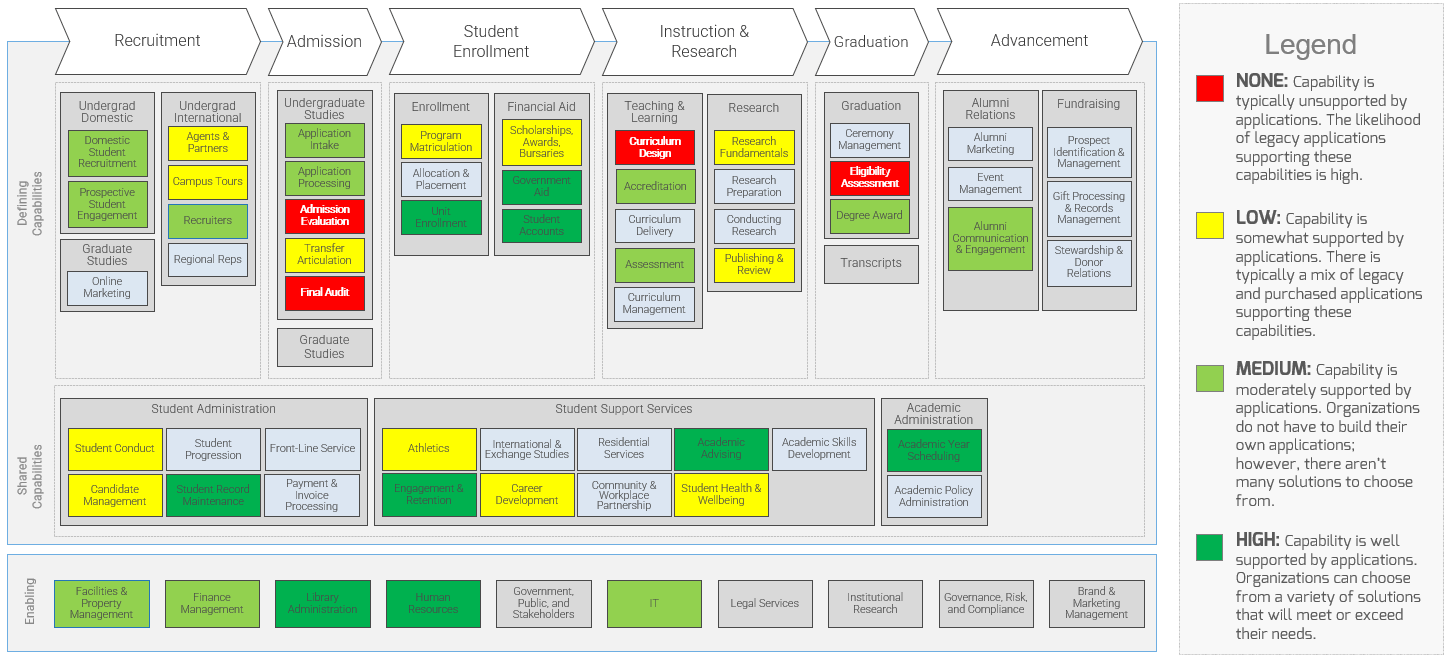
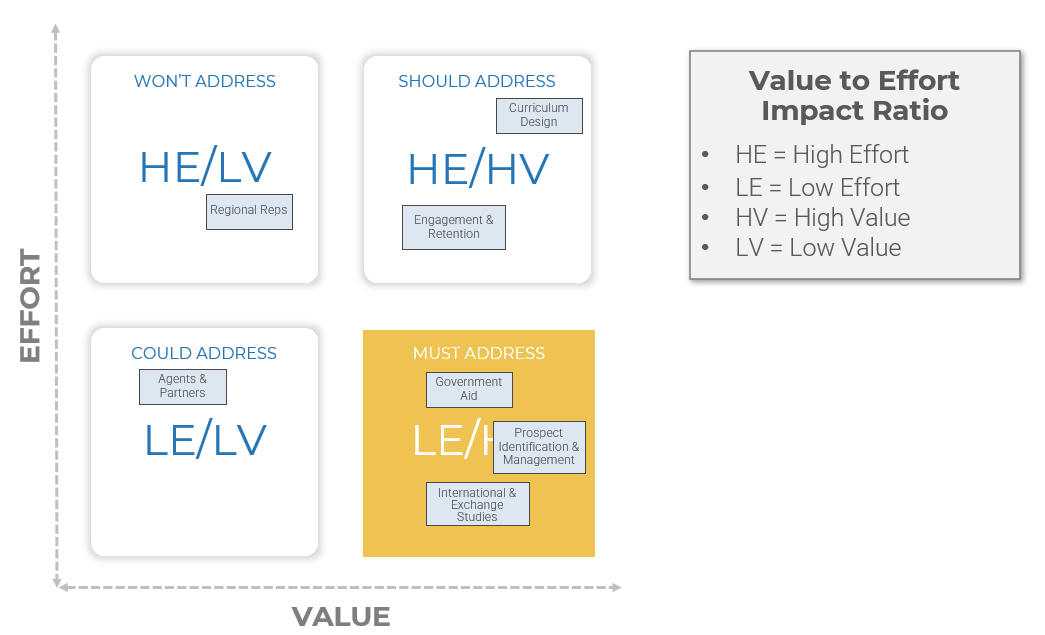


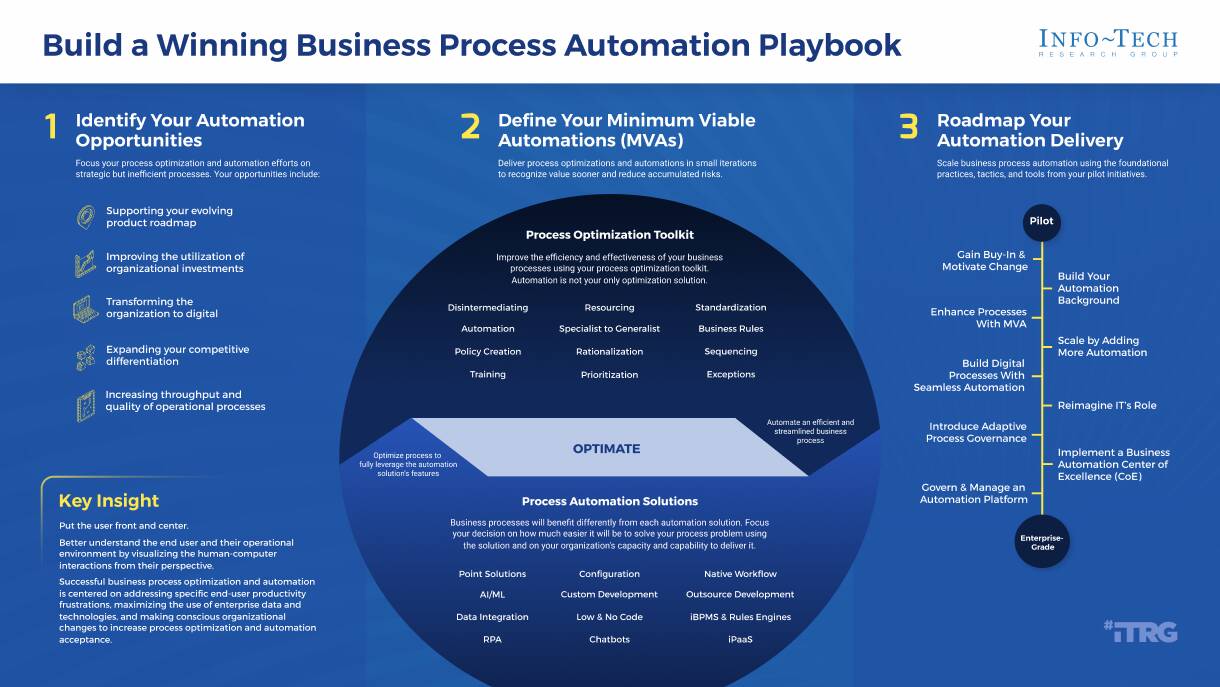

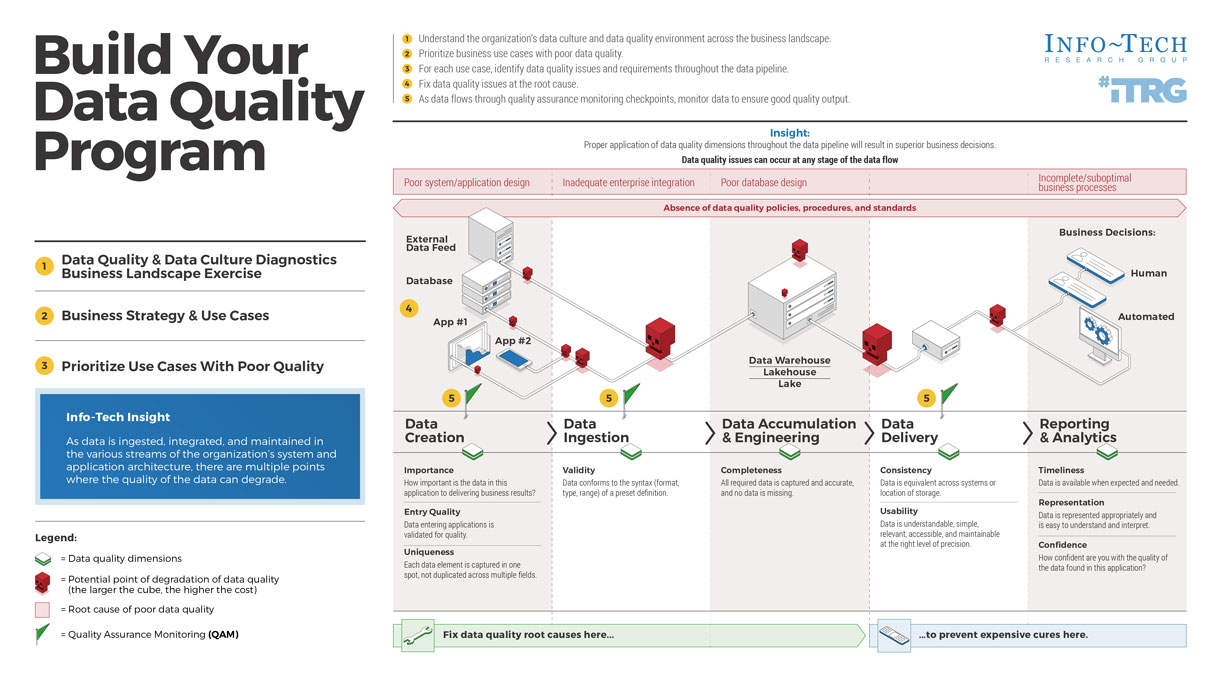
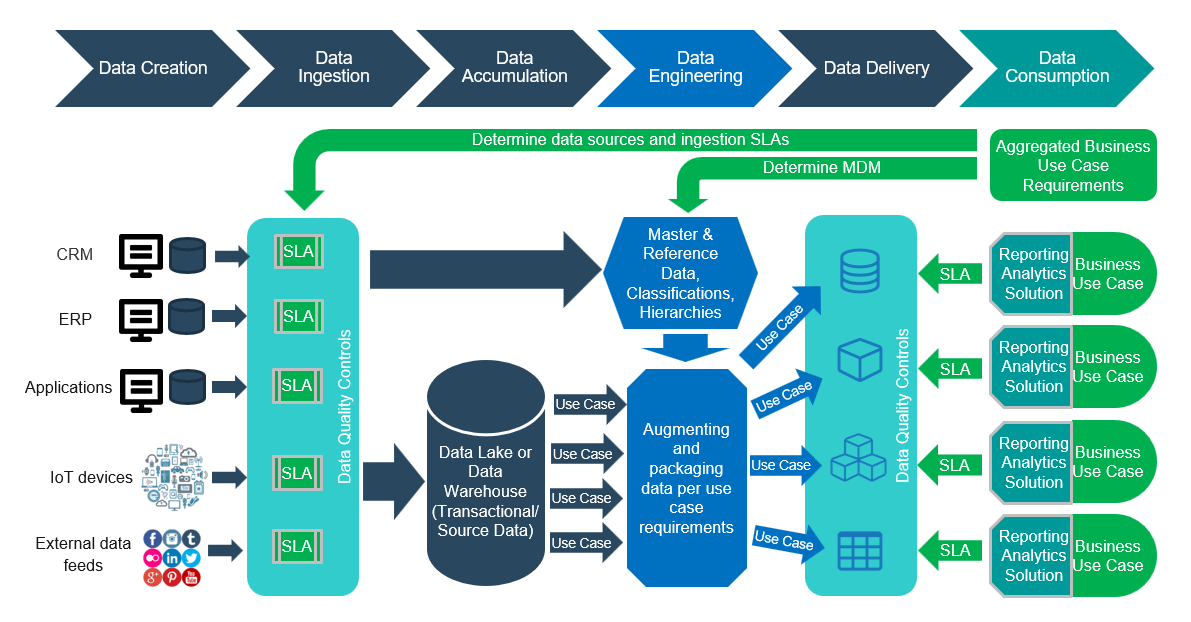
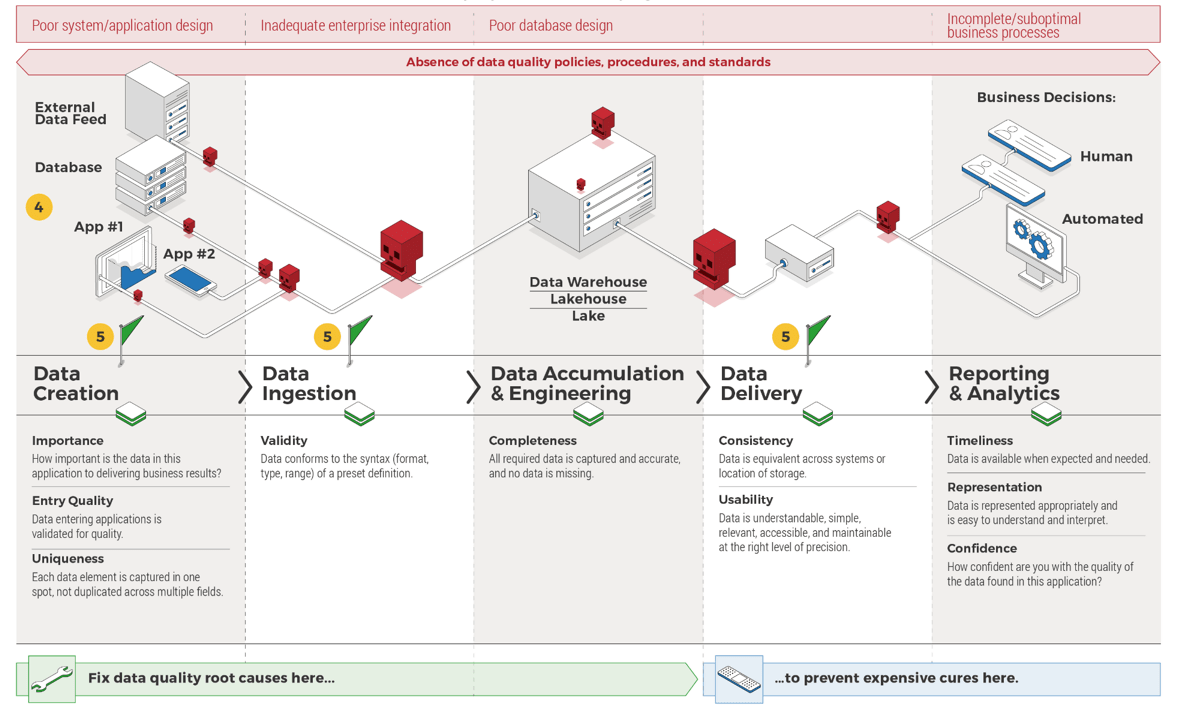
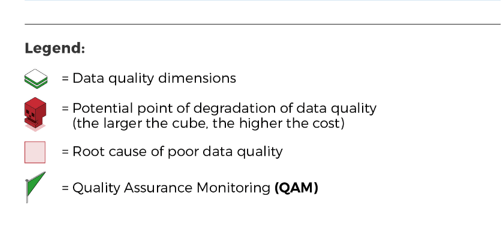
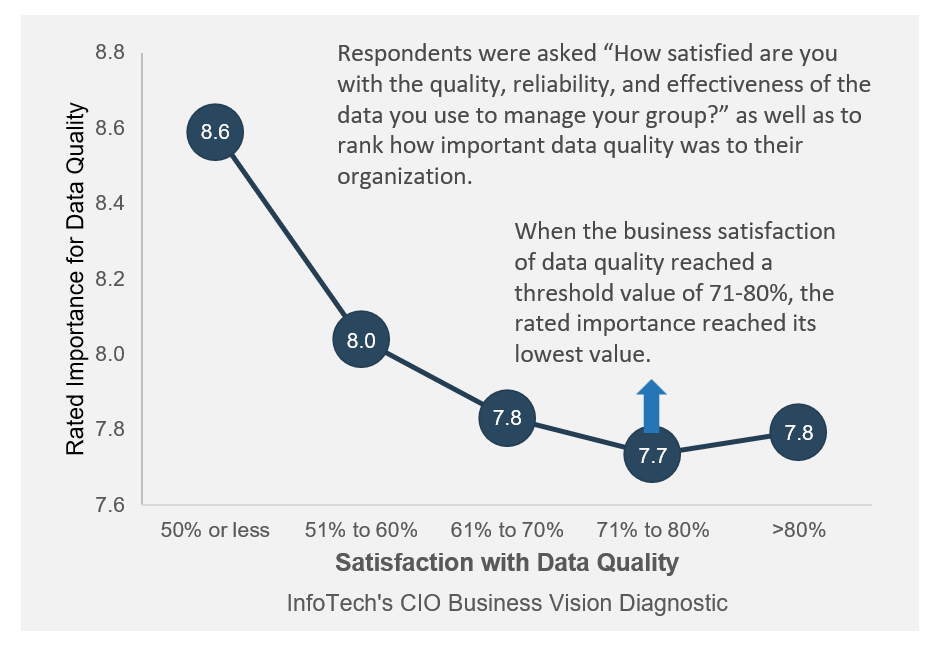
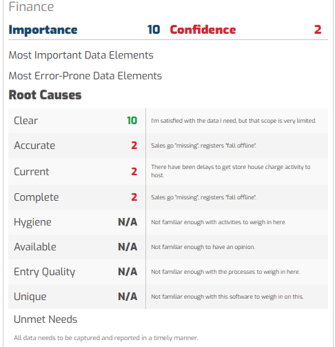
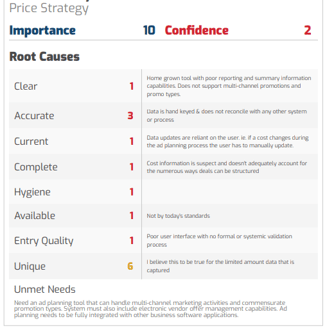
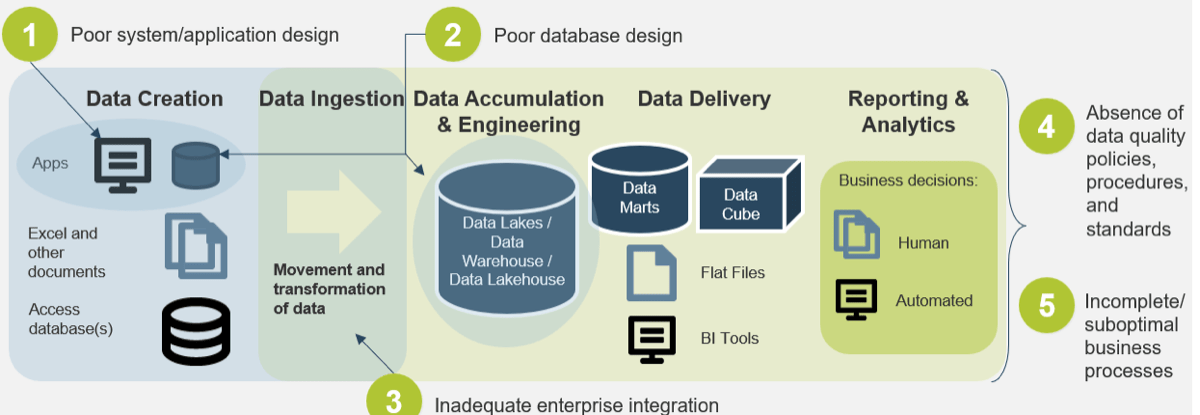
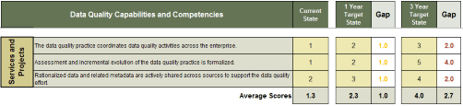
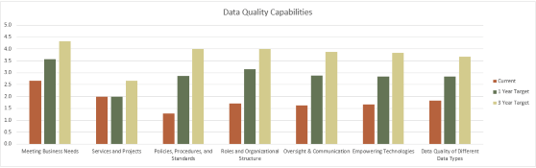
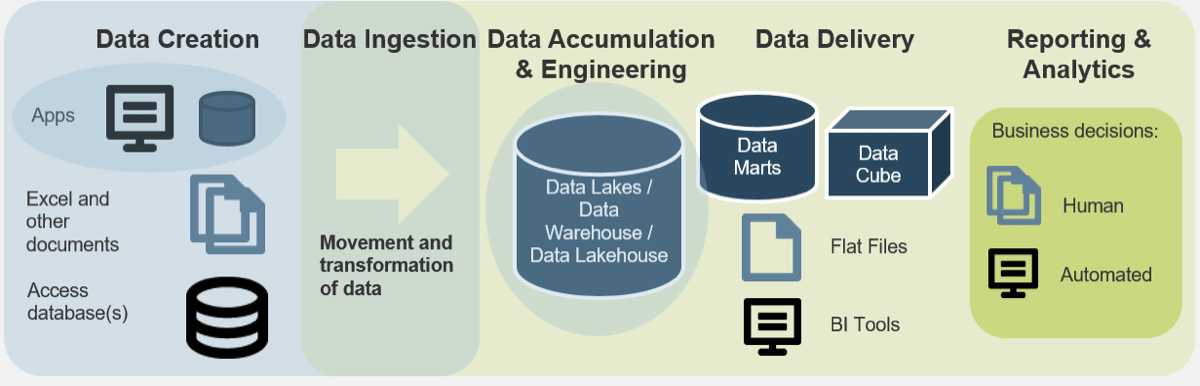
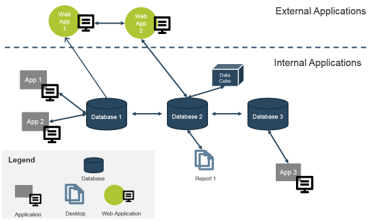
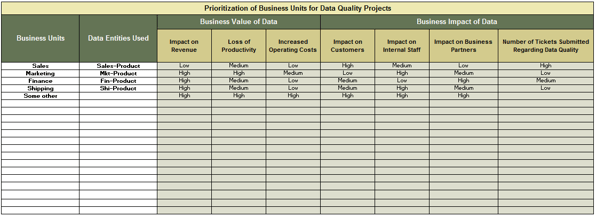
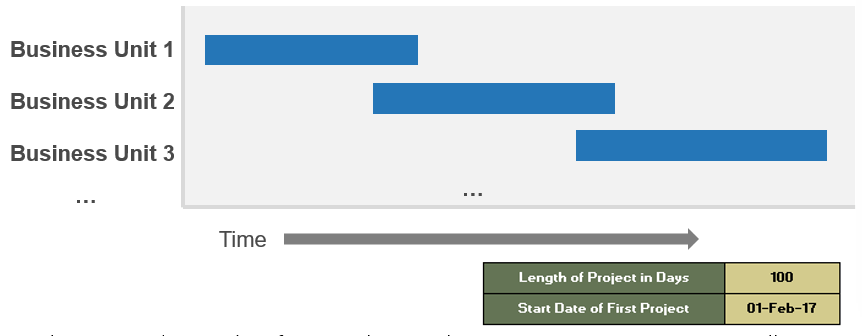
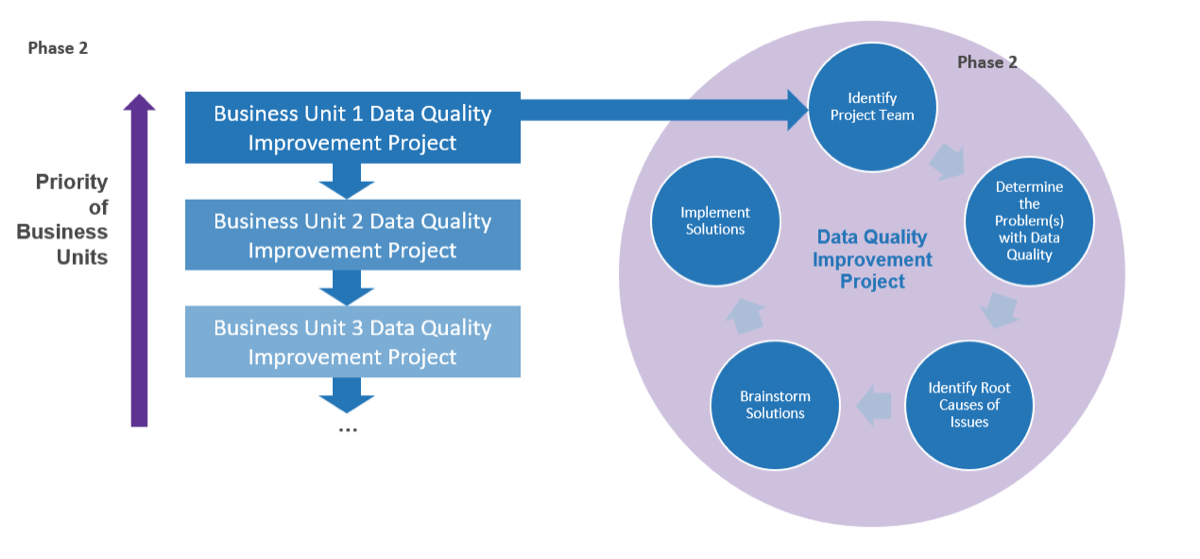
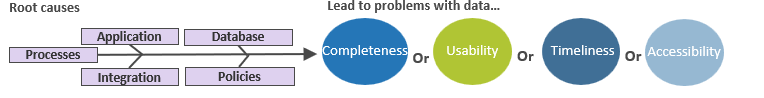
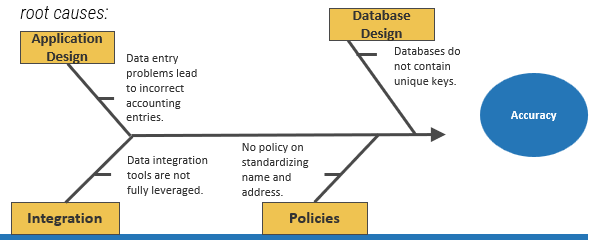
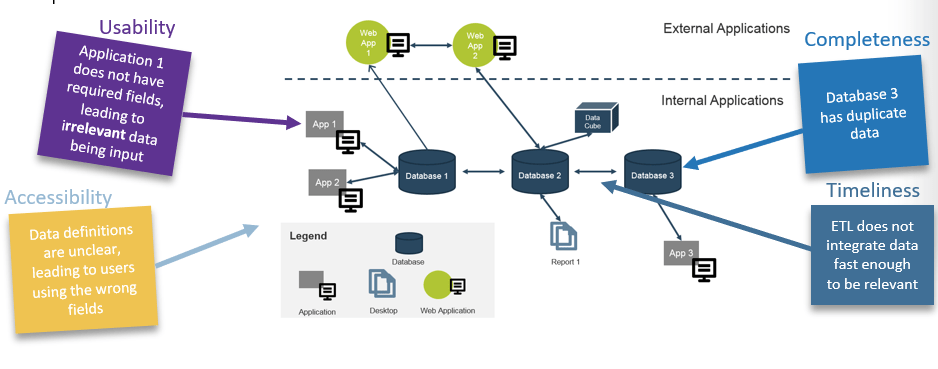
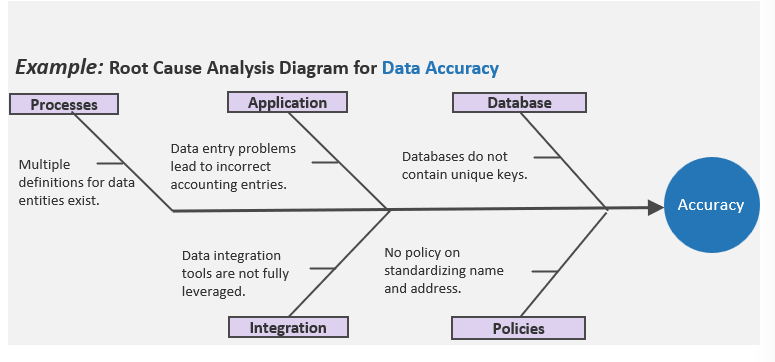
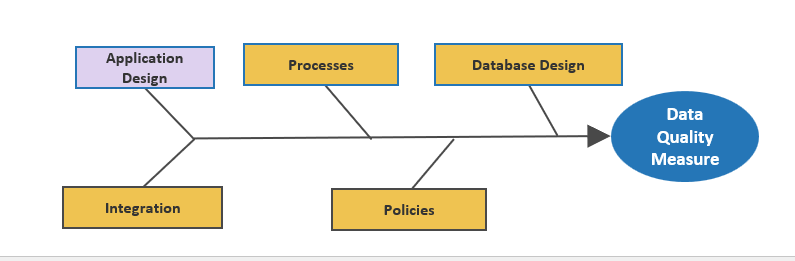
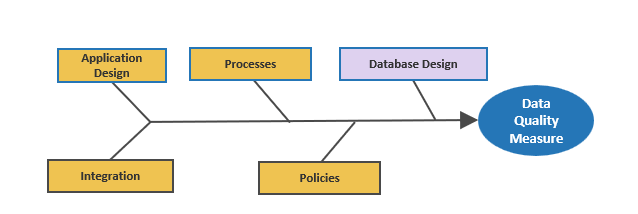
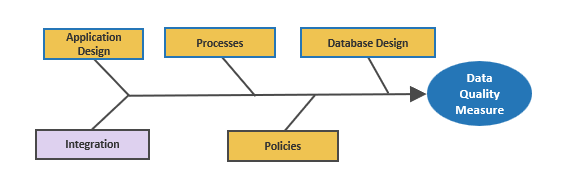
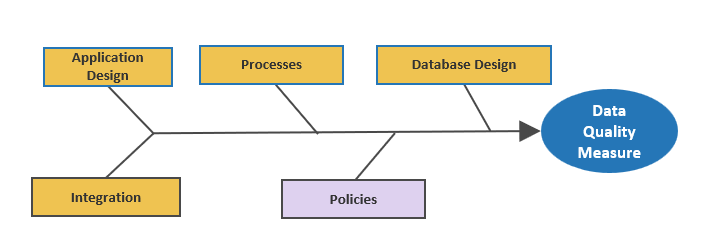
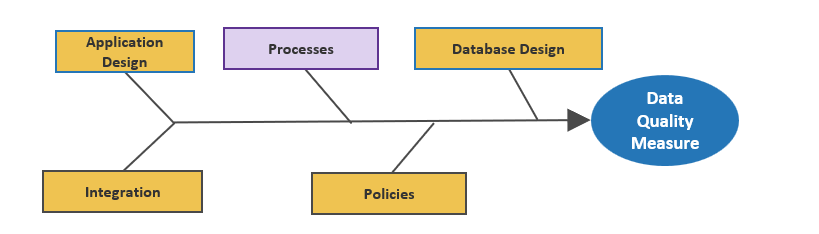
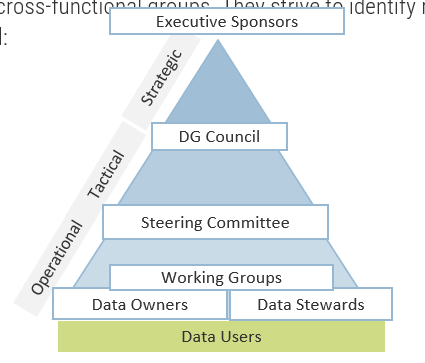
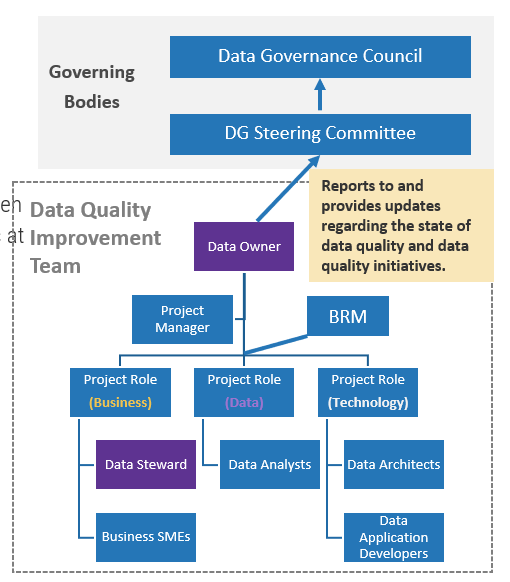
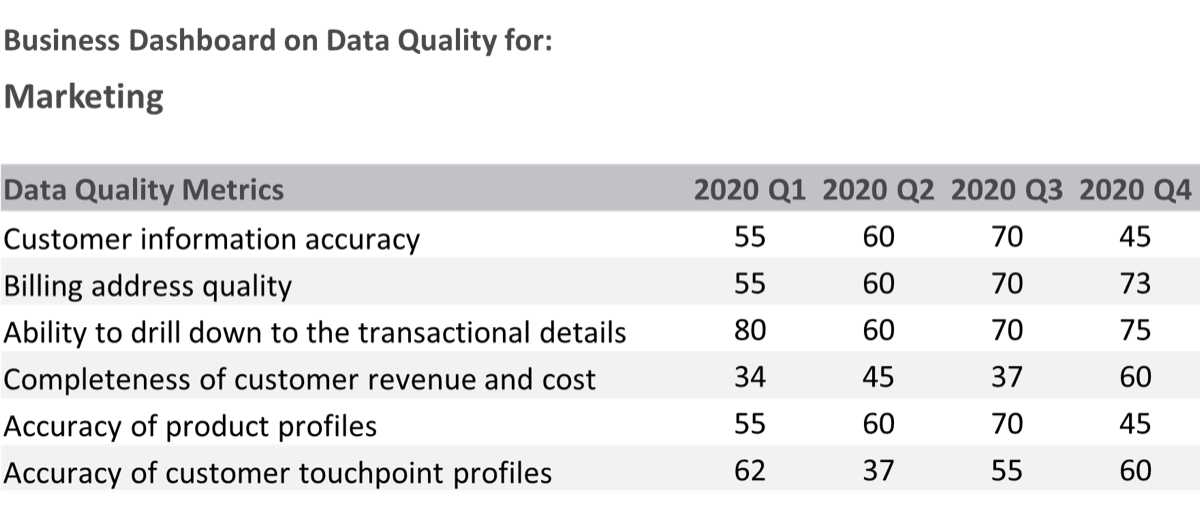

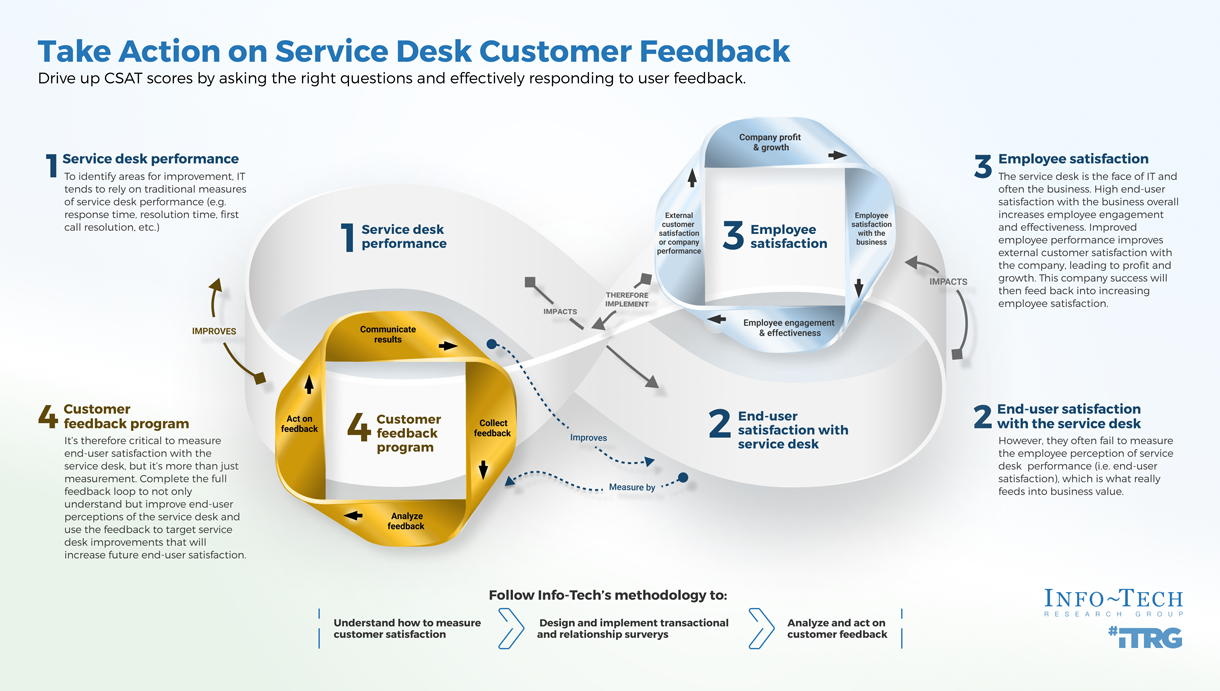


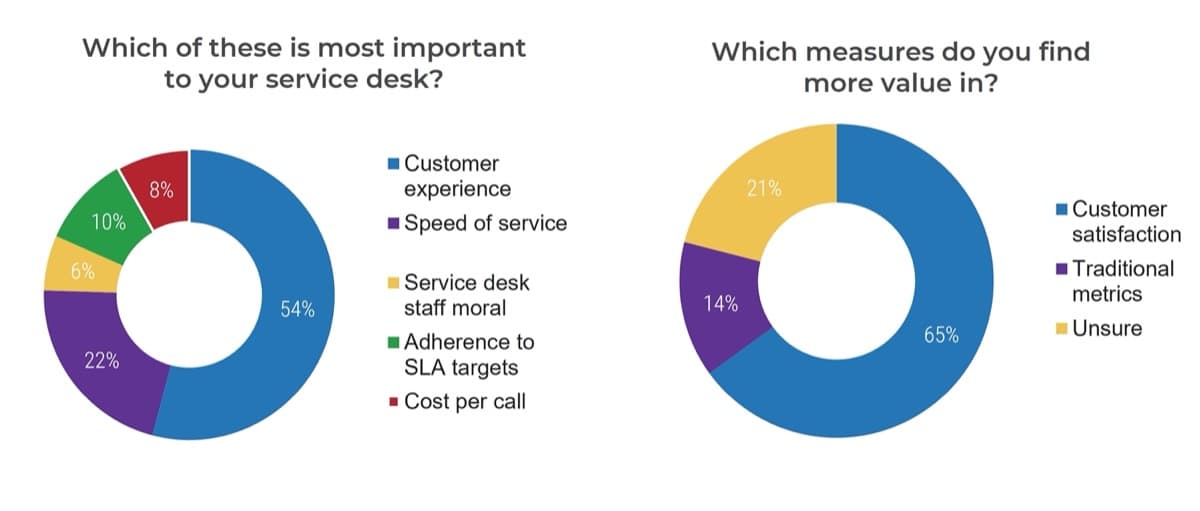
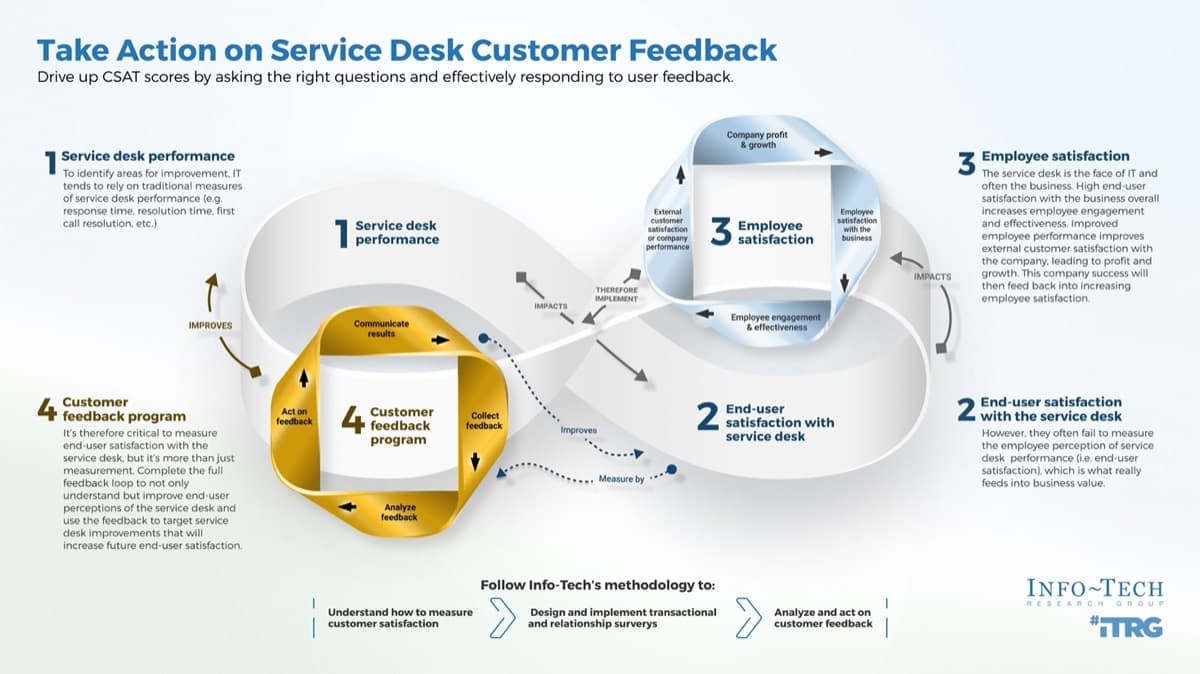
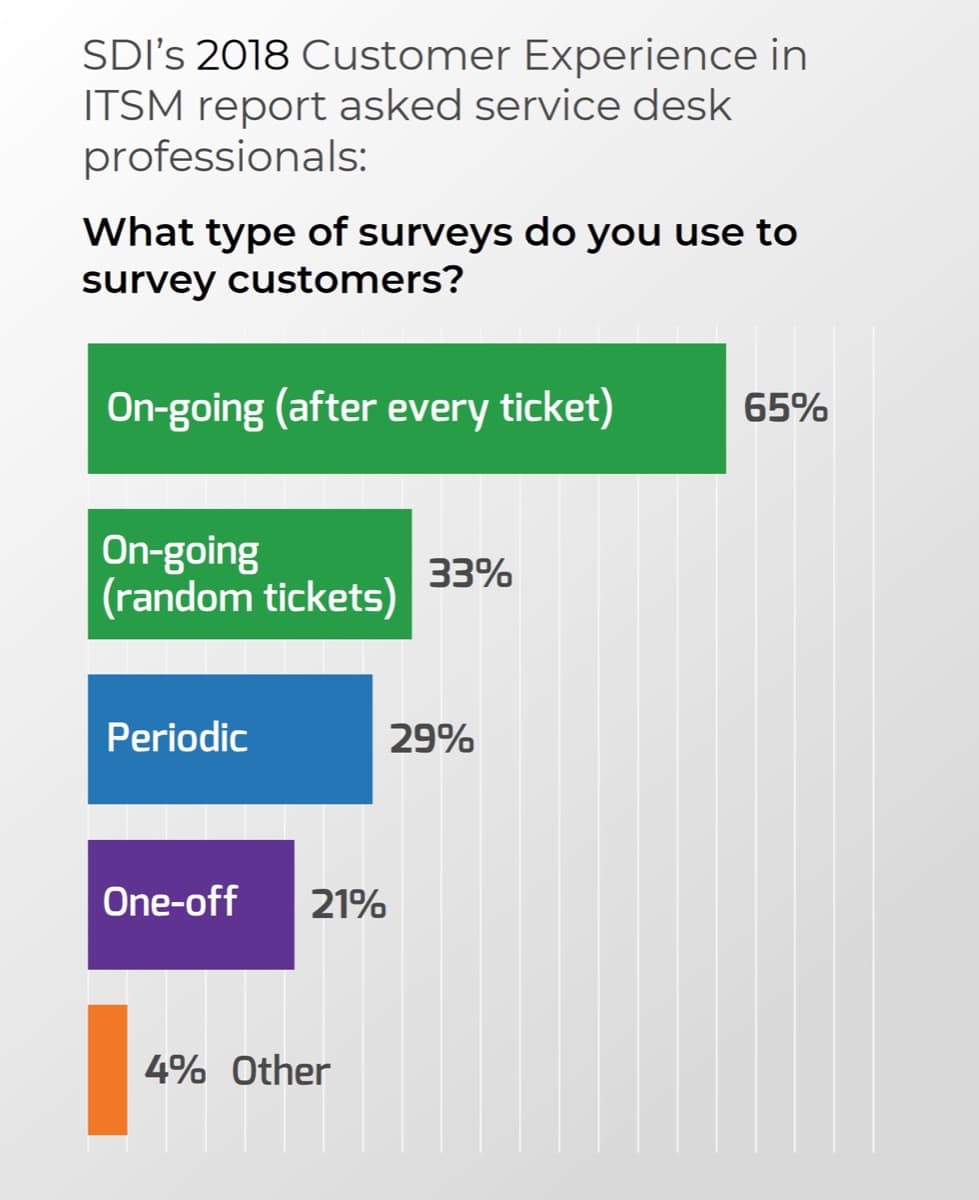
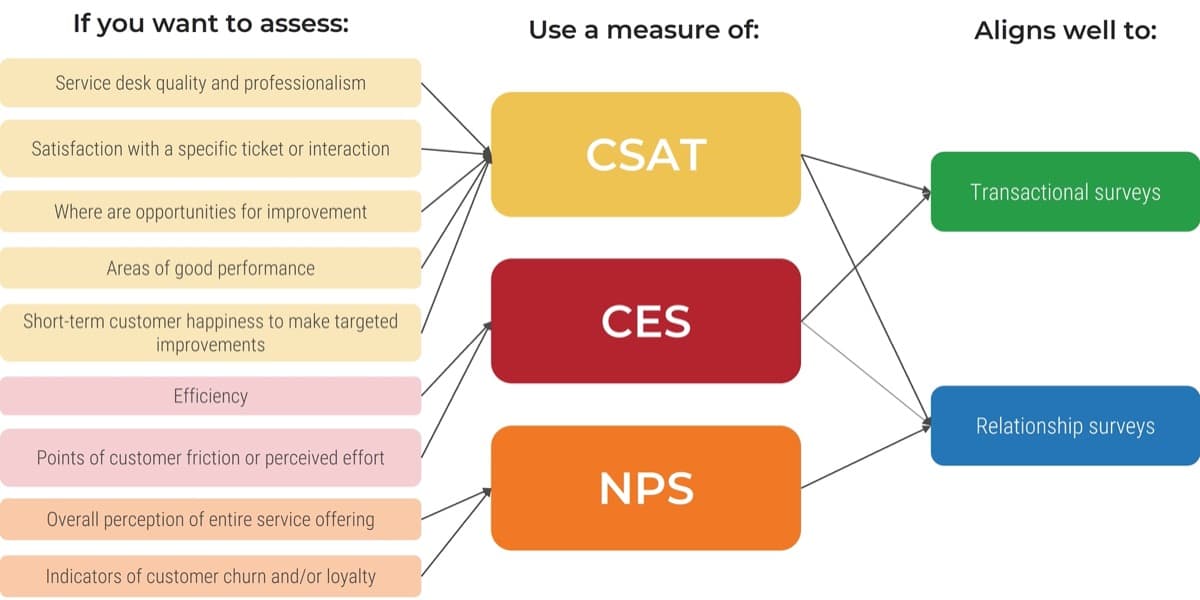
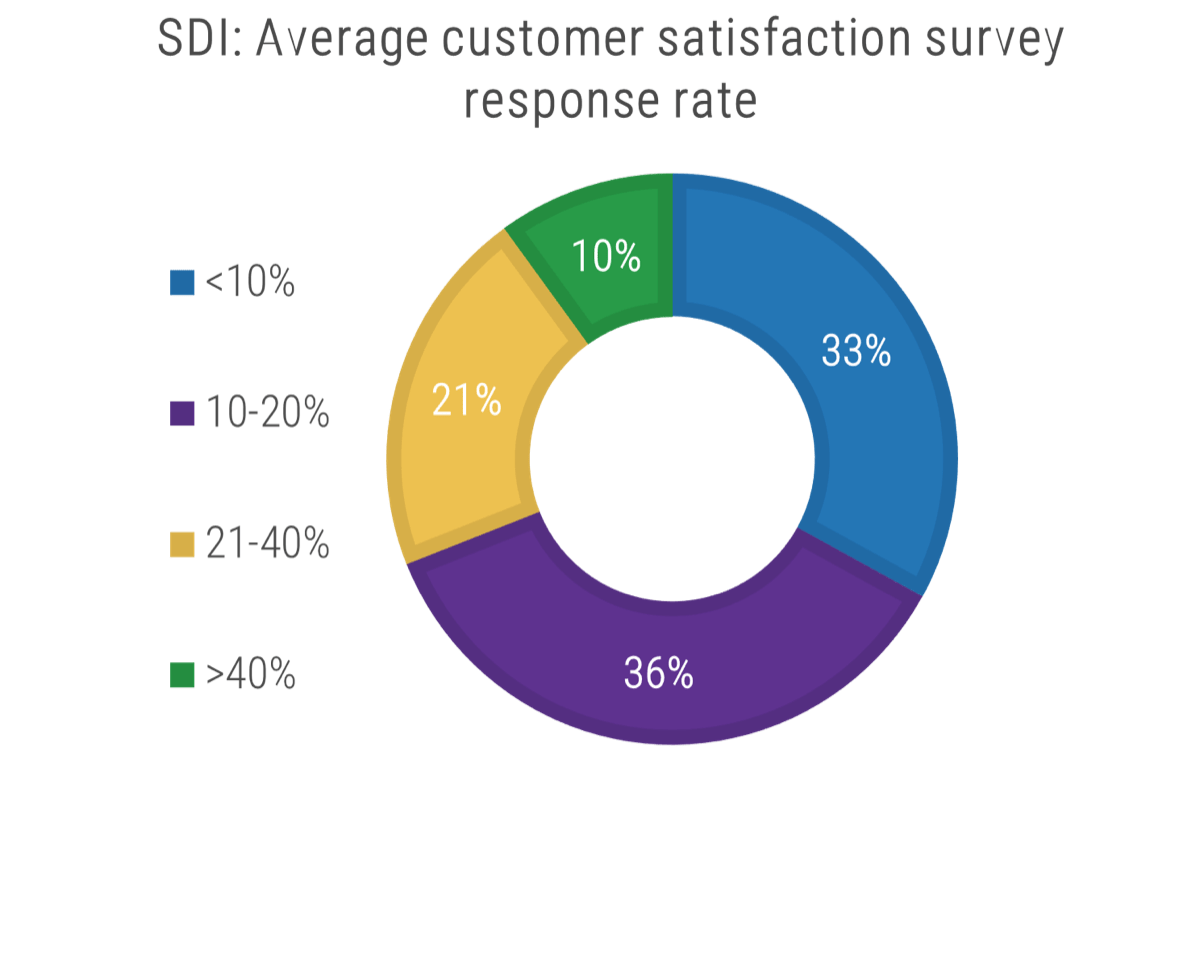
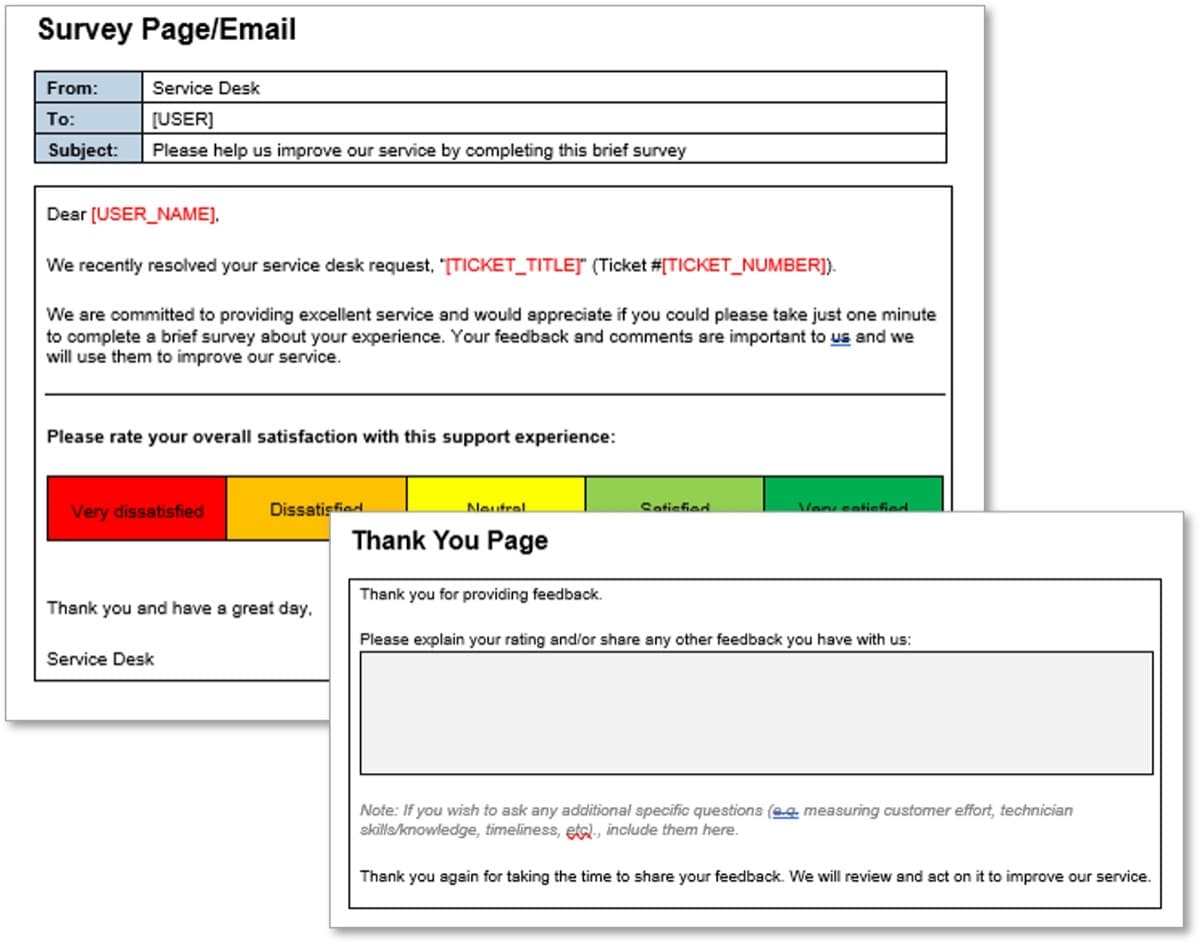
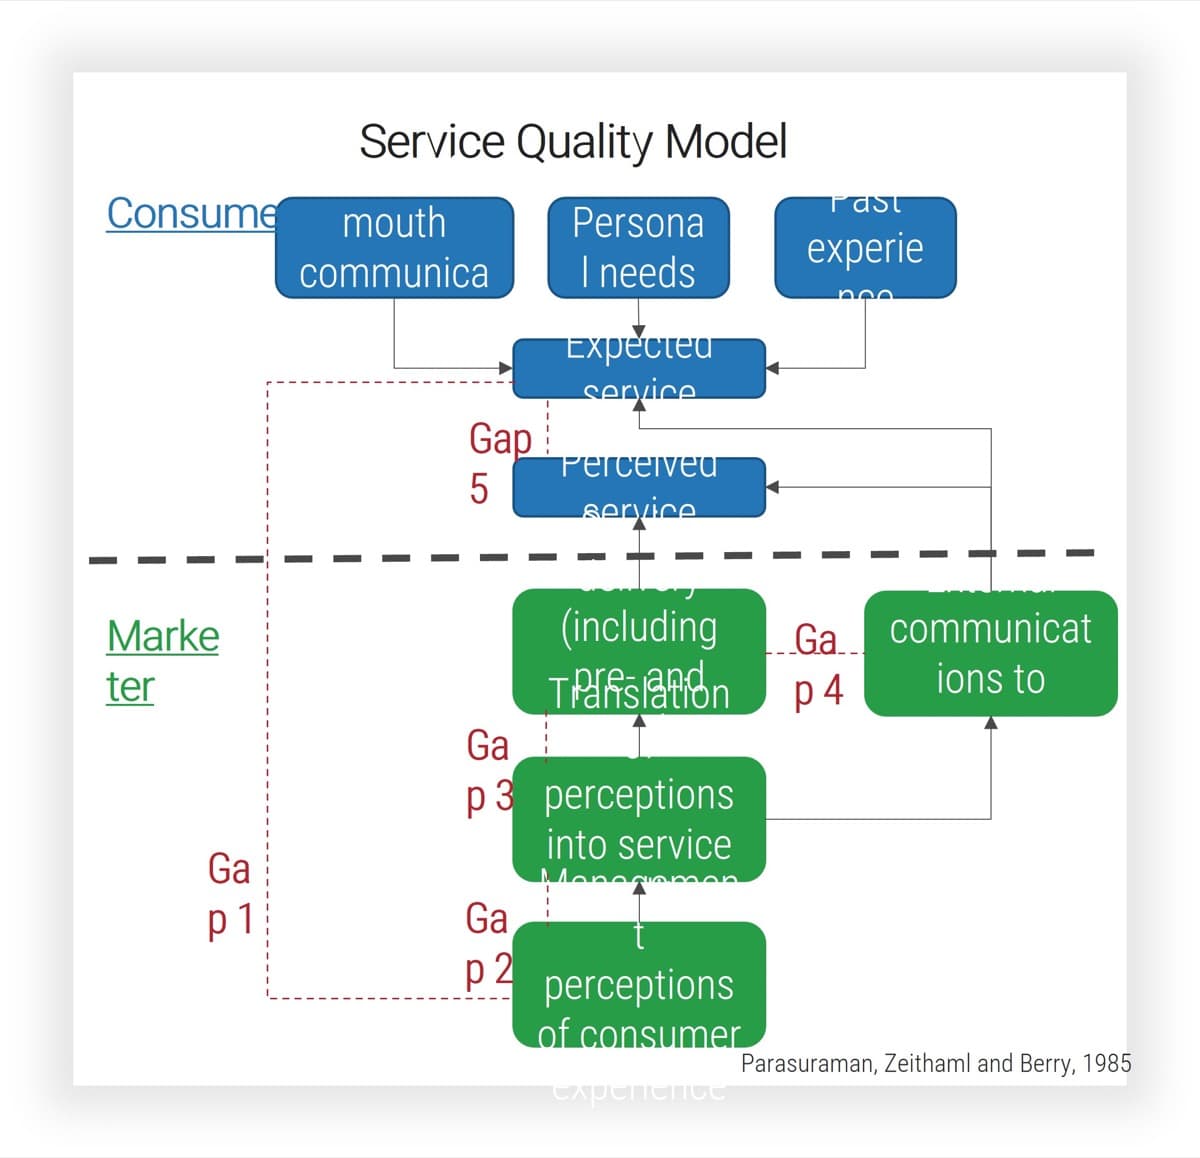
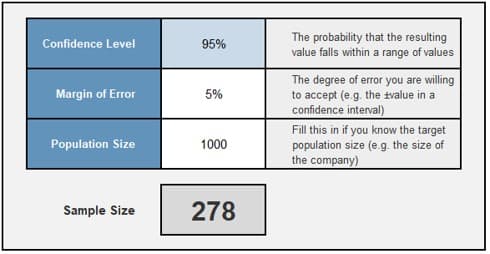
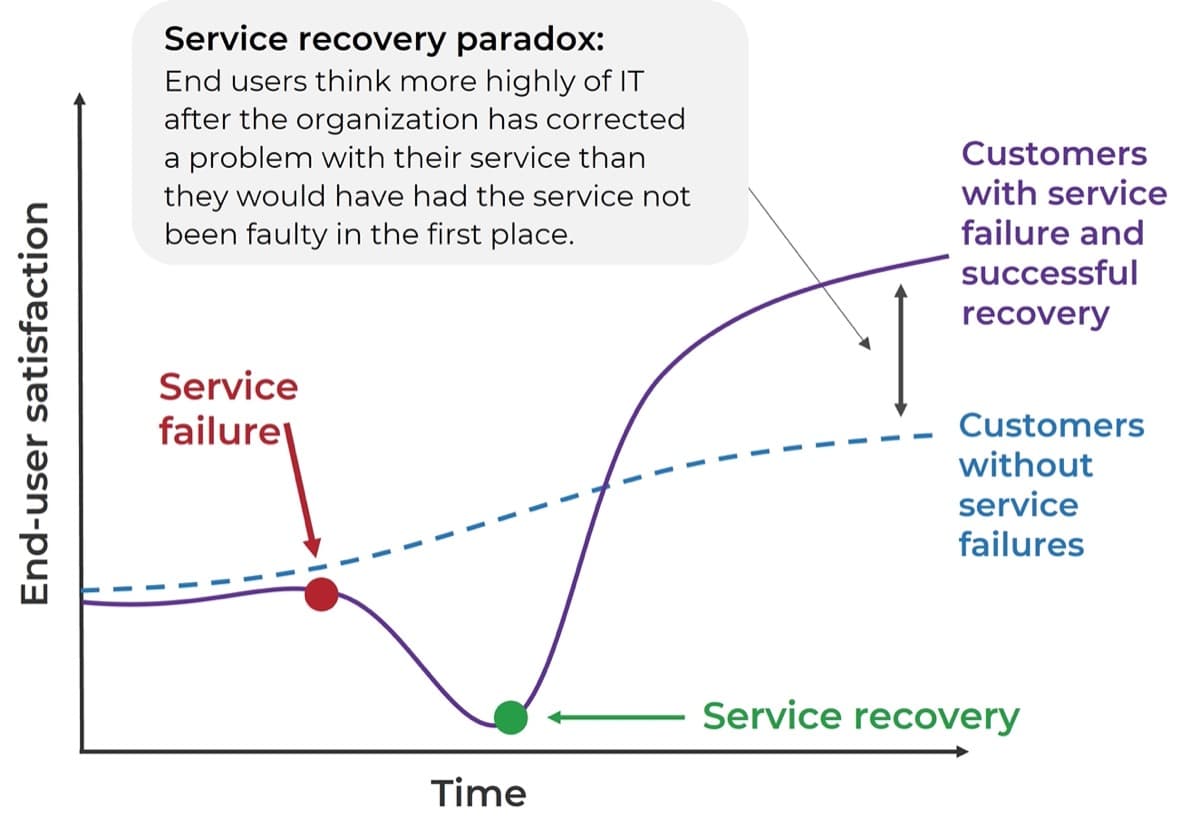
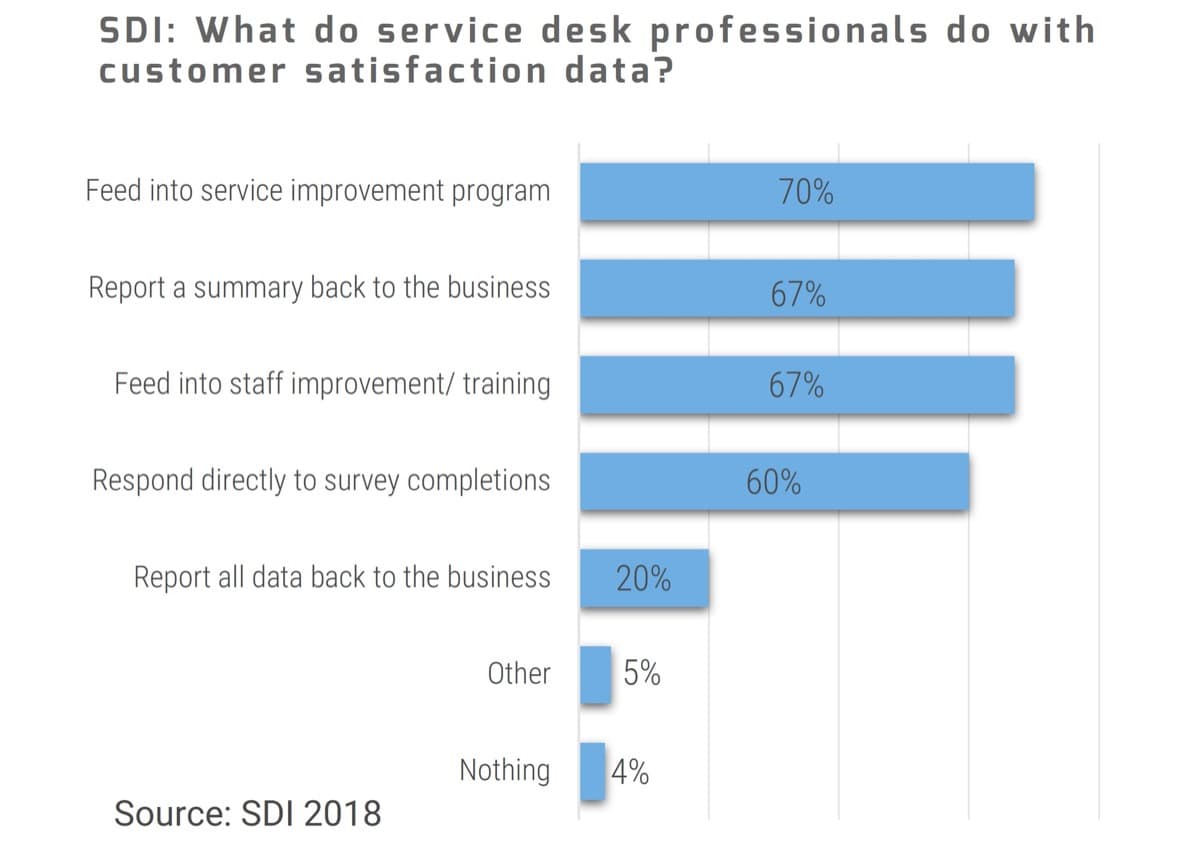
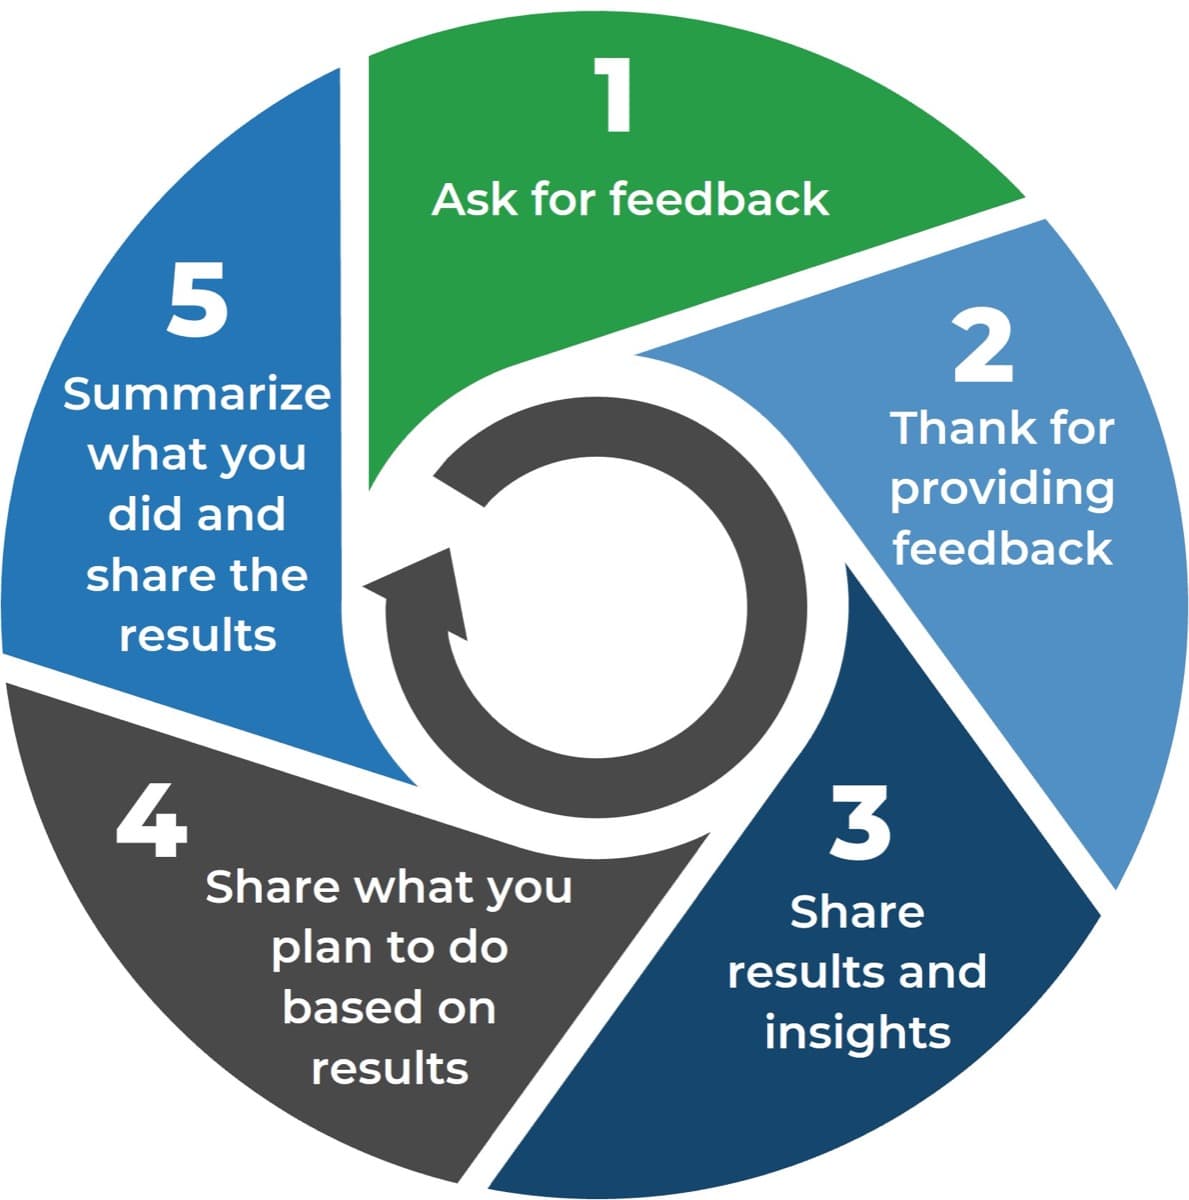
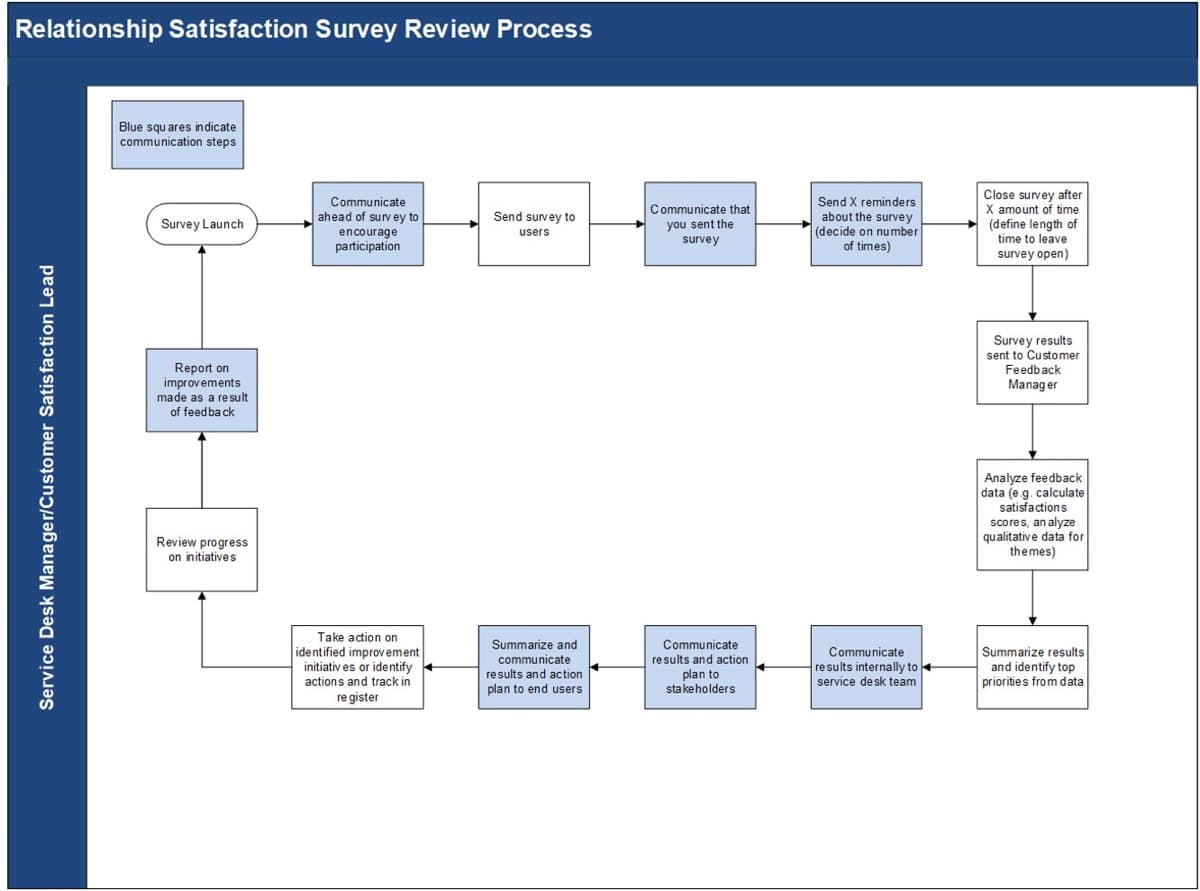
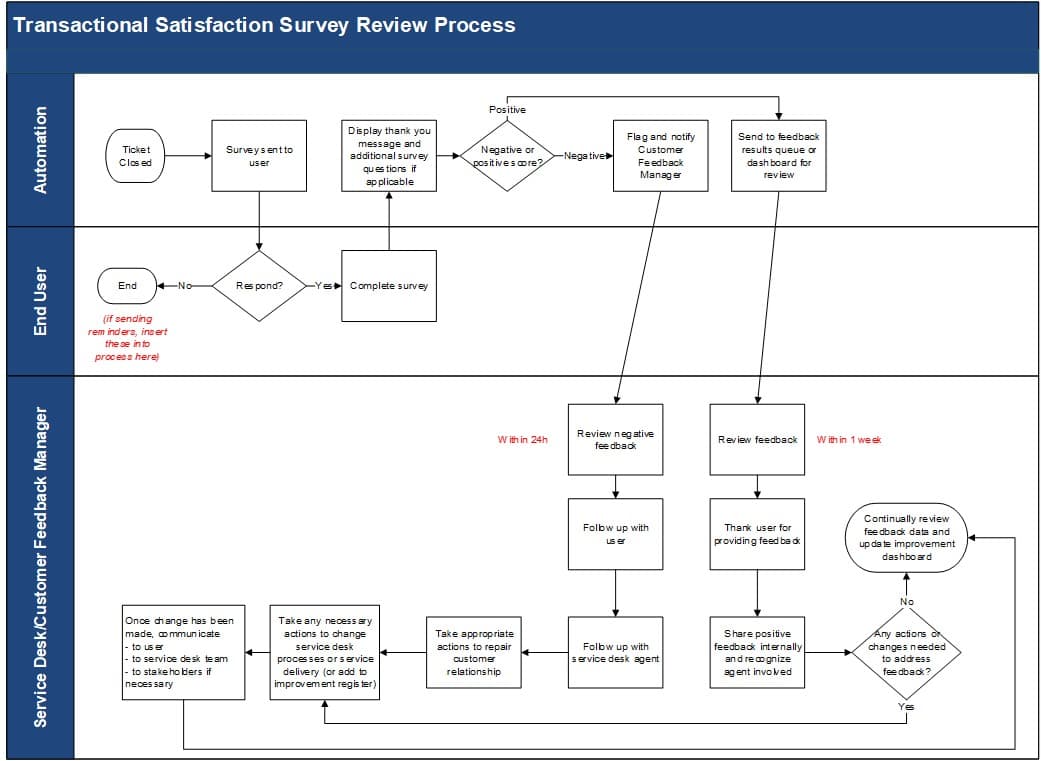

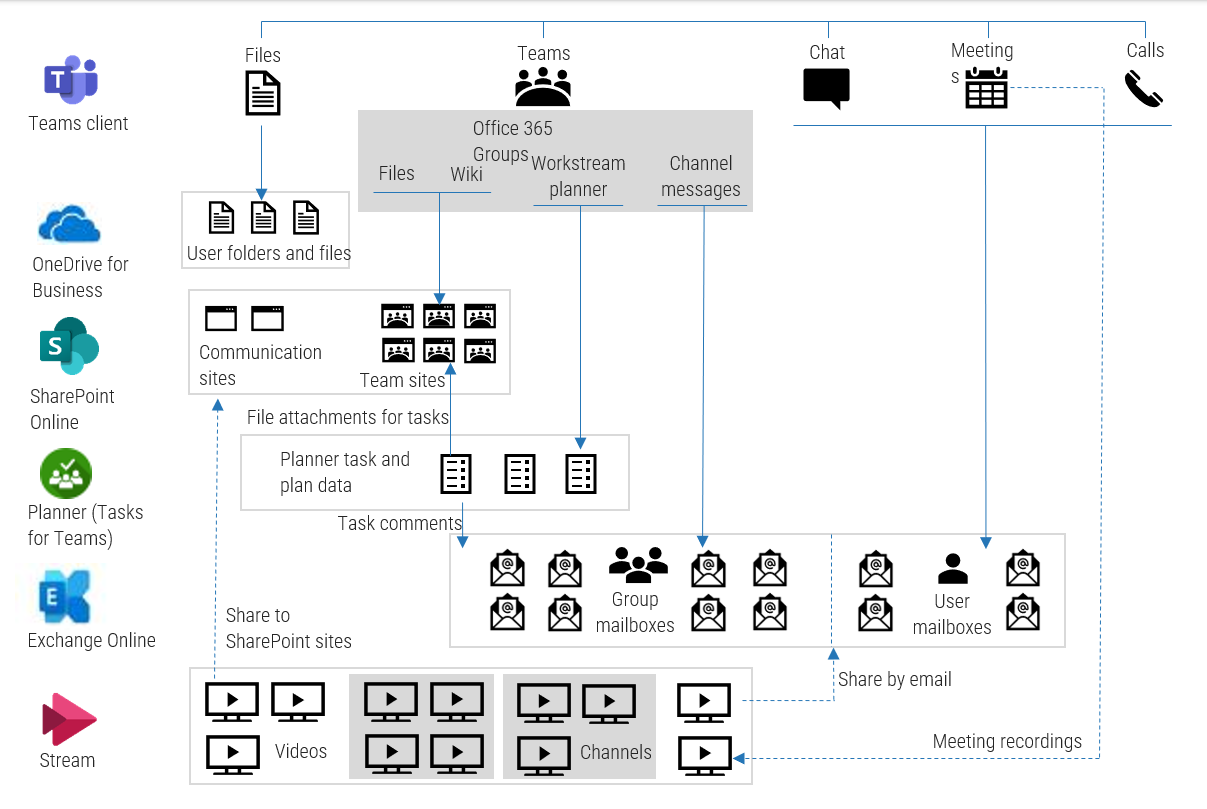
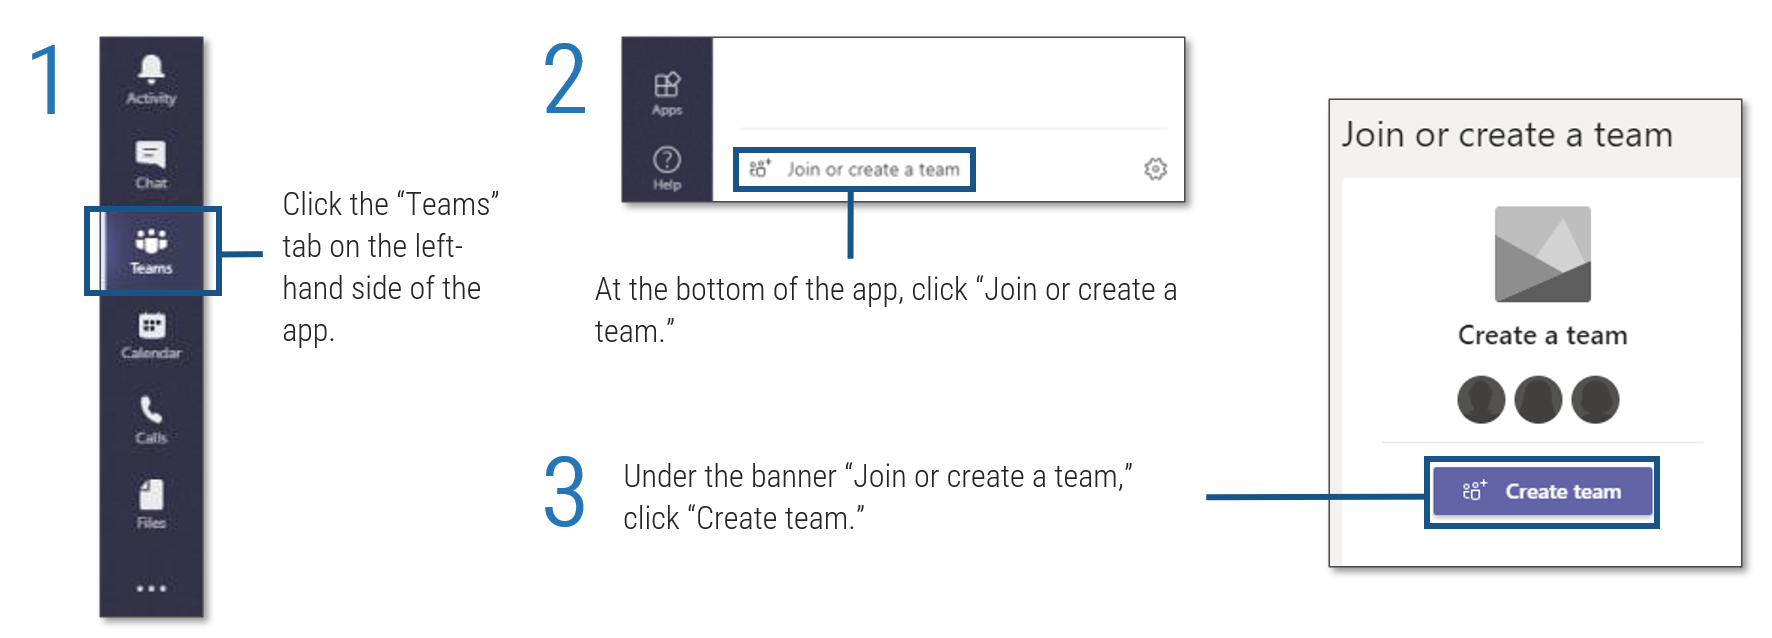 tab on the left-hand side of the app'. Step 2: 'At the bottom of the app, click '. Step 3: 'Under the banner , click '.">
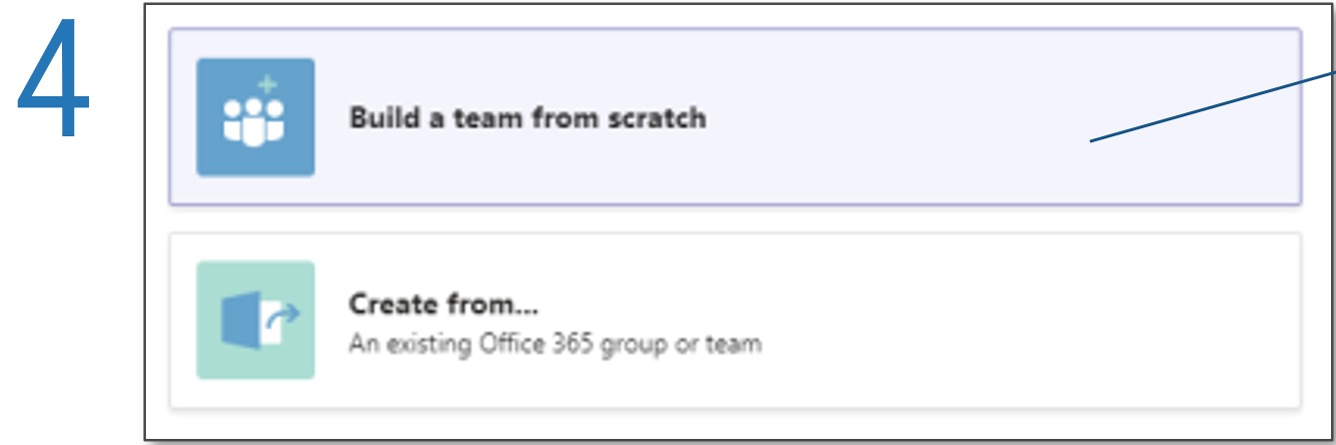
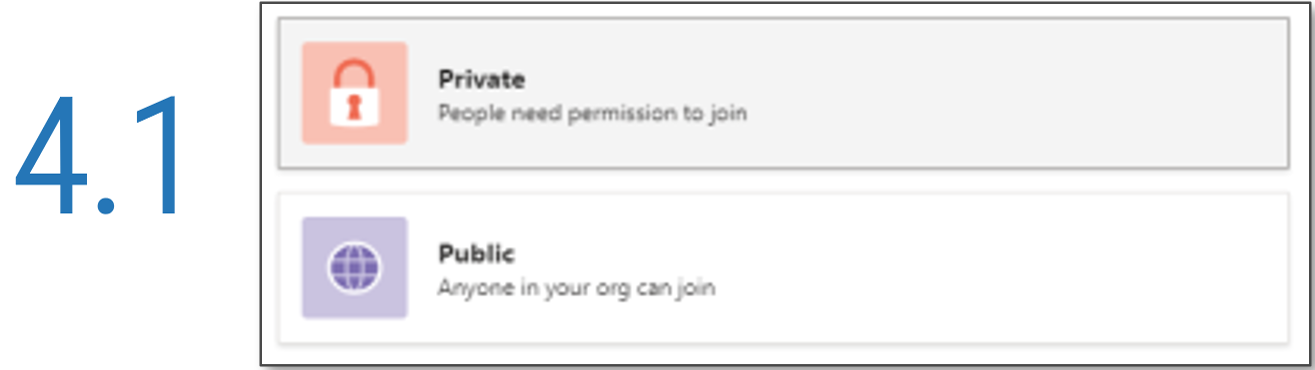
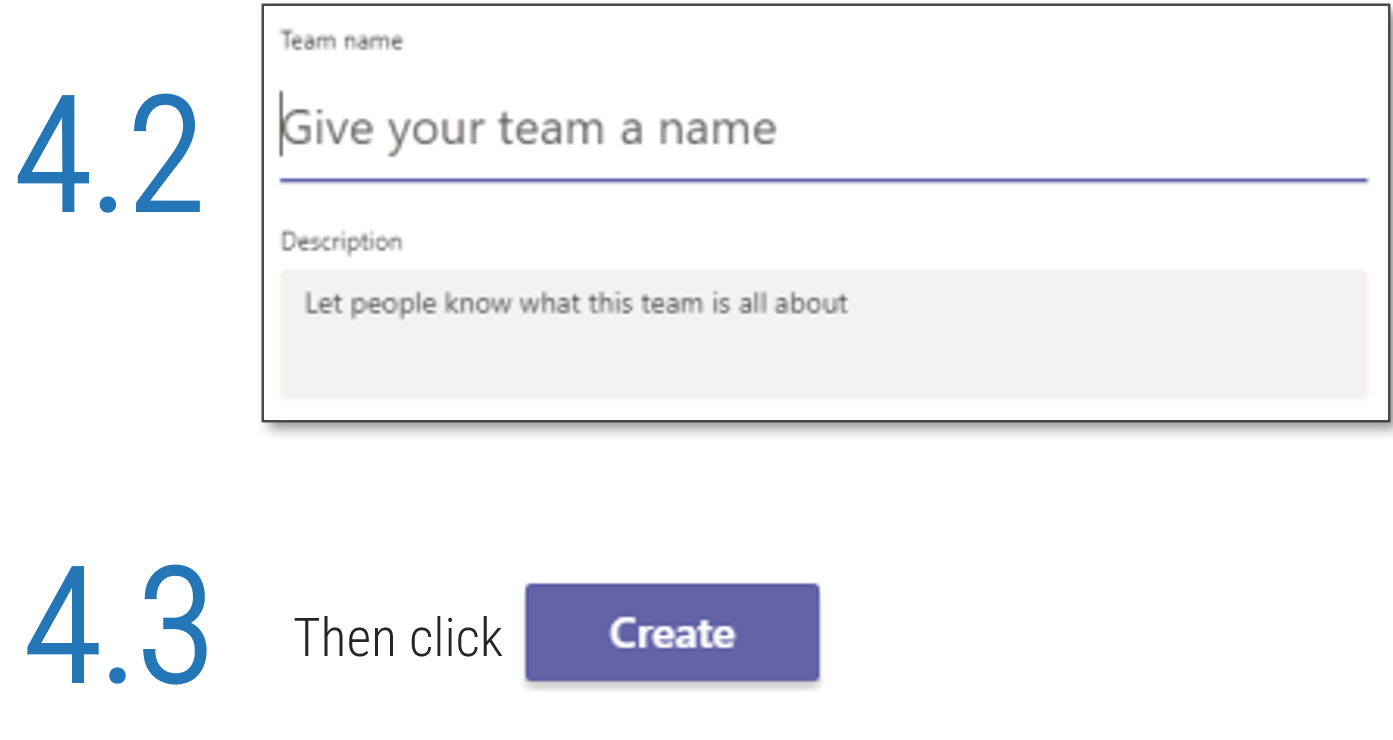 '.">
'.">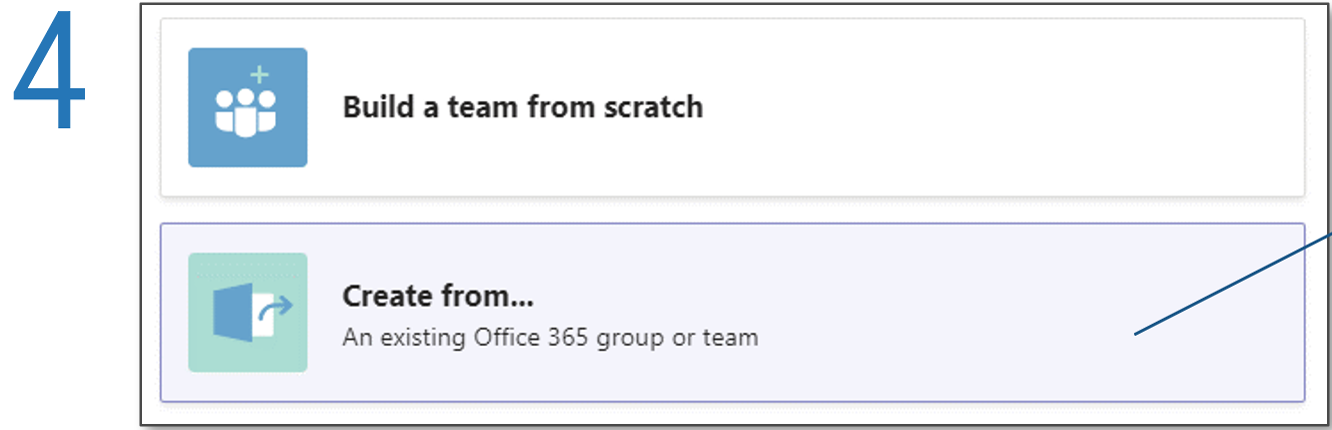
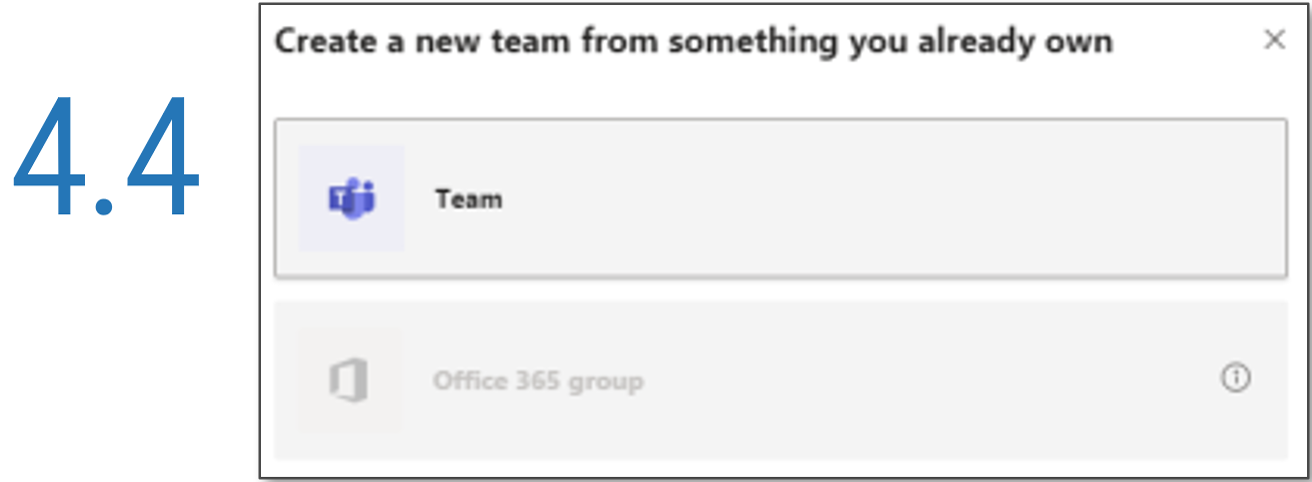
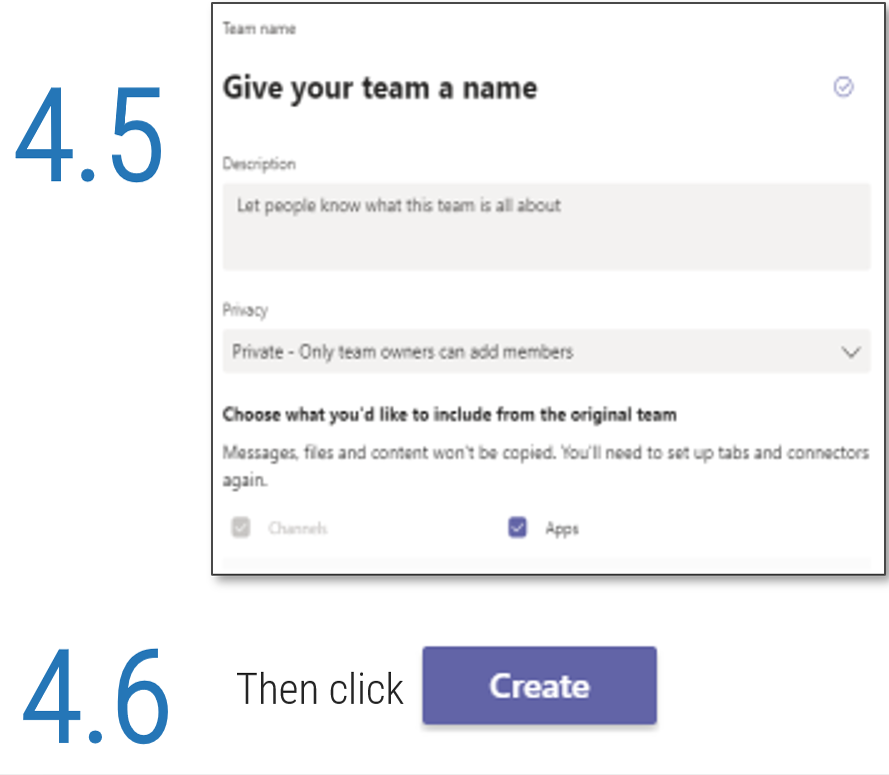 '.">
'.">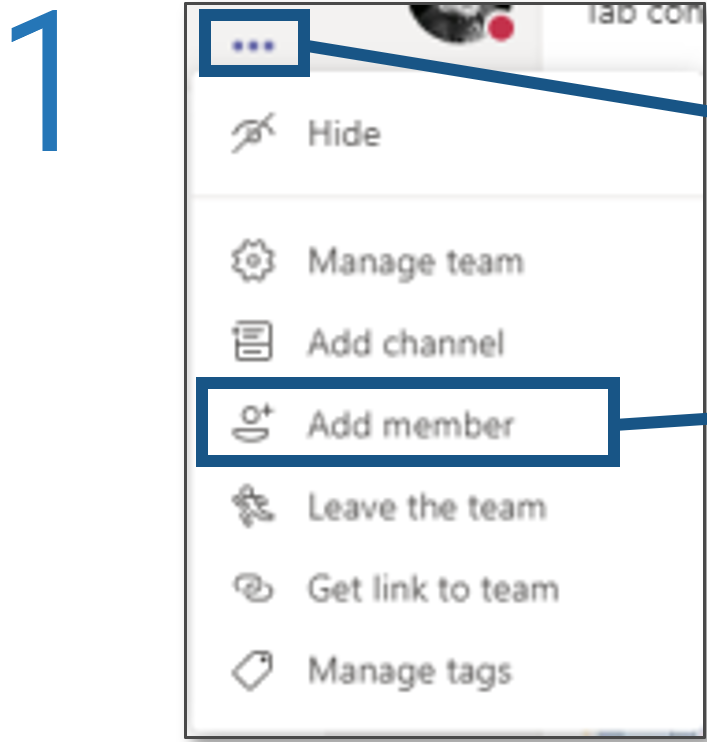
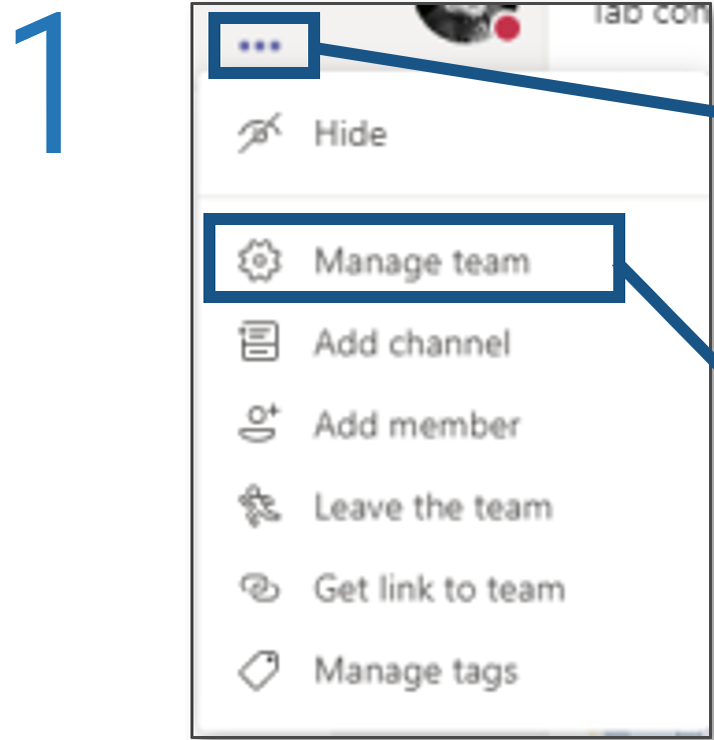
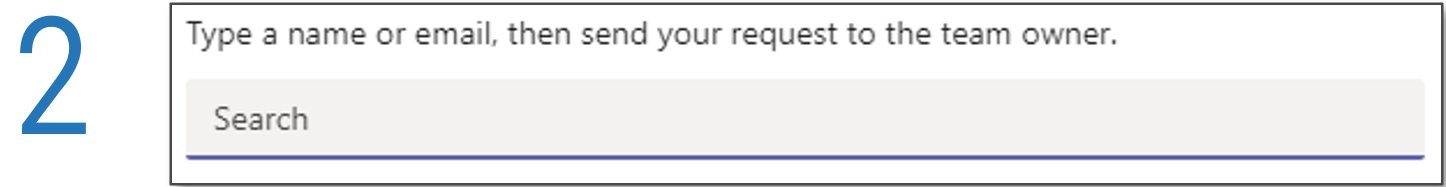

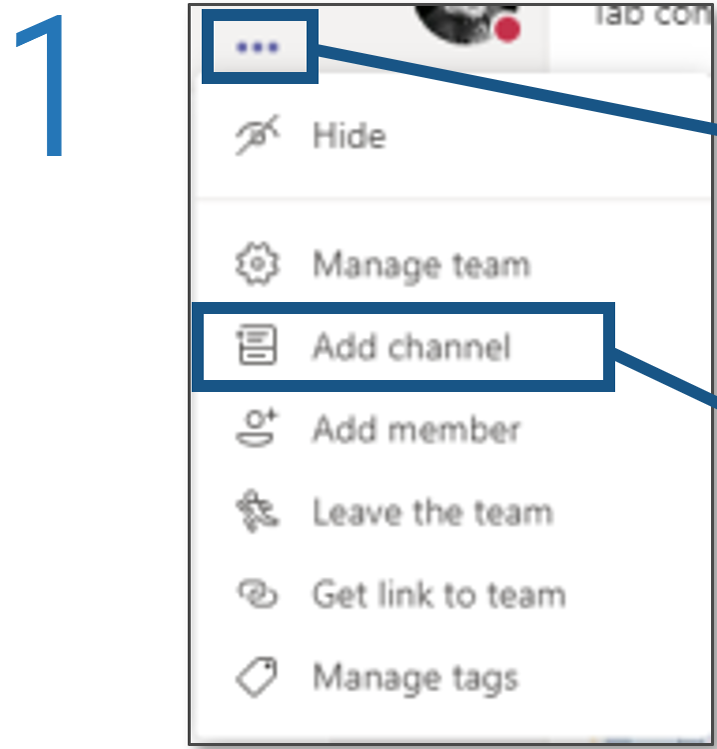
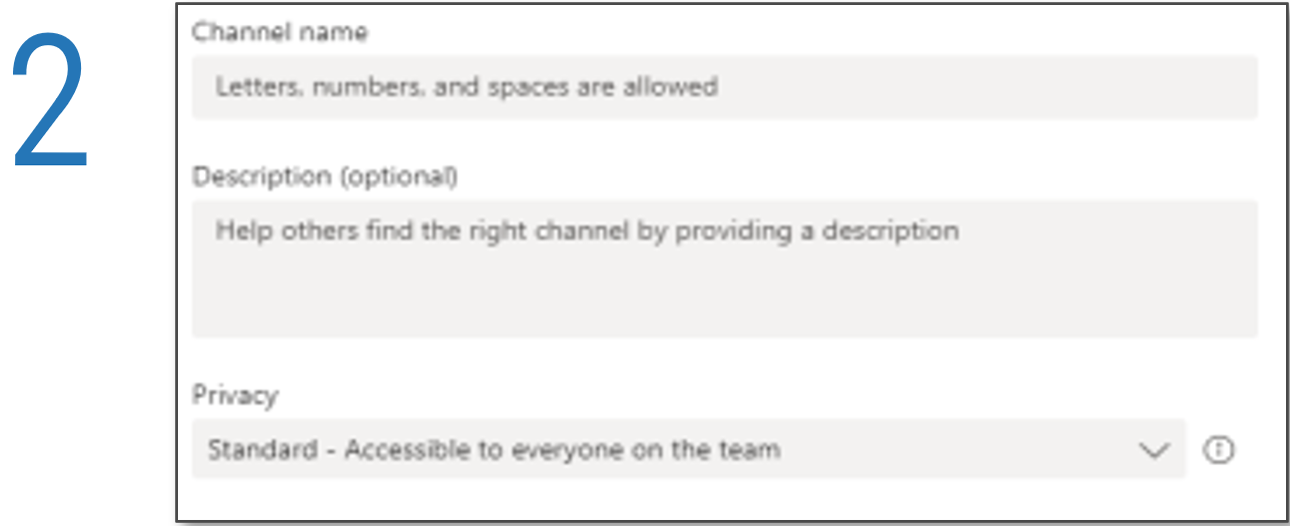
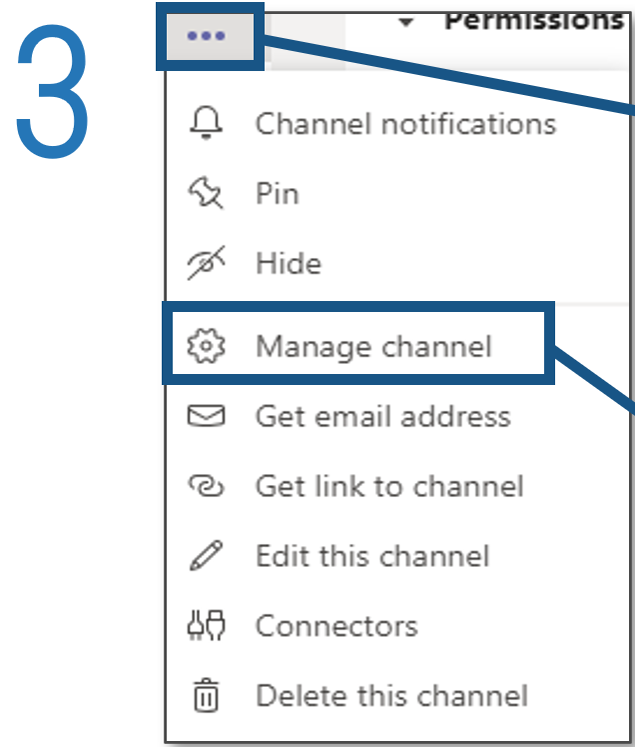
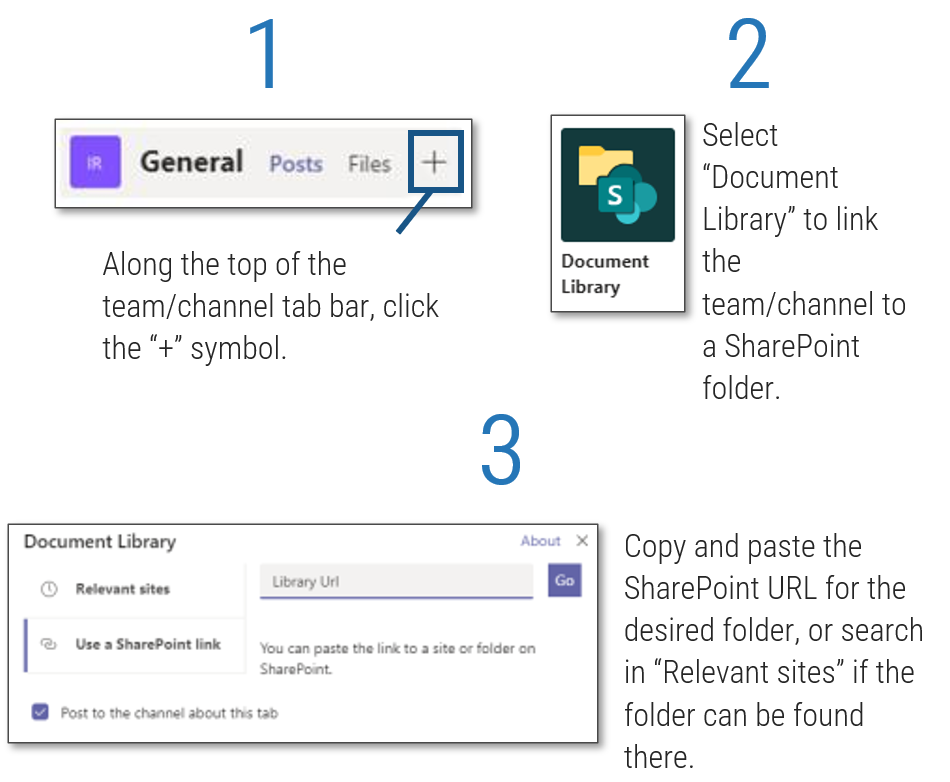
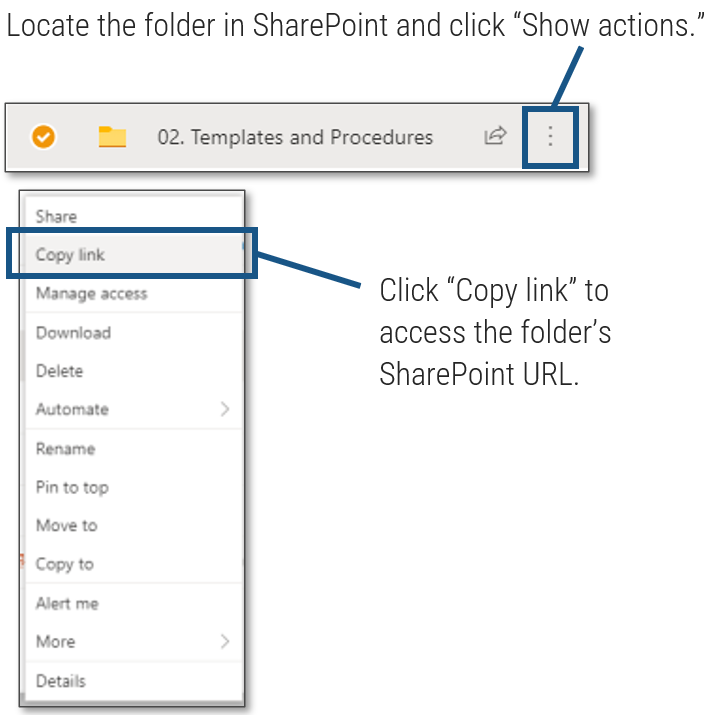 ', 'Click to access the folder's SharePoint URL.'">
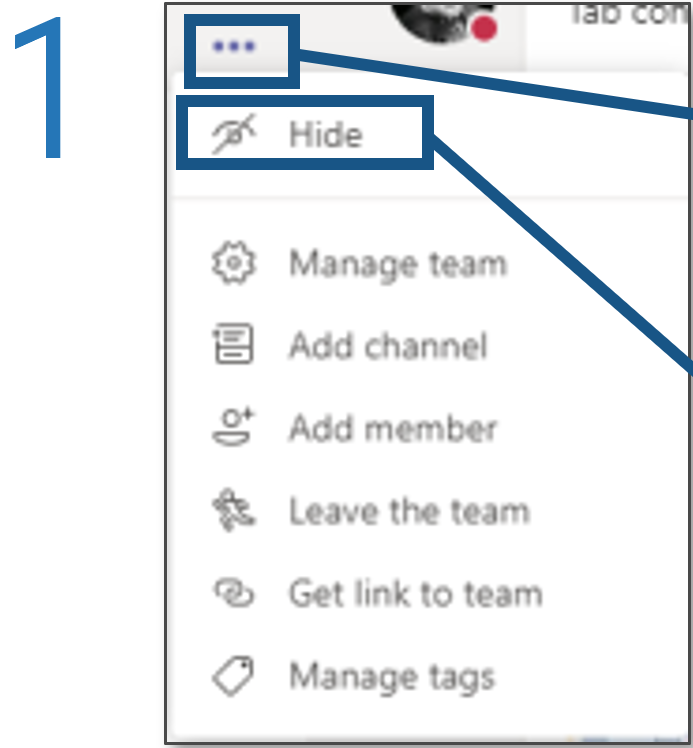
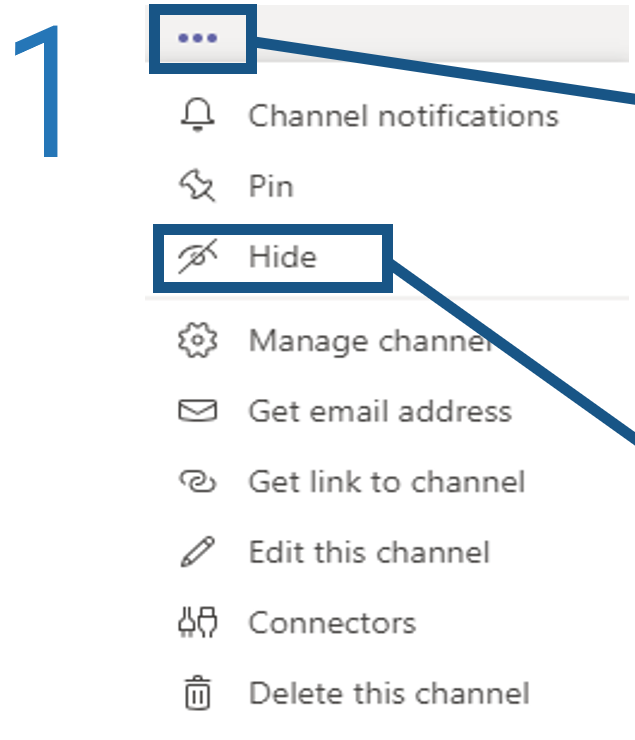
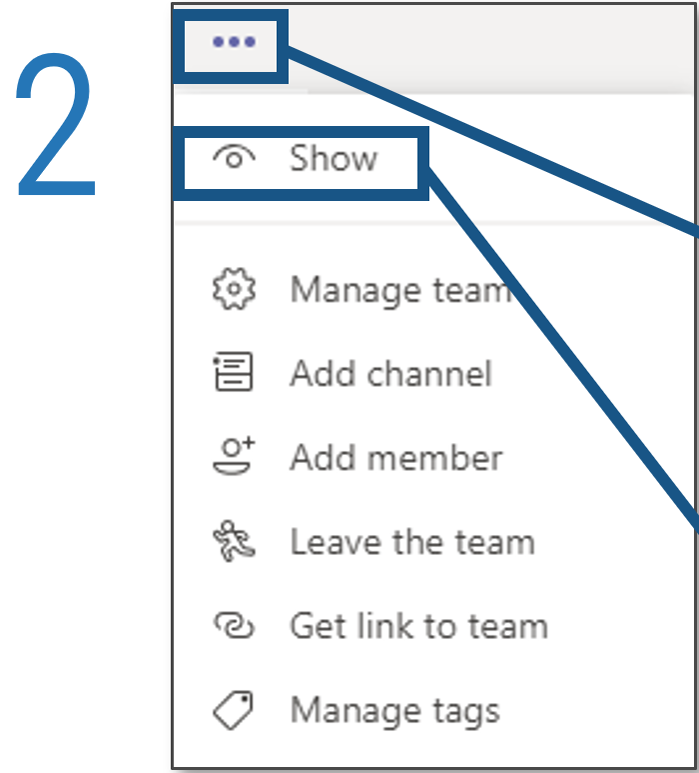
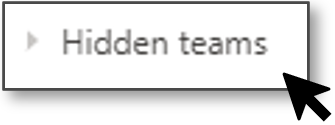
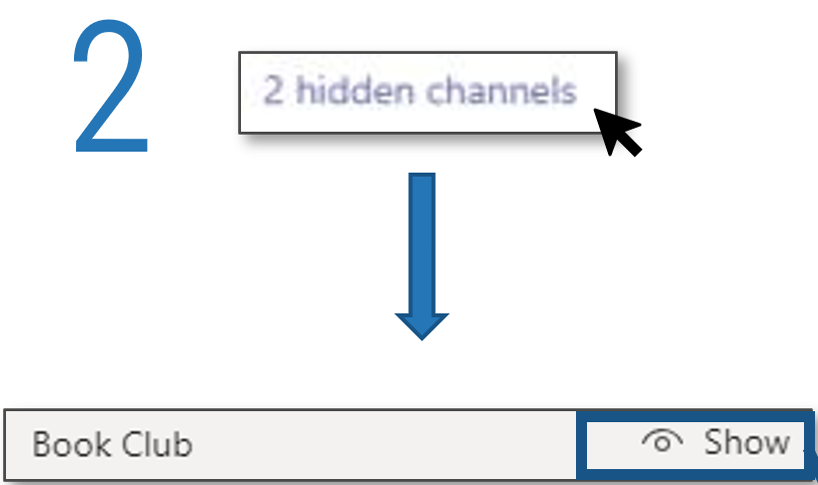
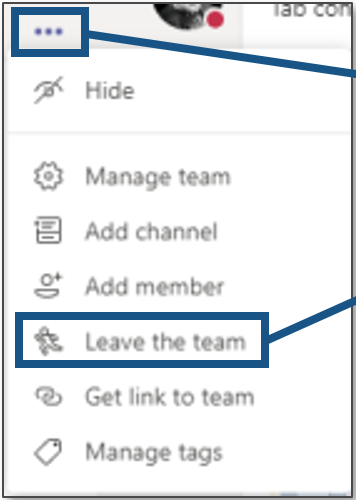
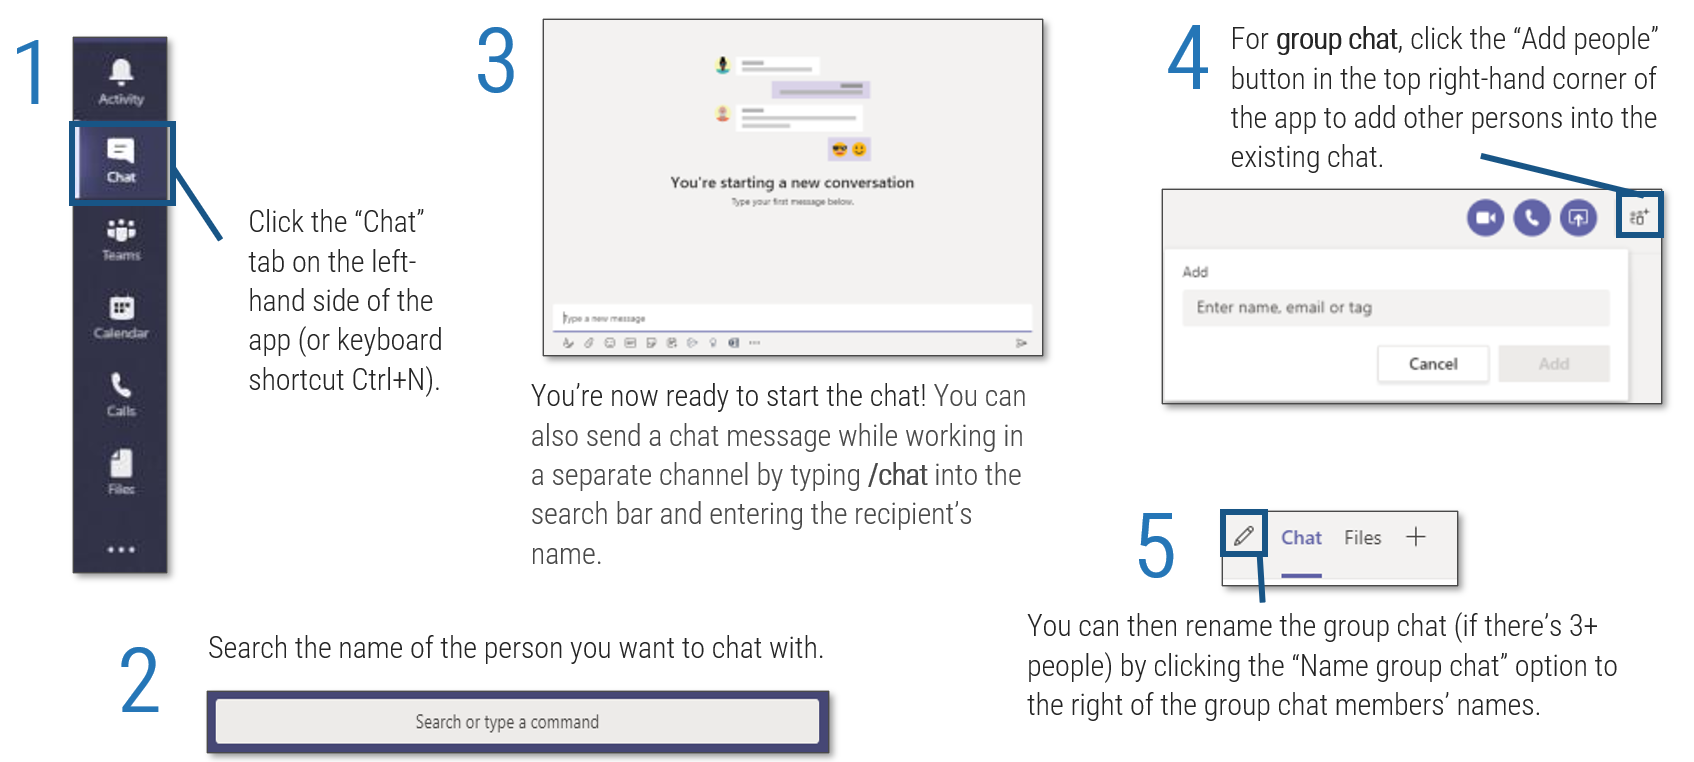
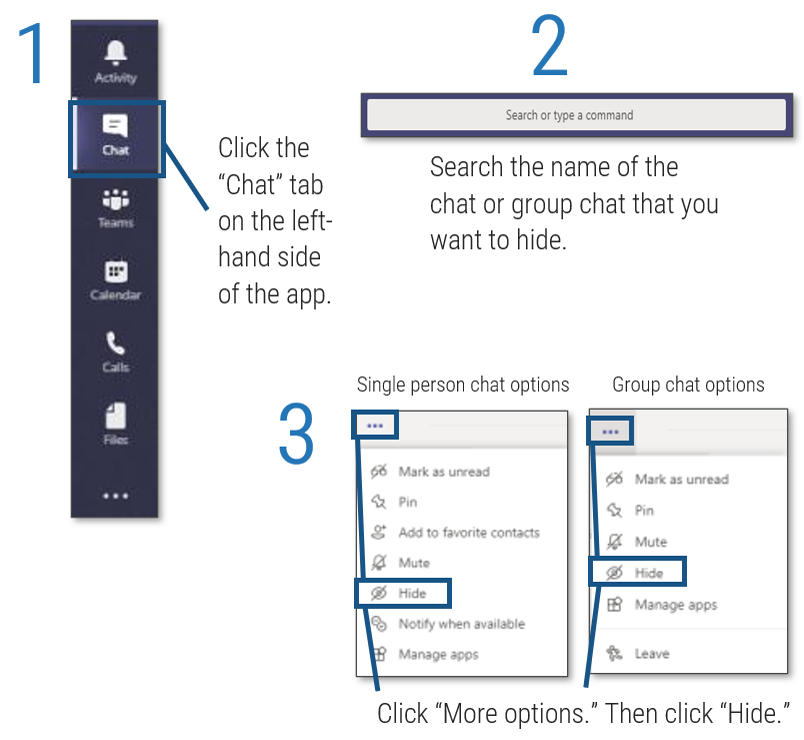
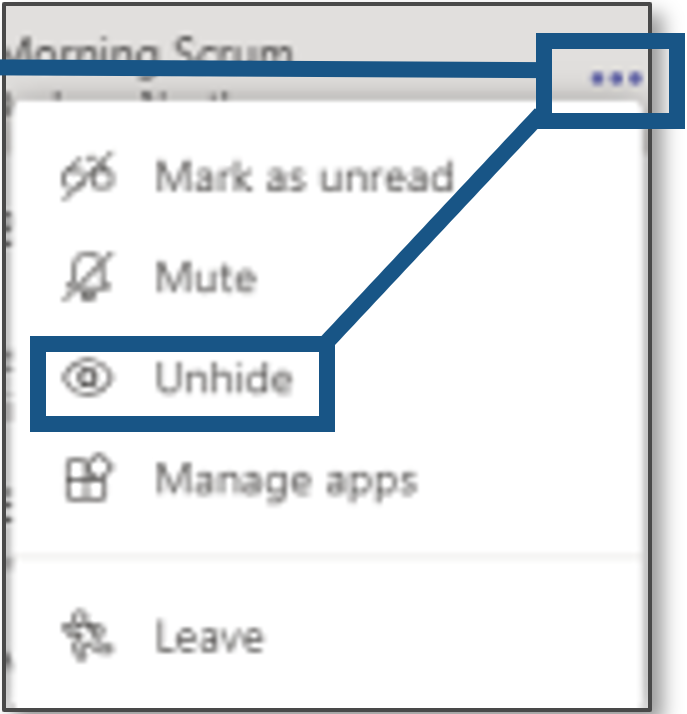
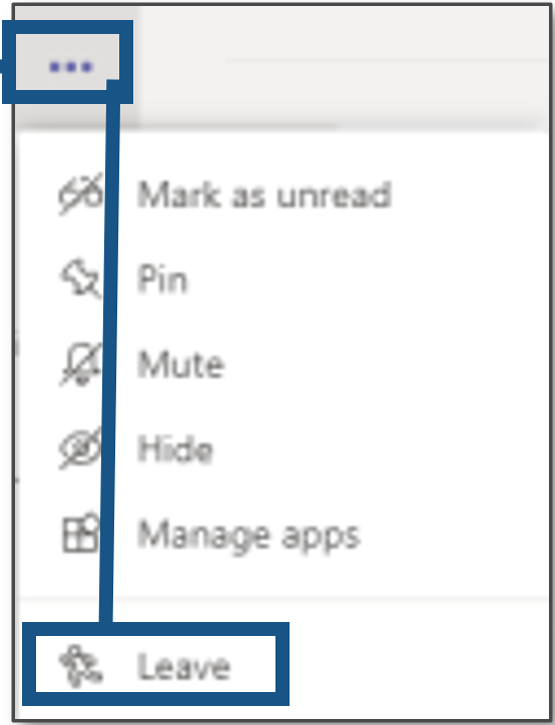
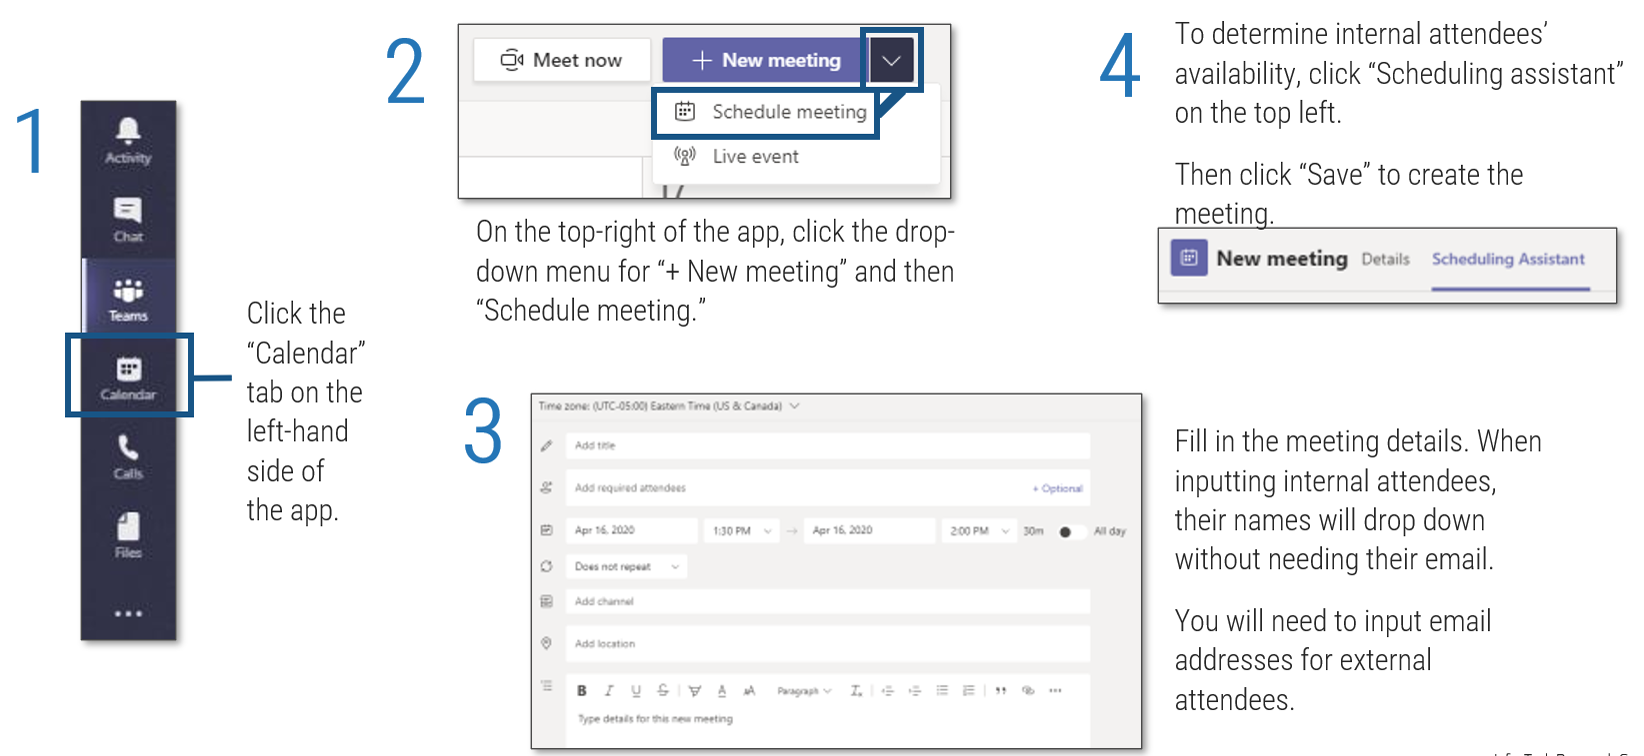
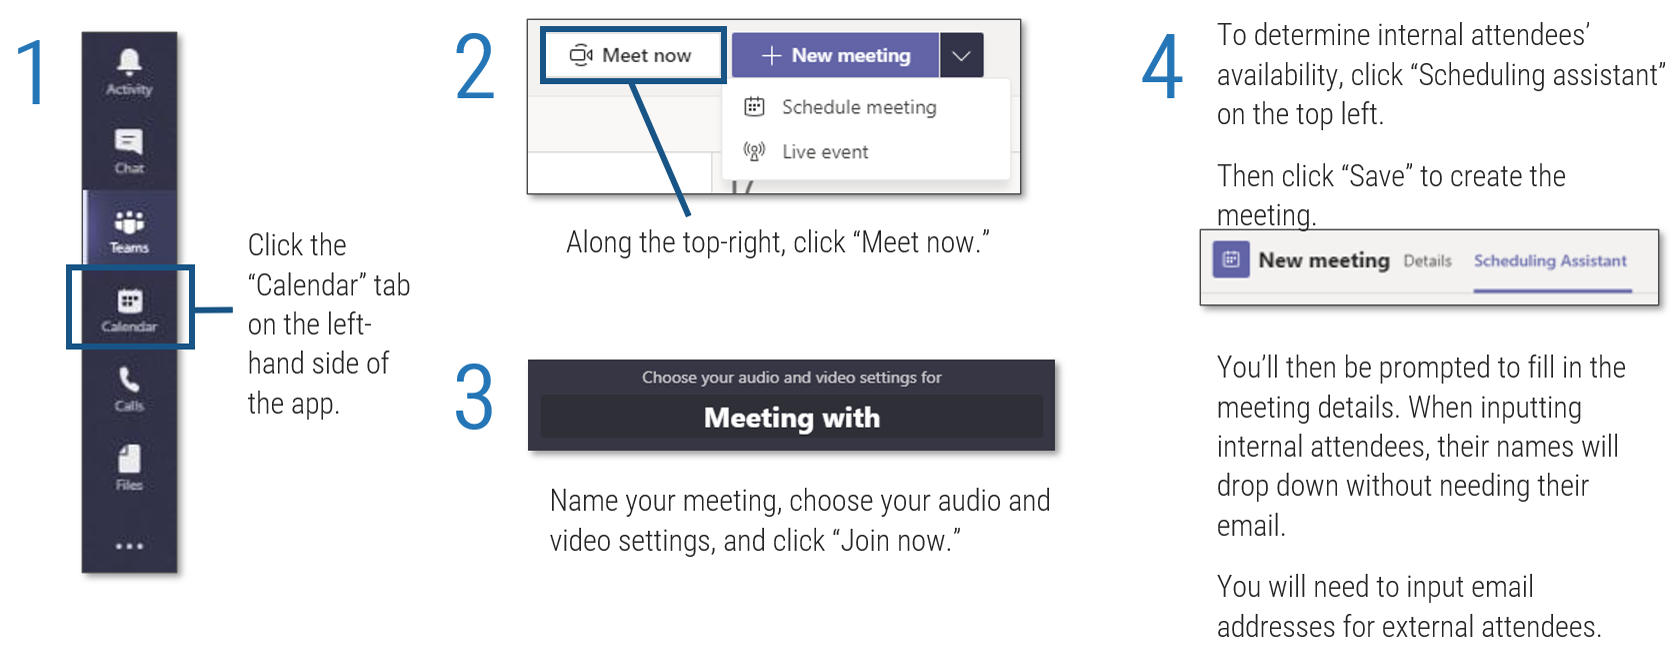
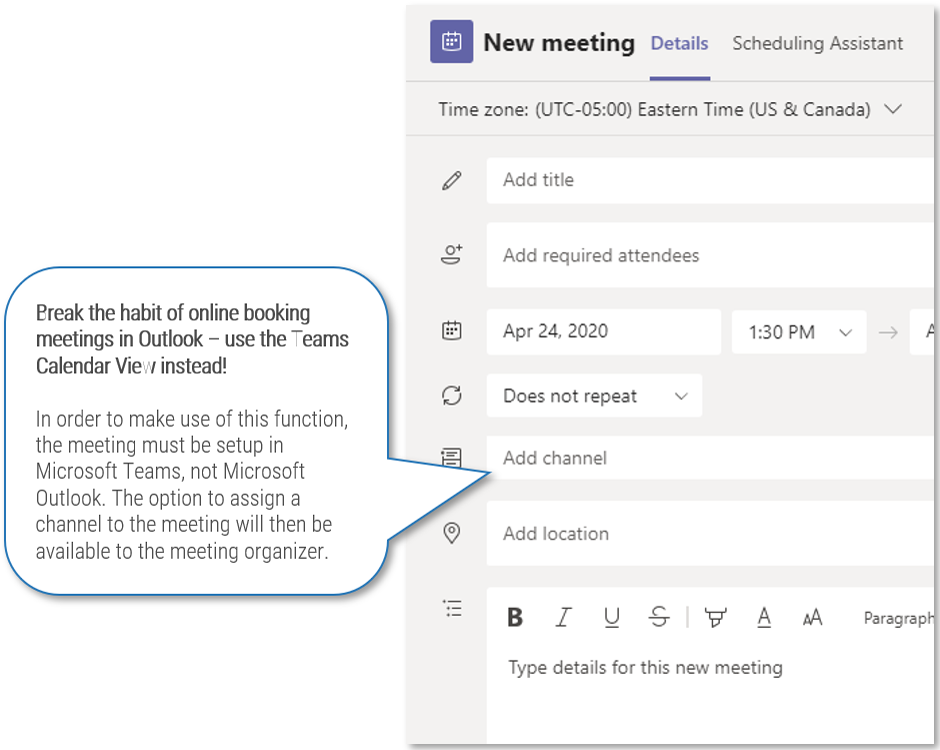
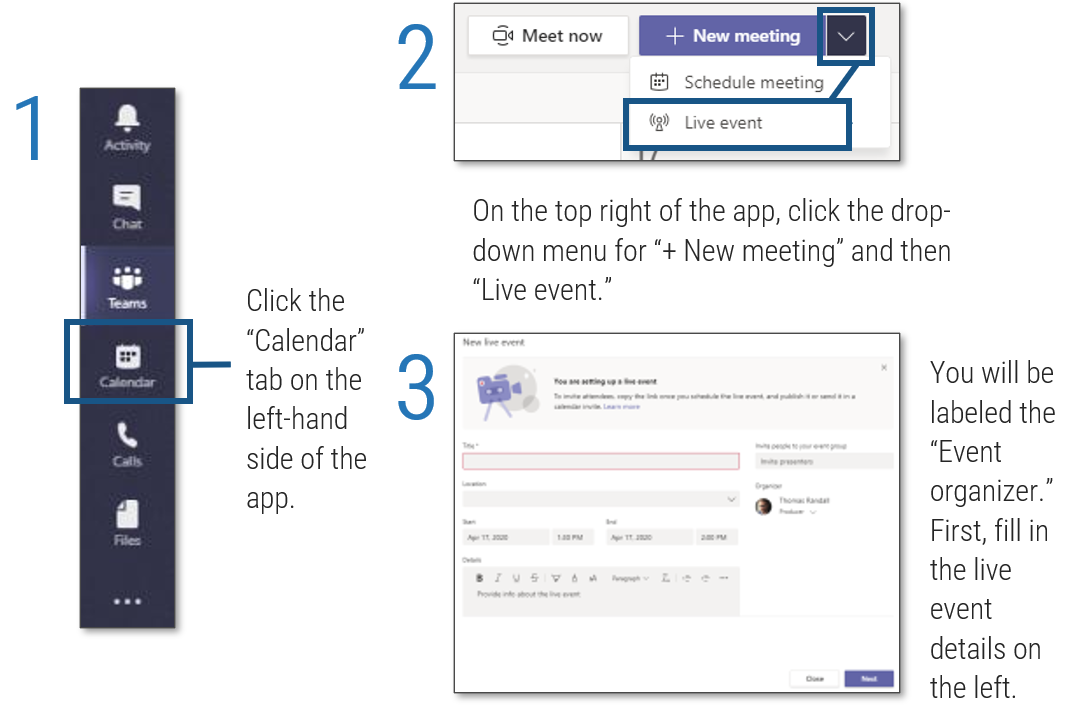
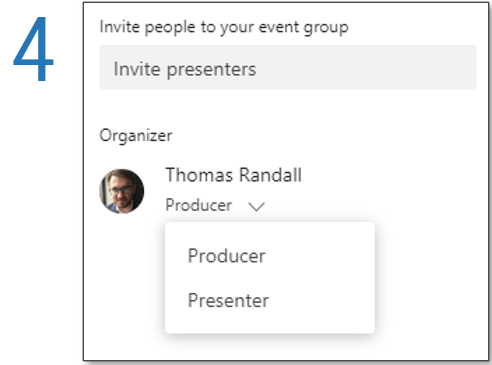
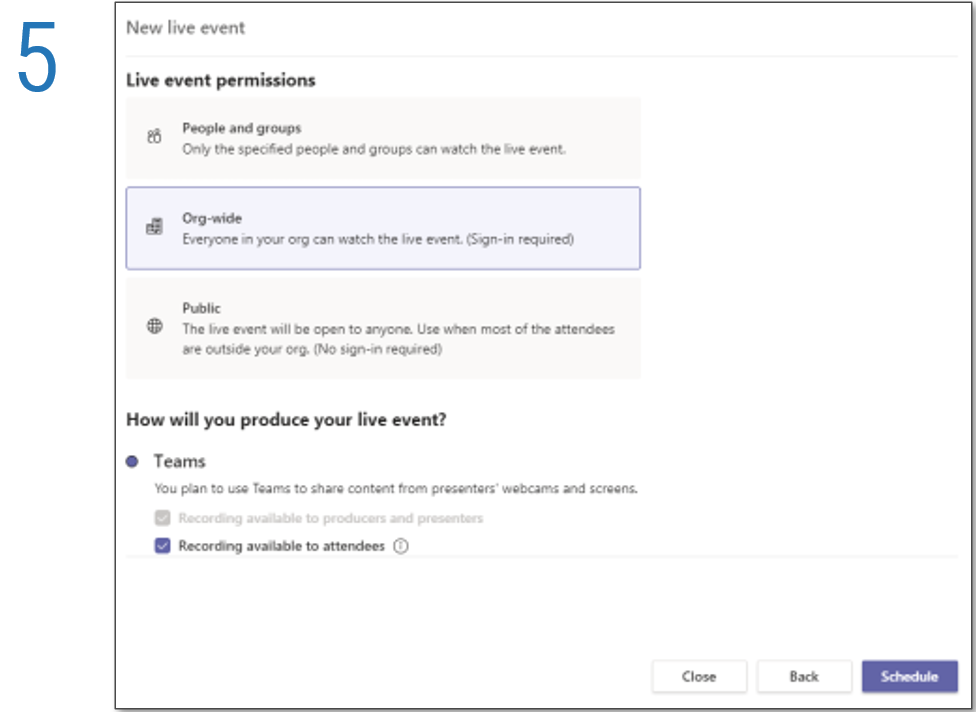
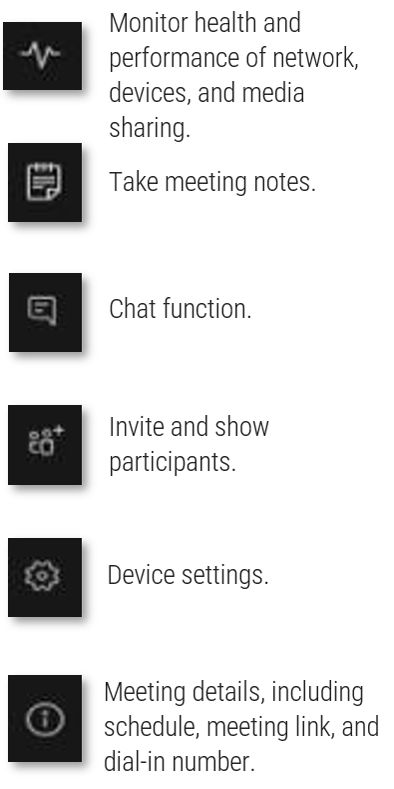


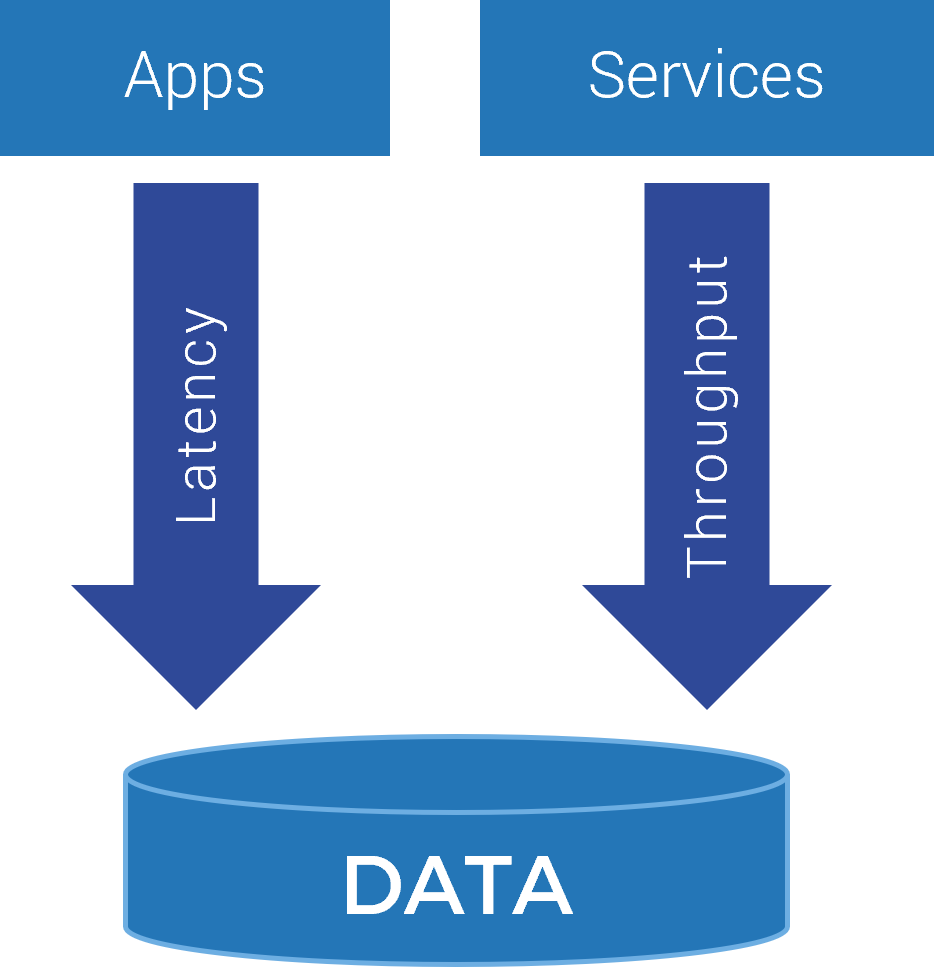
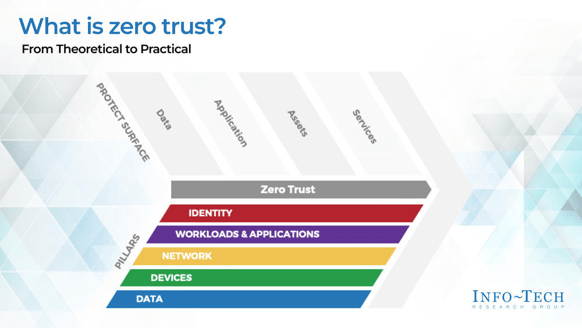


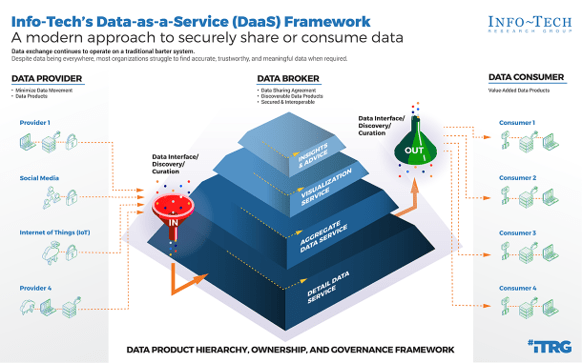
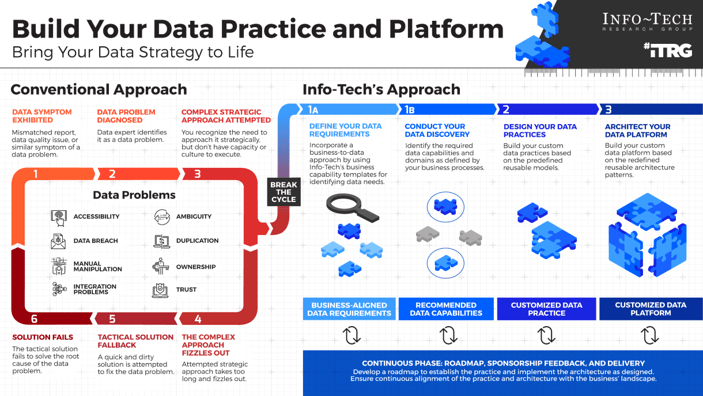


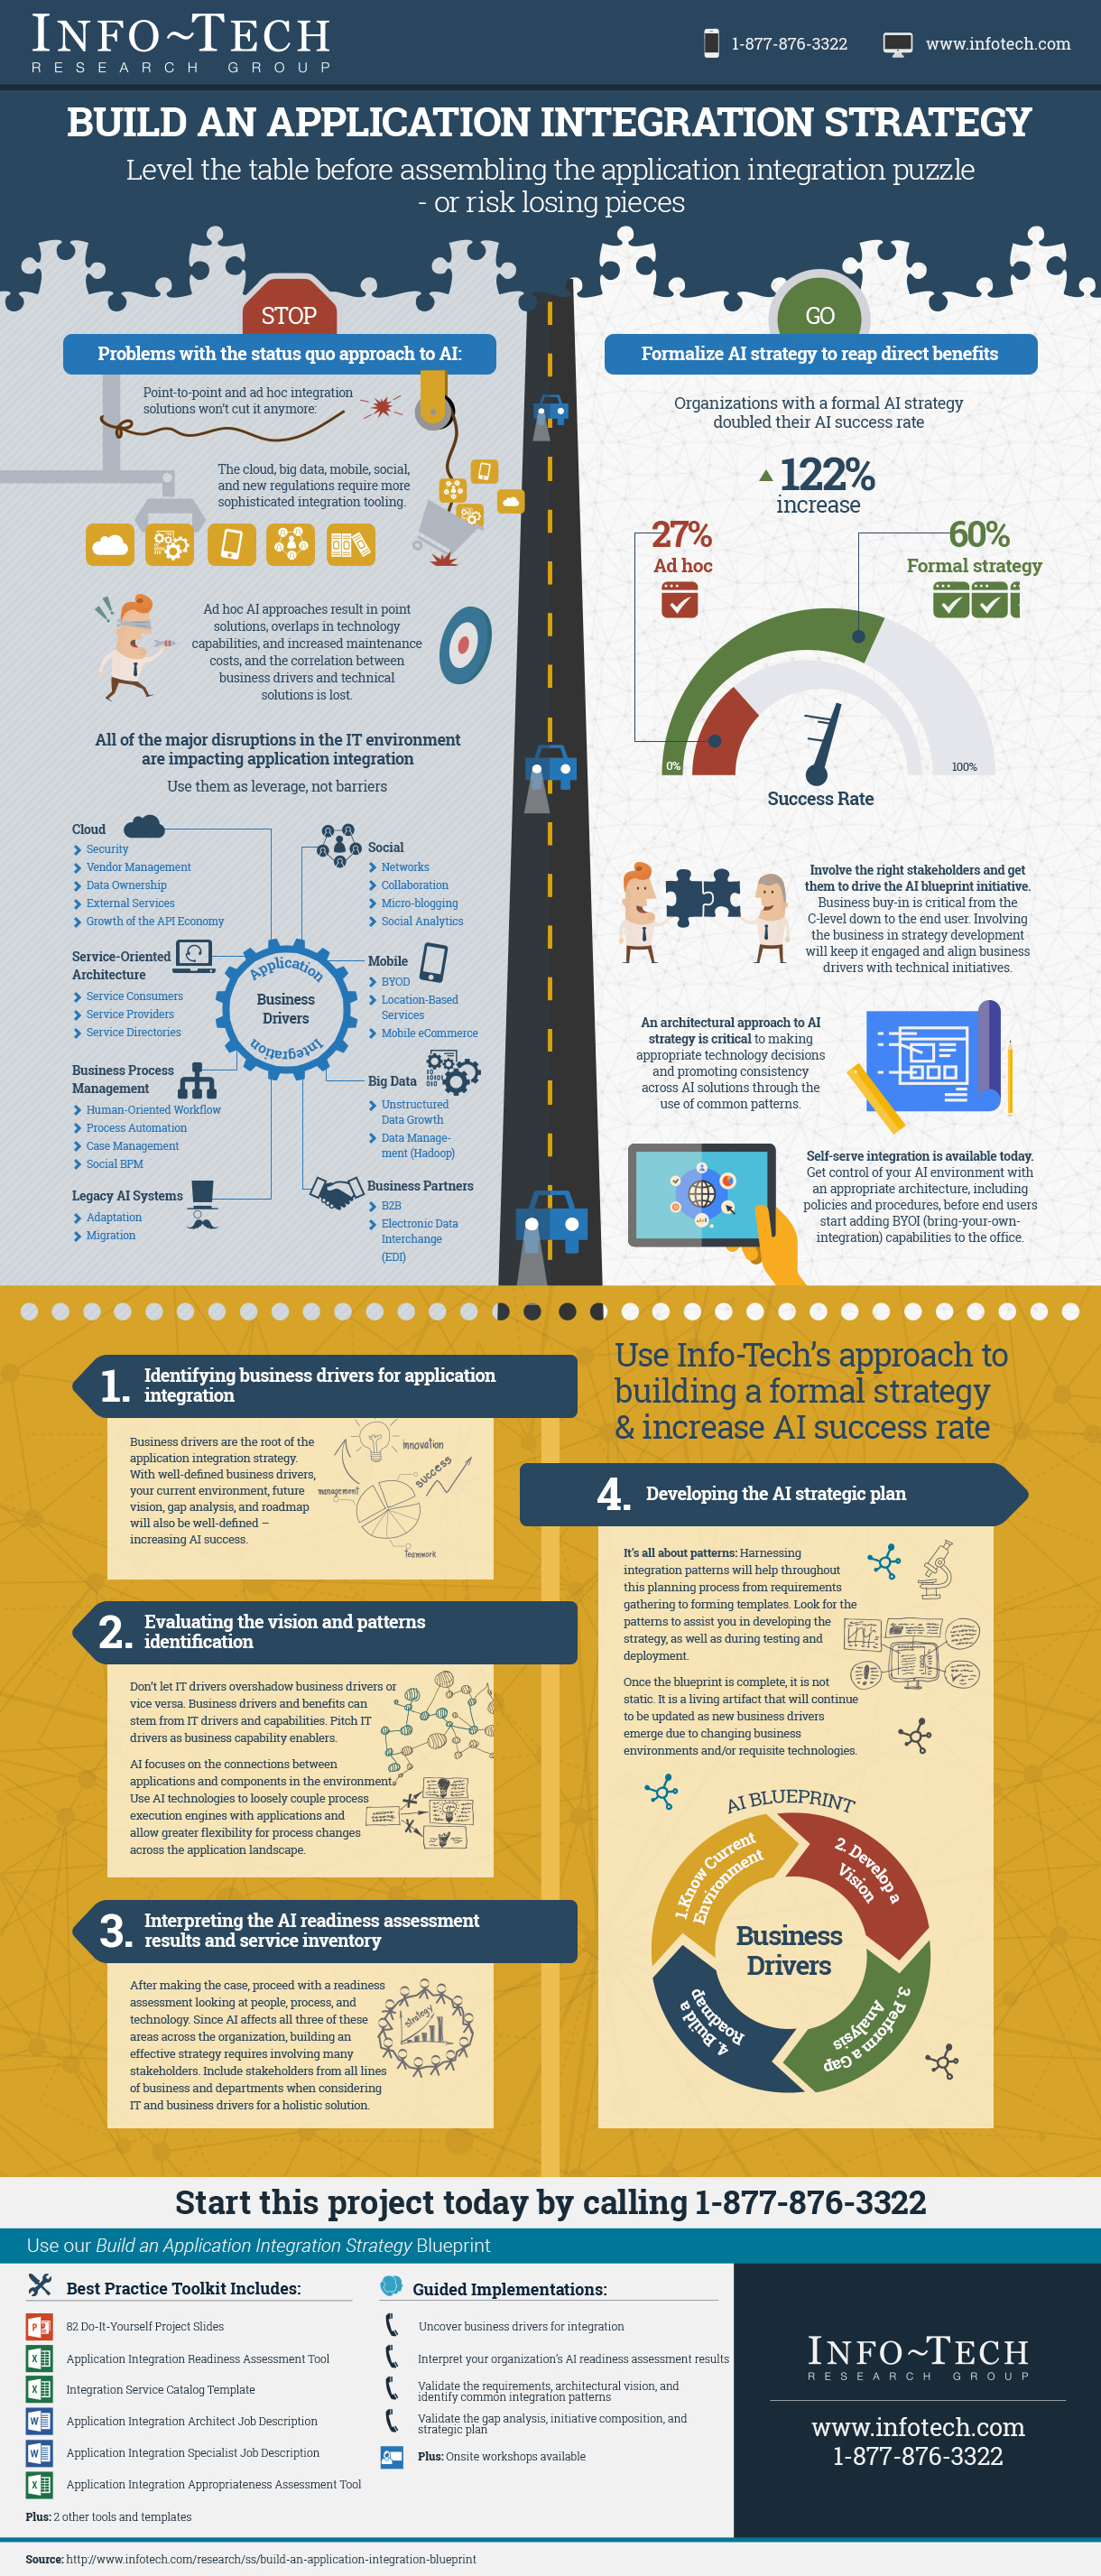


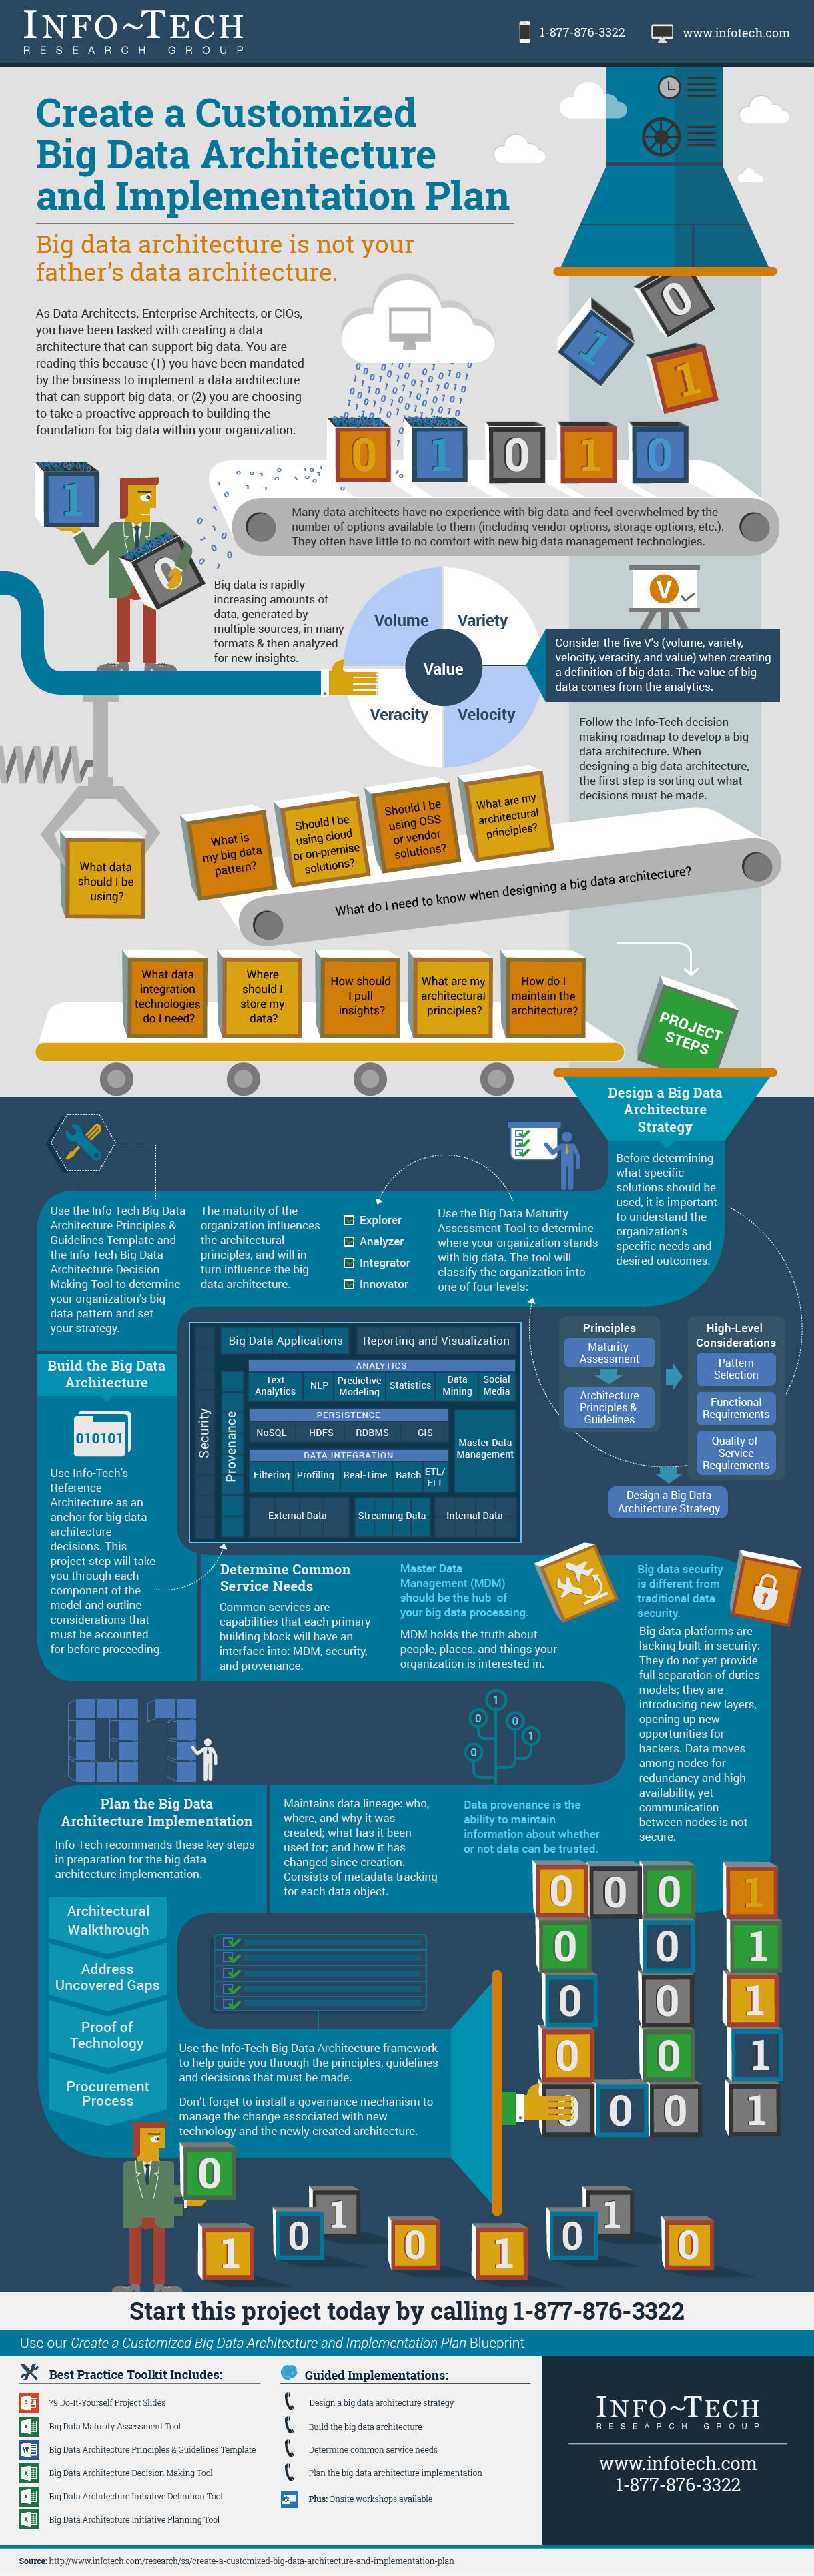


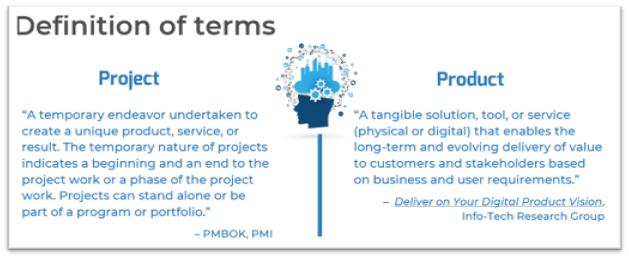
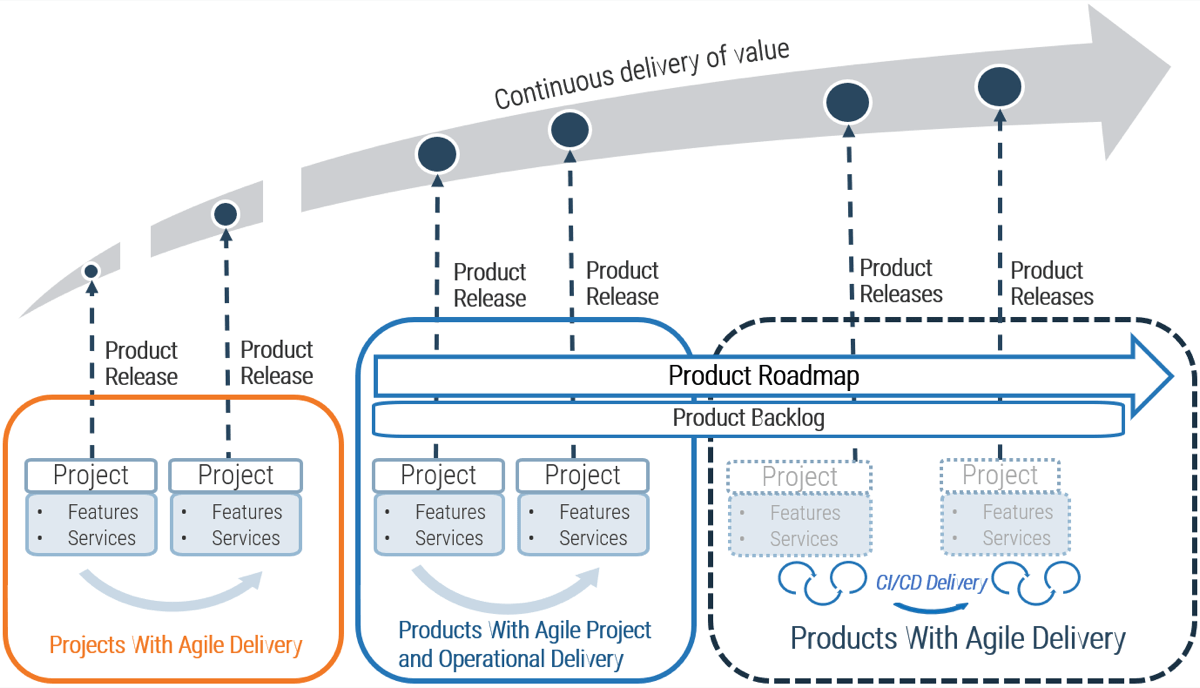


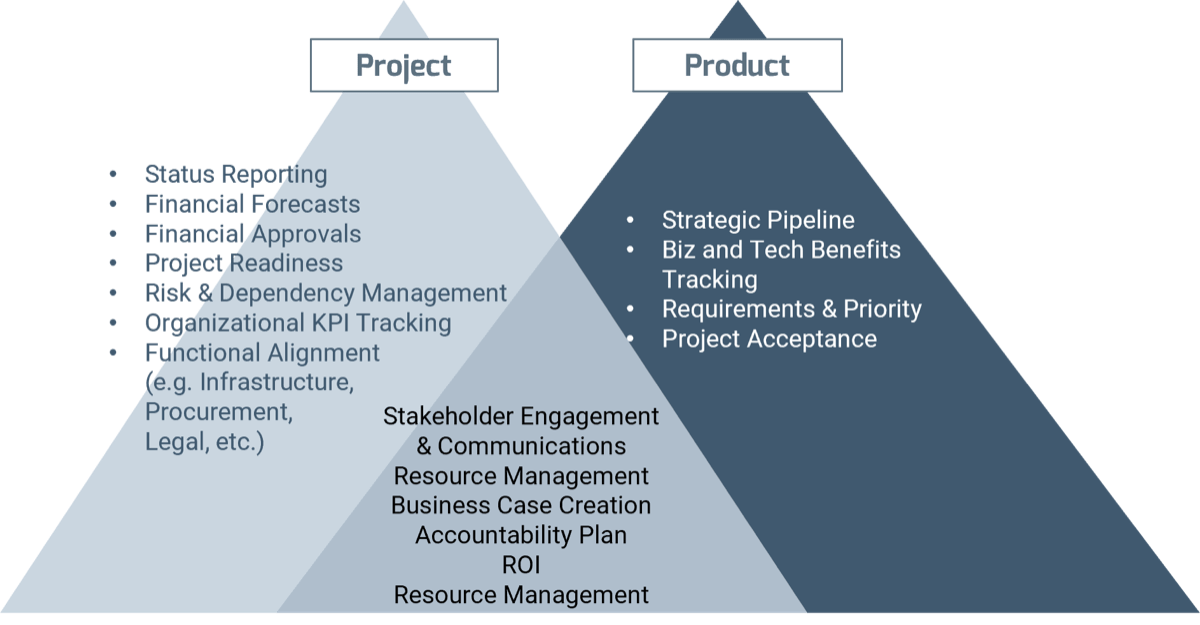
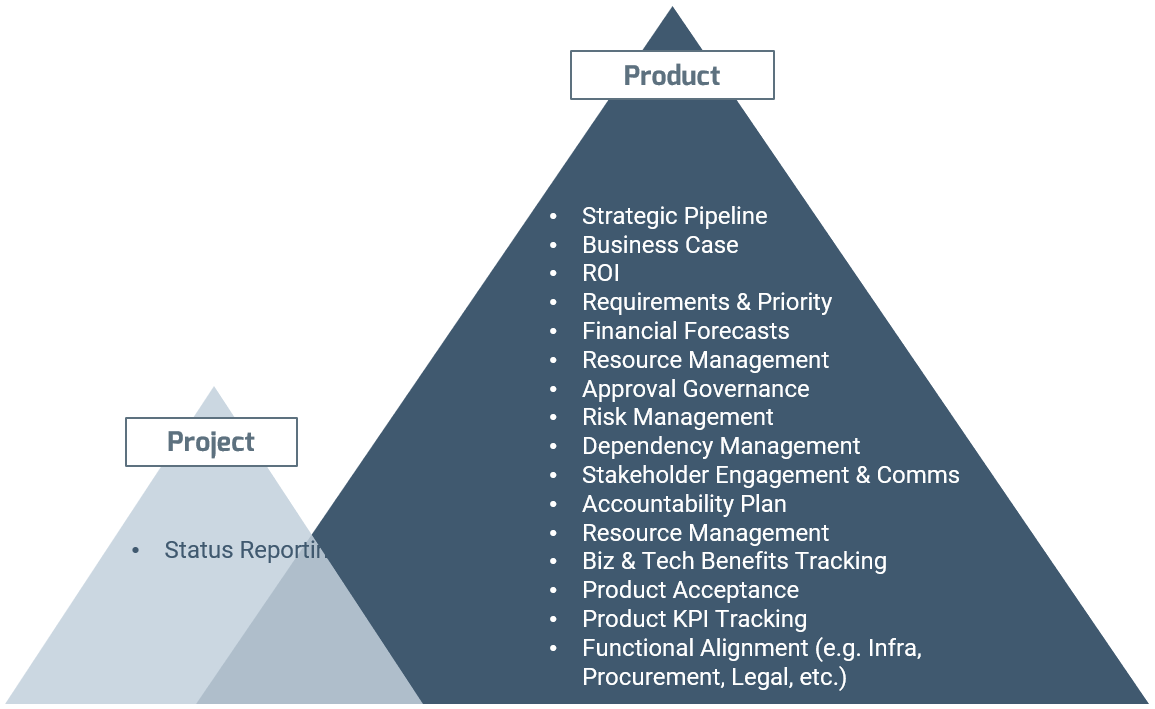


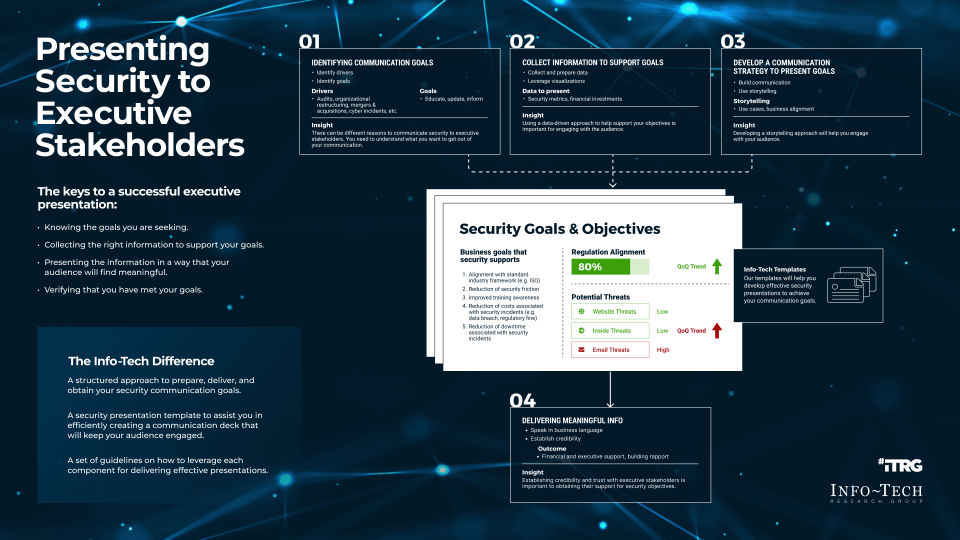
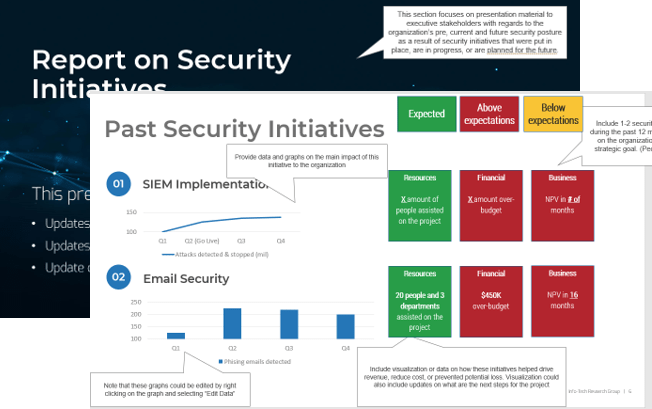
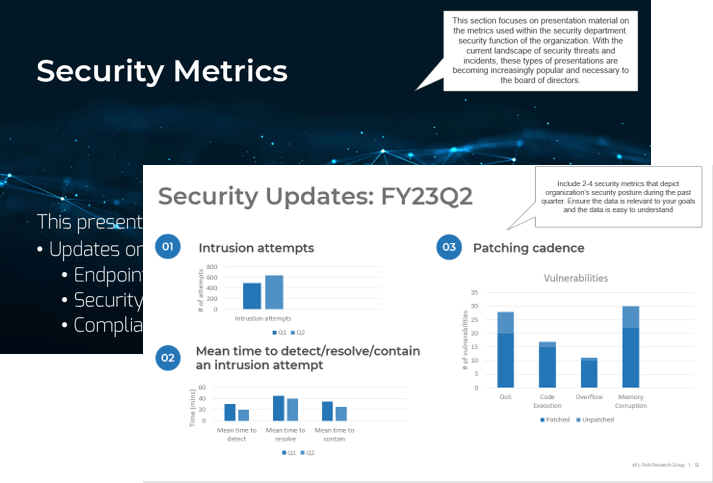
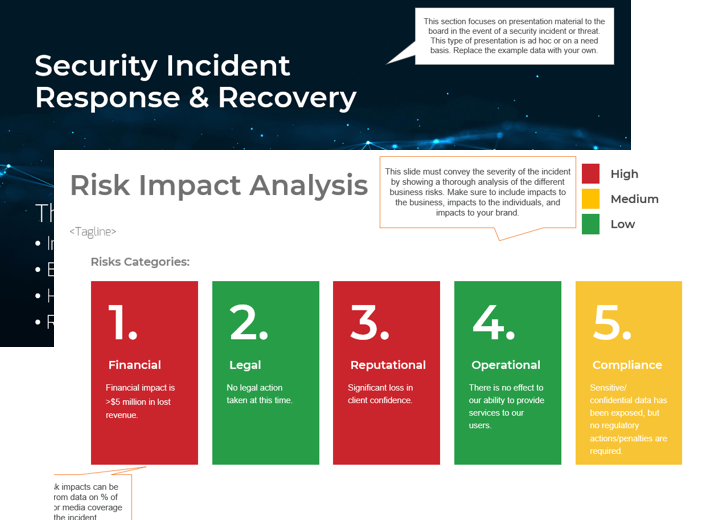
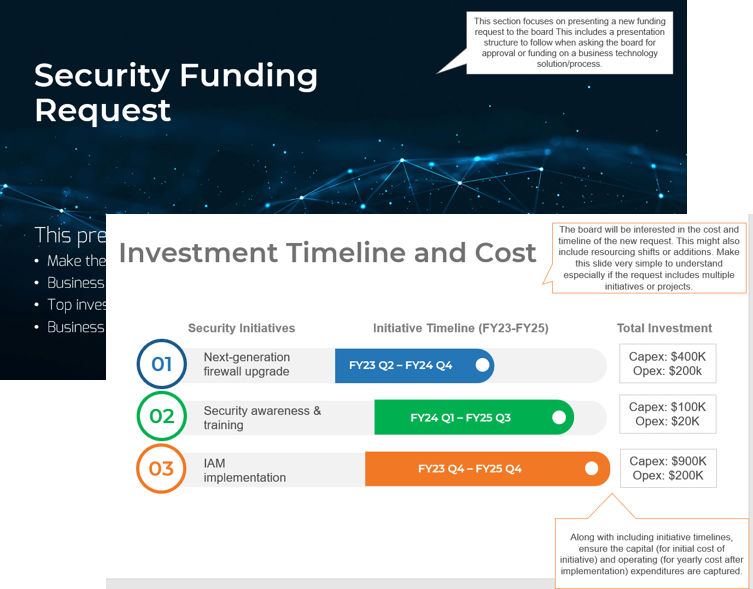
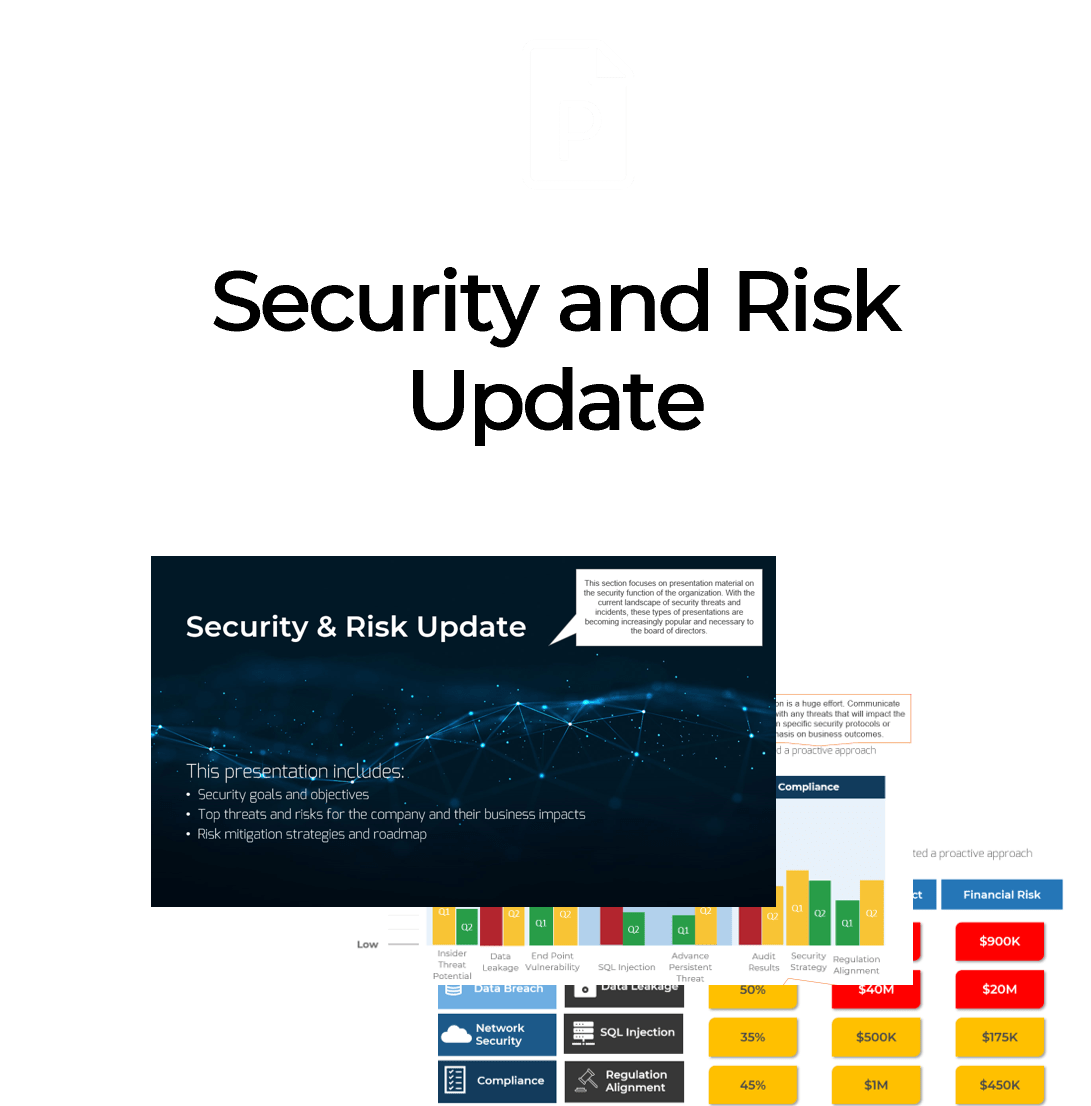
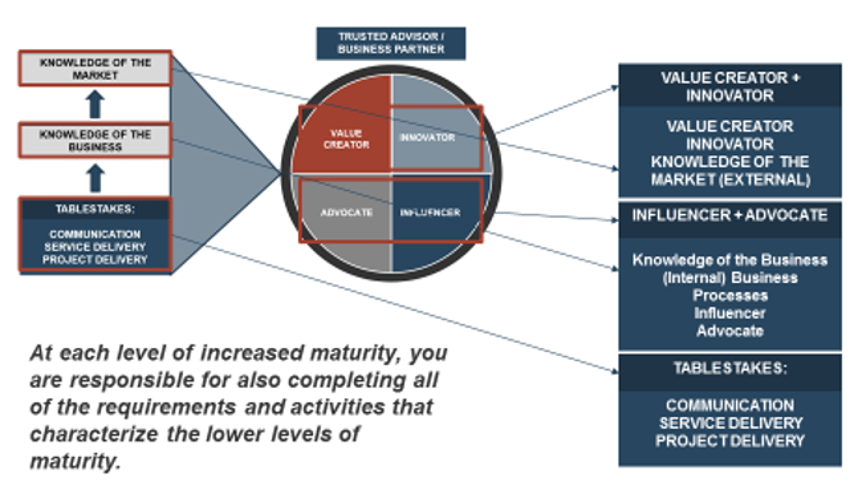
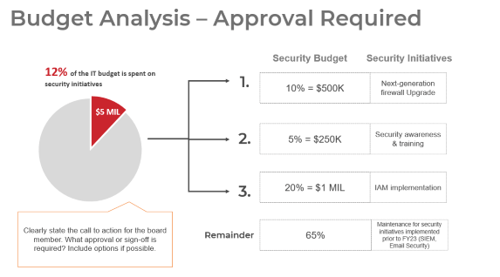
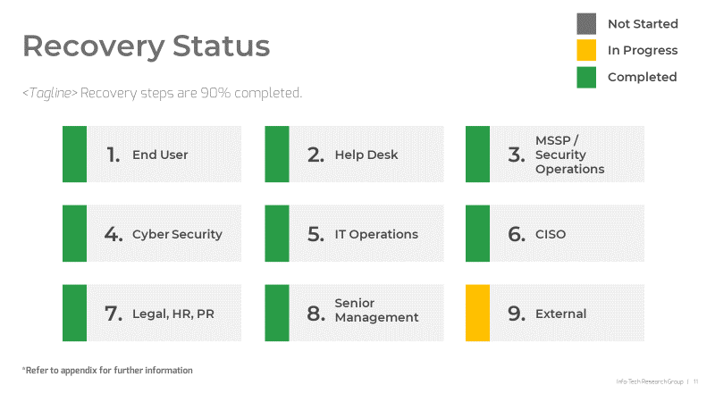
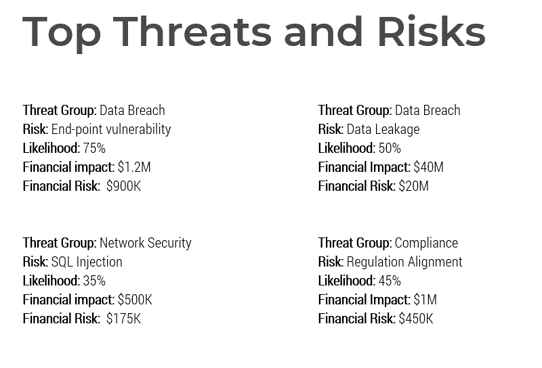
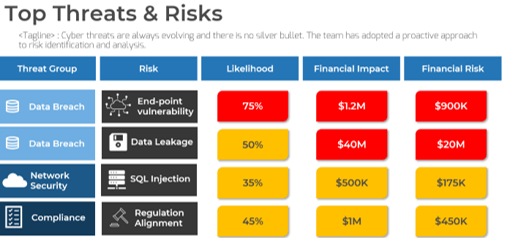
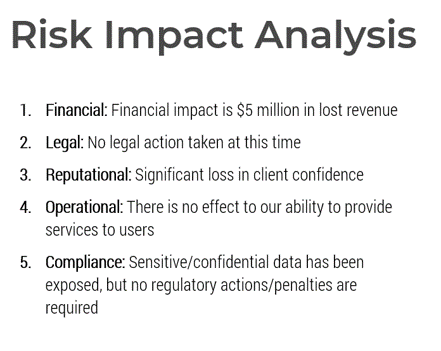
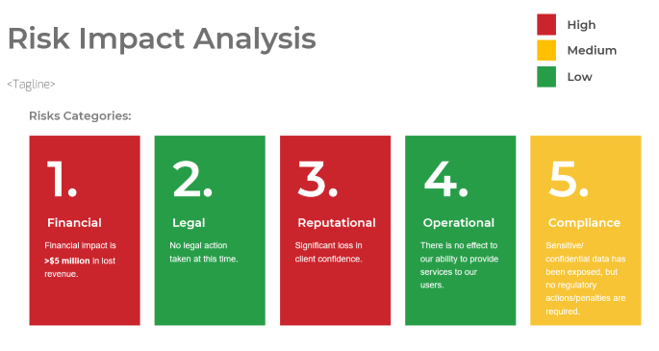
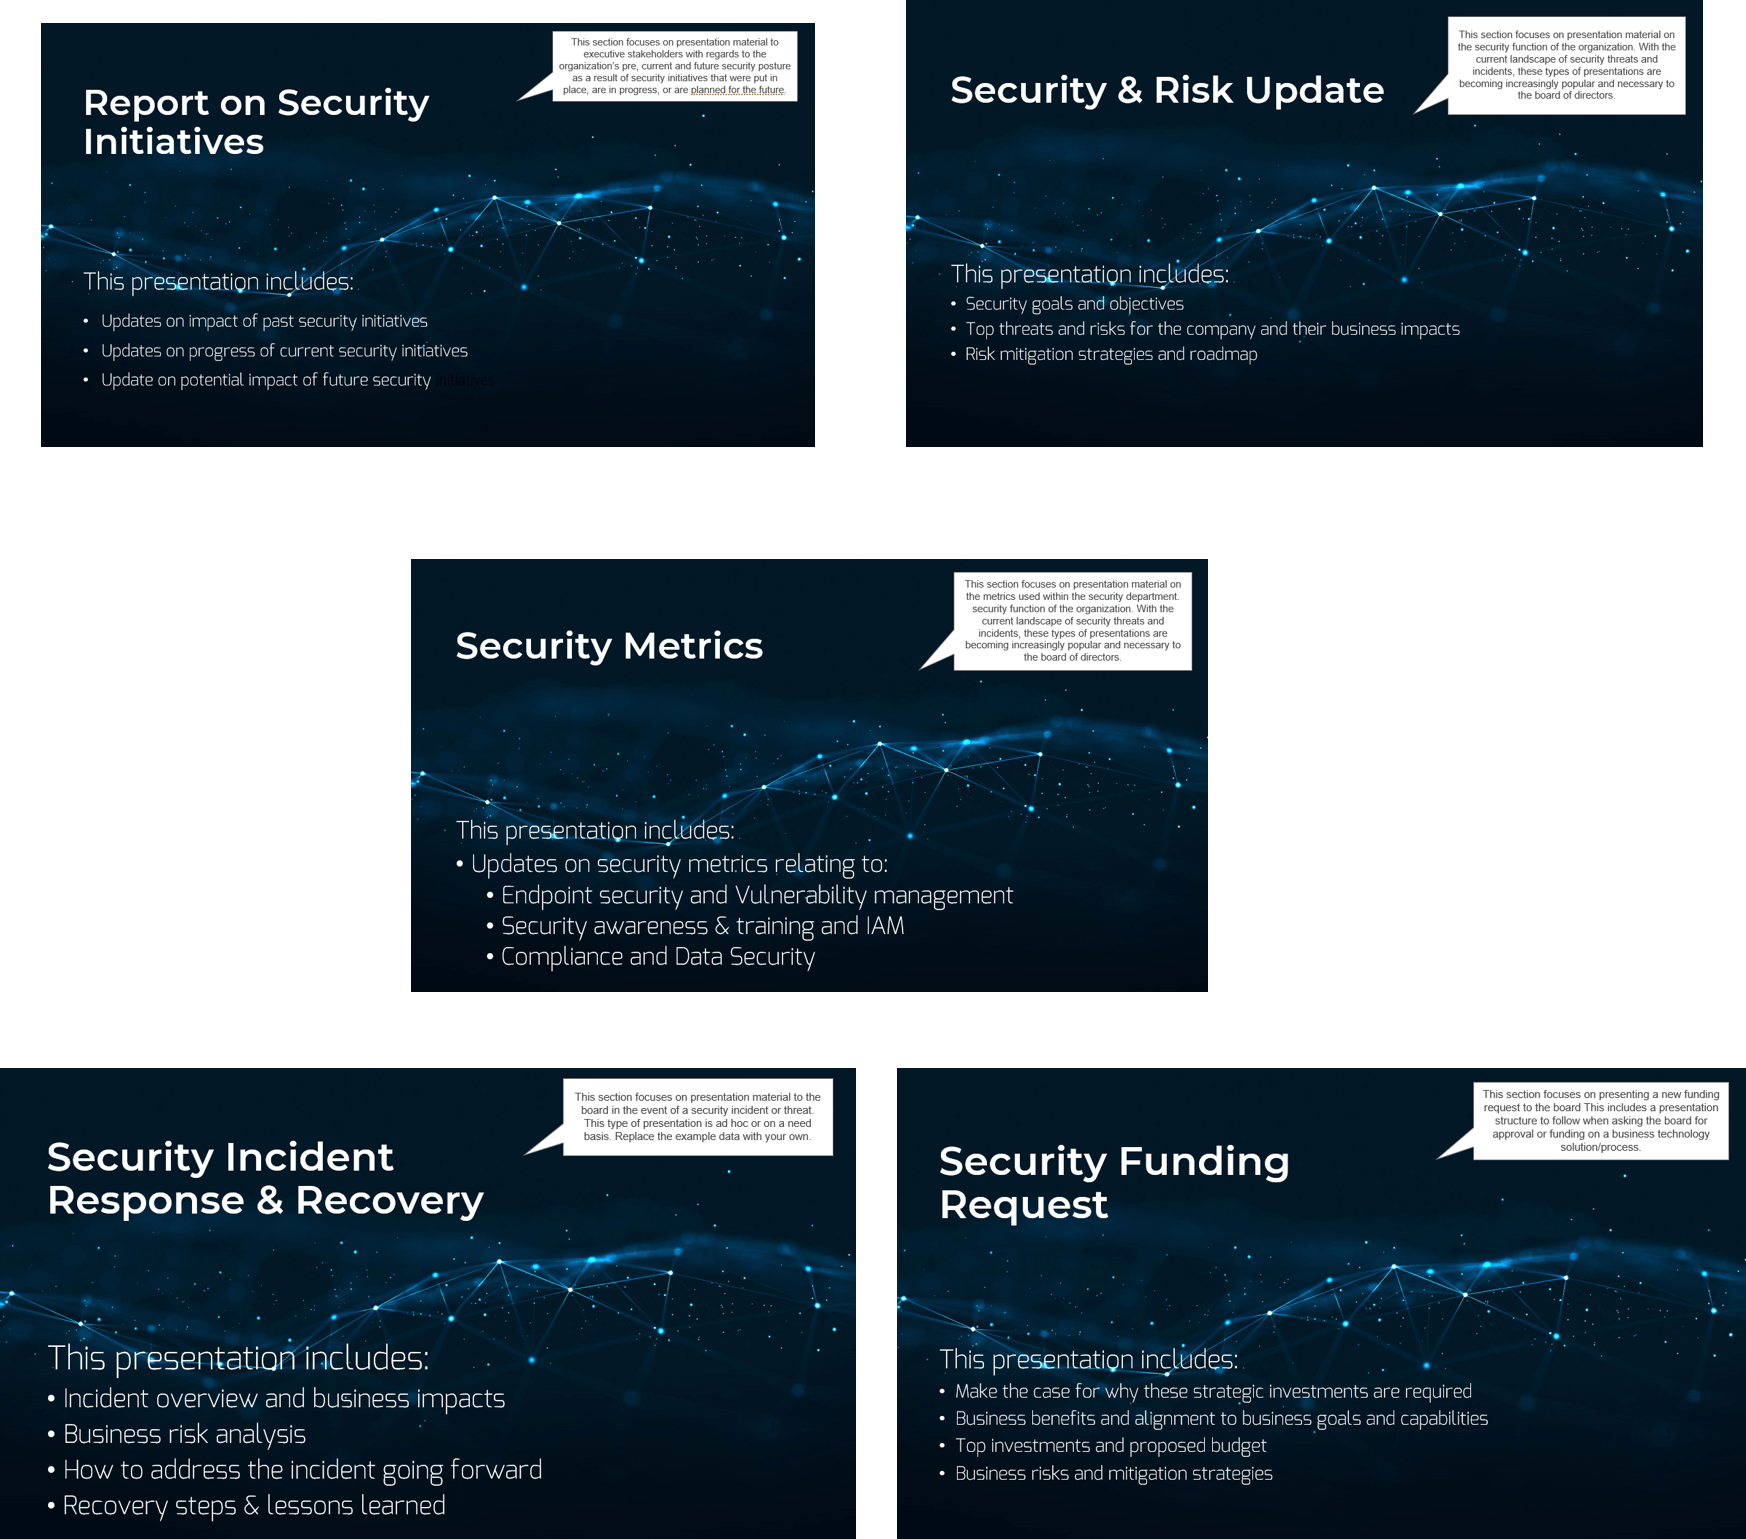
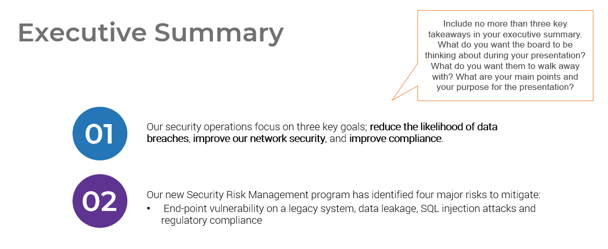
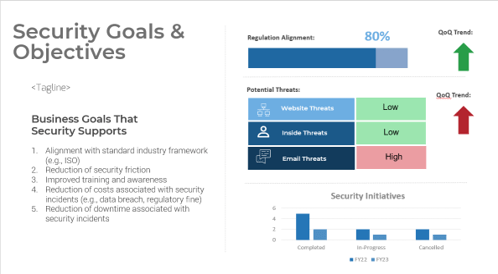
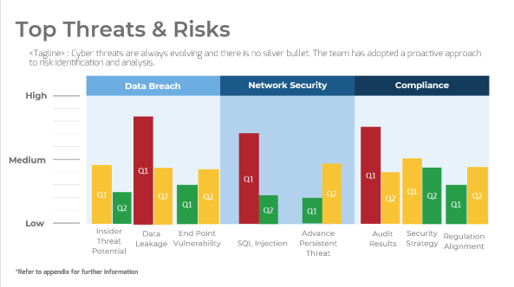
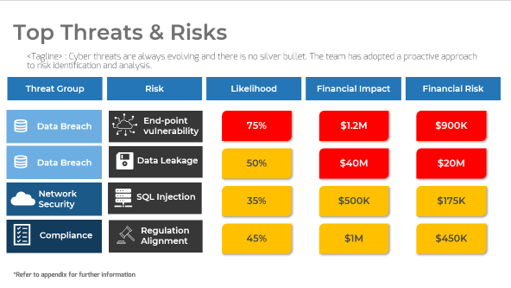
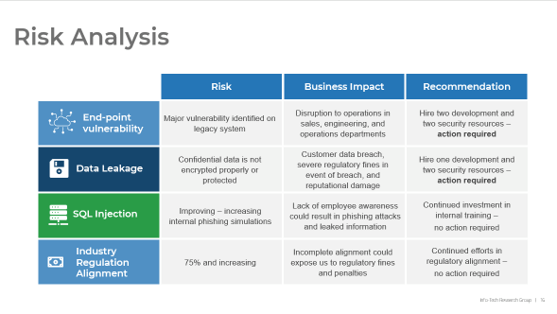
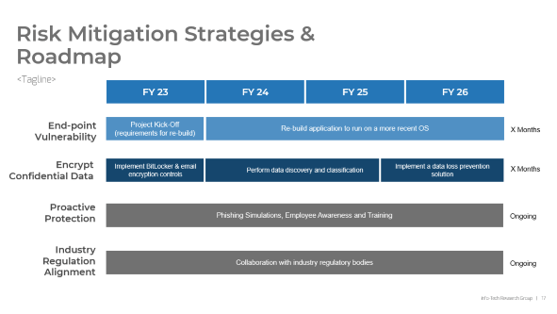


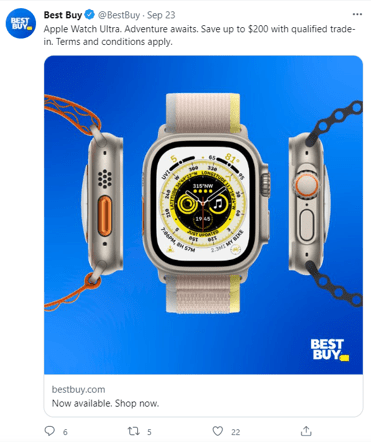


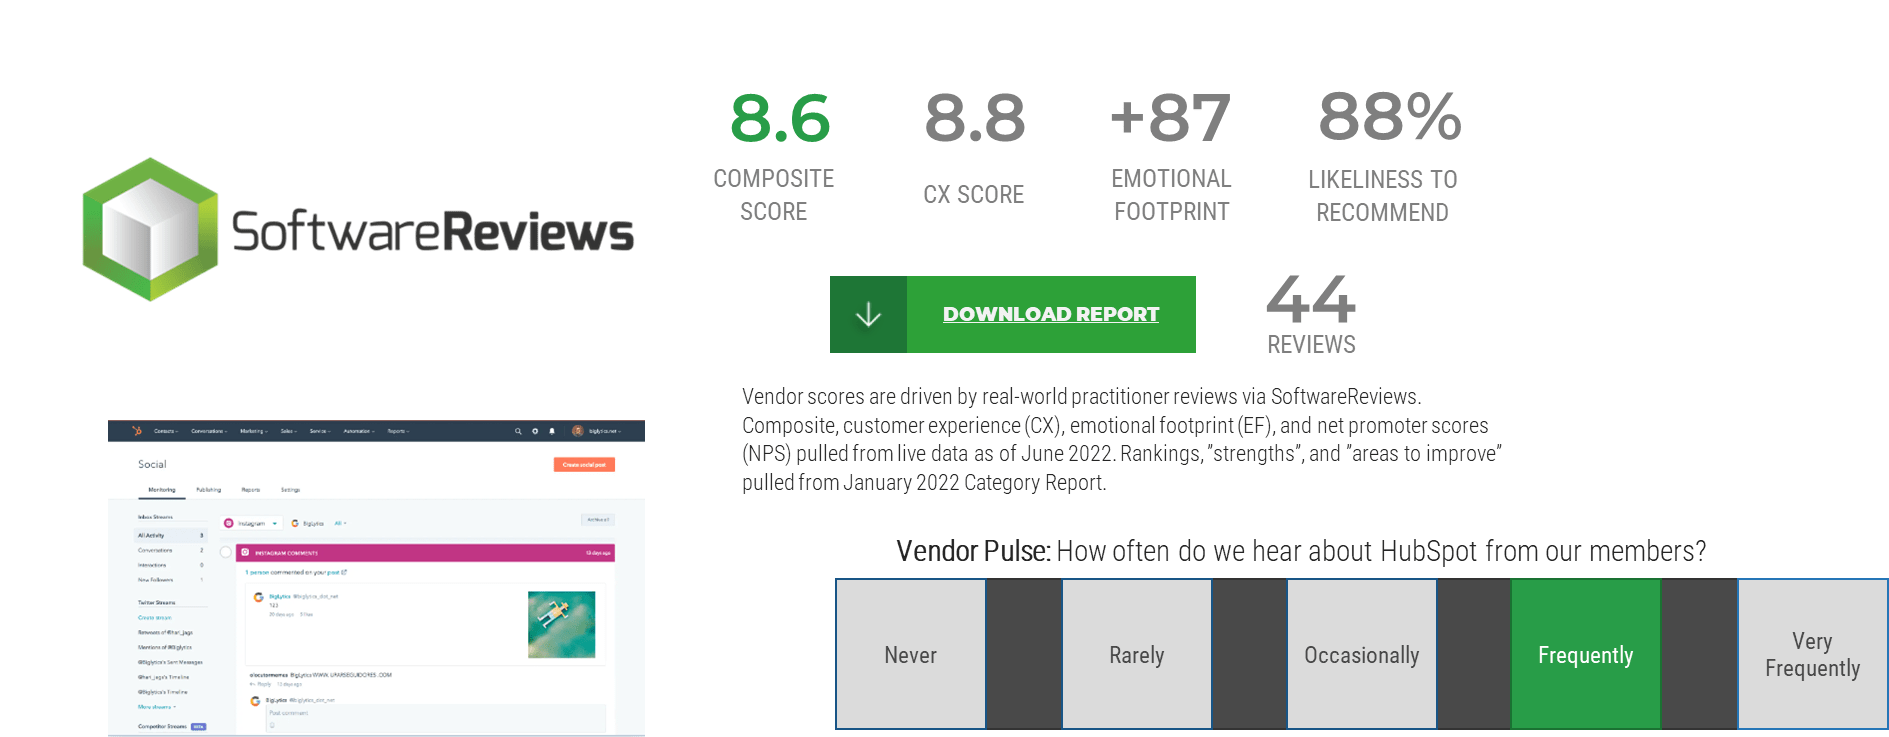


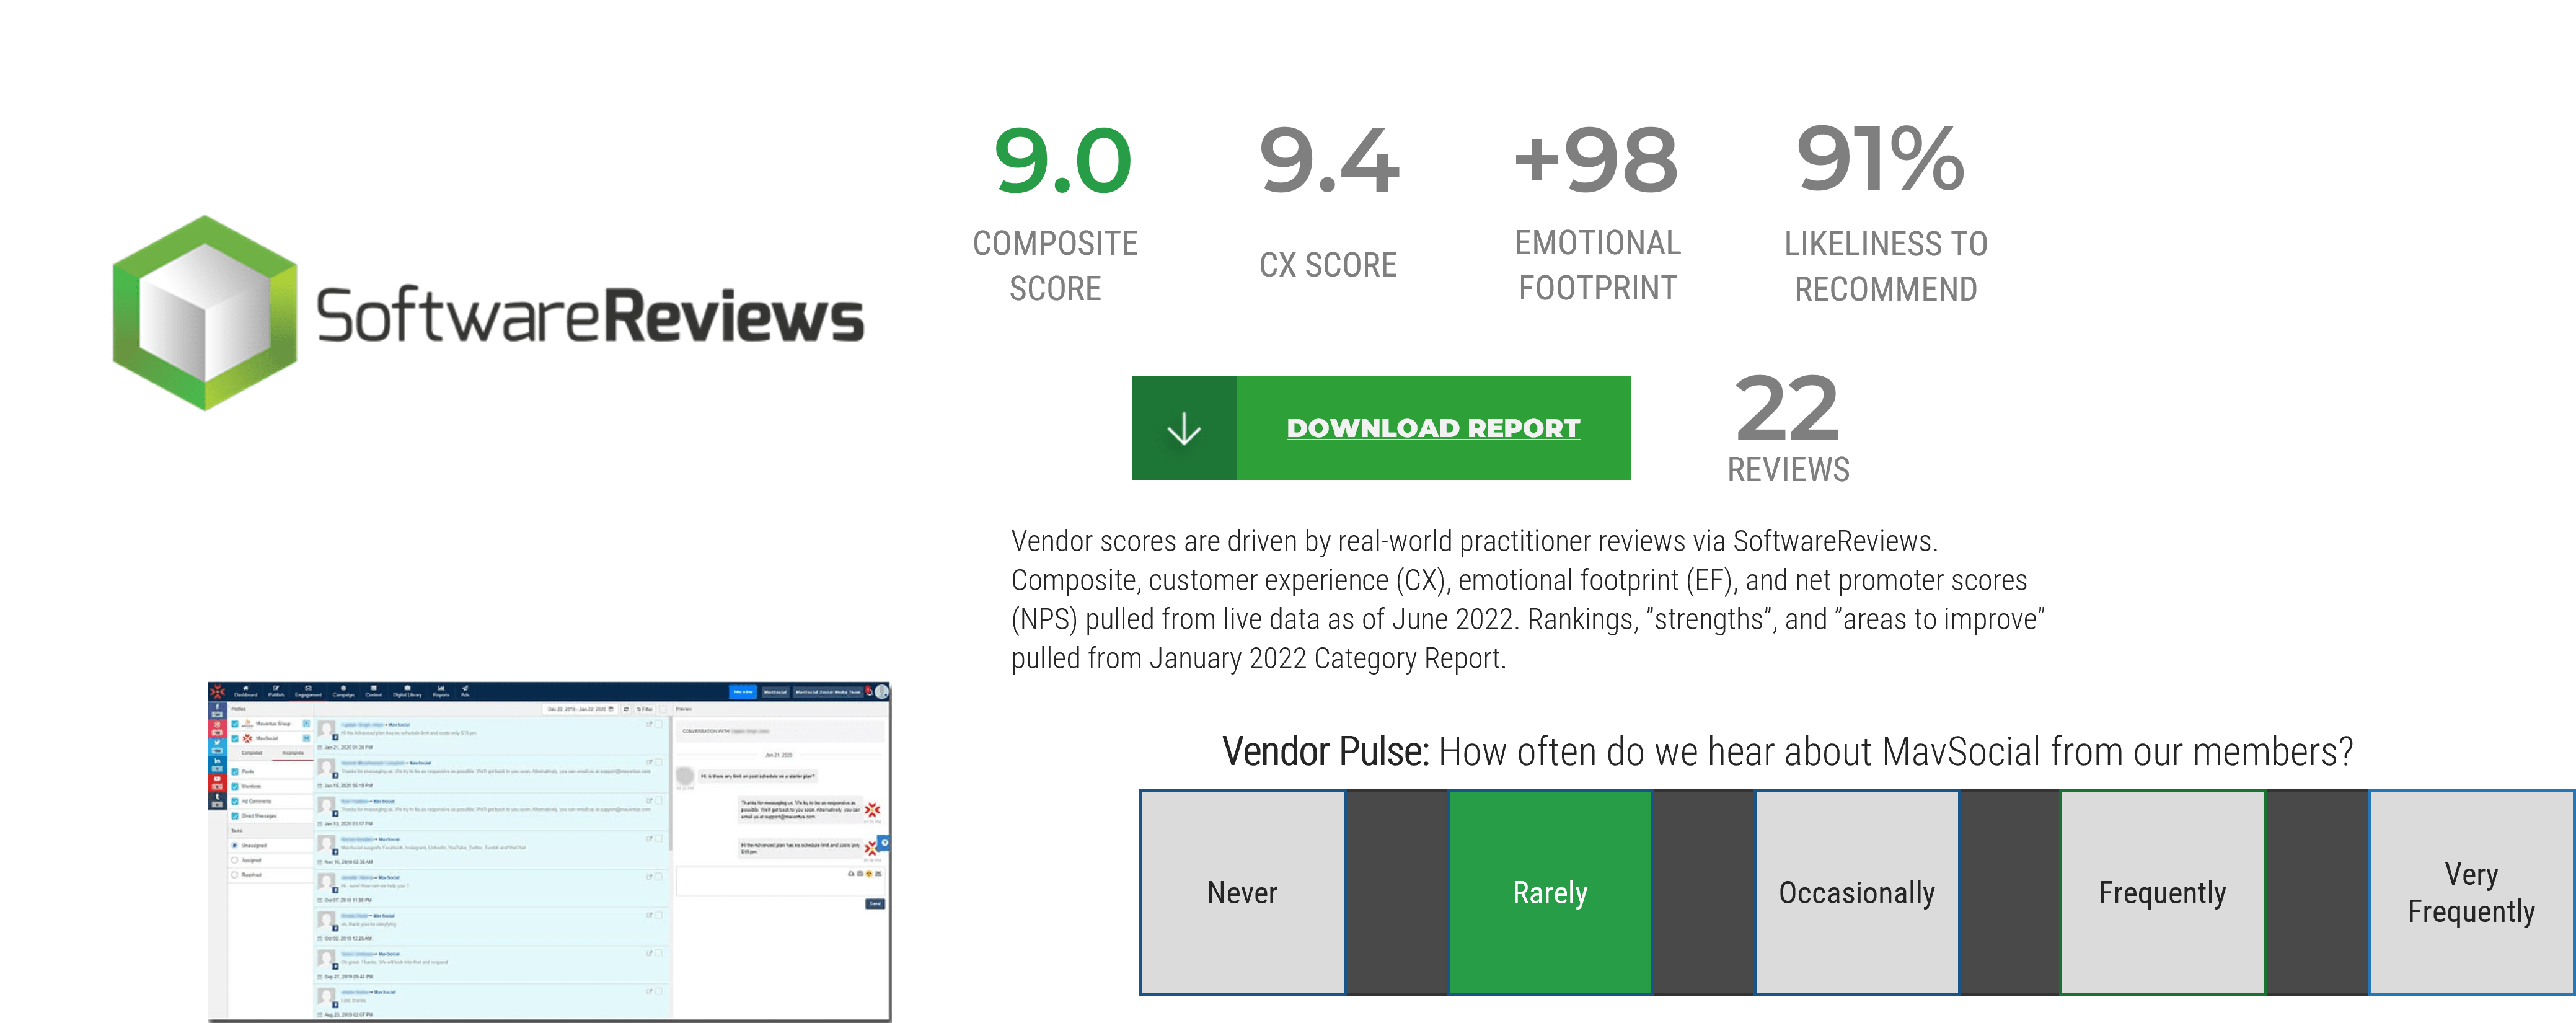
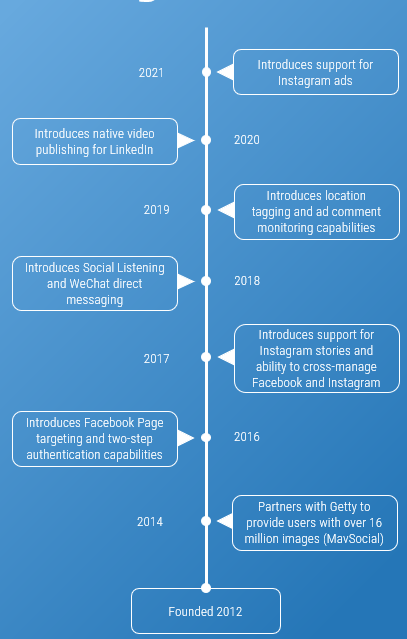
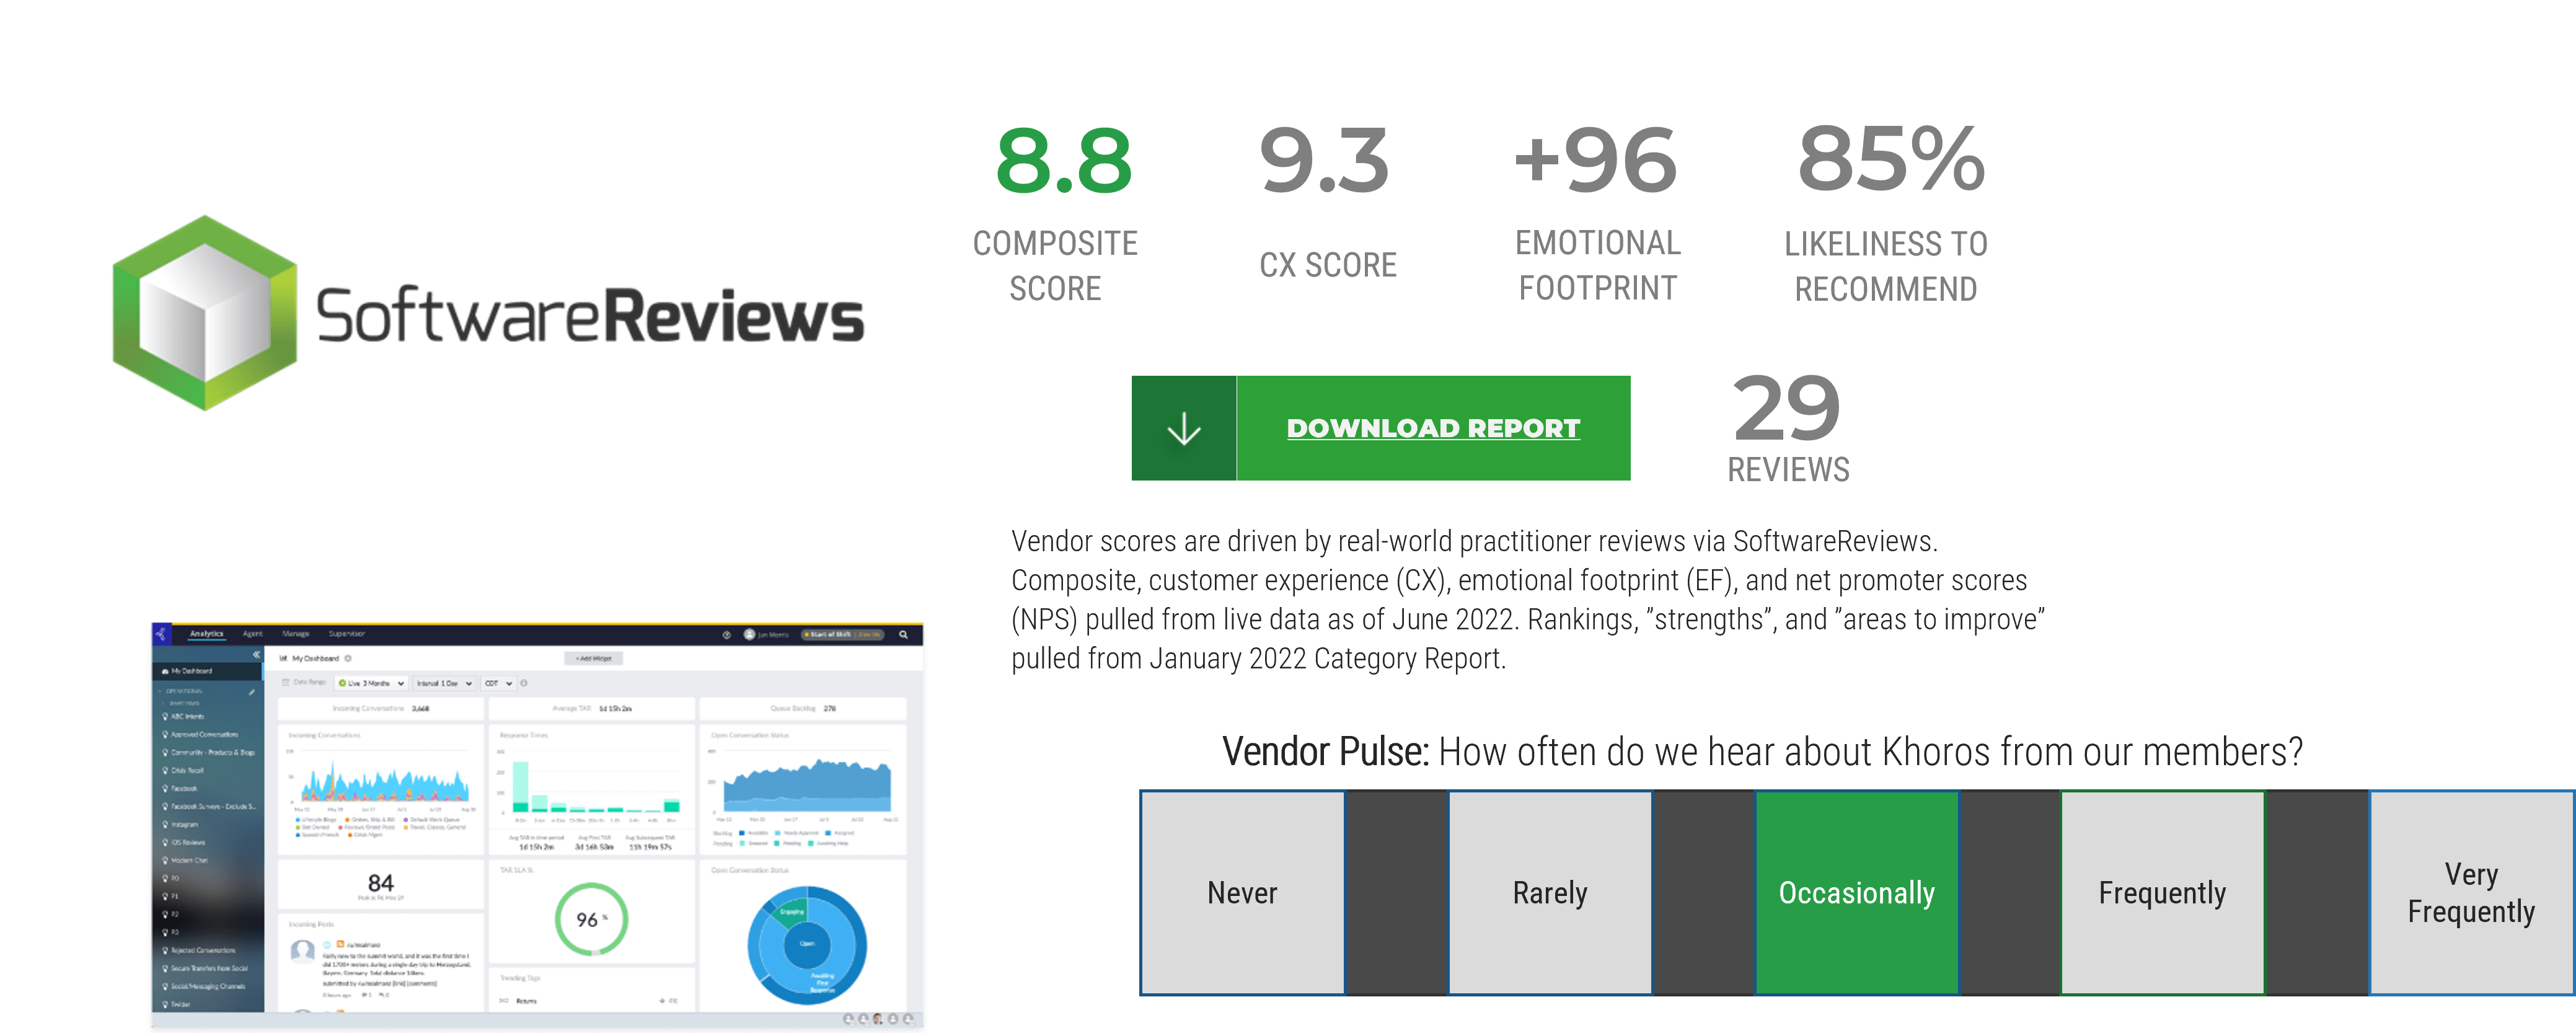
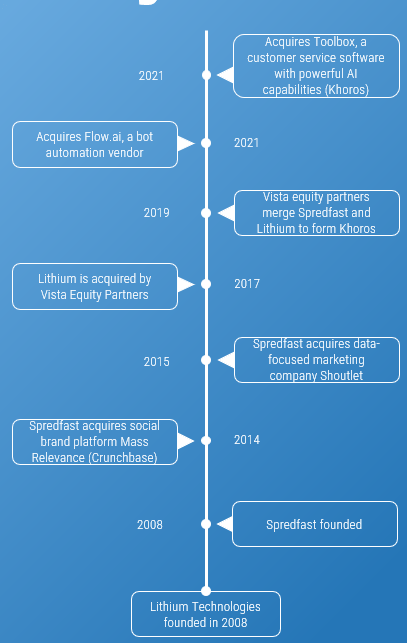
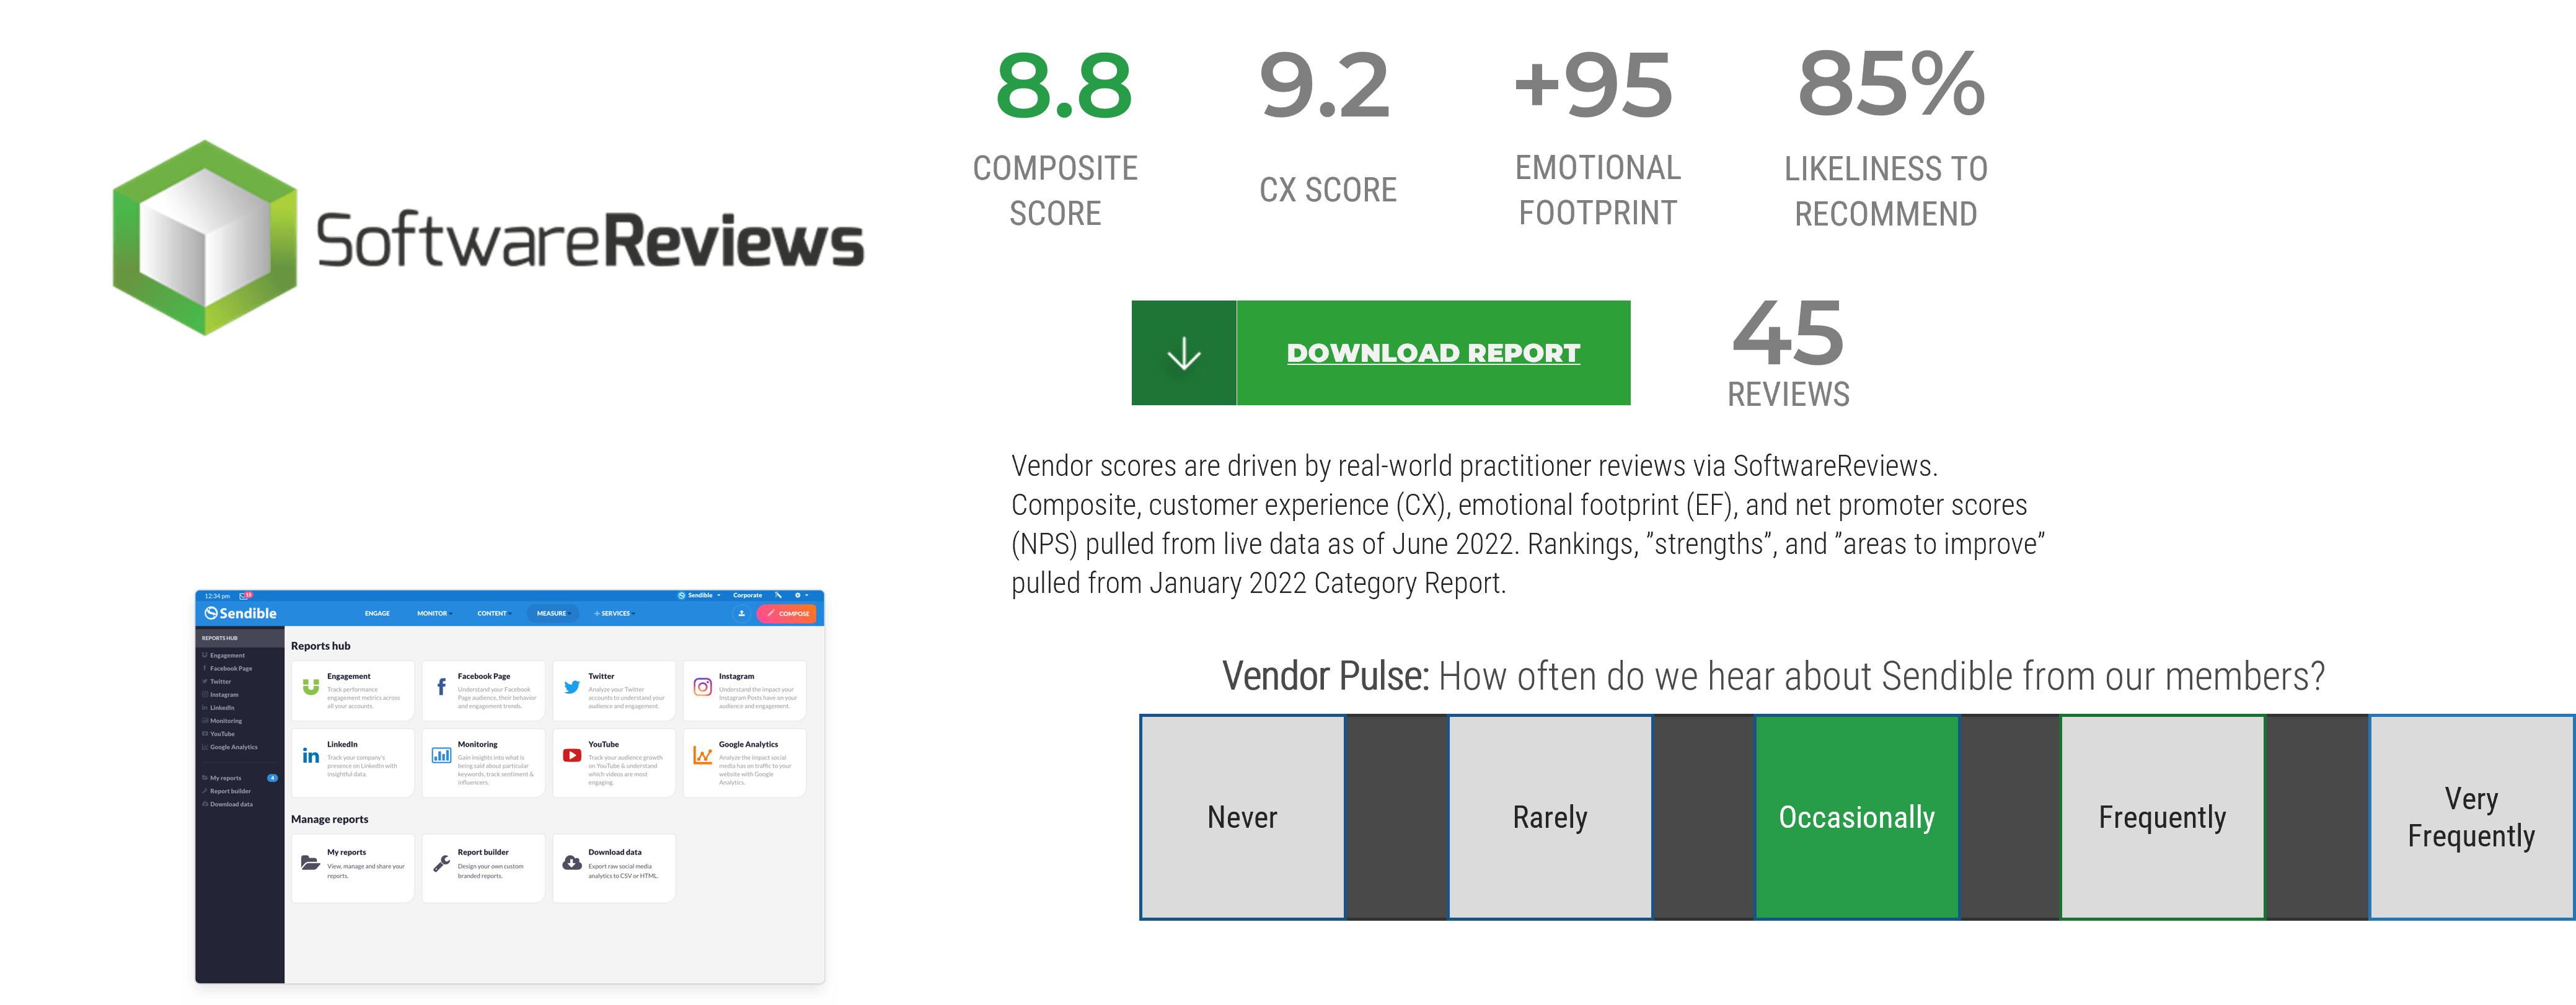
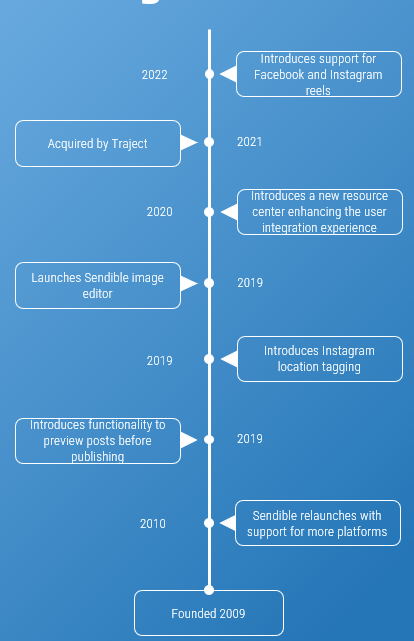
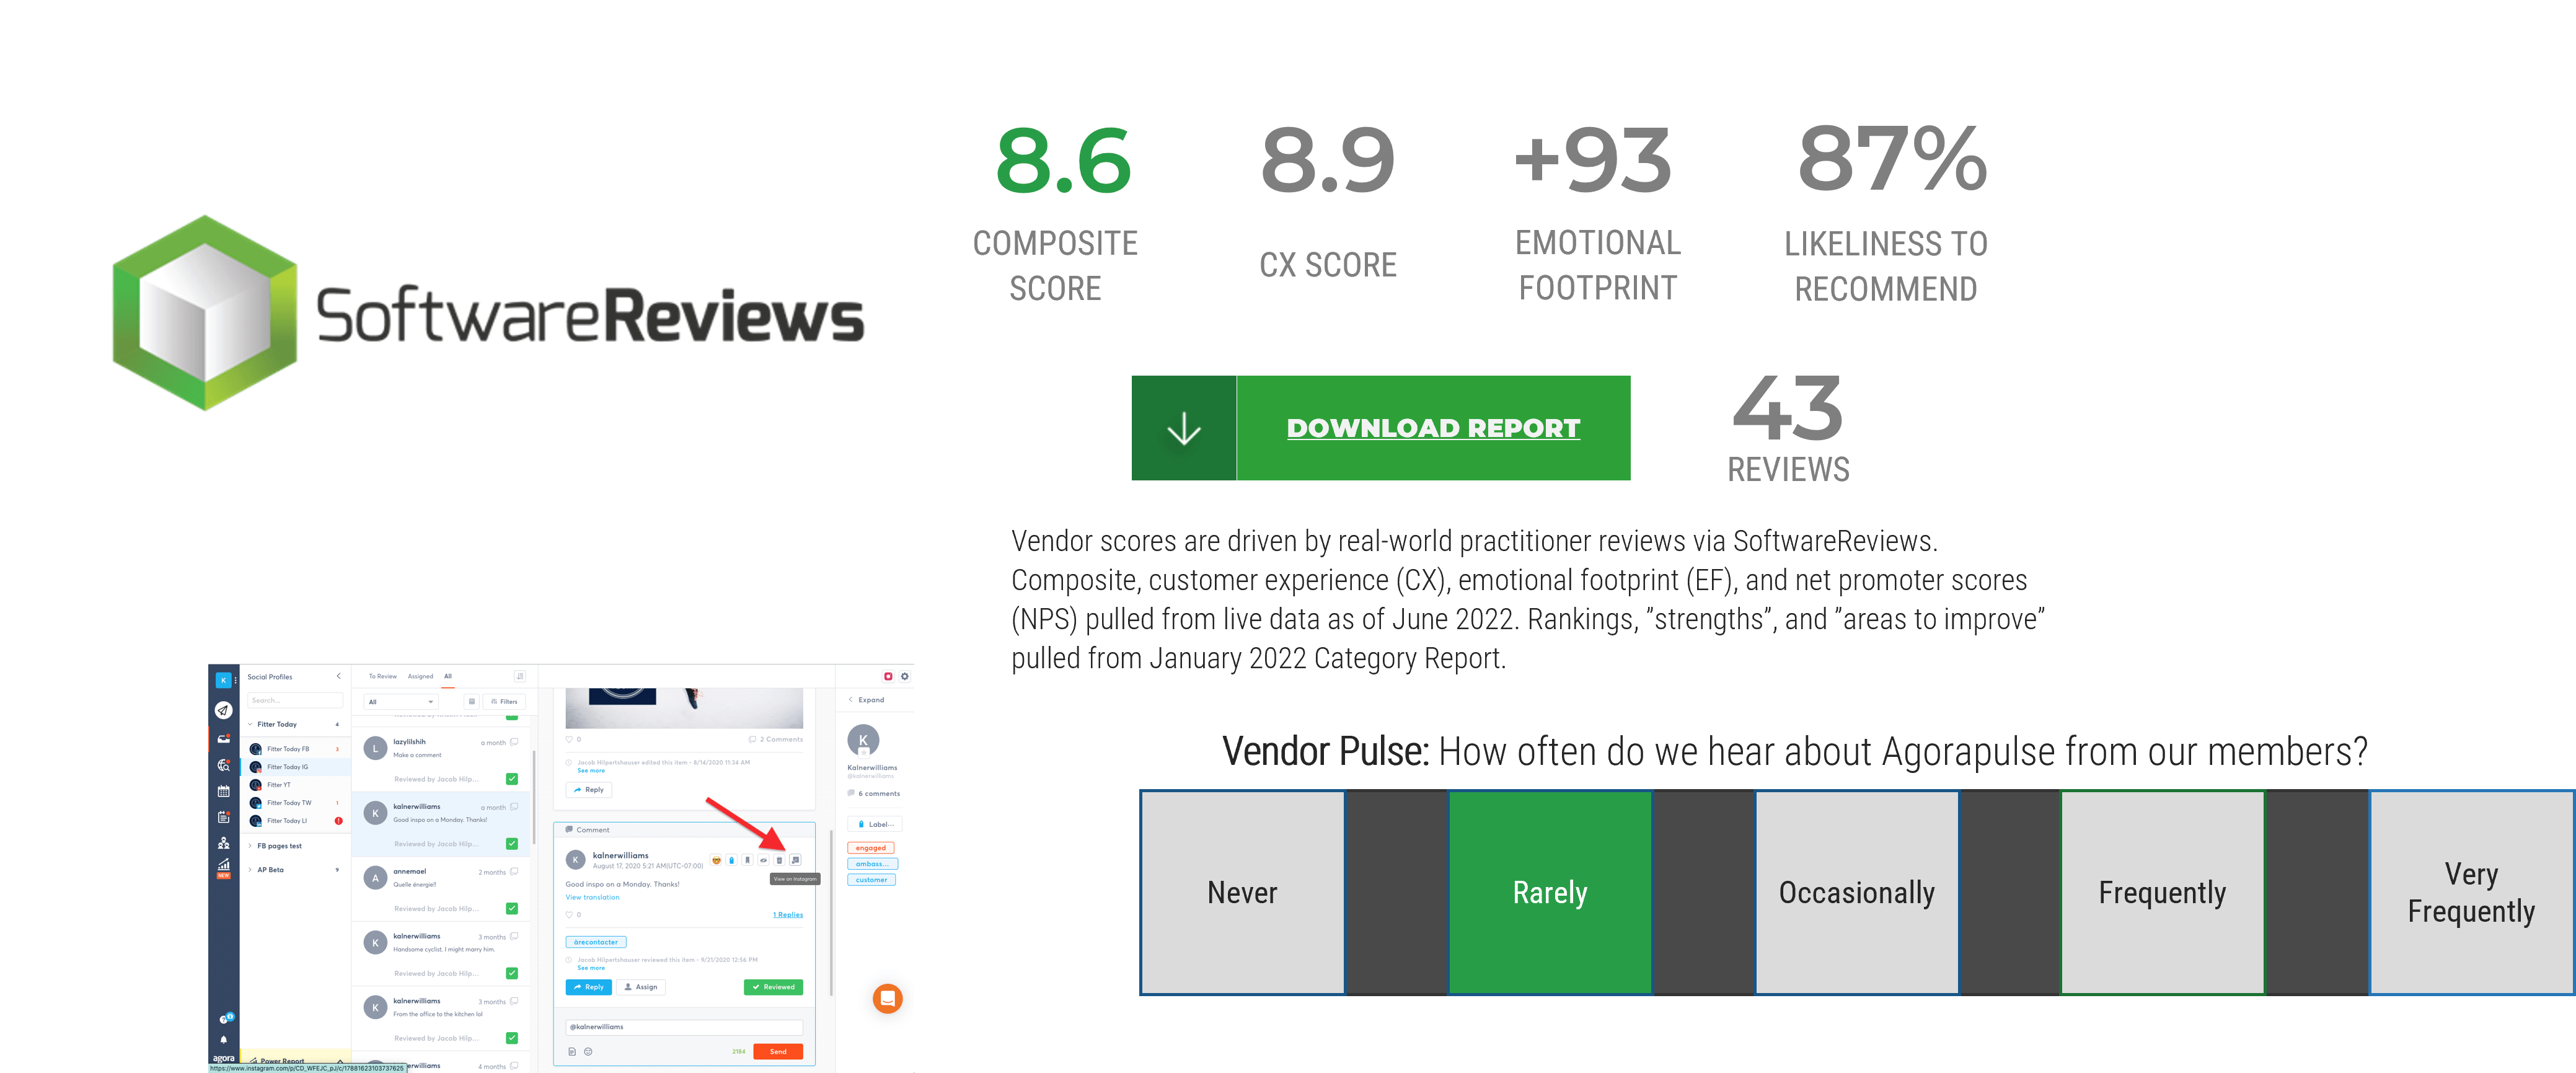
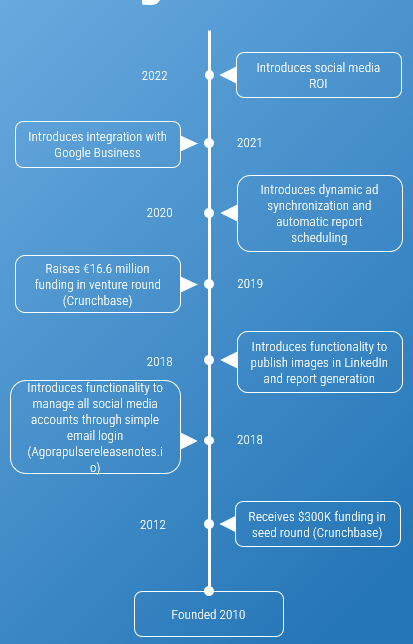
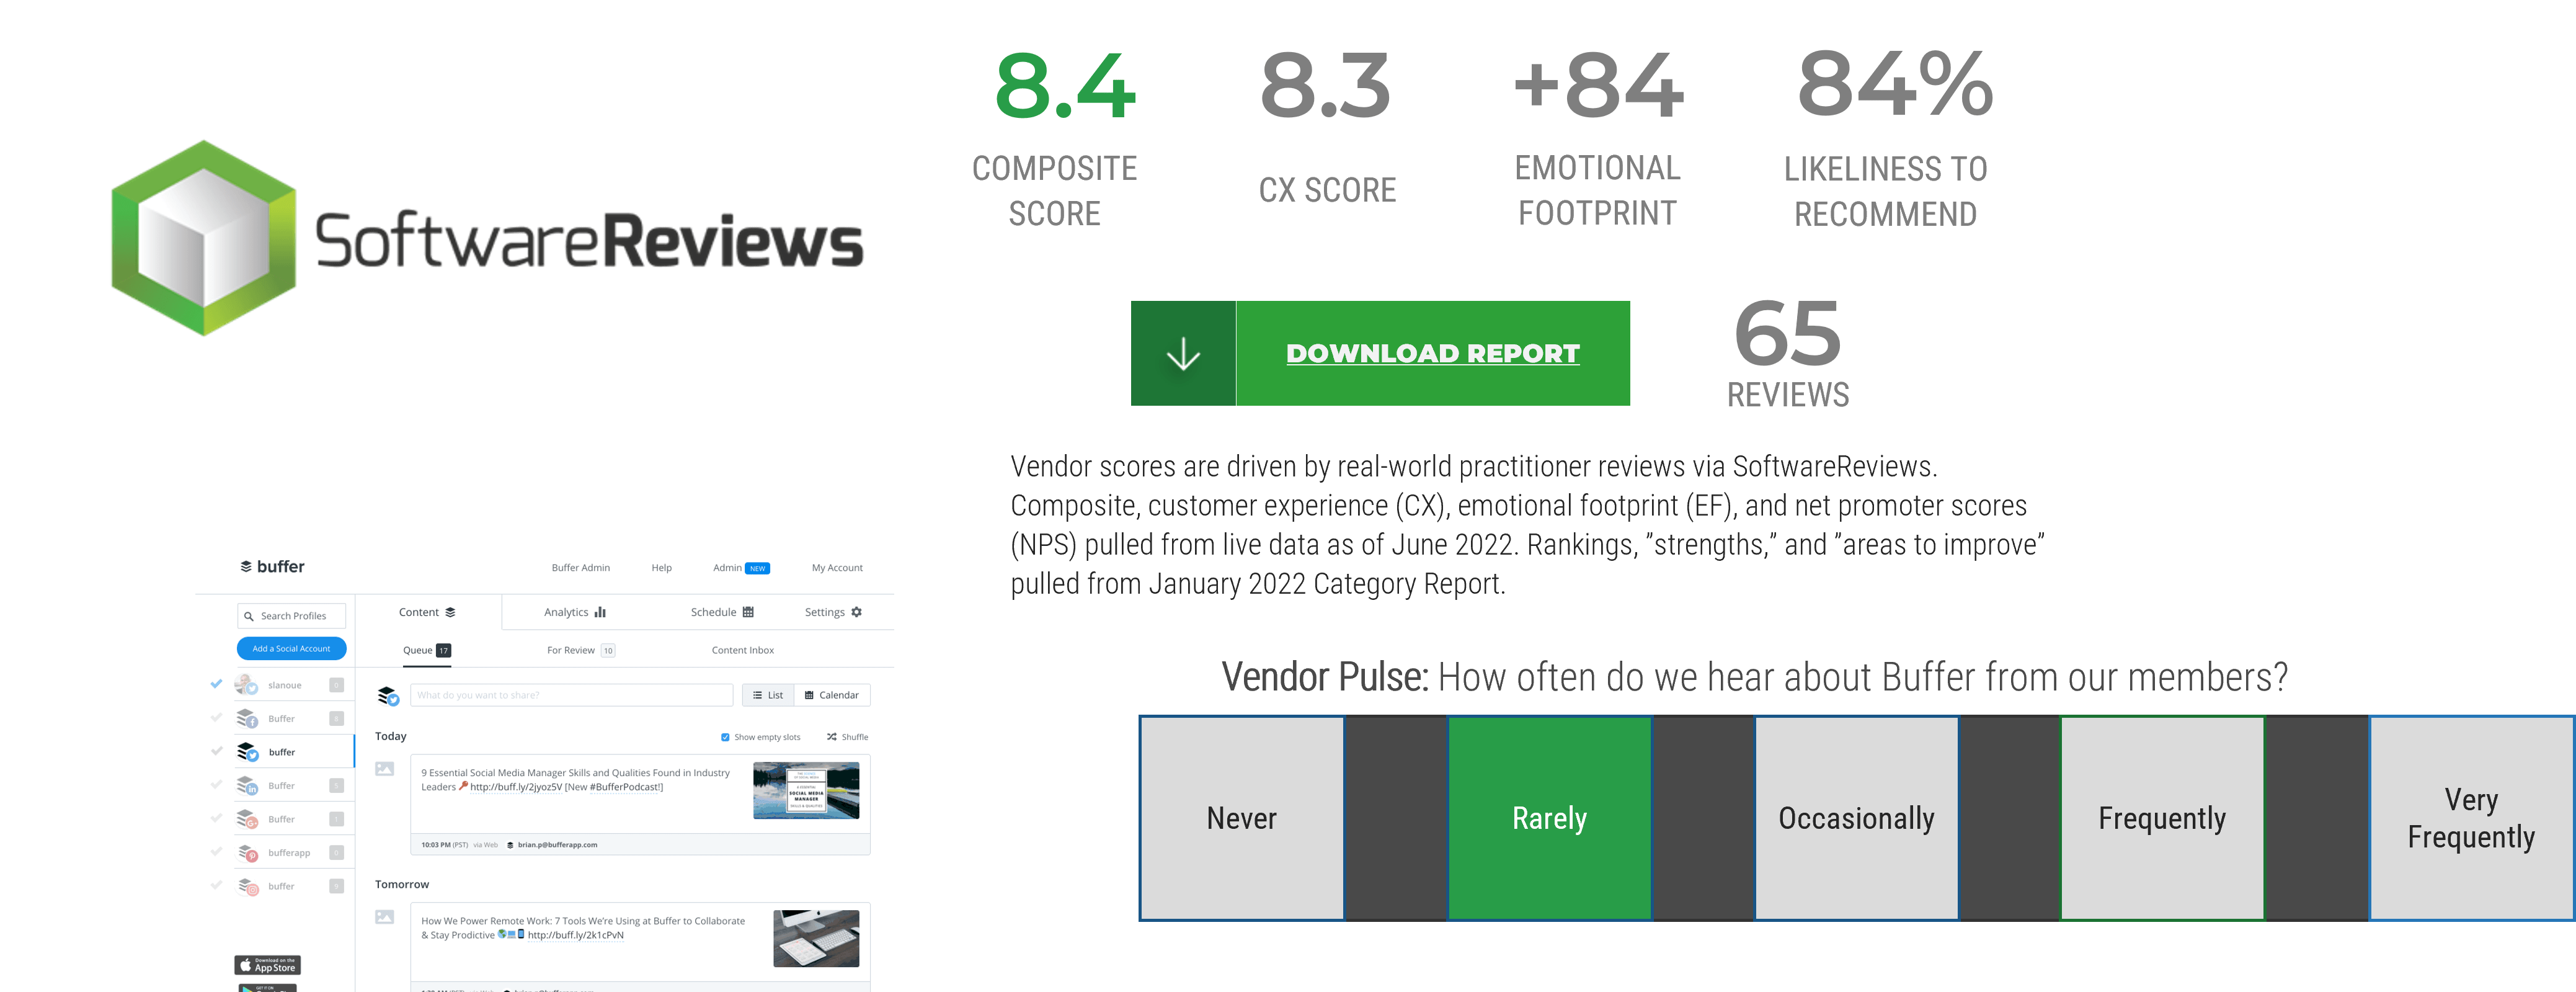
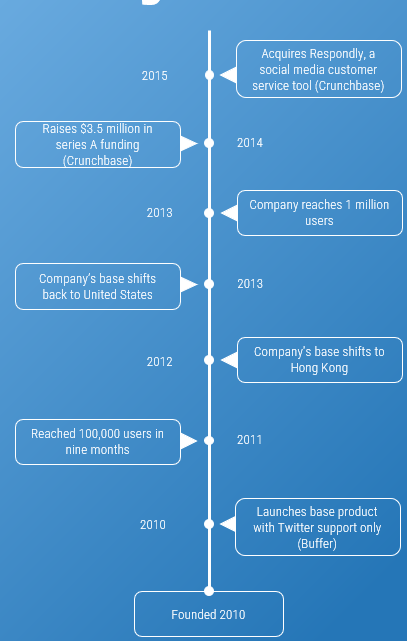


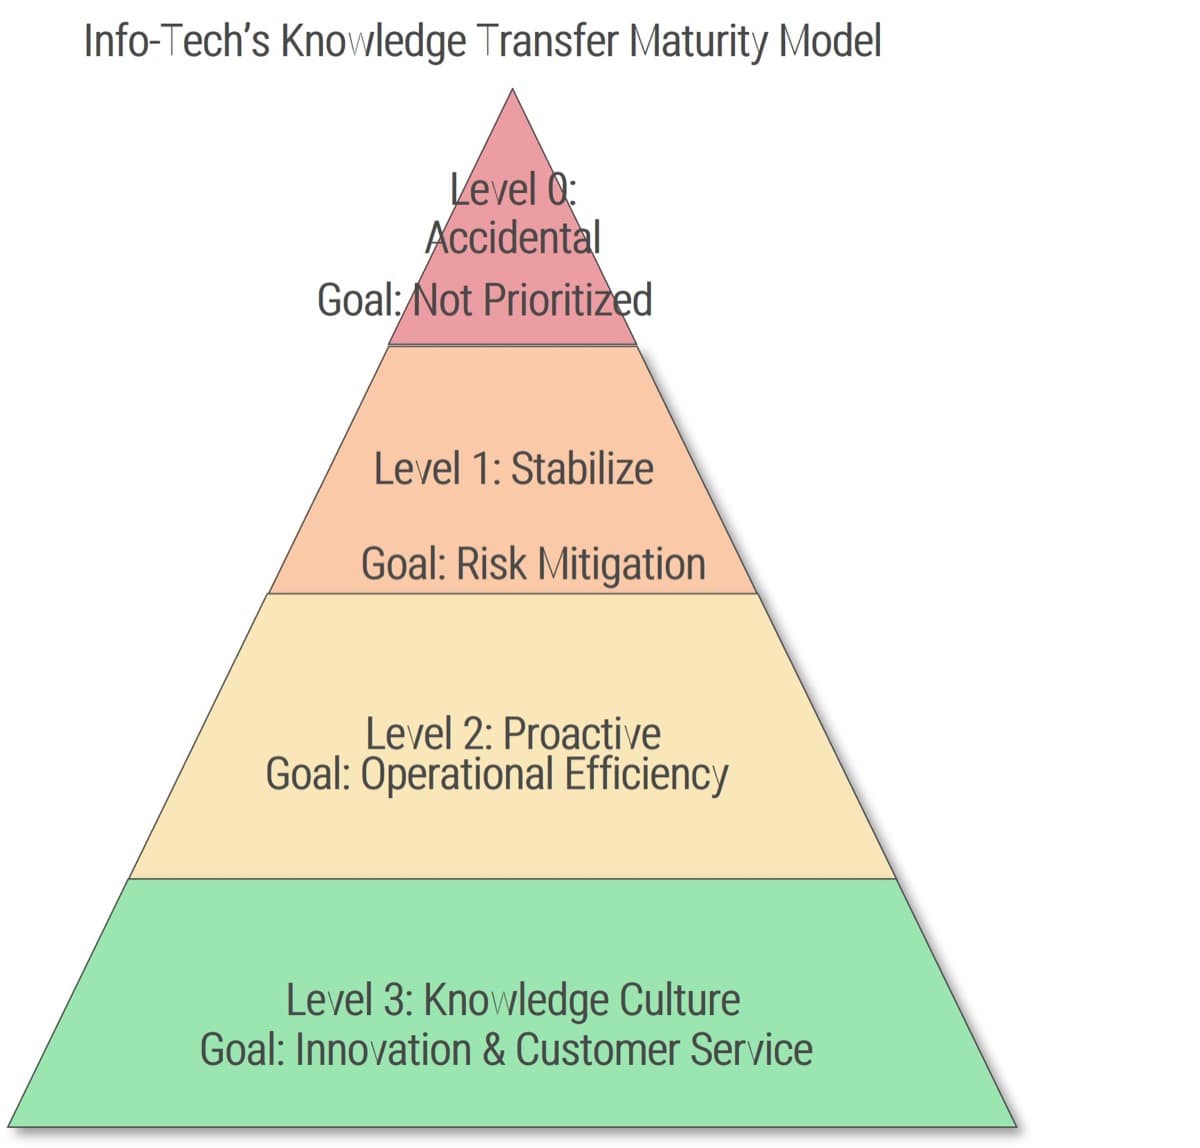
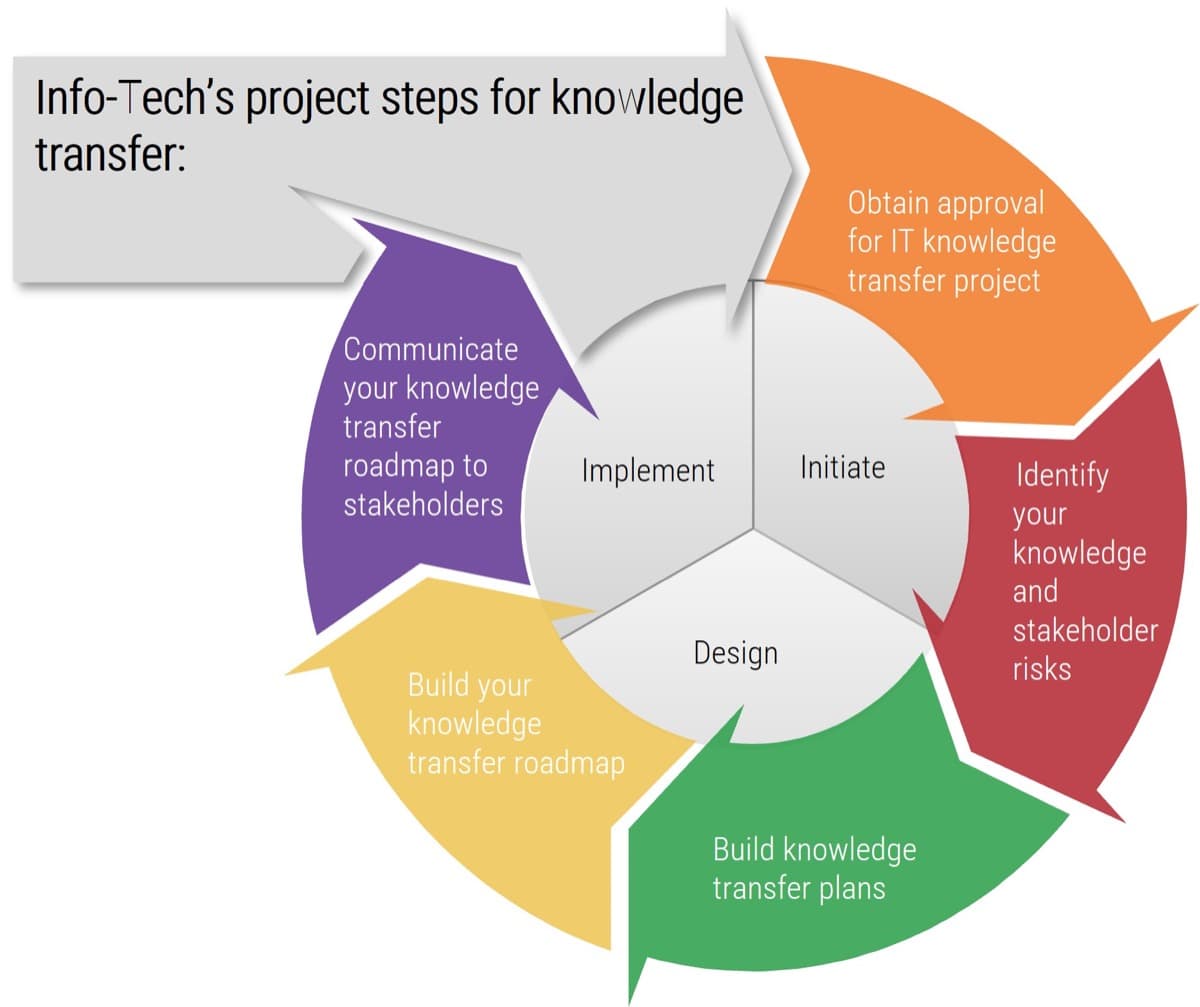
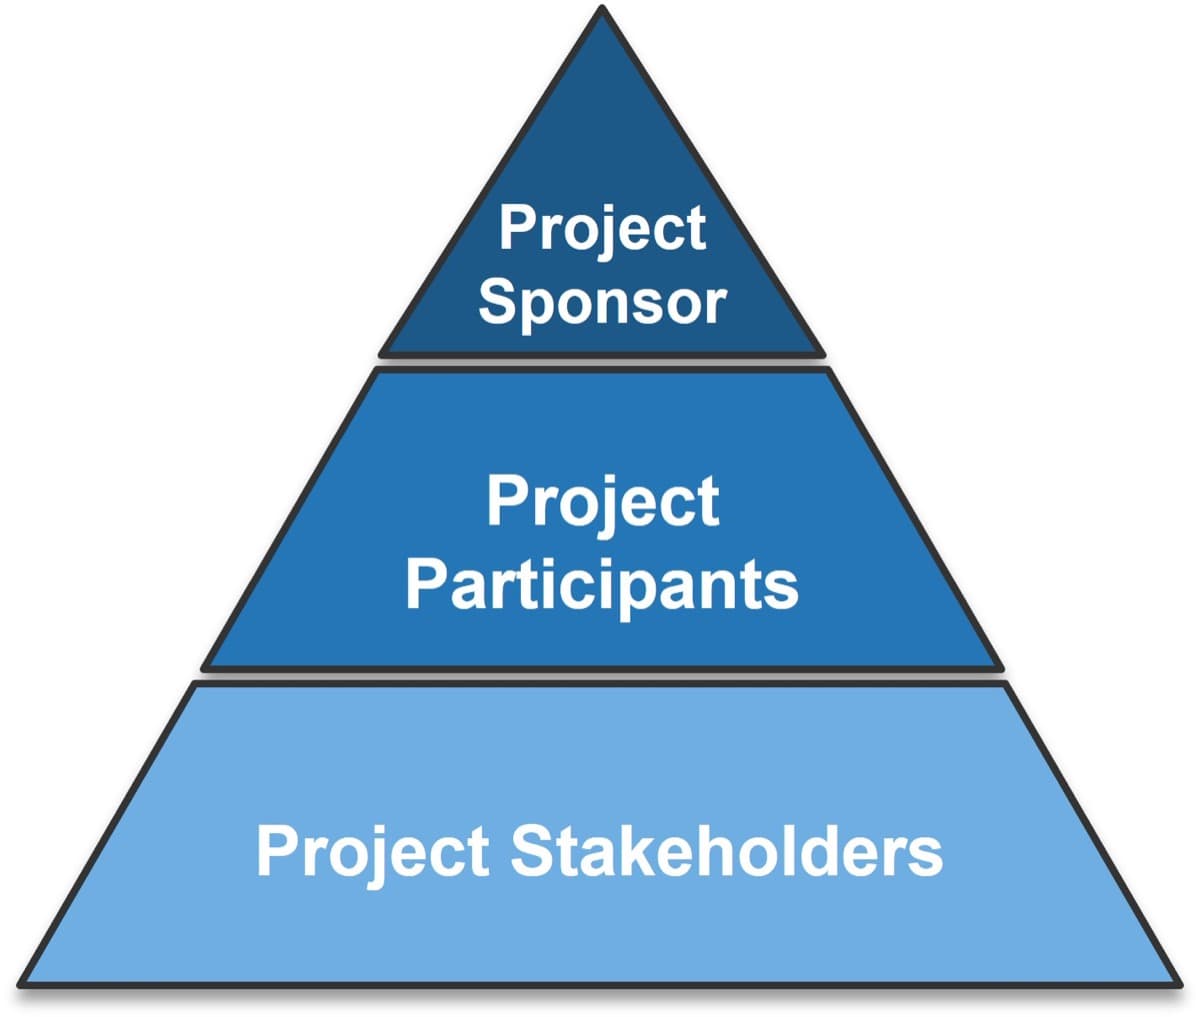
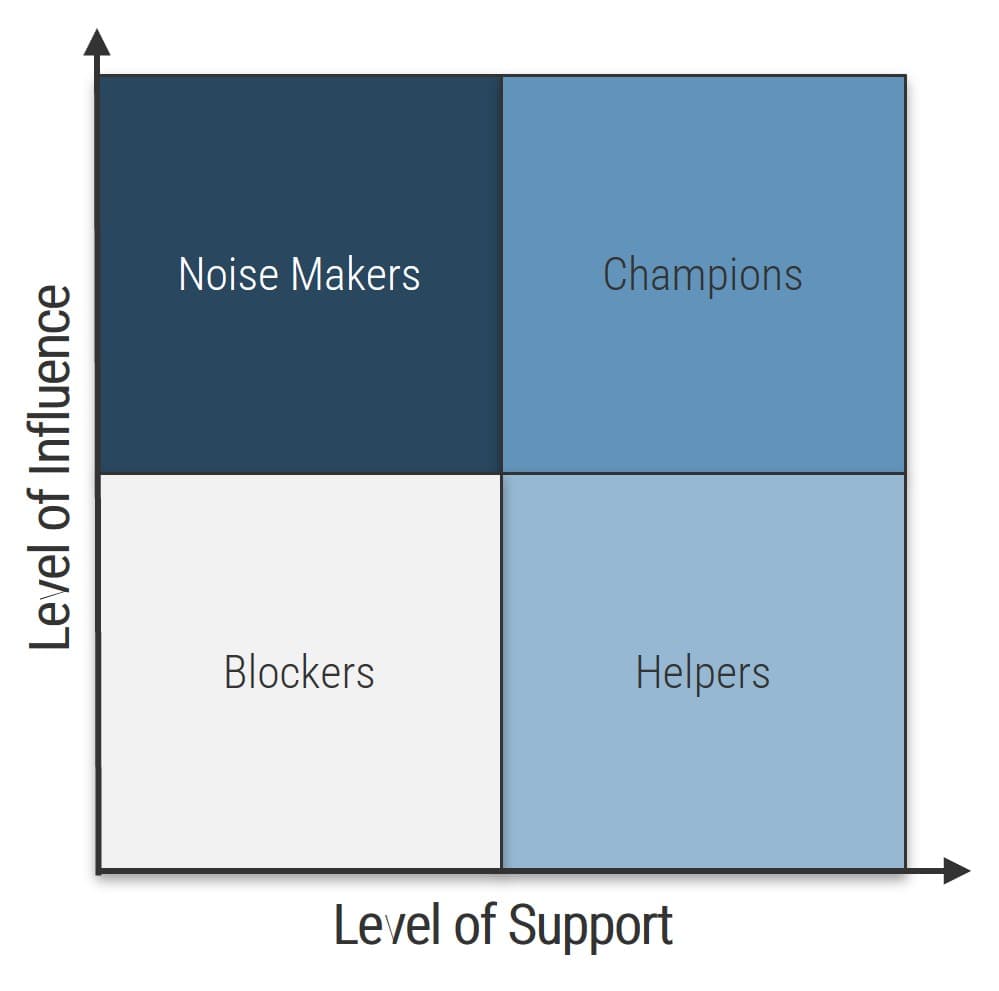
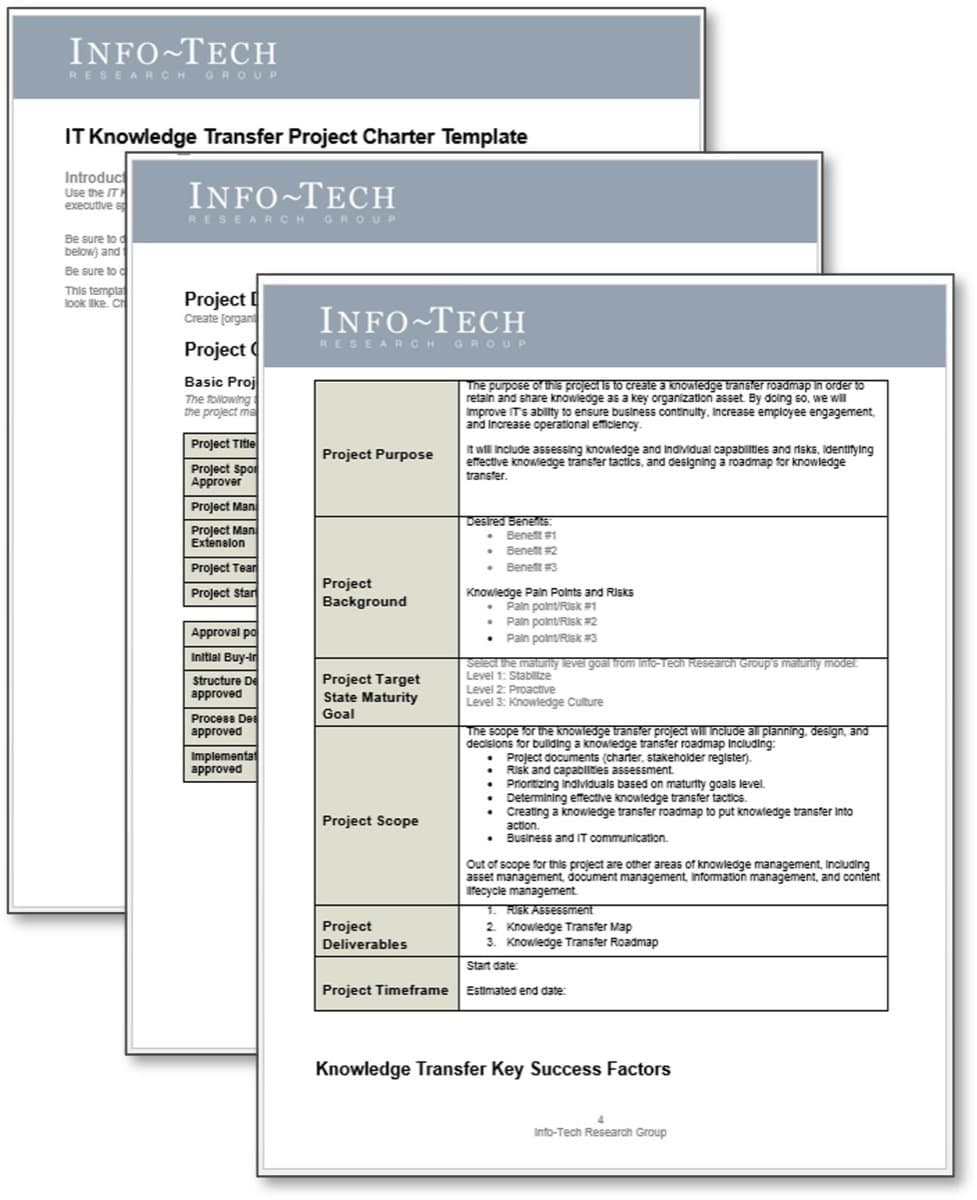
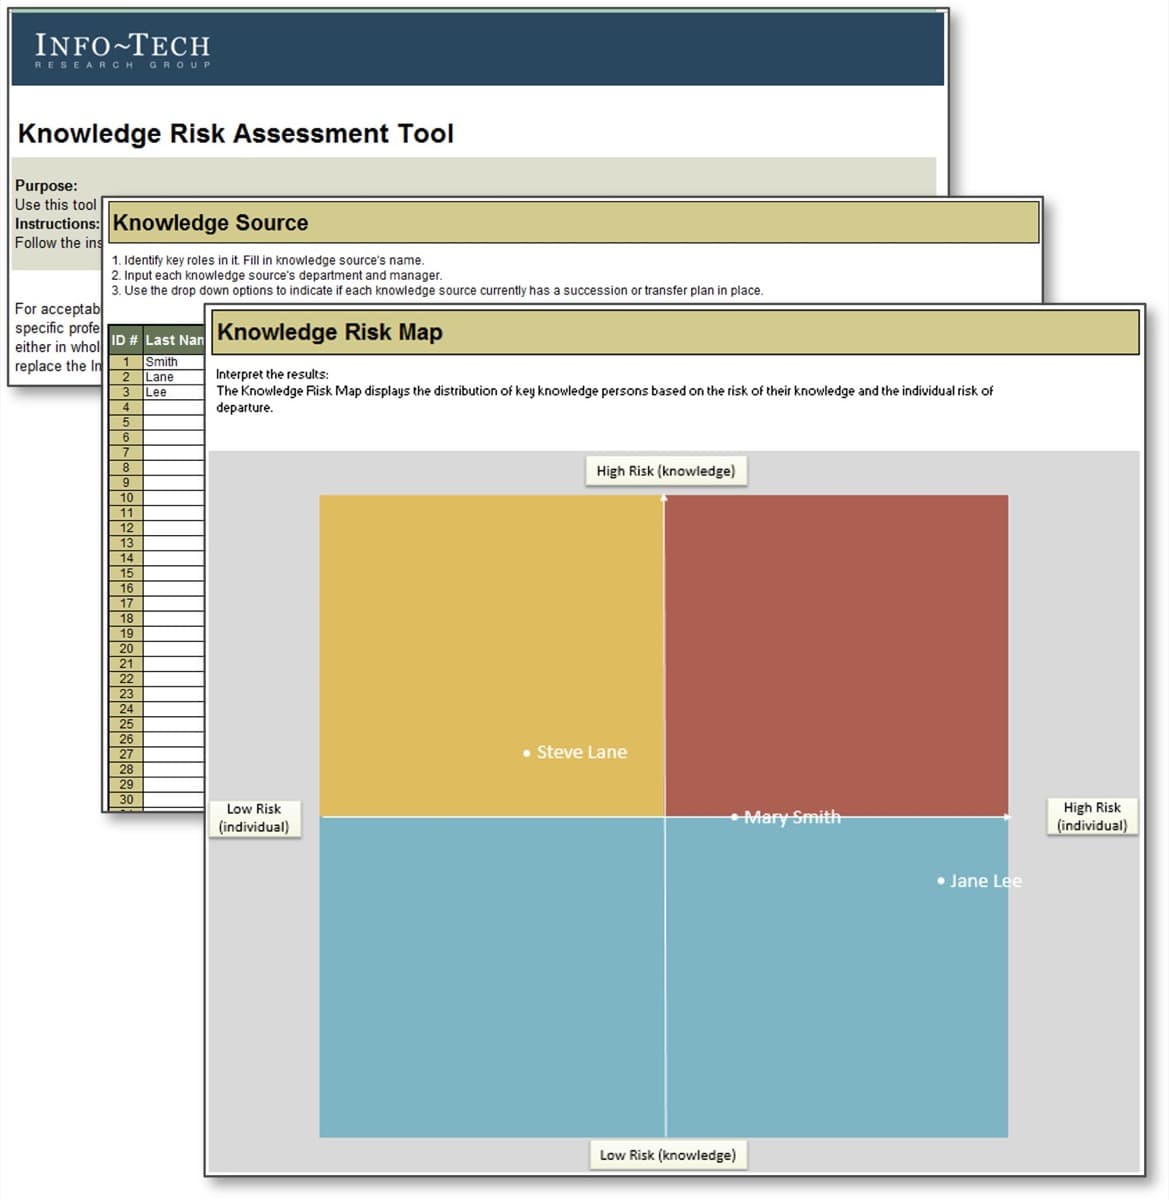
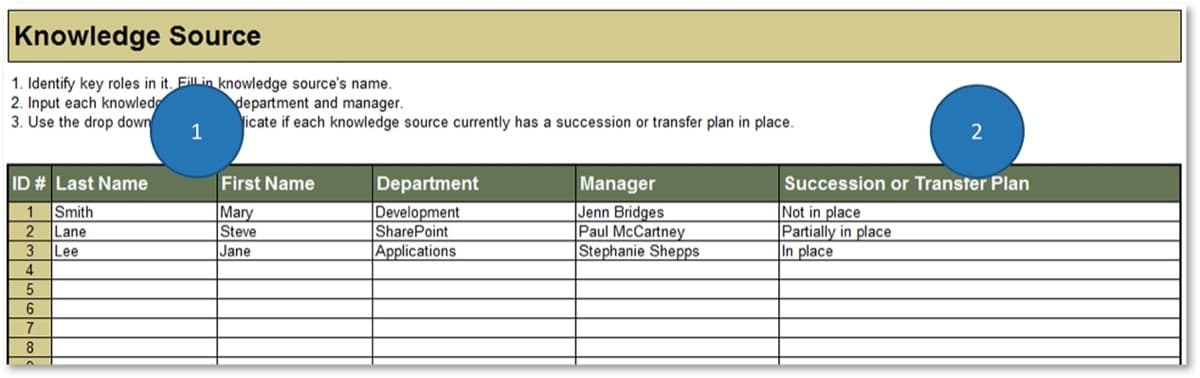
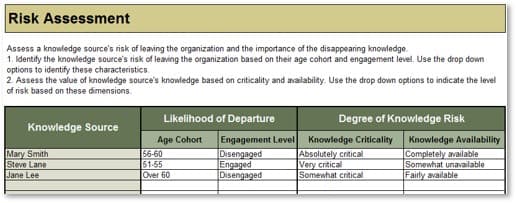
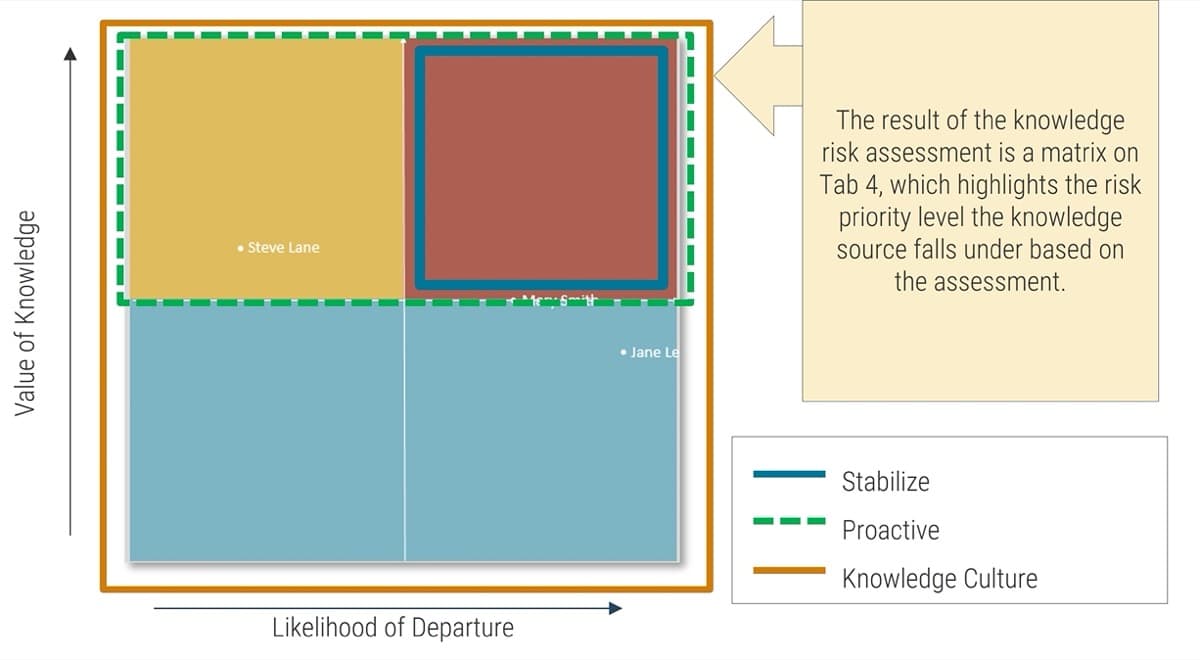
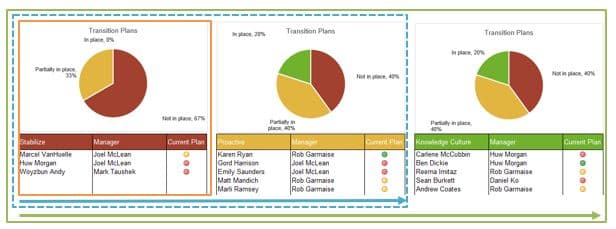
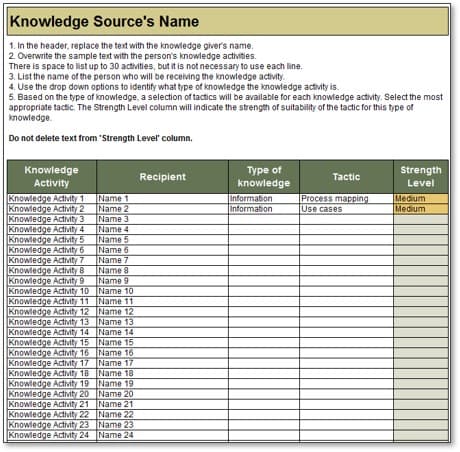
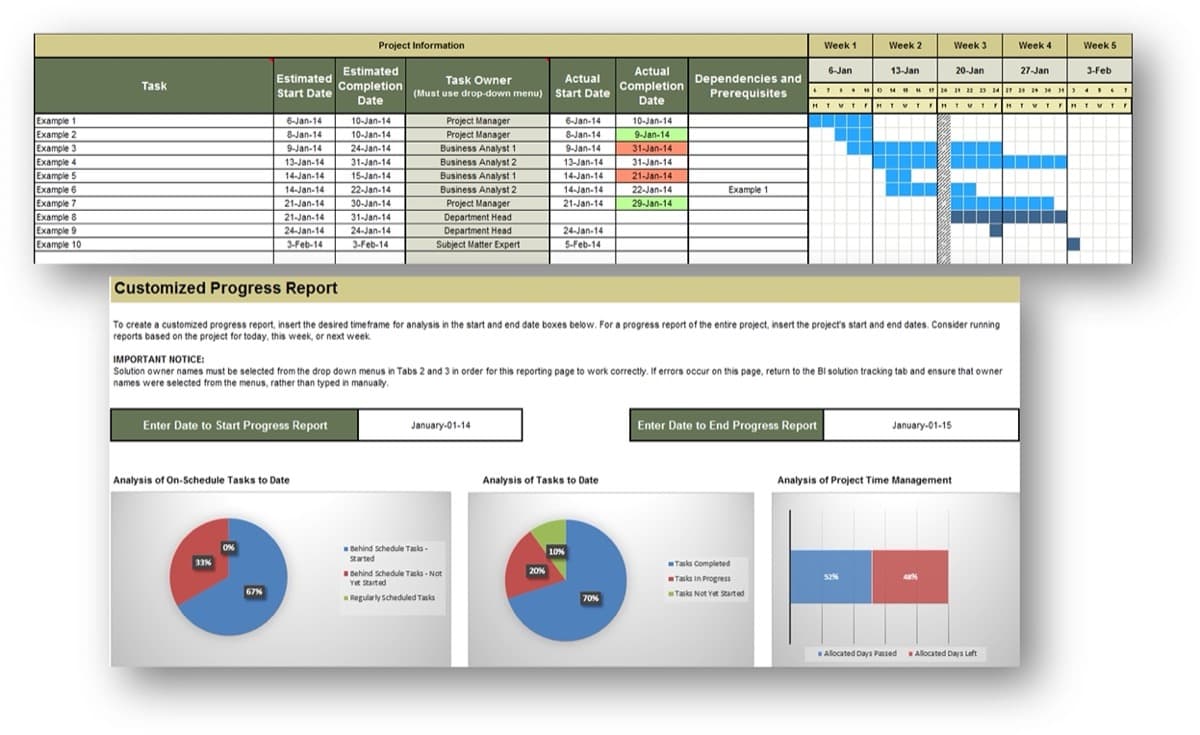
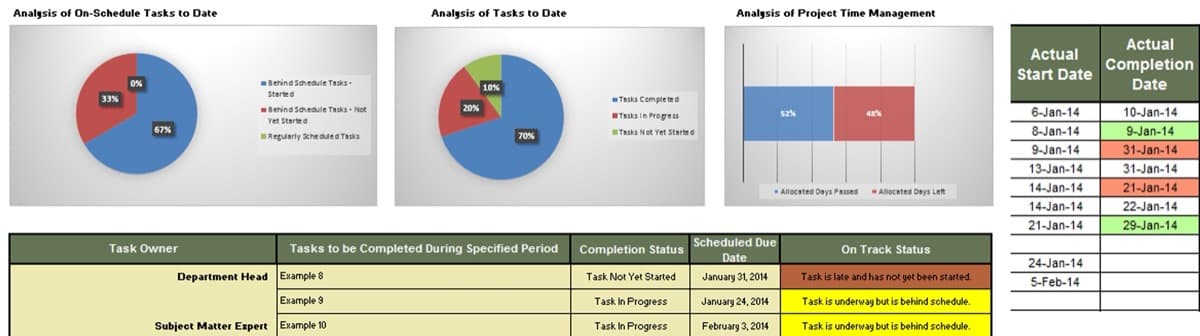
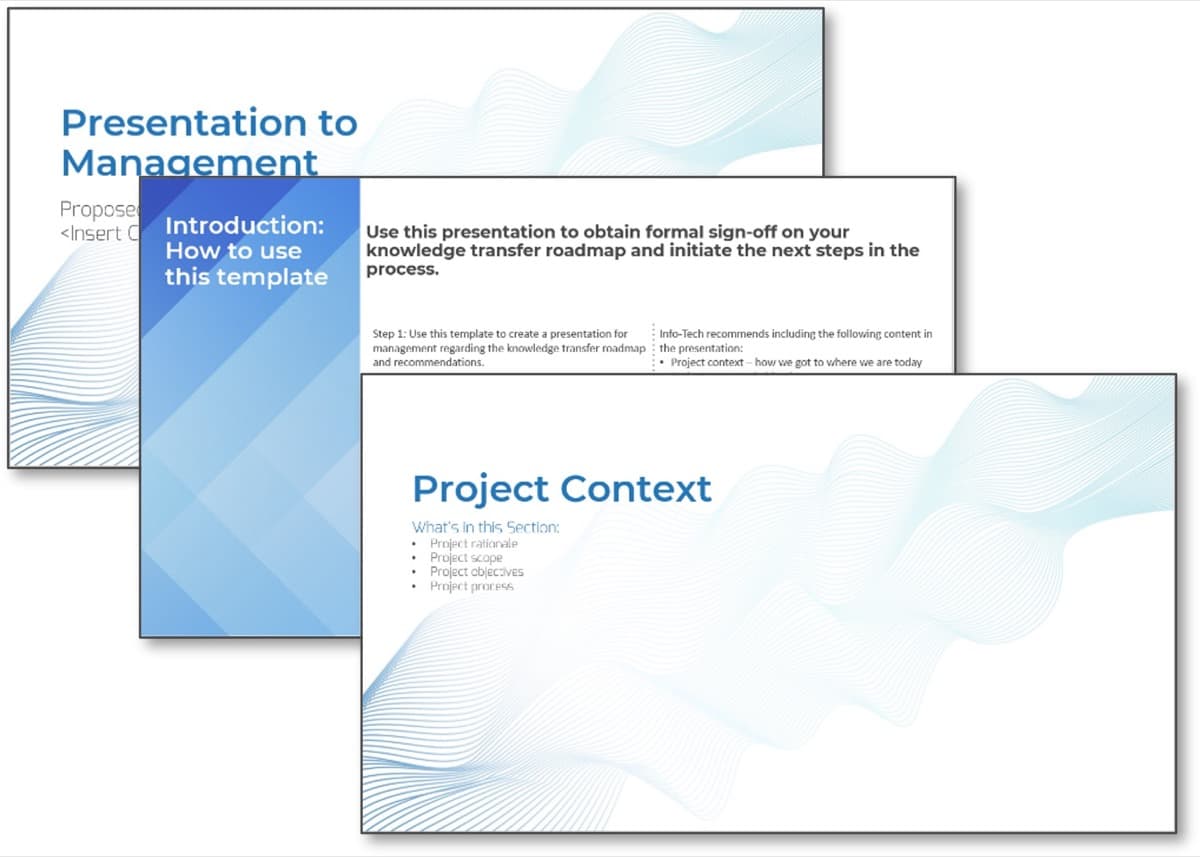


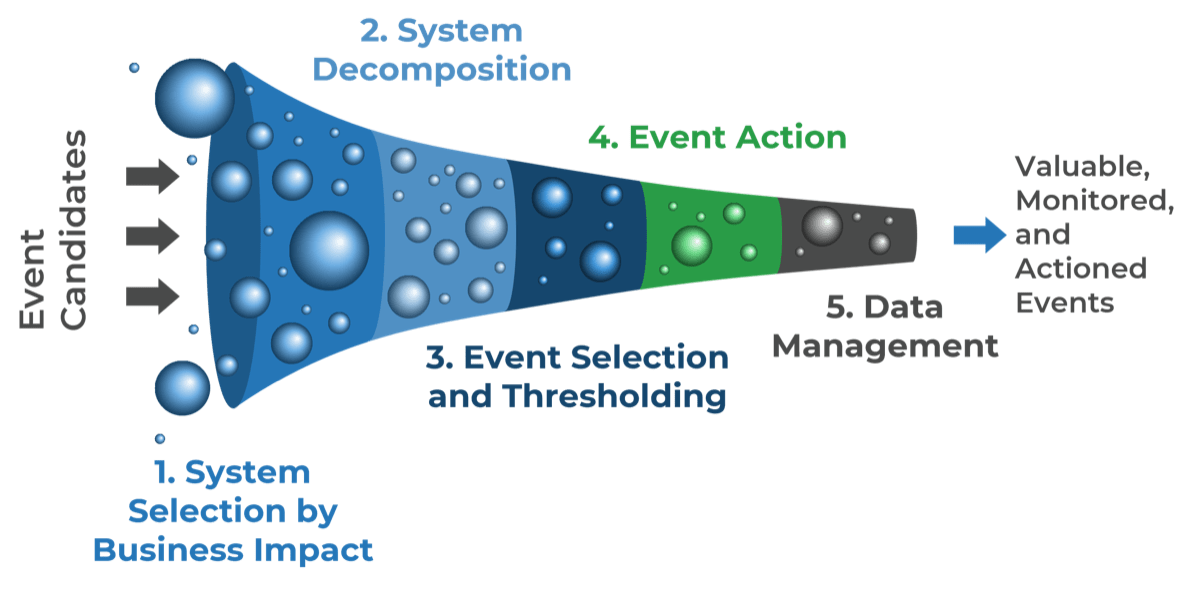
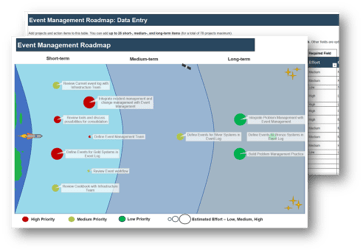
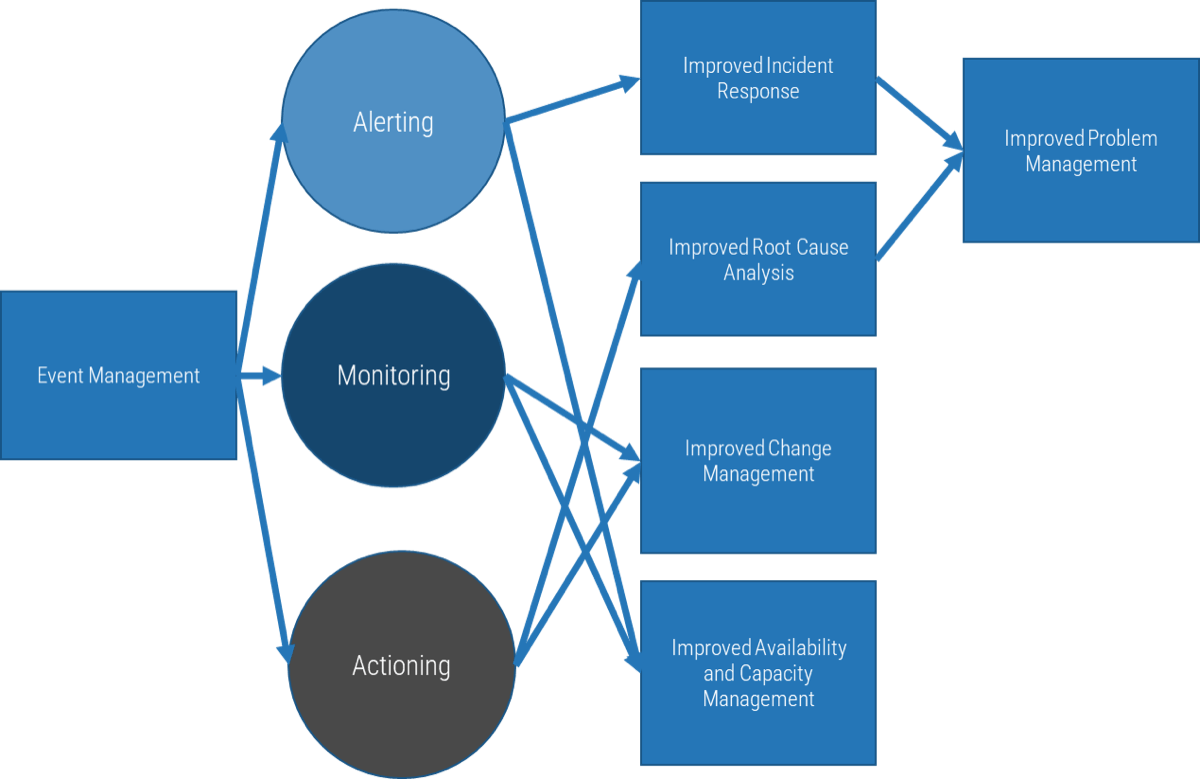
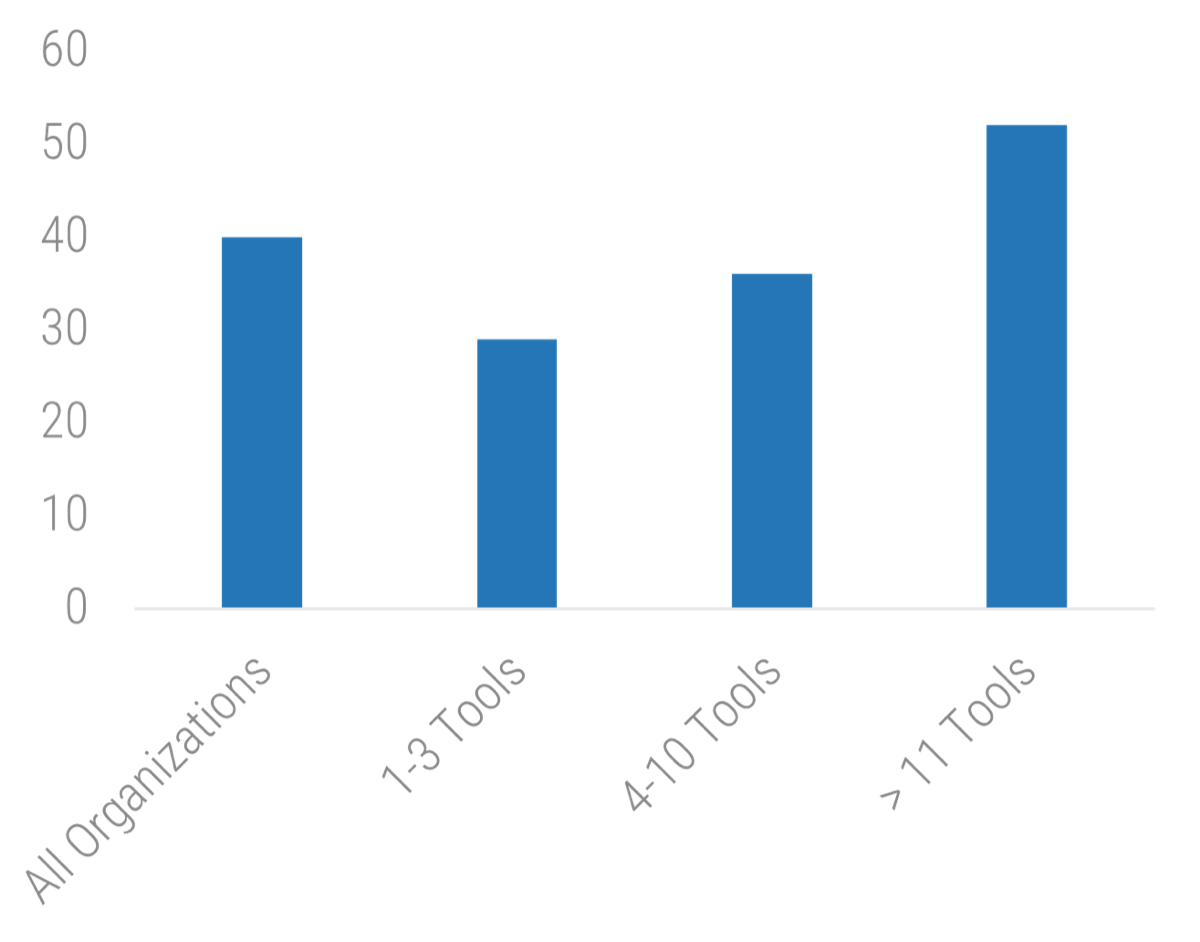 11 Tools: 52">
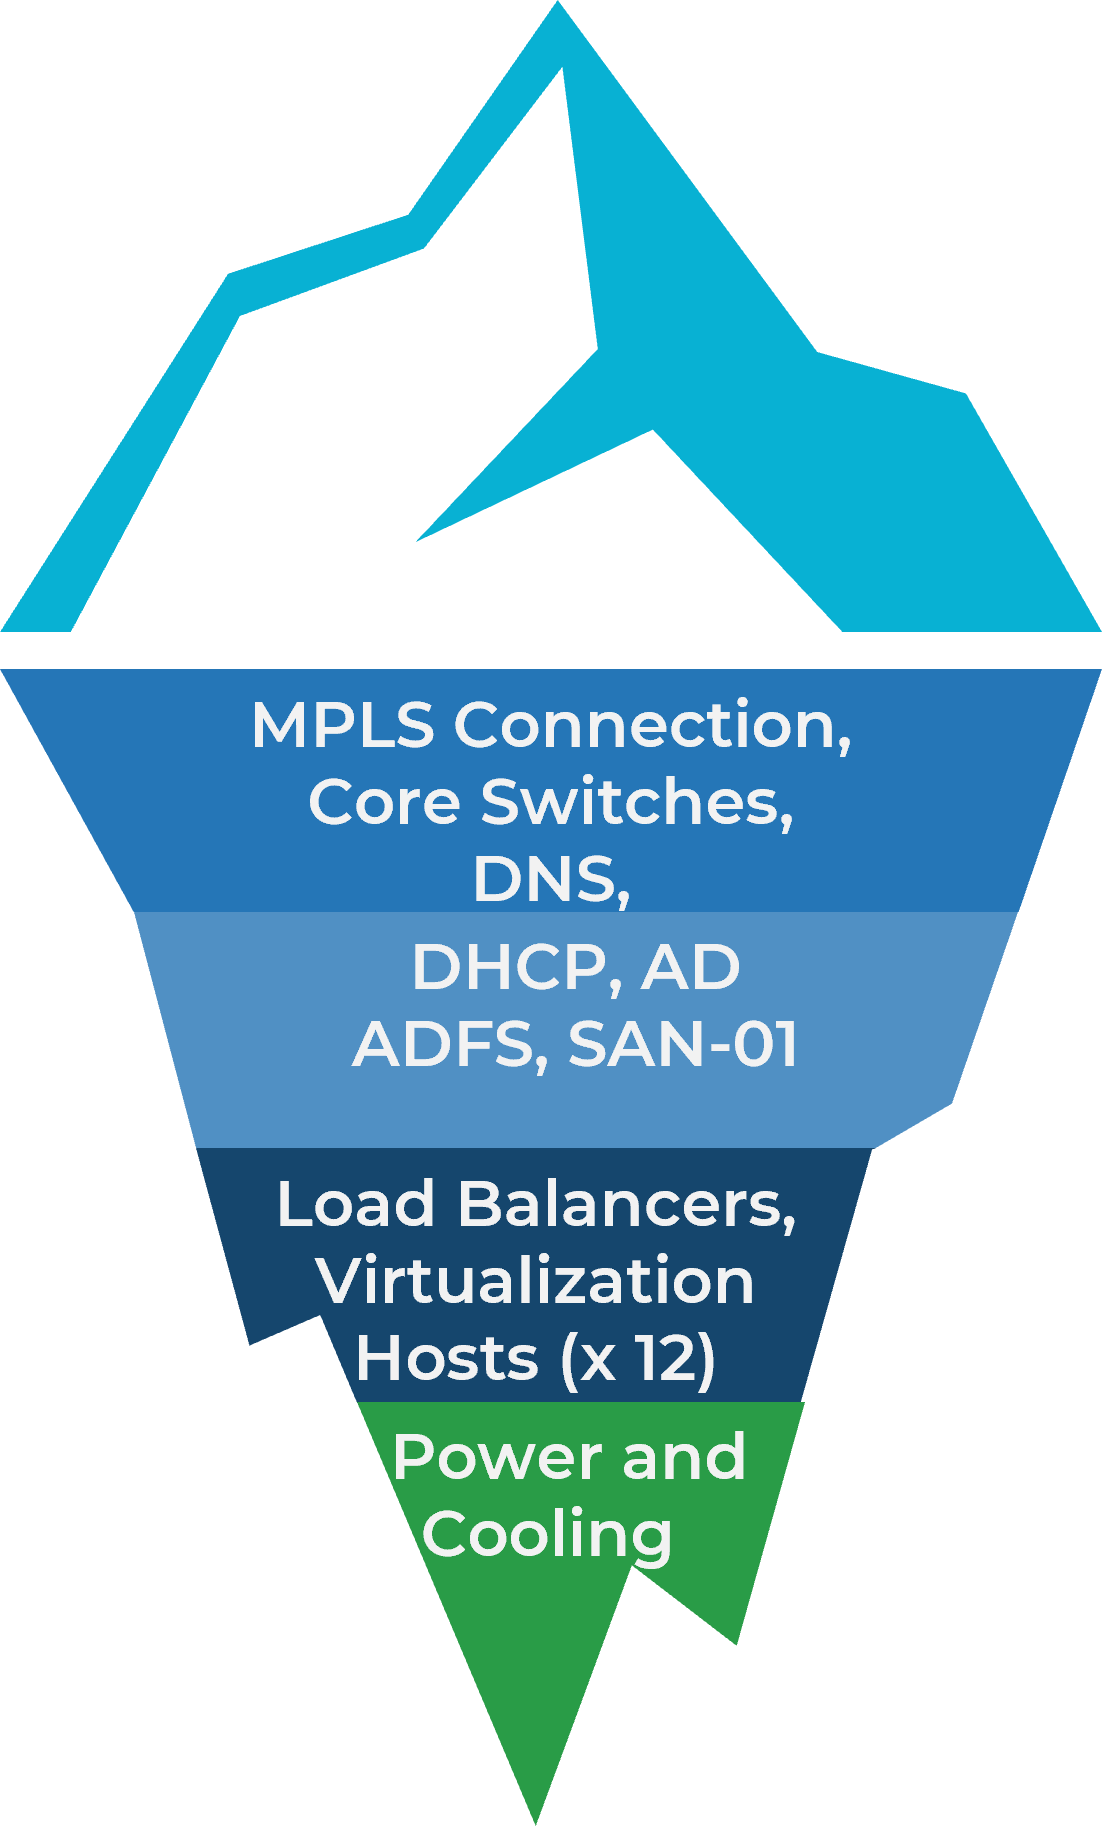
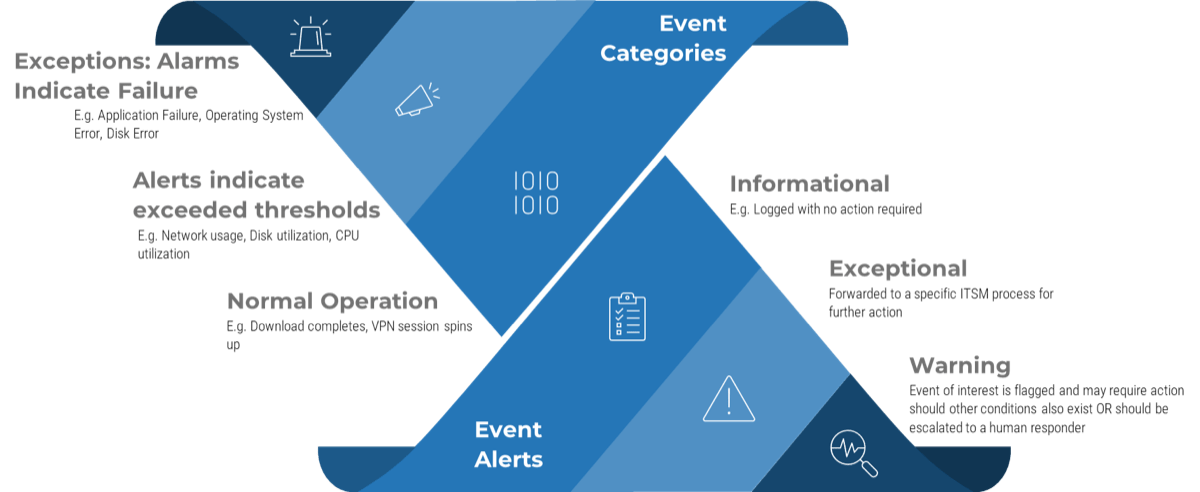
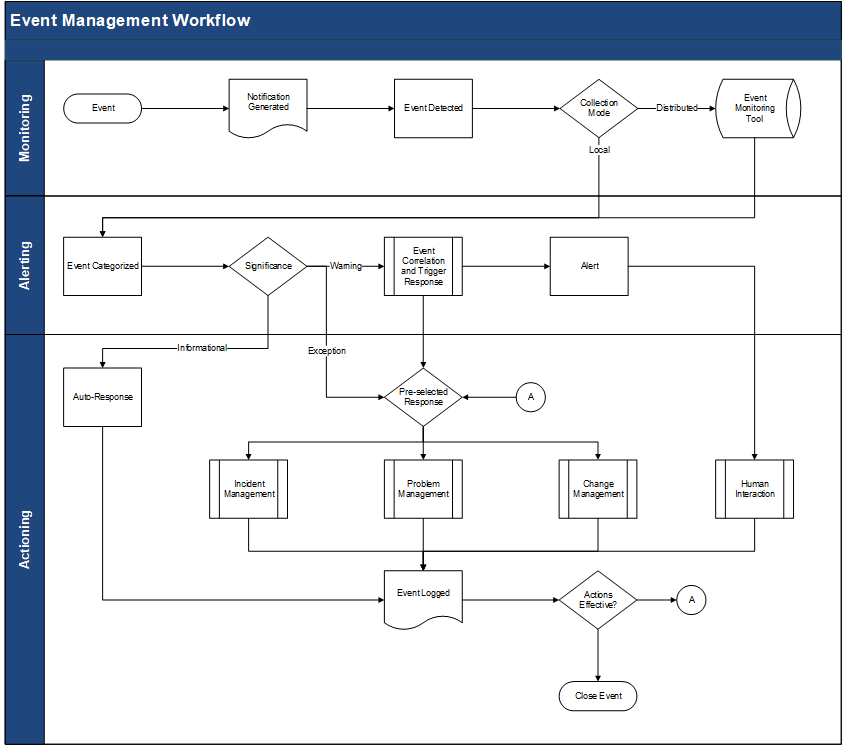
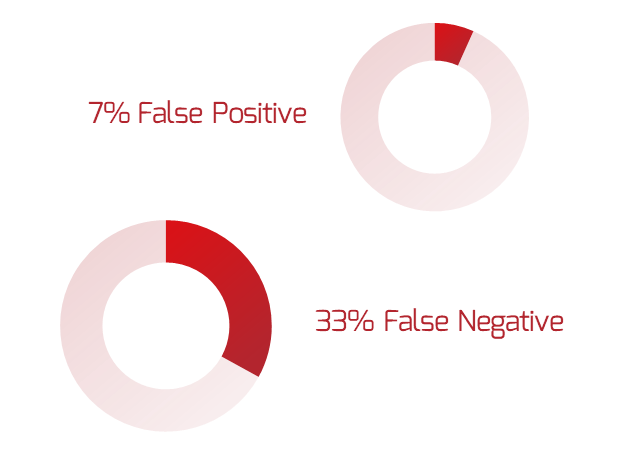

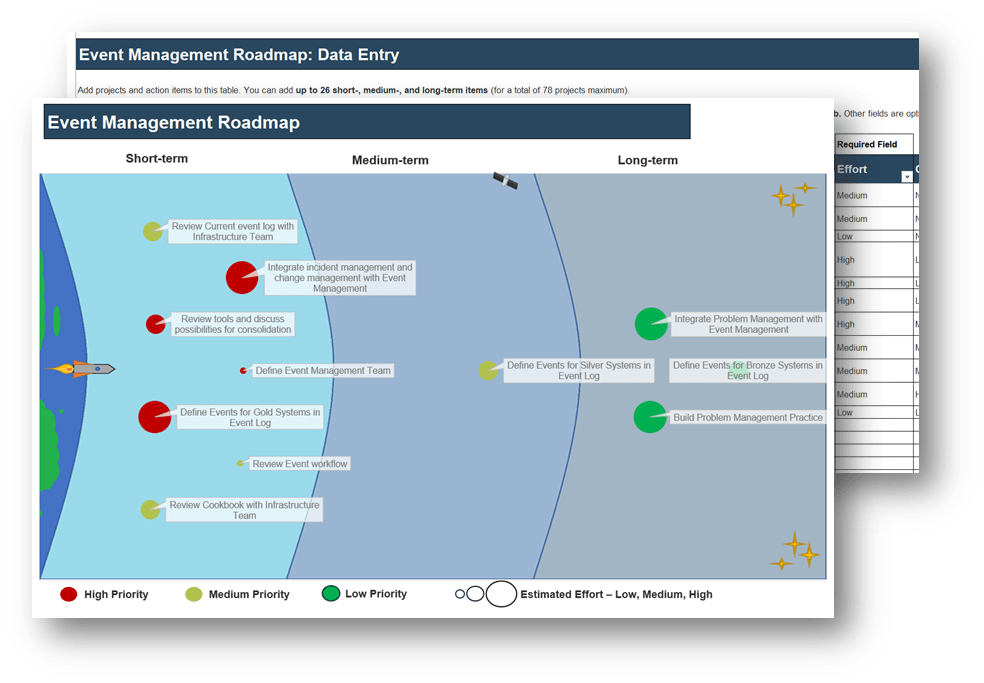
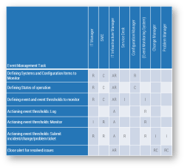
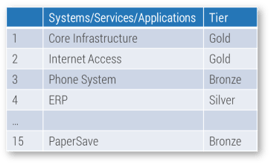


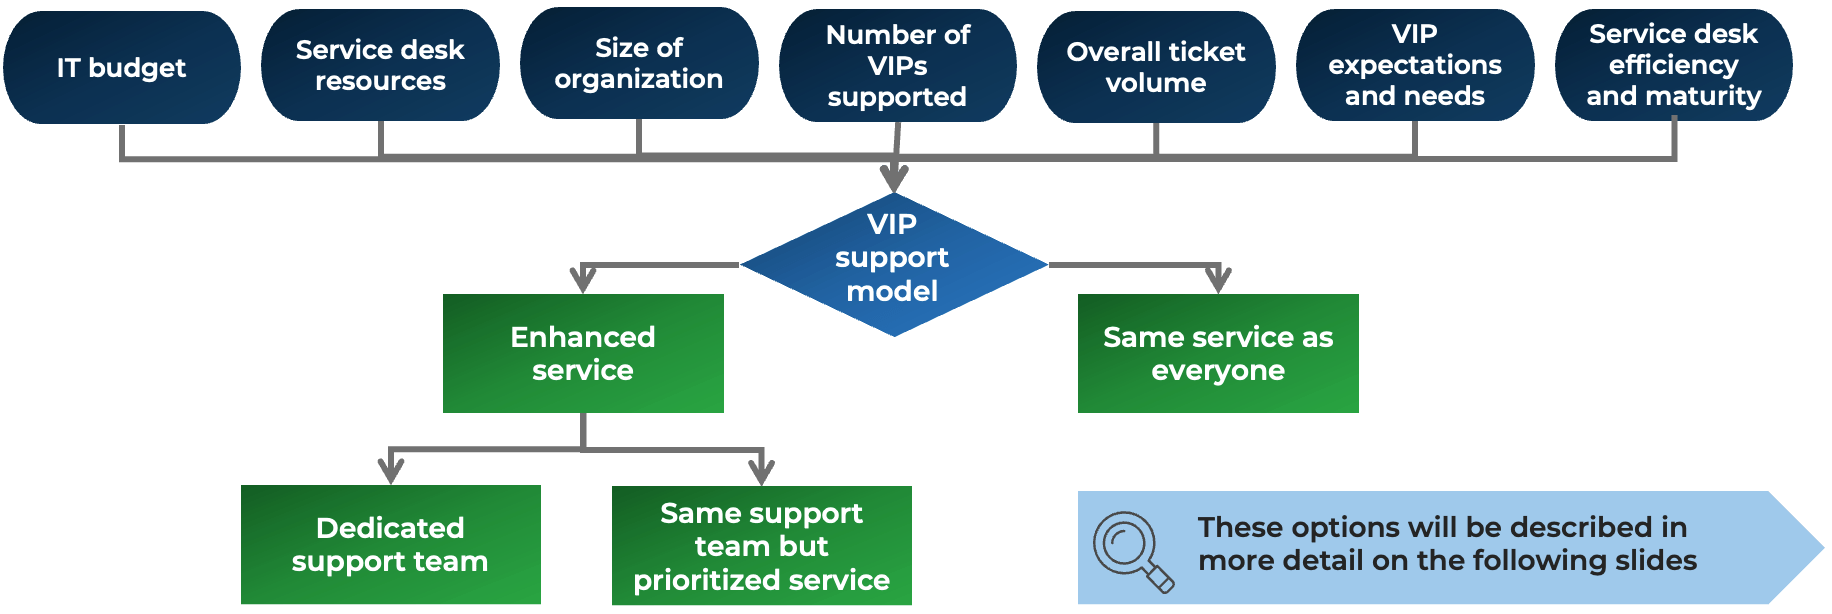
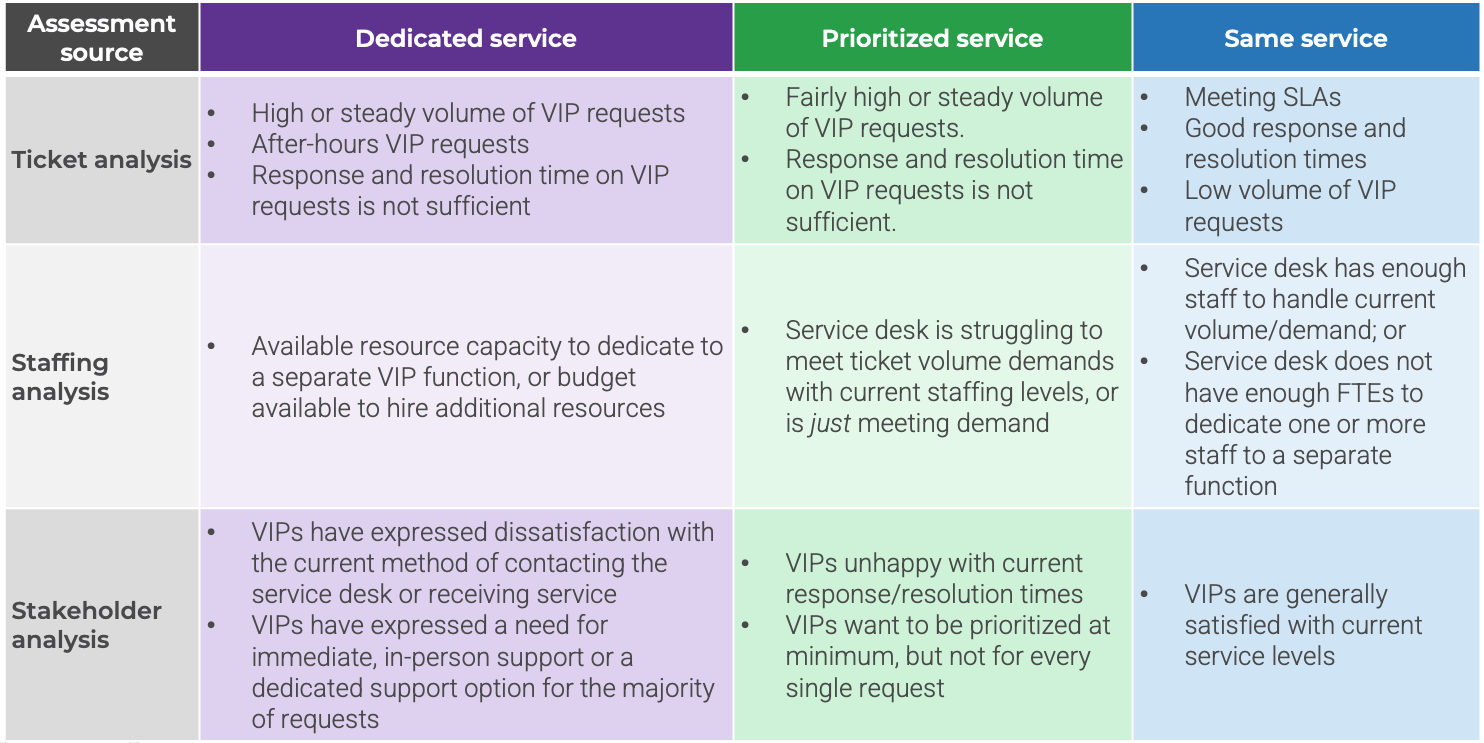
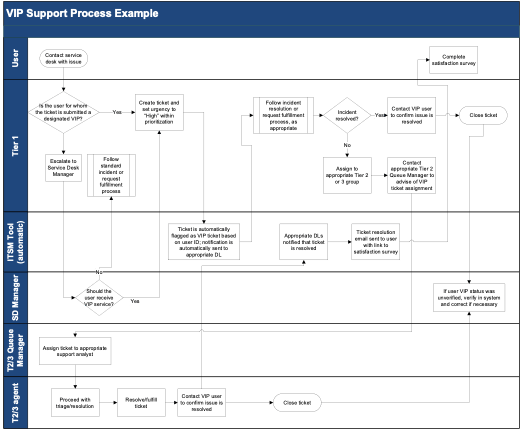
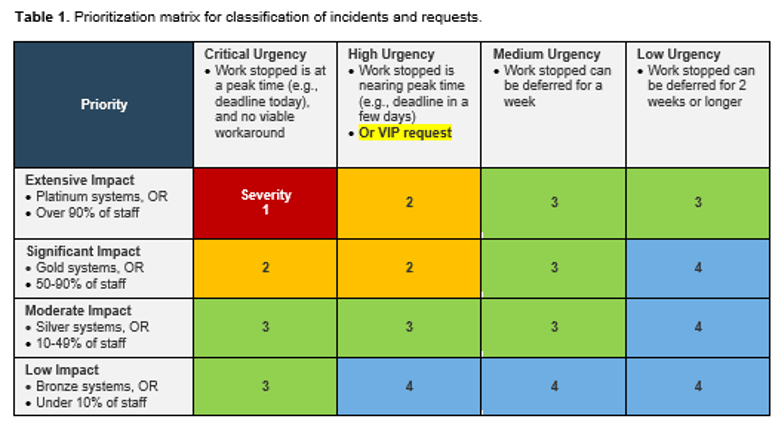


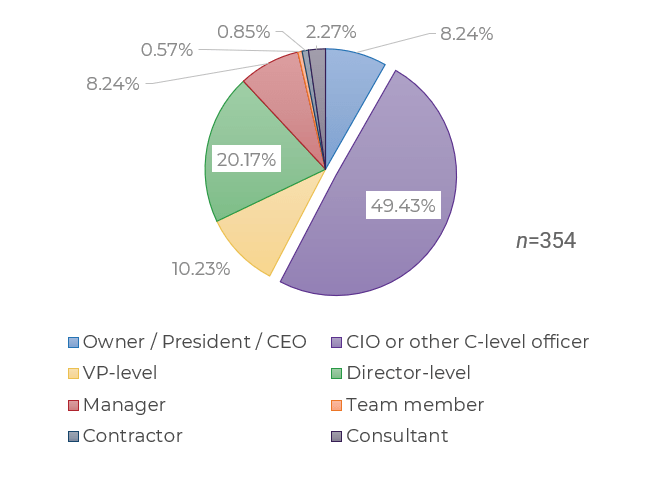
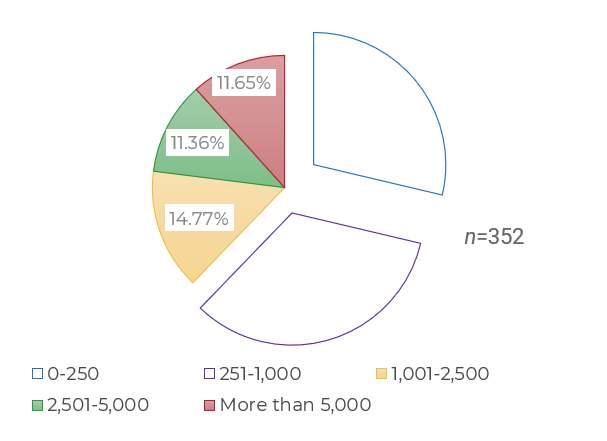
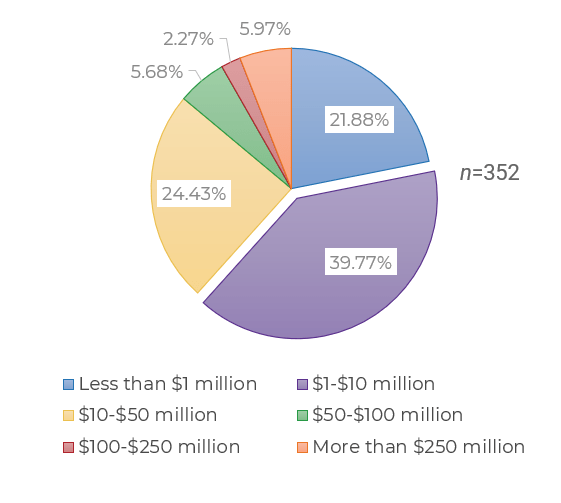
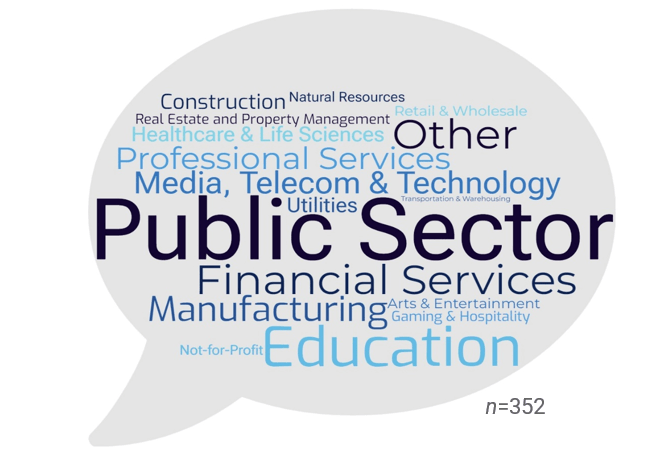
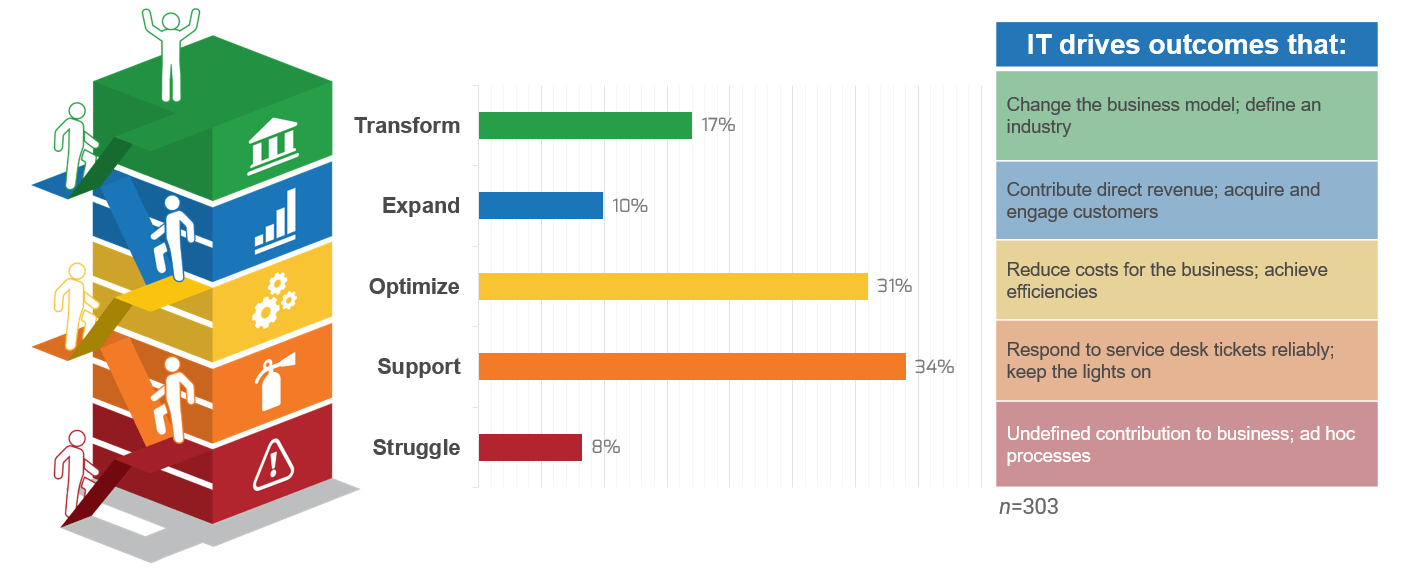
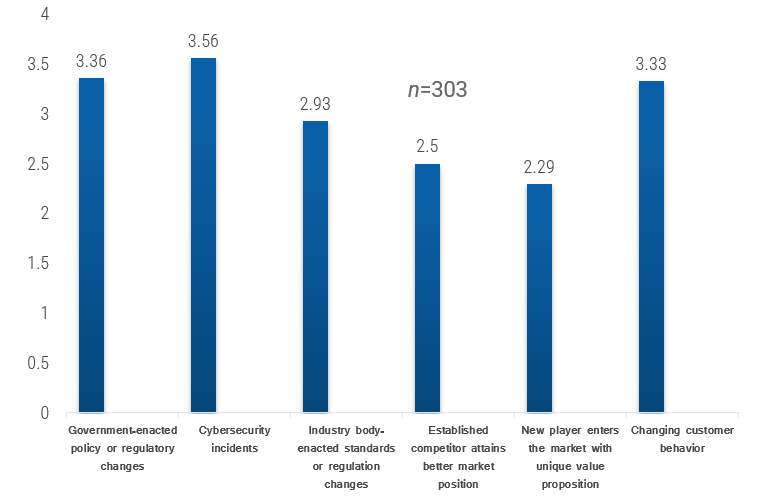
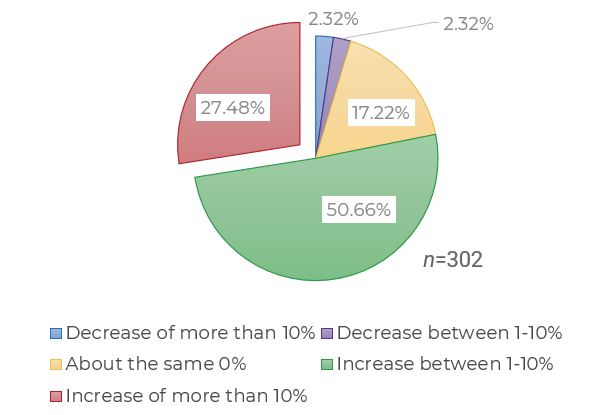
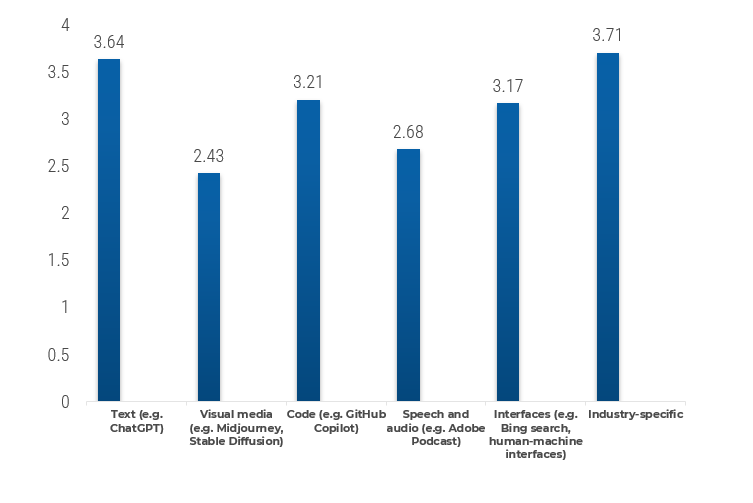
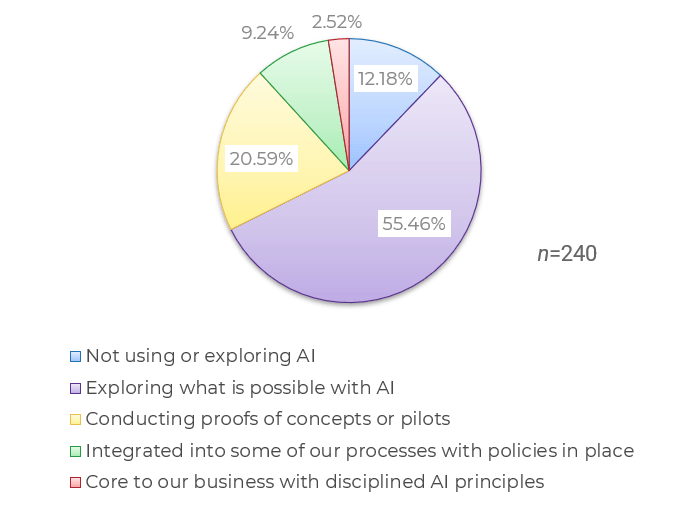
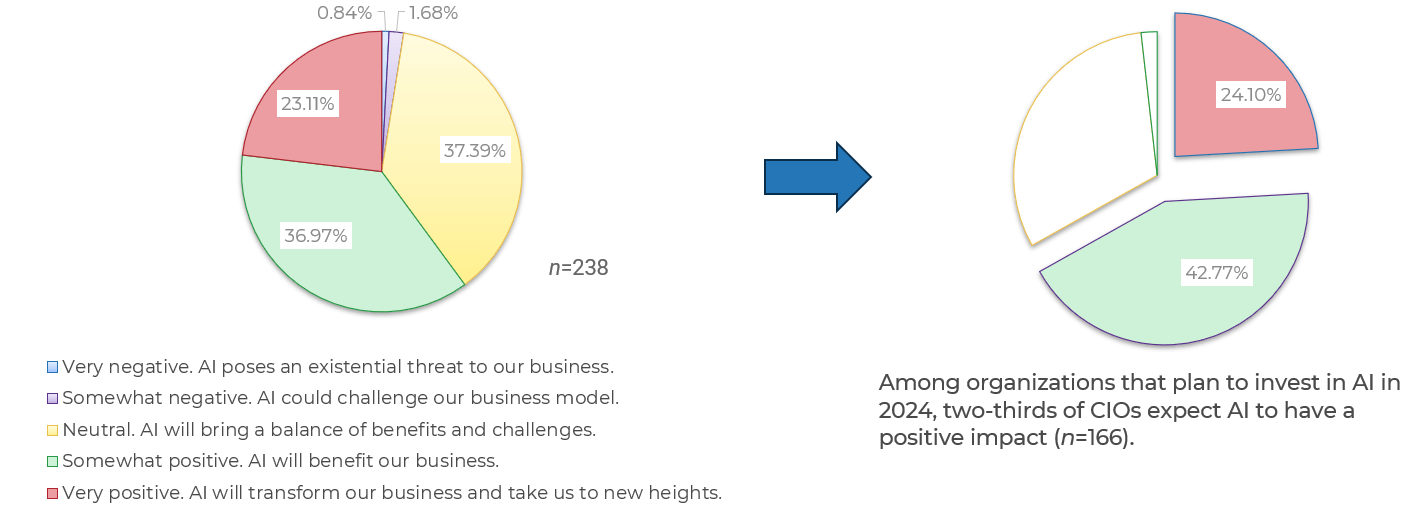
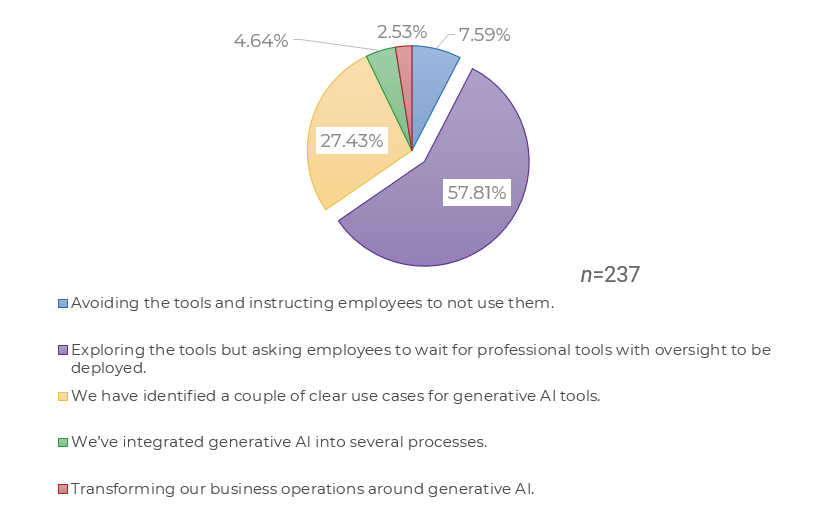
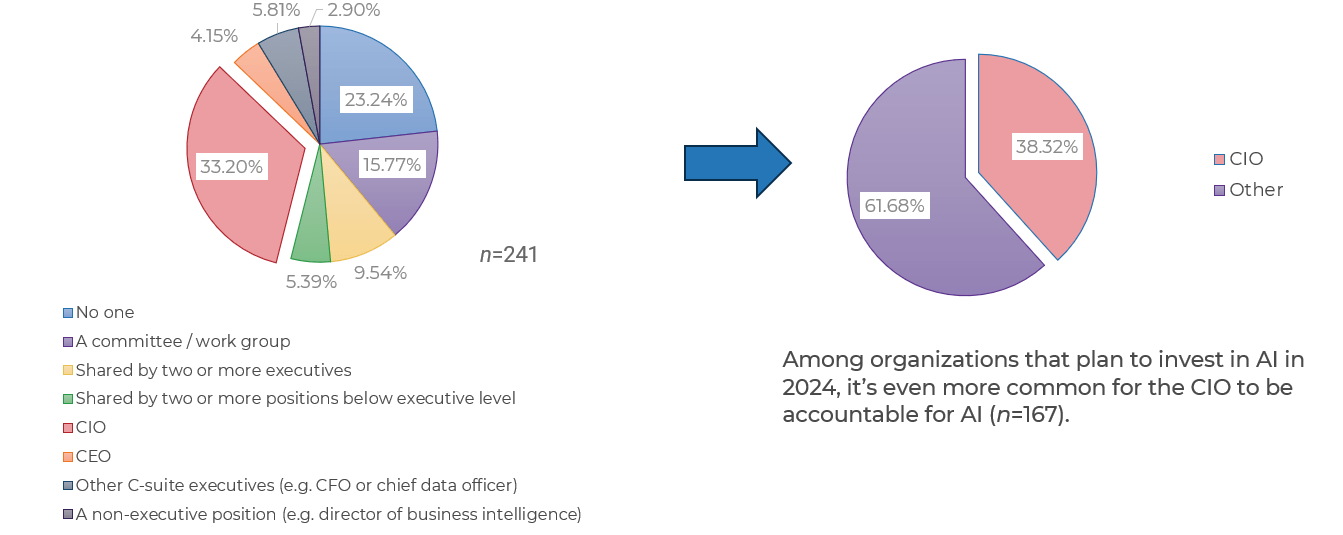
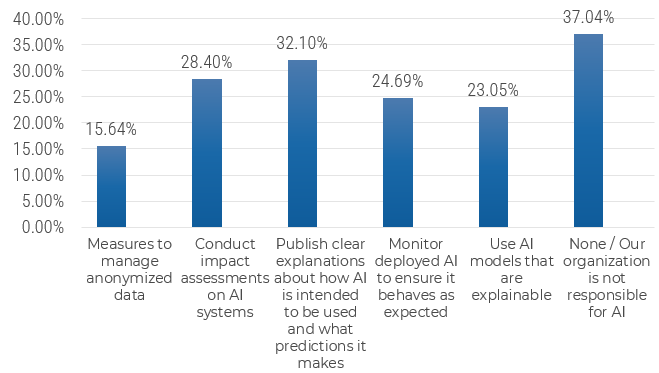
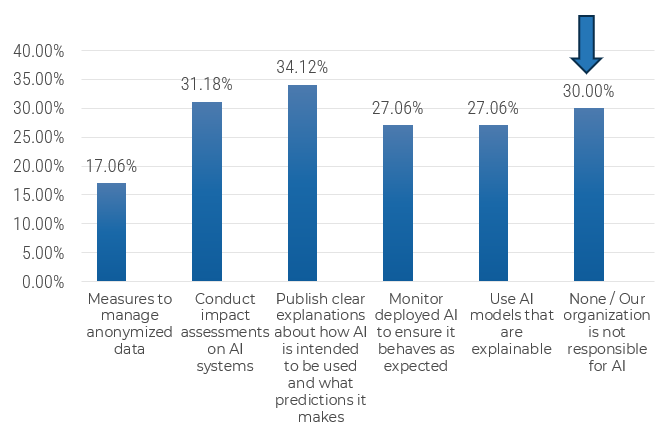
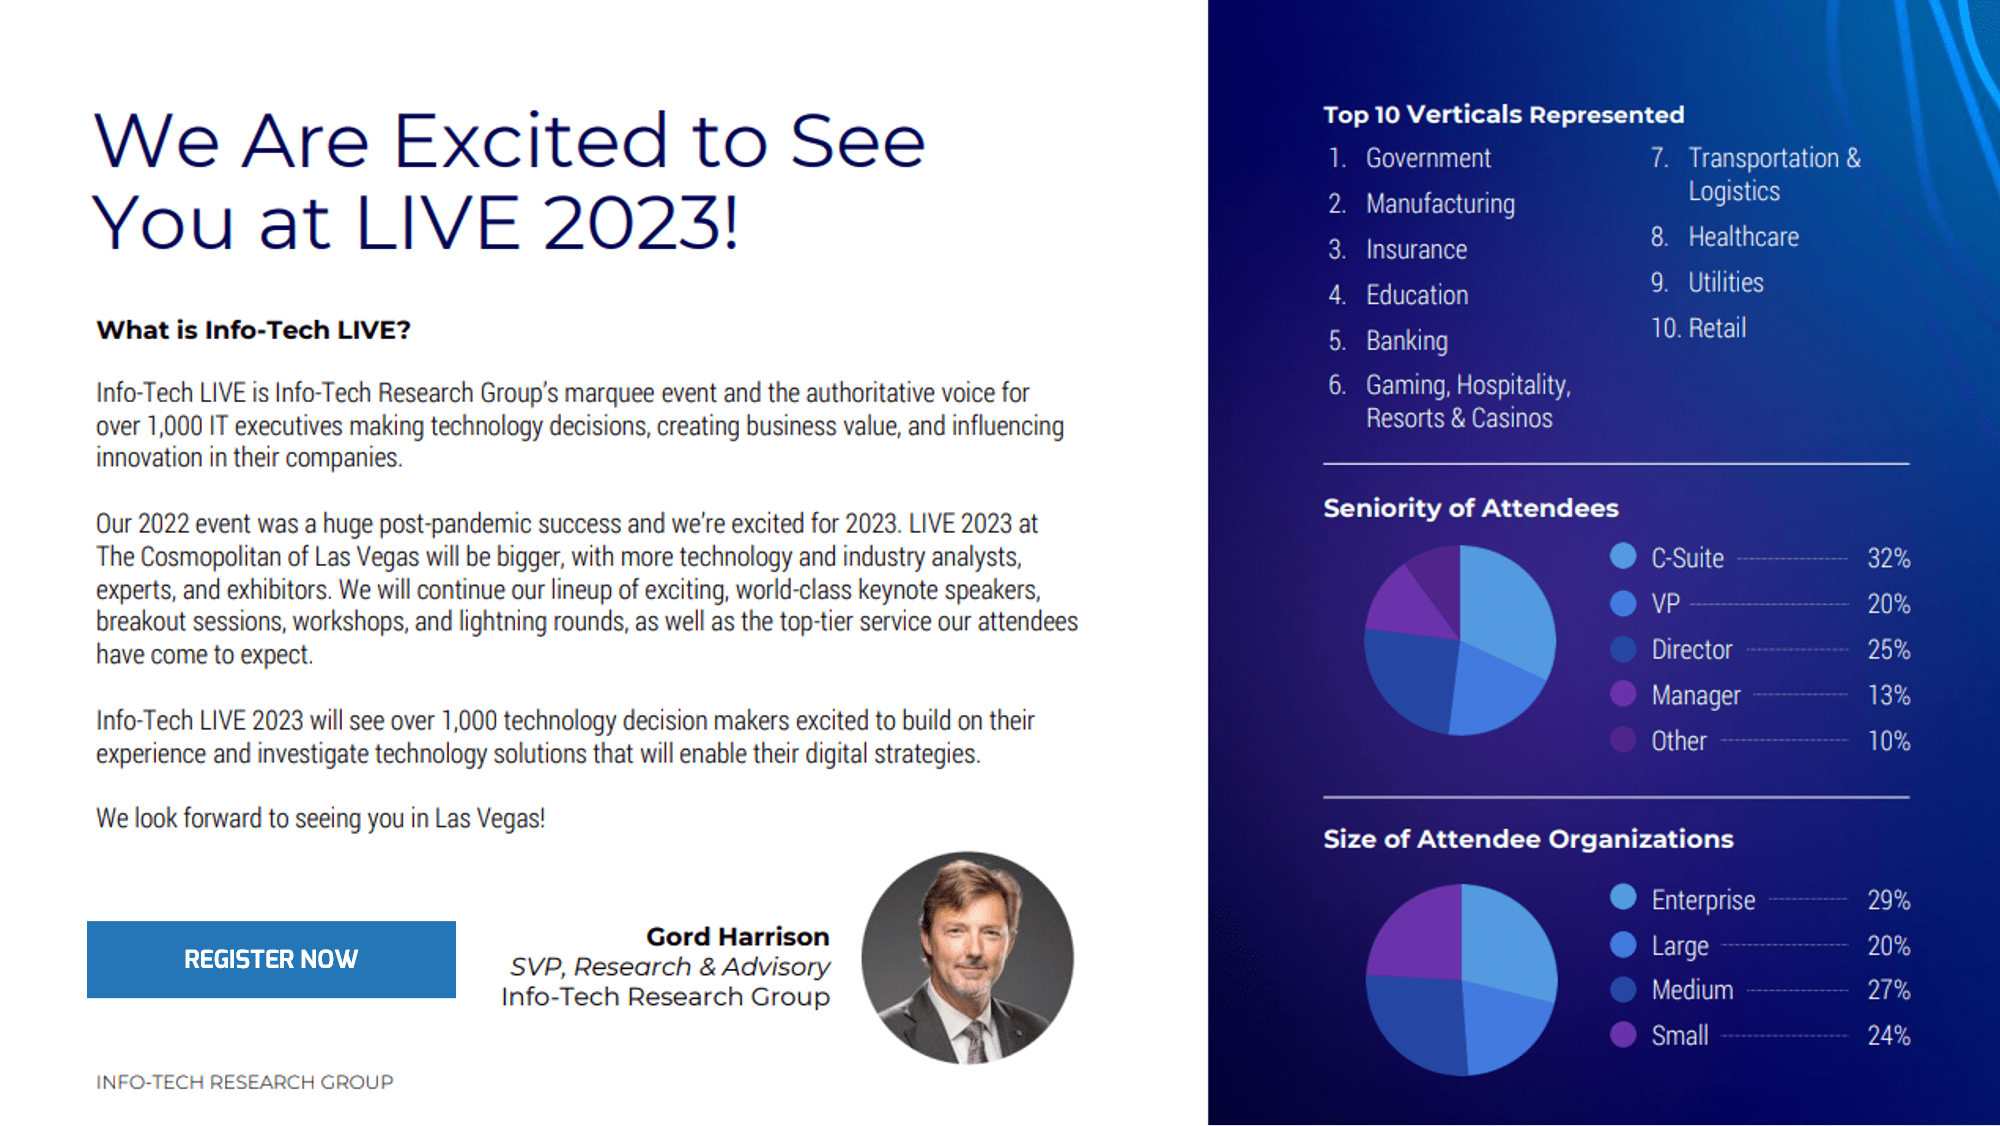


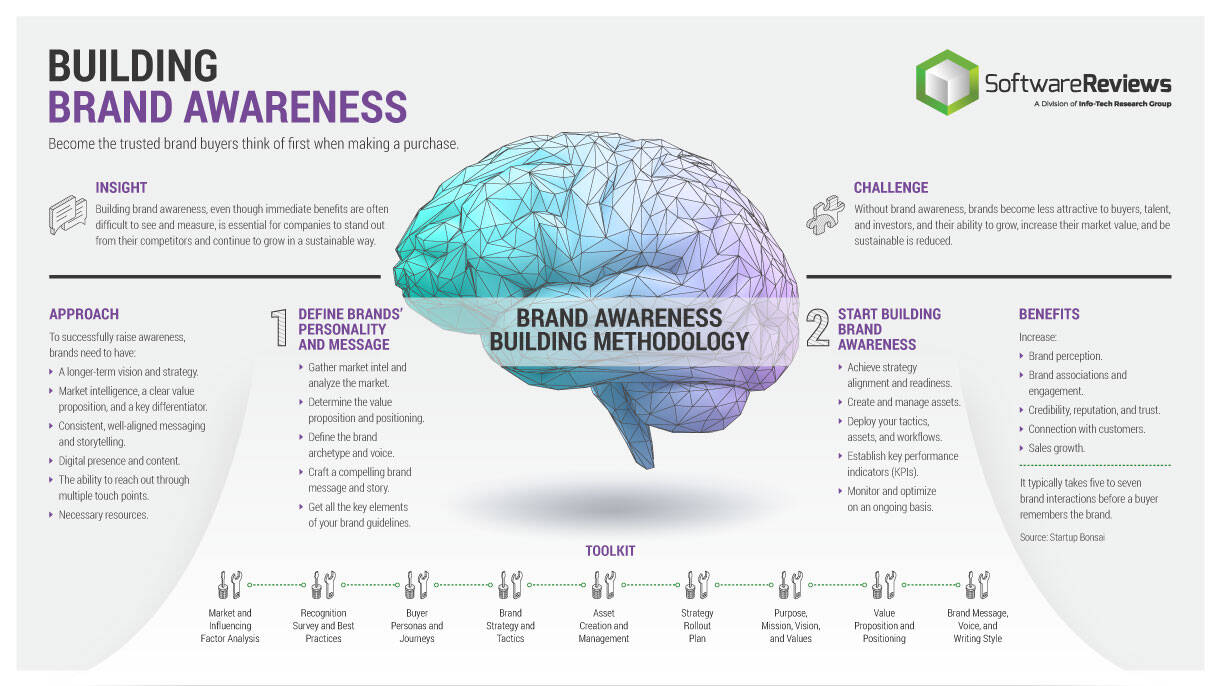

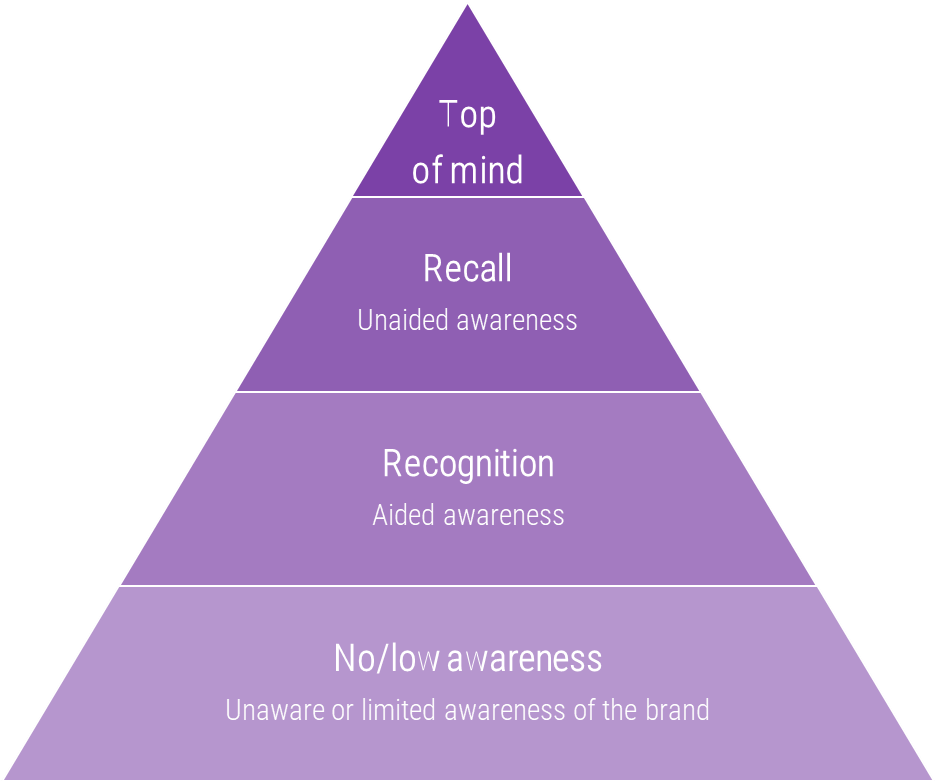
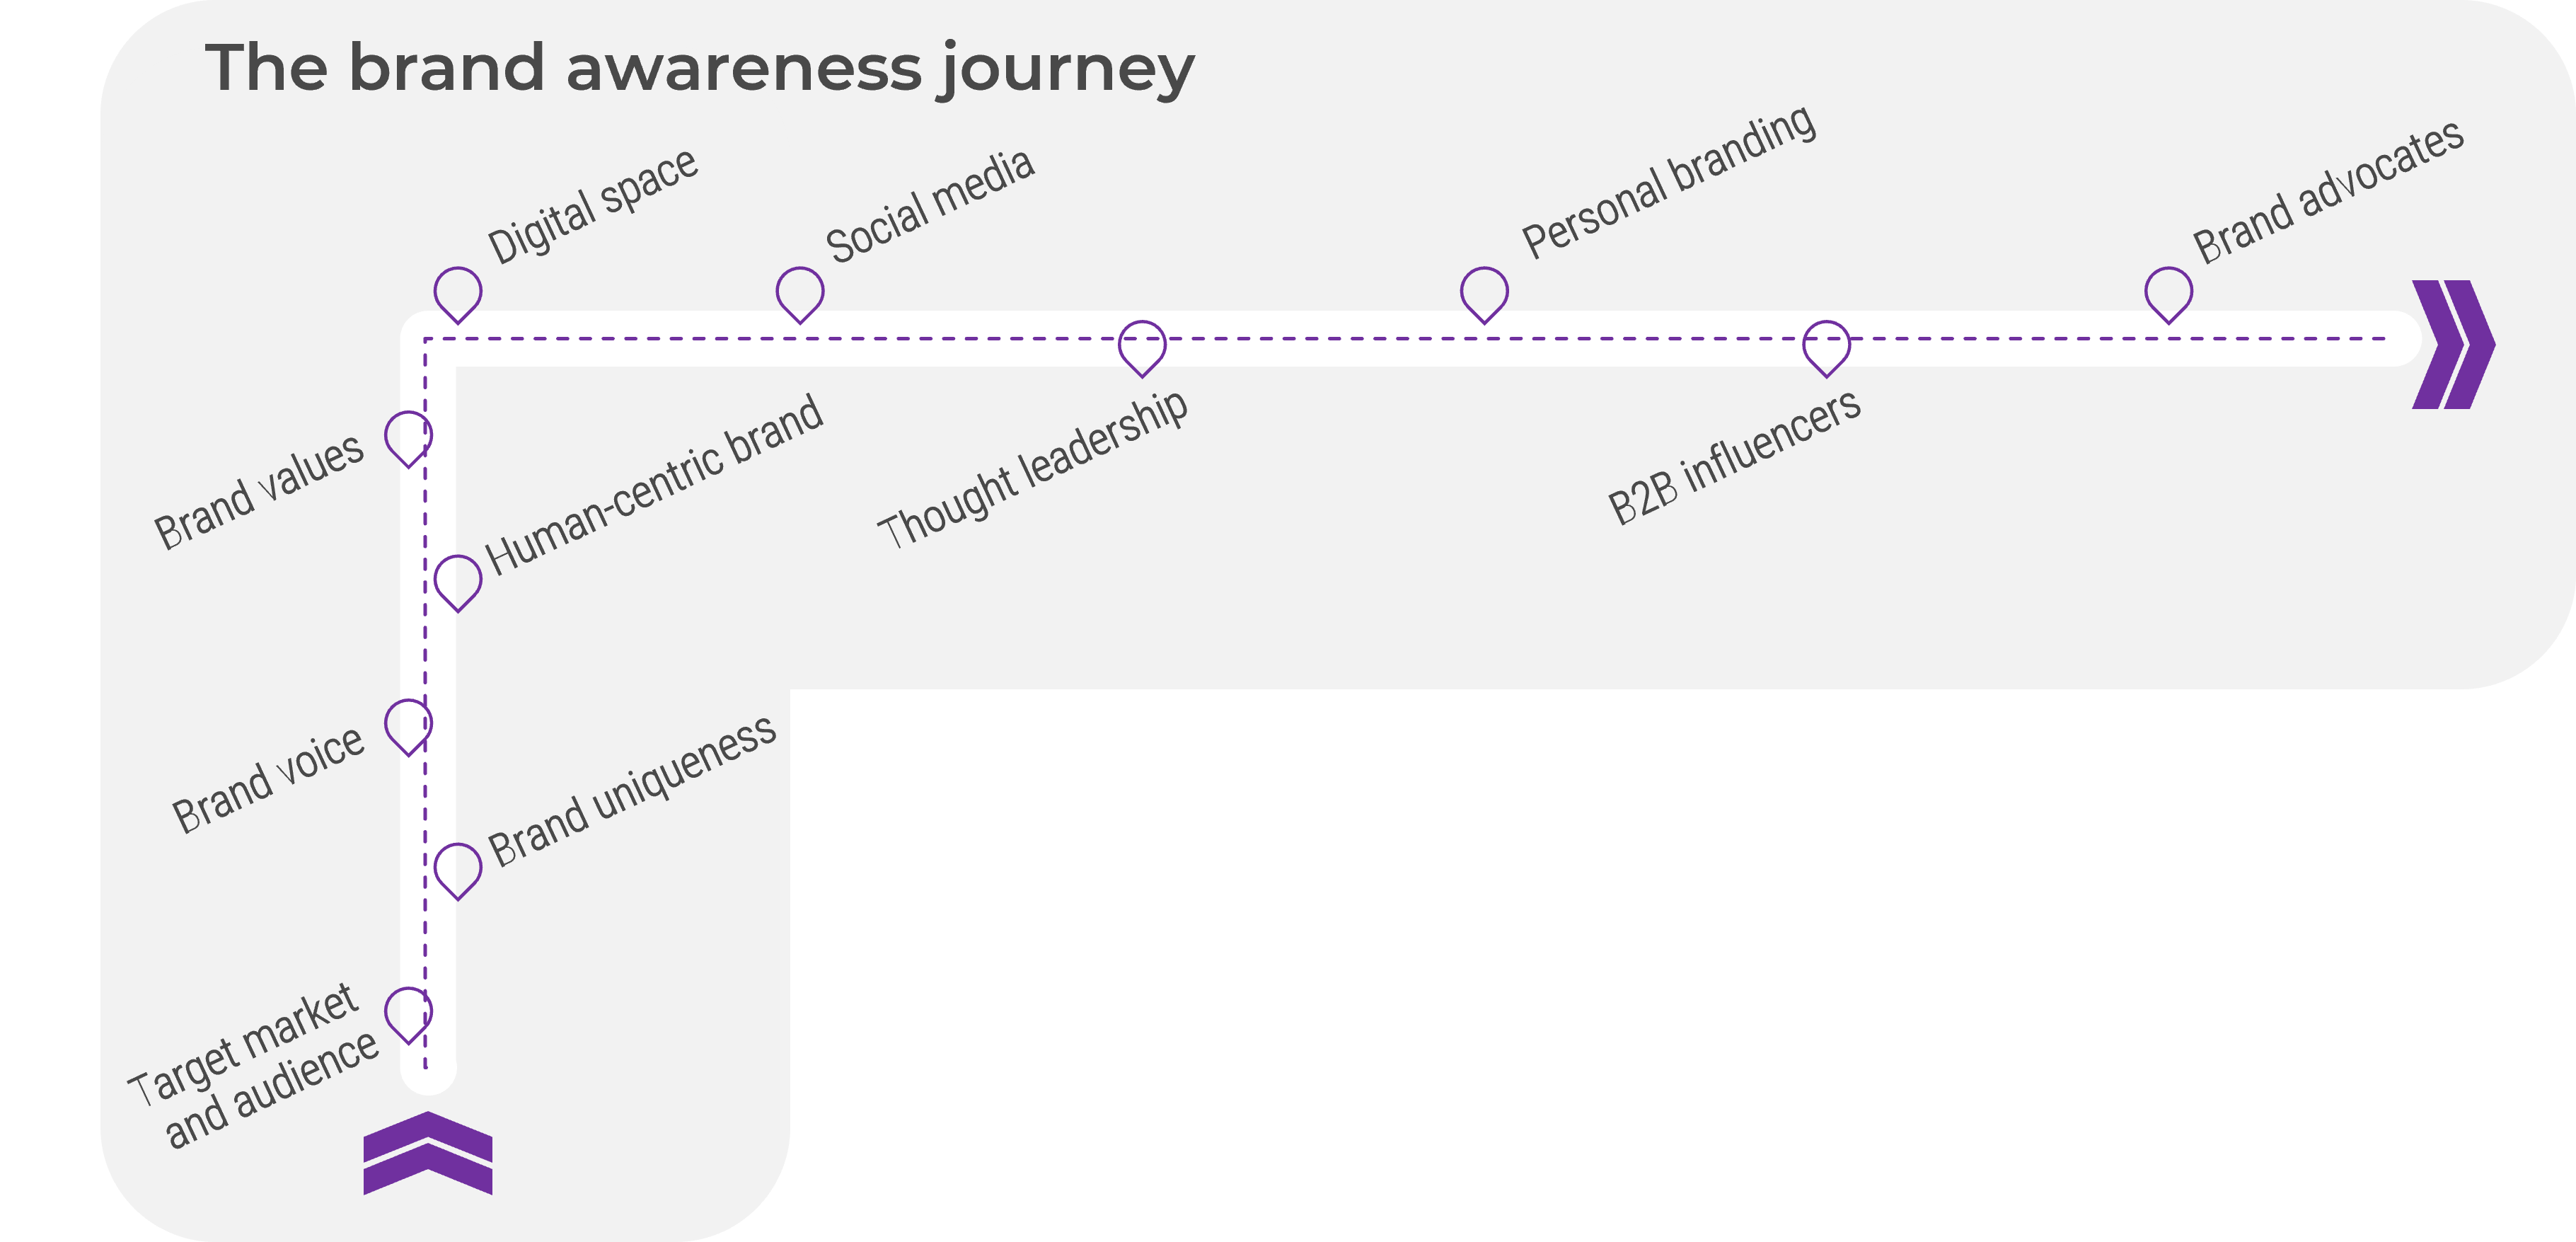
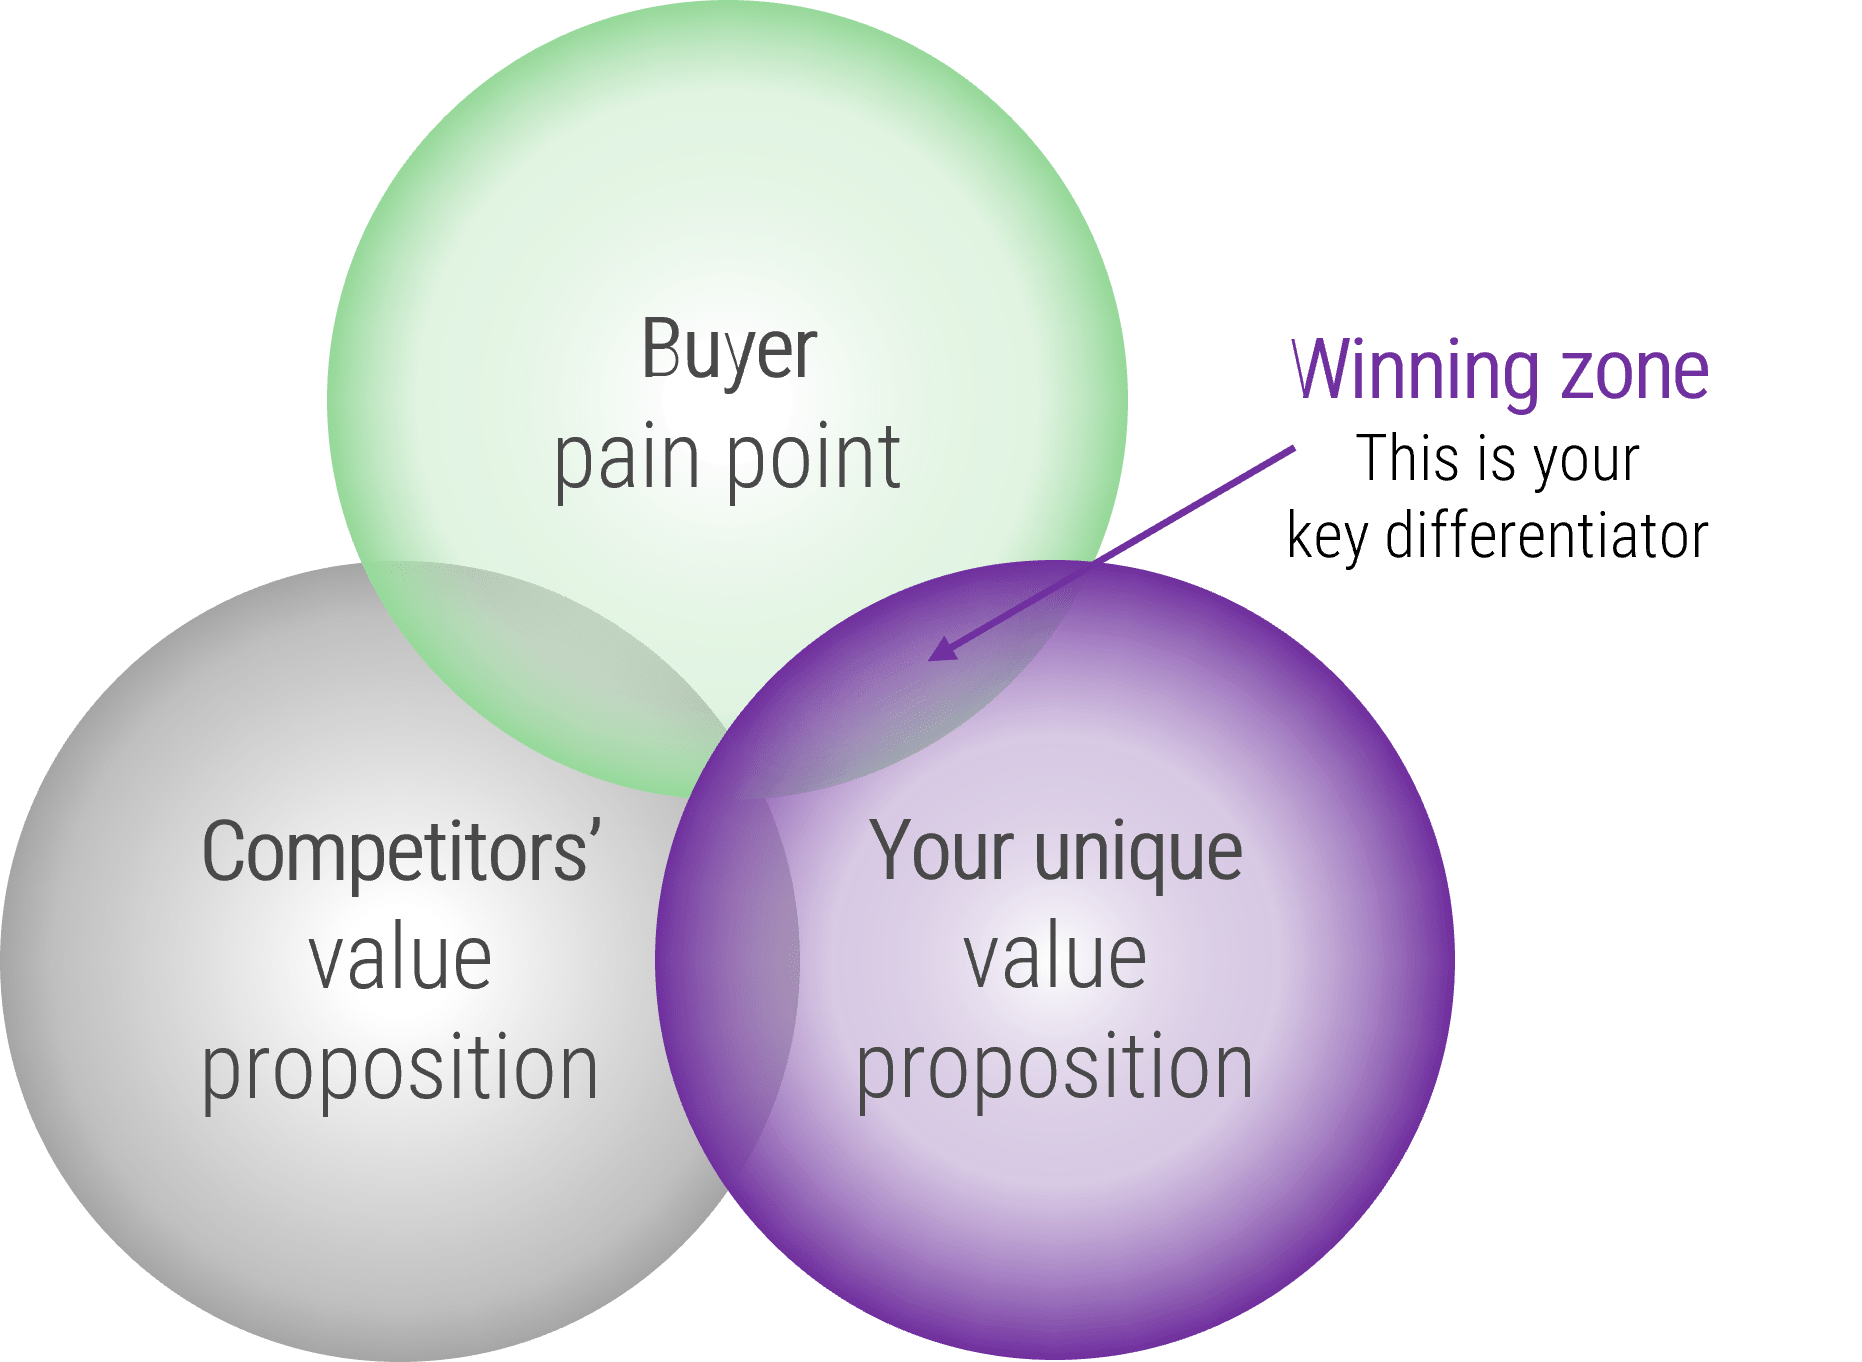
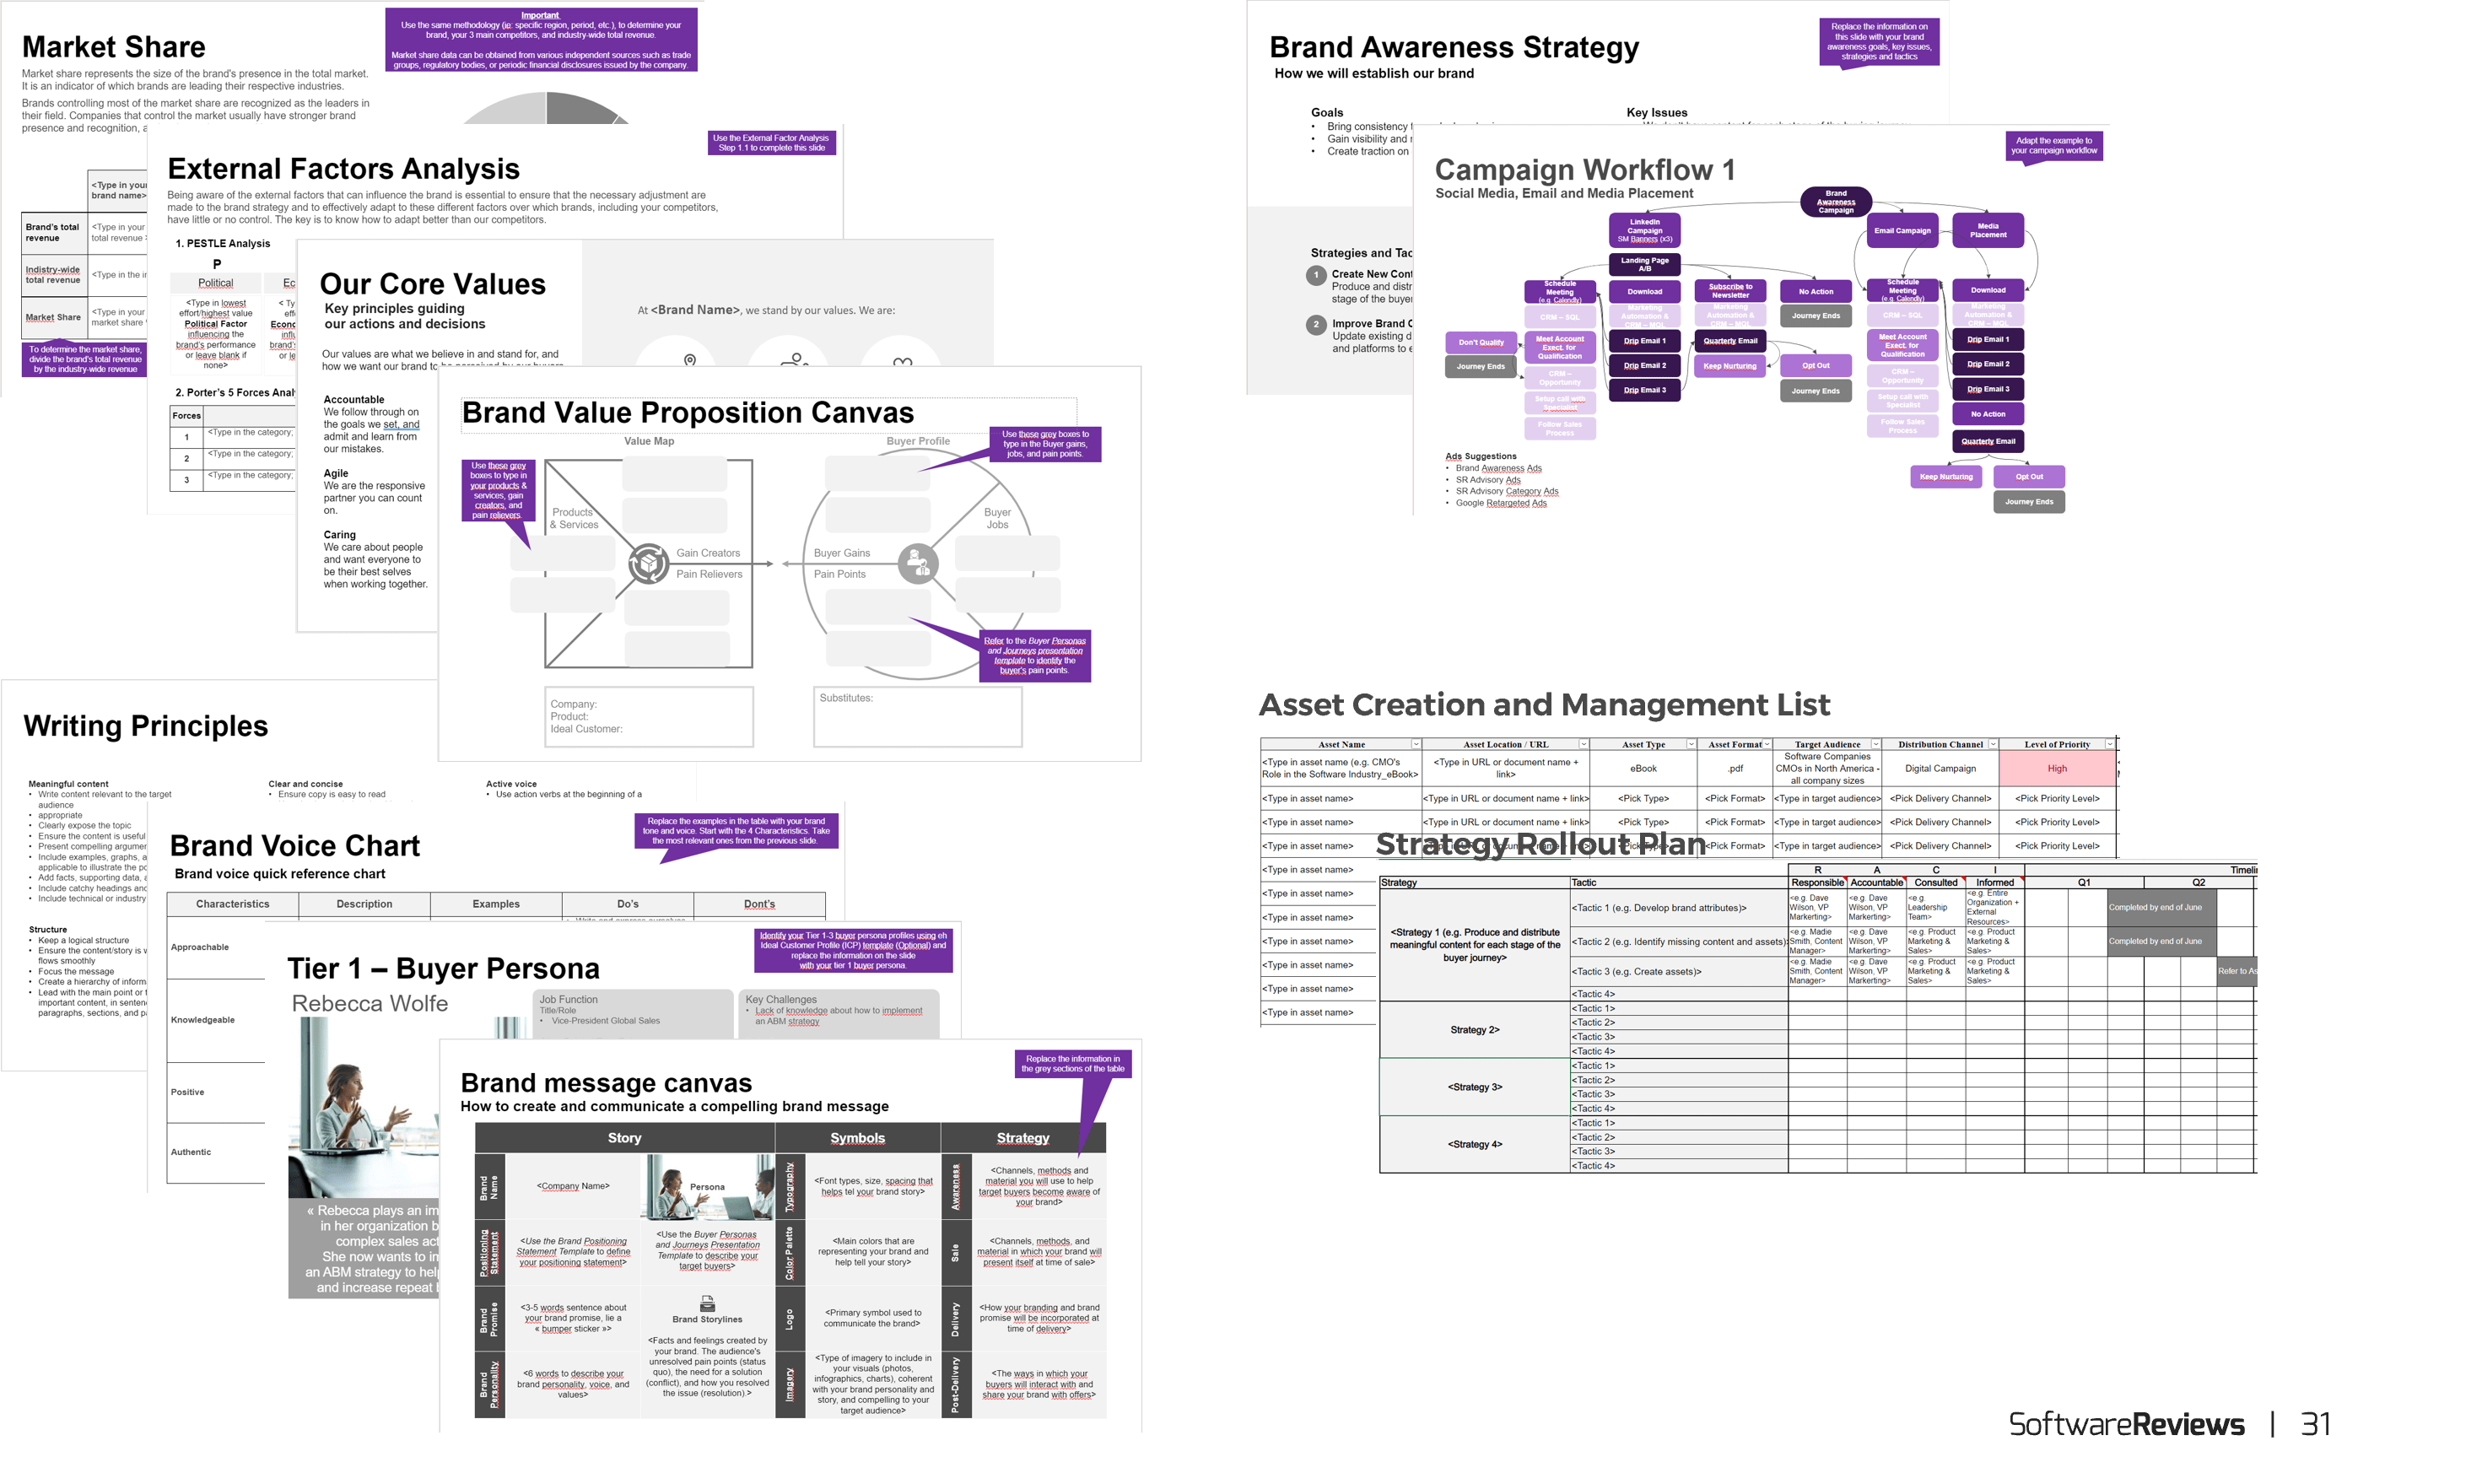

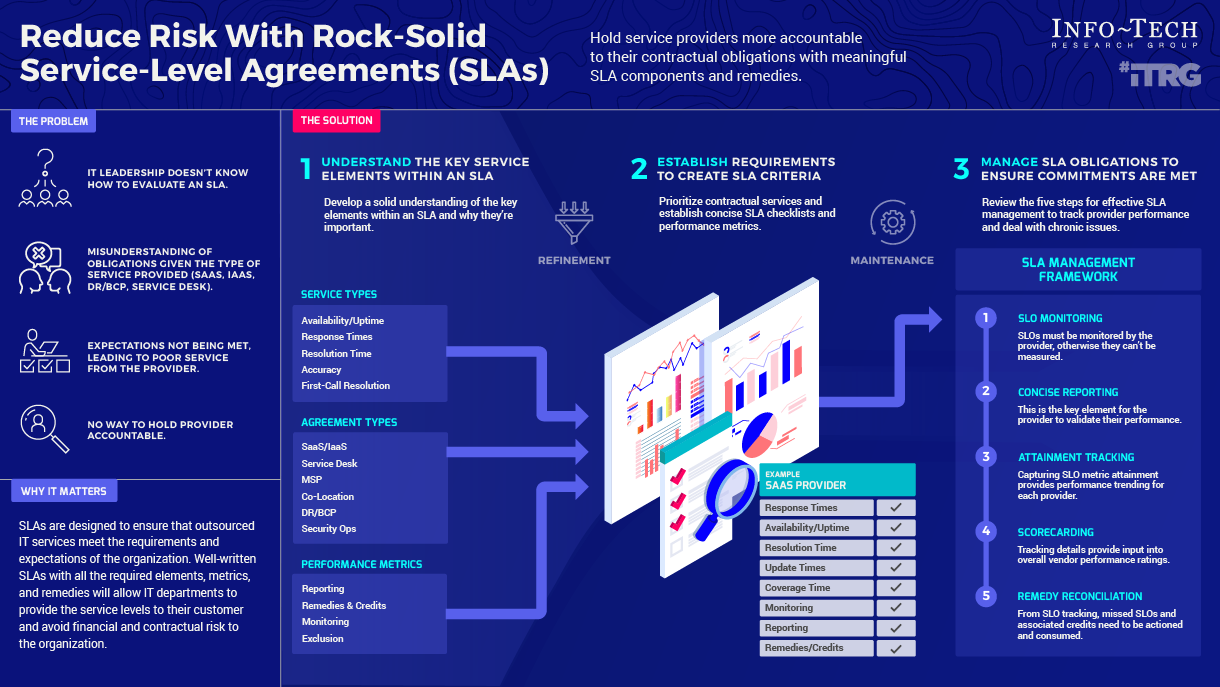

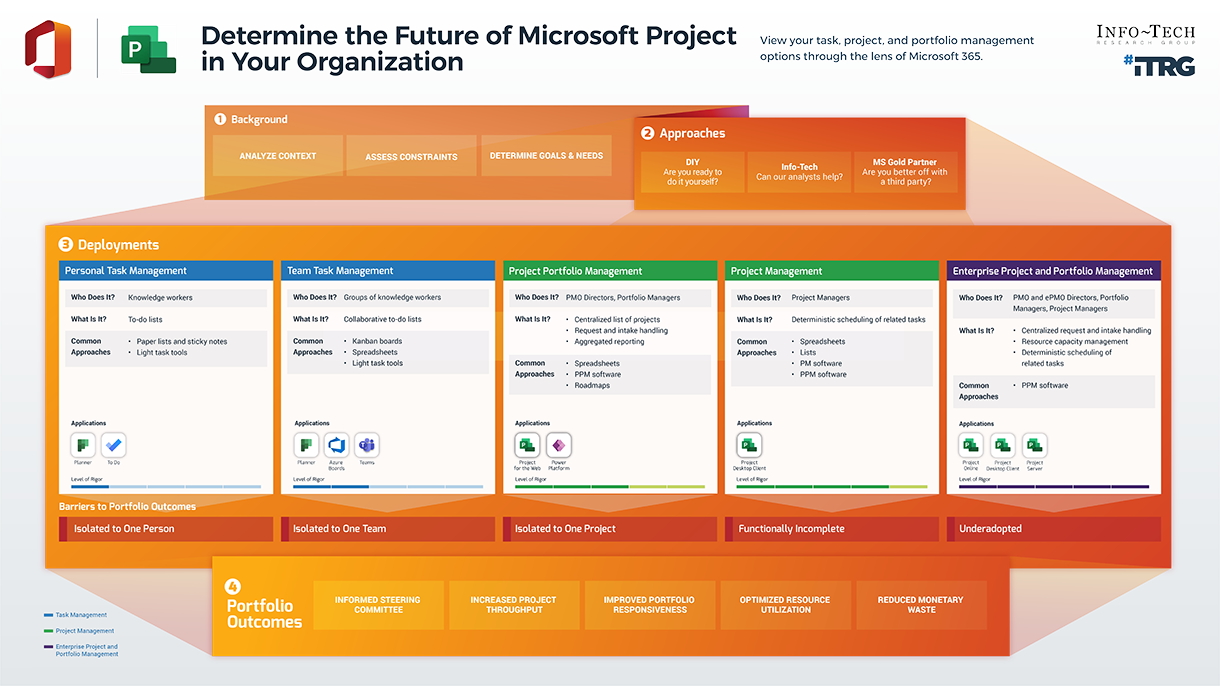
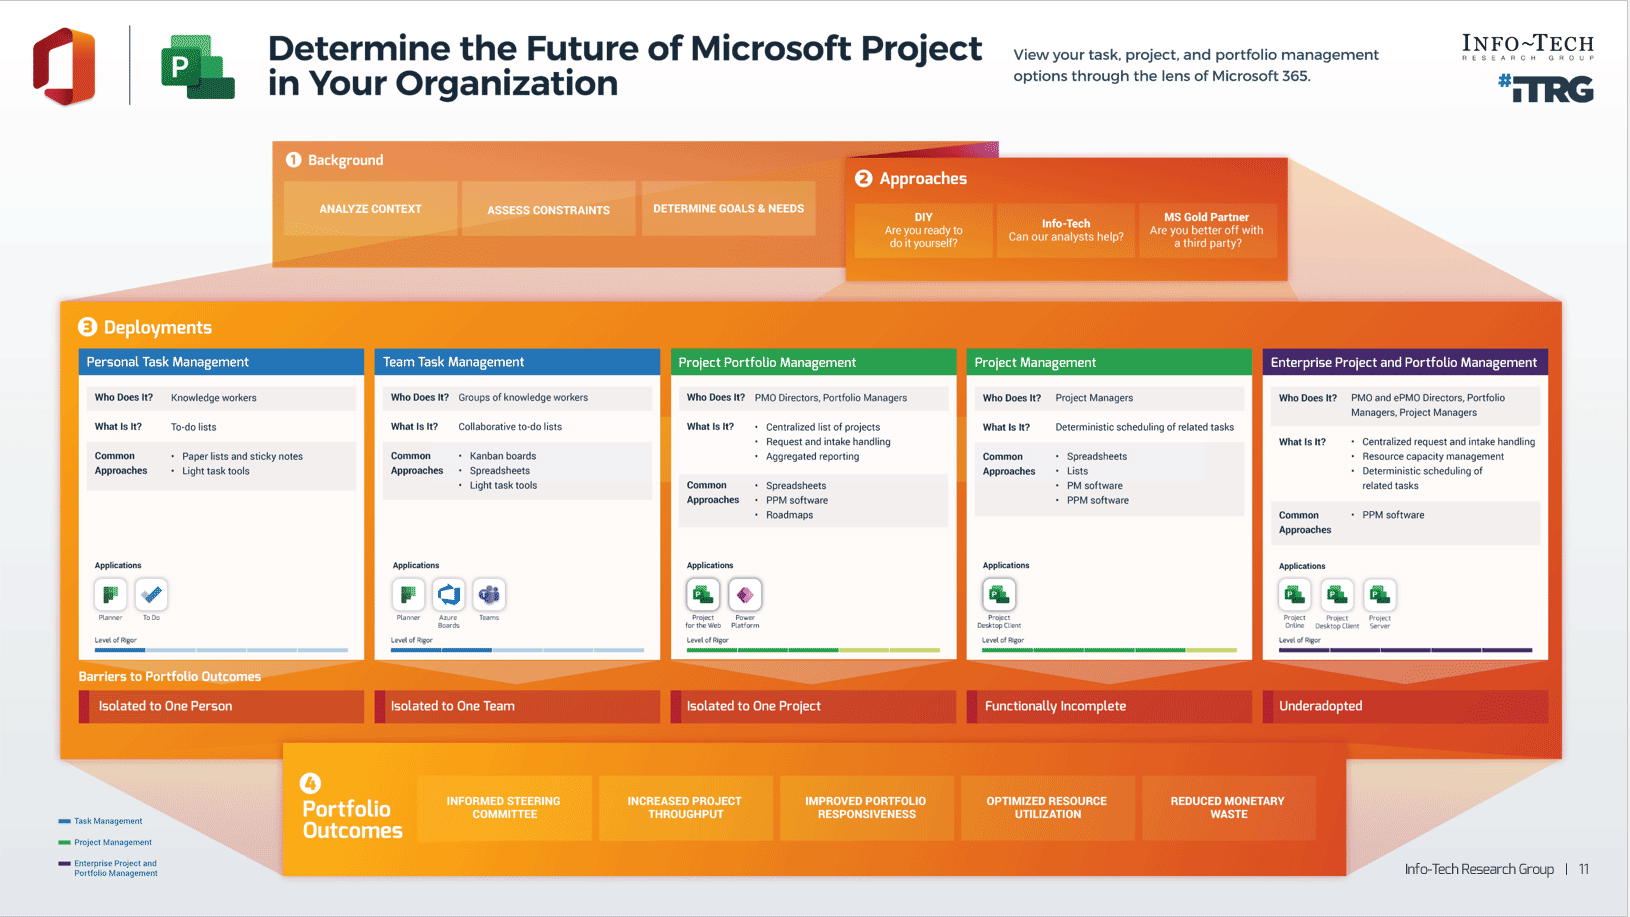
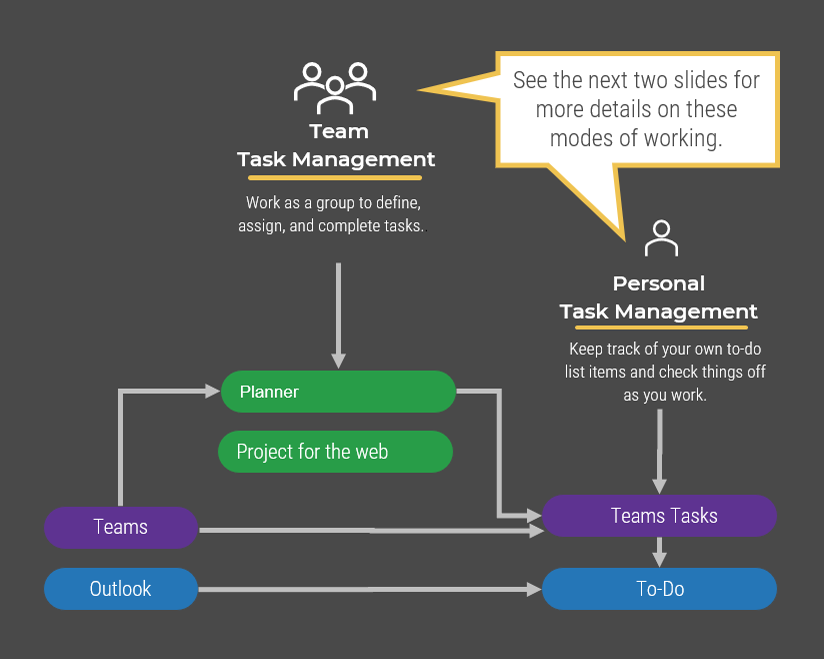
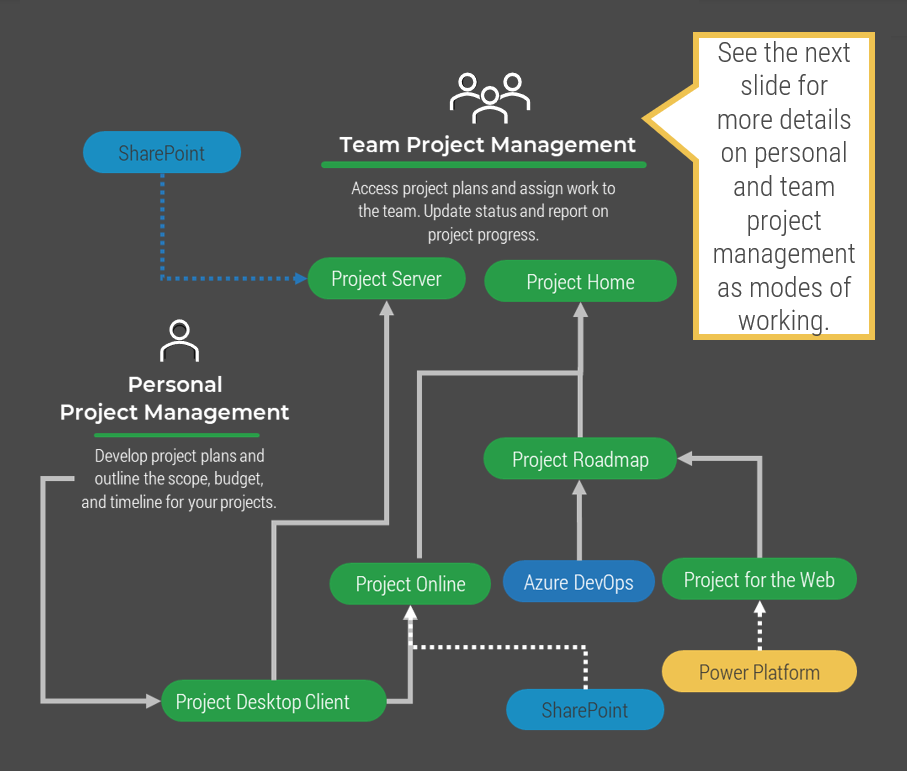
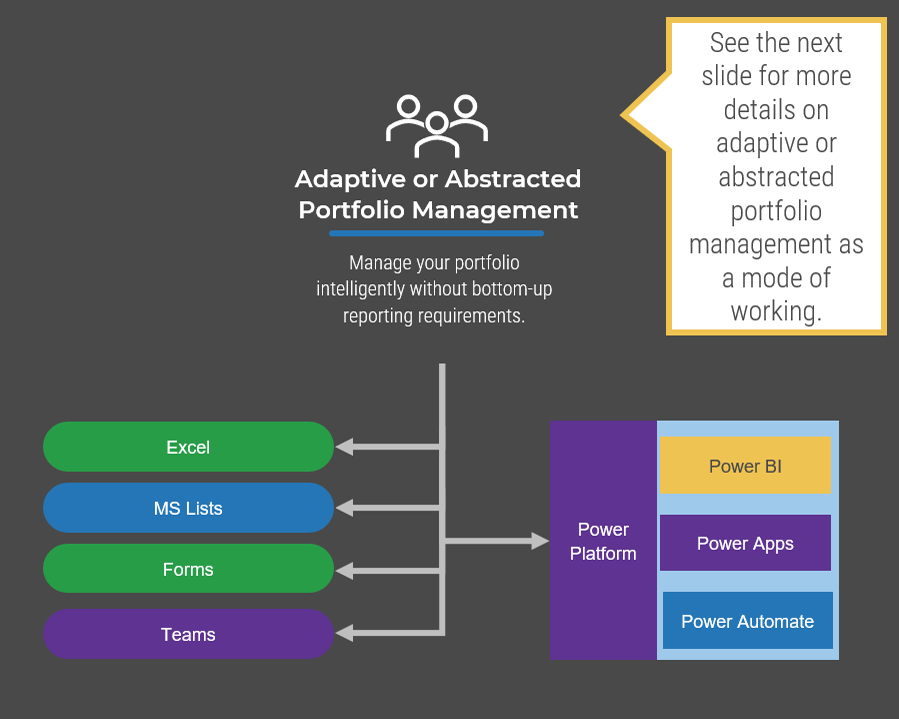
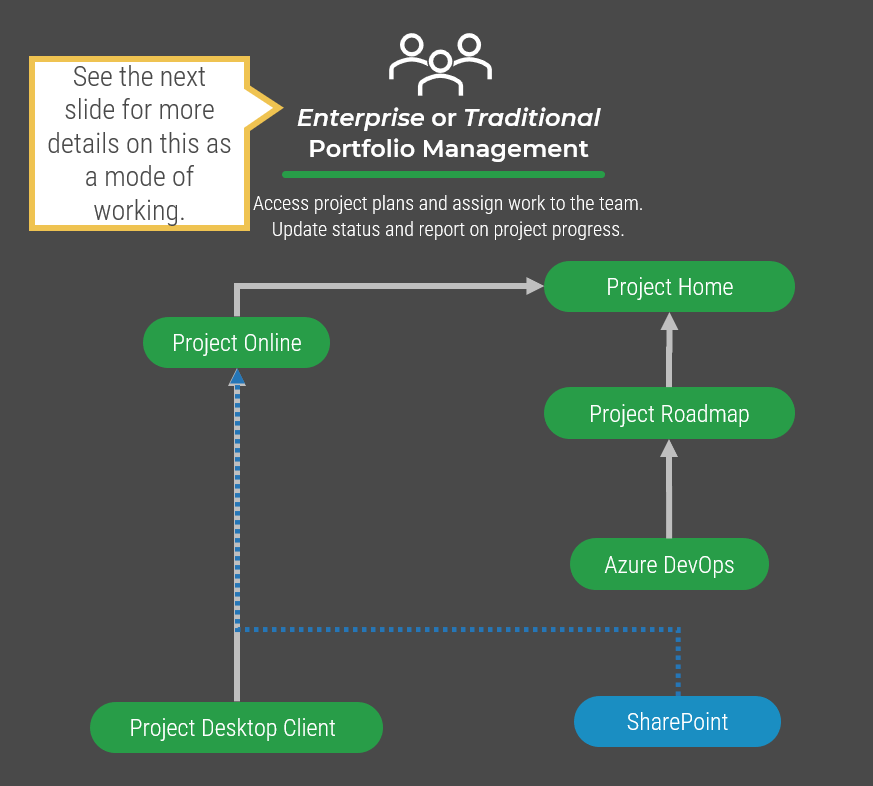
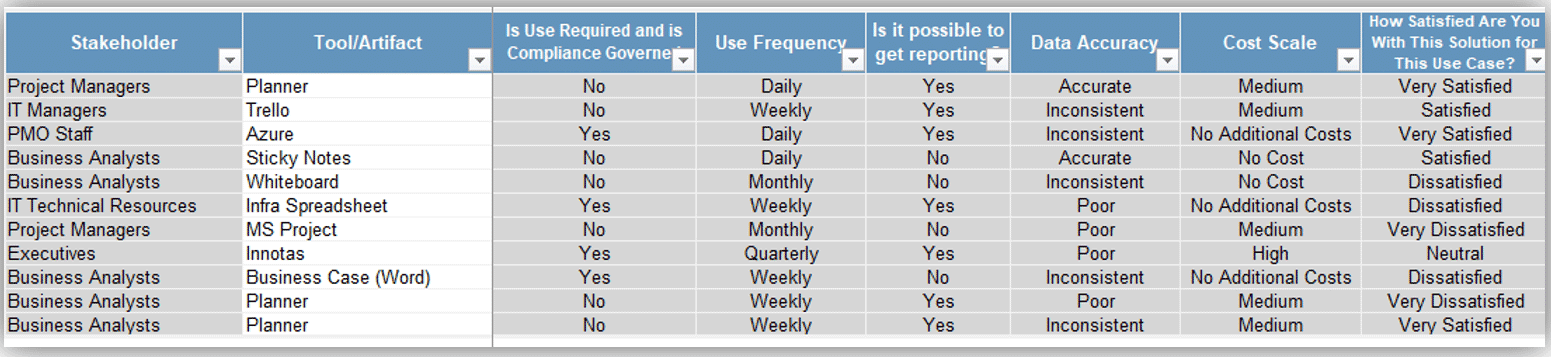
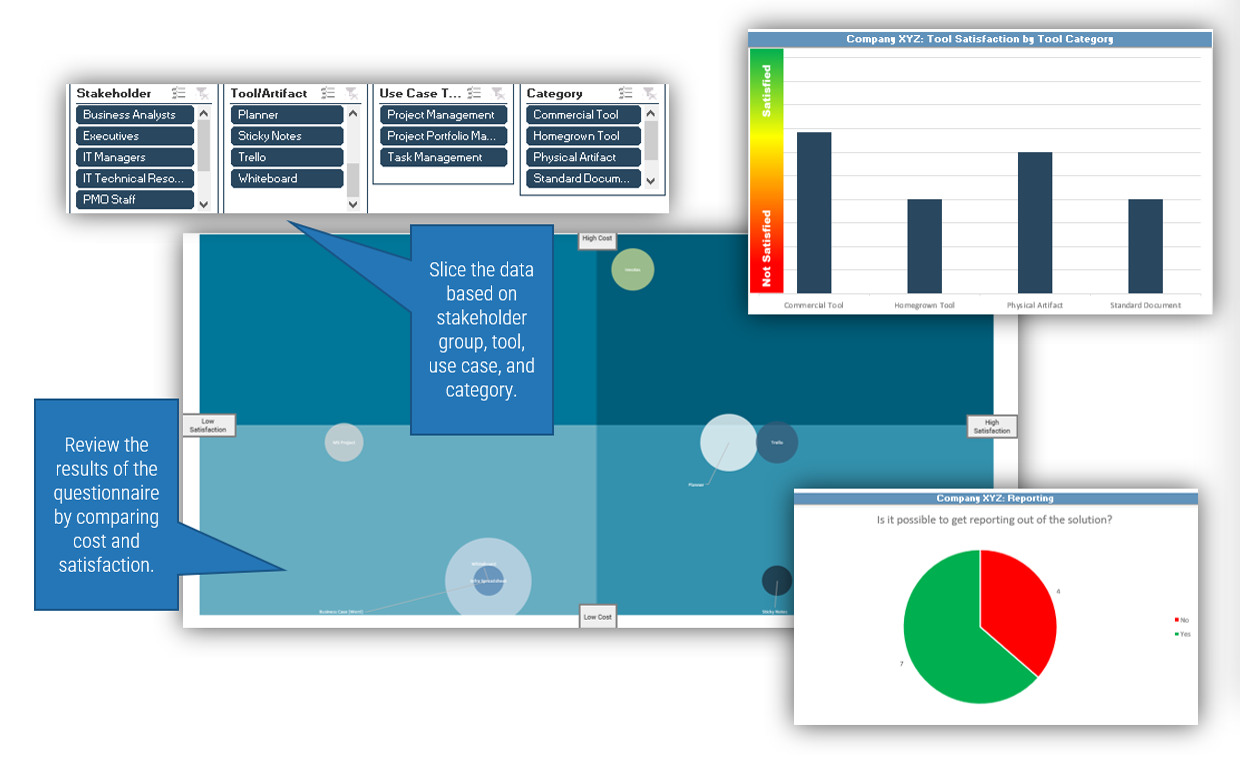
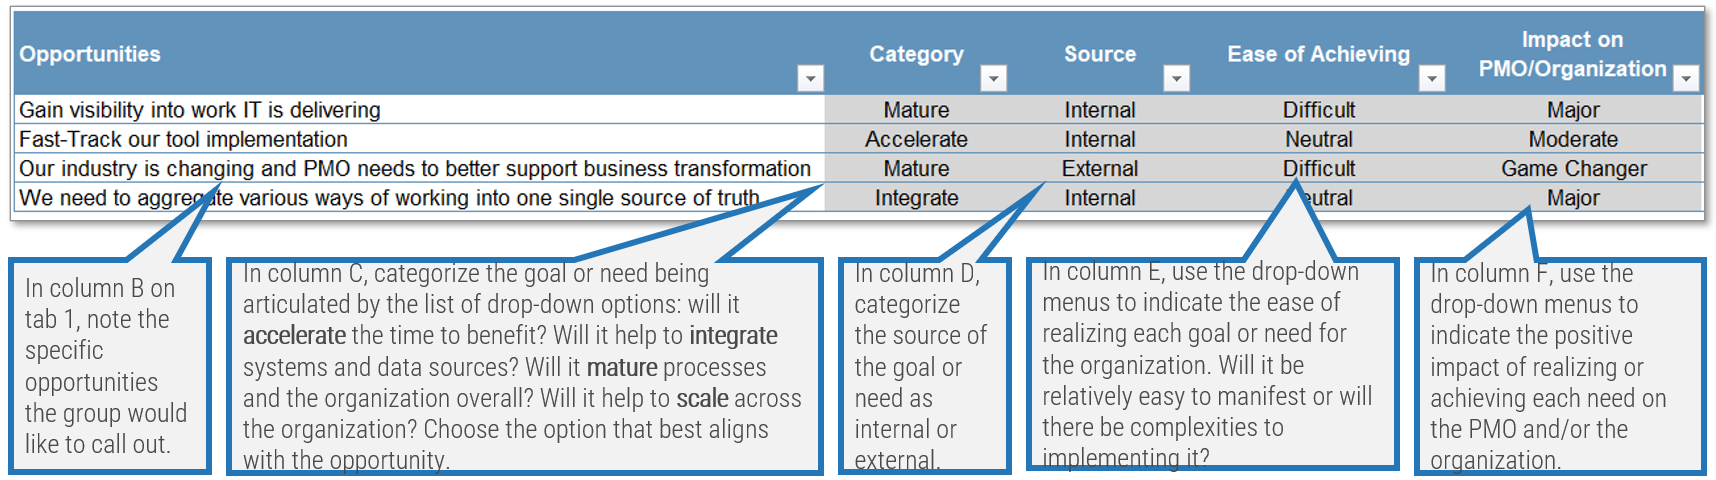
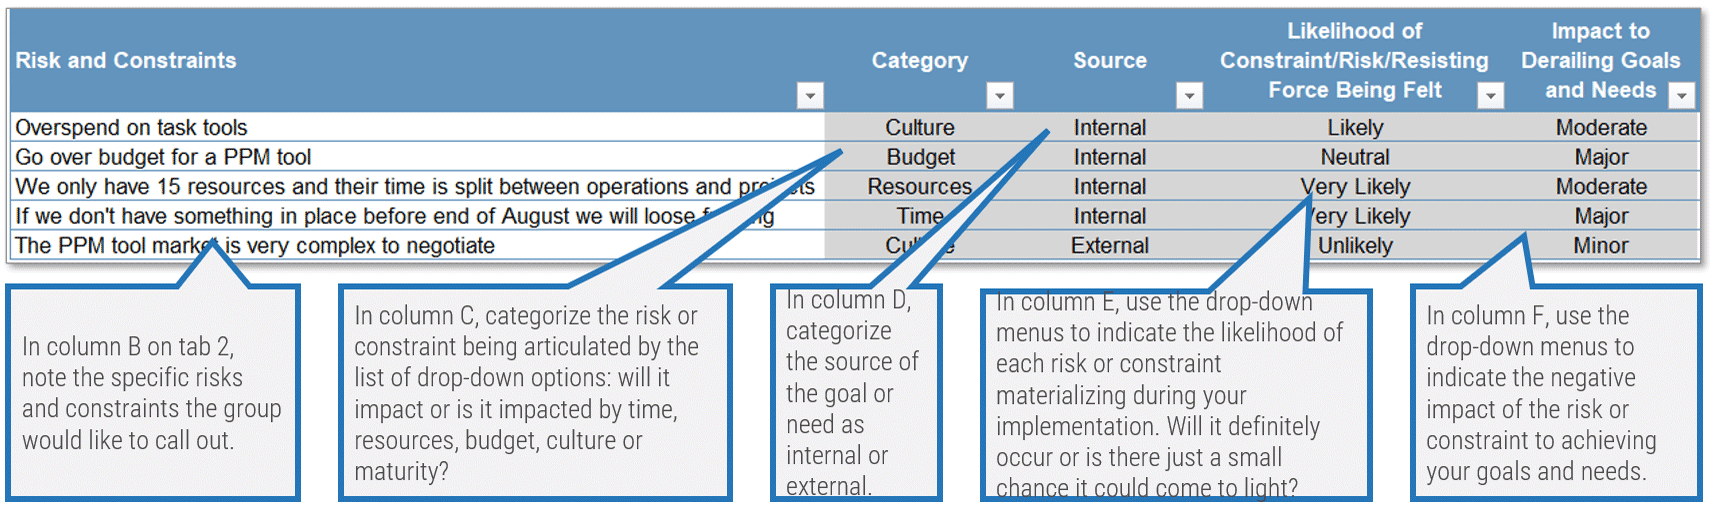
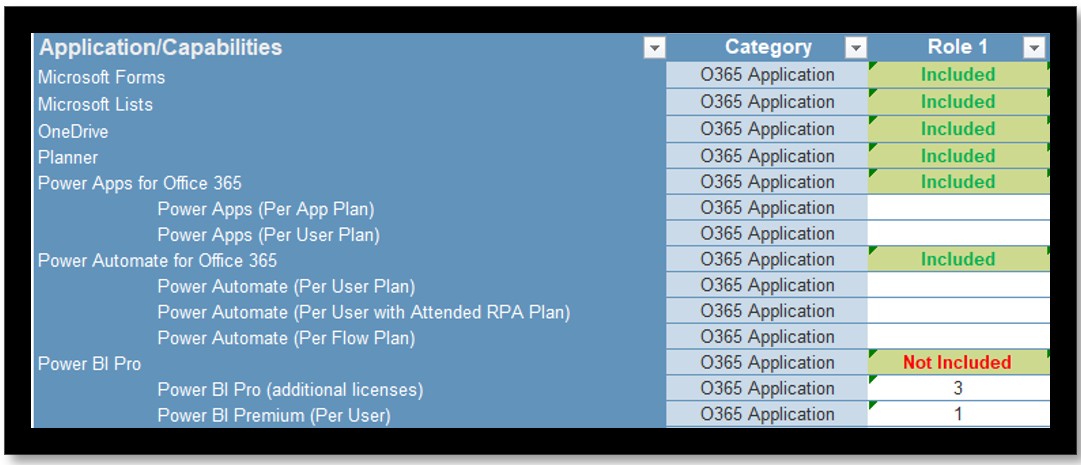
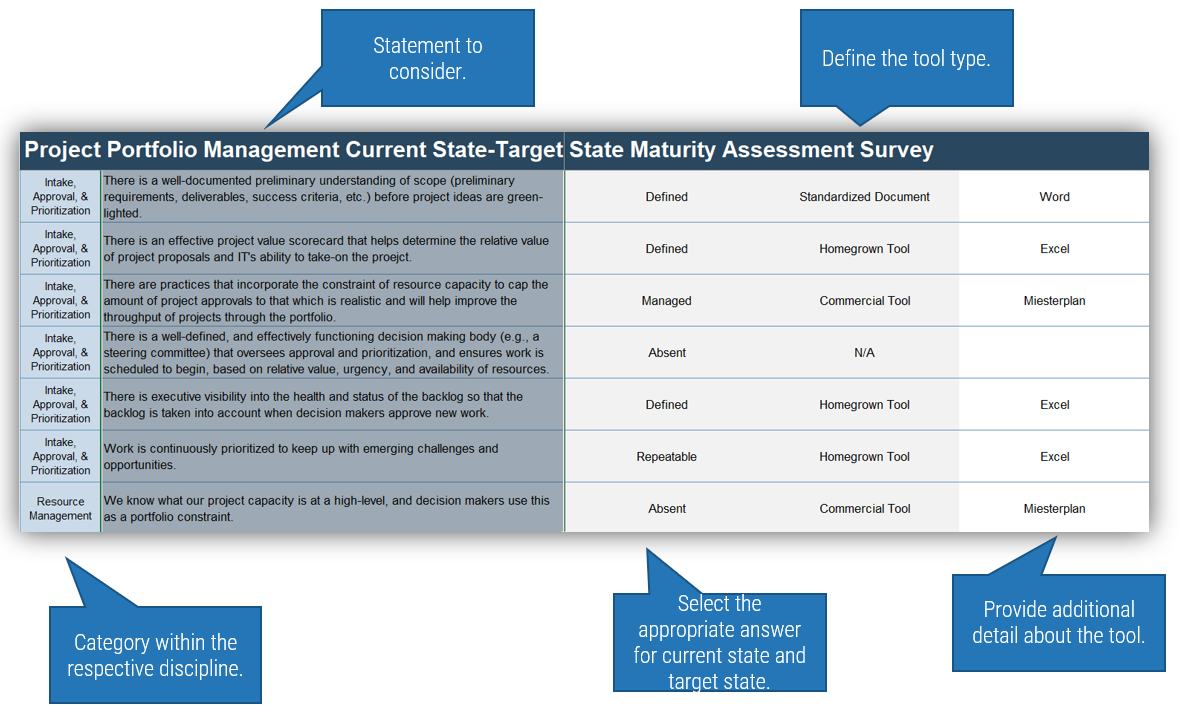
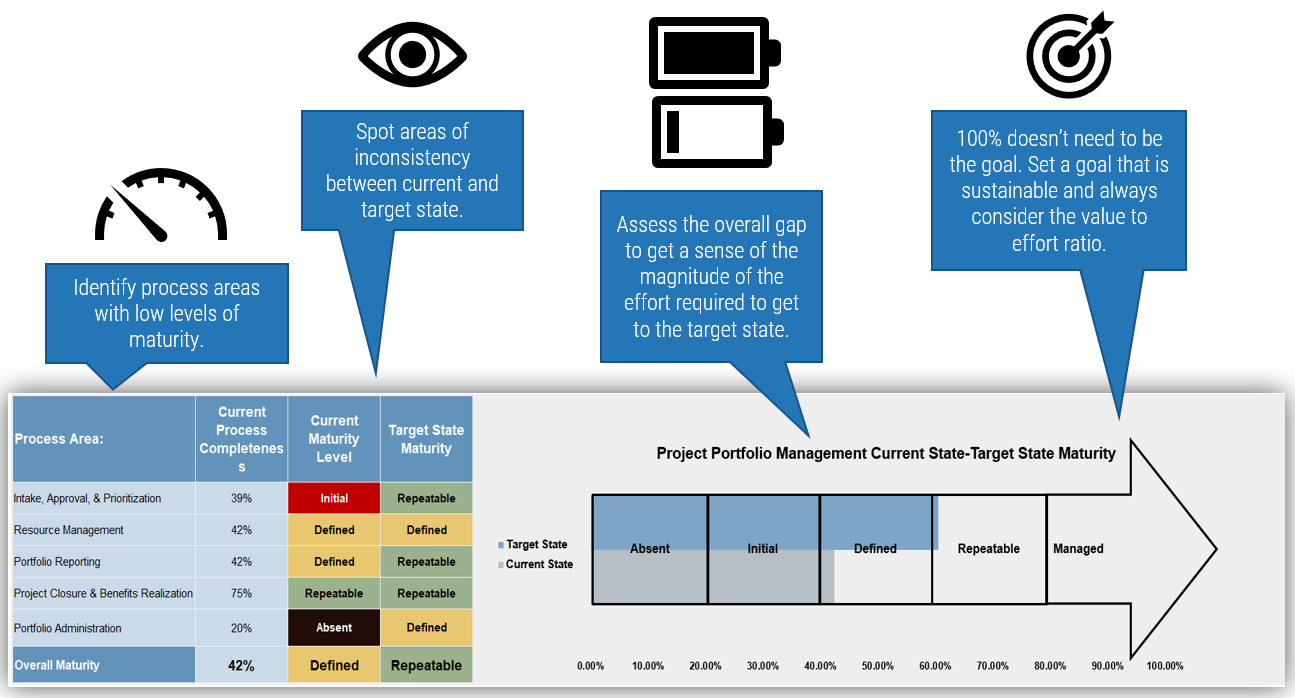
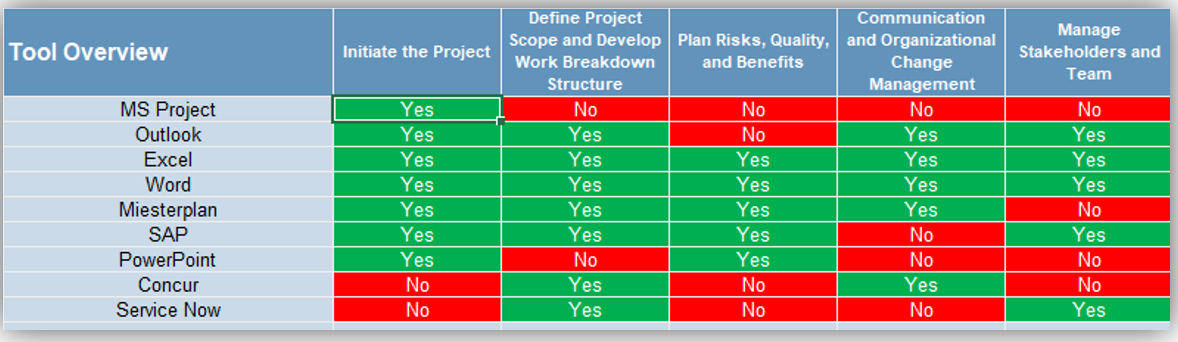
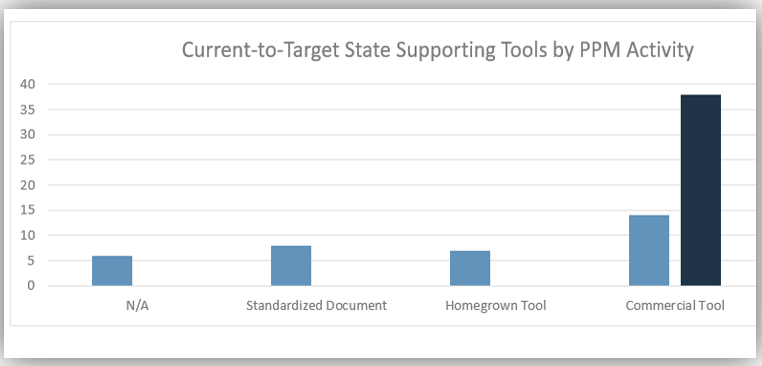
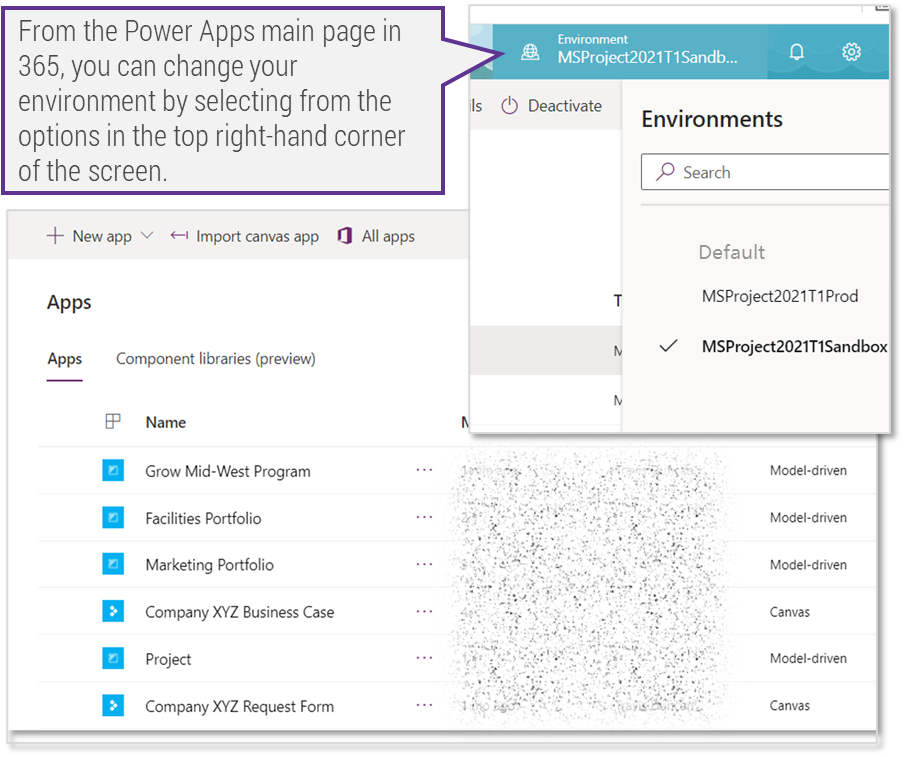
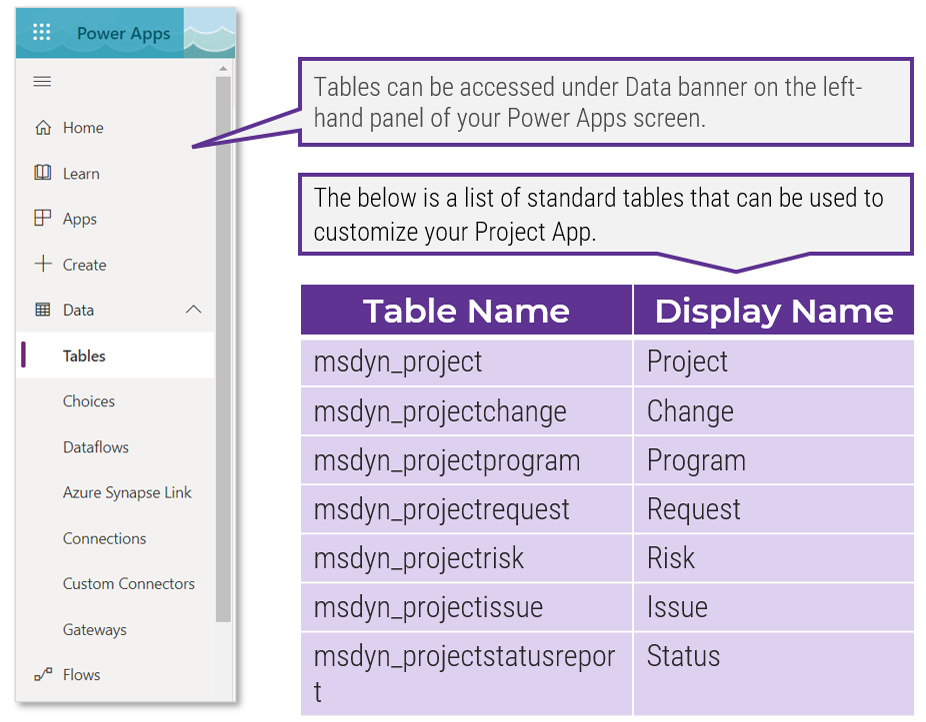
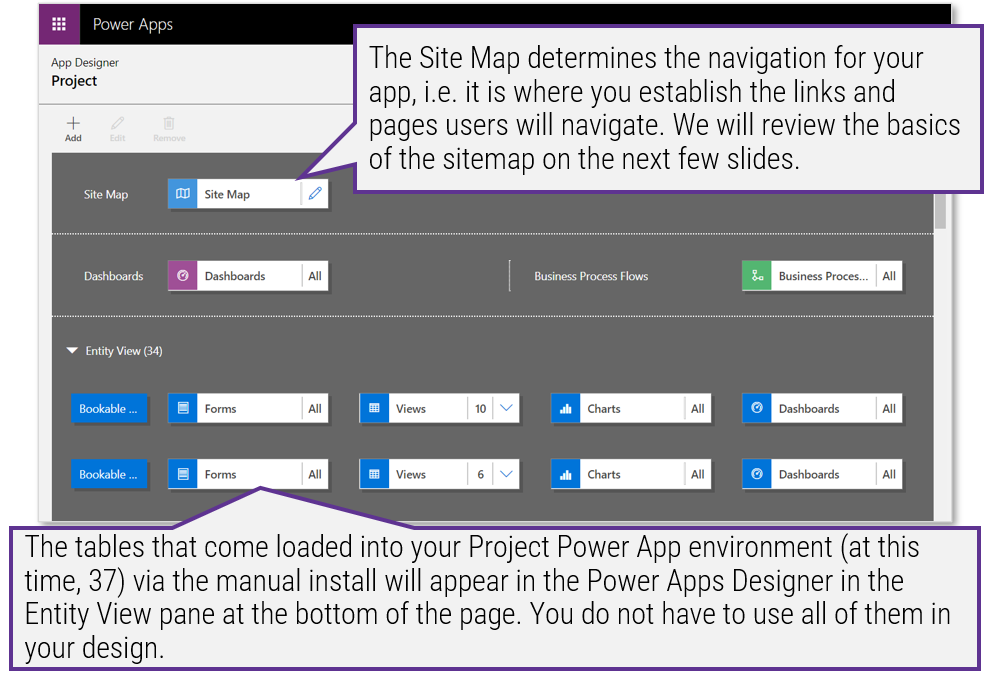
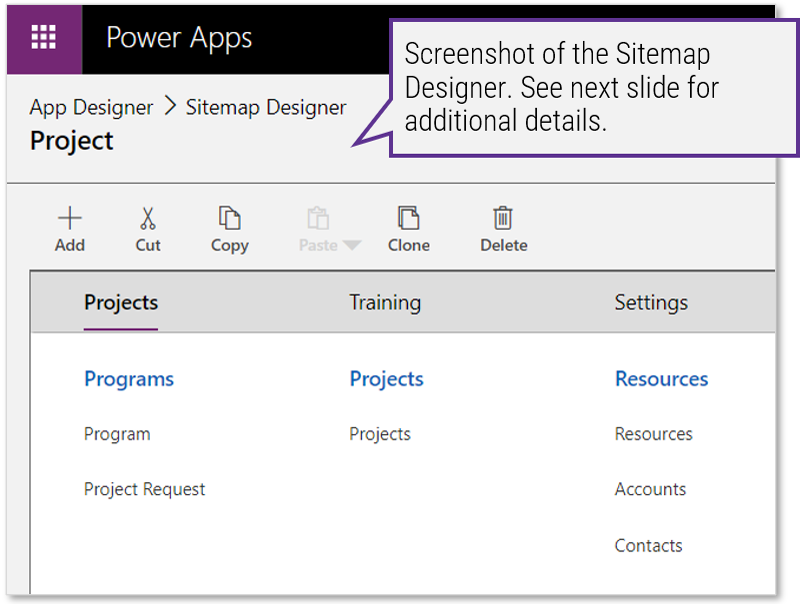
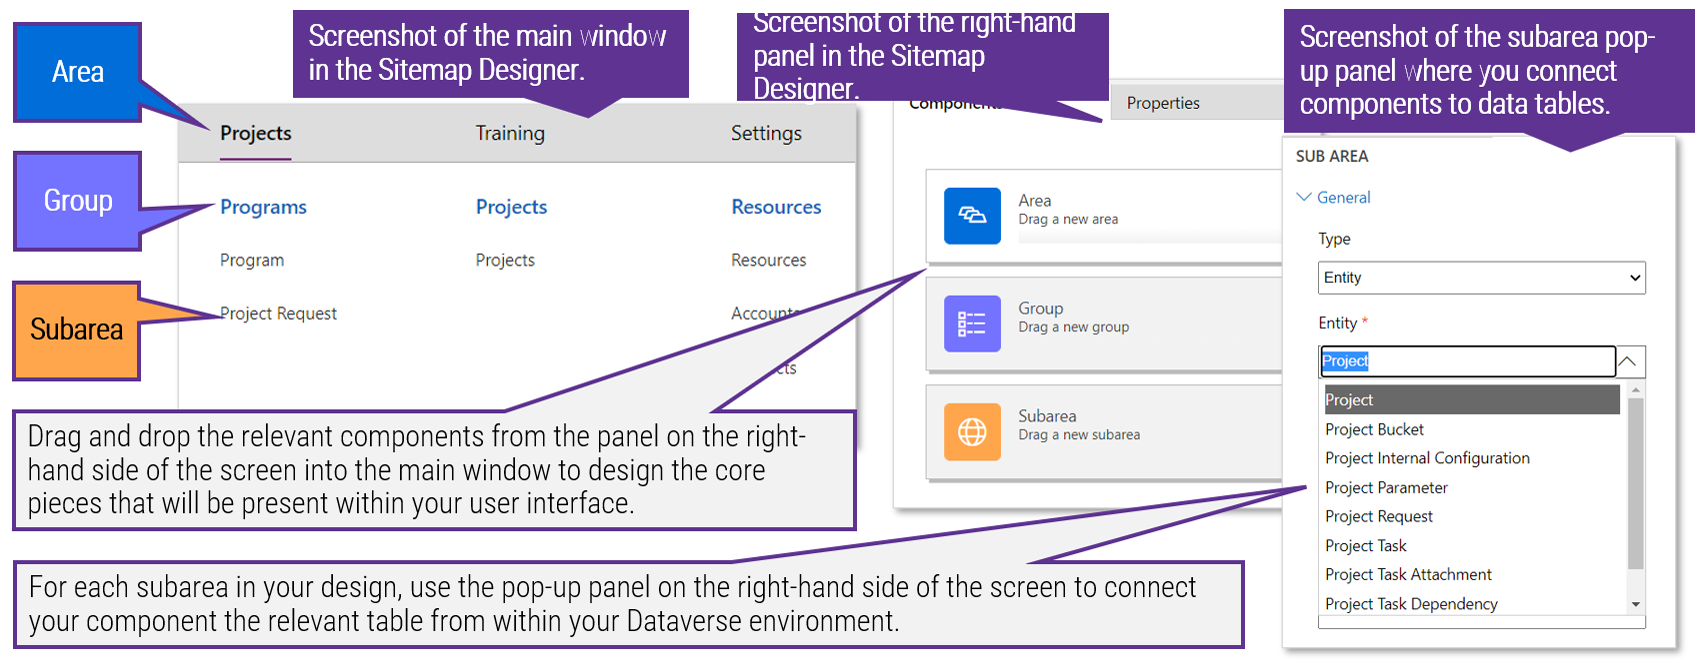
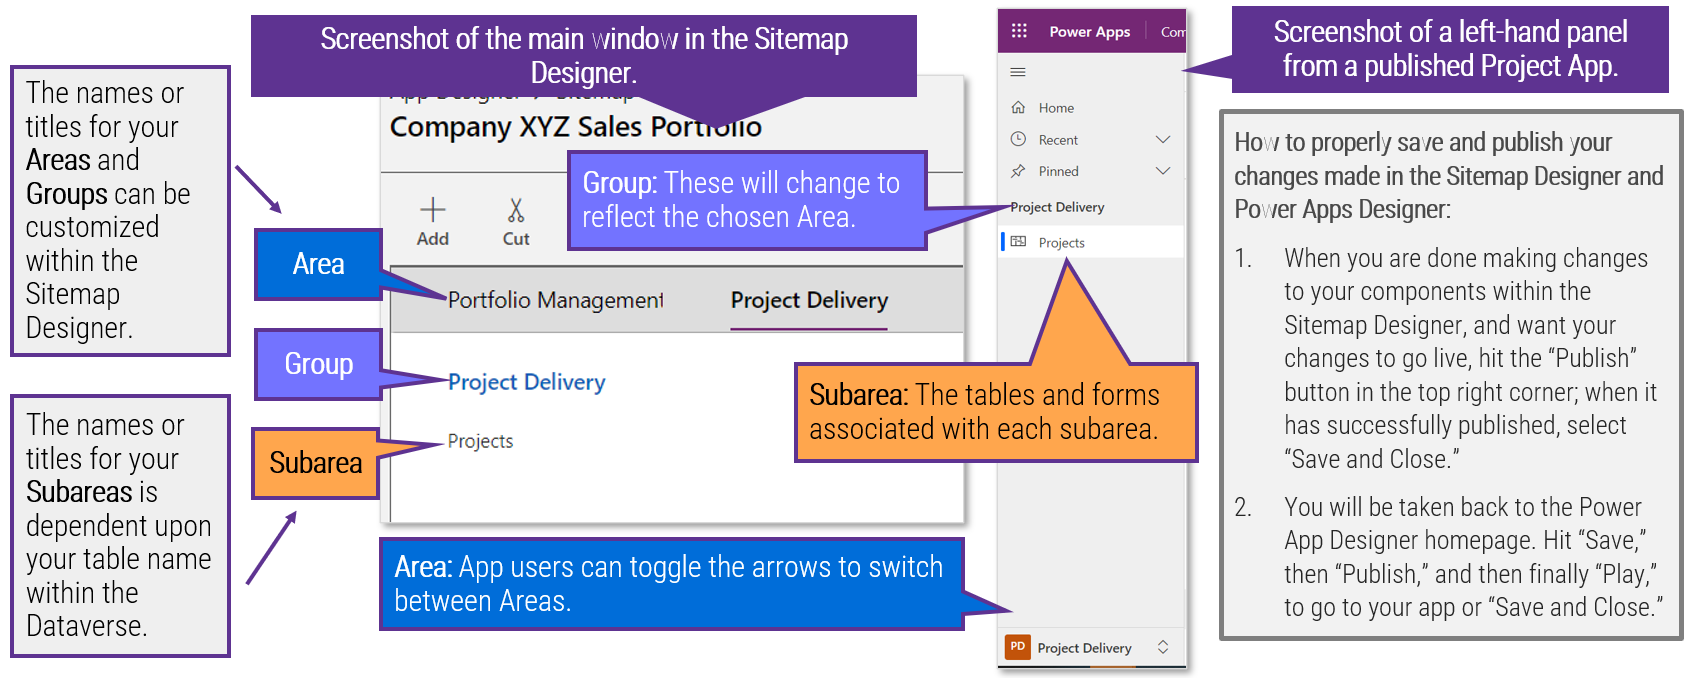
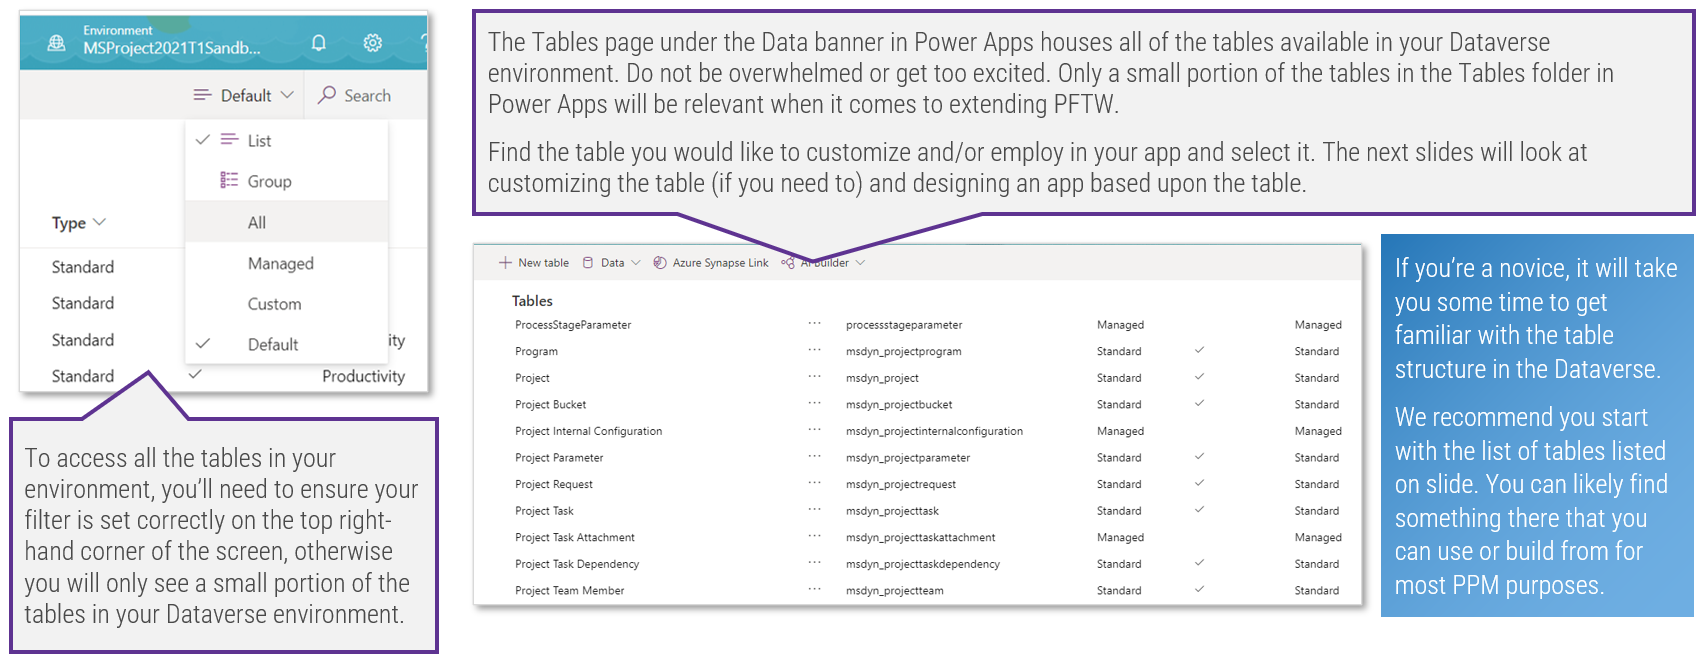
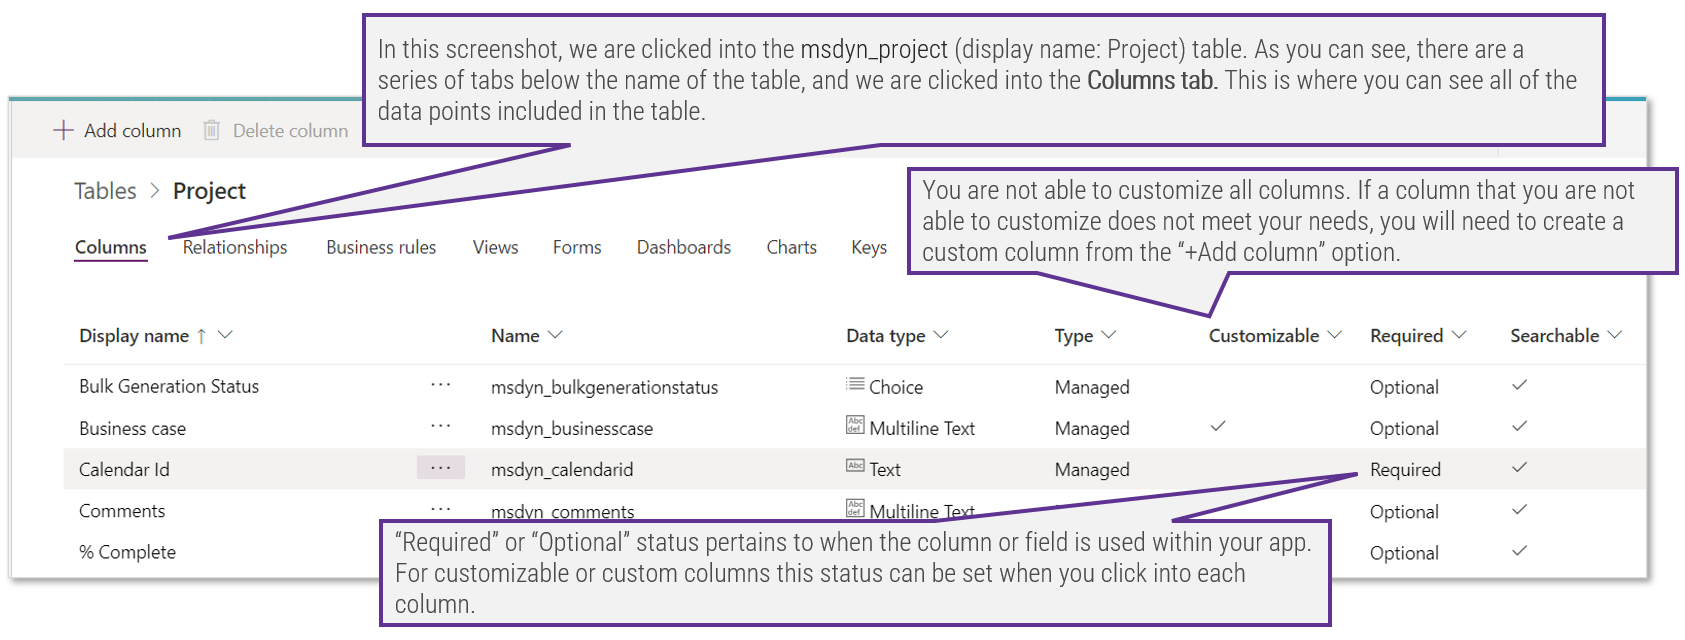
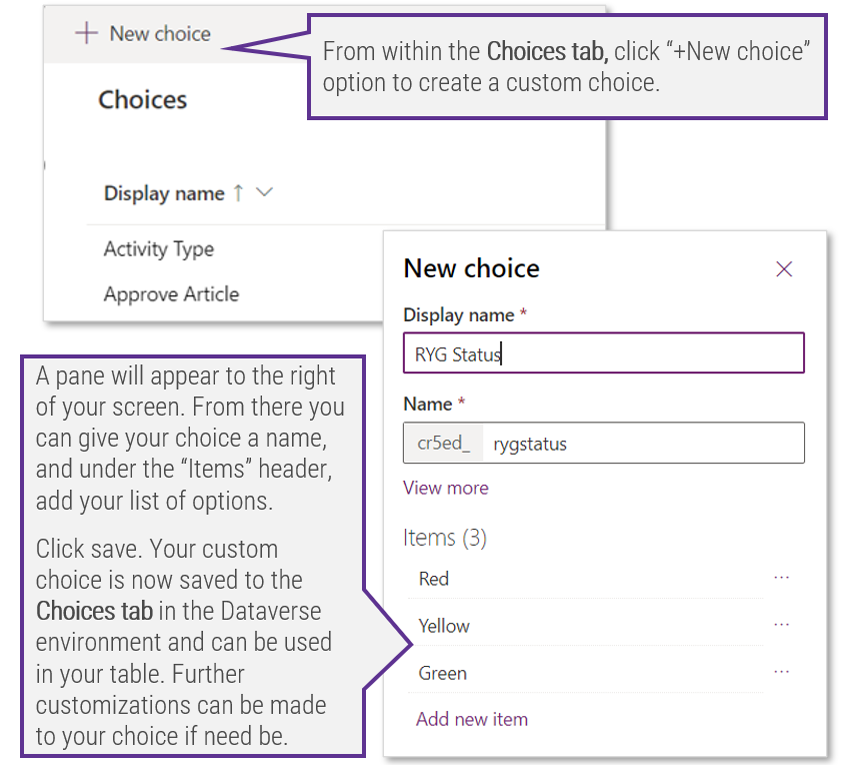
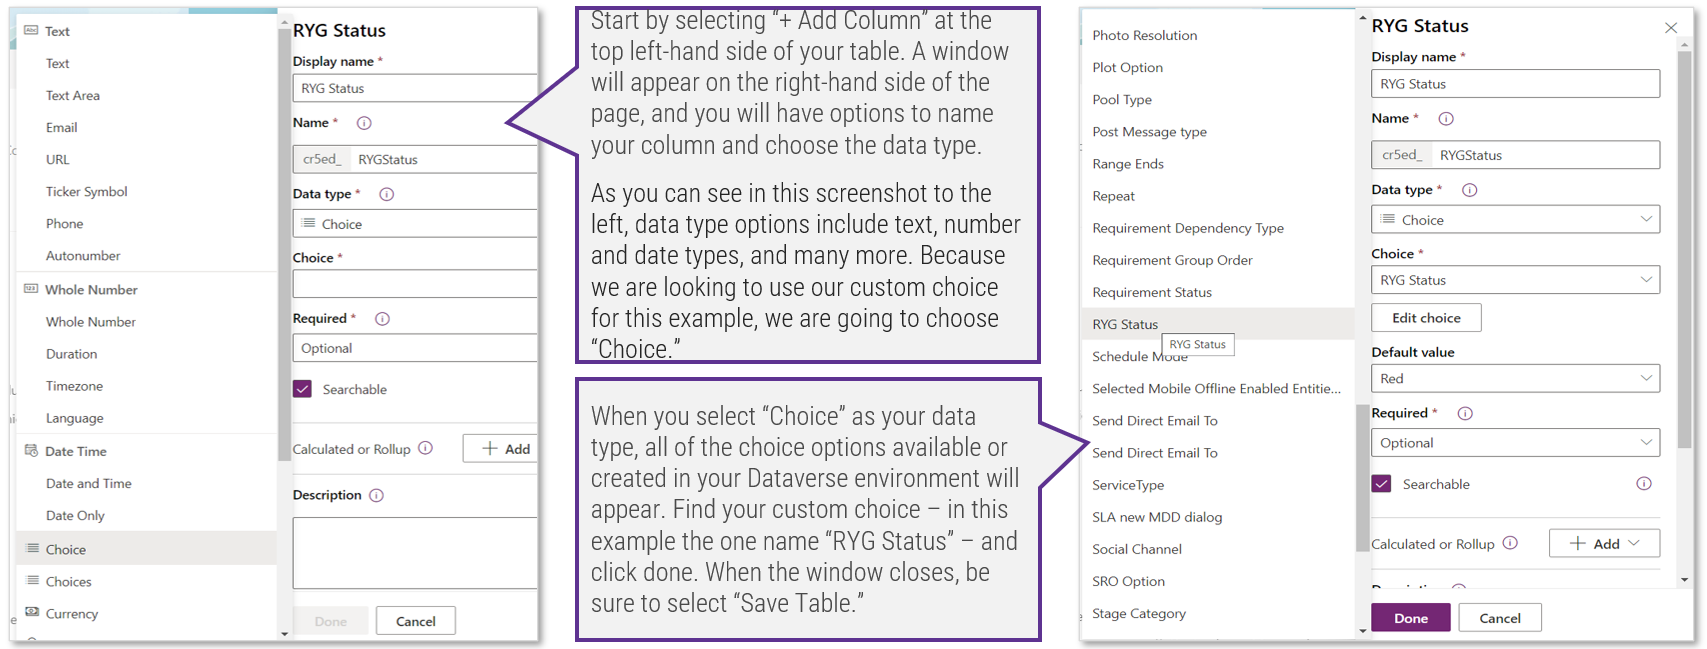
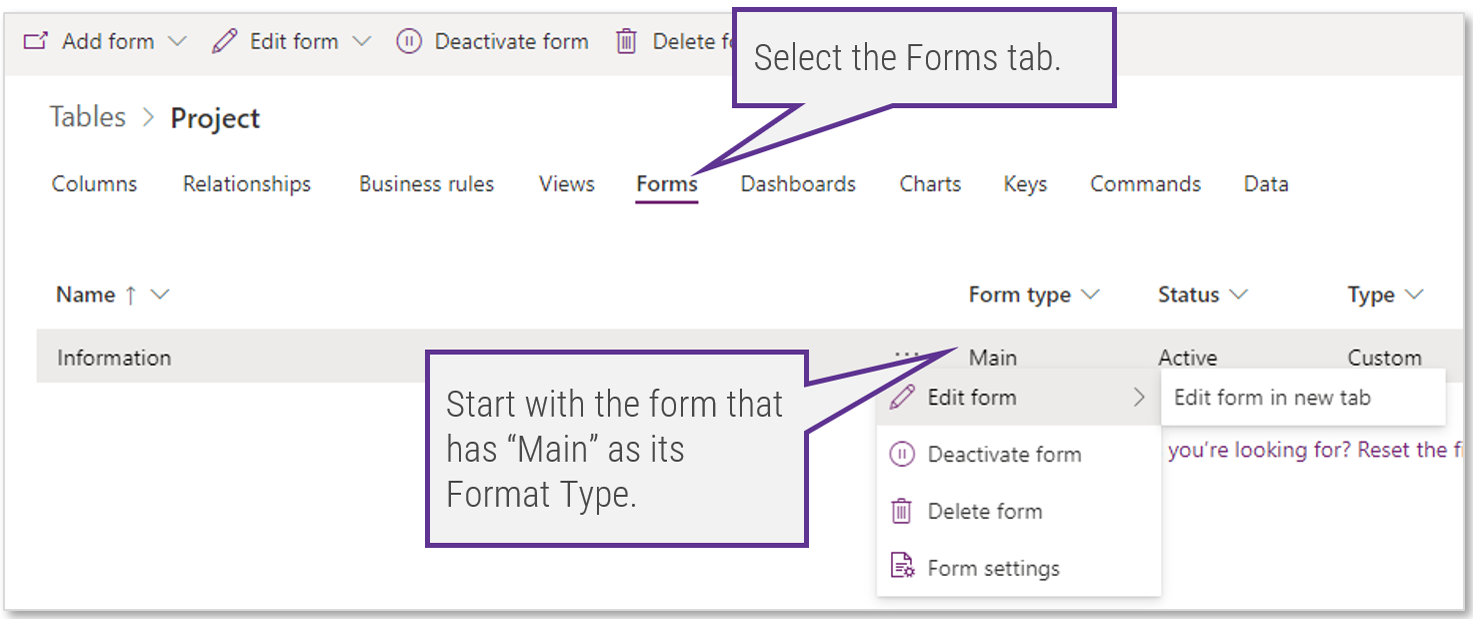
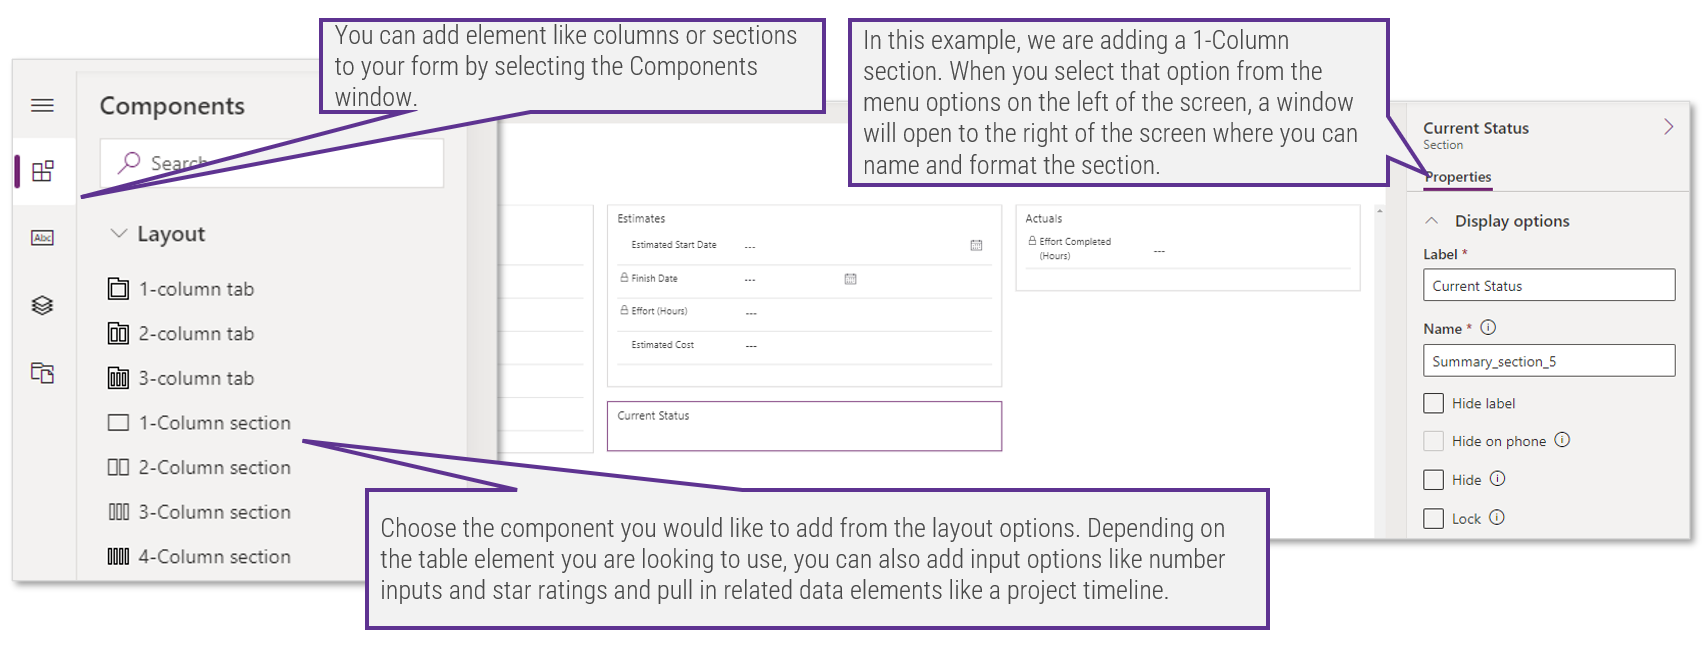
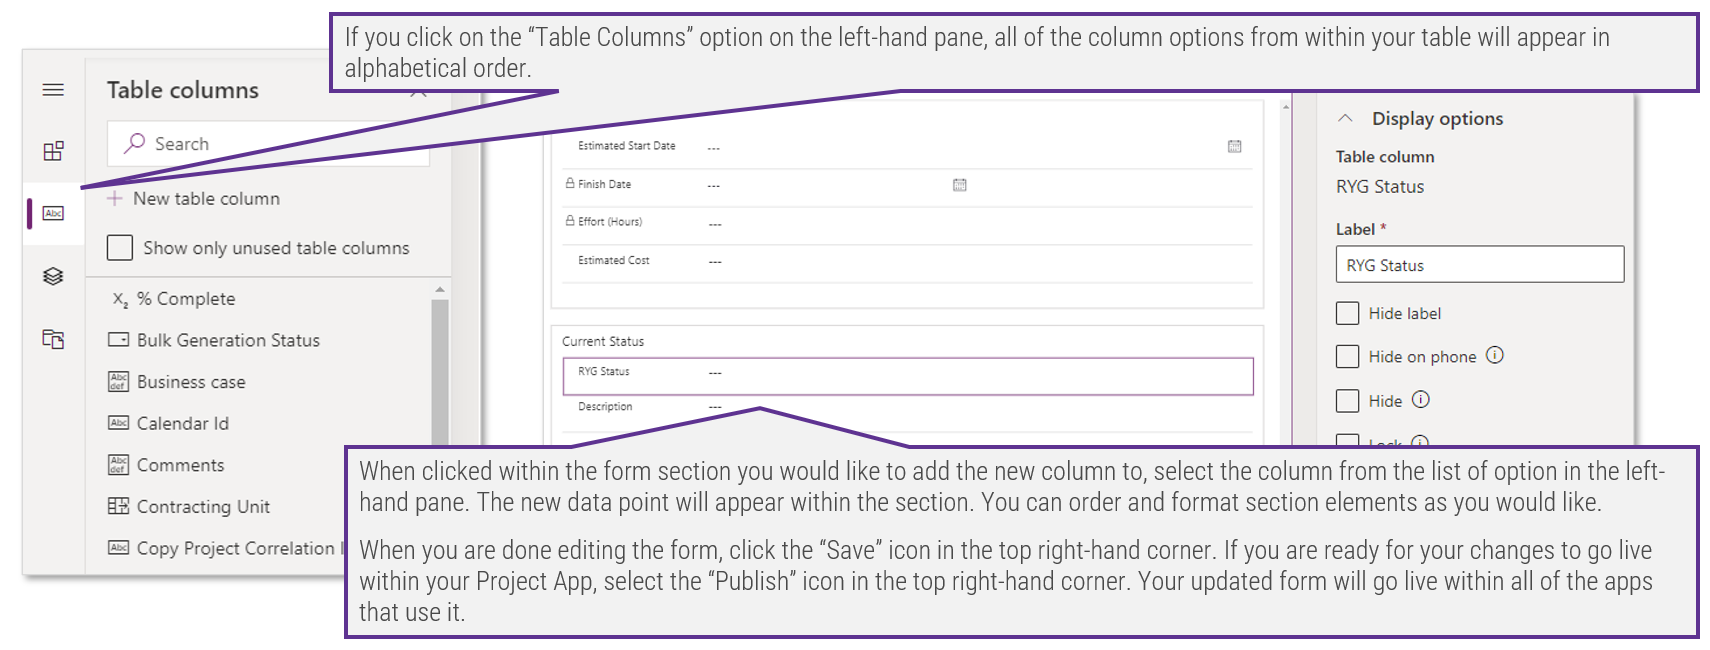
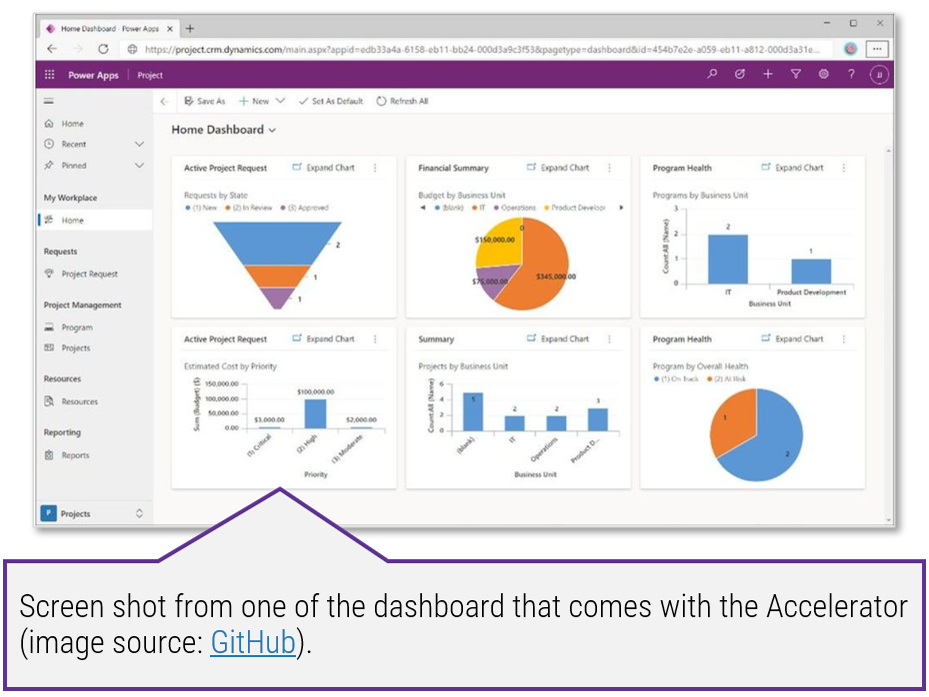
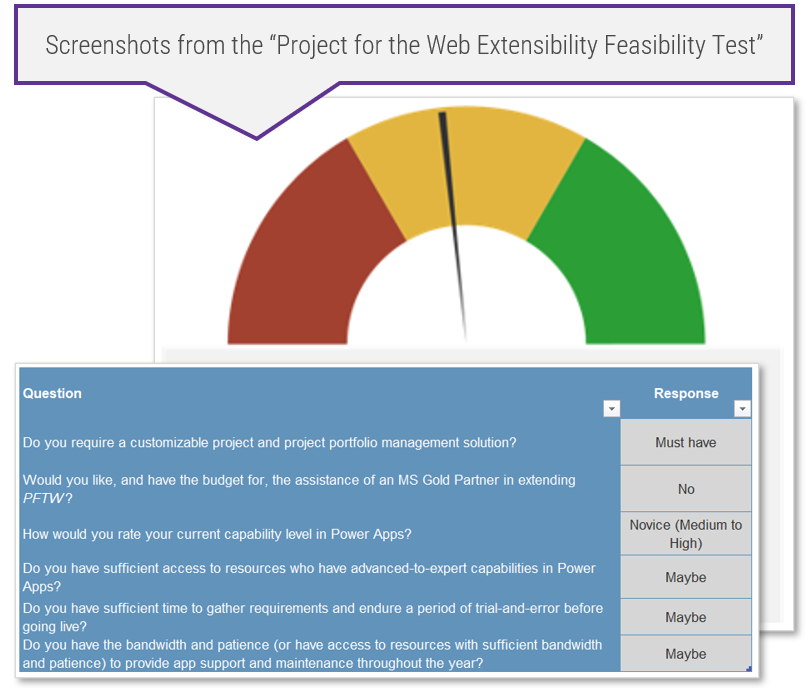

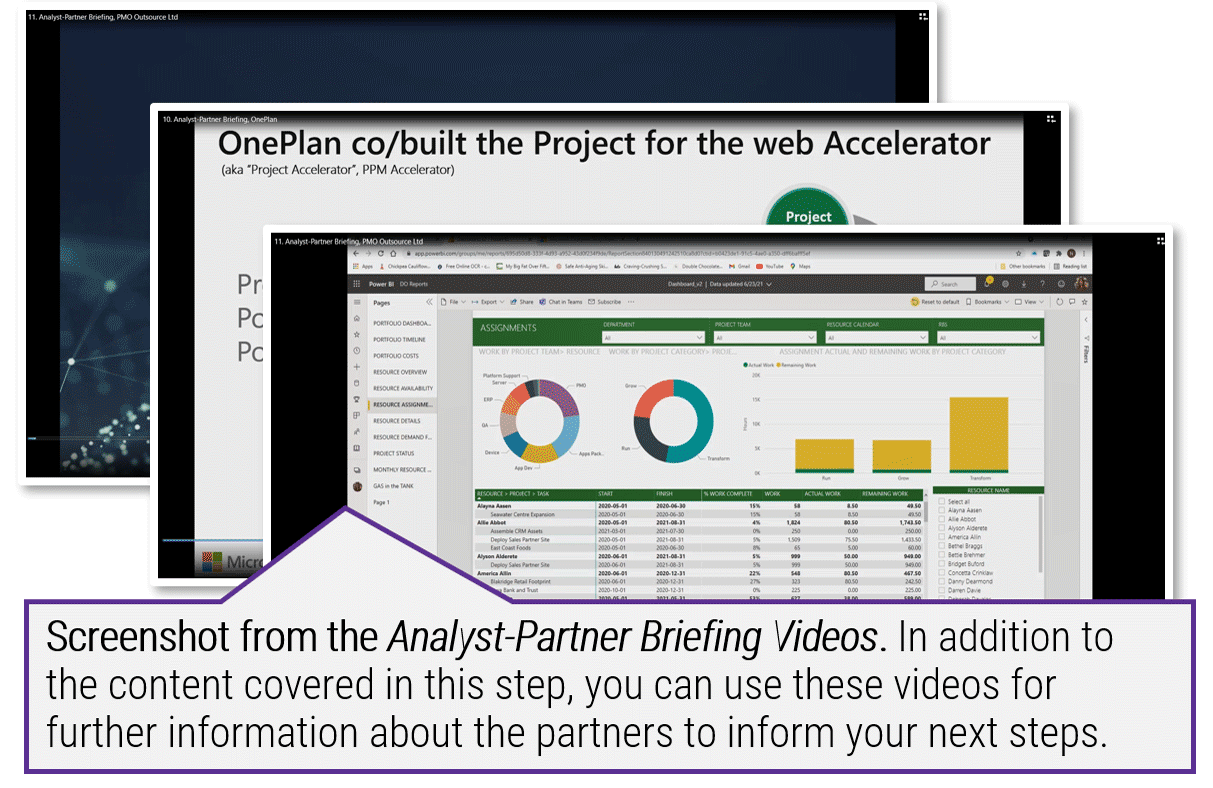
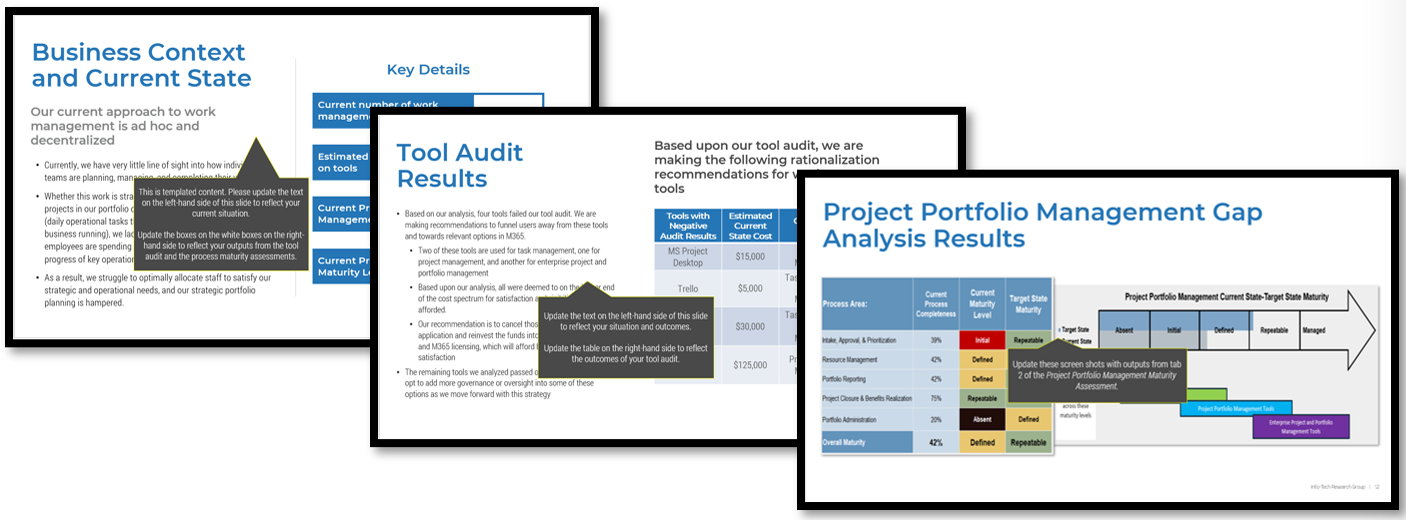


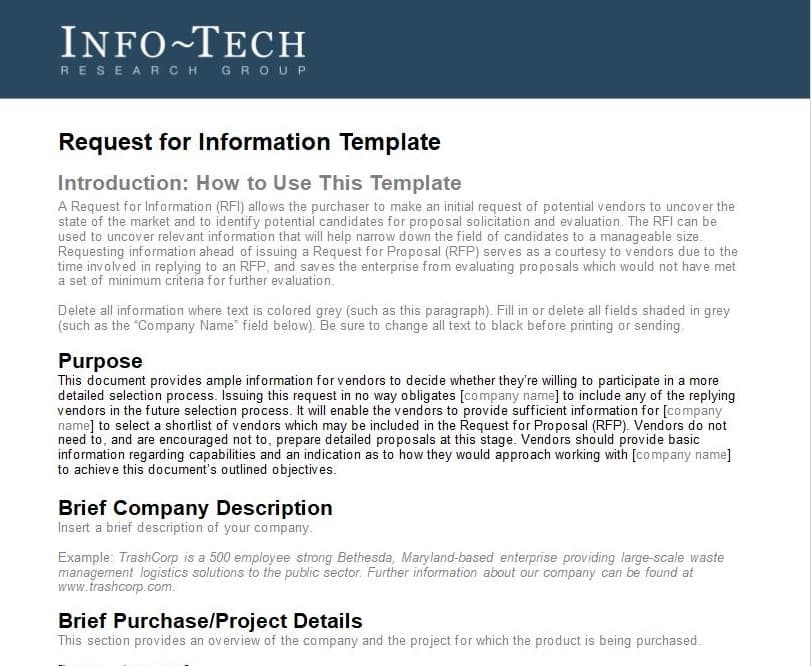
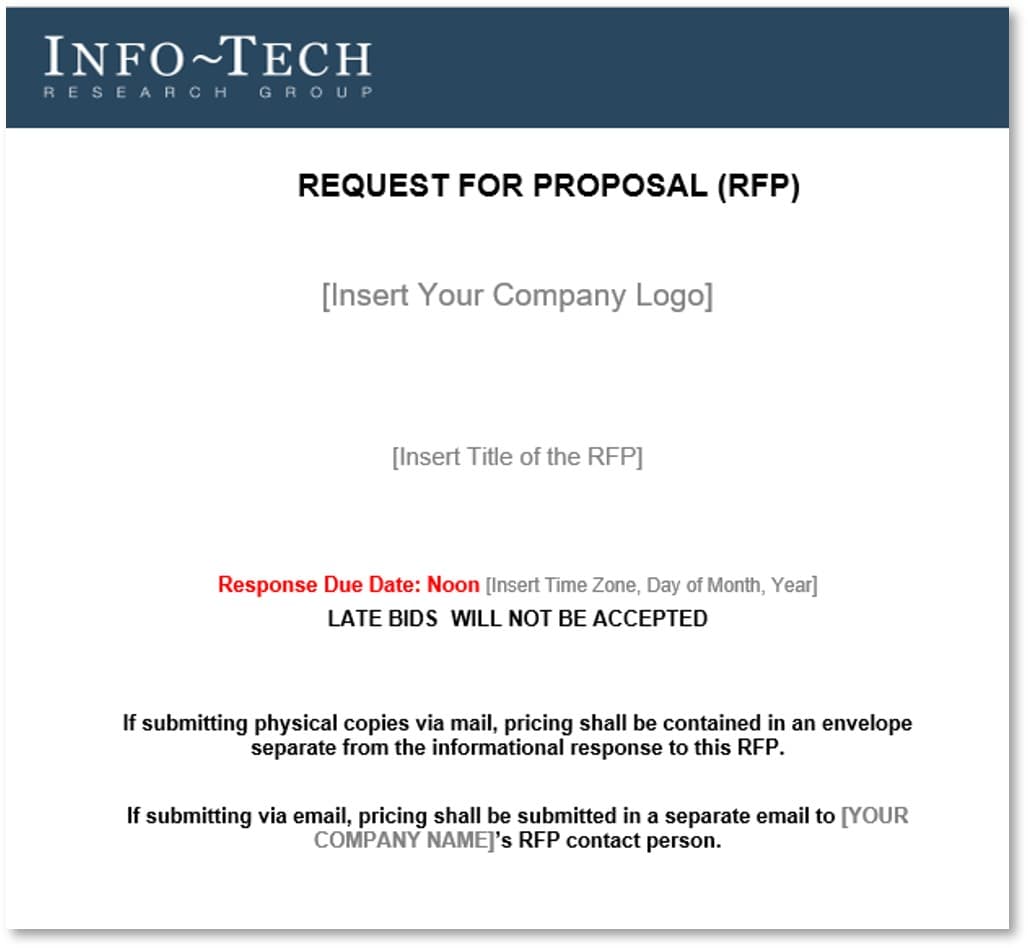
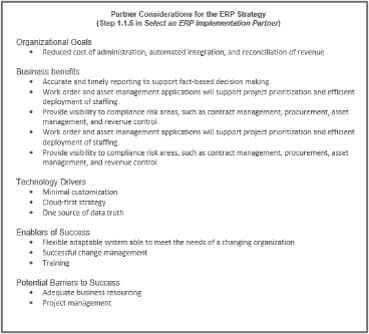
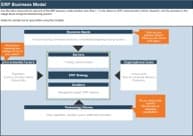
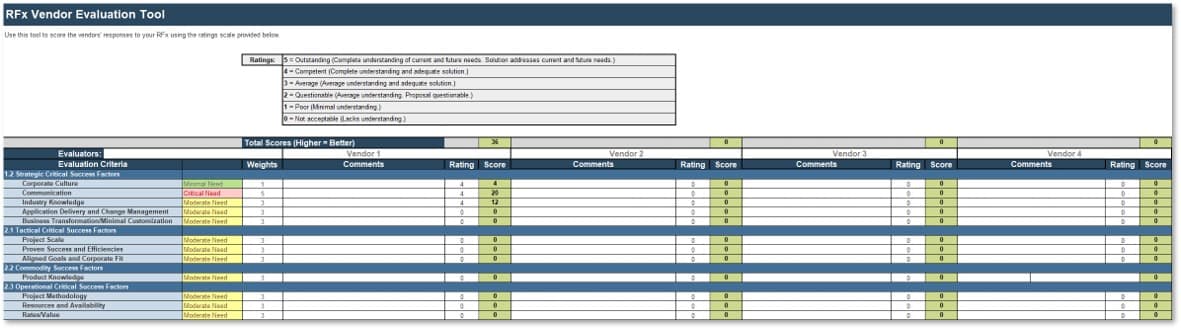
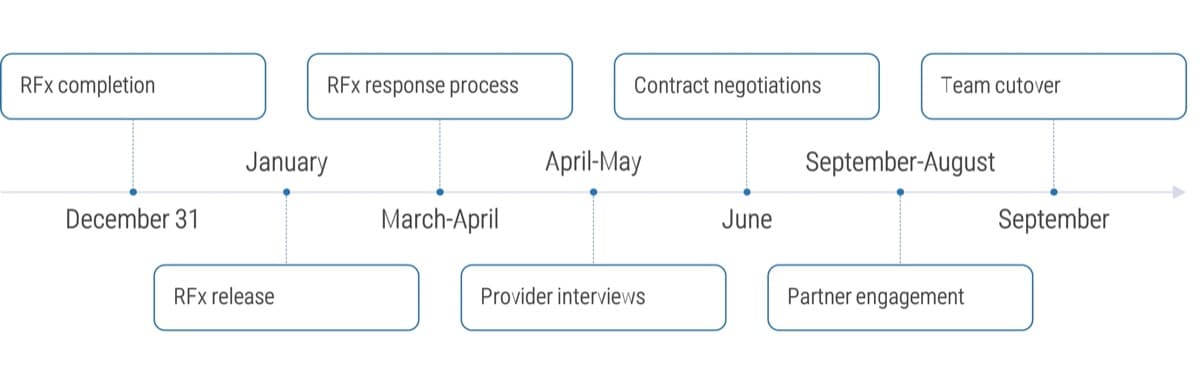


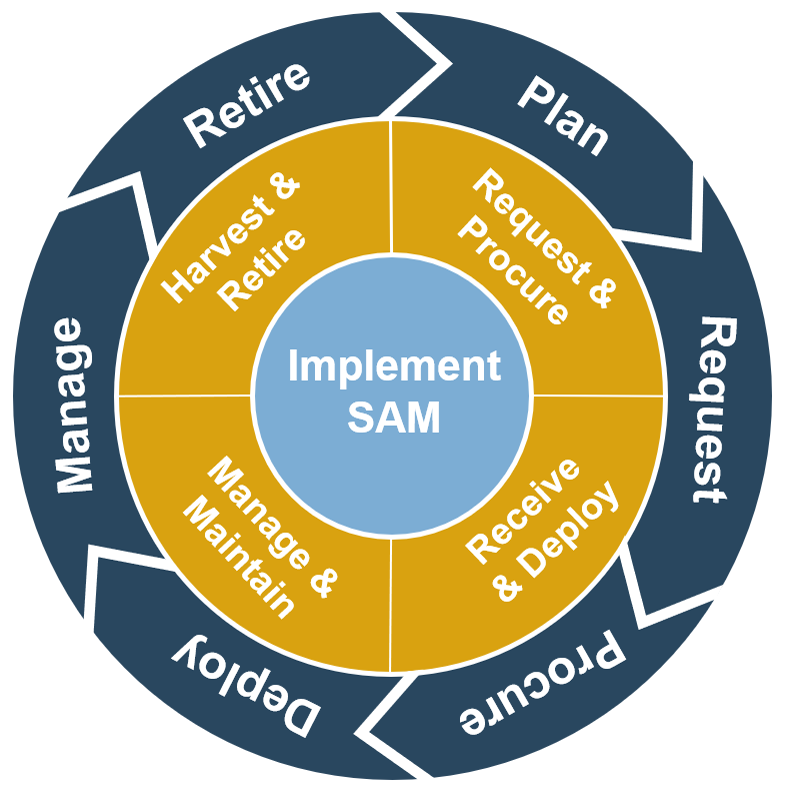
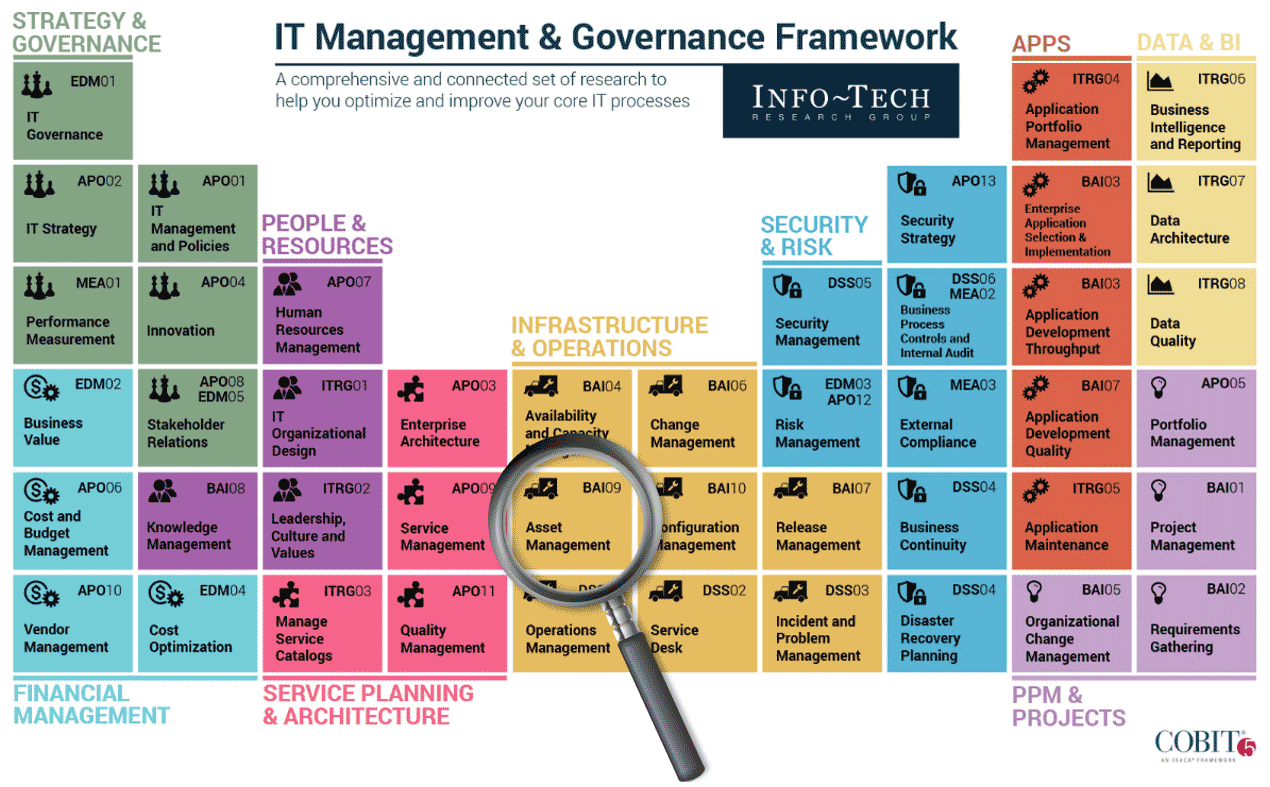
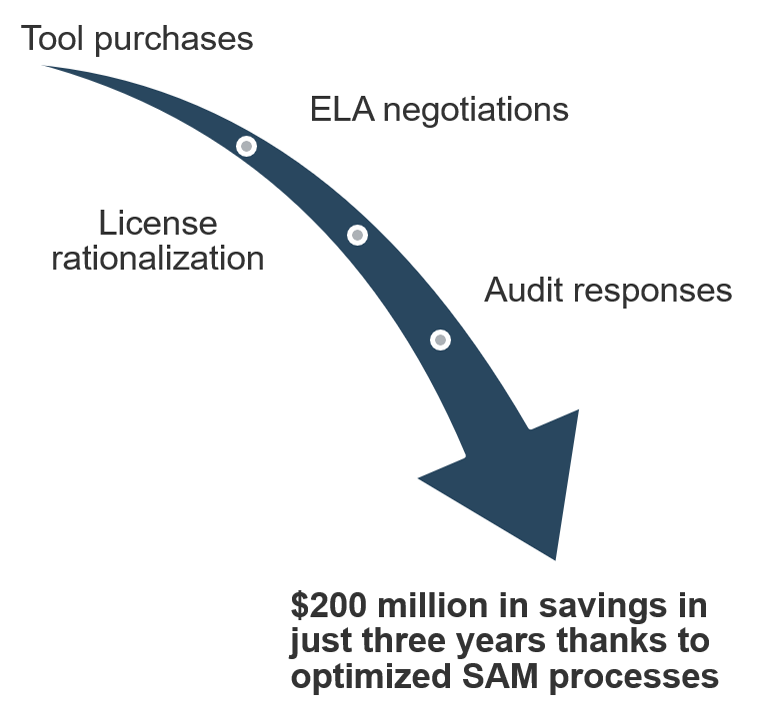
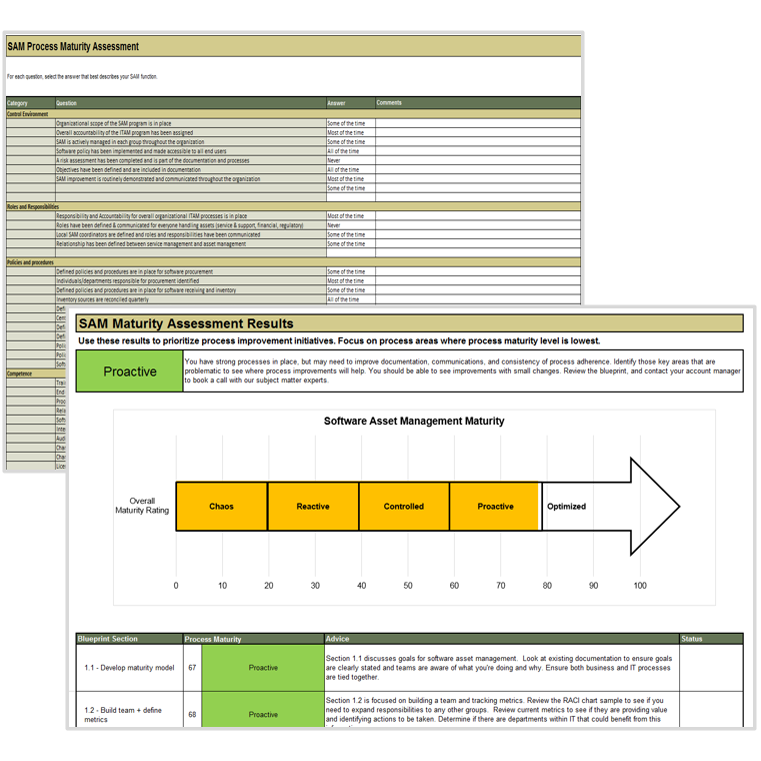
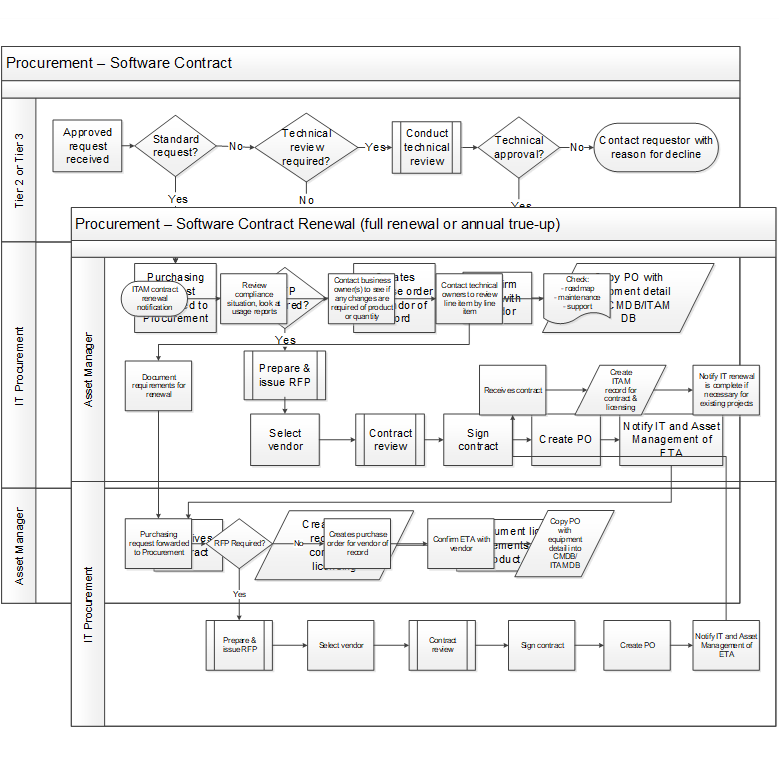
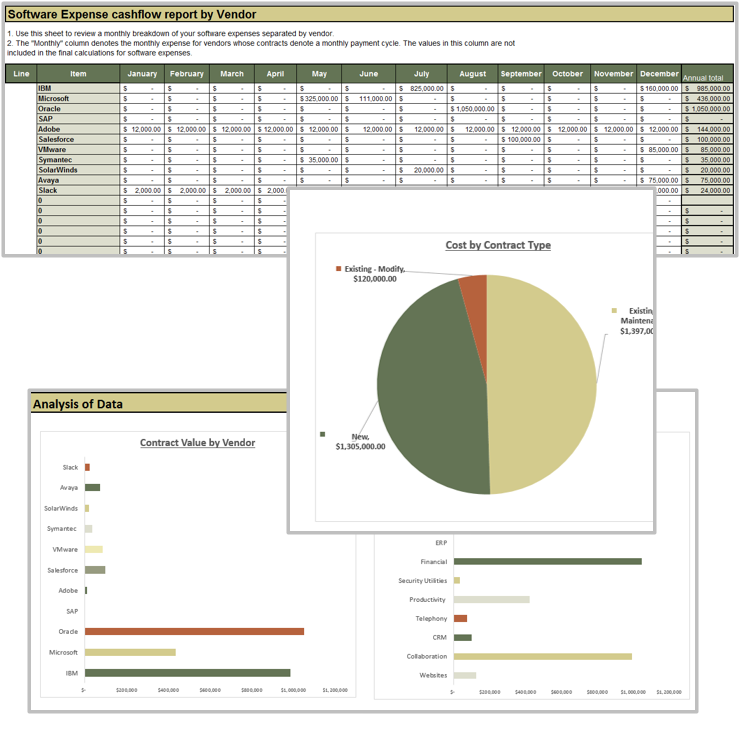
 Best-Practice Toolkit
 Onsite Workshop
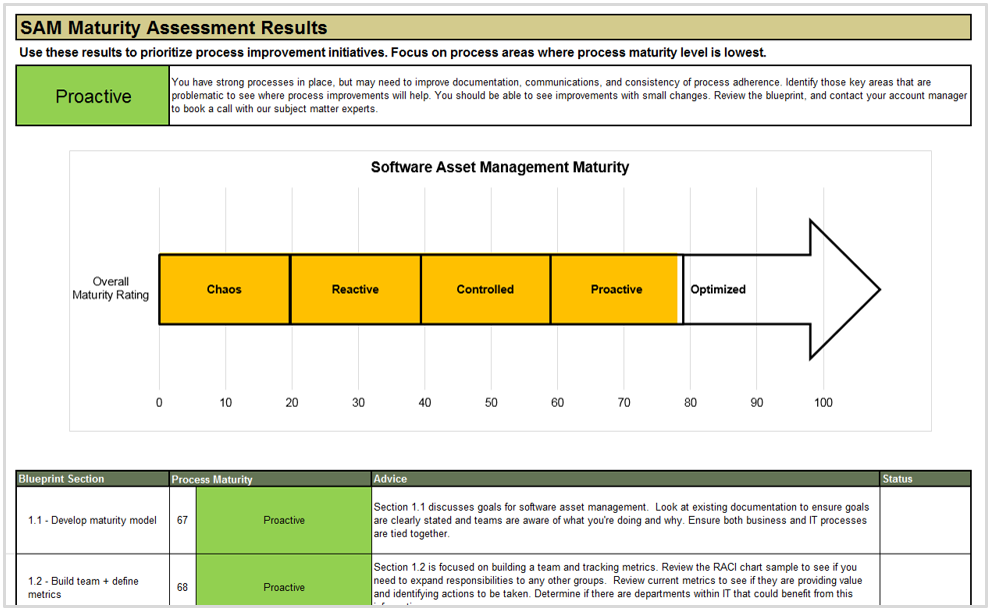
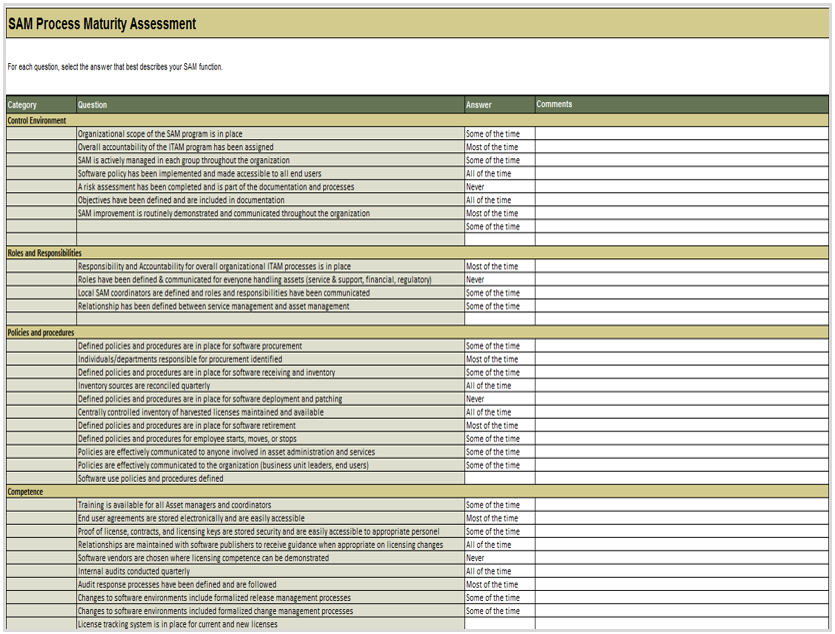
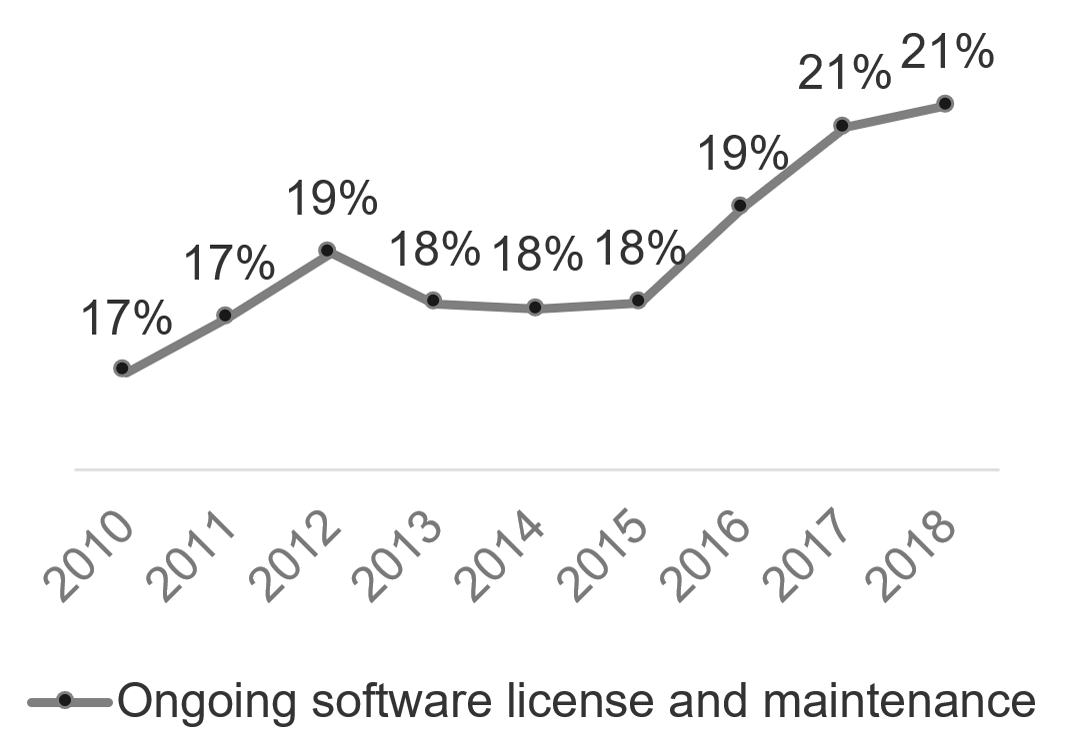
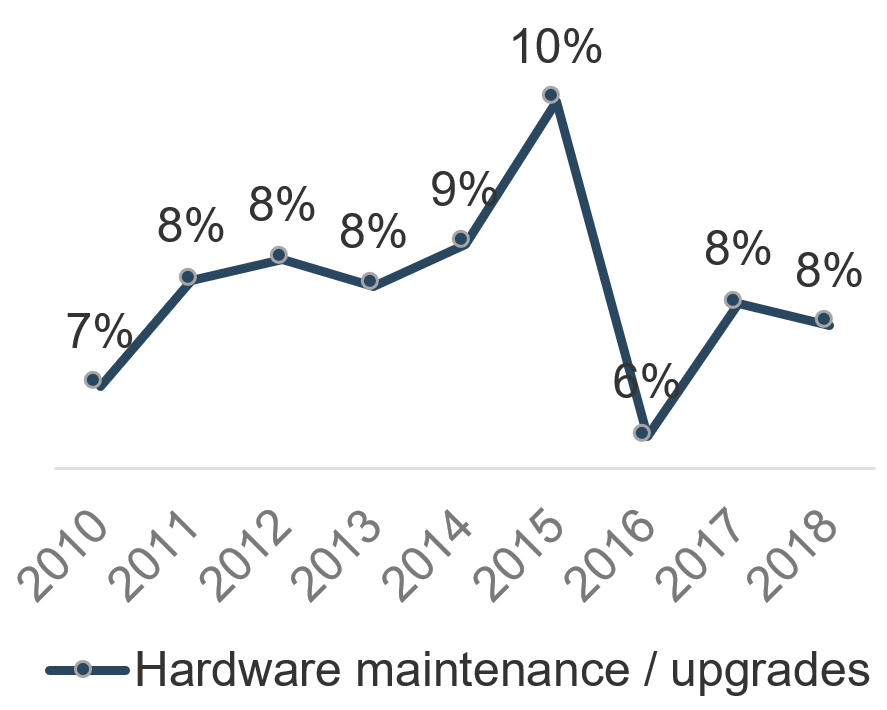
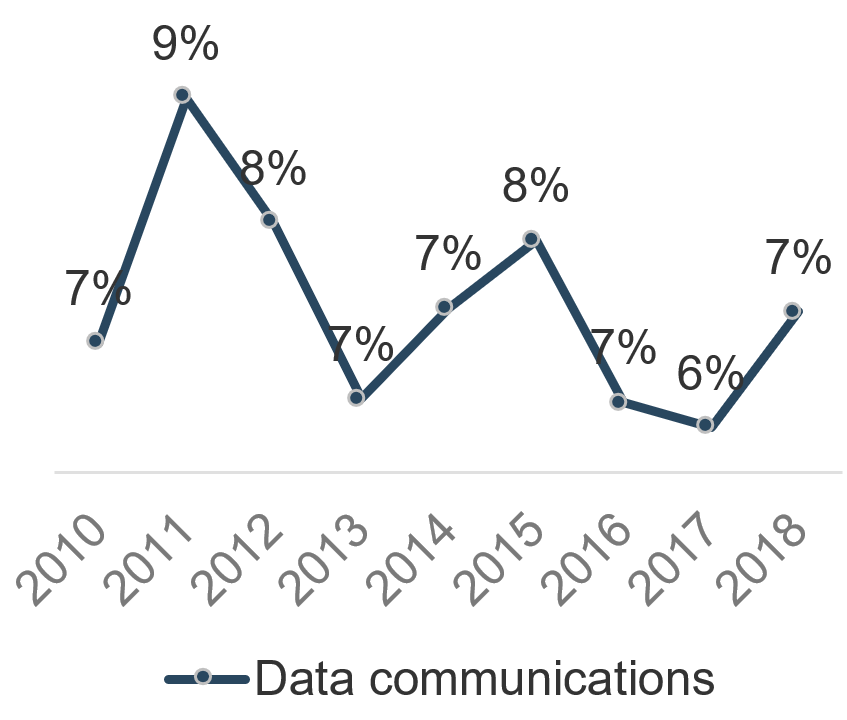
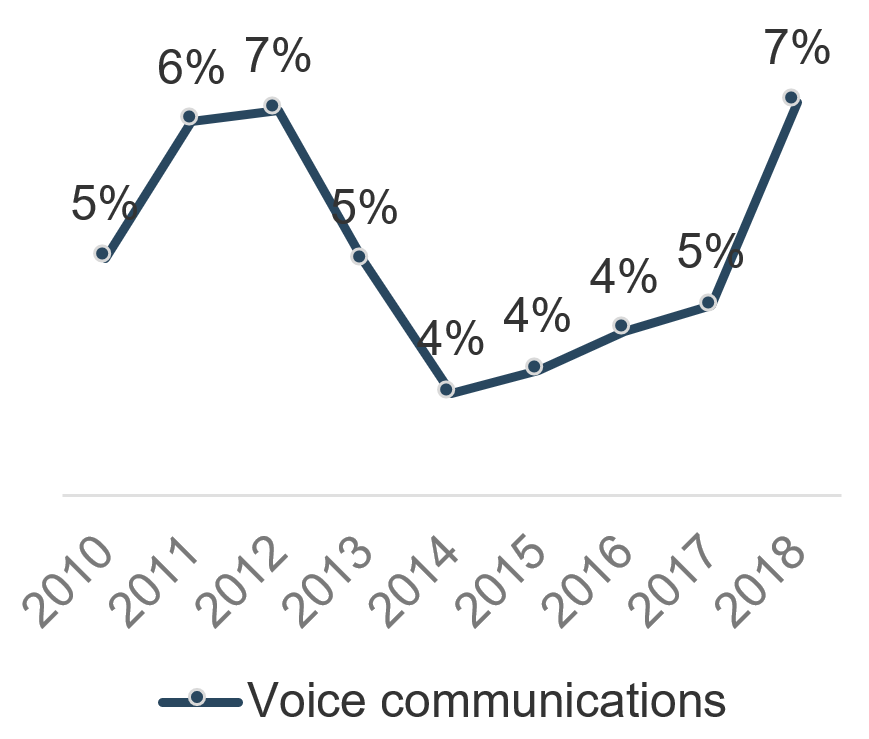
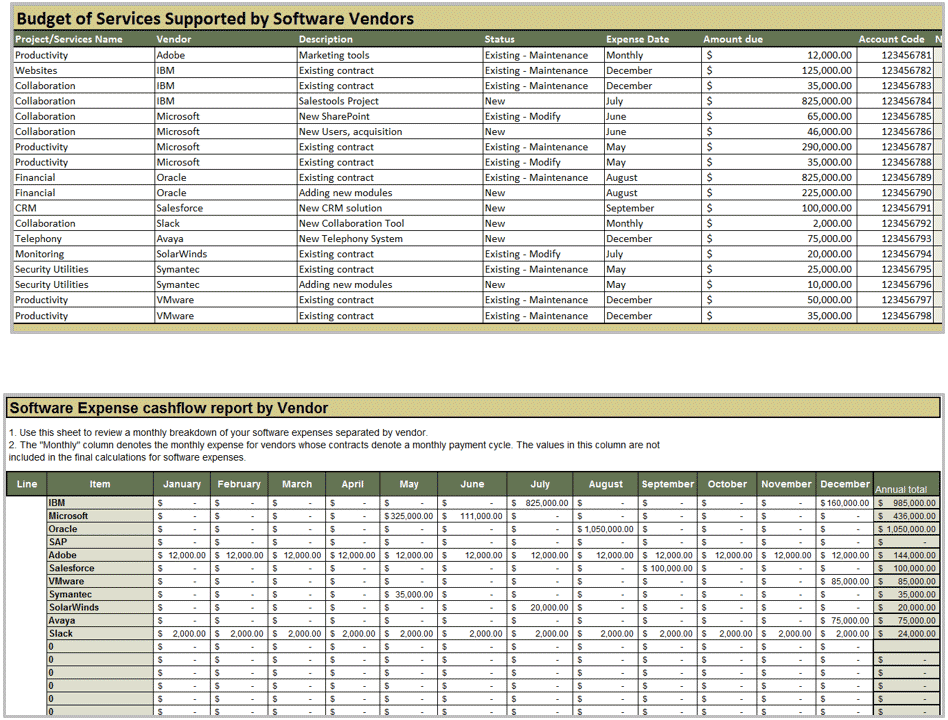
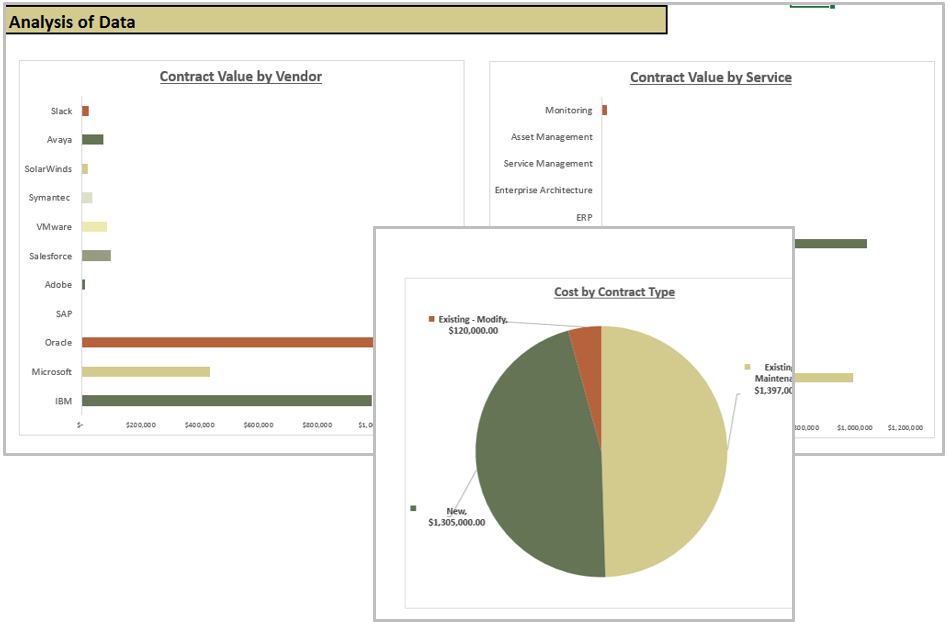

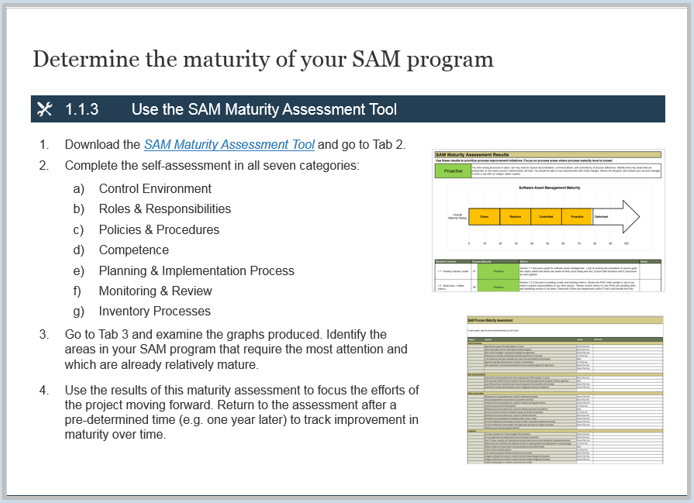
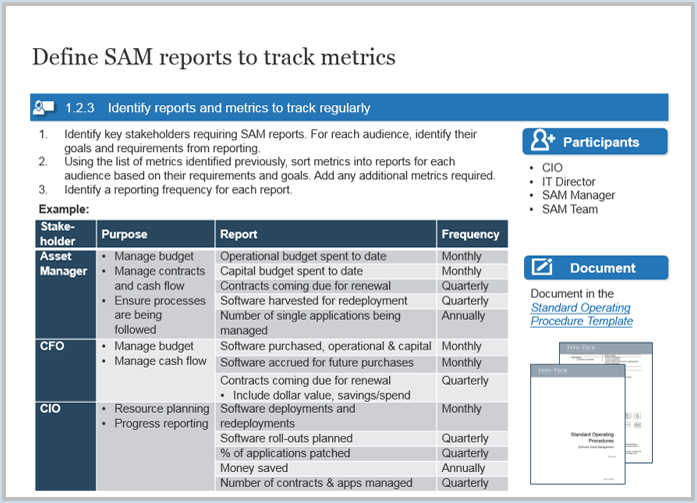

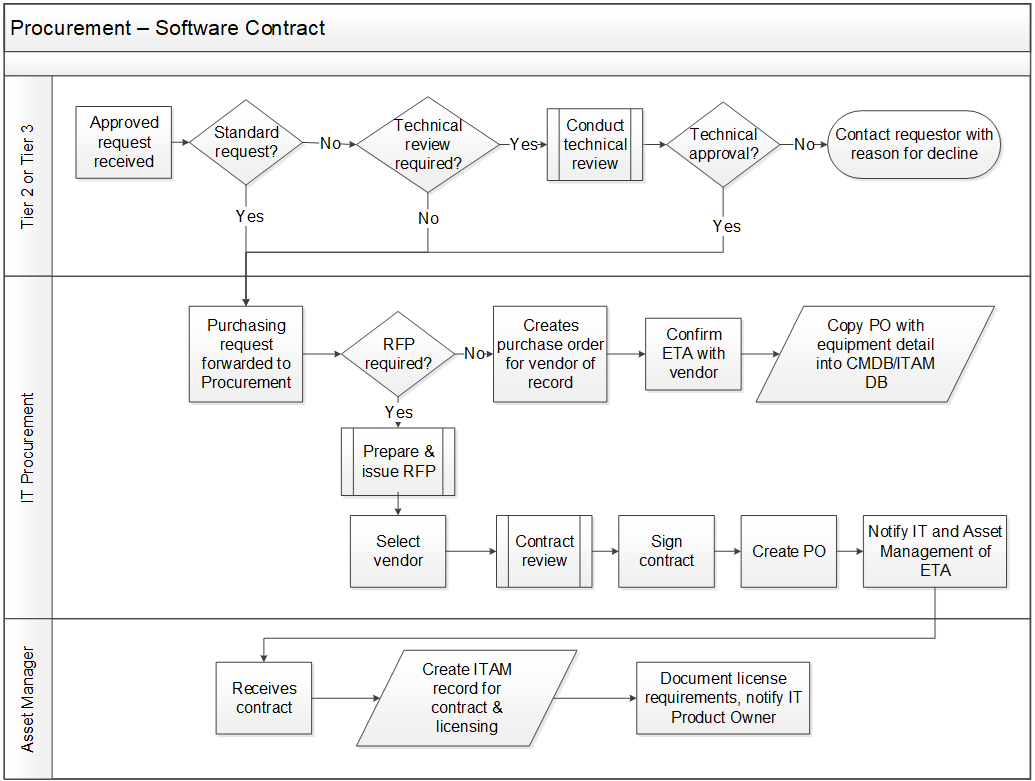
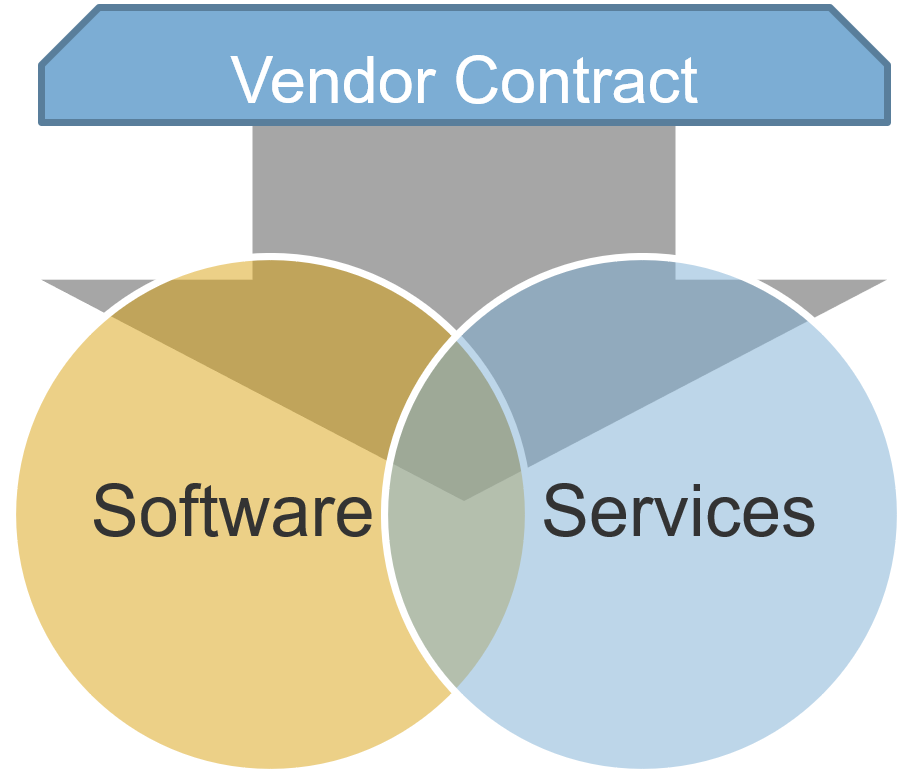
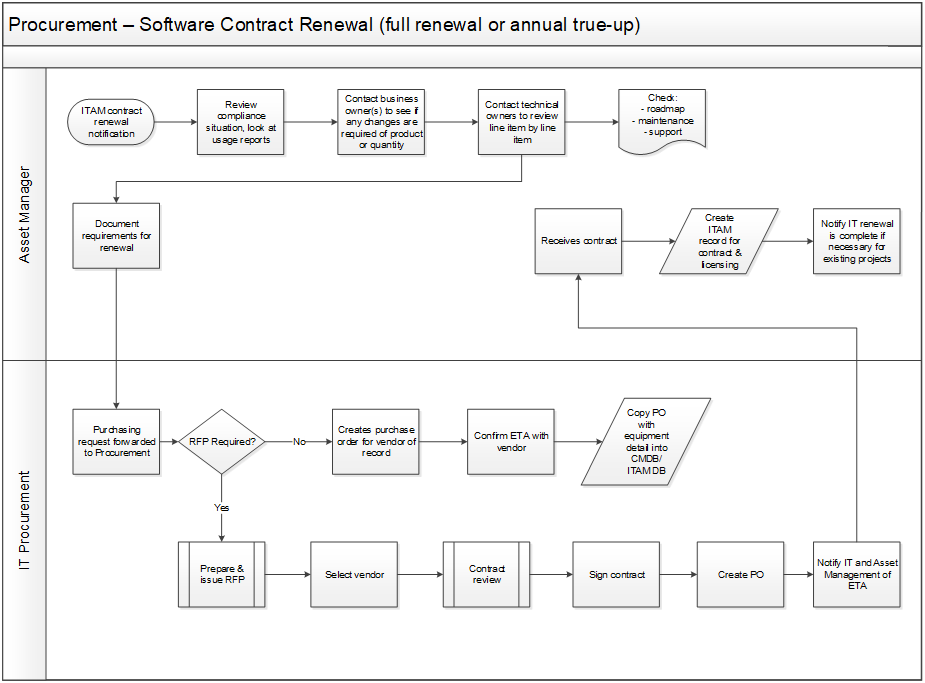
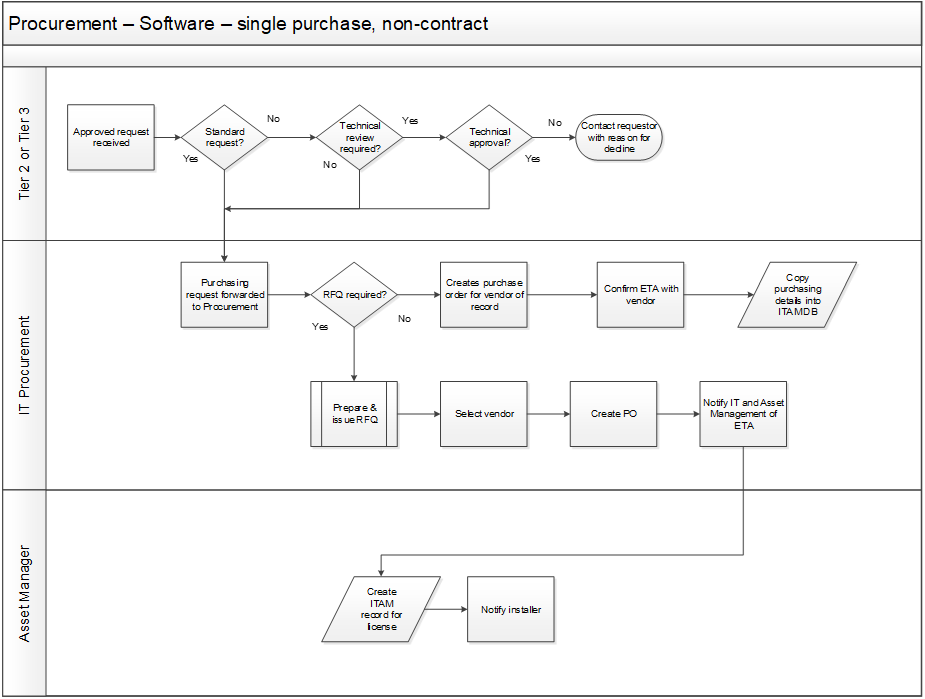
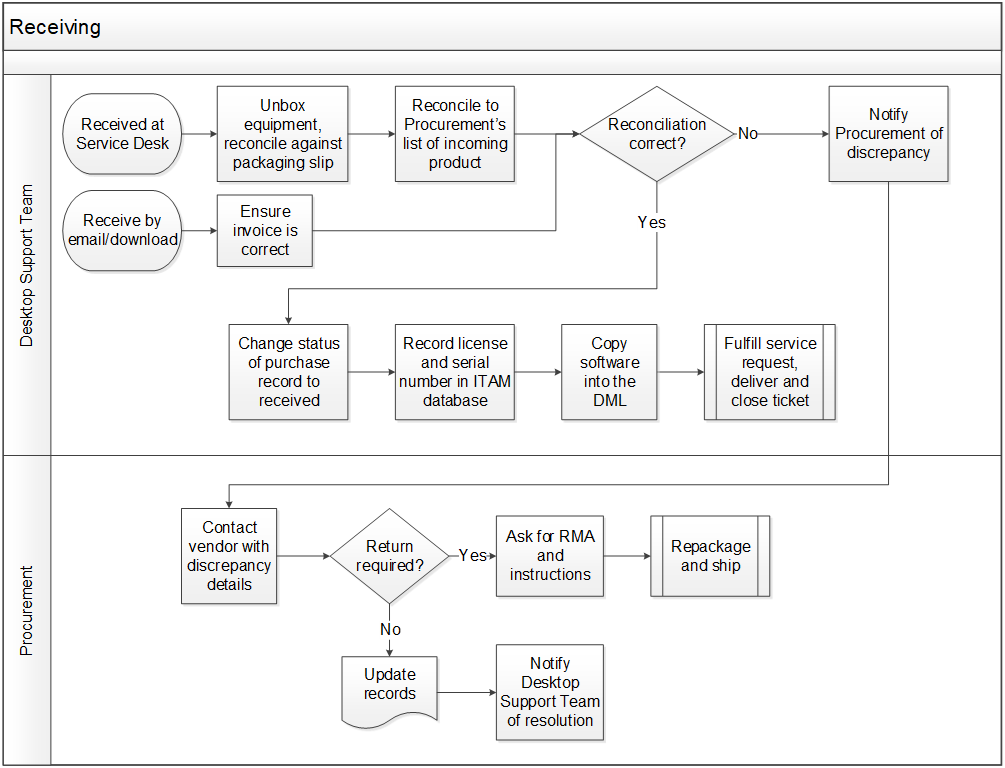
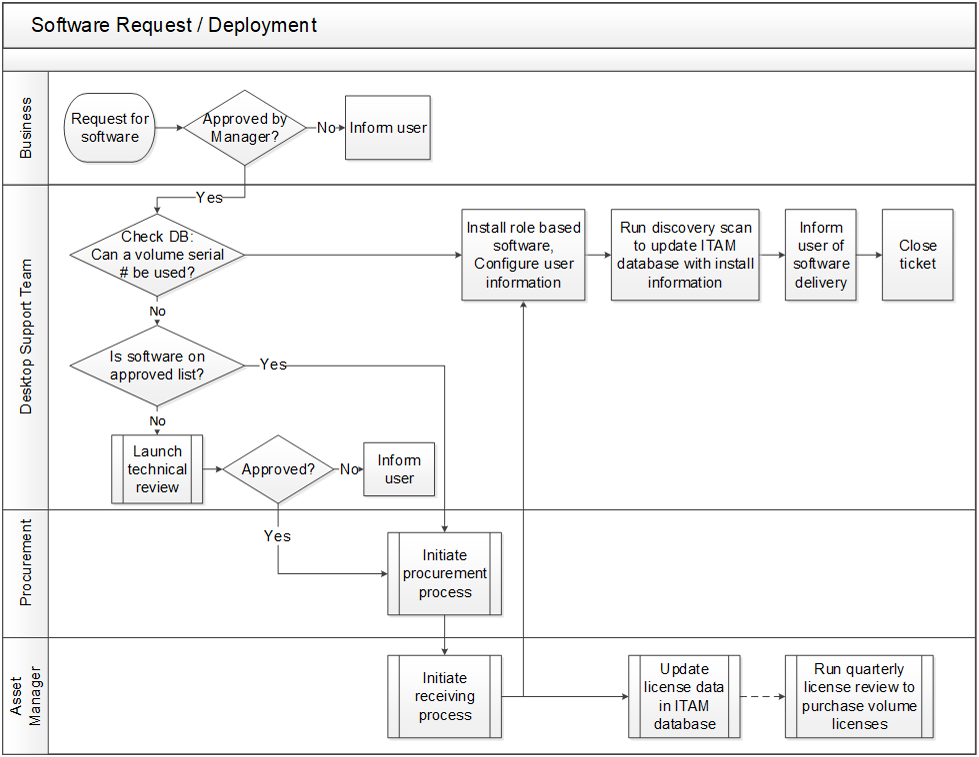
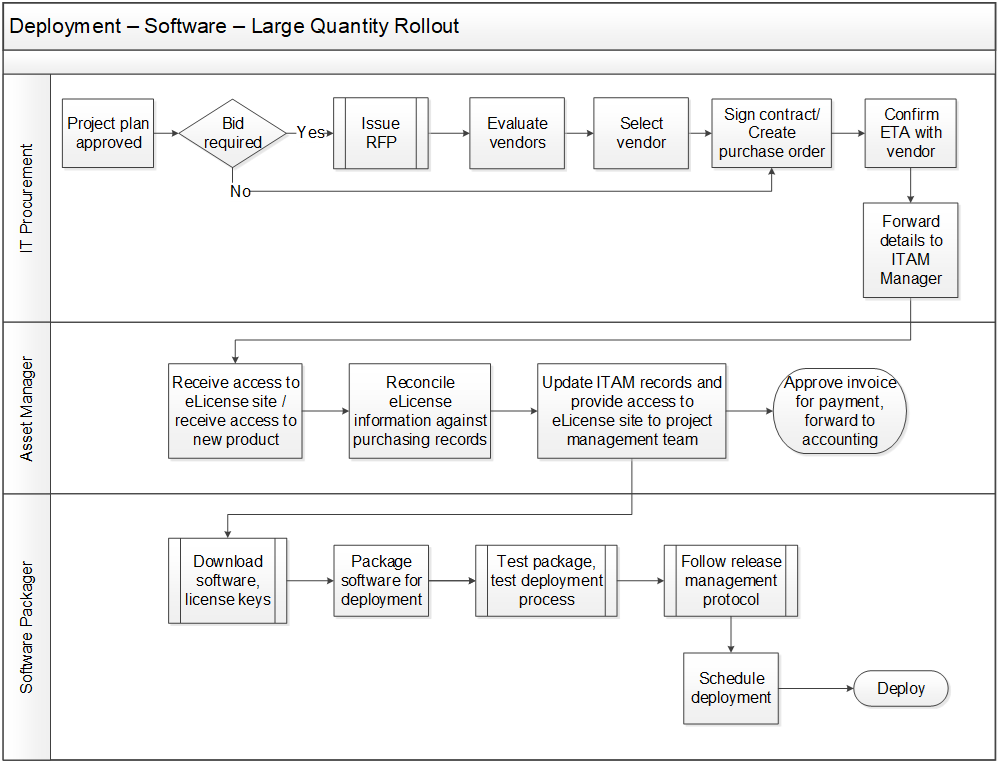
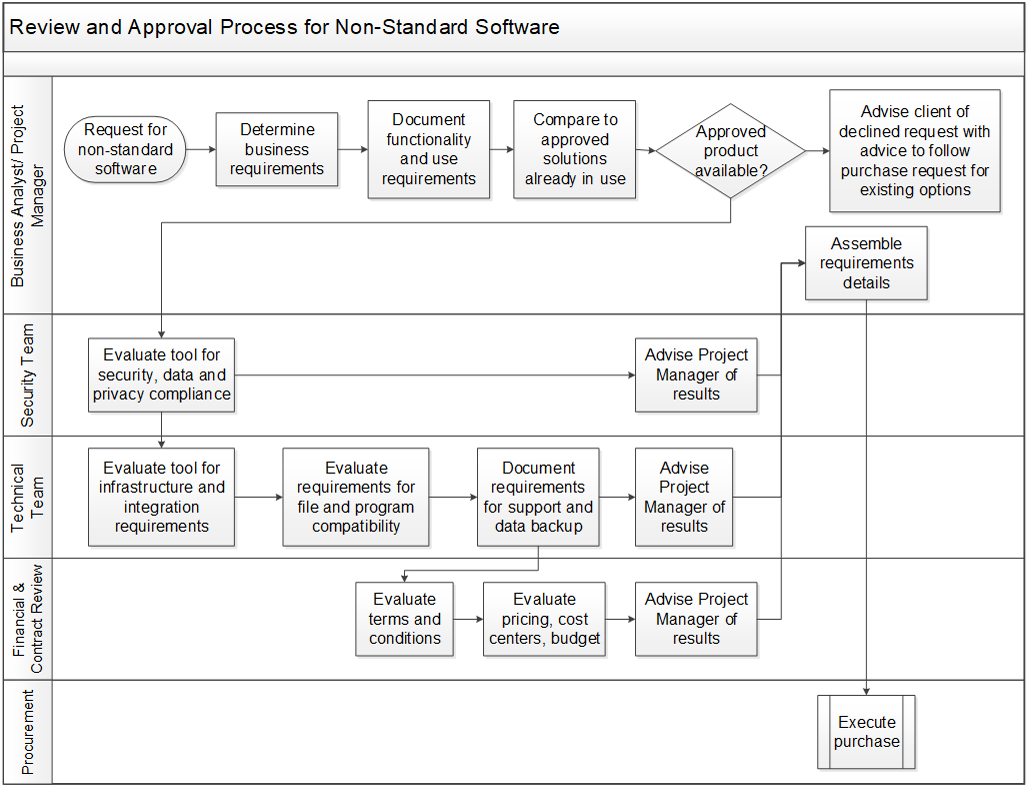
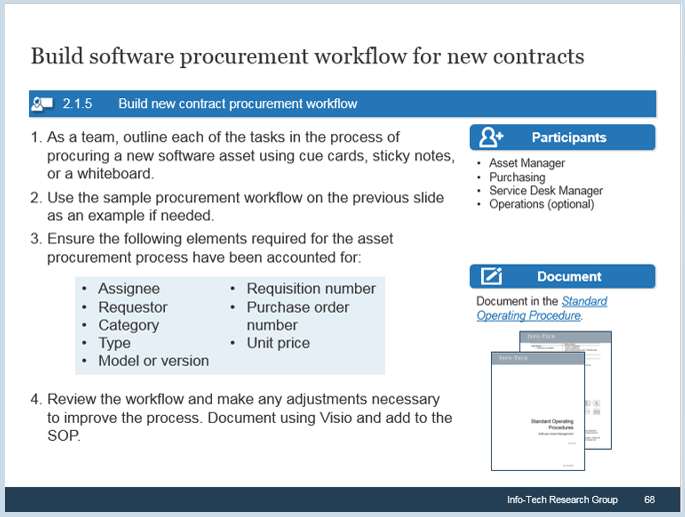
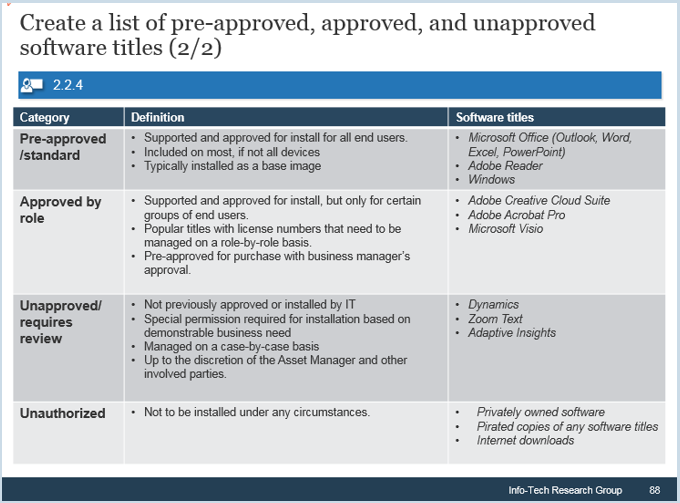
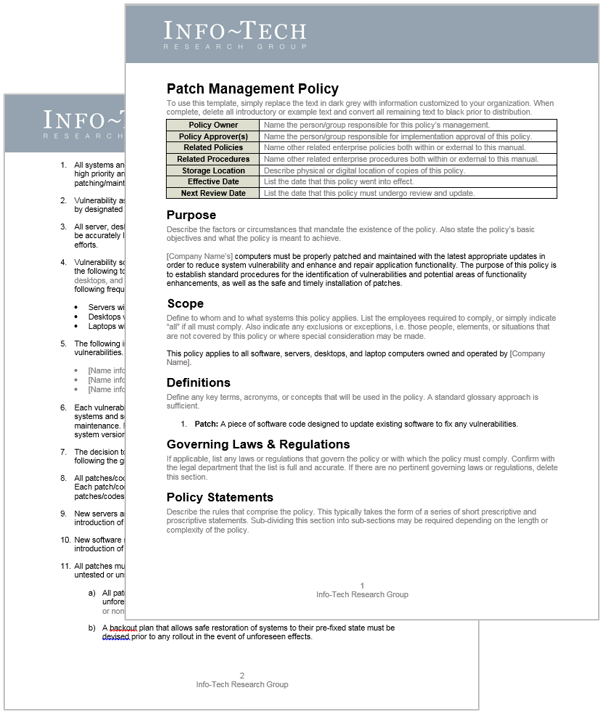
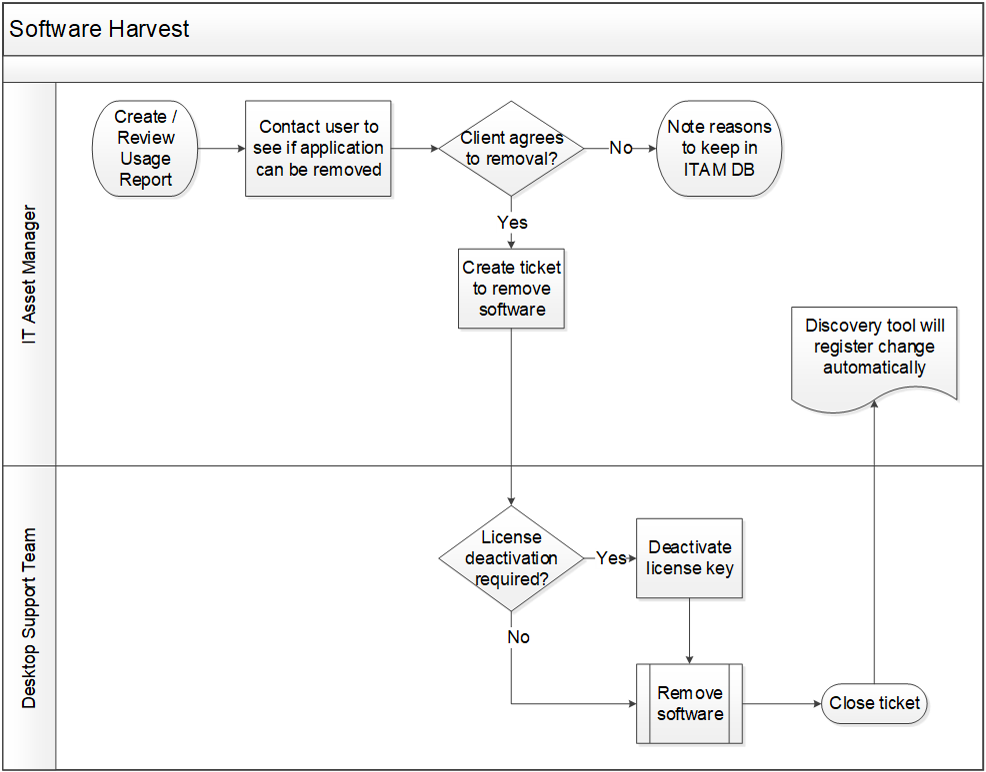
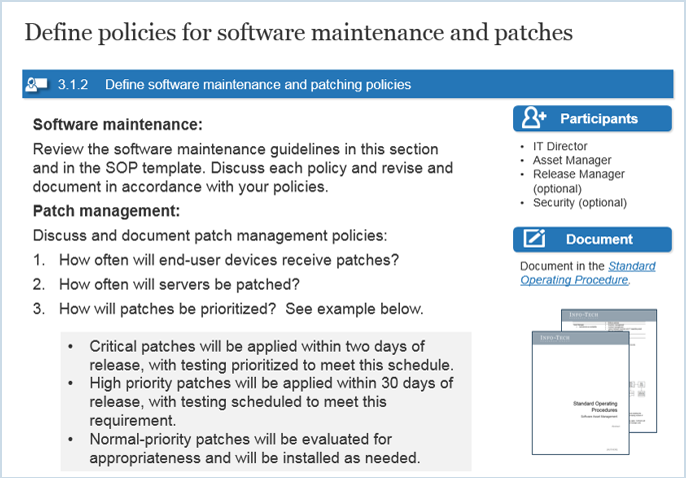
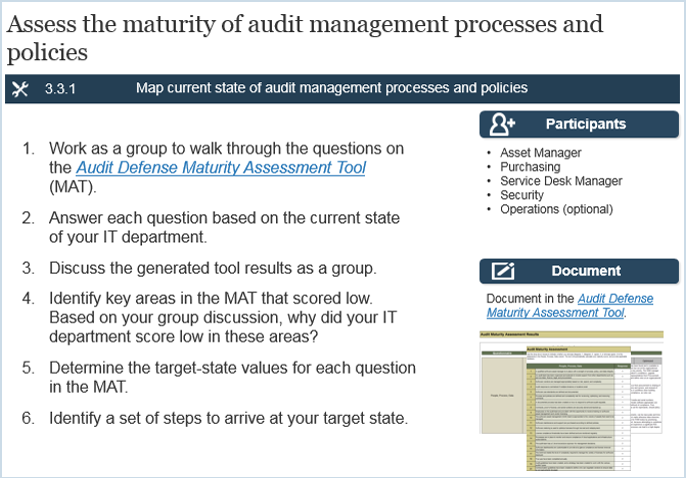
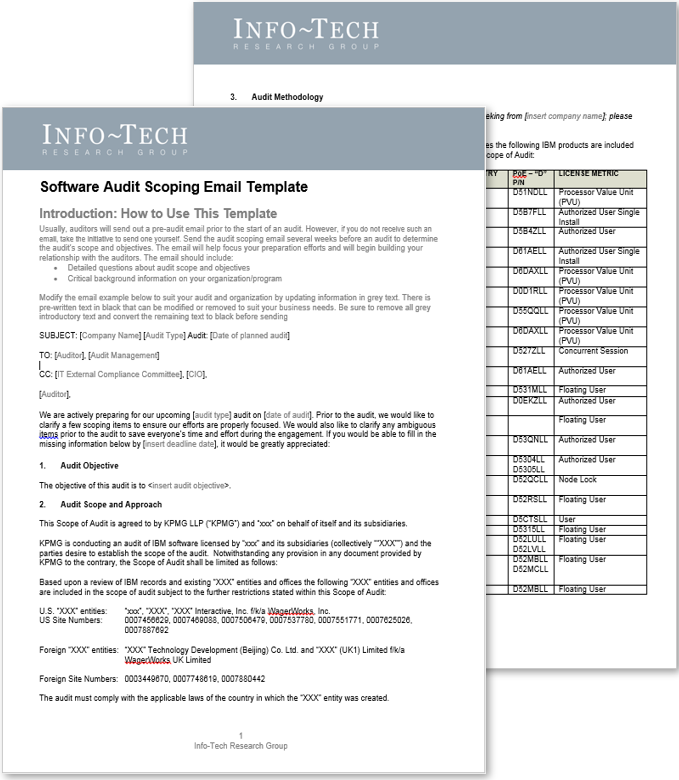
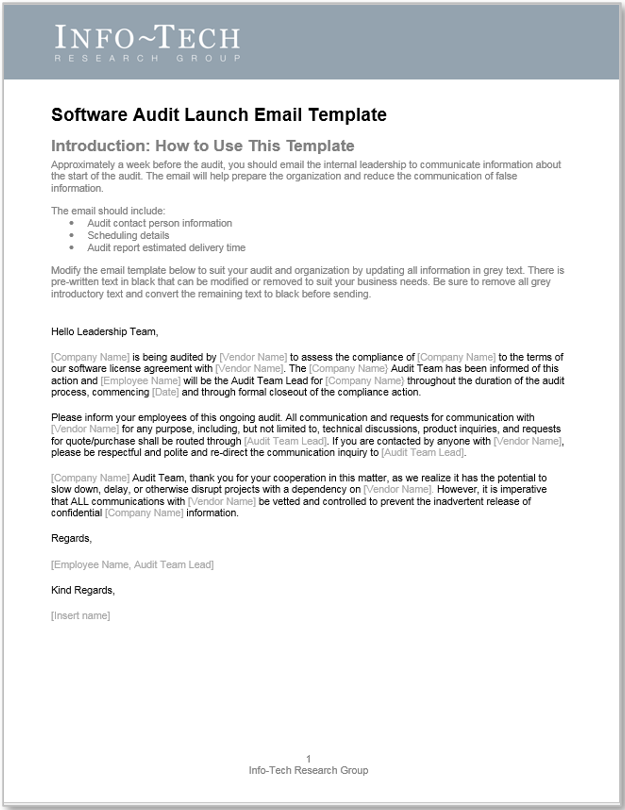
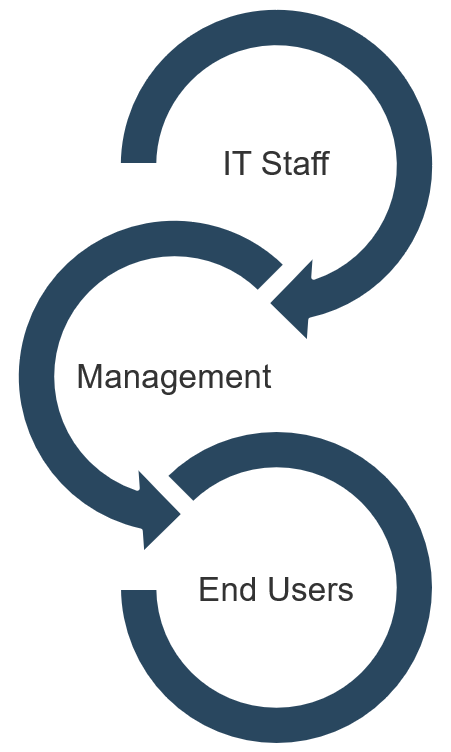
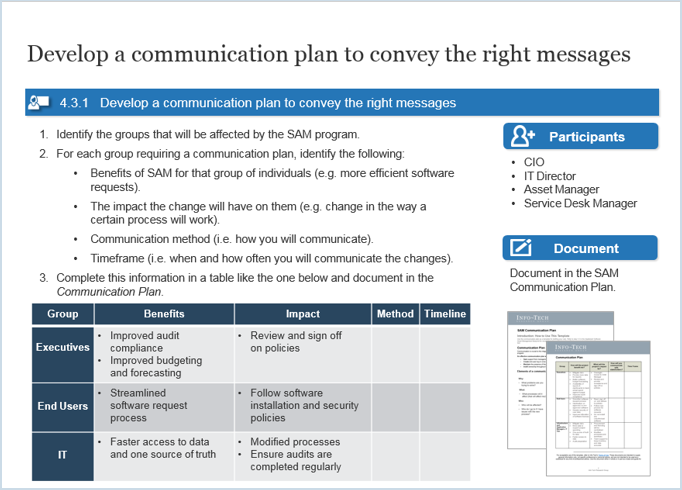
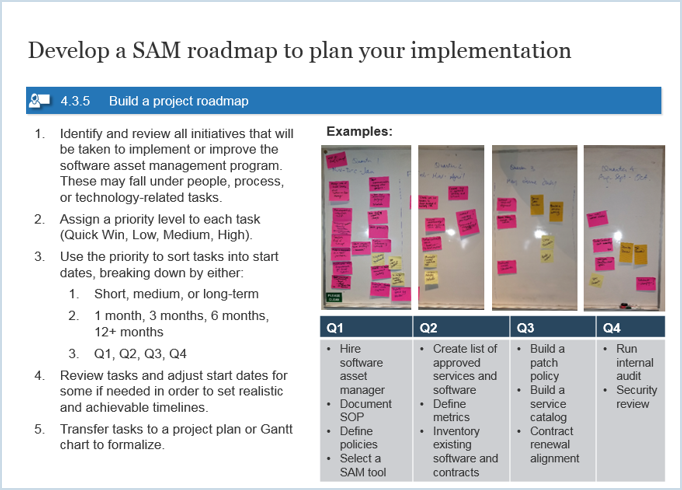


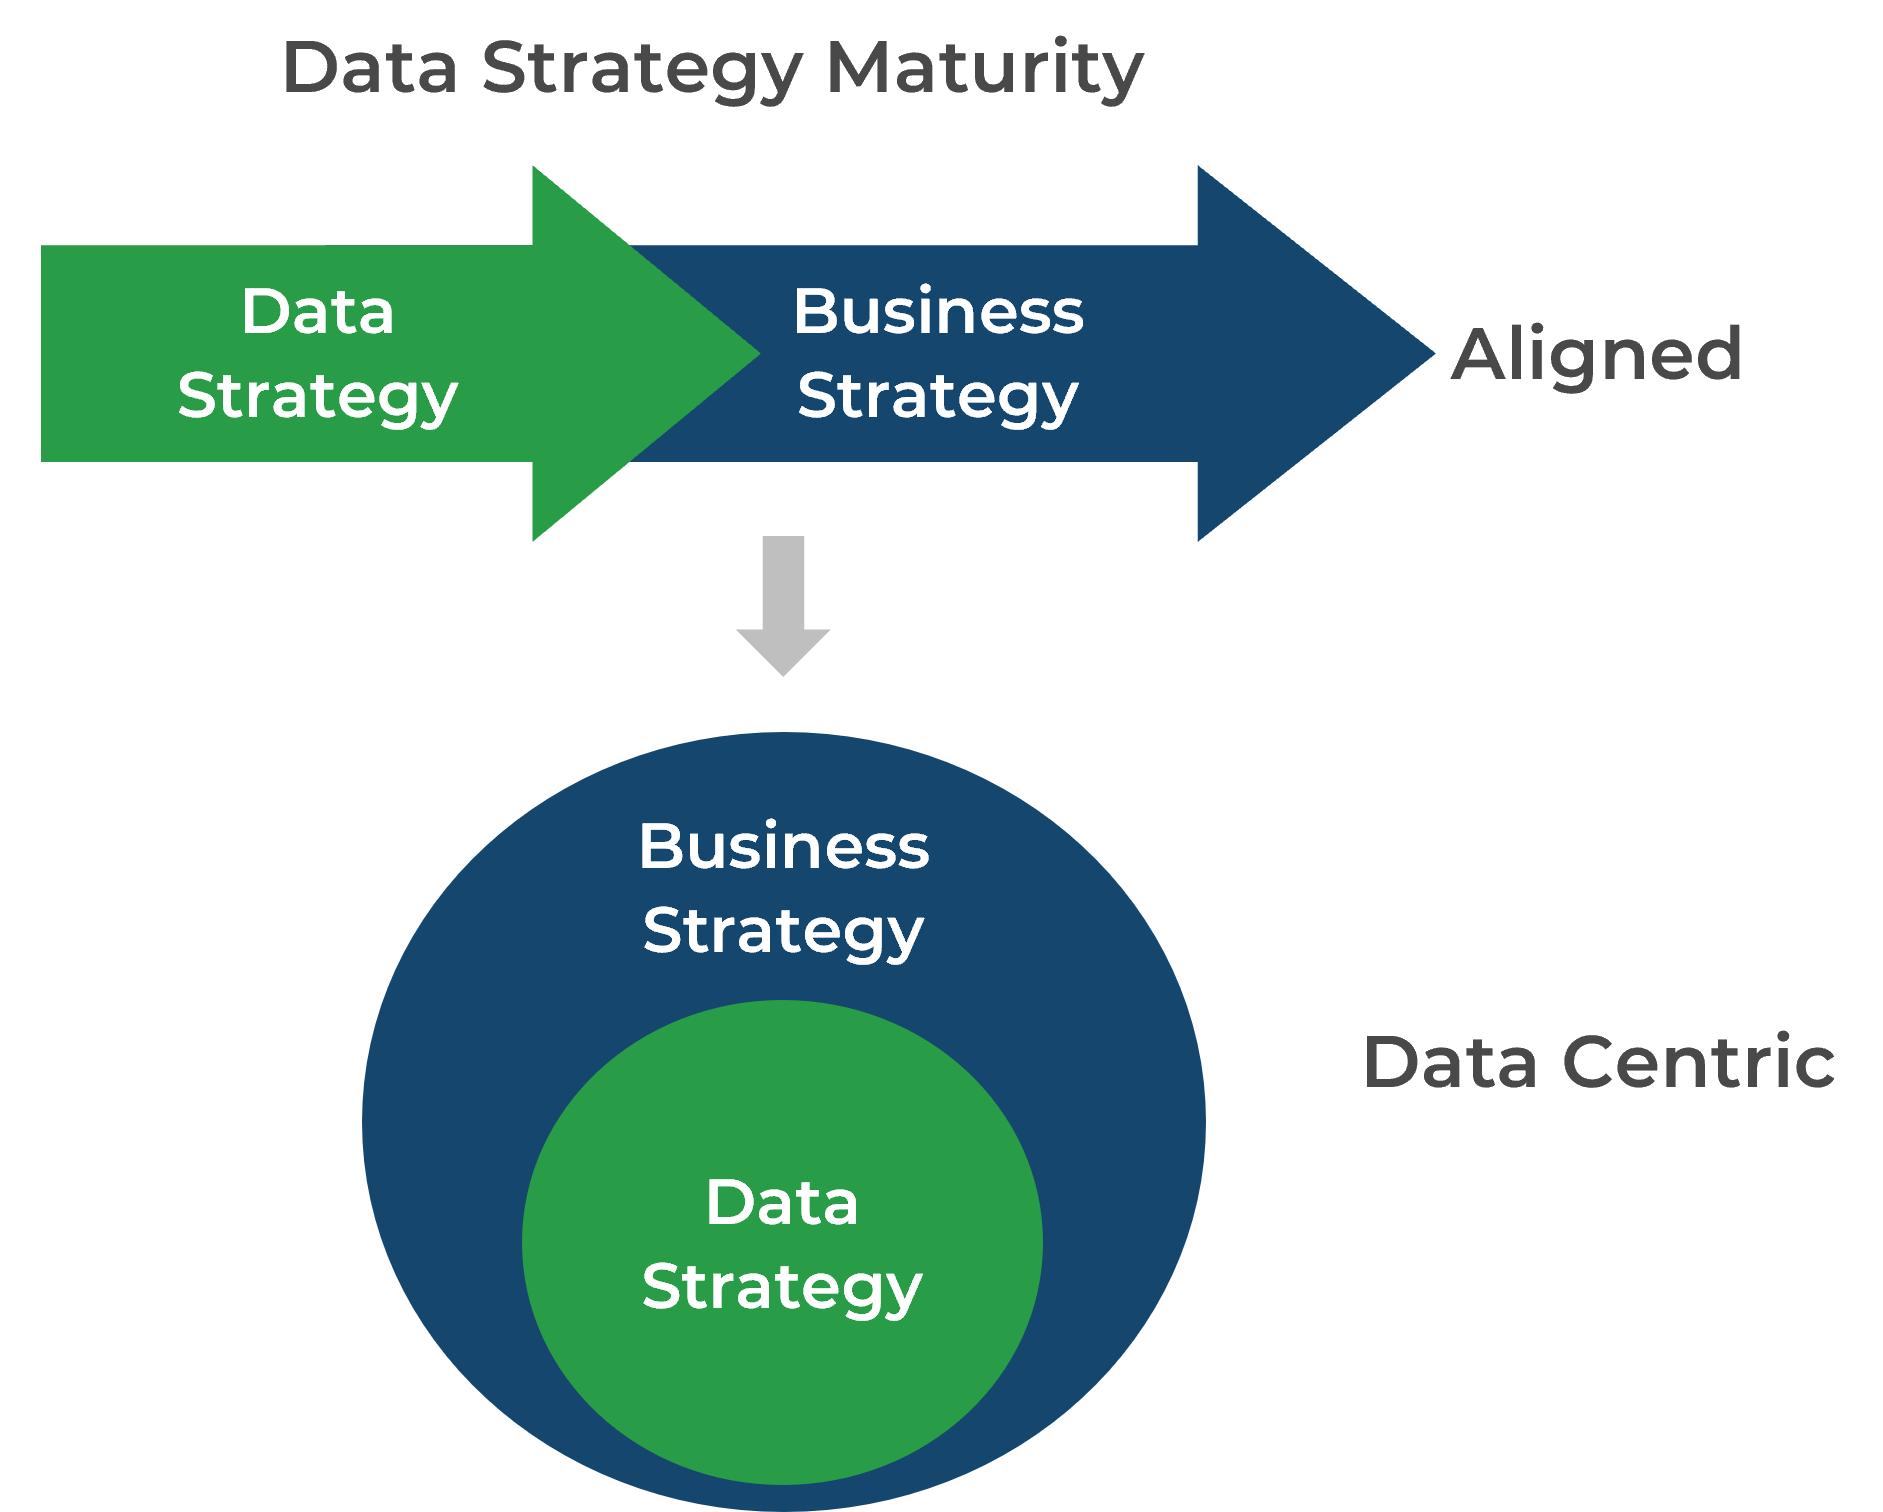
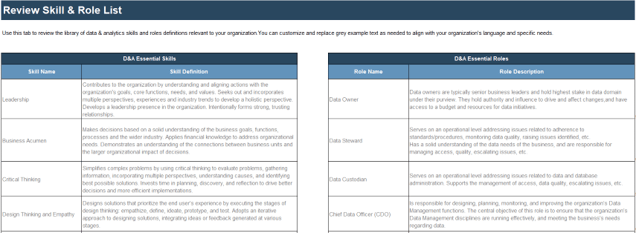
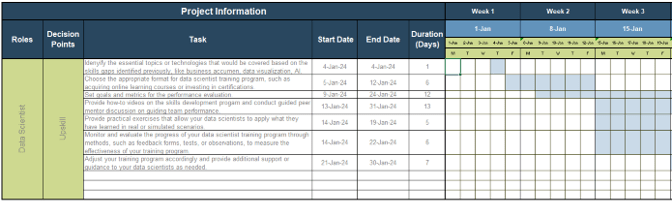
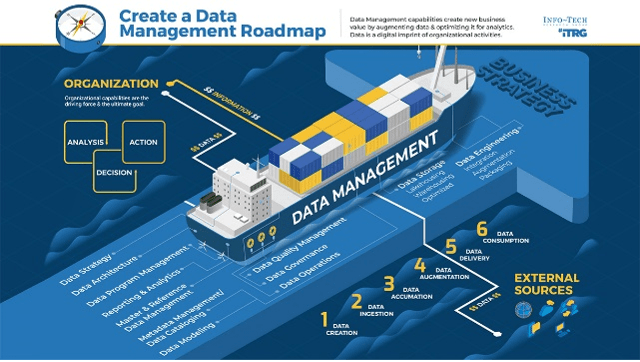

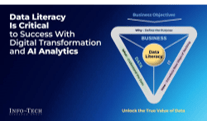


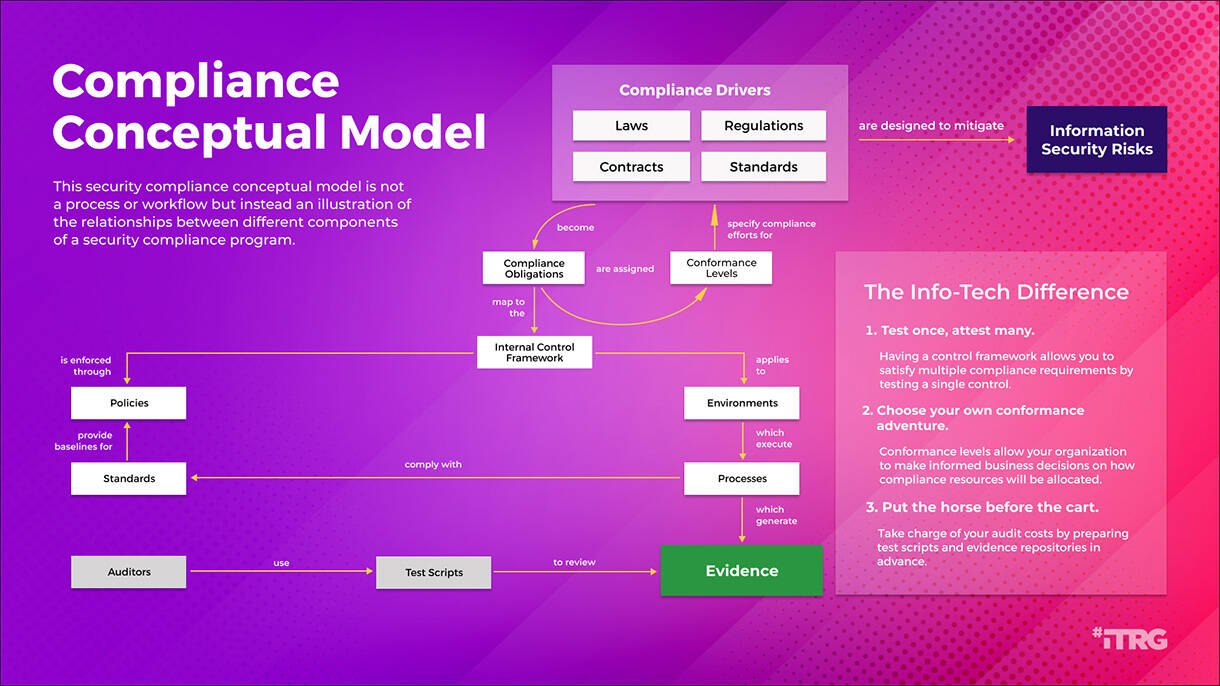


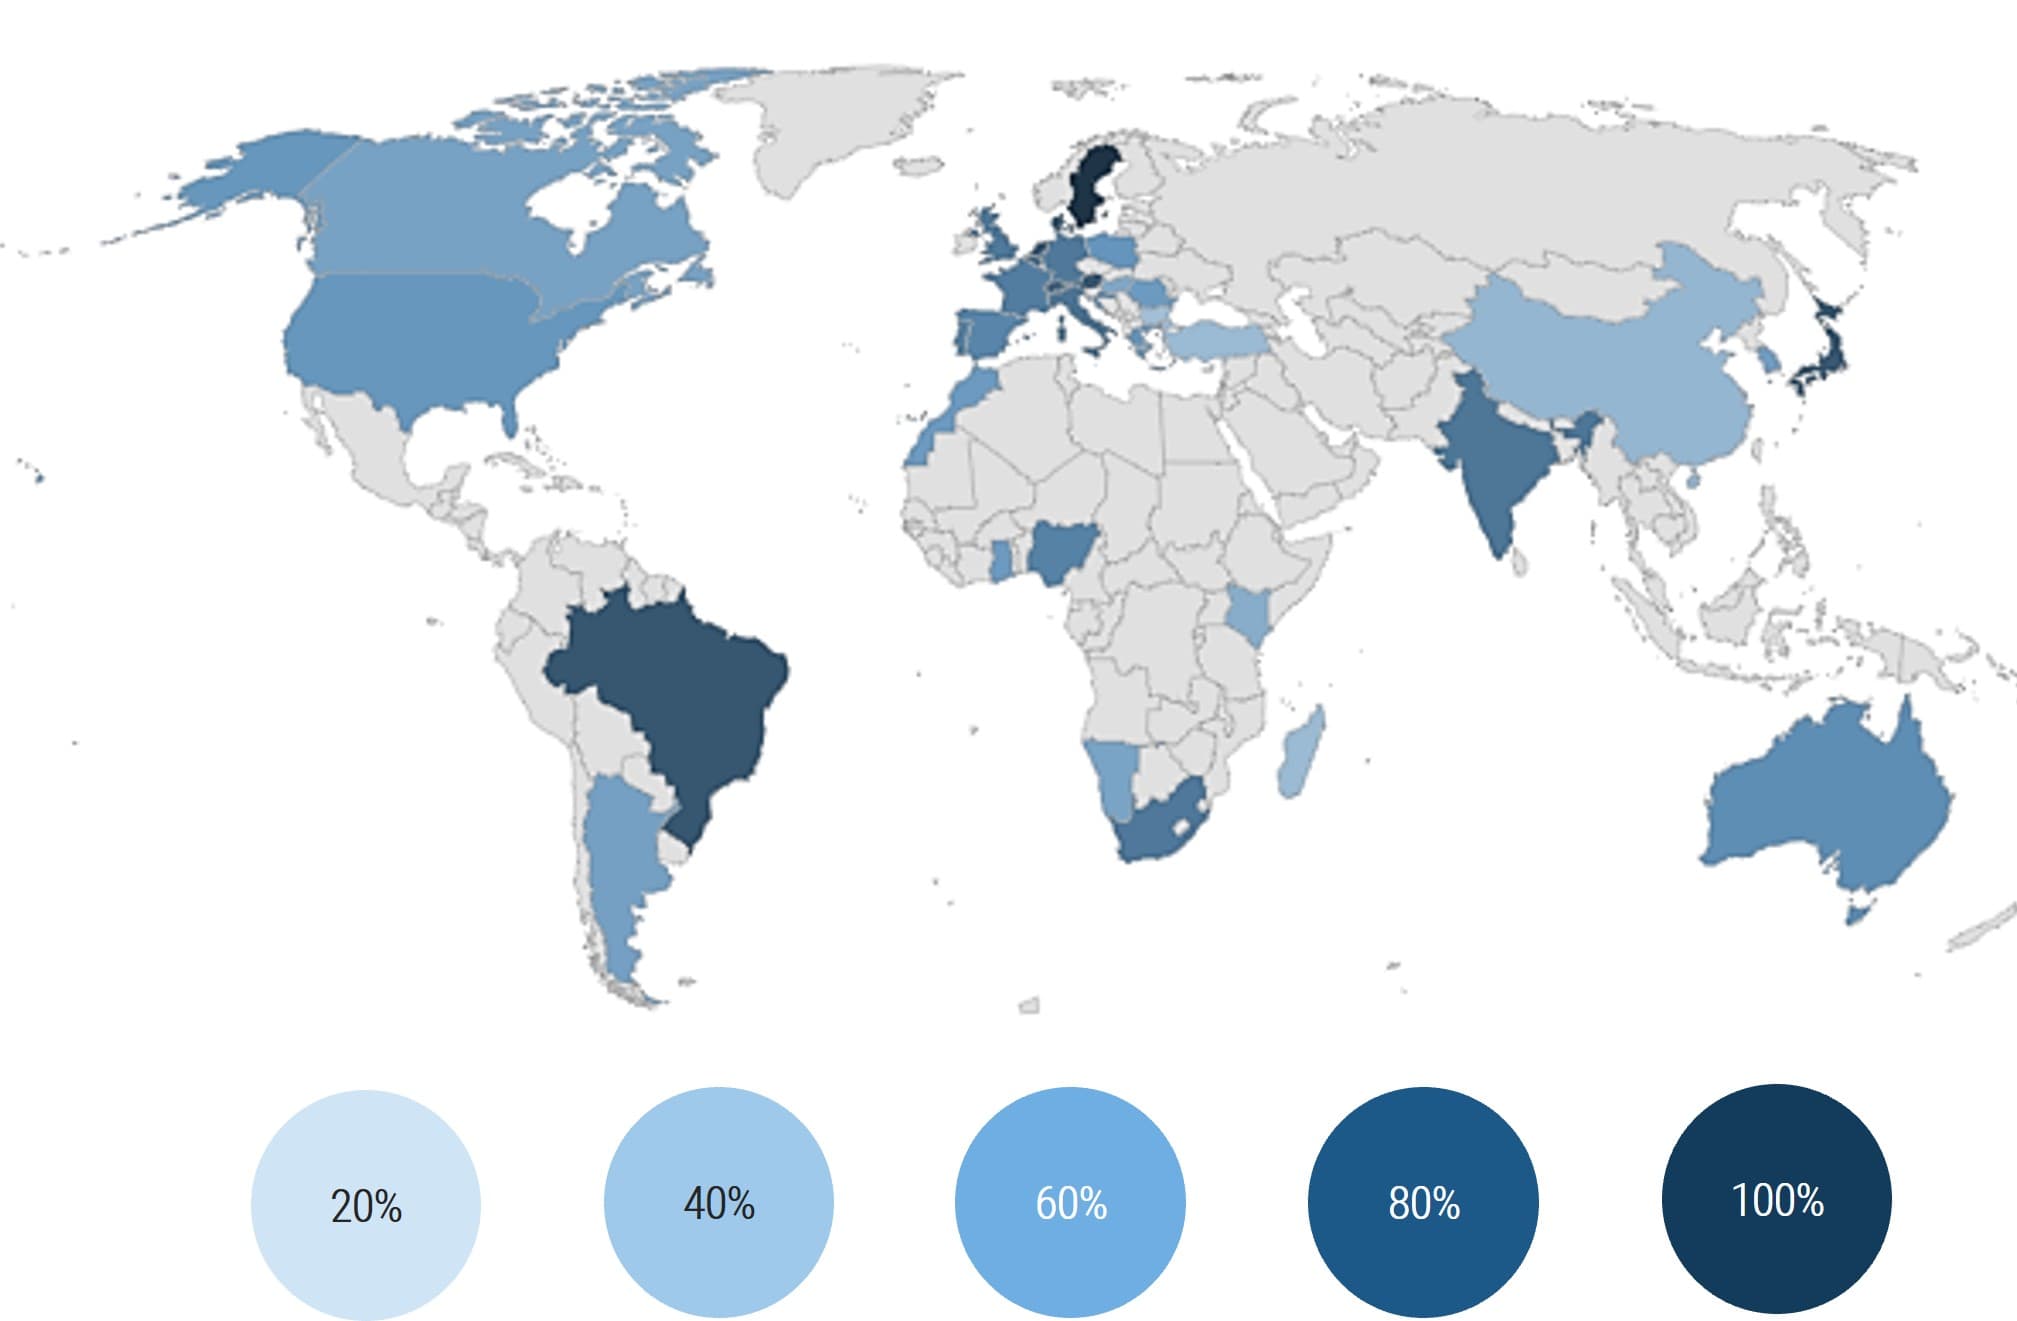
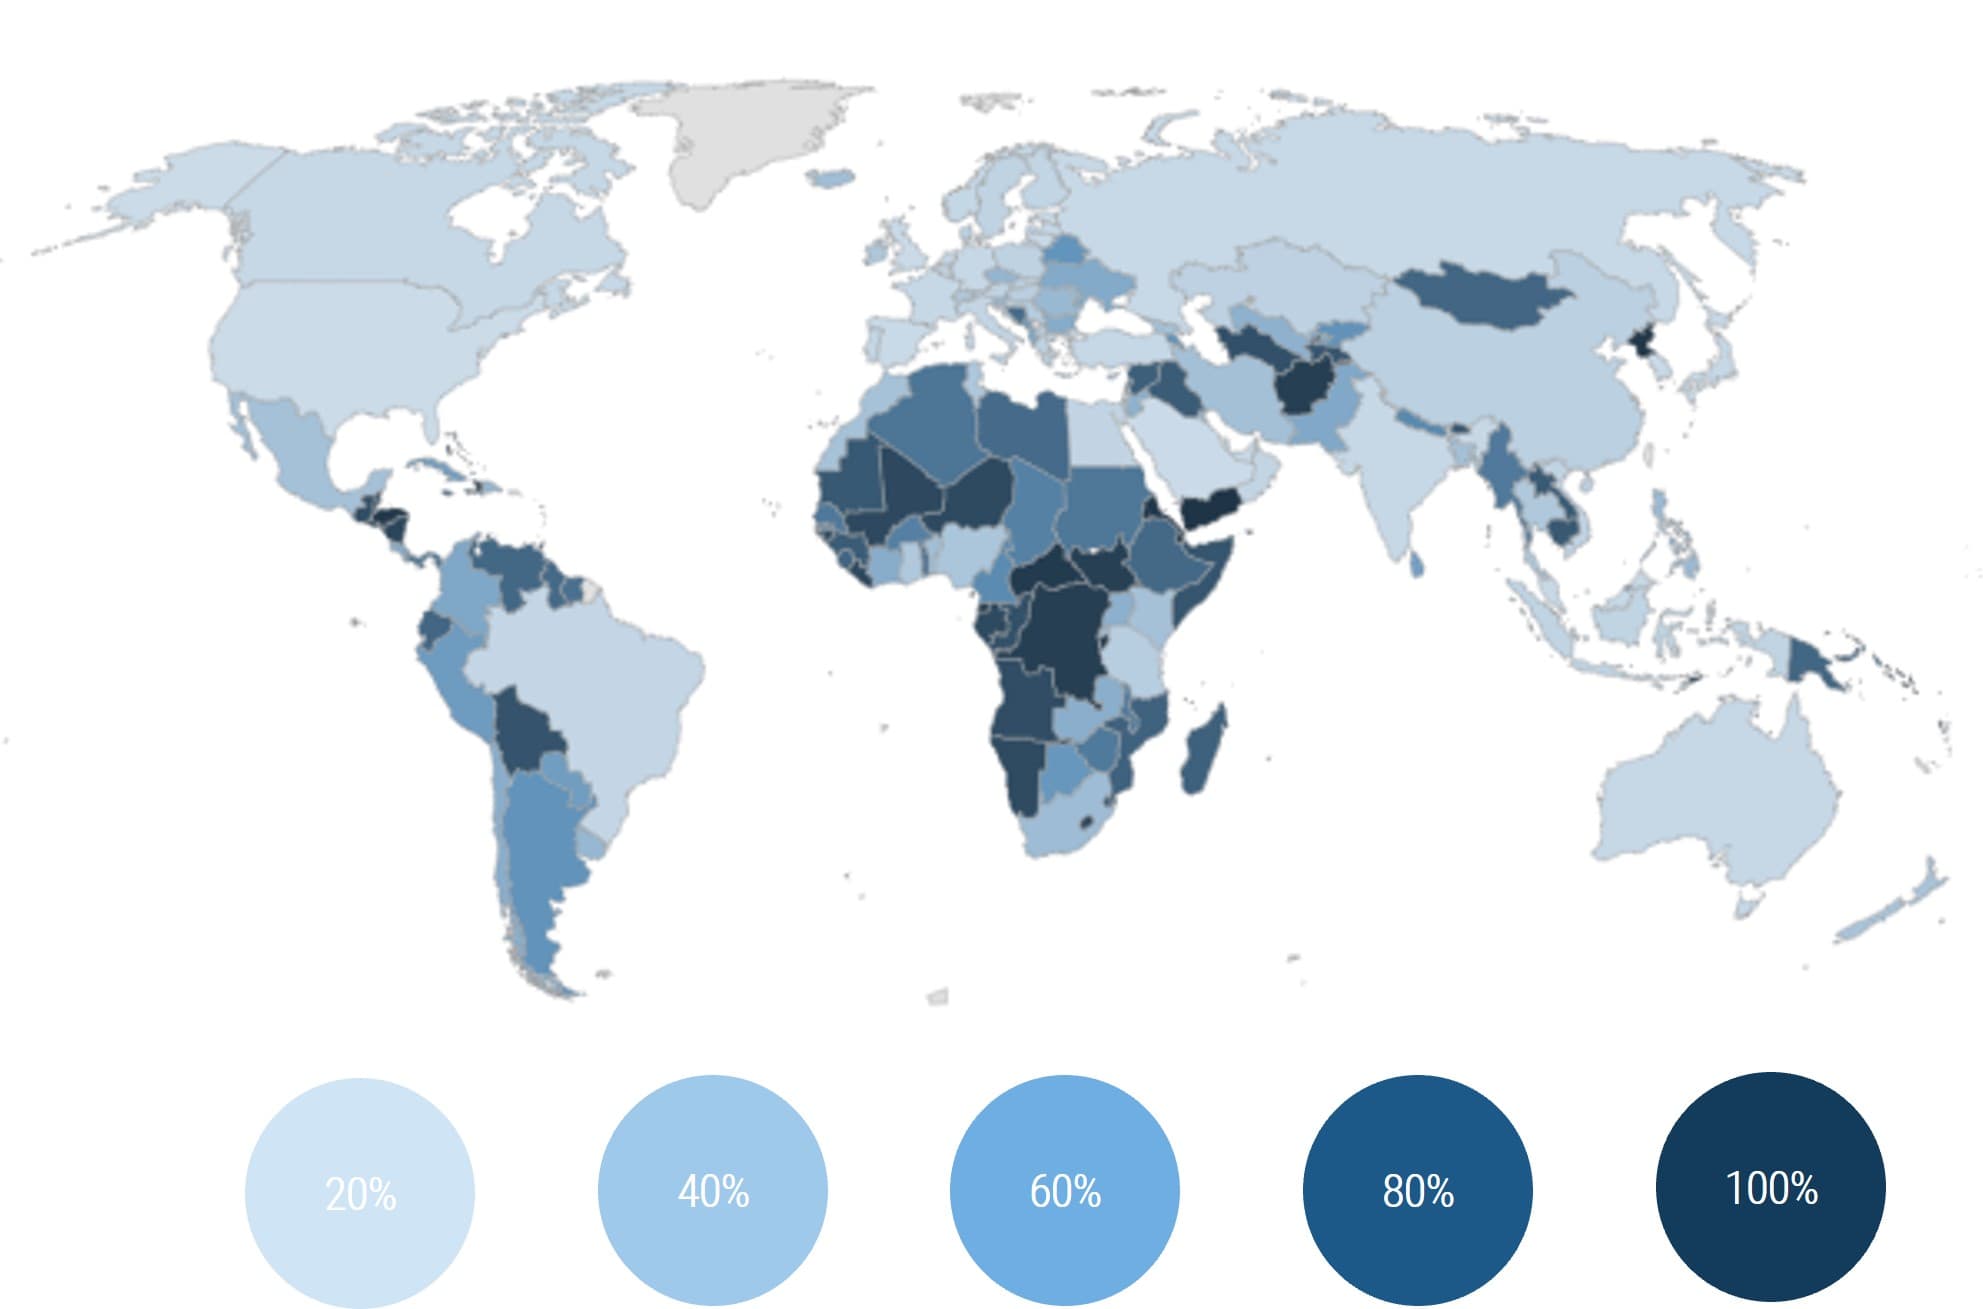
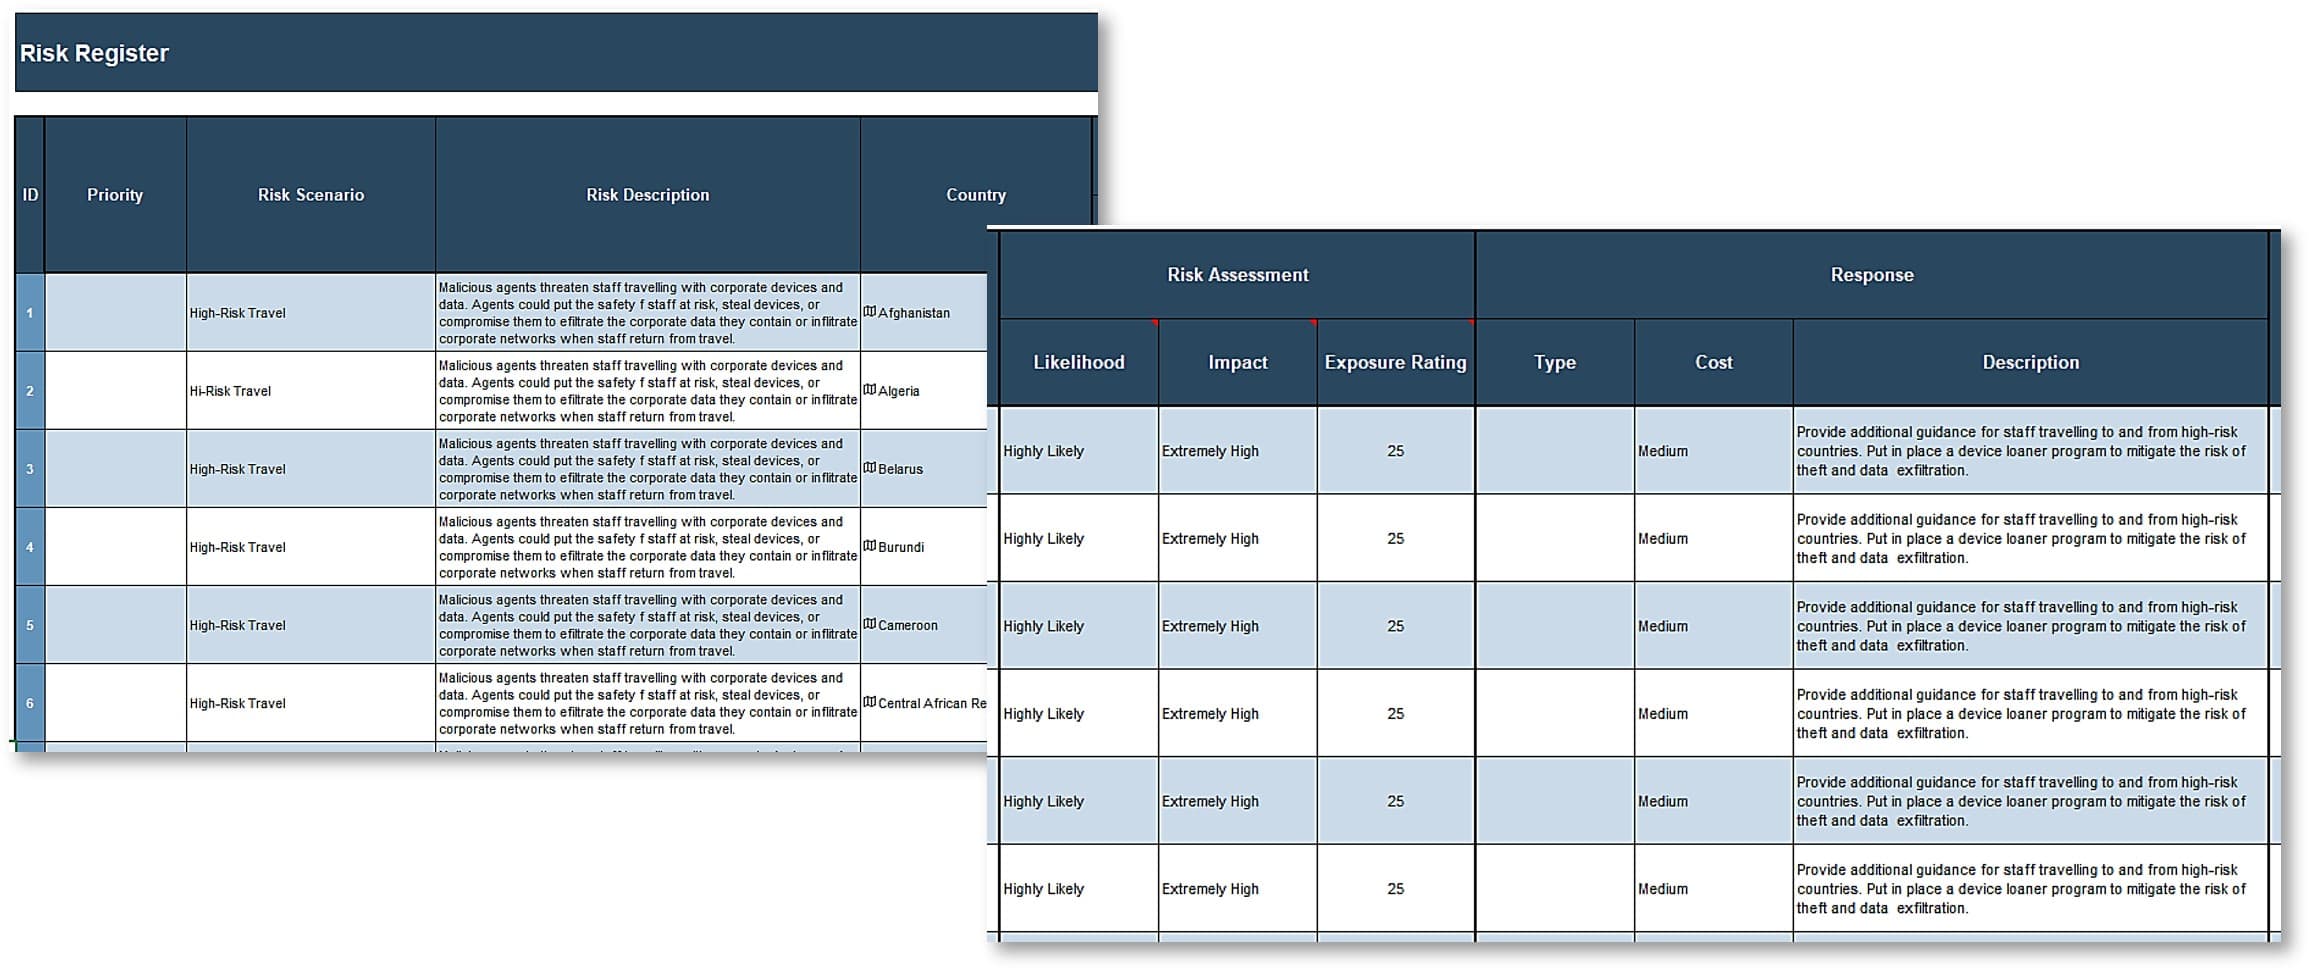
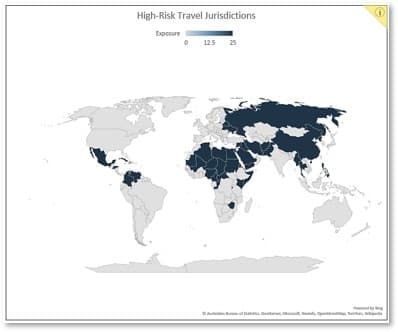
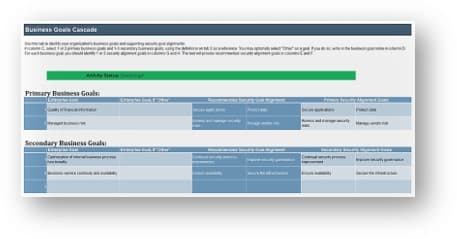
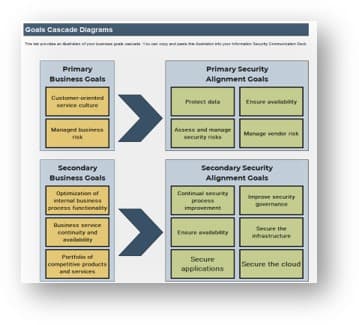
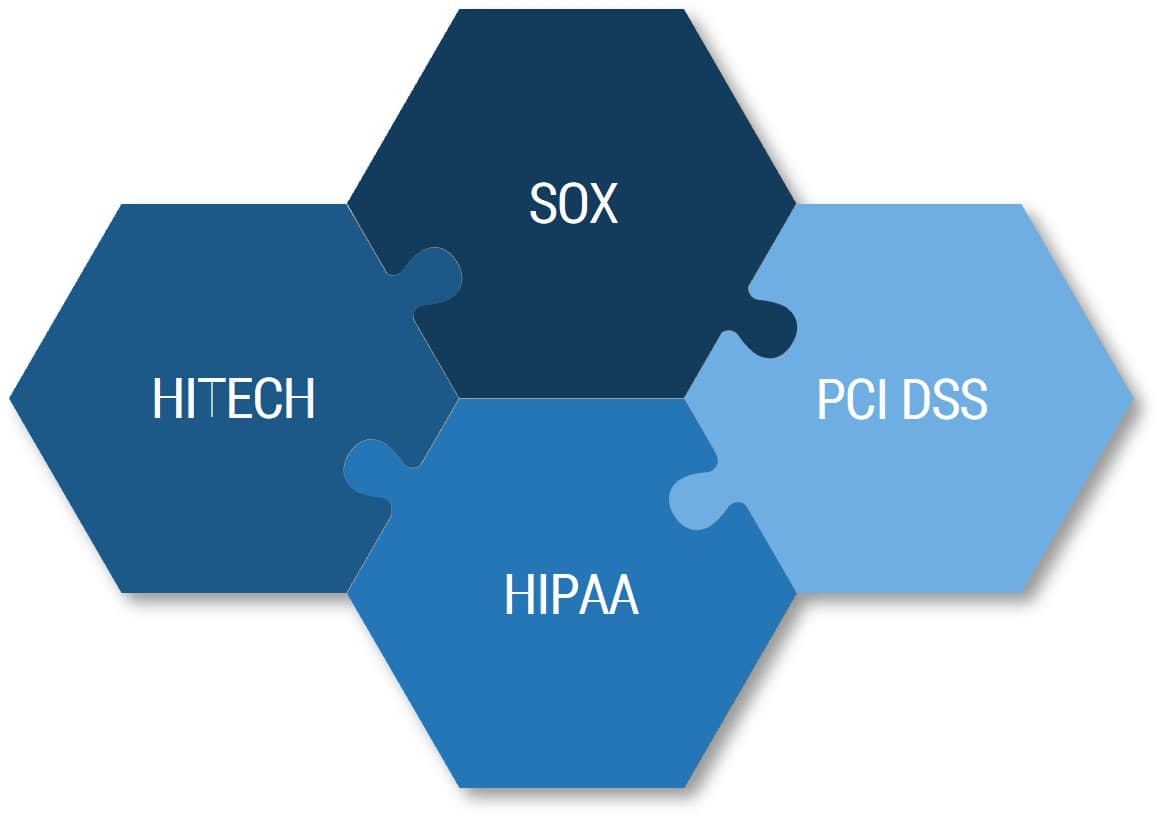
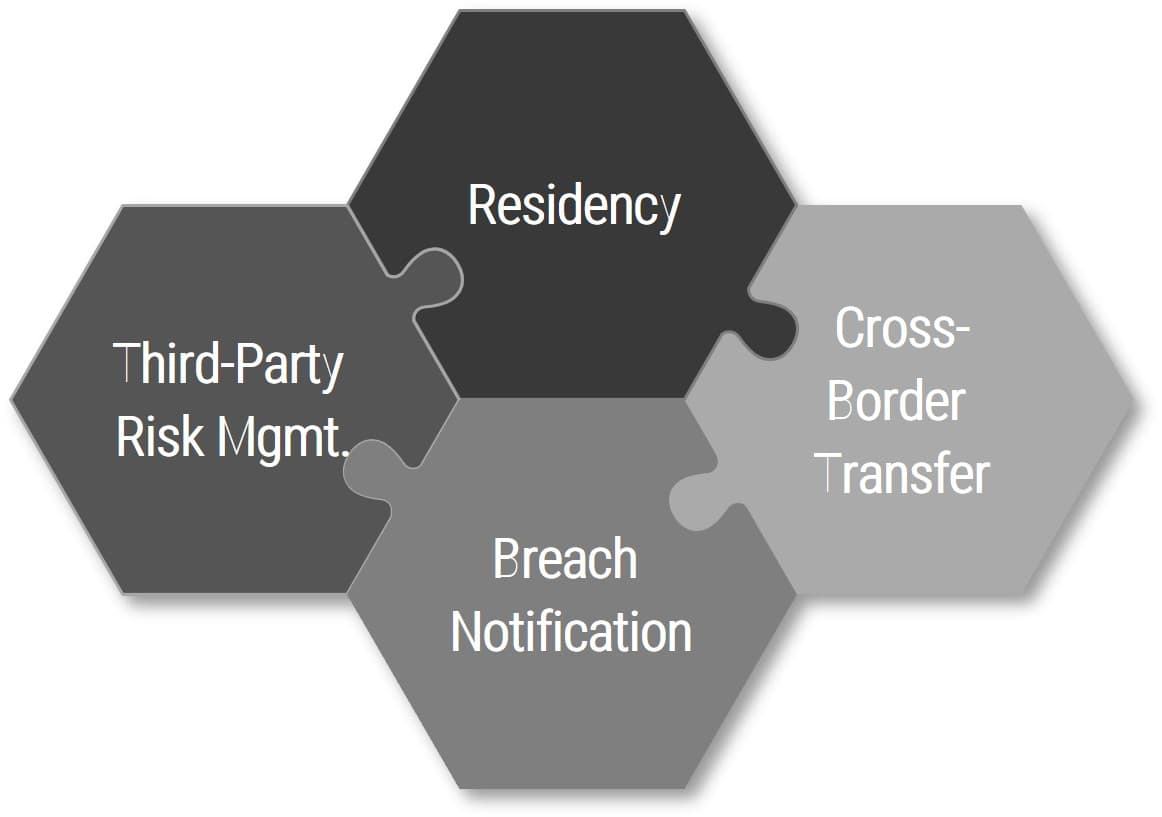
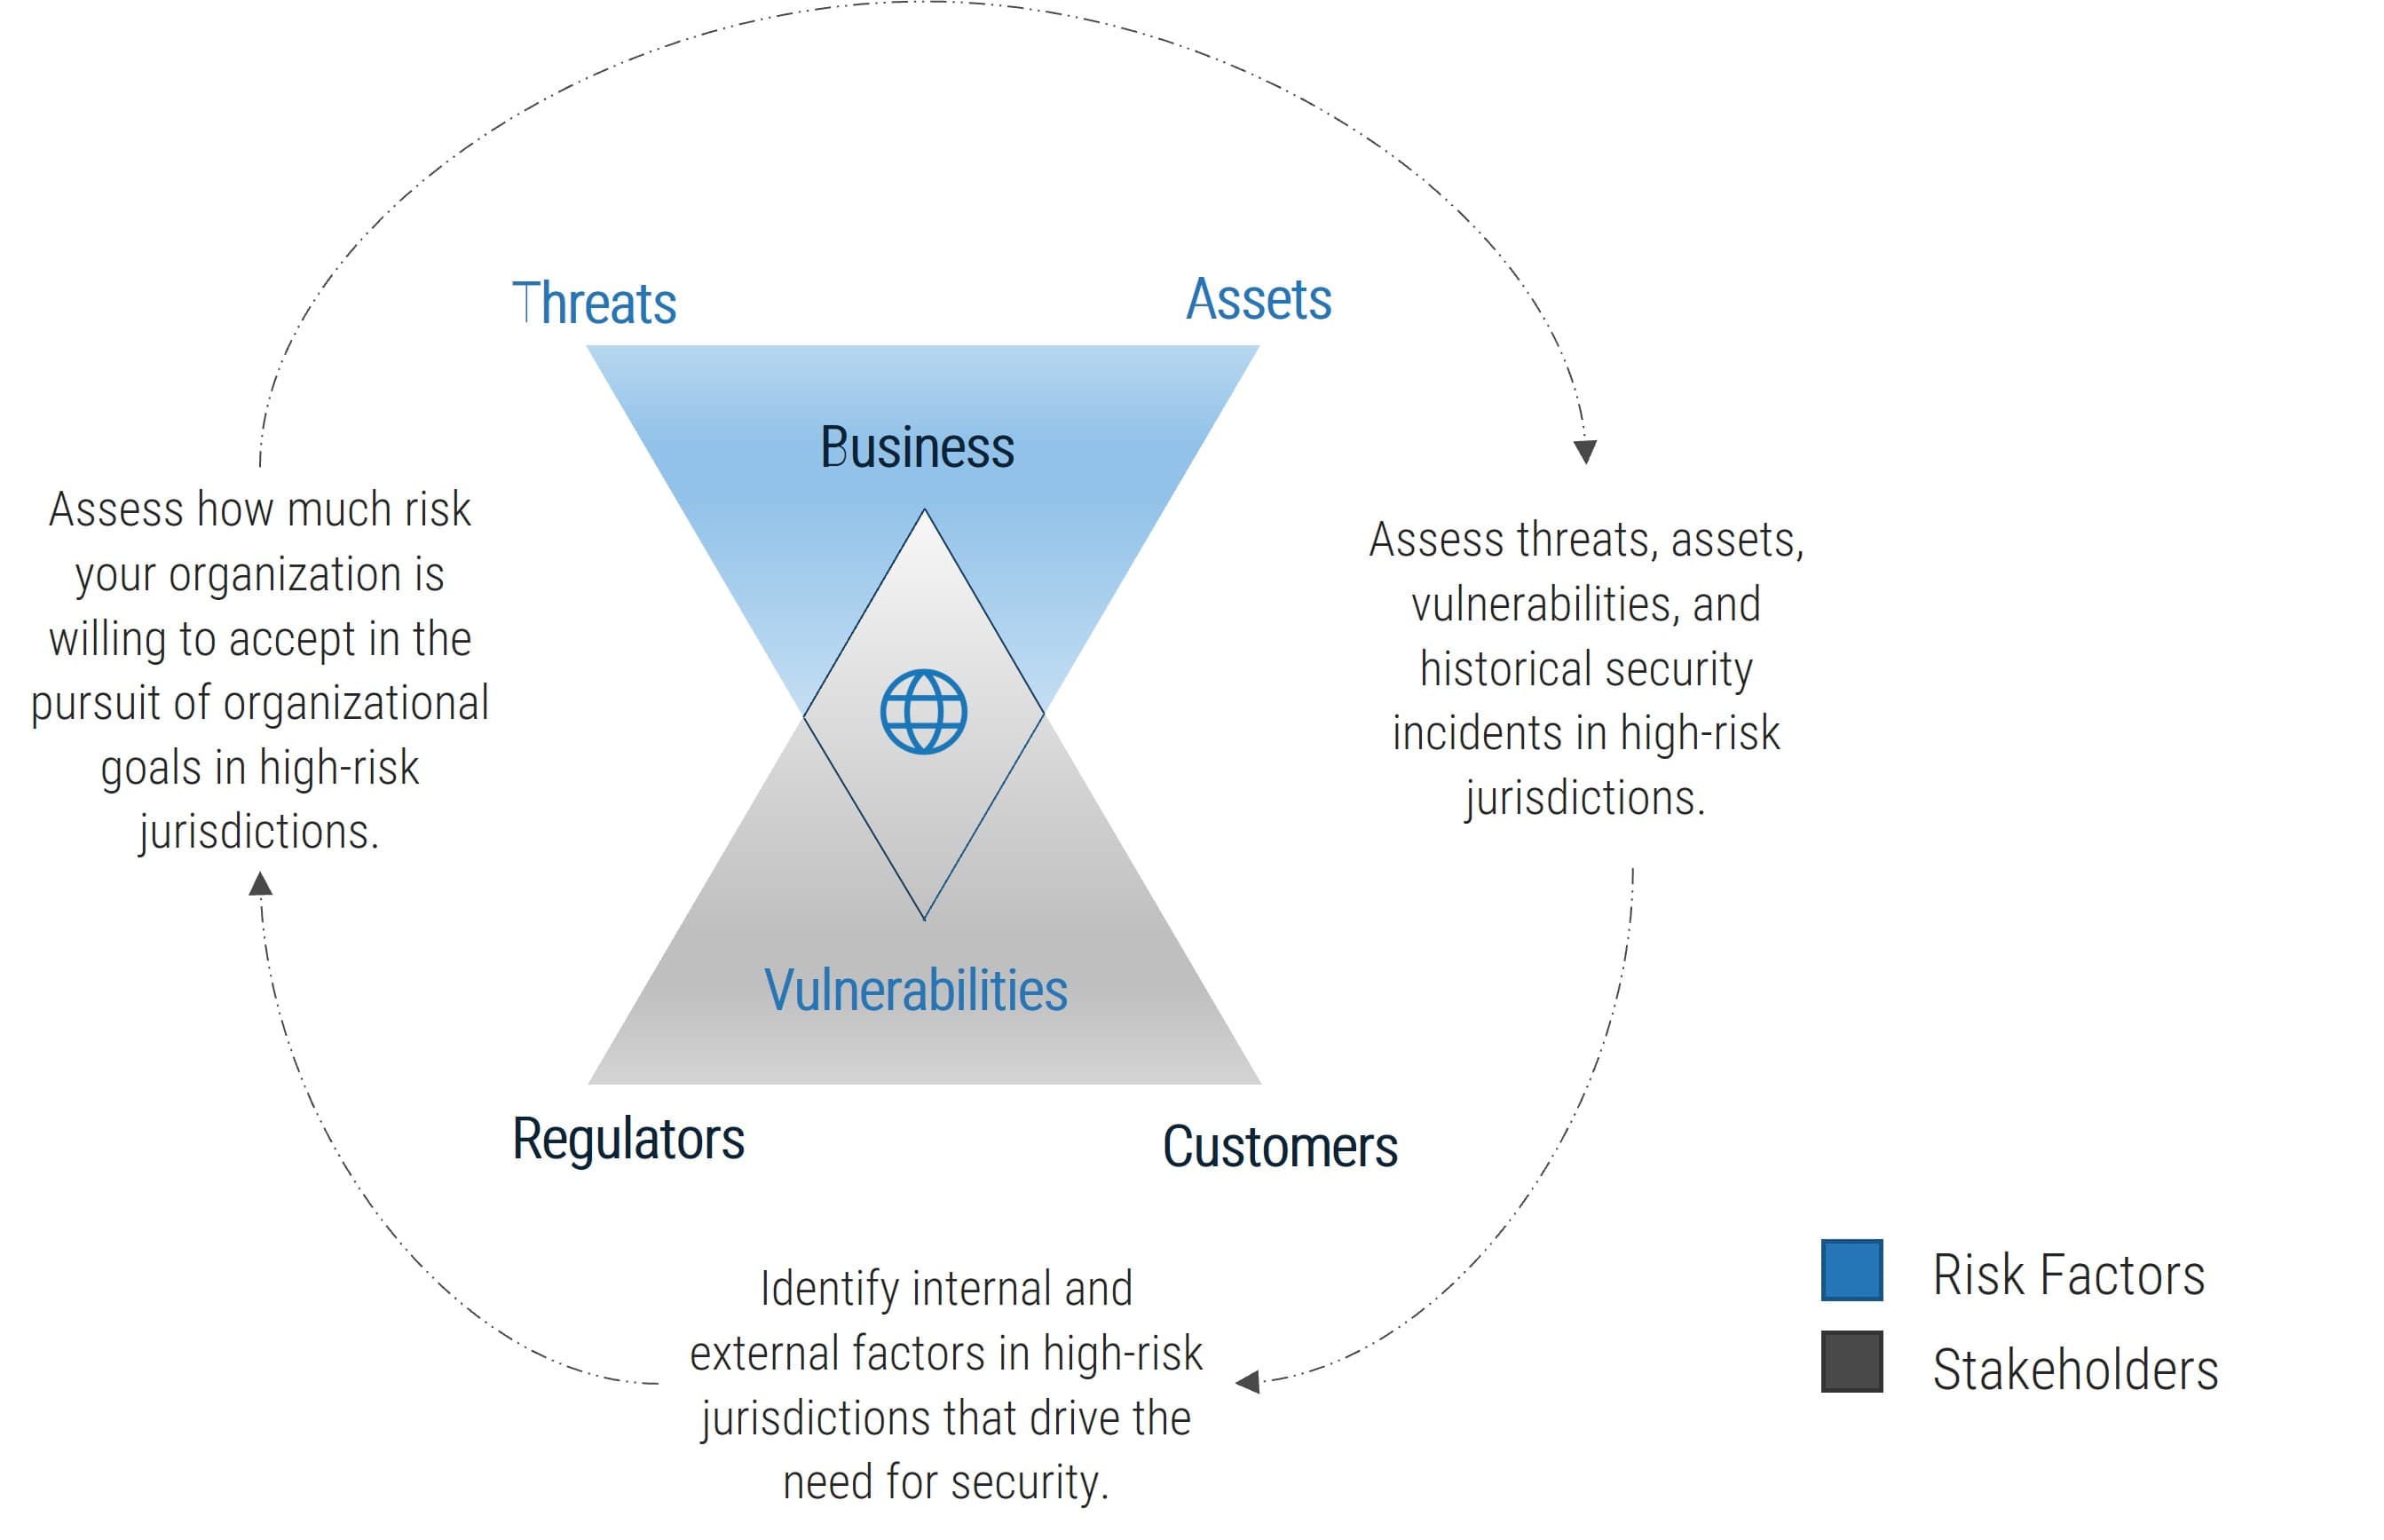
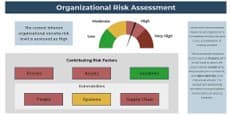
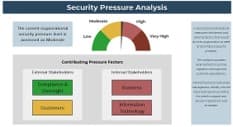
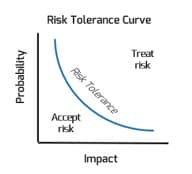
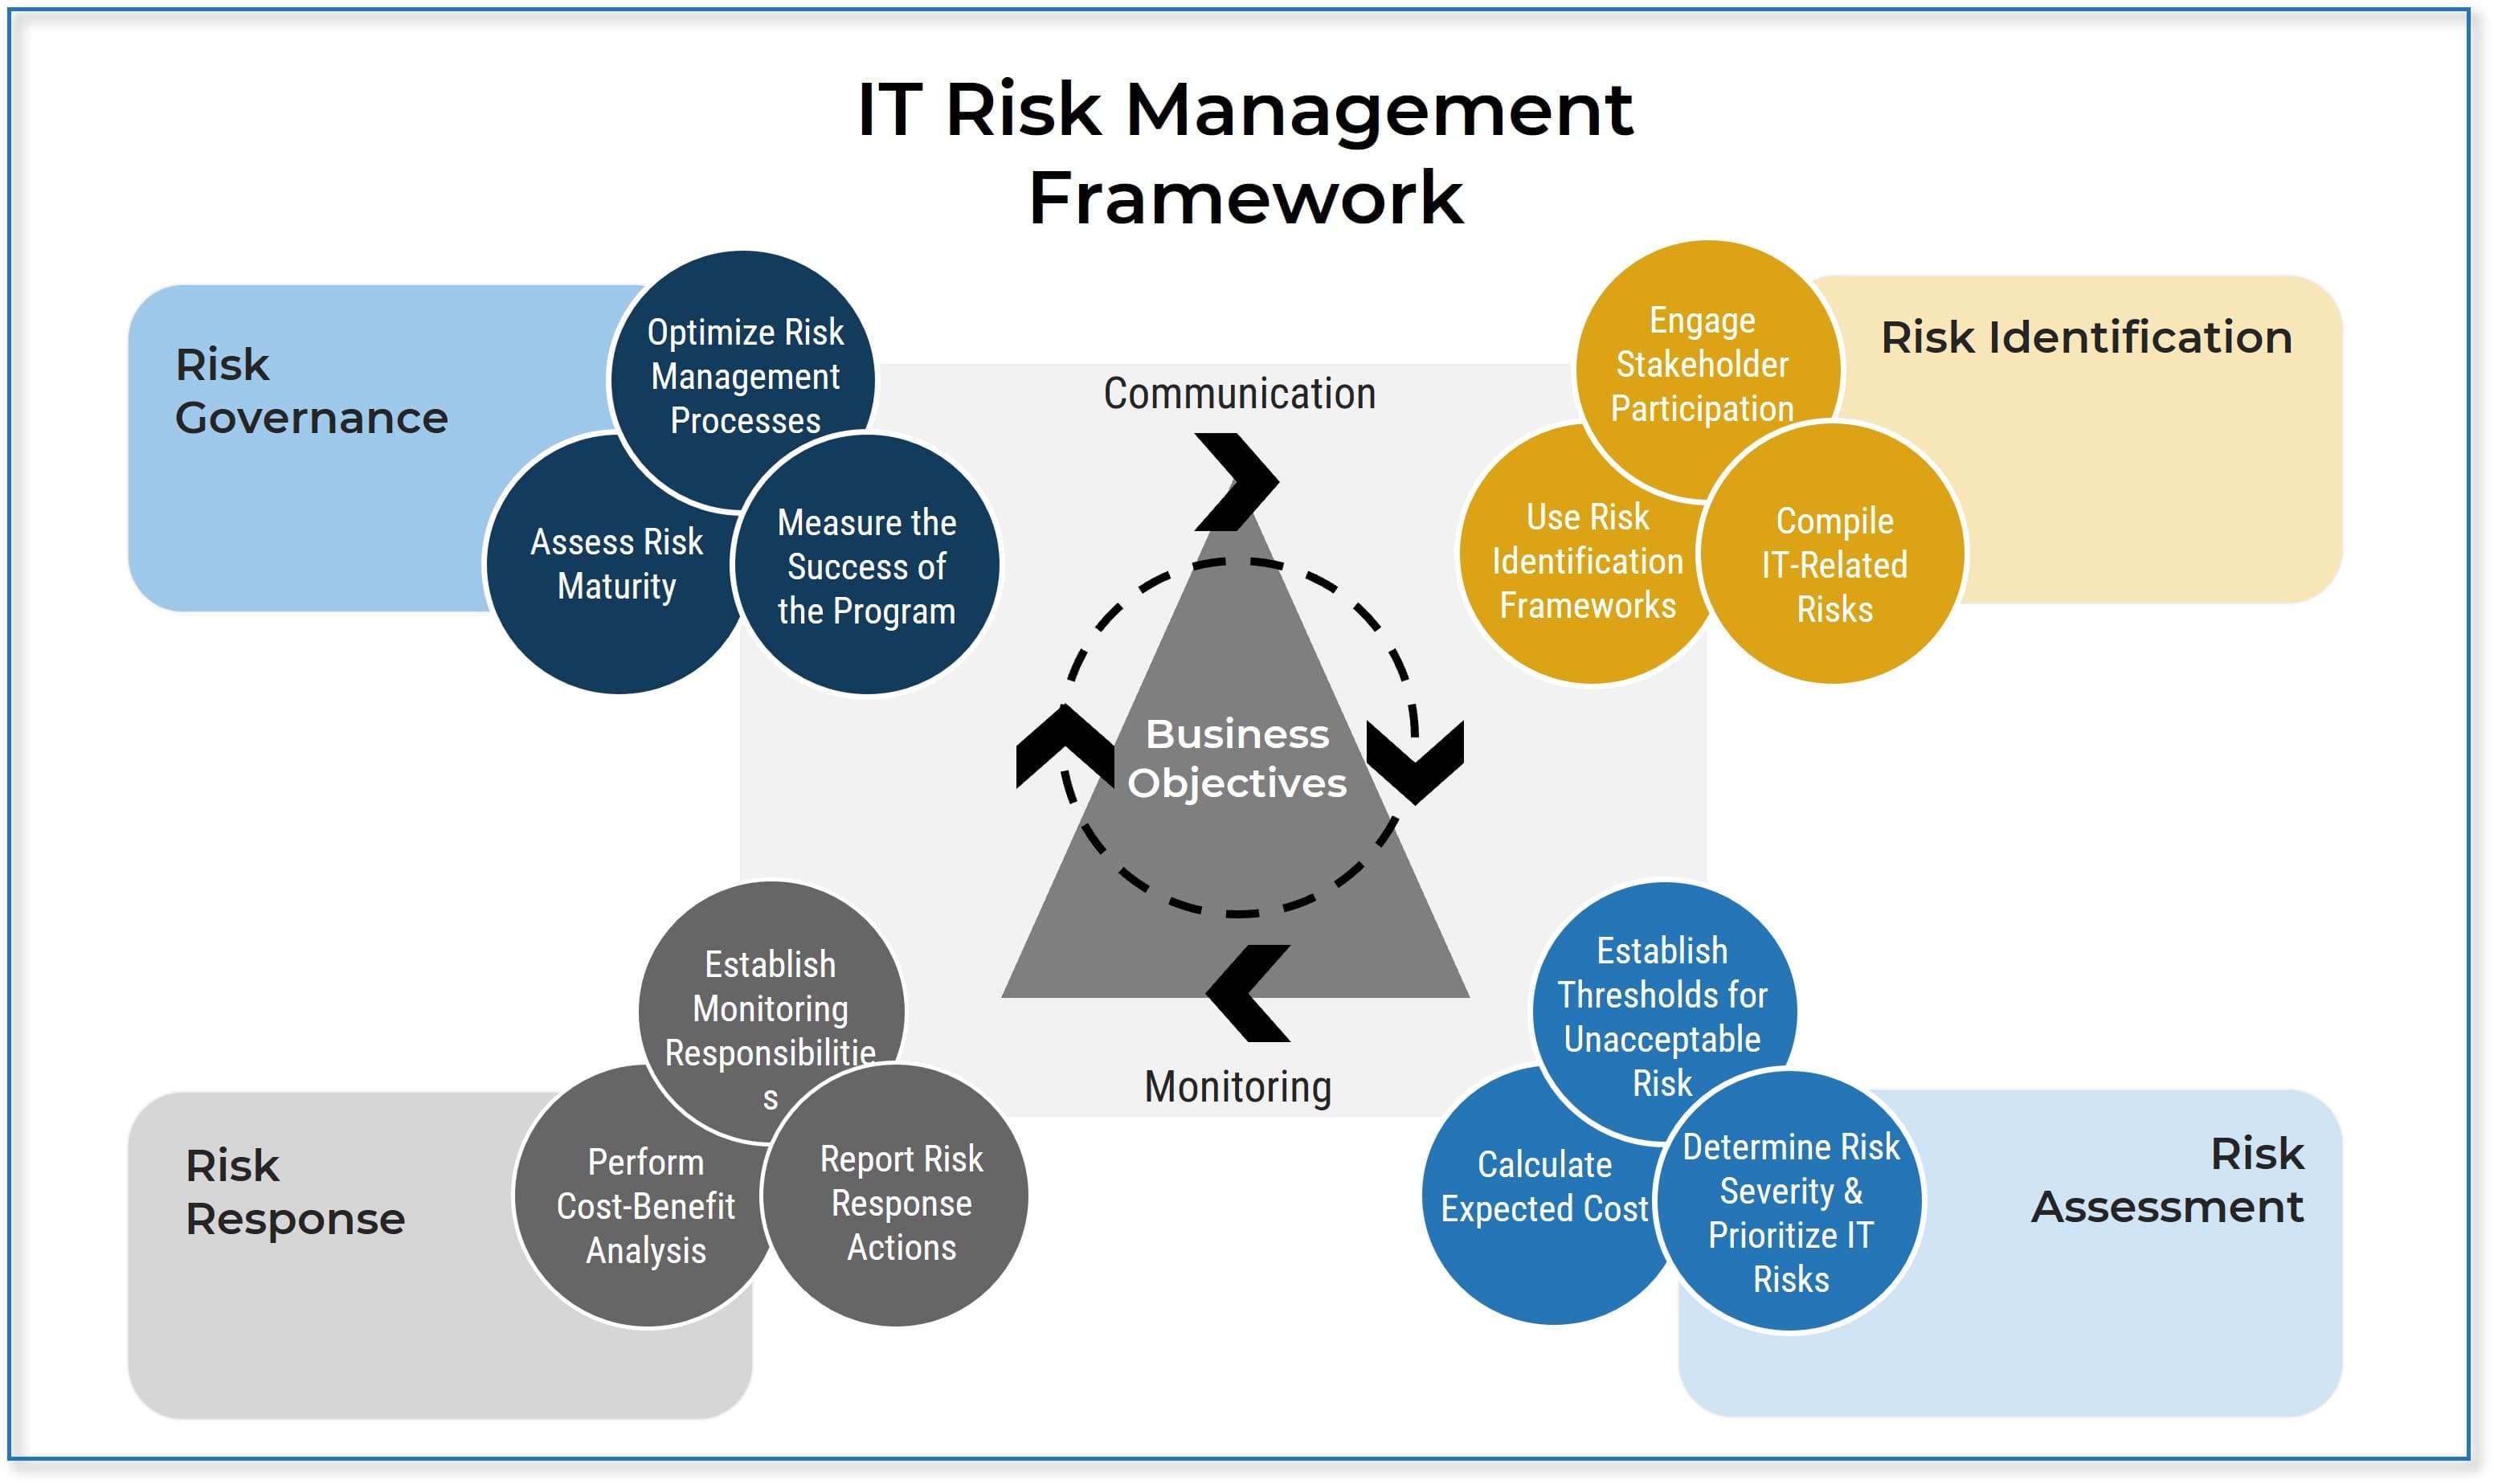
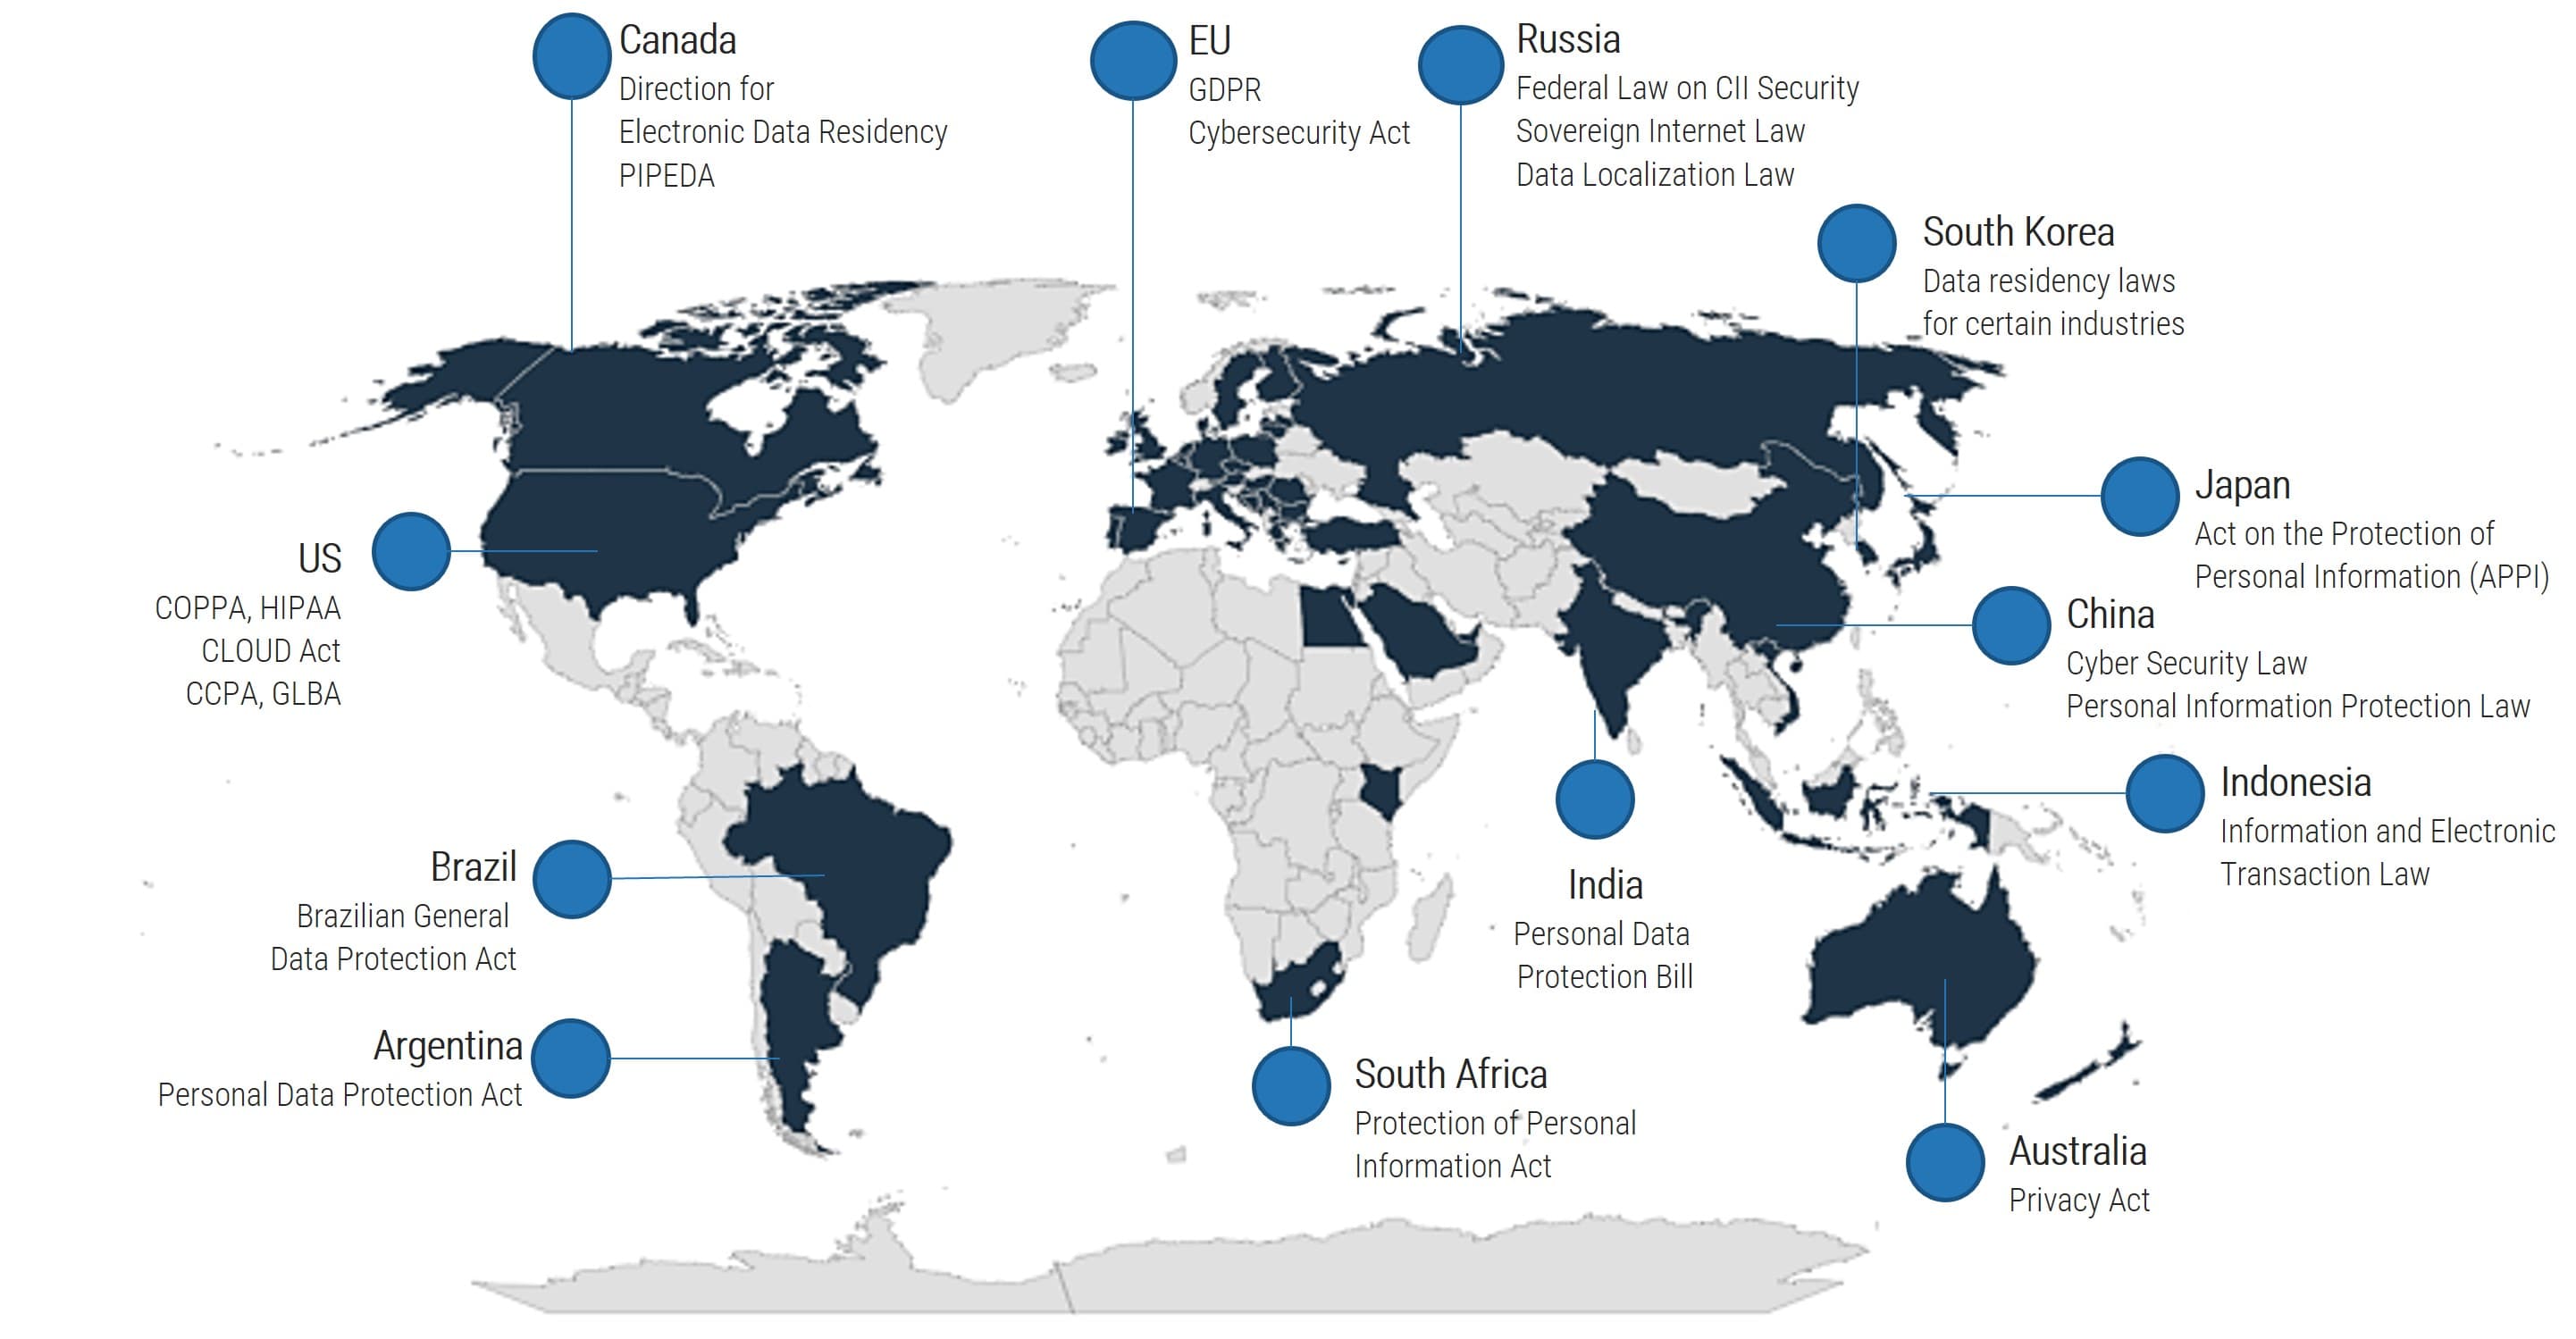
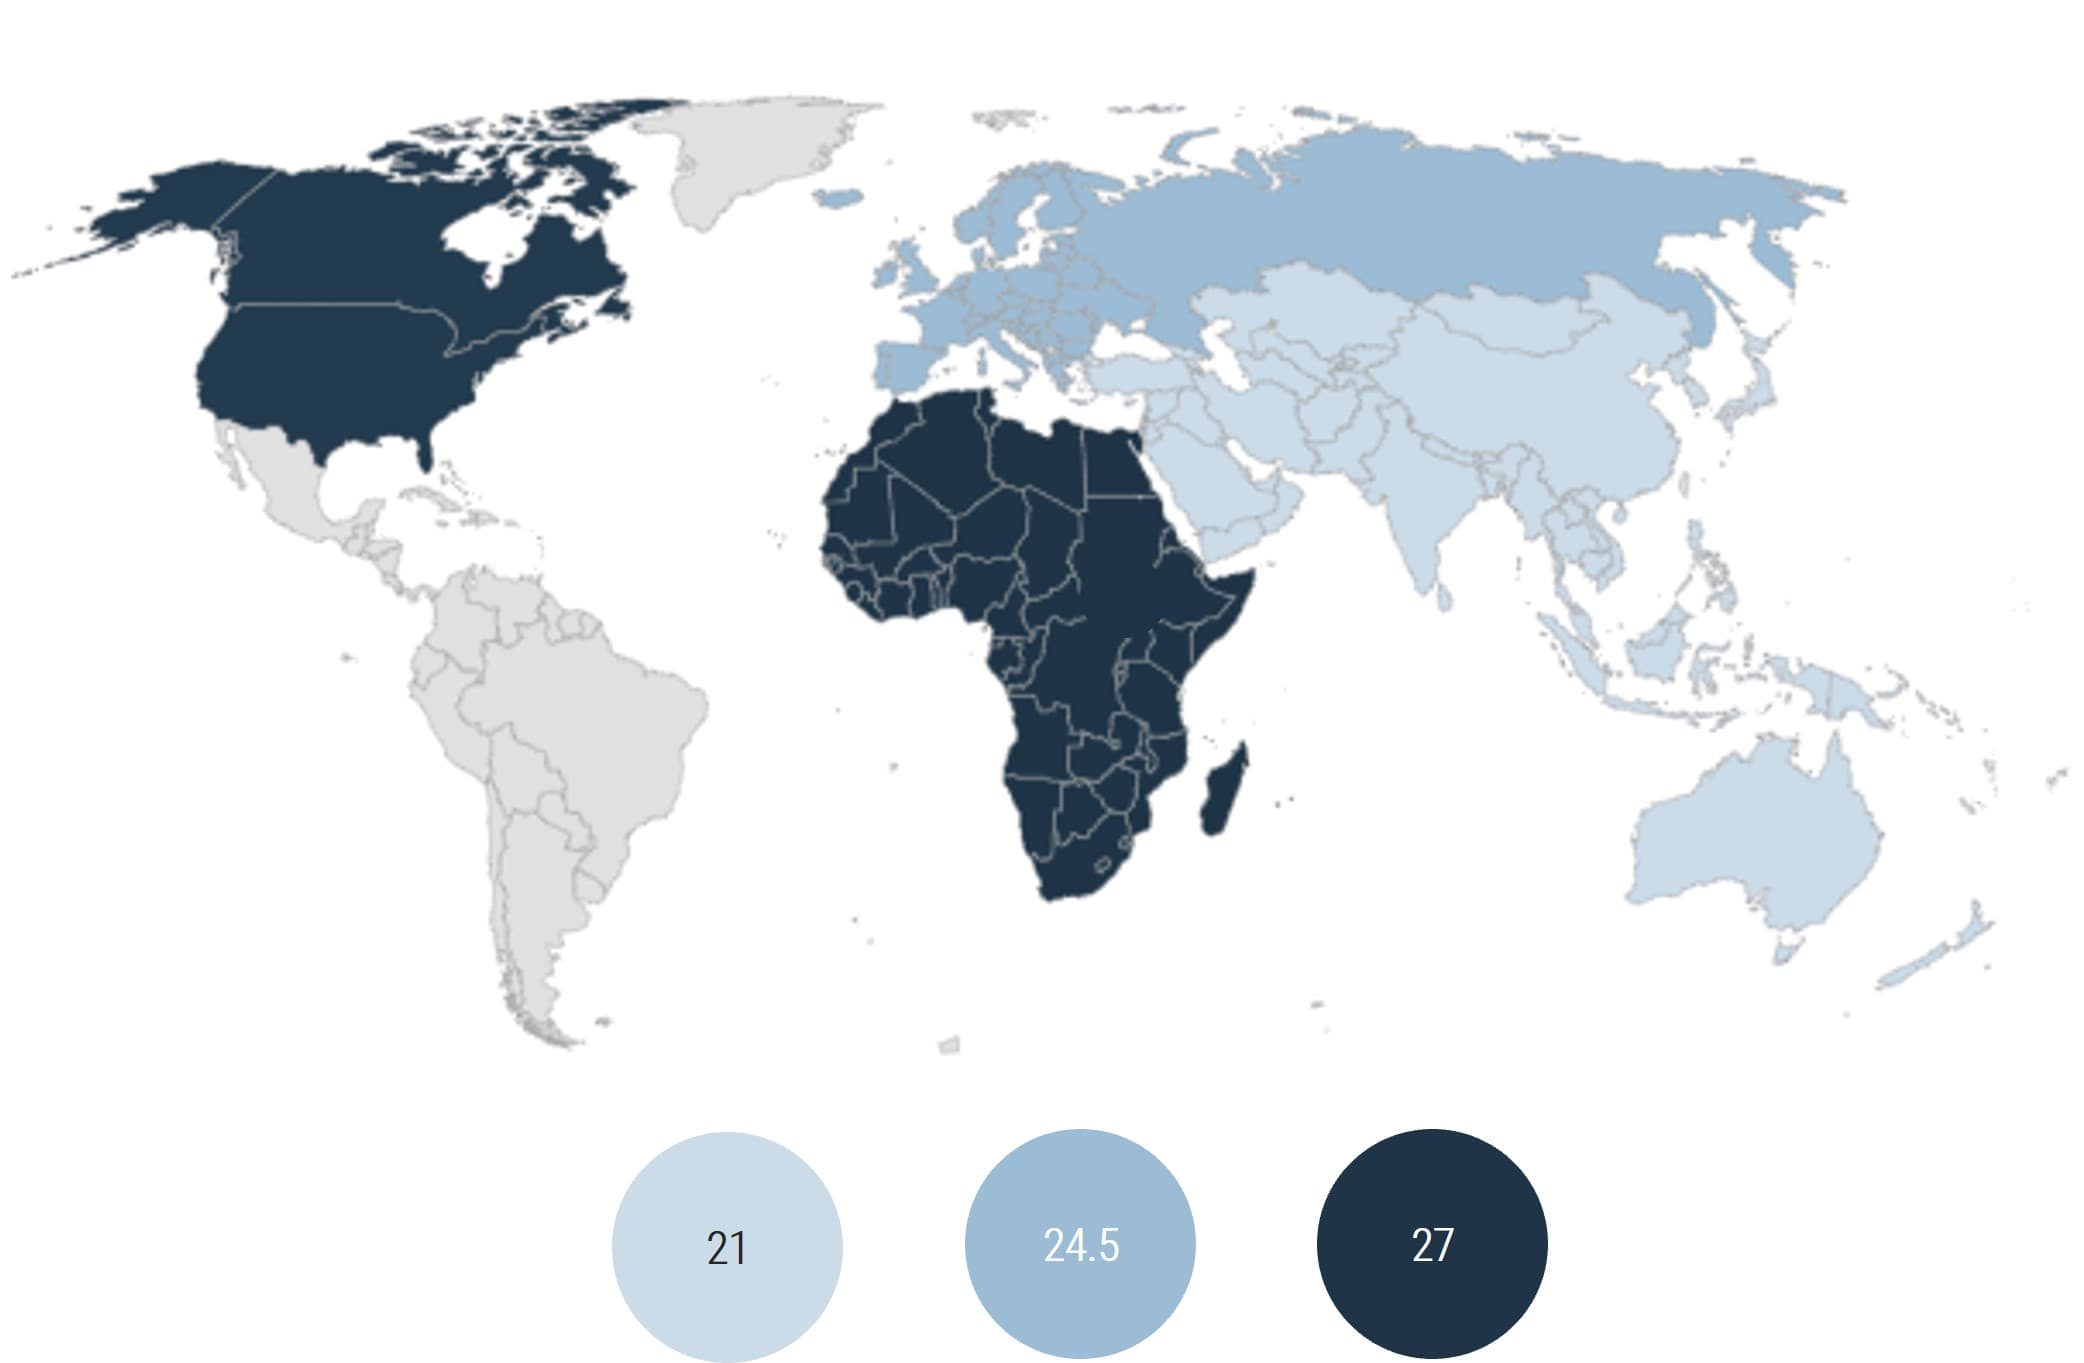
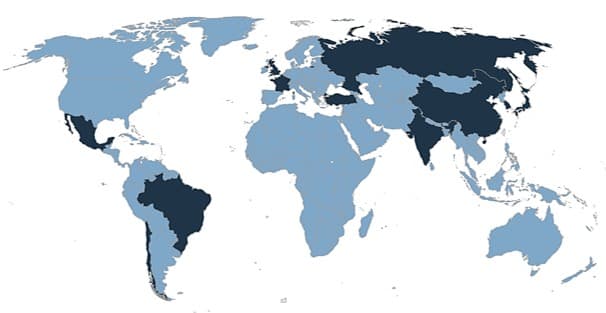
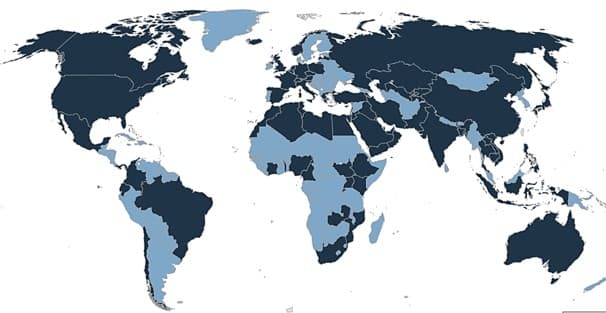
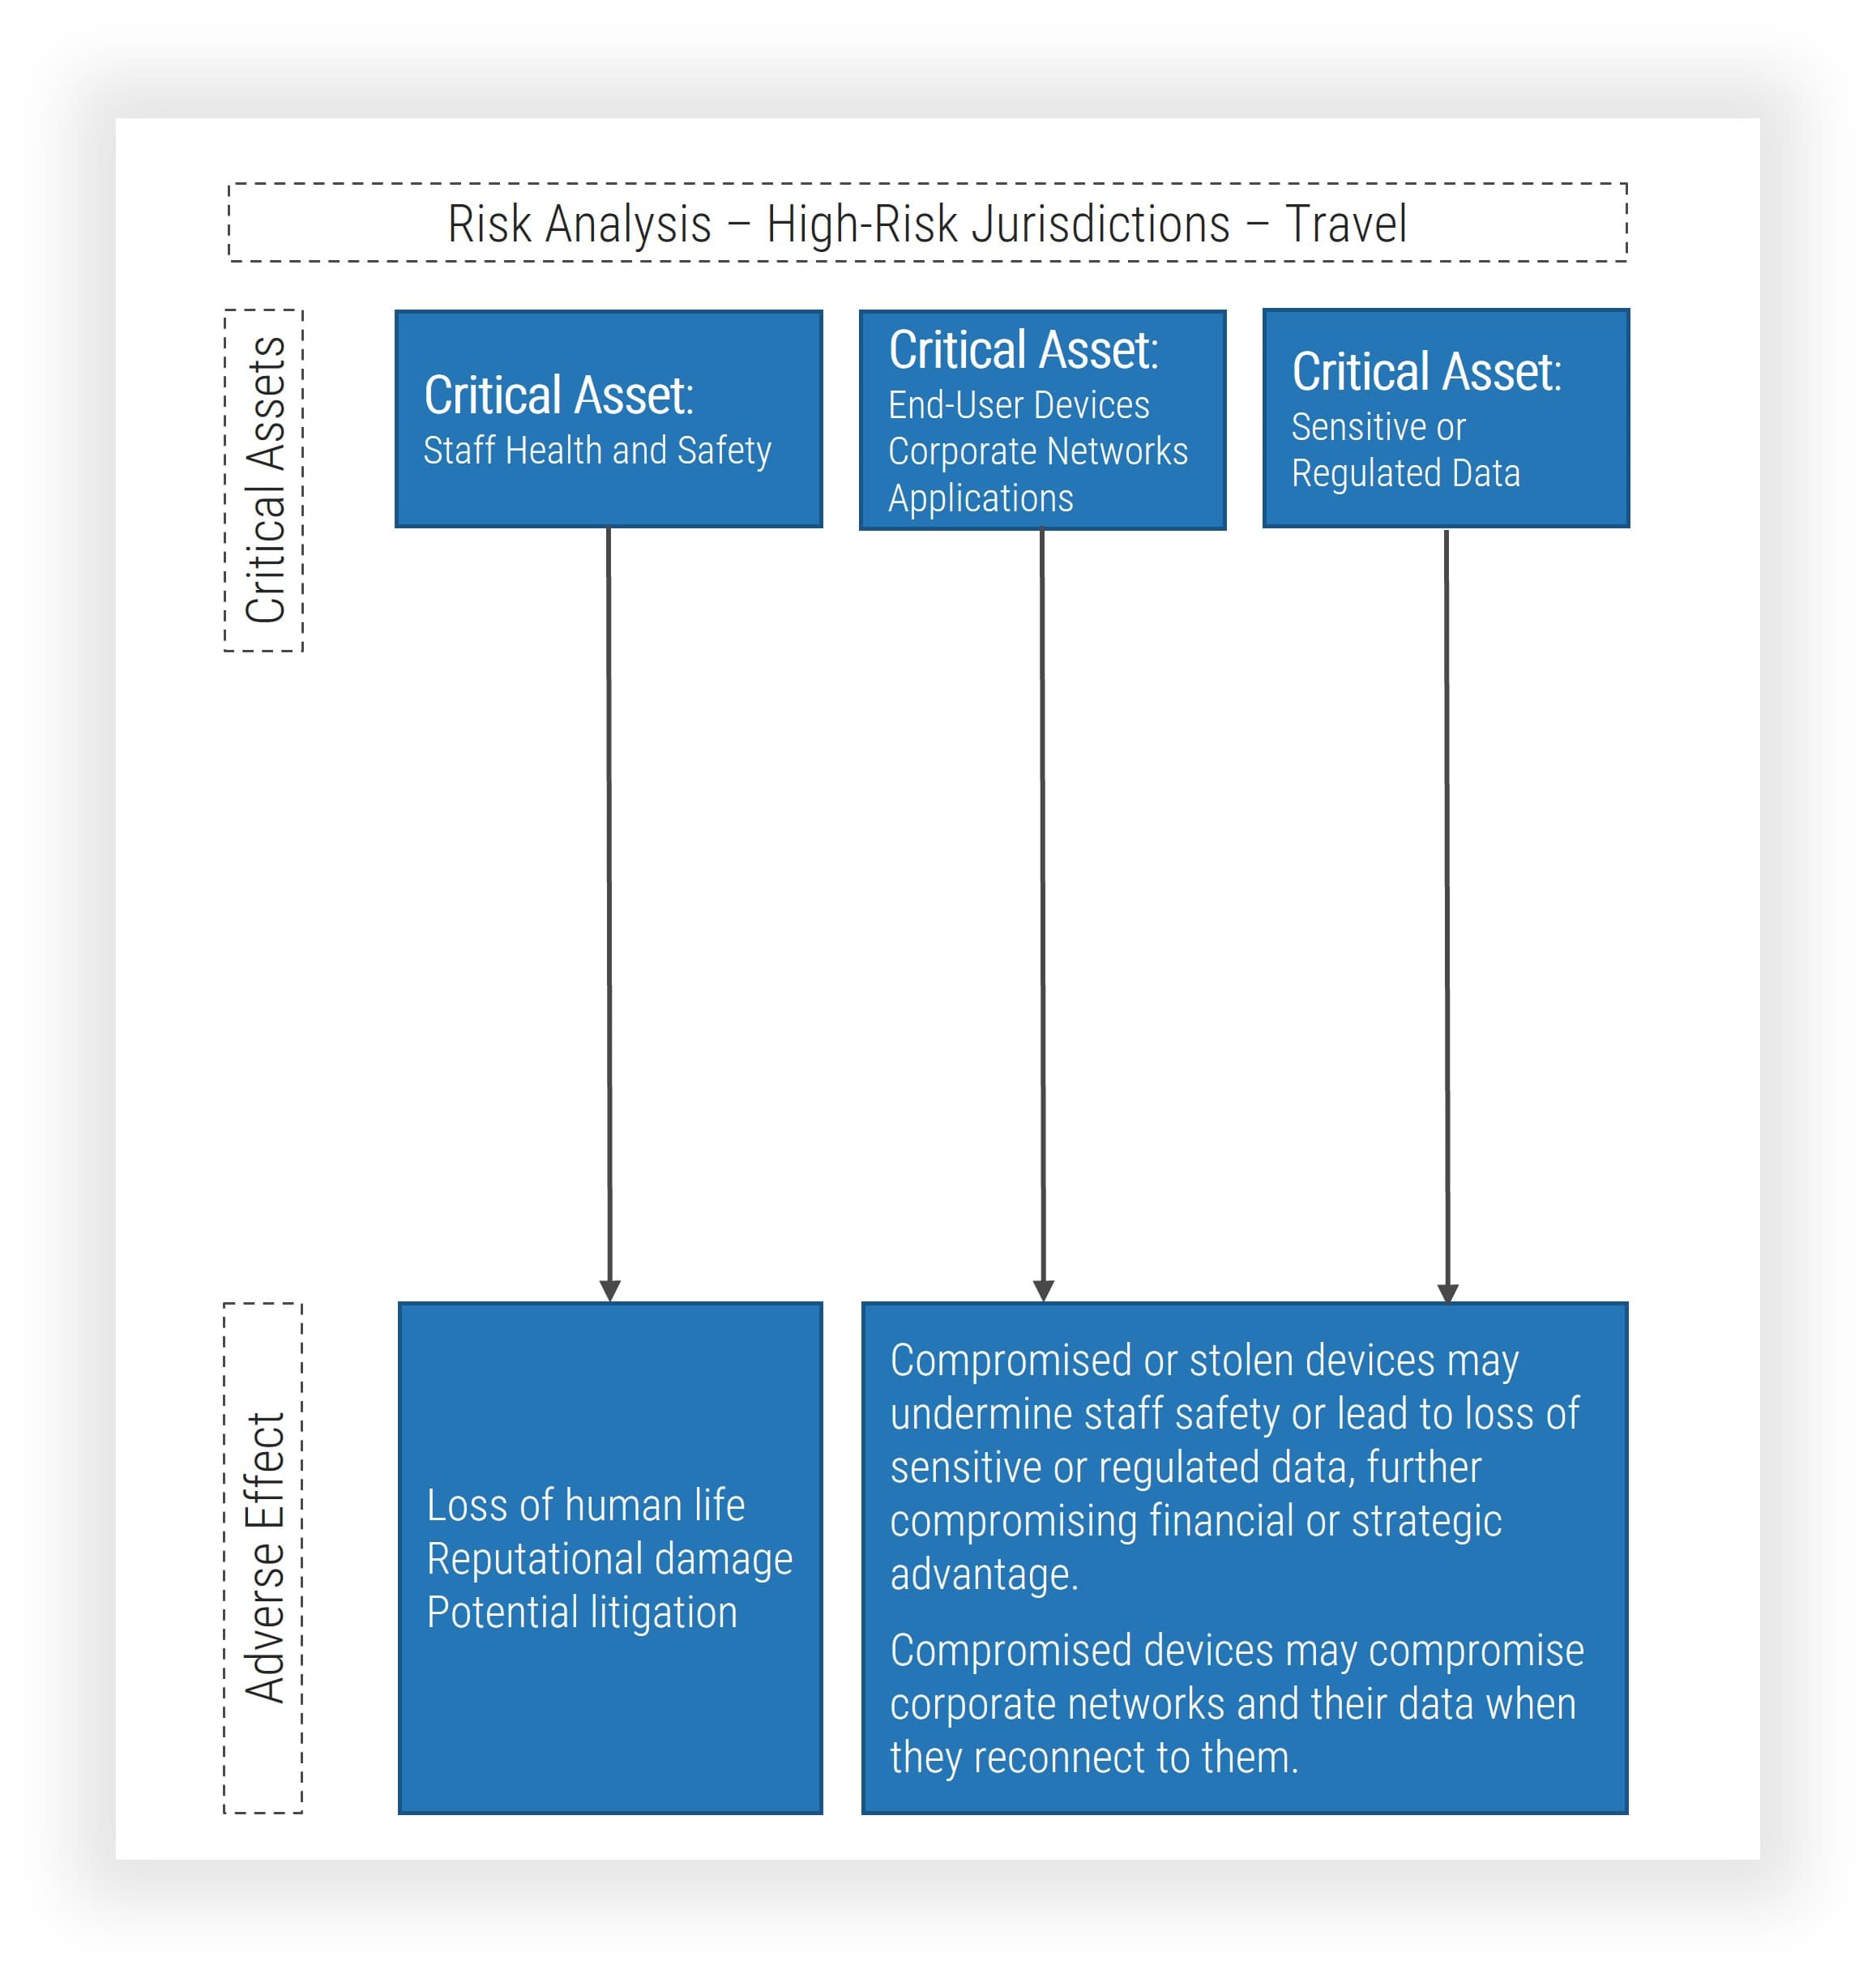
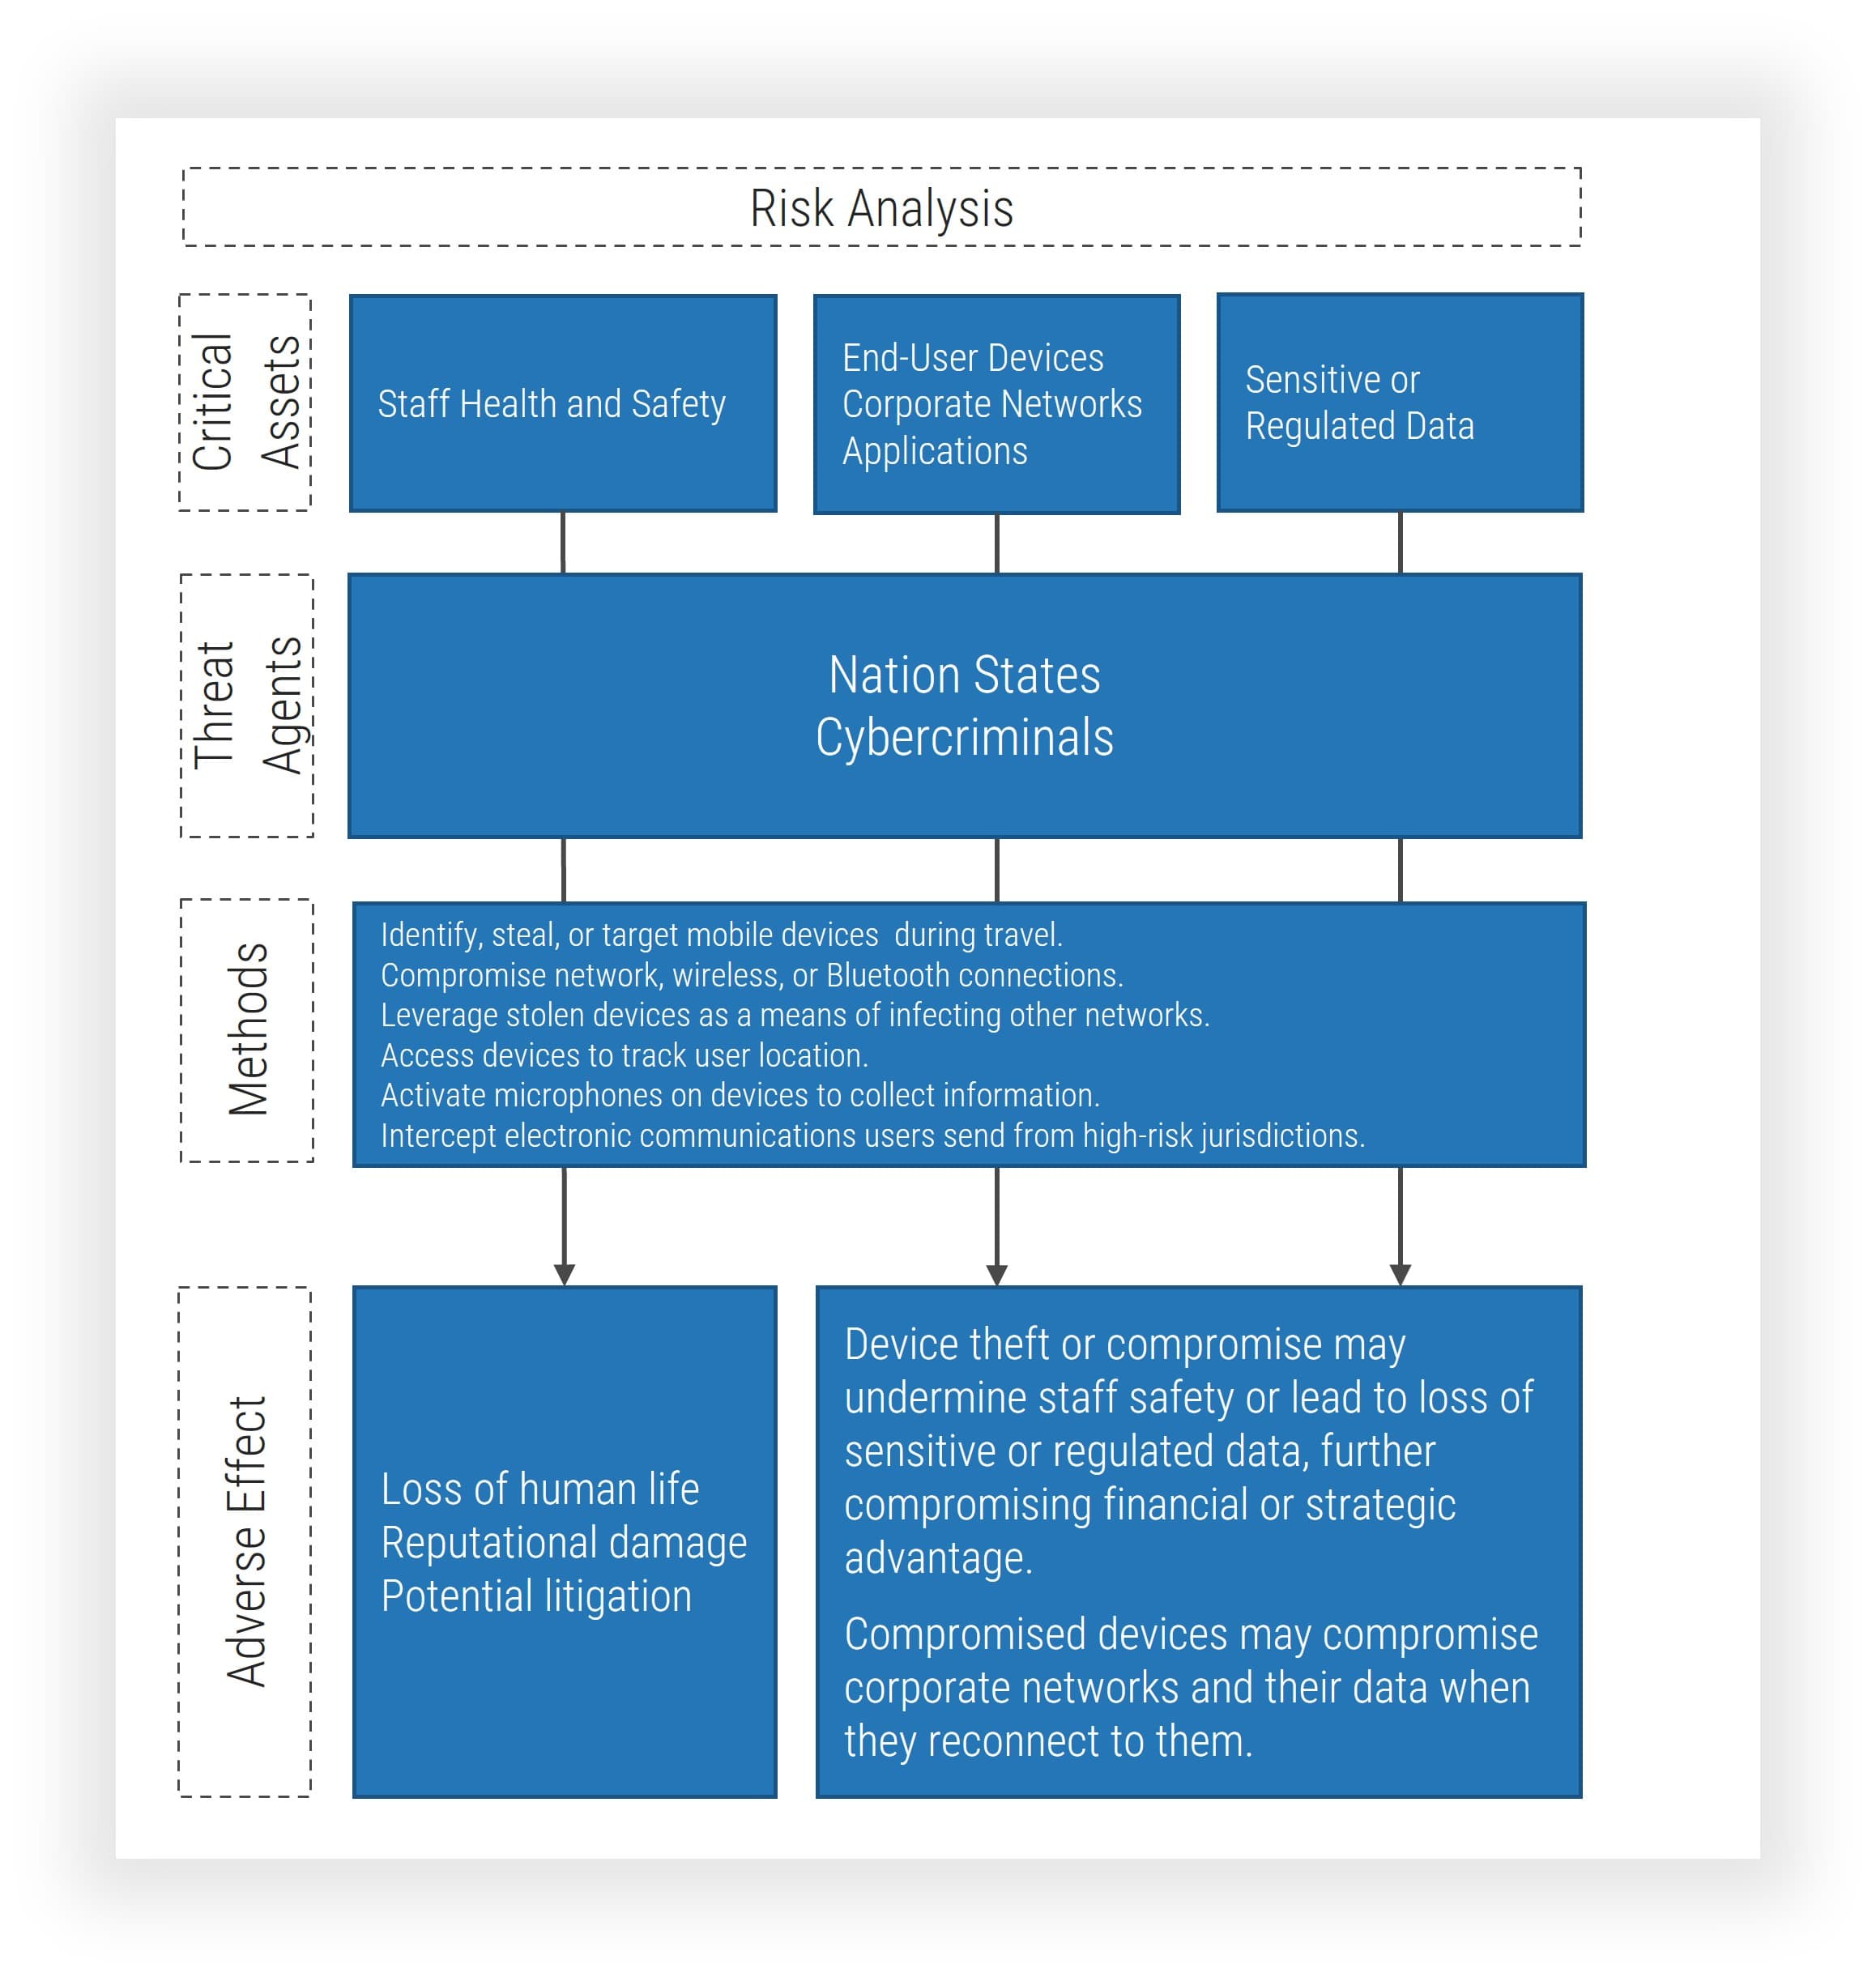
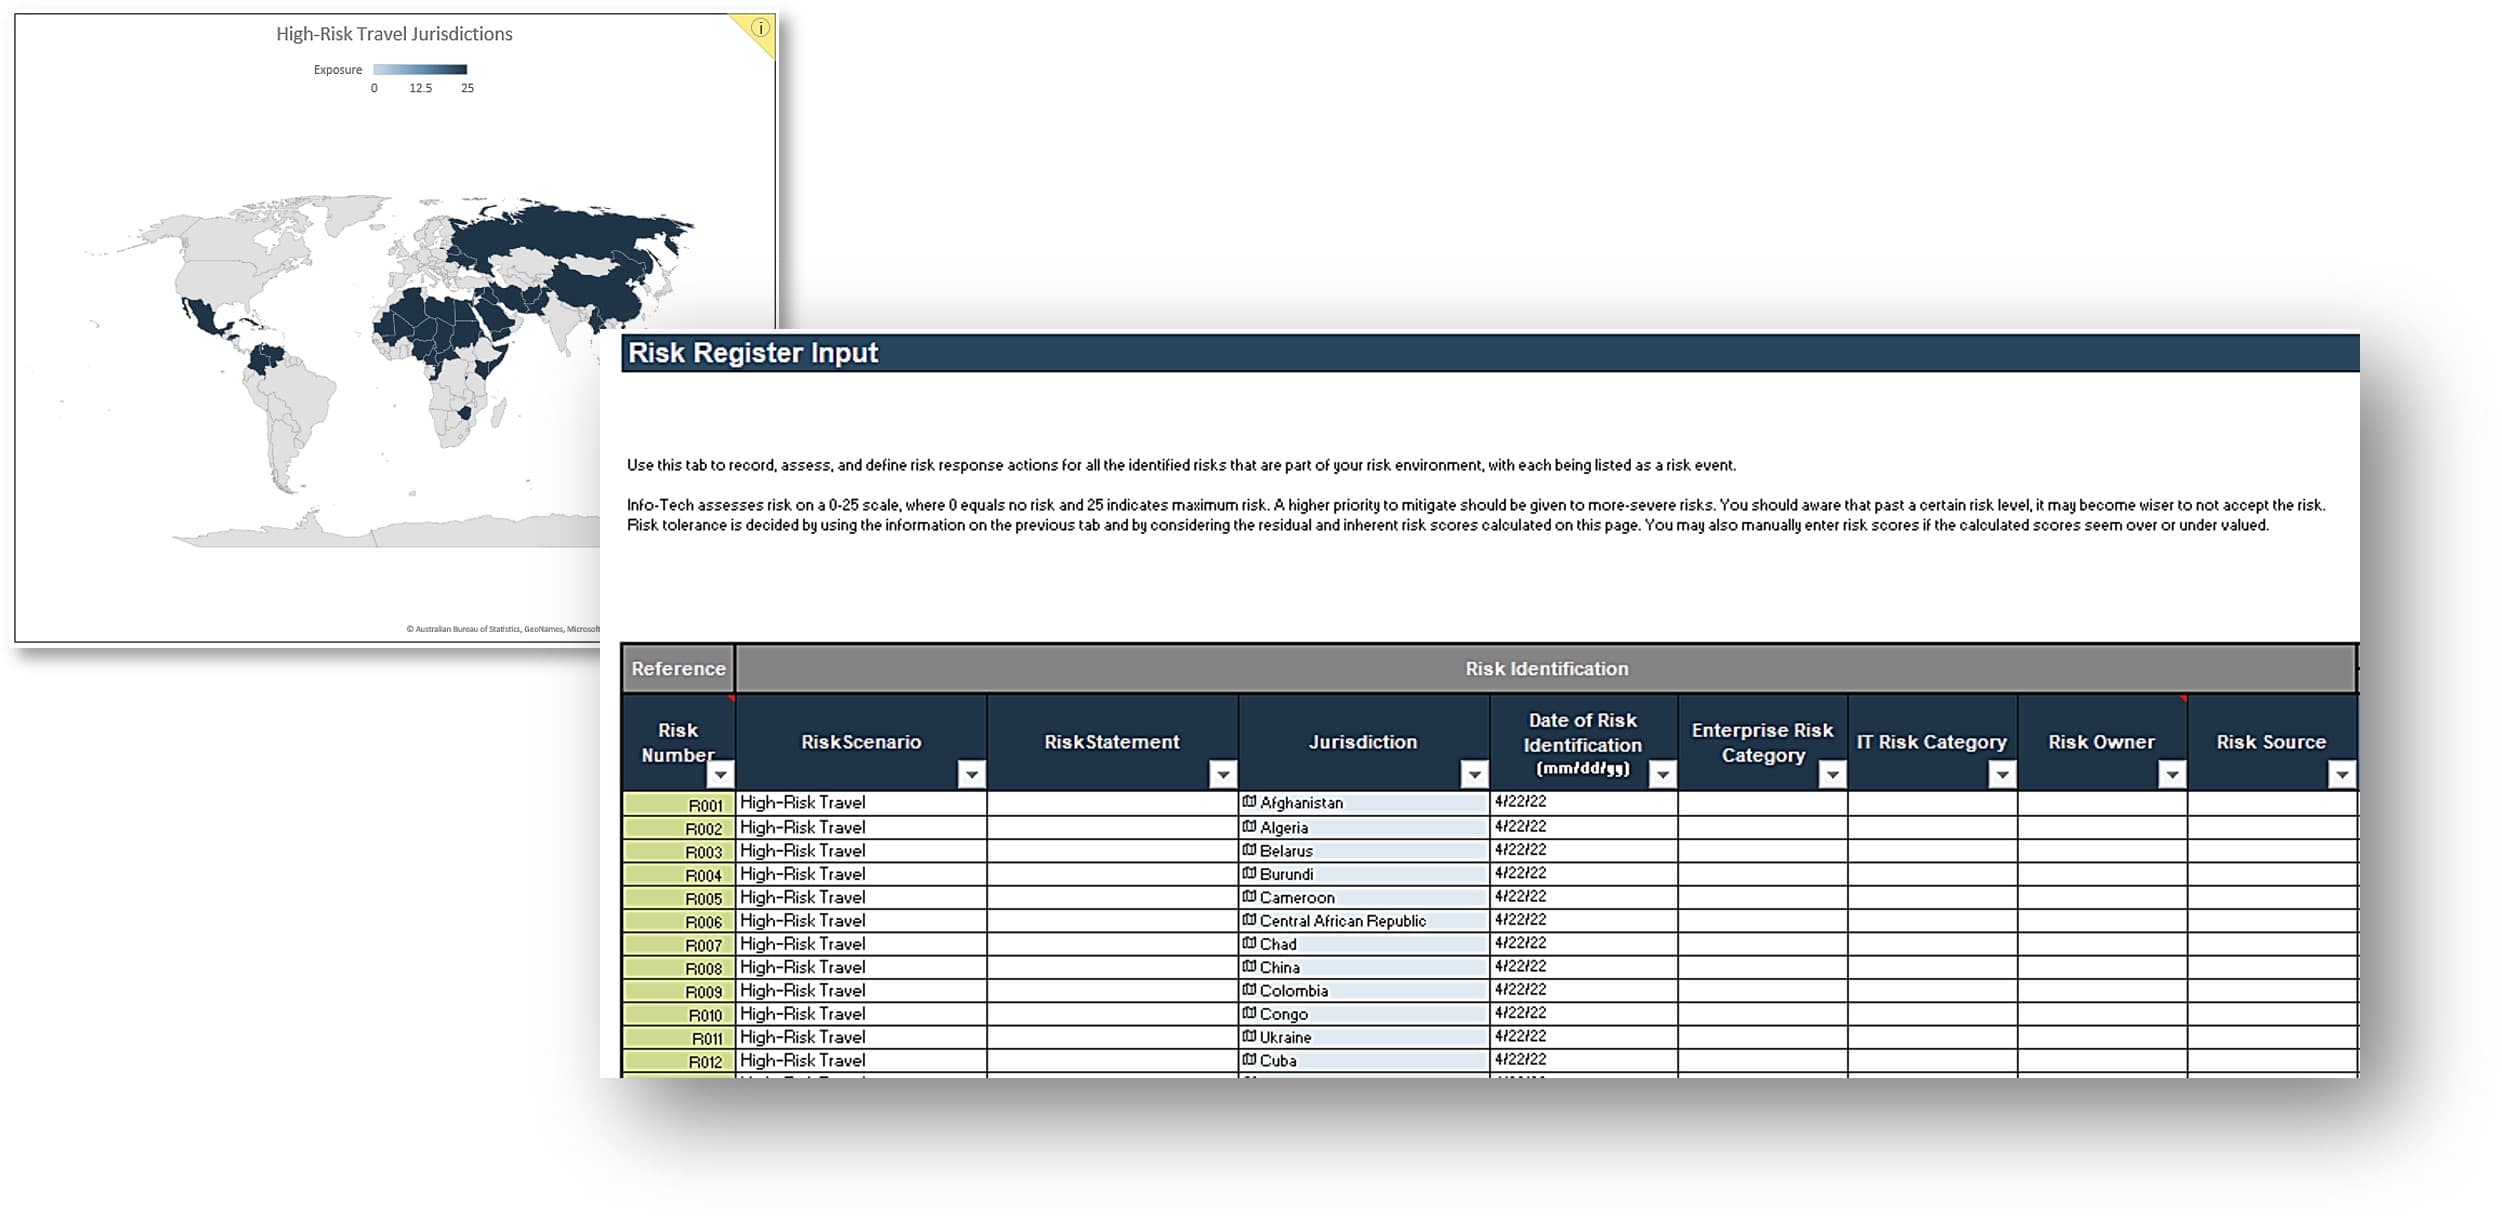
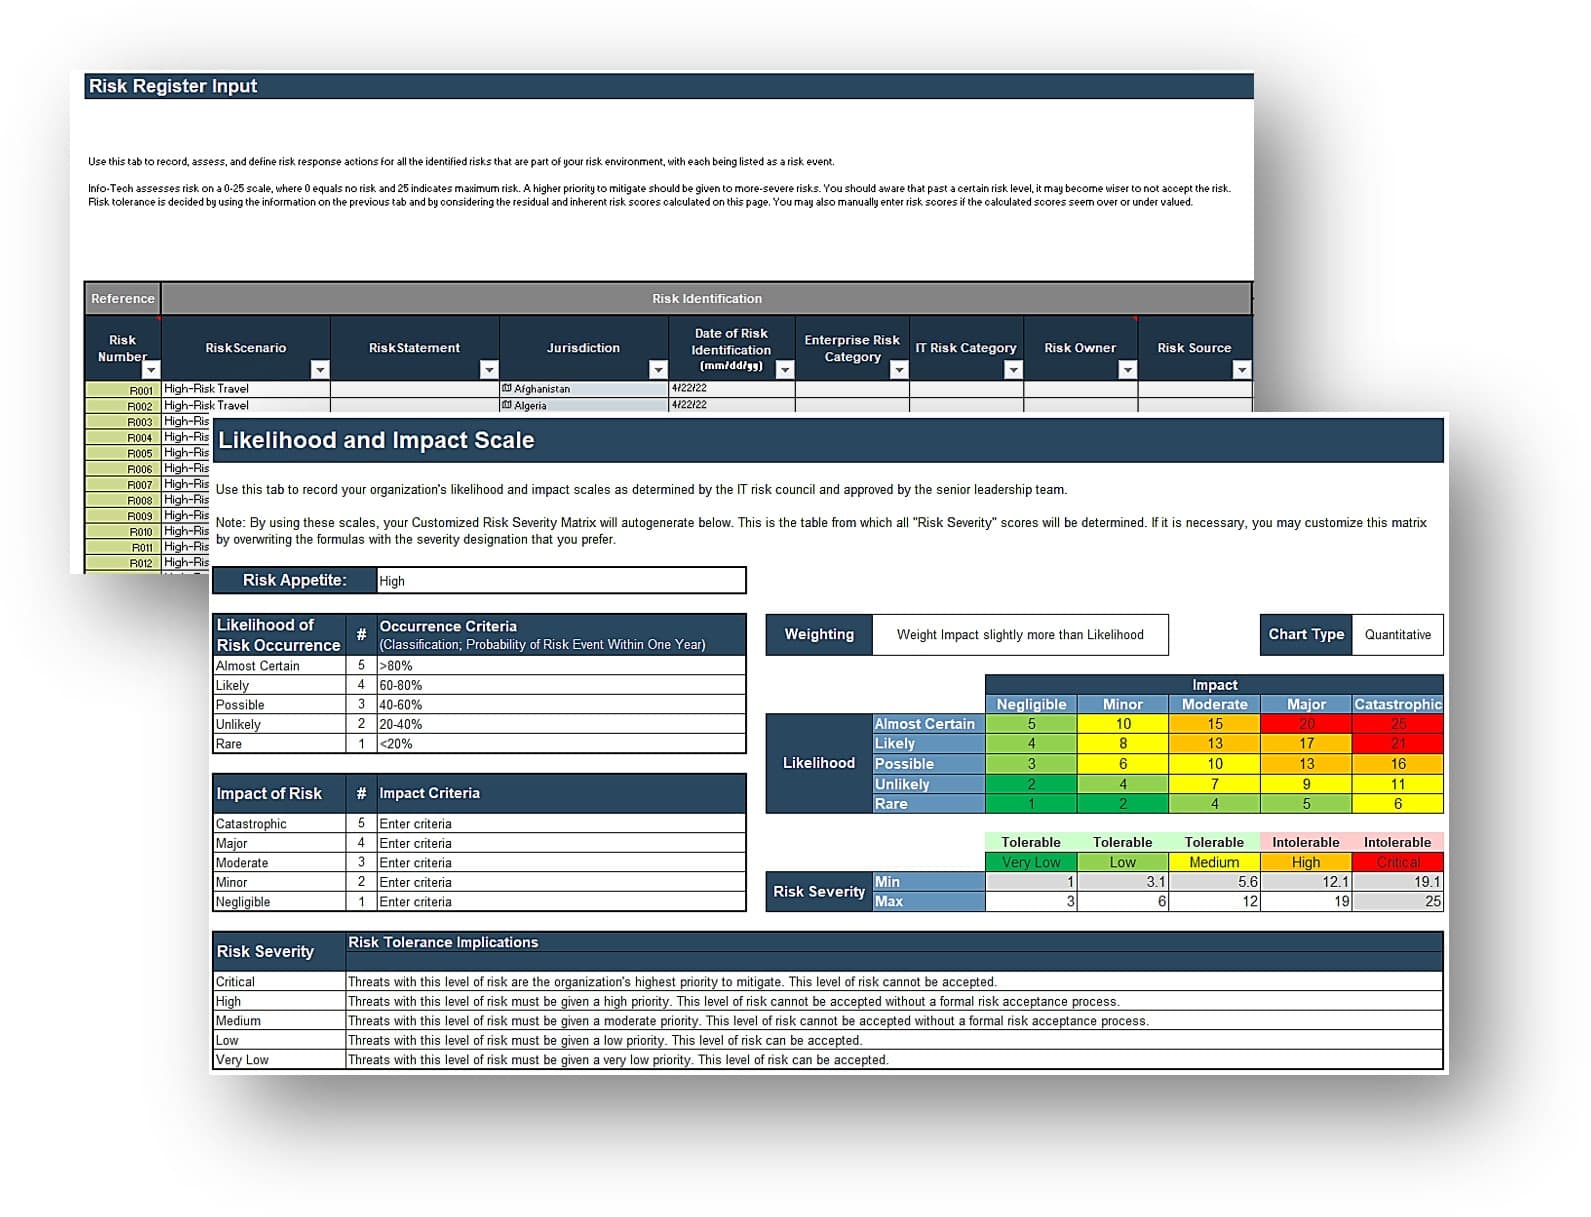
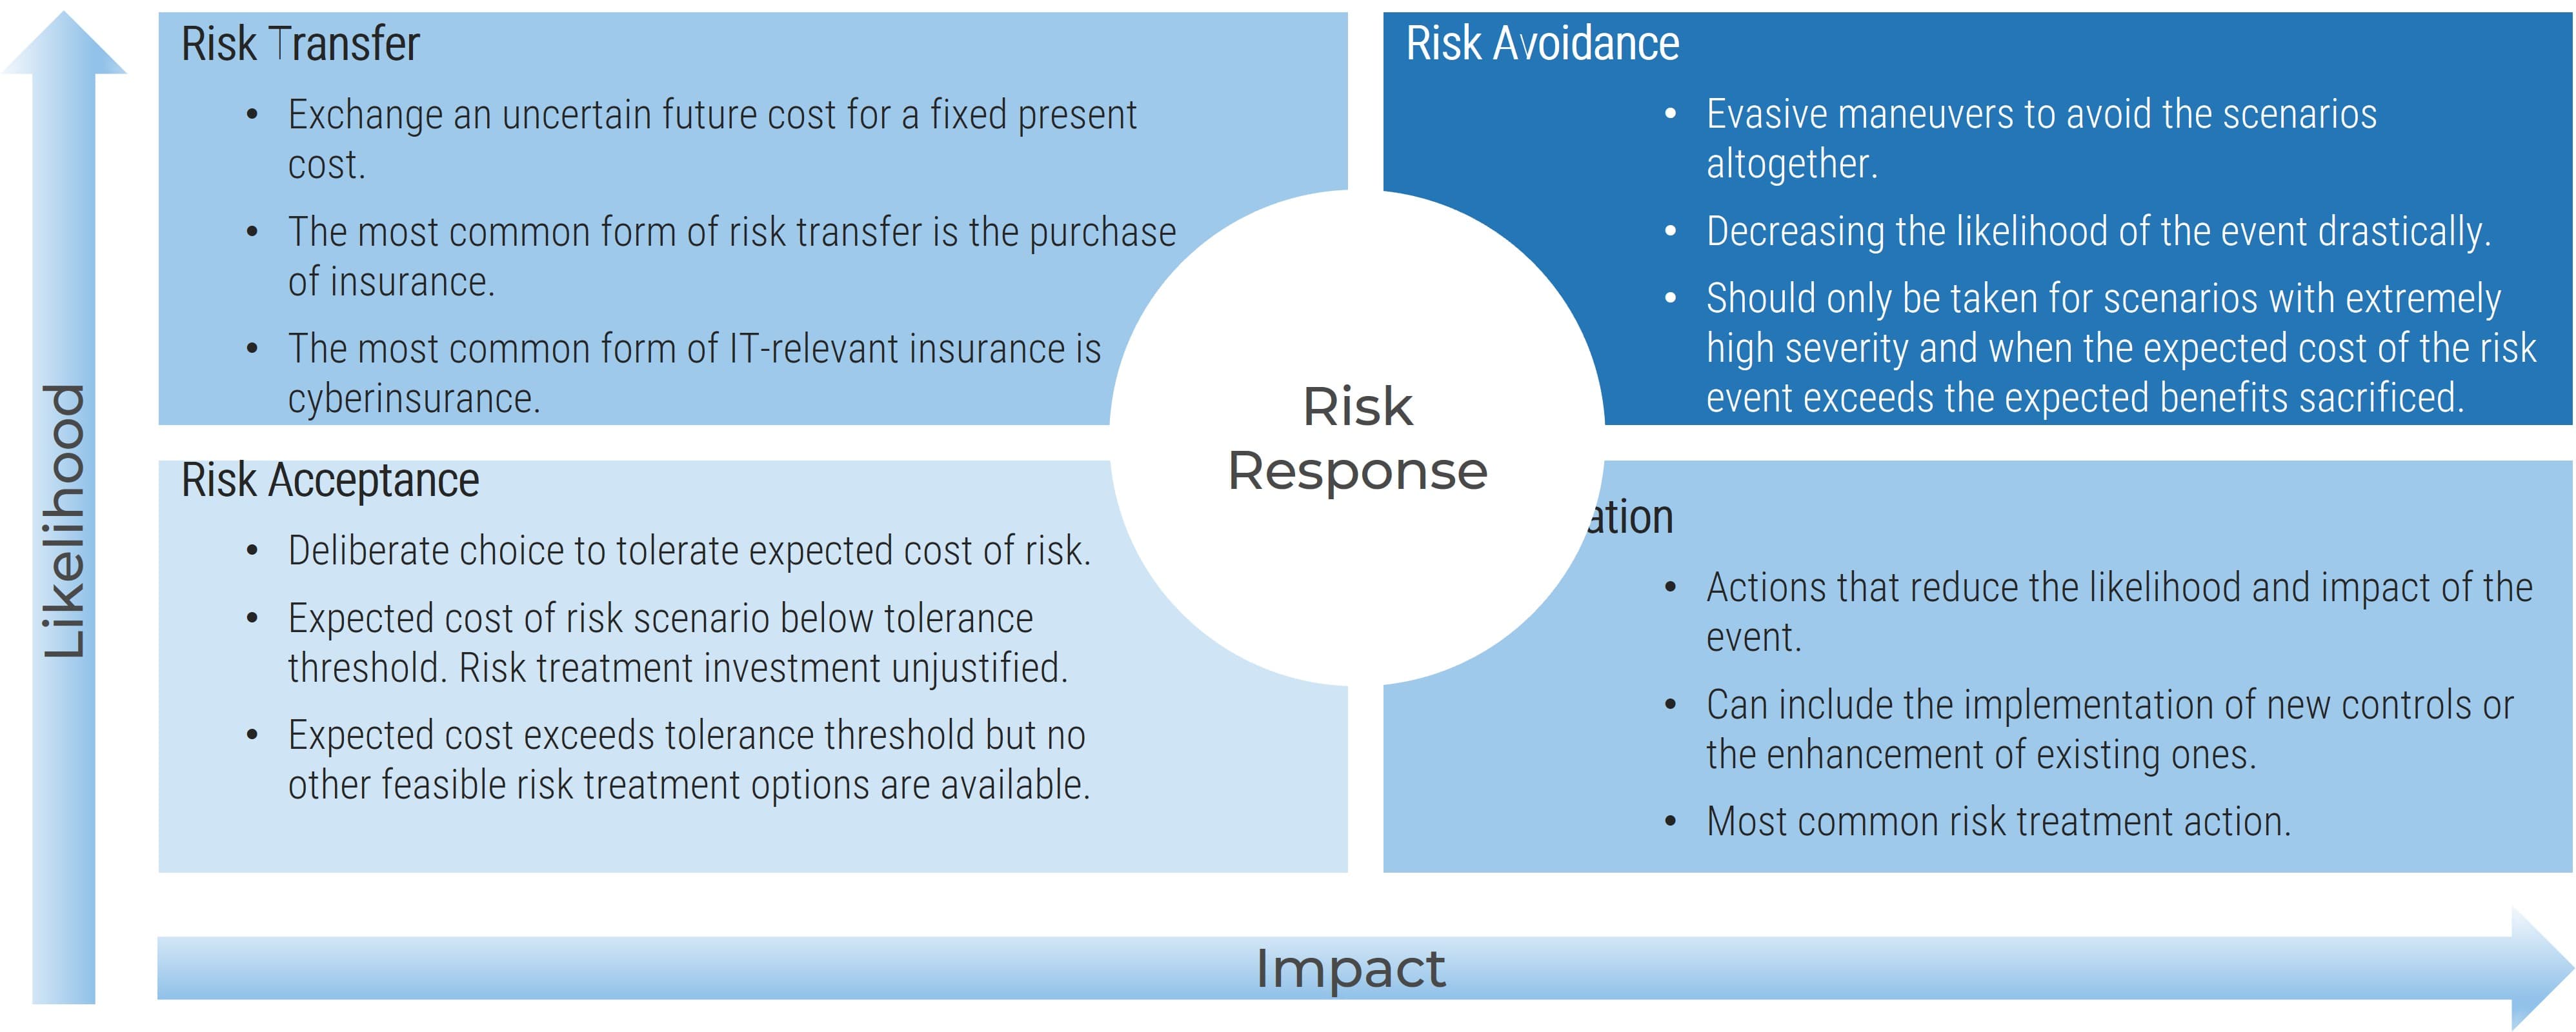
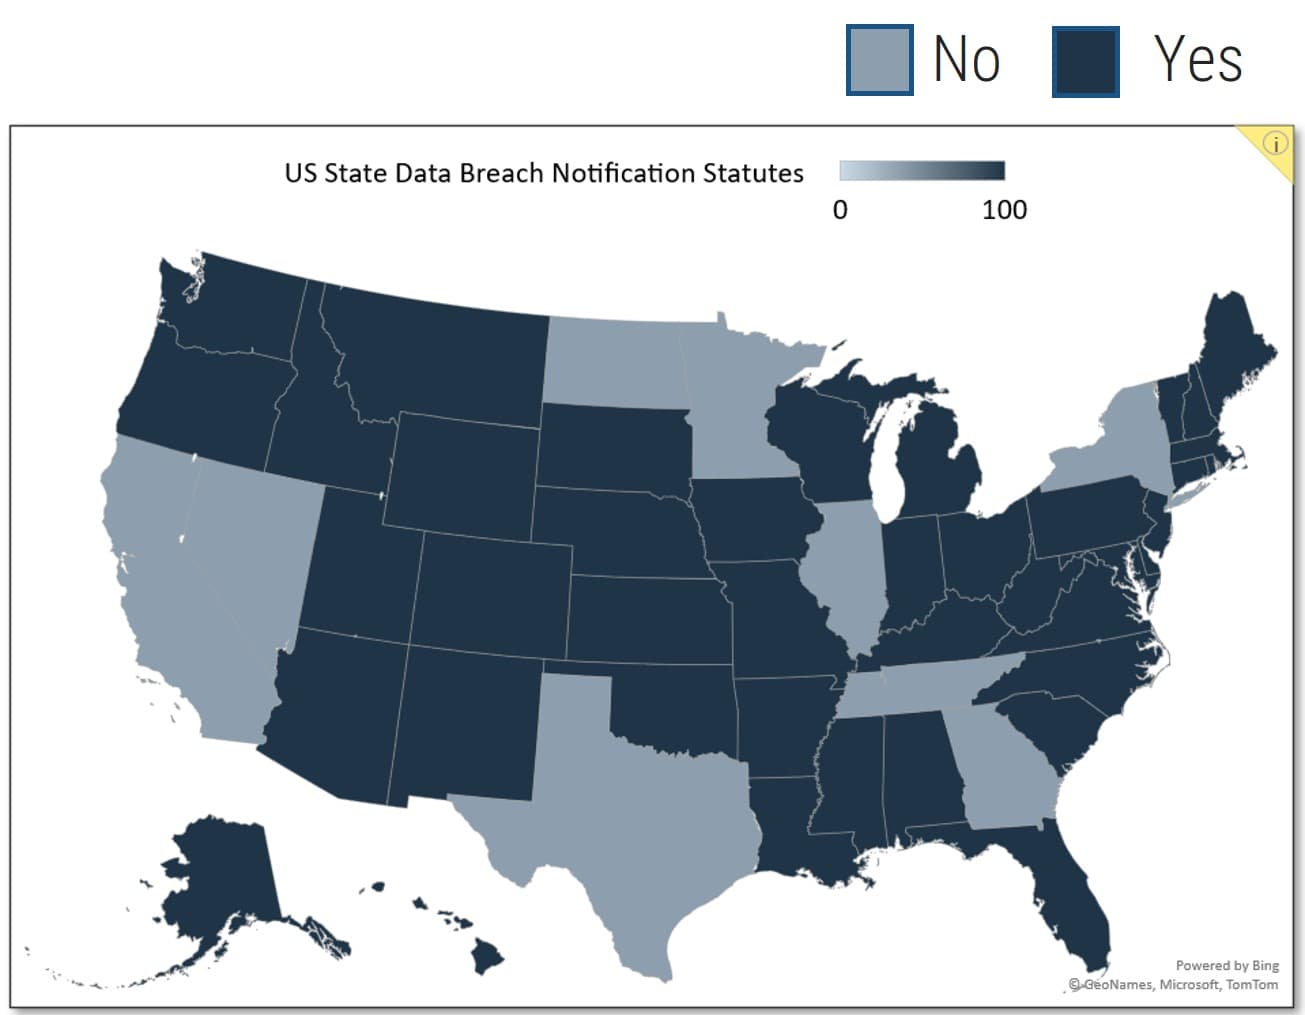
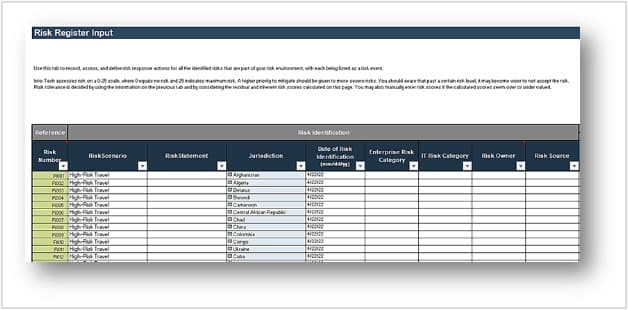
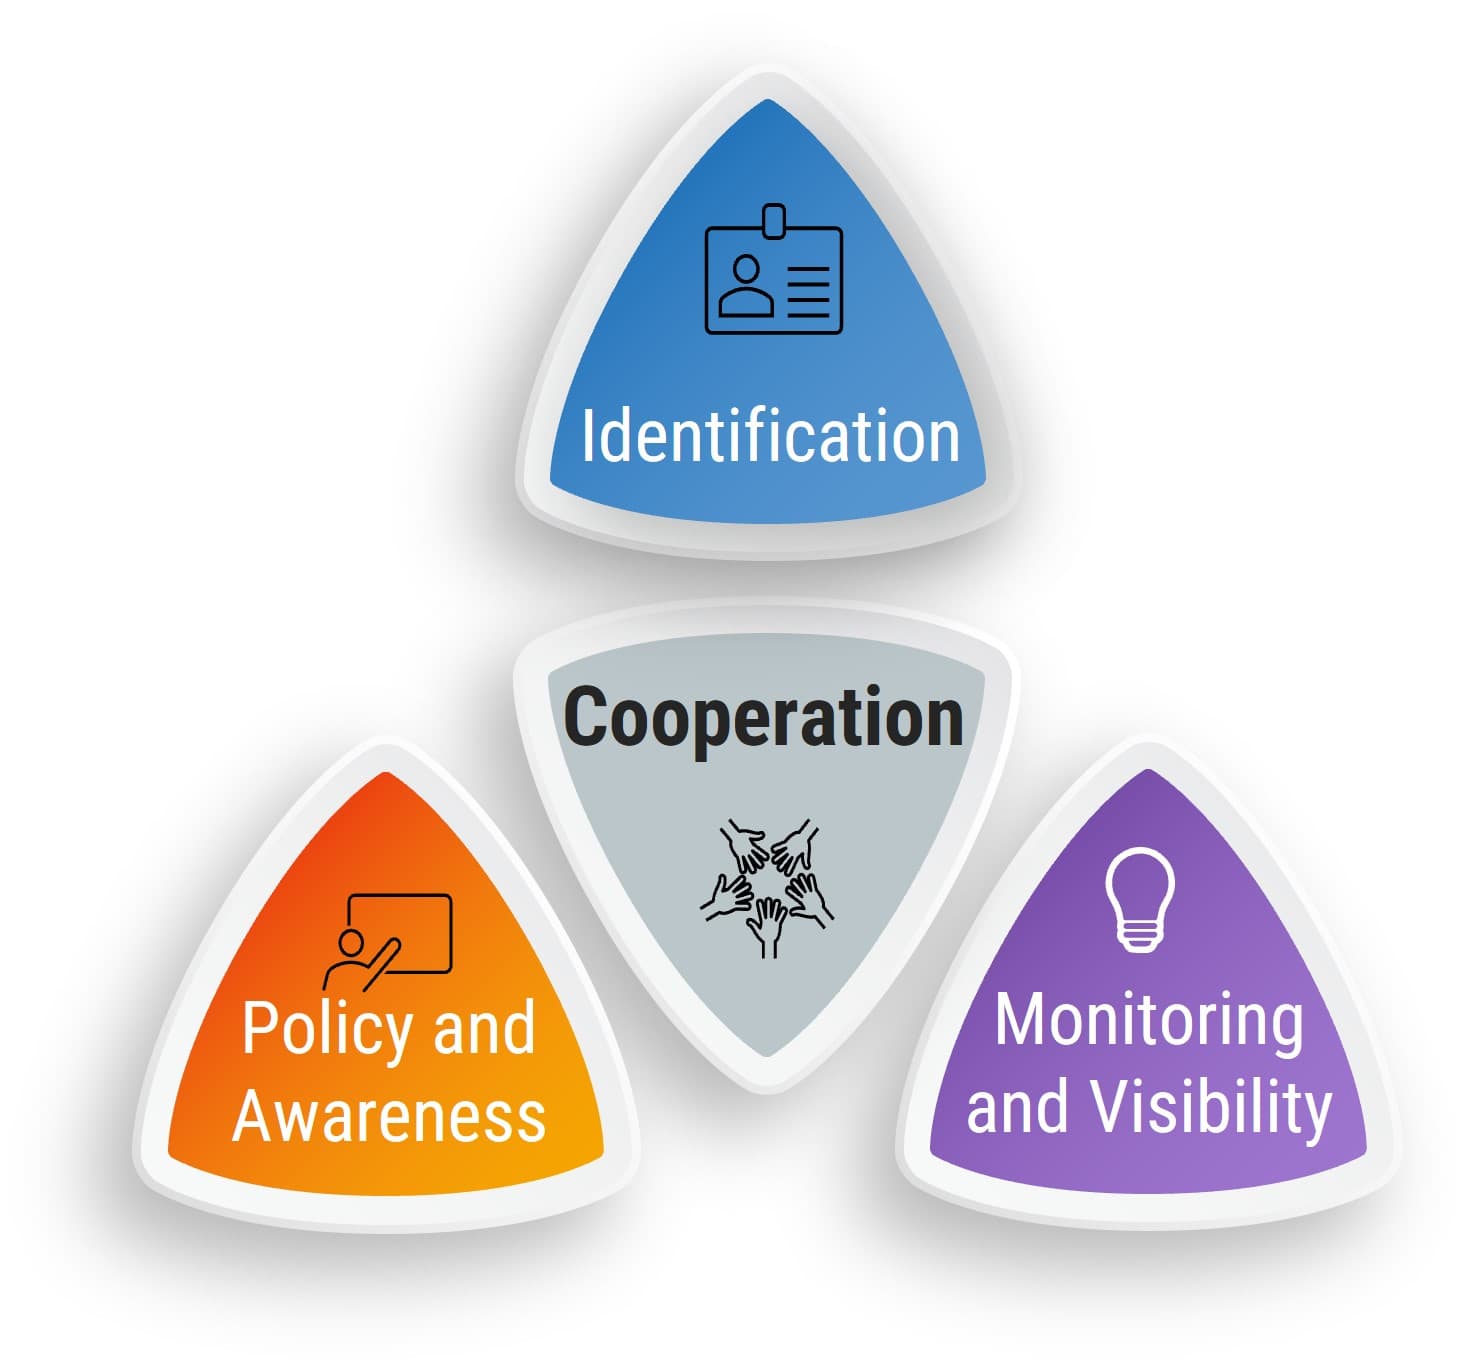
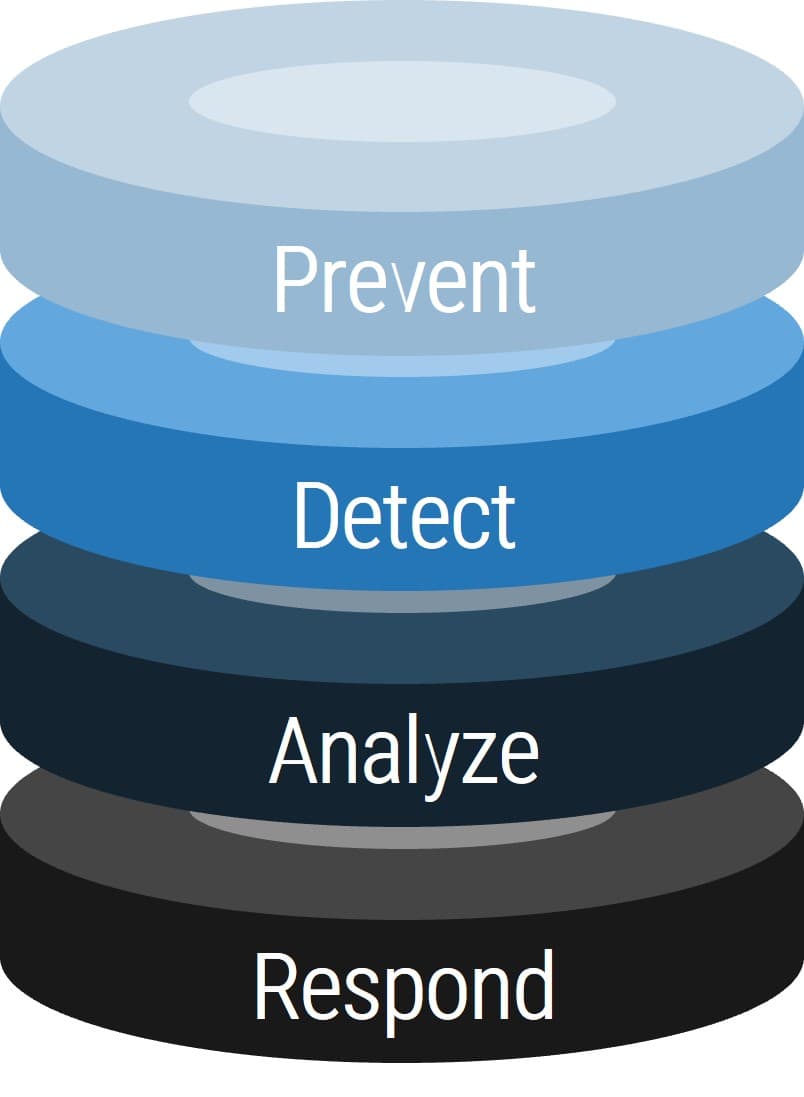
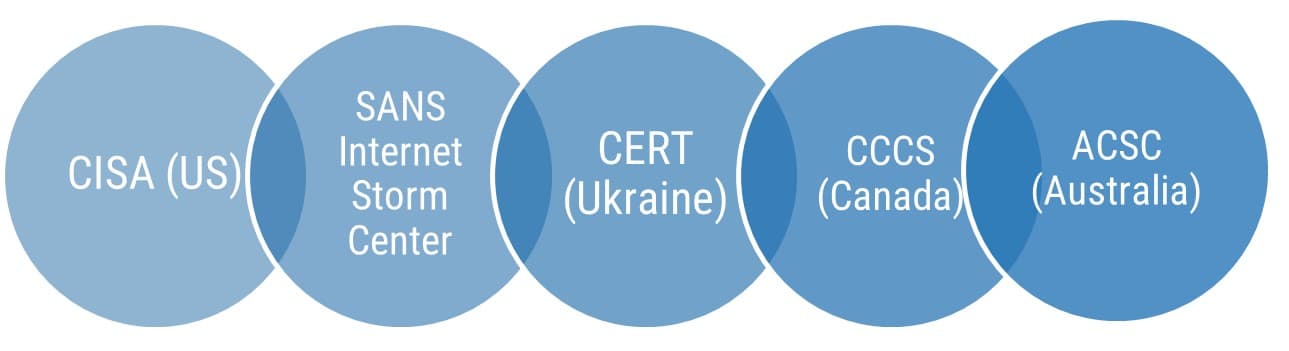


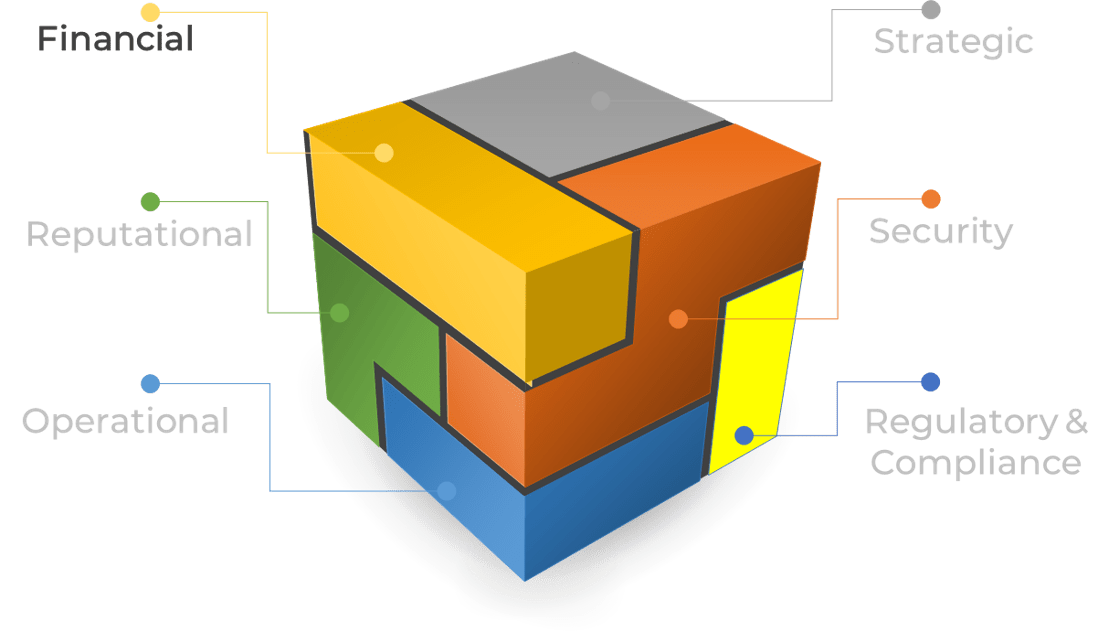


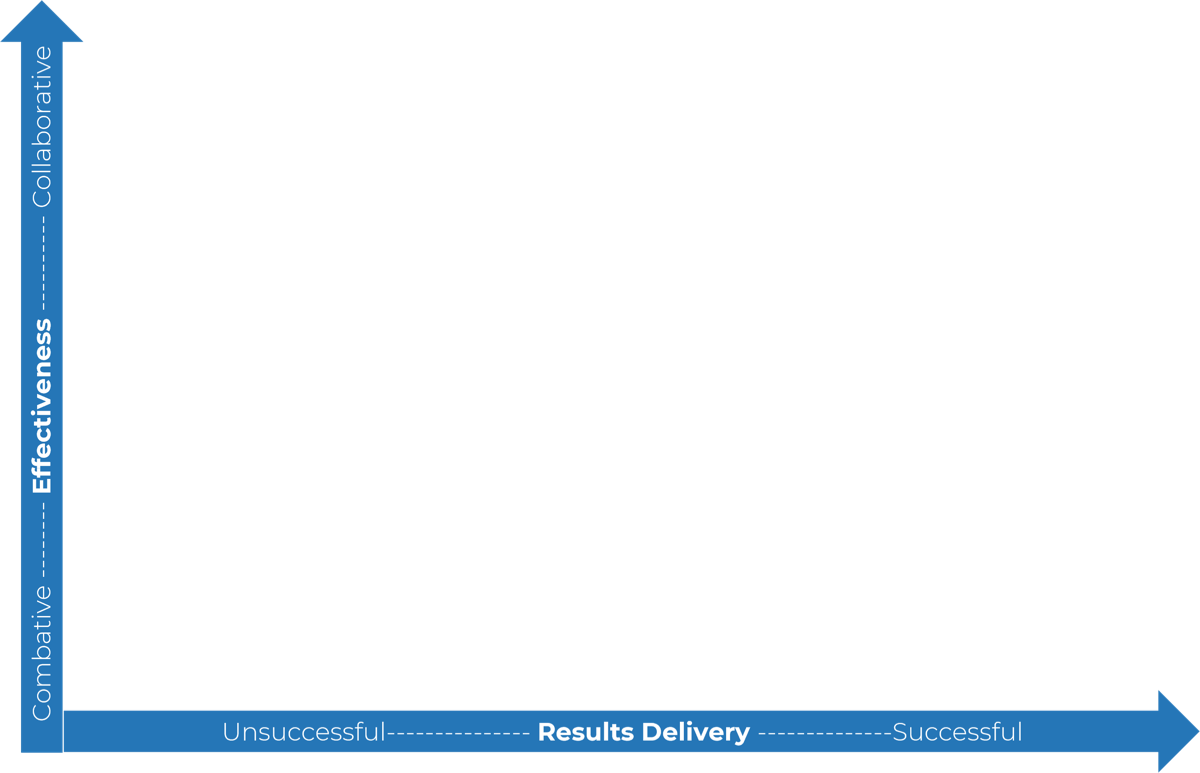
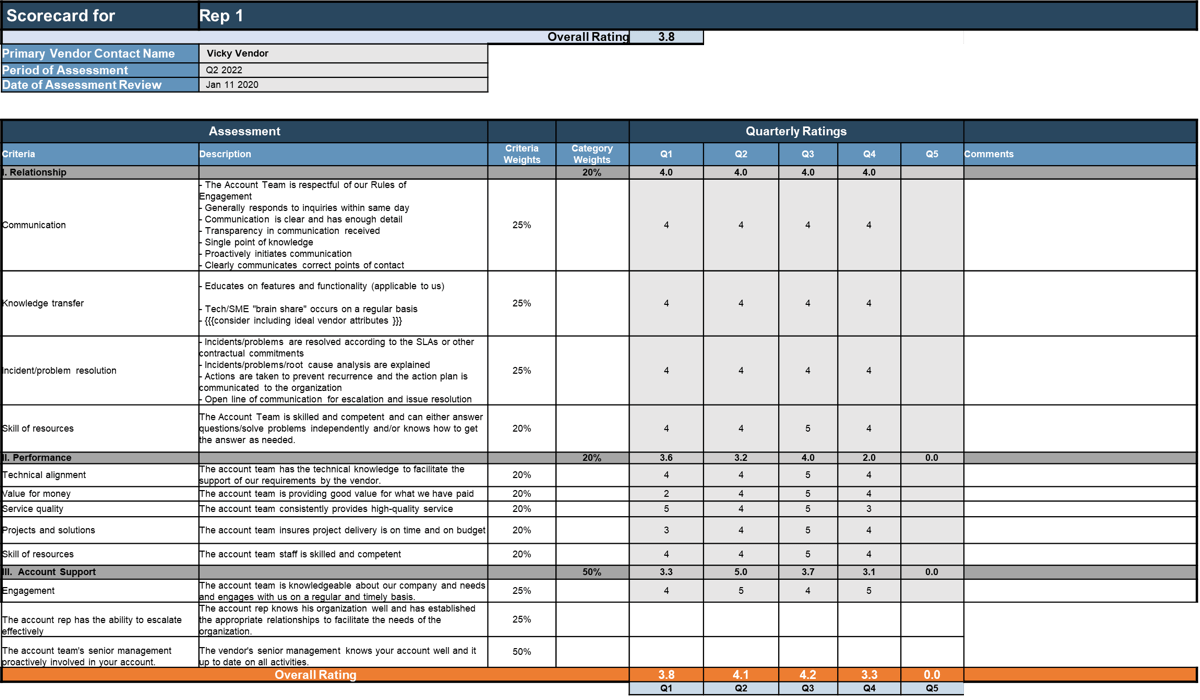


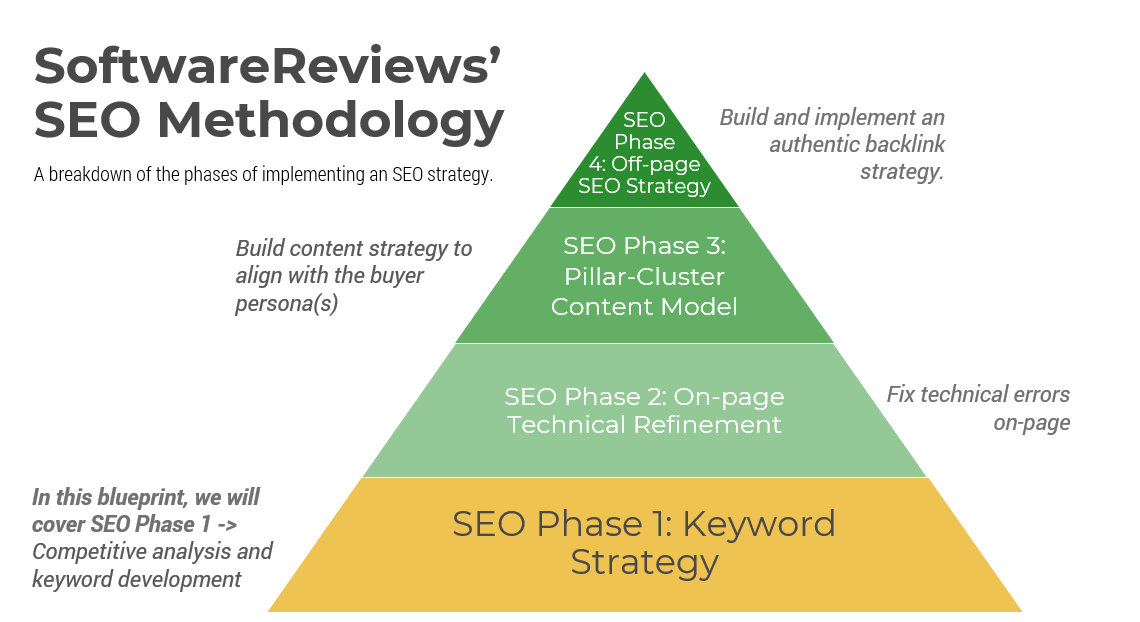
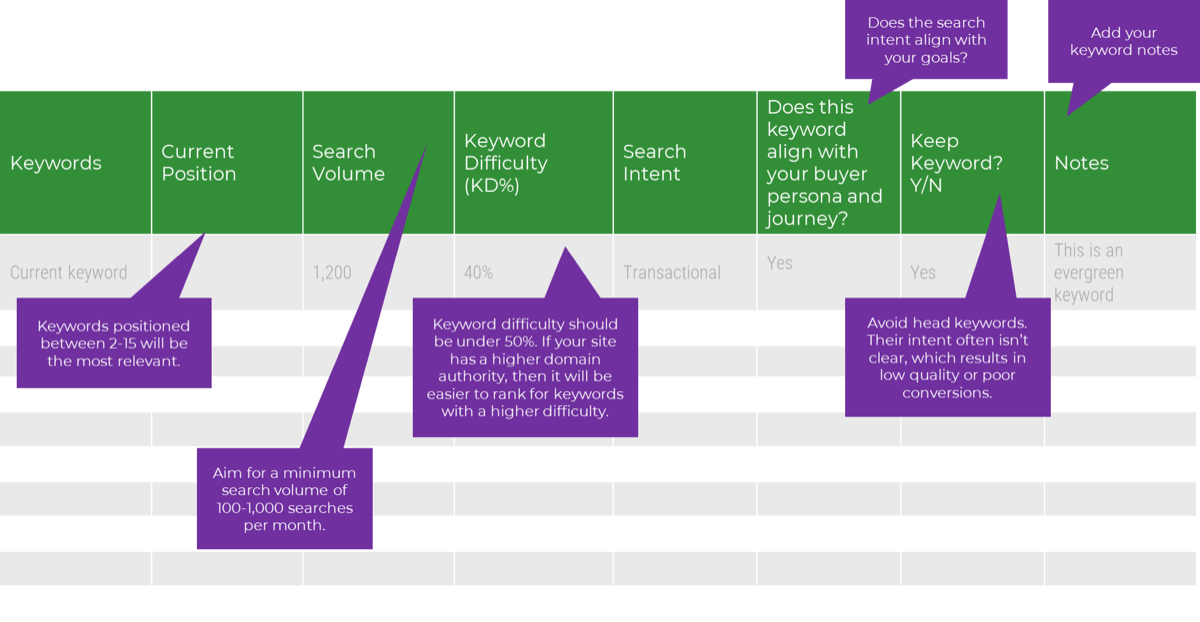
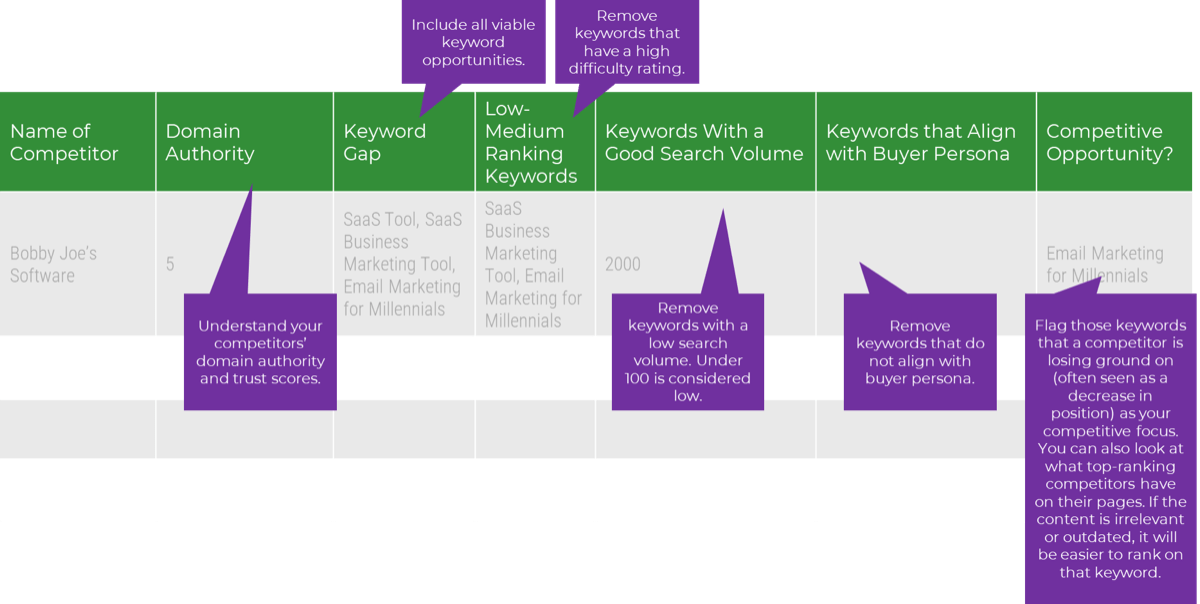
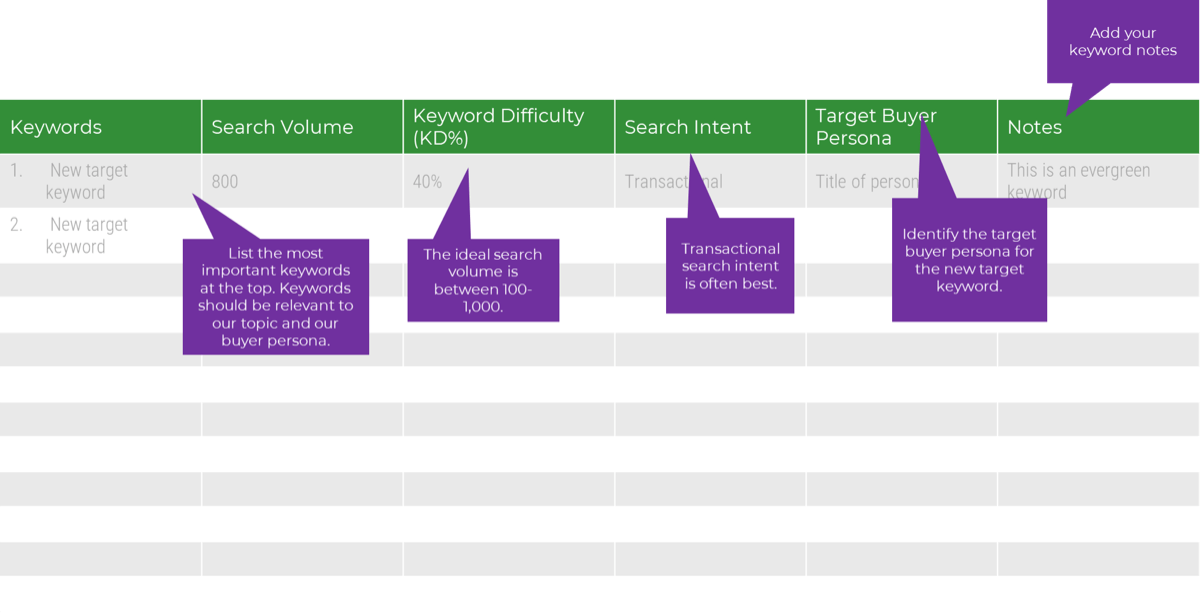

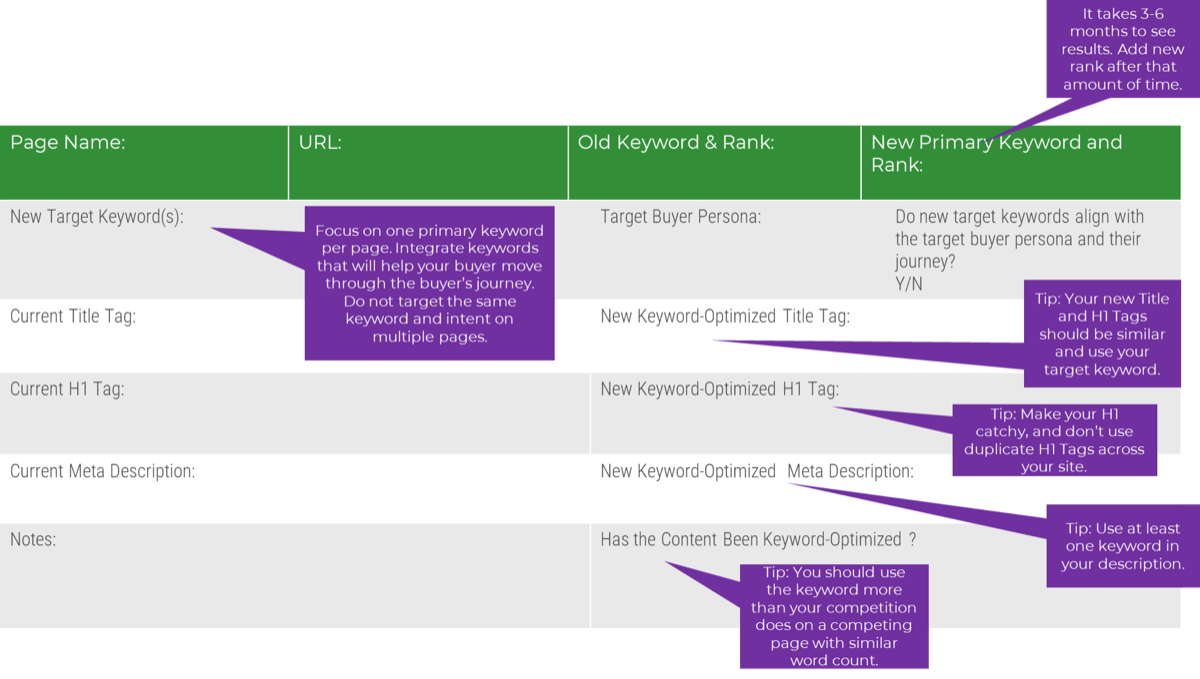


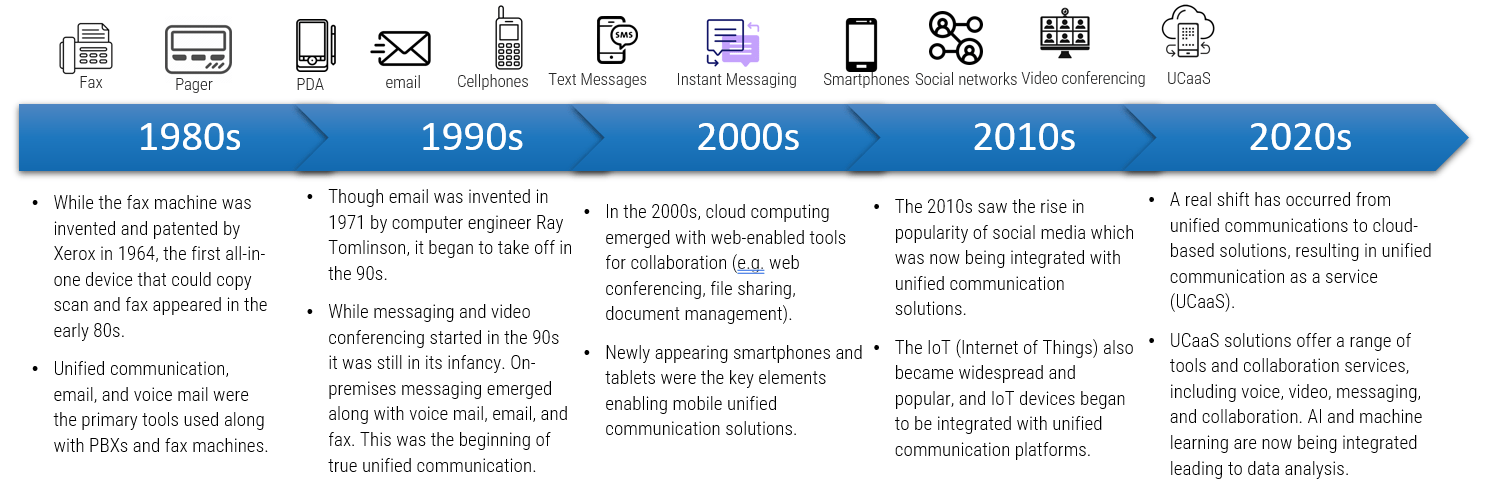
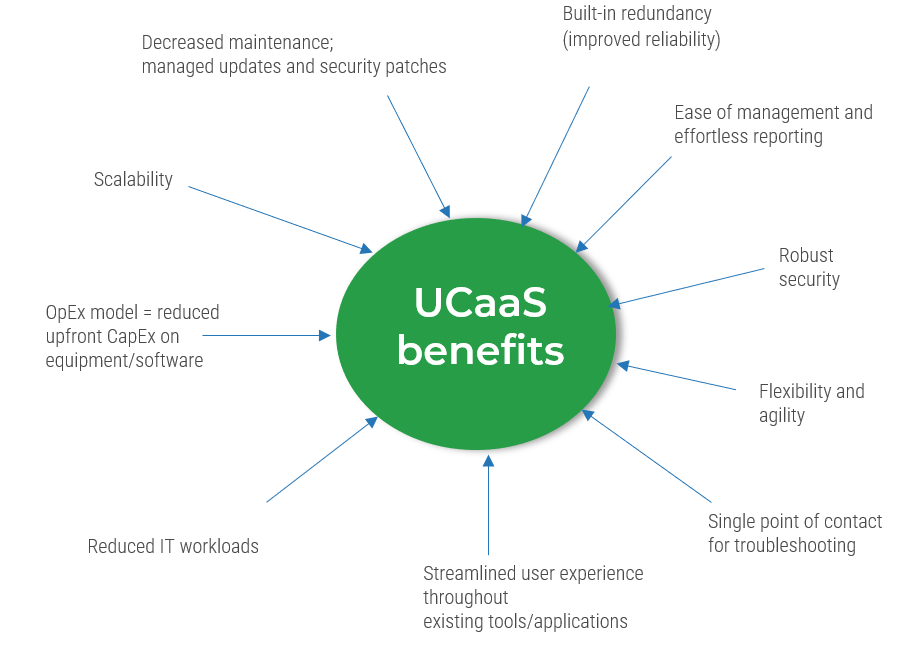
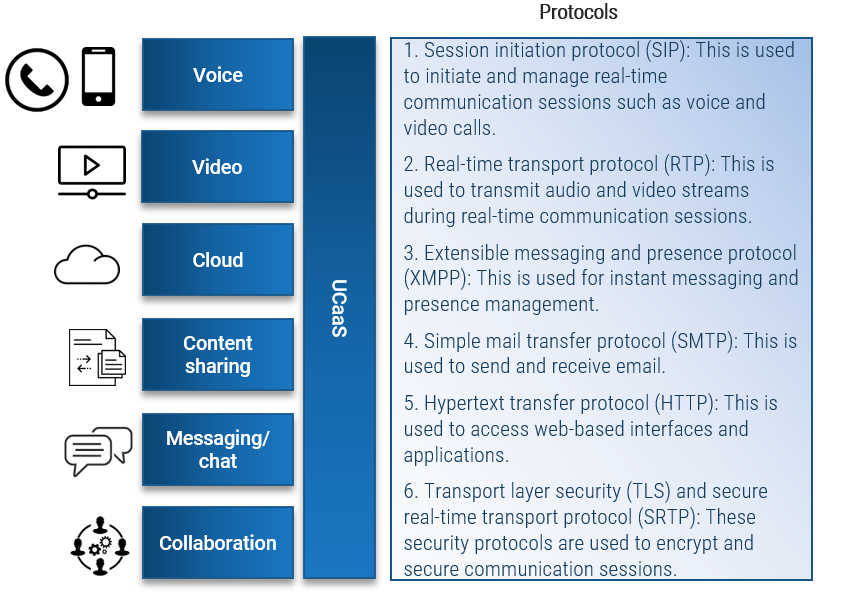
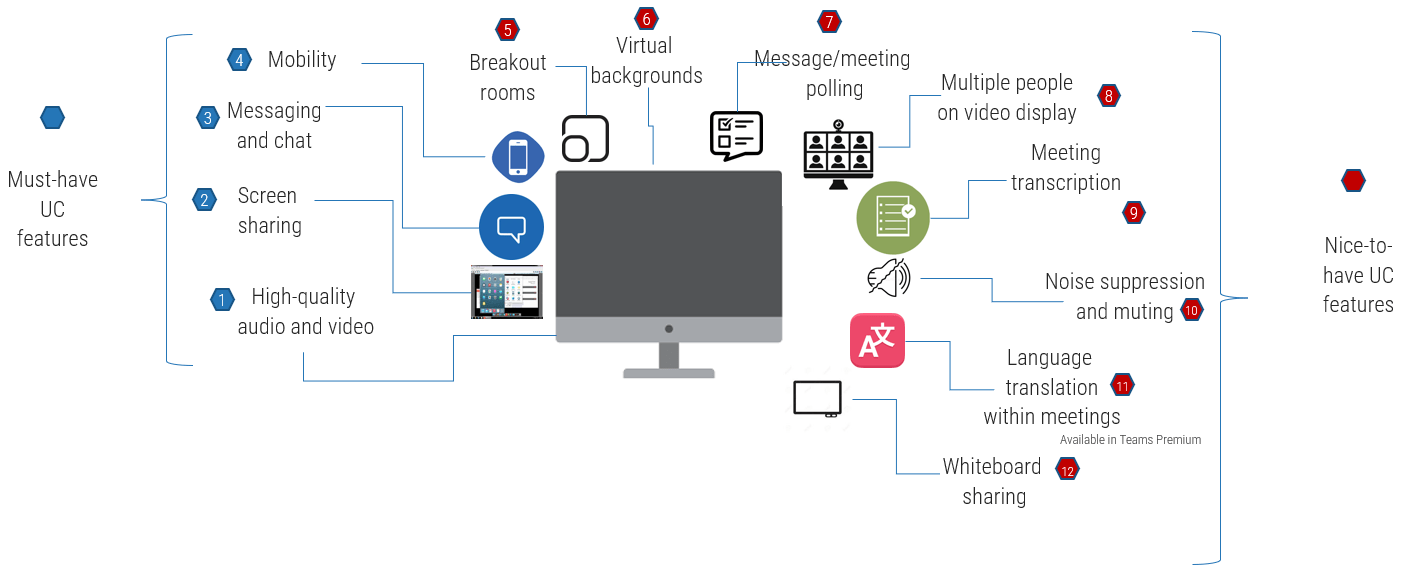


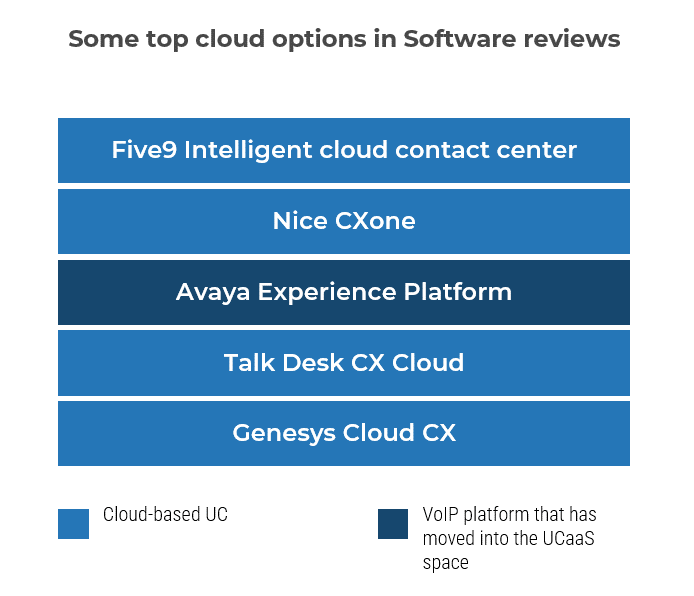
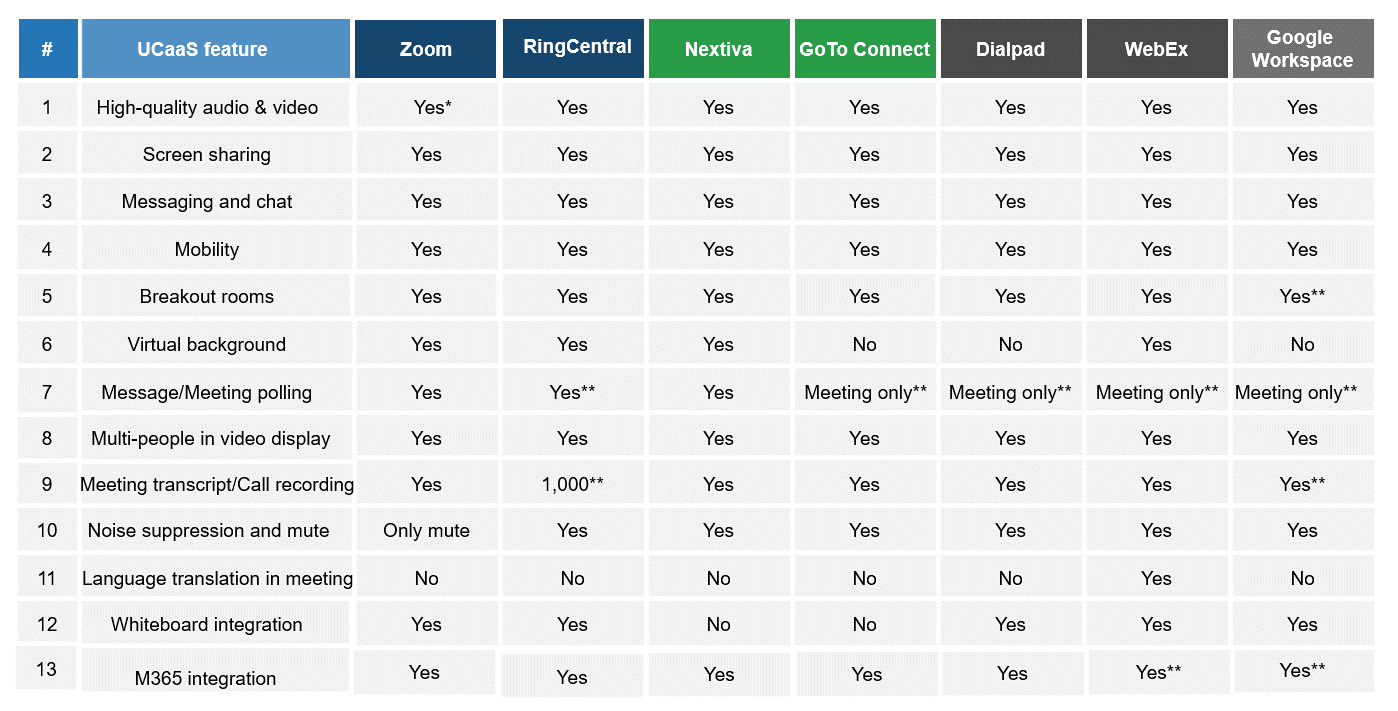
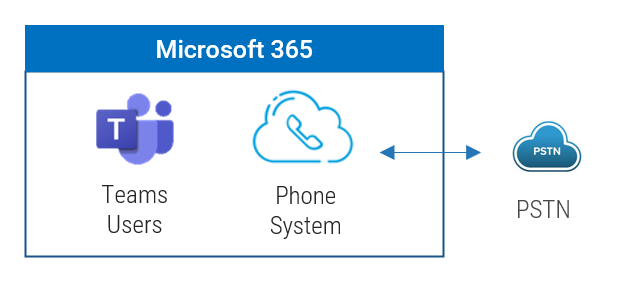
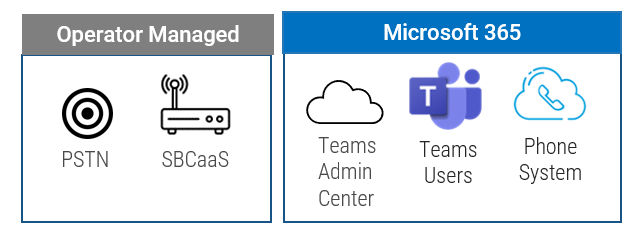
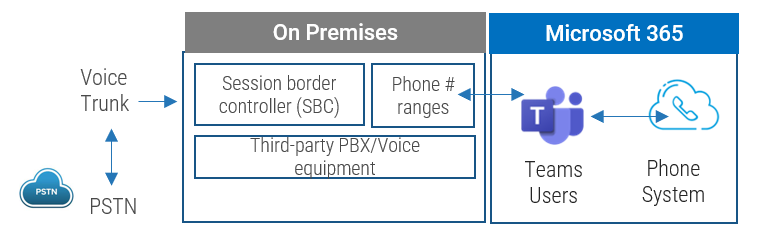
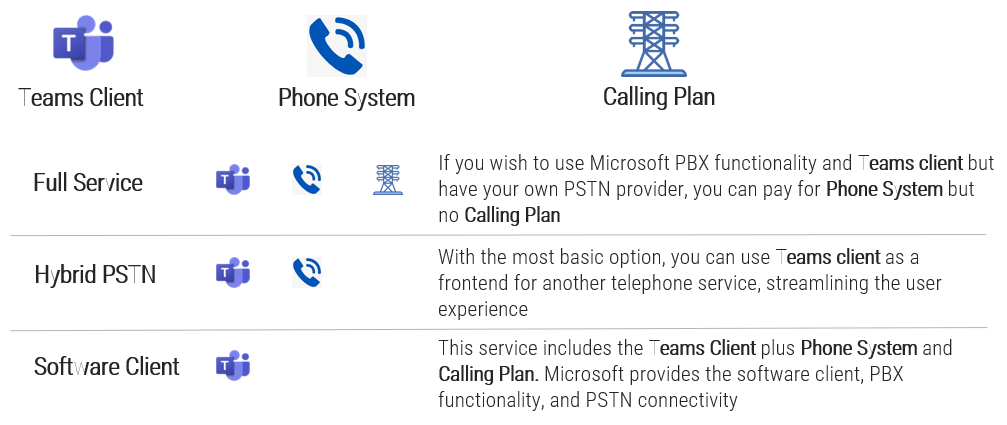
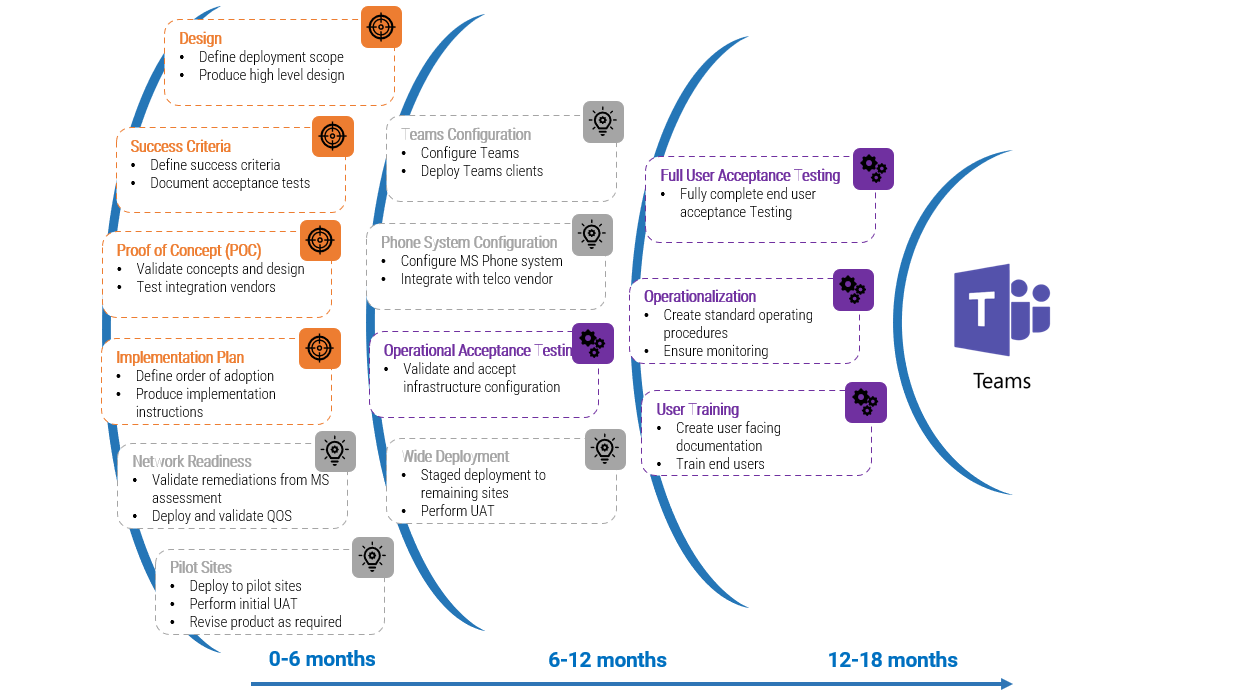
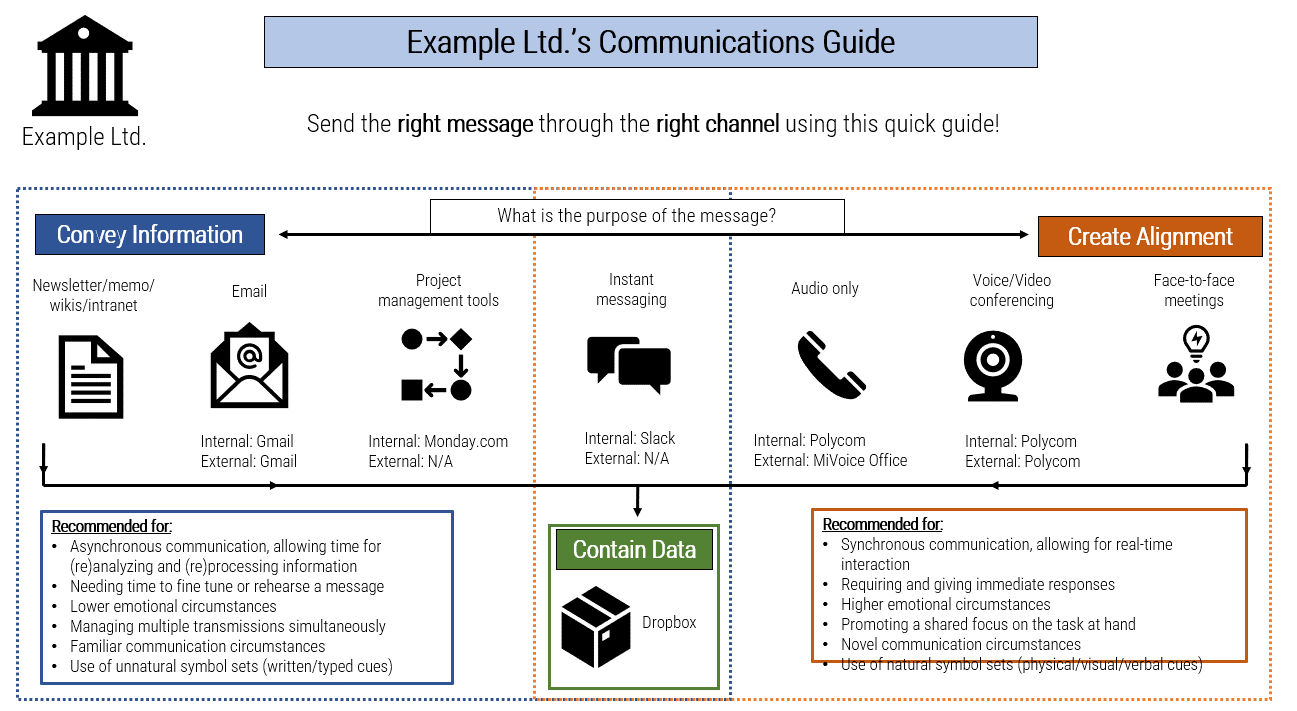
![A diagram that shows [Insert Organization Name]’s Communications Guide](/images/ITMGF/infra-and-operations/end-user-computing/voice-video-management/assess-your-readiness-to-implement-ucaas/030-communications-guide-template.png)


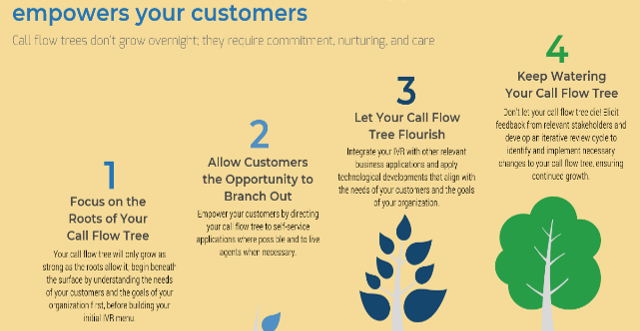


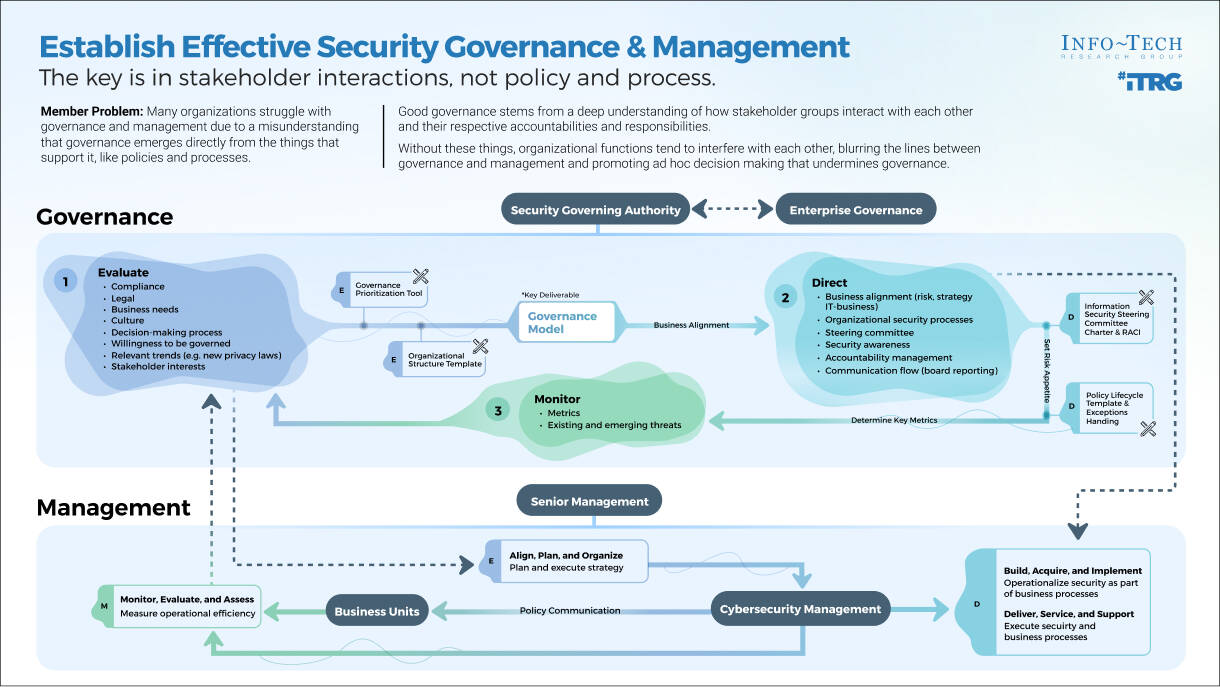

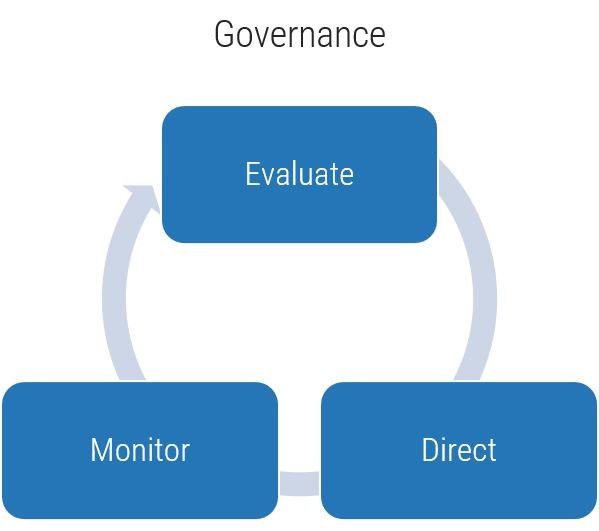
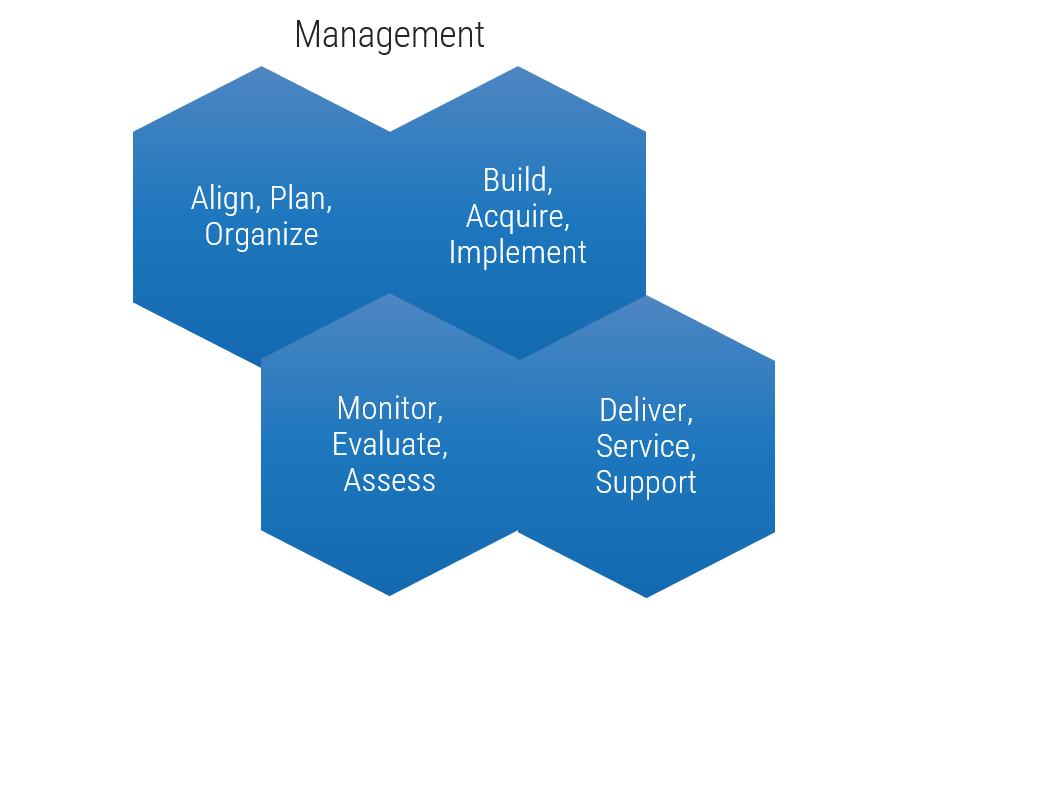
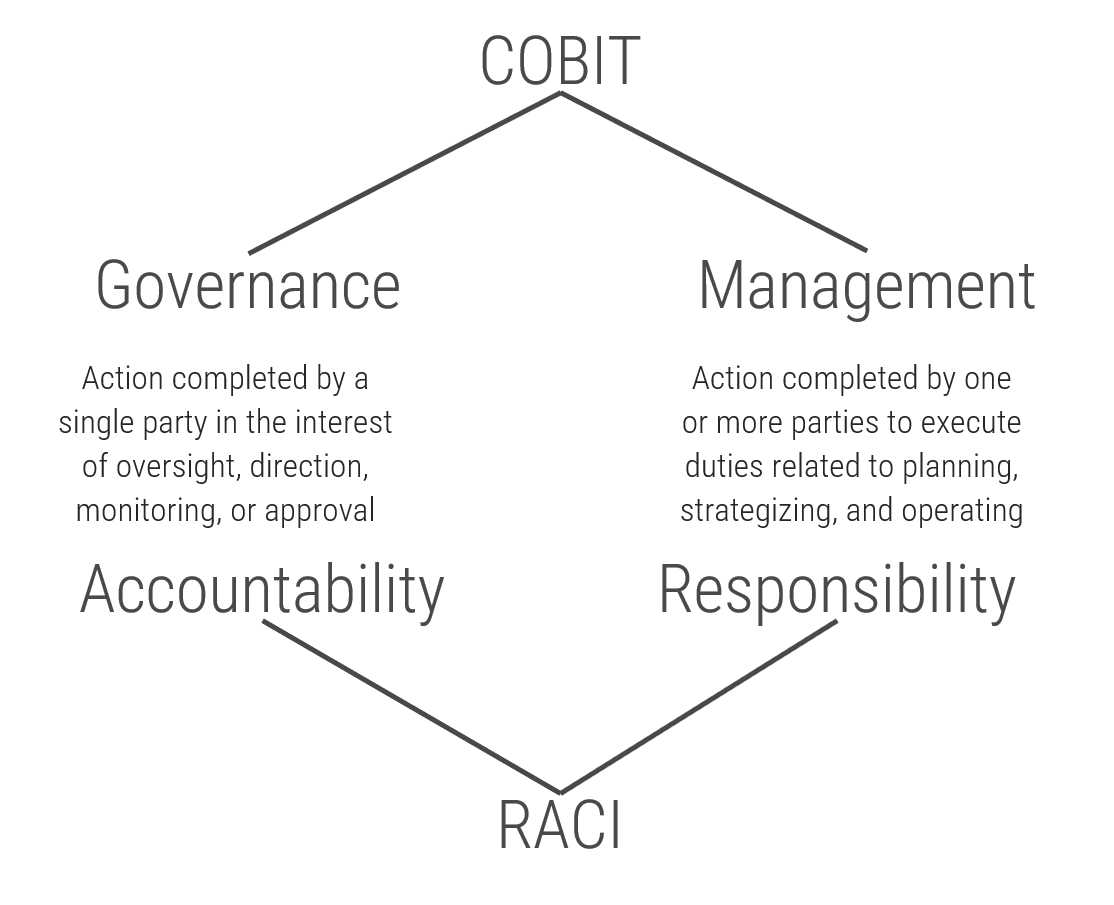
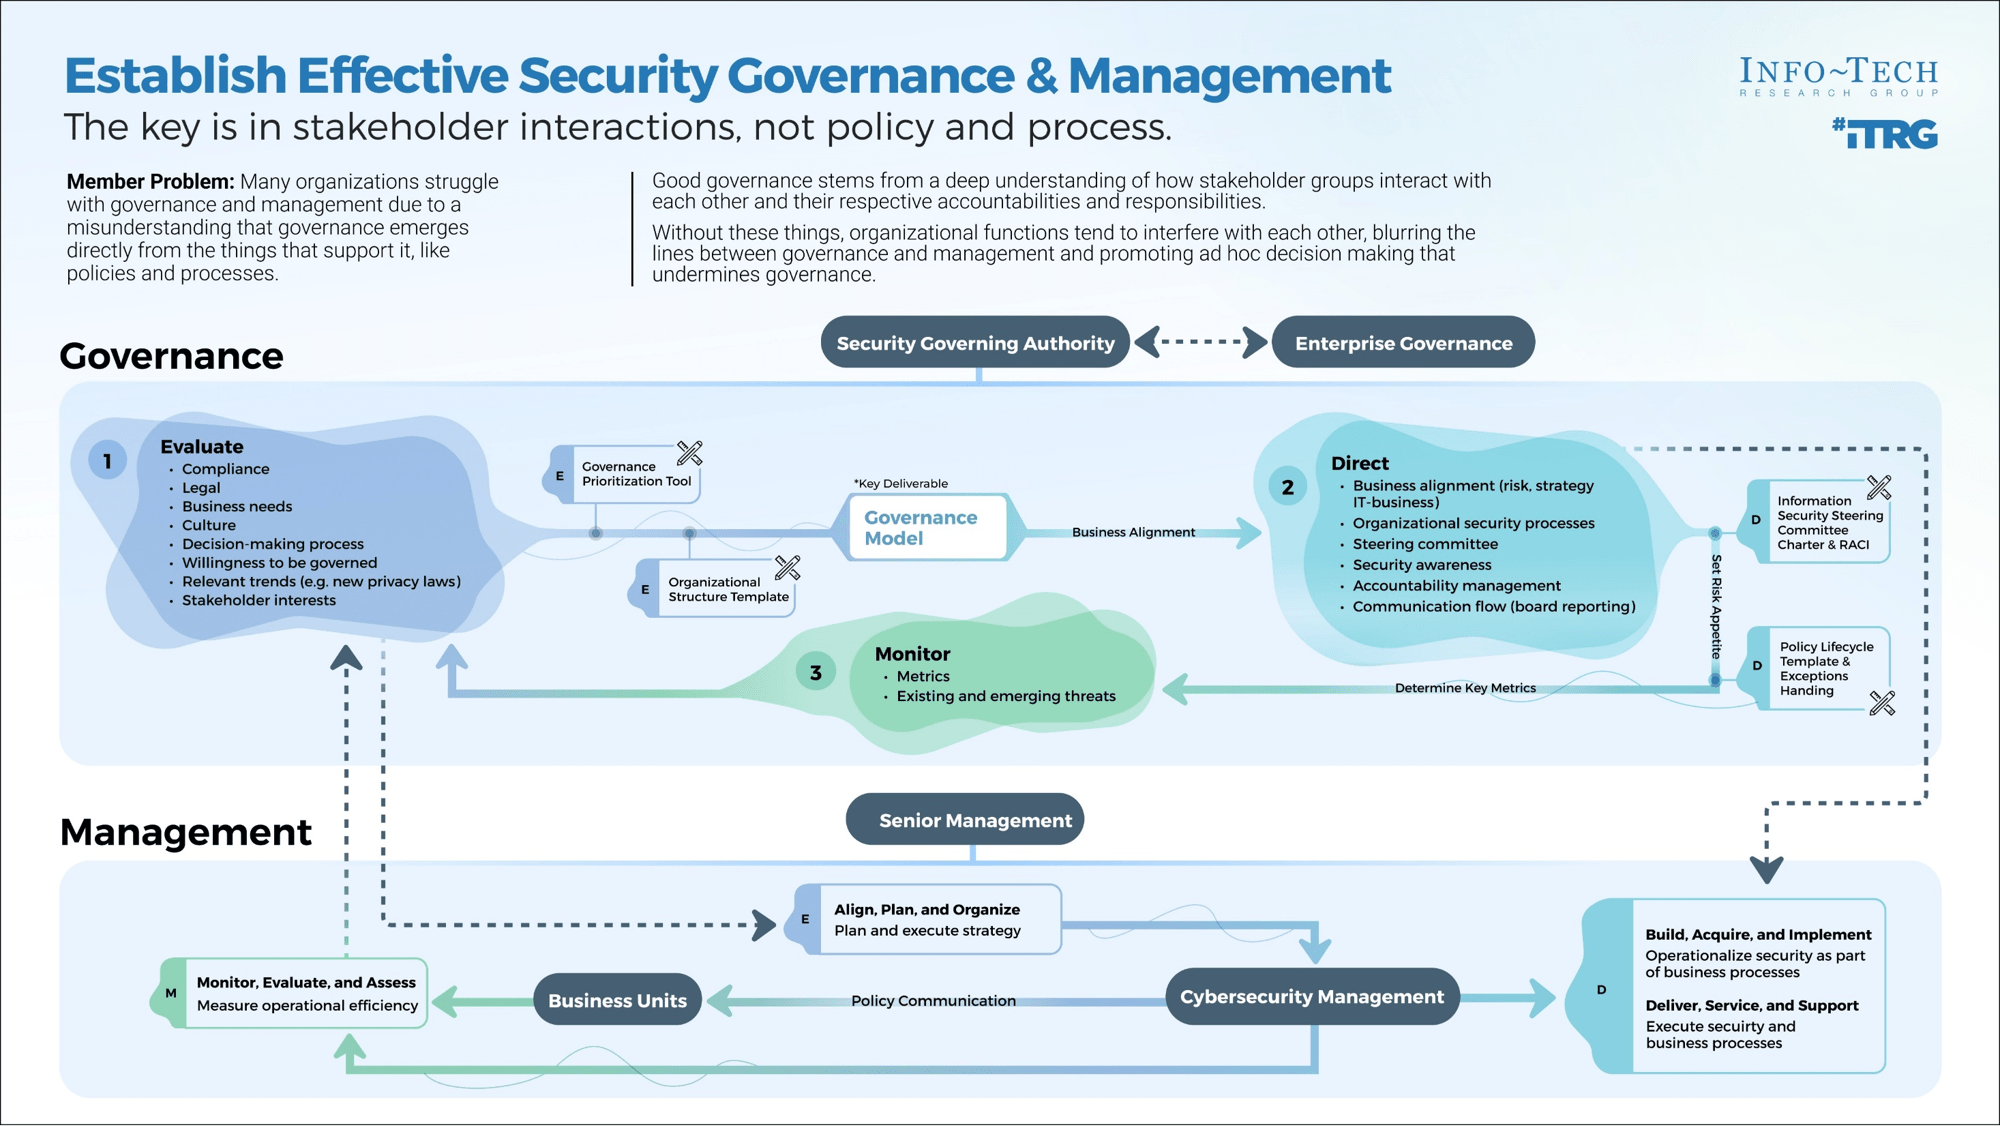
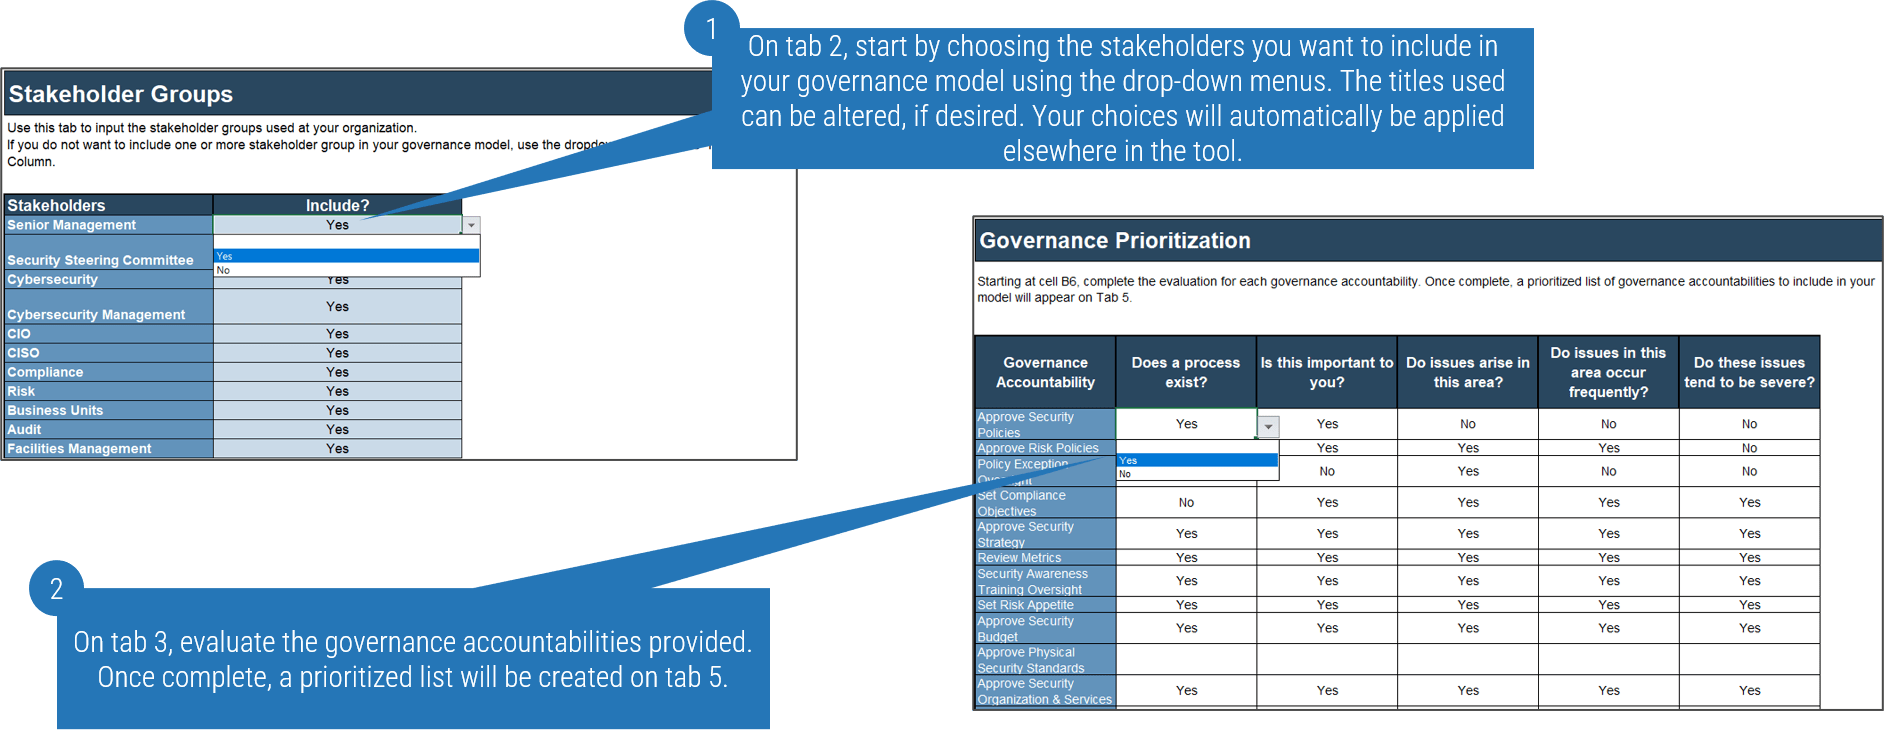
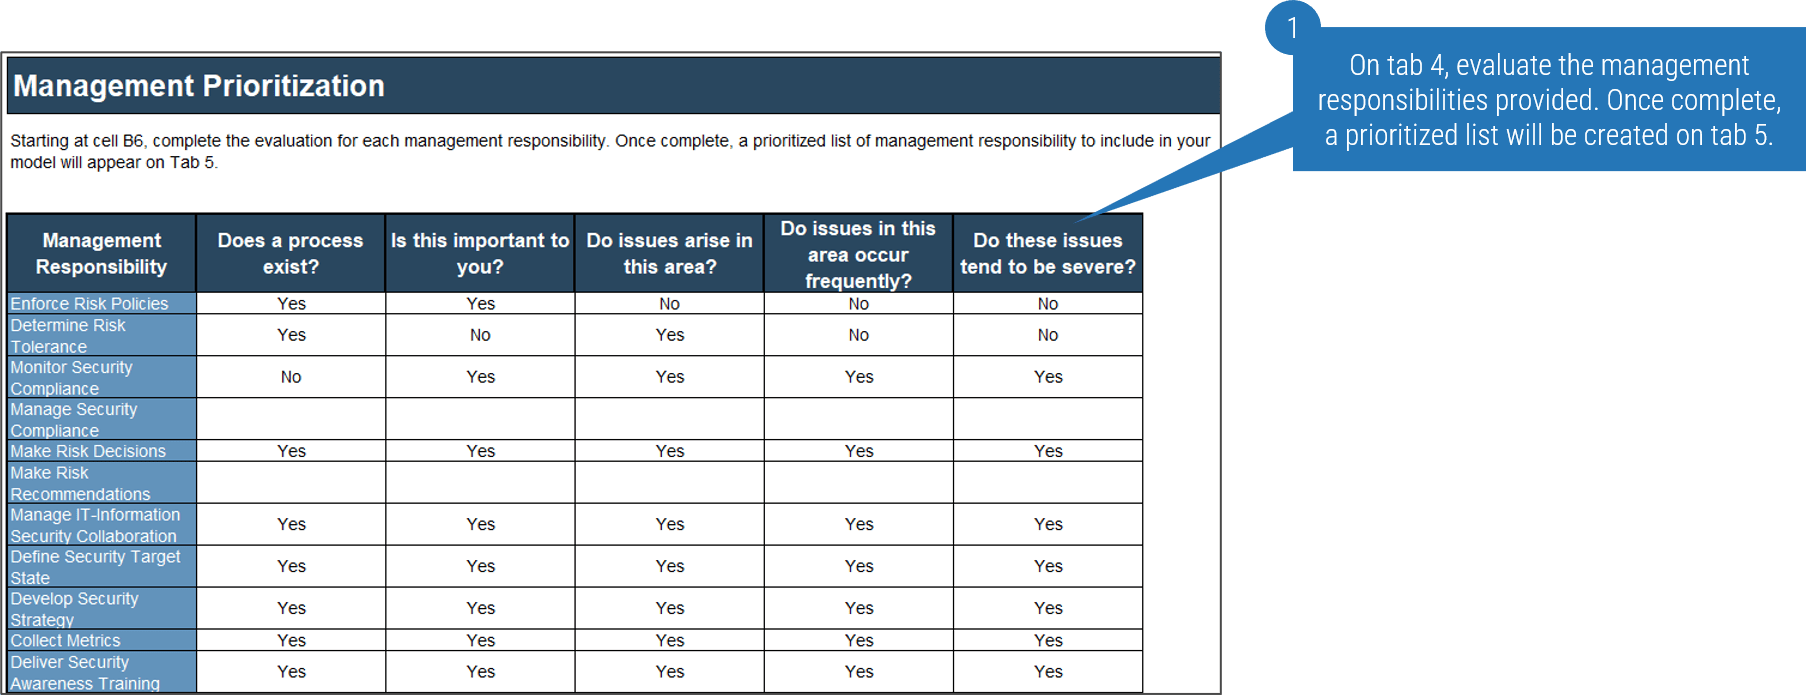
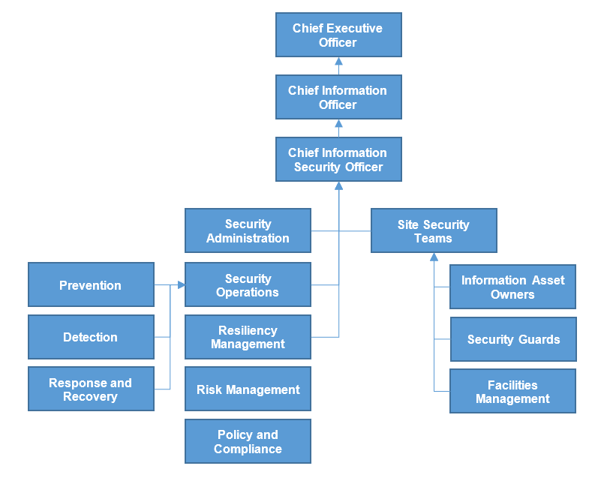
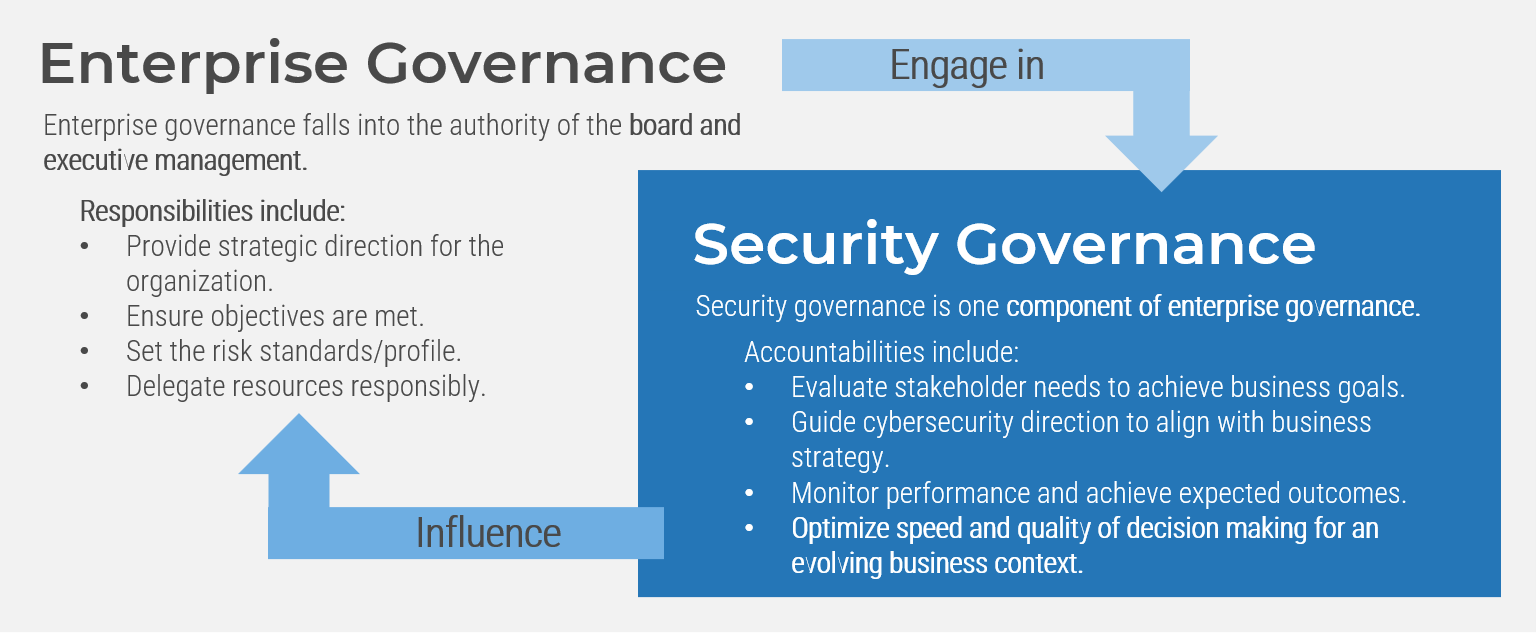
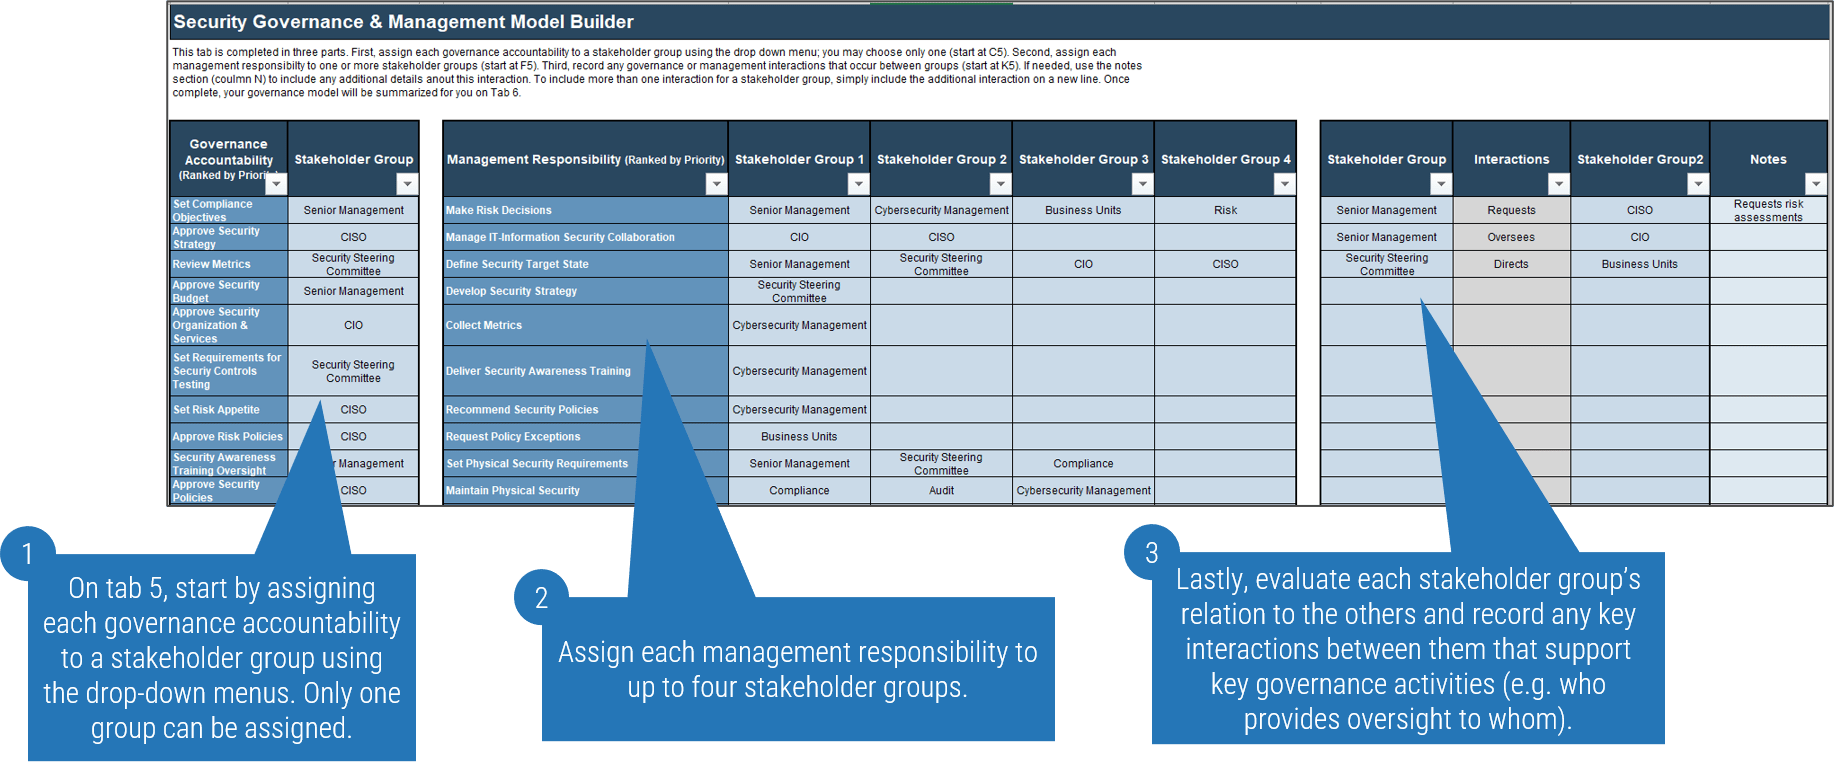
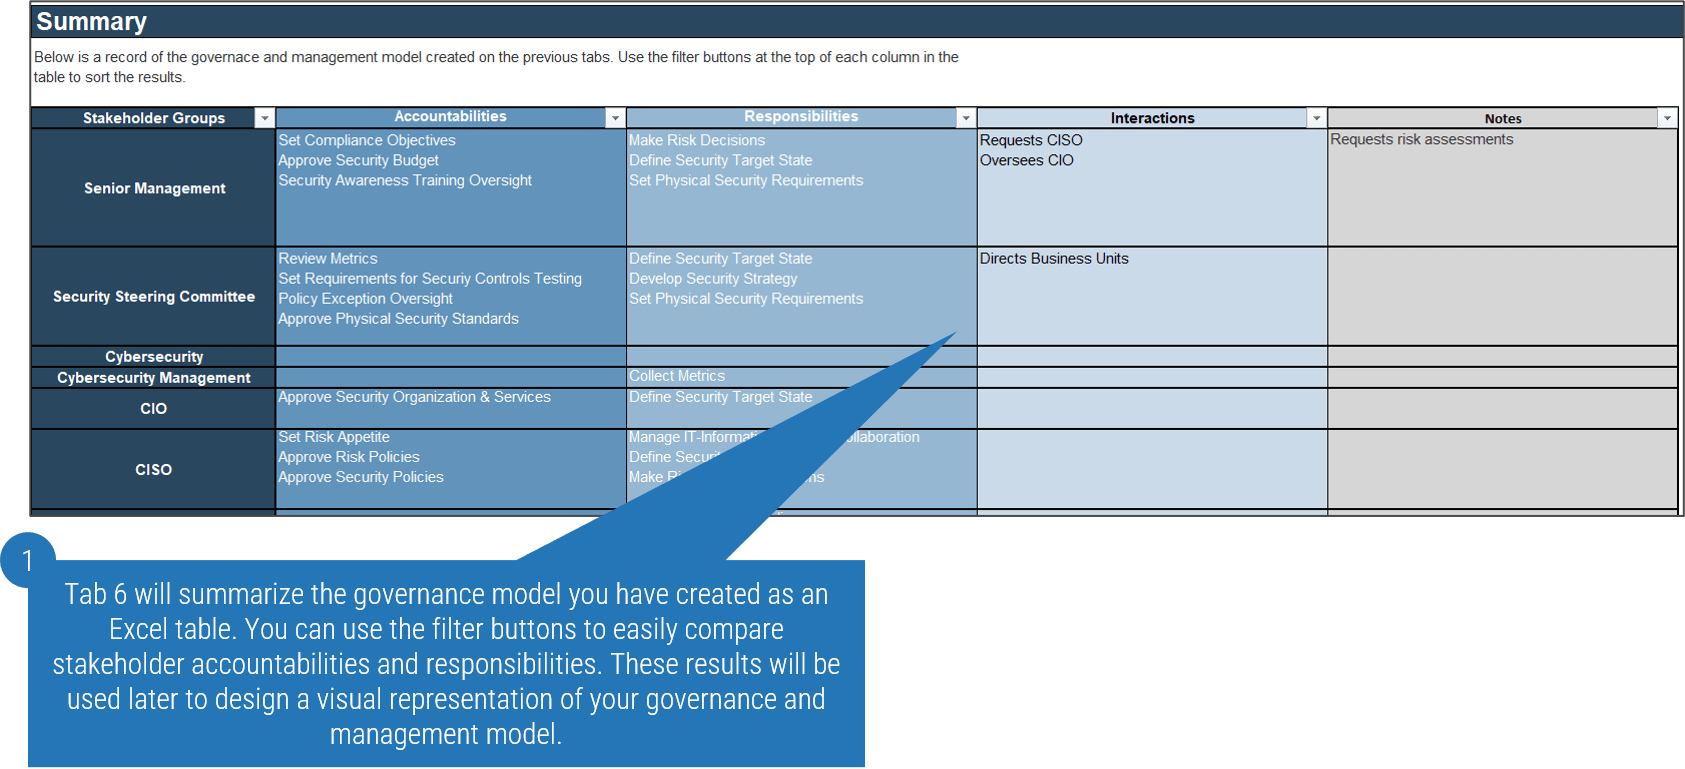
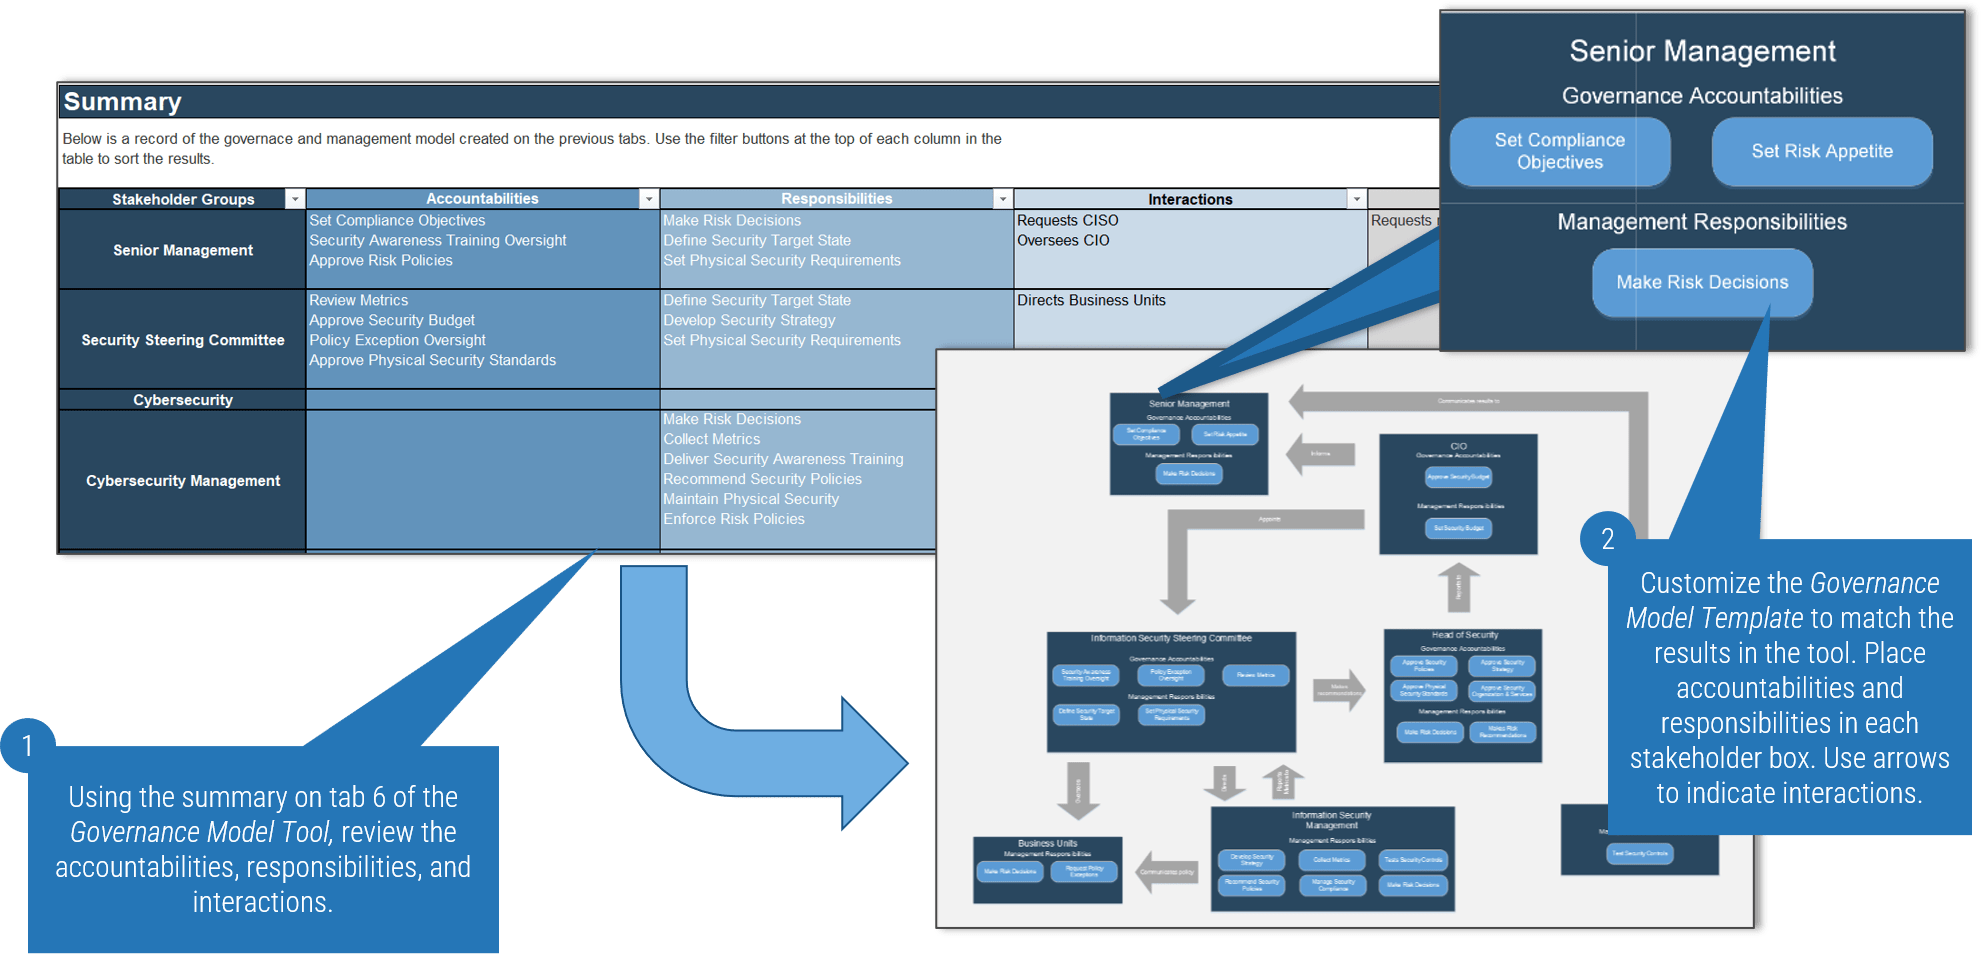
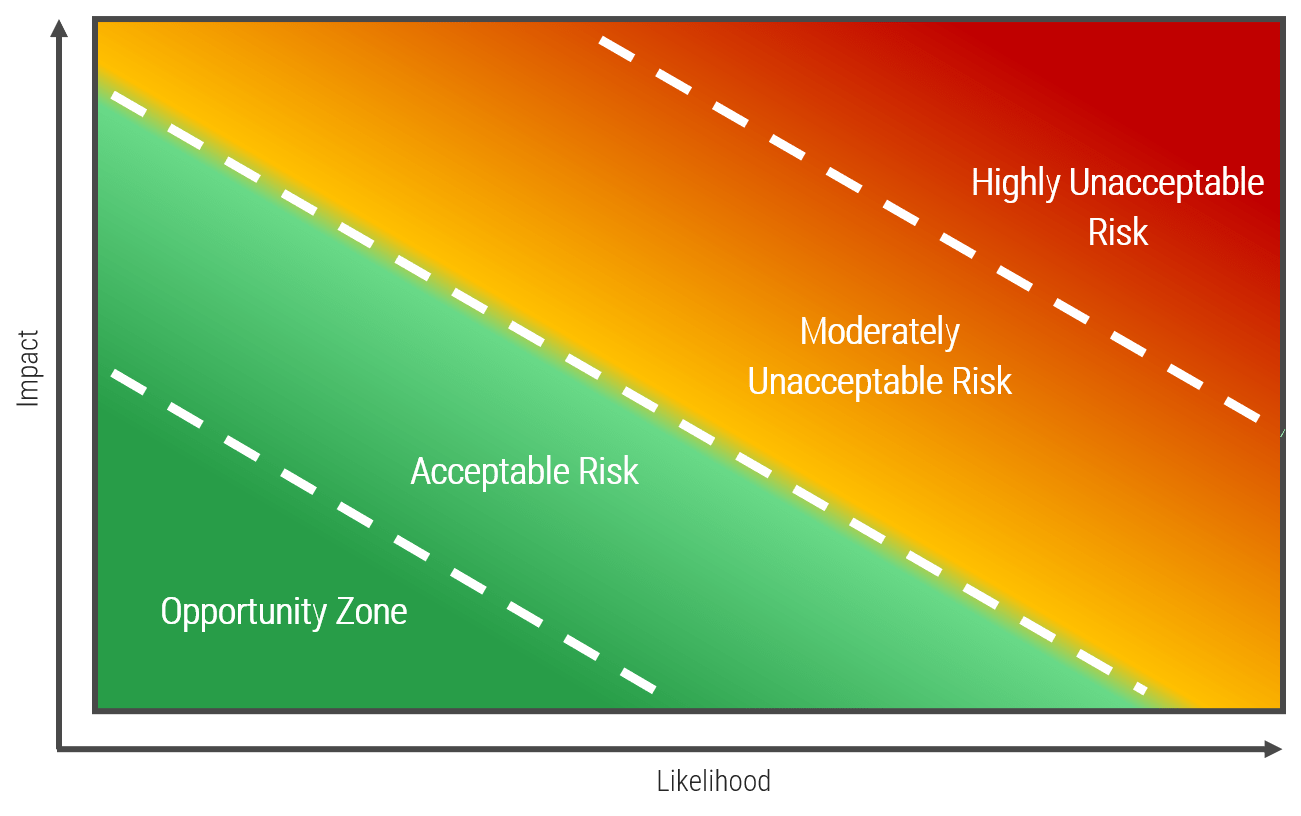
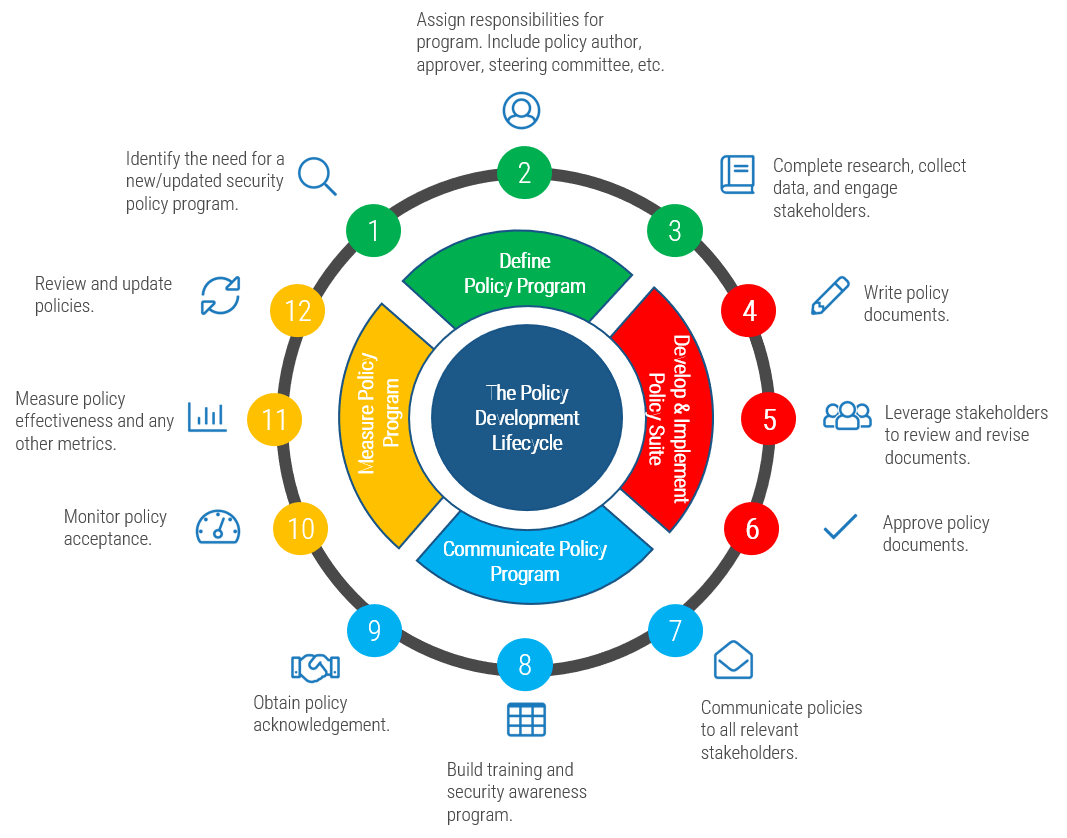


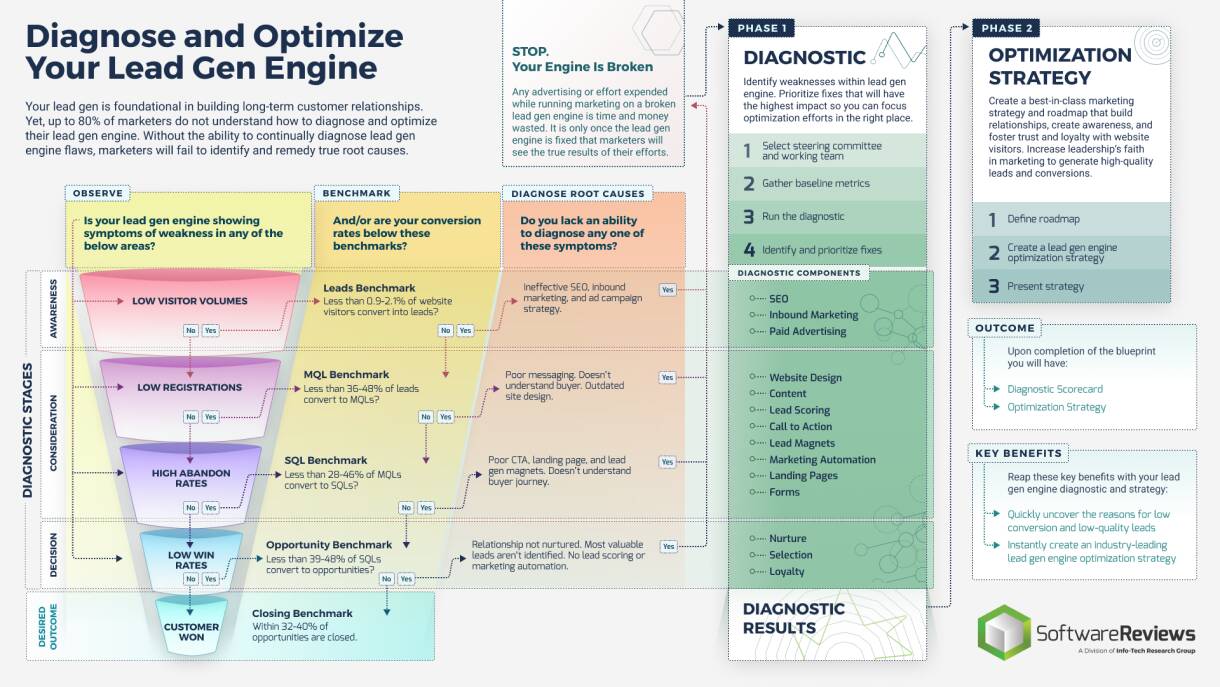

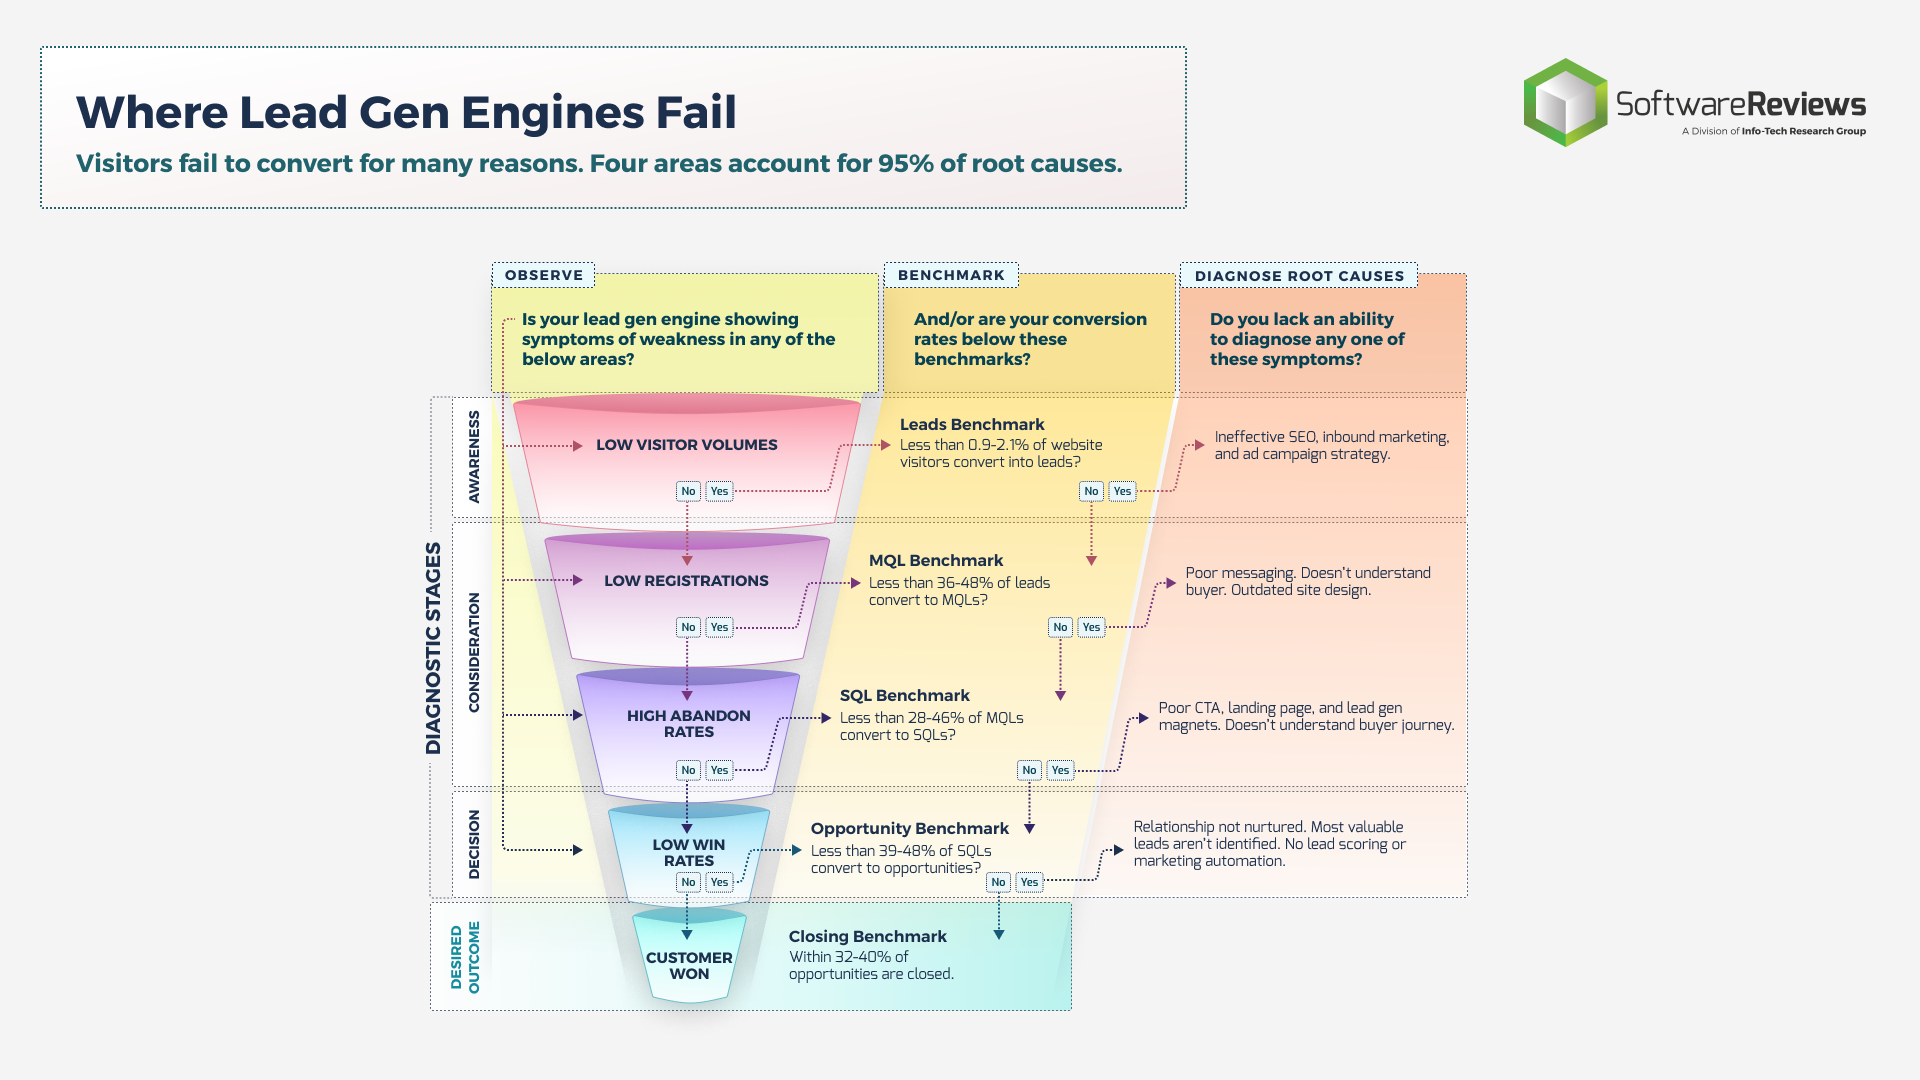
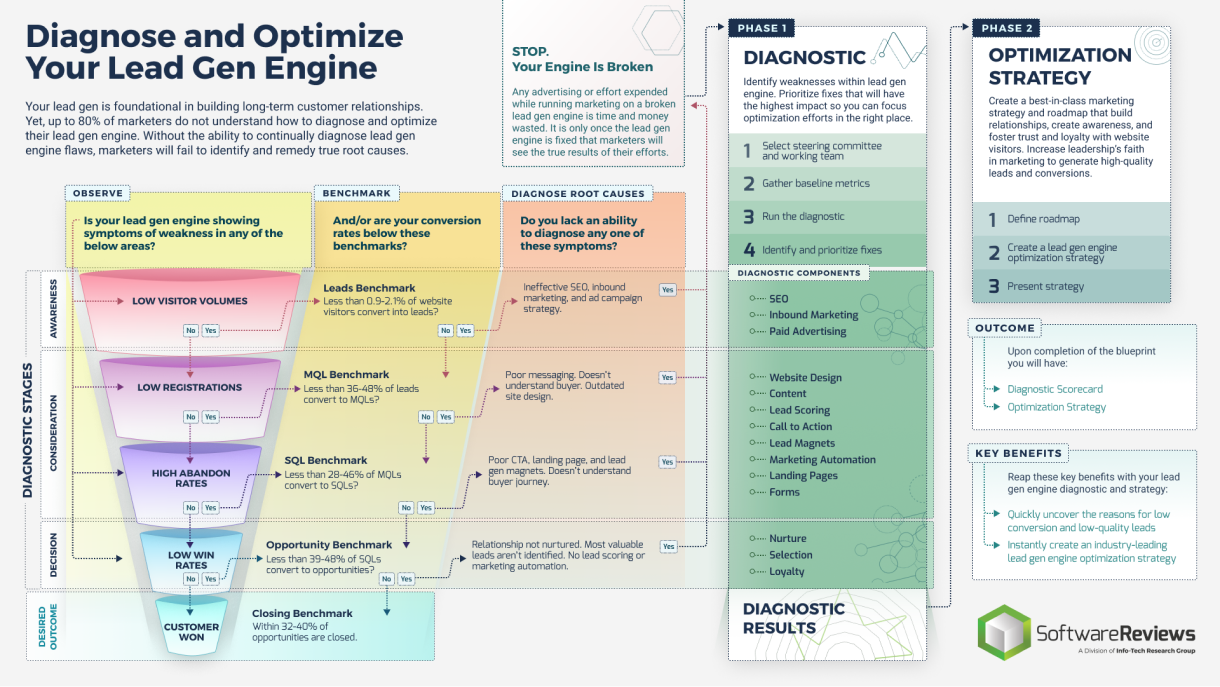
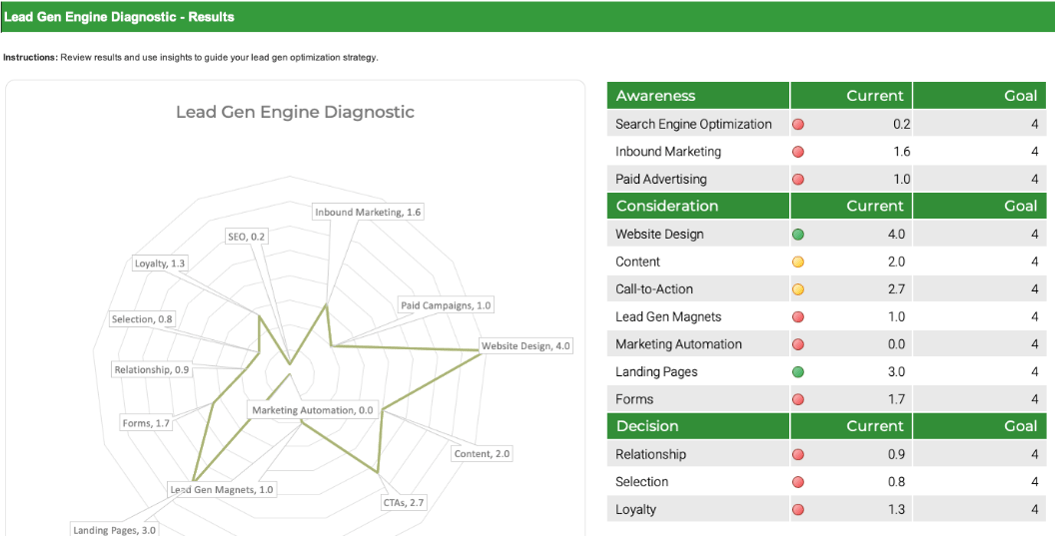
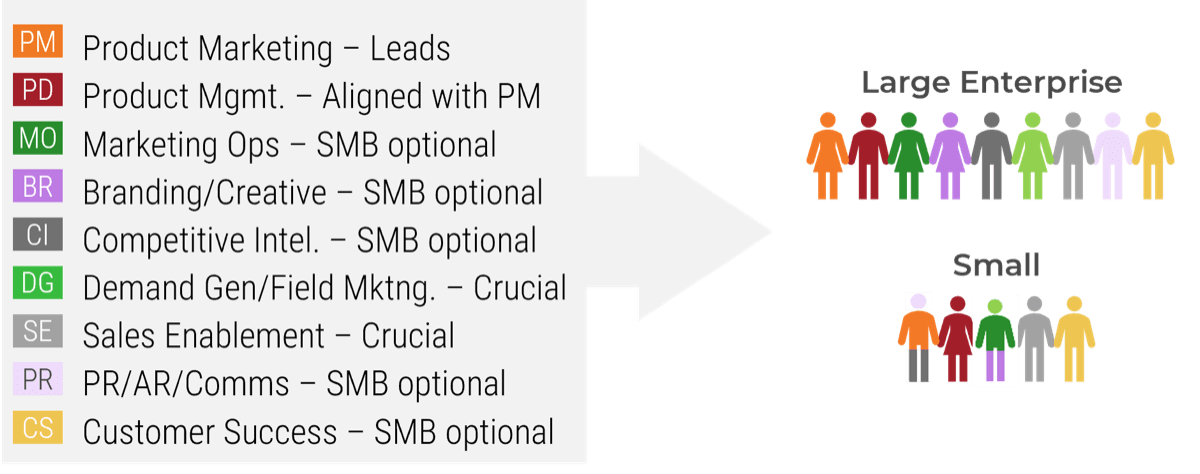


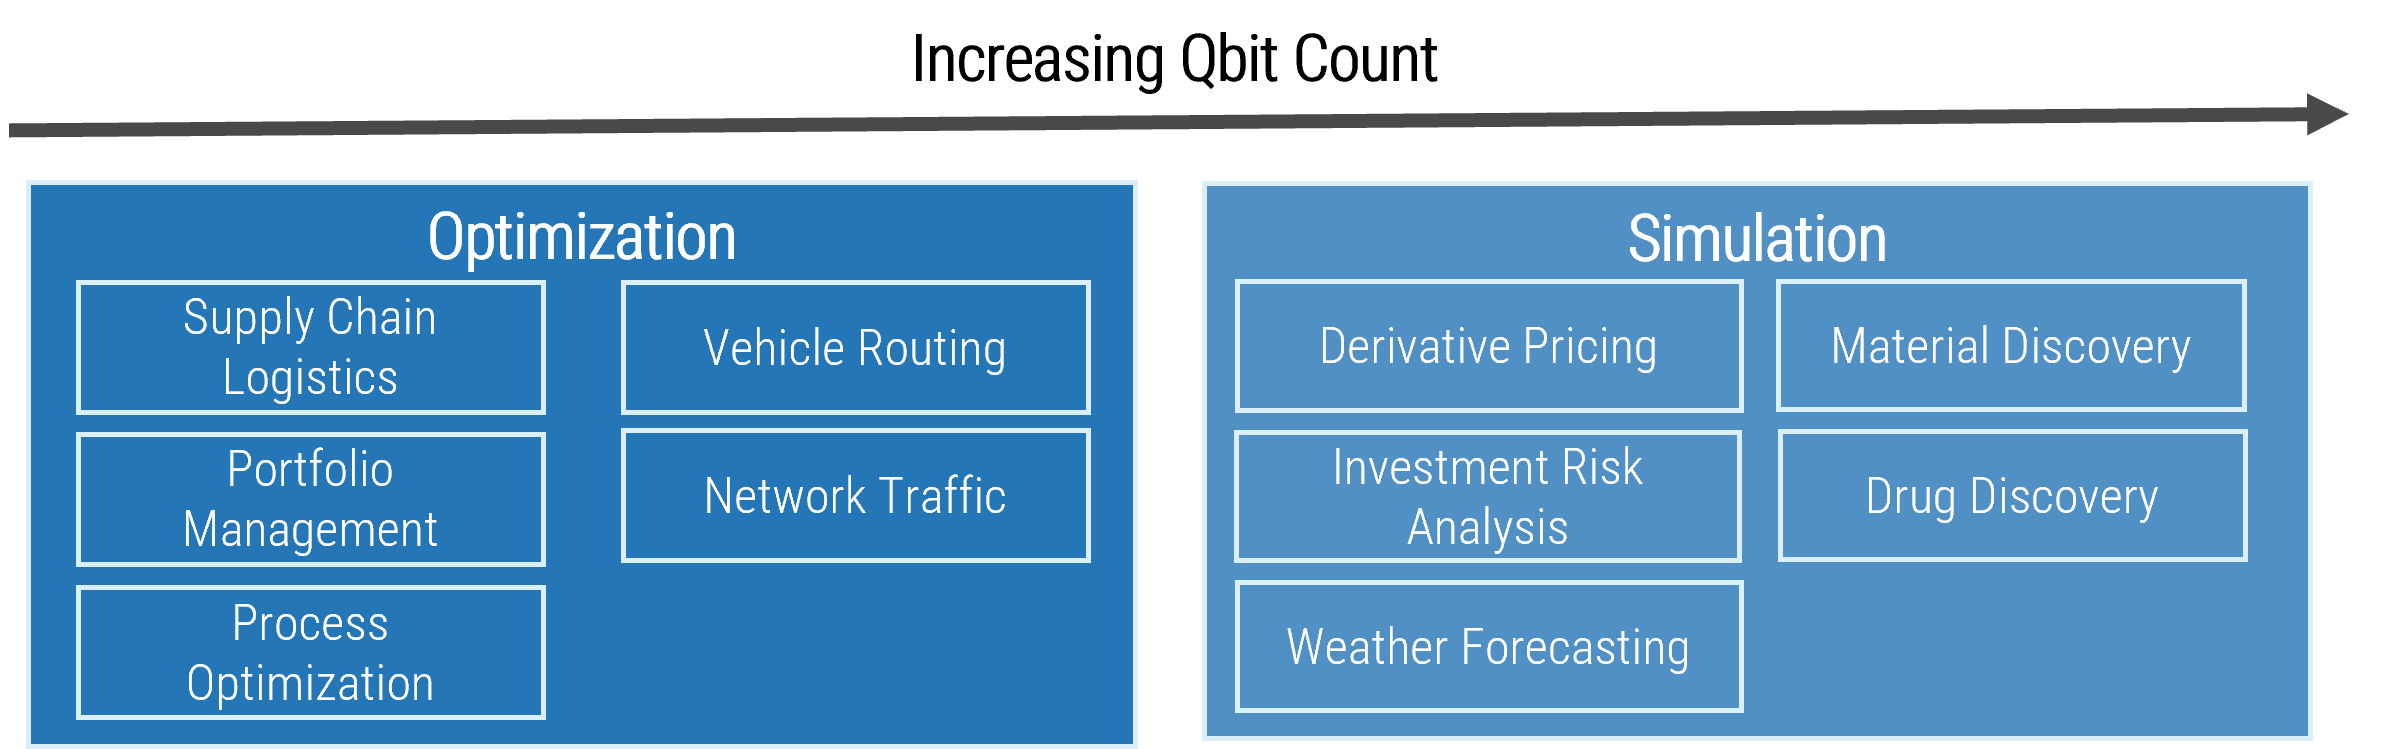
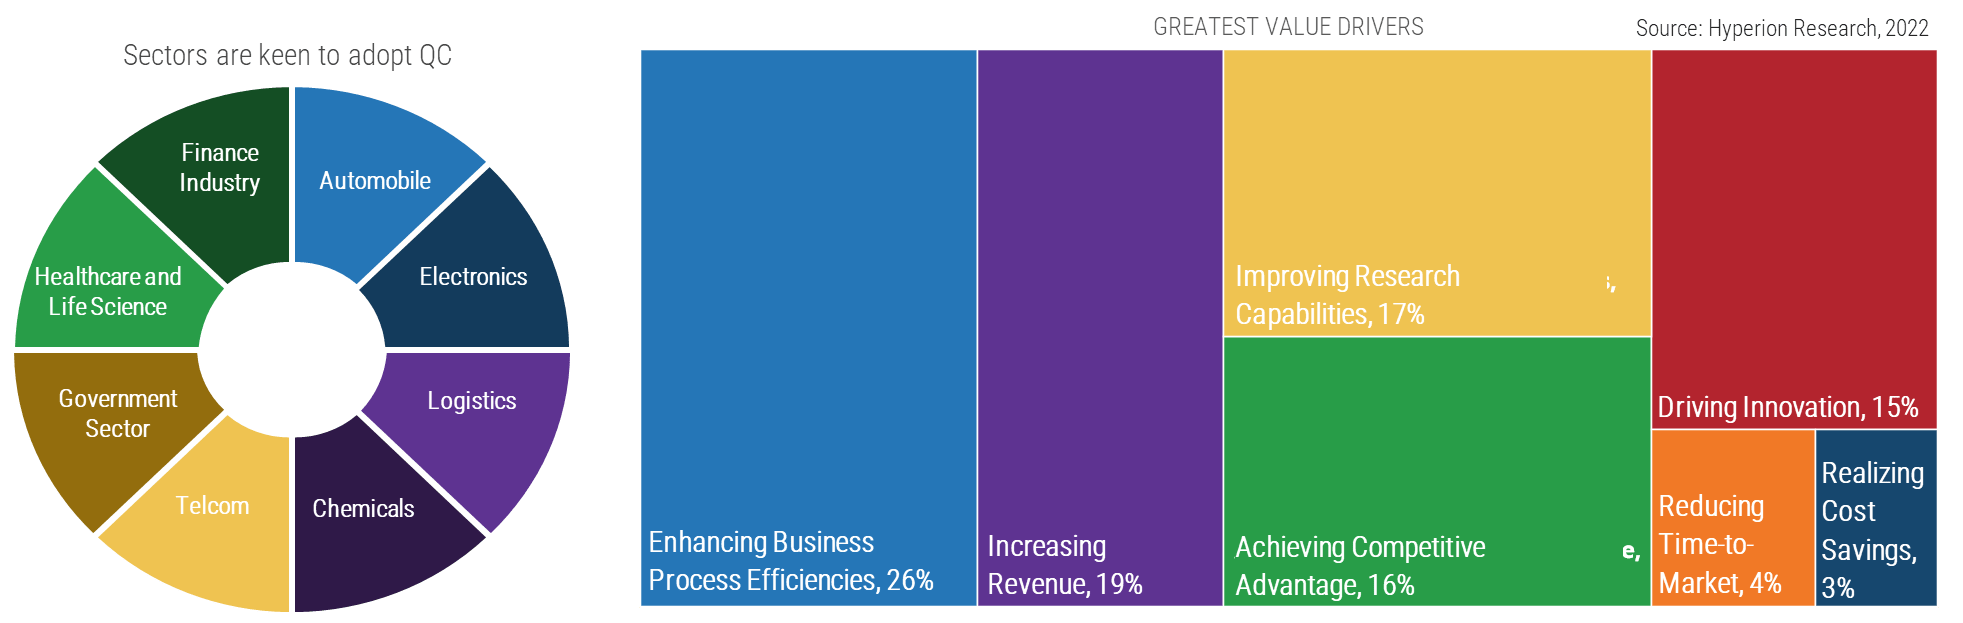
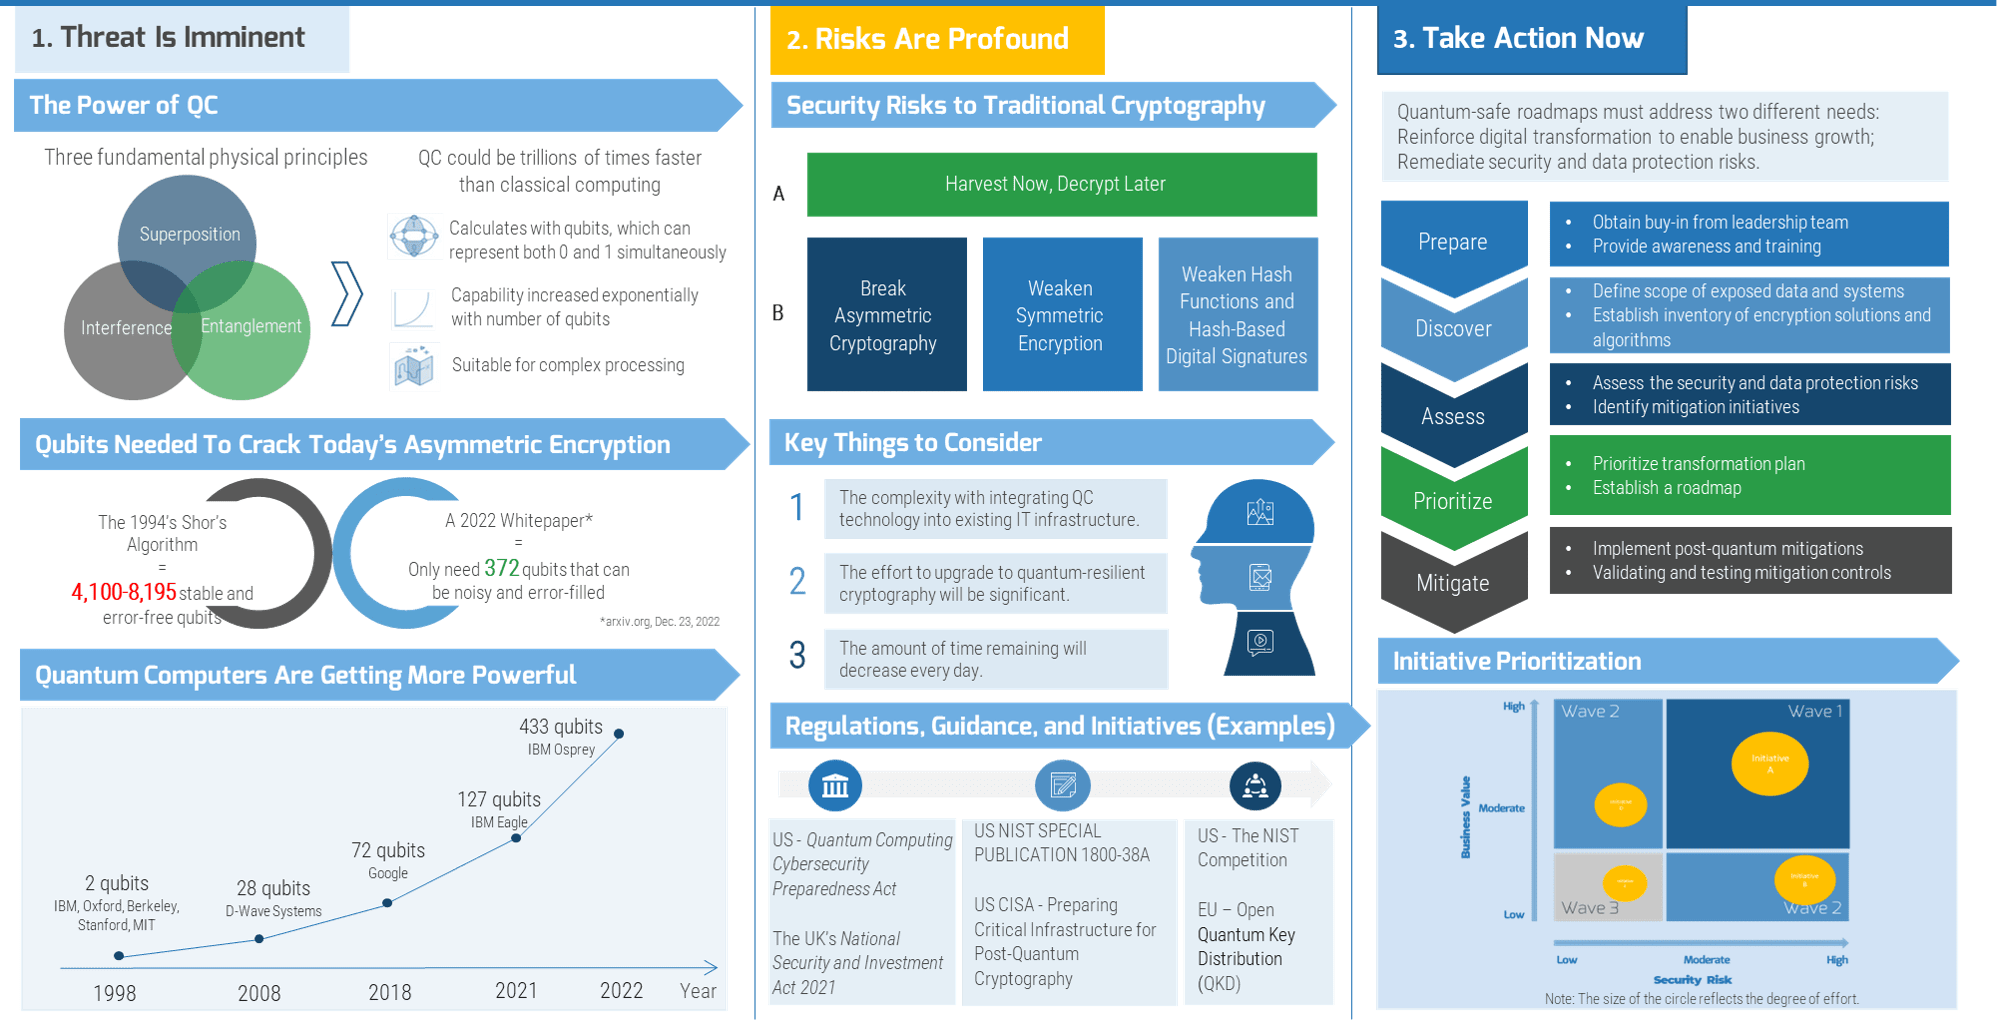
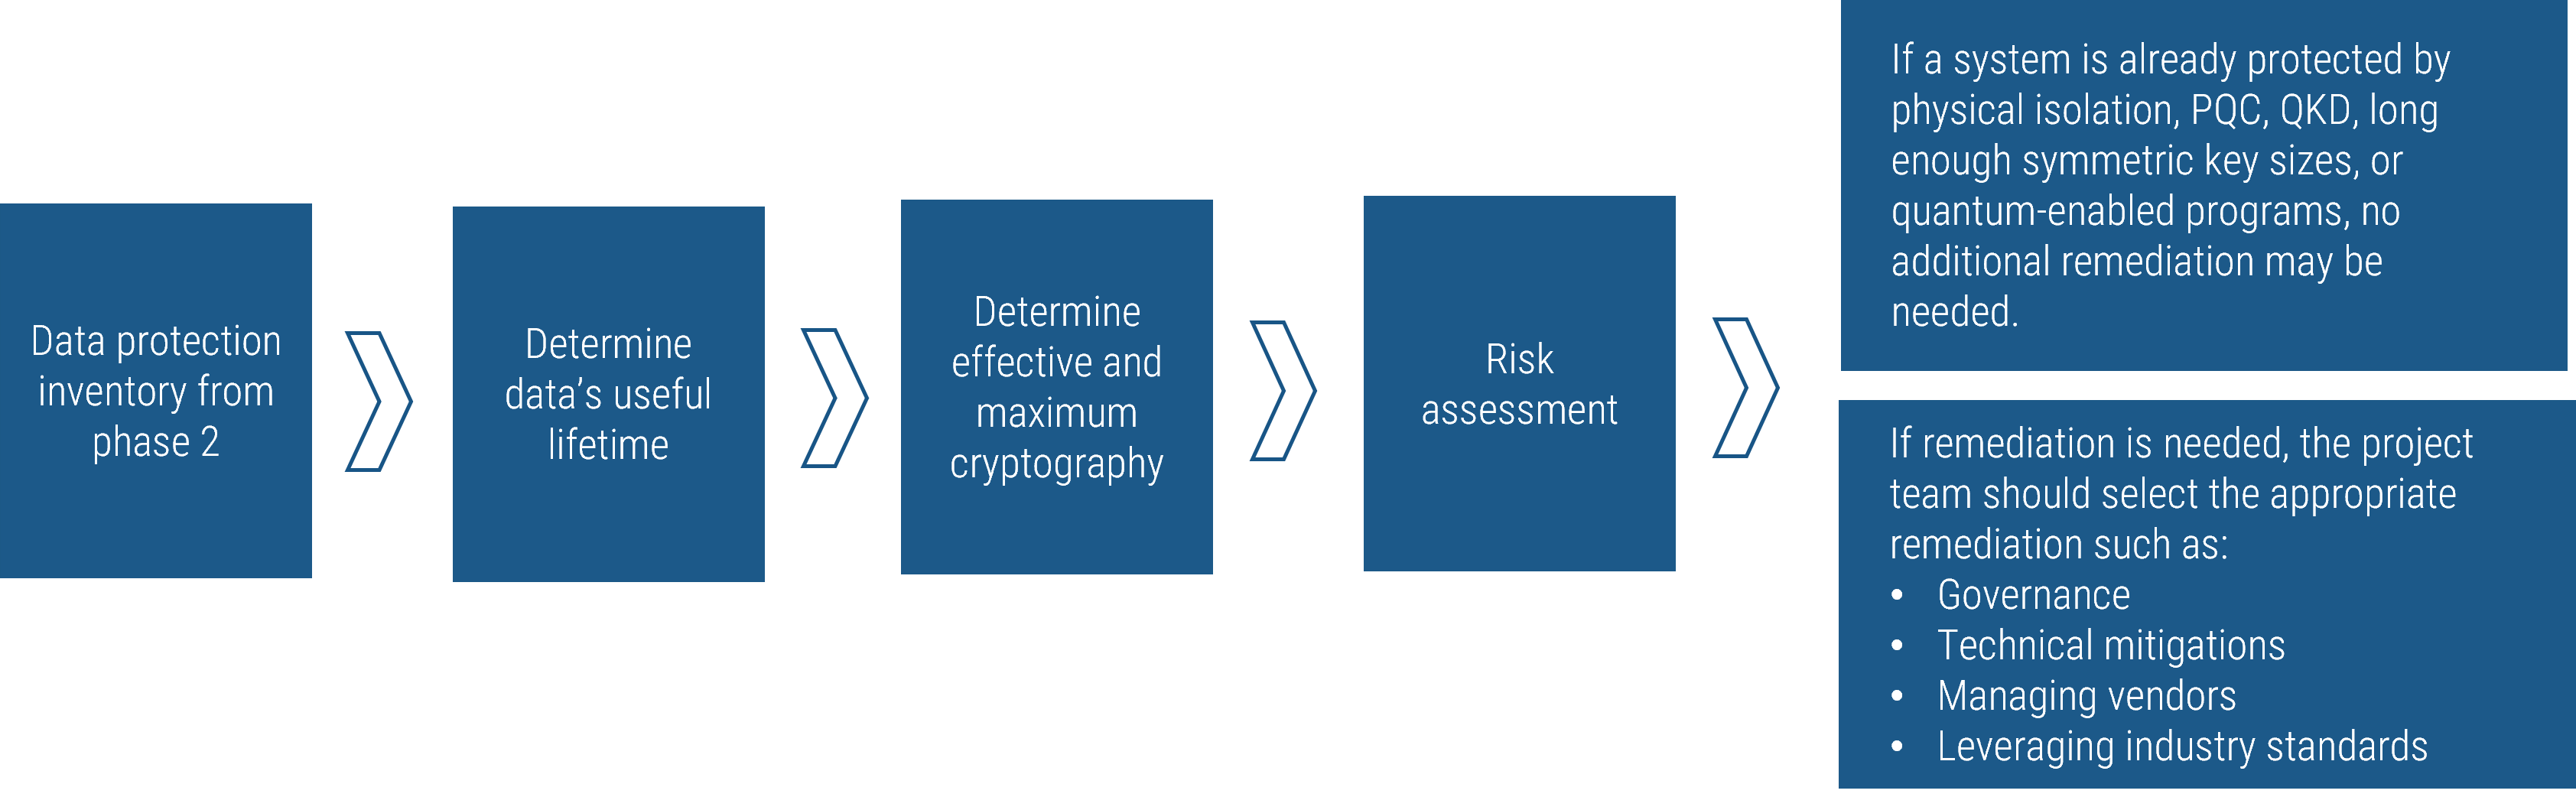
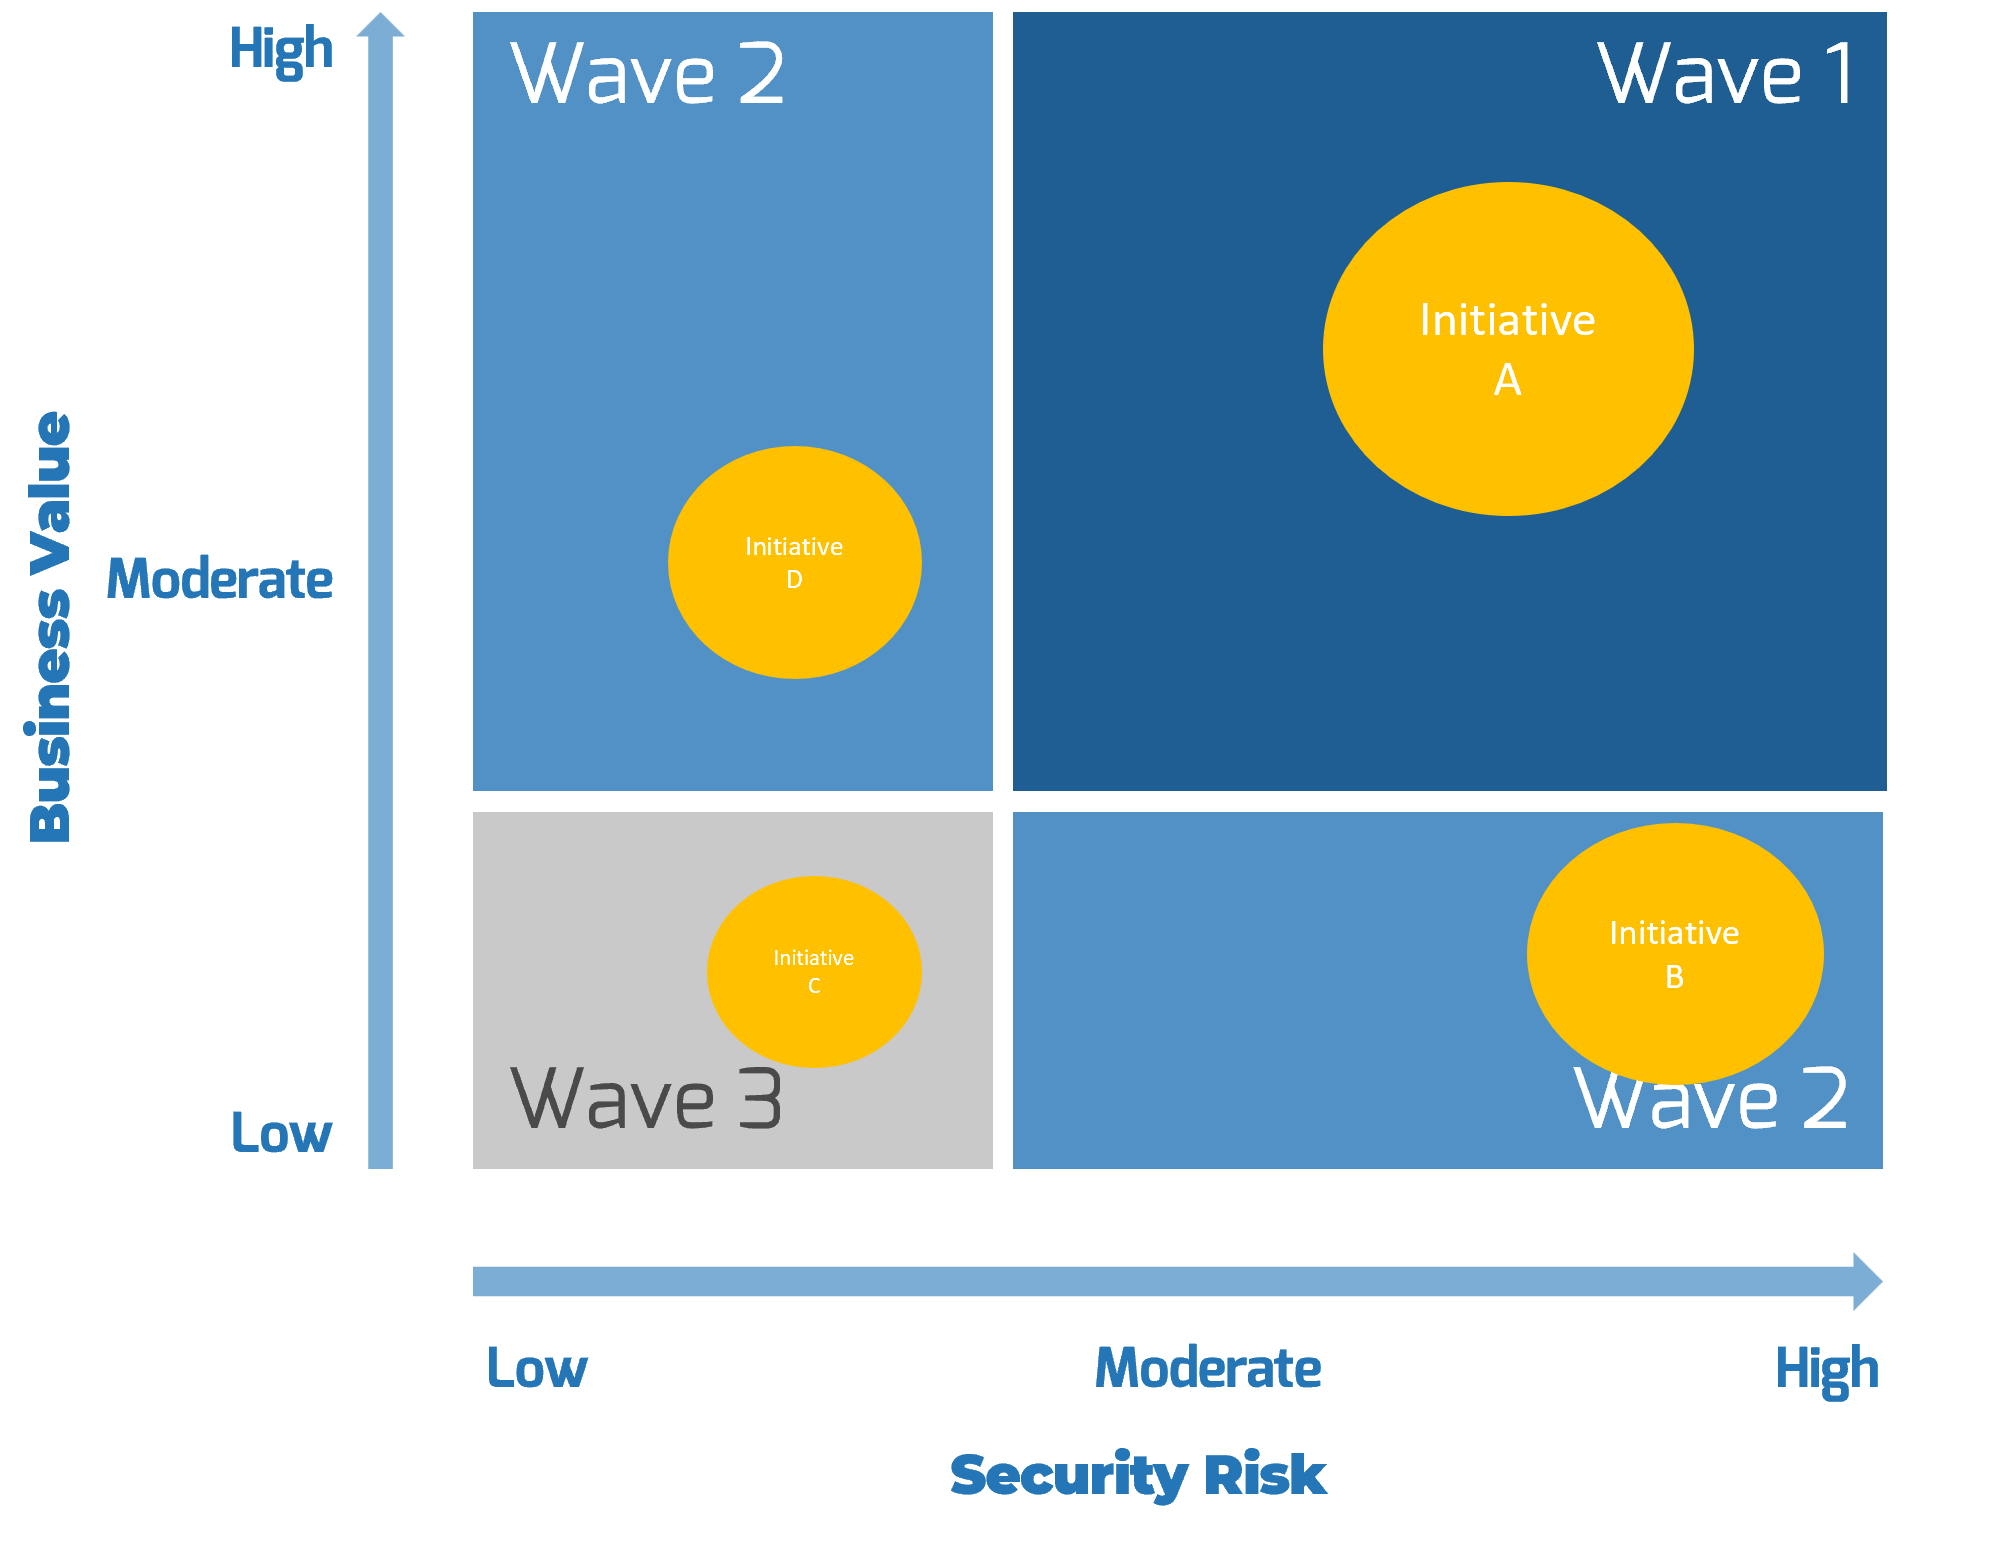
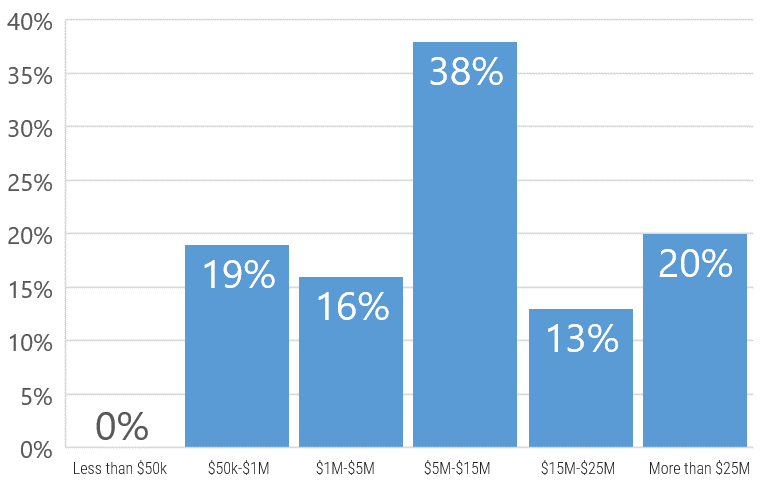
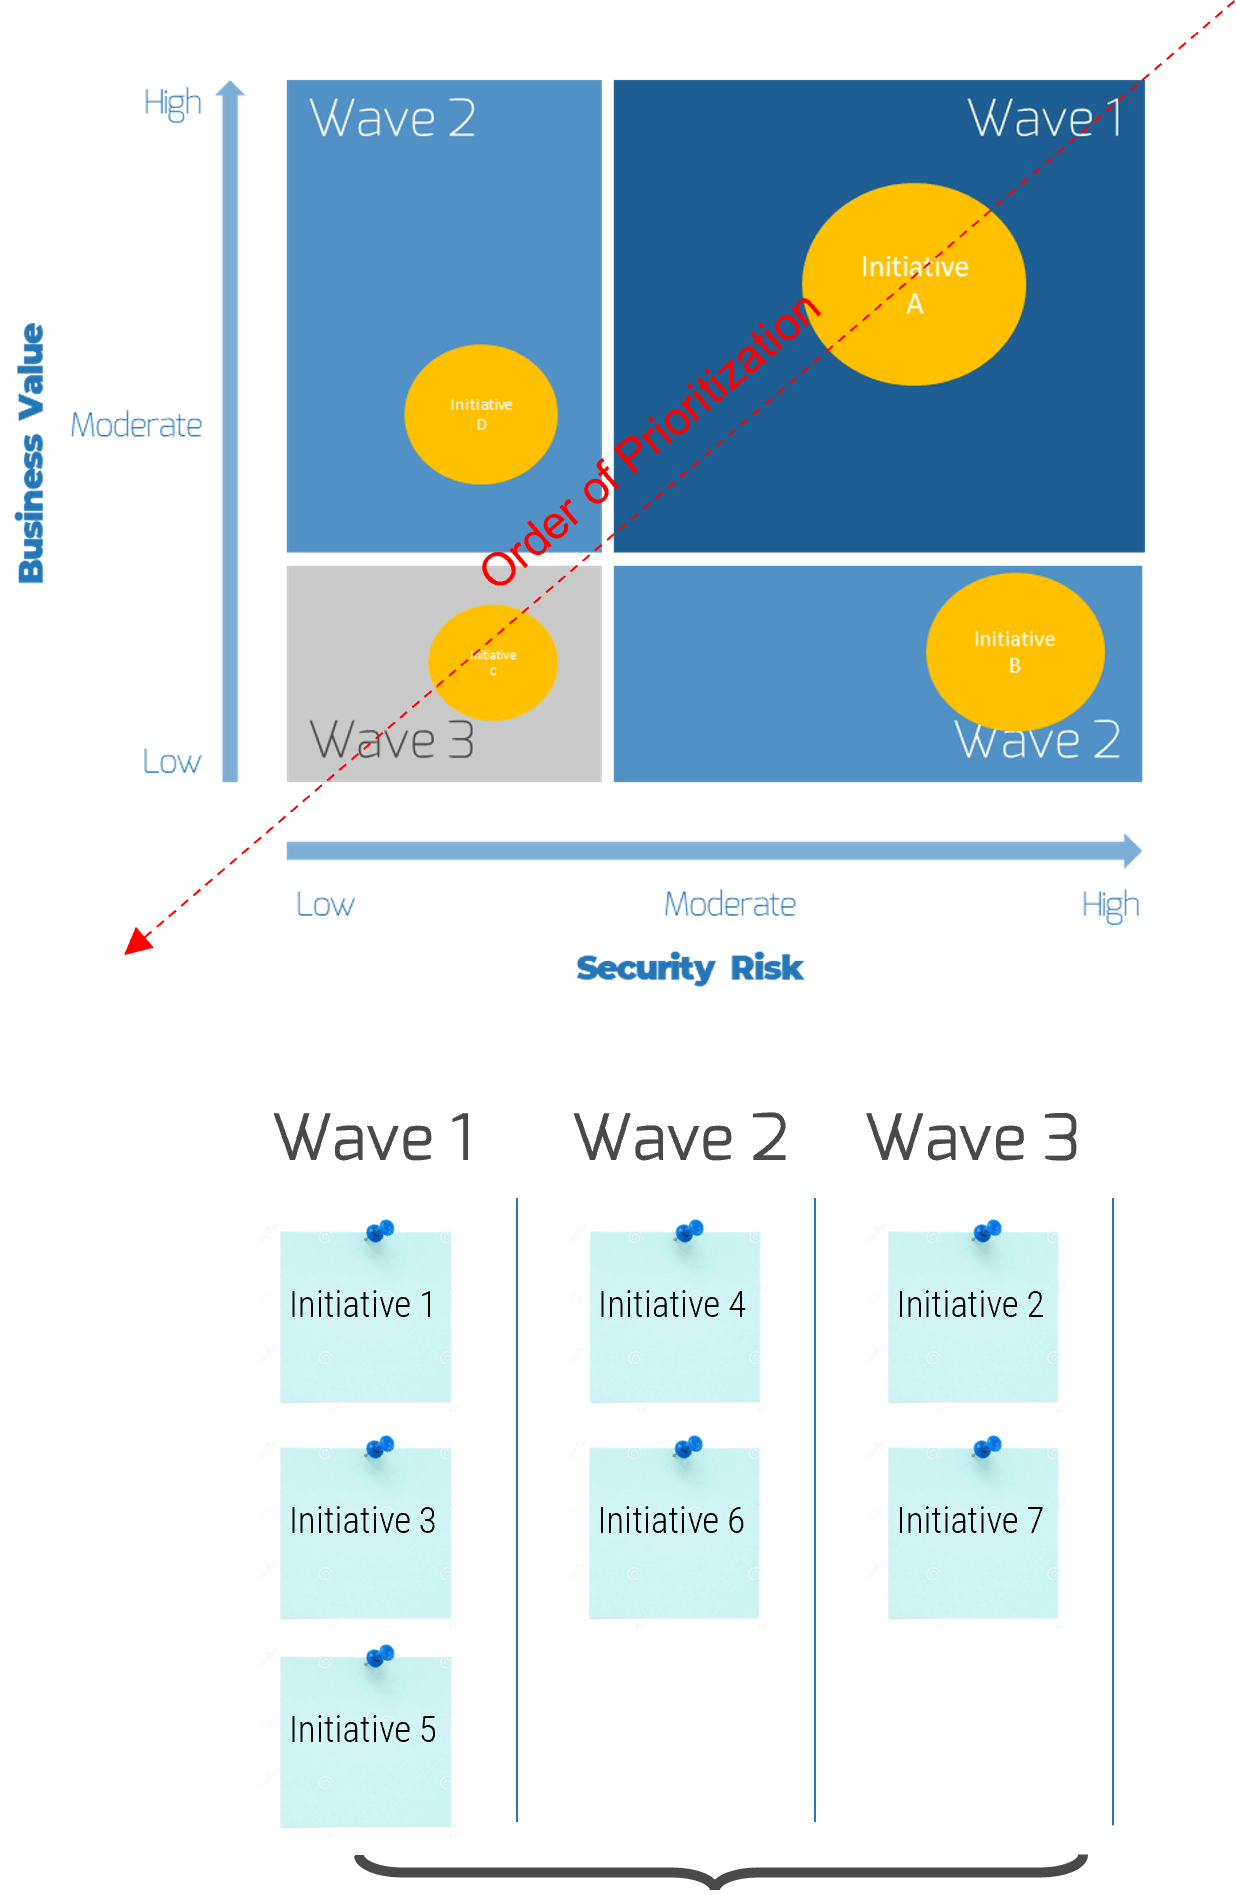


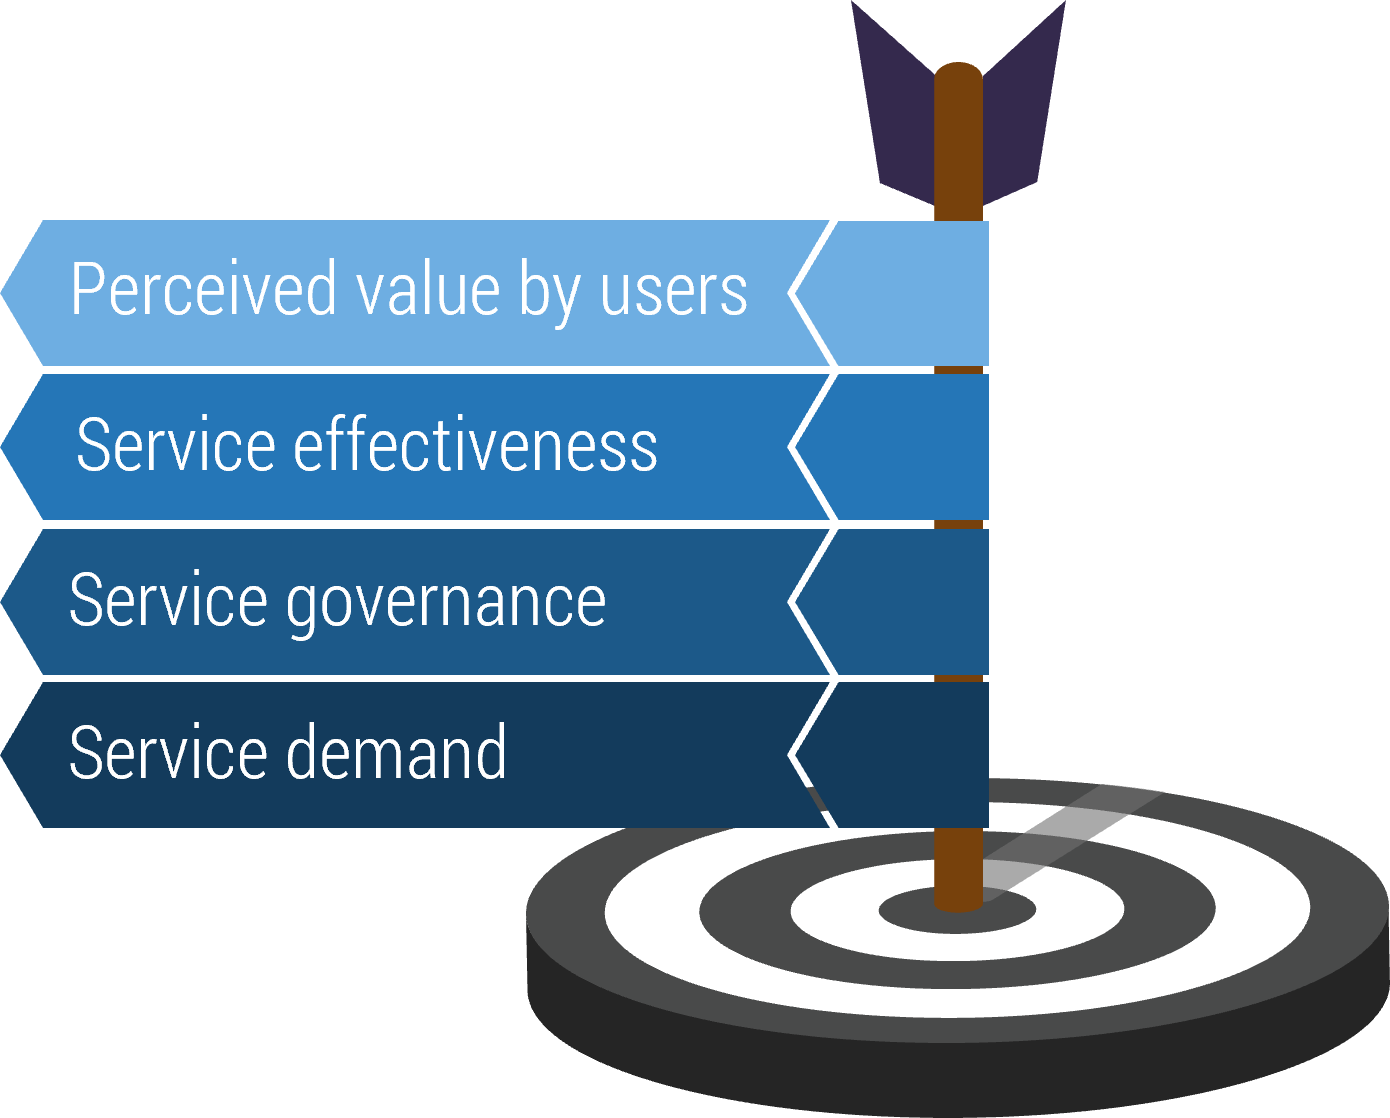
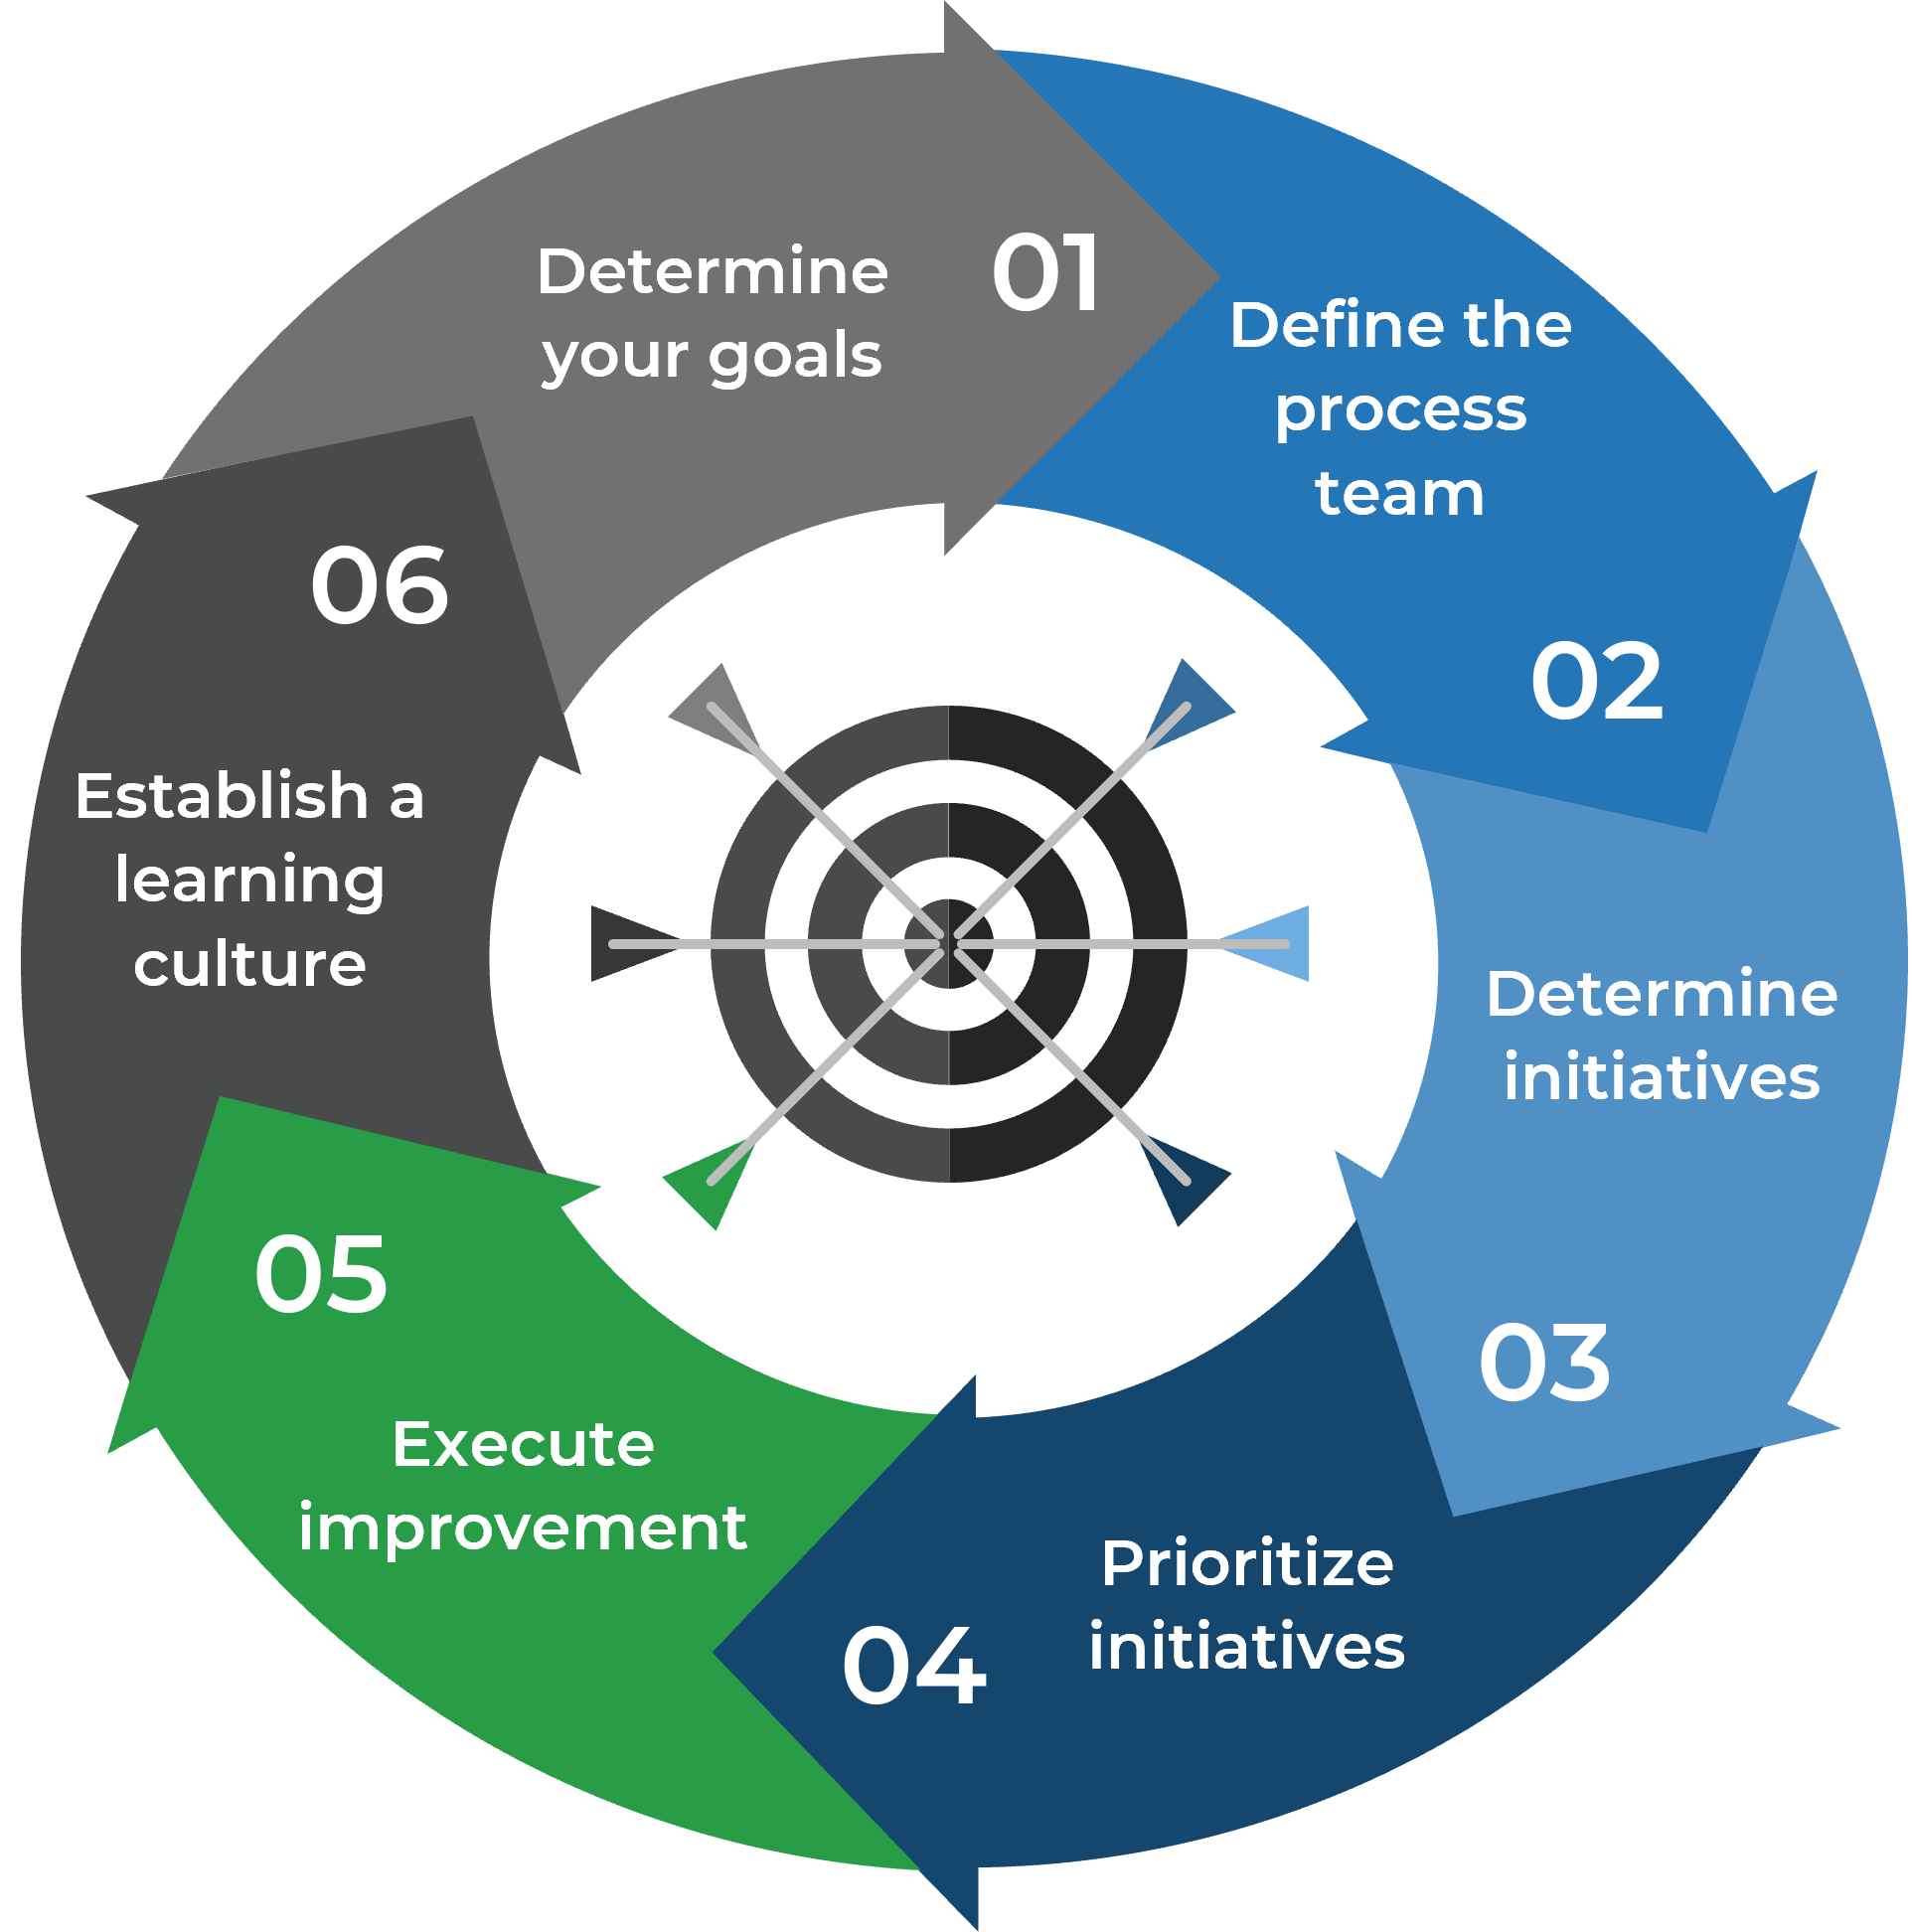

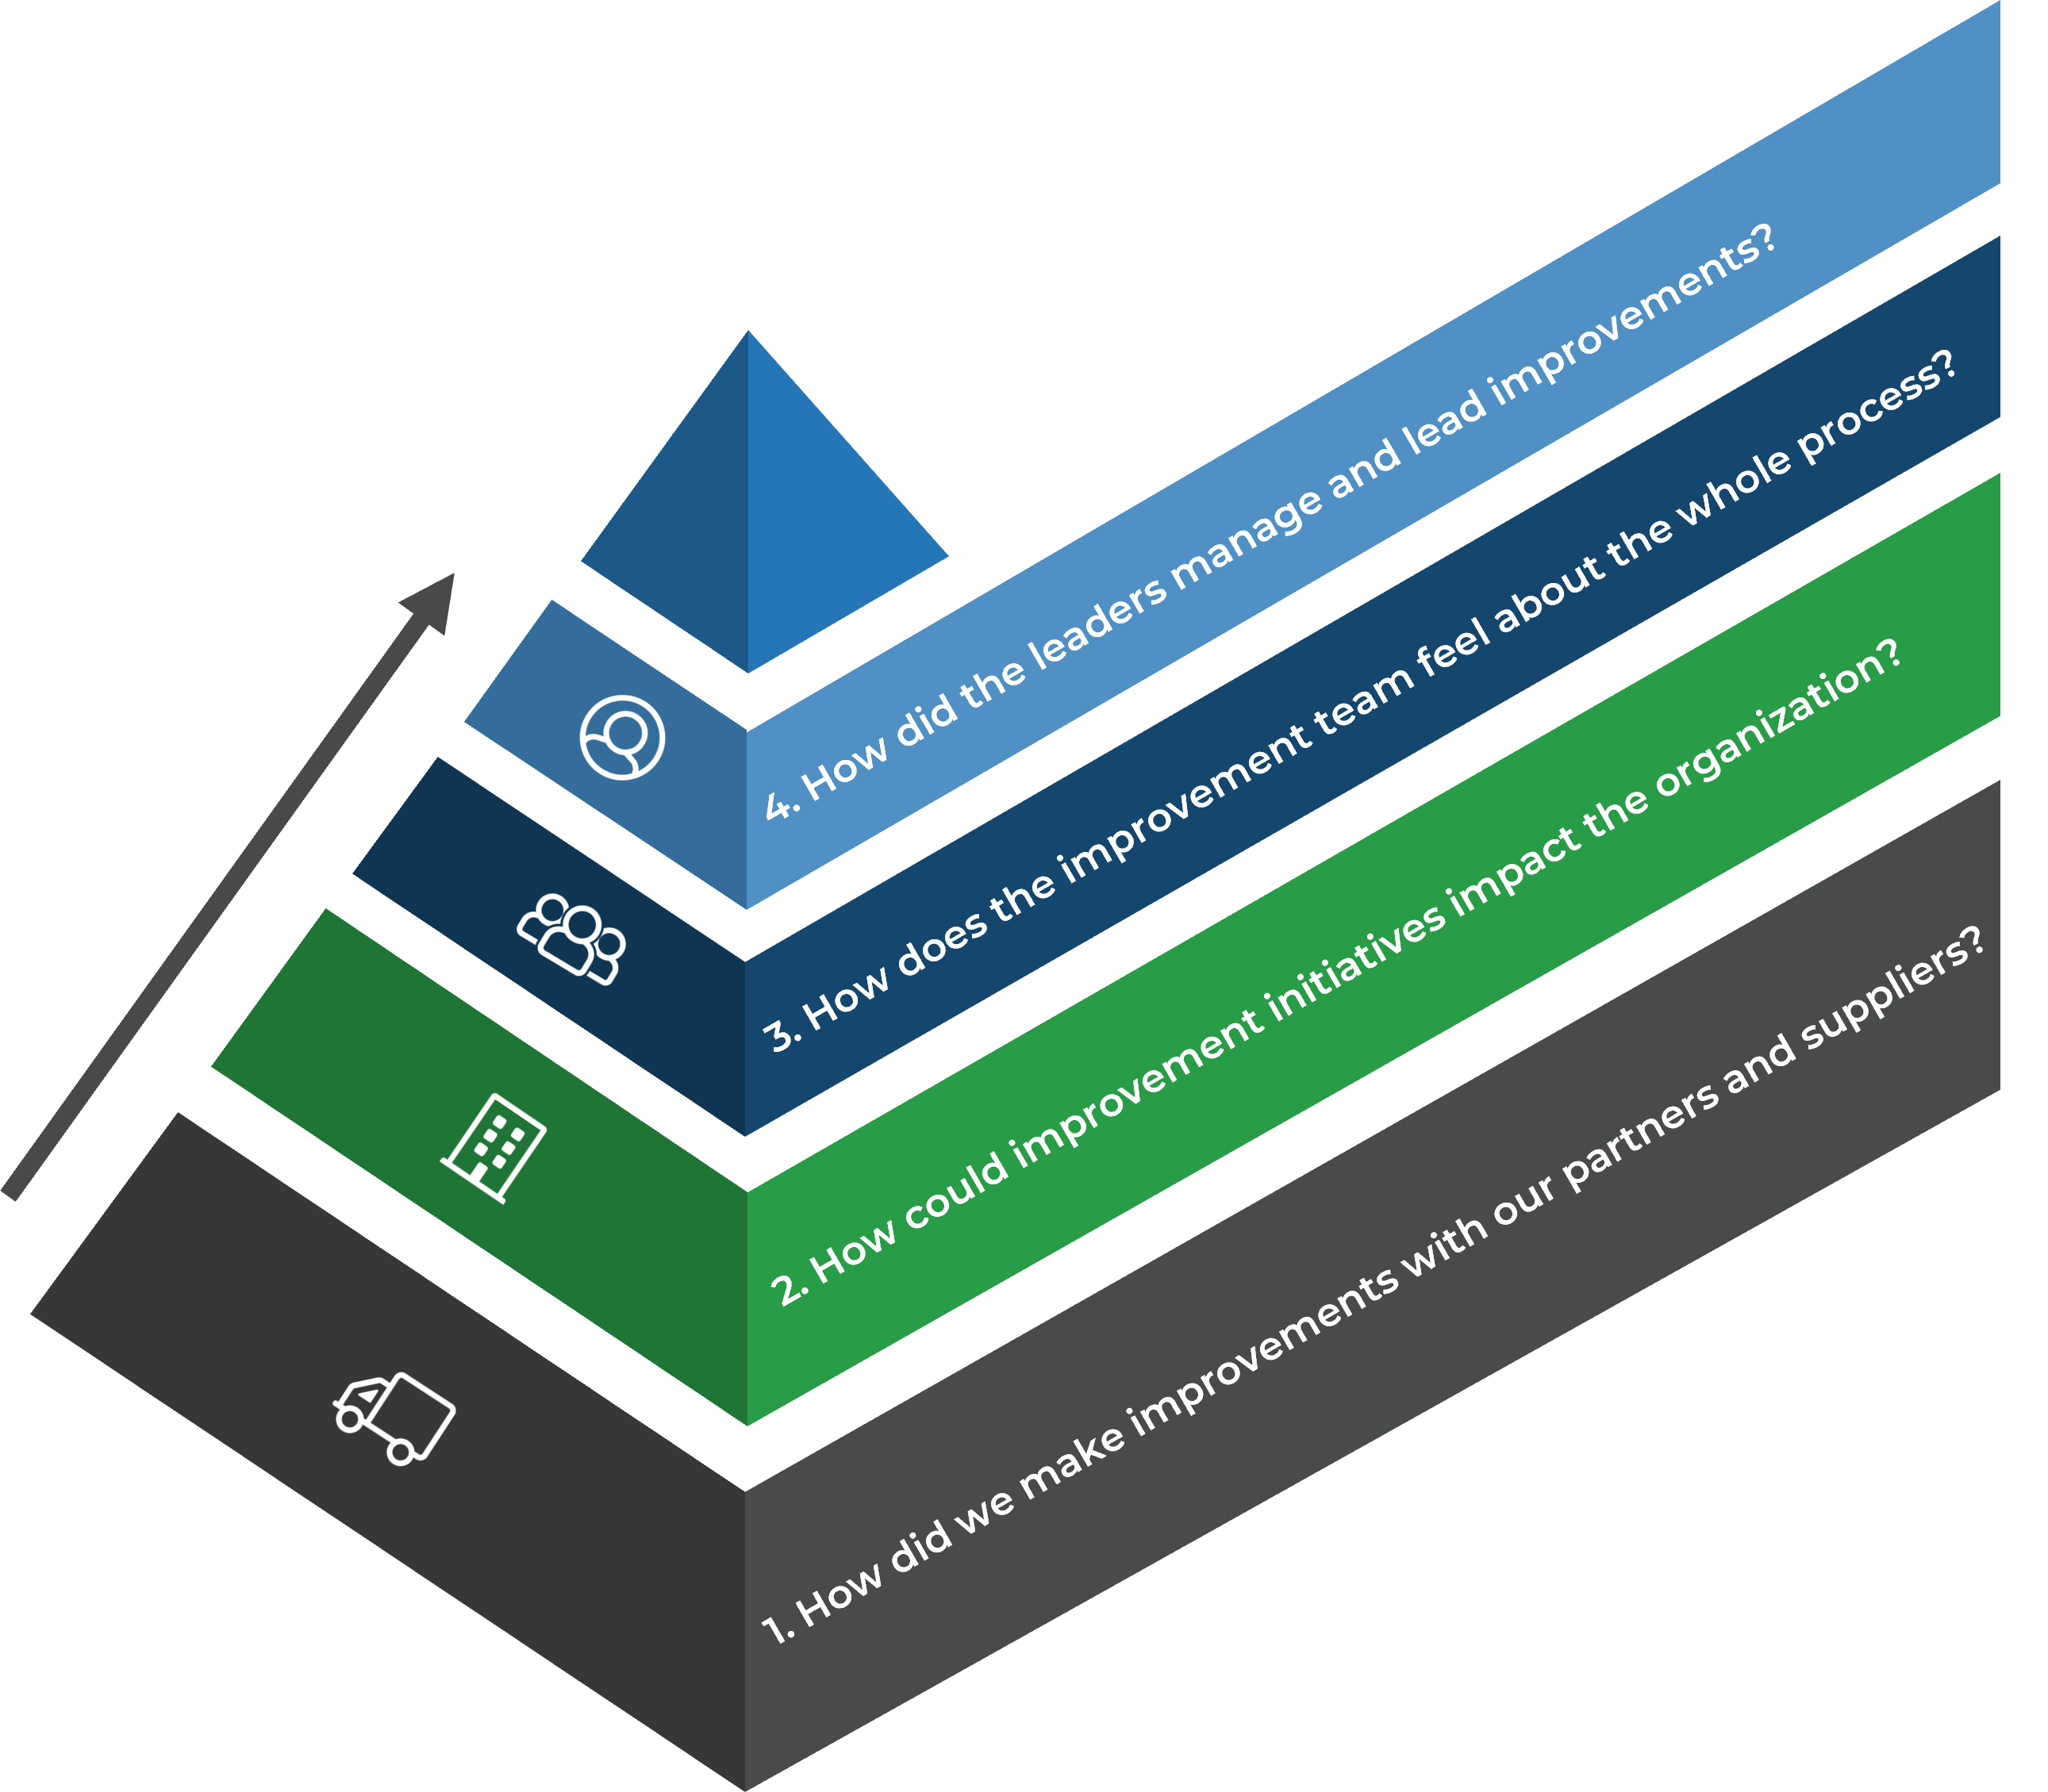
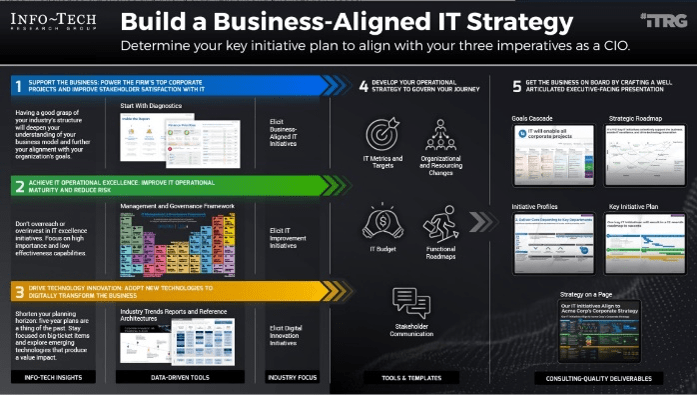
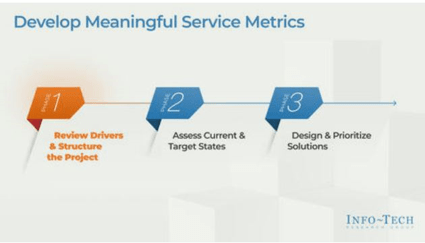
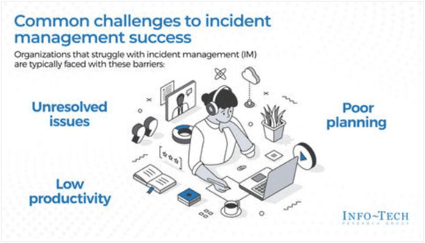


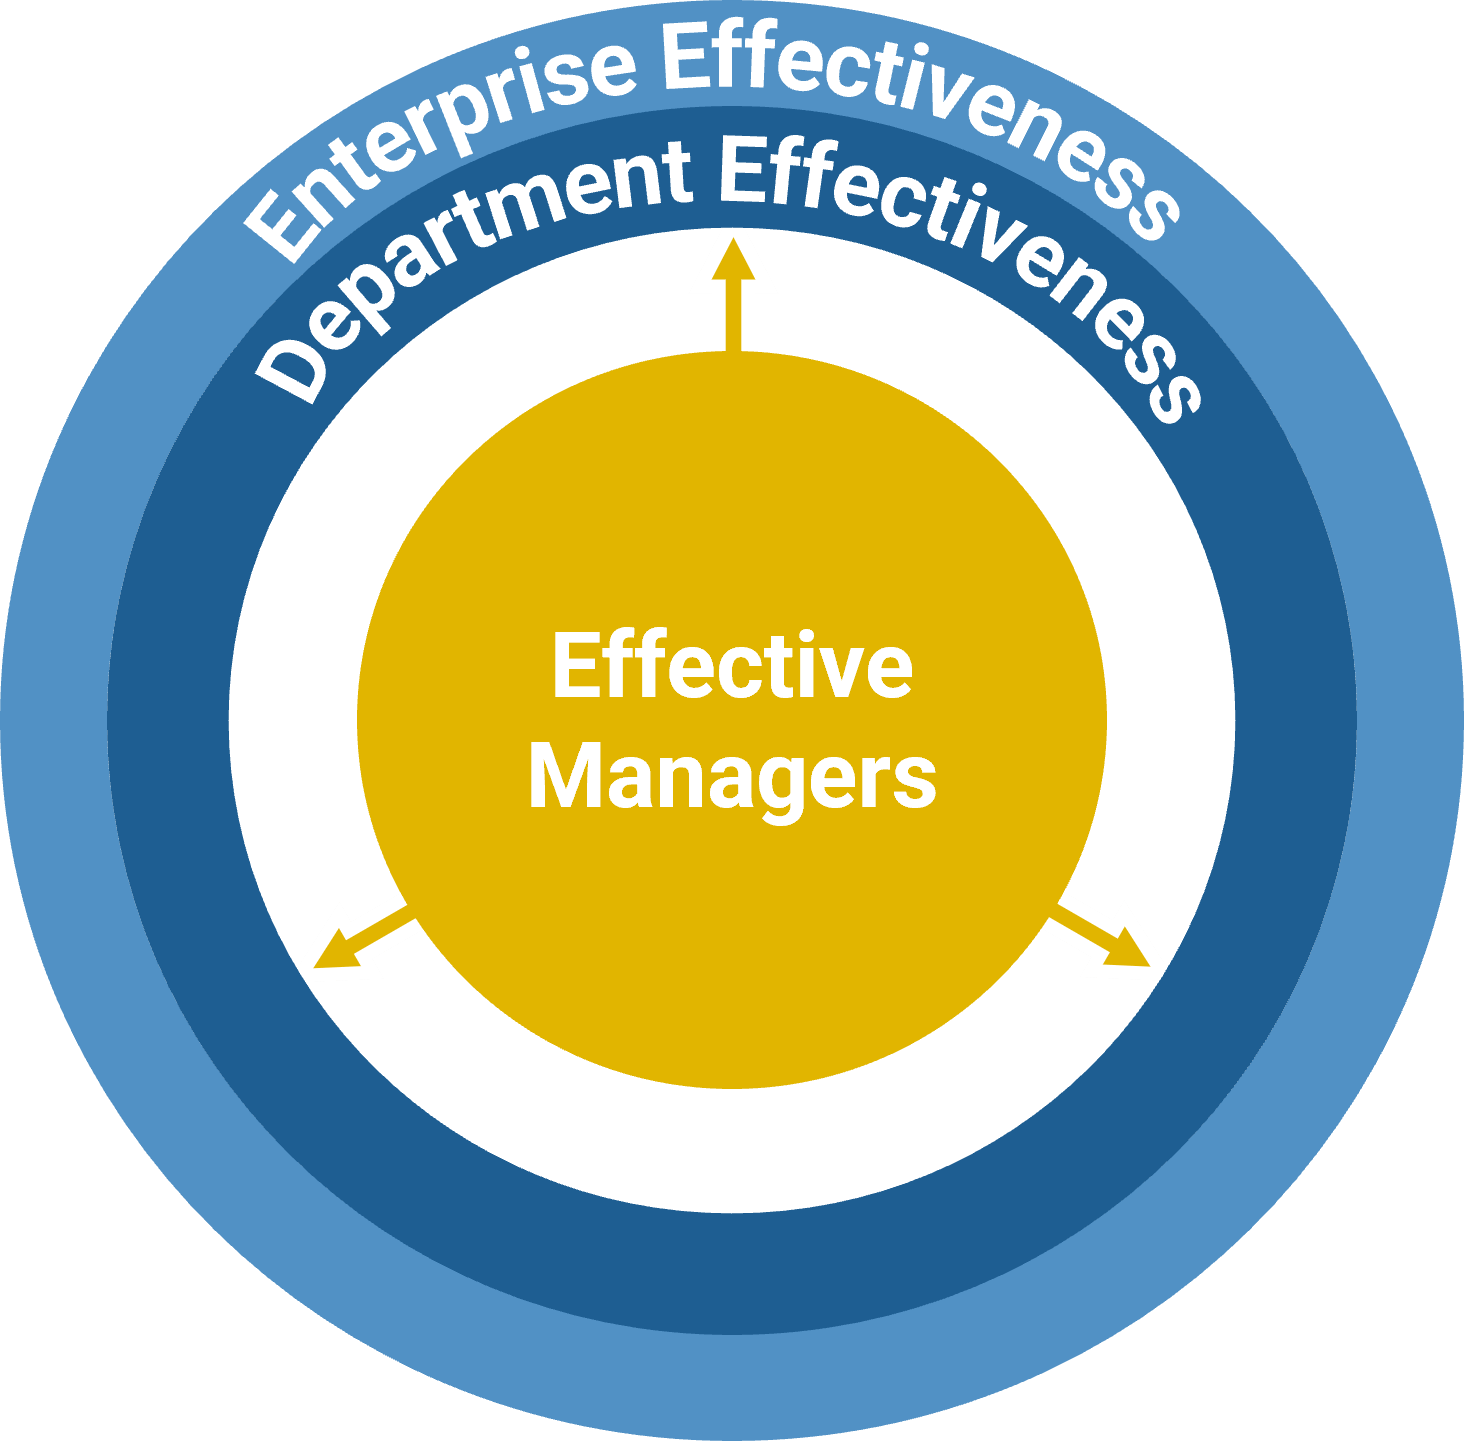
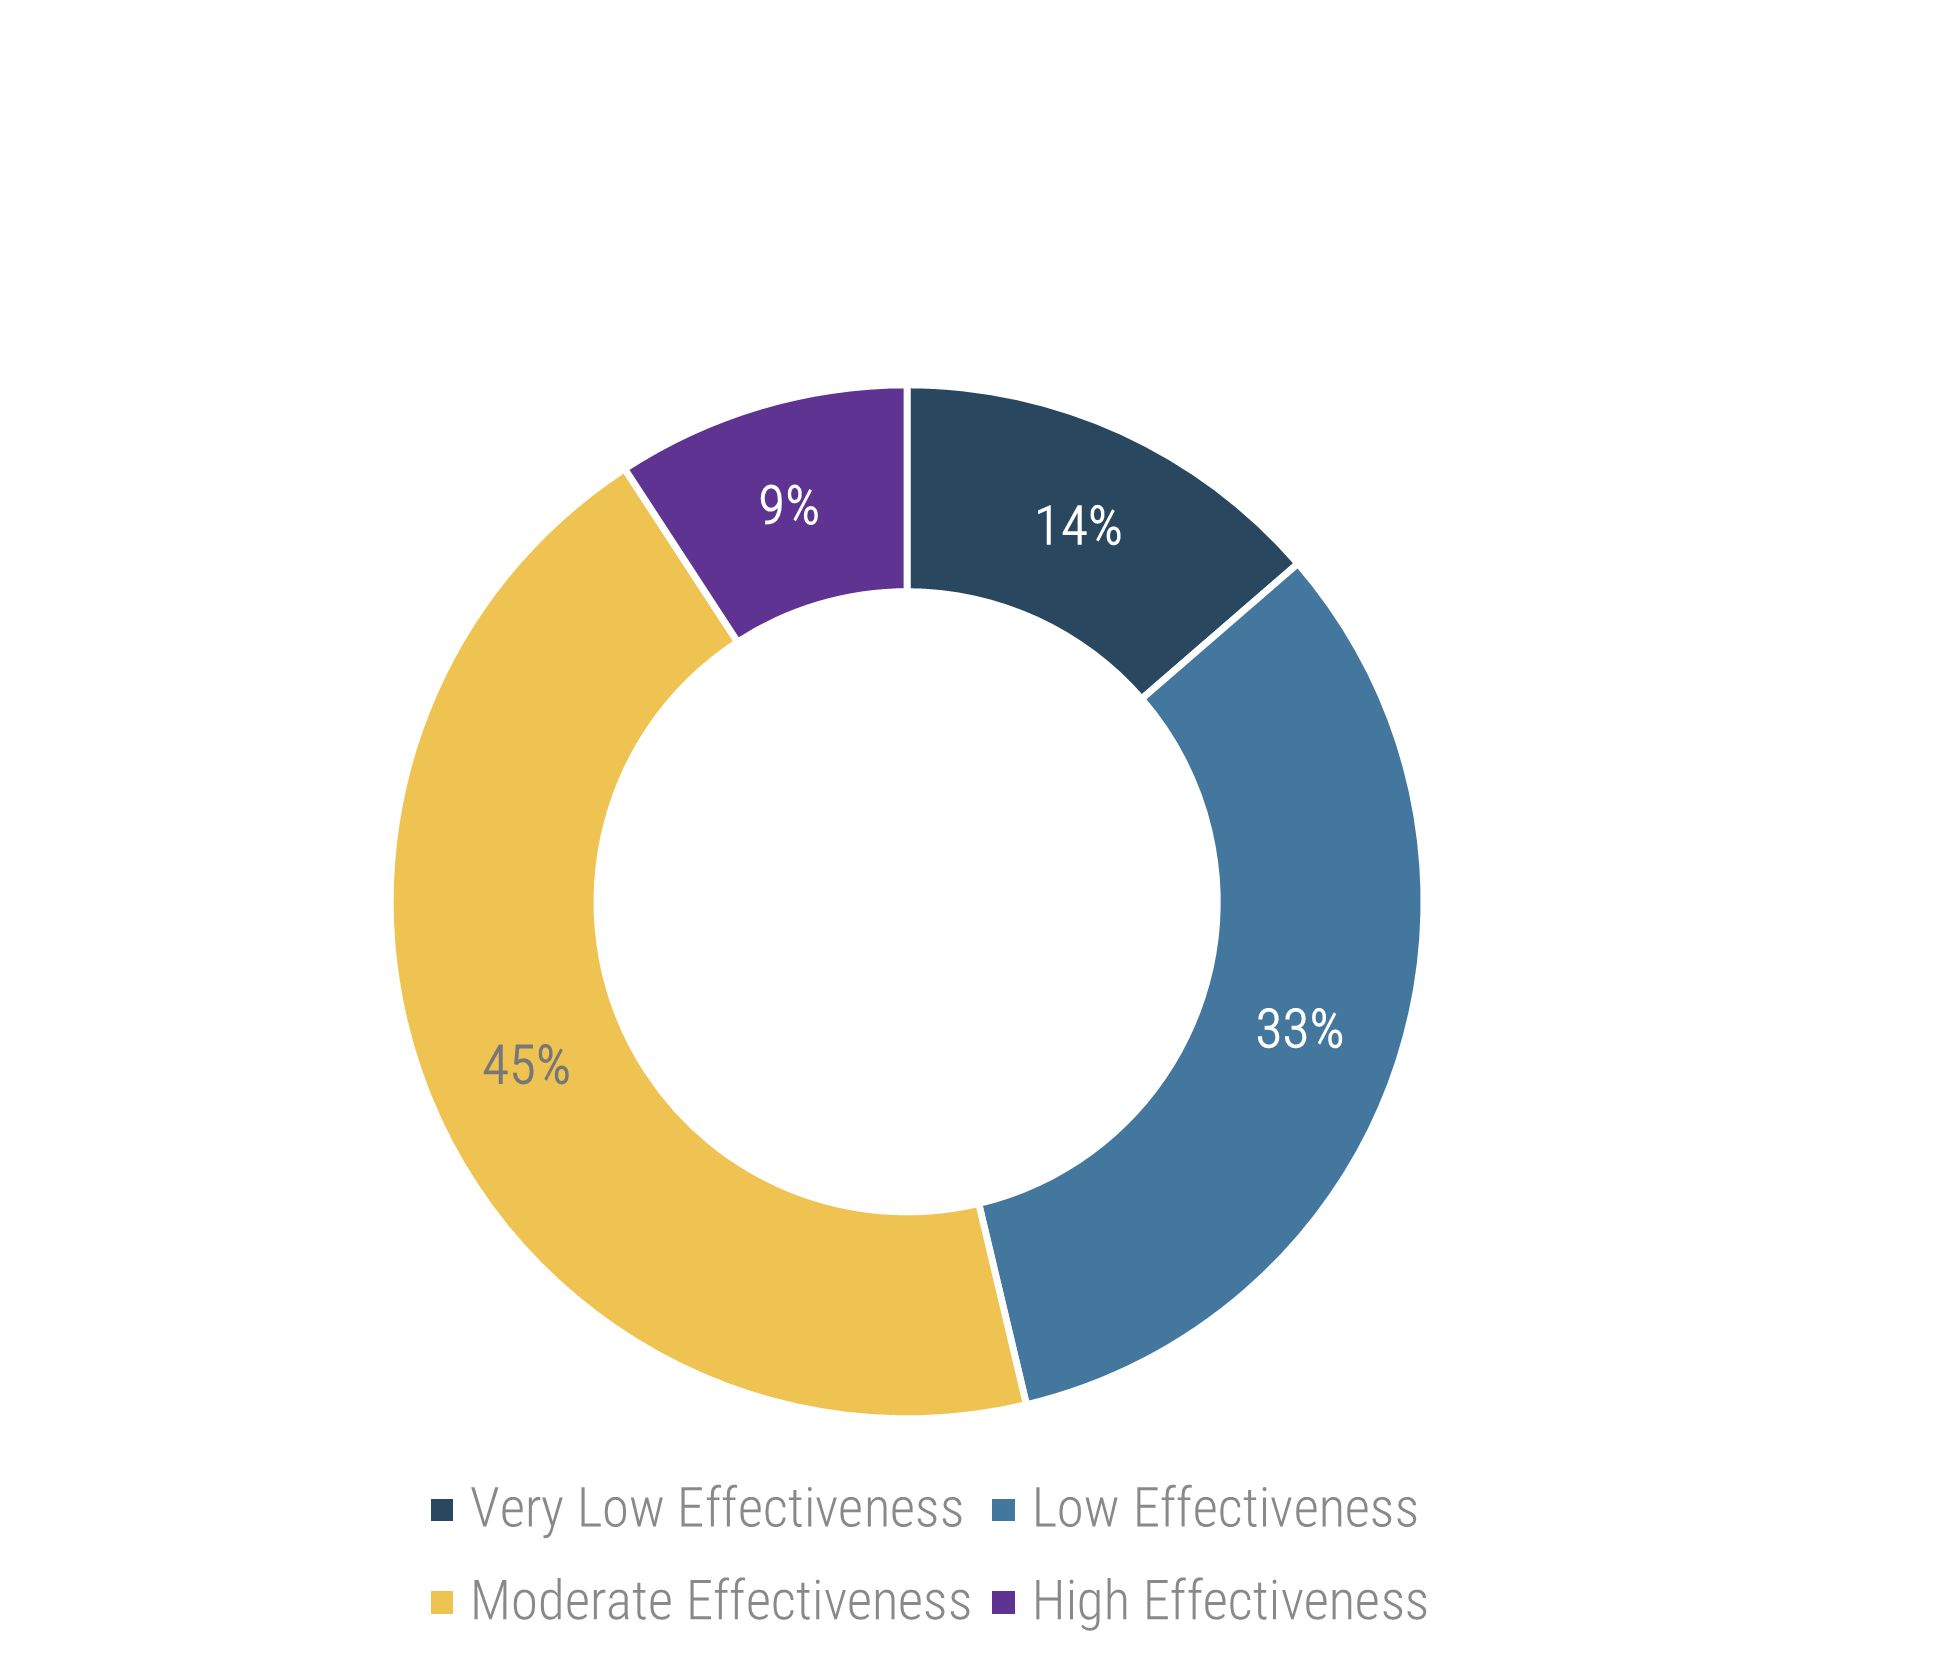
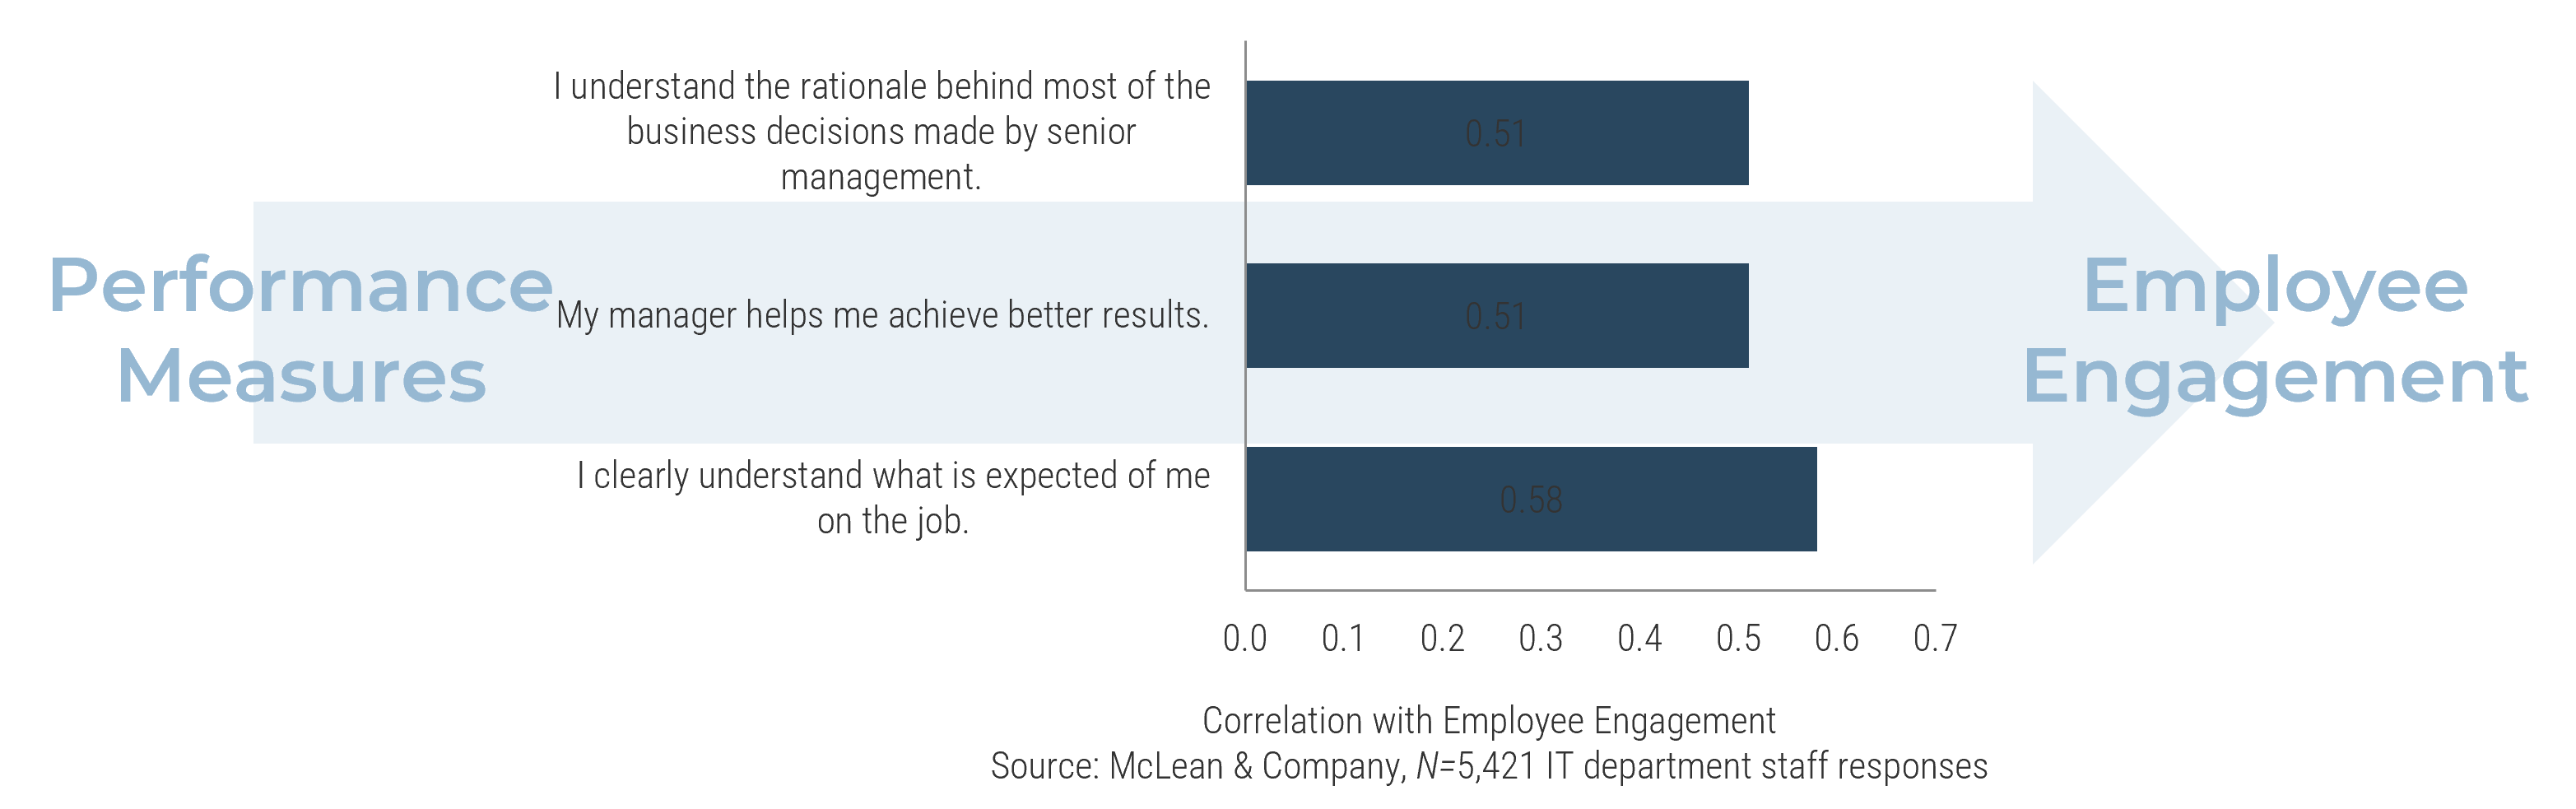
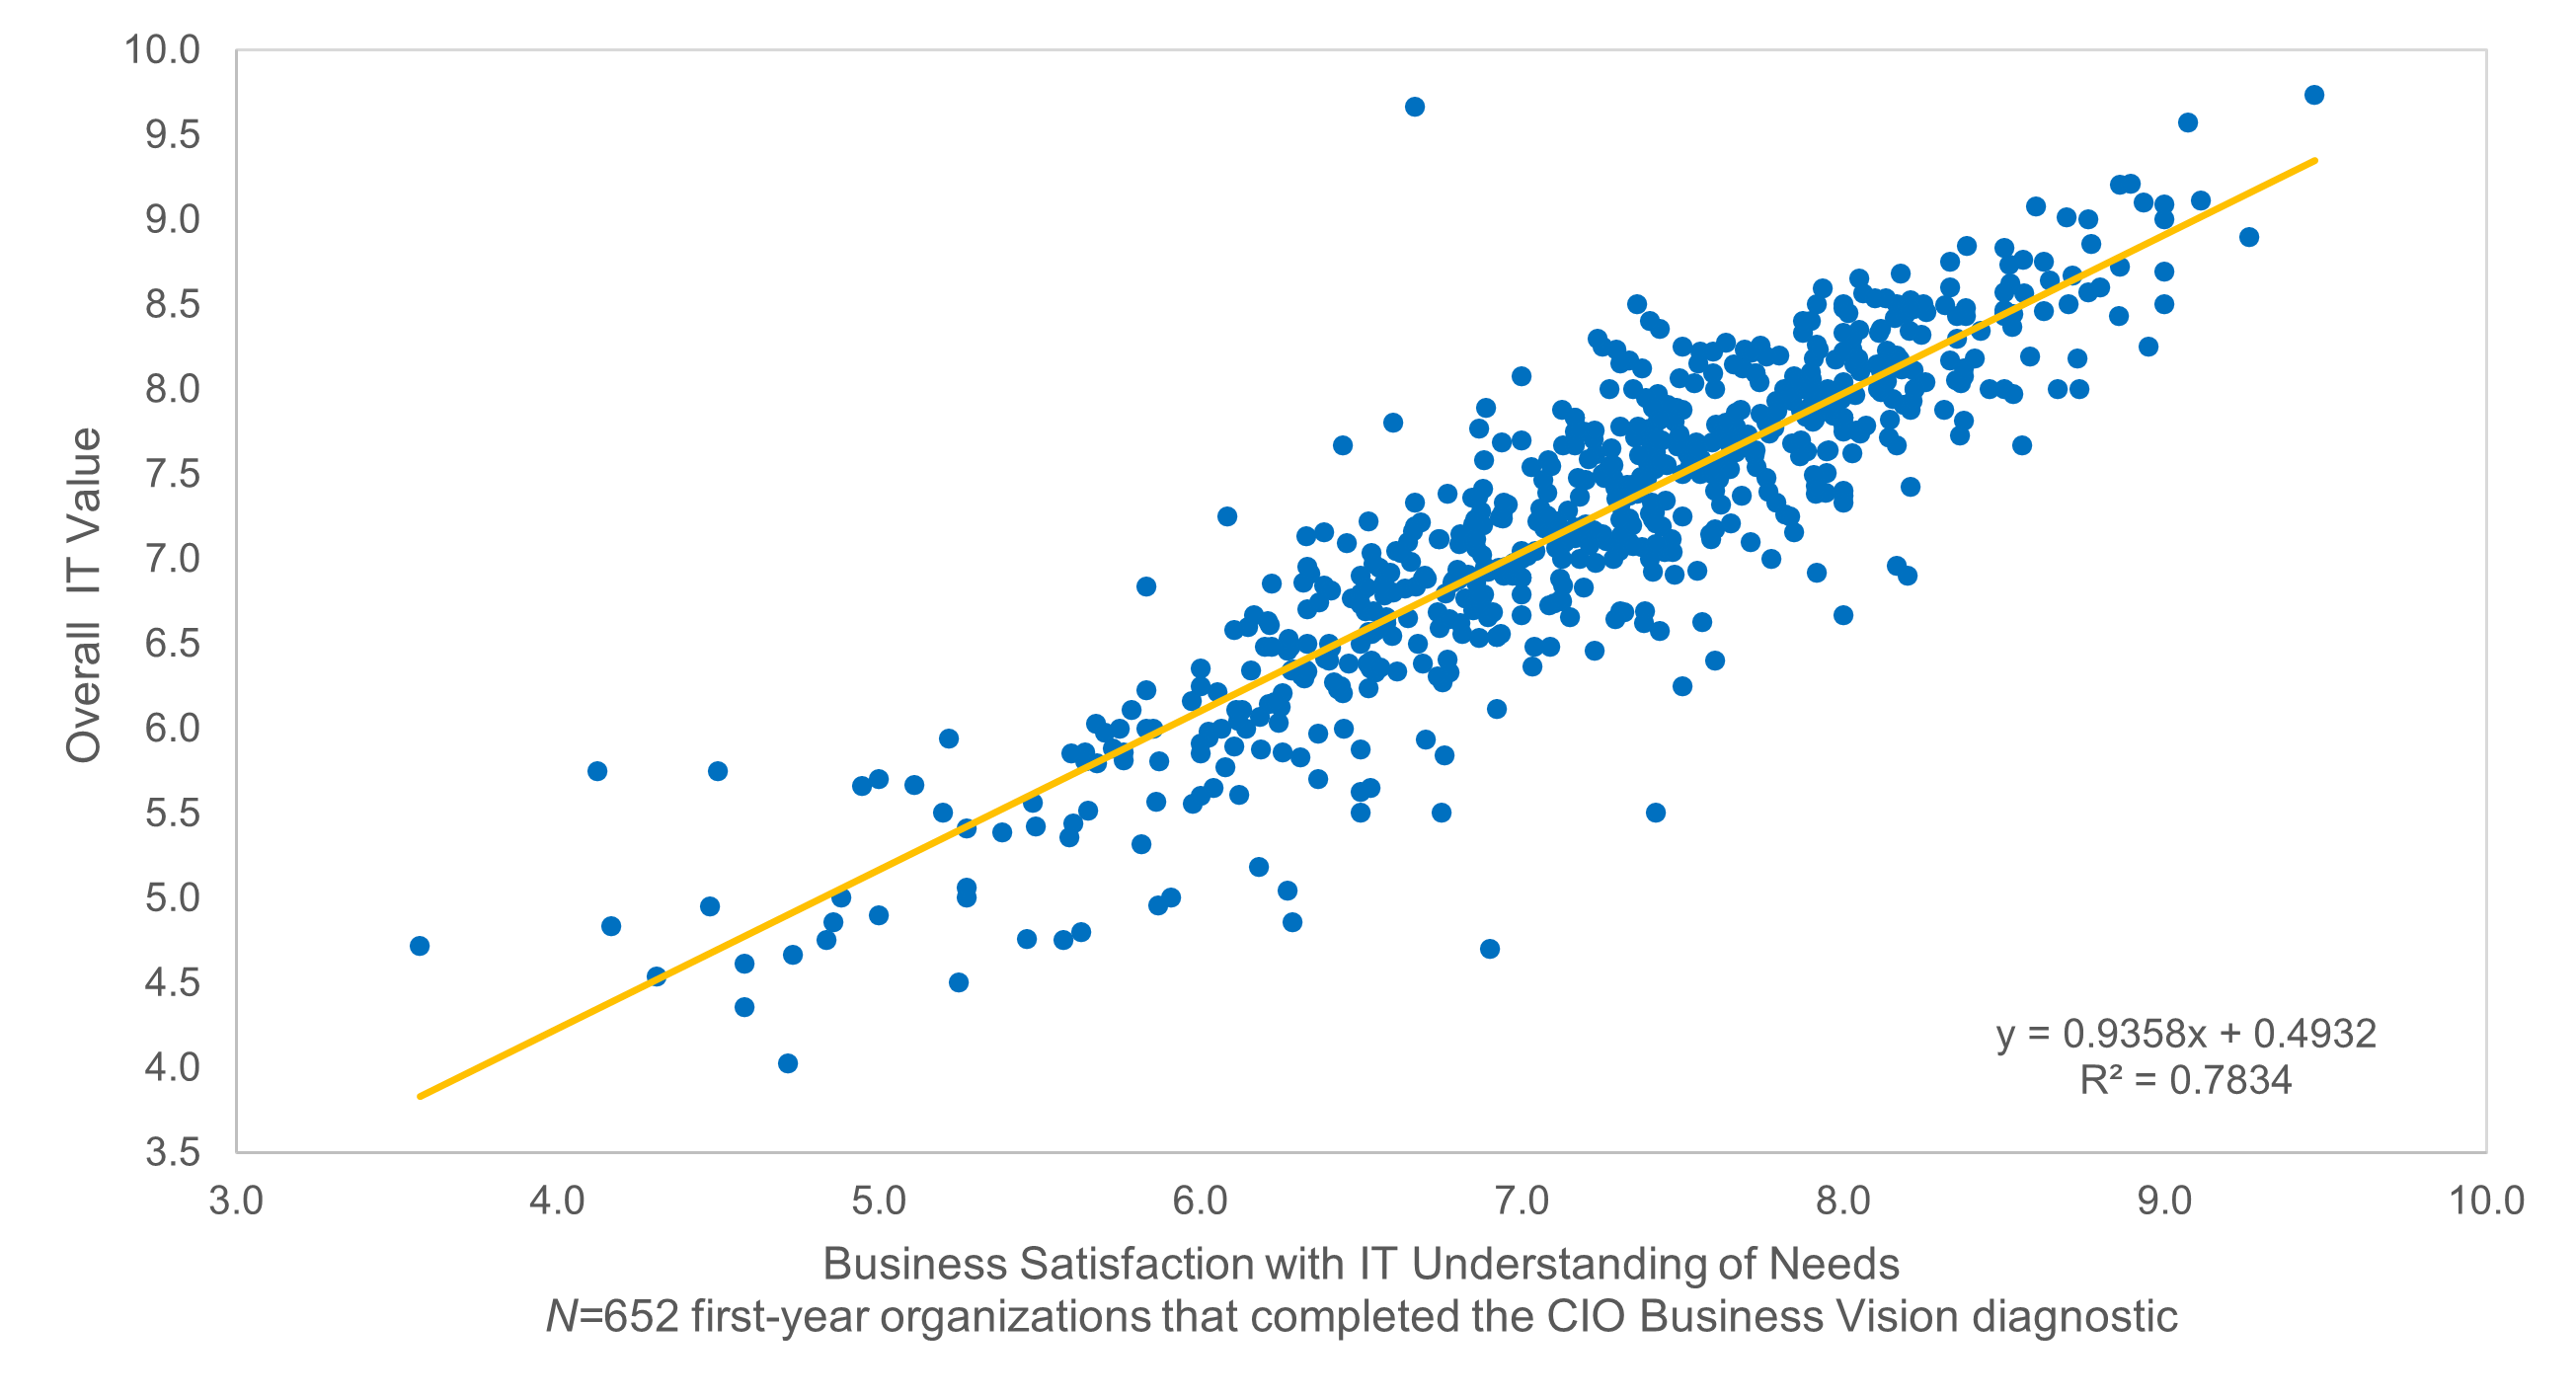
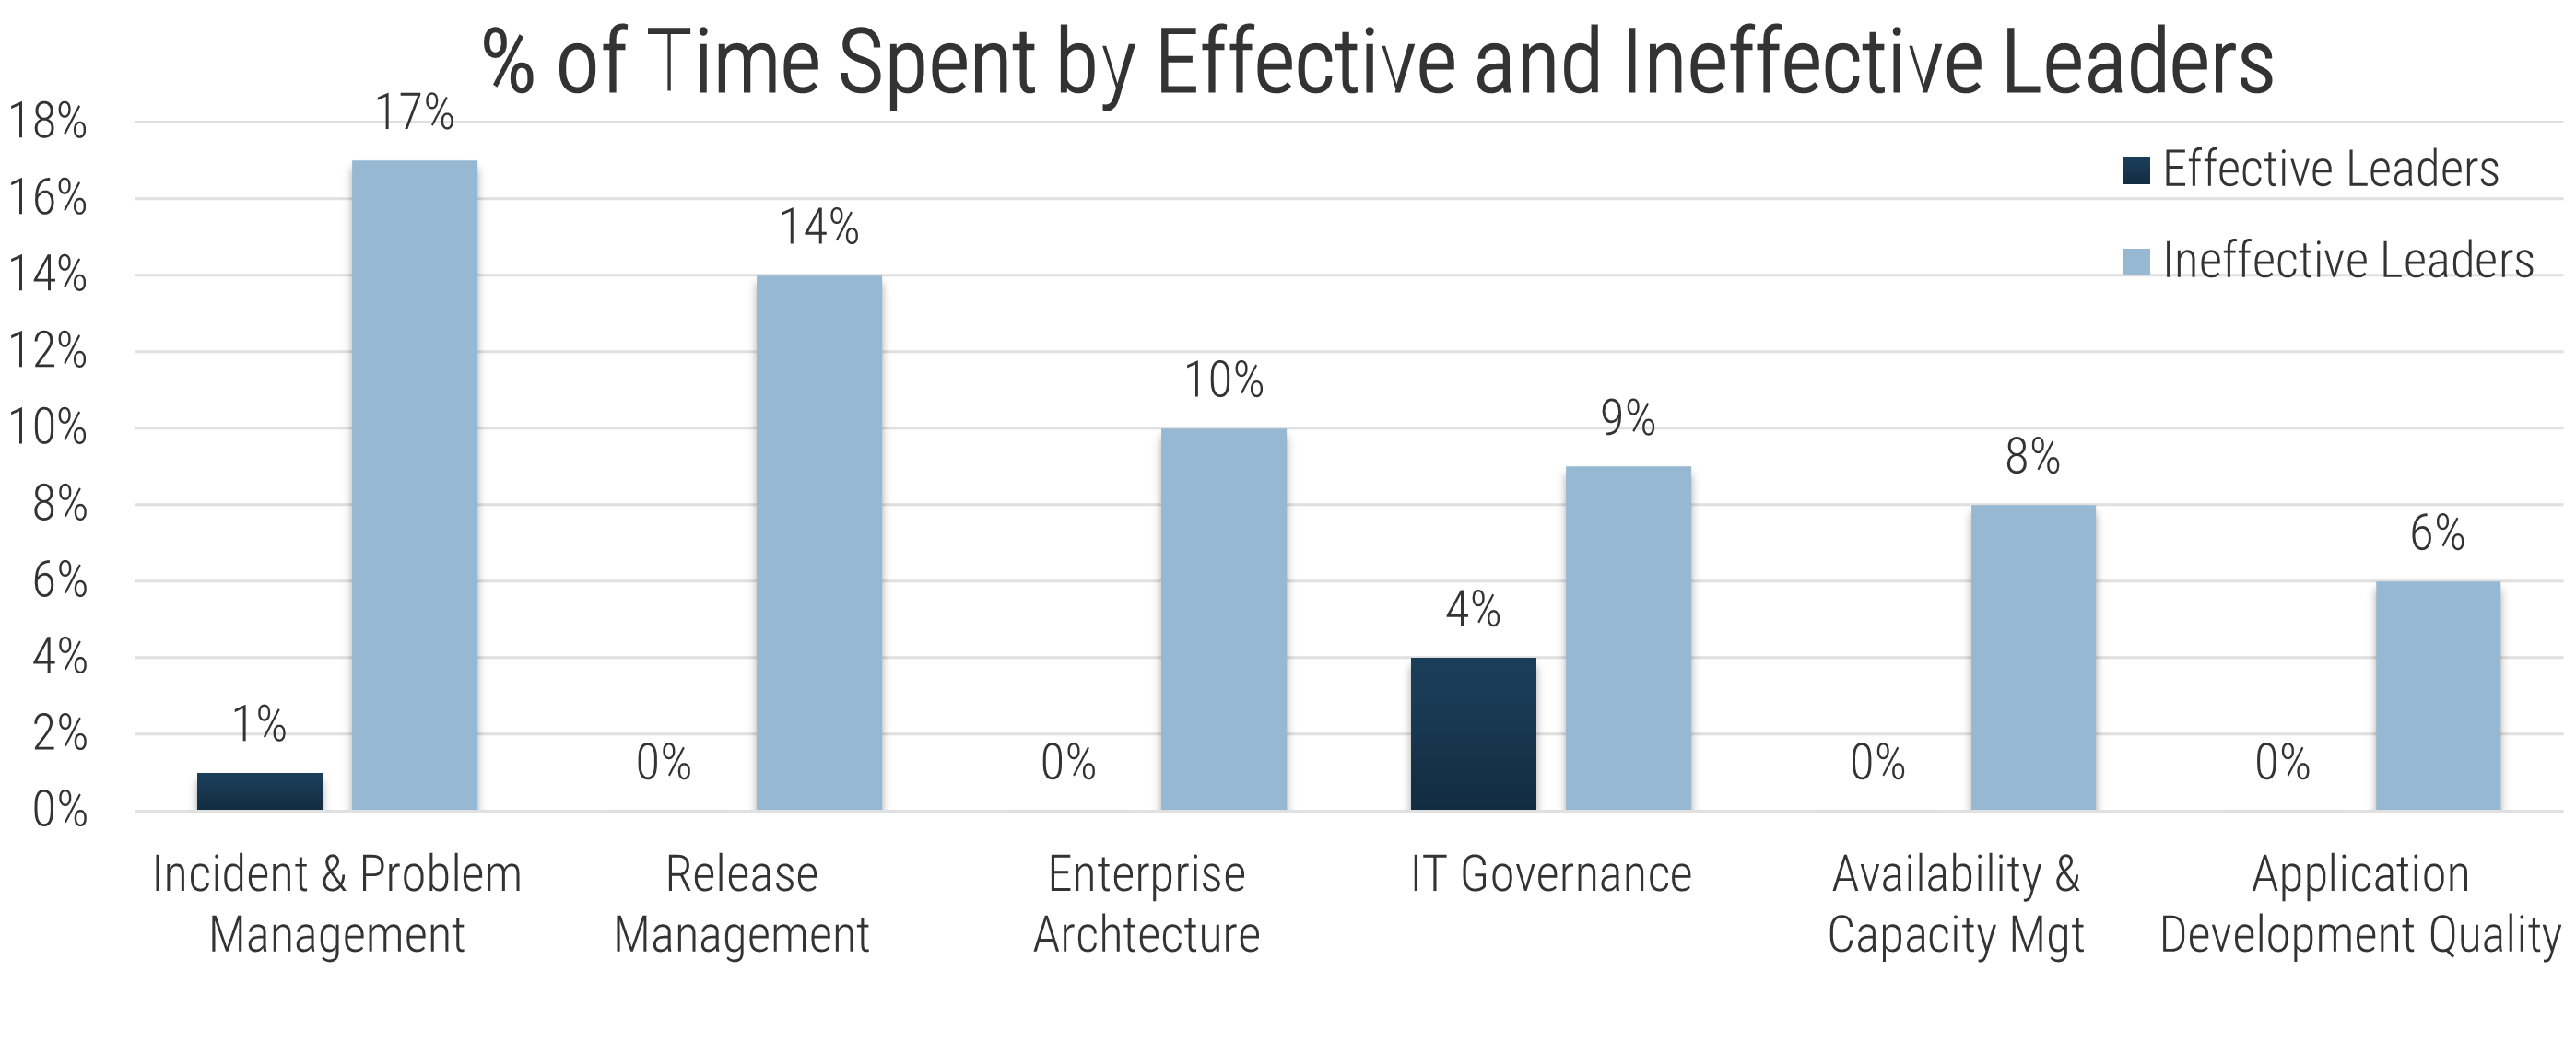
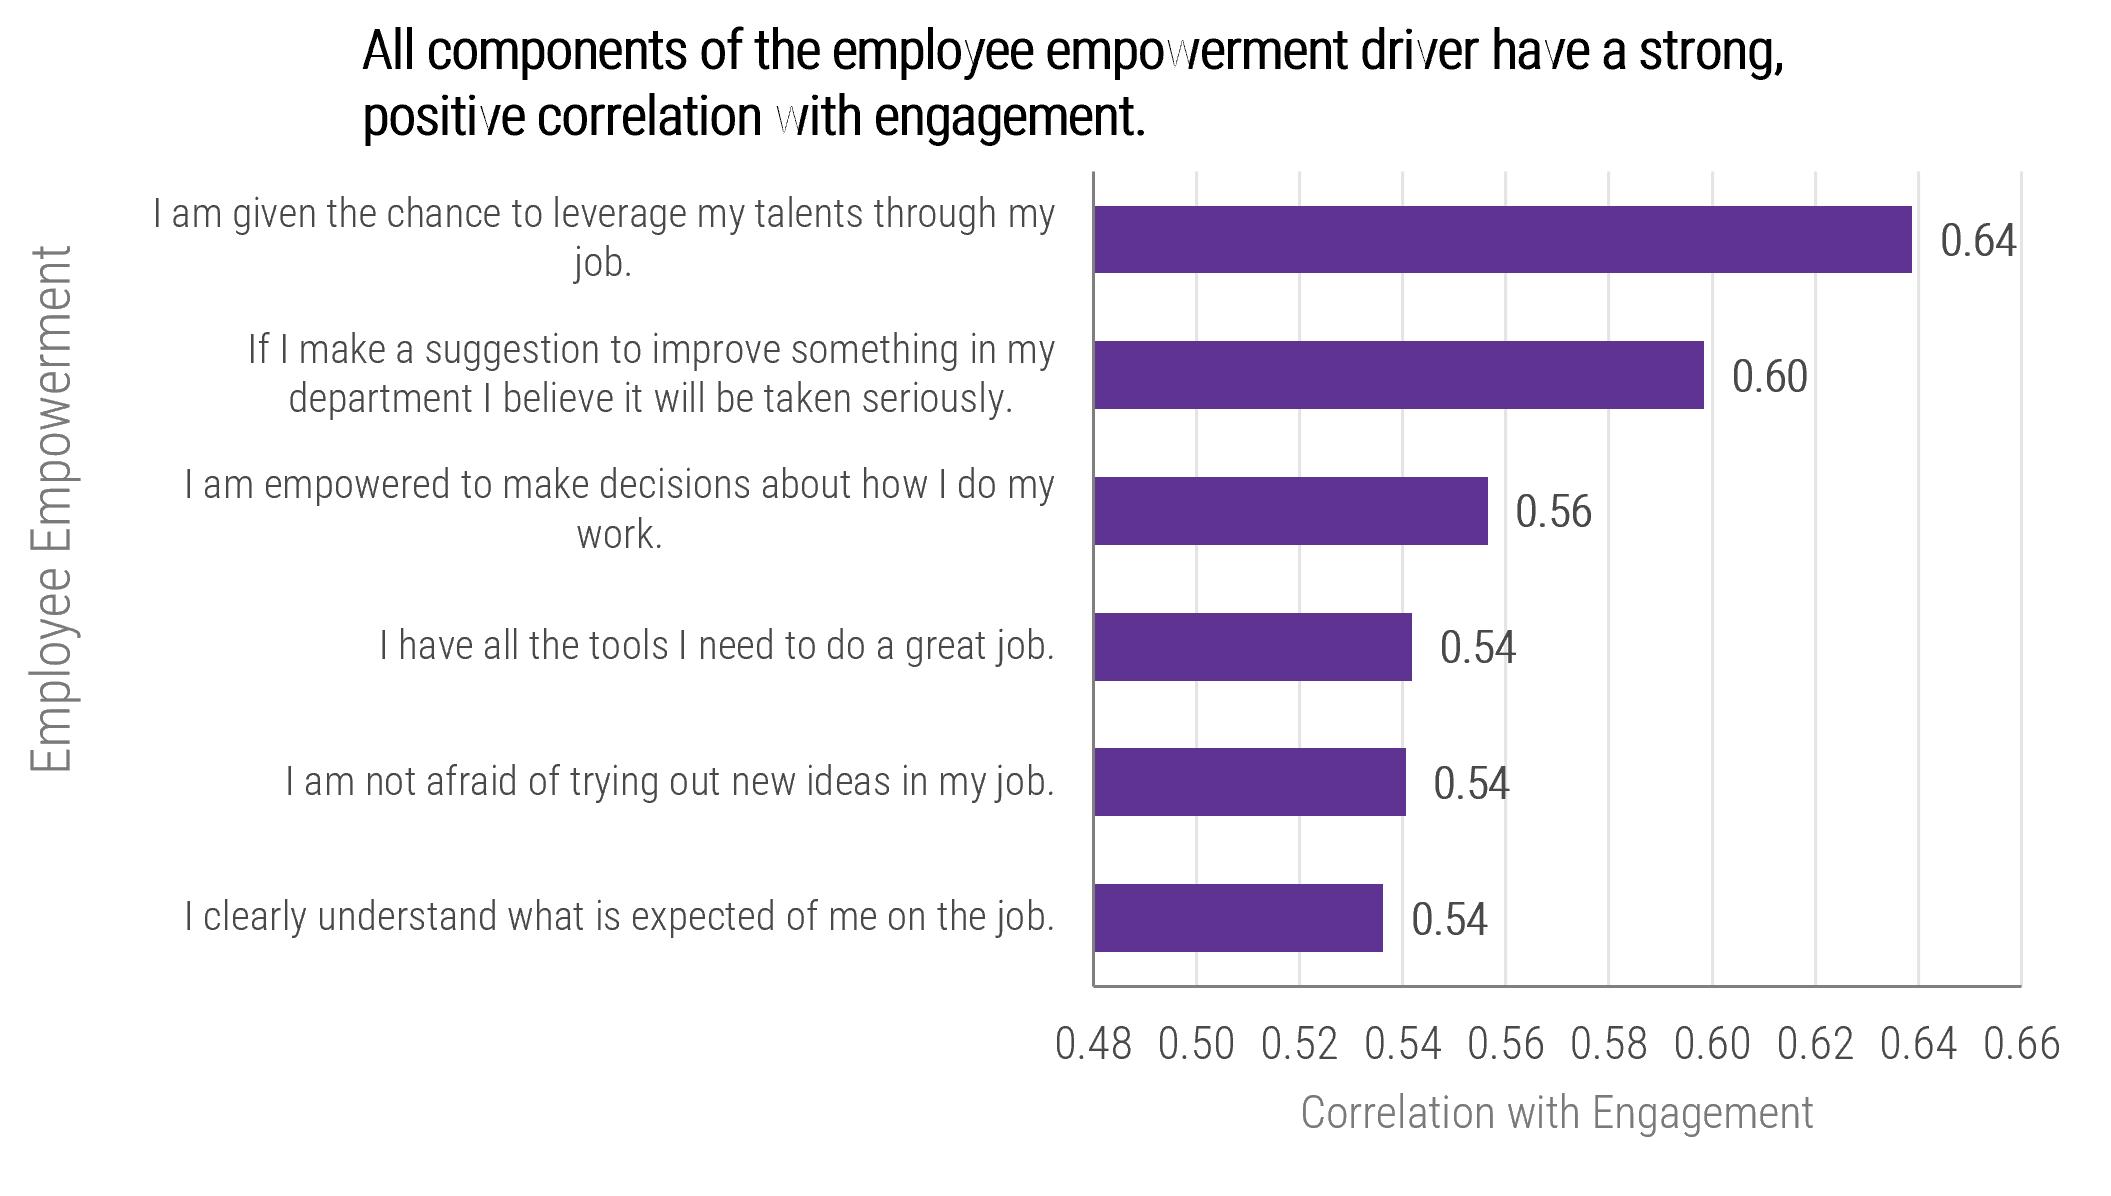


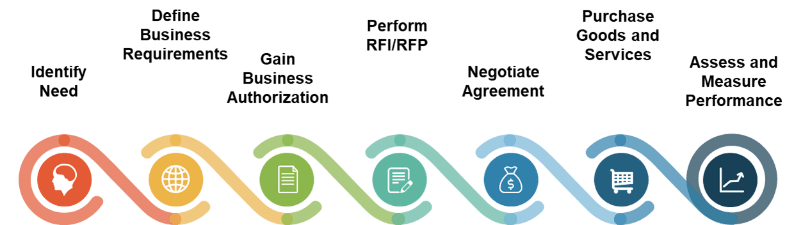
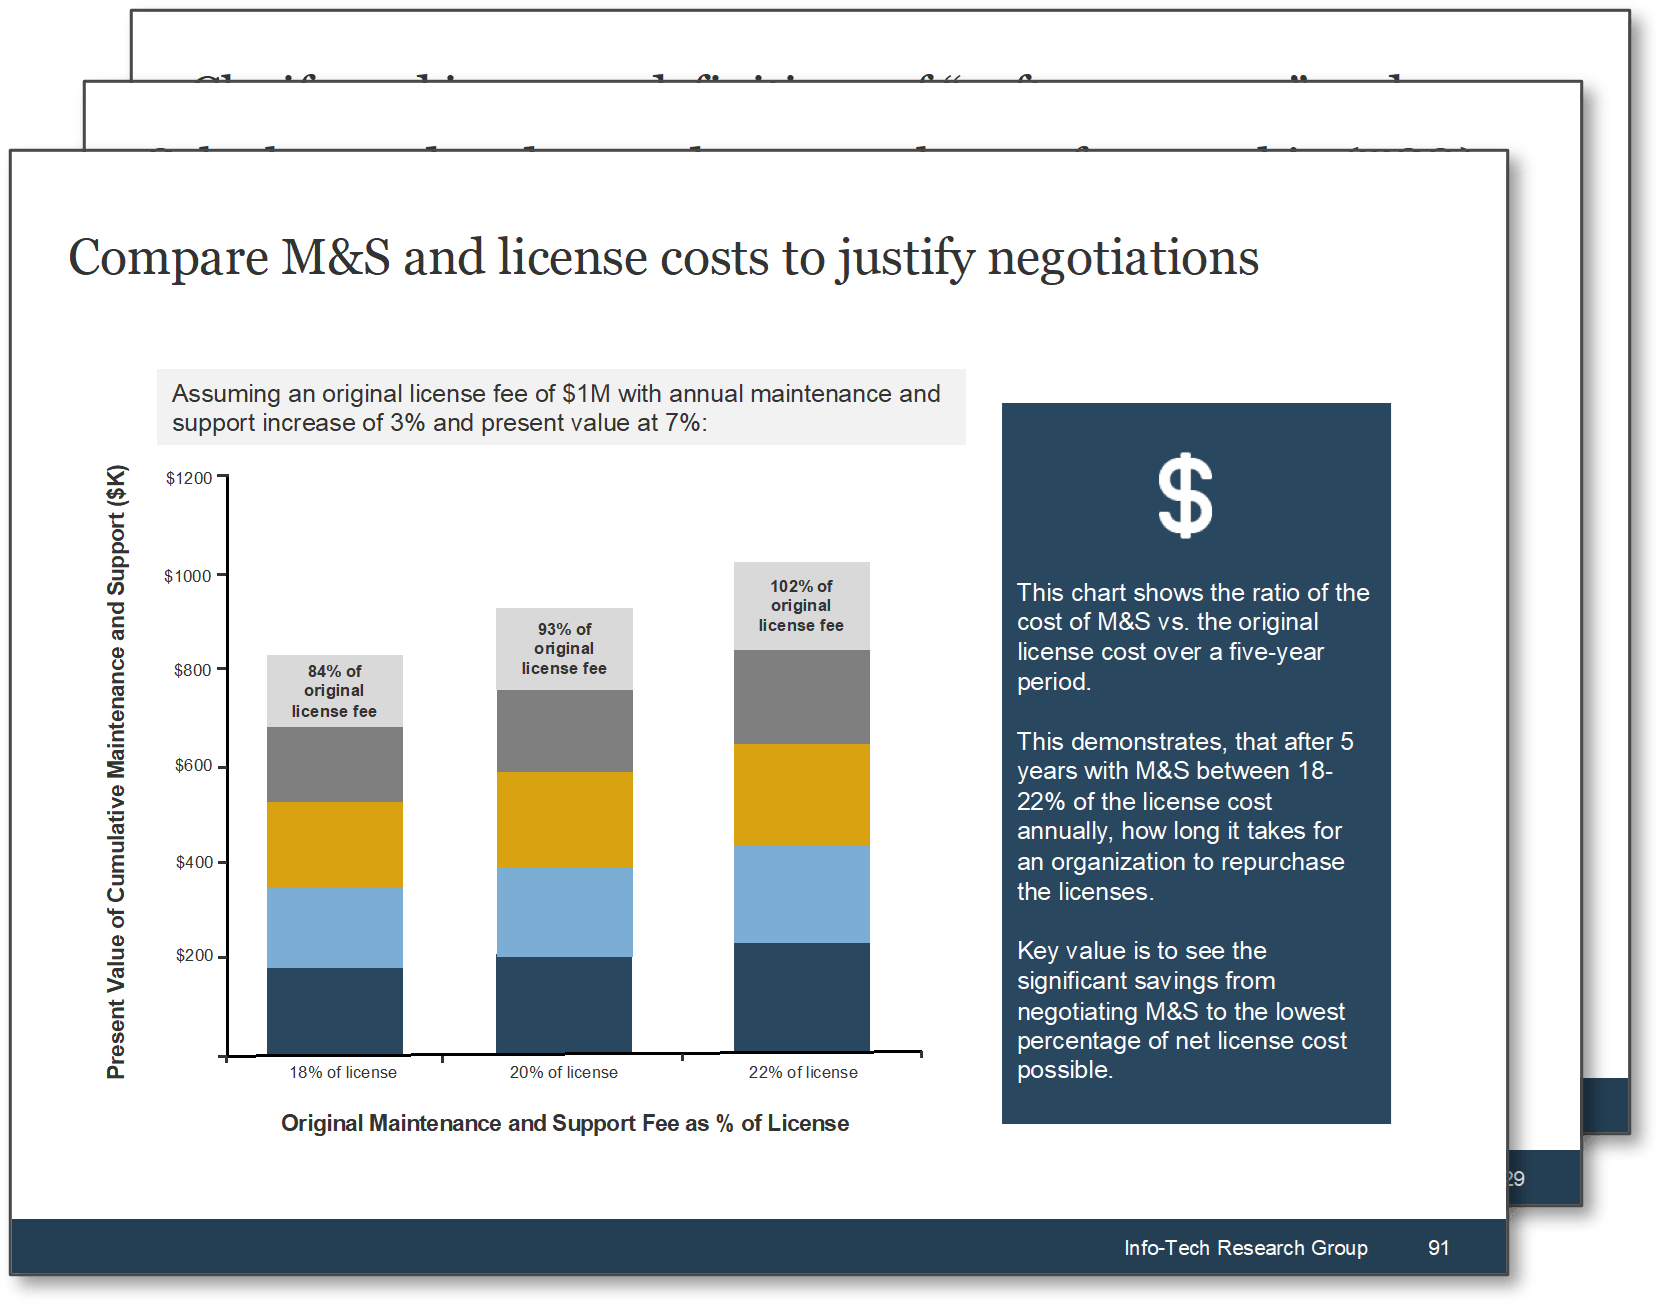
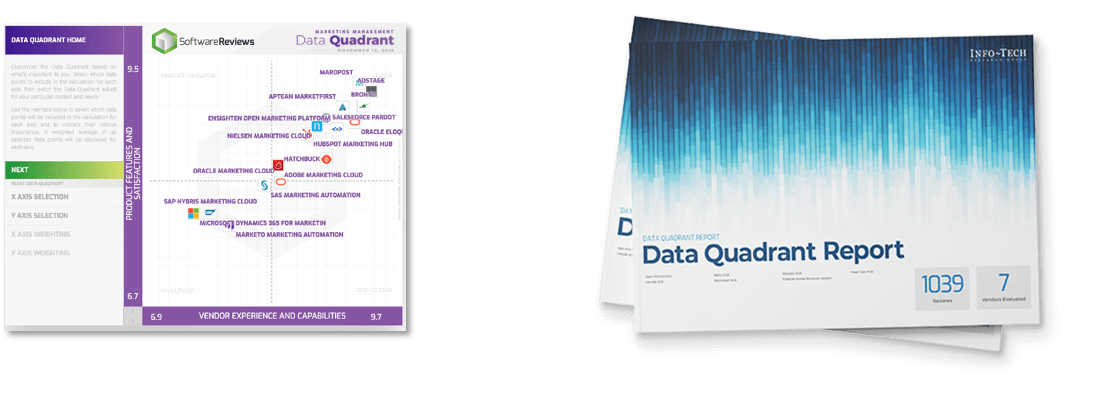
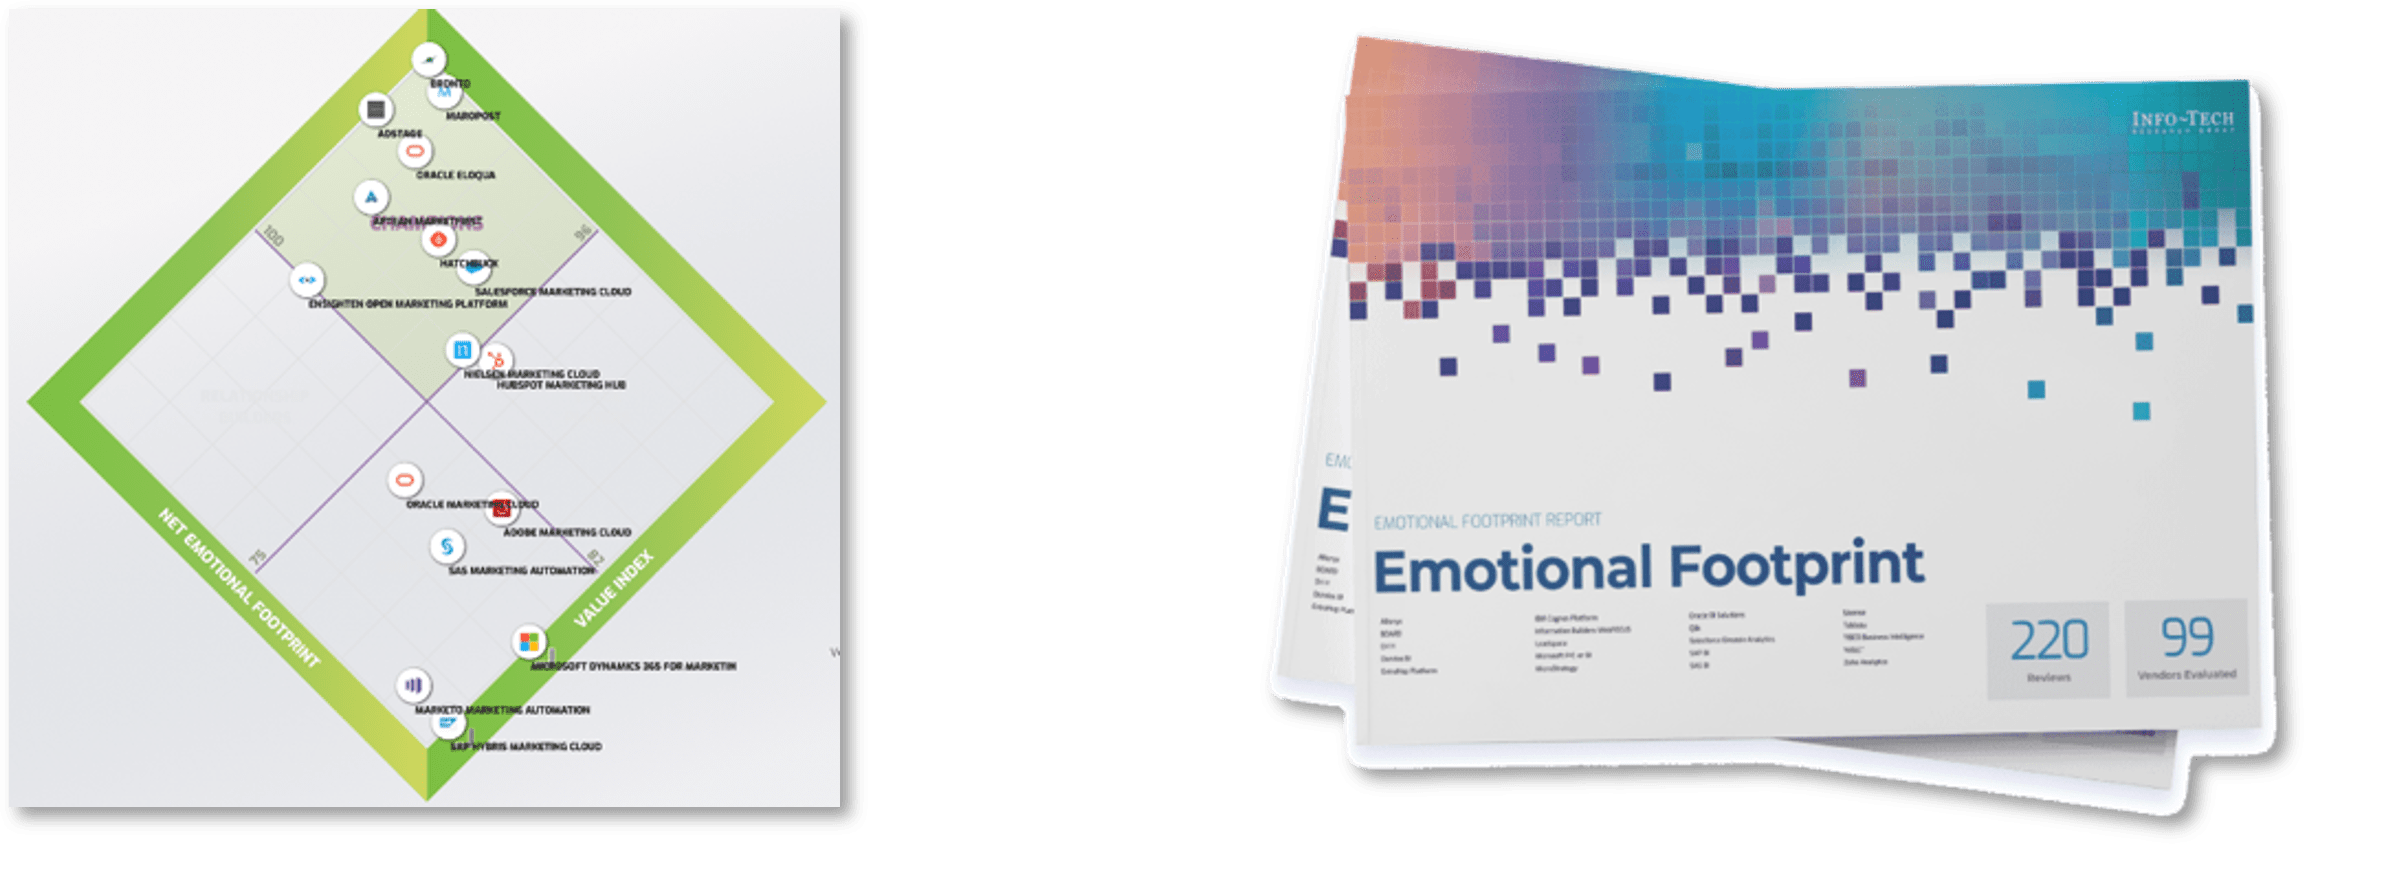

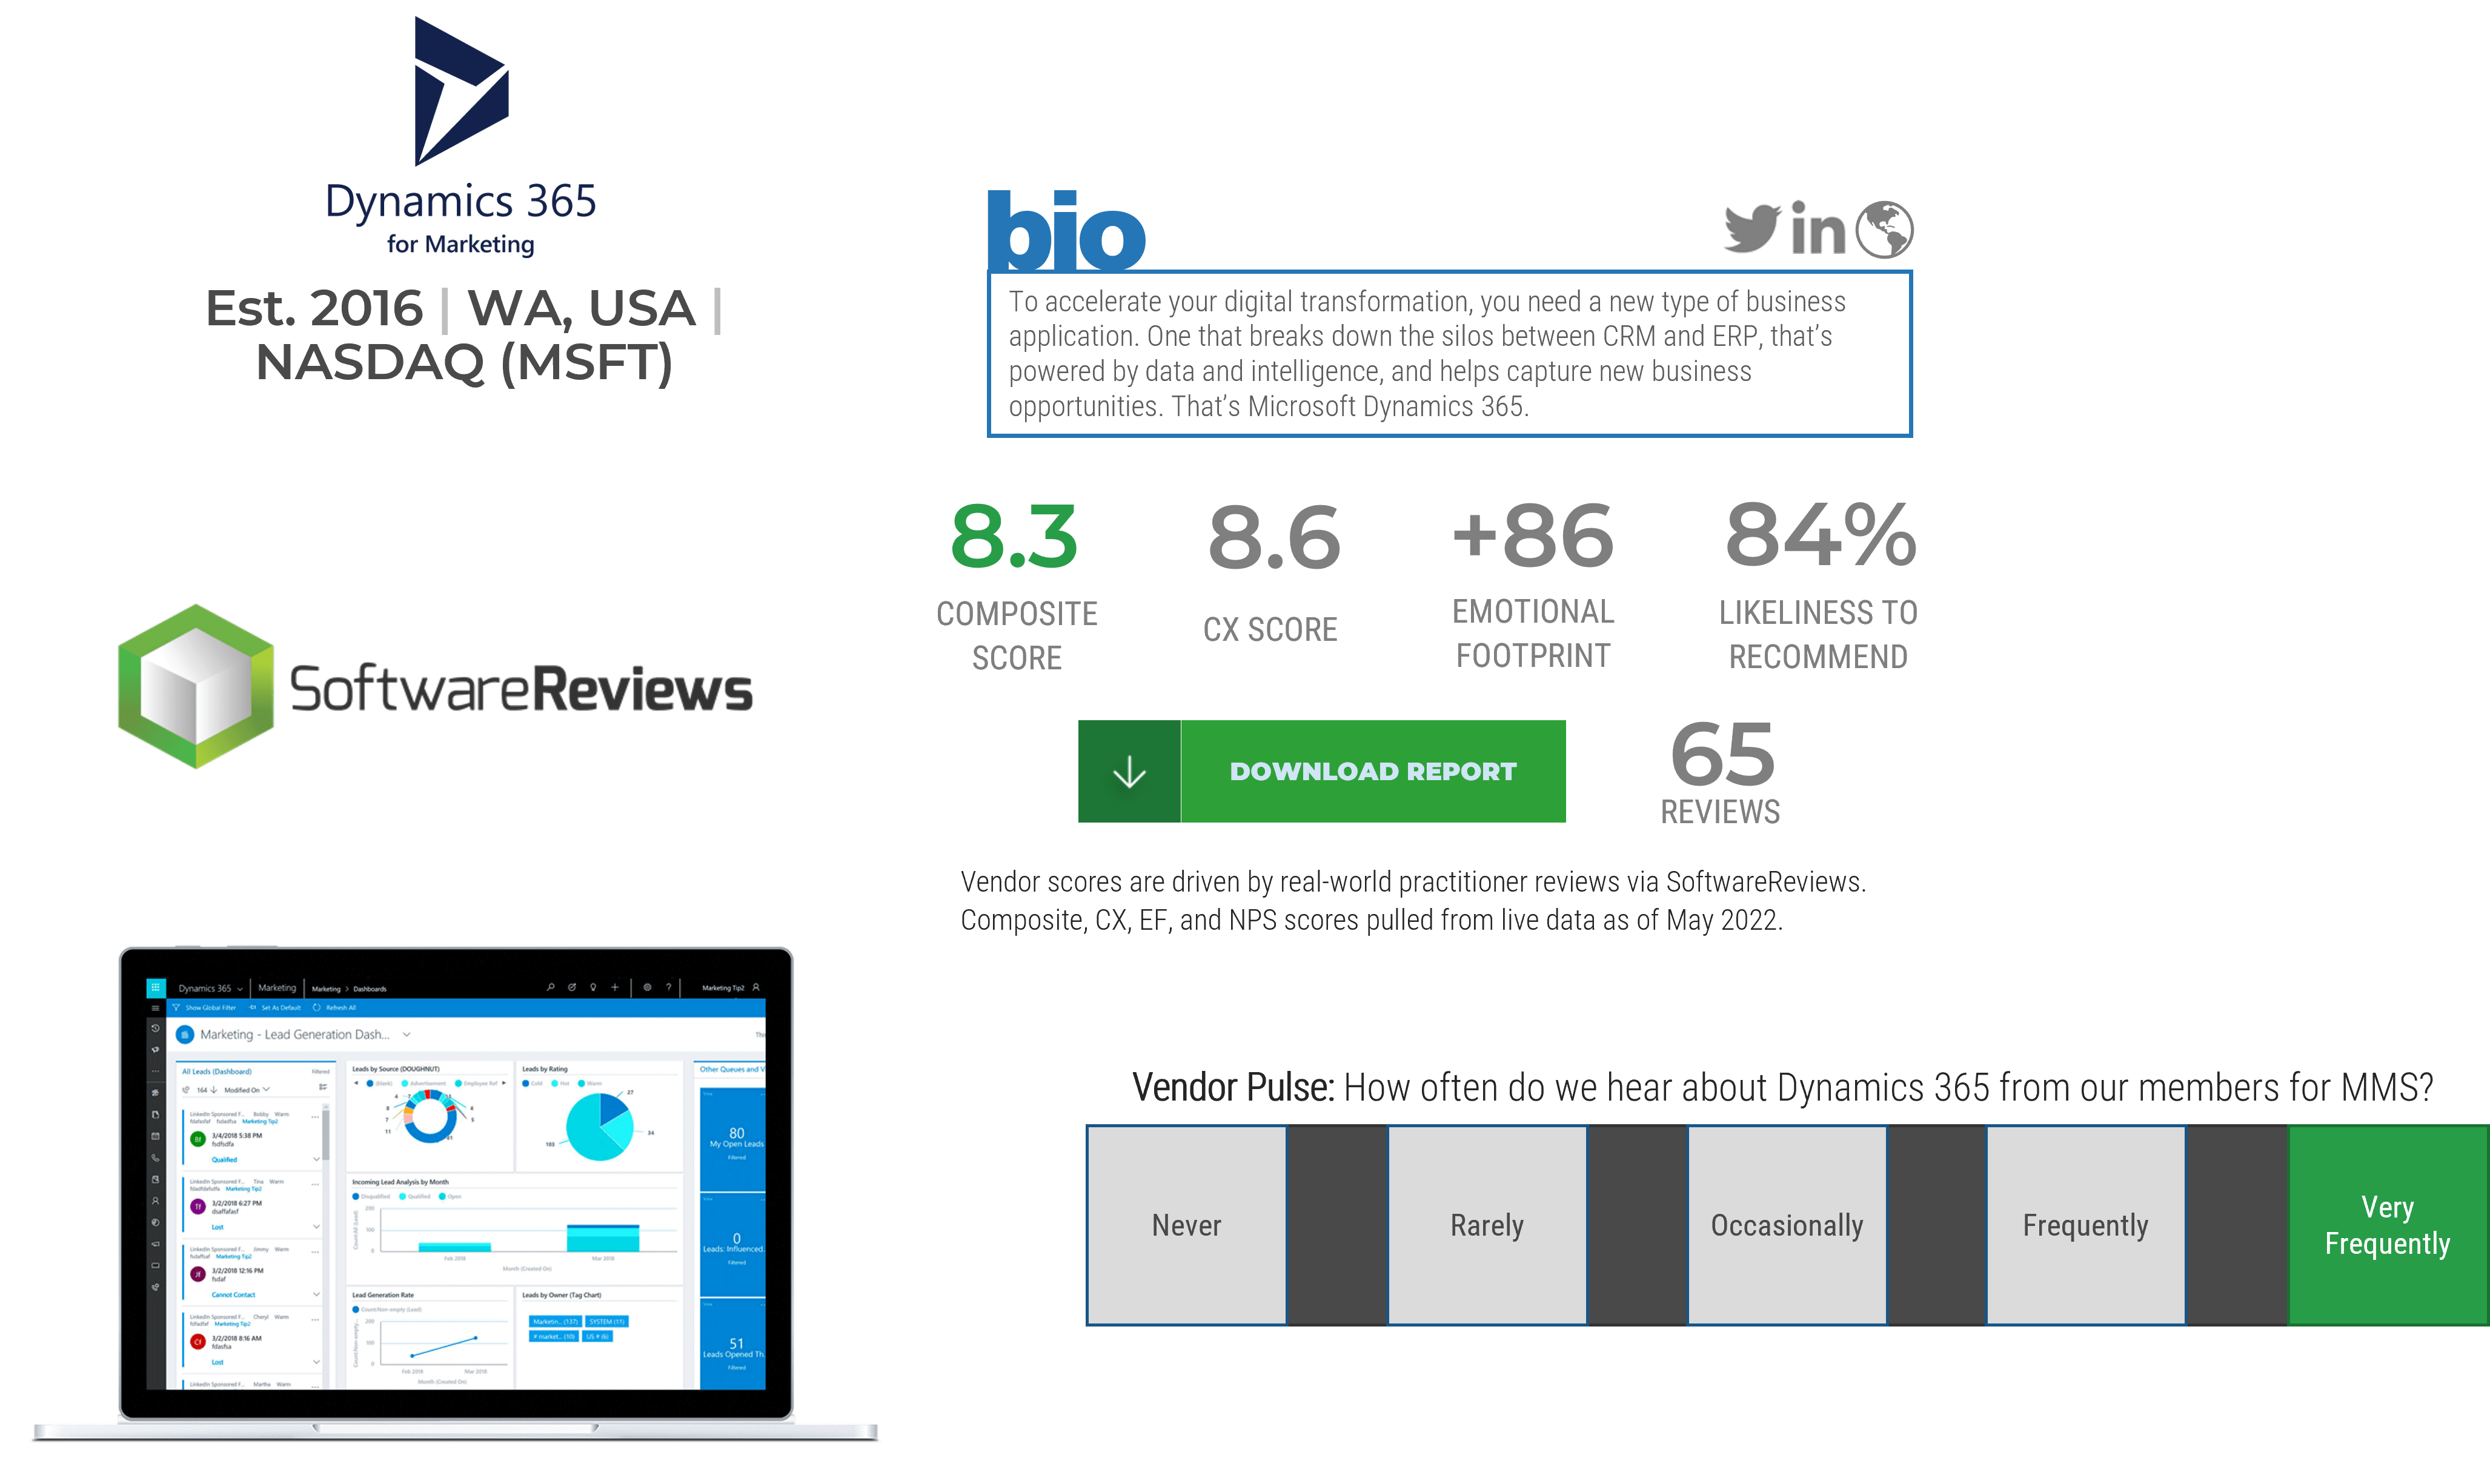
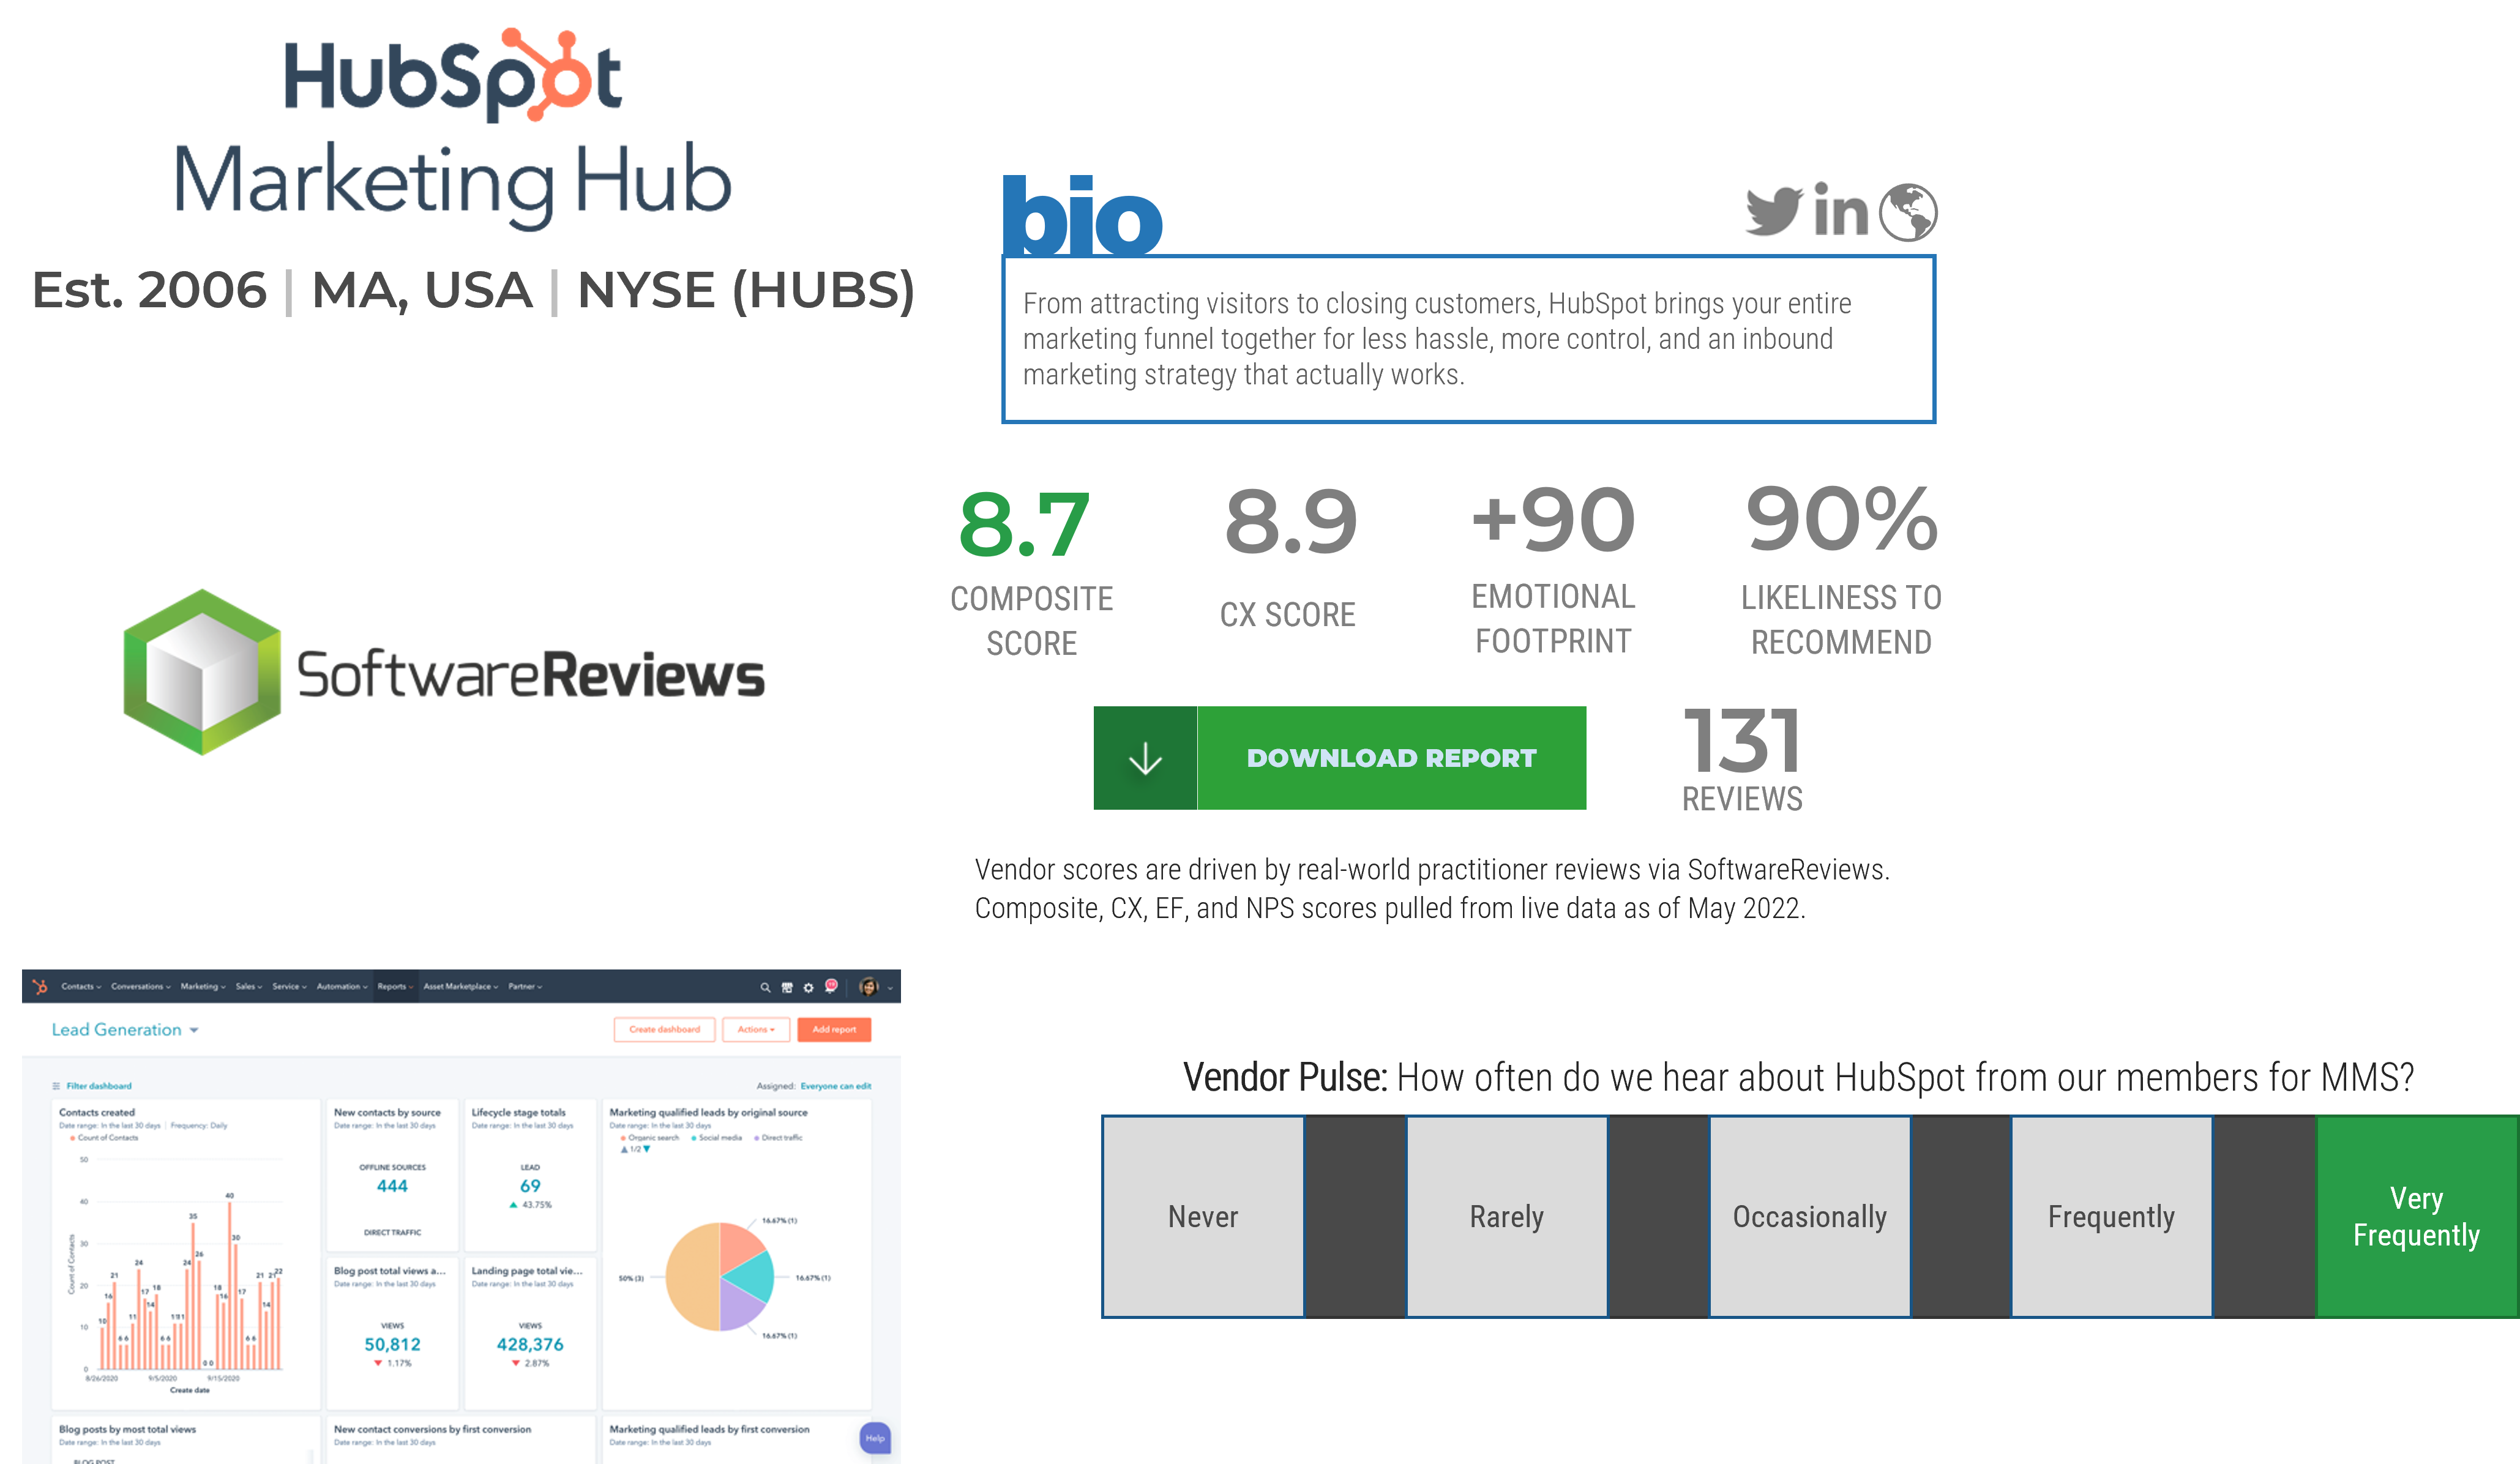

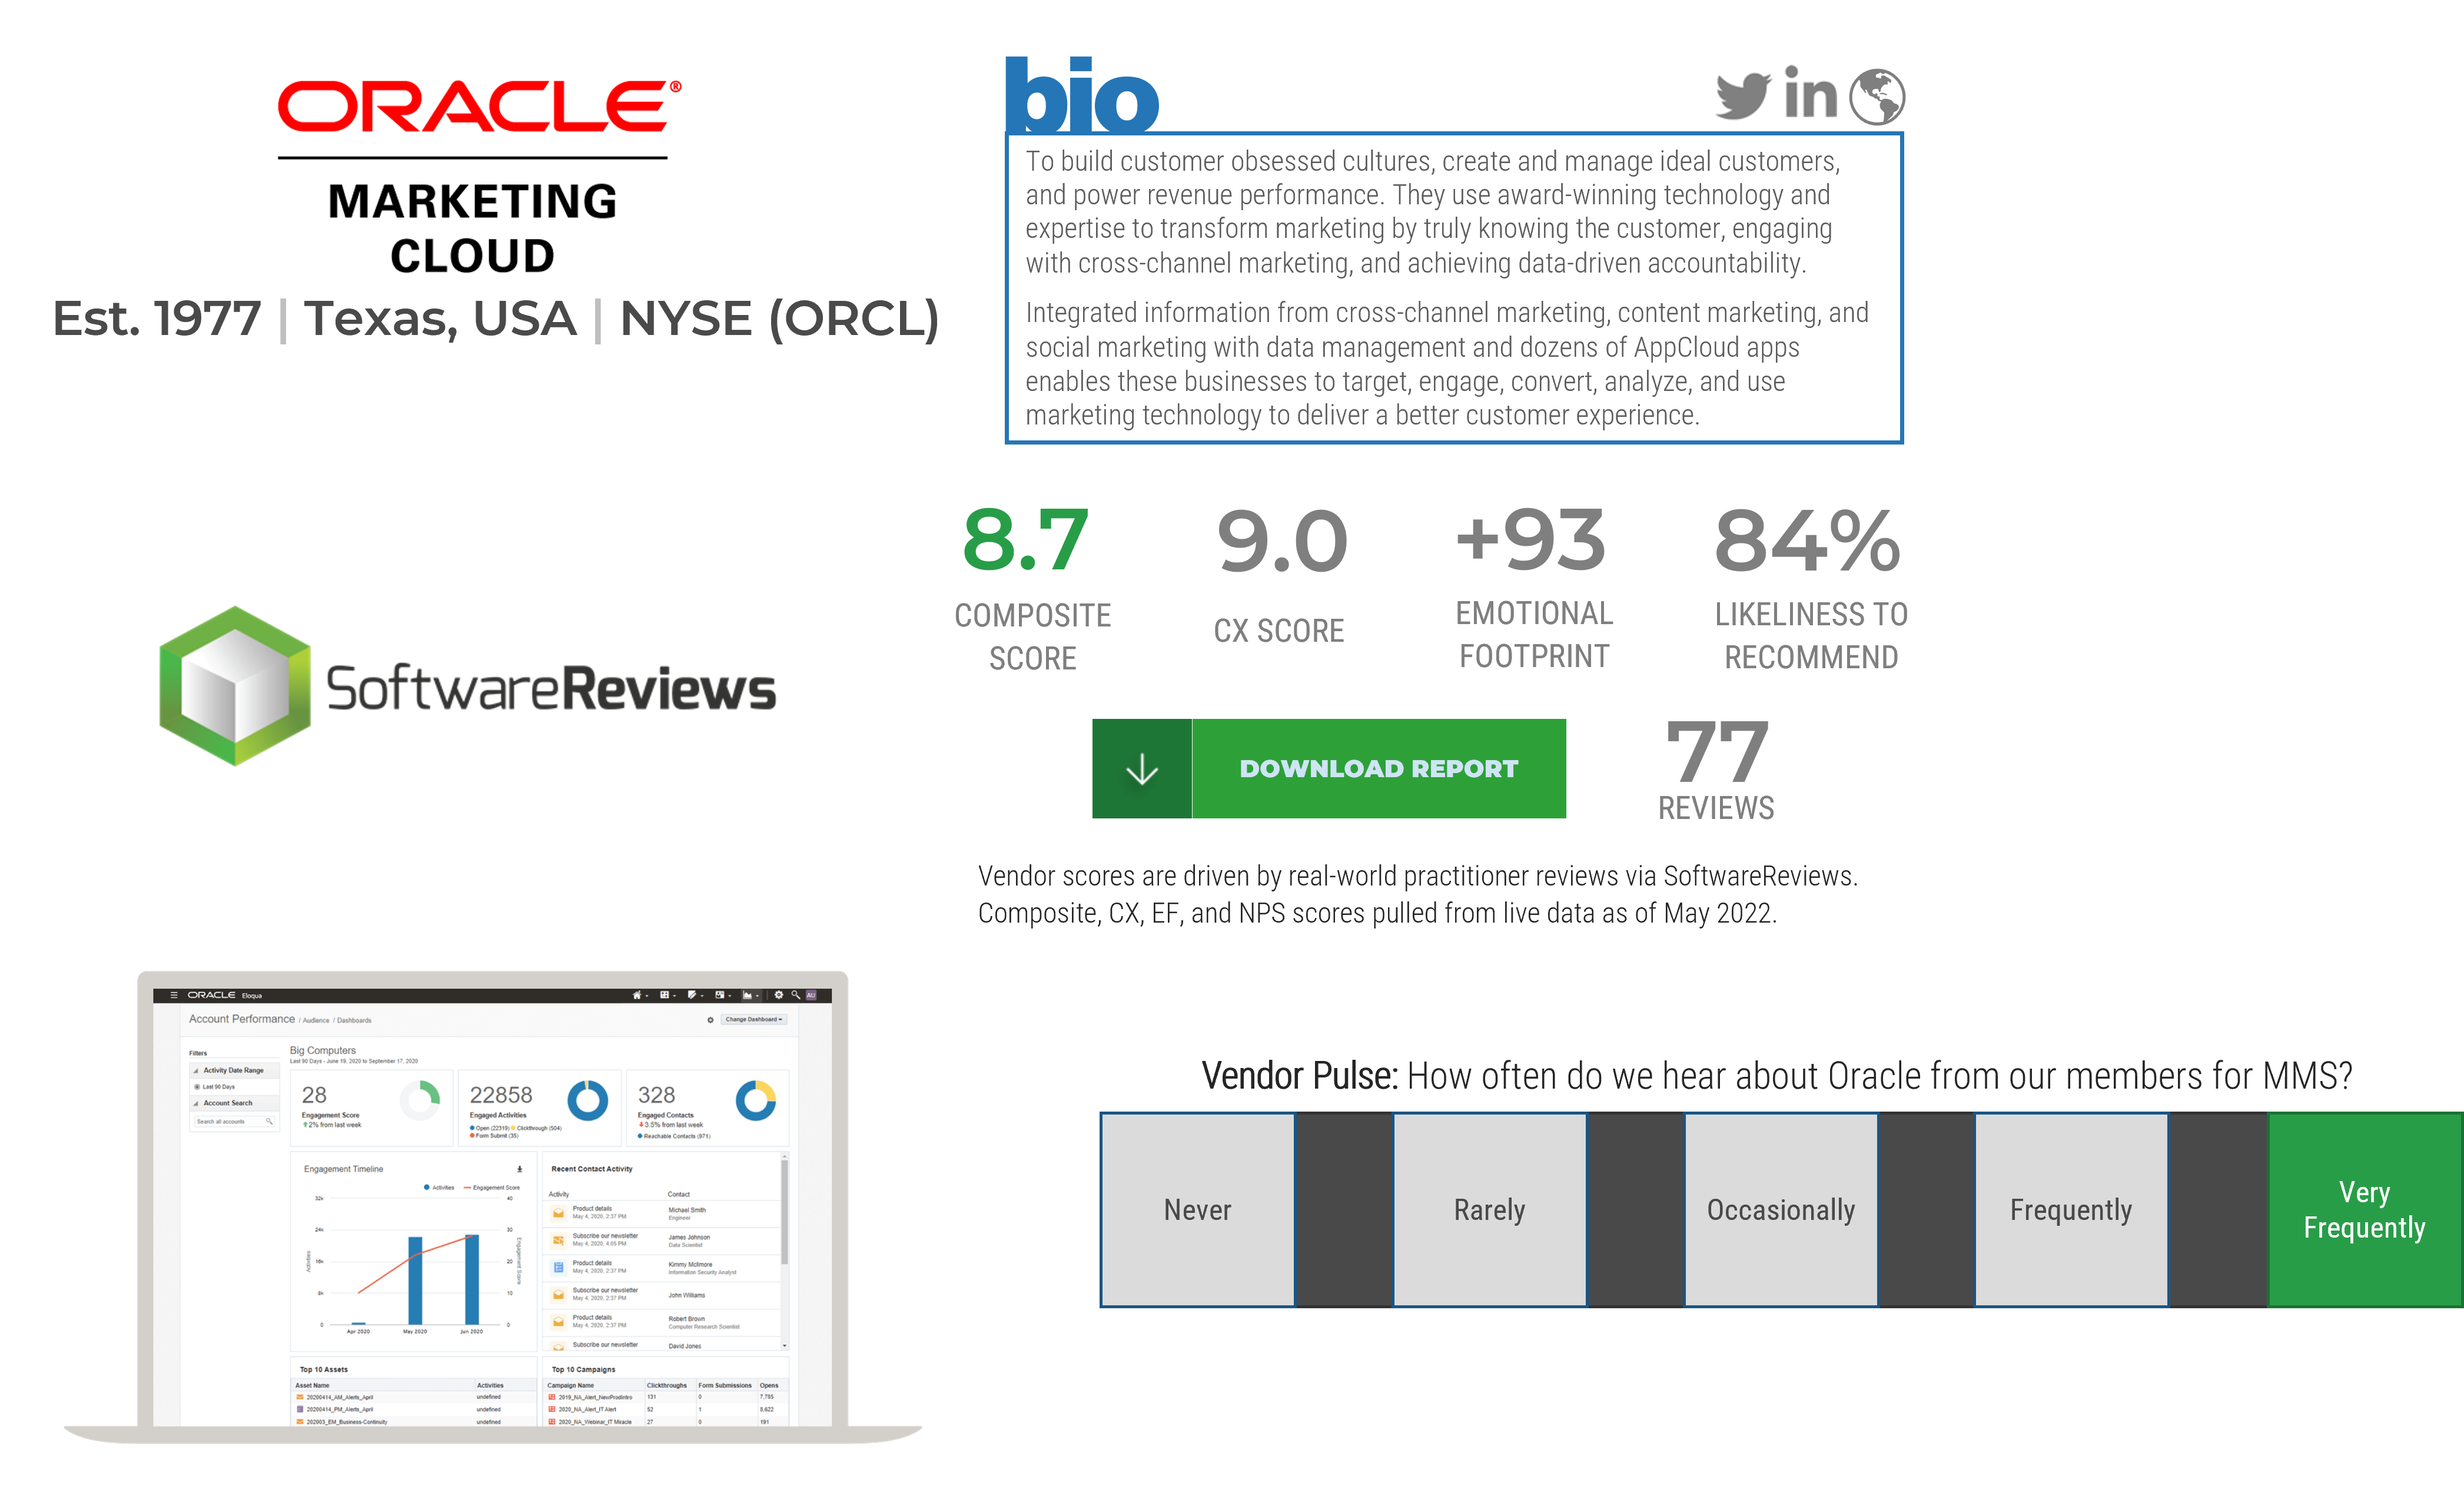
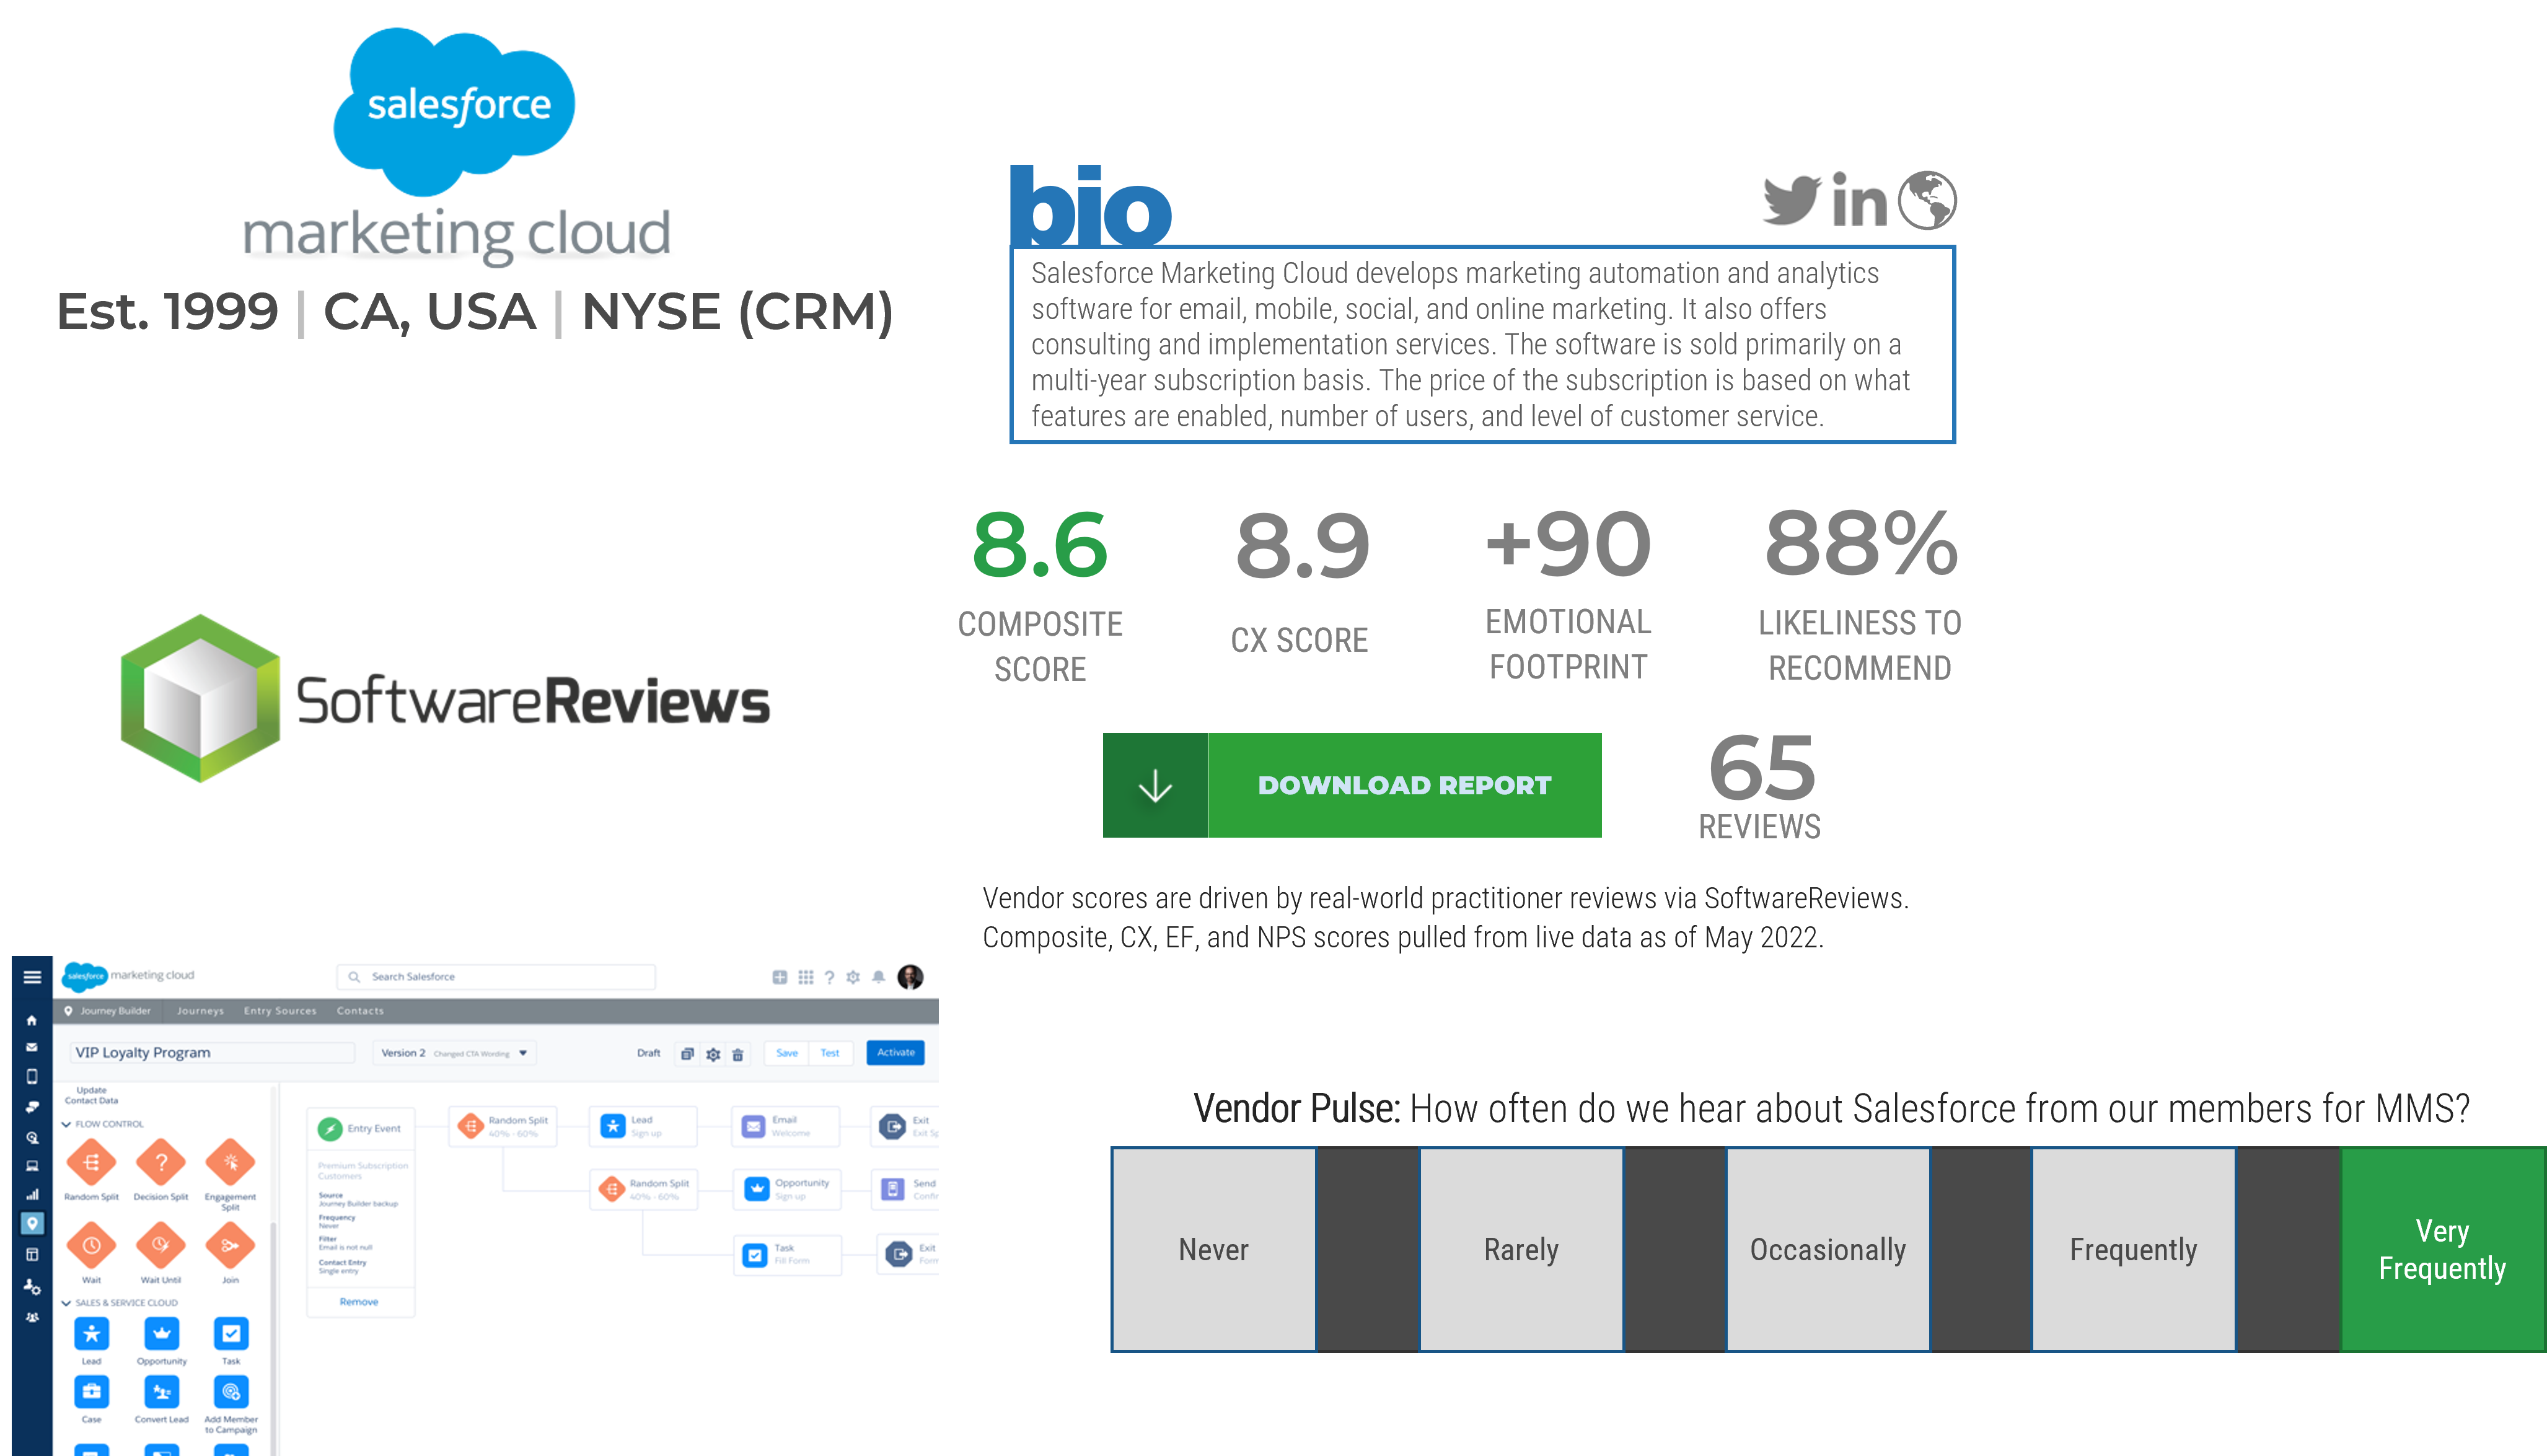
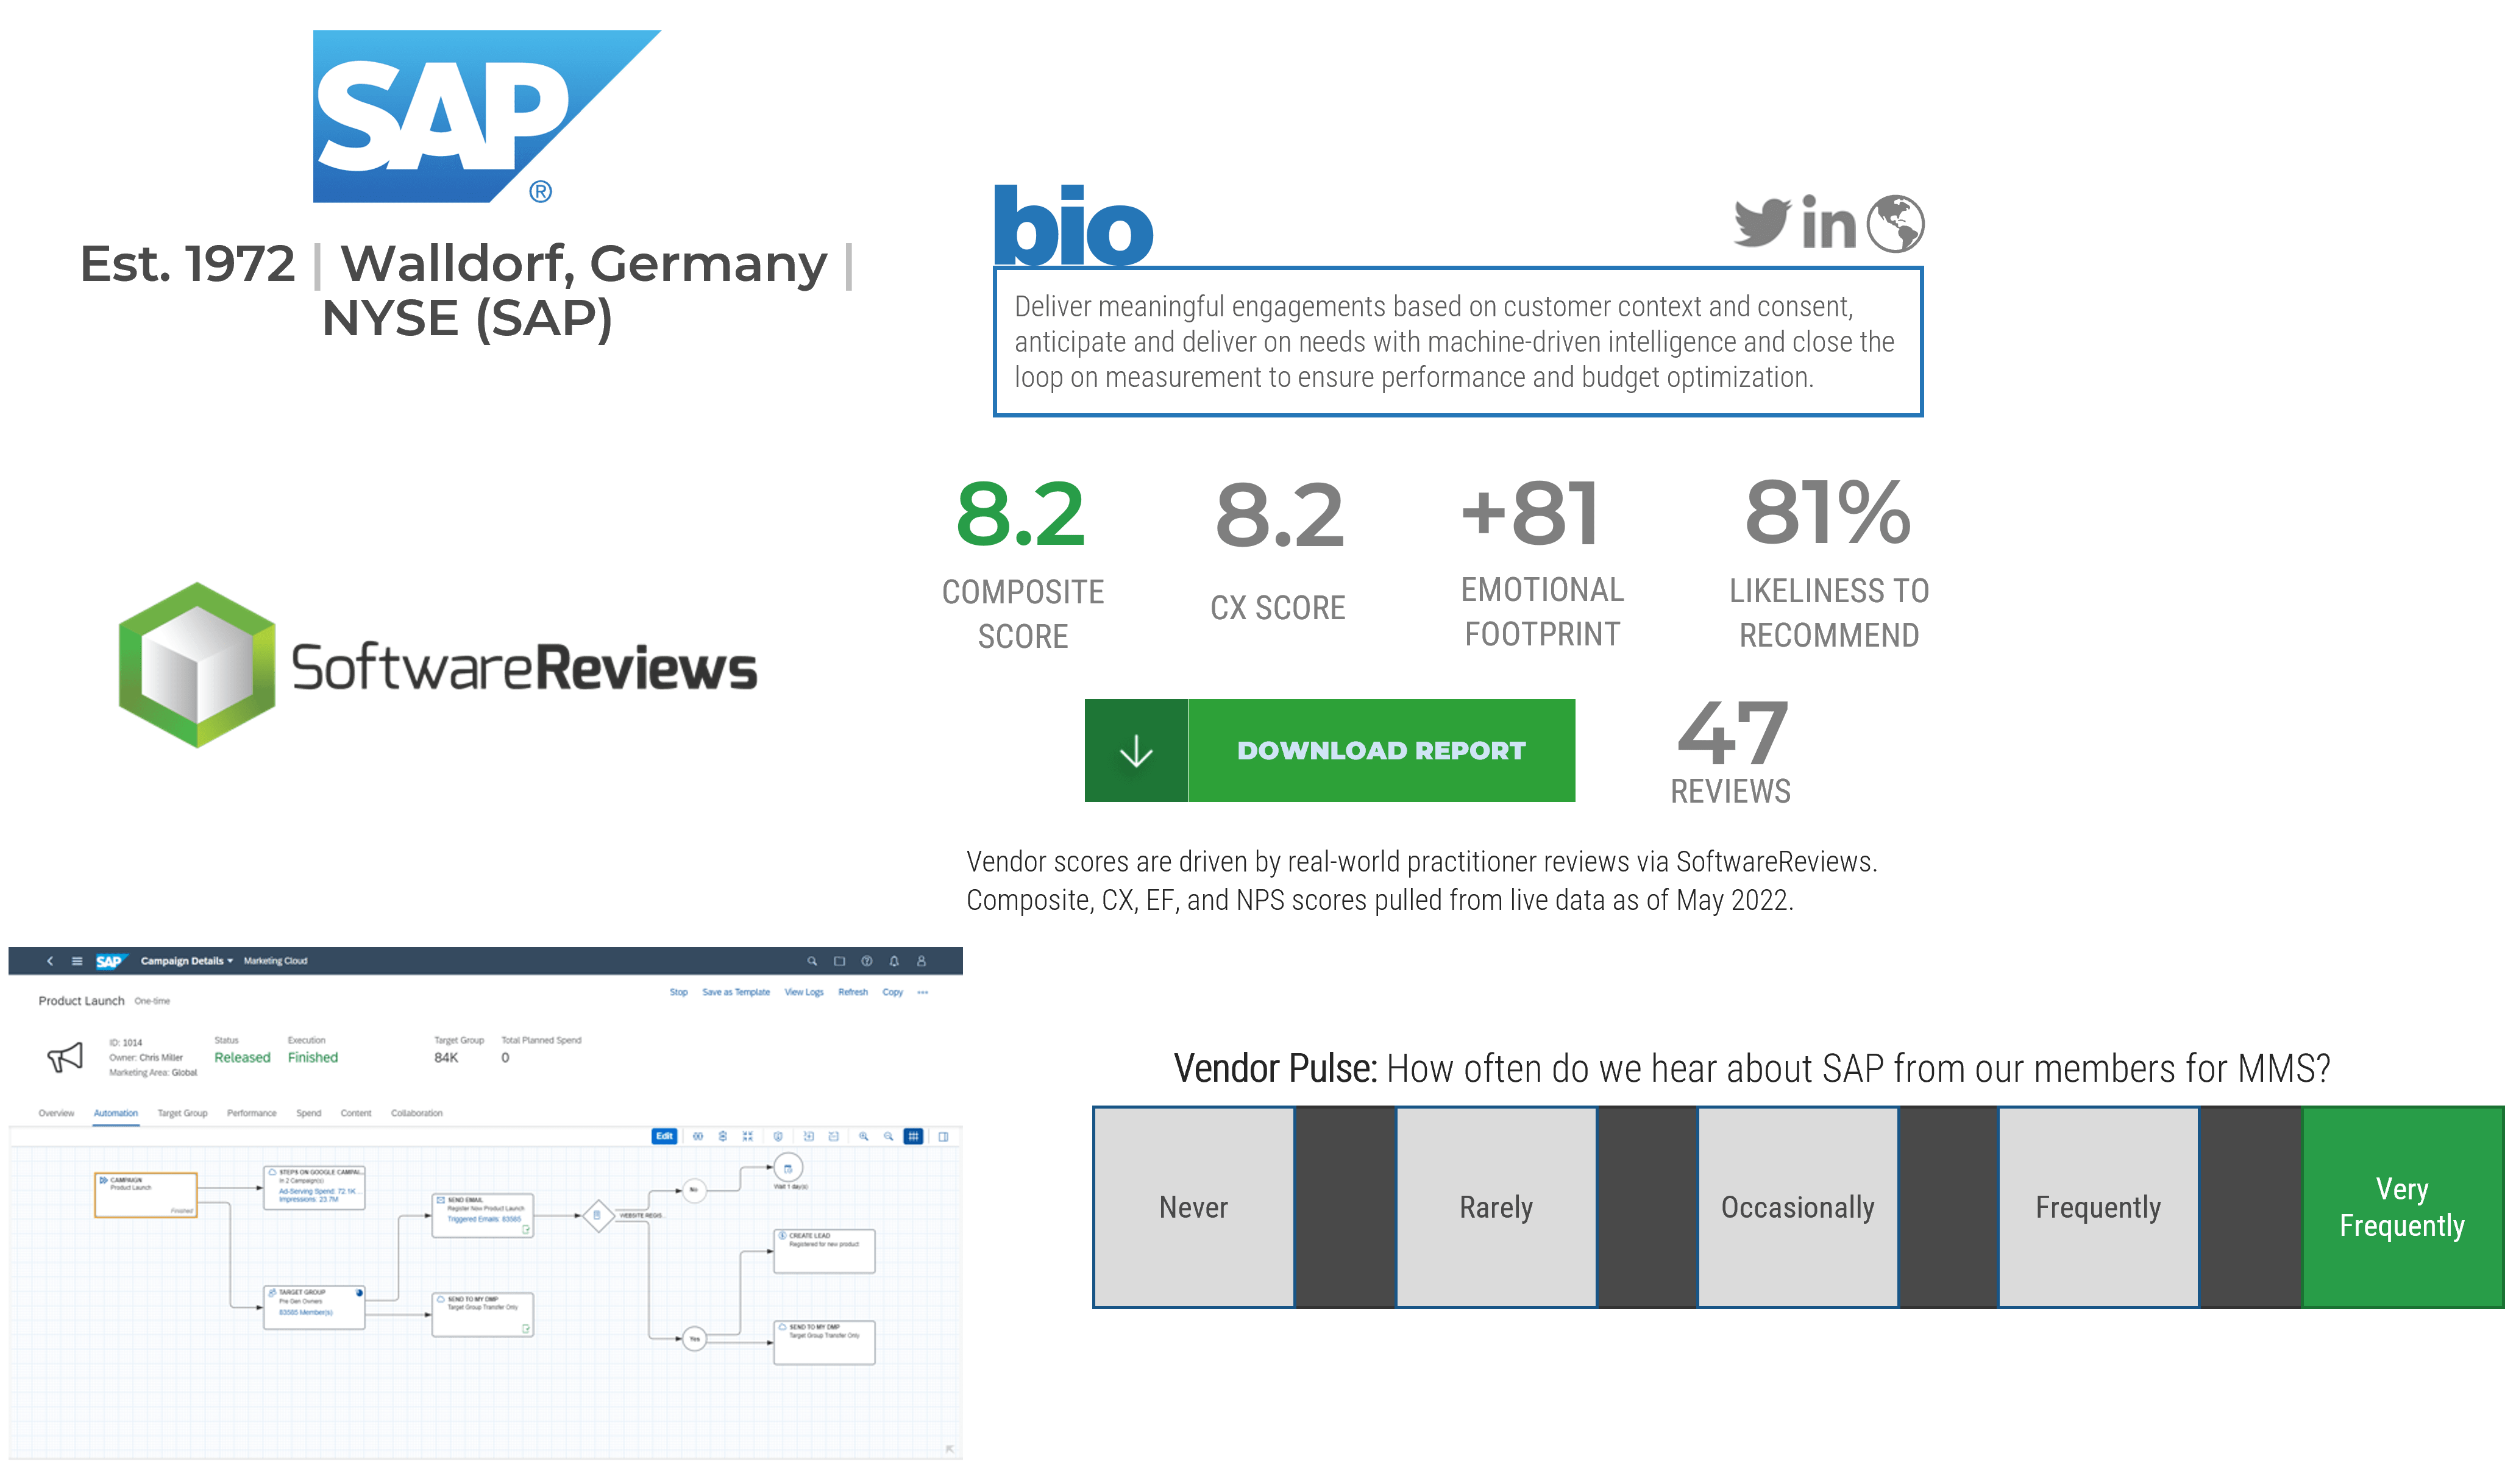


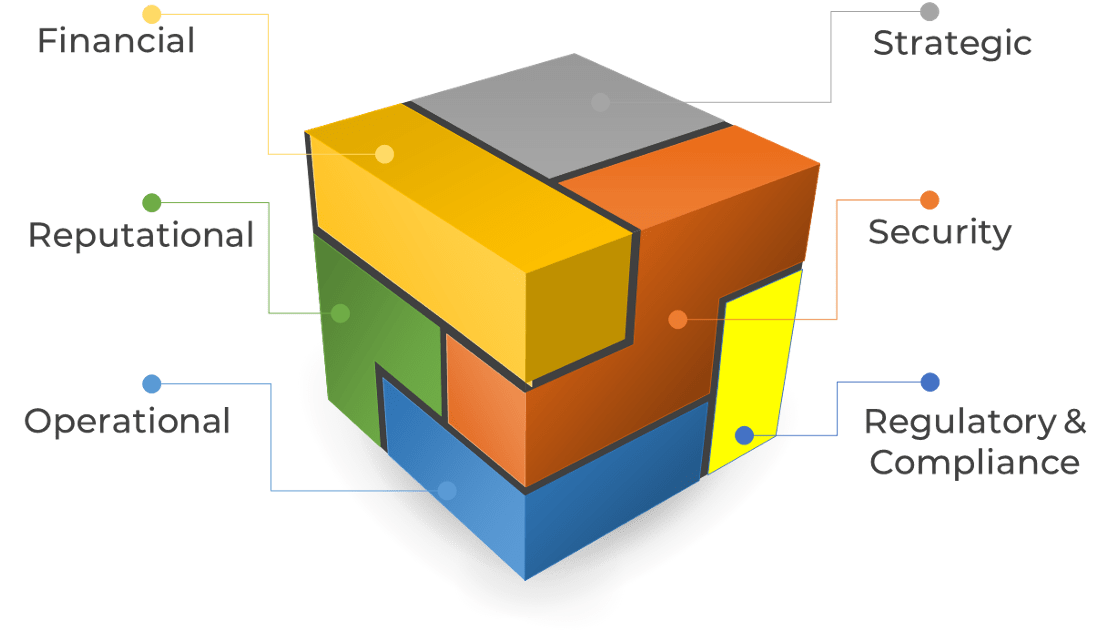
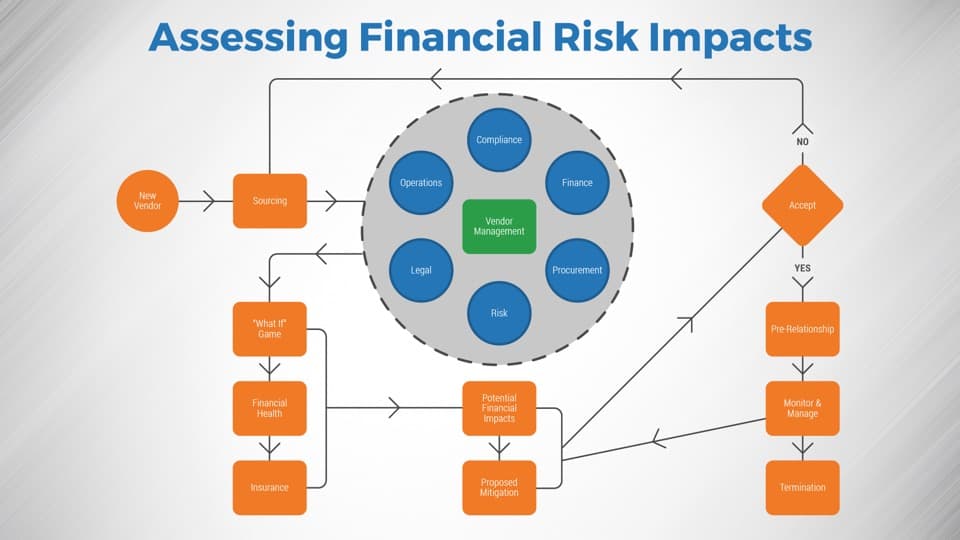
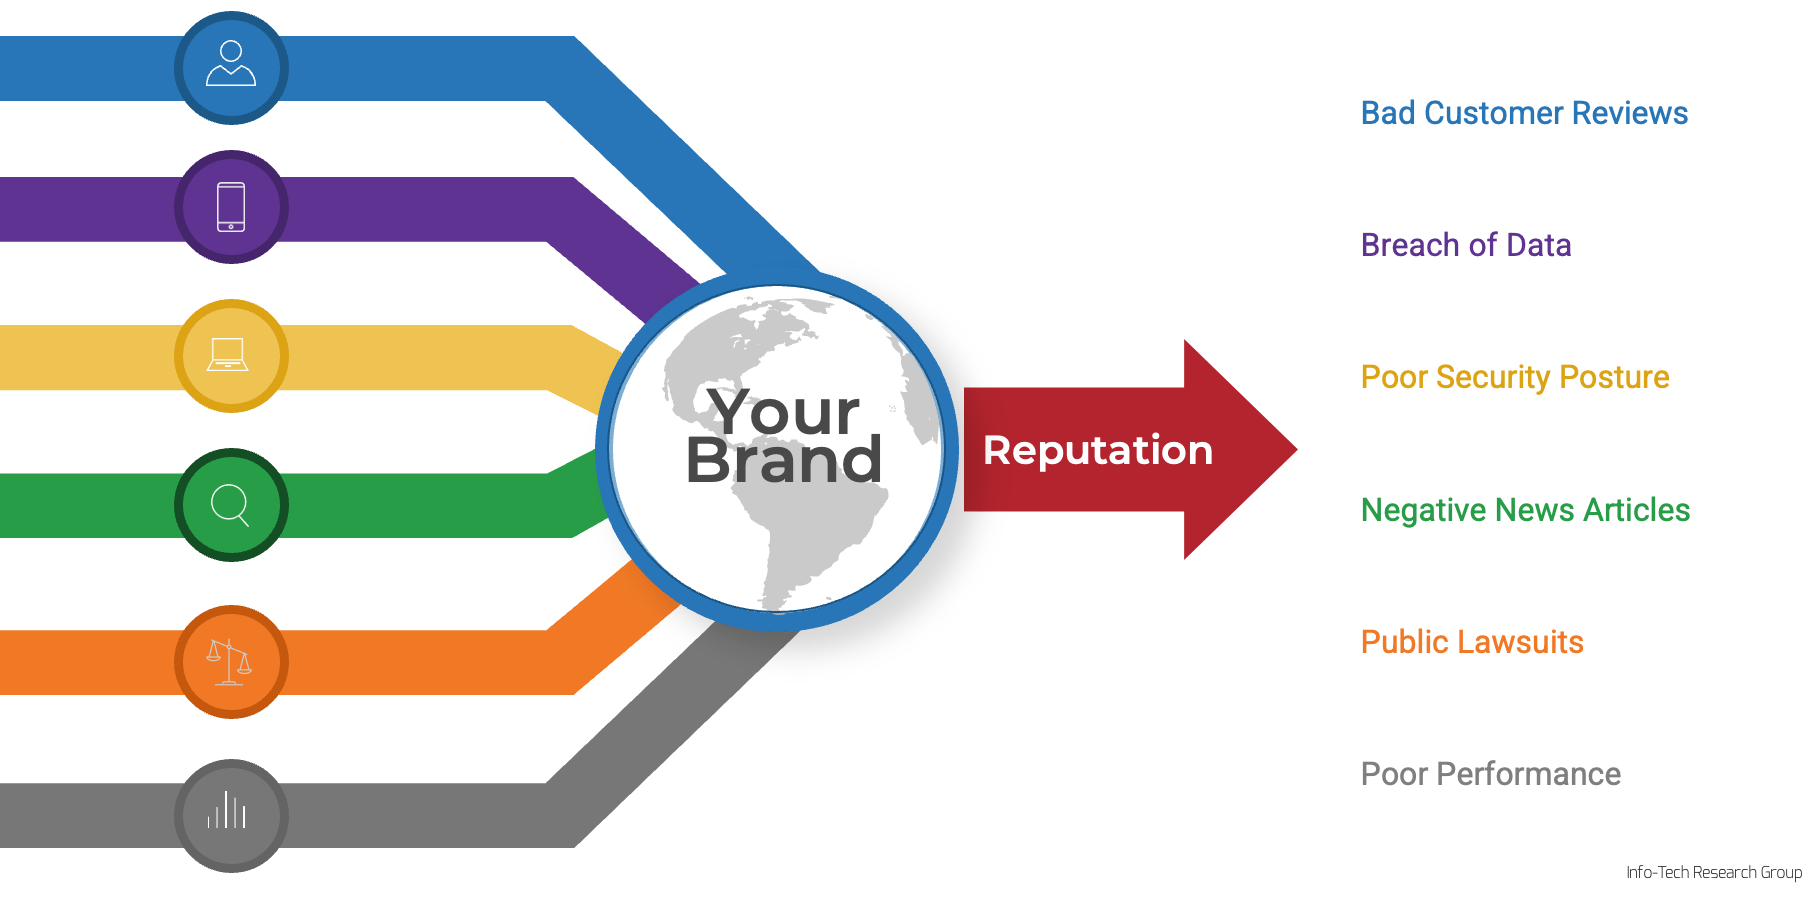
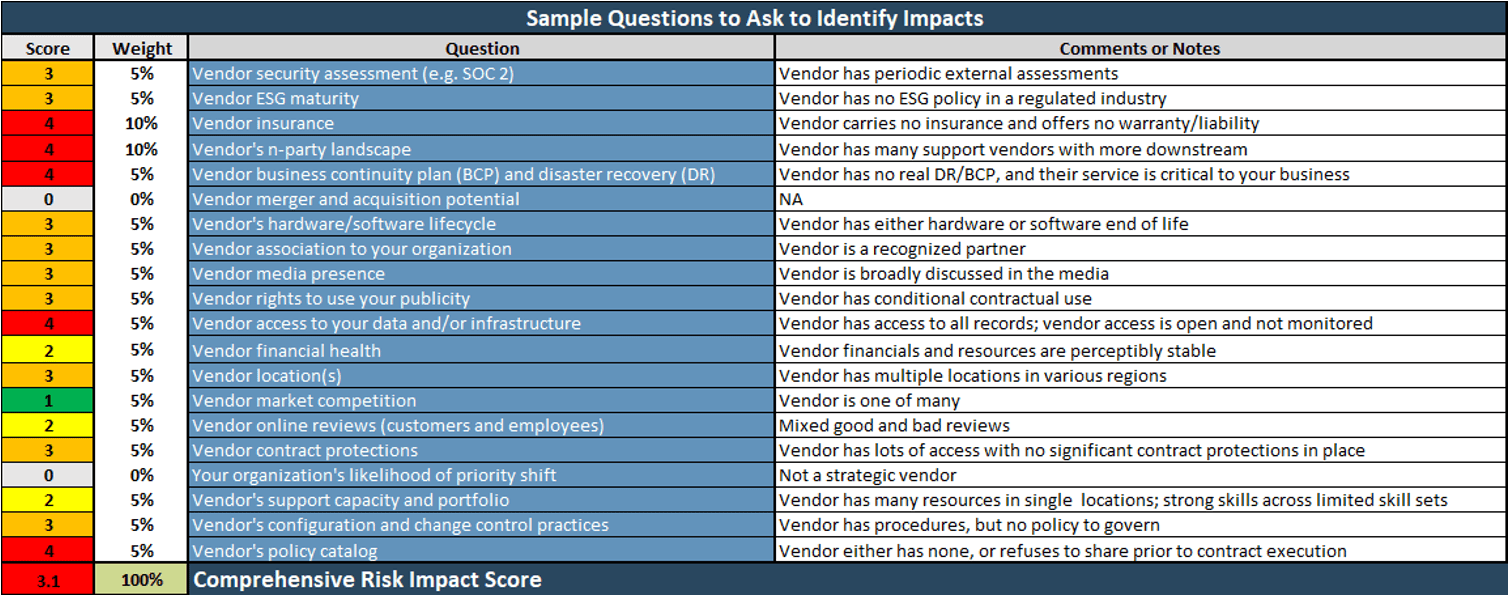
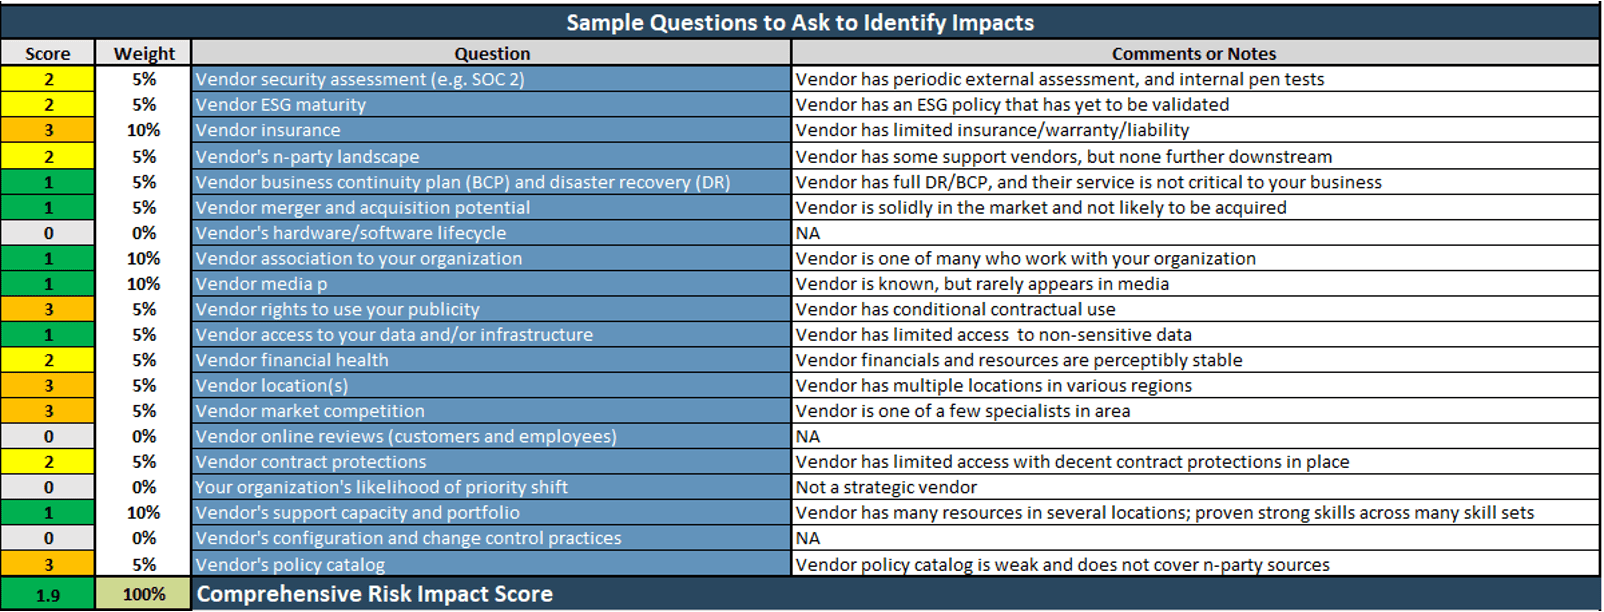

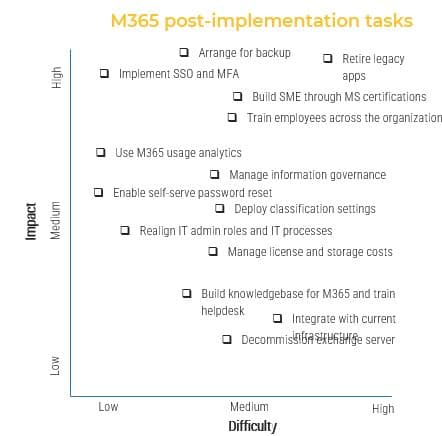
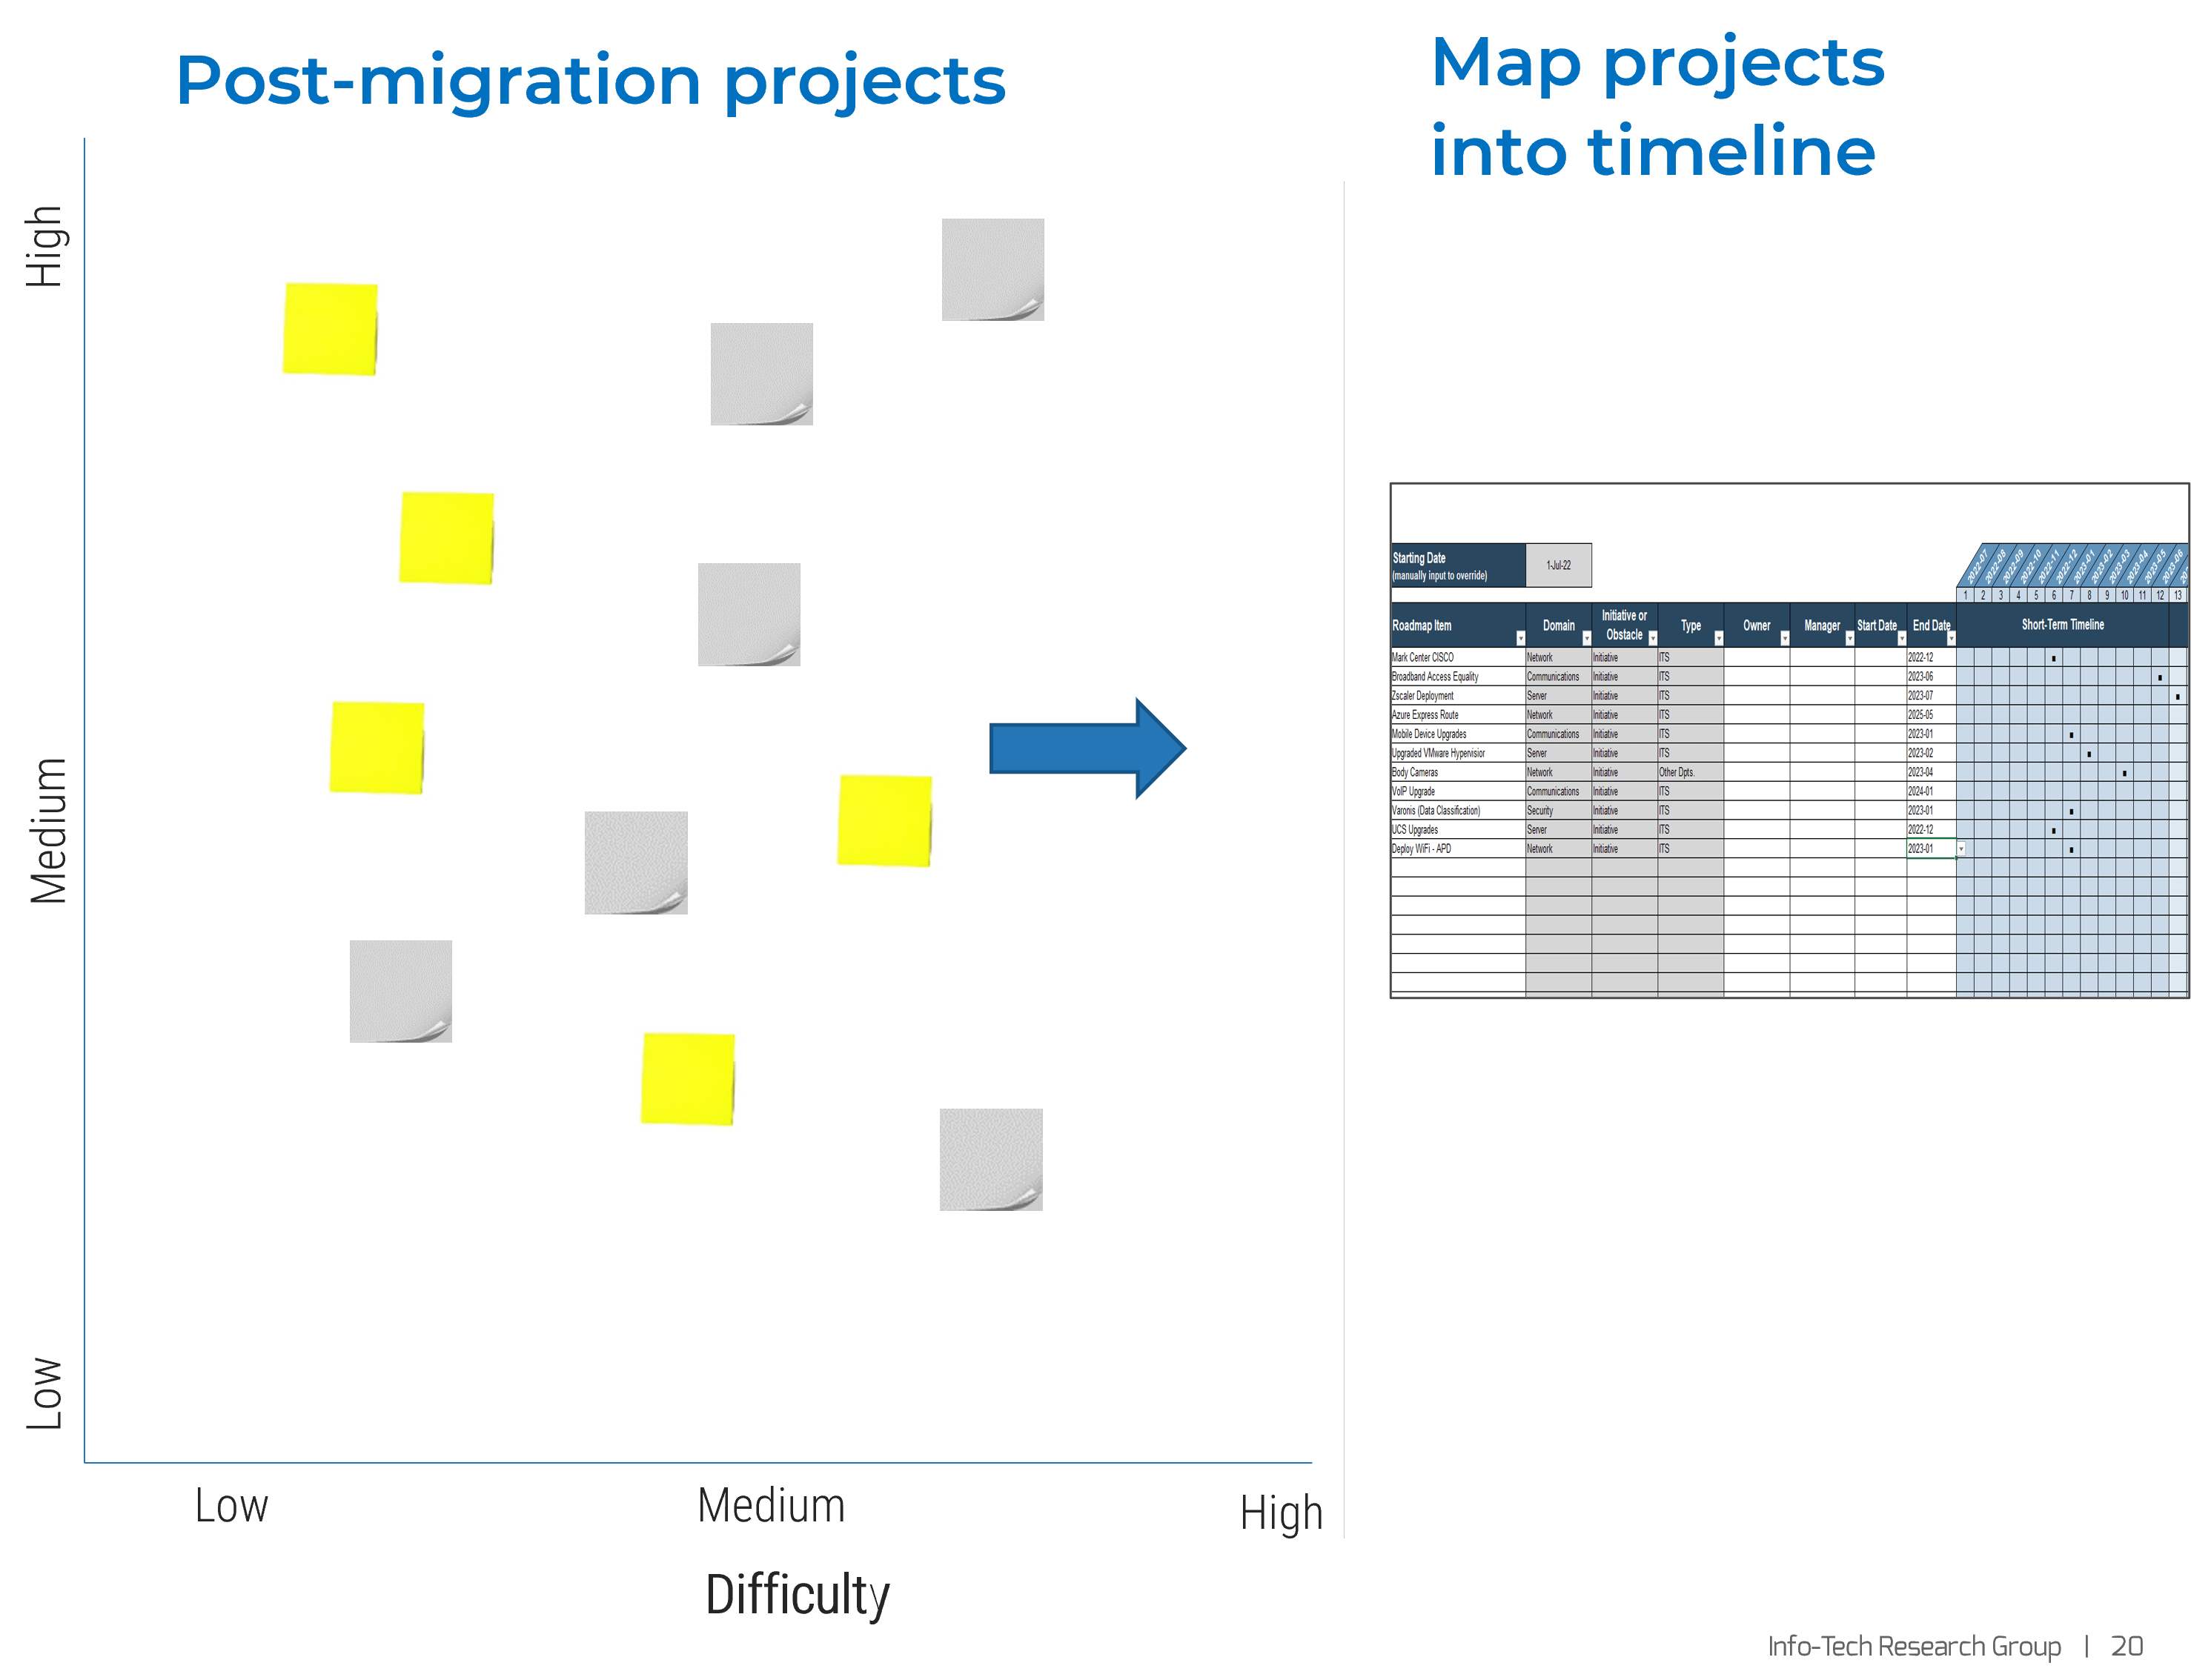

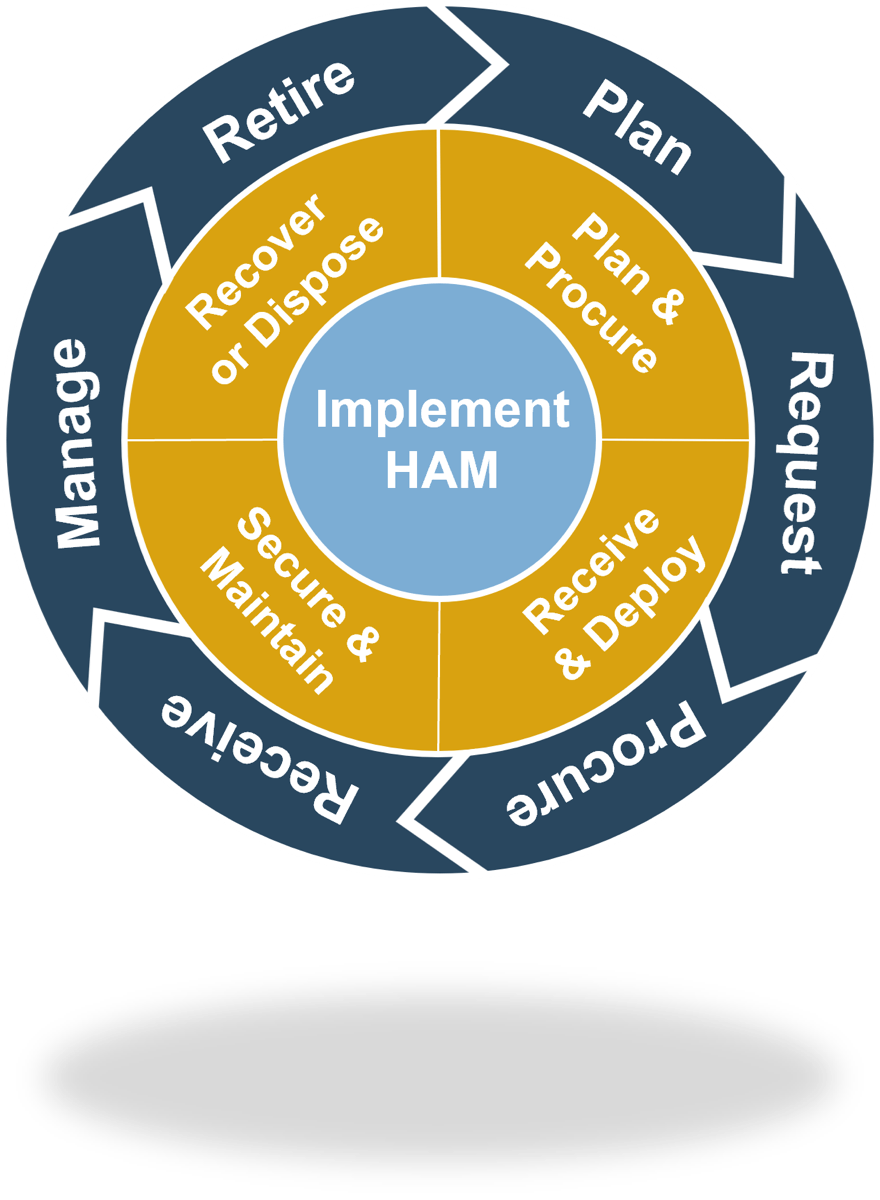
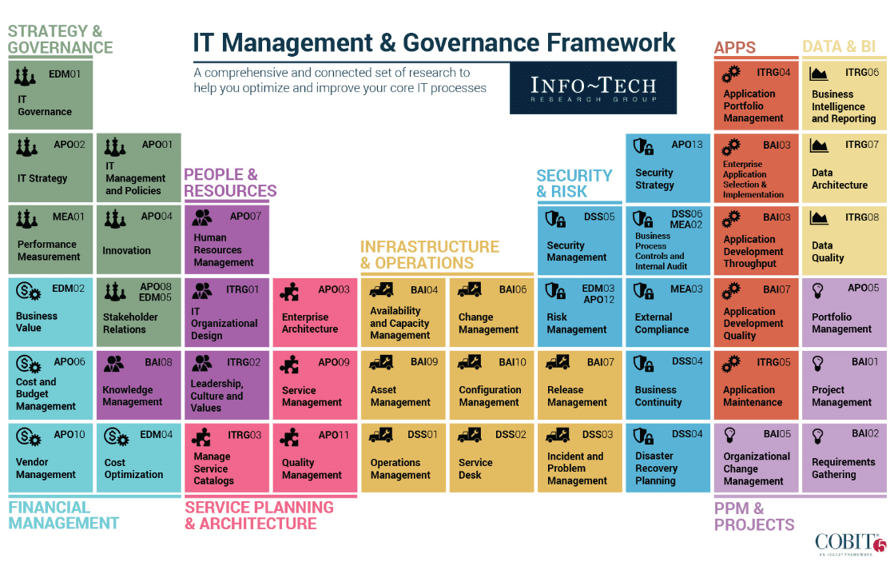
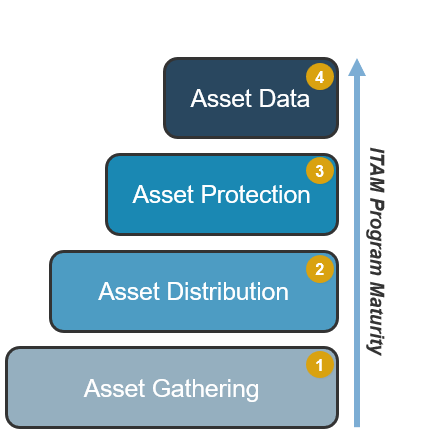
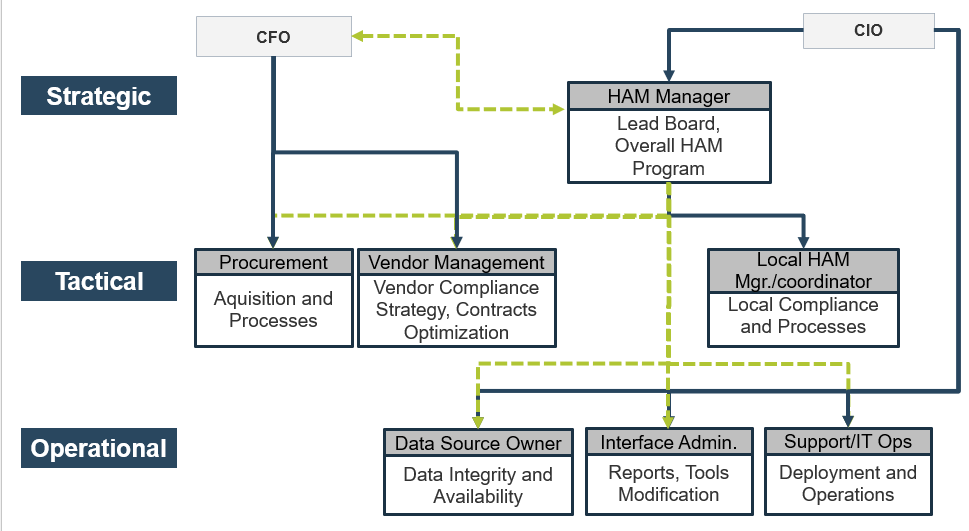
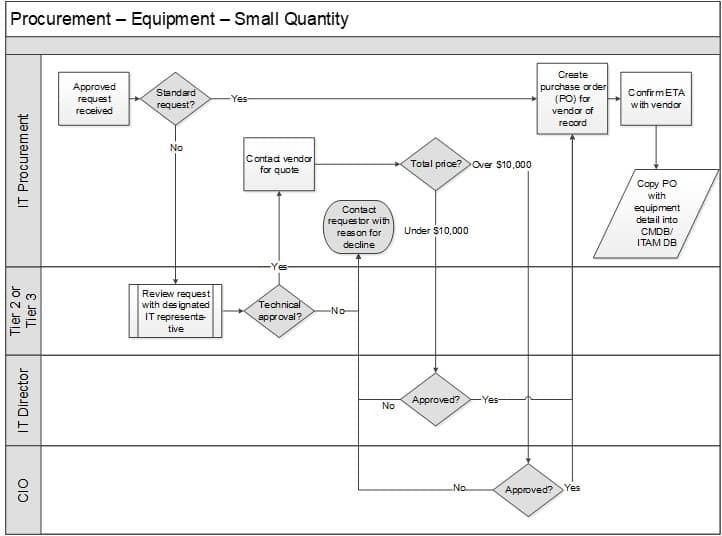
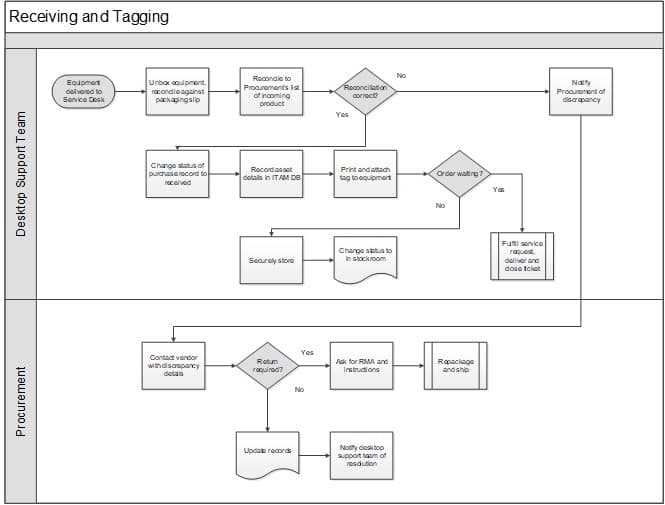
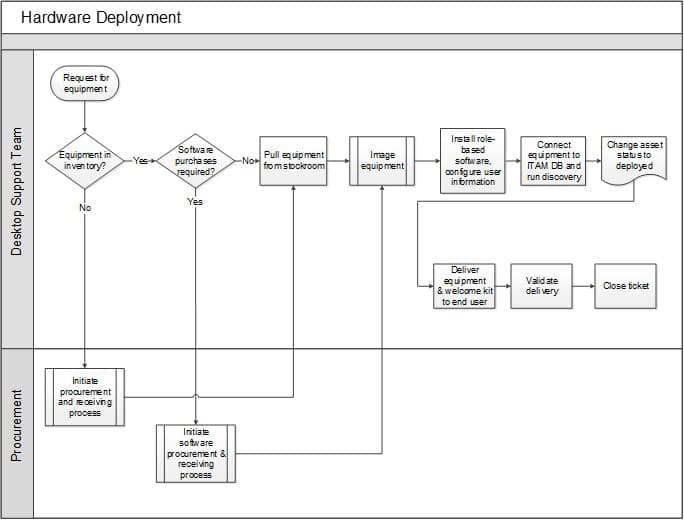
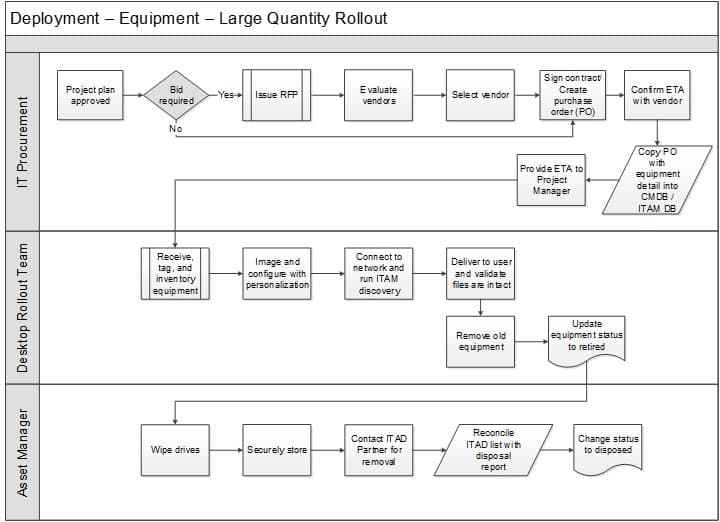
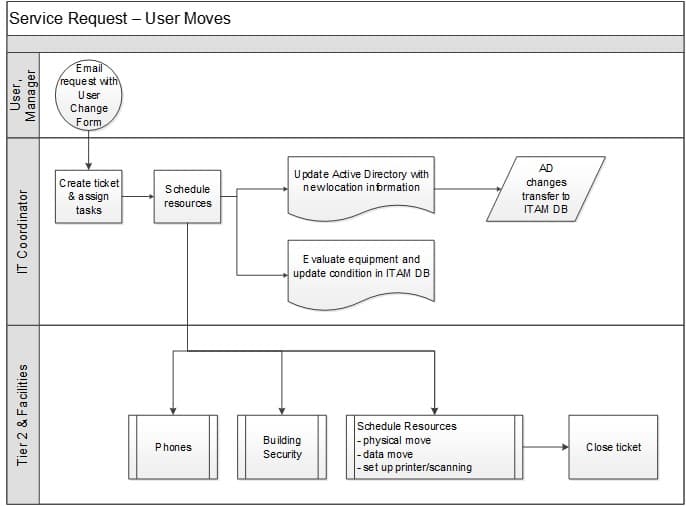
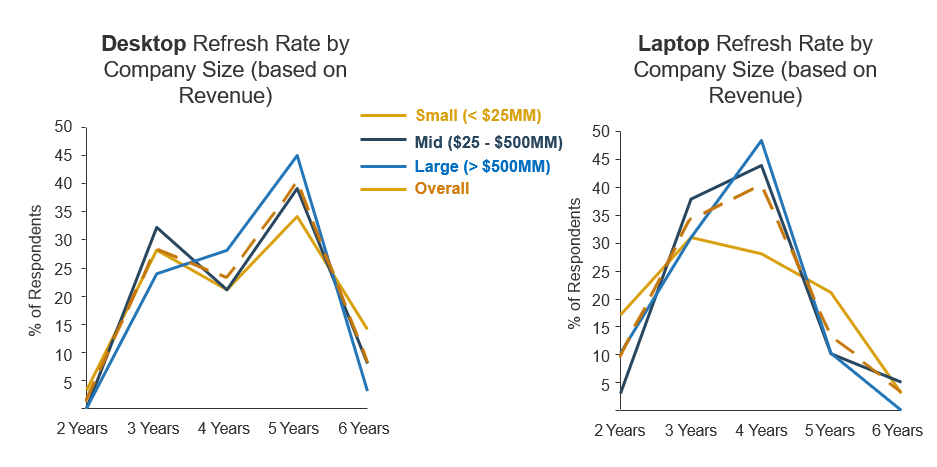 $500MM); and orange is Overall.">
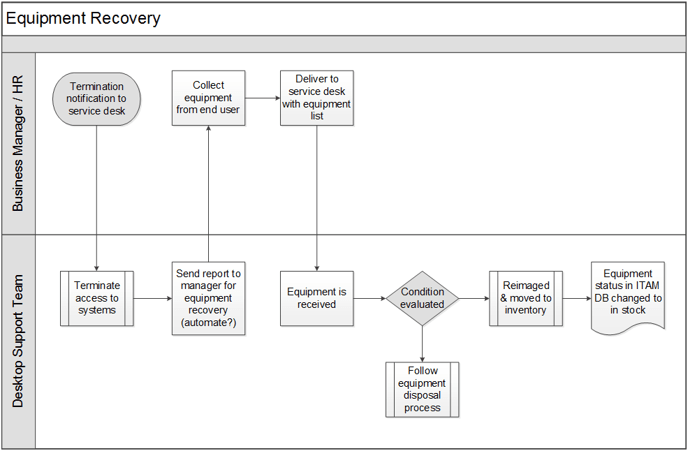
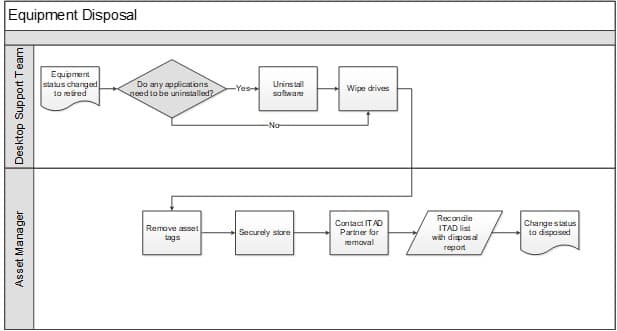

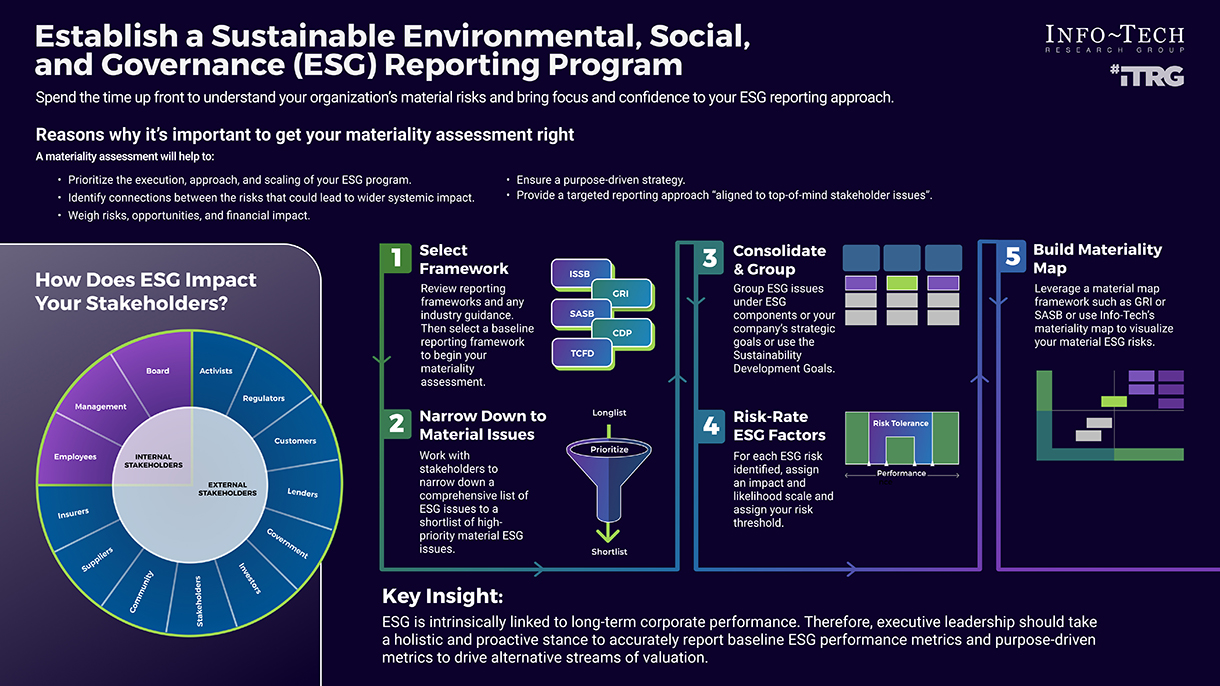


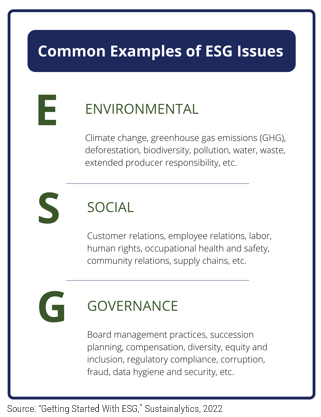
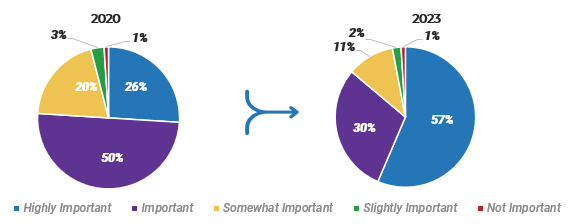
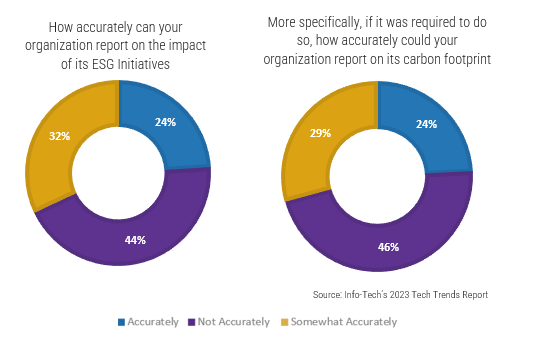

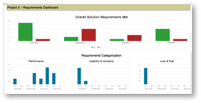
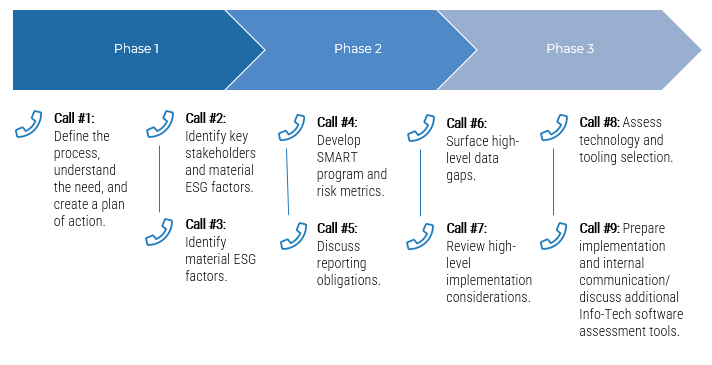
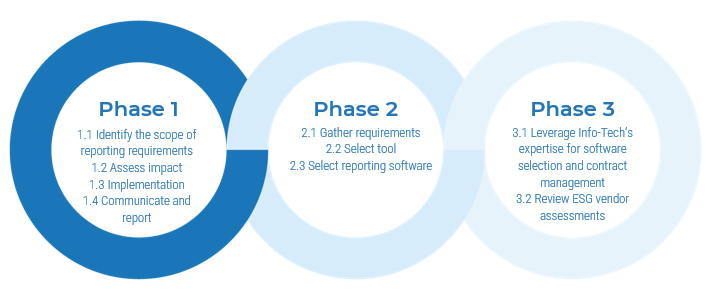
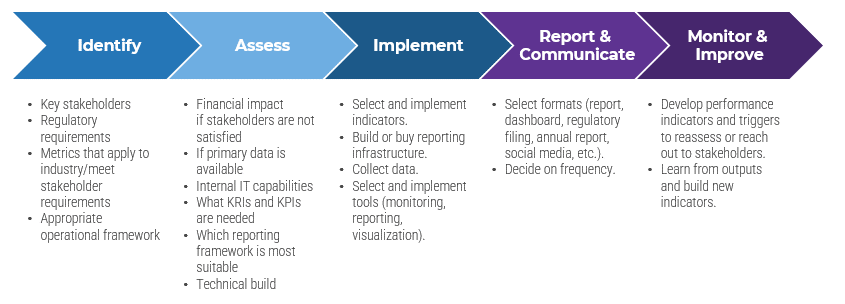
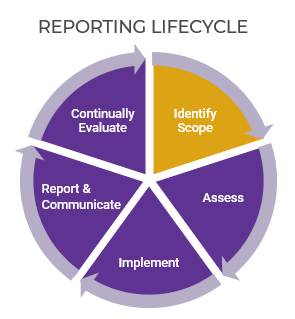
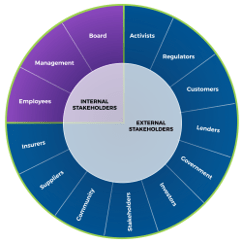
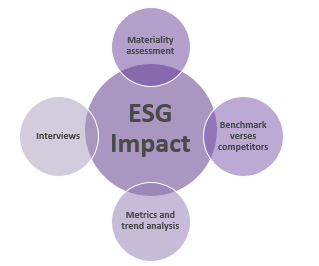
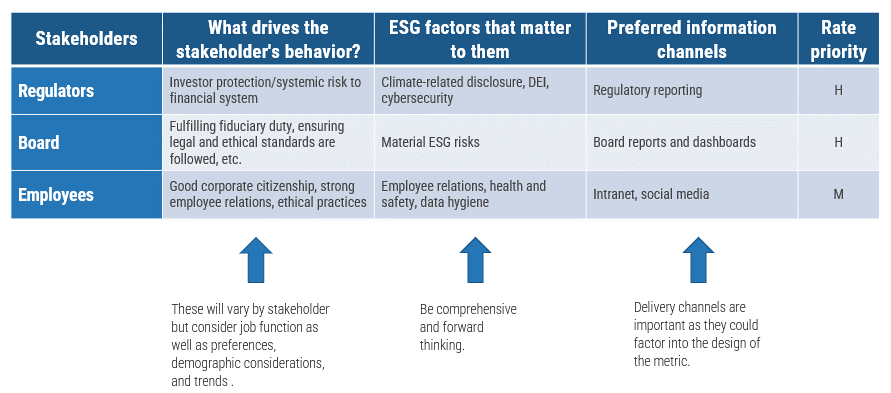
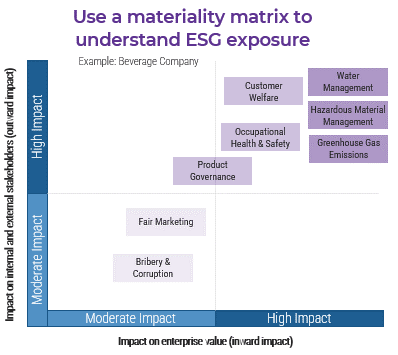
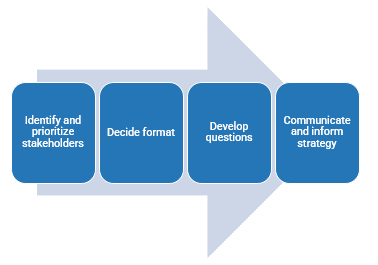
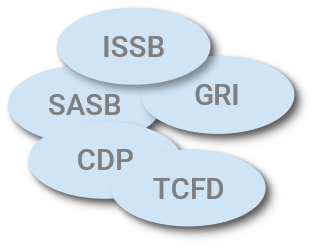
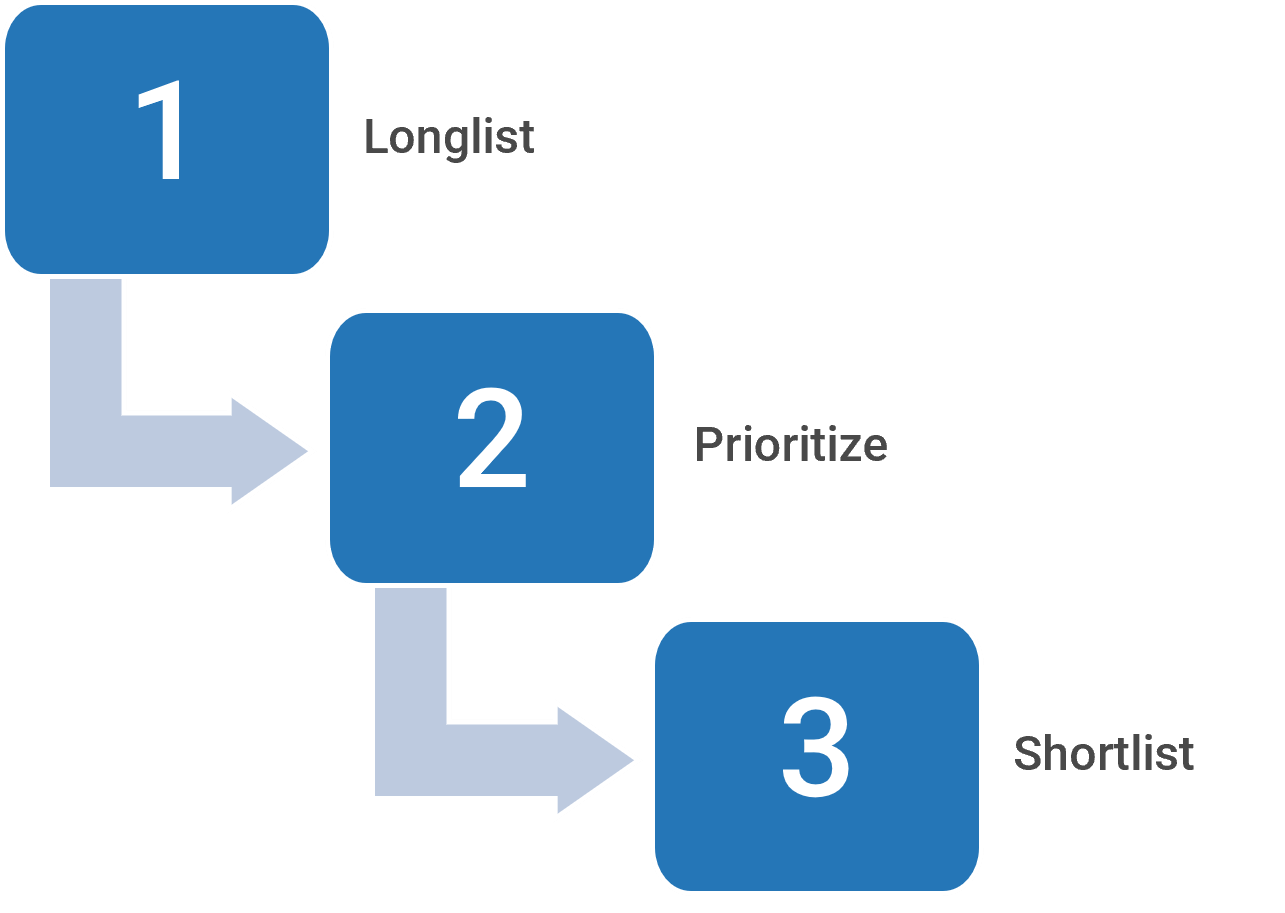
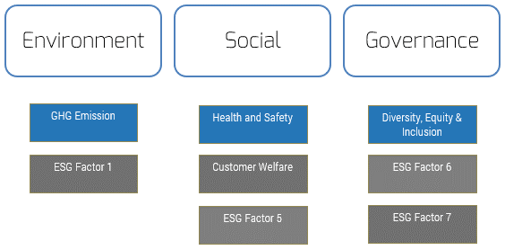
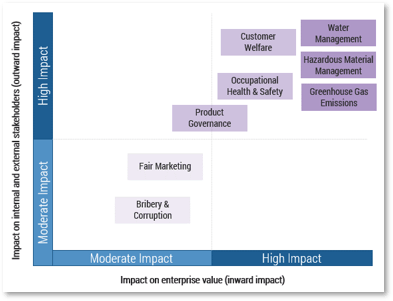
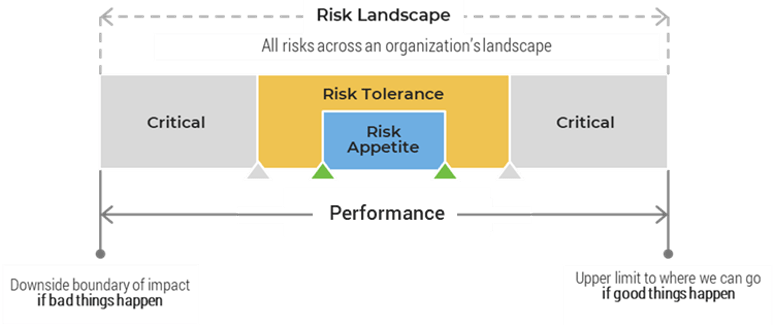
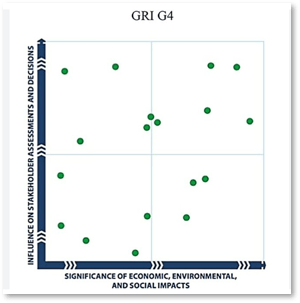
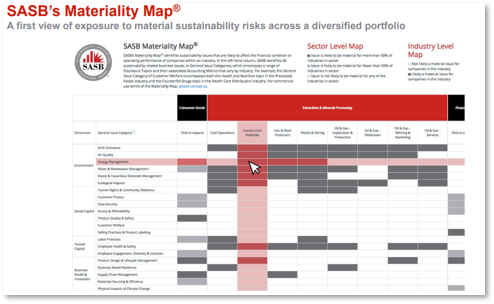

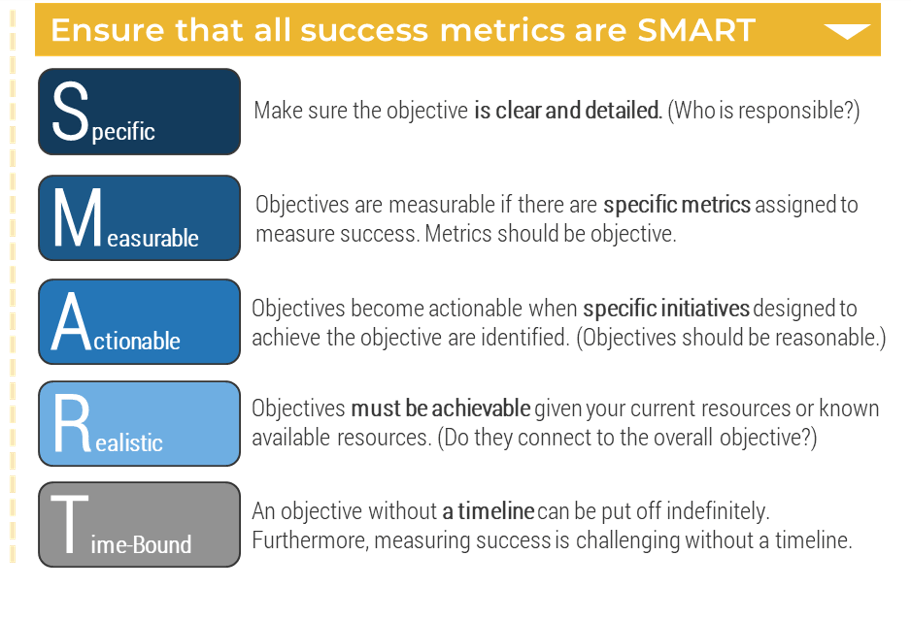
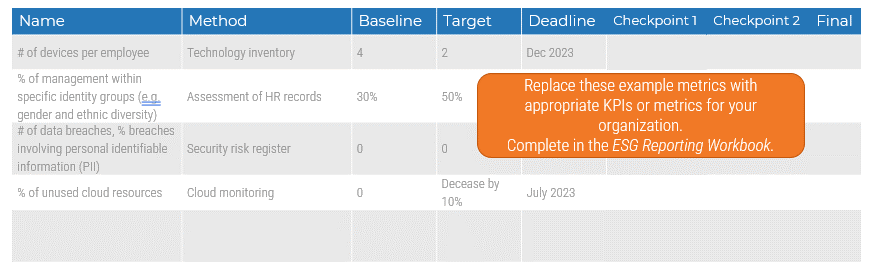
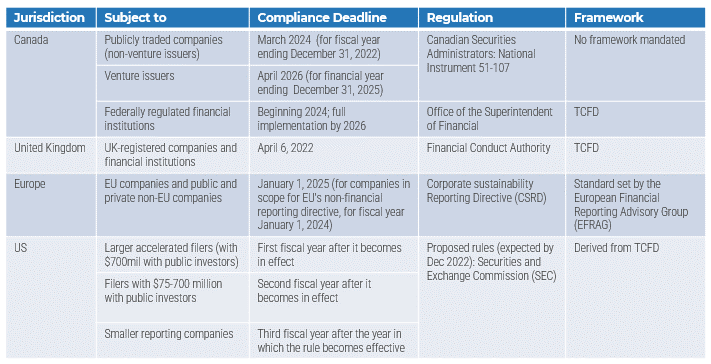
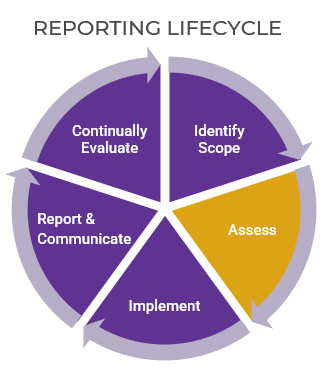
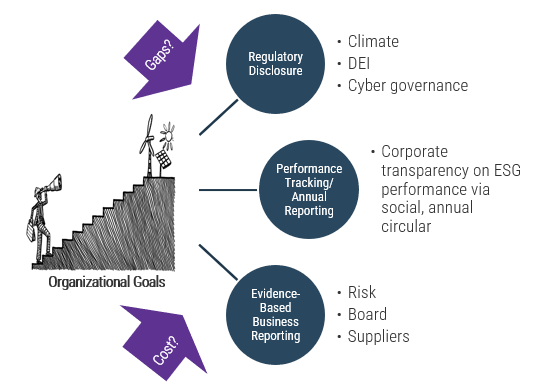
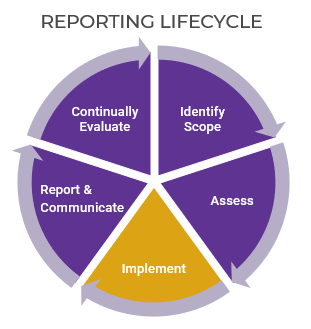


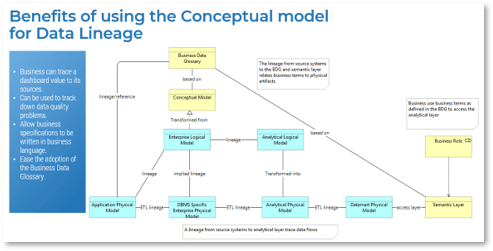
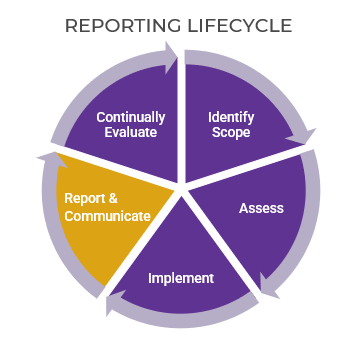
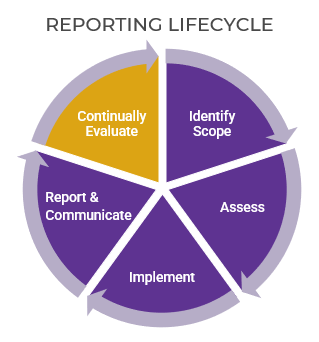
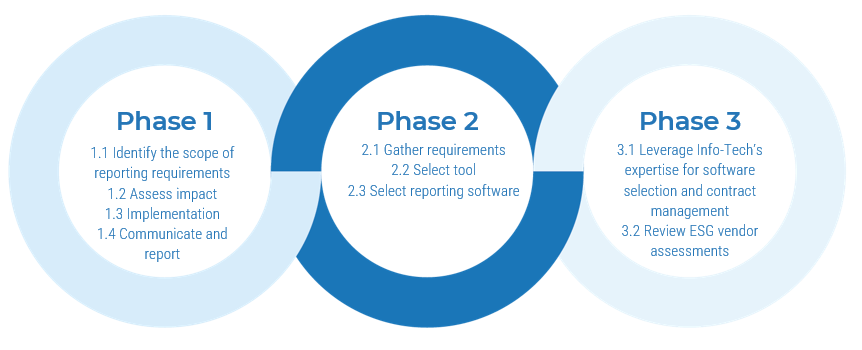


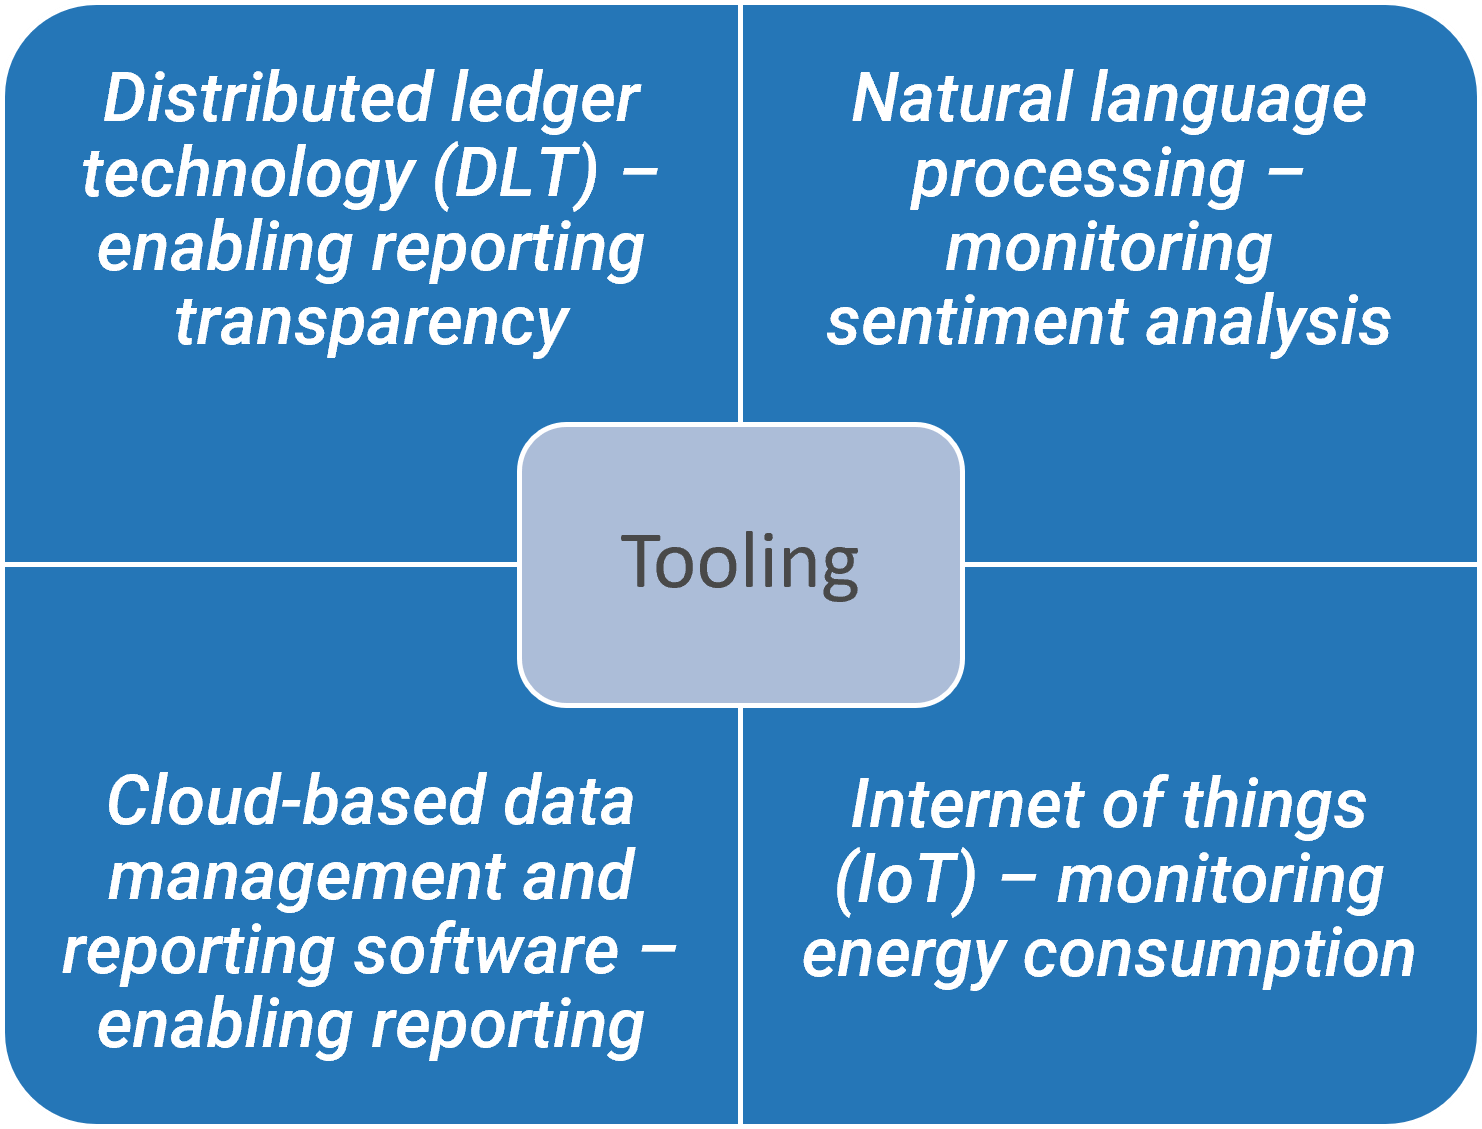
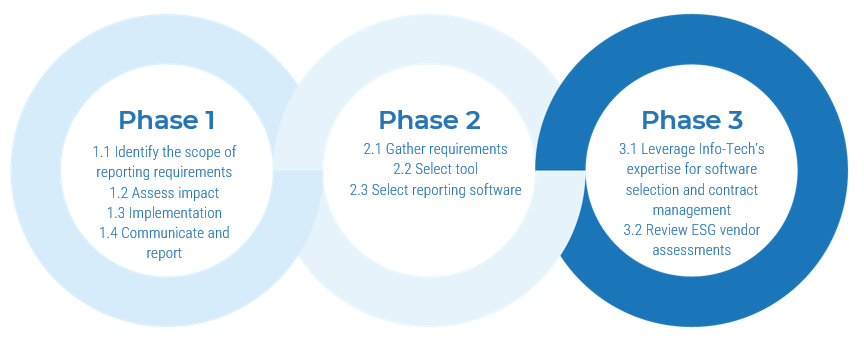
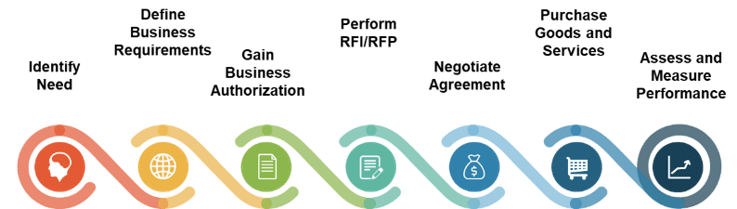
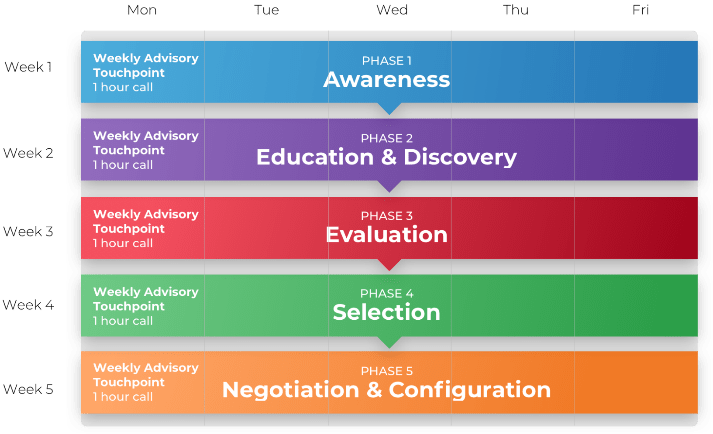
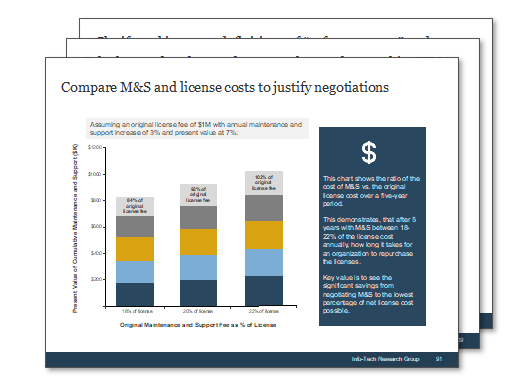
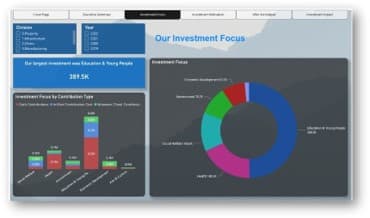
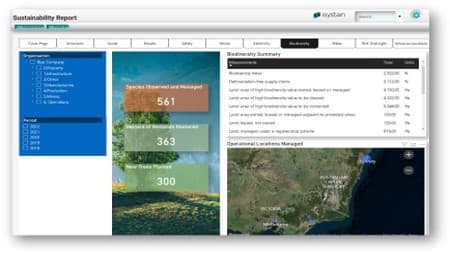

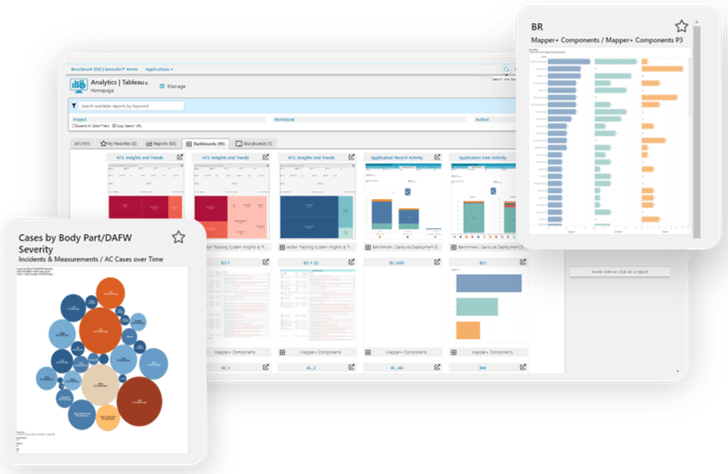
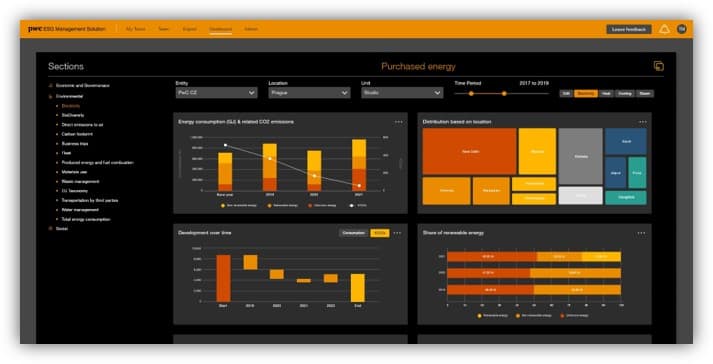


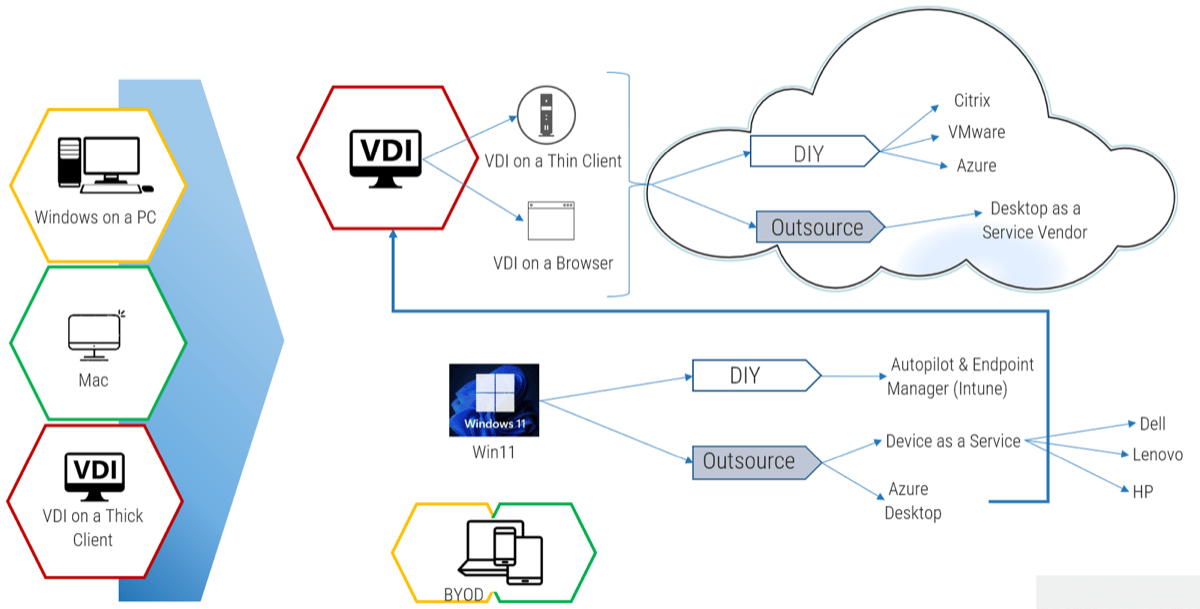
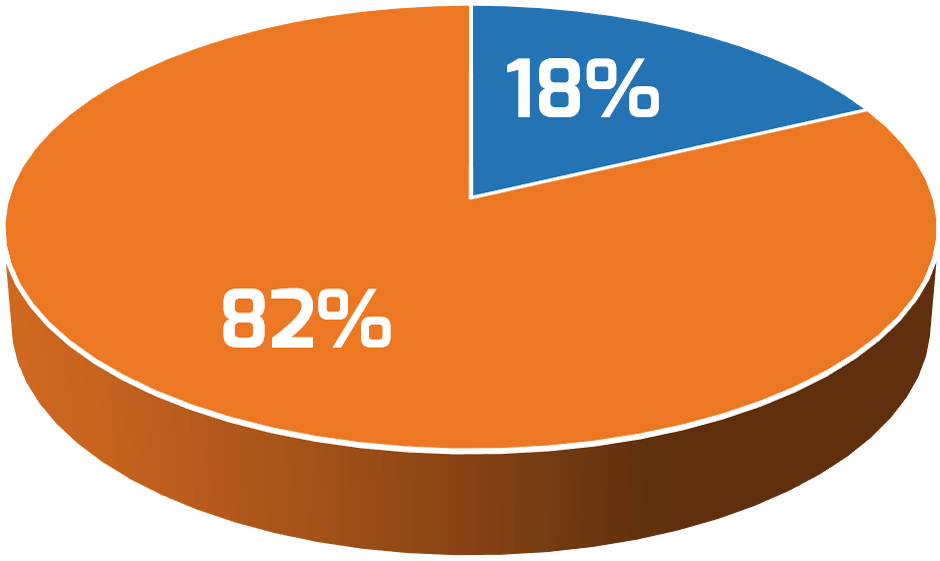
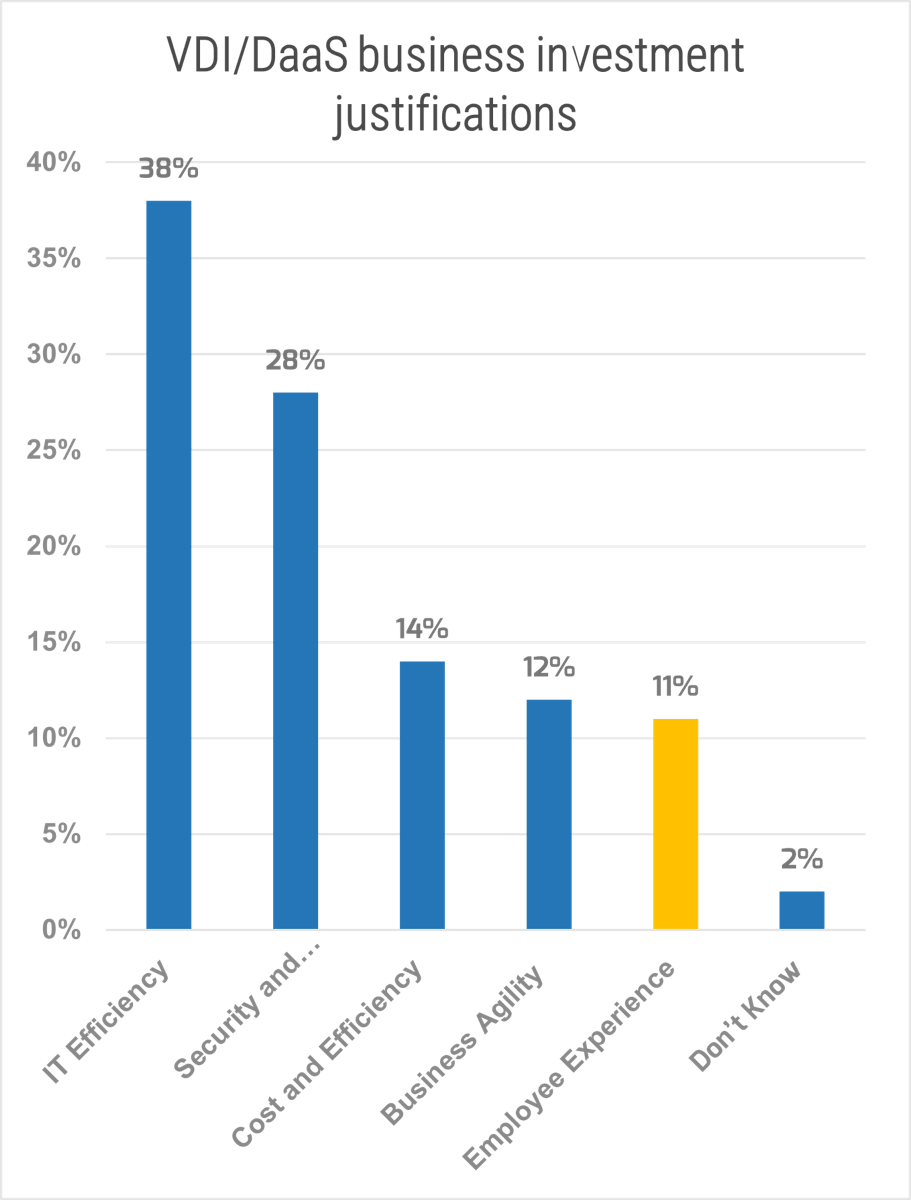
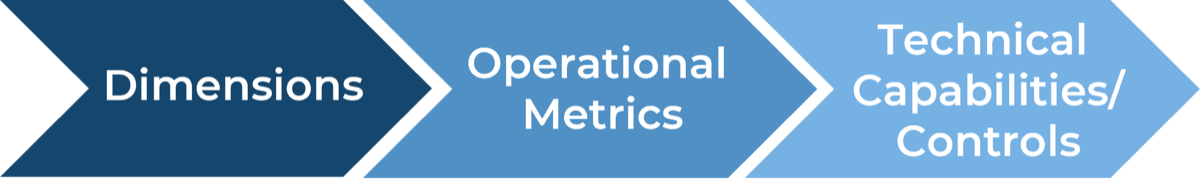
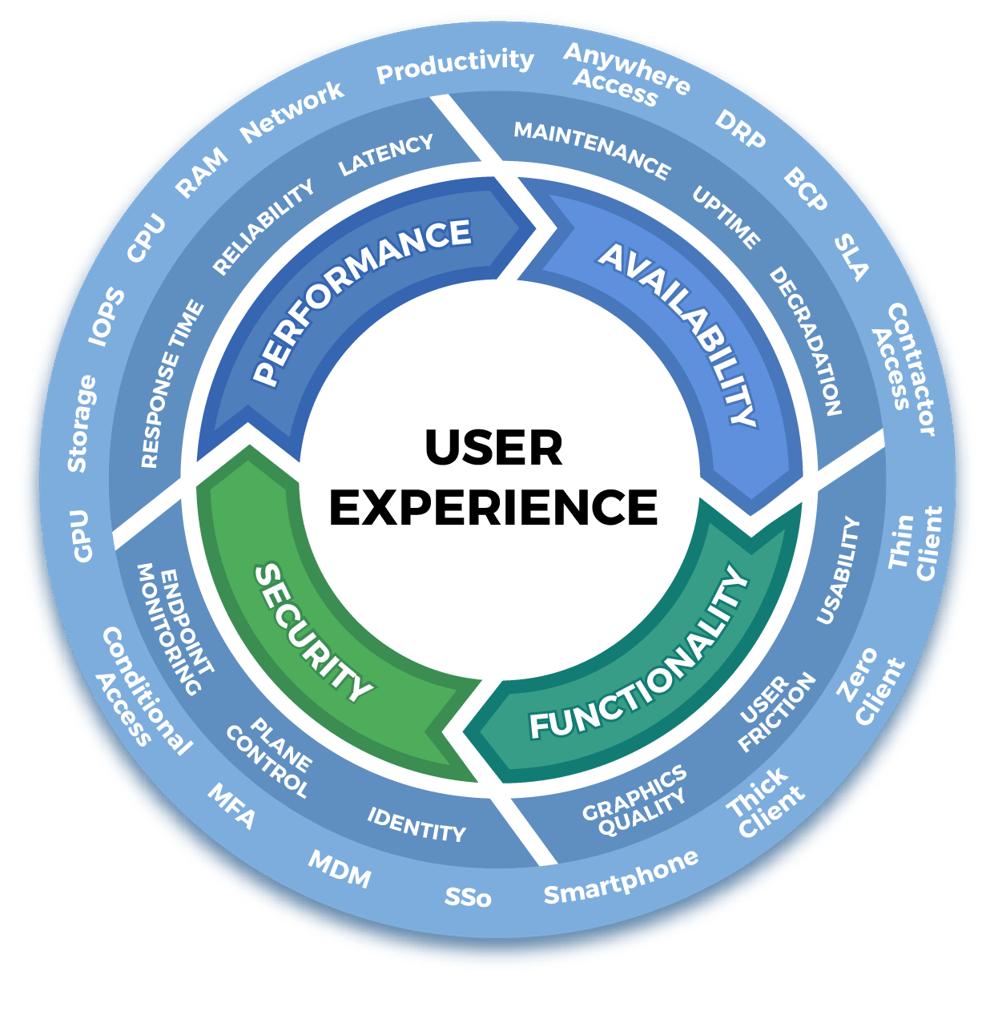
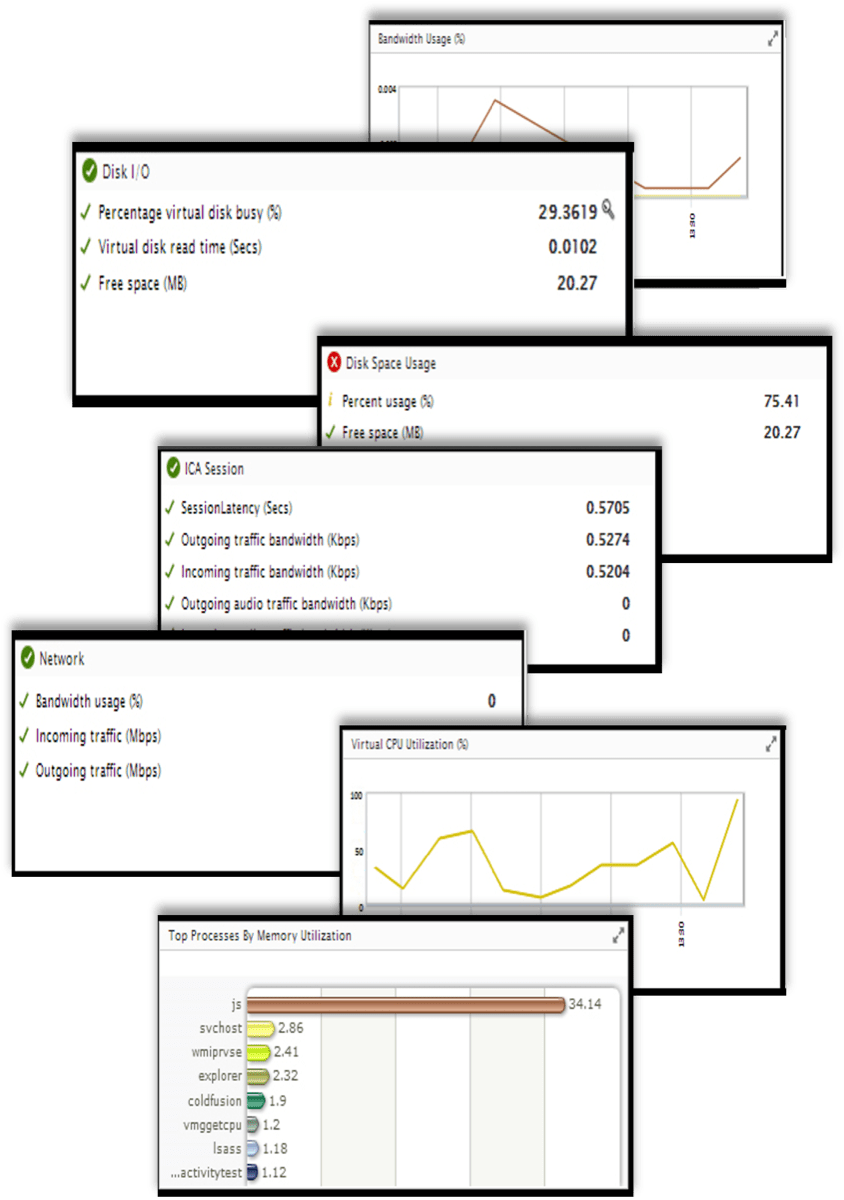
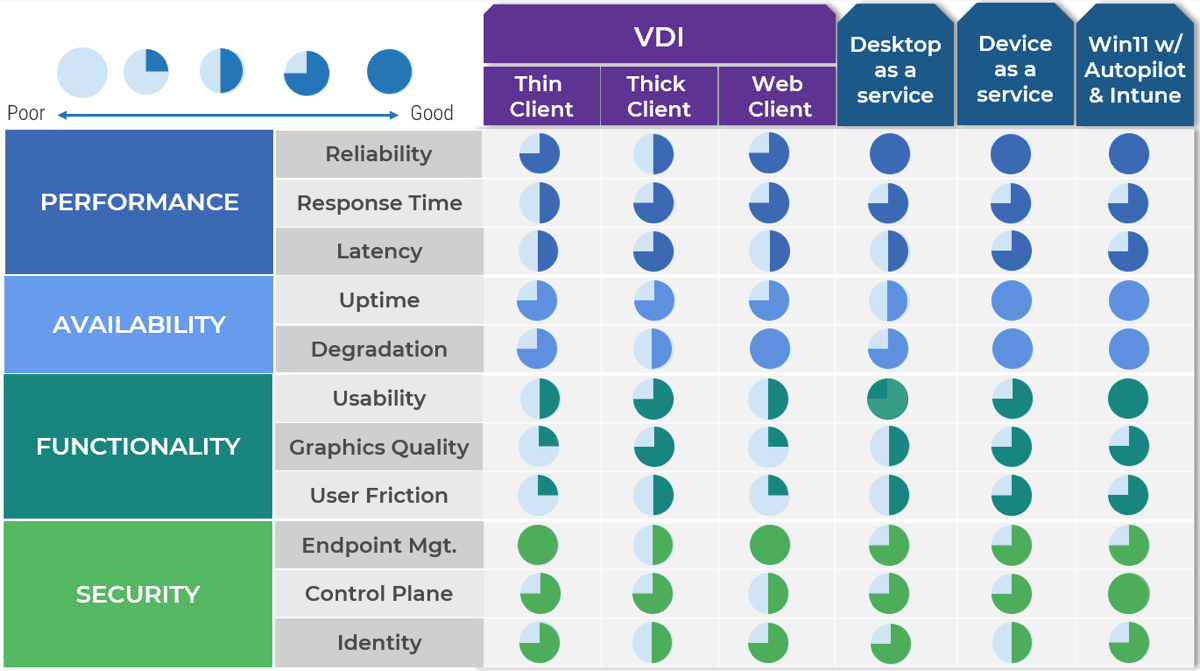
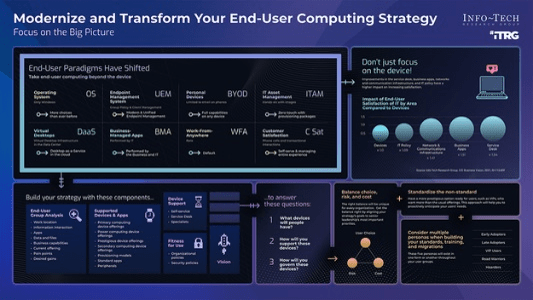


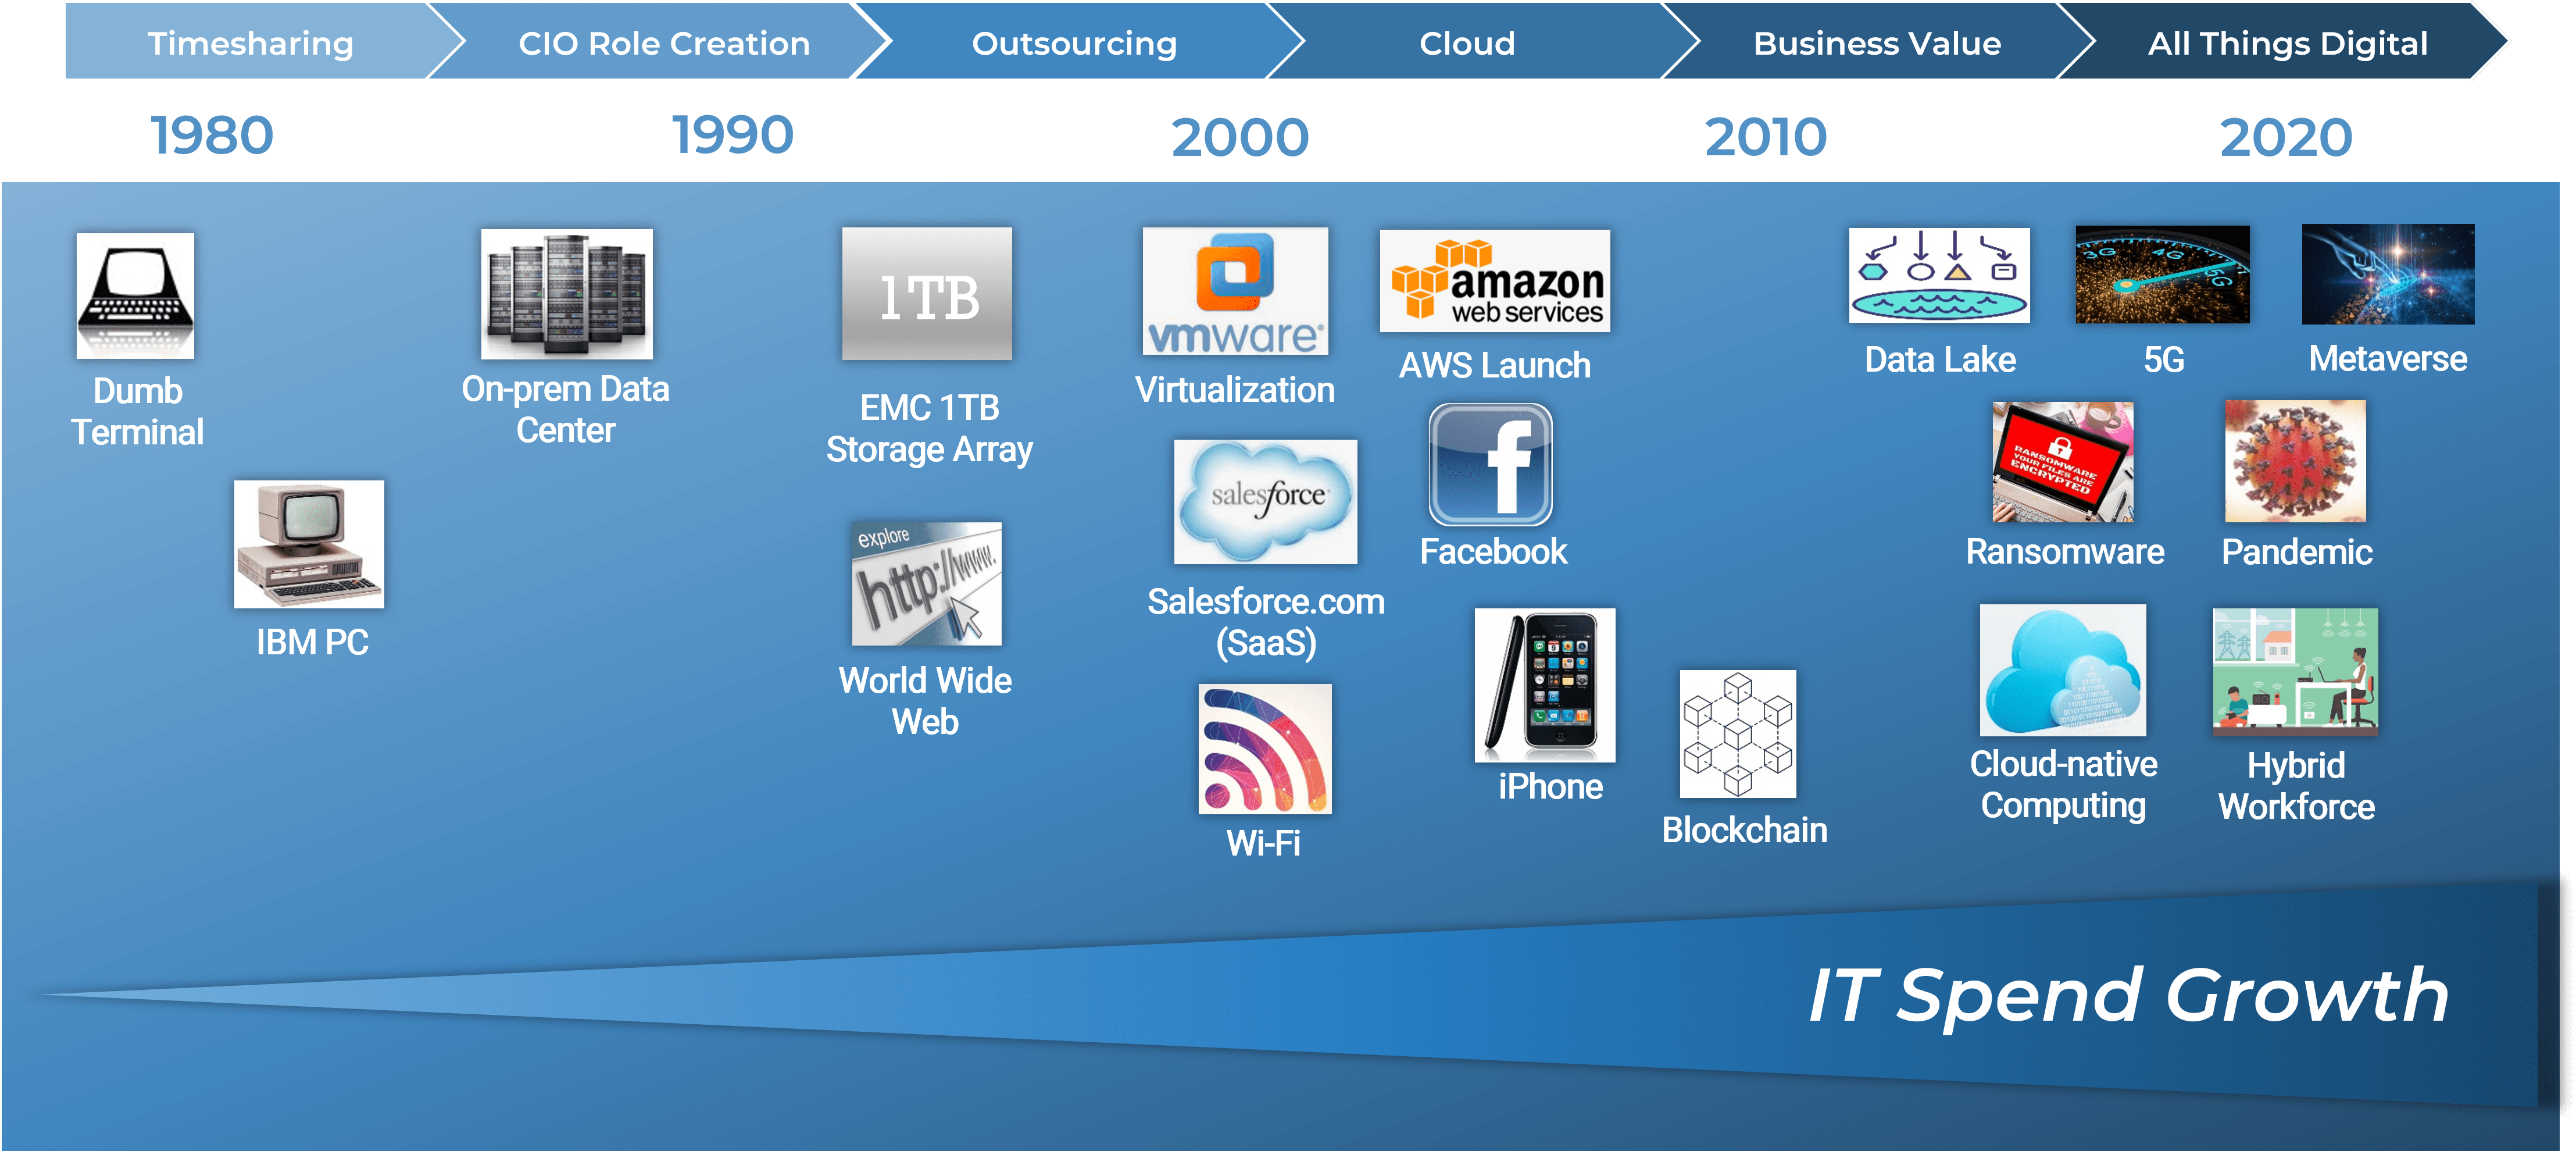
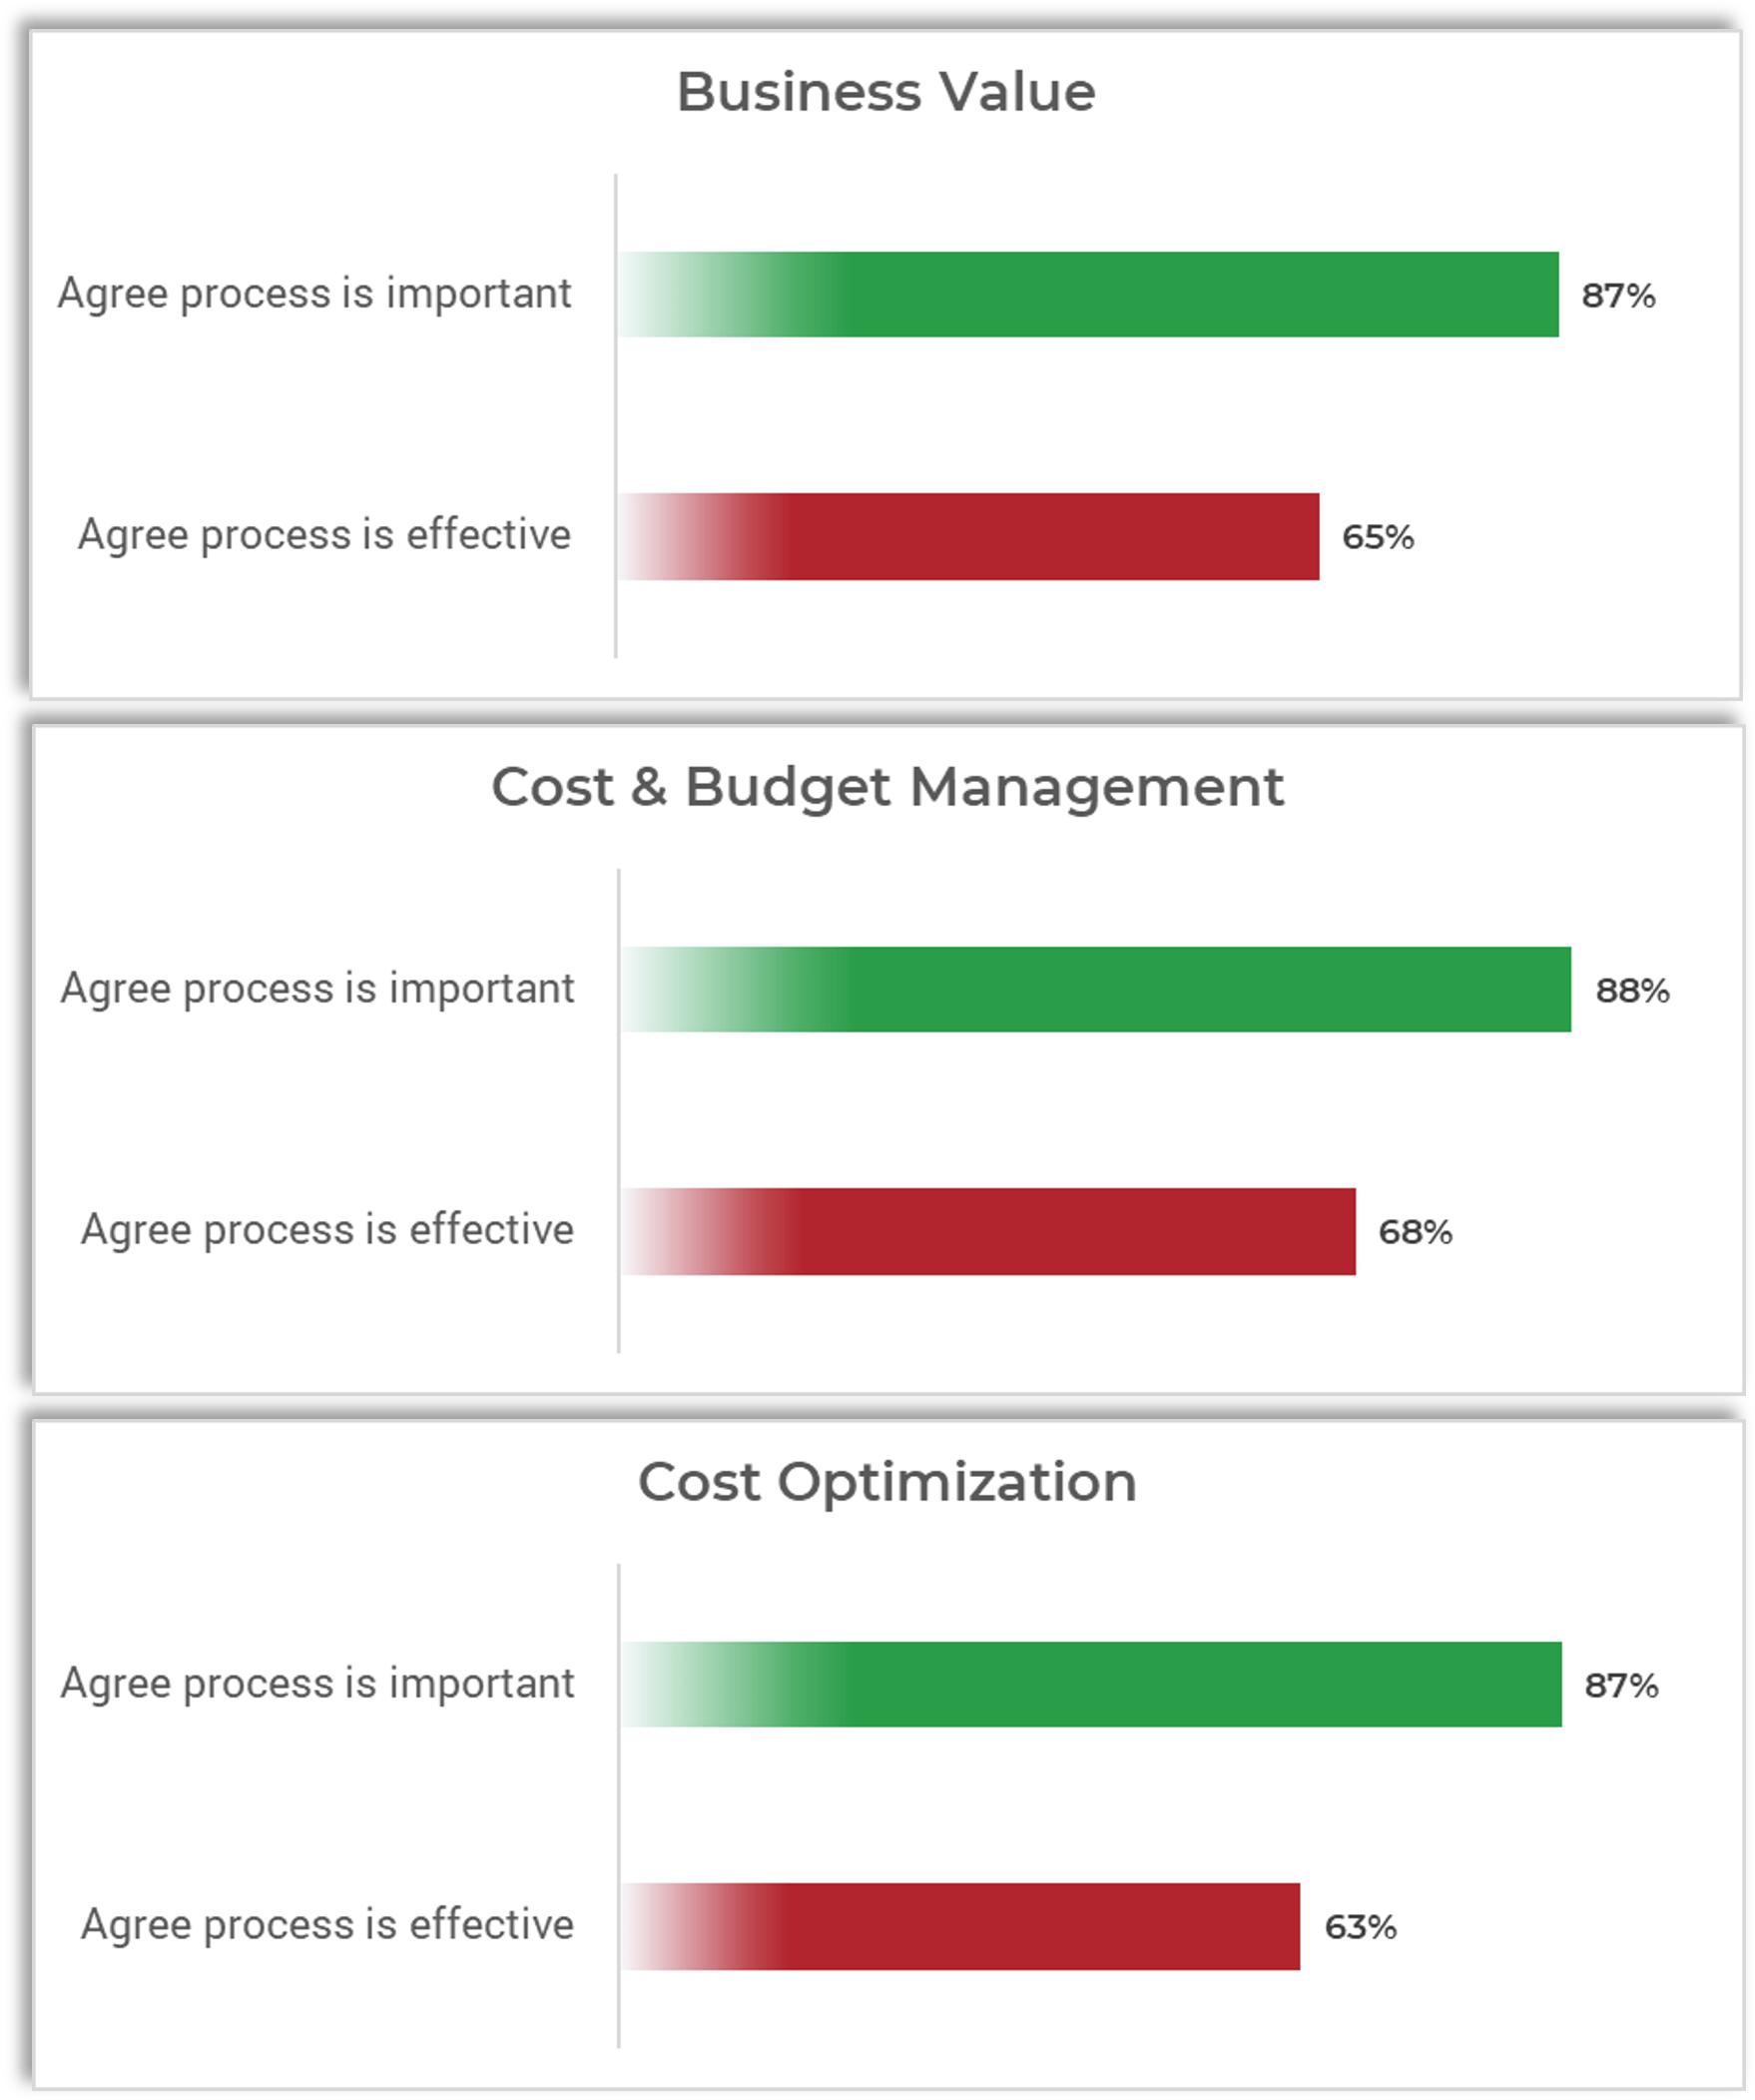
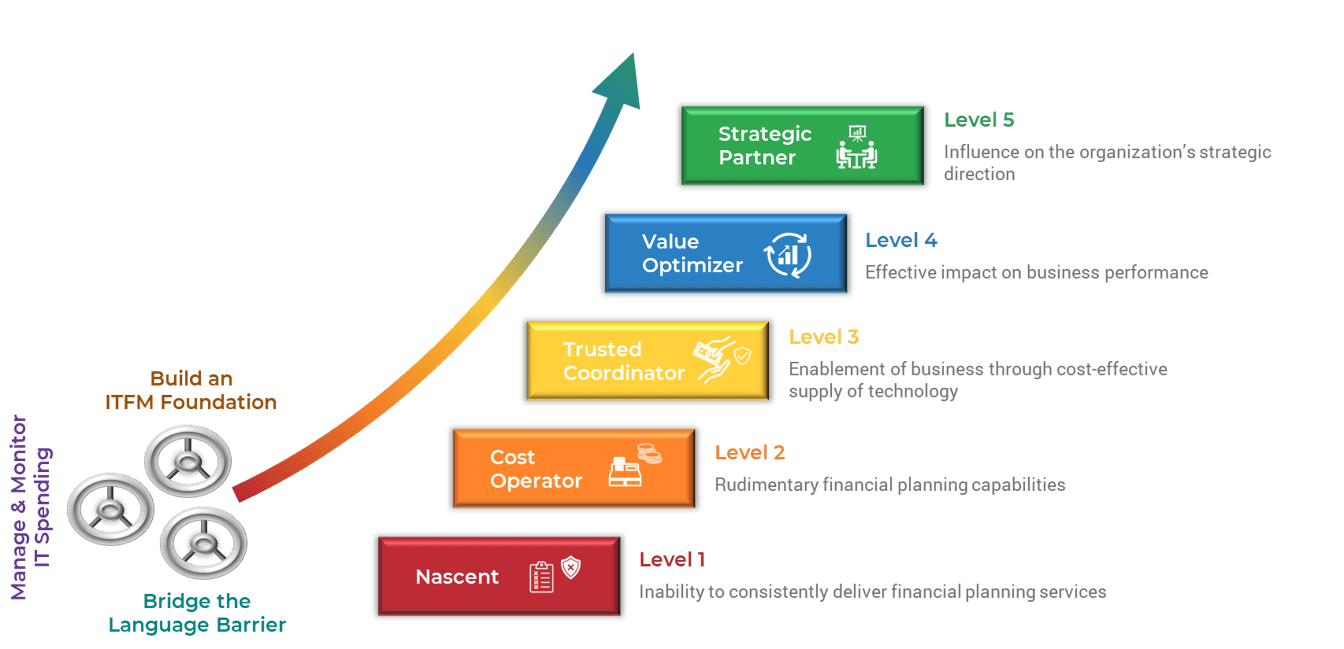
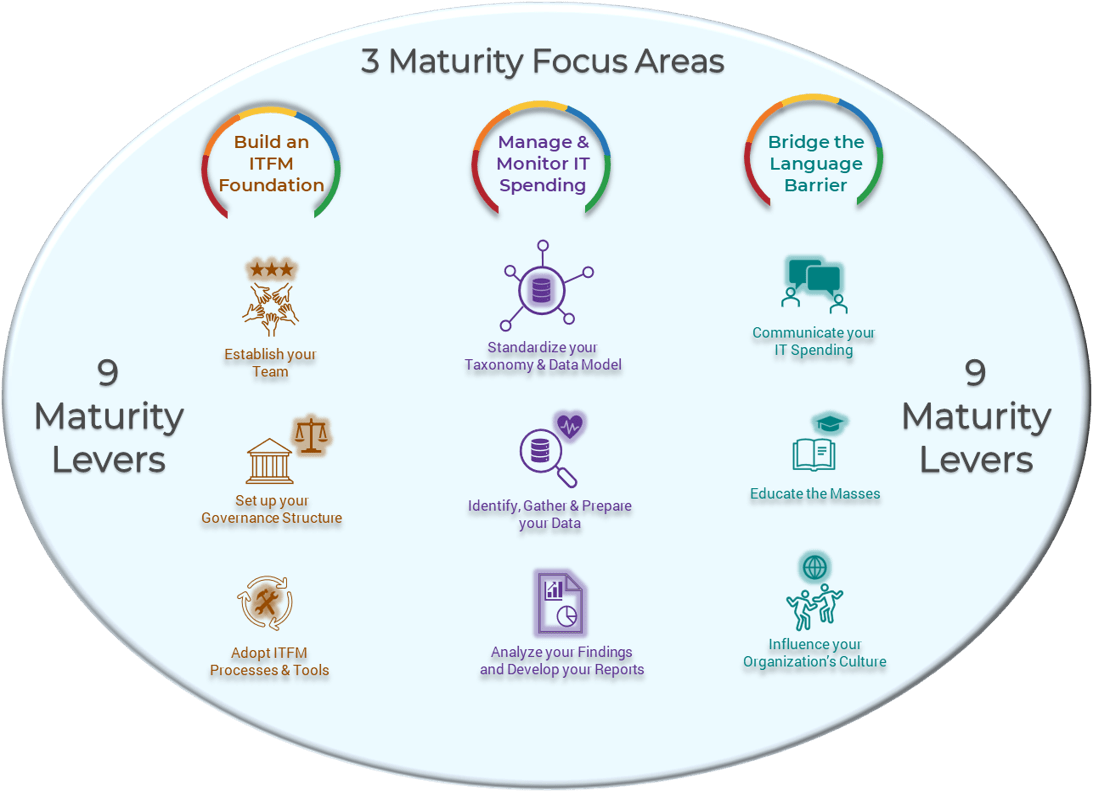
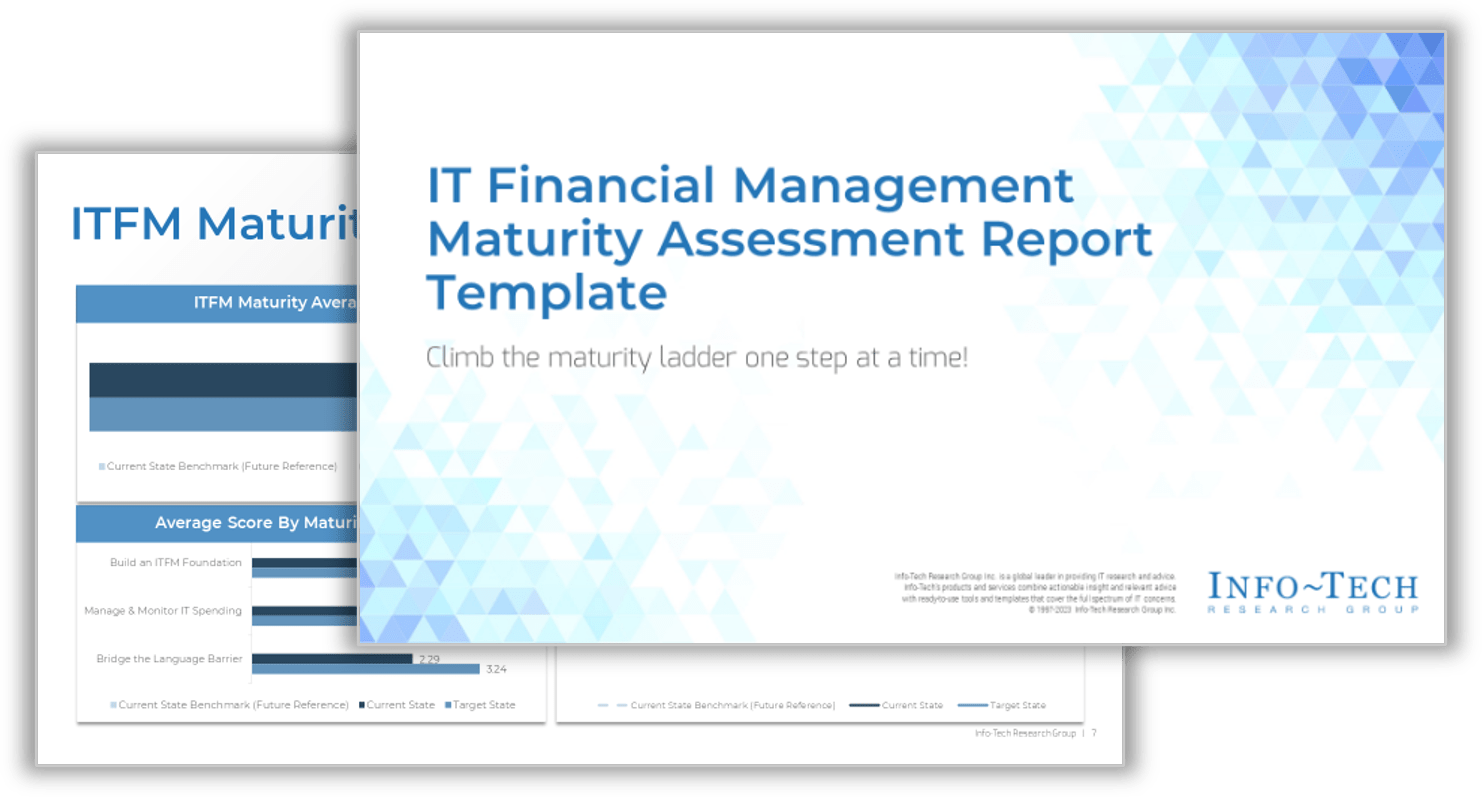
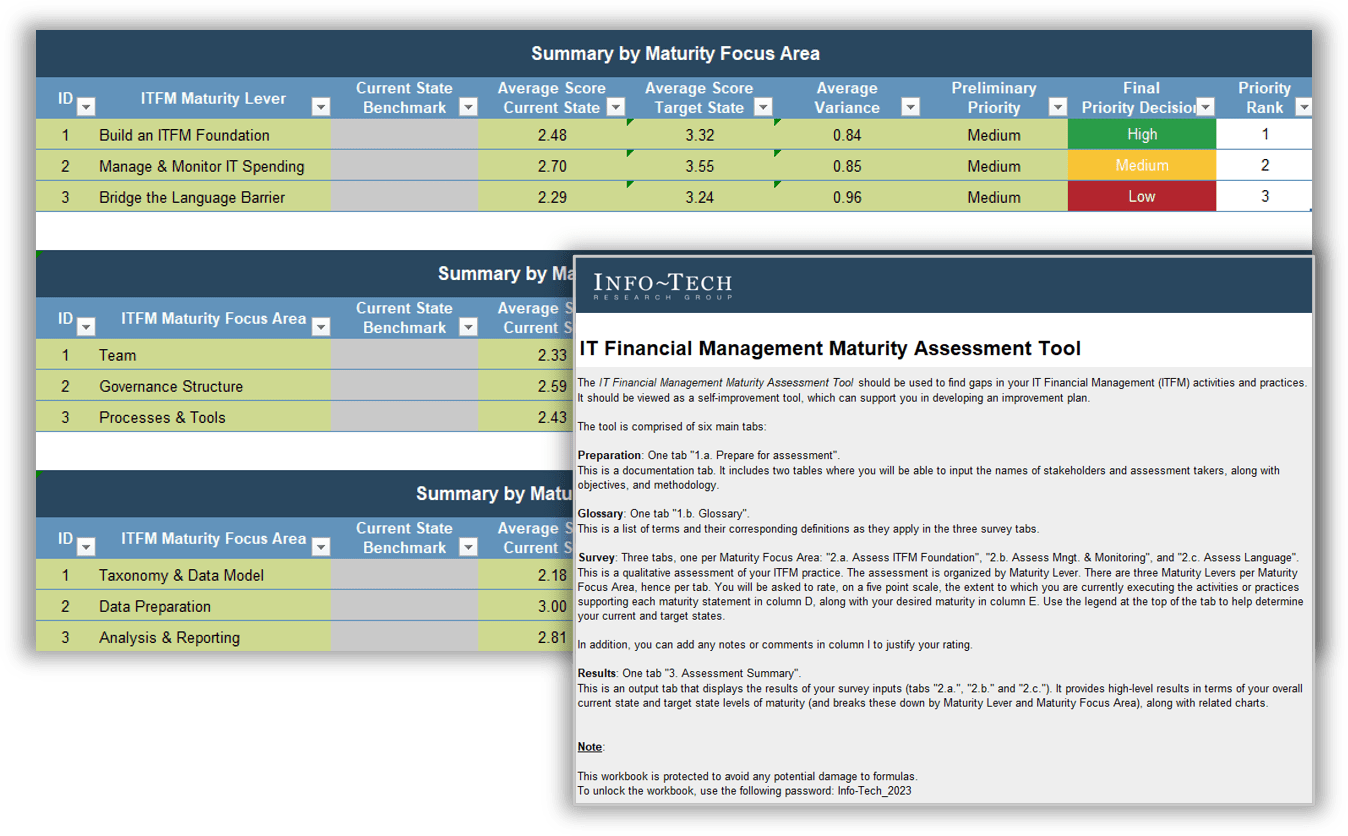
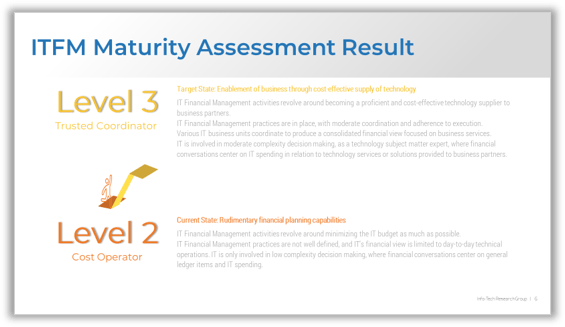
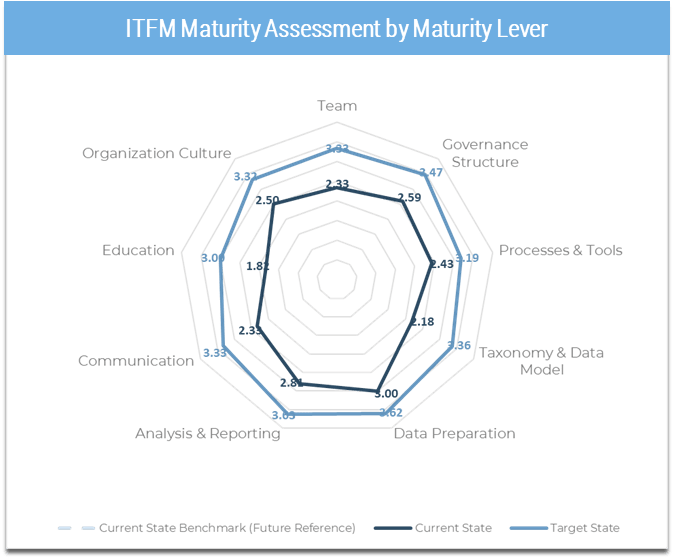
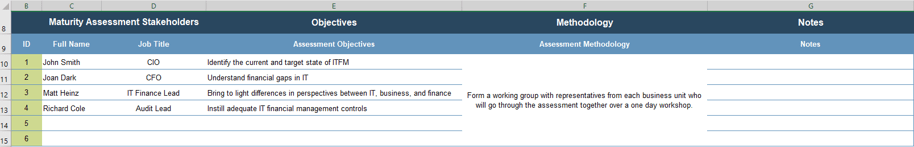
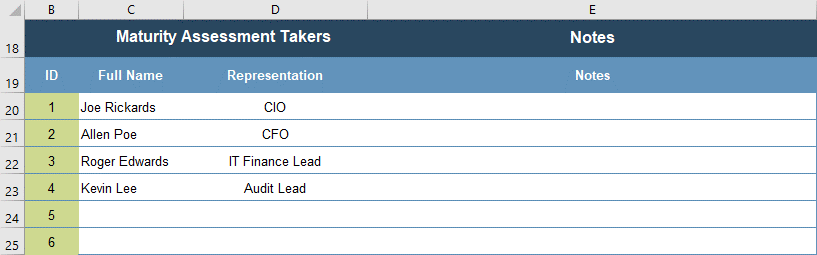
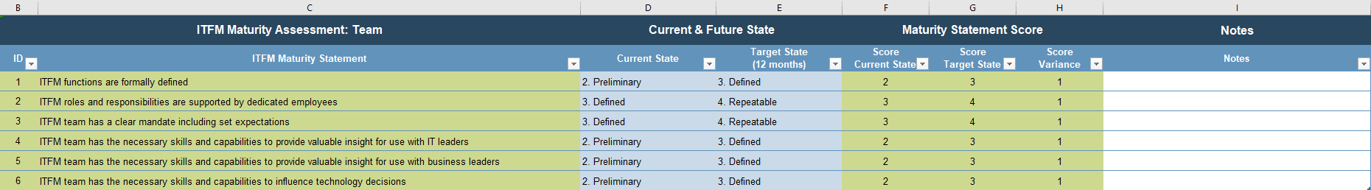
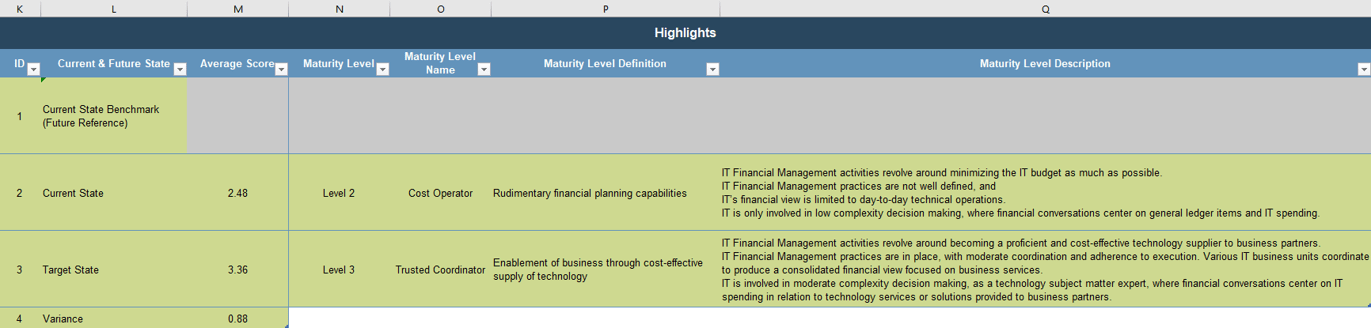
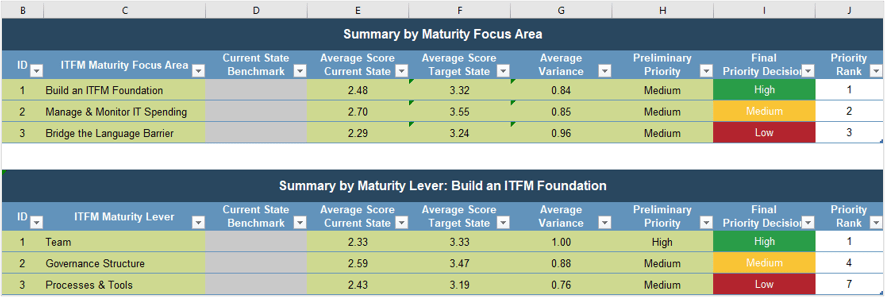
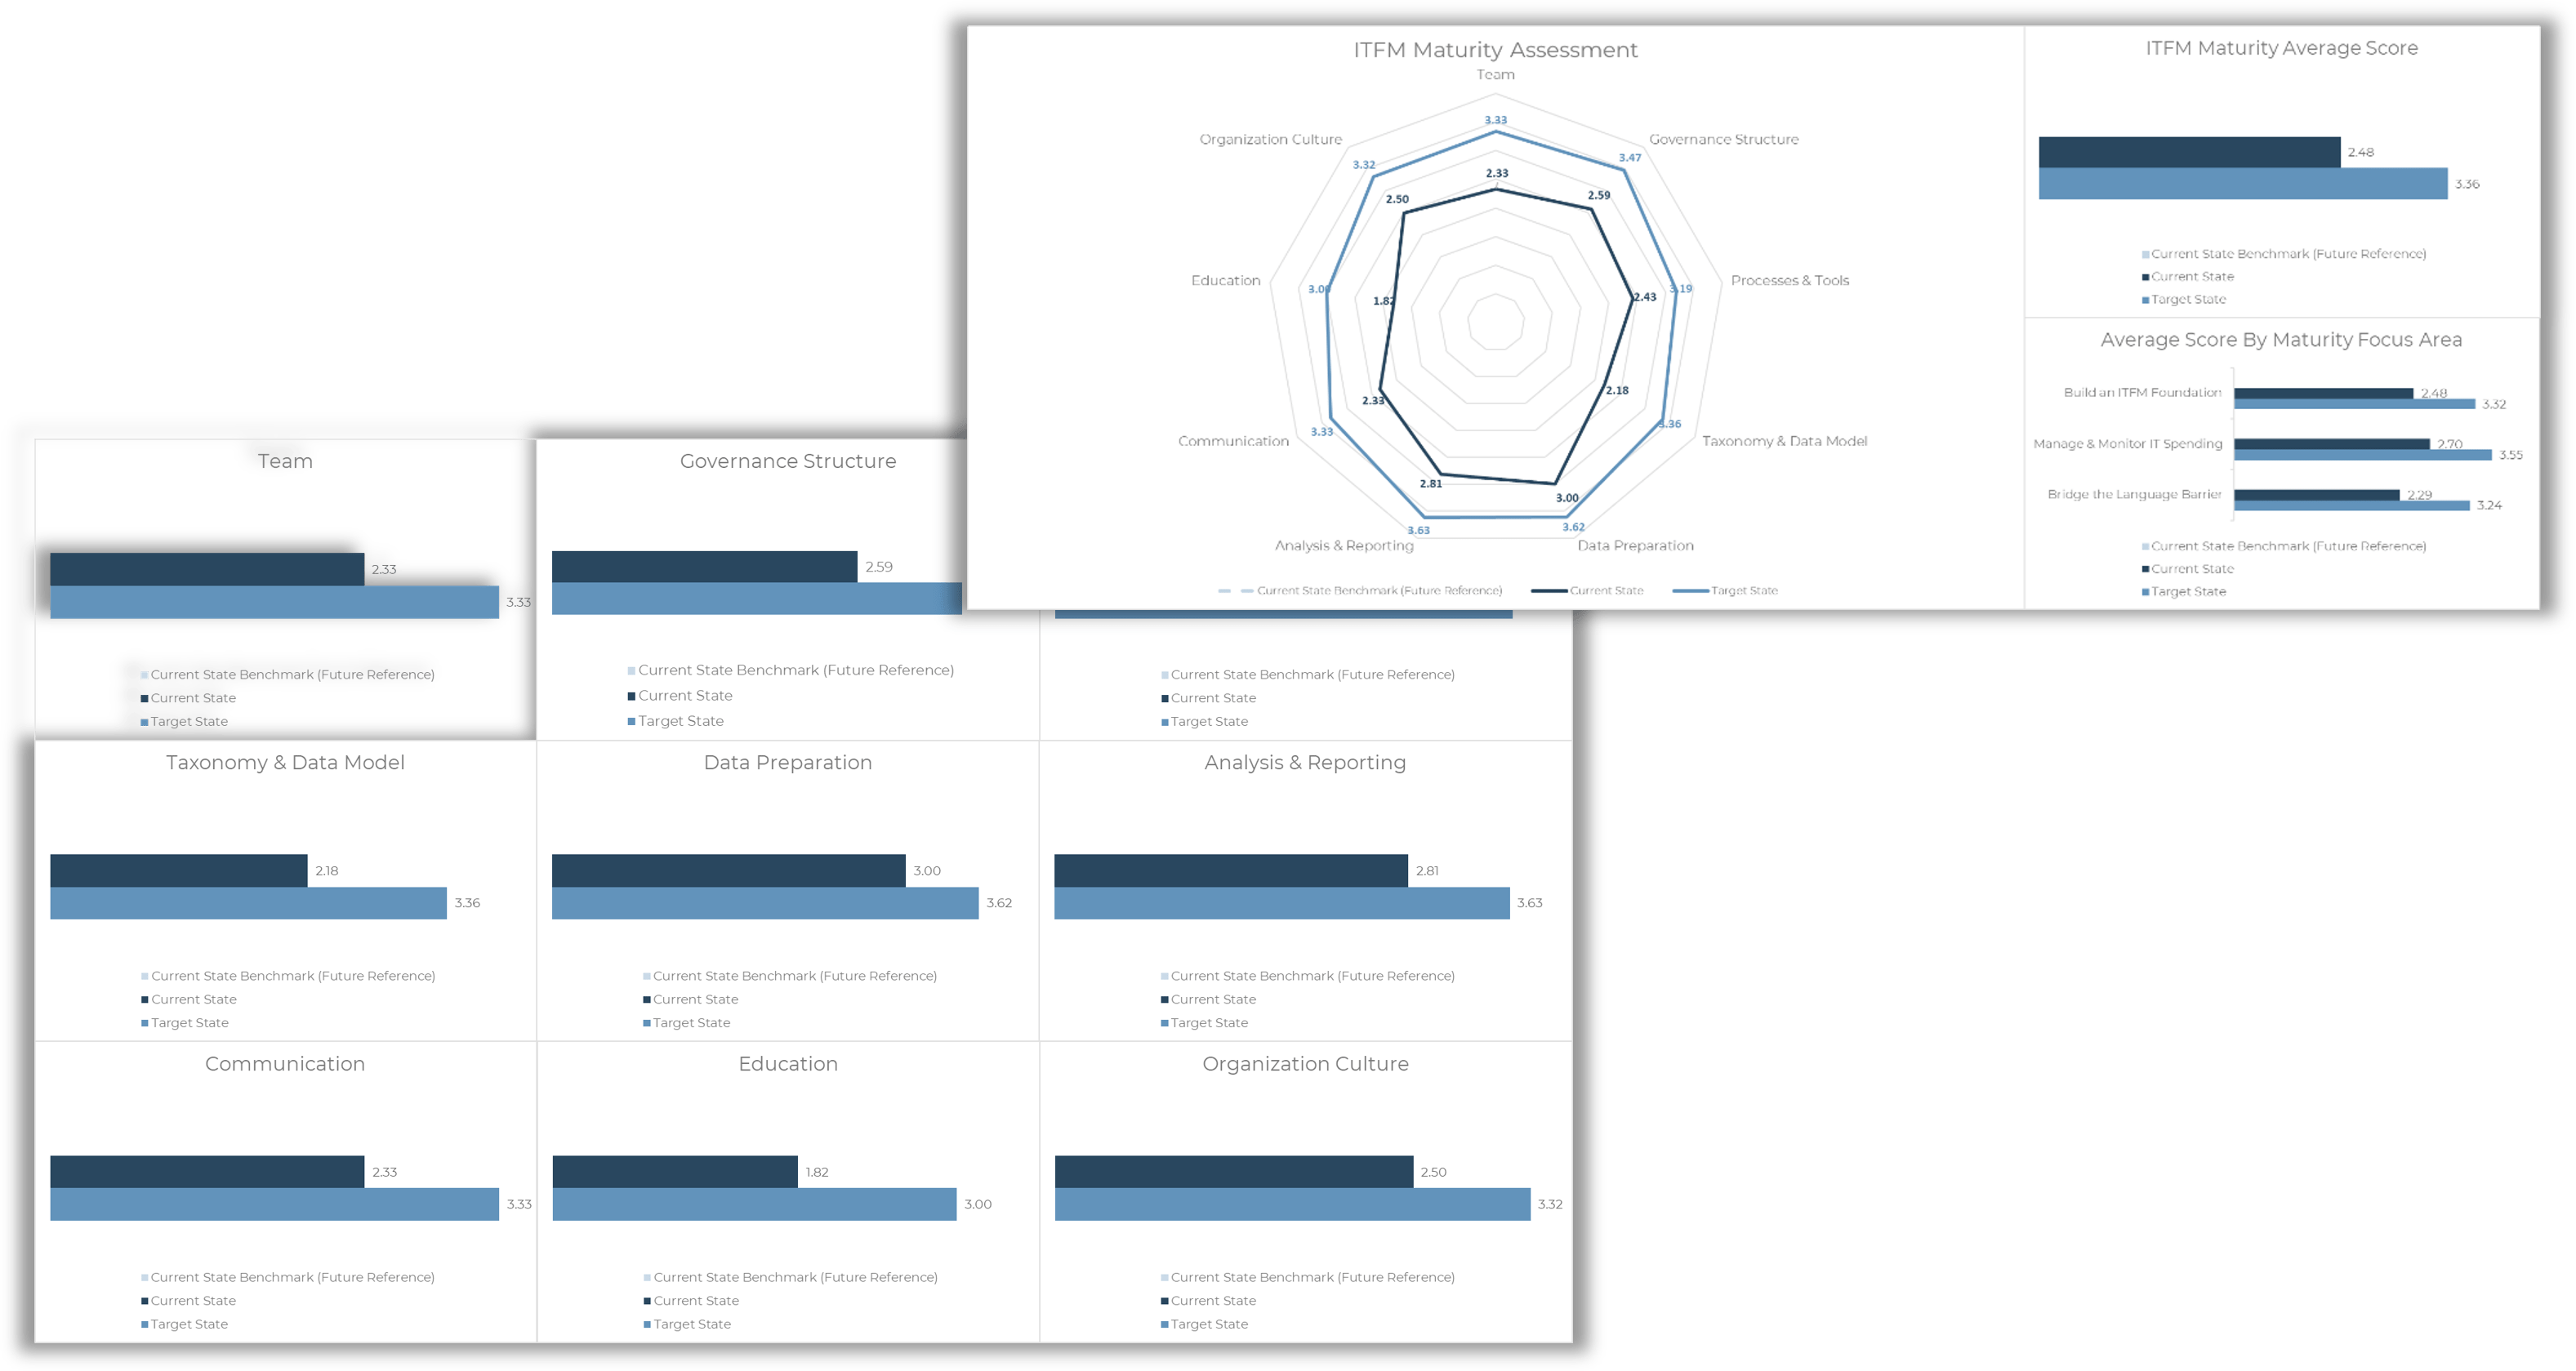
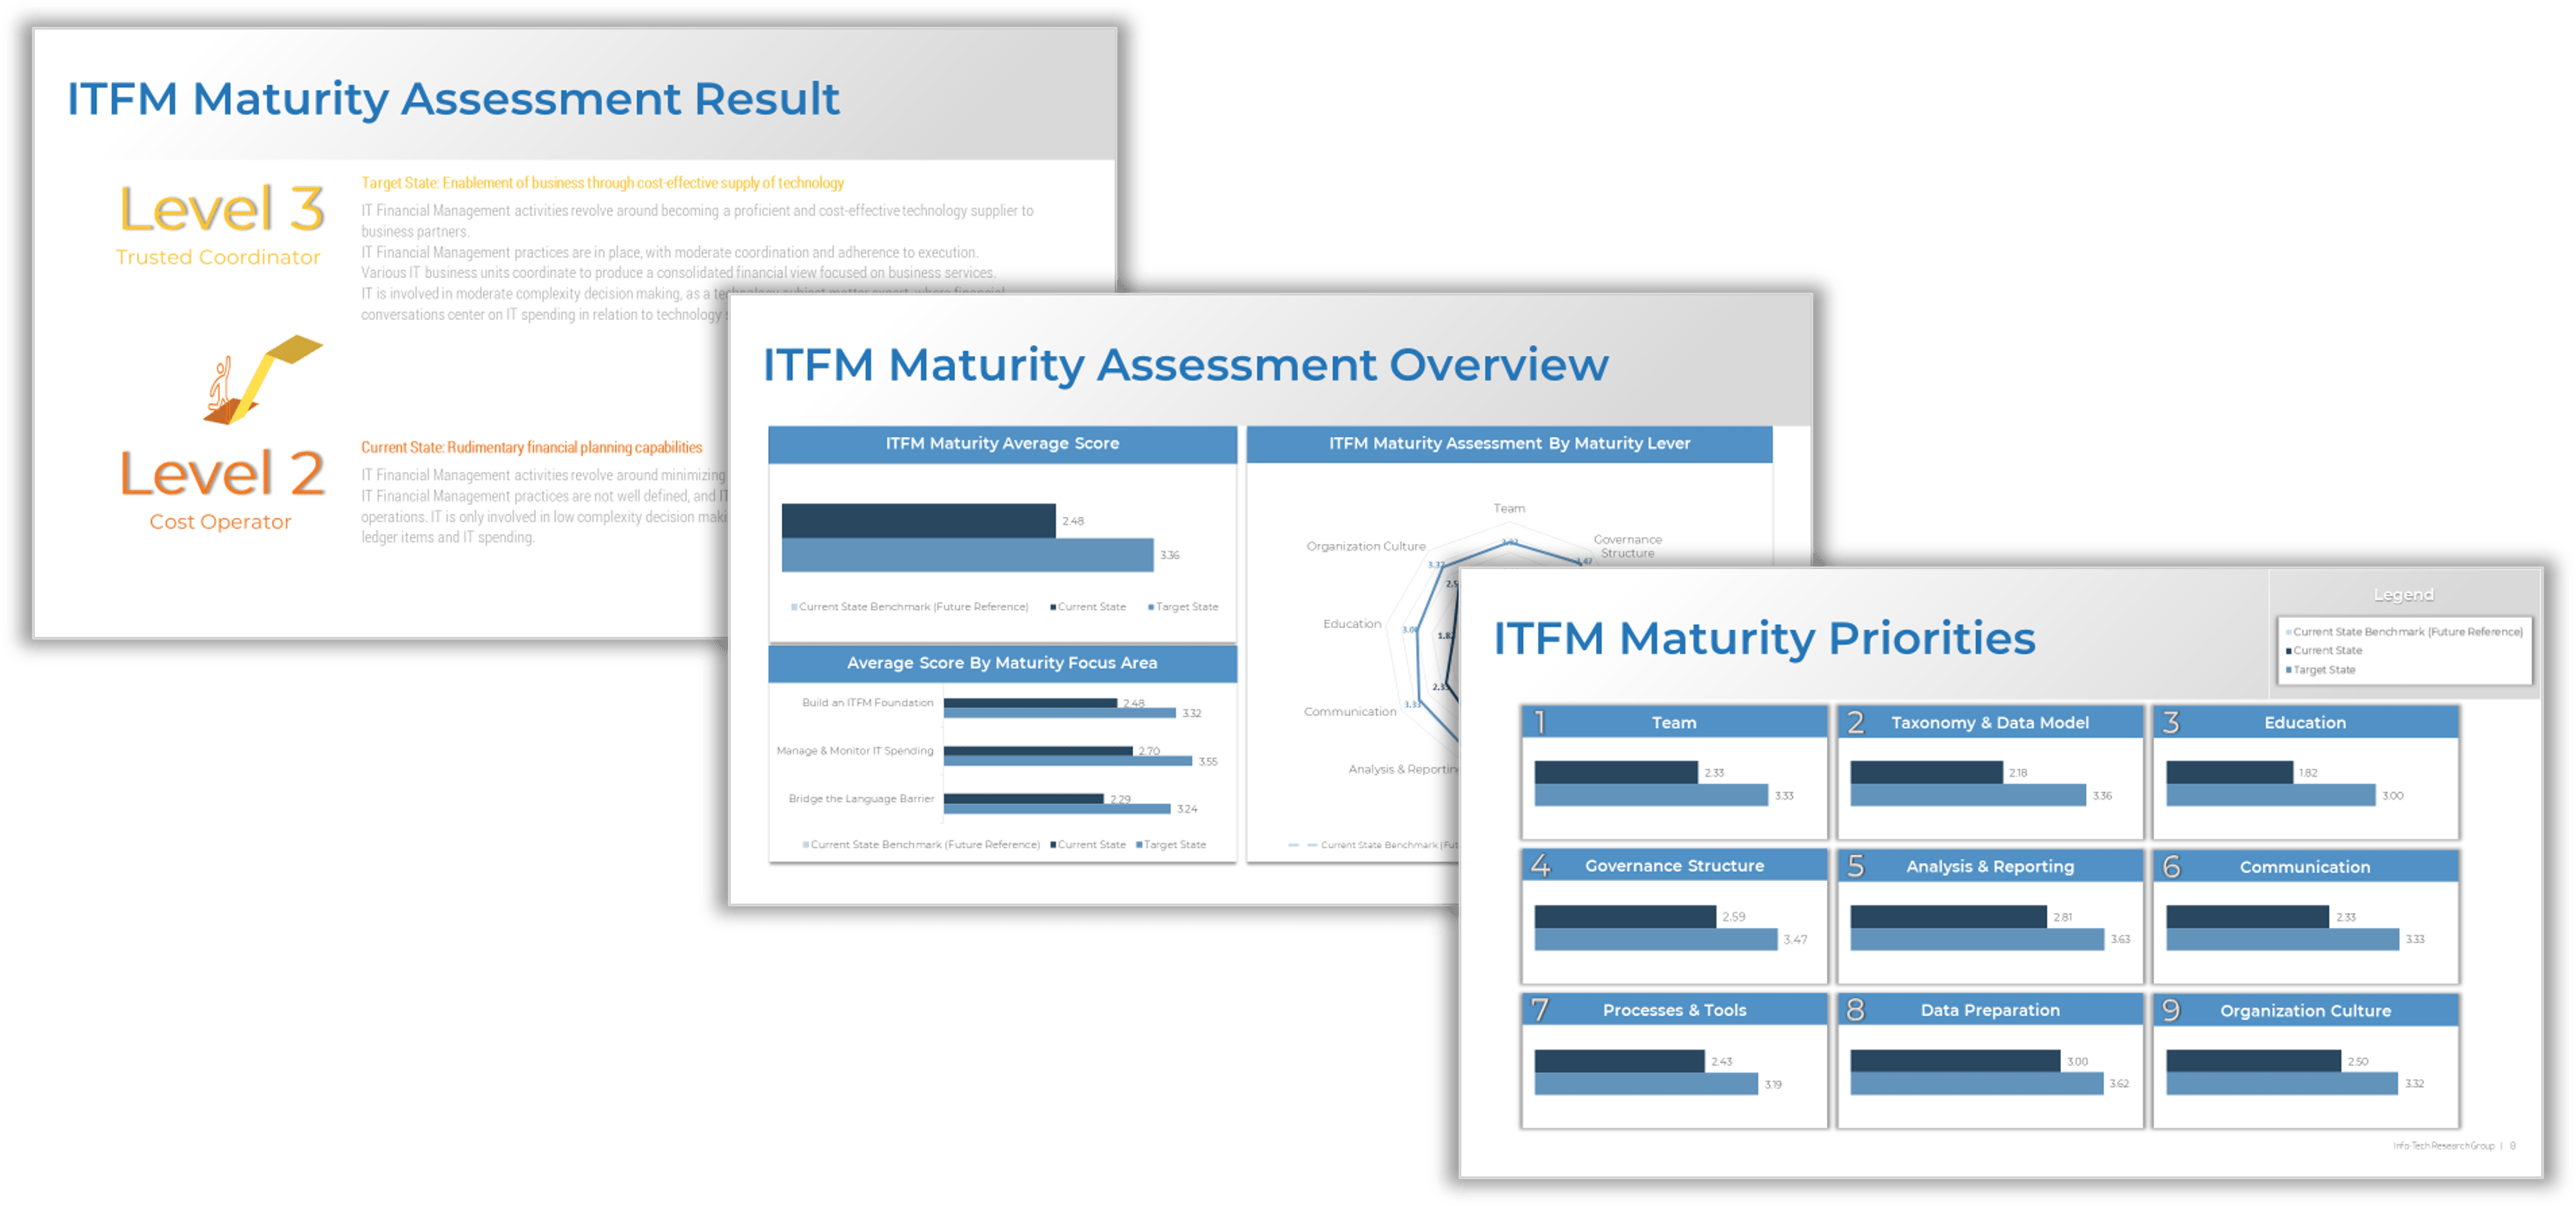


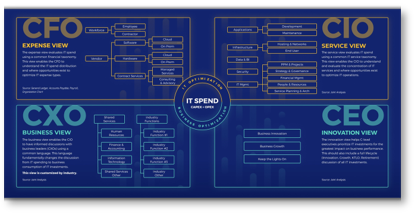
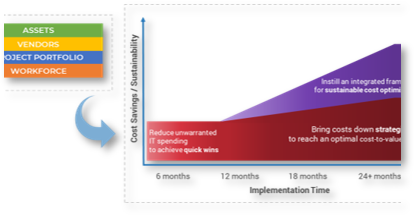


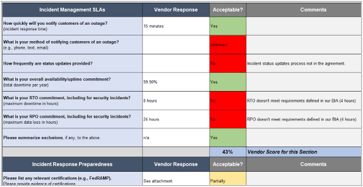
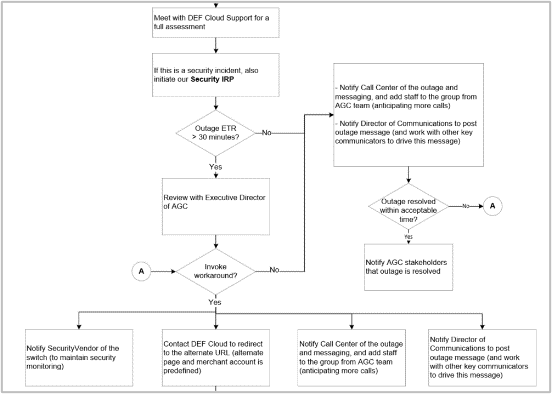
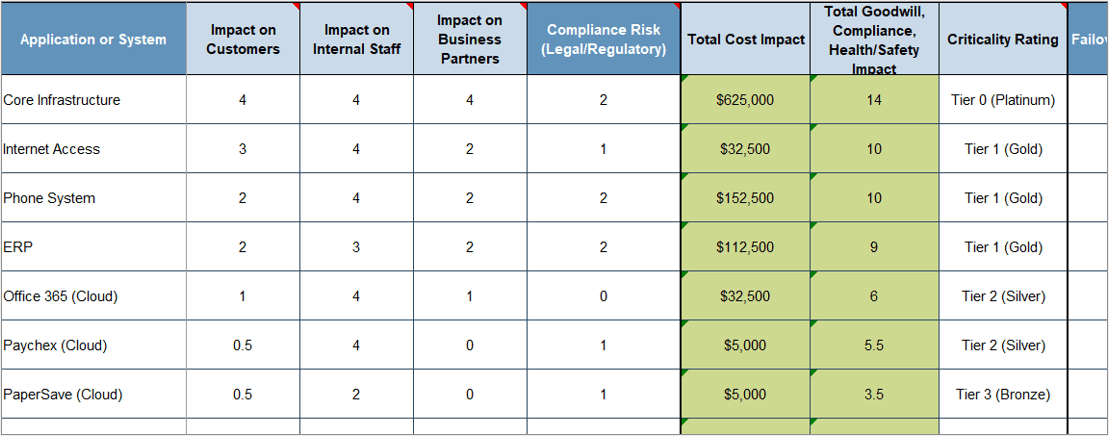
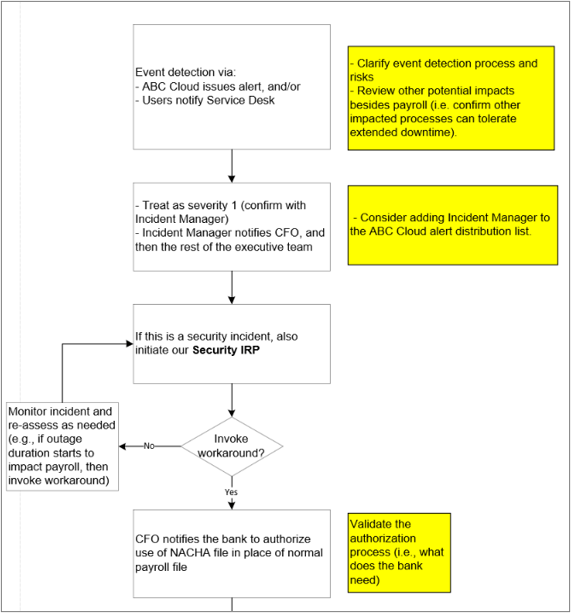


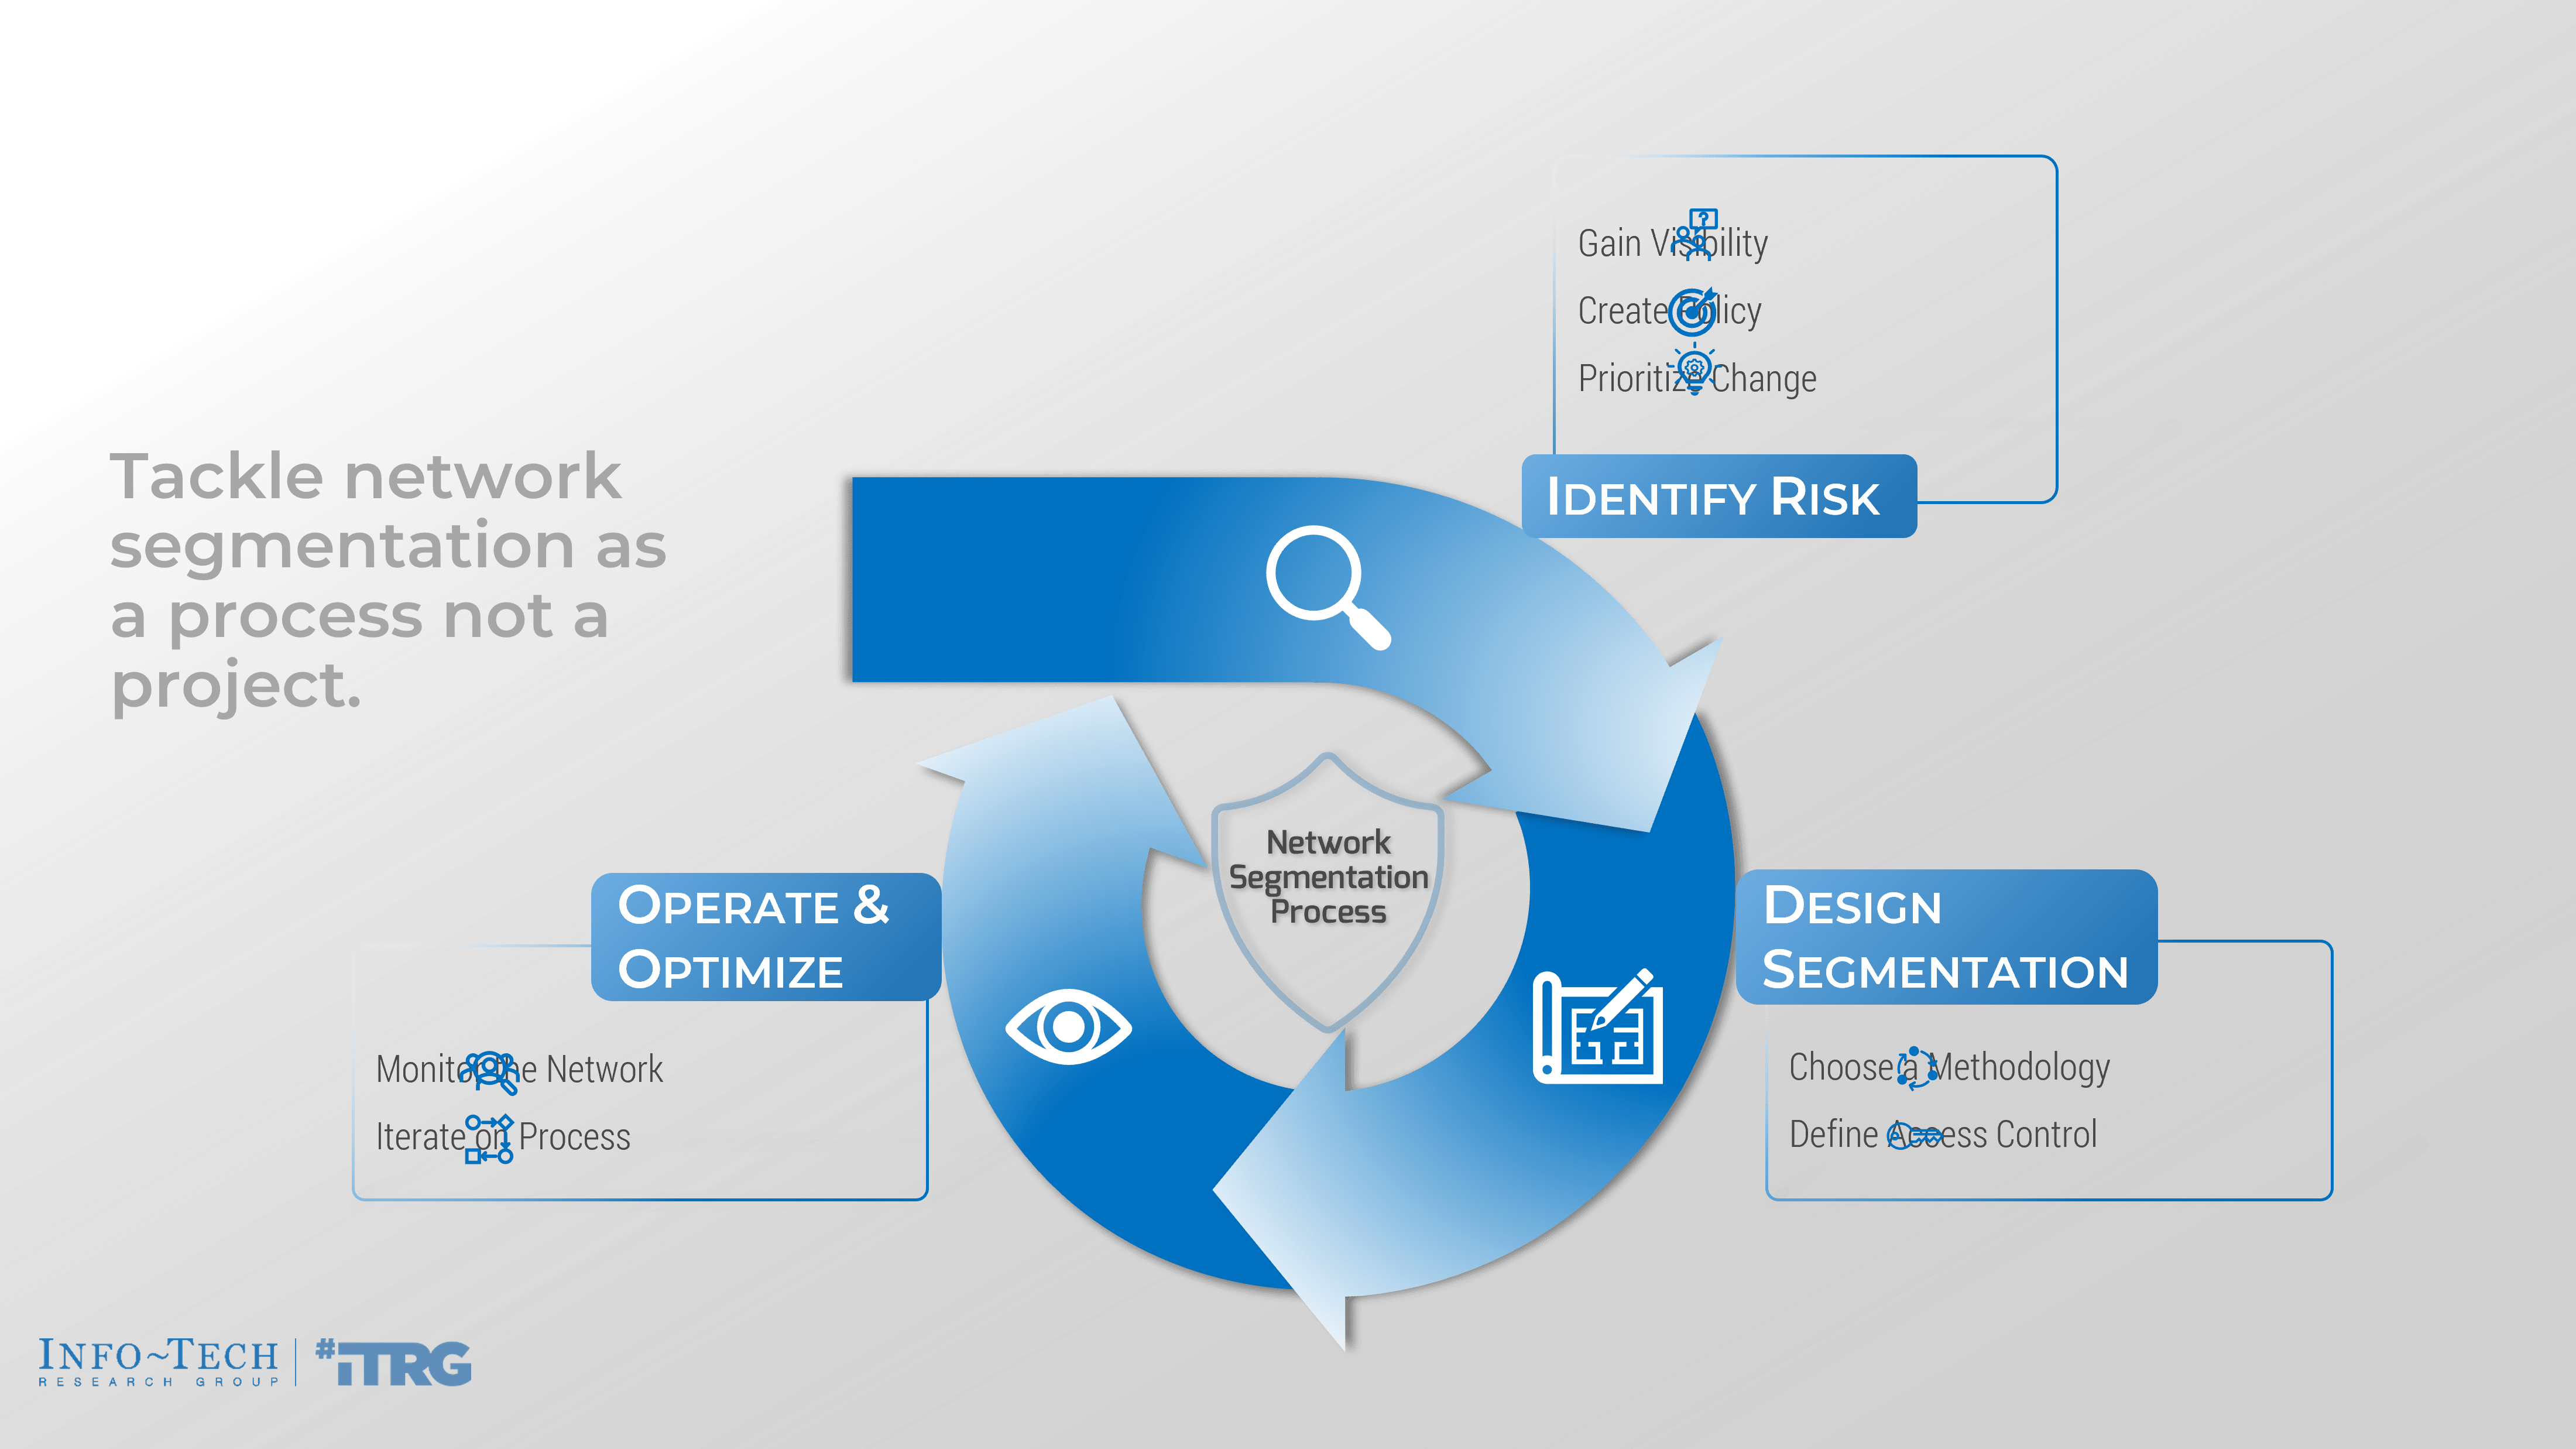
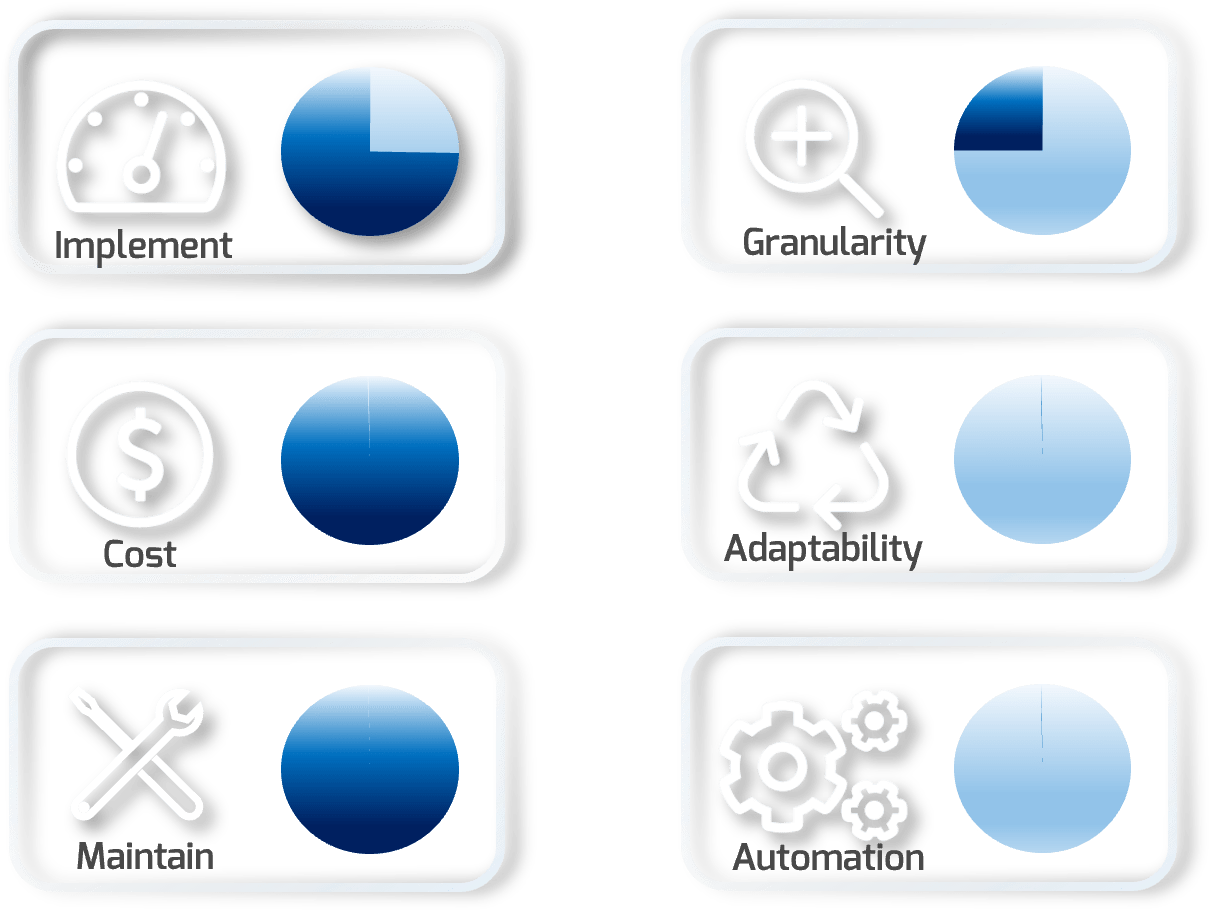
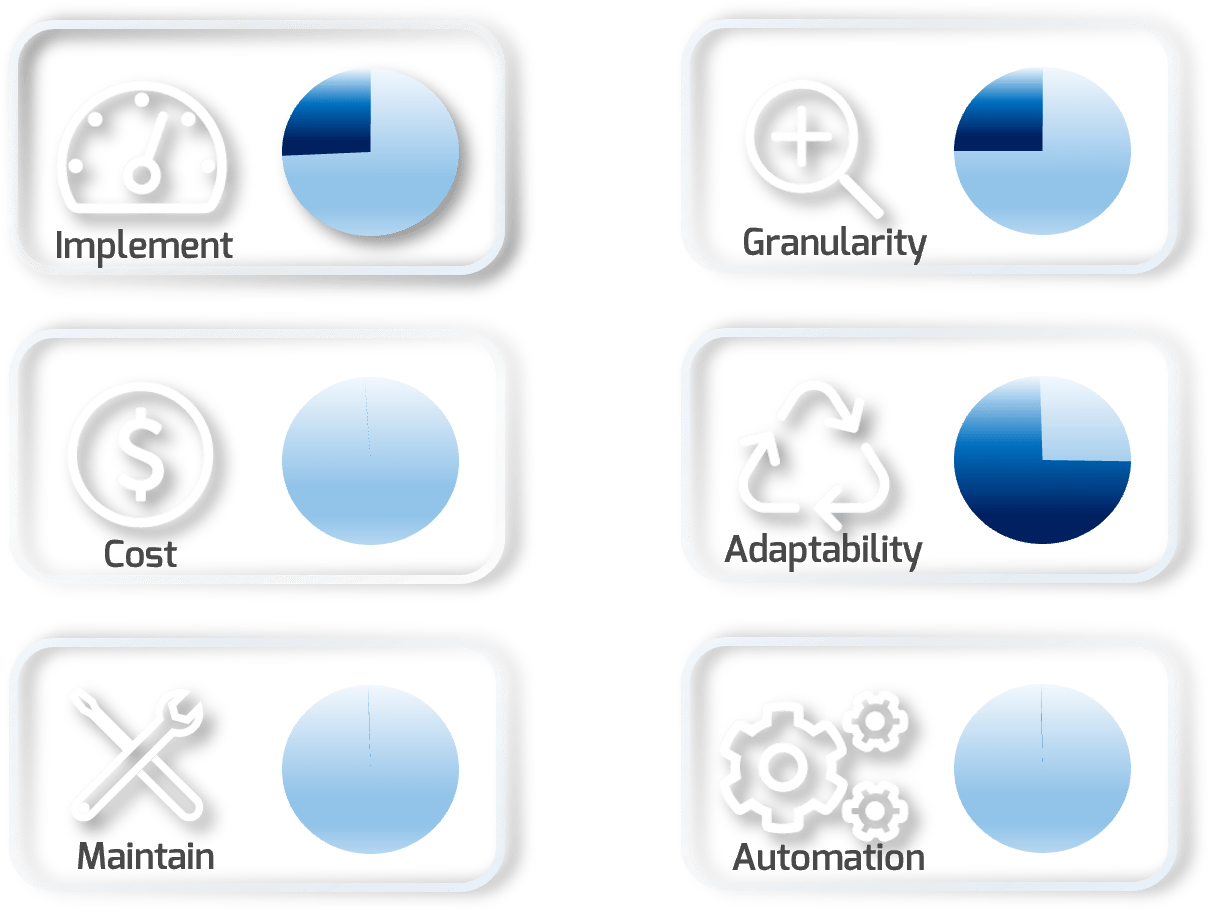
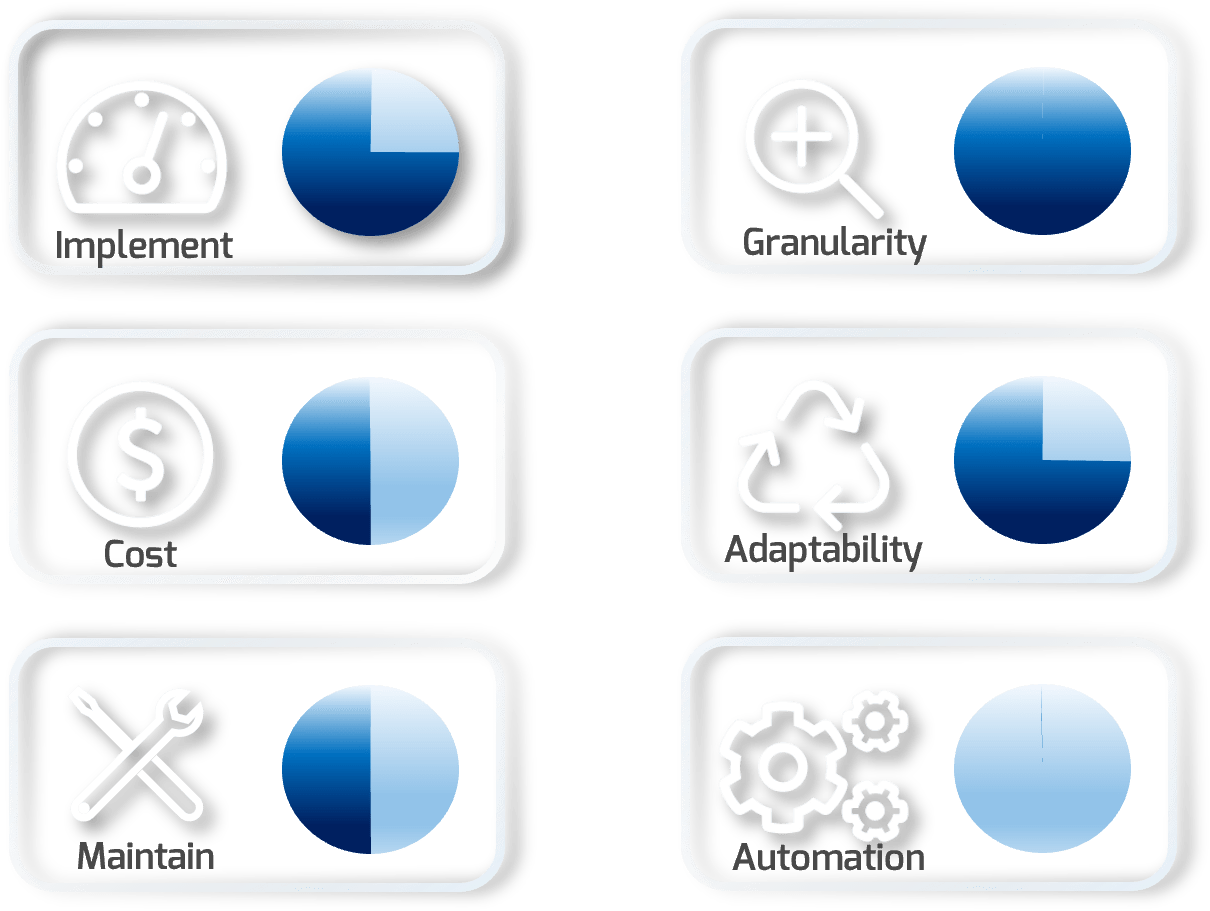
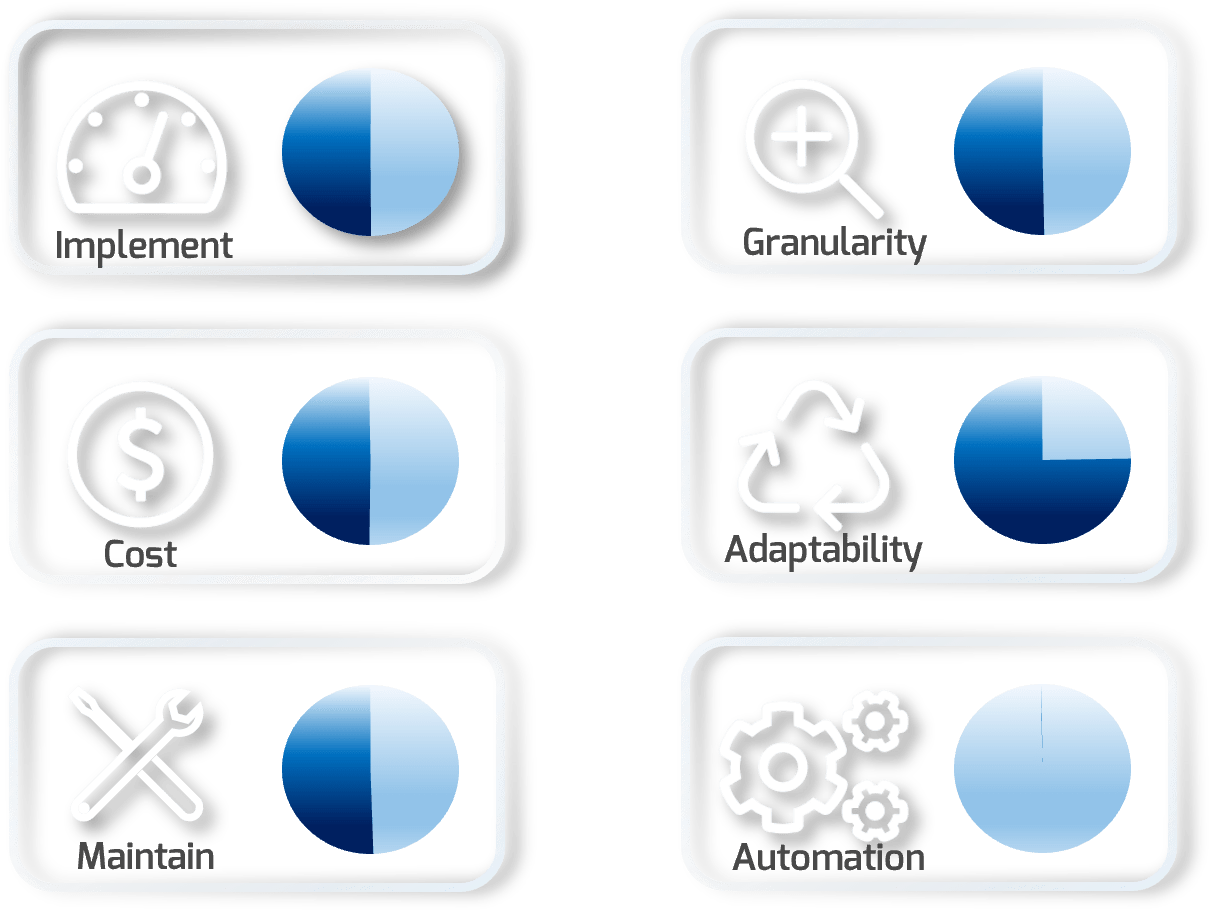
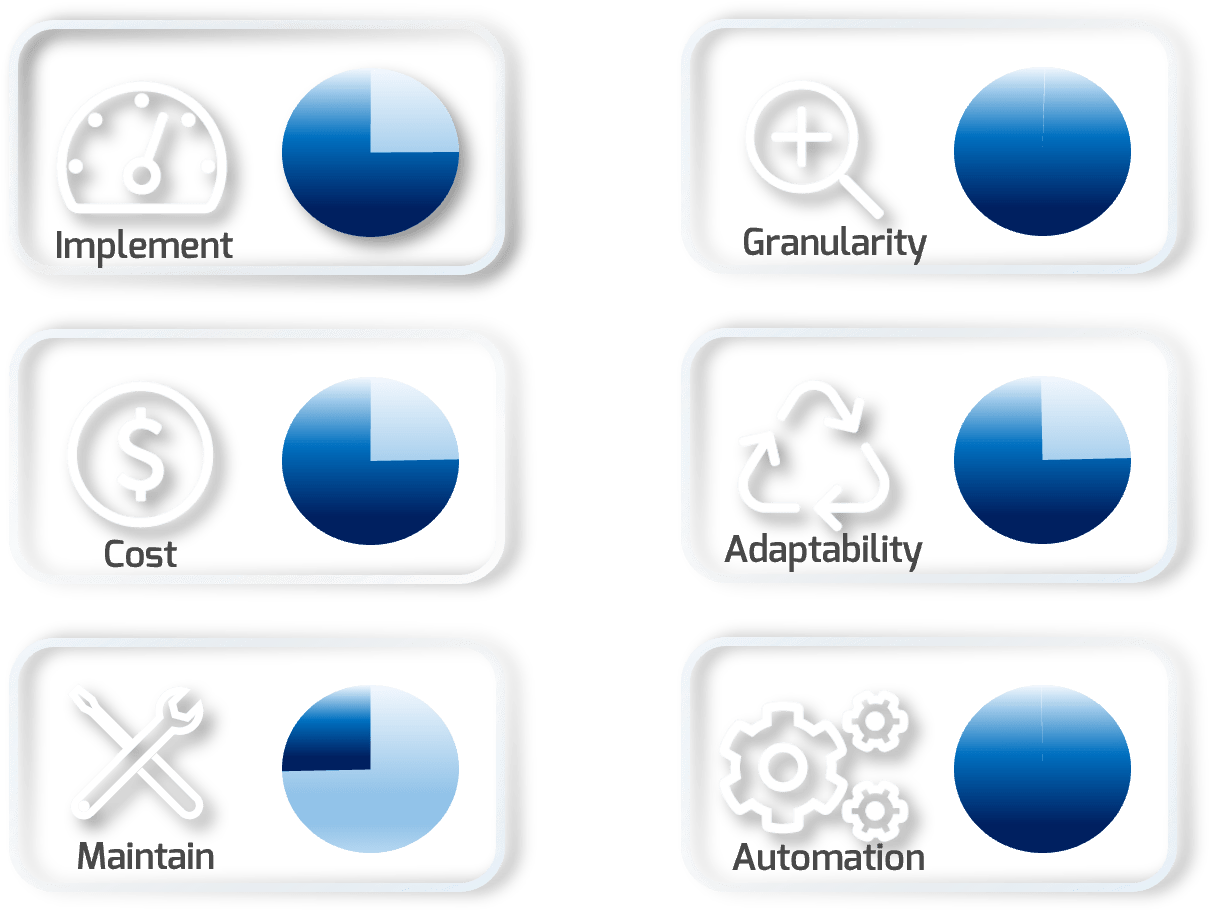

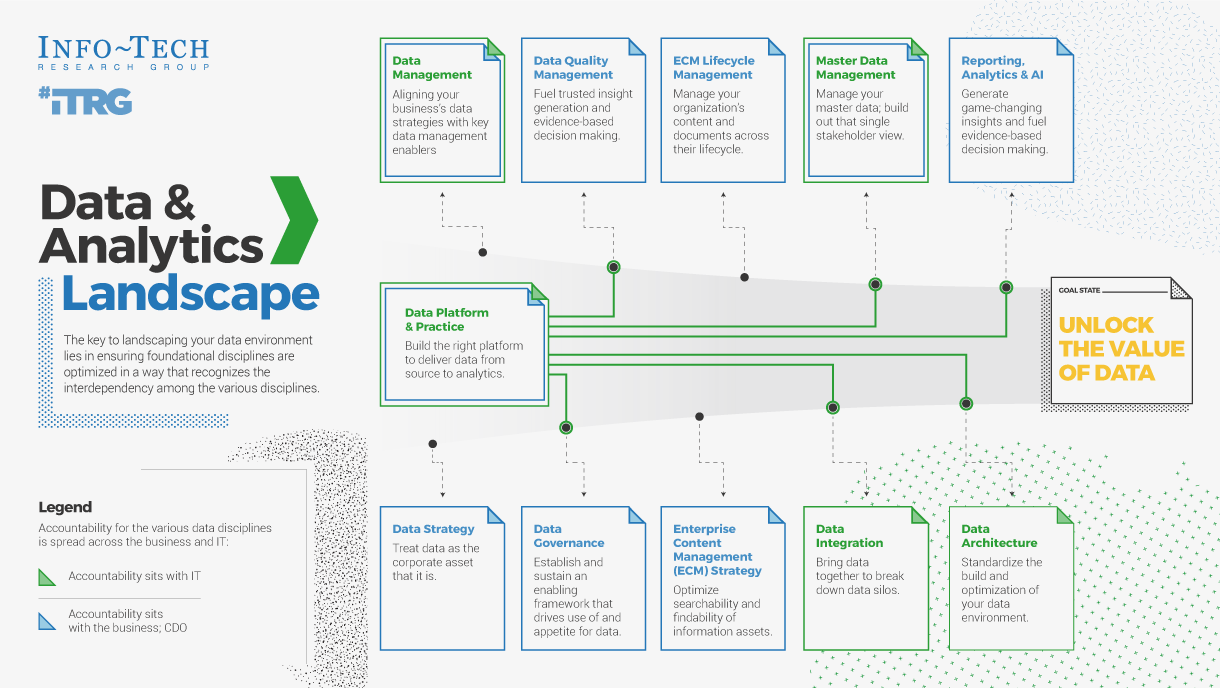


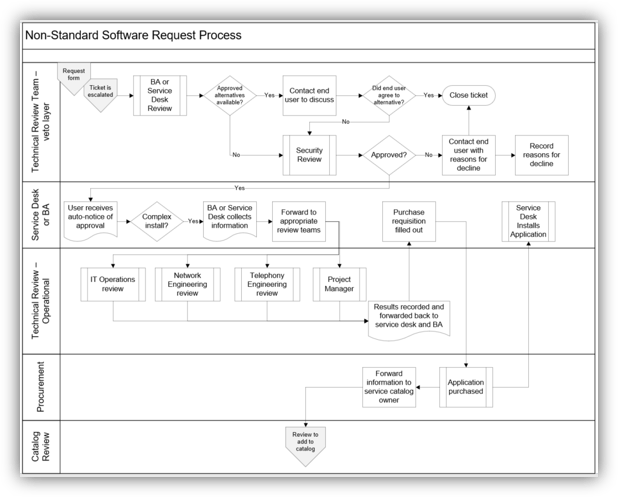
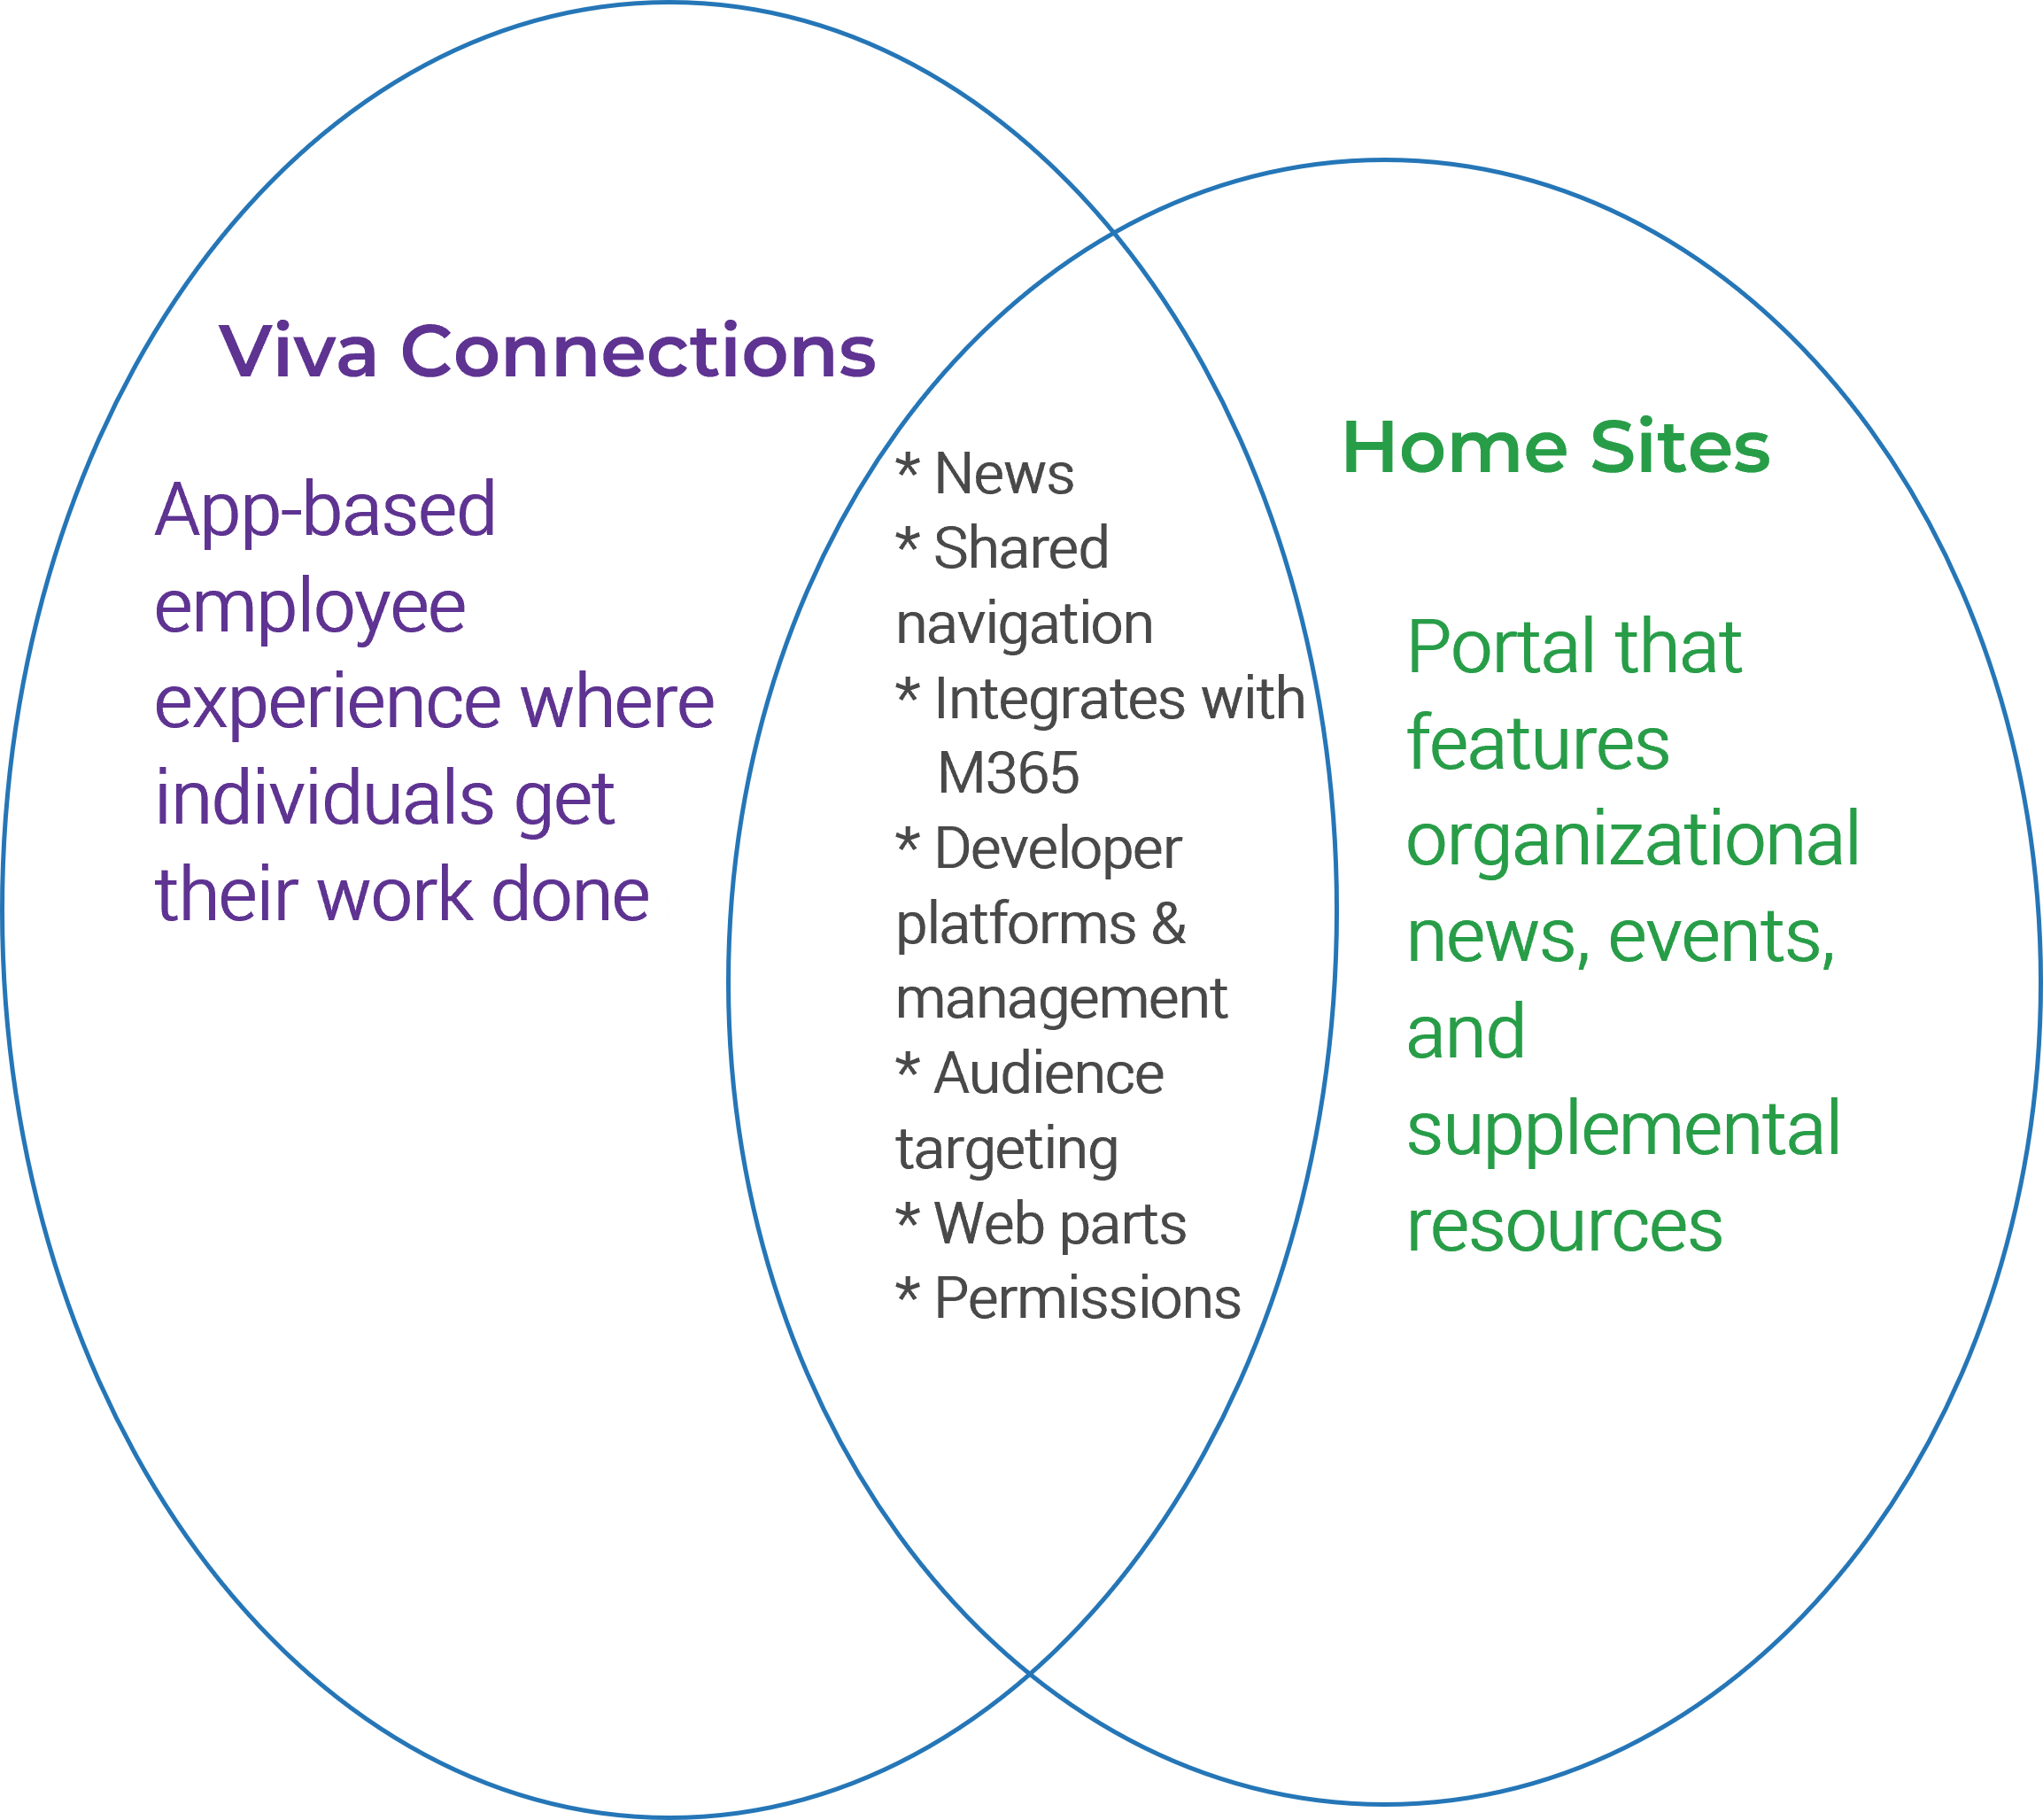 (Venn diagram recreated from
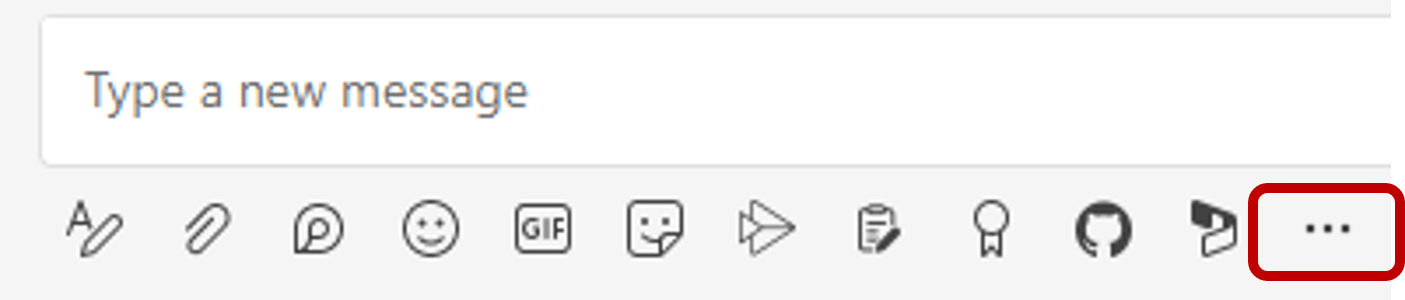


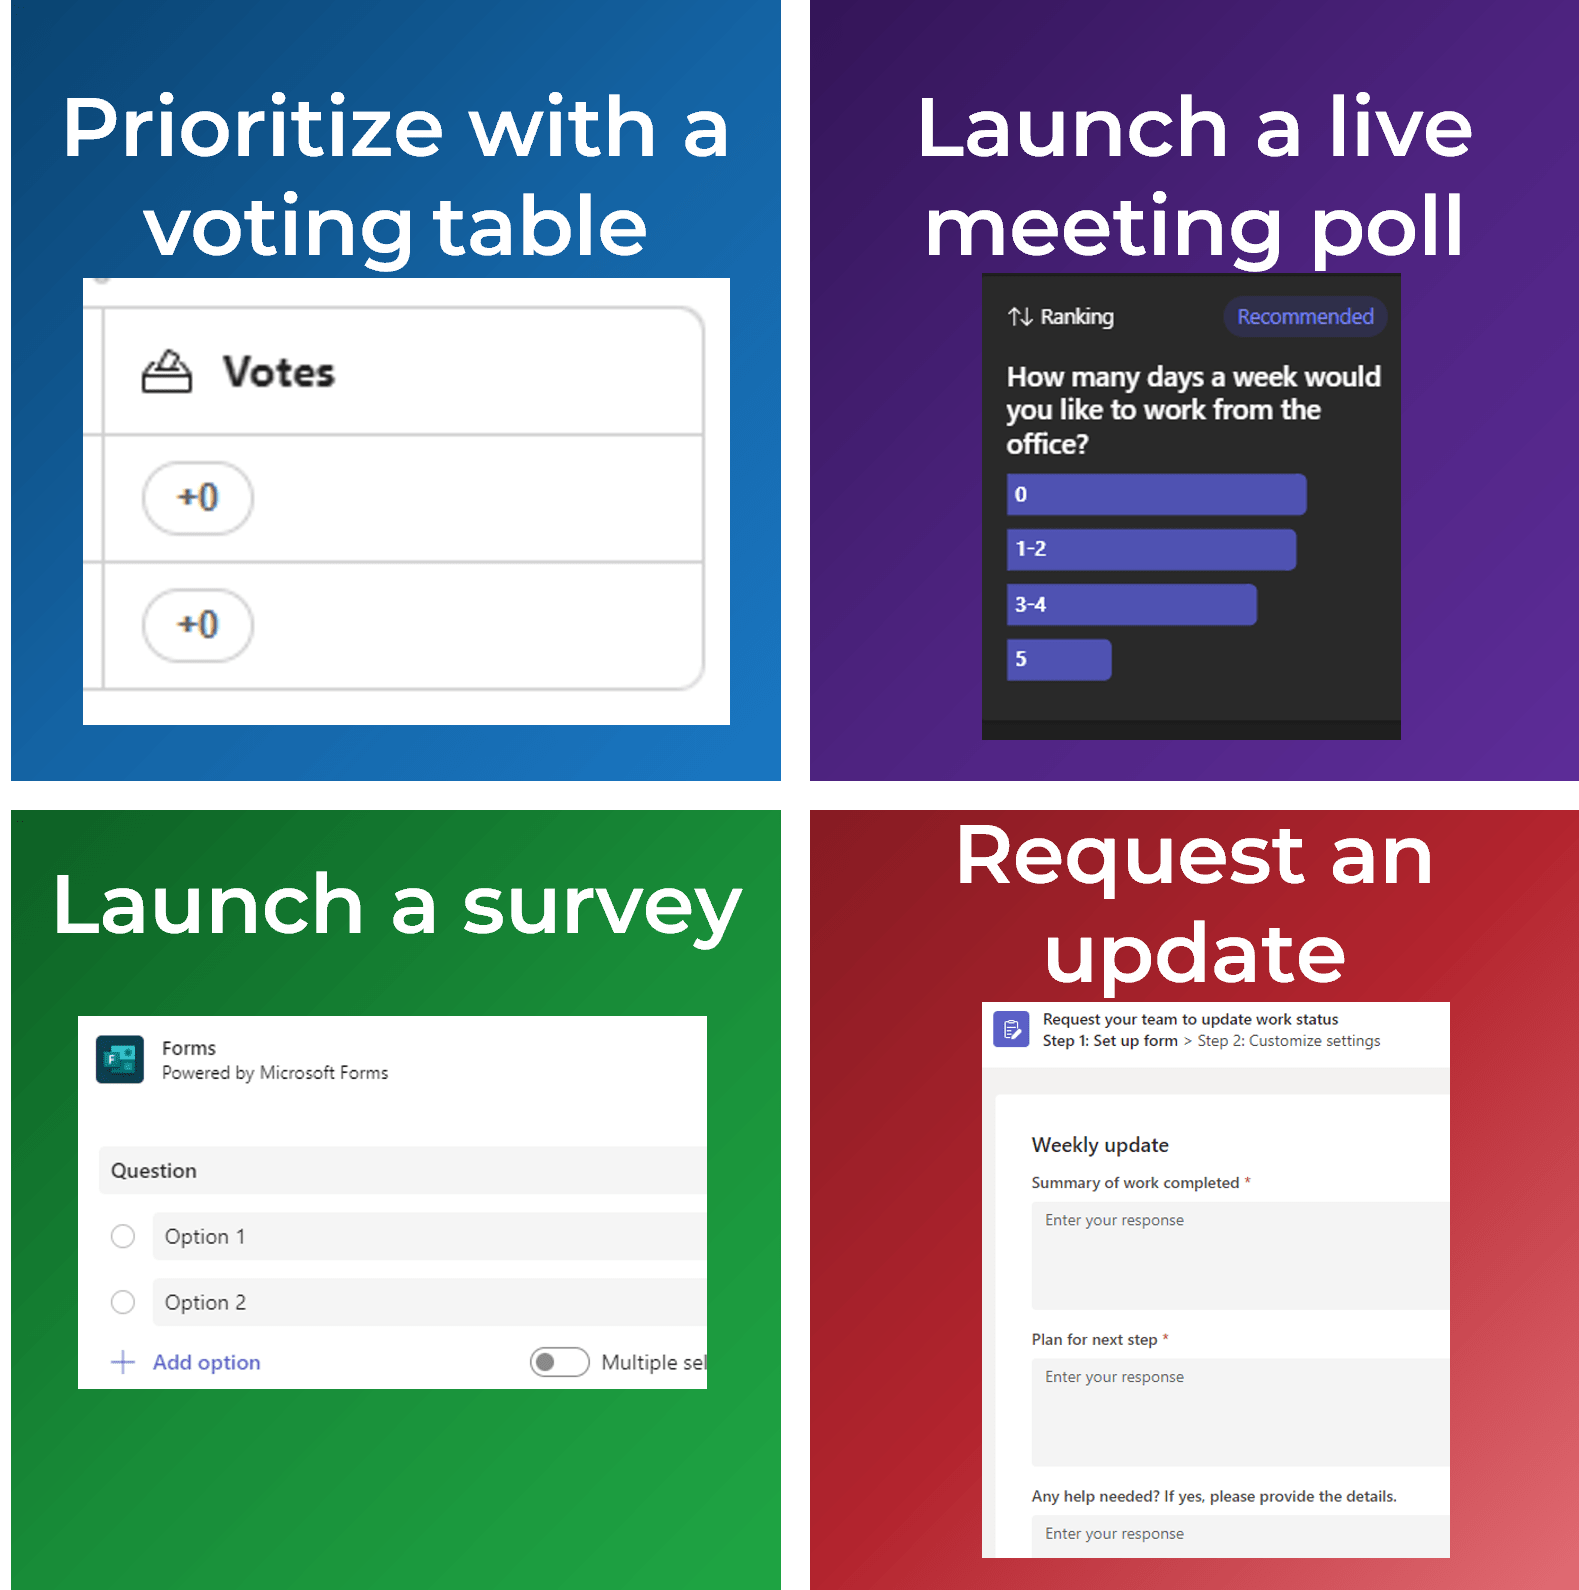
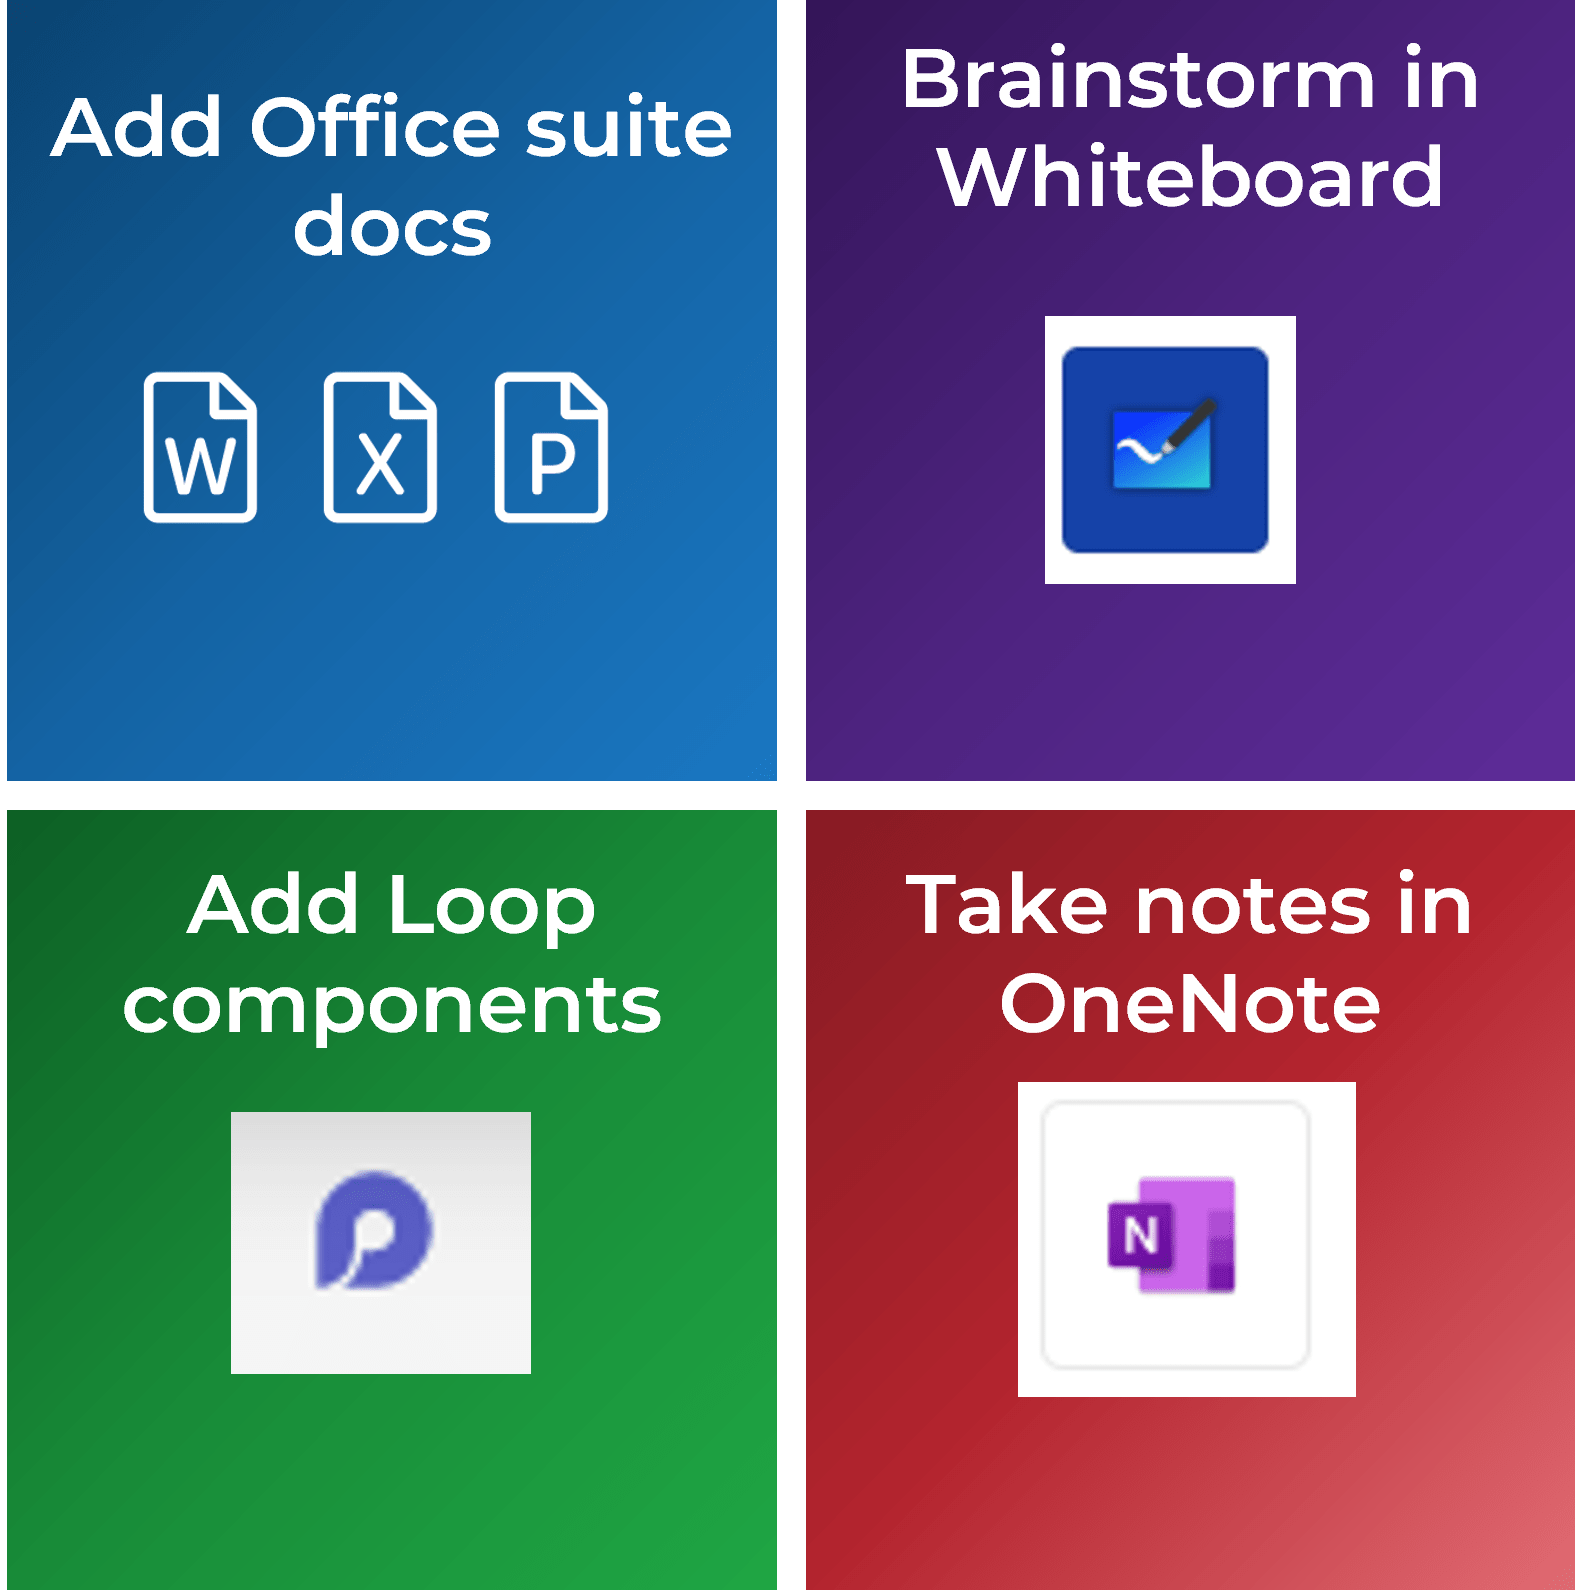
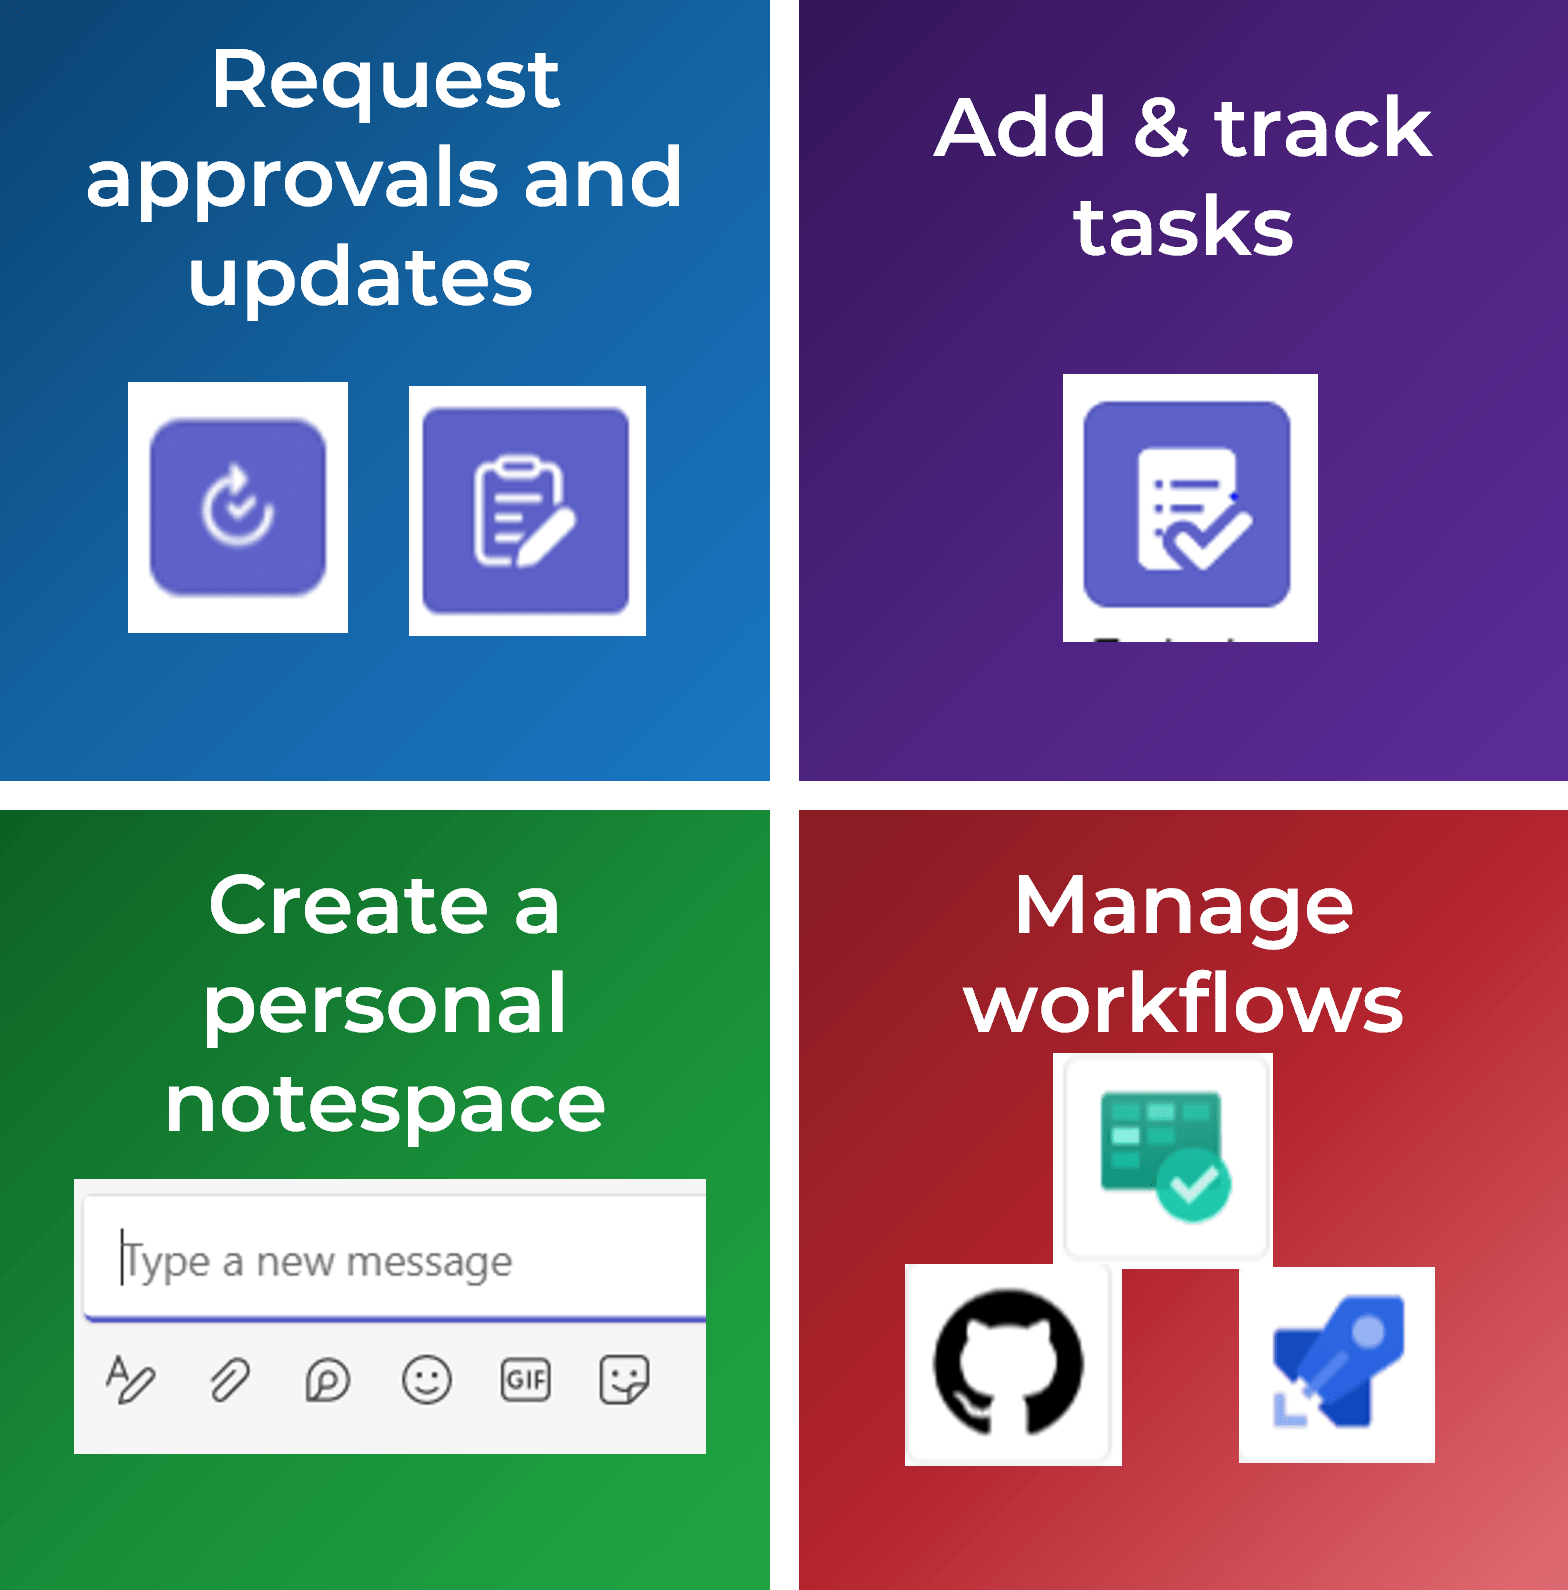

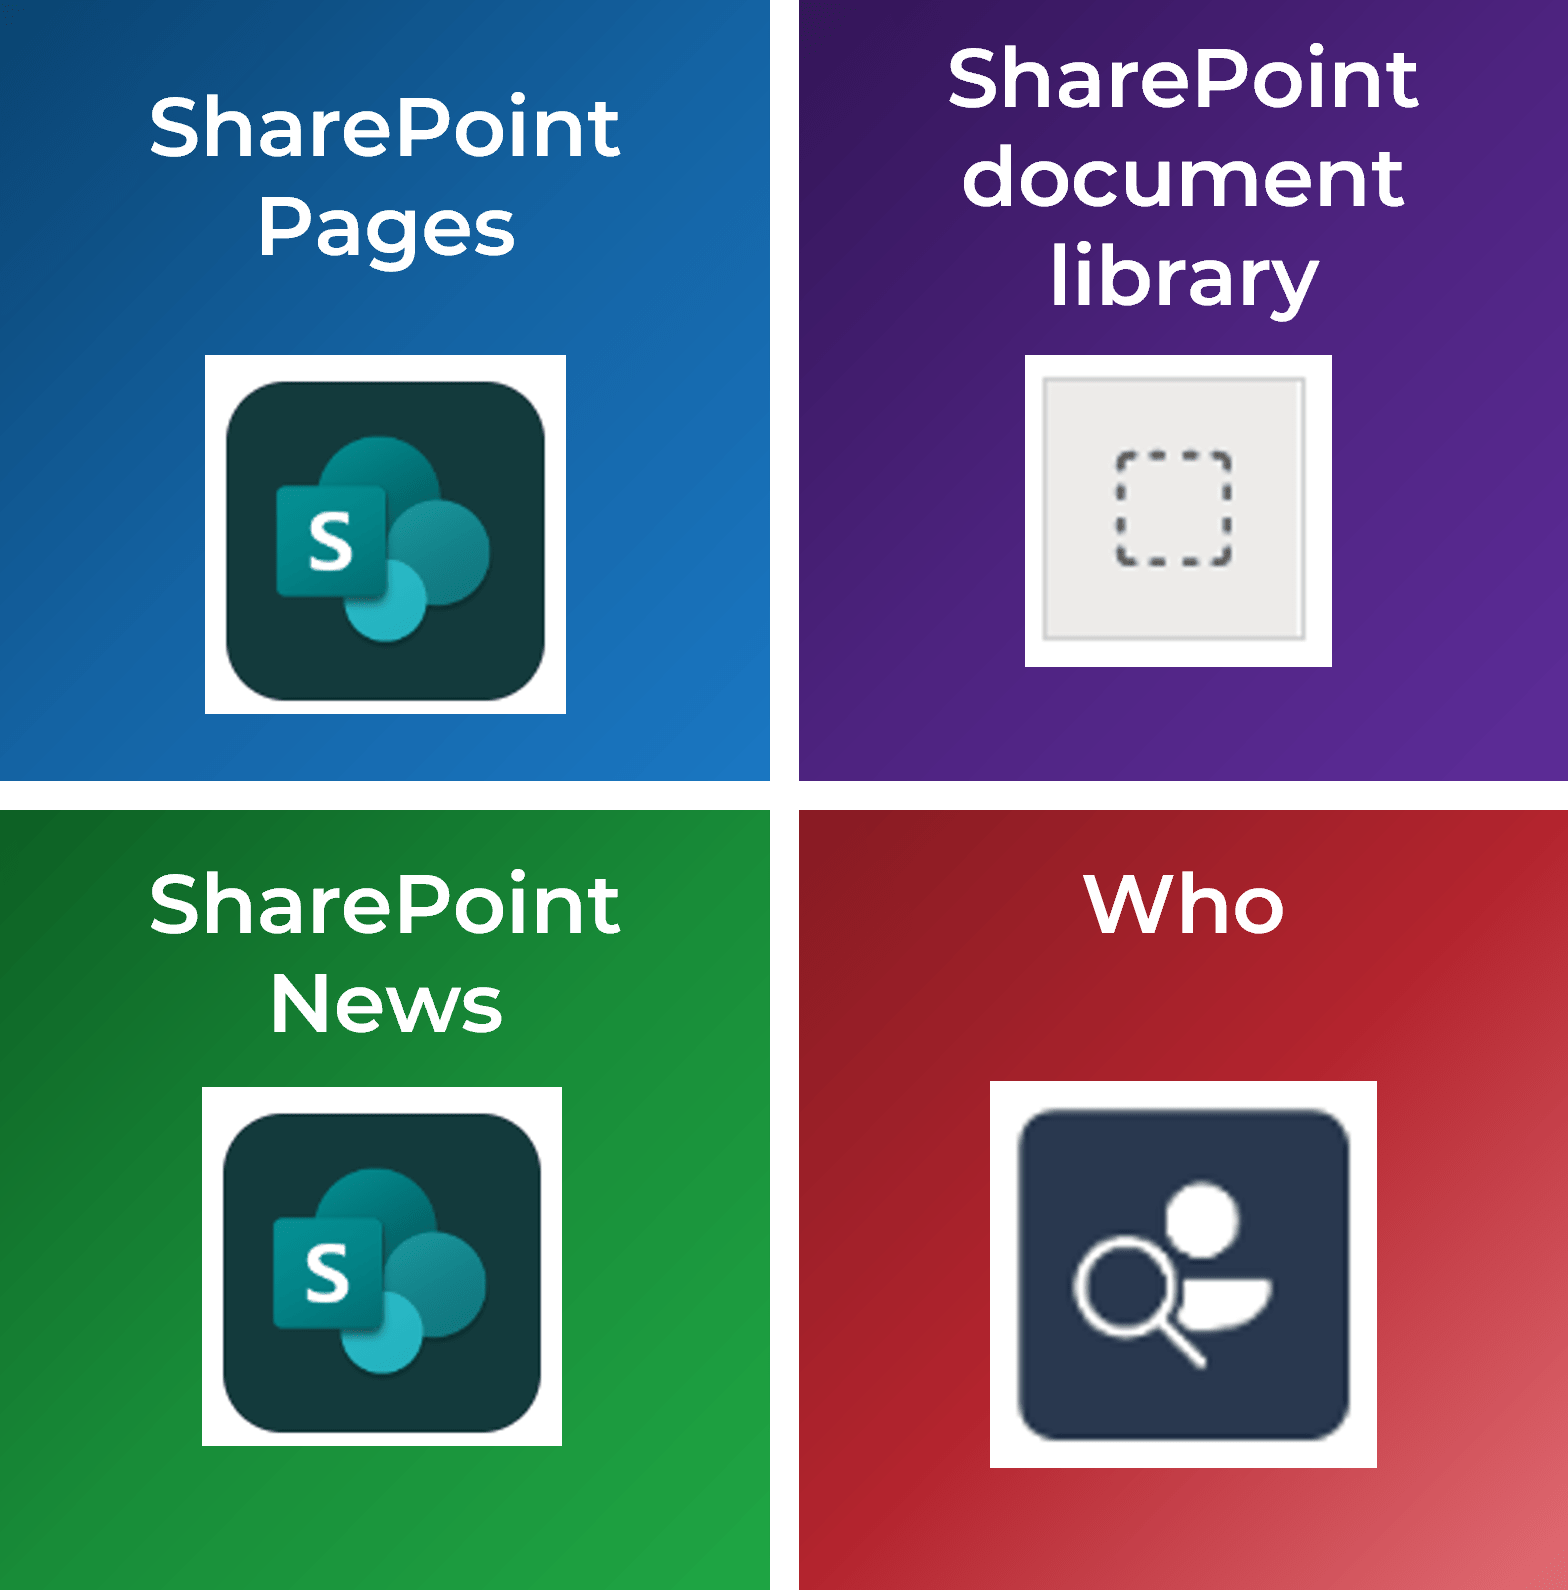


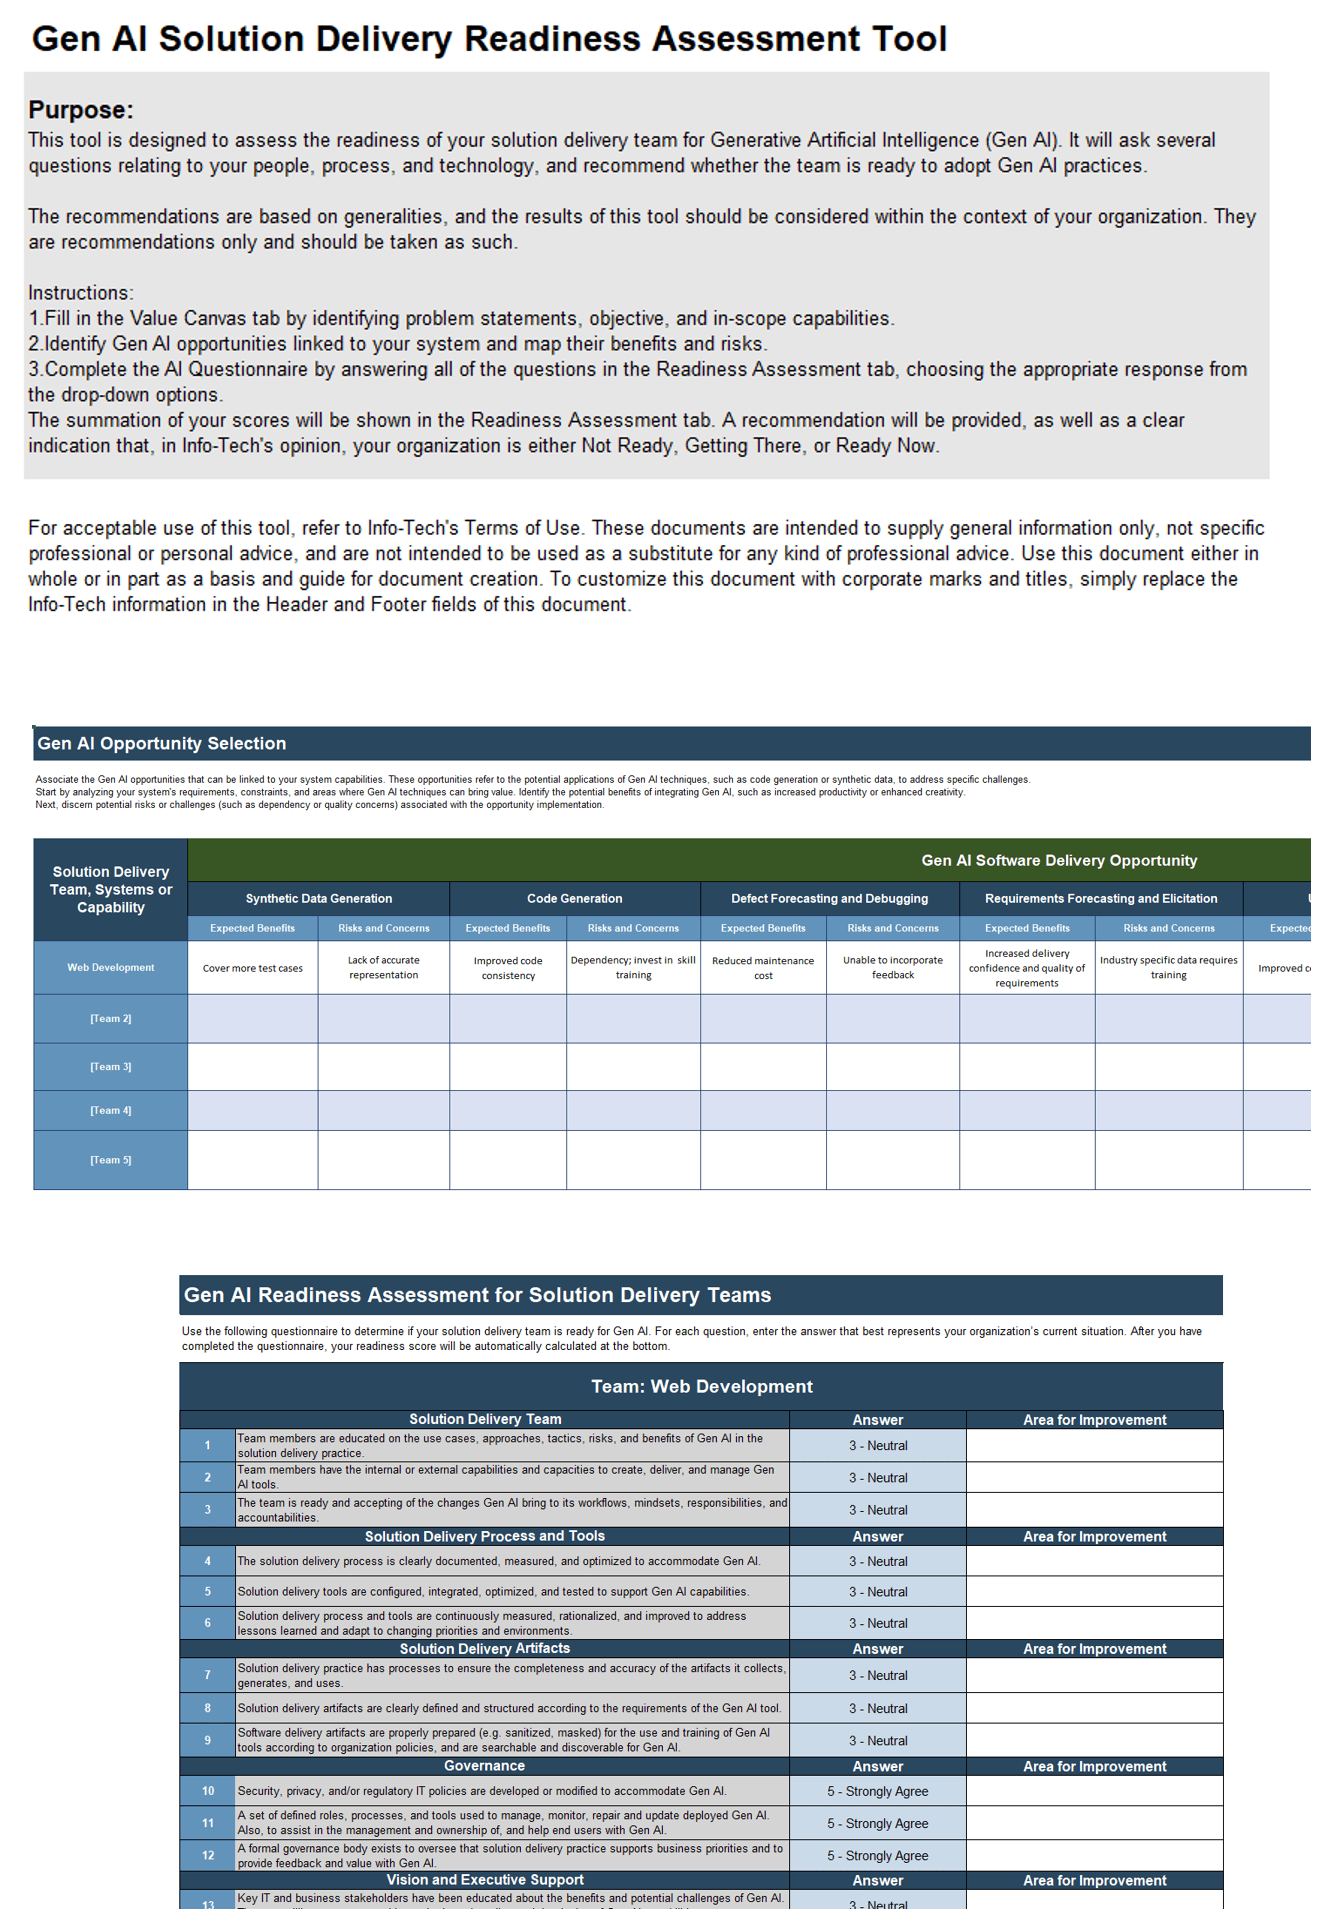
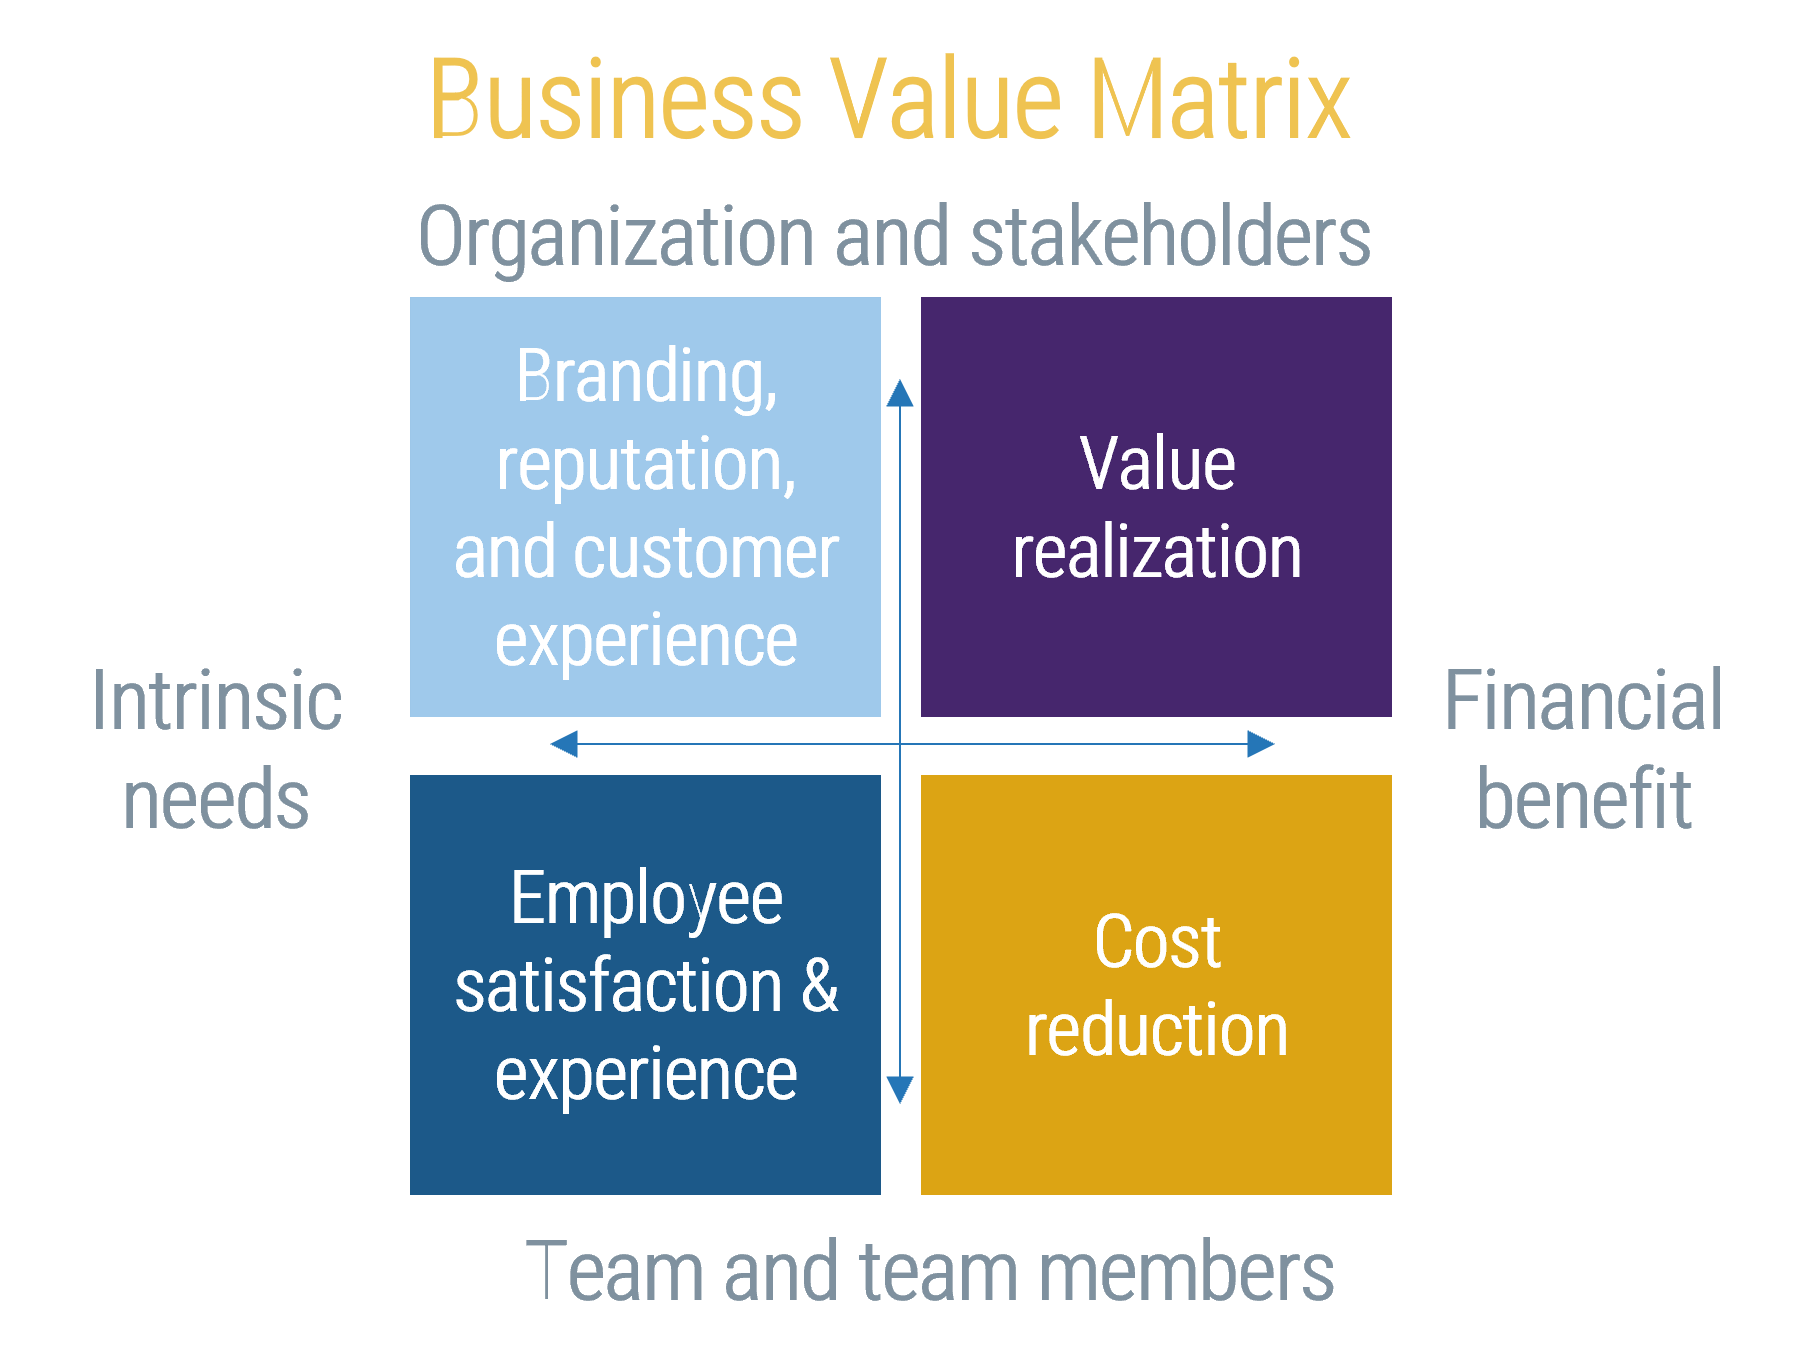
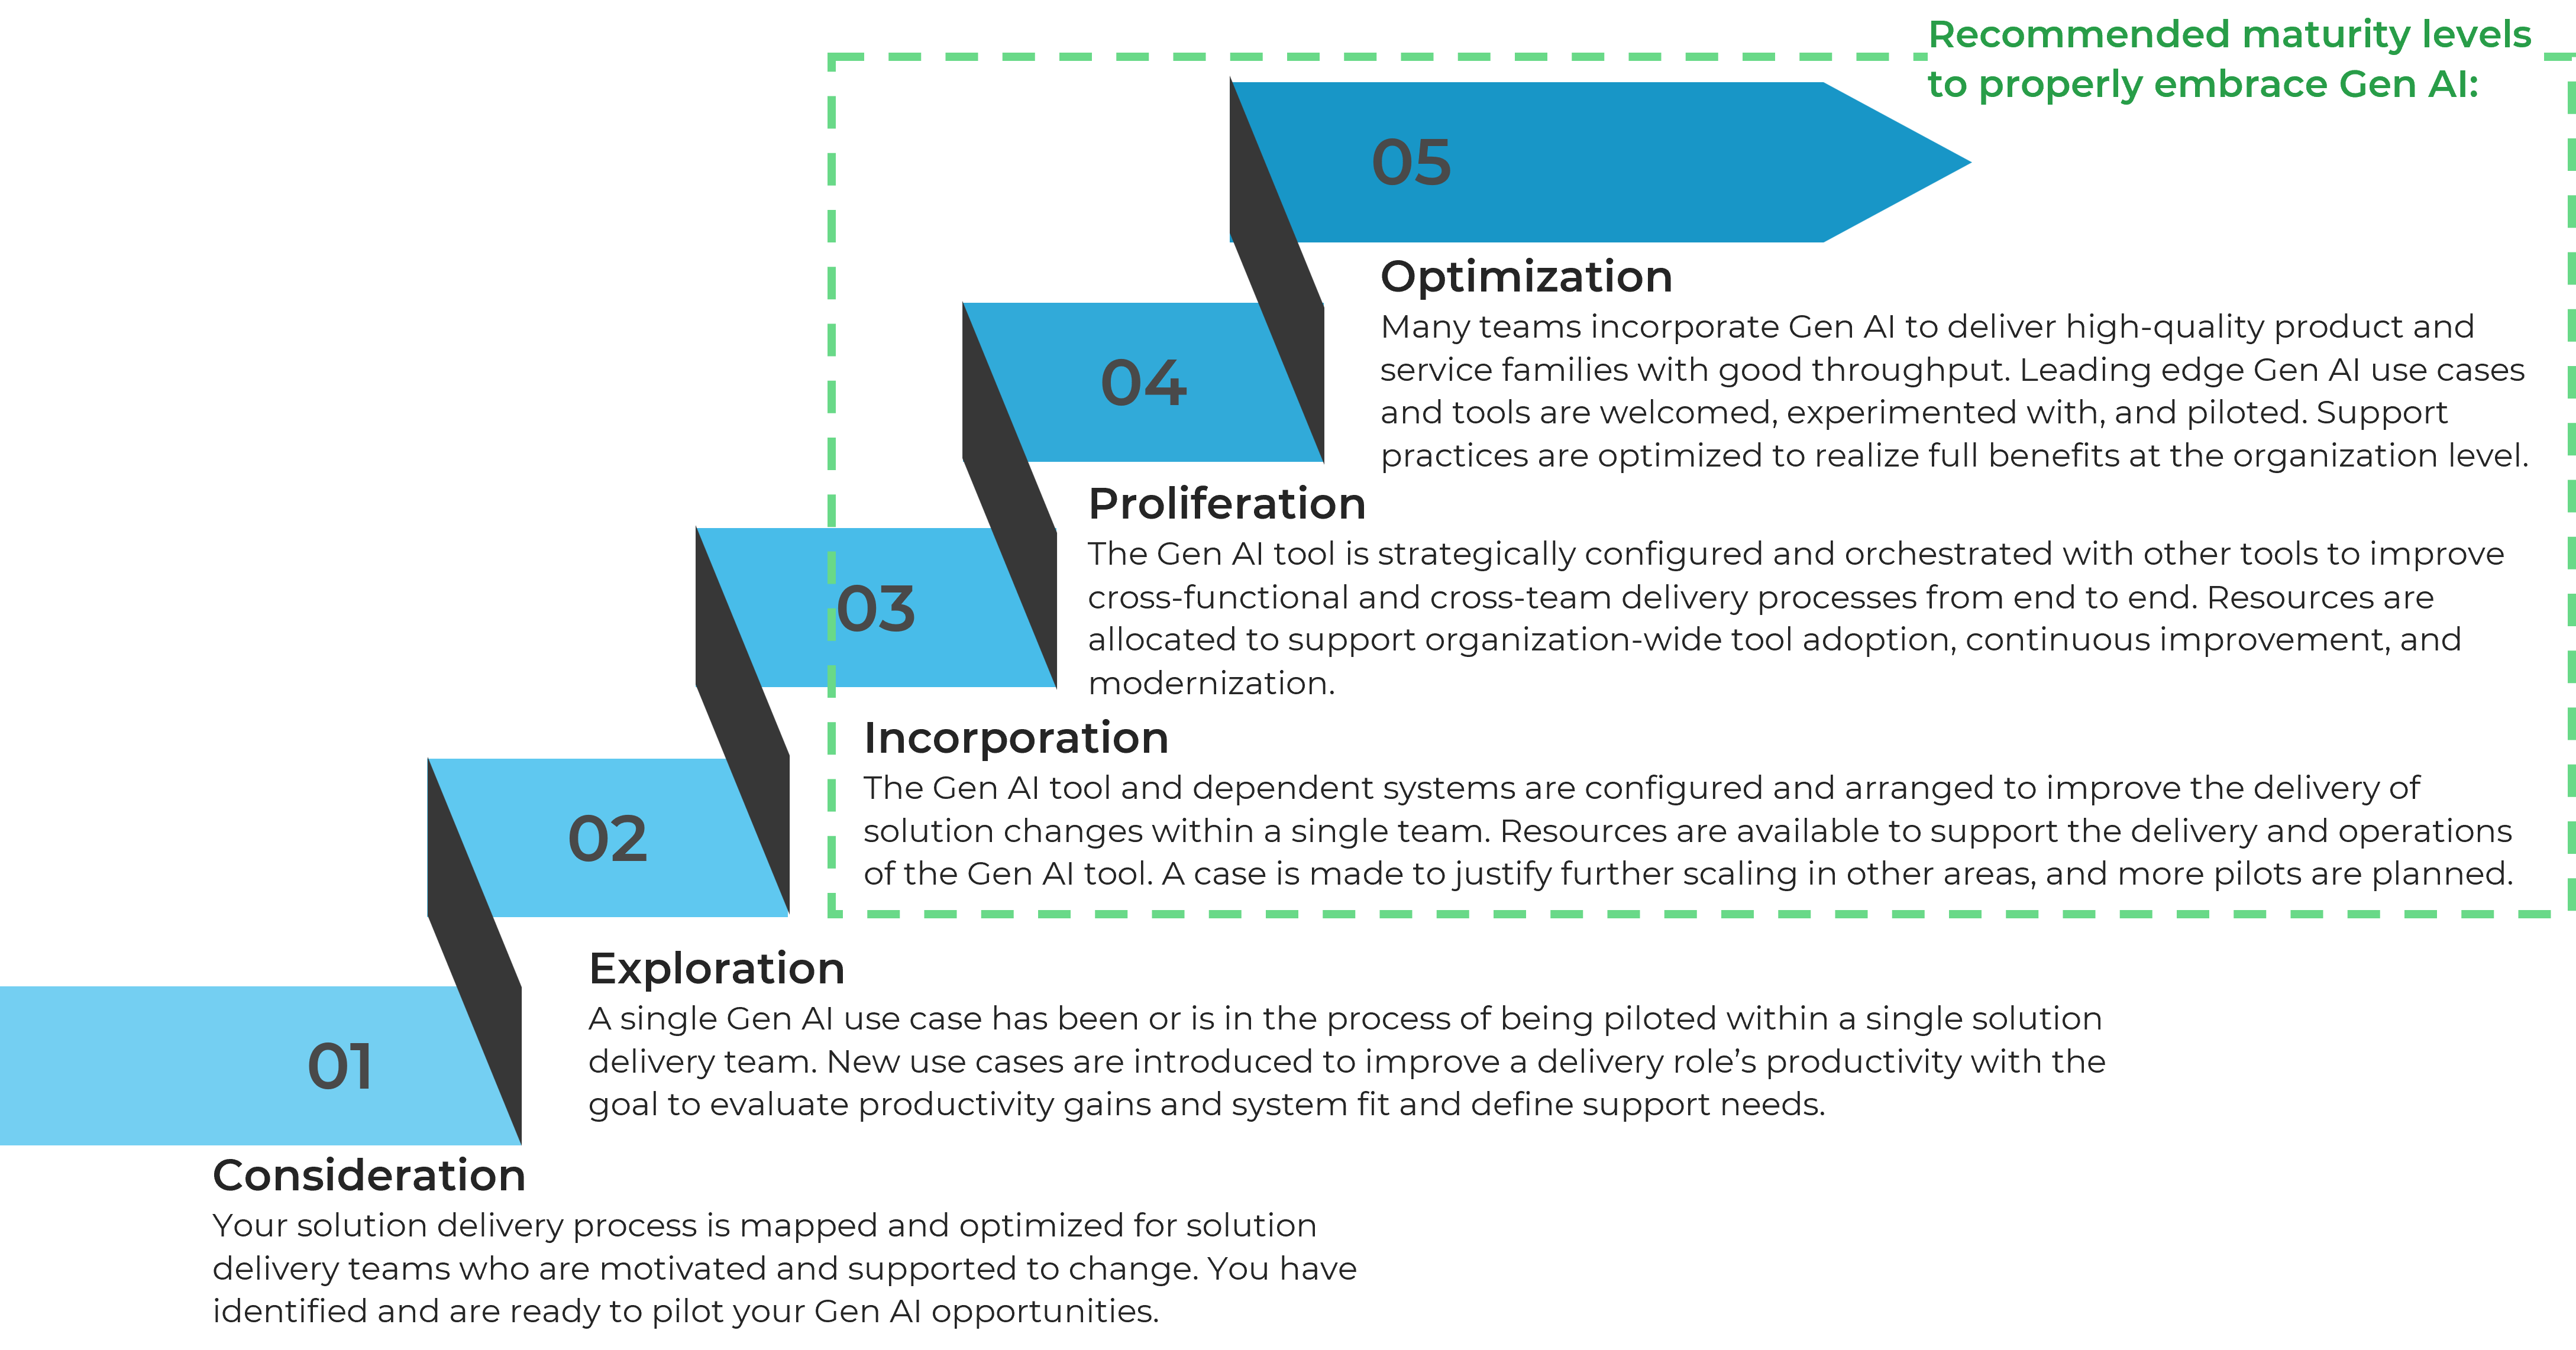

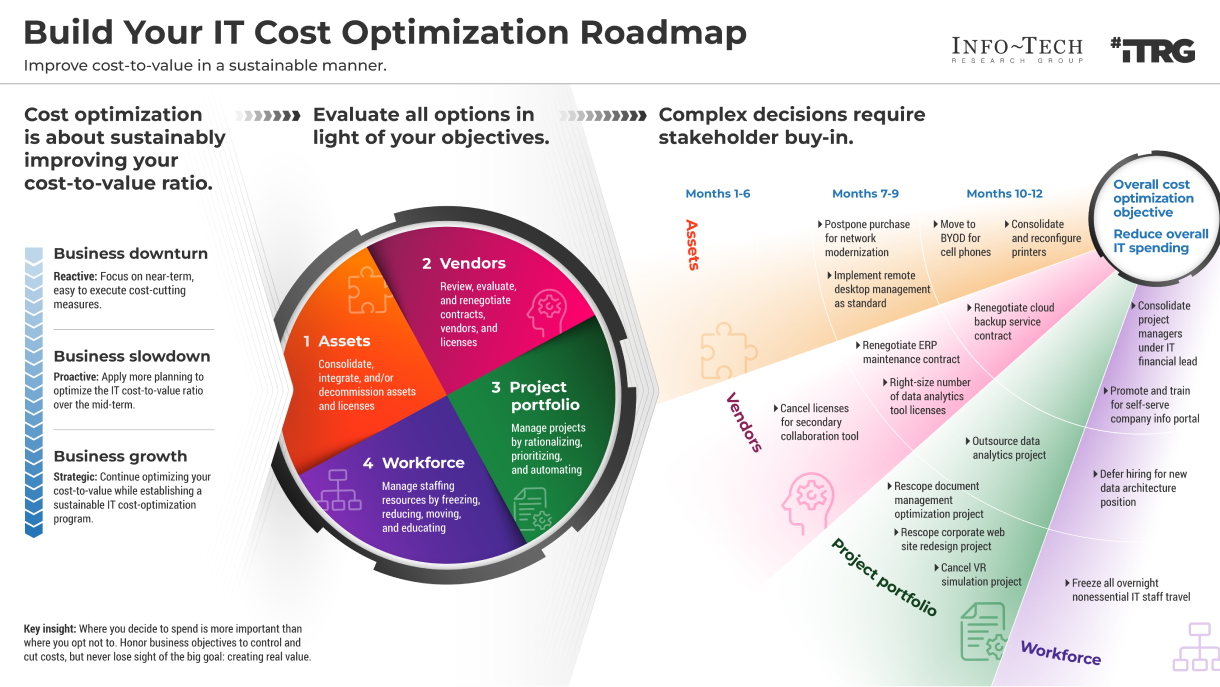

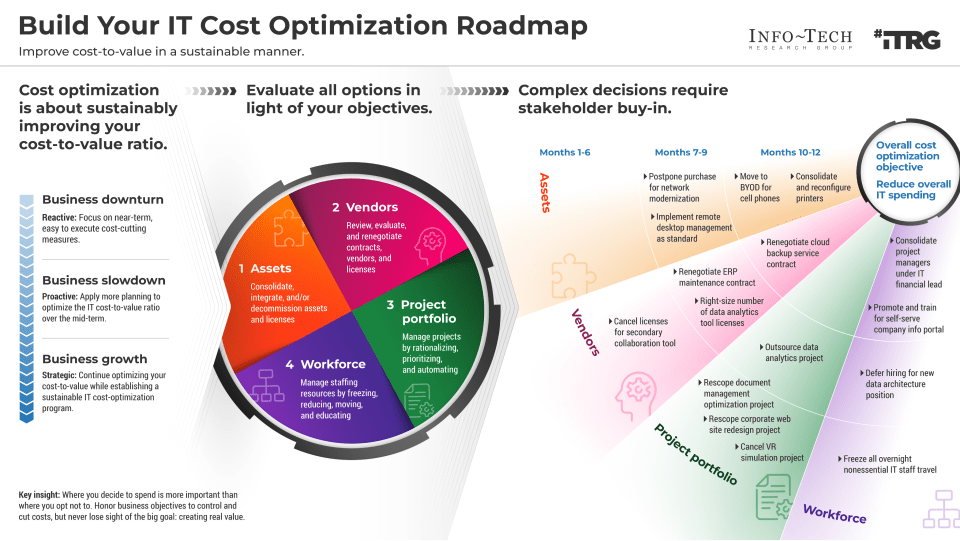
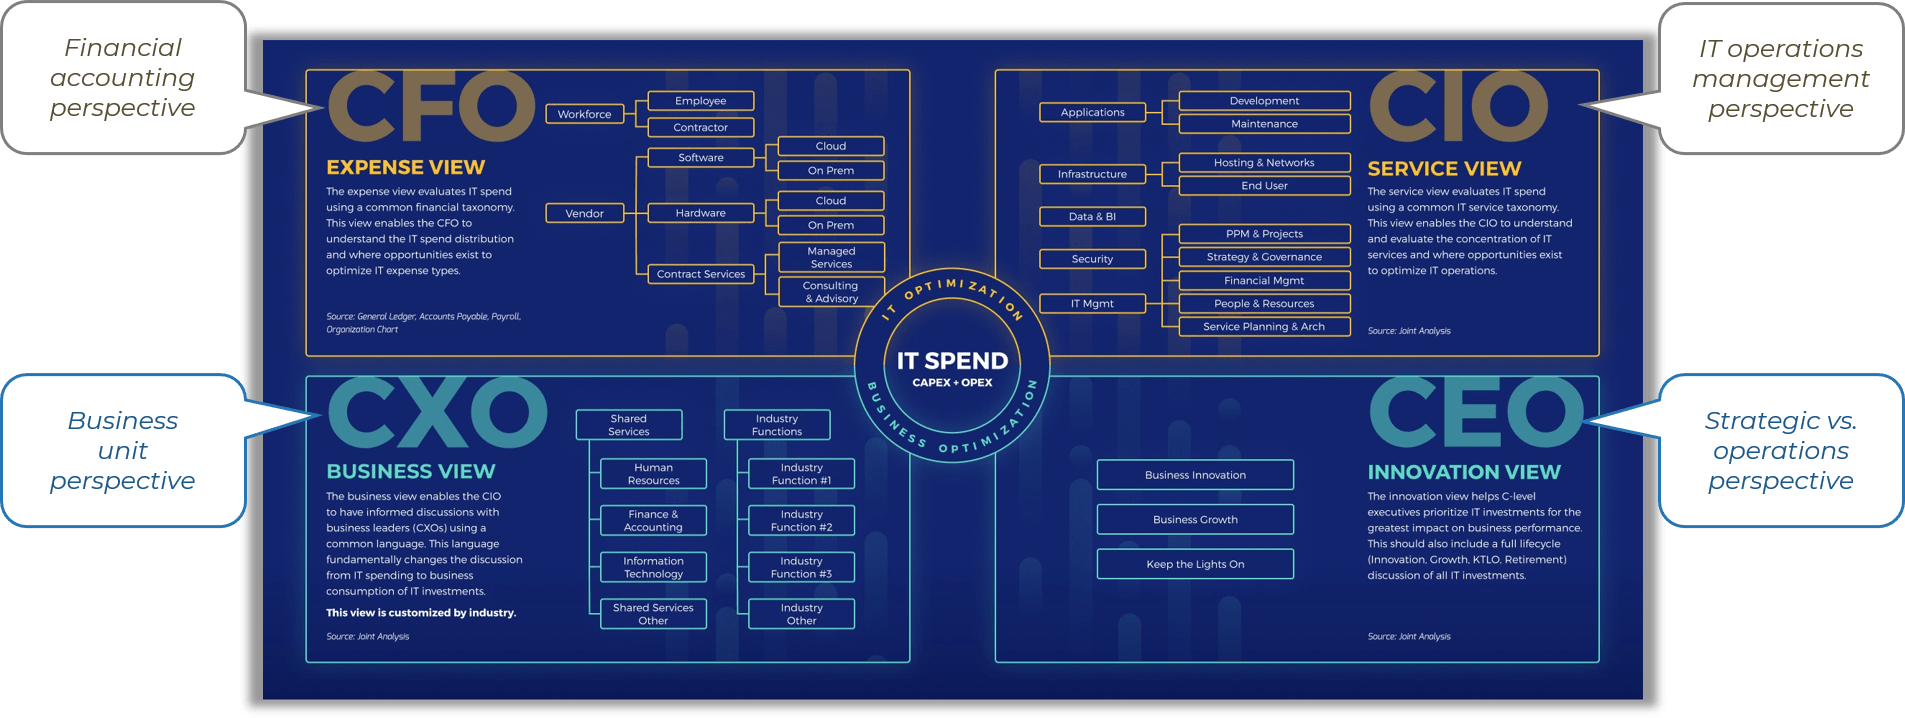
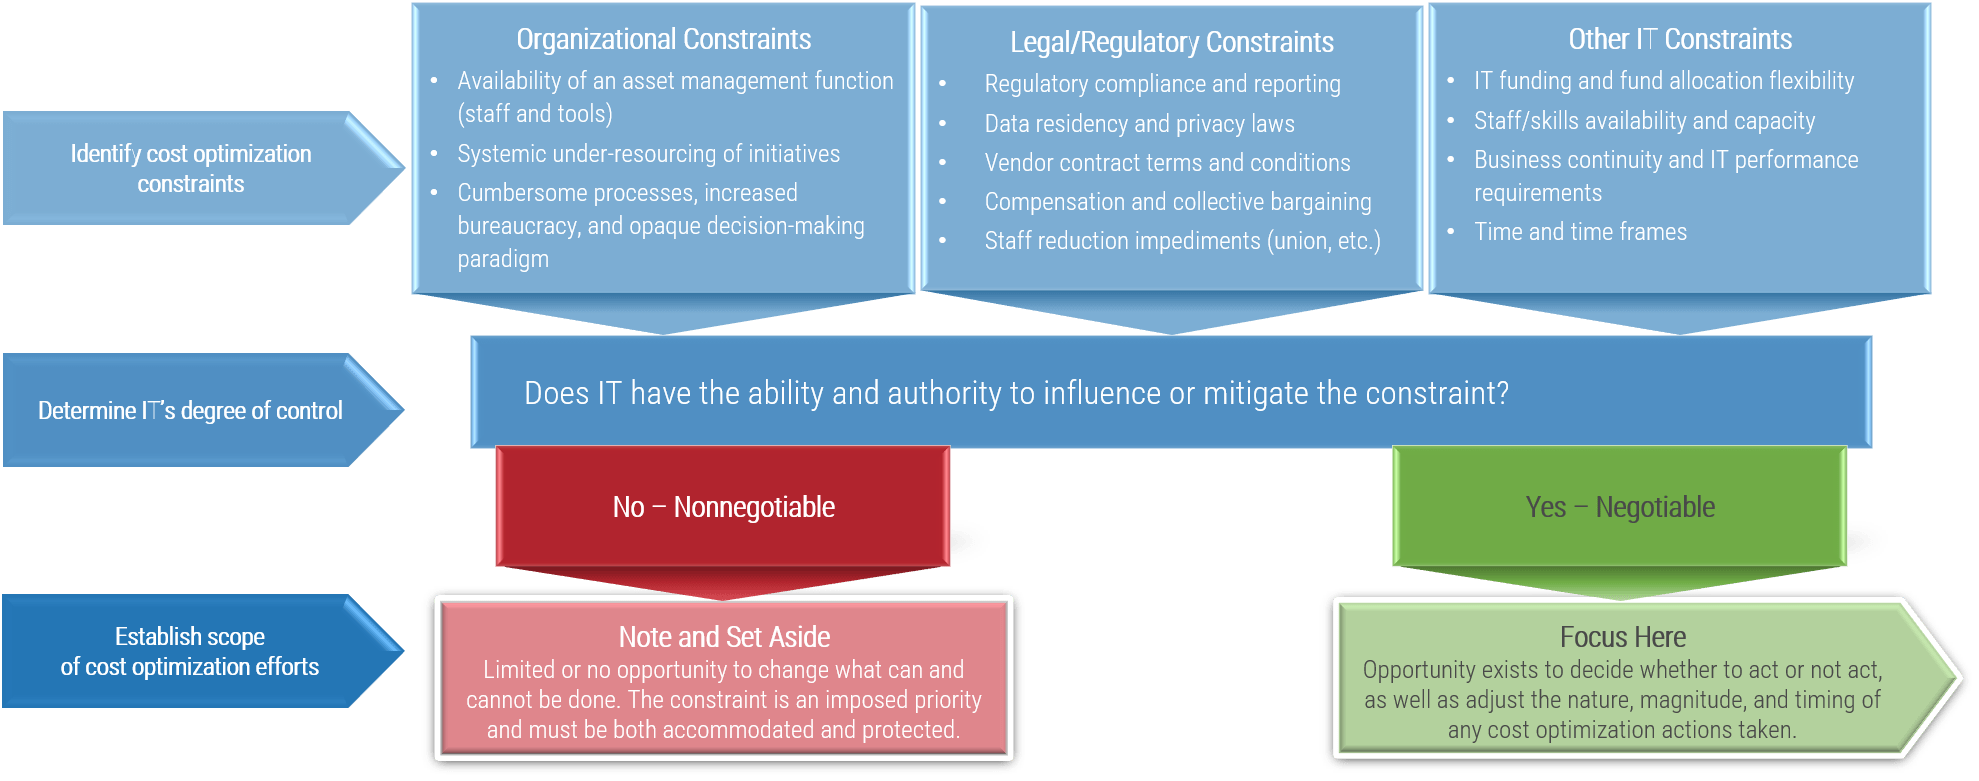
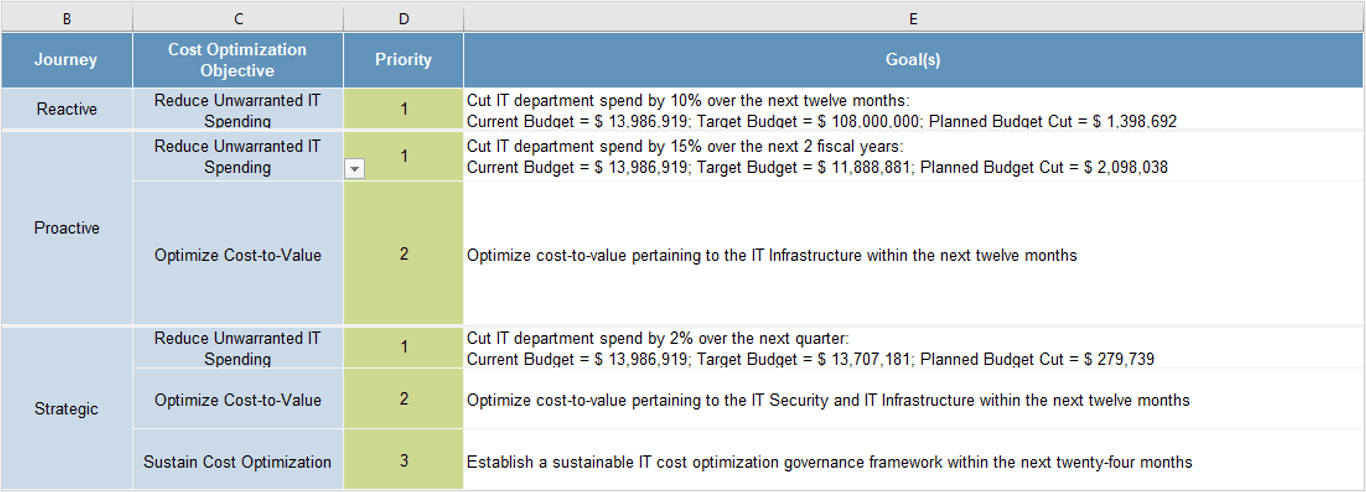
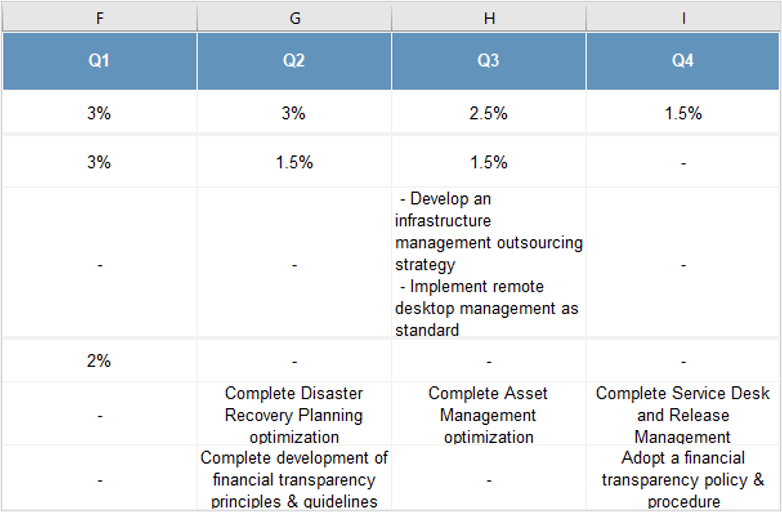
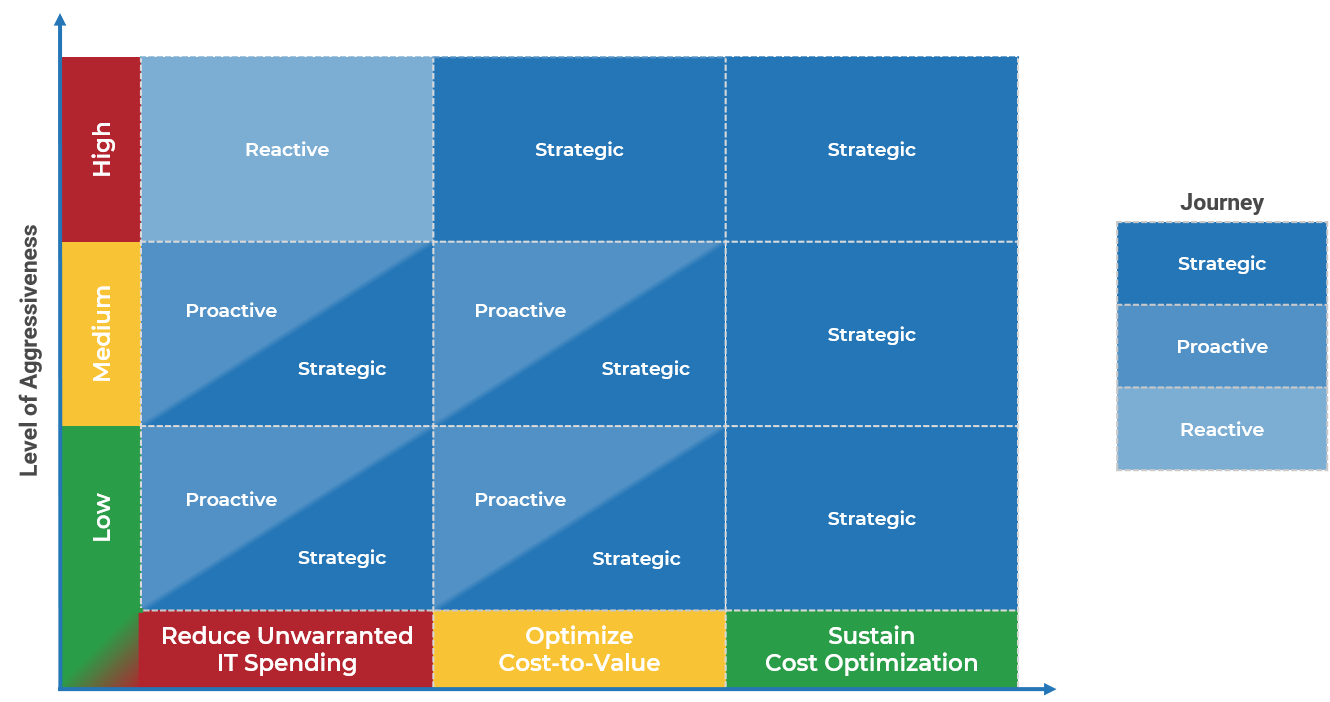
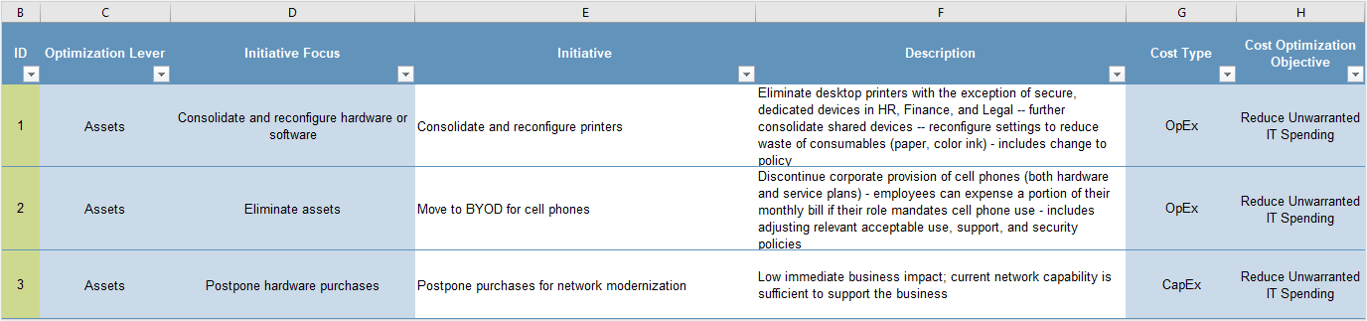
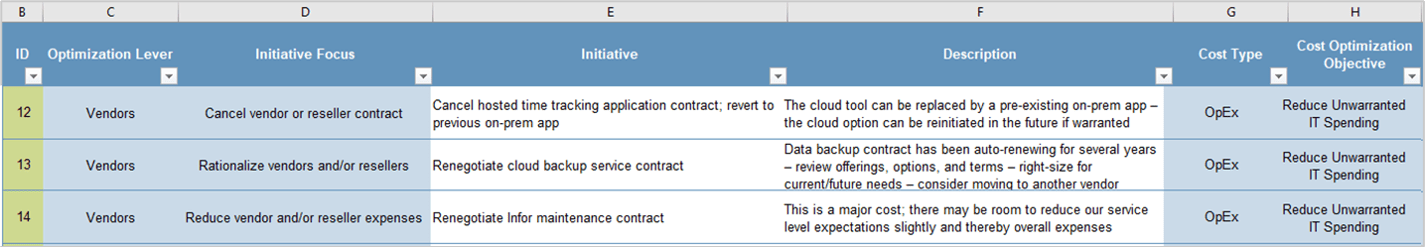
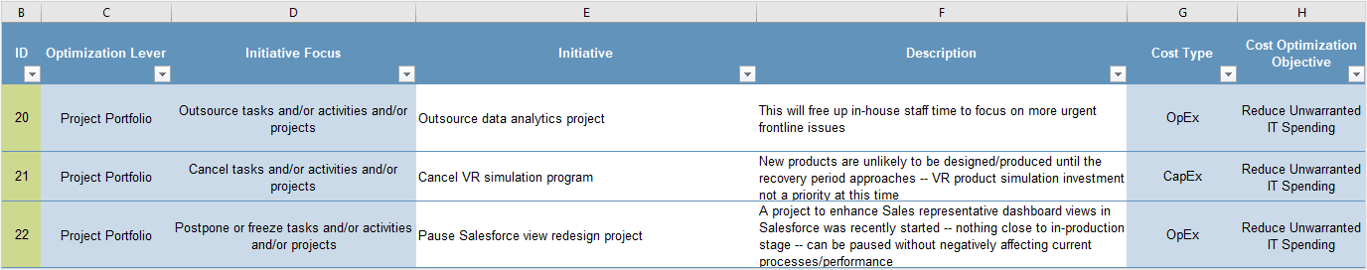
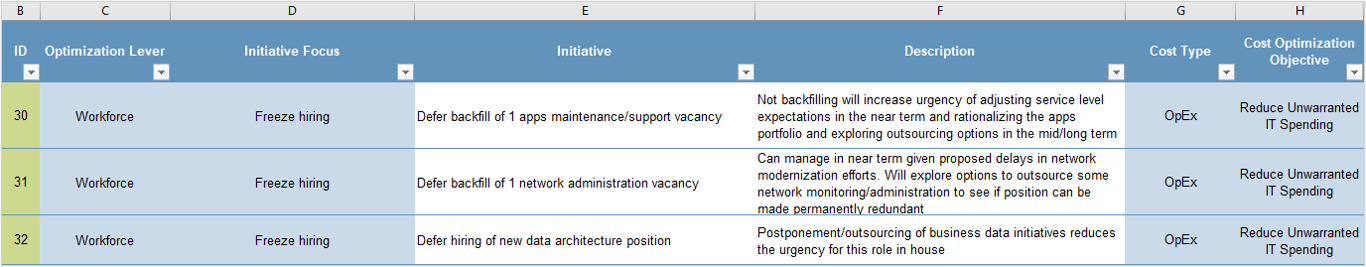
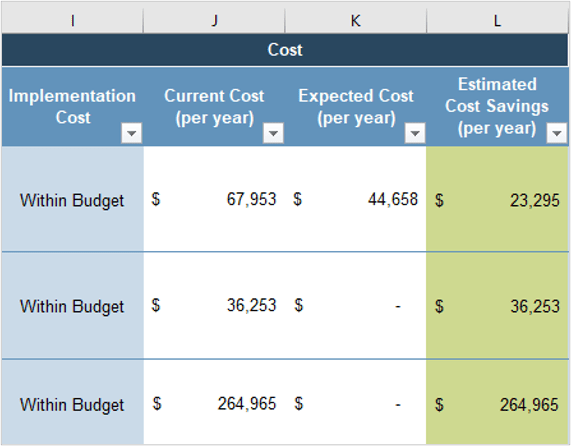
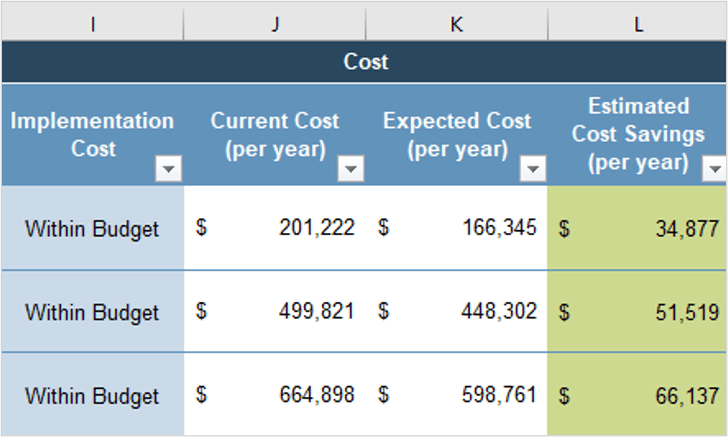
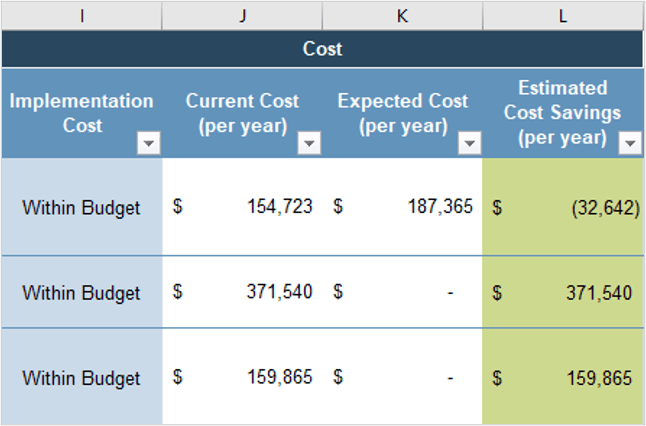
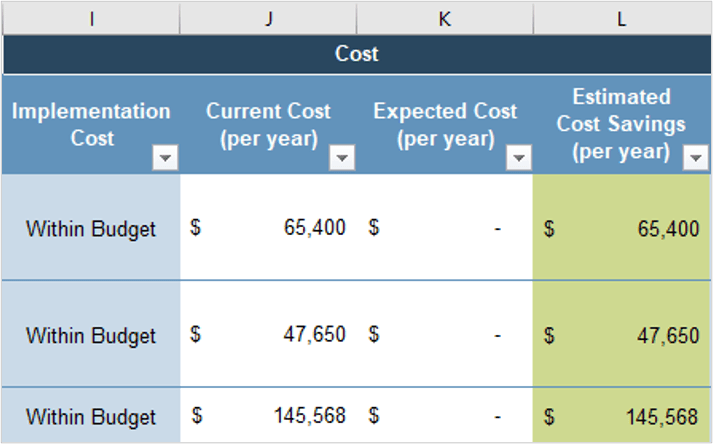
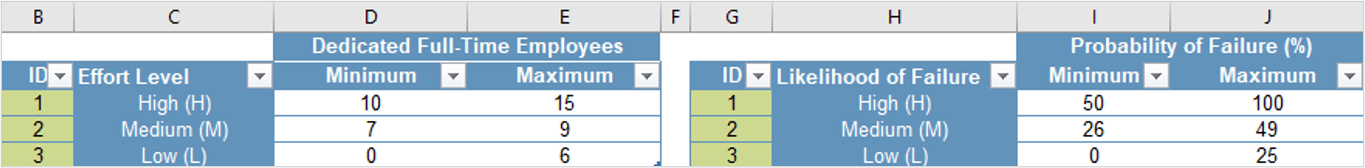
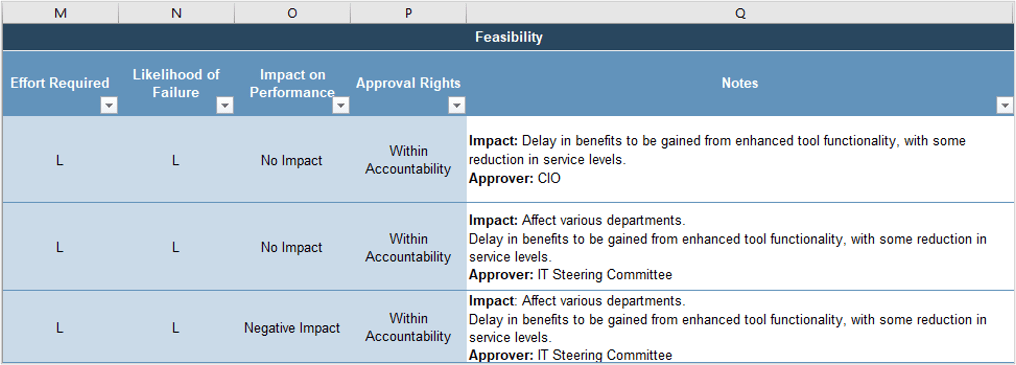
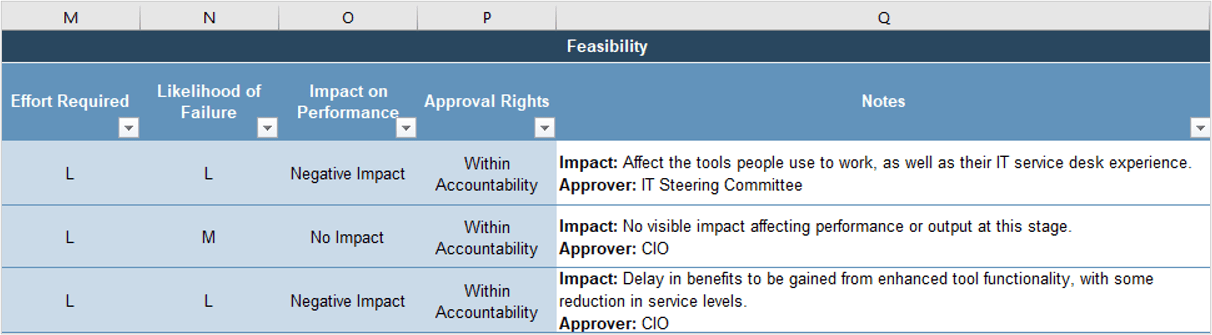
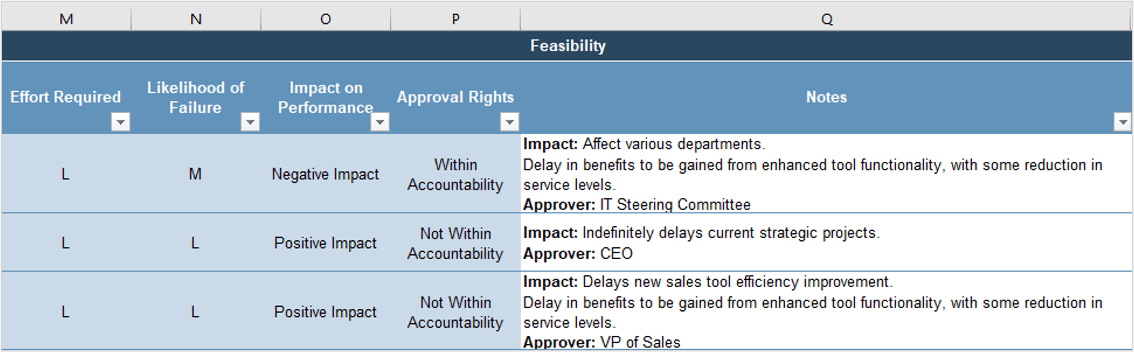
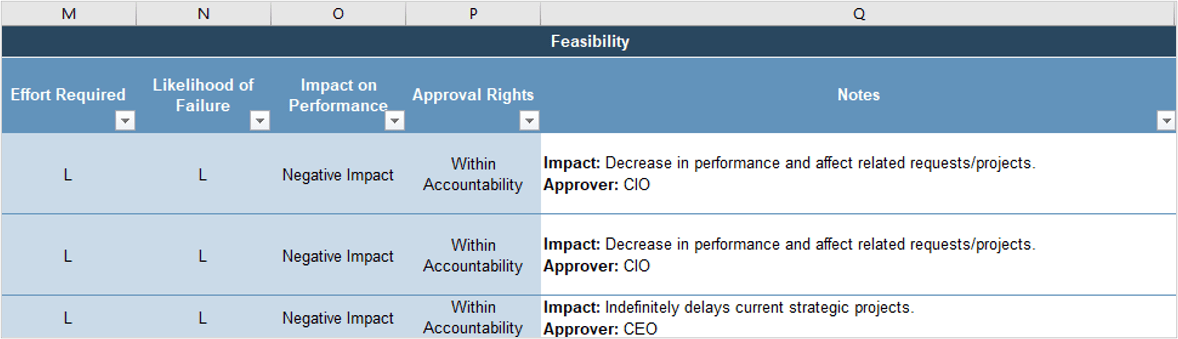
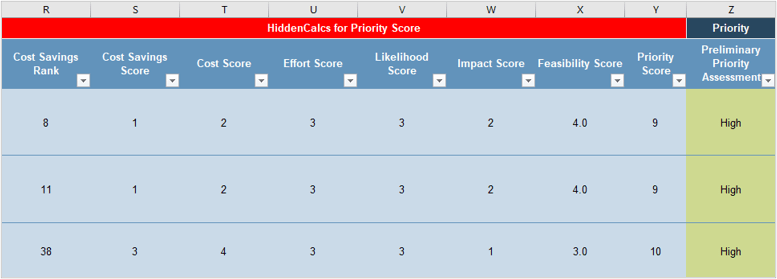

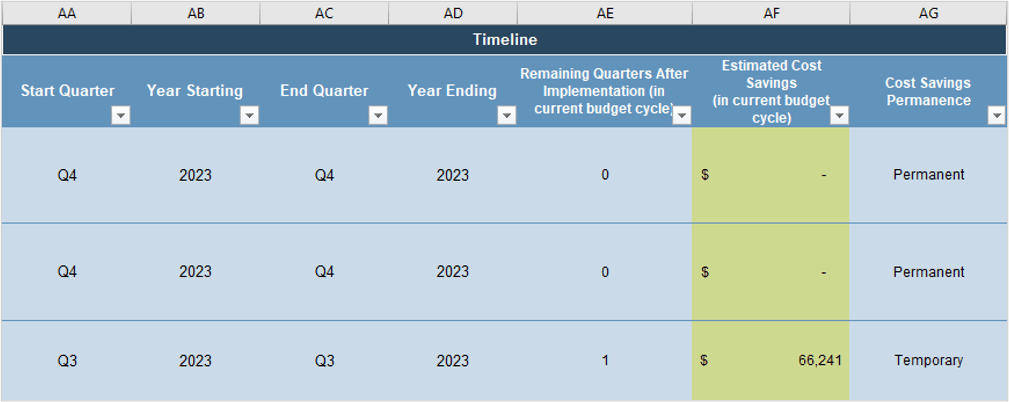
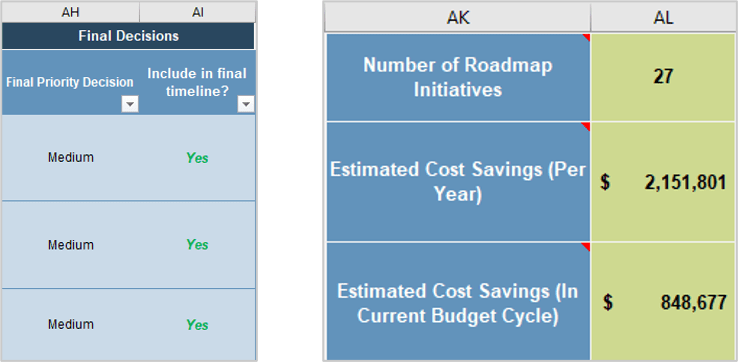
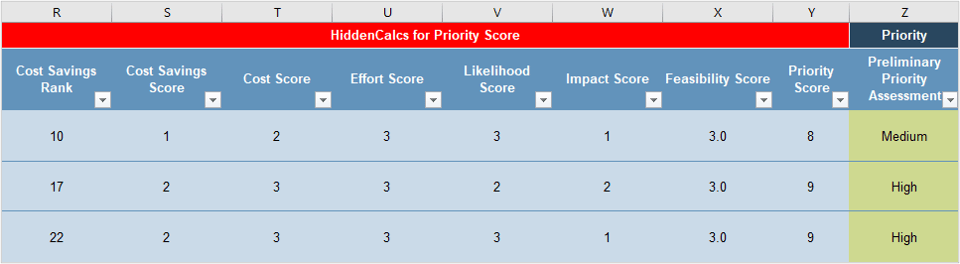

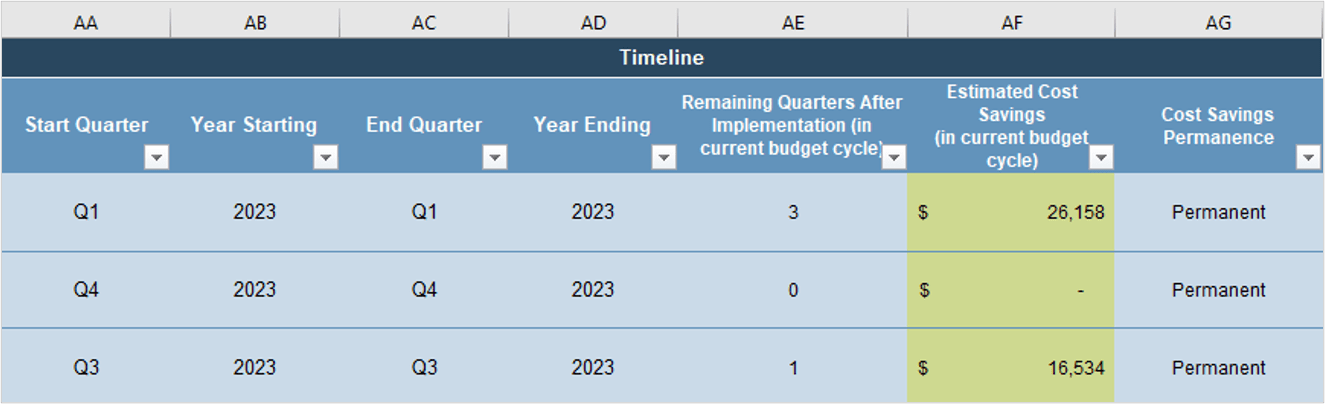
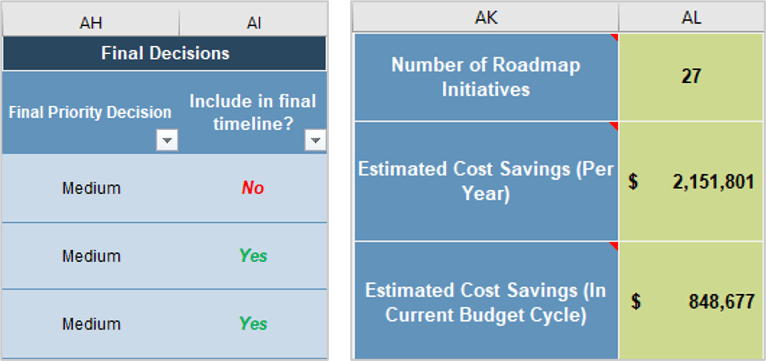
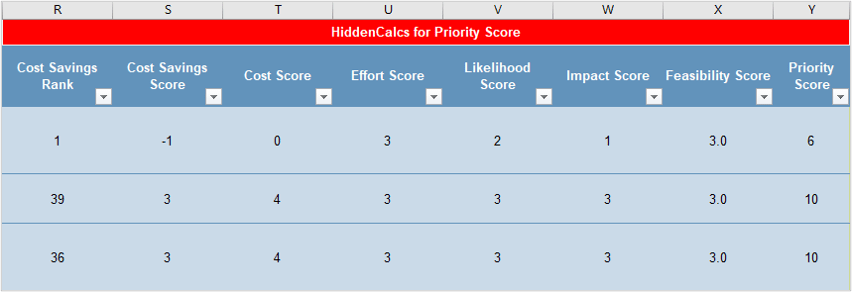
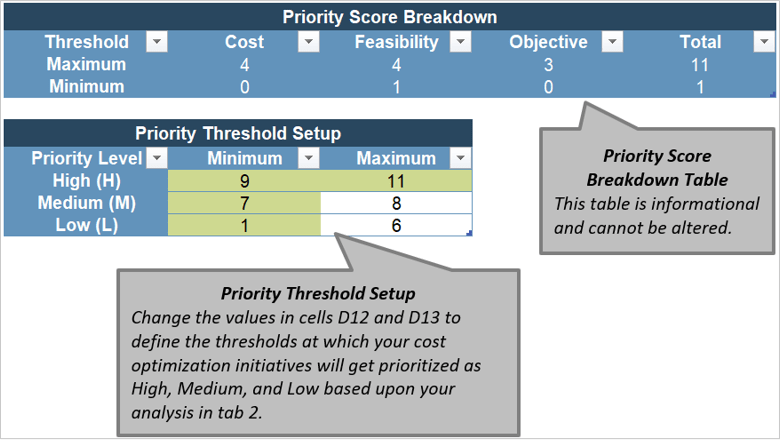
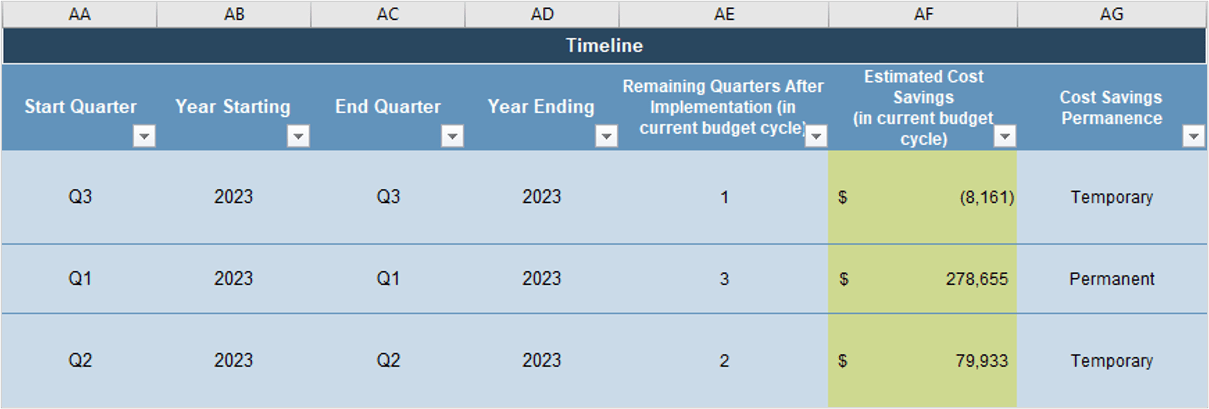
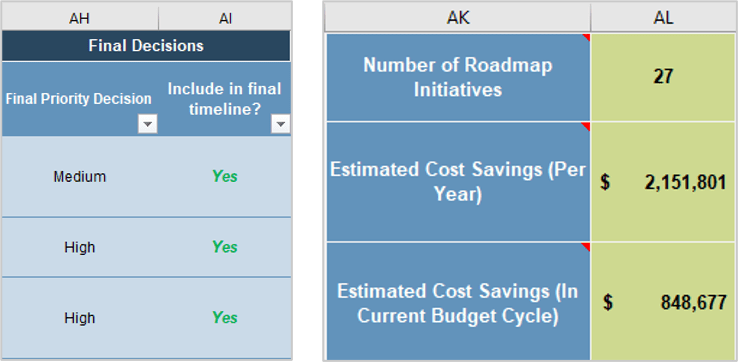
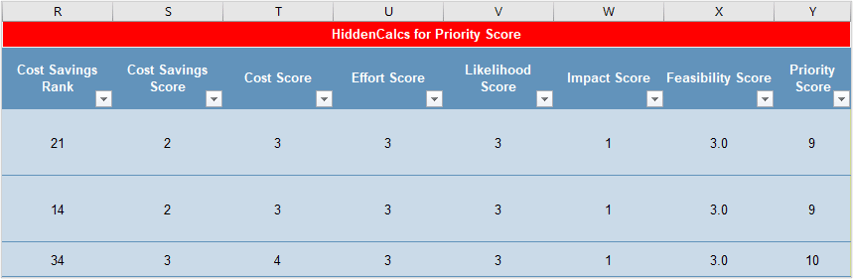

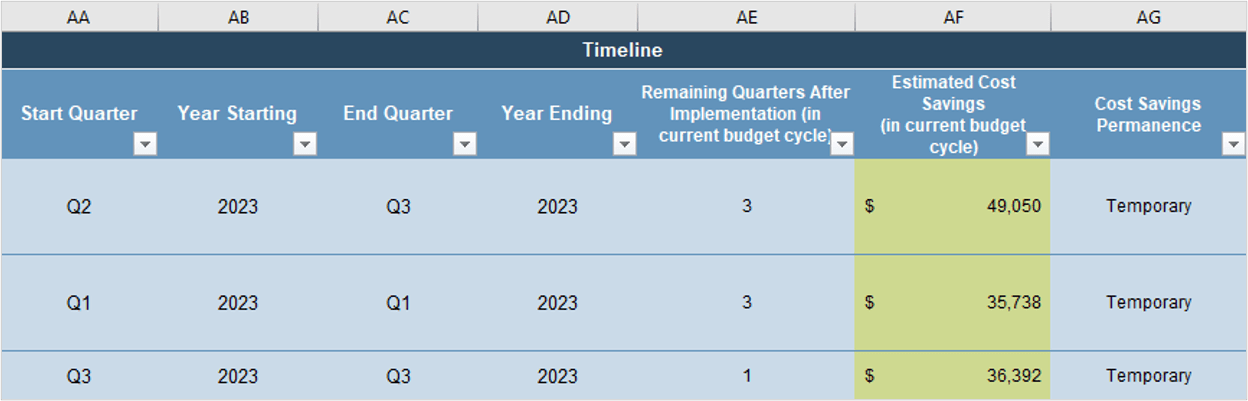
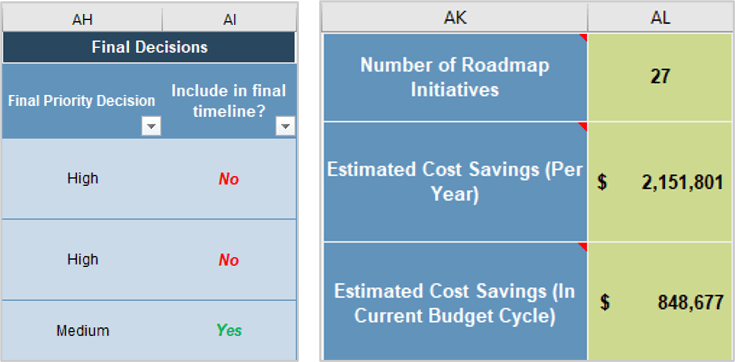
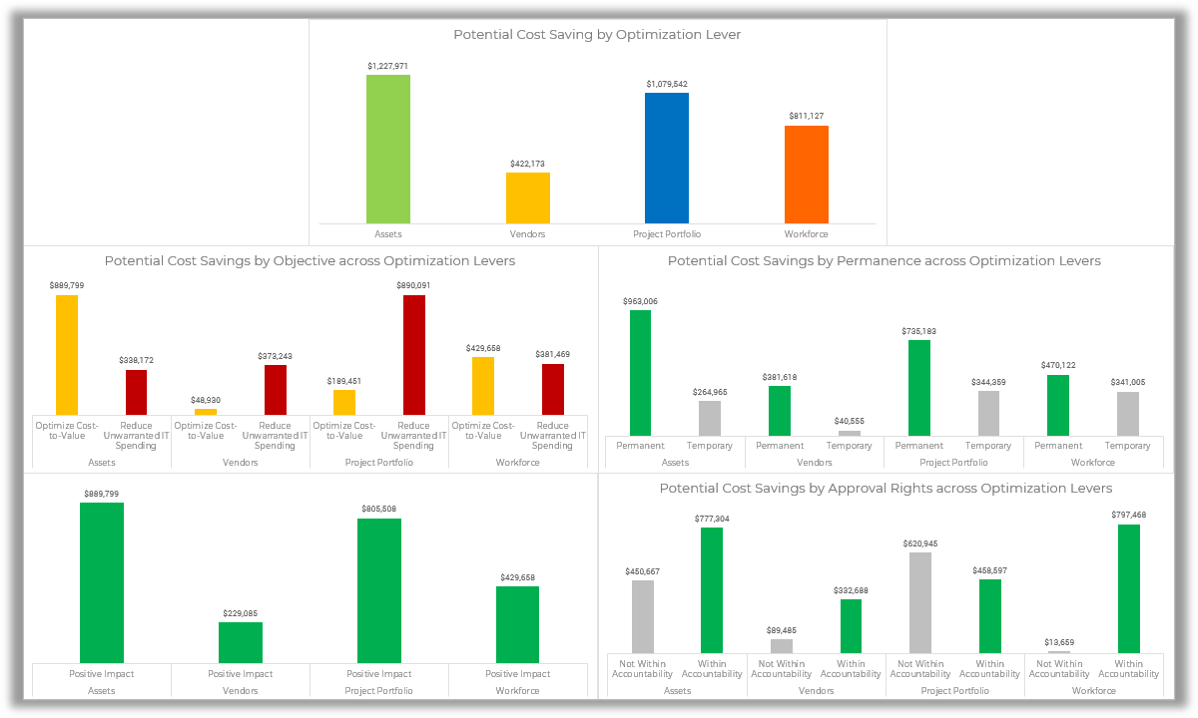
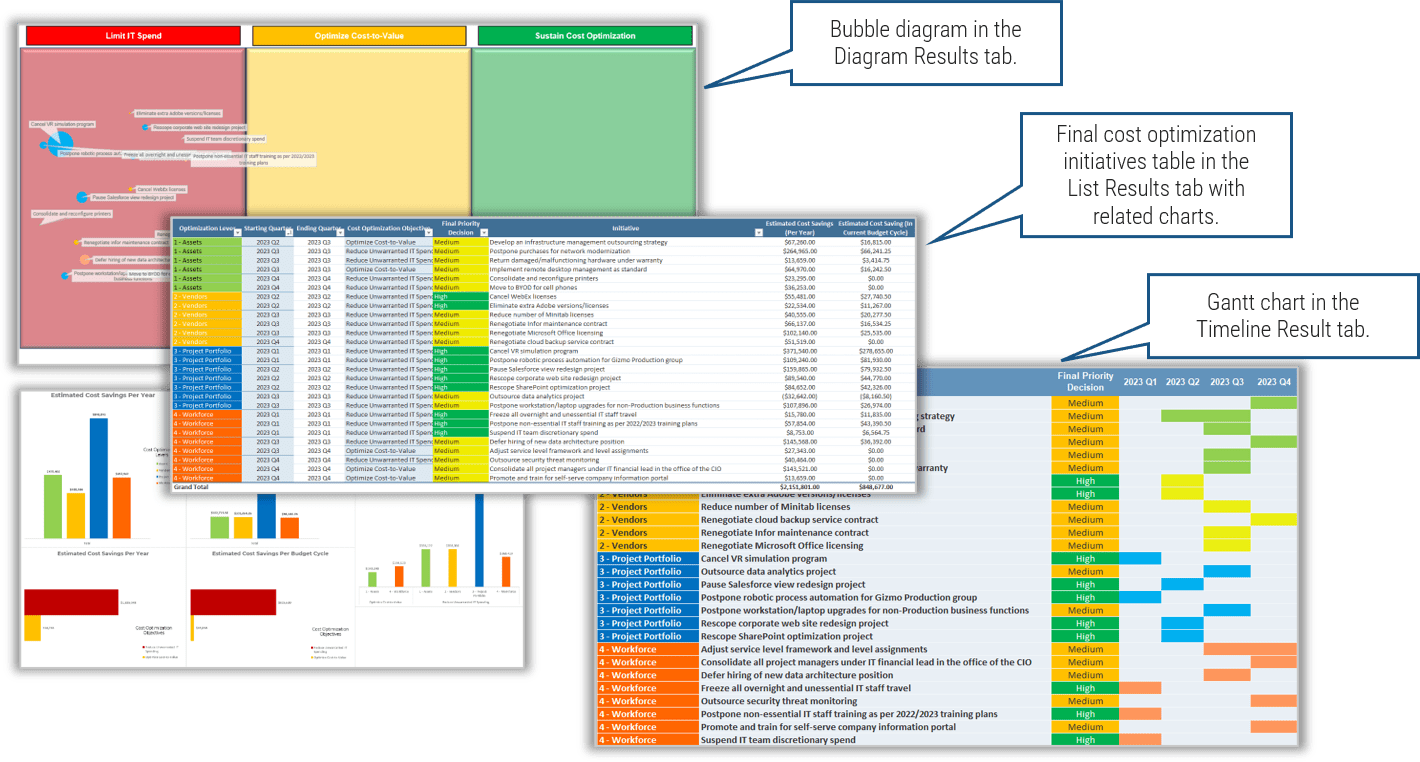
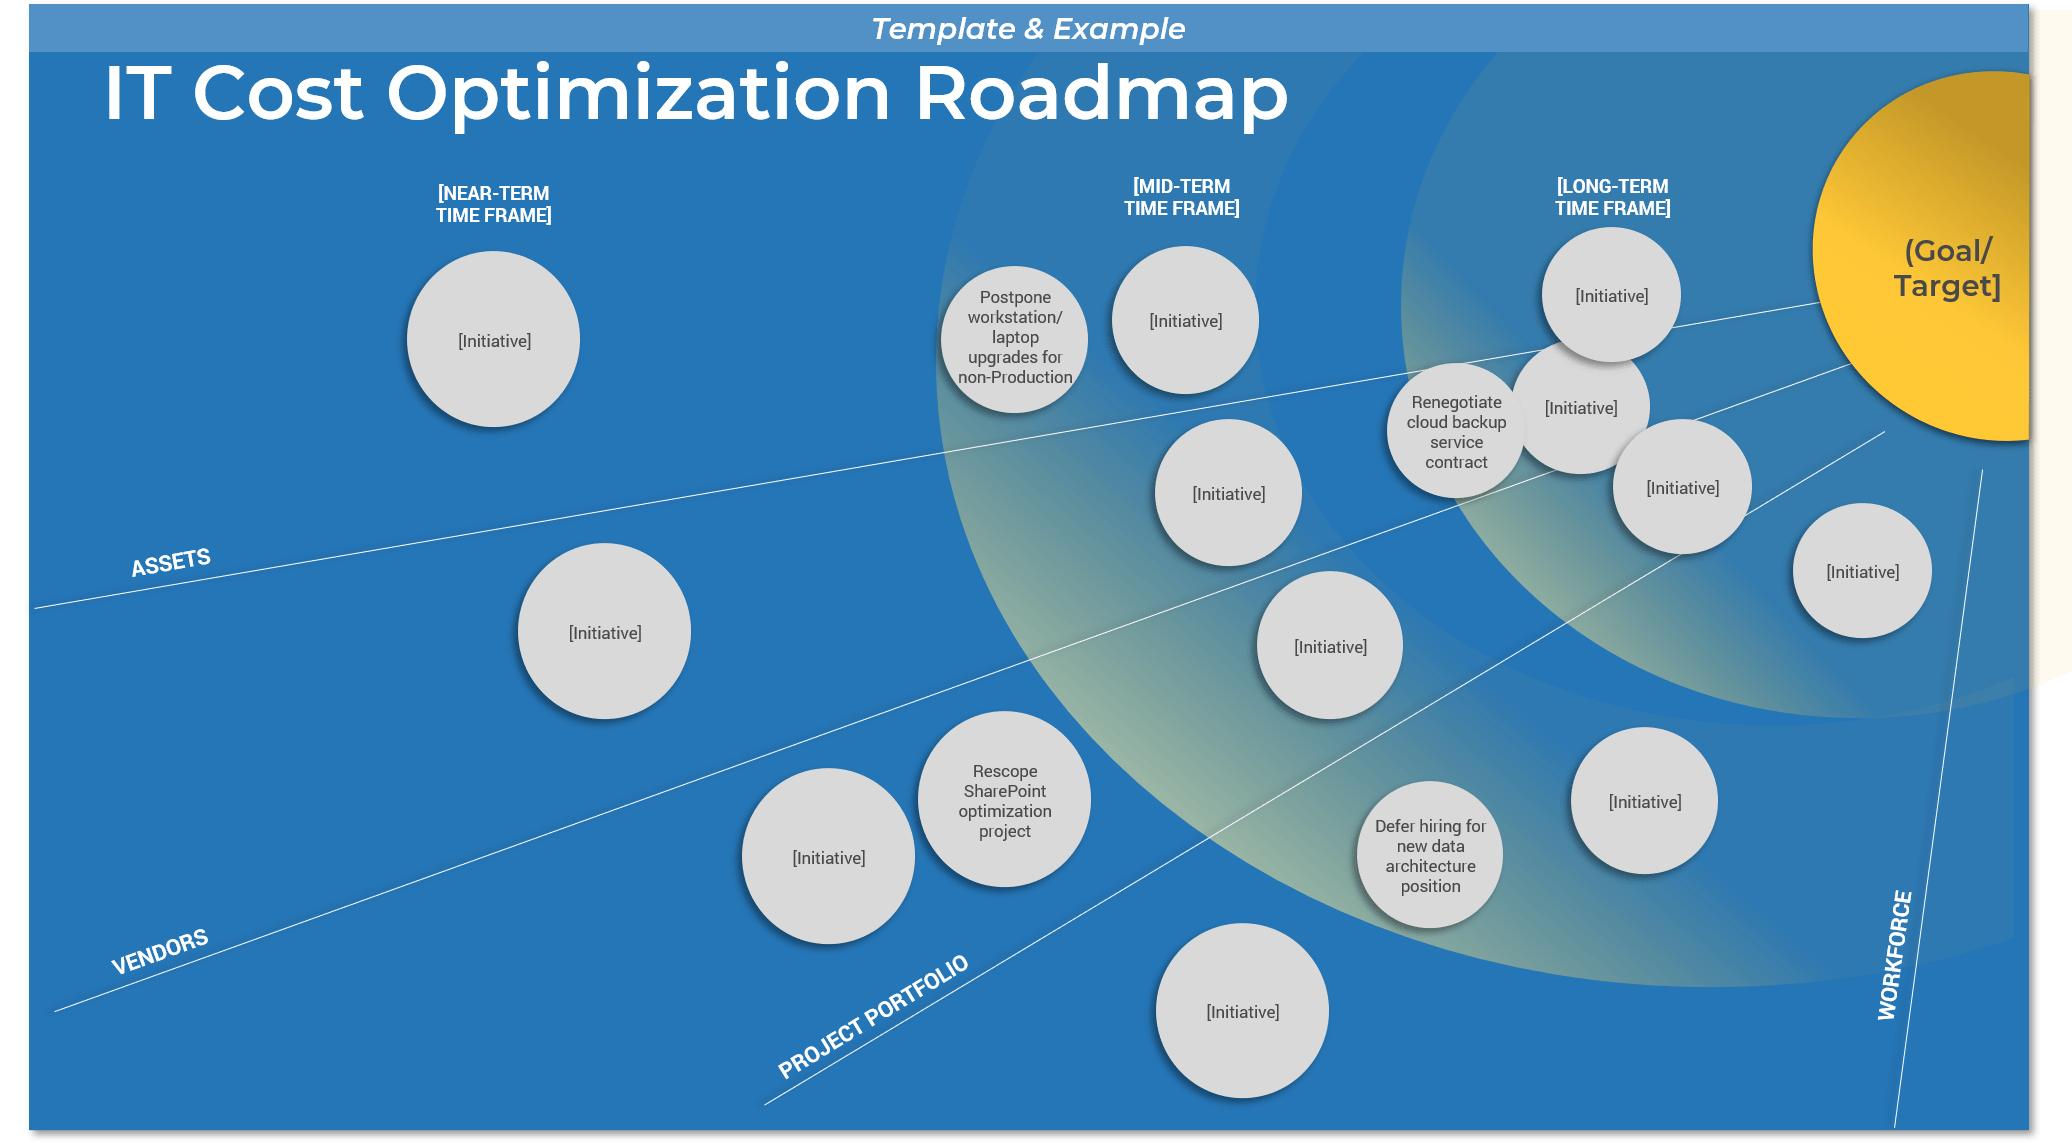


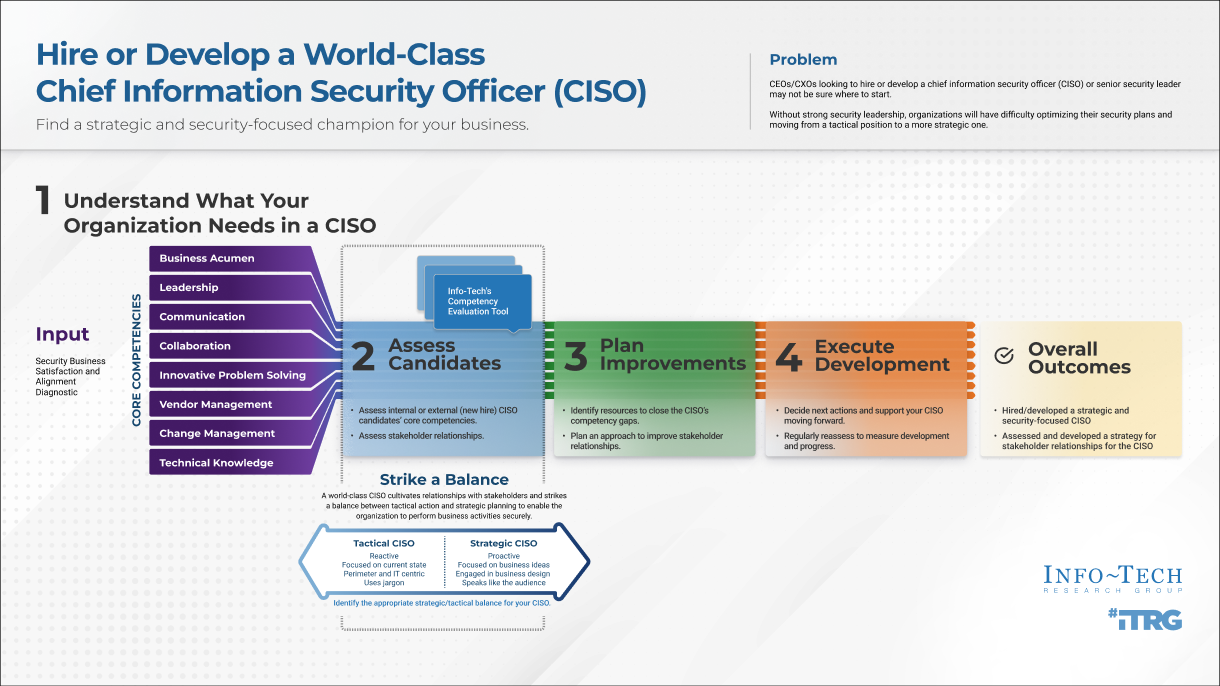


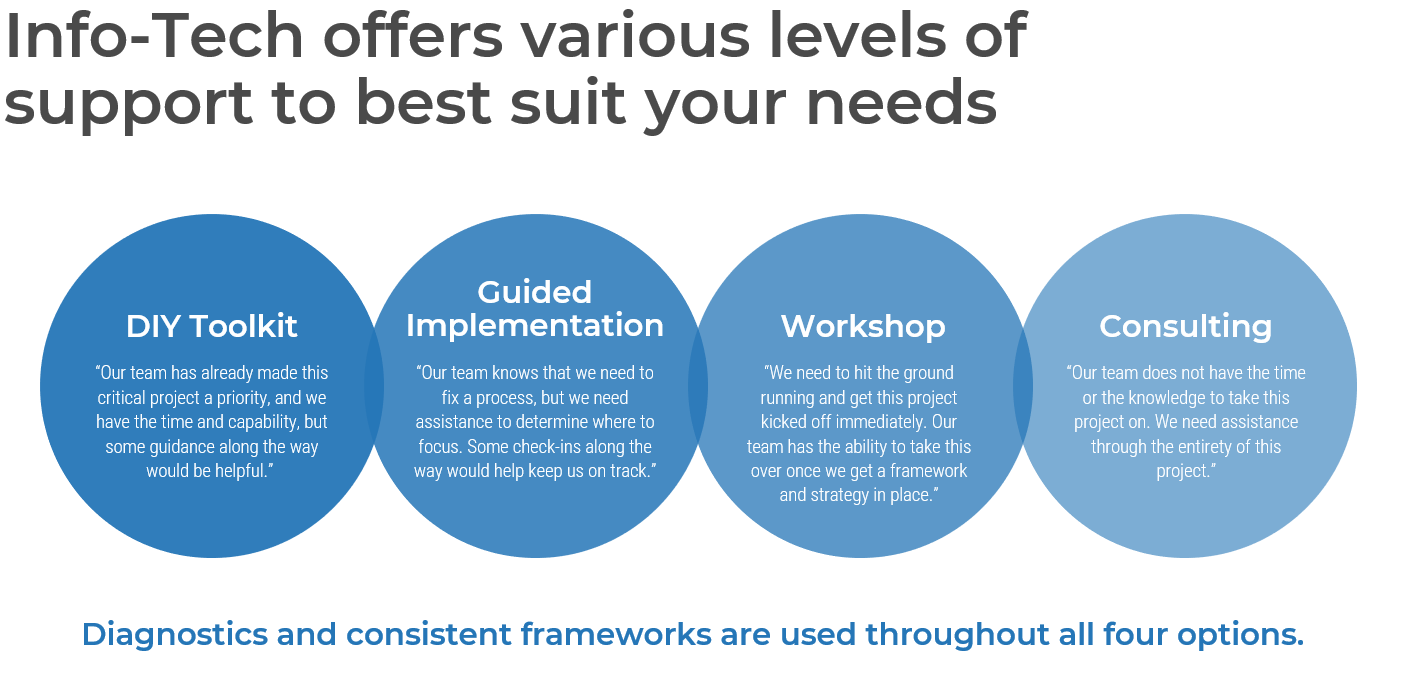
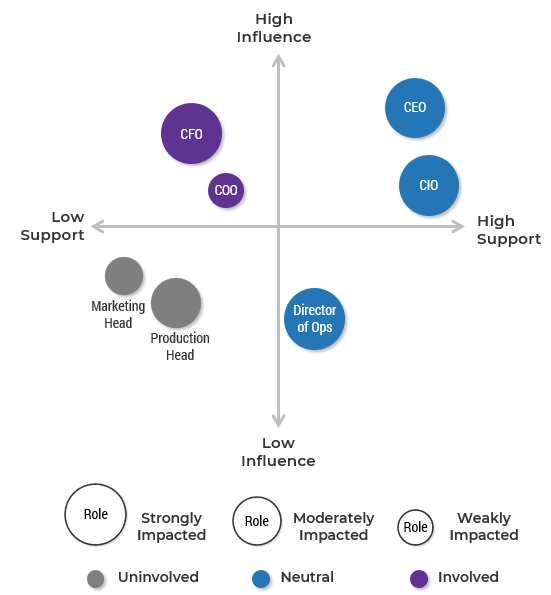
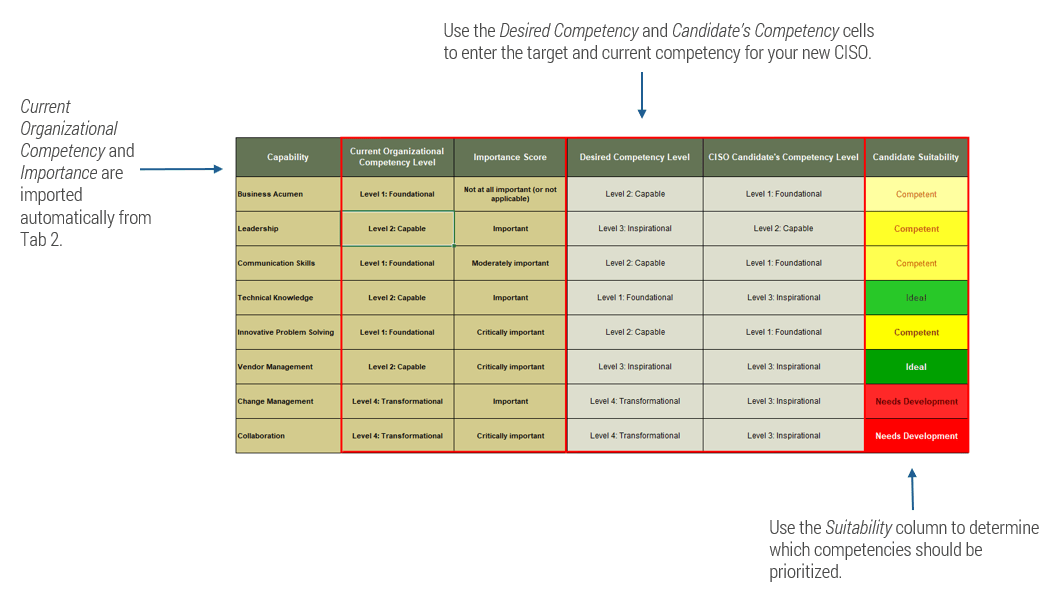
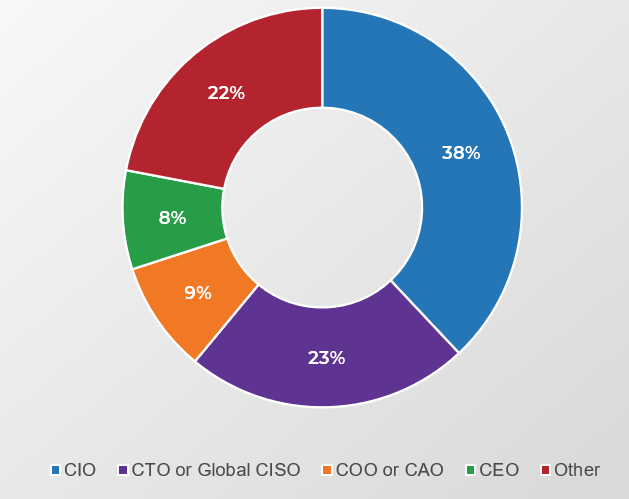


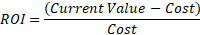
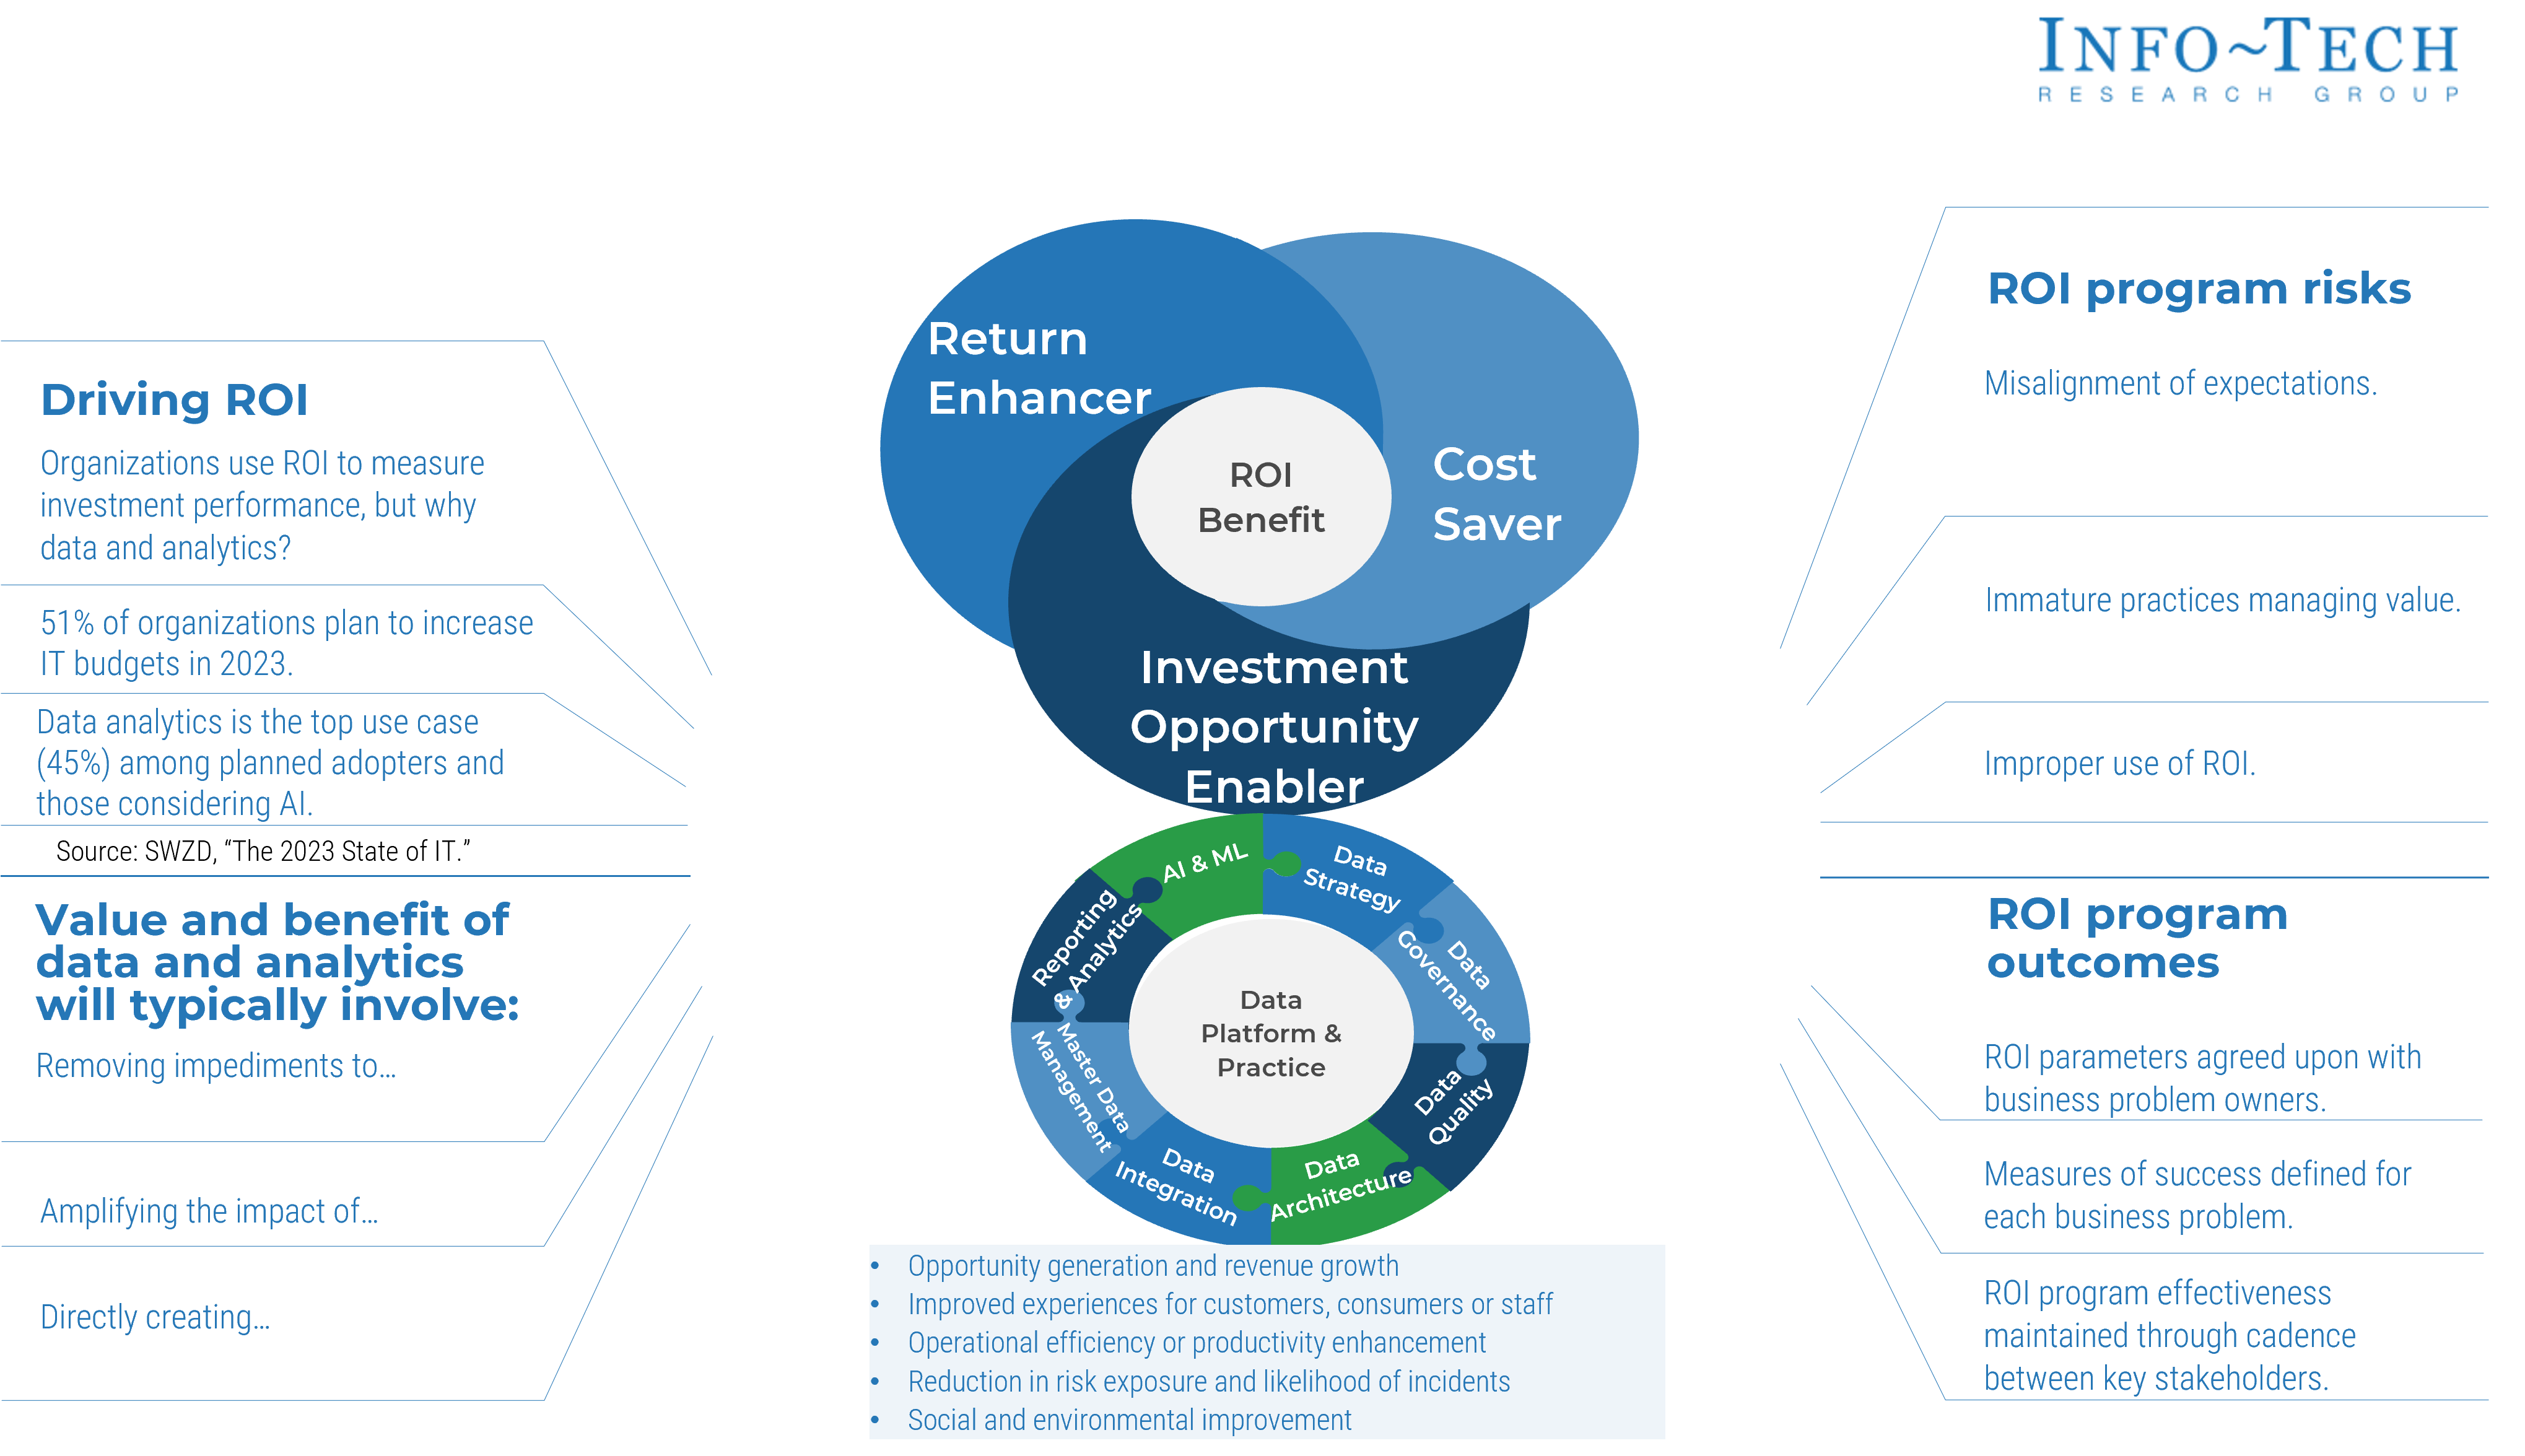

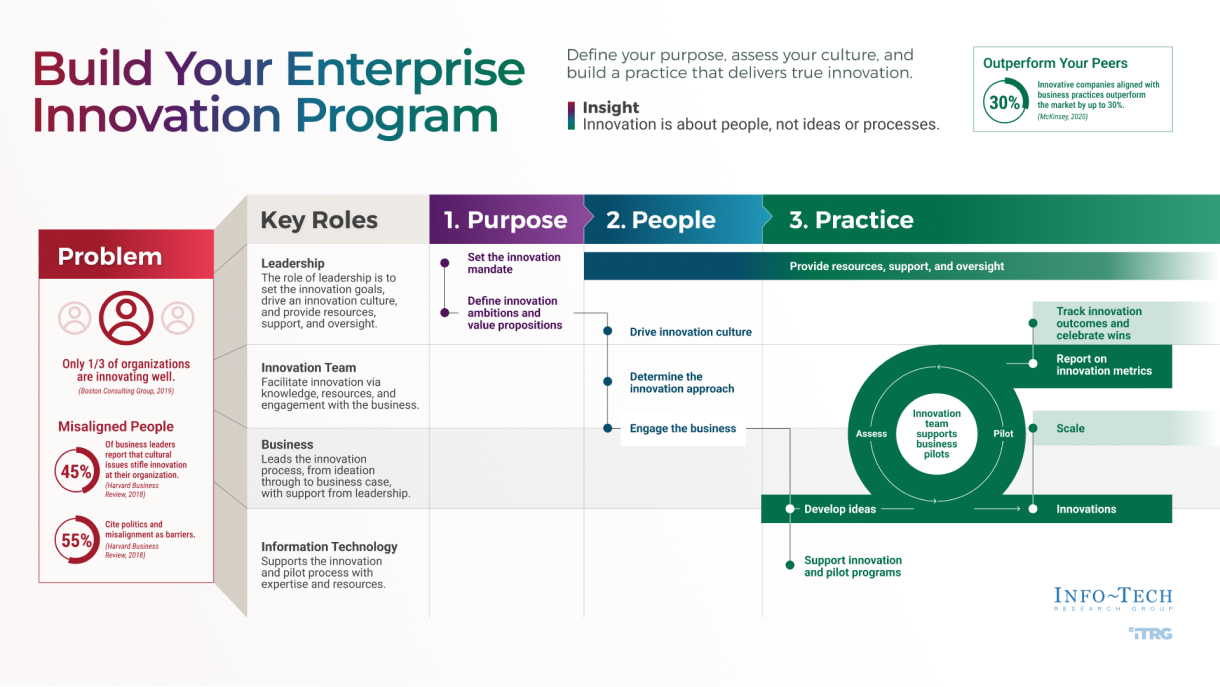

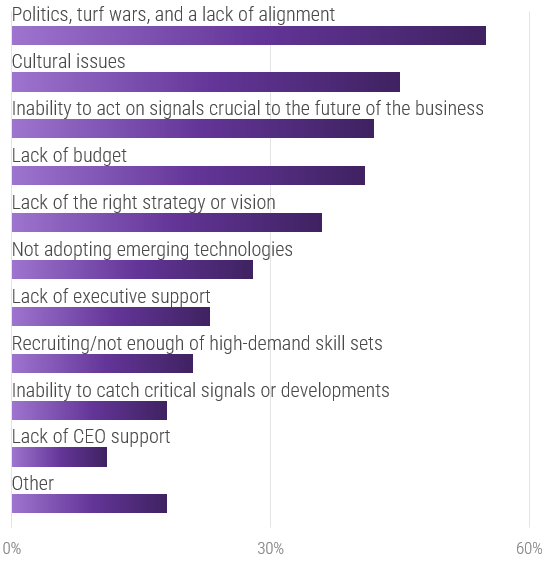
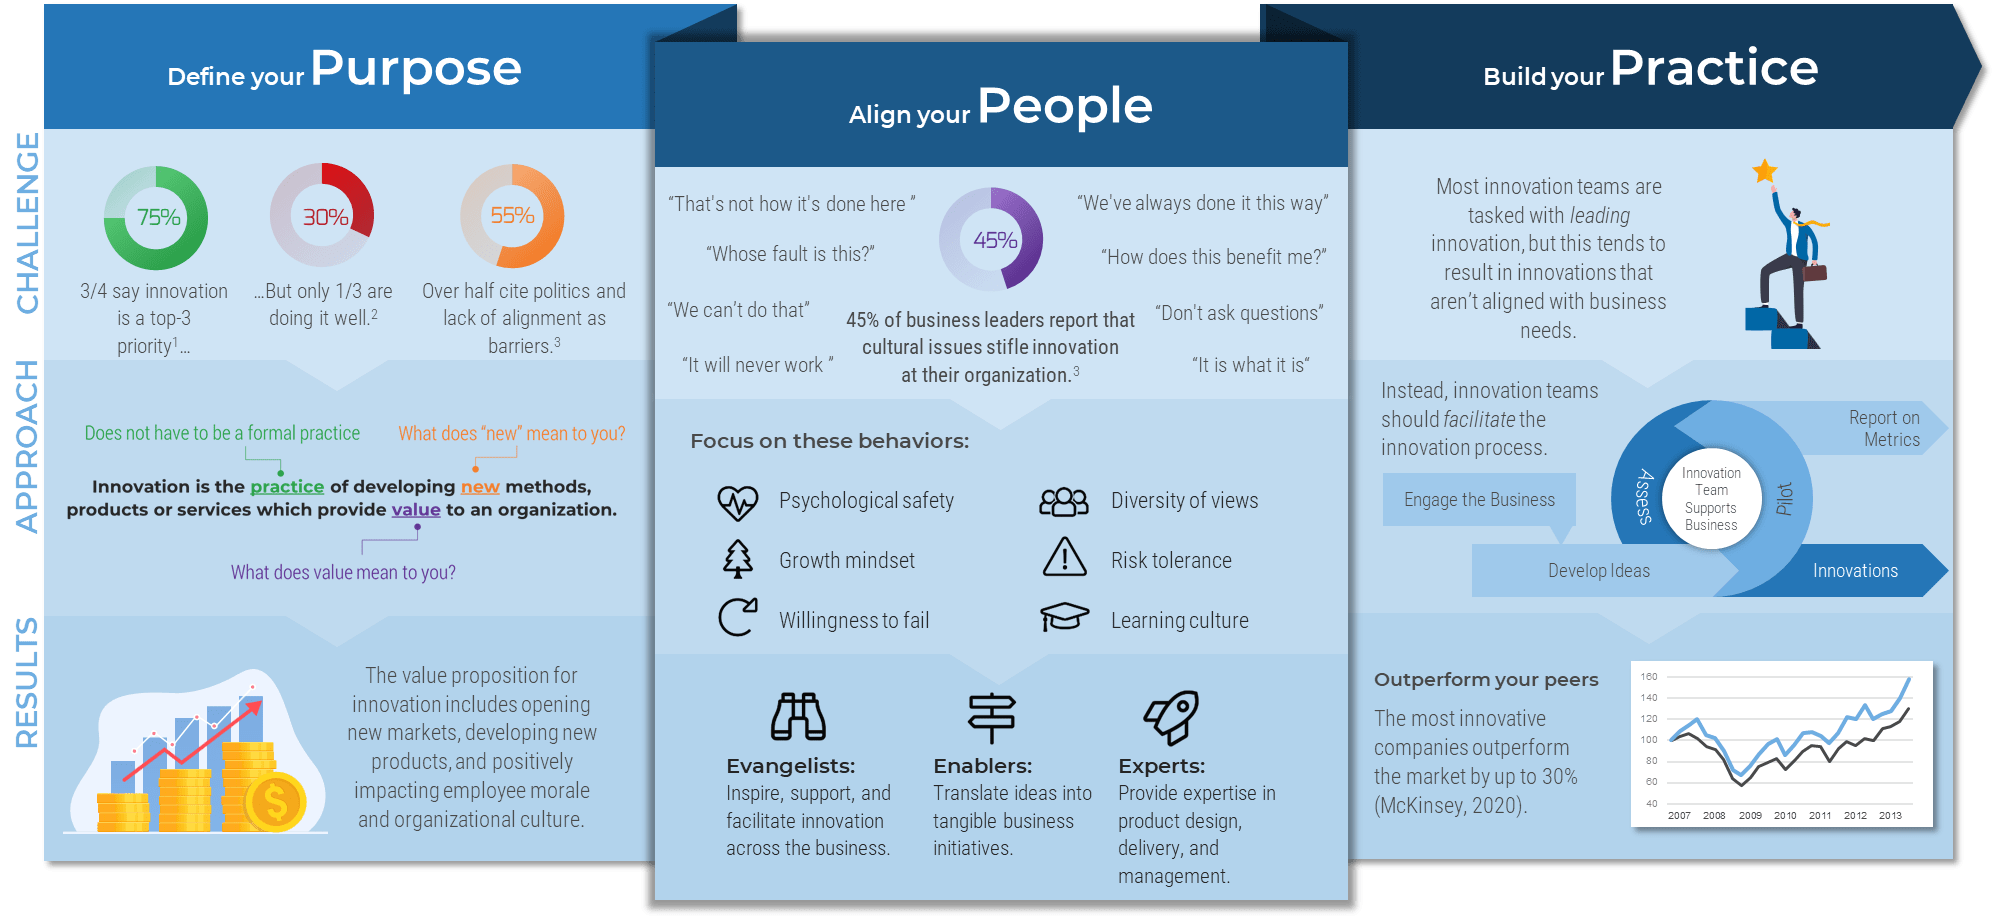
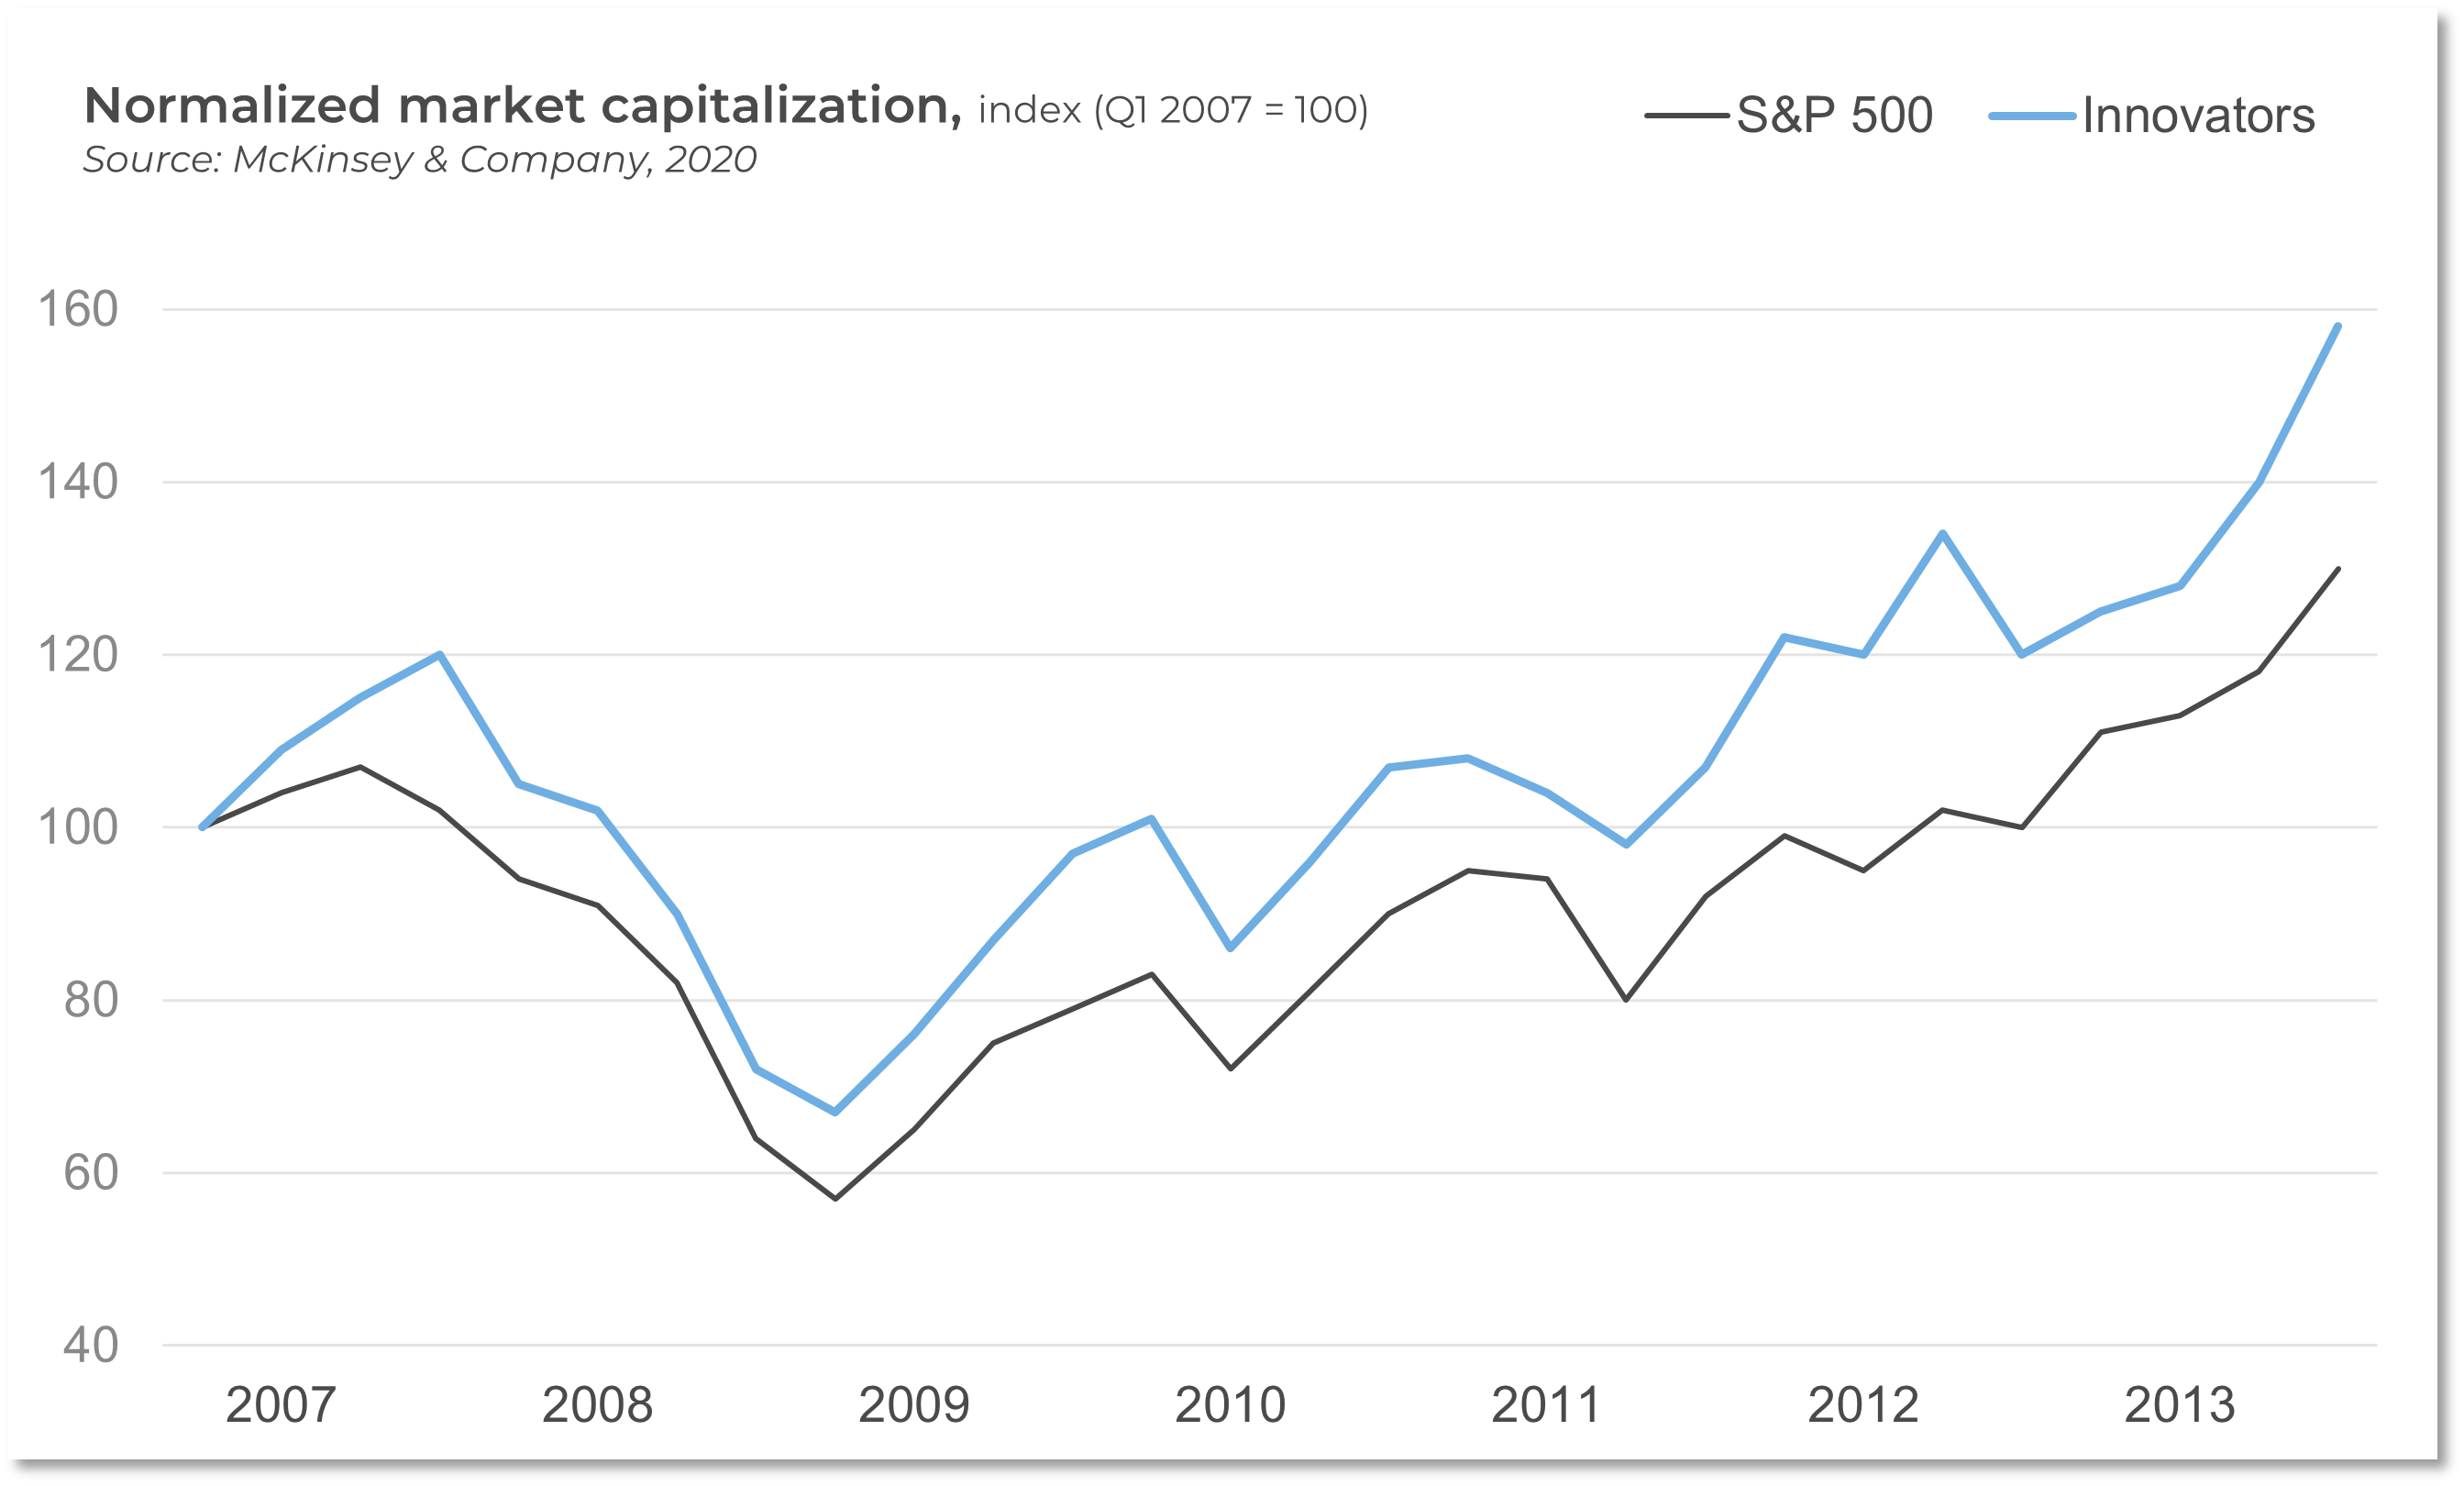


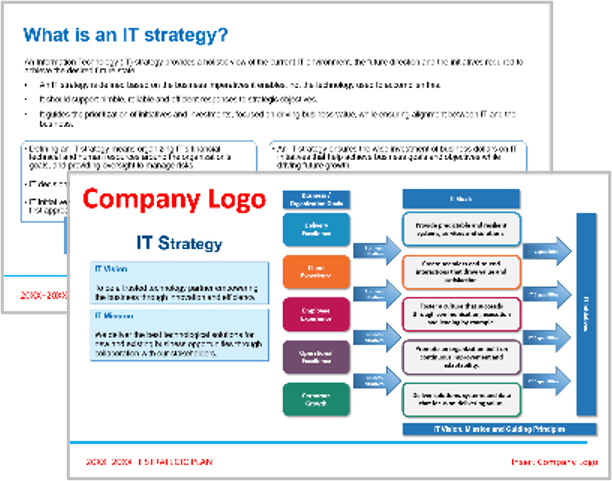
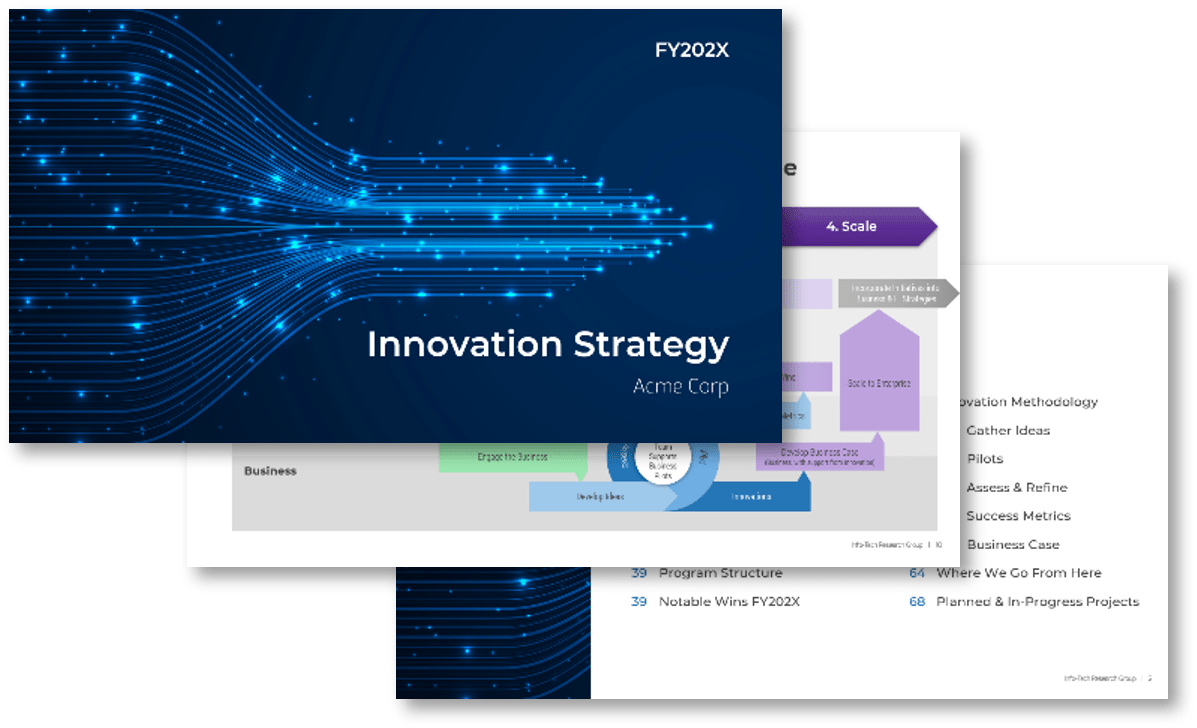


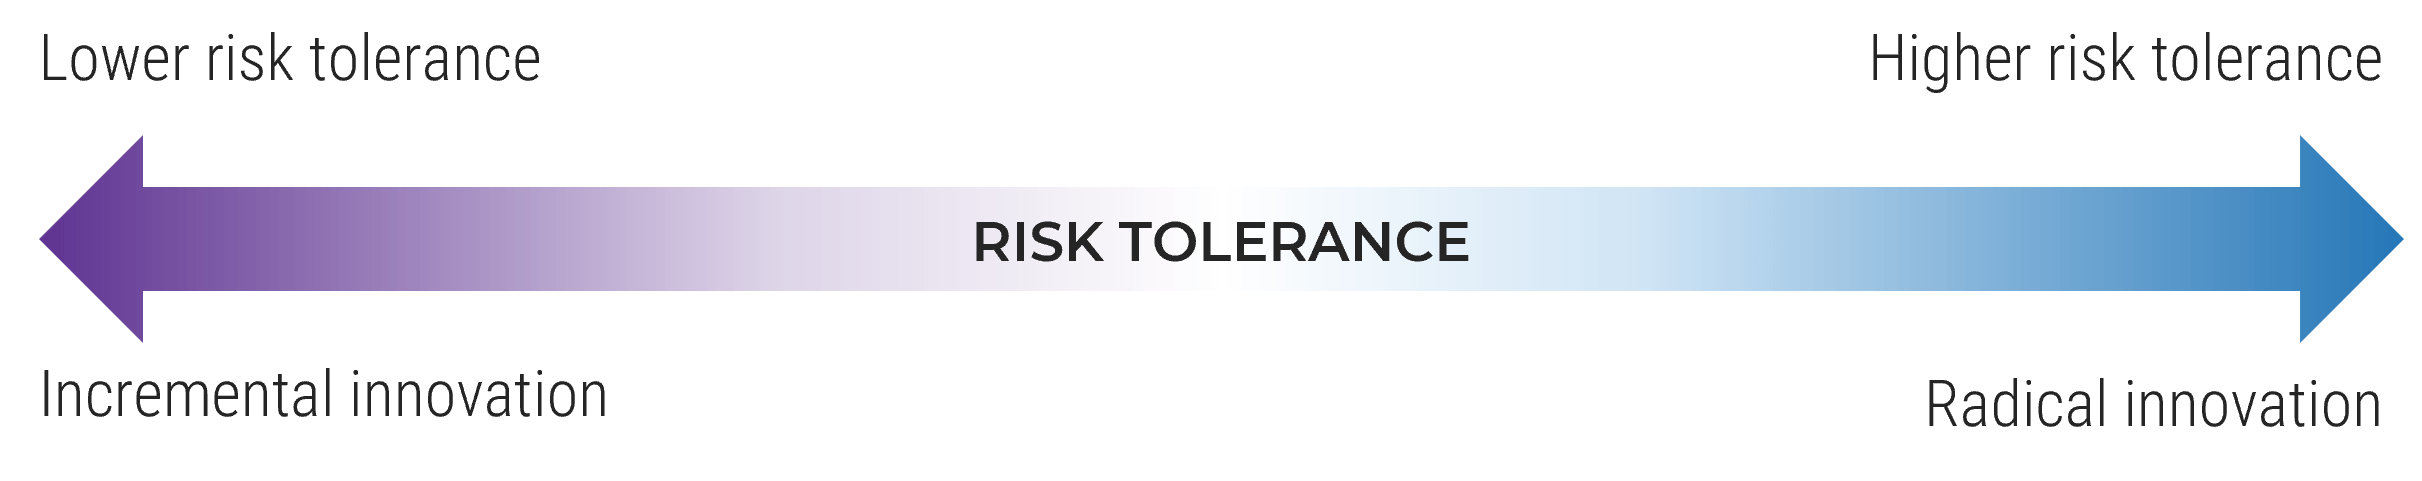
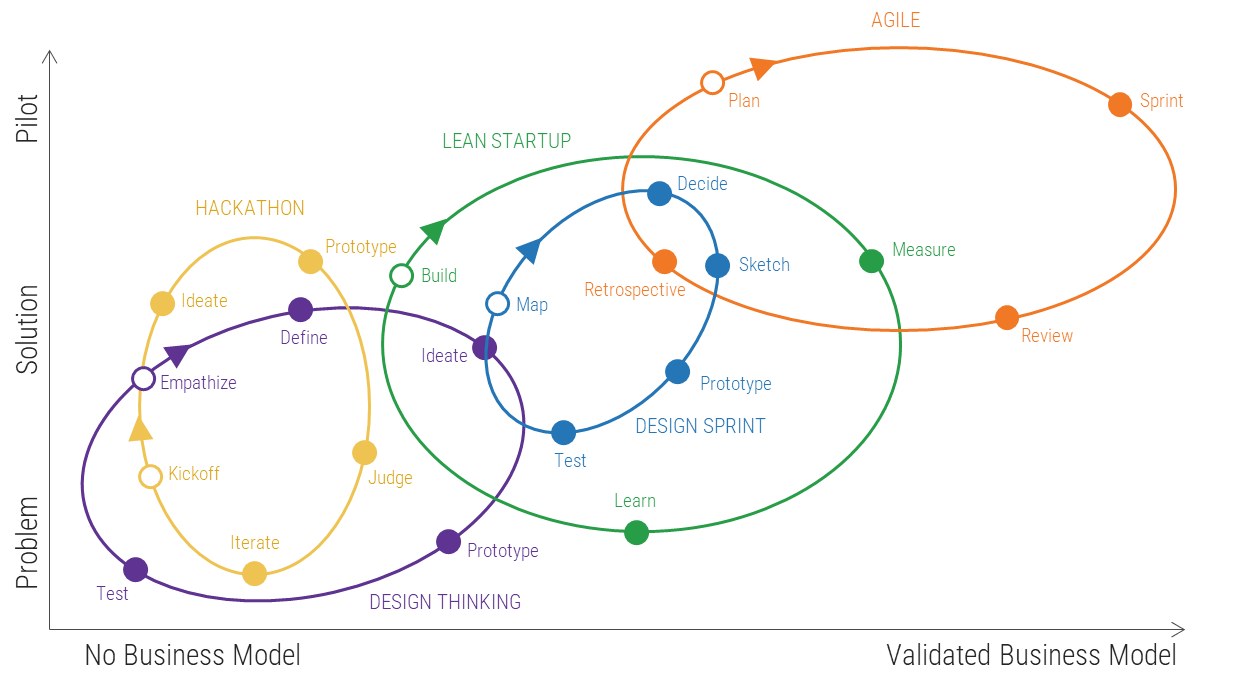
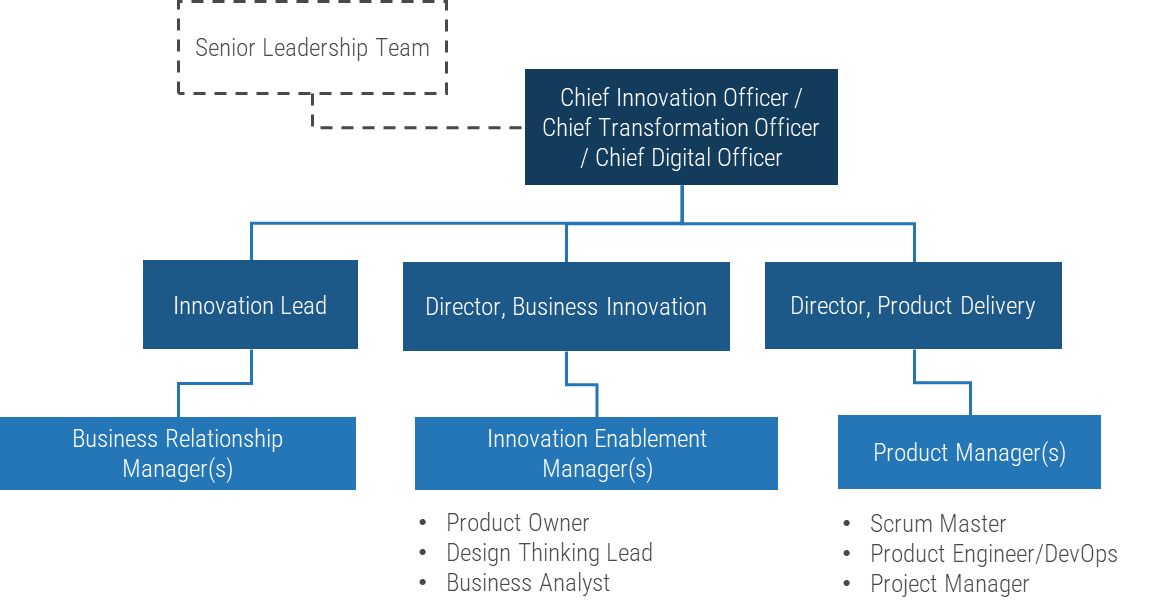
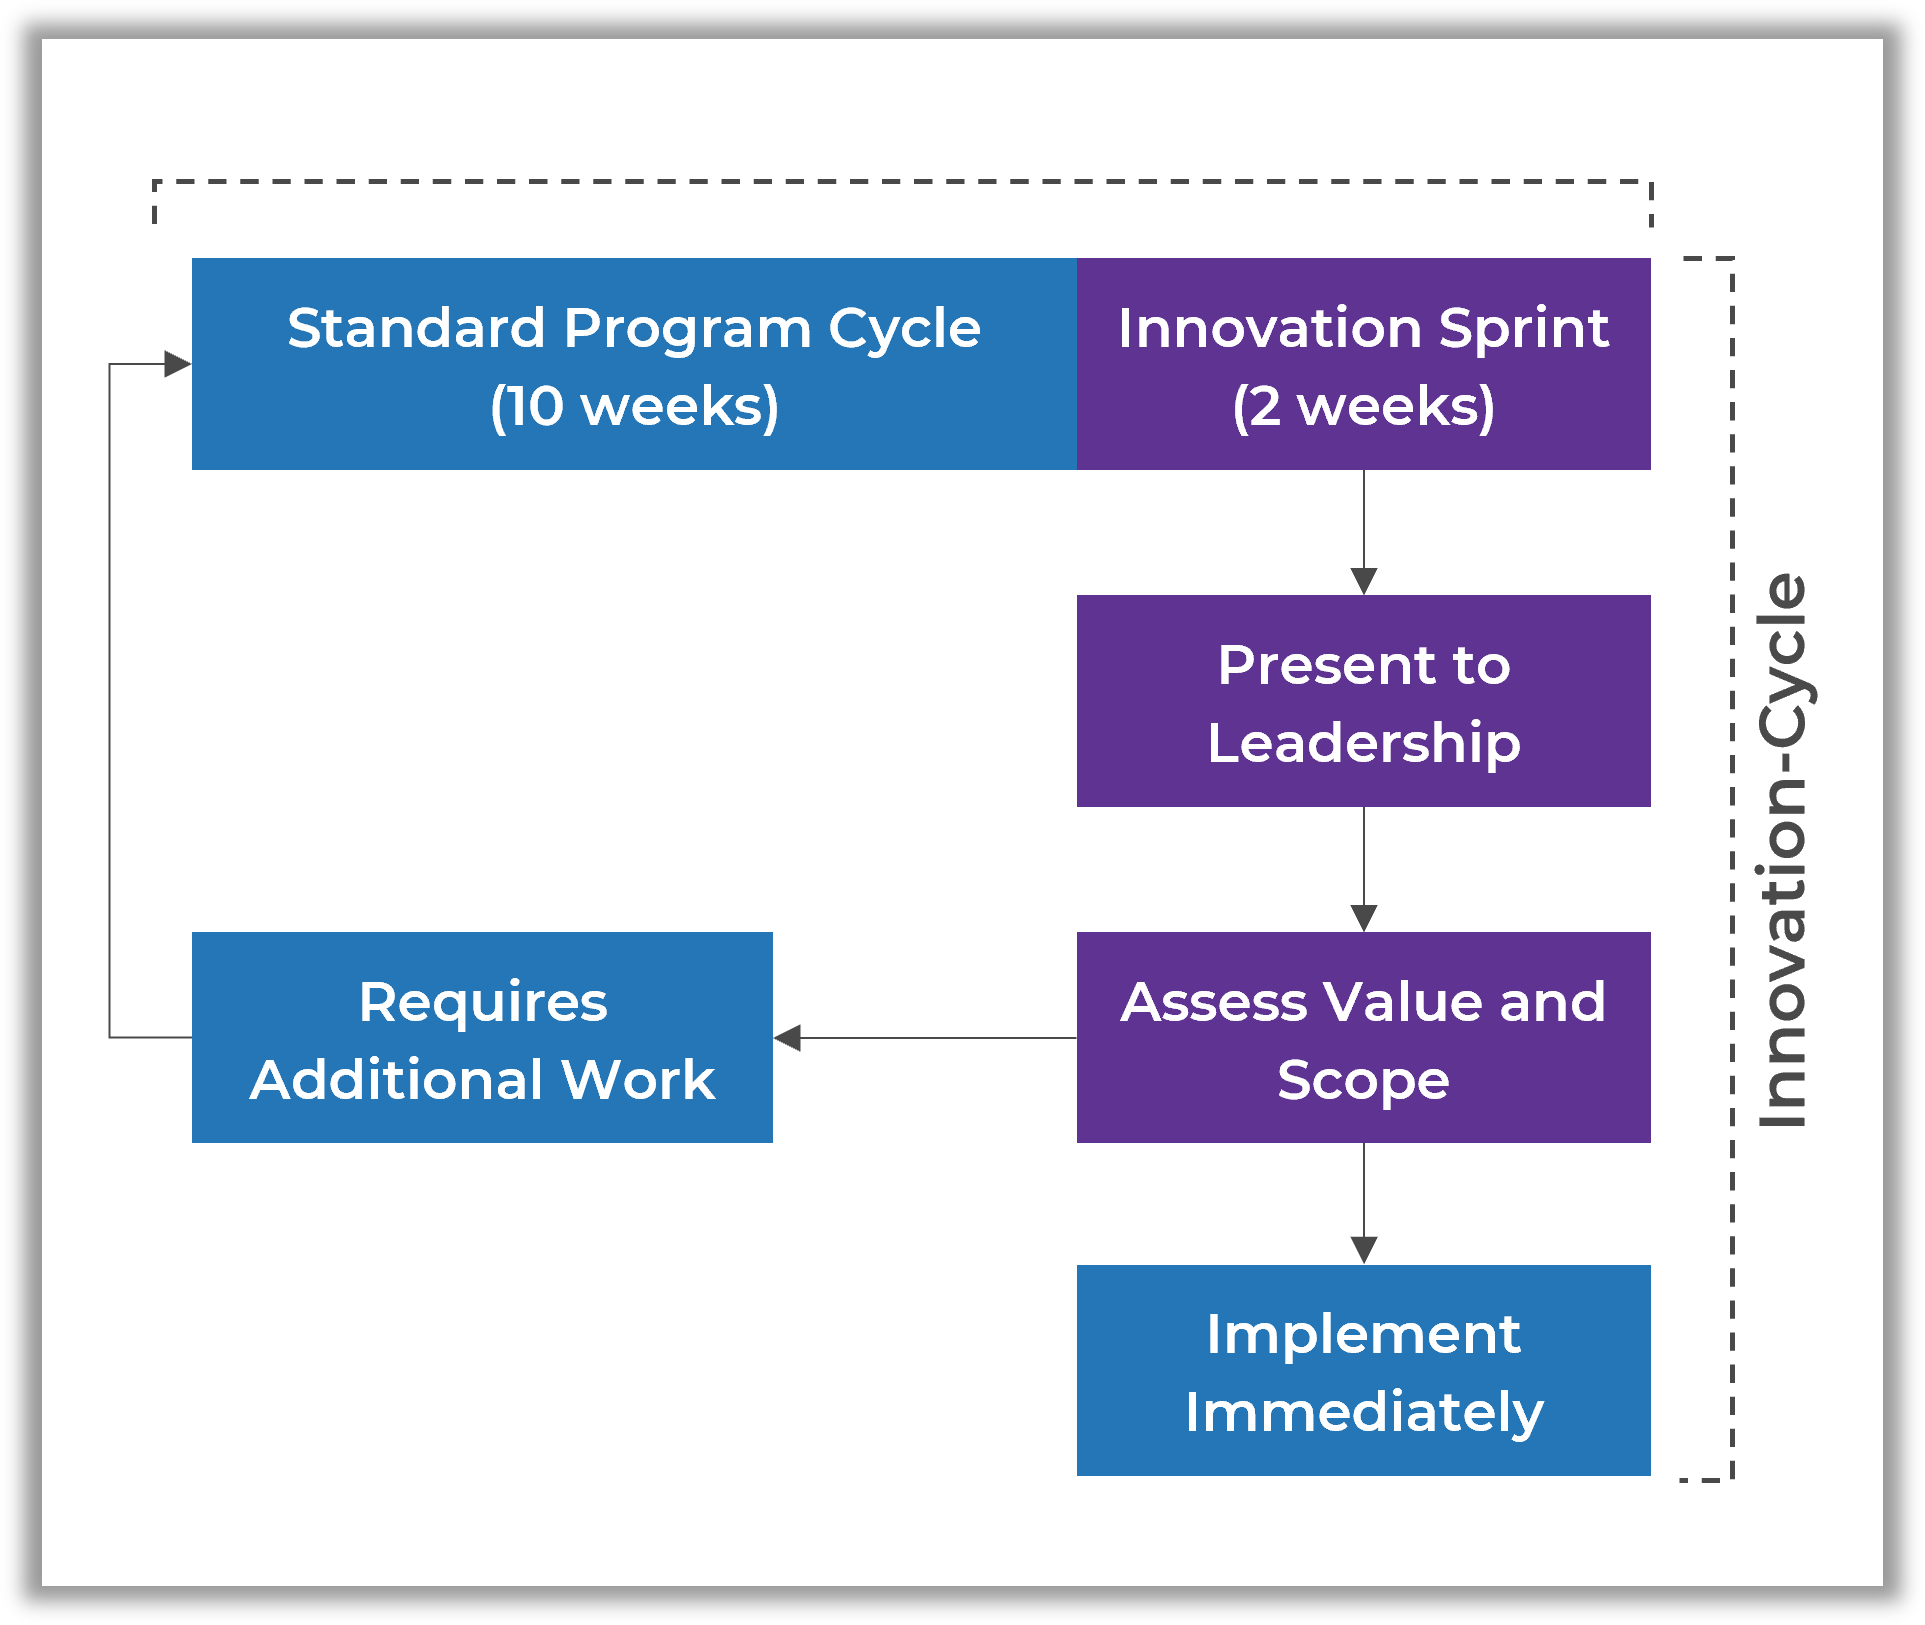
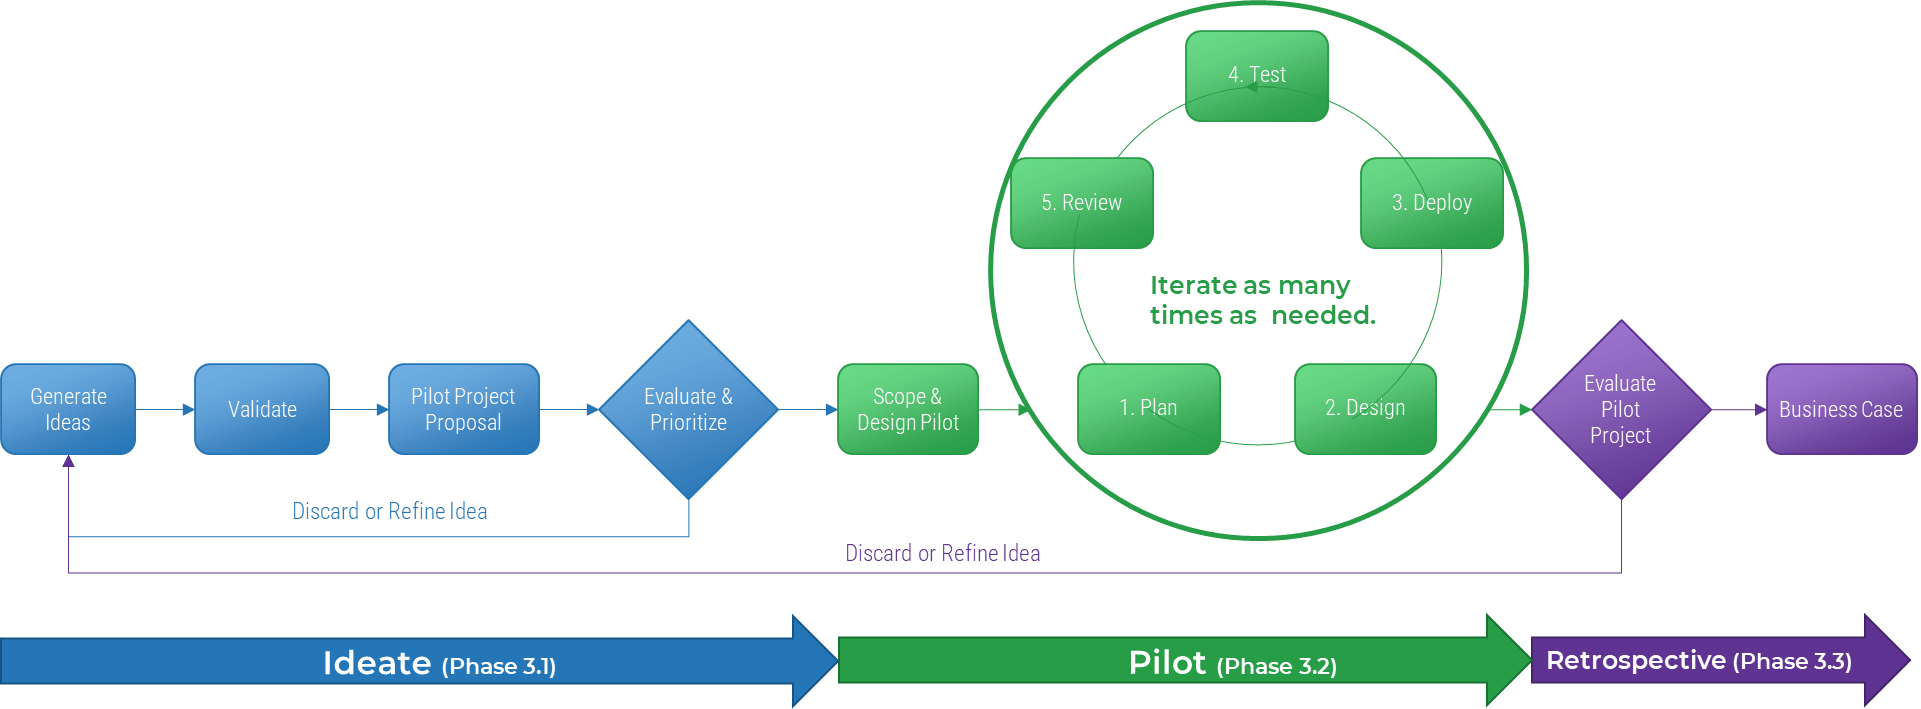
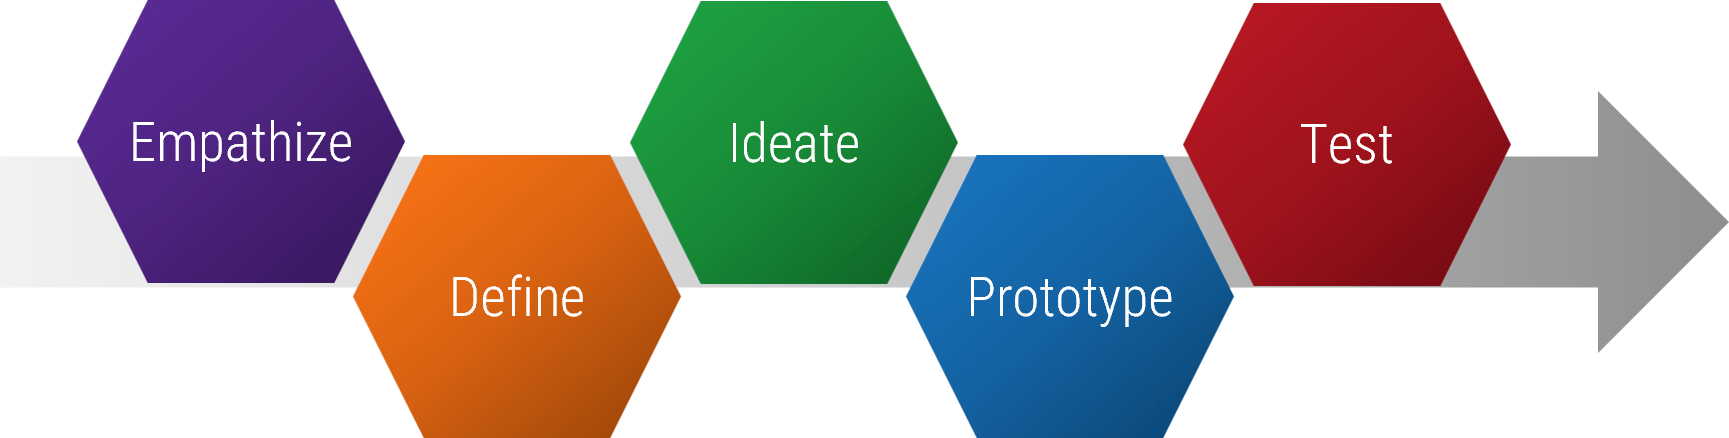
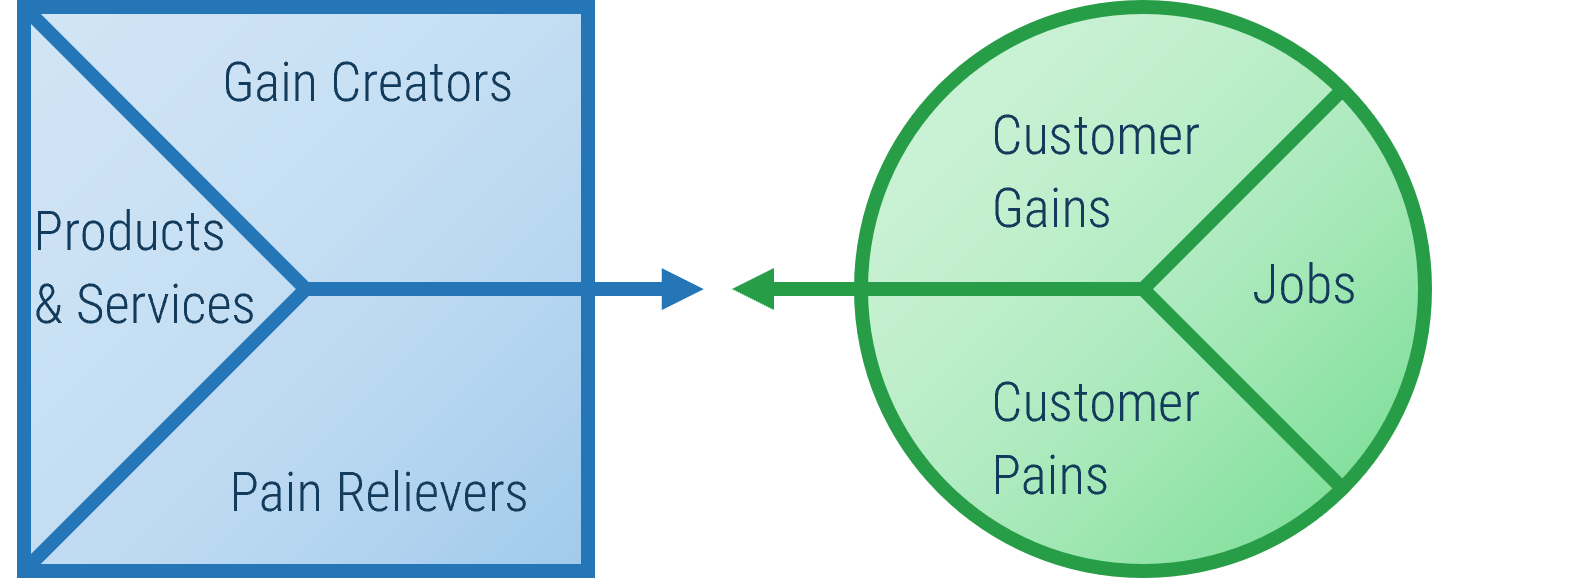


