
- IT leaders do not have a single holistic view of how their 45 IT processes are operating.
- Expecting any single individual to understand the details of all 45 IT processes is unrealistic.
- Problems in performance only become evident when the process has already failed.
Our Advice
Critical Insight
- Mature your IT department by measuring what matters.
- Don’t measure things just because you can; change what you measure as your organization matures.
Impact and Result
- Use Info-Tech’s IT Metrics Library to review typical KPIs for each of the 45 process areas and select those that apply to your organization.
- Configure your IT Management Dashboard to record your selected KPIs and start to measure performance.
- Set up the cadence for review of the KPIs and develop action plans to improve low-performing indicators.
Create a Holistic IT Dashboard Research & Tools
Start here – read the Executive Brief
Read our concise Executive Brief to find out how to develop your KPI program that leads to improved performance.Besides the small introduction, subscribers and consulting clients within this management domain have access to:
- Create a Holistic IT Dashboard – Phases 1-3
1. Choose the KPIs
Identify the KPIs that matter to your organization’s goals.
- Create a Holistic IT Dashboard – Phase 1: Choose the KPIs
- IT Metrics Library
2. Build the Dashboard
Use the IT Management Dashboard on the Info-Tech website to display your chosen KPIs.
- Create a Holistic IT Dashboard – Phase 2: Build the Dashboard
3. Create the Action Plan
Use the review of your KPIs to build an action plan to drive performance.
- Create a Holistic IT Dashboard – Phase 3: Build the Action Plan
Workshop: Create a Holistic IT Dashboard
Workshops offer an easy way to accelerate your project. If you are unable to do the project yourself, and a Guided Implementation isn't enough, we offer low-cost delivery of our project workshops. We take you through every phase of your project and ensure that you have a roadmap in place to complete your project successfully.
1 Identify What to Measure (Offsite)
The Purpose
Determine the KPIs that matter to your organization.
Key Benefits Achieved
Identify organizational goals
Identify IT goals and their organizational goal alignment
Identify business pain points
Activities
1.1 Identify organizational goals.
1.2 Identify IT goals and organizational alignment.
1.3 Identify business pain points.
Outputs
List of goals and pain points to create KPIs for
2 Configure the Dashboard Tool (Onsite)
The Purpose
Learn how to configure and use the IT Management Dashboard.
Key Benefits Achieved
Configured IT dashboard
Initial IT scorecard report
Activities
2.1 Review metrics and KPI best practices.
2.2 Use the IT Metrics Library.
2.3 Select the KPIs for your organization.
2.4 Use the IT Management Dashboard.
Outputs
Definition of KPIs to be used, data sources, and ownership
Configured IT dashboard
3 Review and Develop the Action Plan
The Purpose
Learn how to review and plan actions based on the KPIs.
Key Benefits Achieved
Lead KPI review to actions to improve performance
Activities
3.1 Create the scorecard report.
3.2 Interpret the results of the dashboard.
3.3 Use the IT Metrics Library to review suggested actions.
Outputs
Initial IT scorecard report
Action plan with initial actions
4 Improve Your KPIs (Onsite)
The Purpose
Use your KPIs to drive performance.
Key Benefits Achieved
Improve your metrics program to drive effectiveness
Activities
4.1 Develop your action plan.
4.2 Execute the plan and tracking progress.
4.3 Develop new KPIs as your practice matures.
Outputs
Understanding of how to develop new KPIs using the IT Metrics Library
5 Next Steps and Wrap-Up (Offsite)
The Purpose
Ensure all documentation and plans are complete.
Key Benefits Achieved
Documented next steps
Activities
5.1 Complete IT Metrics Library documentation.
5.2 Document decisions and next steps.
Outputs
IT Metrics Library
Action plan
Further reading
Create a Holistic IT Dashboard
Mature your IT department by measuring what matters.
Executive Brief
Analyst Perspective
Measurement alone provides only minimal improvements
It’s difficult for CIOs and other top-level leaders of IT to know if everything within their mandate is being managed effectively. Gaining visibility into what’s happening on the front lines without micromanaging is a challenge most top leaders face.
Understanding Info-Tech’s Management and Governance Framework of processes that need to be managed and being able to measure what’s important to their organization's success can give leaders the ability to focus on their key responsibilities of ensuring service effectiveness, enabling increased productivity, and creating the ability for their teams to innovate.
Even if you know what to measure, the measurement alone will lead to minimal improvements. Having the right methods in place to systematically collect, review, and act on those measurements is the differentiator to driving up the maturity of your IT organization.
The tools in this blueprint can help you identify what to measure, how to review it, and how to create effective plans to improve performance.
Tony Denford
Research Director, Info-Tech Research Group
Executive Summary
Your Challenge
- IT leaders do not have a single holistic view of how their IT processes are operating.
- Expecting any single individual to understand the details of all IT processes is unrealistic.
- Problems in performance only become evident when the process has already failed.
Common Obstacles
- Business changes quickly, and what should be measured changes as a result.
- Most measures are trailing indicators showing past performance.
- Measuring alone does not result in improved performance.
- There are thousands of operational metrics that could be measured, but what are the right ones for an overall dashboard?
Info-Tech's Approach
- Use Info-Tech’s IT Metrics Library to review typical KPIs for each of the process areas and select those that apply to your organization.
- Configure your IT Management Dashboard to record your selected KPIs and start to measure performance.
- Set up the cadence for review of the KPIs and develop action plans to improve low-performing indicators.
Info-Tech Insight
Mature your IT department by aligning your measures with your organizational goals. Acting early when your KPIs deviate from the goals leads to improved performance.
Your challenge
This research is designed to help organizations quickly choose holistic measures, review the results, and devise action plans.
- The sheer number of possible metrics can be overwhelming. Choose metrics from our IT Metrics Library or choose your own, but always ensure they are in alignment with your organizational goals.
- Ensure your dashboard is balanced across all 45 process areas that a modern CIO is responsible for.
- Finding leading indicators to allow your team to be proactive can be difficult if your team is focused on the day-to-day operational tasks.
- It can be time consuming to figure out what to do if an indicator is underperforming.
Build your dashboard quickly using the toolset in this research and move to improvement actions as soon as possible.
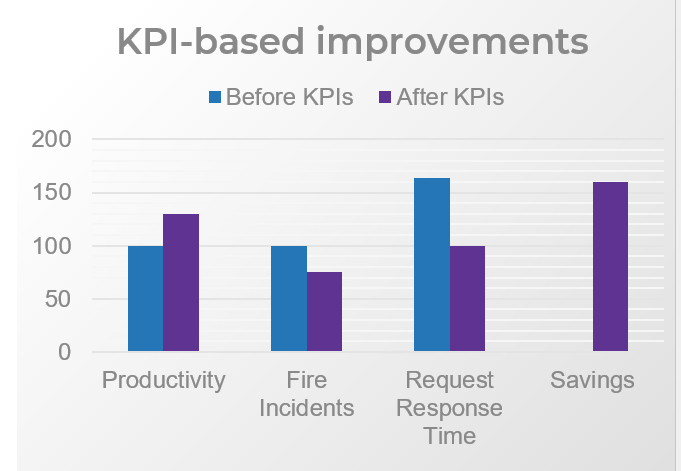
Productivity increased by 30%
Fire/smoke incidents decreased by 25% (high priority)
Average work request response time reduced by 64%
Savings of $1.6 million in the first year
(CFI, 2013)
Common obstacles
These barriers make this challenge difficult to address for many organizations:
- What should be measured can change over time as your organization matures and the business environment changes. Understanding what creates business value for your organization is critical.
- Organizations almost always focus on past result metrics. While this is important, it will not indicate when you need to adjust something until it has already failed.
- It’s not just about measuring. You also need to review the measures often and act on the biggest risks to your organization to drive performance.
Don’t get overwhelmed by the number of things you can measure. It can take some trial and error to find the measures that best indicate the health of the process.
The importance of frequent review
35% - Only 35% of governing bodies review data at each meeting. (Committee of University Chairs, 2008)
Common obstacles
Analysis paralysis
Poor data can lead to incorrect conclusions, limit analysis, and undermine confidence in the value of your dashboard.
Achieving perfect data is extremely time consuming and may not add much value. It can also be an excuse to avoid getting started with metrics and analytics.
Data quality is a struggle for many organizations. Consider how much uncertainty you can tolerate in your analysis and what would be required to improve your data quality to an acceptable level. Consider cost, technological resources, people resources, and time required.
Info-Tech Insight
Analytics are only as good as the data that informs it. Aim for just enough data quality to make informed decisions without getting into analysis paralysis.
Common obstacles
The problem of surrogation
Tying KPIs and metrics to performance often leads to undesired behavior. An example of this is the now infamous Wells Fargo cross-selling scandal, in which 3.5 million credit card and savings accounts were opened without customers’ consent when the company incented sales staff to meet cross-selling targets.
Although this is an extreme example, it’s an all-too-common phenomenon.
A focus on the speed of closure of tickets often leads to shortcuts and lower-quality solutions.
Tying customer value to the measures can align the team on understanding the objective rather than focusing on the measure itself, and the team will no longer be able to ignore the impact of their actions.
Surrogation is a phenomenon in which a measure of a behavior replaces the intent of the measure itself. People focus on achieving the measure instead of the behavior the measure was intended to drive.
Info-Tech’s thought model
| The Threefold Role of the IT Executive | Core CIO Objectives |
|---|---|
| IT Organization - Manager | A - Optimize the Effectiveness of the IT Organization |
| Enterprise - Partner | B - Boost the Productivity of the Enterprise |
| Market - Innovator | C - Enable Business Growth Through Technology |
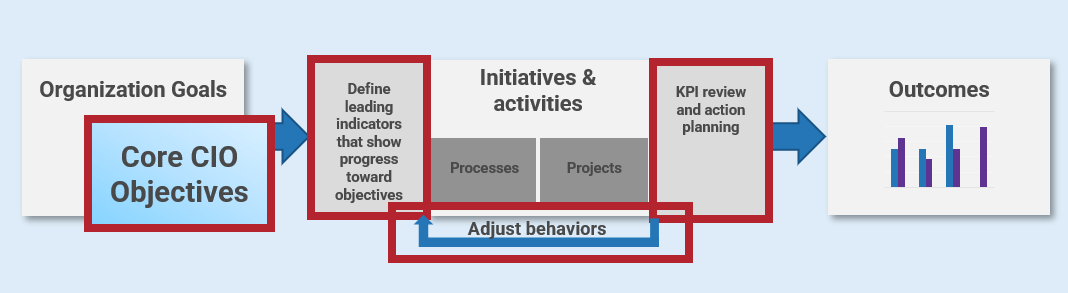
Low-Maturity Metrics Program
Trailing indicators measure the outcomes of the activities of your organization. Hopefully, the initiatives and activities are aligned with the organizational goals.
High-Maturity Metrics Program
The core CIO objectives align with the organizational goals, and teams define leading indicators that show progress toward those goals. KPIs are reviewed often and adjustments are made to improve performance based on the leading indicators. The results are improved outcomes, greater transparency, and increased predictability.
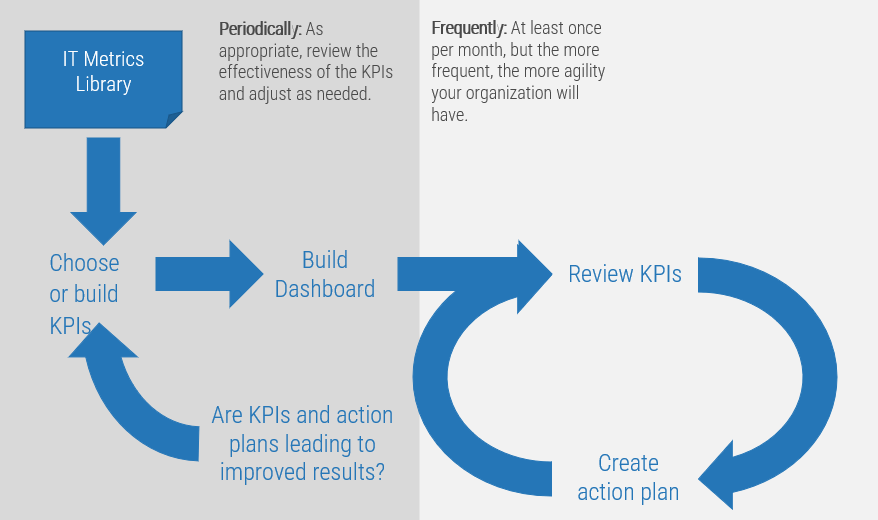
Info-Tech’s approach
Adopt an iterative approach to develop the right KPIs for your dashboard
Periodically: As appropriate, review the effectiveness of the KPIs and adjust as needed.
Frequently: At least once per month, but the more frequent, the more agility your organization will have.
The Info-Tech difference:
- Quickly identify the KPIs that matter to your organization using the IT Metrics Library.
- Build a presentable dashboard using the IT Management Dashboard available on the Info-Tech website.
- When indicators show underperformance, quickly get them back on track using the suggested research in the IT Metrics Library.
- If your organization’s needs are different, define your own custom metrics using the same format as the IT Metrics Library.
- Use the action plan tool to keep track of progress
Info-Tech’s methodology for creating a holistic IT dashboard
| 1. Choose the KPIs | 2. Build the Dashboard | 3. Create the Action Plan | |
|---|---|---|---|
| Phase Steps |
|
|
|
| Phase Outcomes | A defined and documented list of the KPIs that will be used to monitor each of the practice areas in your IT mandate | A configured dashboard covering all the practice areas and the ability to report performance in a consistent and visible way | An action plan for addressing low-performing indicators |
Insight summary
Mature your IT department by aligning your measures with your organizational goals. Acting early when your KPIs deviate from the goals leads to improved performance.
Don’t just measure things because you can. Change what you measure as your organization becomes more mature.
Select what matters to your organization
Measure things that will resolve pain points or drive you toward your goals.
Look for indicators that show the health of the practice, not just the results.
Review KPIs often
Ease of use will determine the success of your metrics program, so keep it simple to create and review the indicators.
Take action to improve performance
If indicators are showing suboptimal performance, develop an action plan to drive the indicator in the right direction.
Act early and often.
Measure what your customers value
Ensure you understand what’s valued and measure whether the value is being produced. Let front-line managers focus on tactical measures and understand how they are linked to value.
Look for predictive measures
Determine what action will lead to the desired result and measure if the action is being performed. It’s better to predict outcomes than react to them.
Blueprint deliverables
Each step of this blueprint is accompanied by supporting deliverables to help you accomplish your goals:
IT Metrics Library
Customize the KPIs for your organization using the IT Metrics Library
IT Metrics Library Action Plan
Keep track of the actions that are generated from your KPI review
Key deliverable:
IT Management Dashboard and Scorecard
The IT Overall Scorecard gives a holistic view of the performance of each IT function
Blueprint benefits
IT Benefits
- An IT dashboard can help IT departments understand how well they are performing against key indicators.
- It can allow IT teams to demonstrate to their business partners the areas they are focusing on.
- Regular review and action planning based on the results will lead to improved performance, efficiency, and effectiveness.
- Create alignment of IT teams by focusing on common areas of performance.
Business Benefits
- Ensure alignment and transparency between the business and IT.
- Understand the value that IT brings to the operation and strategic initiatives of your organization.
- Understand the contribution of the IT team to achieving business outcomes.
- Focus IT on the areas that are important to you by requesting new measures as business needs change.
Measure the value of this blueprint
Utilize the existing IT Metrics Library and IT Dashboard tools to quickly kick off your KPI program
- Developing the metrics your organization should track can be very time consuming. Save approximately 120 hours of effort by choosing from the IT Metrics Library.
- The need for a simple method to display your KPIs means either developing your own tool or buying one off the shelf. Use the IT Management Dashboard to quickly get your KPI program up and running. Using these tools will save approximately 480 hours.
- The true value of this initiative comes from using the KPIs to drive performance.
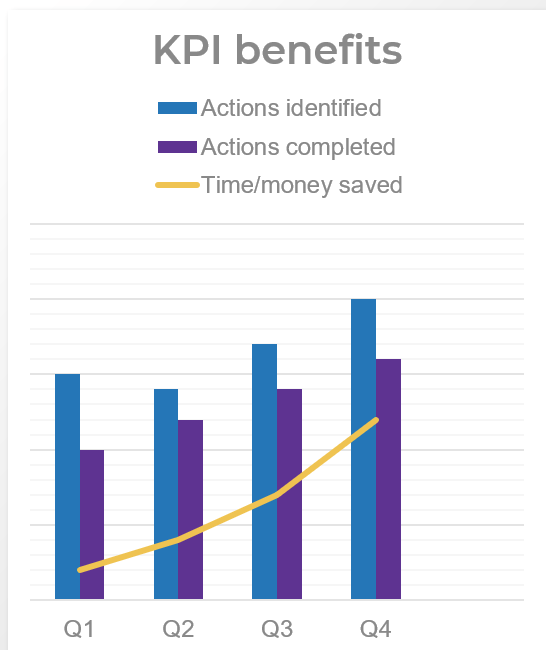
Keeping track of the number of actions identified and completed is a low overhead measure. Tracking time or money saved is higher overhead but also higher value.
Executive Brief Case Study
Using data-driven decision making to drive stability and increase value
Industry: Government Services
Source: Info-Tech analyst experience
Challenge
A newly formed application support team with service desk responsibilities was becoming burned out due to the sheer volume of work landing on their desks. The team was very reactive and was providing poor service due to multiple conflicting priorities.
To make matters worse, there was a plan to add a major new application to the team’s portfolio.
Solution
The team began to measure the types of work they were busy doing and then assessed the value of each type of work.
The team then problem solved how they could reduce or eliminate their low-value workload.
This led to tracking how many problems were being resolved and improved capabilities to problem solve effectively.
Results
Upon initial data collection, the team was performing 100% reactive workload. Eighteen months later slightly more than 80% of workload was proactive high-value activities.
The team not only was able to absorb the additional workload of the new application but also identified efficiencies in their interactions with other teams that led to a 100% success rate in the change process and a 92% decrease in resource needs for major incidents.
Info-Tech offers various levels of support to best suit your needs
DIY Toolkit
"Our team has already made this critical project a priority, and we have the time and capability, but some guidance along the way would be helpful."
Guided Implementation
"Our team knows that we need to fix a process, but we need assistance to determine where to focus. Some check-ins along the way would help keep us on track."
Workshop
"We need to hit the ground running and get this project kicked off immediately. Our team has the ability to take this over once we get a framework and strategy in place."
Consulting
"Our team does not have the time or the knowledge to take this project on. We need assistance through the entirety of this project."
Diagnostic and consistent frameworks are used throughout all four options.
Guided Implementation
What does a typical GI on this topic look like?
Phase 1 - Choose the KPIs
Call #1: Scope dashboard and reporting needs.
Call #2: Learn how to use the IT Metrics Library to select your metrics.
Phase 2 – Build the Dashboard
Call #3: Set up the dashboard.
Call #4: Capture data and produce the report.
Phase 3 – Create the Action Plan
Call #5: Review the data and use the metrics library to determine actions.
Call #6: Improve the KPIs you measure.
A Guided Implementation (GI) is series of calls with an Info-Tech analyst to help implement our best practices in your organization.
A typical GI is between 5 and 8 calls over the course of 2 to 3 months.
Workshop Overview
Contact your account representative for more information.
workshops@infotech.com 1-888-670-8889
| Day 1 | Day 2 | Day 3 | Day 4 | Day 5 | |
|---|---|---|---|---|---|
| Identify What to Measure | Configure the Dashboard Tool | Review and Develop the Action Plan | Improve Your KPIs | Compile Workshop Output | |
| Activities | 1.1 Identify organizational goals. 1.2 Identify IT goals and organizational alignment. 1.3 Identify business pain points. |
2.1 Determine metrics and KPI best practices. 2.2 Learn how to use the IT Metrics Library. 2.3 Select the KPIs for your organization. 2.4 Configure the IT Management Dashboard. |
3.1 Create the scorecard report. 3.2 Interpret the results of the dashboard. 3.3 Use the IT Metrics Library to review suggested actions. |
4.1 Develop your action plan. 4.2 Execute the plan and track progress. 4.3 Develop new KPIs as your practice matures. |
5.1 Complete the IT Metrics Library documentation. 5.2 Document decisions and next steps. |
| Outcomes | 1. List of goals and pain points that KPIs will measure | 1. Definition of KPIs to be used, data sources, and ownership 2. Configured IT dashboard |
1. Initial IT scorecard report 2. Action plan with initial actions |
1. Understanding of how to develop new KPIs using the IT Metrics Library | 1. IT Metrics Library documentation 2. Action plan |
Phase 1
Choose the KPIs
Phase 1
1.1 Review Available KPIs
1.2 Select KPIs for Your Org.
1.3 Identify Data Sources and Owners
Phase 2
2.1 Understand the IT Management Dashboard
2.2 Build and Review the KPIs
Phase 3
3.1 Prioritize Low-Performing Indicators
3.2 Review Suggested Actions
3.3 Develop the Action Plan
This phase will walk you through the following activities:
Reviewing and selecting the KPIs suggested in the IT Metrics Library.
Identifying the data source for the selected KPI and the owner responsible for data collection.
This phase involves the following participants:
- Senior IT leadership
- Process area owners
- Metrics program owners and administrators
Step 1.1
Review Available KPIs
Activities
1.1.1 Download the IT Metrics Library and review the KPIs for each practice area.
Choose the KPIs
Step 1.1 – Review Available KPIs
Step 1.2 – Select KPIs for Your Org.
Step 1.3 – Identify Data Sources and owners
This step will walk you through the following activities:
Downloading the IT Metrics Library
Understanding the content of the tool
Reviewing the intended goals for each practice area
This step involves the following participants:
- Senior IT leadership
- Process area owners
- Metrics program owners and administrators
Outcomes of this step
Downloaded tool ready to select the KPIs for your organization
Using the IT Metrics Library
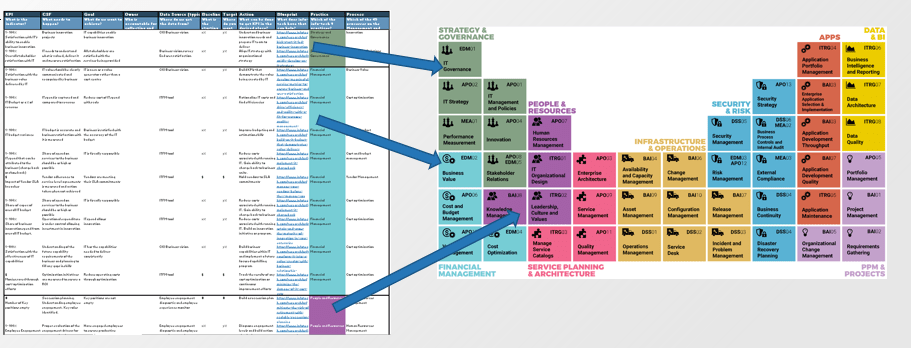
Match the suggested KPIs to the Management and Governance Framework
The “Practice” and “Process” columns relate to each of the boxes on the Info-Tech Management and Governance Framework. This ensures you are measuring each area that needs to be managed by a typical IT department.
Using the IT Metrics Library
Content for each entry
KPI - The key performance indicator to review
CSF - What needs to happen to achieve success for each goal
Goal - The goal your organization is trying to achieve
Owner - Who will be accountable to collect and report the data
Data Source (typical) - Where you plan to get the data that will be used to calculate the KPI
Baseline/Target - The baseline and target for the KPI
Rank - Criticality of this goal to the organization's success
Action - Suggested action if KPI is underperforming
Blueprint - Available research to address typical underperformance of the KPI
Practice/Process - Which practice and process the KPI represents
1.1.1 Download the IT Metrics Library
Input
- IT Metrics Library
Output
- Ideas for which KPIs would be useful to track for each of the practice areas
Materials
- Whiteboard/flip charts
Participants
- IT senior leadership
- Process area owners
- Metrics program owners and administrators
4 hours
- Click the link below to download the IT Metrics Library spreadsheet.
- Open the file and select the “Data Entry” tab.
- The sheet has suggested KPIs for each of the 9 practice areas and 45 processes listed in the Info-Tech Management and Governance Framework. You can identify this grouping in the “Practice” and “Process” columns.
- For each practice area, review the suggested KPIs and their associated goals and discuss as a team which of the KPIs would be useful to track in your organization.
Step 1.2
Select KPIs for Your Organization
Activities
1.2.1 Select the KPIs that will drive your organization forward
1.2.2 Remove unwanted KPIs from the IT Metrics Library
Choose the KPIs
Step 1.1 – Review Available KPIs
Step 1.2 – Select KPIs for Your Org.
Step 1.3 – Identify Data Sources and Owners
This step will walk you through the following activities:
- Selecting the KPIs for your organization and removing unwanted KPIs from IT Metrics Library
This step involves the following participants:
- Senior IT leadership
- Process area owners
- Metrics program owners and administrators
Outcomes of this step
A shortlist of selected KPIs
1.2.1 Select the KPIs that will drive your organization forward
Input
- IT Metrics Library
Output
- KPIs would be useful to track for each of the practice areas
Materials
- IT Metrics Library
Participants
- Senior IT leadership
- Process area owners
- Metrics program owners and administrators
4 hours
- Review the suggested KPIs for each practice area and review the goal.
- Some suggested KPIs are similar, so make sure the goal is appropriate for your organization.
- Pick up to three KPIs per practice.
1.2.2 Remove unwanted KPIs
Input
- IT Metrics Library
Output
- KPIs would be useful to track for each of the practice areas
Materials
- IT Metrics Library
Participants
- Senior IT leadership
- Process area owners
- Metrics program owners and administrators
0.5 hours
- To remove unwanted KPIs from the IT Metric Library Tool, select the unwanted row, right-click on the row, and delete it.
- The result should be up to three KPIs per practice area left on the spreadsheet.
Step 1.3
Identify data sources and owners
Activities
1.3.1 Document the data source
1.3.2 Document the owner
1.3.3 Document baseline and target
Choose the KPIs
Step 1.1 – Review Available KPIs
Step 1.2 – Select KPIs for Your Org.
Step 1.3 – Identify Data Sources and Owners
This step will walk you through the following activities:
Documenting for each KPI where you plan to get the data, who is accountable to collect and report the data, what the current baseline is (if available), and what the target is
This step involves the following participants:
- Senior IT leadership
- Process area owners
- Metrics program owners and administrators
Outcomes of this step
A list of KPIs for your organization with appropriate attributes documented
1.3 Identify data sources, owners, baseline, and target
Input
- IT Metrics Library
Output
- Completed IT Metrics Library
Materials
- IT Metrics Library
Participants
- Process area owners
- Metrics program owners and administrators
2 hours
- For each selected KPI, complete the owner, data source, baseline, and target if the information is available.
- If the information is not available, document the owner and assign them to complete the other columns.
Phase 2
Build the Dashboard
Phase 1
1.1 Review Available KPIs
1.2 Select KPIs for Your Org.
1.3 Identify Data Sources and Owners
Phase 2
2.1 Understand the IT Management Dashboard
2.2 Build and Review the KPIs
Phase 3
3.1 Prioritize Low-Performing Indicators
3.2 Review Suggested Actions
3.3 Develop the Action Plan
This phase will walk you through the following activities:
Understanding the IT Management Dashboard
Configuring the IT Management Dashboard and entering initial measures
Produce thing IT Scorecard from the IT Management Dashboard
Interpreting the results
This phase involves the following participants:
- Senior IT leadership
- Process area owners
- Metrics program owners and administrators
Step 2.1
Understand the IT Management Dashboard
Activities
2.1.1 Logging into the IT Management Dashboard
2.1.2 Understanding the “Overall Scorecard” tab
2.1.3 Understanding the “My Metrics” tab
Build the Dashboard
Step 2.1 – Understand the IT Management Dashboard
Step 2.2 – Build and review the KPIs
This step will walk you through the following activities:
Accessing the IT Management Dashboard
Basic functionality of the tool
This step involves the following participants:
- Senior IT leadership
- Process area owners
- Metrics program owners and administrators
Outcomes of this step
Understanding of how to administer the IT Management Dashboard
2.1.1 Logging into the IT Management Dashboard
Input
- Info-Tech membership
Output
- Access to the IT Management Dashboard
Materials
- Web browser
Participants
- Metrics program owners and administrators
0.5 hours
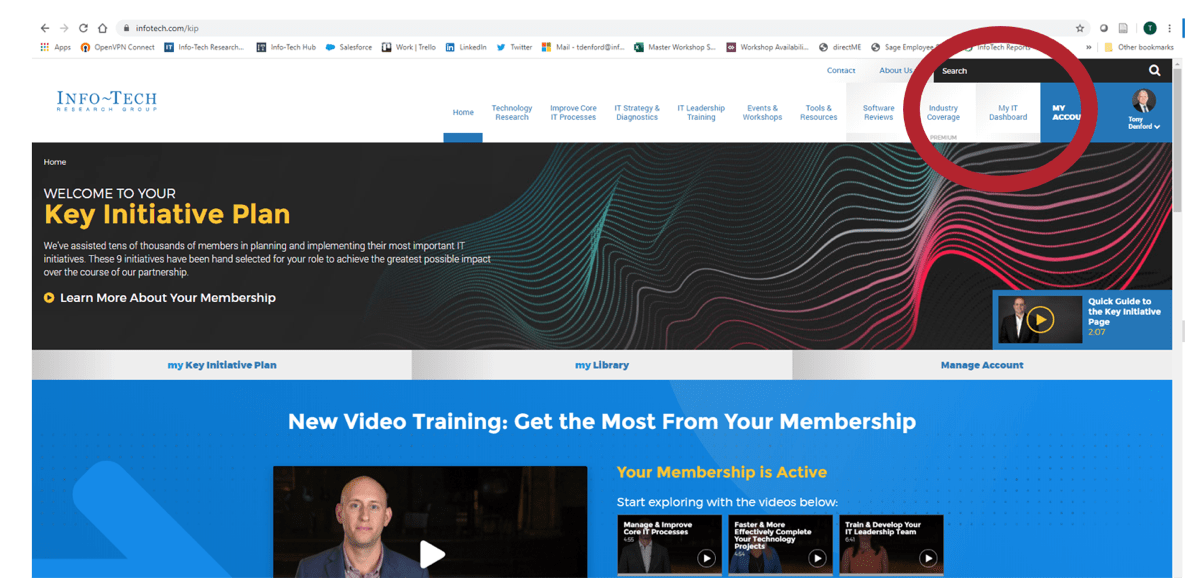
- Using your web browser, access your membership at infotech.com.
- Log into your Info-Tech membership account.
- Select the “My IT Dashboard” option from the menu (circled in red).
- If you cannot gain access to the tool, contact your membership rep.
2.1.2 Understanding the “Overall Scorecard” tab
0.5 hours
- Once you select “My IT Dashboard,” you will be in the “Overall Scorecard” tab view.
- Scrolling down reveals the data entry form for each of the nine practice areas in the Info-Tech Management and Governance Framework, with each section color-coded for easy identification.
- Each of the section headers, KPI names, data sources, and data values can be updated to fit the needs of your organization.
- This view is designed to show a holistic view of all areas in IT that are being managed.
2.1.3 Understanding the “My Metrics” tab
0.5 hours
- On the “My Metrics” tab you can access individual scorecards for each of the nine practice areas.
- Below the “My Metrics” tab is each of the nine practice areas for you to select from. Each shows a different subset of KPIs specific to the practice.
- The functionality of this view is the same as the overall scorecard. Each title, KPI, description, and actuals are editable to fit your organization’s needs.
- This blueprint does not go into detail on this tab, but it is available to be used by practice area leaders in the same way as the overall scorecard.
Step 2.2
Build and review the KPIs
Activities
2.2.1 Entering the KPI descriptions
2.2.2 Entering the KPI actuals
2.2.3 Producing the IT Overall Scorecard
Build the Dashboard
Step 2.1 – Understand the IT Management Dashboard
Step 2.2 – Build and review the KPIs
This step will walk you through the following activities:
Entering the KPI descriptions
Entering the actuals for each KPI
Producing the IT Overall Scorecard
This step involves the following participants:
- Senior IT leadership
- Process area owners
- Metrics program owners and administrators
Outcomes of this step
An overall scorecard indicating the selected KPI performance
2.2.1 Entering the KPI descriptions
Input
- Access to the IT Management Dashboard
- IT Metrics Library with your organization’s KPIs selected
Output
- KPI descriptions entered into tool
Materials
- Web browser
Participants
- Metrics program owners and administrators
1 hour
- Navigate to the IT Management Dashboard as described in section 2.1.1 and scroll down to the practice area you wish to complete.
- If needed, modify the section name to match your organization’s needs.
- Select “Add another score.”
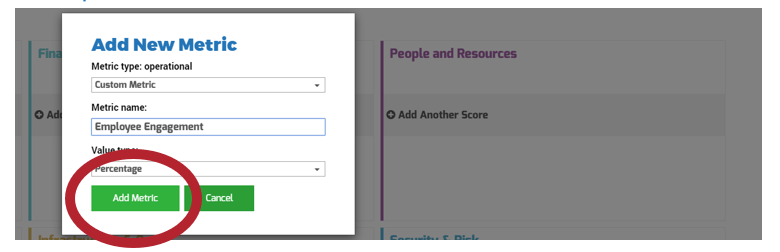
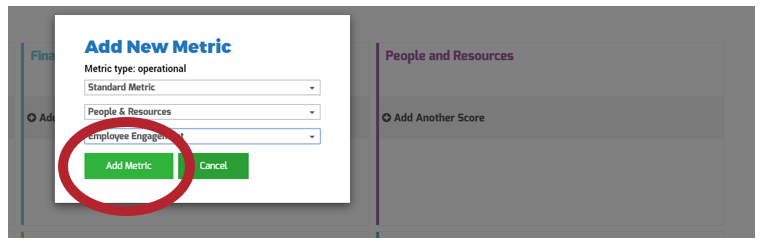
2.2.1 Entering the KPI descriptions
1 hour
- Select if your metric is a custom metric or a standard metric available from one of the Info-Tech diagnostic tools.
- Enter the metric name you selected from the IT Metrics Library.
- Select the value type.
- Select the “Add Metric” button.
- The descriptions only need to be entered when they change.
Example of a custom metric
Example of a standard metric
2.2.2 Entering the KPI actuals
Input
- Actual data from each data source identified
Output
- Actuals recorded in tool
Materials
- Web browser
Participants
- Metrics program owners and administrators
1 hour
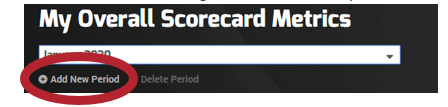
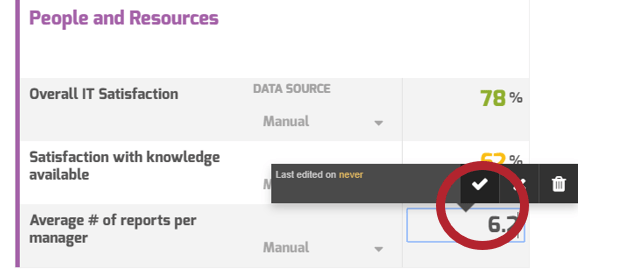
- Select the period you wish to create a scorecard for by selecting “Add New Period” or choosing one from the drop-down list.
- For each KPI on your dashboard, collect the data from the data source and enter the actuals.
- Select the check mark (circled) to save the data for the period.
2.2.3 Producing the IT Overall Scorecard
Input
- Completed IT Overall Scorecard data collection
Output
- IT Overall Scorecard
Materials
- Web browser
Participants
- Metrics program owners and administrators
0.5 hours
- Select the period you wish to create a scorecard for by selecting from the drop-down list.
- Click the “Download as PDF” button to produce the scorecard.
- Once the PDF is produced it is ready for review or distribution.
Phase 3
Create the Action Plan
Phase 1
1.1 Review Available KPIs
1.2 Select KPIs for Your Org.
1.3 Identify Data Sources and Owners
Phase 2
2.1 Understand the IT Management Dashboard
2.2 Build and Review the KPIs
Phase 3
3.1 Prioritize Low-Performing Indicators
3.2 Review Suggested Actions
3.3 Develop the Action Plan
This phase will walk you through the following activities:
Prioritizing low-performing indicators
Using the IT Metrics Library to review suggested actions
Developing your team’s action plan to improve performance
This phase involves the following participants:
- Senior IT leadership
- Process area owners
- Metrics program owners and administrators
Step 3.1
Prioritize low-performing indicators
Activities
3.1.1 Determine criteria for prioritization
3.1.2 Identify low-performing indicators
3.1.3 Prioritize low-performing indicators
Create the action plan
Step 3.1 – Prioritize low-performing indicators
Step 3.2 – Review suggested actions
Step 3.3 – Develop the action plan
This step will walk you through the following activities:
Determining the criteria for prioritization of low-performing indicators
Identifying low-performing indicators
Prioritizing the low-performing indicators
This step involves the following participants:
- Senior IT leadership
- Process area owners
- Metrics program owners and administrators
Outcomes of this step
A prioritized list of low-performing indicators that need remediation
3.1.1 Determine criteria for prioritization
Often when metrics programs are established, there are multiple KPIs that are not performing at the desired level. It’s easy to expect the team to fix all the low-performing indicators, but often teams are stretched and have conflicting priorities.
Therefore it’s important to spend some time to prioritize which of your indicators are most critical to the success of your business.
Also consider, if one area is performing well and others have multiple poor indicators, how do you give the right support to optimize the results?
Lastly, is it better to score slightly lower on multiple measures or perfect on most but failing badly on one or two?
3.1.1 Determine criteria for prioritization
Input
- Business goals and objectives
- IT goals and objectives
- IT organizational structure
Output
- Documented scorecard remediation prioritization criteria
Materials
- Whiteboard or flip charts
Participants
- Senior IT leadership
- Process area owners
- Metrics program owners and administrators
1 hour
- Identify any KPIs that are critical and cannot fail without high impact to your organization.
- Identify any KPIs that cannot fail for an extended period and document the time period.
- Rank the KPIs from most critical to least critical in the IT Metrics Library.
- Look at the owner accountable for the performance of each KPI. If there are any large groups, reassess the ownership or rank.
- Periodically review the criteria to see if they’re aligned with meeting current business goals.
3.1.2 Identify low-performing indicators
Input
- Overall scorecard
- Overall scorecard (previous period)
- IT Metrics Library
Output
- List of low-performing indicators that need remediation
- Planned actions to improve performance
Materials
- Whiteboard or flip charts
Participants
- Senior IT leadership
- Process area owners
- Metrics program owners and administrators
1 hour
- Review the overall scorecard for the current period. List any KPIs that are not meeting the target for the current month in the “Action Plan” tab of the IT Metrics Library.
- Compare current month to previous month. List any KPIs that are moving away from the long-term target documented in the tool IT Metrics Library.
- Revise the target in the IT Metrics Library as business needs change.
3.1.3 Prioritize low-performing indicators
Input
- IT Metrics Library
Output
- Prioritized list of planned actions for low-performing indicators
Materials
- IT Metrics Library
Participants
- Senior IT leadership
- Process area owners
- Metrics program owners and administrators
- Task owners
1 hour
- Look through the list of new and outstanding planned actions in the “Action Plan” tab of the IT Metrics Library, review progress, and prioritize outstanding items.
- Compare the list that needs remediation with the rank in the data entry tab.
- Adjust the priority of the outstanding and new actions to reflect the business needs.
Step 3.2
Review suggested actions
Activities
3.2.1 Review suggested actions in the IT Metrics Library
Create the Action Plan
Step 3.1 – Prioritize low-performing indicators
Step 3.2 – Review suggested actions
Step 3.3 – Develop the action plan
This step will walk you through the following activities:
Reviewing the suggested actions in the IT Metrics Library
This step involves the following participants:
- Senior IT leadership
- Process area owners
- Metrics program owners and administrators
Outcomes of this step
An idea of possible suggested actions
Take Action
Knowing where you are underperforming is only half the battle. You need to act!
- So far you have identified which indicators will tell you whether or not your team is performing and which indicators are most critical to your business success.
- Knowing is the first step, but things will not improve without some kind of action.
- Sometimes the action needed to course-correct is small and simple, but sometimes it is complicated and may take a long time.
- Utilize the diverse ideas of your team to find solutions to underperforming indicators.
- If you don’t have a viable simple solution, leverage the IT Metrics Library, which suggests high-level action needed to improve each indicator. If you need additional information, use your Info-Tech membership to review the recommended research.
3.2.1 Review suggested actions in the IT Metrics Library
Input
- IT Metrics Library
Output
- Suggested actions
Materials
- IT Metrics Library
Participants
- Process area owners
- Metrics program owners and administrators
- Task owners
0.5 hours
- For each of your low-performing indicators, review the suggested action and related research in the IT Metrics Library.
Step 3.3
Develop the action plan
Activities
3.3.1 Document planned actions
3.3.2 Assign ownership of actions
3.3.3 Determine timeline of actions
3.3.4 Review past action status
Create the action plan
Step 3.1 – Prioritize low- performing indicators
Step 3.2 – Review suggested actions
Step 3.3 – Develop the action plan
This step will walk you through the following activities:
Using the action plan tool to document the expected actions for low-performing indicators
Assigning an owner and expected due date for the action
Reviewing past action status for accountability
This step involves the following participants:
- Senior IT leadership
- Process area owners
- Metrics program owners and administrators
Outcomes of this step
An action plan to invoke improved performance
3.3.1 Document planned actions
Input
- IT Metrics Library
Output
- Planned actions
Materials
- IT Metrics Library
Participants
- Process area owners
- Metrics program owners and administrators
- Task owners
1 hour
- Decide on the action you plan to take to bring the indicator in line with expected performance and document the planned action in the “Action Plan” tab of the IT Metrics Library.
Info-Tech Insight
For larger initiatives try to break the task down to what is likely manageable before the next review. Seeing progress can motivate continued action.
3.3.2 Assign ownership of actions
Input
- IT Metrics Library
Output
- Identified owners for each action
Materials
- IT Metrics Library
Participants
- Process area owners
- Metrics program owners and administrators
- Task owners
0.5 hours
- For each unassigned task, assign clear ownership for completion of the task.
- The task owner should be the person accountable for the task.
Info-Tech Insight
Assigning clear ownership can promote accountability for progress.
3.3.3 Determine timeline of actions
Input
- IT Metrics Library
Output
- Expected timeline for each action
Materials
- IT Metrics Library
Participants
- Process area owners
- Metrics program owners and administrators
- Task owners
0.5 hours
- For each task, agree on an estimated target date for completion.
Info-Tech Insight
If the target completion date is too far in the future, break the task into manageable chunks.
3.3.4 Review past action status
Input
- IT Metrics Library
Output
- Complete action plan for increased performance
Materials
- IT Metrics Library
Participants
- Process area owners
- Metrics program owners and administrators
- Task owners
0.5 hours
- For each task, review the progress since last review.
- If desired progress is not being made, adjust your plan based on your organizational constraints.
Info-Tech Insight
Seek to understand the reasons that tasks are not being completed and problem solve for creative solutions to improve performance.
Measure the value of your KPI program
KPIs only produce value if they lead to action
- Tracking the performance of key indicators is the first step, but value only comes from taking action based on this information.
- Keep track of the number of action items that come out of your KPI review and how many are completed.
- If possible, keep track of the time or money saved through completing the action items.
Keeping track of the number of actions identified and completed is a low overhead measure.
Tracking time or money saved is higher overhead but also higher value.
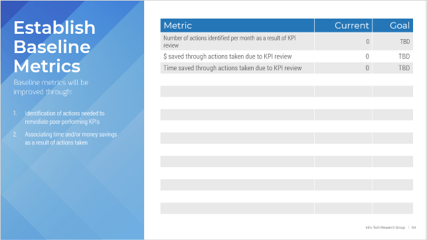
Establish Baseline Metrics
Baseline metrics will be improved through:
- Identifying actions needed to remediate poor-performing KPIs
- Associating time and/or money savings as a result of actions taken
| Metric | Current | Goal |
|---|---|---|
| Number of actions identified per month as a result of KPI review | 0 | TBD |
| $ saved through actions taken due to KPI review | 0 | TBD |
| Time saved through actions taken due to KPI review | 0 | TBD |
Summary of Accomplishment
Problem Solved
Through this project we have identified typical key performance indicators that are important to your organization’s effective management of IT.
You’ve populated the IT Management Dashboard as a simple method to display the results of your selected KPIs.
You’ve also established a regular review process for your KPIs and have a method to track the actions that are needed to improve performance as a result of the KPI review. This should allow you to hold individuals accountable for improvement efforts.
You can also measure the effectiveness of your KPI program by tracking how many actions are identified as a result of the review. Ideally you can also track the money and time savings.
If you would like additional support, have our analysts guide you through other phases as part of an Info-Tech workshop.
Contact your account representative for more information.
workshops@infotech.com
1-888-670-8889
Additional Support
If you would like additional support, have our analysts guide you through other phases as part of an Info-Tech Workshop.
Contact your account representative for more information.
workshops@infotech.com 1-888-670-8889
To accelerate this project, engage your IT team in an Info-Tech Workshop with an Info-Tech analyst team.
Info-Tech analysts will join you and your team at your location or welcome you to Info-Tech’s historic Toronto office to participate in an innovative onsite workshop.
The following are sample activities that will be conducted by Info-Tech analysts with your team:
Select the KPIs for your organization
Examine the benefits of the KPIs suggested in the IT Metrics Library and help selecting those that will drive performance for your maturity level.
Build an action plan
Discuss options for identifying and executing actions that result from your KPI review. Determine how to set up the discipline needed to make the most of your KPI review program.
Research Contributors and Experts
Valence Howden
Principal Research Director, CIO – Service Management Info-Tech Research Group
- Valence has extensive experience in helping organizations be successful through optimizing how they govern themselves, how they design and execute strategies, and how they drive service excellence in all work.
Tracy-Lynn Reid
Practice Lead, CIO – People & Leadership Info-Tech Research Group
- Tracy-Lynn covers key topics related to People & Leadership within an information technology context.
Fred Chagnon
Practice Lead, Infrastructure & Operations Info-Tech Research Group
- Fred brings extensive practical experience in all aspects of enterprise IT Infrastructure, including IP networks, server hardware, operating systems, storage, databases, middleware, virtualization and security.
Aaron Shum
Practice Lead, Security, Risk & Compliance Info-Tech Research Group
- With 20+ years of experience across IT, InfoSec, and Data Privacy, Aaron currently specializes in helping organizations implement comprehensive information security and cybersecurity programs as well as comply with data privacy regulations.
Cole Cioran
Practice Lead, Applications and Agile Development Info-Tech Research Group
- Over the past twenty-five years, Cole has developed software; designed data, infrastructure, and software solutions; defined systems and enterprise architectures; delivered enterprise-wide programs; and managed software development, infrastructure, and business systems analysis practices.
Barry Cousins
Practice Lead, Applications – Project and Portfolio Mgmt. Info-Tech Research Group
- Barry specializes in Project Portfolio Management, Help/Service Desk, and Telephony/Unified Communications. He brings an extensive background in technology, IT management, and business leadership.
Jack Hakimian
Vice President, Applications Info-Tech Research Group
- Jack has close to 25 years of Technology and Management Consulting experience. He has served multi-billion-dollar organizations in multiple industries, including Financial Services and Telecommunications. Jack also served several large public sector institutions.
Vivek Mehta
Research Director, CIO Info-Tech Research Group
- Vivek publishes on topics related to digital transformation and innovation. He is the author of research on Design a Customer-Centric Digital Operating Model and Create Your Digital Strategy as well as numerous keynotes and articles on digital transformation.
Carlos Sanchez
Practice Lead, Enterprise Applications Info-Tech Research Group
- Carlos has a breadth of knowledge in enterprise applications strategy, planning, and execution.
Andy Neill
Practice Lead, Enterprise Architecture, Data & BI Info-Tech Research Group
- Andy has extensive experience in managing technical teams, information architecture, data modeling, and enterprise data strategy.
Michael Fahey
Executive Counselor Info-Tech Research Group
- As an Executive Counselor, Mike applies his decades of business experience and leadership, along with Info-Tech Research Group’s resources, to assist CIOs in delivering outstanding business results.
Related Info-Tech Research
Develop Meaningful Service Metrics to Ensure Business and User Satisfaction
- Reinforce service orientation in your IT organization by ensuring your IT metrics generate value-driven resource behavior.
Use Applications Metrics That Matter
- It all starts with quality and customer satisfaction.
Take Control of Infrastructure Metrics
- Master the metrics maze to help make decisions, manage costs, and plan for change.
Bibliography
Bach, Nancy. “How Often Should You Measure Your Organization's KPIs?” EON, 26 June 2018. Accessed Jan. 2020.
“The Benefits of Tracking KPIs – Both Individually and for a Team.” Hoopla, 30 Jan. 2017. Accessed Jan. 2020.
Chepul, Tiffany. “Top 22 KPI Examples for Technology Companies.” Rhythm Systems, Jan. 2020. Accessed Jan. 2020.
Cooper, Larry. “CSF's, KPI's, Metrics, Outcomes and Benefits” itSM Solutions. 5 Feb. 2010. Accessed Jan 2020.
“CUC Report on the implementation of Key Performance Indicators: case study experience.” Committee of University Chairs, June 2008. Accessed Jan 2020.
Harris, Michael, and Bill Tayler. “Don’t Let Metrics Undermine Your Business.” HBR, Sep.–Oct 2019. Accessed Jan. 2020.
Hatari, Tim. “The Importance of a Strong KPI Dashboard.” TMD Coaching. 27 Dec. 2018. Accessed Jan. 2020.
Roy, Mayu, and Marian Carter. “The Right KPIs, Metrics for High-performing, Cost-saving Space Management.” CFI, 2013. Accessed Jan 2020.
Schrage, Michael, and David Kiron. “Leading With Next-Generation Key Performance Indicators.” MIT Sloan Management Review, 26 June 2018. Accessed Jan. 2020.
Setijono, Djoko, and Jens J. Dahlgaard. “Customer value as a key performance indicator (KPI) and a key improvement indicator (KII)” Emerald Insight, 5 June 2007. Accessed Jan 2020.
Skinner, Ted. “Balanced Scorecard KPI Examples: Comprehensive List of 183 KPI Examples for a Balanced Scorecard KPI Dashboard (Updated for 2020).” Rhythm Systems, Jan. 2020. Accessed Jan 2020.
Wishart, Jessica. “5 Reasons Why You Need The Right KPIs in 2020” Rhythm Systems, 1 Feb. 2020. Accessed Jan. 2020.