
Leverage Web Analytics to Reinforce Your Web Experience Management Strategy
- Organizations are unaware of the capabilities of web analytics tools and unsure how to leverage these new technologies to enhance their web experience.
- Traditional solutions offer only information and data about the activity on the website. It is difficult for organizations to understand the customer motivations and behavioral patterns using the data.
- In addition, there is an overwhelming number of vendors offering various solutions. Understanding which solution best fits your business needs is crucial to avoid overspending.
Our Advice
Critical Insight
- Understanding organizational goals and business objectives is essential in effectively leveraging web analytics.
- It is easy to get lost in a sea of expensive web analytical tools. Choosing tools that align with the business objectives will keep the costs of customer acquisition and retention to a minimum.
- Beyond selection and implementation, leveraging web analytic tools requires commitment from the organization to continuously monitor key KPIs to ensure good customer web experience.
Impact and Result
- Understand what web analytic tools are and some key trends in the market space. Learn about top advanced analytic tools that help understand user behavior.
- Discover top vendors in the market space and some of the top-level features they offer.
- Understand how to use the metrics to gather critical insights about the website’s use and key initiatives for successful implementation.
Leverage Web Analytics to Reinforce Your Web Experience Management Strategy Research & Tools
Leverage Web Analytics to Reinforce Your Web Experience Management Strategy Storyboard – A deck outlining the importance of web analytic tools and how they can be leveraged to meet your business needs.
This research offers insight into web analytic tools, key trends in the market space, and an introduction to advanced web analytics techniques. Follow our five-step initiative to successfully select and implement web analytics tools and identify which baseline metrics to measure and continuously monitor for best results.Besides the small introduction, subscribers and consulting clients within this management domain have access to:
- Leverage Web Analytics to Reinforce Your Web Experience Management Strategy Storyboard
Further reading
Leverage Web Analytics to Reinforce Your Web Experience Management Strategy
Web analytics tools are the gateway to understanding customer behavior.
EXECUTIVE BRIEF
Analyst Perspective
In today’s world, users want to consume concise content and information quickly. Websites have a limited time to prove their usefulness to a new user. Content needs to be as few clicks away from the user as possible. Analyzing user behavior using advanced analytics techniques can help website designers better understand their audience.
Organizations need to implement sophisticated analytics tools to track user data from their website. However, simply extracting data is not enough to understand the user motivation. A successful implementation of a web analytics tool will comprise both understanding what a customer does on the website and why the customer does what they do.
This research will introduce some fundamental and advanced analytics tools and provide insight into some of the vendors in the market space.

|
Sai Krishna Rajaramagopalan
Research Specialist, Applications − Enterprise Applications Info-Tech Research Group |
Executive Summary
Your Challenge
|
Common Obstacles
|
Info-Tech’s Approach
|
Info-Tech Insight
It is easy to get lost in a sea of expensive web analytics tools. Choose tools that align with your business objectives to keep the costs of customer acquisition and retention to a minimum.
Ensure the success of your web analytics programs by following five simple steps
1. ORGANIZATIONAL GOALSThe first key step in implementing and succeeding with web analytics tools is to set clearly defined organizational goals, e.g. improving product sales. 3. KPI METRICSDefine key performance indicators (KPIs) that help track the organization’s performance, e.g. number of page visits, conversion rates, bounce rates. 5. REVIEWContinuous improvement is essential to succeed in understanding customers. The world is a dynamic place, and you must constantly revise your organizational goals, business objectives, and KPIs to remain competitive. |

|
2. BUSINESS OBJECTIVESThe next step is to lay out business objectives that help to achieve the organization’s goals, e.g. to increase customer leads, increase customer transactions, increase web traffic. 4. APPLICATION SELECTIONUnderstand the web analytics tool space and which combination of tools and vendors best fits the organization’s goals. |
Web Analytics Introduction
Understand traditional and advanced tools and their capabilities.
Understanding web analytics
|
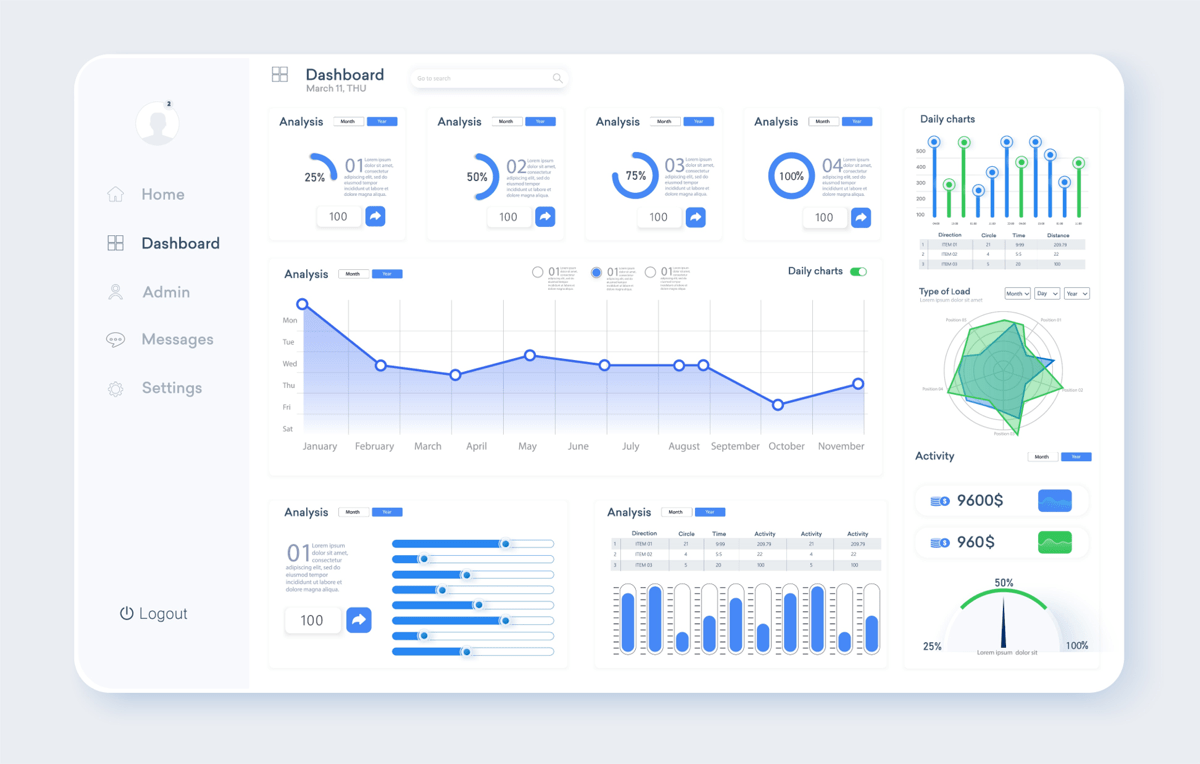
|
Why you should leverage web analytics
Leveraging web analytics allows organizations to better understand their customers and achieve their business goals.
| The global web analytics market size is projected to reach US$5,156.3 million by 2026, from US$2,564 million in 2019, at a CAGR of 10.4% during 2021-2026. (Source: 360 Research Reports, 2021) | Of the top 1 million websites with the highest traffic, there are over 3 million analytics technologies used. Google Analytics has the highest market share, with 50.3%. (Source: “Top 1 Million Sites,” BuiltWith, 2022) |
| Of the 200 million active websites, 57.3% employ some form of web analytics tool. This trend is expected to grow as more sophisticated tools are readily available at a cheaper cost. (Source: “On the Entire Internet,” BuiltWith, 2022; Siteefy, 2022) | A three-month study by Contentsquare showed a 6.9% increase in traffic, 11.8% increase in page views, 12.4% increase in transactions, and 3.6% increase in conversion rates through leveraging web analytics. (Source: Mordor Intelligence, 2022) |
Case Study |
INDUSTRY
|
SOURCE
|
|
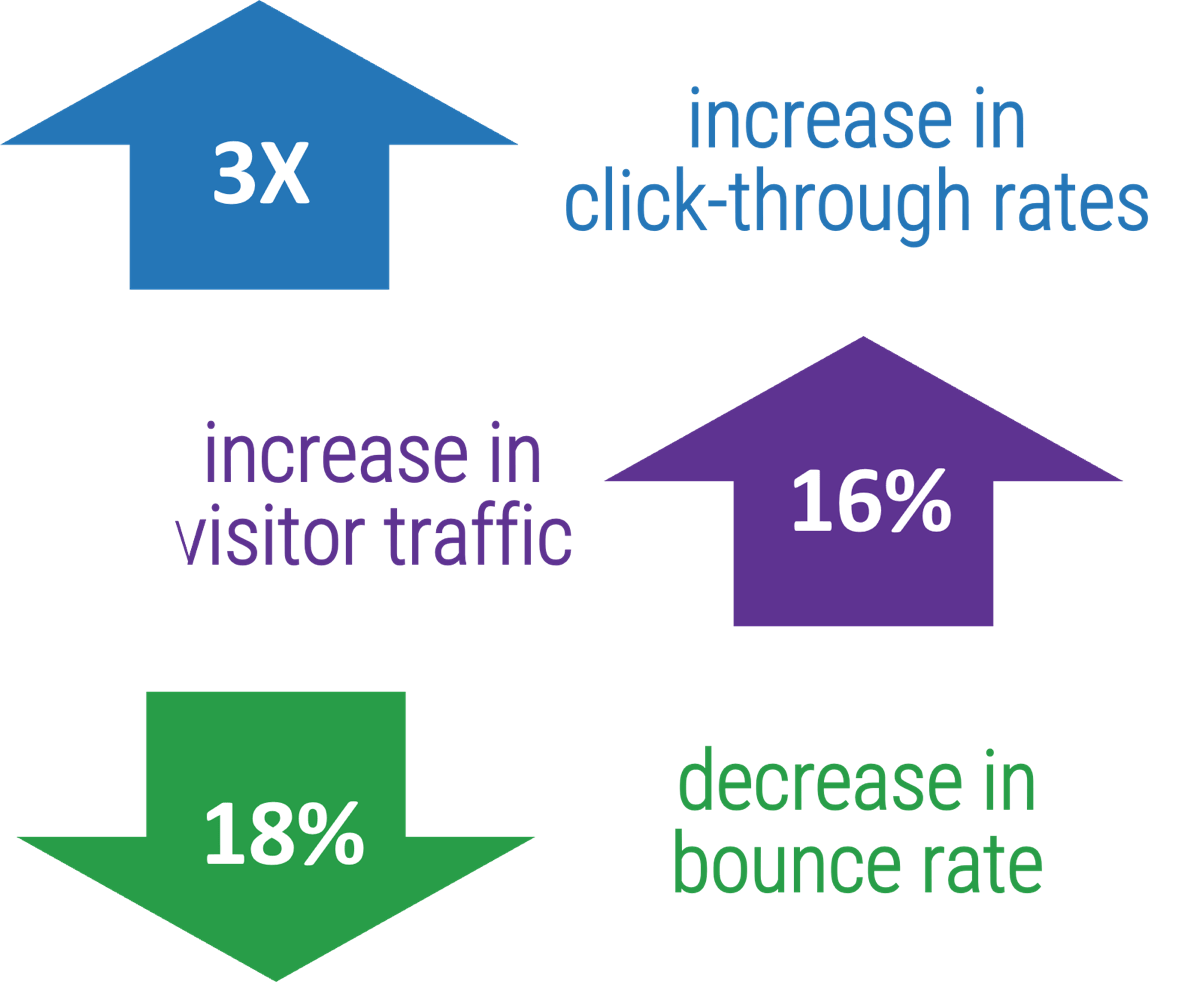
Ryanair is a low-fare airline in Europe that receives nearly all of its bookings via its website. Unhappy with its current web analytics platform, which was difficult to understand and use, Ryanair was looking for a solution that could adapt to its requirements and provide continuous support and long-term collaboration. Ryanair chose AT Internet for its intuitive user interface that could effectively and easily manage all the online activity. AT was the ideal partner to work closely with the airline to strengthen strategic decision making over the long term, increase conversions in an increasingly competitive market, and increase transactions on the website. ResultsBy using AT Internet Web Analytics to improve email campaigns and understand the behavior of website visitors, Ryanair was able to triple click-through rates, increase visitor traffic by 16%, and decrease bounce rate by 18%. |
|
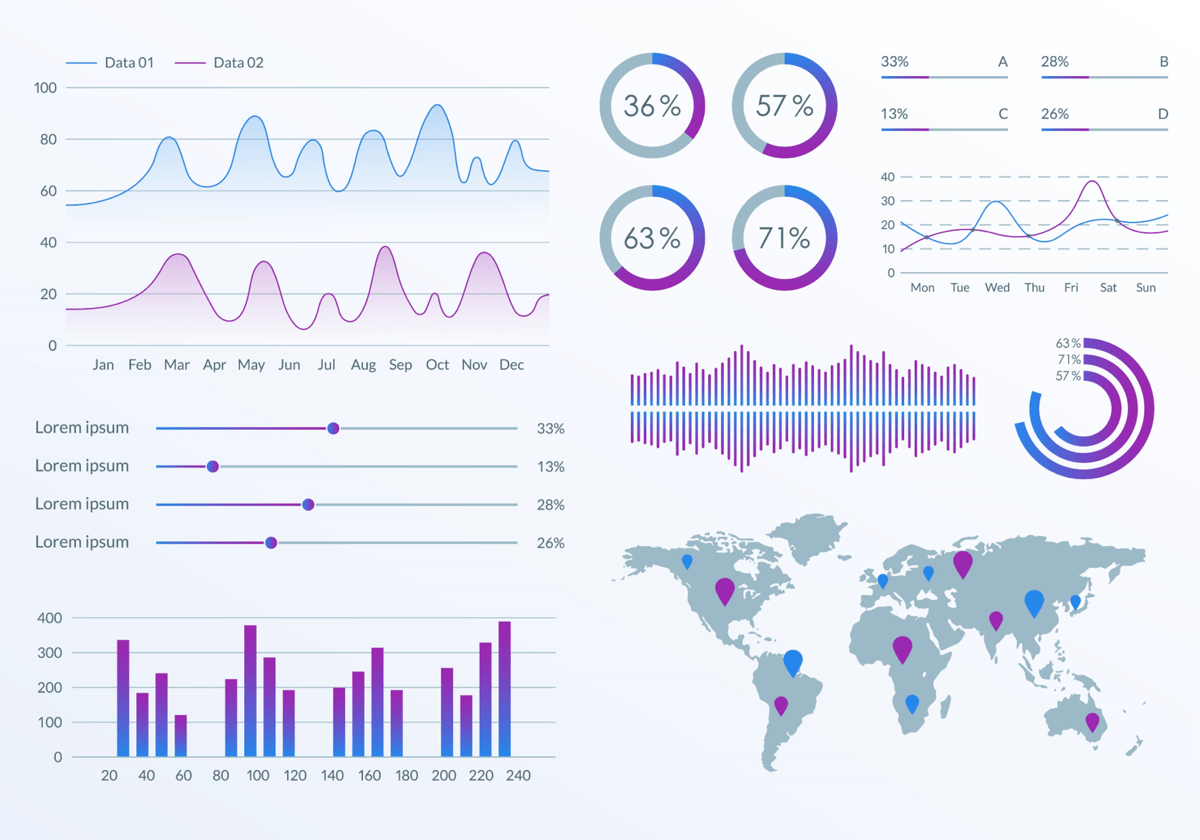
Use traditional web analytics tools to understand your consumer
What does the customer do?
|
|
Use advanced web analytics techniques to understand your consumer
Why does the customer do what they do?
|
|
Apply industry-leading techniques to leverage web analytics
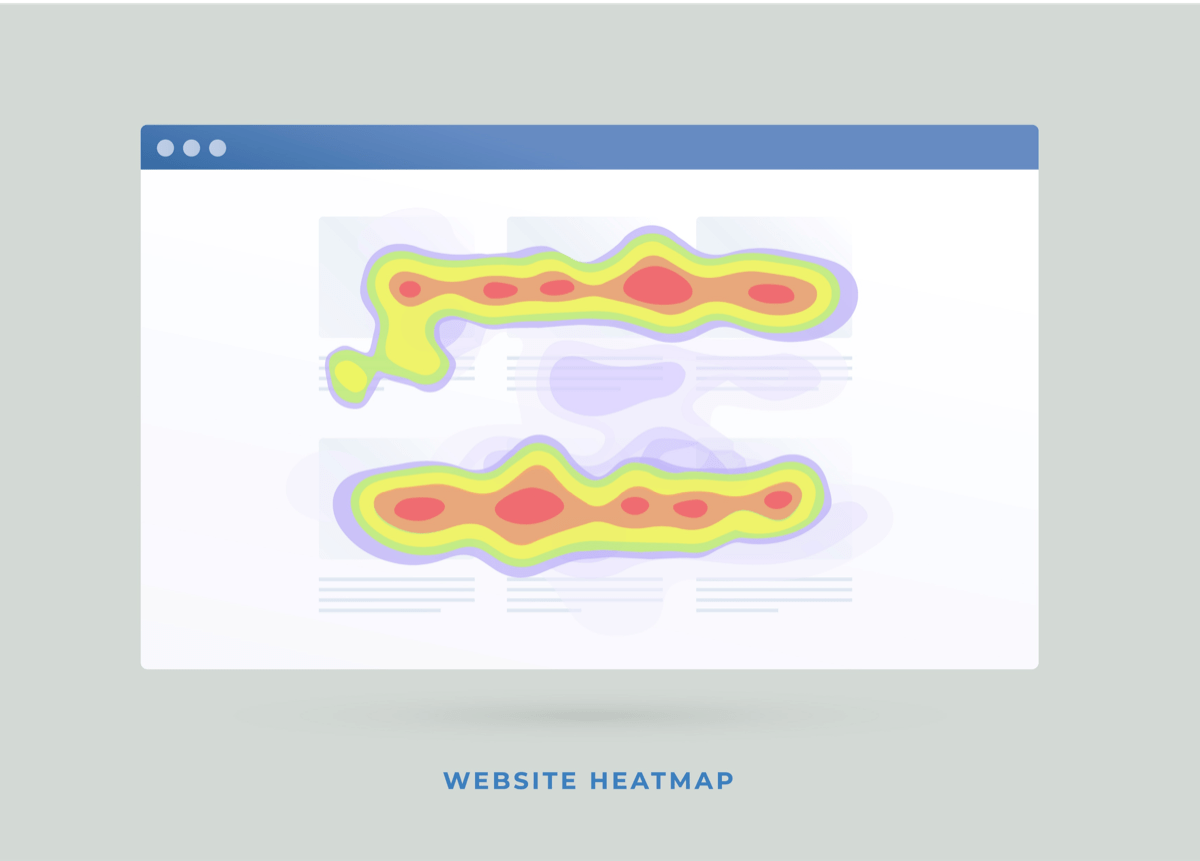
Heatmapping
|
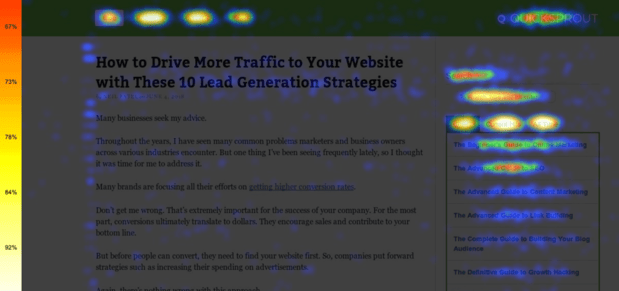 (Source: An example of a heatmap layered with a scrollmap from Crazy Egg, 2020) |
Apply industry-leading techniques to leverage web analytics
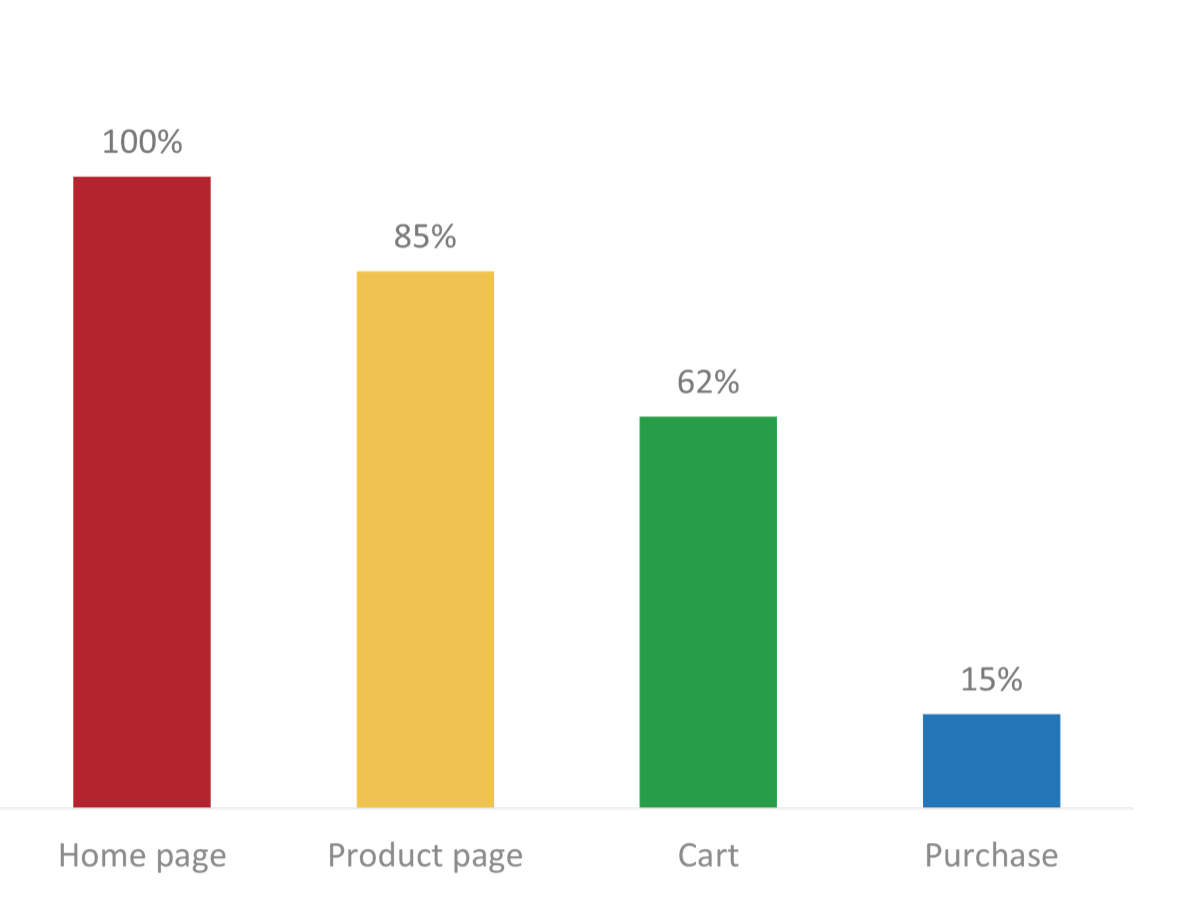
Funneling
|
|
Apply industry-leading techniques to leverage web analytics
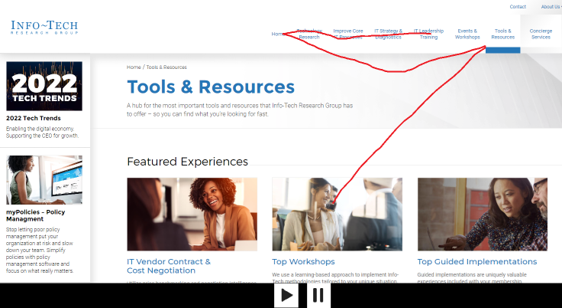
Session recordings
|
|
Apply industry-leading techniques to leverage web analytics
Feedback and microsurveys
|

|
Market Overview
Choose vendors and tools that best match your business needs.
Top-level traditional features
Feature Name |
Description |
| Visitor Count Tracking | Counts the number of visits received by a website or webpage. |
| Geographic Analytics | Uses location information to enable the organization to provide location-based services for various demographics. |
| Conversion Tracking | Measures the proportion of users that complete a certain task compared to total number of users. |
| Device and Browser Analytics | Captures and summarizes device and browser information. |
| Bounce and Exit Tracking | Calculates exit rate and bounce rate on a webpage. |
| CTA Tracking | Measures the number of times users click on a call to action (CTA) button. |
| Audience Demographics | Captures, analyzes, and displays customer demographic/firmographic data from different channels. |
| Aggregate Traffic Reporting | Works backward from a conversion or other key event to analyze the differences, trends, or patterns in the paths users took to get there. |
| Social Media Analytics | Captures information on social signals from popular services (Twitter, Facebook, LinkedIn, etc.). |
Top-level advanced features
Feature Name | Description |
| Heatmapping | Shows where users have clicked on a page and how far they have scrolled down a page or displays the results of eye-tracking tests through the graphical representation of heatmaps. |
| Funnel Exploration | Visualizes the steps users take to complete tasks on your site or app. |
| A/B Testing | Enables you to test the success of various website features. |
| Customer Journey Modelling | Effectively models and displays customer behaviors or journeys through multiple channels and touchpoints. |
| Audience Segmentation | Creates and analyzes discrete customer audience segments based on user-defined criteria or variables. |
| Feedback and Surveys | Enables users to give feedback and share their satisfaction and experience with website designers. |
| Paid Search Integration | Integrates with popular search advertising services (i.e. AdWords) and can make predictive recommendations around areas like keywords. |
| Search Engine Optimization | Provides targeted recommendations for improving and optimizing a page for organic search rankings (i.e. via A/B testing or multivariate testing). |
| Session Recording | Records playbacks of users scrolling, moving, u-turning, and rage clicking on your site. |
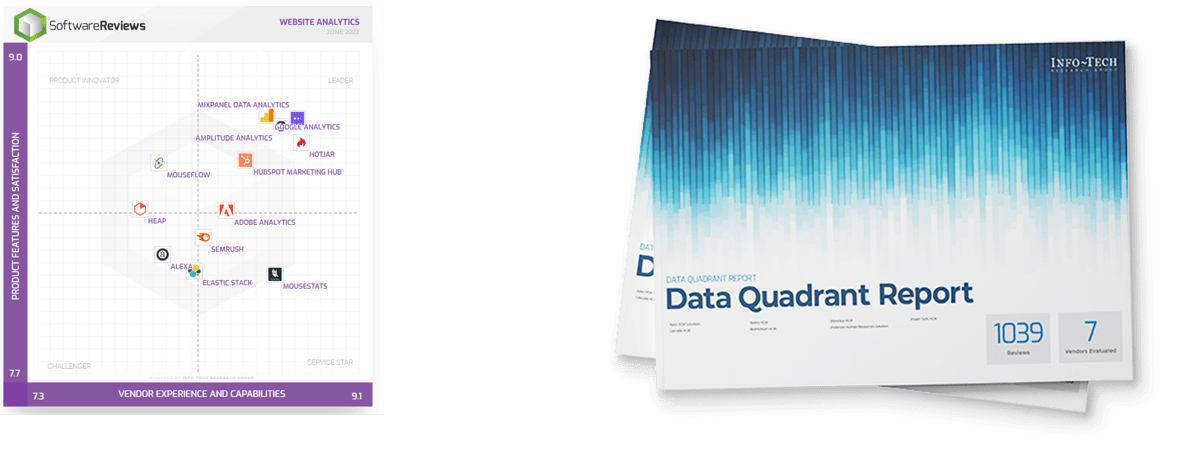
Evaluate software category leaders using SoftwareReviews’ vendor rankings and awards |
|
The Data Quadrant is a thorough evaluation and ranking of all software in an individual category to compare platforms across multiple dimensions.
Vendors are ranked by their Composite Score, based on individual feature evaluations, user satisfaction rankings, vendor capability comparisons, and likeliness to recommend the platform. |
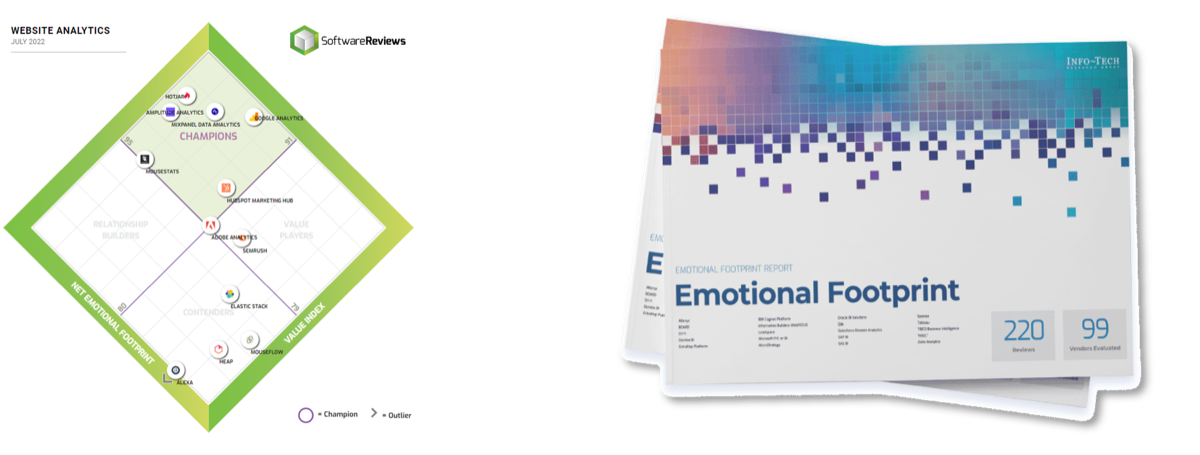
|
The Emotional Footprint is a powerful indicator of overall user sentiment toward the relationship with the vendor, capturing data across five dimensions.
Vendors are ranked by their Customer Experience (CX) Score, which combines the overall Emotional Footprint rating with a measure of the value delivered by the solution. |
Speak with category experts to dive deeper into the vendor landscape |
| Fact-based reviews of business software from IT professionals. | Top-tier data quality backed by a rigorous quality assurance process. | CLICK HERE to ACCESS
Comprehensive software reviews
|
| Product and category reports with state-of-the-art data visualization. | User-experience insight that reveals the intangibles of working with a vendor. |
SoftwareReviews is powered by Info-Tech
Technology coverage is a priority for Info-Tech and SoftwareReviews provides the most comprehensive unbiased data on today’s technology. Combined with the insight of our expert analysts, our members receive unparalleled support in their buying journey.
Top vendors in the web analytics space
| Google Analytics provides comprehensive traditional analytics tools, free of charge, to understand the customer journey and improve marketing ROI. Twenty-four percent of all web analytical tools used on the internet are provided by Google analytics. | |
| Hotjar is a behavior analytics and product experience insights service that helps you empathize with and understand your users through their feedback via tools like heatmaps, session recordings, and surveys. Hotjar complements the data and insights you get from traditional web analytics tools like Google Analytics. | |
| Crazy Egg is a website analytics tool that helps you optimize your site to make it more user-friendly, more engaging, and more conversion-oriented. It does this through heatmaps and A/B testing, which allow you to see how people are interacting with your site. | |
| Amplitude Analytics provides intelligent insight into customer behavior. It offers basic functionalities like measuring conversion rate and engagement metrics and also provides more advanced tools like customer journey maps and predictive analytics capabilities through AI. |
Case Study | INDUSTRY | SOURCE |
Heatmaps and playback recordings
ChallengeMiller & Smith had just redesigned their website, but the organization wanted to make sure it was user-friendly as well as visually appealing. They needed an analytics platform that could provide information about where visitors were coming from and measure the effectiveness of the marketing campaigns. |
SolutionMiller & Smith turned to Crazy Egg to obtain visual insights and track user behavior. They used heatmaps and playback recordings to see user activity within webpages and pinpoint any issues with user interface. In just a few weeks, Miller & Smith gained valuable data to work with: the session recordings helped them understand how users were navigating the site, and the heatmaps allowed them to see where users were clicking – and what they were skipping. |
ResultsDetailed reports generated by the solution allowed Miller & Smith team to convince key stakeholders and implement the changes easily. They were able to pinpoint what changes needed to be made and why these changes would improve their experience. Within few weeks, the bounce rate improved by 7.5% and goal conversion increased by 8.5% over a similar period the previous year. |
Operationalizing Web Analytics Tools
Execute initiatives for successful implementation.
Ensure success of your web analytics programs by following five simple steps
1. ORGANIZATIONAL GOALSThe first key step in implementing and succeeding with web analytics tools is to set clearly defined organizational goals, e.g. improving product sales. 3. KPI METRICSDefine key performance indicators (KPIs) that help track the organization’s performance, e.g. number of page visits, conversion rates, bounce rates. 5. REVIEWContinuous improvement is essential to succeed in understanding customers. The world is a dynamic place, and you must constantly revise your organizational goals, business objectives, and KPIs to remain competitive. |
|
2. BUSINESS OBJECTIVESThe next step is to lay out business objectives that help to achieve the organization’s goals, e.g. to increase customer leads, increase customer transactions, increase web traffic. 4. APPLICATION SELECTIONUnderstand the web analytics tool space and which combination of tools and vendors best fits the organization’s goals. |
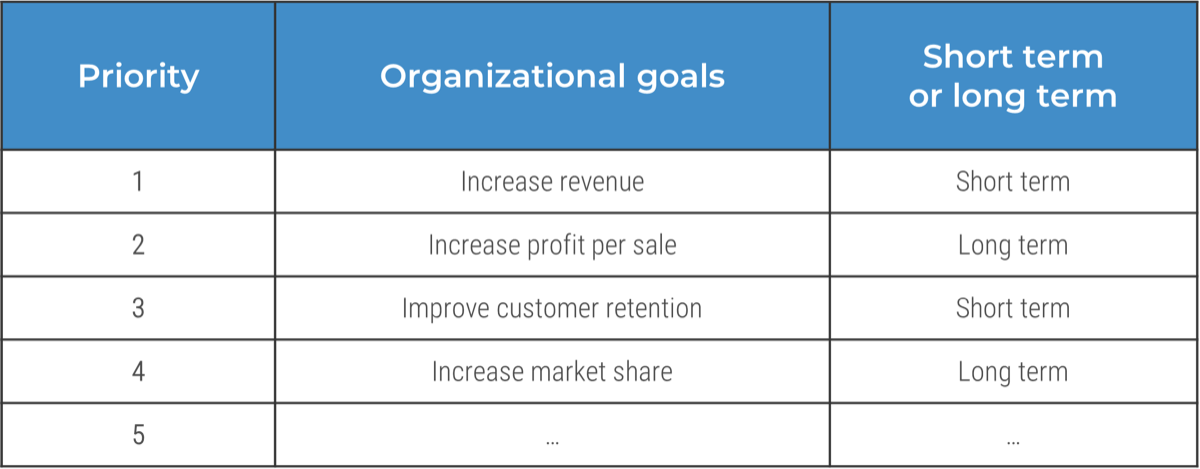
1.1 Understand your organization’s goals
30 minutesOutput: Organization’s goal list
Materials: Whiteboard, Markers
Participants: Core project team
- Identify the key organizational goals for both the short term and the long term.
- Arrange the goals in descending order of priority.
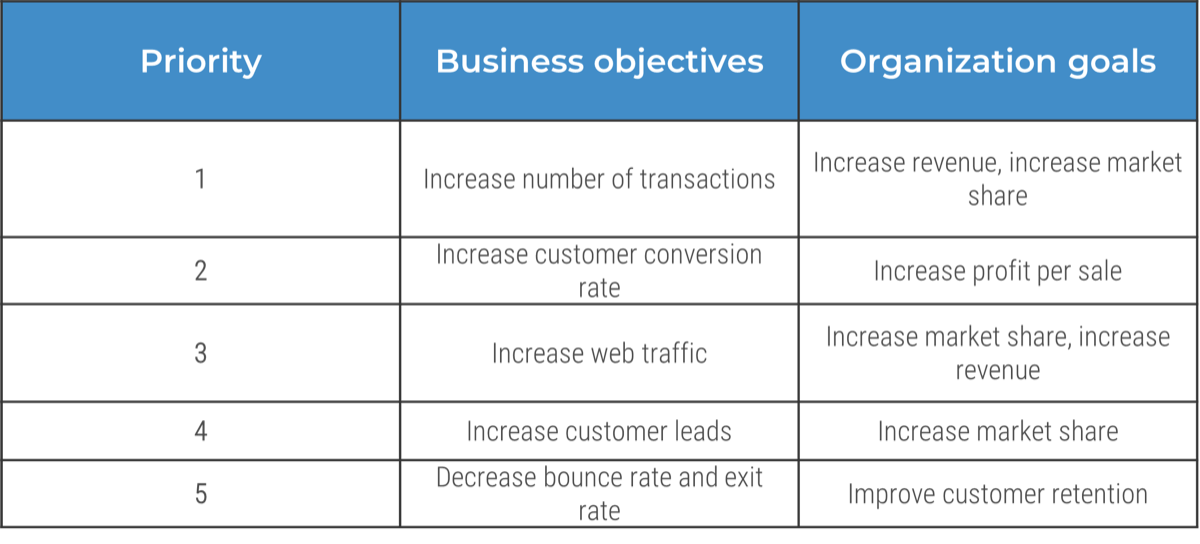
1.2 Align business objectives with organizational goals
30 minutes
Output: Business objectives
Materials: Whiteboard, Markers
Participants: Core project team
- Identify the key business objectives that help attain organization goals.
- Match each business objective with the corresponding organizational goals it helps achieve.
- Arrange the objectives in descending order of priority.
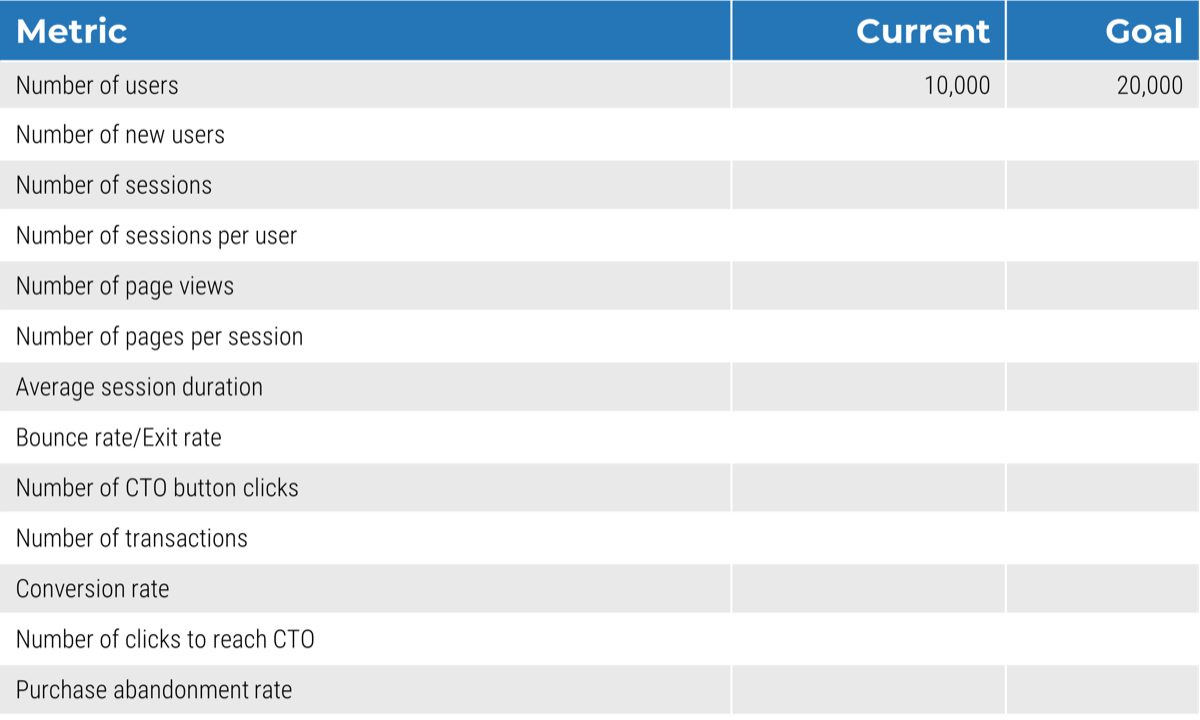
Establish baseline metricsBaseline metrics will be improved through:
|
1.3 Establish baseline metrics that you intend to improve via your web analytics tools30 minutes
|
Accelerate your software selection project
Vendor selection projects often demand extensive and unnecessary documentation.
Software Selection InsightBalance the effort-to-information ratio required for a business impact assessment to keep stakeholders engaged. Use documentation that captures the key data points and critical requirements without taking days to complete. Stakeholders are more receptive to formal selection processes that are friction free. |
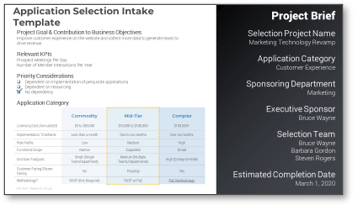
The Software Selection WorkbookWork through the straightforward templates that tie to each phase of the Rapid Application Selection Framework, from assessing the business impact to requirements gathering.
|
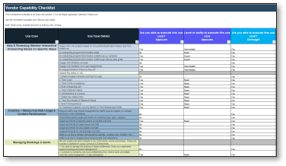
The Vendor Evaluation WorkbookConsolidate the vendor evaluation process into a single document. Easily compare vendors as you narrow the field to finalists.
|
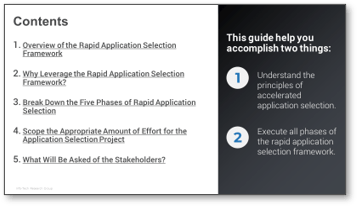
The Guide to Software Selection: A Business Stakeholder ManualQuickly explain the Rapid Application Selection Framework to your team while also highlighting its benefits to stakeholders.
|
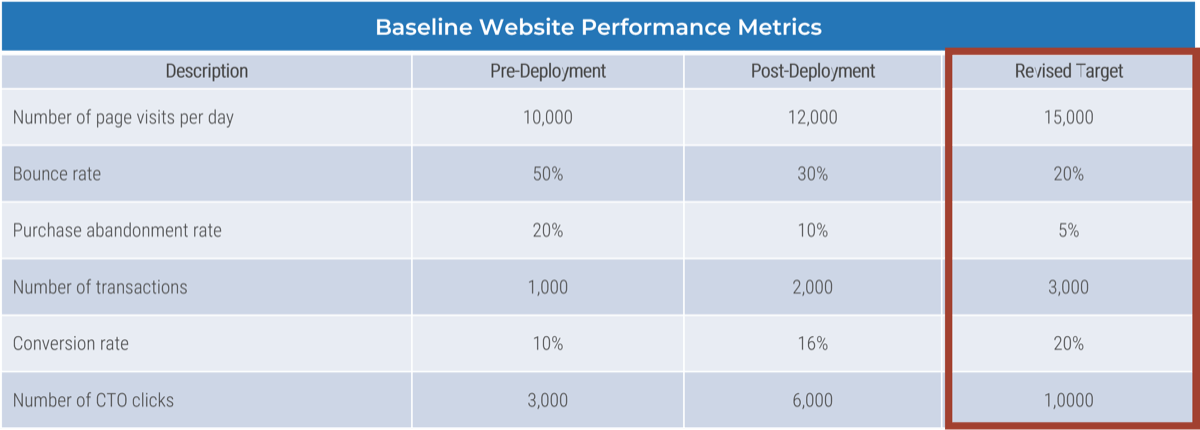
Revisit the metrics you identified and revise your goals
Track the post-deployment results, compare the metrics, and set new targets for the next fiscal year.
Related Info-Tech Research

|
Modernize Your Corporate Website to Drive Business Value
Drive higher user satisfaction and value through UX-driven websites. |

|
Select and Implement a Web Experience Management Solution
Your website is your company’s face to the world: select a best-of-breed platform to ensure you make a rock-star impression with your prospects and customers! |

|
Create an Effective Web Redesign Strategy
Ninety percent of web redesign projects, executed without an effective strategy, fail to accomplish their goals. |
Bibliography
"11 Essential Website Data Factors and What They Mean." CivicPlus, n.d. Accessed 26 July 2022.
“Analytics Usage Distribution in the Top 1 Million Sites.” BuiltWith, 1 Nov. 2022. Accessed 26 July 2022.
"Analytics Usage Distribution on the Entire Internet." BuiltWith, 1 Nov. 2022. Accessed 26 July 2022.
Bell, Erica. “How Miller and Smith Used Crazy Egg to Create an Actionable Plan to Improve Website Usability.” Crazy Egg, n.d. Accessed 26 July 2022.
Brannon, Jordan. "User Behavior Analytics | Enhance The Customer Journey." Coalition Technologies, 8 Nov 2021. Accessed 26 July 2022.
Cardona, Mercedes. "7 Consumer Trends That Will Define The Digital Economy In 2021." Adobe Blog, 7 Dec 2020. Accessed 26 July 2022.
“The Finer Points.“ Analytics Features. Google Marketing Platform, 2022. Accessed 26 July 2022.
Fitzgerald, Anna. "A Beginner’s Guide to Web Analytics." HubSpot, 21 Sept 2022. Accessed 26 July 2022.
"Form Abandonment: How to Avoid It and Increase Your Conversion Rates." Fullstory Blog, 7 April 2022. Accessed 26 July 2022.
Fries, Dan. "Plug Sales Funnel Gaps by Identifying and Tracking Micro-Conversions." Clicky Blog, 9 Dec 2019. Accessed 7 July 2022.
"Funnel Metrics in Saas: What to Track and How to Improve Them?" Userpilot Blog, 23 May 2022. Accessed 26 July 2022.
Garg, Neha. "Digital Experimentation: 3 Key Steps to Building a Culture of Testing." Contentsquare, 21 June 2021. Accessed 26 July 2022.
“Global Web Analytics Market Size, Status and Forecast 2021-2027.” 360 Research Reports, 25 Jan. 2021. Web.
Hamilton, Stephanie. "5 Components of Successful Web Analytics." The Daily Egg, 2011. Accessed 26 July 2022.
"Hammond, Patrick. "Step-by-Step Guide to Cohort Analysis & Reducing Churn Rate." Amplitude, 15 July 2022. Accessed 26 July 2022.
Hawes, Carry. "What Is Session Replay? Discover User Pain Points With Session Recordings." Dynatrace, 20 Dec 2021. Accessed 26 July 2022.
Huss, Nick. “How Many Websites Are There in the World?” Siteefy, 8 Oct. 2022. Web.
Nelson, Hunter. "Establish Web Analytics and Conversion Tracking Foundations Using the Google Marketing Platform.” Tortoise & Hare Software, 29 Oct 2022. Accessed 26 July 2022.
"Product Analytics Vs Product Experience Insights: What’s the Difference?" Hotjar, 14 Sept 2021. Accessed 26 July 2022.
“Record and watch everything your visitors do." Inspectlet, n.d. Accessed 26 July 2022.
“Ryanair: Using Web Analytics to Manage the Site’s Performance More Effectively and Improve Profitability." AT Internet, 1 April 2020. Accessed 26 July 2022.
Sibor, Vojtech. "Introducing Cross-Platform Analytics.” Smartlook Blog, 5 Nov 2022. Accessed 26 July 2022.
"Visualize Visitor Journeys Through Funnels.” VWO, n.d. Accessed 26 July 2022.
"Web Analytics Market Share – Growth, Trends, COVID-19 Impact, and Forecasts (2022-2027)." Mordor Intelligence, 2022. Accessed 26 July 2022.
“What is the Best Heatmap Tool for Real Results?” Crazy Egg, 27 April 2020. Web.
"What Is Visitor Behavior Analysis?" VWO, 2022. Accessed 26 July 2022.
Zheng, Jack G., and Svetlana Peltsverger. “Web Analytics Overview.” IGI Global, 2015. Accessed 26 July 2022.