
- IT organizations measure services from a technology perspective but rarely from a business goal or outcome perspective.
- Most organizations do a poor job of identifying and measuring service outcomes over the duration of a service’s lifecycle – never ensuring the services remain valuable and meet expected long-term ROI.
Our Advice
Critical Insight
- Service metrics are critical to ensuring alignment of IT service performance and business service value achievement.
- Service metrics reinforce positive business and end-user relationships by providing user-centric information that drives responsiveness and consistent service improvement.
- Poorly designed metrics drive unintended and unproductive behaviors that have negative impacts on IT and produce negative service outcomes.
Impact and Result
Effective service metrics will provide the following service gains:
- Confirm service performance and identify gaps.
- Drive service improvement to maximize service value.
- Validate performance improvements while quantifying and demonstrating business value.
- Ensure service reporting aligns with end-user experience.
- Achieve and confirm process and regulatory compliance.
Which will translate into the following relationship gains:
- Embed IT into business value achievement.
- Improve the relationship between the business and IT.
- Achieve higher customer satisfaction (happier end users receiving expected service, the business is able to identify how things are really performing).
- Reinforce desirable actions and behaviors from both IT and the business.
Develop Meaningful Service Metrics Research & Tools
Start here – read the Executive Brief
Read our concise Executive Brief to find out why you should develop meaningful service metrics, review Info-Tech’s methodology, and understand the four ways we can support you in completing this project.Besides the small introduction, subscribers and consulting clients within this management domain have access to:
- Develop Meaningful Service Metrics – Executive Brief
- Develop Meaningful Service Metrics – Phases 1-3
1. Design the metrics
Identify the appropriate service metrics based on stakeholder needs.
- Develop Meaningful Service Metrics to Ensure Business and User Satisfaction – Phase 1: Design the Metrics
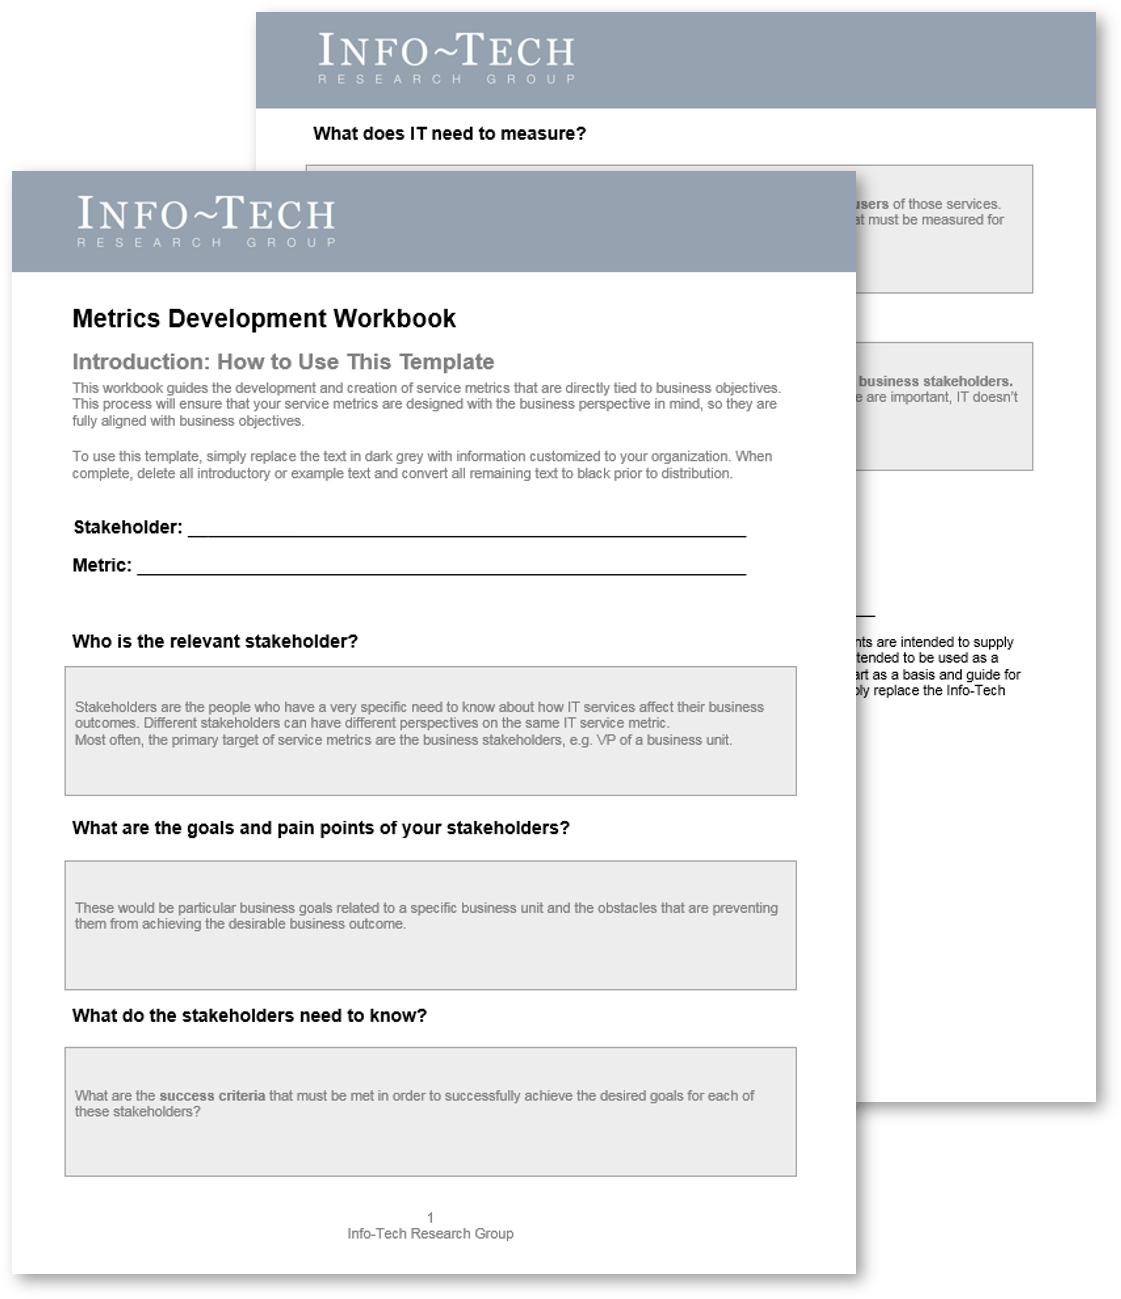
- Metrics Development Workbook
2. Design reports and dashboards
Present the right metrics in the most interesting and stakeholder-centric way possible.
- Develop Meaningful Service Metrics to Ensure Business and User Satisfaction – Phase 2: Design Reports and Dashboards
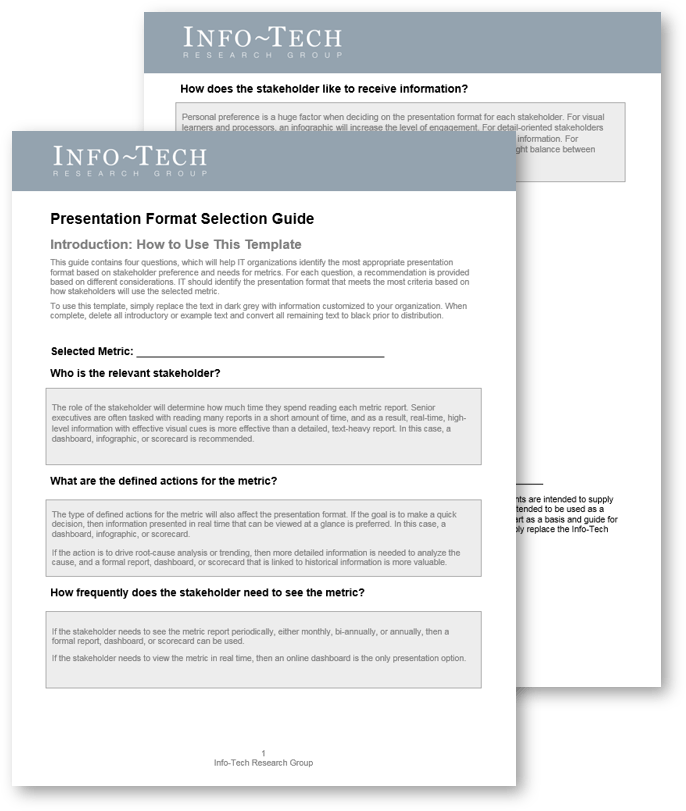
- Metrics Presentation Format Selection Guide
3. Implement, track, and maintain
Run a pilot with a smaller sample of defined service metrics, then continuously validate your approach and make refinements to the processes.
- Develop Meaningful Service Metrics to Ensure Business and User Satisfaction – Phase 3: Implement, Track, and Maintain
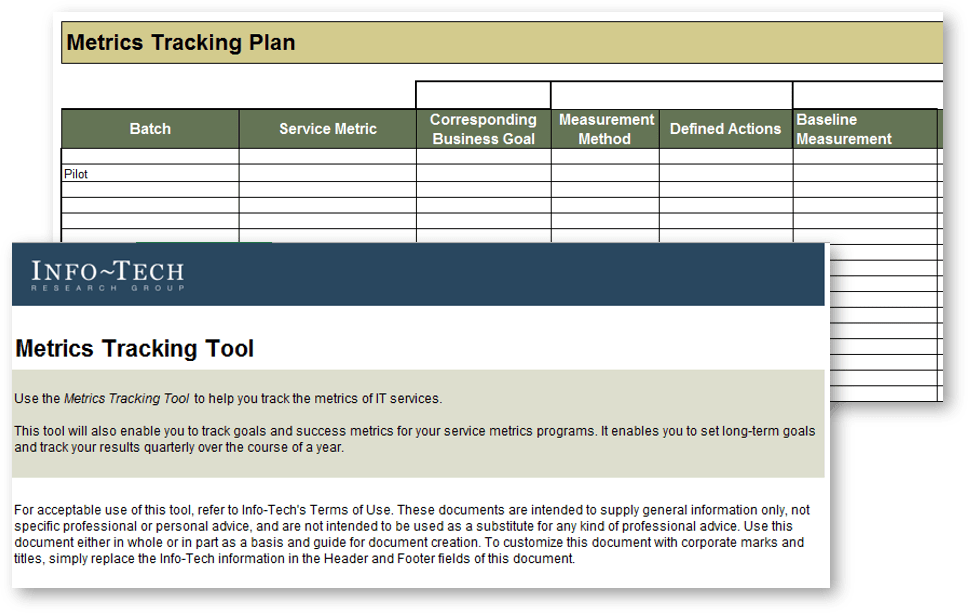
- Metrics Tracking Tool
Workshop: Develop Meaningful Service Metrics
Workshops offer an easy way to accelerate your project. If you are unable to do the project yourself, and a Guided Implementation isn't enough, we offer low-cost delivery of our project workshops. We take you through every phase of your project and ensure that you have a roadmap in place to complete your project successfully.
1 Design the Metrics
The Purpose
Define stakeholder needs for IT based on their success criteria and identify IT services that are tied to the delivery of business outcomes.
Derive meaningful service metrics based on identified IT services and validate that metrics can be collected and measured.
Key Benefits Achieved
Design meaningful service metrics from stakeholder needs.
Validate that metrics can be collected and measured.
Activities
1.1 Determine stakeholder needs, goals, and pain points.
1.2 Determine the success criteria and related IT services.
1.3 Derive the service metrics.
1.4 Validate the data collection process.
1.5 Validate metrics with stakeholders.
Outputs
Understand stakeholder priorities
Adopt a business-centric perspective to align IT and business views
Derive meaningful business metrics that are relevant to the stakeholders
Determine if and how the identified metrics can be collected and measured
Establish a feedback mechanism to have business stakeholders validate the meaningfulness of the metrics
2 Design Reports and Dashboards
The Purpose
Determine the most appropriate presentation format based on stakeholder needs.
Key Benefits Achieved
Ensure the metrics are presented in the most interesting and stakeholder-centric way possible to guarantee that they are read and used.
Activities
2.1 Understand the different presentation options.
2.2 Assess stakeholder needs for information.
2.3 Select and design the metric report.
Outputs
Learn about infographic, scorecard, formal report, and dashboard presentation options
Determine how stakeholders would like to view information and how the metrics can be presented to aid decision making
Select the most appropriate presentation format and create a rough draft of how the report should look
3 Implement, Track, and Maintain Your Metrics
The Purpose
Run a pilot with a smaller sample of defined service metrics to validate your approach.
Make refinements to the implementation and maintenance processes prior to activating all service metrics.
Key Benefits Achieved
High user acceptance and usability of the metrics.
Processes of identifying and presenting metrics are continuously validated and improved.
Activities
3.1 Select the pilot metrics.
3.2 Gather data and set initial targets.
3.3 Generate the reports and validate with stakeholders.
3.4 Implement the service metrics program.
3.5 Track and maintain the metrics program.
Outputs
Select the metrics that should be first implemented based on urgency and impact
Complete the service intake form for a specific initiative
Create a process to gather data, measure baselines, and set initial targets
Establish a process to receive feedback from the business stakeholders once the report is generated
Identify the approach to implement the metrics program across the organization
Set up mechanism to ensure the success of the metrics program by assessing process adherence and process validity
Further reading
Develop Meaningful Service Metrics
Select IT service metrics that drive business value.
ANALYST PERSPECTIVE
Are you measuring and reporting what the business needs to know?
“Service metrics are one of the key tools at IT’s disposal in articulating and ensuring its value to the business, yet metrics are rarely designed and used for that purpose.
Creating IT service metrics directly from business and stakeholder outcomes and goals, written from the business perspective and using business language, is critical to ensuring that the services that IT provides are meeting business needs.
The ability to measure, manage, and improve IT service performance in relation to critical business success factors, with properly designed metrics, embeds IT in the value chain of the business and ensures IT’s focus on where and how it enables business outcomes.”
Valence Howden,
Senior Manager, CIO Advisory
Info-Tech Research Group
Our understanding of the problem
This Research Is Designed For:
|
This Research Will Help You:
|
This Research Will Also Assist:
|
This Research Will Help Them
|
Executive summary
Situation
- IT organizations measure services from a technology perspective yet rarely measure services from a business goal/outcome perspective.
- Most organizations do a poor job of identifying and measuring service outcomes over the duration of a service’s lifecycle – never ensuring the services remain valuable and meet expected long-term ROI.
Complication
- IT organizations have difficulty identifying the right metrics to demonstrate the value of IT services to the business in tangible terms.
- IT metrics, as currently designed, reinforce division between the IT and business perspectives of service performance. They drive siloed thinking and finger-pointing within the IT structure, and prevent IT resources from understanding how their work impacts business value.
Resolution
- Our program enables IT to develop the right service metrics to tie IT service performance to business value and user experience.
- Ensure the metrics you implement have immediate stakeholder value, reinforcing alignment between IT and the business while influencing behavior in the desired direction.
- Make sure that your metrics are defined in relation to the business goals and drivers, ensuring they will provide actionable outcomes.
Info-Tech Insight
- Service metrics are critical to ensuring alignment of IT service performance and business service value achievement.
- Service metrics reinforce positive business and end-user relationships by providing user-centric information that drives responsiveness and consistent service improvement.
- Poorly designed metrics drive unintended and unproductive behaviors, which have negative impacts on IT and produce negative service outcomes.
Service metrics 101
What are service metrics?Service metrics measure IT services in a way that relates to a business outcome. IT needs to measure performance from the business perspective using business language. |
Why do we need service metrics?
To ensure the business cares about the metrics that IT produces, start with business needs to make sure you’re measuring the right things. This will give IT the opportunity talk to the right stakeholders and develop metrics that will meet their business needs. Service metrics are designed with the business perspective in mind, so they are fully aligned with business objectives. |
| Perspectives Matter
Different stakeholders will require different types of metrics. A CEO may require metrics that provide a snapshot of the critical success of the company while a business manager is more concerned about the performance metrics of their department. |
What are the benefits of implementing service metrics?
Service metrics help IT communicate with the business in business terms and enables IT to articulate how and where they provide business value. Business stakeholders can also easily understand how IT services contribute to their success. |
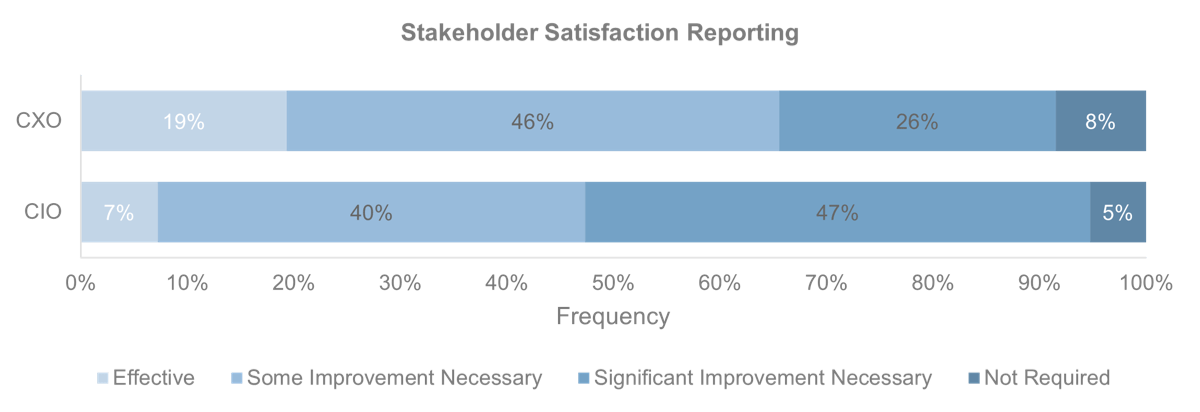
The majority of CIOs feel metrics relating to business value and stakeholder satisfaction require significant improvement
| A significantly higher proportion of CIOs than CEOs feel that there is significant improvement necessary for business value metrics and stakeholder satisfaction reporting. | 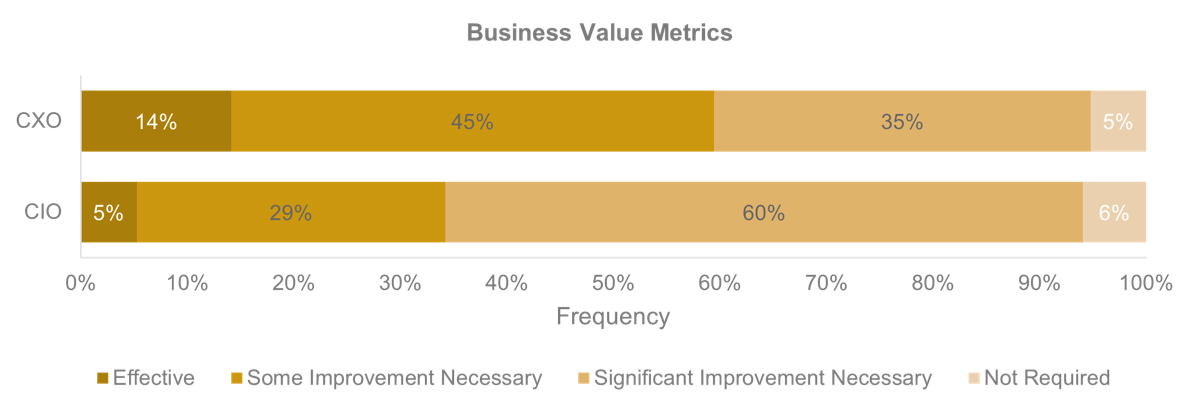 N=364 N=364
|
 N=364
N=364
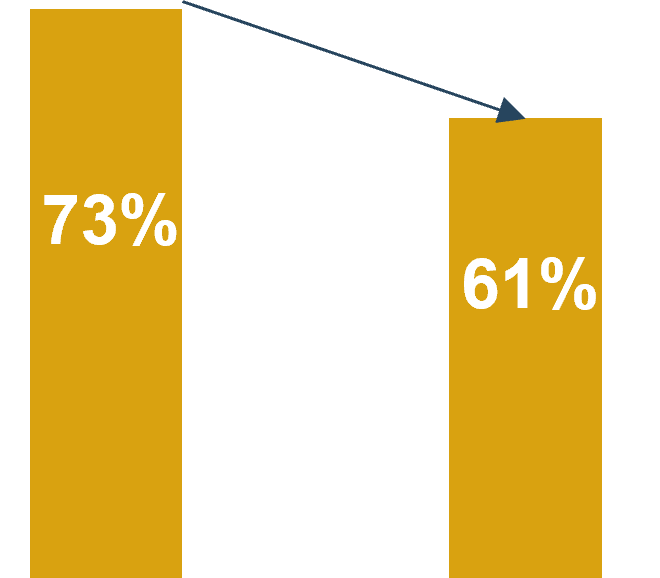
Meaningless metrics are a headache for the business
A major pitfall of many IT organizations is that they often provide pages of technical metrics that are meaningless to their business stakeholders.
|
When considering only CEOs who said that stakeholder satisfaction reporting needed significant improvement, the average satisfaction score goes down to 61.6%, which is a drop in satisfaction of 12%.
|
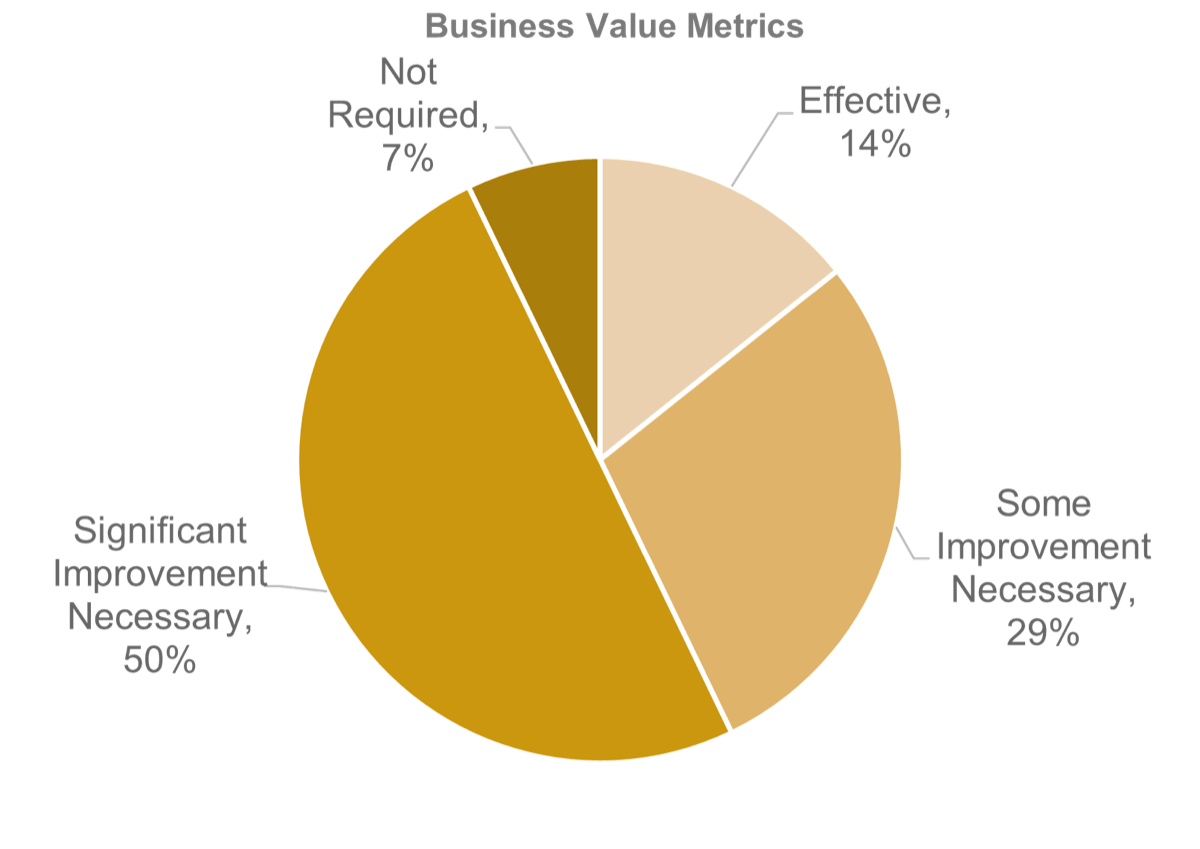
Poorly designed metrics hurt IT’s image within the organization
By providing metrics that do not articulate the value of IT services, IT reinforces its role as a utility provider and an outsider to strategic decisions.
| When the CIOs believe business value metrics weren’t required, 50% of their CEOs said that significant improvements were necessary.
|
|
Articulate meaningful service performance that supports the achievement of business outcomes
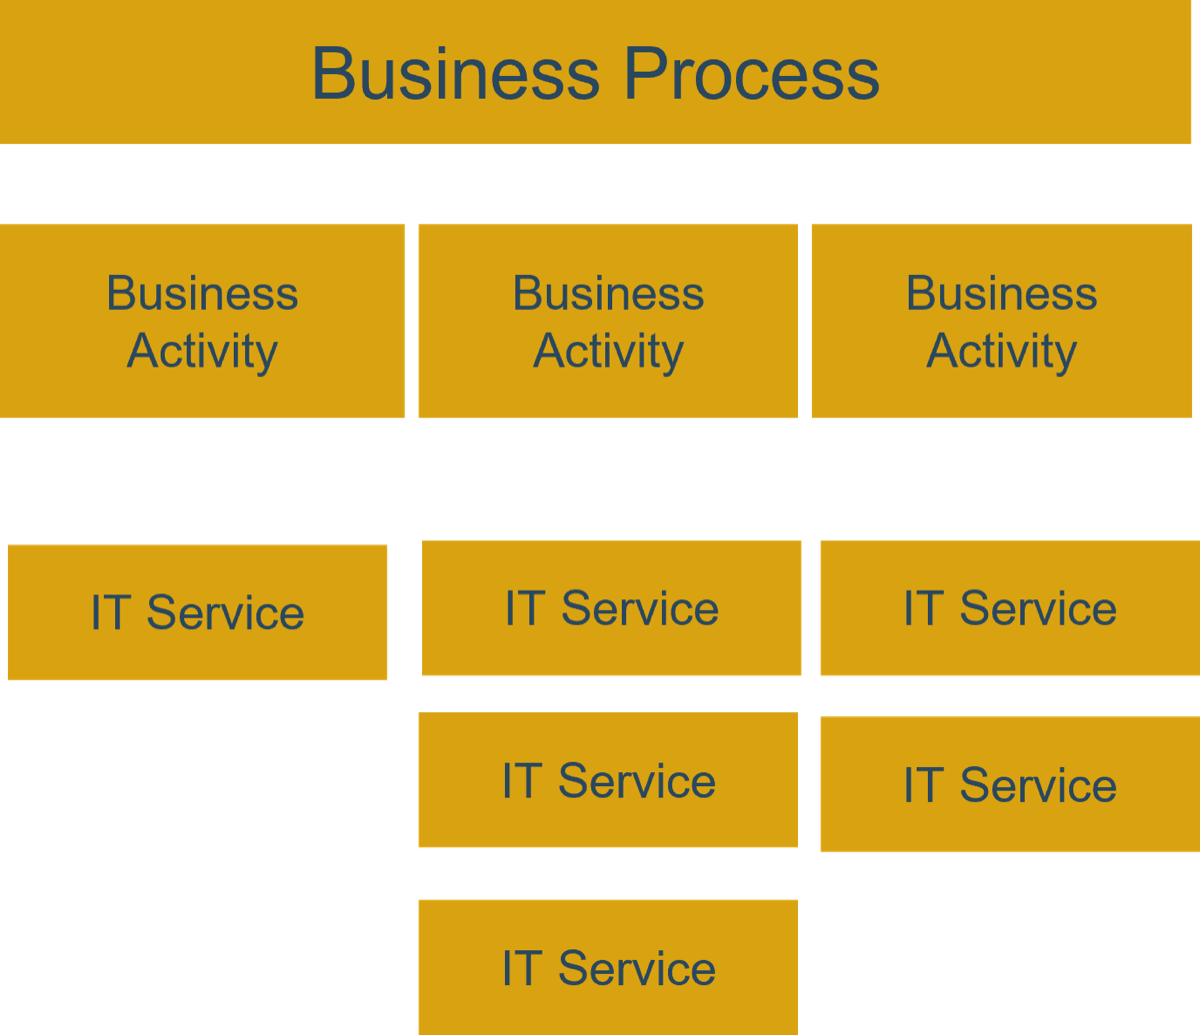
Service metrics measure the performance of IT services and how they enable or drive the activity outcomes.
A business process consists of multiple business activities. In many cases, these business activities require one or more supporting IT services.
|
For each business process, business stakeholders and their goals and objectives should be identified.
For each business activity that supports the completion of a business process, define the success criteria that must be met in order to produce the desirable outcome. Identify the IT services that are used by business stakeholders for each business activity. Measure the performance of these services from a business perspective to arrive at the appropriate service metrics. |
Differentiate between different types of metrics
Stakeholders have different goals and objectives; therefore, it is critical to identify what type of metrics should be presented to each stakeholder.
Business Metrics
Determine Business SuccessBusiness metrics are derived from a pure business perspective. These are the metrics that the business stakeholders will measure themselves on, and business success is determined using these metrics. |
|
Service Metrics
Manage Service Value to the BusinessService metrics are used to measure IT service performance against business outcomes. These metrics, while relating to IT services, are presented in business terms and are tied to business goals. |
|
IT Metrics
Enable Operational ExcellenceIT metrics are internal to the IT organization and used to manage IT service delivery. These metrics are technical, IT-specific, and drive action for IT. They are not presented to the business, and are not written in business language. |
Implementing service metrics is a key step in becoming a service provider and business partner
As a prerequisite, IT organizations must have already established a solid relationship with the business and have a clear understanding of its critical business-facing services.
At the very least, IT needs to have a service-oriented view and understand the specific needs and objectives associated with each stakeholder.
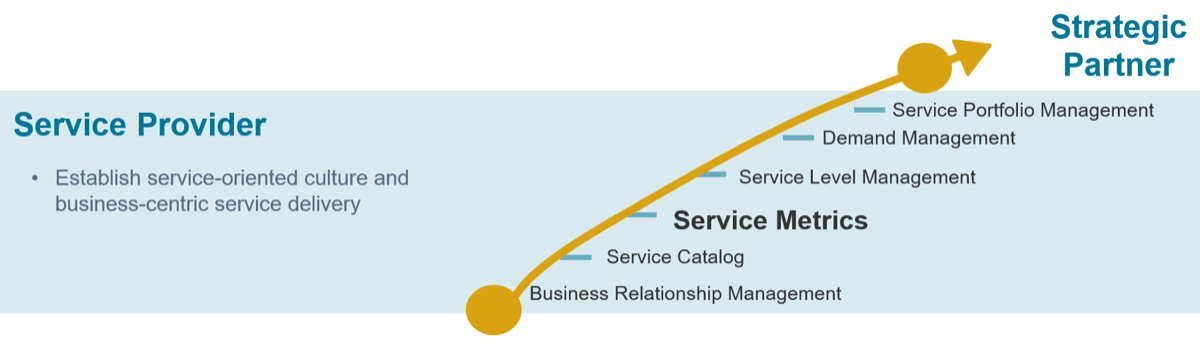
Once IT can present service metrics that the business cares about, it can continue on the service provider journey by managing the performance of services based on business needs, determine and influence service demand, and assess service value to maximize benefits to the business.
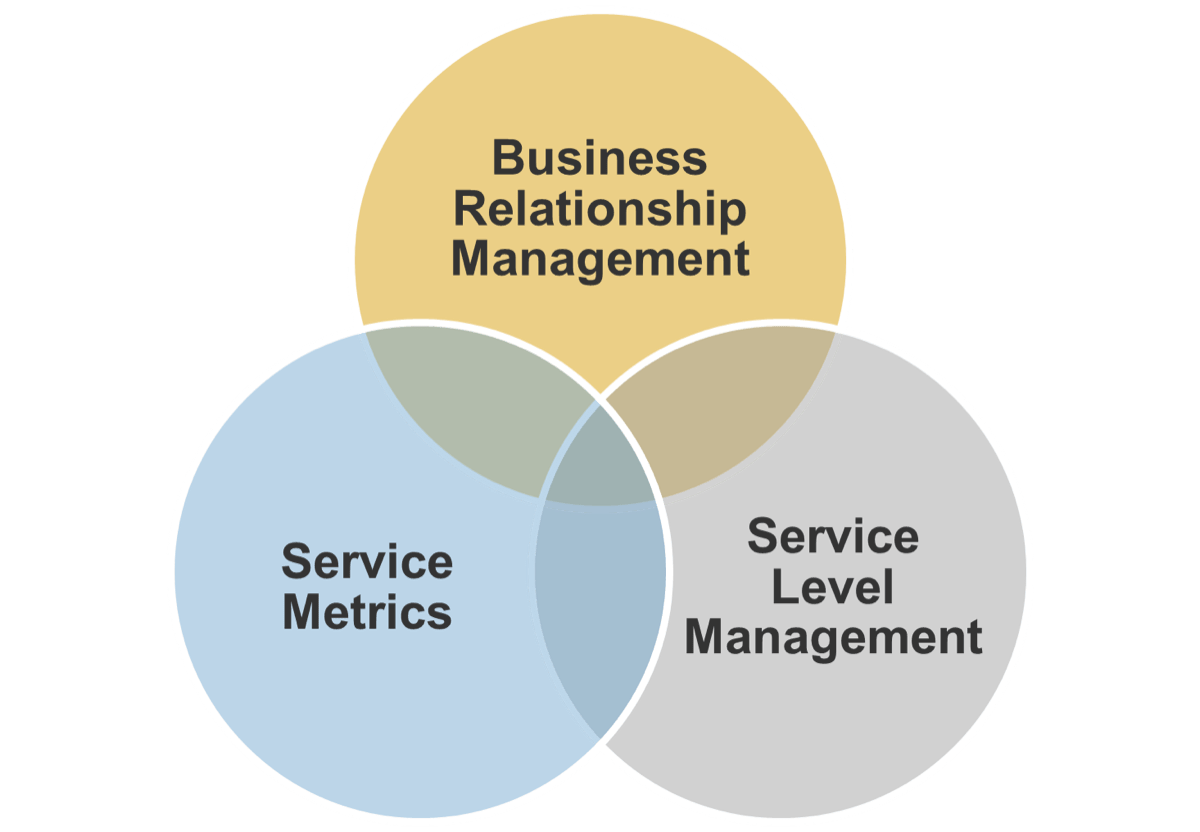
Which processes drive service metrics?
Both business relationship management (BRM) and service level management (SLM) provide inputs into and receive outputs from service metrics.
|
Business Relationship ManagementBRM works to understand the goals and objectives of the business and inputs them into the design of the service metrics. Service MetricsBRM leverages service metrics to help IT organizations manage the relationship with the business. BRM articulates and manages expectations and ensures IT services are meeting business requirements. |
Which processes drive service metrics?
Both BRM and SLM provide inputs into and receive outputs from service metrics.
| Service Level ManagementSLM works with the business to understand service requirements, which are key inputs in designing the service metrics. Service MetricsSLM leverages service metrics in overseeing the day-to-day delivery of IT services. It ensures they are provided to meet expected service level targets and objectives. |
Effective service metrics will deliver both service gains and relationship gains
Effective service metrics will provide the following service gains:
- Confirm service performance and identify gaps
- Drive service improvement to maximize service value
- Validate performance improvements while quantifying and demonstrating business value
- Ensure service reporting aligns with end-user experience
- Achieve and confirm process and regulatory compliance
- Which will translate into the following relationship gains:
- Embed IT into business value achievement
- Improve relationship between the business and IT
- Achieve higher customer satisfaction (happier end users receiving expected service, the business is able to identify how things are really performing)
- Reinforce desirable actions and behaviors from both IT and the business
Don’t let conventional wisdom become your roadblock
Conventional Wisdom |
Info-Tech Perspective |
| Metrics are measured from an application or technology perspective | Metrics need to be derived from a service and business outcome perspective. |
| The business doesn’t care about metrics | Metrics are not usually designed to speak in business terms about business outcomes. Linking metrics to business objectives creates metrics that the business cares about. |
| It is difficult to have a metrics discussion with the business | It is not a metrics/number discussion, it is a discussion on goals and outcomes. |
| Metrics are only presented for the implementation of the service, not the ongoing outcome of the service | IT needs to focus on service outcome and not project outcome. |
| Quality can’t be measured | Quality must be measured in order to properly manage services. |
Our three-phase approach to service metrics development
Let Info-Tech guide you through your service metrics journey
1 |
2 |
3 |
| Design Your Metrics | Develop and Validate Reporting | Implement, Track, and Maintain |
|
|
|
| Start the development and creation of your service metrics by keeping business perspectives in mind, so they are fully aligned with business objectives. | Identify the most appropriate presentation format based on stakeholder preference and need for metrics. | Track goals and success metrics for your service metrics programs. It allows you to set long-term goals and track your results over time. |
CIOs must actively lead the design of the service metrics program
The CIO must actively demonstrate support for the service metrics program and lead the initial discussions to determine what matters to business leaders.
- Lead the initiative by defining the need
Show visible support and demonstrate importance - Articulate the value to both IT and the business
Establish the urgency and benefits - Select and assemble an implementation group
Find the best people to get the job done - Drive initial metrics discussions: goals, objectives, actions
Lead brainstorming with senior business leaders - Work with the team to determine presentation formats and communication methods
Identify the best presentation approach for senior stakeholders - Establish a feedback loop for senior management
Solicit feedback on improvements - Validate the success of the metrics
Confirm service metrics support business outcomes
Measure the success of your service metrics
It is critical to determine if the designed service metrics are fulfilling their intended purpose. The process of maintaining the service metrics program and the outcomes of implementing service metrics need to be monitored and tracked.
| Validating Service Metrics Design | |
Target Outcome |
Related Metrics |
| The business is enabled to identify and improve service performance to their end customer | # of improvement initiatives created based on service metrics $ cost savings/revenue generated due to actions derived from service metrics |
|
Procedure to validate the usefulness of IT metrics |
# / % of service metrics added/removed per year |
| Alignment between IT and business objectives and processes | Business’ satisfaction with IT |
Measure the success of your service metrics
It is critical to determine if the designed service metrics are fulfilling their intended purpose. The process of maintaining the service metrics program and the outcomes of implementing service metrics need to be monitored and tracked.
| Validating Service Metrics Process | |
Target Outcome | Related Metrics |
| Properly defined service metrics aligned with business goals/outcomes Easy understood measurement methodologies | % of services with (or without) defined service metrics % of service metrics tied to business goals |
| Consistent approach to review and adjust metrics | # of service metrics adjusted based on service reviews % of service metrics reviewed on schedule |
Demonstrate monetary value and impact through the service metrics program
In a study done by the Aberdeen Group, organizations engaged in the use of metrics benchmarking and measurement have:
|
A service metric is defined for: “Response time for Business Application A”
The expected response time has not been achieved and this is visible in the service metrics. The reduced performance has been identified as having an impact of $250,000 per month in lost revenue potential. The service metric drove an action to perform a root-cause analysis, which identified a network switch issue and drove a resolution action to fix the technology and architect redundancy to ensure continuity. The fix eliminated the performance impact, allowing for recovery of the $250K per month in revenue, improved end-user confidence in the organization, and increased use of the application, creating additional revenue. |

Implementing and measuring a video conferencing service
| CASE STUDY |
Industry: Manufacturing | Source: CIO interview and case material |
| Situation
The manufacturing business operates within numerous countries and requires a lot of coordination of functions and governance oversight. The company has monthly meetings, both regional and national, and key management and executives travel to attend and participate in the meetings. ComplicationWhile the meetings provide a lot of organizational value, the business has grown significantly and the cost of business travel has started to become prohibitive. ActionIt was decided that only a few core meetings would require onsite face-to-face meetings, and for all other meetings, the company would look at alternative means. The face-to-face aspect of the meetings was still considered critical so they focused on options to retain that aspect. The IT organization identified that they could provide a video conferencing service to meet the business need. The initiative was approved and rolled out in the organization. |
Result:IT service metrics needed to be designed to confirm that the expected value outcome of the implementation of video conferencing was achieved. Under the direction of the CIO, the business goals and needs driving use of the service (i.e. reduction in travel costs, efficiency, no loss of positive outcome) were used to identify success criteria and key questions to confirm success. With this information, the service manager was able to implement relevant service metrics in business language and confirmed an 80% adoption rate and a 95% success rate in term meetings running as expected and achieving core outcomes. |
Use these icons to help direct you as you navigate this research
Use these icons to help guide you through each step of the blueprint and direct you to content related to the recommended activities.

This icon denotes a slide where a supporting Info-Tech tool or template will help you perform the activity or step associated with the slide. Refer to the supporting tool or template to get the best results and proceed to the next step of the project.

This icon denotes a slide with an associated activity. The activity can be performed either as part of your project or with the support of Info-Tech team members, who will come onsite to facilitate a workshop for your organization.
Info-Tech offers various levels of support to best suit your needs
DIY Toolkit |
Guided Implementation |
Workshop |
Consulting |
| "Our team has already made this critical project a priority, and we have the time and capability, but some guidance along the way would be helpful." | "Our team knows that we need to fix a process, but we need assistance to determine where to focus. Some check-ins along the way would help keep us on track." | "We need to hit the ground running and get this project kicked off immediately. Our team has the ability to take this over once we get a framework and strategy in place." | "Our team does not have the time or the knowledge to take this project on. We need assistance through the entirety of this project." |
Diagnostics and consistent frameworks used throughout all four options
Develop meaningful service metrics to ensure business and user satisfaction
| 1. Design the Metrics | 2. Design Reports and Dashboards | 3. Implement, Track, and Maintain | |
Best-Practice Toolkit |
|
|
|
Guided Implementations |
|
|
|
Onsite Workshop |
Module 1: Derive Service Metrics From Business Goals |
Module 2: Select and Design Reports and Dashboards |
Module 3: Implement, Track, and Maintain Your Metrics to Ensure Success |
Phase 1 Outcome:
|
Phase 2 Outcome:
|
Phase 3 Outcome:
|
Workshop overview
Contact your account representative or email Workshops@InfoTech.com for more information.
| Workshop Day 1 | Workshop Day 2 | Workshop Day 3 | Workshop Day 4 | |
Design the Metrics |
Determine Presentation Format and Implement Metrics |
Gather Service Level Requirements |
Monitor and Improve Service Levels |
|
Activities |
|
|
|
|
Deliverables |
|
|
|
|
Develop Meaningful Service Metrics to Ensure Business and User Satisfaction
PHASE 1
Design the Metrics
Step (1): Design the Metrics
| PHASE 1 | PHASE 2 | PHASE 3 | ||
1.1Derive the Service Metrics |
1.2Validate the Metrics |
2.1Determine Reporting Format |
3.1Select Pilot Metrics |
3.2Activate and Maintain Metrics |
This step involves the following participants:
- CIO
- Business Relationship Manager (BRM)
- Service Level Manager (SLM)
Outcomes of this step
- Defined stakeholder needs for IT based on their success criteria
- Identified IT services that are tied to the delivery of business outcomes
- Derived meaningful service metrics based on identified IT services and validated with business stakeholders
- Validated that metrics can be collected and measured
- Determined calculation methodology
Phase 1 outline
Call 1-888-670-8889 or email GuidedImplementations@InfoTech.com for more information.
Complete these steps on your own, or call us to complete a guided implementation. A guided implementation is a series of 2-3 advisory calls that help you execute each phase of a project. They are included in most advisory memberships.
Guided Implementation 1: Design the Metrics
Proposed Time to Completion (in weeks): 4 weeks
| Step 1.1: Design Metrics | Step 1.2: Validate the Metrics |
Start with an analyst kick-off call:
|
Review findings with analyst:
|
Then complete these activities…
|
Then complete these activities…
|
With these tools & templates:
|
With these tools & templates:
|
Design your service metrics – overview

|
Step 1 Derive your service metrics Metrics Worksheet |

|
Step 2 Validate your metrics Metrics Worksheet |

|
Step 3 Confirm with stakeholders Metrics Tracking Sheet |

Defined IT Service Metrics |
Derive your service metrics from business objectives and needs
| Service metrics must be designed with the business perspective in mind so they are fully aligned with business objectives.
Thus, IT must start by identifying specific stakeholder needs. The more IT understands about the business, the more relevant the metrics will be to the business stakeholders. |
|
Derive your service metrics
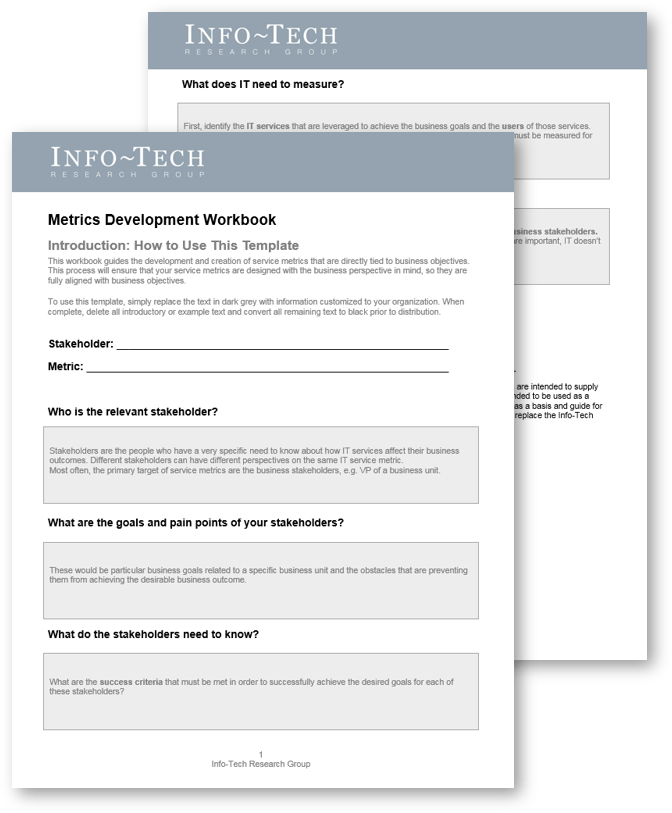
1.1 Metrics Development Workbook
This workbook guides the development and creation of service metrics that are directly tied to stakeholder needs.
This process will ensure that your service metrics are designed with the business perspective in mind so they are fully aligned with business objectives.
Download the Metrics Development Workbook. |
|
Determine your stakeholders
1.1 0.5 Hour
Who are your stakeholders?
|
Video Conferencing Case Study For this phase, we will demonstrate how to derive the service metrics by going through the steps in the methodology. At a manufacturing company, the CIO’s main stakeholder is the CEO, whose chief concern is to improve the financial position of the company. |
Identify goals and pain points of your stakeholders
1.2 0.5 Hour
What are their goals and pain points?
|
VC Case Study One of the top initiatives identified by the company to improve financial performance was to reduce expense. Because the company has several key locations in different states, company executives used to travel extensively to carry out meetings at each location. Therefore, travel expenses represent a significant proportion of operational expenses and reducing travel costs is a key goal for the company’s executives. |
What do the stakeholders need to know?
1.3 0.5 HourWhat do the stakeholders need to know?
| VC Case Study The CEO needs to have assurance that without executives traveling to each location, remote meetings can be as effective as in-person meetings. These meetings must provide the same outcome and allow executives to collaborate and make similar strategic decisions without the onsite, physical presence. Therefore, the success criteria are:
|
What do I need to measure?
1.4 1 HourWhat does IT need to measure?
| VC Case Study The IT department decides to implement the video conferencing service to reduce the number of onsite meetings. This technology would allow executives to meet remotely with both audio and video and is the best option to replicate a physical meeting. The service is initially available to senior executives and will be rolled out to all internal users once the initial implementation is deemed successful. To determine the success of the service, the following needs to be measured:
|
Derive service metrics
1.5 0.5 HourDerive your service metrics
| VC Case Study In the previous step, IT identified that it must measure the outcomes of VC meetings, quality of the VC meetings, and the reduction in travel expenses. From these, the appropriate service metrics can be derived to answer the needs of the CEO. IT needs to measure:
IT also identified the following business metrics:
|
Validate your metrics
Once appropriate service metrics are derived from business objectives, the next step is to determine whether or not it is viable to actually measure the metrics.
| Can you measure it? | The first question IT must answer is whether the metric is measurable. IT must identify the data source, validate its ability to collect the data, and specify the data requirement. Not all metrics can be measured! |
| How will you measure it? | If the metric is measurable, the next step is to create a way to measure the actual data. In most cases, simple formulas that can be easily understood are the best approach. |
| Define your actions | Metrics must be used to drive or reinforce desirable outcomes and behaviors. Thus, IT must predetermine the necessary actions associated with the different metric levels, thresholds, or trends. |
Determine if you can measure the identified metric
1.6 0.5 HourINSTRUCTIONS
| VC Case Study Using the metric derived from the video conferencing service example, IT wants to measure the % of VC meetings successfully delivered. What are the data sources?
|
Determine if you can measure the identified metric
1.6 0.5 HourINSTRUCTIONS
| VC Case Study Data requirement for percent of successful VC meetings:
|
Create the calculation to measure it
1.7 0.5 HourDetermine how to calculate the metrics.
INSTRUCTIONS
| VC Case Study Metric: Percent of VC meetings delivered successfully IT is able to determine the total number of VC meetings that took place and the number of VC service requests to the help desk. That makes it possible to use the following formula to determine the success percentage of the VC service: ((total # VC) – (# of VC with identified incidents)) / (total # VC) * 100 |
Define the actions to be taken for each metric
1.7 1.5 HourINSTRUCTIONSCentered on the defined metrics and their calculations, IT can decide on the actions that should be driven out of each metric based on one of the following scenarios:
| VC Case Study If the success rate of the VC meetings is below 90%, IT needs to focus on determining if there is a common cause and identify if this is a consistent downward trend. A root-cause analysis is performed that identifies that network issues are causing difficulties, impacting the connection quality and usability of the VC service. |
Validate the confirmed metrics with the business
1.8 1 Hour
INPUT: Selected service metrics, Discussion with the business
OUTPUT: Validated metrics with the business
Materials: Metrics with calculation methodology
Participants: IT and business stakeholders, Service owners
INSTRUCTIONS
- Once you have derived the appropriate metrics and established that the metrics are measurable, you must go back to the targeted stakeholders and validate that the selected metrics will provide the right information to meet their identified goals and success criteria.
- Add confirmed metrics to the Metrics Tracking Tool, in the Metrics Tracking Plan tab.
| Service Metric | Corresponding Business Goal |
Measurement Method |
Defined Actions |
Example: Measuring the online banking service at a financial institution
| Who are IT’s stakeholders? | The financial institution provides various banking solutions to its customers. Retail banking is a core service offered by the bank and the VP of retail banking is a major stakeholder of IT. |
| What are their goals and pain points? | The VP of retail banking’s highest priorities are to increase revenue, increase market share, and maintain the bank’s brand and reputation amongst its customers. |
| What do they need to know? | In order to measure success, the VP of retail banking needs to determine performance in attracting new clients, retaining clients, expanding into new territory, and whether they have increased the number of services provided to existing clients. |
| What does IT need to measure? | The recent implementation of an online banking service is a key initiative that will keep the bank competitive and help retail banking meet its goals. The key indicators of this service are: the total number of clients, the number of products per client, percent of clients using online banking, number of clients by segment, service, territory. |
| Derive the service metrics | Based on the key indicators, IT can derive the following service metrics: 1. Number of product applications originated from online banking 2. Customer satisfaction/complaints As part of the process, IT also identified some business metrics, such as the number of online banking users per month or the number of times a client accesses online banking per month. |
Design service metrics to track service performance and value
| CASE STUDY |
Industry: Manufacturing | Source: CIO |
| Challenge | Solution | Results |
| The IT organization needed to generate metrics to show the business whether the video conferencing service was being adopted and if it was providing the expected outcome and value.
Standard IT metrics were technical and did not provide a business context that allowed for easy understanding of performance and decision making. |
The IT organization, working through the CIO and service managers, sat down with the key business stakeholders of the video conferencing service.
They discussed the goals for the meeting and defined the success criteria for those goals in the context of video conference meeting outcomes. The success criteria that were discussed were then translated into a set of questions (key performance indicators) that if answered, would show that the success criteria were achieved. |
The service manager identified what could be measured to answer the defined questions and eliminated any metrics that were either business metrics or non-IT related.
The remaining metrics were identified as the possible service metrics, and the ability to gather the information and produce the metric was confirmed. Service metrics were defined for:
|
If you want additional support, have our analysts guide you through this phase as part of an Info-Tech Workshop
Book a workshop with our Info-Tech analysts:

|
|
The following are sample activities that will be conducted by Info-Tech analysts with your team:
1.1 |
|
Determine stakeholder needs, goals, and pain points
The onsite analyst will help you select key stakeholders and analyze their business objectives and current pain points. |
1.2 |
|
Determine the success criteria and related IT services
The analyst will facilitate a discussion to uncover the information that these stakeholders care about. The group will also identify the IT services that are supporting these objectives. |
If you want additional support, have our analysts guide you through this phase as part of an Info-Tech Workshop
Book a workshop with our Info-Tech analysts:
1.5 |
|
Derive the service metrics
Based on the key performance indicators obtained in the previous page, derive meaningful business metrics that are relevant to the stakeholders. |
1.6 |
|
Validate the data collection process
The analyst will help the workshop group determine whether the identified metrics can be collected and measured. If so, a calculation methodology is created. |
1.7 |
|
Validate metrics with stakeholders
Establish a feedback mechanism to have business stakeholders validate the meaningfulness of the metrics. |
Develop Meaningful Service Metrics to Ensure Business and User Satisfaction
PHASE 2
Design Reports and Dashboards
Step (2): Design Reports and Dashboards
| PHASE 1 | PHASE 2 | PHASE 3 | ||
1.1Derive the Service Metrics | 1.2Validate the Metrics | 2.1Determine Reporting Format | 3.1Select Pilot Metrics | 3.2Activate and Maintain Metrics |
This step involves the following participants:
- Business Relationship Manager
- Service Level Manager
- Business Stakeholders
Outcomes of this step
- Presentation format selected based on stakeholder needs and preference for information
- Presentation format validated with stakeholders
Phase 2 outline
Call 1-888-670-8889 or email GuidedImplementations@InfoTech.com for more information.Complete these steps on your own, or call us to complete a guided implementation. A guided implementation is a series of 2-3 advisory calls that help you execute each phase of a project. They are included in most advisory memberships.
Guided Implementation 2: Design Reports and Dashboards
Proposed Time to Completion (in weeks): 3 weeks
| Step 2.1: Select Presentation Format | Step 2.2: Review Design |
Start with an analyst kick-off call:
|
Review findings with analyst:
|
Then complete these activities…
|
Then complete these activities…
|
With these tools & templates:
|
With these tools & templates:
|
Design the reports – overview
|
|
Step 1 Understand the pros and cons of different reporting styles |
|
Step 2 Determine your reporting and presentation style Presentation Format Selection |
|
Step 3 Design your metrics reports |
Validated Service Reports |
The reports must also display information in a way that generates actions. If your stakeholders cannot make decisions, kick off activities, or ask questions based on your reports, then they have no value.
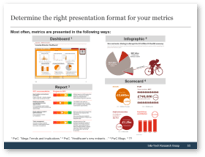
Determine the right presentation format for your metrics
Most often, metrics are presented in the following ways:
| Dashboard (PwC. “Mega-Trends and Implications.”) 
|
Infographic (PwC. “Healthcare’s new entrants.”) 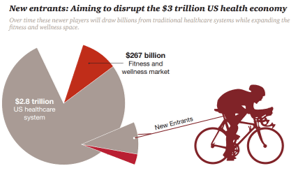
|
| Report (PwC Blogs. “Northern Lights.”) 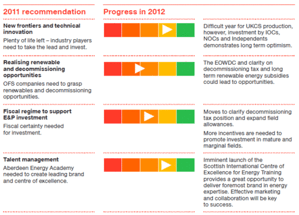
|
Scorecard (PwC. “Annual Report 2015.”) 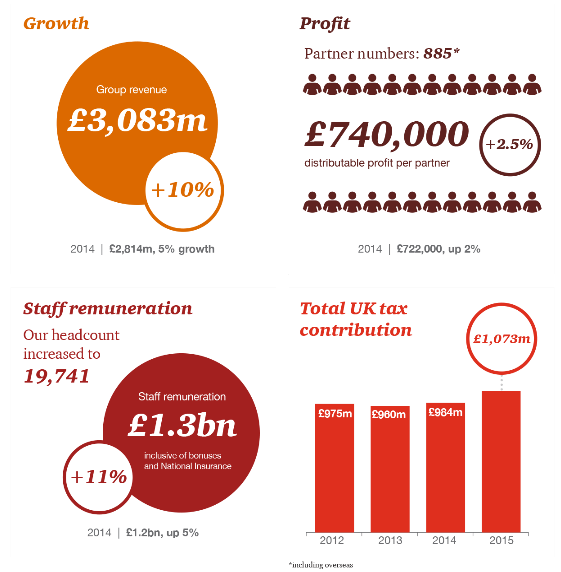
|
Understand the advantages and disadvantages of each reporting style – Dashboard
A dashboard is a reporting method that provides a dynamic at-a-glance view of key metrics from the perspective of key stakeholders. It provides a quick graphical way to process important performance information in real time.
| Features
Typically web-based Dynamic data that is updated in real time |
Advantage
Aggregates a lot of information into a single view Presents metrics in a simplistic style that is well understood Provides a quick point-in-time view of performance Easy to consume visual presentation style |
Disadvantage
Complicated to set up well. Promotes a short-term outlook – focus on now, no historical performance and no future trends. Doesn’t provide the whole picture and story. Existing dashboard tools are often not customized enough to provide real value to each stakeholder. |
Dashboards present real-time metrics that can be accessed and viewed at any time
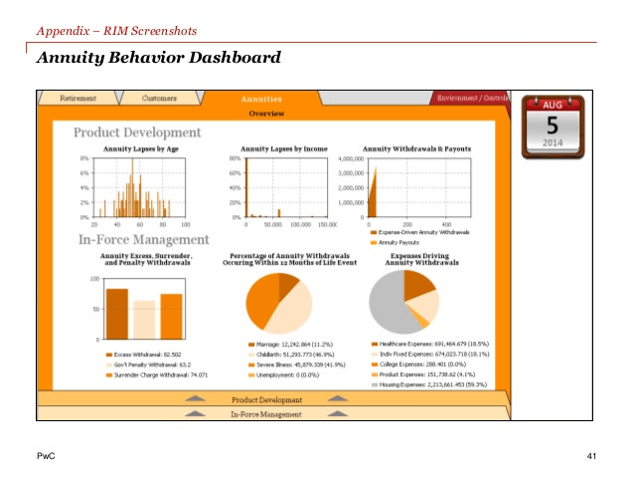 (Source: PwC. “Mega-Trends and Implications.”) |
Metrics presented through online dashboards are calculated in real time, which allows for a dynamic, current view into the performance of IT services at any time. |
Understand the advantages and disadvantages of each reporting style – Infographic
An infographic is a graphical representation of metrics or data, which is used to show information quickly and clearly. It’s based on the understanding that people retain and process visual information more readily than written details.
| Features
Turns dry into attractive –transforms data into eye-catching visual memory that is easier to retain Can be used as the intro to a formal report There are endless types of infographics |
Advantage
Easily consumable Easy to retain Eye catching Easily shared Spurs conversation Customizable |
Disadvantage
Require design expertise and resources Can be time consuming to generate Could be easily misinterpreted Message can be lost with poor design |
Infographics allow for completely unique designs
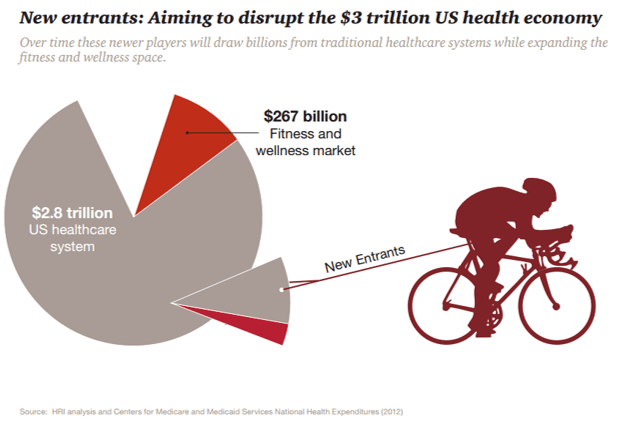 (Source: PwC. “Healthcare’s new entrants…”) |
There is no limit when it comes to designing an infographic. The image used here visually articulates the effects of new entrants pulling away the market. |
Understand the advantages and disadvantages of each reporting style – Formal Report
A formal report is a more structured and official reporting style that contains detailed research, data, and information required to enable specific business decisions, and to help evaluate performance over a defined period of time.
| Definition
Metrics can be presented as a component of a periodic, formal report A physical document that presents detailed information to a particular audience |
Advantage
More detailed, more structured and broader reporting period Formal, shows IT has put in the effort Effectively presents a broader and more complete story Targets different stakeholders at the same time |
Disadvantage
Requires significant effort and resources Higher risk if the report does not meet the expectation of the business stakeholder Done at a specific time and only valuable for that specific time period Harder to change format |
Formal reports provide a detailed view and analysis of performance
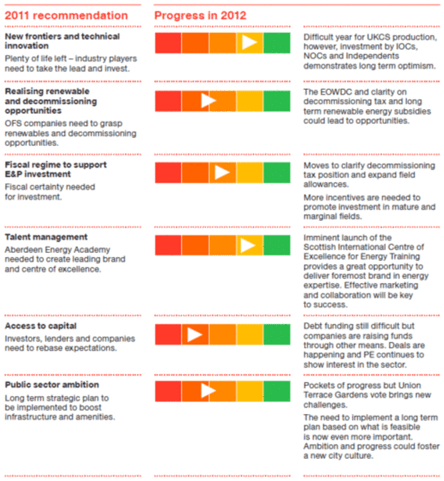 (Source: PwC Blogs. “Northern Lights: Where are we now?”) |
An effective report incorporates visuals to demonstrate key improvements.
Formal reports can still contain visuals, but they are accompanied with detailed explanations. |
Understand the advantages and disadvantages of each reporting style – Scorecard
A scorecard is a graphic view of the progress and performance over time of key performance metrics. These are in relation to specified goals based on identified critical stakeholder objectives.
| Features Incorporates multiple metrics effectively. Scores services against the most important organizational goals and objectives. Scorecards may tie back into strategy and different perspectives of success. | Advantage Quick view of performance against objectives Measure against a set of consistent objectives Easily consumable Easy to retain | Disadvantage Requires a lot of forethought |
Scorecards provide a time-bound summary of performance against defined goals
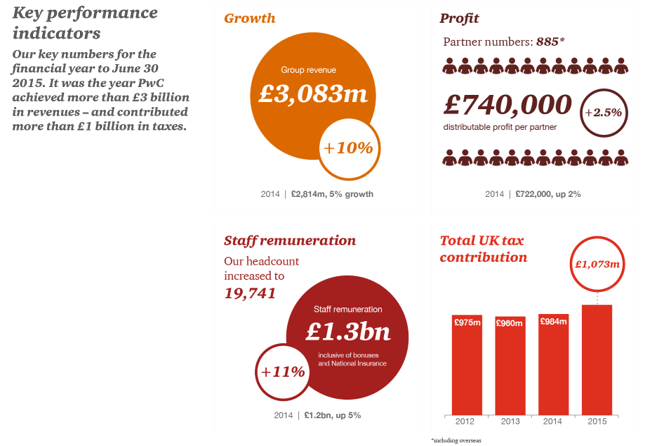 (PwC. “Annual Report 2015.”) |
Scorecards provide a summary of performance that is directly linked to the organizational KPIs. |
Determine your report style
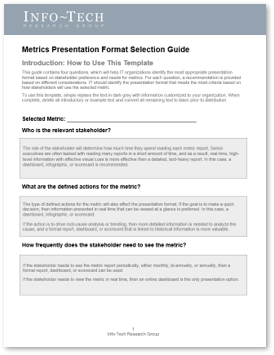
2.1 Metrics Presentation Format Selection Guide
In this section, you will determine the optimal reporting style for the service metrics.
This guide contains four questions, which will help IT organizations identify the most appropriate presentation format based on stakeholder preference and needs for metrics.
|
|
| Download the Metrics Presentation Format Selection Guide. | |
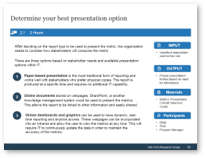
Determine your best presentation option
2.1 2 Hours
INPUT: Identified stakeholder and his/her role
OUTPUT: Proper presentation format based on need for information
Materials: Metrics Presentation Format Selection Guide
Participants: BRM, SLM, Program Manager
After deciding on the report type to be used to present the metric, the organization needs to consider how stakeholders will consume the metric.
There are three options based on stakeholder needs and available presentation options within IT.
- Paper-based presentation is the most traditional form of reporting and works well with stakeholders who prefer physical copies. The report is produced at a specific time and requires no additional IT capability.
- Online documents stored on webpages, SharePoint, or another knowledge management system could be used to present the metrics. This allows the report to be linked to other information and easily shared.
- Online dashboards and graphics can be used to have dynamic, real-time reporting and anytime access. These webpages can be incorporated into an intranet and allow the user to view the metrics at any time. This will require IT to continuously update the data in order to maintain the accuracy of the metrics.
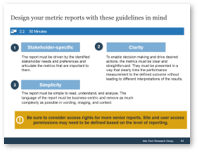
Design your metric reports with these guidelines in mind
2.2 30 Minutes
- Stakeholder-specificThe report must be driven by the identified stakeholder needs and preferences and articulate the metrics that are important to them.
- ClarityTo enable decision making and drive desired actions, the metrics must be clear and straightforward. They must be presented in a way that clearly links the performance measurement to the defined outcome without leading to different interpretations of the results.
- SimplicityThe report must be simple to read, understand, and analyze. The language of the report must be business-centric and remove as much complexity as possible in wording, imaging, and context.
Be sure to consider access rights for more senior reports. Site and user access permissions may need to be defined based on the level of reporting.
Metrics reporting on the video conferencing service
| CASE STUDY |
Industry: Manufacturing | Source: CIO Interview |
| The Situation
The business had a clear need to understand if the implementation of video conferencing would allow previously onsite meetings to achieve the same level of effectiveness. Reporting ContextProvided reports had always been generated from an IT perspective and the business rarely used the information to make decisions. The metrics needed to help the business understand if the meetings were remaining effective and be tied into the financial reporting against travel expenses, but there would be limited visibility during the executive meetings. |
ApproachThe service manager reviewed the information that he had gathered to confirm how often they needed information related to the service. He also met with the CIO to get some insight into the reports that were already being provided to the business, including the ones that were most effective. ConsiderationsThe conversations identified that there was no need for a dynamic real-time view of the performance of the service, since tracking of cost savings and utility would be viewed monthly and quarterly. They also identified that the item would be discussed within a very small window of time during the management meetings. The SolutionIt was determined that the best style of reporting for the metric was an existing scorecard that was produced monthly, using some infographics to ensure that the information is clear at a glance to enable quick decision making. |
If you want additional support, have our analysts guide you through this phase as part of an Info-Tech Workshop
Book a workshop with our Info-Tech analysts:
|
|
|
The following are sample activities that will be conducted by Info-Tech analysts with your team:
2.1 |
|
Understand the different presentation options
The onsite analyst will introduce the group to the communication vehicles of infographic, scorecard, formal report, and dashboard. |
2.1 |
|
Assess stakeholder needs for information
For selected stakeholders, the analyst will facilitate a discussion on how stakeholders would like to view information and how the metrics can be presented to aid decision making. |
If you want additional support, have our analysts guide you through this phase as part of an Info-Tech Workshop
Book a workshop with our Info-Tech analysts:
2.2 |
|
Select and design the metric report
Based on the discussion, the working group will select the most appropriate presentation format and create a rough draft of how the report should look. |
Develop Meaningful Service Metrics to Ensure Business and User Satisfaction
PHASE 3
Implement, Track, and Maintain Your Metrics
Step (3): Implement, Track, and Maintain Your Metrics
| PHASE 1 | PHASE 2 | PHASE 3 | ||
1.1Derive the Service Metrics | 1.2Validate the Metrics | 2.1Determine Reporting Format | 3.1Select Pilot Metrics | 3.2Activate and Maintain Metrics |
This step involves the following participants:
- Service Level Manager
- Business Relationship Manager
- Service Metrics Program Manager
Activities in this step
- Determine the first batch of metrics to be implemented as part of the pilot program
- Create a process to collect and validate data, determine initial targets, and integrate with SLM and BRM functions
- Present the metric reports to the relevant stakeholders and incorporate the feedback into the metric design
- Establish a standard process and roll out the implementation of metrics in batches
- Establish a process to monitor and track the effectiveness of the service metrics program and make adjustments when necessary
Phase 3 outline
Call 1-888-670-8889 or email GuidedImplementations@InfoTech.com for more information.Complete these steps on your own, or call us to complete a guided implementation. A guided implementation is a series of 2-3 advisory calls that help you execute each phase of a project. They are included in most advisory memberships.
Guided Implementation 3: Implement, Track, and Maintain Your Metrics
Proposed Time to Completion (in weeks): 4 weeks
| Step 3.1: Select and Launch Pilot Metrics | Step 3.2: Track and Maintain the Metrics |
Start with an analyst kick-off call:
|
Review findings with analyst:
|
Then complete these activities…
|
Then complete these activities…
|
With these tools & templates:
|
With these tools & templates:
|
Implement, Track, and Maintain the Metrics
|
|
Step 1 Run your pilot Metrics Tracking Tool |
|
Step 2 Validate success Metrics Tracking Tool |
|
Step 3 Implement your metrics program in batches Metrics Tracking Tool |
Active Service Metrics Program |
This allows you to validate your approach and make refinements to the implementation and maintenance processes where necessary, prior to activating all service metrics.
Track the performance of your service metrics
3.1
The Metrics Tracking Tool will enable you to track goals and success metrics for your service metrics programs. It allows you to set long-term goals and track your results over time.
There are three sections in this tool:
|
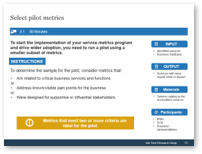
Select pilot metrics
3.1 30 MinutesINPUT: Identified services, Business feedback
OUTPUT: Services with most urgent need or impact
Materials: Service catalog or list of identified services
Participants: BRM, SLM, Business representatives
To start the implementation of your service metrics program and drive wider adoption, you need to run a pilot using a smaller subset of metrics.
INSTRUCTIONS
To determine the sample for the pilot, consider metrics that:
- Are related to critical business services and functions or
- Address known/visible pain points for the business or
- Were designed for supportive or influential stakeholders
Metrics that meet two or more criteria are ideal for the pilot
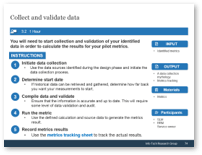
Collect and validate data
3.2 1 HourINPUT: Identified metrics
OUTPUT: A data collection mythology, Metrics tracking
Materials: Metrics
Participants: SLM, BRM, Service owner
You will need to start collection and validation of your identified data in order to calculate the results for your pilot metrics.
INSTRUCTIONS
- Initiate data collection
- Use the data sources identified during the design phase and initiate the data collection process.
- Determine start date
- If historical data can be retrieved and gathered, determine how far back you want your measurements to start.
- Compile data and validate
- Ensure that the information is accurate and up to date. This will require some level of data validation and audit.
- Run the metric
- Use the defined calculation and source data to generate the metrics result.
- Record metrics results
- Use the metrics tracking sheet to track the actual results.
Determine initial targets
3.3 1 HourINPUT: Historical data/baseline data
OUTPUT: Realistic initial target for improvement
Materials: Metrics Tracking Tool
Participants: BRM, SLM, Service owner
INSTRUCTIONS
Identify an initial service objective based on one or more of the following options:
- Establish an initial target using historical data and trends of performance.
- Establish an initial target based on stakeholder-identified requirements and expectations.
- Run the metrics report over a defined period of time and use the baseline level of achievement to establish an initial target.
The target may not always be a number - it could be a trend. The initial target will be changed after review with stakeholders
Integrate with SLM and BRM processes
3.4 1 HourINPUT: SLM and BRM SOPs or responsibility documentations
OUTPUT: Integrate service metrics into the SLM/BRM role
Materials: SLM / BRM reports
Participants: SLM, BRM, CIO, Program manager, Service manager
The service metrics program is usually initiated, used, and maintained by the SLM and BRM functions.
INSTRUCTIONS
Ensure that the metrics pilot is integrated with those functions by:
- Engaging with SLM and BRM functions/resources
- Identify SLM and BRM resources associated with or working on the services where the metrics are being piloted
- Obtain their feedback on the metrics/reporting
- Integrating with the existing reporting and meeting cycles
- Ensure the metrics will be calculated and available for discussion at standing meetings and with existing reports
- Establishing the metrics review and validation cycle for these metrics
- Confirm the review and validation period for the metrics in order to ensure they remain valuable and actionable
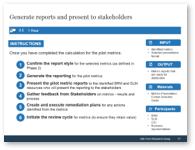
Generate reports and present to stakeholders
3.5 1 HourINPUT: Identified metrics, Selected presentation format
OUTPUT: Metrics reports that are ready for distribution
Materials: Metrics Presentation Format Selection Guide
Participants: BRM, SLM, CIO, Business representatives
INSTRUCTIONS
Once you have completed the calculation for the pilot metrics:
- Confirm the report style for the selected metrics (as defined in Phase 2)
- Generate the reporting for the pilot metrics
- Present the pilot metric reports to the identified BRM and SLM resources who will present the reporting to the stakeholders
- Gather feedback from Stakeholders on metrics - results and process
- Create and execute remediation plans for any actions identified from the metrics
- Initiate the review cycle for metrics (to ensure they retain value)
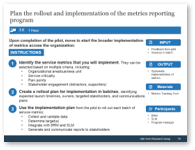
Plan the rollout and implementation of the metrics reporting program
3.6 1 HourINPUT: Feedback from pilot, Services in batch
OUTPUT: Systematic implementation of metrics
Materials: Metrics Tracking Tool
Participants: BRM, SLM, Program manager
Upon completion of the pilot, move to start the broader implementation of metrics across the organization:
INSTRUCTIONS
- Identify the service metrics that you will implement. They can be selected based on multiple criteria, including:
- Organizational area/business unit
- Service criticality
- Pain points
- Stakeholder engagement (detractors, supporters)
- Create a rollout plan for implementation in batches, identifying expected launch timelines, owners, targeted stakeholders, and communications plans
- Use the implementation plan from the pilot to roll out each batch of service metrics:
- Collect and validate data
- Determine target(s)
- Integrate with BRM and SLM
- Generate and communicate reports to stakeholders
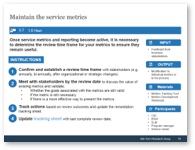
Maintain the service metrics
3.7 1.5 HourINPUT: Feedback from business stakeholders
OUTPUT: Modification to individual metrics or to the process
Materials: Metrics Tracking Tool, Metrics Development Workbook
Participants: CIO, BRM, SLM, Program manager, Service owner
Once service metrics and reporting become active, it is necessary to determine the review time frame for your metrics to ensure they remain useful.
INSTRUCTIONS
- Confirm and establish a review time frame with stakeholders (e.g. annually, bi-annually, after organizational or strategic changes).
- Meet with stakeholders by the review date to discuss the value of existing metrics and validate:
- Whether the goals associated with the metrics are still valid
- If the metric is still necessary
- If there is a more effective way to present the metrics
- Track actions based on review outcomes and update the remediation tracking sheet.
- Update tracking sheet with last complete review date.
Maintain the metrics
3.7
Based on the outcome of the review meeting, decide what needs to be done for each metric, using the following options:
| Add
A new metric is required or an existing metric needs large-scale changes (example: calculation method or scope). |
Change
A minor change is required to the presentation format or data. Note: a major change in a metric would be performed through the Add option. |
| Remove
The metric is no longer required, and it needs to be removed from reporting and data gathering. A final report date for that metric should be determined. |
Maintain
The metric is still useful and no changes are required to the metric, its measurement, or how it’s reported. |
Ensuring metrics remain valuable
| VC CASE STUDY | Industry: Manufacturing | Source: CIO Interview |
Reviewing the value of active metricsWhen the video conferencing service was initially implemented, it was performed as a pilot with a group of executives, and then expanded for use throughout the company. It was understood that prior to seeing the full benefit in cost reduction and increased efficiency and effectiveness, the rate of use and adoption had to be understood. The primary service metrics created for the service were based on tracking the number of requests for video conference meetings that were received by the IT organization. This identified the growth in use and could be used in conjunction with financial metrics related to travel to help identify the impact of the service through its growth phase. Once the service was adopted, this metric continued to be tracked but no longer showed growth or expanded adoption. The service manager was no longer sure this needed to be tracked. |
Key ActivityThe metrics around requests for video conference meetings were reviewed at the annual metrics review meeting with the business. The service manager asked if the need for the metric, the goal of tracking adoption, was still important for the business. The discussion identified that the adoption rate was over 80%, higher than anticipated, and that there was no value in continuing to track this metric. Based on the discussion, the adoption metrics were discontinued and removed from data gathering and reporting, while a success rate metric was added (how many meetings ran successfully and without issue) to ensure the ongoing value of the video conferencing service. |
If you want additional support, have our analysts guide you through this phase as part of an Info-Tech Workshop
Book a workshop with our Info-Tech analysts:
|
|
The following are sample activities that will be conducted by Info-Tech analysts with your team:
3.1 |
|
Select the pilot metrics
The onsite analyst will help the workshop group select the metrics that should be first implemented based on the urgency and impact of these metrics. |
3.2 |
|
Gather data and set initial targets
The analyst will help the group create a process to gather data, measure baselines, and set initial targets. |
If you want additional support, have our analysts guide you through this phase as part of an Info-Tech Workshop
Book a workshop with our Info-Tech analysts:
3.5 |
|
Generate the reports and validate with stakeholders
The Info-Tech analyst will help the group establish a process to receive feedback from the business stakeholders once the report is generated. |
3.6 |
|
Implement the service metrics program
The analyst will facilitate a discussion on how to implement the metrics program across the organization. |
3.7 |
|
Track and maintain the metrics program
Set up a mechanism to ensure the success of the metrics program by assessing process adherence and process validity. |
Insight breakdown
Insight 1
Service metrics are critical to ensuring alignment of IT service performance and business service value achievement.
Insight 2
Service metrics reinforce positive business and end-user relationships by providing user-centric information that drives responsiveness and consistent service improvement.
Insight 3
Poorly designed metrics drive unintended and unproductive behaviors that have negative impacts on IT and produce negative service outcomes.
Summary of accomplishment
Knowledge Gained
- Follow a methodology to identify metrics that are derived from business objectives.
- Understand the proper presentation format based on stakeholder needs for information.
- Establish a process to ensure the metrics provided will continue to provide value and aid decision making.
Processes Optimized
- Metrics presentation to business stakeholders
- Metrics maintenance and tracking
Deliverables Completed
- Metrics Development Workbook
- Metrics Presentation Format Selection Guide
- Metrics Tracking Tool
Research contributors and experts
| Name | Organization |
| Joe Evers | Joe Evers Consulting |
| Glen Notman | Associate Partner, Citihub |
| David Parker | Client Program Manager, eHealth Ontario |
| Marianne Doran Collins | CIO, The CIO-Suite, LLC |
| Chris Kalbfleisch | Manager, Service Management, eHealth Ontario |
| Joshua Klingenberg | BHP Billiton Canada Inc. |
Related Info-Tech research

|
Design & Build a User-Facing Service Catalog The user-facing service catalog is the go-to place for IT service-related information. |

|
Unleash the True Value of IT by Transforming Into a Service Provider Earn your seat at the table and influence business strategy by becoming an IT service provider. |
Bibliography
Pollock, Bill. “Service Benchmarking and Measurement: Using Metrics to Drive Customer Satisfaction and Profits.” Aberdeen Group. June 2009. http://722consulting.com/ServiceBenchmarkingandMeasurement.pdf
PwC. “Mega-Trends and Implications.” RMI Discussion. LinkedIn SlideShare. September 2015. http://www.slideshare.net/AnandRaoPwC/mega-trends-and-implications-to-retirement
PwC. “Healthcare’s new entrants: Who will be the industry’s Amazon.com?” Health Research Institute. April 2014. https://www.pwc.com/us/en/health-industries/healthcare-new-entrants/assets/pwc-hri-new-entrant-chart-pack-v3.pdf
PwC. “Northern Lights: Where are we now?” PwC Blogs. 2012. http://pwc.blogs.com/files/12.09.06---northern-lights-2--summary.pdf
PwC. “PwC’s key performance indicators