- IT spend has increased in volume and complexity, but how IT spend decisions are made has not kept pace.
- In most organizations, technology has evolved faster than the business’ understanding of what it is, how it works, and what it can do for them.
- How traditional financial accounting methods are applied to IT expenditure don’t align well to modern IT realities.
- IT is often directed to make cuts when cost optimization and targeted investment are what’s really needed to sustain and grow the organization in the long term.
Our Advice
Critical Insight
- Meaningful conversations about IT spend don’t happen nearly as frequently as they should. When they do happen, they are often inhibited by a lack of IT financial management (ITFM) maturity combined with the absence of a shared vocabulary between IT, the CFO, and other business function leaders.
- Supporting data about actual technology spend taking place that would inform decision making is often scattered and incomplete.
- Creating transparency in your IT financial data is essential to powering collaborative and informed technology spend decisions.
Impact and Result
- Understand the uses and benefits of making your IT spend more transparent.
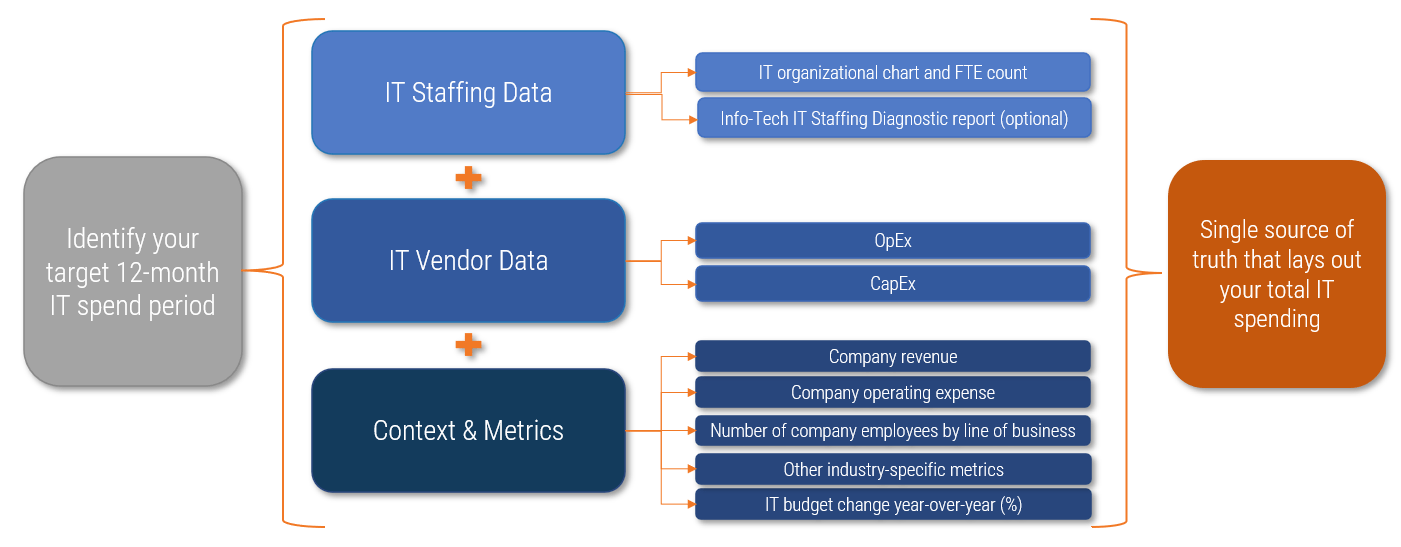
- Discover and organize your IT financial data.
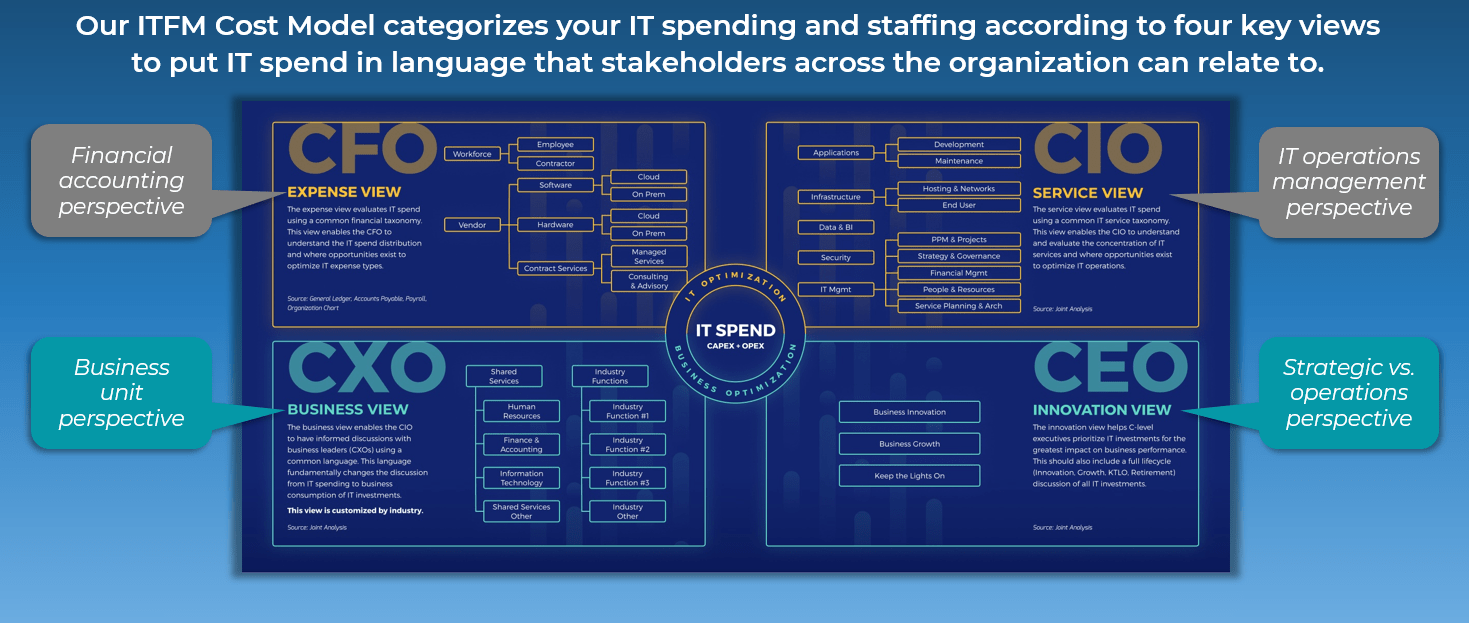
- Map your organization’s total technology spend against four IT stakeholder views: CFO, CIO, CXO, and CEO.
- Gain vocabulary and facts that will help you tell the true story of IT spend.
Members may also be interested in Info-Tech's IT Spend & Staffing Benchmarking Service.
Achieve IT Spend & Staffing Transparency Research & Tools
Besides the small introduction, subscribers and consulting clients within this management domain have access to:
1. Achieve IT Spend & Staffing Transparency Deck – A detailed, do-it-yourself framework and process for clearly mapping your organization’s total technology spend.
This deck mirrors Info-Tech’s own internal methods for delivering its IT Spend & Staffing Benchmarking Service in a do-it-yourself format. Based on Info-Tech’s proven ITFM Cost Model, it includes an IT spend mapping readiness assessment, expert advice for sourcing and organizing your financial data, a methodology for mapping IT staff and vendor spend according to four key stakeholder views (CFO, CIO, CXO, and CEO), and guidance on how to analyze and share your results.
- Achieve IT Spend & Staffing Transparency Storyboard
2. IT Spend & Staffing Transparency Workbook – A structured Excel tool that allows you to allocate your IT spend across four key stakeholder views and generate high-impact visualizations.
This workbook offers a step-by-step approach for mapping and visualizing your organization’s true IT spend.
- IT Spend & Staffing Transparency Workbook
3. IT Spend & Staffing Transparency Executive Presentation Template – A PowerPoint template that helps you summarize and showcase key results from your IT spend transparency exercise.
This presentation template offers a recommended structure for introducing key executive stakeholders to your organization’s true IT spending behavior and IT financial management as a whole.
- IT Spend & Staffing Transparency Executive Presentation Template
Infographic
Further reading
Achieve IT Spend & Staffing Transparency
Lay a foundation for meaningful conversations with the business.
Analyst Perspective
Take the first step in your IT spend journey.
Talking about money is hard. Talking to the CEO, CFO, and other business leaders about money is even harder, especially if IT is seen as just a cost center, is not understood by stakeholders, or is simply taken for granted. In times of economic hardship, already lean IT operations are tasked with becoming even leaner.
When there's little fat to trim, making IT spend decisions without understanding the spend's origin, location, extent, and purpose can lead to mistakes that weaken, not strengthen, the organization.
The first step in optimizing IT spend decisions is setting a baseline. This means having a comprehensive and transparent view of all technology spend, organization-wide. This baseline is the only way to have meaningful, data-driven conversations with stakeholders and approvers around what IT delivers to the business and the implications of making changes to IT funding.
Before stepping forward in your IT financial management journey, know exactly where you're standing today.

Jennifer Perrier
Principal Research Director, ITFM Practice
Info-Tech Research Group
Executive Summary
| Your Challenge | Common Obstacles | Info-Tech's Approach |
IT spend has increased in volume and complexity, but how IT spend decisions are made has not kept pace:
|
Meaningful conversations about IT spend don't happen nearly as much as they should. This is often due to:
|
Lay a foundation for meaningful conversations and informed decision-making around IT spend.
|
Info-Tech Insight
Create transparency in your IT financial data to power both collaborative and informed technology spend decisions.
IT spend has grown alongside IT complexity
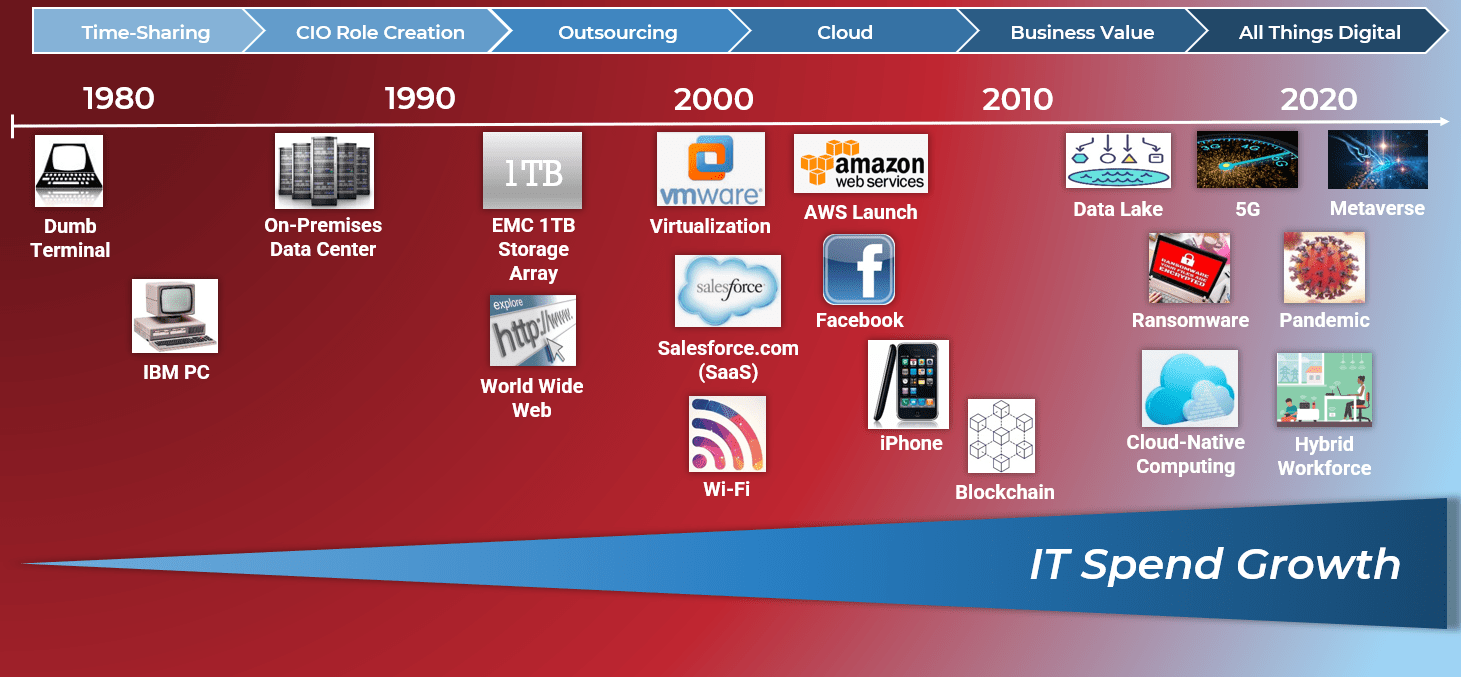
Growth creates change ... and challenges
IT has become more integral to business operations and achievement of strategic goals, driving complexity in how IT funds are allocated and managed.
| How IT funds are spent has changed Value demonstration is two-pronged. The first is return on performance investment, focused on formal and objective goals, metrics, and KPIs. The second is stakeholder satisfaction, a more subjective measure driven by IT-business alignment and relationship. IT leaders must do both well to prove and promote IT's value. |
Funding decision cadence has sped up Many organizations have moved from three- to five-year strategic planning cycles to one-year planning horizons or less, most noticeably since the 2008/2009 recession. Not only has the pace of technological change accelerated, but so too has volatility in the broader business and economic environments, forcing rapid response. |
Justification rigor around IT spend has increased The need for formal business cases, proposals, and participation in formal governance processes has increased, as has demand for financial transparency. With many IT departments still reporting into the CFO, there's no getting around it - today's IT leaders need to possess financial management savvy. |
Clearly showing business value has become priority IT spend has moved from the purchase of discrete hardware and software tools traditionally associated with IT to the need to address larger-scale issues around interoperability, integration, and virtualized cloud solutions. Today's focus is more on big-picture architecture than on day-to-day operations. |
ITFM capabilities haven't grown with IT spend
IT still needs to prove itself.
Increased integration with the core business has made it a priority for the head of IT to be well-versed in business language and practice, specifically in the areas of measurement and financial management.
However, IT staff across all industries aren't very confident in how well IT is doing in managing its finances via three core processes:
- Accounting of costs and budgets.
- Optimizing costs to gain the best return on investment.
- Demonstrating IT's value to the business.
Recent data from 4,137 respondents to Info-Tech's IT Management & Governance Diagnostic shows that while most IT staff feel that these three financial management processes are important, notably fewer feel that IT management is effective at executing them.
IT leadership's capabilities around fundamental cost data capture appear to be lagging, not to mention the essential value-added capabilities around optimizing costs and showing how IT contributes to business value.
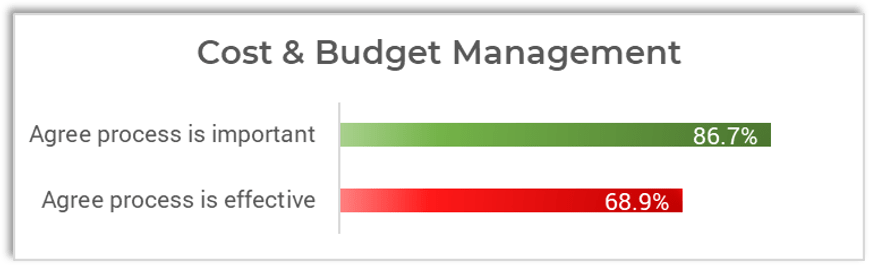
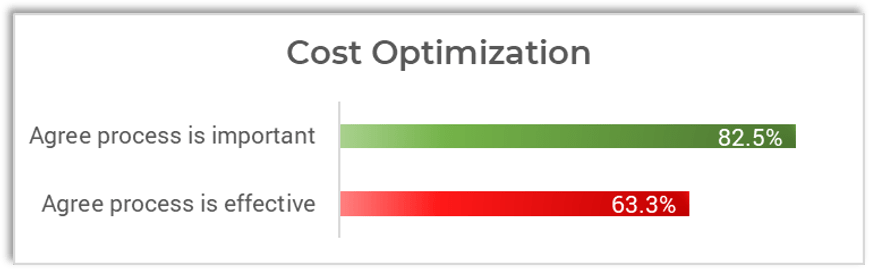
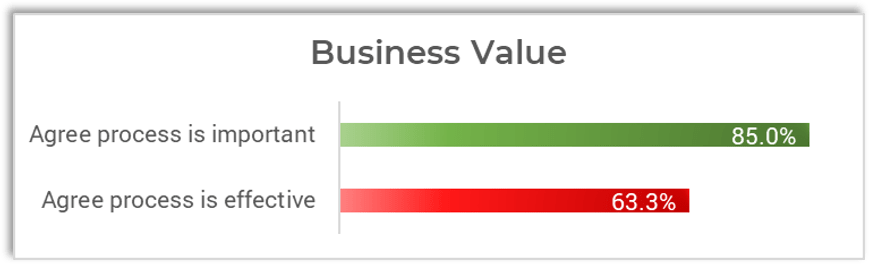
Source: IT Management & Governance Diagnostic, Info-Tech Research Group, 2022.
Take the perspective of key IT stakeholders as a first step in ITFM capability improvement
Other business unit leaders need to deliver on their own specific and unique accountabilities. Create true IT spend transparency by accounting for these multiple perspectives.
Exactly how is IT spending all that money we give them?
Many IT costs, like back-end infrastructure and apps maintenance, can be invisible to the business.
Why doesn't my department get more support from IT?
Some business needs won't align with spend priorities, while others seem to take more than their fair share.
Does the amount we spend on each IT service make sense?
IT will get little done or fall short of meeting service level requirements without appropriate funding.
I know what IT costs us, but what is it really worth?
Questions about value arise as IT investment and spend increase. How to answer these questions is critical.
At the end of the day, telling IT's spend story to the business is a significant challenge if you don't understand your audience, have a shared vocabulary, or use a repeatable framework.
Mapping your IT spend against a reusable framework helps generate transparency
A framework makes transparency possible by simplifying methods, creating common language, and reducing noise.
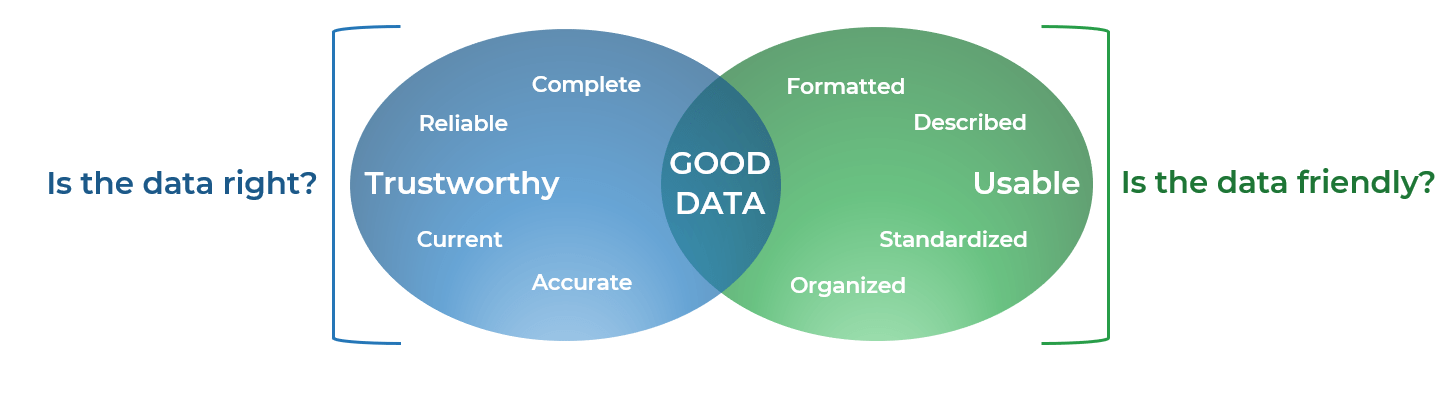
However, the best methodological framework won't work if the materials and information plugged into it are weak. With IT spend, the materials and information are your staff and your vendor financial data. To achieve true transparency, inputs must have the following three characteristics:
| Availability | Reliability | Usability |
|---|---|---|
| The data and information are up-to-date and accessible when needed. | The data and information are accurate, complete, and verifiable. | The data and information are clearly defined, consistently and predictably organized, consumable, and meaningful for decision-making. |
A framework is an organizing principle. When it comes to better understanding your IT spend, the things being organized by a framework are your method and your data.
If your IT spend information is transparent, you have an excellent foundation for having the right conversations with the right people in order to make strategically impactful decisions.
Info-Tech's approach enables meaningful dialogue with stakeholders about IT spend
Investing time in preparing and mapping your IT spend data enables better IT governance
While other IT spend transparency methods exist, Info-Tech's is designed to be straightforward and tactical.
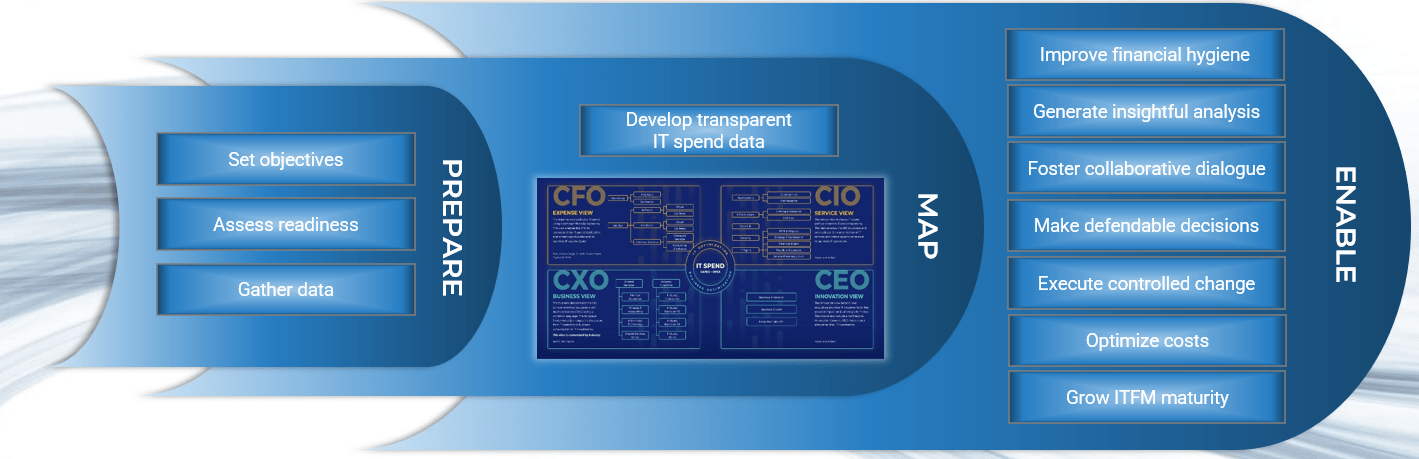
Put your data to work instead of being put to work by your data.
Introducing Info-Tech's methodology for creating transparency on technology spend
| 1. Know your objectives | 2. Gather required data | 3. Map your IT staff spend | 4. Map your IT vendor spend | 5. Identify implications for IT | |
|---|---|---|---|---|---|
| Phase Steps |
|
|
|
|
|
| Phase Outcomes | Goals and scope for your IT spend and staffing transparency effort. | Information and data required to perform the IT staff and vendor spend transparency initiative. | A mapping of the allocation of IT staff spend across the four views of the Info-Tech ITFM Cost Model. | A mapping of the allocation of IT vendor spend across the four views of the Info-Tech ITFM Cost Model. | An analysis of your results and a presentation to aid your communication of findings with stakeholders. |
Insight Summary
Overarching insight
Take the perspective of key stakeholders and lay out your organization's complete IT spend footprint in terms they understand to enable meaningful conversations and start evolving your IT financial management capability.
Phase 1 insight
Your IT spend transparency efforts are only useful if you actually do something with the outcomes of those efforts. Be clear about where you want your IT transparency journey to take you.
Phase 2 insight
Your IT spend transparency efforts are only as good as the quality of your inputs. Take the time to properly source, clean, and organize your data.
Phase 3 insight
Map your IT staff spend data first. It involves work but is relatively straightforward. Practice your mapping approach here and carry forward your lessons learned.
Phase 4 insight
The importance of good, usable data will become apparent when mapping your IT vendor spend. Apply consistent and meaningful vendor labels to enable true aggregation and insight.
Phase 5 insight
Communicating your final IT spend transparency mapping with executive stakeholders is your opportunity to debut IT financial management as not just an IT issue but an organization-wide concern.
Blueprint deliverables
Each step of this blueprint is accompanied by supporting deliverables to help you accomplish your goals.
Use this tool in Phases 1-4
IT Spend & Staffing Transparency Workbook
Input your IT staff and vendor spend data to generate visual outputs for analysis and presentation in your communications.
Key deliverable:
IT Spend & Staffing Transparency Executive Presentation
Create a showcase for your newly-transparent IT staff and vendor spend data and present it to key business stakeholders.
Use this tool in Phase 5
IT and business blueprint benefits
| IT Benefits | Business Benefits |
|---|---|
|
|
Measure the value of this blueprint
You will know that your IT spend and staffing transparency effort is succeeding when:
- Your understanding of where technology funds are really being allocated is comprehensive.
- You're having active and meaningful dialogue with key stakeholders about IT spend issues.
- IT spend transparency is a permanent part of your IT financial management toolkit.
In phase 1 of this blueprint, we will help you identify initiatives where you can leverage the outcomes of your IT spend and staffing transparency effort.
In phases 2, 3, and 4, we will guide you through the process of mapping your IT staff and vendor spend data so you can generate your own IT spend metrics based on reliable sources and verifiable facts.
Win #1: Knowing how to reliably source the financial data you need to make decisions.
Win #2: Getting your IT spend data in an organized format that you can actually analyze.
Win #3: Having a framework that puts IT spend in a language stakeholders understand.
Win #4: Gaining a practical starting point to mature ITFM practices like cost optimization.
Info-Tech offers various levels of support to best suit your needs
| DIY Toolkit | Guided Implementation | Workshop | Consulting |
|---|---|---|---|
| "Our team has already made this critical project a priority, and we have the time and capability, but some guidance along the way would be helpful." | "Our team knows that we need to fix a process, but we need assistance to determine where to focus. Some check-ins along the way would help keep us on track." | "We need to hit the ground running and get this project kicked off immediately. Our team has the ability to take this over once we get a framework and strategy in place." | "Our team does not have the time or the knowledge to take this project on. We need assistance through the entirety of this project." |
Diagnostics and consistent frameworks are used throughout all four options.
Guided Implementation
Info-Tech recommends the following calls in your Guided Implementation.
| Phase 1: Know your objectives | Phase 2: Gather required data | Phase 3: Map your IT staff spend | Phase 4: Map your IT vendor spend | Phase 5: Identify implications for IT |
|---|---|---|---|---|
| Call #1: Discuss your IT spend and staffing transparency objectives and readiness. | Call #2: Review spend and staffing data sources and identify data organization and cleanup needs. | Call #3: Review your mapped IT staff spend and resolve lingering challenges. | Call #4: Review your mapped IT vendor spend and resolve lingering challenges. | Call #5: Analyze your mapping outputs for opportunities and devise next steps. |
A Guided Implementation (GI) is a series of calls with an Info-Tech analyst to help implement our best practices in your organization.
A typical GI is between four to six calls over the course of two to three months.
Want even more help with your IT spend transparency effort?
Let us fast-track your IT spend journey.
The path to IT financial management maturity starts with knowing exactly where your money is going. To streamline this effort, Info-Tech offers an IT Spend & Staffing Benchmarking service that provides full transparency into where your money is going without any heavy lifting on your part.
This unique service features:
- A client-proven approach to meet your IT spend transparency goals.
- Vendor and staff spend mapping that reveals business consumption of IT.
- Industry benchmarking to compare your spending and staffing to that of your peers.
- Results in a fraction of the time with much less effort than going it alone.
- Expert review of results and ongoing discussions with Info-Tech analysts.
If you'd like Info-Tech to pave the way to IT spend transparency, contact your account manager for more information - we're happy to talk anytime.
Phase 1
Know Your Objectives
This phase will walk you through the following activities:
- Establish IT spend and staffing transparency uses and objectives
- Assess your readiness to tackle IT spend and staffing transparency
This phase involves the following participants:
- Head of IT
- IT financial lead
- Other members of IT management
Phase 1: Know your objectives
Envision what transparency can do.
You're at the very beginning of your IT spend transparency journey. In this phase you will:
- Set your objectives for making your IT spend and staffing transparent.
- Assess your readiness to tackle the exercise and gauge how much work you'll need to do in order to do it well.
"I've heard this a lot lately from clients: 'I've got my hands on this data, but it's not structured in a way that will allow me to make any decisions about it. I have these journal entries and they have some accounting codes, GL descriptors, cost objects, and some vendors, but it's not enough detail to make any decisions about my services, my applications, my asset spend.'"
- Angie Reynolds, Principal Research Director, ITFM Practice, Info-Tech Research Group
Transparency positively enables both business outcomes and the practice of business ethics
However, transparency's real superpower is in how it provides fact-based context.
- More accurate and relevant data for decision-making.
- Better managed and more impactful financial outcomes.
- Increased inclusion of people in the decisions that affect them.
- Clearer accountabilities for organizational efficiency and effectiveness goals.
- Concrete proof that business priorities and decisions are being acted on and implemented.
- Greater trust and respect between IT and the business.
- Demonstration of integrity in how funds are being used.
IT spend transparency efforts are only useful if you actually do something with the outputs
Identify in advance how you plan to leverage IT spend transparency outcomes.
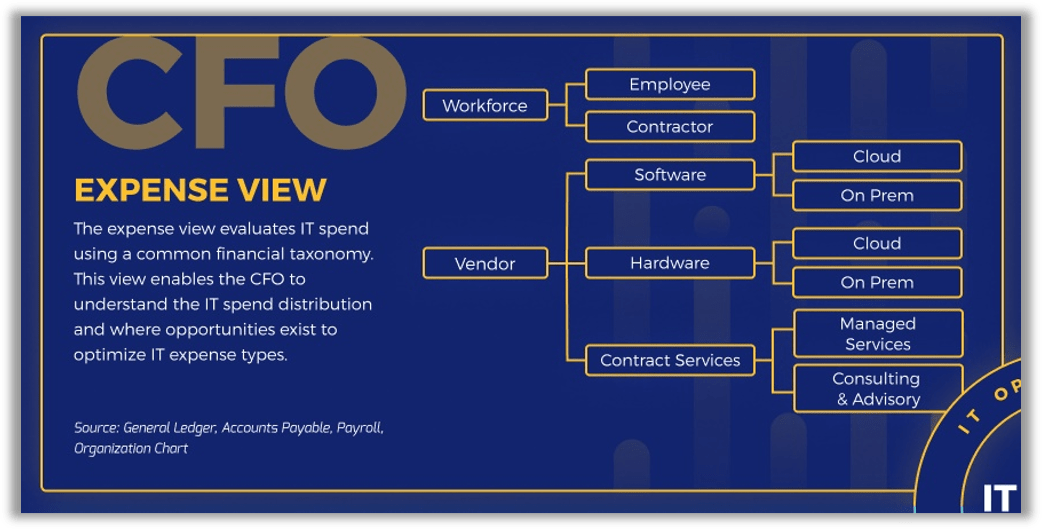
CFO expense view
- Demonstrate actual IT costs at the right level of granularity.
- Update/change the categories finance uses to track IT spend.
- Adjust the expected CapEx/OpEx ratio.
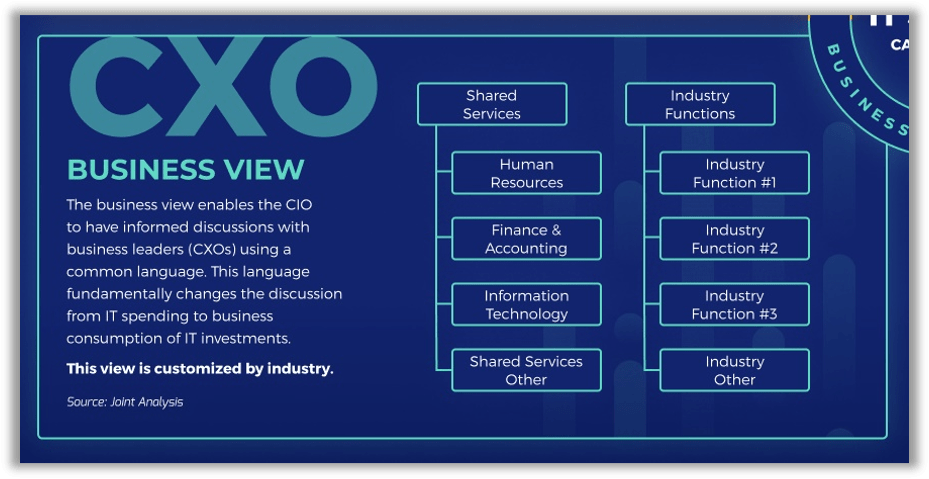
CXO business view
- Calculate consumption of IT resources by department.
- Implement a showback/chargeback mechanism.
- Change the funding conversation about proposed IT projects.
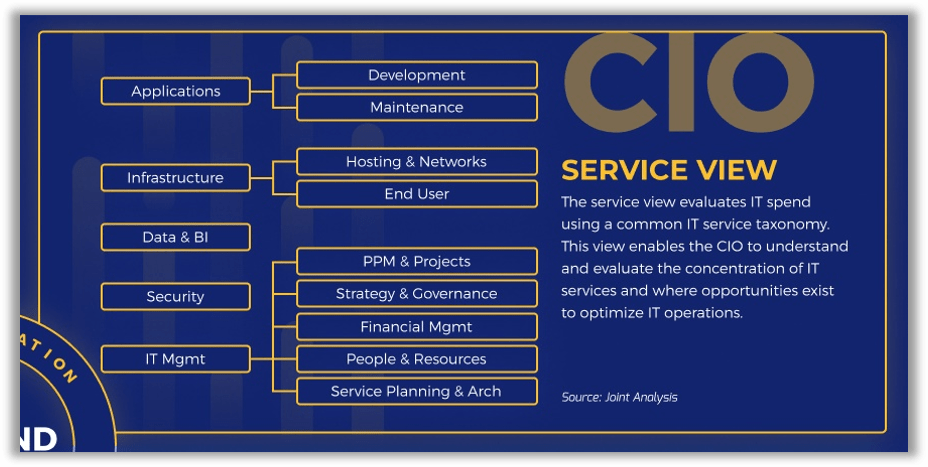
CIO service view
- Calculate the total cost to deliver a specific IT service.
- Adjust the IT service spend-to-value ratio as per business priorities.
- Rightsize IT service levels to reflect true value to the business.
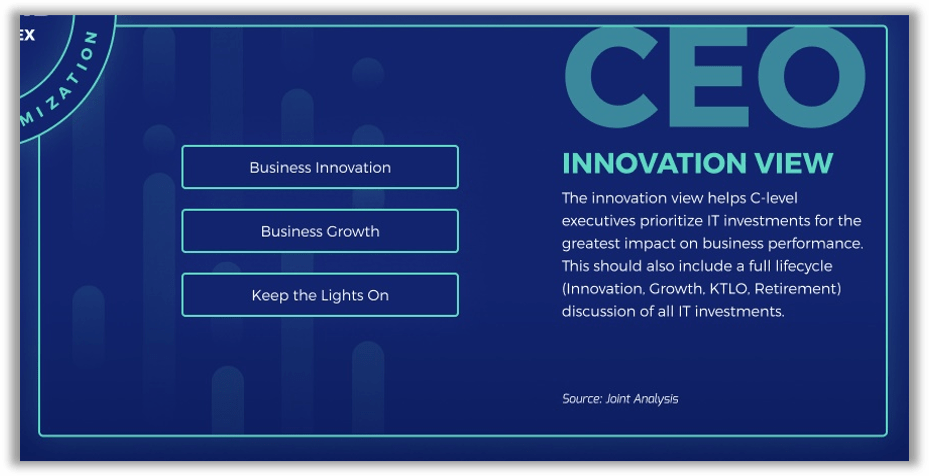
CEO innovation view
- Formalize the organization's position on use of cloud/outsourcing.
- Reduce the portion of spend dedicated to "keeping the lights on."
- Develop a plan for boosting commitment to innovation investment.
When determining your end objectives, think about the real questions IT is being asked by the business and how IT spend transparency will help you answer them.
CFO: Financial accounting perspective
IT spend used to be looked at from a strictly financial accounting perspective - this is the view of the CFO and the finance department. Their question, "exactly how is IT spending all that money we give them," is really about how money is distributed across different asset classes. This question breaks down into other questions that IT leaders needs to ask themselves in order to provide answers:
- How should I classify my IT costs? What are the standard categories you need to have that are meaningful to folks crunching the corporate numbers? If you're too detailed, it won't make sense to them. If you pick outmoded categories, you'll have to adjust in the future as IT evolves, which makes tracking year-over-year spend patterns harder.
- What information should I include in my plans and reports? This is about two things. One is about communicating with the finance department in language that reduces back-and-forth and eliminates misinterpretation. The other is about aligning with the categories the finance department uses to track financial data in the general ledger.
- How do I justify current spend? This is about clarity and transparency. Specifically itemizing spend into categories that are meaningful for your audience does a lot of justification work for you since you don't have to re-explain what everything means.
- How do I justify a budget increase? In a declining economy, this question may not be appropriate. However, establishing a baseline puts you in a better position to discuss spend requirements based on past performance and to focus the conversation.
Exactly how is IT spending all that money we give them?
| Example | |
|---|---|
| Asset Class | % IT Spend |
| Workforce | 42.72% |
| Software - Cloud | 9.26% |
| Software - On Prem | 13.61% |
| Hardware - Cloud | 0.59% |
| Hardware - On Prem | 15.68% |
| Contract Services | 18.14% |
| Info-Tech IT Spend & Staffing Studies, 2022. | |
CIO: IT operations management perspective
As the CIO role was adopted, IT spend was viewed from the IT operations management perspective. Optimizing the IT delivery model is a critical step to reducing time to provision services. For the IT leader, the questions they need to ask themselves are:
- What's the impact of cloud adoption on speed of delivery? Leveraging a SaaS solution can reduce time to deployment as well as increase your ability to scale; however, integration with other functionality will still be a challenge that will incur costs.
- Where can I improve spend efficiency? This is about optimizing spend in your IT delivery model. What service levels does the business require and what's the most cost-effective way to meet those levels without incurring significant technical debt?
- Is my support model optimized? By reviewing where support staff are focused and which services are using most of your resources, you can investigate underlying drivers of your staffing requirements. If staff costs in support of a business function are high, perhaps the portfolio of applications needs to be reviewed.
- How does our spend compare to others? Benchmarking against peers is a useful input, but reflects common practice, not best practice. For example, if you need to invest in IT security, your entire industry is lagging on this front, and you happen to be doing slightly better than most, then bringing forth this benchmark won't help you make the case. Starting with year-over-year internal benchmarking is essential - establish your categories, establish your baseline, and track it consistently.
Does the amount we spend on each IT service make sense?
| Example | |
|---|---|
| Service Area | % IT Spend |
| App Development | 9.06% |
| App Maintenance | 30.36% |
| Hosting/Network | 25.39% |
| End User | 18.59% |
| Data & BI | 3.58% |
| Security & Risk | 5.21% |
| IT Management | 7.82% |
| Info-Tech IT Spend & Staffing Studies, 2022. | |
CXO: Business unit perspective
As business requests have increased, so too has the importance of the business unit perspective. Each business function has a unique mandate to fulfill in the organization and also competes with other business functions for IT resources. By understanding business consumption of IT, organizations can bring transparency and drive a different dialog with their business partners. Every IT leader should find out the answers to these questions:
- Which business units consume the most IT resources? By understanding consumption of IT by business function, IT organizations can clearly articulate which business units are getting the highest share of IT resources. This will bring much needed clarity when it comes to IT spend prioritization and investment.
- Which business units are underserved by IT? By providing full transparency into where all IT spend is consumed, organizations can determine if certain business functions may need increased attention in an upcoming budget cycle. Knowing which levers to pull is critical in aligning IT activities with delivering business value.
- How do I best communicate spend data internally? Different audiences need information presented to them differently. This is not just about the language - it's also about the frequency, format, and channel you use. Ask your audiences directly what methods of communication stand the best chance of you being seen and heard.
- Where do I need better business sponsorship for IT projects? If a lot of IT spend is going toward one or two business units, the leaders of those units need to be active sponsors of IT projects and associated spend that will benefit all users.
Why doesn't my business unit get more support from IT?
| Example | |
|---|---|
| Business Function | % IT Spend |
| HR Department | 6.16% |
| Finance Department | 15.15% |
| IT Department | 10.69% |
| Business Function 1 | 23.80% |
| Business Function 2 | 10.20% |
| Business Function 3 | 6.80% |
| Business Function 4 | 27.20% |
| Source: Info-Tech IT Spend & Staffing Studies, 2022. | |
CEO: Strategic vs. operations perspective
With a business view now available, evaluating IT spend from a strategic standpoint is critical. Simply put, how much is being spent keeping the lights on (KTLO) in the organization versus supporting business or organizational growth versus net-new business innovations? This view is not about what IT costs but rather how it is being prioritized to drive revenue, operating margin, or market share. Here are the questions IT leaders should be asking themselves along with the organization's executive leadership and the CEO:
- Why is KTLO spend so high? This question is a good gauge of where the line is drawn between operations and strategy. Many IT departments want to reduce time spent on maintenance and redeploy resource investment toward strategic projects. This reallocation must include retiring or eliminating technologies to free up funds.
- What should our operational spend priorities be? Maintenance and basic operations aren't going anywhere. The issue is what is necessary and what could be done more wisely. Are you throwing good money after bad on a high-maintenance legacy system?
- Which projects and investments should we prioritize? The answer to this question should tightly align with business strategic goals and account for the lion's share of growth and innovation spend.
- Are we spending enough on innovative initiatives? This is the ultimate dialogue between business partners, the CEO, and IT that needs to take place, yet often doesn't.
I know what IT costs us, but what is it really worth?
| Example | |
|---|---|
| Focus Area | % IT Spend |
| KTLO | 89.16% |
| Grow | 7.18% |
| Innovate | 3.66% |
| Info-Tech IT Spend Studies, 2022. | |
Be clear about where you want your IT spend transparency journey to take you in real life
Transparent IT spend data will allow you to have conversations you couldn't have before. Consider this example of how telling an IT spend story could evolve.
I want to ...
Analyze the impact of the cloud on IT operating expenditure to update finance's expectations of a realistic IT CapEx/OpEx ratio now and into the future.
To address the problem of ...
- Many of our key software vendors have eliminated on-premises products and only offer software as an OpEx service.
- Assumptions that modern IT solutions are largely on-premises and can be treated as capitalizable assets are out-of-date and don't reflect IT financial realities.
And will use transparency to ...
- Provide the CFO with specific, accurate, and annotated OpEx by product/service and vendor for all cloud-based and on-premises solutions.
- Facilitate a realistic calculation of CapEx/OpEx distribution based on actuals, as well as let us develop defendable projections of OpEx into the future based on typical annual service fee increases and anticipated growth in the number of users/licenses.
1.1 Establish ITFM objectives that leverage IT spend transparency
Duration: One hour
- Consider the problems or issues commonly voiced by the business about IT, as well as your own ongoing challenges in communicating with stakeholders. Document these problems/issues as questions or statements as spoken by a person. To help structure your brainstorming, consider these general process domains and examples:
- Spend tracking and reporting. E.g. Why is IT's OpEx so high? We need you to increase IT's percentage of CapEx.
- Service levels and business continuity. E.g. Why do we need to hire more service desk staff? There are more of them in IT than any other role.
- Project and operations resourcing. E.g. Why can't IT just buy this new app we want? It's not very expensive.
- Strategy and innovation. E.g. Did output increase or decrease last quarter per input unit? IT should be able to run those reports for us.
- For each problem/issue noted, identify:
- The source(s) of the question/concern (e.g. CEO, CFO, CXO, CIO).
- The financial process involved (e.g. accurate costing, verification of costs, building a business case to invest).
- For each problem/issue, identify a broader project-style initiative where having transparent IT spend data is a valuable input. One initiative may apply to multiple problems/issues. For each initiative:
- Give it a working title.
- State the goal for the initiative with reference to ITFM aspirations.
- Identify key stakeholders (these will likely overlap with the problem/issue source).
- Set general time frames for resolution.
Document your outputs on the slide immediately following the instruction slides for this exercise. Examples are included.
1.1 Establish ITFM objectives that leverage IT spend transparency
| Input | Output |
|---|---|
|
|
| Materials | Participants |
|
|
ITFM initiatives that leverage transparency
| Problem/Issue Statement | Source/ Stakeholder | Associated ITFM Process | Potential Initiative | Initiative Goal | Time Frame |
| "Why is IT's OpEx so high? We need you to increase IT's percentage of CapEx." | CFO | IT spend categorization and reporting. | Analyze the impact of the cloud on IT operating expenditure. | To update finance's expectations of a realistic IT CapEx/OpEx ratio. | <12 months |
| "Why do we need to hire more service desk staff? There are more of them in IT than any other role." | CFO, VP of HR | Business case for hiring IT staff. | Document ongoing IT support requirements for proposed ERP platform migration project. | To ensure sufficient resources for an anticipated increase in service desk tickets due to implementation of a new ERP system. | 1-3 months |
| "Why can't IT just buy this new app we want? It's not very expensive." | CEO, all CXOs/VPs | Total cost of technology ownership. | Develop a mechanism to review the lifecycle impact on IT of proposed technology purchases. | To determine if functionality of new tool already exists in the org. and the total cost of ownership of a new app. | <6 months |
| "Did output increase or decrease last quarter per input unit? IT should be able to run those reports for us." | CEO, CFO, VP of Production | IT service costing. | Develop an organizational business intelligence strategy. | To create a comprehensive plan for evolving BI capability in the organization and transferring report development to users. Select a department for pilot. | <12 months |
Your organization's governance culture will affect how you approach transparency
| Know your governance culture | Lower Governance
|
Higher Governance
|
| Determine impact on opportunities | How does your governance culture impact IT spend transparency opportunities? | |
|---|---|---|
| Resistance to formality and bureaucracy | Resistance to change and uncertainty | |
| Set expectations and approach | You have plenty of room to implement transparency rigor within the confines of IT, but getting others to give you the time and attention you want will be a challenge. One-on-one, informal relationship building to create goodwill and dialogue is needed before putting forth recommendations or numbers. | Many existing procedures must be accommodated and respected. While you can benefit by working with preexisting mechanisms and touchpoints, expect any changes you want to make to things like IT cost categories or CapEx/OpEx ratios to require a lot of time, meetings, and case-making. |
IT's current maturity around ITFM practice will also affect your approach to transparency
| Know your ITFM maturity level | Lower ITFM Maturity
|
Higher ITFM Maturity
|
| Determine stakeholders' financial literacy | How does your degree of ITFM maturity impact IT spend transparency opportunities? | |
|---|---|---|
| Improve your own financial literacy first | Determine stakeholders' financial literacy | |
| Set expectations and approach | Brush up on core financial management and accounting concepts before taking the discussion beyond IT's walls. Do start mapping your costs, but just know how to communicate what the data is saying before sharing it. | Not everyone will be at your level, familiar with ITFM language and concepts, or focused on the same things you are. Gauge where your audience is at so you can prepare for meaningful dialogue. |
1.2 Assess your readiness to tackle IT spend transparency
Duration: One hour
Note: This assessment is general in nature. It's intended to help you identify and prepare for potential challenges in your IT spend and staffing transparency effort.
- Rate your agreement with the "Data & Information" and "Experience, Expertise, & Support" statements listed on the slide immediately following the two instruction slides for this exercise. For each statement, indicate the extent to which you agree or disagree, where:
- 1 = Strongly disagree
- 2 = Disagree
- 3 = Neither agree nor disagree
- 4 = Agree
- 5 = Strongly agree
- Add up your numerical scores for all statements, where the highest possible score is 65.
- Assess your general readiness against the following guidelines:
- 50-65: Ready. The transparency exercise will involve work, but should be straightforward since you have the data, skills, tools, processes, and support to do it.
- 40-49: Ready, with caveats. The transparency exercise is doable but will require some preparatory legwork and investigation on your part around data sourcing, organization, and interpretation.
- 30-39: Challenged. The transparency exercise will present some obstacles. Expect to encounter data gaps, inconsistencies, errors, roadblocks, and frustrations that will need to be resolved.
- Less than 30: Not ready. You don't have the data, skills, tools, processes, and/or support to do the data transparency exercise. Take time to develop a stronger foundation of financial literacy and governance before tackling it.
Document your outputs on the slide immediately following the two instruction slides for this exercise.
1.2 Assess your readiness to tackle IT spend transparency
| Input | Output |
|---|---|
|
|
| Materials | Participants |
|
|
IT spend transparency readiness assessment
| Data & Information | |
| Statement | Rating |
| We know how to access all IT department spend records. | |
| We know how to access all non-IT-department technology spend records. | |
| We know how to access all IT vendor/contractor agreements. | |
| We know how to access data about our IT staff costs and allocation, such as organizational charts and salaries/benefits. | |
| Our financial and staffing data is up-to-date. | |
| Our financial and staffing data are labeled, described, and organized so that we know what they're referring to. | |
| Our financial and staffing data are in a format that we can easily manipulate (e.g. export, copy and paste, perform calculations). | |
| Experience, Expertise, & Support | |
| Statement | Rating |
| We have sufficient expertise within the IT department to navigate and accurately interpret financial records. | |
| We have reasonable access to expertise/resources in our finance department to support us in an IT spend transparency exercise. | |
| We can allocate sufficient time (about 40 hours) and resources in the near term to do an IT spend transparency exercise. | |
| We have current accountabilities to track and internally report financial information to others on at least a monthly basis. | |
| There are existing financial policies, procedures, and standards in the organization with which we must closely adhere and comply. | |
| We have had the experience of participating in, or responding to the results of, an internal or external audit. | |
Rating scale:
1 = Strongly Disagree; 2 = Disagree; 3 = Neither agree nor disagree; 4 = Agree; 5 = Strongly agree
Assessment scale:
Less than 30 = Not ready; 30-39 = Challenged; 40-49 = Ready with caveats; 50-65 = Ready
Take a closer look at the statements you rated 1, 2, or 3. These will be areas of challenge no matter what your total score on the assessment scale.
Phase 1: Know your objectives
Achievement summary
You've now completed the first two steps on your IT spend transparency journey. You have:
- Set your objectives for making your IT spend and staffing transparent.
- Assessed your readiness to tackle the exercise and know how much work you'll need to do in order to do it well.
"Mapping to a transparency model is labor intensive. You can do it once and never revisit it again, but we would never advise that. What it does is play well into an IT financial management maturity roadmap."
- Monica Braun, Research Director, ITFM Practice, Info-Tech Research Group
Phase 2
Gather Required Data
This phase will walk you through the following activities:
- Gather, clean, and organize your data
- Build your industry-specific business views
This phase involves the following participants:
- Head of IT
- IT financial lead
- Other members of IT management
Phase 2: Gather required data
Finish your preparation.
You're now ready to do the final preparation for your IT spend and staffing transparency journey. In this phase you will:
- Gather your IT spend and staffing data and information.
- Clean and organize your data to streamline mapping.
- Identify your baseline data points.
"Some feel like they don't have all the data, so they give up. Don't. Every data point counts."
- Rex Ding, Research Specialist, ITFM Practice, Info-Tech Research Group
Your IT spend transparency efforts are only as good as the quality of your inputs
Aim for a comprehensive, complete, and accurate set of data and information.
Start by understanding what's included in technology spend
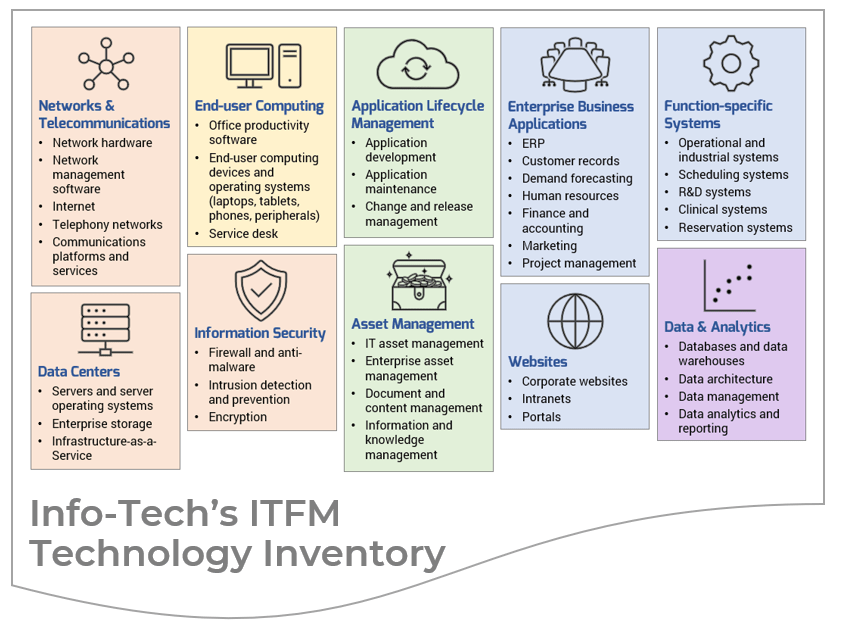
In scope:
- All network, telecom, and data center equipment.
- All end-user productivity software and devices (e.g. laptops, peripheral devices, cell phones).
- Information security.
- All acquisition, development, maintenance, and management of business and operations software.
- All systems used for the storage and management of business assets, data, records, and information.
- All managed IT services.
- Third-party consulting services.
- All identifiable spend from the business for the above.
Expand your thinking: Total tech spend goes beyond what's under IT's operational umbrella
"Technology" means all technology in the organization regardless of where it lives, who bought it, who owns it, who runs it, or who uses it.
IT may have low or no visibility into technologies that exist in the broader business environment beyond IT. Accept that you won't gain 100% visibility right now. However, do get started and be persistent.
Where to look for non-IT technology ...
- Highly specialized business functions - niche tools that are probably used by only a few people.
- Power users and the "underserved" - cloud-based workflow, communication, and productivity tools they got on their own.
- Operational technology - network-connected industrial, building, or physical security sensors and control systems.
- Recently acquired/merged entities - inherited software.
Who might get you what you need ...
- Business unit and team leaders - identification of what they use and copies of their spend records and/or contracts.
- Finance - a report of the "software" expenditure category to spot unrecognized technologies and their owners.
- Vendors - copies of contracts if not forthcoming internally.
- Your service desk - informal knowledge gained about unknown technologies at play in the course of doing their job.
The IT spend and staffing transparency exercise is an opportunity to kick-start a technology discovery process that will give you and the business a true picture of your technology profile, use, and spend.
Seek out data at the right level of granularity with the right supporting information
Key data and information to seek out:
- Credits applied to appropriate debits that show net expense, or detailed descriptions of credits with no matching debit.
- Cash-based accounting (not accrual accounting). If accrual, will need to determine how to simplify the data for your uses.
- Vendor names, asset classes, descriptors, and departments.
- A total spend amount (CapEx + OpEx) that:
- Aligns with the spend period.
- Passes your gut check for total IT spend.
- Includes annual amounts for multi-year contracts (e.g. one year of a three-year Microsoft enterprise agreement).
- Includes technology spend from the business (e.g. OT that IT supports).
- Insights on large projects.
- Consolidated recurring payments, salaries and benefits, and other small expenses.
Look for these data descriptors in your files:
- Cost center/accounting unit
- Cost center/department description
- GL ACCT
- CL account description
- Activity description
- Status
- Program/business function/project description
- Accounting period
- Transaction amount
- Vendor/vendor name
- Product/product name
Avoid data that's hard to use or problematic as it will slow you down and bring limited benefits
Spend data that's out of scope:
- Depreciation/amortization.
- Gain or loss of asset write-off.
- Physical security (e.g. key cards, cameras, motion sensors, floodlights).
- Printer consumables costs.
- Heating and cooling costs (for data centers).
Challenging data formats:
- Large raw data files with limited or no descriptors.
- Major accounts (hardware and software) combined in the same line item.
- Line items (especially software) with no vendor reference information.
- PDF files or screenshots that you can't extract data from readily. Use Excel or CSV files whenever possible.
Getting at the data you need can be easy or hard – it all depends
This is where your governance culture and ITFM maturity start to come into play.
| Data source | Potential data and information | What to expect |
| IT | Current/past budget, vendor agreements, IT project records, discretionary spend, number of IT employees. | The rigor of your ITFM practice and centralization of data and documents will affect how straightforward this is. |
| Finance | General ledger, cash and income statements, contractor payments and other accounts payable, general revenue. | Secure their expertise early. Let them know what you're trying to do and what you need. They may be willing to prepare data for you in the format you need and help you decipher records. |
| Purchasing | List of vendors/suppliers, vendor agreements, purchase invoices. | Purchasing often has more descriptive information about vendors than finance. They can also point you to tech spend in other departments that you didn't know about. |
| Human Resources | Organizational chart, staff salaries and benefits, number of employees overall and by department. | Data about benefits costs is something you're not likely to have, and there's only one place you can reliably get it. |
| Other Business Units | Non-IT technology spend vendor agreements and purchase invoices, number of department employees. | Other departments may be tracking spend in an entirely different way than you. Be prepared to dig and reconcile. |
There may be some data or information you can't get without a Herculean effort. Don't worry about it too much - these items are usually relatively minor and won't significantly affect the overall picture.
Commit to finding out what you don't know
Many IT leaders don't have visibility into other departments' technology spend. In some cases, the fact that spend is even happening may be a complete surprise.
Near-term visibility fix ...
- Ask your finance department for a report on all technology-related spend categories. "Software" is a broad category that finance departments tend to track. Scan the report for items that don't look familiar and confirm the originating department or approver.
- Check in with the procurement office. See what technology-related contracts they have on record and which departments "own" them. Get copies of those contracts if possible.
- Contact individual department heads or technology spend approvers. Devise your contact shortlist based on what you already know or learned from finance and procurement. Position your outreach as a discovery process that supports your transparency effort. Avoid coming across as though you're judging their spend or planning to take over their technologies.
Long-term visibility fix ...
- Develop your relationships with other business unit leaders. This will help open the lines of communication permanently.
- Establish a cross-functional central technology office or group. The main task of this unit is to set and manage technology standards organization-wide, including standards for tracking and documenting technology costs and asset lifecycle factors.
- Ensure IT is formally involved in all technology spend proposals and plans. This gives IT the opportunity to assess them for security compliance, IT network/system interoperability, manageability, and IT support requirements prior to purchase.
- Ensure IT is notified of all technology financial transactions. This includes contracts, invoices, and payments for all one-time purchases, subscription fees, and maintenance costs.
Finally, note any potential anomalies in the IT spend period you're looking at
No two years have the exact same spend patterns. One-time spend for a big capital project, for example, can dramatically alter your overall spend landscape.
Look for the following anomalies:
- New or ongoing capital implementations or projects that span more than one fiscal year.
- Completed projects that have recently transitioned, or are transitioning, from CapEx (decreasing) to OpEx (increasing).
- A major internal reorganization or merger, acquisition, or divestiture event.
- Crises, disasters, or other rare emergencies.
- Changes in IT funding sources (e.g. new or expiring grants).
These anomalies often explain why IT spend is unusually high in certain areas. There's often a good business reason.
In many cases, doing a separate spend transparency exercise for these anomalous projects or events can isolate their costs from other spend so their true nature and impact can be better understood.
2.1 Gather your input data and information
Duration: Variable
- Develop a complete list of the spending and staffing data and information you need to complete the transparency mapping exercise. For each required item, note the following:
- Description of data needed (i.e. type, timeframe, and format).
- Ideal timeframe or deadline for receipt.
- Probable source(s) and contact(s).
- Additional facilitation/support required.
- Person on your transparency team responsible for obtaining it.
- Set up a data and information repository to store all files as soon as they're received. Ideally, you'll want all data/information files to be in an electronic format so that everything can be stored in one place. Avoid paper documents if possible.
- Conduct your outreach to obtain the input data and information on your list. This could include delegating it to a subordinate, sending emails, making phone calls, booking meetings, and so on.
- Review the data and information received to confirm that it's the right type of data, at the correct level of granularity, for the right timeframe, in a usable format, and is generally accurate.
- Enter documentation about your data and information sources in tab "1. Data & Information Sources" in the IT Spend & Staffing Transparency Workbook to reflect what you needed and where you got it in order to make the discovery process easier in the future.
- In the same tab in the IT Spend & Staffing Transparency Workbook, document any significant events that occurred that directly or indirectly impacted the selected year's spend values. These could include mergers/acquisitions/divestitures, major reorganizations or changes in leadership, significant shifts in product offerings or strategic direction, large capital projects, legal/regulatory changes, natural disasters, or changes in the economy.
Download the IT Spend & Staffing Transparency Workbook
2.1 Gather your input data and information
| Input | Output |
|---|---|
|
|
| Materials | Participants |
|
|
Tidy up your data before beginning any spend mapping
Most organizations aren't immaculate in their tech spend documentation and tracking practices. This creates data rife with gaps that lives in hard-to-use formats.
The more preparation you do to approach the "good data" intersection point in the diagram below, the easier your mapping effort will be and the more useful and insightful your final findings.
Make your data "un-unique" to reduce the number of line items and make it manageable
There's a good chance that the IT spend data you've received is in the form of tens of thousands of unique line items. Use the checklist below to help you roll it up.
Warning: Never overwrite your original data. Insert new columns/rows and put your alternate information in these instead.
Step 1: Standardize vendor names
- Start with known large vendors.
- Select a standard name for the vendor.
- Brainstorm possible variations on the vendor name, including abbreviations and shortforms.
- Search for the vendor in your data and document the new standardized vendor name in the appropriate row.
- Repeat the above for all vendors.
- Sort the new vendor name column from A-Z. Look for instances where names remain unique or are missing entirely. Reconcile if needed and fill in missing data.
Step 2: Consolidate vendor spend
- Sort the new vendor name column from A-Z. Start with vendors that have the most line items.
- Add together related spend items from a given vendor. Create a new row for the consolidated spend item and flag it as consolidated. Keep the following item types in separate rows:
- Hardware vs. software spend for the same vendor.
- Cloud vs. on-premises spend for the same vendor.
- Repeat the above for all vendors.
- Consider breaking out separate rows for overly consolidated line items that contain too many different types of IT spend.
2.2 Clean and organize your data
Duration: Variable
- Check to ensure that you have all data and information required to conduct the IT spend transparency exercise.
- Conduct an initial scan to assess the data's current state of hygiene and overall usability. Flag anything of concern and follow up with the data/information provider to fix or reconcile any issues.
- Normalize your data to make it easier to work with. This includes selecting data format standards and changing anything that doesn't conform to those standards. This includes items such as date conventions, currencies, and so on.
- Standardize product and vendor naming/references throughout to enable searching, sorting, and grouping. For example, Microsoft Office may be variably referred to as "Microsoft", "Office", "Office 365", and "Office365" throughout your data. Pick one descriptor for the product/vendor and replace all related references with that descriptor.
- Consolidate and aggregate your data. Ideally, the data you received from your sources has already been simplified; however, you may need to further organize it to reduce the number of individual line items to a more manageable number. The transparency exercise uses relatively high-level categories, so combine data sets and aggregate where feasible without losing appropriate granularity.
- Archive any original copies of files that have been modified or replaced with consolidated/aggregated versions for future reference if needed.
2.2 Clean and organize your data
| Input | Output |
|---|---|
|
|
| Materials | Participants |
|
|
Select IT spend "buckets" for the CXO Business View as your final preparatory step
Every organization has both industry-agnostic and industry-specific lines of business that are the direct beneficiaries of IT spend.
Common shared business functions:
- Human resources.
- Finance and accounting.
- Sales/customer service.
- Marketing and advertising.
- Legal services and regulatory compliance.
- Information technology.
It may seem odd to see IT on the business functions list since the purpose of this exercise is to map IT spend. For business view purposes, IT spend refers to what IT spends on itself to support its own internal operations.
Examples of industry-specific functions:
- Manufacturing: Product research and development; production operations; supply chain management.
- Retail banking: Core banking services; loan, mortgage and credit services; investment and wealth management services.
- Hospitals: Patient intake and admissions; patient diagnosis; patient treatment; patient recovery and ongoing care.
- Insurance: Actuarial analysis; policy creation; underwriting; claims processing.
See the Appendix of this blueprint for definitions of shared business functions plus sample industry-specific business view categories.
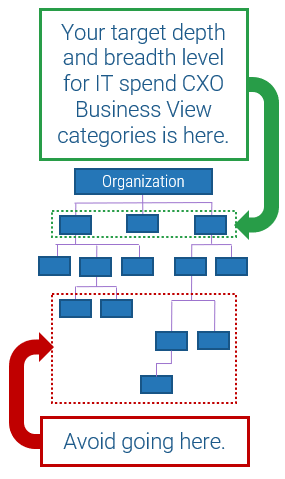
Define your CXO Business View categories to set yourself up well for future ITFM analyses
The CXO Business View buckets you set up today are tools you can and should reuse in your overall approach to ITFM governance. Spend some time to get them right.
Stay high-level
Getting too granular invites administrative headaches and overhead. Keep things high-level and general:
- Limit the number of direct stakeholders represented: This will reduce communication overhead and ensure you're dealing only with people who have real decision-making authority.
- Look to your org. chart: Note the departments or business units listed across the top of the chart that have one executive or top-ranking senior manager accountable for them. These business units often translate as-is into a tidy CXO Business View category.
Limit your number of buckets
Tracking IT spend across more than 8-10 shared and industry-specific business categories is impractical.
- Simplify your options: Too many buckets gets confusing and invites time-wasting doubt.
- Reduce future rework: Business structures will change, which means recategorizing spend data. Using a forklift is a lot easier than using tweezers.
- Stick to major business units: Create separate "Business Other" and "Industry Other" catch-all categories to track IT spend for smaller functions that fall outside of major business unit structures.
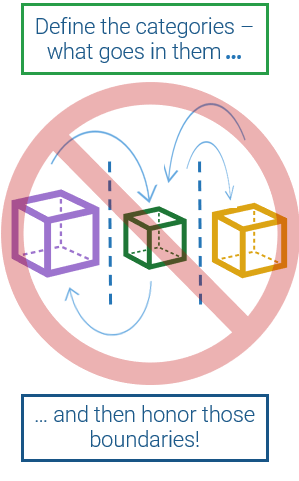
Be clear on what's in and what's out of your categories to keep everyone on the same page
Clear lines of demarcation between CXO Business View categories reduce confusion, doubt, and wheel-reinvention when deciding where to allocate IT spend.
Ensure clear boundaries
Mutual exclusivity is key when defining categories in any taxonomical structure.
- Avoid overlaps: Each high-level business function category should have few or no core function or process overlaps with another business function category. Aim for clear vertical separation.
- Be encompassing: When defining a category, list all the business capabilities and sub-functions included in that category. For example, if defining the finance and accounting function, remember to specify its less obvious accountabilities, like enterprise asset management if appropriate.
Identify exclusions
Listing what's out can be just as informative and clarifying as listing what's in.
- Beware odd bedfellows: Minor business groups are often tucked under a bigger organizational entity even though the two use different processes and technologies. Separate them if appropriate and state this exclusion in the bigger entity's definition.
- Draw a line: If a process crosses business function categories, state which sub-steps are out of scope.
- Document your decisions: This helps ensure you allocate IT spend the same way every time.
2.3 Build your industry-specific business views
Duration: Two hours
- Confirm your list of high-level shared business services (human resources, finance and accounting, etc.) as provided in Info-Tech's IT Spend & Staffing Transparency Workbook. Rename them if needed to match the nomenclature used in your organization.
- Set and define your additional list of high-level, industry-specific business categories that are unique to or define your industry. See the slides immediately following this exercise for tips on developing these categories, as well as the appendix of this blueprint for some examples of industry-specific categories and definitions.
- Create "Business Other" and "Industry Other" categories to capture minor groups and activities supported by IT that fall beyond the major shared and industry-specific business functions you've shortlisted. Briefly note the business groups/activities that fall under these categories.
- Edit/enter your shared and industry-specific business function categories and their definitions on tab "2. Business View Definitions" in the IT Spend & Staffing Transparency Workbook.
Download the IT Spend & Staffing Transparency Workbook
2.3 Build your industry-specific business views
| Input | Output |
|---|---|
|
|
| Materials | Participants |
|
|
Lock in key pieces of baseline data
Calculating core IT spend metrics relies on a few key numbers. Settle these first based on known data before diving into detailed mapping.
These baseline data will allow you to calculate high-level metrics like IT spend as a percent of revenue and year-over-year percent change in IT spend, as well as more granular metrics like IT staff spend per employee for a specific IT service.
Baseline data checklist
- IT spend analysis period (date range).
- Currency used.
- Organizational revenue.
- Organizational OpEx.
- Total current year IT spend.
- Total current year IT CapEx and IT OpEx.
- Total previous-year IT spend.
- Total projected next-year IT spend.
- Number of organizational employees.
- Number of IT employees.
You may have discovered some things you didn't know about during the mapping process. Revisit your baseline data when your mapping is complete and make adjustments where needed.
2.4 Enter your baseline data
Duration: One hour
- Navigate to tab "3. Baseline Data" in the IT Spend & Staffing Transparency Workbook. Using the data you've gathered, enter the following information to set your baseline data for future calculations:
- Your IT spend analysis date range. This can be concrete dates, a fiscal year abbreviation, etc.
- The currency you will be using throughout the workbook. It's important that all monetary values entered are in the same currency.
- Your organization's total revenue and total operating expenditure (OpEx) for the spend analysis data range you've specified. Revenue includes all sources of funding/income.
- Your total IT OpEx and total IT capital expenditure (CapEx). The workbook will add your OpEx and CapEx values for you to arrive at a total IT spend value.
- Total IT spend for the year prior to the current IT spend analysis date range, as well as anticipated total IT spend for the year following.
- Total IT staff spend (salaries, benefits, training, travel, and fees for employees and contractors in a staff augmentation role) for the spend analysis date range.
- The total number of organizational employees and total number of IT employees. These are typically full-time equivalent (FTE) values and include contractors in a staff augmentation role.
- Make note of any issues that have influenced the values you entered.
Download the IT Spend & Staffing Transparency Workbook
2.4 Enter your baseline data
| Input | Output |
|---|---|
|
|
| Materials | Participants |
|
|
Phase 2: Gather required data
Achievement summary
You've now completed all preparation steps for your IT spend transparency journey. You have:
- Gathered your IT spend and staffing data and information.
- Cleaned and organized your data to streamline mapping.
- Identified your baseline data points.
"As an IT person, you're not speaking the same language at all as the accounting department. There's almost always a session of education that's required first."
- Angie Reynolds, Principal Research Director, ITFM Practice, Info-Tech Research Group
Phase 3
Map Your IT Staff Spend
This phase will walk you through the following activities:
- Mapping your IT staff spend across the four views of the ITFM Cost Model
- Validating your mapping
This phase involves the following participants:
- Head of IT
- IT financial lead
- Other members of IT management
Phase 3: Map your IT staff spend
Allocate your workforce costs across the four views.
Now it's time to tackle the first part of your hands-on spend mapping effort, namely IT staff spend. In this phase you will:
- Allocate your IT staff spend across the four views of the ITFM Cost Model.
- Validate your mapping to ensure that it's accurate and complete.
"We're working towards the truth. We know the answer, but it's how to get it. Take Data & BI. For some organizations, four FTEs is too many. Are these people really doing Data & BI? Look at the big picture and see if something's missing."
- Rex Ding, Research Specialist, ITFM Practice, Info-Tech Research Group
Staffing costs comprise a significant percent of OpEx
Staffing is the first thing that comes to mind when it comes to spend. Intentionally bring it out of the shadows to promote constructive conversations.
- Total staffing costs stand out from other IT spend line items. This is because they're comparatively large, often comprising 30-50% of total IT costs.
- Standing out comes at a price. Staff costs are where business leadership looks first if they want cuts. If IT leadership doesn't bring forward ways to cut staffing costs as part of a broader cost-cutting mandate, it will be seen as ignorant of business priorities at best and outright insubordinate at worst.
- Staffing costs as a percentage of total costs vary between IT functions. On the business side, there's a lack of understanding about what functions IT staff serve and support and the real-world costs of obtaining (and keeping) needed IT skills. For example, IT security staffing costs as a percentage of that service's total OpEx will likely be higher than service desk staff given the scarcity and higher market value of the former. Trimming 20% of IT staffing costs from the IT security function has much different implications than cutting 20% of service desk staffing costs.
Staffing spend transparency can do a lot to change the conversation from one where the business thinks that IT management is just being self-protecting to one where they know that IT management is actually protecting the business.
Demonstrating the legitimate reasons behind IT staff spend is critical in both rationalizing past and current spend decisions as well as informing future decisions.
Info-Tech recommends that you map your IT staffing costs before all other IT costs
Mapping your IT staffing spend first is a good idea because:
- Staffing costs are usually documented more clearly, simply, and accurately than other IT costs.
- Gathering all your IT staffing data is usually a one-stop shop (i.e. the HR department).
- The comparative straightforwardness of mapping staff costs compared to other IT costs gives you the opportunity to:
- Get familiar with the ITFM Cost Model views and categories.
- Get the hang of the hands-on mapping process.
- Determine the kinds of speed bumps and questions you'll encounter down the road when you tackle the more complicated mappings.
"Some companies will say software developer. Others say application development specialist or engineer.
What are these things? You have to have conversations ..."
- Rex Ding, Research Specialist, ITFM Practice, Info-Tech Research Group
Understand the CFO Expense View: "Workforce" categories defined
For the staffing spend mapping exercise, we're defining the Workforce category here and will offer Vendor category definitions in the vendor spend mapping exercise later.
Workforce: The total costs of employing labor in the IT organization. This includes all salary/wages, benefits, travel/training, dues and memberships, and contractor pay. Managed services expenses associated with an external service provider should be excluded from Workforce and included in Contract Services.
Employee: A person employed by the IT organization on a permanent full-time or part-time basis. Costs include salary, benefits, training, travel and expenses, and professional dues and memberships. These relationships are managed under human resources and the bulk of spend transactions via payroll processes.
Contractor: A person serving in a non-permanent staff augmentation role. These relationships are typically managed under procurement or finance and spend transactions handled via invoicing and accounts payable processes. Labor costs associated with an external service provider are excluded.

Mapping your IT staff across the CFO Expense View is relatively cut-and-dried
The CFO Expense View is the most straightforward in terms of mapping IT staffing costs as it's made up of only two main categories: Workforce and Vendor.
In the CFO Expense View, all IT spend on staffing is allocated to the Workforce bucket under either Employee or Contractor.
What constitutes a Contractor can be confusing given increased use of long-term labor augmentation strategies, so being absolutely clear about this is imperative. For spend mapping purposes:
- Any staff members under independent contract where individuals are paid directly by your organization as opposed to indirectly via a service provider (e.g. staffing firm) are considered Workforce > Contractor.
- Any circumstances where you pay a third-party organization for labor is slotted under Vendor > Contract Services.
Understand the CIO Service View: Categories defined
We've provided definitions for the major categories that require clarification.
Applications Development: Purchase/development, testing, and deployment of application projects. Includes internally developed or packaged solutions.
Applications Maintenance: Software maintenance fees or maintaining current application functionality along with minor enhancements.
Hosting & Networks: Compute, storage, and network functionality for running/hosting applications and providing communications/connectivity for the organization.
End User: Procurement, provision, management, and maintenance (break/fix) of end-user devices (desktop, laptops, tablets, peripherals, and phones) as well as purchase/support and use of productivity software on these devices. The IT service desk is included here as well.
PPM & Projects: People, processes, and technologies dedicated to the management of IT projects and the IT project portfolio as a whole.
Data & BI: Strategy and oversight of the technology used to support data warehousing, business intelligence, and analytics.
IT Management: Senior IT leadership, IT finance, IT strategy and governance, enterprise architecture, process management, vendor management, talent management, and program and portfolio management oversight.
Security: Information security strategy and oversight, practices, procedures, compliance, and risk mitigation to protect and prevent unauthorized access to organizational data and technology assets.
Mapping your IT staff across the CIO Service View is a slightly harder exercise
The complexity of mapping staff across this view depends on how your IT department is organized and the degree of role specialization vs. generalization.
The CIO Service View mirrors how many IT departments are organized into teams or work groups. However, some partial percentage-based allocations are probably required, especially for smaller IT units with more generalized, cross-functional roles. For example:
- A systems administrator's costs may need to be allocated 80% to Hosting & Networks and 20% to Security.
- An app development team lead may spend about 40% of their time doing hands-on Development work and the other 60% on project management (i.e. PPM & Projects).
Info-Tech has found that allocating staffing costs for Data & BI raises the most doubts as it can be very entangled with Applications and other spend. Do the best you can.
Understand the CXO Expense View: Categories defined
Expand shared services and industry function categories as suits your organization.
Industry Functions: As listed and defined by you for your specific industry.
Human Resources: IT staff and specific application functionality in support of organizational human resource management.
Finance & Accounting: IT staff and specific application functionality in support of corporate finance and accounting.
Shared Services Other: IT staff and specific application functionality in support of all other shared enterprise functions.
Information Technology: IT staff and specific application functionality in support of IT performing its own internal IT operations functions.
Industry Other: IT staff and specific application functionality in support of all other industry-specific functions.
Mapping your IT staff across the CXO Business View warrants the most time
This view is probably the most difficult as many IT department roles are set up according to lines of IT service, not lines of business. Prepare to do a little math.
The CXO Expense View also requires percentage-based splitting of role spend, but to a greater extent.
- Start by mapping staff cost allocations for those roles that are at, or close to, 100% dedicated to a specific business function (if any).
- For IT roles that support organization-wide or multi-department functions, knowing the percent of employees that work in each relevant business unit and parceling IT staff spend by those same percentages may be easiest. For example, a general systems administrator's costs could be allocated as 4% to HR, 2% to finance, 25% to sales, 20% to production operations, and so on based on the percentage of employees in each of the supported business units.
Take a minute to figure out how you plan to map IT's indirect CXO Business View costs
Direct IT costs are those that are dedicated to a specific business unit or user group, such a marketing campaign management app, specialized devices used by a specific subset of workers in the field, or a business analyst embedded full-time in a sales organization.
VS
Indirect IT costs are pretty much everything else that's shared broadly across the organization and can't be tied to just one stakeholder or user group, such as network infrastructure, the service desk, and office productivity apps. These costs must be fairly and evenly distributed.
No indirect mapping method is perfect, but here's a suggestion:
- Take the respective headcount of all business functions sharing the IT resource/service in question.
- Calculate each business function's staff as a percentage of all organizational staff.
- Use this same percent of staff to calculate and allocate a business function's indirect staff and indirect vendor costs.
"There is always a conversation about indirect allocations. There's never been an organization I've heard of or worked for which has been able to allocate every technology cost directly to a business consumption or business unit."
Monica Braun, ITFM Research Director, Info-Tech Research Group
Example:
- A company of 560 employees has six HR staff (about 1.1% of total staff).
- Network admin staffing costs $143,000, so $1,573 (1.1%) would be allocated to HR.
- Internet services cost $40,000, so $440 (1.1%) would be allocated to HR.
Some indirect costs are shared by multiple business functions, but not all. In these cases, exclude non-participating business functions from the total number of organizational employees and re-calculate a new percent of staff for each participating business function.
Know where you're most likely to encounter direct vs. indirect IT staffing costs
Info-Tech has found that direct vs. indirect staffing spend is more commonly found in some areas than others. Use this insight to focus your work.
Direct IT staffing spend
Definition: Individuals or teams whose total time is formally dedicated to the support of one business unit/function.
- Data & BI (direct to one non-IT unit)
- IT Management (direct to IT)
- Service planning & Architecture
- Strategy & Governance
- Financial Management
- People & Resources
Hybrid IT staffing spend
Definition: Teams with a percent of time or entire FTEs formally dedicated to one business unit/function while the remainder of the time or team is generalized.
- Applications
- Applications Development
- Applications Maintenance
- IT Management
- PPM & Projects
Indirect IT staffing spend
Definition: Individuals or teams whose total time is generalized to the support of multiple or all business units or functions.
- Infrastructure
- Hosting & Networks
- End Users
- Security
Indirect staff spend only comes into play in the CXO Business View. Thoroughly map the CIO Service View first and leverage its outcomes to inform your allocations to individual business and industry functions.
Understand the CEO Innovation View: Categories defined
Be particularly clear on your understanding of the difference between business growth and business innovation.
Business Innovation: IT spend/ activities focused on the development of new business capability, new products and services, and/or introduction of existing products/ services into new markets. It does not include expansion or update of existing capabilities.
Business Growth: IT spend/activities focused on the expansion, scaling, or modernization of an existing business capability, product/service, or market. This is specifically related to growth within a current market.
Keep the Lights On: IT spend/activities focused on keeping the organization running on a day-to-day basis. This includes all activities used to ensure the smooth operation of business functions and overall business continuity.
Important Note
Info-Tech analysts often skip mapping staff for the CEO Innovation View when delivering the IT Spend & Staffing Benchmarking Service.
This is because, for many organizations, either most IT staff spend is allocated to Keep the Lights On or any IT staff allocation to Business Growth and Business Innovation activities is untracked, undocumented, and difficult to parse out.
Mapping your IT staff across the CEO Innovation View is largely straightforward
Clear divisions between CapEx and OpEx can be your friend when it comes to mapping this view. Focus your efforts on parsing growth vs. innovation.
- The majority of IT staff costs are OpEx: And the majority of OpEx will land in the Keep the Lights On category. This is a comparatively simple mapping exercise. Know in advance that this will be the largest of the three buckets in the CEO Innovation View by a very wide margin, so don't be surprised if over 90% of IT staffing costs end up here.
- Most of the remaining IT staff costs will be tied to capital projects and investments: This means that they will land in either Business Growth or Business Innovation, with the majority typically sitting under Business Growth. Again, don't be surprised if the Business Innovation category holds less than 3% of total IT staffing spend.
Take your IT staff spend mapping to the next level with detailed time and headcount data
Overlay a broader assessment of your IT staff
Info-Tech's IT Staffing Assessment diagnostic can expand your view of what's really happening on the staffing front.
- Learn your true distribution of IT staff across the same IT services listed in the ITFM Cost Model's CIO Service View.
- Get other metrics such as degrees of seniority, manager span of control, and IT staff perception of their effectiveness.
Take action
- Set it up: Contact your Info-Tech Account Manager and sign your team up to take the diagnostic.
- Assess the findings: Review the output report, specifically how your staff says they spend their time versus what your organization chart's been telling you.
- Apply the percentages: Use the FTE allocation percentages in the output report to guide how you distribute your staff spend across the CIO Service View.
- Expand your analysis: Use your staff's feedback around perceived aids and obstacles to effectiveness in order to inform and defend your recommendations and decisions on how IT funds should be spent.
Consider these final tips for mapping your IT staffing costs before diving in
Mapping your IT staffing costs definitely requires some work. However, knowing the common stumbling blocks and being systematic will yield the best results.
Approach: Be efficient to be effective
Start with what you know best: Map the CFO Expense View first to plug in information you already have. Next, map the CIO Service View since it's most aligned to your organization chart.
Keep a list of questions: You'll need to seek clarifications. Note your questions, but don't reach out until you've done a first pass at the mapping - don't annoy people with a barrage of questions.
Delegate: Your managers and leads have a more accurate view of exactly what their staff do. Consider delegating the CIO Service View and CXO Business View to them or turn the mapping exercise into a series of collaborative leadership team activities.
Biggest challenge: Role/title ambiguity
- The Business Analyst role is often vague. These staffers are often jacks-of-all-trades in IT. You probably can't rely on a generic job description to figure out exactly which services and business functions BAs are spending their time on. Plan to ask a lot of questions.
- Other role titles may be completely inaccurate. Is the word "system" referring to apps, infrastructure, or both? Is the user experience specialist actually a programmer? Is a manager really managing anything? Know your organization's tendencies around meaningful job titling and set your workload expectations accordingly.
Key step - validate! If you see services or functions with low or no allocation, or something just doesn't look right, investigate. Someone's doing that work - take the time to figure out who.
3.1 Map your IT staffing costs
Duration: Variable
- Navigate to tab "4. Staff Spend Mapping" in the IT Spend & Staffing Transparency Workbook. On one row, enter the name of an individual or group to be mapped, their role/title (if an individual), and their total known cost as per your collected data.
- Under the CFO Expense View (columns F-G), enter the number of FTEs represented by the individual or group named and their status (i.e. Employee or Contractor).
- Under the CIO Service View (columns L-AF), allocate the individual or group's spend as a percentage across all service categories. If the allocation for a service is 0%, leave the cell blank.
- Under the CXO Business View (columns AI-BA), allocate the individual or group's spend as a percentage across all business function and industry-specific function categories. If the allocation for a function is 0%, leave the cell blank.
- Under the CEO Innovation View (columns BD-BH), allocate the individual or group's spend as a percentage across Business Innovation, Business Growth, and Keep the Lights On. If the allocation for an investment type is 0%, leave the cell blank.
- Repeat steps 2 to 5 for all other IT staff (as individuals or groups).
- Follow up on and resolve any additional inquiries you need to make based on questions that arose during the mapping process.
- Validate your mapping by:
- Identifying spend categories that have zero staff spend allocation. Additional percentage allocation splits for certain roles are probably required.
- Investigating spend categories that seem to have very high or very low spend allocations based on a gut check. Again, double-check your percentage allocation splits.
- Ensuring your amounts add up to your previously calculated total IT staff spend. A balance tracker is provided on tab "6. Tracker & General Outputs" of the IT Spend & Staffing Transparency Workbook.
Download the IT Spend & Staffing Transparency Workbook
3.1 Map your staffing costs
| Input | Output |
|---|---|
|
|
| Materials | Participants |
|
|
Phase 3: Map your IT staff spend
Achievement summary
You've now completed your IT staff spend mapping. You have:
- Allocated your IT staff spend across the four views of the ITFM Cost Model.
- Validated your mapping to ensure it's accurate and complete.
"Some want to allocate everybody to IT, but that's not how we do it. [In one CXO Business View mapping], a client allocated all their sand network people to the IT department. At the end of the process, the IT department itself accounted for 20% of total IT spend. We went back and reallocated those indirect staff costs across the business."
- Kennedy Confurius, Research Analyst, ITFM Practice, Info-Tech Research Group
Phase 4
Map Your IT Vendor Spend
This phase will walk you through the following activities:
- Mapping your IT vendor spend across the four views of the ITFM Cost Model
- Validating your mapping
This phase involves the following participants:
- Head of IT
- IT financial lead
- Other members of IT management
Phase 4: Map your IT vendor spend
Allocate your vendor costs across the four views.
Now you're ready to take on the second part of your spend mapping, namely IT vendor spend. In this phase you will:
- Allocate your IT vendor spend across the four views of the ITFM Cost Model.
- Validate your mapping to ensure it's accurate and complete.
"[One CIO] said that all technology spend runs through their IT group. But they didn't have hardware in their financial data file - no cellphones or laptops, no network or server expenses. They thought they had everything, but they didn't know what they didn't have. Assume it's out there somewhere."
- Kennedy Confurius, Research Analyst, ITFM Practice, Info-Tech Research Group
Tackle the non-staff side of IT spend
Info-Tech analysts find that mapping the IT vendor spend data is harder because the source data is often scattered and not meaningfully labeled.
- Be patient and systematic. As with mapping your IT staff spend data, the more organized you are from the outset and the more thoroughly you've prepared your data, the more straightforward the exercise will be.
- Did you "un-unique" your data? If not, do that now before attempting mapping.
- Get comfortable with making some assumptions. You need to get through the exercise, so sometimes making a best guess and entering a value is better than diving down a rabbit hole. Your gut is probably right anyway. But only make assumptions around smaller line items that don't have a massive impact on your final numbers. Never assume anything when it comes to big-ticket items.
- Curb your urge to fix. Some of your buckets will start to get big, while others will barely budge. This is normal ... and interesting! Resist the urge to "balance" staffing spend in a bucket by loading it with apps and hardware for fear that the staffing spend looks too high and will be questioned. This exercise is about how things are, not how they look.
"A common financial data problem is no vendor names. I've noticed that, even if the vendor name is there, there are no descriptors. You cannot actually tell what type of service it is. Data security? Infrastructure? Networking? Ask yourself 'What did we purchase and what does it do?'"
- Aman Kumari, Research Specialist, ITFM Practice, Info-Tech Research Group
Understand the CFO Expense View: Vendor categories defined
These are the final definitions for this view. See the previous section for CFO Expense View > Workforce definitions used in the IT staffing cost mapping exercise.
Vendor: Provider of a good or service in exchange for payment.
Hardware: Costs of procuring, maintaining, and managing all IT hardware, including end-user devices, data center and networking equipment, cabling, and hybrid appliances for both on-premises and cloud-based providers.
Software: Costs for all software (applications, database, middleware, utilities, tools) used across the organization. This includes purchase, maintenance, and licensing costs.
Contract Services: Costs for all third-party services including managed service providers, consultants, and advisory services.
Cloud: Offsite hosting and delivery of an on-demand software or hardware computing function by a third-party provider, often on a subscription-type basis.
On-Prem: On-site hosting and delivery of a software or hardware computing function, often requiring upfront purchase cost and subsequent maintenance costs.
Managed Services: Costs for outsourcing the provision and maintenance of a technical process or function.
Consulting & Advisory: Costs for the third-party provision of professional or technical advice and expertise.
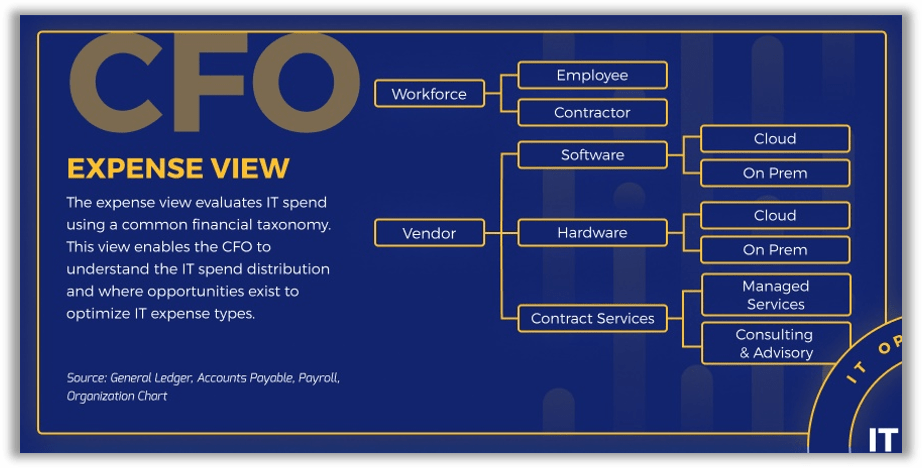
Know if a technology is cloud-based or on-premises before mapping
A technology may be one, the other, or both if multiple versions are in play. Financial records rarely indicate which, but on-premises vs. cloud matters in your planning.
On-Premises
- Check your CapEx. Any net-new purchases of software or hardware for the IT spend analysis year in question should appear on the CapEx side of the equation. After the first year of implementation/rollout, all ongoing maintenance and management costs should be found under OpEx.
- Focus on real in-year costs.
- Don't try to map depreciation or amortization associated with CapEX. Instead, map any upfront purchase costs that occurred in the relevant IT spend analysis year.
- Map any OpEX costs incurred from maintenance and management. For multi-year maintenance contracts, apply the percentage of fees paid for the relevant year.
Cloud
- Check your OpEx. Cloud services are typically fee-based, which means the costs often come in the form of regularly timed bills akin to a subscription.
- Differentiate new services from older ones. If the cloud service was initiated during the IT spend analysis year in question, there may be some one-time service setup and initiation fees that were legitimately slotted under CapEx. If the cloud service isn't new, then all costs should be OpEx.
Vendors are increasingly "retiring" on-premises software products. This means an older version may be on-prem, a newer one cloud, and you may have both in play.
Mapping built-in data, analytics, and security functions can raise doubts
With so many apps focused on capturing, manipulating, and protecting data, built-in analytics, reporting, and security functions blur CIO Service View bucket boundaries.
Applications vs. Data & BI
- In recent years, much more powerful analysis and report-generation features have been added to core enterprise applications. If analytics and reporting functionality is an extended feature of a database-driven application, such as ERP or CRM, then map it to one of the Applications buckets.
- If the sole purpose of the application is to store, manipulate, query, analyze, and/or visualize data, then log its costs under Data & BI. These would include technologies such as data warehouses, marts, cubes, and lakes; desktop data visualization tools; enterprise business intelligence platforms; and specialized reporting tools.
Applications vs. Security
- A similar conundrum exists for Security. So many tools today have built-in security functionality that cannot be unintegrated from the app they support. Don't even try to isolate native security functionality for spend mapping purposes - map it to Applications.
- If the tool is a special-purpose, standalone security tool or security platform, then map it to Security. These tools usually sit within, and are used/managed by, IT. They include firewalls; antivirus/anti-malware; intrusion prevention, detection and response; access control and authentication; encryption; and penetration testing and vulnerability assessment.
Putting spend in the right bucket does matter. However, if uncertainty persists, err on the side of consistency. For most organizations Applications Maintenance does end up being the biggest bucket.
When mapping the CXO Business View, do the biggest vendors first
Below is a suggested order of operations to clear through the majority of vendor spend as early as possible in the process.
| 1 | Sort high to low | Sort your list of vendor spend from highest to lowest. Your top 20 vendors should constitute most of the spend. |
| 2 | Map multi-department enterprise apps | Flag your top apps vendors that have presence in most or all of your business units. Map these first. These tend to be enterprise-level business apps "owned" by core business functions but used broadly across the organization such as enterprise resource planning (ERP), customer relationship management (CRM), and people management systems. |
| 3 | Map end-user spend | Identify top vendors of general end-user technologies like office productivity apps, desktop hardware, and IT service desk tools. Allocate percentages according to your selected indirect spend mapping method. |
| 4 | Map core infrastructure spend | Map the behind-the-scenes network, telecom, and data center technologies that underpin IT, plus any infrastructure managed services. Again, apply your selected indirect spend mapping method. |
| 5 | Map business-unit specific technologies | This is the spend that's often incurred by just one department. This may also be technology spend that's out in the business, not in IT proper. Map it to the right business function or put it in Business Other or Industry Other if the business function doesn't have its own bucket. |
| 6 | Map the miscellaneous | Only smaller spend items likely remain at this point. When in doubt, map them to either Business Other or Industry Other. |
After mapping the CXO Business View, your Other buckets might be getting a bit big
It's common for the Business Other and Industry Other categories to be quite large, and even the largest. This is okay, but plan to dig deeper and understand why.
| Remember "when in doubt, map to either the Business Other or Industry Other category"? Know what large Other buckets might really be telling you. | After your first pass at mapping the CXO Business View, review Business Other and Industry Other if either is more than about 10% of your total spend. |
| Diversification: Your organization has a wide array of business functions and/or associated staff that exist outside the core business and industry-specific categories selected. | Are there minor business functions that can reasonably be included with the core categories identified? If not, don't force it. Better to keep your core buckets clean and uncomplicated. |
| Non-core monolith: There's a significant technology installation outside the core that's associated with a comparatively minor business function. | Is there a business function incurring substantial technology spend that should probably be broken out on its own and added to the core? If so, do it. Spend is unlikely to get smaller as the organization grows, so best to shine a light on it now. |
| Shadow IT: There's significant technology spend in several areas of the organization that is unowned, unmanaged, or serving an unknown purpose as far as IT is concerned. | Is a lot of the spend non-IT technology in the business? If yes, flag it and plan to learn more. It's likely that technologies living elsewhere in the organization will become IT concerns eventually. Better to be ready than to be surprised. |
As with staffing, CapEx vs. OpEx helps map the CEO Innovation View
Mapping to this view was optional for IT staffing. For hard technology vendor spend, mapping this view is key. Use the guidance below to determine what goes where.
Keep the Lights On
Spend usually triggered by a service deck ticket or work order, not a formal project. Includes:
- Daily maintenance and management.
- Repair or upgrade of existing technology to preserve business function/continuity.
- Purchase of "commodity" technology, such as standard-issue laptops and licenses for office productivity software.
Business Growth
Spend usually in the context of a formal project under a CapEx umbrella. Includes:
- Technology spend that directly supports business expansion of an existing product or service and/or market.
- Modernizing existing technology.
- Extension of, or investment in, existing infrastructure to ensure reliability and availability in response to growth-driven scaling of headcount and utilization.
Business Innovation
Spend is always in the context of a formal project and should be 100% CapEx in the first year after purchase. Includes:
- Technology spend that directly supports development and rollout of new products or service and/or entry into new markets.
- Use of existing technology or investment in net-new technology in direct support of a new business initiative, direction, or requirement.
In many organizations, most technology spend will be allocated to Keep the Lights On. This is normal but should generate conversations with the business about redirecting funds to growth and innovation.
Remember these top tips when mapping your technology vendor spend
The benefits of having tidy and organized data can't be overstated, as your source data will be in a more varied state for this phase of the mapping than with IT staffing data.
Approach: Move from macro to micro
- Start with the big enterprise apps: These will probably be in the top five of your vendor spend list and will likely have good info about how and by whom they're used. Get them out of the way.
- Clear out shared technologies. This will feature infrastructure and operations plus office productivity and communications spend. Portioning spend by department headcount for the CXO Business View is the hardest part. Get this forklift task out of the way too.
- Don't sweat the small stuff. Wasting hours chasing the details of a $500 line item isn't worth it when you have five-, six-, or even seven-figure line items to map.
Biggest challenge: Poor vendor labeling
- Vendor labels are often an inconsistent mess or missing entirely. Standardize and apply consistent vendor labels throughout your data so that you can aggregate your data into a workable form.
- Spend transactions with the same vendor can be scattered all over the place in your general ledger. Take the time to "un-unique" your data to save yourself tremendous grief later on.
- Start new go-forward labeling habits. Talk to finance about your new list of vendor naming standards and tagging spend as on-prem or cloud. Getting their cooperation with these are major wins.
Key step - validate! If you see services or functions with low or no allocation, or something just doesn't look right, investigate. There's probably a technology out there in the business doing that work.
4.1 Map your IT vendor spend
Duration: Variable
- Navigate to tab "5. Vendor Spend Mapping" in the IT Spend & Staffing Transparency Workbook. On one row, enter a spend line item (vendor, product, etc.), a brief description, and the known amount of spend.
- Under the CFO Expense View (columns F-P), allocate the line item's spend as a percentage across all asset-class categories. If the allocation for a line item is 0%, leave the cell blank.
- Under the CIO Service View (columns S-AM), allocate the line item's spend as a percentage across all service categories. If the allocation for a service is 0%, leave the cell blank.
- Under the CXO Business View (columns AP-BH), allocate the line item's spend as a percentage across all business function and industry-specific function categories. If the allocation for a function is 0%, leave the cell blank.
- Under the CEO Innovation View (columns BK-BO), allocate the line item's spend as a percentage across Business Innovation, Business Growth, and Keep the Lights On. If the allocation for an investment type is 0%, leave the cell blank.
- Repeat steps 2-5 for all spend line items.
- Follow up on and resolve any additional inquiries you need to make based on questions that arose during the mapping process.
- Validate your mapping by:
- Ensuring your amounts add up to your previously calculated total IT vendor spend. A balance tracker is provided on tab "6. Tracker & General Outputs" of the IT Spend & Staffing Transparency Workbook.
- Identifying spend categories that have zero spend allocation. Additional percentage allocation splits for certain line items are probably required.
- Investigating spend categories that seem to have very high or very low spend allocations based on a gut check. Again, double-check your percentage allocation splits.
Download the IT Spend & Staffing Transparency Workbook
4.1 Map your IT vendor spend
| Input | Output |
|---|---|
|
|
| Materials | Participants |
|
|
Phase 4: Map your IT vendor spend
Achievement summary
You've now completed your IT vendor spend mapping. You have:
- Allocated your IT vendor spend across the four views of the ITFM Cost Model.
- Validated your mapping to ensure it's accurate and complete.
"A lot of organizations log their spending by vendor name with no description of the goods or services they actually purchased from the vendor. It could be hardware, software, consulting services ... anything. Having a clear understanding of what's really in there is an essential aspect of the spend conversation."
- Rex Ding, Research Specialist, ITFM Practice, Info-Tech Research Group
Phase 5
Identify Implications for IT
This phase will walk you through the following activities:
- Analyzing the results of your IT staff and vendor spend mapping across the four views of the ITFM Cost Model
- Preparing an executive presentation of your transparent IT spend
This phase involves the following participants:
- Head of IT
- IT financial lead
- Other members of IT management
Phase 5: Identify implications for IT
Analyze and communicate.
You're now nearing the end of the first leg in your IT spend transparency journey. In this phase you will:
- Analyze the results of your IT spend mapping process.
- Revisit your transparency objectives.
- Prepare an executive presentation so you can share findings with other leaders in your organization.
"Don't plug in numbers just to make yourself look good or please someone else. The only way to improve is to look at real life."
- Monica Braun, Research Director, ITFM Practice, Info-Tech Research Group
You've mapped your IT spend data. Now what?
With mapped data in hand, now you can start to tell IT's spend story with stakeholders in the business.
Mapping your IT spend is a lot of work, but what you've achieved is impressive (applause!) as well as essential for growing your ITFM maturity. Now put your hard work to work.
- Consider benchmarking. While not covered in-depth here, benchmarking against yourself in a year-over-year approach as well as against external industry peers are very useful exercises in your technology spend analysis.
- Review your numbers and graphs. Your IT Spend & Staffing Transparency Workbook contains a series of data visualizations that will help you see the big picture as well as relationships between spend categories.
- Note the very big numbers, the very small numbers, and the things that just look odd. You'll want to investigate and understand these further.
- Prepare to communicate. Facilitating conversations with stakeholders in the business is the immediate objective of the IT spend and staffing transparency exercise. Decide where and with whom you want to start dialogue.
The slides that follow show sample data summaries and visualizations generated in the IT Spend & Staffing Transparency Workbook. We'll take a look at the metrics, tables, and graphs you now have available to you post-mapping and how you can potentially use them in conversations with different IT stakeholders.
Evaluate how you might use benchmarks before diving into your analysis
Benchmarking can be a useful input for contextualizing and interpreting your IT spend data. It's not essential at this point but should be part of your ITFM toolkit.
There are two basic types of benchmarking ...
Internal: Capturing a current-state set of data about an in-house operation to serve as a baseline. Over time, snapshots of the same data are taken and compared to the baseline to track and assess changes. Common uses for internal benchmarking include:
- Assessing the impact of a project or initiative.
- Measuring year-over-year performance.
External: Seeking out aggregated, current-state data about a peer-group operation to assess your own relative status or performance on the same operation. Common uses for external benchmarking include:
- Understanding common practices in the industry.
- Strategic and operational visioning, planning, and goal-setting.
- Putting together a business case for change or investment.
Both types of benchmarking benefit from some formality and rigor. Info-Tech can help you stand up an ITFM benchmarking approach as well as connect you with actual IT spend peer benchmarks via our IT Spend & Staffing Benchmarking service.
5.1 Analyze the results of your IT spend mapping
Duration: Variable
- Review the guidance slides that follow the two instruction slides for this exercise to provide yourself with a grounding on how to interpret and analyze your mapped IT staff and vendor spend data.
- Systematically review the data tables and graphs on the "Outputs" tabs 6 through 10 in the IT Spend & Staffing Transparency Workbook. There are several approaches you can take - use the one that works best for you. For example:
- Review each view in its entirety, one at a time.
- Review all workforce spend collectively across all four views, followed by all vendor spend across all four views (or vice versa).
- Make note of any spend values that are comparatively high or low or strike you as odd or worth further investigation.
- Craft a series of spend-related questions you want to answer for yourself and your stakeholders using the data.
- For example, you need to cut costs and apps maintenance is high. Your question could be, "Can we cut costs on applications maintenance staffing?"
- Alternatively, you can develop a series of statements (research hypotheses) that you seek to prove true or false with the data. This approach is useful for testing assumptions you've been making. For example, "We can cut spending on applications maintenance staff. True or false?"
- Use the template provided on tab "11. Data Analysis" in the IT Spend & Staffing Transparency Workbook to document your findings and conclusions, along with the data that supports them.
Download the IT Spend & Staffing Transparency Workbook
5.1 Analyze the results of your IT spend mapping
| Input | Output |
|---|---|
|
|
| Materials | Participants |
|
|
High-level findings: Use these IT spend metrics to review and set big picture goals
Think of these metrics as key anchors in your long-term strategic planning efforts.
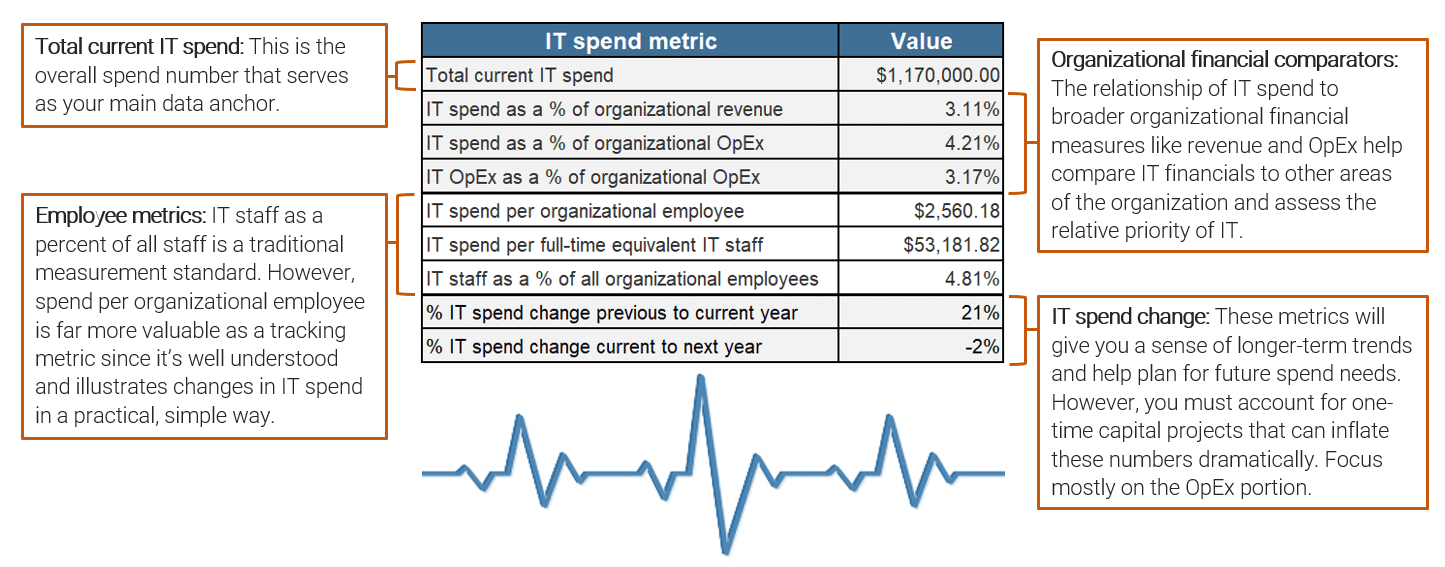
It's common for the business to want a sacrifice in IT OpEx in favor of CapEx
CapEx and OpEx approval mechanisms are often entirely separate. Different tax treatment for CapEx means that it's usually preferred by the business over OpEx.
OpEx is often seen as a sunk cost (i.e. an IT problem).
- Barring a major decision or event, OpEx on an individual item will generally trend upward over time, often by a few percent every year, in lockstep with inflation and growth in organizational headcount.
- A good portion of OpEx, however, is necessary for basic business continuity.
CapEx is usually seen as investment (i.e. a business growth opportunity).
- CapEx behaves quite differently than OpEx. On-the-books capitalized spend on an individual asset tends to trend downward over time due to depreciation or amortization.
- CapEx only tends to go up when a net-new capital project is initiated, and organizations often have more control over if, when, and how this spend happens.
Break down the OpEx/CapEx wall. Reference OpEx whenever you talk about CapEx. The best way to do this is via Total Cost of Ownership (TCO).
- Present data on long-term OpEx projections whenever a new capital project is proposed and ensure ongoing maintenance funds are secured.
- Educate your CFO about the impact of the cloud on OpEx. See if internal OpEx/CapEx ratio expectations can be adjusted to reflect this reality.
Spend by asset class offers the CFO a visual illustration of where the money's really gone
The major spend categories should look very familiar to your CFO. It's the minor sub-categories that sit underneath where you ultimately want to drive the conversation.
Traditional categories don't reflect IT reality anymore.
- Most finance departments have "software" accounts that contain apples and oranges, plus other dissimilar fruit.
- Software isn't just software anymore. Now it's on-premises (CapEx) or cloud (OpEx). The same distinction applies to traditional hardware due to the advent of managed services.
- The basic categories traditionally used to tag IT spend are out of date. This makes it hard for IT to have meaningful conversations with the CFO since they're not working from the same glossary.
"Software (on-premises)" and "hardware (cloud)" are more meaningful descriptors than "software" and "hardware." Shift the dialogue.
Start the migration from major categories to minor categories.
- Still give the CFO the traditional major categories they're looking for but start including minor category breakdowns into your communications. Most importantly, have a meeting to explain what these minor categories are and why they're important to managing IT effectively.
- Next, see if the CFO can formally split on-premises vs. cloud software on the books as a first step in making IT spend tracking more meaningful.
Employees vs. contractors warrants a specific conversation, plus a change in mindset
IT leaders often find it easier to get approval for contracted labor than to hire a permanent employee. However, the true value proposition for contractors does vary.
The decision to go with permanent employees or contractors depends on your ultimate goals.
- Contractors tend to be less expensive and provide more flexibility when adjusting to changing business needs. However, contractors may be less dedicated and take their skills and knowledge with them when they leave.
- Permanent employees bring additional costs like benefits and training. Plus, letting them go is a lot more complicated. However, they can also bring real value in a way a contractor can't when it comes to sustaining long-term strategic growth. They're assets in themselves.
Far too often, labor-sourcing decisions are driven by controlling near-term costs instead of generating and sustaining long-term value.
Introduce the cost-to-value ratio to your workforce spend conversations.
- Your mapped data will allow you to talk about comparative headcount and spend. This is a financial conversation devoid of context.
- Go beyond. Show how workforce spend has allowed stated goals to be achieved while controlling for costs. This is the true definition of value.
CFO Expense View: Shift the ITFM conversation
Now that you've mapped your IT spend data to the CFO Expense View, there are some questions you're better equipped to answer, namely:
- How should I classify my IT costs?
- What information should I include in my plans and reports?
- How do I justify current spend?
- How do I justify a budget increase?
You now have:
- A starting point for educating the CFO about IT spend realities.
- A foundation for creating a shared glossary of terms that works for both IT and the finance department and facilitates more meaningful conversations.
- Proof that there are major areas of IT spend, such as cloud software, that are distinctive and probably warrant their own financial category in the general ledger.
- A transparent record of IT spend that shows that you understand and care about financial issues, fostering the goodwill and trust that facilitates investment in IT.
- A starting point to change the ITFM conversation with the CFO from one focused on cost to one focused on value.
Exactly how is IT spending all that money we give them?
Exactly like this ...
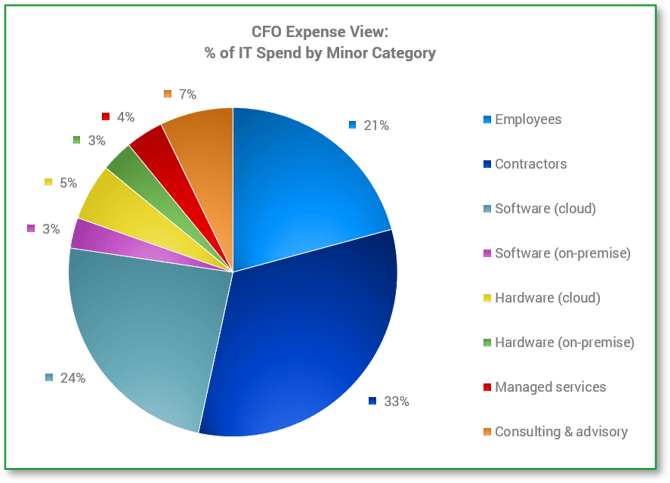
The CIO Service View aligns with how IT organizes and manages itself – this is your view
The data mapped here is a critical input for IT's service planning and management program and should be integrated into your IT performance measurement activities.
Major service categories: These values give a high-level snapshot of your general IT service spend priorities. In most organizations, Applications dominates, making it a focus for cost optimization.
Minor service categories: The level of granularity for these values prove more practical when measuring performance and making service management decisions - not too big, not too small. While not reflected in this example, application maintenance is usually the largest relative consumer of IT spend in most organizations.
Data & BI and security: Isolating the exact spend for these services is challenging given that they're often entangled in applications and infrastructure spend respectively, and separate spend tracking for both is a comparatively recent practice.
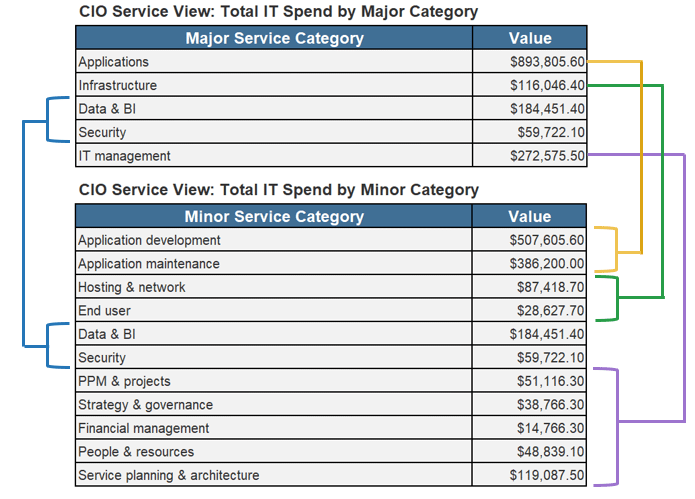
Check the alignment of individual service spend against known business objectives
Some IT services are taken for granted by the business, while others are virtually invisible. This lack of visibility often translates into funding misalignments.
Is the amount of spend on a given service in parallel with the service's overall importance?
- Though often unstated, ensuring continuity of basic business operations is always the top priority. This means business apps, core infrastructure, end users, and security need to be appropriately funded - these should collectively comprise the majority of IT service spend.
- Strategy-supporting IT services, like data & BI, see high investment variability between organizations. If its strategic role/importance doesn't align with spend, flag it as an issue you'll need to reconcile with the business by increasing funding (important) or reducing service levels (unimportant).
- The strategic importance of IT as a whole is often reflected in the spend on IT management services. If spend is low, IT's probably seen as a support function, not a strategic one.
Identify the hot spots and pick your battles.
- Spend levels are just approximate gauges of where and how the business is willing to spend its money. Start with this simple gut check.
- Noting the areas of importance vs. spend misalignment will help you identify where negotiations with the business should probably happen.
A mature IT cost optimization practice is often approached from the service perspective
When optimizing IT costs, you have two OpEx levers to pull - vendor spend and staff spend. Isolating these two sources of IT service spend will help shortlist your options.
It's all about how much room you have to move.
- Any decision made about how a service is provisioned will push vendor and staff spend in clear, predictable, and often opposite directions (e.g. in-house and people-intensive services tend to see higher staff spend, while outsourced and tech-intensive services higher vendor spend).
- Service levels required by the business should be the driving factor behind service design and spend decisions. High service spend may reflect priority but may also indicate it's over-built and is ripe for a cost-optimization treatment.
- Service spend is a useful barometer for tracking the financial impact of any changes made to IT. Add simple unit-cost metrics like "service spend per organizational employee" and "service spend per FTE assigned to the service" to see if and how the dial has moved over time.
Grow your IT service management practice.
- The real power of the CIO Service View is laying the groundwork for next-level IT service management initiatives like developing a service catalog, negotiating service-level agreements, rolling out chargeback and showback mechanisms, and calculating IT's value to the business.
- Use service spend as a common denominator for both your IT service management and IT performance management programs. Better yet, integrate the two programs to ensure a single version of the truth.
CIO Service View: Optimize your cost-to-value ratio
Now that you've mapped your IT spend data to the CIO Service View, there are some questions you're better equipped to answer, namely:
- What's the impact of cloud adoption on speed of delivery?
- Where can I improve spend efficiency?
- Is my support model optimized?
- How does our spend compare to others?
You now have:
- Data that shows the financial impact of change decisions on service costs.
- Insight into the relationship between vendor spend and staff spend within a given IT service.
- The information you need to start developing service unit costing mechanisms.
- A tool for setting and right-sizing service-level agreements with the business.
- A more focused starting point for investigating IT cost-optimization opportunities.
- A baseline for benchmarking common IT services against your peers.
Does the amount we spend on each IT service make sense?
We have some good opportunities for optimization ...
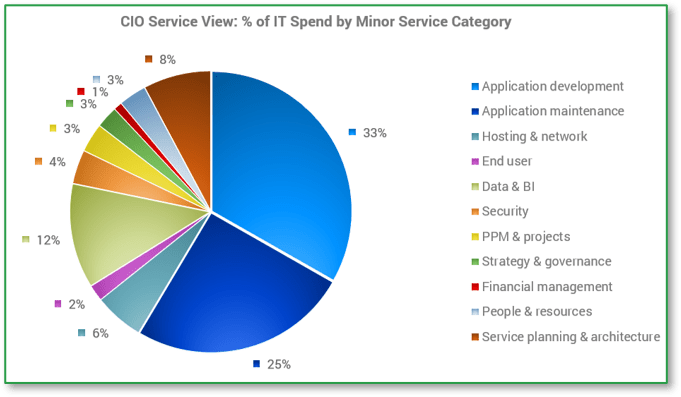
The CXO Business View will spur conversations that may have never happened before
This view is a potential game changer as previously unknown technology spend is often revealed, triggering change in IT's relationship with business unit leaders.
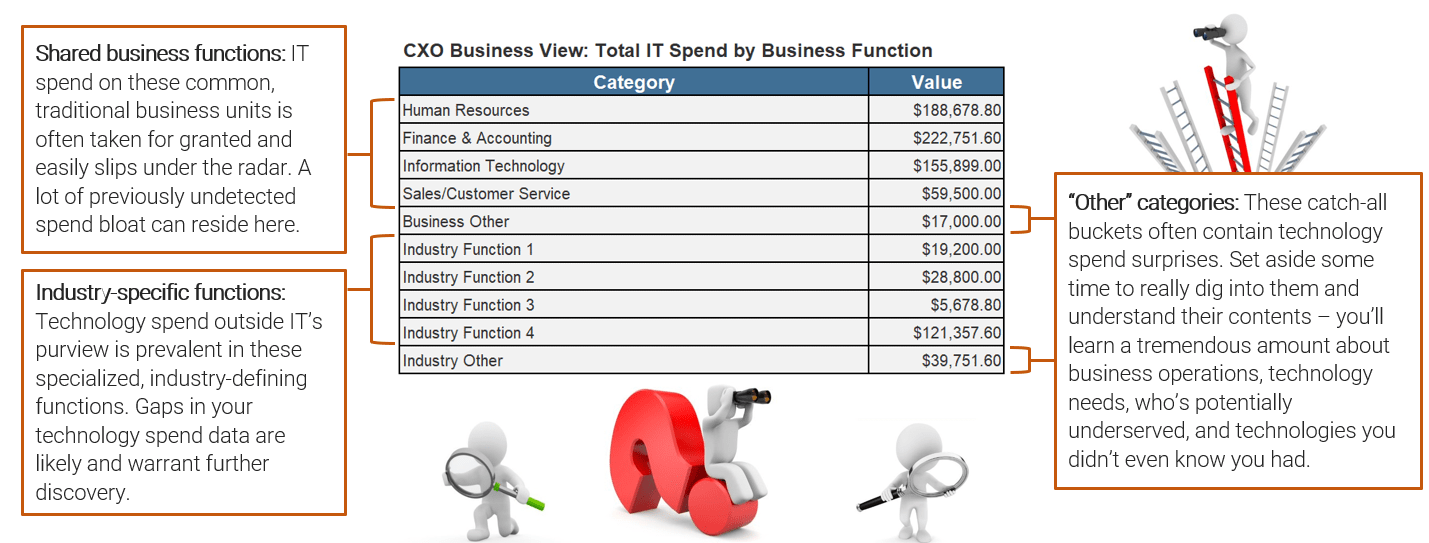
The big beneficiaries of IT spend will leap out
The CXO Business View mapping does have a "shock and awe" quality to it given large spend disparities. They may be totally legitimate, but they're still eye-catching.
Share information, don't push recommendations.
- Have a series of one-on-one meetings with business unit leaders to present these numbers.
- Approach initial meetings as information-sharing sessions only. The data is probably new to them, and they'll need time to reflect and ask questions.
- Bring a list of the big-ticket spend items for that business unit to focus the conversation.
- Present these numbers at a broader leadership meeting.
- It's critical for everyone to hear the same truth and learn about each other's technology needs and uses.
- This is where recommendations for better aligning IT spend with business goals and cost-optimization strategies should surface. A group approach will bring technology haves and have-nots into the open, as well as provide a forum for collaborative solutioning.
If possible, slice the numbers by business unit headcount.
- IT spend per business unit employee is an attention-getting metric that can help gain entry to important conversations.
- Comparing per-employee spend across different business functions is not necessarily an apples-to-apples comparison, as units like HR may have few employees but serve the entire organization. Bring up these kinds of differences to provide context and avoid misinterpretations.
Questions will arise in how you calculated and allocated indirect IT spend
IT spend for things like core infrastructure and end-user services must be distributed fairly across multiple or all business units. Be prepared to explain your methods.
Be transparent in your transparency.
- Distributing indirect spend is imprecise by nature. You can't account for every unique circumstance. However, you can devise a logic-driven, general approach that's defensible, fair, and works for most people most of the time.
- Lay out your assumptions from the start. This is an important part of communicating transparently and can prevent unwanted descent into weedy rabbit holes.
- List what you classified as indirect spend. Use the CFO Expense View and/or CIO Service View categories to aid your presentation of this information.
- Point out known circumstances that didn't fit your general allocation method and how you handled them. Opting to ignore minor anomalies is reasonable but be sure to tell business unit leaders you did this and why.
Use questions about indirect IT staff spend distribution to engage stakeholders.
- As a percentage, the indirect IT staff spend allocation to a specific business unit may be higher than that for IT vendor spend since IT staff tend to operate more generally than the technologies they support.
- Leverage any pushback about indirect spend as an opportunity to engage the broader business leadership group. Let them arrive at a consensus of how they want it done and confirm buy-in.
CXO Business View: Bring the truth to light
Now that you've mapped your IT spend data to the CXO Business View, there are some questions you're better equipped to answer, namely:
- Which business units consume the most IT resources?
- Which business units are underserved by IT?
- How do I best communicate spend data internally?
- Where do I need better business sponsorship for IT projects?
You now have:
- A reason-based accounting of direct and indirect amounts spent on IT vendors and staff in support of each major business unit.
- Insight into the technology haves and have-nots in your organization and where opportunities to optimize costs may exist.
- Attention-getting numbers that will help you engage business-unit leaders in meaningful conversations about their use of IT resources and the value they receive.
- A mechanism to assess if a business unit's consumption of IT is appropriate and aligned with its purpose and mandate in the organization.
- A list of previously unknown business-side technologies that IT will investigate further.
Why doesn't my business unit get more support from IT?
Let's look at how you compare to the other departments ...
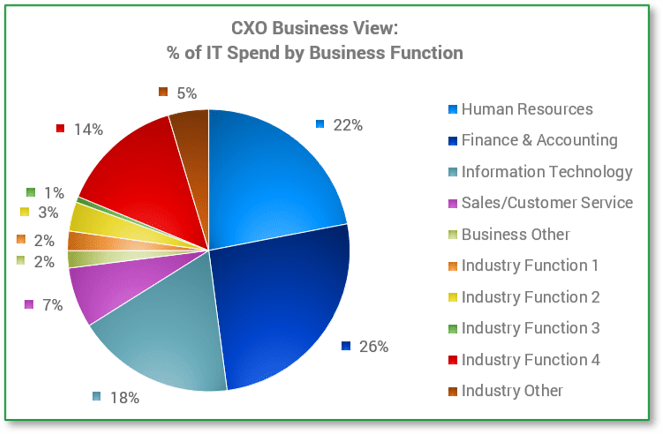
From the CEO's high-level perspective, IT spend is a collection of distinct financial islands
From IT's perspective, these islands are intimately connected, with events on one affecting what happens (or doesn't) on another. Focus on the bridges.
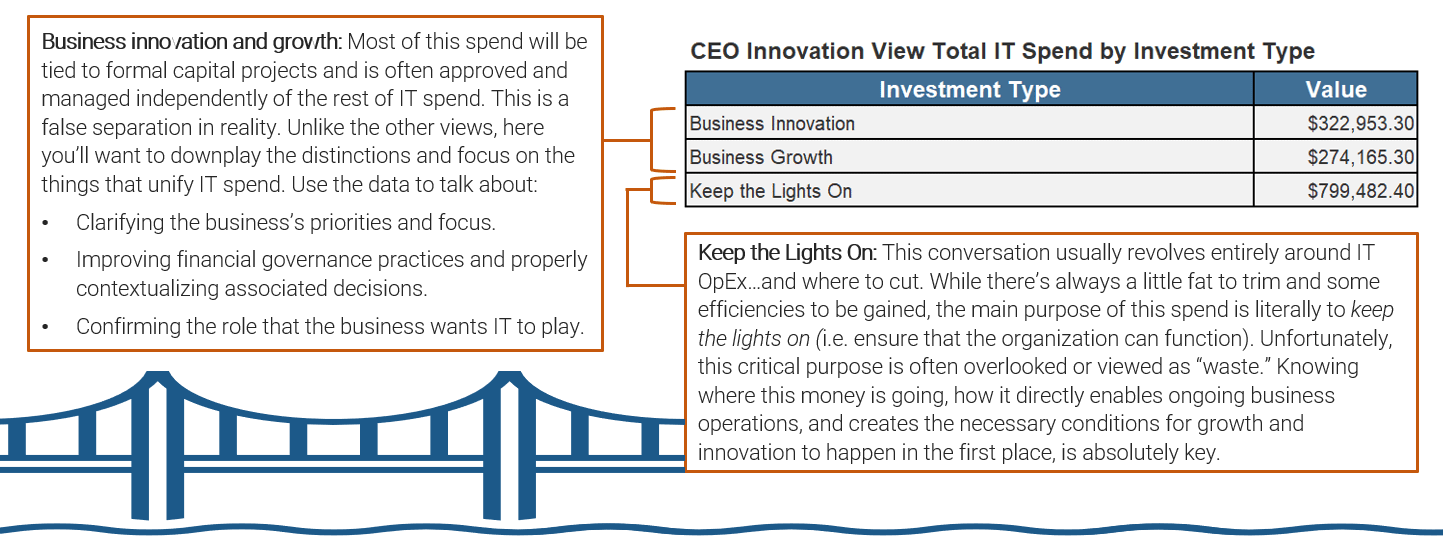
Focus more on unifying the view of technology spend than on the numbers
When talking to the CEO, seek to build mutual understanding and encourage a holistic approach to the organization's technology spend.
Use the numbers to get to the real issues.
- Clarify with the CEO what business innovation, business growth, and KTLO means to them and the role each plays in the organization's strategic and operational plans.
- Find out the role they think IT, and technology as a whole, has in realizing business plans. Only then can you look at the relative allocation of IT spend with them to see if the aspiration aligns with reality.
- Eventually, you'll need to discuss expectations around who pays the bills for operationally supporting capital technology investments over the long-term (i.e. IT or the business units that actually want and use it). You'll have concrete examples of business projects that consumed IT operations resources without a corresponding increase in IT's OpEx budget.
Focus your KTLO spend conversation on risk and trade-off.
- Every strategic conversation needs to look at the impact on ongoing operations. Every discussion about CapEx needs to investigate the long-term repercussions for OpEx. Look at the whole tech spend picture.
- Use risk to get KTLO/OpEx into the conversation. Be straightforward (i.e. "If we do/don't do this, then we can/can't do that"). Simply put, mitigating the risks that get in the way of having it all usually requires spending.
CEO Innovation View: Learn what's really expected of IT
Now that you've mapped your IT spend data to the CEO Innovation View, there are some questions you're better equipped to answer, namely:
- Why is KTLO spend so high?
- What should our operational spend priorities be?
- Which projects and investments should we prioritize?
- Are we spending enough on innovative initiatives?
You now have:
- A holistic, organization-wide view of total technology spend in support of different investment types, namely business innovation, business growth, and keeping things up and running.
- Data-driven examples that prove the impact of near-term capital spend on long-term operational expenses and the intimate relationship between the two types of spend.
- A way to measure the degree of alignment between the innovation and growth goals the organization has and how money is actually being spent to realize those goals.
- A platform to discuss how technology investment decision-making and governance can work better to realize organizational mandates and goals.
I know what IT costs us, but what is it really worth?
Here's how tech spend directly supports business objectives ...
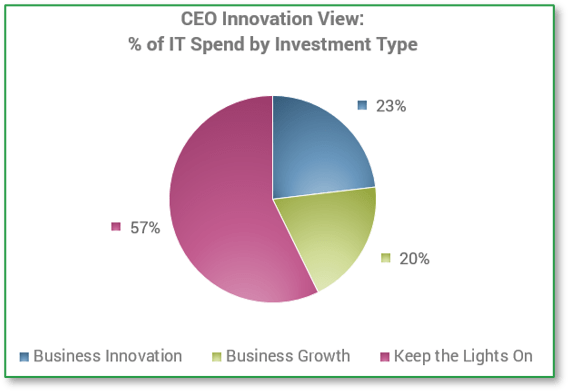
Revisit your IT spend transparency objectives before crafting your executive presentation
Go back to exercise 1.1 to remind yourself why you undertook this effort in the first place, clear your head of all that data, and refocus on the big picture.
Review the real problems and issues you need to address and the key stakeholders.
This will guide what data you focus on or showcase with other business leaders. For example, if IT OpEx is perceived as high, be prepared to examine the CapEx/OpEx ratio as well as cloud-related spend's impact on OpEx.
Flag ITFM processes you'll develop as part of your ITFM maturity improvement plan.
You won't become a TCO math expert overnight, but being able to communicate your awareness of and commitment to developing and applying ITFM capabilities helps build confidence in you and the information you're presenting.
Use your first big presentation to debut ITFM.
ITFM as a formal practice and the changes you hope to make may be a novel concept for your business peers. Use your newfound IT spend and staffing transparency to gently wade into the topic instead of going for the deep dive.
Now it's time to present your transparent IT spend and staffing data to your executive
Pull out of analysis mode. You're starting to tell the IT spend story, and this is just the first chapter. Introduce your cast of characters and pique your audience's interest.
The goal of this first presentation is to showcase IT spend in general and make sure that everyone's getting the same information as everyone else.
Go broad, not deep
Defer any in-depth examinations until after you're sure you have everyone's attention. Only dive deep when you're ready to talk about specific plans via follow-up sessions.
Focus on the CXO
Given your audience, the CXO Business View may be the most interesting for them and will trigger the most questions and discussion. Plan to spend the largest chunk of your time here.
Avoid judgment
Let the numbers speak for themselves. Do point out what's high and what's low, but don't offer your opinion about whether it's good or bad. Let your audience draw their own conclusions.
Ask for impressions
Education and awareness are primary objectives. What comes up will give a good indication of what's known, what's news, who's interested, and where there's work to do.
Pick a starting point
Ask what they see as high-priority areas for both optimizing IT costs as well as improving the organization's approach to making IT spend decisions in general.
What to include in your presentation ...
- Purpose: Why you did the IT spend and staffing transparency exercise.
- Method: The models and processes you used to map the data.
- Data: Charts from the IT Spend & Staffing Transparency Workbook.
- Feedback: Space for your audience to voice their thoughts.
- Next steps: Discussion and summary of actions to come.
5.2 Develop an executive presentation
Duration: Two hours
- Download the IT Staff & Spend Executive Presentation Template.
- Copy and paste the IT spend output tables and graphs into the template. (Note: Pasting as an image will preserve formatting.)
- Incorporate observations and insights about your analysis of your IT spend metrics.
- Conduct an internal review of the final presentation to ensure it includes all the elements you need and is error free.
- Book time to make your presentation to the executive team. Plan time after the presentation to field questions, engage in follow-up information sessions, and act on feedback.
Note: Refer to your organization's standards and norms for executive-level presentations and either adapt the Info-Tech template accordingly or use your own.
| Input | Output |
|---|---|
|
|
| Materials | Participants |
|
|
Download the IT Spend & Staffing Transparency Executive Presentation TemplateTemplate
Phase 5: Identify implications for IT
Achievement summary
You've done the hard part in starting your IT spend transparency journey. You have:
- Analyzed the results of your IT spend mapping process.
- Revisited your transparency objectives.
- Prepared an executive presentation so you can share findings with other leaders in your organization.
"Having internal conversations, especially if there is doubt, allows for accuracy and confidence in your model. I was showing someone the cost of a service he managed. He didn't believe the service was so expensive. We went through it: here are the people we allocated, the assets we allocated, and the software we allocated. It was right - that was the total cost. He was like, 'No way. Wow.' The costs were high, and the transparency is what allowed for a conversation on cost optimization."
- Monica Braun, Research Director, ITFM Practice, Info-Tech Research Group
Next Steps
Achieve IT Spend & Staffing Transparency
This final section will provide you with:
- An overall summary of accomplishment
- Recommended next steps
- A list of contributors to this research
- Some related Info-Tech resources to help you grow your ITFM practice
Summary of Accomplishment
Congratulations! You now have a fully transparent view of your IT spend.
You've now mapped the entirety of technology spend in your organization. You've:
- Learned the key sources of spend data and information in your organization.
- Set some standards for data organization and labeling.
- Have a methodology for continuing to track and document spend in a transparent way.
- Crafted an executive presentation that's a first step in having more meaningful and constructive conversations about IT spend with your key stakeholders.
What's next?
With a reliable baseline, you can look forward to more informed and defensible IT budgeting and cost optimization. Use your newly-transparent IT spend as a foundation for improving your financial data hygiene in the near term and evolving your overall ITFM governance maturity in the long-term.
If you would like additional support, have our analysts guide you through an Info-Tech full-service engagement or Guided Implementation.
Contact your account representative for more information.
1-888-670-8889
Research Contributors and Experts

Monica Braun
Research Director, ITFM Practice
Info-Tech Research Group

Dave Kish
Practice Lead, ITFM Practice
Info-Tech Research Group

Kennedy Confurius
Research Analyst, ITFM Practice
Info-Tech Research Group

Aman Kumari
Research Specialist, ITFM Practice
Info-Tech Research Group

Rex Ding
Research Specialist, ITFM Practice
Info-Tech Research Group

Angie Reynolds
Principal Research Director, ITFM Practice
Info-Tech Research Group
Related Info-Tech Research
Build Your IT Cost Optimization Roadmap
- Cost optimization often doesn't go beyond the cutting part, but cutting costs isn't strategic - it's reactive and can easily result in mistakes.
- True cost optimization is much more than this. Re-focus your efforts on optimizing your cost-to-value ratio and implementing a sustainable cost-optimization practice.
- Budgetary approval is difficult because finance executives have a limited understanding of IT and use a different vocabulary.
- Detailed budgets must be constructed in a way that is transparent but at a level of appropriate detail in order to limit complexity and confusion.
- No one likes to be over budget, but being under budget isn't necessarily good either.
- Implement a budget management process that documents your planned budget and actual expenditures, tracks variances, and responds to those variances to stay on track.
- Control for under- or overspending using Info Tech's budget management tool and tactics.
APPENDIX
Sample shared business services
Sample industry-specific business services
Sample shared business functions
| Business function | Definition |
| Human Resources | The management of the recruitment, training, development, appraisal, compensation/reward, retention, and departure of employees in an organization. Does not include management of subcontractor or outsourced relationships. |
| Finance and Accounting | The management and analysis of an organization's revenue, funds, spend, investments, financial transactions, accounts, and financial statements. Often includes enterprise asset management. |
| Procurement and Supplier Management | Acquiring materials, goods, and services from an external party, including identifying potential suppliers/providers, managing tendering or bidding processes, negotiating terms and agreements, and managing the relationship with the vendor/provider. |
| Information Technology | The development, management, and optimization of information technology resources and systems over their lifecycle in support of an organization's work priorities and goals. Includes computer-based information and communication systems, but typically excludes industrial operational technologies. |
| Legal | Expertise in interpretation, implication, and application of legislation and regulation that affects the enterprise, including guidance and support in the areas of risk, contracting, compliance, ownership, and litigation. |
| Regulatory Affairs and Compliance Management | Identification, operationalization, monitoring, reporting, and enforcement of the standards, rules, codes, and laws that apply to an organization's operating environment and the products and services it offers. |
| Sales | Transactional provision of a product or service to a buyer at an agreed-upon price. Includes identifying and developing prospective buyers, presenting and explaining the product/service, overcoming prospect objections and concerns to purchase, negotiating terms, developing contracts, and billing or invoicing. |
| Customer Service and Support | A range of activities designed to optimize the customer experience with an organization and its products and services throughout the customer lifecycle with the goals of retaining the customer; encouraging additional spend or consumption; the customer positively influencing other potential customers; and minimizing financial and reputational business risks. |
| Marketing and Advertising | Understanding customer/prospect needs, developing strategies to meet those needs, and promotion of the organization's products/services to a target market via a range of channels to maximize revenue, membership, donations, and/or develop the organization's brand or reputation. Includes market research and analysis and promotion, campaign, and brand management. |
Sample industry-specific functions
Supply chain and capital-intensive industries.
| Industry function | Definition |
| Product Innovation | Research, design, development, and launch of new products, including the engineering of their underlying production processes. |
| Product and Service Portfolio Management | The management of an organization's collection of products and services, including management of the product/service roadmap; product/service portfolio and catalog; product/service quality and performance; and product/service pricing, bundling and markdown. |
| Logistics and Supply Chain Management | Sourcing raw materials or component parts needed and shipping of a finished product. Includes demand planning; procurement/supplier management; inventory management; yard management; allocation management; fulfillment and replenishment; and product distribution and delivery. |
| Production Operations | Manufacture, storage, and tracking of a product and ensuring product and production process quality. Includes operations management, materials management, quality/safety control, packaging management, and management of the tools, equipment, and technologies that support it. |
| Architecture & Engineering | The design and planning of structures or critical infrastructure systems according to scientific, functional, and aesthetic principles. |
| Construction | New construction, assembly, or alteration of buildings and critical infrastructure (e.g. transportation systems; telecommunications systems; utilities generation/transmission/distribution facilities and systems). Includes management of all construction project plans and the people, materials, and equipment required to execute. |
| Real Estate Management | Management of any residential, commercial, or industrial real estate holdings (land and buildings), including any financial dealings such as its purchase, sale, transfer, and rental as well as ongoing maintenance and repair of associated infrastructure and capital assets. |
Sample industry-specific functions
Financial services and insurance industries.
| Industry function | Definition |
| Core Banking Services | Includes ATM management; account management (opening, deposit/withdrawal, interest calculation, overdraft management, closing); payments processing; funds transfers; foreign currency exchange; cash management. |
| Loan, Mortgage, and Credit Services | Includes application, adjudication, and approval; facility; disbursement/card issuance; authorization management; merchant services; interest calculation; billing/payment; debt/collections management. |
| Investment and Wealth Management | Processes for the investment of premiums/monies received from policy holders/customers to generate wealth. Often two-pronged: internal investment to fund claim payout in the case of insurance, and customer-facing investment as a financial service (e.g. retirement planning/annuities). Includes product development and management, investment management, safety deposit box services, trust management services. |
| Actuarial Analysis & Policy Creation | Development of new policy products based on analysis of past losses and patterns, forecasts of financial risks, and assessment of potential profitability (i.e. actuarial science). These processes also include development of rate schedules (pricing) and the reserves that the insurer needs to have available for potential claim payouts. |
| Underwriting & Policy Administration | Processes for assessing risk of a potential policy holder; determining whether to insure them or not; setting the premiums the policy holder must pay; and administering the policy over the course of its lifecycle (including updates and billing). |
| Claims Processing & Claims Management | Processes for receiving, investigating, evaluating, approving/denying, and disbursing a claim payout. This process is unique to the insurance industry. In health insurance, ongoing case management processes need to be considered here whereby the insurer monitors and approves patient treatments over a long-term basis to ensure that the treatments are both necessary and beneficial. |
Sample industry-specific functions
Healthcare industry
| Industry function | Definition |
| Patient Intake & Admissions | Processes whereby key pieces of information about a patient are registered, updated, or confirmed with the healthcare provider in order to access healthcare services. Includes patient triage, intake management, and admissions management. These processes are generally administrative in nature. |
| Patient Diagnosis | A range of methods for determining the medical condition a patient has in order to provide appropriate care or treatment. Includes examination, consultation, testing, and diagnostic imaging. |
| Patient Treatment | The range of medical procedures, methods, and interventions to mitigate, relieve, or cure a patient's symptom, injury, disease, or other medical condition. Includes consultation and referral; treatment and care planning; medical procedure management; nursing and personal support; medicine management; trauma management; diet and nutrition management; and patient transportation. |
| Patient Recovery & Ongoing Care | Processes and methods for tracking the progress of a patient post-treatment; improving their health outcomes; restoring, maintaining, or improving their quality of life; and discharging or transferring them to other providers. Includes remote monitoring of vital parameters, physical therapy, post-trauma care, and a range of restorative and lifestyle modification programs. |
Sample industry-specific functions
Gaming and hospitality industries
| Industry function | Definition |
| Accommodation | Short-term lodging in hotel facilities. Includes management and maintenance of guest rooms and common spaces, amenities (e.g. swimming pool), and other related services (e.g. valet parking). |
| Gaming | Includes table wagering games and gambling activities such as slot machines or any other activity that includes on premises mobile casino gaming. |
| Food & Beverage Services | Food and beverages prepared, served, or available for sale by the hotel on the hotel premises via restaurants and bars and room service. Excludes catering (see Events Management) and management or operation of independent leased food and beverage establishments located on the hotel premises. |
| Entertainment & Events | Planning, coordination, and on-premises hosting of events including conferences, conventions, trade shows, parties, ceremonies and live entertainment, and other forms of recreation on the hotel premises. Includes all aspects of entertainment operations, facility management and catering for the event. |