
- IT leaders lack information to help inform and prioritize where improvements are most needed.
- The service desk relies only on traditional metrics such as time to respond or percentage of SLAs met, but no measures of customer satisfaction with the service they receive.
- There are signs of dissatisfied users, but no mechanism in place to formally capture those perceptions in order to address them.
- Even if transactional (ticket) surveys are in use, often nothing is done with the data collected or there is a low response rate, and no broader satisfaction survey is in place.
Our Advice
Critical Insight
- If customer satisfaction is not being measured, it’s often because service desk leaders don’t know how to design customer satisfaction surveys, don’t have a mechanism in place to collect feedback, or lack the resources to take accountability for a customer feedback program.
- If customer satisfaction surveys are in place, it can be difficult to get full value out of them if there is a low response rate due to poor survey design or administration, or if leadership doesn’t understand the value of / know how to analyze the data.
- It can actually be worse to ask your customers for feedback and do nothing with it than not asking for feedback at all. Customers may end up more dissatisfied if they take the time to provide value then see nothing done with it.
Impact and Result
- Understand how to ask the right questions to avoid survey fatigue.
- Design and implement two complementary satisfaction surveys: a transactional survey to capture satisfaction with individual ticket experiences and inform immediate improvements, and a relationship survey to capture broader satisfaction among the entire user base and inform longer-term improvements.
- Build a plan and assign accountability for customer feedback management, including analyzing feedback, prioritizing customer satisfaction insights and using them to improve performance, and communicating the results back to your users and stakeholders.
Take Action on Service Desk Customer Feedback Research & Tools
Besides the small introduction, subscribers and consulting clients within this management domain have access to:
1. Take Action on Service Desk Customer Feedback Deck – A step-by-step document that walks you through how to measure customer satisfaction, design and implement transactional and relationship surveys, and analyze and act on user feedback.
Whether you have no Service Desk customer feedback program in place or you need to improve your existing process for gathering and responding to feedback, this deck will help you design your surveys and act on their results to improve CSAT scores.
- Take Action on Service Desk Customer Feedback Storyboard
2. Transactional Service Desk Survey Template – A template to design a ticket satisfaction survey.
This template provides a sample transactional (ticket) satisfaction survey. If your ITSM tool or other survey mechanism allows you to design or write your own survey, use this template as a starting point.
- Transactional Service Desk Survey Template
3. Sample Size Calculator – A tool to calculate the sample size needed for your survey.
Use the Sample Size Calculator to calculate your ideal sample size for your relationship surveys.
- Sample Size Calculator
4. End-User Satisfaction Survey Review Workflows – Visio templates to map your review process for both transactional and relationship surveys
This template will help you map out the step-by-step process to review collected feedback from your end-user satisfaction surveys, analyze the data, and act on it.
- End-User Satisfaction Survey Review Workflows
Infographic
Further reading
Take Action on Service Desk Customer Feedback
Drive up CSAT scores by asking the right questions and effectively responding to user feedback.
EXECUTIVE BRIEF
Analyst Perspective
Collecting feedback is only half the equation.
Natalie Sansone, PhD
Info-Tech Research Group |
Often when we ask service desk leaders where they need to improve and if they’re measuring customer satisfaction, they either aren’t measuring it at all, or their ticket surveys are turned on but they get very few responses (or only positive responses). They fail to see the value of collecting feedback when this is their experience with it. Feedback is important because traditional service desk metrics can only tell us so much. We often see what’s called the “watermelon effect”: metrics appear “green”, but under the surface they’re “red” because customers are in fact dissatisfied for reasons unmeasured by standard internal IT metrics. Customer satisfaction should always be the goal of service delivery, and directly measuring satisfaction in addition to traditional metrics will help you get a clearer picture of your strengths and weaknesses, and where to prioritize improvements. It’s not as simple as asking customers if they were satisfied with their ticket, however. There are two steps necessary for success. The first is collecting feedback, which should be done purposefully, with clear goals in mind in order to maximize the response rate and value of responses received. The second – and most critical – is acting on that feedback. Use it to inform improvements and communicate those improvements. Doing so will not only make your service desk better, increasing satisfaction through better service delivery, but also will make your customers feel heard and valued, which alone increases satisfaction. |
Emily Sugerman, PhD
Info-Tech Research Group |


Executive Summary
Your Challenge |
Common Obstacles |
Info-Tech’s Approach |
|---|---|---|
|
|
|
Info-Tech Insight
Asking your customers for feedback then doing nothing with it is worse than not asking for feedback at all. Your customers may end up more dissatisfied than they were before, if their opinion is sought out and then ignored. It’s valuable to collect feedback, but the true value for both IT and its customers comes from acting on that feedback and communicating those actions back to your users.
Traditional service desk metrics can be misleading
The watermelon effect
When a service desk appears to hit all its targets according to the metrics it tracks, but service delivery is poor and customer satisfaction is low, this is known as the “watermelon effect”. Service metrics appear green on the outside, but under the surface (unmeasured), they’re red because customers are dissatisfied.
Traditional SLAs and service desk metrics (such as time to respond, average resolution time, percentage of SLAs met) can help you understand service desk performance internally to prioritize your work and identify process improvements. However, they don’t tell you how customers perceive the service or how satisfied they are.
Providing good service to your customers should be your end goal. Failing to measure, monitor, and act on customer feedback means you don’t have the whole picture of how your service desk is performing and whether or where improvements are needed to maximize satisfaction.
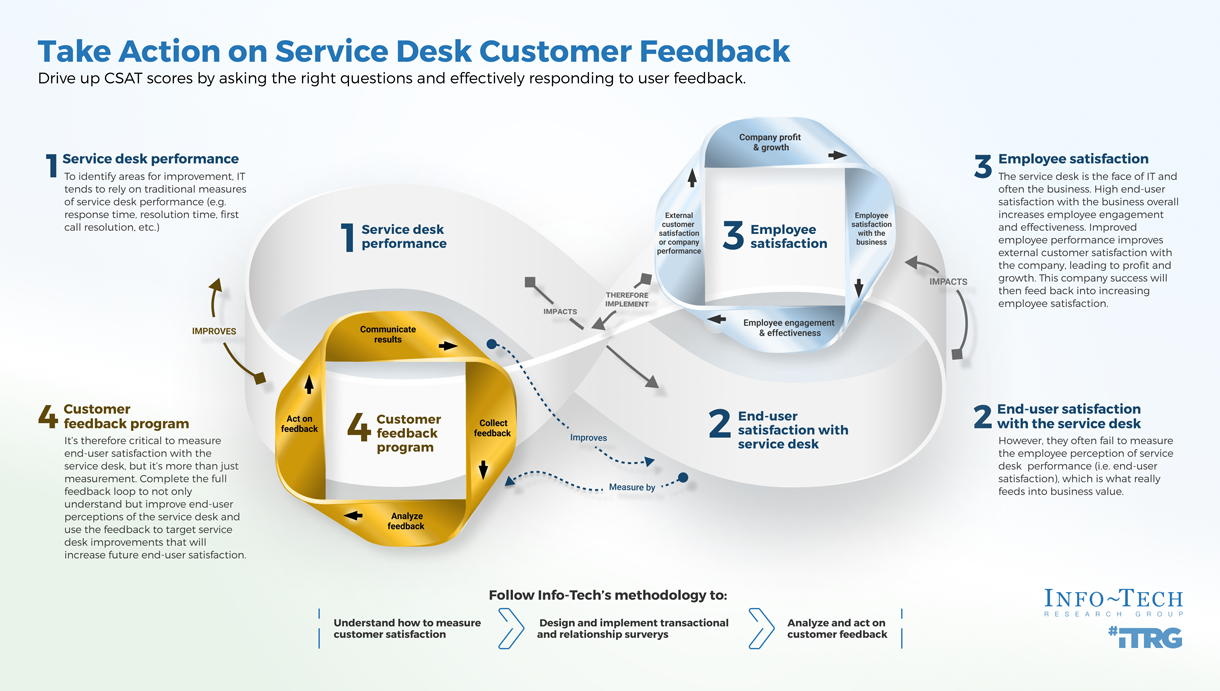
There is a shift in ITSM to focus more on customer experience metrics over traditional ones
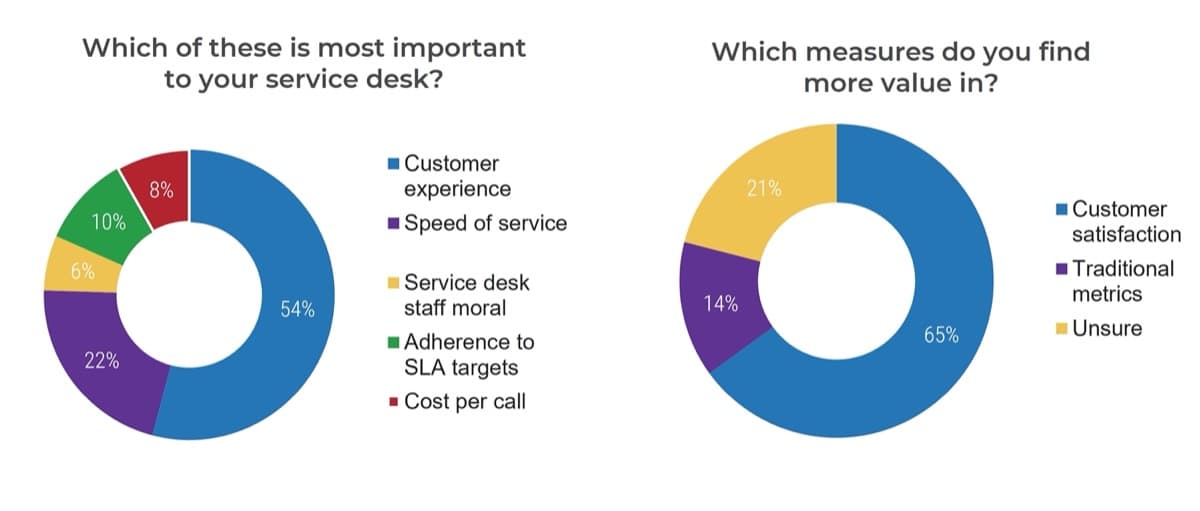
The Service Desk Institute (SDI) suggests that customer satisfaction is the most important indicator of service desk success, and that traditional metrics around SLA targets – currently the most common way to measure service desk performance – may become less valuable or even obsolete in the future as customer experience-focused targets become more popular. (Service Desk Institute, 2021)
SDI conducted a Customer Experience survey of service desk professionals from a range of organizations, both public and private, from January to March 2018. The majority of respondents said that customer experience is more important than other metrics such as speed of service or adherence to SLAs, and that customer satisfaction is more valuable than traditional metrics. (SDI, 2018).
However, many service desk leaders aren’t effectively measuring customer feedback
Not only is it important to measure customer experience and satisfaction levels, but it’s equally important to act on that data and feed it into a service improvement program. However, many IT leaders are neglecting either one or both of those components.
Obstacles to collecting feedback |
Obstacles to acting on collected feedback |
|---|---|
|
|
A strong customer feedback program brings many benefits to IT and the business
Insight into customer experience |
Gather insight into both the overall customer relationship with the service desk and individual transactions to get a holistic picture of the customer experience. |
|---|---|
Data to inform decisions |
Collect data to inform decisions about where to spend limited resources or time on improvement, rather than guessing or wasting effort on the wrong thing. |
Identification of areas for improvement |
Better understand your strengths and weaknesses from the customer’s point of view to help you identify gaps and priorities for improvement. |
Customers feel valued |
Make customers feel heard and valued; this will improve your relationship and their satisfaction. |
Ability to monitor trends over time |
Use the same annual relationship survey to be able to monitor trends and progress in making improvements by comparing data year over year. |
Foresight to prevent problems from occurring |
Understand where potential problems may occur so you can address and prevent them, or who is at risk of becoming a detractor so you can repair the relationship. |
IT staff coaching and engagement opportunities |
Turn negative survey feedback into coaching and improvement opportunities and use positive feedback to boost morale and engagement. |
Take Action on Service Desk Customer Feedback
Info-Tech’s methodology for measuring and acting on service desk customer feedback
Phase |
1. Understand how to measure customer satisfaction |
2. Design and implement transactional surveys |
3. Design and implement relationship surveys |
4. Analyze and act on feedback |
|---|---|---|---|---|
Phase outcomes |
Understand the main types of customer satisfaction surveys, principles for survey design, and best practices for surveying your users. |
Learn why and how to design a simple survey to assess satisfaction with individual service desk transactions (tickets) and a methodology for survey delivery that will improve response rates. |
Understand why and how to design a survey to assess overall satisfaction with the service desk across your organization, or use Info-Tech’s diagnostic. |
Measure and analyze the results of both surveys and build a plan to act on both positive and negative feedback and communicate the results with the organization. |
Insight Summary
Key Insight:
Asking your customers for feedback then doing nothing with it is worse than not asking for feedback at all. Your customers may end up more dissatisfied than they were before if they’re asked for their opinion then see nothing done with it. It’s valuable to collect feedback, but the true value for both IT and its customers comes from acting on that feedback and communicating those actions back to your users.
Additional insights:
Insight 1 |
Take the time to define the goals of your transactional survey program before launching it – it’s not as simple as just deploying the default survey of your ITSM tool out of the box. The objectives of the survey – including whether you want to keep a pulse on average satisfaction or immediately act on any negative experiences – will influence a range of key decisions about the survey configuration. |
|---|---|
Insight 2 |
While transactional surveys provide useful indicators of customer satisfaction with specific tickets and interactions, they tend to have low response rates and can leave out many users who may rarely or never contact the service desk, but still have helpful feedback. Include a relationship survey in your customer feedback program to capture a more holistic picture of what your overall user base thinks about the service desk and where you most need to improve. |
Insight 3 |
Satisfaction scores provide valuable data about how your customers feel, but don’t tell you why they feel that way. Don’t neglect the qualitative data you can gather from open-ended comments and questions in both types of satisfaction surveys. Take the time to read through these responses and categorize them in at least a basic way to gain deeper insight and determine where to prioritize your efforts. |
Understand how to measure customer satisfaction
Phase 1
Understand the main types of customer satisfaction surveys, principles for survey design, and best practices for surveying your users.
Phase 1: |
Phase 2: |
Phase 3: |
Phase 4: |
|---|---|---|---|
Understand how to measure customer satisfaction |
Design and implement transactional surveys |
Design and implement relationship surveys |
Analyze and act on feedback |
Three methods of surveying your customers
Transactional |
Relationship |
One-off |
|
|---|---|---|---|
Also known as |
Ticket surveys, incident follow-up surveys, on-going surveys |
Annual, semi-annual, periodic, comprehensive, relational |
One-time, single, targeted |
Definition |
|
|
|
Pros and cons of the three methods
Transactional | Relationship | One-off | |
|---|---|---|---|
Pros |
|
|
|
Cons |
|
|
|
Which survey method should you choose?
Only relying on one type of survey will leave gaps in your understanding of customer satisfaction. Include both transactional and relationship surveys to provide a holistic picture of customer satisfaction with the service desk.
If you can only start with one type, choose the type that best aligns with your goals and priorities:
If your priority is to identify larger improvement initiatives the service desk can take to improve overall customer satisfaction and trust in the service desk: |
If your priority is to provide customers with the opportunity to let you know when transactions do not go well so you can take immediate action to make improvements: |
| ↓ | ↓ |
Start with a relationship survey |
Start with a transactional survey |
Info-Tech Insight
One-off surveys can be useful to assess whether a specific change has impacted satisfaction, or to inform a planned change/initiative. However, as they aren’t typically part of an on-going customer feedback program, the focus of this research will be on transactional and relationship surveys.
3 common customer satisfaction measures
The three most utilized measures of customer satisfaction include CSAT, CES, and NPS.
| CSAT | CES | NPS | |
|---|---|---|---|
| Name | Customer Satisfaction | Customer Effort Score | Net Promoter score |
| What it measures | Customer happiness | Customer effort | Customer loyalty |
| Description | Measures satisfaction with a company overall, or a specific offering or interaction | Measures how much effort a customer feels they need to put forth in order to accomplish what they wanted | Single question that asks consumers how likely they are to recommend your product, service, or company to other people |
| Survey question | How satisfied are/were you with [company/service/interaction/product]? | How easy was it to [solve your problem/interact with company/handle my issue]? Or: The [company] made it easy for me to handle my issue | How likely are you to recommend [company/service/product] to a friend? |
| Scale | 5, 7, or 10 pt scale, or using images/emojis | 5, 7, or 10 pt scale | 10-pt scale from highly unlikely to highly likely |
| Scoring | Result is usually expressed as a percentage of satisfaction | Result usually expressed as an average | Responses are divided into 3 groups where 0-6 are detractors, 7-8 are passives, 9-10 are promoters |
| Pros |
|
|
|
| Cons |
|
|
|
When to use each satisfaction measure
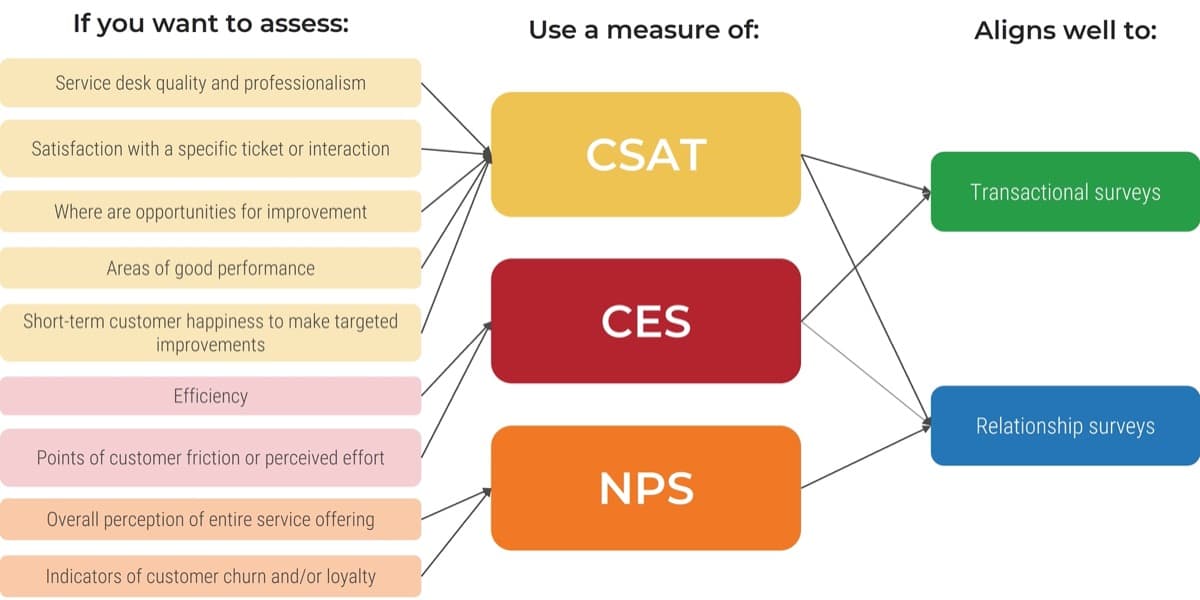
How to choose which measure(s) to incorporate in your surveys
The best measures are the ones that align with your specific goals for collecting feedback.
- Most companies will use multiple satisfaction measures. For example, NPS can be tracked to monitor the overall customer sentiment, and CSAT used for more targeted feedback.
- For internal-facing IT departments, CSAT is the most popular of the three methods, and NPS may not be as useful.
- Choose your measure and survey types based on what you are trying to achieve and what kind of information you need to make improvements.
- Remember that one measure alone isn’t going to give you actionable feedback; you’ll need to follow up with additional measures (especially for NPS and CES).
- For CSAT surveys, customize the satisfaction measures in as many ways as you need to target the questions toward the areas you’re most interested in.
- Don’t stick to just these three measures or types of surveys – there are other ways to collect feedback. Experiment to find what works for you.
- If you’re designing your own survey, keep in mind the principles on the next slide.
Info-Tech Insight
While we focus mainly on traditional survey-based approaches to measuring customer satisfaction in this blueprint, there’s no need to limit yourselves to surveys as your only method. Consider multiple techniques to capture a wider audience, including:
- Customer journey mapping
- Focus groups with stakeholders
- Lunch and learns or workshop sessions
- Interviews – phone, chat, in-person
- Kiosks
Principles for survey design
As you design your satisfaction survey – whether transactional or relational – follow these guidelines to ensure the survey delivers value and gets responses.
- Focus on your goal
- Be brief
- Include open-ended questions
- Keep questions clear and concise
- Avoid biased or leading questions
- Avoid double-barreled questions
- Don’t restrict responses
- Make the survey easy to complete
- Keep questions optional
- Test your survey
Don’t include unnecessary questions that won’t give you actionable information; it will only waste respondents’ time.
Keep each question as short as possible and limit the total number of survey questions to avoid survey fatigue.
Most of your measures will be close-ended, but include at least one comment box to allow for qualitative feedback.
Ensure that question wording is clear and specific so that all respondents interpret it the same way.
You won’t get accurate results if your question leads respondents into thinking or answering a certain way.
Don’t ask about two different things in the same question – it will confuse respondents and make your data hard to interpret.
Response options should include all possible opinions (including “don’t know”) to avoid frustrating respondents.
Pre-populate information where possible (e.g. name, department) and ensure the survey is responsive on mobile devices.
If every question is mandatory, respondents may leave the survey altogether if they can’t or don’t want to answer one question.
Test your survey with your target audience before launching, and incorporate feedback - they may catch issues you didn’t notice.
Prevent survey fatigue to increase response rates
If it takes too much time or effort to complete your survey – whether transactional or relational – your respondents won’t bother. Balance your need to collect relevant data with users’ needs for a simple and worthwhile task in order to get the most value out of your surveys.
There are two types of survey fatigue:
- Survey response fatigue
- Survey taking fatigue
Occurs when users are overwhelmed by too many requests for feedback and stop responding.
Occurs when the survey is too long or irrelevant to users, so they grow tired and abandon the survey.
Fight survey fatigue:
- Make it as easy as possible to answer your survey:
- Keep the survey as short as possible.
- For transactional surveys, allow respondents to answer directly from email without having to click a separate link if possible.
- Don’t make all questions mandatory or users may abandon it if they get to a difficult or unapplicable question.
- Test the survey experience across devices for mobile users.
- Communicate the survey’s value so users will be more likely to donate their time.
- Act on feedback: follow up on both positive and negative responses so users see the value in responding.
- Consider attaching an incentive to responding (e.g. name entered in a monthly draw).
Design and implement transactional surveys
Phase 2
Learn why and how to design a simple survey to assess satisfaction with individual service desk transactions (tickets) and a methodology for survey delivery that will improve response rates.
Phase 1: | Phase 2: | Phase 3: | Phase 4: |
|---|---|---|---|
Understand how to measure customer satisfaction | Design and implement transactional surveys | Design and implement relationship surveys | Analyze and act on feedback |
Use transactional surveys to collect immediate and actionable feedback
Recall the definition of a transactional survey:
- Survey that is tied to a specific customer interaction with the service desk (i.e. a ticket).
- Assesses how satisfied customers are with how the ticket was handled and resolved.
- Sent immediately after ticket is closed.
- Short – usually 1 to 3 questions.
Info-Tech Insight
While feedback on transactional surveys is specific to a single transaction, even one negative experience can impact the overall perception of the service desk. Pair your transactional surveys with an annual relationship survey to capture broader sentiment toward the service desk.
Transactional surveys serve several purposes:
- Gives end users a mechanism to provide feedback when they want to.
- Provides continual insight into customer satisfaction throughout the year to monitor for trends or issues in between broader surveys.
- Provides IT leaders with actionable insights into areas for improvement in their processes, knowledge and skills, or customer service.
- Gives the service desk the opportunity to address any negative experiences or perceptions with customers, to repair the relationship.
- Feeds into individual or team coaching for service desk staff.
Make key decisions ahead of launching your transactional surveys
If you want to get the most of your surveys, you need to do more than just click a button to enable out-of-the-box surveys through your ITSM tool. Make these decisions ahead of time:
| Decision | Considerations | For more guidance, see |
| What are the goals of your survey? | Are you hoping to get an accurate pulse of customer sentiment (if so, you may want to randomly send surveys) or give customers the ability to provide feedback any time they have some (if so, send a survey after every ticket)? | Slide 25 |
| How many questions will you ask? | Keep the survey as short as possible – ideally only one mandatory question. | Slide 26 |
| What questions will you ask? | Do you want a measure of NPS, CES, or CSAT? Do you want to measure overall satisfaction with the interaction or something more specific about the interaction? | Slide 27 |
| What will be the response options/scale? | Keep it simple and think about how you will use the data after. | Slide 28 |
| How often will you send the survey? | Will it be sent after every ticket, every third ticket, or randomly to a select percentage of tickets, etc.? | Slide 29 |
| What conditions would apply? | For example, is there a subset of users who you never want to receive a survey or who you always want to receive a survey? | Slide 30 |
| What mechanism/tool will you use to send the survey? | Will your ITSM tool allow you to make all the configurations you need, or will you need to use a separate survey tool? If so, can it integrate to your ITSM solution? | Slide 30 |
Key decisions, continued
| Decision | Considerations | For more guidance, see |
| What will trigger the survey? | Typically, marking the ticket as either ‘resolved’ or ‘closed’ will trigger the survey. | Slide 31 |
| How long after the ticket is closed will you send the survey? | You’ll want to leave enough time for the user to respond if the ticket wasn’t resolved properly before completing a survey, but not so much time that they don’t remember the ticket. | Slide 31 |
| Will the survey be sent in a separate email or as part of the ticket resolution email? | A separate email might feel like too many emails for the user, but a link within the ticket closure email may be less noticeable. | Slide 32 |
| Will the survey be embedded in email or accessed through a link? | If the survey can be embedded into the email, users will be more likely to respond. | Slide 32 |
| How long will the survey link remain active, and will you send any reminders? | Leave enough time for the user to respond if they are busy or away, but not so much time that the data would be irrelevant. Balance the need to remind busy end users with the possibility of overwhelming them with survey fatigue. | Slide 32 |
| What other text will be in the main body of the survey email and/or thank you page? | Keep messaging short and straightforward and remind users of the benefit to them. | Slide 33 |
| Where will completed surveys be sent/who will have access? | Will the technician assigned to the ticket have access or only the manager? What email address/DL will surveys be sent to? | Slide 33 |
Define the goals of your transactional survey program
Every survey should have a goal in mind to ensure only relevant and useful data is collected.
- Your survey program must be backed by clear and actionable goals that will inform all decisions about the survey.
- Survey questions should be structured around that goal, with every question serving a distinct purpose.
- If you don’t have a clear plan for how you will action the data from a particular question, exclude it.
- Don’t run a survey just for the sake of it; wait until you have a clear plan. If customers respond and then see nothing is done with the data, they will learn to avoid your surveys.
Your survey objectives will also determine how often to send the survey:
If your objective is: |
|
Keep a continual pulse on average customer satisfaction |
Gain the opportunity to act on negative feedback for any poor experience |
Then: |
|
Send survey randomly |
Send survey after every ticket |
Rationale: |
|
Sending a survey less often will help avoid survey fatigue and increase the chances of users responding whether they have good, bad, or neutral feedback |
Always having a survey available means users can provide feedback every time they want to, including for any poor experience – giving you the chance to act on it. |
Info-Tech Insight
Service Managers often get caught up in running a transactional survey program because they think it’s standard practice, or they need to report a satisfaction metric. If that’s your only objective, you will fail to derive value from the data and will only turn customers away from responding.
Design survey content and length
As you design your survey, keep in mind the following principles:
- Keep it short. Your customers won’t bother responding if they see a survey with multiple questions or long questions that require a lot of reading, effort, or time.
- Make it simple. This not only makes it easier for your customers to complete, but easier for you to track and monitor.
- Tie your survey to your goals. Remember that every question should have a clear and actionable purpose.
- Don’t measure anything you can’t control. If you won’t be able to make changes based on the feedback, there’s no value asking about it.
- Include an (optional) open-ended question. This will allow customers to provide more detailed feedback or suggestions.
Q: How many questions should the survey contain?
A: Ideally, your survey will have only one mandatory question that captures overall satisfaction with the interaction.
This question can be followed up with an optional open-ended question prompting the respondent for more details. This will provide a lot more context to the overall rating.
If there are additional questions you need to ask based on your goals, clearly make these questions optional so they don’t deter respondents from completing the survey. For example, they can appear only after the respondent has submitted their overall satisfaction response (i.e. on a separate, thank you page).
Additional (optional) measures may include:
- Customer effort score (how easy or difficult was it to get your issue resolved?)
- Customer service skills of the service desk
- Technical skills/knowledge of the agents
- Speed or response or resolution
Design question wording
Tips for writing survey questions:
- Be clear and concise
- Keep questions as short as possible
- Cut out any unnecessary words or phrasing
- Avoid biasing, or leading respondents to select a certain answer
- Don’t attempt to measure multiple constructs in a single question.
Sample question wording:
How satisfied are you with this support experience?
How would you rate your support experience?
Please rate your overall satisfaction with the way your issue was handled.
Instead of this…. |
Ask this…. |
|---|---|
“We strive to provide excellent service with every interaction. Please rate how satisfied you are with this interaction.” |
“How satisfied were you with this interaction?” |
“How satisfied were you with the customer service skills, knowledge, and responsiveness of the technicians?” |
Choose only one to ask about. |
“How much do you agree that the service you received was excellent?” |
“Please rate the service you received.” |
“On a scale of 1-10, thinking about your most recent experience, how satisfied would you say that you were overall with the way that your ticket was resolved?” |
“How satisfied were you with your ticket resolution?” |
Choose response options
Once you’ve written your survey question, you need to design the response options for the question. Put careful thought into balancing ease of responding for the user with what will give you the actionable data you need to meet your goals. Keep the following in mind:
When planning your response options, remember to keep the survey as easy to respond to as possible – this means allowing a one-click response and a scale that’s intuitive and simple to interpret. |
Think about how you will use the responses and interpret the data. If you choose a 10-point scale, for example, what would you classify as a negative vs positive response? Would a 5-point scale suffice to get the same data? |
Again, use your goals to inform your response options. If you need a satisfaction metric, you may need a numerical scale. If your goal is just to capture negative responses, you may only need two response options: good vs bad. |
Common response options:
|
Investigate the capabilities of your ITSM tool. It may only allow one built-in response option style. But if you have the choice, choose the simplest option that aligns with your goals. |
Decide how often to send surveys
There are two common choices for when to send ticket satisfaction surveys:
After random tickets |
After every ticket |
|
Pros |
|
|
Cons |
|
|
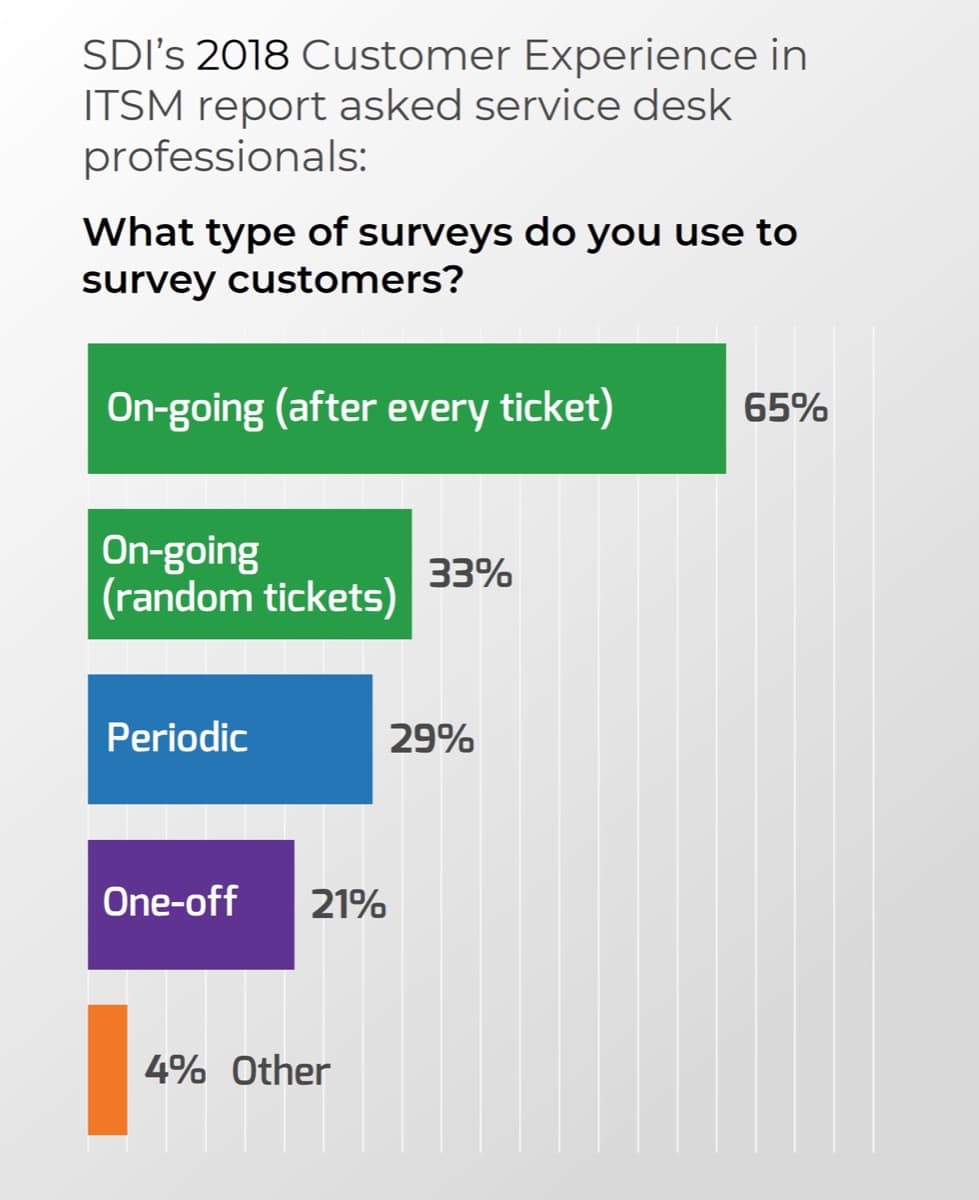
SDI’s 2018 Customer Experience in ITSM survey of service desk professionals found:
Almost two-thirds (65%) send surveys after every ticket.
One-third (33%) send surveys after randomly selected tickets are closed.
Info-Tech Recommendation:
Send a survey after every ticket so that anyone who has feedback gets the opportunity to provide it – and you always get the chance to act on negative feedback. But, limit how often any one customer receives a ticket to avoid over-surveying them – restrict to anywhere between one survey a week to one per month per customer.
Plan detailed survey logistics
Decision #1 |
Decision #2 |
|---|---|
What tool will you use to deliver the survey? |
What (if any) conditions apply to your survey? |
Considerations
|
Considerations Is there a subset of users who you never want to receive a survey (e.g. a specific department, location, role, or title)? Is there a subset of users who you always want to receive a survey, no matter how often they contact the service desk (e.g. VIP users, a department that scored low on the annual satisfaction survey, etc.)? Are there certain times of the year that you don’t want surveys to go out (e.g. fiscal year end, holidays)? Are there times of the day that you don’t want surveys to be sent (e.g. only during business hours; not at the end of the day)? |
Recommendations The built-in functionality of your ITSM tool’s surveys will be easiest to send and track; use it if possible. However, if your tool’s survey module is limited and won’t give you the value you need, consider a third-party solution or survey tool that integrates with your ITSM solution and won’t require significant manual effort to send or review the surveys. |
Recommendations If your survey module allows you to apply conditions, think about whether any are necessary to apply to either maximize your response rate (e.g. don’t send a survey on a holiday), avoid annoying certain users, or seek extra feedback from dissatisfied users. |
Plan detailed survey logistics
Decision #2 | Decision #1 |
|---|---|
What will trigger the survey? | When will the survey be sent? |
Considerations
| Considerations
|
Recommendations Only send the survey once you’re sure the issue has actually been resolved; you could further upset the customer if you ask them how happy they are with the resolution if resolution wasn’t achieved. This means sending the survey once the user confirms resolution (which closes ticket) or the agent closes the ticket. | Recommendations If you are sending the survey upon ticket status moving to ‘resolved’, wait at least 24 hours before sending the survey in case the user responds that their issue wasn’t actually resolved. However, if you are sending the survey after the ticket has been verified resolved and closed, you can send the survey immediately while the experience is still fresh in their memory. |
Plan detailed survey logistics
Decision #1 | Decision #2 |
|---|---|
How will the survey appear in email? | How long will the survey remain active? |
Considerations
| Considerations
|
Recommendations Send the survey separately from the ticket resolution email or users will never notice it. However, if possible, have the entire survey embedded within the email so users can click to respond directly from their email without having to open a separate link. Reduce effort, to make users more likely to respond. | Recommendations Leave enough time for the user to respond if they are busy or away, but not so much time that the data will be irrelevant. Balance the need to remind busy end users, with the possibility of overwhelming them with survey fatigue. About a week is typical. |
Plan detailed survey logistics
Decision #1 | Decision #2 |
|---|---|
What will the body of the email/messaging say? | Where will completed surveys be sent? |
Considerations
| Considerations
|
Recommendations Most users won’t read a long message, especially if they see it multiple times, so keep the email short and simple. Tell users you value their feedback, indicate which interaction you’re asking about, and say how long the survey should take. Thank them after they submit and tell them you will act on their feedback. | Recommendations Survey results should be sent to the Service Manager, Customer Experience Lead, or whoever is the person responsible for managing the survey feedback. They can choose how to share feedback with specific agents and the service desk team. |
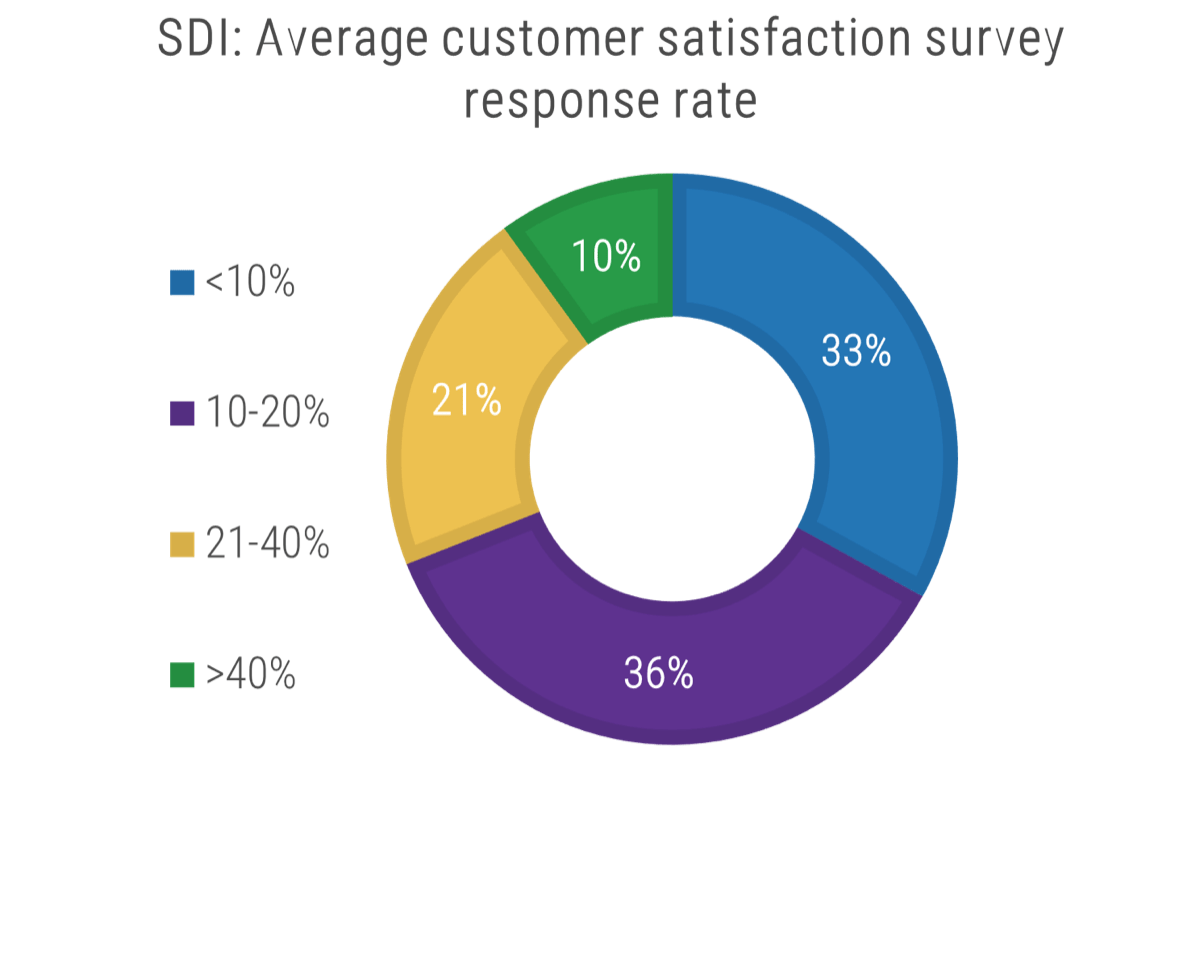
Response rates for transactional surveys are typically low…
Most IT organizations see transactional survey response rates of less than 20%.
Source: SDI, 2018SDI’s 2018 Customer Experience in ITSM survey of service desk professionals found that 69% of respondents had survey response rates of 20% or less. However, they did not distinguish between transactional and relationship surveys. |
Reasons for low response rates:
|
“In my experience, single digits are a sign of a problem. And a downward trend in response rate is also a sign of a problem. World-class survey response rates for brands with highly engaged customers can be as high as 60%. But I’ve never seen it that high for internal support teams. In my experience, if you get a response rate of 15-20% from your internal customers then you’re doing okay. That’s not to say you should be content with the status quo, you should always be looking for ways to increase it.” – David O’Reardon, Founder & CEO of Silversix |
… but there are steps you can take to maximize your response rate
It is still difficult to achieve high response rates to transactional surveys, but you can at least increase your response rate with these strategies:
- Reduce frequency
- Send immediately
- Make it short and simple
- Make it easy to complete
- Change email messaging
- Respond to feedback
- Act on feedback
Don’t over-survey any one user or they will start to ignore the surveys.
Ask for feedback soon after the ticket was resolved so it’s fresh in the user’s memory.
Keep the survey short, concise, and simple to respond to.
Minimize effort involved as much as possible. Allow users to respond directly from email and from any device.
Experiment with your subject line or email messaging to draw more attention.
Respond to customers who provide feedback – especially negative – so they know you’re listening.
Demonstrate that you are acting on feedback so users see the value in responding.
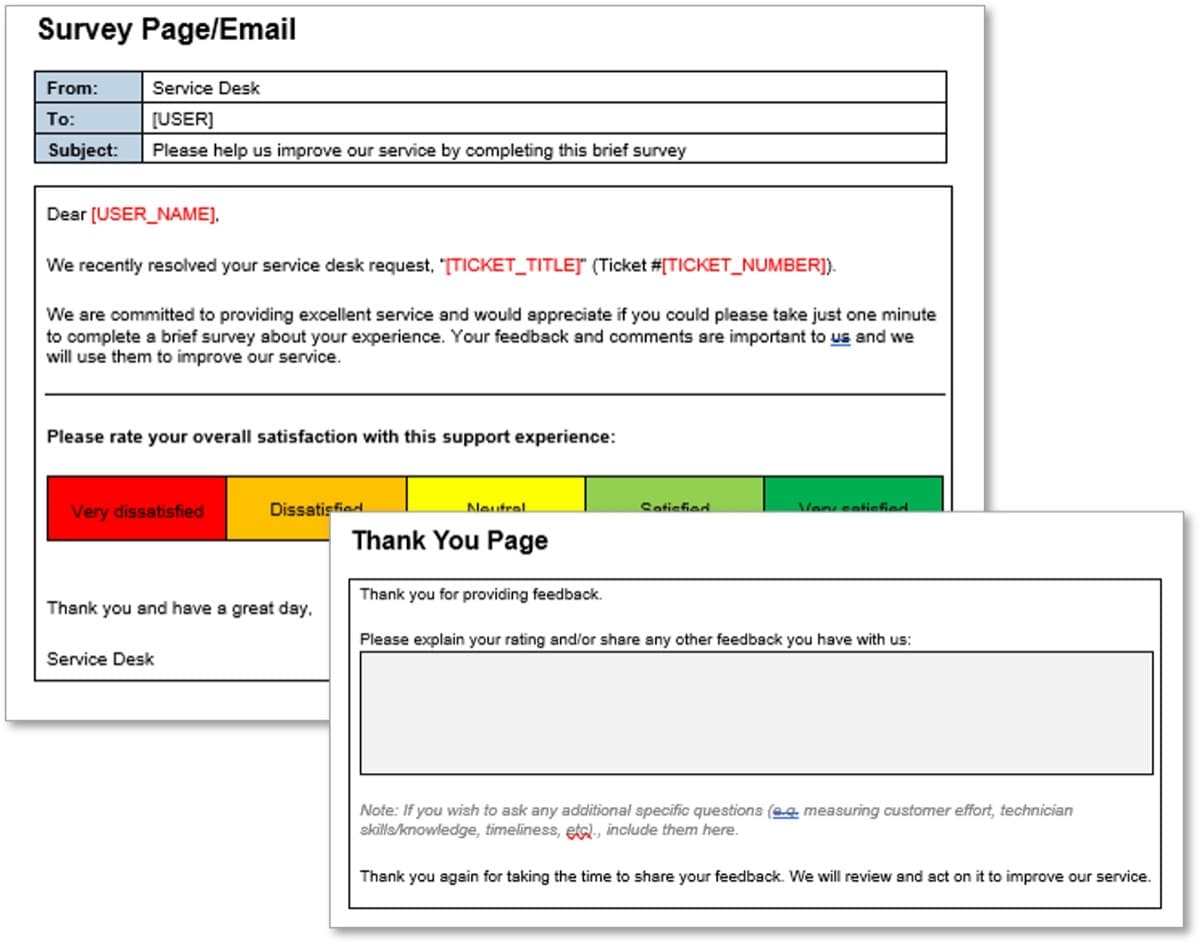
Use Info-Tech’s survey template as a starting point
Once you’ve worked through all the decisions in this step, you’re ready to configure your transactional survey in your ITSM solution or survey tool.
As a starting point, you can leverage Info-Tech’s Transactional Service Desk Survey Templatee to design your templates and wording.
Make adjustments to match your decisions or your configuration limitations as needed.
Refer to the key decisions tables on slides 24 and 25 to ensure you’ve made all the configurations necessary as you set up your survey.
Design and implement relationship surveys
Phase 3
Understand why and how to design a survey to assess overall satisfaction with the service desk across your organization, or use Info-Tech’s diagnostic.
Phase 1: | Phase 2: | Phase 3: | Phase 4: |
|---|---|---|---|
Understand how to measure customer satisfaction | Design and implement transactional surveys | Design and implement relationship surveys | Analyze and act on feedback |
How can we evaluate overall Service Desk service quality?
Evaluating service quality in any industry is challenging for both those seeking feedback and those consuming the service: “service quality is more difficult for the consumer to evaluate than goods quality.”
You are in the position of trying to measure something intangible: customer perception, which “result[s] from a comparison of consumer expectations with actual service performance,” which includes both the service outcome and also “the process of service delivery”
(Source: Parasuraman et al, 1985, 42).
Your mission is to design a relationship survey that is:
- Comprehensive but not too long.
- Easy to understand but complex enough to capture enough detail.
- Able to capture satisfaction with both the outcome and the experience of receiving the service.
Use relationship surveys to measure overall service desk service quality
Recall the definition of a relationship survey:
- Survey that is sent periodically (i.e. semi-annually or annually) to the entire customer base to measure the overall relationship with the service desk.
- Shows you where your customer experience is doing well and where it needs improving.
- Asks customers to rate you based on their overall experience rather than on a specific product or interaction.
- Longer and more comprehensive than transactional surveys, covering multiple dimensions/ topics.
Relationship surveys serve several purposes:
- Gives end users an opportunity to provide overall feedback on a wider range of experiences with IT.
- Gives IT the opportunity to respond to feedback and show users their voices are heard.
- Provides insight into year-over-year trends and customer satisfaction.
- Provides IT leaders the opportunity to segment the results by demographic (e.g. by department, location, or seniority) and target improvements where needed most.
- Feeds into strategic planning and annual reports on user experience and satisfaction
Info-Tech Insight
Annual relationship surveys provide great value in the form of year-over-year internal benchmarking data, which you can use to track improvements and validate the impact of your service improvement efforts.
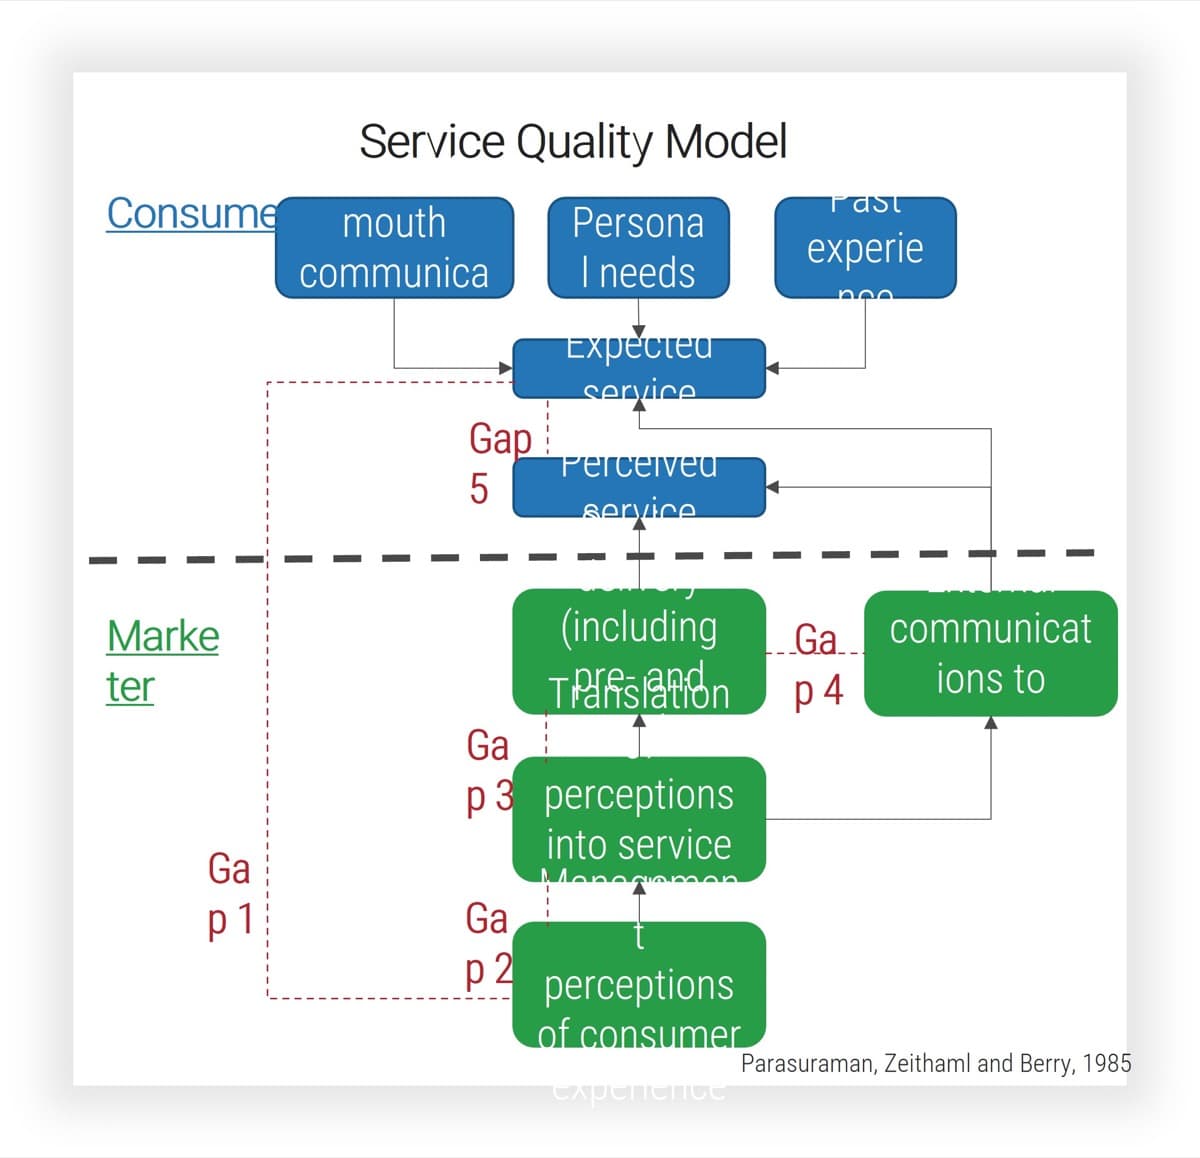
Understand the gaps that decrease service quality
The Service Quality Model (Parasuraman, Zeithaml and Berry, 1985) shows how perceived service quality is negatively impacted by the gap between expectations for quality service and the perceptions of actual service delivery: Gap 1: Consumer expectation – Management perception gap: Are there differences between your assumptions about what users want from a service and what those users expect? Gap 2: Management perception – Service quality specification gap: Do you have challenges translating user expectations for service into standardized processes and guidelines that can meet those expectations? Gap 3: Service quality specifications – Service delivery gap: Do staff members struggle to carry out the service quality processes when delivering service? Gap 4: Service delivery – External communications gap: Have users been led to expect more than you can deliver? Alternatively, are users unaware of how the organization ensures quality service, and therefore unable to appreciate the quality of service they receive? Gap 5: Expected service – Perceived service gap: Is there a discrepancy between users’ expectations and their perception of the service they received (regardless of any user misunderstanding)? |
 |
|---|
Your survey questions about service and support should provide insight into where these gaps exist in your organization
Make key decisions ahead of launch
| Decision/step | Considerations |
| Align the relationship survey with your goals | Align what is motivating you to launch the survey at this time and the outcomes it is intended to feed into. |
| Identify what you’re measuring | Clarify the purpose of the questions. Are you measuring feedback on your service desk, specifically? On all of IT? Are you trying to capture user effort? User satisfaction? These decisions will affect how you word your questions. |
| Determine a framework for your survey | Reporting on results and tracking year-over-year changes will be easier if you design a basic framework that your survey questions fall into. Consider drawing on an existing service quality framework to match best practices in other industries. |
| Cover logistical details | Designing a relationship survey requires attention to many details that may initially be overlooked: the survey’s length and timing, who it should be sent to and how, what demographic info you need to collect to slice and dice the results, and if it will be possible to conduct the survey anonymously. |
| Design question wording | It is important to keep questions clear and concise and to avoid overly lengthy surveys. |
| Select answer scales | The answer scales you select will depend on how you have worded the questions. There is a wide range of answer scales available to you; decide which ones will produce the most meaningful data. |
| Test the survey | Testing the survey before widely distributing it is key. When collecting feedback, conduct at least a few in person observations of someone taking the survey to get their unvarnished first impressions. |
| Monitor and maximize your response rate | Ensure success by staying on top of the survey during the period it is open. |
Align the relationship survey with your goals
What is motivating you to launch the survey at this time?
Is there a renewed focus on customer service satisfaction? If so, this survey will track the initiative’s success, so its questions must align with the sponsors’ expectations.
Are you surveying customer satisfaction in order to comply with legislation, or directives to measure customer service quality?
What objectives/outcomes will this survey feed into?
What do you need to report on to your stakeholders? Have they communicated any expectations regarding the data they expect to see?
Does the CIO want the annual survey to measure end-user satisfaction with all of IT?
- Or do you only want to measure satisfaction with one set of processes (e.g. Service Desk)?
- Are you seeking feedback on a project (e.g. implementation of new ERP)?
- Are you seeking feedback on the application portfolio?
In 1993 the U.S. president issued an Executive Order requiring executive agencies to “survey customers to determine the kind and quality of services they want and their level of satisfaction with existing services” and “post service standards and measure results against them.” (Clinton, 1993)
Identify what you’re measuring
Examples of Measures |
||
Clarify the purpose of the questions Each question should measure something specific you want to track and be phrased accordingly. |
Are you measuring feedback on the service desk? | Service desk professionalism |
Are you measuring user satisfaction? |
Service desk timeliness |
|
Your customers’ happiness with aspects of IT’s service offerings and customer service |
Trust in agents’ knowledge |
|
Users’ preferred ticket intake channel (e.g. portal vs phone) |
||
Satisfaction with self-serve features |
||
Are you measuring user effort? |
Are you measuring feedback on IT overall? |
Satisfaction with IT’s ability to enable the business |
How much effort your customer needs to put forth to accomplish what they wanted/how much friction your service causes or alleviates |
Satisfaction with company-issued devices |
|
| Satisfaction with network/Wi-Fi | ||
Satisfaction with applications |
Info-Tech Insight
As you compose survey questions, decide whether they are intended to capture user satisfaction or effort: this will influence how the question is worded. Include a mix of both.
Determine a framework for your survey
If your relationship survey covers satisfaction with service support, ensure the questions cover the major aspects of service quality. You may wish to align your questions on support with existing frameworks: for example, the SERVQUAL service quality measurement instrument identifies 5 dimensions of service quality: Reliability, Assurance, Tangibles, Empathy, and Responsiveness (see below). As you design the survey, consider if the questions relate to these five dimensions. If you have overlooked any of the dimensions, consider if you need to revise or add questions.
Service dimension |
Definition |
Sample questions |
|---|---|---|
Reliability |
“Ability to perform the promised service dependably and accurately”1 |
|
Assurance |
“Knowledge and courtesy of employees and their ability to convey trust and confidence”2 |
|
Tangibles |
“Appearance of physical facilities, equipment, personnel, and communication materials”3 |
|
Empathy |
“Caring, individualized attention the firm provides its customers”4 |
|
Responsiveness |
“Willingness to help customers and provide prompt service”5 |
|
1-5. Arlen, Chris,2022. Paraphrasing Zeithaml, Parasuraman, and Berry, 1990.
Cover logistical details of the survey
Identify who you will send it to Will you survey your entire user base or a specific subsection? For example, a higher education institution may choose to survey students separately from staff and faculty. If you are gathering data on customer satisfaction with a specific implementation, only survey the affected stakeholders. Determine timing Avoid sending out the survey during known periods of time pressure or absence (e.g. financial year-end, summer vacation). Decide upon its length Consider what survey length your users can tolerate. Configure the survey to show the respondents’ progression or their percentage complete. Clearly introduce the survey The survey should begin with an introduction that thanks users for completing the survey, indicates its length and anonymity status, and conveys how the data will be used, along with who the participants should contact with any questions about the survey. Decide upon incentives Will you incentivize participation (e.g. by entering the participants in a draw or rewarding highest-participating department)? |
Collect demographic information Ensure your data can be “sliced and diced” to give you more granular insights into the results. Ask respondents for information such as department, location, seniority, and tenure to help with your trend analysis later. Clarify if anonymous Users may be more comfortable participating if they can do so anonymously (Quantisoft, n.d.). If you promise anonymity, ensure your survey software/ partner can support this claim. Note the difference between anonymity (identity of participant is not collected) and confidentiality (identifying data is collected but removed from the reported results). Decide how to deliver the survey Will you be distributing the survey yourself through your own licensed software (e.g. through Microsoft Forms if you are an MS shop)? Or, will you be partnering with a third-party provider? Is the survey optimized for mobile? Some find up to 1/3 of participants use mobile devices for their surveys (O’Reardon, 2018). |
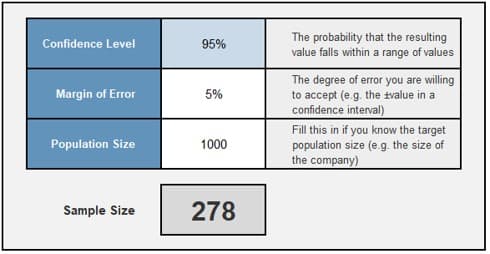
Use the Sample Size Calculator to determine your ideal sample size
Use Info-Tech’s Sample Size Calculator to calculate the number of people you need to complete your survey to have statistically representative results.
In the example above, the service desk supports 1000 total users (and sent the survey to each one). To be 95% confident that the survey results fall within 5% of the true value (if every user responded), they would need 278 respondents to complete their survey. In other words, to have a sample that is representative of the whole population, they would need 278 completed surveys. |
Explanation of terms: Confidence Level: A measure of how reliable your survey is. It represents the probability that your sample accurately reflects the true population (e.g. your entire user base). The industry standard is typically 95%. This means that 95 times out of 100, the true data value that you would get if you surveyed the entire population would fall within the margin of error. Margin of Error: A measure of how accurate the data is, also known as the confidence interval. It represents the degree of error around the data point, or the range of values above and below the actual results from a survey. A typical margin of error is 5%. This means that if your survey sample had a score of 70%, the true value if you sampled the entire population would be between 65% and 75%. To narrow the margin of error, you would need a bigger sample size. Population Size: The total set of people you want to study with your survey. For example, the total number of users you support. Sample Size: The number of people who participate in your survey (i.e. complete the survey) out of the total population. |
Info-Tech’s End-User Satisfaction Diagnostics
If you choose to leverage a third-party partner, an Info-Tech satisfaction survey may already be part of your membership. There are two options, depending on your needs:
I need to measure and report customer satisfaction with all of IT:
|
Both products measure end-user satisfaction One is more general to IT One is more specific to service desk |
I need to measure and report more granularly on Service Desk customer satisfaction:
|
Choose Info-Tech's End User Satisfaction Survey |
Choose Info-Tech’s Service Desk Satisfaction Survey |
Design question wording
Write accessible questions: | Instead of this…. | Ask this…. |
48% of US adults meet or exceed PIACC literacy level 3 and thus able to deal with texts that are “often dense or lengthy.” 52% of US adults meet level 2 or lower. Keep questions clear and concise. Avoid overly lengthy surveys. Source: Highlights of the 2017 U.S. PIAAC Results Web Report |
Users will have difficulty perceiving the difference between these two questions. |
|
Tips for writing survey questions: | “How satisfied are you with the customer service skills, knowledge, and responsiveness of the technicians?” This question measures too many things and the data will not be useful. | Choose only one to ask about. |
| “On a scale of 1-10, thinking about the past year, how satisfied would you say that you were overall with the way that your tickets were resolved?” This question is too wordy. | “How satisfied were you with your ticket resolution?” |
Choose answer scales that best fit your questions and reporting needs
Likert scale
Respondents select from a range of statements the position with which they most agree:
E.g. How satisfied are you with how long it generally takes to resolve your issue completely?
E.g. Very dissatisfied/Somewhat dissatisfied/ Neutral/ Somewhat satisfied/ Very satisfied/ NA
Frequency scale
How often does the respondent have to do something, or how often do they encounter something?
E.g. How frequently do you need to re-open tickets that have been closed without being satisfactorily resolved?
E.g. Never/ Rarely/ Sometimes/ Often/ Always/ NA
Numeric scale
By asking users to rate their satisfaction on a numeric scale (e.g., 1-5, 1-10), you can facilitate reporting on averages:
E.g. How satisfied are you with IS’s ability to provide services to allow the organization to meet its goals?
E.g. 1 – Not at all Satisfied to 10 – Fully Satisfied / NA
Forced ranking
Learn more about your users’ priorities by asking them to rank answers from most to least important, or selecting their top choices (Sauro, 2018):
E.g. From the following list, drag and drop the 3 aspects of our service that are most important to you into the box on the right.
Info-Tech Insight
Always include an optional open-ended question, which allows customers to provide more feedback or suggestions.
Test the survey before launching
Review your questions for repetition and ask for feedback on your survey draft to discover if readers interpret the questions differently than you intended.
Test the survey with different stakeholder groups:
- IT staff: To discover overlooked topics.
- Representatives of your end-user population: To discover whether they understand the intention of the questions.
- Executives: To validate whether you are capturing the data they are interested in reporting on.
Testing methodology:
- Ask your test subjects to take the survey in your presence so you can monitor their experience as they take it.
- Ask them to narrate their experience as they take the survey.
- Watch for:
- The time it takes to complete the survey.
- Moments when they struggle or are uncertain with the survey’s wording.
- Questions they find repetitive or pointless.
Info-Tech Insight
In the survey testing phase, try to capture at least a few real-time responses to the survey. If you collect survey feedback only once the test is over, you may miss some key insights into the user experience of navigating the survey.
“Follow the golden rule: think of your audience and what they may or may not know. Think about what kinds of outside pressures they may bring to the work you’re giving them. What time constraints do they have?”
– Sally Colwell, Project Officer, Government of Canada Pension Centre
Monitor and maximize your response rate
Ensure success by staying on top of the survey during the period it is open.
- When will your users complete the survey? You know your own organization’s culture best, but SurveyMonkey found that weekday survey responses peaked at mid-morning and mid-afternoon (Wronski). Ensure you send the communication at a time it will not be overlooked. For example, some studies found Mondays to have higher response rates; however, the data is not consistent (Amaresan, 2021). Send the survey at a time you believe your users are least likely to be inundated with other notifications.
- Have a trusted leader send out the first communication informing the end-user base of the survey. Ensure the recipient understands your motivation and how their responses will be used to benefit them (O’Reardon, 2016). Remind them that participating in the survey benefits them: since IT is taking actions based on their feedback, it’s their chance to improve their employee experience of the IT services and tools they use to do their job.
- In the introductory communication, test different email subject lines and email body content to learn which versions increase respondents’ rates of opening the survey link, and “keep it short and clear” (O’Reardon, 2016).
- If your users tend to mistrust emailed links due to security training, tell them how to confirm the legitimacy of the survey.
“[Send] one reminder to those who haven’t completed the survey after a few days. Don’t use the word ‘reminder’ because that’ll go straight in the bin, better to say something like, ‘Another chance to provide your feedback’”
– David O’Reardon, Founder & CEO of Silversix
Analyze and act on feedback
Phase 4
Measure and analyze the results of both surveys and build a plan to act on both positive and negative feedback and communicate the results with the organization.
Phase 1: | Phase 2: | Phase 3: | Phase 4: |
|---|---|---|---|
Understand how to measure customer satisfaction | Design and implement transactional surveys | Design and implement relationship surveys | Analyze and act on feedback |
Leverage the service recovery paradox to improve customer satisfaction
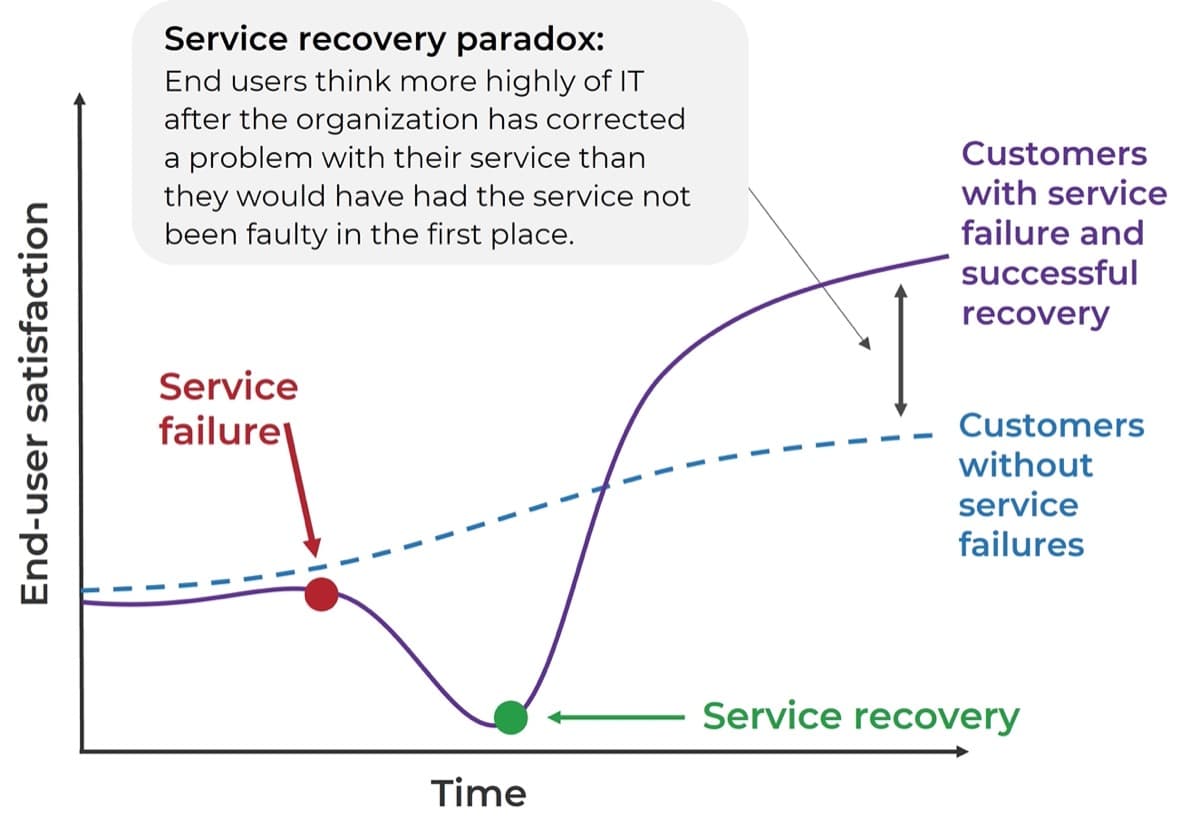
A service failure or a poor experience isn’t what determines customer satisfaction – it’s how you respond to the issue and take steps to fix it that really matters.
This means one poor experience with the service desk doesn’t necessarily lead to an unhappy user; if you quickly and effectively respond to negative feedback to repair the relationship, the customer may be even happier afterwards because you demonstrated that you value them.
“Every complaint becomes an opportunity to turn a bad IT customer experience into a great one.”
– David O’Reardon, Founder & CEO of Silversix
Collecting feedback is only the first step in the customer feedback loop
Closing the feedback loop is one of the most important yet forgotten steps in the process.
- Collect Feedback
- Send transactional surveys after every ticket is resolved.
- Send a broader annual relationship survey to all users.
- Calculate satisfaction scores.
- Read open-ended comments.
- Analyze for trends, categories, common issues and priorities.
- Respond to users who provided feedback.
- Make improvements based on feedback.
- Communicate feedback results and improvements made to respondents and to service desk staff.
- Summarize results and actions to key stakeholders and business leaders.
Act on feedback to get the true value of your satisfaction program
|
 |
“Your IT service desk’s CSAT survey should be the means of improving your service (and the employee experience), and something that encourages people to provide even more feedback, not just the means for understanding how well it’s doing” – Joe the IT Guy, SysAid |
Assign responsibility for acting on feedback
If collecting and analyzing customer feedback is something that happens off the side of your desk, it either won’t get done or won’t get done well.
- Formalize the customer satisfaction program. It’s not a one-time task, but an ongoing initiative that requires significant time and dedication.
- Be clear on who is accountable for the program and who is responsible for all the tasks involved for both transactional and relationship survey data collection, analysis, and communication.
Assign accountability for the customer feedback program to one person (i.e. Service Desk Manager, Service Manager, Infrastructure & Operations Lead, IT Director), who may take on or assign responsibilities such as:
- Designing surveys, including survey questions and response options.
- Configuring survey(s) in ITSM or survey tool.
- Sending relationship surveys and subsequent reminders to the organization.
- Communicating results of both surveys to internal staff, business leaders, and end users.
- Analyzing results.
- Feeding results into improvement plans, coaching, and training.
- Creating reports and dashboards to monitor scores and trends.
Info-Tech Insight
While feedback can feed into internal coaching and training, the goal should never be to place blame or use metrics to punish agents with poor results. The focus should always be on improving the experience for end users.
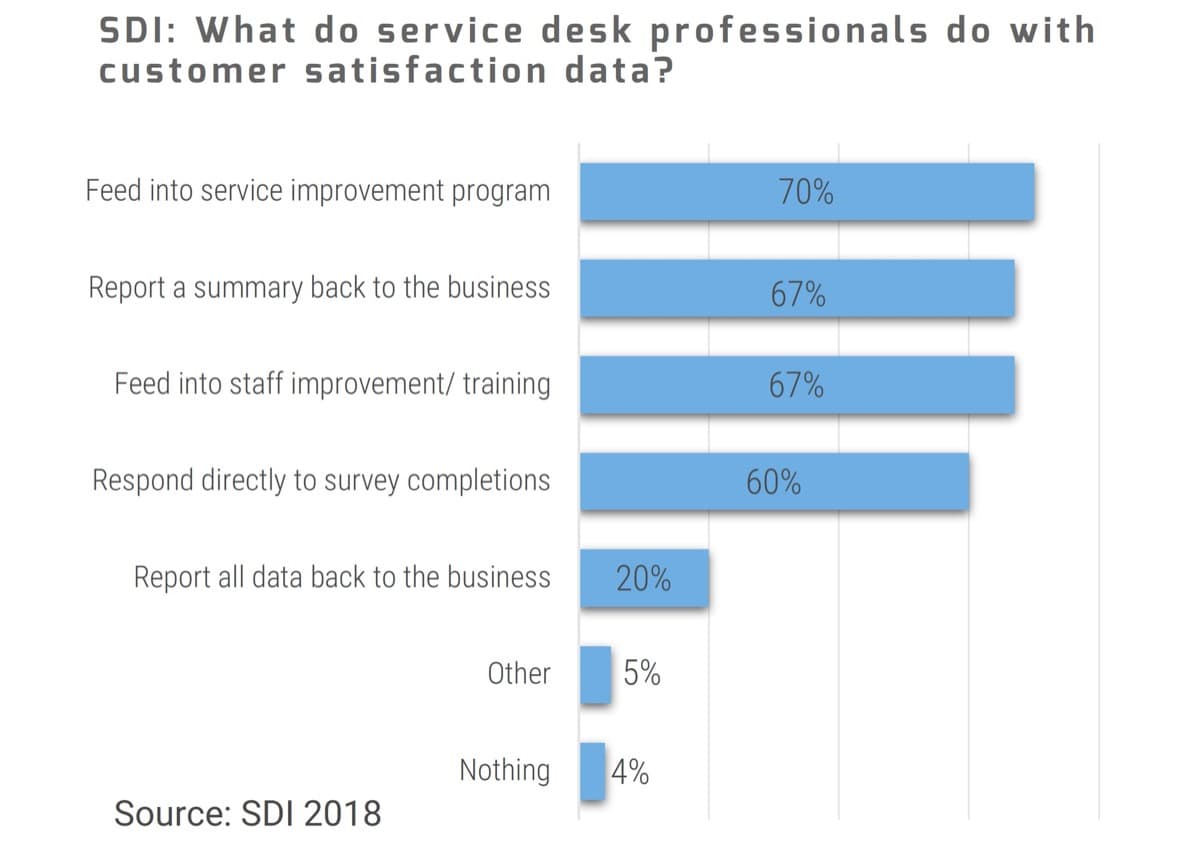
Determine how and how often to analyze feedback data
- Analyze and report scores from both transactional and relationship surveys to get a more holistic picture of satisfaction across the organization.
- Determine how you will calculate and present satisfaction ratings/scores, both overall and for individual questions. See tips on the right for calculating and presenting NPS and CSAT scores.
- A single satisfaction score doesn’t tell the full story; calculate satisfaction scores at multiple levels to determine where improvements are most needed.
- For example, satisfaction by service desk tier, team or location, by business department or location, by customer group, etc.
- Analyze survey data regularly to ensure you communicate and act on feedback promptly and avoid further alienating dissatisfied users. Transactional survey feedback should be reviewed at least weekly, but ideally in real time, as resources allow.
Calculating NPS Scores
Categorize respondents into 3 groups:
- 9-10 = Promoters, 7-8 = Neutral, 1-6 = Detractors
Calculate overall NPS score:
- % Promoters - % Detractors
Calculating CSAT Scores
- CSAT is usually presented as a percentage representing the average score.
- To calculate, take the total of all scores, divide by the maximum possible score, then multiply by 100. For example, a satisfaction rating of 80% means on average, users gave a rating of 4/5 or 8/10.
- Note that some organizations present CSAT as the percentage of “satisfied” users, with satisfied being defined as either “yes” on a two-point scale or a score of 4 or 5 on a 5-point scale. Be clear how you are defining your satisfaction rating.
Don’t neglect qualitative feedback
While it may be more difficult and time-consuming to analyze, the reward is also greater in terms of value derived from the data.
Why analyze qualitative data |
How to analyze qualitative data |
||||||
|---|---|---|---|---|---|---|---|
|
Methods range in sophistication; choose a technique depending on your tools available and goals of your program.
|
Define a process to respond to both negative and positive feedback
Successful customer satisfaction programs respond effectively to both positive and negative outcomes. Late or lack of responses to negative comments may increase customer frustration, while not responding at all to the positive comments may give the perception of indifference.
- Define what qualifies as a positive vs negative score
- Define process to respond to negative feedback
E.g. Scores of 1 to 2 out of 5 are negative, scores of 4 to 5 out of 5 are positive.
- Negative responses should go directly to the Service Desk Manager or whoever is accountable for feedback.
- Set an SLO for when the user will be contacted. It should be within 24h but ideally much sooner.
- Investigate the issue to understand exactly what happened and get to the root cause.
- Identify remediation steps to ensure the issue does not occur again.
- Communicate to the customer the action you have taken to improve.
- Positive responses should also be reviewed by the person accountable for feedback, but the timeline to respond may be longer.
- Show respondents that you value their time by thanking them for responding. Showing appreciate helps to build a long-term relationship with the user.
- Share positive results with the team to improve morale, and as a coaching/training mechanism.
- Consider how to use positive feedback as an incentive or reward.
Build a plan to communicate results to various stakeholders
Regular communication about your feedback results and action plan tied to those results is critical to the success of your feedback program. Build your communication plan around these questions:
1. Who should receive communication? |
Each audience will require different messaging, so start by identifying who those audiences are. At a minimum, you should communicate to your end users who provided feedback, your service desk/IT team, and business leaders or stakeholders. |
|---|---|
2. What information do they need? |
End users: Thank them for providing feedback. Demonstrate what you will do with that feedback. IT team: Share results and what you need them to do differently as a result. Business leaders: Share results, highlight successes, share action plan for improvement. |
3. Who is responsible for communication? |
Typically, this will be the person who is accountable for the customer feedback program, but you may have different people responsible for communicating to different audiences. |
4. When will you communicate? |
Frequency of communication will depend on the survey type – relationship or transactional – as well as the audience, with internal communication being much more frequent than end-user communication. |
5. How will you communicate? |
Again, cater your approach to the audience and choose a method that will resonate with them. End users may view an email, an update on the portal, a video, or update in a company meeting; your internal IT team can view results on a dashboard and have regular meetings. |
Communication to your users impacts both response rates and satisfaction
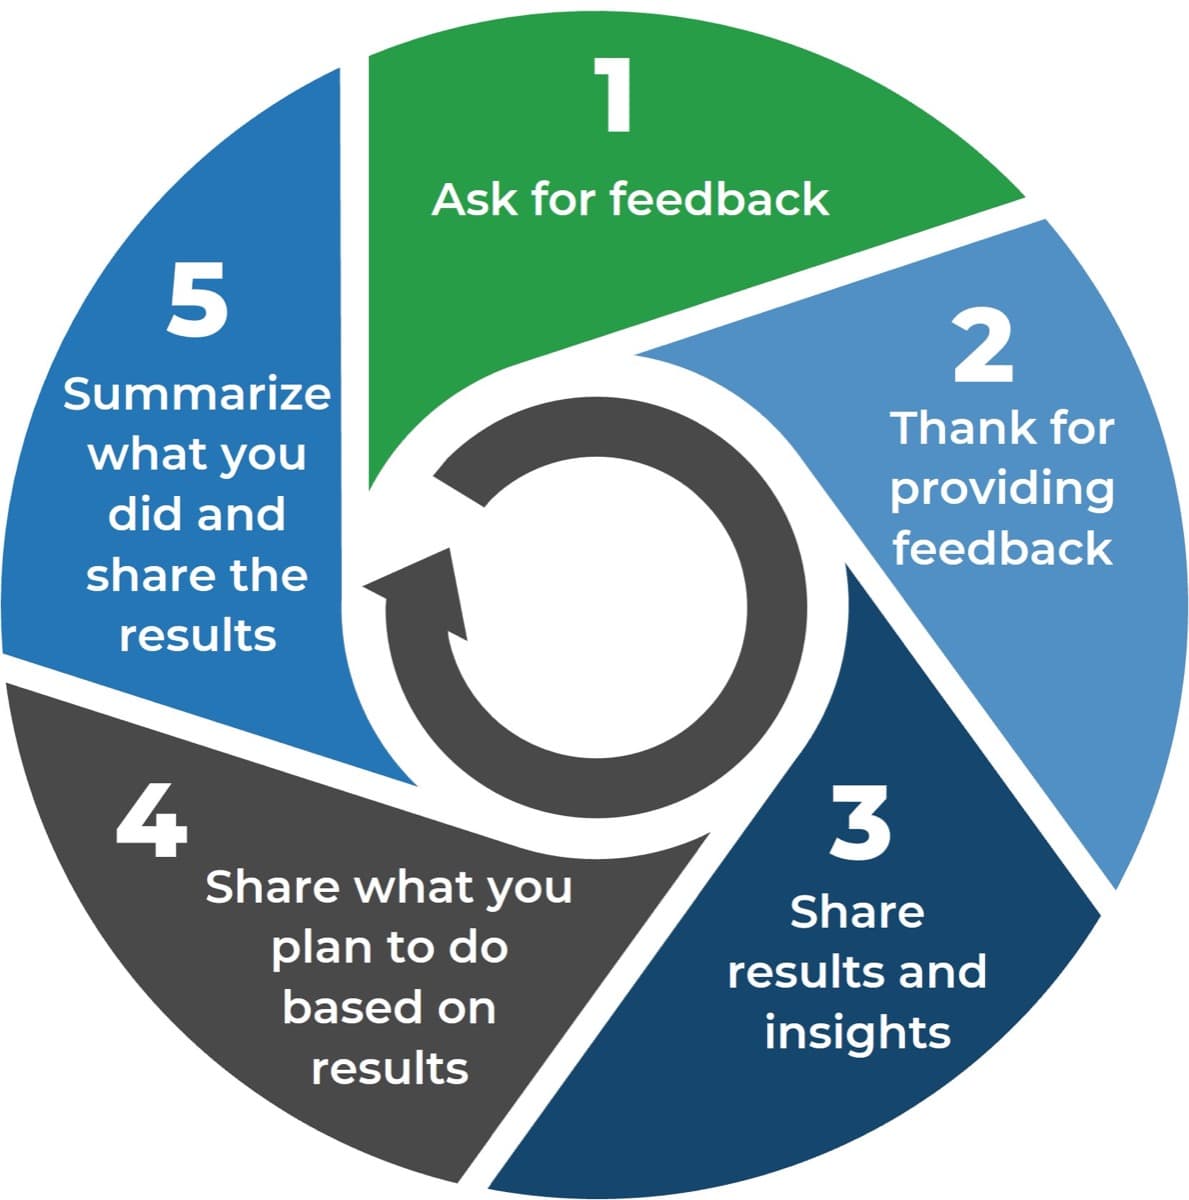
Based on the Customer Communication Cycle by David O’Reardon, 2018 |
|
|---|
Info-Tech Insight
Focus your communications to users around them, not you. Demonstrate that you need feedback to improve their experience, not just for you to collect data.
Translate feedback into actionable improvements
Taking action on feedback is arguably the most important step of the whole customer feedback program.
Prioritize improvements |
Prioritize improvements based on low scores and most commonly received feedback, then build into an action plan. |
|---|---|
Take immediate action on negative feedback |
Investigate the issue, diagnose the root cause, and repair both the relationship and issue – just like you would an incident. |
Apply lessons learned from positive feedback |
Don’t neglect actions you can take from positive feedback – identify how you can expand upon or leverage the things you’re doing well. |
Use feedback in coaching and training |
Share positive experiences with the team as lessons learned, and use negative feedback as an input to coaching and training. |
Make the change stick |
After making a change, train and communicate it to your team to ensure the change sticks and any negative experiences don’t happen again. |
“Without converting feedback into actions, surveys can become just a pointless exercise in number watching.”
– David O’Reardon, Founder & CEO of Silversix
Info-Tech Insight
Outline exactly what you plan to do to address customer feedback in an action plan, and regularly review that action plan to select and prioritize initiatives and monitor progress.
For more guidance on tracking and prioritizing ongoing improvement initiatives, see the blueprints Optimize the Service Desk with a Shift Left Strategy and Build a Continual Improvement Plan for the Service Desk.
Leverage Info-Tech resources to guide your improvement efforts
Map your identified improvements to the relevant resource that can help:
Improve service desk processes: |
Improve end-user self-service options: |
Assess and optimize service desk staffing: |
Improve ease of contacting the service desk: |
|---|---|---|---|
| Standardize the Service Desk | Optimize the Service Desk With a Shift-Left Strategy | Staff the Service Desk to Meet Demand | Improve Service Desk Ticket Intake |
Improve service desk processes: |
Improve end-user self-service options: |
Assess and optimize service desk staffing: |
Improve ease of contacting the service desk:: |
| Improve Incident and Problem Management | Improve Incident and Problem Management | Deliver a Customer Service Training Program to Your IT Department | Modernize and Transform Your End-User Computing Strategy |
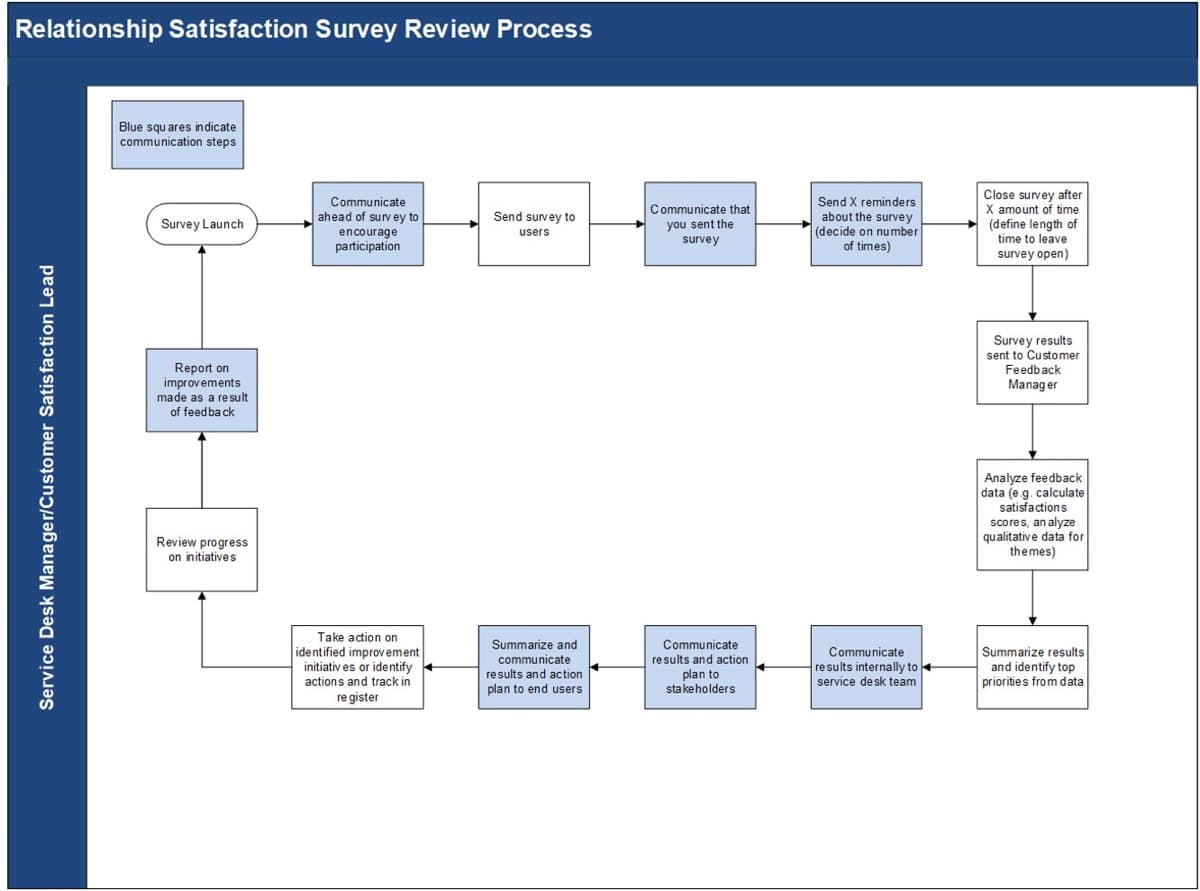
Map process for acting on relationship survey feedback
Use Info-Tech’s Relationship Satisfaction Survey Review Process workflow as a template to define your own process.
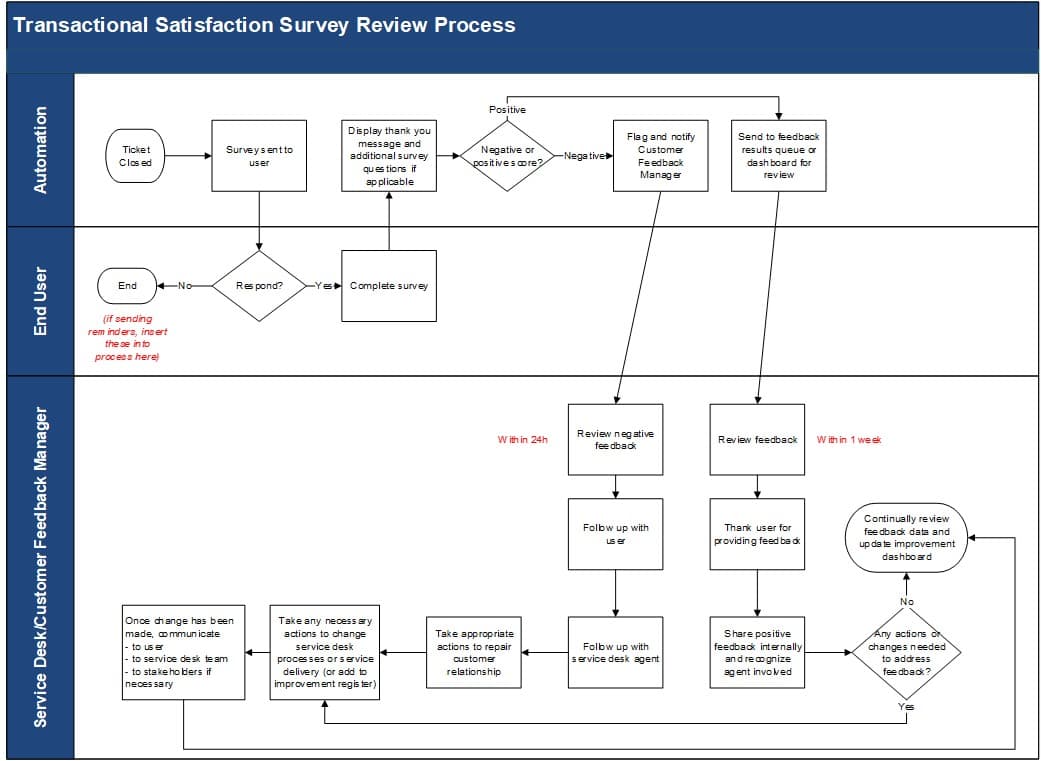
Map process for acting on transactional survey feedback
Use Info-Tech’s Transactional Satisfaction Survey Review Process workflow as a template to define your own process.
Related Info-Tech Research
This project will help you build and improve essential service desk processes, including incident management, request fulfillment, and knowledge management to create a sustainable service desk.
Optimize the Service Desk With a Shift-Left Strategy
This project will help you build a strategy to shift service support left to optimize your service desk operations and increase end-user satisfaction.
Build a Continual Improvement Plan
This project will help you build a continual improvement plan for the service desk to review key processes and services and manage the progress of improvement initiatives.
Deliver a Customer Service Training Program to Your IT Department
This project will help you deliver a targeted customer service training program to your IT team to enhance their customer service skills when dealing with end users, improve overall service delivery and increase customer satisfaction.
Sources Cited
Amaresan, Swetha. “The best time to send a survey, according to 5 studies.” Hubspot. 15 Jun 2021. Accessed October 2022.
Arlen, Chris. “The 5 Service Dimensions All Customers Care About.” Service Performance Inc. n.d. Accessed October 2022.
Clinton, William Jefferson. “Setting Customer Service Standards.” (1993). Federal Register, 58(176).
“Understanding Confidentiality and Anonymity.” The Evergreen State College. 2022. Accessed October 2022.
"Highlights of the 2017 U.S. PIAAC Results Web Report" (NCES 2020-777). U.S. Department of Education. Institute of Education Sciences, National Center for Education Statistics.
Joe the IT Guy. “Are IT Support’s Customer Satisfaction Surveys Their Own Worst Enemy?” Joe the IT Guy. 29 August 2018. Accessed October 2022.
O’Reardon, David. “10 Ways to Get the Most out of your ITSM Ticket Surveys.” LinkedIn. 2 July 2019. Accessed October 2022.
O'Reardon, David. "13 Ways to increase the response rate of your Service Desk surveys".LinkedIn. 8 June 2016. Accessed October 2022.
O’Reardon, David. “IT Customer Feedback Management – A Why & How Q&A with an Expert.” LinkedIn. 13 March 2018. Accessed October 2022.
Parasuraman, A., Zeithaml, V. A., & Berry, L. L. (1985). "A Conceptual Model of Service Quality and Its Implications for Future Research." Journal of Marketing, 49(4), 41–50.
Quantisoft. "How to Increase IT Help Desk Customer Satisfaction and IT Help Desk Performance.“ Quantisoft. n.d. Accessed November 2022.
Rumberg, Jeff. “Metric of the Month: Customer Effort.” HDI. 26 Mar 2020. Accessed September 2022.
Sauro, Jeff. “15 Common Rating Scales Explained.” MeasuringU. 15 August 2018. Accessed October 2022.
SDI. “Customer Experience in ITSM.” SDI. 2018. Accessed October 2022.
SDI. “CX: Delivering Happiness – The Series, Part 1.” SDI. 12 January 2021. Accessed October 2022.
Wronski, Laura. “Who responds to online surveys at each hour of the day?” SurveyMonkey. n.d. Accessed October 2022.
Research contributors
Sally Colwell
Project Officer
Government of Canada Pension Centre