
- Consolidate your metrics and assign context and actions to ones currently tracked.
- Establish tension metrics to see and tell the whole story.
- Split your metrics for each stakeholder group. Assign proper cadences for measurements as a first step to building an effective dashboard.
Our Advice
Critical Insight
- Identify the metrics that serve a real purpose and eliminate the rest. Establish a formal review process to ensure metrics are still valid, continue to provide the answers needed, and are at a manageable and usable level.
Impact and Result
- Tracking goal- and action-based metrics allows you to make meaningful, data-driven decisions for your service desk. You can establish internal benchmarks to set your own baselines.
- Predefining the audience and cadence of each metric allows you to construct targeted dashboards to aid your metrics analysis.
Define Service Desk Metrics That Matter Research & Tools
Besides the small introduction, subscribers and consulting clients within this management domain have access to:
1. Define Service Desk Metrics That Matter Storyboard – A deck that shows you how to look beyond benchmarks and rely on internal metrics to drive success.
Deciding which service desk metrics to track and how to analyze them can be daunting. Use this deck to narrow down your goal-oriented metrics as a starting point and set your own benchmarks.
- Define Service Desk Metrics That Matter Storyboard
2. Service Desk Metrics Workbook – A tool to organize your service desk metrics.
For each metric, consider adding the relevant overall goal, audience, cadence, and action. Use the audience and cadence of the metric to split your tracked metrics into various dashboards. Your final list of metrics and reports can be added to your service desk SOP.
- Service Desk Metrics Workbook
Further reading
Define Service Desk Metrics That Matter
Look beyond benchmarks and rely on internal metrics to drive success.
Analyst Perspective
Don’t get paralyzed by benchmarks when establishing metrics
When establishing a suite of metrics to track, it’s tempting to start with the metrics measured by other organizations. Naturally, benchmarking will enter the conversation. While benchmarking is useful, measuring you organization against others with a lack of context will only highlight your failures. Furthermore, benchmarks will highlight the norm or common practice. It does not necessarily highlight best practice.
Keeping the limitations of benchmarking in mind, establish your own metrics suite with action-based metrics. Define the audience, cadence, and actions for each metric you track and pair them with business goals. Measure only what you need to.
Slowly improve your metrics process over time and analyze your environment using your own data as your benchmark.
Benedict Chang
Research Analyst, Infrastructure & Operations
Info-Tech Research Group
Executive Summary
Your Challenge
- Measure the business value provided by the service desk.
- Consolidate your metrics and assign context and actions to ones currently tracked.
- Establish tension metrics to see and tell the whole story.
- Split your metrics for each stakeholder group. Assign proper cadences for measurements as a first step to building an effective dashboard or effective dashboards.
Common Obstacles
- Becoming too focused on benchmarks or unidimensional metrics (e.g. cost, first-contact resolution, time to resolve) can lead to misinterpretation of the data and poorly informed actions.
- Sifting through the many sources of data post hoc can lead to stalling in data analysis or slow reaction times to poor metrics.
- Dashboards can quickly become cluttered with uninformative metrics, thus reducing the signal-to-noise ratio of meaningful data.
Info-Tech's Approach
- Use metrics that drive productive change and improvement. Track only what you need to report on.
- Ensure each metric aligns with the desired business goal, is action-based, and includes the answers to what, why, how, and who.
- Establish internal benchmarks by analyzing the trends from your own data to set baselines.
- Act on the results of your metrics by adjusting targets and measuring success.
Info-Tech Insight
Identify the metrics that serve a real purpose and eliminate the rest. Establish a formal review process to ensure metrics are still valid, continue to provide the answers needed, and are at a manageable and usable level.
Improve your metrics to align IT with strategic business goals
The right metrics can tell the business how hard IT works and how well they perform.
- Only 19% of CXOs feel that their organization is effective at measuring the success of IT projects with their current metrics.
- Implementing the proper metrics can facilitate communication between the business division and IT practice.
- The proper metrics can help IT know what issues the business has and how the CEO and CIO should tackle them.
- If the goals above resonate with your organization, our blueprint Take Control of Infrastructure and Operations Metrics will take you through the right steps.
Current Metrics Suite
19% Effective
36% Some Improvement Necessary
45% Significant Improvement Necessary
Source: Info-Tech Research Group’s CEO/CIO Alignment Diagnostic, 2019; N=622
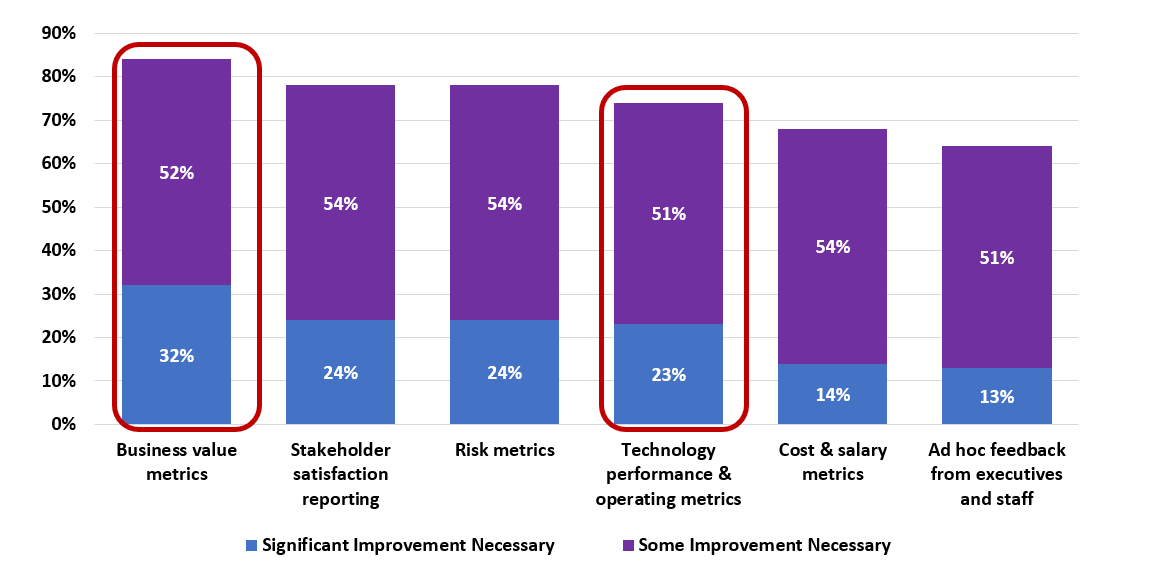
CXOs stress that value is the most critical area for IT to improve in reporting
- You most likely have to improve your metrics suite by addressing business value.
- Over 80% of organizations say they need improvement to their business value metrics, with 32% of organizations reporting that significant improvement is needed.
- Of course, measuring metrics for service desk operations is important, but don’t forget business-oriented metrics such as measuring knowledgebase articles written for shift-left enablement, cost (time and money) of service desk tickets, and overall end-user satisfaction.
Source: Info-Tech Research Group’s CEO/CIO Alignment Diagnostic, 2019; N=622
Benchmarking used in isolation will not tell the whole story
Benchmarks can be used as a step in the metrics process
They can be the first step to reach an end goal, but if benchmarks are observed in isolation, it will only highlight your failures.
Benchmarking relies on standardized models
This does not account for all the unique variables that make up an IT organization.
For example, benchmarks that include cost and revenue may include organizations that prioritize first-call resolution (FCR), but the variables that make up this benchmark model will be quite different within your own organization.
Info-Tech Insight
Benchmarks reflect the norm and common practice, not best practice.
Benchmarks are open to interpretation
Taking the time to establish proper metrics is often more valuable time spent than going down the benchmark rabbit hole.
Being above or below the norm is neither a good nor a bad thing.
Determining what the results mean for you depends on what’s being measured and the unique factors, characteristics, and priorities in your organization.
If benchmark data is a priority within your IT organization, you may look up organizations like MetricNet, but keep the following in mind:
Review the collected benchmark data
See where IT organizations in your industry typically stand in relation to the overall benchmark.
Assess the gaps
Large gaps between yourself and the overall benchmark could indicate areas for improvement or celebration. Use the data to focus your analysis, develop deeper self-awareness, and prioritize areas for potential concern.
Benchmarks are only guidelines
The benchmark source data may not come from true peers in every sense. Each organization is different, so always explore your unique context when interpreting any findings.
Rely on internal metrics to measure and improve performance
Measure internal metrics over time to define goals and drive real improvement
- Internally measured metrics are more reliable because they provide information about your actual performance over time. This allows for targeted improvements and objective measurements of your milestones.
- Whether a given metric is the right one for your service desk will depend on several different factors, including:
- The maturity and capability of your service desk processes
- The volume of service requests and incidents
- The complexity of your environment when resolving tickets
- The degree to which your end users are comfortable with self-service
Take Info-Tech’s approach to metrics management
Use metrics that drive productive change and improvement. Track only what you need to report on.
Ensure each metric aligns with the desired business goal, is action-based, and includes the answers to what, why, how, and who.
Establish internal benchmarks by analyzing the trends from your own data to set baselines.
Act on the results of your metrics by adjusting targets and measuring success.
Define action-based metrics to cut down on analysis paralysis
Every metric needs to be backed with the following criteria:
- Defining audience, cadence, goal, and action for each metric allows you to keep your tracked metrics to a minimum while maximizing the value.
- The audience and cadence of each metric may allow you to define targeted dashboards.
Audience - Who is this metric tracked for?
Goal - Why are you tracking this metric? This can be defined along with the CSFs and KPIs.
Cadence - How often are you going to view, analyze, and action this metric?
Action - What will you do if this metric spikes, dips, trends up, or trends down?
Activity 1. Define your critical success factors and key performance indicators
Critical success factors (CSFs) are high-level goals that help you define the direction of your service desk. Key performance indicators (KPIs) can be treated as the trend of metrics that will indicate that you are moving in the direction of your CSFs. These will help narrow the data you have to track and action (metrics).
CSFs, or your overall goals, typically revolve around three aspects of the service desk: time spent on tickets, resources spent on tickets, and the quality of service provided.
- As a group, brainstorm the CSFs and the KPIs that will help narrow your metrics. Use the Service Desk Metrics Workbook to record the results.
- Look at the example to the right as a starting point.
Example metrics:
| Critical success factor | Key performance indicator |
|---|---|
| High End-User Satisfaction | Increasing CSAT score on transactional surveys |
| High end-user satisfaction score | |
| Proper resolution of tickets | |
| Low time to resolve | |
| Low Cost per Ticket | Decreasing cost per ticket (due to efficient resolution, FCR, automation, self-service, etc.) |
| Improve Access to Self-Service (tangential to improve customer service) | High utilization of knowledgebase |
| High utilization of portal |
Download the Service Desk Metrics Workbook
Activity 2. Define action-based metrics that align with your KPIs and CSFs
- Now that you have defined your goals, continue to fill the workbook by choosing metrics that align with those goals.
- Use the chart below as a guide. For every metric, define the cadence of measurement, audience of the metric, and action associated with the metric. There may be multiple metrics for each KPI.
- If you find you are unable to define the cadence, audience, or action associated with a metric, you may not need to track the metric in the first place. Alternatively, if you find that you may action a metric in the future, you can decide to start gathering data now.
Example metrics:
| Critical success factor | Key performance indicator | Metric | Cadence | Audience | Action |
|---|---|---|---|---|---|
| High End-User Satisfaction | Increasing CSAT score on transactional surveys | Monthly average of ticket satisfaction scores | Monthly | Management | Action low scores immediately, view long-term trends |
| High end-user satisfaction score | Average end-user satisfaction score from annual survey | Annually | IT Leadership | View IT satisfaction trends to align IT with business direction | |
| Proper resolution of tickets | Number of tickets reopened | Weekly | Service Desk Technicians | Action reopened tickets, look for training opportunities | |
| SLA breach rate | Daily | Service Desk Technicians | Action reopened tickets, look for training opportunities | ||
| Low time to resolve | Average TTR (incidents) | Weekly | Management | Look for trends to monitor resources | |
| Average TTR by priority | Weekly | Management | Look for TTR solve rates to align with SLA | ||
| Average TTR by tier | Weekly | Management | Look for improperly escalated tickets or shift-left opportunities |
Download the Service Desk Metrics Workbook
Activity 3. Define the data ownership, metric viability, and dashboards
- For each metric, define where the data is housed. Ideally, the data is directly in the ticketing tool or ITSM tool. This will make it easy to pull and analyze.
- Determine how difficult the metric will be to pull or track. If the effort is high, decide if the value of tracking the metric is worth the hassle of gathering it.
- Lastly, for each metric, use the cadence and audience to place the metric in a reporting dashboard. This will help divide your metrics and make them easier to report and action.
- You may use the output of this exercise to add your tracked metrics to your service desk SOP.
- A full suite of metrics can be found in our Infrastructure & Operations Metrics Library in the Take Control of Infrastructure Metrics Storyboard. The metrics have been categorized by low, medium, and advanced capabilities for you.
Example metrics:
| Metric | Who Owns the Data? | Efforts to Track? | Dashboards |
|---|---|---|---|
| Monthly average of ticket satisfaction scores | Service Desk | Low | Monthly Management Meeting |
| Average end-user satisfaction score | Service Desk | Low | Leadership Meeting |
| Number of tickets reopened | Service Desk | Low | Weekly Technician Standup |
| SLA breach rate | Service Desk | Low | Daily Technician Standup |
| Average TTR (incidents) | Service Desk | Low | Weekly Technician Standup |
| Average TTR by priority | Service Desk | Low | Weekly Technician Standup |
| Average TTR by tier | Service Desk | Low | Weekly Technician Standup |
| Average TTR (SRs) | Service Desk | Low | Weekly Technician Standup |
| Number of tickets reopened | Service Desk | Low | Daily Technician Standup |
Download the Service Desk Metrics Workbook
Keep the following considerations in mind when defining which metrics matter
Keep the customer in mind
Metrics are typically focused on transactional efficiency and process effectiveness and not what was achieved against the customers’ need and satisfaction.
Understand the relationships between performance and metrics management to provide the end-to-end service delivery picture you are aiming to achieve.
Don’t settle for tool defaults
ITSM solutions offer an abundance of metrics to choose from. The most common ones are typically built into the reporting modules of the tool suite.
Do not start tracking everything. Choose metrics that are specifically aligned to your organization’s desired business outcomes.
Establish tension metrics to achieve balance
Don’t ignore the correlation and context between the suites of metrics chosen and how one interacts and affects the other.
Measuring metrics in isolation may lead to an incomplete picture or undesired technician behavior. Tension metrics help complete the picture and lead to proper actions.
Adjust those targets
An arbitrary target on a metric that is consistently met month over month is useless. Each metric should inform the overall performance by combining capable service level management and customer experience programs to prove the value IT is providing to the organization.
Related Info-Tech Research
This project will help you build and improve essential service desk processes, including incident management, request fulfillment, and knowledge management, to create a sustainable service desk.
Take Control of Infrastructure and Operations Metrics
Make faster decisions and improve service delivery by using the right metrics for the job.
Analyze Your Service Desk Ticket Data
Take a data-driven approach to service desk optimization.
IT Diagnostics: Build a Data-Driven IT Strategy
Our data-driven programs ask business and IT stakeholders the right questions to ensure you have the inputs necessary to build an effective IT strategy.