
- Your team’s time is burned up by incident response.
- Manual repetitive work uses up expensive resources.
- You don’t have the visibility to ensure the availability the business demands.
Our Advice
Critical Insight
- Sell the project to the business.
- Leverage the Operations Center to improve IT Operations.
Impact and Result
- Clarify lines of accountability and metrics for success.
- Implement targeted initiatives and track key metrics for continual improvement.
Optimize the IT Operations Center Research & Tools
Start here – read the Executive Brief
Read our concise Executive Brief to find out why you should Optimize the IT Operations Center, review Info-Tech’s methodology, and understand the four ways we can support you in completing this project.Besides the small introduction, subscribers and consulting clients within this management domain have access to:
- Optimize the IT Operations Center – Phases 1-4
1. Lightning Phase: Pluck Low-Hanging Fruit for Quick Wins
Get quick wins to demonstrate early value for investments in IT Operations.
- Optimize the IT Operations Center – Lightning Phase: Pluck Low-Hanging Fruit for Quick Wins
2. Get buy-in
Get buy-in from business stakeholders by speaking their language.
- Optimize the IT Operations Center – Phase 1: Get Buy-In
- IT Operations Center Prerequisites Assessment Tool
- IT Operations Center Stakeholder Buy-In Presentation
- IT Operations Center Continual Improvement Tracker
3. Define accountability and metrics
Formalize process and task accountability and develop targeted metrics.
- Optimize the IT Operations Center – Phase 2: Define Accountability and Metrics
- IT Operations Center RACI Charts Template
4. Assess gaps and prioritize initiatives
Identify pain points and determine the top solutions.
- Optimize the IT Operations Center – Phase 3: Assess Gaps and Prioritize Initiatives
- IT Operations Center Gap and Initiative Tracker
- IT Operations Center Initiative Prioritization Tool
5. Launch initiatives and track metrics
Lay the foundation for implementation and continual improvement.
- Optimize the IT Operations Center – Phase 4: Launch Initiatives and Track Metrics
Workshop: Optimize the IT Operations Center
Workshops offer an easy way to accelerate your project. If you are unable to do the project yourself, and a Guided Implementation isn't enough, we offer low-cost delivery of our project workshops. We take you through every phase of your project and ensure that you have a roadmap in place to complete your project successfully.
1 Check Foundation
The Purpose
Ensure base maturity in IT Operations processes.
Key Benefits Achieved
Verify that foundation is in place to proceed with Operations Center project.
Activities
1.1 Evaluate base maturity.
Outputs
IT Operations Center Prerequisites Assessment Tool
2 Define Accountabilities
The Purpose
Define accountabilities for Operations processes and tasks.
Key Benefits Achieved
Documented accountabilities.
Activities
2.1 Pluck low-hanging fruit for quick wins.
2.2 Complete process RACI.
2.3 Complete task RACI.
Outputs
Project plan
Process RACI
Task RACI
3 Map the Challenge
The Purpose
Define metrics and identify accountabilities and gaps.
Key Benefits Achieved
List of initiatives to address pain points.
Activities
3.1 Define metrics.
3.2 Define accountabilities.
3.3 Identify gaps.
Outputs
IT Operations Center Gap and Initiative Tracker
4 Build Action Plan
The Purpose
Develop an action plan to boost KPIs.
Key Benefits Achieved
Action plan and success criteria.
Activities
4.1 Prioritize initiatives.
Outputs
IT Operations Center Initiative Prioritization Tool
5 Map Out Implementation
The Purpose
Build an implementation plan for continual improvement.
Key Benefits Achieved
Continual improvement against identified metrics and KPIs.
Activities
5.1 Build implementation plan.
Outputs
IT Operations Center Continual Improvement Tracker
Further reading
Optimize the IT Operations Center
Stop burning budget on non-value-adding activities.
ANALYST PERSPECTIVE
The Network Operations Center is not in Kansas anymore.
"The old-school Network Operations Center of the telecom world was heavily peopled and reactionary.
Now, the IT Operations Center is about more than network monitoring. An effective Operations Center provides visibility across the entire stack, generates actionable alerts, resolves a host of different incidents, and drives continual improvement in the delivery of high-quality services.
IT’s traditional siloed approach cannot provide the value the business demands. The modern Operations Center breaks down these silos for the end-to-end view required for a service-focused approach."
Derek Shank,
Research Analyst, Infrastructure & Operations
Info-Tech Research Group
Our understanding of the problem
This Research Is Designed For:
- IT Operations Managers
- IT Infrastructure Managers
- CIOs
This Research Will Help You:
- Improve reliability of services.
- Reduce the cost of incident response.
- Reduce the cost of manual repetitive work (MRW).
This Research Will Also Assist
- Business Analysts
- Project Managers
- Business Relationship Managers
This Research Will Help Them
- Develop appropriate non-functional requirements.
- Integrate non-functional requirements into solution design and project implementation.
Executive Summary
Situation
- Your team’s time is burned up by incident response.
- MRW burns up expensive resources.
- You don’t have the visibility to ensure the availability the business demands.
Complication
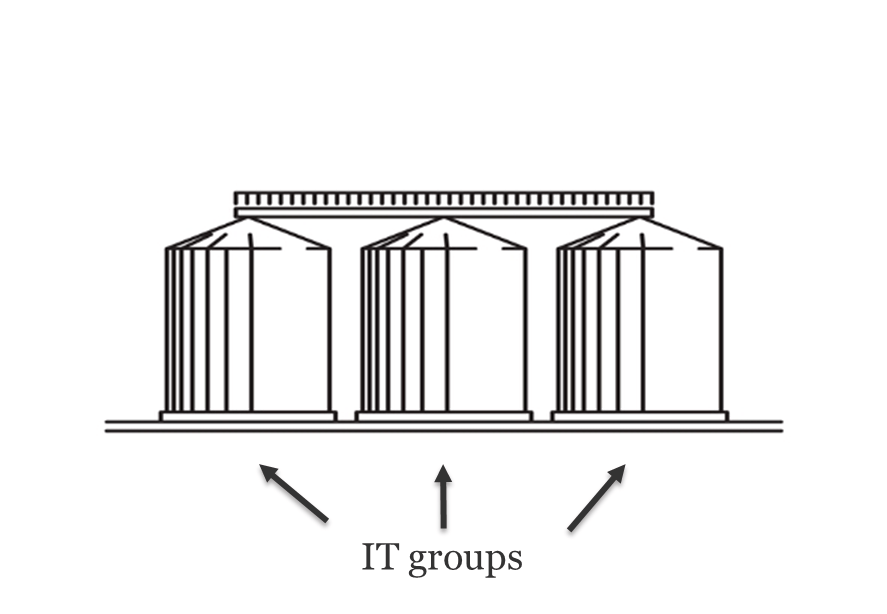
- The increasing complexity of technology has resulted in siloed teams of specialists.
- The business views IT Operations as a cost center and doesn’t want to provide resources to support improvement initiatives.
Resolution
- Pluck low-hanging fruit for quick wins.
- Obtain buy-in from business stakeholders by speaking their language.
- Clarify lines of accountability and metrics for success.
- Implement targeted initiatives and track key metrics for continual improvement.
Info-Tech Insight
- Sell the project to the business. Your first job is a sales job because executive sponsorship is key to project success.
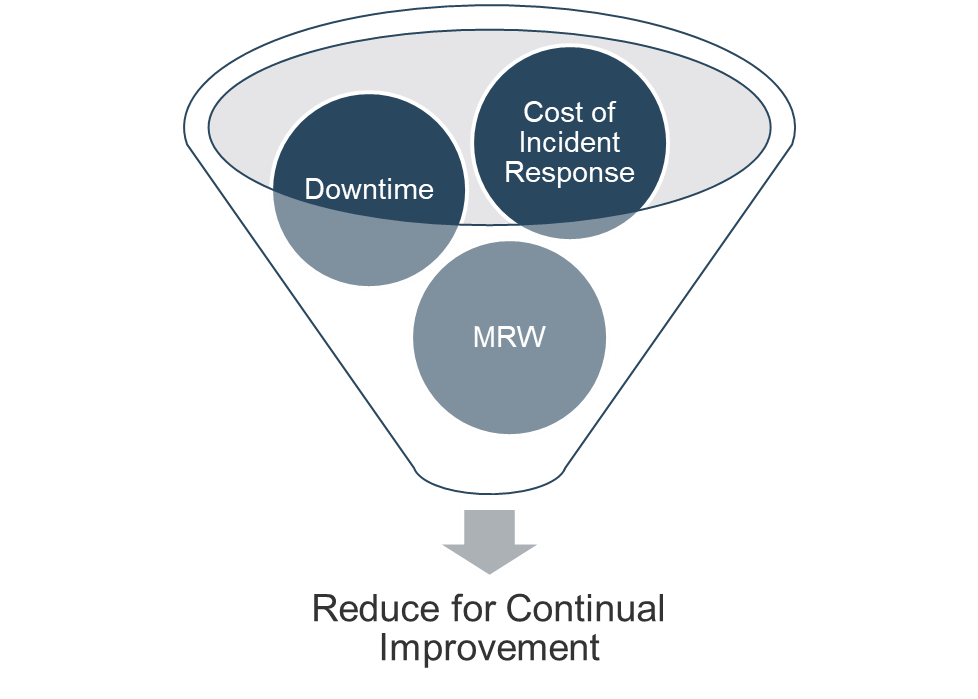
- Worship the holy trinity of metrics: impact of downtime, cost of incident response, and time spent on manual repetitive work (MRW).
- Invest in order to profit. Improving the Operations Center takes time and money. Expect short-term pain to realize long-term gain.
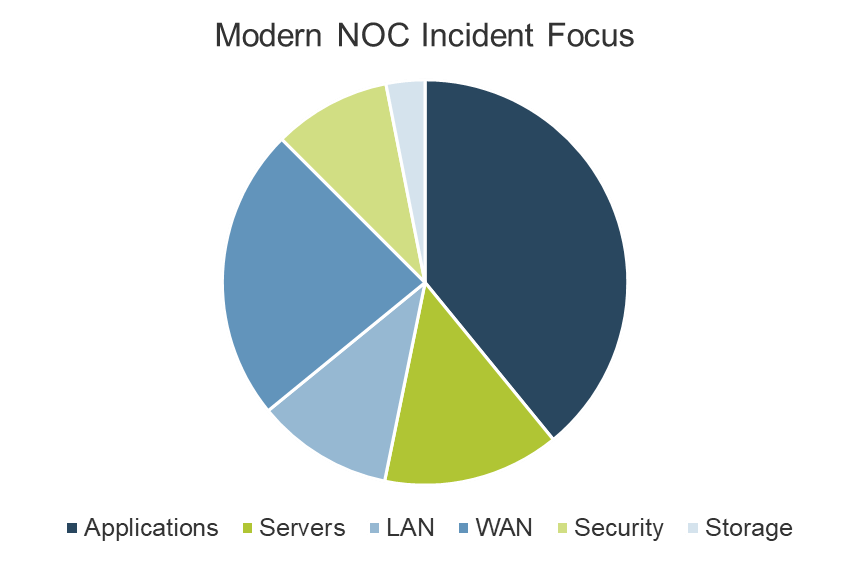
The role of the Network Operations Center has changed
- The old approach was technology siloed and the Network Operations Center (NOC) only cared about the network.
- The modern Operations Center is about ensuring high availability of end-user services, and requires cross-functional expertise and visibility across all the layers of the technology stack.
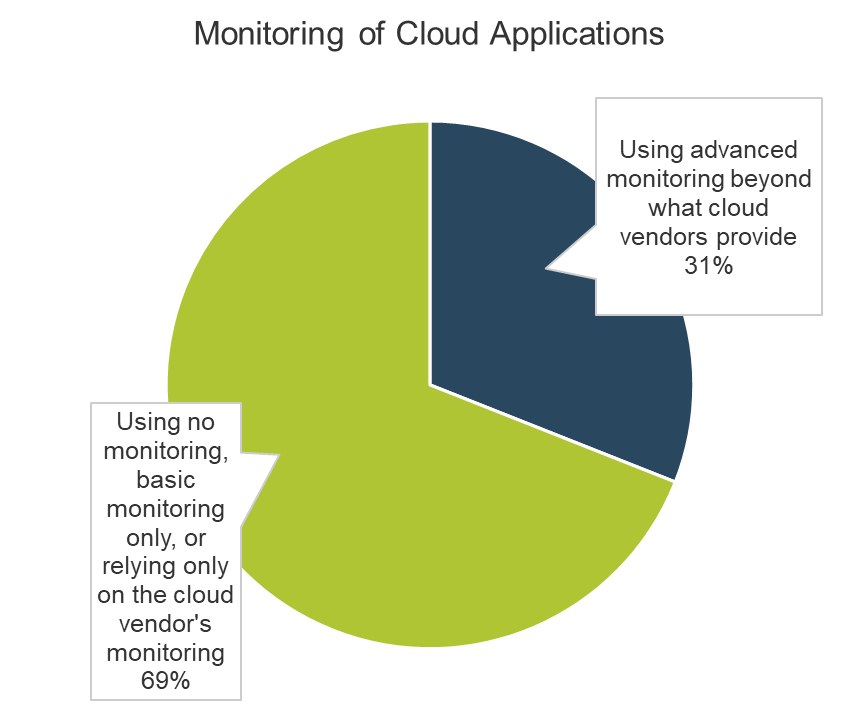
Most organizations lack adequate visibility
- The rise of hybrid cloud has made environments more complex, not less.
- The increasing complexity makes monitoring and incident response more difficult than ever.
- Only 31% of organizations use advanced monitoring beyond what is offered by cloud providers.
- 69% perform no monitoring, basic monitoring, or rely entirely on the cloud provider’s monitoring tools.
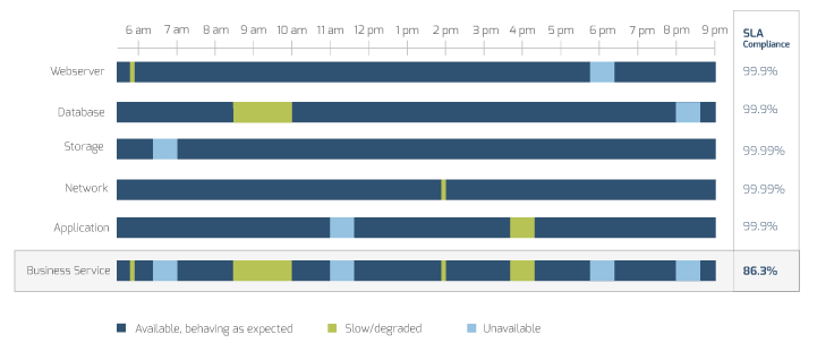
Siloed service level agreements cannot ensure availability
You can meet high service level agreements (SLAs) for functional silos, but still miss the mark for service availability. The business just wants things to work!
The cost of downtime is massive
Increasing reliance on IT makes downtime hurt more than ever.
98% of enterprises lose $100,000+.
81% of enterprises lose $300,000+ per hour of downtime.
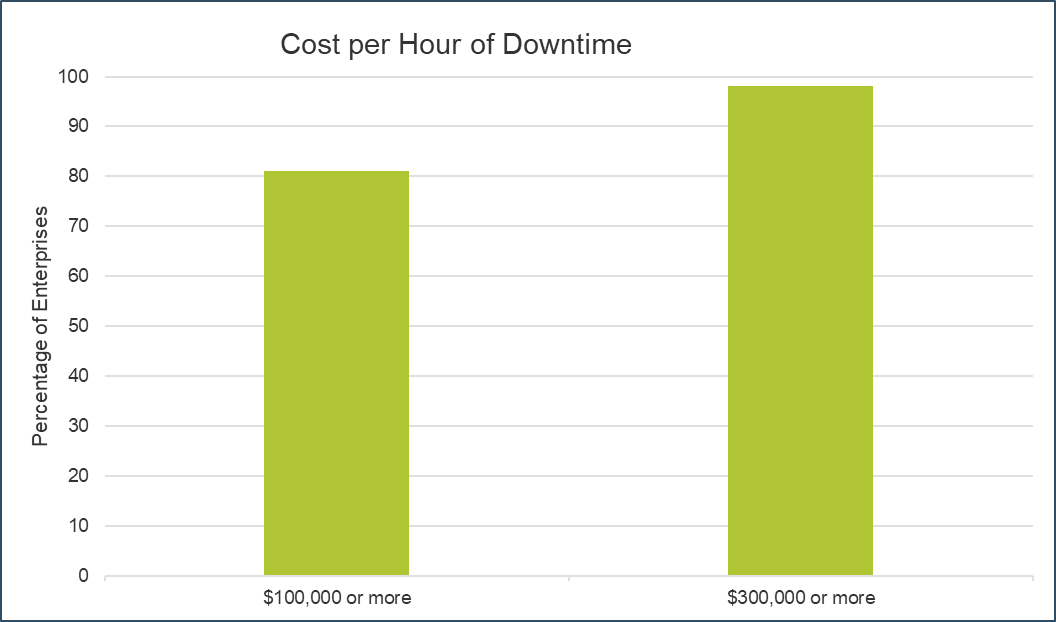
Source: ITIC, 2016
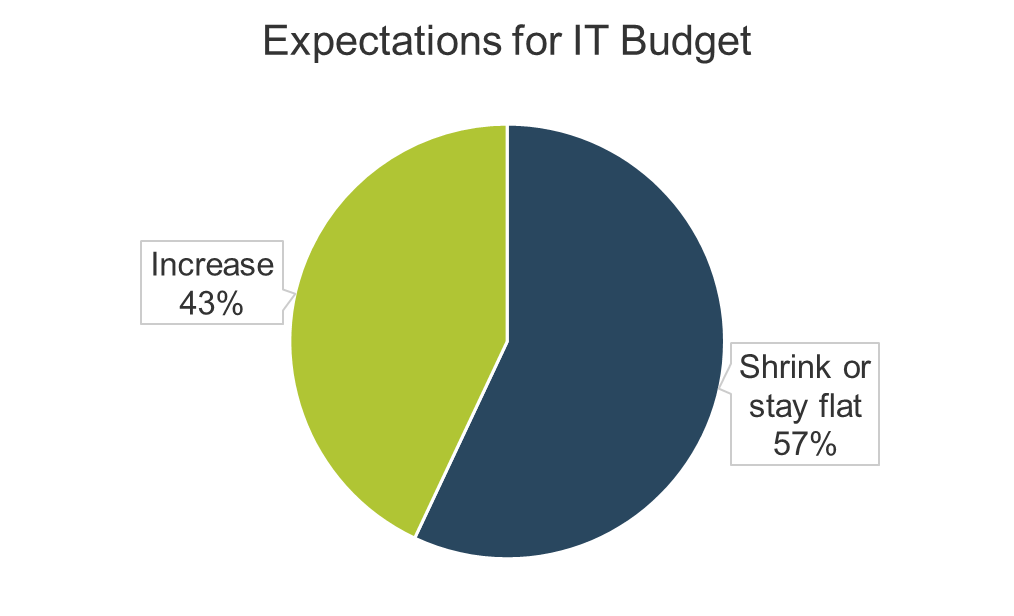
IT is asked to do more with less
Most IT budgets are staying flat or shrinking.
57% of IT departments expect their budget to stay flat or to shrink from 2018 to 2019.
Unify and streamline IT Operations
A well-run Operations Center ensures high availability at reasonable cost. Improving your Operations Center results in:
- Higher availability
- Increased reliability
- Improved project capacity
- Higher business satisfaction
Measure success with the holy trinity of metrics
Focus on reducing downtime, cost of incident response, and MRW.
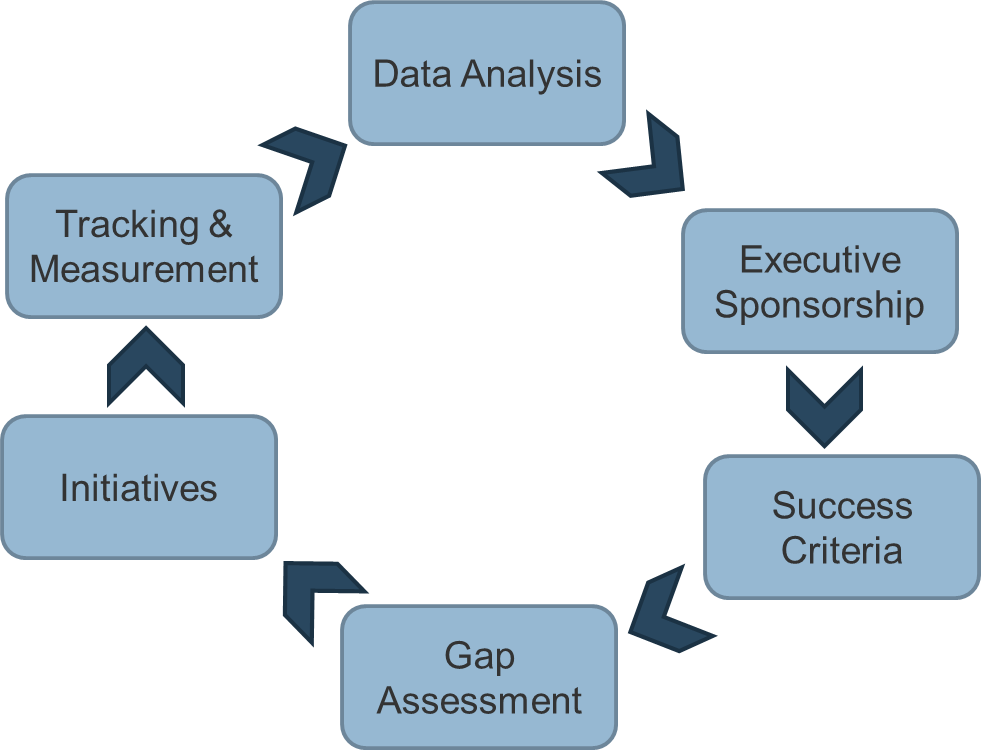
Start from the top and employ a targeted approach
Analyze data to get buy-in from stakeholders, and use our tools and templates to follow the process for continual improvement in IT Operations.
Info-Tech offers various levels of support to best suit your needs
DIY Toolkit
"Our team has already made this critical project a priority, and we have the time and capability, but some guidance along the way would be helpful.”
Guided Implementation
“Our team knows that we need to fix a process, but we need assistance to determine where to focus. Some check-ins along the way would help keep us on track."
Workshop
"We need to hit the ground running and get this project kicked off immediately. Our team has the ability to take this over once we get a framework and strategy in place."
Consulting
"Our team does not have the time or the knowledge to take this project on. We need assistance through the entirety of this project."
Diagnostics and consistent frameworks used throughout all four options
Optimize the IT Operations Center – project overview
|
Launch the Project |
Identify Enterprise Services |
Identify Line of Business Services |
Complete Service Definitions |
|
|---|---|---|---|---|
| Best-Practice Toolkit |
🗲 Pluck Low-Hanging Fruit for Quick Wins 1.1 Ensure Base Maturity Is in Place 1.2 Make the Case |
2.1 Define Accountabilities 2.2 Define Metrics |
3.1 Assess Gaps 3.2 Plan Initiatives |
4.1 Lay Foundation 4.2 Launch and Measure |
| Guided Implementations |
Discuss current state. Review stakeholder presentation. |
Review RACIs. Review metrics. |
Discuss gaps. Discuss initiatives. |
Review plan and metric schedule. |
| Onsite Workshop | Module 1:
Clear understanding of project objectives and support obtained from the business. |
Module 2:
Enterprise services defined and categorized. |
Module 3:
LOB services defined based on user perspective. |
Module 4:
Service record designed according to how IT wishes to communicate to the business. |
| Phase 1 Results: Stakeholder presentation |
Phase 2 Results:
|
Phase 3 Results:
|
Phase 4 Results:
|
Workshop overview
Contact your account representative or email Workshops@InfoTech.com for more information.
| Pre-Workshop | Workshop Day 1 | Workshop Day 2 | Workshop Day 3 | Workshop Day 4 | |
|---|---|---|---|---|---|
| Activities |
Check Foundation |
Define Accountabilities |
Map the Challenge |
Build Action Plan |
Map Out Implementation |
|
1.1 Ensure base maturity. |
🗲 Pluck low-hanging fruit for quick wins. 2.1 Complete process RACI. 2.2 Complete task RACI. |
3.1 Define metrics. 3.2 Define accountabilities. 3.2 Identify gaps. |
4.1 Prioritize initiatives. |
5.1 Build implementation plan. |
|
| Deliverables |
|
|
|
|
|
PHASE 🗲
Pluck Low-Hanging Fruit for Quick Wins
Optimize the IT Operations Center
Conduct a ticket-trend analysis
Generate reports on tickets from your IT service management (ITSM) tool. Look for areas that consume the most resources, such as:
- Recurring tickets.
- Tickets that have taken a long time to resolve.
- Tickets that could have been resolved at a lower tier.
- Tickets that were unnecessarily or improperly escalated.
Identify issues
Analyze the tickets:
- Look for recurring tickets that may indicate underlying problems.
- Ask tier 2 and 3 technicians to flag tickets that could have been resolved at a lower tier.
- Identify painful and/or time consuming service requests.
- Flag any manual repetitive work.
Write the issues on a whiteboard.
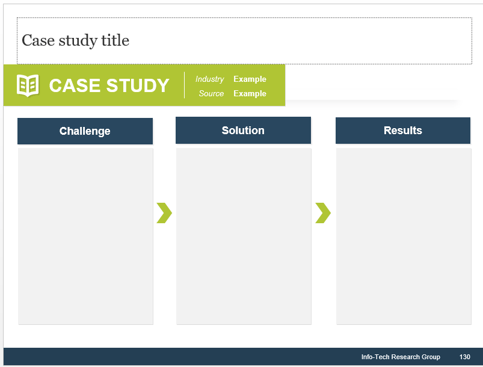
Oil & Gas IT reduces manual repetitive maintenance work
CASE STUDY
Industry Oil & Gas
Source Interview
Challenge
The company used a webserver to collect data from field stations for analytics. The server’s version did not clear its cache – it filled up its own memory and would not overwrite, so it would just lock up and have to be rebooted manually.
Solution
The team found out that the volumes and units of data would cause the memory to fill at a certain time of the month. They wrote a script to reboot the machine and set up a planned outage during the appropriate weekend each month.
Results
The team never had to do manual reboots again – though they did have to tweak their reboot script not to rely on their calendar, after a shift in production broke the pattern between memory consumption and the calendar.
Rank the issues
🗲.1.1 10 minutes
- Assign each participant five sticky dots to use for voting.
- Have each participant place any number of dots beside the issue(s) of their choice.
- Count the dots and rank the top three most important issues.
INPUT
- List of issues
OUTPUT
- Top three issues
Materials
- Whiteboard
- Markers
- Sticky dots
Participants
- Operations Manager
- Infrastructure Manager
- I&O team members
Brainstorm solutions
🗲.1.2 10 minutes
- Write the three issues at the top of a whiteboard, each at the head of its own column.
- Focusing on one issue at a time, brainstorm potential solutions for each issue. Have one person write all the proposed solutions on the board beneath the issue.
Info-Tech Best Practice
Do not censor or evaluate the proposed solutions at this time. During brainstorming, focus on coming up with as many potential solutions as possible, no matter how infeasible or outlandish.
INPUT
- Top three issues
OUTPUT
- Potential solutions
Materials
- Whiteboard
- Markers
Participants
- Operations Manager
- Infrastructure Manager
- I&O team members
Evaluate and rank potential solutions
🗲.1.3 30 minutes
- Score the solutions from 1-5 on each of the two dimensions:
- Attainability
- Probable efficacy
Info-Tech Insight
Quick wins are the best of both worlds. To get a quick win, pick a solution that is both readily attainable and likely to have high impact.
INPUT
- Potential solutions
OUTPUT
- Ranked list of solutions
Materials
- Whiteboard
- Markers
Participants
- Operations Manager
- Infrastructure Manager
- I&O team members
Develop metrics to measure the effectiveness of solutions
You should now have a top potential solution for each pain point.
For each pain point and proposed solution, identify the metric that would indicate whether the solution had been effective or not. For example:
- Pain point: Too many unnecessary escalations for SharePoint issues.
- Solution: Train tier 1 staff to resolve SharePoint tickets.
- Metric: % of SharePoint tickets resolved at tier 1.
Design solutions
- Some solutions explain themselves. E.g., hire an extra service desk person.
- Others require more planning and design, as they involve a bespoke solution. E.g., improve asset management process or automate onboarding of new users.
- For the solutions that require planning, take the time to design each solution fully before rushing to implement it.
Build solutions
- Build any of the solutions that require building. For example, any scripting for automations requires the writing of those scripts, and any automated ticket routing requires configuration of your ITSM tool.
- Part of the build phase for many solutions should also involve designing the tests of those solutions.
Test solutions – refine and iterate
- Think about the expected outcome and results of the solutions that require testing.
- Test each solution under production-like circumstances to see if the results and behavior are as expected.
- Refine and iterate upon the solutions as necessary, and test again.
Implement solutions and measure results
- Before implementing each solution, take a baseline measurement of the metric that will measure success.
- Implement the solutions using your change management process.
- After implementation, measure the success of the solution using the appropriate metric.
- Document the results and judge whether the solution has been effective.
Use the top result as a case study to obtain buy-in
Your most effective solution will make a great case study.
Write up the results and input the case study into the IT Operations Center Stakeholder Buy-In Presentation.
If you want additional support, have our analysts guide you through this phase as part of an Info-Tech workshop
Book a workshop with our Info-Tech analysts

- To accelerate this project, engage your IT team in an Info-Tech workshop with an Info-Tech analyst team.
- Info-Tech analysts will join you and your team onsite at your location or welcome you to Info-Tech’s historic Toronto office to participate in an innovative onsite workshop.
- Contact your account manager (www.infotech.com/account), or email Workshops@InfoTech.com for more information.
| The following are sample activities that will be conducted by Info-Tech analysts with your team: | ||
|---|---|---|
| 🗲.1.2 | 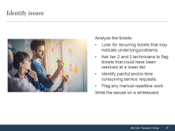
|
Identify issues Look for areas that aren’t working optimally. |
| 🗲.1.3 | |
Evaluate and rank potential solutions Sort the wheat from the chaff and plan for quick wins. |
PHASE 1
Get Buy-In
Optimize the IT Operations Center
Step 1.1: Ensure Base Maturity Is in Place
This step will walk you through the following activities:
- Assess maturity of base IT Operations processes.
Outcomes of this step
- Completed IT Operations Center Prerequisites Assessment Tool
Base processes underpin the Operations Center
- Before you optimize your Operations Center, you should have foundational ITSM processes in place: service desk, and incident, problem, and change management.
- Attempting to optimize Operations before it rests on a solid foundation can only lead to frustration.
IT Operations Center
- Service Desk
- Incident Management
- Problem Management
- Change Management
Info-Tech Insight
ITIL isn’t dead. New technology such as cloud solutions and advanced monitoring tools have transformed how ITSM processes are implemented, but have not obviated them.
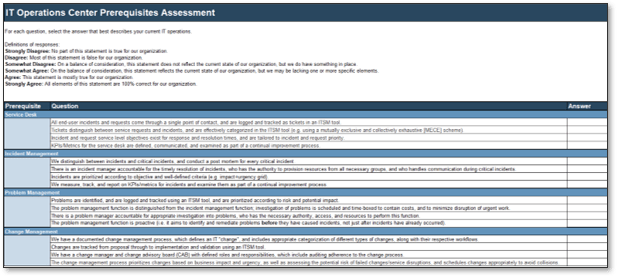
Assess maturity of prerequisite processes
1.1.1 IT Operations Center Prerequisites Assessment Tool
- Don’t try to prematurely optimize your Operations Center.
- Before undertaking this project, you should already have a base level of maturity in the four foundational IT Operations processes.
- Complete the IT Operations Center Prerequisites Assessment Tool to assess your current level in service desk, incident management, problem management, and change management.
Make targeted improvements on prerequisite processes if necessary
If there are deficiencies in any of your foundational processes, take the time to remedy those first before proceeding with Optimize the IT Operations Center. See Info-Tech’s other blueprints:
Strengthen your service desk to build a strong ITSM foundation.
Incident and Problem Management
Don’t let persistent problems govern your department.
Turn and face the change with a right-sized change management process.
Step 1.2: Make the Case
This step will walk you through the following activities:
- Estimate the impact of downtime for top five applications.
- Estimate the cost of incident response.
- Estimate the cost of MRW.
- Set success metrics and estimate the ROI of the Operations Center project.
- IT Operations Center Stakeholder Buy-In Presentation
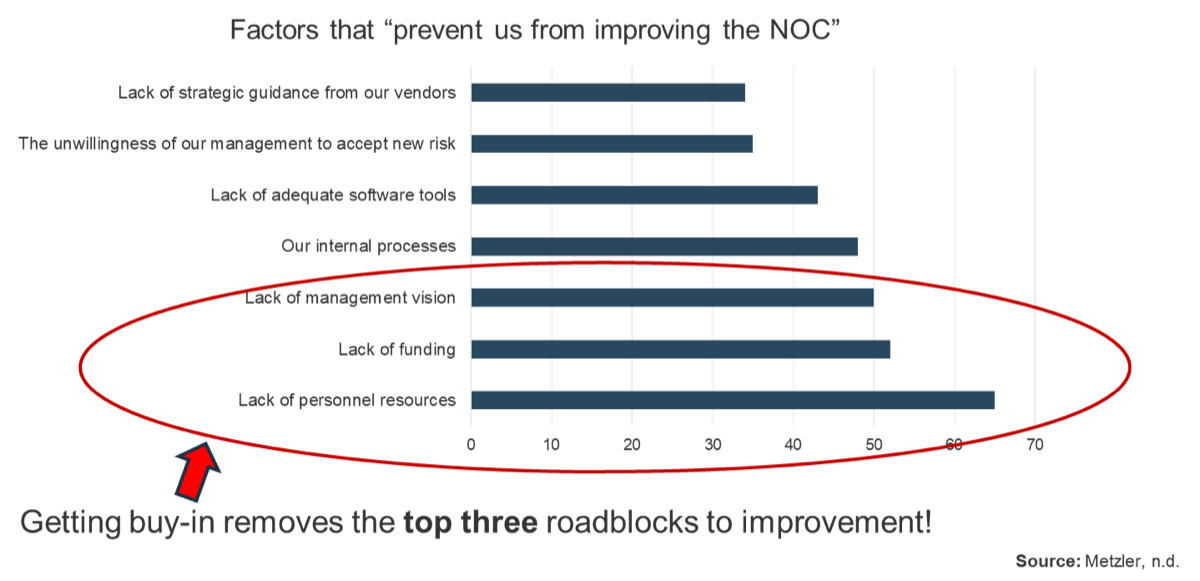
Obtaining buy-in is critical
Buy-in from top-level stakeholders is critical to the success of the project.
Before jumping into your initiatives, take the time to make the case and bring the business on board.
Factors that “prevent us from improving the NOC”
List your top five applications
List your top five applications for business criticality.
Don’t agonize over decisions at this point.
Generally, the top applications will be customer facing, end-user facing for the most critical business units, or critical for health and safety.
Estimate impact of downtime
- Come up with a rough, back-of-the-napkin estimate of the hourly cost of downtime for each application.
- Complete page two of the IT Operations Center Stakeholder Buy-In Presentation.
- Estimate loss of revenue per hour, loss of productivity per hour, and IT cost per incident resolution hour.
- Pull a report on incident hours/outages in the past year from your ITSM tool. Multiply the total cost per incident hour by the incident hours per year to determine the current cost per year of service disruptions for each service.
- Add up the cost for each of the top five services.
- Now you can show the business a hard value number that quantifies your availability issues.
Estimate salary cost of non-value-adding work
Complete page three of the IT Operations Center Stakeholder Buy-In Presentation.
- Estimate annual wage cost of incident response: multiply incident response hours per year (take from your ITSM tool) by the average hourly wage of incident responders.
- Estimate annual cost of MRW: multiply MRW hours per year (take from ITSM tool or from time-keeping tool, or use best guess based on talking to staff members) by the average hourly wage of IT staff performing MRW.
- Add the two numbers together to calculate the non-value-adding IT salary cost per year.
- Express the previous number as a percentage of total IT salary. Everything that is not incident response or MRW is value-adding work.
Now you have the holy trinity of metrics: set some targets
The holy trinity of metrics:
- Cost of downtime
- % of salary on incident response
- % of salary on MRW
You want to reduce the above numbers. Set some back-of-the-napkin targets for percentage reductions for each of these areas. These are high-level metrics that business stakeholders will care about.
Take your best guess at targets. Higher maturity organizations will have less potential for reduction from a percentage point of view (eventually you hit diminishing returns), while organizations just beginning to optimize their Operations Center have the potential for huge gains.
Calculate the potential gains of targets
Complete page five of the IT Operations Center Stakeholder Buy-In Presentation.
- Multiply the targeted/estimated % reductions of the costs by your current costs to determine the potential savings/benefits.
- Do a back-of-the napkin estimate of the cost of the Operations Center improvement project. Use reasonable numbers for cost of personnel time and cost of tools, and be sure to include ongoing personnel time costs – your time isn’t free and continual improvement takes work and effort.
- Calculate the ROI.
Fill out the case study
- Complete page six of the IT Operations Center Stakeholder Buy-In Presentation. If you completed the lightning phase, use the results of your own quick win project(s) as an example of feasibility.
- If you did not complete the lightning phase, delete this slide, or use an example of what other organizations have achieved to demonstrate feasibility.
Present to stakeholders
- Deliver the presentation to key stakeholders.
- Focus on the high-level story that the current state is costing real dollars and wages, and that these losses can be minimized through process improvements.
- Be up front that many of the numbers are based on estimates, but be prepared to defend the reasonableness of the estimates.
Gain buy-in and identify project sponsor
- If the business is on board with the project, determine one person to be the executive sponsor for the project. This person should have a strong desire to see the project succeed, and should have some skin in the game.
Formalize communication with the project sponsor
- Establish how you will communicate with the sponsor throughout the project (e.g. weekly or monthly e-mail updates, bi-weekly meetings).
- Set up a regular/recurring cadence and stick to it, so it can be put on auto-pilot. Be clear about who is responsible for initiating communication and sticking to the reporting schedule.
Info-Tech Insight
Tailor communication to the sponsor. The project sponsor is not the project manager. The sponsor’s role is to drive the project forward by allocating appropriate resources and demonstrating highly visible support to the broader organization. The sponsor should be kept in the loop, but not bothered with minutiae.
Note the starting numbers for the holy trinity
Use the IT Operations Center Continual Improvement Tracker:
- Enter your starting numbers for the holy trinity of metrics.
- After planning and implementing initiatives, this tracker will be used to update against the holy trinity to assess the success of the project on an ongoing basis and to drive continual improvement.
PHASE 2
Define Accountability and Metrics
Optimize the IT Operations Center
Step 2.1: Define Accountabilities
This step will walk you through the following activities:
- Formalize RACI for key processes.
- Formalize RACI for key tasks.
Outcomes of this step
- Completed RACIs
List key Operations Center processes
Compile a list of processes that are key for the Operations Center.
These processes should include the four foundational processes:
- Service Desk
- Incident Management
- Problem Management
- Change Management
You may also want to include processes such as the following:
- Event Management
- Configuration Management
Avoid listing processes you have yet to develop – stick with those already playing a role in your current state.
Formalize RACI for key processes
Use the IT Operations Center RACI Charts Template. Complete a RACI for each of the key processes involved in the IT Operations Center.
RACI:
- Responsible (does the work on a day-to-day basis)
- Accountable (reviews, signs off, and is held accountable for outcomes)
- Consulted (input is sought to feed into decision making)
- Informed (is given notification of outcomes)
As a best practice, no more than one person should be responsible or accountable for any given process. The same person can be both responsible and accountable for a given process, or it could be two different people.
Avoid making someone accountable for a process if they do not have full visibility into the process for appropriate oversight, or do not have time to give the process sufficient attention.
Formalize RACI for IT tasks
Now think about the actual tasks or work that goes on in IT. Which roles and individuals are accountable for which tasks or pieces of work?
In this case, more than one role/person can be listed as responsible or accountable in the RACI because we’re talking about types or categories of work. No conflict will occur because these individuals will be responsible or accountable for different pieces of work or individual tasks of the same type. (e.g. all service desk staff are responsible for answering phones and inputting tickets into the ITSM tool, but no more than one staff member is responsible for the input of any given ticket from a specific phone call).
Step 2.2: Define Metrics
This step will walk you through the following activities:
- Cascade operational metrics from the holy trinity.
- Evaluate metrics and identify key performance indicators (KPIs).
- Cascade performance assessment (PA) metrics to support KPIs.
- Build feedback loop for PA metrics.
Outcomes of this step
- KPIs
- PA metrics
Metrics must span across silos for shared accountability
To adequately support the business goals of the organization, IT metrics should span across functional silos.
Metrics that span across silos foster shared accountability across the IT organization.
Metrics supported by all groups
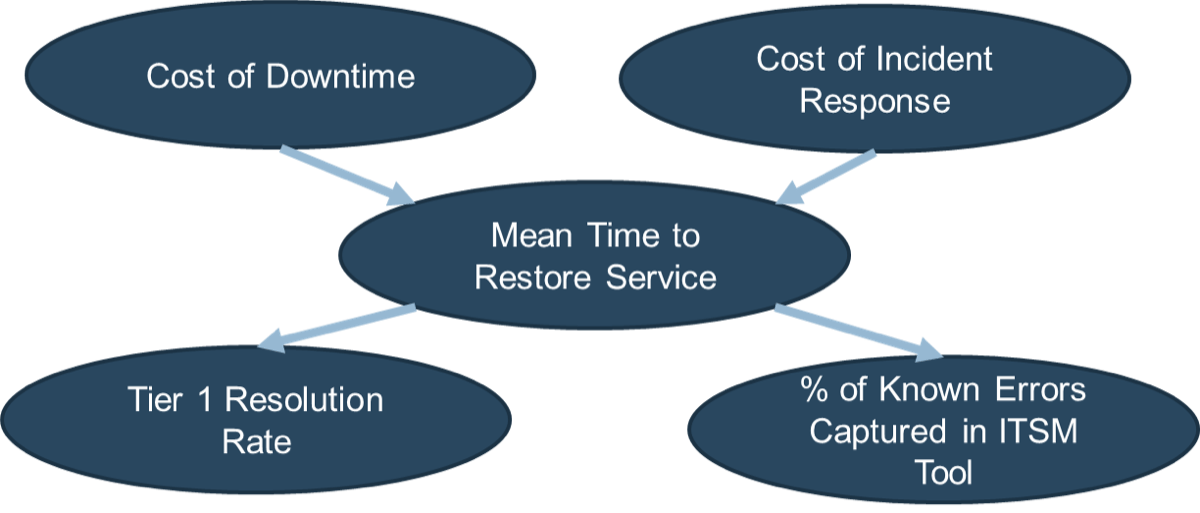
Cascade operational metrics from the holy trinity
Focus on the holy trinity of metrics.
From these, cascade down to operational metrics that contribute to the holy trinity. It is possible that an operational metric may support more than one trinity metric. For example:
Evaluate metrics and identify KPIs
-
- Evaluate your operational metrics and determine which ones are likely to have the largest impact on the holy trinity of metrics.
- Identify the ten metrics likely to have the most impact: these will be your KPIs moving forward.
- Enter these KPIs into the IT Operations Center Continual Improvement Tracker.
Beware how changing variables/context can affect metrics
- Changes in context can affect metrics drastically. It’s important to keep the overall context in mind to avoid being led astray by certain numbers taken in isolation.
- For example, a huge hiring spree might exhaust the stock of end-user devices, requiring time to procure hardware before the onboarding tickets can be completely fulfilled. You may have improved your onboarding process through automation, but see a large increase in average time to onboard a new user. Keep an eye out for such anomalies or fluctuations, and avoid putting too much stock in any single operational KPI.
- Remember, operational KPIs are just a heuristic tool to support the holy trinity of metrics.
Determine accountability for KPIs
- For each operational KPI, assign one person to be accountable for that KPI.
- Be sure the person in charge has the necessary authority and oversight over the processes and personnel that most affect that KPI – otherwise it makes little sense to hold the individual accountable.
- Consulting your process RACIs is a good place to start.
- Record the accountable person for each KPI in the IT Operations Center Continual Improvement Tracker.
Info-Tech Best Practice
Match accountability with authority. The person accountable for each KPI should be the one who has the closet and most direct control over the work and processes that most heavily impact that KPI.
Cascade PA metrics to support KPIs
KPIs are ultimately driven by how IT does its work, and how individuals work is driven by how their performance is assessed and evaluated.
For the top KPIs, be sure there are individual PA metrics in place that support the KPI, and if not, develop the appropriate PA metrics.
For example:
- KPI: Mean time to resolve incidents
- PA metric: % of escalations that followed SOP (e.g. not holding onto a ticket longer than supposed to)
- KPI: Number of knowledge base articles written
- PA metric: Number of knowledge base articles written/contributed to
Communicate key changes in PA metrics
Any changes from the previous step will take time and effort to implement and make stick.
Changing people’s way of working is extremely difficult.
Build a communication and implementation plan about rolling out these changes, emphasize the benefits for everyone involved, and get buy-in from the affected staff members.
Build feedback loops for PA metrics
Now that PA metrics support your Operations Center’s KPIs, you should create frequent feedback loops to drive and boost those PA metrics.
Once per year or once per quarter is not frequent enough. Managers should meet with their direct reports at least monthly and review their reports’ performance against PA metrics.
Use a “set it and forget it” implementation, such as a recurring task or meeting in your calendar.
If you want additional support, have our analysts guide you through this phase as part of an Info-Tech workshop
Book a workshop with our Info-Tech analysts
- To accelerate this project, engage your IT team in an Info-Tech workshop with an Info-Tech analyst team.
- Info-Tech analysts will join you and your team onsite at your location or welcome you to Info-Tech’s historic Toronto office to participate in an innovative onsite workshop.
- Contact your account manager (www.infotech.com/account), or email Workshops@InfoTech.com for more information.
| The following are sample activities that will be conducted by Info-Tech analysts with your team: | ||
|---|---|---|
| 2.2.1 | 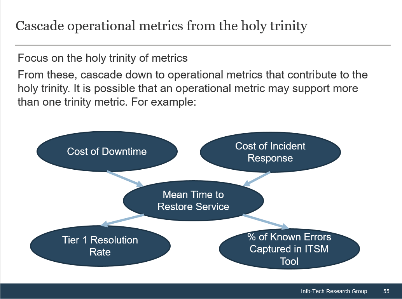
|
Cascade operational metrics from the holy trinity Rank goals based on business impact and stakeholder pecking order. |
| 2.2.2 | 
|
Determine accountability for KPIs Craft a concise and compelling elevator pitch that will drive the project forward. |
PHASE 3
Assess Gaps and Prioritize Initiatives
Optimize the IT Operations Center
Step 3.1: Assess Gaps
This step will walk you through the following activities:
- Assess visibility provided by monitoring.
- Assess process workflows and identify areas for automation.
- Assess requests and identify potential for automation.
- Assess Operations Center staff capabilities.
- Conduct a root cause analysis on the gaps/pain points.
Outcomes of this step
- List of gaps
- List of root causes
Measure current state of KPIs and identify lagging ones
Take a baseline measurement of each operational KPI.
If historical data is available, compare the present state measurement to data points collected over the last year or so.
Review the measured KPIs.
Identify any KPIs that seem lagging or low, or that may be particularly important to influence.
Record lagging KPIs in the IT Operations Center Gap and Initiative Tracker tool.
Assess visibility provided by monitoring
List the top five most critical business services supported by IT.
Assess the current state of your monitoring tools.
For each business service, rate the level of visibility your monitoring tools allow from the following options:
- We have no visibility into the service, or lack visibility into crucial elements.
- We have basic visibility (up/down) into all the IT components that support the service.
- We have basic visibility (up/down) into the end service itself, in addition to all the IT components that make it up.
- We have some advanced visibility into some aspects of the service and/or its IT components.
- We have a full, end-to-end view of performance across all the layers of the stack, as well as the end business service itself.
Identify where more visibility may be necessary
For most organizations it isn’t practical to have complete visibility into everything. For the areas in which visibility is lacking into key services, think about whether more visibility is actually required or not. Consider some of the following questions:
- How great is the impact of this service being unavailable?
- Would greater visibility into the service significantly reduce the mean time to restore the service in the event of incidents?
Record any deficiencies in the IT Operations CenterGap and Initiative Tracker tool.
Assess alerting
Assess alerting for your most critical services.
Consider whether any of the following problems occur:
- Often receive no alert(s) in the event of critical outages of key services (we find out about critical outages from the service desk).
- We are regularly overwhelmed with too many alerts to investigate properly.
- Our alerts are rarely actionable.
- We often receive many false alerts.
Identify areas for potential improvement in the managing of alerts. Record any deficiencies in the IT Operations Center Gap and Initiative Tracker tool.
Assess process workflows and identify areas for automation
Review your process flows for base processes such as Service Desk, Incident Management, Problem Management, and Change Management.
Identify areas in the workflows where there may be defects, inefficiencies, or potential for improvement or automation.
Record any deficiencies in the IT Operations Center Gap and Initiative Tracker tool.
See the blueprint Prepare for Cognitive Service Management for process workflows and areas to look for automation possibilities.
Prepare for Cognitive Service Management
Make ready for AI-assisted IT operations.
Assess requests and identify potential for automation
- Assess the most common work orders or requests handled by the Operations Center group (i.e. this does not include requests fulfilled by the help desk).
- Which work orders are the most painful? That is, what common work orders involve the greatest effort or the most manual work to fulfill?
- Fulfillment of common, recurring work orders is MRW, and should be reduced or removed if possible.
- Consider automation of certain work orders, or self-service delivery.
- Record any deficiencies in the IT Operations Center Gap and Initiative Tracker tool.
Assess Operations Center staff capabilities
- Assess the skills and expertise of your team members.
- Consider some of the following:
- Are there team members who could perform their job more effectively by picking up certain skills or proficiencies?
- Are there team members who have the potential to shift into more valuable or useful roles, given the appropriate training?
- Are there individual team members whose knowledge is crucial for operations, and whose function cannot be taken up by others?
Record any deficiencies in the IT Operations Center Gap and Initiative Tracker tool.
Info-Tech Insight
Train to avoid pain. All too often organizations expose themselves to significant key person risk by relying on the specialized skills and knowledge of one team member. Use cross training to remedy such single points of failure before the risk materializes.
Brainstorm pain points
Brainstorm any pain points not discussed in the previous areas.
Pain points can be specific operational issues that have not yet been considered. For example:
- Tom is overwhelmed with tickets.
- Our MSP often breaches SLA.
- We don’t have a training budget.
Record any deficiencies in the IT Operations CenterGap and Initiative Tracker tool.
Conduct a root cause analysis on the gaps/pain points
- Pain points can often be symptoms of other deficiencies, or somewhat removed from the actual problem.
- Using the 5 Whys, conduct a root cause analysis on the pain points for which the causes are not obvious.
- For each pain point, ask “why” for a sequence of five times, attempting to proceed to the root cause of the issue. This root cause is the true gap that needs to be remedied to resolve the pain point.
- For example:
- The Wi-Fi network often goes down in the afternoon.
- Why?: Its bandwidth gets overloaded.
- Why?: Many people are streaming video.
- Why?: There’s a live broadcast of a football game at that time.
- Possible solutions:
- Block access to the streaming services.
- Project the game on a screen in a large conference room and encourage everyone to watch it there.
- The Wi-Fi network often goes down in the afternoon.
Step 3.2: Plan Initiatives
This step will walk you through the following activities:
- Brainstorm initiatives to boost KPIs and address gaps.
- Prioritize potential initiatives.
- Decide which initiatives to include on the roadmap.
Outcomes of this step
- Targeted improvement roadmap
Brainstorm initiatives to boost KPIs and address gaps
- Consider the lagging KPIs and the gaps identified in the various areas.
- Brainstorm initiatives to boost KPIs.
- Record potential initiatives in the IT Operations Center Gap and Initiative Tracker tool.
Prioritize potential initiatives
3.2.1 IT Operations Center Initiative Prioritization Tool
- Use the IT Operations Center Initiative Prioritization Tool.
- Enter the initiatives into the tool.
- For each initiative, input the following ranking criteria:
- The metric/KPI’s estimated degree of impact on the holy trinity.
- The gap or pain point’s estimated degree of impact on the metric/KPI.
- The initiative’s estimated degree of positive impact on the gap or pain point
- The initiative’s attainability.
- Estimate the resourcing capacity required for each initiative.
- For accurate capacity assessment, input as “force include” all current in-flight projects handled by the Operations Center group (including those unrelated to the Operations Center project).
Decide which initiatives to include on the roadmap
- Not all initiatives will be worth pursuing – and especially not all at once.
- Consider the results displayed on the final tab of the IT Operations CenterInitiative Prioritization Tool.
- Based on the prioritization and taking capacity into account, decide which initiatives to include on your roadmap.
- Sometimes, for operational or logistical reasons, it may make sense to schedule an initiative at a time other than its priority might dictate. Make such exceptions on a case-by-case basis.
Assign an owner to each initiative, and provide resourcing
- For each initiative, assign one person to be the owner of that initiative.
- Be sure that person has the authority and the bandwidth necessary to drive the initiative forward.
- Secure additional resourcing for any initiatives you want to include on your roadmap that are lacking capacity.
Info-Tech Insight
You must invest resources in order to reduce the time spent on non-value-adding work.
"The SRE model of working – and all of the benefits that come with it – depends on teams having ample capacity for engineering work. If toil eats up that capacity, the SRE model can’t be launched or sustained. An SRE perpetually buried under toil isn’t an SRE, they are just a traditional long-suffering SysAdmin with a new title."– David N. Blank-Edelman
If you want additional support, have our analysts guide you through this phase as part of an Info-Tech workshop
Book a workshop with our Info-Tech analysts
- To accelerate this project, engage your IT team in an Info-Tech workshop with an Info-Tech analyst team.
- Info-Tech analysts will join you and your team onsite at your location or welcome you to Info-Tech’s historic Toronto office to participate in an innovative onsite workshop.
- Contact your account manager (www.infotech.com/account), or email Workshops@InfoTech.com for more information.
| The following are sample activities that will be conducted by Info-Tech analysts with your team: | ||
|---|---|---|
| 3.1.1 | 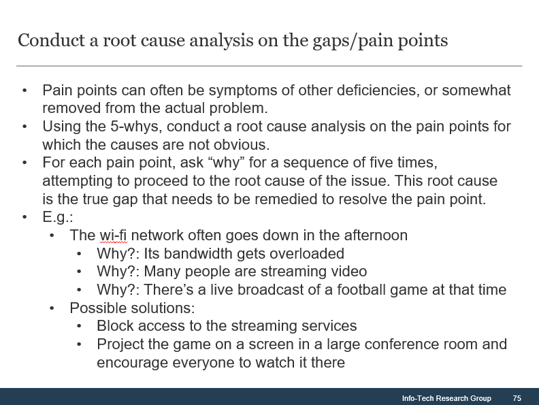
|
Conduct a root cause analysis on the gaps/pain points Find out the cause, so you can come up with solutions. |
| 3.2.1 | 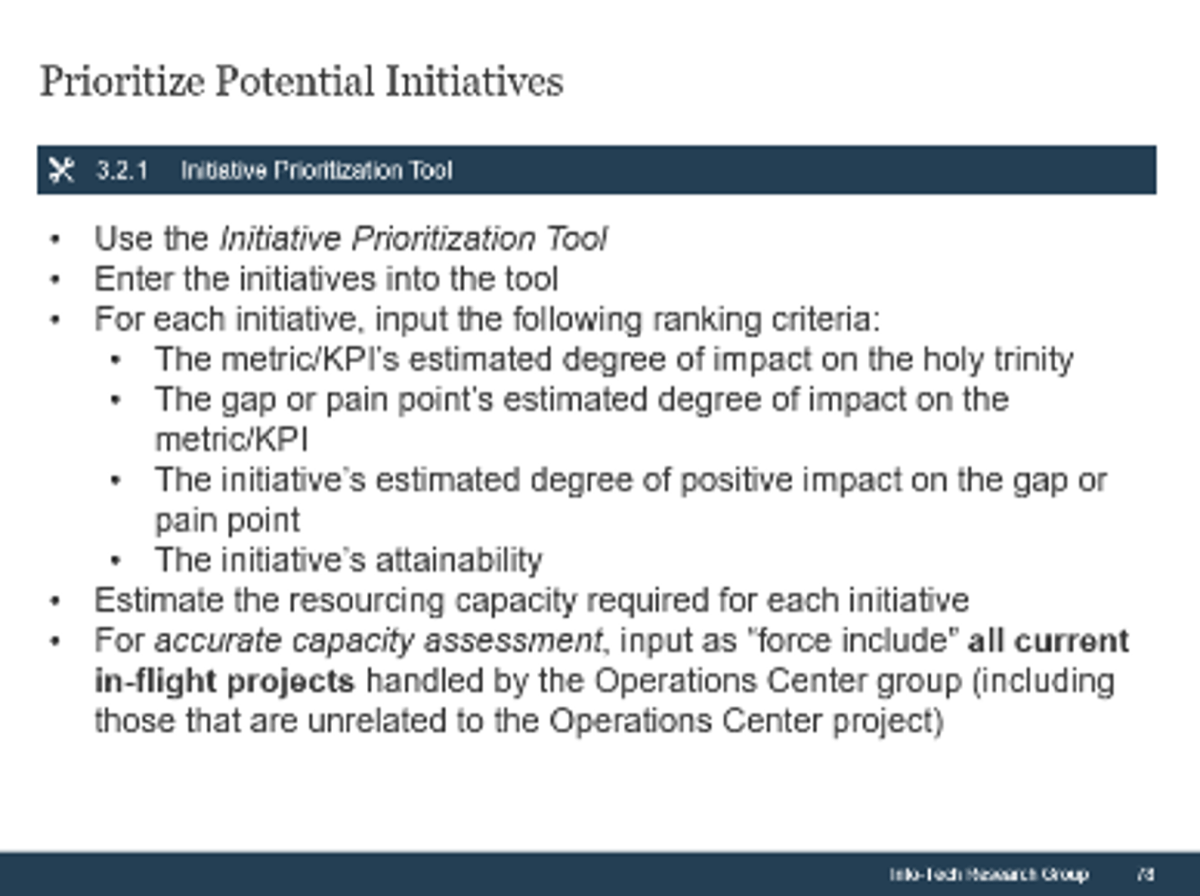
|
Prioritize potential initiatives Don’t try to boil the ocean. Target what’s manageable and what will have the most impact. |
PHASE 4
Launch Initiatives and Track Metrics
Optimize the IT Operations Center
Step 4.1: Lay Foundation
This step will walk you through the following activities:
- Build initiative communication plan.
- Develop a testing plan for each technical initiative.
Outcomes of this step
- Communication plan
- Testing plan(s)
Expect resistance to change
- It’s not as simple as rolling out what you’ve designed.
- Anything that affects people’s way of working will inevitably be met with suspicion and pushback.
- Be prepared to fight the battle.
"The hardest part is culture. You must get people to see the value of automation. Their first response is ‘We've been doing it this way for 10 years, why do we need to do it another way?’ It's hard to get someone out of their comfort zone to learn something new, especially when they've been at an organization for 20 years. You need to give them incentives."– Cyrus Kalatbari, Senior IT Architect, Infrastructure/Cloud
Communicate changes in advance, along with their benefits!
- Communicate changes well in advance of the date(s) of implementation.
- Emphasize the benefits of the changes – not just for the organization, but for employees and staff members.
- Advance communication of changes helps make them more palatable, and builds trust in employees by making them feel informed of what’s going on.
Involve IT staff in design and implementation of changes
- As you communicate the coming changes, take the opportunity to involve any affected staff members who have not yet participated in the project.
- Solicit their feedback and get them to help design and implement the initiatives that involve significant changes to their roles.
Develop a testing plan for each technical initiative
- Some initiatives, such as appointing a new change manager or hiring a new staff member, do not make sense to test.
- On the other hand, technical initiatives such as automation scripts, new monitoring tools or dashboards, and changed alert thresholds should be tested thoroughly before implementation.
- For each technical initiative, think about the expected results and performance if it were to run in production, and build a test plan to ensure it behaves as expected and there are no corner cases.
Test technology initiatives and iterate if necessary
- Test each technical initiative under a variety of circumstances, with as close an environment to production as possible.
- Try to develop corner cases or unusual or unexpected situations, and see if any of these will break the functionality or produce unintended or unexpected results.
- Document the results of the testing, and iterate on the initiative and test again if necessary.
"The most important things – and the things that people miss – are prerequisites and expected results. People jump out and build scripts, then the scripts go into the ditch, and they end up debugging in production." – Darin Stahl, Research Director, Infrastructure & Operations
Step 4.2: Launch and Measure
This step will walk you through the following activities:
- Launch initiatives and track adoption and effectiveness.
- Investigate initiatives that appear ineffective.
- Measure success with the holy trinity.
Outcomes of this step
- Continual improvement roadmap
Establish a review cycle for each metric
- For each of the metrics and KPIs in the IT Operations Center Continual Improvement Tracker, input an appropriate review cycle.
- Info-Tech suggests reviewing most operational KPIs monthly.
- Each metric must be reviewed regularly.
Info-Tech Best Practice
Don’t measure what doesn’t matter. If a metric is not going to be reviewed or reported on for informational or decision-making purposes, it should not be tracked.
Launch initiatives and track adoption and effectiveness
- Launch the initiatives.
- Some initiatives will need to proceed through your change management process in order to roll out, but others will not.
- Track the adoption of initiatives that require it.
- Some initiatives will require tracking of adoption, whereas others will not.
- For example, hiring a new service desk staff member does not require tracking of adoption, but implementing a new process for ticket handling does.
- The implementation plan should include a way to measure the adoption of such initiatives, and regularly review the numbers to see if the implementation has been successful.
- For all initiatives, measure their effectiveness by continuing to track the KPI/metric that the initiative is intended to influence.
Assess metrics according to review cycle for continual improvement
- Assess metrics according to the review cycle.
- Note whether metrics are improving in the right direction or not.
- Correlate changes in the metrics with measures of the adoption of the initiatives – see whether initiatives that have been adopted are moving the needle on the KPIs they are intended to.
Investigate initiatives that appear ineffective
- If the adoption of an initiative has succeeded, but the expected impact of that initiative on the KPI has not taken place, investigate further and conduct a root causes analysis to determine why this is the case.
- Sometimes, anomalies or fluctuations will occur that cause the KPI not to move in accordance with the success of the initiative. In this case, it’s just a fluke and the initiative can still be successful in influencing the KPI over the long term.
- Other times, the initiative may prove mostly or entirely ineffective, either due to misdesign of the initiative itself, a change of circumstances, or other compounding factors or complexities. If the initiative proves ineffective, consider iterating modifications of the initiative and continuing to measure the effect on KPIs – or perhaps killing the initiative altogether.
- Remember that experimentation is not a bad thing – it’s okay that not every initiative will always prove worthwhile.
Measure success with the holy trinity
- Report to business stakeholders on the effect on the holy trinity of metrics at least annually.
- Calculate the ROI of the project after two years and compare the results to the targeted ROI you initially presented in the IT Operations Center Stakeholder Buy-In Presentation.
Iterate on the Operations Center process for continual improvement
If you want additional support, have our analysts guide you through this phase as part of an Info-Tech workshop
Book a workshop with our Info-Tech analysts
- To accelerate this project, engage your IT team in an Info-Tech workshop with an Info-Tech analyst team.
- Info-Tech analysts will join you and your team onsite at your location or welcome you to Info-Tech’s historic Toronto office to participate in an innovative onsite workshop.
- Contact your account manager (www.infotech.com/account), or email Workshops@InfoTech.com for more information.
| The following are sample activities that will be conducted by Info-Tech analysts with your team: | ||
|---|---|---|
| 4.1.1 |  | Communicate changes in advance, along with their benefits! Rank goals based on business impact and stakeholder pecking order. |
| 4.1.2 |  | Develop a testing plan for each technical initiative Craft a concise and compelling elevator pitch that will drive the project forward. |
| Research contributors and experts | ||
|---|---|---|

|
Cyrus Kalatbari, IT Infrastructure/Cloud Architect |
Cyrus’ in-depth knowledge cutting across I&O and service delivery has enhanced the IT operations of multiple enterprise-class clients. |

|
Derek Cullen, Chief Technology Officer |
Derek is a proven leader in managing enterprise-scale development, deployment, and integration of applications, platforms, and systems, with a sharp focus on organizational transformation and corporate change. |

|
Phil Webb, Senior Manager – Unified Messaging and Mobility |
Phil specializes in service delivery for cloud-based and hybrid technology solutions, spanning requirements gathering, solution design, new technology introduction, development, integration, deployment, production support, change/release delivery, maintenance, and continuous improvement. |

|
Richie Mendoza, IT Services Delivery Consultant |
Ritchie’s accomplishments include pioneering a cloud capacity management process and presenting to the Operations team and to higher management, while providing a high level of technical leadership in all phases of capacity management activities. |

|
Rob Thomson, Solutions Architect |
Rob is an IT leader with a track record of creating and executing digital transformation initiatives to achieve the desired outcomes by integrating people, process, and technology into an efficient and effective operating model. |
Related Info-Tech research
Create a Configuration Management Roadmap
Right-size your CMDB to improve IT operations.
Harness Configuration Management Superpowers
Build a CMDB around the IT services that are most important to the organization.
Develop an IT Infrastructure Services Playbook
Automation, SDI, and DevOps – build a cheat sheet to manage a changing Infrastructure & Operations environment.
Develop an Availability and Capacity Management Plan
Manage capacity to increase uptime and reduce costs.
Establish a Program to Enable Effective Performance Monitoring
Maximize the benefits of infrastructure monitoring investments by diagnosing and assessing transaction performance, from network to server to end-user interface.
Bibliography
Baker, Dan, and Hal Baylor. “How Benchmarking & Streamlining NOC Operations Can Lower Costs & Boost Effectiveness.” Top Operator, Mar. 2017. Web.
Blank-Edelman, David. Seeking SRE: Conversations About Running Production Systems at Scale. O'Reilly, 2018. Web.
CA Technologies. “IT Transformation to Next-Generation Operations Centers: Assure Business Service Reliability by Optimizing IT Operations.” CA Technologies, 2014. Web.
Ditmore, Jim. “Improving Availability: Where to Start.” Recipes for IT, n.d. Web.
Ennis, Shawn. “A Phased Approach for Building a Next-Generation Network Operations Center.” Monolith Software, 2009. Web.
Faraclas, Matt. “Why Does Infrastructure Operations Still Suck?” Ideni, 25 Feb. 2016. Web.
InterOp ITX. “2018 State of the Cloud.” InterOp ITX, Feb. 2018. Web.
ITIC. “Cost of Hourly Downtime Soars: 81% of Enterprises Say it Exceeds $300K On Average.” ITIC, 2 Aug. 2016. Web.
Joe the IT Guy. “Availability Management Is Harder Than it Looks.” Joe the IT Guy, 10 Feb. 2016. Web.
---. “Do Quick Wins Exist for Availability Management?” Joe the IT Guy, 15 May 2014. Web.
Lawless, Steve. “11 Top Tips for Availability Management.” Purple Griffon, 4 Jan. 2019. Web.
Metzler, Jim. “The Next Generation Network Operations Center: How the Focus on Application Delivery is Redefining the NOC.” Ashton, Metzler & Associates, n.d. Web.
Nilekar, Shirish. “Beyond Redundancy: Improving IT Availability.” Network Computing, 28 Aug. 2015. Web.
Slocum, Mac. “Site Reliability Engineering (SRE): A Simple Overview.” O’Reilly, 16 Aug. 2018. Web.
Spiceworks. “The 2019 State of IT.” Spiceworks, 2019. Web