
- IT infrastructure managers have conflicting accountabilities. It can be difficult to fight fires as they appear while engaging in systematic fire prevention.
- Repetitive interruptions erode faith in IT. If incidents recur consistently, why should the business trust IT to resolve them?
Improve Incident and Problem Management Research & Tools
Besides the small introduction, subscribers and consulting clients within this management domain have access to:
1. Improve Incident and Problem Management: Our Methodology
Step-by-step methodology to identify existing challenges, clarify process and role expectations, and create concise effective process documentation to drive improvement. Review the executive brief at the start of the slide deck for an overview of the methodology and the value it can provide your organization.
- Improve Incident and Problem Management Storyboard
2. Incident Management and Service Desk SOP
Document process and role expectations to drive consistent and effective incident response.
- Incident Management and Service Desk SOP
3. Incident Management and Service Desk Workflows
Create incident response workflows to clarify steps and identify opportunities to improve.
- Incident Management and Service Desk Workflows (Visio)
- Incident Management and Service Desk Workflows (PDF)
4. Incident KB Article Examples
Use these examples to guide your KB article templates and to clarify appropriate level of detail.
- Incident KB Article Examples
5. Incident Status Updates and Incident Report Templates
Modify these examples to suit your requirements and expedite incident status communications.
- Incident Status Updates and Incident Report Examples
6. Problem Management SOP
Define your problem management process, roles, and techniques.
- Problem Management SOP
7. Problem Management Workflow
Clarify problem intake and action steps in a workflow format that is easier for stakeholders to consume.
- Problem Management Workflow (Visio)
- Problem Management Workflow (PDF)
8. Problem Ticket Template
Use this example as a guide to create a problem ticket template in your ITSM tool.
- Problem Ticket Template
9. Communication Initiatives Template
Capture initiatives to educate staff and drive buy-in from senior leadership on improvements to your incident and problem management processes.
- Communication Initiatives Template
10. Incident and Problem Management Project Roadmap Tool
Translate ideas into specific initiatives to improve your incident and problem management processes.
- Incident and Problem Management Project Roadmap Tool
[infographic]
Workshop: Improve Incident and Problem Management
Workshops offer an easy way to accelerate your project. If you are unable to do the project yourself, and a Guided Implementation isn't enough, we offer low-cost delivery of our project workshops. We take you through every phase of your project and ensure that you have a roadmap in place to complete your project successfully.
1 Optimize Ticket Handling
The Purpose
Improve how tickets logged, categorized, and prioritized.
Key Benefits Achieved
Efficient ticket processing and consistent treatment of tickets based on severity.
Activities
1.1 Review the incident lifecycle and your current challenges.
1.2 Improve how you identify, log, and categorize incidents.
1.3 Define a ticket prioritization scheme.
1.4 Consistent ticket prioritization scheme.
1.5 Drive more efficient ticket intake.
Outputs
Challenges summary.
Action items to improve initial ticket processing.
Streamline how users submit tickets.
2 Standardize and Streamline Incident Response
The Purpose
Clarify incident management steps, roles, and responsibilities.
Key Benefits Achieved
Incident Management SOP and Workflows documented to drive consistent and effective incident response.
Activities
2.1 Document your target-state Incident Management Workflow.
2.2 Document your target-state Critical Incident Response Workflow.
2.3 Define SLOs and escalation rules.
Outputs
Incident Management Workflow.
Critical Incident Response Workflow.
SLOs and escalation timelines.
3 Incident Management Wrap-Up, and Effective Problem Management
The Purpose
Key Benefits Achieved
Efficient and effective problem management, reducing incident recurrence and impact.
Activities
3.1 Identify knowledgebase article candidates and create templates to expedite incident response.
3.2 Identify opportunities to improve efficiency with shift-left and automation.
3.3 Define problem management.
3.4 Standardize your problem intake process.
3.5 Standardize your problem action process (investigate, root cause analysis, resolve).
Outputs
Knowledgebase article candidates identified.
Action items to explore shift-left and automation opportunities.
Problem management parameters defined.
Problem intake process documented.
4 Problem Management Wrap-Up, and Next Steps
The Purpose
Plan how you will implement improvements.
Key Benefits Achieved
Translate ideas into action, with specific steps to implement tangible improvements in the areas of people (training), process, and technology.
Activities
4.1 Establish appropriate problem management governance.
4.2 Create a plan to communicate process changes.
4.3 Create a project roadmap to implement improvements.
4.4 Review workshop results.
Outputs
Problem Management SOP updated.
Initiatives to communicate process improvements.
Project roadmap to improve incident and problem management.
Workshop outcomes and next steps summarized.
Further reading
Improve Incident and Problem Management
Rise above firefighter mode with structured incident management to enable effective problem management
EXECUTIVE BRIEF
AnalystPerspective
Keep it simple. Good data and consistent processes will help you break out of firefighter mode.
Incident management teams often find themselves too busy to create the knowledgebase (KB) articles or track the incident data that will save them time in the future. It becomes a vicious cycle that keeps them constantly in firefighter mode.
The key to breaking this cycle is to keep it simple as you seek to implement better structure and processes and right-size your approach. For example, avoid complex categorization schemes, and start with KB articles for known recurring incidents. Don’t jump to automation before you have the processes and resources to support it.
Similarly, when it comes to problem management, keep it simple by starting with Sev 1 tickets and recurring incidents that are obvious candidates for problem management. Support problem management with a consistent, structured approach that enables you to prioritize your limited resources.
As you build momentum with quick wins and better structure, improved incident management will drive more effective problem management and reduce future incidents as the incident-problem lifecycle comes full circle.
Frank Trovato
Research Director, Infrastructure and Operations
Info-Tech Research Group
Executive Summary
Your Challenge
Establish a consistent incident management process to better categorize, prioritize, and resolve incidents.
Enable faster resolution time through well-defined escalation protocols.
Prevent incidents from happening in the first place by identifying and resolving the underlying root cause via problem management.
Leverage event management to predict problems before potential incidents occur.
Common Obstacles
IT managers have conflicting accountabilities. It can be difficult to set aside time for preventing incidents (i.e., problem management) when staff are already busy resolving existing incidents and working on projects.
Resolving incidents quickly boosts confidence in IT, but recurring incidents erodes confidence, as does the need to use cumbersome workarounds.
Info-Tech’s Approach
Implement structured incident management to drive efficiency (e.g., effective use of categorization to drive appropriate ticket routing), and build out a knowledgebase to expedite future incident response.
On the problem management side, acknowledge that you have limited time for this, so start with obvious problems (e.g., recurring incidents) and then expand from there as problem management starts to reduce incident volume.
Info-Tech Insight
Effective problem management drives business value by preventing incidents, but it starts with good incident management that produces the data needed to identify problems that are driving recurring and related incidents. Specifically, logical categorization and resolution codes drive effective trend analysis to identify problems, and documenting troubleshooting, resolution details, and known errors provides a solid starting point for root cause analysis via problem management.
Common challenges to incident management success
Organizations that struggle with incident management (IM) are typically faced with these barriers:
Unresolved issues
- Tickets are not created for all incidents.
- Tickets are lost or escalated to the wrong technicians.
- Poor data impedes root-cause analysis of incidents.
Low productivity
- Lack of cross-training and knowledge sharing.
- Time is wasted troubleshooting recurring issues.
- Reports unavailable due to lack of data and poor categorization.
Poor planning
- Lack of data for effective trend analysis leads to poor demand planning.
- Lack of data leads to lost opportunities for templating and automation.
Expedite incident resolution with better data and focused documentation
| ITIL Incident Mgmt. Lifecycle | Key data and documentation to improve incident management |
|---|---|
| 1. Detection (identify, triage) | Improve ticket intake methods and triage to gather better data upfront (e.g., a web portal that can make required data mandatory). |
| 2. Registration (log ticket) | Capture as much detail as you can (e.g., context, affected system) to expedite troubleshooting, post-incident review, & problem management. |
| 3. Classification (categorize, prioritize) | Define a categorization scheme that drives appropriate ticket routing and identifying recurring incidents, but keep it simple — 3 layers max. |
| 4. Diagnosis (investigate) | Document known errors and KB articles for common incidents to increase first-call resolution and expedite troubleshooting. |
| 5. Resolution (solve, validate) | *Record solution details, update the category if necessary, and assign a resolution code to ensure more-accurate trends reporting. |
| 6. Closure (final updates) | Determine if a KB would expedite future troubleshooting or incident resolution. Don’t let lessons learned float away into the ether. |
*Category and resolution can also be updated at Closure if needed.
The Info-Tech difference:
- Start by analyzing your existing tickets. This translates theoretical goals and challenges into your reality.
- Identify specific issues that get in the way of better incident data and processes. Are there quick wins available?
- Define action items with a realistic time frame — short, medium, and long-term — to improve processes right-sized for your organization.
Leverage improved incident data to move from reactive to proactive mode with improved problem management
The Info-Tech difference:
- Problem management is a planned activity but with limited resources, so prioritizing your efforts is crucial.
- Start with known issues – critical incidents and recurring incidents identified through effective incident classification. This drives tangible business benefits that justify time spent on problem management.
- Not every problem has a viable or practical permanent resolution. A workaround that expedites resolving future occurrences of the incident can make more business sense, depending on the time and money needed for a permanent resolution.
STOP: Ensure you have foundational Service Desk operations before continuing
This blueprint will help you improve existing incident management processes, and then build on that foundation to implement or improve problem management.
If you need more foundational improvements to your Service Desk operations, we recommend starting with the blueprint Standardize the Service Desk.
Specifically, the following are pre-requisites for this blueprint:
- There is a formal process for submitting tickets or reporting issues (e.g., Service Desk email address, phone number, or portal).
- Ticket intake process separates incidents from service requests.
- Tier 1 roles are defined that manage ticket intake and provide first-call resolutions for low-complexity issues (e.g., forgot my password).
Info-Tech’s methodology to improve incident and problem management
| 1. Optimize Ticket Intake and Routing | 2. Standardize and Streamline Incident Response | 3. Establish Effective Problem Management | 4. Implement Improvements | |
|---|---|---|---|---|
| Phase Steps |
|
|
|
|
| Phase Deliverables |
|
|
|
|
Insight summary
Shift-left starts with a good knowledge base
A good knowledge base expedites incident resolution and supports “shift-left” (e.g., enabling Tier 1 to solve incidents that would otherwise escalate to Tier 2 or 3).
Every incident is potentially an opportunity to document a solution, troubleshoot steps, or establish relevant operational documentation needed solve the incident.
If you capture this information only in the ticket or your own personal repository, you limit the ability to shift left and expedite future incident resolution.
Don’t reinvent your processes because of a critical incident
All hands on deck doesn’t mean abandoning processes. Instead, supplement your existing incident management processes to maintain structure to your response. For example:
- Alert senior IT leads in case they’re needed but follow existing processes to triage and assign the incident to the right SMEs.
- Notify affected users as usual but add appropriate updates to senior leadership.
- Leverage existing incident response collaboration methods – e.g., use the same MS Teams channel you normally use to collaborate on incidents; if necessary, set up a separate channel for leadership updates.
Apply structure to problem management to find value
Time must be allocated to problem management to get the long-term benefits. It’s not going to be driven by the urgency of an outage, but rather the foresight to predict and prevent future incidents.
Effective problem management follows a structured process to get the most out of the time allocated to this proactive effort. This includes appropriate prioritization, a root cause analysis methodology, and a decision point on whether to adopt a workaround or continue to pursue a permanent solution.
If problem management is ad-hoc or “when I have time,” something else will always take precedence.
Blueprint deliverables
Each step of this blueprint is accompanied by supporting deliverables to help you accomplish your goals:
Incident Knowledgebase Article Examples
Use the examples as a guide for your KB article templates.
Incident, Critical Incident, and Problem Workflows
Workflows are critical to communication process expectations and driving consistent execution.
Incident Status Updates and Incident Report Templates
Modify our examples to suit your requirements.
Incident and Problem Management Project Roadmap
Identify, prioritize, and present initiatives to improve incident and problem management.
Key deliverable:
SOPs for Incident Management and Problem Management
Clarify process and role expectations to improve consistency, efficiency, and effectiveness.
Blueprint benefits
IT Benefits
- Documented incident management processes clarify expectations for Tier 1, 2, and 3 roles and drive consistent process execution.
- Capturing good incident data makes it easier to identify and resolve problems.
- Similarly, promoting knowledgebase development as part of your core process (e.g., identifying KB opportunities as part of resolving a ticket) not only expedites future incident resolution but also provides input to problem management to resolve the underlying root cause.
Business Benefits
- Quicker incident resolution through better process (e.g., routing tickets to the correct SMEs) and leveraging KB articles.
- Preventing recurring incidents by resolving the root cause.
- Predicting and preventing future incidents through proactive problem management.
Info-Tech offers various levels of support to best suit your needs
DIY Toolkit
“Our team has already made this critical project a priority, and we have the time and capability, but some guidance along the way would be helpful.”
Guided Implementation
“Our team knows that we need to fix a process, but we need assistance to determine where to focus. Some check-ins along the way would help keep us on track.”
Workshop
“We need to hit the ground running and get this project kicked off immediately. Our team has the ability to take this over once we get a framework and strategy in place.”
Consulting
“Our team does not have the time or the knowledge to take this project on. We need assistance through the entirety of this project.”
Diagnostics and consistent frameworks used throughout all four options
Guided Implementation
What does a typical GI on this topic look like?
A Guided Implementation (GI) is a series
of calls with an Info-Tech analyst to help implement our best practices in your organization.
A typical GI is between eight and 12 calls over the course of four to six months.
| Phase 1 | Phase 2 | Phase 3 | Phase 4 |
|---|---|---|---|
| Call #1: Scope requirements, objectives, and your specific challenges. | Call #3: Incident Management Workflows. | Call #6: Problem ticket sources. | Call #9: Plan how you will communicate changes. |
| Call #2: Incident ticket intake and routing. | Call #4: Critical Incident Workflows. | Call #7: Problem management workflows. | Call #10: Create a project roadmap to implement improvements. |
| Call #5: Complete the Incident Management SOP | Call #8: Complete the Problem Management SOP |
Workshop Overview
Contact your account representative for more information.
workshops@infotech.com 1-888-670-8889
| Day 1 | Day 2 | Day 3 | Day 4 | |
|---|---|---|---|---|
| Activities | Optimize Ticket Intake and Routing | Standardize and Streamline Incident Response | Incident Wrap-Up and Establish Effective Problem Management | Problem Management Wrap-Up and Next Steps |
|
1.1 Review the incident lifecycle and your current challenges. 1.2 Improve how you identify, log, and categorize incidents. 1.3 Define a ticket prioritization scheme. 1.4 Drive more efficient ticket intake. |
2.1 Document your target-state Incident Management Workflow. 2.2 Document your target-state Critical Incident Response Workflow. 2.3 Define SLOs and escalation rules. |
2.4 Identify knowledgebase article candidates and create templates to expedite incident response. 2.5 Identify opportunities to improve efficiency with shift-left and automation (introduction). 3.1 Define problem management. 3.2 Standardize your problem intake process. 3.3 Standardize your problem action process (investigate, root cause analysis, resolve). |
3.4 Establish appropriate problem management governance. 4.1 Create a plan to communicate process changes. 4.2 Create a project roadmap to implement improvements. 4.3 Review workshop results. |
|
| Deliverables |
|
|
|
|
Phase 1: Optimize Ticket Intake and Routing
Phase 1
Optimize Ticket Intake and Routing
Phase 2
Standardize and Streamline Incident Response
Phase 3
Establish Effective Problem Management
Phase 4
Implement Improvements
This phase will walk you through the following steps:
- Review the incident lifecycle and your current challenges.
- Improve how you identify, log, and categorize incidents.
- Define a ticket prioritization scheme.
- Drive more efficient ticket intake.
Improve Incident and Problem Management
Step 1.1
Review the incident lifecycle and your current challenges
Activities
1.1.1 Identify challenges with your existing incident management processes
This step will guide you through the following content and activities:
- Establish a common understanding of the incident lifecycle.
- Identify challenges with your existing incident management processes.
This step involves the following participants:
- Incident Management Team (e.g., Tier 1 and 2 roles and the Incident Manager)
- Tier 3 reps from relevant IT teams (e.g., network, servers, security, apps, etc.)
Outcomes of this step
- Level-setting across the team regarding incident lifecycle stages, based on ITIL.
- High-level challenges identified with your existing incident management processes.
Blueprint pre-step: Gather your data to relate this blueprint to your reality
Before you begin this project, gather the data from your existing ticketing system.
You will use this data as you work through this blueprint to help you make decisions on what the target state of your incident management program looks like.
You will need:
- An export of your existing ticket categorization scheme; raw data is better so you can easily manipulate the data as you are analyzing it.
- Each person on the project team will pull ten tickets from each priority level you are currently using (10 sev1, 10 sev2, 10 sev3).
- A snapshot of the incident ticket interface to be able to quickly reference existing fields and functionality.
This image will help remind you to search through your own ticket data to help guide your decisions during the design phase of incident management.
Establish a common understanding of the incident lifecycle
1) Detection: User reporting an issue, event triggering an alert, and so on. Conduct initial triage/discovery. Confirm it’s an incident (for service requests, follow a separate process).
2) Registration: Create/update the ticket based on initial triage (e.g., incident details) or monitoring system that generated the alert (e.g., relevant system).
3) Classification: Categorize, prioritize, and conduct initial investigation (e.g., check KB for known errors). Escalate or re-assign if necessary.
4) Diagnosis: Additional investigation if solution not already identified. Peer discussion, check KB, and/or consult vendor. Escalate or re-assign if necessary.
5) Resolution: Apply solution (permanent fix or workaround) to restore service. If applicable, submit a change request to move the fix into production.
6) Closure: Finalize ticket details, including status (Closed). Provide final update to affected users. Identify if a KB is needed to expedite future troubleshooting or incident resolution.
Note: Ideally, steps 1 to 3 are executed by Tier 1 staff so that Tier 2 and 3 are included only when an issue needs to be escalated. This drives lower-cost resolution and frees time for Tier 2 and 3 to focus on project work, more-complex incidents, and problem management. Ticket updates occur throughout and are finalized as needed at Closure.
1.1.1 Identify challenges with your existing incident management processes
1-3 hours
Materials
- Whiteboard or flip chart
Participants
- Incident Management Team (e.g., Tier 1 and 2 roles and the Incident Manager)
- Tier 3 reps from relevant IT teams (e.g., network, servers, security, apps, etc.)
- As a group, outline the challenges or weaknesses you have in each step of the incident lifecycle. Separate the challenges into people, process, and technology for a wholistic view.
- Record those challenges for reference purposes. Phase 4 will include creating a project roadmap to address gaps and improve processes.
- Below are examples of common challenges to consider:
- Are incidents resolved at the appropriate Tier? Are Tier 2 and 3 resolving incidents that could be solved at a lower Tier?
- Any challenges with identifying ticket type, category, or severity level? Is it clear where to route tickets (e.g., based on category)?
- Is it clear when to escalate tickets? Is Tier 1 gathering enough information before escalating?
- Is ticket data updated appropriately by Tier 2 or 3 staff?
- Is there appropriate documentation available to support ticket troubleshooting (e.g., system information, relevant KB articles, etc.)?
- Any common complaints from users or executives (e.g., slow response, ticket status is unclear)?
- Below are examples of common challenges to consider:
Step 1.2
Improve how you identify, log, and categorize incidents
Activities
1.2.1 Review and update your categorization scheme
1.2.2 Define resolution codes to further improve reporting
This step will guide you through the following content and activities:
- Separate incidents from service requests
- Understand categorization best practices
- Review/update categorization scheme
- Define resolution codes to further improve reporting
This step involves the following participants:
- Incident Management Team (e.g., Tier 1 and 2 roles and the Incident Manager)
- Tier 3 reps from relevant IT teams (e.g., network, servers, security, apps, etc.)
Outcomes of this step
- Improved ticket categorization scheme and resolution codes.
- Knowledge sharing between teams regarding proper use of categories and resolution codes.
Separate incidents and service requests for better-defined SLAs
Defining the differences between service requests and incidents is not just for reporting purposes. It has a major impact on how service is delivered. If you fail to distinguish between ticket types, your metrics will obscure service desk performance.
Incidents
Are unexpected disruptions to normal business processes and require attempts to restore services as soon as possible (e.g. the printer is not working).
Service Requests
Are tasks that don’t involve something that is broken or has an immediate impact on services. They can typically be scheduled (e.g. request for new software).
| Incidents | Key Differences | Service Requests |
|---|---|---|
| Incidents will be prioritized based on urgency and impact to the organization. | Prioritization | Service requests will be scheduled and only increase in prioritization if there is a request process issue (e.g. I forgot to request Visio and I need it for a presentation today). Track these exceptions and report on non-compliance. |
| Did incidents get resolved according to prioritization rules? | Service Level Agreement | Did service requests get completed on time? |
| Incidents will typically need to be triaged at the service desk unless specific types of issues are set up to go directly to a specialist. | Routing of tickets | Service requests don’t need triage (typically) and can be routed automatically for approvals and fulfillment. |
Improve ticket routing and reporting with an effective categorization scheme
Too many options cause confusion; too few options provide little value.
Keep these guidelines in mind:
- A good categorization scheme is exhaustive and mutually exclusive: there’s a place for every ticket and every ticket fits in only one place.
- Pre-populate ticket templates with relevant categories to dramatically improve reporting and routing accuracy.
- Use a tiered system to make the categories easier to navigate. Three tiers with six to eight categories per tier provides up to 512 sub-categories, which should be enough even for the most ambitious team.
- Track only what you will use for reporting purposes. If you don’t need a report on individual kinds of laptops, don’t create a category beyond “laptops.”
- Keep it simple; no need to maintain two separate categorization schemes. Use meaningful descriptions that will help end users and IT staff put the ticket in the correct category.
- Caution if using “miscellaneous” categories. If you need a miscellaneous category to capture orphaned or stranded tickets, clean it regularly (at least quarterly) and assign those tickets to the proper categories. Otherwise, you lose the opportunity for meaningful reporting.
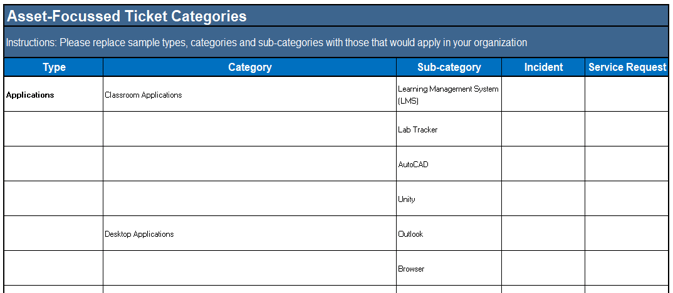
| Type | Category | Subcategory |
|---|---|---|
| Hardware | Mobile Device | Surface |
| iPad | ||
| Desktop | Laptops | |
| Monitor | ||
| CPU | ||
| Accessories | Docking Station | |
| USB Drives | ||
| Webcams | ||
| Infrastructure | Network | Switches/Routers |
| Connectivity/ISP | ||
| Wi-Fi | ||
| LAN/WAN Appliances |
Info-Tech Insight
Think about how you will use the data to determine which components need to be included in reports. If components won’t be used for reporting, routing, or warranty, reporting down to the component level adds little value.
1.2.1 Review and update your categorization scheme
1-3 hours
Materials
- Whiteboard or flip chart or work directly in the relevant template
- Your ticket categories
Participants
- Incident Management Team (e.g., Tier 1 and 2 roles, and the Incident Manager)
- Tier 3 reps from relevant IT teams (e.g., network, servers, security, apps, etc.)
- As a group, review existing categories, looking for duplicates and designations that won’t effect ticket routing. Reconcile duplicates and remove non-essential categories.
- As a group, redo the categories, ensuring that the new categorization scheme will meet the reporting requirements outlined earlier.
- Are categories exhaustive and mutually exclusive?
- Is the tier simple and easy to use (i.e. three tiers x eight categories)?
- Test against recent tickets to ensure you have the right categories.
- Record the ticket categorization scheme in the Service Desk Categorization Tool.
When building the categories, ask these questions:
- Type: What asset am I working on?
- Category: What general asset group does this type belong in?
- Sub-category: What exact device am I working on?
Download the Service Desk Ticket Categorization Schemes
1.2.2 Define resolution codes to further improve reporting
Materials
- Whiteboard or flip chart or work directly in the relevant template
- Your tickets
Participants
- Incident Management Team (e.g., Tier 1 and 2 roles, and the Incident Manager)
- Tier 3 reps from relevant IT teams (e.g., network, servers, security, apps, etc.)
A resolution code is a field within the ticketing system that clarifies the primary way the ticket was resolved – e.g., incident resolution required a configuration change or training for the user, etc. See the list to the right or the Resolution Codes section in the SOP for examples.
The resolution code improves reporting by adding another level to the categorization scheme. Use reporting by category and resolution code to identify knowledgebase article candidates, training needs, or potential problem ticket candidates.
Activity Instructions:
- If you have resolution codes, are they being used properly? Are they telling the right story? Would they help identify related incidents or trends?
- If you don’t have resolution codes:
- Brainstorm resolution codes and critically assess their value.
- Test the resolution codes against the tickets you pulled. Do they work against real ticket examples? Review and update based on this review.
- Record them in the Incident Management and Service Desk SOP.
Example Resolution Codes
- How to/training
- Configuration change
- Upgrade
- Installation
- Data import/export/change
- Information/research
- Reboot
Download the Incident Management and Service Desk SOP
Step 1.3
Define a ticket prioritization scheme
Activities
1.3.1 Define your impact and urgency scales
This step will guide you through the following content and activities:
- Combine impact and urgency to factor in the timing of the incident
- Simplify ticket prioritization by focusing on a few easily assessed impact and urgency criteria
- Define your impact and urgency scales
This step involves the following participants:
- Incident Management Team (e.g., Tier 1 and 2 roles and the Incident Manager)
- Tier 3 reps from relevant IT teams (e.g., network, servers, security, apps, etc.)
Outcomes of this step
- Improved ticket categorization scheme and resolution codes.
- Knowledge sharing between teams regarding proper use of categories and resolution codes.
Combine impact and urgency to factor in the timing of the incident
The severity of an incident often depends on context, so factor that into your ticket prioritization scale – specifically, consider impact and urgency
- Example 1: Payroll system down just as HR is preparing to submit their payroll file to the bank:
- Extensive impact (could affect all users)
- Critical urgency (deadline to submit payroll is today by 5:00pm)
- = Severity 1
- Example 2: Payroll system down, but it’s not a payroll week (payroll system not needed until next week).
- Extensive impact (could affect all users)
- High urgency (needs to be resolved in the next few days)
- = Severity 2
Tip: Four severity levels works well for most organizations. It allows Severity 1 to be reserved for truly critical incidents (potentially require invoking your DRP or BCP if it can’t be resolved soon) and three remaining levels for High, Medium, Low severities.
Severity Level = Impact x Urgency
Impact = The effect of the incident on the organization
Urgency = Is the incident impact, time-sensitive
| URGENCY | |||||
|---|---|---|---|---|---|
| Critical | High | Medium | Low | ||
| IMPACT | Extensive |
Severity 1 |
2 | 3 | 3 |
| Significant | 2 | 2 | 3 | 4 | |
| Moderate | 3 | 3 | 3 | 4 | |
| Low | 3 | 4 | 4 | 4 |
Refer to the Incident Management and Service Desk SOP template for an example
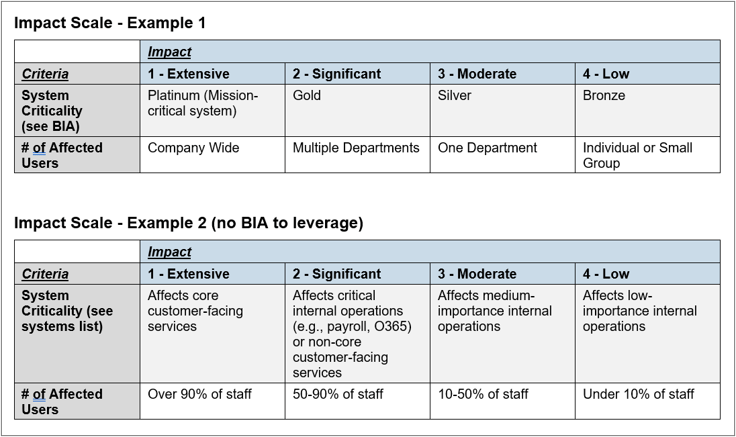
Simplify ticket prioritization by focusing on a few easily assessed impact criteria
Keep in mind prioritization may need to occur quickly and be based on information readily available to your Tier 1 staff.
- Impact typically considers:
- System criticality (affected system supports critical business functions). If the organization has conducted a Business Impact Analysis (BIA), then leverage the criticality tiers assigned in the BIA.
- Scope (e.g., how many users are significantly effected).
- Keep it simple by allowing one criteria to determine impact. E.g., if a critical system is down that supports a key customer service, but very few staff are directly impacted, it’s still a critical impact. Doesn’t need to be critical across all criteria.
- Avoid using criteria that would be difficult for Tier 1 staff to assess. E.g.:
- It would be difficult for Tier 1 staff, or really any user, to measure financial impact in the moment that an incident is reported.
- However, it’s reasonable to expect they will know which business processes/functions are critical to the business (e.g., payroll, customer-facing services, etc.). If they don’t, that is an achievable training opportunity facilitated by mapping systems to critical business functions.
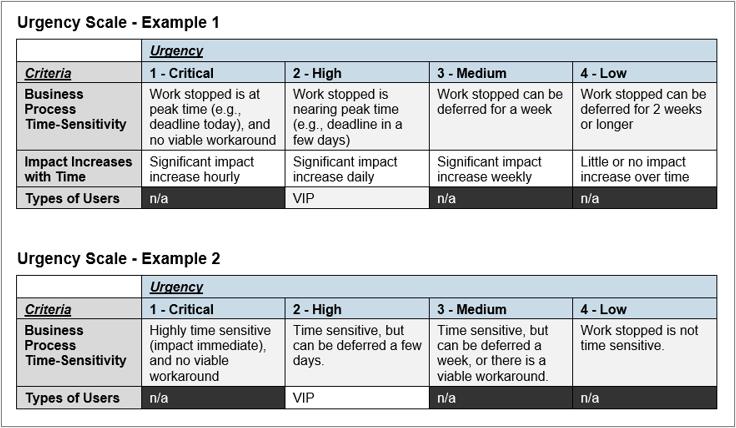
Similarly, identify urgency criteria that are easily assessed
No user is going to say “take your time with this incident,” but you can get specific with your triage to identify the impacted business activity and whether or not it is time sensitive.
- Urgency considers whether the incident is effecting time-sensitive activities, or whether the impact is going to increase quickly. Below are example criteria for assessing urgency:
- Business process time sensitivity (e.g., payroll system in a payroll week).
- Impact increases with time (e.g., payroll is next week; by Tuesday, may have to consider unacceptable workarounds).
- Types of users (VIPs) (e.g., impacting a senior executive). Due to their role, the expectation is that potentially time-sensitive processes are effected, and a quick resolution is expected. Customers could also be considered for this criteria, but they are typically factored into the Impact scale.
- As with impact, keep it simple by allowing one criteria to determine urgency. Also, you don’t necessarily need all the above criteria (see the example on the right).
- Avoid using criteria that would be difficult for Tier 1 staff to assess. E.g.: It may be difficult to forecast how much impact will increase over time (e.g., double every hour) versus simply forecasting if impact will increase (e.g., impact will increase on Friday because work deadlines will be missed).
1.3.1 Define your impact and urgency scales
Materials
- Whiteboard or flip chart or work directly in the relevant template
- Your tickets
Participants
- Incident Management Team (e.g., Tier 1 and 2 roles, and the Incident Manager)
- Tier 3 reps from relevant IT teams (e.g., network, servers, security, apps, etc.)
- As a group, discuss possible impact criteria and select the best candidates. See previous slides for examples.
- Test the impact scale against examples of your tickets. Review and update based on this review.
- Now consider urgency criteria and select the best candidates.
- Test the urgency scale against examples of your tickets. Review and update based on this review.
- Update the ticket prioritization table in the Incident Management and Service Desk SOP based on your work to this point.
- Test the prioritization matrix against examples of your tickets. Review and update based on this review.
Example:
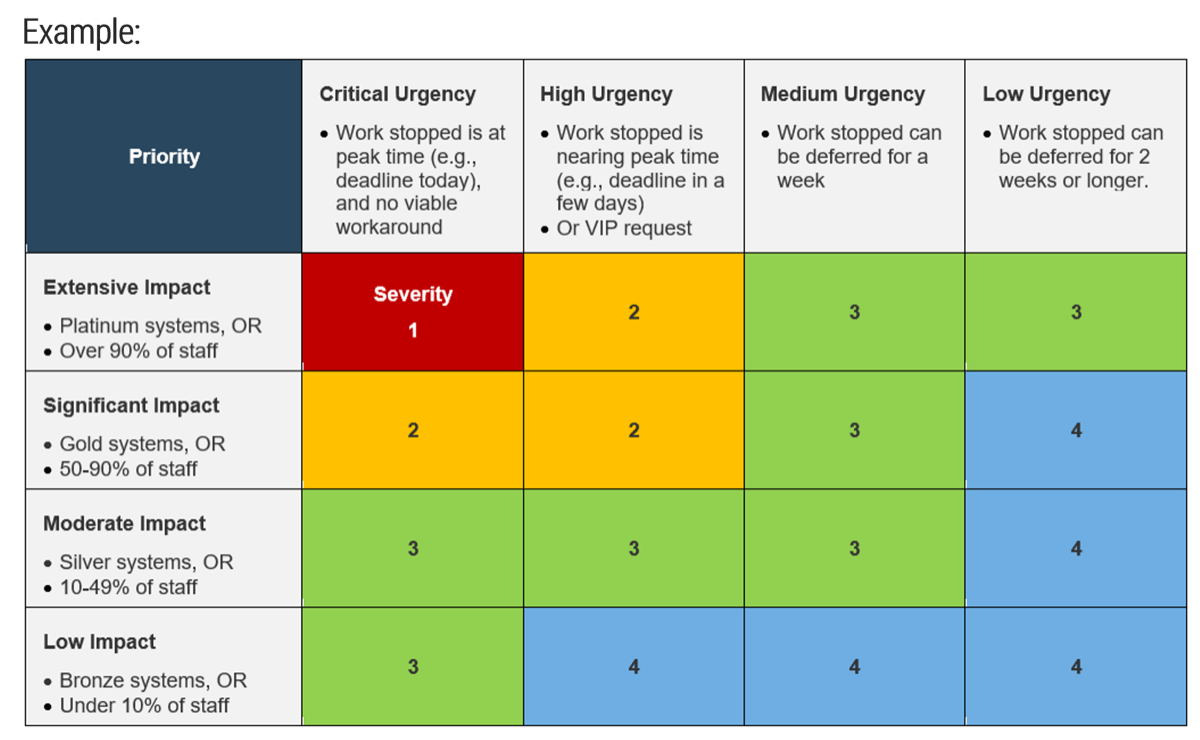
Note: The example above and in the SOP are reasonable but not universal. Adjust the scales and/or the severities assigned to each cross-section if necessary to suit your requirements or circumstances.
Step 1.4
Drive more efficient ticket intake
Activities
1.4.1 Identify action items to improve ticket intake
This step will guide you through the following content and activities:
- Review possible intake channels and their fit in your organization
- Look at your ticket data to identify opportunities
- Identify action items to improve ticket intake
This step involves the following participants:
- Incident Management Team (e.g., Tier 1 and 2 roles and the Incident Manager)
- Tier 3 reps from relevant IT teams (e.g., network, servers, security, apps, etc.)
Outcomes of this step
- Clarifying current state regarding intake channels.
- Identifying opportunities to improve ticket intake.
Review possible intake channels and how they’ll fit into your organization
Understand the value of each of the standard intake channels described below. For example, while phone intake may be inefficient, it’s effective for urgent requests.
The web portal is the most efficient intake method, but ensure it is user friendly before promoting it.
Maintain the phone for users from other locations and for critical incidents, but encourage users who call in to submit a ticket through the portal.
Email works well if it automatically creates a ticket in your ticketing system, but users often don’t provide enough information in unstructured emails. Use required fields and ticket templates to ensure the ticket is properly categorized.
If walk-ins are permitted, formalize the support so it can be scheduled and managed rather than interrupt driven. Ensure all interrupt-driven work is ticketed for proper workload management.
If chat is available, make it structured through the ticket queue management. Otherwise, it can lead to interruptions and prioritization challenges.
Look at your ticket data to identify opportunities
Review the tickets you pulled and ask yourself the following questions to help see the gaps and opportunities for improvement.
Formalize walk-ins
- Do you always have someone at the service desk?
- Are technicians being hijacked in the hallway to complete work without tickets?
- Are you capturing ALL work through a ticket?
- Why are users choosing to spend more time coming to the service desk than submitting a ticket?
- Do they think it’s faster?
Build a self-service portal
- Do users know where to find the portal?
- How many tickets are created through the portal?
- Is the interface easy to use?
- Is it easy for a user to find the correct category for the help they’re seeking?
How is the phone used?
- Do we have enough resources to answer the calls?
- Is there voicemail capability and are messages picked up on time?
- Are there automated call routing prompts? Are they clear and simple?
Deal with email efficiently
- How quickly are the messages picked up?
- Are they manually transferred to a ticket or is it automated?
- How many transactions does one email take the service desk to have all the correct information?
Info-Tech Best Practice
The two most efficient intake channels should be encouraged for most tickets.
1.4.1 Identify action items to improve ticket intake
1-3 hours
Materials
- Whiteboard or flip chart
Participants
- Incident Management Team (e.g., Tier 1 and 2 roles and the Incident Manager)
- Tier 3 reps from relevant IT teams (e.g., network, servers, security, apps, etc.)
- As a group, review the previous slides outlining considerations for common intake channels.
- List the challenges you find today with each intake channel. Consider people, process, and technology channels. For example:
- Do you have to overcome the inertia of users who are just used to a certain intake channel and perhaps don’t realize there’s a better option?
- Is the process for submitting and receiving those tickets easy to use?
- Is the technology lacking (e.g., are emails not auto-generating tickets)?
- Prioritize the challenges and write down potential initiatives to address each challenge.
Note: These potential initiatives will feed the project roadmap exercise in Phase 4 of this blueprint.
Phase 2: Standardize and Streamline Incident Response
Phase 1
Optimize Ticket Intake and Routing
Phase 2
Standardize and Streamline Incident Response
Phase 3
Establish Effective Problem Management
Phase 4
Implement Improvements
This phase will guide you through the following steps:
- Document your target-state Incident Management Workflow.
- Document your target-state Critical Incident Response Workflow.
- Define SLOs and escalation rules.
- Create knowledgebase articles and communication templates to expedite incident response.
- Improve efficiency with shift-left and automation.
Improve Incident and Problem Management
Step 2.1
Document your target-state Incident Management Workflow
Activities
2.1.1 Use tabletop planning to capture your current-state workflow and gaps
2.1.2 Document your target-state workflow and where change needs to occur
2.1.3 Complete the RACI chart in your SOP to clarify expectations for each role
This step will guide you through the following content and activities:
- Review the key elements in an Incident Management workflow
- Use tabletop planning to capture your current-state workflow and gaps
- Document your target-state workflow
- Complete the RACI chart in your SOP
This step involves the following participants:
- Incident Management Team (e.g., Tier 1 and 2 roles, and the Incident Manager)
- Tier 3 reps from relevant IT teams (e.g., network, servers, security, apps, etc.)
Outcomes of this step
- Documenting your incident management workflow
- Documenting roles and responsibilities to clarify expectations
Review the key elements in an Incident Management workflow
Workflow elements include:
- Ticket creation and closure
- Triage, categorization, and prioritization
- Troubleshooting if necessary
- Escalations to Tier 2 or 3 if necessary
- Vendor escalations if necessary
- Communications
- Change management if necessary
- Documentation (ticket updates, KBs)
Example workflow
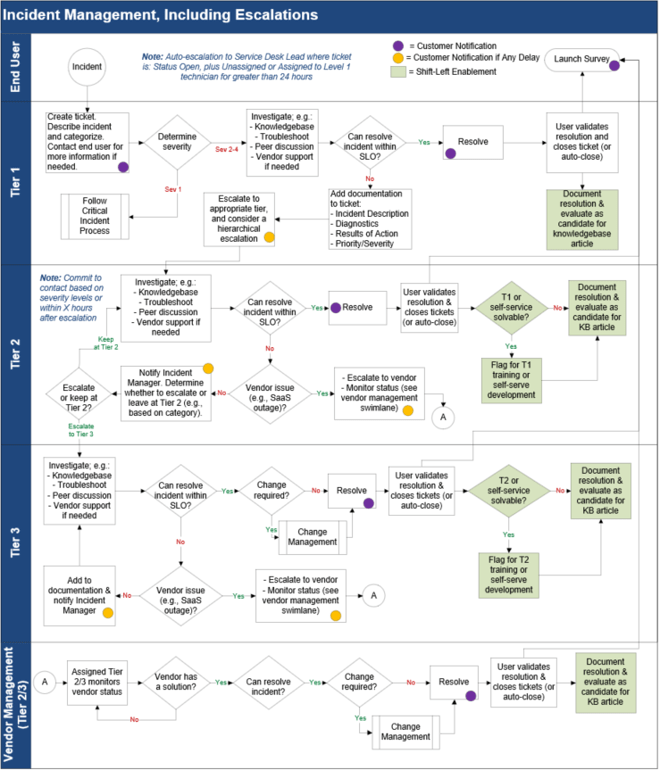
Download Incident Management Workflow Library
2.1.1 Use tabletop planning to capture your current-state workflow and gaps
1-3 hours
Materials
- Whiteboard or flip chart
- Your tickets
Participants
- Incident Management Team (e.g., Tier 1 and 2 roles and the Incident Manager).
- Tier 3 reps from relevant IT teams (e.g., network, servers, security, apps, etc.).
Tabletop planning is a walk-through exercise. In this case, we will be walking through how you would respond to an actual incident using the incident lifecycle steps.
- For this exercise, identify at least one example incident for each of your severity levels, not including severity 1 (that will be covered later in this deck).
- Capture the steps you would typically follow today through each phase of incident management (detection through to post-incident).
- Discuss each step to identify challenges and process gaps. For example:
- Are incidents resolved at the appropriate tier? Is there sufficient triaging before escalating?
- Is it clear where to route tickets (e.g., based on category)? Is it clear when to escalate tickets?
- Is there appropriate documentation available to support ticket troubleshooting (e.g., system information, relevant KB articles, etc.?).
- Are you over- or under-communicating with effected users (e.g., for triage or status updates)?
1. Detection (identify, triage)
2. Registration (log ticket)
3. Classification (categorize, prioritize)
4. Diagnosis (investigate)
5. Resolution (solve, validate)
6. Closure (final updates)
2.1.2 Document your target-state workflow and where change needs to occur
1-3 hours
Materials
- Whiteboard or flip chart or work directly in the relevant template
Participants
- Incident Management Team (e.g., Tier 1 and 2 roles and the Incident Manager)
- Tier 3 reps from relevant IT teams (e.g., network, servers, security, apps, etc.)
- Review your current-state workflow and identify specific changes you plan to implement:
- Focus on realistic changes that can happen with existing resources (e.g., process changes in IT’s control, updates to your existing ITSM tool setup, and so on).
- Longer-term goals that may require a significant technology change (e.g., migrating to a better ITSM tool) or process change outside of your control can be captured as part of your overall project roadmap that would include short-, medium-, and long-term initiatives.
- Create a copy of your current-state workflow and modify it to reflect the changes identified above. Alternatively, use the example Incident Management Workflow in this blueprint as a starting point.
- In the target-state workflow, use colored dots to identify customer notification steps and shift-left opportunities, as in the example Incident Management Workflow in this blueprint. In addition, add colored dots to identify desired changes so it’s clear to staff where you are focusing on improvements.
- Review and update the Incident Management and Service Desk SOP to reflect these changes.
Download Incident Management Workflow Library
Download Incident Management and Service Desk SOP
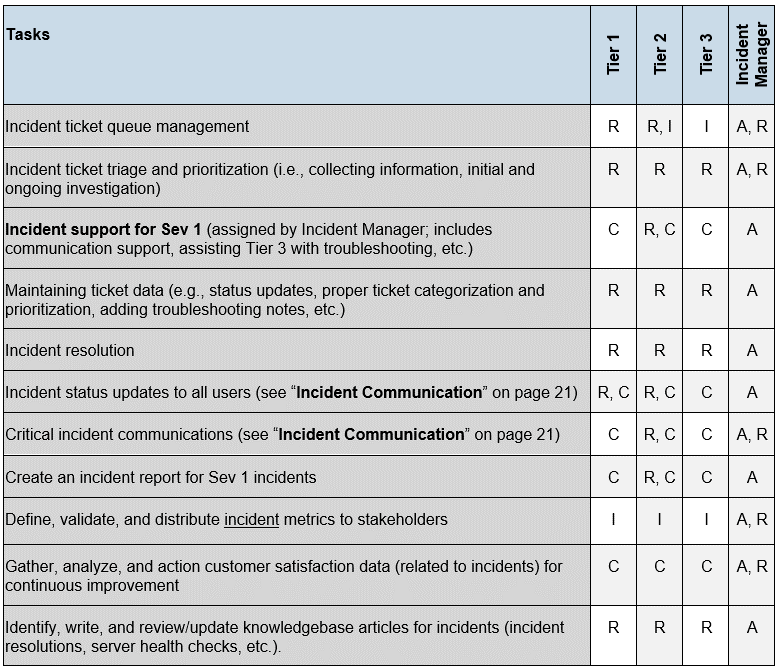
A RACI chart will help clarify roles in your target workflow
RACI stands for Responsible, Accountable, Consulted, and Informed. A RACI chart aligns tasks with roles to clarify expectations.
Specifically, the RACI chart documents:
- Who is doing the task (Responsible)? E.g., Tiers 1, 2, and 3 might be responsible for triaging incoming tickets.
- Who ensures the task is completed (Accountable)? E.g., the Incident Manager may be accountable for ensuring their staff follow appropriate processes.
- Who contributes information to the task (Consulted)? E.g., The person creating an Incident Report may need to consult the other technicians involved.
- Who receives information from the task (Informed)? E.g., Tier 1, 2, and 3 staff might be informed of the incident metrics gathered by the Incident Manager.
RACI chart example from the Incident Management and Service Desk SOP in this blueprint.
Establish a common understanding of the differences between Tier 1, 2, and 3 roles
Below is an example of the high-level differences between these roles.
| Tier | Duties | Example |
|---|---|---|
| Tier 1 | Ticket intake (initial triage, categorization, and assigning tickets if beyond Tier 1 expertise). Resolve low-complexity incidents or where a KB enables Tier 1 first-call resolution. |
|
| Tier 2 | More senior incident response, though not specialists. Tier 2 provides all of the capabilities of tier 1 plus the ability to resolve incidents that require deeper knowledge. |
|
| Tier 2 (Specialist) | Reports to the infrastructure manager or the applications manager, but not Tier 3 expertise. Tier 2 specialists are required when certain permissions or expertise is required beyond the general Tier 2 staff capabilities. |
|
| Tier 3 | Reports to the infrastructure manager or the applications manager. Handles the most challenging incidents. |
|
2.1.3 Complete the RACI chart in your SOP to clarify expectations for each role
1-3 hours
Materials
- Whiteboard or flip chart or work directly in the relevant template
Participants
- Incident Management Team (e.g., Tier 1 and 2 roles and the Incident Manager)
- Tier 3 reps from relevant IT teams (e.g., network, servers, security, apps, etc.)
- In the RACI chart in the Incident Management and Service Desk SOP, update the top row to reflect the relevant roles in your organization. For example, if your Service Desk Manager also functions as your Incident Manager, change the role title in the RACI chart to Service Desk Manager.
- Review and update the task list in the RACI chart based on your target-state workflow.
- For example, you may want to add tasks that are not in the example RACI chart to reflect your circumstances or to emphasize task changes you wish to implement.
- At the same time, avoid being too granular with the task list. Use the example RACI chart as a guide to what level of granularity is appropriate, even if the specific tasks might be different for you.
- Once the roles and tasks are updated, fill in the appropriate RACI value.
- Make only one role Accountable for each task. Multiple accountables can lead to confusion over expectations.
- The Accountable role can also be Responsible if they are in charge and doing the work.
- Assign C and I where needed for clarity. E.g., all roles might be informed as a matter of course, but assign an I for specific roles that need to be informed.
- Ensure everyone on the team understands what’s expected by the RACI values assigned to their role.
Step 2.2
Document your target-state Critical Incident Response Workflow
Activities
2.2.1 Use tabletop planning to capture your current-state workflow and gaps for critical incidents
2.2.2 Document your target-state critical incident workflow and where change needs to occur
This step will guide you through the following content and activities:
- Review the key elements in a Critical Incident Response workflow
- Use tabletop planning to capture your current-state workflow and gaps for critical incidents
- Document your target-state critical incident workflow and where change needs to occur
This step involves the following participants:
- Incident Management Team (e.g., Tier 1 and 2 roles and the Incident Manager)
- Tier 3 reps from relevant IT teams (e.g., network, servers, security, apps, etc.).
Outcomes of this step
- Documenting your critical incident response workflow.
- Identifying gaps to address.
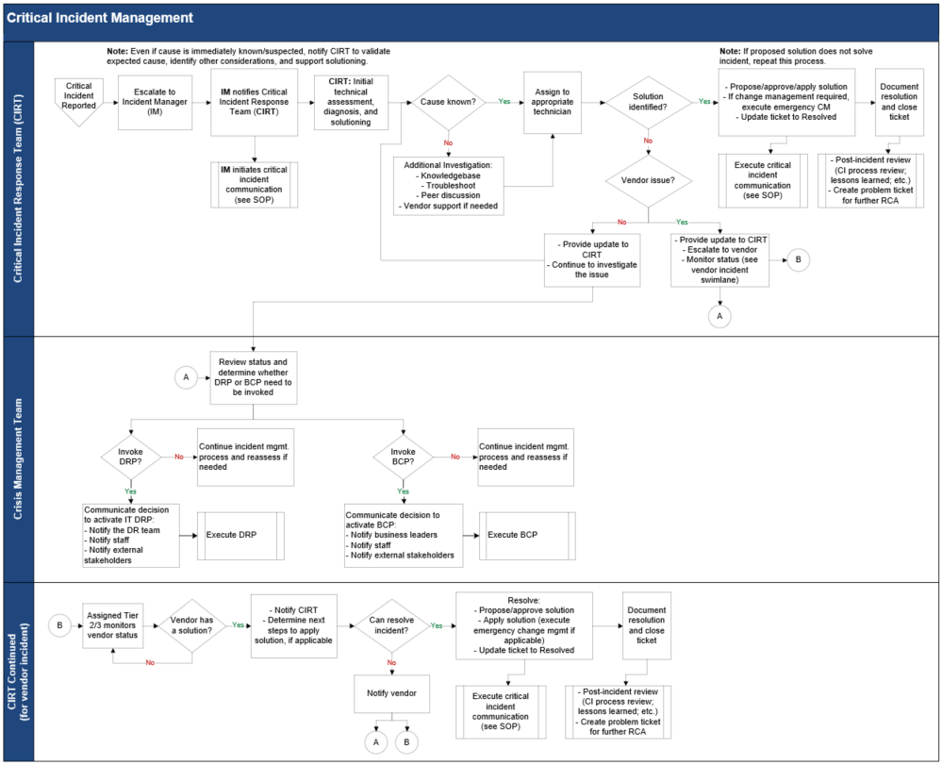
Review the key elements in a Critical Incident Response workflow
Workflow elements once an incident is identified as a Severity 1 include the following (in addition to normal non-critical incident management elements):
- Immediate escalation to the Incident Manager.
- Notifying the IT Critical Incident Response Team (CIRT); the team may or may not be required, but they need to be aware in case they (or their resources) are needed.
- Critical incident communication (e.g., notifying the executive team) in addition to notifying relevant IT staff.
- Decision whether to invoke your DRP and/or BCP, depending on impact and how quickly the incident can be resolved.
- Emergency change management, if the resolution needs to go through a change management process.
- Post-incident review that includes an incident report and creating a problem ticket for further root cause analysis.
Download Incident Management Workflow Library
Example workflow
2.2.1 Use tabletop planning to capture your current-state workflow and gaps for critical incidents
1-3 hours
Materials
- Whiteboard or flip chart
- Your tickets
Participants
- Incident Management Team (e.g., Tier 1 and 2 roles and the Incident Manager)
- Tier 3 reps from relevant IT teams (e.g., network, servers, security, apps, etc.).
- Infrastructure Manager
- Apps Manager
- For this exercise, identify at least one example of a recent Severity 1 incident that meets the criteria defined in the earlier ticket prioritization exercise, or make up a realistic what-if critical incident.
- Capture the steps you would typically follow today through each phase of incident management for a critical incident (detection through to post-incident).
- Discuss each step to identify challenges and process gaps. For example:
- Is there confusion over whether an incident qualifies as a Sev 1? Is the distinction between a Severity 1 incident and a DR incident clear?
- Is it clear when to escalate and who needs to be notified?
- Are critical incident response roles clear?
- Are communication responsibilities clear – e.g., for status updates to effected users and status updates to senior leadership?
- Is there appropriate documentation available to support troubleshooting and recovery (e.g., system information, relevant KB articles, etc.)?
- Is there a suitable emergency change management process defined, if needed?
2.2.2 Document your target-state critical incident workflow and where change needs to occur
1-3 hours
Materials
- Whiteboard or flip chart or work directly in the relevant template
- Your tickets
Participants
- Incident Management Team (e.g., Tier 1 and 2 roles and the Incident Manager)
- Tier 3 reps from relevant IT teams (e.g., network, servers, security, apps, etc.)
- Infrastructure Manager
- Apps Manager
- Review your current-state workflow and identify specific changes you plan to implement.
- Focus on realistic changes that can happen with existing resources (e.g., process changes in IT’s control, updates to your existing ITSM tool setup, and so on).
- Longer-term goals that may require a significant technology change (e.g., migrating to a better ITSM tool) or process change outside of your control can be captured as part of your overall project roadmap that would include short, medium, and long-term initiatives.
- Create a copy of your current-state workflow and modify it to reflect the changes identified above. Alternatively, use the example critical incident workflow in the Incident Management and Service Desk Workflow Library in this blueprint as a starting point.
- In the target-state workflow, use colored dots to identify desired changes so it’s clear to staff where you are focusing on improvements.
- Also review and update the Critical Incident Management section in the Incident Management and Service Desk SOP to reflect these changes. This includes capturing the Critical Incident Response Team roles and communication assignments.
Download Incident Management Workflow Library
Step 2.3
Define SLOs and escalation rules
Activities
2.3.1 Define SLOs and escalation timelines for each severity level
2.3.2 Identify system owners to expedite escalations
This step will guide you through the following content and activities:
- Understand SLOs versus SLAs and how they impact escalation timelines
- Define SLOs and escalation timelines for each severity level
- Identify system owners to expedite escalations
This step involves the following participants:
- Incident Management Team (e.g., Tier 1 and 2 roles and the Incident Manager)
- Tier 3 reps from relevant IT teams (e.g., network, servers, security, apps, etc.)
Outcomes
- SLOs defined and documented.
- System owners identified and documented.
Start with SLOs before defining SLAs
Use metrics to measure existing operational processes (e.g., time to respond to a ticket, time to resolve, etc.) to identify bottlenecks, drive improvement, and ultimately establish reasonable service level targets. Define those targets as Service Level Objectives (SLOs), which are internal IT-facing metrics to keep the focus initially on process improvement. You can choose to make SLOs business-facing to set expectations, but they are a goal, not a commitment.
As you mature your incident management program, you can be more confident about establishing business-facing commitments in a Services Level Agreement (SLA).
The table below further clarifies the differences between SLOs and SLAs.
| Service Level Objectives (SLOs) | Service Level Agreements (SLAs) |
|---|---|
| Internal objectives within IT. | Service levels agreed to with your customer. |
| SLOs can be defined for components of an overall service. | SLAs measure customer-facing service levels, not the timeline for IT sub-steps required to meet the SLA. |
| SLO breaches are tracked to identify opportunities for improvement. | SLA breaches/compliance metrics are typically reported to the customer. |
| For both SLOs and SLAs, escalation timelines are defined to ensure added resources are applied when needed for the best chance of meeting the overall SLO or SLA. | |
Note: For additional guidance on metrics, including the use of tension metrics to avoid gaming the system or driving unintended behavior, please refer to the Standardize the Service Desk blueprint.
Escalation timelines are geared to meeting SLOs (or SLAs)
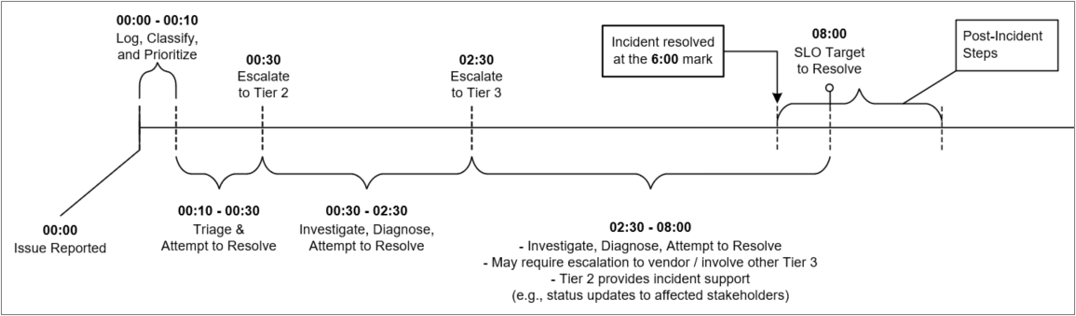
Example – Sev 2 incident timeline:
- Sev 2 Response SLO is 1 hour:
- Response occurs within 10 minutes in this example.
- Sev 2 Resolution SLO is 8 hours:
- Escalates to Tier 2 within 30 minutes (if no progress), and then to Tier 3 within 2.5 hours to ensure appropriate resources are leveraged to resolve the incident before the Resolution SLO deadline.
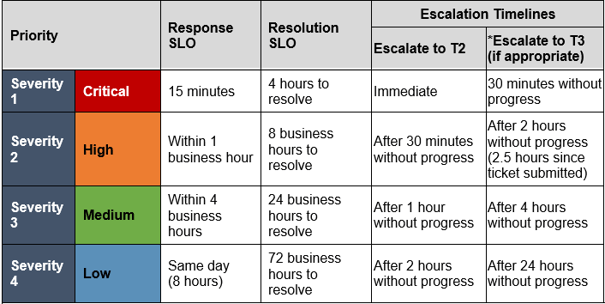
2.3.1 Define SLOs and escalation timelines for each severity level
1-3 hours
Materials
- Whiteboard or flip chart or work directly in the relevant template
- Your tickets
Participants
- Incident Management Team (e.g., Tier 1 and 2 roles and the Incident Manager)
- Tier 3 reps from relevant IT teams (e.g., network, servers, security, apps, etc.)
- Infrastructure Manager
- Apps Manager
- Review your target incident workflows, existing escalation rules (if in place), and any relevant metrics you have to determine reasonable targets for the following values for each severity level:
- Response time: Time from when the incident record is created to the time that you confirm receipt and assignment (i.e., not just the automated notification from your ITSM tool when a user submits a ticket).
- Resolution time: Time from when the incident record is created to the time that the customer has been notified that it is resolved.
- Escalation time: Maximum amount of time that ticket should be worked on without resolution progress before escalating.
- Map your sample tickets into an incident timeline to validate whether you would be able to meet your targets.
- Document your targets in the Incident Management and Service Desk SOP.
Example SLO and Escalation Timelines
2.3.2 Identify system owners to expedite escalations
1-3 hours
Materials
- Whiteboard or flip chart
Participants
- Incident Management Team (e.g., Tier 1 and 2 roles and the Incident Manager)
- Tier 3 reps from relevant IT teams (e.g., network, servers, security, apps, etc.)
- Infrastructure Manager
- Apps Manager
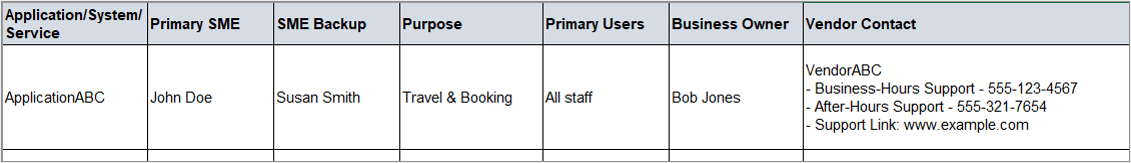
- Identify systems/applications/services that will require specialists for troubleshooting or access rights. Start with ten key systems (or applications or services). You can always add to this list, including services such as SaaS solutions.
- Identify primary and secondary specialists for each system as well as the vendor(s) that will receive escalations either immediately or after troubleshooting.
- Identify the system’s purpose, primary users, and business owner (if assigned). This information can help with assessing impact, targeting incident communications, and getting approval for change management if needed to resolve the incident.
- Document this information in a spreadsheet or other tool or format that works for you. Below is an example:
To automate or further streamline ticket routing and escalations, also do the following:
- Set up relevant skills/systems groups in your ITSM tool.
- Set up workflows in your ITSM tool where appropriate to facilitate ticket routing to the appropriate skills group.
Step 2.4
Create knowledgebase articles and communication templates to expedite incident response
Activities
2.4.1 Identify and assign candidates for KB articles
2.4.2 Create incident status templates to simplify communication
2.4.3 Create an incident report template for critical incidents
This step will guide you through the following content and activities:
- Elements to include in an Incident KB article
- Identify and assign candidates for KB articles
- Create incident status templates to simplify communication
- Create an incident report template for critical incidents
This step involves the following participants:
- Incident Management Team (e.g., Tier 1 and 2 roles, and the Incident Manager)
- Tier 3 reps from relevant IT teams (e.g., network, servers, security, apps, etc.)
Outcomes of this step
- Candidates for KB articles identified
- Incident status templates
- Incident report template
A knowledgebase is an essential tool for expediting incident resolution
Knowledge Management
- Gathering, analyzing, storing, and sharing knowledge to reduce the need to rediscover known solutions.
Knowledgebase
- Organized repository of IT best practices and knowledge gained from practical experiences.
- End-User KB
- Give end users a chance to resolve simple issues themselves without submitting a ticket.
- Internal KB
- Shared resource for service desk staff and managers to share and use knowledge.
Use the knowledgebase to document:
- Steps for pre-escalation troubleshooting.
- Known errors.
- Workarounds or solutions to recurring issues.
- Solutions that require research or complex troubleshooting.
- Incidents that have many root causes.
- Start with the most frequent solution and work toward less likely issues.
It’s better to start small than to have nothing at all
Service desk teams are often overwhelmed by the idea of building and maintaining a comprehensive integrated knowledgebase that covers an extensive amount of information.
Don’t let this idea stop you from building a knowledgebase! It takes time to build a comprehensive knowledgebase and you have to start somewhere.
Start with existing documentation or knowledge that is easy to document and you will soon see the benefits.
Then continue to build and improve from there. Eventually, knowledge management will be a part of the culture.
Note: This section focuses on getting started with capturing KB articles.
For more details on building and maintaining a knowledgebase, refer to the blueprint Standardize the Service Desk.
Review the key elements to include in an incident KB article
Use the Incident Knowledge Base Article Examples document in this blueprint as a guide to create templates in your ITSM tool Knowledge Base module or an equivalent tool that allows for version control, triggering reviews, and role-based access to automate at least some of the knowledge management tasks.
Key elements to include in your template and KB articles:
- Article metadata: Consistent metadata to track ownership, audience, version details, and a scheduled review date.
- Issue description: Short summary of how the incident presents itself – what is the error that is seen or experienced?
- Known error: Indicate if it’s a known error; if it is, provide specific details about the known error.
- Solution requirements/related information: Include requirements to execute the solution, such as specific resources and/or access rights.
- Procedure: Provide the steps to resolve the incident.
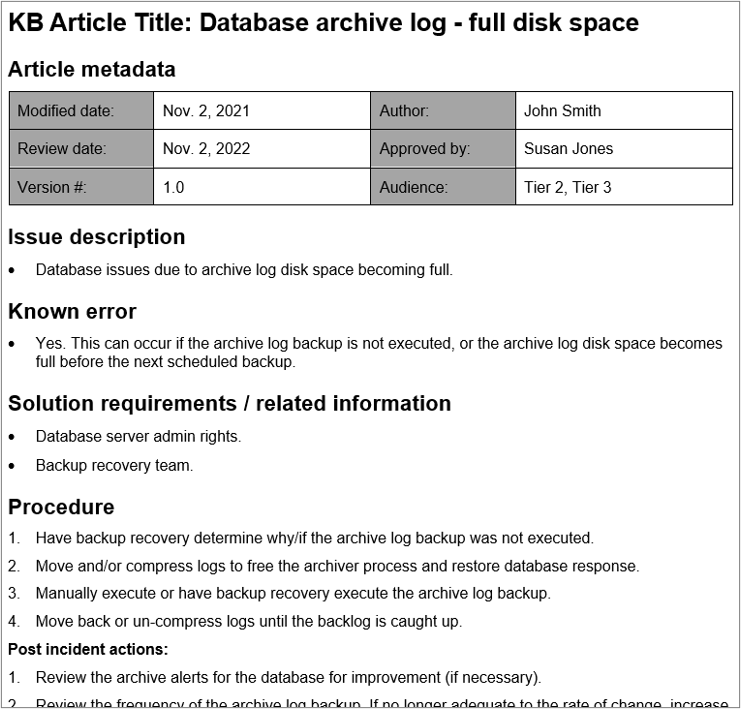
Example Incident KB Article – download the Incident Knowledge Base Article Examples document for more details and examples
2.4.1 Identify and assign candidates for KB articles
1-3 hours
Materials
- Whiteboard or flip chart
- Your tickets
Participants
- Incident Management Team (e.g., Tier 1 and 2 roles and the Incident Manager).
- Tier 3 reps from relevant IT teams (e.g., network, servers, security, apps, etc.).
- Review your incident trends (e.g., based on category) to identify five to ten recurring incidents.
- Evaluate whether these incidents are candidates for KB articles and prioritize them based on:
- Incident frequency: Higher frequency is greater justification to write a KB article. You’ll save time. What’s the frequency of these incidents, and is that likely to change (for better or worse)?
- Incident complexity: The greater the complexity, typically the more time can be saved by documenting the procedure. This will help you avoid having to re-invent the solution each time.
- Business impact: The greater the impact, the greater the need to reduce resolution time, and a KB will help.
- Also consider KB article candidates such as system health check procedures that would help with general troubleshooting but aren’t necessarily specific to one incident.
- For each KB article candidate, identify the following:
- Author: Include the KB article in the action items for improving incident management.
- Audience: This will impact the content and article access rights. If the article should be available to end users as part of self-service initiatives, the procedures will need to be written for a non-technical audience.
- Assign a KB Manager who will lead the effort in creating the appropriate templates, monitoring KB article completion, and supporting staff with identifying future KB article candidates.
For more information about setting up a Knowledge Base, see the blueprint Standardize the Service Desk.
2.4.2 Create incident status templates to simplify communication
1-3 hours
Materials
- Whiteboard or flip chart or work directly in the relevant template
Participants
- Incident Management Team (e.g., Tier 1 and 2 roles and the Incident Manager).
- Tier 3 reps from relevant IT teams (e.g., network, servers, security, apps, etc.).
Use the Incident Status Updates and Incident Report Templates document in this blueprint as a guide to create communication templates (e.g., in your ITSM tool) to simplify and standardize status updates.
- Review the examples in the template. Consider the following:
- The status updates to individuals (e.g., I can’t print) is focused on acknowledging the incident, indicating the assigned priority, and providing contact information. If you have SLAs defined, then that can be part of the template too.
- The status updates for incidents impacting multiple users (e.g., an application is down) will have additional information such as affected services and regular updates.
- Design your template’s contents, using these examples as a starting point.
- Identify guidelines for when to use each template. E.g., rather than number of users effected, associate the template with a severity level.
Download the Incident Status Updates and Incident Report Templates to see the examples indicated above. Note: The Incident report is described on a separate slide.
2.4.3 Create an incident report template for critical incidents
1-3 hours
Materials
- Whiteboard or flip chart or work directly in the relevant template
Participants
- Incident Management Team (e.g., Tier 1 and 2 roles and the Incident Manager). Tier 3 reps from relevant IT teams (e.g., network, servers, security, apps, etc.).
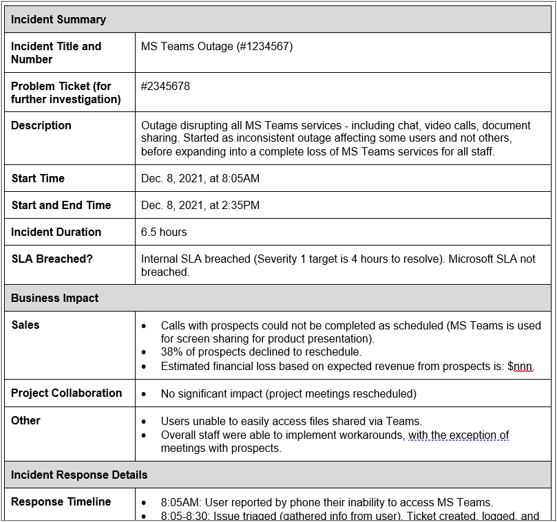
Incident reports are typically created only for severity 1 issues or as requested by senior leadership: i.e., where the impact of the incident warrants providing a formal report to senior leadership. The Incident Status Updates and Incident Report Templates document provides an example (see the excerpt to the right).
- Review the example. It includes the following elements:
- Business impact. The audience is the executive team, so business impact is a key concern.
- Incident response details. This includes a chronological report of what happened, the identified root cause, and lessons learned.
- Action Items. In addition to business impact, another key expectation from senior leadership is what will you do to mitigate future related risk.
- Modify the incident report template to suit your requirements.
- Ensure you also complete the communication section in the Incident Management and Service Desk SOP to account for this report and critical incident communication during the event.
Download the Incident Status Updates and Incident Report Templates to see the full example and guidelines.
Step 2.5
Improve efficiency with shift-left and automation
Activities
2.5.1 Identify shift-left and automation initiatives for your organization
This step will guide you through the following content and activities:
- Shift-left overview
- Automation and AI overview
- Identify shift-left and automation initiatives for your organization
This step involves the following participants:
- Incident Management Team (e.g., Tier 1 and 2 roles and the Incident Manager).
- Tier 3 reps from relevant IT teams (e.g., network, servers, security, apps, etc.).
Outcomes of this step
- Shift-left and automation opportunities identified.
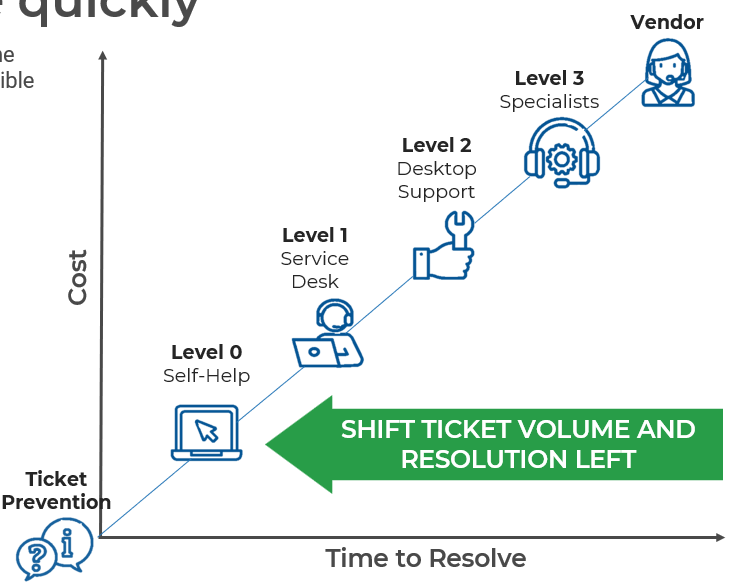
Shift left to reduce support costs and solve incidents more quickly
Shift left means moving issue resolution as close to the front line of the service desk and the end user as possible and reducing the number of escalations right.
- As seen in the model below, the further a ticket gets escalated, the more cost and time is involved in resolving it.
- Moving the resolution to Level 1 of the service desk empowers frontline staff with the tools and information to solve more issues, reducing wait time for users and freeing up specialists to focus on projects and problem management.
- Moving solutions to self-service empowers end users to solve their own issues, further reducing resolution time, increasing customer satisfaction, and reducing overall ticket volume.
- Successfully shifting left can reduce time to resolve, decrease support costs, and increase end-user satisfaction.
Download Optimize the Service Desk with a Shift-Left Strategy for a more in-depth look
Automation and AI can further streamline incident management, if you are ready
Don’t get swept away by the hype.
It’s easy to fall into the trap of thinking that AI will seamlessly automate all your processes and solve all your problems. AI and automation will certainly support your shift-left strategy, but it needs to be implemented carefully and slowly with the right foundations behind it in order to reap the benefits.
AI is a long-term investment and takes time and resources to plan and execute. The best way to start to realize the benefits of AI is by building your AI-enabled capabilities around the goals of your shift-left project and organizational goals.
The scope of AI is also beyond just the service desk, so consider the full business benefits of automation solutions before starting an automation project.
Optimize the Service Desk With a Shift-Left Strategy - The best type of service desk ticket is the one that doesn’t exist.
Accelerate Your Automation Processes - Integrate automation solutions and take the first steps to building an automation suite.
Build a Chatbot Proof of Concept - Create value for your business with your chatbot implementation.
See the blueprints above for more details on adding automation to your service desk.
2.5.1 Identify shift-left and automation initiatives for your organization
1-3 hours
Materials
- Whiteboard or flip chart
Participants
- Incident Management Team (e.g., Tier 1 and 2 roles and the Incident Manager).
- Tier 3 reps from relevant IT teams (e.g., network, servers, security, apps, etc.).
- Brainstorm a list of shift-left and automation objectives relevant to your organization. See the table below for examples.
- For each goal, brainstorm associated tactical tasks to achieve that goal. These tasks will provide input to the project roadmap activity in Phase 4.
- Leverage the Optimize Your Service Desk With a Shift-Left Strategy blueprint for additional guidance.
| Automation Goal/Objective | Tasks/Projects/Implementations |
|---|---|
| Expediting self-service and ticket intake |
|
| Automatically categorizing incidents based on issue |
|
| Automatically routing tickets to the right queue/agent |
|
Phase 3: Establish Effective Problem Management
Phase 1
Optimize Ticket Intake and Routing
Phase 2
Standardize and Streamline Incident Response
Phase 3
Establish Effective Problem Management
Phase 4
Implement Improvements
This phase will walk you through the following steps:
- Define problem management.
- Standardize your problem intake process.
- Standardize your problem action process (investigate, root cause analysis, resolve).
- Establish appropriate problem management governance.
Improve Incident and Problem Management
Step 3.1
Define problem management
Activities
3.1.1 Outline your problem management lifecycle challenges
This step will guide you through the following content and activities:
- Understand the key components of the problem management lifecycle
- Potential sources for problem management intake
- Outline your problem management lifecycle challenges
This step involves the following participants:
- Incident Management Team
- Problem Management Team
- Tier 3 reps from relevant IT teams (e.g., network, servers, security, apps, etc.)
Outcomes of this step
- Clarify the components and purpose of problem management.
- High-level challenges identified with your existing problem management processes.
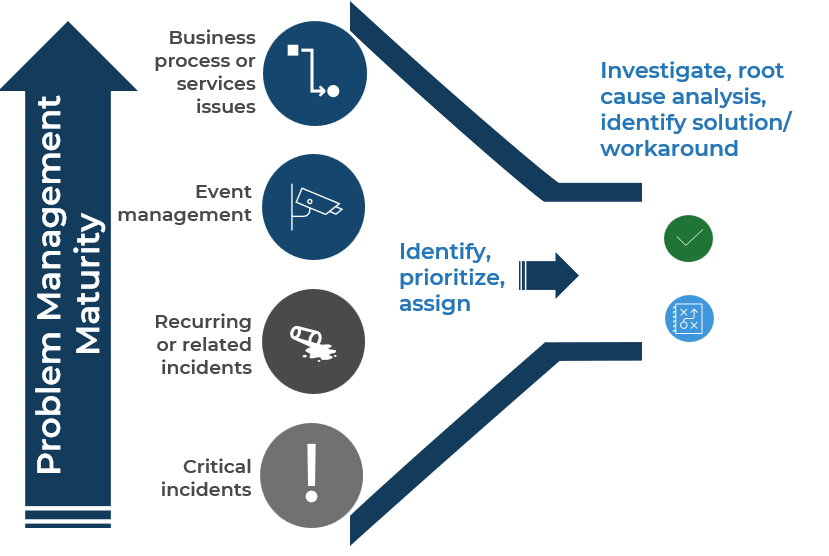
Understand the key components of the problem management lifecycle
Problem management seeks to prevent future incidents by resolving the root cause of past incidents (reactive) and anticipated future incidents (proactive)
*Problem Identification (Intake)
- Identify problem candidates from:
- Past incidents (reactive) - e.g., Sev 1 and recurring Sev 2/Sev 3 incidents.
- Indicators of potential future incidents (proactive) – e.g., from system/event management, vendors communicating known issues, technical audits/reviews.
- Register the problem (create a problem ticket with relevant details).
- Prioritize and assign problem.
Problem Control (Action)
- Investigate assigned problem tickets. This includes gathering relevant information (identifying relevant systems or configuration items), running diagnostics if applicable, and executing root cause analyses.
- Identify a permanent solution or workaround.
- If a solution or workaround is not identified or is not practical (due to cost or effort), focus on improving incident response (e.g., create a KB documenting the known error and how to resolve the issue when it arises).
Error Control (Output / Value Created)
- Implement resolution:
- Solution (submit to change management), or
- Workaround (e.g., publish KB article and/or end-user instructions), or
- Publish known error KB article
- Update the ticket:
- Update the status.
- Update problem details (e.g., relevant CIs and investigation results).
*ITIL refers to problem identification, problem control, and error control. For greater clarity, this blueprint refers to these phases as intake, action, and output (value). In addition, ITIL uses the term problem categorization to refer to capturing relevant details as part of logging the ticket. To avoid, confusion with incident categories, this blueprint refrains from describing that process as “categorization.”
Problem management drives business value
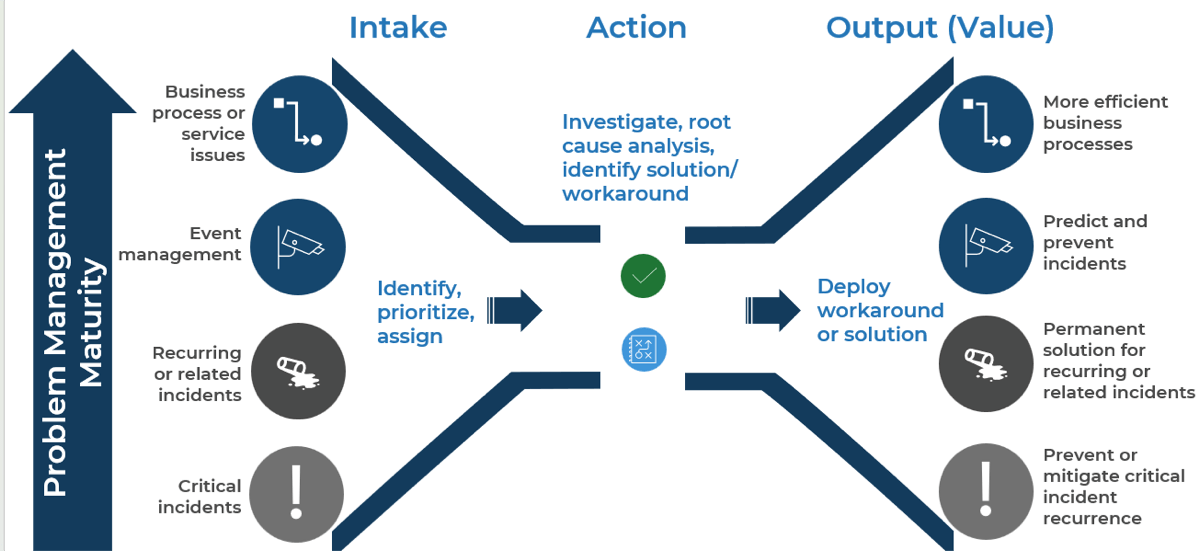
Potential sources for problem management intake
Potential sources for problem tickets:
- Critical incidents (Sev 1 tickets). When a critical incident occurs, the immediate goal is to restore services. We recommend that all critical incidents then go through problem management to determine if there is an underlying root cause to be resolved.
- Recurring incidents. One of the outcomes of good incident management is being able to identify related recurring incidents that may be an indicator of an underlying problem.
- Event management. Effective event management includes identifying indicators of potential future issues (e.g., CPU utilization is spiking, storage capacity is dwindling, etc.).
- Business processes or services issues. With mature problem management, the approach can also be used to tackle issues that are not necessarily incident or IT related, such as an inefficient business process or service design issues.
Problem Management
- Business process or services issues
- Event management identifies potential issues
- SEV 3; SEV 3; SEV 3; SEV 3
- SEV 2; SEV 2; SEV 2
- Critical Incident SEV 1
Problem management is a group effort
Problem management requires a coordination of multiple teams.
Problem Management
- INCIDENT MANAGEMENT
- INTAKE: Ticket data from incident management is needed for incident matching to identify problems. Critical Incidents are also a main input to problem management.
- EVENT MANAGEMENT
- INTAKE: SMEs and operations teams monitoring system health events can identify indicators of potential future issues before they become incidents.
- APPLICATION, INFRASTRUCTURE, and SECURITY TEAMS
- ACTION: Problem tickets require investigation from relevant SMEs across different IT teams to identify potential solutions or workarounds.
- CHANGE MANAGEMENT
- OUTPUT: Problem resolution may need to go through Change Management for proper authorization and risk management.
3.1.1 Outline your problem management lifecycle challenges
1-3 hours
Materials
- Whiteboard or flip chart
Participants
- Incident Management Team (e.g., Tier 1 and 2 roles and the Incident Manager).
- Problem Management Team (e.g., Problem Manager and any staff dedicated to problem management).
- Tier 3 reps from relevant IT teams (e.g., network, servers, security, apps, etc.).
- As a group, outline the challenges or weaknesses you have in each step of the problem management lifecycle. Separate the challenges into people, process, and technology for a wholistic view.
- Record those challenges for reference purposes. Phase 4 will include creating a project roadmap to address gaps and improve processes. Below are examples of common challenges to consider:
- Are problem tickets being generated consistently for Severity 1 tickets? If not, can this be automated?
- Do you have a process and sufficient data to identify recurring or related incidents?
- Are there resources available to investigate problem tickets?
Step 3.2
Standardize your problem intake process
Activities
3.2.1 Validate your process to identify related (or recurring) incidents
3.2.2 Identify opportunities for proactive and non-IT problem management
3.2.3 Set guidelines for identifying problem tickets
3.2.4 Create a problem ticket template
3.2.5 Define problem prioritization guidelines based on risk
This step will guide you through the following content and activities:
- Example Problem Intake Workflow
- Validate process to identify related incidents
- Event management proactive intake channel
- Identify opportunities for proactive and non-IT problem management
- Set guidelines for identifying problem tickets
- Create a problem ticket template
- Define problem prioritization guidelines
This step involves the following participants:
- Incident Management Team
- Problem Management Team
- Tier 3 reps from relevant IT teams (e.g., network, servers, security, apps, etc.)
Outcomes of this step
- Document guidelines for problem intake.
- Define a problem ticket template and problem prioritization guidelines.
Example problem intake workflow
Identify, prioritize, assign tickets
This example includes several intake channels, including Sev 1 tickets, system monitoring, and a monthly review of incidents to identify problem ticket candidates.
If you aren’t ready yet for more advanced problem intake, such as via systems monitoring, then set that as a future goal and adjust your workflow accordingly.
The key elements to include in your intake workflow are:
- Intake source (from day-to-day processes and periodic review)
- Problem prioritization and assignment
- Managing the problem backlog
Download the Problem Management Workflow
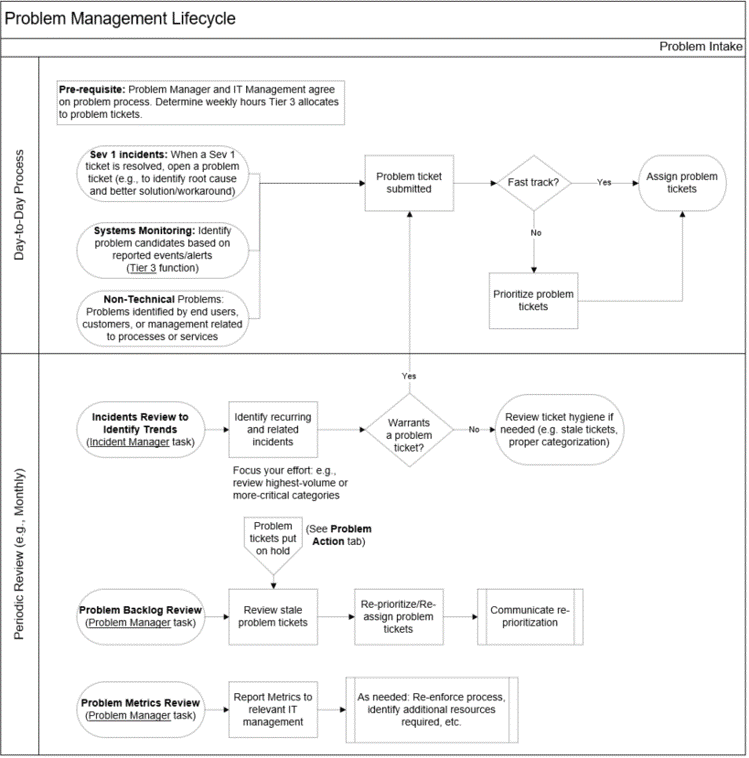
3.2.1 Validate your process to identify related or recurring incidents
1-3 hours
Materials
- Whiteboard or flip chart
- Your tickets
Participants
- Incident Management Team (e.g., Tier 1 and 2 roles and the Incident Manager).
- Provide a sampling of incidents to the exercise participants from the previous month.
- Have each participant attempt to identify related incidents (including recurring incidents) based on criteria such as: similar symptoms, similar categories, common applications, or common hardware.
- As a group, review the related incidents identified and consider the following:
- Are your incident categories providing a reliable starting point to begin grouping potentially related incidents? If not, what are the issues (e.g., too granular, overlap between categories, categories not filled in correctly)?
- Are ticket details sufficient to identify where incidents had similar symptoms?
- Who grouped which incidents and why? What were some disagreements?
- Identify action items to improve this process (the action items will be leveraged for the project roadmap exercise in Phase 4). Action items might include:
- Review and update categories.
- Train staff on incident categories and ticket updates.
- Provide examples of related incidents and the data enabling that incident matching.
Event management can provide a proactive intake channel
However, event monitoring can also drive information overload if not managed properly.
An effective event management program will have these characteristics:
- Specific goals driving event management. For example:
- Validate successful IT operations. Similarly, track operations for security or audit purposes (e.g., system login, network traffic, etc.).
- Expedite incident management (e.g., alert key staff if a system fails).
- Predict failures (this is the feed into problem management).
- Appropriate thresholds and parameters to avoid alert overload.
- Ability to correlate events to identify broader trends. This could also feed problem management.
Example Event Categories and Potential Actions
| Event Categories | Potential Actions |
|---|---|
|
Normal operation. E.g.:
|
Identified as Informational.
|
|
Exceptions (alarms indicate failure). E.g.:
|
Identified as a Warning.
|
|
Thresholds exceeded. E.g.:
|
Identified as a Caution.
|
3.2.2 Identify opportunities for proactive and non-IT problem management
1-3 hours
Materials
- Whiteboard or flip chart
Participants
- Incident Management Team (e.g., Tier 1 and 2 roles and the Incident Manager).
- Problem Management Team (e.g., Problem Manager and any staff dedicated to problem management).
- Tier 3 reps from relevant IT teams (e.g., network, servers, security, apps, etc.).
- As a group, discuss possible opportunities for proactive problem management. For example:
- Event management that not only identifies incidents but risks of future incidents (e.g., CPU spiking at certain times of the day).
- Monitoring vendor bulletins reporting potential issues.
- Reviewing the existing resilience of key applications/systems. Leverage your Tier 3 staff’s knowledge of the systems they manage.
- Discuss potential problem candidates outside of IT incidents. For example:
- Lack of efficiency observed in IT operations.
- Lack of efficiency observed in business operations.
- Complaints from customers regarding business services – could be a result of poor service design, inefficient processes, etc., that could be tackled using problem management techniques such as root cause analysis.
- Etc.
- Brainstorm initiatives to incorporate the above intake channels into your problem management process. This will provide input to the project roadmap exercise in Phase 4.
3.2.3 Set guidelines for identifying problem tickets
1-3 hours
Materials
- Whiteboard or flip chart or work directly in the relevant template
Participants
- Incident Management Team (e.g., Tier 1 and 2 roles and the Incident Manager)
- Problem Management Team (e.g., Problem Manager and any staff dedicated to problem management)
- Tier 3 reps from relevant IT teams (e.g., network, servers, security, apps, etc.)
- Identify inputs for problem management. Use the example as a guide.
- Record the guidelines in the Problem Management SOP.
Note:
- Consider starting with only Severity 1 incidents and recurring incidents as problem sources. Over time, aim to expand the intake to include proactive problem identification via sources such as event management.
- As in the example, consider whether to include Severity 2 tickets as a source at the discretion of the Incident Manager (e.g., if the ticket was borderline critical or avoided critical status just because of the timing of the incident, etc., and warrants further investigation to prevent future occurrences).
Example Problem Ticket Intake Guidelines
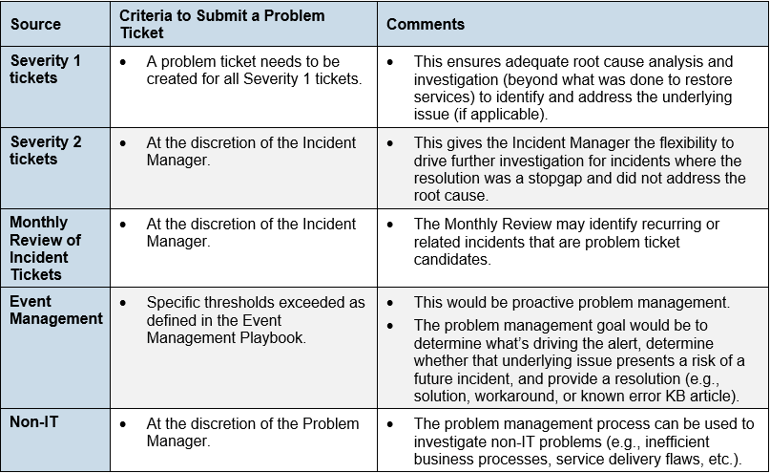
3.2.4 Create a problem ticket template
1-3 hours
Materials
- Whiteboard or flip chart or work directly in the relevant template
Participants
- Incident Management Team (e.g., Tier 1 and 2 roles and the Incident Manager)
- Problem Management Team (e.g., Problem Manager and any staff dedicated to problem management)
- Tier 3 reps from relevant IT teams (e.g., network, servers, security, apps, etc.)
Use the example Problem Ticket Template as a guide to create a template in your ITSM tool to clarify the information to capture to support problem investigation and tracking. Depending on your ITSM tool, the template might also facilitate auto-filling some fields.
Below are recommended fields to include at a minimum (besides auto-generated fields such as a ticket number):
- Status: Open, Pending Change, Resolved.
- Source: Indicate source; e.g., critical incident, recurring incident, event management, etc.
- Priority: Problem priority is not the same as incident priority. It’s typically based on problem risk (impact x likelihood).
- Short Description: Issue description.
- Related Incidents: List the related/recurring incident tickets that led to opening this problem ticket as well as relevant problem tickets if applicable.
- Root Cause: This field will be completed once the root cause is identified. Be as specific as possible (e.g., reference specific config changes that were the root cause).
- Problem Owner: Person accountable for ticket progress.
- Assigned Team: Team responsible for solving the problem.
3.2.5 Define problem prioritization guidelines based on risk
Potential impact (not current impact) and frequency (not urgency) drive problem prioritization
- Use risk to provide a baseline prioritization value:
- Incident prioritization considers impact and urgency – e.g., email is down; there is immediate impact and urgency.
- Problem prioritization is focused on potential impact and likelihood of the underlying problem resulting in an incident (i.e., risk of a future event).
- As a result, a risk matrix (impact and likelihood, instead of impact and urgency) provides a good starting point to assign priority. See the example on this slide.
- Consider the following additional guidelines that could adjust priority:
- Business input (e.g., a mandate to improve resilience of a particular service would increase the priority for problems related to that service).
- Ease of resolution (e.g., do you focus resources on clearing the backlog of ten easy-to-solve medium-priority problem tickets? Or tackle one complex high-priority problem?)
- Applying more weight to impact vs. likelihood or vice-versa.
- Document your guidelines in the Problem Management SOP.
Example Problem Ticket Prioritization Scheme
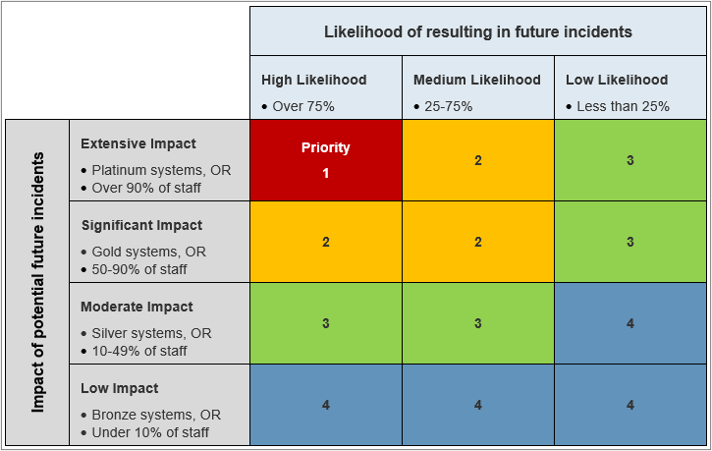
- Problem ticket prioritization considers likelihood instead of urgency.
- The number of priority, impact, and likelihood levels do not have to match the severity, impact, and urgency levels used for incidents. In this example, three likelihood levels are used to simplify assessment.
Step 3.3
Standardize your problem action process (investigate, root cause analysis, resolve)
Activities
3.3.1 Conduct a series of RCAs to clarify how and when to use each technique
3.3.2 Establish how you will decide between a permanent solution and a workaround or if you will leave it as a known error
3.3.3 Document your problem intake and action workflow
This step will guide you through the following content and activities:
- Example Problem Action Workflow
- Root cause analysis (RCA) techniques
- Conduct a series of RCAs to clarify how and when to use each technique
- Establish how you will decide between a permanent solution and workaround or if you will leave it as a known error
- Document your problem intake and action workflow
This step involves the following participants:
- Incident Management Team
- Problem Management Team
- Tier 3 reps from relevant IT teams (e.g., network, servers, security, apps, etc.)
Outcomes of this step
- Clarified RCA techniques
- Documented problem management workflow
Example problem action workflow
Investigate, root cause analysis, resolve (solution or workaround)
Key elements to include :
- Investigation and root cause analysis of prioritized problems.
- Decision on whether to pursue a permanent solution or workaround.
- High-level steps to implement a solution and/or workaround, including change management.
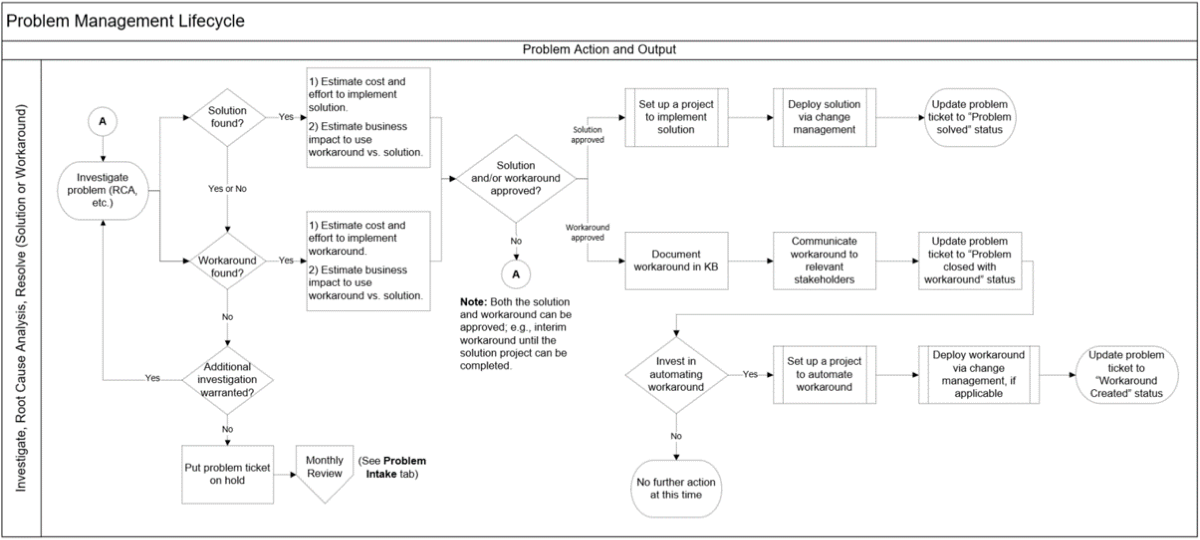
Download the Problem Management Workflow Library
Establish a range of root-cause-analysis (RCA) techniques you can leverage depending on the problem
| Method | Description | Effort | When to Use |
|---|---|---|---|
| Brainstorm and Eliminate | Brainstorm possibilities from a wide variety of perspectives. Eliminate unlikely causes. | Low | Use as a starting point. This might be all you need if the solution is easily identified, or if your environment has low complexity. |
| Five Whys | Ask Why? five times in an effort to dig deeper than the initial suspected root cause. Helps clarify the issue and potential solutions. | Medium | Use this if brainstorming does not generate a suitable solution. Drill down further with the Five Whys technique. |
| Ishikawa/Fishbone Diagram | Use a fishbone diagram to capture the problem statement (the spine), problem categories (the ribs), and brainstorm potential causes (branches off the ribs). A visual method to organize potential causes. | High | Use this where there are potentially multiple root causes, or where the other approaches do not generate a suitable outcome. |
Example – Brainstorm and Eliminate RCA
Using the process of elimination might seem obvious, but it can be a powerful tool to determine root causes.
Process
- Assemble a small team of SMEs for the application/system/process relevant to the problem.
- As a group, establish a consensus around the problem statement and write it down.
- Write down the problem statement and brainstorm a list of potential causes. Like all brainstorming exercises, remember that the purpose is to gather the widest possible variety of perspectives, so be sure not to eliminate any suggested causes without good reason.
- Once you have an exhaustive list of potential causes, you can begin the process of eliminating unlikely causes in order to arrive at a list of likely potential causes that you can investigate further.
Example Output
Problem Statement: The microwave isn’t working; everyone’s fish is cold.
Potential Causes (Brainstormed)
The fish is un-heatablePower has gone outUsers are improperly using the microwave- The microwave is unplugged
The microwave is broken
The strikethroughs represent unlikely causes or causes that have been eliminated empirically by investigation.
Example – Five Whys RCA
Repeatedly asking “Why?” is an effective technique to clarify the problem and identify root causes that might not be initially considered
Process
- Assemble a small team of SMEs for the application/system/process relevant to the problem. Note: If you have already tried the Brainstorming RCA, consider adjusting the team adding a person to the team to provide a fresh perspective.
- As a group, establish a consensus around the problem statement and write it down.
- Go around the room and have each person suggest a potential reason for its occurrence.
- For each potential reason, ask “Why?” until there are no more potential causes to explore. Note: The total number of Whys can be more or less than five.
- Review the potential causes to identify the most likely or appropriate root cause to pursue. It’s not necessarily the last or bottom root cause (see the example).
Example Output
- Problem: the microwave in the office isn’t working – everyone’s fish is cold. Why?
- The microwave isn’t plugged in. Why?
- Employee A unplugged it because it kept tripping the breaker. Why?
- There are too many devices plugged in, overloading the circuit. Why?
- Everyone on the second floor brought in space heaters. Why?
- The office has cold drafts due to inadequate insulation and substandard windows. Why?
- Everyone on the second floor brought in space heaters. Why?
- There are too many devices plugged in, overloading the circuit. Why?
- Employee A unplugged it because it kept tripping the breaker. Why?
- The microwave isn’t plugged in. Why?
In this example, the ultimate root cause appears to be a cold office. However:
- Fixing a cold office might be deemed too difficult or expensive to fix.
- Instead, you might focus on “Everyone brought in space heaters” as the root cause to identify an appropriate solution such as “Install a dedicated circuit for the microwave” or a workaround such as instruct staff to turn off space heaters before 11AM (this is also an example of a workaround that’s difficult to enforce, which might drive buy-in for a permanent solution).
Example – Fishbone RCA
Use a fishbone diagram to organize potential causes by category to facilitate review, evaluation, and additional brainstorming
Process
- Assemble a small team of SMEs for the application/system/process relevant to the problem.
- As a group, establish a consensus around the problem statement.
- On a whiteboard or flipchart pad, draw a fishbone diagram with the problem statement at one end of the horizontal line (the “spine”) and possible root cause categories labeling each “rib” stemming from the spine (see the example). In the IT context, consider root cause categories such as: operating system, applications, network, security, server, hardware, and storage.
- Go around the room and ask, “What causes this problem to happen?” Every answer should fit into one of the identified categories. Capture the suggestions as branches on the relevant “rib” (e.g., on the “Equipment” rib, a possible cause is “the microwave is defective”).
- Continue to brainstorm sub-causes and capture them as more branches. Review the potential causes to identify the most likely category and root cause to pursue.
Example Output
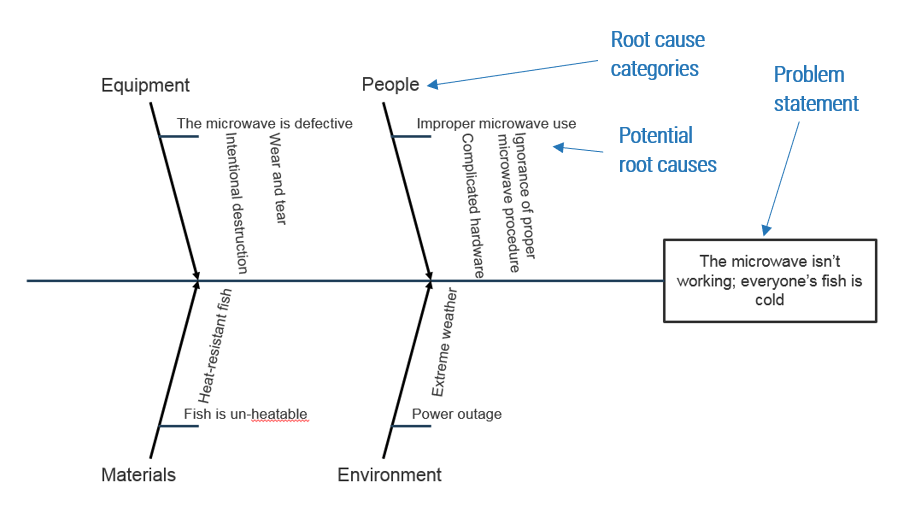
3.3.1 Conduct a series of RCAs to clarify how and when to use each technique
1-3 hours
Materials
- Whiteboard or flip chart
- Your tickets
Participants
- Incident Management Team (e.g., Tier 1 and 2 roles and the Incident Manager)
- Problem Management Team (e.g., Problem Manager and any staff dedicated to problem management)
- Tier 3 reps from relevant IT teams (e.g., network, servers, security, apps, etc.)
- Select a problem from your existing list of problem tickets or problem candidates from your incident review. If that’s not an option, see the example problems to the right. Note: If you have a large audience for this exercise, then divide them into small groups of three to five people each. You can assign a separate problem to each group or have all groups work on the same problem.
- Run through the Brainstorming RCA and review the results. Did you arrive at a reasonable hypothesis for the root cause? Would a deeper RCA be beneficial?
- Now apply the Five Whys technique. Review the results and compare to what was generated through the Brainstorming RCA.
- Then apply the Fishbone technique. Review the results and compare to what was generated through the Brainstorming and Five Whys RCAs.
- Discuss the pros and cons of each technique and the types of problems that might be a good fit for each approach.
Example Problems
- The server goes down every Thursday at 6:30pm.
- The network has been running slowly for the past month.
- Nobody in one satellite office can print, though printing is unimpeded at other sites.
- One pod of four desks on the second floor is suffering from consistently slow internet.
- The service desk is flooded with calls about important emails bouncing back one afternoon.
- Phones are out of service – the sales staff has resorted to cellphones for the time being.
- Users are consistently exceeding their laptops’ hard drive capacity within six months.
Validate suspected root causes and seek additional input if needed
A root cause that has not been validated is simply a hypothesis
- Validate the root cause using hard evidence: Do not proceed to solutioning and change management without validating the root cause using data.
- If possible, recreate the incident in a controlled setting (not in a production environment) to verify the root cause. Recreating the disruption is the clearest evidence of a root cause, but it is not always practical.
- When replicating service disruptions, it is not necessary to replicate the outage’s scope. If an entire department’s desktop computers go down, it may only be necessary to replicate the incident on a single computer, for example.
There are several options if a root cause analysis doesn’t produce a useful result
- Seek out greater or different expertise: Escalate the investigation to more senior staff or other groups for a different perspective.
- Contact relevant vendors: Make inquiries with the vendor to determine if they are aware of the problem – it may be a known error with a course of action already outlined.
- Repeat the RCA: Go back to the brainstorming phase and investigate alternative causes, and apply the other techniques to go deeper.
3.3.2 Establish how you will decide between a permanent solution and workaround or if you will leave it as a known error
1-3 hours
Materials
- Whiteboard or flip chart
Participants
- Incident Management Team (e.g., Tier 1 and 2 roles and the Incident Manager).
- Problem Management Team (e.g., Problem Manager and any staff dedicated to problem management).
- Tier 3 reps from relevant IT teams (e.g., network, servers, security, apps, etc.).
- Define process inputs that will inform the decision. E.g.:
- Current risk (potential incident likelihood and impact). Impact would include financial, goodwill/reputation, compliance, and health & safety impact.
- Effort, cost, and risk of the potential solution and workaround.
- Determine who makes the decision. E.g.:
- Problem Manager, if low risk, no additional cost, and effort is within existing time allocated to problem management (e.g., needs a low-risk config change).
- Problem Advisory Board (e.g., a repurposed Change Advisory Board) if the solution or workaround requires additional cost or time commitment beyond what is allocated to problem management (e.g., re-architecting an application, purchasing a product upgrade, etc.).
- Identify how problem status will be tracked. E.g.:
- Keep the problem ticket open until a solution or workaround is deployed.
- Continue to track status in the ticket. E.g., if a project is assigned, in addition to normal project tracking, also report project milestones in the ticket.
- Establish a monthly review of problem ticket statuses.
Example: CRM not sending meeting invites
| Decision Inputs | Example |
|---|---|
| Root cause | Conflicting SalesOps CRM processes overwriting invitation send. |
| Current problem risk | Five incidents per month. Typically the issue is detected, but when it’s not, a client meeting is missed. |
| Permanent solution | Configuration change requiring approximately 30 minutes of dev time. Low risk of affecting other aspects of the CRM. Straightforward roll back if it causes unexpected issues. |
| Workaround | Developer can manually push out invite when the issue is reported via an incident ticket (~30 minutes to resolve). No risk with the workaround; the risk is that the issue is not always detected. |
| Decision | Low risk and time commitment for the permanent solution. Task assigned and will go through change management for approval. |
Note: The initial workaround might come from the incident resolution. Problem management would seek to find a permanent solution or a better workaround.
3.3.3 Document your problem intake and action workflow
1-3 hours
Materials
- Whiteboard or flip chart or work directly in the relevant template
Participants
- Incident Management Team (e.g., Tier 1 and 2 roles and the Incident Manager)
- Problem Management Team (e.g., Problem Manager and any staff dedicated to problem management)
- Tier 3 reps from relevant IT teams (e.g., network, servers, security, apps, etc.)
Problem management has fairly standard components so you can use the example workflow in this blueprint as your starting point. With this in mind, follow these steps to create your workflow:
- Review the Problem Management Workflow example and identify any required changes based on the activities completed to this point. For example:
- Which sources you are ready to include (e.g., you might want to start with just Sev 1 tickets and recurring incidents).
- The frequency or method you plan to implement for incident ticket review (to identify trends and potential problems).
- At what point you execute prioritization.
- Your process for deciding between permanent solution vs. workaround.
- Modify the example workflow to incorporate the adjustments above.
- Unless you are truly greenfield when it comes to problem management, then the workflow will be a combination of formalizing existing practice and adding desired improvements. As with the Incident Management Workflow, add colored dots to identify desired changes so it’s clear to staff where you are focusing on improvements.
- Update the Problem Management SOP as needed to reflect your workflow.
Step 3.4
Establish appropriate problem management governance
Activities
3.4.1 Identify key performance indicators to track problem management success
3.4.2 Identify what you will track on a Problem Management dashboard
3.4.3 Identify problem management roles and responsibilities
3.4.4 Create a meeting schedule for the problem management team
This step will guide you through the following content and activities:
- Identify key performance indicators to track problem management success
- Identify what you will track on a Problem Management dashboard
- Identify problem management roles and responsibilities
- Create a meeting schedule for the problem management team
This step involves the following participants:
- Incident Management Team
- Problem Management Team
- Tier 3 reps from relevant IT teams (e.g., network, servers, security, apps, etc.)
Outcomes of this step
- Core elements to govern problem management
3.4.1 Identify key performance indicators to track problem management success
1-3 hours
Materials
- Whiteboard or flip chart or work directly in the relevant template
Participants
- Incident Management Team (e.g., Tier 1 and 2 roles and the Incident Manager)
- Problem Management Team (e.g., Problem Manager and any staff dedicated to problem management)
- Tier 3 reps from relevant IT teams (e.g., network, servers, security, apps, etc.)
Problem management is a part-time role for most, which makes it even more important to clarify expectations. A RACI chart is an effective tool for setting and communicating those expectations.
- Discuss the example KPIs on this slide and consider:
- Which KPIs are most important to you? Are there other KPIs to consider?
- What’s realistic for you to track today? (Consider the underlying metrics required.)
- What’s a realistic future goal?
- Document the KPIs that you plan to track in the Problem Management SOP.
- Update your problem ticket template to include required fields to track the underlying metrics (e.g., RCA effort).
Example Problem Management KPIs
| Key performance indicator | Description |
|---|---|
| Number of incidents per problem | How many incidents are linked to each problem ticket? |
| Mean time to root cause (MTRC) | How long does it take the problem management team to find the root cause of the problem? |
| Average root cause analysis effort | How many hours to identify RCA (base this on mean time to root cause and number of FTEs involved)? |
| Percentage of problems not resolved | How often is a problem returned to the backlog with no permanent solution or workaround identified? |
| Average problem severity | How many problems are at the higher end of the risk scale? |
3.4.2 Identify what you will track on a Problem Management dashboard
A dashboard helps the Problem Manager monitor status, and drives accountability across the team through greater visibility
1-3 hours
Materials
- Whiteboard or flip chart or work directly in the relevant template
Participants
- Incident Management Team (e.g., Tier 1 and 2 roles and the Incident Manager)
- Problem Management Team (e.g., Problem Manager and any staff dedicated to problem management)
- Tier 3 reps from relevant IT teams (e.g., network, servers, security, apps, etc.)
- Discuss whether you will be able to leverage your ITSM tool to create the dashboard, or if an external dashboard will need to be designed and built. This might effect the timeline for building the dashboard and what data you choose to report.
- Decide what will be reported on the dashboard. Below is an example:
- Number of open problem tickets, with subtotals for each priority.
- Problem ticket aging (age per ticket, overall average age, highest age).
- Mean time to root cause analysis.
- Mean time to resolution.
- Subtotals for each of the above for each IT team leader (e.g., network, servers, etc.).
- Monthly totals for problem tickets by status (number of open, resolved, new, etc.).
- Document the metrics you plan to track in the Problem Management SOP.
Tip: Make the problem dashboard available to all members of the problem management team. This will help team leaders manage the tickets assigned to them and report successes.
3.4.3 Identify problem management roles and responsibilities
Use a RACI chart to clarify expectations
1-3 hours
Materials
- Whiteboard or flip chart or work directly in the relevant template
Participants
- Incident Management Team (e.g., Tier 1 and 2 roles and the Incident Manager)
- Problem Management Team (e.g., Problem Manager and any staff dedicated to problem management)
- Tier 3 reps from relevant IT teams (e.g., network, servers, security, apps, etc.)
Problem management is a part-time role for most, which makes it even more important to clarify expectations. A RACI chart is an effective tool for setting and communicating those expectations.
- In the RACI chart in the Problem Management SOP, update the top row to reflect the relevant roles in your organization.
- Review and update the task list in the RACI chart.
- After updating roles and tasks, fill in the appropriate RACI value.
- Make only one role Accountable for each task. Multiple accountable roles can lead to confusion over expectations.
- The Accountable role can also be Responsible if they are in charge and doing the work.
- Assign C and I where needed for clarity. E.g., all roles might be informed as a matter of course, but assign an I for specific roles that need to be informed.
- Ensure everyone on the team understands what’s expected by the RACI values assigned to their role.
Problem Management RACI Chart Example
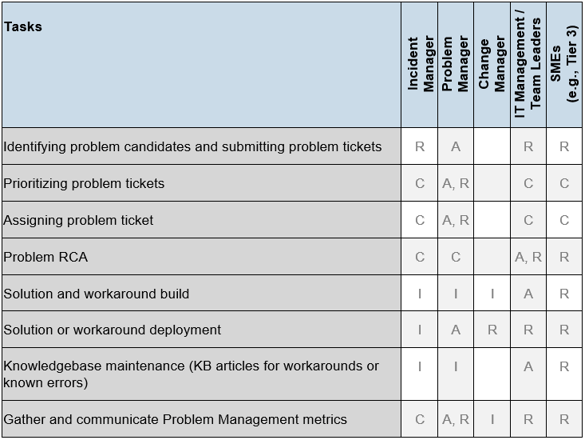
3.4.4 Create a meeting schedule for the problem management team
Regular meetings will help maintain problem management priority, particularly since most will have other commitments
1-3 hours
Materials
- Whiteboard or flip chart or work directly in the relevant template
Participants
- Incident Management Team (e.g., Tier 1 and 2 roles and the Incident Manager)
- Problem Management Team (e.g., Problem Manager and any staff dedicated to problem management)
- Tier 3 reps from relevant IT teams (e.g., network, servers, security, apps, etc.)
Optimal problem management, however, involves holding regular meetings (as opposed to ad hoc), consistent in terms of membership, focused, and retrospective.
- Identify meeting goals. Below are recommended goals:
- Review the status of open problem tickets, including roadblocks to resolution.
- Review problem metrics and any implications (e.g., is the problem ticket volume growing, and what seems to be driving that?).
- At least once per year, use the meeting to review your existing processes, identify process issues, and brainstorm solutions.
- Decide on meeting frequency. Monthly meetings are a good cadence for most organizations.
- Decide on meeting participants. At the very least, this should include the Problem Manager, Incident Manager, and IT Team Leaders.
- Document the meeting schedule in the Problem Management SOP.
Phase 4: Implement Improvements
Phase 1
Optimize Ticket Intake and Routing
Phase 2
Standardize and Streamline Incident Response
Phase 3
Establish Effective Problem Management
Phase 4
Implement Improvements
This phase will guide you through the following steps:
- Create a plan to communicate process changes.
- Create a project roadmap to implement improvements.
Improve Incident and Problem Management
Step 4.1
Create a plan to communicate process changes
Activities
4.1.1 Identify and assign communication action items
This step will guide you through the following content and activities:
- Communication targets
- Identify and assign communication action items
This step involves the following participants:
- Incident Management Team
- Problem Management Team
- Tier 3 reps from relevant IT teams (e.g., network, servers, security, apps, etc.).
Outcomes of this step
- Specific actions to educate stakeholders on process improvements and drive buy-in.
4.1.1 Identify and assign communication action items
1-3 hours
Materials
- Whiteboard or flip chart or work directly in the relevant template
Participants
- Incident Management Team (e.g., Tier 1 and 2 roles and the Incident Manager)
- Problem Management Team (e.g., Problem Manager and any staff dedicated to problem management)
- Tier 3 reps from relevant IT teams (e.g., network, servers, security, apps, etc.)
Incident and problem management depend on collaboration with a wide range of stakeholders; for most of them, incident and problem management is not their primary concern, so shifting behavior will require effective communication and some perseverance.
With the above in mind, use the Communication Initiatives Template to identify specific initiatives to communicate process changes, your expectations of stakeholders, and what’s in it for them, as outlined below:
- Identify and record stakeholders who need to be aware of process changes.
- For each stakeholder, identify benefits (e.g., faster response), obligations (e.g., use the web portal), method (e.g., lunch & learn presentation).
- For each method, indicate who will execute the initiative (Assigned to) and the target date.
Communication Initiatives Template
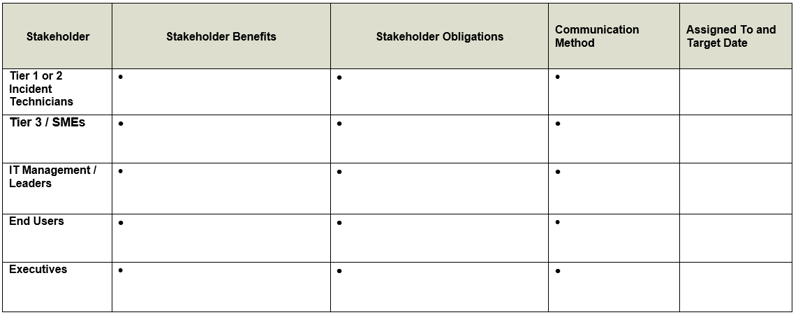
Step 4.2
Create a project roadmap to implement improvements
Activities
4.2.1 Prioritize initiatives based on factors such as effort, cost, and risk
4.2.2 Review the dashboard to fine-tune the roadmap
This step will guide you through the following content and activities:
- Project roadmap tool instructions
- Prioritize initiatives based on factors such as effort, cost, and risk
- Review the dashboard to fine-tune the roadmap
This step involves the following participants:
- Incident Management Team
- Problem Management Team
- Tier 3 reps from relevant IT teams (e.g., network, servers, security, apps, etc.)
Outcomes of this step
- A project roadmap to implement incident and problem management improvements.
Project Roadmap Tool overview
Use the Incident and Problem Management Project Roadmap Tool in this blueprint as your template to build your project roadmap to improve incident and problem management. At a high-level, the steps are:
- Use the Setup tab to define criteria to evaluate and prioritize initiatives.
- Use the Data Entry tab to list, evaluate, and prioritize initiatives.
- Use the Dashboard tab to review and communicate the resulting project roadmap to relevant stakeholders.
Download the Incident and Problem Management Project Roadmap Tool
Note: This tool is based on the DRP Roadmap Tool (although it’s labeled for DRP, the same tool can be used to create any project roadmap as we have done here). For additional instructions if needed and any updates to the source project roadmap tool, refer to Info-Tech’s Create a Right-Sized Disaster Recovery Plan blueprint.
4.2.1 Prioritize initiatives based on factors such as effort and cost
1-3 hours
Materials
- Incident and Problem Management Project Roadmap Tool
Participants
- Incident Management Team (e.g., Tier 1 and 2 roles and the Incident Manager)
- Problem Management Team (e.g., Problem Manager and any staff dedicated to problem management)
- Tier 3 reps from relevant IT teams (e.g., network, servers, security, apps, etc.)
Use the Incident and Problem Management Project Roadmap Tool to prioritize initiatives:
- Phases 1 to 3 included activities to identify initiatives to implement improvements and address challenges. Refine your list of initiatives.
- On the “Setup” tab, decide which criteria you wish to include in your evaluation (beyond required fields such as effort) and update the default values as needed (e.g., define the values for the different levels of effort). Tip: Consider the initiatives you have identified to help you define appropriate parameters such as cost and effort. You may even wish to first capture those initiatives on the Data Entry tab to consolidate the list.
- Complete the “Data Entry” tab:
- Enter initiatives in the Roadmap Item column. Tip: The “Roadmap Item” is what appears on the Roadmap dashboard in tab 3, so use short phrases to avoid cluttering the dashboard. Use the “Description and Rationale” column to provide more details.
- Fill in the evaluation criteria for the required fields (e.g., effort) and optional fields you have decided to include. Tip: Hide the columns you don’t plan to use to avoid confusion.
- Use the evaluation criteria to inform the priority and timeline; e.g., a high-effort, low priority item might be deferred to the long-term timeline.
Project Roadmap Data Entry Example
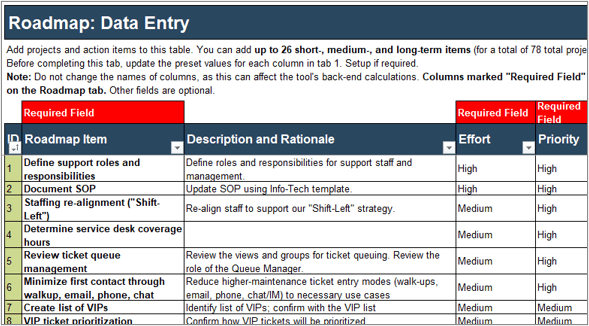
4.2.2 Review the dashboard to fine-tune the roadmap
1-3 hours
Materials
- Incident and Problem Management Project Roadmap Tool
Participants
- Incident Management Team (e.g., Tier 1 and 2 roles and the Incident Manager)
- Problem Management Team (e.g., Problem Manager and any staff dedicated to problem management)
- Tier 3 reps from relevant IT teams (e.g., network, servers, security, apps, etc.)
Review your project roadmap results:
- On the “Roadmap” tab, review your resulting dashboard (you may need to run a data refresh to update the dashboard). For example, during your review, ensure:
- The timeline is realistic (avoid multiple high-effort projects planned for the short term).
- Higher-priority items are generally scheduled sooner than low-priority items.
- The short term includes some quick wins (e.g. high-priority, low-effort items).
- It overall supports the story you wish to communicate (e.g. a plan to address gaps, along with the required effort and timeline).
- Tip: When you eventually present the dashboard to relevant stakeholders, use the filters to refine the message or the focus. Highlight high-priority tasks, present possible capacity bottlenecks by filtering by owner, and so on.
- Based on your review, update the values on the “Data Entry” tab as needed.
Project Roadmap Dashboard Example
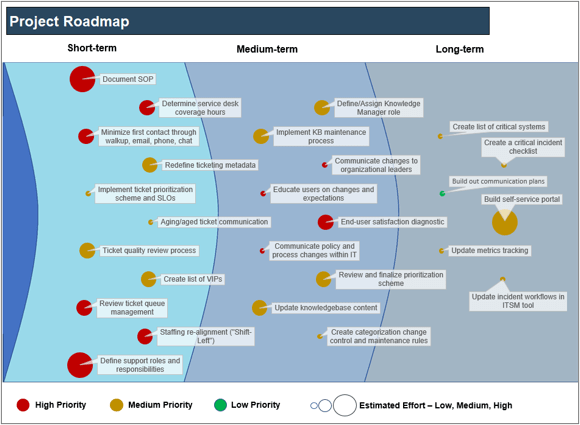
Summary of Accomplishments
Project Overview
This blueprint helped you define or improve your incident and problem management processes and create supporting documentation such as KB articles and status update templates.
Project Phases
Phase 1: Optimize Ticket Intake and Routing
Phase 2: Standardize and Streamline Incident Response
Phase 3: Establish Effective Problem Management
Phase 4: Implement Improvements
Project Deliverables
- Incident Management and Service Desk SOP: Clarify process and role expectations.
- Incident Management and Service Desk Workflows: Provide process workflows for easier reference and to communicate process expectations to stakeholders.
- Incident KB Article Examples: Use these examples to guide your KB article templates and to clarify appropriate level of detail.
- Incident Status Updates and Incident Report Examples: Modify these examples to suit your requirements.
- Problem Management SOP: Clarify process and role expectations.
- Problem Management Workflow: Provide a process workflow for easier reference and to communicate process expectations to stakeholders.
- Communication Initiatives Template: Capture initiatives to educate staff and drive buy-in from senior leadership on improvements to your incident and problem management processes.
- Incident and Problem Management Project Roadmap Tool: Identify, prioritize, and present initiatives to improve incident and problem management.
Related Info-Tech Research
Standardize the Service DeskCreate a consistent customer service experience for service desk patrons and increase efficiency, first-call resolution, and end-user satisfaction with the Service Desk.
Develop and Implement a Security Incident Management ProgramCreate a scalable incident response program for a wide range of potential security incidents. Refer to this blueprint for additional details on overall security incident management.
Create a Ransomware Incident Response PlanTake a deeper dive specifically into ransomware readiness and incident response.
Create a Right-Sized Disaster Recovery PlanAvoid over- or under-provisioning your disaster recovery (DR) solution. Prioritize business requirements, determine your ability to meet those requirements, and then identify projects to close the gap between your current and required DR capabilities.
Implement Crisis Management Best PracticesDon’t be another example of what not to do. Implement an effective crisis response plan to minimize the impact on business continuity, reputation, and profitability.
Research Contributors and Experts
Hardy Baker
Incident and Problem Manager
Waste Management
- Hardy Baker is an IT professional with more than 20 years of experience managing incidents and problems for a large corporation. He has been responsible for a variety of initiatives at Waste Management including a problem dashboard and the use of social media for incident communication.
Rob England
Managing Director
Two Hills Ltd, Blogger at Itskeptic.org
- Rob England is a New Zealand-based consultant who specializes in IT management, strategy, governance, and practices. He is the author of numerous books and articles, and his web presence is well established (you may know him better as the “ITSkeptic”).
Rishi Bhargava
Co-Founder
Demisto Inc.
- Rishi Bhargava is the co-founder of Demisto Inc., a security operations platform that uses a ChatOps interface to combine intelligent automation and collaboration to help security teams respond to threats. Before Demisto, Rishi served as GM & VP, Software Defined Datacenter for Intel Security Solutions.
Steven Ingram
Data Engineer
Wave HQ
- Steven Ingram is an IT professional with over 17 years of integrating users and technology. He specializes in integrating people, processes, and tools with the purpose of driving effective analysis that will produce concrete results for the business.
Research Contributors and Experts
George Jucan
Founder
Organizational Performance Enablers Network
- George Jucan is an internationally recognized project management expert, currently leading the Canadian Committee at International Organization of Standardization (ISO) for the establishment of Project, Programme, and Portfolio Management family of standards. He is well known as a successful project management consultant, speaker at public events, trainer, and author of high-impact project management articles.
Rick Moroz
Associate Director, Information Systems
University of Guelph
- Rick Moroz is an IT professional with significant experience in the non-profit and charitable sector, along with project management and privacy regulation. In his current role, Rick is responsible for staffing and the budgeting of technical services for Guelph’s Alumni Affairs and Development Office.
Note: In addition to the above, several anonymous external interviewees contributed to this project.
Bibliography
ASQ. “Fishbone (Ishikawa) Diagram.” ASQ. N.d. Web. November 24, 2014.
“Creating Problem Tickets.” Boston University Information Services and Technology. N.d. Web. November 24, 2016.
Draper, Steve. “Correlation and causation.” University of Glasgow. October 21, 2014. Web. November 24, 2016.
England, Rob. “Measuring Problem Management.” The IT Skeptic. February 1, 2014. Web. November 24, 2016.
England, Rob. Owning ITIL. Two Hills. 2009.
England, Rob. “Rob England: Proactive Problem Management.” December 5, 2012. Web. November 24, 2016.
Galley, Mark. “Improving on the Fishbone: Effective Cause-and-Effect Analysis: Cause Mapping.” ThinkReliability. 2007. Web. November 24, 2016.
“Problem Management.” ISACA. N.d. Web. November 24, 2016.
Higginson, Simon. “Four Problem Management SLAs you really can’t live without.” The ITSM Review. February 28, 2013. Web. November 24, 2016.
“How to use the Fishbone Tool for Root Cause Analysis.” Centers for Medicare and Medicaid Services. N.d. Web. November 24, 2016.
“Incident and Problem Management Dashboard.” IBM Knowledge Center. 2009. Web. November 24, 2016.
Isbell, Douglas, and Don Savage. “Mars Climate Orbiter Failure Board Releases Report, Numerous NASA Actions Underway in Response.” National Aeronautics and Space Administration. November 10, 1999. Web. November 24, 2016.
“Incident Management ITIL4 Practice Guide.” AXELOS.com. January 11, 2020.
“Problem Management ITIL4 Practice Guide.” AXELOS.com. January 11, 2020.