
- Any time a natural disaster or major IT outage occurs, it increases executive awareness and internal pressure to create a disaster recovery plan (DRP).
- Traditional DRP templates are onerous and result in a lengthy, dense plan that might satisfy auditors but will not be effective in a crisis.
- The myth that a DRP is only for major disasters leaves organizations vulnerable to more common incidents.
- The growing use of outsourced infrastructure services has increased reliance on vendors to meet recovery timeline objectives.
Our Advice
Critical Insight
- At its core, disaster recovery (DR) is about ensuring service continuity. Create a plan that can be leveraged for both isolated and catastrophic events.
- Remember Murphy’s Law. Failure happens. Focus on improving overall resiliency and recovery, rather than basing DR on risk probability analysis.
- Cost-effective DR and service continuity starts with identifying what is truly mission critical so you can focus resources accordingly. Not all services require fast failover.
Impact and Result
- Define appropriate objectives for service downtime and data loss based on business impact.
- Document an incident response plan that captures all of the steps from event detection to data center recovery.
- Create a DR roadmap to close gaps between current DR capabilities and recovery objectives.
Create a Right-Sized Disaster Recovery Plan Research & Tools
Besides the small introduction, subscribers and consulting clients within this management domain have access to:
1. Disaster Recovery Plan (DRP) Research – A step-by-step document that helps streamline your DR planning process and build a plan that's concise, usable, and maintainable.
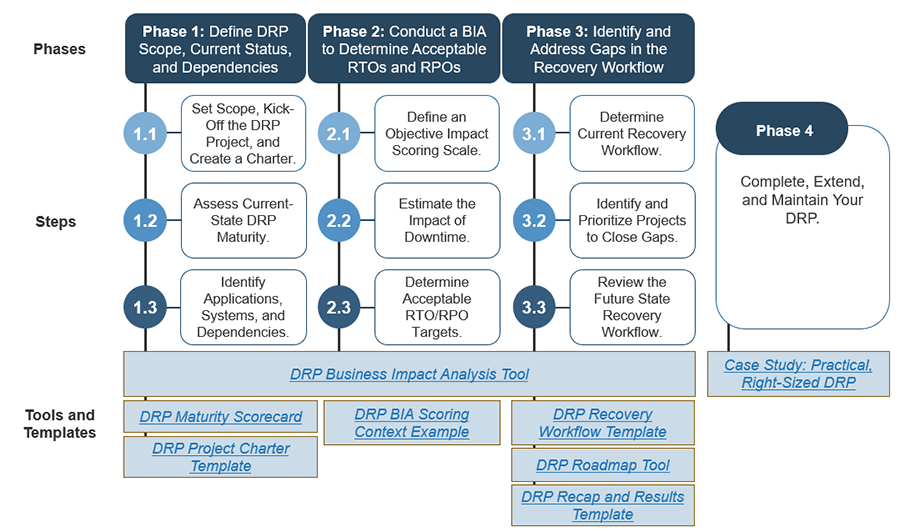
Any time a major IT outage occurs, it increases executive awareness and internal pressure to create an IT DRP. This blueprint will help you develop an actionable DRP by following our four-phase methodology to define scope, current status, and dependencies; conduct a business impact analysis; identify and address gaps in the recovery workflow; and complete, extend, and maintain your DRP.
- Create a Right-Sized Disaster Recovery Plan – Phases 1-4
2. DRP Case Studies – Examples to help you understand the governance and incident response components of a DRP and to show that your DRP project does not need to be as onerous as imagined.
These examples include a client who leveraged the DRP blueprint to create practical, concise, and easy-to-maintain DRP governance and incident response plans and a case study based on a hospital providing a wide range of healthcare services.
- Case Study: Practical, Right-Sized DRP
- Case Study: Practical, Right-Sized DRP – Healthcare Example
3. DRP Maturity Scorecard – An assessment tool to evaluate the current state of your DRP.
Use this tool to measure your current DRP maturity and identify gaps to address. It includes a comprehensive list of requirements for your DRP program, including core and industry requirements.
- DRP Maturity Scorecard
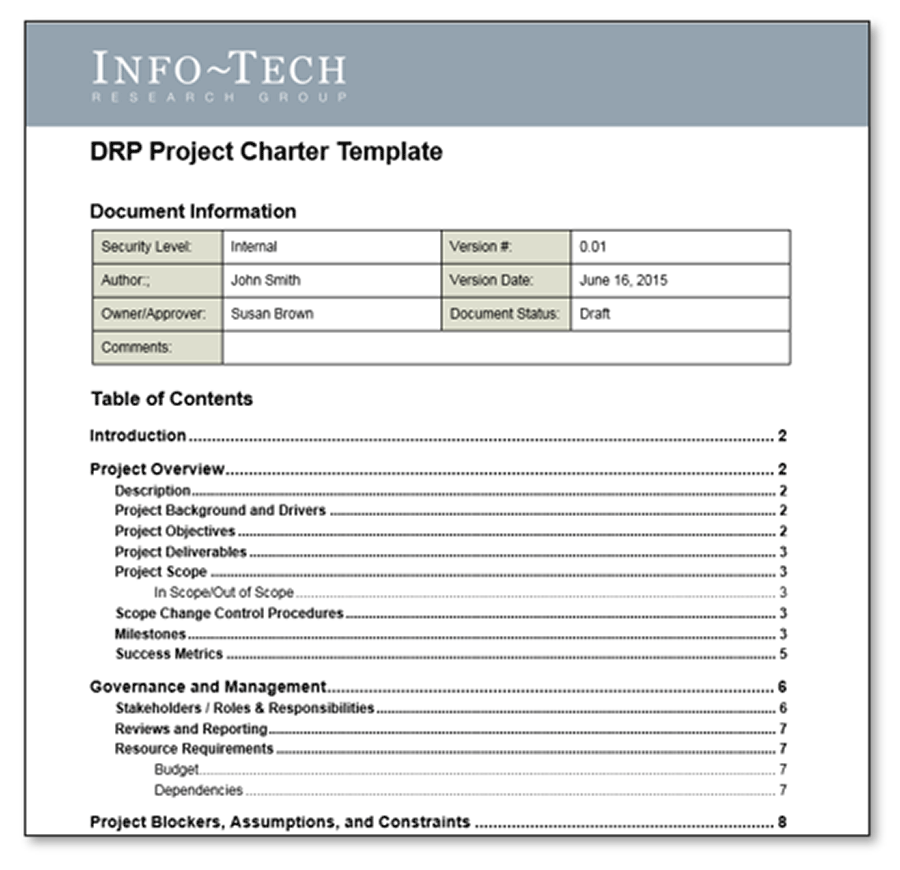
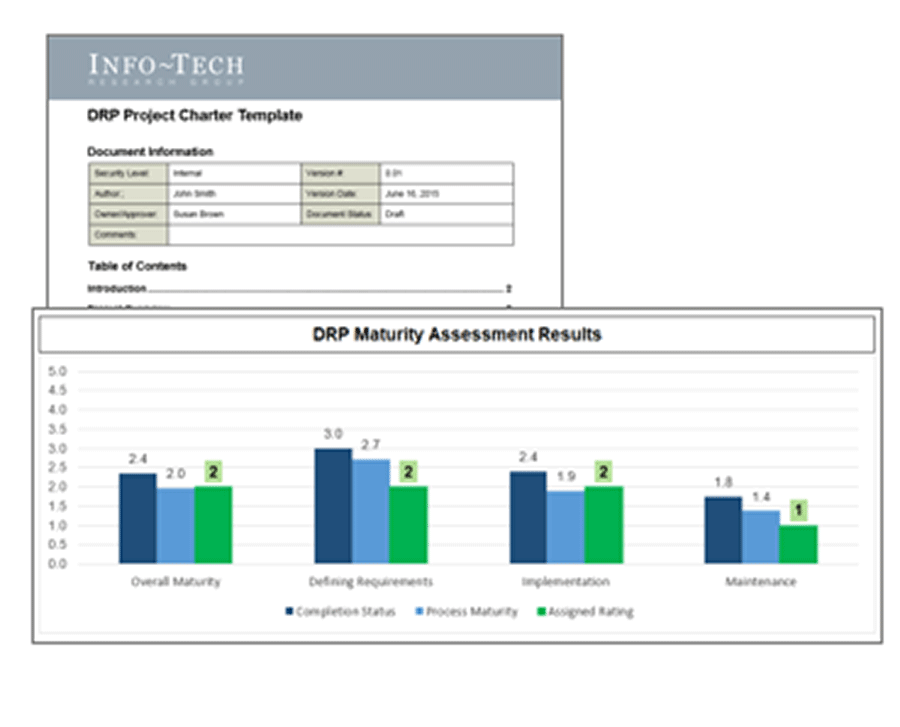
4. DRP Project Charter Template – A template to communicate important details on the project purpose, scope, and parameters.
The project charter template includes details on the project overview (description, background, drivers, and objectives); governance and management (project stakeholders/roles, budget, and dependencies); and risks, assumptions, and constraints (known and potential risks and mitigation strategy).
- DRP Project Charter Template
5. DRP Business Impact Analysis Tool – An evaluation tool to estimate the impact of downtime to determine appropriate, acceptable recovery time objectives (RTOs) and recovery point objectives (RPOs) and to review gaps between objectives and actuals.
This tool enables you to identify critical applications/systems; identify dependencies; define objective scoring criteria to evaluate the impact of application/system downtime; determine the impact of downtime and establish criticality tiers; set recovery objectives (RTO/RPO) based on the impact of downtime; record recovery actuals (RTA/RPA) and identify any gaps between objectives and actuals; and identify dependencies that regularly fail (and have a significant impact when they fail) to prioritize efforts to improve resiliency.
- DRP Business Impact Analysis Tool
- Legacy DRP Business Impact Analysis Tool
6. DRP BIA Scoring Context Example – A tool to record assumptions you made in the DRP Business Impact Analysis Tool to explain the results and drive business engagement and feedback.
Use this tool to specifically record assumptions made about who and what are impacted by system downtime and record assumptions made about impact severity.
- DRP BIA Scoring Context Example
7. DRP Recovery Workflow Template – A flowchart template to provide an at-a-glance view of the recovery workflow.
This simple format is ideal during crisis situations, easier to maintain, and often quicker to create. Use this template to document the Notify - Assess - Declare disaster workflow, document current and planned future state recovery workflows, including gaps and risks, and review an example recovery workflow.
- DRP Recovery Workflow Template (PDF)
- DRP Recovery Workflow Template (Visio)
8. DRP Roadmap Tool – A visual roadmapping tool that will help you plan, communicate, and track progress for your DRP initiatives.
Improving DR capabilities is a marathon, not a sprint. You likely can't fund and resource all the measures for risk mitigation at once. Instead, use this tool to create a roadmap for actions, tasks, projects, and initiatives to complete in the short, medium, and long term. Prioritize high-benefit, low-cost mitigations.
- DRP Roadmap Tool
9. DRP Recap and Results Template – A template to summarize and present key findings from your DR planning exercises and documents.
Use this template to present your results from the DRP Maturity Scorecard, BCP-DRP Fitness Assessment, DRP Business Impact Analysis Tool, tabletop planning exercises, DRP Recovery Workflow Template, and DRP Roadmap Tool.
- DRP Recap and Results Template
10. DRP Workbook – A comprehensive tool that enables you to organize information to support DR planning.
Leverage this tool to document information regarding DRP resources (list the documents/information sources that support DR planning and where they are located) and DR teams and contacts (list the DR teams, SMEs critical to DR, and key contacts, including business continuity management team leads that would be involved in declaring a disaster and coordinating response at an organizational level).
- DRP Workbook
11. Appendix
The following tools and templates are also included as part of this blueprint to use as needed to supplement the core steps above:
- DRP Incident Response Management Tool
- DRP Vendor Evaluation Questionnaire
- DRP Vendor Evaluation Tool
- Severity Definitions and Escalation Rules Template
- BCP-DRP Fitness Assessment
Workshop: Create a Right-Sized Disaster Recovery Plan
Workshops offer an easy way to accelerate your project. If you are unable to do the project yourself, and a Guided Implementation isn't enough, we offer low-cost delivery of our project workshops. We take you through every phase of your project and ensure that you have a roadmap in place to complete your project successfully.
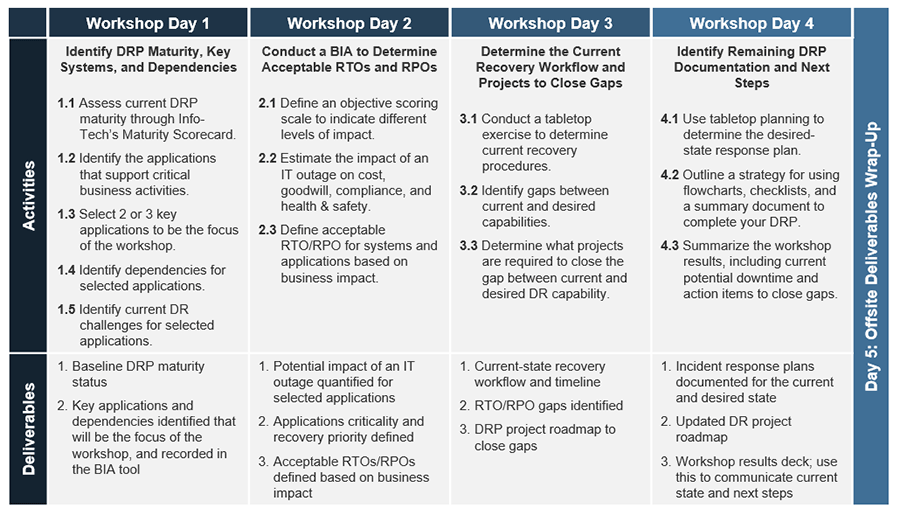
1 Define Parameters for Your DRP
The Purpose
Identify key applications and dependencies based on business needs.
Key Benefits Achieved
Understand the entire IT “footprint” that needs to be recovered for key applications.
Activities
1.1 Assess current DR maturity.
1.2 Determine critical business operations.
1.3 Identify key applications and dependencies.
Outputs
Current challenges identified through a DRP Maturity Scorecard.
Key applications and dependencies documented in the Business Impact Analysis (BIA) Tool.
2 Determine the Desired Recovery Timeline
The Purpose
Quantify application criticality based on business impact.
Key Benefits Achieved
Appropriate recovery time and recovery point objectives defined (RTOs/RPOs).
Activities
2.1 Define an objective scoring scale to indicate different levels of impact.
2.2 Estimate the impact of downtime.
2.3 Determine desired RTO/RPO targets for applications based on business impact.
Outputs
Business impact analysis scoring criteria defined.
Application criticality validated.
RTOs/RPOs defined for applications and dependencies.
3 Determine the Current Recovery Timeline and DR Gaps
The Purpose
Determine your baseline DR capabilities (your current state).
Key Benefits Achieved
Gaps between current and desired DR capability are quantified.
Activities
3.1 Conduct a tabletop exercise to determine current recovery procedures.
3.2 Identify gaps between current and desired capabilities.
3.3 Estimate likelihood and impact of failure of individual dependencies.
Outputs
Current achievable recovery timeline defined (i.e. the current state).
RTO/RPO gaps identified.
Critical single points of failure identified.
4 Create a Project Roadmap to Close DR Gaps
The Purpose
Identify and prioritize projects to close DR gaps.
Key Benefits Achieved
DRP project roadmap defined that will reduce downtime and data loss to acceptable levels.
Activities
4.1 Determine what projects are required to close the gap between current and desired DR capability.
4.2 Prioritize projects based on cost, effort, and impact on RTO/RPO reduction.
4.3 Validate that the suggested projects will achieve the desired DR capability.
Outputs
Potential DR projects identified.
DRP project roadmap defined.
Desired-state incident response plan defined, and project roadmap validated.
5 Establish a Framework for Documenting Your DRP, and Summarize Next Steps
The Purpose
Outline how to create concise, usable DRP documentation.
Summarize workshop results.
Key Benefits Achieved
A realistic and practical approach to documenting your DRP.
Next steps documented.
Activities
5.1 Outline a strategy for using flowcharts and checklists to create concise, usable documentation.
5.2 Review Info-Tech’s DRP templates for creating system recovery procedures and a DRP summary document.
5.3 Summarize the workshop results, including current potential downtime and action items to close gaps.
Outputs
Current-state and desired-state incident response plan flowcharts.
Templates to create more detailed documentation where necessary.
Executive communication deck that outlines current DR gaps, how to close those gaps, and recommended next steps.
Further reading
Create a Right-Sized Disaster Recovery Plan
Close the gap between your DR capabilities and service continuity requirements.
ANALYST PERSPECTIVE
An effective disaster recovery plan (DRP) is not just an insurance policy.
"An effective DRP addresses common outages such as hardware and software failures, as well as regional events, to provide day-to-day service continuity. It’s not just insurance you might never cash in. Customers are also demanding evidence of an effective DRP, so organizations without a DRP risk business impact not only from extended outages but also from lost sales. If you are fortunate enough to have executive buy-in, whether it’s due to customer pressure or concern over potential downtime, you still have the challenge of limited time to dedicate to disaster recovery (DR) planning. Organizations need a practical but structured approach that enables IT leaders to create a DRP without it becoming their full-time job."
Frank Trovato,
Research Director, Infrastructure
Info-Tech Research Group
Is this research for you?
This Research Is Designed For:
- Senior IT management responsible for executing DR.
- Organizations seeking to formalize, optimize, or validate an existing DRP.
- Business continuity management (BCM) professionals leading DRP development.
This Research Will Help You:
- Create a DRP that is aligned with business requirements.
- Prioritize technology enhancements based on DR requirements and risk-impact analysis.
- Identify and address process and technology gaps that impact DR capabilities and day-to-day service continuity.
This Research Will Also Assist:
- Executives who want to understand the time and resource commitment required for DRP.
- Members of BCM and crisis management teams who need to understand the key elements of an IT DRP.
This Research Will Help Them:
- Scope the time and effort required to develop a DRP.
- Align business continuity, DR, and crisis management plans.
Executive summary
Situation
- Any time a natural disaster or major IT outage occurs, it increases executive awareness and internal pressure to create a DRP.
- Industry standards and government regulations are driving external pressure to develop business continuity and IT DR plans.
- Customers are asking suppliers and partners to provide evidence that they have a workable DRP before agreeing to do business.
Complication
- Traditional DRP templates are onerous and result in a lengthy, dense plan that might satisfy auditors, but will not be effective in a crisis.
- The myth that a DRP is only for major disasters leaves organizations vulnerable to more common incidents.
- The growing use of outsourced infrastructure services has increased reliance on vendors to meet recovery timeline objectives.
Resolution
- Create an effective DRP by following a structured process to discover current capabilities and define business requirements for continuity:
- Define appropriate objectives for service downtime and data loss based on business impact.
- Document an incident response plan that captures all of the steps from event detection to data center recovery.
- Create a DR roadmap to close gaps between current DR capabilities and recovery objectives.
Info-Tech Insight
- At its core, DR is about ensuring service continuity. Create a plan that can be leveraged for both isolated and catastrophic events.
- Remember Murphy’s Law. Failure happens. Focus on improving overall resiliency and recovery, rather than basing DR on risk probability analysis.
- Cost-effective DR and service continuity starts with identifying what is truly mission critical so you can focus resources accordingly. Not all services require fast failover.
An effective DRP is critical to reducing the cost of downtime
If you don’t have an effective DRP when failure occurs, expect to face extended downtime and exponentially rising costs due to confusion and lack of documented processes.
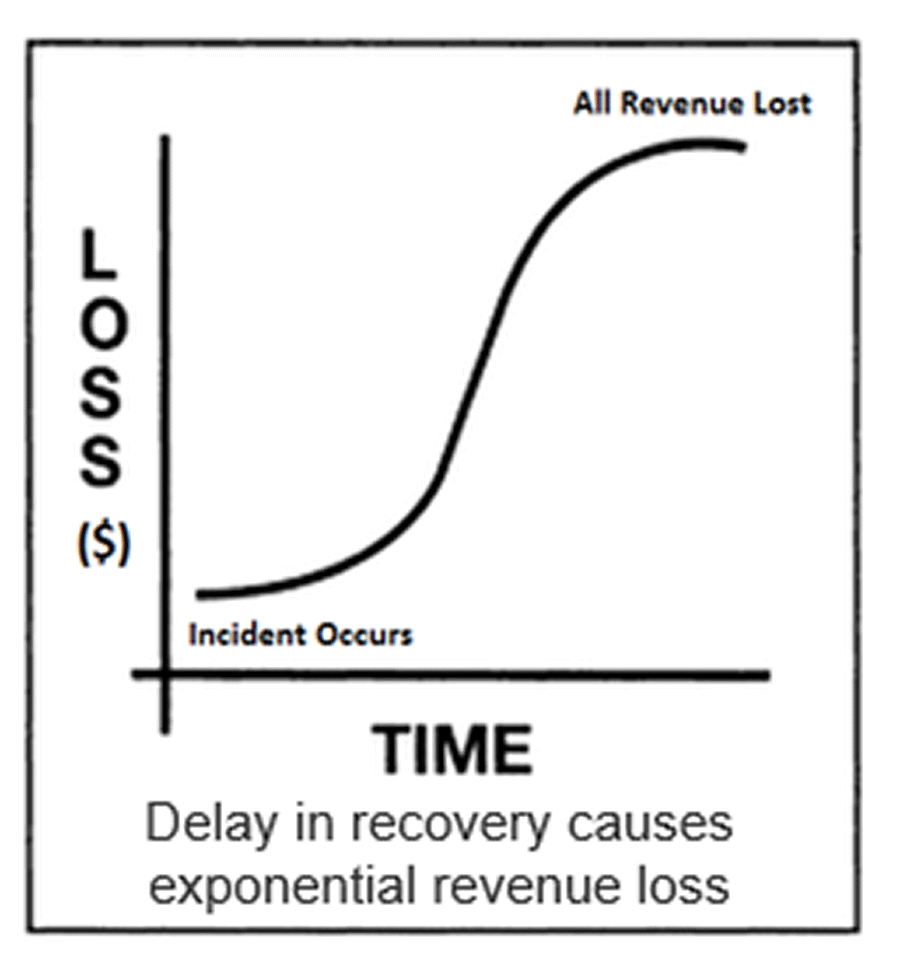
Potential Lost Revenue
The impact of downtime tends to increase exponentially as systems remain unavailable (graph at left). A current, tested DRP will significantly improve your ability to execute systems recovery, minimizing downtime and business impact. Without a DRP, IT is gambling on its ability to define and implement a recovery strategy during a time of crisis. At the very least, this means extended downtime – potentially weeks or months – and substantial business impact.
Adapted from: Philip Jan Rothstein, 2007
Cost of Downtime for the Fortune 1000
Cost of unplanned apps downtime per year: $1.25B to $2.5B.
Cost of critical apps failure per hour: $500,000 to $1M.
Cost of infrastructure failure per hour: $100,000.
35% reported to have recovered within 12 hours.
17% of infrastructure failures took more than 24 hours to recover.
13% of application failures took more than 24 hours to recover.
Source: Stephen Elliot, 2015
Info-Tech Insight
The cost of downtime is rising across the board, and not just for organizations that traditionally depend on IT (e.g. e-commerce). Downtime cost increase since 2010:
Hospitality: 129% increase
Transportation: 108% increase
Media organizations: 104% increase
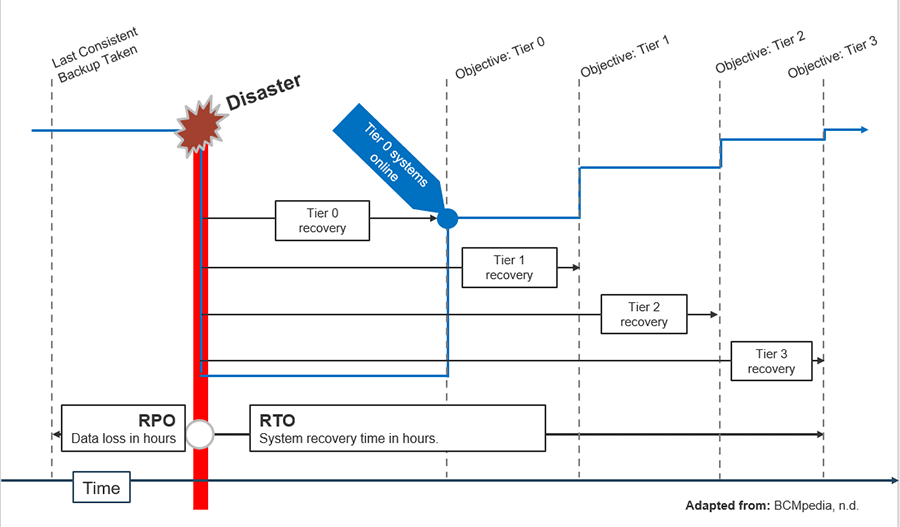
An effective DRP also sets clear recovery objectives that align with system criticality to optimize spend
Take a practical approach that creates a more concise and actionable DRP
DR planning is not your full-time job, so it can’t be a resource- and time-intensive process.
| The Traditional Approach | Info-Tech’s Approach |
|---|---|
|
Start with extensive risk and probability analysis. Challenge: You can’t predict every event that can occur, and this delays work on your actual recovery procedures. |
Focus on how to recover regardless of the incident. We know failure will happen. Focus on improving your ability to failover to a DR environment so you are protected regardless of what causes primary site failure. |
|
Build a plan for major events such as natural disasters. Challenge: Major destructive events only account for 12% of incidents while software/hardware issues account for 45%. The vast majority of incidents are isolated local events. |
An effective DRP improves day-to-day service continuity, and is not just for major events. Leverage DR planning to address both common (e.g. power/network outage or hardware failure) as well as major events. It must be documentation you can use, not shelfware. |
|
Create a DRP manual that provides step-by-step instructions that anyone could follow. Challenge: The result is lengthy, dense manuals that are difficult to maintain and hard to use in a crisis. The usability of DR documents has a direct impact on DR success. |
Create concise documentation written for technical experts. Use flowcharts, checklists, and diagrams. They are more usable in a crisis and easier to maintain. You aren’t going to ask a business user to recover your SQL Server databases, so you can afford to be concise. |
DR must be integrated with day-to-day incident management to ensure service continuity
When a tornado takes out your data center, it’s an obvious DR scenario and the escalation towards declaring a disaster is straightforward.
The challenge is to be just as decisive in less-obvious (and more common) DR scenarios such as a critical system hardware/software failure, and knowing when to move from incident management to DR. Don’t get stuck troubleshooting for days when you could have failed over in hours.
Bridge the gap with clearly-defined escalation rules and criteria for when to treat an incident as a disaster.
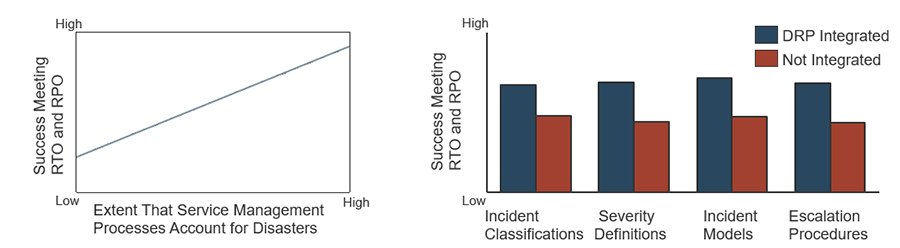
Source: Info-Tech Research Group; N=92
Myth busted: The DRP is separate from day-to-day ops and incident management.
The most common threats to service continuity are hardware and software failures, network outages, and power outages
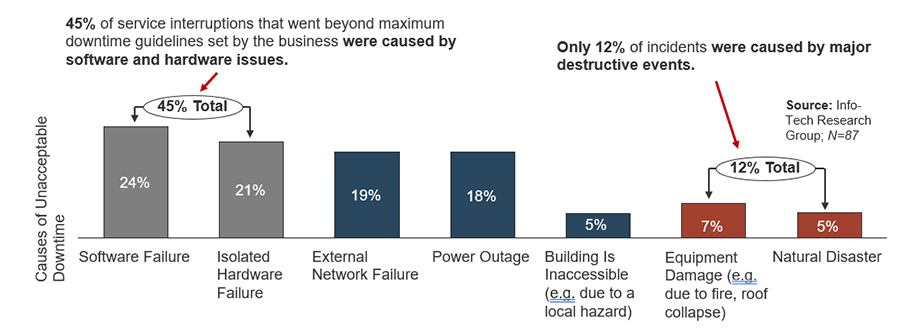
Source: Info-Tech Research Group; N=87
Info-Tech Insight
Does this mean I don’t need to worry about natural disasters? No. It means DR planning needs to focus on overall service continuity, not just major disasters. If you ignore the more common but less dramatic causes of service interruptions, you are diminishing the business value of a DRP.
Myth busted: DRPs are just for destructive events – fires, floods, and natural disasters.
DR isn’t about identifying risks; it’s about ensuring service continuity
The traditional approach to DR starts with an in-depth exercise to identify risks to IT service continuity and the probability that those risks will occur.
Here’s why starting with a risk register is ineffective:
- Odds are, you won’t think of every incident that might occur. If you think of twenty risks, it’ll be the twenty-first that gets you. If you try to guard against that twenty-first risk, you can quickly get into cartoonish scenarios and much more costly solutions.
- The ability to failover to another site mitigates the risk of most (if not all) incidents (fire, flood, hardware failure, tornado, etc.). A risk and probability analysis doesn’t change the need for a plan that includes a failover procedure.
Where risk is incorporated in this methodology:
- Use known risks to further refine your strategy (e.g. if you are prone to hurricanes, plan for greater geographic separation between sites; ensure you have backups, in addition to replication, to mitigate the risk of ransomware).
- Identify risks to your ability to execute DR (e.g. lack of cross-training, backups that are not tested) and take steps to mitigate those risks.
Myth busted: A risk register is the critical first step to creating an effective DR plan.
You can’t outsource accountability and you can’t assume your vendor’s DR capabilities meet your needs
Outsourcing infrastructure services – to a cloud provider, co-location provider, or managed service provider (MSP) – can improve your DR and service continuity capabilities. For example, a large public cloud provider will generally have:
- Redundant telecoms service providers, network infrastructure, power feeds, and standby power.
- Round-the-clock infrastructure and security monitoring.
- Multiple data centers in a given region, and options to replicate data and services across regions.
Still, failure is inevitable – it’s been demonstrated multiple times1 through high-profile outages. When you surrender direct control of the systems themselves, it’s your responsibility to ensure the vendor can meet your DR requirements, including:
- A DR site and acceptable recovery times for systems at that site.
- An acceptable replication/backup schedule.
Sources: Kyle York, 2016; Shaun Nichols, 2017; Stephen Burke, 2017
Myth busted: I outsource infrastructure services so I don’t have to worry about DR. That’s my vendor’s responsibility.
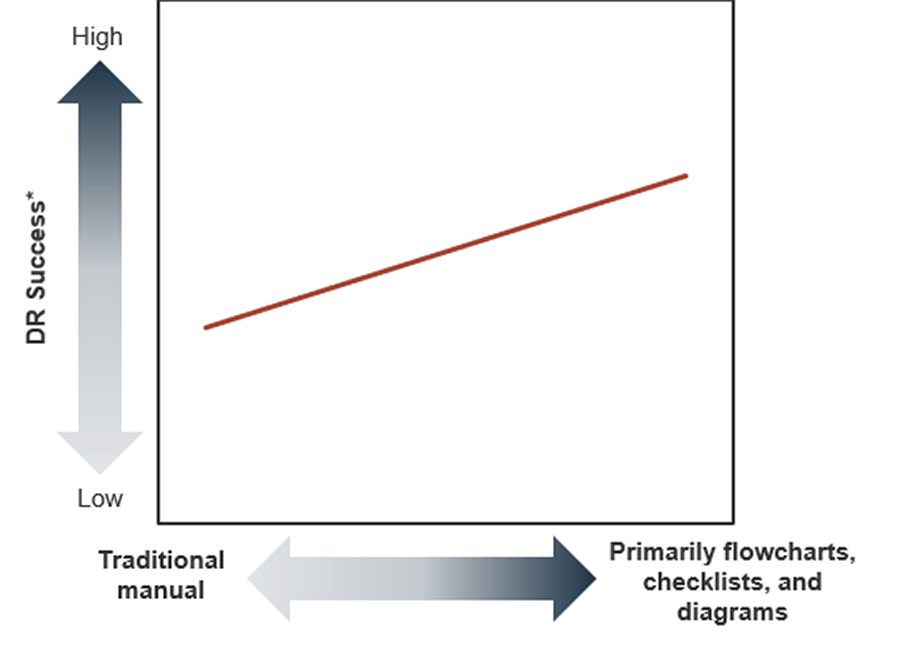
Choose flowcharts over process guides, checklists over procedures, and diagrams over descriptions
IT DR is not an airplane disaster movie. You aren’t going to ask a business user to execute a system recovery, just like you wouldn’t really want a passenger with no flying experience to land a plane.
In reality, you write a DR plan for knowledgeable technical staff, which allows you to summarize key details your staff already know. Concise, visual documentation is:
- Quicker to create.
- Easier to use.
- Simpler to maintain.
"Without question, 300-page DRPs are not effective. I mean, auditors love them because of the detail, but give me a 10-page DRP with contact lists, process flows, diagrams, and recovery checklists that are easy to follow."
– Bernard Jones, MBCI, CBCP, CORP, Manager Disaster Recovery/BCP, ActiveHealth Management
Source: Info-Tech Research Group; N=95
*DR Success is based on stated ability to meet recovery time objectives (RTOs) and recovery point objectives (RPOs), and reported confidence in ability to consistently meet targets.
Myth busted: A DRP must include every detail so anyone can execute recovery.
A DRP is part of an overall business continuity plan
A DRP is the set of procedures and supporting documentation that enables an organization to restore its core IT services (i.e. applications and infrastructure) as part of an overall business continuity plan (BCP), as described below. Use the templates, tools, and activities in this blueprint to create your DRP.
| Overall BCP |
|---|
| IT DRP | BCP for Each Business Unit | Crisis Management Plan |
|---|---|---|
A plan to restore IT services (e.g. applications and infrastructure) following a disruption. This includes:
|
A set of plans to resume business processes for each business unit. Info-Tech’s Develop a Business Continuity Plan blueprint provides a methodology for creating business unit BCPs as part of an overall BCP for the organization. | A set of processes to manage a wide range of crises, from health and safety incidents to business disruptions to reputational damage. This includes emergency response plans, crisis communication plans, and the steps to invoke BC/DR plans when applicable. Info-Tech’s Implement Crisis Management Best Practices blueprint provides a structured approach to develop a crisis management process. |
Note: For DRP, we focus on business-facing IT services (as opposed to the underlying infrastructure), and then identify required infrastructure as dependencies (e.g. servers, databases, network).
Take a practical but structured approach to creating a concise and effective DRP
Info-Tech offers various levels of support to best suit your needs
DIY Toolkit
"Our team has already made this critical project a priority, and we have the time and capability, but some guidance along the way would be helpful."
Guided Implementation
“Our team knows that we need to fix a process, but we need assistance to determine where to focus. Some check-ins along the way would help keep us on track.”
Workshop
“We need to hit the ground running and get this project kicked off immediately. Our team has the ability to take this over once we get a framework and strategy in place.”
Consulting
“Our team does not have the time or the knowledge to take this project on. We need assistance through the entirety of this project.”
Diagnostics and consistent frameworks used throughout all four options
Info-Tech advisory services deliver measurable value
Info-Tech members save an average of $22,983 and 22 days by working with an Info-Tech analyst on DRP (based on client response data from Info-Tech Research Group’s Measured Value Survey, following analyst advisory on this blueprint).
Why do members report value from analyst engagement?
- Expert advice on your specific situation to overcome obstacles and speed bumps.
- Structured project and guidance to stay on track.
- Project deliverables review to ensure the process is applied properly.
Guided implementation overview
Your trusted advisor is just a call away.
Define DRP scope (Call 1)
Scope requirements, objectives, and your specific challenges. Identify applications/ systems to focus on first.
Define current status and system dependencies (Calls 2-3)
Assess current DRP maturity. Identify system dependencies.
Conduct a BIA (Calls 4-6)
Create an impact scoring scale and conduct a BIA. Identify RTO and RPO for each system.
Recovery workflow (Calls 7-8)
Create a recovery workflow based on tabletop planning. Identify gaps in recovery capabilities.
Projects and action items (Calls 9-10)
Identify and prioritize improvements. Summarize results and plan next steps.
Your guided implementations will pair you with an advisor from our analyst team for the duration of your DRP project.
Workshop overview
Contact your account representative or email Workshops@InfoTech.com for more information.
End-user complaints distract from serious IT-based risks to business continuity
Case Study
Industry: Manufacturing
Source: Info-Tech Research Group Client Engagement
A global manufacturer with annual sales over $1B worked with Info-Tech to improve DR capabilities.
DRP BIA
Conversations with the IT team and business units identified the following impact of downtime over 24 hours:
- Email: Direct Cost: $100k; Goodwill Impact Score: 8.5/16
- ERP: Direct Cost: $1.35mm; Goodwill Impact Score: 12.5/16
Tabletop Testing and Recovery Capabilities
Reviewing the organization’s current systems recovery workflow identified the following capabilities:
- Email: RTO: minutes, RPO: minutes
- ERP: RTO: 14 hours, RPO: 24 hours
Findings
Because of end-user complaints, IT had invested heavily in email resiliency though email downtime had a relatively minimal impact on the business. After working through the methodology, it was clear that the business needed to provide additional support for critical systems.
Insights at each step:
Identify DR Maturity and System Dependencies
Conduct a BIA
Outline Incident Response and Recovery Workflow With Tabletop Exercises
Mitigate Gaps and Risks
Create a Right-Sized Disaster Recovery Plan
Phase 1
Define DRP Scope, Current Status, and Dependencies
Step 1.1: Set Scope, Kick-Off the DRP Project, and Create a Charter
This step will walk you through the following activities:
- Establish a team for DR planning.
- Retrieve and review existing, relevant documentation.
- Create a project charter.
This step involves the following participants:
- DRP Coordinator
- DRP Team (Key IT SMEs)
- IT Managers
Results and Insights
- Set scope for the first iteration of the DRP methodology.
- Don’t try to complete your DR and BCPs all at once.
- Don’t bite off too much at once.
Kick-off your DRP project
You’re ready to start your DR project.
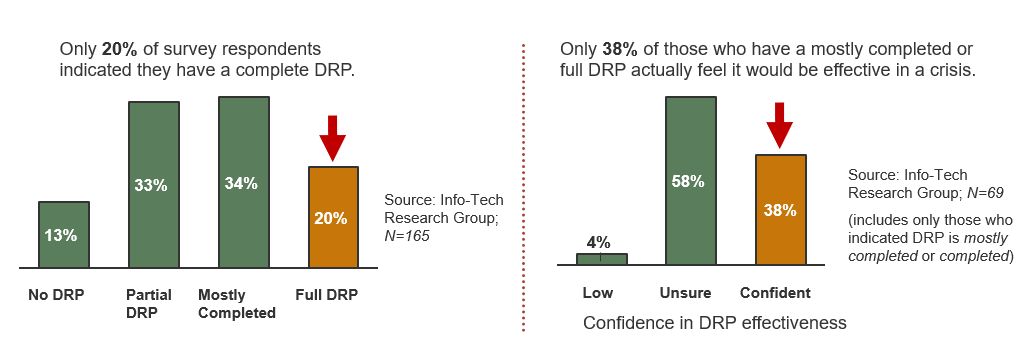
This could be an annual review – but more likely, this is the first time you’ve reviewed the DR plan in years.* Maybe a failed audit might have provided a mandate for DR planning, or a real disaster might have highlighted gaps in DR capabilities. First, set appropriate expectations for what the project is and isn’t, in terms of scope, outputs, and resource commitments. Very few organizations can afford to hire a full-time DR planner, so it’s likely this won’t be your full-time job. Set objectives and timelines accordingly.
Gather a team
- Often, DR efforts are led by the infrastructure and operations leader. This person can act as the DRP coordinator or may delegate this role.
- Key infrastructure subject-matter experts (SMEs) are usually part of the team and involved through the project.
Find and review existing documentation
- An existing DRP may have information you can re-purpose rather than re-create.
- High-level architecture diagrams and network diagrams can help set scope (and will become part of your DR kit).
- Current business-centric continuity of operations plans (COOPs) or BCPs are important to understand.
Set specific, realistic objectives
- Create a project charter (see next slide) to record objectives, timelines, and assumptions.
*Only 20% of respondents to an Info-Tech Research Group survey (N=165) had a complete DRP; only 38% of respondents with a complete or mostly complete DRP felt it would be effective in a crisis.
List DRP drivers and challenges
1(a) Drivers and roadblocks
Estimated Time: 30 minutes
Identify the drivers and challenges to completing a functional DRP plan with the core DR team.
DRP Drivers
- Past outages (be specific):
- Hardware and software failures
- External network and power outages
- Building damage
- Natural disaster(s)
- Audit findings
- Events in the news
- Other?
DRP Challenges
- Lack of time
- Insufficient DR budget
- Lack of executive support
- No internal DRP expertise
- Challenges making the case for DRP
- Other?
Write down insights from the meeting on flip-chart paper or a whiteboard and use the findings to inform your DRP project (e.g. challenges to address).
Clarify expectations with a project charter
1(b) DRP Project Charter Template
DRP Project Charter Template components:
Define project parameters, roles, and objectives, and clarify expectations with the executive team. Specific subsections are listed below and described in more detail in the remainder of this phase.
- Project Overview: Includes objectives, deliverables, and scope. Leverage relevant notes from the “Project Drivers” brainstorming exercise (e.g. past outages and near misses which help make the case).
- Governance and Management: Includes roles, responsibilities, and resource requirements.
- Project Risks, Assumptions, and Constraints: Includes risks and mitigation strategies, as well as any assumptions and constraints.
- Project Sign-Off: Includes IT and executive sign-off (if required).
Note: Identify the initial team roles and responsibilities first so they can assist in defining the project charter.
Step 1.2: Assess Current State DRP Maturity
This step will walk you through the following activities:
- Complete Info-Tech’s DRP Maturity Scorecard.
This step involves the following participants:
- DRP Coordinator
- IT SMEs
Results and Insights
- Identify the current state of the organization’s DRP and continuity management. Set a baseline for improvement.
- Discover where improvement is most needed to create an effective plan.
Only 38% of IT departments believe their DRPs would be effective in a real crisis
Even organizations with documented DRPs struggle to make them actionable.
- Even when a DRP does become a priority (e.g. due to regulatory or customer drivers), the challenge is knowing where to start and having a methodical step-by-step process for doing the work. With no guide to plan and resource the project, it becomes work that you complete piecemeal when you aren’t working on other projects, or at night after the kids go to bed.
- Far too many organizations create a document to satisfy auditors rather than creating a usable plan. People in this group often just want a fill-in-the-blanks template. What they will typically find is a template for the traditional 300-page manual that goes in a binder that sits on a shelf, is difficult to maintain, and is not effective in a crisis.
Use the DRP Maturity Scorecard to assess the current state of your DRP and identify areas to improve
1(c) DRP Maturity Scorecard
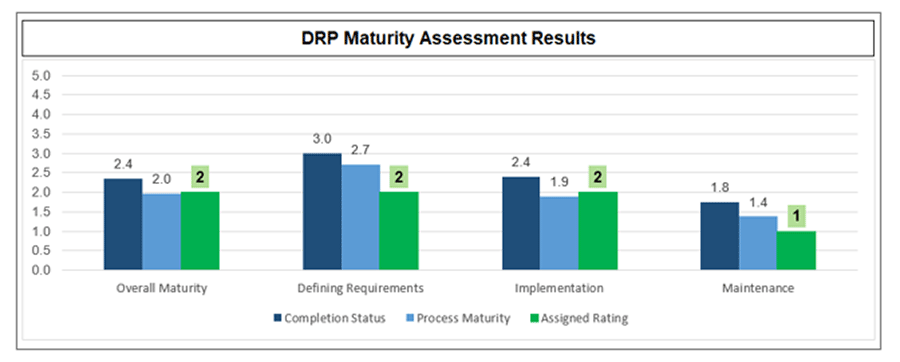
Info-Tech’s DRP Maturity Scorecard evaluates completion status and process maturity for a comprehensive yet practical assessment across three aspects of an effective DRP program – Defining Requirements, Implementation, and Maintenance.
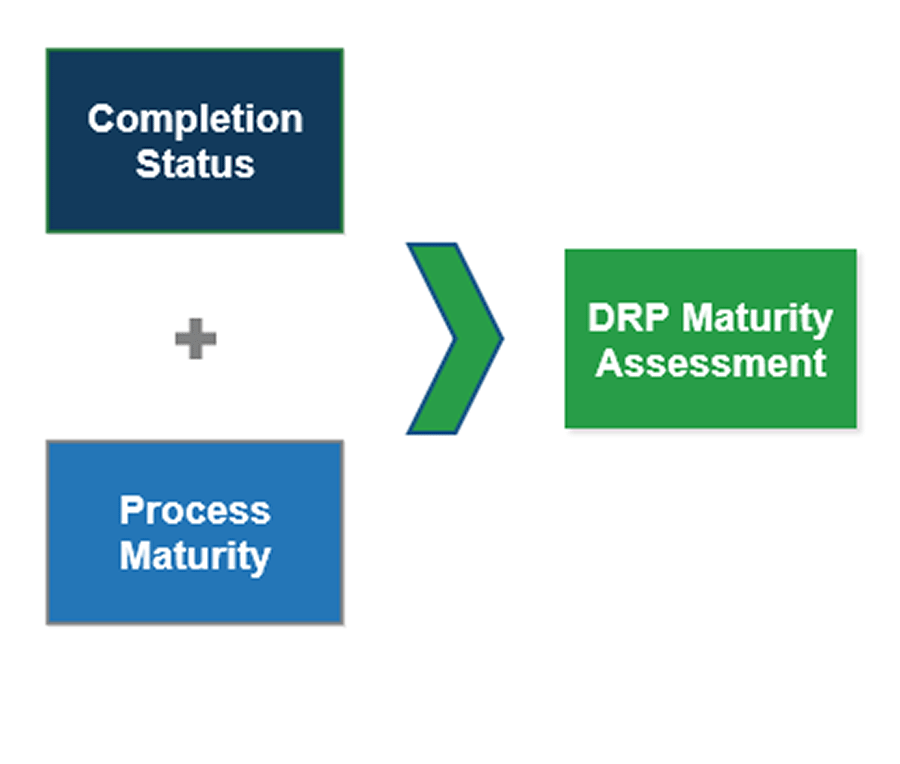
Completion Status: Reflects the progress made with each component of your DRP Program.
Process Maturity: Reflects the consistency and quality of the steps executed to achieve your completion status.
DRP Maturity Assessment: Each component (e.g. BIA) of your DRP Program is evaluated based on completion status and process maturity to provide an accurate holistic assessment. For example, if your BIA completion status is 4 out of 5, but process maturity is a 2, then requirements were not derived from a consistent defined process. The risk is inconsistent application prioritization and misalignment with actual business requirements.
Step 1.3: Identify Applications, Systems, and Dependencies
This step will walk you through the following activities:
- Identify systems, applications, and services, and the business units that use them.
- Document applications, systems, and their dependencies in the DRP Business Impact Analysis Tool.
This step involves the following participants:
- DRP Coordinator
- DRP Team
Results and Insights
- Identify core services and the applications that depend on them.
- Add applications and dependencies to the DRP Business Impact Analysis Tool.
Select 5-10 services to get started on the DRP methodology
1(d) High-level prioritization
Estimated Time: 30 minutes
Working through the planning process the first time can be challenging. If losing momentum is a concern, limit the BIA to a few critical systems to start.
Run this exercise if you need a structured exercise to decide where to focus first and identify the business users you should ask for input on the impact of system downtime.
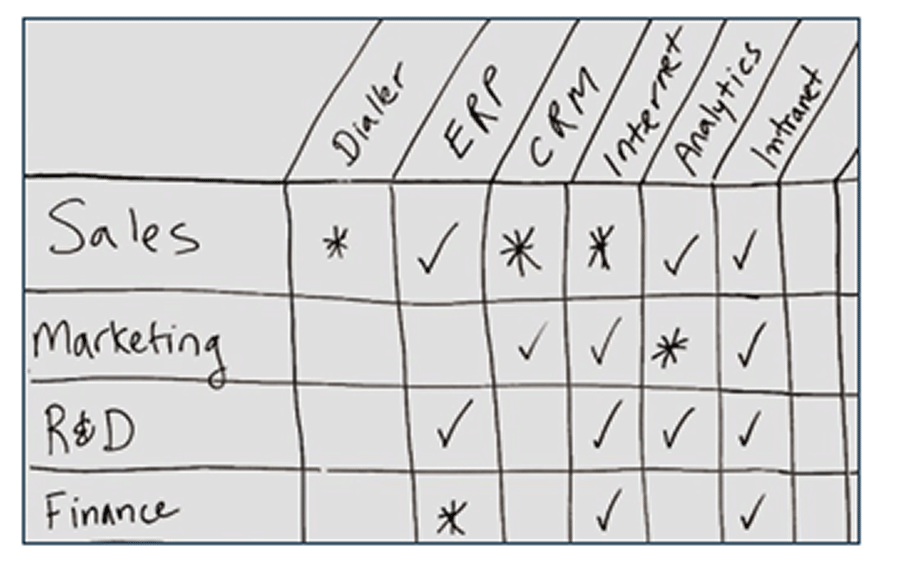
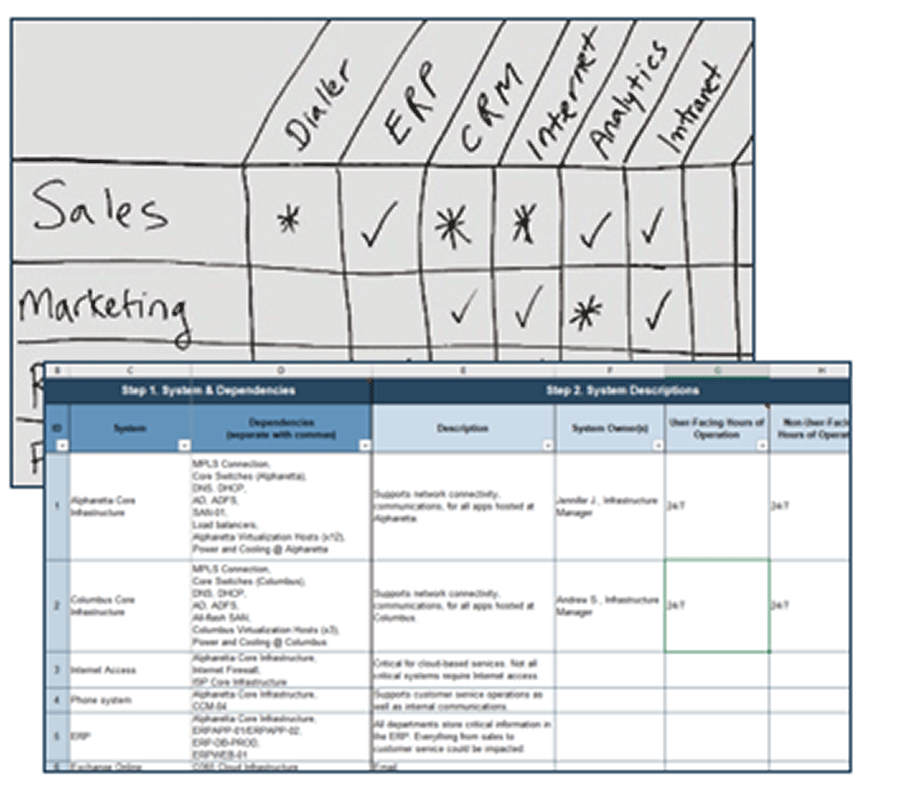
- On a whiteboard or flip-chart paper, list business units in a column on the left. List key applications/systems in a row at the top. Draw a grid.
- At a high level, review how applications are used by each unit. Take notes to keep track of any assumptions you make.
- Add a ✓ if members of the unit use the application or system.
- Add an ✱ if members of the unit are heavy users of the application or system and/or use it for time sensitive tasks.
- Leave the box blank if the app isn’t used by this unit.
- Use the chart to prioritize systems to include in the BIA (e.g. systems marked with an *) but also include a few less-critical systems to illustrate DRP requirements for a range of systems.
| Application | Notes |
|---|---|
| CRM |
|
| Dialer |
|
Draw a high-level sketch of your environment
1(e) Sketch your environment
Estimated Time: 1-2 hours
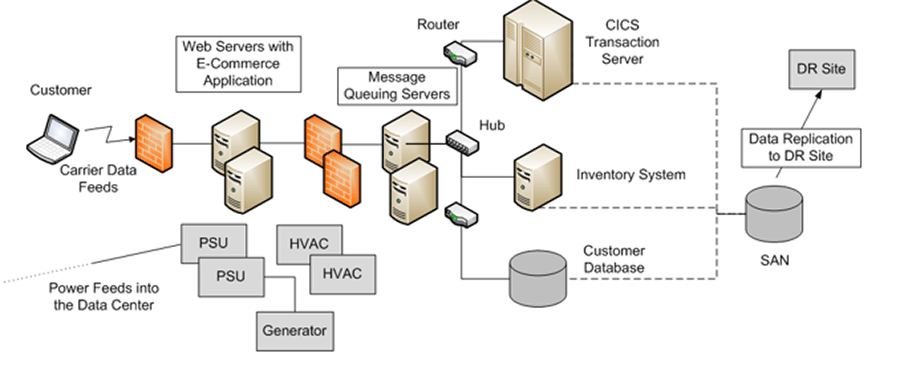
A high-level topology or architectural diagram is an effective way to identify dependencies, application ownership, outsourced services, hardware redundancies, and more.
Note:
- Network diagrams or high-level architecture diagrams help to identify dependencies and redundancies. Even a rough sketch is a useful reference tool for participants, and will be valuable documentation in the final DR plan.
- Keep the drawings tidy. Visualize the final diagram before you start to draw on the whiteboard to help with spacing and placement.
- Collaborate with relevant SMEs to identify dependencies. Keep the drawing high-level.
- Illustrate connections between applications or components with lines. Use color coding to illustrate where applications are hosted (e.g. in-house, at a co-lo, in a cloud or MSP environment).
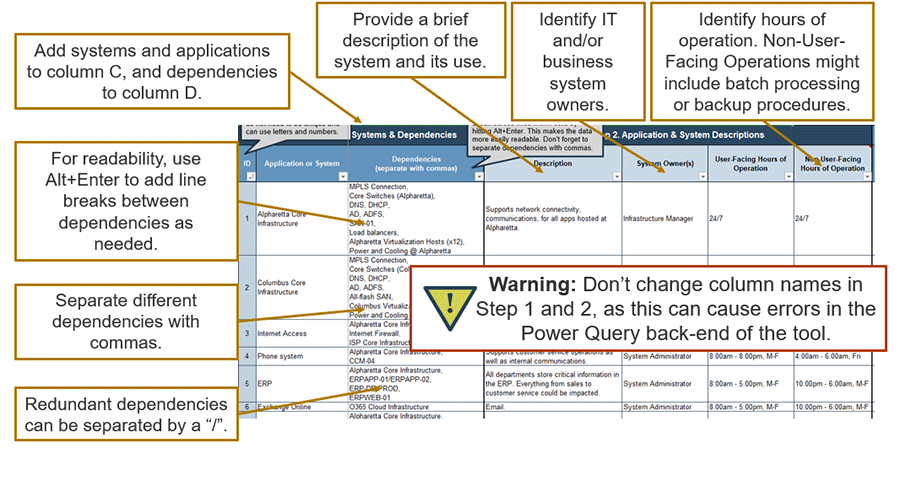
Document systems and dependencies
Collaborate with system SMEs to identify dependencies for each application or system. Document the dependencies in the DRP Business Impact Analysis Tool (see image below)
- When listing applications, focus on business-facing systems or services that business users will recognize and use terminology they’ll understand.
- Group infrastructure components that support all other services as a single core infrastructure service to simplify dependency mapping (e.g. core router, virtual hosts, ID management, and DNS).
- In general, each data center will have its own core infrastructure components. List each data center separately – especially if different services are hosted at each data center.
- Be specific when documenting dependencies. Use existing asset tracking tables, discovery tools, asset management records, or configuration management tools to identify specific server names.
- Core infrastructure dependencies, such as the network infrastructure, power supply, and centralized storage, will be a common set of dependencies for most applications, so group these into a separate category called “Core Infrastructure” to minimize repetition in your DR planning.
- Document production components in the BIA tool. Capture in-production, redundant components performing the same work on a single dependency line. List standby systems in the notes.
Info-Tech Best Practice
In general, visual documentation is easier to use in a crisis and easier to maintain over time. Use Info-Tech’s research to help build your own visual SOPs.
Document systems and dependencies
1(f) DRP Business Impact Analysis Tool – Record systems and dependencies
Stories from the field: Info-Tech clients find value in Phase 1 in the following ways
An organization uncovers a key dependency that needed to be treated as a Tier 1 system
Reviewing the entire ecosystem for applications identified key dependencies that were previously considered non-critical. For example, a system used to facilitate secure data transfers was identified as a key dependency for payroll and other critical business processes, and elevated to Tier 1.
A picture’s worth a thousand words (and 1600 servers)
Drawing a simple architectural diagram was an invaluable tool to identify key dependencies and critical systems, and to understand how systems and dependencies were interconnected. The drawing was an aha moment for IT and business stakeholders trying to make sense of their 1600-server environment.
Make the case for DRP
A member of the S&P 500 used Info-Tech’s DRP Maturity Scorecard to provide a reliable objective assessment and make the case for improvements to the board of directors.
State government agency initiates a DRP project to complement an existing COOP
Info-Tech's DRP Project Charter enabled the CIO to clarify their DRP project scope and where it fit into their overall COOP. The project charter example provided much of the standard copy – objectives, scope, project roles, methodology, etc. – required to outline the project.
Phase 1: Insights and accomplishments
Created a charter and identified current maturity
Identified systems and dependencies for the BIA
Summary of Accomplishments:
- Created a DRP project charter.
- Completed the DRP Maturity Scorecard and identified current DRP maturity.
- Prioritized applications/systems for a first pass through DR planning.
- Identified dependencies for each application and system.
Up Next: Conduct a BIA to establish recovery requirements
Create a Right-Sized Disaster Recovery Plan
Phase 2
Conduct a BIA to Determine Acceptable RTOs and RPOs
Step 2.1: Define an Objective Impact Scoring Scale
This step will walk you through the following activities:
- Create a scoring scale to measure the business impact of application and system downtime.
This step involves the following participants:
- DRP Coordinator
- DRP Team
Results and Insights
- Use a scoring scale tied to multiple categories of real business impact to develop a more objective assessment of application and system criticality.
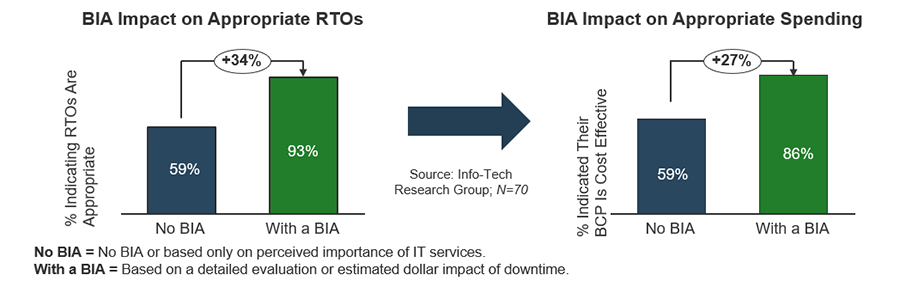
Align capabilities to appropriate and acceptable RTOs and RPOs with a BIA
Too many organizations avoid a BIA because they perceive it as onerous or unneeded. A well-managed BIA is straightforward and the benefits are tangible.
A BIA enables you to identify appropriate spend levels, maintain executive support, and prioritize DR planning for a more successful outcome. Info-Tech has found that a BIA has a measurable impact on the organization’s ability to set appropriate objectives and investment goals.
Info-Tech Insight
Business input is important, but don’t let a lack of it delay a draft BIA. Complete a draft based on your knowledge of the business. Create a draft within IT, and use it to get input from business leaders. It’s easier to edit estimates than to start from scratch; even weak estimates are far better than a blank sheet.
Pick impact categories that are relevant to your business to develop a holistic view of business impact
Direct Cost Impact Categories
- Revenue: permanently lost revenue.
- Example: one third of daily sales are lost due to a website failure.
- Productivity: lost productivity.
- Example: finance staff can’t work without the accounting system.
- Operating costs: additional operating costs.
- Example: temporary staff are needed to re-key data.
- Financial penalties: fines/penalties that could be incurred due to downtime.
- Example: failure to meet contractual service-level agreements (SLAs) for uptime results in financial penalties.
Goodwill, Compliance, and Health and Safety Categories
- Stakeholder goodwill: lost customer, staff, or business partner goodwill due to harm, frustration, etc.
- Example: customers can’t access needed services because the website is down.
- Example: a payroll system outage delays paychecks for all staff.
- Example: suppliers are paid late because the purchasing system is down.
- Compliance, health, and safety:
- Example: financial system downtime results in a missed tax filing.
- Example: network downtime disconnects security cameras.
Info-Tech Insight
You don’t have to include every impact category in your BIA. Include categories that could affect your business. Defer or exclude other categories. For example, the bulk of revenue for governmental organizations comes from taxes, which won’t be permanently lost if IT systems fail.
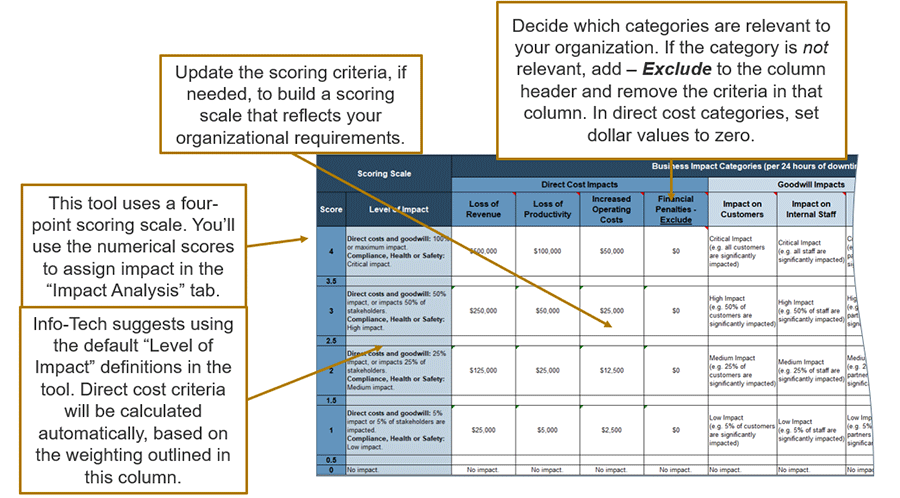
Modify scoring criteria to help you measure the impact of downtime
The scoring scales define different types of business impact (e.g. costs, lost goodwill) using a common four-point scale and 24-hour timeframe to simplify BIA exercises and documentation.
Use the suggestions below as a guide as you modify scoring criteria in the DRP Business Impact Analysis Tool:
- All the direct cost categories (revenue, productivity, operating costs, financial penalties) require the user to define only a maximum value; the tool will populate the rest of the criteria for that category. Use the suggestions below to find the maximum scores for each of the direct cost categories:
- Revenue: Divide total revenue for the previous year by 365 to estimate daily revenue. Assume this is the most revenue you could lose in a day, and use this number as the top score.
- Loss of Productivity: Divide fully-loaded labor costs for the organization by 365 to estimate daily productivity costs. Use this as a proxy measure for the work lost if all business stopped for one day.
- Increased Operating Costs: Isolate this to known additional costs that result from a disruption (e.g. costs for overtime or temporary staff). Estimate the maximum cost for the organization.
- Financial Penalties: Isolate this to known financial penalties (e.g. due to failure to meet SLAs or compliance requirements). Use the estimated maximum penalty as the highest value on the scale.
- Impact on Goodwill: Use an estimate of the percentage of all stakeholders impacted to assess goodwill impact.
- Impact on Compliance; Impact on Health and Safety: The BIA tool contains default scoring criteria that account for the severity of the impact, the likelihood of occurrence, and in the case of compliance, whether a grace period is available. Use this scale as-is, or adapt this scale to suit your needs.
Modify the default scoring scale in the DRP Business Impact Analysis Tool to reflect your organization
2(a) DRP Business Impact Analysis Tool – Scoring criteria
Step 2.2: Estimate the Impact of Downtime
This step will walk you through the following activities:
- Identify the business impact of service/system/application downtime.
This step involves the following participants:
- DRP Coordinator
- DRP Team
- IT Service SMEs
- Business-Side Technology Owners (optional)
Results and Insights
- Apply the scoring scale to develop a more objective assessment of the business impact of downtime.
- Create criticality tiers based on the business impact of downtime.
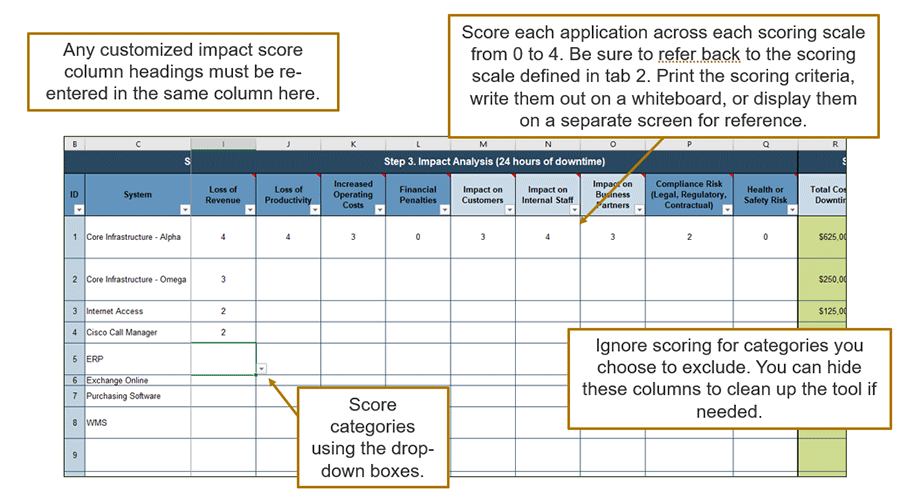
Estimate the impact of downtime for each system and application
2(b) Estimate the impact of systems downtime
Estimated Time: 3 hours
On tab 3 of the DRP Business Impact Analysis Tool indicate the costs of downtime, as described below:
- Have a copy of the “Scoring Criteria” tab available to use as a reference (e.g. printed or on a second display). In tab 3 use the drop-down menu to assign a score of 0 to 4 based on levels of impact defined in the “Scoring Criteria” tab.
- Work horizontally across all categories for a single system or application. This will familiarize you with your scoring scales for all impact categories, and allow you to modify the scoring scales if needed before you proceed much further.
For example, if a core call center phone system was down:
- Loss of Revenue would be the portion of sales revenue generated through the call center. This might score a 1 or 2 depending on the percent of sales that are processed by the call center.
- The Impact on Customers might be a 2 or 3 depending on the extent that some customers might be using the call center to receive support or purchase new products or services.
- The Legal/Regulatory Compliance and Health or Safety Risk might be a 0, as the call center has no impact in either area.
Add impact scores to the DRP Business Impact Analysis Tool
2(c) DRP Business Impact Analysis Tool
Record business reasons and assumptions that drive BIA scores
2(d) DRP BIA Scoring Context Example
Info-Tech suggests that IT leadership and staff identify the impact of downtime first to create a version that you can then validate with relevant business owners. As you work through the BIA as a team, have a notetaker record assumptions you make to help you explain the results and drive business engagement and feedback.
Some common assumptions:
- You can’t schedule a disaster, so Info-Tech suggests you assume the worst possible timing for downtime. Base the impact of downtime on the worst day for a disaster (e.g. year-end close, payroll run).
- Record assumptions made about who and what are impacted by system downtime.
- Record assumptions made about impact severity.
- If you deviate from the scoring scale, or if a particular impact doesn’t fit well into the defined scoring scale, document the exception.
Use Info-Tech’s DRP BIA Scoring Context Example as a note-taking template.
Info-Tech Insight
You can’t build a perfect scoring scale. It’s fine to make reasonable assumptions based on your judgment and knowledge of the business. Just write down your assumptions. If you don’t write them down, you’ll forget how you arrived at that conclusion.
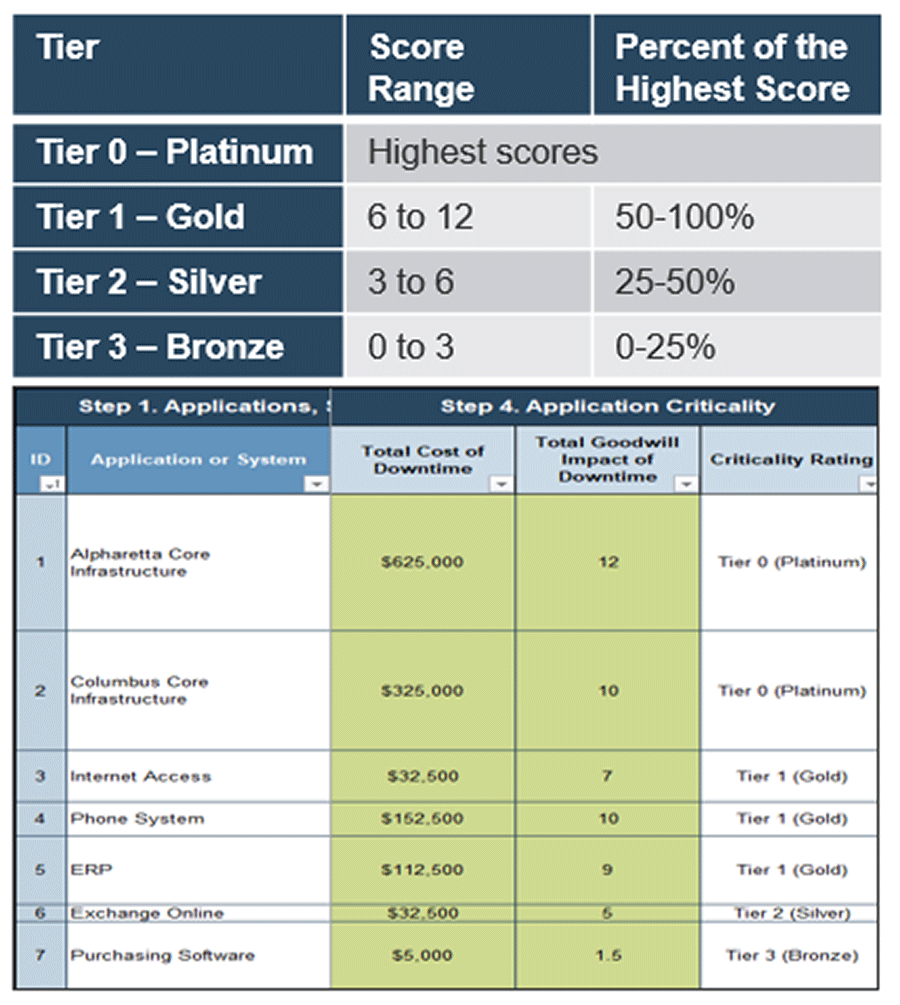
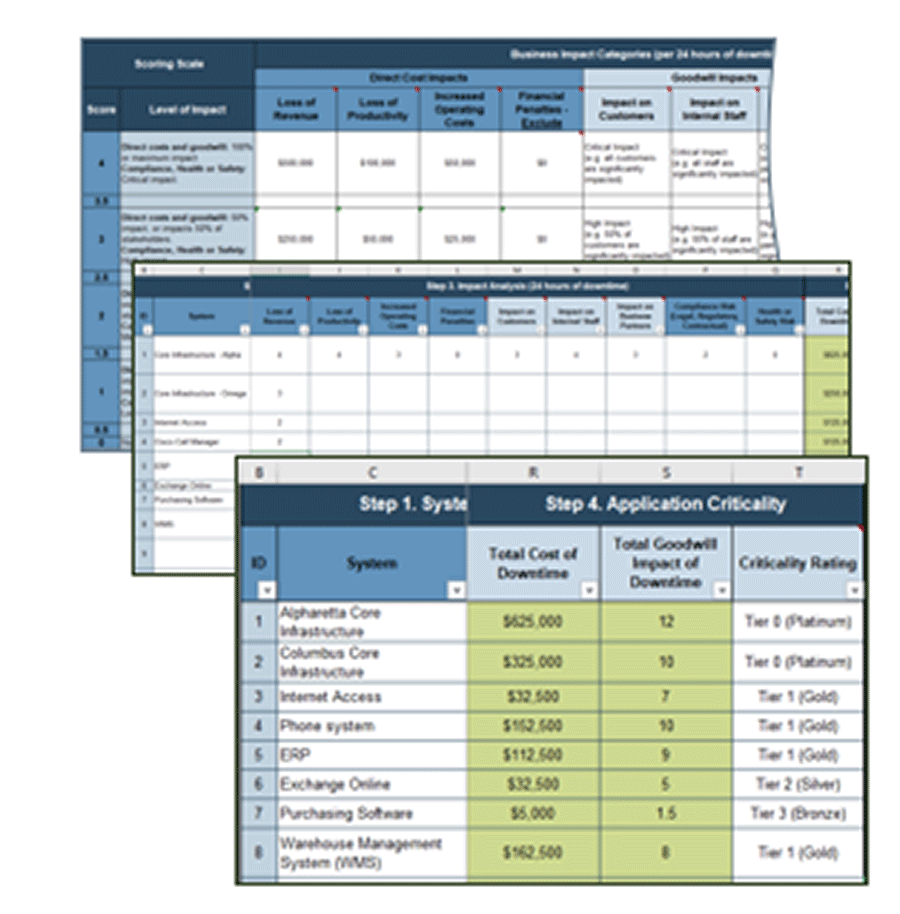
Assign a criticality rating based on total direct and indirect costs of downtime
2(e) DRP Business Impact Analysis Tool – Assign criticality tiers
Once you’ve finished estimating the impact of downtime, use the following rough guideline to create an initial sort of applications into Tiers 1, 2, and 3.
- In general, sort applications based on the Total Impact on Goodwill, Compliance, and Safety first.
- An effective tactic for a quick sort: assign a Tier 1 rating where scores are 50% or more of the highest total score, Tier 2 where scores are between 25% and 50%, and Tier 3 where scores are below 25%. Some organizations will also include a Tier 0 for the highest-scoring systems.
- Then review and validate these scores and assignments.
- Next, consider the Total Cost of Downtime.
- The Total Cost is calculated by the tool based on the Scoring Criteria in tab 2 and the impact scores on tab 3.
- Decide if the total cost impact justifies increasing the criticality rating (e.g. from Tier 2 to Tier 1 due to high cost impact).
- Review the assigned impact scores and tiers to check that they’re in alignment. If you need to make an exception, document why. Keep exceptions to a minimum.
Example: Highest total score is 12
Step 2.3: Determine Acceptable RTO/RPO Targets
This step will walk you through the following activities:
- Review the “Debate Space” approach to setting RTO and RPO (recovery targets).
- Set preliminary RTOs and RPOs by criticality tier.
This step involves the following participants:
- DRP Coordinator
- DRP Team
Results and Insights
- Align recovery targets with the business impact of downtime and data loss.
Use the “Debate Space” approach to align RTOs and RPOs with the impact of downtime
The business must validate acceptable and appropriate RTOs and RPOs, but IT can use the guidelines below to set an initial estimate.
Right-size recovery.
A shorter RTO typically requires higher investment. If a short period of downtime has minimal impact, setting a low RTO may not be justifiable. As downtime continues, impact begins to increase exponentially to a point where downtime is intolerable – an acceptable RTO must be shorter than this. Apply the same thinking to RPOs – how much data loss is unnoticeable? How much is intolerable?
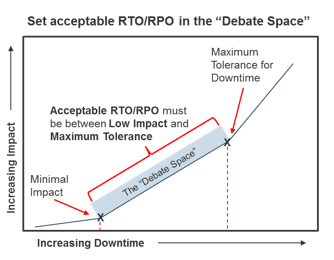
The “Debate Space” is between minimal impact and maximum tolerance for downtime.
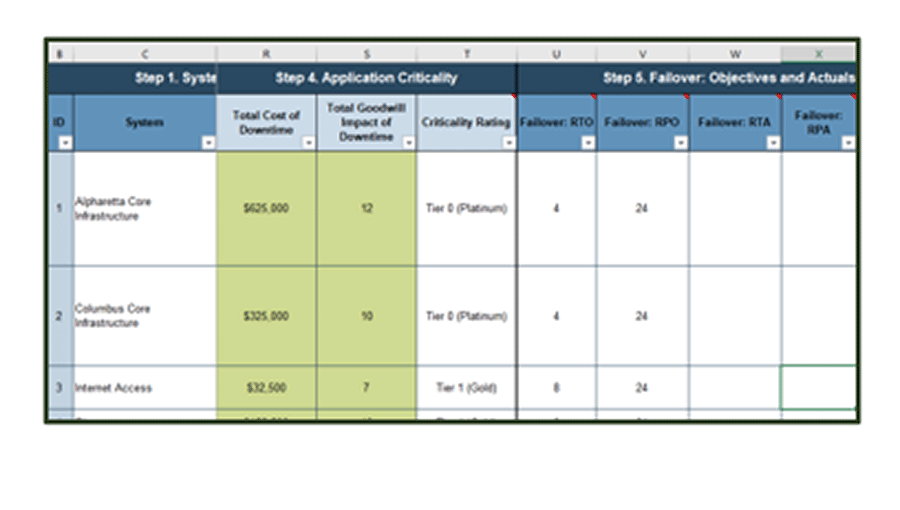
Estimate appropriate, acceptable RTOs and RPOs for each tier
2(f) Set recovery targets
Estimated Time: 30 minutes
RTO and RPO tiers simplify management by setting similar recovery goals for systems and applications with similar criticality.
Use the “Debate Space” approach to set appropriate and acceptable targets.
- For RTO, establish a recovery time range that is appropriate based on impact.
- Overall, the RTO tiers might be 0-4 hours for gold, 4-24 hours for silver, and 24-48 hours for bronze.
- RPOs reflect target data protection measures.
- Identify the lowest RPO within a tier and make that the standard.
- For example, RPO for gold data might be five minutes, silver might be four hours, and bronze might be one day.
- Use this as a guideline. RPO doesn’t always align perfectly with RTO tiers.
- Review RTOs and RPOs and make sure they accurately reflect criticality.
Info-Tech Insight
In general, the more critical the system, the shorter the RPO. But that’s not always the case. For example, a service bus might be Tier 1, but if it doesn’t store any data, RPO might be longer than other Tier 1 systems. Some systems may have a different RPO than most other systems in that tier. As long as the targets are acceptable to the business and appropriate given the impact, that’s okay.
Add recovery targets to the DRP Business Impact Analysis Tool
2(g) DRP Business Impact Analysis Tool – Document recovery objectives
Stories from the field: Info-Tech clients find value in Phase 2 in the following ways
Most organizations discover something new about key applications, or the way stakeholders use them, when they work through the BIA and review the results with stakeholders. For example:
Why complete a BIA? There could be a million reasons
- A global manufacturer completed the DRP BIA exercise. When email went down, Service Desk phones lit up until it was resolved. That grief led to a high availability implementation for email. However, the BIA illustrated that ERP downtime was far more impactful.
- ERP downtime would stop production lines, delay customer orders, and ultimately cost the business a million dollars a day.
- The BIA results clearly showed that the ERP needed to be prioritized higher, and required business support for investment.
Move from airing grievances to making informed decisions
The DRP Business Impact Analysis Tool helped structure stakeholder consultations on DR requirements for a large university IT department. Past consultations had become an airing of grievances. Using objective impact scores helped stakeholders stay focused and make informed decisions around appropriate RTOs and RPOs.
Phase 2: Insights and accomplishments
Estimated the business impact of downtime
Set recovery targets
Summary of Accomplishments
- Created a scoring scale tied to different categories of business impact.
- Applied the scoring scale to estimate the business impact of system downtime.
- Identified appropriate, acceptable RTOs and RPOs.
Up Next:Conduct a tabletop planning exercise to establish current recovery capabilities
Create a Right-Sized Disaster Recovery Plan
Phase 3
Identify and Address Gaps in the Recovery Workflow
Step 3.1: Determine Current Recovery Workflow
This step will walk you through the following activities:
- Run a tabletop exercise.
- Outline the steps for the initial response (notification, assessment, disaster declaration) and systems recovery (i.e. document your recovery workflow).
- Identify any gaps and risks in your initial response and systems recovery.
This step involves the following participants:
- DRP Coordinator
- IT Infrastructure SMEs (for systems in scope)
- Application SMEs (for systems in scope)
Results and Insights
- Use a repeatable practical exercise to outline and document the steps you would use to recover systems in the event of a disaster, as well as identify gaps and risks to address.
- This is also a knowledge-sharing opportunity for your team, and a practical means to get their insights, suggestions, and recovery knowledge down on paper.
Tabletop planning: an effective way to test and document your recovery workflow
In a tabletop planning exercise, the DRP team walks through a disaster scenario to map out what should happen at each stage, and effectively defines a high-level incident response plan (i.e. recovery workflow).
Tabletop planning had the greatest impact on meeting recovery objectives (RTOs/RPOs) among survey respondents.
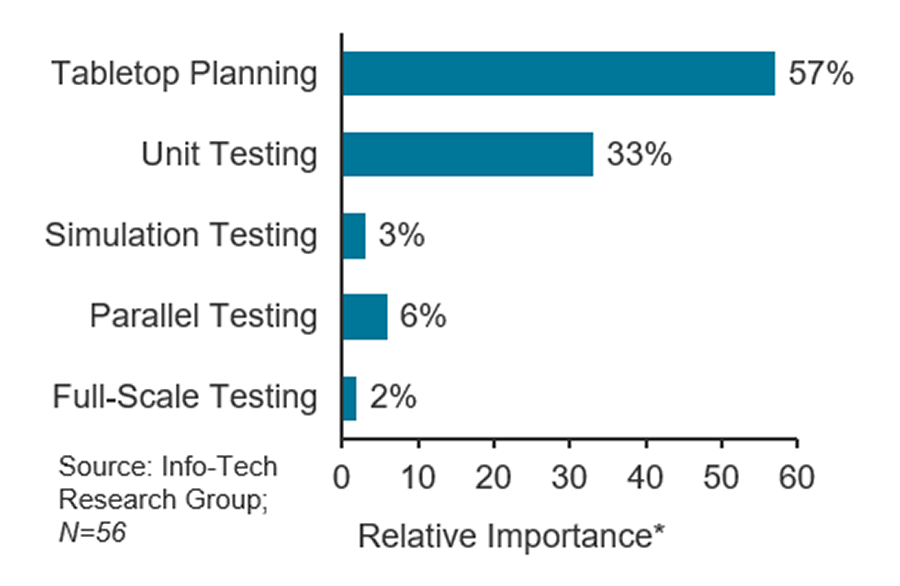
*Note: Relative importance indicates the contribution an individual testing methodology, conducted at least annually, had on predicting success meeting recovery objectives, when controlling for all other types of tests in a regression model. The relative-importance values have been standardized to sum to 100%.
Success was based on the following items:
- RTOs are consistently met.
- IT has confidence in the ongoing ability to meet RTOs.
- RPOs are consistently met.
- IT has confidence in the ongoing ability to meet RPOs.
Why is tabletop planning so effective?
- It enables you to play out a wider range of scenarios than technology-based testing (e.g. full-scale, parallel) due to cost and complexity factors.
- It is non-intrusive, so it can be executed more frequently than other testing methodologies.
- It easily translates into the backbone of your recovery documentation, as it allows you to review all aspects of your recovery plan.
Focus first on IT DR
Your DRP is IT contingency planning. It is not crisis management or BCP.
The goal is to define a plan to restore applications and systems following a disruption. For your first tabletop exercise, Info-Tech recommends you use a non-life-threatening scenario that requires at least a temporary relocation of your data center (i.e. failing over to a DR site/environment). Assume a gas leak or burst water pipe renders the data center inaccessible. Power is shut off and IT must failover systems to another location. Once you create the master procedure, review the plan to ensure it addresses other scenarios.
Info-Tech Insight
When systems fail, you are faced with two high-level options: failover or recover in place. If you document the plan to failover systems to another location, you’ll have documented the core of your DR procedures. This differs from traditional scenario planning where you define separate plans for different what-if scenarios. The goal is one plan that can be adapted to different scenarios, which reduces the effort to build and maintain your DRP.
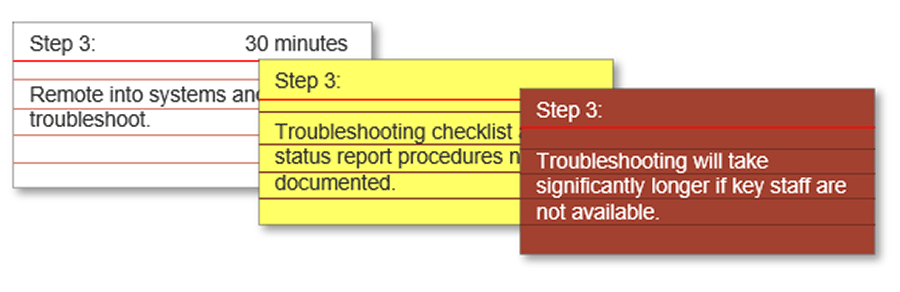
Conduct a tabletop planning exercise to outline DR procedures in your current environment
3(a) Tabletop planning
Estimated Time: 2-3 hours
For each high-level recovery step, do the following:
- On white cue cards:
- Record the step.
- Indicate the task owner (if required for clarity).
- Note time required to complete the step. After the exercise, use this to build a running recovery time where 00:00 is when the incident occurred.
- On yellow cue cards, document gaps in people, process, and technology requirements to complete the step.
- On red cue cards, indicate risks (e.g. no backup person for a key staff member).
Do:
- Review the complete workflow from notification all the way to user acceptance testing.
- Keep focused; stay on task and on time.
- Revisit each step and record gaps and risks (and known solutions, but don’t dwell on this).
- Revise and improve the plan with task owners.
Don't:
- Get weighed down by tools.
- Document the details right away – stick to the high-level plan for the first exercise.
- Try to find solutions to every gap/risk as you go. Save in-depth research/discussion for later.
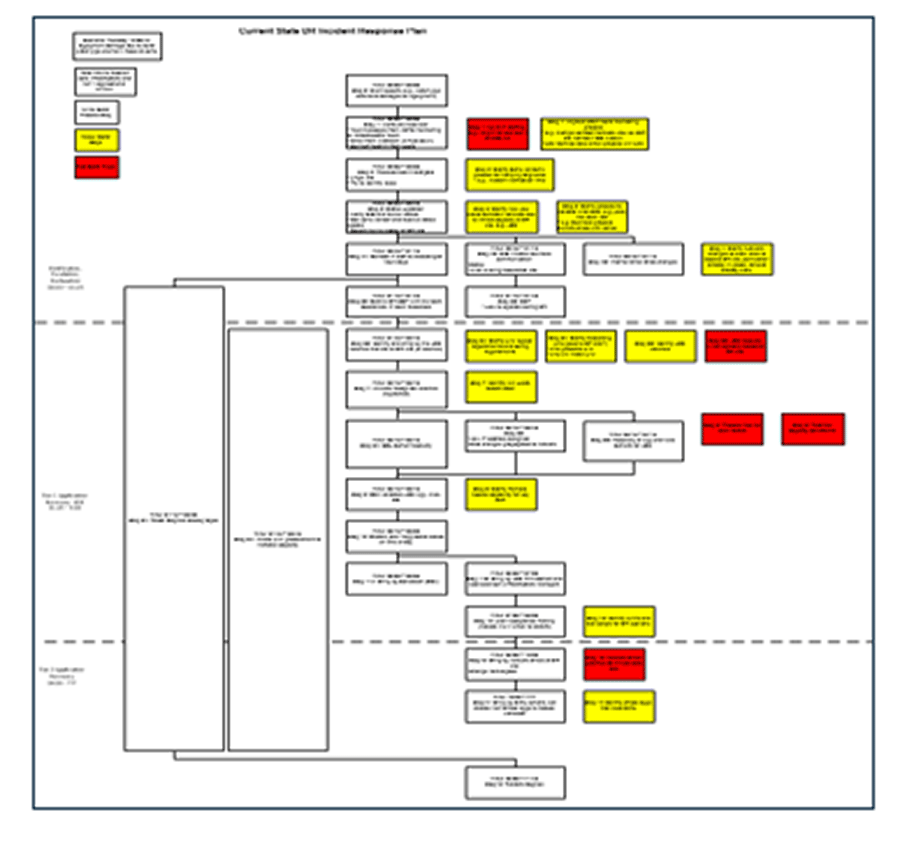
Flowchart the current-state incident response plan (i.e. document the recovery workflow)
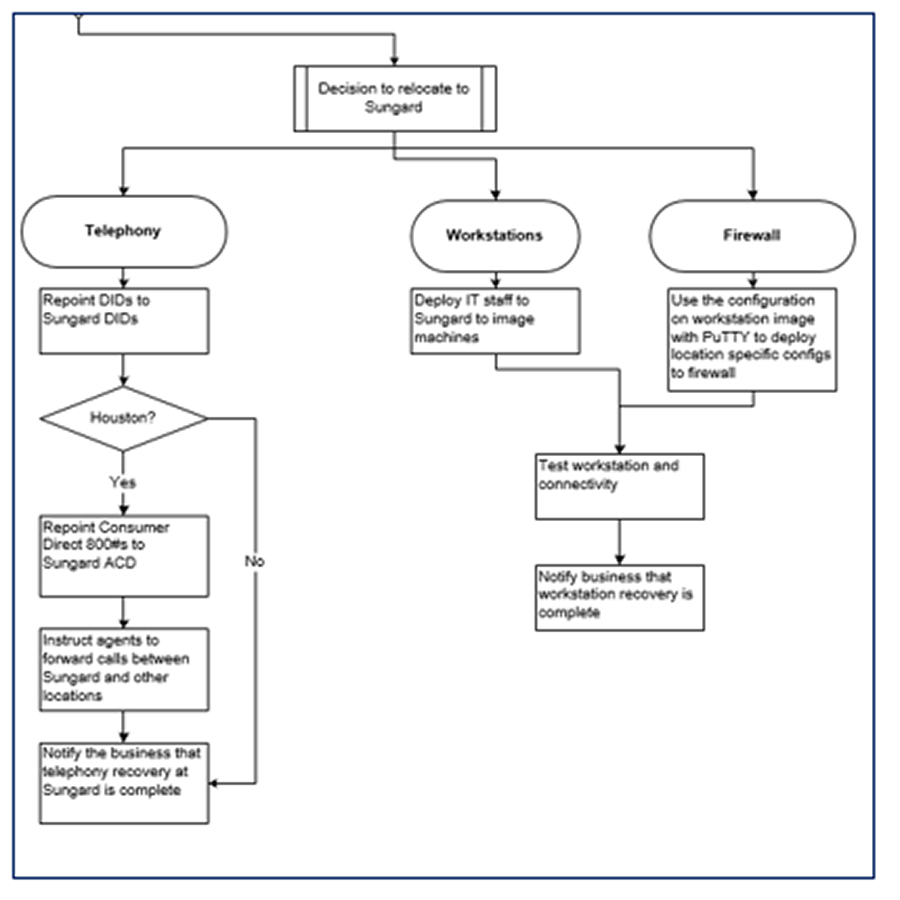
3(b) DRP Recovery Workflow Template and Case Study: Practical, Right-Sized DRP
Why use flowcharts?
- Flowcharts provide an at-a-glance view, ideal for disaster scenarios where pressure is high and quick upward communication is necessary.
- For experienced staff, a high-level reminder of key steps is sufficient.
Use the completed tabletop planning exercise results to build this workflow.
"We use flowcharts for our declaration procedures. Flowcharts are more effective when you have to explain status and next steps to upper management." – Assistant Director, IT Operations, Healthcare Industry
Source: Info-Tech Research Group Interview

For a formatted template you can use to capture your plan, see Info-Tech’s DRP Recovery Workflow Template.
For a completed example of tabletop planning results, review Info-Tech’s Case Study: Practical, Right-Sized DRP.
Identify RPA
What’s my RPA? Consider the following case:
- Once a week, a full backup is taken of the complete ERP system and is transferred over the WAN to a secondary site 250 miles away, where it is stored on disk.
- Overnight, an incremental backup is taken of the day’s changes, and is transferred to the same secondary site, and also stored on disk.
- During office hours, the SAN takes a snapshot of changes which are kept on local storage (information on the accounting system usually only changes during office hours).
- So what’s the RPA? One hour (snapshots), one day (incrementals), or one week (full backups)?
When identifying RPA, remember the following:
You are planning for a disaster scenario, where on-site systems may be inaccessible and any copies of data taken during the disaster may fail, be corrupt, or never make it out of the data center (e.g. if the network fails before the backup file ships). In the scenario above, it seems likely that off-site incremental backups could be restored, leading to a 24-hour RPA. However, if there were serious concerns about the reliability of the daily incrementals, the RPA could arguably be based on the weekly full backups.
Info-Tech Best Practice
The RPA is a commitment to the maximum data you would lose in a DR scenario with current capabilities (people, process, and technology). Pick a number you can likely achieve. List any situations where you couldn’t meet this RPA, and identify those for a risk tolerance discussion. In the example above, complete loss of the primary SAN would also mean losing the snapshots, so the last good copy of the data could be up to 24-hours old.
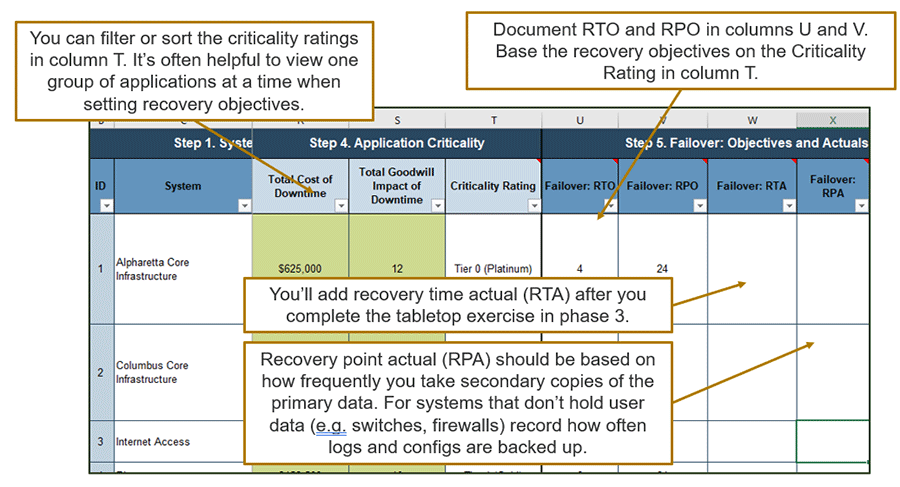
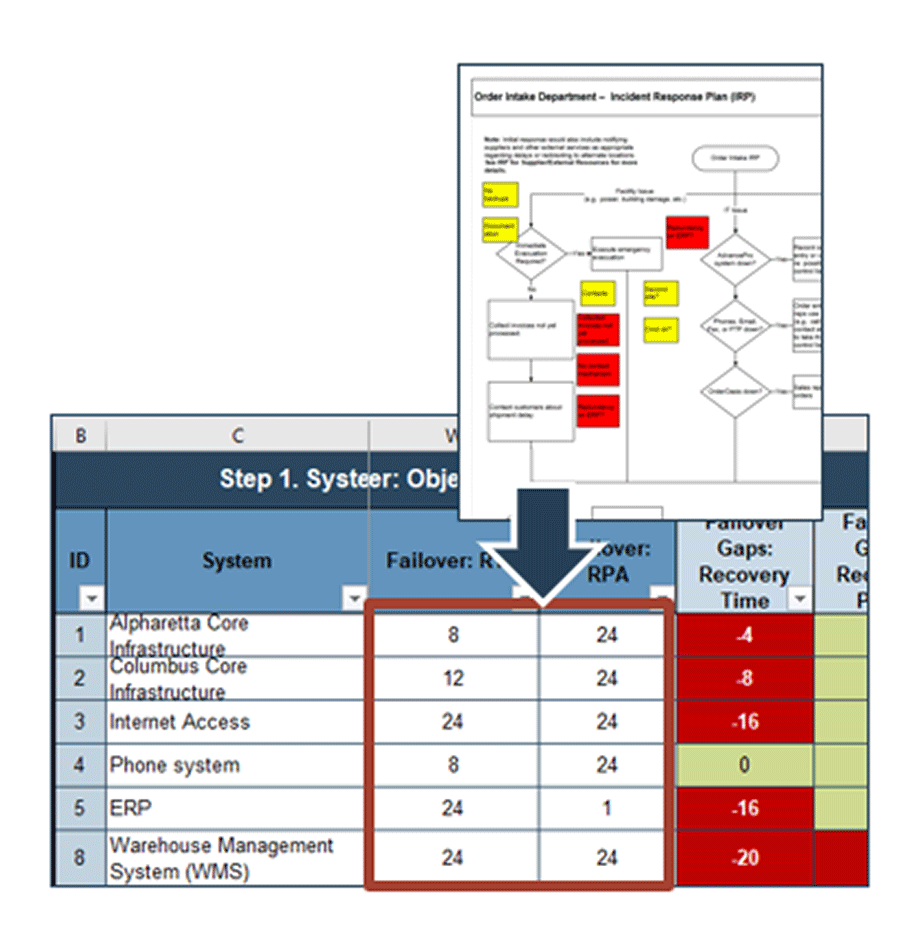
Add recovery actuals (RTA/RPA) to your copy of the BIA
3(c) DRP Business Impact Analysis Tool– Recovery actuals
On the “Impact Analysis” tab in the DRP Business Impact Analysis Tool, enter the estimated maximum downtime and data loss in the RTA and RPA columns.
- Estimate the RTA based on the required time for complete recovery. Review your recovery workflow to identify this timeline. For example, if the notification, assessment, and declaration process takes two hours, and systems recovery requires most of a day, the estimated RTA could be 24 hours.
- Estimate the RPA based on the longest interval between copies of the data being shipped offsite. For example, if data on a particular system is backed up offsite once per day, and the onsite system was destroyed just before that backup began, the entire day’s data could be lost and estimated RPA could be 24 hours. Note: Enter 9999 to indicate that data is unrecoverable.
Info-Tech Best Practice
It’s okay to round numbers to the nearest shift, day, or week for simplicity (e.g. 24 hours rather than 22.5 hours, or 8 hours rather than 7.25 hours).
Test the recovery workflow against additional scenarios
3(d) Workflow review
Estimated Time: 1 hour
Review your recovery workflow with a different scenario in mind.
- Work from and update the soft copy of your recovery workflow.
- Would any steps be different if the scenario changes? If yes, capture the different flow with a decision diamond. Identify any new gaps or risks you encounter with red and yellow cards. Use as few decision diamonds as possible.
Info-Tech Best Practice
As you start to consider scenarios where injuries or loss of life are a possibility, remember that health and safety risks are the top priority in a crisis. If there’s a fire in the data center, evacuating the building is the first priority, even if that means foregoing a graceful shut down. For more details on emergency response and crisis management, see Implement Crisis Management Best Practices.
Consider additional IT disaster scenarios
3(e) Thought experiment – Review additional scenarios
Walk through your recovery workflow in the context of additional, different scenarios to ensure there are no gaps. Collaborate with your DR team to identify changes that might be required, and incorporate these changes in the plan.
| Scenario Type | Considerations |
| Isolated hardware/software failure |
|
| Power outage or network outage |
|
| Local hazard (e.g. chemical leak, police incident) |
|
| Equipment/building damage (e.g. fire, roof collapse) |
|
| Regional natural disasters |
|
Step 3.2: Identify and Prioritize Projects to Close Gaps
This step will walk you through the following activities:
- Analyze the gaps that were identified from the maturity scorecard, tabletop planning exercise, and the RTO/RPO gaps analysis.
- Brainstorm solutions to close gaps and mitigate risks.
- Determine a course of action to close these gaps. Prioritize each project. Create a project implementation timeline.
This step involves the following participants:
- DRP Coordinator
- IT Infrastructure SMEs
Results and Insights
- Prioritized list of projects and action items that can improve DR capabilities.
- Often low-cost, low-effort quick wins are identified to mitigate at least some gaps/risks. Higher-cost, higher-effort projects can be part of a longer-term IT strategy. Improving service continuity is an ongoing commitment.
Brainstorm solutions to address gaps and risk
3(f) Solutioning
Estimated Time: 1.5 hours
- Review each of the risk and gap cards from the tabletop exercise.
- As a group, brainstorm ideas to address gaps, mitigate risks, and improve resiliency. Write the list of ideas on a whiteboard or flip-chart paper. The solutions can range from quick-wins and action items to major capital investments.
- Try to avoid debates about feasibility at this point – that should happen later. The goal is to get all ideas on the board.
Info-Tech Best Practice
It’s about finding ways to solve the problem, not about solving the problem. When you’re brainstorming solutions to problems, don’t stop with the first idea, even if the solution seems obvious. The first idea isn’t always the best or only solution; other ideas can expand on and improve that first idea.
Select an optimal DR deployment model from a world of choice
There are many options for a DR deployment. What makes sense for you?
- Sifting through the options for a DR site can be overwhelming. Simplify by eliminating deployment models that aren’t a good fit for your requirements or organization using Info-Tech’s research.
- Someone will ask you about DR in the cloud. Cut to the chase and evaluate cloud for fit with your organization’s current capabilities and requirements. Read about the 10 Secrets for Successful DR in the Cloud.
- Selecting and deploying a DR site is an exercise in risk mitigation. IT’s role is to advise the business on options to address the risk of not having a DR site, including cost and effort estimates. The business must then decide how to manage risk. Build total cost of ownership (TCO) estimates and evaluate possible challenges and risks for each option.
Is it practical to invest in greater geo-redundancy that meets RTOs and RPOs during a widespread event?
Info-Tech suggests you consider events that impact both sites, and your risk tolerance for that impact. Outline the impact of downtime at a high level if both the primary and secondary site were affected. Research how often events severe enough to have impacted both your primary and secondary sites have occurred in the past. What’s the business tolerance for this type of event?
A common strategy: have a primary and DR site that are close enough to support low RPO/RTO, but far enough away to mitigate the impact of known regional events. Back up data to a remote third location as protection against a catastrophic event.
Info-Tech Insight
Approach site selection as a project. Leverage Select an Optimal Disaster Recovery Deployment Model to structure your own site-selection project.
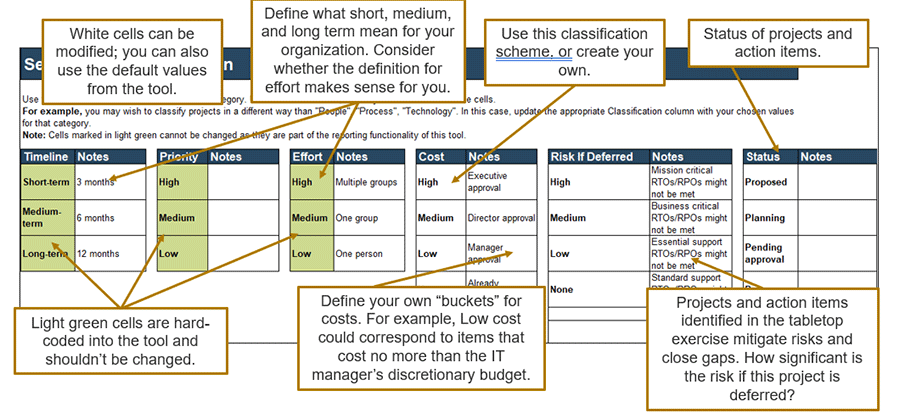
Set up the DRP Roadmap Tool
3(g) DRP Roadmap Tool – Set up tool
Use the DRP Roadmap Tool to create a high-level roadmap to plan and communicate DR action items and initiatives. Determine the data you’ll use to define roadmap items.
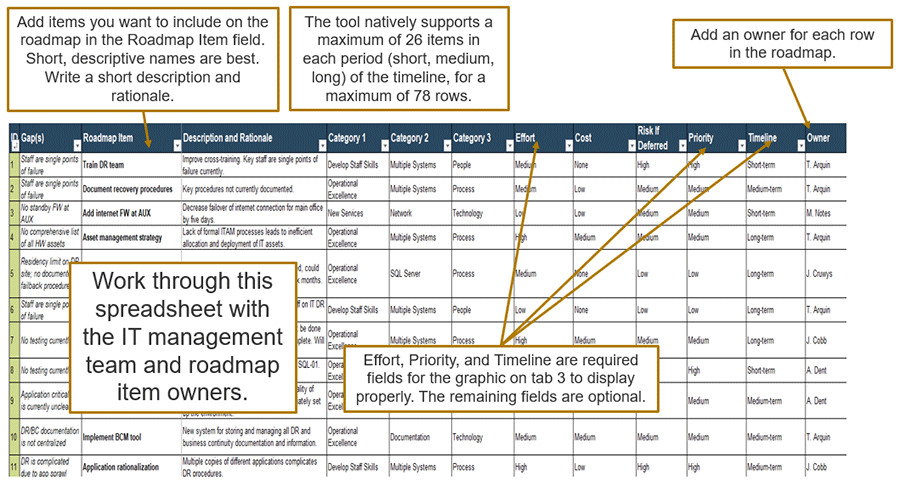
Plan next steps by estimating timeline, effort, priority, and more
3(h) DRP Roadmap Tool – Describe roadmap items
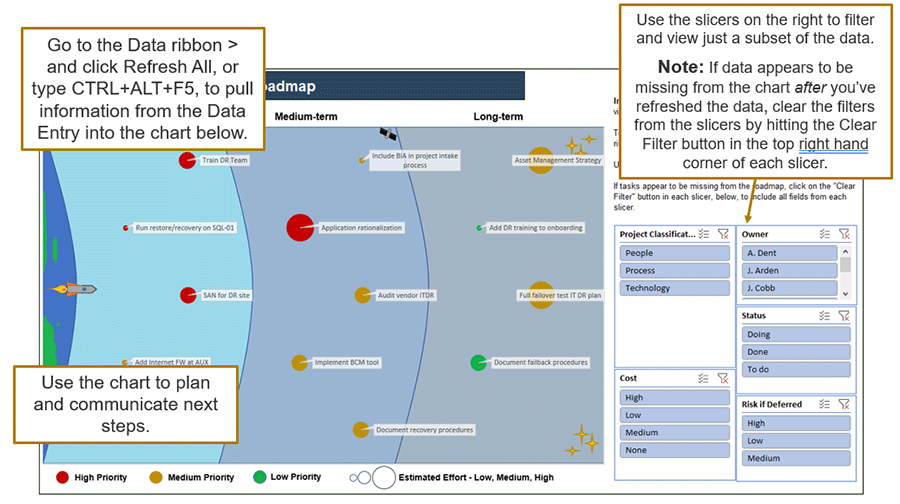
Review and communicate the DRP Roadmap Tool
3(i) DRP Roadmap Tool – View roadmap chart
Step 3.3: Review the Future State Recovery Process
This step will walk you through the following activities:
- Update the recovery workflow to outline your future recovery procedure.
- Summarize findings from DR exercises and present the results to the project sponsor and other interested executives.
This step involves the following participants:
- DRP Coordinator
- IT SMEs (Future State Recovery Flow)
- DR Project Sponsor
Results and Insights
- Summarize results from DR planning exercises to make the case for needed DR investment.
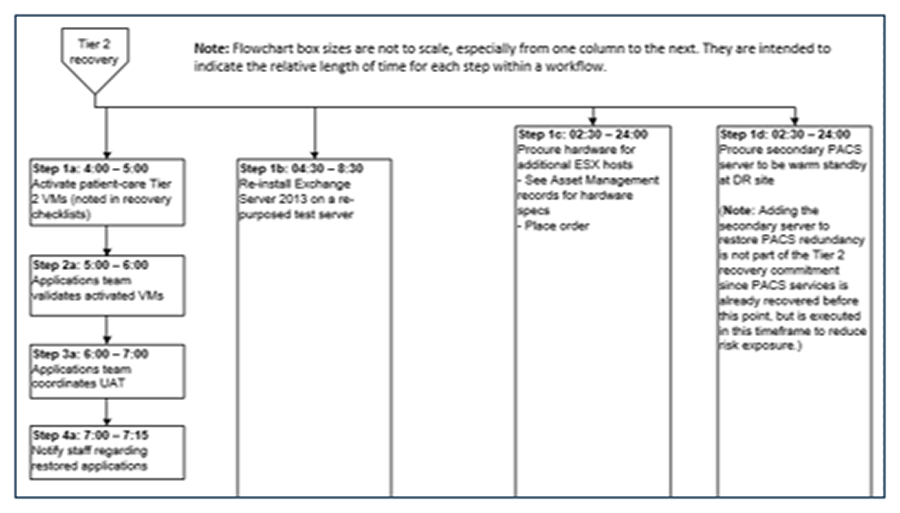
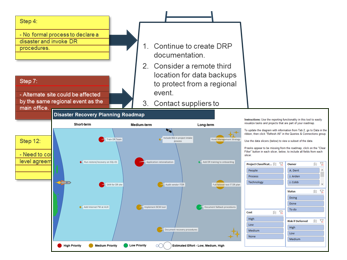
Outline your future state recovery flow
3(j) Update the recovery workflow to outline response and recovery in the future
Estimated Time: 30 minutes
Outline your expected future state recovery flow to demonstrate improvements once projects and action items have been completed.
- Create a copy of your DRP recovery workflow in a new tab in Visio.
- Delete gap and risk cards that are addressed by proposed projects. Consolidate or eliminate steps that would be simplified or streamlined in the future if projects are implemented.
- Create a short-, medium-, and long-term review of changes to illustrate improvements over time to the project roadmap.
- Update this workflow as you implement and improve DR capabilities.
Validate recovery targets and communicate actual recovery capabilities
3(k) Validate findings, present recommendations, secure budget
Estimated Time: time required will vary
- Interview managers or process owners to validate RTO, RPO, and business impact scores.Use your assessment of “heavy users” of particular applications (picture at right) to remind you which business users you should include in the interview process.
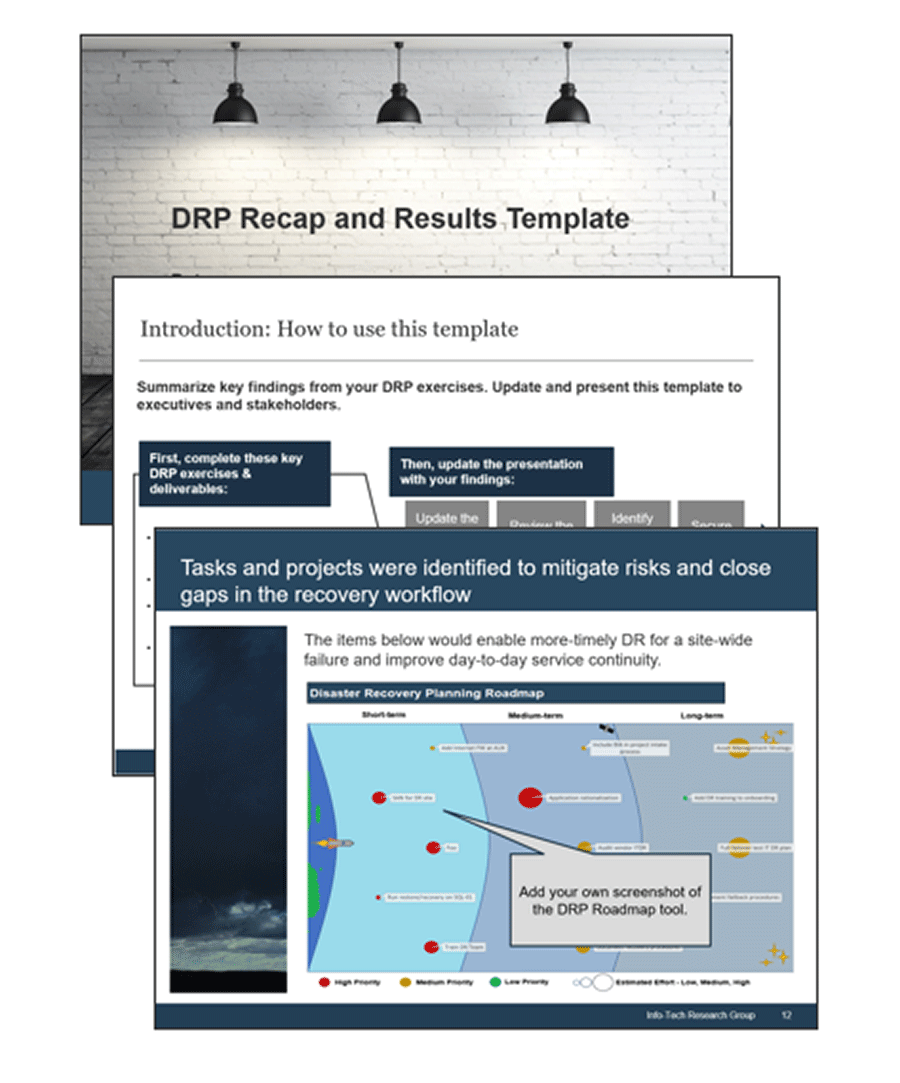
- Present an overview of your findings to the management team.Use Info-Tech’s DRP Recap and Results Template to summarize your findings.
- Take projects into the budget process.With the management team aware of the rationale for investment in DRP, build the business case and secure budget where needed.
Present DRP findings and make the case for needed investment
3(I) DRP Recap and Results Template
Create a communication deck to recap key findings for stakeholders.
- Write a clear problem statement. Identify why you did this project (what problem you’re solving).
- Clearly state key findings, insights, and recommendations.
- Leverage the completed tools and templates to populate the deck. Callouts throughout the template presentation will direct you to take and populate screenshots throughout the document.
- Use the presentation to communicate key findings to, and gather feedback from, business unit managers, executives, and IT staff.
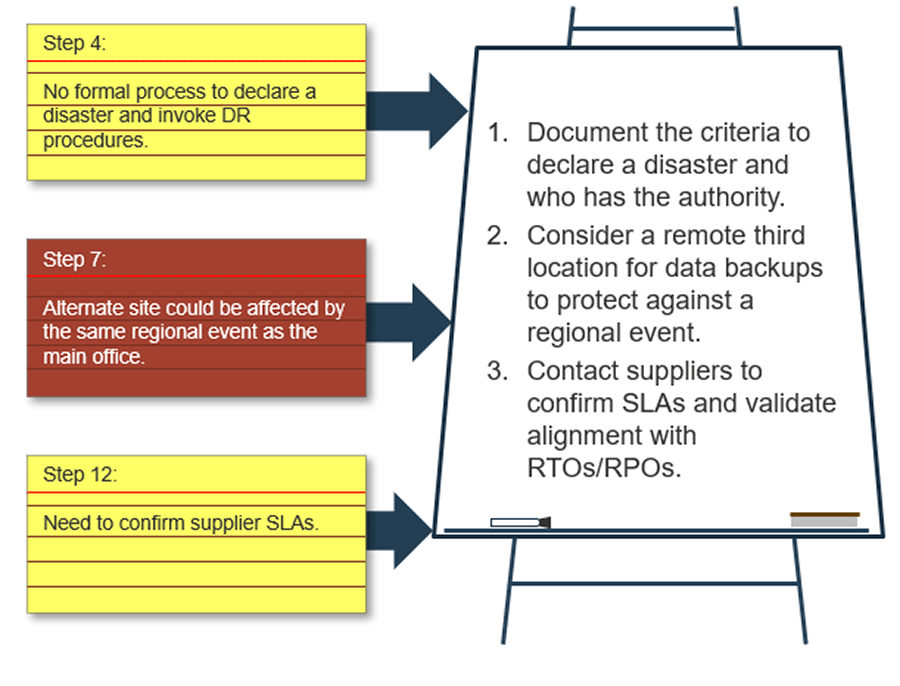
Stories from the field: Info-Tech clients find value in Phase 3 in the following ways
Tabletop planning is an effective way to discover gaps in recovery capabilities. Identify issues in the tabletop exercise so you can manage them before disaster strikes. For example:
Back up a second…
A client started to back up application data offsite. To minimize data transfer and storage costs, the systems themselves weren’t backed up. Working through the restore process at the DR site, the DBA realized 30 years of COBOL and SQR code – critical business functionality – wasn’t backed up offsite.
Net… work?
A 500-employee professional services firm realized its internet connection could be a significant roadblock to recovery. Without internet, no one at head office could access critical cloud systems. The tabletop exercise identified this recovery bottleneck and helped prioritize the fix on the roadmap.
Someone call a doctor!
Hospitals rely on their phone systems for system downtime procedures. A tabletop exercise with a hospital client highlighted that if the data center were damaged, the phone system would likely be damaged as well. Identifying this provided more urgency to the ongoing VOIP migration.
The test of time
A small municipality relied on a local MSP to perform systems restore, but realized it had never tested the restore procedure to identify RTA. Contacting the MSP to review capabilities became a roadmap item to address this risk.
Phase 3: Insights and accomplishments
Outlined the DRP response and risks to recovery
Brainstormed risk mitigation measures
Summary of Accomplishments
- Planned and documented your DR incident response and systems recovery workflow.
- Identified gaps and risks to recovery and incident management.
- Brainstormed and identified projects and action items to mitigate risks and close gaps.
Up Next: Leverage the core deliverables to complete, extend, and maintain your DRP
Create a Right-Sized Disaster Recovery Plan
Phase 4
Complete, Extend, and Maintain Your DRP
Phase 4: Complete, Extend, and Maintain Your DRP
This phase will walk you through the following activities:
- Identify progress made on your DRP by reassessing your DRP maturity.
- Prioritize the highest value major initiatives to complete, extend, and maintain your DRP.
This phase involves the following participants:
- DRP Coordinator
- Executive Sponsor
Results and Insights
- Communicate the value of your DRP by demonstrating progress against items in the DRP Maturity Scorecard.
- Identify and prioritize future major initiatives to support the DRP, and the larger BCP.
Celebrate accomplishments, plan for the future
Congratulations! You’ve completed the core DRP deliverables and made the case for investment in DR capabilities. Take a moment to celebrate your accomplishments.
This milestone is an opportunity to look back and look forward.
- Look back: measure your progress since you started to build your DRP. Revisit the assessments completed in phase 1, and assess the change in your overall DRP maturity.
- Look forward: prioritize future initiatives to complete, extend, and maintain your DRP. Prioritize initiatives that are the highest impact for the least requirement of effort and resources.
We have completed the core DRP methodology for key systems:
- BIA, recovery objectives, high-level recovery workflow, and recovery actuals.
- Identify key tasks to meet recovery objectives.
What could we do next?
- Repeat the core methodology for additional systems.
- Identify a DR site to meet recovery requirements, and review vendor DR capabilities.
- Create a summary DRP document including requirements, capabilities, and change procedures.
- Create a test plan and detailed recovery documentation.
- Coordinate the creation of BCPs.
- Integrate DR in other key operational processes.
Revisit the DRP Maturity Scorecard to measure progress and identify remaining areas to improve
4(a) DRP Maturity Scorecard – Reassess your DRP program maturity
- Find the copy of the DRP Maturity Scorecard you completed previously. Save a second copy of the completed scorecard in the same folder.
- Update scoring where you have improved your DRP documentation or capabilities.
- Review the new scores on tab 3. Compare the new scores to the original scores.
Info-Tech Best Practice
Use the completed, updated DRP Maturity Scorecard to demonstrate the value of your continuity program, and to help you decide where to focus next.
Prioritize major initiatives to complete, extend, and maintain the DRP
4(b) Prioritize major initiatives
Estimated Time: 2 hours
Prioritize major initiatives that mitigate significant risk with the least cost and effort.
- Use the scoring criteria below to evaluate risk, effort, and cost for potential initiatives. Modify the criteria if required for your organization. Write this out on a whiteboard or flip-chart paper.
- Assign a score from 1 to 3. Multiply the scores for each initiative together for an aggregate score. In general, prioritize initiatives with higher scores.
| Score | A: How significant are the risks this initiative will mitigate? | B: How easily can we complete this initiative? | C: How cost-effective is this initiative? |
|---|---|---|---|
| 3: High | Critical impact on +50% of stakeholders, or major impact to compliance posture, or significant health/safety risk. | One sprint, can be completed by a few individuals with minor supervision. | Within the IT discretionary budget. |
| 2: Medium | Impacts <50% of stakeholders, or minor impact on compliance, or degradation to health or safety controls. | One quarter, and/or some increased effort required, some risk to completion. | Requires budget approval from finance. |
| 1: Low | Impacts limited to <25% of stakeholders, no impact on compliance posture or health/safety. | One year, and/or major vendor or organizational challenges. | Requires budget approval from the board of directors. |
Info-Tech Best Practice
You can use a similar scoring exercise to prioritize and schedule high-benefit, low-effort, low-cost items identified in the roadmap in phase 3.
Example: Prioritize major initiatives
4(b) Prioritize major initiatives continued
Write out the table on a whiteboard (record the results in a spreadsheet for reference). In the case below, IT might decide to work on repeating the core methodology first as they create the active testing plans, and tackle process changes later.
| Initiative | A: How significant are the risks this initiative will mitigate? | B: How easily can we complete this initiative? | C: How cost-effective is this initiative? | Aggregate score (A x B x C) |
|---|---|---|---|---|
| Repeat the core methodology for all systems | 2 – will impact some stakeholders, no compliance or safety impact. | 2 – will require about 3 months, no significant complications. | 3 – No cost. | 12 |
| Add DR to project mgmt. and change mgmt. | 1 – Mitigates some recovery risks over the long term. | 1 – Requires extensive consultation and process review. | 3 – No cost. | 3 |
| Active failover testing on plan | 2 – Mitigates some risks; documentation and cross training is already in place. | 2 – Requires 3-4 months of occasional effort to prepare for test. | 2 – May need to purchase some equipment before testing. | 8 |
Info-Tech Best Practice
Find a pace that allows you to keep momentum going, but also leaves enough time to act on the initial findings, projects, and action items identified in the DRP Roadmap Tool. Include these initiatives in the Roadmap tool to visualize how identified initiatives fit with other tasks identified to improve your recovery capabilities.
Repeat the core DR methodology for additional systems and applications
You have created a DR plan for your most critical systems. Now, add the rest:
- Build on the work you’ve already done. Re-use the BIA scoring scale. Update your existing recovery workflows, rather than creating and formatting an entirely new document. A number of steps in the recovery will be shared with, or similar to, the recovery procedures for your Tier 1 systems.
Risks and Challenges Mitigated
- DR requirements and capabilities for less-critical systems have not been evaluated.
- Gaps in the recovery process for less critical systems have not been evaluated or addressed.
- DR capabilities for less critical systems may not meet business requirements.
| Sample Outputs |
|---|
| Add Tier 2 & 3 systems to the BIA. |
| Complete another tabletop exercise for Tier 2 & 3 systems recovery, and add the results to the recovery workflow. |
| Identify projects to close additional gaps in the recovery process. Add projects to the project roadmap. |
Info-Tech Best Practice
Use this example of a complete, practical, right-size DR plan to drive and guide your efforts.
Extend your core DRP deliverables
You’ve completed the core DRP deliverables. Continue to create DRP documentation to support recovery procedures and governance processes:
- DR documentation efforts fail when organizations try to boil the ocean with an all-in-one plan aimed at auditors, business leaders, and IT. It’s long, hard to maintain, and ends up as shelfware.
- Create documentation in layers to keep it manageable. Build supporting documentation over time to support your high-level recovery workflow.
Risks and Challenges Mitigated
- Key contact information, escalation, and disaster declaration responsibilities are not identified or formalized.
- DRP requirements and capabilities aren’t centralized. Key DRP findings are in multiple documents, complicating governance and oversight by auditors, executives, and board members.
- Detailed recovery procedures and peripheral information (e.g. network diagrams) are not documented.
| Sample Outputs |
|---|
| Three to five detailed systems recovery flowcharts/checklists. |
| Documented team roles, succession plans, and contact information. |
| Notification, assessment, and disaster declaration plan. |
| DRP summary. |
| Layer 1, 2 & 3 network diagrams. |
Info-Tech Best Practice
Use this example of a complete, practical, right-size DR plan to drive and guide your efforts.
Select an optimal DR deployment model and deployment site
Your DR site has been identified as inadequate:
- Begin with the end in mind. Commit to mastering the selected model and leverage your vendor relationship for effective DR.
- Cut to the chase and evaluate the feasibility of cloud first. Gauge your organization’s current capabilities for DR in the cloud before becoming infatuated with the idea.
- A mixed model gives you the best of both worlds. Diversify your strategy by identifying fit for purpose and balancing the work required to maintain various models.
Risks and Challenges Mitigated
- Without an identified DR site, you’ll be scrambling when a disaster hits to find and contract for a location to restore IT services.
- Without systems and application data backed up offsite, you stand to lose critical business data and logic if all copies of the data at your primary site were lost.
| Sample Outputs |
|---|
| Application assessment for cloud DR. |
| TCO tool for different environments. |
| Solution decision and executive presentation. |
Info-Tech Best Practice
Use Info-Tech’s blueprint, Select the Optimal Disaster Recovery Deployment Model, to help you make sense of a world of choice for your DR site.
Extend DRP findings to business process resiliency with a BCP pilot
Integrate your findings from DRP into the overall BCP:
- As an IT leader you have the skillset and organizational knowledge to lead a BCP project, but ultimately business leaders need to own the BCP – they know their processes and requirements to resume business operations better than anyone else.
- The traditional approach to BCP is a massive project that most organizations can’t execute without hiring a consultant. To execute BCP in-house, carve up the task into manageable pieces.
Risks and Challenges Mitigated
- No formal plan exists to recover from a disruption to critical business processes.
- Business requirements for IT systems recovery may change following a comprehensive review of business continuity requirements.
- Outside of core systems recovery, IT could be involved in relocating staff, imaging and issuing new end-user equipment, etc. Identifying these requirements is part of BCP.
| Sample Outputs |
|---|
| Business process-focused BIA for one business unit. |
| Recovery workflows for one business unit. |
| Provisioning list for one business unit. |
| BCP project roadmap. |
Info-Tech Best Practice
Use Info-Tech’s blueprint, Develop a Business Continuity Plan, to develop and deploy a repeatable BCP methodology.
Test the plan to validate capabilities and cross-train staff on recovery procedures
You don’t have a program to regularly test the DR plan:
- Most DR tests are focused solely on the technology and not the DR management process – which is where most plans fail.
- Be proactive – establish an annual test cycle and identify and coordinate resources well in advance.
- Update DRP documentation with findings from the plan, and track the changes you make over time.
Risks and Challenges Mitigated
- Gaps likely still exist in the plan that are hard to find without some form of testing.
- Customers and auditors may ask for some form of DR testing.
- Staff may not be familiar with DR documentation or how they can use it.
- No formal cycle to validate and update the DRP.
| Sample Outputs |
|---|
| DR testing readiness assessment. |
| Testing handbooks. |
| Test plan summary template. |
| DR test issue log and analysis tool. |
Info-Tech Best Practice
Uncover deficiencies in your recovery procedures by using Info-Tech’s blueprint Reduce Costly Downtime Through DR Testing.
“Operationalize” DRP management
Inject DR planning in key operational processes to support plan maintenance:
- Major changes, or multiple routine changes, can materially alter DR capabilities and requirements. It’s not feasible to update the DR plan after every routine change, so leverage criticality tiers in the BIA to focus your change management efforts. Critical systems require more rigorous change procedures.
- Likewise, you can build criticality tiers into more focused project management and performance measurement processes.
- Schedule regular tasks in your ticketing system to verify capabilities and cross-train staff on key recovery procedures (e.g. backup and restore).
Risks and Challenges Mitigated
- DRP is not updated “as needed” – as requirements and capabilities change due to business and technology changes.
- The DRP is disconnected from day-to-day operations.
| Sample Outputs |
|---|
| Reviewed and updated change, project, and performance management processes. |
| Reviewed and updated internal SLAs. |
| Reviewed and updated data protection and backup procedures. |
Review infrastructure service provider DR capabilities
Insert DR planning in key operational processes to support plan maintenance:
- Reviewing vendor DR capabilities is a core IT vendor management competency.
- As your DR requirements change year-to-year, ensure your vendors’ service commitments still meet your DR requirements.
- Identify changes in the vendor’s service offerings and DR capabilities, e.g. higher costs for additional DR support, new offerings to reduce potential downtime, or conversely, a degradation in DR capabilities.
Risks and Challenges Mitigated
- Vendor capabilities haven’t been measured against business requirements.
- No internal capability exists currently to assess vendor ability to meet promised SLAs.
- No internal capability exists to track vendor performance on recoverability.
| Sample Outputs |
|---|
| A customized vendor DRP questionnaire. |
| Reviewed vendor SLAs. |
| Choose to keep or change service levels or vendor offerings based on findings. |
Phase 4: Insights and accomplishments

Identified progress against targets
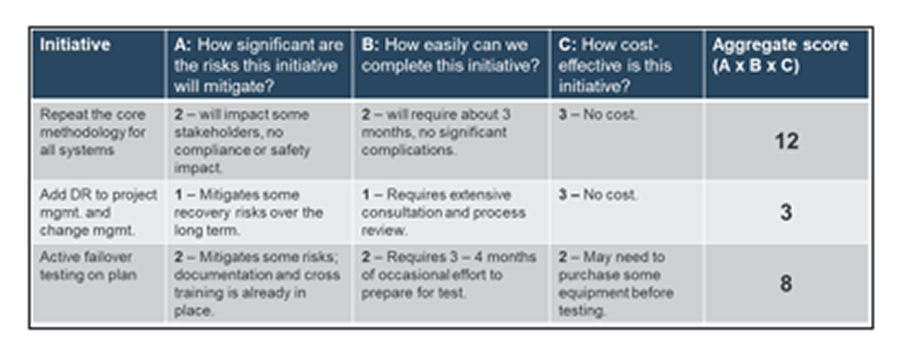
Prioritized further initiatives
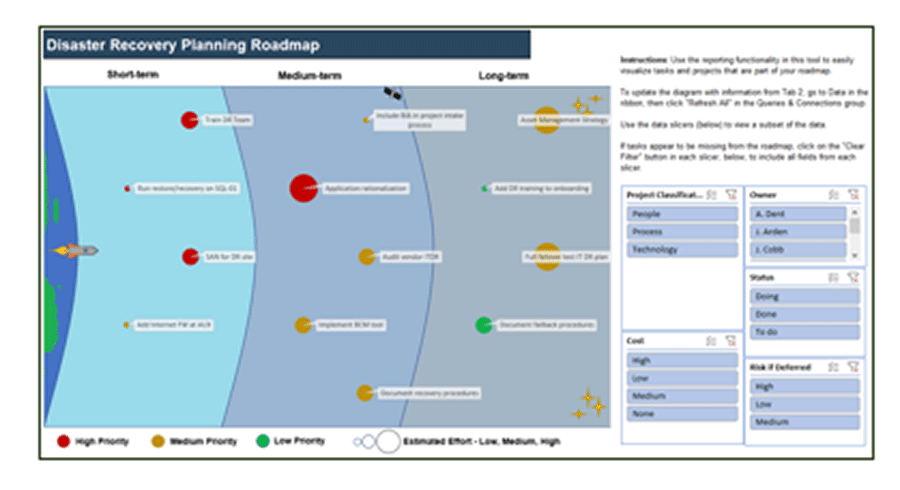
Added initiatives to the roadmap
Summary of Accomplishments
- Developed a list of high-priority initiatives that can support the extension and maintenance of the DR plan over the long term.
- Reviewed and update maturity assessments to establish progress and communicate the value of the DR program.
Summary of accomplishment
Knowledge Gained
- Conduct a BIA to determine appropriate targets for RTOs and RPOs.
- Identify DR projects required to close RTO/RPO gaps and mitigate risks.
- Use tabletop planning to create and validate an incident response plan.
Processes Optimized
- Your DRP process was optimized, from BIA to documenting an incident response plan.
- Your vendor evaluation process was optimized to identify and assess a vendor’s ability to meet your DR requirements, and to repeat this evaluation on an annual basis.
Deliverables Completed
- DRP Maturity Scorecard
- DRP Business Impact Analysis Tool
- DRP Roadmap Tool
- Incident response plan and systems recovery workflow
- Executive presentation
Info-Tech’s insights bust the most obstinate myths of DRP
Myth #1: DRPs need to focus on major events such as natural disasters and other highly destructive incidents such as fire and flood.
Reality: The most common threats to service continuity are hardware and software failures, network outages, and power outages.
Myth #2: Effective DRPs start with identifying and evaluating potential risks.
Reality: DR isn’t about identifying risks; it’s about ensuring service continuity.
Myth #3: DRPs are separate from day-to-day operations and incident management.
Reality: DR must be integrated with service management to ensure service continuity.
Myth #4: I use a co-lo or cloud services so I don’t have to worry about DR. That’s my vendor’s responsibility.
Reality: You can’t outsource accountability. You can’t just assume your vendor’s DR capabilities will meet your needs.
Myth #5: A DRP must include every detail so anyone can execute the recovery.
Reality: IT DR is not an airplane disaster movie. You aren’t going to ask a business user to execute a system recovery, just like you wouldn’t really want a passenger with no flying experience to land a plane.
Supplement the core documentation with these tools and templates
- An Excel workbook workbook to track key roles on DR, business continuity, and emergency response teams. Can also track DR documentation location and any hardware purchases required for DR.
- A questionnaire template and a response tracking tool to structure your investigation of vendor DR capabilities.
- Integrate escalation with your DR plan by defining incident severity and escalation rules . Use this example as a template or integrate ideas into your own severity definitions and escalation rules in your incident management procedures.
- A minute-by-minute time-tracking tool to capture progress in a DR or testing scenario. Monitor progress against objectives in real time as recovery tasks are started and completed.
Next steps: Related Info-Tech research
Select the Optimal Disaster Recovery Deployment Model Evaluate cloud, co-lo, and on-premises disaster recovery deployment models.
Develop a Business Continuity Plan Streamline the traditional approach to make BCP development manageable and repeatable.
Prepare for a DRP Audit Assess your current DRP maturity, identify required improvements, and complete an audit-ready DRP summary document.
Document and Maintain Your Disaster Recovery Plan Put your DRP on a diet: keep it fit, trim, and ready for action.
Reduce Costly Downtime Through DR Testing Improve your DR plan and your team’s ability to execute on it.
Implement Crisis Management Best Practices An effective crisis response minimizes the impact of a crisis on reputation, profitability, and continuity.
Research contributors and experts
- Alan Byrum, Director of Business Continuity, Intellitech
- Bernard Jones (MBCI, CBCP, CORP, ITILv3), Owner/Principal, B Jones BCP Consulting, LLC
- Paul Beaudry, Assistant Vice-President, Technical Services, MIS, Richardson International Limited
- Yogi Schulz, President, Corvelle Consulting
Glossary
- Business Continuity Management (BCM) Program: Ongoing management and governance process supported by top management and appropriately resourced to implement and maintain business continuity management. (Source: ISO 22301:2012)
- Business Continuity Plan (BCP): Documented procedures that guide organizations to respond, recover, resume, and restore to a pre-defined level of operation following disruption. The BCP is not necessarily one document, but a collection of procedures and information.
- Crisis: A situation with a high level of uncertainty that disrupts the core activities and/or credibility of an organization and requires urgent action. (Source: ISO 22300)
- Crisis Management Team (CMT): A group of individuals responsible for developing and implementing a comprehensive plan for responding to a disruptive incident. The team consists of a core group of decision makers trained in incident management and prepared to respond to any situation.
- Disaster Recovery Planning (DRP): The activities associated with the continuing availability and restoration of the IT infrastructure.
- Incident: An event that has the capacity to lead to loss of, or a disruption to, an organization’s operations, services, or functions – which, if not managed, can escalate into an emergency, crisis, or disaster.
- Incident Management Plan: A clearly defined and documented plan of action for use at the time of an incident, typically covering the key personnel, resources, services, and actions needed to implement the incident management process.
- IT Disaster: A service interruption requiring IT to rebuild a service, restore from backups, or activate redundancy at the backup site.
- Recovery Point: Time elapsed between the last good copy of the data being taken and failure/corruption on the production environment; think of this as data loss.
- Recovery Point Actual (RPA): The currently achievable recovery point after a disaster event, given existing people, processes, and technology. This reflects expected maximum data loss that could actually occur in a disaster scenario.
- Recovery Point Objective (RPO): The target recovery point after a disaster event, usually calculated in hours, on a given system, application, or service. Think of this as acceptable and appropriate data loss. RPO should be based on a business impact analysis (BIA) to identify an acceptable and appropriate recovery target.
- Recovery Time: Time required to restore a system, application, or service to a functional state; think of this as downtime.
- Recovery Time Actual (RTA): The currently achievable recovery time after a disaster event, given existing people, processes, and technology. This reflects expected maximum downtime that could actually occur in a disaster scenario.
- Recovery Time Objective (RTO): The target recovery time after a disaster event for a given system, application, or service. RTO should be based on a business impact analysis (BIA) to identify acceptable and appropriate downtime.
BCI Editor’s Note: In most countries “incident” and “crisis” are used interchangeably, but in the UK the term “crisis” has been generally reserved for dealing with wide-area incidents involving Emergency Services. The BCI prefers the use of “incident” for normal BCM purposes. (Source: The Business Continuity Institute)
Bibliography
BCMpedia. “Recovery Objectives: RTO, RPO, and MTPD.” BCMpedia, n.d. Web.
Burke, Stephen. “Public Cloud Pitfalls: Microsoft Azure Storage Cluster Loses Power, Puts Spotlight On Private, Hybrid Cloud Advantages.” CRN, 16 Mar. 2017. Web.
Elliot, Stephen. “DevOps and the Cost of Downtime: Fortune 1000 Best Practice Metrics Quantified.” IDC, 2015. Web.
FEMA. Planning & Templates. FEMA, 2015. Web.
FINRA. “Business Continuity Plans and Emergency Contact Information.” FINRA, 2015. Web.
FINRA. “FINRA, the SEC and CFTC Issue Joint Advisory on Business Continuity Planning.” FINRA, 2013. Web.
Gosling, Mel, and Andrew Hiles. “Business Continuity Statistics: Where Myth Meets Fact.” Continuity Central, 2009. Web.
Hanwacker, Linda. “COOP Templates for Success Workbook.” The LSH Group, n.d. Web.
Homeland Security. Federal Information Security Management Act (FISMA). Homeland Security, 2015. Web.
Nichols, Shaun. “AWS's S3 Outage Was So Bad Amazon Couldn't Get Into Its Own Dashboard to Warn the World.” The Register, 1 Mar. 2017. Web.
Potter, Patrick. “BCM Regulatory Alphabet Soup.” RSA Archer Organization, 2012. Web.
Rothstein, Philip Jan. “Disaster Recovery Testing: Exercising Your Contingency Plan.” Rothstein Associates Inc., 2007. Web.
The Business Continuity Institute. “The Good Practice Guidelines.” The Business Continuity Institute, 2013. Web.
The Disaster Recovery Journal. “Disaster Resource Guide.” The Disaster Recovery Journal, 2015. Web.
The Disaster Recovery Journal. “DR Rules & Regulations.” The Disaster Recovery Journal, 2015. Web.
The Federal Financial Institution Examination Council (FFIEC). Business Continuity Planning. IT Examination Handbook InfoBase, 2015. Web.
York, Kyle. “Read Dyn’s Statement on the 10/21/2016 DNS DDoS Attack.” Oracle, 22 Oct. 2016. Web.