
- Experiencing the pitfalls of poor data quality and failing to benefit from good data quality, including:
- Unreliable data and unfavorable output.
- Inefficiencies and costly remedies.
- Dissatisfied stakeholders.
- The chances of successful decision-making capabilities are hindered with poor data quality.
Our Advice
Critical Insight
- Address the root causes of your data quality issues and form a viable data quality program.
- Be familiar with your organization’s data environment and business landscape.
- Prioritize business use cases for data quality fixes.
- Fix data quality issues at the root cause to ensure proper foundation for your data to flow.
- It is important to sustain best practices and grow your data quality program.
Impact and Result
- Implement a set of data quality initiatives that are aligned with overall business objectives and aimed at addressing data practices and the data itself.
- Develop a prioritized data quality improvement project roadmap and long-term improvement strategy.
- Build related practices such as artificial intelligence and analytics with more confidence and less risk after achieving an appropriate level of data quality.
Build Your Data Quality Program Research & Tools
Start here – read the Executive Brief
Read our concise Executive Brief to find out why you should establish a data quality program, review Info-Tech’s methodology, and understand the four ways we can support you in completing this project.Besides the small introduction, subscribers and consulting clients within this management domain have access to:
- Build Your Data Quality Program – Phases 1-4
1. Define your organization’s data environment and business landscape
Learn about what causes data quality issues, how to measure data quality, what makes a good data quality practice in relation to your data and business environments.
- Business Capability Map Template
2. Analyze your priorities for data quality fixes
Determine your business unit priorities to create data quality improvement projects.
- Data Quality Problem Statement Template
- Data Quality Practice Assessment and Project Planning Tool
3. Establish your organization’s data quality program
Revisit the root causes of data quality issues and identify the relevant root causes to the highest priority business unit, then determine a strategy for fixing those issues.
- Data Lineage Diagram Template
- Data Quality Improvement Plan Template
4. Grow and sustain your data quality practices
Identify strategies for continuously monitoring and improving data quality at the organization.
Infographic
Workshop: Build Your Data Quality Program
Workshops offer an easy way to accelerate your project. If you are unable to do the project yourself, and a Guided Implementation isn't enough, we offer low-cost delivery of our project workshops. We take you through every phase of your project and ensure that you have a roadmap in place to complete your project successfully.
1 Define Your Organization’s Data Environment and Business Landscape
The Purpose
Evaluate the maturity of the existing data quality practice and activities.
Assess how data quality is embedded into related data management practices.
Envision a target state for the data quality practice.
Key Benefits Achieved
Understanding of the current data quality landscape
Gaps, inefficiencies, and opportunities in the data quality practice are identified
Target state for the data quality practice is defined
Activities
1.1 Explain approach and value proposition
1.2 Detail business vision, objectives, and drivers
1.3 Discuss data quality barriers, needs, and principles
1.4 Assess current enterprise-wide data quality capabilities
1.5 Identify data quality practice future state
1.6 Analyze gaps in data quality practice
Outputs
Data Quality Management Primer
Business Capability Map Template
Data Culture Diagnostic
Data Quality Diagnostic
Data Quality Problem Statement Template
2 Create a Strategy for Data Quality Project 1
The Purpose
Define improvement initiatives
Define a data quality improvement strategy and roadmap
Key Benefits Achieved
Improvement initiatives are defined
Improvement initiatives are evaluated and prioritized to develop an improvement strategy
A roadmap is defined to depict when and how to tackle the improvement initiatives
Activities
2.1 Create business unit prioritization roadmap
2.2 Develop subject areas project scope
2.3 By subject area 1 data lineage analysis, root cause analysis, impact assessment, and business analysis
Outputs
Business Unit Prioritization Roadmap
Subject area scope
Data Lineage Diagram
3 Create a Strategy for Data Quality Project 2
The Purpose
Define improvement initiatives
Define a data quality improvement strategy and roadmap
Key Benefits Achieved
Improvement initiatives are defined
Improvement initiatives are evaluated and prioritized to develop an improvement strategy
A roadmap is defined to depict when and how to tackle the improvement initiatives
Activities
3.1 Understand how data quality management fits in with the organization’s data governance and data management programs
3.2 By subject area 2 data lineage analysis, root cause analysis, impact assessment, and business analysis
Outputs
Data Lineage Diagram
Root Cause Analysis
Impact Analysis
4 Create a Strategy for Data Quality Project 3
The Purpose
Determine a strategy for fixing data quality issues for the highest priority business unit
Key Benefits Achieved
Strategy defined for fixing data quality issues for highest priority business unit
Activities
4.1 Formulate strategies and actions to achieve data quality practice future state
4.2 Formulate a data quality resolution plan for the defined subject area
4.3 By subject area 3 data lineage analysis, root cause analysis, impact assessment, and business analysis
Outputs
Data Quality Improvement Plan
Data Lineage Diagram
5 Create a Plan for Sustaining Data Quality
The Purpose
Plan for continuous improvement in data quality
Incorporate data quality management into the organization’s existing data management and governance programs
Key Benefits Achieved
Sustained and communicated data quality program
Activities
5.1 Formulate metrics for continuous tracking of data quality and monitoring the success of the data quality improvement initiative
5.2 Workshop Debrief with Project Sponsor
5.3 Meet with project sponsor/manager to discuss results and action items
5.4 Wrap up outstanding items from the workshop, deliverables expectations, GIs
Outputs
Data Quality Practice Improvement Roadmap
Data Quality Improvement Plan (for defined subject areas)
Further reading
Build Your Data Quality Program
Quality Data Drives Quality Business Decisions
Executive Brief
Analyst Perspective
Get ahead of the data curve by conquering data quality challenges.
Regardless of the driving business strategy or focus, organizations are turning to data to leverage key insights and help improve the organization’s ability to realize its vision, key goals, and objectives.
Poor quality data, however, can negatively affect time-to-insight and can undermine an organization’s customer experience efforts, product or service innovation, operational efficiency, or risk and compliance management. If you are looking to draw insights from your data for decision making, the quality of those insights is only as good as the quality of the data feeding or fueling them.
Improving data quality means having a data quality management practice that is sustainably successful and appropriate to the use of the data, while evolving to keep pace with or get ahead of changing business and data landscapes. It is not a matter of fixing one data set at a time, which is resource and time intensive, but instead identifying where data quality consistently goes off the rails, and creating a program to improve the data processes at the source.
Crystal Singh
Research Director, Data and Analytics
Info-Tech Research Group
Executive Summary
Your Challenge
Your organization is experiencing the pitfalls of poor data quality, including:
- Unreliable data and unfavorable output.
- Inefficiencies and costly remedies.
- Dissatisfied stakeholders.
Poor data quality hinders successful decision making.
Common Obstacles
Not understanding the purpose and execution of data quality causes some disorientation with your data.
- Failure to realize the importance/value of data quality.
- Unsure of where to start with data quality.
- Lack of investment in data quality.
Organizations tend to adopt a project mentality when it comes to data quality instead of taking the strategic approach that would be all-around more beneficial in the long term.
Info-Tech’s Approach
Address the root causes of your data quality issues by forming a viable data quality program.
- Be familiar with your organization’s data environment and business landscape.
- Prioritize business use cases for data quality fixes.
- Fixing data quality issues at the root cause to ensure a proper foundation for your data to flow.
It is important to sustain best practices and grow your data quality program.
Info-Tech Insight
Fix data quality issues as close as possible to the source of data while understanding that business use cases will each have different requirements and expectations from data quality.
Data is the foundation of your organization’s knowledge
Data enables your organization to make decisions.
Reliable data is needed to facilitate data consumers at all levels of the enterprise.
Insights, knowledge, and information are needed to inform operational, tactical, and strategic decision-making processes. Data and information are needed to manage the business and empower business processes such as billing, customer touchpoints, and fulfillment.
Raw Data
Business Information
Actionable Insights
Data should be at the foundation of your organization’s evolution. The transformational insights that executives are constantly seeking can be uncovered with a data quality practice that makes high-quality, trustworthy information readily available to the business users who need it.
98% of companies use data to improve customer experience. (Experian Data Quality, 2019)
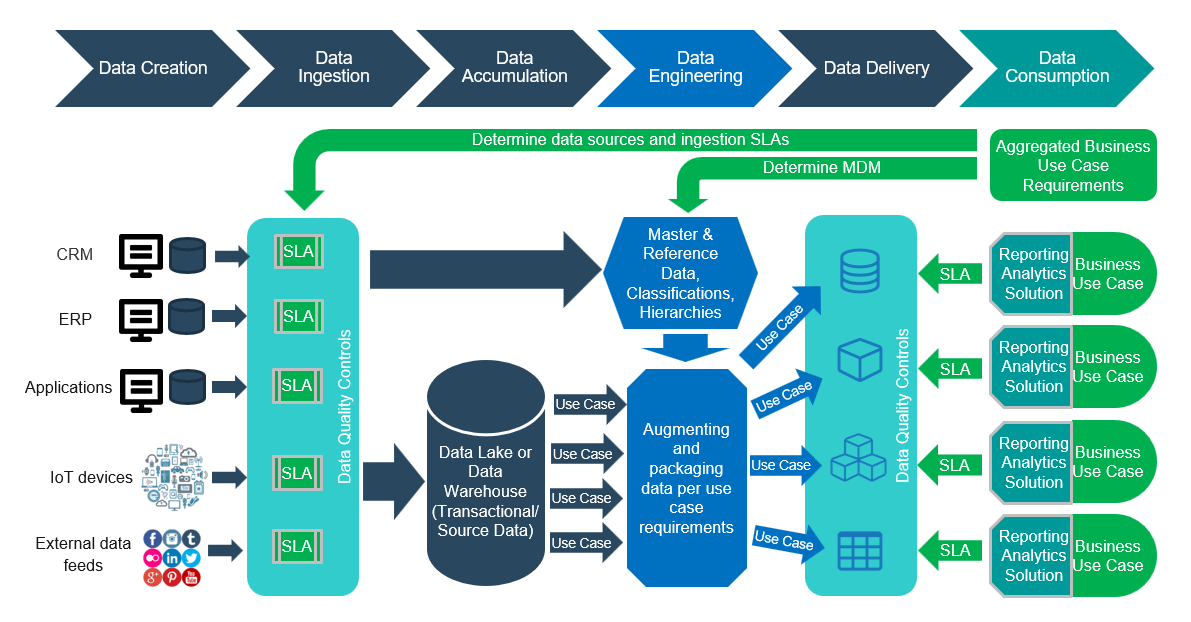
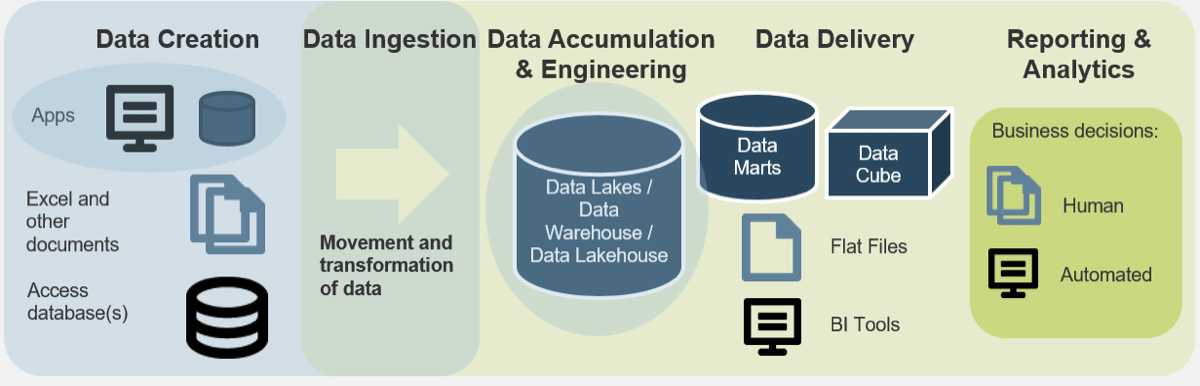
High-Level Data Architecture
Build Your Data Quality Program
- Data Quality & Data Culture Diagnostics Business Landscape Exercise
- Business Strategy & Use Cases
- Prioritize Use Cases With Poor Quality
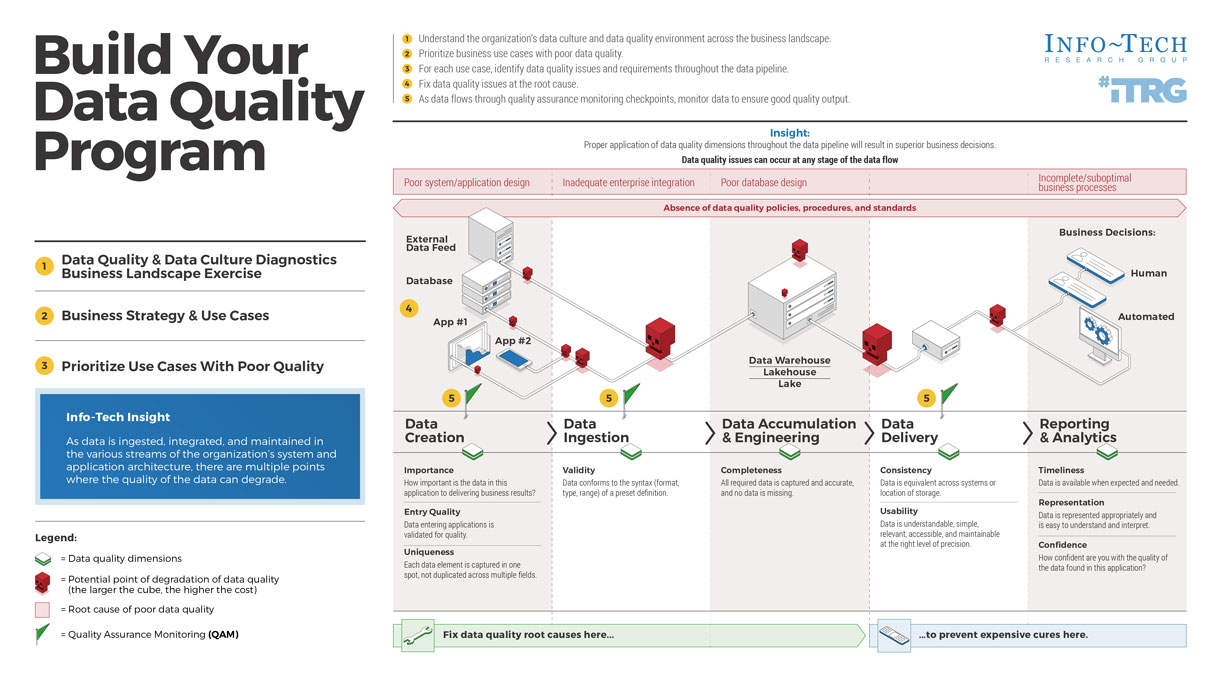
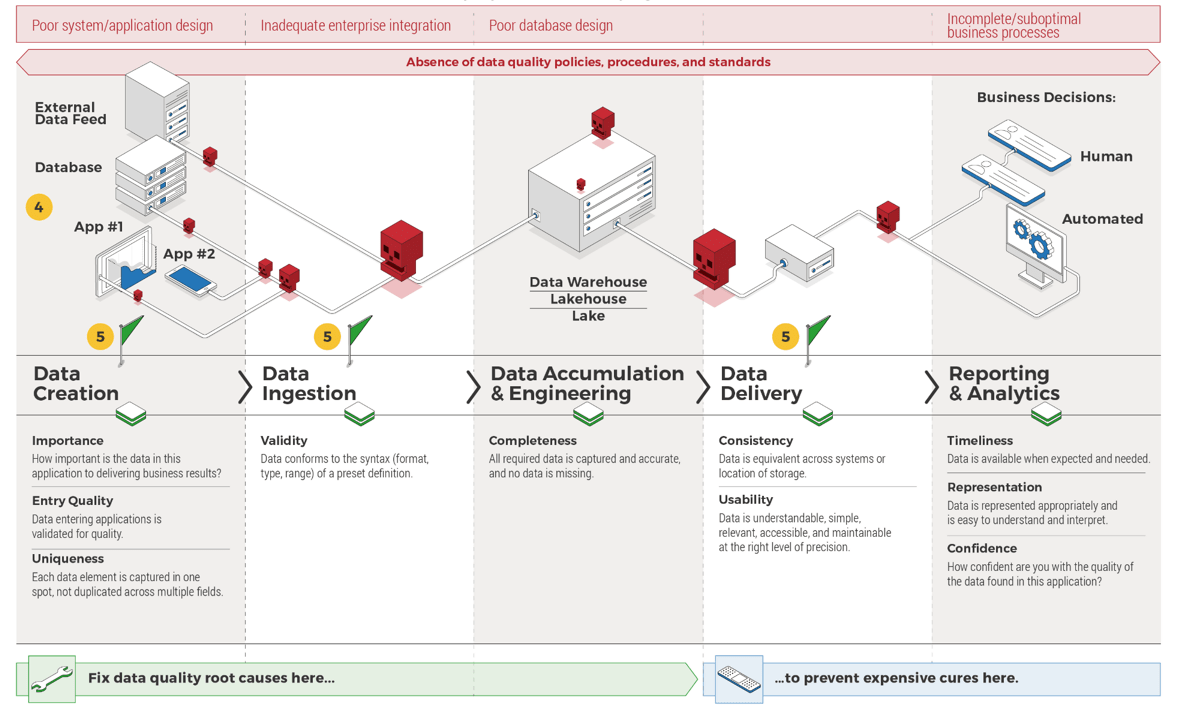
Info-Tech Insight
As data is ingested, integrated, and maintained in the various streams of the organization's system and application architecture, there are multiple points where the quality of the data can degrade.
- Understand the organization's data culture and data quality environment across the business landscape.
- Prioritize business use cases with poor data quality.
- For each use case, identify data quality issues and requirements throughout the data pipeline.
- Fix data quality issues at the root cause.
- As data flow through quality assurance monitoring checkpoints, monitor data to ensure good quality output.
Insight:
Proper application of data quality dimensions throughout the data pipeline will result in superior business decisions.
Data quality issues can occur at any stage of the data flow.
Prevent the domino effect of poor data quality
Data is the foundation of decisions made at data-driven organizations.
Therefore, if there are problems with the organization’s underlying data, this can have a domino effect on many downstream business functions.
Let’s use an example to illustrate the domino effect of poor data quality.
Organization X is looking to migrate their data to a single platform, System Y. After the migration, it has become apparent that reports generated from this platform are inconsistent and often seem wrong. What is the effect of this?
- Time must be spent on identifying the data quality issues, and often manual data quality fixes are employed. This will extend the time to deliver the project that depends on system Y by X months.
- To repair these issues, the business needs to contract two additional resources to complete the unforeseen work. The new resources cost $X each, as well as additional infrastructure and hardware costs.
- Now, the strategic objectives of the business are at risk and there is a feeling of mistrust in the new system Y.
Three key challenges impacting the ability to deliver excellent customer experience
30% Poor data quality
30% Method of interaction changing
30% Legacy systems or lack of new technology
95% Of organizations indicated that poor data quality undermines business performance.
(Source: Experian Data Quality, 2019)
Maintaining quality data will support more informed decisions and strategic insight
Improving your organization’s data quality will help the business realize the following benefits:
Data-Driven Decision Making
Business decisions should be made with a strong rationale. Data can provide insight into key business questions, such as, “How can I provide better customer satisfaction?”
89% Of CIOs surveyed say lack of quality data is an obstacle to good decision making. (Larry Dignan, CIOs juggling digital transformation pace, bad data, cloud lock0in and business alignment, 2020)
Customer Intimacy
Improve marketing and the customer experience by using the right data from the system of record to analyze complete customer views of transactions, sentiments, and interactions.
94% Percentage of senior IT leaders who say that poor data quality impinges business outcomes. (Clint Boulton, Disconnect between CIOs and LOB managers weakens data quality, 2016)
Innovation Leadership
Gain insights on your products, services, usage trends, industry directions, and competitor results to support decisions on innovations, new products, services, and pricing.
20% Businesses lose as much as 20% of revenue due to poor data quality. (RingLead Data Management Solutions, 10 Stats About Data Quality I Bet You Didn’t Know)
Operational Excellence
Make sure the right solution is delivered rapidly and consistently to the right parties for the right price and cost structure. Automate processes by using the right data to drive process improvements.
10-20% The implementation of data quality initiatives can lead to reductions in corporate budget of up to 20%. (HaloBI, 2015)
However, maintaining data quality is difficult
Avoid these pitfalls to get the true value out of your data.
- Data debt drags down ROI – a high degree of data debt will hinder you from attaining the ROI you’re expecting.
- Lack of trust means lack of usage – a lack of confidence in data results in a lack of data usage in your organization, which negatively effects strategic planning, KPIs, and business outcomes.
- Strategic assets become a liability – bad data puts your business at risk of failing compliance standards, which could result in you paying millions in fines.
- Increased costs and inefficiency – time spent fixing bad data means less workload capacity for your important initiatives and the inability to make data-based decisions.
- Barrier to adopting data-driven tech – emerging technologies, such as predictive analytics and artificial intelligence, rely on quality data. Inaccurate, incomplete, or irrelevant data will result in delays or a lack of ROI.
- Bad customer experience – Running your business on bad data can hinder your ability to deliver to your customers, growing their frustration, which negatively impacts your ability to maintain your customer base.
Info-Tech Insight
Data quality suffers most at the point of entry. This is one of the causes of the domino effect of data quality – and can be one of the most costly forms of data quality errors due to the error propagation. In other words, fix data ingestion, whether through improving your application and database design or improving your data ingestion policy, and you will fix a large majority of data quality issues.
Follow Our Data & Analytics Journey
Data Quality is laced into Data Strategy, Data Management, and Data Governance.
- Data Strategy
- Data Management
- Data Quality
- Data Governance
- Data Architecture
- MDM
- Data Integration
- Enterprise Content Management
- Information Lifecycle Management
- Data Warehouse/Lake/Lakehouse
- Reporting and Analytics
- AI
- Data Warehouse/Lake/Lakehouse
- Data Architecture
- Data Management
Data quality is rooted in data management
Extract Maximum Benefit Out of Your Data Quality Management.
- Data management is the planning, execution, and oversight of policies, practices, and projects that acquire, control, protect, deliver, and enhance the value of data and information assets (DAMA, 2009).
- In other words, getting the right information, to the right people, at the right time.
- Data quality management exists within each of the data practices, information dimensions, business resources, and subject areas that comprise the data management framework.
- Within this framework, an effective data quality practice will replace ad hoc processes with standardized practices.
- An effective data quality practice cannot succeed without proper alignment and collaboration across this framework.
- Alignment ensures that the data quality practice is fit for purpose to the business.
The DAMA DMBOK2 Data Management Framework
- Data Governance
- Data Quality
- Data Architecture
- Data Modeling & Design
- Data Storage & Operations
- Data Security
- Data Integration & Interoperability
- Documents & Content
- Reference & Master Data
- Data Warehousing & Business Intelligence
- Meta-data
(Source: DAMA International)
Related Info-Tech Research
Build a Robust and Comprehensive Data Strategy
- People often think that the main problems they need to fix first are related to data quality when the issues transpire at a much larger level. This blueprint is the key to building and fostering a data-driven culture.
Create a Data Management Roadmap
- Refer to this blueprint to understand data quality in the context of data disciplines and methods for improving your data management capabilities.
- Define an effective data governance strategy and ensure the strategy integrates well with data quality with this blueprint.
Info-Tech’s methodology for Data Quality
| Phase Steps | 1. Define Your Organization’s Data Environment and Business Landscape | 2. Analyze Your Priorities for Data Quality Fixes | 3. Establish Your Organization’s Data Quality Program | 4. Grow and Sustain Your Data Quality Practice |
|---|---|---|---|---|
| Phase Outcomes | This step identifies the foundational understanding of your data and business landscape, the essential concepts around data quality, as well as the core capabilities and competencies that IT needs to effectively improve data quality. | To begin addressing specific, business-driven data quality projects, you must identify and prioritize the data-driven business units. This will ensure that data improvement initiatives are aligned to business goals and priorities. | After determining whose data is going to be fixed based on priority, determine the specific problems that they are facing with data quality, and implement an improvement plan to fix it. | Now that you have put an improvement plan into action, make sure that the data quality issues don’t keep cropping up. Integrate data quality management with data governance practices into your organization and look to grow your organization’s overall data maturity. |
Info-Tech Insight
“Data Quality is in the eyes of the beholder.”– Igor Ikonnikov, Research Director
Data quality means tolerance, not perfection
Data from Info-Tech’s CIO Business Vision Diagnostic, which represents over 400 business stakeholders, shows that data quality is very important when satisfaction with data quality is low.
However, when data quality satisfaction hit a threshold, it became less important.
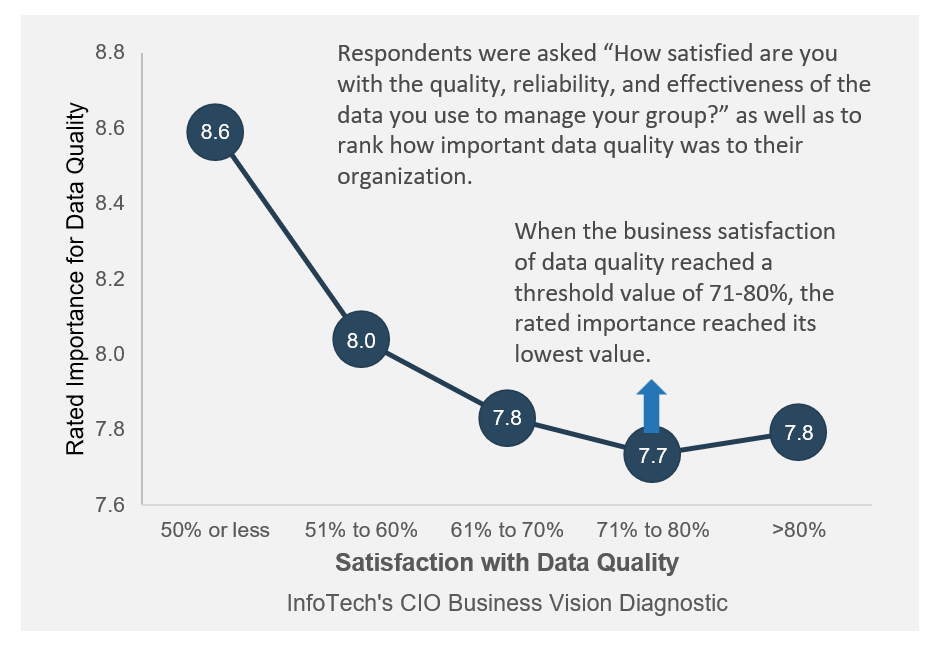
Respondents were asked “How satisfied are you with the quality, reliability, and effectiveness of the data you use to manage your group?” as well as to rank how important data quality was to their organization.
When the business satisfaction of data quality reached a threshold value of 71-80%, the rated importance reached its lowest value.
Info-Tech Insight
Data needs to be good, but truly spectacular data may go unnoticed.
Provide the right level of data quality, with the appropriate effort, for the correct usage. This blueprint will help you to determine what “the right level of data quality” means, as well as create a plan to achieve that goal for the business.
Data Roles and Responsibilities
Data quality occurs through three main layers across the data lifecycle
Data Strategy Data Strategy should contain Data Quality as a standard component. ← Data Quality issues can occur throughout at any stage of the data flow → |
||||
DQ Dimensions Timeliness – Representation – Usability – Consistency – Completeness – Uniqueness – Entry Quality – Validity – Confidence – Importance |
||||
Source System Layer
|
Data Transformation Layer
|
Consumption Layer
|
||
| Data Creation → | [SLA] Data Ingestion [ QA] | →Data Accumulation & Engineering → | [SLA] Data Delivery [QA] | →Reporting & Analytics |
| Fix Data Quality root causes here… | → | to prevent expensive cures here. | ||
Executive Brief Case Study
Industry: Healthcare
Source: Primary Info-Tech Research
Align source systems to maximize business output.
A healthcare insurance agency faced data quality issues in which a key business use case was impacted negatively. Business rules were not well defined, and default values instead of real value caused a concern. When dealing with multiple addresses, data was coming from different source systems.
The challenge was to identify the most accurate address, as some were incomplete, and some lacked currency and were not up to date. This especially challenged a key business unit, marketing, to derive business value in performing key activities by being unable to reach out to existing customers to advertise any additional products.
For this initiative, this insurance agency took an economic approach by addressing those data quality issues using internal resources.
Results
Without having any MDM tools or having a master record or any specific technology relating to data quality, this insurance agency used in-house development to tackle those particular issues at the source system. Data quality capabilities such as data profiling were used to uncover those issues and address them.
“Data quality is subjective; you have to be selective in terms of targeting the data that matters the most. When getting business tools right, most issues will be fixed and lead to achieving the most value.” – Asif Mumtaz, Data & Solution Architect
Info-Tech offers various levels of support to best suit your needs
DIY Toolkit
"Our team has already made this critical project a priority, and we have the time and capability, but some guidance along the way would be helpful."
Guided Implementation
"Our team knows that we need to fix a process, but we need assistance to determine where to focus. Some check-ins along the way would help keep us on track."
Workshop
"We need to hit the ground running and get this project kicked off immediately. Our team has the ability to take this over once we get a framework and strategy in place."
Consulting
"Our team does not have the time or the knowledge to take this project on. We need assistance through the entirety of this project."
Diagnostic and consistent frameworks are used throughout all four options.
Guided Implementation
What does a typical GI on this topic look like?
| Phase 1 | Phase 2 | Phase 3 | Phase 4 |
|---|---|---|---|
|
|
|
|
A Guided Implementation (GI) is a series of calls with an Info-Tech analyst to help implement our best practices in your organization.
A typical GI is between eight to twelve calls over the course of four to six months.
Workshop Overview
Contact your account representative for more information. workshops@infotech.com 1-888-670-8889
| Day 1 | Day 2 | Day 3 | Day 4 | Day 5 | |
|---|---|---|---|---|---|
| Define Your Organization’s Data Environment and Business Landscape | Create a Strategy for Data Quality Project 1 | Create a Strategy for Data Quality Project 2 | Create a Strategy for Data Quality Project 3 | Create a Plan for Sustaining Data Quality | |
| Activities |
|
|
|
|
|
| Deliverables |
|
|
|
|
|
Phase 1
Define Your Organization’s Data Environment and Business Landscape
Build Your Data Quality Program
Data quality is a methodology and must be treated as such
A comprehensive data quality practice includes appropriate business requirements gathering, planning, governance, and oversight capabilities, as well as empowering technologies for properly trained staff, and ongoing development processes.
Some common examples of appropriate data management methodologies for data quality are:
- The data quality team has the necessary competencies and resources to perform the outlined workload.
- There are processes that exist for continuously evaluating data quality performance capabilities.
- Improvement strategies are designed to increase data quality performance capabilities.
- Policies and procedures that govern data quality are well-documented, communicated, followed, and updated.
- Change controls exist for revising policies and procedures, including communication of updates and changes.
- Self-auditing techniques are used to ensure business-IT alignment when designing or recalibrating strategies.
Effective data quality practices coordinate with other overarching data disciplines, related data practices, and strategic business objectives.
“You don’t solve data quality with a Band-Aid; you solve it with a methodology.” – Diraj Goel, Growth Advisor, BC Tech
Data quality can be defined by four key quality indicators
Similar to measuring the acidity of a substance with a litmus test, the quality of your data can be measured using a simple indicator test. As you learn about common root causes of data quality problems in the following slides, think about these four quality indicators to assess the quality of your data:
- Completeness – Closeness to the correct value. Encompasses accuracy, consistency, and comparability to other databases.
- Usability – The degree to which data meets current user needs. To measure this, you must determine if the user is satisfied with the data they are using to complete their business functions.
- Timeliness – Length of time between creation and availability of data.
- Accessibility – How easily a user can access and understand the data (including data definitions and context). Interpretability can also be used to describe this indicator.
Info-Tech Insight
Quality is a relative term. Data quality is measured in terms of tolerance. Perfect data quality is both impossible and a waste of time and effort.
How to get investment for your data quality program
Follow these steps to convince leadership of the value of data quality:
“You have to level with people, you cannot just start talking with the language of data and expect them to understand when the other language is money and numbers.” – Izabela Edmunds, Information Architect at Mott MacDonald
- Perform Phases 0 & 1 of this blueprint as this will offer value in carrying out the following steps.
- Build credibility. Show them your understanding of data and how it aligns to the business.
- Provide tangible evidence of how significant business use cases are impacted by poor quality data.
- Present the ROI of fixing the data quality issues you have prioritized.
- Explain how the data quality program will be established, implemented, and sustained.
- Prove the importance of fixing data quality issues at the source and how it is the most efficient, effective, and cost-friendly solution.
Phase 1 deliverables
Each of these deliverables serve as inputs to detect key outcomes about your organization and to help complete this blueprint:
1. Data Culture Diagnostic
Use this report to understand where your organization lies across areas relating to data culture.
While the Quality & Trust area of the report might be most prevalent to this blueprint, this diagnostic may point out other areas demanding more attention.
Please speak to your account manager for access
2. Business Capability Map Template
Perform this process to understand the capabilities that enable specific value streams. The output of this deliverable is a high-level view of your organization’s defined business capabilities.
Info-Tech Insight
Understanding your data culture and business capabilities are foundational to starting the journey of data quality improvement.
Key deliverable:
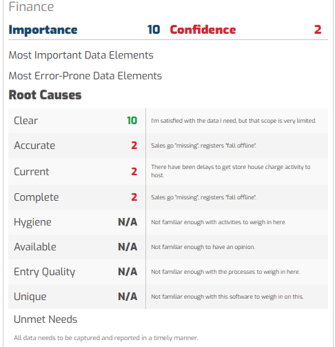
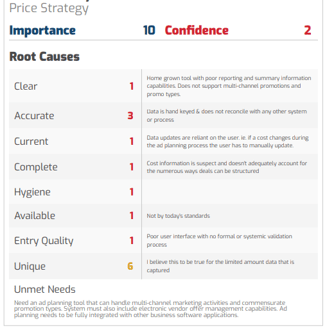
3. Data Quality Diagnostic
The Data Quality Report is designed to help you understand, assess, and improve key organizational data quality issues. This is where respondents across various areas in the organization can assess Data Quality across various dimensions.
Data Quality Diagnostic Value
Prioritize business use cases with our data quality dimensions.
- Complete this diagnostic for each major business use case. The output from the Data Culture Diagnostic and the Business Capability Map should help you understand which use cases to address.
- Involve all key stakeholders involved in the business use case. There may be multiple business units involved in a single use case.
- Prioritize the business use cases that need the most attention pertaining to data quality by comparing the scores of the Importance and Confidence data quality dimensions.
If there are data elements that are considered of high importance and low confidence, then they must be prioritized.
Sample Scorecard
Poor data quality develops due to multiple root causes
After you get to know the properties of good quality data, understand the underlying causes of why those indicators can point to poor data quality.
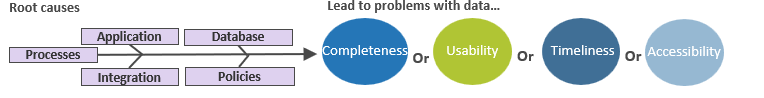
If you notice that the usability, completeness, timeliness, or accessibility of the organization’s data is suffering, one or more of the following root causes are likely plaguing your data:
Common root causes of poor data quality, through the lens of Info-Tech’s Five-Tier Data Architecture:
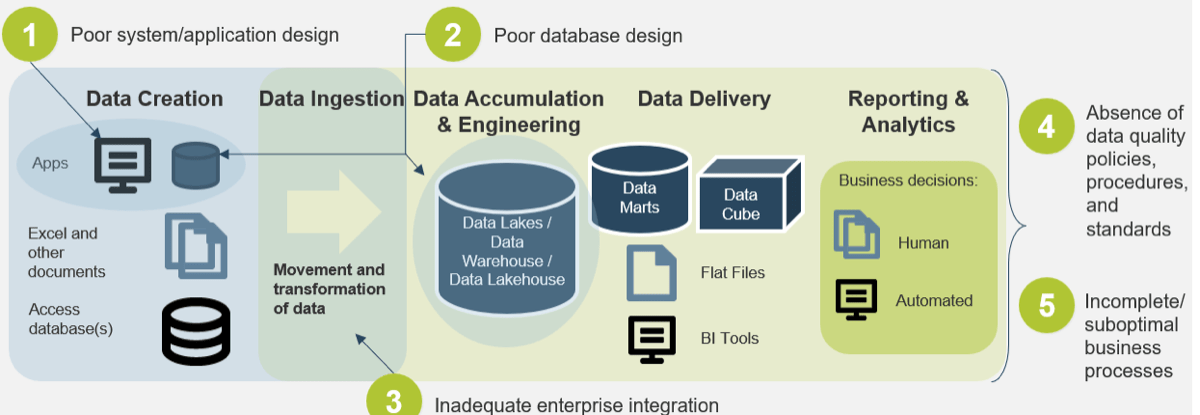
These root causes of poor data quality are difficult to avoid, not only because they are often generated at an organization’s beginning stages, but also because change can be difficult. This means that the root causes are often propagated through stale or outdated business processes.
Data quality problems root cause #1:
Poor system or application design
Application design plays one of the largest roles in the quality of the organization’s data. The proper design of applications can prevent data quality issues that can snowball into larger issues downstream.
Proper ingestion is 90% of the battle. An ounce of prevention is worth a pound of cure. This is true in many different topics, and data quality is one of them. Designing an application so that data gets entered properly, whether by internal staff or external customers, is the single most effective way to prevent data quality issues.
Some common causes of data quality problems at the application/system level include:
- Too many open fields (free-form text fields that accept a variety of inputs).
- There are no lookup capabilities present. Reference data should be looked up instead of entered.
- Mandatory fields are not defined, resulting in blank fields.
- No validation of data entries before writing to the underlying database.
- Manual data entry encourages human error. This can be compounded by poor application design that facilitates the incorrect data entry.
Data quality problems root cause #2:
Poor database design
Database design also affects data quality. How a database is designed to handle incoming data, including the schema and key identification, can impact the integrity of the data used for reporting and analytics.
The most common type of database is the relational database. Therefore, we will focus on this type of database.
When working with and designing relational databases, there are some important concepts that must be considered.
Referential integrity is a term that is important for the design of relational database schema, and indicates that table relationships must always be consistent.
For table relationships to be consistent, primary keys (unique value for each row) must uniquely identify entities in columns of the table. Foreign keys (field that is defined in a second table but refers to the primary key in the first table) must agree with the primary key that is referenced by the foreign key. To maintain referential integrity, any updates must be propagated to the primary parent key.
Info-Tech Insight
Other types of databases, including databases with unstructured data, need data quality consideration. However, unstructured data may have different levels of quality tolerance.
At the database level, some common root causes include:
- Lack of referential integrity.
- Lack of unique keys.
- Don’t have restricted data range.
- Incorrect datatype, string fields that can hold too many characters.
- Orphaned records.
Databases and People:
Even though database design is a technology issue, don’t forget about the people.
A lack of training employees on database permissions for updating/entering data into the physical databases is a common problem for data quality.
Data quality problems root cause #3:
Improper integration and synchronization of enterprise data
Data ingestion is another category of data-quality-issue root causes. When moving data in Tier 2, whether it is through ETL, ESB, point-to-point integration, etc., the integrity of the data during movement and/or transformation needs to be maintained.
Tier 2 (the data ingestion layer) serves to move data for one of two main purposes:
- To move data from originating systems to downstream systems to support integrated business processes.
- To move data to Tier 3 where data rests for other purposes. This movement of data in its purest form means we move raw data to storage locations in an overall data warehouse environment reflecting any security, compliance and other standards in our choices for how to store. Also, it is where data is transformed for unique business purpose that will also be moved to a place of rest or a place of specific use. Data cleansing and matching and other data-related blending tasks occur at this layer.
This ensures the data is pristine throughout the process and improves trustworthiness of outcomes and speed to task completion.
At the integration layer, some common root causes of data quality problems include:
- No data mask. For example, zip code should have a mask of five numeric characters.
- Questionable aggregation, transformation process, or incorrect logic.
- Unsynchronized data refresh process in an integrated environment.
- Lack of a data matching tool.
- Lack of a data quality tool.
- Don’t have data profiling capability.
- Errors with data conversion or migration processes – when migrating, decommissioning, or converting systems – movement of data sets.
- Incorrect data mapping between data sources and targets.
Data quality problems root cause #4:
Insufficient and ineffective data quality policies and procedures
Data policies and procedures are necessary for establishing standards around data and represent another category of data-quality-issue root causes. This issue spans across all five of the 5 Tier Architecture.
Data policies are short statements that seek to manage the creation, acquisition, integrity, security, compliance, and quality of data. These policies vary amongst organizations, depending on your specific data needs.
- Policies describe what to do, while standards and procedures describe how to do something.
- There should be few data policies, and they should be brief and direct. Policies are living documents and should be continuously updated to respond to the organization’s data needs.
- The data policies should highlight who is responsible for the data under various scenarios and rules around how to manage it effectively.
Some common root causes of data quality issues related to policies and procedures include:
- Policies are absent or out of date.
- Employees are largely unaware of policies in effect.
- Policies are unmonitored and unenforced.
- Policies are in multiple locations.
- Multiple versions of the same policy exist.
- Policies are managed inconsistently across different silos.
- Policies are written poorly by untrained authors.
- Inadequate policy training program.
- Draft policies stall and lose momentum.
- Weak policy support from senior management.
Data quality problems root cause #5:
Inefficient or ineffective business processes
Some common root causes of data quality issues related to business processes include:
- Multiple entries of the same record leads to duplicate records proliferating in the database.
- Many business definitions of data.
- Failure to document data manipulations when presenting data.
- Failure to train people on how to understand data.
- Manually intensive processes can result in duplication of effort (creates room for errors).
- No clear delineation of dependencies of business processes within or between departments, which leads to a siloed approach to business processes, rather than a coordinated and aligned approach.
Business processes can impact data quality. How data is entered into systems, as well as employee training and knowledge about the correct data definitions, can impact the quality of your organization’s data.
These problematic business process root causes can lead to:
Duplicate records
Incomplete data
Improper use of data
Wrong data entered into fields
These data quality issues will result in costly and inefficient manual fixes, wasting valuable time and resources.
Phase 1 Summary
1. Data Quality Understanding
- Understanding that data quality is a methodology and should be treated as such.
- Data quality can be defined by four key indicators which are completeness, usability, timeliness, and accessibility.
- Explained how to get investment for your data quality program and showcasing its value to leadership.
2. Phase 0 Deliverables
Introduced foundational tools to help you throughout this blueprint:
- Complete the Data Culture Diagnostic and Business Capability Map Template as they are foundational in understanding your data culture and business capabilities to start the journey of data quality improvement.
- Involve key relevant stakeholders when completing the Data Quality Diagnostic for each major business use case. Use the Importance and Confidence dimensions to help you prioritize which use case to address.
3. Common Root Causes
Addressed where multiple root causes can occur throughout the flow of your data.
Analyzed the following common root causes of data quality:
- Poor system or application design
- Poor database design
- Improper integration and synchronization of enterprise data
- Insufficient and ineffective data quality policies and procedures
- Inefficient or ineffective business processes
Phase 2
Analyze Your Priorities for Data Quality Fixes
Build Your Data Quality Program
Business Context & Data Quality
Establish the business context of data quality improvement projects at the business unit level to find common goals.
- To ensure the data improvement strategy is business driven, start your data quality project evaluation by understanding the business context. You will then determine which business units use data and create a roadmap for prioritizing business units for data quality repairs.
- Your business context is represented by your corporate business vision, mission, goals and objectives, differentiators, and drivers. Collectively, they provide essential information on what is important to your organization, and some hints on how to achieve that. In this step, you will gather important information about your business view and interpret the business view to establish a data view.
Business Vision
Business Goals
Business Drivers
Business Differentiators
Not every business unit uses data to the same extent
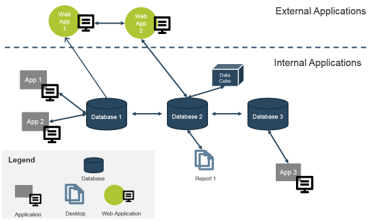
A data flow diagram can provide value by allowing an organization to adopt a proactive approach to data quality. Save time by knowing where the entry points are and where to look for data flaws.
Understanding where data lives can be challenging as it is often in motion and rarely resides in one place. There are multiple benefits that come from taking the time to create a data flow diagram.
- Mapping out the flow of data can help provide clarity on where the data lives and how it moves through the enterprise systems.
- Having a visual of where and when data moves helps to understand who is using data and how it is being manipulated at different points.
- A data flow diagram will allow you to elicit how data is used in a different use case.
Info-Tech’s Four-Column Model of Data will help you to identify the essential aspects of your data:
Business Use Case →Used by→Business Unit →Housed in→Systems→Used for→Usage of the Data
Not every business unit requires the same standard of data quality
To prioritize your business units for data quality improvement projects, you must analyze the relative importance of the data they use to the business. The more important the data is to the business, the higher the priority is of fixing that data. There are two measures for determining the importance of data: business value and business impact.
Business Value of Data
Business value of data can be evaluated by thinking about its ties to revenue generation for the organization, as well as how it is used for productivity and operations at the organization.
The business value of data is assessed by asking what would happen to the following parameters if the data is not usable (due to poor quality, for example):
- Loss of Revenue
- Loss of Productivity
- Increased Operating Costs
Business Impact of Data
Business impact of data should take into account the effects of poor data on both internal and external parties.
The business impact of data is assessed by asking what the impact would be of bad data on the following parameters:
- Impact on Customers
- Impact on Internal Staff
- Impact on Business Partners
Value + Impact = Data Priority Score
Ensure that the project starts on the right foot by completing Info-Tech’s Data Quality Problem Statement Template
Before you can identify a solution, you must identify the problem with the business unit’s data.
Use Info-Tech’s Data Quality Problem Statement Template to identify the symptoms of poor data quality and articulate the problem.
Info-Tech’s Data Quality Problem Statement Template will walk you through a step-by-step approach to identifying and describing the problems that the business unit feels regarding its data quality.
Before articulating the problem, it helps to identify the symptoms of the problem. The following W’s will help you to describe the symptoms of the data quality issues:
What
Define the symptoms and feelings produced by poor data quality in the business unit.
Where
Define the location of the data that are causing data quality issues.
When
Define how severe the data quality issues are in frequency and duration.
Who
Define who is affected by the data quality problems and who works with the data.
Info-Tech Best Practice
Symptoms vs. Problems. Often, people will identify a list of symptoms of a problem and mistake those for the problem. Identifying the symptoms helps to define the problem, but symptoms do not help to identify the solution. The problem statement helps you to create solutions.
Define the project problem to articulate the purpose
1 hour
Input
- Symptoms of data quality issues in the business unit
Output
- Refined problem description
Materials
- Data Quality Problem Statement Template
Participants
- Data Quality Improvement Project team
- Business line representatives
A defined problem helps you to create clear goals, as well as lead your thinking to determine solutions to the problem.
A problem statement consists of one or two sentences that summarize a condition or issue that a quality improvement team is meant to address. For the improvement team to fix the problem, the problem statement therefore has to be specific and concise.
Instructions
- Gather the Data Quality Improvement Project Team in a room and start with an issue that is believed to be related to data quality.
- Ask what are the attributes and symptoms of that reality today; do this with the people impacted by the issue. This should be an IT and business collaboration.
- Draw your conclusions of what it all means: what have you collectively learned?
- Consider the implications of your conclusions and other considerations that must be taken into account such as regulatory needs, compliance, policy, and targets.
- Develop solutions – Contain the problem to something that can be solved in a realistic timeframe, such as three months.
Case Study
A strategic roadmap rooted in business requirements primes a data quality improvement plan for success.
MathWorks
Industry
Software Development
Source
Primary Info-Tech Research
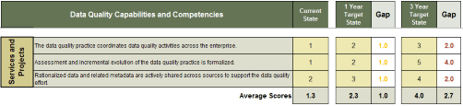
As part of moving to a formalized data quality practice, MathWorks leveraged an incremental approach that took its time investigating business cases to support improvement actions. Establishing realistic goals for improvement in the form of a roadmap was a central component for gaining executive approval to push the project forward.
Roadmap Creation
In constructing a comprehensive roadmap that incorporated findings from business process and data analyses, MathWorks opted to document five-year and three-year overall goals, with one-year objectives that supported each goal. This approach ensured that the tactical actions taken were directed by long-term strategic objectives.
Results – Business Alignment
In presenting their roadmap for executive approval, MathWorks placed emphasis on communicating the progression and impact of their initiatives in terms that would engage business users. They focused on maintaining continual lines of communication with business stakeholders to demonstrate the value of the initiatives and also to gradually shift the corporate culture to one that is invested in an effective data quality practice.
“Don’t jump at the first opportunity, because you may be putting out a fire with a cup of water where a fire truck is needed.” – Executive Advisor, IT Research and Advisory Firm
Use Info-Tech’s Practice Assessment and Project Planning Tool to create your strategy for improving data quality
Assess IT’s capabilities and competencies around data quality and plan to build these as the organization’s data quality practice develops. Before you can fix data quality, make sure you have the necessary skills and abilities to fix data quality correctly.
The following IT capabilities are developed on an ongoing basis and are necessary for standardizing and structuring a data quality practice:
- Meeting Business Needs
- Services and Projects
- Policies, Procedures, and Standards
- Roles and Organizational Structure
- Oversight and Communication
- Data Quality of Different Data Types
Data Handling and Remediation Competencies:
- Data Standardization: Formatting values into consistent standards based on industry standards and business rules.
- Data Cleansing: Modification of values to meet domain restrictions, integrity constraints, or other business rules for sufficient data quality for the organization.
- Data Matching: Identification, linking, and merging related entries in or across sets of data.
- Data Validation: Checking for correctness of the data.
After these capabilities and competencies are assessed for a current and desired target state, the Data Quality Practice Assessment and Project Planning Tool will suggest improvement actions that should be followed in order to build your data quality practice. In addition, a roadmap will be generated after target dates are set to create your data quality practice development strategy.
Benchmark current and identify target capabilities for your data quality practice
1 hour
Input
- Current and desired data quality practices in the organization
Output
- Assessment of where the gaps lie in your data quality practice
Materials
- Data Quality Practice Assessment and Project Planning Tool
Participants
- Data Quality Project Lead
- Business Line Representatives
- Business Architects
Use the Data Quality Practice Assessment and Project Planning Tool to evaluate the baseline and target capabilities of your practice in terms of how data quality is approached and executed.
Instructions
- Invite the appropriate stakeholders to participate in this exercise. Examples:
- Business executives will have input in Tab 2
- Unique stakeholders: communications expert or executive advisors may have input
- On Tab 2: Practice Components, assess the current and target states of each capability on a scale of 1–5. Note: “Ad hoc” implies a capability is completed, but randomly, informally, and without a standardized method.
These results will set the baseline against which you will monitor performance progress and keep track of improvements over time.
Info-Tech Insight
Focus on early alignment. Assessing capabilities within specific people’s job functions can naturally result in disagreement or debate, especially between business and IT people. Remind everyone that data quality should ultimately serve business needs wherever possible.
Visualization improves the holistic understanding of where gaps exist in your data quality practice
To enable deeper analysis on the results of your practice assessment, Tab 3: Data Quality Practice Scorecard in the Data Quality Practice Assessment and Project Planning Tool creates visualizations of the gaps identified in each of your practice capabilities and related data management practices. These diagrams serve as analysis summaries.
Gap assessment of “Meeting Business Needs” capabilities
Visualization of gap assessment of data quality practice capabilities
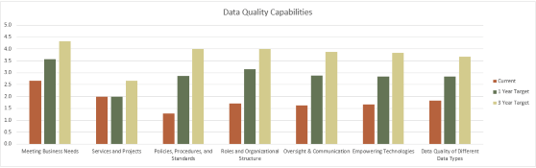
- Enhance your gap analyses by forming a relative comparison of total gaps in key practice capability areas, which will help in determining priorities.
- Example: In Tab 2 compare your capabilities within “Policies, Procedures, and Standards.” Then in Tab 3, compare your overall capabilities in “Policies, Procedures, and Standards” versus “Empowering Technologies.”
Before engaging in the data quality improvement project plan, receive signoff from IT regarding feasibility
The final piece of the puzzle is to gain sign-off from IT.
Hofstadter's law: It always takes longer than you expect, even when you take into account Hofstadter’s Law.
This means that before engaging IT in data quality projects to fix the business units’ data in Phase 2, IT must assess feasibility of the data quality improvement plan. A feasibility analysis is typically used to review the strengths and weaknesses of the projects, as well as the availability of required skills and technologies needed to complete them. Use the following workflow to guide you in performing a feasibility analysis:
Project evaluation process:
Present capabilities
- Operational Capabilities
- System Capabilities
- Schedule Capabilities
- Summary of Evaluation Results
- Recommendations/ modifications to the project plan
- Summary of Evaluation Results
Info-Tech Best Practice
While the PMO identifies and coordinates projects, IT must determine how long and for how much.
Conduct gap analysis sessions to review and prioritize the capability gaps
1 hour
Input
- Current and Target State Assessment
Output
- Documented initiatives to help you get to the target state
Materials
- Data Quality Practice Assessment and Project Planning Tool
Participants
- Data Quality team
- IT representatives
Instructions
- Analyze Gap Analysis Results – As a group, discuss the high-level results on Tab 3: Data Quality Practice Score. Discuss the implications of the gaps identified.
- Do a line-item review of the gaps between current and target levels for each assessed capability by using Tab 2: Practice Components.
- Brainstorm Alignment Strategies – Brainstorm the effort and activities that will be necessary to support the practice in building its capabilities to the desired target level. Ask the following questions:
- What activities must occur to enable this capability?
- What changes/additions to resources, process, technology, business involvement, and communication must occur?
- Document Data Quality Initiatives – Turn activities into initiatives by documenting them in Tab 4. Data Quality Practice Roadmap. Review the initiatives and estimate the start and end dates of each one.
- Continue to evaluate the assessment results in order to create a comprehensive set of data quality initiatives that support your practice in building capabilities.
Create the organization’s data quality improvement strategy roadmap
1 hour
Input
- Data quality practice gaps and improvement actions
Output
- Data quality practice improvement roadmap
Materials
- Data Quality Practice Assessment and Project Planning Tool
Participants
- Data Quality Project Lead
- Business Executives
- IT Executives
- Business Architects
Generating Your Roadmap
- Plan the sequence, starting time, and length of each initiative in the Data Quality Practice Assessment and Project Planning Tool.
- The tool will generate a Gantt chart based on the start and length of your initiatives.
- The Gantt chart is generated in Tab 4: Data Quality Practice Roadmap, and can be used to organize and ensure that all of the essential aspects of data quality are addressed.
Use the Practice Roadmap to plan and improve data quality capabilities
Info-Tech Best Practice
To help get you started, Info-Tech has provided an extensive list of data quality improvement initiatives that are commonly undertaken by organizations looking to improve their data quality.
Establish Baseline Metrics
Baseline metrics will be improved through:
2 hours
Create practice-level metrics to monitor your data quality practice.
Instructions:
- Establish metrics for both the business and IT that will be used to determine if the data quality practice development is effective.
- Set targets for each metric.
- Collect current data to calculate the metrics and establish a baseline.
- Assign an owner for tracking each metric to be accountable for performance.
| Metric | Current | Goal |
|---|---|---|
| Usage (% of trained users using the data warehouse) | ||
| Performance (response time) | ||
| Performance (response time) | ||
| Resource utilization (memory usage, number of machine cycles) | ||
| User satisfaction (quarterly user surveys) | ||
| Data quality (% values outside valid values, % fields missing, wrong data type, data outside acceptable range, data that violates business rules. Some aspects of data quality can be automatically tracked and reported) | ||
| Costs (initial installation and ongoing, Total Cost of Ownership including servers, software licenses, support staff) | ||
| Security (security violations detected, where violations are coming from, breaches) | ||
| Patterns that are used | ||
| Reduction in time to market for the data | ||
| Completeness of data that is available | ||
| How many "standard" data models are being used | ||
| What is the extra business value from the data governance program? | ||
| How much time is spent for data prep by BI & analytics team? |
Phase 2 summary
As you improve your data quality practice and move from reactive to stable, don’t rest and assume that you can let data quality keep going by itself. Rapidly changing consumer requirements or other pains will catch up to your organization and you will fall behind again. By moving to the proactive and predictive end of the maturity scale, you can stay ahead of the curve. By following the methodology laid out in Phase 1, the data quality practices at your organization will improve over time, leading to the following results:
Chaotic
Before Data Quality Practice Improvements
- No standards to data quality
Reactive
Year 1
- Processes defined
- Data cleansing approach to data quality
Stable
Year 2
- Business rules/ stewardship in place
- Education and training
Proactive
Year 3
- Data quality practices fully in place and embedded in the culture
- Trusted and intelligent enterprise
(Global Data Excellence, Data Excellence Maturity Model)
Phase 3
Establish Your Organization’s Data Quality Program
Build Your Data Quality Program
Create a data lineage diagram to map the data journey and identify the data subject areas to be targeted for fixes
It is important to understand the various data that exist in the business unit, as well as which data are essential to business function and require the highest degree of quality efforts.
Visualize your databases and the flow of data. A data lineage diagram can help you and the Data Quality Improvement Team visualize where data issues lie. Keeping the five-tier architecture in mind, build your data lineage diagram.
Reminder: Five-Tier Architecture
Use the following icons to represent your various data systems and databases.
![]()
Use Info-Tech’s Data Lineage Diagram to document the data sources and applications used by the business unit
2 hours
Input
- Data sources and applications used by the business unit
Output
- Data lineage diagram
Materials
- Data Lineage Diagram Template
Participants
- Business Unit Head/Data Owner
- Business Unit SMEs
- Data Analysts/Architects
Map the flow and location of data within a business unit by creating a system context diagram.
Gain an accurate view of data locations and uses: Engage business users and representatives with a wide breadth of knowledge-related business processes and the use of data by related business operations.
- Sit down with key business representatives of the business unit.
- Document the sources of data and processes in which they’re involved, and get IT confirmation that the sources of the data are correct.
- Map out the sources and processes in a system context diagram.
Sample Data Lineage Diagram
Leverage Info-Tech’s Data Quality Practice Assessment and Project Planning Tool to document business context
1 hour
Input
- Business vision, goals, and drivers
Output
- Business context for the data quality improvement project
Materials
- Data Quality Practice Assessment and Project Planning Tool
Participants
- Data Quality project lead
- Business line representatives
- IT executives
Develop goals and align them with specific objectives to set the framework for your data quality initiatives.
In the context of achieving business vision, mission, goals, and objectives and sustaining differentiators and key drivers, think about where and how data quality is a barrier. Then brainstorm data quality improvement objectives that map to these barriers. Document your list of objectives in Tab 5. Prioritize business units of the Data Quality Practice Assessment and Project Planning Tool.
Establishing Business Context Example Healthcare Industry |
|
|---|---|
| Vision | To improve member services and make service provider experience more effective through improving data quality and data collection, aggregation, and accessibility for all the members. |
| Goals | Establish meaningful metrics that guide to the improvement of healthcare for member effectiveness of health care providers:
|
| Differentiator | Connect service consumers with service providers, that comply with established regulations by delivering data that is accurate, trusted, timely, and easy to understand to connect service providers and eliminate bureaucracy and save money and time. |
| Key Driver | Seamlessly provide a healthcare for members. |
Document the identified business units and their associated data
30 minutes
Input
- Business units
Output
- Documented business units to begin prioritization
Materials
- Data Quality Practice Assessment and Project Planning Tool
Participants
- Project Manager
Instructions
- Using Tab 5: Prioritize Business Units of the Data Quality Practice Assessment and Project Planning Tool, document the business units that use data in the organization. This will likely be all business units in the organization.
- Next, document the primary data used by those business units.
- These inputs will then be used to assess business unit priority to generate a data quality improvement project roadmap.
Reminder – Not every business unit requires the same standard of data quality
To prioritize your business units for data quality improvement projects, you must analyze the relative importance of the data they use to the business. The more important the data is to the business, the higher the priority is of fixing that data. There are two measures for determining the importance of data: business value and business impact.
Business Value of Data
Business value of data can be evaluated by thinking about its ties to revenue generation for the organization, as well as how it is used for productivity and operations at the organization.
The business value of data is assessed by asking what would happen to the following parameters if the data is not usable (due to poor quality, for example):
- Loss of Revenue
- Loss of Productivity
- Increased Operating Costs
Business Impact of Data
Business impact of data should take into account the effects of poor data on both internal and external parties.
The business impact of data is assessed by asking what the impact would be of bad data on the following parameters:
- Impact on Customers
- Impact on Internal Staff
- Impact on Business Partners
Value + Impact = Data Priority Score
Assess the business unit priority order for data quality improvements
2 hours
Input
- Assessment of value and impact of business unit data
Output
- Prioritization list for data quality improvement projects
Materials
- Data Quality Practice Assessment and Project Planning Tool
Participants
- Project Manager
- Data owners
Instructions
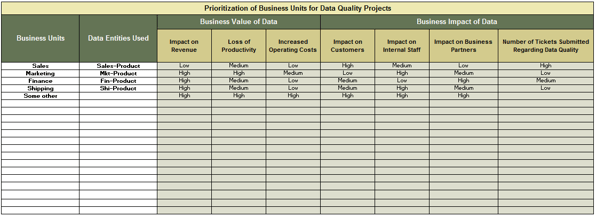
Instructions In Tab 5: Prioritize Business Units of the Data Quality Practice Assessment and Project Planning Tool, assess business value and business impact of the data within each documented business unit.
Use the ratings High, Medium, and Low to measure the financial, productivity, and efficiency value and impact of each business unit’s data.
In addition to these ratings, assess the number of help desk tickets that are submitted to IT regarding data quality issues. This parameter is an indicator that the business unit’s data is high priority for data quality fixes.
Create a business unit order roadmap for your data quality improvement projects
1 hour
Input
- Rating of importance of data for each business unit
Output
- Roadmap for data quality improvement projects
Materials
- Data Quality Practice Assessment and Project Planning Tool
Participants
- Project Manager
- Product Manager
- Business line representatives
Instructions
After assessing the business units for the business value and business impact of their data, the Data Quality Practice Assessment and Project Planning Tool automatically assesses the prioritization of the business units based on your ratings. These prioritizations are then summarized in a roadmap on Tab 6: Data Quality Project Roadmap. The following is an example of a project roadmap:
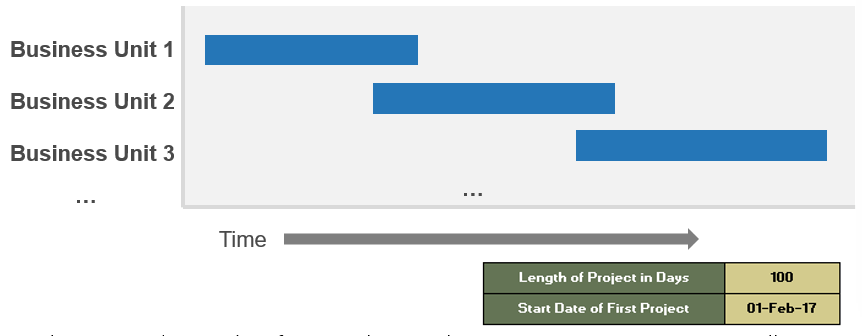
On Tab 6, insert the timeline for your data quality improvement projects, as well as the starting date of your first data quality project. The roadmap will automatically update with the chosen timing and dates.
Identify metrics at the business unit level to track data quality improvements
As you improve the data quality for specific business units, measuring the benefits of data quality improvements will help you demonstrate the value of the projects to the business.
Use the following table to guide you in creating business-aligned metrics:
| Business Unit | Driver | Metrics | Goal |
|---|---|---|---|
| Sales | Customer Intimacy | Accuracy of customer data. Percent of missing or incomplete records. | 10% decrease in customer record errors. |
Marketing |
Customer Intimacy | Accuracy of customer data. Percent of missing or incomplete records. | 10% decrease in customer record errors. |
| Finance | Operational Excellence | Relevance of financial reports. | Decrease in report inaccuracy complaints. |
| HR | Risk Management | Accuracy of employee data. | 10% decrease in employee record errors. |
| Shipping | Operational Excellence | Timeliness of invoice data. | 10% decrease in time to report. |
Info-Tech Insight
Relating data governance success metrics to overall business benefits keeps executive management and executive sponsors engaged because they are seeing actionable results. Review metrics on an ongoing basis with those data owners/stewards who are accountable, the data governance steering committee, and the executive sponsors.
Case Study
Address data quality with the right approach to maximize the ROI
EDC
Industry: Government
Source: Environment Development of Canada (EDC)
Challenge
Environment Development Canada (EDC) would initially identify data elements that are important to the business purely based on their business instinct.
Leadership attempted to tackle the enterprise’s data issues by bringing a set of different tools into the organization.
It didn’t work out because the fundamental foundational layer, which is the data and infrastructure, was not right – they didn't have the foundational capabilities to enable those tools.
Solution
Leadership listened to the need for one single team to be responsible for the data persistence.
Therefore, the data platform team was granted that mandate to extensively execute the data quality program across the enterprise.
A data quality team was formed under the Data & Analytics COE. They had the mandate to profile the data and to understand what quality of data needed to be achieved. They worked constantly with the business to build the data quality rules.
Results
EDC tackled the source of their data quality issues through initially performing a data quality management assessment with business stakeholders.
From then on, EDC was able to establish their data quality program and carry out other key initiatives that prove the ROI on data quality.
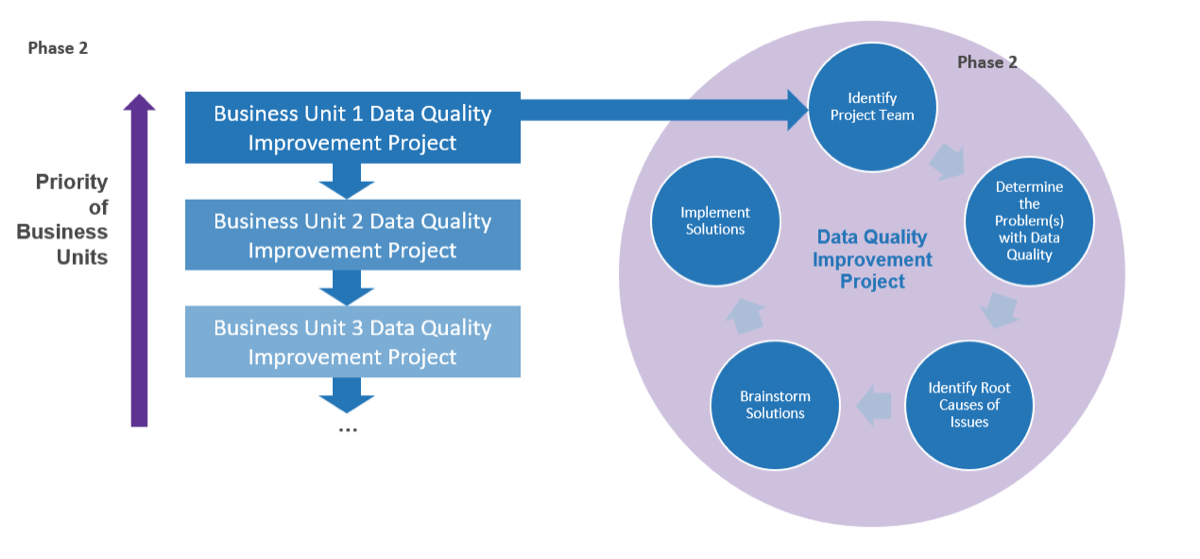
Begin your data quality improvement project starting with the highest priority business unit
Now that you have a prioritized list for your data quality improvement projects, identify the highest priority business unit. This is the business unit you will work through Phase 3 with to fix their data quality issues.
Once you have initiated and identified solutions for the first business unit, tackle data quality for the next business unit in the prioritized list.
Create and document your data quality improvement team
1 hour
Input
- Individuals who fit the data quality improvement plan team roles
Output
- Project team
Materials
- Data Quality Improvement Plan Template
Participants
- Data owner
- Project Manager
- Product Manager
The Data Quality Improvement Plan is a concise document that should be created for each data quality project (i.e. for each business unit) to keep track of the project.
Instructions
- Meet with the data owner of the business unit identified for the data quality improvement project.
- Identify individuals who fit the data quality improvement plan team roles.
- Using the Data Quality Improvement Plan Template to document the roles and individuals who will fit those roles.
- Have an introductory meeting with the Improvement team to clarify roles and responsibilities for the project.
| Team role | Assigned to |
|---|---|
| Data Owner | [Name] |
| Project Manager | [Name] |
| Business Analyst/BRM | [Name] |
| Data Steward | [Name] |
| Data Analyst | [Name] |
Document the business context of the Data Quality Improvement Plan
1 hour
Input
- Project team
- Identified data attributes
Output
- Business context for the data quality improvement plan
Materials
- Data Quality Improvement Plan Template
Participants
- Data owner
- Project Sponsor
- Product owner
Data quality initiatives have to be relevant to the business, and the business context will be used to provide inputs to the data improvement strategy. The context can then be used to determine exactly where the root causes of data quality issues are, which will inform your solutions.
Instructions
The business context of the data quality improvement plan includes documenting from previous activities:
- The Data Quality Improvement Team.
- Your Data Lineage Diagram.
- Your Data Quality Problem Statement.
Info-Tech Best Practice
While many organizations adopt data quality principles, not all organizations express them along the same terms. Have multiple perspectives within your organization outline principles that fit your unique data quality agenda. Anyone interested in resolving the day-to-day data quality issues that they face can be helpful for creating the context around the project.
Now that you have a defined problem, revisit the root causes of poor data quality
You previously fleshed out the problem with data quality present in the business unit chosen as highest priority. Now it is time to figure out what is causing those problems.
In the table below, you will find some of the common categories of causes of data quality issues, as well as some specific root causes.
| Category | Description |
|---|---|
| 1. System/Application Design | Ineffective, insufficient, or even incorrect system/application design accepts incorrect and missing data elements to the source applications and databases. The data records in those source systems may propagate into systems in tiers 2, 3, 4, and 5 of the 5-tier architecture, creating domino and ripple effects. |
| 2. Database design | Database is created and modeled in an incorrect manner so that the management of the data records is incorrect, resulting in duplicated and orphaned records, and records that are missing data elements or records that contain incorrect data elements. Poor operational data in databases often leads to issues in tiers 2, 3, 4, and 5. |
| 3. Enterprise Integration | Data or information is improperly integrated, transformed, masked, and aggregated in tier 2. In addition, some data integration tasks might not be timely, resulting in out-of-date data or even data that contradicts with other data. Enterprise integration is a precursor of loading a data warehouse and data marts. Issues in this layer affect tier 3, 4 and 5 on the 5-tier architecture. |
| 4. Policies and Procedures | Policies and procedures are not effectively used to reinforce data quality. In some situations, policy gaps are found. In others, policies are overlapped and duplicated. Policies may also be out-of-date or too complex, affecting the users’ ability to interpret the policy objectives. Policies affect all tiers in the 5-tier architecture. |
| 5. Business Processes | Improper business process design introduces poor data into the data systems. Failure to create processes around approving data changes, failure to document key data elements, and failure to train employees on the proper uses of data make data quality a burning problem. |
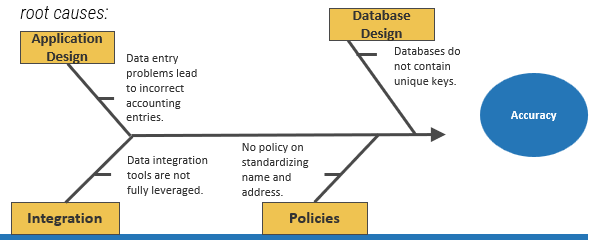
Leverage a root cause analysis approach to pinpoint the origins of your data issues
A root cause analysis is a systematic approach to decompose a problem into its components. Use fishbone diagrams to help reveal the root causes of data issues.
Info-Tech recommends five root cause categories for assessing data quality issues:
Application Design. Is the issue caused by human error at the application level? Consider internal employees, external partners/suppliers, and customers.
Database Design. Is the issue caused by a particular database and stems from inadequacies in its design?
Integration. Data integration tools may not be fully leveraged, or data matching rules may be poorly designed.
Policies and Procedures. Do the issues take place because of lack of governance?
Business Processes. Do the issues take place due to insufficient processes?
For Example:
When performing a deeper analysis of your data issues related to the accuracy of the business unit’s data, you would perform a root cause analysis by assessing the contribution of each of the five categories of data quality problem root causes:
Leverage a combination of data analysis techniques to identify and quantify root causes
Info-Tech Insight
Including all attributes of the key subject area in your data profiling activities may produce too much information to make sense of. Conduct data profiling primarily at the table level and undergo attribute profiling only if you are able to narrow down your scope sufficiently.
Data Profiling Tool
Data profiling extracts a sample of the target data set and runs it through multiple levels of analysis. The end result is a detailed report of statistics about a variety of data quality criteria (duplicate data, incomplete data, stale data, etc.).
Many data profiling tools have built-in templates and reports to help you uncover data issues. In addition, they quantify the occurrences of the data issues.
E-Discovery Tool
This supplements a profiling tool. For Example, use a BI tool to create a custom grouping of all the invalid states (e.g. “CAL,” “AZN,” etc.) and visualize the percentage of invalid states compared to all states.
SQL Queries
This supplements a profiling tool. For example, use a SQL statement to group the customer data by customer segment and then by state to identify which segment–state combinations contain poor data.
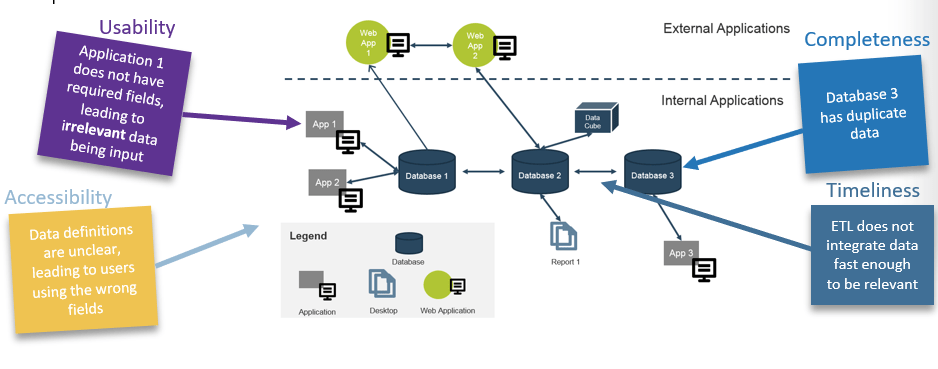
Identify the data issues for the particular business unit under consideration
2 hours
Input
- Issues with data quality felt by the business unit
- Data lineage diagram
Output
- Categorized data quality issues
Materials
- Whiteboard, markers, sticky notes
- Data Quality Improvement Plan Template
Participants
- Data quality improvement project team
- Business line representatives
Instructions
- Gather the data quality improvement project team in a room, along with sticky notes and a whiteboard.
- Display your previously created data lineage diagram on the whiteboard.
- Using color-coded sticky notes, attach issues to each component of the data lineage diagram that team members can identify. Use different colors for the four quality attributes: Completeness, Usability, Timeliness, and Accessibility.
Example:
Map the data issues on fishbone diagrams to identify root causes
1 hour
Input
- Categorized data quality issues
Output
- Completed fishbone diagrams
Materials
- Whiteboard, markers, sticky notes
- Data Quality Improvement Plan Template
Participants
- Data quality improvement project team
Now that you have data quality issues classified according to the data quality attributes, map these issues onto four fishbone diagrams.
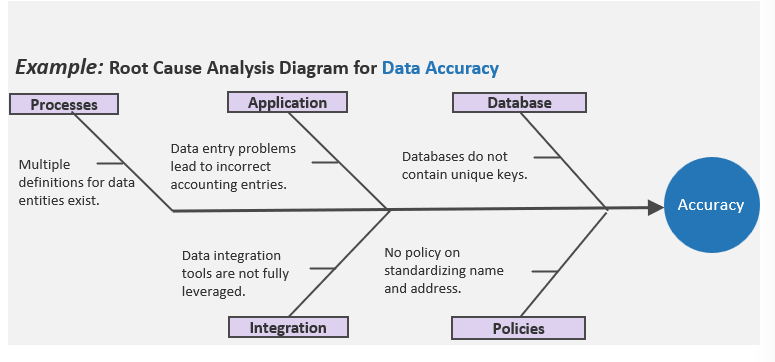
Get to know the root causes behind system/application design mistakes
Suboptimal system/application design provides entry points for bad data.
| Business Process | |||||
|---|---|---|---|---|---|
| Usually found in → | Tier 1 | Tier 2 | Tier 3 | Tier 4 | Tier 5 |
| Issue | Root Causes | Usability | Completeness | Timeliness | Accessibility |
|---|---|---|---|---|---|
| Insufficient data mask | No data mask is defined for a free-form text field in a user interface. E.g. North American phone number should have 4 masks – country code (1-digit), area code (3-digit), and local number (7-digit). | X | X | ||
| Too many free-form text fields | Incorrect use of free-form text fields (fields that accept a variety of inputs). E.g. Use a free-form text field for zip code instead of a backend look up. | X | X | ||
| Lack of value lookup | Reference data is not looked up from a reference list. E.g. State abbreviation is entered instead of being looked up from a standard list of states. | X | X | ||
| Lack of mandatory field definitions | Mandatory fields are not identified and reinforced. Resulting data records with many missing data elements. E.g. Some users may fill up 2 or 3 fields in a UI that has 20 non-mandatory fields. | X |
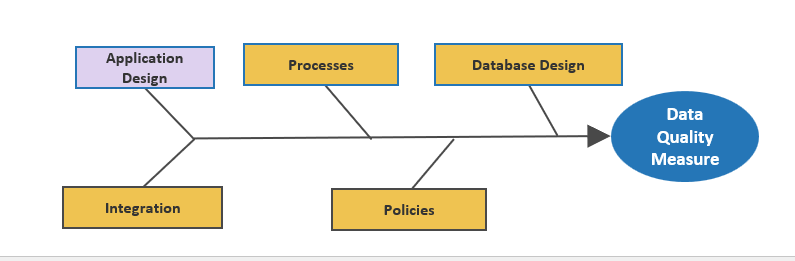
Get to know the root causes behind common database design mistakes
Improper database design allows incorrect data to be stored and propagated.
| Business Process | |||||
|---|---|---|---|---|---|
| Usually found in → | Tier 1 | Tier 2 | Tier 3 | Tier 4 | Tier 5 |
| Issue | Root Causes | Usability | Completeness | Timeliness | Accessibility |
|---|---|---|---|---|---|
| Incorrect referential integrity | Referential integrity constraints are absent or incorrectly implemented, resulting in child records without parent records, or related records are updated or deleted in a cascading manner. E.g. An invoice line item is created before an invoice is created. | X | X | ||
| Lack of unique keys | Lack of unique keys creating scenarios where record uniqueness cannot be guaranteed. E.g. Customer records with the same customer_ID. | X | X | ||
| Data range | Fail to define a data range for incoming data, resulting in data values that are out of range. E.g. The age field is able to store an age of 999. | X | X | ||
| Incorrect data type | Incorrect data types are used to store data fields. E.g. A string field is used to store zip codes. Some users use that to store phone numbers, birthdays, etc. | X | X |
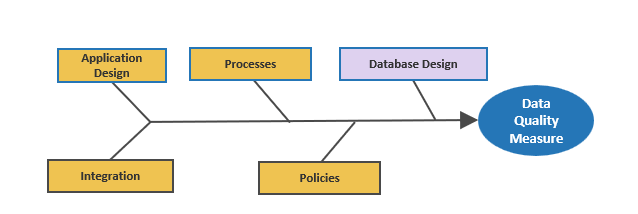
Get to know the root causes behind enterprise integration mistakes
Improper data integration or synchronization may create poor analytical data.
| Business Process | |||||
|---|---|---|---|---|---|
| Usually found in → | Tier 1 | Tier 2 | Tier 3 | Tier 4 | Tier 5 |
| Issue | Root Causes | Usability | Completeness | Timeliness | Accessibility |
|---|---|---|---|---|---|
| Incorrect transformation | Transformation is done incorrectly. A wrong formula may have been used, transformation is done at the wrong data granularity, or aggregation logic is incorrect. E.g. Aggregation is done for all customers instead of just active customers. | X | X | ||
| Data refresh is out of sync | Data is synchronized at different intervals, resulting in a data warehouse where data domains are out of sync. E.g. Customer transactions are refreshed to reflect the latest activities but the account balance is not yet refreshed. | X | X | ||
| Data is matched incorrectly | Fail to match records from disparate systems, resulting in duplications and unmatched records. E.g. Unable to match customers from different systems because they have different cust_ID. | X | X | ||
| Incorrect data mapping | Fields from source systems are not properly matched with data warehouse fields. E.g. Status fields from different systems are mixed into one field. | X | X |
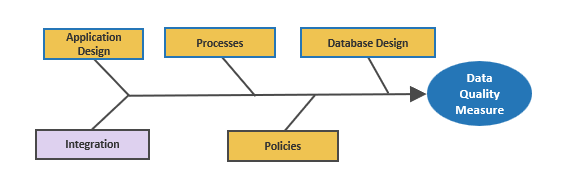
Get to know the root causes behind policy and procedure mistakes
Suboptimal policies and procedures undermine the effect of best practices.
| Business Process | |||||
|---|---|---|---|---|---|
| Usually found in → | Tier 1 | Tier 2 | Tier 3 | Tier 4 | Tier 5 |
| Issue | Root Causes | Usability | Completeness | Timeliness | Accessibility |
|---|---|---|---|---|---|
| Policy Gaps | There are gaps in the policy landscape in terms of some missing key policies or policies that are not refreshed to reflect the latest changes. E.g. A data entry policy is absent, leading to inconsistent data entry practices. | X | X | ||
| Policy Communications | Policies are in place but the policies are not communicated effectively to the organization, resulting in misinterpretation of policies and under-enforcement of policies. E.g. The data standard is created but very few developers are aware of its existence. | X | X | ||
| Policy Enforcement | Policies are in place but not proactively re-enforced and that leads to inconsistent application of policies and policy adoption. E.g. Policy adoption is dropping over time due to lack of reinforcement. | X | X | ||
| Policy Quality | Policies are written by untrained authors and they do not communicate the messages. E.g. A non-technical data user may find a policy that is loaded with technical terms confusing. | X | X |
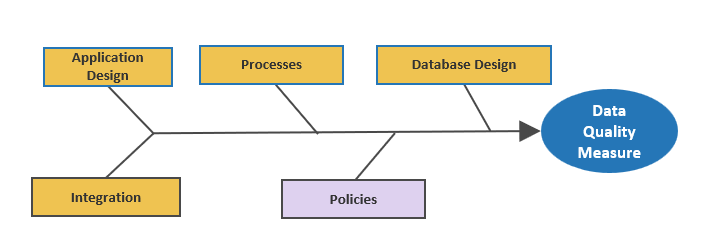
Get to know the root causes behind common business process mistakes
Ineffective and inefficient business processes create entry points for poor data.
| Business Process | |||||
|---|---|---|---|---|---|
| Usually found in → | Tier 1 | Tier 2 | Tier 3 | Tier 4 | Tier 5 |
| Issue | Root Causes | Usability | Completeness | Timeliness | Accessibility |
|---|---|---|---|---|---|
| Lack of training | Key data personnel and business analysts are not trained in data quality and data governance, leading to lack of accountability. E.g. A data steward is not aware of downstream impact of a duplicated financial statement. | X | X | ||
| Ineffective business process | The same piece of information is entered into data systems two or more times. Or a piece of data is stalled in a data system for too long. E.g. A paper form is scanned multiple times to extract data into different data systems. | X | X | ||
| Lack of documentation | Fail to document the work flows of the key business processes. A lack of work flow results in sub-optimal use of data. E.g. Data is modeled incorrectly due to undocumented business logic. | X | X | ||
| Lack of integration between business silos | Business silos hold on to their own datasets resulting in data silos in which data is not shared and/or data is transferred with errors. E.g. Data from a unit is extracted as a data file and stored in a shared drive with little access. | X | X |
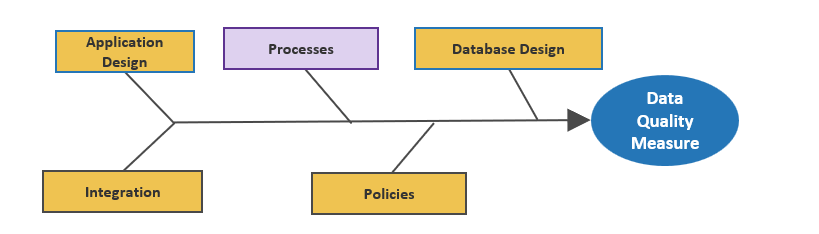
Phase 3 Summary
- Data Lineage Diagram
- Creating the data lineage diagram is recommended to help visualize the flow of your data and to map the data journey and identify the data subject areas to be targeted for fixes.
- The data lineage diagram was leveraged multiple times throughout this Phase. For example, the data lineage diagram was used to document the data sources and applications used by the business unit
- Business context was documented through the Data Quality Practice Assessment and Project Planning Tool.
- The same tool was used to document identified business units and their associated data.
- Metrics were also identified at the business unit level to track data quality improvements.
- Leverage a root cause analysis approach to pinpoint the origins of your data quality issues.
- Analyzed and got to know the root causes behind the following:
- System/application design mistakes
- Common database design mistakes
- Enterprise integration mistakes
- Policies and procedures mistakes
- Common business processes mistakes
Phase 4
Grow and Sustain Your Data Quality Program
Build Your Data Quality Program
For the identified root causes, determine the solutions for the problem
As you worked through the previous step, you identified the root causes of your data quality problems within the business unit. Now, it is time to identify solutions.
The following slides provide an overview of the solutions to common data quality issues. As you identify solutions that apply to the business unit being addressed, insert the solution tables in Section 4: Proposed Solutions of the Data Quality Improvement Plan Template.
All data quality solutions have two components to them:
- Technology
- People
For the next five data quality solution slides, look for the slider for the contributions of each category to the solution. Use this scale to guide you in creating solutions.
When designing solutions, keep in mind that solutions to data quality problems are not mutually exclusive. In other words, an identified root cause may have multiple solutions that apply to it.
For example, if an application is plagued with inaccurate data, the application design may be suboptimal, but also the process that leads to data being entered may need fixing.
Data quality improvement strategy #1:
Fix data quality issues by improving system/application design.
Technology
Application Interface Design
Restrict field length – Capture only the characters you need for your application.
Leverage data masks – Use data masks in standardized fields like zip code and phone number.
Restrict the use of open text fields and use reference tables – Only present open text fields when there is a need. Use reference tables to limit data values.
Provide options – Use radio buttons, drop-down lists, and multi-select instead of using open text fields.
Data Validation at the Application Level
Validate data before committing – Use simple validation to ensure the data entered is not random numbers and letters.
Track history – Keep track of who entered what fields.
Cannot submit twice – Only design for one-time submission.
People
Training
Data-entry training – Training that is related to data entry, creating, or updating data records.
Data resolution training – Training data stewards or other dedicated data personnel on how to resolve data records that are not entered properly.
Continuous Improvement
Standards – Develop application design principles and standards.
Field testing – Field data entry with a few people to look for abnormalities and discrepancies.
Detection and resolution – Abnormal data records should be isolated and resolved ASAP.
Application Testing
Thorough testing – Application design is your first line of defence against poor data. Test to ensure bad data is kept out of the systems.
Case Study
HMS
Industry: Healthcare
Source: Informatica
Improve your data quality ingestion procedures to provide better customer intimacy for your users
Healthcare Management Systems (HMS) provides cost containment services for healthcare sponsors and payers, and coordinates benefits services. This is to ensure that healthcare claims are paid correctly to both government agencies and individuals. To do so, HMS relies on data, and this data needs to be of high quality to ensure the correct decisions are made, the right people get the correct claims, and the appropriate parties pay out.
To improve the integrity of HMS’s customer data, HMS put in place a framework that helped to standardize the collection of high volume and highly variable data.
Results
Working with a data quality platform vendor to establish a framework for data standardization, HMS was able to streamline data analysis and reduce new customer implementations from months to weeks.
HMS data was plagued with a lack of standardization of data ingestion procedures.
| Before improving data quality processes | After improving data quality processes |
| Data Ingestion | Data Ingestion |
| Many standards of ingestion. | Standardized data ingestion |
| Data Storage | Data Storage |
| Lack of ability to match data, creating data quality errors. | |
| Data Analysis | Data Analysis |
| = | = |
| Slow Customer Implementation Time | 50% Reduction in Customer Implementation Time |
Data quality improvement strategy #2:
Fix data quality issues using proper database design.
Technology
Database Design Best Practices
Referential integrity – Ensure parent/child relationships are maintained in terms of cascade creation, update, and deletion.
Primary key definition – Ensure there is at least one key to guarantee the uniqueness of the data records, and primary key should not allow null.
Validate data domain – Create triggers to check the data values entered in the database fields.
Field type and length – Define the most suitable data type and length to hold field values.
One-Time Data Fix (more on the next slide)
Explore solutions – Where to fix the data issues? Is there a case to fix the issues?
Running profiling tools to catch errors – Run scans on the database with defined criteria to identify occurrences of questionable data.
Fix a sample before fixing all records – Use a proof-of-concept approach to explore fix options and evaluate impacts before fixing the full set.
People
The DBA Team
Perform key tasks in pairs – Take a pair approach to perform key tasks so that validation and cross-check can happen.
Skilled DBAs – DBAs should be certified and accredited.
Competence – Assess DBA competency on an ongoing basis.
Preparedness – Develop drills to stimulate data issues and train DBAs.
Cross train – Cross train team members so that one DBA can cover another DBA.
Data quality improvement strategy #3:
Improve integration and synchronization of enterprise data.
Technology
Integration Architecture
Info-Tech’s 5-Tier Architecture – When doing transformations, it is good practice to persist the integration results in tier 3 before the data is further refined and presented in tier 4.
Timing, timing, and timing – Think of the sequence of events. You may need to perform some ETL tasks before other tasks to achieve synchronization and consistence.
Historical changes – Ensure your tier 3 is robust enough to include historical data. You need to enable type 2 slowly, changing dimension to recreate the data at a point in time.
Data Cleansing
Standardize – Leverage data standardization to standardize name and address fields to improve matching and integration.
Fuzzy matching – When there are no common keys between datasets. The datasets can only be matched by fuzzy matching. Fuzzy matching is not hard science; define a confidence level and think about a mechanism to deal with the unmatched.
People
Reporting and Documentations
Business data glossary and data lineage – Define a business data glossary to enhance findability of key data elements. Document data mappings and ETL logics.
Create data quality reports – Many ETL platforms provide canned data quality reports. Leverage those quality reports to monitor the data health.
Code Review
Create data quality reports – Many ETL platforms provide canned data quality reports. Leverage those quality reports to monitor the data health.
ARB (architectural review board) – All ETL codes should be approved by the architectural review board to ensure alignment with the overall integration strategy.
Data quality improvement strategy #4:
Improve data quality policies and procedures.
Technology
Policy Reporting
Data quality reports – Leverage canned data quality reports from the ETL platforms to monitor data quality on an on-going basis. When abnormalities are found, provoke the right policies to deal with the issues.
Store policies in a central location that is well known and easy to find and access. A key way that technology can help communicate policies is by having them published on a centralized website.
Make the repository searchable and easily navigable. myPolicies helps you do all this and more.
myPolicies helps you do all this and more.
People
Policy Review and Training
Policy review – Create a schedule for reviewing policies on a regular basis – invite professional writers to ensure polices are understandable.
Policy training – Policies are often unread and misread. Training users and stakeholders on policies is an effective way to make sure those users and stakeholders understand the rationale of the policies. It is also a good practice to include a few scenarios that are handled by the policies.
Policy hotline/mailbox – To avoid misinterpretation of the policies, a policy hotline/mailbox should be set up to answer any data policy questions from the end users/stakeholders.
Policy Communications
Simplified communications – Create handy one-pagers and infographic posters to communicate the key messages of the polices.
Policy briefing – Whenever a new data project is initiated, a briefing of data policies should be given to ensure the project team follows the policies from the very beginning.
Data quality improvement strategy #5:
Streamline and optimize business processes.
Technology
Requirements Gathering
Data Lineage – Leverage a metadata management tool to construct and document data lineage for future reference.
Documentations Repository – It is a best practice to document key project information and share that knowledge across the project team and with the stakeholder. An improvement understanding of the project helps to identify data quality issues early on in the project.
“Automating creation of data would help data quality most. You have to look at existing processes and create data signatures. You can then derive data off those data codes.” – Patrick Bossey, Manager of Business Intelligence, Crawford and Company
People
Requirements Gathering
Info-Tech’s 4-Column Model – The datasets may exist but the business units do not have an effective way of communicating the quality needs. Use our four-column model and the eleven supporting questions to better understand the quality needs. See subsequent slides.
I don’t know what the data means so I think the quality is poor – It is not uncommon to see that the right data presented to the business but the business does not trust the data. They also do not understand the business logic done on the data. See our Business Data Glossary in subsequent slides.
Understand the business workflow – Know the business workflow to understand the manual steps associated with the workflow. You may find steps in which data is entered, manipulated, or consumed inappropriately.
“Do a shadow data exercise where you identify the human workflows of how data gets entered, and then you can identify where data entry can be automated.” – Diraj Goel, Growth Advisor, BC Tech
Brainstorm solutions to your data quality issues
4 hours
Input
- Data profiling results
- Preliminary root cause analyses
Output
- Proposals for data fix
- Fixed issues
Materials
- Data Quality Improvement Plan Template
Participants
- Business and Data Analysts
- Data experts and stewards
After walking through the best-practice solutions to data quality issues, propose solutions to fix your identified issues.
Instructions
- Review Root Cause Analyses: Revisit the root cause analysis and data lineage diagram you have generated in Step 3.2. to understand the issues in greater details.
- Characterize Each Issue: You may need to generate a data profiling report to characterize the issue. The report can be generated by using data quality suites, BI platforms, or even SQL statements.
- Brainstorm the Solutions: As a group, discuss potential ways to fix the issue. You can tackle the issues by approaching from these areas:
| Solution Approaches |
|---|
| Technology Approach |
| People Approach |
X crossover with
| Problematic Areas |
|---|
| Application/System Design |
| Database Design |
| Data Integration and Synchronization |
| Policies and Procedures |
| Business Processes |
- Document and Communicate: Document the solutions to your data issues. You may need to reuse or refer to the solutions. Also brainstorm some ideas on how to communicate the results back to the business.
Sustaining your data quality requires continuous oversight through a data governance practice
Quality data is the ultimate outcome of data governance and data quality management. Data governance enables data quality by providing the necessary oversight and controls for business processes in order to maintain data quality. There are three primary groups (at right) that are involved in a mature governance practice. Data quality should be tightly integrated with all of them.
Define an effective data governance strategy and ensure the strategy integrates well with data quality with Info-Tech’s Establish Data Governance blueprint.
Data Governance Council
This council establishes data management practices that span across the organization. This should be comprised of senior management or C-suite executives that can represent the various departments and lines of business within the organization. The data governance council can help to promote the value of data governance, facilitate a culture that nurtures data quality, and ensure that the goals of the data governance program are well aligned with business objectives.
Data Owners
Identifying the data owner role within an organization helps to create a greater degree of accountability for data issues. They often oversee how the data is being generated as well as how it is being consumed. Data owners come from the business side and have legal rights and defined control over a data set. They ensure data is available to the right people within the organization.
Data Stewards
Conflict can occur within an organization’s data governance program when a data steward’s role is confused with that of the steering committee’s role. Data stewards exist to enforce decisions made about data governance and data management. Data stewards are often business analysts or power users of a particular system/dataset. Where a data owner is primarily responsible for access, a data steward is responsible for the quality of a dataset.
Integrate the data quality management strategy with existing data governance committees
Ongoing and regular data quality management is the responsibility of the data governance bodies of the organization.
The oversight of ongoing data quality activities rests on the shoulders of the data governance committees that exist in the organization.
There is no one-size-fits-all data governance structure. However, most organizations follow a similar pattern when establishing committees, councils, and cross-functional groups. They strive to identify roles and responsibilities at a strategic, tactical, and operational level:
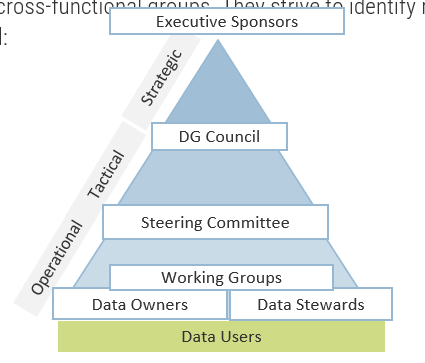
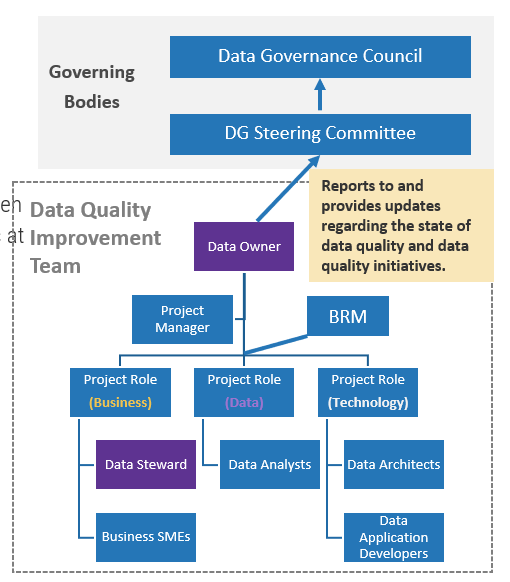
Create and update the organization’s Business Data Glossary to keep up with current data definitions
2 hours
Input
- Metrics and goals for data quality
Output
- Regularly scheduled data quality checkups
Materials
- Business Data Glossary Template
- Data Quality Dashboard
Participants
- Data steward
A crucial aspect of data quality and governance is the Business Data Glossary. The Business Data Glossary helps to align the terminology of the business with the organization’s data assets. It allows the people who interact with the data to quickly identify the applications, processes, and stewardship associated with it, which will enhance the accuracy and efficiency of searches for organization data definitions and attributes, enabling better access to the data. This will, in turn, enhance the quality of the organization’s data because it will be more accurate, relevant, and accessible.
Use the Business Data Glossary Template to document key aspects of the data, such as:
- Definition
- Source System
- Possible Values
- Data Steward
- Data Sensitivity
- Data Availability
- Batch or Live
- Retention
Data Element
- Mkt-Product
- Fin-Product
Info-Tech Insight
The Business Data Glossary ensures that the crucial data that has key business use by key business systems and users is appropriately owned and defined. It also establishes rules that lead to proper data management and quality to be enforced by the data owners.
Data Steward(s): Use the Data Quality Improvement Plan of the business unit for ongoing quality monitoring
Integrating your data quality strategy into the organization’s data governance program requires passing the strategy over to members of the data governance program. The data steward role is responsible for data quality at the business unit level, and should have been involved with the creation and implementation of the data quality improvement project. After the data quality repairs have been made, it is the responsibility of the data steward to regularly monitor the quality of the business unit’s data.
| Create Improvement Plan ↓ |
|
| Implement Improvement Plan ↓ |
|
| Sustain Improvement Plan |
|
See Info-Tech’s Data Steward Job Description Template for a detailed understanding of the roles and responsibilities of the data steward.
Responsible for sustaining
Develop a business-facing data quality dashboard to show improvements or a sudden dip in data quality
One tool that the data steward can take advantage of is the data quality dashboard. Initiatives that are implemented to address data quality must have metrics defined by business objectives in order to demonstrate the value of the data quality improvement projects. In addition, the data steward should have tools for tracking data quality in the business unit to report issues to the data owner and data governance steering committee.
- Example 1: Marketing uses data for direct mail and e-marketing campaigns. They care about customer data in particular. Specifically, they require high data quality in attributes such as customer name, address, and product profile.
- Example 2: Alternatively, Finance places emphasis on financial data, focusing on attributes like account balance, latency in payment, credit score, and billing date.
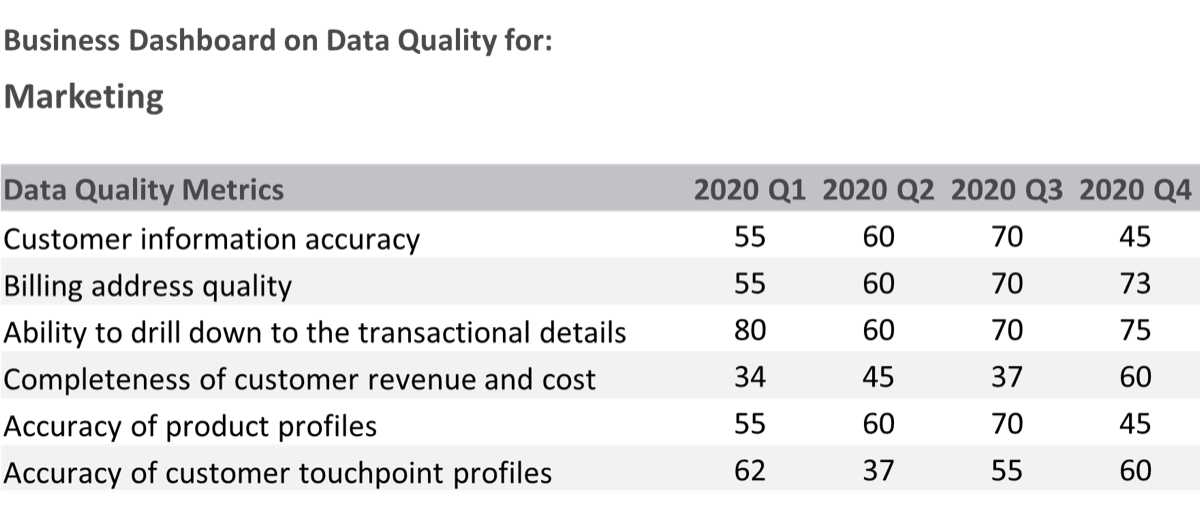
Notes on chart:
General improvement in billing address quality
Sudden drop in touchpoint accuracy may prompt business to ask for explanations
Approach to creating a business-facing data quality dashboard:
- Schedule a meeting with the functional unit to discuss what key data quality metrics are essential to their business operations. You should consider the business context, functional area, and subject area analyses you completed in Phase 1 as a starting point.
- Discuss how to gather data for the key metrics and their associated calculations.
- Discuss and decide the reporting intervals.
- Discuss and decide the unit of measurement.
- Generate a dashboard similar to the example. Consider using a BI or analytics tool to develop the dashboard.
Data quality management must be sustained for ongoing improvements to the organization’s data
- Data quality is never truly complete; it is a set of ongoing processes and disciplines that requires a permanent plan for monitoring practices, reviewing processes, and maintaining consistent data standards.
- Setting the expectation to stakeholders that a long-term commitment is required to maintain quality data within the organization is critical to the success of the program.
- A data quality maintenance program will continually revise and fine-tune ongoing practices, processes, and procedures employed for organizational data management.
Data quality is a program that requires continual care:
→Maintain→Good Data →
Data quality management is a long-term commitment that shifts how an organization views, manages, and utilizes its corporate data assets. Long-term buy-in from all involved is critical.
“Data quality is a process. We are trying to constantly improve the quality over time. It is not a one-time fix.” – Akin Akinwumi, Manager of Data Governance, Startech.com
Define a data quality review agenda for data quality sustainment
2 hours
Input
- Metrics and goals for data quality
Output
- Regularly scheduled data quality checkups
Materials
- Data Quality Diagnostic
- Data Quality Dashboard
Participants
- Data Steward
As a data steward, you are responsible for ongoing data quality checks of the business unit’s data. Define an improvement agenda to organize the improvement activities. Organize the activities yearly and quarterly to ensure improvement is done year-round.
Quarterly
- Measure data quality metrics against milestones. Perform a regular data quality health check with Info-Tech’s Data Quality Diagnostic.
- Review the business unit’s Business Data Glossary to ensure that it is up to date and comprehensive.
- Assess progress of practice area initiatives (time, milestones, budget, benefits delivered).
- Analyze overall data quality and report progress on key improvement projects and corrective actions in the executive dashboard.
- Communicate overall status of data quality to oversight body.
Annually
- Calculate your current baseline and measure progress by comparing it to previous years.
- Set/revise quality objectives for each practice area and inter-practice hand-off processes.
- Re-evaluate/re-establish data quality objectives.
- Set/review data quality metrics and tracking mechanisms.
- Set data quality review milestones and timelines.
- Revisit data quality training from an end-user perspective and from a practitioner perspective.
Info-Tech Insight
Do data quality diagnostic at the beginning of any improvement plan, then recheck health with the diagnostic at regular intervals to see if symptoms are coming back. This should be a monitoring activity, not a data quality fixing activity. If symptoms are bad enough, repeat the improvement plan process.
Take the next step in your Data & Analytics Journey
After establishing your data quality program, look to increase your data & analytics maturity.
- Artificial Intelligence (AI) is a concept that many organizations strive to implement. AI can really help in areas such as data preparation. However, implementing AI solutions requires a level of maturity that many organizations are not at.
- While a solid data quality foundation is essential for AI initiatives being successful, AI can also ensure high data quality.
- An AI analytics solution can address data integrity issues at the earliest point of data processing, rapidly transforming these vast volumes of data into trusted business information. This can be done through Anomaly detection, which flags “bad” data, identifying suspicious anomalies that can impact data quality. By tracking and evaluating data, anomaly detection gives critical insights into data quality as data is processed. (Ira Cohen, The End to a Never-Ending Story? Improve Data Quality with AI Analytics, anodot, 2020)
Consider… “Garbage in, garbage out.”
Lay a solid foundation by addressing your data quality issues prior to investing heavily in an AI solution.
Related Info-Tech Research
- Use AI as a compelling event to expedite funding, resources, and project plans for your data-related initiatives. Check out this note to understand what it takes to be ready to implement AI solutions.
Get Started With Artificial Intelligence
- Current AI technology is data-enabled, automated, adaptive decision support. Once you believe you are ready for AI, check out this blueprint on how to get started.
Build a Data Architecture Roadmap
- The data lineage diagram was a key tool used in establishing your data quality program. Check out this blueprint and learn how to optimize your data architecture to provide greatest value from data.
- Build your target state architecture from predefined best practice building blocks. This blueprint assists members first to assess if they have the maturity to embrace AI in their organization, and if so, which AI acquisition model fits them best.
Phase 4 Summary
- Data Quality Improvement Strategy
- Brainstorm solutions to your data quality issues using the following data quality improvement strategies as a guide:
- Fix data quality issues by improving system/application design
- Fix data quality issues using proper database design
- Improve integration and synchronization of enterprise data
- Improve data quality policies and procedures
- Streamline and optimize business processes
- Quality data is the ultimate outcome of data governance and data quality management.
- Sustaining your data quality requires continuous oversight through a data governance practice.
- There are three primary groups (Data Governance Council, Data Owners, and Data Stewards) that are involved in a mature governance practice.
- After establishing your data quality program, take the next step in increasing your data & analytics maturity.
- Good data quality is the foundation of pursuing different ways of maximizing the value of your data such as implementing AI solutions.
- Continue your data & analytics journey by referring to Info-Tech’s quality research.
Research Contributors and Experts
Izabela Edmunds
Information Architect Mott MacDonald
Akin Akinwumi
Manager of Data Governance Startech.com
Diraj Goel
Growth Advisor BC Tech
Sujay Deb
Director of Data Analytics Technology and Platforms Export Development Canada
Asif Mumtaz
Data & Solution Architect Blue Cross Blue Shield Association
Patrick Bossey
Manager of Business Intelligence Crawford and Company
Anonymous Contributors
Ibrahim Abdel-Kader
Research Specialist Info-Tech Research Group
Ibrahim is a Research Specialist at Info-Tech Research Group. In his career to date he has assisted many clients using his knowledge in process design, knowledge management, SharePoint for ECM, and more. He is expanding his familiarity in many areas such as data and analytics, enterprise architecture, and CIO-related topics.
Reddy Doddipalli
Senior Workshop Director Info-Tech Research Group
Reddy is a Senior Workshop Director at Info-Tech Research Group, focused on data management and specialized analytics applications. He has over 25 years of strong industry experience in IT leading and managing analytics suite of solutions, enterprise data management, enterprise architecture, and artificial intelligence–based complex expert systems.
Andy Neill
Practice Lead, Data & Analytics and Enterprise Architecture Info-Tech Research Group
Andy leads the data and analytics and enterprise architecture practices at ITRG. He has over 15 years of experience in managing technical teams, information architecture, data modeling, and enterprise data strategy. He is an expert in enterprise data architecture, data integration, data standards, data strategy, big data, and development of industry standard data models.
Crystal Singh
Research Director, Data & Analytics Info-Tech Research Group
Crystal is a Research Director at Info-Tech Research Group. She brings a diverse and global perspective to her role, drawing from her professional experiences in various industries and locations. Prior to joining Info-Tech, Crystal led the Enterprise Data Services function at Rogers Communications, one of Canada’s leading telecommunications companies.
Igor Ikonnikov
Research Director, Data & Analytics Info-Tech Research Group
Igor is a Research Director at Info-Tech Research Group. He has extensive experience in strategy formation and execution in the information management domain, including master data management, data governance, knowledge management, enterprise content management, big data, and analytics.
Andrea Malick
Research Director, Data & Analytics Info-Tech Research Group
Andrea Malick is a Research Director at Info-Tech Research Group, focused on building best practices knowledge in the enterprise information management domain, with corporate and consulting leadership in enterprise architecture and content management (ECM).
Natalia Modjeska
Research Director, Data & Analytics Info-Tech Research Group
Natalia Modjeska is a Research Director at Info-Tech Research Group. She advises members on topics related to AI, machine learning, advanced analytics, and data science, including ethics and governance. Natalia has over 15 years of experience in developing, selling, and implementing analytical solutions.
Rajesh Parab
Research Director, Data & Analytics Info-Tech Research Group
Rajesh Parab is a Research Director at Info-Tech Research Group. He has over 20 years of global experience and brings a unique mix of technology and business acumen. He has worked on many data-driven business applications. In his previous architecture roles, Rajesh created a number of product roadmaps, technology strategies, and models.
Bibliography
Amidon, Kirk. "Case Study: How Data Quality Has Evolved at MathWorks." The Fifth MIT Information Quality Industry Symposium. 13 July 2011. Web. 19 Aug. 2015.
Boulton, Clint. “Disconnect between CIOs and LOB managers weakens data quality.” CIO. 05 February 2016. Accessed June 2020.
COBIT 5: Enabling Information. Rolling Meadows, IL: ISACA, 2013. Web.
Cohen, Ira. “The End to a Never-Ending Story? Improve Data Quality with AI Analytics.” anodot. 2020.
“DAMA Guide to the Data Management Body of Knowledge (DAMA-DMBOK Guide).” First Edition. DAMA International. 2009. Digital. April 2014.
"Data Profiling: Underpinning Data Quality Management." Pitney Bowes. Pitney Bowes - Group 1 Software, 2007. Web. 18 Aug. 2015.
Data.com. “Data.com Clean.” Salesforce. 2016. Web. 18 Aug. 2015.
“Dawn of the CDO." Experian Data Quality. 2015. Web. 18 Aug. 2015.
Demirkan, Haluk, and Bulent Dal. "Why Do So Many Analytics Projects Fail?" The Data Economy: Why Do so Many Analytics Projects Fail? Analytics Magazine. July-Aug. 2014. Web.
Dignan, Larry. “CIOs juggling digital transformation pace, bad data, cloud lock-in and business alignment.” ZDNet. 11 March 2020. Accessed July.
Dumbleton, Janani, and Derek Munro. "Global Data Quality Research - Discussion Paper 2015." Experian Data Quality. 2015. Web. 18 Aug. 2015.
Eckerson, Wayne W. "Data Quality and the Bottom Line - Achieving Business Success through a Commitment to High Quality Data." The Data Warehouse Institute. 2002. Web. 18 Aug. 2015.
“Infographic: Data Quality in BI the Costs and Benefits.” HaloBI. 2015 Web.
Lee, Y.W. and Strong, D.M. “Knowing-Why About Data Processes and Data Quality.” Journal of Management Information Systems. 2004.
“Making Data Quality a Way of Life.” Cognizant. 2014. Web. 18 Aug. 2015.
"Merck Serono Achieves Single Source of Truth with Comprehensive RIM Solutions." www.productlifegroup.com. ProductLife Group. 15 Apr. 2015. Web. 23 Nov. 2015.
Myers, Dan. “List of Conformed Dimensions of Data Quality.” Conformed Dimensions of Data Quality (CDDQ). 2019. Web.
Redman, Thomas C. “Make the Case for Better Data Quality.” Harvard Business Review. 24 Aug. 2012. Web. 19 Aug. 2015.
RingLead Data Management Solutions. “10 Stats About Data Quality I Bet You Didn’t Know.” RingLead. Accessed 7 July 2020.
Schwartzrock, Todd. "Chrysler's Data Quality Management Case Study." Online video clip. YouTube. 21 April. 2011. Web. 18 Aug. 2015
“Taking control in the digital age.” Experian Data Quality. Jan 2019. Web.
“The data-driven organization, a transformation in progress.” Experian Data Quality. 2020. Web.
"The Data Quality Benchmark Report." Experian Data Quality. Jan. 2015. Web. 18 Aug. 2015.
“The state of data quality.” Experian Data Quality. Sept. 2013. Web. 17 Aug. 2015.
Vincent, Lanny. “Differentiating Competence, Capability and Capacity.” Innovation Management Services. Web. June 2008.
“7 ways poor data quality is costing your business.” Experian Data Quality. July 2020. Web.