
Analysts do not feel empowered to challenge requirements to deliver a better outcome. This alongside underlying data quality issues prevents the creation of accurate and helpful information. Graphic representations do not provide meaningful and actionable insights.
Our Advice
Critical Insight
As organizations strive to become more data-driven, good storytelling with data visualization supports growing corporate data literacy and helps analysts in providing insights that improves organization's decision-making and value-driving processes, which ultimately boosts business performance.
Impact and Result
Follow a step-by-step guide to address the business bias of tacet experience over data facts and increase audience's understanding and acceptance toward data solutions.
Save the lost hours and remove the challenges of reports and dashboards being disregarded due to ineffective usage.
Gain insights from data-driven recommendations and have decision support to make informed decisions.
Tell Your Story With Data Visualization Research & Tools
Besides the small introduction, subscribers and consulting clients within this management domain have access to:
1. Tell Your Story With Data Visualization Deck – Solve challenging business problems more effectively and improve communication with audiences by demonstrating significant insights through data storytelling with impactful visuals.
Here is our step-by-step process of getting value out of effective storytelling with data visualization:
- Tell Your Story With Data Visualization Storyboard
2. Storytelling Whiteboard Canvas Template – Plan out storytelling using Info-Tech’s whiteboard canvas template.
This storytelling whiteboard canvas is a template that will help you create your visualization story narrative by:
- Storytelling Whiteboard Canvas Template
Further reading
Tell Your Story With Data Visualization
Build trust with your stakeholders.
Analyst Perspective
Build trust with your stakeholders.
Data visualization refers to graphical representations of data which help an audience understand. Without good storytelling, however, these representations can distract an audience with enormous amounts of data or even lead them to incorrect conclusions.
Good storytelling with data visualization involves identifying the business problem, exploring potential drivers, formulating a hypothesis, and creating meaningful narratives and powerful visuals that resonate with all audiences and ultimately lead to clear actionable insights.
Follow Info-Tech's step-by-step approach to address the business bias of tacit experience over data facts, improve analysts' effectiveness and support better decision making.

Ibrahim Abdel-Kader
Research Analyst,
Data, Analytics, and Enterprise Architecture

Nikitha Patel
Research Specialist,
Data, Analytics, and Enterprise Architecture

Ruyi Sun
Research Specialist,
Data, Analytics, and Enterprise Architecture
Our understanding of the problem
This research is designed for
- Business analysts, data analysts, or their equivalent who (in either a centralized or federated operating model) look to solve challenging business problems more effectively and improve communication with audiences by demonstrating significant insights through visual data storytelling.
This research will also assist
- A CIO or business unit (BU) leader looking to improve reporting and analytics, reduce time to information, and embrace decision making.
This research will help you
- Identify the business problem and root causes that you are looking to address for key stakeholders.
- Improve business decision making through effective data storytelling.
- Focus on insight generation rather than report production.
- Apply design thinking principles to support the collection of different perspectives.
This research will help them
- Understand the report quickly and efficiently, regardless of their data literacy level.
- Grasp the current situation of data within the organization.
Executive Summary
| Your Challenge | Common Obstacles | Info-Tech's Approach |
As analysts, you may experience some critical challenges when presenting a data story.
|
Some common roadblocks may prevent you from addressing these challenges.
|
|
Info-Tech Insight
As organizations strive to become more data-driven, good storytelling with data visualization supports growing corporate data literacy and helps analysts provide insights that improve organizational decision-making and value-driving processes, which ultimately boosts business performance.
Glossary
- Data: Facts or figures, especially those stored in a computer, that can be used for calculating, reasoning, or planning. When data is processed, organized, structured, or presented in a given context to make it useful, it is called information. Data leaders are accountable for certain data domains and sets.
- Data storytelling: The ability to create a narrative powered by data and analytics that supports the hypothesis and intent of the story. Narrators of the story should deliver a significant view of the message in a way easily understood by the target audience. Data visualization can be used as a tactic to enhance storytelling.
- Data visualization: The ability to visually represent a complete story to the target audience powered by data & analytics, using data storytelling as an enabling mechanism to convey narratives. Typically, there are two types of visuals used as part of data visualization: explanatory/informative visuals (the entire story or specific aspects delivered to the audience) and exploratory visuals (the collected data used to clarify what questions must be answered).
- Data literacy: The ability to read, work with, analyze, and argue with data. Easy access to data is essential to exercising these skills. All organizational employees involved with data-driven decisions should learn to think critically about the data they use for analytics and how they assess and interpret the results of their work.
- Data quality: A measure of the condition of data based on factors such as accuracy, completeness, consistency, reliability, and being up-to-date. This is about how well-suited a data set is to serve its intended purpose, therefore business users and stakeholders set the standards for what is good enough. The governance function along with IT ensures that data quality measures are applied, and corrective actions taken.
- Analytics/Business intelligence (BI): A technology-driven process for analyzing data and delivering actionable information that helps executives, managers, and workers make informed business decisions. As part of the BI process, organizations collect data from internal IT systems and external sources, prepare it for analysis, run queries against the data, and create data visualizations.
Note: In some frameworks, analytics and BI refer to different types of analyses (i.e. analytics predict future outcomes, BI describes what is or has been).
Getting value out of effective storytelling with data visualization
Data storytelling is gaining wide recognition as a tool for supporting businesses in driving data insights and making better strategic decisions.
92% of respondents agreed that data storytelling is an effective way of communicating or delivering data and analytics results.
87% of respondents agreed that if insights were presented in a simpler/clearer manner, their organization's leadership team would make more data-driven decisions.
93% of respondents agreed that decisions made based on successful data storytelling could potentially help increase revenue.
Source: Exasol, 2021
Despite organizations recognizing the value of data storytelling, issues remain which cannot be remedied solely with better technology.
61% Top challenges of conveying important insights through dashboards are lack of context (61%), over-communication (54%), and inability to customize contents for intended audiences (46%).
49% of respondents feel their organizations lack storytelling skills, regardless of whether employees are data literate.
Source: Exasol, 2021
Info-Tech Insight
Storytelling is a key component of data literacy. Although enterprises are increasingly investing in data analytics software, only 21% of employees are confident with their data literacy skills. (Accenture, 2020)
Prerequisite Checklist
Before applying Info-Tech's storytelling methodology, you should have addressed the following criteria:
- Select the right data visualization tools.
- Have the necessary training in statistical analysis and data visualization technology.
- Have competent levels of data literacy.
- Good quality data founded on data governance and data architecture best practices.
To get a complete view of the field you want to explore, please refer to the following Info-Tech resources:
Select and Implement a Reporting and Analytics Solution
Build a Data Architecture Roadmap
Info-Tech's Storytelling With Data Visualization Framework
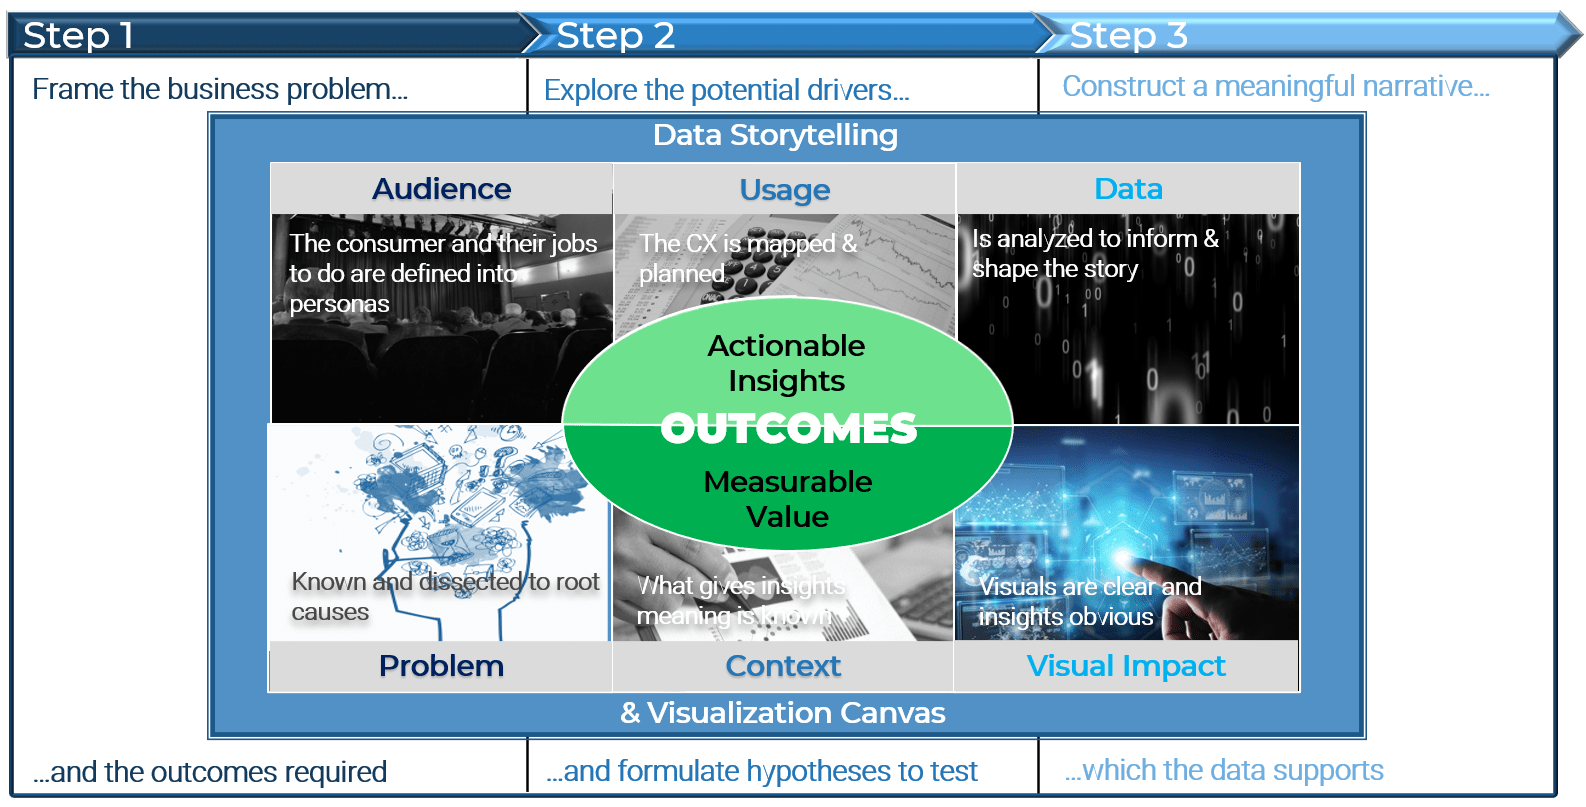
Info-Tech Insight
As organizations strive to become more data-driven, good storytelling with data visualization supports growing corporate data literacy and helps analysts provide insights that improve organizational decision-making and value-driving processes, which ultimately boosts business performance.
Research Benefits
| Member Benefits | Business Benefits |
|---|---|
|
|
Info-Tech offers various levels of support to best suit your needs
| DIY Toolkit | Guided Implementation | Workshop | Consulting |
|---|---|---|---|
| "Our team has already made this critical project a priority, and we have the time and capability, but some guidance along the way would be helpful." | "Our team knows that we need to fix a process, but we need assistance to determine where to focus. Some check-ins along the way would help keep us on track." | "We need to hit the ground running and get this project kicked off immediately. Our team has the ability to take this over once we get a framework and strategy in place." | "Our team does not have the time or the knowledge to take this project on. We need assistance through the entirety of this project." |
Diagnostics and consistent frameworks are used throughout all four options.