
Data is a unique resource that keeps growing, presenting opportunities along the way. CIOs and IT leaders can use rapidly evolving technologies and capabilities to harness this data and its value for the organization.
IT leaders must prepare their teams and operations with the right knowledge, capabilities, and strategies to make sure they remain competitive in 2023 and beyond. Nine trends that expand on the three common Vs of data – volume, velocity, and variety – can help guide the way.
Focus on trends that align with your opportunities and challenges
The path to becoming more competitive in a data-driven economy differs from one company to the next. IT leaders should use the data and analytics trends that align most with their organizational goals and can lead to positive business outcomes.
- Prioritize your investments: Conduct market analysis and prioritize the data and analytics investments that will be critical to your business.
- Build a robust strategy: Identify a clear path between your data vision and business outcomes to build a strategy that’s a good fit for your organization.
- Inspire practical innovation: Follow a pragmatic approach to implementing trends that range from data gravity and democratization to data monetization and augmented analytics.
Data and Analytics Trends 2023 Research & Tools
Besides the small introduction, subscribers and consulting clients within this management domain have access to:
1. Data and Analytics Trends Report 2023 – A report that explores nine data use cases for emerging technologies that can improve on capabilities needed to compete in the data-driven economy.
Data technologies are rapidly evolving. Understanding data's art of the possible is critical. However, to adapt to these upcoming data trends, a solid data management foundation is required. This report explores nine data trends based on the proven framework of data V's: Volume, Velocity, Variety, Veracity, Value, Virtue, Visualization, Virality, and Viscosity.
- Data and Analytics Trends Report 2023
Further reading
Data and Analytics Trends Report 2023
SOONER OR LATER, YOU WILL BE IN THE DATA BUSINESS!
Nine Data Trends for 2023
In this report, we explore nine data use cases for emerging technologies that can improve on capabilities needed to compete in the data-driven economy. Use cases combine emerging data trends and modernization of existing capabilities.
- VOLUME
- Data Gravity
- VELOCITY
- Democratizing Real-Time Data
- Augmented Data Management
- Identity Authenticity
- Data Monetization
- Adaptive Data Governance
- AI-Driven Storytelling & Augmented Analytics
- Data Marketplace
- DevOps – DataOps – XOps
VOLUME
Data Gravity
Trend 01 Demand for storage and bandwidth continues to grow
When organizations begin to prioritize data, they first consider the sheer volume of data, which will influence data system design. Your data systems must consider the existing and growing volume of data by assessing industry initiatives such as digital transformation, Industry 4.0, IoT, consumer digital footprint, etc.
|
The largest data center in the world is a citadel in Reno, Nevada, that stretches over 7.2 million square feet! Source: Cloudwards, 2022 |
IoT devices will generate 79.4 zettabytes of data Source: IDC, 2019 |
There were about 97 Source: “Volume of Data,” Statista, 2022 |
VOLUME
Data Gravity
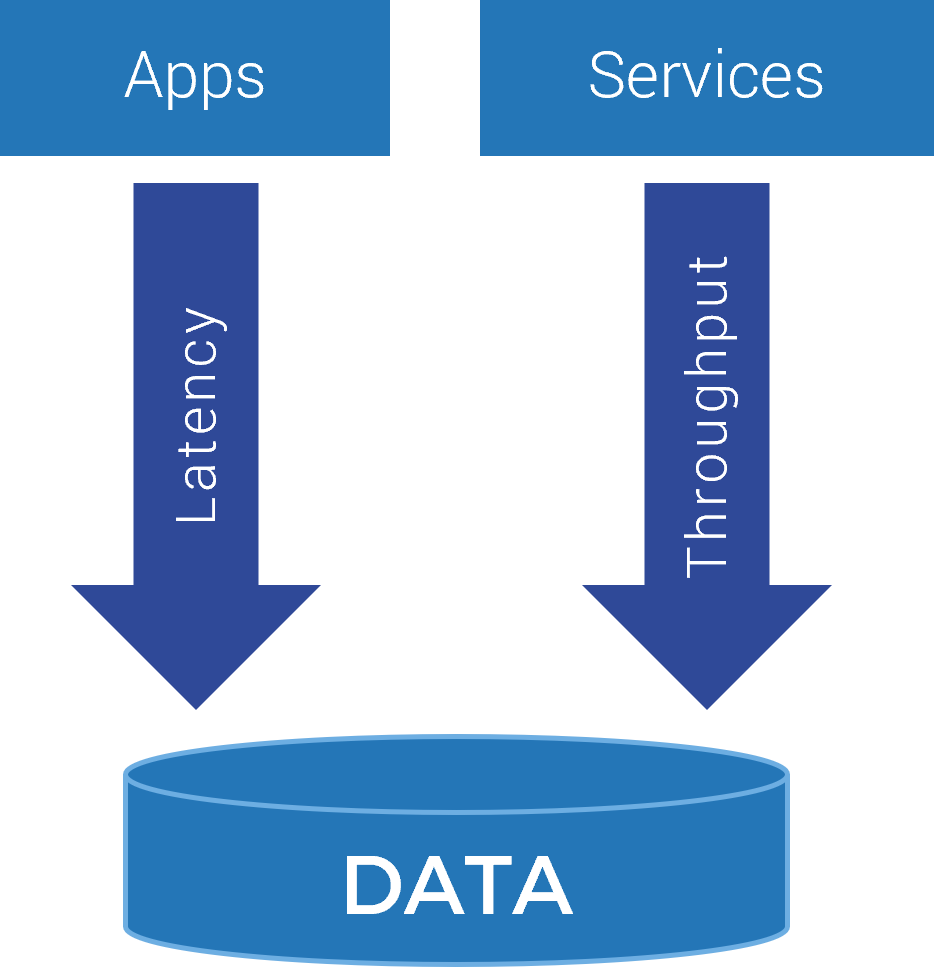
Data attracts more data and an ecosystem of applications and services
SharePoint, OneDrive, Google Drive, and Dropbox offer APIs and integration opportunities for developers to enhance their products.
Social media platforms thought about this early by allowing for an ecosystem of filters, apps, games, and effects that engage their users with little to no additional effort from internal resources.
VOLUME
Data Gravity
Focus on data gravity and avoid cloud repatriation
Data gravity is the tendency of data to attract applications, services, and other data. A growing number of cloud migration decisions will be made based on the data gravity concept. It will become increasingly important in data strategies, with failure potentially resulting in costly cloud repatriations.
Emerging technologies and capabilities:
Data Lakehouse, Data Mesh, Data Fabric, Hybrid Data, Cloud Data, Edge Computing
| 47% |
Centralized cloud storage going down in 2 years |
22% |
| 25% |
Hybrid storage (centralized + edge) going up in 2 years |
47% |
Source: CIO, 2022
VOLUME
Data Gravity
What worked for terabytes is ineffective for petabytes
When compared to on-premises infrastructure, cloud computing is less expensive and easier to implement. However, poor data replication and data gravity can significantly increase cloud costs to the point of failure. Data gravity will help organizations make better cloud migration decisions.
It is also critical to recognize changes in the industry landscape. The goal of data processing and analytics is to generate the right data for users to act on. In most cases, the user is a human being, but in the case of autonomous driving (AD), the car takes on the role of the user (DXC Technology).
To avoid cloud repatriation, it will become prudent for all organizations to consider data gravity and the timing of cloud migration.
VELOCITY
Democratizing Real-Time Data
Trend 02 Real-time analytics presents an important differentiator
The velocity element of data can be assessed from two standpoints: the speed at which data is being generated and how fast the organization needs to respond to the incoming information through capture, analysis, and use. Traditionally data was processed in a batch format (all at once or in incremental nightly data loads). There is a growing demand to process data continuously using streaming data-processing techniques.
Emerging technologies and capabilities:
Edge Computing
|
Google announced it has a quantum computer that is 100 million times faster than any classical computer in its lab. Source: Science Alert, 2015 |
The number of qubits in quantum computers has been increasing dramatically, from 2 qubits in 1998 to 128 qubits in 2019. Source: Statista, 2019 |
IBM released a 433-qubit quantum chip named Osprey in 2022 and expects to surpass 1,000 qubits with its next chip, Condor, in 2023. Source: Nature, 2023 |
VELOCITY
Democratizing Real-Time Data
Make data accessible to everyone in real time
- 90% of an organization’s data is replicated or redundant.
- Build API and web services that allow for live access to data.
- Most social media platforms, like Twitter and Facebook, have APIs that offer access to incredible amounts of data and insights.
VELOCITY
Democratizing Real-Time Data
Trend in Data Velocity
Data democratization means data is widely accessible to all stakeholders without bottlenecks or barriers. Success in data democratization comes with ubiquitous real-time analytics. Google highlights a need to address democratization in two different frames:
- Democratizing stream analytics for all businesses to ensure real-time data at the company level.
- Democratizing stream analytics for all personas and the ability of all users to generate real-time insights.
Emerging technologies and capabilities:
Data Lakehouse, Streaming API Ecosystem, Industry 4.0, Zero-Copy Cloning
Nearly 70% of all new vehicles globally will be connected to the internet by 2023.
Source: “Connected light-duty vehicles,” Statista, 2022
VELOCITY
Democratizing Real-Time Data
Enable real-time processing with API
In the past, data democratization has largely translated into a free data set and open data portals. This has allowed the government to freely share data with the public. Also, the data science community has embraced the availability of large data sets such as weather data, stock data, etc. In the future, more focus will be on the combination of IoT and steaming analytics, which will provide better responsiveness and agility.
Many researchers, media companies, and organizations now have easy access to the Twitter/Facebook API platform to study various aspects of human behavior and sentiments. Large technology companies have already democratized their data using real-time APIs.
Thousands of sources for open data are available at your local municipalities alone.
6G will push Wi-Fi connectivity to 1 terabyte per second! This is expected to become commercially available by 2030.
VARIETY
Augmented Data Management
Trend 03 Need to manage unstructured data
The variety of data types is increasingly diverse. Structured data often comes from relational databases, while unstructured data comes from several sources such as photos, video, text documents, cell phones, etc. The variety of data is where technology can drive business value. However, unstructured data also poses a risk, especially for external data.
|
The number of IoT devices could rise to 30.9 billion by 2025. Source: “IoT and Non-IoT Connections Worldwide,” Statista, 2022 |
The global edge computing market is expected to reach $250.6 billion by 2024. Source: “Edge Computing,” Statista, 2022 |
Genomics research is expected to generate between 2 and 40 exabytes of data within the next decade. Source: NIH, 2022 |
VARIETY
Augmented Data Management
Employ AI to automate data management
New tools will enhance many aspects of data management:
- Data preparation, integration, cataloging, and quality
- Metadata management
- Master data management
Enabling AI-assisted decision-making tools
VARIETY
Augmented Data Management
Trend in Data Variety
Augmented data management will enhance or automate data management capabilities by leveraging AI and related advanced techniques. It is quite possible to leverage existing data management tools and techniques, but most experts have recognized that more work and advanced patterns are needed to solve many complex data problems.
Emerging technologies and capabilities:
Data Factory, Data Mesh, Data Fabric, Artificial Intelligence, Machine Learning
VARIETY
Augmented Data Management
Data Fabric vs. Data Mesh: The Data Journey continues at an accelerated pace
|
Data Fabric |
Data Mesh |
|---|---|
|
Data fabric is an architecture that facilitates the end-to-end integration of various data pipelines and cloud environments using intelligent and automated systems. It’s a data integration pattern to unify disparate data systems, embed governance, strengthen security and privacy measures, and provide more data accessibility to workers and particularly to business users. |
The data mesh architecture is an approach that aligns data sources by business domains, or functions, with data owners. With data ownership decentralization, data owners can create data products for their respective domains, meaning data consumers, both data scientists and business users, can use a combination of these data products for data analytics and data science. |
More Unstructured Data
95% of businesses cite the need to manage unstructured data as a problem for their business.
VERACITY
Identity Authenticity
Trend 04 Veracity of data is a true test of your data capabilities
Data veracity is defined as the accuracy or truthfulness of a data set. More and more data is created in semi-structured and unstructured formats and originates from largely uncontrolled sources (e.g. social media platforms, external sources). The reliability and quality of the data being integrated should be a top concern. The veracity of data is imperative when looking to use data for predictive purposes. For example, energy companies rely heavily on weather patterns to optimize their service outputs, but weather patterns have an element of unpredictability.
|
Data quality affects overall labor productivity by as much as 20%, and 30% of operating expenses are due to insufficient data. Source: Pragmatic Works, 2017 |
Bad data costs up to Source: MIT Sloan Management Review, 2017 |
VERACITY
Identity Authenticity
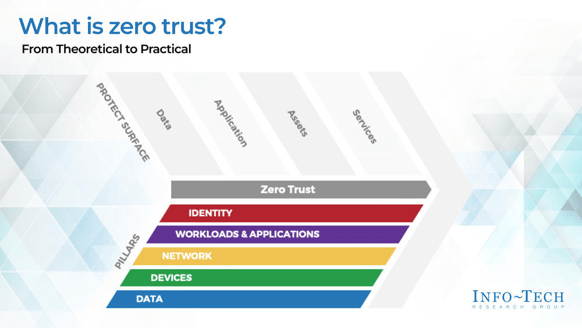
Veracity of data is a true test of your data capabilities
- Stop creating your own identity architectures and instead integrate a tried-and-true platform.
- Aim for a single source of truth for digital identity.
- Establish data governance that can withstand scrutiny.
- Imagine a day in the future where verified accounts on social media platforms are available.
- Zero-trust architecture should be used.
VERACITY
Identity Authenticity
Trend in Data Veracity
Veracity is a concept deeply linked to identity. As the value of the data increases, a greater degree of veracity is required: We must provide more proof to open a bank account than to make friends on Facebook. As a result, there is more trust in bank data than in Facebook data. There is also a growing need to protect marginalized communities.
Emerging technologies and capabilities:
Zero Trust, Blockchain, Data Governance, IoT, Cybersecurity
VERACITY
Identity Authenticity
The identity discussion is no longer limited to people or organizations. The development of new technologies, such as the IoT phenomenon, will lead to an explosion of objects, from refrigerators to shipping containers, coming online as well. If all these entities start communicating with each other, standards will be needed to establish who or what they are.
|
IDENTITY Age Gender Address Fingerprint Face Voice Irises |
IDENTITY Password Passphrase PIN Sequence |
IDENTITY Access badge Smartcard Security token Mobile phone ID document |
IDENTITY Motor skills Handwriting Gestures Keystrokes Applications use |
The IoT market is expected to grow 18% to 14.4 billion in 2022 and 27 billion by 2025.
Source: IoT Analytics, 2022
VALUE
Data Monetization
Trend 05 Not Many organization know the true value of their data
Data can be valuable if used effectively or dangerous if mishandled. The rise of the data economy has created significant opportunities but also has its challenges. It has become urgent to understand the value of data, which may vary for stakeholders based on their business model and strategy. Organizations first need to understand ownership of their data by establishing a data strategy, then they must improve data maturity by developing a deeper understanding of data value.
|
94% of enterprises say data is essential to business growth. Source: Find stack, 2021 |
VALUE
Data Monetization
Start developing your data business
- Blockbuster ran its business well, but Netflix transformed the video rental industry overnight!
- Big players with data are catching up fast.
- You don’t have to be a giant to monetize data.
- Data monetization is probably closer than you think.
- You simply need to find it, catalog it, and deliver it.
VALUE
Data Monetization
Trend in Data Value
Data monetization is the transformation of data into financial value. However, this does not imply selling data alone. Monetary value is produced by using data to improve and upgrade existing and new products and services. Data monetization demands an organization-wide strategy for value development.
Emerging technologies and capabilities:
Data Strategy, Data Monetization Strategy, Data Products
Netflix uses big data to save $1 billion per year on customer retention.
Source: Logidots, 2021
VALUE
Data Monetization
Data is a strategic asset
Data is beyond currency, assets, or commodities and needs to be a category
of its own.
- Data always outlives people, processes, and technology. They all come and go while data remains.
- Oil is a limited resource. Data is not. Unlike oil, data is likely to grow over time.
- Data is likely to outlast all other current popular financial instruments, including currency, assets, or commodities.
- Data is used internally and externally and can easily be replicated or combined.
Data monetization is currently in the speculative territory, which is unacceptable. It should instead be guided by sound data management theory.
VIRTUE
Adaptive Data Governance
Trend 06 Five Core Virtues: Resilience, Humility, Grit, Liberal Education, Empathy (Forbes, 2020)
We have become more and more dependent on data, analytics, and organizational protection policies. Data virtue is about leveraging data securely and ethically. This topic has become more critical with the advent of GDPR, the right to be forgotten, and related regulations. Data governance, which seeks to establish an oversight framework that manages the creation, acquisition, integrity, security, compliance, and quality of data, is essential for any organization that makes decisions about data.
|
Cultural obstacles are the greatest barrier to becoming data-driven, according to 91.9% of executives. Source: Harvard Business Review, 2022 |
Fifty million Facebook profiles were harvested for Cambridge Analytica in a major data breach. Source: The Guardian, 2018 |
VIRTUE
Adaptive Data Governance
Encourage noninvasive and automated data governance
- Data governance affects the entire organization, not just data.
- The old model for data governance was slow and clumsy.
- Adaptive data governance encourages faster decision making and a more collaborative approach to governance.
- Agile data governance allows for faster and more flexible decision making.
- Automated data governance will simplify execution across the organization.
- It is great for compliance, quality, impact tracking, and cross-referencing and offers independence to data users.
VIRTUE
Adaptive Data Governance
Trend in Data Virtue
Adaptive data governance encourages a flexible approach that allows an organization to employ multiple data governance strategies depending on changing business situations. The other aspect of adaptive data governance is moving away from manual (and often slow) data governance and toward aggressive automation.
Emerging technologies and capabilities:
AI-Powered Data Catalog and Metadata Management,
Automated Data Policy Enforcement
|
“To effectively meet the needs and velocity of digital organizations and modern practices, IT governance must be embedded and automated where possible to drive success and value.” Source: Valence Howden, Info-Tech Research Group |
|
“Research reveals that the combination of AI and big data technologies can automate almost 80% of all physical work, 70% of data processing, and 64% of data collection tasks.” Source: Forbes, 2021 |
VIRTUE
Data Governance Automation
Simple and easy Data Governance
Tools are not the ultimate answer to implementing data governance. You will still need to secure stakeholders' buy-in and engagement in the data process. Data governance automation should be about simplifying the execution of roles and responsibilities.
“When you can see where your data governance strategy can be improved, it’s time to put in place automation that help to streamline processes.”
Source: Nintex, 2021
VISUALIZATION
AI-Driven Storytelling & Augmented Analytics
Trend 07 Automated and augmented data storytelling is not that far away
Today, data storytelling is led by the user. It’s the manual practice of combining narrative with data to deliver insights in a compelling form to assist decision makers in engaging with data and analytics. A story backed by data is more easily consumed and understood than a dashboard, which can be overwhelming. However, manual data storytelling has some major shortcomings.
Problem # 1: Telling stories on more than just the insights noticed by people
Problem # 2: Poor data literacy and the limitations of manual self-service
Problem # 3: Scaling data storytelling across the business
VISUALIZATION
AI-Driven Storytelling & Augmented Analytics
Use AI to enhance data storytelling
- Tableau, Power BI, and many other applications already use
AI-driven analytics. - Power BI and SharePoint can use AI to generate visuals for any SharePoint list in a matter of seconds.
VISUALIZATION
AI-Driven Storytelling & Augmented Analytics
Trend in Data Visualization
AI and natural language processing will drive future visualization and data storytelling. These tools and techniques are improving rapidly and are now designed in a streamlined way to guide people in understanding what their data means and how to act on it instead of expecting them to do self-service analysis with dashboards and charts and know what to do next. Ultimately, being able to understand how to translate emotion, tropes, personal interpretation, and experience and how to tell what’s most relevant to each user is the next frontier for augmented and automated analytics
Emerging technologies and capabilities:
AI-Powered Data Catalog and Metadata Management,
Automated Data Policy Enforcement
VISUALIZATION
Data Storytelling
Augmented data storytelling is not that far away
Emotions are a cornerstone of human intelligence and decision making. Mastering the art of storytelling is not easy.
Industry experts predict the combination of data storytelling with augmented and automated techniques; these capabilities are more than capable of generating and automating parts of a data story’s creation for end users.
The next challenge for AI is translating emotion, tropes, personal interpretation, and experience into what is most essential to end users.
Source: Yellowfin, 2021
VIRALITY
Data Marketplace
Trend 08 Missing data marketplace
Data virality measures data spread and popularity. However, for data virality to occur, an ecosystem comparable to that of traditional or modern digital marketplaces is required. Organizations must reevaluate their data strategies to ensure investment in appropriate data domains by understanding data virality. Data virality is the exact opposite of dark data.
Dark data is “all the information companies collect in their regular business processes, don’t use, have no plans to use, but will never throw out.”
Source: Forbes, 2019
VIRALITY
Data Marketplace
Make data easily accessible
- Making data accessible to a broader audience is the key to successful virality.
- Data marketplaces provide a location for you to make your data public.
- Why do this? Contributing to public data marketplaces builds credibility, just like contributing to public GitHub projects.
- Big players like Microsoft, Amazon, and Snowflake already do this!
- Snowflake introduced zero-copy cloning, which allows users to interact with source data without compromising the integrity of the original source.
VIRALITY
Data Marketplace
Trend in Data Virality
The data marketplace can be defined as a dynamic marketplace where users decide what has the most value. Companies can gauge which data is most popular based on usage and decide where to invest. Users can shop for data products within the marketplace and then join these products with other ones they’ve created to launch truly powerful data-driven projects.
Emerging technologies and capabilities:
AI-Powered Data Catalog and Metadata Management,
Automated Data Policy Enforcement
“Data is like garbage. You’d better know what you are going to do with it before you collect it.”
– Mark Twain
VIRALITY
Data Marketplace
Journey from siloed data platforms to dynamic data marketplaces
Data remains a complex topic due to many missing foundational components and infrastructure. Interoperability, security, quality, discoverability, speed, and ease are some of those missing foundational components that most organizations face daily.
Data lacks an ecosystem that is comparable to those of traditional assets or commodities. Data must be available in open or closed data marketplaces to measure its value. These data marketplaces are still in their infancy.
“Data markets are an important component of the data economy that could unleash the full potential of data generated by the digital economy and human activity in general.”
Source: ITU Journal, 2018
VISCOSITY
DevOps – DataOps – XOps
Trend 09 Increase efficiency by removing bottlenecks
Compared to water, a fluid with a high viscosity flows more slowly, like honey. Data viscosity measures the resistance to flow in a volume of data. The data resistance may come from other Vs (variety, velocity, etc.).
VISCOSITY
DevOps – DataOps – XOps
Increase efficiency by removing bottlenecks
Consider XOps for a second. It makes no difference what X is. What's important is matching operational requirements to enterprise capabilities.
- For example, Operations must meet the demands of Sales – hence SalesOps
or S&Op. - Development resources must meet the demands of Operations – hence DevOps.
- Finally, Data must also meet the demand of Operations.
These Operations guys are demanding!!
VISCOSITY
DevOps – DataOps – XOps
Trend in Data Viscosity
The merger of development (Dev) and IT Operations (Ops) started in software development with the concept of DevOps. Since then, new Ops terms have formed rapidly (AIOps, MLOps, ModelOps, PlatformOps, SalesOps, SecOps, etc.). All these methodologies come from Lean manufacturing principles, which seek to identify waste by focusing on eliminating errors, cycle time, collaboration, and measurement. Buzzwords are distractions, and the focus must be on the underlying goals and principles. XOps goals should include the elimination of errors and improving efficiencies.
Emerging technologies and capabilities:
Collaborative Data Management, Automation Tools
VISCOSITY
DataOps → Data Observability
Data observability, a subcomponent of DataOps, is a set of technical practices, cultural norms, and architecture that enables low error rates. Data observability focuses on error rates instead of only measuring data quality at a single point in time.
|
Data Quality Dimensions
|
→ |
ERROR RATES Lateness: Missing Your SLA System Processing Issues Code Change That Broke Something Data Quality |
What’s next? Go beyond the buzzwords.
Avoid following trends solely for the sake of following them. It is critical to comprehend the concept and apply it to your industry. Every industry has its own set of problems and opportunities.
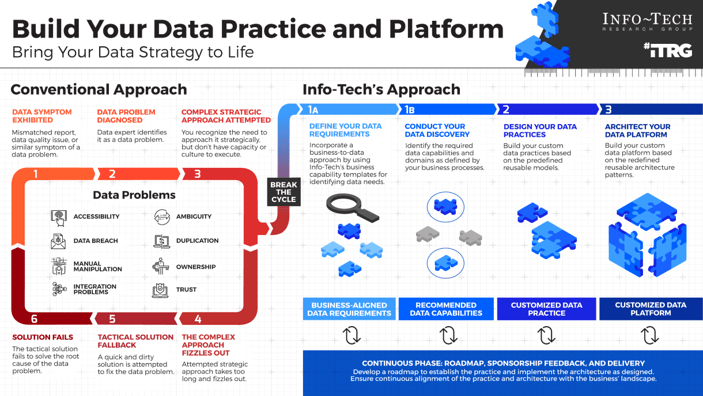
Highlight the data trends (or lack thereof) that have been most beneficial to you in your organizations. Follow Info-Tech’s approach to building a data practice and platform to develop your data capabilities through the establishment of data goals.
Research Authors

|

|
|
Rajesh Parab Director, Research & Advisory Data and Analytics |
Chris Dyck Research Lead Data and Analytics |
“Data technologies are rapidly evolving. Understanding what’s possible is critical. Adapting to these upcoming data trends requires a solid data management foundation.”
– Rajesh Parab
Contributing Experts

|

|
|
Executive Counselor Info-Tech Research Group |
Executive Counselor Info-Tech Research Group |
Bibliography
Bean, Randy. “Why Becoming a Data-Driven Organization Is So Hard.” Harvard Business Review, 24 Feb. 2022. Accessed Oct. 2022.
Brown, Annie. “Utilizing AI And Big Data To Reduce Costs And Increase Profits In Departments Across An Organization.” Forbes, 13 April 2021.
Accessed Oct. 2022.
Burciaga, Aaron. “Five Core Virtues For Data Science And Artificial Intelligence.” Forbes, 27 Feb. 2020. Accessed Aug. 2022.
Cadwalladr, Carole, and Emma Graham-Harrison. “Revealed: 50 million Facebook profiles harvested for Cambridge Analytica in major data breach.”
The Guardian, 17 March 2018. Accessed Aug. 2022.
Carlier, Mathilde. “Connected light-duty vehicles as a share of total vehicles in 2023.” Statista, 31 Mar. 2021. Accessed Oct. 2022.
Carter, Rebekah. “The Ultimate List of Big Data Statistics for 2022.” Findstack, 22 May 2021. Accessed Oct. 2022.
Castelvecchi, Davide. “Underdog technologies gain ground in quantum-computing race.” Nature, 6 Nov. 2023. Accessed Feb. 2023.
Clark-Jones, Anthony, et al. “Digital Identity:” UBS, 2016. Accessed Aug 2022.
“The Cost of Bad Data – Infographic.” Pragmatic Works, 25 May 2017. Accessed Oct. 2022.
Demchenko, Yuri, et al. “Data as Economic Goods: Definitions, Properties, Challenges, Enabling Technologies for Future Data Markets.“ ITU Journal: ICT Discoveries, Special Issue, no. 2, vol. 23, Nov. 2018. Accessed Aug 2022.
Feldman, Sarah. ”20 Years of Quantum Computing Growth.” Statista, 6 May 2019. Accessed Oct. 2022.
“Genomic Data Science.” NIH, National Human Genome Research Institute, 5 April 2022. Accessed Oct. 2022.
Bibliography
Hasbe, Sudhir, and Ryan Lippert. “The democratization of data and insights: making real-time analytics ubiquitous.” Google Cloud, 15 Jan. 2021.
Accessed Aug. 2022.
Helmenstine, Anne. “Viscosity Definition and Examples.” Science Notes, 3 Aug. 2021. Accessed Aug. 2022.
“How data storytelling and augmented analytics are shaping the future of BI together.” Yellowfin, 19 Aug. 2021. Accessed Aug. 2022.
“How Netflix Saves $1B Annually using AI?” Logidots, 24 Sept. 2021. Accessed Oct. 2022
Hui, Kenneth. “The AWS Love/Hate Relationship with Data Gravity.” Cloud Architect Musings, 30 Jan. 2017. Accessed Aug 2022.
ICD. “The Growth in Connected IoT Devices Is Expected to Generate 79.4ZB of Data in 2025, According to a New IDC Forecast.” Business Wire, 18 June 2019. Accessed Oct 2022.
Internet of Things (IoT) and non-IoT active device connections worldwide from 2010 to 2025” Statista, 27 Nov. 2022. Accessed Nov. 2022.
Koch, Gunter. “The critical role of data management for autonomous driving development.” DXC Technology, 2021. Accessed Aug. 2022.
Morris, John. “The Pull of Data Gravity.” CIO, 23 Feb. 2022. Accessed Aug. 2022.
Nield, David. “Google's Quantum Computer Is 100 Million Times Faster Than Your Laptop.” ScienceAlert, 9 Dec. 2015. Accessed Oct. 2022.
Redman, Thomas C. “Seizing Opportunity in Data Quality.” MIT Sloan Management Review, 27 Nov. 2017. Accessed Oct. 2022.
Segovia Domingo, Ana I., and Álvaro Martín Enríquez. “Digital Identity: the current state of affairs.” BBVA Research, 2018. Accessed Aug. 2022.
Bibliography
“State of IoT 2022: Number of connected IoT devices growing 18% to 14.4 billion globally.” IOT Analytics, 18 May 2022. Accessed. 14 Nov. 2022.
Strod, Eran. “Data Observability and Monitoring with DataOps.” DataKitchen, 10 May 2021. Accessed Aug. 2022.
Sujay Vailshery, Lionel. “Edge computing market value worldwide 2019-2025.” Statista, 25 Feb. 2022. Accessed Oct 2022.
Sujay Vailshery, Lionel. “IoT and non-IoT connections worldwide 2010-2025.” Statista, 6 Sept. 2022. Accessed Oct. 2022.
Sumina, Vladimir. “26 Cloud Computing Statistics, Facts & Trends for 2022.” Cloudwards, 7 June 2022. Accessed Oct. 2022.
Taulli, Tom. “What You Need To Know About Dark Data.” Forbes, 27 Oct. 2019. Accessed Oct. 2022.
Taylor, Linnet. “What is data justice? The case for connecting digital rights and freedoms globally.“ Big Data & Society, July-Dec 2017. Accessed Aug 2022.
“Twitter: Data Collection With API Research Paper.” IvyPanda, 28 April 2022. Accessed Aug. 2022.
“Using governance automation to reduce data risk.” Nintex, 15 Nov. 2021. Accessed Oct. 2022
“Volume of data/information created, captured, copied, and consumed worldwide from 2010 to 2020, with forecasts from 2021 to 2025.” Statista, 8 Sept. 2022. Accessed Oct 2022.
Wang, R. “Monday's Musings: Beyond The Three V's of Big Data – Viscosity and Virality.” Forbes, 27 Feb. 2012. Accessed Aug 2022.
“What is a data fabric?” IBM, n.d. Accessed Aug 2022.
Yego, Kip. “Augmented data management: Data fabric versus data mesh.” IBM, 27 April 2022. Accessed Aug 2022.