
- Rapid changes in today’s market require rapid, value-based decisions, and organizations that lack a shared definition of value fail to maintain their competitive advantage.
- Different parts of an organization have different value drivers that must be given balanced consideration.
- Focusing solely on revenue ignores the full extent of value creation in your organization and does not necessarily result in the right outcomes.
Our Advice
Critical Insight
- Business is the authority on business value. While IT can identify some sources of value, business stakeholders must participate in the creation of a definition that is meaningful to the whole organization.
- It’s about more than profit. Organizations must have a definition that encompasses all of the sources of value or they risk making short-term decisions with long-term negative impacts.
- Technology creates business value. Treating IT as a cost center makes for short-sighted decisions in a world where every business process is enabled by technology.
Impact and Result
- Standardize your definition of business value. Work with your business partners to define the different sources of business value that are created through technology-enabled products and services.
- Weigh your value drivers. Ensure that business and IT understand the relative weight and priority of the different sources of business value you have identified.
- Use a balanced scorecard to understand value. Use the different value drivers to understand and prioritize different products, applications, projects, initiatives, and enhancements.
Build a Value Measurement Framework Research & Tools
Start here – read the Executive Brief
Read this Executive Brief to understand why building a consistent and aligned framework to measure the value of your products and services is vital for setting priorities and getting the business on board.Besides the small introduction, subscribers and consulting clients within this management domain have access to:
- Build a Value Measurement Framework – Phases 1-2
1. Define your value drivers
This phase will help you define and weigh value drivers based on overarching organizational priorities and goals.
- Build a Value Measurement Framework – Phase 1: Define Your Value Drivers
- Value Calculator
2. Measure value
This phase will help you analyze the value sources of your products and services and their alignment to value drivers to produce a value score that you can use for prioritization.
- Build a Value Measurement Framework – Phase 2: Measure Value
Further reading
Build a Value Measurement Framework
Focus product delivery on business value–driven outcomes.
ANALYST PERSPECTIVE
"A meaningful measurable definition of value is the key to effectively managing the intake, prioritization, and delivery of technology-enabled products and services."
Cole Cioran,
Senior Director, Research – Application Development and Portfolio Management
Info-Tech Research Group
Our understanding of the problem
This Research Is Designed For:
- CIOs who need to understand the value IT creates
- Application leaders who need to make good decisions on what work to prioritize and deliver
- Application and project portfolio managers who need to ensure the portfolio creates business value
- Product owners who are accountable for delivering value
This Research Will Help You:
- Define quality in your organization’s context from both business and IT perspectives.
- Define a repeatable process to understand the value of a product, application, project, initiative, or enhancement.
- Define value sources and metrics.
- Create a tool to make it easier to balance different sources of value.
This Research Will Also Assist:
- Product and application delivery teams who want to make better decisions about what they deliver
- Business analysts who need to make better decisions about how to prioritize their requirements
This Research Will Help Them:
- Create a meaningful relationship with business partners around what creates value for the organization.
- Enable better understanding of your customers and their needs.
Executive summary
Situation
- Measuring the business value provided by IT is critical for improving the relationship between business and IT.
- Rapid changes in today’s market require rapid, value-based decisions.
- Every organization has unique drivers that make it difficult to see the benefits based on time and impact approaches to prioritization.
Complication
- An organization’s lack of a shared definition of value leads to politics and decision making that does not have a firm, quantitative basis.
- Different parts of an organization have different value drivers that must be given balanced consideration.
- Focusing solely on revenue does not necessarily result in the right outcomes.
Resolution
- Standardize your definition of business value. Work with your business partners to define the different sources of business value that are created through technology-enabled products and services.
- Weigh your value drivers. Ensure business and IT understand the relative weight and priority of the different sources of business value you have identified.
- Use a balanced scorecard to understand value. Use the different value drivers to understand and prioritize different products, applications, projects, initiatives, and enhancements.
Info-Tech Insight
- Business is the authority on business value. While IT can identify some sources of value, business stakeholders must participate in the creation of a definition that is meaningful to the whole organization.
- It’s about more than profit. Organizations must have a definition that encompasses all of the sources of value, or they risk making short-term decisions with long-term negative impacts.
- Technology creates business value. Treating IT as a cost center makes for short-sighted decisions in a world where every business process is enabled by technology.
Software is not currently creating the right outcomes
Software products are taking more and more out of IT budgets.
38% of spend on IT employees goes to software roles.
Source: Info-Tech’s Staffing Survey
18% of opex is spent on software licenses.
Source: SoftwareReviews.com
33% of capex is spent on new software.
However, the reception and value of software products do not justify the money invested.
Only 34% of software is rated as both important and effective by users.
Source: Info-Tech’s CIO Business Vision
IT benchmarks do not help or matter to the business. Focus on the metrics that represent business outcomes.
IT departments have a tendency to measure only their own role-based activities and deliverables, which only prove useful for selling practice improvement services. Technology doesn’t exist for technology's sake. It’s in place to generate specific outcomes. IT and the business need to be aligned toward a common goal of enabling business outcomes, and that’s the important measurement.
"In today’s connected world, IT and business must not speak different languages. "
– Cognizant, 2017
CxOs stress the importance of value as the most critical area for IT to improve reporting
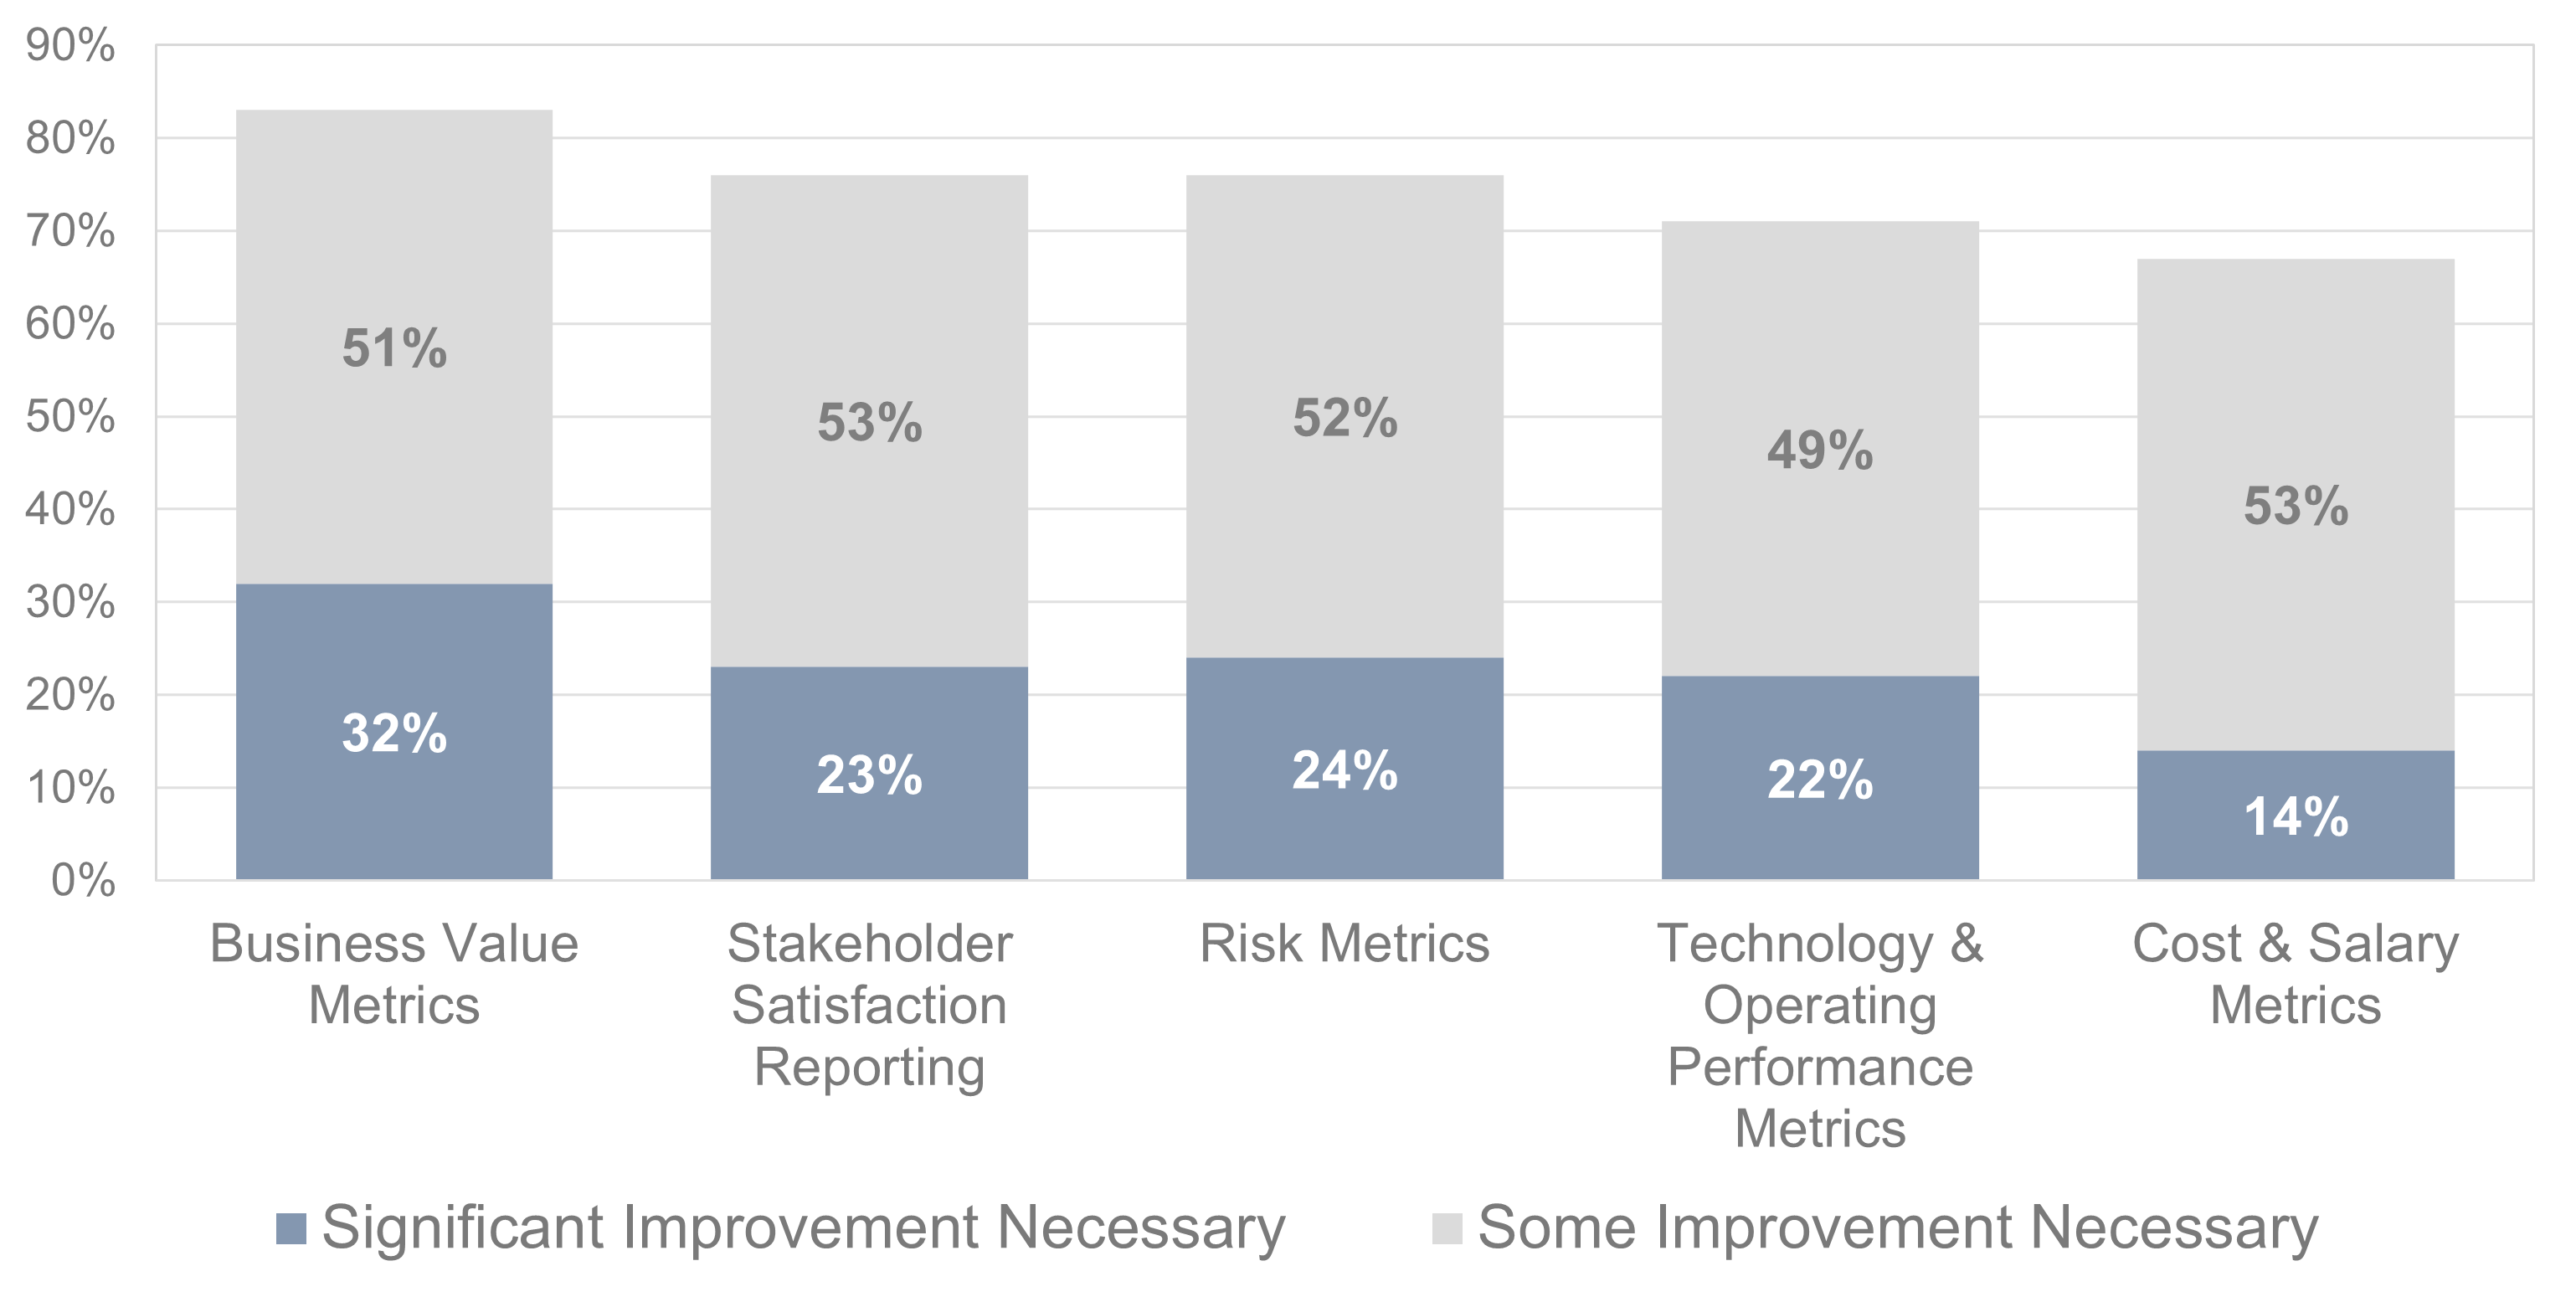
N=469 CxOs from Info-Tech’s CEO/CIO Alignment Diagnostic
Key stakeholders want to know how you and your products or services help them realize their goals.
While the basics of value are clear, few take the time to reach a common definition and means to measure and apply value
Often, IT misses the opportunity to become a strategic partner because it doesn’t understand how to communicate and measure its value to the business.
"Price is what you pay. Value is what you get."
– Warren Buffett
Being able to understand the value context will allow IT to articulate where IT spend supports business value and how it enables business goal achievement.
Value is...
Derived from business context
Enabled through governance and strategy
The underlying context for decision making
A measure of achievement
Determine your business context by assessing the goals and defining the unique value drivers in your organization
Competent organizations know that value cannot always be represented by revenue or reduced expenses. However, it is not always apparent how to envision the full spectrum of sources of value. Dissecting value by the benefit type and the value source’s orientation allows you to see the many ways in which a product or service brings value to the organization.
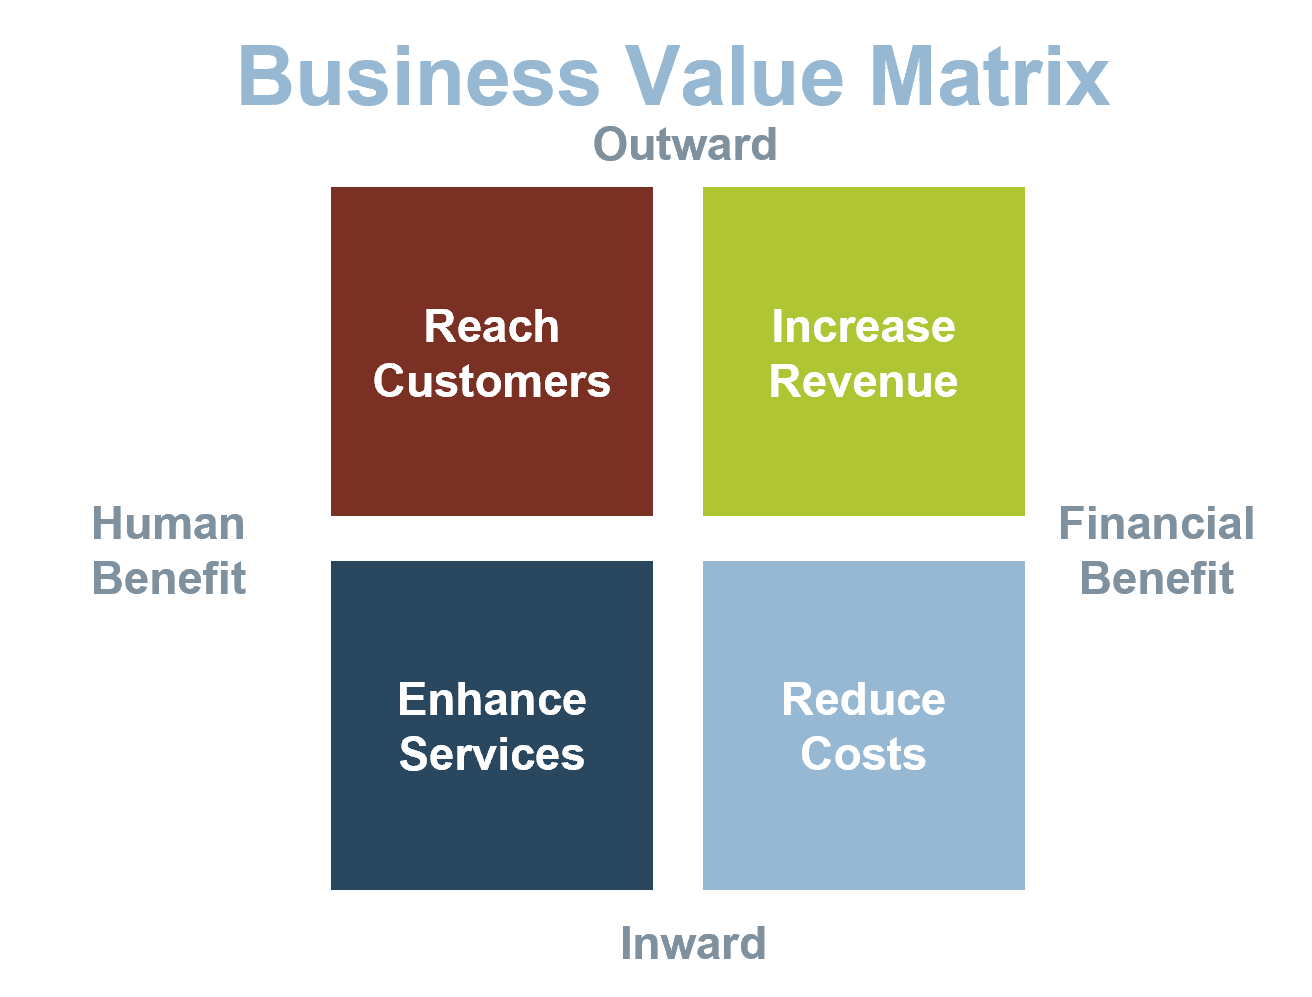
Financial Benefits vs. Improved Capabilities
Financial Benefits refers to the degree to which the value source can be measured through monetary metrics and is often quite tangible. Human Benefits refers to how a product or service can deliver value through a user’s experience.Inward vs. Outward Orientation
Inward refers to value sources that have an internal impact and improve your organization’s effectiveness and efficiency in performing its operations.Outward refers to value sources that come from your interaction with external factors, such as the market or your customers.
|
Increase Revenue |
Reduce Costs |
Enhance Services |
Reach Customers |
|---|---|---|---|
|
Product or service functions that are specifically related to the impact on your organization’s ability to generate revenue. |
Reduction of overhead. They typically are less related to broad strategic vision or goals and more simply limit expenses that would occur had the product or service not been put in place. |
Functions that enable business capabilities that improve the organization’s ability to perform its internal operations. |
Application functions that enable and improve the interaction with customers or produce market information and insights. |
See your strategy through by involving both IT and the business
Buy-in for your IT strategy comes from the ability to showcase value. IT needs to ensure it has an aligned understanding of what is valuable to the organization.
Business value needs to first be established by the business. After that, IT can build a partnership with the business to determine what that value means in the context of IT products and services.
|
The Business |
What the Business and IT have in common |
IT |
|---|---|---|
|
Keepers of the organization’s mission, vision, and value statements that define IT success. The business maintains the overall ownership and evaluation of the products along with those most familiar with the capabilities or processes enabled by technology. |
Business Value of Products and Services |
Technical subject matter experts of the products and services they deliver and maintain. Each IT function works together to ensure quality products and services are delivered up to stakeholder expectations. |
Measure your product or services with Info-Tech’s Value Measurement Framework (VMF) and value scores
The VMF provides a consistent and less subjective approach to generating a value score for an application, product, service, or individual feature, by using business-defined value drivers and product-specific value metrics.
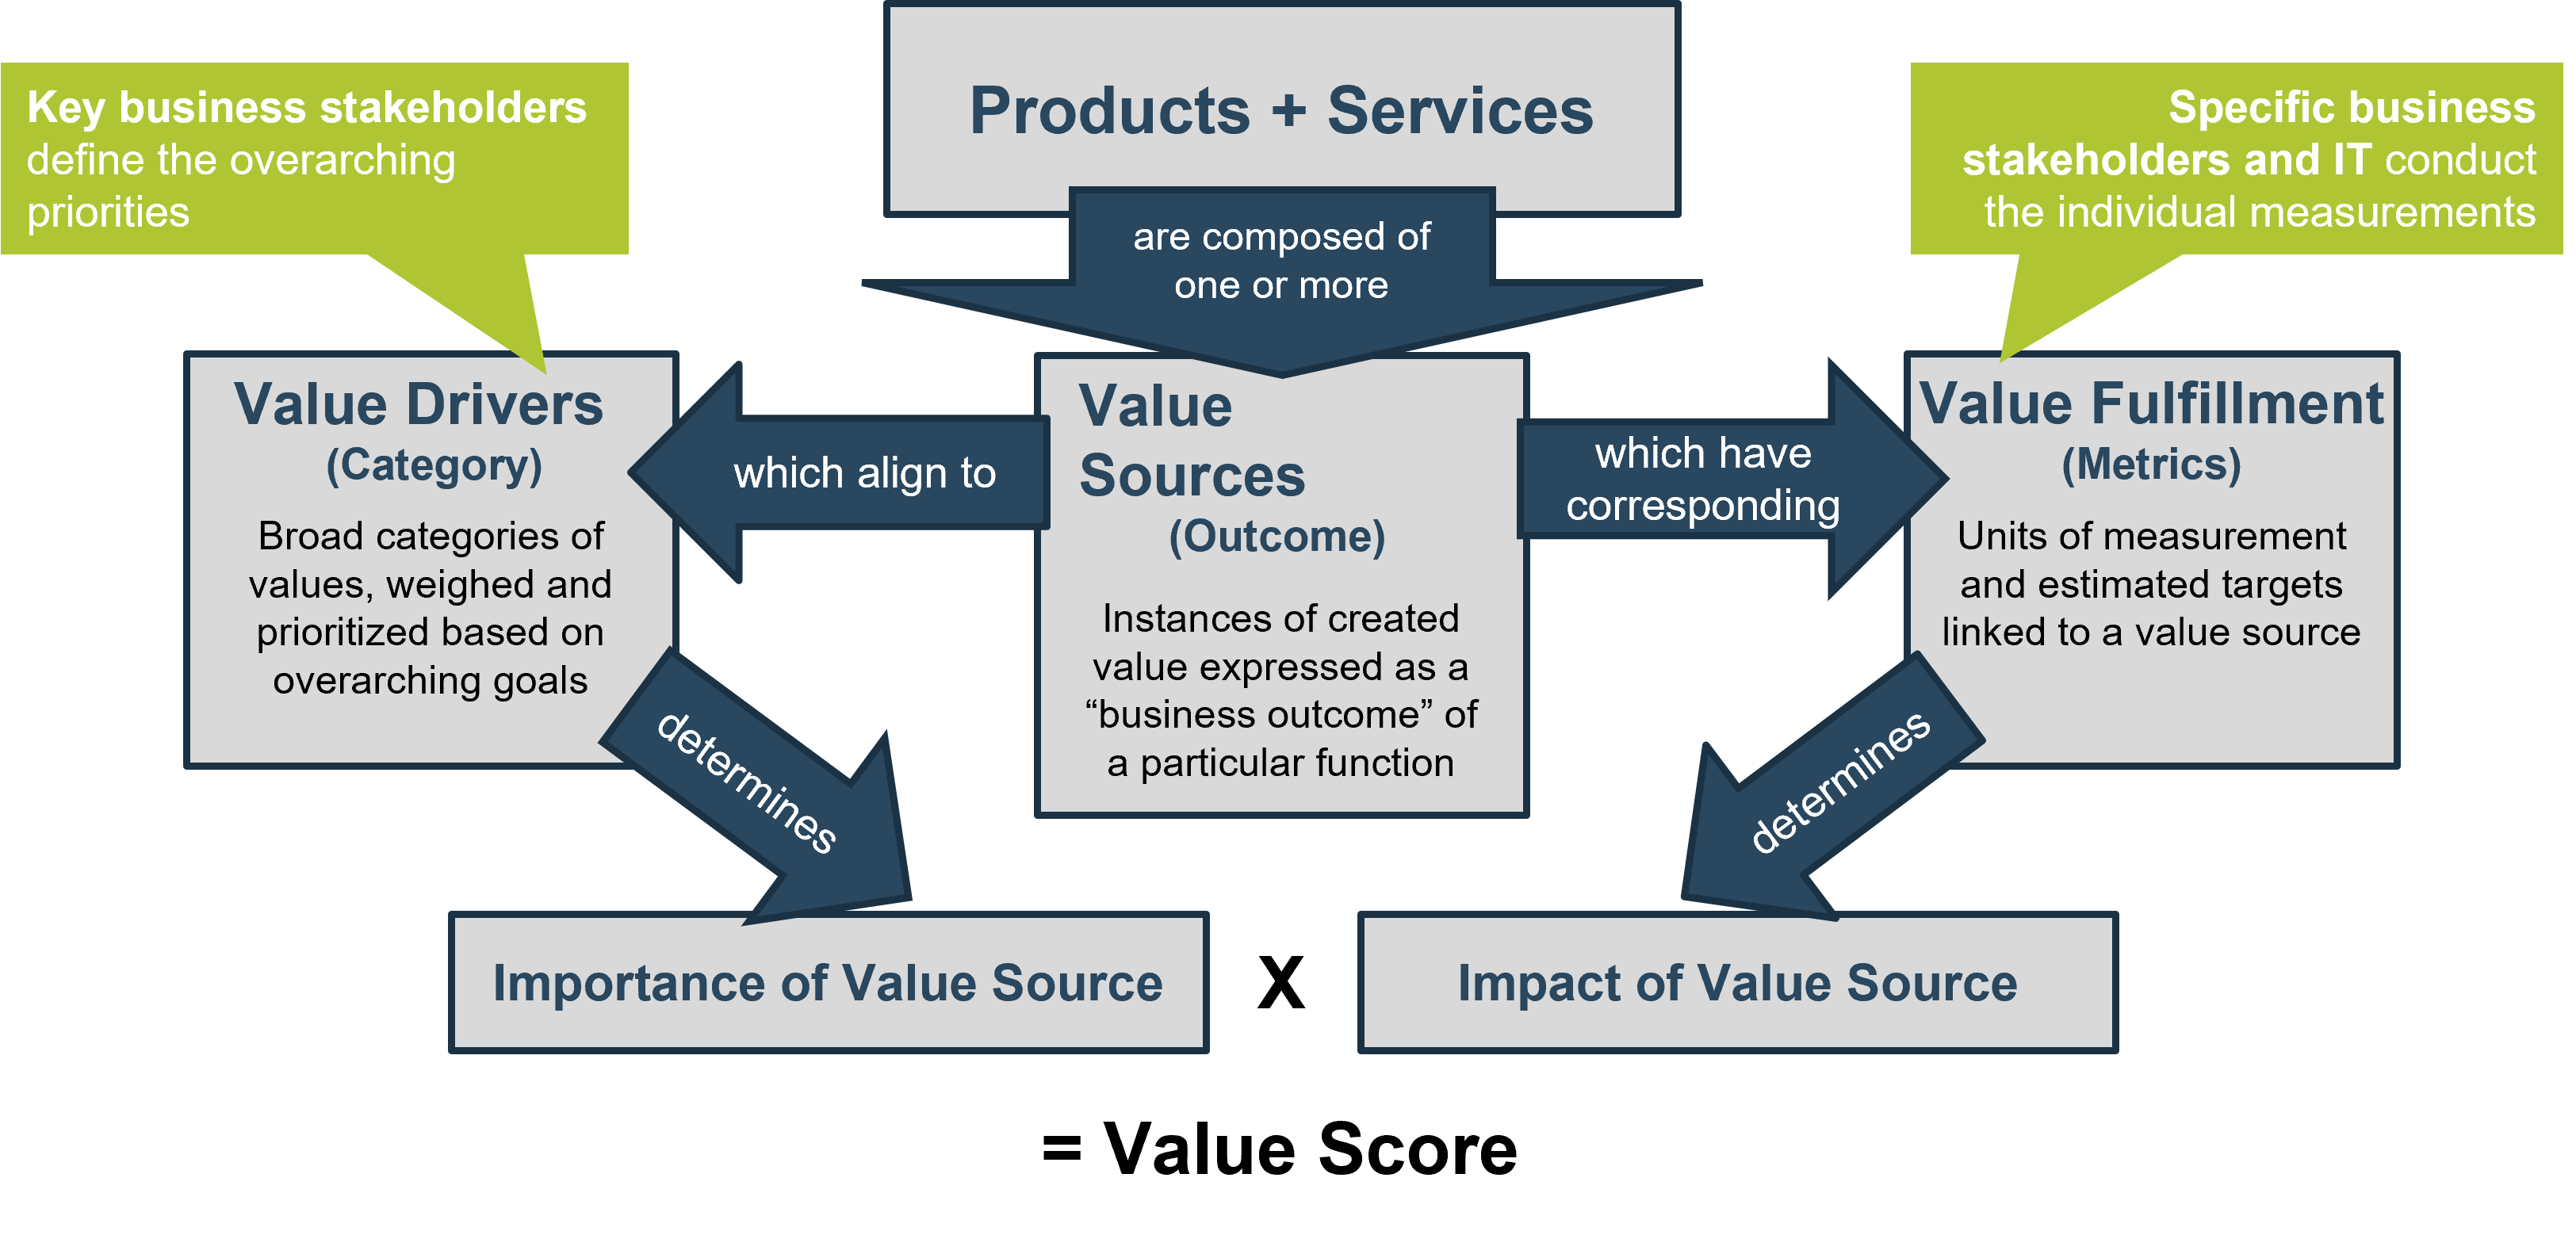
A consistent set of established value drivers, sources, and metrics gives more accurate comparisons of relative value
Value Drivers | Value Sources | Value Fulfillment Metrics |
|---|---|---|
Broad categories of values, weighed and prioritized based on overarching goals | Instances of created value expressed as a “business outcome” of a particular function | Units of measurement and estimated targets linked to a value source |
Reach Customers | Customer Satisfaction | Net Promoter Score |
Customer Loyalty | # of Repeat Visits | |
Create Revenue Streams | Data Monetization | Dollars Derived From Data Sales |
Leads Generation | Leads Conversation Rate | |
Operational Efficiency | Operational Efficiency | Number of Interactions |
Workflow Management | Cycle Time | |
Adhere to regulations & compliance | Number of Policy Exceptions |
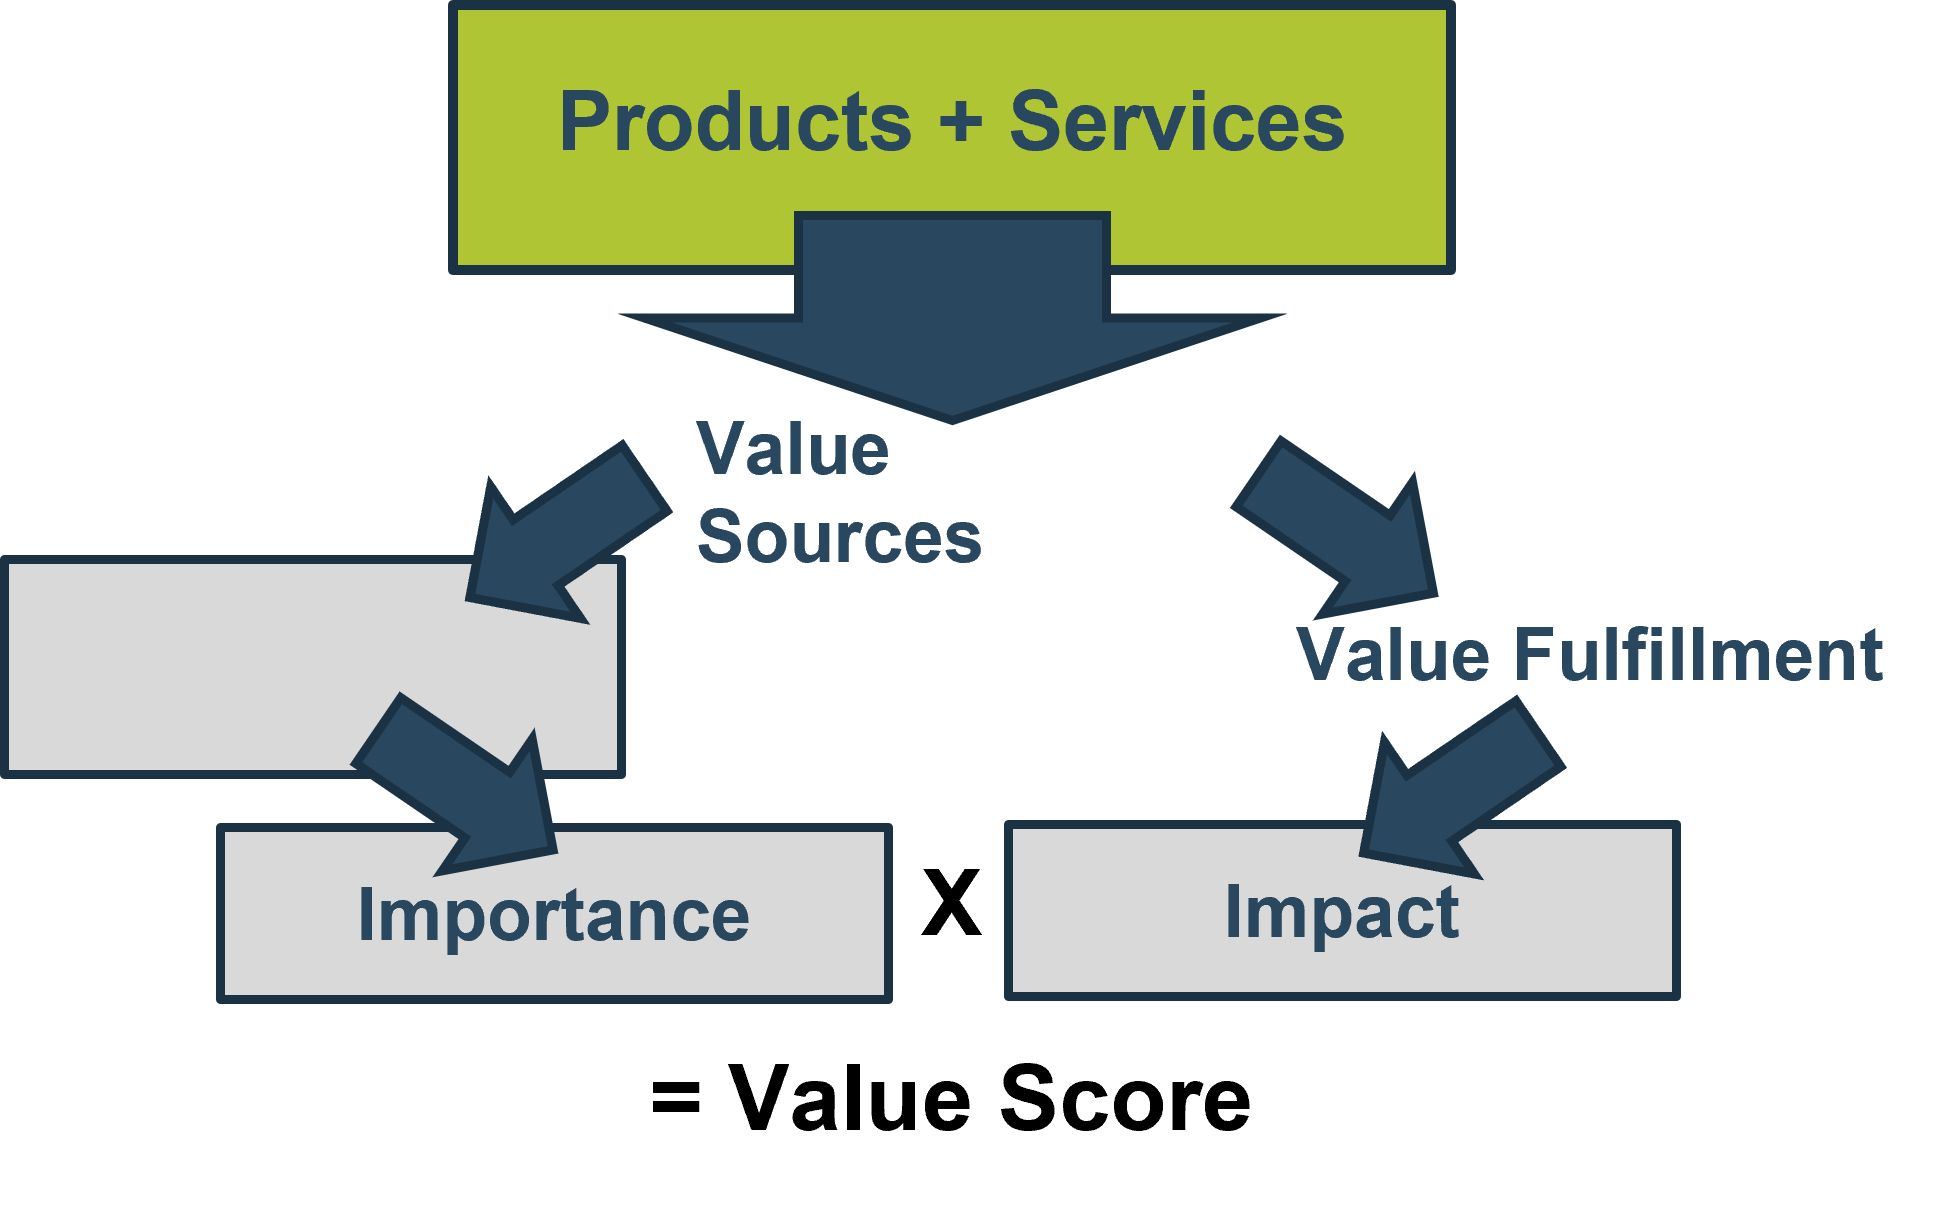
A balanced and weighted scorecard allows you to measure the various ways products generate value to the business
The Info-Tech approach to measuring value applies the balanced value scorecard approach.
|
Importance of value source |
X |
Impact of value source |
= Value Score |
|
Which is based on… |
Which is based on… |
||
|
Alignment to value driver |
Realistic targets for the KPI |
||
|
Which is weighed by… |
Which is estimated by… |
||
|
A 1-5 scale of the relative importance of the value driver to the organization |
A 1-5 scale of the application or feature’s ability to fulfill that value source |
|
+ |
Importance of Value Source |
X |
Impact of Value Source |
|
+ |
Importance of Value Source |
+ |
Impact of Value Source |
|
+ |
Importance of Value Source |
+ |
Impact of Value Source |
|
+ |
Importance of Value Source |
+ |
Impact of Value Source |
|
= |
Balanced Business Value Score |
||
Value Score1 + VS2 + … + VSN = Overall Balance Value Score
Value scores help support decisions. This blueprint looks specifically at four use cases for value scores.
A value score is an input to the following activities:
- Prioritize Your Product Backlog
- Prioritize Your Project Backlog
- Rationalize Your Applications
- Categorize Application Tiers
Estimate the relative value of different product backlog items (i.e. epics, features, etc.) to ensure the highest value items are completed first.
This blueprint can be used as an input into Info-Tech’s Build a Better Backlog.
Estimate the relative value of proposed new applications or major changes or enhancements to existing applications to ensure the right projects are selected and completed first.
This blueprint can be used as an input into Info-Tech’s Optimize Project Intake, Approval, and Prioritization.
Gauge the relative value from the current use of your applications to support strategic decision making such as retirement, consolidation, and further investments.
This blueprint can be used as an input into Info-Tech’s Visualize Your Application Portfolio Strategy With a Business Value-Driven Roadmap.
Gauge the relative value of your existing applications to distinguish your most to least important systems and build tailored support structures that limit the downtime of key value sources.
This blueprint can be used as an input into Info-Tech’s Streamline Application Maintenance.
The priorities, metrics, and a common understanding of value in your VMF carry over to many other Info-Tech blueprints
Transition to Product Delivery
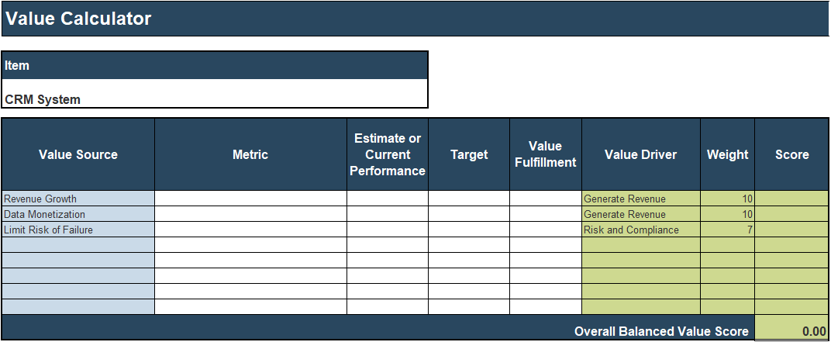
Use Info-Tech’s Value Calculator
The Value Calculator facilitates the activities surrounding defining and measuring the business value of your products and services.
Use this tool to:
- Weigh the importance of each Value Driver based on established organizational priorities.
- Create a repository for Value Sources to provide consistency throughout each measurement.
- Produce an Overall Balanced Value Score for a specific item.
Info-Tech Deliverable
Populate the Value Calculator as you complete the activities and steps on the following slides.
Limitations of the Value Measurement Framework
"All models are wrong, but some are useful."
– George E.P. Box, 1979
Value is tricky: Value can be intangible, ambiguous, and cause all sorts of confusion, with the multiple, and often conflicting, priorities any organization is sure to have. You won’t likely come to a unified understanding of value or an agreement on whether one thing is more valuable than something else. However, this doesn’t mean you shouldn’t try. The VMF provides a means to organize various priorities in a meaningful way and to assess the relative value of a product or service to guide managers and decision makers on the right track and keep alignment with the rest of the organization.
Relative value vs. ROI: This assessment produces a score to determine the value of a product or service relative to other products or services. Its primary function is to prioritize similar items (projects, epics, requirements, etc.) as opposed to producing a monetary value that can directly justify cost and make the case for a positive ROI.
Apply caution with metrics: We live in a metric-crazed era, where everything is believed to be measurable. While there is little debate over recent advances in data, analytics, and our ability to trace business activity, some goals are still quite intangible, and managers stumble trying to link these goals to a quantifiable data source.
In applying the VMF Info-Tech urges you to remember that metrics are not a magical solution. They should be treated as a tool in your toolbox and are sometimes no more than a rough gauge of performance. Carefully assign metrics to your products and services and do not disregard the informed subjective perspective when SMART metrics are unavailable.
"One of the deadly diseases of management is running a company on visible figures alone."
– William Edwards Deming, 1982
Info-Tech’s Build a Value Measurement Framework glossary of terms
This blueprint discusses value in a variety of ways. Use our glossary of terms to understand our specific focus.
|
Value Measurement Framework (VMF) |
A method of measuring relative value for a product or service, or the various components within a product or service, through the use of metrics and weighted organizational priorities. |
|
Value Driver |
A board organizational goal that acts as a category for many value sources. |
|
Value Source |
A specific business goal or outcome that business and product or service capabilities are designed to fulfill. |
|
Value Fulfillment |
The degree to which a product or service impacts a business outcome, ideally linked to a metric. |
|
Value Score |
A measurement of the value fulfillment factored by the weight of the corresponding value driver. |
|
Overall Balanced Value Score |
The combined value scores of all value sources linked to a product or service. |
|
Relative Value |
A comparison of value between two similar items (i.e. applications to applications, projects to projects, feature to feature). |
Info-Tech offers various levels of support to best suit your needs
DIY Toolkit
“Our team has already made this critical project a priority, and we have the time and capability, but some guidance along the way would be helpful.”
Guided Implementation
“Our team knows that we need to fix a process, but we need assistance to determine where to focus. Some check-ins along the way would help keep us on track.”
Workshop
“We need to hit the ground running and get this project kicked off immediately. Our team has the ability to take this over once we get a framework and strategy in place.”
Consulting
“Our team does not have the time or the knowledge to take this project on. We need assistance through the entirety of this project.”
Diagnostics and consistent frameworks used throughout all four options
Build a Value Measurement Framework – project overview
|
1. Define Your Value Drivers |
2. Measure Value |
|
|
Best-Practice Toolkit |
1.1 Identify your business value authorities. 2.1 Define your value drivers. 2.2 Weigh your value drivers. |
|
|
Guided Implementations |
Identify the stakeholders who should be the authority on business value. Identify, define, and weigh the value drivers that will be used in your VMF and all proceeding value measurements. |
Identify the stakeholders who are the subject matter experts for your products or services. Measure the value of your products and services with value sources, fulfillment, and drivers. |
|
Outcome:
|
Outcome:
|
Phase 1
Define Your Value Drivers
First determine your value drivers and add them to your VMF
One of the main aspects of the VMF is to apply consistent and business-aligned weights to the products or services you will evaluate.
This is why we establish your value drivers first:
- Get the right executive-level “value authorities” to establish the overarching weights.
- Build these into the backbone of the VMF to consistently apply to all your future measurements.
Step 1.1: Identify Value Authorities
Phase 1
1.1: Identify Value Authorities
1.2: Define Value Drivers
Phase 2
2.1: Identify Product or Service SMEs
2.2: Measure Value
This step will walk you through the following activities:
- Identify your authorities on business value.
This step involves the following participants:
- Owners of your value measurement framework
Outcomes of this step
- Your list of targeted individuals to include in Step 2.1
Business value is best defined and measured by the combined effort and perspective of both IT and the business
Buy-in for your IT strategy comes from the ability to showcase value. IT needs to ensure it has an aligned understanding of what is valuable to the organization. First, priorities need to be established by the business. Second, IT can build a partnership with the business to determine what that value means in the context of IT products and services.
|
The Business |
What the Business and IT have in common |
IT |
|---|---|---|
|
Keepers of the organization’s mission, vision, and value statements that define IT success. The business maintains the overall ownership and evaluation of the products along with those most familiar with the capabilities or processes enabled by technology. |
Business Value of Products and Services |
Technical subject matter experts of the products and services they deliver and maintain. Each IT function works together to ensure quality products and services are delivered up to stakeholder expectations. |
Engage key stakeholders to reach a consensus on organizational priorities and value drivers
Engage these key players to create your value drivers:
CEO: Who better holds the vision or mandate of the organization than its leader? Ideally, they are front and center for this discussion.
CIO: IT must ensure that technical/practical considerations are taken into account when determining value.
CFO: The CFO or designated representative will ensure that estimated costs and benefits can be used to manage the budgets.
VPs: Application delivery and mgmt. is designed to generate value for the business. Senior management from business units must help define what that value is.
Evaluators (PMO, PO, APM, etc.): Those primarily responsible for applying the VMF should be present and active in identifying and carefully defining your organization’s value drivers.
Steering Committee: This established body, responsible for the strategic direction of the organization, is really the primary audience.
Identify your authorities of business value to identify, define, and weigh value drivers
1.1 Estimated Time: 15 minutes
The objective of this exercise is to identify key business stakeholders involved in strategic decision making at an organizational level.
- Review your organization’s governance structure and any related materials.
- Identify your key business stakeholders. These individuals are the critical business strategic partners.
- Target those who represent the business at an organizational level and often comprise the organization’s governing bodies.
- Prioritize a product backlog – include product owners and product managers who are in tune with the specific value drivers of the product in question.
INFO-TECH TIP
If your organization does not have a formal governance structure, your stakeholders would be the key players in devising business strategy. For example:
- CEO
- CFO
- BRMs
- VPs
Leverage your organizational chart, governing charter, and senior management knowledge to better identify key stakeholders.
INPUT
- Key decision maker roles
OUTPUT
- Targeted individuals to define and weigh value drivers
Materials
- N/A
Participants
- Owner of the value measurement framework
Step 1.2: Define Value Drivers
Phase 1
1.1: Identify Value Authorities
1.2: Define Value Drivers
Phase 2
2.1: Identify Product or Service SMEs
2.2: Measure Value
This step will walk you through the following activities:
- Define your value drivers.
- Weigh your value drivers.
This step involves the following participants:
- Owners of your value measurement framework
- Authorities of business value
Outcomes of this step
- A list of your defined and weighted value drivers
Value is based on business needs and vision
Value is subjective. It is defined through the organization’s past achievement and its future objectives.
|
Purpose & Mission |
Past Achievement & Current State |
|
Vision & Future State |
Culture & Leadership |
There must be a consensus view of what is valuable within the organization, and these values need to be shared across the enterprise. Instead of maintaining siloed views and fighting for priorities, all departments must have the same value and purpose in mind. These factors – purpose and mission, past achievement and current state, vision and future state, and culture and leadership – impact what is valuable to the organization.
Value derives from the mission and vision of an organization; therefore, value is unique to each organization
Business value represents what the business needs to do to achieve its target state. Establishing the mission and vision helps identify that target state.
|
Mission |
Vision |
Business Value |
|---|---|---|
|
Why does the company exist?
|
What does the organization see itself becoming?
|
What critical factors fulfill the mission and vision?
|
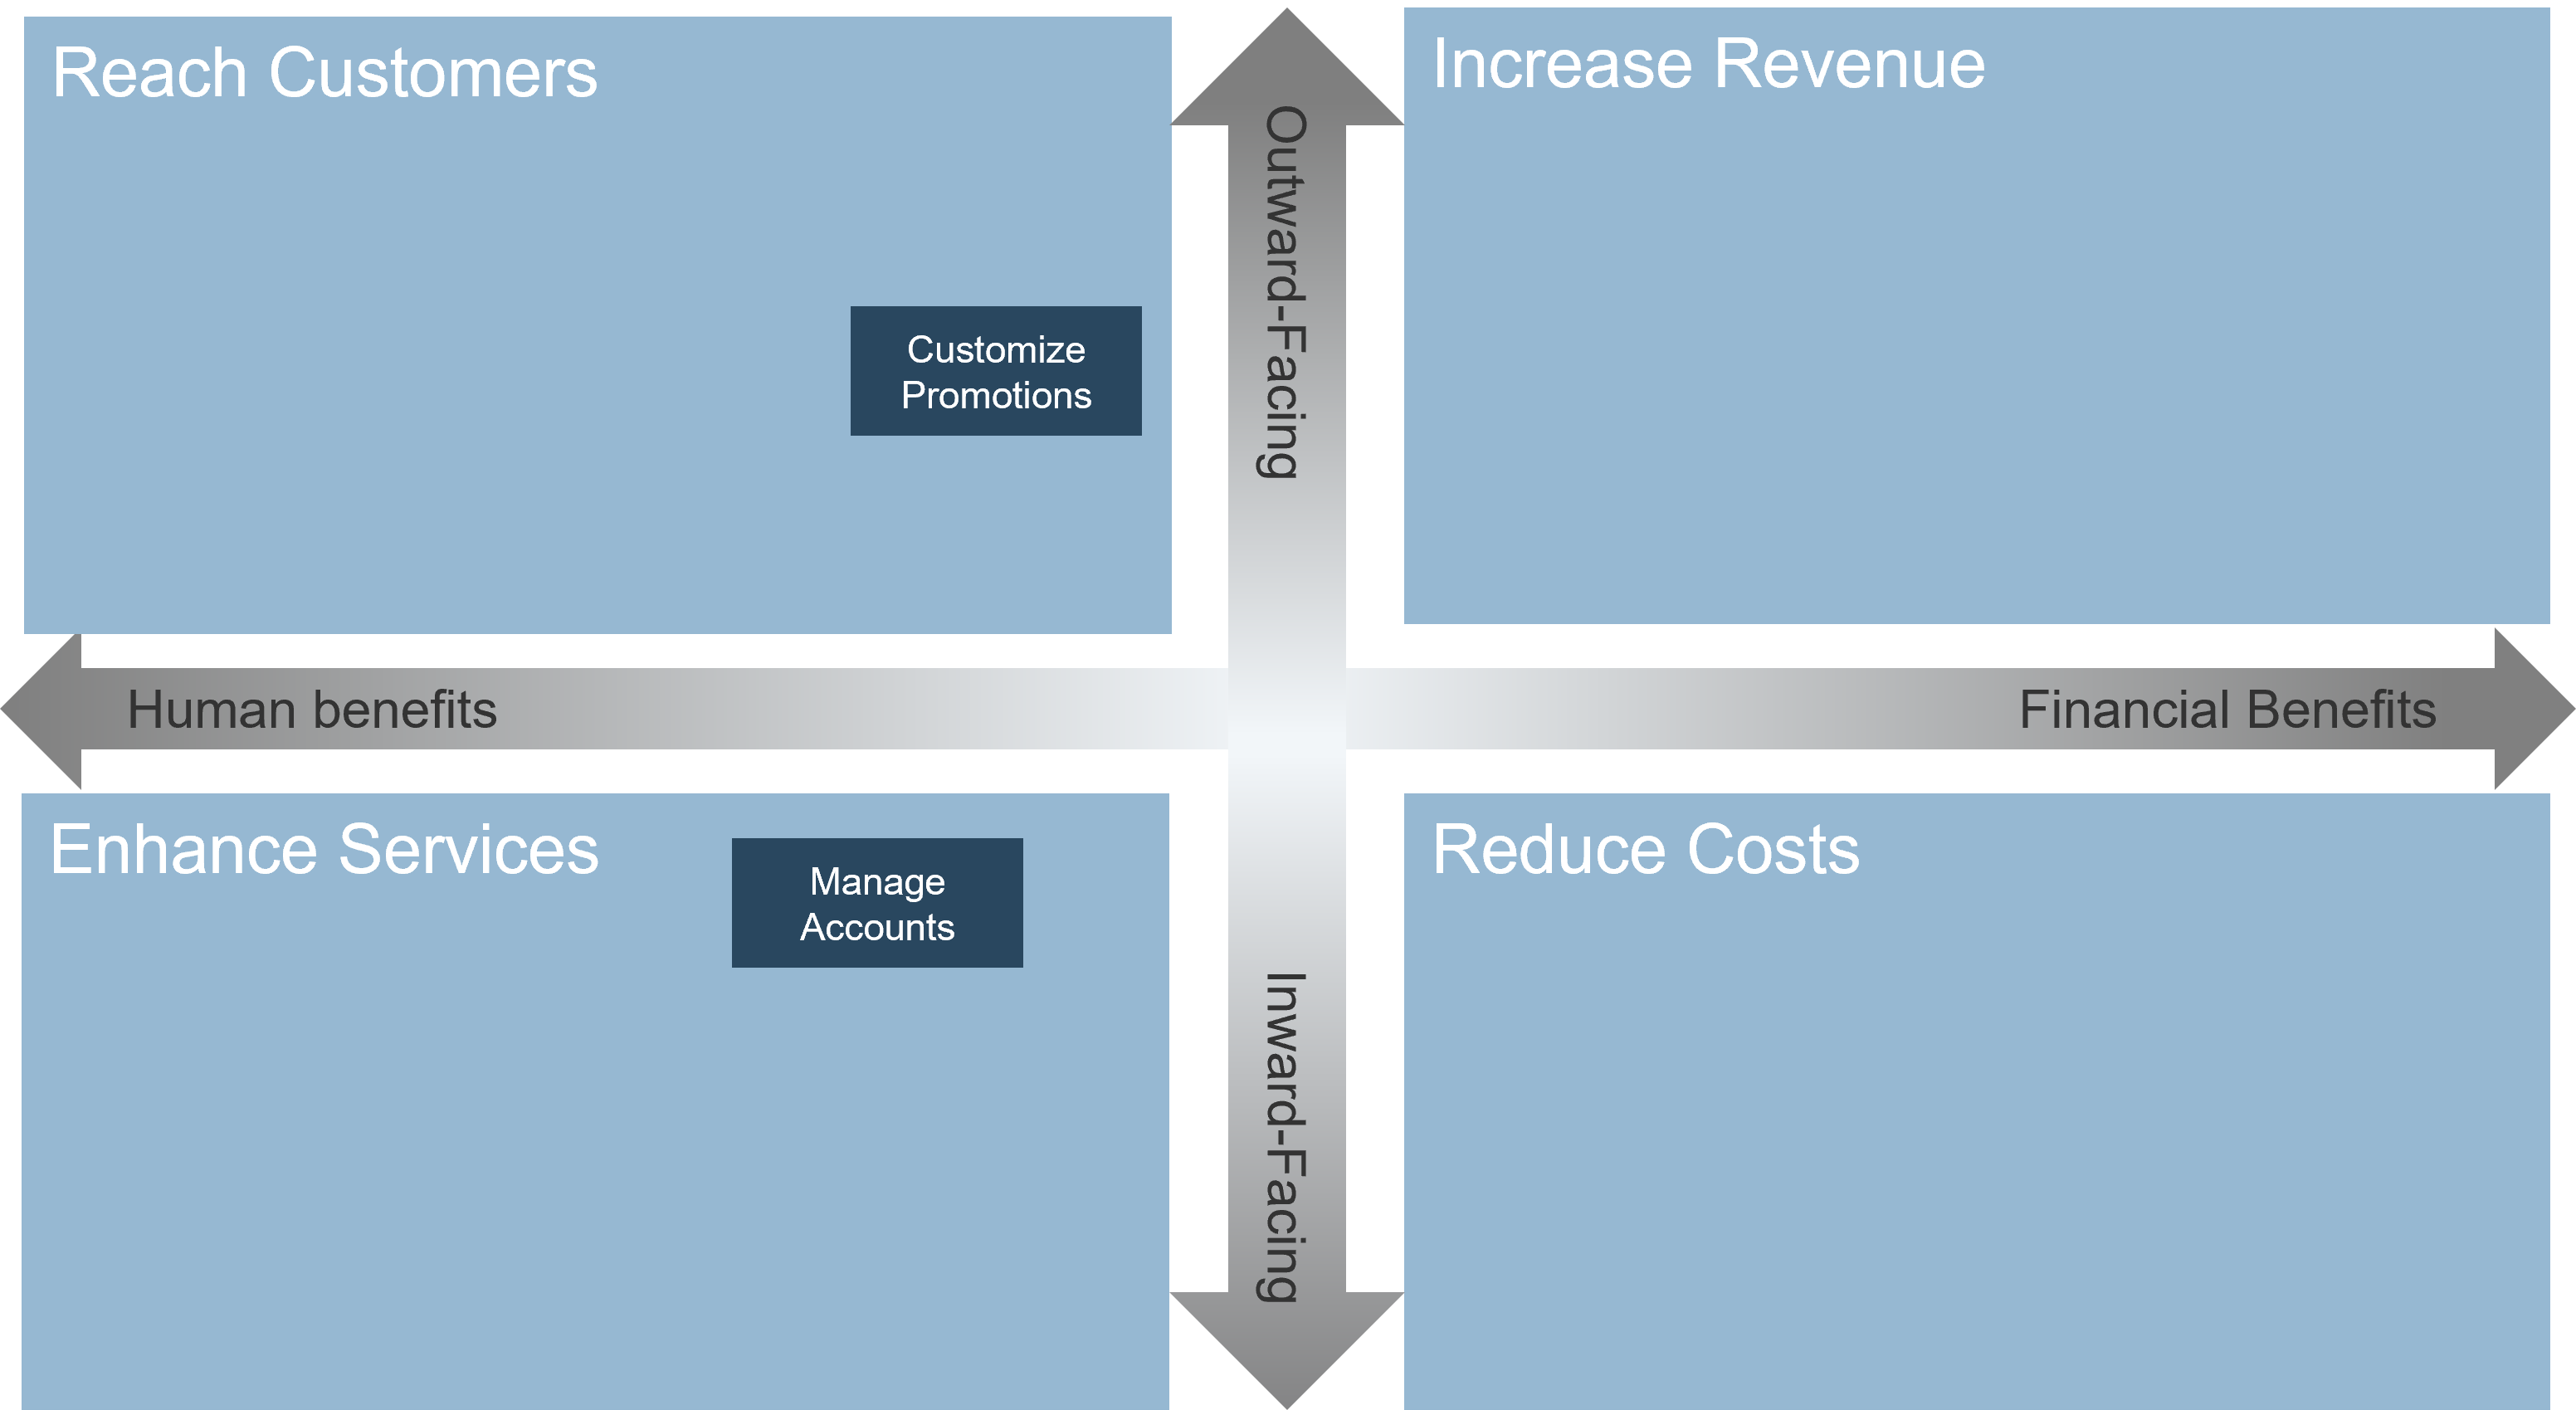
Understand the many types of value your products or services produce
Competent organizations know that value cannot always be represented by revenue or reduced expenses. However, it is not always apparent how to envision the full spectrum of value sources. Dissecting value by the benefit type and the value source’s orientation allows you to see the many ways in which a product or service brings value to the organization.
Financial Benefits vs. Improved Capabilities
Financial Benefits refers to the degree to which the value source can be measured through monetary metrics and is often quite tangible. Human Benefits refers to how a product or service can deliver value through a user’s experience.
Inward vs. Outward Orientation
Inward refers to value sources that have an internal impact and improve your organization’s effectiveness and efficiency in performing its operations. Outward refers to value sources that come from your interaction with external factors, such as the market or your customers.
|
Increase Revenue |
Reduce Costs |
Enhance Services |
Reach Customers |
|---|---|---|---|
|
Product or service functions that are specifically related to the impact on your organization’s ability to generate revenue. |
Reduction of overhead. They typically are less related to broad strategic vision or goals and more simply limit expenses that would occur had the product or service not been put in place. |
Functions that enable business capabilities that improve the organization’s ability to perform its internal operations. |
Application functions that enable and improve the interaction with customers or produce market information and insights. |
Expand past Info-Tech’s high-level value quadrants and identify the value drivers specific to your organization
Different industries have a wide range of value drivers. Consider the difference between public and private entities with respect to generating revenue or reaching their customers or other external stakeholders. Even organizations in the same industry may have different values. For example, a mature, well-established manufacturer may view reputation and innovation as its highest-priority values, whereas a struggling manufacturer will see revenue or market share growth as its main drivers.
Value Drivers | |||
|---|---|---|---|
Increase Revenue | Reduce Costs | Enhance Services | Reach Customers |
|
|
|
|
You do not need to dissect each quadrant into an exhaustive list of value drivers. Info-Tech recommends defining distinct value drivers only for the areas you’ve identified as critical to your organization’s core goals and objectives.
Understand value drivers that enable revenue growth
|
Direct Revenue This value driver is the ability of a product or service to directly produce revenue through core revenue streams. Can be derived from:
Be aware of the differences between your products and services that enable a revenue source and those that facilitate the flow of capital. |
Funding This value driver is the ability of a product or service to enable other types of funding unrelated to core revenue streams. Can be derived from:
Be aware of the difference between your products and services that enable a revenue source and those that facilitate the flow of capital. |
|
Scale & Growth In essence, this driver can be viewed as the potential for growth in market share or new developing revenue sources. Does the product or service:
Be cautious of which items you identify here, as many innovative activities may have some potential to generate future revenue. Stick to those with a strong connection to future revenue and don’t qualify for other value driver categories. |
Monetization of Assets This value driver is the ability of your products and services to generate additional assets. Can be derived from:
This value source is often overlooked. If given the right attention, it can lead to a big win for IT’s role in the business. |
Understand value drivers that reduce costs
|
Cost Reduction A cost reduction is a “hard” cost saving that is reflected as a tangible decrease to the bottom line. This can be derived from reduction of expenses such as:
Cost reduction plays a critical role in an application’s ability to increase efficiency. |
Cost Avoidance A cost avoidance is a “soft” cost saving, typically achieved by preventing a cost from occurring in the first place (i.e. risk mitigation). Cost avoidance indirectly impacts the bottom line. This can be derived from prevention of expenses by:
|
Understand the value drivers that enhance your services
|
Enable Core Operations Some applications are in place to facilitate and support the structure of the organization. These vary depending on the capabilities of your organization but should be assessed in relation to the organization’s culture and structure.
This example is intentionally broad, as “core operations” should be further dissected to define different capabilities with ranging priority. |
Compliance A product or service may be required in order to meet a regulatory requirement. In these cases, you need to be aware of the organizational risk of NOT implementing or maintaining a service in relation to those risks. In this case, the product or service is required in order to:
|
|
Internal Improvement An application’s ability to create value outside of its core operations and facilitate the transfer of information, insights, and knowledge. Value can be derived by:
|
Innovation Innovation is typically an ill-defined value driver, as it refers to the ability of your products and services to explore new value streams. Consider:
Innovation is one of the more divisive value drivers, as some organizations will strive to be cutting edge and others will want no part in taking such risks. |
Understand business value drivers that connect the business to your customers
|
Policy Products and services can also be assessed in relation to whether they enable and support policies of the organization. Policies identify and reinforce required processes, organizational culture, and core values. Policy value can be derived from:
|
Experience Applications are often designed to improve the interaction between customer and product. This value type is most closely linked to product quality and user experience. Customers, in this sense, can also include any stakeholders who consume core offerings. Customer experience value can be derived from:
|
|
Customer Information Understanding demand and customer trends is a core driver for all organizations. Data provided through understanding the ways, times, and reasons that consumers use your services is a key driver for growth and stability. Customer information value can be achieved when an app:
|
Trust & Reputation Products and services are designed to enable goals of digital ethics and are highly linked to your organization’s brand strategy. Trust and reputation can also be described as:
Prioritizing this value source is critical, as traditional priorities can often come at the expense of trust and reputation. |
Define your value drivers
1.2 Estimated Time: 1.5 hours
The objective of this exercise is to establish a common understanding of the different values of the organization.
- Place your business value authorities at the center of this exercise.
- Collect all the documents your organization has on the mission and vision, strategy, governance, and target state, which may be defined by enterprise architecture.
- Identify the company mission and vision. Simply transfer the information from the mission and vision document into the appropriate spaces in the business value statement.
- Determine the organization’s business value drivers. Use the mission and vision, as well as the information from the collected documents, to formulate your own idea of business values.
- Use value driver template on the next slide to define the value driver, including:
- Value Driver Name
- Description
- Related Business Capabilities – If available, review business architecture materials, such as business capability maps.
- Established KPI and Targets – If available, include any organization-wide established KPIs related to your value driver. These KPIs will likely be used or influence the metrics eventually assigned to your applications.
INPUT
- Mission, vision, value statements
OUTPUT
- List and description of value drivers
Materials
- Whiteboard
- Markers
Participants
- Business value authorities
- Owner of value measurement framework
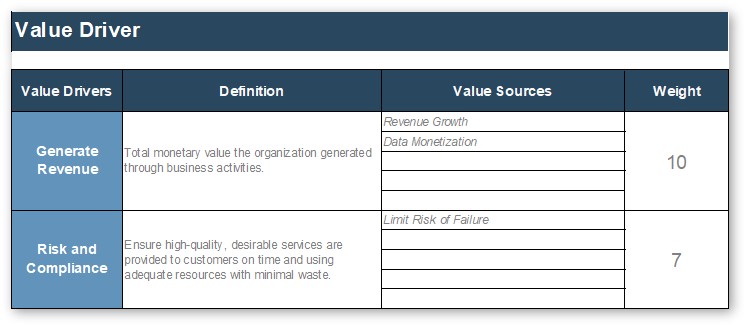
Example Value Driver
Value Driver Name Reach Customers | Value Driver Description Our organization’s ability to provide quality products and experience to our core customers | Value Driver Weight 10/10 |
Related Business Capabilities
| Key Business Outcomes, KPIs, and Targets
| |
Weigh your value drivers
1.3 Estimated Time: 30 minutes
The objective of this exercise is to prioritize your value drivers based on their relative importance to the business.
- Again, place the business value authorities at the center of this exercise.
- In order to determine priority, divide 100% among your value drivers, allocating a percentage to each based on its relative importance to the organization.
- Normalize those percentages on to a scale of 1 to 10, which will act as the weights for your value drivers.
INPUT
- Mission, vision, value statements
OUTPUT
- Weights for value drivers
Materials
- Whiteboard
- Markers
Participants
- Business value authorities
- Owner of value measurement framework
Weigh your value drivers
1.3 Estimated Time: 30 minutes
Value Driver | Percentage Allocation | 1 to 10 Weight |
|---|---|---|
Revenue and other funding | 24% | 9 |
Cost reduction | 8% | 3 |
Compliance | 5% | 2 |
Customer value | 30% | 10 |
Operations | 13% | 7 |
Innovation | 5% | 2 |
Sustainability and social responsibility | 2% | 1 |
Internal learning and development | 3% | 1 |
Future growth | 10% | 5 |
Total | 100% |
Carry results over to the Value Calculator
1.3
Document results of this activity in the “Value Drivers” tab of the Value Calculator.
List your value drivers.
Define or describe your value drivers.
Use this tool to create a repository for value sources to reuse and maintain consistency across your measurements.
Enter the weight of each value driver in terms of importance to the organization.
Phase 2
Measure Value
Step 2.1: Identify Product or Service SMEs
Phase 1
1.1: Identify Value Authorities
1.2: Define Value Drivers
Phase 2
2.1: Identify Product or Service SMEs
2.2: Measure Value
This step will walk you through the following activities:
- Identify your product or service SMEs.
- List your product or services items and components.
This step involves the following participants:
- Owners of your value measurement framework
- Product or service SMEs
Outcomes of this step
- Your list of targeted individuals to include in Step 2.2
Identify the products and services you are evaluating and break down their various components for the VMF
In order to get a full evaluation of a product or service you need to understand its multiple facets, functions, features capabilities, requirements, or any language you use to describe its various components.
Decompose a product or service:
- Get the right subject matter experts in place who know the business and technical aspects of the product or service.
- Decompose the product or service to capture all necessary components.
Before beginning, consider how your use case will impact your value measurement approach
This table looks at how the different use cases of the VMF call for variations of this analysis, is directed at different roles, and relies on participation from different subject matter experts to provide business context.
|
Use Case (uses of the VMF applied in this blueprint) |
Value (current vs. future value) |
Item (the singular entity you are producing a value score for) |
Components (the various facets of that entity that need to be considered) |
Scope (# of systems undergoing analysis) |
Evaluator (typical role responsible for applying the VMF) |
Cadence (when and why do you apply the VMF) |
Information Sources (what documents, tools, etc., do you need to leverage) |
SMEs (who needs to participate to define and measure value) |
|---|---|---|---|---|---|---|---|---|
|
1. Prioritize Your Product Backlog |
You are estimating future value of proposed changes to an application. |
Product backlog items (epic, feature, etc.) in your product backlog |
|
A product |
Product owner |
Continuously apply the VMF to prioritize new and changing product backlog items. |
|
Product manager ???? |
|
2. Prioritize Your Project Backlog |
Proposed projects in your project backlog |
|
Multiple existing and/or new applications |
Project portfolio manager |
Apply the VMF during your project intake process as new projects are proposed. |
|
Project manager Product owners Business analysts |
|
|
3. Application Rationalization |
You are measuring current value of existing applications and their features. |
An application in your portfolio |
The uses of the application (features, function, capabilities) |
A subset of applications or the full portfolio |
Application portfolio manager |
During an application rationalization initiative:
|
|
Business process owners Business unit representatives Business architects Application architects Application SMEs |
|
4. Application Categorization |
The full portfolio |
Application maintenance or operations manager |
|
Identify your product or service SMEs
2.1 Estimated Time: 15 minutes
The objective of this exercise is to identify specific business stakeholders who can speak to the business outcomes of your applications at a functional level.
- Review your related materials that reference the stakeholders for the scoped products and services (i.e. capability maps, org charts, stakeholder maps).
- Identify your specific business stakeholders and application SMEs. These individuals represent the business at a functional level and are in tune with the business outcomes of their operations and the applications that support their operations.
- Use Case 1 – Product Owner, Product Manager
- Use Case 2 – Project Portfolio Manager, Project Manager, Product Owners, Business Process Owners, Appropriate Business Unit Representatives
- Use Case 3 – Application Portfolio Manager, Product Owners, Business Analysts, Application SMEs, Business Process Owners, Appropriate Business Unit Representatives
- Use Case 4 – Application Maintenance Manager, Operations Managers, Application Portfolio Manager, Product Owners, Application SMEs, Business Process Owners, Appropriate Business Unit Representatives
INPUT
- Specific product or service knowledge
OUTPUT
- Targeted individuals to measure specific products or services
Materials
- Whiteboard
- Markers
Participants
- Owner of value measurement framework
Use Case 1: Collect and review all of the product backlog items
Prioritizing your product backlog (epics, features, etc.) requires a consistent method of measuring the value of your product backlog items (PBIs) to continuously compare their value relative to one another. This should be treated as an ongoing initiative as new items are added and existing items change, but an initial introduction of the VMF will require you to collect and analyze all of the items in your backlog.
Regardless of producing a value score for an epic, feature, or user story, your focus should be on identifying their various value sources. Review your product’s artifact documentation, toolsets, or other information sources to extract the business outcomes, impact, benefits, KPIs, or any other description of a value source.
|
High |
Epics Carefully valuated with input from multiple stakeholders, using metrics and consistent scoring |
|
Level of valuation effort per PBI |
User Stories Collaboratively valuated by the product owner and teams based on alignment and traceability to corresponding epic or feature |
|
Low |
Raw Ideas Intuitively valuated by the product owner based on alignment to product vision and organization value drivers |
What’s in your backlog?
You may need to create standards for defining and measuring your different PBIs. Traceability can be critical here, as defined business outcomes for features or user stories may be documented at an epic level.
Additional Research
Build a Better Backlog helps you define and organize your product backlog items.
Use Case 2: Review the scope and requirements of the project to determine all of the business outcomes
Depending on where your project is in your intake process, there should be some degree of stated business outcomes or benefits. This may be a less refined description in the form of a project request or business case document, or it could be more defined in a project charter, business requirements document/toolset, or work breakdown structure (WBS). Regardless of the information source, to make proper use of the VMF you need a clear understanding of the various business outcomes to establish the new or improved value sources for the proposed project.
|
Project |
||
|
User Requirements |
Business Requirements |
System Requirements |
|
1 |
1 |
1 |
|
2 |
2 |
2 |
|
3 |
3 |
|
|
4 |
||
Set Metrics Early
Good project intake documentation begins the discussion of KPIs early on. This alerts teams to the intended value and gives your PMO the ability to integrate it into the workload of other proposed or approved projects.
Additional Research
Use Cases 3 & 4: Ensure you’ve listed all of each application’s uses (functions, features, capabilities, etc.) and user groups
An application can enable multiple capabilities, perform a variety of functions, and have a range of different user groups. Therefore, a single application can produce multiple value sources, which range in type, impact, and significance to the business’ overarching priorities. In order to effectively measure the overall value of an application you need to determine all of the ways in which that application is used and apply a business-downward view of your applications.
Business Capability
- Sub-capability
- Process
- Task
Application
- Module
- Feature
- Function
Aim for Business Use
Simply listing the business capabilities of an app can be too high level. Regardless of your organization’s terminology, you need to establish all of the different uses and users of an application to properly measure all of the facets of its value.
Additional Research
List your product or services items and components
2.2 Estimated Time: 15 minutes
The objective of this exercise is to produce a list of the different items that you are scoring and ensure you have considered all relevant components.
- List each item you intend to produce a value score for:
- Use Case 1 – This may be the epics in your product backlog.
- Use Case 2 – This may be the projects in your project backlog.
- Use Cases 3 & 4 – This may be the applications in your portfolio. For this approach Info-Tech strongly recommends iteratively assessing the portfolio to produce a list of a subset of applications.
- For each item list its various components:
- Use Case 1 – This may be the features or user stories of an epic.
- Use Case 2 – This may be the business requirements of a project.
- Use Cases 3 & 4 – This may be the modules, features, functions, capabilities, or subsystems of an application.
|
Item |
Components |
|---|---|
|
Add Customer Portal (Epic) |
User story #1: As a sales team member I need to process customer info. User story #2: As a customer I want access to… |
|
Transition to the Cloud (Project) |
Requirement #1: Build Checkout Cart NFR – Build integration with data store |
|
CRM (Application) |
Order Processing (module), Returns & Claims (module), Analytics & Reporting (Feature) |
INPUT
- Product or service knowledge
OUTPUT
- Detailed list of items and components
Materials
- Whiteboard
- Markers
Participants
- Owner of value measurement framework
- Product or service SMEs
Use Cases 3 & 4: Create a functional view of your applications (optional)
2.3 Estimated Time: 1 hour
The objective of this exercise is to establish the different use cases of an application.
- Recall the functional requirements and business capabilities for your applications.
- List the various actors who will be interacting with your applications and list the consumers who will be receiving the information from the applications.
- Based on your functional requirements, list the use cases that the actors will perform to deliver the necessary information to consumers. Each use case serves as a core function of the application. See the diagram below for an example.
- Sometimes several use cases are completed before information is sent to consumers. Use arrows to demonstrate the flow of information from one use case to another.
Example: Ordering Products Online
|
Actors Order Customer |
Order Online |
Search Products |
Consumers |
|
Submit Delivery Information |
Order Customer |
||
|
Pay Order |
Bank |
INPUT
- Product or service knowledge
OUTPUT
- Product or service function
Materials
- Whiteboard
- Markers
Participants
- Application architect
- Enterprise architect
- Business and IT stakeholders
- Business analyst
- Development teams
Use Cases 3 & 4: Create a functional view of your applications (optional) (cont’d.)
2.3 Estimated Time: 1 hour
5. Align your application’s use cases to the appropriate business capabilities and stakeholder objectives.
Example:
|
Stakeholder Objective: Automate Client Creation Processes |
Business Capability: Account Management |
Function: Create Client Profile |
|
Function: Search Client Profiles |
||
|
Business Capability: Sales Transaction Management |
Function: Order Online |
Function: Search Products Function: Search Products |
|
Function: Submit Delivery Information |
||
|
Function: Pay Order |
Step 2.2: Measure Value
Phase 1
1.1: Identify Value Authorities
1.2: Define Value Drivers
Phase 2
2.1: Identify Product or Service SMEs
2.2: Measure Value
This step will walk you through the following activities:
- Identify your value sources.
- Align to a value driver.
- Assign metrics and gauge value fulfillment.
This step involves the following participants:
- Owners of your value measurement framework
- Product or service SMEs
Outcomes of this step
- An initial list of reusable value sources and metrics
- Value scores for your products or services
Use your VMF and a repeatable process to produce value scores for all of your items
With your products or services broken down, you can then determine a list of value sources, as well as their alignment to a value driver and a gauge of their value fulfillment, which in turn indicate the importance and impact of a value source respectively.
Lastly, we produce a value score for all items:
- Determine business outcomes and value sources.
- Align to the appropriate value driver.
- Use metrics as the gauge of value fulfillment.
- Collect your score.
- Repeat.
The business outcome is the impact the product or service has on the intended business activity
Business outcomes are the business-oriented results produced by organization’s capabilities and the applications that support those capabilities. The value source is, in essence, “How does the application impact the outcome?” and this can be either qualitative or quantitative.
|
Quantitative |
Qualitative |
||
|---|---|---|---|
|
Key Words |
Examples |
Key Words |
Examples |
|
Faster, cheaper |
Deliver faster |
Better |
Better user experience |
|
More, less |
More registrations per week |
Private |
Enhanced privacy |
|
Increase, decrease |
Decrease clerical errors |
Easier |
Easier to input data |
|
Can, cannot |
Can access their own records |
Improved |
Improved screen flow |
|
Do not have to |
Do not have to print form |
Enjoyable |
Enjoyable user experience |
|
Compliant |
Complies with regulation 12 |
Transparent |
Transparent progress |
|
Consistent |
Standardized information gathered |
Richer |
Richer data availability |
Adapted from Agile Coach Journal.
Measure value – Identify your value sources
2.4 Estimated Time: 30 minutes
The objective of this exercise is to establish the different value sources of a product or service.
- List the items you are producing an overall balance value score for. These can be products, services, projects, applications, product backlog items, epics, etc.
- For each item, list its various business outcomes in the form of a description that includes:
- The item being measured
- Business capability or activity
- How the item impacts said capability or activity
Consider applying the user story format for future value sources or a variation for current value sources.
As a (user), I want to (activity) so that I get (impact)
INPUT
- Product or service knowledge
- Business process knowledge
OUTPUT
- List of value sources
Materials
- Whiteboard
- Markers
Participants
- Owner of value measurement framework
- Product or service SMEs
Measure value – Align to a value driver
2.5 Estimated Time: 30 minutes
The objective of this exercise is to determine the value driver for each value source.
- Align each value source to a value driver. Choose between options A and B.
- Using a whiteboard, draw out a 2 x 2 business value matrix or an adapted version based on your own organizational value drivers. Place each value source in the appropriate quadrant.
- Increase Revenue
- Reduce Costs
- Enhance Services
- Reach Customers
- Using a whiteboard or large sticky pads, create a section for each value driver. Place each value source with the appropriate value driver.
INPUT
- Product or service knowledge
- Business process knowledge
OUTPUT
- Value driver weight
Materials
- Whiteboard
- Markers
Participants
- Owner of value measurement framework
- Product or service SMEs
Brainstorm the different sources of business value (cont’d.)
2.5
Example:
Carry results over to the Value Calculator
2.5
Document results of this activity in the Value Calculator in the Item {#} tab.
List your Value Sources
Your Value Driver weights will auto-populate
Aim, but do not reach, for SMART metrics
Creating meaningful metrics
S pecific
M easureable
A chievable
R ealisitic
T ime-based
Follow the SMART framework when adding metrics to the VMF.
The intention of SMART goals and metrics is to make sure you have chosen a gauge that will:
- Reflect the actual business outcome or value source you are measuring.
- Ensure all relevant stakeholders understand the goals or value you are driving towards.
- Ensure you actually have the means to capture the performance.
Info-Tech Insight
Metrics are NOT a magical solution. They should be treated as a tool in your toolbox and are sometimes no more than a rough gauge of performance. Carefully assign metrics to your products and services and do not disregard the informed subjective perspective when SMART metrics are unavailable.
Info-Tech Best Practice
One last critical consideration here is the degree of effort required to collect the metric compared to the value of the analysis you are performing. Assessing whether or not to invest in a project should apply the rigor of carefully selecting and measuring value. However, performing a rationalization of the full app portfolio will likely lead to analysis paralysis. Taking an informed subjective perspective may be the better route.
Measure value – Assign metrics and gauge value fulfillment
2.6 30-60 minutes
The objective of this exercise is to determine an appropriate metric for each value source.
- For each value source assign a metric that will be the unit of measurement to gauge the value fulfilment of the application.
- Review the product or services performance with the metric
- Use case 1&2 (Proposed Applications and/or Features) - You will need to estimate the degree of impact the product or services will have on your selected metric.
- Use case 3&4 (Existing Applications and/or Features) – You can review historically how the product or service has performed with your selected metric
- Determine a value fulfillment on a scale of 1 – 10.
10 = The product or service far exceeds expectations and targets on the metric.
5 = the product or service meets expectations on this metric.
1 = the product or service underperforms on this metric.
INPUT
- Product or service knowledge
- Business process knowledge
OUTPUT
- Value driver weight
Materials
- Whiteboard
- Markers
Participants
- Owner of value measurement framework
- Product or service SMEs
Carry results over to the Value Calculator
2.6
Document results of this activity in the Value Calculator in the Item {#} tab.
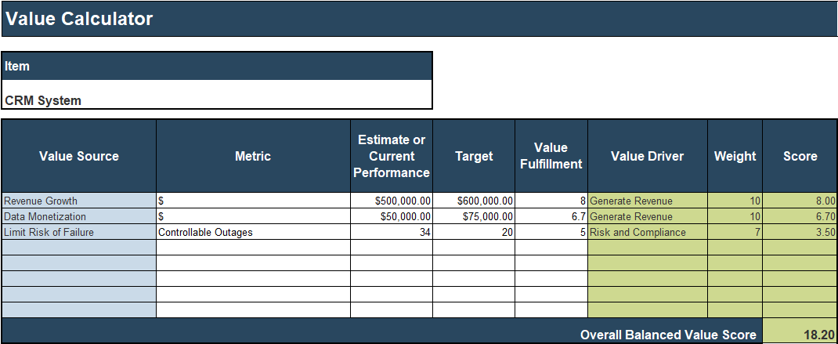
Assign Metrics.
Consider using current or estimated performance and targets.
Assess the impact on the value source with the value fulfillment.
Collect your Overall Balanced Value Score
Appendix
Bibliography
Brown, Alex. “Calculating Business Value.” Agile 2014 Orlando – July 13, 2014. Scrum Inc. 2014. Web. 20 Nov. 2017.
Brown, Roger. “Defining Business Value.” Scrum Gathering San Diego 2017. Agile Coach Journal. Web.
Curtis, Bill. “The Business Value of Application Internal Quality.” CAST. 6 April 2009. Web. 20 Nov. 2017.
Fleet, Neville, Joan Lasselle, and Paul Zimmerman. “Using a Balance Scorecard to Measure the Productivity and Value of Technical Documentation Organizations.” CIDM. April 2008. Web. 20 Nov. 2017.
Harris, Michael. “Measuring the Business Value of IT.” David Consulting Group. 20 Nov. 2017.
Intrafocus. “What is a Balanced Scorecard?” Intrafocus. Web. 20 Nov. 2017
Kerzner, Harold. Project Management: A Systems Approach to Planning, Scheduling, and Controlling. 12th ed., Wiley, 2017.
Lankhorst, Marc., et al. “Architecture-Based IT Valuation.” Via Nova Architectura. 31 March 2010. Web. 20 Nov. 2017.
Rachlin, Sue, and John Marshall. “Value Measuring Methodology.” Federal CIO Council, Best Practices Committee. October 2002. Web. April 2019.
Thiagarajan, Srinivasan. “Bridging the Gap: Enabling IT to Deliver Better Business Outcomes.” Cognizant. July 2017. Web. April 2019.