Modernize Your SDLC

  • Buy Link or Shortcode: {j2store}148|cart{/j2store}
  • member rating overall impact (scale of 10): 9.5/10 Overall Impact
  • member rating average dollars saved: $30,263 Average $ Saved
  • member rating average days saved: 39 Average Days Saved
  • Parent Category Name: Development
  • Parent Category Link: /development
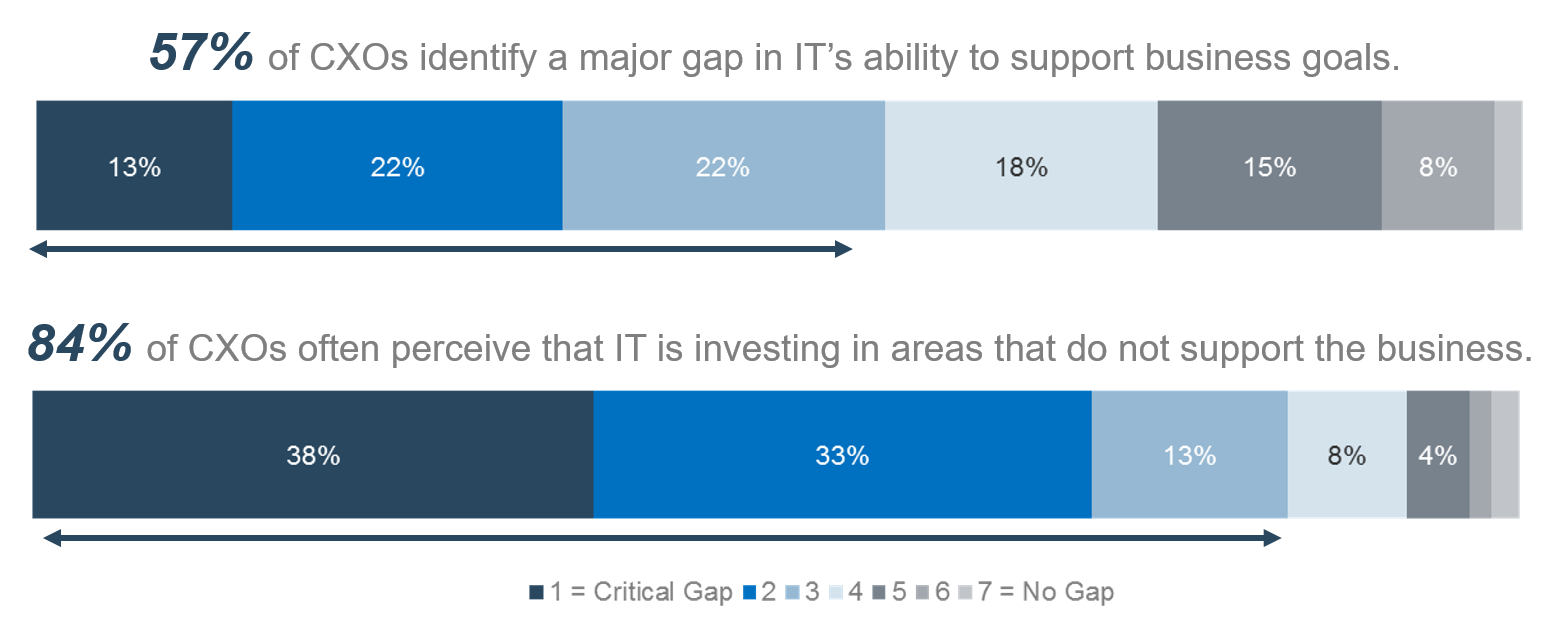
  • Today’s rapidly scaling and increasingly complex products create mounting pressure on delivery teams to release new features and changes quickly and with sufficient quality.
  • Many organizations lack the critical capabilities and resources needed to satisfy their growing backlog, jeopardizing product success.

Our Advice

Critical Insight

  • Delivery quality and throughput go hand in hand. Focus on meeting minimum process and product quality standards first. Improved throughput will eventually follow.
  • Business integration is not optional. The business must be involved in guiding delivery efforts, and ongoing validation and verification product changes.
  • The software development lifecycle (SDLC) must deliver more than software. Business value is generated through the products and services delivered by your SDLC. Teams must provide the required product support and stakeholders must be willing to participate in the product’s delivery.

Impact and Result

  • Standardize your definition of a successful product. Come to an organizational agreement of what defines a high-quality and successful product. Accommodate both business and IT perspectives in your definition.
  • Clarify the roles, processes, and tools to support business value delivery and satisfy stakeholder expectations. Indicate where and how key roles are involved throughout product delivery to validate and verify work items and artifacts. Describe how specific techniques and tools are employed to meet stakeholder requirements.
  • Focus optimization efforts on most affected stages. Reveal the health of your SDLC from the value delivery, business and technical practice quality standards, discipline, throughput, and governance perspectives with a diagnostic. Identify and roadmap the solutions to overcome the root causes of your diagnostic results.

Modernize Your SDLC Research & Tools

Start here – read the Executive Brief

Read our concise Executive Brief to find out why you should modernize your SDLC, review Info-Tech’s methodology, and understand the four ways we can support you in completing this project.

Besides the small introduction, subscribers and consulting clients within this management domain have access to:

1. Set your SDLC context

State the success criteria of your SDLC practice through the definition of product quality and organizational priorities. Define your SDLC current state.

  • Modernize Your SDLC – Phase 1: Set Your SDLC Context
  • SDLC Strategy Template

2. Diagnose your SDLC

Build your SDLC diagnostic framework based on your practice’s product and process objectives. Root cause your improvement opportunities.

  • Modernize Your SDLC – Phase 2: Diagnose Your SDLC
  • SDLC Diagnostic Tool

3. Modernize your SDLC

Learn of today’s good SDLC practices and use them to address the root causes revealed in your SDLC diagnostic results.

  • Modernize Your SDLC – Phase 3: Modernize Your SDLC
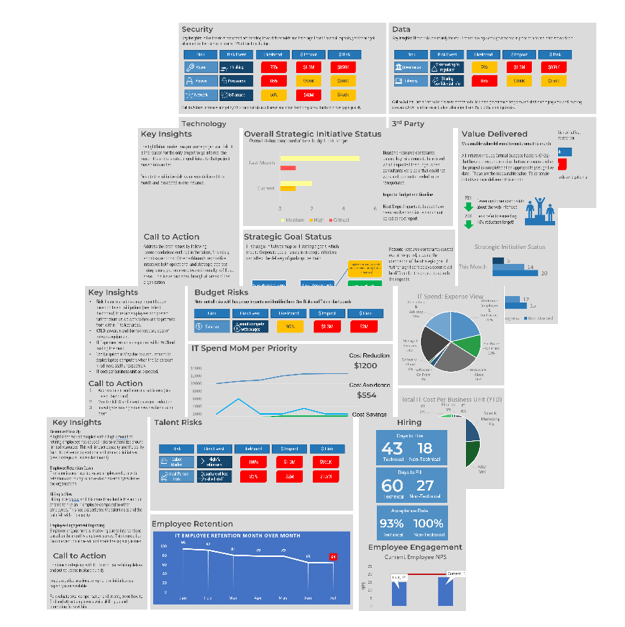
[infographic]

Workshop: Modernize Your SDLC

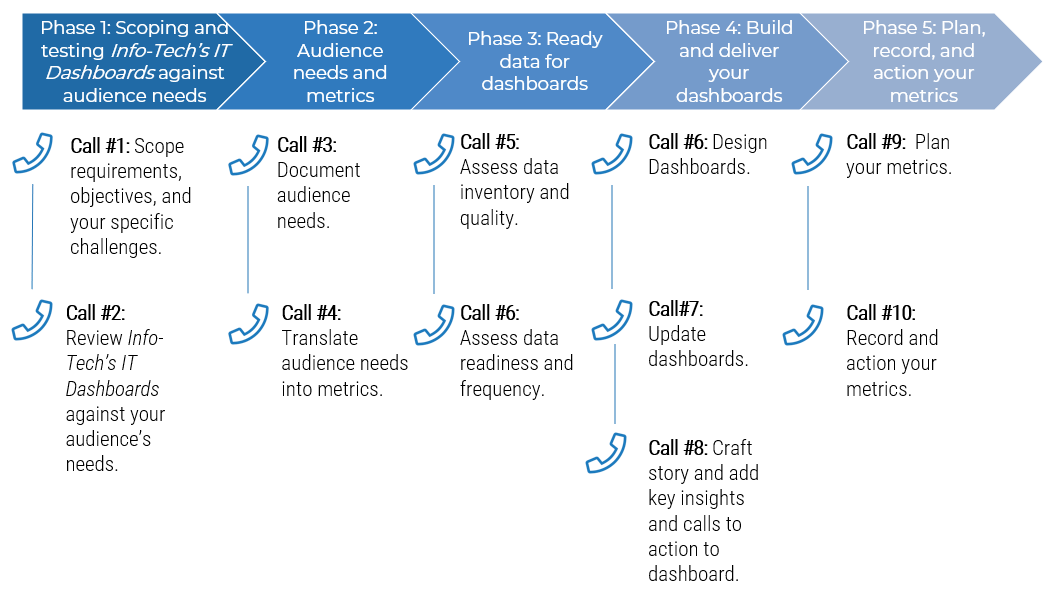
Workshops offer an easy way to accelerate your project. If you are unable to do the project yourself, and a Guided Implementation isn't enough, we offer low-cost delivery of our project workshops. We take you through every phase of your project and ensure that you have a roadmap in place to complete your project successfully.

1 Set Your SDLC Context

The Purpose

Discuss your quality and product definitions and how quality is interpreted from both business and IT perspectives.

Review your case for strengthening your SDLC practice.

Review the current state of your roles, processes, and tools in your organization.

Key Benefits Achieved

Grounded understanding of products and quality that is accepted across the organization.

Clear business and IT objectives and metrics that dictate your SDLC practice’s success.

Defined SDLC current state people, process, and technologies.

Activities

1.1 Define your products and quality.

1.2 Define your SDLC objectives.

1.3 Measure your SDLC effectiveness.

1.4 Define your current SDLC state.

Outputs

Product and quality definitions.

SDLC business and technical objectives and vision.

SDLC metrics.

SDLC capabilities, processes, roles and responsibilities, resourcing model, and tools and technologies.

2 Diagnose Your SDLC

The Purpose

Discuss the components of your diagnostic framework.

Review the results of your SDLC diagnostic.

Key Benefits Achieved

SDLC diagnostic framework tied to your SDLC objectives and definitions.

Root causes to your SDLC issues and optimization opportunities.

Activities

2.1 Build your diagnostic framework.

2.2 Diagnose your SDLC.

Outputs

SDLC diagnostic framework.

Root causes to SDLC issues and optimization opportunities.

3 Modernize Your SDLC

The Purpose

Discuss the SDLC practices used in the industry.

Review the scope and achievability of your SDLC optimization initiatives.

Key Benefits Achieved

Knowledge of good practices that can improve the effectiveness and efficiency of your SDLC.

Realistic and achievable SDLC optimization roadmap.

Activities

3.1 Learn and adopt SDLC good practices.

3.2 Build your optimization roadmap.

Outputs

Optimization initiatives and target state SDLC practice.

SDLC optimization roadmap, risks and mitigations, and stakeholder communication flow.

Develop a Project Portfolio Management Strategy

  • Buy Link or Shortcode: {j2store}331|cart{/j2store}
  • member rating overall impact (scale of 10): 9.4/10 Overall Impact
  • member rating average dollars saved: $111,064 Average $ Saved
  • member rating average days saved: 33 Average Days Saved
  • Parent Category Name: Project Management Office
  • Parent Category Link: /project-management-office
  • As an IT leader, you oversee a project environment in which the organizational demand for new products, services, and enhancements far outweighs IT’s resource capacity to adequately deliver on everything.
  • As a result, project throughput suffers. IT starts a lot of projects, but has constant difficulties delivering the bulk of them on time, on budget, in scope, and of high quality. What’s more, many of the projects that consume IT’s time are of questionable value to the business.
  • You need a project portfolio management (PPM) strategy to help bring order to IT’s project activity. With the right PPM strategy, you can ensure that you’re driving the throughput of the best projects and maximizing stakeholder satisfaction with IT.

Our Advice

Critical Insight

  • IT leaders commonly conflate PPM and project management, falsely believing that they already have a PPM strategy via their project management playbook. While the tactical focus of project management can help ensure that individual projects are effectively planned, executed, and closed, it is no supplement for the insight into “the big picture” that a PPM strategy can provide.
  • Many organizations falter at PPM by mistaking a set of processes for a strategy. While processes are no doubt important, without an end in mind – such as that provided by a deliberate strategy – they inevitably devolve into inertia or confusion.
  • Executive layer buy-in is a critical prerequisite for the success of a PPM strategy. Without it, any efforts to reconcile supply and demand, and improve the strategic value of IT’s project activity, could be quashed by irresponsible, non-compliant stakeholders.

Impact and Result

  • Manage the portfolio as more than just the sum of its parts. Create a coherent strategy to maximize the sum of values that projects deliver as a whole – as a project portfolio, rather than a collection of individual projects.
  • Get to value early. Info-Tech’s methodology tackles one of PPM’s most pressing challenges upfront by helping you to articulate a strategy and get executive buy-in for it before you define your process goals. When senior management understands why a PPM strategy is necessary and of value to them, the path to implementation is much more stable.
  • Create PPM processes you can sustain. Translate your PPM strategy into specific, tangible near-term and long-term goals, which are realized through a suite of project portfolio management processes tailored to your organization and its culture.

Develop a Project Portfolio Management Strategy Research & Tools

Start here – read the Executive Brief

Read our concise Executive Brief to find out why you should develop a project portfolio management strategy, review Info-Tech’s methodology, and understand the four ways we can support you in completing this project.

Besides the small introduction, subscribers and consulting clients within this management domain have access to:

  • Develop a Project Portfolio Management Strategy – Executive Brief
  • Develop a Project Portfolio Management Strategy – Phases 1-3

1. Get executive buy-in for your PPM strategy

Choose the right PPM strategy for your organization and get executive buy-in before you start to set PPM process goals.

  • Develop a Project Portfolio Management Strategy – Phase 1: Get Executive Buy-In for Your PPM Strategy
  • PPM High-Level Supply-Demand Calculator
  • PPM Strategic Plan Template
  • PPM Strategy-Process Goals Translation Matrix Template

2. Align PPM processes to your strategic goals

Use the advice and tools in this phase to align the PPM processes that make up the infrastructure around projects with your new PPM strategy.

  • Develop a Project Portfolio Management Strategy – Phase 2: Align PPM Processes to Your Strategic Goals
  • PPM Strategy Development Tool

3. Complete your PPM strategic plan

Refine your PPM strategic plan with inputs from the previous phases by adding a cost-benefit analysis and PPM tool recommendation.

  • Develop a Project Portfolio Management Strategy – Phase 3: Complete Your PPM Strategic Plan
  • Project Portfolio Analyst / PMO Analyst
[infographic]

Workshop: Develop a Project Portfolio Management Strategy

Workshops offer an easy way to accelerate your project. If you are unable to do the project yourself, and a Guided Implementation isn't enough, we offer low-cost delivery of our project workshops. We take you through every phase of your project and ensure that you have a roadmap in place to complete your project successfully.

1 Get Executive Buy-In for Your PPM Strategy

The Purpose

Choose the right PPM strategy for your organization and ensure executive buy-in.

Set process goals to address PPM strategic expectations and steer the PPM strategic plan.

Key Benefits Achieved

A right-sized PPM strategy complete with executive buy-in for it.

A prioritized list of PPM process goals.

Activities

1.1 Assess leadership mandate.

1.2 Determine potential resource capacity.

1.3 Create a project inventory.

1.4 Prepare to communicate your PPM strategy to key stakeholders.

1.5 Translate each strategic goal into process goals.

1.6 Set metrics and preliminary targets for PPM process goals.

Outputs

Choice of PPM strategy and the leadership mandate

Analysis of current project capacity

Analysis of current project demand

PPM Strategic Plan – Executive Brief

PPM strategy-aligned process goals

Metrics and long-term targets for PPM process goals

2 Align PPM Processes to Your Strategic Goals

The Purpose

Examine your current-state PPM processes and create a high-level description of the target-state process for each of the five PPM processes within Info-Tech’s PPM framework.

Build a sound business case for implementing the new PPM strategy by documenting roles and responsibilities for key PPM activities as well as the time costs associated with them.

Key Benefits Achieved

Near-term and long-term goals as well as an organizationally specific wireframe for your PPM processes.

Time cost assumptions for your proposed processes to ensure sustainability.

Activities

2.1 Develop and refine the project intake, prioritization, and approval process.

2.2 Develop and refine the resource management process.

2.3 Develop and refine the portfolio reporting process.

2.4 Develop and refine the project closure process

2.5 Develop and refine the benefits realization process.

Outputs

Process capability level

Current-state PPM process description

Retrospective examination of the current-state PPM process

Action items to achieve the target states

Time cost of the process at current and target states

3 Complete Your PPM Strategic Plan

The Purpose

Perform a PPM tool analysis in order to determine the right tool to support your processes.

Estimate the total cost-in-use of managing the project portfolio, as well as the estimated benefits of an optimized PPM strategy.

Key Benefits Achieved

A right-sized tool selection to help support your PPM strategy.

A PPM strategy cost-benefit analysis.

Activities

3.1 Right-size the PPM tools for your processes.

3.2 Conduct a cost-benefit analysis of implementing the new PPM strategy.

3.3 Define roles and responsibilities for the new processes.

3.4 Refine and consolidate the near-term action items into a cohesive plan.

Outputs

Recommendation for a PPM tool

Cost-benefit analysis

Roles and responsibilities matrix for each PPM process

An implementation timeline for your PPM strategy

Further reading

Develop a Project Portfolio Management Strategy

Drive IT project throughput by throttling resource capacity.

Analyst Perspective

“Tactics without strategy is the noise before defeat.” – Sun Tzŭ

"Organizations typically come to project portfolio management (PPM) with at least one of two misconceptions: (1) that PPM is synonymous with project management and (2) that a collection of PPM processes constitutes a PPM strategy.

Both foundations are faulty: project management and PPM are separate disciplines with distinct goals and processes, and a set of processes do not comprise a strategy – they should flow from a strategy, not precede one. When built upon these foundations, the benefits of PPM go unrealized, as the means (i.e. project and portfolio processes) commonly eclipse the ends of a PPM strategy – e.g. a portfolio better aligned with business goals, improved project throughput, increased stakeholder satisfaction, and so on.

Start with the end in mind: articulate a PPM strategy that is truly project portfolio in nature, i.e. focused on the whole portfolio and not just the individual parts. Then, let your PPM strategy guide your process goals and help to drive successful outcomes, project after project." (Barry Cousins, Senior Director of Research, PMO Practice, Info-Tech Research Group)

Our understanding of the problem

This Research Is Designed For:

  • CIOs who want to maximize IT’s fulfillment of both business strategic goals and operational needs.
  • CIOs who want to better manage the business and project sponsors’ expectations and satisfaction.
  • CIOs, PMO directors, and portfolio managers who want a strategy to set the best projects for the highest chance of success.

This Research Will Help You:

  • Get C-level buy-in on a strategy for managing the project portfolio and clarify their expectations on how it should be managed.
  • Draft strategy-aligned, high-level project portfolio management process description.
  • Put together a strategic plan for improving PPM processes to reclaim wasted project capacity and increase business satisfaction of IT.

This Research Will Also Assist:

  • Steering committee and C-suite management who want to maximize IT’s value to business.
  • Project sponsors who seek clarity and fairness on pushing their projects through a myriad of priorities and objectives.
  • CIOs, PMO directors, and portfolio managers who want to enable data-driven decisions from the portfolio owners.

This Research Will Help Them:

  • Optimize IT’s added value to the business through project delivery.
  • Provide clarity on how IT’s project portfolio should be managed and the expectations for its management.
  • Improve project portfolio visibility by making trustworthy project portfolio data available, with which to steer the portfolio.

Executive Summary

Situation

  • As CIO, there are too many projects and not enough resource capacity to deliver projects on time, on budget, and in scope with high quality.
  • Prioritizing projects against one another is difficult in the face of conflicting priorities and agenda; therefore, projects with dubious value/benefits consume resource capacity.

Complication

  • Not all IT projects carry a direct value to business; IT is accountable for keeping the lights on and it consumes a significant amount of resources.
  • Business and project sponsors approve projects without considering the scarcity of resource capacity and are frustrated when the projects fail to deliver or linger in the backlog.

Resolution

  • Create a coherent strategy to maximize the total value that projects deliver as a whole portfolio, rather than a collection of individual projects.
  • Ensure that the steering committee or senior executive layer buys into the strategy by helping them understand why the said strategy is necessary, and more importantly, why the strategy is valuable to them.
  • Translate the strategic expectations to specific, tangible goals, which are realized through a suite of project portfolio management processes tailored to your organization and its culture.
  • Putting into place people, processes, and tools that are sustainable and manageable, plus a communication strategy to maintain the stakeholder buy-in.

Info-Tech Insight

  1. Time is money; therefore, the portfolio manager is an accountant of time. It is the portfolio manager’s responsibility to provide the project portfolio owners with reliable data and close the loop on portfolio decisions.
  2. Business satisfaction is driven by delivering projects that align to and maximize business value. Use Info-Tech’s method for developing a PPM strategy and synchronize its definition of “best projects” with yours.

Projects that deliver on strategic goals of the business is the #1 driver of business satisfaction for IT

Info-Tech’s CIO Business Vision Survey (N=21,367) has identified a direct correlation between IT project success and overall business satisfaction with IT.

Comparative rankings of IT services in two columns 'Reported Importance' and 'Actual Importance' with arrows showing where each service moved to in the 'Actual Importance' ranking. The highlighted move is 'Projects' from number 10 in 'Reported' to number 1 in 'Actual'. 'Reported' rankings from 1 to 12 are 'Network Infrastructure', 'Service Desk', 'Business Applications', 'Data Quality', Devices', 'Analytical Capability', 'Client-Facing Technology', 'Work Orders', 'Innovation Leadership', 'Projects', 'IT Policies', and 'Requirements Gathering'. 'Actual' rankings from 1 to 12 are 'Projects', 'Work Orders', 'Innovation Leadership', 'Business Applications', 'Requirements Gathering', 'Service Desk', 'Client-Facing Technology', 'Network Infrastructure', 'Analytical Capability', 'Data Quality', 'IT Policies', and 'Devices'.

Reported Importance: Initially, when CIOs were asked to rank the importance of IT services, respondents ranked “projects” low on the list – 10 out of a possible 12.

Actual Importance: Despite this low “reported importance,” of those organizations that were “satisfied” to “fully satisfied” with IT, the service that had the strongest correlation to high business satisfaction was “projects,” i.e. IT’s ability to help plan, support, and execute projects and initiatives that help the business achieve its strategic goals.

On average, executives perceive IT as being poorly aligned with business strategy

Info-Tech’s CIO Business Vision Survey data highlights the importance of IT projects in supporting the business achieve its strategic goals. However, Info-Tech’s CEO-CIO Alignment Survey (N=124) data indicates that CEOs perceive IT to be poorly aligned to business’ strategic goals:

  • 43% of CEOs believe that business goals are going unsupported by IT.
  • 60% of CEOs believe that improvement is required around IT’s understanding of business goals.
  • 80% of CIOs/CEOs are misaligned on the target role for IT.
  • 30% of business stakeholders* are supporters of their IT departments.
  • (Source: Info-Tech CIO/CEO Alignment Diagnostics, * N=32,536)

Efforts to deliver on projects are largely hampered by causes of project failure outside a project manager’s control

The most recent data from the Project Management Institute (PMI) shows that more projects are meeting their original goals and business intent and less projects are being deemed failures. However, at the same time, more projects are experiencing scope creep. Scope creeps result in schedule and cost overrun, which result in dissatisfied project sponsors, stakeholders, and project workers.

Graph of data from Project Management Institute comparing projects from 2015 to 2017 that 'Met original goals/business intent', 'Experienced scope creep', and were 'Deemed failures'. Projects from the first two categories went up in 2017, while projects that were deemed failures went down.

Meanwhile, the primary causes of project failures remain largely unchanged. Interestingly, most of these primary causes can be traced to sources outside of a project manager’s control, either entirely or in part. As a result, project management tactics and processes are limited in adequately addressing them.

Relative rank

Primary cause of project failure

2015

2016

2017

Trend

Change in organization's priorities 1st 1st 1st Stable
Inaccurate requirements gathering 2nd 3rd 2nd Stable
Change in project objectives 3rd 2nd 3rd Stable
Inadequate vision/goal for project 6th 5th 4th Rising
Inadequate/poor communication 5th 7th 5th Stable
Poor change management 11th 9th 6th Rising
(Source: Project Management Institute, Pulse of the Profession, 2015-2017)

Project portfolio management (PPM) can improve business alignment of projects and reduce chance of project failure

PPM is about “doing the right things.”

The PMI describes PPM as:

Interrelated organizational processes by which an organization evaluates, selects, prioritizes, and allocates its limited internal resources to best accomplish organizational strategies consistent with its vision, mission, and values. (PMI, Standard for Portfolio Management, 3rd ed.)

Selecting and prioritizing projects with the strongest alignment to business strategy goals and ensuring that resources are properly allocated to deliver them, enable IT to:

  1. Improve business satisfaction and their perception of IT’s alignment with the business.
  2. Better engage the business and the project customers.
  3. Minimize the risk of project failure due to changing organizational/ project vision, goals, and objectives.

"In today’s competitive business environment, a portfolio management process improves the linkage between corporate strategy and the selection of the ‘right’ projects for investment. It also provides focus, helping to ensure the most efficient and effective use of available resources." (Lou Pack, PMP, Senior VP, ICF International (PMI, 2015))

PPM is a common area of shortcomings for IT, with much room for improvement

Info-Tech’s IT Management & Governance Survey (N=879) shows that PPM tends to be regarded as neither an effective nor an important process amongst IT organizations.

Two deviation from median charts highlighting Portfolio Management's ranking compared to other IT processes in 'Effectiveness scores' and 'Importance scores'. PPM ranks 37th out of 45 in Effectiveness and 33rd out of 45 in Importance.

55% ... of IT organizations believe that their PPM processes are neither effective nor important.

21% ... of IT organizations reported having no one responsible or accountable for PPM.

62% ... of projects in organizations effective in PPM met/exceeded the expected ROI (PMI, 2015).

In addition to PPM’s benefits, improving PPM processes presents an opportunity for getting ahead of the curve in the industry.

Info-Tech’s methodology for developing a PPM strategy delivers extraordinary value, fast

Our methodology is designed to tackle your hardest challenge first to deliver the highest-value part of the deliverable. For developing a PPM strategy, the biggest challenge is to get the buy-in of the executive layer.

"Without senior management participation, PPM doesn’t work, and the organization is likely to end up with, or return to, a squeaky-wheel-gets-the-grease mindset for all those involved." (Mark Price Perry, Business Driven Project Portfolio Management)

In the first step of the blueprint, you will be guided through the following steps:

  1. Choose the right PPM strategy: driven by the executives, supported by management.
  2. Objectively assess your current project portfolio with minimal effort to build a case for the PPM strategy.
  3. Engage the executive layer to get the critical prerequisite of a PPM strategy: their buy-in.

A PPM strategic plan is the end deliverable of this blueprint. In the first step, download the pre-filled template with content that represents the most common case. Then, throughout the blueprint, customize with your data.

Use this blueprint to develop, or refine, a PPM strategy that works for your organization

Get buy-in for PPM strategy from decision makers.

Buy-in from the owners of project portfolio (Steering Committee, C-suite management, etc.) is a critical prerequisite for any PPM strategy. This blueprint will give you the tools and templates to help you make your case and win the buy-in of portfolio owners.

Connect strategic expectations to PPM process goals.

This blueprint offers a methodology to translate the broad aim of PPM to practical, tactical goals of the five core PPM processes, as well as how to measure the results. Our methodology is supported with industry-leading frameworks, best practices, and our insider research.

Develop your PPM processes.

This blueprint takes you through a series of steps to translate the process goals into a high-level process description, as well as a business case and a roadmap for implementing the new PPM processes.

Refine your PPM processes.

Our methodology is also equally as applicable for making your existing PPM processes better, and help you draft a roadmap for improvement with well-defined goals, roles, and responsibilities.

Info-Tech’s PPM model consists of five core processes

There are five core processes in Info-Tech’s thought model for PPM.

Info-Tech's Process Model detailing the steps and their importance in project portfolio management. Step 3: 'Status and Progress Reporting' sits above the others as a process of importance throughout the model. In the 'Intake' phase of the model are Step 1: 'Intake, Approval, and Prioritization' and Step 2: 'Resource Management'. In the 'Execution' phase is 'Project Management', the main highlighted section, and a part of Step 3, the overarching 'Status and Progress Reporting'. In the 'Closure' phase of the model are Step 4: 'Project Closure' and Step 5: 'Benefits Tracking'.

These processes create an infrastructure around projects, which aims to enable:

  1. Initiation of the “best” projects with the right resources and project information.
  2. Timely and trustworthy reporting to facilitate the flow of information for better decision making.
  3. Proper closure of projects, releasing resources, and managing benefits realization.

PPM has many moving pieces. To ensure that all of these processes work in harmony, you need a PPM strategy.

De-couple project management from PPM to break down complexity and create flexibility

Tailor project management (PM) processes to fit your projects.

Info-Tech’s PPM thought model enables you to manage your project portfolio independent of your PM methodology or capability. Projects interact with PPM via:

  • A project charter that authorizes the use of resources and defines project benefits.
  • Status reports that feed up-to-date, trustworthy data to your project portfolio.
  • Acceptance of deliverables that enable proper project closure and benefits reporting.

Info-Tech’s PPM strategy is applicable whether you use Agile, waterfall, or anything in between for PM.

The process model from the previous page but with project management processes overlaid. The 'Intake' phase is covered by 'Project Charter'. The 'Execution' phase, or 'Project Management' is covered by 'Status report'. The 'Closure' phase is covered by 'Deliverable Acceptance'.

Learn about project management approach for small projects in Info-Tech’s Tailor PM Processes to Fit Your Projects blueprint.

Sample of the Info-Tech blueprint 'Tailor PM Processes to Fit Your Projects'.

Info-Tech’s approach to PPM is informed by industry best practices and rooted in practical insider research

Info-Tech uses PMI and ISACA frameworks for areas of this research.

Logo for 'Project Management Institute (PMI)'.' Logo for 'COBIT 5 an ISACA Framework'.
PMI’s Standard for Portfolio Management, 3rd ed. is the leading industry framework, proving project portfolio management best practices and process guidelines. COBIT 5 is the leading framework for the governance and management of enterprise IT.

In addition to industry-leading frameworks, our best-practice approach is enhanced by the insights and guidance from our analysts, industry experts, and our clients.

Logo for 'Info-Tech Research Group'.

33,000+ Our peer network of over 33,000 happy clients proves the effectiveness of our research.

1000+ Our team conducts 1,000+ hours of primary and secondary research to ensure that our approach is enhanced by best practices.

Re-position IT as the “facilitator of business projects” for PPM success

CASE STUDY

Industry: Construction
Source: Info-Tech Client

Chaos in the project portfolio

At first, there were no less than 14 teams of developers, each with their own methodologies and processes. Changes to projects were not managed. Only 35% of the projects were completed on time.

Business drives, IT facilitates

Anyone had the right to ask for something; however, converting ideas to a formal project demand required senior leadership within a business division getting on board with the idea.

The CIO and senior leadership decided that projects, previously assigned to IT, were to be owned and driven by the business, as the projects are undertaken to serve its needs and rarely IT’s own. The rest of the organization understood that the business, not IT, was accountable for prioritizing project work: IT was re-positioned as a facilitator of business projects. While it was a long process, the result speaks for itself: 75% of projects were now being completed on time.

Balancing the target mix of the project portfolio

What about maintaining and feeding the IT infrastructure? The CIO reserved 40% of IT project capacity for “keeping the lights on,” and 20% for reactive, unplanned activities, with an aim to lower this percentage. With the rest of the time, IT facilitated business projects

Three key drivers of project priority

  1. Does the project meet the overall company goals and objectives?
    “If they don't, we must ask why we are bothering with it.”
  2. Does the project address a regulatory or compliance need?
    “Half of our business is heavily regulated. We must focus on it.”
  3. Are there significant savings to be had?
    “Not soft; hard savings. Can we demonstrate that, after implementing this, can we see good hard results? And, can we measure it?”

"Projects are dumped on IT, and the business abdicates responsibility. Flip that over, and say ‘that's your project’ and ‘how can we help you?’"

Use these icons to help direct you as you navigate this research

Use these icons to help guide you through each step of the blueprint and direct you to content related to the recommended activities.

A small monochrome icon of a wrench and screwdriver creating an X.

This icon denotes a slide where a supporting Info-Tech tool or template will help you perform the activity or step associated with the slide. Refer to the supporting tool or template to get the best results and proceed to the next step of the project.

A small monochrome icon depicting a person in front of a blank slide.

This icon denotes a slide with an associated activity. The activity can be performed either as part of your project or with the support of Info-Tech team members, who will come onsite to facilitate a workshop for your organization.

Info-Tech offers various levels of support to best suit your needs

DIY Toolkit

Guided Implementation

Workshop

Consulting

"Our team has already made this critical project a priority, and we have the time and capability, but some guidance along the way would be helpful." "Our team knows that we need to fix a process, but we need assistance to determine where to focus. Some check-ins along the way would help keep us on track." "We need to hit the ground running and get this project kicked off immediately. Our team has the ability to take this over once we get a framework and strategy in place." "Our team does not have the time or the knowledge to take this project on. We need assistance through the entirety of this project."

Diagnostics and consistent frameworks used throughout all four options

Develop a PPM strategy – project overview

1. Get executive buy-in for your PPM strategy

2. Align PPM processes to your strategic goals

3. Complete your PPM strategic plan

Supporting Tool icon

Best-Practice Toolkit

1.1 Choose the right PPM strategy for your organization

1.2 Translate PPM strategy expectations to specific process goals

2.1 Develop and refine project intake, prioritization, and resource management processes

2.2 Develop and refine portfolio reporting, project closure, and benefits realization processes

3.1 Select a right-sized PPM solution for supporting your new processes

3.2 Finalize customizing your PPM Strategic Plan Template

Guided Implementations

  • Scoping call: discuss current state of PPM and review strategy options.
  • How to wireframe realistic process goals, rooted in your PPM strategic expectations, that will be sustained by the organization.
  • Examine your current-state PPM process and create a high-level description of the target-state process for each of the five PPM processes (1-2 calls per each process).
  • Assess your PPM tool requirements to help support your processes.
  • Determine the costs and potential benefits of your PPM practice.
Associated Activity icon

Onsite Workshop

Module 1:
Set strategic expectations and realistic goals for the PPM strategy
Module 2:
Develop and refine strategy-aligned PPM processes
Module 3:
Compose your PPM strategic plan
Phase 1 Outcome:
  • Analysis of the current state of PPM
  • Strategy-aligned goals and metrics for PPM processes
Phase 2 Outcome:
  • PPM capability levels
  • High-level descriptions of near- and long-term target state
Phase 3 Outcome:
  • PPM tool recommendations
  • Cost-benefit analysis
  • Customized PPM strategic plan

Workshop overview

Contact your account representative or email Workshops@InfoTech.com for more information.

Workshop Day 1

Workshop Day 2

Workshop Day 3

Workshop Day 4

Workshop Day 5

Get leadership buy-in for PPM strategy Set PPM process goals and metrics with strategic expectations Develop and Refine PPM processes Develop and Refine PPM processes Complete the PPM strategic plan

Activities

  • 1.1 Assess leadership mandate.
  • 1.2 Determine potential resource capacity.
  • 1.3 Create a project inventory.
  • 1.4 Communicate your PPM strategy to key stakeholders.
  • 2.1 Translate each strategic goal into process goals.
  • 2.2 Set metrics and preliminary targets for PPM process goals.
  • 3.1 Develop and refine the project intake, prioritization, and approval process.
  • 3.2 Develop and refine the resource management process.
  • 4.1 Develop and refine the portfolio reporting process.
  • 4.2 Develop and refine the project closure process.
  • 4.3 Develop and refine the benefits realization process.
  • 5.1 Right-size the PPM tools for your processes.
  • 5.2 Conduct a cost-benefit analysis of implementing the new PPM strategy.
  • 5.3 Define roles and responsibilities for the new processes.

Deliverables

  1. Choice of PPM strategy and the leadership mandate
  2. Analysis of current project capacity
  3. Analysis of current project demand
  4. PPM Strategic Plan – Executive Brief
  1. PPM strategy-aligned process goals
  2. Metrics and long-term targets for PPM process goals
    For each of the five PPM processes:
  1. Process capability level
  2. Current-state PPM process description
  3. Retrospective examination of the current-state PPM process
  4. Action items to achieve the target states
  5. Time cost of the process at current and target states
  1. Recommendation for a PPM tool
  2. Cost-benefit analysis
  3. Roles and responsibilities matrix for each PPM process

Develop a Project Portfolio Management Strategy

PHASE 1

Get Executive Buy-In for Your PPM Strategy

Phase 1 outline

Associated Activity icon Call 1-888-670-8889 or email GuidedImplementations@InfoTech.com for more information.

Complete these steps on your own, or call us to complete a guided implementation. A guided implementation is a series of 2-3 advisory calls that help you execute each phase of a project. They are included in most advisory memberships.

Guided Implementation 1: Get executive buy-in for your PPM strategy

Proposed Time to Completion: 2 weeks
Step 1.1: Choose the right PPM strategy Step 1.2: Translate strategic expectations to process goals
Start with an analyst kick-off call:
  • Scoping call to discuss the current state of PPM and review strategy options.
Work with an analyst to:
  • Discuss how to wireframe realistic process goals, rooted in your PPM strategic expectations, that will be sustained by the organization.
Then complete these activities…
  • Execute a leadership mandate survey.
  • Perform a high-level supply/demand analysis.
  • Prepare an executive presentation to get strategy buy-in.
Then complete these activities…
  • Develop realistic process goals based in your PPM strategic expectations.
  • Set metrics and preliminary targets for your high-priority PPM process goals.
With these tools & templates:
  • PPM High-Level Supply/Demand Calculator
  • PPM Strategic Plan Template
With these tools & templates:
  • PPM Strategy-Process Translation Matrix

Phase 1 Results & Insights

  • Executive layer buy-in is a critical prerequisite for the success of a top-down PPM strategy. Ensure your executives are onboard before proceeding to implement your PPM strategy.

Prepare to get to value early with step 1.1 of this blueprint

The first step of this blueprint will help you define your PPM strategy and get executive buy-in for it using section one of Info-Tech’s PPM Strategic Plan Template.

Where traditional models of consulting can take considerable amounts of time before delivering value to clients, Info-Tech’s methodology for developing a PPM strategy gets you to value fast.

In the first step of this blueprint, you will define your PPM strategy and prepare an executive presentation to get buy-in for the strategy. The presentation can be prepared in just a few hours.

  • The activities in step 1.1 of this blueprint will help you customize the slides in section 1 of Info-Tech’s PPM Strategic Plan Template.
  • Section one of the Template will then serve as your presentation document.

Once you have received buy-in for your PPM strategy, the remainder of this blueprint will help you customize section 2 of the Template.

  • Section 2 of the Template will communicate:
    • Your processes and process goals.
    • Your near-term and long-term action items for implementing the strategy.
    • Your PPM tool requirements.
    • The costs and benefits of your PPM strategy.

Download Info-Tech’s PPM Strategic Plan Template.

Sample of Info-Tech's 'PPM Strategic Plan Template.'

Step 1.1: Choose the right PPM strategy for your organization

PHASE 1

PHASE 2

PHASE 3

1.1 1.2 2.1 2.2 3.1 3.2
Choose the right PPM strategy Translate strategy into process goals Define intake & resource mgmt. processes Define reporting, closure, & benefits mgmt. processes Select a right-sized PPM solution Finalize your PPM strategic plan

This step will walk you through the following activities:

  • Perform a leadership mandate survey.
  • Choose your PPM strategy.
  • Calculate your resource capacity for projects.
  • Determine overall organizational demand for projects.
  • Prepare an executive presentation of the PPM strategy.

This step involves the following participants:

  • CIO
  • PMO Director/Portfolio Manager
  • Project Managers
  • IT Managers

Outcomes of this step

  • A PPM strategy
  • A resource supply/project demand analysis
  • An executive brief presentation
  • Executive buy-in for the PPM strategy

“Too many projects, not enough resources” is the reality of most IT environments

In today’s organizations, the desires of business units for new products and enhancements, and the appetites of senior leadership to approve more and more projects for those products and services, far outstrips IT’s ability to realistically deliver on everything.

The vast majority of IT departments lack the resourcing to meet project demand – especially given the fact that day-to-day operational demands frequently trump project work.

As a result, project throughput suffers – and with it, IT's reputation within the organization.

A visualization of 'Project Demand' versus 'Resource supply' utilizing courtroom scales with numerous project titles weighing down the 'Project Demand' side and silhouettes of three little people raised aloft on the 'Resource supply' side.

In these environments, a PPM strategy is required.

A PPM strategy should enable executive decision makers to make sense of the excess of demand and give IT the ability to prioritize those projects that are of the most strategic value to the business.

With the right PPM strategy, IT can improve project outcomes across its portfolio and drive business value – all while improving the workloads of IT project staff.

Info-Tech has two PPM strategy options that you can start to deploy today

This step will help you choose the most suitable option, depending on your project pain points and current level of executive engagement in actively steering the portfolio.

Option A:
Top-Down, Executive Driven Strategy

Option B:
Bottom-Up, Project Manager Driven Strategy

Goals of this approach:
  • This approach is intended to assist decision makers in their job: choosing the right projects, committing to timelines for those projects, and monitoring/directing their progress.
Goals of this approach:
  • This approach is primarily intended to ensure that projects are well managed in a standardized manner in order to provide project managers with clear direction.
Who this approach is for:
  • IT departments looking to improve alignment of project demand and resource capacity.
  • IT departments wanting to prioritize strategically valuable work.
  • IT departments with sufficient executive backing and engagement with the portfolio.
Who this approach is for:
  • IT departments that would not the get support for a top-down approach due to a disengaged executive layer.
  • IT departments that already have a top-down PPM strategy and feel they are sufficiently resourced to confront project demand.

Each of these strategy options is driven by a set of specific strategic expectations to help communicate your PPM goals. See the following slides for an articulation of each strategy option.

A top-down, executive driven strategy is the optimal route, putting leadership in a position to best conduct the portfolio

Option A: Top-Down, Executive Driven Strategy

Strategic Expectations:

  • Project Throughput: Maximize throughput of the best projects.
  • Portfolio Visibility: Ensure visibility of current and pending projects.
  • Portfolio Responsiveness: Make the portfolio responsive to executive steering when new projects and changing priorities need rapid action.
  • Resource Utilization: Minimize resource waste and optimize the alignment of skills to assignments.
  • Benefits Realization: Clarify accountability for post-project benefits attainment for each project, and facilitate the process of tracking/reporting those benefits.

Info-Tech Insight

Serve the executive with insight before you impede the projects with governance. This strategy option is where Info-Tech sees the most PPM success. A strategy focused at improving decision making at the executive layer will both improve project outcomes and help alleviate project workloads.

A bottom-up strategy can help project managers and teams succeed where insight into the big picture is lacking

Option B: Bottom-Up, Project Manager Driven Strategy

Strategic Expectations:

  • Project Management Governance: All projects consuming IT resources will be continually validated in terms of best-practice process compliance.
  • Project Risk Management: Identify risks and related mitigation approaches for all high-risk areas.
  • Stakeholder Management: Ensure that project stakeholders are identified and involved.
  • Project Manager Resourcing: Provide project managers as needed.
  • Project-Level Visibility: Provide access to the details of project management processes (planning and progress) as needed.

Info-Tech Insight

Right-size governance to maximize success. Project management and governance success don’t necessarily equal project success. Project management processes should be a means to an end (i.e. successful project outcomes), and not an end in themselves. Ensure the ends justify the means.

Most recurring project challenges require a top-down portfolio management approach

While project management is a key ingredient to project success, tying to solve endemic project problems with project management alone won’t improve results over the long term.

Why Top-Down is a better starting point than Bottom-Up.

The most common IT project problems – schedule and budget overruns, scope creep, and poor quality – can ultimately, in the vast majority of cases, be traced back to bad decisions made at the portfolio level:

  • The wrong projects get greenlighted.
  • Shifting leadership priorities and operational demands make project plans and estimated delivery dates obsolete from the start.
  • Too many projects get approved when there are not enough resources to effectively work on them all.

No amount of project management rigor can help alleviate these common root causes of project failure.

With a top-down PPM strategy, however, you can make sure that leadership is informed and engaged in making the right project decisions and that project managers and teams are situated for success.

"There is nothing so useless as doing efficiently that which should not be done at all." (Peter Drucker (quoted in Lessing))

Info-Tech Insight

Get Strategic About Project Success.

The difference between project management and project portfolio management comes down to doing things right vs. doing the right things. Both are important, no doubt; but doing the wrong things well doesn’t provide much value to the business in the long run.

Get insight into the big picture with a top-down strategy before imposing more administrative overhead on project managers and leads.

Perform a leadership mandate assessment to gauge executive needs and expectations

Associated Activity icon 1.1.1 – 15 to 30 minutes (prep time) 10 to 20 minutes (execution time)

INPUT: Leadership expectations for portfolio and project management.

OUTPUT: Leadership mandate bar chart

Materials: Tab 6 of Info-Tech’s PPM High-Level Supply-Demand Calculator

Participants: Portfolio manager (or equivalent), PPM strategy sponsor(s), CIO and other members of senior management

Before choosing your strategy option, survey the organization’s leadership to assess what they’re expecting from the PPM strategy.

Use the “Leadership Mandate Survey” (located on tab 6 of Info-Tech’s PPM High-Level Supply-Demand Calculator) to assess the degree to which your leadership expects the PPM strategy to provide outcomes across the following capabilities: portfolio reporting, project governance, and project management.

  • Deploy the 12-question survey via individual one-on-one meetings or group working sessions with your boss (the PPM strategy sponsor) as well as with the CIO and other senior managers from within IT and the business.
    • If you cannot connect with the executive layer for this survey, do your best to estimate their responses to complete the survey.
  • The survey should help distinguish if executives are looking for portfolio management or project management. It should be one input that informs your choice of strategy option A or B.
    • If leadership is looking primarily for project management, you should proceed to Info-Tech’s Tailor Project Management Processes that Fit Your Projects blueprint.

Refer to the next slide for assistance analyzing the outputs in tab 6 and using them to inform your choice of strategy.

How to make use of the results of the leadership survey

Two possible result scenarios of the leadership survey. There are two bar graphs titled 'Leadership Mandate', each with an explanation of the scenario they belong to. In Scenario 1, the 'Leadership Mandate' graph has a descending trend with 'Portfolio Reporting' at the highest level, 'Project Governance' in the middle, and 'Project Management' at the lowest level. 'A result like this, with a higher portfolio reporting score, shows a higher need for a top-down approach and demonstrates well-balanced expectations for a PPM strategy from the leadership. There is greater emphasis put on the portfolio than there is project governance or project management.' In Scenario 2, the 'Leadership Mandate' graph has an ascending trend with 'Portfolio Reporting' at the lowest level, 'Project Governance' in the middle, and 'Project Management' at the highest level. 'If your graph looks like this, your executive leadership has placed greater importance on project governance and management. Completing a top-down PPM strategy may not meet their expectations at this time. In this situation, a bottom-up approach may be more applicable.'

Customize Info-Tech’s PPM Strategic Plan Template. Insert screenshots of the survey and the bar graph from tab 6 of the PPM High-Level Supply-Demand Calculator onto slides 7 and 8, “PPM Strategy Leadership Mandate,” of the PPM Strategic Plan Template.

Proceed with the right PPM strategy for your organization

Based upon the results of the “Leadership Mandate Survey,” and your assessment of each strategy option as described in the previous slides, choose the strategy option that is right for your IT department/PMO at this time.

"Without a strategic methodology, project portfolio planning is frustrating and has little chance of achieving exceptional business success." (G Wahl (quoted in Merkhofer))

Option A:

Those proceeding with Option A should continue with remainder of this blueprint. Update your strategy statement on slide 3 of your PPM Strategic Plan Template to reflect your choice

Option B:

Those proceeding with Option B should exit this blueprint and refer to Info-Tech’s Tailor Project Management Processes to Fit Your Projects blueprint to help define a project management standard operating procedure.

Customize Info-Tech’s PPM Strategic Plan Template. If you’re proceeding with Option A, update slide 4, “Project Portfolio Management Strategy,” of your PPM Strategic Plan Template to reflect your choice of PPM strategy. If you’re proceeding with Option B, you may want to include your strategy statement in your Project Management SOP Template.

The success of your top-down strategy will hinge on the quality of your capacity awareness and resource utilization

A PPM strategy should facilitate alignment between project demand with resource supply. Use Info-Tech’s PPM High-Level Supply/Demand Calculator as a step towards this alignment.

Info-Tech’s research shows that the ability to provide a centralized view of IT’s capacity for projects is one of the top PPM capabilities that contributes to overall project success.

Accurate and reliable forecasts into IT’s capacity, coupled with an engaged executive layer making project approval and prioritization decisions based upon that capacity data, is the hallmark of an effective top-down PPM strategy.

  • Use Info-Tech’s PPM High-Level Supply/Demand Calculator to help improve visibility (and with it, organizational understanding) into project demand and IT resource supply.
  • The Calculator will help you determine IT’s actual capacity for projects and analyze organizational demand by taking an inventory of active and backlog projects.

Download Info-Tech’s PPM High-Level Supply/Demand Calculator.

Sample of Into-Tech's PPM High-Level Supply/Demand Calculator.

Info-Tech Insight

Where does the time go? The portfolio manager (or equivalent) should function as the accounting department for time, showing what’s available in IT’s human resources budget for projects and providing ongoing visibility into how that budget of time is being spent.

Establish the total resource capacity of your portfolio

Associated Activity icon 1.1.2 – 30 to 60 minutes

INPUT: Staff resource types, Average work week, Estimated allocations

OUTPUT: Breakdown of annual portfolio HR spend, Capacity pie chart

Materials: PPM High-Level Supply/Demand Calculator, tab 3

Participants: Portfolio manager (or equivalent), Resource and/or project managers

Use tab 3 of the calculator to determine your actual HR portfolio budget for projects, relative to the organization’s non-project demands.

  • Tab 3 analyzes your resource supply asks you to consider how your staff spend their time weekly across four categories: out of office time, administrative time (e.g. meetings, training, checking email), keep-the-lights-on time (i.e. support and maintenance), and project time.
  • The screenshot below walks you through columns B to E of tab 3, which help calculate your potential capacity. This activity will continue on the next slide, where we will determine your realized capacity for project work from this potential capacity.
Screenshot of tab 3 in the PPM High-Level Supply/Demand Calculator. It has 4 columns, 'Resource Type', '# People', 'Hours / Week', and 'Hours / Year', which are referred to in notes as columns B through E respectively. The note on 'Resource Type' reads '1. Compile a list of each of the roles within your department in column B'. The note on '# People' reads '2. In column C, provide the number of staff currently performing each role'. The note on 'Hours / Week' reads '3. In column D, provide a baseline for the number of hours in a typical work week for each role'. The note on 'Hours / Year' reads '4. Column E will auto-populate based on E and D. The total at the bottom of column E (row 26) constitutes your department’s total capacity'.

Determine the project/non-project ratio for each role

Associated Activity icon 1.1.2 (continued)

The previous slide walked you through columns B to E of tab 3. This slide walks you through columns F to J, which ask you to consider how your potential capacity is spent.

Screenshot of tab 3 in the PPM High-Level Supply/Demand Calculator. It has 6 columns, 'Hours / Year', 'Absence', 'Working Time / Year', 'Admin', 'KTLO', and 'Project Work', which, starting at 'Absence', are referred to in notes as columns F through J respectively. The note on 'Absence' reads '5. Enter the percentage of your total time across each role that is unavailable due to foreseeable out-of-office time (vacation, sick time, etc.) in column F. Industry standard runs anywhere from 12% to 16%, depending on your industry and geographical region'. The note on 'Working Time / Year' reads '6. Column G will auto-calculate to show your overall net capacity after out-of-office percentages have been taken off the top. These totals constitute your working time for the year'. The note on 'Admin' and 'KTLO' reads '6. Column G will auto-calculate to show your overall net capacity after out-of-office percentages have been taken off the top. These totals constitute your working time for the year'. The note on 'Project Work' reads '8. The project percentage in column J will auto-calculate based upon what’s leftover after your non-project working time allocations in columns H and I have been subtracted'.

Review your annual portfolio capacity for projects

Associated Activity icon 1.1.2 (continued)

The previous slides walked you through the inputs for tab “3. Project Capacity.” This slide walks you through the outputs of the tab.

Based upon the inputs from columns B to J, the rest of tab 3 analyzes how IT available time is spent across the time categories, highlighting how much of IT’s capacity is actually available for projects after admin work, support and maintenance work, and absences have been taken into account.

A table and pie chart of output data from Tab 3 of the PPM High-Level Supply/Demand Calculator. Pie segments are labelled 'Admin', 'Absence', 'Project Capacity', and 'Keep The Lights On'.

Customize Info-Tech’s PPM Strategic Plan Template. Update slide 10, “Current Project Capacity,” of your PPM Strategic Plan Template to include the outputs from tab 3 of the Calculator.

Create an inventory of active and backlog projects to help gauge overall project demand

Associated Activity icon 1.1.3 – 15 to 30 minutes

INPUT: Number of active and backlog projects across different sizes

OUTPUT: Total project demand in estimated hours of work effort

Materials: PPM High-Level Supply/Demand Calculator, tab 4

Participants: Portfolio manager (or equivalent), Project managers

Where tab 3 of the Calculator gave you visibility into your overall resource supply for projects, tab 4 will help you establish insight into the demand side.

  • Before starting on tab 4, be sure to enter the required project size data on the set-up tab.
  • Using a list of current active projects, categorize the items on the list by size: small, medium, large, and extra large. Enter the number of projects in each category of project in column C of tab 4.
  • Using a list of on-hold projects, or projects that have been approved but not started, categorize the list by size and enter the number of projects in each category in column D.
  • In column E, estimate the number of new requests and projects across each size that you anticipate being added to the portfolio/backlog in the next 12 months. Use historical data from the past 12 to 24 months to inform your estimates.
  • In column F, estimate the number of projects that you anticipate being completed in each size category in the next 12 months. Take the current state of active projects into account as you make your estimates, as well as throughput data from the previous 12 to 24 months.
Screenshot of tab 4 in the PPM High-Level Supply/Demand Calculator. It has 5 columns labelled 'Project Types' with values Small to Extra-Large, 'Number of active projects currently in the portfolio', 'Number of projects currently in the portfolio backlog', 'Number of new requests anticipated to be added to the portfolio/backlog in the next 12 months', and 'Number of projects expected to be delivered within the next 12 months'.

Make supply and demand part of the conversation as you get buy-in for your top-down strategy

Tab 5 of the Calculator is an output tab, visualizing the alignment (or lack thereof) of project demand and resource supply.

Once tabs 3 and 4 are complete, use tab 5 to analyze the supply/demand data to help build your case for a top-down PPM strategy and get buy-in for it.

Screenshots of Tab 5 in the PPM High-Level Supply/Demand Calculator. A bar chart obscures a table with the note 'The bar chart shows your estimated total project demand in person hours (in black) relative to your estimated total resource capacity for projects (in green)'. Notes on the table are 'The table below the bar chart shows your estimated annual project throughput rate (based upon the number of projects you estimated you would complete this year) as well as the rate at which portfolio demand will grow (based upon the number of new requests and projects you estimated for the next 12 months)' and 'If the “Total Estimated Project Demand (in hours) in 12 Months Time” number is more than your current demand levels, then you have a supply-demand problem that your PPM strategy will need to address'.

Customize Info-Tech’s PPM Strategic Plan Template. Update slides 11 and 12, “Current Project Demand,” of your PPM Strategic Plan Template to include the outputs from tabs 4 and 5 of the Calculator.

Recommended: Complete Info-Tech’s PPM Current State Scorecard to measure your resource utilization

Associated Activity icon Contact your rep or call 1-888-670-8889

This step is highly recommended but not required. Call 1-888-670-8889 to inquire about or request the PPM Diagnostics.

Info-Tech’s PPM Current State Scorecard diagnostic provides a comprehensive view of your portfolio management strengths and weaknesses, including project portfolio management, project management, customer management, and resource utilization.

Screenshots of Info-Tech's PPM Current State Scorecard diagnostic with a pie chart obscuring a table/key. The attached note reads 'In particular, the analysis of resource utilization in the PPM Current State Scorecard report, will help to complement the supply/demand analysis in the previous slides. The diagnostic will help you to analyze how, within that percentage of your overall capacity that is available for project work, your staff productively utilizes this time to successfully complete project tasks and how much of this time is lost within Info-Tech’s categories of resource waste.'

Customize Info-Tech’s PPM Strategic Plan Template. Update slides 14 and 15, “Current State Resource Utilization” of your PPM Strategic Plan Template to include the resource utilization outputs from your PPM Current State Scorecard.

Finalize section one of the PPM Strategic Plan Template and prepare to communicate your strategy

Associated Activity icon 1.1.4 – 10 to 30 minutes

INPUT: The previous activities from this step

OUTPUT: An presentation communication your PPM strategy

Materials: PPM Strategic Plan Template, section 1

Participants: Portfolio manager (or equivalent)

By now, you should be ready to complete section one of the PPM Strategic Plan Template.

The purpose of this section of the Template is to capture the outputs of this step and use them to communicate the value of a top-down PPM strategy and to get buy-in for this strategy from senior management before you move forward to develop your PPM processes in the subsequent phases of this blueprint.

  • Within section one, update any of the text that is (in grey) to reflect the specifics of your organization – i.e. the name of your organization and department – and the specific outcomes of step 1.2 activities. In addition, replace the placeholders for a company logo with the logo of your company.
  • Replace the tool screenshots with the outputs from your version of the PPM High-Level Supply/Demand Calculator.
  • Proofread all of the text to ensure the content accurately reflects your outcomes. Edit the content as needed to more accurately reflect your outcomes.
  • Determine the audience for the presentation of your PPM strategy and make a logistical arrangement. Include PPM strategy sponsors, senior management from within IT and the business, and other important stakeholders.

Get executive buy-in for your top-down PPM strategy

Executive layer buy-in is a critical prerequisite for the success of a top-down PPM strategy. Ensure your executives are on board before preceding.

You’re now ready to communicate your PPM strategy to your leadership team and other stakeholders.

It is essential that you get preliminary buy-in for this strategy from the executive layer before you move forward to develop your PPM processes in the subsequent phases of this blueprint. Lack of executive engagement is one of the top barriers to PPM strategy success.

  • If you have gone through the preceding activities in this step, section one of your PPM Strategic Plan Template should now be ready to present.
  • As explained in 1.1.4, you should present this section to an audience of PPM strategy sponsors, C-suite executives, and other members of the senior management team.
  • Allow at least 60 minutes for the presentation – around 20 minutes to deliver the slide presentation and 40 minutes for discussion.
  • If you get sufficient buy-in by the end of the presentation, proceed to the next step of this blueprint. If buy-in is lacking, now might not be the right time for a top-down PPM strategy. Think about adopting a bottom-up approach until leadership is more engaged in the portfolio.

"Gaining executive sponsorship early is key…It is important for the executives in your organization to understand that the PPM initiatives and the PMO organization are there to support (but never hinder) executive decision making." (KeyedIn Projects)

Info-Tech Best Practice

Engage(d) sponsorship. According to Prosci, the top factor in contributing to the success of a change initiative is active and visible executive sponsorship. Use this meeting to communicate to your sponsor(s) the importance of their involvement in championing the PPM strategy.

A PPM strategic plan elevates PMO’s status to a business strategic partner

CASE STUDY

Industry: Public Administration
Source: IAG / Info-Tech Interview

Challenge

The PMO operated in a way that is, in their self-assessment, reactive; project requests and capacity were not effectively managed. Perhaps due to this, the leadership team was not always visible, or regularly available, to PM leaders. This, in turn, complicated efforts to effectively manage their projects.

Solution

Establishing a simple prioritization methodology enabled the senior leadership to engage and effectively steer the project portfolio by strategic importance. The criteria and tool also gave the business units a clear understanding to promote the strategic value of each of their project requests.

Results

PM leaders now have the support and confidence of the senior leadership team to both proactively manage and deliver on strategic projects. This new prioritization model brought the PM Leader and senior leadership team in direct access with each other.

"By implementing this new project intake and prioritization framework, we drastically improved our ability to predict, meet, and manage project requests and unit workload. We adopted a client-focused and client-centric approach that enabled all project participants to see their role and value in successful project delivery. We created methodologies that were easy to follow from the client participation perspective, but also as PM leaders, provided us with the metrics, planning, and proactive tools to meet and anticipate client project demand. The response from our clients was extremely positive, encouraging, and appreciative."

Step 1.2: Translate PPM strategic expectations to process goals

PHASE 1

PHASE 2

PHASE 3

1.11.22.12.23.13.2
Choose the right PPM strategyTranslate strategy into process goalsDefine intake & resource mgmt. processesDefine reporting, closure, & benefits mgmt. processesSelect a right-sized PPM solutionFinalize your PPM strategic plan

This step will walk you through the following activities:

  • Determine process goals based upon your PPM strategy.
  • Set metrics and preliminary targets for your PPM processes.

This step involves the following participants:

  • CIO
  • Steering Committee
  • Business Unit Leaders
  • PMO Director/Portfolio Manager

Outcomes of this step

  • Stakeholder-prioritized PPM process goals
  • Metrics and targets for high-priority process goals

Use the PPM strategy to set the direction for PPM processes that make up the infrastructure around projects

PPM strategy enables you to answer any and all of these questions in a way that is consistent, cohesive, and aligned with one another.

Info-Tech's PPM Process Model from earlier with notes overlaid asking a series of questions. The questions for '1. Intake, Approval, and Prioritization' are 'Who can request a project? How do you request a project? Who decides what to fund? What is the target investment mix? How will they decide?' The questions for '2. Resource Management' are 'Who assigns the resources? Who feeds the data on resources? How do we make sure it’s valid? How do we handle contingencies when projects are late, or if availability changes?' The questions for '3. Status and Progress Reporting' are 'What project information that should be reported? Who reports on project status? When? How?' The questions between 'Project Management' and '4. Project Closure' are 'Who declares that a project is done? Who validates it? Who is this reported to? Who terminates low-value projects? How will they decide?' The questions for '5. Benefits Tracking' are 'How do we validate the project benefits from the original business case? How do we track the benefits? Who reports it? When?'

Set process goals to address PPM strategic expectations and steer the PPM strategic plan

Associated Activity icon 1.2.1 – 2 hours

INPUT: PPM strategy & expectations, Organizational strategy and culture

OUTPUT: Prioritized list of strategy-aligned PPM process goals

Materials: PPM Strategy-Process Translation Matrix

Participants: CIO, Steering Committee, Business Unit Leaders, PMO Director/ Portfolio Manager

This activity is designed for key departmental stakeholders to articulate how PPM processes should be developed or refined to meet the PPM strategic expectations.

Participation of the key departmental stakeholders in this exercise is critical, e.g. CIO, Steering Committee, business unit leaders.

Strategic Expectations x Processes = Process goals aligned to strategy
Throughput Project Intake, Approval, & Prioritization
Visibility Resource Management
Responsiveness Status & Progress Reporting
Resource Utilization Project Closure
Benefits Benefits Realization

Download Info-Tech’s PPM Strategy-Process Goals Translation Matrix Template.

Use Info-Tech’s Translation Matrix to systematically articulate strategy-aligned PPM process goals

Supporting Tool icon 1.2.1 – PPM Strategy-Process Translation Matrix, tab 2

Formula: To answer “[question]” in a way that we can [strategic expectation], it will be important to [process goal].

Example 1:
To answer the question “who can request a project, and how?” in a way that we can maximize the throughput of the best projects, it will be important to standardize the project request process.

Example 2:
To answer the question “how will they decide what to fund?” in a way that we can maximize the throughput of the best projects, it will be important to reach a consensus on project prioritization criteria.

Example 3:
To answer the question “how will we track the projected benefits?” in a way that we can maximize the throughput of the best projects, it will be important to double-check the validity of benefits before projects are approved.

Screenshot of Tab 2 in Info-Tech's PPM Strategy-Process Translation Matrix tool. There is a table with notes overlaid 'Enter the process goals in the appropriate question–strategic expectation slot' and 'Assign a priority, from the most important (1) to the least important (5)'.

Set metrics and preliminary targets for your high-priority PPM process goals

Associated Activity icon 1.2.2 – 1-2 hours

INPUT: Prioritized list of strategy-aligned PPM process goals, Organizational strategy and culture

OUTPUT: Metrics and targets for high-priority PPM process goals

Materials: PPM Strategy-Process Translation Matrix

Participants: CIO, Steering Committee, Business Unit Leaders, PMO Director/ Portfolio Manager

Your highest-priority process goals and their corresponding strategy expectations are displayed in tab 3 of the PPM Strategy-Process Translation Matrix template (example below).

Through a group discussion, document what will be measured to decide the achievement of each process goal, as well as your current estimate and the long-term target. If necessary, adjust the approximate target duration.

Screenshot of Tab 3 in Info-Tech's PPM Strategy-Process Translation Matrix tool. There is a table with 6 columns 'PPM Process', 'High-priority Process Goals', 'Strategy Expectation', 'How will you measure success?', 'Current Estimate', and 'Long-Term Target'; they are referred to in notes as columns B through G respectively. Overlaid notes are 'Columns C and D will auto-populate based upon your inputs from tab 2. The five PPM process areas are arranged vertically in column B and your top-five process goals from each area appear in column C.' 'Use column E to brainstorm how you might measure the success of each process goal at your organization. These can be tentative for now and refined over time.' 'Determine current metrics for each process goals and long-term target metrics in columns F and G.'

Project-client-centered approach to PPM process design improves client satisfaction and team confidence

CASE STUDY

Industry: Public Administration
Source: IAG / Info-Tech Interview

Challenge

Reactive instead of proactive

"We had no effective means of tracking project intake requests vs. capacity. We struggled using ad hoc processes and methods which worked to meet immediate needs, but we quickly realized that they were ineffective in tracking critical project metrics, key performance indicators (KPIs), or performance measures...In short, we were being reactive, instead of proactive."

The result was a disorganized portfolio that led to low client satisfaction and team morale.

Solution

Examine processes “through the eyes of the client”

With the guiding principle of “through the eyes of the client,” PPM processes and tools were developed to formalize project intake, prioritization, and capacity planning. All touchpoints between client and PPM processes were identified, and practices for managing client expectations were put in place. A client satisfaction survey was formulated as part of the post-project assessment and review.

Results

Client-centered processes improved client satisfaction and team confidence

People, processes, and tools are now aligned to support client demand, manage client expectations, measure project KPIs, and perform post-project analysis. A standard for client satisfaction metrics was put in place. The overwhelmingly positive feedback has increased team confidence in their ability to deliver quality efforts.

If you want additional support, have our analysts guide you through this phase as part of an Info-Tech Workshop Associated Activity icon

Book a workshop with our Info-Tech analysts:

Photo of Barry Cousins.
  • To accelerate this project, engage your IT team in an Info-Tech workshop with an Info-Tech analyst team.
  • Info-Tech analyst will join you and your team onsite at your location or welcome you to Info-Tech's historic Toronto office to participate in an innovative onsite workshop.
  • Contact your account manager (www.infotech.com/account), or email Workshops@InfoTech.com for more information.

The following are sample activities that will be conducted by Info-Tech analysts with your team:

Sample of activity 1.1.2 'Determine your actual resource capacity for projects'. Determine your actual resource capacity for projects

Work with Info-Tech analysts to define your project vs. non-project ratio to help define how much of your overall resource capacity is actual available for projects.

Sample of activity 1.2.1 'Set realistic PPM process goals'. Set realistic PPM process goals

Leverage Info-Tech facilitators to help walk you through our PPM framework and define achievable process goals that are rooted in your current PPM maturity levels and organizational culture.

Develop a Project Portfolio Management Strategy

PHASE 2

Align PPM Processes to Your Strategic Goals

Phase 2 outline

Associated Activity icon Call 1-888-670-8889 or email GuidedImplementations@InfoTech.com for more information.

Complete these steps on your own, or call us to complete a guided implementation. A guided implementation is a series of 2-3 advisory calls that help you execute each phase of a project. They are included in most advisory memberships.

Guided Implementation 2: Align PPM processes to your strategic goals

Proposed Time to Completion: 2-4 weeks
Step 2.1: Develop intake & resource mgmt. processes Step 2.2: Define reporting, closure, & benefits processes
Work with an analyst to:
  • Assess your current intake, prioritization, and resource management processes and wireframe a sustainable target state for each capability.
Work with an analyst to:
  • Analyze your current portfolio reporting, project closure, and benefits realization processes and wireframe a sustainable target state for each capability.
Then complete these activities…
  • Set near-term and long-term goals.
  • Draft high-level steps within your target-state processes.
  • Document your process steps and roles and responsibilities.
Then complete these activities…
  • Set near-term and long-term goals.
  • Draft high-level steps within your target-state processes.
  • Document your process steps and roles and responsibilities.
With these tools & templates:
  • PPM Strategy Development Tool
  • PPM Strategic Plan Template
With these tools & templates:
  • PPM Strategy Development Tool
  • PPM Strategic Plan Template

Phase 2 Results & Insights

  • The means of project and portfolio management (i.e. processes) shouldn’t eclipse the ends – strategic goals. Root your process in your PPM strategic goals to realize PPM benefits (e.g. optimized portfolio value, improved project throughput, increased stakeholder satisfaction).

Read first: Overview of the methodology for articulating new strategy-aligned PPM processes

In the previous step of the blueprint, key department stakeholders established the PPM process goals, metrics, and targets in a way that aligns with the overall PPM strategy. In this phase, we draft a high-level description of the five PPM processes that reflect those goals using the following methodology:

Methodology at a glance

  1. Articulate the current state of the process.
  2. Examine the process against the strategy-aligned goals.
  3. Create short- and long-term action items to refine the current process and meet the strategy-aligned targets.
  4. Develop a high-level target-state description of the PPM process.
  5. Estimate costs-in-use of the target-state process.

Out-of-scope topics

  • Draft a detailed target-state description of the PPM process. Avoid falling into the “analysis paralysis” trap and keep the discussion focused on the overall PPM strategy.
  • PPM tools to support the process. This discussion will take place in the next phase of the blueprint.

INPUT

–›

PROCESS

–›

OUTPUT

  • Strategy-aligned process goals, metrics, and targets (Activity 1.2.1)
  • Knowledge of current process
  • Knowledge of organizational culture and structure
  • Capability level assessment
  • Table-top design planning activity
  • Start-stop-continue retrospective
  • High-level description of the target state
  • PPM Strategy Development Tool
  • High-level descriptions of current and target states
  • Short- and long-term action items for improving the process
  • Cost-in-use of the current- and target-state processes

Download Info-Tech’s PPM Strategy Development Tool

Build a sound business case for implementing the new PPM strategy with realistic costs and benefits of managing your project portfolio.

Time spent on managing the project portfolio is an investment. Like any other business endeavors, the benefits must outweigh the costs to be worth doing.

As you draft a high-level description of the PPM processes in this phase of the blueprint, use Info-Tech’s PPM Strategy Development Tool to track the estimate the cost-in-use of the process. In the next phase, this information will be inform a cost-benefit analysis, which will be used to support your plan to implement the PPM strategy.

Download Info-Tech’s PPM Strategy Development Tool.

Screenshots of Info-Tech's PPM Strategy Development Tool including a Cost-Benefit Analysis with tables and graphs.

Step 2.1: Develop and refine project intake, prioritization, and resource management processes

PHASE 1

PHASE 2

PHASE 3

1.11.22.12.23.13.2
Choose the right PPM strategyTranslate strategy into process goalsDefine intake & resource mgmt. processesDefine reporting, closure, & benefits mgmt. processesSelect a right-sized PPM solutionFinalize your PPM strategic plan

This step will walk you through the following activities:

  • Determine your process maturity.
  • Benchmark current processes against strategy-aligned goals.
  • Set near- and long-term action items.
  • Draft a high-level description of your target state.
  • Document your new processes.

This step involves the following participants:

  • PMO Director/Portfolio Manager
  • Project Managers
  • Resource Managers
  • Business Analysts

Outcomes of this step

  • A definition of current and target state maturity levels for intake, prioritization, and resource management
  • Near-term and long-term process goals for intake, prioritization, and resource management
  • A high-level wireframe for your intake, prioritization, and resource management process steps

Project intake, prioritization, and approval: Get projects with the highest value done first

Give your organization the voice to say “no” (or “not yet”) to new projects.

Questions

  • Who can request a project?
  • How do you request a project?
  • Who decides what to fund?
  • What is the target investment mix?
  • How will they decide?

Benefits

  • Maximize value of time spent on project work by aligning projects with priorities and stakeholder needs.
  • Finish the projects you start by improving alignment of intake and prioritization with resource capacity.
  • Improve stakeholder satisfaction by managing expectations with consistent, streamlined processes.

Challenges

  • Stakeholders who benefit from political or ad hoc prioritization processes will resist or circumvent formal intake processes.
  • Many organizations lack sufficient awareness of resource capacity necessary to align intake with availability.

A graph highlighting the sweet spot of project intake decision making. The vertical axis is 'Rigor and Effort' increasing upward, and the horizontal axis is 'Quality and Effectiveness of Decisions' increasing to the right. The trend line starts at 'Gut Feel' with low 'Rigor and Effort', and gradually curves upward to 'Analysis Paralysis' at the top. A note with an arrow pointing to a midway point in the line reads 'The sweet spot changes between situations and types of decisions'.

Info-Tech Insight

This process aims to control the project demand. A balance between rigor and flexibility is critical in order to avoid the “analysis paralysis” as much as the “gut feel” approach.

Funnel project requests into a triage system for project intake

Info-Tech recommends following a four-step process for managing project intake.

  1. Requestor fills out form and submits the request into the funnel.
  2. Requests are triaged into the proper queue.
    1. Divert non-project request.
    2. Quickly assess value and urgency.
    3. Assign specialist to follow up on request.
    4. Inform the requestor.
  3. Business analyst starts to gather preliminary requirements.
    1. Follow up with sponsors to validate and define scope.
    2. Estimate size and determine project management rigor required.
    3. Start to develop an initial business case.
  4. Requestor is given realistic expectations for approval process.

Info-Tech Best Practice

An excess number of intake channels is the tell-tale sign of a project portfolio in distress. The PMO needs to exercise and enforce discipline on stakeholders. PMO should demand proper documentation and diligence from stakeholders before proceeding with requests.

Maintain reliable resourcing data with a recurrent project intake, prioritization, and approval practice

Info-Tech recommends following a five-step process for managing project intake, prioritization, and approval.

A diagram of Info-Tech's five-step process for managing project intake. There are four groups that may be involved in any one step, they are laid out on the side as row headers that each step's columns may fall into, 'Resources', 'Business Analysts', 'PMO', and 'Governance Layer'. The first step is 'Collect project requests' which involves 'Resources'. Step 2 is 'Screen project requests' which involves 'Business Analysts' and 'PMO'. A part of the step that may be applicable to some organizations is 'Concept approval' involving 'Governance Layer'. Step 3 is 'Develop business case' which involves 'Business Analysts' and 'PMO'. A part of the step that may be applicable to some organizations is 'Get a project sponsor' involving 'Governance Layer'. Step 4 is 'Prioritize project' which involves 'Business Analysts' and 'PMO'. Step 5 is 'Approve (greenlight) project' which involves 'Business Analysts', 'PMO', and 'Governance Layer', with an attached note that reads 'Ensure that up-to-date project portfolio information is available (project status, resource forecast, etc.)'. All of these steps lead to 'Initiate project, commit resources, etc.'

Info-Tech Insight

“Approval” can be a dangerous word in project and portfolio management. Use it carefully. Clarify precisely what is being “approved” at each step in the process, what is required to pass each gate, and how long the process will take.

Determine your project intake, prioritization, and approval process maturity

Associated Activity icon 2.1.1a – 10 minutes

INPUT: Organizational strategy and culture

OUTPUT: Project intake, prioritization, and approval capability level

Materials: PPM Strategy Development Tool

Participants: PMO Director/ Portfolio Manager, Project Managers, Resource Managers, Business Analysts

Kick-off the discussion about the project intake, prioritization, and approval process by reading the capability level descriptions below and discussing which level currently applies to you the most.

Capability Level Descriptions

Capability Level 5: Optimized We have effective intake processes with right-sized administrative overhead. Work is continuously prioritized to keep up with emerging challenges and opportunities.
Capability Level 4: Aligned We have very strong intake processes. Project approvals are based on business cases and aligned with future resource capacity.
Capability Level 3: Engaged Processes are in place to track project requests and follow up on them. Priorities are periodically re-evaluated, based largely on the best judgment of one or several executives.
Capability Level 2: Defined Some processes are in place, but there is no capacity to say no to new projects. There is a backlog, but little or no method for grooming it.
Capability Level 1: Unmanaged Our organization has no formal intake processes in place. Most work is done reactively, with little ability to prioritize project work proactively.

Benchmark the current project intake, prioritization, and approval process against strategy-aligned goals

Associated Activity icon 2.1.1b – 1-2 hours

INPUT: Documentation describing the current process (e.g. standard operating procedures), Process goals from activity 1.2.1

OUTPUT: Retrospective review of current process

Materials: 4x6” recipe cards, Whiteboard

Participants: PMO Director/ Portfolio Manager, Project Managers, Resource Managers, Business Analysts

Conduct a table-top planning exercise to map out the process currently in place.

  1. Use white 4”x6” recipe cards to write unique steps of a process. Use the intake, prioritization, and approval process from the previous slides as a guide.
  2. Use green cards to write artifacts or deliverables that result from a step.
  3. Use pink cards to write issues, problems, or risks.
  4. Discuss how the process could better achieve the strategy-aligned goals from activity 1.2.1. Keep a list of possible changes in the form of a start-stop-continue retrospective (example below) on a whiteboard.
Start Stop Continue
  • Simplify business cases
  • Send emails to requestor to manage expectations
  • Accept verbal project requests
  • Approve “pet projects”
  • Monthly prioritization meetings
  • Evaluate prioritization criteria

Set near- and long-term action items for the project intake, prioritization, and approval process

Associated Activity icon 2.1.1c – 30 minutes - 1 hour

INPUT: Outcome of the retrospective review, Process goals and metrics from activity 1.2.1

OUTPUT: Action items for evolving the process to a target state

Materials: Whiteboard

Participants: PMO Director/ Portfolio Manager, Project Managers, Resource Managers, Business Analysts

Analyze each item in the start-stop-continue retrospective to compile a set of near-term and long-term action items.

The near-term plan should include steps that are within the authority of the PMO and do not require approval or investment outside of that authority. The long-term plan should include steps that may require a longer approval process, buy-in of external stakeholders, and the investment of time and money.
Near-Term Action Items Long-Term Action Items
For example:
  • Limit the number of channels available to request new projects.
  • Revise the intake form.
  • Establish a regular triage process.
For example:
  • Establish a comprehensive scorecard and business case scoring process at the steering committee level.
  • Limit the rate of approval to be aligned with resource capacity.

Review and customize slide 23, “Project intake, prioritization, and approval: action items,” in Info-Tech’s PPM Strategic Plan Template.

Draft a high-level description of the intake, prioritization, and approval process at a target state

Associated Activity icon 2.1.1d – 1-2 hours

INPUT: Action items for evolving the process to a target state

OUTPUT: High-level description of the process at the target state

Materials: Whiteboard, PPM Strategy Development Tool

Participants: PMO Director/ Portfolio Manager, Project Managers, Resource Managers, Business Analysts

  1. Break down the process into several tasks at a high level. Avoid getting into too much detail by limiting the number of steps.
  2. An example of high-level breakdown: project intake, prioritization, and approval
    Collect project requests –› Screen requests –› Develop business case –› Prioritize project –› Approve project

  3. Describe each task by answering the following questions. Document your response in the PPM Strategic Plan Template.
  4. Question

    Description

    Input What information do you need to perform the work?
    Output What artifacts/deliverables are produced as a result?
    Frequency/Timing How often, and when, will the work be performed?
    Responsibility Who will perform the work?
    Accountability Who will approve the work and assume the ownership of any decisions?

  5. Record the time cost of each process using the PPM Strategy Development Tool; see next slide for instructions.

Use the PPM Strategy Development Tool to track the time cost of the process

Supporting Tool icon 2.1.1 – PPM Strategy Development Tool, Tab 3: Costing Assumptions

Record the time cost of each high-level process task from Activity 2.1.1d.

Screenshot of tab 3 from Info-Tech's PPM Strategy Development Tool with notes overlaid. Columns are 'ID', 'Task Description', 'Who does the task?', a super-column titled 'Current State' which includes 'How many times per year?', 'How many people?', and 'For how long?', a super-column titled 'Near-Term Target State' with the same three sub columns, and a super-column titled 'Long-Term Target State' with the same three sub columns. Notes for 'Who does the task?' read 'Choose executive, management or resource' and 'If task is done by more than one party, duplicate the task'. Notes for the 3 recurring sub columns are 'Estimate how many times in a year the task is performed (e.g. 120 project requests per year)', 'Indicate the number of people needed to perform the task each time', 'Estimate the average work-hours for the task… either in minutes or in hours', 'If a task is not applicable to a state (e.g. currently PMO does not screen project requests), leave the row blank', and 'For meetings, remember to indicate the number of people'.

Document the high-level description for the new intake, prioritization, and approval process

Associated Activity icon 2.1.1e – 30 minutes - 1 hour

INPUT: High-level description of the process at the target state

OUTPUT: Updated PPM strategic plan

Materials: Whiteboard, PPM Strategic Plan Template

Participants: PMO Director/ Portfolio Manager

Update your PPM strategic plan with the new high-level description for the new project intake, prioritization, and approval process. Depending on your current process capability level, you may wish to include additional information on your strategic document, for example:

  • Updated prioritization scorecard.
  • Roles and responsibility matrix, identifying consulted and informed parties.

Info-Tech has a dedicated blueprint to help you develop the high-level process description into a fully operationalized process. Upon completion of this PPM strategy blueprint, speak to an Info-Tech account manager or analyst to get started.

Read Info-Tech’s Optimize Project Intake, Prioritization, and Approval blueprint.

Review and customize slide 24, “Project intake, prioritization, and approval: target state,” in Info-Tech’s PPM Strategic Plan Template.

Clarity in project prioritization process leads to enterprise-wide buy-in

CASE STUDY

Industry: Public Administration
Source: IAG / Info-Tech Interview

Challenge

"Our challenge from the start was to better understand the strategic perspective and priorities of our client departments.

In addition, much of the work requested was not aligned to corporate goals and efforts, and seemed to be contradictory, redundant, and lacking strategic focus."

Complicating this challenge was the fact that work requests were being received via all means of communication, which made the monitoring and controlling of requests more difficult.

Solution

Client departments were consulted to improve the understanding of their strategic goals and priorities. Based on the consultation:

  • A new, enterprise-wide project prioritization criteria was developed.
  • Priority of project requests from all business areas are evaluated on a quarterly basis.
  • A prioritized list of projects are made available to the senior leadership team.

Results

"By creating and implementing a tool for departments to prioritize strategic efforts, we helped them consider the important overall project criteria and measure them uniformly, across all anticipated projects. This set a standard of assessment, prioritization, and ranking, which helped departments clearly see which efforts were supportive and matched their strategic goals."

Resource management process ensures that projects get the resources they need

Reclaim project capacity: properly allocate project work and establish more stable project timelines.

Questions

  • Who assigns the resources?
  • Who feeds the data on resources?
  • How do we make sure it’s valid?
  • How do we handle contingencies when projects are late, or if availability changes?

Benefits

  • Ensure that approved projects can be completed by aligning intake with real project capacity.
  • Reduce over-allocation of resources by allocating based on their proportion of project vs. non-project work.
  • Forecast future resource requirements by maintaining accurate resource capacity data.

Challenges

  • Time tracking can be difficult when project workers balance project work with “keep the lights on” activities and other administrative work.
  • Continuous partial attention, interruptions, and distractions are a part of today’s reality that makes it very difficult to maximize productivity.
A see-saw balancing 'Resource availability' on one side and 'Ongoing projects, Operational work, Administrative work, and Resource absence' on the other side.

Maintain reliable resourcing data with a recurrent resource management practice

Info-Tech recommends following a five-step process for resource management.

A diagram of Info-Tech's five-step process for resource management. There are five groups that may be involved in any one step, they are laid out on the side as row headers that each step's columns may fall into, 'Resources', 'Resource Managers', 'Project Managers', 'PMO', and 'Governance Layer'. The first step is 'Collect resource availability' which involves 'Resources' and 'Resource Managers'. Step 2 is 'Collect resource demand' which involves 'Resource Managers', 'Project Managers' and 'PMO'. Step 3 is 'Identify need for reconciliation' which involves 'PMO'. Step 4 is 'Resolve conflicts and smoothen resource allocations' which involves 'Resource Managers', 'Project Managers' and 'PMO'. Step 5 is 'Report resource allocations and forecast' which involves all groups, with an attached note that reads 'Ensure that up-to-date information is available for project approval, portfolio reporting, closure, etc.'

Info-Tech Insight

This process aims to control the resource supply to meet the demand – project and non-project alike. Coordinate this process with the intake, approval, and prioritization process.

Determine your resource management process capability level

Associated Activity icon 2.1.2a – 10 minutes

INPUT: Organizational strategy and culture

OUTPUT: Resource management capability level

Materials: PPM Strategy Development Tool

Participants: PMO Director/ Portfolio Manager, Project Managers, Resource Managers, Business Analysts

Kick-off the discussion about the resource management process by reading the capability level descriptions below and discussing which level currently applies to you the most.

Capability Level Descriptions

Capability Level 5: OptimizedOur organization has an accurate picture of project versus non-project work loads and allocates resources accordingly. We periodically reclaim lost capacity through organizational and behavioral change.
Capability Level 4: AlignedWe have an accurate picture of how much time is spent on project versus non-project work. We allocate resources to these projects accordingly. We are checking in on project progress bi-weekly.
Capability Level 3: PixelatedWe are allocating resources to projects and tracking progress monthly. We have a rough estimate of how much time is spent on project versus non-project work.
Capability Level 2: OpaqueWe match resources teams to projects and check in annually, but we do not forecast future resource needs or track project versus non-project work.
Capability Level 1: UnmanagedOur organization expects projects to be finished, but there is no process in place for allocating resources or tracking project progress.

Benchmark the current resource management process against strategy-aligned goals

Associated Activity icon 2.1.2b – 1-2 hours

INPUT: Documentation describing the current process (e.g. standard operating procedures), Process goals from activity 1.2.1

OUTPUT: Retrospective review of current process

Materials: 4x6” recipe cards, Whiteboard

Participants: PMO Director/ Portfolio Manager, Project Managers, Resource Managers, Business Analysts

Conduct a table-top planning exercise to map out the process currently in place.

  1. Use white 4”x6” recipe cards to write unique steps of a process. Use the resource management process from the previous slides as a guide.
  2. Use green cards to write artifacts or deliverables that result from a step.
  3. Use pink cards to write issues, problems, or risks.
  4. Discuss how the process could better achieve the strategy-aligned goals from activity 1.2.1. Keep a list of possible changes in the form of a start-stop-continue retrospective (example below) on a whiteboard.
Start Stop Continue
  • Collect project actuals
  • Make enhancements to the PPM tool in use
  • Over allocating resources
  • “Around the room” reporting at monthly meeting
  • Send project updates before resource management meetings

Set near- and long-term action items for the resource management process

Associated Activity icon 2.1.2c – 30 minutes - 1 hour

INPUT: Outcome of the retrospective review, Process goals and metrics from activity 1.2.1

OUTPUT: Action items for evolving the process to a target state

Materials: Whiteboard

Participants: PMO Director/ Portfolio Manager, Project Managers, Resource Managers, Business Analysts

Analyze each item in the start-stop-continue retrospective to compile a set of near-term and long-term action items.

The near-term plan should include steps that are within the authority of the PMO and do not require approval or investment outside of that authority. The long-term plan should include steps that may require a longer approval process, buy-in of external stakeholders, and the investment of time and money.
Near-Term Action Items Long-Term Action Items
For example:
  • Determine the percentage of project vs. non-project work through implementation of a weekly survey.
For example:
  • Reduce resource waste to 6%.
  • Forecast resource requirements monthly.
  • Implement a mid-market PPM tool.

Review and customize slide 26, “Resource management: action items,” in Info-Tech’s PPM Strategic Plan Template.

Draft a high-level description of the resource management process at a target state

Associated Activity icon 2.1.2d – 1-2 hours

INPUT: Action items for evolving the process to a target state

OUTPUT: High-level description of the process at the target state

Materials: Whiteboard, PPM Strategy Development Tool

Participants: PMO Director/ Portfolio Manager, Project Managers, Resource Managers, Business Analysts

  1. Break down the process into several tasks at a high level. Avoid getting into too much detail by limiting the number of steps.
  2. An example of high-level breakdown: resource management
    Collect resource availability –› Collect resource demand –› Identify need for reconciliation –› Resolve conflicts and over-allocation –› Update resource forecast


  3. Describe each task by answering the following questions. Document your response in the PPM Strategic Plan Template.
  4. Question

    Description

    Input What information do you need to perform the work?
    Output What artifacts/deliverables are produced as a result?
    Frequency/Timing How often, and when, will the work be performed?
    Responsibility Who will perform the work?
    Accountability Who will approve the work and assume the ownership of any decisions?


  5. Record the time cost of each process using the PPM Strategy Development Tool.

Document the high-level description for the new resource management process

Associated Activity icon 2.1.2e – 30 minutes - 1 hour

INPUT: High-level description of the process at the target state

OUTPUT: Updated PPM strategic plan

Materials: PPM Strategic Plan Template

Participants: PMO Director/ Portfolio Manager

Update your PPM strategic plan with the new high-level description for the new resource management process. Depending on your current process capability level, you may wish to include additional information on your strategic plan, for example:

  • Resource management meeting agenda template
  • Roles and responsibility matrix, identifying consulted and informed parties

Info-Tech has a dedicated blueprint to help you develop the high-level process description into a fully operationalized process. Upon completion of this PPM strategy blueprint, speak to an Info-Tech account manager or analyst to get started.

Read Info-Tech’s Develop a Resource Management for the New Reality blueprint.

Review and customize slide 27, “Resource management: target state,” in Info-Tech’s PPM Strategic Plan Template.

Step 2.2: Develop and refine portfolio reporting, project closure, and benefits realization processes

PHASE 1

PHASE 2

PHASE 3

1.11.22.12.23.13.2
Choose the right PPM strategyTranslate strategy into process goalsDefine intake & resource mgmt. processesDefine reporting, closure, & benefits mgmt. processesSelect a right-sized PPM solutionFinalize your PPM strategic plan

This step will walk you through the following activities:

  • Determine your process maturity.
  • Benchmark current processes against strategy-aligned goals.
  • Set near- and long-term action items.
  • Draft a high-level description of your target state.
  • Document your new processes.

This step involves the following participants:

  • PMO Director/Portfolio Manager
  • Project Managers
  • Business Analysts

Outcomes of this step

  • A definition of current and target state maturity levels for portfolio reporting, project closure, and benefits realization
  • Near-term and long-term process goals for portfolio reporting, project closure, and benefits realization
  • A high-level wireframe for your portfolio reporting, project closure, and benefits realization process steps

Portfolio reporting process makes trustworthy data accessible for informing decisions

Giving stakeholders the ability to make informed decisions is the most important function of managing the project portfolio.

Questions

  • What project information should be reported?
  • Who reports on project status?
  • When and how do we report on the status of the project portfolio?

Benefits

  • Reporting is the linchpin of any successful PPM strategy.
  • Timely and accurate status reports enable decision makers to address issues risks and issues before they create bigger problems.
  • Executive visibility can be achieved with or without a commercial tool using spreadsheets, a content management system such as SharePoint, or a combination of tools you already have.

Challenges

  • Trying to increase detailed visibility too fast leads to difficulty gathering and maintaining data. As a result, reporting is rarely accurate and people quickly lose trust in the portfolio.
  • If you are planning to adopt a commercial tool, Info-Tech strongly recommends validating your organization’s ability to maintain a consistent reporting process using simple tools before investing in a more sophisticated system.

Info-Tech Insight

If you can only do one thing, establish frequently current reporting on project status. Reporting doesn’t have to be detailed or precise, as long as it’s accurate.

Maintain reliable portfolio status data with a recurrent status and progress reporting practice

Info-Tech recommends following a four-step process for portfolio status and progress reporting.

A diagram of Info-Tech's four-step process for portfolio status and progress reporting. There are four groups that may be involved in any one step, they are laid out on the side as row headers that each step's columns may fall into, 'Resources', 'Project Managers', 'PMO', and 'Governance Layer'. The first step is 'Create project status reports' which involves 'Resources' and 'Project Managers'. Step 2 is 'Create a project portfolio status report' which involves 'Project Managers' and 'PMO', with a note that reads 'Ensure that up-to-date information is available for project approval, resource management, closure, etc.' Step 3 is 'Report on project portfolio status' which involves 'PMO' and 'Governance layer'. Step 4 is 'Act on portfolio steering decisions' which involves 'Resources', 'Project Managers' and 'PMO'.

Start by establishing a regular reporting cadence with lightweight project status KPIs:

Red Issue or risk that requires intervention For projects that are red or yellow, high-level status reports should be elaborated on with additional comments on budget, estimated hours/days until completion, etc.
Yellow Issue or risk that stakeholders should be aware of
Green No significant risks or issues

Determine your resource management process capability level

Associated Activity icon 2.2.1a – 10 minutes

INPUT: Organizational strategy and culture

OUTPUT: Portfolio reporting capability level

Materials: PPM Strategy Development Tool

Participants: PMO Director/ Portfolio Manager, Project Managers

Kick-off the discussion about the portfolio reporting process by reading the capability level descriptions below and discussing which level currently applies to you the most.

Capability Level Descriptions

Capability Level 5: OptimizedWith the right tools, we can ensure that all projects are planned and maintained at a detailed task level with high-quality estimates, and that actual task progress is updated at least weekly.
Capability Level 4: AlignedWe have the skills, knowledge, and resources needed to prepare a detailed cost-benefit analysis for all proposed projects. We track the progress throughout project execution.
Capability Level 3: InterventionWith the right tools, we can ensure that project issues and risks are identified and addressed on a regular basis (e.g. at least monthly) for all projects.
Capability Level 2: OversightWith the right tools, we can ensure that project status updates are revised on a regular basis (e.g. at least monthly) for all ongoing projects.
Capability Level 1: ReactiveProject managers escalate issues directly with their direct supervisor or project sponsor because there is no formal PPM practice.

Benchmark the current portfolio reporting process against strategy-aligned goals

Associated Activity icon 2.2.1b – 1-2 hours

INPUT: Documentation describing the current process (e.g. standard operating procedures), Process goals from activity 1.2.1

OUTPUT: Retrospective review of current process

Materials: 4x6” recipe cards, Whiteboard

Participants: PMO Director/ Portfolio Manager, Project Managers

Conduct a table-top planning exercise to map out the process currently in place.

  1. Use white 4”x6” recipe cards to write unique steps of a process. Use the portfolio reporting process from the previous slides as a guide.
  2. Use green cards to write artifacts or deliverables that result from a step.
  3. Use pink cards to write issues, problems, or risks.
  4. Discuss how the process could better achieve the strategy-aligned goals from activity 1.2.1. Keep a list of possible changes in the form of a start-stop-continue retrospective (example below) on a whiteboard.
Start Stop Continue
  • Report on lightweight KPIs
  • Standardize the status reports
  • Project managers waiting too long before declaring a red status
  • Produce weekly project portfolio-wide report for senior leadership

Set near- and long-term action items for the portfolio reporting process

Associated Activity icon 2.2.1c – 30 minutes - 1 hour

INPUT: Outcome of the retrospective review, Process goals and metrics from activity 1.2.1

OUTPUT: Action items for evolving the process to a target state

Materials: Whiteboard

Participants: PMO Director/ Portfolio Manager, Project Managers

Analyze each item in the start-stop-continue retrospective to compile a set of near-term and long-term action items.

The near-term plan should include steps that are within the authority of the PMO and do not require approval or investment outside of that authority. The long-term plan should include steps that may require a longer approval process, buy-in of external stakeholders, and the investment of time and money.
Near-Term Action Items Long-Term Action Items
For example:
  • Establish a reporting process that can be consistently maintained using lightweight KPIs.
  • Provide a simple dashboard that stakeholders can use to see their project status reports at a high level.
For example:
  • Adopt a commercial tool for maintaining consistent status reports.
  • Support the tool with training and a mandate of adoption among all users.

Review and customize slide 29, “Portfolio reporting: action items,” in Info-Tech’s PPM Strategic Plan Template.

Draft a high-level description of the portfolio reporting process at a target state

Associated Activity icon 2.2.1d – 1-2 hours

INPUT: Action items for evolving the process to a target state

OUTPUT: High-level description of the process at the target state

Materials: Whiteboard, PPM Strategy Development Tool

Participants: PMO Director/ Portfolio Manager, Project Managers

  1. Break down the process into several tasks at a high level. Avoid getting into too much detail by limiting the number of steps.
  2. An example of high-level breakdown: portfolio reporting
    Create project status reports –› Create a project portfolio status report –› Report on project portfolio status –› Act on portfolio steering decisions


  3. Describe each task by answering the following questions. Document your response in the PPM Strategic Plan Template.
  4. Question

    Description

    InputWhat information do you need to perform the work?
    OutputWhat artifacts/deliverables are produced as a result?
    Frequency/TimingHow often, and when, will the work be performed?
    ResponsibilityWho will perform the work?
    AccountabilityWho will approve the work and assume the ownership of any decisions?

  5. Record the time cost of each process using the PPM Strategy Development Tool.

Document the high-level description for the new portfolio reporting process

Associated Activity icon 2.2.1e – 30 minutes - 1 hour

INPUT: High-level description of the process at the target state

OUTPUT: Updated PPM strategic plan

Materials: PPM Strategic Plan Template

Participants: PMO Director/ Portfolio Manager

Update your PPM strategic plan with the new high-level description for the new portfolio reporting process. Depending on your current process capability level, you may wish to include additional information on your strategic plan, for example:

  • Updated project status report template with new KPIs.
  • Documentation of requirements for improved PPM dashboards and reports.

Info-Tech has a dedicated blueprint to help you develop the high-level process description into a fully operationalized process. Upon completion of this PPM strategy blueprint, speak to an Info-Tech account manager or analyst to get started.

Read Info-Tech’s Enhance PPM Dashboards and Reports blueprint.

Review and customize slide 30, “Portfolio reporting: target state,” in Info-Tech’s PPM Strategic Plan Template.

Streamlined status reporting improves portfolio visibility for executives, enabling data-driven steering of the portfolio

CASE STUDY

Industry: Public Administration
Source: IAG / Info-Tech Interview

Challenge

The client had no effective real-time reporting in place to summarize their work efforts. In addition, the client struggled with managing existing resources against the ability to deliver on the requested project workload.

Existing project reporting processes were manually intensive and lacked mature reporting capabilities.

Solution

Through a short and effective engagement, IAG conducted surveys and facilitated interviews to identify the information needed by each stakeholder. From this analysis and industry best practices, IAG developed scorecards, dashboards, and project summary reports tailored to the needs of each stakeholder group. This integrated reporting tool was then made available on a central portal for PPM stakeholders.

Results

Stakeholders can access project scorecard and dashboard reports that are available at any given time.

Resource reporting enabled the PMO to better balance client demand with available project capacity and forecast any upcoming deficiencies in resourcing that affect project delivery.

Project closure at the portfolio level controls throughput and responsiveness of the portfolio

Take control over projects that linger on, projects that don’t provide value, and projects that do not align with changing organizational priority.

Questions

  • Who declares that a project is done?
  • Who validates it?
  • Who is this reported to?
  • Who terminates low-value projects?
  • How will they decide that a project is too low value to continue?

Benefits

  • Minimize post-implementation problems by ensuring clean handoffs, with clear responsibilities for ongoing support and maintenance.
  • Drive continuous improvement by capturing and applying lessons learned.
  • Increase the project portfolio’s responsiveness to change by responding to emerging opportunities and challenges.

Challenges

  • Completion criteria and “definition of done” need to be well defined and done so at project initiation.
  • Scope changes need to be managed and documented throughout the project.
  • Portfolio responsiveness requires deep cultural changes that will be met with confusion and resistance from some stakeholders.

Info-Tech Insight

Although “change in organizational priority” is the most frequently cited cause of project failure (PMI Pulse of Profession, 2017), closing projects that don’t align with organizational priority ought to be a key PPM goal. Therefore, don’t think of it as project failure; instead, think of it as PPM success.

Maintain the health of the project portfolio with a repeatable project closure process

Info-Tech recommends following a four-step process for project closure.

A diagram of Info-Tech's four-step process for project closure. There are five groups that may be involved in any one step, they are laid out on the side as row headers that each step's columns may fall into, 'Resources', 'Resource Managers', 'Project Managers', 'PMO', and 'Governance Layer'. The first steps are 'Complete project' which involves 'Project Managers', and 'Terminate low value projects' which involves 'PMO' and 'Governance layer'. Step 2 is 'Validate project closure' which involves 'Project Managers' and 'PMO', with a note that reads 'This includes facilitating the project sponsor sign-off, accepting and archiving lessons learned documents, etc.' The third steps are 'Conduct post-project work' which involves 'Project Managers' and 'PMO', and 'Update resource availability' which includes 'Resource Managers'. Step 4 is 'Conduct post-implementation review' which involves all groups.

Info-Tech Best Practice

Post-implementation review checks which benefits (including those set out in the business case) have been achieved and identifies opportunities for further improvement. Without it, it can be difficult to demonstrate that investment in a project was worthwhile.

Determine your project closure process capability level

Associated Activity icon 2.2.2a – 10 minutes

INPUT: Organizational strategy and culture

OUTPUT: Project closure capability level

Materials: PPM Strategy Development Tool

Participants: PMO Director/ Portfolio Manager, Project Managers, Business Analysts

Kick-off the discussion about the project closure process by reading the capability level descriptions below and discussing which level currently applies to you the most.

Capability Level Descriptions

Capability Level 5: OptimizedProject closure is centrally managed and supports post-project benefits tracking.
Capability Level 4: AlignedProject closure is centrally managed at the portfolio level to ensure completion/acceptance criteria are satisfied.
Capability Level 3: EngagedProject closure is confirmed at the portfolio level, but with minimal enforcement of satisfaction of completion/acceptance criteria.
Capability Level 2: EncouragedProject managers often follow handoff and closure procedures, but project closure is not confirmed or governed at the portfolio level.
Capability Level 1: UnmanagedProject closure is not governed at either the project or portfolio level.

Benchmark the current project closure process against strategy-aligned goals

Associated Activity icon 2.2.2b – 1-2 hours

INPUT: Documentation describing the current process (e.g. standard operating procedures), Process goals from activity 1.2.1

OUTPUT: Retrospective review of current process

Materials: 4x6” recipe cards, Whiteboard

Participants: PMO Director/ Portfolio Manager, Project Managers, Business Analysts

Conduct a table-top planning exercise to map out the process currently in place.

  1. Use white 4”x6” recipe cards to write unique steps of a process. Use the project closure process from the previous slides as a guide.
  2. Use green cards to write artifacts or deliverables that result from a step.
  3. Use pink cards to write issues, problems, or risks.
  4. Discuss how the process could better achieve the strategy-aligned goals from activity 1.2.1. Keep a list of possible changes in the form of a start-stop-continue retrospective (example below) on a whiteboard.
Start Stop Continue
  • Conduct reprioritization of projects at a regular cadence
  • Prune projects every year
  • Waive post-implementation review for time-constrained projects
  • Collect project post-mortem reports and curate in PMO SharePoint

Set near- and long-term action items for the project closure process

Associated Activity icon 2.2.2c – 30 minutes - 1 hour

INPUT: Outcome of the retrospective review, Process goals and metrics from activity 1.2.1

OUTPUT: Action items for evolving the process to a target state

Materials: Whiteboard

Participants: PMO Director/ Portfolio Manager, Project Managers, Resource Managers, Business Analysts

Analyze each item in the start-stop-continue retrospective to compile a set of near-term and long-term action items.

The near-term plan should include steps that are within the authority of the PMO and do not require approval or investment outside of that authority. The long-term plan should include steps that may require a longer approval process, buy-in of external stakeholders, and the investment of time and money.
Near-Term Action Items Long-Term Action Items
For example:
  • Begin establishing project closure criteria in the project initiation process.
  • Manage and document scope changes throughout the project.
For example:
  • Institute a formal process to ensure that all projects are closed at the portfolio level and properly handed off to support and maintenance teams.

Review and customize slide 32, “Project closure: action items,” in Info-Tech’s PPM Strategic Plan Template.

Draft a high-level description of the project closure process at a target state

Associated Activity icon 2.2.2d – 1-2 hours

INPUT: Action items for evolving the process to a target state

OUTPUT: High-level description of the process at the target state

Materials: Whiteboard, PPM Strategy Development Tool

Participants: PMO Director/ Portfolio Manager, Project Managers, Resource Managers, Business Analysts

  1. Break down the process into several tasks at a high level. Avoid getting into too much detail by limiting the number of steps.
  2. An example of high-level breakdown: project closure
    Complete or terminate projects –› Validate project closure –› Conduct post-project work –› Conduct post-implementation review


  3. Describe each task by answering the following questions. Document your response in the PPM Strategic Plan Template.
  4. Question

    Description

    Input What information do you need to perform the work?
    Output What artifacts/deliverables are produced as a result?
    Frequency/Timing How often, and when, will the work be performed?
    Responsibility Who will perform the work?
    Accountability Who will approve the work and assume the ownership of any decisions?


  5. Record the time cost of each process using the PPM Strategy Development Tool.

Document the high-level description for the new project closure process

Associated Activity icon 2.2.2e – 30 minutes - 1 hour

INPUT: High-level description of the process at the target state

OUTPUT: Updated PPM strategic plan

Materials: PPM Strategic Plan Template

Participants: PMO Director/ Portfolio Manager

Update your PPM strategic plan with the new high-level description for the new project closure process. Depending on your current process capability level, you may wish to include additional information on your strategic plan, for example:

  • Updated project closure checklist.
  • Project value review meeting process document.
  • Post-implementation review process document.

Info-Tech has several research notes that elaborate on aspects of project closure. Upon completion of this PPM strategy blueprint, speak to an Info-Tech account manager or analyst to get started.

Read Info-Tech’s research notes on project closure:

  • The Importance of Conducting a Post Implementation Review
  • Five Key Steps to Mastering Project Closure
  • ‘Governance’ Will Kill Your Projects

Review and customize slide 33, “Project closure: target state,” in Info-Tech’s PPM Strategic Plan Template.

Validate the time and effort spent on projects with a benefits realization process

Maximizing benefits from projects is the primary goal of PPM. Tracking and reporting on benefits post-project closes the loop on benefits.

Questions

  • How do validate the project benefits from the original business case?
  • How do we track the benefits?
  • Who reports it? When?

Benefits

  • Maximize benefits realization by identifying and addressing unforeseen issues or limitations to success.
  • Improve project approval and prioritization by improving validity of the business case definition process.

Challenges

  • Project sponsors need to be willing to invest time – months and years post-project completion – to validate benefits realization.
  • Portfolio management needs to proactively work with sponsors to facilitate benefits tracking.
  • Business cases need to be well developed and documented to reflect real anticipated benefits.

Too many projects fail to achieve the originally proposed benefits, and too few organizations are able to identify and address the root causes of those shortfalls.

Info-Tech Insight

In reality, benefits realization process extends across the entire project life cycle: during intake, during the execution of the project, and after project completion. Be mindful of this extended scope when you discuss benefits realization in the following activity.

Keep project benefits front and center with a repeatable benefits realization process

Info-Tech recommends following a four-step process for benefits realization.

A diagram of Info-Tech's four-step process for benefits realization. There are four groups that may be involved in any one step, they are laid out on the side as row headers that each step's columns may fall into, 'Business Analysts', 'Project Managers', 'PMO', and 'Governance Layer'. The first step is 'Quantify and validate benefits in business case' which happens 'Before Project' and involves 'Business Analysts' and 'Project Managers'. Step 2 is 'Update projected project benefits' which happens 'During Project' and involves 'Project Managers' and 'PMO'. Step 3 is 'Hand-off benefits realization ownership' which happens at the end of project and involves 'Project Managers', 'PMO' and 'Governance layer'. Step 4 is 'Monitor and report on benefits' which happens 'After Project' and involves 'PMO' and 'Governance layer'.

Info-Tech Insight

At the heart of benefits realization is accountability: who is held accountable for projects that don’t realize the benefits and how? Without the buy-in from the entire executive layer team, addressing this issue is very difficult.

Determine your benefits realization process capability level

Associated Activity icon 2.2.3a – 10 minutes

INPUT: Organizational strategy and culture

OUTPUT: benefits realization capability level

Materials: PPM Strategy Development Tool

Participants: PMO Director/ Portfolio Manager, Project Managers, Resource Managers, Business Analysts

Kick-off the discussion about the benefits realization process by reading the capability level descriptions below and discussing which level currently applies to you the most.

Capability Level Descriptions

Capability Level 5: OptimizedProject sponsors and key stakeholders are accountable for stated project benefits before, during and after the project. There is a process to maximize the realization of project benefits.
Capability Level 4: AlignedProject benefits are forecasted and taken into account for approval, updated when changes are made to the project, and monitored/reported after projects are completed.
Capability Level 3: EngagedProject benefits are forecasted and taken into account for approval, and there is a loosely defined process to report on benefits realization.
Capability Level 2: DefinedProject benefits are forecasted and taken into account for approval, but there is no process to monitor whether the said benefits are realized.
Capability Level 1: UnmanagedProjects are approved and initiated without discussing benefits.

Benchmark the current benefits realization process against strategy-aligned goals

Associated Activity icon 2.2.3b – 1-2 hours

INPUT: Documentation describing the current process (e.g. standard operating procedures), Process goals from activity 1.2.1

OUTPUT: Retrospective review of current process

Materials: 4x6” recipe cards, Whiteboard

Participants: PMO Director/ Portfolio Manager, Project Managers, Resource Managers, Business Analysts

Conduct a table-top planning exercise to map out the process currently in place.

  1. Use white 4”x6” recipe cards to write unique steps of a process. Use the benefits realization process from the previous slides as a guide.
  2. Use green cards to write artifacts or deliverables that result from a step.
  3. Use pink cards to write issues, problems, or risks.
  4. Discuss how the process could better achieve the strategy-aligned goals from activity 1.2.1. Keep a list of possible changes in the form of a start-stop-continue retrospective (example below) on a whiteboard.
StartStopContinue
  • Require “hard monetary value” in business benefits
  • Send project updates before resource management meetings

Set near- and long-term action items for the benefits realization process

Associated Activity icon 2.2.3c – 30 minutes - 1 hour

INPUT: Outcome of the retrospective review, Process goals and metrics from activity 1.2.1

OUTPUT: Action items for evolving the process to a target state

Materials: Whiteboard

Participants: PMO Director/ Portfolio Manager, Project Managers, Resource Managers, Business Analysts

Analyze each item in the start-stop-continue retrospective to compile a set of near-term and long-term action items.

The near-term plan should include steps that are within the authority of the PMO and do not require approval or investment outside of that authority. The long-term plan should include steps that may require a longer approval process, buy-in of external stakeholders, and the investment of time and money.
Near-Term Action Items Long-Term Action Items
For example:
  • Create an “orientation for project sponsors” document.
  • Encourage project managers to re-validate project benefits on an ongoing basis and report any deviation.
For example:
  • Recruit the finance department’s help in benefits tracking.
  • Require Finance’s sign-off on project benefits in business cases during intake.

Review and customize slide 35, “Benefits realization: action items,” in Info-Tech’s PPM Strategic Plan Template.

Draft a high-level description of the benefits realization process at a target state

Associated Activity icon 2.2.3d – 1-2 hours

INPUT: Action items for evolving the process to a target state

OUTPUT: High-level description of the process at the target state

Materials: Whiteboard, PPM Strategy Development Tool

Participants: PMO Director/ Portfolio Manager, Project Managers, Resource Managers, Business Analysts

  1. Break down the process into several tasks at a high level. Avoid getting into too much detail by limiting the number of steps.
  2. An example of high-level breakdown: benefits realization
    Validate benefits in business case –› Update project benefits during execution –› Hand-off benefits ownership –› Monitor and report on benefits


  3. Describe each task by answering the following questions. Document your response in the PPM Strategic Plan Template.
  4. Question

    Description

    InputWhat information do you need to perform the work?
    OutputWhat artifacts/deliverables are produced as a result?
    Frequency/TimingHow often, and when, will the work be performed?
    ResponsibilityWho will perform the work?
    AccountabilityWho will approve the work and assume the ownership of any decisions?

  5. Record the time cost of each process using the PPM Strategy Development Tool.

Document the high-level description for the new benefits realization process

Associated Activity icon 2.2.3e – 30 minutes - 1 hour

INPUT: High-level description of the process at the target state

OUTPUT: Updated PPM strategic plan

Materials: PPM Strategic Plan Template

Participants: PMO Director/ Portfolio Manager

Update your PPM strategic plan with the new high-level description for the new benefits realization process. Depending on your current process capability level, you may wish to include additional information on your strategic plan, for example:

  • Updated business plan templates.
  • Communication plan for project sponsors.

Info-Tech has a dedicated blueprint to help you develop the high-level process description into a fully operationalized process. Upon completion of this PPM strategy blueprint, speak to an Info-Tech account manager or analyst to get started.

Read Info-Tech’s Establish the Benefits Realization Process blueprint.

Review and customize slide 36, “Benefits realization: target state,” in Info-Tech’s PPM Strategic Plan Template.

If you want additional support, have our analysts guide you through this phase as part of an Info-Tech Workshop Associated Activity icon

Book a workshop with our Info-Tech analysts:

Photo of Barry Cousins.
  • To accelerate this project, engage your IT team in an Info-Tech workshop with an Info-Tech analyst team.
  • Info-Tech analyst will join you and your team onsite at your location or welcome you to Info-Tech's historic Toronto office to participate in an innovative onsite workshop.
  • Contact your account manager (www.infotech.com/account), or email Workshops@InfoTech.com for more information.

The following are sample activities that will be conducted by Info-Tech analysts with your team:

Sample of activity 2.1.1 'Align your project intake, prioritization, and approval process to the PPM strategy'. Align your project intake, prioritization, and approval process to the PPM strategy

Examine the process at the current state and develop an action plan to improve it, with a high-level description of the process at a target state and its overhead costs. The outcome of this activity feeds into the overall PPM strategic plan.

Sample of activity 2.1.2 'Align your resource management process to the PPM strategy'. Align your resource management process to the PPM strategy

Examine the process at the current state and develop an action plan to improve it, with a high-level description of the process at a target state and its overhead costs. The outcome of this activity feeds into the overall PPM strategic plan.

If you want additional support, have our analysts guide you through this phase as part of an Info-Tech Workshop Associated Activity icon

Book a workshop with our Info-Tech analysts:

Sample of activity 2.2.1 'Align your portfolio reporting process to the PPM strategy'.Align your portfolio reporting process to the PPM strategy

Examine the process at the current state and develop an action plan to improve it, with a high-level description of the process at a target state and its overhead costs. The outcome of this activity feeds into the overall PPM strategic plan.

Sample of activity 2.2.2 'Align your project closure process to the PPM strategy'.Align your project closure process to the PPM strategy

Examine the process at the current state and develop an action plan to improve it, with a high-level description of the process at a target state and its overhead costs. The outcome of this activity feeds into the overall PPM strategic plan.

Sample of activity 2.2.3 'Align your benefits realization process to the PPM strategy'.Align your benefits realization process to the PPM strategy

Examine the process at the current state and develop an action plan to improve it, with a high-level description of the process at a target state and its overhead costs. The outcome of this activity feeds into the overall PPM strategic plan.

Develop a Project Portfolio Management Strategy

PHASE 3

Complete Your PPM Strategic Plan

Phase 2 outline

Associated Activity icon Call 1-888-670-8889 or email GuidedImplementations@InfoTech.com for more information.

Complete these steps on your own, or call us to complete a guided implementation. A guided implementation is a series of 2-3 advisory calls that help you execute each phase of a project. They are included in most advisory memberships.

Guided Implementation 3: Complete your PPM strategic plan

Proposed Time to Completion: 2 weeks
Step 3.1: Select a right-sized PPM solutionStep 3.2: Finalize your PPM Strategic Plan Template
Work with an analyst to:
  • Assess your PPM tool requirements to help support your processes.
Review findings with analyst:
  • Determine the costs and potential benefits of your PPM strategy.
Then complete these activities…
  • Determine the functionality requirements of the PPM solution.
  • Estimate your PPM tool budget.
  • Review the tool assessment.
Then complete these activities…
  • Estimate the total cost-in-use of managing the project portfolio.
  • Estimate the benefits of the PPM strategy.
  • Refine and consolidate the near-term action items into a cohesive implementation plan.
With these tools & templates:
  • PPM Strategy Development Tool
With these tools & templates:
  • PPM Strategy Development Tool
  • PPM Strategic Plan Template

Phase 3 Insight:

  • Approach PPM as an evolving discipline that requires adaptability and long-term organizational change. Near-term process improvements should create stakeholder desire for better portfolio visibility and agility over the long term.

Step 3.1: Select a right-sized PPM solution for supporting your new processes

PHASE 1

PHASE 2

PHASE 3

1.11.22.12.23.13.2
Choose the right PPM strategyTranslate strategy into process goalsDefine intake & resource mgmt. processesDefine reporting, closure, & benefits mgmt. processesSelect a right-sized PPM solutionFinalize your PPM strategic plan

This step will walk you through the following activities:

  • Determine the functionality requirements of a PPM solution in the near and long terms.
  • Estimate your PPM tool budget.
  • Review tool assessment.

This step involves the following participants:

  • CIO
  • PMO Director/ Portfolio Manager
  • Project Managers
  • IT Managers

Outcomes of this step

  • List of functional requirements for a PPM solution
  • An estimate budget and cost for supporting a PPM tool in the near and long terms
  • PPM tool requirements for the near and long terms

Right-size your PPM solution/tool to fit your PPM processes

Avoid a common pitfall: the disconnect between PPM processes and PPM tools.

PPM tools act as both a receptacle for portfolio data generated by your processes and a source of portfolio data to drive your processes forward. Therefore, choosing a suitable PPM tool is critical to the success of your PPM strategy:

  • PPM tool inputs must match the type, level of detail, and amount of portfolio data generated by your PPM processes.
  • PPM tool outputs must be useful, insightful, easy to access, and easy to understand for people who engage in your PPM processes.

User adoption is an often cited cause of failed PPM tool implementation:

"The biggest problem is getting the team to work with the tool. We need to make sure that we’re not wasting time delving too far down into the tool, yet putting enough information to get useful information back." (IT Director, Financial Services)

This final step of the blueprint will discuss the choice of PPM tools to ensure the success of PPM strategy by avoiding the process-tool disconnect.

Common pitfalls for PPM tools

  • Purchasing and implementing a PPM tool before the process is defined and accepted.
  • Poor expectation setting: inability of tools to perform the necessary analysis.
  • Underleveraged: low user/process adoption.
  • Poor integration with the corporate finance function.
  • (WGroup, 2017)

Leverage PPM tools to get the information you need

An optimized PPM solution is the vehicle that provides decision makers with four key pieces of information they require when making decisions for your project portfolio:

  • Historical Insight – inform decision makers about how much time and resources have been spent to date, and benchmark the accuracy of prior project estimates and resource allocations.
  • Forecasting – provide a trustworthy estimate of demand on resources and current projects.
  • Portfolio Analytics – analyze portfolio data and generate easy-to-consume reports that provide answers to questions such as:
    • How big is our overall portfolio?
    • How much money/resource time is available?
    • How efficiently are we using our resources?
  • Project Visibility – provide a trustworthy report on the status of current projects and the resources working on them.

Info-Tech Insight

Without the proper information, decision makers are driving blind and are forced to make gut feel decisions as opposed to data-informed decisions. Implement a PPM solution to allocate projects properly and ensure time and money don’t vanish without being accounted for.

Commercial PPM tools have more functionality but are more costly, complex, and difficult to adopt

  • Granular timesheet management
  • Workflow and team collaboration
  • Robust data and application integration
  • Advanced what-if planning
  • Mobile usability
A map comparing commercial PPM tools by 'Functionality', 'Cost', and 'Difficulty to implement/adopt'. 'Functionality' and 'Difficulty to implement/adopt' share an axis and can be assumed to have a linear relationship. 'Spreadsheets' are low functionality and low cost. 'Google Sites' are low to middling functionality and low cost. 'SharePoint' is middling functionality with a slightly higher cost. The next three start at middling cost and above-average functionality and trend higher in both categories: 'Commercial Entry-Level PPM', 'Commercial Mid-Market PPM', and 'Commercial Enterprise PPM'.
  • Business case scoring and prioritization
  • Multi-user reporting and request portal
  • High-level resource management
  • Project status, cost, and risk tracking

"Price tags [for PPM tools] vary considerably. Expensive products don't always provide more capability. Inexpensive products are generally low cost for good reason." (Merkhofer)

Your PPM tool options are not limited to commercial offerings

Despite the rapid growth in the commercial PPM tool market today, homegrown approaches like spreadsheets and intranet sites continue to be used as PPM tools.

Kinds of PPM solutions used by Info-Tech clients

A pie chart visualizing the kinds of PPM solutions that are used by Info-Tech clients. There are three sections, the largest of which is 'Spreadsheet-based, 46%', then 'Commercial, 33%', then 'No solution, 21%'. (Source: Info-Tech Research Group (2016), N=433)

Category

Characteristics

PPM maturity

Enterprise tool
  • Higher professional services requirements for enterprise deployment
  • Larger reference customers
High
Mid-market tool
  • Lower expectation of professional services engaged in initial deployment contract
  • Fewer globally recognizable reference clients
  • Faster deployments
High
Entry-level tool
  • Lower cost than mid-market & enterprise PPM tools
  • Limited configurability, reporting, and resource management functionalities
  • Compelling solutions to the organizations that wants to get a fast start to a trial deployment
Intermediate
Spreadsheet based
  • Little/no up-front cost, highly customizable to suit your organization’s needs
  • Varying degrees of sophistication
  • Few people in the organization may understand the logic behind the tool; knowledge may not be easily transferrable
Intermediate Low

Determine the functional requirements of the PPM solution

Associated Activity icon 3.1.1 – 20 minutes

INPUT: PPM strategic plan

OUTPUT: Modified PPM strategic plan with a proposed choice of PPM tool

Materials: PPM Strategy Development Tool

Participants: PMO Director/ Portfolio Manager, Project Managers, IT Managers

Use the Tool Assessment tab (tab 4) of Info-Tech’s PPM Strategy Development Tool to rate and analyze functional requirements of your PPM solution.

  • Review the list of PPM features provided on column B of tab 4. You can add any desired features not listed.
  • Rate your near-term and long-term feature requirements using the drop-down menus in columns C and D. Your selections here will inform the tool selection bubble chart to the right of the features list.

Screenshot showing the features list on tab 4 of the PPM Strategy Development Tool.

Estimate your PPM tool budget

Associated Activity icon 3.1.2 – 20 minutes

INPUT: PPM strategic plan

OUTPUT: Modified PPM strategic plan with a proposed choice of PPM tool

Materials: PPM Strategy Development Tool

Participants: CIO, PMO Director/ Portfolio Manager, Project Managers, IT Managers

Enter the PPM tool budget information on the Tool Assessment tab of Info-Tech’s PPM Strategy Development Tool.

  • As a starting point, it can help to know that low-priced PPM tools cost around $1,000 per user per year. High-priced PPM tools cost around $3,000 per user per year.
  • Software-as-a-Service (SaaS)-based pricing for PPM solutions is increasingly popular. If you plan to purchase perpetual licensing, divide the total implementation and licensing cost by three years to be comparable with a three-year SaaS total cost of ownership analysis.

Screenshot showing the tool assessment from the PPM Strategy Development Tool with 'Near-Term' and 'Long-Term' budget columns. Notes include 'Enter the number of fully licensed PPM users you expect to provision for and your estimated annual budget for a PPM tool', 'The tool assessment automatically calculates your annual budget per user, which is reflected in the bubble chart analysis (see next slide)'.

Review the tool assessment graphic

Associated Activity icon 3.1.3 – 20 minutes

The map comparing commercial PPM tools from before, this time overlaid with 'Near-Term' and 'Long-Term' budgets as coloured circles. The vertical axis is 'Functionality Rating' and the horizontal axis is now 'Annual Cost/Budget per User'. 'Spreadsheets' are low functionality and low cost. 'Google Sites' are low to middling functionality and low cost. 'SharePoint' is middling functionality with a slightly higher cost. The 'Near-Term' budget circle covers those three tools. The next three start at middling cost and above-average functionality and trend higher in both categories: 'Commercial Entry-Level PPM', 'Commercial Mid-Market PPM', and 'Commercial Enterprise PPM'. The 'Long-Term' budget circle covers 'Commercial Mid-Market PPM'.

If you are in one of the non-covered areas, consider revisiting your functional requirements and PPM strategy. You may need to lessen your expectations to be able to stay within your budget, or find a way to get more money.

Keep in mind that the long-term goal can be to work towards a commercial tool, while the short-term goal would be to be able to maintain your portfolio in a simple spreadsheet first.

Info-Tech Insight

If you choose a commercial solution, you will need to gain executive buy-in in order to implement the tool; proceed to near-term and long-term plans to get the ball rolling on this decision.

Review and customize slide 37, “Tools for PPM: proposed near- and long-term solutions,” in Info-Tech’s PPM Strategic Plan Template.

Grow your own, or select and implement, a PPM solution with Info-Tech

Whether you choose spreadsheet-based or commercially available PPM solutions, use Info-Tech’s research for scoping, designing, and implementing them.

Info-Tech’s Grow Your Own PPM Solution blueprint will help you implement a highly evolved spreadsheet-based PPM solution. It features the Portfolio Manager 2017, a Microsoft Excel-based workbook that leverages its business intelligence features to provide a basis for implementing a scalable, highly customizable PPM tool with useful and easy-to-manipulate analytics.

Read Info-Tech’s Grow Your Own PPM Solution blueprint.

Info-Tech’s Select and Implement a PPM Solution blueprint is part of our Vendor Landscape research. Make sense of the diversity of PPM solutions available in today’s market, and choose the most appropriate solutions for your organization’s size and level of PPM maturity.

Read Info-Tech’s Select and Implement a PPM Solution blueprint.

A right-sized PPM strategy leads to a right-sized portfolio management tool based on Info-Tech’s template

CASE STUDY

Industry: Energy
Source: Info-Tech Client

“The approach makes it easy to run the portfolio without taking time away from the project themselves.” (IT Manager, Energy Resources Firm)

Situation

  • A small IT department struggled with balancing project work with ongoing operational management and support work.
  • The department includes experienced and successful project managers and a mature, skilled team.
  • However, the nature of the department’s role has evolved to the point where the project and operational work demands have exceeded the available time.
  • Prioritization needed to become more centralized and formalized while management control of the work assignments became increasingly decentralized.

Complication

  • Agile projects offer clear advantages by lightening the requirement for proactive planning. However, getting the staff to adapt would be challenging because of the overall workload and competing priorities.
  • Some of the team’s time needed to be carefully tracked and reported for time & materials-based billing, but the time sheet system was unsuited to their portfolio management needs.
  • Commercial PPM systems were ruled out because strict task management seemed unlikely to gain adoption.

Resolution

  • The team deployed Info-Tech’s Project Portfolio Workbook, based on a Microsoft Excel template, and the Grow Your Own PPM Solution blueprint.
  • For the first time, executive leadership was given a 12-month forecast of resource capacity based on existing and pending project commitments. The data behind the capacity forecast was based on allocating people to projects with a percentage of their time for each calendar month.
  • The data behind the forecast is high level but easily maintainable.

Step 3.2: Finalize customizing your PPM Strategic Plan Template

PHASE 1

PHASE 2

PHASE 3

1.11.22.12.23.13.2
Choose the right PPM strategyTranslate strategy into process goalsDefine intake & resource mgmt. processesDefine reporting, closure, & benefits mgmt. processesSelect a right-sized PPM solutionFinalize your PPM strategic plan

This step will walk you through the following activities:

  • Determine the costs of support your PPM strategic plan.
  • Estimate some of the benefits of your PPM strategic plan.
  • Perform a cost-benefit analysis.
  • Refine and consolidate the near-term action items into a cohesive plan.

This step involves the following participants:

  • CIO
  • PMO Director/ Portfolio Manager
  • Project Managers
  • IT Managers

Outcomes of this step

  • A cost/benefit analyst
  • An implementation action plan
  • A finalized PPM Strategic Plan Template

Estimate the total cost-in-use of managing the project portfolio

Supporting Tool icon 3.2.1 – PPM Strategy Development Tool, Tab 5: Costing Summary

The time cost of PPM processes (tab 3) and PPM tool costs (tab 4) are summarized in this tab. Enter additional data to estimate the total PPM cost-in-use: the setup information and the current cost of PPM software tools.

Screenshot of the PPM Strategy Development Tool, Tab 5: Costing Summary. Notes include 'If unknown, the overall HR budget of your project portfolio can be estimated as: (# FTEs) * (fully-loaded FTE cost per hour) * 1800', 'This is your total PPM cost-in-use'.

Estimate the benefits of managing the project portfolio

Supporting Tool icon 3.2.2 – PPM Strategy Development Tool, Tab 6: Benefits Assumptions

The benefits of PPM processes are estimated by projecting the sources of waste on your resource capacity.

  1. Estimate the current extent of waste on your resource capacity. If you have completed Info-Tech’s PPM Current Score Scorecard, enter the data from the report.
  2. Screenshot of a Waste Assessment pie chart from the PPM Strategy Development Tool, Tab 6: Benefits Assumptions.
  3. Given your near- and long-term action items for improving PPM processes, estimate how each source of waste on your resource capacity will change.
  4. Screenshot of a Waste Assessment table titled 'These inputs represent the percentage of your overall portfolio budget that is wasted in each scenario' from the PPM Strategy Development Tool, Tab 6: Benefits Assumptions.

Review the cost-benefit analysis results and update the PPM Strategic Plan Template

Supporting Tool icon 3.2.3 – PPM Strategy Development Tool, Tab 7: Conclusion Screenshot of a 'PPM Strategy Cost-Benefit Analysis' from the PPM Strategy Development Tool, Tab 7: Conclusion. It has tables on top and bar charts underneath.

This tab summarizes the costs and benefits of your PPM strategic plan.

  • Costs are estimated from wasted project capacity and time spent on PPM process work.
  • Benefits are estimated from the project capacity to be reclaimed as a result of improvements in PPM.
  • Return on investment is calculated by dividing the value of project capacity to be reclaimed by investment in PPM in addition to the current-state cost.

Capture this summary in your PPM strategic plan.

Customize slides 40 and 41, “Return on PPM investment,” in Info-Tech’s PPM Strategic Plan Template.

Determine who will be responsible for coordinating the flow, collection, and reporting of portfolio data

Supporting Tool icon 3.2.3 – Project Portfolio/PMO Analyst Job Description

You will need to determine responsibilities and accountabilities for portfolio management functions within your team.

If you do not have a clearly identifiable portfolio manager at this time, you will need to clarify who will wear which hats in terms of facilitating intake and prioritization, high-level capacity awareness, and portfolio reporting.

  • Use Info-Tech’s Project Portfolio Analyst Job Description Template to help clarify some of the required responsibilities to support your PPM strategy.
    • If you need to bring in an additional staff member to help support the strategy, you can customize the job description template to help advertise the position. Simply edit the text in grey within the template.
  • If you have other PPM tasks that you need to define responsibilities for, you can use the RASCI chart on the final tab of the PPM Strategy Develop Tool.

Download Info-Tech’s Project Portfolio Analyst Job Description Template.

Sample of Info-Tech's Project Portfolio Analyst Job Description Template.

Refine and consolidate the near-term action items into a cohesive plan

Associated Activity icon 3.2.4 – 30 minutes

INPUT: Near-term action items

OUTPUT: Near-term action plan

Materials: PPM Strategy Development Tool

Participants: PMO Director/ Portfolio Manager, Project Managers, Resource Managers, Business Analysts

Collect the near-term action items for each of the five PPM processes and arrange them into a table that outlines the near-term action plan. Once it is compiled, adjust the timeline and responsibility so that the plan is coherent and realistic as a whole.

Example:

Outcome

Action required

Timeline

Responsibility

Determine the percentage distribution of project vs. non-project work Run a time audit survey with all project resources 2 weeks Resource managers
Test a simple dashboard for project status Pilot Info-Tech’s Portfolio Manager 2017 workbook 2 weeks PMO Director

"There is a huge risk of taking on too much too soon, especially with the introduction of specific tools and tool sets. There is also an element of risk involved that can lead to failure and disappointment with PPM if these tools are not properly introduced and supported." (Jim Carse, Director of the Portfolio Office, Queen’s University)

Review and customize slide 43, “Summary of near-term action plan,” in Info-Tech’s PPM Strategic Plan Template.

Finalize and publish your PPM strategic plan

Table of Contents

Read over the document to ensure its completeness and consistency.

At this point, you have a PPM strategic plan that is actionable and realistic, which addresses the goals set by the senior leadership.

The executive brief establishes the need for PPM strategy, the goals and metrics are set by members of the senior leadership that gave the initial buy-in, and the target states of PPM processes that meet those goals are described. Finally, the costs and benefits of the improved PPM practice are laid out in a way that can be validated.

The next step for your PPM strategy is to use this document as a foundation for implementing and operationalizing the target-state PPM processes.

Review and publish the document for your executive layer and key project stakeholders. Solicit their feedback.

Info-Tech has a library of blueprints that will guide you through each of the five processes. Contact your Info-Tech account manager or Info-Tech analyst to get started.

  • Project Portfolio Management Strategy
    • Strategic Expectations
    • Overview
  • Leadership Mandate
  • Project Demand and Resource Supply
  • The Current State of Resource Utilization
  • PPM Processes
    • Project intake, prioritization, and approval
    • Resource management
    • Portfolio reporting
    • Project closure
    • Benefits realization
    • Tools for PPM
  • The Economic Impact of PPM
  • PPM Strategy Next Steps

If you want additional support, have our analysts guide you through this phase as part of an Info-Tech Workshop Associated Activity icon

Book a workshop with our Info-Tech analysts:

Photo of Barry Cousins.
  • To accelerate this project, engage your IT team in an Info-Tech workshop with an Info-Tech analyst team.
  • Info-Tech analyst will join you and your team onsite at your location or welcome you to Info-Tech's historic Toronto office to participate in an innovative onsite workshop.
  • Contact your account manager (www.infotech.com/account), or email Workshops@InfoTech.com for more information.

The following are sample activities that will be conducted by Info-Tech analysts with your team:

Sample of activity 3.1 'Scope the right-sized PPM solution for your PPM strategy'. Scope the right-sized PPM solution for your PPM strategy

Use the PPM Strategy Development Tool to quickly determine our near- and long-term recommendation for your PPM solution.

Sample of activity 3.2 'Conduct a cost-benefit analysis of your PPM strategic plan'. Conduct a cost-benefit analysis of your PPM strategic plan

Using the time cost estimates of each process and the requirement for a PPM tool, Info-Tech helps you quantify the overhead costs of PPM and estimate the monetary benefits of reclaimed project capacity for your project portfolio.

Insight breakdown

Insight 1

  • Executive layer buy-in is a critical prerequisite for the success of a top-down PPM strategy. Ensure your executives are on board before preceding to implement your PPM strategy.

Insight 2

  • The means of project and portfolio management (i.e. processes) shouldn’t eclipse the ends – strategic goals. Root your process in your PPM strategic goals to realize PPM benefits (e.g. optimized portfolio value, improved project throughput, increased stakeholder satisfaction).

Insight 3

  • Without the proper information, decision makers are driving blind and are forced to make gut-feel decisions as opposed to data-informed decisions. Implement a PPM solution to allocate projects properly and ensure time and money don’t vanish without being accounted for.

Summary of accomplishment

Knowledge Gained

  • Info-Tech’s thought model on PPM processes that create an infrastructure around projects
  • Your current state of project portfolio: project capacity vs. project demand
  • Importance of gaining executive buy-in for installing the PPM practice

Processes Optimized

  • Project intake, prioritization, and approval process
  • Resource management process
  • Portfolio reporting process
  • Project closure process
  • Benefits realization process

Deliverables Completed

  • Choice of PPM strategy and the leadership mandate
  • Analysis of current project capacity and demand
  • PPM process goals and metrics, aligned to meet PPM strategic expectations
  • PPM process capability levels
  • Retrospective examination of current state, near/long-term action items for improvement, and high-level descriptions of the five PPM processes
  • Recommendation of PPM tools to support the processes
  • Estimate of PPM overhead costs
  • Cost-benefit analysis of PPM practice
  • PPM strategic plan

Related Info-Tech Research

  • Develop a Project Portfolio Management Strategy
  • Grow Your Own PPM Solution
  • Optimize Project Intake, Approval, and Prioritization
  • Develop a Resource Management Strategy for the New Reality
  • Manage a Minimum-Viable PMO
  • Establish the Benefits Realization Process
  • Manage an Agile Portfolio
  • Establish the Benefits Realization Process
  • Project Portfolio Management Diagnostic Program
    The Project Portfolio Management Diagnostic Program is a low-effort, high-impact program designed to help project owners assess and improve their PPM practices. Gather and report on all aspects of your PPM environment in order to understand where you stand and how you can improve.

Research contributors and experts

Photo of Kiron D. Bondale PMP, PMI-RMP, CDAP, CDAI, Senior Project Portfolio Management Professional Kiron D. Bondale PMP, PMI-RMP, CDAP, CDAI
Senior Project Portfolio Management Professional

Kiron has worked in the project management domain for more than fifteen years managing multiple projects, leading Project Management Offices (PMO) and providing project portfolio management consulting services to over a hundred clients across multiple industries. He has been an active member of the Project Management Institute (PMI) since 1999 and served as a volunteer director on the Board of the PMI Lakeshore Chapter for six years. Kiron has published articles on project and project portfolio management in multiple journals and has delivered over a hundred webinar presentations on a variety of PPM and PM topics and has presented at multiple industry conferences. Since 2009, Kiron has been blogging on a weekly basis on project management topics and responds to questions daily in the LinkedIn PMI Project, Program and Portfolio Management discussion group.

Photo of Shaun Cahill, Project Manager, Queen’s University Shaun Cahill, Project Manager &
Jim Carse, Director of the Project Portfolio Office
Queen’s University

Research contributors and experts

Photo of Amy Fowler Stadler, Managing Partner, Lewis Fowler Amy Fowler Stadler, Managing Partner
Lewis Fowler

Amy has more than 20 years of experience in business and technology, most recently owning her own management consulting firm since 2002, focused on business transformation, technology enablement, and operational improvement. Prior to that, she was at CenturyLink (formerly Qwest) as an IT Director, Perot Systems in various roles, and Information Handling Services, Inc. as a Software Development Product Manager.

Amy holds a bachelor’s degree in Computer Science with a minor in Business Communications and is also a 2015 Hall of Fame inductee to Illinois State University College of Applied Science and Technology.

Photo of Rick Morris, President, R2 Consulting LLC Rick Morris, President
R2 Consulting LLC

Rick A. Morris, PMP, is a certified Scrum Agile Master, Human Behavior Consultant, best-selling author, mentor, and evangelist for project management. Rick is an accomplished project manager and public speaker. His appetite for knowledge and passion for the profession makes him an internationally sought after speaker delivering keynote presentations for large conferences and PMI events around the world. He holds the PMP (Project Management Professional), MPM (Masters of Project Management), Scrum Agile Master, OPM3, Six Sigma Green Belt, MCITP, MCTS, MCSE, TQM, ATM-S, ITIL, and ISO certifications, and is a John Maxwell Certified Speaker, Mentor, and Coach. Rick is the Owner of R2 Consulting, LLC and has worked for organizations such as GE, Xerox, and CA, and has consulted with numerous clients in a wide variety of industries including financial services, entertainment, construction, non-profit, hospitality, pharmaceutical, retail, and manufacturing.

Research contributors and experts

Photo of Terry Lee Ricci PgMP, PfMP, PMP, PPM Practice Lead, IAG Consulting Terry Lee Ricci PgMP, PfMP, PMP, PPM Practice Lead
IAG Consulting

Terry is passionate and highly skilled at PMO transformation, developing high-performing teams that sustain long-term business results. Terry has a reputation built upon integrity, resourcefulness, and respect. She has the vision to implement long and short-term strategies, meeting both current and evolving business needs.

Change Management/Business transformation: Terry has extensive background in PMO strategy development aligned to corporate goals. Many years in the PMO organization integration/transformation building or overhauling programs and processes.

Governance: Terry loves to monitor and measure performance and outcomes and uses her collaborative style to successfully bring simplicity to complexity (technology – people – process). Performance optimization results are easy to use and clearly define who is doing what across functions. End results consistently align to business strategy while mitigating risks effectively.

Comprehensive: A “through the ranks” executive with a comprehensive understanding of PMO operations, high-performance teams, and the respective business units they support.

Photo of Alana Ruckstuhl MSc, IT Project Officer, Federal Economic Development Agency for Southern Ontario Alana Ruckstuhl MSc, IT Project Officer
Federal Economic Development Agency for Southern Ontario

Research contributors and experts

Photo of Jay Wardle, Director of the PMO, Red Wing Shoes Co. Jay Wardle, Director of the PMO
Red Wing Shoes Co.
Photo of Bob White, Vice President/Chief Information Officer, ALM Holding Company Bob White, Vice President/Chief Information Officer
ALM Holding Company

As vice president and chief information officer for ALM Holding Company, Bob White directs all technology activity and support for three main verticals: road construction, energy management, and delivery and transportation. He has been with ALM Holding Company for one and a half years, focusing on PPM process improvement, cybersecurity initiatives, and IT service management.

Prior to joining ALM, Bob was executive vice president/chief information officer at Ashley Furniture Industries, Inc. where he led the strategic direction, implementation, and management of information technology throughout the company’s global operations. Bob has also held VP/CIO positions at the Stride Rite Corporation and Timex Corporation.

Bob holds a Master’s degree in Operations Management from the University of Arkansas and a Bachelor of Science degree in Industrial Engineering from Southern Illinois University.

Bibliography

Bersin, Josh. “Time to Scrap Performance Appraisals?” Forbes Magazine, 5 June 2013. Web. 30 Oct 2013.

Cheese, Peter et al. “Creating an Agile Organization.” Accenture, Oct. 2009. Web. Nov. 2013.

Croxon, Bruce et al. “Dinner Series: Performance Management with Bruce Croxon from CBC's 'Dragon's Den'” HRPA Toronto Chapter. Sheraton Hotel, Toronto, ON. 12 Nov. 2013. Panel discussion.

Culbert, Samuel. “10 Reasons to Get Rid of Performance Reviews.” Huffington Post Business, 18 Dec. 2012. Web. 28 Oct. 2013.

Denning, Steve. “The Case Against Agile: Ten Perennial Management Objections.” Forbes Magazine, 17 Apr. 2012. Web. Nov. 2013.

Estis, Ryan. “Blowing up the Performance Review: Interview with Adobe’s Donna Morris.” Ryan Estis & Associates, 17 June 2013. Web. Oct. 2013.

Gallup, Inc. “Gallup Study: Engaged Employees Inspire Company Innovation.” Gallup Management Journal, 12 Oct. 2006. Web. 12 Jan 2012.

Gartside, David et al. “Trends Reshaping the Future of HR.” Accenture, 2013. Web. 5 Nov. 2013.

KeyedIn Solutions. “Why PPM and PMOs Fail.” KeyedIn Projects, 2013. Ebook.

Lessing, Lawrence. Free Culture. Lulu Press Inc.: 30 July 2016.

Merkhofer, Lee. “Keys to Implementing Project Portfolio Management.” Lee Merkhofer Consulting, 2017.

Perry, Mark Price. Business Driven Project Portfolio Management. J Ross Pub: 17 May 2011.

Project Management Institute. “Pulse of the Profession 2015: Capturing the Value of Project Management.” PMI, Feb. 2015. Web.

Project Management Institute. “Pulse of the Profession 2016: The High Cost of Low Performance.” PMI, 2016. Web.

Project Management Institute. “Pulse of the Profession 2017: Success Rates Rise.” PMI, 2017. Web.

Project Management Institute. The Standard for Portfolio Management – Third Edition. PMI: 1 Dec. 2012.

WGroup. “Common Pitfalls in Project Portfolio Management – Part 2.” WGroup, 24 Jan. 2017. Web.

Create a Post-Implementation Plan for Microsoft 365

  • member rating overall impact (scale of 10): N/A
  • member rating average dollars saved: N/A
  • member rating average days saved: N/A
  • Parent Category Name: End-User Computing Applications
  • Parent Category Link: /end-user-computing-applications

M365 projects are fraught with obstacles. Common mistakes organizations make include:

  • Not having a post-migration plan in place.
  • Treating user training as an afterthought.
  • Inadequate communication to end users.

Our Advice

Critical Insight

There are three primary areas where organizations fail in a successful implementation of M365: training, adoption, and information governance. While it is not up to IT to ensure every user is well trained, it is their initial responsibility to find champions, SMEs, and business-based trainers and manage information governance from the backup, retention, and security aspects of data management.

Impact and Result

Migrating to M365 is a disruptive move for most organizations. It poses risk to untrained IT staff, including admins, help desk, and security teams. The aim for organizations, especially in this new hybrid workspace, is to maintain efficiencies through collaboration, share information in a secure environment, and work from anywhere, any time.

Create a Post-Implementation Plan for Microsoft 365 Research & Tools

Besides the small introduction, subscribers and consulting clients within this management domain have access to:

1. Create a Post-Implementation Plan for Microsoft 365 Storyboard – A deck that guides you through the important considerations that will help you avoid common pitfalls and make the most of your investment.

There are three primary goals when deploying Microsoft 365: productivity, security and compliance, and collaborative functionality. On top of these you need to meet the business KPIs and IT’s drive for adoption and usage. This research will guide you through the important considerations that are often overlooked as this powerful suite of tools is rolled out to the organization.

[infographic]

Further reading

Create a Post-Implementation Plan for Microsoft 365

You’ve deployed M365. Now what? Look at your business goals and match your M365 KPIs to meet those objectives.

Analyst perspective

You’ve deployed M365. Now what?

John Donovan

There are three primary objectives when deploying Microsoft 365: from a business perspective, the expectations are based on productivity; from an IT perspective, the expectations are based on IT efficiencies, security, and compliance; and from an organizational perspective, they are based on a digital employee experience and collaborative functionality.

Of course, all these expectations are based on one primary objective, and that is user adoption of Teams, OneDrive, and SharePoint Online. A mass adoption, along with a high usage rate and a change in the way users work, is required for your investment in M365 to be considered successful.

So, adoption is your first step, and that can be tracked and analyzed through analytics in M365 or other tools. But what else needs to be considered once you have released M365 on your organization? What about backup? What about security? What about sharing data outside your business? What about self-service? What about ongoing training? M365 is a powerful suite of tools, and taking advantage of all that it entails should be IT’s primary goal. How to accomplish that, efficiently and securely, is up to you!

John Donovan
Principal Research Director, I&O
Info-Tech Research Group

Insight summary

Collaboration, efficiencies, and cost savings need to be earned

Migrating to M365 is a disruptive move for most organizations. Additionally, it poses risk to untrained IT staff, including admins, help desk, and security teams. The aim for organizations, especially in this new hybrid workspace, is to maintain efficiencies through collaboration, share information in a secure environment, and work from anywhere, any time. However, organizations need to manage their licensing and storage costs and build this new way of working through post-deployment planning. By reducing their hardware and software footprint they can ensure they have earned these savings and efficiencies.

Understand any shortcomings in M365 or pay the price

Failing to understand any shortcomings M365 poses for your organization can ruin your chances at a successful implementation. Commonly overlooked expenses include backup and archiving, especially for regulated organizations; spending on risk mitigation through third-party tools for security; and paying a premium to Microsoft to use its Azure offerings with Microsoft Sentinel, Microsoft Defender, or any security add-on that comes at a price above your E5 license, which is expensive in itself.

Spend time with users to understand how they will use M365

Understanding business processes is key to anticipating how your end users will adopt M365. By spending time with the staff and understanding their day-to-day activities and interactions, you can build better training scenarios to suit their needs and help them understand how the apps in M365 can help them do their job. On top of this you need to meet the business KPIs and IT’s drive for adoption and usage. Encourage early adopters to become trainers and champions. Success will soon follow.

Executive summary

Your Challenge

Common Obstacles

Info-Tech’s Approach

M365 is a full suite of tools for collaboration, communication, and productivity, but organizations find the platform is not used to its full advantage and fail to get full value from their license subscription.

Many users are unsure which tool to use when: Do you use Teams or Viva Engage, MS Project or Planner? When do you use SharePoint versus OneDrive?

From an IT perspective, finding time to help users at the outset is difficult – it’s quite the task to set up governance, security, and backup. Yet training staff must be a priority if the implementation is to succeed.

M365 projects are fraught with obstacles. Common mistakes organizations make include:

  • No post-migration plan in place.
  • User training is an afterthought.
  • Lack of communication to end users.
  • No C-suite promotion and sponsorship.
  • Absence of a vision and KPIs to meet that vision.

To define your post-migration tasks and projects:

  • List all projects in a spreadsheet and rank them according to difficulty and impact.
  • Look for quick wins with easy tasks that have high impact and low difficulty.
  • Build a timeline to execute your plans and communicate clearly how these plans will impact the business and meet that vision.

Failure to take meaningful action will not bode well for your M365 journey.

Info-Tech Insight

There are three primary areas where organizations fail in a successful implementation of M365: training, adoption, and information governance. While it is not up to IT to ensure every user is well trained, it is their initial responsibility to find champions, SMEs, and business-based trainers and to manage information governance from backup, retention, and security aspects of data management.

Business priorities

What priorities is IT focusing on with M365 adoption?

What IT teams are saying

  • In a 2019 SoftwareONE survey, the biggest reason IT decision makers gave for adopting M365 was to achieve a “more collaborative working style.”
  • Organizations must plan and execute a strategy for mass adoption and training to ensure processes match business goals.
  • Cost savings can only be achieved through rightsizing license subscriptions, retiring legacy apps, and building efficiencies within the IT organization.
  • With increased mobility comes with increased cybersecurity risk. Make sure you take care of your security before prioritizing mobility. Multifactor authentication (MFA), conditional access (CA), and additional identity management will maintain a safe work-from-anywhere environment.

Top IT reasons for adopting M365

61% More collaborative working style

54% Cost savings

51% Improved cybersecurity

49% Greater mobility

Source: SoftwareONE, 2019; N=200 IT decision makers across multiple industries and organization sizes

Define & organize post-implementation projects

Key areas to success

  • Using Microsoft’s M365 adoption guide, we can prioritize and focus on solutions that will bring about better use of the M365 suite.
  • Most of your planning and prioritizing should be done before implementation. Many organizations, however, adopted M365 – and especially Teams, SharePoint Online, and OneDrive – in an ad hoc manner in response to the pandemic measures that forced users to work from home.
  • Use a Power BI Pro license to set up dashboards for M365 usage analytics. Install GitHub from AppSource and use the templates that will give you good insight and the ability to create business reports to show adoption and usage rates on the platform.
  • Reimagine your working behavior. Remember, you want to bring about a more collective and open framework for work. Take advantage of a champion SME to show the way. Every organization is different, so make sure your training is aligned to your business processes.
The image contains a screenshot of the M365 post-implementation tasks.

Process steps

Define Vision

Build Team

Plan Projects

Execute

Define your vision and what your priorities are for M365. Understand how to reach your vision.

Ensure you have an executive sponsor, develop champions, and build a team of SMEs.

List all projects in a to-be scenario. Rank and prioritize projects to understand impact and difficulty.

Build your roadmap, create timelines, and ensure you have enough resources and time to execute and deliver to the business.

Info-Tech’s approach

Use the out-of-the-box tools and take advantage of your subscription.

The image contains a screenshot of the various tools and services Microsoft provides.

Info-Tech Insight

A clear understanding of the business purpose and processes, along with insight into the organizational culture, will help you align the right apps with the right tasks. This approach will bring about better adoption and collaboration and cancel out the shadow IT products we see in every business silo.

Leverage built-in usage analytics

Adoption of services in M365

To give organizations insight into the adoption of services in M365, Microsoft provides built-in usage analytics in Power BI, with templates for visualization and custom reports. There are third-party tools out there, but why pay more? However, the template app is not free; you do need a Power BI Pro license.

Usage Analytics pulls data from ActiveDirectory, including location, department, and organization, giving you deeper insight into how users are behaving. It can collect up to 12 months of data to analyze.

Reports that can be created include Adoption, Usage, Communication, Collaboration (how OneDrive and SharePoint are being used), Storage (cloud storage for mailboxes, OneDrive, and SharePoint), and Mobility (which clients and devices are used to connect to Teams, email, Yammer, etc.).

Source: Microsoft 365 usage analytics

Understand admin roles

Prevent intentional or unintentional internal breaches

Admin Roles

Best Practices

  • Global admin: Assign this role only to users who need the most access to management features and data across your tenant. Only global admins can modify an admin role.
  • Exchange admin: Assign this role to users who need to view and manage user mailboxes, M365 groups, and Exchange Online and handle Microsoft support requests.
  • Groups admin: These users can create, edit, delete, and restore M365 groups as well as create expiration and naming policies.
  • Helpdesk admin: These users can resets passwords, force user sign-out, manage Microsoft support requests, and monitor service health.
  • Teams/SharePoint Online admin: Assign these roles for users who manage the Teams and SharePoint Admin Center.
  • User admin: These users can assign licenses, add users and groups, manage user properties, and create and manage user views.

Only assign two to four global admins, depending on the size of the organization. Too many admins increases security risk. In larger organizations, segment admin roles using role-based access control.

Because admins have access to sensitive data, you’ll want to assign the least permissive role so they can access only the tools and data they need to do their job.

Enable MFA for all admins except one break-glass account that is stored in the cloud and not synced. Ensure a complex password, stored securely, and use only in the event of an MFA outage.

Due to the large number of admin roles available and the challenges that brings with it, Microsoft has a built-in tool to compare roles in the admin portal. This can help you determine which role should be used for specific tasks.

Secure your M365 tenant

A checklist to ensure basic security coverage post M365

  • Multifactor Authentication: MFA is part of your M365 tenant, so using it should be a practical identity security. If you want additional conditional access (CA), you will require an Azure AD (AAD) Premium P1+ license. This will ensure adequate identity security protecting the business.
  • Password Protection: Use the AAD portal to set this up under Security > Authentication Methods. Microsoft provides a list of over 2,000 known bad passwords and variants to block.
  • Legacy Authentication: Disable legacy protocols; check to see if your legacy apps/workflows/scripts use them in the AAD portal. Once identified, update them and turn the protocols off. Use CA policies.
  • Self-Service Password Reset: Enable self-service to lower the helpdesk load for password resets. Users will have to initially register and set security questions. Hybrid AD businesses must write back to AD from AAD once changes are made.
  • Security Defaults: For small businesses, turn on default settings. To enable additional security settings, such as break- glass accounts, go into Manage Security Defaults in your AAD properties.
  • Conditional Access (CA) Policies: Use CA policies if strong identity security and zero trust are required. To create policies in AAD go to Security > Conditional Access > New Policies.

Identity Checklist

  • Enable MFA for Admins
  • Enable MFA for Users
  • Disable App Passwords
  • Configure Trusted IPs
  • Disable Text/Phone MFA
  • Remember MFA on Trusted Devices for 90 Days
  • Train Staff in Using MFA Correctly
  • Integrate Apps Into Azure AD

Training guidelines

Identify business scenarios and training adoption KPIs

  • Customize your training to meet your organizational goals, align with your business culture, and define how users will work inside the world of M365.
  • Create scenario templates that align to your current day-to-day operations in each department. These can be created by individual business unit champions.
  • Make sure you have covered must-have capabilities and services within M365 that need to be rolled out post-pilot.
  • Phase in large transitions rather than multiple small ones to ensure collaboration between departments meets business scenarios.
  • Ensure your success metrics are being measured and continue to communicate and train after deployment using tools available in M365. See Microsoft’s adoption guidelines and template for training.

Determine your training needs and align with your business processes. Choose training modalities that will give users the best chance of success. Consider one or many training methods, such as:

  • Online training
  • In-person classroom
  • Business scenario use cases
  • Mentoring
  • Department champion/Early adopter
  • Weekly bulletin fun facts

Don’t forget backup!

Providing 99% uptime and availability is not enough

Why is M365 backup so important?

Accidental Data Deletion.

If a user is deleted, that deletion gets replicated across the network. Backup can save you here by restoring that user.

Internal and External Security Threats.

Malicious internal deletion of data and external threats including viruses, ransomware, and malware can severely damage a business and its reputation. A clean backup can easily restore the business’ uninfected data.

Legal and Compliance Requirements.

While e-discovery and legal hold are available to retain sensitive data, a third-party backup solution can easily search and restore all data to meet regulatory requirements – without depending on someone to ensure a policy was set.

Retention Policy Gaps.

Retention policies are not a substitute for backup. While they can be used to retain or delete content, they are difficult to keep track of and manage. Backups offer greater latitude in retention and better security for that data.

Retire your legacy apps to gain adoption

Identify like for like and retire your legacy apps

Legacy

Microsoft 365

SharePoint 2016/19

SharePoint Online

Microsoft Exchange Server

Microsoft Exchange in Azure

Skype for Business Server

Teams

Trello

Planner 2022

System Center Configuration Manager (SCCM)

Endpoint Manager, Intune, Autopilot

File servers

OneDrive

Access

Power Apps

To meet the objectives of cost reduction and rationalization, look at synergies that M365 brings to the table. Determine what you are currently using to meet collaboration, storage, and security needs and plan to use the equivalent in your Microsoft entitlement.

Managing M365’s hidden costs

Licenses and storage limits TCO

  • Email security. Ninety-one percent of all cyberattacks come from phishing on email. Microsoft Defender for M365 is a bolt-on, so it is an additional cost.
  • Backup. This will bring additional cost to M365. Plan to spend more to ensure data is backed up and stored.
  • Email archiving. Archiving is different than backup. See our research on the subject. Archiving is needed for compliance purposes. Email archiving solutions are available through third-party software, which is an added cost.
  • Email end-to-end encryption. This is a requirement for all organizations that are serious about security. The enterprise products from Microsoft come at an additional cost.
  • Cybersecurity training. IT needs to ramp up on training, another expense.
  • Microsoft 365 Power Platform Licencing. From low-code and no-code developer tools (Power Apps), workflow tools (Power Automate), and business intelligence (Power BI) – while the E5 license gives you Power BI Pro, there are limitations and costs. Power BI Pro has limitations for data volume, data refresh, and query response time, so your premium license comes at a considerably marked up cost.

M365 is not standalone

  • While Microsoft 365 is a platform that is ”just good enough,” it is actually not good enough in today’s cyberthreat environment. Microsoft provides add-ons with Defender for 365, Purview, and Sentinel, which pose additional costs, just like a third-party solution would. See the Threat Intelligence & Incident Response research in our Security practice.
  • The lack of data archiving, backup, and encryption means additional costs that may not have been budgeted for at the outset. Microsoft provides 30-60-90-day recovery, but anything else is additional cost. For more information see Understand the Difference between Backups and Archiving.

Compliance and regulations

Security and compliance features out of the box

There are plenty of preconfigured security features contained in M365, but what’s available to you depends on your license. For example, Microsoft Defender, which has many preset policies, is built-in for E5 licenses, but if you have E3 licenses Defender is an add-on.

Three elements in security policies are profiles, policies, and policy settings.

  • Preset Profiles come in the shape of:
    • Standard – baseline protection for most users
    • Strict – aggressive protection for profiles that may be high-value targets
    • Built-in Protection – turned on by default; it is not recommended to make exceptions based on users, groups, or domains
  • Preset Security Policies
    • Exchange Online Protection Policies – anti-spam, -malware, and -phishing policies
    • Microsoft Defender Policies – safe links and safe attachments policies
  • Policy Settings
    • User impersonation protection for internal and external domains
    • Select priorities from strict, standard, custom, and built-in

Info-Tech Insight

Check your license entitlement before you start purchasing add-ons or third-party solutions. Security and compliance are not optional in today’s cybersecurity risk world. With many organizations offering hybrid and remote work arrangements and bring-your-own-device (BYOD) policies, it is necessary to protect your data at the tenant level. Defender for Microsoft 365 is a tool that can protect both your exchange and collaboration environments.

More information: Microsoft 365 Defender

Use Intune and Autopilot

Meet the needs of your hybrid workforce

  • Using the tools available in M365 can help you develop your hybrid or remote work strategy.
  • This strategy will help you maintain security controls for mobile and BYOD.
  • Migrating to Intune and Autopilot will give rise to the opportunity to migrate off SCCM and further reduce your on-premises infrastructure.

NOTE: You must have Azure AD Premium and Windows 10 V1703 or later as well as Intune or other MDM service to use Autopilot. There is a monthly usage fee based on volume of data transmitted. These fees can add up over time.

For more details visit the following Microsoft Learn pages:

Intune /Autopilot Overview

The image contains a screenshot of the Intune/Autopilot Overview.

Info-Tech’s research on zero-touch provisioning goes into more detail on Intune and Autopilot:
Simplify Remote Deployment With Zero-Touch Provisioning

M365 long-term strategies

Manage your costs in an inflationary world

  • Recent inflation globally, whether caused by supply chain woes or political uncertainty, will impact IT and cloud services along with everything else. Be prepared to pay more for your existing services and budget accordingly.
  • Your long-term strategies must include ongoing cost management, data management, security risks, and license and storage costs.
  • Continually investigate efficiencies, overlaps, and new tools in M365 that can get the job done for the business. Use as many of the applications as you can to ensure you are getting the best bang for your buck.
  • Watch for upgrades in the M365 suite of tools. As Microsoft continues to improve and deliver on most business applications well after their first release, you may find that something that was previously inefficient could work in your environment today and replace a tool you currently use.

Ongoing Activities You Need to Maintain

  • Be aware of increased license costs and higher storage costs.
  • Keep an eye on Teams sprawl.
  • Understand your total cost of ownership.
  • Continue to look at legacy apps and get rid of your infrastructure debt.

Activity

Build your own M365 post-migration plan

  1. Using slide 6 as your guideline, create your own project list using impact and difficulty as your weighting factors.
  2. Do this exercise as a whiteboard sticky note exercise to agree on impact and difficulty as a team.
  3. Identify easy wins that have high impact.
  4. Place the projects into a project plan with time lines.
  5. Agree on start and completion dates.
  6. Ensure you have the right resources to execute.

The image contains a screenshot of the activity described in the above text.

Related Info-Tech Research

Govern Office 365

  • Office 365 is as difficult to wrangle as it is valuable. Leverage best practices to produce governance outcomes aligned with your goals.

Drive Ongoing Adoption With an M365 Center of Excellence

  • Accelerate business processes change and get more value from your subscription by building and sharing, thanks to an effective center of excellence.

Simplify Remote Deployment With Zero-Touch Provisioning

  • Adopt zero-touch provisioning to provide better services to your end users.
  • Save time and resources during device deployment while providing a high-quality experience to remote end users.

Bibliography

“5 Reasons Why Microsoft Office 365 Backup Is Important.” Apps 4Rent, Dec 2021, Accessed Oct 2022 .
Chandrasekhar, Aishwarya. “Office 365 Migration Best Practices & Challenges 2022.” Saketa, 31 Mar 2022. Accessed Oct. 2022.
Chronlund, Daniel. “The Fundamental Checklist – Secure your Microsoft 365 Tenant”. Daniel Chronlund Cloud Tech Blog,1 Feb 2019. Accessed 1 Oct 2022.
Davies, Joe. “The Microsoft 365 Enterprise Deployment Guide.” Tech Community, Microsoft, 19 Sept 2018. Accessed 2 Oct 2022.
Dillaway, Kevin. “I Upgraded to Microsoft 365 E5, Now What?!.” SpyGlassMTG, 10 Jan 2022. Accessed 4 Oct. 2022.
Hartsel, Joe. “How to Make Your Office 365 Implementation Project a Success.” Centric, 20 Dec 2021. Accessed 2 Oct. 2022.
Jha, Mohit. “The Ultimate Microsoft Office 365 Migration Checklist for Pre & Post Migration.” Office365 Tips.Org, 24 June 2022. Accessed Sept. 2022.
Lang, John. “Why organizations don't realize the full value of Microsoft 365.“Business IT, 29 Nov 202I. Accessed 10 Oct 2022.
Mason, Quinn. “How to increase Office 365 / Microsoft 365 user adoption.” Sharegate, 19 Sept 2019. Accessed 3 Oct 2022.
McDermott, Matt. “6-Point Office 365 Post-Migration Checklist.” Spanning , 12 July 2019 . Accessed 4 Oct 2022.
“Microsoft 365 usage analytics.” Microsoft 365, Microsoft, 25 Oct 2022. Web.
Sharma, Megha. “Office 365 Pre & Post Migration Checklist.’” Kernel Data Recovery, 26 July 2022. Accessed 30 Sept. 2022.
Sivertsen, Per. “How to avoid a failed M365 implementation? Infotechtion, 19 Dec 2021. Accessed 2 Oct. 2022.
St. Hilaire, Dan. “Most Common Mistakes with Office 365 Deployment (and How to Avoid Them).“ KnowledgeWave, 4Mar 2019. Accessed Oct. 2022.
“Under the Hood of Microsoft 365 and Office 365 Adoption.” SoftwareONE, 2019. Web.

Implement Hardware Asset Management

  • Buy Link or Shortcode: {j2store}312|cart{/j2store}
  • member rating overall impact (scale of 10): 9.4/10 Overall Impact
  • member rating average dollars saved: $29,447 Average $ Saved
  • member rating average days saved: 25 Average Days Saved
  • Parent Category Name: Asset Management
  • Parent Category Link: /asset-management
  • Executives are often aware of the benefits asset management offers, but many organizations lack a defined program to manage their hardware.
  • Efforts to implement hardware asset management (HAM) are stalled because organizations feel overwhelmed navigating the process or under use the data, failing to deliver value.

Our Advice

Critical Insight

  • Organizations often implement an asset management program as a one-off project and let it stagnate.
  • Organizations often fail to dedicate adequate resources to the HAM process, leading to unfinished processes and inconsistent standards.
  • Hardware asset management programs yield a large amount of useful data. Unfortunately, this data is often underutilized. Departments within IT become data siloes, preventing effective use of the data.

Impact and Result

  • As the IT environment continues to change, it is important to establish consistency in the standards around IT asset management.
  • A current state assessment of your HAM program will shed light on the steps needed to safeguard your processes.
  • Define the assets that will need to be managed to inform the scope of the ITAM program before defining processes.
  • Build and involve an ITAM team in the process from the beginning to help embed the change.
  • Define standard policies, processes, and procedures for each stage of the hardware asset lifecycle, from procurement through to disposal.

Implement Hardware Asset Management Research & Tools

Start here – read the Executive Brief

Read our concise Executive Brief to find out why you should Implement Hardware Asset Management, review Info-Tech’s methodology, and understand the four ways we can support you in completing this project.

Besides the small introduction, subscribers and consulting clients within this management domain have access to:

1. Lay foundations

Build the foundations for the program to succeed.

  • Implement Hardware Asset Management – Phase 1: Lay Foundations
  • HAM Standard Operating Procedures
  • HAM Maturity Assessment Tool
  • IT Asset Manager
  • IT Asset Administrator

2. Procure & receive

Define processes for requesting, procuring, receiving, and deploying hardware.

  • Implement Hardware Asset Management – Phase 2: Procure and Receive
  • HAM Process Workflows (Visio)
  • HAM Process Workflows (PDF)
  • Non-Standard Hardware Request Form
  • Purchasing Policy

3. Maintain & dispose

Define processes and policies for managing, securing, and maintaining assets then disposing or redeploying them.

  • Implement Hardware Asset Management – Phase 3: Maintain and Dispose
  • Asset Security Policy
  • Hardware Asset Disposition Policy

4. Plan implementation

Plan the hardware budget, then build a communication plan and roadmap to implement the project.

  • Implement Hardware Asset Management – Phase 4: Plan Implementation 
  • HAM Budgeting Tool
  • HAM Communication Plan
  • HAM Implementation Roadmap
[infographic]

Workshop: Implement Hardware Asset Management

Workshops offer an easy way to accelerate your project. If you are unable to do the project yourself, and a Guided Implementation isn't enough, we offer low-cost delivery of our project workshops. We take you through every phase of your project and ensure that you have a roadmap in place to complete your project successfully.

1 Lay Foundations

The Purpose

Build the foundations for the program to succeed.

Key Benefits Achieved

Evaluation of current challenges and maturity level

Defined scope for HAM program

Defined roles and responsibilities

Identified metrics and reporting requirements

Activities

1.1 Outline hardware asset management challenges.

1.2 Conduct HAM maturity assessment.

1.3 Classify hardware assets to define scope of the program.

1.4 Define responsibilities.

1.5 Use a RACI chart to determine roles.

1.6 Identify HAM metrics and reporting requirements.

Outputs

HAM Maturity Assessment

Classified hardware assets

Job description templates

RACI Chart

2 Procure & Receive

The Purpose

Define processes for requesting, procuring, receiving, and deploying hardware.

Key Benefits Achieved

Defined standard and non-standard requests for hardware

Documented procurement, receiving, and deployment processes

Standardized asset tagging method

Activities

2.1 Identify IT asset procurement challenges.

2.2 Define standard hardware requests.

2.3 Document standard hardware request procedure.

2.4 Build a non-standard hardware request form.

2.5 Make lease vs. buy decisions for hardware assets.

2.6 Document procurement workflow.

2.7 Select appropriate asset tagging method.

2.8 Design workflow for receiving and inventorying equipment.

2.9 Document the deployment workflow(s).

Outputs

Non-standard hardware request form

Procurement workflow

Receiving and tagging workflow

Deployment workflow

3 Maintain & Dispose

The Purpose

Define processes and policies for managing, securing, and maintaining assets then disposing or redeploying them.

Key Benefits Achieved

Policies and processes for hardware maintenance and asset security

Documented workflows for hardware disposal and recovery/redeployment

Activities

3.1 Build a MAC policy, request form, and workflow.

3.2 Design process and policies for hardware maintenance, warranty, and support documentation handling.

3.3 Revise or create an asset security policy.

3.4 Identify challenges with IT asset recovery and disposal and design hardware asset recovery and disposal workflows.

Outputs

User move workflow

Asset security policy

Asset disposition policy, recovery and disposal workflows

4 Plan Implementation

The Purpose

Select tools, plan the hardware budget, then build a communication plan and roadmap to implement the project.

Key Benefits Achieved

Shortlist of ITAM tools

Hardware asset budget plan

Communication plan and HAM implementation roadmap

Activities

4.1 Generate a shortlist of ITAM tools that will meet requirements.

4.2 Use Info-Tech’s HAM Budgeting Tool to plan your hardware asset budget.

4.3 Build HAM policies.

4.4 Develop a communication plan.

4.5 Develop a HAM implementation roadmap.

Outputs

HAM budget

Additional HAM policies

HAM communication plan

HAM roadmap tool

Further reading

Implement Hardware Asset Management

Build IT services value on the foundation of a proactive asset management program.

ANALYST PERSPECTIVE

IT asset data impacts the entire organization. It’s time to harness that potential.

"Asset management is like exercise: everyone is aware of the benefits, but many struggle to get started because the process seems daunting. Others fail to recognize the integrative potential that asset management offers once an effective program has been implemented.

A proper hardware asset management (HAM) program will allow your organization to cut spending, eliminate wasteful hardware, and improve your organizational security. More data will lead to better business decision-making across the organization.

As your program matures and your data gathering and utility improves, other areas of your organization will experience similar improvements. The true value of asset management comes from improved IT services built upon the foundation of a proactive asset management program." - Sandi Conrad, Practice Lead, Infrastructure & Operations Info-Tech Research Group

Our understanding of the problem

This Research Is Designed For:

  • Asset Managers and Service Delivery Managers tasked with developing an asset management program who need a quick start.
  • CIOs and CFOs who want to reduce or improve budgeting of hardware lifecycle costs.
  • Information Security Officers who need to mitigate the risk of sensitive data loss due to insecure assets.

This Research Will Help You:

  • Develop a hardware asset management (HAM) standard operating procedure (SOP) that documents:
    • Process roles and responsibilities.
    • Data classification scheme.
    • Procurement standards, processes, and workflows for hardware assets.
    • Hardware deployment policies, processes, and workflows.
    • Processes and workflows for hardware asset security and disposal.
  • Identify requirements for an IT asset management (ITAM) solution to help generate a shortlist.
  • Develop a hardware asset management implementation roadmap.
  • Draft a communication plan for the initiative.

Executive summary

Situation

  • Executives are aware of the numerous benefits asset management offers, but many organizations lack a defined ITAM program and especially a HAM program.
  • Efforts to implement HAM are stalled because organizations cannot establish and maintain defined processes and policies.

Complication

  • Organizations often implement an asset management program as a one- off project and let it stagnate, but asset management needs to be a dynamic, continually involving process to succeed.
  • Organizations often fail to dedicate adequate resources to the HAM process, leading to unfinished processes and inconsistent standards.
  • Hardware asset management programs yield a large amount of useful data. Unfortunately, this data is often underused. Departments within IT become data siloes, preventing effective use of the data.

Resolution

  • As the IT environment continues to change, it is important to establish consistency in the standards around IT asset management.
  • A current state assessment of your HAM program will shed light on the steps needed to safeguard your processes.
  • Define the assets that will need to be managed to inform the scope of the ITAM program before defining processes.
  • Build and involve an ITAM team in the process from the beginning to help embed the change.
  • Define standard policies, processes, and procedures for each stage of the hardware asset lifecycle, from procurement through to disposal.
  • Pace yourself; a staged implementation will make your ITAM program a success.

Info-Tech Insight

  1. HAM is more than just tracking inventory. A mature asset management program provides data for proactive planning and decision making to reduce operating costs and mitigate risk.
  2. ITAM is not just IT. IT leaders need to collaborate with Finance, Procurement, Security, and other business units to make informed decisions and create value across the enterprise.
  3. Treat HAM like a process, not a project. HAM is a dynamic process that must react and adapt to the needs of the business.

Implement HAM to reduce and manage costs, gain efficiencies, and ensure regulatory compliance

Save & Manage Money

  • Companies with effective HAM practices achieve cost savings through redeployment, reduction of lost or stolen equipment, power management, and on-time lease returns.
  • The right HAM system will enable more accurate planning and budgeting by business units.

Improve Contract Management

  • Real-time asset tracking to vendor terms and conditions allows for more effective negotiation.

Inform Technology Refresh

  • HAM provides accurate information on hardware capacity and compatibility to inform upgrade and capacity planning

Gain Service Efficiencies

  • Integrating the hardware lifecycle with the service desk will enable efficiencies through Install/Moves/Adds/Changes (IMAC) processes, for larger organizations.

Meet Regulatory Requirements

  • You can’t secure organizational assets if you don’t know where they are! Meet governance and privacy laws by knowing asset location and that data is secure.

Prevent Risk

  • Ensure data is properly destroyed through disposal processes, track lost and stolen hardware, and monitor hardware to quickly identify and isolate vulnerabilities.

HAM is more than just inventory; 92% of organizations say that it helps them provide better customer support

Hardware asset management (HAM) provides a framework for managing equipment throughout its entire lifecycle. HAM is more than just keeping an inventory; it focuses on knowing where the product is, what costs are associated with it, and how to ensure auditable disposition according to best options and local environmental laws.

Implementing a HAM practice enables integration of data and enhancement of many other IT services such as financial reporting, service management, green IT, and data and asset security.

Cost savings and efficiency gains will vary based on the organization’s starting state and what measures are implemented, but most organizations who implement HAM benefit from it. As organizations increase in size, they will find the greatest gains operationally by becoming more efficient at handling assets and identifying costs associated with them.

A 2015 survey by HDI of 342 technical support professionals found that 92% say that HAM has helped their teams provide better support to customers on hardware-related issues. Seventy-seven percent have improved customer satisfaction through managing hardware assets. (HDI, 2015)

HAM delivers cost savings beyond only the procurementstage

HAM cost savings aren’t necessarily realized through the procurement process or reduced purchase price of assets, but rather through the cost of managing the assets.

HAM delivers cost savings in several ways:

  • Use a discovery tool to identify assets that may be retired, redeployed, or reused to cut or reallocate their costs.
  • Enforce power management policies to reduce energy consumption as well as costs associated with wasted energy.
  • Enforce policies to lock down unauthorized devices and ensure that confidential information isn’t lost (and you don’t have to waste money recovering lost data).
  • Know the location of all your assets and which are connected to the network to ensure patches are up to date and avoid costly security risks and unplanned downtime.
  • Scan assets to identify and remediate vulnerabilities that can cause expensive security attacks.
  • Improve vendor and contract management to identify areas of hardware savings.

The ROI for HAM is significant and measurable

Benefit Calculation Sample Annual Savings

Reduced help desk support

  • The length of support calls should be reduced by making it easier for technicians to identify PC configuration.
# of hardware-related support tickets per year * cost per ticket * % reduction in average call length 2,000 * $40 * 20% = $16,000

Greater inventory efficiency

  • An ITAM solution can automate and accelerate inventory preparation and tasks.
Hours required to complete inventory * staff required * hourly pay rate for staff * number of times a year inventory required 8 hours * 5 staff * $33 per hour * 2 times a year = $2,640

Improved employee productivity

  • Organizations can monitor and detect unapproved programs that result in lost productivity.
# of employees * percentage of employees who encounter productivity loss through unauthorized software * number of hours per year spent using unauthorized software * average hourly pay rate 500 employees * 10% * 156 hours * $18 = $140,400

Improved security

  • Improved asset tracking and stronger policy enforcement will reduce lost and stolen devices and data.
# of devices lost or stolen last year * average replacement value of device + # of devices stolen * value of data lost from device (50 * $1,000) + (50 * $5,000) = $300,000
Total Savings: $459,040
  1. Weigh the return against the annual cost of investing in an ITAM solution to calculate the ROI.
  2. Don’t forget about the intangible benefits that are more difficult to quantify but still significant, such as increased visibility into hardware, more accurate IT planning and budgeting, improved service delivery, and streamlined operations.

Avoid these common barriers to ITAM success

Organizations that struggle to implement ITAM successfully usually fall victim to these barriers:

Organizational resistance to change

Senior-level sponsorship, engagement, and communication is necessary to achieve the desired outcomes of ITAM; without it, ITAM implementations stall and fail or lack the necessary resources to deliver the value.

Lack of dedicated resources

ITAM often becomes an added responsibility for resources who already have other full-time responsibilities, which can quickly cause the program to lose focus. Increase the chance of success through dedicated resources.

Focus on tool over process

Many organizations buy a tool thinking it will do most of the work for them, but without supporting processes to define ITAM, the data within the tool can become unreliable.

Choosing a tool or process that doesn’t scale

Some organizations are able to track assets through manual discovery, but as their network and user base grows, this quickly becomes impossible. Choose a tool and build processes that will support the organization as it grows.

Using data only to respond to an audit without understanding root causes

Often, organizations implement ITAM only to the extent necessary to achieve compliance for audits, but without investigating the underlying causes of non-compliance and thus not solving the real problems.

To help you make quick progress, Info-Tech Research Group parses hardware asset management into essential processes

Focus on hardware asset lifecycle management essentials:

IT Asset Procurement:

  • Define procurement standards for new hardware along with related warranties and support options.
  • Develop processes and workflows for purchasing and work out financial implications to inform budgeting later.

IT Asset Intake and Deployment:

  • Define policies, processes, and workflows for hardware and receiving, inventory, and tracking practices.
  • Develop processes and workflows for managing imaging, change and moves, and large-scale rollouts.

IT Asset Security and Maintenance:

  • Develop processes, policies, and workflows for asset tracking and security.
  • Maintain contracts and agreements.

IT Asset Disposal or Recovery:

  • Manage the employee termination and equipment recovery cycle.
  • Securely wipe and dispose of assets that have reached retirement stage.

The image is a circular graphic, with Implement HAM written in the middle. Around the centre circle are four phrases: Recover or Dispose; Plan & Procure; Receive & Deploy; Secure & Maintain. Around that circle are six words: Retire; Plan; Request; Procure; Receive; Manage.

Follow Info-Tech’s methodology to build a plan to implement hardware asset management

Phase 1: Assess & Plan Phase 2: Procure & Receive Phase 3: Maintain & Dispose Phase 4: Plan Budget & Build Roadmap
1.1 Assess current state & plan scope 2.1 Request & procure 3.1 Manage & maintain 4.1 Plan budget
1.2 Build team & define metrics 2.2 Receive & deploy 3.2 Redeploy or dispose 4.2 Communicate & build roadmap
Deliverables
Standard Operating Procedure (SOP)
HAM Maturity Assessment Procurement workflow User move workflow HAM Budgeting Tool
Classified hardware assets Non-standard hardware request form Asset security policy HAM Communication Plan
RACI Chart Receiving & tagging workflow Asset disposition policy HAM Roadmap Tool
Job Descriptions Deployment workflow Asset recovery & disposal workflows Additional HAM policies

Asset management is a key piece of Info-Tech's COBIT- inspired IT Management and Governance Framework

The image shows a graphic which is a large grid, showing Info-Tech's research, sorted into categories.

Cisco IT reduced costs by upwards of $50 million through implementing ITAM

CASE STUDY

Industry IT

Source Cisco Systems, Inc.

Cisco Systems, Inc.

Cisco Systems, Inc. is the largest networking company in the world. Headquartered in San Jose, California, the company employees over 70,000 people.

Asset Management

As is typical with technology companies, Cisco boasted a proactive work environment that encouraged individualism amongst employees. Unfortunately, this high degree of freedom combined with the rapid mobilization of PCs and other devices created numerous headaches for asset tracking. At its peak, spending on hardware alone exceeded $100 million per year.

Results

Through a comprehensive ITAM implementation, the new asset management program at Cisco has been a resounding success. While employees did have to adjust to new rules, the process as a whole has been streamlined and user-satisfaction levels have risen. Centralized purchasing and a smaller number of hardware platforms have allowed Cisco to cut its hardware spend in half, according to Mark Edmondson, manager of IT services expenses for Cisco Finance.

This case study continues in phase 1

The image shows four bars, from bottom to top: 1. Asset Gathering; 2. Asset Distribution; 3. Asset Protection; 4. Asset Data. On the right, there is an arrow pointing upwards labelled ITAM Program Maturity.

Info-Tech delivers: Use our tools and templates to accelerate your project to completion

HAM Standard Operating Procedures (SOP)

HAM Maturity Assessment

Non-Standard Hardware Request Form

HAM Visio Process Workflows

HAM Policy Templates

HAM Budgeting Tool

HAM Communication Plan

HAM Implementation Roadmap Tool

Measured value for Guided Implementations (GIs)

Engaging in GIs doesn’t just offer valuable project advice, it also results in significant cost savings.

GI Measured Value
Phase 1: Lay Foundations
  • Time, value, and resources saved by using Info-Tech’s tools and templates to assess current state and maturity, plan scope of HAM program, and define roles and metrics.
  • For example, 2 FTEs * 14 days * $80,000/year = $8,615
Phase 2: Procure & Receive
  • Time, value, and resources saved by using Info-Tech’s tools and templates to build processes for hardware request, procurement, receiving, and deployment.
  • For example, 2 FTEs * 14 days * $80,000/year = $8,615
Phase 3: Maintain & Dispose
  • Time, value, and resources saved by following Info-Tech’s tools and methodology to build processes and policies for managing and maintaining hardware and disposing or redeploying of equipment.
  • For example, 2 FTE * 14 days * $80,000/year = $8,615
Phase 4: Plan Implementation
  • Time, value, and resources saved by following Info-Tech’s tools and methodology to select tools, plan the hardware budget, and build a roadmap.
  • For example, 2 FTE * 14 days * $80,000/year = $8,615
Total savings $25,845

Info-Tech offers various levels of support to best suit your needs

DIY Toolkit

“Our team has already made this critical project a priority, and we have the time and capability, but some guidance along the way would be helpful.”

Guided Implementation

“Our team knows that we need to fix a process, but we need assistance to determine where to focus. Some check-ins along the way would help keep us on track.”

Workshop

“We need to hit the ground running and get this project kicked off immediately. Our team has the ability to take this over once we get a framework and strategy in place.”

Consulting

“Our team does not have the time or the knowledge to take this project on. We need assistance through the entirety of this project.”

Diagnostics and consistent frameworks used throughout all four options

Guided Implementation overview

1. Lay Foundations 2. Procure & Receive 3. Maintain & Dispose 4. Budget & Implementation
Best-Practice Toolkit

1.1 Assess current state & plan scope

1.2 Build team & define metrics

2.1 Request & procure

2.2 Receive & deploy

3.1 Manage & maintain

3.2 Redeploy or dispose

4.1 Plan budget

4.2 Communicate & build roadmap

Guided Implementation
  • Assess current state.
  • Define scope of HAM program.
  • Define roles and metrics.
  • Define standard and non-standard hardware.
  • Build procurement process.
  • Determine asset tagging method and build equipment receiving and deployment processing.
  • Define processes for managing and maintaining equipment.
  • Define policies for maintaining asset security.
  • Build process for redeploying or disposing of assets.
  • Discuss best practices for effectively managing a hardware budget.
  • Build communications plan and roadmap.
Results & Outcomes
  • Evaluation of current maturity level of HAM
  • Defined scope for the HAM program including list of hardware to track as assets
  • Defined roles and responsibilities
  • Defined and documented KPIs and metrics to meet HAM reporting requirements
  • Defined standard and non- standard requests and processes
  • Defined and documented procurement workflow and purchasing policy
  • Asset tagging method and process
  • Documented equipment receiving and deployment processes
  • MAC policies and workflows
  • Policies and processes for hardware maintenance and asset security
  • Documented workflows for hardware disposal and recovery/redeployment
  • Shortlist of ITAM tools
  • Hardware asset budget plan
  • Communication plan and HAM implementation roadmap

Workshop overview

Contact your account representative or email Workshops@InfoTech.comfor more information.

Phases: Teams, Scope & Hardware Procurement Hardware Procurement and Receiving Hardware Maintenance & Disposal Budgets, Roadmap & Communications
Duration* 1 day 1 day 1 day 1 day
* Activities across phases may overlap to ensure a timely completion of the engagement
Projected Activities
  • Outline hardware asset management goals
  • Review HAM maturity and anticipated milestones
  • Define scope and classify hardware assets
  • Define roles and responsibilities
  • Define metrics and reporting requirements
  • Define standard and non-standard hardware requests
  • Review and document procurement workflow
  • Discuss appropriate asset tagging method
  • Design and document workflow for receiving and inventorying equipment
  • Review/create policy for hardware procurement and receiving
  • Identify data sources and methodology for inventory and data collection
  • Define install/moves/adds/changes (MAC) policy
  • Build workflows to document user MAC processes and design request form
  • Design process and policies for hardware maintenance, warranty, and support documentation handling
  • Design hardware asset recovery and disposal workflows
  • Define budgeting process and review Info-Tech’s HAM Budgeting Tool
  • Develop a communication plan
  • Develop a HAM implementation plan
Projected Deliverables
  • Standard operating procedures for hardware
  • Visio diagrams for all workflows
  • Workshop summary with milestones and task list
  • Budget template
  • Policy draft

Phase 1

Lay Foundations

Implement Hardware Asset Management

A centralized procurement process helped cut Cisco’s hardware spend in half

CASE STUDY

Industry IT

Source Cisco Systems, Inc.

Challenge

Cisco Systems’ hardware spend was out of control. Peaking at $100 million per year, the technology giant needed to standardize procurement processes in its highly individualized work environment.

Users had a variety of demands related to hardware and network availability. As a result, data was spread out amongst multiple databases and was managed by different teams.

Solution

The IT team at Cisco set out to solve their hardware-spend problem using a phased project approach.

The first major step was to identify and use the data available within various departments and databases. The heavily siloed nature of these databases was a major roadblock for the asset management program.

This information had to be centralized, then consolidated and correlated into a meaningful format.

Results

The centralized tracking system allowed a single point of contact (POC) for the entire lifecycle of a PC. This also created a centralized source of information about all the PC assets at the company.

This reduced the number of PCs that were unaccounted for, reducing the chance that Cisco IT would overspend based on its hardware needs.

There were still a few limitations to address following the first step in the project, which will be described in more detail further on in this blueprint.

This case study continues in phase 2

Step 1.1: Assess current state and plan scope

Phase 1: Assess & Plan

1.1 Assess current state & plan scope

1.2 Build team & define metrics

This step will walk you through the following activities:

1.1.1 Complete MGD (optional)

1.1.2 Outline hardware asset management challenges

1.1.3 Conduct HAM maturity assessment

1.1.4 Classify hardware assets to define scope of the program

This step involves the following participants:

  • CIO/CFO
  • IT Director
  • Asset Manager
  • Purchasing
  • Service Desk Manager
  • Security (optional)
  • Operations (optional)

Step Outcomes

  • Understand key challenges related to hardware asset management within your organization to inform program development.
  • Evaluate current maturity level of hardware asset management components and overall program to determine starting point.
  • Define scope for the ITAM program including list of hardware to track as assets.

Complete the Management & Governance Diagnostic (MGD) to weigh the effectiveness of ITAM against other services

1.1.1 Optional Diagnostic

The MGD helps you get the data you need to confirm the importance of improving the effectiveness of your asset management program.

The MGD allows you to understand the landscape of all IT processes, including asset management. Evaluate all team members’ perceptions of each process’ importance and effectiveness.

Use the results to understand the urgency to change asset management and its relevant impact on the organization.

Establish process owners and hold team members accountable for process improvement initiatives to ensure successful implementation and realize the benefits from more effective processes.

To book a diagnostic, or get a copy of our questions to inform your own survey, visit Info-Tech’s Benchmarking Tools, contact your account manager, or call toll-free 1-888-670-8889 (US) or 1-844-618-3192 (CAN).

Sketch out challenges related to hardware asset management to shape the direction of the project

Common HAM Challenges

Processes and Policies:

  • Existing asset management practices are labor intensive and time consuming
  • Manual spreadsheets are used, making collaboration and automation difficult
  • Lack of HAM policies and standard operating procedures
  • Asset management data is not centralized
  • Lack of clarity on roles and responsibilities for ITAM functions
  • End users don’t understand the value of asset management

Tracking:

  • Assets move across multiple locations and are difficult to track
  • Hardware asset data comes from multiple sources, creating fragmented datasets
  • No location data is available for hardware
  • No data on ownership of assets

Security and Risk:

  • No insight into which assets contain sensitive data
  • There is no information on risks by asset type
  • Rogue systems need to be identified as part of risk management best practices
  • No data exists for assets that contain critical/sensitive data

Procurement:

  • No centralized procurement department
  • Multiple quotes from vendors are not currently part of the procurement process
  • A lack of formal process can create issues surrounding employee onboarding such as long lead times
  • Not all procurement standards are currently defined
  • Rogue purchases create financial risk

Receiving:

  • No formal process exists, resulting in no assigned receiving location and no assigned receiving role
  • No automatic asset tracking system exists

Disposal:

  • No insight into where disposed assets go
  • Formal refresh and disposal system is needed

Contracts:

  • No central repository exists for contracts
  • No insight into contract lifecycle, hindering negotiation effectiveness and pricing optimization

Outline hardware asset management challenges

1.1.1 Brainstorm HAM challenges

Participants

  • CIO/CFO
  • IT Director
  • Asset Manager
  • Purchasing
  • Service Desk Manager
  • Security
  • Operations (optional)

A. As a group, outline the hardware asset management challenges facing the organization.

Use the previous slide to help you get started. You can use the following headings as a guide or think of your own:

  • Processes and Policies
  • Tracking
  • Procurement
  • Receiving
  • Security and Risk
  • Disposal
  • Contracts

B. If you get stuck, use the Hardware Asset Management Maturity Assessment Tool to get a quick view of your challenges and maturity targets and kick-start the conversation.

To be effective with hardware asset management, understand the drivers and potential impact to the organization

Drivers of effective HAM Results of effective HAM
Contracts and vendor licensing programs are complex and challenging to administer without data related to assets and their environment. Improved access to accurate data on contracts, licensing, warranties, installed hardware and software for new contracts, renewals, and audit requests.
Increased need to meet compliance requires a formal approach to tracking and managing assets, regardless of device type. Encryption, hardware tracking and discovery, software application controls, and change notifications all contribute to better asset controls and data security.
Cost cutting is on the agenda, and management is looking to reduce overall IT spend in the organization in any possible way. Reduction of hardware spend by as much as 5% of the total budget through data for better forecasting and planning.
Assets with sensitive data are not properly secured, go missing, or are not safely disposed of when retired. Document and enforce security policies for end users and IT staff to ensure sensitive data is properly secured, preventing costs much larger than the cost of only the device.

Each level of HAM maturity comes with its own unique challenges

Maturity People & Policies Processes Technology
Chaos
  • No dedicated staff
  • No policies published
  • Procedures not documented or standardized
  • Hardware not safely secured or tagged
  • Hardware purchasing decisions not based on data
  • Minimal tracking tools in place
Reactive
  • Semi-focused HAM manager
  • No policies published
  • Reliance on suppliers to provide reports for hardware purchases
  • Hardware standards are enforced
  • Discovery tools and spreadsheets used to manage hardware
Controlled
  • Full-time HAM manager
  • End-user policies published
  • HAM manager involved in budgeting and planning sessions
  • Inventory tracking is in place
  • Hardware is secured and tagged
  • Discovery and inventory tools used to manage hardware
  • Compliance reports run as needed
Proactive
  • Extended HAM team, including Help Desk, HR, Purchasing
  • Corporate hardware use policies in place and enforced
  • HAM process integrated with help desk and HR processes
  • More complex reporting and integrated financial information and contracts with asset data
  • Hardware requests are automated where possible
  • Product usage reports and alerts in place to harvest and reuse licenses
  • Compliance and usage reports used to negotiate software contracts
Optimized
  • HAM manager trained and certified
  • Working with HR, Legal, Finance, and IT to enforce policies
  • Quarterly meetings with ITAM team to review policies, procedures, upcoming contracts, and rollouts; data is reviewed before any financial decisions made
  • Full transparency into hardware lifecycle
  • Aligned with business objectives
  • Detailed savings reports provided to executive team annually
  • Automated policy enforcement and process workflows

Conduct a hardware maturity assessment to understand your starting point and challenges

1.1.3 Complete HAM Maturity Assessment Tool

Complete the Hardware Asset Management Maturity Assessment Tool to understand your organization’s overall maturity level in HAM, as well as the starting maturity level aligned with each step of the blueprint, in order to identify areas of strength and weakness to plan the project. Use this to track progress on the project.

An effective asset management project has four essential components, with varying levels of management required

The hardware present in your organization can be classified into four categories of ascending strategic complexity: commodity, inventory, asset, and configuration.

Commodity items are devices that are low-cost, low-risk items, where tracking is difficult and of low value.

Inventory is tracked primarily to identify location and original expense, which may be depreciated by Finance. Typically there will not be data on these devices and they’ll be replaced as they lose functionality.

Assets will need the full lifecycle managed. They are identified by cost and risk. Often there is data on these devices and they are typically replaced proactively before they become unstable.

Configuration items will generally be tracked in a configuration management database (CMDB) for the purpose of enabling the support teams to make decisions involving dependencies, configurations, and impact analysis. Some data will be duplicated between systems, but should be synchronized to improve accuracy between systems.

See Harness Configuration Management Superpowers to learn more about building a CMDB.

Classify your hardware assets to determine the scope and strategy of the program

Asset: A unique device or configuration of devices that enables a user to perform productive work tasks and has a defined location and ownership attributes.

  • Hardware asset management involves tracking and managing physical components from procurement through to retirement. It provides the base for software asset management and is an important process that can lead to improved lifecycle management, service request fulfillment, security, and cost savings through harvesting and redeployment.
  • When choosing your strategy, focus on those devices that are high cost and high risk/function such as desktops, laptops, servers, and mobile devices.

ASSET - Items of high importance and may contain data, such as PCs, mobile devices, and servers.

INVENTORY - Items that require significant financial investment but no tracking beyond its existence, such as a projector.

COMMODITY - Items that are often in use but are of relatively low cost, such as keyboards or mice.

Classify your hardware assets to define the scope of the program

1.1.4 Define the assets to be tracked within your organization

Participants

  • Participants
  • CIO/CFO
  • IT Director
  • Asset Manager
  • Purchasing
  • Service Desk Manager
  • Security (optional)
  • Operations (optional)

Document

Document in the Standard Operating Procedures, Section 1 – Overview & Scope

  1. Determine value/risk threshold at which items should be tracked (e.g. over $1,000 and holding data).
  2. Divide a whiteboard or flip chart into three columns: commodity, asset, and inventory.
  3. Divide participants into groups by functional role to brainstorm devices in use within the organization. Write them down on sticky notes.
  4. Place the sticky notes in the column that best describes the role of the product in your organization.

Align the scope of the program with business requirements

CASE STUDY

Industry Public Administration

Source Client Case Study

Situation

A state government designed a process to track hardware worth more than $1,000. Initially, most assets consisted of end-user computing devices.

The manual tracking process, which relied on a series of Excel documents, worked well enough to track the lifecycle of desktop and laptop assets.

However, two changes upended the organization’s program: the cost of end-user computing devices dropped dramatically and the demand for network services led to the proliferation of expensive equipment all over the state.

Complication

The existing program was no longer robust enough to meet business requirements. Networking equipment was not only more expensive than end-user computing devices, but also more critical to IT services.

What was needed was a streamlined process for procuring high-cost, high-utility equipment, tracking their location, and managing their lifecycle costs without compromising services.

Resolution

The organization decided to formalize, document, and automate hardware asset management processes to meet the new challenges and focus efforts on high-cost, high-utility end-user computing devices only.

Step 1.2: Build team and define metrics

Phase 1: Assess & Plan

1.1 Assess current state & plan scope

1.2 Build team and define metrics

This step will walk you through the following activities:

1.2.1 Define responsibilities for Asset Manager and Asset Administrator

1.2.2 Use a RACI chart to determine roles within HAM team

1.2.3 Further clarify HAM responsibilities for each role

1.2.4 Identify HAM reporting requirements

This step involves the following participants:

  • CIO/CFO
  • IT Director
  • IT Managers
  • Asset Manager
  • Asset Coordinators
  • ITAM Team
  • Service Desk
  • End-User Device Support Team

Step Outcomes:

  • Defined responsibilities for Asset Manager and Asset Administrator
  • Documented RACI chart assigning responsibility and accountability for core HAM processes
  • Documented responsibilities for ITAM/HAM team
  • Defined and documented KPIs and metrics to meet HAM reporting requirements

Form an asset management team to lead the project

Asset management is an organizational change. To gain buy-in for the new processes and workflows that will be put in place, a dedicated, passionate team needs to jump-start the project.

Delegate the following roles to team members and grow your team accordingly.

Asset Manager

  • Responsible for setting policy and governance of process and data accuracy
  • Support budget process
  • Support asset tracking processes in the field
  • Train employees in asset tracking processes

Asset Administrator

  • The front-lines of asset management
  • Communicates with and supports asset process implementation teams
  • Updates and contributes information to asset databases
Service Desk, IT Operations, Applications
  • Responsible for advising asset team of changes to the IT environment, which may impact pricing or ability to locate devices
  • Works with Asset Coordinator/Manager to set standards for lifecycle stages
  • The ITAM team should visit and consult with each component of the business as well as IT.
  • Engage with leaders in each department to determine what their pain points are.
  • The needs of each department are different and their responses will assist the ITAM team when designing goals for asset management.
  • Consultations within each department also communicates the change early, which will help with the transition to the new ITAM program.

Info-Tech Insight

Ensure that there is diversity within the ITAM team. Assets for many organizations are diverse and the composition of your team should reflect that. Have multiple departments and experience levels represented to ensure a balanced view of the current situation.

Define the responsibilities for core ITAM/HAM roles of Asset Manager and Asset Administrator

1.2.1 Use Info-Tech’s job description templates to define roles

The role of the IT Asset Manager is to oversee the daily and long-term strategic management of software and technology- related hardware within the organization. This includes:

  • Planning, monitoring, and recording software licenses and/or hardware assets to ensure compliance with vendor contracts.
  • Forming procurement strategies to optimize technology spend across the organization.
  • Developing and implementing procedures for tracking company assets to oversee quality control throughout their lifecycles.

The role of the IT Asset Administrator is to actively manage hardware and software assets within the organization. This includes:

  • Updating and maintaining accurate asset records.
  • Planning, monitoring, and recording software licenses and/or hardware assets to ensure compliance with vendor contracts.
  • Administrative duties within procurement and inventory management.
  • Maintaining records and databases regarding warranties, service agreements, and lifecycle management.
  • Product standardization and tracking.

Use Info-Tech’s job description templates to assist in defining the responsibilities for these roles.

Organize your HAM team based on where they fit within the strategic, tactical, and operational components

Typically the asset manager will answer to either the CFO or CIO. Occasionally they answer to a vendor manager executive. The hierarchy may vary based on experience and how strategic a role the asset manager will play.

The image shows a flowchart for organizing the HAM team, structured by three components: Strategic (at the top); Tactical (in the middle); and Operational (at the bottom). The chart shows how the job roles flow together within the hierarchy.

Determine the roles and responsibilities of the team who will support your HAM program

1.2.2 Complete a RACI

A RACI chart will identify who should be responsible, accountable, consulted, and informed for each key activity during the consolidation.

Participants

  • Project Sponsor
  • IT Director, CIO
  • Project Manager
  • IT Managers and Asset Manager(s)
  • ITAM Team

Document

Document in the Standard Operating Procedure.

Instructions:

  1. Write out the list of all stakeholders along the top of a whiteboard. Write out the key initiative steps for the consolidation project along the left side (use this list as a starting point).
  2. For each initiative, identify each team member’s role. Are they:
    • Responsible? The one responsible for getting the job done.
    • Accountable? Only one person can be accountable for each task.
    • Consulted? Involved through input of knowledge and information.
    • Informed? Receive information about process execution and quality.
  3. As you proceed through the initiative, continue to add tasks and assign responsibility to this RACI chart.

A sample RACI chart is provided on the next slide

Start with a RACI chart to determine the responsibilities

1.2.2 Complete a RACI chart for your organization

HAM Tasks CIO CFO HAM Manager HAM Administrator Service Desk (T1,T2, T3) IT Operations Security Procurement HR Business Unit Leaders Compliance /Legal Project Manager
Policies and governance A I R I I C I C C I I
Strategy A R R R R
Data entry and quality management C I A I C C I I C C
Risk management and asset security A R C C R C C
Process compliance auditing A R I I I I I
Awareness, education, and training I A I I C
Printer contracts C A C C C R C C
Hardware contract management A I R R I I R R I I
Workflow review and revisions I A C C C C
Budgeting A R C I C
Asset acquisition A R C C C C I C C
Asset receiving (inspection/acceptance) I A R R I
Asset deployment A R R I I
Asset recovery/harvesting A R R I I
Asset disposal C A R R I I
Asset inventory (input/validate/maintain) I I A/R R R R I I I

Further clarify HAM responsibilities for each role

1.2.3 Define roles and responsibilities for the HAM team

Participants

  • Participants IT Asset Managers and Coordinators
  • ITAM Team
  • IT Managers and IT Director

Document

  1. Discuss and finalize positions to be established within the ITAM/HAM office as well as additional roles that will be involved in HAM.
  2. Review the sample responsibilities below and revise or create responsibilities for each key position within the HAM team.
  3. Document in the HAM Standard Operating Procedures.
Role Responsibility
IT Manager
  • Responsible for writing policies regarding asset management and approving final documents
  • Build and revise budget, tracking actual spend vs. budget, seeking final approvals from the business
  • Process definition, communication, reporting and ensuring people are following process
  • Awareness campaign for new policy and process
Asset Managers
  • Approval of purchases up to $10,000
  • Inventory and contract management including contract review and recommendations based on business and IT requirements
  • Liaison between business and IT regarding software and hardware
  • Monitor and improve workflows and asset related processes
  • Monitor controls, audit and recommend policies and procedures as needed
  • Validate, manage and analyze data as related to asset management
  • Provide reports as needed for decision making and reporting on risk, process effectiveness and other purposes as required
  • Asset acquisition and disposal
Service Desk
Desktop team
Security
Infrastructure teams

Determine criteria for success: establish metrics to quantify and demonstrate the results and value of the HAM function

HAM metrics fall in the following categories:

HAM Metrics

  • Quantity e.g. inventory levels and need
  • Cost e.g. value of assets, budget for hardware
  • Compliance e.g. contracts, policies
  • Quality e.g. accuracy of data
  • Duration e.g. time to procure or deploy hardware

Follow a process for establishing metrics:

  1. Identify and obtain consensus on the organization’s ITAM objectives, prioritized if possible.
  2. For each ITAM objective, select two or three metrics in the applicable categories (not all categories will apply to all objectives); be sure to select metrics that are achievable with reasonable effort.
  3. Establish a baseline measurement for each metric.
  4. Establish a method and accountability for ongoing measurement and analysis/reporting.
  5. Establish accountability for taking action on reported results.
  6. As ITAM expands and matures, change or expand the metrics as appropriate.

Define KPIs and associated metrics

  • Identify the critical success factors (CSFs) for your hardware asset management program based on strategic goals.
  • For each success factor, identify the key performance indicators (KPIs) to measure success and specific metrics that will be tracked and reported on.
  • Sample metrics are below:
CSF KPI Metrics
Improve accuracy of IT budget and forecasting
  • Asset costs and value
  • Average cost of workstation
  • Total asset spending
  • Total value of assets
  • Budget vs. spend
Identify discrepancies in IT environment
  • Unauthorized or failing assets
  • Number of unauthorized assets
  • Assets identified as cause of service failure
Avoid over purchasing equipment
  • Number of unused and underused computers
  • Number of unaccounted-for computers
  • Money saved from harvesting equipment instead of purchasing new
Make more-effective purchasing decisions
  • Predicted replacement time and cost of assets
  • Deprecation rate of assets
  • Average cost of maintaining an asset
  • Number of workstations in repair
Improve accuracy of data
  • Accuracy of asset data
  • Accuracy rate of inventory data
  • Percentage improvement in accuracy of audit of assets
Improved service delivery
  • Time to deploy new hardware
  • Mean time to purchase new hardware
  • Mean time to deploy new hardware

Identify hardware asset reporting requirements and the data you need to collect to meet them

1.2.4 Identify asset reporting requirements

Participants

  • CIO/CFO
  • IT Director
  • Asset Manager
  • Purchasing
  • Service Desk Manager
  • Operations (optional)

Document

Document in the Standard Operating Procedures, Section 13: Reporting

  1. Discuss the goals and objectives of implementing or improving hardware asset management, based on challenges identified in Step 1.2.
  2. From the goals, identify the critical success factors for the HAM program
  3. For each CSF, identify one to three key performance indicators to evaluate achievement of the success factor.
  4. For each KPI, identify one to three metrics that can be tracked and reported on to measure success. Ensure that the metrics are tangible and measurable and will be useful for decision making or to take action.
  5. Determine who needs this information and the frequency of reporting.
  6. If you have existing ITAM data, record the baseline metric.
CSF KPI Metrics Stakeholder/frequency

Phase 1 Guided Implementation

Call 1-888-670-8889 or email GuidedImplementations@InfoTech.com for more information.

Complete these steps on your own or call us to complete a guided implementation. A guided implementation is a series of 2-3 advisory calls that help you execute each phase of a project. They are included in most advisory memberships.

Guided Implementation 1: Lay Foundations

Proposed Time to Completion: 4 weeks

Step 1.1: Assess current state and plan scope

Start with an analyst kick-off call:

  • Review challenges.
  • Assess current HAM maturity level.
  • Define scope of HAM program.

Then complete these activities…

  • Complete MGD (optional).
  • Outline hardware asset management challenges.
  • Conduct HAM maturity assessment.
  • Classify hardware assets to define scope of the program.

With these tools & templates:

HAM Maturity Assessment

Standard Operating Procedures

Step 1.2: Build team and define metrics

Review findings with analyst:

  • Define roles and responsibilities.
  • Assess reporting requirements.
  • Document metrics to track.

Then complete these activities…

  • Define responsibilities for Asset Manager and Asset Administrator.
  • Use a RACI chart to determine roles within HAM team.
  • Document responsibilities for HAM roles.
  • Identify HAM reporting requirements.

With these tools & templates:

RACI Chart

Asset Manager and Asset Administrator Job Descriptions

Standard Operating Procedures

Phase 1 Results & Insights:

For asset management to succeed, it needs to support the business. Engage business leaders to determine needs and build your HAM program around these goals.

If you want additional support, have our analysts guide you through this phase as part of an Info-Tech workshop

Book a workshop with our Info-Tech analysts:

  • To accelerate this project, engage your IT team in an Info-Tech workshop with an Info-Tech analyst team.
  • Info-Tech analysts will join you and your team onsite at your location or welcome you to Info-Tech’s historic Toronto office to participate in an innovative onsite workshop.
  • Contact your account manager (www.infotech.com/account), or email Workshops@InfoTech.com for more information.

The following are sample activities that will be conducted by Info-Tech analysts with your team:

1.1.4 Classify hardware assets to define scope of the program

Determine value/risk threshold at which assets should be tracked, then divide a whiteboard into four quadrants representing four categories of assets. Participants write assets down on sticky notes and place them in the appropriate quadrant to classify assets.

1.2.2 Build a RACI chart to determine responsibilities

Identify all roles within the organization that will play a part in hardware asset management, then document all core HAM processes and tasks. For each task, assign each role to be responsible, accountable, consulted, or informed.

Phase 2

Procure and Receive

Implement Hardware Asset Management

Step 2.1: Request and Procure Hardware

Phase 2: Procure & Receive

2.1 Request & Procure

2.2 Receive & Deploy

This step will walk you through the following activities:

2.1.1 Identify IT asset procurement challenges

2.1.2 Define standard hardware requests

2.1.3 Document standard hardware request procedure

2.1.4 Build a non-standard hardware request form

2.1.5 Make lease vs. buy decisions for hardware assets

2.1.6 Document procurement workflow

2.1.7 Build a purchasing policy

This step involves the following participants:

  • Asset Manager
  • Purchasing
  • Service Desk Manager
  • Operations (optional)
  • CFO or other management representative from Finance

Step Outcomes:

  • Definition of standard hardware requests for roles, including core vs. optional assets
  • End-user request process for standard hardware
  • Non-standard hardware request form
  • Lease vs. buy decisions for major hardware assets
  • Defined and documented procurement workflow
  • Documented purchasing policy

California saved $40 million per year using a green procurement strategy

CASE STUDY

Industry Government

Source Itassetmanagement.net

Challenge

Signed July 27, 2004, Executive order S-20-04, the “Green Building Initiative,” placed strict regulations on energy consumption, greenhouse gas emissions, and raw material usage and waste.

In compliance with S-20-04, the State of California needed to adopt a new procurement strategy. Its IT department was one of the worst offenders given the intensive energy usage by the variety of assets managed under the IT umbrella.

Solution

A green IT initiative was enacted, which involved an extensive hardware refresh based on a combination of agent-less discovery data and market data (device age, expiry dates, power consumption, etc.).

A hardware refresh of almost a quarter-million PCs, 9,500 servers, and 100 email systems was rolled out as a result.

Other changes, including improved software license compliance and data center consolidation, were also enacted.

Results

Because of the scale of this hardware refresh, the small changes meant big savings.

A reduction in power consumption equated to savings of over $40 million per year in electricity costs. Additionally, annual carbon emissions were trimmed by 200,000 tons.

Improve your hardware asset procurement process to…

Asset Procurement

  • Standardization
  • Aligned procurement processes
  • SLAs
  • TCO reduction
  • Use of centralized/ single POC

Standardize processes: Using standard products throughout the enterprise lowers support costs by reducing the variety of parts that must be stocked for onsite repairs or for provisioning and supporting equipment.

Align procurement processes: Procurement processes must be aligned with customers’ business requirements, which can have unique needs.

Define SLAs: Providing accurate and timely performance metrics for all service activities allows infrastructure management based on fact rather than supposition.

Reduce TCO: Management recognizes service infrastructure activities as actual cost drivers.

Implement a single POC: A consolidated service desk is used where the contact understands both standards (products, processes, and practices) and the user’s business and technical environment.

Identify procurement challenges to identify process improvement needs

2.1.1 Identify IT asset procurement challenges

Participants

  • Asset Manager
  • Purchasing
  • Service Desk Manager
  • Operations (optional)
  1. As a group, brainstorm existing challenges related to IT hardware requests and procurement.
  2. If you get stuck, consider the common challenges listed below.
  3. Use the results of the discussion to focus on which problems can be resolved and integrated into your organization as operational standards.

Document hardware standards to speed time to procure and improve communications to users regarding options

The first step in your procurement workflow will be to determine what is in scope for a standard request, and how non-standard requests will be handled. Questions that should be answered by this procedure include:

  • What constitutes a non-standard request?
  • Who is responsible for evaluating each type of request? Will there be one individual or will each division in IT elect a representative to handle requests specific to their scope of work?
  • What additional security measures need to be taken?
  • Are there exceptions made for specific departments or high-ranking individuals?

If your end-user device strategy requires an overhaul, schedule time with an Info-Tech analyst to review our blueprint Build an End-User Computing Strategy.

Once you’ve answered questions like these, you can outline your hardware standards as in the example below:

Use Case Mobile Standard Mac Standard Mobile Power User
Asset Lenovo ThinkPad T570 iMac Pro Lenovo ThinkPad P71
Operating system Windows 10 Pro Mac OSX Windows 10 Pro, 64 bit
Display 15.6" 21.5" 17.3”

Memory

32GB 8GB 64GB
Processor Intel i7 – 7600U Processor 2.3GHz Xeon E3 v6 Processor
Drive 500GB 1TB 1TB
Warranty 3 year 1 year + 2 extended 3 year

Info-Tech Insight

Approach hardware standards from a continual improvement frame of mind. Asset management is a dynamic process. Hardware standards will need to adapt over time to match the needs of the business. Plan assessments at routine intervals to ensure your current hardware standards align with business needs.

Document specifications to meet environmental, security, and manageability requirements

Determine environmental requirements and constraints.

Power management

Compare equipment for power consumption and ability to remotely power down machines when not in use.

Heat and noise

Test equipment run to see how hot the device gets, where the heat is expelled, and how much noise is generated. This may be particularly important for users who are working in close quarters.

Carbon footprint

Ask what the manufacturer is doing to reduce post-consumer waste and eliminate hazardous materials and chemicals from their products.

Ensure security requirements can be met.

  • Determine if network/wireless cards meet security requirements and if USB ports can be turned off to prevent removal of data.
  • Understand the level of security needed for mobile devices including encryption, remote shut down or wipe of hard drives, recovery software, or GPS tracking.
  • Decide if fingerprint scanners with password managers would be appropriate to enable tighter security and reduce the forgotten-password support calls.

Review features available to enhance manageability.

  • Discuss manageability goals with your IT team to see if any can be solved with added features, for example:
    • Remote control for troubleshooting and remote management of data security settings.
    • Asset management software or tags for bar coding, radio frequency identification (RFID), or GPS, which could be used in combination with strong asset management practices to inventory, track, and manage equipment.

If choosing refurbished equipment, avoid headaches by asking the right questions and choosing the right vendor

  • Is the equipment functional and for how long is it expected to last?
  • How long will the vendor stand behind the product and what support can be expected?
    • This is typically two to five years, but will vary from vendor to vendor.
    • Will they repair or replace machines? Many will just replace the machine.
  • How big is the inventory supply?
    • What kind of inventory does the vendor keep and for how long can you expect the vendor to keep it?
    • How does the vendor source the equipment and do they have large quantities of the same make and model for easier imaging and support?
  • How complete is the refurbishment process?
    • Do they test all components, replace as appropriate, and securely wipe or replace hard drives?
    • Are they authorized to reload MS Windows OEM?
  • Is the product Open Box or used?
    • Open Box is a new product returned back to the vendor. Even if it is not used, the product cannot be resold as a new product. Open Box comes with a manufacturer’s warranty and the latest operating system.
    • If used, how old is the product?

"If you are looking for a product for two or three years, you can get it for less than half the price of new. I bought refurbished equipment for my call center for years and never had a problem". – Glen Collins, President, Applied Sales Group

Info-Tech Insight

Price differences are minimal between large and small vendors when dealing with refurbished machines. The decision to purchase should be based on ability to provide and service equipment.

Define standard hardware requests, including core and optional assets

2.1.2 Identify standards for hardware procurement by role

Participants

  • Asset Manager
  • Purchasing
  • Service Desk Manager
  • Operations (optional)
  • Representatives from all other areas of the business

Document

Document in the Standard Operating Procedures, Section 7: Procurement.

  1. Divide a whiteboard into columns representing all major areas of the business.
  2. List the approximate number of end users present at each tier and record these totals on the board.
  3. Distribute sticky notes. Use two different sizes: large sizes represent critically important hardware and small sizes represent optional hardware.
  4. Define core hardware assets for each division as well as optional hardware assets.
  5. Focus on the small sticky notes to determine if these optional purchases are necessary.
  6. Finalize the group decision to determine the standard hardware procurement for each role in the organization. Record results in a table similar to the example below:
Department Core Hardware Assets Optional Hardware Assets
IT PC, tablet, monitor Second monitor
Sales PC, monitor Laptop
HR PC, monitor Laptop
Marketing PC (iMac) Tablet, laptop

Document procedures for users to make standard hardware requests

2.1.3 Document standard hardware request procedure

Participants

  • Asset Manager
  • Purchasing
  • Service Desk Manager
  • Operations (optional)
  • Representatives from all other areas of the business

Document

Document in the Standard Operating Procedures, Section 6: End-User Request Process.

Discuss and document the end-user request process:

  1. In which cases can users request a primary device?
  2. In which cases can users request a secondary (optional device)?
  3. What justification is needed to approve of a secondary device?
    1. E.g. The request for a secondary device should be via email to the IS Projects and Procurements Officer. This email should outline the business case for why multiple devices are required.
  4. Will a service catalog be available and integrated with an ITAM solution for users to make standard requests? If so, can users also configure their options?
  5. Document the process in the standard operating procedure. Example:

End-User Request Process

  • Hardware and software will be purchased through the user-facing catalog.
  • Peripherals will be ordered as needed.
  • End-user devices will be routed to business managers for approval prior to fulfillment by IT.
  • Requests for secondary devices must be accompanied by a business case.
  • Equipment replacements due to age will be managed through IT replacement processes.

Improve the process for ordering non-standard hardware by formalizing the request process, including business needs

2.1.4 Build a non-standard hardware request form

  • Although the goal should be to standardize as much as possible, this isn’t always possible. Ensure users who are requesting non-standard hardware have a streamlined process to follow that satisfies the justifications for increased costs to deliver.
  • Use Info-Tech’s template to build a non-standard hardware request form that may be used by departments/users requesting non-standard hardware in order to collect all necessary information for the request to be evaluated, approved, and sent to procurement.
  • Ensure that the requestor provides detailed information around the equipment requested and the reason standard equipment does not suffice and includes all required approvals.
  • Include instructions for completing and submitting the form as well as expected turnaround time for the approval process.

Info-Tech Insight

Include non-standard requests in continual improvement assessment. If a large portion of requests are for non-standard equipment, it’s possible the hardware doesn’t meet the recommended requirements for specialized software in use with many of your business users. Determine if new standards need to be set for all users or just “power users.”

Identify the information you need to collect to ensure a smooth purchasing process

Categories Peripherals Desktops/Laptops Servers
Financial
  • Operational expenses
  • Ordered for inventory with the exceptions of monitors that will be ordered as needed
  • Equipment will be purchased through IT budget
  • Capital expenses
  • Ordered as needed…
  • Inventory kept for…
  • End-user devices will be purchased through departmental budgets
  • Capital expenses
  • Ordered as needed to meet capacity or stability requirements
  • Devices will be purchased through IT budgets
Request authorization
  • Any user can request
  • Users who are traveling can purchase and expense peripherals as needed, with manager approvals
  • Tier 3 technicians
Required approvals
  • Manager approvals required for monitors
  • Infrastructure and applications manager up to [$]
  • CIO over [$]
Warranty requirements
  • None
  • Three years
  • Will be approved with project plan
Inventory requirements
  • Minimum inventory at each location of 5 of each: mice, keyboards, cables
  • Docking stations will be ordered as needed
  • Laptops (standard): 5
  • Laptops (ultra light): 1
  • Desktops: 5
  • Inventory kept in stock as per DR plan
Tracking requirements
  • None
  • Added to ITAM database, CMDB
  • Asset tag to be added to all equipment
  • Added to ITAM database, CMDB

Info-Tech Best Practice

Take into account the possibility of encountering taxation issues based on where the equipment is being delivered as well as taxes imposed or incurred in the location from which the asset was shipped or sent. This may impact purchasing decisions and shipping instructions.

Develop a procurement plan to get everyone in the business on the same page

  • Without an efficient and structured process around how IT purchases are budgeted and authorized, maverick spending and dark procurement can result, limiting IT’s control and visibility into purchases.
  • The challenge many IT departments face is that there is a disconnect between meeting the needs of the business and bringing in equipment according to existing policies and procedures.
  • The asset manager should demonstrate how they can bridge the gaps and improve tracking mechanisms at the same time.

Improve procurement decisions:

  • Demonstrate how technology is a value-add.
  • Make a clear case for the budget by using the same language as the rest of the business.
  • Quantify the output of technology investments in tangible business terms to justify the cost.
  • Include the refresh cycle in the procurement plan to ensure mission- critical systems will include support and appropriate warranty.
  • Plan technology needs for the future and ensure IT technology will continue to meet changing needs.
  • Synchronize redundant organizational procurement chains in order to lower cost.

Document the following in your procurement procedure:

  • Process for purchase requests
  • Roles and responsibilities, including requestors and approvers
  • Hardware assets to purchase and why they are needed
  • Timelines for purchase
  • Process for vendors

Info-Tech Insight

IT procurement teams are often heavily siloed from ITAM teams. The procurement team is typically found in the finance department. One way to bridge the gap is to implement routine, reliable reporting between departments.

Determine if it makes sense to lease or buy your equipment; weigh the pros and cons of leasing hardware

Pros

  • Keeps operational costs low in the short term by containing immediate cost.
  • Easy, predictable payments makes it easier to budget for equipment over long term.
  • Get the equipment you need to start doing business right away if you’re just starting out.
  • After the leasing term is up, you can continue the lease and update your hardware to the latest version.
  • Typical leases last 2 or 3 years, meaning your hardware can get upgrades when it needs it and your business is in a better position to keep up with technology.
  • Leasing directly from the vendor provides operational flexibility.
  • Focus on the business and let the vendor focus on equipment service and updates as you don’t have to pay for maintenance.
  • Costs structured as OPEX.

Cons

  • In the long term, leasing is almost always more expensive than buying because there’s no equity in leased equipment and there may be additional fees and interest.
  • Commitment to payment through the entire lease period even if you’re not using the equipment anymore.
  • Early termination fees if you need to get out of the lease.
  • No option to sell equipment once you’re finished with it to make money back.
  • Maintenance is up to leasing company’s specifications.
  • Product availability may be limited.

Recommended for:

  • Companies just starting out
  • Business owners with limited capital or budget
  • Organizations with equipment that needs to be upgraded relatively often

Weigh the pros and cons of purchasing hardware

Pros

  • Complete control over assets.
  • More flexible and straightforward procurement process.
  • Tax incentives: May be able to fully deduct the cost of some newly purchased assets or write off depreciation for computers and peripherals on taxes.
  • Preferable if your equipment will not be obsolete in the next two or three years.
  • You can resell the asset once you don’t need it anymore to recover some of the cost.
  • Customization and management of equipment is easier when not bound by terms of leasing agreement.
  • No waiting on vendor when maintenance is needed; no permission needed to make changes.

Cons

  • High initial cost of investment with CAPEX expense model.
  • More paperwork.
  • You (as opposed to vendor) are responsible for equipment disposal in accordance with environmental regulations.
  • You are responsible for keeping up with upgrades, updates, and patches.
  • You risk ending up with out-of-date or obsolete equipment.
  • Hardware may break after terms of warranty are up.

Recommended for:

  • Established businesses
  • Organizations needing equipment with long-term lifecycles

Make a lease vs. buy decision for equipment purchases

2.1.4 Decide whether to purchase or lease

Participants

  • Asset Manager
  • Purchasing
  • Service Desk Manager
  • Operations (optional)
  • Representatives from all other areas of the business

Document

Document policy decisions in the Standard Operating Procedures – Section 7: Procurement

  1. Identify hardware equipment that requires a purchase vs. lease decision.
  2. Discuss with Finance whether it makes sense to purchase or lease each major asset, considering the following:
  • Costs of equipment through each method
  • Tax deductions
  • Potential resale value
  • Potential revenue from using the equipment
  • How quickly the equipment will be outdated or require refresh
  • Size of equipment
  • Maintenance and support requirements
  • Overall costs
  • The leasing vs. buying decision should take considerable thought and evaluation to make the decision that best fits your organizational needs and situation.
  • Determine appropriate warranty and service-level agreements for your organization

    Determine acceptable response time, and weigh the cost of warranty against the value of service.

    • Standard warranties vary by manufacturer, but are typically one or three years.
    • Next-day, onsite service may be part of the standard offering or may be available as an uplift.
    • Four-hour, same-day service can also be added for high availability needs.
    • Extended warranties can be purchased beyond three years, although not many organizations take advantage of this offering.
    • Other organizations lower or remove the warranty and have reported savings of as much as $150 per machine.

    Speak to your partner to see how they can help the process of distributing machines.

    • Internal components change frequently with laptops and desktops. If purchasing product over time rather than buying in bulk, ensure the model will be available for a reasonable term to reduce imaging and support challenges.
    • Determine which services are important to your organization and request these services as part of the initial quote. If sending out a formal RFQ or RFP, document required services and use as the basis for negotiating SLAs.
    • Document details of SLA, including expectations of services for manufacturer, vendor, and internal team.
    • If partner will be providing services, request they stock an appropriate number of hot spares for frequently replaced parts.
    • If self-certifying, review resource capabilities, understand skill and certification requirements; for example, A+ certification may be a pre-requisite.
    • Understand DOA policy and negotiate a “lemon policy,” meaning if product dies within 15 or 30 days it can be classified as DOA. Seek clarity on return processes.

    Consider negotiation strategies, including how and when to engage with different partners during acquisition

    Direct Model

    • Dell’s primary sales model is direct either through a sales associate or through its e-commerce site. Promotions are regularly listed on the website, or if customization is required, desktops and laptops have some flexibility in configuration. Discounts can be negotiated with a sales rep on quantity purchases, but the discount level changes based on the model and configuration.
    • Other tier-one manufacturers typically sell direct only from their e-commerce sites, providing promotions based on stock they wish to move, and providing some configuration flexibility. They rely heavily on the channel for the majority of their business.

    Channel Model

    • Most tier one manufacturers have processes in place to manage a smaller number of partners rather than billing and shipping out to individual customers. Deviating from this process and dealing direct with end customers can create order processing issues.
    • Resellers have the ability to negotiate discounts based on quantities. Discounts will vary based on model, timing (quarter or year end), and quantity commitment.
    • Negotiations on large quantities should involve a manufacturer rep as well as the reseller to clearly designate roles and services, ensure processes are in place to fulfill your needs, and agree on pricing scheme. This will prevent misunderstandings and bring clarity to any commitments.
    • Often the channel partners are authorized to provide repair services under warranty for the manufacturer.
    • Dell also uses the channel model for distribution where customers demand additional services.

    Expect discounts to reflect quantity and method of purchase

    Transaction-based purchases will receive the smallest discounting.

    • Understand requirements to find the most appropriate make and model of equipment.
    • Prepare a forecast of expected purchases for the year and discuss discounting.
    • Typically initial discounts will be 3-5% off suggested retail price.
    • Once a history is in place, and the vendor is receiving regular orders, it may extend deeper discounts.

    Bulk purchases will receive more aggressive discounting of 5-15% off suggested retail price, depending on quantities.

    • Examine shipping options and costs to take advantage of bulk deliveries; in some cases vendors may waive shipping fees as an extension of the discounting.
    • If choosing end-of-line product, ensure appropriate quantity of a single model is available to efficiently roll out equipment.
    • Various pricing models can be used to obtain best price.

    Larger quantities rolled out over time will require commitments to the manufacturer to obtain deepest discounts.

    • Discuss all required services as part of negotiation to ensure there are no surprise charges.
    • Several pricing models can be used to obtain the best price.
      • Suggested retail price minus as much as 20%.
      • Cost plus 3% up to 10% or more.
      • Fixed price based on negotiating equipment availability with budget requirements.

    If sending out to bid, determine requirements and scoring criteria

    It’s nearly impossible to find two manufacturers with the exact same specifications, so comparisons between vendors is more art than science.

    New or upgraded components will be introduced into configurations when it makes the most sense in a production cycle. This creates a challenge in comparing products, especially in an RFP. The best way to handle this is to:

    • Define and document minimum technology requirements.
    • Define and document service needs.
    • Compare vendors to see if they’ve met the criteria or not; if yes, compare prices.
    • If the vendors have included additional offerings, see if they make sense for your organization. If they do, include that in the scoring. If not, exclude and score based on price.
    • Recognize that the complexity of the purchase will dictate the complexity of scoring.

    "The hardware is the least important part of the equation. What is important is the warranty, delivery, imaging, asset tagging, and if they cannot deliver all these aspects the hardware doesn’t matter." – Doug Stevens, Assistant Manager Contract Services, Toronto District School Board

    Document and analyze the hardware procurement workflow to streamline process

    The procurement process should balance the need to negotiate appropriate pricing with the need to quickly approve and fulfill requests. The process should include steps to follow for approving, ordering, and tracking equipment until it is ready for receipt.

    Within the process, it is particularly important to decide if this is where equipment is added into the database or if it will happen upon receipt.

    A poorly designed procurement workflow:

    • Includes many bottlenecks, stopping and starting points.
    • May impact project and service requests and requires unrealistic lead times.
    • May lead to lost productivity for users and lost credibility for the IT department.

    A well-designed hardware procurement workflow:

    • Provides reasonable lead times for project managers and service or hardware request fulfillment.
    • Provides predictability for technical resources to plan deployments.
    • Reduces bureaucracy and workload for following up on missing shipments.
    • Enables improved documentation of assets to start lifecycle management.

    Info-Tech Insight

    Where the Hardware Asset Manager is unable to affect procurement processes to reduce time to deliver, consider bringing inventory onsite or having your hardware vendor keep stock, ready to ship on demand. Projects, replacements, and new-user requests cannot be delayed in a service-focused IT organization due to bureaucratic processes.

    Document and analyze your procurement workflow to identify opportunities for improvement and communicate process

    Determine if you need one workflow for all equipment or multiples for small vs. large purchases.

    Occasionally large rollouts require significant changes from lower dollar purchases.

    Watch for:

    • Back and forth communications
    • Delays in approvals
    • Inability to get ETAs from vendors
    • Too many requests for quotes for small purchases
    • Entry into asset database

    This sample can be found in the HAM Process Workflows.

    The image shows a workflow, titled Procurement-Equipment-Small Quantity. On the left, the chart is separated into categories: IT Procurment; Tier 2 or Tier 3; IT Director; CIO.

    Design the process workflow for hardware procurement

    2.1.6 Illustrate procurement workflow with a tabletop exercise

    Participants

    • Asset Manager
    • Purchasing
    • Service Desk Manager
    • Operations (optional)
    • CFO or other management representative from Finance

    Document

    Document in the Standard Operating Procedures, Section 7: Procurement

    1. In a group, distribute sticky notes or cue cards.
    2. Designate a space on the table/whiteboard to plot the workflow.
    3. Determine which individuals are responsible for handling non-standard requests. Establish any exceptions that may apply to your defined hardware standard.
    4. Gather input from Finance on what the threshold will be for hardware purchases that will require further approval.
    5. Map the procurement process for a standard hardware purchase.
    6. If applicable, map the procurement process for a non-standard request separately.
    7. Evaluate the workflow to identify any areas of inefficiency and make any changes necessary to improve the process.
    8. Be sure to discuss and include:
      • All necessary approvals
      • Time required for standard equipment process
      • Time required for non-standard equipment process
      • How information will be transferred to ITAM database

    Document and share an organizational purchasing policy

    2.1.7 Build a purchasing policy

    A purchasing policy helps to establish company standards, guidelines, and procedures for the purchase of all information technology hardware, software, and computer-related components as well as the purchase of all technical services.

    The policy will ensure that all purchasing processes are consistent and in alignment with company strategy. The purchasing policy is key to ensuring that corporate purchases are effective and the best value for money is obtained.

    Implement a purchasing policy to prevent or reduce:

    • Costly corporate conflict of interest cases.
    • Unauthorized purchases of non-standard, difficult to support equipment.
    • Unauthorized purchases resulting in non-traceable equipment.
    • Budget overruns due to decentralized, equipment acquisition.

    Download Info-Tech’s Purchasing Policytemplate to build your own purchasing policy.

    Step 2.2: Receive and Deploy Hardware

    Phase 2: Procure & Receive

    2.1 Request & Procure

    2.2 Receive & Deploy

    This step will walk you through the following activities:

    2.2.1 Select appropriate asset tagging method

    2.2.2 Design workflow for receiving and inventorying equipment

    2.2.3 Document the deployment workflow(s)

    This step involves the following participants:

    • Asset Manager
    • Purchasing
    • Receiver (optional)
    • Service Desk Manager
    • Operations (optional)

    Step Outcomes:

    • Understanding of the pros and cons of various asset tagging methods
    • Defined asset tagging method, process, and location by equipment type
    • Identified equipment acceptance, testing, and return procedures
    • Documented equipment receiving and inventorying workflow
    • Documented deployment workflows for desktop hardware and large-scale deployments

    Cisco implemented automation to improve its inventory and deployment system

    CASE STUDY

    Industry Networking

    Source Cisco IT

    Challenge

    Although Cisco Systems had implemented a centralized procurement location for all PCs used in the company, inventory tracking had yet to be addressed.

    Inventory tracking was still a manual process. Given the volume of PCs that are purchased each year, this is an incredibly labor-intensive process.

    Sharing information with management and end users also required the generation of reports – another manual task.

    Solution

    The team at Cisco recognized that automation was the key component holding back the success of the inventory management program.

    Rolling out an automated process across multiple offices and groups, both nationally and internationally, was deemed too difficult to accomplish in the short amount of time needed, so Cisco elected to outsource its PC management needs to an experienced vendor.

    Results

    As a result of the PC management vendor’s industry experience, the implementation of automated tracking and management functions drastically improved the inventory management situation at Cisco.

    The vendor helped determine an ideal leasing set life of 30 months for PCs, while also managing installations, maintenance, and returns.

    Even though automation helped improve inventory and deployment practices, Cisco still needed to address another key facet of asset management: security.

    This case study continues in phase 3.

    An effective equipment intake process is critical to ensure product is correct, documented, and secured

    Examine your current process for receiving assets. Typical problems include:

    Receiving inventory at multiple locations can lead to inconsistent processes. This can make invoice reconciliation challenging and result in untracked or lost equipment and delays in deployment.

    Equipment not received and secured quickly. Idle equipment tends to go missing if left unsupervised for too long. Missed opportunities to manage returns where equipment is incorrect or defective.

    Disconnect between procurement and receiving where ETAs are unknown or incorrect. This can create an issue where no one is prepared for equipment arrival and is especially problematic on large orders.

    How do you solve these problems? Create a standardized workflow that outlines clear steps for asset receiving.

    A workflow will help to answer questions such as:

    • How do you deal with damaged shipments? Incorrect shipments?
    • Did you reach an agreement with the vendor to replace damaged/incorrect shipments within a certain timeframe?
    • When does the product get tagged and entered into the system as received?
    • What information needs to get captured on the asset tag?

    Standardize the process for receiving your hardware assets

    The first step in effective hardware asset intake is establishing proper procedures for receiving and handling of assets.

    Process: Start with information from the procurement process to determine what steps need to follow to receive into appropriate systems and what processes will enable tagging to happen as soon as possible.

    People: Ensure anyone who may impact this process is aware of the importance of documenting before deployment. Having everyone who may be handling equipment on board is key to success.

    Security: Equipment will be secured at the loading dock or reception. It will need to be secured as inventory and be secured if delivering directly to the bench for imaging. Ensure all receiving activities are done before equipment is deployed.

    Tools: A centralized ERP system may already provide a place to receive and reconcile with purchasing and invoicing, but there may still be a need to receive directly into the ITAM and/or CMDB database rather than importing directly from the ERP system.

    Tagging: A variety of methods can be used to tag equipment to assist with inventory. Consider the overall lifecycle management when determining which tagging methods are best.

    Info-Tech Insight

    Decentralized receiving doesn’t have to mean multiple processes. Take advantage of enterprise solutions that will centralize the data and ensure everyone follows the same processes unless there is an uncompromising and compelling logistical reason to deviate.

    Evaluate the pros and cons of different asset tagging methods

    Method Cost Strengths Weaknesses Recommendation
    RFID with barcoding – asset tag with both a barcode and RFID solution $$$$
    • Secure, fast, and robust
    • Track assets in real time
    • Quick and efficient
    • Most expensive option, requiring purchase of barcode scanner with RFID reader and software)
    • Does not work as well in an environment with less control over assets
    • Requires management of asset database
    • Best in a controlled environment with mature processes and requirement for secure assets
    RFID only – small chip with significant data capacity $$$
    • Track assets from remote locations
    • RFID can be read through boxes so you don’t have to unpack equipment
    • Scan multiple RFID-tagged hardware simultaneously
    • Large data capacity on small chip
    • Expensive, requiring purchase of RFID reading equipment and software
    • Ideal if your environment is spread over multiple locations
    Barcoding only – adding tags with unique barcodes $$
    • Reasonable security
    • Report inventory directly to database
    • Relatively low cost
    • Only read one at a time
    • Need to purchase barcode scanners and software
    • Can be labor intensive to deploy with manual scanning of individual assets
    • Less secure
    • Can’t hold as much data
    • Not as secure as barcodes with RFID but works for environments that are more widely distributed and less controlled

    Evaluate the pros and cons of different asset tagging methods

    Method Cost Strengths Weaknesses Recommendation
    QR codes – two-dimensional codes that can store text, binary, image, or URL data $$
    • Easily scannable from many angles
    • Save and print on labels
    • Can be read by barcode scanning apps or mobile phones
    • Can encode more data than barcodes
    • QR codes need to be large enough to be usable, which can be difficult with smaller IT assets
    • Scanning on mobile devices takes longer than scanning barcodes
    • Ideal if you need to include additional data and information in labels and want workers to use smartphones to scan labels
    Manual tags – tag each asset with your own internal labels and naming system $
    • Most affordable
    • Manual
    • Tags are not durable
    • Labor intensive and time consuming
    • Leaves room for error, misunderstanding, and process variances between locations
    • As this is the most time consuming and resource intensive with a low payoff, it is ideal for low maturity organizations looking for a low-cost option for tagging assets
    Asset serial numbers – tag assets using their serial number $
    • Less expensive
    • Unique serial numbers identified by vendor
    • Serial numbers have to be added to database manually, which is labor intensive and leaves room for error
    • Serial numbers can rub off over time
    • Hard to track down already existing assets
    • Doesn’t help track location of assets after deployment
    • Potential for duplicates
    • Inconsistent formats of serial numbers by manufacturers makes this method prone to error and not ideal for asset management

    Select the appropriate method for tagging and tracking your hardware assets

    2.2.1 Select asset tagging method

    Participants

    • Asset Manager
    • Purchasing
    • Service Desk Manager
    • Operations (optional)

    Document

    Document in the Standard Operating Procedures, Section 8

    1. Define your asset tagging method. For most organizations, asset tracking is done via barcoding or QR codes, either by using one method or a combination of the two. Other methods, including RFID, may be applicable based on cost or tracking complexity. Overall, barcodes embedded with RFID are the most robust and efficient method for asset tagging, but also the most expensive. Choose the best method for your organization, taking into account affordability, labor-intensiveness, data complexity needs, and ease of deployment.
    2. Define the process for tagging assets, including how soon they should receive the tag, whose responsibility it is, and whether the tag type varies depending on the asset type.
    3. Define the location of asset tags according to equipment type. Example:
    Asset Type Asset Tag Location
    PC desktop Right upper front corner
    Laptop Right corner closest to user when laptop is closed
    Server Right upper front corner
    Printer Right upper front corner
    Modems Top side, right corner

    Inspect and test equipment before accepting it into inventory to ensure it’s working according to specifications

    Upon receipt of procured hardware, validate the equipment before accepting it into inventory.

    1. Receive - Upon taking possession of the equipment, stage them for inspection before placing them into inventory or deploying for immediate use.
    2. Inspect - The inspection process should involve at minimum examining the products that have been delivered to determine conformance to purchase specifications.
    3. Test -Depending on the type and cost of hardware, some assets may benefit from additional testing to determine if they perform at a satisfactory level before being accepted.
    4. Accept - If the products conform to the requirements of the purchase order, acknowledge receipt so the supplier may be paid. Most shipments are automatically considered as accepted and approved for payment within a specific timeframe.

    Assign responsibility and accountability for inspection and acceptance of equipment, verifying the following:

    • The products conform to purchase order requirements.
    • The quantity ordered is the same as the quantity delivered.
    • There is no damage to equipment.
    • Delivery documentation is acceptable.
    • Products are operable and perform according to specifications.
    • If required, document an acceptance testing process as a separate procedure.

    Build the RMA procedure into the receiving process to handle receipt of defective equipment

    The return merchandise authorization (RMA) process should be a standard part of the receiving process to handle the return of defective materials to the vendor for either repair or replacement.

    If there is a standard process in place for all returns in the organization, you can follow the same process for returning hardware equipment:

    • Call the vendor to receive a unique RMA number that will be attached to the equipment to be returned, then follow manufacturer specifications for returning equipment within allowable timelines according to the contract where applicable.
    • Establish a lemon policy with vendors, allowing for full returns up to 30 days after equipment is deployed if the product proves defective after initial acceptance.

    Info-Tech Insight

    Make sure you’re well aware of the stipulations in your contract or purchase order. Sometimes acceptance is assumed after 60 days or less, and oftentimes the clock starts as soon as the equipment is shipped out rather than when it is received.

    Info-Tech Best Practice

    Keep in mind that the serial number on the received assed may not be the asset that ultimately ends up on the user’s desk if the RMA process is initiated. Record the serial number after the RMA process or add a correction process to the workflow to ensure the asset is properly accounted for.

    Determine what equipment should be stocked for quick deployment where demand is high or speed is crucial

    The most important feature of your receiving and inventory process should be categorization. A well-designed inventory system should reflect not only the type of asset, but also the usage level.

    A common technique employed by asset managers is to categorize your assets using an ABC analysis. Assets are classified as either A, B, or C items. The ratings are based on the following criteria:

    A

    A items have the highest usage. Typically, 10-20% of total assets in your inventory account for upwards of 70-80% of the total asset requests.

    A items should be tightly controlled with secure storage areas and policies. Avoiding stock depletion is a top priority.

    B

    B items are assets that have a moderate usage level, with around 30% of total assets accounting for 15-25% of total requests.

    B items must be monitored; B items can transition to A or C items, especially during cycles of heavier business activity.

    C

    C items are assets that have the lowest usage, with upwards of 50% of your total inventory accounting for just 5% of total asset requests.

    C items are reordered the least frequently, and present a low demand and high risk for excessive inventory (especially if they have a short lifecycle). Many organizations look to move towards an on-demand policy to mitigate risk.

    Info-Tech Insight

    Get your vendor to keep stock of your assets. If large quantities of a certain asset are required but you lack the space to securely store them onsite, ask your vendor to keep stock for you and release as you issue purchase orders. This speeds up delivery and delays warranty activation until the item is shipped. This does require an adherence to equipment standards and understanding of demand to be effective.

    Define the process for receiving equipment into inventory

    Define the following in your receiving process:

    • When will equipment be opened once delivered?
    • Who will open and validate equipment upon receipt?
    • How will discrepancies be resolved?
    • When will equipment be tagged and identified in the tracking tool?
    • When will equipment be locked in secure storage?
    • Where will equipment go if it needs to be immediately deployed?

    The image shows a workflow chart titled Receiving and Tagging. The process is split into two sections, labelled on the left as: Desktop Support Team and Procurement.

    Design the workflow for receiving and inventorying equipment

    2.2.2 Illustrate receiving workflow with a tabletop exercise

    Participants

    • Asset Manager
    • Purchasing
    • Service Desk Manager
    • Operations (optional)
    • CFO or other management representative from Finance

    Document

    Document in the Standard Operating Procedures, Section 8: Receiving and Equipment Inventory

    Option 1: Whiteboard

    1. Discuss the workflow and draw it on the whiteboard.
    2. Assess whether you are using the best workflow. Modify it if necessary.
    3. Use the sample workflow from this step as a guide if starting from scratch.
    4. Engage the team in refining the process workflow.
    5. Transfer data to Visio and add to the SOP.

    Option 2: Tabletop Exercise

    1. Distribute index cards to each member of the team.
    2. Have each person write a single task they perform on the index card. Be granular. Include the title or the name of the person responsible.
    3. Mark cards that are decision points. Use a card of a different color or use a marker to make a colored dot.
    4. Arrange the index cards in order, removing duplicates.
    5. Assess whether you are using the best workflow. Engage the team to refine it if necessary.
    6. Transfer data to Visio and add to the SOP.

    Improve device deployment by documenting software personas for each role

    • Improve the deployment process for new users by having a comprehensive list of software used by common roles within the organization. With large variations in roles, it may be impossible to build a complete list, but as you start to see patterns in requirements, you may find less distinct personas than anticipated.
    • Consider a survey to business units to determine what they need if this will solve some immediate problems. If this portion of the project will be deferred, use the data uncovered in the discovery process to identify which software is used by which roles.
    • Replacement equipment can have the software footprint created by what was actually utilized by the user, not necessarily what software was installed on the previous device.

    The image shows 4 bubbles, representing software usage. The ARC-GIS bubble is the largest, Auto CAD the second largest, and MS Office and Adobe CS equal in size.

    A software usage snapshot for an urban planner/engineer.

    • Once software needs are determined, use this information to review the appropriate device for each persona.
      • Ensure hardware is appropriate for the type of work the user does and supports required software.
      • If it is more appropriate for a user to have a tablet, ensure the software they use can be used on any device.
    • Review deployment methods to determine if there is any opportunity to improve the imaging or software deployment process with better tools or methodologies.
    • Document the device’s location if it will be static, or if the user may be more mobile, add location information for their primary location.
    • Think about the best place to document – if this information can be stored in Active Directory and imported to the ITAM database, you can update once and use in multiple applications. But this process is built into your add/move/change workflows.

    Maintain a lean library to simplify image management

    Simplify, simplify, simplify. Use a minimal number of desktop images and automate as much as you can.

    • Embrace minimalism. When it comes to managing your desktop image library, your ultimate goal should be to minimize the manual effort involved in provisioning new desktops.
    • Less is more. Try to maintain as few standard desktop images as possible and consider a thin gold image, which can be patched and updated on a regular basis. A thin image with efficient application deployment will improve the provisioning process.
    • Standardize and repeat. System provisioning should be a repeatable process. This means it is ripe for standardization and automation. Look at balancing the imaging process with software provisioning, using group policy and deployment tools to reduce time to provision and deliver equipment.
    • Outsource where appropriate. Imaging is one of the most employed services, where the image is built in-house and deployed by the hardware vendor. As a minimum, quarterly updates should still be provided to integrate the latest patches into the operating system.

    Document the process workflow for hardware deployment

    Define the process for deploying hardware to users.

    Include the following in your workflow:

    • How will equipment be configured and imaged before deployment?
    • Which images will be used for specific roles?
    • Which assets are assigned to specific roles?
    • How will the device status be changed in the ITAM tool once deployed?

    The image shows a workflow chart titled Hardware Deployment. It is divided into two categories, listed on the left: Desktop Support Team and Procurement.

    Large-scale deployments should be run as projects, benefitting from economies of scale in each step

    Large-scale desktop deployments or data center upgrades will likely be managed as projects.

    These projects should include project plans, including resources, timelines, and detailed procedures.

    Define the process for large-scale deployment if it will differ from the regular deployment process.

    The image is a graphic of a flowchart titled Deployment-Equipment-Large Quantity Rollout. It is divided into three categories, listed on the left: IT Procurement; Desktop Rollout Team; Asset Manager.

    Document the deployment workflow(s)

    2.2.3 Document deployment workflows for desktop and large-scale deployment

    Participants

    • Asset Manager
    • Purchasing
    • Service Desk Manager
    • Operations (optional)
    • CFO or other management representative from Finance

    Document

    Document in the Standard Operating Procedures, Section 9: Deployment

    Document each step in the system deployment process with notecards or on a whiteboard. Identify the challenges faced by your organization and strategize potential solutions.

    1. Outline each step in the process of desktop deployment. Be as granular as possible. On each card, describe the step as well as the individual responsible for it.
    2. When you are satisfied that each step is accurately captured, use a second color of notecard to document any challenges, inefficiencies, or pains associated with each step. Consider further documenting the time on each task.
    3. Examine each challenge or pain point. Discuss whether or not there is a clear solution to the problem. If yes, document the solution and amend the workflow. If not, engage in a broader discussion of possible solutions, taking into account people, processes, and available technology.
    4. Document separately the process for large-scale deployment if required.

    Look for opportunities to improve the request and deployment process with better communication and tools

    The biggest challenge in deploying equipment is meeting expectations of the business, and without cooperation from multiple departments, this becomes significantly more difficult.

    • Work with the procurement and the services team to ensure inventory is accessible, and regularly validate that inventory levels in the ITAM database are accurate.
    • Work with the HR department to predict (where possible) anticipated new hires. Plan for inventory ebbs and flows to match the hiring timelines where there are large variations.
    • If service catalogs will be made available for communicating options and SLAs for equipment purchases, work with the service catalog administrators to automate inventory checks and notifications. Work with the end-user device managers to set standards and reduce equipment variations to a manageable amount.
    • Where deployments are part of equipment refresh, ensure data is up to date for the services team to plan the project rollouts and know which software should be redeployed with the devices.
    • Infrastructure and security teams may have specific hardware assets relating to networking, data centers, and security, which may bypass the end-user device workflows but need to be tagged and entered into inventory early in the process. Work with these teams to have their equipment follow the same receiving and inventory processes. Deployment will vary based on equipment type and location.

    Automate hardware deployment where users are dispersed and deployment volume is high

    Self-serve kiosks (vending machines) can provide cost reductions in delivery of up to 25%. Organizations that have a high distribution rate are seeing reductions in cost of peripherals averaging 30-35% and a few extreme cases of closer to 85%.

    Benefits of using vending machines:

    • Secure equipment until deployed.
    • Equipment can be either purchased by credit card or linked to employee ID cards, enabling secure transactions and reporting.
    • Access rights can be controlled in real time, preventing terminated employees from accessing equipment or managing how many devices can be deployed to each user.
    • Vending machines can be managed through a cellular or wireless network.
    • Technology partners can be tasked with monitoring and refilling vending machines.
    • Employees are able to access technology wherever a vending machine can be located rather than needing to travel to the help desk.
    • Equipment loans and new employee packages can be managed through vending machines.

    Phase 2 Guided Implementation

    Call 1-888-670-8889 or email GuidedImplementations@InfoTech.com for more information.

    Complete these steps on your own or call us to complete a guided implementation. A guided implementation is a series of 2-3 advisory calls that help you execute each phase of a project. They are included in most advisory memberships.

    Guided Implementation 2: Request, Procure, Receive, and Deploy

    Proposed Time to Completion: 4 weeks

    Step 2.1: Request & Procure

    Start with an analyst kick-off call:

    • Define standard and non-standard hardware.
    • Weigh the pros and cons of leasing vs. buying.
    • Build the procurement process.

    Then complete these activities…

    • Define standard hardware requests.
    • Document standard hardware request procedure.
    • Document procurement workflow.
    • Build a purchasing policy.

    With these tools & templates:

    • Standard Operating Procedures
    • Non-Standard Hardware Request Form
    • Hardware Procurement Workflow
    • Purchasing Policy

    Step 2.2: Receive & Deploy

    Review findings with analyst:

    • Determine appropriate asset tagging method.
    • Define equipment receiving process.
    • Define equipment deployment process.

    Then complete these activities…

    • Select appropriate asset tagging method.
    • Design workflow for receiving and inventorying equipment.
    • Document the deployment workflow(s).

    With these tools & templates:

    • Standard Operating Procedures
    • Equipment Receiving & Tagging Workflow
    • Deployment Workflow

    Phase 2 Insight: Bridge the gap between IT and Finance to build a smoother request and procurement process through communication and routine reporting. If you’re unable to affect procurement processes to reduce time to deliver, consider bringing inventory onsite or having your hardware vendor keep stock, ready to ship on demand.

    If you want additional support, have our analysts guide you through this phase as part of an Info-Tech workshop

    Book a workshop with our Info-Tech analysts:

    • To accelerate this project, engage your IT team in an Info-Tech workshop with an Info-Tech analyst team.
    • Info-Tech analysts will join you and your team onsite at your location or welcome you to Info-Tech’s historic Toronto office to participate in an innovative onsite workshop.
    • Contact your account manager (www.infotech.com/account), or email Workshops@InfoTech.com for more information.

    The following are sample activities that will be conducted by Info-Tech analysts with your team:

    2.1.2 Define standard hardware requests

    Divide whiteboard into columns representing core business areas. Define core hardware assets for end users in each division along with optional hardware assets. Discuss optional assets to narrow and define standard equipment requests.

    2.2.1 Select appropriate method for tagging and tracking assets

    Discuss the various asset tagging methods and choose the tagging method that is most appropriate for your organization. Define the process for tagging assets and document the standard asset tag location according to equipment type.

    Phase 3

    Maintain and Dispose

    Implement Hardware Asset Management

    Cisco overcame organizational resistance to change to improve asset security

    CASE STUDY

    Industry Networking

    Source Cisco IT

    Challenge

    Cisco Systems had created a dynamic work environment that prized individuality. This environment created high employee satisfaction, but it also created a great deal of risk surrounding device security.

    Cisco lacked an asset security policy; there were no standards for employees to follow. This created a surplus of not only hardware, but software to support the variety of needs amongst various teams at Cisco.

    Solution

    The ITAM team at Cisco recognized that their largest problem was the lack of standardization with respect to PCs. Variance in cost, lifecycle, and software needs/compatibility were primary issues.

    Cisco introduced a PC leasing program with the help of a PC asset management vendor to correct these issues. The primary goal was to increase on-time returns of PCs. A set life of 30 months was defined by the vendor.

    Results

    Cisco engaged employees to help contribute to improving its asset management protocols, and the approach worked.

    On-time returns increased from 60% to 80%. Costs were reduced due to active tracking and disposal of any owned assets still present.

    A reduction in hardware and software platforms has cut costs and increased security thanks to improved tracking capabilities.

    This case study continues in phase 4

    Step 3.1: Manage, Maintain, and Secure Hardware Assets

    Phase 3: Maintain & Dispose

    3.1 Manage & Maintain

    3.2 Dispose or Redeploy

    This step will walk you through the following activities:

    3.1.1 Build a MAC policy and request form

    3.1.2 Build workflows to document user MAC processes

    3.1.3 Design process and policies for hardware maintenance, warranty, and support documentation handling

    3.1.4 Revise or create an asset security policy

    This step involves the following participants:

    • Asset Manager
    • Service Desk Manager
    • Operations (optional)
    • Security Department

    Step Outcomes

    • Understanding of inventory management process best practices
    • Templates for move/add/change request policy and form
    • Documented process workflows for the user move/add/change process
    • Process and policies for hardware maintenance, warranty, and support documentation handling
    • Defined policies for maintaining asset security

    Determine methods for performing inventory audits on equipment

    Auto-discovery

    • Auto-discovery tools will be crucial to the process of understanding what equipment is connected to the network and in use.
    • The core functionality of discovery tools is to scan the environment and collect configuration data from all connected assets, but most tools can also be used to collect usage data, network monitoring, and software asset management data including software distribution, compliance, and license information.
    • These tools may not connect to peripheral devices such as monitors and external drives, will not scan devices that are turned off or disconnected from the network, may not inventory remote users, and will rarely provide location information. This often results in a need to complete physical audits as well.

    Info-Tech Insight

    One of the most common mistakes we see when it comes to asset management is to assume that the discovery tool will discovery most or all of your inventory and do all the work. It is better to assume only 80-90% coverage by the discovery tool and build ownership records to uncover the unreportable assets that are not tied into the network.

    Physical audit

    • The physical audit can be greatly improved with barcode, RFID, or QR codes, allowing items to be scanned, records opened, then updated.
    • If not everything is tagged or entered into the ITAM database, then searching closets, cabinets, and desk drawers may be required to tag and enter those devices into the database.
    • Provide the inventory team with exact instructions on what needs to be collected, verified, and recorded. Depending on the experience and thoroughness of the team, spot checks early in the process may alleviate quality issues often discovered at the end of the inventory cycle.

    Determine requirements for performing inventory audits on equipment

    Conduct an annual hardware audit to ensure hardware is still assigned to the person and location identified in your ITAM system, and assess its condition.

    Perform a quarterly review of hardware stock levels in order to ensure all equipment is relevant and usable. The table below is an example of how to organize this information.

    Item Target Stock Levels Estimated $ Value
    Desktop computers
    Standard issue laptops
    Mice
    Keyboards
    Network cables
    Phones

    Info-Tech Insight

    Don’t forget about your remotely deployed assets. Think about how you plan to inventory remotely deployed equipment. Some tools will allow data collection through an agent that will talk to the server over the internet, and some will completely ignore those assets or provide a way to manually collect the data and email back to the asset manager. Mobile device management tools may also help with this inventory process. Determine what is most appropriate based on the volume of remote workers and devices.

    Build an inventory management process to maintain an accurate view of owned hardware assets

    • Your inventory should capture which assets are on hand, where they are located, and who owns them, at minimum. Maintaining an accurate, up-to-date view of owned hardware assets allows you to see at any time the actual state of the components that make up your infrastructure across the enterprise.
    • Automated inventory practices save time and effort from doing physical inventories and also reduce the interruption to business users while improving accuracy of data.
    • If you are just starting out, define the process for conducting an inventory of deployed assets, and then define the process for regular upkeep and audit of inventory data.

    Inventory Methods

    • Electronic – captures networked asset information only and can be deployed over the network with no deskside service interaction.
    • Physical – captures environmental detail and must be performed manually by a service technician with possible disruption to users.
    • Full inventory – both physical and electronic inventory of assets.

    Internal asset information to collect electronically

    • Hardware configuration
    • Installed software
    • Operating system
    • System BIOS
    • Network configuration
    • Network drive mappings
    • Printer setups
    • System variables

    External asset information that cannot be detected electronically

    • Assigned user
    • Associated assets
    • Asset/user location
    • Usage of asset
    • Asset tag number

    IMAC (Install, Move, Add, Change) services will form the bulk of asset management work while assets are deployed

    IMAC services are usually performed at a user’s deskside by a services technician and can include:

    • Installing new desktops or peripherals
    • Installing or modifying software
    • Physically moving an end user’s equipment
    • Upgrading or adding components to a desktop

    Specific activities may include:

    Changes

    • Add new user IDs
    • Manage IDs
    • Network changes
    • Run auto-discovery scan

    Moves

    • Perform new location site survey
    • Coordinate with facilities
    • Disconnect old equipment
    • Move to new location
    • Reconnect at new location
    • Test installed asset
    • Obtain customer acceptance
    • Close request

    Installs and Adds

    • Perform site survey
    • Perform final configuration
    • Coordinate with Facilities
    • Asset tagging
    • Transfer data from old desktop
    • Wipe old desktop hard drive
    • Test installed asset
    • Initiate auto-discovery scan
    • Obtain customer acceptance
    • Close request

    A strong IMAC request process will lessen the burden on IT asset managers

    • When assets are actively in use, Asset Managers must also participate in the IMAC (Install-Move-Add-Change) process and ensure that any changes to asset characteristics or locations are updated and tracked in the asset management tool and that the value and usefulness of the asset is monitored.
    • The IMAC process should not only be reactive in response to requests, but proactive to plan for moves and relocations during any organizational change events.

    Recommendations:

    Automate. Wherever possible, use tools to automate the IMAC process.

    E-forms, help desk, ticketing, or change management software can automate the request workflow by allowing the requestor to submit a request ticket that can then be automatically assigned to a designated team member according to the established chain of command. As work is completed, the ticket can be updated, and the requestor will be able to check the status of the work at any time.

    Communicate the length of any downtime associated with execution of the IMAC request to lessen the frustration and impatience among users.

    Involve HR. When it comes to adding or removing user accounts, HR can be a valuable resource. As most new employees should be hired through HR, work with them to improve the onboarding process with enough advanced notice to set up accounts and equipment. Role changes with access rights and software modifications can benefit from improved communications. Review the termination process as well, to secure data and equipment.

    Build a MAC request policy and form for end users

    A consistent Move, Add, Change (MAC) request process is essential for lessening the burden on the IT department. MAC requests are used to address any number of tasks, including:

    • Relocation of PCs and/or peripherals.
    • New account setup.
    • Hardware or software upgrades.
    • Equipment swaps or replacements.
    • User account/access changes.
    • Document generation.
    • User acceptance testing.
    • Vendor coordination.

    Create a request form.

    If you are not using help desk or other ticketing software, create a request template that must be submitted for each MAC. The request should include:

    • The name and department of the requester.
    • The date of the request.
    • Severity of the request. For example, severity can be graded on a score of high, medium, or low where high represents a mission-critical change that could compromise business continuity if not addressed immediately, and low represents a more cosmetic change that will not negatively affect operations. The severity of the request can be determined by the service-level agreement (SLA) associated with the service.
    • Date the request must be completed by. Or at least, what would be the ideal date for completion. This will vary greatly depending on the severity of the request. For example, deleting the access of a terminated employee would be very time sensitive.
    • Item or service to be moved, added, or changed. Include location, serial number, or other designated identifier where possible.
    • If the item or service is to be moved, indicated where it is being moved.
    • It is a good idea to include a comments section where the requester can add any additional questions or details.

    Use Info-Tech’s templates to build your MAC policy and request form

    3.1.1 Build a MAC policy and request form

    Desktop Move/Add/Change Policy

    This desktop move/add/change policy should be put in place to mitigate the risk associated with unauthorized changes, minimize disruption to the business, IT department, and end users, and maintain consistent expectations.

    Move, Add, Change Request Form

    Help end users navigate the move/add/change process. Use the Move/Add/Change Request Form to increase efficiency and organization for MAC requests.

    Document the process for user equipment moves

    Include the following in your process documentation:

    • How and when will any changes to user or location information be made in the ITAM tool?
    • Will any changes in AD automatically update in the ITAM tool?
    • How should requests for equipment moves or changes be made?
    • How will resources be scheduled?

    The image shows a flowchart titled SErvice Request - User Moves. The chart of processes is split into three categories, listed on the left side of the chart: User Manager; IT Coordinator; and Tier 2 & Facilities.

    Build workflows to document user MAC processes

    3.1.2 Build MAC process workflows

    Participants

    • Asset Manager
    • Service Desk Manager
    • Operations (optional)

    Document

    Document in the Standard Operating Procedures, Section 10: Equipment Install, Adds, Moves, and Changes

    Document each step in the system deployment process using notecards or on a whiteboard. Identify the challenges faced by your organization and strategize potential solutions.

    1. Outline each step in the process of desktop deployment. Be as granular as possible. On each card, describe the step as well as the individual responsible for each step.
    2. When you are satisfied that each step is accurately captured, use a second color of notecard to document any challenges, inefficiencies, or pains associated with each step. Consider further documenting the time on each task.
    3. Examine each challenge or pain point. Discuss whether or not there is a clear solution to the problem. If so, document the solution and amend the workflow. If not, engage in a broader discussion of possible solutions, taking into account people, processes, and available technology.
    4. Document separately the process for large-scale deployment if required.

    Define a policy to ensure effective maintenance of hardware assets

    Effective maintenance and support of assets provides longer life, higher employee productivity, and increased user satisfaction.

    • Your asset management documentation and database should store equipment maintenance contract information so that it can be consulted whenever hardware service is required.
    • Record who to contact as well as how, warranty information, and any SLAs that are associated with the maintenance agreement.
    • Record all maintenance that hardware equipment receives, which will be valuable for evaluating asset and supplier performance.
    • In most cases, the Service Desk should be the central point of contact for maintenance calls to all suppliers.

    Sample equipment maintenance policy terms:

    • Maintenance and support arrangements are required for all standard and non-standard hardware.
    • All onsite hardware should be covered by onsite warranty agreements with appropriate response times to meet business continuity needs.
    • Defective items under warranty should be repaired in a timely fashion.
    • Service, maintenance, and support shall be managed through the help desk ticketing system.

    Design process and policies for hardware maintenance, warranty, and support documentation handling

    3.1.3 Design process for hardware maintenance

    Participants

    • Asset Manager
    • Purchasing
    • Service Desk Manager
    • Security
    • Operations (optional)

    Document

    Document in the Standard Operating Procedures, Section 10

    1. Discuss and document the policy for hardware maintenance, warranty, and support.
    2. Key outcomes should include:
    • Who signs off on policies?
    • What is the timeline for documentation review?
    • Where are warranty and maintenance documents stored?
    • How will equipment be assessed for condition during audits?
    • How often will deployed equipment be reimaged?
    • How will equipment repair needs be requested?
    • How will repairs for equipment outside warranty be handled?
  • Document in the Standard Operating Procedure.
  • Use your HAM program to improve security and meet regulatory requirements

    ITAM complements and strengthens security tools and processes, improving the company’s ability to protect its data and systems and reduce operational risk.

    It’s estimated that businesses worldwide lose more than $221 billion per year as a result of security breaches. HAM is one important factor in securing data, equipment investment, and meeting certain regulatory requirements.

    How does HAM help keep your organization secure?

    • Educating users on best practices for securing their devices, and providing physical security such as cable locks and tracking mechanisms.
    • Best practices for reporting lost or stolen equipment for quickly removing access and remotely wiping devices.
    • Accurate location and disposal records will enable accurate reporting for HIPAA and PCI DSS audits where movement of media or hardware containing data is a requirement. Best practices for disposal will include properly wiping drives, recording information, and ensuring equipment is disposed of according to environmental regulations.
    • Secure access to data through end-user mobile devices. Use accurate records and MDM tools to securely track, remove access, and wipe mobile devices if compromised.
    • Encrypt devices that may be difficult to track such as USB drives or secure ports to prevent data from being copied to external drives.
    • Managed hardware allows software to be managed and patched on a regular basis.

    Best Practices

    1. Educate end users about traveling with equipment. Phones and laptops are regularly stolen from cars; tablets and phones are left on planes. Encourage users to consider how they store equipment on the way home from work.
    2. Cable locks used at unsecured offsite or onsite work areas should be supplied to employees.
    3. Equipment stored in IT must be secured at all times.

    Implement mobile device management (MDM) solutions

    Organizations with a formal mobile management strategy have fewer problems with their mobile devices.

    Develop a secure MDM to:

    • Provide connection and device support when the device is fully subsidized by the organization to increase device control.
    • Have loaner devices for when traveling to limit device theft or data loss.
    • Personal devices not managed by MDM should be limited to internet access on a guest network.
    • Limit personal device access to only internet access or a limited zone for data access and a subset of applications.
    • Advanced MDM platforms provide additional capabilities including containerization.

    The benefits of a deployed MDM solution:

    • Central management of a variety of devices and platforms is the most important advantage of MDM. Administrators can gain visibility into device status and health, set policies to groups of users, and control who has access to what.
    • Security features such as enforcing passcodes and remote wipe are also essential, given the increased risk of mobile devices.
      • Remote wipe should be able to wipe either the whole device or just selected areas.
    • Separation of personal data is becoming increasingly important as BYOD becomes the norm. This is a feature that vendors are approaching radically differently.
    • Device lock: Be able to lock the device itself, its container, or its SIM. Even if the SIM is replaced, the device should still remain locked. Consider remote locking a device if retrieval is possible.

    Mobile device management is constantly evolving to incorporate new features and expand to new control areas. This is a high-growth area that warrants constant up-to-date knowledge on the latest developments.

    What can be packed into an MDM can vary and be customized in many forms for what your organization needs.

    Secure endpoint devices to protect the data you cannot control

    Endpoint Encryption

    Endpoints Average None
    Desktop 73% 4%
    Laptops 65% 9%
    Smartphones 27% 28%
    Netbooks 26% 48%
    Tablets 16% 59%
    Grand average 41%

    Benefits from endpoint encryption:

    • Reduced risk associated with mobile workers.
    • Enabled sharing of data in secured workspace.
    • Enhanced end-user accountability.
    • Reduced number of data breach incidents.
    • Reduced number of regulatory violations.

    Ways to reduce endpoint encryption costs:

    • Use multiple vendors (multiple platforms): 33%
    • Use a single vendor (one platform): 40%
    • Use a single management console: 22%
    • Outsource to managed service provider: 26%
    • Permit user self-recovery: 26%

    Remote Wiping

    • If all else fails, a device can always be erased of all its data, protecting sensitive data that may have been on it.
    • Selective wipe takes it a step further by erasing only sensitive data.

    Selective wipe is not perfect.

    It is nearly impossible to keep the types of data separate, even with a sandbox approach. Selective wipe will miss some corporate data, and even a full remote wipe can only catch some of users’ increasingly widely distributed data.

    Selective wipe can erase:

    • Corporate profiles, email, and network settings.
    • Data within a corporate container or other sandbox.
    • Apps deployed across the enterprise.

    Know when to perform a remote wipe.

    Not every violation of policy warrants a wipe. Playing Candy Crush during work hours probably does not warrant a wipe, but jail breaking or removing a master data management client can open up security holes that do warrant a wipe.

    Design an effective asset security policy to protect the business

    Data security is not simply restricted to compromised software. In fact, 70% of all data breaches in the healthcare industry since 2010 are due to device theft or loss, not hacking. (California Data Breach Report – October, 2014) ITAM is not just about tracking a device, it is also about tracking the data on the device.

    Organizations often struggle with the following with respect to IT asset security:

    • IT hardware asset removal control.
    • Personal IT hardware assets (BYOD).
    • Data removal from IT hardware assets.
    • Inventory control with respect to leased hardware and software.
    • Unused software.
    • Repetitive versions of software.
    • Unauthorized software.

    Your security policy should seek to protect IT hardware and software that:

    • Have value to the business.
    • Require ongoing maintenance and support.
    • Create potential risk in terms of financial loss, data loss, or exposure.

    These assets should be documented and controlled in order to meet security requirements.

    The asset security policy should encompass the following:

    • Involved parties.
    • Hardware removal policy/documentation procedure.
    • End-user asset security responsibilities.
    • Theft/loss reporting procedure.
    • BYOD standards, procedures, and documentation requirements.
    • Data removal.
    • Software usage.
    • Software installation.

    Info-Tech Insight

    Hardware can be pricey; data is priceless. The cost of losing a device is minimal compared to the cost of losing data contained on a device.

    Revise or create an asset security policy

    3.1.4 Develop IT asset security policy

    Participants

    • CIO or IT Director
    • Asset Manager
    • Service Desk Manager
    • Security
    • Operations (optional)

    Document

    Document in the Asset Security Policy.

    1. Identify asset security challenges within your organization. Record them in a table like the one below.
    Challenge Current Security Risk Target Policy
    Hardware removal Secure access and storage, data loss Designated and secure storage area
    BYOD No BYOD policy in place N/A → phasing out BYOD as an option
    Hardware data removal Secure data disposal Data disposal, disposal vendor
    Unused software Lack of support/patching makes software vulnerable Discovery and retirement of unused software
    Unauthorized software Harder to track, less secure Stricter stance on pirated software
    1. Brainstorm the reasons for why these challenges exist.
    2. Identify target policy details that pertain to each challenge. Record the outcomes in section(s) 5.1, 5.2, or 5.3 of the Asset Security Policy.

    Poor asset security and data protection had costly consequences for UK Ministry of Justice

    CASE STUDY

    Industry Legal

    Source ICO

    Challenge

    The Ministry of Justice (MoJ) in the UK had a security problem: hard drives that contained sensitive prisoner data were unencrypted and largely unprotected for theft.

    These hard drives contained information related to health, history of drug use, and past links to organized crime.

    After two separate incidents of hard drive theft that resulted in data breaches, the Information Commissioner’s Office (ICO), stepped in.

    Solution

    It was determined that after the first hard drive theft in October 2011, replacement hard drives with encryption software were provisioned to prisons managed by the MoJ.

    Unfortunately, the IT security personnel employed by the MoJ were unaware that the encryption software required manual activation.

    When the second hard drive theft occurred, the digital encryption could not act as a backup to poor physical security (the hard drive was not secured in a locker as per protocol).

    Results

    The perpetrators were never found and the stolen hard drives were never recovered.

    As a result of the two data breaches, the MoJ had to implement costly security upgrades to its data protection system.

    The ICO fined the MoJ £180,000 for its repeated security breaches. This costly fine could have been avoided if more diligence was present in the MoJ’s asset management program.

    Step 3.2: Dispose or Redeploy Assets

    3.1 Manage & Maintain

    3.2 Dispose or Redeploy

    This step will walk you through the following activities:

    3.2.1 Identify challenges with IT asset recovery and disposal

    3.2.2 Design hardware asset recovery and disposal workflows

    3.2.3 Build a hardware asset disposition policy

    This step involves the following participants:

    • Infrastructure Director/Manager
    • Asset Manager
    • Service Desk Manager
    • Operations (optional)

    Step Outcomes:

    • Defined process to determine when to redeploy vs. dispose of hardware assets
    • Process for recovering and redeploying hardware equipment
    • Process for safely disposing of assets that cannot be redeployed
    • Comprehensive asset disposition policy

    Balance the effort to roll out new equipment against the cost to maintain equipment when building your lifecycle strategy

    The image shows two line graphs. The graph on the left is titled: Desktop Refresh Rate by Company Size (based on Revenue). The graph on the right is titled: Laptop Refresh Rate by Company Size (based on Revenue). Each graph has four lines, defined by a legend in the centre of the image: yellow is small ($25mm); dark blue is Mid ($25-500MM); light blue is large ( data-verified=$500MM); and orange is Overall.">

    (Info-Tech Research Group; N=96)

    Determining the optimal length of time to continue to use equipment will depend on use case and equipment type

    Budget profiles Refresh methods

    Stretched

    Average equipment age: 7+ years

    To save money, some organizations will take a cascading approach, using the most powerful machines for engineers or scientists to ensure processing power, video requirements and drives will meet the needs of their applications and storage needs; then passing systems down to departments who will require standard-use machines. The oldest and least powerful machines are either used as terminals or disposed.

    Generous

    Average equipment age: 3 years

    Organizations that do not want to risk user dissatisfaction or potential compatibility or reliability issues will take a more aggressive replacement approach. These organizations often have less people assigned to end-user device maintenance and will not repair equipment outside of warranty. There is little variation in processing power among devices, with major differences determined by mobility and operating system.

    Cautious

    Average equipment age: 4 to 5 years

    Organizations that fit between the other two profiles will look to stretch the budget beyond warranty years, but will keep a close eye on maintenance requirements. Repairs needed outside of warranty will require an eye to costs, efforts, and subsequent administrative work of loaning equipment to keep the end user productive while waiting on service.

    Recommendations to keep users happy and equipment in prime form is to check condition at the 2-3 year mark, reimage at least once to improve performance, and have backup machines, if equipment starts to become problematic.

    Build a process to determine when and how to redeploy or dispose of hardware assets at end of use

    • When equipment is no longer needed for the function or individual to whom it was assigned, the Hardware Asset Manager needs to use data to ensure the right decision is made as to what to do with the asset.
    • End of use involves evaluating options for either continuing to use the equipment in another capacity or by another individual or determining that the asset has no remaining value to the organization in any capacity and it is time to retire it.
    • If the asset is retired, it may still have capacity for continued use outside of the organization or it may be disposed.

    Redeployment

    • Deliver the asset to a new user if it is no longer needed by the original user but still has value and usability.
    • Redeployment saves money and prevents unnecessary purchases.
    • Common when employees leave the company or a merge or acquisition changes the asset pool.

    VS.

    Disposal

    • When an asset is no longer of use to the organization, it may be disposed of.
    • Need to consider potential financial and public relations considerations if disposal is not done according to environmental legislation.
    • Need to ensure proper documentation and data removal is built into disposition policy.

    Use persistent documentation and communication to improve hardware disposal and recovery

    Warning! Poor hardware disposal and recovery practices can be caused by the following:

    1. Your IT team is too busy and stretched thin. Data disposal is one of many services your IT team is likely to have to deal with, but this service requires undivided attention. By standardizing hardware refreshes, you can instill more predictability with your hardware life cycles and better manage disposal.
    2. Poor inventory management. Outdated data and poor tracking practices can result in lost assets during the disposal phase. It only takes a single lost asset to cause a disastrous data breach in your supply chain.
    3. Obliviousness to disposal regulations. Electronic disposal and electronically stored data are governed by strict regulation.

    How do you improve your hardware disposal and recovery process?

    • A specific, controlled process needs to be in place to wipe all equipment and verify that it’s been wiped properly. Otherwise, companies will continue to spend money to protect data while equipment is in use, but overlook the dangerous implications of careless IT asset disposal. Create a detailed documentation process to track your assets every step of the way to ensure that data and applications are properly disposed of. Detailed documentation can also help bolster sustainability reporting for organizations wishing to track such data.
    • Better communication should be required. Most decommissioning or refresh processes use multiple partners for manufacturing, warehousing, data destruction, product resale, and logistics. Setting up and vetting these networks can take years, and even then, managing them can be like playing a game of telephone; transparency is key.

    Address three core challenges of asset disposal and recovery

    Asset Disposal

    Data Security

    Sixty-five percent of organizations cite data security as their top concern. Many data breaches are a result of hardware theft or poor data destruction practices.

    Choosing a reputable IT disposal company or data removal software is crucial to ensuring data security with asset disposal.

    Environmental

    Electronics contain harmful heavy metals such as mercury, arsenic, and cadmium.

    Disposal of e-waste is heavily regulated, and improper disposal can result in hefty fines and bad publicity for organizations.

    Residual value

    Many obsolete IT assets are simply confined to storage at their end of life.

    This often imposes additional costs with maintenance or storage fees and leaves a lot of value on the table through assets that could be sold or re-purposed within the organization.

    Identify challenges with IT asset recovery and disposal with a triple bottom line scorecard

    3.2.1 Identify challenges with IT asset recovery and disposal

    Participants

    • Infrastructure Director/Manager
    • Asset Manager
    • Service Desk Manager
    • Operations (optional)
    1. Divide the whiteboard into three boxes: Social, Economic, and Environmental.
    2. Divide each box into columns like the one shown below:
    Economic
    Challenge Objectives Targets Initiatives
    No data capture during disposal Develop reporting standards 80% disposed assets recorded Work with Finance to develop reporting procedure
    Idle assets Find resale market/dispose of idle assets 50% of idle assets disposed of within the year Locate resale vendor and disposal service
    1. Ask participants to list challenges associated with each area.
    2. Once challenges facing recovery and disposal have been exhausted from the group, assign a significance of 1-5 (1 being the lowest and 5 being the highest) to each challenge.
    3. Discuss the most significant challenges and how they might be addressed through the next steps of building recovery & disposal processes.

    Build a process for recovery and redeployment of hardware

    • Having hardware standards in place makes redeploying easier by creating a larger pool of possible users for a standardized asset.
    • Most redeployment activities will be carried out by the Help Desk as a service request ticket, so it is important to have clear communication and guidelines with the Help Desk as to which tasks need to be carried out as part of the request.

    Ensure the following are addressed:

    • Where will equipment be stored before being redeployed?
    • Will shipping be required and are shipping costs factored into analysis?
    • Ensure equipment is cleaned before it is redeployed.
    • Do repairs and reconfigurations need to be made?
    • How will software be removed and licenses harvested and reported to Software Asset Manager?
    • How will data be securely wiped and protected?

    The image shows a work process in flowchart format titled Equipment Recovery. The chart is divided into two sections, listed on the left: Business Manager/HR and Desktop Support Team.

    Define the process for safely disposing of assets that cannot be redeployed

    Asset Disposal Checklist

    1. Review the data stored on the device.
    2. Determine if there has been any sensitive or confidential information stored.
    3. Remove all sensitive/confidential information.
    4. Determine if software licenses are transferable.
    5. Remove any non- transferable software prior to reassignment.
    6. Update the department’s inventory record to indicate new individual assigned custody.
    7. In the event of a transfer to another department, remove data and licensed software.
    8. If sensitive data has been stored, physically destroy the storage device.
    • Define the process for retiring and disposing of equipment that has reached replacement age or no longer meets minimum conditions or standards.
    • Clearly define the steps that need to be taken both before and after the involvement of an ITAD partner.

    The image shows a flowchart titled Equipment Disposal. It is divided into two sections, labelled on the left as: Desktop Support Team and Asset Manager.

    Design hardware asset recovery and disposal workflows

    3.2.2 Design hardware asset recovery and disposal policies and workflows

    Participants

    • Infrastructure Director/Manager
    • Asset Manager
    • Service Desk Manager
    • Operations (optional)

    Document

    Document in the Standard Operating Procedures, Sections 11 and 12

    Document each step in the recovery and disposal process in two separate workflows using notecards or on a whiteboard. Identify the challenges faced by your organization and strategize potential solutions.

    1. Keeping in mind current challenges around hardware asset recovery and disposal, design the target state for both the asset recovery and disposal processes.
    2. Outline each step of the process and be as granular as possible.
    3. When you are satisfied that each step is accurately captured, use a second color of notecard to document any challenges, inefficiencies, or pains associated with each step. Consider further documenting the time on each task.
    4. Examine each challenge or pain point. Discuss whether or not there is a clear solution to the problem. If so, document the solution and amend the workflow. If not, engage in a broader discussion of possible solutions, taking into account people, processes, and available technology.
    5. Review the checklists on the previous slides to ensure all critical tasks are accounted for in your process workflows.

    Add equipment disposition to asset lifecycle decisions to meet environmental regulations and mitigate risk

    Although traditionally an afterthought in asset management, IT asset disposition (ITAD) needs to be front and center. Increase focus on data security and concern surrounding environmental sustainability and develop an awareness of the cost efficiencies possible through best-practices disposition.

    Optimized ITAD solutions:

    1. Protect sensitive or valuable data
    2. Support sustainability
    3. Focus on asset value recovery

    Info-Tech Insight

    A well-thought-out asset management program mitigates risk and is typically less costly than dealing with a large-scale data loss incident or an inappropriate disposal suit. Also, it protects your company’s reputation – which is difficult to put a price on.

    Partner with an ITAD vendor to support your disposition strategy

    Maximizing returns on assets requires knowledge and skills in asset valuation, upgrading to optimize market return, supply chain management, and packaging and shipping. It’s unlikely that the return will be adequate to justify that level of investment, so partnering with a full-service ITAD vendor is a no-brainer.

    • An ITAD vendor knows the repurpose and resale space better than your organization. They know the industry and have access to more potential buyers.
    • ITAD vendors can help your organization navigate costly environmental regulations for improper disposal of IT assets.

    Disposal doesn’t mean your equipment has to go to waste.

    Additionally, your ITAD vendor can assist with a large donation of hardware to a charitable organization or a school.

    Donating equipment to schools or non-profits may provide charitable receipts that can be used as taxable benefits.

    Before donating:

    • Ensure equipment is needed and useful to the organization.
    • Be prepared for an appraisal requirement. Receipts can only be issued for fair market value.
    • Prevent compromised data by thoroughly wiping or completely replacing drives.
    • Ensure official transfer of ownership to prevent liability if improper disposal practices follow.

    Info-Tech Insight

    Government assistance grants may be available to help keep your organization’s hardware up to date, thereby providing incentives to upgrade equipment while older equipment still has a useful life.

    Protect the organization by sufficiently researching potential ITAD partners

    Research ITAD vendors as diligently as you would primary hardware vendors.

    Failure to thoroughly investigate a vendor could result in a massive data breach, fines for disposal standards violations, or a poor resale price for your disposed assets. Evaluate vendors using questions such as the following:

    • Are you a full-service vendor or are you connected to a wholesaler?
    • Who are your collectors and processors?
    • How do you handle data wiping? If you erase the data, how many passes do you perform?
    • What do you do with the e-waste? How much is reused? How much is recycled?
    • Do you have errors and omissions insurance in case data is compromised?
    • How much will it cost to recycle or dispose of worthless equipment?
    • How much will I receive for assets that still have useful life?

    ITAD vendors that focus on recycling will bundle assets to ship to an e-waste plant – leaving money on the table.

    ITAD vendors with a focus on reuse will individually package salable assets for resale – which will yield top dollars.

    Info-Tech Insight

    To judge the success of a HAM overhaul, you need to establish a baseline with which to compare final results. Be sure to take HAM “snapshots” before ITAD partnering so it’s easy to illustrate the savings later.

    Work with ITAD partner or equipment supplier to determine most cost-effective method and appropriate time for disposal

    2-4 Two-to-four year hardware refresh cycle

    • Consider selling equipment to an ITAD partner who specializes in sales of refurbished equipment.
    • Consider donating equipment to schools or non-profits, possibly using an ITAD partner who specializes in refurbishing equipment and managing the donation process.

    5-7 Five-to-seven year hardware refresh cycle

    • At this stage equipment may still have a viable life, but would not be appropriate for school or non-profit donations, due to a potentially shorter lifespan. Consider selling equipment to an ITAD partner who has customers interested in older, refurbished equipment.

    7+ Seven or more years hardware refresh cycle

    • If keeping computers until they reach end of life, harvest parts for replacement on existing machines and budget for disposal fees.
    • Ask new computer supplier about disposal services or seek out ITAD partner who will disassemble and dispose of equipment in an environmentally responsible manner.

    Info-Tech Insight

    • In all cases, ensure hard drives are cleansed of data with no option for data recovery. Many ITAD partners will provide a drive erasure at DoD levels as part of their disposal service.
    • Many ITAD partners will provide analysts to help determine the most advantageous time to refresh.

    Ensure data security and compliance by engaging in reliable data wiping before disposition

    Failure to properly dispose of data can not only result in costly data breaches, but also fines and other regulatory repercussions. Choosing an ITAD vendor or a vendor that specializes in data erasure is crucial. Depending on your needs, there are a variety of data wiping methods available.

    Certified data erasure is the only method that leaves the asset’s hard drive intact for resale or donation. Three swipes is the bare minimum, but seven is recommended for more sensitive data (and required by the US Department of Defense). Data erasure applications may be destructive or non-destructive – both methods overwrite data to make it irretrievable.

    Physical destruction must be done thoroughly, and rigorous testing must be done to verify data irretrievability. Methods such as hand drilling are proven to be unreliable.

    Degaussing uses high-powered magnets to erase hard drives and makes them unusable. This is the most expensive option; degaussing devices can be purchased or rented.

    Info-Tech Best Practice

    Data wiping can be done onsite or can be contracted to an ITAD partner. Using an ITAD partner can ensure greater security at a more affordable price.

    Make data security a primary driver of asset disposition practices

    It is estimated that 10-15% of data loss cases result from insecure asset disposal. Protect yourself by following some simple disposition rules.

    1. Reconcile your data onsite
    • Verify that bills of landing and inventory records match before assets leave. Otherwise, you must take the receiver’s word on shipment contents.
  • Wipe data at least once onsite
    • Do at least one in-house data wipe before the assets leave the site for greater data security.
  • Transport promptly after data wiping
    • Prompt shipment will minimize involvement with the assets, and therefore, cost. Also, the chance of missing assets will drop dramatically.
  • Avoid third-party transport services
    • Reputable ITAD companies maintain strict chain of custody control over assets. Using a third party introduces unnecessary risk.
  • Keep detailed disposition records
    • Records will protect you in the event of an audit, a data loss incident, or an environmental degradation claim. They could save you millions.
  • Wipe all data-carrying items
    • Don’t forget cell phones, fax machines, USB drives, scanners, and printers – they can carry sensitive information that can put the organization at risk.
  • Only partner with insured ITAD vendors
    • You are never completely out of danger with regards to liability, but partnering with an insured vendor is potent risk mitigation.
  • Work these rules into your disposition policy to mitigate data loss risk.

    Support your HAM efforts with a comprehensive disposition policy

    3.2.3 Build a Hardware Asset Disposition Policy

    Implementation of a HAM program is a waste of time if you aren’t going to maintain it. Maintenance requires the implementation of detailed policies, training, and an ongoing commitment to proper management.

    Use Info-Tech’s Hardware Asset Disposition Policy to:

    1. Establish and define clear standards, procedures, and restrictions surrounding disposition.
    2. Ensure continual compliance with applicable data security and environmental legislation.
    3. Assign specific responsibilities to individuals or groups to ensure ongoing adherence to policy standards and that costs or benefits are in line with expectations.

    Phase 3 Guided Implementation

    Call 1-888-670-8889 or email GuidedImplementations@InfoTech.com for more information.

    Complete these steps on your own or call us to complete a guided implementation. A guided implementation is a series of 2-3 advisory calls that help you execute each phase of a project. They are included in most advisory memberships.

    Guided Implementation 3: Maintain & Dispose

    Proposed Time to Completion: 4 weeks

    Start with an analyst kick-off call:

    • Discuss inventory management best practices.
    • Build process for moves, adds, and changes.
    • Build process for hardware maintenance.
    • Define policies for maintaining asset security.

    Then complete these activities…

    • Build a MAC policy and request form.
    • Build workflows to document user MAC processes.
    • Design processes and policies for hardware maintenance, warranty, and support documentation handling.
    • Build an asset security policy.

    With these tools & templates:

    • Standard Operating Procedures
    • Asset Security Policy

    Step 3.2: Dispose or Redeploy Assets

    Review findings with analyst:

    • Discuss when to dispose vs. redeploy assets.
    • Build process for redeploying vs. disposing of assets.
    • Review ITAD vendors.

    Then complete these activities…

    • Identify challenges with IT asset recovery and disposal.
    • Design hardware asset recovery and disposal workflows.
    • Build a hardware asset disposition policy.

    With these tools & templates:

    • Standard Operating Procedures
    • Asset Recovery Workflow
    • Asset Disposal Workflow
    • Hardware Asset Disposition Policy

    Phase 3 Insight: Not all assets are created equal. Taking a blanket approach to asset maintenance and security is time consuming and costly. Focus on the high-cost, high-use, and data-sensitive assets first.

    If you want additional support, have our analysts guide you through this phase as part of an Info-Tech workshop

    Book a workshop with our Info-Tech analysts:

    • To accelerate this project, engage your IT team in an Info-Tech workshop with an Info-Tech analyst team.
    • Info-Tech analysts will join you and your team onsite at your location or welcome you to Info-Tech’s historic Toronto office to participate in an innovative onsite workshop.
    • Contact your account manager (www.infotech.com/account), or email Workshops@InfoTech.com for more information.

    The following are sample activities that will be conducted by Info-Tech analysts with your team:

    3.1.4 Revise or create an asset security policy

    Discuss asset security challenges within the organization; brainstorm reasons the challenges exist and process changes to address them. Document a new asset security policy.

    3.2.2 Design hardware asset recovery and disposal workflows

    Document each step in the hardware asset recovery and disposal process, including all decision points. Examine challenges and amend the workflow to address them.

    Phase 4

    Plan Budget Process and Build Roadmap

    Implement Hardware Asset Management

    Cisco deployed an enterprise-wide re-education program to implement asset management

    CASE STUDY

    Industry Networking

    Source Cisco IT

    Challenge

    Even though Cisco Systems had designed a comprehensive asset management program, implementing it across the enterprise was another story.

    An effective solution, complete with a process that could be adopted by everyone within the organization, would require extensive internal promotion of cost savings, efficiencies, and other benefits to the enterprise and end users.

    Cisco’s asset management problem was as much a cultural challenge as it was a process challenge.

    Solution

    The ITAM team at Cisco began discussions with departments that had been tracking and managing their own assets.

    These sessions were used as an educational tool, but also as opportunities to gather internal best practices to deploy across the enterprise.

    Eventually, Cisco introduced weekly meetings with global representation to encourage company-wide communication and collaboration.

    Results

    By establishing a process for managing PC assets, we have cut our hardware costs in half.” – Mark Edmonson, Manager – IT Services Expenses

    Cisco reports that although change was difficult to adopt, end-user satisfaction has never been higher. The centralized asset management approach has resulted in better contract negotiations through better data access.

    A reduced number of hardware and software platforms has streamlined tracking and support, and will only drive down costs as time goes on.

    Step 4.1: Plan Hardware Asset Budget

    Phase 4: Plan Budget & Build Roadmap

    4.1 Plan Budget

    4.2 Communicate & Build Roadmap

    This step will walk you through the following activities:

    4.1 Use Info-Tech’s HAM Budgeting Tool to plan your hardware asset budget

    This step involves the following participants:

    • IT Director
    • Asset Manager
    • Finance Department

    Step Outcomes

    • Know where to find data to budget for hardware needs accurately
    • Learn how to manage a hardware budget
    • Plan hardware asset budget with a budgeting tool

    Gain control of the budget to increase the success of HAM

    A sophisticated hardware asset management program will be able to uncover hidden costs, identify targets for downsizing, save money through redistributing equipment, and improve forecasting of equipment to help control IT spending.

    While some asset managers may not have experience managing budgets, there are several advantages to ITAM owning the hardware budget:

    • Be more involved in negotiating pricing with suppliers.
    • Build better relationships with stakeholders across the business.
    • Forecast requirements more accurately.
    • Inform benchmarks for hardware performance.
    • Gain more responsibility and have a greater influence on purchasing decisions.
    • Directly impact the reduction in IT spend.
    • Manage the asset database more easily and have a greater understanding of hardware needs.
    • Build a continuous rolling refresh.

    Use ITAM data to forecast hardware needs accurately and realistically

    Your IT budget should be realistic, accounting for business needs, routine maintenance, hardware replacement costs, unexpected equipment failures, and associated support and warranty costs. Know where to find the data you need and who to work with to forecast hardware needs as accurately as possible.

    What type of data should I take into account?

    Plan for:

    • New hardware purchases required
      • Planned refreshes based on equipment lifecycle
      • Inventory for break and fix
      • Standard equipment for new hires
      • Non-standard equipment required
      • Hardware for planned projects
      • Implementation and setup costs
      • Routine hardware implementation
      • Large hardware implementation for projects
      • Support and warranty costs

    Take into account:

    • Standard refresh cycle for each hardware asset
    • Amount of inventory to keep on hand
    • Length of time from procurement to inventory
    • Current equipment costs and equipment price increases
    • Equipment depreciation rates and resale profits

    Where do I find the information I need to budget accurately?

    • Work with HR to forecast equipment needs for new hires.
    • Work with the Infrastructure Manager to forecast devices and equipment needed for approved and planned projects.
    • Use the asset management database to forecast hardware refresh and replacement needs based on age and lifecycle.
    • Work with business stakeholders to ensure all new equipment needs are accounted for in the budget.

    Use Info-Tech’s HAM Budgeting Tool to plan your hardware asset budget

    4.1.1 Build HAM budget

    This tool is designed to assist in developing and justifying the budget for hardware assets for the upcoming year. The tool will allow you to budget for projects requiring hardware asset purchases as well as equipment requiring refresh and to adjust the budget as needed to accommodate both projects and refreshes. Follow the instructions on each tab to complete the tool.

    The hardware budget should serve as a planning and communications tool for the organization

    The most successful relationships have a common vocabulary. Thus, it is important to translate “tech speak” into everyday language and business goals and initiatives as you plan your budget.

    One of the biggest barriers that infrastructure and operations team face with regards to equipment budgeting is the lack of understanding of IT infrastructure and how it impacts the rest of the organization. The biggest challenge is to help the rest of the organization overcome this barrier.

    There are several things you can do to overcome this barrier:

    • Avoid using technical terms or jargon. Terms many would consider common knowledge, such as “WLAN,” are foreign to many.
    • Don’t assume the business knows how the technology you’re referring to will impact their day-to-day work. You will need to demonstrate it to them.
    • Help the audience understand the business impact of not implementing each initiative. What does this mean for them?
    • Discuss the options on the table in terms of the business value that the hardware can enable. Review how deferring refresh projects can impact user-facing applications, systems, and business unit operations.
    • Present options. If you can’t implement everything on the project list, present what you can do at different levels of funding.

    Info-Tech Insight

    Err on the side of inviting more discussion. Your budgeting process relies on business decision makers and receiving actionable feedback requires an ongoing exchange of information.

    Help users understand the importance of regular infrastructure refreshes

    Getting business users to support regular investments in maintenance relies on understanding and trust. Present the facts in plain language. Provide options, and clearly state the impact of each option.

    Example: Your storage environment is nearing capacity.

    Don’t:

    Explain the project exclusively in technical terms or slang.

    We’re exploring deduping technology as well as cheap solid state, SATA, and tape storage to address capacity.”

    Do:

    • Explain impact in terms that the business can understand.

    Deduplication technology can reduce our storage needs by up to 50%, allowing us to defer a new storage purchase.”

    • Be ready to present project alternatives and impacts.

    Without implementing deduplication technology, we will need to purchase additional storage by the end of the year at an estimated cost of $25,000.”

    • Connect the project to business initiatives and strategic priorities.

    This is a cost-effective technique to increase storage capacity to manage annual average data growth at around 20% per year.

    Step 4.2: Build Communication Plan and Roadmap

    Phase 4: Plan Budget & Build Roadmap

    4.1 Plan Budget

    4.2 Communicate & Build Roadmap

    This step will walk you through the following activities:

    4.2 Develop a HAM implementation roadmap

    This step involves the following participants:

    • CIO
    • IT Director
    • Asset Manager
    • Service Desk Manager

    Step Outcomes

    • Documented end-user hardware asset management policies
    • Communications plan to achieve support from end users and other business units
    • HAM implementation roadmap

    Educate end users through ITAM training to increase program success

    As part of your communication plan and overall HAM implementation, training should be provided to end users within the organization.

    All facets of the business, from management to new hires, should be provided with ITAM training to help them understand their role in the project’s success.

    ITAM solutions are complex by nature with both business process and technical knowledge required to use them correctly. Keep the message appropriate to the audience – end users don’t need to know the complete process, but will need to know policy and how to request.

    Management may have priorities that appear to clash with new processes. Engage management by making them aware of the benefits and importance of ITAM. Include the benefits and consequences of not implementing ITAM in your education approach. Encourage them to support efforts by reinforcing your messages to end users.

    New hires should have ITAM training bundled into their onboarding process. Fresh minds are easier to train and the ITAM program will be seen as an organizational standard, not merely a change.

    Policy documents can help summarize end users’ obligations and clarify processes. Consider an IT Resources Acceptable UsePolicy.

    "The lowest user is the most important user in your asset management program. New employees are your most important resource. The life cycle of the assets will go much smoother if new employees are brought on board." – Tyrell Hall, ITAM Program Coordinator

    Info-Tech Insight

    During training, you should present the material through the lens of “what’s in it for me?” Otherwise, you risk alienating end users through implementing organizational change viewed as low value.

    Include policy design and enforcement in your communication plan

    • Hardware asset management policies should define the actions to be taken to protect and preserve technology assets from failure, loss, destruction, theft, or damage.
    • Implementing asset management policies enforces the notion that the organization takes its IT assets and the management of them seriously, and will help ensure the benefits of ITAM are achieved.
    • Designing, approving, documenting, and adopting one set of standard ITAM policies for each department to follow will ensure the processes are enforced equally across the organization.
    • Good ITAM policies answer the “what, how, and why” of IT asset management, provide the means for ITAM governance, and provide a basis for strategy and decision making.

    Info-Tech Insight

    Use policy templates to jumpstart your policy development and ensure policies are comprehensive, but be sure to modify and adapt policies to suit your corporate culture or they will not gain buy-in from employees. For a policy to be successful, it must be a living document and have participation and involvement from the committees and departments to whom it will pertain.

    Use Info-Tech’s policy templates to build HAM policies

    4.2.1 Build HAM policies

    Use these HAM policy templates to get started:

    Information Technology Standards Policy

    This policy establishes standards and guidelines for a company’s information technology environment to ensure the confidentiality, integrity, and availability of company computing resources.

    Desktop Move/Add/Change Policy

    This desktop move/add/change policy is put in place for users to request to change their desktop computing environments. This policy applies configuration changes within a company.

    Purchasing Policy

    The purchasing policy helps to establish company standards, guidelines, and procedures for the purchase of all information technology hardware, software, and computer-related components as well as the purchase of all technical services.

    Hardware Asset Disposition Policy

    This policy assists in creating guidelines around disposition in the last stage of the asset lifecycle.

    Additional policy templates

    Info-Tech Insight

    Use policy templates to jumpstart your policy development and ensure policies are comprehensive, but modify and adapt them to suit your corporate culture or they will not gain buy-in from employees. For a policy to be successful, it must be a living document and have participation from the committees and departments to whom it will pertain.

    Create a communication plan to achieve end-user support and adherence to policies

    Communication is crucial to the integration and overall implementation of your ITAM program. An effective communication plan will:

    • Gain support from management at the project proposal phase.
    • Create end-user buy-in once the program is set to launch.
    • Maintain the presence of the program throughout the business.
    • Instill ownership throughout the business from top-level management to new hires.

    Use the variety of components as part of your communication plan in order to reach the organization.

    1. Advertise successes.
    • Regularly demonstrate the value of the ITAM program with descriptive statistics focused on key financial benefits.
    • Share data with the appropriate personnel; promote success to obtain further support from senior management.
  • Report and share asset data.
    • Sharing detailed asset-related reports frequently gives decision makers useful data to aid in their strategy.
    • These reports can help your organization prepare for audits, adjust asset budgeting, and detect unauthorized assets.
  • Communicate the value of ITAM.
    • Educate management and end users about how they fit into the bigger picture.
    • Individuals need to know that their behaviors can adversely affect data quality and, ultimately, lead to better decision making.
  • Develop a communication plan to convey the right messages

    4.2.2 Develop a communication plan to convey the right messages

    Participants

    • CIO
    • IT Director
    • Asset Manager
    • Service Desk Manager

    Document

    Document in the HAM Communication Plan

    1. Identify the groups that will be affected by the HAM program as those who will require communication.
    2. For each group requiring a communication plan, identify the following:
    • Benefits of HAM for that group of individuals (e.g. better data, security).
    • The impact the change will have on them (e.g. change in the way a certain process will work).
    • Communication method (i.e. how you will communicate).
    • Timeframe (i.e. when and how often you will communicate the changes).
  • Complete this information in a table like the one below and document in the Communication Plan.
  • Group Benefits Impact Method Timeline
    Service Desk Improve end-user device support Follow new processes Email campaign 3 months
    Executives Mitigate risks, better security, more data for reporting Review and sign off on policies
    End Users Smoother request process Adhere to device security and use policies
    Infrastructure Faster access to data and one source of truth Modified processes for centralized procurement and inventory

    Implement ITAM in a phased, constructive approach

    • One of the most difficult decisions to make when implementing ITAM is: “where do we start?”
    • The pyramid to the right mirrors Maslow’s hierarchy of needs. The base is the absolute bare minimum that should be in place, and each level builds upon the previous one.
    • As you track up the pyramid, your ITAM program will become more and more mature.

    Now that your asset lifecycle environment has been constructed in full, it’s time to study it. Gather data about your assets and use the results to create reports and new solutions to continually improve the business.

    • Asset Data
    • Asset Protection: safely protect and dispose of assets once they are mass distributed throughout your organization.
    • Asset Distribution: determine standards for asset provisioning and asset inventory strategy.
    • Asset Gathering: define what assets you will procure, distribute, and track. Classifying your assets by tier will allow you to make decisions as you progress up the pyramid.

    ↑ ITAM Program Maturity

    Integrate your HAM program into the organization to assist its implementation

    The HAM program cannot perform on its own – it must be integrated with other functional areas of the organization in order to maintain its stability and support.

    • Effective IT asset management is supported by a comprehensive set of processes as part of its implementation.
    • For example, integration with the purchasing/procurement team is required to gather hardware and software purchase data to control asset costs and mitigate software license compliance risk.
    • Integration with Finance is required to support internal cost allocations and charge backs.

    To integrate your ITAM program into your organization effectively, a clear implementation roadmap needs to be designed. Prioritize “quick wins” in order to demonstrate success to the business early and gain buy-in from your team. Long-term goals should be designed that will be supported by the outcomes of the short-term gains of your ITAM program.

    Short-term goal Long-term goal
    Identify inventory classification and tool (hardware first) Hardware contract data integration (warranty, maintenance, lease)
    Create basic ITAM policies and processes Continual improvement through policy impact review and revision
    Implement ITAM auto-discovery tools Software compliance reports, internal audits

    Info-Tech Insight

    Installing an ITAM tool does not mean you have an effective asset management program. A complete solution needs to be built around your tool, but the strength of ITAM comes from processes embedded in the organization that are shaped and supported by your ITAM data.

    Develop an IT hardware asset management implementation roadmap

    4.2.3 Develop a HAM implementation roadmap

    Participants

    • CIO
    • IT Director
    • Asset Manager
    • Service Desk Manager

    Document

    Document in the IT Hardware Asset Management Implementation Roadmap

    1. Identify up to five streams to work on initiatives for the hardware asset management project.
    2. Fill out key tasks and objectives for each process. Assign responsibility for each task.
    3. Select a start date and end date for each task. See tab 1 of the tool for instructions on which letters to input for each stage of the process.
    4. Once your list is complete, open tab 3 of the tool to see your completed sunshine diagram.
    5. Keep this diagram visible for your team and use it as a guide to task completion as you work towards your future-state value stream.

    Focus on continual improvement to sustain your ITAM program

    Periodically review the ITAM program in order to achieve defined goals, objectives, and benefits.

    Act → Plan → Do → Check

    Once ITAM is in place in your organization, a focus on continual improvement creates the following benefits:

    • Remain in sync with the business: your asset management program reflects the current and desired future states of your organization at the time of its creation. But the needs of the business change. As mentioned previously, asset management is a dynamic process, so in order for your program to keep pace, a focus on continual improvement is needed.
      • For example, imagine if your organization had designed your ITAM program before cloud-based solutions were an option. What if your asset classification scheme did not include personal devices or tablets or your asset security policy lacked a section on BYOD?
    • Create funding for new projects through ITAM continual improvement: one of the goals is to save money through more efficient use of your assets by “sweating” out underused hardware and software.
      • It may be tempting to simply present the results to Finance as savings, but instead, describe the results as “available funds for other projects.” Otherwise, Finance may view the savings as a nod to restrict IT’s budget and allocate funds elsewhere. Make it clear that any saved funds are still required, albeit in a different capacity.

    Info-Tech Best Practice

    Look for new uses for ITAM data. Ask management what their goals are for the next 12-18 months. Analyze the data you are gathering and determine how your ITAM data can assist with achieving these goals.

    Phase 4 outline

    Call 1-888-670-8889 or email GuidedImplementations@InfoTech.com for more information.

    Complete these steps on your own or call us to complete a guided implementation. A guided implementation is a series of 2-3 advisory calls that help you execute each phase of a project. They are included in most advisory memberships.

    Step 4.1: Plan Budget

    Start with an analyst kick-off call:

    • Know where to find data to budget for hardware needs accurately.
    • Learn how to manage a hardware budget.

    Then complete these activities…

    • Plan hardware asset budget.

    With these tools & templates:

    HAM Budgeting Tool

    Step 4.2: Communicate & Roadmap

    Review findings with analyst:

    • Develop policies for end users.
    • Build communications plan.
    • Build an implementation roadmap.

    Then complete these activities…

    • Build HAM policies.
    • Develop a communication plan.
    • Develop a HAM implementation roadmap.

    With these tools & templates:

    HAM policy templates

    HAM Communication Plan

    HAM Implementation Roadmap

    If you want additional support, have our analysts guide you through this phase as part of an Info-Tech workshop

    Book a workshop with our Info-Tech analysts:

    • To accelerate this project, engage your IT team in an Info-Tech workshop with an Info-Tech analyst team.
    • Info-Tech analysts will join you and your team onsite at your location or welcome you to Info-Tech’s historic Toronto office to participate in an innovative onsite workshop.
    • Contact your account manager (www.infotech.com/account), or email Workshops@InfoTech.com for more information.

    The following are sample activities that will be conducted by Info-Tech analysts with your team:

    4.1.1 Build a hardware asset budget

    Review upcoming hardware refresh needs and projects requiring hardware purchases. Use this data to forecast and budget equipment for the upcoming year.

    4.2.2 Develop a communication plan

    Identify groups that will be affected by the new HAM program and for each group, document a communications plan.

    Insight breakdown

    Overarching Insights

    HAM is more than just tracking inventory. A mature asset management program provides data for proactive planning and decision making to reduce operating costs and mitigate risk.

    ITAM is not just IT. IT leaders need to collaborate with Finance, Procurement, Security, and other business units to make informed decisions and create value across the enterprise.

    Treat HAM like a process, not a project. HAM is a dynamic process that must react and adapt to the needs of the business.

    Phase 1 Insight

    For asset management to succeed, it needs to support the business. Engage business leaders to determine needs and build your HAM program around these goals.

    Phase 2 Insight

    Bridge the gap between IT and Finance to build a smoother request and procurement process through communication and routine reporting. If you’re unable to affect procurement processes to reduce time to deliver, consider bringing inventory onsite or having your hardware vendor keep stock, ready to ship on demand.

    Phase 3 Insight

    Not all assets are created equal. Taking a blanket approach to asset maintenance and security is time consuming and costly. Focus on the high-cost, high-use, and data-sensitive assets first.

    Phase 4 Insight

    Deploying a fancy ITAM tool will not make hardware asset management implementation easier. Implementation is a project that requires you focus on people and process first – the technology comes after.

    Related Info-Tech research

    Implement Software Asset Management

    Build an End-User Computing Strategy

    Find the Value – and Remain Valuable – With Cloud Asset Management

    Consolidate IT Asset Management

    Harness Configuration Management Superpowers

    IT Asset Management Market Overview

    Bibliography

    Chalkley, Martin. “Should ITAM Own Budget?” The ITAM Review. 19 May 2011. Web.

    “CHAMP: Certified Hardware Asset Management Professional Manual.” International Association of Information Technology Asset Managers, Inc. 2008. Web.

    Foxen, David. “The Importance of Effective HAM (Hardware Asset Management).” The ITAM Review. 19 Feb. 2015. Web.

    Foxen, David. “Quick Guide to Hardware Asset Tagging.” The ITAM Review. 5 Sep. 2014. Web.

    Galecki, Daniel. “ITAM Lifecycle and Savings Opportunities – Mapping out the Journey.” International Association of IT Asset Managers, Inc. 16 Nov. 2014. Web.

    “How Cisco IT Reduced Costs Through PC Asset Management.” Cisco IT Case Study. 2007. Web.

    Irwin, Sherry. “ITAM Metrics.” The ITAM Review. 14 Dec. 2009. Web.

    “IT Asset and Software Management.” ECP Media LLC, 2006. Web.

    Rains, Jenny. “IT Hardware Asset Management.” HDI Research Brief. May 2015. Web.

    Riley, Nathan. “IT Asset Management and Tagging Hardware: Best Practices.” Samanage Blog. 5 March 2015. Web.

    “The IAITAM Practitioner Survey Results for 2016 – Lean Toward Ongoing Value.” International Association of IT Asset Managers, Inc. 24 May 2016. Web.

    Manage End-User Devices

    • Buy Link or Shortcode: {j2store}307|cart{/j2store}
    • member rating overall impact (scale of 10): 10.0/10 Overall Impact
    • member rating average dollars saved: $45,499 Average $ Saved
    • member rating average days saved: 10 Average Days Saved
    • Parent Category Name: End-User Computing Devices
    • Parent Category Link: /end-user-computing-devices
    • Desktop and mobile device management teams use separate tools and different processes.
    • People at all levels of IT are involved in device management.
    • Vendors are pushing unified endpoint management (UEM) products, and teams struggling with device management are hoping that UEM is their savior.
    • The number and variety of devices will only increase with the continued advance of mobility and emergence of the Internet of Things (IoT).

    Our Advice

    Critical Insight

    • Many problems can be solved by fixing roles, responsibilities, and process. Standardize so you can optimize.
    • UEM is not a silver bullet. Your current solution can image computers in less than 4 hours if you use lean images.
    • Done with, not done to. Getting input from the business will improve adoption, avoid frustration, and save everyone time.

    Impact and Result

    • Define the benefits that you want to achieve and optimize based on those benefits.
    • Take an evolutionary, rather than revolutionary, approach to merging end-user support teams. Process and tool unity comes first.
    • Define the roles and responsibilities involved in end-user device management, and create a training plan to ensure everyone can execute their responsibilities.
    • Stop using device management practices from the era of Windows XP. Create a plan for lean images and app packages.

    Manage End-User Devices Research & Tools

    Start here – read the Executive Brief

    Read our concise Executive Brief to find out why you should optimize end-user device management, review Info-Tech’s methodology, and understand the four ways we can support you in completing this project.

    Besides the small introduction, subscribers and consulting clients within this management domain have access to:

    1. Identify the business and IT benefits of optimizing endpoint management

    Get your desktop and mobile device support teams out of firefighting mode by identifying the real problem.

    • Manage End-User Devices – Phase 1: Identify the Business and IT Benefits
    • End-User Device Management Standard Operating Procedure
    • End-User Device Management Executive Presentation

    2. Improve supporting teams and processes

    Improve the day-to-day operations of your desktop and mobile device support teams through role definition, training, and process standardization.

    • Manage End-User Devices – Phase 2: Improve Supporting Teams and Processes
    • End-User Device Management Workflow Library (Visio)
    • End-User Device Management Workflow Library (PDF)

    3. Improve supporting technologies

    Stop using management tools and techniques from the Windows XP era. Save yourself, and your technicians, from needless pain.

    • Manage End-User Devices – Phase 3: Improve Supporting Technologies
    [infographic]

    Workshop: Manage End-User Devices

    Workshops offer an easy way to accelerate your project. If you are unable to do the project yourself, and a Guided Implementation isn't enough, we offer low-cost delivery of our project workshops. We take you through every phase of your project and ensure that you have a roadmap in place to complete your project successfully.

    1 Identify the Business and IT Benefits of Optimizing End-User Device Management

    The Purpose

    Identify how unified endpoint management (UEM) can improve the lives of the end user and of IT.

    Key Benefits Achieved

    Cutting through the vendor hype and aligning with business needs.

    Activities

    1.1 Identify benefits you can provide to stakeholders.

    1.2 Identify business and IT goals in order to prioritize benefits.

    1.3 Identify how to achieve benefits.

    1.4 Define goals based on desired benefits.

    Outputs

    Executive presentation

    2 Improve the Teams and Processes That Support End-User Device Management

    The Purpose

    Ensure that your teams have a consistent approach to end-user device management.

    Key Benefits Achieved

    Developed a standard approach to roles and responsibilities, to training, and to device management processes.

    Activities

    2.1 Align roles to your environment.

    2.2 Assign architect-, engineer-, and administrator-level responsibilities.

    2.3 Rationalize your responsibility matrix.

    2.4 Ensure you have the necessary skills.

    2.5 Define Tier 2 processes, including patch deployment, emergency patch deployment, device deployment, app deployment, and app packaging.

    Outputs

    List of roles involved in end-user device management

    Responsibility matrix for end-user device management

    End-user device management training plan

    End-user device management standard operating procedure

    Workflows and checklists of end-user device management processes

    3 Improve the Technologies That Support End-User Device Management

    The Purpose

    Modernize the toolset used by IT to manage end-user devices.

    Key Benefits Achieved

    Saving time and resources for many standard device management processes.

    Activities

    3.1 Define the core image for each device/OS.

    3.2 Define app packages.

    3.3 Gather action items for improving the support technologies.

    3.4 Create a roadmap for improving end-user device management.

    3.5 Create a communication plan for improving end-user device management.

    Outputs

    Core image outline

    Application package outline

    End-user device management roadmap

    End-user device management communication plan

    Innovation

    • Buy Link or Shortcode: {j2store}21|cart{/j2store}
    • Related Products: {j2store}21|crosssells{/j2store}
    • Teaser Video: Visit Website
    • Teaser Video Title: Digital Ethics = Data Equity
    • member rating overall impact (scale of 10): N/A
    • member rating average dollars saved: N/A
    • member rating average days saved: N/A
    • sidebar graphic: Visit Link
    • Parent Category Name: Strategy and Governance
    • Parent Category Link: /strategy-and-governance
    Innovation is the at heart of every organization, especially in these fast moving times. It does not matter if you are in a supporting or "traditional" sector.  The company performing the service in a faster, better and more efficient way, wins.

    innovation

    Design a VIP Experience for Your Service Desk

    • Buy Link or Shortcode: {j2store}480|cart{/j2store}
    • member rating overall impact (scale of 10): N/A
    • member rating average dollars saved: N/A
    • member rating average days saved: N/A
    • Parent Category Name: Service Desk
    • Parent Category Link: /service-desk
    • VIPs and executives expect to get immediate service for every IT issue, no matter how minor, and the service desk is constantly in reactive mode trying to quickly resolve these issues.
    • VIPs don’t understand or have input into service desk processes, procedures, and SLAs, especially when it comes to prioritization of their issues over other tickets.
    • The C-suite calls the CIO directly with every issue they have, tying them up and forcing them to redirect resources with little notice.
    • VIP tickets sit in the queue too long without a response or resolution, and VIPs are dissatisfied with the service they receive.

    Our Advice

    Critical Insight

    • Service desk and IT leaders are unclear on VIPs' service delivery expectations or the best support model to meet their needs while continuing to meet SLAs for the rest of the organization.
    • Deploying resources to service VIPs ahead of other users or more critical problems can result in inappropriate prioritization of issues and poor service delivery to the rest of the organization.
    • The reality for most organizations is that VIPs need special treatment; but providing VIP service shouldn’t come at the expense of good service delivery for the rest of the organization.

    Impact and Result

    • Stop being reactive to VIP requests and start planning for them so you can formally define the service and set expectations.
    • Talk to all relevant stakeholders to clarify their expectations before choosing a VIP service delivery model. Once you have designed your model, define and document the VIP service processes and procedures and communicate them to your stakeholders so everyone is clear on what is in and out of scope.
    • Once you’ve launched the service, track and report on key service desk metrics associated with VIP requests so you can properly allocate resources, budget accurately, evaluate the effectiveness of the service and demonstrate it to executives.

    Design a VIP Experience for Your Service Desk Research & Tools

    Besides the small introduction, subscribers and consulting clients within this management domain have access to:

    1. Design a VIP Experience for Your Service Desk Storyboard – A guide to defining your VIP service desk support model

    Follow the seven steps outlined in this blueprint to design a VIP support model that best suits your organization, then communicate and evaluate the service to ensure it delivers results.

    • Design a VIP Experience for Your Service Desk Storyboard

    2. Service Desk VIP Procedures Template – A customizable template to document your service desk procedures for handling VIP tickets.

    This template is designed to assist with documenting your service desk procedures for handling VIP or executive tickets. It can be adapted and customized to reflect your specific support model and procedures.

    • Service Desk VIP Procedures Template

    3. VIP Support Process Workflow Example – A Visio template to document your process for resolving VIP tickets.

    This Visio template provides an example of a VIP support process, with every step involved in resolving or fulfilling VIP service desk tickets. Use this as an example to follow and a template to document your own process.

    • VIP Support Process Workflow Example

    4. VIP Support Service Communication Template – A customizable PowerPoint template to communicate and market the service to VIP users.

    This template can be customized to use as an executive presentation to communicate and market the service to VIP users and ensure everyone is on the same page.

    • VIP Support Service Communication Template
    [infographic]

    Further reading

    Design a VIP Experience for Your Service Desk

    Keep the C-suite satisfied without sacrificing service to the rest of the organization.

    Analyst Perspective

    Stop being reactive to VIP demands and formalize their service offering.

    Natalie Sansone, PHD

    Natalie Sansone, PHD

    Research Director,
    Infrastructure & Operations
    Info-Tech Research Group

    In a perfect world, executives wouldn’t need any special treatment because the service desk could rapidly resolve every ticket, regardless of the submitter, keeping satisfaction levels high across the board.

    But we know that’s not the case for most organizations. Executives and VIPs demand higher levels of service because the reality in most companies is that their time is worth more. And any IT leader who’s had a VIP complain about their service knows that their voice also carries more weight than that of a regular dissatisfied user.

    That said, most service desks feel strapped for resources and don’t know how to improve service for VIPs without sacrificing service to the rest of the organization.

    The key is to stop being reactive to VIP demands and formalize your VIP service procedures so that you can properly set expectations for the service, monitor and measure it, and continually evaluate it to make changes if necessary.

    A VIP offering doesn’t have to mean a white glove concierge service, either – it could simply mean prioritizing VIP tickets differently. How do you decide which level of service to offer? Start by assessing your specific needs based on demand, gather requirements from relevant stakeholders, choose the right approach to fit your business needs and capabilities, clearly define and document all aspects of the service then communicate it so that everyone is on the same page as to what is in and out of scope, and continually monitor and evaluate the service to make changes and improvements as needed.

    Executive Summary

    Your Challenge

    • VIPs and executives expect to get immediate service for every IT issue, no matter how minor, and the service desk is constantly in reactive mode trying to quickly resolve these issues.
    • VIPs don’t understand or have input into service desk processes, procedures, and SLAs, especially when it comes to prioritization of their issues over other tickets.
    • The C-suite calls the CIO directly with every issue they have, tying them up and forcing them to redirect resources with little notice.
    • VIP tickets sit in the queue too long without a response or resolution, and VIPs are dissatisfied with the service they receive.

    Common Obstacles

    • Service desk and IT leaders are unclear on the expectations that VIPs have for service delivery, or they disagree about the best support model to meet their needs while continuing to meet SLAs for the rest of the organization.
    • Service desk teams with limited resources are unsure how best to allocate those resources to handle VIP tickets in a timely manner.
    • There aren’t enough resources available at the service desk to provide the level of service that VIPs expect for their issues.
    • Deploying resources to service VIPs ahead of other users can result in inappropriate prioritization of issues and poor service delivery to the rest of the organization

    Info-Tech's Approach

    • Stop being reactive to VIP requests and start planning for them so you can formally define the service and set expectations.
    • Talk to all relevant stakeholders to clarify their expectations before choosing a VIP service delivery model.
    • Define and document the VIP service processes and procedures, including exactly what is in and out of scope.
    • Track and report on metrics associated with VIP requests so you can properly allocate resources and budget for the service.
    • Continually evaluate the service to expand, reduce, or redefine it, as necessary.

    Info-Tech Insight

    The reality for most organizations is that VIPs need special treatment. But providing VIP service shouldn’t come at the expense of good service delivery for the rest of the organization. To be successful with your approach, formalize the VIP offering to bring consistency and clear expectations for both users and the IT staff delivering the service.

    Do any of these scenarios sound familiar?

    All these familiar scenarios can occur when the service desk treats VIP issues reactively and doesn’t have a defined, documented, and agreed-upon VIP process in place.
    • A VIP calls because their personal printer isn’t working, but you also have a network issue affecting payroll being able to issue paychecks. The VIP wants their issue fixed immediately despite there being a workaround and a higher priority incident needing resources.
    • The COO calls the CIO after hours about issues they’re having with their email. The CIO immediately deploys a field tech back to the office to help the COO. Once the tech arrives, the COO says the issue could have waited until the morning.
    • The company president wants IT to spend a day at their house setting up their new personal laptop to be able to connect into the office before their vacation tomorrow. It would take away one FTE from an already understaffed service desk.
    • The CEO brings their child’s new iPhone in and asks the service desk if they have time to set it up as a favor today. The service desk manager instructs the T2 apps specialist to drop his other tickets to work on this immediately.
    • Two tickets come in at the same time – one is from an SVP who can’t log in to Teams and has an online meeting in half an hour, and the other is for a department of 10 who can’t access the network. The service desk doesn’t know who to help first.

    Different organizations can take very different approaches to VIP requests

    CASE STUDIES

    Providing VIP support helped this company grow

    Allocating a dedicated VIP technician slowed down service delivery for this company

    Situation

    A SaaS company looking to build and scale its services and customers decided to set up a VIP support program, which involved giving their most valuable customers white glove treatment to ensure they had a great experience, became long-term customers, and thus had a positive influence on others to build up the company’s customer base. VIPs were receiving executive-level support with a dedicated person for VIP tickets. The VIPs were happy with the service, but the VIP technician’s regular work was frequently impeded by having to spend most of her time doing white glove activities. The service desk found that in some cases, more critical work was slipping as a result of prioritizing all executive tickets.

    Resolution

    First, they defined who would receive VIP support, then they clearly defined the service, including what VIP support includes, who gets the service, and what their SLAs for service are. They found that the program was an effective way to focus their limited resources on the customers with the highest value potential to increase sales.
    While this model differs from an IT service desk VIP support program, the principles of dedicating resources to provide elevated support to your most important and influential customers for the benefit and growth of the company as a whole remain the same.
    The service desk decided to remove the VIP function. They demonstrated that the cost per contact was too high for dedicated executive support, and reallocating that dedicated technician to the service desk would improve the resolution time of all business incidents and requests. VIPs could still receive prioritized support through the escalation process, but they would contact the regular service desk with their issues. VIPs approved the change, and as a result of removing the dedicated support function, the service desk reduced average incident resolution times by 28% and request fulfillment times by 33%.

    A well-designed and communicated VIP support service can deliver many benefits

    The key to deciding whether a VIP service is right for your organization is to first analyze your needs, match them against your resources, then clearly define and document exactly what is in scope for the service.

    A successfully designed VIP service will lead to:

    • Executives and VIPs can easily contact the service desk and receive exceptional support and customer service from a knowledgeable technician, increasing their trust in the service desk.
    • All service desk tickets are prioritized appropriately and effectively in order to maximize overall ticket resolution and fulfillment times.
    • All users have a clear understanding of how to get in touch with the service desk and expected SLAs for specific ticket types.
    • Critical, business-impacting issues still receive priority service ahead of minor tickets submitted by a VIP.
    • All service desk technicians are clear on processes and procedures for prioritizing and handling VIP tickets.
    • Executives are satisfied with the service they receive and the value that IT provides
    • Reduced VIP downtime, contributing to overall organization productivity and growth.

    A poorly designed or reactive VIP service will lead to:

    • VIPs expect immediate service for non-critical issues, including after-hours.
    • VIPs circumvent the correct process and contact the CIO or service desk manager directly for all their issues.
    • Service desk resources stretched thin, or poor allocation of resources leads to degraded service for the majority of users.
    • More critical business issues are pushed back in order to fix non-critical executive issues.
    • Service desk is not clear how to prioritize tickets and always addresses VIP tickets first regardless of priority.
    • The service desk automatically acts on VIP tickets even when the VIP doesn’t require it or realize they’re getting a different level of service.
    • Non-VIP users are aware of the different service levels and try to request the same priority for their tickets. Support costs are over budget.

    Follow Info-Tech’s approach to design a successful VIP support model

    Follow the seven steps in this blueprint to design a VIP support model that works for your organization:
    1. Understand the support models available, from white glove service to the same service for everyone.
    2. Gather business requirements from all relevant stakeholders.
    3. Based on your business needs, choose the right approach.
    4. Define and document all details of the VIP service offering.
    5. Communicate and market the offering to VIPs so they’re aware of what’s in scope.
    6. Monitor volume and track metrics to evaluate what’s working.
    7. Continually improve or modify the service as needed over time.

    Blueprint deliverables

    The templates listed below are designed to assist you with various stages of this project. This storyboard will direct you when and how to complete them.

    Service Desk VIP Procedures Template

    Use this template to assist with documenting your service desk procedures for handling VIP or executive tickets.

    VIP Support Process Workflow Example

    Use this Visio template to document your process for resolving or fulfilling VIP tickets, from when the ticket is submitted to when it’s closed.

    VIP Support Service Communication Template

    Use this template to customize your executive presentation to communicate and market the service to VIP users.

    Insight Summary

    Key Insight

    The reality for most organizations is that VIPs need special treatment. But providing VIP service shouldn’t be at the expense of good service delivery for the rest of the organization. To be successful with your approach, formalize the VIP offering to bring consistency and clear expectations for both users and the IT staff delivering the service.

    Additional insights:

    Insight 1

    VIP service doesn’t have to mean concierge service. There are different levels and models of VIP support that range in cost and level of service provided. Carefully evaluate your needs and capacity to choose the approach that works best for your organization.

    Insight 2

    This service is for your most valued users, so design it right from the start to ensure their satisfaction. Involve stakeholders from the beginning, incorporate their feedback and requirements, keep them well-informed about the service, and continually collect and act on feedback to deliver the intended value.

    Insight 3

    Intentional, continual monitoring and measurement of the program must be part of your strategy. If your metrics or feedback show that something isn’t working, fix it. If you find that the perceived value isn’t worth the high cost of the program, make changes. Even if everything seems to be working fine, identify ways to improve it or make it more efficient.

    Step 1: Understand the different support models

    Step overview:

    • Understand the support models available, from white glove service to the same service for everyone

    First, define what “VIP support” means in your organization

    VIP support from the service desk usually refers to an elevated level of service (i.e. faster, after-hours, off-site, and/or with more experienced resources) that is provided to those at the executive level of the organization.

    A VIP typically includes executives across the business (e.g. CIO, CEO, CxO, VPs) and sometimes the executive assistants who work directly with them. However, it can also include non-executive-level but critical business roles in some organizations.

    The level of VIP service provided can differ from receiving prioritization in the queue to having a dedicated, full-time technician providing “white glove” service.

    Info-Tech Insight

    You don’t have to use the term “VIP”, as long as you clearly define the terms you are using. Some organizations use the term “VIR” to refer to very important roles rather than people, and some define “critical users” to reflect who should receive prioritized service, for example.

    There are essentially two options for VIP support, but multiple determining factors

    While the details are more specific, your options for VIP support really come down to two: they either receive some kind of enhanced service (either from a dedicated support team or through prioritization from the regular support team) or they don’t. Which option you choose will depend on a wide range of factors, some of which are represented in the diagram below. Factors such as IT budget, size of organization help determine which VIP support model you choose: Enhanced, or the same as everyone else. With enhanced service, you can opt to a dedicated support team or same support team but with prioritized service.

    Option 1: Same service for everyone

    What does it look like?

    VIP tickets are prioritized in the same way as every other ticket – with an assessment by impact and urgency. This allows every ticket to be prioritized appropriately according to how big the impact of the issue is and how quickly it needs to be resolved – regardless of who the submitter is. This means that VIPs with very urgent issues will still receive immediate support, as would a non-VIP user with a critical issue.

    Who is it best suited for?

    • Small organizations and IT teams.
    • Executives don’t want special treatment.
    • Not enough service desk resources or budget to provide prioritized or dedicated VIP service.
    • Service desk is already efficient and meeting SLAs for all requests and incidents.

    Pros

    • Highest level of consistency in service because the same process is followed for all user groups.
    • Ensures that service doesn’t suffer for non-VIP users for teams with a limited number of service desk staff.
    • No additional cost.
    • Potential to argue for more resources if executive service expectations aren’t met.

    Cons

    • Does not work if executives expect or require elevated service regardless of issue type.
    • Potential for increase in management escalations or complaints from dissatisfied executives. Some may end up jumping the queue as a result, which results in unstandardized VIP treatment only for some users.

    Info-Tech Insight

    Don’t design a VIP service solely out of fear that VIPs will be unhappy with the standard level of support the service desk provides. In some cases, it is better to focus your efforts on improving your standard support for everyone rather than only for a small percentage of users, especially if providing that elevated VIP support would further deteriorate service levels for the rest of the organization.

    Option 2: Prioritized service for VIPs

    What does it look like?

    • VIPs still go through the service desk but receive higher priority than non-VIP tickets.
    • Requests from VIP submitters are still evaluated using the standard prioritization matrix but are bumped up in urgency or priority. More critical issues can still take precedence.
    • Existing service desk resources are still used to resolve the request, but requests are just placed closer to the “front of the line.”
    • VIP users are identified in the ticketing system and may have a separate number to call or are routed differently/skip the queue within the ACD/IVR.

    Who is it best suited for?

    • Organizations that want or need to give VIPs expedited or enhanced service, but that don’t have the resources to dedicate to a completely separate VIP service desk team.

    Pros

    • Meets the need of executives for faster service.
    • Balances the need for prioritized service to VIPs while not sacrificing resources to handle most user requests.
    • All tickets still go through a single point of contact to be triaged and monitored by the service desk.
    • Easy to measure and compare performance of VIP service vs. standard service because processes are the same.

    Cons

    • Slight cost associated with implementing changes to phone system if necessary.
    • Makes other users aware that VIPs receive “special treatment” – some may try to jump the queue themselves.
    • May not meet the expectations of some executives who prefer dedicated, face-to-face resources to resolve their issues.

    Info-Tech Insight

    If you’re already informally bumping VIP tickets up the queue, this may be the most appropriate model for you. Bring formalization to your process by clearly defining exactly where VIP tickets fit in your prioritization matrix to ensure they are handled consistently and that VIPs are aware of the process.

    Option 3: Dedicated VIP service

    What does it look like?

    • VIPs contact a dedicated service desk and receive immediate/expedited support, often face to face.
    • Often a separate phone number or point of contact.
    • Similar to concierge service or “white glove” service models.
    • At least one dedicated FTE with good customer service skills and technical knowledge who builds trust with executives.

    Who is it best suited for?

    • Larger enterprises with many VIP users to support, but where VIPs are geographically clustered (as geography sprawls, the cost of the service will spiral).
    • IT organizations with enough resources on the service desk to support a dedicated VIP function.
    • Organizations where executives require immediate, in-person support.

    Pros

    • Most of the time, this model results in the fastest service delivery to executives.
    • Most personal method of delivering support with help often provided in person and from familiar, trusted technicians.
    • Usually leads to the highest level of satisfaction with the service desk from executives.

    Cons

    • Most expensive model; usually requires at least one dedicated, experienced FTE to support and sometimes after-hours support.
    • Essentially two separate service desks; can result in a disconnect between staff.
    • Career path and cross-training opportunities for the dedicated staff may be limited; role can be exhausting.
    • Reporting on the service can be more complicated and tickets are often logged after the fact.
    • If not done well, quality of service can suffer for the rest of the organization.

    Info-Tech Insight

    This type of model is essential in many large enterprises where the success of the company can depend on VIPs having access to dedicated support to minimize downtime as much as possible. However, it also requires the highest level of planning and dedication to get right. Without carefully documented processes and procedures and highly trained staff to support the model, it will fail to deliver the expected benefits.

    Step 2: Capture business needs

    Step overview:

    • Analyze your data and gather requirements to determine whether there is a need for a VIP service.

    Assess current state and metrics

    You can’t define your target state without a clear understanding of your current state. Analyze your ticket data and reports to identify the type and volume of VIP requests the service desk receives and how well you’re able to meet these requests with your current resources and structure.

    Analyze ticket data

    • What volume of tickets are you supporting? How many of those tickets come from VIP users?
    • What is your current resolution time for incidents and requests? How well are you currently meeting SLAs?
    • How quickly are executive/VIP tickets being resolved? How long do they have to wait for a response?
    • How many after-hours requests do you receive?

    Assess resourcing

    • How many users do you support; what percentage of them would be identified as VIP users?
    • How many service desk technicians do you have at each tier?
    • How well are you currently meeting demand? Would you be able to meet demand if you dedicated one or more Tier 2 technicians to VIP support?
    • If you would need to hire additional resources, is there budget to do so?

    Use the data to inform your assessment

    • Do you have a current problem with service delivery to VIPs and/or all users that needs to be addressed by changing the VIP support model?
    • Do you have the demand to support the need for a VIP service?
    • Do you have the resources to support providing VIP service?

    Leverage Info-Tech’s tools to inform your assessment

    Analyze your ticket data and reports to understand how well you’re currently meeting SLAs, your average response and resolution times, and the volume and type of requests you get from VIPs in order to understand the need for changing your current model. If you don’t have the ticket data to inform your assessment, leverage Info-Tech’s Service Desk Ticket Analysis Tool.

    Service Desk Ticket Analysis Tool

    Use this tool to identify trends and patterns in your ticket data. The ticket summary dashboard contains multiple reports analyzing how tickets come in, who requests them, who resolves them, and how long it takes to resolve them.

    If you need help understanding how well your current staff is able to handle your current ticket volume, leverage Info-Tech’s Service Desk Staffing Calculator to analyze demand and ticket volume trends. While not specifically designed to analyze VIP tickets, you could run the assessment separately for VIP volume if you have that data available.

    Service Desk Staffing Calculator

    Use this tool to help you estimate the optimal resource allocation to support your demand over time.

    Engage stakeholders to understand their requirements

    Follow your organization’s requirements gathering process to identify and prioritize stakeholders, conduct stakeholder interviews, and identify, track, and prioritize their requirements and expectations for service delivery.

    Gather requirements from VIP stakeholders

    1. Identify which stakeholders need to be consulted.
    2. Prioritize stakeholders in terms of influence and interest in order to identify who to engage in the requirements gathering process.
    3. Build a plan for gathering the requirements of key stakeholders in terms of VIP service delivery.
    4. Conduct requirements gathering and record the results of each stakeholder interaction.
    5. Analyze and summarize the results to determine the top expectations and requirements for VIP service desk support.

    If your organization does not have a defined requirements gathering process or template, leverage Info-Tech tools and templates:

    The Improve Requirements Gathering blueprint can be adapted from software requirements gathering to service desk.

    The PMO Requirements Gathering Tool can be adapted from interviewing stakeholders on their PMO requirements to service desk requirements.

    Info-Tech Insight

    Don’t guess at what your VIPs need or want – ask them and involve them in the service design. Many IT leaders sacrifice overall service quality to prioritize VIPs, thinking they expect immediate service. However, they later find out that the VIPs just assumed the service they were receiving was the standard service and many of their issues can wait.

    Identify additional challenges and opportunities by collecting perceptions of business users and stakeholders

    Formally measuring perceptions from your end users and key business stakeholders will help to inform your needs and determine how well the service desk is currently meeting demands from both VIP users and the entire user base.

    CIO Business Vision

    Info-Tech's CIO Business Vision program is a low-effort, high-impact program that will give you detailed report cards on the organization’s satisfaction with IT’s core services. Use these insights to understand your key business stakeholders, find out what is important to them, and improve your interactions.

    End User Satisfaction

    Info-Tech’s End User Satisfaction Program helps you measure end-user satisfaction and importance ratings of core IT services, IT communications, and business enablement to help you decide which IT service capabilities need to be addressed to meet the demands of the business.

    Learn more about Info-Tech’s CIO Business Vision or End User Satisfaction Program .

    Step 3: Choose the right approach

    Step overview:

    • Based on your assessment from Step 2, decide on the best way to move forward with your VIP service model.

    Use your assessment results to choose the most appropriate support model

    The table below is a rough guide for how the results of your assessments may line up to the most appropriate model for your organization:

    Example assessment results for: Dedicated service, prioritized service, and same servce based off of the assessment source: Ticket analysis, staffing analysis, or stakeholder.

    Info-Tech Insight

    If you’re in the position of deciding how to improve service to VIPs, it’s unlikely that you will end up choosing the “same service” model. If your data analysis tells you that you are currently meeting every metric target for all users, this may actually indicate that you’re overstaffed at the service desk.

    If you choose a specialized VIP support model, ensure there is a strong, defined need before moving forward

    Do not proceed if:

    • Your decision is purely reactive in response to a perceived need or challenges you’re currently experiencing
    • The demand is coming from a single dissatisfied executive without requirements from other VIPs being collected.
    • Your assessment data does not support the demand for a dedicated VIP function.
    • You don’t have the resources or support required to be successful in the approach.

    Proceed with a VIP model if:

    • You’re prepared to scale and support the model over the long term.
    • Business stakeholders have clearly expressed a need for improved VIP service.
    • Data shows that there is a high volume of urgent requests from VIPs.
    • You have the budget and resources required to support an enhanced VIP service delivery model.

    Step 4: Design the service offering

    Step overview:

    • Define and document all processes, procedures, and responsibilities relevant to the VIP support offering.

    Clearly define the service and eligible users

    Once you’ve decided on the most appropriate model, clearly describe the service and document who is eligible to receive it.

    1. Define exactly what the service is before going into the procedural details. High-level examples to start from are provided below:

    Prioritized Service Model

    When a designated VIP user contacts the service desk with a question, incident, or service request, their ticket will be prioritized over non-VIP tickets following the prioritization matrix. This process has been designed in accordance with business needs and requirements, as defined VIP users have more urgent demands on their time and the impact of downtime is greater as it has the potential to impact the business. However, all tickets, VIP tickets included, must still be prioritized by impact and urgency. Incidents that are more critical will still be resolved before VIP tickets in accordance with the prioritization process.

    Dedicated Service Model

    VIP support is a team of dedicated field technicians available to provide an elevated level of service including deskside support for executives and designated VIP users. VIP users have the ability to contact the VIP support service through a dedicated phone number and will receive expedited ticket handling and resolution by dedicated Tier 2 specialists with experience dealing with executives and their unique needs and requirements. This process has been designed in accordance with business needs and requirements.

    2 Identify VIP-eligible users

    • Define who qualifies as a VIP to receive VIP support or be eligible to contact the dedicated VIP service desk/concierge desk.
    • If other users or EAs can submit tickets on behalf of VIPs, identify those individuals as well.
    • Review the list and cut back if necessary. Less is usually more here, especially when starting out. If everyone is a VIP, then no one is truly a VIP.
    • Identify who maintains ownership over the list of eligible VIP users and how any changes to the list or requests for changes will be handled.
    • Ensure that all VIP-eligible users are clearly identified in the ITSM system.

    Map out the VIP process in a workflow

    Use a visual workflow to document the process for resolving or fulfilling VIP tickets, from when the ticket is submitted to when it gets closed.

    Your workflow should address the following:

    • How should the ticket be prioritized?
    • When are escalations necessary?
    • What happens if a user requests VIP service but is not defined as eligible?
    • Should the user verify that the issue is resolved before the ticket is closed?
    • What automatic notifications or communications need to go out and when?
    • What manual communications or notifications need to be sent out (e.g. when a ticket is escalated or reassigned)?
    VIP Support Process Example.

    Use the VIP Support Process Workflow Example as a template to map out your own process.

    Define and document all VIP processes and procedures

    Clearly describe the service and all related processes and procedures so that both the service delivery team and users are on the same page.

    Define all aspects of the service so that every VIP request will follow the same standardized process and VIPs will have clear expectations for the service they receive. This may include:

    • How VIPs should contact the service desk
    • How VIP tickets will be prioritized
    • SLAs and service expectations for VIP tickets
    • Ticket resolution or fulfillment steps and process
    • Escalation points and contacts
    • After-hours requests process

    If VIP user requests receive enhanced priority, for example, define exactly how those requests should be prioritized using your prioritization matrix. An example is found below and in the Service Desk VIP Procedures Template.

    Prioritization matrix for classification of incidents and requests.

    Use Info-Tech’s Service Desk VIP Procedures Template as a guide

    This template is designed to assist with documenting your service desk procedures for handling VIP or executive tickets. The template is not meant to cover all possible VIP support models but is an example of one support model only. It should be adapted and customized to reflect your specific support model and procedures.

    It includes the following sections:

    1. VIP support description/overview
    2. VIP support entitlement (who is eligible)
    3. Procedures
      • Ticket submission and triage
      • Ticket prioritization
      • SLAs and escalation
      • VIP ticket resolution process
      • After-hours requests
    4. Monitoring and reporting

    Download the Service Desk VIP Procedures Template

    Allocate resources or assign responsibilities specific to VIP support

    Regardless of the support model you choose, you’ll need to be clear on service desk agents’ responsibilities when dealing with VIP users.
    • Clarify the expectations of any service desk agent who will be handling VIP tickets; they should demonstrate excellent customer service skills and expertise, respect for the VIP and the sensitivity of their data, and prompt service.
    • Use a RACI chart to clarify responsibility and accountability for VIP-specific support tasks.
    • If you will be moving to a dedicated VIP support team, clearly define the responsibilities of any new roles or tasks. Sample responsibilities can be found on the right.
    • If you will be changing the role of an existing service desk agent to become focused solely on providing VIP support, clarify how the responsibilities of other service desk agents may change too, if at all.
    • Be clear on expectations of agents for after-hours support, especially if there will be a change to the current service provision.

    Sample responsibilities for a dedicated VIP support technician/specialist may include:

    • Resolve support tickets for all eligible VIP users following established processes and procedures.
    • Provide both onsite and remote support to executives.
    • Quickly and effectively diagnose and resolve technical issues with minimal disruption to the executive team.
    • Establish trust with executives/VIPs by maintaining confidentiality and privacy while providing technical support.
    • Set up, monitor, and support high-priority meetings, conferences, and events.
    • Demonstrate excellent communication and customer service skills when providing support to executives.
    • Coordinate more complex support issues with higher level support staff and track tickets through to resolution when needed.
    • Learn new technology and software ahead of implementation to train and support executive teams for use.
    • Conduct individual or group training as needed to educate on applications or how to best use technology to enhance productivity.
    • Proactively manage, maintain, update, and upgrade end-user devices as needed.

    Configure your ITSM tool to support your processes

    Configure your tool to support your processes, not the other way around.
    • Identify and configure VIP users in the system to ensure that they are easily identifiable in the system (e.g. there may be a symbol beside their name).
    • Configure automations or build ticket templates that would automatically set the urgency or priority of VIP tickets.
    • Configure any business rules or workflows that apply to the VIP support process.
    • Define any automated notifications that need to be sent when a VIP ticket is submitted, assigned, escalated, or resolved (e.g. notify service desk manager or a specific DL).
    • Define metrics and customize dashboards and reports to monitor VIP tickets and measure the success of the VIP service.
    • Configure any SLAs that apply only to VIPs to ensure displayed SLAs are accurate.

    Step 5: Launch the service

    Step overview:

    • Communicate and market the service to all relevant stakeholders so everyone is on the same page as to how it works and what’s in scope.

    Communicate the new or revised service to relevant stakeholders ahead of the launch

    If you did your due diligence, the VIP service launch won’t be a surprise to executives. However, it’s critical to

    continue the engagement and communicate the details of the service well to ensure there are no misperceptions about the

    service when it launches.

    Goals of communicating and marketing the service:

    1. Create awareness and understanding of the purpose of the VIP service and what it means for eligible users.
    2. Solidify commitment and buy-in for the service from all stakeholders.
    3. Ensure that all users know how to access the service and any changes to the way they should interact with the service desk.
    4. Set expectations for new/revised service levels.
    5. Reduce and address any concerns about the change in process.

    Info-Tech Insight

    This step isn’t only for the launch of new services. Even if you’re enhancing or right-sizing an existing VIP service, take the opportunity to market the improvements, remind users of the correct processes, and collect feedback.

    Leverage Info-Tech’s communication template to structure your presentation

    This template can be customized to use as an executive presentation to communicate and market the service to VIP users. It includes:

    • Key takeaways
    • Current-state assessment
    • Requirements gathering and feedback results
    • Objectives for the service
    • Anticipated benefits
    • Service entitlement
    • How the service works
    • Escalations and feedback contacts
    • Timeline of next steps

    Info-Tech Insight

    If you’re launching a dedicated concierge service for VIPs, highlight the exclusivity of the service in your marketing to draw users in. For example, if eligible VIPs get a separate number to call, expedited SLAs, or access to more tenured service desk experts, promote this added value of the service.

    Download the VIP Support Service Communication Template

    Step 6: Monitor and measure

    Step overview:

    • Measure and monitor the success of the program by tracking and reporting on targeted metrics.

    Evaluate and demonstrate the success of the program with key metrics

    Targeted metrics to evaluate the success of the VIP program will be critical to understanding and demonstrating whether the service is delivering the intended value. Track key metrics to:

    • Track if and how well you’re meeting your defined SLAs for VIP support.
    • Measure demand for VIP support (i.e. ticket volume and types of tickets) and evaluate against resource supply to determine whether a staffing adjustment is needed to meet demand.
    • Measure the cost of providing the VIP service in order to report back to executives.
    • Leverage real data to quantitatively demonstrate that you’re providing enhanced service to VIPs if there is an escalation or negative feedback from one individual.
    • Monitor service delivery to non-VIP users to ensure that service to the rest of the organization isn’t impacted by the VIP service
    • Evaluate the types of ticket that are submitted to the VIP service to inform training plans, self-service options, device upgrades, or alternatives to reduce future volume.

    Info-Tech Insight

    If your data definitively shows the VIP offering delivers enhanced service levels, publish these results to business leadership. A successful VIP service is a great accomplishment to market and build credibility for the service desk.

    Tie metrics to critical success factors

    Apart from your regular service desk metrics, identify the top metrics to tie to the key performance indicators of the program’s success factors.

    Sample Critical Success Factors

    • Increased executive satisfaction with the service desk
    • Improved response and resolution times to VIP tickets
    • Demand for the service is matched by supply

    Sample Metrics

    • End-user satisfaction scores on VIP tickets
    • Executive satisfaction with the service desk as measured on a broader annual survey
    • Response and resolution times for VIP tickets
    • Percentage of SLAs met for VIP tickets
    • VIP ticket volume
    • Average speed of answer for VIP calls

    Download Define Service Desk Metrics that Matter and the Service Desk Metrics Workbook for help defining CSFs, KPIs, and key metrics

    Step 7: Continually improve

    Step overview:

    • Continually evaluate the program to identify opportunities for improvement or modifications to the service support model.

    Continually evaluate the service to identify improvements

    Executives are happy, resolution times are on target – now what? Even if everything seems to be working well, never stop monitoring, measuring, and evaluating the service. Not only can metrics change, but there can also always be ways to improve service.

    • Continual improvement should be a mindset – there are always opportunities for improvement, and someone should be responsible for identifying and tracking these opportunities so that they actually get done.
    • Just as you asked for feedback and involvement from VIPs (and their assistants who may submit tickets on their behalf) in designing the service, you should continually collect that feedback and use it to inform improvements to the service.
    • End-user satisfaction surveys, especially broader, more targeted surveys, are also a great source of improvement ideas.
    • Even if end users don’t perceive any need for improvement, IT should still assess how they can make their own processes more efficient or offer alternatives to make delivery easier.

    Download Info-Tech’s Build a Continual Improvement Program blueprint to help you build a process around continual improvement, and use the Continual Improvement Register tool to help you identify and prioritize improvement initiatives.

    Info-Tech Insight

    Don’t limit your continual improvement efforts to the VIP service. Once you’ve successfully elevated the VIP service, look to how you can apply elements of that service to elevate support to the rest of the organization. For example, through providing a roaming service desk, a concierge desk, a Genius-Bar-style walk-in service, etc.

    Expand, reduce, or modify as needed

    Don’t stop with a one-time program evaluation. Continually use your metrics to evaluate whether the service offering needs to change to better suit the needs of your executives and organization. It may be fine as is, or you may find you need to do one of the following:

    Expand

    • If the service offering has been successful and/or your data shows underuse of VIP-dedicated resources, you may be able to expand the offering to identify additional roles as VIP-eligible.
    • Be cautious not to expand the service too widely; not only should it feel exclusive to VIPs, but you need to be able to support it.
    • Also consider whether elements that have been successful in the VIP program (e.g. a concierge desk, after-hours support) should be expanded to be offered to non-VIPs.

    Reduce

    • If VIPs are not using the service as much as anticipated or data shows supply outweighs demand, you may consider scaling back the service to save costs and resources.
    • However, be careful in how you approach this – it shouldn’t negatively impact service to existing users.
    • Rather, evaluate costly services like after-hours support and whether it’s necessary based on demand, adjust SLAs if needed, or reallocate service desk resources or responsibilities. For example, if demand doesn’t justify a dedicated service desk technician, either add non-VIP tasks to their responsibilities or consider moving to a prioritized model.

    Modify

    • The support model doesn’t need to be set in stone. If elements aren’t working, change them! If the entire support model isn’t working, reevaluate if it’s the best model for your organization.
    • Don’t make decisions in a vacuum, though. Just as executives were involved in decision-making at the outset, continually gather their feedback and use it to inform the service design.

    Related Info-Tech Research

    Standardize the Service Desk

    This project will help you build and improve essential service desk processes, including incident management, request fulfillment, and knowledge management to create a sustainable service desk.

    Optimize the Service Desk With a Shift-Left Strategy

    This project will help you build a strategy to shift service support left to optimize your service desk operations and increase end-user satisfaction.

    Build a Continual Improvement Plan

    This project will help you build a continual improvement plan for the service desk to review key processes and services and manage the progress of improvement initiatives.

    Deliver a Customer Service Training Program to Your IT Department

    This project will help you deliver a targeted customer service training program to your IT team to enhance their customer service skills when dealing with end users, improve overall service delivery, and increase customer satisfaction.

    Works Cited

    Munger, Nate. “Why You Should Provide VIP Customer Support.” Intercom, 13 Jan. 2016. Accessed Jan. 2023.

    Ogilvie, Ryan. “We Did Away With VIP Support and Got More Efficient.” HDI, 17 Sep. 2020. Accessed Jan. 2023.

    Effective IT Communications

    • Buy Link or Shortcode: {j2store}429|cart{/j2store}
    • member rating overall impact (scale of 10): N/A
    • member rating average dollars saved: N/A
    • member rating average days saved: N/A
    • Parent Category Name: Lead
    • Parent Category Link: /lead

    IT communications are often considered ineffective. This is demonstrated by:

    • A lack of inclusion or time to present in board meetings.
    • Confusion around IT priorities and how they align to organizational objectives.
    • Segregating IT from the rest of the organization.
    • The inability to secure the necessary funding for IT-led initiatives.
    • IT employees not feeling supported or engaged.

    Our Advice

    Critical Insight

    • No one is born a good communicator. Every IT employee needs to spend the time and effort to grow their communication skills; with constant change and worsening IT crises, IT cannot afford to communicate poorly anymore.
    • The skills needed to communicate effectively as a front=line employee or CIO are the same. It is important to begin the development of these skills from the beginning of one's career.
    • Time is a non-renewable resource. Any communication needs to be considered valuable and engaging by the audience or they will be unforgiving.

    Impact and Result

    Communications is a responsibility of all members of IT. This is demonstrated through:

    • Engaging in two-way communications that are continuous and evolving.
    • Establishing a communications strategy – and following the plan.
    • Increasing the skills of all IT employees when it comes to communications.
    • Identifying audiences and their preferred means of communication.

    Effective IT Communications Research & Tools

    Besides the small introduction, subscribers and consulting clients within this management domain have access to:

    1. Effective IT Communications Capstone Deck – A resource center to ensure you never start communications from a blank page again.

    This capstone blueprint highlights the components, best practices, and importance of good communication for all IT employees.

    • Effective IT Communications Storyboard

    2. IT Townhall Template – A ready-to-use template to help you engage with IT employees and ensure consistent access to information.

    IT town halls must deliver value to employees, or they will withdraw and miss key messages. To engage employees, use well-crafted communications in an event that includes crowd-sourced contents, peer involvement, recognition, significant Q&A time allotment, organizational discussions, and goal alignment.

    • IT Townhall Template

    3. IT Year in Review Template – A ready-to-use template to help communicate IT successes and future objectives.

    This template provides a framework to build your own IT Year In Review presentation. An IT Year In Review presentation typically covers the major accomplishments, challenges, and initiatives of an organization's information technology (IT) department over the past year.

    • IT Year in Review Template

    Infographic

    Further reading

    Effective IT Communications

    Empower IT employees to communicate well with any stakeholder across the organization.

    Analyst perspective

    There has never been an expectation for IT to communicate well.

    Brittany Lutes

    Brittany Lutes
    Research Director
    Info-Tech Research Group

    Diana MacPherson

    Diana MacPherson
    Senior Research Analyst
    Info-Tech Research Group

    IT rarely engages in proper communications. We speak at, inform, or tell our audience what we believe to be important. But true communications seldom take place.

    Communications only occur when channels are created to ensure the continuous opportunity to obtain two-way feedback. It is a skill that is developed over time, with no individual having an innate ability to be better at communications. Each person in IT needs to work toward developing their personal communications style. The problem is we rarely invest in development or training related to communications. Information and technology fields spend time and money developing hard skills within IT, not soft ones.

    The benefits associated with communications are immense: higher business satisfaction, funding for IT initiatives, increased employee engagement, better IT to business alignment, and the general ability to form ongoing partnerships with stakeholders. So, for IT departments looking to obtain these benefits through true communications, develop the necessary skills.

    Executive summary

    Your Challenge Common Obstacles Info-Tech’s Approach
    IT communications are often considered ineffective. This is demonstrated by:
    • A lack of inclusion or time to present in board meetings.
    • Confusion around IT priorities and how they align to organizational objectives.
    • Segregating IT from the rest of the organization.
    • An inability to secure the necessary funding for IT-led initiatives.
    • IT employees not feeling supported or engaged.
    Frequently, these barriers have prevented IT communications from being effective:
    • Using technical jargon when a universal language is needed.
    • Speaking at organization stakeholders rather than engaging through dialogue.
    • Understanding the needs of the audience.
    Overall, IT has not been expected to engage in good communications or taken a proactive approach to communicate effectively.
    Communications is a responsibility of all members of IT. This is demonstrated through:
    • Engaging in two-way communications that are continuous and evolving.
    • Establishing a communications strategy – and following the plan.
    • Increasing the skills of all IT employees when it comes to communications.
    • Identifying audiences and their preferred means of communication.

    Info-Tech Insight
    No one is born a good communicator. Every IT employee needs to spend the time and effort to grow their communication skills as constant change and worsening IT crises mean that IT cannot afford to communicate poorly anymore.

    Your challenge

    Overall satisfaction with IT is correlated to satisfaction with IT communications

    Chart showing satisfaction with it and communications

    The bottom line? For every 10% increase in communications there 8.6% increase in overall IT satisfaction. Therefore, when IT communicates with the organization, stakeholders are more likely to be satisfied with IT overall.

    Info-Tech Diagnostic Programs, N=330 organizations

    IT struggles to communicate effectively with the organization:

    • CIOs are given minimal time to present to the board or executive leaders about IT’s value and alignment to business goals.
    • IT initiatives are considered complicated and confusing.
    • The frequency and impact of IT crises are under planned for, making communications more difficult during a major incident.
    • IT managers do not have the skills to communicate effectively with their team.
    • IT employees do not have the skills to communicate effectively with one another and end users.

    Common obstacles

    IT is prevented from communicating effectively due to these barriers:

    • Difficulty assessing the needs of the audience to inform the language and means of communication that should be used.
    • Using technical jargon rather than translating the communication into commonly understood terms.
    • Not receiving the training required to develop communication skills across IT employees.
    • Frequently speak at organization stakeholders rather than engaging through dialogue.
    • Beginning many communications from a blank page, especially crisis communications.
    • Difficulty presenting complex concepts in a short time to an audience in a digestible and concise manner without diluting the point.

    Effective IT communications are rare:

    53% of CXOs believe poor communication between business and IT is a barrier to innovation.
    Source: Info-Tech CEO-CIO Alignment Survey, 2022

    69% of those in management positions don’t feel comfortable even communicating with their staff.”
    Source: TeamStage, 2022

    Info-Tech’s approach

    Effective communications is not a broadcast but a dialogue between communicator and audience in a continuous feedback loop.

    Continuous loop of dialogue

    The Info-Tech difference:

    1. Always treat every communication as a dialogue, enabling the receiver of the message to raise questions, concerns, or ideas.
    2. Different audiences will require different communications. Be sure to cater the communication to the needs of the receiver(s).
    3. Never assume the communication was effective. Create measures and adjust the communications to get the desired outcome.

    Common IT communications

    And the less common but still important communications

    Communicating Up to Board or Executives

    • Board Presentations
    • Executive Leadership Committee Meetings
    • Technology Updates
    • Budget Updates
    • Risk Updates
    • Year in Review

    Communicating Across the Organization

    • Townhalls – external to IT
    • Year in Review
    • Crisis Email
    • Intranet Communication
    • Customer/Constituent Requests for Information
    • Product Launches
    • Email
    • Watercooler Chat

    Communicating Within IT

    • Townhalls – internal to IT
    • Employee 1:1s
    • Team Meetings
    • Project Updates
    • Project Collaboration Sessions
    • Year in Review
    • All-Hands Meeting
    • Employee Interview
    • Onboarding Documentation
    • Vendor Negotiation Meetings
    • Vendor Product Meetings
    • Email
    • Watercooler Chat

    Insight Summary

    Overarching insight
    IT cannot afford to communicate poorly given the overwhelming impact and frequency of change related to technology. Learn to communicate well or get out of the way of someone who can.

    Insight 1: The skills needed to communicate effectively as a frontline employee or a CIO are the same. It’s important to begin the development of these skills from the beginning of one’s career.
    Insight 2: Time is a non-renewable resource. Any communication needs to be considered valuable and engaging by the audience or they will be unforgiving.
    Insight 3: Don’t make data your star. It is a supporting character. People can argue about the collection methods or interpretation of the data, but they cannot argue the story you share.
    Insight 4: Measure if the communication is being received and resulting in the desired outcome. If not, modify what and how the message is being expressed.
    Insight 5: Messages are also non-verbal. Practice using your voice and body to set the right tone and impact your audience.

    Communication principles

    Follow these principles to support all IT communications.

    Two-Way

    Incorporate feedback loops into your communication efforts. Providing stakeholders with the opportunity to voice their opinions and ideas will help gain their commitment and buy-in.

    Timely

    Frequent communications mitigate rumors and the spread of misinformation. Provide warning before the implementation of any changes whenever possible. Communicate as soon as possible after decisions have been made.

    Consistent

    Make sure the messaging is consistent across departments, mediums, and presenters. Provide managers with key phrases to support the consistency of messages.

    Open & Honest

    Transparency is a critical component of communication. Always tell employees that you will share information as soon as you can. This may not be as soon as you receive the information but as soon as sharing it is acceptable.

    Authentic

    Write messages in a way that embodies the personality of the organization. Don’t spin information; position it within the wider organizational context.

    Targeted

    Use your target audience profiles to determine which audiences need to consume which messages and what mediums should be employed.

    Importance of IT being a good communicator

    Don’t pay the price for poor communication.

    IT needs to communicate well because:

    • IT risk mitigation and technology initiative funding are dependent on critical stakeholders comprehending the risk impact and initiative benefit in easy-to-understand terms.
    • IT employees need clear and direct information to feel empowered and accountable to do their jobs well.
    • End users who have a good experience engaging in communications with IT employees have an overall increase in satisfaction with IT.
    • Continuously demonstrating IT’s value to the organization comes when those initiatives are clearly aligned to overall objectives.
    • Communication prevents assumptions and further miscommunication from happening among IT employees who are usually impacted and fear change the most.

    “Poor communication results in employee misunderstanding and errors that cost approximately $37 billion.”
    – Intranet Connections, 2019

    Effective communication enables organizational strategy and facilitates a two-way exchange

    Effective communication facilitates a two-way exchange

    What makes internal communications effective?

    To be effective, internal communications must be strategic. They should directly support organizational objectives, reinforce key messages to make sure they drive action, and facilitate two-way dialogue, not just one-way messaging.

    Measure the value of the communication

    Communication effectiveness can be measured through a variety of metrics:

    • Increase in Productivity
    • “When employees are offered better communication technology and skills, productivity can increase by up to 30%” (Expert Market, 2022).
    • Increase in Understanding Decision Rationale
    • Employees who report understanding the rationale behind the business decisions made by the executive leadership team (ELT) are 3.6x more likely to be engaged, compared to those who were not (McLean & Company Engagement Survey Database, 2022; N=133,167 responses, 187 organizations).
    • Increase in Revenue
    • Collaboration amongst C-suite executives led to a 27% increase in revenue compared to low collaborating C-suites (IBM, 2021).
    • Increase in End-User Satisfaction
    • 80.9% of end users are satisfied with IT’s ability to communicate with them regarding the information they need to perform their job (Info-Tech’s End-User Satisfaction Survey Database, N=20,617 end users from 126 organizations).

    Methods to determine effectiveness:

    • CIO Business Vision Survey
    • Engagement surveys
    • Focus groups
    • Suggestion boxes
    • Team meetings
    • Random sampling
    • Informal feedback
    • Direct feedback
    • Audience body language
    • Repeating the message back

    How to navigate the research center

    This research center is intended to ensure that IT never starts their communications from a blank page again:

    Tools to help IT be better communicators

    “‘Effectiveness’ can mean different things, and effectiveness for your project is going to look different than it would for any other project.”
    – Gale McCreary in WikiHow, 2022

    Audience: Organizational leadership

    Speaking with Board and executive leaders about strategy, risk, and value

    Keep in mind:

    1 2 3
    Priorities Differ Words Matter The Power of Three
    What’s important to you as CIO is very different from what is important to a board or executive leadership team or even the individual members of these groups. Share only what is important or relevant to the stakeholder(s). Simplify the message into common language whenever possible. A good test is to ensure that someone without any technical background could understand the message. Keep every slide to three points with no more than three words. You are the one to translate this information into a worth-while story to share.

    “Today’s CIOs have a story to tell. They must change the old narrative and describe the art of the (newly) possible. A great leader rises to the occasion and shares a vision that inspires the entire organization.”
    – Dan Roberts, CIO, 2019

    Communications for board presentations

    Secure funding and demonstrate IT as a value add to business objectives.

    DEFINING INSIGHT

    Stop presenting what is important to you as the CIO and present to the board what is important to them.

    Why does IT need to communicate with the board?

    • To get their buy-in and funding for critical IT initiatives.
    • To ensure that IT risks are understood and receive the funding necessary to mitigate.
    • To change the narrative of IT as a service provider to a business enabler.

    FRAMEWORK

    Framework for board presentations

    CHECKLIST

    Do’s & Don’ts of Communicating Board Presentations:

    Do: Ensure you know all the members of the board and their strengths/areas of focus.

    Do: Ensure the IT objectives and initiatives align to the business objectives.

    Do: Avoid using any technical jargon.

    Do: Limit the amount of data you are using to present information. If it can’t stand alone, it isn’t a strong enough data point.

    Do: Avoid providing IT service metrics or other operational statistics.

    Do: Demonstrate how the organization’s revenue is impacted by IT activities.

    Do: Tell a story that is compelling and excited.

    OUTCOME

    Organization Alignment

    • Approved organization objectives and IT objectives are aligned and supporting one another.

    Stakeholder Buy-In

    • Board members all understand what the future state of IT will look like – and are excited for it!

    Awareness on Technology Trends

    • It is the responsibility of the CIO to ensure the board is aware of critical technology trends that can impact the future of the organization/industry.

    Risks

    • Risks are understood, the impact they could have on the organization is clear, and the necessary controls required to mitigate the risk are funded.

    Communications for business updates

    Continuously build strong relationships with all members of business leadership.

    DEFINING INSIGHT

    Business leaders care about themselves and their goals – present ideas and initiatives that lean into this self-interest.

    Why does IT need to communicate business updates?

    • The key element here is to highlight how IT is impacting the organization’s overall ability to meet goals and targets.
    • Ensure all executive leaders know about and understand IT’s upcoming initiatives – and how they will be involved.

    FRAMEWORK

    Framework for business updates

    CHECKLIST

    Do’s & Don’ts of Communicating Business Updates:

    Do: Ensure IT is given sufficient time to present with the rest of the business leaders.

    Do: Ensure the goals of IT are clear and can be depicted visually.

    Do: Tie every IT goal to the objectives of different business leaders.

    Do: Avoid using any technical jargon.

    Do: Reinforce the positive benefits business leaders can expect.

    Do: Avoid providing IT service metrics or other operational statistics.

    Do: Demonstrate how IT is driving the digital transformation of the organization.

    OUTCOME

    Better Reputation

    • Get other business leaders to see IT as a value add to any initiative, making IT an enabler not an order taker.

    Executive Buy-In

    • Executives are concerned about their own budgets; they want to embrace all the innovation but within reason and minimal impact to their own finances.

    Digital Transformation

    • Indicate and commit to how IT can help the different leaders deliver on their digital transformation activities.

    Relationship Building

    • Establish trust with the different leaders so they want to engage with you on a regular basis.

    Audience: Organization wide

    Speaking with all members of the organization about the future of technology – and unexpected crises.

    1 2 3
    Competing to Be Heard Measure Impact Enhance the IT Brand
    IT messages are often competing with a variety of other communications simultaneously taking place in the organization. Avoid the information-overload paradox by communicating necessary, timely, and relevant information. Don’t underestimate the benefit of qualitative feedback that comes from talking to people within the organization. Ensure they read/heard and absorbed the communication. IT might be a business enabler, but if it is never communicated as such to the organization, it will only be seen as a support function. Use purposeful communications to change the IT narrative.

    Less than 50% of internal communications lean on a proper framework to support their communication activities.
    – Philip Nunn, iabc, 2020

    Communications for strategic IT initiatives

    Communicate IT’s strategic objectives with all business stakeholders and users.

    DEFINING INSIGHT

    IT leaders struggle to communicate how the IT strategy is aligned to the overall business objectives using a common language understood by all.

    Why does IT need to communicate its strategic objectives?

    • To ensure a clear and consistent view of IT strategic objectives can be understood by all stakeholders within the organization.
    • To demonstrate that IT strategic objectives are aligned with the overall mission and vision of the organization.

    FRAMEWORK

    Framework for IT strategic initiatives

    CHECKLIST

    Do’s & Don’ts of Communicating IT Strategic Objectives:

    Do: Ensure all IT leaders are aware of and understand the objectives in the IT strategy.

    Do: Ensure there is a visual representation of IT’s goals.

    Do: Ensure the IT objectives and initiatives align to the business objectives.

    Do: Avoid using any technical jargon.

    Do: Provide metrics if they are relevant, timely, and immediately understandable.

    Do: Avoid providing IT service metrics or other operational statistics.

    Do: Demonstrate how the future of the organization will benefit from IT initiatives.

    OUTCOME

    Organization Alignment

    • All employees recognize the IT strategy as being aligned, even embedded, into the overall organization strategy.

    Stakeholder Buy-In

    • Business and IT stakeholders alike understand what the future state of IT will look like – and are excited for it!

    Role Clarity

    • Employees within IT are clear on how their day-to-day activities impact the overall objectives of the organization.

    Demonstrate Growth

    • Focus on where IT is going to be maturing in the coming one to two years and how this will benefit all employees.

    Communications for crisis management

    Minimize the fear and chaos with transparent communications.

    DEFINING INSIGHT

    A crisis communication should fit onto a sticky note. If it’s not clear, concise, and reassuring, it won’t be effectively understood by the audience.

    Why does IT need to communicate when a crisis occurs?

    • To ensure all members of the organization have an understanding of what the crisis is, how impactful that crisis is, and when they can expect more information.
    • “Half of US companies don’t have a crisis communication plan” (CIO, 2017).

    FRAMEWORK

    Framework for crisis management

    CHECKLIST

    Do’s & Don’ts of Communicating During a Crisis:

    Do: Provide timely and regular updates about the crisis to all stakeholders.

    Do: Involve the Board or ELT immediately for transparency.

    Do: Avoid providing too much information in a crisis communication.

    Do: Have crisis communication statements ready to be shared at any time for possible or common IT crises.

    Do: Highlight that employee safety and wellbeing is top priority.

    Do: Work with members of the public relations team to prepare any external communications that might be required.

    OUTCOME

    Ready to Act

    • Holding statements for possible crises will eliminate the time and effort required when the crisis does occur.

    Reduce Fears

    • Prevent employees from spreading concerns and not feeling included in the crisis.

    Maintain Trust

    • Ensure Board and ELT members trust IT to respond in an appropriate manner to any crisis or major incident.

    Eliminate Negative Reactions

    • Any crisis communication should be clear and concise enough when done via email.

    Audience: IT employees

    IT employees need to receive and obtain regular transparent communications to better deliver on their expectations.

    Keep in mind:

    1 2 3
    Training for All Listening Is Critical Reinforce Collaboration
    From the service desk technician to CIO, every person within IT needs to have a basic ability to communicate. Invest in the training necessary to develop this skill set. It seems simple, but as humans we do an innately poor job at listening to others. It’s important you hear employee concerns, feedback, and recommendations, enabling the two-way aspect of communication. IT employees will reflect the types of communications they see. If IT leaders and managers cannot collaborate together, then teams will also struggle, leading to productivity and quality losses.

    “IT professionals who […] enroll in communications training have a chance to both upgrade their professional capabilities and set themselves apart in a crowded field of technology specialists.”
    – Mark Schlesinger, Forbes, 2021

    Communications for IT activities and tactics

    Get IT employees aligned and clear on their daily objectives.

    DEFINING INSIGHT

    Depending on IT goals, the structure might need to change to support better communication among IT employees.

    Why does IT need to communicate IT activities?

    • To ensure all members of the project team are aligned with their tasks and responsibilities related to the project.
    • To be able to identify, track, and mitigate any problems that are preventing the successful delivery of the project.

    FRAMEWORK

    Framework for IT activities & tactics

    CHECKLIST

    Do’s & Don’ts of Communicating IT Activities:

    Do: Provide metrics that define how success of the project will be measured.

    Do: Demonstrate how each project aligns to the overarching objectives of the organization.

    Do: Avoid having large meetings that include stakeholders from two or more projects.

    Do: Consistently create a safe space for employees to communicate risks related to the project(s).

    Do: Ensure the right tools are being leveraged for in-office, hybrid, and virtual environments to support project collaboration.

    Do: Leverage a project management software to reduce unnecessary communications.

    OUTCOME

    Stakeholder Adoption

    • Create a standard communication template so stakeholders can easily find and apply communications.

    Resource Allocation

    • Understand what the various asks of IT are so employees can be adequately assigned to tasks.

    Meet Responsibly

    • Project status meetings are rarely valuable or insightful. Use meetings for collaboration, troubleshooting, and knowledge sharing.

    Encourage Engagement

    • Recognize employees and their work against critical milestones, especially for projects that have a long timeline.

    Communications for everyday IT

    Engage employees and drive results with clear and consistent communications.

    DEFINING INSIGHT

    Employees are looking for empathy to be demonstrated by those they are interacting with, from their peers to managers. Yet, we rarely provide it.

    Why does IT need to communicate on regularly with itself?

    • Regular communication ensures employees are valued, empowered, and clear about their expectations.
    • 97% of employees believe that their ability to perform their tasks efficiently is impacted by communication (Expert Market, 2022).

    FRAMEWORK

    Framework for everyday IT

    CHECKLIST

    Do’s & Don’ts of Communicating within IT:

    Do: Have responses for likely questions prepared and ready to go.

    Do: Ensure that all leaders are sharing the same messages with their teams.

    Do: Avoid providing irrelevant or confusing information.

    Do: Speak with your team on a regular basis.

    Do: Reinforce the messages of the organization every chance possible.

    Do: Ensure employees feel empowered to do their jobs effectively.

    Do: Engage employees in dialogue. The worst employee experience is when they are only spoken at, not engaged with.

    OUTCOME

    Increased Collaboration

    • Operating in a vacuum or silo is no longer an option. Enable employees to successfully collaborate and deliver holistic results.

    Role Clarity

    • Clear expectations and responsibilities eliminate confusion and blame game. Engage employees and create a positive work culture with role clarity.

    Prevent Rumors

    • Inconsistent communication often leads to information sharing and employees spreading an (in)accurate narrative.

    Organizational Insight

    • Employees trust the organization’s direction because they are aware of the different activities taking place and provided with a rationale about decisions.

    Case Study

    Amazon

    INDUSTRY
    E-Commerce

    SOURCE
    Harvard Business Review

    Jeff Bezos has definitely taken on unorthodox approaches to business and leadership, but one that many might not know about is his approach to communication. Some of the key elements that he focused on in the early 2000s when Amazon was becoming a multi-billion-dollar empire included:

    • Banning PowerPoint for all members of the leadership team. They had to learn to communicate without the crutch of the most commonly used presentation tool.
    • Leveraging memos that included specific action steps and clear nouns
    • Reducing all communication to an eighth-grade reading level, including pitches for new products (e.g. Kindle).

    Results

    While he was creating the Amazon empire, 85% of Jeff Bezos’ communication was written in a way that an eighth grader could read. Communicating in a way that was easy to understand and encouraging his leadership team to do so as well is one of the many reasons this business has grown to an estimated value of over $800B.

    “If you cannot simplify a message and communicate it compellingly, believe me, you cannot get the masses to follow you.”
    – Indra Nooyi, in Harvard Business Review, 2022

    Communication competency expectations

    Communication is a business skill; not a technical skill.

    Demonstrated Communication Behavior
    Level 1: Follow Has sufficient communication skills for effective dialogue with others.
    Level 2: Assist Has sufficient communication skills for effective dialogue with customers, suppliers, and partners.
    Level 3: Apply Demonstrates effective communication skills.
    Level 4: Enable Communicates fluently, orally, and in writing and can present complex information to both technical and non-technical audiences.
    Level 5: Ensure, Advise Communicates effectively both formally and informally.
    Level 6: Initiate, Influence Communicates effectively at all levels to both technical and non-technical audiences.
    Level 7: Set Strategy, Inspire, Mobilize Understands, explains, and presents complex ideas to audiences at all levels in a persuasive and convincing manner.

    Source: Skills Framework for the Information Age, 2021

    Key KPIs for communication with any stakeholder

    Measuring communication is hard; use these to determine effectiveness.

    Goal Key Performance Indicator (KPI) Related Resource
    Obtain board buy-in for IT strategic initiatives X% of IT initiatives that were approved to be funded. Number of times technical initiatives were asked to be explained further. Using our Board Presentation Review service
    Establish stronger relationships with executive leaders X% of business leadership satisfied with the statement “IT communicates with your group effectively.” Using the CIO Business Vision Diagnostic
    Organizationally, people know what products and services IT provides X% of end users who are satisfied with communications around changing services or applications. Using the End-User Satisfaction Survey
    Organizational reach and understanding of the crisis. Number of follow-up tickets or requests related to the crisis after the initial crisis communication was sent. Using templates and tools for crisis communications
    Project stakeholders receive sufficient communication throughout the initiative. X% overall satisfaction with the quality of the project communications. Using the PPM Customer Satisfaction Diagnostic
    Employee feedback is provided, heard, and acted on X% of satisfaction employees have with managers or IT leadership to act on employee feedback. Using the Employee Engagement Diagnostic Program

    Standard workshop communication activities

    Introduction
    Communications overview.

    Plan
    Plan your communications using a strategic tool.

    Compose
    Create your own message.

    Deliver
    Practice delivering your own message.

    Contact your account representative for more information. workshops@infotech.com 1-888-670-8889

    Research contributors and experts

    Anuja Agrawal, National Communications Director, PwC

    Anuja Agrawal
    National Communications Director
    PwC

    Anuja is an accomplished global communications professional, with extensive experience in the insurance, banking, financial, and professional services industries in Asia, the US, and Canada. She is currently the National Communications Director at PwC Canada. Her prior work experience includes communication leadership roles at Deutsche Bank, GE, Aviva, and Veritas. Anuja works closely with senior business leaders and key stakeholders to deliver measurable results and effective change and culture building programs. Anuja has experience in both internal and external communications, including strategic leadership communication, employee engagement, PR and media management, digital and social media, and M&A/change and crisis management. Anuja believes in leveraging digital tools and technology-enabled solutions, combined with in-person engagement, to help improve the quality of dialogue and increase interactive communication within the organization to help build an inclusive culture of belonging.

    Nastaran Bisheban, Chief Technology Officer, KFC Canada

    Nastaran Bisheban
    Chief Technology Officer
    KFC Canada

    A passionate technologist, and seasoned transformational leader. A software engineer and computer scientist by education, a certified Project Manager that holds an MBA in Leadership with Honors and Distinction from University of Liverpool. A public speaker on various disciplines of technology and data strategy with a Harvard Business School executive leadership program training to round it all. Challenges status quo and conventional practices; is an advocate for taking calculated risk and following the principle of continuous improvement. With multiple computer software and project management publications she is a strategic mentor and board member on various non-profit organizations. Nastaran sees the world as a better place only when everyone has a seat at the table and is an active advocate for diversity and inclusion.

    Heidi Davidson, Co-Founder & CEO, Galvanize Worldwide and Galvanize On Demand

    Heidi Davidson
    Co-Founder & CEO
    Galvanize Worldwide and Galvanize On Demand

    Dr. Heidi Davidson is the co-founder and CEO of Galvanize Worldwide, the largest distributed network of marketing and communications experts in the world. She also is the co-founder and CEO of Galvanize On Demand, a tech platform that matches marketing and communications freelancers with client projects. Now with 167 active experts, the Galvanize team delivers startup advisory work, outsourced marketing, training, and crisis communications to organizations of all sizes. Before Galvanize, Heidi spent four years as part of the turnaround team at BlackBerry as the Chief Communications Officer and SVP of Corporate Marketing, where she helped the company move from a device manufacturer to a security software provider.

    Eli Gladstone, Co-Founder, Speaker Labs

    Eli Gladstone
    Co-Founder
    Speaker Labs

    Eli is a co-founder of Speaker Labs. He has spent over six years helping countless individuals overcome their public speaking fears and communicate with clarity and confidence. When he’s not coaching others on how to build and deliver the perfect presentation, you’ll probably find him reading some weird books, teaching his kids how to ski or play tennis, or trying to develop a good-enough jumpshot to avoid being a liability on the basketball court.

    Francisco Mahfuz, Keynote Speaker & Storytelling Coach

    Francisco Mahfuz
    Keynote Speaker & Storytelling Coach

    Francisco Mahfuz has been telling stories in front of audiences for a decade and even became a National Champion of public speaking. Today, Francisco is a keynote speaker and storytelling coach and offers communication training to individuals and international organizations and has worked with organizations like Pepsi, HP, the United Nations, Santander, and Cornell University. He’s the author of Bare: A Guide to Brutally Honest Public Speaking and the host of The Storypowers Podcast, and he’s been part of the IESE MBA communications course since 2020. He’s received a BA in English Literature from Birkbeck University in London.

    Sarah Shortreed, EVP & CTO, ATCO Ltd.

    Sarah Shortreed
    EVP & CTO
    ATCO Ltd.

    Sarah Shortreed is ATCO’s Executive Vice President and Chief Technology Officer. Her responsibilities include leading ATCO’s Information Technology (IT) function as it continues to drive agility and collaboration throughout ATCO’s global businesses and expanding and enhancing its enterprise IT strategy, including establishing ATCO’s technology roadmap for the future. Ms. Shortreed’s skill and expertise are drawn from her more than 30-year career that spans many industries and includes executive roles in business consulting, complex multi-stakeholder programs, operations, sales, customer relationship management, and product management. She was recently the Chief Information Officer at Bruce Power and has previously worked at BlackBerry, IBM, and Union Gas. She sits on the Board of Governors for the University of Western Ontario and is the current Chair of the Chief Information Officer (CIO) Committee at the Conference Board of Canada.

    Eric Silverberg, Co-Founder, Speaker Labs

    Eric Silverberg
    Co-Founder
    Speaker Labs

    Eric is a co-founder of Speaker Labs and has helped thousands of people build their public speaking confidence and become more dynamic and engaging communicators. When he’s not running workshops to help people grow in their careers, there’s a good chance you’ll find him with his wife and dog, drinking Diet Coke, and rewatching iconic episodes of the reality TV show Survivor! He’s such a die-hard fan, that you’ll probably see him playing the game one day.

    Stephanie Stewart, Communications Officer & DR Coordinator, Info Security Services Simon Fraser University

    Stephanie Stewart
    Communications Officer & DR Coordinator
    Info Security Services Simon Fraser University

    Steve Strout, President, Miovision Technologies

    Steve Strout
    President
    Miovision Technologies

    Mr. Strout is a recognized and experienced technology leader with extensive experience in delivering value. He has successfully led business and technology transformations by leveraging many dozens of complex global SFDC, Oracle, and SAP projects. He is especially adept at leading what some call “Project Rescues” – saving people’s careers where projects have gone awry; always driving “on-time and on-budget.” Mr. Strout is the current President of Miovision Technologies and the former CEO and board member of the Americas’ SAP Users” Group (ASUG). His wealth of practical knowledge comes from 30 years of extensive experience in many CxO and executive roles at some prestigious organizations such as Vonage, Sabre, BlackBerry, Shred-it, The Thomson Corporation (now Thomson Reuters), and Morris Communications. He has served on boards including Customer Advisory Boards of Apple, AgriSource Data, Dell, Edgewise, EMC, LogiSense, Socrates.ai, Spiro Carbon Group, and Unifi.

    Info-Tech Research Group Contributors:

    Sanchia Benedict, Research Lead
    Antony Chan Executive Counsellor
    Janice Clatterbuck, Executive Counsellor
    Ahmed Jowar, Research Specialist
    Dave Kish, Practice Lead
    Nick Kozlo, Senior Research Analyst
    Heather Leier Murray, Senior Research Analyst
    Amanda Mathieson, Research Director
    Carlene McCubbin, Practice Lead
    Joe Meier, Executive Counsellor
    Andy Neill, AVP Research
    Thomas Randall, Research Director

    Plus an additional two contributors who wish to remain anonymous.

    Related Info-Tech Research

    Boardroom Presentation Review

    • You will come away with a clear, concise, and compelling board presentation that IT leaders can feel confident presenting in front of their board of directors.
    • Add improvements to your current board presentation in terms of visual appeal and logical flow to ensure it resonates with your board of directors.
    • Leverage a best-of-breed presentation template.

    Build a Better Manager

    • Management skills training is needed, but organizations are struggling to provide training that makes a long-term difference in the skills managers actually use in their day to day.
    • Many training programs are ineffective because they offer the wrong content, deliver it in a way that is not memorable, and are not aligned with the IT department’s business objectives.

    Crisis Communication Guides

    During a crisis it is important to communicate to employees through messages that convey calm and are transparent and tailored to your audience. Use the Crisis Communication Guides to:

    • Draft a communication strategy.
    • Tailor messages to your audience.
    • Draft employee crisis communications.
    Use this guide to equip leadership to communicate in times of crisis.

    Bibliography

    “Communication in the Workplace Statistics: Importance and Effectiveness in 2022.” TeamStage, 2022.

    Gallo, Carmine. “How Great Leaders Communicate.” Harvard Business Review, 23 November 2022

    Guthrie, Georgina. “Why Good Internal Communications Matter Now More than Ever.” Nulab, 15 December 2021.

    Lambden, Duncan. “The Importance of Effective Workplace Communication – Statistics for 2022.” Expert Market, 13 June 2022.

    “Mapping SFIA Levels of Responsibilities to Behavioural Factors.” Skills Framework for the Information Age, 2021.

    McCreary, Gale. “How to Measure the Effectiveness of Communication: 14 Steps.” WikiHow, 31 March 2023.

    Nowak, Marcin. “Top 7 Communication Problems in the Workplace.” MIT Enterprise Forum CEE, 2021.

    Nunn, Philip. “Messaging That Works: A Unique Framework to Maximize Communication Success.” iabc, 26 October 2020.

    Picincu, Andra. “How to Measure Effective Communications.” Small Business Chron. 12 January 2021.

    Price. David A. “Pixar Story Rules.” Stories From the Frontiers of Knowledge, 2011.

    Roberts, Dan. “How CIOs Become Visionary Communicators.” CIO, 2019.

    Schlesinger, Mark. “Why building effective communication skill in IT is incredibly important.” Forbes, 2021.

    Stanten, Andrew. “Planning for the Worst: Crisis Communications 101.” CIO, 25 May 2017.

    State of the American Workplace Report. Gallup, 6 February 2020.

    “The CIO Revolution.” IBM, 2021.

    “The State of High Performing Teams in Tech 2022.” Hypercontex, 2022.

    Walters, Katlin. “Top 5 Ways to Measure Internal Communication.” Intranet Connections, 30 May 2019.

    Build, Optimize, and Present a Risk-Based Security Budget

    • Buy Link or Shortcode: {j2store}371|cart{/j2store}
    • member rating overall impact (scale of 10): N/A
    • member rating average dollars saved: N/A
    • member rating average days saved: N/A
    • Parent Category Name: Security Strategy & Budgeting
    • Parent Category Link: /security-strategy-and-budgeting
    • Year after year, CISOs need to develop a comprehensive security budget that is able to mitigate against threats.
    • This budget will have to be defended against many other stakeholders to ensure there is proper funding.
    • Security budgets are unlike other departmental budgets. Increases or decreases in the budget can drastically affect the organizational risk level.
    • CISOs struggle with the ability to assess the effectiveness of their security controls and where to allocate money.

    Our Advice

    Critical Insight

    • CISOs can demonstrate the value of security when they correlate mitigations to business operations and attribute future budgetary needs to business evolution.
    • To identify the critical areas and issues that must be reflected in your security budget, develop a comprehensive corporate risk analysis and mitigation effectiveness model, which will illustrate where the moving targets are in your security posture.

    Impact and Result

    • Info-Tech’s methodology moves you away from the traditional budgeting approach to building a budget that is designed to be as dynamic as the business growth model.
    • Collect your organization's requirements and build different budget options to describe how increases and decreases can affect the risk level.
    • Discuss the different budgets with the business to determine what level of funding is needed for the desired level of security.
    • Gain approval of your budget early by preshopping and presenting the budget to individual stakeholders prior to the final budget approval process.

    Build, Optimize, and Present a Risk-Based Security Budget Research & Tools

    Start here – read the Executive Brief

    Read our concise Executive Brief to find out why you should build, optimize, and present a risk-based security budget, review Info-Tech’s methodology, and understand the four ways we can support you in completing this project.

    Besides the small introduction, subscribers and consulting clients within this management domain have access to:

    1. Review requirements for the budget

    Collect and review the required information for your security budget.

    • Build, Optimize, and Present a Risk-Based Security Budget – Phase 1: Review Requirements for the Budget

    2. Build the budget

    Take your requirements and build a risk-based security budget.

    • Build, Optimize, and Present a Risk-Based Security Budget – Phase 2: Build the Budget
    • Security Budgeting Tool

    3. Present the budget

    Gain approval from business stakeholders by presenting the budget.

    • Build, Optimize, and Present a Risk-Based Security Budget – Phase 3: Present the Budget
    • Preshopping Security Budget Presentation Template
    • Final Security Budget Presentation Template
    [infographic]

    Workshop: Build, Optimize, and Present a Risk-Based Security Budget

    Workshops offer an easy way to accelerate your project. If you are unable to do the project yourself, and a Guided Implementation isn't enough, we offer low-cost delivery of our project workshops. We take you through every phase of your project and ensure that you have a roadmap in place to complete your project successfully.

    1 Review Requirements for the Budget

    The Purpose

    Understand your organization’s security requirements.

    Collect and review the requirements.

    Key Benefits Achieved

    Requirements are gathered and understood, and they will provide priorities for the security budget.

    Activities

    1.1 Define the scope and boundaries of the security budget.

    1.2 Review the security strategy.

    1.3 Review other requirements as needed, such as the mitigation effectiveness assessment or risk tolerance level.

    Outputs

    Defined scope and boundaries of the security budget

    2 Build the Budget

    The Purpose

    Map business capabilities to security controls.

    Create a budget that represents how risk can affect the organization.

    Key Benefits Achieved

    Finalized security budget that presents three different options to account for risk and mitigations.

    Activities

    2.1 Identify major business capabilities.

    2.2 Map capabilities to IT systems and security controls.

    2.3 Categorize security controls by bare minimum, standard practice, and ideal.

    2.4 Input all security controls.

    2.5 Input all other expenses related to security.

    2.6 Review the different budget options.

    2.7 Optimize the budget through defense-in-depth options.

    2.8 Finalize the budget.

    Outputs

    Identified major business capabilities, mapped to the IT systems and controls

    Completed security budget providing three different options based on risk associated

    Optimized security budget

    3 Present the Budget

    The Purpose

    Prepare a presentation to speak with stakeholders early and build support prior to budget approvals.

    Present a pilot presentation and incorporate any feedback.

    Prepare for the final budget presentation.

    Key Benefits Achieved

    Final presentations in which to present the completed budget and gain stakeholder feedback.

    Activities

    3.1 Begin developing a communication strategy.

    3.2 Build the preshopping report.

    3.3 Practice the presentation.

    3.4 Conduct preshopping discussions with stakeholders.

    3.5 Collect initial feedback and incorporate into the budget.

    3.6 Prepare for the final budget presentation.

    Outputs

    Preshopping Report

    Final Budget Presentation

    Time Study

    • Buy Link or Shortcode: {j2store}260|cart{/j2store}
    • member rating overall impact (scale of 10): N/A
    • member rating average dollars saved: N/A
    • member rating average days saved: N/A
    • Parent Category Name: Governance, Risk & Compliance
    • Parent Category Link: /governance-risk-compliance
    • In ESG’s 2018 report “The Life of Cybersecurity Professionals,” 36% of participants expressed the overwhelming workload was a stressful aspect of their job.
    • Organizations expect a lot from their security specialists. From monitoring the threat environment, protecting business assets, and learning new tools, to keeping up with IT initiatives, cybersecurity teams struggle to balance their responsibilities with the constant emergencies and disruptions that take them away from their primary tasks.
    • Businesses fail to recognize the challenges associated with task prioritization and the time management practices of a security professional.

    Our Advice

    Critical Insight

    • The majority of scheduled calendar meetings include employees and peers.
      • Our research indicates cybersecurity professionals spent the majority of their meetings with employees (28%) and peers (24%). Other stakeholders involved in meetings included by myself (15%), boss (13%), customers (10%), vendors (8%), and board of directors (2%).
    • Calendar meetings are focused on project work, management, and operations.
      • When asked to categorize calendar meetings, the focus was on project work (26%), management (23%), and operations (22%). Other scheduled meetings included ones focused on strategy (15%), innovation (9%), and personal time (5%).
    • Time management scores were influenced by the percentage of time spent with employees and peers.
      • When participants were divided into good and poor time managers, we found good time managers spent less time with their peers and more time with their employees. This may be due to the nature of employee meetings being more directly tied to the project outputs of the manager than their peer meetings. Managers who spend more time in meetings with their employees feel a sense of accomplishment, and hence rate themselves higher in time management.

    Impact and Result

    • Understand how cybersecurity professionals allocate their time.
    • Gain insight on whether perceived time management skills are associated with calendar maintenance factors.
    • Identify common time management pain points among cybersecurity professionals.
    • Identify current strategies cybersecurity professionals use to manage their time.

    Time Study Research & Tools

    Besides the small introduction, subscribers and consulting clients within this management domain have access to:

    1. Read our Time Study

    Read our Time Study to understand how cybersecurity professionals allocate their time, what pain points they endure, and tactics that can be leveraged to better manage time.

    • Time Study Storyboard
    [infographic]

    Document and Maintain Your Disaster Recovery Plan

    • Buy Link or Shortcode: {j2store}417|cart{/j2store}
    • member rating overall impact (scale of 10): 9.3/10 Overall Impact
    • member rating average dollars saved: $52,224 Average $ Saved
    • member rating average days saved: 38 Average Days Saved
    • Parent Category Name: DR and Business Continuity
    • Parent Category Link: /business-continuity
    • Disaster recovery plan (DRP) documentation is often driven by audit or compliance requirements rather than aimed at the team that would need to execute recovery.
    • Between day-to-day IT projects and the difficulty of maintaining 300+ page manuals, DRP documentation is not updated and quickly becomes unreliable.
    • Inefficient publishing strategies result in your DRP not being accessible during disaster or key staff not knowing where to find the latest version.

    Our Advice

    Critical Insight

    • DR documentation fails when organizations try to boil the ocean with an all-in-one plan aimed at auditors, business leaders, and IT. It’s too long, too hard to maintain, and ends up being little more than shelf-ware.
    • Using flowcharts, checklists, and diagrams aimed at an IT audience is more concise and effective in a disaster, quicker to create, and easier to maintain.
    • Create your DRP in layers to keep the work manageable. Start with a recovery workflow to ensure a coordinated response, and build out supporting documentation over time.

    Impact and Result

    • Create visual and concise DR documentation that strips out unnecessary content and is written for an IT audience – the team that would actually be executing the recovery. Your business leaders can take the same approach to create separate business response plans. Don’t mix the two in an all-in-one plan that is not effective for either audience.
    • Determine a documentation distribution strategy that supports ease of maintenance and accessibility during a disaster.
    • Incorporate DRP maintenance into change management procedures to systematically update and refine the DR documentation. Don’t save up changes for a year-end blitz, which turns document maintenance into an onerous project.

    Document and Maintain Your Disaster Recovery Plan Research & Tools

    Start here – read the Executive Brief

    Read our concise Executive Brief to find out why you should adopt a visual-based DRP, review Info-Tech’s methodology, and understand the four ways we can support you in completing this project.

    Besides the small introduction, subscribers and consulting clients within this management domain have access to:

    1. Streamline DRP documentation

    Start by documenting your recovery workflow. Create supporting documentation in the form of checklists, flowcharts, topology diagrams, and contact lists. Finally, summarize your DR capabilities in a DRP Summary Document for stakeholders and auditors.

    • Document and Maintain Your Disaster Recovery Plan – Phase 1: Streamline DRP Documentation

    2. Select the optimal DRP publishing strategy

    Select criteria for assessing DRP tools, and evaluate whether a business continuity management tool, document management solution, wiki site, or manually distributing documentation is best for your DR team.

    • Document and Maintain Your Disaster Recovery Plan – Phase 2: Select the Optimal DRP Publishing Strategy
    • DRP Publishing and Document Management Solution Evaluation Tool
    • BCM Tool – RFP Selection Criteria

    3. Keep your DRP relevant through maintenance best practices

    Learn how to integrate DRP maintenance into core IT processes, and learn what to look for during testing and during annual reviews of your DRP.

    • Document and Maintain Your Disaster Recovery Plan – Phase 3: Keep Your DRP Relevant Through Maintenance Best Practices
    • Sample Project Intake Form Addendum for Disaster Recovery
    • Sample Change Management Checklist for Disaster Recovery
    • DRP Review Checklist
    • DRP-BCP Review Workflow (Visio)
    • DRP-BCP Review Workflow (PDF)

    4. Appendix: XMPL Case Study

    Model your DRP after the XMPL case study disaster recovery plan documentation.

    • Document and Maintain Your Disaster Recovery Plan – Appendix: XMPL Case Study
    • XMPL DRP Summary Document
    • XMPL Notification, Assessment, and Declaration Plan
    • XMPL Systems Recovery Playbook
    • XMPL Recovery Workflows (Visio)
    • XMPL Recovery Workflows (PDF)
    • XMPL Data Center and Network Diagrams (Visio)
    • XMPL Data Center and Network Diagrams (PDF)
    • XMPL DRP Business Impact Analysis Tool
    • XMPL DRP Workbook
    [infographic]

    Workshop: Document and Maintain Your Disaster Recovery Plan

    Workshops offer an easy way to accelerate your project. If you are unable to do the project yourself, and a Guided Implementation isn't enough, we offer low-cost delivery of our project workshops. We take you through every phase of your project and ensure that you have a roadmap in place to complete your project successfully.

    1 Streamline DRP Documentation

    The Purpose

    Teach your team how to create visual-based documentation.

    Key Benefits Achieved

    Learn how to create visual-based DR documentation.

    Activities

    1.1 Conduct a table-top planning exercise.

    1.2 Document your high-level incident response plan.

    1.3 Identify documentation to include in your playbook.

    1.4 Create an initial collection of supplementary documentation.

    1.5 Discuss what further documentation is necessary for recovering from a disaster.

    1.6 Summarize your DR capabilities for stakeholders.

    Outputs

    Documented high-level incident response plan

    List of documentation action items

    Collection of 1-3 draft checklists, flowcharts, topology diagrams, and contact lists

    Action items for ensuring that the DRP is executable for both primary and backup DR personnel

    DRP Summary Document

    2 Select the Optimal DRP Publishing Strategy

    The Purpose

    Learn the considerations for publishing your DRP.

    Key Benefits Achieved

    Identify the best strategy for publishing your DRP.

    Activities

    2.1 Select criteria for assessing DRP tools.

    2.2 Evaluate categories for DRP tools.

    Outputs

    Strategy for publishing DRP

    3 Learn How to Keep Your DRP Relevant Through Maintenance Best Practices

    The Purpose

    Address the common pain point of unmaintained DRPs.

    Key Benefits Achieved

    Create an approach for maintaining your DRP.

    Activities

    3.1 Alter your project intake considerations.

    3.2 Integrate DR considerations into change management.

    3.3 Integrate documentation into performance measurement and performance management.

    3.4 Learn best practices for maintaining your DRP.

    Outputs

    Project Intake Form Addendum Template

    Change Management DRP Checklist Template

    Further reading

    Document and Maintain Your Disaster Recovery Plan

    Put your DRP on a diet – keep it fit, trim, and ready for action.

    ANALYST PERSPECTIVE

    The traditional disaster recovery plan (DRP) “red binder” is dead. It takes too long to create, it’s too hard to maintain, and it’s not usable in a crisis.

    “This blueprint outlines the following key tactics to streamline your documentation effort and produce a better result:

    • Write for an IT audience and focus on how to recover. You don’t need 30 pages of fluff describing the purpose of the document.
    • Use flowcharts, checklists, and diagrams over traditional manuals. This drives documentation that is more concise, easier to maintain, and effective in a crisis.
    • Create your DRP in layers to get tangible results faster, starting with a recovery workflow that outlines your DR strategy, and then build out the specific documentation needed to support recovery.”
    (Frank Trovato, Research Director, Infrastructure, Info-Tech Research Group)

    This project is about DRP documentation after you have clarified your DR strategy; create these necessary inputs first

    These artifacts are the cornerstone for any disaster recovery plan.

    • Business Impact Analysis
    • DR Roles and Responsibilities
    • Recovery Workflow

    Missing a component? Start here. ➔ Create a Right-Sized Disaster Recovery Plan

    This blueprint walks you through building these inputs.
    Our approach saves clients on average US$16,825.22. (Clients self-reported an average saving of US$16,869.21 while completing the Create a Right-Sized Disaster Recovery Plan blueprint through advisory calls, guided implementations, or workshops (Info-Tech Research Group, 2017, N=129).)

    How this blueprint will help you document your DRP

    This Research is Designed For:

    • IT managers in charge of disaster recovery planning (DRP) and execution.
    • Organizations seeking to optimize their DRP using best-practice methodology.
    • Business continuity professionals that are involved with disaster recovery.

    This Research Will Help You:

    • Divide the process of creating DR documentation into manageable chunks, providing a defined scope for you to work in.
    • Identify an appropriate DRP document management and distribution strategy.
    • Ensure that DR documentation is up to date and accessible.

    This Research Will Also Assist:

    • IT managers preparing for a DR audit.
    • IT managers looking to incorporate components of DR into an IT operations document.

    This Research Will Help Them:

    • Follow a structured approach in building DR documentation using best practices.
    • Integrate DR into day-to-day IT operations.

    Executive summary

    Situation

    • DR documentation is often driven by audit or compliance requirements, rather than aimed at the team that would need to execute recovery.
    • Traditional DRPs are text-heavy, 300+ page manuals that are simply not usable in a crisis.
    • Compounding the problem, DR documentation is rarely updated, so it’s just shelf-ware.

    Complication

    • DRP is often given lower priority as day-to-day IT projects displace DR documentation efforts.
    • Inefficient publishing strategies result in your DRP not being accessible during disasters or key staff not knowing where to find the latest version.
    • Organizations that create traditional DRPs end up with massive manuals that are difficult to maintain, so they quickly become unreliable.

    Resolution

    • Create visual and concise DR documentation that strips out unnecessary content and is written for an IT audience – the team that would actually be executing the recovery. Your business leaders can take the same approach to create separate business response plans – don’t mix the two into an all-in-one plan that is not effective for either audience.
    • Determine a documentation distribution strategy that supports ease of maintenance and accessibility during a disaster.
    • Incorporate DRP maintenance into change management and project intake procedures to systematically update and refine the DR documentation. Don’t save up changes for a year-end blitz, which turns document maintenance into an onerous project.

    Info-Tech Insight

    1. DR documentation fails when organizations try to boil the ocean with an all-in-one plan aimed at auditors, business leaders, and IT. It’s too long, too hard to maintain, and ends up being little more than shelf-ware.
    2. Using flowcharts, checklists, and diagrams aimed at an IT audience is more concise and effective in a disaster, quicker to create, and easier to maintain.
    3. Create your DRP in layers to keep the work manageable. Start with a recovery workflow to ensure a coordinated response, and build out supporting documentation over time.

    An effective DRP that mitigates a wide range of potential outages is critical to minimizing the impact of downtime

    The criticality of having an effective DRP is underestimated.

    Cost of Downtime for the Fortune 1000
    • Cost of unplanned apps downtime per year: $1.25B to $2.5B
    • Cost of critical apps failure per hour: $500,000 to $1M
    • Cost of infrastructure failure per hour: $100,000
    • 35% reported to have recovered within 12 hours.
    • 17% of infrastructure failures took more than 24 hours to recover.
    • 13% of application failures took more than 24 hours to recover.
    Size of Impact Increasing Across Industries
    • The cost of downtime is rising across the board and not just for organizations that traditionally depend on IT (e.g. e-commerce).
    • Downtime cost increase since 2010:
      • Hospitality: 129% increase
      • Transportation: 108% increase
      • Media organizations: 104% increase
    Potential Lost Revenue
    A line graph of Potential Lost Revenue with vertical axis 'LOSS ($)' and horizontal axis 'TIME'. The line starts with low losses near the origin where 'Incident Occurs', gradually accelerates to higher losses as time passes, then decelerates before 'All Revenue Lost'. Note: 'Delay in recovery causes exponential revenue loss'.
    (Adapted from: Rothstein, Philip Jan. Disaster Recovery Testing: Exercising Your Contingency Plan (2007 Edition).)

    The impact of downtime increases significantly over time, not just in terms of lost revenue (as illustrated here) but also goodwill/reputation and health/safety. An effective DR solution and overall resiliency that mitigate a wide range of potential outages are critical to minimizing the impact of downtime.

    Without an effective DRP, your organization is gambling on being able to define and implement a recovery strategy during a time of crisis. At the very least, this means extended downtime – potentially weeks – and substantial impact.

    Only 38% of those with a full or mostly complete DRP believe their DRPs would be effective in a real crisis

    Organizations continue to struggle with creating DRPs, let alone making them actionable.

    Why are so many living with either an incomplete or ineffective DRP? For the same reasons that IT documentation in general continues to be a pain point:

    • It is an outdated model of what documentation should be – the traditional manual with detailed (lengthy) descriptions and procedures.
    • Despite the importance of DR, low priority is placed on creating a DRP and the day-to-day SOPs required to support a recovery.
    • There is a lack of effective processes for ensuring documentation stays up to date.
    A bar graph documenting percentages of survey responses about the completeness of their DRP. 'Only 20% of survey respondents indicated they have a complete DRP'. 13% said 'No DRP'. 33% said 'Partial DRP'. 34% said 'Mostly Completed'. 20% said 'Full DRP'.
    (Source: Info-Tech Research Group, N=165)
    A bar graph documenting percentages of survey responses about the level of confidence in their DRP. 'Only 38% of those who have a mostly completed or full DRP actually feel it would be effective in a crisis'. 4% said 'Low'. 58% said 'Unsure'. 38% said 'Confident'.
    (Source: Info-Tech Research Group, N=69 (includes only those who indicated DRP is mostly completed or completed))

    Improve usability and effectiveness with visual-based and more-concise documentation

    Choose flowcharts over process guides, checklists over lengthy procedures, and diagrams over descriptions.

    If you need a three-inch binder to hold your DRP, imagine having to flip through it to determine next steps during a crisis.

    DR documentation needs to be concise, scannable, and quickly understood to be effective. Visual-based documentation meets these requirements, so it’s no surprise that it also leads to higher DR success.

    DR success scores are based on:

    • Meeting recovery time objectives (RTOs).
    • Meeting recovery point objectives (RPOs).
    • IT staff’s confidence in their ability to meet RTOs/RPOs.
    A line graph of DR documentation types and their effectiveness. The vertical axis is 'DR Success', from Low to High. The horizontal axis is Documentation Type, from 'Traditional Manual' to 'Primarily flowcharts, checklists, and diagrams'. The line trends up to higher success with visual-based and more-concise documentation.(Source: Info-Tech Research Group, N=95)

    “Without question, 300-page DRPs are not effective. I mean, auditors love them because of the detail, but give me a 10-page DRP with contact lists, process flows, diagrams, and recovery checklists that are easy to follow.” (Bernard Jones, MBCI, CBCP, CORP, Manager Disaster Recovery/BCP, ActiveHealth Management)

    Maintainability is another argument for visual-based, concise documentation

    There are two end goals for your DR documentation: effectiveness and maintainability. Without either, you will not have success during a disaster.

    Organizations using a visual-based approach were 30% more likely to find that DR documentation is easy to maintain. “Easy to maintain” leads to a 46% higher rate of DR success.
    Two bar graphs documenting survey responses regarding maintenance ease of DR documentation types. The first graph compares Traditional Manual vs Visual-based. For 'Traditional Manual' 72% responded they were Difficult to maintain while 28% responded they were Easy to maintain; for 'Visual-based' 42% responded they were Difficult to maintain while 58% responded they were Easy to maintain. Visual-based DR documentation received 30% more votes for Easy to Maintain. The second graph compares success rates of 'Difficult to Maintain' vs 'Easy to Maintain' DR documentation with Difficult being 31% and Easy being 77%, a 46% difference. 'Source: Info-Tech Research Group, N=96'.

    Not only are visual-based disaster recovery plans more effective, but they are also easier to maintain.

    Overcome documentation inertia with a tiered model that allows you to eat the elephant one bite at a time

    Start with a recovery workflow to at least ensure a coordinated response. Then use that workflow to determine required supporting documentation.

    Recovery Workflow: Starting the project with overly detailed documentation can slow down the entire process. Overcome planning inertia by starting with high-level incident response plans in a flowchart format. For examples and additional information, see XMPL Medical’s Recovery Workflows.

    Recovery Procedures (Systems Recovery Playbook): For each step in the high-level flowchart, create recovery procedures where necessary using additional flowcharts, checklists, and diagrams as appropriate. Leverage Info-Tech’s Systems Recovery Playbook example as a starting point.

    Additional Reference Documentation: Reference existing IT documentation, such as network diagrams and configuration documents, as well as more detailed step-by-step procedures where necessary (e.g. vendor documentation), particularly where needed to support alternate recovery staff who may not be as well versed as the primary system owners.

    Info-Tech Insight

    Organizations that use flowcharts, checklist, and diagrams over traditional, dense DRP manuals are far more likely to meet their RTOs/RPOs because their documentation is more usable and easier to maintain.

    Use a DRP summary document to satisfy executives, auditors, and clients

    Stakeholders don’t have time to sift through a pile of paper. Summarize your overall continuity capabilities in one, easy-to-read place.

    DRP Summary Document

    • Summarize BIA results
    • Summarize DR strategy (including DR sites)
    • Summarize backup strategy
    • Summarize testing and maintenance plans

    Follow Info-Tech’s methodology to make DRP documentation efficient and effective

    Phases

    Phase 1: Streamline DRP documentation Phase 2: Select the optimal DRP publishing strategy Phase 3: Keep your DRP relevant through maintenance best practices

    Phases

    1.1

    Start with a recovery workflow

    2.1

    Decide on a publishing strategy

    3.1

    Incorporate DRP maintenance into core IT processes

    1.2

    Create supporting DRP documentation

    3.2

    Conduct an annual focused review

    1.3

    Write the DRP Summary

    Tools and Templates

    End-to-End Sample DRP DRP Publishing Evaluation Tool Project In-take/Request Form

    Change Management Checklist

    Follow XMPL Medical’s journey through DR documentation

    CASE STUDY

    Industry Healthcare
    Source Created by amalgamating data from Info-Tech’s client base

    Streamline your documentation and maintenance process by following the approach outlined in XMPL Medical’s journey to an end-to-end DRP.

    Outline of the Disaster Recovery Plan

    XMPL’s disaster recovery plan includes its business impact analysis and a subset of tier 1 and tier 2 patient care applications.

    Its DRP includes incident response flowcharts, system recovery checklists, and a communication plan. Its DRP also references IT operations documentation (e.g. asset management documents, system specs, and system configuration docs), but this material is not published with the example documentation.

    Resulting Disaster Recovery Plan

    XMPL’s DRP includes actionable documents in the form of high-level disaster response plan flowcharts and system recovery checklists. During an incident, the DR team is able to clearly see the items for which they are responsible.

    Disaster Recovery Plan
    • Recovery Workflow
    • Business Impact Analysis
    • DRP Summary
    • System Recovery Checklists
    • Communication, Assessment, and Disaster Declaration Plan

    Info-Tech Best Practice

    XMPL Medical’s disaster recovery plan illustrates an effective DRP. Model your end-to-end disaster recovery plan after XMPL’s completed templates. The specific data points will differ from organization to organization, but the structure of each document will be similar.

    Model your disaster recovery documentation off of our example

    CASE STUDY

    Industry Healthcare
    Source Created by amalgamating data from Info-Tech’s client base

    Recovery Workflow:

    • Recovery Workflows (PDF, VSDX)

    Recovery Procedures (Systems Recovery Playbook):

    • DR Notification, Assessment, and Disaster Declaration Plan
    • Systems Recovery Playbook
    • Network Topology Diagrams

    Additional Reference Documentation:

    • DRP Workbook
    • Business Impact Analysis
    • DRP Summary Document

    Use Info-Tech’s DRP Maturity Scorecard to evaluate your progress

    Info-Tech offers various levels of support to best suit your needs

    DIY Toolkit

    Guided Implementation

    Workshop

    Consulting

    "Our team has already made this critical project a priority, and we have the time and capability, but some guidance along the way would be helpful." "Our team knows that we need to fix a process, but we need assistance to determine where to focus. Some check-ins along the way would help keep us on track." "We need to hit the ground running and get this project kicked off immediately. Our team has the ability to take this over once we get a framework and strategy in place." "Our team does not have the time or the knowledge to take this project on. We need assistance through the entirety of this project."

    Diagnostics and consistent frameworks used throughout all four options

    Document and Maintain Your Disaster Recovery Plan – Project Overview

    1. Streamline DRP Documentation 2. Select the Optimal DRP Publishing Strategy 3. Keep Your DRP Relevant
    Supporting Tool icon
    Best-Practice Toolkit

    1.1 Start with a recovery workflow

    1.2 Create supporting DRP documentation

    1.3 Write the DRP summary

    2.1 Create Committee Profiles

    3.1 Build Governance Structure Map

    3.2 Create Committee Profiles

    Guided Implementations
    • Review Info-Tech’s approach to DRP documentation.
    • Create a high-level recovery workflow.
    • Create supporting DRP documentation.
    • Write the DRP summary.
    • Identify criteria for selecting a DRP publishing strategy.
    • Select a DRP publishing strategy.
    • Optional: Select requirements for a BCM tool and issue an RFP.
    • Optional: Review responses to RFP.
    • Learn best practices for integrating DRP maintenance into day-to-day IT processes.
    • Learn best practices for DRP-focused reviews.
    Associated Activity icon
    Onsite Workshop
    Module 1:
    Streamline DRP documentation
    Module 2:
    Select the optimal DRP publishing strategy
    Module 3:
    Learn best practices for keeping your DRP relevant
    Phase 1 Outcome:
    • A complete end-to-end DRP
    Phase 2 Outcome:
    • Selection of a publishing and management tool for your DRP documentation
    Phase 3 Outcome:
    • Strategy for maintaining your DRP documentation

    Workshop Overview Associated Activity icon

    Contact your account representative or email Workshops@InfoTech.com for more information.

    Workshop Day 1 Workshop Day 2 Workshop Day 3 Workshop Day 4 Workshop Day 5
    Info-Tech Analysts Finalize Deliverables
    Activities
    Assess DRP Maturity and Review Current Capabilities

    0.1 Assess current DRP maturity through Info-Tech’s Maturity Scorecard.

    0.2 Identify the IT systems that support mission-critical business activities, and select 2 or 3 key applications to be the focus of the workshop.

    0.3 Identify current recovery strategies for selected applications.

    0.4 Identify current DR challenges for selected applications.

    Document Your Recovery Workflow

    1.1 Create a recovery workflow: review tabletop planning, walk through DR scenarios, identify DR gaps, and determine how to fill them.

    Create Supporting Documentation

    1.2 Create supporting DRP documentation.

    1.3 Write the DRP summary.

    Establish a DRP Publishing, Management, and Maintenance Strategy

    2.1 Decide on a publishing strategy.

    3.1 Incorporate DRP maintenance into core IT.

    3.2 Considerations for reviewing your DRP regularly.

    Deliverables
    1. Baseline DRP metric (based on DRP Maturity Scorecard)
    1. High-level DRP workflow
    2. DRP gaps and risks identified
    1. Recovery workflow and/or checklist for sample of IT systems
    2. Customized DRP Summary Template
    1. Strategy for selecting a DRP publishing tool
    2. DRP management and maintenance strategy
    3. Workshop summary presentation deck

    Workshop Goal: Learn how to document and maintain your DRP.

    Use these icons to help direct you as you navigate this research

    Use these icons to help guide you through each step of the blueprint and direct you to content related to the recommended activities.

    A small monochrome icon of a wrench and screwdriver creating an X.

    This icon denotes a slide where a supporting Info-Tech tool or template will help you perform the activity or step associated with the slide. Refer to the supporting tool or template to get the best results and proceed to the next step of the project.

    A small monochrome icon depicting a person in front of a blank slide.

    This icon denotes a slide with an associated activity. The activity can be performed either as part of your project or with the support of Info-Tech team members, who will come onsite to facilitate a workshop for your organization.


    Phase 1: Streamline DRP Documentation

    Step 1.1: Start with a recovery workflow

    PHASE 1
    PHASE 2
    PHASE 3
    1.1 1.2 1.3 2.1 3.1 3.2
    Start with a Recovery Workflow Create Supporting Documentation Write the DRP Summary Select DRP Publishing Strategy Integrate into Core IT Processes Conduct an Annual Focused Review

    This step will walk you through the following activities:

    • Review a model DRP.
    • Review your recovery workflow.
    • Identify documentation required to support the recovery workflow.

    This step involves the following participants:

    • DRP Owner
    • System SMEs
    • Alternate DR Personnel

    Outcomes of this step

    • Understanding the visual-based, concise approach to DR documentation.
    • Creating a recovery workflow that provides a roadmap for coordinating incident response and identifying required supporting documentation.

    Info-Tech Insights

    A DRP is a collection of procedures and supporting documents that allow an organization to recover its IT services to minimize system downtime for the business.

    1.1 — Start with a recovery workflow to ensure a coordinated response and identify required supporting documentation

    The recovery workflow clarifies your DR strategy and ensures the DR team is on the same page.

    Recovery Workflow

    The recovery workflow maps out the incident response plan from event detection, assessment, and declaration to systems recovery and validation.

    This documentation includes:

    • Clarifying initial incident response steps.
    • Clarifying the order of systems recovery and which recovery actions can occur concurrently.
    • Estimating actual recovery timeline through each stage of recovery.
    Recovery Procedures (Playbook)
    Additional Reference Documentation

    “We use flowcharts for our declaration procedures. Flowcharts are more effective when you have to explain status and next steps to upper management.” (Assistant Director-IT Operations, Healthcare Industry)

    Review business impact analysis (BIA) results to plan your recovery workflow

    The BIA defines system criticality from the business’s perspective. Use it to guide system recovery order.

    Specifically, review the following from your BIA:

    • The list of tier 1, 2, and 3 applications. This will dictate the recovery order in your recovery workflow.
    • Application dependencies. This will outline what needs to be included as part of an application recovery workflow.
    • The recovery time objective (RTO) and recovery point objective (RPO) for each application. This will also guide the recovery, and enable you to identify gaps where the recovery workflow does not meet RTOs and RPOs.

    CASE STUDY: The XMPL DRP documentation is based on this Business Impact Analysis Tool.

    Haven’t conducted a BIA? Use Info-Tech’s streamlined approach.

    Info-Tech’s publication Create a Right-Sized Disaster Recovery Plan takes a very practical approach to BIA work. Our process gives IT leaders a mechanism to quickly get agreement on system recovery order and DR investment priorities.

    Conduct a tabletop planning exercise to determine your recovery workflow

    Associated Activity icon 1.1.1 Tabletop Planning Exercise

    1. Define a scenario to drive the tabletop planning exercise:
      • Use a scenario that forces a full failover to your DR environment, so you can capture an end-to-end recovery workflow.
      • Avoid scenarios that impact health and safety such as tornados or a fire. You want to focus on IT recovery.
      • Example scenarios: Burst water pipe that causes data-center-wide damage or a gas leak that forces evacuation and power to be shut down for at least two days.

    Note: You may have already completed this exercise as part of Create a Right-Sized Disaster Recovery Plan.

    Info-Tech Insight

    Use scenarios to provide context for DR planning, and to test your plans, but don’t create a separate plan for every possibility.

    The high-level recovery plan will be the same whether the incident is a fire, flood, or tornado. While there might be some variances and outliers, these scenarios can be addressed by adding decision points and/or separate, supplementary instructions.

    Walk through the scenario and capture the recovery workflow

    Associated Activity icon 1.1.2 Tabletop Planning Exercise
    1. Capture the following information for tier 1, tier 2, and tier 3 systems:
      1. On white cue cards, record the steps and track start and end times for each step (where 00:00 is when the incident occurred).
      2. On yellow cue cards, document gaps in people, process, and technology requirements to complete the step.
      3. On red cue cards, indicate risks (e.g. no backup person for a key staff member).

    Note:

    • Ensure the language is sufficiently genericized (e.g. refer to events, not specifically a burst water pipe).
    • Review isolated failures (e.g. hardware, software). Typically, the recovery procedure documented for individual systems covers the essence of the recovery workflow whether it’s just the one system that failed or it’s part of a site-wide recovery.

    Note: You may have already completed this exercise as part of Create a Right-Sized Disaster Recovery Plan.

    Document your current-state recovery workflow based on the results of the tabletop planning

    Supporting Tool icon 1.1.2 Incident Response Plan Flowcharts, Tabs 2 and 3

    After you finish the tabletop planning exercise, the steps on the set of cue cards define your recovery workflow. Capture this in a flowchart format.

    Use the sample DRP to guide your own flowchart. Some notes on the example are:

    • XMPL’s Incident Management to DR flowchart shows the connection between its standard Service Desk processes and DR processes.
    • XMPL’s high-level workflows outline its recovery of tier 1, 2, and 3 systems.
    • Where more detail is required, include links to supporting documentation. In this example, XMPL Medical includes links to its Systems Recovery Playbook.
    Preview of an Info-Tech Template depicting a sample flowchart.

    This sample flowchart is included in XMPL Recovery Workflows.

    Step 1.2: Create Supporting DRP Documentation

    PHASE 1
    PHASE 2
    PHASE 3
    1.11.21.32.13.13.2
    Start with a Recovery WorkflowCreate Supporting DocumentationWrite the DRP SummarySelect DRP Publishing StrategyIntegrate into Core IT ProcessesConduct an Annual Focused Review

    This step will walk you through the following activities:

    • Create checklists for your playbook.
    • Document more complex procedures with flowcharts.
    • Gather and/or write network topology diagrams.
    • Compile a contact list.
    • Ensure there is enough material for backup personnel.

    This step involves the following participants:

    • DRP Owner
    • System SMEs
    • Backup DR Personnel

    Outcomes of this step

    • Actionable supporting documentation for your disaster recovery plan.
    • Contact list for IT personnel, business personnel, and vendor support.

    1.2 — Create supporting documentation for your disaster recovery plan

    Now that you have a high-level incident response plan, collect the information you need for executing that plan.

    Recovery Workflow

    Write your recovery procedures playbook to be effective and usable. Your playbook documentation should include:

    • Supplementary flowcharts
    • Checklists
    • Topology diagrams
    • Contact lists
    • DRP summary

    Reference vendors’ technical information in your flowcharts and checklists where appropriate.

    Recovery Procedures (Playbook)

    Additional Reference Documentation

    Info-Tech Insight

    Write for your audience. The playbook is for IT; include only the information they need to execute the plan. DRP summaries are for executives and auditors; do not include information intended for IT. Similarly, your disaster recovery plan is not for business units; keep BCP content out of your DRP.

    Use checklists to streamline step-by-step procedures

    Supporting Tool icon 1.2.1 XMPL Medical’s System Recovery Checklists

    Checklists are ideal when staff just need a reminder of what to do, not how to do it.

    XMPL Medical used its high-level flowcharts as a roadmap for creating its Systems Recovery Playbook.

    • Since its Playbook is intended for experienced IT staff, the writing style in the checklists is concise. XMPL includes links to reference material to support recovery, especially for alternate staff who might need additional instruction.
    • XMPL includes key parameters (e.g. IP addresses) rather than assume those details would be memorized, especially in a stressful DR scenario.
    • Similarly, include links to other useful resources such as VM templates.
    Preview of the Info-Tech Template 'Systems Recovery Playbook'.

    Included in the XMPL Systems Recovery Playbook are checklists for recovering XMPL’s virtual desktop infrastructure, mission-critical applications, and core infrastructure components.

    Use flowcharts to document processes with concurrent tasks not easily captured in a checklist

    Supporting Tool icon 1.2.2 XMPL Medical’s Phone Services Recovery Flowchart

    Recovery procedures can consist of flowcharts, checklists, or both, as well as diagrams. The main goal is to be clear and concise.

    • XMPL Medical created a flowchart to capture its phone services recovery procedure to capture concurrent tasks.
    • Additional instructions, where required, could still be captured in a Playbook checklist or other supporting documentation.
    • The flowchart could have also included key settings or other details as appropriate, particularly if the DR team chose to maintain this recovery procedure just in a flowchart format.
    Preview of the Info-Tech Template 'Recovery Workflows'.

    Included in the XMPL DR documentation is an example flowchart for recovering phone systems. This flowchart is in Recovery Workflows.

    Reference this blueprint for more SOP flowchart examples: Create Visual SOP Documents that Drive Process Optimization, Not Just Peace of Mind

    Use topology diagrams to capture network layout, integrations, and system information

    Supporting Tool icon 1.2.4 XMPL Medical’s Data Center and Network Diagrams

    Topology diagrams, key checklists, and configuration settings are often enough for experienced networking staff to carry out their DR tasks.

    • XMPL Medical includes these diagrams with its DRP. Instead of recreating these diagrams, the XMPL Medical DR Manager asked their network team for these diagrams:
      • Primary data center diagram
      • DR site diagram
      • High-level network diagrams
    • Often, organizations already have network topology diagrams for reference purposes.

    “Our network engineers came to me and said our standard SOP template didn't work for them. They're now using a lot of diagrams and flowcharts, and that has worked out better for them.” (Assistant Director-IT Operations, Healthcare Industry)

    Preview of the Info-Tech Template 'Systems Recovery Playbook'.

    You can download a PDF and a VSD version of these Data Center and Network Diagrams from Info-Tech’s website.

    Create a list of organizational, IT, and vendor contacts that may be required to assist with recovery

    If there is something strange happening to your IT infrastructure, who you gonna call?

    Many DR managers have their team on speed dial. However, having the contact info of alternate staff, BCP leads, and vendors can be very helpful during a disaster. XMPL Medical lists the following information in its DRP Workbook:

    • The DR Teams, SMEs critical to disaster recovery, their backups, and key contacts (e.g. BC Management team leads, vendor contacts) that would be involved in:
      • Declaring a disaster.
      • Coordinating a response at an organizational level.
      • Executing recovery.
    • The people that have authority to declare a disaster.
    • Each person’s spending authority.
    • The rules for delegating authority.
    • Primary and alternate staff for each role.
    Example list of alternate staff, BCP leads, and vendors.

    Confirm with your DR team that you have all of the documentation that you need to recover during a disaster

    Associated Activity icon 1.2.7 Group Discussion

    DISCUSS: Is there enough information in your DRP for both primary and backup DR personnel?

    • Is it clear who is responsible for each DR task, including notification steps?
    • Have alternate staff for each role been identified?
    • Does the recovery workflow capture all of the high-level steps?
    • Is there enough documentation for alternate staff (e.g. network specs)?

    Step 1.3: Write the DRP Summary

    PHASE 1
    PHASE 2
    PHASE 3
    1.11.21.32.13.13.2
    Start with a Recovery WorkflowCreate Supporting DocumentationWrite the DRP SummarySelect DRP Publishing StrategyIntegrate into Core IT ProcessesConduct an Annual Focused Review

    This step will walk you through the following activities:

    • Write a DRP summary document.

    This step involves the following participants:

    • DRP Owner

    Outcomes of this step

    • High-level outline of your DRP capabilities for stakeholders such as executives, auditors, and clients.

    Summarize your DR capabilities using a DRP summary document

    Supporting Tool icon 1.3.1 DRP Summary Document

    The sample included on Info-Tech’s website is customized for the XMPL Medical Case Study – use the download as a starting point for your own summary document.

    DRP Summary Document

    XMPL’s DRP Summary is organized into the following categories:

    • DR requirements: This includes a summary of scope, business impact analysis (BIA), risk assessment, and high-level RTOs and achievable RTOs.
    • DR strategy: This includes a summary of XMPL’s recovery procedures, DR site, and backup strategy.
    • Testing and maintenance: This includes a summary of XMPL’s DRP testing and maintenance strategy.

    Be transparent about existing business risks in your DRP summary

    The DRP summary document is business facing. Include information of which business leaders (and other stakeholders) need to be aware.

    • Discrepancies between desired and achievable RTOs? Organizational leadership needs to know this information. Only then can they assign the resources and budget that IT needs to achieve the desired DR capabilities.
    • What is the DRP’s scope? XMPL Medical lists the IT components that will be recovered during a disaster, and components which will not. For instance, XMPL’s DRP does not recover medical equipment, and XMPL has separate plans for business continuity and emergency response coordination.
    Application tier Desired RTO (hh:mm) Desired RPO (hh:mm) Achievable RTO (hh:mm) Achievable RPO (hh:mm)
    Tier 1 4:00 1:00 *90:00 1:00
    Tier 2 8:00 1:00 *40:00 1:00
    Tier 3 48:00 24:00 *96:00 24:00

    The above table to is a snippet from the XMPL DR Summary Document (section 2.1.3.2).

    In the example, the DR team is unable to recover tier 1, 2, and 3 systems within the desired RTO. As such, they clearly communicate this information in the DRP summary, and include action items to address these gaps.

    Phase 2: Select the Optimal DRP Publishing Strategy

    Step 2.1: Select a DRP Publishing Strategy

    PHASE 1
    PHASE 2
    PHASE 3
    1.11.21.32.13.13.2
    Start with a Recovery WorkflowCreate Supporting DocumentationWrite the DRP SummarySelect DRP Publishing StrategyIntegrate into Core IT ProcessesConduct an Annual Focused Review

    This step will walk you through the following activities:

    • Select criteria for assessing DRP tools.
    • Evaluate categories for DRP tools.
    • Optional: Write an RFP for a BCM tool.

    This step involves the following participants:

    • DRP Owner

    Outcomes of this step

    • Identified strategies for publishing your DRP (i.e. making it available to your DR team).

    Info-Tech Insights

    Diversify your publishing strategy to ensure you can access your DRP in a disaster. For example, if you are using a BCM tool or SharePoint Online as your primary documentation repository, also push the DRP to your DR team’s smartphones as a backup in case the disaster affects internet access.

    2.1 — Select a DR publishing and document management strategy that fits your organization

    Publishing and document management considerations:

    Portability/External Access: Assume your primary site is down and inaccessible. Can you still access your documentation? As shown in this chart, traditional strategies of either keeping a copy at another location (e.g. at the failover site) or with staff (e.g. on a USB drive) still dominate, but these aren’t necessarily the best options.
    A bar chart titled 'Portability Strategy Popularity'. 'External Website (wiki site, cloud-based DRP tool, etc.)' scored 16%. 'Failover Site (network drive or redundant SharePoint, etc.)' scored 53%. 'Distribute to Staff (use USB drive, personal email, etc.)' scored 50%. 'Not Accessible Offsite' scored 7%.
    Note: Percentages total more than 100% due to respondents using more than one portability strategy.
    (Source: Info-Tech Research Group, N=118)
    Maintainability/Usability: How easy is it to create, update, and use the documentation? Is it easy to link to other documents as shown in the flowchart and checklist examples? Is there version control? Lack of version control can create a maintenance nightmare as well as issues in a crisis if staff are questioning whether they have the right version.
    Cost/Effort: Is the cost and effort appropriate? For example, a large enterprise may need a formal solution (e.g. DRP tools or SharePoint), but the cost might be hard to justify for a smaller company.

    Pros and cons of potential strategies

    This section will review the following strategies, their pros and cons, and how they meet publishing and document management requirements:

    • DRP tools (e.g. eBRP, Recovery Planner, LDRPS)
    • In-house solutions combining SharePoint and MS Office (or equivalent)
    • Wiki site
    • “Manual” approaches such as storing documents on a USB drive

    Avoid 42 hours of downtime due to a non-diversified publishing strategy

    CASE STUDY

    Industry Municipality
    Source Interview

    Situation

    • A municipal government has recently completed an end-to-end disaster recovery plan.
    • The team is feeling good about the fact that they were able to identify:
      • Relative criticality of applications.
      • Dependencies for each application.
      • Incident response plans for the current state and desired state.
      • System recovery procedures.

    Challenge

    • While the DR plan itself was comprehensive, the team only published the DR onto the government’s network drives.
    • A power generation issue caused power to be shut down, which in turn cascaded into downtime for the network.
    • Once the network was down, their DRP was inaccessible.

    Insights

    • Each piece of documentation that was created could have contributed to recovery efforts. However, because they were inaccessible, there was a delayed response to the incident. The result was 42 hours of downtime for end users.
    • Having redundant publishing strategies is just like having redundant IT infrastructure. In the event of downtime, not only do you need to have DR documentation, but you also need to make sure that it is accessible.

    Decide on a DR publishing strategy by looking at portability, maintainability, cost, and required effort

    Supporting Tool icon 2.1.1 DRP Publishing and Management Evaluation Tool

    Use the information included in Step 2.1 to guide your analysis of DRP publishing solutions.

    The tool enables you to compare two possible solutions based on these key considerations discussed in this section:

    • Portability/external access
    • Maintainability/usability
    • Cost
    • Effort

    The right choice will depend on factors such as current in-house tools, maturity around document management, the size of your IT department, and so on.

    For example, a small shop may do very well with the USB drive strategy, whereas a multi-national company will need a more formal strategy to manage consistent DRP distribution.

    Preview of Info-Tech's 'DRP Publishing and Management Solution Evaluation Tool'.

    The DRP Publishing and Management Solution Evaluation Tool helps you to evaluate the tools included in this section.

    Don’t think of a business continuity management (BCM) tool as a silver bullet; know what you’re getting out of it

    Portability/External Access:
    • Pros: Typically a SaaS option provides built-in external access with appropriate security and user administration to vary access rights.
    • Cons: Degree of external access is often dependent on the vendor.
    Maintainability/Usability:
    • Pros: Built-in templates encourage consistency and guide initial content development by indicating what details need to be captured.
    • Pros: Built-in document management (e.g. version control, metadata support), centralized access/navigation to required documents, and some automation (e.g. update contacts throughout the system).
    • Cons: Not a silver bullet. You still have to do the work to define and capture your processes.
    • Cons: Requires end-user and administrator training.
    Cost/Effort:
    • Pros: For large enterprises, the convenience of built-in document management and templates can outweigh the cost.
    • Cons: Expect leading DRP tools to cost $20K or more per year.

    About this approach:
    BCM tools are solutions that provide templates, tools, and document management to create BC and DR documentation.

    Info-Tech Insight

    The business case for a BCM tool is built by answering the following questions:

    • Will the BCM tool solve an unmet need?
    • Will the tool be more effective and efficient than an in-house solution?
    • Will the solution provide enhanced capabilities that an in-house solution cannot provide?

    If you cannot get a satisfactory answer to each of these questions, then opt for an in-house solution.

    “We explored a DRP tool, and it was something we might have used, but it was tens of thousands of pounds per year, so it didn’t stack up financially for us at all.” (Rik Toms, Head of Strategy – IP and IT, Cable and Wireless Communications)

    For in-house solutions, leverage tools such as SharePoint to provide document management capabilities

    Portability/External Access:
    • Pros: SharePoint is commonly web-enabled and supports external access with appropriate security and user administration.
    • Cons: Must be installed at redundant sites or be cloud-based to be effective in a crisis that takes down your primary data center.
    Maintainability/Usability:
    • Pros: Built-in document management (e.g. version control, metadata support) as well as centralized access/navigation to required documents.
    • Pros: No tool learning curve – SharePoint and MS Office would be existing solutions already used on a daily basis.
    • Cons: No built-in automation (e.g. automated updates to contacts throughout the system).
    • Cons: Consistency depends on creating templates and implementing processes for document updates, review, and approval.
    Cost/Effort:
    • Pros: Using existing tools, so this is a sunk cost in terms of capex.
    • Cons: Additional effort required to create templates and manage the documentation library.

    About this approach:
    DRPs and SOPs most often start as MS Office documents, even if there is a DRP tool available. For organizations that elect to bypass a formal DRP tool, and most do, the biggest gap they have to overcome is document management.

    Many organizations are turning to SharePoint to meet this need. For those that already have SharePoint in place, it makes sense to further leverage SharePoint for DR documentation and day-to-day SOPs.

    For SharePoint to be a practical solution, the documentation must still be accessible if the primary data center is down, e.g. by having redundant SharePoint instances at multiple in-house locations, or using a cloud-based SharePoint solution.

    “Just about everything that a DR planning tool does, you can do yourself using homegrown solutions or tools that you're already familiar with such as Word, Excel, and SharePoint.” (Allen Zuk, President and CEO, Sierra Management Consulting)

    A healthcare company uses SharePoint as its DRP and SOP documentation management solution

    CASE STUDY Healthcare

    • This organization is responsible for 50 medical facilities across three states.
    • It explored DRP tools, but didn’t find the right fit, so it has developed an in-house solution based in SharePoint. While DRP tools have improved, the organization no longer needs that type of solution. Its in-house solution is meeting its needs.
    • It has SharePoint instances at multiple locations to ensure availability if one site is down.

    Documentation Strategy

    • Created an IT operations library in SharePoint for DR and SOPs, from basic support to bare-metal restore procedures.
    • SOPs are linked from SharePoint to the virtual help desk for greater accessibility.
    • Where practical, diagrams and flowcharts are used, e.g. DR process flowcharts and network services SOPs dominated by diagrams and flowcharts.

    Management Strategy

    • Directors and the CIO have made finishing off SOPs their performance improvement objective for the year. The result is staff have made time to get this work done.
    • Status updates are posted monthly, and documentation is a regular agenda item in leadership meetings.
    • Regular tabletop testing validates documentation and ensures familiarity with procedures, including where to find required information.

    Results

    • Dependency on a few key individuals has been reduced. All relevant staff know what they need to do and where to access required documentation.
    • SOPs are enabling DR training as well as day-to-day operations training for new staff.
    • The organization has a high confidence in its ability to recovery from a disaster within established timelines.

    Explore using a wiki site as an inexpensive alternative to SharePoint and other content management solutions

    Portability/External Access:
    • Pros: Wiki sites can support external access as with any web solution.
    • Cons: Must be installed at redundant sites, hosted, or cloud-based to be effective in a crisis that takes down your primary data center.
    Maintainability/Usability:
    • Pros: Built-in document management (version control, metadata support, etc.) as well as centralized access/navigation to required information.
    • Pros: Authorized users can make updates dynamically, depending on how much restriction you have on the site.
    • Cons: No built-in automation (e.g. automated updates to contacts throughout the system).
    • Cons: Consistency depends on creating templates and implementing processes for document updates, review, and approval.
    Cost/Effort:
    • Pros: An inexpensive option compared to traditional content management solutions such as SharePoint.
    • Cons: Learning curve if wikis are new to your organization.

    About this approach:
    Wiki sites are websites where users collaborate to create and edit the content. Wikipedia is an example.

    While wiki sites are typically used for collaboration and dynamic content development, the traditional collaborative authoring model can be restricted to provide structure and an approval process.

    Several tools are available to create and manage wiki sites (and other collaboration solutions), as outlined in the following research:

    Info-Tech Insight

    If your organization is not already using wiki sites, this technology can introduce a culture shock. Start slow by using a wiki site within a specific department or for a particular project. Then evaluate how well your staff adapt to this technology as well as its potential effectiveness in your organization. Refer to our collaboration strategy research for additional guidance.

    For small IT shops, distributing documentation to key staff (e.g. via a USB drive) can still be effective

    Portability/External Access:
    • Pros: Appropriate staff have the documentation with them; there is no need to log into a remote site or access a tool to get at the information.
    • Cons: Relies on staff to be diligent about ensuring they have the latest documentation and keep it with them (not leave it in their desk drawer).
    Maintainability/Usability:
    • Pros: With this strategy, MS Office (or equivalent) is used to create and maintain the documentation, so there is no learning curve.
    • Pros: Simple, straightforward methodology – keep the master on a network drive, and download a copy to your USB drive.
    • Cons: No built-in automation (e.g. automated updates to contact information) or document management (e.g. version control).
    • Cons: Consistency depends on creating templates and implementing rigid processes for document updates, review, and approval.
    Cost/Effort:
    • Pros: Little to no cost and no tool management required.
    • Cons: “Manual” document management requires strict attention to process for version control, updates, approvals, and distribution.

    About this approach:
    With this strategy, your ERT and key IT staff keep a copy of your DRP and relevant documentation with them (e.g. on a USB drive). If the primary site experiences a major event, they have ready access to the documentation.

    Fifty percent of respondents in our recent survey use this strategy. A common scenario is to use a shared network drive or a solution such as SharePoint as the master centralized repository, but distribute a copy to key staff.

    Info-Tech Insight

    This approach can have similar disadvantages as using hard copies. Ensuring the USB drives are up to date, and that all staff who might need access have a copy, can become a burdensome process. More often, USB drives are updated periodically, so there is the risk that the information will be out of date or incomplete.

    Avoid extensive use of paper copies of DR documentation

    DR documents need to be easy to update, accessible from anywhere, and searchable. Paper doesn’t meet these needs.

    Portability/External Access:
    • Pros: Does not rely on technology or power.
    • Cons: Requires all staff who might be involved in a DR to have a copy, and to have it with them at all times, to truly have access at any time from anywhere.
    Maintainability/Usability:
    • Pros: In terms of usability, again there is no dependence on technology.
    • Cons: Updates need to be printed and distributed to all relevant staff every time there is a change to ensure staff have access to the latest, most accurate documentation if a disaster occurred. You can’t schedule disasters, so information needs to be current all the time.
    • Cons: Navigation to other information is manual – flipping through pages, etc. No searching or hyperlinks.
    Cost/Effort:
    • Pros: No technology system to maintain, aside from what you use for printing.
    • Cons: Printing expenses are actually among the highest incurred by organizations, and this adds to it.
    • Cons: Labor intensive due to need to print and physically distribute documentation updates.

    About this approach:
    Traditionally DRPs are printed and distributed to managers and/or kept in a central location at both the primary site and a secondary site. In addition, wallet cards are distributed that contain key information such as contact numbers.

    A wallet card or even a few printed copies of your high-level DRP for general reference can be helpful, but paper is not a practical solution for your overall DR documentation library, particularly when you include SOPs for recovery procedures.

    One argument in favor of paper is there is no dependency on power during a crisis. However, in a power outage, staff can use smartphones and potentially laptops (with battery power) to access electronically stored documentation to get through first response steps. In addition, your DR site should have backup power to be an appropriate recovery site.

    Optional: Partial list of BCM tool vendors

    A partial list of BCM tool vendors, including: Business Protector, catalyst, clearview, ContinuityLogic. Fusion, Logic Manager, Quantivate, RecoveryPlanner.com, MetricStream, SimpleRisk, riskonnect, Strategic BCP - ResilienceONE, RSA, and Sungard Availability Services.

    The list is only a partial list of BCM tool vendors. The order in which vendors are presented, and inclusion in this list, does not represent an endorsement.

    Optional: Use our list of requirements as a foundation for selecting and reviewing BCM tools

    Supporting Tool icon 2.1.2 BCM Tool – RFP Selection Criteria

    If a BCM tool is the best option for your environment, expedite the evaluation process with our BCM Tool – RFP Selection Criteria.

    Through advisory services, workshops, and consulting engagements, we have created this BCM Tool Requirements List. The featured requirements includes the following categories:

    1. Integrations
    2. Planning and Monitoring
    3. Administration
    4. Architecture
    5. Security
    6. Support and Training
    Preview of the Info-Tech template 'BCM Tool – RFP Selection Criteria'.

    This BCM Tool – RFP Selection Criteria can be appended to an RFP. You can leverage Info-Tech’s RFP Template if your organization does not have one.

    Info-Tech can write full RFPs

    As part of a consulting engagement, Info-Tech can write RFPs for BCM tools and provide a customized scoring tool based on your environment’s unique requirements.

    Phase 3: Keep Your DRP Relevant Through Maintenance Best Practices

    Step 3.1: Integrate DRP maintenance into core IT processes

    PHASE 1
    PHASE 2
    PHASE 3
    1.11.21.32.13.13.2
    Start with a Recovery WorkflowCreate Supporting DocumentationWrite the DRP SummarySelect DRP Publishing StrategyIntegrate into Core IT ProcessesConduct an Annual Focused Review

    This step will walk you through the following activities:

    • Integrate DRP maintenance with Project Management.
    • Integrate DRP considerations into Change Management.
    • Integrate with Performance Management.

    This step involves the following participants:

    • DRP Owner
    • Head of Project Management Office
    • Head of Change Advisory Board
    • CIO

    Outcomes of this step

    • Updated project intake form.
    • Updated change management practice.
    • Updated performance appraisals.

    3.1 — Incorporate DRP maintenance into core IT processes

    Focusing on these three processes will help ensure that your plan stays current, accurate, and usable.

    The Info-Tech / COBIT5 'IT Management and Governance Framework' with three processes highlighted: 'MEA01 Performance Measurement', 'BAI06 Change Management', and 'BAI01 Project Management'.

    Info-Tech Best Practice

    Prioritize quick wins that will have large benefits. The advice presented in this section offers easy ways to help keep your DRP up to date. These simple solutions can save a lot of time and effort for your DRP team as opposed to more intricate changes to the processes above.

    Assess how new projects impact service criticality and DR requirements upfront during project intake

    Icon for process 'BAI01 Project Management'.
    Supporting Tool icon 3.1.1 Sample Project Intake Form Addendum

    Understand the RTO/RPO requirements and IT impacts for new or enhanced services to ensure appropriate provisioning and overall DRP updates.

    • Have submitters include service continuity requirements. This information can be inserted into your business impact analysis. Use similar language that you use in your own BIA.
      • The submitter should know how critical the resulting project will be. Any items that the submitter doesn’t know, the Project Steering Committee should investigate.
    • Have IT assess the impact on the DRP. The submitter will not know how the DRP will be impacted directly. Ask the project committee to consider how DRP documentation and the DR environment will need to be changed due to the project under consideration.

    Note: The goal is not to make DR a roadblock, but rather to ensure project requirements will be met – including availability and DR requirements.

    Preview of the Info-Tech template 'Project Intake Form'.

    This Project Intake Form asks the submitter to fill out the availability and criticality requirements for the project.

    Leverage your change management process to identify required DRP updates as they occur

    Icon for process 'BAI06 Change Management'.

    Avoid the year-end rush to update your DRP. Keeping it up to date as changes occur saves time in the long run and ensures your plan is accurate when you need it.

    • As part of your change management process, identify potential updates to:
      • System documentation (e.g. configuration settings).
      • Recovery procedures (e.g. if a system has been virtualized, that changes the recovery procedure).
      • Your DR environment (e.g. system configuration updates for standby systems).
    • Keep track of how often a system has changed. Relevant DRP documentation might be due for a deeper review:
      • After a system has been changed ten times (even from routine changes), notify your DRP Manager to flag the relevant DRP documentation for review.
      • As part of formal DRP reviews, pay closer attention to DRP documentation for the flagged systems.
    Preview of the Info-Tech template 'Disaster Recovery Change Management'.

    This template asks the submitter to fill out the availability and criticality requirements for the project.

    For change management best practices beyond DRP considerations, please see Optimize Change Management.

    Integrate documentation into performance measurement and performance management

    Icon for process 'MEA01 Performance Measurement'.

    Documentation is a necessary evil – few like to create it and more immediate tasks take priority. If it isn’t scheduled and prioritized, it won’t happen.

    Why documentation is such a challenge

    How management can address these challenges

    We all know that IT staff typically do not like to write documentation. That’s not why they were hired, and good documentation is not what gets them promoted. Include documentation deliverables in your IT staff’s performance appraisal to stress the importance of ensuring documentation is up to date, especially where it might impact DR success.
    Similarly, documentation is secondary to more urgent tasks. Time to write documentation is often not allocated by project managers. Schedule time for developing documentation, just like any other project, or it won’t happen.
    Writing manuals is typically a time-intensive task. Focus on what is necessary for another experienced IT professional to execute the recovery. As discussed earlier, often a diagram or checklist is good enough and actually far more usable in a crisis.

    “Our directors and our CIO have tied SOP work to performance evaluations, and SOP status is reviewed during management meetings. People have now found time to get this work done.” (Assistant Director – IT Operations, Healthcare Industry)

    Step 3.2: Conduct an Annual Focused Review

    PHASE 1
    PHASE 2
    PHASE 3
    1.11.21.32.13.13.2
    Start with a Recovery WorkflowCreate Supporting DocumentationWrite the DRP SummarySelect DRP Publishing StrategyIntegrate into Core IT ProcessesConduct an Annual Focused Review

    This step will walk you through the following activities:

    1. Identify components of your DRP to refresh.
    2. Identify organizational changes requiring further focus.
    3. Test your DRP and identify problems.
    4. Correct problems identified with DRP.

    This step involves the following participants:

    • DRP Owner
    • System SMEs
    • Backup DR Personnel

    Outcomes of this step

    • An actionable, up-to-date DRP.

    Info-Tech Insight

    Testing is a waste of time and resources if you do not fix what’s broken. Tabletop testing is effective at uncovering gaps in your DR processes, but if you don’t address those gaps, then your DRP will still be unusable in a disaster.

    Set up a safety net to capture changes that slipped through the cracks with a focused review process

    Evaluate documentation supporting high-priority systems, as well as documentation supporting IT systems that have been significantly changed.

    • Ideally you’re maintaining documentation as you go along. But you need to have an annual review to catch items that may have slipped through.
    • Don’t review everything. Instead, review:
      • IT systems that have had 10+ changes: small changes and updates can add up over time. Ensure:
        • The plans for these systems are updated for changes (e.g. configuration changes).
        • SMEs and backup personnel are familiar with the changes.
      • Tier 1 / Gold Systems: Ensure that you can still recover tier 1 systems with your existing DRP documentation.
    • Track documentation issues that you discovered with your ticketing system or service desk tool to ensure necessary documentation changes are made.
    1. Annual Focused Review
    2. Tier 1 Systems
    3. Significantly Changed Systems
    4. Organizational Changes

    Identify larger changes, both organizational and within IT, that necessitate DRP updates

    During your focused review, consider how organizational changes have impacted your DRP.

    The COBIT 5 Enablers provide a foundation for this analysis. Consider:

    • Changes in regulatory requirements: Are there new requirements for IT that are not reflected in your DRP? Is the organization required to comply with any additional regulations?
    • Changes to organizational structures, business processes, and how employees work: Can employees still be productive once tier 1 services are restored or have RTOs changed? Has organizational turnover impacted your DRP?
    • SMEs leaving or changing roles: Can IT still execute your DRP? Are there still people for all the key roles?
    • Changes to IT infrastructure and applications: Can the business still access the information they need during a disaster? Is your BIA still accurate? Do new services need to be considered tier 1?

    Info-Tech Best Practice

    COBIT 5 Enablers
    What changes need to be reflected in your DRP?

    A cycle visualization titled 'Disaster Recovery Plan'. Starting at 'Changes in Regulatory Requirements', it proceeds clockwise to 'Organizational Structure', 'Changes in Business Processes', and 'How Employees Work', before it returns to DRP. Then 'Changes to Applications', 'Changes to Infrastructure', 'SMEs Leaving or Changing Roles', and then back to the DRP.

    Create a plan during your annual focused review to test your DRP throughout the year

    Regardless of your documentation approach, training and familiarity with relevant procedures is critical.

    • Start with tabletop exercises and progress to technology-based testing (simulation, parallel, and full-scale testing).
    • Ask staff to reference documentation while testing, even if they do not need to. This practice helps to confirm documentation accuracy and accessibility.
    • Incorporate cross-training in DR testing. This gives important experience to backup personnel and will further validate that documents are complete and accurate.
    • Track any discovered documentation issues with your ticketing system or project tracking tools to ensure necessary documentation changes are made.

    Example Test Schedule:

    1. Q1: Tabletop testing shadowed by backup personnel
    2. Q2: Tabletop testing led by backup personnel
    3. Q3: Technology-based testing
    4. Annual Focused Review: Review Results

    Reference this blueprint for guidance on DRP testing plans: Reduce Costly Downtime Through DR Testing

    Appendix A: XMPL Case Study

    Follow XMPL Medical’s journey through DR documentation

    CASE STUDY

    Industry Healthcare
    Source Created by amalgamating data from Info-Tech’s client base

    Streamline your documentation and maintenance process by following the approach outlined in XMPL Medical’s journey to an end-to-end DRP.

    Outline of the Disaster Recovery Plan

    XMPL’s disaster recovery plan includes its business impact analysis and a subset of tier 1 and tier 2 patient care applications.

    Its DRP includes incident response flowcharts, system recovery checklists, and a communication plan. Its DRP also references IT operations documentation (e.g. asset management documents, system specs, and system configuration docs), but this material is not published with the example documentation.

    Resulting Disaster Recovery Plan

    XMPL’s DRP includes actionable documents in the form of high-level disaster response plan flowcharts and system recovery checklists. During an incident, the DR team is able to clearly see the items for which they are responsible.

    Disaster Recovery Plan
    • Recovery Workflow
    • Business Impact Analysis
    • DRP Summary
    • System Recovery Checklists
    • Communication, Assessment, and Disaster Declaration Plan

    Info-Tech Best Practice

    XMPL Medical’s disaster recovery plan illustrates an effective DRP. Model your end-to-end disaster recovery plan after XMPL’s completed templates. The specific data points will differ from organization to organization, but the structure of each document will be similar.

    Model your disaster recovery documentation off of our example

    CASE STUDY

    Industry Healthcare
    Source Created by amalgamating data from Info-Tech’s client base

    Recovery Workflow:

    • Recovery Workflows (PDF, VSDX)

    Recovery Procedures (Systems Recovery Playbook):

    • DR Notification, Assessment, and Disaster Declaration Plan
    • Systems Recovery Playbook
    • Network Topology Diagrams

    Additional Reference Documentation:

    • DRP Workbook
    • Business Impact Analysis
    • DRP Summary Document

    Use our structure to create your practical disaster recovery plan.

    Appendix B: Summary, Next Steps, and Bibliography

    Insight breakdown

    Use visual-based documentation instead of a traditional DRP manual.

    • Flowcharts, checklists, and diagrams are more concise, easier to maintain, and more effective in a crisis.
    • Write for an IT audience and focus on how to recover. You don’t need 30 pages of fluff describing the purpose of the document.

    Create your DRP in layers to keep the work manageable.

    • Start with a recovery workflow to ensure a coordinated response, and build out supporting documentation over time.

    Prioritize quick wins to make DRP maintenance easier and more likely to happen.

    • Incorporate DRP maintenance into change management and project intake procedures to systematically update and refine the DR documentation. Don’t save up changes for a year-end blitz, which turns document maintenance into an onerous project.

    Summary of accomplishment

    Knowledge Gained

    • How to create visual-based DRP documentation
    • How to integrate DRP maintenance into core IT processes

    Processes Optimized

    • DRP documentation creation
    • DRP publishing tool selection
    • DRP documentation maintenance

    Deliverables Completed

    • DRP documentation
    • Strategy for publishing your DRP
    • Modified project-intake form
    • Change management checklist for DR considerations

    Project step summary

    Client Project: Document and Maintain Your Disaster Recovery Plan

    • Create a recovery workflow.
    • Create supporting DRP documentation.
    • Write a summary for your DRP.
    • Decide on a publishing strategy.
    • Incorporate DRP maintenance into core IT processes.
    • Conduct an annual focused review.

    Info-Tech Insight

    This project has the ability to fit the following formats:

    • Onsite workshop by Info-Tech Research Group consulting analysts.
    • Do-it-yourself with your team.
    • Remote delivery (Info-Tech Guided Implementation).

    Related Info-Tech research

    Create a Right-Sized Disaster Recovery Plan
    Close the gap between your DR capabilities and service continuity requirements.

    Reduce Costly Downtime Through DR Testing
    Improve the accuracy of your DRP and your team’s ability to efficiently execute recovery procedures through regular DR testing.

    Create Visual SOP Documents that Drive Process Optimization, Not Just Peace of Mind
    Go beyond satisfying auditors to drive process improvement, consistent IT operations, and effective knowledge transfer.

    Prepare for a DRP Audit
    Assess your current DRP maturity, identify required improvements, and complete an audit-ready DRP summary document.

    Bibliography

    A Structured Approach to Enterprise Risk Management (ERM) and the Requirements of ISO 31000. The Association of Insurance and Risk Managers, Alarm: The Public Risk Management Association, and The Institute of Risk Management, 2010.

    “APO012: Manage Risk.” COBIT 5: Enabling Processes. ISACA, 2012.

    Bird, Lyndon, Ian Charters, Mel Gosling, Tim Janes, James McAlister, and Charlie Maclean-Bristol. Good Practice Guidelines: A Guide to Global Good Practice in Business Continuity. Global ed. Business Continuity Institute, 2013.

    COBIT 5: A Business Framework for the Governance and Management of Enterprise IT. ISACA, 2012.

    “EDM03: Ensure Risk Optimisation.” COBIT 5: Enabling Processes. ISACA, 2012.

    Risk Management. ISO 31000:2009.

    Rothstein, Philip Jan. Disaster Recovery Testing: Exercising Your Contingency Plan. Rothstein Associates: 1 Oct. 2007.

    Societal Security – Business continuity management systems – Guidance. ISO 22313:2012.

    Societal Security – Business continuity management systems – Requirements. ISO 22301:2012.

    Understanding and Articulating Risk Appetite. KPMG, 2008.

    Reduce Risk With Rock-Solid Service-Level Agreements

    • Buy Link or Shortcode: {j2store}365|cart{/j2store}
    • member rating overall impact (scale of 10): N/A
    • member rating average dollars saved: N/A
    • member rating average days saved: N/A
    • Parent Category Name: Vendor Management
    • Parent Category Link: /vendor-management

    Organizations can struggle to understand what service-level agreements (SLAs) are required and how they can differ depending on the service type. In addition, these other challenges can also cloud an organization’s knowledge of SLAs:

    • No standardized SLAs documents, service levels, or metrics
    • Dealing with lost productivity and revenue due to persistent downtime
    • Not understanding SLAs components and what service levels are required for a particular service
    • How to manage the SLA and hold the vendor accountable

    Our Advice

    Critical Insight

    SLAs need to have clear, easy-to-measure objectives, to meet expectations and service level requirements, including meaningful reporting and remedies to hold the provider accountable to its obligations.

    Impact and Result

    This project will provide several benefits and learnings for almost all IT workers:

    • Better understanding of an SLA framework and required SLA elements
    • Standardized service levels and metrics aligned to the organization’s requirements
    • Reduced time in reviewing, evaluating, and managing service provider SLAs

    Reduce Risk With Rock-Solid Service-Level Agreements Research & Tools

    Start here – Read our Executive Brief

    Understand how to resolve your challenges with SLAs and their components and ensuring adequate metrics. Learn how to create meaningful SLAs that meet your requirements and manage them effectively.

    Besides the small introduction, subscribers and consulting clients within this management domain have access to:

    1. Understand SLA elements – Understand the elements of SLAs, service types, service levels, metrics/KPIs, monitoring, and reporting

    • SLA Checklist
    • SLA Evaluation Tool

    2. Create requirements – Create your own SLA criteria and templates that meet your organization’s requirements

    • SLA Template & Metrics Reference Guide

    3. Manage obligations – Learn the SLA Management Framework to track providers’ performance and adherence to their commitments.

    • SLO Tracker & Trending Tool

    Infographic

    Workshop: Reduce Risk With Rock-Solid Service-Level Agreements

    Workshops offer an easy way to accelerate your project. If you are unable to do the project yourself, and a Guided Implementation isn't enough, we offer low-cost delivery of our project workshops. We take you through every phase of your project and ensure that you have a roadmap in place to complete your project successfully.

    1 Understand the Elements of SLAs

    The Purpose

    Understand key components and elements of an SLA.

    Key Benefits Achieved

    Properly evaluate an SLA for required elements.

    Activities

    1.1 SLA overview, objectives, SLA types, service levels

    1.2 SLA elements and objectives

    1.3 SLA components: monitoring, reporting, and remedies

    1.4 SLA checklist review

    Outputs

    SLA Checklist 

    Evaluation Process

    SLA Checklist

    Evaluation Process

    SLA Checklist

    Evaluation Process

    SLA Checklist

    Evaluation Process

    2 Create SLA Criteria and Management Framework

    The Purpose

    Apply knowledge of SLA elements to create internal SLA requirements.

    Key Benefits Achieved

    Templated SLAs that meet requirements.

    Framework to manage SLOs.

    Activities

    2.1 Creating SLA criteria and requirements

    2.2 SLA templates and policy

    2.3 SLA evaluation activity

    2.4 SLA Management Framework

    2.5 SLA monitoring, tracking, and remedy reconciliation

    Outputs

    Internal SLA Management Framework

    Evaluation of current SLAs

    SLA tracking and trending

    Internal SLA Management Framework

    Evaluation of current SLAs

    SLA tracking and trending

    Internal SLA Management Framework

    Evaluation of current SLAs

    SLA tracking and trending

    Internal SLA Management Framework

    Evaluation of current SLAs

    SLA tracking and trending

    Internal SLA Management Framework

    Evaluation of current SLAs

    SLA tracking and trending

    Further reading

    Reduce Risk With Rock-Solid Service-Level Agreements

    Hold Service Providers more accountable to their contractual obligations with meaningful SLA components & remedies

    EXECUTIVE BRIEF

    Analyst Perspective

    Reduce Risk With Rock-Solid Service-Level Agreements

    Every year organizations outsource more and more IT infrastructure to the cloud, and IT operations to managed service providers. This increase in outsourcing presents an increase in risk to the CIO to save on IT spend through outsourcing while maintaining required and expected service levels to internal customers and the organization. Ensuring that the service provider constantly meets their obligations so that the CIO can meet their obligation to the organization can be a constant challenge. This brings forth the importance of the Service Level Agreement.

    Research clearly indicates that there is a general lack of knowledge when comes to understanding the key elements of a Service Level Agreement (SLA). Even less understanding of the importance of the components of Service Levels and the Service Level Objectives (SLO) that service provider needs to meet so that the outsourced service consistently meets requirements of the organization. Most service providers are very good at providing the contracted service and they all are very good at presenting SLOs that are easy to meet with very few or no ramifications if they don’t meet their objectives. IT leaders need to be more resolute in only accepting SLOs that are meaningful to their requirements and have meaningful, proactive reporting and associated remedies to hold service providers accountable to their obligations.

    Ted Walker

    Principal Research Director, Vendor Practice

    Info-Tech Research Group

    Executive Brief

    Vendors provide service level commitments to customers in contracts to show a level of trust, performance, availability, security, and responsiveness in an effort create a sense of confidence that their service or platform will meet your organization’s requirements and expectations. Sifting through these promises can be challenging for many IT Leaders. Customers struggle to understand and evaluate what’s in the SLA – are they meaningful and protect your investment? Not understanding the details of SLAs applicable to various types of Service (SaaS, MSP, Service Desk, DR, ISP) can lead to financial and compliance risk for the organization as well as poor customer satisfaction.

    This project will provide IT leadership the knowledge & tools that will allow them to:

    • Understand what SLAs are and why they need them.
    • Develop standard SLAs that meet the organization’s requirements.
    • Negotiate meaningful remedies aligned to Service Levels metrics or KPIs.
    • Create SLA monitoring & reporting and remedies requirements to hold the provider accountable.

    This research:

    1. Is designed for:
    • The CIO or CFO who needs to better understand their provider’s SLAs.
    • The CIO or BU that could benefit from improved service levels.
    • Vendor management who needs to standardize SLAs for the organization IT leadership that needs consistent service levels to the business
    • The contract manager who needs a better understanding of contact SLAs
  • Will help you:
    • Understand what a Service Level Agreement is and what it’s for
    • Learn what the components are of an SLA and why you need them
    • Create a checklist of required SLA elements for your organization
    • Develop standard SLA template requirements for various service types
    • Learn the importance of SLA management to hold providers accountable
  • Will also assist:
    • Vendor management
    • Procurement and sourcing
    • Organizations that need to understand SLAs within contract language
    • With creating standardized monitoring & reporting requirements
    • Organizations get better position remedies & credits to hold vendors accountable to their commitments
  • Reduce Risk With Rock-Solid Service-Level Agreements (SLAs)

    Hold service providers more accountable to their contractual obligations with meaningful SLA components and remedies

    The Problem

    IT Leadership doesn't know how to evaluate an SLA.

    Misunderstanding of obligations given the type of service provided (SAAS, IAAS, DR/BCP, Service Desk)

    Expectations not being met, leading to poor service from the provider.

    No way to hold provider accountable.

    Why it matters

    SLAS are designed to ensure that outsourced IT services meet the requirements and expectations of the organization. Well-written SLAs with all the required elements, metrics, and remedies will allow IT departments to provide the service levels to their customer and avoid financial and contractual risk to the organization.

    The Solution

    1. Understand the key service elements within an SLA
    • Develop a solid understanding of the key elements within an SLA and why they're important.
  • Establish requirements to create SLA criteria
    • Prioritize contractual services and establish concise SLA checklists and performance metrics.
  • Manage SLA obligations to ensure commitments are met
    • Review the five steps for effective SLA management to track provider performance and deal with chronic issues.
  • Service types

    • Availability/Uptime
    • Response Times
    • Resolution Time
    • Accuracy
    • First-Call Resolution

    Agreement Types

    • SaaS/IaaS
    • Service Desk
    • MSP
    • Co-Location
    • DR/BCP
    • Security Ops

    Performance Metrics

    • Reporting
    • Remedies & Credits
    • Monitoring
    • Exclusion

    Example SaaS Provider

    • Response Times ✓
    • Availability/Uptime ✓
    • Resolution Time ✓
    • Update Times ✓
    • Coverage Time ✓
    • Monitoring ✓
    • Reporting ✓
    • Remedies/Credits ✓

    SLA Management Framework

    1. SLO Monitoring
    • SLOs must be monitored by the provider, otherwise they can't be measured.
  • Concise Reporting
    • This is the key element for the provider to validate their performance.
  • Attainment Tracking
    • Capturing SLO metric attainment provides performance trending for each provider.
  • Score carding
    • Tracking details provide input into overall vendor performance ratings.
  • Remedy Reconciliation
    • From SLO tracking, missed SLOs and associated credits needs to be actioned and consumed.
  • Executive Summary

    Your Challenge

    To understand which SLAs are required for your organization and how they can differ depending on the service type. In addition, these other challenges can also cloud your knowledge of SLAs

    • No standardized SLA documents, Service levels, or metrics
    • Dealing with lost productivity & revenue due to persistent downtime
    • Understanding SLA components and what service levels are requires for a particular service
    • How to manage the SLA and hold the vendor accountable

    Common Obstacles

    There are several unknowns that SLA can present to different departments within the organization:

    • Little knowledge of what service levels are required
    • Not knowing SLO standards for a service type
    • Lack of resources to manage vendor obligations
    • Negotiating required metrics/KPIs with the provider
    • Low understanding of the risk that poor SLAs can present to the organization

    Info-Tech's Approach

    Info-Tech has a three-step approach to effective SLAs

    • Understand the elements of an SLA
    • Create Requirements for your organization
    • Manage the SLA obligations

    There are some basic components that every SLA should have – most don’t have half of what is required

    Info-Tech Insight

    SLAs need to have clear, easy to measure objectives to meet your expectations and service level requirements, including meaningful reporting and remedies to hold the provider accountable to their obligations.

    Your challenge

    This research is designed to help organizations gain a better understanding of what an SLA is, understand the importance of SLAs in IT contracts, and ensure organizations are provided with rock-solid SLAs that meet their requirements and not just what the vendor wants to provide.

    • Vendors can make SLAs weak and difficult to understand; sometimes the metrics are meaningless. Not fully understanding what makes up a good SLA can bring unknown risks to the organization.
    • Managing vendor SLA obligations effectively is important. Are adequate resources available? Does the vendor provide manual vs. automated processes and which do you need? Is the process proactive from the vendor or reactive from the customer?

    SLAs come in many variations and for many service types. Understanding what needs to be in them is one of the keys to reducing risk to your organization.

    “One of the biggest mistakes an IT leader can make is ignoring the ‘A’ in SLA,” adds Wendy M. Pfeiffer, CIO at Nutanix. “

    An agreement isn’t a one-sided declaration of IT capabilities, nor is it a one-sided demand of business requirements,” she says. “An agreement involves creating a shared understanding of desired service delivery and quality, calculating costs related to expectations, and then agreeing to outcomes in exchange for investment.” (15 SLA mistakes IT leaders still make | CIO)

    Common obstacles

    There are typically a lot of unknowns when it comes to SLAs and how to manage them.

    Most organizations don’t have a full understanding of what SLAs they require and how to ensure they are met by the vendor. Other obstacles that SLAs can present are:

    • Inadequate resources to create and manage SLAs
    • Poor awareness of standard or required SLA metrics/KPIs
    • Lack of knowledge about each provider’s commitment as well as your obligations
    • Low vendor willingness to provide or negotiate meaningful SLAs and credits
    • The know-how or resources to effectively monitor and manage the SLA’s performance

    SLAs need to address your requirements

    55% of businesses do not find all of their service desk metrics useful or valuable (Freshservice.com)

    27% of businesses spend four to seven hours a month collating metric reports (Freshservice.com)

    Executive Summary

    Info-Tech’s Approach

    • Understand the elements of an SLA
      • Availability
      • Monitoring
      • Response Times
      • SLO Calculation
      • Resolution Time
      • Reporting
      • Milestones
      • Exclusions
      • Accuracy
      • Remedies & Credits
    • Create standard SLA requirements and criteria
      • SLA Element Checklist
      • Corporate Requirements and Standards
      • SLA Templates and Policy
    • Effectively Manage the SLA Obligations
      • SLA Management Framework
        • SLO Monitoring
        • Concise Reporting
        • Attainment Tracking
        • Score Carding
        • Remedy Reconciliation

    Info-Tech’s three phase approach

    Reduce Risk With Rock-Solid Service-Level Agreements

    Phase 1

    Understand SLA Elements

    Phase Content:

    • 1.1 What are SLAs, types of SLAs, and why are they needed?
    • 1.2 Elements of an SLA
    • 1.3 Obligation management monitoring, Reporting requirements
    • 1.4 Exclusions
    • 1.5 SLAs vs. SLOs vs. SLIs

    Outcome:

    This phase will present you with an understanding of the elements of an SLA: What they are, why you need them, and how to validate them.

    Phase 2

    Create Requirements

    Phase Content:

    • 2.1 Create a list of your SLA criteria
    • 2.2 Develop SLA policy & templates
    • 2.3 Create a negotiation strategy
    • 2.4 SLA Overachieving discussion

    Outcome:

    This phase will leverage knowledge gained in Phase 1 and guide you through the creation of SLA requirements, criteria, and templates to ensure that providers meet the service level obligations needed for various service types to meet your organization’s service expectations.

    Phase 3

    Manage Obligations

    Phase Content:

    • 3.1 SLA Monitoring, Tracking
    • 3.2 Reporting
    • 3.3 Vendor SLA Reviews & Optimizing
    • 3.4 Performance management

    Outcome:

    This phase will provide you with an SLA management framework and the best practices that will allow you to effectively manage service providers and their SLA obligations.

    Insight summary

    Overarching insight

    SLAs need to have clear, easy-to-measure objectives to meet your expectations and service level requirements, including meaningful reporting and remedies to hold the provider accountable to their obligations.

    Phase 1 insight

    Not understanding the required elements of an SLA and not having meaningful remedies to hold service providers accountable to their obligations can present several risk factors to your organization.

    Phase 2 insight

    Creating standard SLA criteria for your organization’s service providers will ensure consistent service levels for your business units and customers.

    Phase 3 insight

    SLAs can have appropriate SLOs and remedies but without effective management processes they could become meaningless.

    Tactical insight

    Be sure to set SLAs that are easily measurable from regularly accessible data and that are straight forward to interpret.

    Tactical insight

    Beware of low, easy to attain service levels and metrics/KPIs. Service levels need to meet your expectations and needs not the vendor’s.

    Blueprint deliverables

    Each step of this blueprint is accompanied by supporting deliverables to help you accomplish your goals:
    SLA Tracker & Trending Tool

    Track the provider’s SLO attainment and see how their performance is trending over time

    SLA Evaluation Tool

    Evaluate SLA service levels, metrics, credit values, reporting, and other elements

    SLA Template & Metrics Reference Guide

    Reference guide for typical SLA metrics with a generic SLA Template

    Service-Level Agreement Checklist

    Complete SLA component checklist for core SLA and contractual elements.

    Key deliverable:

    Service-Level Agreement Evaluation Tool

    Evaluate each component of the SLA , including service levels, metrics, credit values, reporting, and processes to meet your requirements

    Blueprint objectives

    Understand the components of an SLA and effectively manage their obligations

    • To provide an understanding of different types of SLAs, their required elements, and what they mean to your organization. How to identify meaningful service levels based on service types. We will break down the elements of the SLA such as service types and define service levels such as response times, availability, accuracy, and associated metrics or KPIs to ensure they are concise and easy to measure.
    • To show how important it is that all metrics have remedies to hold the service provider accountable to their SLA obligations.

    Once you have this knowledge you will be able to create and negotiate SLA requirements to meet your organization’s needs and then manage them effectively throughout the term of the agreement.

    InfoTech Insight:

    Right-size your requirements and create your SLO criteria based on risk mitigation and create measurements that motivate the desired behavior from the SLA.

    Blueprint benefits

    IT Benefits

    • An understanding of standard SLA service levels and metrics
    • Reduced financial risk through clear and concise easy-to-measure metrics and KPIs
    • Improved SLA commitments from the service provider
    • Meaningful reporting and remedies to hold the provider accountable
    • Service levels and metrics that meet your requirements to support your customers

    Business Benefits

    • Better understanding of an SLA framework and required SLA elements
    • Improved vendor performance
    • Standardized service levels and metrics aligned to your organization’s requirements
    • Reduced time in reviewing and comprehending vendor SLAs
    • Consistent performance from your service providers

    Measure the value of this blueprint

    1. Dollars Saved
    • Improved performance from your service provider
    • Reduced financial risk through meaningful service levels & remedies
    • Dollars gained through:
      • Reconciled credits from obligation tracking and management
      • Savings due to automated processes
  • Time Saved
    • Reduced time in creating effective SLAs through requirement templates
    • Time spent tracking and managing SLA obligations
    • Reduced negotiation time
    • Time spent tracking and reconciling credits
  • Knowledge Gained
    • Understanding of SLA elements, service levels, service types, reporting, and remedies
    • Standard metrics and KPIs required for various service types and levels
    • How to effectively manage the service provider obligations
    • Tactics to negotiate appropriate service levels to meet your requirements
  • Info-Tech offers various levels of support to best suit your needs

    DIY Toolkit

    "Our team has already made this critical project a priority, and we have the time and capability, but some guidance along the way would be helpful."

    Guided Implementation

    "Our team knows that we need to fix a process, but we need assistance to determine where to focus. Some check-ins along the way wound help keep us on track."

    Workshop

    "We need to hit the ground running and get this project kicked off immediately. Our team has the ability to take this over once we get a framework and strategy in place."

    Consulting

    "Our team does not have the time or the knowledge to take this project on. We need assistance through the entirety of this project."

    Diagnostics and consistent frameworks are used throughout all four options.

    Guided Implementation

    What does a typical GI on this topic look like?

    A Guided Implementation (GI) is a series of calls with an Info-Tech analyst to help implement our best practices in your organization.

    A typical GI is between three to six calls over the course of two to three months.

    Phase 1 - Understand

    • Call #1: Scope requirements, objectives, and your specific SLA challenges

    Phase 2 - Create Requirements

    • Call #2: Review key SLA and how to identify them
    • Call #3: Deep dive into SLA elements and why you need them
    • Call #4: Review your service types and SLA criteria
    • Call #5: Create internal SLA requirements and templates

    Phase 3 - Management

    • Call #6: Review SLA Management Framework
    • Call #7: Review and create SLA Reporting and Tracking

    Workshop Overview

    Contact your account representative for more information.

    workshops@infotech.com 1-888-670-8889

    Day 1 Day 2
    Understanding SLAs SLA Templating & Management
    Activities

    1.1 SLA overview, objectives, SLA types, service levels

    1.2 SLA elements and objectives

    1.3 SLA components – monitoring, reporting, remedies

    1.4 SLA Checklist review

    2.1 Creating SLA criteria and requirements

    2.2 SLA policy & template

    2.3 SLA evaluation activity

    2.4 SLA management framework

    2.5 SLA monitoring, tracking, remedy reconciliation

    Deliverables
    1. SLA Checklist
    2. SLA policy & template creation
    3. SLA management gap analysis
    1. Evaluation of current SLAs
    2. SLA tracking and trending
    3. Create internal SLA management framework

    Reduce Risk With Rock-Solid Service-Level Agreements

    Phase 1

    Phase 1

    Understand SLA Elements

    Phase Steps

    • 1.1 What are SLAs, the types of SLAs, and why are they needed?
    • 1.2 Elements of an SLA
    • 1.3 Obligation management monitoring, Reporting requirements
    • 1.4 Exclusions and exceptions
    • 1.5 SLAs vs. SLOs vs. SLIs

    Create Requirements

    Manage Obligations

    1.1 What are SLAs, the types of SLAs, and why are they needed?

    SLA Overview

    What is a Service Level Agreement?

    An SLA is an overarching contractual agreement between a service provider and a customer (can be external or internal) that describes the services that will be delivered by the provider. It describes the service levels and associated performance metrics and expectations, how the provider will show it has attained the SLAs, and defines any remedies or credits that would apply if the provider fails to meet its commitments. Some SLAs also include a change or revision process.

    SLAs come in a few forms. Some are unique, separate, standalone documents that define the service types and levels in more detail and is customized to your needs. Some are separate documents that apply to a service and are web posted or linked to an MSA or SSA. The most common is to have them embedded in, or as an appendix to an MSA or SSA. When negotiating an MSA it’s generally more effective to negotiate better service levels and metrics at the same time.

    Objectives of an SLA

    To be effective, SLAs need to have clearly described objectives that define the service type(s) that the service provider will perform, along with commitment to associated measurable metrics or KPIs that are sufficient to meet your expectations. The goal of these service levels and metrics is to ensure that the service provider is committed to providing the service that you require, and to allow you to maintain service levels to your customers whether internal or external.

    1.1 What are SLAs, the types of SLAs, and why are they needed?

    Key Elements of an SLA

    Principle service elements of an SLA

    There are several more common service-related elements of an SLA. These generally include:

    • The Agreement – the document that defines service levels and commitments.
    • The service types – the type of service being provided by the vendor. These can include SaaS, MSP, Service Desk, Telecom/network, PaaS, Co-Lo, BCP, etc.
    • The service levels – these are the measurable performance objectives of the SLA. They include availability (uptime), response times, restore times, priority level, accuracy level, resolution times, event prevention, completion time, etc.
    • Metrics/KPIs – These are the targets or commitments associated to the service level that the service provider is obligated to meet.
    • Other elements – Reporting requirements, monitoring, remedies/credit values and process.

    Contractual Construct Elements

    These are construct components of an SLA that outline their roles and responsibilities, T&Cs, escalation process, etc.

    In addition, there are several contractual-type elements including, but not limited to:

    • A statement regarding the purpose of the SLA.
    • A list of services being supplied (service types).
    • An in-depth description of how services will be provided and when.
    • Vendor and customer requirements.
    • Vendor and customer obligations.
    • Acknowledgment/acceptance of the SLA.
    • They also list each party’s responsibilities and how issues will be escalated and resolved.

    Common types of SLAs explained

    Service-level SLA

    • This service-level agreement construct is the Service-based SLA. This SLA covers an identified service for all customers in general (for example, if an IT service provider offers customer response times for a service to several customers). In a service-based agreement, the response times would be the same and apply to all customers using the service. Any customer using the service would be provided the same SLA – in this case the same defined response time.

    Customer-based SLA

    • A customer-based SLA is a unique agreement with one customer. The entire agreement is defined for one or all service levels provided to a particular customer (for example, you may use several services from one telecom vendor). The SLAs for these services would be covered in one contract between you and the vendor, creating a unique customer-based vendor agreement. Another scenario could be where a vendor offers general SLAs for its services but you negotiate a specific SLA for a particular service that is unique or exclusive to you. This would be a customer-based SLA as well.

    Multi-level SLA

    • This service-level agreement construct is the multi-level SLA. In a multi-level SLA, components are defined to the organizational levels of the customer with cascading coverage to sublevels of the organization. The SLA typically entails all services and is designed to the cover each sub-level or department within the organization. Sometimes the multi-level SLA is known as a master organization SLA as it cascades to several levels of the organization.

    InfoTech Insight: Beware of low, easy to attain Service levels and metrics/KPIs. Service levels need to meet your requirements, expectations, and needs not the vendor’s.

    1.2 Elements of SLA-objectives, service types, and service levels

    Objectives of Service Levels

    The objective of the service levels and service credits are to:

    • Ensure that the services are of a consistently high quality and meet the requirements of the customer
    • Provide a mechanism whereby the customer can attain meaningful recognition of the vendors failure to deliver the level of service for which it was contracted to deliver
    • Incentivize the vendor or service provider to comply with and to expeditiously provide a remedy for any failure to attain the service levels committed to in the SLA
    • To ensure that the service provider fulfills the defined objectives of the outsourced service

    Service types

    There are several service types that can be part of an SLA. Service types are the different nature of services associated with the SLA that the provider is performing and being measured against. These can include:

    Service Desk, SaaS, PaaS, IaaS, ISP/Telecom/Network MSP, DR & BCP, Co-location security ops, SOW.

    Each service type should have standard service level targets or obligations that can vary depending on your requirements and reliance on the service being provided.

    Service levels

    Service levels are measurable targets, metrics, or KPIs that the service provider has committed to for the particular service type. Service levels are the key element of SLAs – they are the performance expectations set between you and the provider. The service performance of the provider is measured against the service level commitments. The ability of the provider to consistently meet these metrics will allow your organization to fully benefit from the objectives of the service and associated SLAs. Most service levels are time related but not all are.

    Common service levels are:

    Response times, resolution times per percent, restore/recovery times, accuracy, availability/uptime, completion/milestones, updating/communication, latency.

    Each service level has standard or minimum metrics for the provider. The metrics, or KPIs, should be relatively easy to measure and report against on a regular basis. Service levels are generally negotiable to meet your requirements.

    1.2.1 Activity SLA Checklist Tool

    1-2 hours

    Input

    • SLA content, Service elements
    • Contract terms & exclusions
    • Service metrices/KPIs

    Output

    • A concise list of SLA components
    • A list of missing SLA elements
    • Evaluation of the SLA

    Materials

    • Comprehensive checklist
    • Service provider SLA
    • Internal templates or policies

    Participants

    • Vendor or contract manager
    • IT or business unit manager
    • Legal
    • Finance

    Using this checklist will help you review a provider’s SLA to ensure it contains adequate service levels and remedies as well as contract-type elements.

    Instructions:

    Use the checklist to identify the principal service level elements as well as the contractual-type elements within the SLA.

    Review the SLA and use the dropdowns in the checklist to verify if the element is in the SLA and whether it is within acceptable parameters as well the page or section for reference.

    The checklist contains a list of service types that can be used for reference of what SLA elements you should expect to see in that service type SLA.

    Download the SLA Checklist Tool

    1.3 Monitoring, reporting requirements, remedies/credit process

    Monitoring & Reporting

    As mentioned, well-defined service levels are key to the success of the SLA. Validating that the metrics/KPIs are being met on a consistent basis requires regular monitoring and reporting. These elements of the SLA are how you hold the provider accountable to the SLA commitments and obligations. To achieve the service level, the service must be monitored to validate that timelines are met and accuracy is achieved.

    • Data or details from monitoring must then be presented in a report and delivered to the customer in an agreed-upon format. These formats can be in a dashboard, portal, spreadsheet, or csv file, and they must have sufficient criteria to validate the service-level metric. Reports should be kept for future review and to create historical trending.
    • Monitoring and reporting should be the responsibility of the service provider. This is the only way that they can validate to the customer that a service level has been achieved.
    • Reporting criteria and delivery timelines should be defined in the SLA and can even have a service level associated with it, such as a scheduled report delivery on the fifth day of the following month.
    • Reports need to be checked and balanced. When defining report criteria, be sure to define data source(s) that can be easily validated by both parties.
    • Report criteria should include compliance requirements, target metric/KPIs, and whether they were attained.
    • The report should identify any attainment shortfall or missed KPIs.

    Too many SLAs do not have these elements as often the provider tries to put the onus on the customer to monitor their performance of the service levels. .

    1.3.1 Monitoring, reporting requirements, remedies/credit process

    Remedies and Credits

    Service-level reports validate the performance of the service provider to the SLA metrics or KPIs. If the metrics are met, then by rights, the service provider is doing its job and performing up to expectations of the SLA and your organization.

    • What if the metrics are not being met either periodically or consistently? Solving this is the goal of remedies. Remedies are typically monetary costs (in some form) to the provider that they must pay for not meeting a service-level commitment. Credits can vary significantly and should be aligned to the severity of the missed service level. Sometimes there no credits offered by the vendor. This is a red flag in an SLA.
    • Typically expressed as a monetary credit, the SLA will have service levels and associated credits if the service-level metric/KPI is not met during the reporting period. Credits can be expressed in a dollar format, often defined as a percentage of a monthly fee or prorated annual fee. Although less common, some SLAs offer non-financial credits. These could include: an extension to service term, additional modules, training credits, access to a higher support level, etc.
    • Regardless of how the credit is presented, this is typically the only way to hold your provider accountable to their commitments and to ensure they perform consistently to expectations. You must do a rough calculation to validate the potential monetary value and if the credit is meaningful enough to the provider.

    Research shows that credit values that equate to just a few dollars, when you are paying the provider tens of thousands of dollars a month for a service or product, the credit is insignificant and therefore doesn’t incent the provider to achieve or maintain a service level.

    1.3.2 Monitoring, reporting requirements, remedies/credit process

    Credit Process

    Along with meaningful credit values, there must be a defined credit calculation method and credit redemption process in the SLA.

    Credit calculation. The credit calculation should be simple and straight forward. Many times, we see providers define complicated methods of calculating the credit value. In some cases complicated service levels require higher effort to monitor and report on, but this shouldn’t mean that the credit for missing the service level needs to require the same effort to calculate. Do a sample credit calculation to validate if the potential credit value is meaningful enough or meets your requirements.

    Credit redemption process. The SLA should define the process of how a credit is provided to the customer. Ideally the process should be fairly automated by the service provider. If the report shows a missed service level, that should trigger a credit calculation and credit value posted to account followed by notification. In many SLAs that we review, the credit process is either poorly defined or not defined at all. When it is defined, the process typically requires the customer to follow an onerous process and submit a credit request that must then be validated by the provider and then, if approved, posted to your account to be applied at year end as long as you are in complete compliance with the agreement and up-to-date on your account etc. This is what we need to avoid in provider-written SLAs. You need a proactive process where the service provider takes responsibility for missing an SLA and automatically assigns an accurate credit to your account with an email notice.

    Secondary level remedies. These are remedies for partial performance. For example, the platform is accessible but some major modules are not working (i.e.: the payroll platform is up and running and accessible but the tax table is not working properly so you can’t complete your payroll run on-time). Consider the requirement of a service level, metric, and remedy for critical components of a service and not just the platform availability.

    Info-Tech Insight SLA’s without adequate remedies to hold the vendor accountable to their commitments make the SLAs essentially meaningless.

    1.4 Exclusions indemnification, force majeure, scheduled maintenance

    Contract-Related Exclusions

    Attaining service-level commitments by the provider within an SLA can depend on other factors that could greatly influence their performance to service levels. Most of these other factors are common and should be defined in the SLA as exclusions or exceptions. Exceptions/exclusions can typically apply to credit calculations as well. Typical exceptions to attaining service levels are:

    • Denial of Service (DoS) attacks
    • Communication/ISP outage
    • Outages of third-party hosting
    • Actions or inactions of the client or third parties
    • Scheduled maintenance but not emergency maintenance
    • Force majeure events which can cover several different scenarios

    Attention should be taken to review the exceptions to ensure they are in fact not within the reasonable control of the provider. Many times the provider will list several exclusions. Often these are not reasonable or can be avoided, and in most cases, they allow the service provider the opportunity to show unjustified service-level achievements. These should be negotiated out of the SLA.

    1.5 Activity SLA Evaluation Tool

    1-2 hours

    Input

    • SLA content
    • SLA elements
    • SLA objectives
    • SLO calculation methods

    Output

    • Rating of the SLA service levels and objectives
    • Overall rating of the SLA content
    • Targeted list of required improvements

    Materials

    • SLA comprehensive checklist
    • Service provider SLA

    Participants

    • Vendor or contract manager
    • IT manager or leadership
    • Application or business unit manager

    The SLA Evaluation Tool will allow you evaluate an SLA for content. Enter details into the tool and evaluate the service levels and SLA elements and components to ensure the agreement contains adequate SLOs to meet your organization’s service requirements.

    Instructions:

    Review and identify SLA elements within the service provider’s SLA.

    Enter service-level details into the tool and rate the SLOs.

    Enter service elements details, validate that all required elements are in the SLA, and rate them accordingly.

    Capture and evaluate service-level SLO calculations.

    Review the overall rating for the SLA and create a targeted list for improvements with the service provider.

    Download the SLA Evaluation Tool

    1.5 Clarification: SLAs vs. SLOs vs. SLIs

    SLA – Service-Level Agreement The promise or commitment

    • This is the formal agreement between you and your service provider that contains their service levels and obligations with measurable metrics/KPIs and associated remedies. SLAs can be a separate or unique document, but are most commonly embedded within an MSA, SOW, SaaS, etc. as an addendum or exhibit.

    SLO – Service-Level Objective The goals or targets

    • This service-level agreement construct is the customer-based SLA. A Customer-based SLA is a unique agreement with one customer. The entire agreement is defined for one or all service levels provided to a particular customer. For example, you may use several services from one telecom vendor. The SLAs for these services would be covered in one contract between you and the Telco vendor, creating a unique customer-based to vendor agreement. Another scenario: a vendor offers general SLAs for its services and you negotiate a specific SLA for a particular service that is unique or exclusive to you. This would be a customer-based SLA as well.

    Other common names are Metrics and Key Performance Indicators (KPIs )

    SLI – Service-Level Indicator How did we do? Did we achieve the objectives?

    • An SLI is the actual metric attained after the measurement period. SLI measures compliance with an SLO (service level objective). So, for example, if your SLA specifies that your systems will be available 99.95% of the time, your SLO is 99.95% uptime and your SLI is the actual measurement of your uptime. Maybe it’s 99.96%. maybe 99.99% or even 99.75% For the vendor to be compliant to the SLA, the SLI(s) must meet or exceed the SLOs within the SLA document.

    Other common names: attainment, results, actual

    Info-Tech Insight:

    Web-posted SLAs that are not embedded within a signed MSA, can present uncertainty and risk as they can change at any time and typically without direct notice to the customer

    Reduce Risk With Rock-Solid Service-Level Agreements

    Phase 2

    Understand SLA Elements

    Phase 2

    Create Requirements

    Phase Steps

    • 2.1 Create a list of your SLA criteria
    • 2.2 Develop SLA policy & templates
    • 2.3 Create a negotiation strategy
    • 2.4 SLA overachieving discussion

    Manage Obligations

    2.1 Create a list of your SLA criteria

    Principle Service Elements

    With your understanding of the types of SLAs and the elements that comprise a well-written agreement

    • The next step is to start to create a set of SLA criteria for service types that your organization outsources or may require in the future.
    • This criteria should define the elements of the SLA with tolerance levels that will require the provider to meet your service expectations.
    • Service levels, metrics/KPIs, associated remedies and reporting criteria. This criteria could be captured into table-like templates that can be referenced or inserted into service provider SLAs.
    • Once you have defined minimum service-level criteria, we recommend that you do a deeper review of the various service provider types that your organization has in place. The goal of the review is to understand the objective of the service type and associated service levels and then compare them to your requirements for the service to meet your expectations. Service levels and KPIs should be no less than if your IT department was providing the service with its own resources and infrastructure.
    • Most IT departments have service levels that they are required to meet with their infrastructure to the business units or organization, whether it’s App delivery, issue or problem resolution, availability etc. When any of these services are outsourced to an external service provider, you need to make all efforts to ensure that the service levels are equal to or better than the previous or existing internal expectations.
    • Additionally, the goal is to identify service levels and metrics that don’t meet your requirements or expectations and/or service levels that are missing.

    2.2 Develop SLA policies and templates

    Contract-type Elements

    After creating templates for minimum-service metrics & KPIs, reporting criteria templates, process, and timing, the next step should be to work on contract-type elements and additional service-level components. These elements should include:

    • Reporting format, criteria, and timelines
    • Monitoring requirements
    • Minimum acceptable remedy or credits process; proactive by provider vs. reactive by customer
    • Roles & responsibilities
    • Acceptable exclusion details
    • Termination language for persistent failure to meet SLOs

    These templates or criteria minimums can be used as guidelines or policy when creating or negotiating SLAs with a service provider.

    Start your initial element templates for your strategic vendors and most common service types: SaaS, IaaS, Service Desk, SecOps, etc. The goal of SLA templates is to create simple minimum guidelines for service levels that will allow you to meet your internal SLAs and expectations. Having SLA templates will show the service provider that you understand your requirements and may put you in a better negotiating position when reviewing with the provider.

    When considering SLO metrics or KPIs consider the SMART guidance:

    Simple: A KPI should be easy to measure. It should not be complicated, and the purpose behind recording it must be documented and communicated.

    Measurable: A KPI that cannot be measured will not help in the decision-making process. The selected KPIs must be measurable, whether qualitatively or quantitatively. The procedure for measuring the KPIs must be consistent and well-defined.

    Actionable: KPIs should contribute to the decision-making process of your organization. A KPI that does not make any such contributions serves no purpose.

    Relevant: KPIs must be related to operations or functions that a security team seeks to assess.

    Time-based: KPIs should be flexible enough to demonstrate changes over time. In a practical sense, an ideal KPI can be grouped together by different time intervals.

    (Guide for Security Operations Metrics)

    2.2.1 Activity: Review SLA Template & Metrics Reference Guide

    1-2 hours

    Input

    • Service level metrics
    • List of who is accountable for PPM decisions

    Output

    • SLO templates for service types
    • SLA criteria that meets your organization’s requirements

    Materials

    • SLA Checklist
    • SLA criteria list with SLO & credit values
    • PPM Decision Review Workbook

    Participants

    • Vendor manager
    • IT leadership
    • Procurement or contract manager
    1. Review the SLA Template and Metrics Reference Guide for common metrics & KPIs for the various service types. Each Service Type tab has SLA elements and SLO metrics typically associated with the type of service.
    2. Some service levels have common or standard credits* that are typically associated with the service level or metric.
    3. Use the SLA Template to enter service levels, metrics, and credits that meet your organization’s criteria or requirements for a given service type.

    Download the SLA Template & Metrics Reference Guide

    *Credit values are not standard values, rather general ranges that our research shows to be the typical ranges that credit values should be for a given missed service level

    2.3 Create a negotiation strategy

    Once you have created service-level element criteria templates for your organization’s requirements, it’s time to document a negotiation position or strategy to use when negotiating with service providers. Not all providers are flexible with their SLA commitments, in fact most are reluctant to change or create “unique” SLOs for individual customers. Particularly cloud vendors providing IaaS, SaaS, or PaaS, SLAs. ISP/Telcom, Co-Lo and DR/BU providers also have standard SLOs that they don’t like to stray far from. On the other hand, security ops (SIEM), service desk, hardware, and SOW/PS providers who are generally contracted to provide variable services are somewhat more flexible with their SLAs and more willing to meet your requirements.

    • Service providers want to avoid being held accountable to SLOs, and their SLAs are typically written to reflect that.

    The goal of creating internal SLA templates and policies is to set a minimum baseline of service levels that your organization is willing to accept, and that will meet their requirements and expectations for the outsourced service. Using these templated SLOs will set the basis for negotiating the entire SLA with the provider. You can set the SLA purpose, objectives, roles, and responsibilities and then achieve these from the service provider with solid SLOs and associated reporting and remedies.

    Info-Tech Insight

    Web-posted SLAs that are not embedded within a signed MSA can present uncertainty and risk as they can change at any time and typically without direct notice to the customer

    2.3.1 Negotiating strategy guidance

    • Be prepared. Create a negotiating plan and put together a team that understands your organization’s requirements for SLA.
    • Stay informed. Request provider’s recent performance data and negotiate SLOs to the provider’s average performance.
    • Know what you need. Corporate SLA templates or policies should be positioned to service providers as baseline minimums.
    • Show some flexibility. Be willing to give up some ground on one SLO in exchange for acceptance of SLOs that may be more important to your organization.
    • Re-group. Have a fallback position or Plan B. What if the provider can’t or won’t meet your key SLOs? Do you walk?
    • Do your homework. Understand what the typical standard SLOs are for the type of service level.

    2.4 SLO overachieving incentive discussion

    Monitoring & Reporting

    • SLO overachieving metrics are seen in some SLAs where there is a high priority for a service provider to meet and or exceed the SLOs within the SLA. These are not common terms but can be used to improve the overall service levels of a provider. In these scenarios the provider is sometimes rewarded for overachieving on the SLOs, either consistently or on a monthly or quarterly basis. In some cases, it can make financial sense to incent the service provider to overachieve on their commitments. Incentives can drive behaviors and improved performance by the provider that can intern improve the benefits to your organization and therefore justify an incent of some type.
    • Example: You could have an SLO for invoice accuracy. If not achieved, it could cost the vendor if they don’t meet the accuracy metric, however if they were to consistently overachieve the metric it could save accounts payable hours of time in validation and therefore you could pass on some of these measurable savings to the provider.
    • Overachieving incentives can add complexity to the SLA so they need to be easily measurable and simple to manage.
    • Overachieving incentives can also be used in provider performance improvement plans, where a provider might have poor trending attainment and you need to have them improve their performance in a short period of time. Incentives typically will motivate provider improvement and generally will cost much less than replacing the provider.
    • There is another school of thought that you shouldn’t have to pay a provider for doing their job; however, others are of the opinion that incentives or bonuses improve the overall performance of individuals or teams and are therefore worth consideration if both parties benefit from the over performance.

    Reduce Risk With Rock-Solid Service-Level Agreements

    Phase 3

    Understand SLA Elements

    Create Requirements

    Phase 3

    Manage Obligations

    Phase Steps

    • 3.1 SLA monitoring and tracking
    • 3.2 Reporting
    • 3.3 Vendor SLA reviews & optimizing
    • 3.4 Performance management

    3.1 SLA monitoring, tracking, and remedy reconciliation

    The next step to effective SLAs is the management component. It could be fruitless if you were to spend your time and efforts negotiating your required service levels and metrics and don’t have some level of managing the SLA. In that situation you would have no way of knowing if the service provider is attaining their SLOs.

    There are several key elements to effective SLA management:

    • SLO monitoring
    • Simple, concise reporting
    • SLO attainment tracking
    • Score carding & trending
    • Remedy reconciliation

    SLA Management framework

    SLA Monitoring → Concise Reporting → Attainment Tracking → Score Carding →Remedy Reconciliation

    “A shift we’re beginning to see is an increased use of data and process discovery tools to measure SLAs,” says Borowski of West Monroe. “While not pervasive yet, these tools represent an opportunity to identify the most meaningful metrics and objectively measure performance (e.g., cycle time, quality, compliance). When provided by the client, it also eliminates the dependency on provider tools as the source-of-truth for performance data.” – Stephanie Overby

    3.1 SLA management framework

    SLA Performance Management

    • SLA monitoring provides data for SLO reports or dashboards. Reports provide attainment data for tacking over time. Attainment data feeds scorecards and allows for trending analysis. Missed attainment data triggers remedies.
    • All service providers monitor their systems, platforms, tickets, agents, sensors etc. to be able to do their jobs. Therefore, monitoring is readily available from your service provider in some form.
    • One of the key purposes of monitoring is to generate data into internal reports or dashboards that capture the performance metrics of the various services. Therefore, service-level and metric reports are readily available for all of the service levels that a service provider is contracted or engaged to provide.
    • Monitoring and reporting are the key elements that validate how your service provider is meeting its SLA obligations and thus are very important elements of an SLA. SLO report data becomes attainment data once the metric or KPI has been captured.
    • As a component of effective SLA management, this attainment data needs to be tracked/recorded in an easy-to-read format or table over a period of time. Attainment data can then be used to generate scorecards and trending reports for your review both internally and with the provider as required.
    • If attainment data shows that the service provider is meeting their SLA obligations, then the SLA is meeting your requirements and expectations. If on the other hand, attainment data shows that obligations are not being met, then actions must be taken to hold the service provider accountable. The most common method is through remedies that are typically in the form of a credit through a defined process (see Sec. 1.3). Any credits due for missed SLOs should also be tracked and reported to stakeholders and accounting for validation, reconciliation, and collection.

    3.2 Reporting

    Monitoring & Reporting

    • Many SLAs are silent on monitoring and reporting elements and require that the customer, if aware or able, to monitor the providers service levels and attainment and create their own KPI and reports. Then if SLOs are not met there is an arduous process that the customer must go through to request their rightful credit. This manual and reactive method creates all kinds of risk and cost to the customer and they should make all attempts to ensure that the service provider proactively provides SLO/KPI attainment reports on a regular basis.
    • Automated monitoring and reporting is a common task for many IT departments. There is no reason that a service provider can’t send reports proactively in a format that can be easily interpreted by the customer. The ideal state would be to capture KPI report data into a customer’s internal service provider scorecard.
    • Automated or automatic credit posting is another key element that service providers tend to ignore, primarily in hopes that the customer won’t request or go through the trouble of the process. This needs to change. Some large cloud vendors already have automated processes that automatically post a credit to your account if they miss an SLO. This proactive credit process should be at the top of your negotiation checklist. Service providers are avoiding thousands of credit dollars every year based on the design of their credit process. As more customers push back and negotiate more efficient credit processes, vendors will soon start to change and may use it as a differentiator with their service.

    3.2.1 Performance tracking and trending

    What gets measured gets done

    SLO Attainment Tracking

    A primary goal of proactive and automated reporting and credit process is to capture the provider’s attainment data into a tracker or vendor scorecard. These tracking scorecards can easily create status reports and performance trending of service providers, to IT leadership as well as feed QBR agenda content.

    Remedy Reconciliation

    Regardless of how a credit is processed it should be tracked and reconciled with internal stakeholders and accounting to ensure credits are duly applied or received from the provider and in a timely manner. Tracking and reconciliation must also align with your payment terms, whether monthly or annually.

    “While the adage, ‘You can't manage what you don't measure,’ continues to be true, the downside for organizations using metrics is that the provider will change their behavior to maximize their scores on performance benchmarks.” – Rob Lemos

    3.2.1 Activity SLA Tracker and Trending Tool

    1-2 hours setup

    Input

    • SLO metrics/KPIs from the SLA
    • Credit values associated with SLO

    Output

    • Monthly SLO attainment data
    • Credit tracking
    • SLO trending graphs

    Materials

    • Service provider SLO reports
    • Service provider SLA
    • SLO Tracker & Trending Tool

    Participants

    • Contract or vendor managers
    • Application or service managers
    • Service provider

    An important activity in the SLA management framework is to track the provider’s SLO attainment on a monthly or quarterly basis. In addition, if an SLO is missed, an associated credit needs to be tracked and captured. This activity allows you to capture the SLOs from the SLA and track them continually and provide data for trending and review at vendor performance meetings and executive updates.

    Instructions: Enter SLOs from the SLA as applicable.

    Each month, from the provider’s reports or dashboards, enter the SLO metric attainment.

    When an SLO is met, the cell will turn green. If the SLO is missed, the cell will turn red and a corresponding cell in the Credit Tracker will turn green, meaning that a credit needs to be reconciled.

    Use the Trending tab to view trending graphs of key service levels and SLOs.

    Download the SLO Tracker and Trending Tool

    3.3 Vendor SLA reviews and optimizing

    Regular reviews should be done with providers

    Collecting attainment data with scorecards or tracking tools provides summary information on the performance of the service provider to their SLA obligations. This information should be used for regular reviews both internally and with the provider.

    Regular attainment reviews should be used for:

    • Performance trending upward or downward
    • Identifying opportunities to revise or improve SLOs
    • Optimizing SLO and processes
    • Creating a Performance Improvement Plan (PIP) for the service provider

    Some organizations choose to review SLA performance with providers at regular QBRs or at specific SLA review meetings

    This should be determined based on the criticality, risk, and strategic importance of the provider’s service. Providers that provide essential services like ERP, payroll, CRM, HRIS, IaaS etc. should be reviewed much more regularly to ensure that any decline in service is identified early and addressed properly in accordance with the service provider. Negative trending performance should also be documented for consideration at renewal time.

    3.4 Performance management

    Dealing with persistent poor performance and termination

    Service providers that consistently miss key service level metrics or KPIs present financial and security risk to the organization. Poor performance of a service provider reflects directly on the IT leadership and will affect many other business aspects of the organization including:

    • Ability to conduct day-to-day business activities
    • Meet internal obligations and expectations
    • Employee productivity and satisfaction
    • Maintain corporate policies or industry compliance
    • Meet security requirements

    Communication is key. Poor performance of a service provider needs to be dealt with in a timely manner in order to avoid more critical impact of the poor performance. Actions taken with the provider can also vary depending again on the criticality, risk, and strategic importance of the provider’s service.

    Performance reviews should provide the actions required with the goal of:

    • Making the performance problems into opportunities
    • Working with the provider to create a PIP with aggressive timelines and ramifications if not attained
    • Non-renewal or termination consideration, if feasible including provider replacement options, risk, costs, etc.
    • SLA renegotiation or revisions
    • Warning notifications to the service provider with concise issues and ramifications

    To avoid the issues and challenges of dealing with chronic poor performance, consider a Persistent or Chronic Failure clause into the SLA contract language. These clauses can define chronic failure, scenarios, ramifications there of, and defined options for the client including increased credit values, non-monetary remedies, and termination options without liability.

    Info-Tech Insight

    It’s difficult to prevent chronic poor performance but you can certainly track it and deal with it in a way that reduces risk and cost to your organization.

    SLA Hall of Shame

    Crazy service provider SLA content collection

    • Excessive list of unreasonable exclusions
    • Subcontractors’ behavior could be excluded
    • Downtime credit, equal to downtime percent x the MRC
    • Controllable FM events (internal labor issues, health events)
    • Difficult downtime or credit calculations that don’t make sense
    • Credits are not valid if agreement is terminated early or not renewed
    • Customer is not current on their account, SLA or credits do not count/apply
    • Total downtime = to prorated credit value (down 3 hrs = 3/720hrs = 0.4% credit)
    • SLOs don’t apply if customer fails to report the issue or request a trouble ticket
    • Downtime during off hours (overnight) do not count towards availability metrics
    • Different availability commitments based on different support-levels packages
    • Extending the agreement term by the length of downtime as a form of a remedy

    SLA Dos and Don’ts

    Dos

    • Do negotiate SLOs to vendor’s average performance
    • Do strive for automated reporting and credit processes
    • Do right-size and create your SLO criteria based on risk mitigation
    • Do review SLA attainment results with strategic service providers on a regular basis
    • Do ensure that all key elements and components of an SLA are present in the document or appendix

    Don'ts

    • Don’t accept the providers response that “we can’t change the SLOs for you because then we’d have to change them for everyone”
    • Don’t leave SLA preparation to the last minute. Give it priority as you negotiate with the provider
    • Don’t create complex SLAs with numerous service levels and SLOs that need to be reported and managed
    • Don’t aim for absolute perfection. Rather, prioritize which service levels are most important to you for the service

    Summary of Accomplishment

    Problem Solved

    Knowledge Gained

    • Understanding of the elements and components of an SLA
    • A list of SLO metrics aligned to service types that meet your organization’s criteria
    • SLA metric/KPI templates
    • SLA Management process for your provider’s service objectives
    • Reporting and tracking process for performance trending

    Deliverables Completed

    • SLA component and contract element checklist
    • Evaluation or service provider SLAs
    • SLA templates for strategic service types
    • SLA tracker for strategic service providers

    If you would like additional support, have our analysts guide you through other phases as part of an Info-Tech workshop.

    Contact your account representative for more information.

    workshops@infotech.com

    1-888-670-8889

    Related Info-Tech Research

    Improve IT-Business Alignment Through an Internal SLA

    • Understand business requirements, clarify current capabilities, and enable strategies to close service-level gaps.

    Data center Co-location SLA & Service Definition Template

    • In essence, the SLA defines the “product” that is being purchased, permitting the provider to rationalize resources to best meet the needs of varied clients, and permits the buyer to ensure that business requirements are being met.

    Ensure Cloud Security in IaaS, PaaS, and SaaS Environments

    • Keep your information security risks manageable when leveraging the benefits of cloud computing.

    Bibliography

    Henderson, George. “3 Most Common Types of Service Level Agreement (SLA).” Master of Project Academy. N.d. Web.

    “Guide to Security Operations Metrics.” Logsign. Oct 5, 2020. Web.

    Lemos, Rob. “4 lessons from SOC metrics: What your SpecOps team needs to know.” TechBeacon. N.d. Web.

    “Measuring and Making the Most of Service Desk Metrics.” Freshworks. N.d. Web.

    Overby, Stephanie. “15 SLA Mistakes IT Leaders Still Make.” CIO. Jan 21, 2021.

    Leverage Agile Goal Setting for Improved Employee Engagement & Performance

    • Buy Link or Shortcode: {j2store}593|cart{/j2store}
    • member rating overall impact (scale of 10): N/A
    • member rating average dollars saved: N/A
    • member rating average days saved: N/A
    • Parent Category Name: Manage & Coach
    • Parent Category Link: /manage-coach
    • Managers are responsible for driving the best performance out of their staff while still developing individuals professionally.
    • Micromanaging tasks is an ineffective, inefficient way to get things done and keep employees engaged at the same time.
    • Both managers and employees view goal setting as a cumbersome process that never materializes in day-to-day work.
    • Without a consistent and agile goal-setting environment that pervades every day, managers risk low productivity and disengaged employees.

    Our Advice

    Critical Insight

    • Effective performance management occurs throughout the year, on a daily and weekly basis, not just at annual performance review time. Managers must embrace this reality and get into the habit of setting agile short-term goals to drive productivity.
    • Employee empowerment is one of the most significant contributors to employee engagement, which is a proven performance driver. Short-term goal setting, which is ultimately employee-owned, develops and nurtures a strong sense of employee empowerment.
    • Micromanaging employee tasks will get managers nowhere quickly. Putting in the effort to collaboratively define goals that benefit both the organization and the employee will pay off in the long run.
    • Goal setting should not be a cumbersome activity, but an agile, rolling habit that ensures employees are focused, supported, and given appropriate feedback to continue to drive performance.

    Impact and Result

    • Managers who have daily meetings to set goals are 17% more successful in terms of employee performance than managers who set goals annually.
    • Managers must be agile goal-setting role models, or risk over a third of their staff being confused about productivity expectations.
    • Managers that allow tracking of goals to be an inhibitor to goal setting are most likely to have a negative effect on employee performance success. In fact, tracking goals should not be a priority in the short-term.

    Leverage Agile Goal Setting for Improved Employee Engagement & Performance Research & Tools

    Besides the small introduction, subscribers and consulting clients within this management domain have access to:

    1. Learn the agile, short-term goal-setting process

    Implement agile goal setting with your team right away and drive performance.

    • Storyboard: Leverage Agile Goal Setting for Improved Employee Engagement & Performance
    [infographic]

    Business Intelligence and Reporting

    • Buy Link or Shortcode: {j2store}6|cart{/j2store}
    • Related Products: {j2store}6|crosssells{/j2store}
    • member rating overall impact (scale of 10): 8.9/10
    • member rating average dollars saved: $45,792
    • member rating average days saved: 29
    • Parent Category Name: Data and Business Intelligence
    • Parent Category Link: /improve-your-core-processes/data-and-business-intelligence

    The challenge

    • Your business partners need an environment that facilitates flexible data delivery.
    • Your data and BI strategy must continuously adapt to new business realities and data sources to stay relevant.
    • The pressure to go directly to the solution design is high.  

    Our advice

    Insight

    • A BI initiative is not static. It must be treated as a living platform to adhere to changing business goals and objectives. Only then will it support effective decision-making.
    • Hear the voice of the business; that is the "B" in BI.
    • Boys and their toys... The solution to better intelligence often lies not in the tool but the BI practices.
    • Build a roadmap that starts with quick-wins to establish base support for your initiative.

    Impact and results 

    • Use the business goals and objectives to drive your BI initiatives.
    • Focus first on what you already have in your company's business intelligence landscape before investing in a new tool that will only complicate things.
    • Understand the core of what your users need by leveraging different approaches to pinpointing BI capabilities.
    • Create a roadmap that details the iterative deliveries of your business intelligence initiative. Show both the short and long term.

    The roadmap

    Besides the small introduction, subscribers and consulting clients within this management domain have access to:

    Get started

    Our concise executive brief shows why you should create or refresh your business intelligence (BI) strategy. We'll show you our methodology and the ways we can help you in handling this.

    Upon ordering you receive the complete guide with all files zipped.

    Understand your business context and BI landscape

    Understand critical business information and analyze your current business intelligence landscape.

    • Build a Next-Generation BI with a Game-Changing BI Strategy – Phase 1: Understand the Business Context and BI Landscape (ppt)
    • BI Strategy and Roadmap Template (doc)
    • BI End-User Satisfaction Survey Framework (ppt)

    Evaluate your current business intelligence practices

    Assess your current maturity level and define the future state.

    • Build a Next-Generation BI with a Game-Changing BI Strategy – Phase 2: Evaluate the Current BI Practice (ppt)
    • BI Practice Assessment Tool – Example 1 (xls)
    • BI Practice Assessment Tool – Example 2 (xls)

    Create your BI roadmap

    Create business intelligence focused initiatives for continuous improvement.

    • Build a Next-Generation BI with a Game-Changing BI Strategy – Phase 3: Create a BI Roadmap for Continuous Improvement (ppt)
    • BI Initiatives and Roadmap Tool (xls)
    • BI Strategy and Roadmap Executive Presentation Template (ppt)


    IT Operations Consulting

    Operations... make sure that the services and products you offer your clients are delivered in the most efficient way possible. IT Operations makes sure that the applications and infrastructure that your delivery depends on is solid.

    Gert Taeymans has over 20 years experience in directing the implementation and management of mission-critical services for businesses in high-volume international markets. Strong track record in risk management, crisis management including disaster recovery, service delivery and change & config management.

    Continue reading

    Data Quality

    • Buy Link or Shortcode: {j2store}19|cart{/j2store}
    • Related Products: {j2store}19|crosssells{/j2store}
    • Teaser Video: Visit Website
    • Teaser Video Title: Big data after pandemic
    • member rating overall impact (scale of 10): 8.3/10
    • member rating average dollars saved: $5,100
    • member rating average days saved: 8
    • Parent Category Name: Data and Business Intelligence
    • Parent Category Link: /data-and-business-intelligence
    Restore trust in your data by aligning your data management approach to the business strategy

    Establish Data Governance – APAC Edition

    • Buy Link or Shortcode: {j2store}348|cart{/j2store}
    • member rating overall impact (scale of 10): 10.0/10 Overall Impact
    • member rating average dollars saved: $172,999 Average $ Saved
    • member rating average days saved: 63 Average Days Saved
    • Parent Category Name: Data Management
    • Parent Category Link: /data-management
    • Organisations are faced with challenges associated with changing data landscapes, evolving business models, industry disruptions, regulatory and compliance obligations, and changing and maturing user landscapes and demands for data.
    • Although the need for a data governance program is often evident, organisations miss the mark when their data governance efforts are not directly aligned to delivering measurable business value by supporting key strategic initiatives, value streams, and their underlying business capabilities.

    Our Advice

    Critical Insight

    • Your organisation’s value streams and the associated business capabilities require effectively governed data. Without this, you face the impact of elevated operational costs, missed opportunities, eroded stakeholder satisfaction, and exposure to increased business risk.
    • Ensure your data governance program delivers measurable business value by aligning the associated data governance initiatives with the business architecture.
    • Data governance must continuously align with the organisation’s enterprise governance function. It should not be perceived as an IT pet project, but rather as a business-driven initiative.

    Impact and Result

    Info-Tech’s approach to establishing and sustaining effective data governance is anchored in the strong alignment of organisational value streams and their business capabilities with key data governance dimensions and initiatives.

    • Align with enterprise governance, business strategy and organizational value streams to ensure the program delivers measurable business value.
    • Understand your current data governance capabilities and build out a future state that is right sized and relevant.
    • Define data governance leadership, accountability, and responsibility, supported by an operating model that effectively manages change and communication and fosters a culture of data excellence.

    Establish Data Governance – APAC Edition Research & Tools

    Besides the small introduction, subscribers and consulting clients within this management domain have access to:

    1. Data Governance Research – A step-by-step document to ensure that the people handling the data are involved in the decisions surrounding data usage, data quality, business processes, and change implementation.

    Data governance is a strategic program that will help your organisation control data by managing the people, processes, and information technology needed to ensure that accurate and consistent data policies exist across varying lines of the business, enabling data-driven insight. This research will provide an overview of data governance and its importance to your organization, assist in making the case and securing buy-in for data governance, identify data governance best practices and the challenges associated with them, and provide guidance on how to implement data governance best practices for a successful launch.

    • Establish Data Governance – Phases 1-3 – APAC

    2. Data Governance Planning and Roadmapping Workbook – A structured tool to assist with establishing effective data governance practices.

    This workbook will help your organisation understand the business and user context by leveraging your business capability map and value streams, developing data use cases using Info-Tech's framework for building data use cases, and gauging the current state of your organisation's data culture.

    • Data Governance Planning and Roadmapping Workbook – APAC

    3. Data Use Case Framework Template – An exemplar template to highlight and create relevant use cases around the organisation’s data-related problems and opportunities.

    This business needs gathering activity will highlight and create relevant use cases around data-related problems or opportunities that are clear and contained and, if addressed, will deliver value to the organisation. This template provides a framework for data requirements and a mapping methodology for creating use cases.

    • Data Use Case Framework Template – APAC

    4. Data Governance Initiative Planning and Roadmap Tool – A visual roadmapping tool to assist with establishing effective data governance practices.

    This tool will help your organisation plan the sequence of activities, capture start dates and expected completion dates, and create a roadmap that can be effectively communicated to the organisation.

    • Data Governance Initiative Planning and Roadmap Tool – APAC

    5. Business Data Catalogue – A comprehensive template to help you to document the key data assets that are to be governed based on in-depth business unit interviews, data risk/value assessments, and a data flow diagram for the organisation.

    Use this template to document information about key data assets such as data definition, source system, possible values, data sensitivity, data steward, and usage of the data.

    • Business Data Catalogue – APAC

    6. Data Governance Program Charter Template – A program charter template to sell the importance of data governance to senior executives.

    This template will help get the backing required to get a data governance project rolling. The program charter will help communicate the project purpose, define the scope, and identify the project team, roles, and responsibilities.

    • Data Governance Program Charter Template – APAC

    7. Data Policies – A set of policy templates to support the data governance framework for the organisation.

    This set of policies supports the organisation's use and management of data to ensure that it efficiently and effectively serves the needs of the organisation.

    • Data Governance Policy – APAC
    • Data Classification Policy, Standard, and Procedure – APAC
    • Data Quality Policy, Standard, and Procedure – APAC
    • Data Management Definitions – APAC
    • Metadata Management Policy, Standard, and Procedure – APAC
    • Data Retention Policy and Procedure – APAC
    [infographic]

    Workshop: Establish Data Governance – APAC Edition

    Workshops offer an easy way to accelerate your project. If you are unable to do the project yourself, and a Guided Implementation isn't enough, we offer low-cost delivery of our project workshops. We take you through every phase of your project and ensure that you have a roadmap in place to complete your project successfully.

    1 Establish Business Context and Value

    The Purpose

    Identify key business data assets that need to be governed.

    Create a unifying vision for the data governance program.

    Key Benefits Achieved

    Understand the value of data governance and how it can help the organisation better leverage its data.

    Gain knowledge of how data governance can benefit both IT and the business.

    Activities

    1.1 Establish business context, value, and scope of data governance at the organisation.

    1.2 Introduction to Info-Tech’s data governance framework.

    1.3 Discuss vision and mission for data governance.

    1.4 Understand your business architecture, including your business capability map and value streams.

    1.5 Build use cases aligned to core business capabilities.

    Outputs

    Sample use cases (tied to the business capability map) and a repeatable use case framework

    Vision and mission for data governance

    2 Understand Current Data Governance Capabilities and Plot Target-State Levels

    The Purpose

    Assess which data contains value and/or risk and determine metrics that will determine how valuable the data is to the organisation.

    Assess where the organisation currently stands in data governance initiatives.

    Determine gaps between the current and future states of the data governance program.

    Key Benefits Achieved

    Gain a holistic understanding of organisational data and how it flows through business units and systems.

    Identify which data should fall under the governance umbrella.

    Determine a practical starting point for the program.

    Activities

    2.1 Understand your current data governance capabilities and maturity.

    2.2 Set target-state data governance capabilities.

    Outputs

    Current state of data governance maturity

    Definition of target state

    3 Build Data Domain to Data Governance Role Mapping

    The Purpose

    Determine strategic initiatives and create a roadmap outlining key steps required to get the organisation to start enabling data-driven insights.

    Determine timing of the initiatives.

    Key Benefits Achieved

    Establish clear direction for the data governance program.

    Step-by-step outline of how to create effective data governance, with true business-IT collaboration.

    Activities

    3.1 Evaluate and prioritise performance gaps.

    3.2 Develop and consolidate data governance target-state initiatives.

    3.3 Define the role of data governance: data domain to data governance role mapping.

    Outputs

    Target-state data governance initiatives

    Data domain to data governance role mapping

    4 Formulate a Plan to Get to Your Target State

    The Purpose

    Consolidate the roadmap and other strategies to determine the plan of action from day one.

    Create the required policies, procedures, and positions for data governance to be sustainable and effective.

    Key Benefits Achieved

    Prioritised initiatives with dependencies mapped out.

    A clearly communicated plan for data governance that will have full business backing.

    Activities

    4.1 Identify and prioritise next steps.

    4.2 Define roles and responsibilities and complete a high-level RACI.

    4.3 Wrap-up and discuss next steps and post-workshop support.

    Outputs

    Initialised roadmap

    Initialised RACI

    Further reading

    Establish Data Governance

    Deliver measurable business value.

    Analyst Perspective

    Establish a data governance program that brings value to your organisation.

    Picture of analyst

    Data governance does not sit as an island on its own in the organisation – it must align with and be driven by your enterprise governance. As you build out data governance in your organisation, it's important to keep in mind that this program is meant to be an enabling framework of oversight and accountabilities for managing, handling, and protecting your company's data assets. It should never be perceived as bureaucratic or inhibiting to your data users. It should deliver agreed-upon models that are conducive to your organisation's operating culture, offering clarity on who can do what with the data and via what means. Data governance is the key enabler for bringing high-quality, trusted, secure, and discoverable data to the right users across your organisation. Promote and drive the responsible and ethical use of data while helping to build and foster an organisational culture of data excellence.

    Crystal Singh

    Director, Research & Advisory, Data & Analytics Practice

    Info-Tech Research Group

    Executive Summary

    Your Challenge

    The amount of data within organisations is growing at an exponential rate, creating a need to adopt a formal approach to governing data. However, many organisations remain uninformed on how to effectively govern their data. Comprehensive data governance should define leadership, accountability, and responsibility related to data use and handling and be supported by a well-oiled operating model and relevant policies and procedures. This will help ensure the right data gets to the right people at the right time, using the right mechanisms.

    Common Obstacles

    Organisations are faced with challenges associated with changing data landscapes, evolving business models, industry disruptions, regulatory and compliance obligations, and changing and maturing user landscape and demand for data. Although the need for a data governance program is often evident, organisations miss the mark when their data governance efforts are not directly aligned to delivering measurable business value. Initiatives should support key strategic initiatives, as well as value streams and their underlying business capabilities.

    Info-Tech's Approach

    Info-Tech's approach to establishing and sustaining effective data governance is anchored in the strong alignment of organisational value streams and their business capabilities with key data governance dimensions and initiatives. Organisations should:

    • Align their data governance with enterprise governance, business strategy and value streams to ensure the program delivers measurable business value.
    • Understand their current data governance capabilities so as to build out a future state that is right-sized and relevant.
    • Define data leadership, accountability, and responsibility. Support these with an operating model that effectively manages change and communication and fosters a culture of data excellence.

    Info-Tech Insight

    Your organisation's value streams and the associated business capabilities require effectively governed data. Without this, you face elevated operating costs, missed opportunities, eroded stakeholder satisfaction, and increased business risk.

    Your challenge

    This research is designed to help organisations build and sustain an effective data governance program.

    • Your organisation has recognised the need to treat data as a corporate asset for generating business value and/or managing and mitigating risk.
    • This has brought data governance to the forefront and highlighted the need to build a performance-driven enterprise program for delivering quality, trusted, and readily consumable data to users.
    • An effective data governance program is one that defines leadership, accountability. and responsibility related to data use and handling. It's supported by a well-oiled operating model and relevant policies and procedures, all of which help build and foster a culture of data excellence where the right users get access to the right data at the right time via the right mechanisms.

    As you embark on establishing data governance in your organisation, it's vital to ensure from the get-go that you define the drivers and business context for the program. Data governance should never be attempted without direction on how the program will yield measurable business value.

    'Data processing and cleanup can consume more than half of an analytics team's time, including that of highly paid data scientists, which limits scalability and frustrates employees.' – Petzold, et al., 2020

    Image is a circle graph and 30% of it is coloured with the number 30% in the middle of the graph

    'The productivity of employees across the organisation can suffer.' – Petzold, et al., 2020

    Respondents to McKinsey's 2019 Global Data Transformation Survey reported that an average of 30% of their total enterprise time was spent on non-value-added tasks because of poor data quality and availability. – Petzold, et al., 2020

    Common obstacles

    Some of the barriers that make data governance difficult to address for many organisations include:

    • Gaps in communicating the strategic value of data and data governance to the organisation. This is vital for securing senior leadership buy-in and support, which, in turn, is crucial for sustained success of the data governance program.
    • Misinterpretation or a lack of understanding about data governance, including what it means for the organisation and the individual data user.
    • A perception that data governance is inhibiting or an added layer of bureaucracy or complication rather than an enabling and empowering framework for stakeholders in their use and handling of data.
    • Embarking on data governance without firmly substantiating and understanding the organisational drivers for doing so. How is data governance going to support the organisation's value streams and their various business capabilities?
    • Neglecting to define and measure success and performance. Just as in any other enterprise initiative, you have to be able to demonstrate an ROI for time, resources and funding. These metrics must demonstrate the measurable business value that data governance brings to the organisation.
    • Failure to align data governance with enterprise governance.
    Image is a circle graph and 78% of it is coloured with the number 78% in the middle of the graph

    78% of companies (and 92% of top-tier companies) have a corporate initiative to become more data-driven. – Alation, 2020.

    Image is a circle graph and 58% of it is coloured with the number 58% in the middle of the graph

    But despite these ambitions, there appears to be a 'data culture disconnect' – 58% of leaders overestimate the current data culture of their enterprises, giving a grade higher than the one produced by the study. – Fregoni, 2020.

    The strategic value of data

    Power intelligent and transformative organisational performance through leveraging data.

    Respond to industry disruptors

    Optimise the way you serve your stakeholders and customers

    Develop products and services to meet ever-evolving needs

    Manage operations and mitigate risk

    Harness the value of your data

    The journey to being data-driven

    The journey to declaring that you are a data-driven organisation requires a pit stop at data enablement.

    The Data Economy

    Data Disengaged

    You have a low appetite for data and rarely use data for decision making.

    Data Enabled

    Technology, data architecture, and people and processes are optimised and supported by data governance.

    Data Driven

    You are differentiating and competing on data and analytics; described as a 'data first' organisation. You're collaborating through data. Data is an asset.

    Data governance is essential for any organisation that makes decisions about how it uses its data.

    Data governance is an enabling framework of decision rights, responsibilities, and accountabilities for data assets across the enterprise.

    Data governance is:

    • Executed according to agreed-upon models that describe who can take what actions with what information, when, and using what methods (Olavsrud, 2021).
    • True business-IT collaboration that will lead to increased consistency and confidence in data to support decision making. This, in turn, helps fuel innovation and growth.

    If done correctly, data governance is not:

    • An annoying, finger-waving roadblock in the way of getting things done.
    • Meant to solve all data-related business or IT problems in an organisation.
    • An inhibitor or impediment to using and sharing data.

    Info-Tech's Data Governance Framework

    An image of Info-Tech's Data Governance Framework

    Create impactful data governance by embedding it within enterprise governance

    A model is depicted to show the relationship between enterprise governance and data governance.

    Organisational drivers for data governance

    Data governance personas:

    Conformance: Establishing data governance to meet regulations and compliance requirements.

    Performance: Establishing data governance to fuel data-driven decision making for driving business value and managing and mitigating business risk.

    Two images are depicted that show the difference between conformance and performance.

    Data Governance is not a one-person show

    • Data governance needs a leader and a home. Define who is going to be leading, driving, and steering data governance in your organisation.
    • Senior executive leaders play a crucial role in championing and bringing visibility to the value of data and data governance. This is vital for building and fostering a culture of data excellence.
    • Effective data governance comes with business and IT alignment, collaboration, and formally defined roles around data leadership, ownership, and stewardship.
    Four circles are depicted. There is one person in the circle on the left and is labelled: Data Governance Leadership. The circle beside it has two people in it and labelled: Organisational Champions. The circle beside it has three people in it and labelled: Data Owners, Stewards & Custodians. The last circle has four people in it and labelled: The Organisation & Data Storytellers.

    Traditional data governance organisational structure

    A traditional structure includes committees and roles that span across strategic, tactical, and operational duties. There is no one-size-fits-all data governance structure. However, most organisations follow a similar pattern when establishing committees, councils, and cross-functional groups. Most organisations strive to identify roles and responsibilities at a strategic and operational level. Several factors will influence the structure of the program, such as the focus of the data governance project and the maturity and size of the organisation.

    A triangular model is depicted and is split into three tiers to show the traditional data governance organisational structure.

    A healthy data culture is key to amplifying the power of your data.

    'Albert Einstein is said to have remarked, "The world cannot be changed without changing our thinking." What is clear is that the greatest barrier to data success today is business culture, not lagging technology.' – Randy Bean, 2020

    What does it look like?

    • Everybody knows the data.
    • Everybody trusts the data.
    • Everybody talks about the data.

    'It is not enough for companies to embrace modern data architectures, agile methodologies, and integrated business-data teams, or to establish centres of excellence to accelerate data initiatives, when only about 1 in 4 executives reported that their organisation has successfully forged a data culture.'– Randy Bean, 2020

    Data literacy is an essential part of a data-driven culture

    • In a data-driven culture, decisions are made based on data evidence, not on gut instinct.
    • Data often has untapped potential. A data-driven culture builds tools and skills, builds users' trust in the condition and sources of data, and raises the data skills and understanding among their people on the front lines.
    • Building a data culture takes an ongoing investment of time, effort, and money. This investment will not achieve the transformation you want without data literacy at the grassroots level.

    Data-driven culture = 'data matters to our company'

    Despite investments in data initiative, organisations are carrying high levels of data debt

    Data debt is 'the accumulated cost that is associated with the sub-optimal governance of data assets in an enterprise, like technical debt.'

    Data debt is a problem for 78% of organisations.

    40% of organisations say individuals within the business do not trust data insights.

    66% of organisations say a backlog of data debt is impacting new data management initiatives.

    33% of organisations are not able to get value from a new system or technology investment.

    30% of organisations are unable to become data-driven.

    Source: Experian, 2020

    Absent or sub-optimal data governance leads to data debt

    Only 3% of companies' data meets basic quality standards. (Source: Nagle, et al., 2017)

    Organisations suspect 28% of their customer and prospect data is inaccurate in some way. (Source: Experian, 2020)

    Only 51% of organisations consider the current state of their CRM or ERP data to be clean, allowing them to fully leverage it. (Source: Experian, 2020)

    35% of organisations say they're not able to see a ROI for data management initiatives. (Source: Experian, 2020)

    Embrace the technology

    Make the available data governance tools and technology work for you:

    • Data catalogue
    • Business data glossary
    • Data lineage
    • Metadata management

    While data governance tools and technologies are no panacea, leverage their automated and AI-enabled capabilities to augment your data governance program.

    Logos of data governance tools and technology.

    Measure success to demonstrate tangible business value

    Put data governance into the context of the business:

    • Tie the value of data governance and its initiatives back to the business capabilities that are enabled.
    • Leverage the KPIs of those business capabilities to demonstrate tangible and measurable value. Use terms and language that will resonate with senior leadership.

    Don't let measurement be an afterthought:

    Start substantiating early on how you are going to measure success as your data governance program evolves.

    Build a right-sized roadmap

    Formulate an actionable roadmap that is right-sized to deliver value in your organisation.

    Key considerations:

    • When building your data governance roadmap, ensure you do so through an enterprise lens. Be cognizant of other initiatives that might be coming down the pipeline that may require you to align your data governance milestones accordingly.
    • Apart from doing your planning with consideration for other big projects or launches that might be in-flight and require the time and attention of your data governance partners, also be mindful of the more routine yet still demanding initiatives.
    • When doing your roadmapping, consider factors like the organisation's fiscal cycle, typical or potential year-end demands, and monthly/quarterly reporting periods and audits. Initiatives such as these are likely to monopolise the time and focus of personnel key to delivering on your data governance milestones.

    Sample milestones:

    Data Governance Leadership & Org Structure Definition

    Define the home for data governance and other key roles around ownership and stewardship, as approved by senior leadership.

    Data Governance Charter and Policies

    Create a charter for your program and build/refresh associated policies.

    Data Culture Diagnostic

    Understand the organisation's current data culture, perception of data, value of data, and knowledge gaps.

    Use Case Build and Prioritisation

    Build a use case that is tied to business capabilities. Prioritise accordingly.

    Business Data Glossary

    Build and/or refresh the business' glossary for addressing data definitions and standardisation issues.

    Tools & Technology

    Explore the tools and technology offering in the data governance space that would serve as an enabler to the program. (e.g. RFI, RFP).

    Key takeaways for effective business-driven data governance

    Data governance leadership and sponsorship is key.

    Ensure strategic business alignment.

    Build and foster a culture of data excellence.

    Evolve along the data journey.

    Make data governance an enabler, not a hindrance.

    Insight summary

    Overarching insight

    Your organisation's value streams and the associated business capabilities require effectively governed data. Without this, you face the impact of elevated operational costs, missed opportunities, eroded stakeholder satisfaction, and exposure to increased business risk.

    Insight 1

    Data governance should not sit as an island in your organisation. It must continuously align with the organisation's enterprise governance function. It shouldn't be perceived as a pet project of IT, but rather as an enterprise-wide, business-driven initiative.

    Insight 2

    Ensure your data governance program delivers measurable business value by aligning the associated data governance initiatives with the business architecture. Leverage the measures of success or KPIs of the underlying business capabilities to demonstrate the value data governance has yielded for the organisation.

    Insight 3

    Data governance remains the foundation of all forms of reporting and analytics. Advanced capabilities such as AI and machine learning require effectively governed data to fuel their success.

    Tactical insight

    Tailor your data literacy program to meet your organisation's needs, filling your range of knowledge gaps and catering to your different levels of stakeholders. When it comes to rolling out a data literacy program, there is no one-size-fits-all solution. Your data literacy program is intended to fill the knowledge gaps about data, as they exist in your organisation. It should be targeted across the board – from your executive leadership and management through to the subject matter experts across different lines of the business in your organisation.

    Info-Tech's methodology for establishing data governance

    1. Build Business and User Context 2. Understand Your Current Data Governance Capabilities 3. Build a Target State Roadmap and Plan
    Phase Steps
    1. Substantiate Business Drivers
    2. Build High-Value Use Cases for Data Governance
    1. Understand the Key Components of Data Governance
    2. Gauge Your Organisation's Current Data Culture
    1. Formulate an Actionable Roadmap and Right-Sized Plan
    Phase Outcomes
    • Your organisation's business capabilities and value streams
    • A business capability map for your organisation
    • Categorisation of your organisation's key capabilities
    • A strategy map tied to data governance
    • High-value use cases for data governance
    • An understanding of the core components of an effective data governance program
    • An understanding your organisation's current data culture
    • A data governance roadmap and target-state plan comprising of prioritised initiatives

    Blueprint deliverables

    Each step of this blueprint is accompanied by supporting deliverables to help you accomplish your goals:

    Screenshot of Info-Tech's Data Governance Planning and Roadmapping Workbook data-verified=

    Data Governance Planning and Roadmapping Workbook

    Use the Data Governance Planning and Roadmapping Workbook as you plan, build, roll out, and scale data governance in your organisation.

    Screenshot of Info-Tech's Data Use Case Framework Template

    Data Use Case Framework Template

    This template takes you through a business needs gathering activity to highlight and create relevant use cases around the organisation's data-related problems and opportunities.

    Screenshot of Info-Tech's Business Data Glossary data-verified=

    Business Data Glossary

    Use this template to document the key data assets that are to be governed and create a data flow diagram for your organisation.

    Screenshot of Info-Tech's Data Culture Diagnostic and Scorecard data-verified=

    Data Culture Diagnostic and Scorecard

    Leverage Info-Tech's Data Culture Diagnostic to understand how your organisation scores across 10 areas relating to data culture.

    Key deliverable:

    Data Governance Planning and Roadmapping Workbook

    Blueprint deliverables

    Each step of this blueprint is accompanied by supporting deliverables to help you accomplish your goals:

    Data Governance Initiative Planning and Roadmap Tool

    Leverage this tool to assess your current data governance capabilities and plot your target state accordingly.

    This tool will help you plan the sequence of activities, capture start dates and expected completion dates, and create a roadmap that can be effectively communicated to the organisation.

    Data Governance Program Charter Template

    This template will help get the backing required to get a data governance project rolling. The program charter will help communicate the project purpose, define the scope, and identify the project team, roles, and responsibilities.

    Data Governance Policy

    This policy establishes uniformed data governance standards and identifies the shared responsibilities for assuring the integrity of the data and that it efficiently and effectively serves the needs of your organisation

    Other Deliverables:

    • Data Governance Initiative Planning and Roadmap Tool
    • Data Governance Program Charter Template
    • Data Governance Policy

    Blueprint benefits

    Defined data accountability & responsibility

    Shared knowledge & common understanding of data assets

    Elevated trust & confidence in traceable data

    Improved data ROI & reduced data debt

    Support for ethical use and handling of data in a culture of excellence

    Measure the value of this blueprint

    Leverage this blueprint's approach to ensure your data governance initiatives align and support your key value streams and their business capabilities.

    • Aligning your data governance program and its initiatives to your organisation's business capabilities is vital for tracing and demonstrating measurable business value for the program.
    • This alignment of data governance with value streams and business capabilities enables you to use business-defined KPIs and demonstrate tangible value.
    Screenshot from this blueprint on the Measurable Business Value

    In phases 1 and 2 of this blueprint, we will help you establish the business context, define your business drivers and KPIs, and understand your current data governance capabilities and strengths.

    In phase 3, we will help you develop a plan and a roadmap for addressing any gaps and improving the relevant data governance capabilities so that data is well positioned to deliver on those defined business metrics.

    Info-Tech offers various levels of support to best suit your needs

    DIY Toolkit

    'Our team, has already made this critical project a priority, and we have the time and capability, but some guidance along the way would be helpful.'

    Guided Implementation

    'Our team knows that we need to fix a process, but we need assistance to determine where to focus. Some check-ins along the way would help keeps us on track.'

    Workshop

    'We need to hit the ground running and get this project kicked off immediately. Our team has the ability to take this over once we get a framework and strategy in place.'

    Consulting

    'Our team does not have the time or the knowledge to take this project on. We need assistance through the entirety of this project.'

    Diagnostics and consistent frameworks are used throughout all four options.

    Establish Data Governance project overview

    Contact your account representative for more information. workshops@infotech.com 1-888-670-8889

    1. Build Business and User context2. Understand Your Current Data Governance Capabilities3. Build a Target State Roadmap and Plan
    Best-Practice Toolkit
    1. Substantiate Business Drivers
    2. Build High-Value Use Cases for Data Governance
    1. Understand the Key Components of Data Governance
    2. Gauge Your Organisation's Current Data Culture
    1. Formulate an Actionable Roadmap and Right-Sized Plan
    Guided Implementation
    • Call 1
    • Call 2
    • Call 3
    • Call 4
    • Call 5
    • Call 6
    • Call 7
    • Call 8
    • Call 9
    Phase Outcomes
    • Your organisation's business capabilities and value streams
    • A business capability map for your organisation
    • Categorisation of your organisation's key capabilities
    • A strategy map tied to data governance
    • High-value use cases for data governance
    • An understanding of the core components of an effective data governance program
    • An understanding your organisation's current data culture
    • A data governance roadmap and target-state plan comprising of prioritised initiatives

    Guided Implementation

    What does a typical GI on this topic look like?

    An outline of what guided implementation looks like.

    A Guided Implementation (GI) is a series of calls with an Info-Tech analyst to help implement our best practices in your organisation. A typical GI is between 8 to 12 calls over the course of 4 to 6 months.

    Workshop overview

    Contact your account representative for more information. workshops@infotech.com 1-888-670-8889

    Day 1 Day 2 Day 3 Day 4
    Establish Business Context and Value Understand Current Data Governance Capabilities and Plot Target-State Levels Build Data Domain to Data Governance Role Mapping Formulate a Plan to Get to Your Target State
    Activities
    • Establish business context, value, and scope of data governance at the organisation
    • Introduction to Info-Tech's data governance framework
    • Discuss vision and mission for data governance
    • Understand your business architecture, including your business capability map and value streams
    • Build use cases aligned to core business capabilities
    • Understand your current data governance capabilities and maturity
    • Set target state data governance capabilities
    • Evaluate and prioritise performance gaps
    • Develop and consolidate data governance target-state initiatives
    • Define the role of data governance: data domain to data governance role mapping
    • Identify and prioritise next steps
    • Define roles and responsibilities and complete a high-level RACI
    • Wrap-up and discuss next steps and post-workshop support
    Deliverables
    1. Sample use cases (tied to the business capability map) and a repeatable use case framework
    2. Vision and mission for data governance
    1. Current state of data governance maturity
    2. Definition of target state
    1. Target-state data governance initiatives
    2. Data domain to data governance role mapping
    1. Initialised roadmap
    2. Initialised RACI
    3. Completed Business Data Glossary (BDG)

    Phase 1

    Build Business and User Context

    Three circles are in the image that list the three phases and the main steps. Phase 1 is highlighted.

    'When business users are invited to participate in the conversation around data with data users and IT, it adds a fundamental dimension — business context. Without a real understanding of how data ties back to the business, the value of analysis and insights can get lost.' – Jason Lim, Alation

    This phase will guide you through the following activities:

    • Identify Your Business Capabilities
    • Define your Organisation's Key Business Capabilities
    • Develop a Strategy Map that Aligns Business Capabilities to Your Strategic Focus

    This phase involves the following participants:

    • Data Governance Leader/Data Leader (CDO)
    • Senior Business Leaders
    • Business SMEs
    • Data Leadership, Data Owners, Data Stewards and Custodians

    Step 1.1

    Substantiate Business Drivers

    Activities

    1.1.1 Identify Your Business Capabilities

    1.1.2 Categorise Your Organisation's Key Business Capabilities

    1.1.3 Develop a Strategy Map Tied to Data Governance

    This step will guide you through the following activities:

    • Leverage your organisation's existing business capability map or initiate the formulation of a business capability map, guided by Info-Tech's approach
    • Determine which business capabilities are considered high priority by your organisation
    • Map your organisation's strategic objectives to value streams and capabilities to communicate how objectives are realised with the support of data

    Outcomes of this step

    • A foundation for data governance initiative planning that's aligned with the organisation's business architecture: value streams, business capability map, and strategy map

    Info-Tech Insight

    Gaining a sound understanding of your business architecture (value streams and business capabilities) is a critical foundation for establishing and sustaining a data governance program that delivers measurable business value.

    1.1.1 Identify Your Business Capabilities

    Confirm your organisation's existing business capability map or initiate the formulation of a business capability map:

    1. If you have an existing business capability map, meet with the relevant business owners/stakeholders to confirm that the content is accurate and up to date. Confirm the value streams (how your organisation creates and captures value) and their business capabilities are reflective of the organisation's current business environment.
    2. If you do not have an existing business capability map, follow this activity to initiate the formulation of a map (value streams and related business capabilities):
      1. Define the organisation's value streams. Meet with senior leadership and other key business stakeholders to define how your organisation creates and captures value.
      2. Define the relevant business capabilities. Meet with senior leadership and other key business stakeholders to define the business capabilities.

    Note: A business capability defines what a business does to enable value creation. Business capabilities are business terms defined using descriptive nouns such as 'Marketing' or 'Research and Development.' They represent stable business functions, are unique and independent of each other, and typically will have a defined business outcome.

    Input

    • List of confirmed value streams and their related business capabilities

    Output

    • Business capability map with value streams for your organisation

    Materials

    • Your existing business capability map or the template provided in the Data Governance Planning and Roadmapping Workbook accompanying this blueprint

    Participants

    • Key business stakeholders
    • Data stewards
    • Data custodians
    • Data Governance Working Group

    For more information, refer to Info-Tech's Document Your Business Architecture.

    Define or validate the organisation's value streams

    Value streams connect business goals to the organisation's value realisation activities. These value realisation activities, in turn, depend on data.

    If the organisation does not have a business architecture function to conduct and guide Activity 1.1.1, you can leverage the following approach:

    • Meet with key stakeholders regarding this topic, then discuss and document your findings.
    • When trying to identify the right stakeholders, consider: Who are the decision makers and key influencers? Who will impact this piece of business architecture related work? Who has the relevant skills, competencies, experience, and knowledge about the organisation?
    • Engage with these stakeholders to define and validate how the organisation creates value.
    • Consider:
      • Who are your main stakeholders? This will depend on the industry in which you operate. For example, customers, residents, citizens, constituents, students, patients.
      • What are your stakeholders looking to accomplish?
      • How does your organisation's products and/or services help them accomplish that?
      • What are the benefits your organisation delivers to them and how does your organisation deliver those benefits?
      • How do your stakeholders receive those benefits?

    Align data governance to the organisation's value realisation activities.

    Value streams enable the organisation to create or capture value in the market in which it operates by engaging in a set of interconnected activities.

    Info-Tech Insight

    Your organisation's value streams and the associated business capabilities require effectively governed data. Without this, you face the possibilities of elevated operational costs, missed opportunities, eroded stakeholder satisfaction, negative impact to reputation and brand, and/or increased exposure to business risk.

    Example of value streams – Retail Banking

    Value streams connect business goals to the organisation's value realisation activities.

    Example value stream descriptions for: Retail Banking

    Value streams enable the organisation to create or capture value in the market in which it operates by engaging in a set of interconnected activities.

    Model example of value streams for retail banking.

    For this value stream, download Info-Tech's Info-Tech's Industry Reference Architecture for Retail Banking.

    Example of value streams – Higher Education

    Value streams connect business goals to the organisation's value realisation activities.

    Example value stream descriptions for: Higher Education

    Value streams enable the organisation to create or capture value in the market in which it operates by engaging in a set of interconnected activities.

    Model example of value streams for higher education

    For this value stream, download Info-Tech's Industry Reference Architecture for Higher Education.

    Example of value streams – Local Government

    Value streams connect business goals to the organisation's value realisation activities.

    Example value stream descriptions for: Local Government

    Value streams enable the organisation to create or capture value in the market in which it operates by engaging in a set of interconnected activities.

    Model example of value streams for local government

    For this value stream, download Info-Tech's Industry Reference Architecture for Local Government.

    Example of value streams – Manufacturing

    Value streams connect business goals to the organisation's value realisation activities.

    Example value stream descriptions for: Manufacturing

    Value streams enable the organisation to create or capture value in the market in which it operates by engaging in a set of interconnected activities.

    Model example of value streams for manufacturing

    For this value stream, download Info-Tech's Industry Reference Architecture for Manufacturing.

    Example of value streams – Retail

    Value streams connect business goals to the organisation's value realisation activities.

    Example value stream descriptions for: Retail

    Model example of value streams for retail

    Value streams enable the organisation to create or capture value in the market in which it operates by engaging in a set of interconnected activities.

    For this value stream, download Info-Tech's Industry Reference Architecture for Retail.

    Define the organisation's business capabilities in a business capability map

    A business capability defines what a business does to enable value creation. Business capabilities represent stable business functions and typically will have a defined business outcome.

    Business capabilities can be thought of as business terms defined using descriptive nouns such as 'Marketing' or 'Research and Development.'

    If your organisation doesn't already have a business capability map, you can leverage the following approach to build one. This initiative requires a good understanding of the business. By working with the right stakeholders, you can develop a business capability map that speaks a common language and accurately depicts your business.

    Working with the stakeholders as described above:

    • Analyse the value streams to identify and describe the organisation's capabilities that support them.
    • Consider: What is the objective of your value stream? (This can highlight which capabilities support which value stream.)
    • As you initiate your engagement with your stakeholders, don't start a blank page. Leverage the examples on the next slides as a starting point for your business capability map.
    • When using these examples, consider: What are the activities that make up your particular business? Keep the ones that apply to your organisation, remove the ones that don't, and add any needed.

    Align data governance to the organisation's value realisation activities.

    Info-Tech Insight

    A business capability map can be thought of as a visual representation of your organisation's business capabilities and hence represents a view of what your data governance program must support.

    For more information, refer to Info-Tech's Document Your Business Architecture.

    Example business capability map – Retail Banking

    A business capability map can be thought of as a visual representation of your organisation's business capabilities and hence represents a view of what your data governance program must support.

    Validate your business capability map with the right stakeholders, including your executive team, business unit leaders, and/or other key stakeholders.

    Info-Tech Tip:

    Leverage your business capability map verification session with these key stakeholders as a prime opportunity to share and explain the role of data and data governance in supporting the very value realisation capabilities under discussion. This will help to build awareness and visibility of the data governance program.

    Example business capability map for: Retail Banking

    Model example business capability map for retail banking

    For this business capability map, download Info-Tech's Industry Reference Architecture for Retail Banking.

    Example business capability map – Higher Education

    A business capability map can be thought of as a visual representation of your organisation's business capabilities and hence represents a view of what your data governance program must support.

    Validate your business capability map with the right stakeholders, including your executive team, business unit leaders, and/or other key stakeholders.

    Info-Tech Tip:

    Leverage your business capability map verification session with these key stakeholders as a prime opportunity to share and explain the role of data and data governance in supporting the very value realisation capabilities under discussion. This will help to build awareness and visibility of the data governance program.

    Example business capability map for: Higher Education

    Model example business capability map for higher education

    For this business capability map, download Info-Tech's Industry Reference Architecture for Higher Education.

    Example business capability map – Local Government

    A business capability map can be thought of as a visual representation of your organisation's business capabilities and hence represents a view of what your data governance program must support.

    Validate your business capability map with the right stakeholders, including your executive team, business unit leaders, and/or other key stakeholders.

    Info-Tech Tip:

    Leverage your business capability map verification session with these key stakeholders as a prime opportunity to share and explain the role of data and data governance in supporting the very value realisation capabilities under discussion. This will help to build awareness and visibility of the data governance program.

    Example business capability map for: Local Government

    Model example business capability map for local government

    For this business capability map, download Info-Tech's Industry Reference Architecture for Local Government.

    Example business capability map – Manufacturing

    A business capability map can be thought of as a visual representation of your organisation's business capabilities and hence represents a view of what your data governance program must support.

    Validate your business capability map with the right stakeholders, including your executive team, business unit leaders, and/or other key stakeholders.

    Info-Tech Tip:

    Leverage your business capability map verification session with these key stakeholders as a prime opportunity to share and explain the role of data and data governance in supporting the very value realisation capabilities under discussion. This will help to build awareness and visibility of the data governance program.

    Example business capability map for: Manufacturing

    Model example business capability map for manufacturing

    For this business capability map, download Info-Tech's Industry Reference Architecture for Manufacturing.

    Example business capability map - Retail

    A business capability map can be thought of as a visual representation of your organisation's business capabilities and hence represents a view of what your data governance program must support.

    Validate your business capability map with the right stakeholders, including your executive team, business unit leaders, and/or other key stakeholders.

    Info-Tech Tip:

    Leverage your business capability map verification session with these key stakeholders as a prime opportunity to share and explain the role of data and data governance in supporting the very value realisation capabilities under discussion. This will help to build awareness and visibility of the data governance program.

    Example business capability map for: Retail

    Model example business capability map for retail

    For this business capability map, download Info-Tech's Industry Reference Architecture for Retail.

    1.1.2 Categorise Your Organisation's Key Capabilities

    Determine which capabilities are considered high priority in your organisation.

    1. Categorise or heatmap the organisation's key capabilities. Consult with senior and other key business stakeholders to categorise and prioritise the business' capabilities. This will aid in ensuring your data governance future state planning is aligned with the mandate of the business. One approach to prioritising capabilities with business stakeholders is to examine them through the lens of cost advantage creators, competitive advantage differentiators, and/or by high value/high risk.
    2. Identify cost advantage creators. Focus on capabilities that drive a cost advantage for your organisation. Highlight these capabilities and prioritise programs that support them.
    3. Identify competitive advantage differentiators. Focus on capabilities that give your organisation an edge over rivals or other players in your industry.

    This categorisation/prioritisation exercise helps highlight prime areas of opportunity for building use cases, determining prioritisation, and the overall optimisation of data and data governance.

    Input

    • Strategic insight from senior business stakeholders on the business capabilities that drive value for the organisation

    Output

    • Business capabilities categorised and prioritised (e.g. cost advantage creators, competitive advantage differentiators, high value/high risk)

    Materials

    • Your existing business capability map or the business capability map derived in the previous activity

    Participants

    • Key business stakeholders
    • Data stewards
    • Data custodians
    • Data Governance Working Group

    For more information, refer to Info-Tech's Document Your Business Architecture.

    Example of business capabilities categorisation or heatmapping – Retail

    This exercise is useful in ensuring the data governance program is focused and aligned to support the priorities and direction of the business.

    • Depending on the mandate from the business, priority may be on developing cost advantage. Hence the capabilities that deliver efficiency gains are the ones considered to be cost advantage creators.
    • The business' priority may be on maintaining or gaining a competitive advantage over its industry counterparts. Differentiation might be achieved in delivering unique or enhanced products, services, and/or experiences, and the focus will tend to be on the capabilities that are more end-stakeholder-facing (e.g. customer-, student-, patient,- and/or constituent-facing). These are the organisation's competitive advantage creators.

    Example: Retail

    Example of business capabilities categorisation or heatmapping – Retail

    For this business capability map, download Info-Tech's Industry Reference Architecture for Retail.

    1.1.3 Develop a Strategy Map Tied to Data Governance

    Identify the strategic objectives for the business. Knowing the key strategic objectives will drive business-data governance alignment. It's important to make sure the right strategic objectives of the organisation have been identified and are well understood.

    1. Meet with senior business leaders and other relevant stakeholders to help identify and document the key strategic objectives for the business.
    2. Leverage their knowledge of the organisation's business strategy and strategic priorities to visually represent how these map to value streams, business capabilities, and, ultimately, to data and data governance needs and initiatives. Tip: Your map is one way to visually communicate and link the business strategy to other levels of the organisation.
    3. Confirm the strategy mapping with other relevant stakeholders.

    Guide to creating your map: Starting with strategic objectives, map the value streams that will ultimately drive them. Next, link the key capabilities that enable each value stream. Then map the data and data governance to initiatives that support those capabilities. This is one approach to help you prioritise the data initiatives that deliver the most value to the organisation.

    Input

    • Strategic objectives as outlined by the organisation's business strategy and confirmed by senior leaders

    Output

    • A strategy map that maps your organisational strategic objectives to value streams, business capabilities, and, ultimately, to data program

    Materials

    Participants

    • Key business stakeholders
    • Data stewards
    • Data custodians
    • Data Governance Working Group

    Download Info-Tech's Data Governance Planning and Roadmapping Workbook

    Example of a strategy map tied to data governance

    • Strategic objectives are the outcomes that the organisation is looking to achieve.
    • Value streams enable an organisation to create and capture value in the market through interconnected activities that support strategic objectives.
    • Business capabilities define what a business does to enable value creation in value streams.
    • Data capabilities and initiatives are descriptions of action items on the data and data governance roadmap and which will enable one or multiple business capabilities in its desired target state.

    Info-Tech Tip:

    Start with the strategic objectives, then map the value streams that will ultimately drive them. Next, link the key capabilities that enable each value stream. Then map the data and data governance initiatives that support those capabilities. This process will help you prioritise the data initiatives that deliver the most value to the organisation.

    Example: Retail

    Example of a strategy map tied to data governance for retail

    For this strategy map, download Info-Tech's Industry Reference Architecture for Retail.

    Step 1.2

    Build High-Value Use Cases for Data Governance

    Activities

    1.2.1 Build High-Value Use Cases

    This step will guide you through the following activities:

    • Leveraging your categorised business capability map to conduct deep-dive sessions with key business stakeholders for creating high-value uses cases
    • Discussing current challenges, risks, and opportunities associated with the use of data across the lines of business
    • Exploring which other business capabilities, stakeholder groups, and business units will be impacted

    Outcomes of this step

    • Relevant use cases that articulate the data-related challenges, needs, or opportunities that are clear and contained and, if addressed ,will deliver value to the organisation

    Info-Tech Tip

    One of the most important aspects when building use cases is to ensure you include KPIs or measures of success. You have to be able to demonstrate how the use case ties back to the organisational priorities or delivers measurable business value. Leverage the KPIs and success factors of the business capabilities tied to each particular use case.

    1.2.1 Build High-Value Use Cases

    This business needs-gathering activity will highlight and create relevant use cases around data-related problems or opportunities that are clear and contained and, if addressed, will deliver value to the organisation.

    1. Bring together key business stakeholders (data owner, stewards, SMEs) from a particular line of business as well as the relevant data custodian(s) to build cases for their units. Leverage the business capability map you created for facilitating this act.
    2. Leverage Info-Tech's framework for data requirements and methodology for creating use cases, as outlined in the Data Use Case Framework Template and seen on the next slide.
    3. Have the stakeholders move through each breakout session outlined in the Use Case Worksheet. Use flip charts or a whiteboard to brainstorm and document their thoughts.
    4. Debrief and document results in the Data Use Case Framework Template.
    5. Repeat this exercise with as many lines of the business as possible, leveraging your business capability map to guide your progress and align with business value.

    Tip: Don't conclude these use case discussions without substantiating what measures of success will be used to demonstrate the business value of the effort to produce the desired future state, as relevant to each particular use case.

    This business needs-gathering activity will highlight and create relevant use cases around data-related problems or opportunities that are clear and contained and, if addressed, will deliver value to the organisation.

    1. Bring together key business stakeholders (data owner, stewards, SMEs) from a particular line of business as well the relevant data custodian(s) to build cases for their units. Leverage the business capability map you created for facilitating this act.
    2. Leverage Info-Tech's framework for data requirements and methodology for creating use cases, as outlined in the Data Use Case Framework Template and seen on the next slide.
    3. Have the stakeholders move through each breakout session outlined in the Use Case Worksheet. Use flip charts or a whiteboard to brainstorm and document their thoughts.
    4. Debrief and document results in the Data Use Case Framework Template
    5. Repeat this exercise with as many lines of the business as possible, leveraging your business capability map to guide your progress and align with business value.

    Tip: Don't conclude these use case discussions without substantiating what measures of success will be used to demonstrate the business value of the effort to produce the desired future state, as relevant to each particular use case.

    Input

    • Value streams and business capabilities as defined by business leaders
    • Business stakeholders' subject area expertise
    • Data custodian systems, integration, and data knowledge

    Output

    • Use cases that articulate data-related challenges, needs or opportunities that are tied to defined business capabilities and hence if addressed will deliver measurable value to the organisation.

    Materials

    • Your business capability map from activity 1.1.1
    • Info-Tech's Data Use Case Framework Template
    • Whiteboard or flip charts (or shared screen if working remotely)
    • Markers/pens

    Participants

    • Key business stakeholders
    • Data stewards and business SMEs
    • Data custodians
    • Data Governance Working Group

    Download Info-Tech's Data Use Case Framework Template

    Info-Tech's Framework for Building Use Cases

    Objective: This business needs-gathering activity will highlight and create relevant use cases around data-related problems or opportunities that are clear and contained and, if addressed, will deliver value to the organisation.

    Leveraging your business capability map, build use cases that align with the organisation's key business capabilities.

    Consider:

    • Is the business capability a cost advantage creator or an industry differentiator?
    • Is the business capability currently underserved by data?
    • Does this need to be addressed? If so, is this risk- or value-driven?

    Info-Tech's Data Requirements and Mapping Methodology for Creating Use Cases

    1. What business capability (or capabilities) is this use case tied to for your business area(s)?
    2. What are your data-related challenges in performing this today?
    3. What are the steps in this process/activity today?
    4. What are the applications/systems used at each step today?
    5. What data domains are involved, created, used, and/or transformed at each step today?
    6. What does an ideal or improved state look like?
    7. What other business units, business capabilities, activities, and/or processes will be impacted or improved if this issue was solved?
    8. Who are the stakeholders impacted by these changes? Who needs to be consulted?
    9. What are the risks to the organisation (business capability, revenue, reputation, customer loyalty, etc.) if this is not addressed?
    10. What compliance, regulatory, and/or policy concerns do we need to consider in any solution?
    11. What measures of success or change should we use to prove the value of the effort (such as KPIs, ROI)? What is the measurable business value of doing this?

    The resulting use cases are to be prioritised and leveraged for informing the business case and the data governance capabilities optimisation plan.

    Taken from Info-Tech's Data Use Case Framework Template

    Phase 2

    Understand Your Current Data Governance Capabilities

    Three circles are in the image that list the three phases and the main steps. Phase 2 is highlighted.

    This phase will guide you through the following activities:

    • Understand the Key Components of Data Governance
    • Gauge Your Organisation's Current Data Culture

    This phase involves the following participants:

    • Data Leadership
    • Data Ownership & Stewardship
    • Policies & Procedures
    • Data Literacy & Culture
    • Operating Model
    • Data Management
    • Data Privacy & Security
    • Enterprise Projects & Services

    Step 2.1

    Understand the Key Components of Data Governance

    This step will guide you through the following activities:

    • Understanding the core components of an effective data governance program and determining your organisation's current capabilities in these areas:
      • Data Leadership
      • Data Ownership & Stewardship
      • Policies & Procedures
      • Data Literacy & Culture
      • Operating Model
      • Data Management
      • Data Privacy & Security
      • Enterprise Projects & Services

    Outcomes of this step

    • An understanding of the core components of an effective data governance program
    • An understanding your organisation's current data governance capabilities

    Leverage Info-Tech's: Data Governance Initiative Planning and Roadmap Tool to assess your current data governance capabilities and plot your target state accordingly.

    This tool will help your organisation plan the sequence of activities, capture start dates and expected completion dates, and create a roadmap that can be effectively communicated to the organisation.

    Review: Info-Tech's Data Governance Framework

    An image of Info-Tech's Data Governance Framework

    Key components of data governance

    A well-defined data governance program will deliver:

    • Defined accountability and responsibility for data.
    • Improved knowledge and common understanding of the organisation's data assets.
    • Elevated trust and confidence in traceable data.
    • Improved data ROI and reduced data debt.
    • An enabling framework for supporting the ethical use and handling of data.
    • A foundation for building and fostering a data-driven and data-literate organisational culture.

    The key components of establishing sustainable enterprise data governance, taken from Info-Tech's Data Governance Framework:

    • Data Leadership
    • Data Ownership & Stewardship
    • Operating Model
    • Policies & Procedures
    • Data Literacy & Culture
    • Data Management
    • Data Privacy & Security
    • Enterprise Projects & Services

    Data Leadership

    • Data governance needs a dedicated head or leader to steer the organisation's data governance program.
    • For organisations that do have a chief data officer (CDO), their office is the ideal and effective home for data governance.
    • Heads of data governance also have titles such as director of data governance, director of data quality, and director of analytics.
    • The head of your data governance program works with all stakeholders and partners to ensure there is continuous enterprise governance alignment and oversight and to drive the program's direction.
    • While key stakeholders from the business and IT will play vital data governance roles, the head of data governance steers the various components, stakeholders, and initiatives, and provides oversight of the overall program.
    • Vital data governance roles include: data owners, data stewards, data custodians, data governance steering committee (or your organisation's equivalent), and any data governance working group(s).

    The role of the CDO: the voice of data

    The office of the chief data officer (CDO):

    • Has a cross-organisational vision and strategy for data.
    • Owns and drives the data strategy; ensures it supports the overall organisational strategic direction and business goals.
    • Leads the organisational data initiatives, including data governance
    • Is accountable for the policy, strategy, data standards, and data literacy necessary for the organisation to operate effectively.
    • Educates users and leaders about what it means to be 'data-driven.'
    • Builds and fosters a culture of data excellence.

    'Compared to most of their C-suite colleagues, the CDO is faced with a unique set of problems. The role is still being defined. The chief data officer is bringing a new dimension and focus to the organisation: "data." '
    – Carruthers and Jackson, 2020

    Who does the CDO report to?

    Example reporting structure.
    • The CDO should be a true C- level executive.
    • Where the organisation places the CDO role in the structure sends an important signal to the business about how much it values data.

    'The title matters. In my opinion, you can't have a CDO without executive authority. Otherwise no one will listen.'

    – Anonymous European CDO

    'The reporting structure depends on who's the 'glue' that ties together all these uniquely skilled individuals.'

    – John Kemp, Senior Director, Executive Services, Info-Tech Research Group

    Data Ownership & Stewardship

    Who are best suited to be data owners?

    • Wherever they may sit in your organisation, data owners will typically have the highest stake in that data.
    • Data owners needs to be suitably senior and have the necessary decision-making power.
    • They have the highest interest in the related business data domain, whether they are the head of a business unit or the head of a line of business that produces data or consumes data (or both).
    • If they are neither of these, it's unlikely they will have the interest in the data (in terms of its quality, protection, ethical use, and handling, for instance) necessary to undertake and adopt the role effectively.

    Data owners are typically senior business leaders with the following characteristics:

    • Positioned to accept accountability for their data domain.
    • Hold authority and influence to affect change, including across business processes and systems, needed to improve data quality, use, handling, integration, etc.
    • Have access to a budget and resources for data initiatives such as resolving data quality issues, data cleansing initiatives, business data catalogue build, related tools and technology, policy management, etc.
    • Hold the influence needed to drive change in behaviour and culture.
    • Act as ambassadors of data and its value as an organisational strategic asset.

    Right-size your data governance organisational structure

    • Most organisations strive to identify roles and responsibilities at a strategic, and operational level. Several factors will influence the structure of the program such as the focus of the data governance project as well as the maturity and size of the organisation.
    • Your data governance structure has to work for your organisation, and it has to evolve as the organisation evolves.
    • Formulate your blend of data governance roles, committees, councils, and cross-functional groups, that make sense for your organisation.
    • Your data governance organisational structure should not add complexity or bureaucracy to your organisation's data landscape; it should support and enable your principle of treating data as an asset.

    There is no one-size-fits-all data governance organisational structure.

    Example of a Data Governance Organisational Structure

    Critical roles and responsibilities for data governance

    Data Governance Working Groups

    Data governance working groups:

    • Are cross-functional teams
    • Deliver on data governance projects, initiatives, and ad hoc review committees.

    Data Stewards

    Traditionally, data stewards:

    • Serve on an operational level addressing issues related to adherence to standards/procedures, monitoring data quality, raising issues identified, etc.
    • Are responsible for managing access, quality, escalating issues, etc.

    Data Custodians

    • Traditionally, data custodians:
    • Serve on an operational level addressing issues related to data and database administration.
    • Support the management of access, data quality, escalating issues, etc.
    • Are SMEs from IT and database administration.

    Example: Business capabilities to data owner and data stewards mapping for a selected data domain

    Info-Tech Insight

    Your organisation's value streams and the associated business capabilities require effectively governed data. Without this, you face elevated operational costs, missed opportunities, eroded stakeholder satisfaction, and exposure to increased business risk.

    Enabling business capabilities with data governance role definitions

    Example: Business capabilities to data owner and data stewards mapping for a selected data domain

    Operating Model

    Your operating model is the key to designing and operationalizing a form of data governance that delivers measurable business value to your organisation.

    'Generate excitement for data: When people are excited and committed to the vision of data enablement, they're more likely to help ensure that data is high quality and safe.' – Petzold, et al., 2020

    Operating Model

    Defining your data governance operating model will help create a well-oiled program that sustainably delivers value to the organisation and manages risks while building and fostering a culture of data excellence along the way. Some organisations are able to establish a formal data governance office, whether independent or attached to the office of the chief data officer. Regardless of how you are organised, data governance requires a home, a leader, and an operating model to ensure its sustainability and evolution.

    Examples of focus areas for your operating model:

    • Delivery: While there are core tenets to every data governance program, there is a level of variability in the implementation of data governance programs across organisations, sectors, and industries. Every organisation has its own particular drivers and mandates, so the level and rigour applied will also vary.
    • The key is to determine what style will work best in your organisation, taking into consideration your organisational culture, executive leadership support (present and ongoing), catalysts such as other enterprise-wide transformative and modernisation initiatives, and/or regulatory and compliances drivers.

    • Communication: Communication is vital across all levels and stakeholder groups. For instance, there needs to be communication from the data governance office up to senior leadership, as well as communication within the data governance organisation, which is typically made up of the data governance steering committee, data governance council, executive sponsor/champion, data stewards, and data custodians and working groups.
    • Furthermore, communication with the wider organisation of data producers, users, and consumers is one of the core elements of the overall data governance communications plan.

    Communication is vital for ensuring acceptance of new processes, rules, guidelines, and technologies by all data producers and users as well as for sharing success stories of the program.

    Operating Model

    Tie the value of data governance and its initiatives back to the business capabilities that are enabled.

    'Leading organisations invest in change management to build data supporters and convert the sceptics. This can be the most difficult part of the program, as it requires motivating employees to use data and encouraging producers to share it (and ideally improve its quality at the source)[.]' – Petzold, et al., 2020

    Operating Model

    Examples of focus areas for your operating model (continued):

    • Change management and issue resolution: Data governance initiatives will very likely bring about a level of organisational disruption, with governance recommendations and future state requiring potentially significant business change. This may include a redesign of a substantial number of data processes affecting various business units, which will require tweaking the organisation's culture, thought processes, and procedures surrounding its data.
    • Preparing people for change well in advance will allow them to take the steps necessary to adapt and reduce potential confrontation. By planning for and efficiently communicating any changes that a data governance initiative may bring, many initial issues can be resolved from the outset.

      Attempting to implement change without an effective communications plan can result in disagreements over data control and stalemates between stakeholder units. The recommendations of the governance group must reflect the needs of all stakeholders or there will be pushback.

    • Performance measuring, monitoring and reporting: Measuring and reporting on performance, successes, and realisation of tangible business value are a must for sustaining, growing, and scaling your data governance program.
    • Aligning your data governance to the organisation's value realisation activities enables you to leverage the KPIs of those business capabilities to demonstrate tangible and measurable value. Use terms and language that will resonate with your senior business leadership.

    Info-Tech Tip:

    Launching a data governance program will bring with it a level of disruption to the culture of the organisation. That disruption doesn't have to be detrimental if you are prepared to manage the change proactively and effectively.

    Policies, Procedures & Standards

    'Data standards are the rules by which data are described and recorded. In order to share, exchange, and understand data, we must standardise the format as well as the meaning.' – U.S. Geological Survey

    Policies, Procedures & Standards

    • When defining, updating, or refreshing your data policies, procedures, and standards, ensure they are relevant, serve a purpose, and/or support the use of data in the organisation.
    • Avoid the common pitfall of building out a host of policies, procedures, and standards that are never used or followed by users and therefore don't bring value or serve to mitigate risk for the organisation.
    • Data policies can be thought of as formal statements and are typically created, approved, and updated by the organisation's data decision-making body (such as a data governance steering committee).
    • Data standards and procedures function as actions, or rules, that support the policies and their statements.
    • Standards and procedures are designed to standardise the processes during the overall data lifecycle. Procedures are instructions to achieve the objectives of the policies. The procedures are iterative and will be updated with approval from your data governance committee as needed.
    • Your organisation's data policies, standards, and procedures should not bog down or inhibit users; rather, they should enable confident data use and handling across the overall data lifecycle. They should support more effective and seamless data capture, integration, aggregation, sharing, and retention of data in the organisation.

    Examples of data policies:

    • Data Classification Policy
    • Data Retention Policy
    • Data Entry Policy
    • Data Backup Policy
    • Data Provenance Policy
    • Data Management Policy

    See Info-Tech's Data Governance Policy Template: This policy establishes uniformed data governance standards and identifies the shared responsibilities for assuring the integrity of the data and that it efficiently and effectively serves the needs of your organisation.

    Data Domain Documentation

    Select the correct granularity for your business need

    Diagram of data domain documentation
    Sources: Dataversity; Atlan; Analytics8

    Data Domain Documentation Examples

    Data Domain Documentation Examples

    Data Culture

    'Organisational culture can accelerate the application of analytics, amplify its power, and steer companies away from risky outcomes.' – Petzold, et al., 2020

    A healthy data culture is key to amplifying the power of your data and to building and sustaining an effective data governance program.

    What does a healthy data culture look like?

    • Everybody knows the data.
    • Everybody trusts the data.
    • Everybody talks about the data.

    Building a culture of data excellence.

    Leverage Info-Tech's Data Culture Diagnostic to understand your organisation's culture around data.

    Screenshot of Data Culture Scorecard

    Contact your Info-Tech Account Representative for more information on the Data Culture Diagnostic

    Cultivating a data-driven culture is not easy

    'People are at the heart of every culture, and one of the biggest challenges to creating a data culture is bringing everyone into the fold.' – Lim, Alation

    It cannot be purchased or manufactured,

    It must be nurtured and developed,

    And it must evolve as the business, user, and data landscapes evolve.

    'Companies that have succeeded in their data-driven efforts understand that forging a data culture is a relentless pursuit, and magic bullets and bromides do not deliver results.' – Randy Bean, 2020

    Hallmarks of a data-driven culture

    There is a trusted, single source of data the whole company can draw from.

    There's a business glossary and data catalogue and users know what the data fields mean.

    Users have access to data and analytics tools. Employees can leverage data immediately to resolve a situation, perform an activity, or make a decision – including frontline workers.

    Data literacy, the ability to collect, manage, evaluate, and apply data in a critical manner, is high.

    Data is used for decision making. The company encourages decisions based on objective data and the intelligent application of it.

    A data-driven culture requires a number of elements:

    • High-quality data
    • Broad access and data literacy
    • Data-driven decision-making processes
    • Effective communication

    Data Literacy

    Data literacy is an essential part of a data-driven culture.

    • Building a data-driven culture takes an ongoing investment of time, effort, and money.
    • This investment will not realise its full return without building up the organisation's data literacy.
    • Data literacy is about filling data knowledge gaps across all levels of the organisation.
    • It's about ensuring all users – senior leadership right through to core users – are equipped with appropriate levels of training, skills, understanding, and awareness around the organisation's data and the use of associated tools and technologies. Data literacy ensures users have the data they need and they know how to interpret and leverage it.
    • Data literacy drives the appetite, demand, and consumption for data.
    • A data-literate culture is one where the users feel confident and skilled in their use of data, leveraging it for making informed or evidence-based decisions and generating insights for the organisation.

    Data Management

    • Data governance serves as an enabler to all of the core components that make up data management:
      • Data quality management
      • Data architecture management
      • Data platform
      • Data integration
      • Data operations management
      • Data risk management
      • Reference and master data management (MDM)
      • Document and content management
      • Metadata management
      • Business intelligence (BI), reporting, analytics and advanced analytics, artificial intelligence (AI), machine learning (ML)
    • Key tools such as the business data glossary and data catalogue are vital for operationalizing data governance and in supporting data management disciplines such as data quality management, metadata management, and MDM as well as BI, reporting, and analytics.

    Enterprise Projects & Services

    • Data governance serves as an enabler to enterprise projects and services that require, use, share, sell, and/or rely on data for their viability and, ultimately, their success.
    • Folding or embedding data governance into the organisation's project management function or project management office (PMO) serves to ensure that, for any initiative, suitable consideration is given to how data is treated.
    • This may include defining parameters, following standards and procedures around bringing in new sources of data, integrating that data into the organisation's data ecosystem, using and sharing that data, and retaining that data post-project completion.
    • The data governance function helps to identify and manage any ethical issues, whether at the start of the project and/or throughout.
    • It provides a foundation for asking relevant questions as it relates to the use or incorporation of data in delivering the specific project or service. Do we know where the data obtained from? Do we have rights to use that data? Are there legislations, policies, or regulations that guide or dictate how that data can be used? What are the positive effects, negative impacts, and/or risks associated with our intended use of that data? Are we positioned to mitigate those risks?
    • Mature data governance creates organisations where the above considerations around data management and the ethical use and handling of data is routinely implemented across the business and in the rollout and delivery of projects and services.

    Data Privacy & Security

    • Data governance supports the organisation's data privacy and security functions.
    • Key tools include the data classification policy and standards and defined roles around data ownership and data stewardship. These are vital for operationalizing data governance and supporting data privacy, security, and the ethical use and handling of data.
    • While some organisations may have a dedicated data security and privacy group, data governance provides an added level of oversight in this regard.
    • Some of the typical checks and balances include ensuring:
      • There are policies and procedures in place to restrict and monitor staff's access to data (one common way this is done is according to job descriptions and responsibilities) and that these comply with relevant laws and regulations.
      • There's a data classification scheme in place where data has been classified on a hierarchy of sensitivity (e.g. top secret, confidential, internal, limited, public).
      • The organisation has a comprehensive data security framework, including administrative, physical, and technical procedures for addressing data security issues (e.g. password management and regular training).
      • Risk assessments are conducted, including an evaluation of risks and vulnerabilities related to intentional and unintentional misuse of data.
      • Policies and procedures are in place to mitigate the risks associated with incidents such as data breaches.
      • The organisation regularly audits and monitors its data security.

    Ethical Use & Handling of Data

    Data governance will support your organisation's ethical use and handling of data by facilitating definition around important factors, such as:

    • What are the various data assets in the organisation and what purpose(s) can they be used for? Are there any limitations?
    • Who is the related data owner? Who holds accountability for that data? Who will be answerable?
    • Where was the data obtained from? What is the intended use of that data? Do you have rights to use that data? Are there legislations, policies, or regulations that guide or dictate how that data can be used?
    • What are the positive effects, negative impacts, and/or risks associated with the use of that data?

    Ethical Use & Handling of Data

    • Data governance serves as an enabler to the ethical use and handling of an organisation's data.
    • The Open Data Institute (ODI) defines data ethics as: 'A branch of ethics that evaluates data practices with the potential to adversely impact on people and society – in data collection, sharing and use.'
    • Data ethics relates to good practice around how data is collected, used and shared. It's especially relevant when data activities have the potential to impact people and society, whether directly or indirectly (Open Data Institute, 2019).
    • A failure to handle and use data ethically can negatively impact an organisation's direct stakeholders and/or the public at large, lead to a loss of trust and confidence in the organisation's products and services, lead to financial loss, and impact the organisation's brand, reputation, and legal standing.
    • Data governance plays a vital role is building and managing your data assets, knowing what data you have, and knowing the limitations of that data. Data ownership, data stewardship, and your data governance decision-making body are key tenets and foundational components of your data governance. They enable an organisation to define, categorise, and confidently make decisions about its data.

    Step 2.2

    Gauge Your Organisation's Current Data Culture

    Activities

    2.2.1 Gauge Your Organisation's Current Data Culture

    This step will guide you through the following activities:

    • Conduct a data culture survey or leverage Info-Tech's Data Culture Diagnostic to increase your understanding of your organisation's data culture

    Outcomes of this step

    • An understanding of your organisational data culture

    2.2.1 Gauge Your Organisation's Current Data Culture

    Conduct a Data Culture Survey or Diagnostic

    The objectives of conducting a data culture survey are to increase the understanding of the organisation's data culture, your users' appetite for data, and their appreciation for data in terms of governance, quality, accessibility, ownership, and stewardship. To perform a data culture survey:

    1. Identify members of the data user base, data consumers, and other key stakeholders for surveying.
    2. Conduct an information session to introduce Info-Tech's Data Culture Diagnostic survey. Explain the objective and importance of the survey and its role in helping to understand the organisation's current data culture and inform the improvement of that culture.
    3. Roll out the Info-Tech Data Culture Diagnostic survey to the identified users and stakeholders.
    4. Debrief and document the results and scorecard in the Data Strategy Stakeholder Interview Guide and Findings document.

    Input

    • Email addresses of participants in your organisation who should receive the survey

    Output

    • Your organisation's Data Culture Scorecard for understanding current data culture as it relates to the use and consumption of data
    • An understanding of whether data is currently perceived to be an asset to the organisation

    Materials

    Screenshot of Data Culture Scorecard

    Participants

    • Participants include those at the senior leadership level through to middle management, as well as other business stakeholders at varying levels across the organisation
    • Data owners, stewards, and custodians
    • Core data users and consumers

    Contact your Info-Tech Account Representative for details on launching a Data Culture Diagnostic.

    Phase 3

    Build a Target State Roadmap and Plan

    Three circles are in the image that list the three phases and the main steps. Phase 3 is highlighted.

    'Achieving data success is a journey, not a sprint. Companies that set a clear course, with reasonable expectations and phased results over a period of time, get to the destination faster.' – Randy Bean, 2020

    This phase will guide you through the following activities:

    • Build your Data Governance Roadmap
    • Develop a target state plan comprising of prioritised initiatives

    This phase involves the following participants:

    • Data Governance Leadership
    • Data Owners/Data Stewards
    • Data Custodians
    • Data Governance Working Group(s)

    Step 3.1

    Formulate an Actionable Roadmap and Right-Sized Plan

    This step will guide you through the following activities:

    • Build your data governance roadmap
    • Develop a target state plan comprising of prioritised initiatives

    Download Info-Tech's Data Governance Planning and Roadmapping Workbook

    See Info-Tech's Data Governance Program Charter Template: A program charter template to sell the importance of data governance to senior executives.

    This template will help get the backing required to get a data governance project rolling. The program charter will help communicate the project purpose, define the scope, and identify the project team, roles, and responsibilities.

    Outcomes of this step

    • A foundation for data governance initiative planning that's aligned with the organisation's business architecture: value streams, business capability map, and strategy map

    Build a right-sized roadmap

    Formulate an actionable roadmap that is right sized to deliver value in your organisation.

    Key considerations:

    • When building your data governance roadmap, ensure you do so through an enterprise lens. Be cognizant of other initiatives that might be coming down the pipeline that may require you to align your data governance milestones accordingly.
    • Apart from doing your planning with consideration for other big projects or launches that might be in-flight and require the time and attention of your data governance partners, also be mindful of the more routine yet still demanding initiatives.
    • When doing your roadmapping, consider factors like the organisation's fiscal cycle, typical or potential year-end demands, and monthly/quarterly reporting periods and audits. Initiatives such as these are likely to monopolise the time and focus of personnel key to delivering on your data governance milestones.

    Sample milestones:

    Data Governance Leadership & Org Structure Definition

    Define the home for data governance and other key roles around ownership and stewardship, as approved by senior leadership.

    Data Governance Charter and Policies

    Create a charter for your program and build/refresh associated policies.

    Data Culture Diagnostic

    Understand the organisation's current data culture, perception of data, value of data, and knowledge gaps.

    Use Case Build and Prioritisation

    Build a use case that is tied to business capabilities. Prioritise accordingly.

    Business Data Glossary/catalogue

    Build and/or refresh the business' glossary for addressing data definitions and standardisation issues.

    Tools & Technology

    Explore the tools and technology offering in the data governance space that would serve as an enabler to the program. (e.g. RFI, RFP).

    Recall: Info-Tech's Data Governance Framework

    An image of Info-Tech's Data Governance Framework

    Build an actionable roadmap

    Data Governance Leadership & Org Structure Division

    Define key roles for getting started.

    Use Case Build & Prioritisation

    Start small and then scale – deliver early wins.

    Literacy Program

    Start understanding data knowledge gaps, building the program, and delivering.

    Tools & Technology

    Make the available data governance tools and technology work for you.

    Key components of your data governance roadmap

    Data Governance Program Charter Template – A program charter template to sell the importance of data governance to senior executives.

    This template will help get the backing required to get a data governance project rolling. The program charter will help communicate the project purpose, define the scope, and identify the project team, roles, and responsibilities.

    By now, you have assessed current data governance environment and capabilities. Use this assessment, coupled with the driving needs of your business, to plot your data Governance roadmap accordingly.

    Sample data governance roadmap milestones:

    • Define data governance leadership.
    • Define and formalise data ownership and stewardship (as well as the role IT/data management will play as data custodians).
    • Build/confirm your business capability map and data domains.
    • Build business data use cases specific to business capabilities.
    • Define business measures/KPIs for the data governance program (i.e. metrics by use case that are relevant to business capabilities).
    • Data management:
      • Build your data glossary or catalogue starting with identified and prioritised terms.
      • Define data domains.
    • Design and define the data governance operating model (oversight model definition, communication plan, internal marketing such as townhalls, formulate change management plan, RFP of data governance tool and technology options for supporting data governance and its administration).
    • Data policies and procedures:
      • Formulate, update, refresh, consolidate, rationalise, and/or retire data policies and procedures.
      • Define policy management and administration framework (i.e. roll-out, maintenance, updates, adherence, system to be used).
    • Conduct Info-Tech's Data Culture Diagnostic or survey (across all levels of the organisation).
    • Define and formalise the data literacy program (build modules, incorporate into LMS, plan lunch and learn sessions).
    • Data privacy and security: build data classification policy, define classification standards.
    • Enterprise projects and services: embed data governance in the organisation's PMO, conduct 'Data Governance 101' for the PMO.

    Defining data governance roles and organisational structure at Organisation

    The approach employed for defining the data governance roles and supporting organisational structure for .

    Key Considerations:

    • The data owner and data steward roles are formally defined and documented within the organisation. Their involvement is clear, well-defined, and repeatable.
    • There are data owners and data stewards for each data domain within the organisation. The data steward role is given to someone with a high degree of subject matter expertise.
    • Data owners and data stewards are effective in their roles by ensuring that their data domain is clean and free of errors and that they protect the organisation against data loss.
    • Data owners and data stewards have the authority to make final decisions on data definitions, formats, and standard processes that apply to their respective data sets. Data owners and data stewards have authority regarding who has access to certain data.
    • Data owners and data stewards are not from the IT side of the organisation. They understand the lifecycle of the data (how it is created, curated, retrieved, used, archived, and destroyed) and they are well-versed in any compliance requirements as it relates to their data.
    • The data custodian role is formally defined and is given to the relevant IT expert. This is an individual with technical administrative and/or operational responsibility over data (e.g. a DBA).
    • A data governance steering committee exists and is comprised of well-defined roles, responsibilities, executive sponsors, business representatives, and IT experts.
    • The data governance steering committee works to provide oversight and enforce policies, procedures, and standards for governing data.
    • The data governance working group has cross-functional representation. This comprises business and IT representation, as well as project management and change management where applicable: data stewards, data custodians, business subject matter experts, PM, etc.).
    • Data governance meetings are coordinated and communicated about. The meeting agenda is always clear and concise, and meetings review pressing data-related issues. Meeting minutes are consistently documented and communicated.

    Sample: Business capabilities to data owner and data stewards mapping for a selected data domain

    Info-Tech Insight

    Your organisation's value streams and the associated business capabilities require effectively governed data. Without this, you face elevated operational costs, missed opportunities, eroded stakeholder satisfaction, and exposure to increased business risk.

    Enable business capabilities with data governance role definitions.

    Sample: Business capabilities to data owner and data stewards mapping for a selected data domain

    Consider your technology options:

    Make the available data governance tools and technology work for you:

    • Data catalogue
    • Business data glossary
    • Data lineage
    • Metadata management

    Logos of data governance tools and technology.

    These are some of the data governance tools and technology players. Check out SoftwareReviews for help making better software decisions.

    Make the data steward the catalyst for organisational change and driving data culture

    The data steward must be empowered and backed politically with decision-making authority, or the role becomes stale and powerless.

    Ensuring compliance can be difficult. Data stewards may experience pushback from stakeholders who must deliver on the policies, procedures, and processes that the data steward enforces.

    Because the data steward must enforce data processes and liaise with so many different people and departments within the organisation, the data steward role should be their primary full-time job function – where possible.

    However, in circumstances where budget doesn't allow a full-time data steward role, develop these skills within the organisation by adding data steward responsibilities to individuals who are already managing data sets for their department or line of business.

    Info-Tech Tip

    A stewardship role is generally more about managing the cultural change that data governance brings. This requires the steward to have exceptional interpersonal skills that will assist in building relationships across departmental boundaries and ensuring that all stakeholders within the organisation believe in the initiative, understand the anticipated outcomes, and take some level of responsibility for its success.

    Changes to organisational data processes are inevitable; have a communication plan in place to manage change

    Create awareness of your data governance program. Use knowledge transfer to get as many people on board as possible.

    Data governance initiatives must contain a strong organisational disruption component. A clear and concise communication strategy that conveys milestones and success stories will address the various concerns that business unit stakeholders may have.

    By planning for and efficiently communicating any changes that a data governance initiative may bring, many initial issues can be resolved from the outset.

    Governance recommendations will require significant business change. The redesign of a substantial number of data processes affecting various business units will require an overhaul of the organisation's culture, thought processes, and procedures surrounding its data. Preparing people for change well in advance will allow them to take the necessary steps to adapt and reduce potential confrontation.

    Because a data governance initiative will involve data-driven business units across the organisation, the governance team must present a compelling case for data governance to ensure acceptance of new processes, rules, guidelines, and technologies by all data producers and users.

    Attempting to implement change without an effective communication plan can result in disagreements over data control and stalemates between stakeholder units. The recommendations of the governance group must reflect the needs of all stakeholders or there will be pushback.

    Info-Tech Insight

    Launching a data governance initiative is guaranteed to disrupt the culture of the organisation. That disruption doesn't have to be detrimental if you are prepared to manage the change proactively and effectively.

    Create a common data governance vision that is consistently communicated to the organisation

    A data governance program should be an enterprise-wide initiative.

    To create a strong vision for data governance, there must be participation from the business and IT. A common vision will articulate the state the organisation wishes to achieve and how it will reach that state. Visioning helps to develop long-term goals and direction.

    Once the vision is established, it must be effectively communicated to everyone, especially those who are involved in creating, managing, disposing, or archiving data.

    The data governance program should be periodically refined. This will ensure the organisation continues to incorporate best methods and practices as the organisation grows and data needs evolve.

    Info-Tech Tips

    • Use information from the stakeholder interviews to derive business goals and objectives.
    • Work to integrate different opinions and perspectives into the overall vision for data governance.
    • Brainstorm guiding principles for data and understand the overall value to the organisation.

    Develop a compelling data governance communications plan to get all departmental lines of business on board

    A data governance program will impact all data-driven business units within the organisation.

    A successful data governance communications plan involves making the initiative visible and promoting staff awareness. Educate the team on how data is collected, distributed, and used, what internal processes use data, and how that data is used across departmental boundaries.

    By demonstrating how data governance will affect staff directly, you create a deeper level of understanding across lines of business, and ultimately, a higher level of acceptance for new processes, rules, and guidelines.

    A clear and concise communications strategy will raise the profile of data governance within the organisation, and staff will understand how the program will benefit them and how they can share in the success of the initiative. This will end up providing support for the initiative across the board.

    A proactive communications plan will:

    • Assist in overcoming issues with data control, stalemates between stakeholder units, and staff resistance.
    • Provide a formalised process for implementing new policies, rules, guidelines, and technologies, and managing organisational data.
    • Detail data ownership and accountability for decision making, and identify and resolve data issues throughout the organisation.
    • Encourage acceptance and support of the initiative.

    Info-Tech Tip

    Focus on literacy and communication: include training in the communication plan. Providing training for data users on the correct procedures for updating and verifying the accuracy of data, data quality, and standardised data policies will help validate how data governance will benefit them and the organisation.

    Leverage the data governance program to communicate and promote the value of data within the organisation

    The data governance program is responsible for continuously promoting the value of data to the organisation. The data governance program should seek a variety of ways to educate the organisation and data stakeholders on the benefit of data management.

    Even if data policies and procedures are created, they will be highly ineffective if they are not properly communicated to the data producers and users alike.

    There needs to be a communication plan that highlights how the data producer and user will be affected, what their new responsibilities are, and the value of that change.

    To learn how to manage organisational change, refer to Info-Tech's Master Organisational Change Management Practices.

    Understand what makes for an effective policy for data governance

    It can be difficult to understand what a policy is, and what it is not. Start by identifying the differences between a policy and standards, guidelines, and procedures.

    Diagram of an effective policy for data governance

    The following are key elements of a good policy:

    Heading Descriptions
    Purpose Describes the factors or circumstances that mandate the existence of the policy. Also states the policy's basic objectives and what the policy is meant to achieve.
    Scope Defines to whom and to what systems this policy applies. Lists the employees required to comply or simply indicates 'all' if all must comply. Also indicates any exclusions or exceptions, i.e. those people, elements, or situations that are not covered by this policy or where special consideration may be made.
    Definitions Define any key terms, acronyms, or concepts that will be used in the policy. A standard glossary approach is sufficient.
    Policy Statements Describe the rules that comprise the policy. This typically takes the form of a series of short prescriptive and proscriptive statements. Sub-dividing this section into sub-sections may be required depending on the length or complexity of the policy.
    Non-Compliance Clearly describe consequences (legal and/or disciplinary) for employee non-compliance with the policy. It may be pertinent to describe the escalation process for repeated non-compliance.
    Agreement Confirms understanding of the policy and provides a designated space to attest to the document.

    Leverage myPolicies, Info-Tech's web-based application for managing your policies and procedures

    Most organisations have problems with policy management. These include:

    1. Policies are absent or out of date
    2. Employees largely unaware of policies in effect
    3. Policies are unmonitored and unenforced
    4. Policies are in multiple locations
    5. Multiple versions of the same policy exist
    6. Policies managed inconsistently across different silos
    7. Policies are written poorly by untrained authors
    8. Inadequate policy training program
    9. Draft policies stall and lose momentum
    10. Weak policy support from senior management

    Technology should be used as a means to solve these problems and effectively monitor, enforce, and communicate policies.

    Product Overview

    myPolicies is a web-based solution to create, distribute, and manage corporate policies, procedures, and forms. Our solution provides policy managers with the tools they need to mitigate the risk of sanctions and reduce the administrative burden of policy management. It also enables employees to find the documents relevant to them and build a culture of compliance.

    Some key success factors for policy management include:

    • Store policies in a central location that is well known and easy to find and access. A key way that technology can help communicate policies is by having them published on a centralised website.
    • Link this repository to other policies' taxonomies of your organisation. E.g. HR policies to provide a single interface for employees to access guidance across the organisation.
    • Reassess policies annually at a minimum. myPolicies can remind you to update the organisation's policies at the appropriate time.
    • Make the repository searchable and easily navigable.
    • myPolicies helps you do all this and more.
    myPolicies logo myPolicies

    Enforce data policies to promote consistency of business processes

    Data policies are short statements that seek to manage the creation, acquisition, integrity, security, compliance, and quality of data. These policies vary amongst organisations, depending on your specific data needs.

    • Policies describe what to do, while standards and procedures describe how to do something.
    • There should be few data policies, and they should be brief and direct. Policies are living documents and should be continuously updated to respond to the organisation's data needs.
    • The data policies should highlight who is responsible for the data under various scenarios and rules around how to manage it effectively.

    Examples of Data Policies

    Trust

    • Data Cleansing and Quality Policy
    • Data Entry Policy

    Availability

    • Acceptable Use Policy
    • Data Backup Policy

    Security

    • Data Security Policy
    • Password Policy Template
    • User Authorisation, Identification, and Authentication Policy Template
    • Data Protection Policy

    Compliance

    • Archiving Policy
    • Data Classification Policy
    • Data Retention Policy

    Leverage data management-related policies to standardise your data management practices

    Info-Tech's Data Management Policy:

    This policy establishes uniform data management standards and identifies the shared responsibilities for assuring the integrity of the data and that it efficiently and effectively serves the needs of the organisation. This policy applies to all critical data and to all staff who may be creators and/or users of such data.

    Info-Tech's Data Entry Policy:

    The integrity and quality of data and evidence used to inform decision making is central to both the short-term and long-term health of an organisation. It is essential that required data be sourced appropriately and entered into databases and applications in an accurate and complete manner to ensure the reliability and validity of the data and decisions made based on the data.

    Info-Tech's Data Provenance Policy:

    Create policies to keep your data's value, such as:

    • Only allow entry of data from reliable sources.
    • Employees entering and accessing data must observe requirements for capturing/maintaining provenance metadata.
    • Provenance metadata will be used to track the lifecycle of data from creation through to disposal.

    Info-Tech's Data Integration and Virtualisation Policy:

    This policy aims to assure the organisation, staff, and other interested parties that data integration, replication, and virtualisation risks are taken seriously. Staff must use the policy (and supporting guidelines) when deciding whether to integrate, replicate, or virtualise data sets.

    Select the right mix of metrics to successfully supervise data policies and processes

    Policies are only as good as your level of compliance. Ensure supervision controls exist to oversee adherence to policies and procedures.

    Although they can be highly subjective, metrics are extremely important to data governance success.

    • Establishing metrics that measure the performance of a specific process or data set will:
      • Create a greater degree of ownership from data stewards and data owners.
      • Help identify underperforming individuals.
      • Allow the steering committee to easily communicate tailored objectives to individual data stewards and owners.
    • Be cautious when establishing metrics. The wrong metrics can have negative repercussions.
      • They will likely draw attention to an aspect of the process that doesn't align with the initial strategy.
      • Employees will work hard and grow frustrated as their successes aren't accurately captured.

    Policies are great to have from a legal perspective, but unless they are followed, they will not benefit the organisation.

    • One of the most useful metrics for policies is currency. This tracks how up to date the policy is and how often employees are informed about the policy. Often, a policy will be introduced and then ignored. Policies must be continuously reviewed by management and employees.
    • Some other metrics include adherence (including performance in tests for adherence) and impacts from non-adherence.

    Review metrics on an ongoing basis with those data owners/stewards who are accountable, the data governance steering committee, and the executive sponsors.

    Establish data standards and procedures for use across all organisational lines of business

    A data governance program will impact all data-driven business units within the organisation.

    • Data management procedures are the methods, techniques, and steps to accomplish a specific data objective. Creating standard data definitions should be one of the first tasks for a data governance steering committee.
    • Data moves across all departmental boundaries and lines of business within the organisation. These definitions must be developed as a common set of standards that can be accepted and used enterprise wide.
    • Consistent data standards and definitions will improve data flow across departmental boundaries and between lines of business.
    • Ensure these standards and definitions are used uniformly throughout the organisation to maintain reliable and useful data.

    Data standards and procedural guidelines will vary from company to company.

    Examples include:

    • Data modelling and architecture standards.
    • Metadata integration and usage procedures.
    • Data security standards and procedures.
    • Business intelligence standards and procedures.

    Info-Tech Tip

    Have a fundamental data definition model for the entire business to adhere to. Those in the positions that generate and produce data must follow the common set of standards developed by the steering committee and be accountable for the creation of valid, clean data.

    Changes to organisational data processes are inevitable; have a communications plan in place to manage change

    Create awareness of your data governance program, using knowledge transfer to get as many people on board as possible.

    By planning for and efficiently communicating any changes that a data governance initiative may bring, many initial issues can be resolved from the outset.

    Governance recommendations will require significant business change. The redesign of a substantial number of data processes affecting various business units will require an overhaul of the organisation's culture, thought processes, and procedures surrounding its data. Preparing people for change well in advance will allow them to take the necessary steps to adapt and reduce potential confrontation.

    Because a data governance initiative will involve data-driven business units across the organisation, the governance team must present a compelling case for data governance to ensure acceptance of new processes, rules, guidelines, and technologies by all data producers and users.

    Attempting to implement change without an effective communications plan can result in disagreements over data control and stalemates between stakeholder units. The recommendations of the governance group must reflect the needs of all stakeholders or there will be pushback.

    Data governance initiatives will very likely bring about a level of organisational disruption. A clear and concise communications strategy that conveys milestones and success stories will address the various concerns that business unit stakeholders may have.

    Info-Tech Tip

    Launching a data governance program will bring with it a level of disruption to the culture of the organisation. That disruption doesn't have to be detrimental if you are prepared to manage the change proactively and effectively.

    Other Deliverables:

    The list of supporting deliverables will help to kick start on some of the Data Governance initiatives

    • Data Classification Policy, Standard, and Procedure
    • Data Quality Policy, Standard, and Procedure
    • Metadata Management Policy, Standard, and Procedure
    • Data Retention Policy and Procurement

    Screenshot from Data Classification Policy, Standard, and Procedure

    Data Classification Policy, Standard, and Procedure

    Screenshot from Data Retention Policy and Procedure

    Data Retention Policy and Procedure

    Screenshot from Metadata Management Policy, Standard, and Procedure

    Metadata Management Policy, Standard, and Procedure

    Screenshot from Data Quality Policy, Standard, and Procedure

    Data Quality Policy, Standard, and Procedure

    Additional Support

    If you would like additional support, have our analysts guide you through other phases as part of an Info-Tech Workshop.

    Picture of analyst

    Contact your account representative for more information.

    workshops@infotech.com 1-888-670-8889

    To accelerate this project, engage your IT team in an Info-Tech workshop with an Info-Tech analyst team. Info-Tech analysts will join you and your team at your location or welcome you to Info-Tech's historic Toronto office to participate in an innovative onsite workshop.

    The following are sample activities that will be conducted by Info-Tech analysts with your team:

    Screenshot of example data governance strategy map.

    Build Your Business and User Context

    Work with your core team of stakeholders to build out your data governance strategy map, aligning data governance initiatives with business capabilities, value streams, and, ultimately, your strategic priorities.

    Screenshot of Data governance roadmap

    Formulate a Plan to Get to Your Target State

    Develop a data governance future state roadmap and plan based on an understanding of your current data governance capabilities, your operating environment, and the driving needs of your business.

    Related Info-Tech Research

    Build a Robust and Comprehensive Data Strategy

    Key to building and fostering a data-driven culture.

    Create a Data Management Roadmap

    Streamline your data management program with our simplified framework.

    The First 100 Days as CDO

    Be the voice of data in a time of transformation.

    Research Contributors

    Name Position Company
    David N. Weber Executive Director - Planning, Research and Effectiveness Palm Beach State College
    Izabela Edmunds Information Architect Mott MacDonald
    Andy Neill Practice Lead, Data & Analytics Info-Tech Research Group
    Dirk Coetsee Research Director, Data & Analytics Info-Tech Research Group
    Graham Price Executive Advisor, Advisory Executive Services Info-Tech Research Group
    Igor Ikonnikov Research Director, Data & Analytics Info-Tech Research Group
    Jean Bujold Senior Workshop Delivery Director Info-Tech Research Group
    Rajesh Parab Research Director, Data & Analytics Info-Tech Research Group
    Reddy Doddipalli Senior Workshop Director Info-Tech Research Group
    Valence Howden Principal Research Director, CIO Info-Tech Research Group

    Bibliography

    Alation. “The Alation State of Data Culture Report – Q3 2020.” Alation, 2020. Accessed 25 June 2021.

    Allott, Joseph, et al. “Data: The Next Wave in Forestry Productivity.” McKinsey & Company, 27 Oct. 2020. Accessed 25 June 2021.

    Bean, Randy. “Why Culture Is the Greatest Barrier to Data Success.” MIT Sloan Management Review, 30 Sept. 2020. Accessed 25 June 2021.

    Brence, Thomas. “Overcoming the Operationalization Challenge With Data Governance at New York Life.” Informatica, 18 March 2020. Accessed 25 June 2021.

    Bullmore, Simon, and Stuart Coleman. “ODI Inside Business – A Checklist for Leaders.” Open Data Institute, 19 Oct. 2020. Accessed 25 June 2021.

    Canadian Institute for Health Information. “Developing and Implementing Accurate National Standards for Canadian Health Care Information.” Canadian Institute for Health Information. Accessed 25 June 2021.

    Carruthers, Caroline, and Peter Jackson. “The Secret Ingredients of the Successful CDO.” IRM UK Connects, 23 Feb. 2017.

    Dashboards. “Useful KPIs for Healthy Hospital Quality Management.” Dashboards. Accessed 25 June 2021.

    Dashboards. “Why (and How) You Should Improve Data Literacy in Your Organization Today.” Dashboards. Accessed 25 June 2021.

    Datapine. “Healthcare Key Performance Indicators and Metrics.” Datapine. Accessed 25 June 2021.

    Datapine. “KPI Examples & Templates: Measure what matters the most and really impacts your success.” Datapine. Accessed 25 June 2021.

    Diaz, Alejandro, et al. “Why Data Culture Matters.” McKinsey Quarterly, Sept. 2018. Accessed 25 June 2021.

    Everett, Dan. “Chief Data Officer (CDO): One Job, Four Roles.” Informatica, 9 Sept. 2020. Accessed 25 June 2021.

    Experian. “10 Signs You Are Sitting On A Pile Of Data Debt.” Experian. Accessed 25 June 2021.

    Fregoni, Silvia. “New Research Reveals Why Some Business Leaders Still Ignore the Data.” Silicon Angle, 1 Oct. 2020

    Informatica. Holistic Data Governance: A Framework for Competitive Advantage. Informatica, 2017. Accessed 25 June 2021.

    Knight, Michelle. “What Is a Data Catalog?” Dataversity, 28 Dec. 2017. Web.

    Lim, Jason. “Alation 2020.3: Getting Business Users in the Game.” Alation, 2020. Accessed 25 June 2021.

    McDonagh, Mariann. “Automating Data Governance.” Erwin, 29 Oct. 2020. Accessed 25 June 2021.

    NewVantage Partners. Data-Driven Business Transformation: Connecting Data/AI Investment to Business Outcomes. NewVantage Partners, 2020. Accessed 25 June 2021.

    Olavsrud, Thor. “What Is Data Governance? A Best Practices Framework For Managing Data Assets.” CIO.com, 18 March 2021. Accessed 25 June 2021.

    Open Data Institute. “Introduction to Data Ethics and the Data Ethics Canvas.” Open Data Institute, 2020. Accessed 25 June 2021.

    Open Data Institute. “The UK National Data Strategy 2020: Doing Data Ethically.” Open Data Institute, 17 Nov. 2020. Accessed 25 June 2021.

    Open Data Institute. “What Is the Data Ethics Canvas?” Open Data Institute, 3 July 2019. Accessed 25 June 2021.

    Pathak, Rahul. “Becoming a Data-Driven Enterprise: Meeting the Challenges, Changing the Culture.” MIT Sloan Management Review, 28 Sept. 2020. Accessed 25 June 2021.

    Petzold, Bryan, et al. “Designing Data Governance That Delivers Value.” McKinsey & Company, 26 June 2020. Accessed 25 June 2021.

    Redman, Thomas, et al. “Only 3% of Companies’ Data Meets Basic Quality Standards.” Harvard Business Review. 11 Sept 2017.

    Smaje, Kate. “How Six Companies Are Using Technology and Data To Transform Themselves.” McKinsey & Company, 12 Aug. 2020. Accessed 25 June 2021.

    Talend. “The Definitive Guide to Data Governance.” Talend. Accessed 25 June 2021.

    “The Powerfully Simple Modern Data Catalog.” Atlan, 2021. Web.

    U.S. Geological Survey. “Data Management: Data Standards.” U.S. Geological Survey. Accessed 25 June 2021.

    Waller, David. “10 Steps to Creating a Data-Driven Culture.” Harvard Business Review, 6 Feb. 2020. Accessed 25 June 2021.

    “What Is the Difference Between A Business Glossary, A Data Dictionary, and A Data Catalog, and How Do They Play A Role In Modern Data Management?” Analytics8, 23 June 2021. Web.

    Wikipedia. “RFM (Market Research).” Wikipedia. Accessed 25 June 2021.

    Windheuser, Christoph, and Nina Wainwright. “Data in a Modern Digital Business.” Thoughtworks, 12 May 2020. Accessed 25 June 2021.

    Wright, Tom. “Digital Marketing KPIs - The 12 Key Metrics You Should Be Tracking.” Cascade, 3 March 2021. Accessed 25 June 2021.

    2020 Applications Priorities Report

    • Buy Link or Shortcode: {j2store}159|cart{/j2store}
    • member rating overall impact (scale of 10): N/A
    • member rating average dollars saved: N/A
    • member rating average days saved: N/A
    • Parent Category Name: Optimization
    • Parent Category Link: /optimization
    • Although IT may have time to look at trends, it does not have the capacity to analyze the trends and turn them into initiatives.
    • IT does not have time to parse trends for initiatives that are relevant to them.
    • The business complains that if IT does not pursue trends the organization will get left behind by cutting-edge competitors. At the same time, when IT pursues trends, the business feels that IT is unable to deal with the basic issues.

    Our Advice

    Critical Insight

    • Take advantage of a trend by first understanding why it is happening and how it is actionable. Build momentum now. Breaking a trend into bite-sized initiatives and building them into your IT foundations enables the organization to maintain pace with competitors and make the technological leap.
    • The concepts of shadow IT and governance are critical. As it becomes easier for the business to purchase its own applications, it will be essential for IT to embrace this form of user empowerment. With a diminished focus on vendor selection, IT will drive the most value by directing its energy toward data and integration governance.

    Impact and Result

    • Determine how to explore, adopt, and optimize the technology and practice initiatives in this report by understanding which core objective(s) each initiative serves:
      • Optimize the effectiveness of the IT organization.
      • Boost the productivity of the enterprise.
      • Enable business growth through technology.

    2020 Applications Priorities Report Research & Tools

    Start here – read the Executive Brief

    Read our concise Executive Brief for a summary of the priorities and themes that an IT organization should focus on this year.

    Besides the small introduction, subscribers and consulting clients within this management domain have access to:

    1. Read the 2020 Applications Priorities Report

    Use Info-Tech's 2020 Applications Priorities Report to learn about the five initiatives that IT should prioritize for the coming year.

    • 2020 Applications Priorities Report Storyboard
    [infographic]

    Collaborate Effectively in Microsoft Teams

    • Buy Link or Shortcode: {j2store}63|cart{/j2store}
    • member rating overall impact (scale of 10): N/A
    • member rating average dollars saved: N/A
    • member rating average days saved: N/A
    • Parent Category Name: End-User Computing Applications
    • Parent Category Link: /end-user-computing-applications

    Your organization has adopted Microsoft Teams, but users are not maximizing their use of it.

    • IT needs to support the business to get the best value out of Microsoft Teams: managing Teams effectively while also enabling end users to use Teams creatively.
    • IT must follow best practices for evaluation of new functionality when integrating Microsoft and third-party apps and also communicate changes to end users.
    • Due in part to the frequent addition of new features and lack of communication and training, many organizations don’t know which apps would benefit their users.

    Our Advice

    Critical Insight

    Collaboration is as much an art as a science. IT can help users collaborate more effectively in Teams by removing friction – while still maintaining guardrails – for users attempting to build out and experiment with features and capabilities.

    Impact and Result

    Use Info-Tech’s Collaborate Effectively in Microsoft Teams to help collaboration flourish:

    • Collate key organizational collaboration use cases.
    • Prioritize the most important Teams apps and features to support use cases.
    • Implement request process for new Teams apps.
    • Communicate new Teams collaboration functionality.

    Collaborate Effectively in Microsoft Teams Research & Tools

    Besides the small introduction, subscribers and consulting clients within this management domain have access to:

    1. Collaborate Effectively in Microsoft Teams Deck – Maximize the use of your chosen collaboration software solution.

    Set up your users for Teams collaboration success. Create a process that improves their ability to access, understand, and maximize their use of your chosen collaboration software solution.

    • Collaborate Effectively in Microsoft Teams Storyboard

    2. Microsoft Teams End-User Satisfaction Survey – Capture end-user feedback on their collaborative use of Microsoft Teams.

    The survey responses will inform your organization's collaboration use cases for Teams and help you to identify which features and apps to enable.

    • Microsoft Teams End-User Satisfaction Survey

    3. Microsoft Teams Planning Tool – A tool to help prioritize features to implement.

    Use this Excel tool to help you document the organization’s key collaboration use cases and prioritize which Teams apps to implement and encourage adoption on.

    • Microsoft Teams Planning Tool
    [infographic]

    Further reading

    Collaborate Effectively in Microsoft Teams

    Empower your users to explore Teams collaboration beyond the basics.

    Analyst Perspective

    Life after Teams implementation

    You have adopted Teams, implemented it, and painted an early picture for your users on the basics. However, your organization is not yet maximizing its use of Teams' collaboration capabilities. Although web conferencing, channel-based collaboration, and chat are the most obvious ways Teams supports collaboration, users must explore Teams' functionality further to harness the application's full potential.

    You should enable your users to expand their collaboration use cases in Teams, but not at the risk of being flooded with app requests, nor user confusion or dissatisfaction. Instead, develop a process to evaluate and integrate new apps that will benefit the organization. Encourage your users to request new apps that will benefit them, while proactively planning for app integration that users should be alerted to.

    Photo of Emily Sugerman, Research Analyst, Infrastructure and Operations, Info-Tech Research Group. Emily Sugerman
    Research Analyst, Infrastructure and Operations
    Info-Tech Research Group

    Executive Summary

    Your Challenge

    Your organization has adopted Microsoft Teams, but users are not getting the maximum benefit.

    • IT needs to support the business to get the best value out of Microsoft Teams: managing Teams effectively while enabling end-user creativity.
    • IT must follow best practices for evaluating new functionality when integrating Microsoft and third-party apps, while communicating changes to end users.
    • Due partly to the frequent addition of new features and lack of communication and training, many organizations don't know which apps would benefit their users.

    Common Obstacles

    • Users are unenthusiastic about exploring Teams further due to negative past experiences, preference for other applications, or indifference.
    • End users are unaware of the available range of features. When they become aware and try to add unapproved or unlicensed apps, they experience the frustration of being declined.
    • Users seek support from IT who are unfamiliar with new Teams features an apps, or with supporting Teams beyond the basics.
    • IT teams have no process to raise end-user awareness of these apps and functionality.

    Info-Tech's Approach

    Use Info-Tech's Collaborate Effectively in Microsoft Teams to help collaboration flourish:

    • Collate key organizational collaboration use cases
    • Prioritize the most important Teams apps and features to support use cases
    • Implement request process for new Teams apps
    • Communicate new Teams collaboration functionality

    Info-Tech Insight

    Collaboration is as much an art as a science. IT can help users collaborate more effectively in Teams by removing friction – while still maintaining guardrails – for users attempting to build out and experiment with features and capabilities.

    Are your users in a Teams rut?

    Are users failing to maximize their use of Teams to collaborate and get work done?

    Teams can do much more than chat, video conferencing, and document sharing. A fully-deployed Teams also lets users leverage apps and advanced collaboration features.

    However, IT must create a process for evaluating and approving Microsoft and third-party apps, and for communicating changes to end users.

    In the end, IT needs to support the business to get the best value out of Microsoft Teams: managing Teams effectively while also enabling end-user creativity.

    Third-party app use in Teams is rising:

    “Within Teams, the third-party apps with 10,000 users and above rose nearly 40% year-over-year.”
    Source: UC Today, 2023.

    Collaborate effectively in Microsoft Teams

    Set up your users for Teams collaboration success. Create a process that improves their ability to access, understand, and maximize their use of your chosen collaboration software solution.

    Challenges with Teams collaboration

    • Lack of motivation to explore available features
    • Scattered information
    • Lack of comfort using Teams beyond the basics
    • Blocked apps
    • Overlapping features
    • Confusing permissions

    Empowering Collaboration in Microsoft Teams

    1. Identify current collaboration challenges and use cases in Teams
    2. Create Teams app request workflows
    3. Set up communication hubs in Teams
    4. Empower end users to customize their Teams for effective collaboration

    Solution

    • Collate key organizational collaboration use cases
    • Prioritize the most important Teams apps and features to support use cases
    • Implement request process for new Teams apps
    • Communicate new Teams collaboration functionality

    Project deliverables

    Use these tools to develop your plan to enable effective collaboration in Microsoft Teams.

    Key deliverable:

    Microsoft Teams Planning Tool

    An Excel tool for documenting the organization's key collaboration use cases and prioritizing which Teams apps to implement and encourage adoption of.

    Sample of the Microsoft Teams Planning Tool deliverable.

    Additional support:

    Microsoft Teams End-User Satisfaction Survey

    Use or adapt this survey to capture user perception of how effectively Teams supports collaboration needs.

    Sample of the End-user satisfaction survey deliverable.

    Insight Summary

    Key Insight:

    Collaboration is as much an art as a science. IT can help users collaborate more effectively in Teams by removing friction – while still maintaining guardrails – for users attempting to build out and experiment with features and capabilities.

    Additional insights:

    Insight 1

    Users can browse the Teams app store and attempt to add unapproved apps, but they may not be able to distinguish between available and blocked apps. To avoid a bad user experience, communicate which apps they can add without additional approval and which they will need to send through an approval process.

    Insight 2

    Teams lets you customize the message users see when they request unapproved apps and/or redirect their request to your own URL. Review this step in the request process to ensure users are seeing the instructions that they need to see.

    Insight 3

    A Teams hub is where users can access a service catalog of approved Teams apps and submit service requests for new ones via the Make a Request button.

    Section 1: Collaborating Effectively in Teams for IT

    Section 1

    Collaborating Effectively in Teams for IT

    Section 2

    Collaborating Effectively in Teams for End Users

    Stop: Do you need the Teams Cookbook?

    If you:

    • are at the Teams implementation stage,
    • require IT best practices for initial governance of Teams creation, or
    • require end-user best practices for basic Teams functionality …

    Consult the Microsoft Teams Cookbook first.

    Understand the Microsoft vision of Teams collaboration

    Does it work for you?

    Microsoft's vision for Teams collaboration is to enable end-user freedom. For example, out of the box, users can create their own teams and channels unless IT restricts this ability.

    Teams is meant to be more than just chats and meetings. Microsoft is pushing Teams app integration so that Teams becomes, essentially, a landing page from which users can centralize their work and org updates.

    In partnership with the business, IT must determine which guardrails are necessary to balance end-user collaboration and creativity with the need for governance and control.

    Why is it difficult to increase the caliber of collaboration in Teams?

    Because collaboration is inherently messy, complex, and creative

    Schubert & Glitsch find that enterprise collaboration systems (such as Teams) have characteristics that reflect the unstructured and creative nature of collaboration. These systems “are designed to support joint work among people in the workplace. . . [They] contain, for the most part, unstructured content such as documents, blogs, or news posts,” and their implementations “are often reported to follow a ‘bottom up' and rather experimental introduction approach.” The open-endedness of the tool requires users to be able to creatively and voluntarily apply it, which in turn requires more enterprise effort to help increase adoption over time through trial and error.

    Source: Procedia Computer Science, 2015

    Info-Tech Insight

    Collaboration is as much an art as a science. IT can help users collaborate more effectively in Teams by removing friction – while still maintaining guardrails – for users attempting to build out and experiment with features and capabilities.

    Activity 1: Identify current challenges

    Input: Team input, Survey results
    Output: List of Teams challenges experienced by the organization
    Materials: Whiteboard (digital or physical)
    Participants: Teams collaboration working group

    First, identify what works and what doesn't for your users in Teams

    • Have users reported any challenges with Teams as their primary means of channel-based collaboration? Run a short survey to capture end-user sentiment on how Teams works for them. This survey can be set up and distributed through Microsoft Forms. Distribute either to the whole organization or a specific focus group. Gather feedback from users on the following: What are the major ways they need to collaborate to do their jobs? What IT-supported tools do they need to support this collaboration? What specific aspects of Teams do they want to better exploit?
    • If you send out transactional surveys on service desk tickets, run a report on Teams-related tickets to identify common complaints.
    • Brainstorm Teams challenges IT has experienced personally or have seen reported – especially difficulties with collaboration.
    • Once you have the data, group the challenges into themes. Are the challenges specifically related to collaboration? Data issues? Support issues? Access issues? Technical issues? Document them in tab 2 of the Microsoft Teams Planning Tool.

    Download the Microsoft Teams End-User Satisfaction Survey template

    Define your organization's key collaboration scenarios

    Next, identify what users need to do in Teams

    The term collaboration scenarios has been proposed to describe the types of collaboration behavior your software – in this case, Teams – must support (Schubert & Glitsch, 2015). A successful implementation of this kind of tool requires that you “identif[y] use cases and collaboration scenarios that best suit a specific company and the people working in it” (Schubert & Glitsch, 2016).

    Teams tends to support the following kinds of collaboration and productivity goals (see list).

    What types of collaboration scenarios arise in the user feedback in the previous activity? What do users most need to do?

    Be proactive: Configure Microsoft Teams to match collaboration scenarios/use cases your users must engage in. This will help prevent an increase in shadow IT, where users attempt to bring in unapproved/unreviewed software that might duplicate your existing service catalog and/or circumvent the proper review and procurement process.

    MS Teams Use Cases

    1. Gather feedback
    2. Collaboratively create content
    3. Improve project & task management
    4. Add media content
    5. Conduct knowledge management
    6. Increase meeting effectiveness
    7. Increase employee engagement
    8. Enhance professional development
    9. Provide or access support
    10. Add third-party apps

    Activity 2: Match your collaboration scenarios to Teams capabilities

    Input: Collaboration scenarios, Teams use cases
    Output: Ranked list of Teams features to implement and/or promote
    Materials: Microsoft Teams Planning Tool
    Participants: Teams collaboration working group

    Which features support the key collaboration use cases?

    1. Using the Microsoft Teams Planning Tool, list your organization's key collaboration scenarios. Draw on the data returned in the previous activity. List them in Tab 2.
    2. See the following slide for the types of collaboration use cases Teams is designed to support. In the planning tool, select use cases that best match your organizational collaboration scenarios.
    3. Dive into more specific features on Tab 3, which are categorized by collaboration use case. Where do users' collaboration needs align with Teams' inherent capabilities? Add lines in Tab C for the third-party apps that you are considering adding to Teams.
    4. In columns B and C of Tab 3, decide and prioritize the candidates for implementation. Review the list of prioritized features on tab 4.

    NB: Microsoft has introduced a Teams Premium offering, with additional capabilities for meetings and webinars (including customized banding, meeting watermarks, and virtual webinar green rooms) and will paywall some features previously available without Premium (live caption translations, meeting data on attendee departure/arrival times) (“What is Microsoft Teams Premium?”, n.d.)

    Download the Microsoft Teams Planning Tool

    MS Teams productivity & collab features

    Teams apps & collaboration features enable the following types of work. When designing collaboration use cases, identify which types of collaboration are necessary, then explore each category in depth.

    1. Gather feedback

      Solicit feedback and comments, and provide updates
    2. Collaboratively create content

      Compose as a group, with live-synced changes
    3. Improve project & task management

      Keep track of projects and tasks
    4. Add media content

      Enrich Teams conversations with media, and keep a library of video resources
    5. Knowledge management

      Pull together document libraries and make information easier to find
    6. Increase meeting effectiveness

      Facilitate interactions and document meeting outcomes
    7. Increase employee engagement

      Use features that enhance social interaction among Teams users
    8. Enhance professional development

      Find resources to help achieve professional goals
    9. Provide or access support

      IT and user-facing resources for accessing and/or providing support
    10. Add third-party apps

      Understand the availability/restrictions of the built-in Teams app catalog

    The Teams app store

    • The lure of the app store: Your users will encounter a mix of supported and unsupported applications, some of which they can access, some for which you have no licenses, some built by your organization, some built by Microsoft or third parties. However, the distinction between these categories may not be immediately apparent to users. Microsoft does not remove blocked apps from users' view.
    • Users may attempt to add unsupported apps and then receive error messages or prompts to send a request through Teams to IT for approval.
    • App add-ins are not limited to those built by Microsoft Corporation. The Teams app store also features a plethora of third-party apps that can provide value.
    • However, their third-party status introduces another set of complications.
    • Attempting to add third-party apps may expose users to sales pitches and encourage the implementation of shadow IT, circumventing the IT request process.

    Info-Tech Insight

    Users can browse and attempt to add unapproved apps in the Teams app store, but they may have difficulty distinguishing between available and blocked apps. To avoid a bad user experience, communicate to your users which apps they can add without additional approval, and which must be sent through an approval process.

    Decide how you will evaluate requests for new Teams apps

    • As you encourage users to explore and fully utilize Teams, you may see increased requests for admin approval for apps you do not currently support.
    • To prevent disorganized response and user dissatisfaction, build out a workflow for handling new/unapproved Teams app requests. Ensure the workflow accounts for Microsoft and third-party apps.
    • What must you consider when integrating third-party tools? You must have control over what users may add. These requests should follow, or build upon, your existing process for non-standard requests, including a process for communicating the change.
    • Track the fulfillment time for Teams app requests. The longer the user must wait for a response, the more their satisfaction will decline.

    icrosoft suggests that you regularly review the app usage report in the Teams admin center as “a signal about the demand for an app within your organization.” This will help you proactively determine which apps to evaluate for approval.

    Build request workflow for unsupported Teams apps

    What are the key steps?

    1. Request comes in
    2. Review by a technical review team
    3. Review by service desk or business analyst
    4. Additional operational technical reviews if necessary
    5. Procurement and installation
    6. Communication of result to requester
    7. App added to the catalog so it can be used by others

    Example workflow of a 'Non-Standard Software Request Process'.

    Info-Tech Insight

    Teams allows you to customize the message users see when they request an unapproved app and/or redirect their request to your own URL. Review this step in the request process to ensure your users are seeing the instructions that they need to see.

    Download the Service Request Workflow library

    Incorporate new approved service requests into a service request catalog

    Follow the process in Reduce Shadow IT With a Service Request Catalog to build out a robust request management process and service catalog to continuously incorporate new non-standard requests and advertise new Teams apps:

    • Design the service
    • Design the catalog
    • Build the catalog
    • Market the service

    Sample of the 'Reduce Shadow IT With a Service Request Catalog' blueprint.

    Add a company hub to Teams

    Use Teams to help users access the company intranet for organizational information that is relevant to their roles.

    This can be done in two ways:

    1. By adding a SharePoint home site to Teams.
    2. By leveraging Viva Connections: A hub to access other apps and Viva services. The user sees a personalized dashboard, feed, and resources.

    Venn diagram with two circles 'Viva Connections - App-based employee experience where individuals get their work done' and 'Home Sites - Portal that features organizational news, events, and supplemental resources'. The overlapping middle has a list: 'News, Shared navigation, Integrates with M365, Developer platforms & management, Audience targeting, Web parts, Permissions'. (Venn diagram recreated from Microsoft Learn, 2023.)

    Info-Tech Insight

    The hub is where users can access a service catalog of approved Teams apps and submit service requests for a new one via a Make a Request button.

    Communicate changes to Teams

    Let end users know what's available and how to add new productivity tools.

    Where will users find approved Teams apps? How will you inform people about what's available? Once a new app is available, how is this communicated?

    Options:

    • Communicate new Teams features in high-visibility places (e.g. the Hub).
    • Leverage the Power Apps Bulletins app in Teams to communicate regular announcements about new features.
    • Create a company-wide Team with a channel called “What's New in Teams.” Post updates on new features and integrations, and link to more detailed knowledgebase articles on how to use the new features.
    • Aim for the sweet spot of communication frequency: not too much nor too little.

    Measure your success

    Determine how you will evaluate the success of your efforts to improve the Teams collaboration experience

    Improved satisfaction with Teams: Increased net promoter score (NPS)

    Utilization of features: Increased daily average users on key features, apps, integrations

    Timeliness: % of SLAs met for service request fulfillment

    Improved communication to end users about Teams' functionality: Satisfaction with knowledgebase articles on Teams

    Satisfaction with communication from IT

    Section 2: Collaborating Effectively in Teams for End Users

    Section 1

    Collaborating Effectively in Teams for IT

    Section 2

    Collaborating Effectively in Teams for End Users

    For IT: Use this section to help users understand Teams collaboration features

    Share the collateral in this section with your users to support their deeper exploration of Teams collaboration.

    • Use the Microsoft Teams Planning Tool to prepare a simple service catalog of the features and apps available to your users.
    • Edit Tab 2 (MS Teams Collab Features & Apps) by deleting the blocked apps/features.
    • Share this document with your users by linking to it via this image on the following slides:
    Sample of the Microsoft Teams Planning Tool deliverable.

    Download the Microsoft Teams Planning Tool for an expanded list of features & apps

    End-user customization of Teams

    Consider how you want to set up your Teams view. Add the apps you already use to have them at your fingertips in Teams.

    You can . . .

    1. Customize your navigation bar by pinning your preferred apps and working with them within Teams (Microsoft calls these personal apps).
    2. Customize your message bar by adding the app extensions you find most useful. Screenshot of the message bar with the 3-dot highlighted.
    3. Customize chats and Teams by adding tabs with content your group needs frequent access to. Screenshot of MS Teams tabs with the plus sign highlighted.
    4. Set up connectors to send notifications from apps to a Team and bots to answer questions and automate simple tasks. Screenshot of the 'Set up a connector' button.

    Learn more from Microsoft here

    MS Teams productivity & collab features

    The Apps catalog includes a range of apps that users may add to channels, chat, or the navigation bar. Teams also possesses other collaboration features that may be underused in your organization.

    1. Gather feedback

      Solicit feedback and comments, and provide updates
    2. Collaboratively create content

      Compose as a group, with live-synced changes
    3. Improve project & task management

      Keep track of projects and tasks
    4. Add media content

      Enrich Teams conversations with media, and keep a library of video resources
    5. Knowledge management

      Pull together document libraries and make information easier to find
    6. Increase meeting effectiveness

      Facilitate interactions and document meeting outcomes
    7. Increase employee engagement

      Use features that enhance social interaction among Teams users
    8. Enhance professional development

      Find resources to help achieve professional goals
    9. Provide or access support

      IT and user-facing resources for accessing and/or providing support
    10. Add third-party apps

      Understand the availability/restrictions of the built-in Teams app catalog

    Samples of four features: 'Prioritize with a voting table', 'Launch a live meeting poll', 'Launch a survey', and 'Request an update'.

    Download the Microsoft Teams Collaboration Tool for an expanded list of features & apps

    Use integrated Teams features to gather feedback and provide updates

    • Vote: Create a list of items for teams to brainstorm pros and cons, and then tabulate votes on. This component can be edited inline by anyone with whom the component is shared. The edits will sync anywhere the component is shared.
    • Meeting polls: Capture instant feedback from teams, chat, and call participants. Participant anonymity can be set by the poll organizer. Results can be exported.
    • Create surveys and quizzes and share the results. Results can be exported.
    • Create, track, and review updates and progress reports from teams and individuals.

    Collaboratively create content

    Samples of four features: 'Add Office suite docs', 'Brainstorm in Whiteboard', 'Add Loop components', and 'Take notes in OneNote'.

    Download the Microsoft Teams Planning Tool for an expanded list of features & apps

    Use integrated Teams features composed as a group, with live-synced changes

    • Microsoft Office documents: Add/upload files to a chat or channel discussion. Find them again in the Files tab or add the file itself as a tab to a chat or channel and edit it within Teams.
    • Brainstorm with the Whiteboard application. Add a whiteboard to a tab or to a meeting.
    • Add Loop components to a chat: Create a list, checklist, paragraph, or table that can be edited in real time by anyone in the chat.
    • Add OneNote to a chat or channel tab or use during a meeting to take notes. Pin OneNote to your app bar if it's one of your most frequently-used apps.

    Improve project & task management

    Samples of four features: 'Request approvals and updates', 'Add & track tasks', 'Create a personal notespace', and 'Manage workflows'.

    Download the Microsoft Teams Planning Tool for an expanded list of features & apps

    Keep track of projects and tasks

    • Use the Approvals and Update apps to create, track, and respond to requests for approvals and progress reports within Teams.
    • Use Tasks by Planner & To Do to track both individual and team tasks. Pin the Tasks app to the app bar, add a plan as a tab to a Team, and turn any Teams message into a task by right-clicking on it.
    • Start a chat with yourself to maintain a private space to jot down quick notes.
    • Add Lists to a Teams channel.
    • Explore automation: Add pre-built Teams workflows from the Workflows app, or build new ones in PowerAutomate
    • IT teams may leverage Teams apps like Azure Boards, Pipelines, Repos, AD notifications, and GitHub.

    Add media content

    Samples of four features: 'Share news stories', 'Share YouTube videos', 'Share Stream content', and 'Add RSS feeds'.

    Download the Microsoft Teams Planning Tool for an expanded list of features & apps

    Enrich Teams conversations with media, and keep a library of video resources

    • Search for and add specific news stories to a chat or channel. See recent news stories in search.
    • Search, share, and watch YouTube videos.
    • Share video links from Microsoft Stream.
    • Add RSS feeds.

    Knowledge management

    Samples of four features: 'SharePoint Pages', 'SharePoint document library', 'SharePoint News', and 'Who'.

    Download the Microsoft Teams Planning Tool for an expanded list of features & apps

    Pull together document libraries and make information easier to find

    • Add a page from an existing SharePoint site to a Team as a tab.
    • Add a SharePoint document library to a Team as a tab.
    • Search names of members of your organization to learn about their role, place in the organizational structure, and contact information.

    Increase meeting effectiveness

    Samples of four features: 'Take meeting notes', 'Set up a Q&A', 'Use live captions', and 'Record and transcribe meetings'.

    Download the Microsoft Teams Planning Tool for an expanded list of features & apps

    Facilitate interactions and document meeting outcomes

    • Take simple notes during a meeting.
    • Start conversations and ask and answer questions in a dedicated Q&A space during the Teams meeting.
    • Turn on live captions during the meeting.
    • Record a meeting and automatically generate a transcript of the meeting.
    • Assign attendees to breakout rooms.
    • Track the effectiveness of the meeting by producing an attendance report with the number of attendees, the meeting start/end time, a list of the attendees, and participation in activities.

    Increase employee engagement

    Samples of four features: 'Send praise', 'Build an avatar', 'Add video effects', and 'Play games during meetings'.

    Download the Microsoft Teams Planning Tool for an expanded list of features & apps

    Use features that enhance social interaction among Teams users

    • Send supportive comments to colleagues using Praise.
    • Build out digital avatars to toggle on during meetings instead of your own video.
    • Apply different visual effects, filters, and backgrounds to your screen during meetings.
    • Games for Work: Launch icebreaker games during a meeting.
    • Translate a Teams message from another language to your default language.
    • Send emojis, GIFs, and stickers in messages or as reactions to others' messages. You can also send reactions live during meetings to increase meeting engagement.

    Enhance professional development

    Samples of four features: 'Launch Viva Learning', 'Turn on Speaker Coach', 'Viva Insights', and 'Viva Goals'.

    Download the Microsoft Teams Planning Tool for an expanded list of features & apps

    Connect with learning resources and apply data-driven feedback based on Teams usage

    • Add learning materials from various course catalogs in Viva Learning.
    • Speaker Coach: Receive AI feedback on your performance as a speaker during a meeting.
    • Receive automatically generated insights and suggestions from Viva Insights on work habits and time allocation to different work activities.
    • Viva Goals: Track organizational "objectives and key results"/manage organizational goals

    Provide or access support

    Samples of four features: 'Access MS Support', 'Manage Teams & M365', 'Deploy power virtual agents', and 'Consult MS resource center'.

    Download the Microsoft Teams Planning Tool for an expanded list of features & apps

    IT and user-facing resources for accessing or providing support

    • Admin: Carry out simple Teams management tasks (for IT).
    • Power Virtual Agents: Build out chatbots to answer user questions (can be built by IT and end users for their customers).
    • Resource Center: A combination of pre-built Microsoft resources (tips, templates) with resources provided by organizational IT.
    • Support: Access Microsoft self-serve knowledgebase articles (for IT).

    Add third-party apps

    Understand the availability/restrictions of the built-in Teams app catalog

    • App add-ins are not limited to those built by Microsoft Corporation. The Teams app store also features a plethora of third-party apps that may provide value.
    • However, being able to view an app in the app store does not necessarily mean it's supported or licensed by your organization.
    • Teams will allow users to request access to apps, which will then be evaluated by your IT support team. Follow your service desk's recommended request process for requesting and justifying the addition of a new Teams app that is not currently supported.
    • Before making the request, investigate existing Teams features to determine if the functionality is already available.

    Research contributors

    Mike Cavanagh
    Global Service Desk Manager
    Clearwater Seafoods LP

    Info-Tech contributors:

    Benedict Chang, Senior Advisory Analyst

    John Donovan, Principal Research Director

    Allison Kinnaird, Practice Lead

    P.J. Ryan, Research Director

    Natalie Sansone, Research Director

    Christine West, Managing Partner

    Related Info-Tech Research

    Sample of the 'Reduce Shadow IT with a Service Request Catalog' blueprint.

    Reduce Shadow IT With a Service Request Catalog

    Foster business relationships through sourcing-as-a-service. There is a direct correlation between service delivery dissatisfaction and increases in shadow IT. Whether the goal is to reduce shadow IT or gain control, improved customer service and fast delivery are key to making lasting changes.

    Sample of the 'Microsoft Teams Cookbook' blueprint.

    Microsoft Teams Cookbook

    Recipes for best practices and use cases for Teams. Microsoft Teams is not a standalone app. Successful utilization of Teams occurs when conceived in the broader context of how it integrates with M365. Understanding how information flows between Teams, SharePoint Online, and OneDrive for Business, for instance, will aid governance with permissions, information storage, and file sharing.

    Sample of the 'Govern Office 365 (M365)' blueprint.

    Govern Office 365

    You bought it. Use it right. Map your organizational goals to the administration features available in the Office 365/M365 console. Your governance should reflect your requirements.

    Bibliography

    Mehta, Tejas. “The Home Site App for Microsoft Teams.” Microsoft Community Hub. https://techcommunity.microsoft.com/t5/microsoft-sharepoint-blog/the-home-site-app-for-microsoft-teams/ba-p/1714255.

    Overview: Viva Connections. 7 Mar. 2023, https://learn.microsoft.com/en-us/viva/connections/viva-connections-overview.

    Rogers, Laura. “SharePoint Home Site in Teams.” Wonderlaura, 24 Jun 2021. https://wonderlaura.com/2021/06/24/sharepoint-home...

    Schubert, Petra, and Johannes H. Glitsch. “Adding Structure to Enterprise Collaboration Systems: Identification of Use Cases and Collaboration Scenarios.” Procedia Computer Science, vol. 64, Jan. 2015, pp. 161–69. ScienceDirect, https://doi.org/10.1016/j.procs.2015.08.477.

    Schubert, Petra, and Johannes Glitsch. “Use Cases and Collaboration Scenarios: How Employees Use Socially-Enabled Enterprise Collaboration Systems (ECS).” International Journal of Information Systems and Project Management, vol. 4, no. 2, Jan. 2016, pp. 41–62.

    Thompson, Mark. “User Requests for Blocked Apps in the Teams Store.” Supersimple365, 5 Apr 2022, https://supersimple365.com/user-requests-for-apps-...

    “What is Microsoft Teams Premium?” Breakwater IT, n.d., https://breakwaterit.co.uk/guides/microsoft-teams-...

    Wills, Jonny. “Microsoft Teams Monthly Users Hits 280 Million.” UC Today, 25 Jan. 2023, https://www.uctoday.com/unified-communications/microsoft-teams-monthly-users-hits-280-million/.

    Standardize the Service Desk

    • Buy Link or Shortcode: {j2store}477|cart{/j2store}
    • member rating overall impact (scale of 10): 9.5/10 Overall Impact
    • member rating average dollars saved: $24,155 Average $ Saved
    • member rating average days saved: 24 Average Days Saved
    • Parent Category Name: Service Desk
    • Parent Category Link: /service-desk
    • Not everyone embraces their role in service support. Specialists would rather work on projects than provide service support.
    • The Service Desk lacks processes and workflows to provide consistent service. Service desk managers struggle to set and meet service-level expectations, which further compromises end-user satisfaction.

    Our Advice

    Critical Insight

    • Service desk improvement is an exercise in organizational change. Engage specialists across the IT organization in building the solution. Establish a single service-support team across the IT group and enforce it with a cooperative, customer-focused culture.
    • Don’t be fooled by a tool that’s new. A new service desk tool alone won’t solve the problem. Service desk maturity improvements depend on putting in place the right people and processes to support the technology.

    Impact and Result

    • Create a consistent customer service experience for service desk patrons, and increase efficiency, first-call resolution, and end-user satisfaction with the Service Desk.
    • Decrease time and cost to resolve service desk tickets.
    • Understand and address reporting needs to address root causes and measure success and build a solid foundation for future IT service improvements.

    Standardize the Service Desk Research & Tools

    Besides the small introduction, subscribers and consulting clients within this management domain have access to:

    1. Standardize the Service Desk Research – A step-by-step document that helps you improve customer service by driving consistency in your support approach and meet SLAs.

    Use this blueprint to standardize your service desk by assessing your current capability and laying the foundations for your service desk, design an effective incident management workflow, design a request fulfillment process, and apply the discussions and activities to make an actionable plan for improving your service desk.

    • Standardize the Service Desk – Phases 1-4

    2. Service Desk Maturity Assessment – An assessment tool to help guide process improvement efforts and track progress.

    This tool is designed to assess your service desk process maturity, identify gaps, guide improvement efforts, and measure your progress.

    • Service Desk Maturity Assessment

    3. Service Desk Project Summary – A template to help you organize process improvement initiatives using examples.

    Use this template to organize information about the service desk challenges that the organization is facing, make the case to build a right-sized service desk to address those challenges, and outline the recommended process changes.

    • Service Desk Project Summary

    4. Service Desk Roles and Responsibilities Guide – An analysis tool to determine the right roles and build ownership.

    Use the RACI template to determine roles for your service desk initiatives and to build ownership around them. Use the template and replace it with your organization's information.

    • Service Desk Roles and Responsibilities Guide

    5. Incident Management and Service Desk Standard Operating Procedure – A template designed to help service managers kick-start the standardization of service desk processes.

    The template will help you identify service desk roles and responsibilities, build ticket management processes, put in place sustainable knowledgebase practices, document ticket prioritization scheme and SLO, and document ticket workflows.

    • Incident Management and Service Desk SOP

    6. Ticket and Call Quality Assessment Tool – An assessment tool to check in on ticket and call quality quarterly and improve the quality of service desk data.

    Use this tool to help review the quality of tickets handled by agents and discuss each technician's technical capabilities to handle tickets.

    • Ticket and Call Quality Assessment Tool

    7. Workflow Library – A repository of typical workflows.

    The Workflow Library provides examples of typical workflows that make up the bulk of the incident management and request fulfillment processes at the service desk.

    • Incident Management and Service Desk Workflows (Visio)
    • Incident Management and Service Desk Workflows (PDF)

    8. Service Desk Ticket Categorization Schemes – A repository of ticket categories.

    The Ticket Categorization Schemes provide examples of ticket categories to organize the data in the service desk tool and produce reports that help managers manage the service desk and meet business requirements.

    • Service Desk Ticket Categorization Schemes

    9. Knowledge Manager – A job description template that includes a detailed explication of the responsibilities and expectations of a Knowledge Manager role.

    The Knowledge Manager's role is to collect, synthesize, organize, and manage corporate information in support of business units across the enterprise.

    • Knowledge Manager

    10. Knowledgebase Article Template – A comprehensive record of the incident management process.

    An accurate and comprehensive record of the incident management process, including a description of the incident, any workarounds identified, the root cause (if available), and the profile of the incident's source, will improve incident resolution time.

    • Knowledgebase Article Template

    11. Sample Communication Plan – A sample template to guide your communications around the integration and implementation of your overall service desk improvement initiatives.

    Use this template to develop a communication plan that outlines what stakeholders can expect as the process improvements recommended in the Standardize the Service Desk blueprint are implemented.

    • Sample Communication Plan

    12. Service Desk Roadmap – A structured roadmap tool to help build your service desk initiatives timeline.

    The Service Desk Roadmap helps track outstanding implementation activities from your service desk standardization project. Use the roadmap tool to define service desk project tasks, their owners, priorities, and timeline.

    • Service Desk Roadmap
    [infographic]

    Workshop: Standardize the Service Desk

    Workshops offer an easy way to accelerate your project. If you are unable to do the project yourself, and a Guided Implementation isn't enough, we offer low-cost delivery of our project workshops. We take you through every phase of your project and ensure that you have a roadmap in place to complete your project successfully.

    1 Lay Service Desk Foundations

    The Purpose

    Discover your challenges and understand what roles, metrics, and ticket handling procedures are needed to tackle the challenges.

    Key Benefits Achieved

    Set a clear understanding about the importance of service desk to your organization and service desk best practices.

    Activities

    1.1 Assess current state of the service desk.

    1.2 Review service desk and shift-left strategy.

    1.3 Identify service desk metrics and reports.

    1.4 Identify ticket handling procedures

    Outputs

    Current state assessment

    Shift-left strategy and implications

    Service desk metrics and reports

    Ticket handling procedures

    2 Design Incident Management

    The Purpose

    Build workflows for incident and critical incident tickets.

    Key Benefits Achieved

    Distinguish incidents from service requests.

    Ticket categorization facilitates ticket. routing and reporting.

    Develop an SLA for your service desk team for a consistent service delivery.

    Activities

    2.1 Build incident and critical incident management workflows.

    2.2 Design ticket categorization scheme and proper ticket handling guidelines.

    2.3 Design incident escalation and prioritization guidelines.

    Outputs

    Incident and critical incident management workflows

    Ticket categorization scheme

    Ticket escalation and prioritization guidelines

    3 Design Request Fulfilment

    The Purpose

    Build service request workflows and prepare self-service portal.

    Key Benefits Achieved

    Standardize request fulfilment processes.

    Prepare for better knowledge management and leverage self-service portal to facilitate shift-left strategy.

    Activities

    3.1 Build service request workflows.

    3.2 Build a targeted knowledgebase.

    3.3 Prepare for a self-serve portal project.

    Outputs

    Distinguishing criteria for requests and projects

    Service request workflows and SLAs

    Knowledgebase article template, processes, and workflows

    4 Build Project Implementation Plan

    The Purpose

    Now that you have laid the foundation of your service desk, put all the initiatives into an action plan.

    Key Benefits Achieved

    Discuss priorities, set timeline, and identify effort for your service desk.

    Identify the benefits and impacts of communicating service desk initiatives to stakeholders and define channels to communicate service desk changes.

    Activities

    4.1 Build an implementation roadmap.

    4.2 Build a communication plan

    Outputs

    Project implementation and task list with associated owners

    Project communication plan and workshop summary presentation

    Further reading

    Analyst Perspective

    "Customer service issues are rarely based on personality but are almost always a symptom of poor and inconsistent process. When service desk managers are looking to hire to resolve customer service issues and executives are pushing back, it’s time to look at improving process and the support strategy to make the best use of technicians’ time, tools, and knowledge sharing. Once improvements have been made, it’s easier to make the case to add people or introduce automation.

    Replacing service desk solutions will also highlight issues around poor process. Without fixing the baseline services, the new solution will simply wrap your issues in a prettier package.

    Ultimately, the service desk needs to be the entry point for users to get help and the rest of IT needs to provide the appropriate support to ensure the first line of interaction has the knowledge and tools they need to resolve quickly and preferably on first contact. If your plans include optimization to self-serve or automation, you’ll have a hard time getting there without standardizing first."

    Sandi Conrad

    Principal Research Director, Infrastructure & Operations Practice

    Info-Tech Research Group

    A method for getting your service desk out of firefighter mode

    This Research Is Designed For:

    • The CIO and senior IT management who need to increase service desk effectiveness and timeliness and improve end-user satisfaction.
    • The service desk manager who wants to lead the team from firefighting mode to providing consistent and proactive support.

    This Research Will Also Assist:

    • Service desk teams who want to increase their own effectiveness and move from a help desk to a service desk.
    • Infrastructure and applications managers who want to decrease reactive support activities and increase strategic project productivity by shifting repetitive and low-value work left.

    This Research Will Help You:

    • Create a consistent customer service experience for service desk patrons.
    • Increase efficiency, first-call resolution, and end-user satisfaction with the Service Desk.
    • Decrease time and cost to resolve service desk tickets.
    • Understand and address reporting needs to address root causes and measure success.
    • Build a solid foundation for future IT service improvements.

    Executive Summary

    Situation

    • The CIO and senior IT management who need to increase service desk effectiveness and timeliness and improve end-user satisfaction.
    • If only the phone could stop ringing, the Service Desk could become proactive, address service levels, and improve end-user IT satisfaction.

    Complication

    • Not everyone embraces their role in service support. Specialists would rather work on projects than provide service support.
    • The Service Desk lacks processes and workflows to provide consistent service. Service desk managers struggle to set and meet service-level expectations, which further compromises end-user satisfaction.

    Resolution

    • Go beyond the blind adoption of best-practice frameworks. No simple formula exists for improving service desk maturity. Use diagnostic tools to assess the current state of the Service Desk. Identify service support challenges and draw on best-practice frameworks intelligently to build a structured response to those challenges.
    • An effective service desk must be built on the right foundations. Understand how:
      • Service desk structure affects cost and ticket volume capacity.
      • Incident management workflows can improve ticket handling, prioritization, and escalation.
      • Request fulfillment processes create opportunities for streamlining and automating services.
      • Knowledge sharing supports the processes and workflows essential to effective service support.

    Info-Tech Insight

    Service desk improvement is an exercise in organizational change. Engage specialists across the IT organization in building the solution. Establish a single service-support team across the IT group and enforce it with a cooperative, customer-focused culture. Don’t be fooled by a tool that’s new. A new service desk tool alone won’t solve the problem. Service desk maturity improvements depend on putting in place the right people and processes to support the technology

    Directors and executives understand the importance of the service desk and believe IT can do better

    A double bar graph is depicted. The blue bars represent Effectiveness and the green bars represent Importance in terms of service desk at different seniority levels, which include frontline, manager, director, and executive.

    Source: Info-Tech, 2019 Responses (N=189 organizations)

    Service Desk Importance Scores

      No Importance: 1.0-6.9
      Limited Importance: 7.0-7.9
      Significant Importance: 8.0-8.9
      Critical Importance: 9.0-10.0

    Service Desk Effectiveness Scores

      Not in Place: N/A
      Not Effective: 0.0-4.9
      Somewhat Ineffective: 5.0-5.9
      Somewhat Effective: 6.0-6.9
      Very Effective: 7.0-10.0

    Info-Tech Research Group’s IT Management and Governance Diagnostic (MGD) program assesses the importance and effectiveness of core IT processes. Since its inception, the MGD has consistently identified the service desk as an area to leverage.

    Business stakeholders consistently rank the service desk as one of the top five most important services that IT provides

    Since 2013, Info-Tech has surveyed over 40,000 business stakeholders as part of our CIO Business Vision program.

    Business stakeholders ranked the following 12 core IT services in terms of importance:

    Learn more about the CIO Business Vision Program.
    *Note: IT Security was added to CIO Business Vision 2.0 in 2019

    Top IT Services for Business Stakeholders

    1. Network Infrastructure
    2. IT Security*
    3. Data Quality
    4. Service Desk
    5. Business Applications
    6. Devices
    7. Client-Facing Technology
    8. Analytical Capability
    9. IT Innovation Leadership
    10. Projects
    11. Work Orders
    12. IT Policies
    13. Requirements Gathering
    Source: Info-Tech Research Group, 2019 (N=224 organizations)

    Having an effective and timely service desk correlates with higher end-user satisfaction with all other IT services

    A double bar graph is depicted. The blue bar represents dissatisfied ender user, and the green bar represents satisfied end user. The bars show the average of dissatisfied and satisfied end users for service desk effectiveness and service desk timeliness.

    On average, organizations that were satisfied with service desk effectiveness rated all other IT processes 46% higher than dissatisfied end users.

    Organizations that were satisfied with service desk timeliness rated all other IT processes 37% higher than dissatisfied end users.
    “Satisfied” organizations had average scores =8.“Dissatisfied" organizations had average scores “Dissatisfied" organizations had average scores =6. Source: Info-Tech Research Group, 2019 (N=18,500+ respondents from 75 organizations)

    Standardize the service desk the Info-Tech way to get measurable results

    More than one hundred organizations engaged with Info-Tech, through advisory calls and workshops, for their service desk projects in 2016. Their goal was either to improve an existing service desk or build one from scratch.

    Organizations that estimate the business impact of each project phase help us shed light on the average measured value of the engagements.

    "The analysts are an amazing resource for this project. Their approach is very methodical, and they have the ability to fill in the big picture with detailed, actionable steps. There is a real opportunity for us to get off the treadmill and make real IT service management improvements"

    - Rod Gula, IT Director

    American Realty Advisors

    Three circles are depicted. The top circle shows the sum of measured value dollar impact which is US$1,659,493.37. The middle circle shows the average measured value dollar impact which is US$19,755.87. The bottom circle shows the average measured value time saved which is 27 days.

    Info-Tech’s approach to service desk standardization focuses on building service management essentials

    This image depicts all of the phases and steps in this blueprint.

    Info-Tech draws on the COBIT framework, which focuses on consistent delivery of IT services across the organization

    This image depicts research that can be used to improve IT processes. Service Desk is circled to demonstrate which research is being used.

    The service desk is the foundation of all other service management processes.

    The image shows how the service desk is a foundation for other service management processes.

    Info-Tech offers various levels of support to best suit your needs

    DIY Toolkit

    “Our team has already made this critical project a priority, and we have the time and capability, but some guidance along the way would be helpful.”

    Guided Implementation

    “Our team knows that we need to fix a process, but we need assistance to determine where to focus. Some check-ins along the way would help keep us on track.”

    Workshop

    “We need to hit the ground running and get this project kicked off immediately. Our team has the ability to take this over once we get a framework and strategy in place.”

    Consulting

    “Our team does not have the time or the knowledge to take this project on. We need assistance through the entirety of this project.”

    Diagnostics and consistent frameworks used throughout all four options

    Standardize the Service Desk – project overview

    This image shows the project overview of this blueprint.

    Info-Tech delivers: Use our tools and templates to accelerate your project to completion

    Project Summary

    Image of template.

    Service Desk Standard Operating Procedures

    Image of tool.

    Service Desk Maturity Assessment Tool

    Image of tool.

    Service Desk Implementation Roadmap

    Image of tool Incident, knowledge, and request management workflows

    Incident, knowledge, and request management workflows

    The project’s key deliverable is a service desk standard operating procedure

    Benefits of documented SOPs:

    Improved training and knowledge transfer: Routine tasks can be delegated to junior staff (freeing senior staff to work on higher priority tasks).

    IT automation, process optimization, and consistent operations: Defining, documenting, and then optimizing processes enables IT automation to be built on sound processes, so consistent positive results can be achieved.

    Compliance: Compliance audits are more manageable because the documentation is already in place.

    Transparency: Visually documented processes answer the common business question of “why does that take so long?”

    Cost savings: Work solved at first contact or with a minimal number of escalations will result in greater efficiency and more cost-effective support. This will also lead to better customer service.

    Impact of undocumented/undefined SOPs:

    Tasks will be difficult to delegate, key staff become a bottleneck, knowledge transfer is inconsistent, and there is a longer onboarding process for new staff

    IT automation built on poorly defined, unoptimized processes leads to inconsistent results.

    Documenting SOPs to prepare for an audit becomes a major time-intensive project.

    Other areas of the organization may not understand how IT operates, which can lead to confusion and unrealistic expectations.

    Support costs are highest through inefficient processes, and proactive work becomes more difficult to schedule, making the organization vulnerable to costly disruptions.

    Workshop Overview

    Image depicts workshop overview occurring over four days.

    Contact your account representative or email Workshops@InfoTech.com for more information.

    Phase 1

    Lay Service Desk Foundations

    Step 1.1:Assess current state

    Image shows the steps in phase 1. Highlight is on step 1.1

    This step will walk you through the following activities:

    • 1.1.1 Outline service desk challenges
    • 1.1.2 Assess the service desk maturity

    This step involves the following participants:

    • Project Sponsor
    • IT Director, CIO
    • IT Managers and Service Desk Manager(s)
    • Representation from tier 2 and tier 3 specialists

    Outcomes

    Alignment on the challenges that the service desk faces, an assessment of the current state of service desk processes and technologies, and baseline metrics against which to measure improvements.

    Deliverables

    • Service Desk Maturity Assessment

    Standardizing the service desk benefits the whole business

    The image depicts 3 circles to represent the service desk foundations.

    Embrace standardization

    • Standardization prevents wasted energy on reinventing solutions to recurring issues.
    • Standardized processes are scalable so that process maturity increases with the size of your organization.

    Increase business satisfaction

    • Improve confidence that the service desk can meet service levels.
    • Create a single point of contact for incidents and requests and escalate quickly.
    • Analyze trends to forecast and meet shifting business requirements.

    Reduce recurring issues

    • Create tickets for every task and categorize them accurately.
    • Generate reliable data to support root-cause analysis.

    Increase efficiency and lower operating costs

    • Empower end users and technicians with a targeted knowledgebase (KB).
    • Cross-train to improve service consistency.

    Case Study: The CIO of Westminster College took stock of existing processes before moving to empower the “helpless desk”

    Scott Lowe helped a small staff of eight IT professionals formalize service desk processes and increase the amount of time available for projects.

    When he joined Westminster College as CIO in 2006, the department faced several infrastructure challenges, including:

    • An unreliable network
    • Aging server replacements and no replacement plan
    • IT was the “department of no”
    • A help desk known as the “helpless desk”
    • A lack of wireless connectivity
    • Internet connection speed that was much too slow

    As the CIO investigated how to address the infrastructure challenges, he realized people cared deeply about how IT spent its time.

    The project load of IT staff increased, with new projects coming in every day.

    With a long project list, it became increasingly important to improve the transparency of project request and prioritization.

    Some weeks, staff spent 80% of their time working on projects. Other weeks, support requirements might leave only 10% for project work.

    He addressed the infrastructure challenges in part by analyzing IT’s routine processes.

    Internally, IT had inefficient support processes that reduced the amount of time they could spend on projects.

    They undertook an internal process analysis effort to identify processes that would have a return on investment if they were improved. The goal was to reduce operational support time so that project time could be increased.

    Five years later, they had a better understanding of the organization's operational support time needs and were able to shift workloads to accommodate projects without compromising support.

    Common challenges experienced by service desk teams

    Unresolved issues

    • Tickets are not created for all incidents.
    • Tickets are lost or escalated to the wrong technicians.
    • Poor data impedes root-cause analysis of incidents.

    Lost resources/accountability

    • Lack of cross-training and knowledge sharing.
    • Lack of skills coverage for critical applications and services.
    • Time is wasted troubleshooting recurring issues.
    • Reports unavailable due to lack of data and poor categorization.

    High cost to resolve

    • Tier 2/3 resolve issues that should be resolved at tier 1.
    • Tier 2/3 often interrupt projects to focus on service support.

    Poor planning

    • Lack of data for effective trend analysis leads to poor demand planning.
    • Lack of data leads to lost opportunities for templating and automation.

    Low business satisfaction

    • Users are unable to get assistance with IT services quickly.
    • Users go to their favorite technician instead of using the service desk.

    Outline the organization’s service desk challenges

    1.1.1 Brainstorm service desk challenges

    Estimated Time: 45 minutes

    A. As a group, outline the areas where you think the service desk is experiencing challenges or weaknesses. Use sticky notes or a whiteboard to separate the challenges into People, Process, and Technology so you have a wholistic view of the constraints across the department.

    B. Think about the following:

    • What have you heard from users? (e.g. slow response time)
    • What have you heard from executives? (e.g. poor communication)
    • What should you start doing? (e.g. documenting processes)
    • What should you stop doing? (e.g. work that is not being entered as tickets)

    C. Document challenges in the Service Desk Project Summary.

    Participants:

    • CIO
    • IT Managers
    • Service Desk Manager
    • Service Desk Agents

    Assess current service desk maturity to establish a baseline and create a plan for service desk improvement

    A current-state assessment will help you build a foundation for process improvements. Current-state assessments follow a basic formula:

    1. Determine the current state of the service desk.
    2. Determine the desired state of the service desk.
    3. Build a practical path from current to desired state.
    Image depicts 2 circles and a box. The circle on the 1. left has assess current state. The circle on the right has 2. assess target state. The box has 3. build a roadmap.

    Ideally, the current-state assessment should align the delivery of IT services with organizational needs. The assessment should achieve the following goals:

    1. Identify service desk pain points.
    2. Map each pain point to business services.
    3. Assign a broad business value to the resolution of each pain point.
    4. Map each pain point to a process.

    Expert Insight

    Image of expert.

    “How do you know if you aren’t mature enough? Nothing – or everything – is recorded and tracked, customer satisfaction is low, frustration is high, and there are multiple requests and incidents that nobody ever bothers to address.”

    Rob England

    IT Consultant & Commentator

    Owner Two Hills

    Also known as The IT Skeptic

    Assess the process maturity of the service desk to determine which project phase and steps will bring the most value

    1.1.2 Measure which activity will have the greatest impact

    The Service Desk Maturity Assessmenttool helps organizations assess their service desk process maturity and focus the project on the activities that matter most.

    The tool will help guide improvement efforts and measure your progress.

    • The second tab of the tool walks through a qualitative assessment of your service desk practices. Questions will prompt you to evaluate how you are executing key activities. Select the answer in the drop-down menus that most closely aligns with your current state.
    • The third tab displays your rate of process completeness and maturity. You will receive a score for each phase, an overall score, and advice based on your performance.
    • Document the results of the efficiency assessment in the Service Desk Project Summary.

    The tool is intended for periodic use. Review your answers each year and devise initiatives to improve the process performance where you need it most.

    Where do I find the data?

    Consult:

    • Service Manager
    • Service Desk Tools
    Image is the service desk tools.

    Step 1.2:Review service support best practices

    Image shows the steps in phase 1. Highlight is on step 1.2.

    This step will walk you through the following activities:

    1. 1.2.1 Identify roles and responsibilities in your organization
    2. 1.2.2 Map out the current and target structure of the service desk

    This step involves the following participants:

    • Project Sponsor
    • IT Director, CIO
    • IT Managers and Service Desk Manager(s)
    • Representation from tier 2 and tier 3 specialists

    Outcomes

    Identifying who is accountable for different support practices in the service desk will allow workload to be distributed effectively between functional teams and individuals. Closing the gaps in responsibilities will enable the execution of a shift-left strategy.

    Deliverables

    • Roles & responsibilities guide
    • Service desk structure

    Everyone in IT contributes to the success of service support

    Regardless of the service desk structure chosen to meet an organization’s service support requirements, IT staff should not doubt the role they play in service support.

    If you try to standardize service desk processes without engaging specialists in other parts of the IT organization, you will fail. Everyone in IT has a role to play in providing service support and meeting service-level agreements.

    Service Support Engagement Plan

    • Identify who is accountable for different service support processes.
    • Outline the different responsibilities of service desk agents at tier 1, tier 2, and tier 3 in meeting service-level agreements for service support.
    • Draft operational-level agreements between specialty groups and the service desk to improve accountability.
    • Configure the service desk tool to ensure ticket visibility and ownership across queues.
    • Engage tier 2 and tier 3 resources in building workflows for incident management, request fulfilment, and writing knowledgebase articles.
    • Emphasize the benefits of cooperation across IT silos:
      • Better customer service and end-user satisfaction.
      • Shorter time to resolve incidents and implement requests.
      • A higher tier 1 resolution rate, more efficient escalations, and fewer interruptions from project work.

    Info-Tech Insight

    Specialists tend to distance themselves from service support as they progress through their career to focus on projects.

    However, their cooperation is critical to the success of the new service desk. Not only do they contribute to the knowledgebase, but they also handle escalations from tiers 1 and 2.

    Clear project complications by leveraging roles and responsibilities

    R

    Responsible: This person is the staff member who completes the work. Assign at least one Responsible for each task, but this could be more than one.

    A

    Accountable: This team member delegates a task and is the last person to review deliverables and/or task. Sometimes Responsible and Accountable can be the same staff. Make sure that you always assign only one Accountable for each task and not more.

    C

    Consulted: People who do not carry out the task but need to be consulted. Typically, these people are subject matter experts or stakeholders.

    I

    Informed: People who receive information about process execution and quality and need to stay informed regarding the task.

    A RACI analysis is helpful with the following:

    • Workload Balancing: Allowing responsibilities to be distributed effectively between functional teams and individuals.
    • Change Management: Ensuring key functions and processes are not overlooked during organizational changes.
    • Onboarding: New employees can identify their own roles and responsibilities.

    A RACI chart outlines which positions are Responsible, Accountable, Consulted, and Informed

    Image shows example of RACI chart

    Create a list of roles and responsibilities in your organization

    1.2.1 Create RACI matrix to define responsibilities

    1. Use the Service Desk Roles and Responsibilities Guidefor a better understanding of the roles and responsibilities of different service desk tiers.
    2. In the RACI chart, replace the top row with specific roles in your organization.
    3. Modify or expand the process tasks, as needed, in the left column.
    4. For each role, identify the responsibility values that the person brings to the service desk. Fill out each column.
    5. Document in the Service Desk SOP. Schedule a time to share the results with organization leads.
    6. Distribute the chart between all teams in your organization.

    Notes:

    • Assign one Accountable for each task.
    • Have at least one Responsible for each task.
    • Avoid generic responsibilities, such as “team meetings.”
    • Keep your RACI definitions in your documents, as they are sometimes tough to remember.

    Participants

    • CIO
    • IT Managers
    • Service Desk Manager
    • Service Desk Agents

    What You'll Need

    • Service Desk SOP
    • Roles and Responsibilities Guide
    • Flip Chart
    • Whiteboard

    Build a single point of contact for the service desk

    Regardless of the service desk structure chosen to meet your service support requirements, end users should be in no doubt about how to access the service.

    Provide end users with:

    • A single phone number.
    • A single email address.
    • A single web portal for all incidents and requests.

    A single point of contact will ensure:

    • An agent is available to field incidents and requests.
    • Incidents and requests are prioritized according to impact and urgency.
    • Work is tracked to completion.

    This prevents ad hoc ticket channels such as shoulder grabs or direct emails, chats, or calls to a technician from interrupting work.

    A single point of contact does not mean the service desk is only accessible through one intake channel, but rather all tickets are directed to the service desk (i.e. tier 1) to be resolved or redirected appropriately.

    Image depicts 2 boxes. The smaller box labelled users and the larger box labelled Service Desk Tier 1. There are four double-sided arrows. The top is labelled email, the second is walk-in, the third is phone, the fourth is web portal.

    Directors and executives understand the importance of the service desk and believe IT can do better

    A double bar graph is depicted. The blue bars represent Effectiveness and the green bars represent Importance in terms of service desk at different seniority levels, which include frontline, manager, director, and executive.

    Source: Info-Tech, 2019 Responses (N=189 organizations)

    Service Desk Importance Scores

      No Importance: 1.0-6.9
      Limited Importance: 7.0-7.9
      Significant Importance: 8.0-8.9
      Critical Importance: 9.0-10.0

    Service Desk Effectiveness Scores

      Not in Place: N/A
      Not Effective: 0.0-4.9
      Somewhat Ineffective: 5.0-5.9
      Somewhat Effective: 6.0-6.9
      Very Effective: 7.0-10.0

    Info-Tech Research Group’s IT Management and Governance Diagnostic (MGD) program assesses the importance and effectiveness of core IT processes. Since its inception, the MGD has consistently identified the service desk as an area to leverage.

    Business stakeholders consistently rank the service desk as one of the top five most important services that IT provides

    Since 2013, Info-Tech has surveyed over 40,000 business stakeholders as part of our CIO Business Vision program.

    Business stakeholders ranked the following 12 core IT services in terms of importance:

    Learn more about the CIO Business Vision Program.
    *Note: IT Security was added to CIO Business Vision 2.0 in 2019

    Top IT Services for Business Stakeholders

    1. Network Infrastructure
    2. IT Security*
    3. Data Quality
    4. Service Desk
    5. Business Applications
    6. Devices
    7. Client-Facing Technology
    8. Analytical Capability
    9. IT Innovation Leadership
    10. Projects
    11. Work Orders
    12. IT Policies
    13. Requirements Gathering
    Source: Info-Tech Research Group, 2019 (N=224 organizations)

    Having an effective and timely service desk correlates with higher end-user satisfaction with all other IT services

    A double bar graph is depicted. The blue bar represents dissatisfied ender user, and the green bar represents satisfied end user. The bars show the average of dissatisfied and satisfied end users for service desk effectiveness and service desk timeliness.

    On average, organizations that were satisfied with service desk effectiveness rated all other IT processes 46% higher than dissatisfied end users.

    Organizations that were satisfied with service desk timeliness rated all other IT processes 37% higher than dissatisfied end users.
    “Satisfied” organizations had average scores =8.“Dissatisfied" organizations had average scores “Dissatisfied" organizations had average scores =6. Source: Info-Tech Research Group, 2019 (N=18,500+ respondents from 75 organizations)

    Standardize the service desk the Info-Tech way to get measurable results

    More than one hundred organizations engaged with Info-Tech, through advisory calls and workshops, for their service desk projects in 2016. Their goal was either to improve an existing service desk or build one from scratch.

    Organizations that estimate the business impact of each project phase help us shed light on the average measured value of the engagements.

    "The analysts are an amazing resource for this project. Their approach is very methodical, and they have the ability to fill in the big picture with detailed, actionable steps. There is a real opportunity for us to get off the treadmill and make real IT service management improvements"

    - Rod Gula, IT Director

    American Realty Advisors

    Three circles are depicted. The top circle shows the sum of measured value dollar impact which is US$1,659,493.37. The middle circle shows the average measured value dollar impact which is US$19,755.87. The bottom circle shows the average measured value time saved which is 27 days.

    Info-Tech’s approach to service desk standardization focuses on building service management essentials

    This image depicts all of the phases and steps in this blueprint.

    Info-Tech draws on the COBIT framework, which focuses on consistent delivery of IT services across the organization

    This image depicts research that can be used to improve IT processes. Service Desk is circled to demonstrate which research is being used.

    The service desk is the foundation of all other service management processes.

    The image shows how the service desk is a foundation for other service management processes.

    Info-Tech offers various levels of support to best suit your needs

    DIY Toolkit

    “Our team has already made this critical project a priority, and we have the time and capability, but some guidance along the way would be helpful.”

    Guided Implementation

    “Our team knows that we need to fix a process, but we need assistance to determine where to focus. Some check-ins along the way would help keep us on track.”

    Workshop

    “We need to hit the ground running and get this project kicked off immediately. Our team has the ability to take this over once we get a framework and strategy in place.”

    Consulting

    “Our team does not have the time or the knowledge to take this project on. We need assistance through the entirety of this project.”

    Diagnostics and consistent frameworks used throughout all four options

    Standardize the Service Desk – project overview

    This image shows the project overview of this blueprint.

    Info-Tech delivers: Use our tools and templates to accelerate your project to completion

    Project Summary

    Image of template.

    Service Desk Standard Operating Procedures

    Image of tool.

    Service Desk Maturity Assessment Tool

    Image of tool.

    Service Desk Implementation Roadmap

    Image of tool Incident, knowledge, and request management workflows

    Incident, knowledge, and request management workflows

    The project’s key deliverable is a service desk standard operating procedure

    Benefits of documented SOPs:

    Improved training and knowledge transfer: Routine tasks can be delegated to junior staff (freeing senior staff to work on higher priority tasks).

    IT automation, process optimization, and consistent operations: Defining, documenting, and then optimizing processes enables IT automation to be built on sound processes, so consistent positive results can be achieved.

    Compliance: Compliance audits are more manageable because the documentation is already in place.

    Transparency: Visually documented processes answer the common business question of “why does that take so long?”

    Cost savings: Work solved at first contact or with a minimal number of escalations will result in greater efficiency and more cost-effective support. This will also lead to better customer service.

    Impact of undocumented/undefined SOPs:

    Tasks will be difficult to delegate, key staff become a bottleneck, knowledge transfer is inconsistent, and there is a longer onboarding process for new staff

    IT automation built on poorly defined, unoptimized processes leads to inconsistent results.

    Documenting SOPs to prepare for an audit becomes a major time-intensive project.

    Other areas of the organization may not understand how IT operates, which can lead to confusion and unrealistic expectations.

    Support costs are highest through inefficient processes, and proactive work becomes more difficult to schedule, making the organization vulnerable to costly disruptions.

    Workshop Overview

    Image depicts workshop overview occurring over four days.

    Contact your account representative or email Workshops@InfoTech.com for more information.

    Phase 1

    Lay Service Desk Foundations

    Step 1.1:Assess current state

    Image shows the steps in phase 1. Highlight is on step 1.1

    This step will walk you through the following activities:

    • 1.1.1 Outline service desk challenges
    • 1.1.2 Assess the service desk maturity

    This step involves the following participants:

    • Project Sponsor
    • IT Director, CIO
    • IT Managers and Service Desk Manager(s)
    • Representation from tier 2 and tier 3 specialists

    Outcomes

    Alignment on the challenges that the service desk faces, an assessment of the current state of service desk processes and technologies, and baseline metrics against which to measure improvements.

    Deliverables

    • Service Desk Maturity Assessment

    Standardizing the service desk benefits the whole business

    The image depicts 3 circles to represent the service desk foundations.

    Embrace standardization

    • Standardization prevents wasted energy on reinventing solutions to recurring issues.
    • Standardized processes are scalable so that process maturity increases with the size of your organization.

    Increase business satisfaction

    • Improve confidence that the service desk can meet service levels.
    • Create a single point of contact for incidents and requests and escalate quickly.
    • Analyze trends to forecast and meet shifting business requirements.

    Reduce recurring issues

    • Create tickets for every task and categorize them accurately.
    • Generate reliable data to support root-cause analysis.

    Increase efficiency and lower operating costs

    • Empower end users and technicians with a targeted knowledgebase (KB).
    • Cross-train to improve service consistency.

    Case Study: The CIO of Westminster College took stock of existing processes before moving to empower the “helpless desk”

    Scott Lowe helped a small staff of eight IT professionals formalize service desk processes and increase the amount of time available for projects.

    When he joined Westminster College as CIO in 2006, the department faced several infrastructure challenges, including:

    • An unreliable network
    • Aging server replacements and no replacement plan
    • IT was the “department of no”
    • A help desk known as the “helpless desk”
    • A lack of wireless connectivity
    • Internet connection speed that was much too slow

    As the CIO investigated how to address the infrastructure challenges, he realized people cared deeply about how IT spent its time.

    The project load of IT staff increased, with new projects coming in every day.

    With a long project list, it became increasingly important to improve the transparency of project request and prioritization.

    Some weeks, staff spent 80% of their time working on projects. Other weeks, support requirements might leave only 10% for project work.

    He addressed the infrastructure challenges in part by analyzing IT’s routine processes.

    Internally, IT had inefficient support processes that reduced the amount of time they could spend on projects.

    They undertook an internal process analysis effort to identify processes that would have a return on investment if they were improved. The goal was to reduce operational support time so that project time could be increased.

    Five years later, they had a better understanding of the organization's operational support time needs and were able to shift workloads to accommodate projects without compromising support.

    Common challenges experienced by service desk teams

    Unresolved issues

    • Tickets are not created for all incidents.
    • Tickets are lost or escalated to the wrong technicians.
    • Poor data impedes root-cause analysis of incidents.

    Lost resources/accountability

    • Lack of cross-training and knowledge sharing.
    • Lack of skills coverage for critical applications and services.
    • Time is wasted troubleshooting recurring issues.
    • Reports unavailable due to lack of data and poor categorization.

    High cost to resolve

    • Tier 2/3 resolve issues that should be resolved at tier 1.
    • Tier 2/3 often interrupt projects to focus on service support.

    Poor planning

    • Lack of data for effective trend analysis leads to poor demand planning.
    • Lack of data leads to lost opportunities for templating and automation.

    Low business satisfaction

    • Users are unable to get assistance with IT services quickly.
    • Users go to their favorite technician instead of using the service desk.

    Outline the organization’s service desk challenges

    1.1.1 Brainstorm service desk challenges

    Estimated Time: 45 minutes

    A. As a group, outline the areas where you think the service desk is experiencing challenges or weaknesses. Use sticky notes or a whiteboard to separate the challenges into People, Process, and Technology so you have a wholistic view of the constraints across the department.

    B. Think about the following:

    • What have you heard from users? (e.g. slow response time)
    • What have you heard from executives? (e.g. poor communication)
    • What should you start doing? (e.g. documenting processes)
    • What should you stop doing? (e.g. work that is not being entered as tickets)

    C. Document challenges in the Service Desk Project Summary.

    Participants:

    • CIO
    • IT Managers
    • Service Desk Manager
    • Service Desk Agents

    Assess current service desk maturity to establish a baseline and create a plan for service desk improvement

    A current-state assessment will help you build a foundation for process improvements. Current-state assessments follow a basic formula:

    1. Determine the current state of the service desk.
    2. Determine the desired state of the service desk.
    3. Build a practical path from current to desired state.
    Image depicts 2 circles and a box. The circle on the 1. left has assess current state. The circle on the right has 2. assess target state. The box has 3. build a roadmap.

    Ideally, the current-state assessment should align the delivery of IT services with organizational needs. The assessment should achieve the following goals:

    1. Identify service desk pain points.
    2. Map each pain point to business services.
    3. Assign a broad business value to the resolution of each pain point.
    4. Map each pain point to a process.

    Expert Insight

    Image of expert.

    “How do you know if you aren’t mature enough? Nothing – or everything – is recorded and tracked, customer satisfaction is low, frustration is high, and there are multiple requests and incidents that nobody ever bothers to address.”

    Rob England

    IT Consultant & Commentator

    Owner Two Hills

    Also known as The IT Skeptic

    Assess the process maturity of the service desk to determine which project phase and steps will bring the most value

    1.1.2 Measure which activity will have the greatest impact

    The Service Desk Maturity Assessmenttool helps organizations assess their service desk process maturity and focus the project on the activities that matter most.

    The tool will help guide improvement efforts and measure your progress.

    • The second tab of the tool walks through a qualitative assessment of your service desk practices. Questions will prompt you to evaluate how you are executing key activities. Select the answer in the drop-down menus that most closely aligns with your current state.
    • The third tab displays your rate of process completeness and maturity. You will receive a score for each phase, an overall score, and advice based on your performance.
    • Document the results of the efficiency assessment in the Service Desk Project Summary.

    The tool is intended for periodic use. Review your answers each year and devise initiatives to improve the process performance where you need it most.

    Where do I find the data?

    Consult:

    • Service Manager
    • Service Desk Tools
    Image is the service desk tools.

    Step 1.2:Review service support best practices

    Image shows the steps in phase 1. Highlight is on step 1.2.

    This step will walk you through the following activities:

    1. 1.2.1 Identify roles and responsibilities in your organization
    2. 1.2.2 Map out the current and target structure of the service desk

    This step involves the following participants:

    • Project Sponsor
    • IT Director, CIO
    • IT Managers and Service Desk Manager(s)
    • Representation from tier 2 and tier 3 specialists

    Outcomes

    Identifying who is accountable for different support practices in the service desk will allow workload to be distributed effectively between functional teams and individuals. Closing the gaps in responsibilities will enable the execution of a shift-left strategy.

    Deliverables

    • Roles & responsibilities guide
    • Service desk structure

    Everyone in IT contributes to the success of service support

    Regardless of the service desk structure chosen to meet an organization’s service support requirements, IT staff should not doubt the role they play in service support.

    If you try to standardize service desk processes without engaging specialists in other parts of the IT organization, you will fail. Everyone in IT has a role to play in providing service support and meeting service-level agreements.

    Service Support Engagement Plan

    • Identify who is accountable for different service support processes.
    • Outline the different responsibilities of service desk agents at tier 1, tier 2, and tier 3 in meeting service-level agreements for service support.
    • Draft operational-level agreements between specialty groups and the service desk to improve accountability.
    • Configure the service desk tool to ensure ticket visibility and ownership across queues.
    • Engage tier 2 and tier 3 resources in building workflows for incident management, request fulfilment, and writing knowledgebase articles.
    • Emphasize the benefits of cooperation across IT silos:
      • Better customer service and end-user satisfaction.
      • Shorter time to resolve incidents and implement requests.
      • A higher tier 1 resolution rate, more efficient escalations, and fewer interruptions from project work.

    Info-Tech Insight

    Specialists tend to distance themselves from service support as they progress through their career to focus on projects.

    However, their cooperation is critical to the success of the new service desk. Not only do they contribute to the knowledgebase, but they also handle escalations from tiers 1 and 2.

    Clear project complications by leveraging roles and responsibilities

    R

    Responsible: This person is the staff member who completes the work. Assign at least one Responsible for each task, but this could be more than one.

    A

    Accountable: This team member delegates a task and is the last person to review deliverables and/or task. Sometimes Responsible and Accountable can be the same staff. Make sure that you always assign only one Accountable for each task and not more.

    C

    Consulted: People who do not carry out the task but need to be consulted. Typically, these people are subject matter experts or stakeholders.

    I

    Informed: People who receive information about process execution and quality and need to stay informed regarding the task.

    A RACI analysis is helpful with the following:

    • Workload Balancing: Allowing responsibilities to be distributed effectively between functional teams and individuals.
    • Change Management: Ensuring key functions and processes are not overlooked during organizational changes.
    • Onboarding: New employees can identify their own roles and responsibilities.

    A RACI chart outlines which positions are Responsible, Accountable, Consulted, and Informed

    Image shows example of RACI chart

    Create a list of roles and responsibilities in your organization

    1.2.1 Create RACI matrix to define responsibilities

    1. Use the Service Desk Roles and Responsibilities Guidefor a better understanding of the roles and responsibilities of different service desk tiers.
    2. In the RACI chart, replace the top row with specific roles in your organization.
    3. Modify or expand the process tasks, as needed, in the left column.
    4. For each role, identify the responsibility values that the person brings to the service desk. Fill out each column.
    5. Document in the Service Desk SOP. Schedule a time to share the results with organization leads.
    6. Distribute the chart between all teams in your organization.

    Notes:

    • Assign one Accountable for each task.
    • Have at least one Responsible for each task.
    • Avoid generic responsibilities, such as “team meetings.”
    • Keep your RACI definitions in your documents, as they are sometimes tough to remember.

    Participants

    • CIO
    • IT Managers
    • Service Desk Manager
    • Service Desk Agents

    What You'll Need

    • Service Desk SOP
    • Roles and Responsibilities Guide
    • Flip Chart
    • Whiteboard

    Build a tiered generalist service desk to optimize costs

    A tiered generalist service desk with a first-tier resolution rate greater than 60% has the best operating cost and customer satisfaction of all competing service desk structural models.

    Image depicts a tiered generalist service desk example. It shows a flow from users to tier 1 and to tiers 2 and 3.

    The success of a tiered generalist model depends on standardized, defined processes

    Image lists the processes and benefits of a successful tiered generalist service desk.

    Define the structure of the service desk

    1.2.2 Map out the current and target structure of the service desk

    Estimated Time: 45 minutes

    Instructions:

    1. Using the model from the previous slides as a guide, discuss how closely it matches the current service desk structure.
    2. Map out a similar diagram of your existing service desk structure, intake channels, and escalation paths.
    3. Review the structure and discuss any changes that could be made to improve efficiency. Revise as needed.
    4. Document the outcome in the Service Desk Project Summary.

    Image depicts a tiered generalist service desk example. It shows a flow from users to tier 1 and to tiers 2 and 3.

    Participants

    • CIO
    • IT Managers
    • Service Desk Manager
    • Service Desk Agents

    Use a shift-left strategy to lower service support costs, reduce time to resolve, and improve end-user satisfaction

    Shift-left strategy:

    • Shift service support tasks from specialists to generalists.
    • Implement self-service.
    • Automate incident resolution.
    Image shows the incident and service request resolution in a graph. It includes metrics of cost per ticket, average time to resolve, and end-user satisfaction.

    Work through the implications of adopting a shift-left strategy

    Overview:

    Identify process gaps that you need to fill to support the shift-left strategy and discuss how you could adopt or improve the shift-left strategy, using the discussion questions below as a guide.

    Which process gaps do you need to fill to identify ticket trends?

    • What are your most common incidents and service requests?
    • Which tickets could be resolved at tier 1?
    • Which tickets could be resolved as self-service tickets?
    • Which tickets could be automated?

    Which processes do you most need to improve to support a shift-left strategy?

    • Which incident and request processes are well documented?
    • Do you have recurring tickets that could be automated?
    • What is the state of your knowledgebase maintenance process?
    • Which articles do you most need to support tier 1 resolution?
    • What is the state of your web portal? How could it be improved to support self-service?

    Document in the Project Summary

    Step 1.3: Identify service desk metrics and reports

    Image shows the steps in phase 1. Highlight is on step 1.3.

    This step will walk you through the following activities:

    • 1.3 Create a list of required reports to identify relevant metrics

    This step involves the following participants:

    • Project Sponsor
    • IT Managers and Service Desk Manager(s)
    • Representation from tier 2 and tier 3 specialists

    Outcomes

    Managers and analysts will have service desk metrics and reports that help set expectations and communicate service desk performance.

    Deliverables

    • A list of service desk performance metrics and reports

    Engage business unit leaders with data to appreciate needs

    Service desk reports are an opportunity to communicate the story of IT and collect stakeholder feedback. Interview business unit leaders and look for opportunities to improve IT services.

    Start with the following questions:

    • What are you hearing from your team about working with IT?
    • What are the issues that are contributing to productivity losses?
    • What are the workarounds your team does because something isn’t working?
    • Are you able to access the information you need?

    Work with business unit leaders to develop an action plan.

    Remember to communicate what you do to address stakeholder grievances.

    The service recovery paradox is a situation in which end users think more highly of IT after the organization has corrected a problem with their service compared to how they would regard the company if the service had not been faulty in the first place.

    The point is that addressing issues (and being seen to address issues) will significantly improve end-user satisfaction. Communicate that you’re listening and acting, and you should see satisfaction improve.

    Info-Tech Insight

    Presentation is everything:

    If you are presenting outside of IT, or using operational metrics to create strategic information, be prepared to:

    • Discuss trends.
    • Identify organizational and departmental impacts.
    • Assess IT costs and productivity.

    For example, “Number of incidents with ERP system has decreased by 5% after our last patch release. We are working on the next set of changes and expect the issues to continue to decrease.”

    Engage technicians to ensure they input quality data in the service desk tool

    You need better data to address problems. Communicate to the technical team what you need from them and how their efforts contribute to the usefulness of reports.

    Tickets MUST:

    • Be created for all incidents and service requests.
    • Be categorized correctly, and categories updated when the ticket is resolved.
    • Be closed after the incidents and service requests are resolved or implemented.

    Emphasize that reports are analyzed regularly and used to manage costs, improve services, and request more resources.

    Info-Tech Insight

    Service Desk Manager: Technical staff can help themselves analyze the backlog and improve service metrics if they’re looking at the right information. Ensure their service desk dashboards are helping them identify high-priority and quick-win tickets and anticipate potential SLA breaches.

    Produce service desk reports targeted to improve IT services

    Use metrics and reports to tell the story of IT.

    Metrics should be tied to business requirements and show how well IT is meeting those requirements and where obstacles exist.

    Tailor metrics and reports to specific stakeholders.

    Technicians require mostly real-time information in the form of a dashboard, providing visibility into a prioritized list of tickets for which they are responsible.

    Supervisors need tactical information to manage the team and set client expectations as well as track and meet strategic goals.

    Managers and executives need summary information that supports strategic goals. Start by looking at executive goals for the support team and then working through some of the more tactical data that will help support those goals.

    One metric doesn’t give you the whole picture

    • Don’t put too much emphasis on a single metric. At best, it will give you a distorted picture of your service desk performance. At worst, it will distort the behavior of your agents as they may adopt poor practices to meet the metric.
    • The solution is to use tension metrics: metrics that work together to give you a better sense of the state of operations.
    • Tension metrics ensure a balanced focus toward shared goals.

    Example:

    First-call resolution (FCR), end-user satisfaction, and number of tickets reopened all work together to give you a complete picture. As FCR goes up, so should end-user satisfaction, as number of tickets re-opened stays steady or declines. If the three metrics are heading in different directions, then you know you have a problem.

    Rely on internal metrics to measure and improve performance

    External metrics provide useful context, but they represent broad generalizations across different industries and organizations of different sizes. Internal metrics measured annually are more reliable.

    Internal metrics provide you with information about your actual performance. With the right continual improvement process, you can improve those metrics year over year, which is a better measure of the performance of your service desk.

    Whether a given metric is the right one for your service desk will depend on several different factors, not the least of which include:

    • The maturity of your service desk processes.
    • Your ticket volume.
    • The complexity of your tickets.
    • The degree to which your end users are comfortable with self-service.

    Info-Tech Insight

    Take external metrics with a grain of salt. Most benchmarks represent what service desks do across different industries, not what they should do. There also might be significant differences between different industries in terms of the kinds of tickets they deal with, differences which the overall average obscures.

    Use key service desk metrics to build a business case for service support improvements

    The right metrics can tell the business how hard IT works and how many resources it needs to perform:

    1. End-User Satisfactions:
      • The most important metric for measuring the perceived value of the service desk. Determine this based on a robust annual satisfaction survey of end users and transactional satisfaction surveys sent with a percentage of tickets.
    2. Ticket Volume and Cost per Ticket:
      • A key indicator of service desk efficiency, computed as the monthly operating expense divided by the average ticket volume per month.
    3. First-Contact Resolution Rate:
      • The biggest driver of end-user satisfaction. Depending on the kind of tickets you deal with, you can measure first-contact, first-tier, or first-day resolution.
    4. Average Time to Resolve (Incident) or Fulfill (Service Requests):
      • An assessment of the service desk's ability to resolve tickets effectively, measuring the time elapsed between the moment the ticket status is set to “open” and the moment it is set to “resolved.”

    Info-Tech Insight

    Metrics should be tied to business requirements. They tell the story of how well IT is meeting those requirements and help identify when obstacles get in the way. The latter can be done by pointing to discrepancies between the internal metrics you expected to reach but didn’t and external metrics you trust.

    Use service desk metrics to track progress toward strategic, operational, and tactical goals

    Image depicts a chart to show the various metrics in terms of strategic goals, tactical goals, and operational goals.

    Cost per ticket and customer satisfaction are the foundation metrics of service support

    Ultimately, everything boils down to cost containment (measured by cost per ticket) and quality of service (measured by customer satisfaction).

    Cost per ticket is a measure of the efficiency of service support:

    • A higher than average cost per ticket is not necessarily a bad thing, particularly if accompanied by higher-than-average quality levels.
    • Conversely, a low cost per ticket is not necessarily good, particularly if the low cost is achieved by sacrificing quality of service.

    Cost per ticket is the total monthly operating expense of the service desk divided by the monthly ticket volume. Operating expense includes the following components:

    • Salaries and benefits for desktop support technicians
    • Salaries and benefits for indirect personnel (team leads, supervisors, workforce schedulers, dispatchers, QA/QC personnel, trainers, and managers)
    • Technology expense (e.g. computers, software licensing fees)
    • Telecommunications expenses
    • Facilities expenses (e.g. office space, utilities, insurance)
    • Travel, training, and office supplies
    Image displays a pie chart that shows the various service desk costs.

    Create a list of required reports to identify metrics to track

    1.3.1 Start by identifying the reports you need, then identify the metrics that produce them

    1. Answer the following questions to determine the data your reports require:
      • What strategic initiatives do you need to track?
        • Example: reducing mean time to resolve, meeting SLAs
      • What operational areas need attention?
        • Example: recurring issues that need a permanent resolution
      • What kind of issues do you want to solve?
        • Example: automate tasks such as password reset or software distribution
      • What decisions or processes are held up due to lack of information?
        • Example: need to build a business case to justify infrastructure upgrades
      • How can the data be used to improve services to the business?
        • Example: recurring issues by department
    2. Document report and metrics requirements in Service Desk SOP.
    3. Provide the list to your tool administrator to create reports with auto-distribution.

    Participants

    • CIO
    • IT Managers
    • Service Desk Manager
    • Service Desk Agents

    What You'll Need

    • Service Desk SOP
    • Flip Chart
    • Whiteboard

    Step 1.4: Review ticket handling procedures

    Image shows the steps in phase 1. Highlight is on step 1.4.

    This step will walk you through the following activities:

    • 1.4.1 Review ticket handling practices
    • 1.4.2 Identify opportunities to automate ticket creation and reduce recurring tickets

    This step involves the following participants:

    • Project Sponsor
    • IT Managers and Service Desk Manager(s)
    • Representation from tier 2 and tier 3 specialists

    Outcomes

    Managers and analysts will have best practices for ticket handling and troubleshooting to support ITSM data quality and improve first-tier resolution.

    DELIVERABLES

    • List of ticket templates and recurring tickets
    • Ticket and Call QA Template and ticket handling best practices

    Start by reviewing the incident intake process to find opportunities for improvement

    If end users are avoiding your service desk, you may have an intake problem. Create alternative ways for users to seek help to manage the volume; keep in mind not every request is an emergency.

    Image shows the various intake channels and the recommendation.

    Identify opportunities for improvement in your ticket channels

    The two most efficient intake channels should be encouraged for the majority of tickets.

    • Build a self-service portal.
      • Do users know where to find the portal?
      • How many tickets are created through the portal?
      • Is the interface easy to use?
    • Deal efficiently with email.
      • How quickly are messages picked up?
      • Are they manually transferred to a ticket or does the service desk tool automatically create a ticket?

    The two most traditional and fastest methods to get help must deal with emergencies and escalation effectively.

    • Phone should be the fastest way to get help for emergencies.
      • Are enough agents answering calls?
      • Are voicemails picked up on time?
      • Are the automated call routing prompts clear and concise?
    • Are walk-ins permitted and formalized?
      • Do you always have someone at the desk?
      • Is your equipment secure?
      • Are walk-ins common because no one picks up the phone or is the traffic as you’d expect?

    Ensure technicians create tickets for all incidents and requests

    Why Collect Ticket Data?

    If many tickets are missing, help service support staff understand the need to collect the data. Reports will be inaccurate and meaningless if quality data isn’t entered into the ticketing system.

    Image shows example of ticket data

    Set ticket handling expectations to drive a consistent process

    Set expectations:

    • Create and update tickets, but not at the expense of good customer service. Agents can start the ticket but shouldn’t spend five minutes creating the ticket when they should be troubleshooting the problem.
    • Update the ticket when the issue is resolved or needs to be escalated. If agents are escalating, they should make sure all relevant information is passed along to the next technician.
    • Update user of ETA if issue cannot be resolved quickly.
    • Ticket templates for common incidents can lead to fast creation, data input, and categorizations. Templates can reduce the time it takes to create tickets from two minutes to 30 seconds.
    • Update categories to reflect the actual issue and resolution.
    • Reference or link to the knowledgebase article as the documented steps taken to resolve the incident.
    • Validate incident is resolved with client; automate this process with ticket closure after a certain time.
    • Close or resolve the ticket on time.

    Use the Ticket and Call Quality Assessment Tool to improve the quality of service desk data

    Build a process to check-in on ticket and call quality monthly

    Better data leads to better decisions. Use the Ticket and Call Quality Assessment Toolto check-in on the ticket and call quality monthly for each technician and improve service desk data quality.

    1. Fill tab 1 with technician’s name.
    2. Use either tab 2 (auto-scoring) or tab 3 (manual scoring) to score the agent. The assessment includes ticket evaluation, call evaluation, and overall metric.
    3. Record the results of each review in the score summary of tab 1.
    Image shows tool.

    Use ticket templates to make ticket creation, updating, and resolution more efficient

    A screenshot of the Ticket and Call Quality Assessment Tool

    Implement measures to improve ticket handling and identify ticket template candidates

    1.4.1 Identify opportunities to automate ticket creation

    1. Poll the team and discuss.
      • How many members of the team are not creating tickets? Why?
      • How can we address those barriers?
      • What are the expectations of management?
    2. Brainstorm five to ten good candidates for ticket templates.
      • What data can auto-fill?
      • What will help process the ticket faster?
      • What automations can we build to ensure a fast, consistent service?
      • Note:
        • Ticket template name
        • Information that will auto-fill from AD and other applications
        • Categories and resolution codes
        • Automated routing and email responses
    3. Document ticket template candidates in the Service Desk Roadmap to capture the actions.

    Participants

    • Service Desk Manager
    • Service Desk Agents

    What You'll Needs

    • Flip Chart
    • Whiteboard

    Phase 2

    Design Incident Management Processes

    Step 2.1: Build incident management workflows

    Image shows the steps in phase 2. Highlight is on step 2.1.

    This step will walk you through the following activities:

    • 2.1.1 Review incident management challenges
    • 2.1.2 Define the incident management workflow
    • 2.1.3 Define the critical incident management workflow
    • 2.1.4 Design critical incident communication plan

    This step involves the following participants:

    • IT Managers
    • Service Desk Manager(s)
    • Representation from tier 2 and tier 3 specialists

    Outcomes

    Workflows for incident management and critical incident management will improve the consistency and quality of service delivery and prepare the service desk to negotiate reliable service levels with the organization.

    DELIVERABLES

    • Incident management workflows
    • Critical incident management workflows
    • Critical incident communication plan

    Communicate the great incident resolution work that you do to improve end-user satisfaction

    End users think more highly of IT after the organization has corrected a problem with their service than they would have had the service not been faulty in the first place.

    Image displays a graph to show the service recovery paradox

    Info-Tech Insight

    Use the service recovery paradox to your advantage. Address service desk challenges explicitly, develop incident management processes that get services back online quickly, and communicate the changes.

    If you show that the service desk recovered well from the challenges end users raised, you will get greater loyalty from them.

    Assign incident roles and responsibilities to promote accountability

    The role of an incident coordinator or manager can be assigned to anyone inside the service desk that has a strong knowledge of incident resolution, attention to detail, and knows how to herd cats.

    In organizations with high ticket volumes, a separate role may be necessary.

    Everyone must recognize that incident management is a cross-IT organization process and it does not have to be a unique service desk process.

    An incident coordinator is responsible for:

    • Improving incident management processes.
    • Tracking metrics and producing reports.
    • Developing and maintaining the incident management system.
    • Developing and maintaining critical incident processes.
    • Ensuring the service support team follows the incident management process.
    • Gathering post-mortem information from the various technical resources on root cause for critical or severity 1 incidents.

    The Director of IT Services invested in incident management to improve responsiveness and set end-user expectations

    Practitioner Insight

    Ben Rodrigues developed a progressive plan to create a responsive, service-oriented culture for the service support organization.

    "When I joined the organization, there wasn’t a service desk. People just phoned, emailed, maybe left [sticky] notes for who they thought in IT would resolve it. There wasn’t a lot of investment in developing clear processes. It was ‘Let’s call somebody in IT.’

    I set up the service desk to clarify what we would do for end users and to establish some SLAs.

    I didn’t commit to service levels right away. I needed to see how many resources and what skill sets I would need. I started by drafting some SLA targets and plugging them into our tracking application. I then monitored how we did on certain things and established if we needed other skill sets. Then I communicated those SOPs to the business, so that ‘if you have an issue, this is where you go, and this is how you do it,’ and then shared those KPIs with them.

    I had monthly meetings with different function heads to say, ‘this is what I see your guys calling me about,’ and we worked on something together to make some of the pain disappear."

    -Ben Rodrigues

    Director, IT Services

    Gamma Dynacare

    Sketch out incident management challenges to focus improvements

    Common Incident Management Challenges

    End Users

    • No faith in the service desk beyond speaking with their favorite technician.
    • No expectations for response or resolution time.
    • Non-IT staff are disrupted as people ask their colleagues for IT advice.

    Technicians

    • No one manages and escalates incidents.
    • Incidents are unnecessarily urgent and more likely to have a greater impact.
    • Agents are flooded with requests to do routine tasks during desk visits.
    • Specialist support staff are subject to constant interruptions.
    • Tickets are lost, incomplete, or escalated incorrectly.
    • Incidents are resolved from scratch rather than referring to existing solutions.

    Managers

    • Tickets are incomplete or lack historical information to address complaints.
    • Tickets in system don’t match the perceived workload.
    • Unable to gather data for budgeting or business analysis.

    Info-Tech Insight

    Consistent incident management processes will improve end-user satisfaction with all other IT services.

    However, be prepared to overcome these common obstacles as you put the process in place, including:

    • Absence of management or staff commitment.
    • Lack of clarity on organizational needs.
    • Outdated work practices.
    • Poorly defined service desk goals and responsibilities.
    • Lack of a reliable knowledgebase.
    • Inadequate training.
    • Resistance to change.

    Prepare to implement or improve incident management

    2.1.1 Review incident management challenges and metrics

    1. Review your incident management challenges and the benefits of addressing them.
    2. Review the level of service you are providing with the current resources. Define clear goals and deliverables for the improvement initiative.
    3. Decide how the incident management process will interface with the service desk. Who will take on the responsibility for resolving incidents? Specifically, who will:
      • Log incidents.
      • Perform initial incident troubleshooting.
      • Own and monitor tickets.
      • Communicate with end users.
      • Update records with the resolution.
      • Close incidents.
      • Implement next steps (e.g. initiate problem management).
    4. Document recommendations and the incident management process requirements in the Service Desk SOP.

    Participants

    • Service Desk Manager
    • Service Desk Agents

    What You’ll Need

    • Service Desk SOP
    • Flip Chart
    • Whiteboard

    Distinguish between different kinds of tickets for better SLAs

    Different ticket types are associated with radically different prioritization, routing, and service levels. For instance, most incidents are resolved within a business day, but requests take longer to implement.

    If you fail to distinguish between ticket types, your metrics will obscure service desk performance.

    Common Service Desk Tickets

    • Incidents
      • An unanticipated interruption of a service.
        • The goal of incident management is to restore the service as soon as possible, even if the resolution involves a workaround.
    • Problems
      • The root cause of several incidents.
        • The goal of problem management is to detect the root cause and provide long-term resolution and prevention.
    • Requests
      • A generic description for small changes or service access
        • Requests are small, frequent, and low risk. They are best handled by a process distinct from incident, change, and project management.
    • Changes
      • Modification or removal of anything that could influence IT services.
        • The scope includes significant changes to architectures, processes, tools, metrics, and documentation.

    Info-Tech Insight

    Organizations sometimes mistakenly classify small projects as service requests, which can compromise your data, resulting in a negative impact to the perceived value of the service desk.

    Separate incidents and service requests for increased customer service and better-defined SLAs

    Defining the differences between service requests and incidents is not just for reporting purposes. It also has a major impact on how service is delivered.

    Incidents are unexpected disruptions to normal business processes and require attempts to restore services as soon as possible (e.g. the printer is not working).

    Service requests are tasks that don’t involve something that is broken or has an immediate impact on services. They do not require immediate resolution and can typically be scheduled (e.g. new software).

    Image shows a chart on incidents and service requests.

    Focus on the big picture first to capture and streamline how your organization resolves incidents

    Image displays a flow chart to show how to organize resolving incidents.

    Document your incident management workflow to identify opportunities for improvement

    Image shows a flow cart on how to organize incident management.

    Workflow should include:

    • Ticket creation and closure
    • Triage
    • Troubleshooting
    • Escalations
    • Communications
    • Change management
    • Documentation
    • Vendor escalations

    Notes:

    • Notification and alerts should be used to set or reset expectations on delivery or resolution
    • Identify all the steps where a customer is informed and ensure we are not over or under communicating

    Collaborate to define each step of the incident management workflow

    2.1.2 Define the incident management workflow

    Estimated Time: 60 minutes

    Option 1: Whiteboard

    1. Discuss the workflow and draw it on the whiteboard.
    2. Assess whether you are using the best workflow. Modify it if necessary.
    3. Engage the team in refining the process workflow.
    4. Transfer data to Visio and add to the SOP.

    Option 2: Tabletop Exercise

    1. Distribute index cards to each member of the team.
    2. Have each person write a single task they perform on the index card. Be granular. Include the title or the name of the person responsible.
    3. Mark cards that are decision points. Use a card of a different color or use a marker to make a colored dot.
    4. Arrange the index cards in order, removing duplicates.
    5. Assess whether you are using the best workflow. Engage the team to refine it if necessary.
    6. Transfer data to Visio and add to the Service Desk SOP.

    Participants

    • Service Manager
    • Service Desk Support
    • Applications or Infrastructure Support

    What You’ll Need

    • Flip Chart Paper
    • Sticky Notes
    • Pens
    • Service Desk SOP
    • Project Summary

    Formalize the process for critical incident management to reduce organizational impact

    Discuss these elements to see how the organization will handle them.

    • Communication plan:
      • Who communicates with end users?
      • Who communicates with the executive team?
    • It’s important to separate the role of the technician trying to solve a problem with the need to communicate progress.
    • Change management:
    • Define a separate process for regular and emergency change management to ensure changes are timely and appropriate.
    • Business continuity plan:
    • Identify criteria to decide when a business continuity plan (BCP) must be implemented during a critical incident to minimize the business impact of the incident.
    • Post-mortems:
    • Formalize the process of discussing and documenting lessons learned, understanding outstanding issues, and addressing the root cause of incidents.
    • Source of incident notification:
    • Does the process change if users notify the service desk of an issue or if the systems management tools alert technicians?

    Critical incidents are high-impact, high-urgency events that put the effectiveness and timeliness of the service desk center stage.

    Build a workflow that focuses on quickly bringing together the right people to resolve the incident and reduces the chances of recurrence.

    Document your critical incident management workflow to identify opportunities for improvement

    Image shows a flow cart on how to organize critical incident management.

    Workflow should include:

    • Ticket creation and closure
    • Triage
    • Troubleshooting
    • Escalations
    • Communications plan
    • Change management
    • Disaster recovery or business continuity plan
    • Documentation
    • Vendor escalations
    • Post-mortem

    Collaborate to define each step of the critical incident management workflow

    2.1.3 Define the critical incident management workflow

    Estimated Time: 60 minutes

    Option 1: Whiteboard

    1. Discuss the workflow and draw it on the whiteboard.
    2. Assess whether you are using the best workflow. Modify it if necessary.
    3. Engage the team in refining the process workflow.
    4. Transfer data to Visio and add to the SOP.

    Option 2: Tabletop Exercise

    1. Distribute index cards to each member of the team.
    2. Have each person write a single task they perform on the index card. Be granular. Include the title or the name of the person responsible.
    3. Mark cards that are decision points. Use a card of a different color or use a marker to make a colored dot.
    4. Arrange the index cards in order, removing duplicates.
    5. Assess whether you are using the best workflow. Engage the team to refine it if necessary.
    6. Transfer data to Visio and add to the Service Desk SOP.

    Participants

    • Service Manager
    • Service Desk Support
    • Applications or Infrastructure Support

    What You’ll Need

    • Flip Chart Paper
    • Sticky Notes
    • Pens
    • Service Desk SOP

    Establish a critical incident management communication plan

    When it comes to communicating during major incidents, it’s important to get the information just right. Users don’t want too little, they don’t want too much, they just want what’s relevant to them, and they want that information at the right time.

    As an IT professional, you may not have a background in communications, but it becomes an important part of your job. Broad guidelines for good communication during a critical incident are:

    1. Communicate as broadly as the impact of your incident requires.
    2. Communicate as much detail as a specific audience requires, but no more than necessary.
    3. Communicate as far ahead of impact as possible.

    Why does communication matter?

    Sending the wrong message, at the wrong time, to the wrong stakeholders, can result in:

    • Drop in customer satisfaction.
    • Wasted time and resources from multiple customers contacting you with the same issue.
    • Dissatisfied executives kept in the dark.
    • Increased resolution time if the relevant providers and IT staff are not informed soon enough to help.

    Info-Tech Insight

    End users understand that sometimes things break. What’s important to them is that (1) you don’t repeatedly have the same problem, (2) you keep them informed, and (3) you give them enough notice when their systems will be impacted and when service will be returned.

    Automate communication to save time and deliver consistent messaging to the right stakeholders

    In the middle of resolving a critical incident, the last thing you have time for is worrying about crafting a good message. Create a series of templates to save time by providing automated, tailored messages for each stage of the process that can be quickly altered and sent out to the right stakeholders.

    Once templates are in place, when the incident occurs, it’s simply a matter of:

    1. Choosing the relevant template.
    2. Updating recipients and messaging if necessary.
    3. Adding specific, relevant data and fields.
    4. Sending the message.

    When to communicate?

    Tell users the information they need to know when they need to know it. If a user is directly impacted, tell them that. If the incident does not directly affect the user, the communication may lead to decreased customer satisfaction or failure to pay attention to future relevant messaging.

    What to say?

    • Keep messaging short and to the point.
    • Only say what you know for sure.
    • Provide only the details the audience needs to know to take any necessary action or steps on their side and no more. There’s no need to provide details on the reason for the failure before it’s resolved, though this can be done after resolution and restoration of service.

    You’ll need distinct messages for distinct audiences. For example:

    • To incident resolvers: “Servers X through Y in ABC Location are failing intermittently. Please test the servers and all the connections to determine the exact cause so we can take corrective action ASAP.”
    • To the IT department head: “Servers X through Y in ABC Location are failing intermittently. We are beginning tests. We will let you know when we have determined the exact cause and can give you an estimated completion time.”
    • To executives: “We’re having an issue with some servers at ABC Location. We are testing to determine the cause and will let you know the estimated completion time as soon as possible.”
    • To end users: “We are experience some service issues. We are working on a resolution diligently and will restore service as soon as possible.”

    Map out who will need to be contacted in the event of a critical incident

    2.1.4 Design the critical incident communication plan

    • Identify critical incidents that require communication.
    • Identify stakeholders who will need to be informed about each incident.
    • For each audience, determine:
      1. Frequency of communication
      2. Content of communication
    Use the sample template to the right as an example.

    Some questions to assist you:

    • Whose work will be interrupted, either by their services going down or by their workers having to drop everything to solve the incident?
    • What would happen if we didn’t notify this person?
    • What level of detail do they need?
    • How often would they want to be updated?
    Document outcomes in the Service Desk SOP. Image shows template of unplanned service outage.

    Measure and improve customer satisfaction with the use of relationship and transactional surveys

    Customer experience programs with a combination of relationship and transactional surveys tend to be more effective. Merging the two will give a wholistic picture of the customer experience.

    Relationship Surveys

    Relationship surveys focus on obtaining feedback on the overall customer experience.

    • Inform how well you are doing or where you need improvement in the broad services provided.
    • Provide a high-level perspective on the relationship between the business and IT.
    • Help with strategic improvement decisions.
    • Should be sent over a duration of time and to the entire customer base after they’ve had time to experience all the services provided by the service desk. This can be done as frequently as per quarter or on a yearly basis.
    • E.g. An annual satisfaction survey such as Info-Tech’s End User Satisfaction Diagnostic.

    Transactional Surveys

    Transactional surveys are tied to a specific interaction or transaction your end users have with a specific product or service.

    • Help with tactical improvement decisions.
    • Questions should point to a specific interaction.
    • Usually only a few questions that are quick and easy to complete following the transaction.
    • Since transactional surveys allow you to improve individual relationships, they should be sent shortly after the interaction with the service desk has occurred.
    • E.g. How satisfied are you with the way your ticket was resolved?

    Add transactional end-user surveys at ticket close to escalate unsatisfactory results

    A simple quantitative survey at the closing of a ticket can inform the service desk manager of any issues that were not resolved to the end user’s satisfaction. Take advantage of workflows to escalate poor results immediately for quick follow-up.

    Image shows example of survey question with rating.

    If a more complex survey is required, you may wish to include some of these questions:

    Please rate your overall satisfaction with the way your issue was handled (1=unsatisfactory, 5=fantastic)

    • The professionalism of the analyst.
    • The technical skills or knowledge of the analyst.
    • The timeliness of the service provided.
    • The overall service experience.

    Add an open-ended, qualitative question to put the number in context, and solicit critical feedback:

    What could the service desk have done to improve your experience?

    Define a process to respond to both negative and positive feedback

    Successful customer satisfaction programs respond effectively to both positive and negative outcomes. Late or lack of responses to negative comments may increase customer frustration, while not responding at all to the positive comments may give the perception of indifference. If customers are taking the time to fill out the survey, good or bad, they should be followed up with

    Take these steps to handle survey feedback:

    1. Assign resources to receive, read, and track responses. The entire team doesn’t need to receive every response, while a single resource may not have capacity to respond in a timely manner. Decide what makes the most sense in your environment.
    2. Respond to negative feedback: It may not be possible to respond to every customer that fills out a survey. Set guidelines for responding to negative surveys with no details on the issue; don’t spend time guessing why they were upset, simply ask the user why they were unsatisfied. The critical piece of taking advantage of the service recovery paradox is in the follow-up to the customer.
    3. Investigate and improve: Make sure you investigate the issue to ensure that it is a justified complaint or whether the issue is a symptom of another issue’s root cause. Identify remediation steps to ensure the issue does not repeat itself, and then communicate to the customer the action you have taken to improve.
    4. Act on positive feedback as well: If it’s easy for customers to provide feedback, then make room in your process for handling the positive results. Appreciate the time and effort your customers take to give kudos and use it as a tool to build a long-term relationship with that user. Saying thank you goes a long way and when customers know their time matters, they will be encouraged to fill out those surveys. This is also a good way to show what a great job the service desk team did with the interaction.

    Analyze survey feedback month over month to complement and justify metric results already in place

    When you combine the tracking and analysis of relationship and transactional survey data you will be able to dive into specific issues, identify trends and patterns, assess impact to users, and build a plan to make improvements.

    Once the survey data is centralized, categorized, and available you can start to focus on metrics. At a minimum, for transactional surveys, consider tracking:

    • Breakdown of satisfaction scores with trends over time
    • Unsatisfactory surveys that are related to incidents and service requests
    • Total surveys that have been actioned vs pending

    For relationship surveys, consider tracking:

    • Satisfaction scores by department and seniority level
    • Satisfaction with IT services, applications, and communication
    • Satisfaction with IT’s business enablement

    Scores of overall satisfaction with IT

    Image Source: Info-Tech End User Satisfaction Report

    Prioritize company-wide improvement initiatives by those that have the biggest impact to the entire customer base first and then communicate the plan to the organization using a variety of communication channels that will draw your customers in, e.g. dashboards, newsletters, email alerts.

    Info-Tech Insight

    Consider automating or using your ITSM notification system as a direct communication method to inform the service desk manager of negative survey results.

    Step 2.2: Design ticket categorization

    Image shows the steps in phase 2. Highlight is on step 2.2

    This step will walk you through the following activities:

    • 2.2.1 Assess ticket categorization
    • 2.2.2 Enhance ticket categories with resolution and status codes

    This step involves the following participants:

    • IT Managers
    • Service Desk Manager(s)
    • Representation from tier 2 and tier 3 specialists

    Outcomes

    The reviewed ticket categorization scheme will be easier to use and deploy more consistently, which will improve the categorization of data and the reliability of reports.

    DELIVERABLES

    • Optimized ticket categorization

    Design a ticket classification scheme to produce useful reports

    Reliable reports depend on an effective categorization scheme.

    Too many options cause confusion; too few options provide little value. As you build the classification scheme over the next few slides, let call routing and reporting requirements be your guide.

    Effective classification schemes are concise, easy to use correctly, and easy to maintain.

    Image shows example of a ticket classification scheme.

    Keep these guidelines in mind:

    • A good categorization scheme is exhaustive and mutually exclusive: there’s a place for every ticket and every ticket fits in only one place.
    • As you build your classification scheme, ensure the categories describe the actual asset or service involved based on final resolution, not how it was reported initially.
    • Pre-populate ticket templates with relevant categories to dramatically improve reporting and routing accuracy.
    • Use a tiered system to make the categories easier to navigate. Three tiers with 6-8 categories per tier provides up to 512 sub-categories, which should be enough for the most ambitious team.
    • Track only what you will use for reporting purposes. If you don’t need a report on individual kinds of laptops, don’t create a category beyond “laptops.”
    • Avoid “miscellaneous” categories. A large portion of your tickets will eventually end up there.

    Info-Tech Insight

    Don’t do it alone! Collaborate with managers in the specialized IT groups responsible for root-cause analysis to develop a categorization scheme that makes sense for them.

    The first approach to categorization breaks down the IT portfolio into asset types

    WHY SHOULD I START WITH ASSETS?

    Start with asset types if asset management and configuration management processes figure prominently in your practice or on your service management implementation roadmap.

    Image displays example of asset types and how to categorize them.

    Building the Categories

    Ask these questions:

    • Type: What kind of asset am I working on?
    • Category: What general asset group am I working on?
    • Subcategory: What particular asset am I working on?

    Need to make quick progress? Use Info-Tech Research Group’s Service Desk Ticket Categorization Schemes template.

    Info-Tech Insight

    Think about how you will use the data to determine which components need to be included in reports. If components won’t be used for reporting, routing, or warranty, reporting down to the component level adds little value.

    The second approach to categorization breaks down the IT portfolio into types of services

    WHY SHOULD I START WITH SERVICES?

    Start with asset services if service management generally figures prominently in your practice, especially service catalog management.

    Image displays example of service types and how to categorize them.

    Building the Categories

    Ask these questions:

    • Type: What kind of service am I working on?
    • Category: What general service group am I working on?
    • Subcategory: What particular service am I working on?

    Need to make quick progress? Use Info-Tech Research Group’s Service Desk Ticket Categorization Schemes template.

    Info-Tech Insight

    Remember, ticket categories are not your only source of reports. Enhance the classification scheme with resolution and status codes for more granular reporting.

    Improve the categorization scheme to enhance routing and reporting

    2.2.1 Assess whether the service desk can improve its ticket categorization

    1. As a group, review existing categories, looking for duplicates and designations that won’t affect ticket routing. Reconcile duplicates and remove non-essential categories.
    2. As a group, re-do the categories, ensuring that the new categorization scheme will meet the reporting requirements outlined earlier.
      • Are categories exhaustive and mutually exclusive?
      • Is the tier simple and easy to use (i.e. 3 tiers x 8 categories)?
    3. Test against recent tickets to ensure you have the right categories.
    4. Record the ticket categorization scheme in the Service Desk Ticket Categorization Schemes template.

    A screenshot of the Service Desk Ticket Categorization Schemes template.

    Participants

    • Service Desk Manager
    • Service Desk Agents

    What You’ll Need

    • Flip Chart
    • Whiteboard
    • Service Desk Ticket Categorization Scheme

    Enhance the classification scheme with resolution and status codes for more granular reporting

    Resolution codes differ from detailed resolution notes.

    • A resolution code is a field within the ticketing system that should be updated at ticket close to categorize the primary way the ticket was resolved.
    • This is important for reporting purposes as it adds another level to the categorization scheme and can help you identify knowledgebase article candidates, training needs, or problems.

    Ticket statuses are a helpful field for both IT and end users to identify the current status of the ticket and to initiate workflows.

    • The most common statuses are open, pending/in progress, resolved, and closed (note the difference between resolved and closed).
    • Waiting on user or waiting on vendor are also helpful statuses to stop the clock when awaiting further information or input.

    Common Examples:

    Resolution Codes

    • How to/training
    • Configuration change
    • Upgrade
    • Installation
    • Data import/export/change
    • Information/research
    • Reboot

    Status Fields

    • Declined
    • Open
    • Closed
    • Waiting on user
    • Waiting on vendor
    • Reopened by user

    Identify and document resolution and status codes

    2.2.2 Enhance ticket categories with resolution codes

    Discuss:

    • How can we use resolution information to enhance reporting?
    • Are current status fields telling the right story?
    • Are there other requirements like project linking?

    Draft:

    1. Write out proposed resolution codes and status fields and critically assess their value.
    2. Resolutions can be further broken down by incident and service request if desired.
    3. Test resolution codes against a few recent tickets.
    4. Record the ticket categorization scheme in the Service Desk SOP.

    Participants

    • CIO
    • Service Desk Manager
    • Service Desk Technician(s)

    What You’ll Need

    • Whiteboard or Flip Chart
    • Markers

    Step 2.3: Design incident escalation and prioritization

    Image shows the steps in phase 2. Highlight is on step 2.3.

    This step will walk you through the following activities:

    • 2.3.1 Build a small number of rules to facilitate prioritization
    • 2.3.2 Define escalation rules
    • 2.3.3 Define automated escalations
    • 2.3.4 Provide guidance to each tier around escalation steps and times

    This step involves the following participants:

    • IT Managers
    • Service Desk Manager(s)
    • Representation from tier 2 and tier 3 specialists

    Outcomes

    The reviewed ticket escalation and prioritization will streamline queue management, improve the quality of escalations, and ensure agents work on the right tickets at the right time.

    DELIVERABLES

    • Optimized ticket prioritization scheme
    • Guidelines for ticket escalations
    • List of automatic escalations

    Build a ticket prioritization matrix to make escalation assessment less subjective

    Most IT leaders agree that prioritization is one of the most difficult aspects of IT in general. Set priorities based on business needs first.

    Mission-critical systems or problems that affect many people should always come first (i.e. Severity Level 1).

    The bulk of reported problems, however, are often individual problems with desktop PCs (i.e. Severity Level 3 or 4).

    Some questions to consider when deciding on problem severity include:

    • How is productivity affected?
    • How many users are affected?
    • How many systems are affected?
    • How critical are the affected systems to the organization?

    Decide how many severity levels the organization needs the service desk to have. Four levels of severity are ideal for most organizations.

    Image shows example ticket prioritization matrix

    Collect the ticket prioritization scheme in one diagram to ensure service support aligns to business requirements

    Image shows example ticket prioritization matrix

    Prioritize incidents based on severity and urgency to foreground critical issues

    2.3.1 Build a clearly defined priority scheme

    Estimated Time: 60 minutes

    1. Decide how many levels of severity are appropriate for your organization.
    2. Build a prioritization matrix, breaking down priority levels by impact and urgency.
    3. Build out the definitions of impact and urgency to complete the prioritization matrix.
    4. Run through examples of each priority level to make sure everyone is on the same page.

    Image shows example ticket prioritization matrix

    Document in the SOP

    Participants

    • Service Managers
    • Service Desk Support
    • Applications or Infrastructure Support

    What You'll Need

    • Flip Chart Paper
    • Sticky Notes
    • Pens
    • Service Desk SOP

    Example of outcome from 2.3.1

    Define response and resolution targets for each priority level to establish service-level objectives for service support

    Image shows example of response and resolution targets.

    Build clear rules to help agents determine when to escalate

    2.3.2 Assign response, resolution, and escalation times to each priority level

    Estimated Time: 60 minutes

    Instructions:

    For each incident priority level, define the associated:

    1. Response time – time from when incident record is created to the time the service desk acknowledges to the customer that their ticket has been received and assigned.
    2. Resolution time – time from when the incident record is created to the time that the customer has been advised that their problem has been resolved.
    3. Escalation time – maximum amount of time that a ticket should be worked on without progress before being escalated to someone else.

    Participants

    • Service Managers
    • Service Desk Support
    • Applications or Infrastructure Support

    What You'll Need

    • Flip Chart Paper
    • Sticky Notes
    • Pens

    Image shows example of response and resolution targets

    Use the table on the previous slide as a guide.

    Discuss the possible root causes for escalation issues

    WHY IS ESCALATION IMPORTANT?

    Escalation is not about admitting defeat, but about using your resources properly.

    Defining procedures for escalation reduces the amount of time the service desk spends troubleshooting before allocating the incident to a higher service tier. This reduces the mean time to resolve and increases end-user satisfaction.

    You can correlate escalation paths to ticket categories devised in step 2.2.

    Image shows example on potential root causes for escalation issues.

    Build decision rights to help agents determine when to escalate

    2.3.3 Provide guidance to each tier around escalation steps and times

    Estimated Time: 60 minutes

    Instructions

    1. For each support tier, define escalation rules for troubleshooting (steps that each tier should take before escalation).
    2. For each support tier, define maximum escalation times (maximum amount of time to work on a ticket without progress before escalating).
    Example of outcome from step 2.3.3 to determine when to escalate issues.

    Create a list of application specialists to get the escalation right the first time

    2.3.4 Define automated escalations

    Estimated Time: 60 minutes

    1. Identify applications that will require specialists for troubleshooting or access rights.
    2. Identify primary and secondary specialists for each application.
    3. Identify vendors that will receive escalations either immediately or after troubleshooting.
    4. Set up application groups in the service desk tool.
    5. Set up workflows in the service desk tool where appropriate.
    6. Document the automated escalations in the categorization scheme developed in step 2.2 and in the Service Desk Roles and Responsibilities Guide.

    A screenshot of the Service Desk Roles and Responsibilities Guide

    Participants

    • Service Managers
    • Service Desk Support
    • Applications or Infrastructure Support

    What You'll Need

    • Flip Chart Paper
    • Sticky Notes
    • Pens

    Phase 3

    Design Request Fulfilment Processes

    Step 3.1: Build request workflows

    Image shows the steps in phase 3. Highlight is on step 3.1.

    This step will walk you through the following activities:

    • 3.1.1 Distinguish between requests and small projects
    • 3.1.2 Define service requests with SLAs
    • 3.1.3 Build and critique request workflows

    This step involves the following participants:

    • IT Managers
    • Service Desk Manager(s)
    • Representation from tier 2 and tier 3 specialists

    Outcomes

    Workflows for service requests will improve the consistency and quality of service delivery and prepare the service desk to negotiate reliable service levels with the organization.

    DELIVERABLES

    • Workflows for the most common service requests
    • An estimated service level for each service request
    • Request vs. project criteria

    Standardize service requests for more efficient delivery

    Definitions:

    • An incident is an unexpected disruption to normal business processes and requires attempts to restore service as soon as possible (e.g. printer not working).
    • A service request is a request where nothing is broken or impacting a service and typically can be scheduled rather than requiring immediate resolution (e.g. new software application).
    • Service requests are repeatable, predictable, and easier to commit to SLAs.
    • By committing to SLAs, expectations can be set for users and business units for service fulfillment.
    • Workflows for service requests should be documented and reviewed to ensure consistency of fulfillment.
    • Documentation should be created for service request procedures that are complex.
    • Efficiencies can be created through automation such as with software deployment.
    • All service requests can be communicated through a self-service portal or service catalog.

    PREPARE A FUTURE SERVICE CATALOG

    Standardize requests to develop a consistent offering and prepare for a future service catalog.

    Document service requests to identify time to fulfill and approvals.

    Identify which service requests can be auto-approved and which will require a workflow to gain approval.

    Document workflows and analyze them to identify ways to improve SLAs. If any approvals are interrupting technical processes, rearrange them so that approvals happen before the technical team is involved.

    Determine support levels for each service offering and ensure your team can sustain them.

    Where it makes sense, automate delivery of services such as software deployment.

    Distinguish between service requests and small projects to ensure agents and end users follow the right process

    The distinction between service requests and small projects has two use cases, which are two sides of the same resourcing issue.

    • Service desk managers need to understand the difference to ensure the right approval process is followed. Typically, projects have more stringent intake requirements than requests do.
    • PMOs need to understand the difference to ensure the right people are doing the work and that small, frequent changes are standardized, automated, and taken out of the project list.

    What’s the difference between a service request and a small project?

    • The key differences involve resource scope, frequency, and risk.
    • Requests are likely to require fewer resources than projects, be fulfilled more often, and involve less risk.
    • Requests are typically done by tier 1 and 2 employees throughout the IT organization.
    • A request can turn into a small project if the scope of the request grows beyond the bounds of a normal request.

    Example: A mid-sized organization goes on a hiring blitz and needs to onboard 150 new employees in one quarter. Submitting and scheduling 150 requests for onboarding new employees would require much more time and resources.

    Projects are different from service requests and have different criteria

    A project, by terminology, is a temporary endeavor planned around producing a specific organizational or business outcome.

    Common Characteristics of Projects:

    • Time sensitive, temporary, one-off.
    • Uncertainty around how to create the unique thing, product, or service that is the project’s goal.
    • Non-repetitive work and sizeable enough to introduce heightened risk and complexity.
    • Strategic focus, business case-informed capital funding, and execution activities driven by a charter.
    • Introduces change to the organization.
    • Multiple stakeholders involved and cross-functional resourcing.

    Info-Tech Insight

    Projects require greater risk, effort, and resources than a service request and should be redirected to the PMO.

    Standard service requests vs. non-standard service requests: criteria to make them distinct

    • If there is no differentiation between standard and non-standard requests, those tickets can easily move into the backlog, growing it very quickly.
    • Create a process to easily identify non-standard requests when they enter the ticket queue to ensure customers are made aware of any delay of service, especially if it is a product or service currently not offered. This will give time for any approvals or technical solutioning that may need to occur.
    • Take recurring non-standard requests and make them standard. This is a good way to determine if there are any gaps in services offered and another vehicle to understand what your customers want.

    Standard Requests

    • Very common requests, delivered on an on-going basis
    • Defined process
    • Measured in hours or days
    • Uses service catalog, if it exists
    • Formalized and should already be documented
    • The time to deal with the request is defined

    Non-Standard Requests

    • Higher level complexity than standard requests
    • Cannot be fulfilled via service catalog
    • No defined process
    • Not supplied by questions that Service Request Definition (SRD) offers
    • Product or service is not currently offered, and it may need time for technical review, additional approvals, and procurement processes

    The right questions can help you distinguish between standard requests, non-standard requests, and projects

    Where do we draw the line between a standard and non-standard request and a project?

    The service desk can’t and shouldn’t distinguish between requests and projects on its own. Instead, engage stakeholders to determine where to draw the line.

    Whatever criteria you choose, define them carefully.

    Be pragmatic: there is no single best set of criteria and no single best definition for each criterion. The best criteria and definitions will be the ones that work in your organizational context.

    Common distinguishing factors and thresholds:

    Image shows table of the common distinguishing factors and thresholds.

    Distinguish between standard and non-standard service requests and projects

    3.1.1 Distinguish between service requests and projects

    1. Divide the group into two small teams.
    2. Each team will brainstorm examples of service requests and small projects.
    3. Identify factors and thresholds that distinguish between the two groups of items.
    4. Bring the two groups together and discuss the two sets of criteria.
    5. Consolidate one set of criteria that will help make the distinction between projects and service requests.
    6. Capture the table in the Service Desk SOP.

    Image shows blank template of the common distinguishing factors and thresholds.

    Participants

    • Service Desk Manager
    • Service Desk Agents

    What You'll Need

    • Service Desk SOP
    • Flip Chart
    • Whiteboard

    Distinguishing factors and thresholds

    Don’t standardize request fulfilment processes alone

    Everyone in IT contributes to the fulfilment of requests, but do they know it?

    New service desk managers sometimes try to standardize request fulfilment processes on their own only to encounter either apathy or significant resistance to change.

    Moving to a tiered generalist service desk with a service-oriented culture, a high first-tier generalist resolution rate, and collaborative T2 and T3 specialists can be a big change. It is critical to get the request workflows right.

    Don’t go it alone. Engage a core team of process champions from all service support. With executive support, the right process building exercises can help you overcome resistance to change.

    Consider running the process building activities in this project phase in a working session or a workshop setting.

    Info-Tech Insight

    If they build it, they will come. Service desk improvement is an exercise in organizational change that crosses IT disciplines. Organizations that fail to engage IT specialists from other silos often encounter resistance to change that jeopardizes the process improvements they are trying to make. Overcome resistance by highlighting how process changes will benefit different groups in IT and solicit the feedback of specialists who can affect or be affected by the changes.

    Define standard service requests with SLAs and workflows

    WHY DO I NEED WORKFLOWS?

    Move approvals out of technical IT processes to make them more efficient. Evaluate all service requests to see where auto-approvals make sense. Where approvals are required, use tools and workflows to manage the process.

    Example:

    Image is an example of SLAs and workflows.

    Approvals can be the main roadblock to fulfilling service requests

    Image is example of workflow approvals.

    Review the general standard service request and inquiry fulfillment processes

    As standard service requests should follow standard, repeatable, and predictable steps to fulfill, they can be documented with workflows.

    Image is a flow chart of service and inquiry request processes.

    Review the general standard service request and inquiry fulfillment processes

    Ensure there is a standard and predictable methodology for assessing non-standard requests; inevitably those requests may still cause delay in fulfillment.

    Create a process to ensure reasonable expectations of delivery can be set with the end user and then identify what technology requests should become part of the existing standard offerings.

    Image is a flowchart of non-standard request processes

    Document service requests to ensure consistent delivery and communicate requirements to users

    3.1.2 Define service requests with SLAs

    1. On a flip chart, list standard service requests.
    2. Identify time required to fulfill, including time to schedule resources.
    3. Identify approvals required; determine if approvals can be automated through defining roles.
    4. Discuss opportunities to reduce SLAs or automate, but recognize that this may not happen right away.
    5. Discuss plans to communicate SLAs to the business units, recognizing that some users may take a bit of time to adapt to the new SLAs.
    6. Work toward improving SLAs as new opportunities for process change occur.
    7. Document SLAs in the Service Desk SOP and update as SLAs change.
    8. Build templates in the service desk tool that encapsulate workflows and routing, SLAs, categorization, and resolution.

    Participants

    • Service Desk Managers
    • Service Desk Agents

    What You'll Need

    • Service Desk SOP
    • Flip Chart
    • Whiteboard

    Info-Tech Insight

    These should all be scheduled services. Anything that is requested as a rush needs to be marked as a higher urgency or priority to track end users who need training on the process.

    Analyze service request workflows to improve service delivery

    3.1.3 Build and critique request workflows

    1. Divide the group into small teams.
    2. Each team will choose one service request from the list created in the previous module and then draw the workflow. Include decision points and approvals.
    3. Discuss availability and technical support:
      • Can the service be fulfilled during regular business hours or 24x7?
      • Is technical support and application access available during regular business hours or 24x7?
    4. Reconvene and present workflows to the group.
    5. Document workflows in Visio and add to the Service Desk SOP. Where appropriate, enter workflows in the service desk tool.

    Critique workflows for efficiencies and effectiveness:

    • Do the workflows support the SLAs identified in the previous exercise?
    • Are the workflows efficient?
    • Is the IT staff consistently following the same workflow?
    • Are approvals appropriate? Is there too much bureaucracy or can some approvals be removed? Can they be preapproved?
    • Are approvals interrupting technical processes? If so, can they be moved?

    Participants

    • Service Desk Managers
    • Service Desk Agents

    What You'll Need

    • Service Desk SOP
    • Project Summary
    • Flip Chart
    • Whiteboard

    Step 3.2: Build a targeted knowledgebase

    Image shows the steps in phase 3. Highlight is on step 3.2.

    This step will walk you through the following activities:

    • 3.2.1 Design knowledge management processes
    • 3.2.2 Create actionable knowledgebase articles

    This step involves the following participants:

    • IT Managers
    • Service Desk Manager(s)
    • Representation from tier 2 and tier 3 specialists

    Outcomes

    The section will introduce service catalogs and get the organization to envision what self-service tools it might include.

    DELIVERABLES

    • Knowledgebase policy and process

    A knowledgebase is an essential tool in the service management toolbox

    Knowledge Management

    Gathering, analyzing, storing & sharing knowledge to reduce the need to rediscover known solutions.

    Knowledgebase

    Organized repository of IT best practices and knowledge gained from practical experiences.

    • End-User KB
    • Give end users a chance to resolve simple issues themselves without submitting a ticket.

    • Internal KB
    • Shared resource for service desk staff and managers to share and use knowledge.

    Use the knowledgebase to document:

    • Steps for pre-escalation troubleshooting.
    • Known errors.
    • Workarounds or solutions to recurring issues.
    • Solutions that require research or complex troubleshooting.
    • Incidents that have many root causes. Start with the most frequent solution and work toward less likely issues.

    Draw on organizational goals to define the knowledge transfer target state

    Image is Info-Tech’s Knowledge Transfer Maturity Model
    *Source: McLean & Company, 2013; N=120

    It’s better to start small than to have nothing at all

    Service desk teams are often overwhelmed by the idea of building and maintaining a comprehensive integrated knowledgebase that covers an extensive amount of information.

    Don’t let this idea stop you from building a knowledgebase! It takes time to build a comprehensive knowledgebase and you must start somewhere.

    Start with existing documentation or knowledge that depends on the expertise of only a few people and is easy to document and you will already see the benefits.

    Then continue to build and improve from there. Eventually, knowledge management will be a part of the culture.

    Engage the team to build a knowledgebase targeted on your most important incidents and requests

    WHERE DO I START?

    Inventory and consolidate existing documentation, then evaluate it for audience relevancy, accuracy, and usability. Use the exercise and the next slides to develop a knowledgebase template.

    Produce a plan to improve the knowledgebase.

    • Identify the current top five or ten incidents from the service desk reports and create related knowledgebase articles.
    • Evaluate for end-user self-service or technician resolution.
    • Note any resolutions that require access rights to servers.
    • Assign documentation creation tasks for the knowledgebase to individual team members each week.
    • Apply only one incident per article.
    • Set goals for each technician to submit one or two meaningful articles per month.
    • Assign a knowledge manager to monitor creation and edit and maintain the database.
    • Set policy to drive currency of the knowledgebase. See the Service Desk SOP for an example of a workable knowledge policy.

    Use a phased approach to build a knowledgebase

    Image is an example of a phased approach to build a knowledge base

    Use a quarterly, phased approach to continue to build and maintain your knowledgebase

    Continual Knowledgebase Maintenance:

    • Once a knowledgebase is in place, future articles should be written using established templates.
    • Articles should be regularly reviewed and monitored for usage. Outdated information will be retired and archived.
    • Ticket trend analysis should be done on an ongoing basis to identify new articles.
    • A proactive approach will anticipate upcoming issues based on planned upgrades and maintenance or other changes, and document resolution steps in knowledgebase articles ahead of time.

    Every Quarter:

    1. Conduct a ticket trend analysis. Identify the most important and common tickets.
    2. Review the knowledgebase to identify relevant articles that need to be revised or written.
    3. Use data from knowledge management tool to track expiring content and lesser used articles.
    4. Assign the task of writing articles to all IT staff members.
    5. Build and revise ticket templates for incident and service requests.

    Assign a knowledge manager role to ensure accountability for knowledgebase maintenance

    Assign a knowledge manager to monitor creation and edit and maintain database.

    Knowledge Manager/Owner Role:

    • Has overall responsibility for the knowledgebase.
    • Ensures content is consistent and maintains standards.
    • Regularly monitors and updates the list of issues that should be added to the knowledgebase.
    • Regularly reviews existing knowledgebase articles to ensure KB is up to date and flags content to retire or review.
    • Assigns content creation tasks.
    • Optimizes knowledgebase structure and organization.
    • See Info-Tech’s knowledge manager role description if you need a hand defining this position.

    The knowledge manager role will likely be a role assigned to an existing resource rather than a dedicated position.

    Develop a template to ensure knowledgebase articles are easy to read and write

    A screenshot of the Knowledgebase Article Template

    QUICK TIPS

    • Use non-technical language whenever possible to help less-technical readers.
    • Identify error messages and use screenshots where it makes sense.
    • Take advantage of social features like voting buttons to increase use.
    • Use Info-Tech’s Knowledge Base Article Template to get you started.

    Analyze the necessary features for your knowledgebase and compare them against existing tools

    Service desk knowledgebases range in complexity from simple FAQs to fully integrated software suites.

    Options include:

    • Article search with negative and positive filters.
    • Tagging, with the option to have keywords generate top matches.
    • Role-based permissions (to prevent unauthorized deletions).
    • Ability to turn a ticket resolution into a knowledgebase article (typically only available if knowledgebase tool is part of the service desk tool).
    • Natural language search.
    • Partitioning so relevant articles only appear for specific audiences.
    • Editorial workflow management.
    • Ability to set alerts for scheduled article review.
    • Article reporting (most viewed, was it useful?).
    • Rich text fields for attaching screenshots.

    Determine which features your organization needs and check to see if your tools have them.

    For more information on knowledgebase improvement, refer to Info-Tech’s Optimize the Service Desk With a Shift-Left Strategy.

    Document your knowledge management maintenance workflow to identify opportunities for improvement

    Workflow should include:

    • How you will identify top articles that need to be written
    • How you will ensure articles remain relevant
    • How you will assign new articles to be written, inclusive of peer review
    Image of flowchart of knowledgebase maintenance process.

    Design knowledgebase management processes

    3.2.1 Design knowledgebase management processes

    1. Assign a knowledge manager to monitor creation and edit and maintain the database. See Info-Tech’s knowledge manager role description if you need a hand defining this position.
    2. Discuss how you can use the service desk tool to integrate the knowledgebase with incident management, request fulfilment, and self-service processes.
    3. Discuss the suitability of a quarterly process to build and edit articles for a target knowledgebase that covers your most important incidents and requests.
    4. Set knowledgebase creation targets for tier 1, 2, and 3 analysts.
    5. Identify relevant performance metrics.
    6. Brainstorm elements that might be used as an incentive program to encourage the creation of knowledgebase articles and knowledge sharing more generally.
    7. Set policy to drive currency of knowledgebase. See the Service Desk SOP for an example of a workable knowledge policy.

    Participants

    • Service Desk Manager
    • Service Desk Agents

    What You’ll Need

    • Service Desk SOP
    • Flip Chart
    • Whiteboard

    Create actionable knowledgebase articles

    3.2.2 Run a knowledgebase working group

    Write and critique knowledgebase articles.

    1. On a whiteboard, build a list of potential knowledgebase articles divided by audience: Technician or End User.
    2. Each team member chooses one topic and spends 20 minutes writing.
    3. Each team member either reads the article and has the team critique or passes to the technician to the right for peer review. If there are many participants, break into smaller groups.
    4. Set a goal with the team for how, when, and how often knowledgebase articles will be created.
    5. Capture knowledgebase processes in the Service Desk SOP.

    Audience: Technician

    • Password update
    • VPN printing
    • Active directory – policy, procedures, naming conventions
    • Cell phones
    • VPN client and creation set-up

    Audience: End users

    • Set up email account
    • Password creation policy
    • Voicemail – access, change greeting, activities
    • Best practices for virus, malware, phishing attempts
    • Windows 10 tips and tricks

    Participants

    • Service Desk Manager
    • Service Desk Agents

    What You’ll Need

    • Service Desk SOP
    • Flip Chart
    • Whiteboard

    Step 3.3: Prepare for a self-service portal project

    Image shows the steps in phase 3. Highlight is on step 3.3.

    This step will walk you through the following activities:

    • 3.3.1 Develop self-service tools for the end user
    • 3.3.2 Make a plan for creating or improving the self-service portal

    This step involves the following participants:

    • IT Managers
    • Service Desk Manager(s)
    • Representation from tier 2 and tier 3 specialists

    Outcomes

    The section prepares you to tackle a self-service portal project once the service desk standardization is complete.

    DELIVERABLES

    • High-level activities to create a self-service portal

    Design the self-service portal with the users’ computer skills in mind

    A study by the OECD offers a useful reminder of one of usability’s most hard-earned lessons: you are not the user.

    • There is an important difference between IT professionals and the average user that’s even more damaging to your ability to predict what will be a good self-service tool: skills in using computers, the internet, and technology in general.
    • An international research study explored the computer skills of 215,942 people aged 16-65 in 33 countries.
    • The results show that across 33 rich countries, only 5% of the population has strong computer-related abilities and only 33% of people can complete medium-complexity computer tasks.
    • End users are skilled, they just don’t have the same level of comfort with computers as the average IT professional. Design your self-service tools with that fact in mind.
    Image is of a graph showing the ability of computer skills from age 16-65 among various countries.

    Take an incremental and iterative approach to developing your self-service portal

    Use a web portal to offer self-serve functionality or provide FAQ information to your customers to start.

    • Don’t build from scratch. Ideally, use the functionality included with your ITSM tool.
    • If your ITSM tool doesn’t have an adequate self-service portal functionality, then harness other tools that IT already uses. Common examples include Microsoft SharePoint and Google Forms.
    • Make it as easy as possible to access the portal:
      • Deploy an app to managed devices or put the app in your app store.
      • Create a shortcut on people’s start menus or home screens.
      • Print the URL on swag such as mousepads.
    • Follow Info-Tech’s approach to developing your user facing service catalog.

    Some companies use vending machines as a form of self serve. Users can enter their purchase code and “buy” a thin client, mouse, keyboard, software, USB keys, tablet, headphones, or loaners.

    Info-Tech Insight

    Building the basics first will provide your users with immediate value. Incrementally add new features to your portal.

    Optimize the portal: self-service should be faster and more convenient than the alternative

    Design the portal by demand, not supply

    Don’t build a portal framed around current offerings and capabilities just for the sake of it. Build the portal based on what your users want and need if you want them to use it.

    Make user experience a top priority

    The portal should be designed for users to self-serve, and thus self-service must be seamless, clear, and attractive to users.

    Speak your users’ language

    Keep in mind that users may not have high technical literacy or be familiar with terminology that you find commonplace. Use terms that are easy to understand.

    Appeal to both clickers and searchers

    Ensure that users can find what they’re looking for both by browsing the site and by using search functionality.

    Use one central portal for all departments

    If multiple departments (i.e. HR, Finance) use or will use a portal, set up a shared portal so that users won’t have to guess where to go to ask for help.

    You won’t know unless you test

    You will know how to navigate the portal better than anyone, but that doesn’t mean it’s intuitive for a new user. Test the portal with users to collect and incorporate feedback.

    Self-service portal examples (1/2)

    Image is of an example of the self-service portal

    Image source: Cherwell Service Management

    Self-service examples (2/2)

    Image is of an example of the self-service portal

    Image source: Team Dynamix

    Keep the end-user facing knowledgebase relevant with workflows, multi-device access, and social features

    Workflows:

    • Easily manage peer reviews and editorial and relevance review.
    • Enable links and importing between tickets and knowledgebase articles.
    • Enable articles to appear based on ticket content.

    Multi-device access:

    • Encourage users to access self-service.
    • Enable technicians to solve problems from anywhere.

    Social features:

    • Display most popular articles first to solve trending issues.
    • Enable voting to improve usability of articles.
    • Allow collaboration on self-service.

    For more information on building self-service portal, refer to Info-Tech’s Optimize the Service Desk with a Shift-Left Strategy

    Draft a high-level project plan for a self-service portal project

    3.3.1 Draft a high-level project plan for a self-service portal project

    1. Identify stakeholders who can contribute to the project.
      • Who will help with FAQ creation?
      • Who can design the self-service portal?
      • Who needs to sign off on the project?
    2. Identify the high-level tasks that need to be done.
      • How many FAQs need to be created?
      • How will we design the service catalog’s web portal?
      • What might a phased approach look like?
      • How can we break down the project into design, build, and implementation tasks?
      • What is the rough timeline for these tasks?
    3. Capture the high-level activities in the Service Desk Roadmap.

    Participants

    • Service Desk Manager
    • Service Desk Agents

    What You’ll Need

    • Flip Chart
    • Whiteboard
    • Implementation Roadmap

    Once you have a service portal, you can review the business requirements for a service catalog

    A service catalog is a communications device that lists the IT services offered by an organization. The service catalog is designed to enable the creation of a self-service portal for the end user. The portal augments the service desk so analysts can spend time managing incidents and providing technical support.

    The big value comes from workflows:

    • Improved economics and a means to measure the costs to serve over time.
    • Incentive for adoption because things work better.
    • Abstracts delivery from offer to serve so you can outsource, insource, crowdsource, slow, speed, reassign, and cover absences without involving the end user.

    There are three types of catalogs:

    • Static:Informational only, so can be a basic website.
    • Routing and workflow: Attached to service desk tool.
    • Workflow and e-commerce: Integrated with service desk tool and ERP system.
    Image is an example of service catalog

    Image courtesy of University of Victoria

    Understand the time and effort involved in building a service catalog

    A service catalog will streamline IT service delivery, but putting one together requires a significant investment. Service desk standardization comes first.

    • Workflows and back-end services must be in place before setting up a service catalog.
    • Think of the catalog as just the delivery mechanism for service you currently provide. If they aren’t running well and delivery is not consistent, you don’t want to advertise SLAs and options.
    • Service catalogs require maintenance.
    • It’s not a one-time investment – service catalogs must be kept up to date to be useful.
    • Service catalog building requires input from VIPs.
    • Architects and wordsmiths are not the only ones that spend effort on the service catalog. Leadership from IT and the business also provide input on policy and content.

    Sample Service Catalog Efforts

    • A college with 17 IT staff spent one week on a simple service catalog.
    • A law firm with 110 IT staff spent two months on a service catalog project.
    • A municipal government with 300 IT people spent over seven months and has yet to complete the project.
    • A financial organization with 2,000 IT people has spent seven months on service catalog automation alone! The whole project has taken multiple years.

    “I would say a client with 2,000 users and an IT department with a couple of hundred, then you're looking at six months before you have the catalog there.”

    – Service Catalog Implementation Specialist,

    Health Services

    Draft a high-level project plan for a self-service portal project

    3.2.2 Make a plan for creating or improving the self-service portal

    Identify stakeholders who can contribute to the project.

    • Who will help with FAQs creation?
    • Who can design the self-service portal?
    • Who needs to sign off on the project?

    Evaluate tool options.

    • Will you stick with your existing tool or invest in a new tool?

    Identify the high-level tasks that need to be done.

    • How will we design the web portal?
    • What might a phased approach look like?
    • What is the rough timeline for these tasks?
    • How many FAQs need to be created?
    • Will we have a service catalog, and what type?

    Document the plan and tasks in the Service Desk Roadmap.

    Examples of publicly posted service catalogs:

    University of Victoria is an example of a catalog that started simple and now includes multiple divisions, notifications, systems status, communications, e-commerce, incident registration, and more.

    Indiana University is a student, faculty, and staff service catalog and self-service portal that goes beyond IT services.

    If you are ready to start building a service catalog, use Info-Tech’s Design and Build a User-Facing Service Catalog blueprint to get started.

    Phase 4

    Plan the Implementation of the Service Desk

    Step 4.1: Build communication plan

    Image shows the steps in phase 4. Highlight is on step 4.1.

    This step will walk you through the following activities:

    • 4.1.1 Create the communication plan

    This step involves the following participants:

    • CIO
    • IT Director
    • IT Managers
    • Service Desk Manager(s)
    • Representation from tier 2 and tier 3 specialists

    Outcomes

    The communication plan and project summary will help project managers outline recommendations and communicate their benefits.

    DELIVERABLES

    • Communication plan
    • Project summary

    Effectively communicate the game plan to IT to ensure the success of service desk improvements

    Communication is crucial to the integration and overall implementation of your service desk improvement.

    An effective communication plan will:

    • Gain support from management at the project proposal phase.
    • Create end-user buy-in once the program is set to launch.
    • Maintainthe presence of the program throughout the business.
    • Instill ownership throughout the business, from top-level management to new hires.

    Build a communication plan to:

    1. Communicate benefits to IT:
      • Share the standard operating procedures for training and feedback.
      • Train staff on policies as they relate to end users and ensure awareness of all policy changes.
      • As changes are implemented, continue to solicit feedback on what is and is not working and communicate adjustments as appropriate.
    2. Train technicians:
      • Make sure everyone is comfortable communicating changes to customers.
    3. Measure success:
      • Review SLAs and reports. Are you consistently meeting SLAs?
      • Is it safe to communicate with end users?

    Create your communication plan to anticipate challenges, remove obstacles, and secure buy-in

    Why:

    • What problems are you trying to solve?

    What:

    • What processes will it affect (that will affect me)?

    Who:

    • Who will be affected?
    • Who do I go to if I have issues with the new process?
    3 gears are depicted. The top gear is labelled managers with an arrow going clockwise. The middle gear is labelled technical staff with an arrow going counterclockwise. The bottom gear is labelled end users with an arrow going clockwise

    When:

    • When will this be happening?
    • When will it affect me?

    How:

    • How will these changes manifest themselves?

    Goal:

    • What is the final goal?
    • How will it benefit me?

    Create a communication plan to outline the project benefits

    Improved business satisfaction:

    • Improve confidence that the service desk can solve issues within the service-level agreement.
    • Channel incidents and requests through the service desk.
    • Escalate incidents quickly and accurately.

    Fewer recurring issues:

    • Tickets are created for every incident and categorized correctly.
    • Reports can be used for root-cause analysis.

    Increased efficiency or lower cost to serve:

    • Use FAQs to enable end users to self-solve.
    • Use knowledgebase to troubleshoot once, solve many times.
    • Cross-train to improve service consistency.

    Enhanced demand planning:

    • Trend analysis and reporting improve IT’s ability to forecast and address the demands of the business.

    Organize the information to manage the deployment of key messages

    Example of how to organize and manage key messages

    Create the communication plan

    4.1.1 Create the communication plan

    Estimated Time: 45 minutes

    Develop a stakeholder analysis.

    1. Identify everyone affected by the project.
    2. Assess their level of interest, value, and influence.
    3. Develop a communication strategy tailored to their level of engagement.

    Craft key messages tailored to each stakeholder group.

    Finalize the communication plan.

    1. Examine your roadmap and determine the most appropriate timing for communications.
    2. Assess when communications must happen with executives, business unit leaders, end users, and technicians.
    3. Identify any additional communication challenges that have come up.
    4. Identify who will send out the communications.
    5. Identify multiple methods for getting the messages out (newsletters, emails, posters, company meetings).
    6. For inspiration, you can refer to the Sample Communication Plan for the project.

    Participants

    • CIO
    • IT Managers
    • Service Desk Manager
    • Service Desk Agents

    Step 4.2: Build implementation roadmap

    Image shows the steps in phase 4. Highlight is on step 4.2.

    This step will walk you through the following activities:

    • 4.2.1 Build implementation roadmap

    This step involves the following participants:

    • CIO
    • IT Director
    • IT Managers
    • Service Desk Manager
    • Representation from tier 2 and tier 3 specialists

    Outcomes

    The implementation plan will help track and categorize the next steps and finalize the project.

    DELIVERABLES

    • Implementation roadmap

    Collaborate to create an implementation plan

    4.2.1 Create the implementation plan

    Estimated Time: 45 minutes

    Determine the sequence of improvement initiatives that have been identified throughout the project.

    The purpose of this exercise is to define a timeline and commit to initiatives to reach your goals.

    Instructions:

    1. Review the initiatives that will be taken to improve the service desk and revise tasks, as necessary.
    2. Input each of the tasks in the data entry tab and provide a description and rationale behind the task.
    3. Assign an effort, priority, and cost level to each task (high, medium, low).
    4. Assign ownership to each task.
    5. Identify the timeline for each task based on the priority, effort, and cost (short, medium, and long term).
    6. Highlight risk for each task if it will be deferred.
    7. Track the progress of each task with the status column.

    Participants

    • CIO
    • IT Managers
    • Service Desk Manager
    • Service Desk Agents

    A screenshot of the Roadmap tool.

    Document using the Roadmap tool.

    Related Info-Tech Research

    Standardize the Service Desk

    ImplementHardware and Software Asset Management

    Optimize Change Management Incident and Problem Management Build a Continual Improvement Plan for the Service Desk

    The Standardize blueprint reviews service desk structures and metrics and builds essential processes and workflows for incident management, service request fulfillment, and knowledge management practices.

    Once the service desk is operational, there are three paths to basic ITSM maturity:

    • Having the incident management processes and workflows built allows you to:
      • Introduce Change Management to reduce change-related incidents.
      • Introduce Problem Management to reduce incident recurrence.
      • Introduce Asset Management to augment service management processes with reliable data.

    Solicit targeted department feedback on core IT service capabilities, IT communications, and business enablement. Use the results to assess the satisfaction of end users, with each service broken down by department and seniority level.

    Works cited

    “Help Desk Staffing Models: Simple Analysis Can Save You Money.” Giva, Inc., 2 Sept. 2009. Web.

    Marrone et al. “IT Service Management: A Cross-national Study of ITIL Adoption.” Communications of the Association for Information Systems: Vol. 34, Article 49. 2014. PDF.

    Rumburg, Jeff. “Metric of the Month: First Level Resolution Rate.” MetricNet, 2011. Web.

    “Service Recovery Paradox.” Wikipedia, n.d. Web.

    Tang, Xiaojun, and Yuki Todo. “A Study of Service Desk Setup in Implementing IT Service Management in Enterprises.” Technology and Investment: Vol. 4, pp. 190-196. 2013. PDF.

    “The Survey of Adult Skills (PIAAC).” Organisation for Economic Co-operation and Development (OECD), 2016. Web.

    Contributors

    • Jason Aqui, IT Director, Bellevue College
    • Kevin Sigil, IT Director, Southwest Care Centre
    • Lucas Gutierrez, Service Desk Manager, City of Santa Fe
    • Rama Dhuwaraha, CIO, University of North Texas System
    • Annelie Rugg, CIO, UCLA Humanities
    • Owen McKeith, Manager IT Infrastructure, Canpotex
    • Rod Gula, IT Director, American Realty Association
    • Rosalba Trujillo, Service Desk Manager, Northgate Markets
    • Jason Metcalfe, IT Manager, Mesalabs
    • Bradley Rodgers, IT Manager, SecureTek
    • Daun Costa, IT Manager, Pita Pit
    • Kari Petty, Service Desk Manager, Mansfield Oil
    • Denis Borka, Service Desk Manager, PennTex Midstream
    • Lateef Ashekun, IT Manager, City of Atlanta
    • Ted Zeisner, IT Manager, University of Ottawa Institut de Cardiologie

    Tactics to Retain IT Talent

    • Buy Link or Shortcode: {j2store}549|cart{/j2store}
    • member rating overall impact (scale of 10): N/A
    • member rating average dollars saved: N/A
    • member rating average days saved: N/A
    • Parent Category Name: Engage
    • Parent Category Link: /engage
    • Regrettable turnover is impacting organizational productivity and leading to significant costs associated with employee departures and the recruitment required to replace them.
    • Many organizations focus on increasing engagement to improve retention, but this approach doesn’t address the entire problem.

    Our Advice

    Critical Insight

    • Engagement surveys mask the volatility of the employee experience and hide the reason why individual employees leave. You must also talk to employees to understand the moments that matter and engage managers to understand turnover triggers.

    Impact and Result

    • Build the case for creating retention plans by leveraging employee data and feedback to identify the key reasons for turnover that need to be addressed.
    • Target employee segments and work with management to develop solutions to retain top talent.

    Tactics to Retain IT Talent Research & Tools

    Besides the small introduction, subscribers and consulting clients within this management domain have access to:

    1. Tactics to Retain IT Talent Storyboard – Use this storyboard to develop a targeted talent retention plan to retain top and core talent in the organization.

    Integrate data from exit surveys and interviews, engagement surveys, and stay interviews to understand the most commonly cited reasons for employee departure in order to select and prioritize tactics that improve retention. This blueprint will help you identify reasons for regrettable turnover, select solutions, and create an action plan.

    • Tactics to Retain IT Talent Storyboard

    2. Retention Plan Workbook – Capture key information in one place as you work through the process to assess and prioritize solutions.

    Use this tool to document and analyze turnover data to find suitable retention solutions.

    • Retention Plan Workbook

    3. Stay Interview Guide – Managers will use this guide to conduct regular stay interviews with employees to anticipate and address turnover triggers.

    The Stay Interview Guide helps managers conduct interviews with current employees, enabling the manager to understand the employee's current engagement level, satisfaction with current role and responsibilities, suggestions for potential improvements, and intent to stay with the organization.

    • Stay Interview Guide

    4. IT Retention Solutions Catalog – Use this catalog to select and prioritize retention solutions across the employee lifecycle.

    Review best-practice solutions to identify those that are most suitable to your organizational culture and employee needs. Use the IT Retention Solutions Catalog to explore a variety of methods to improve retention, understand their use cases, and determine stakeholder responsibilities.

    • IT Retention Solutions Catalog
    [infographic]

    Workshop: Tactics to Retain IT Talent

    Workshops offer an easy way to accelerate your project. If you are unable to do the project yourself, and a Guided Implementation isn't enough, we offer low-cost delivery of our project workshops. We take you through every phase of your project and ensure that you have a roadmap in place to complete your project successfully.

    1 Identify Reasons for Regrettable Turnover

    The Purpose

    Identify the main drivers of turnover at the organization.

    Key Benefits Achieved

    Find out what to explore during focus groups.

    Activities

    1.1 Review data to determine why employees join, stay, and leave.

    1.2 Identify common themes.

    1.3 Prepare for focus groups.

    Outputs

    List of common themes/pain points recorded in the Retention Plan Workbook.

    2 Conduct Focus Groups

    The Purpose

    Conduct focus groups to explore retention drivers.

    Key Benefits Achieved

    Explore identified themes.

    Activities

    2.1 Conduct four 1-hour focus groups with the employee segment(s) identified in the pre-workshop activities.

    2.2 Info-Tech facilitators independently analyze results of focus groups and group results by theme.

    Outputs

    Focus group feedback.

    Focus group feedback analyzed and organized by themes.

    3 Identify Needs and Retention Initiatives

    The Purpose

    Home in on employee needs that are a priority.

    Key Benefits Achieved

    A list of initiatives to address the identified needs

    Activities

    3.1 Create an empathy map to identify needs.

    3.2 Shortlist retention initiatives.

    Outputs

    Employee needs and shortlist of initiatives to address them.

    4 Prepare to Communicate and Launch

    The Purpose

    Prepare to launch your retention initiatives.

    Key Benefits Achieved

    A clear action plan for implementing your retention initiatives.

    Activities

    4.1 Select retention initiatives.

    4.2 Determine goals and metrics.

    4.3 Plan stakeholder communication.

    4.4 Build a high-level action plan.

    Outputs

    Finalized list of retention initiatives.

    Goals and associated metrics recorded in the Retention Plan Workbook.

    Further reading

    Tactics to Retain IT Talent

    Keep talent from walking out the door by discovering and addressing moments that matter and turnover triggers.

    Executive Summary

    Your Challenge

    Many organizations are facing an increase in voluntary turnover as low unemployment, a lack of skilled labor, and a rise in the number of vacant roles have given employees more employment choices.

    Common Obstacles

    Regrettable turnover is impacting organizational productivity and leading to significant costs associated with employee departures and the recruitment required to replace them.

    Many organizations tackle retention from an engagement perspective: Increase engagement to improve retention. This approach doesn't consider the whole problem.

    Info-Tech's Approach

    Build the case for creating retention plans by leveraging employee data and feedback to identify the key reasons for turnover that need to be addressed.

    Target employee segments and work with management to develop solutions to retain top talent.

    Info-Tech Insight

    Engagement surveys mask the volatility of the employee experience and hide the reason why individual employees leave. You must also talk to employees to understand the moments that matter and engage managers to understand turnover triggers.

    This research addresses regrettable turnover

    This is an image of a flow chart with three levels. The top level has only one box, labeled Turnover.  the Second level has 2 boxes, labeled Voluntary, and Involuntary.  The third level has two boxes under Voluntary, labeled Non-regrettable: The loss of employees that the organization did not wish to keep, e.g. low performers, and Regrettable:  The loss of employees that the organization wishes it could have kept.

    Low unemployment and rising voluntary turnover makes it critical to focus on retention

    As the economy continues to recover from the pandemic, unemployment continues to trend downward even with a looming recession. This leaves more job openings vacant, making it easier for employees to job hop.

    This image contains a graph of the US Employment rate between 2020 - 2022 from the US Bureau of Economic Analysis and Bureau of Labor Statistics (BLS), 2022, the percentage of individuals who change jobs every one to five years from 2022 Job Seeker Nation Study, Jobvite, 2022, and voluntary turnover rates from BLS, 2022

    With more employees voluntarily choosing to leave jobs, it is more important than ever for organizations to identify key employees they want to retain and put plans in place to keep them.

    Retention is a challenge for many organizations

    The number of HR professionals citing retention/turnover as a top workforce management challenge is increasing, and it is now the second highest recruiting priority ("2020 Recruiter Nation Survey," Jobvite, 2020).

    65% of employees believe they can find a better position elsewhere (Legaljobs, 2021). This is a challenge for organizations in that they need to find ways to ensure employees want to stay at the organization or they will lose them, which results in high turnover costs.

    Executives and IT are making retention and turnover – two sides of the same coin – a priority because they cost organizations money.

    • 87% of HR professionals cited retention/turnover as a critical and high priority for the next few years (TINYpulse, 2020).
    • $630B The cost of voluntary turnover in the US (Work Institute, 2020).
    • 66% of organizations consider employee retention to be important or very important to an organization (PayScale, 2019).

    Improving retention leads to broad-reaching organizational benefits

    Cost savings: the price of turnover as a percentage of salary

    • 33% Improving retention can result in significant cost savings. A recent study found turnover costs, on average, to be around a third of an employee's annual salary (SHRM, 2019).
    • 37.9% of employees leave their organization within the first year. Employees who leave within the first 90 days of being hired offer very little or no return on the investment made to hire them (Work Institute, 2020).

    Improved performance

    Employees with longer tenure have an increased understanding of an organization's policies and processes, which leads to increased productivity (Indeed, 2021).

    Prevents a ripple effect

    Turnover often ripples across a team or department, with employees following each other out of the organization (Mereo). Retaining even one individual can often have an impact across the organization.

    Transfer of knowledge

    Retaining key individuals allows them to pass it on to other employees through communities of practice, mentoring, or other knowledge-sharing activities.

    Info-Tech Insight

    Improving retention goes beyond cost savings: Employees who agree with the statement "I expect to be at this organization a year from now" are 71% more likely to put in extra hours and 32% more likely to accomplish more than what is expected of their role (McLean & Company Engagement Survey, 2021; N=77,170 and 97,326 respectively).

    However, the traditional engagement-focused approach to retention is not enough

    Employee engagement is a strong driver of retention, with only 25% of disengaged employees expecting to be at their organization a year from now compared to 92% of engaged employees (McLean & Company Engagement Survey, 2018-2021; N=117,307).

    Average employee Net Promoter Score (eNPS)

    This image contains a graph of the Average employee Net Promoter Score (eNPS)

    Individual employee Net Promoter Scores (eNPS)

    This image contains a graph of the Individual employee Net Promoter Scores (eNPS)

    However, engagement surveys mask the volatility of the employee experience and hide the reason why individual employees leave.

    This analysis of McLean & Company's engagement survey results shows that while an organization's average employee net promoter score (eNPS) stays relatively static, at an individual level there is a huge amount of volatility.

    This demonstrates the need for an approach that is more capable of responding to or identifying employees' in-the-moment needs, which an annual engagement survey doesn't support.

    Turnover triggers and moments that matter also have an impact on retention

    Retention needs to be monitored throughout the employee lifecycle. To address the variety of issues that can appear, consider three main paths to turnover:

    1. Employee engagement – areas of low engagement.
    2. Turnover triggers that can quickly lead to departures.
    3. Moments that matter in the employee experience (EX).

    Employee engagement

    Engagement drivers are strong predictors of turnover.

    Employees who are highly engaged are 3.6x more likely to believe they will be with the organization 12 months from now than disengaged employees (McLean & Company Engagement Survey, 2018-2021; N=117,307).

    Turnover triggers

    Turnover triggers are events that act as shocks or catalysts that quickly lead to an employee's departure.

    Turnover triggers are a cause for voluntary turnover more often than accumulated issues (Lee et al.).

    Moments that matter

    Employee experience is the employee's perception of the accumulation of moments that matter within their employee lifecycle.

    Retention rates increase from 21% to 44% when employees have positive experiences in the following categories: belonging, purpose, achievement, happiness, and vigor at work. (Workhuman, 2020).

    While managers do not directly impact turnover, they do influence the three main paths to turnover

    Research shows managers do not appear as one of the common reasons for employee turnover.

    Top five most common reasons employees leave an organization (McLean & Company, Exit Survey, 2018-2021; N=107 to 141 companies,14,870 to 19,431 responses).

    Turnover factorsRank
    Opportunities for career advancement1
    Satisfaction with my role and responsibilities2
    Base pay3
    Opportunities for career-related skill development4
    The degree to which my skills were used in my job5

    However, managers can still have a huge impact on the turnover of their team through each of the three main paths to turnover:

    Employee engagement

    Employees who believe their managers care about them as a person are 3.3x more likely to be engaged than those who do not (McLean & Company, 2021; N=105,186).

    Turnover triggers

    Managers who are involved with and aware of their staff can serve as an early warning system for triggers that lead to turnover too quickly to detect with data.

    Moments that matter

    Managers have a direct connection with each individual and can tailor the employee experience to meet the needs of the individuals who report to them.

    Gallup has found that 52% of exiting employees say their manager could have done something to prevent them from leaving (Gallup, 2019). Do not discount the power of managers in anticipating and preventing regrettable turnover.

    Addressing engagement, turnover triggers, and moments that matter is the key to retention

    This is an image of a flow chart with four levels. The top level has only one box, labeled Turnover.  the Second level has 2 boxes, labeled Voluntary, and Involuntary.  The third level has two boxes under Voluntary, labeled Non-regrettable, and Regrettable.  The fourth level has three boxes under Regrettable, labeled Employee Engagement, Turnover triggers, and Moments that matter

    Info-Tech Insight

    HR traditionally seeks to examine engagement levels when faced with retention challenges, but engagement is only a part of the full picture. You must also talk to employees to understand the moments that matter and engage managers to understand turnover triggers.

    Follow Info-Tech's two-step process to create a retention plan

    1. Identify Reasons for Regrettable Turnover

    2. Select Solutions and Create an Action Plan

    Step 1

    Identify Reasons for Regrettable Turnover

    After completing this step you will have:

    • Analyzed and documented why employees join, stay, and leave your organization.
    • Identified common themes and employee needs.
    • Conducted employee focus groups and prioritized employee needs.

    Step 1 focuses on analyzing existing data and validating it through focus groups

    Employee engagement

    Employee engagement and moments that matter are easily tracked by data. Validating employee feedback data by speaking and empathizing with employees helps to uncover moments that matter. This step focuses on analyzing existing data and validating it through focus groups.

    Engagement drivers such as compensation or working environment are strong predictors of turnover.
    Moments that matter
    Employee experience (EX) is the employee's perception of the accumulation of moments that matter with the organization.
    Turnover triggers
    Turnover triggers are events that act as shocks or catalysts that quickly lead to an employee's departure.

    Turnover triggers

    This step will not touch on turnover triggers. Instead, they will be discussed in step 2 in the context of the role of the manager in improving retention.

    Turnover triggers are events that act as shocks or catalysts that quickly lead to an employee's departure.

    Info-Tech Insight

    IT managers often have insights into where and why retention is an issue through their day-to-day work. Gathering detailed quantitative and qualitative data provides credibility to these insights and is key to building a business case for action. Keep an open mind and allow the data to inform your gut feeling, not the other way around.

    Gather data to better understand why employees join, stay, and leave

    Start to gather and examine additional data to accurately identify the reason(s) for high turnover. Begin to uncover the story behind why these employees join, stay, and leave your organization through themes and trends that emerge.

    Look for these icons throughout step 2.

    Join

    Why do candidates join your organization?

    Stay

    Why do employees stay with your organization?

    Leave

    Why do employees leave your organization?

    For more information on analysis, visualization, and storytelling with data, see Info-Tech's Start Making Data-Driven People Decisions blueprint.

    Employee feedback data to look at includes:

    Gather insights through:

    • Focus groups
    • Verbatim comments
    • Exit interviews
    • Using the employee value proposition (EVP) as a filter (does it resonate with the lived experience of employees?)

    Prepare to draw themes and trends from employee data throughout step 1.

    Uncover employee needs and reasons for turnover by analyzing employee feedback data.

    • Look for trends (e.g. new hires join for career opportunities and leave for the same reason, or most departments have strong work-life balance scores in engagement data).
    • Review if there are recurring issues being raised that may impact turnover.
    • Group feedback to highlight themes (e.g. lack of understanding of EVP).
    • Identify which key employee needs merit further investigation or information.

    This is an image showing how you can draw out themes and trends using employee data throughout step 1.

    Classify where key employee needs fall within the employee lifecycle diagram in tab 2 of the Retention Plan Workbook. This will be used in step 2 to pinpoint and prioritize solutions.

    Info-Tech Insight

    The employee lifecycle is a valuable way to analyze and organize engagement pain points, moments that matter, and turnover triggers. It ensures that you consider the entirety of an employee's tenure and the different factors that lead to turnover.

    Examine new hire data and begin to document emerging themes

    Join

    While conducting a high-level analysis of new hire data, look for these three key themes impacting retention:

    Issues or pain points that occurred during the hiring process.

    Reasons why employees joined your organization.

    The experience of their first 90 days. This can include their satisfaction with the onboarding process and their overall experience with the organization.

    Themes will help to identify areas of strength and weakness organization-wide and within key segments. Document in tab 3 of the Retention Plan Workbook.

    1. Start by isolating the top reasons employees joined your organization. Ask:
      • Do the reasons align with the benefits you associate with working at your organization?
      • How might this impact your EVP?
      • If you use a new hire survey, look at the results for the following questions:
      • For which of the following reasons did you apply to this organization?
      • For what reasons did you accept the job offer with this organization?
    2. then, examine other potential problem areas that may not be covered by your new hire survey, such as onboarding or the candidate experience during the hiring process.
      • If you conduct a new hire survey, look at the results in the following sections:
        • Candidate Experience
        • Acclimatization
        • Training and Development
        • Defining Performance Expectations

      Analyze engagement data to identify areas of strength that drive retention

      Employees who are engaged are 3.6x more likely to believe they will be with the organization 12 months from now (McLean & Company Engagement Survey, 2018-2021; N=117,307). Given the strength of this relationship, it is essential to identify areas of strength to maintain and leverage.

      1. Look at the highest-performing drivers in your organization's employee engagement survey and drivers that fall into the "leverage" and "maintain" quadrants of the priority matrix.
        • These drivers provide insight into what prompts broader groups of employees to stay.

      This is an image of a quadrant analysis, with the following quadrants in order from left to right, top to bottom.  Improve; Leverage; Evaluate; Maintain.

      1. Look into what efforts have been made to maintain programs, policies, and practices related to these drivers and ensure they are consistent across the entire organization.
      2. Document trends and themes related to engagement strengths in tab 2 of the Retention Plan Workbook.

      If you use Info-Tech's Engagement Survey, look in detail at what are classified as "Retention Drivers": total compensation, working environment, and work-life balance.

      Identify areas of weakness that drive turnover in your engagement data

      1. Look at the lowest-performing drivers in your organization's employee engagement survey and drivers that fall into the "improve" and "evaluate" quadrants of the priority matrix.
        • These drivers provide insight into what pushes employees to leave the organization.
      2. Delve into organizational efforts that have been made to address issues with the programs, policies, and practices related to these drivers. Are there any projects underway to improve them? What are the barriers preventing improvements?
      3. Document trends and themes related to engagement weaknesses in tab 2 of the Retention Plan Workbook.

      If you use a product other than Info-Tech's Engagement Survey, your results will look different. The key is to look at areas of weakness that emerge from the data.

      This is an image of a quadrant analysis, with the following quadrants in order from left to right, top to bottom.  Improve; Leverage; Evaluate; Maintain.

      If you use Info-Tech's Engagement Survey, look in detail at what are classified as "Retention Drivers": total compensation, working environment, and work-life balance.

      Mine exit surveys to develop an integrated, holistic understanding of why employees leave

      Conduct a high-level analysis of the data from your employee exit diagnostic. While analyzing this data, consider the following:

      • What are the trends and quantitative data about why employees leave your organization that may illuminate employee needs or issues at specific points throughout the employee lifecycle?
      • What are insights around your key segments? Data on key segments is easily sliced from exit survey results and can be used as a starting point for digging deeper into retention issues for specific groups.
      • Exit surveys are an excellent starting point. However, it is valuable to validate the data gathered from an exit survey using exit interviews.
      1. Isolate results for key segments of employees to target with retention initiatives (e.g. by age group or by department).
      2. Identify data trends or patterns over time; for example, that compensation factors have been increasing in importance.
      3. Document trends and themes taken from the exit survey results in tab 2 of the Retention Plan Workbook.

      If your organization conducts exit interviews, analyze the results alongside or in lieu of exit survey data.

      Compare new hire data with exit data to identify patterns and insights

      Determine if new hire expectations weren't met, prompting employees to leave your organization, to help identify where in the employee lifecycle issues driving turnover may be occurring.

      1. Look at your new hire data for the top reasons employees joined your organization.
        • McLean & Company's New Hire Survey database shows that the top three reasons candidates accept job offers on average are:
          1. Career opportunities
          2. Nature of the job
          3. Development opportunities
      2. Next, look at your exit data and the top reasons employees left your organization.
        1. McLean & Company's Exit Survey database shows that the top three reasons employees leave on average are:
          1. Opportunities for career advancement
          2. Base pay
          3. Satisfaction with my role and responsibilities
      3. Examine the results and ask:
        • Is there a link between why employees join and leave the organization?
        • Did they cite the same reasons for joining and for leaving?
        • What do the results say about what your employees do and do not value about working at your organization?
      4. Document the resulting insights in tab 2 of the Retention Plan Workbook.

      Example:

      A result where employees are leaving for the same reason they're joining the organization could signal a disconnect between your organization's employee value proposition and the lived experience.

      Revisit your employee value proposition to uncover misalignment

      Your employee value proposition (EVP), formal or informal, communicates the value your organization can offer to prospective employees.

      If your EVP is mismatched with the lived experience of your employees, new hires will be in for a surprise when they start their new job and find out it isn't what they were expecting.

      Forty-six percent of respondents who left a job within 90 days of starting cited a mismatch of expectations about their role ("Job Seeker Nation Study 2020," Jobvite, 2020).

      1. Use the EVP as a filter through which you look at all your employee feedback data. It will help identify misalignment between the promised and the lived experience.
      2. If you have EVP documentation, start there. If not, go to your careers page and put yourself in the shoes of a candidate. Ask what the four elements of an EVP look like for candidates:
        • Compensation and benefits
        • Day-to-day job elements
        • Working conditions
        • Organizational elements
      3. Next, compare this to your own day-to-day experiences. Does it differ drastically? Are there any contradictions with the lived experience at your organization? Are there misleading statements or promises?
      4. Document any insights or patterns you uncover in tab 2 of the Retention Plan Workbook.

      Conduct focus groups to examine themes

      Through focus groups, explore the themes you have uncovered with employees to discover employee needs that are not being met. Addressing these employee needs will be a key aspect of your retention plan.

      Identify employee groups who will participate in focus groups:

      • Incorporate diverse perspectives (e.g. employees, managers, supervisors).
      • Include employees from departments and demographics with strong and weak engagement for a full picture of how engagement impacts your employees.
      • Invite boomerang employees to learn why an individual might return to your organization after leaving.

      image contains two screenshots Mclean & Company's Standard Focus Group Guide.

      Customize Info-Tech's Standard Focus Group Guide based on the themes you have identified in tab 3 of the Retention Plan Workbook.

      The goal of the focus group is to learn from employees and use this information to design or modify a process, system, or other solution that impacts retention.

      Focus questions on the employees' personal experience from their perspective.

      Key things to remember:

      • It is vital for facilitators to be objective.
      • Keep an open mind; no feelings are wrong.
      • Beware of your own biases.
      • Be open and share the reason for conducting the focus groups.

      Info-Tech Insight

      Maintaining an open dialogue with employees will help flesh out the context behind the data you've gathered and allow you to keep in mind that retention is about people first and foremost.

      Empathize with employees to identify moments that matter

      Look for discrepancies between what employees are saying and doing.

      1. Say

      "What words or quotes did the employee use?"

      3.Think

      "What might the employee be thinking?"

      Record feelings and thoughts discussed, body language observed, tone of voice, and words used.

      Look for areas of negative emotion to determine the moments that matter that drive retention.

      2. Do

      "What actions or behavior did the employee demonstrate?"

      4. Feel

      "What might the employee be feeling?"

      Record them in tab 3 of the Retention Plan Workbook.

      5. Identify Needs

      "Needs are verbs (activities or desires), not nouns (solutions)"

      Synthesize focus group findings using Info-Tech's Empathy Map Template.

      6. Identify Insights

      "Ask yourself, why?"

      (Based on Stanford d.school Empathy Map Method)

      Distill employee needs into priority issues to address first

      Take employee needs revealed by your data and focus groups and prioritize three to five needs.

      Select a limited number of employee needs to develop solutions to ensure that the scope of the project is feasible and that the resources dedicated to this project are not stretched too thin. The remaining needs should not be ignored – act on them later.

      Share the needs you identify with stakeholders so they can support prioritization and so you can confirm their buy-in and approval where necessary.

      Ask yourself the following questions to determine your priority employee needs:

      • Which needs will have the greatest impact on turnover?
      • Which needs have the potential to be an easy fix or quick win?
      • Which themes or trends came up repeatedly in different data sources?
      • Which needs evoked particularly strong or negative emotions in the focus groups?

      This image contains screenshots of two table templates found in tab 5 of the Retention Plan Workbook

      In the Retention Plan Workbook, distill employee needs on tab 2 into three to five priorities on tab 5.

      Step 2

      Select Solutions and Create an Action Plan

      After completing this step, you will have:

      • Selected and prioritized solutions to address employee needs.
      • Created a plan to launch stay interviews.
      • Built an action plan to implement solutions.

      Select IT-owned solutions and implement people leader–driven initiatives

      Solutions

      First, select and prioritize solutions to address employee needs identified in the previous step. These solutions will address reasons for turnover that influence employee engagement and moments that matter.

      • Brainstorm solutions using the Retention Solutions Catalog as a starting point. Select a longlist of solutions to address your priority needs.
      • Prioritize the longlist of solutions into a manageable number to act on.

      People leaders

      Next, create a plan to launch stay interviews to increase managers' accountability in improving retention. Managers will be critical to solving issues stemming from turnover triggers.

      • Clarify the importance of harnessing the influence of people leaders in improving retention.
      • Discover what might cause individual employees to leave through stay interviews.
      • Increase trust in managers through training.

      Action plan

      Finally, create an action plan and present to senior leadership for approval.

      Look for these icons in the top right of slides in this step.

      Select solutions to employee needs, starting with the Retention Solutions Catalog

      Based on the priority needs you have identified, use the Retention Solutions Catalog to review best-practice solutions for pain points associated with each stage of the lifecycle.

      Use this tool as a starting point, adding to it and iterating based on your own experience and organizational culture and goals.

      This image contains three screenshots from Info-Tech's Retention Solutions Catalog.

      Use Info-Tech's Retention Solutions Catalog to start the brainstorming process and produce a shortlist of potential solutions that will be prioritized on the next slide.

      Info-Tech Insight

      Unless you have the good fortune of having only a few pain points, no single initiative will completely solve your retention issues. Combine one or two of these broad solutions with people-leader initiatives to ensure employee needs are addressed on an individual and an aggregate level.

      Prioritize solutions to be implemented

      Target efforts accordingly

      Quick wins are high-impact, low-effort initiatives that will build traction and credibility within the organization.

      Long-term initiatives require more time and need to be planned for accordingly but will still deliver a large impact. Review the planning horizon to determine how early these need to begin.

      Re-evaluate low-impact and low-effort initiatives and identify ones that either support other higher impact initiatives or have the highest impact to gain traction and credibility. Look for low-hanging fruit.

      Deprioritize initiatives that will take a high degree of effort to deliver lower-value results.

      When assessing the impact of potential solutions, consider:

      • How many critical segments or employees will this solution affect?
      • Is the employee need it addresses critical, or did the solution encompass several themes in the data you analyzed?
      • Will the success of this solution help build a case for further action?
      • Will the solution address multiple employee needs?

      Info-Tech Insight

      It's better to master a few initiatives than under-deliver on many. Start with a few solutions that will have a measurable impact to build the case for further action in the future.

      Solutions

      Low ImpactMedium ImpactLarge Impact
      Large EffortThis is an image of the used to help you prioritize solutions to be implemented.
      Medium Effort
      Low Effort

      Use tab 3 of the Retention Plan Workbook to prioritize your shortlist of solutions.

      Harness the influence of people leaders to improve employee retention

      Leaders at all levels have a huge impact on employees.

      Effective people leaders:

      • Manage work distribution.
      • Create a motivating work environment.
      • Provide development opportunities.
      • Ensure work is stimulating and challenging, but not overwhelming.
      • Provide clear, actionable feedback.
      • Recognize team member contributions.
      • Develop positive relationships with their teams.
      • Create a line of sight between what the employee is doing and what the organization's objectives are.

      Support leaders in recommitting to their role as people managers through Learning & Development initiatives with particular emphasis on coaching and building trust.

      For coaching training, see Info-Tech's Build a Better Manager: Team Essentials – Feedback and Coaching training deck.

      For more information on supporting managers to become better people leaders, see Info-Tech's Build a Better Manager: Manage Your People blueprint.

      "HR can't fix turnover. But leaders on the front line can."
      – Richard P. Finnegan, CEO, C-Suite Analytics

      Equip managers to conduct regular stay interviews to address turnover triggers

      Managers often have the most visibility into their employees' personal and work lives and have a key opportunity to anticipate and address turnover triggers.

      Stay interviews are an effective way of uncovering potential retention issues and allowing managers to act as an early warning system for turnover triggers.

      Examples of common turnover triggers and potential manager responses:

      • Moving, creating a long commute to the office.
        • Through stay interviews, a manager can learn that a long commute is an issue and can help find workarounds such as flexible/remote work options.
      • Not receiving an expected promotion.
        • A trusted manager can anticipate issues stemming from this, discuss why the decision was made, and plan development opportunities for future openings.

      Stay interview best practices

      1. Conducted by an employee's direct manager.
      2. Happen regularly as a part of an ongoing process.
      3. Based on the stay interview, managers produce a turnover forecast for each direct report.
        1. The method used by stay interview expert Richard P. Finnegan is simple: red for high risk, yellow for medium, and green for low.
      4. Provide managers with training and a rough script or list of questions to follow.
        1. Use and customize Info-Tech's Stay Interview Guide to provide a guide for managers on how to conduct a stay interview.
      5. Managers use the results to create an individualized retention action plan made up of concrete actions the manager and employee will take.

      Sources: Richard P. Finnegan, CEO, C-Suite Analytics; SHRM

      Build an action plan to implement the retention plan

      For each initiative identified, map out timelines and actions that need to be taken.

      When building actions and timelines:

      • Refer to the priority needs you identified in tab 4 of the Retention Plan Workbook and ensure they are addressed first.
      • Engage internal stakeholders who will be key to the development of the initiatives to ensure they have sufficient time to complete their deliverables.
        • For example, if you conduct manager training, Learning & Development needs to be involved in the development and launch of the program.
      • Include a date to revisit your baseline retention and engagement data in your project milestones.
      • Designate process owners for new processes such as stay interviews.

      Plan for stay interviews by determining:

      • Whether stay interviews will be a requirement for all employees.
      • How much flexibility managers will have with the process.
      • How you will communicate the stay interview approach to managers.
      • If manager training is required.
      • How managers should record stay interview data and how you will collect this data from them as a way to monitor retention issues.
        • For example, managers can share their turnover forecasts and action plans for each employee.

      Be clear about manager accountabilities for initiatives they will own, such as stay interviews. Plan to communicate the goals and timelines managers will be asked to meet, such as when they must conduct interviews or their responsibility to follow up on action items that come from interviews.

      Track project success to iterate and improve your solutions

      Analyze measurements

      • Regularly remeasure your engagement and retention levels to identify themes and trends that provide insights into program improvements.
      • For example, look at the difference in manager relationship score to see if training has had an impact, or look at changes in critical segment turnover to calculate cost savings.

      Revisit employee and manager feedback

      • After three to six months, conduct additional surveys or focus groups to determine the success of your initiatives and opportunities for improvement. Tweak the program, including stay interviews, based on manager and employee feedback.

      Iterate frequently

      • Revisit your initiatives every two or three years to determine if a refresh is necessary to meet changing organizational and employee needs and to update your goals and targets.

      Key insights

      Insight 1Insight 2Insight 3

      Retention and turnover are two sides of the same coin. You can't fix retention without first understanding turnover.

      Engagement surveys mask the volatility of the employee experience and hide the reason why individual employees leave. You must also talk to employees to understand the moments that matter and engage managers to understand turnover triggers.

      Improving retention isn't just about lowering turnover, it's about discovering what healthy retention looks like for your organization.

      Insight 4Insight 5Insight 6

      HR professionals often have insights into where and why retention is an issue. Gathering detailed employee feedback data through surveys and focus groups provides credibility to these insights and is key to building a case for action. Keep an open mind and allow the data to inform your gut feeling, not the other way around.

      Successful retention plans must be owned by both IT leaders and HR.

      IT leaders often have the most visibility into their employees' personal and work lives and have a key opportunity to anticipate and address turnover triggers.

      Stay interviews help managers anticipate potential retention issues on their teams.

      Workshop Overview

      Contact your account representative for more information.
      workshops@infotech.com 1-888-670-8889

      Info-Tech AnalystsPre-workPost-work
      Client Data Gathering and PlanningImplementation Supported Through Analyst Calls

      1.1 Discuss participants, logistics, overview of workshop activities

      1.2 Provide support to client for below activities through calls.

      2.1 Schedule follow-up calls to work through implementation of retention solutions based on identified needs.
      Client

      1.Gather results of engagement survey, new hire survey, exit survey, and any exit and stay interview feedback.

      2.Gather and analyze turnover data.

      3.Identify key employee segment(s) and identify and organize participants for focus groups.

      4.Complete cost of turnover analysis.

      5.Review turnover data and prioritize list of employee segments.

      1.Obtain senior leader approval to proceed with retention plan.

      2.Finalize and implement retention solutions.

      3.Prepare managers to conduct stay interviews.

      4.Communicate next steps to stakeholders.

      Workshop Overview

      Contact your account representative for more information.
      workshops@infotech.com 1-888-670-8889

      ActivitiesDay 1Day 2Day 3Day 4
      Assess Current StateConduct Focus GroupsIdentify Needs and Retention InitiativesPrepare to Communicate and Launch

      1.1 Review data to determine why employees join, stay, and leave.

      1.2 Identify common themes.

      1.3 Prepare for focus groups.

      2.1 Conduct four 1-hour focus groups with the employee segment(s) identified in the pre-workshop activities..

      2.2 Info-Tech facilitators independently analyze results of focus groups and group results by theme.

      3.1 Create an empathy map to identify needs

      3.2 Shortlist retention initiatives

      4.1 Select retention initiatives

      4.2 Determine goals and metrics

      4.3 Plan stakeholder communication4.4 Build a high-level action plan

      Deliverables

      1.List of common themes/pain points recorded in the Retention Plan Workbook

      2.Plan for focus groups documented in the Focus Group Guide

      1.Focus group feedback

      2.Focus group feedback analyzed and organized by themes

      1.Employee needs and shortlist of initiatives to address them1.Finalized list of retention initiatives

      Info-Tech offers various levels of support to best suit your needs

      DIY Toolkit

      “Our team has already made this critical project a priority, and we have the time and capability, but some guidance along the way would be helpful.”

      Guided Implementation

      “Our team knows that we need to fix a process, but we need assistance to determine where to focus. Some check-ins along the way would help keep us on track.”

      Workshop

      “We need to hit the ground running and get this project kicked off immediately. Our team has the ability to take this over once we get a framework and strategy in place.”

      Consulting

      “Our team does not have the time or the knowledge to take this project on. We need assistance through the entirety of this project.”

      Diagnostics and consistent frameworks used throughout all four options

      Research Contributors and Experts

      Jeff Bonnell
      VP HR
      Info-Tech Research Group

      Phillip Kotanidis
      CHRO
      Michael Garron Hospital

      Michael McGuire
      Director, Organizational Development
      William Osler Health System

      Dr. Iris Ware
      Chief Learning Officer
      City of Detroit

      Richard P. Finnegan
      CEO
      C-Suite Analytics

      Dr. Thomas Lee
      Professor of Management
      University of Washington

      Jane Moughon
      Specialist in increasing profits, reducing turnover, and maximizing human potential in manufacturing companies

      Lisa Kaste
      Former HR Director
      Citco

      Piyush Mathur
      Head of Workforce Analytics
      Johnson & Johnson

      Gregory P. Smith
      CEO
      Chart Your Course

      Works Cited

      "17 Surprising Statistics about Employee Retention." TINYpulse, 8 Sept. 2020. Web.
      "2020 Job Seeker Nation Study." Jobvite, April 2020. Web.
      "2020 Recruiter Nation Survey." Jobvite, 2020. Web.
      "2020 Retention Report: Insights on 2019 Turnover Trends, Reasons, Costs, & Recommendations." Work Institute, 2020. Web.
      "25 Essential Productivity Statistics for 2021." TeamStage, 2021. Accessed 22 Jun. 2021.
      Agovino, Theresa. "To Have and to Hold." SHRM, 23 Feb. 2019. Web.
      "Civilian Unemployment Rate." Bureau of Labor Statistics, June 2020. Web.
      Foreman, Paul. "The domino effect of chief sales officer turnover on salespeople." Mereo, 19 July 2018. Web.
      "Gross Domestic Product." U.S. Bureau of Economic Analysis, 27 May 2021. Accessed 22 Jun. 2020.
      Kinne, Aaron. "Back to Basics: What is Employee Experience?" Workhuman, 27August 2020. Accessed 21 Jun. 2021.
      Lee, Thomas W, et al. "Managing employee retention and turnover with 21st century ideas." Organizational Dynamics, vol 47, no. 2, 2017, pp. 88-98. Web.
      Lee, Thomas W. and Terence R. Mitchell. "Control Turnover by Understanding its Causes." The Blackwell Handbook of Principles of Organizational Behaviour. 2017. Print.
      McFeely, Shane, and Ben Wigert. "This Fixable Problem Costs U.S. Businesses $1 Trillion." Gallup. 13 March 2019. Web.
      "Table 18. Annual Quit rates by Industry and Region Not Seasonally Adjusted." Bureau of Labor Statistics. June 2021. Web.
      "The 2019 Compensation Best Practices Report: Will They Stay or Will They Go? Employee Retention and Acquisition in an Uncertain Economy." PayScale. 2019. Web.
      Vuleta, Branka. "30 Troubling Employee Retention Statistics." Legaljobs. 1 Feb. 2021. Web.
      "What is a Tenured Employee? Top Benefits of Tenure and How to Stay Engaged as One." Indeed. 22 Feb. 2021. Accessed 22 Jun. 2021.

      Knowledge Management

      • Buy Link or Shortcode: {j2store}33|cart{/j2store}
      • Related Products: {j2store}33|crosssells{/j2store}
      • member rating overall impact (scale of 10): 9.0/10
      • member rating average dollars saved: $10,000
      • member rating average days saved: 2
      • Parent Category Name: People and Resources
      • Parent Category Link: /people-and-resources
      Mitigate Key IT Employee Knowledge Loss

      Enterprise Architecture Trends

      • Buy Link or Shortcode: {j2store}584|cart{/j2store}
      • member rating overall impact (scale of 10): N/A
      • member rating average dollars saved: N/A
      • member rating average days saved: N/A
      • Parent Category Name: Strategy & Operating Model
      • Parent Category Link: /strategy-and-operating-model
      • The digital transformation journey brings business and technology increasingly closer.
      • Because the two become more and more intertwined, the role of the enterprise architecture increases in importance, aligning the two in providing additional efficiencies.
      • The current need for an accelerated digital transformation elevates the importance of enterprise architecture.

      Our Advice

      Critical Insight

      • Enterprise architecture is impacted and has an increasing role in the following areas:
        • Business agility
        • Security
        • Innovation
        • Collaborative EA
        • Tools and automation

      Impact and Result

      EA’s role in brokering and negotiating overlapping areas can lead to the creation of additional efficiencies at the enterprise level.

      Enterprise Architecture Trends Research & Tools

      Besides the small introduction, subscribers and consulting clients within this management domain have access to:

      1. Enterprise Architecture Trends Deck – A trend report to support executives as they digitally transform the enterprise.

      In an accelerated path to digitization, the increasingly important role of enterprise architecture is one of collaboration across siloes, inside and outside the enterprise, in a configurable way that allows for quick adjustment to new threats and conditions, while embracing unprecedented opportunities to scale, stimulating innovation, in order to increase the organization’s competitive advantage.

      • Enterprise Architecture Trends Report

      Infographic

      Further reading

      Enterprise Architecture Trends

      Supporting Executives to Digitally Transform the Enterprise

      Analyst Perspective

      Enterprise architecture, seen as the glue of the organization, aligns business goals with all the other aspects of the organization, providing additional effectiveness and efficiencies while also providing guardrails for safety.

      In an accelerated path to digitization, the increasingly important role of enterprise architecture (EA) is one of collaboration across siloes, inside and outside the enterprise, in a configurable way that allows for quick adjustment to new threats and conditions while embracing unprecedented opportunities to scale, stimulating innovation to increase the organization’s competitive advantage.

      Photo of Milena Litoiu, Principal/Senior Director, Enterprise Architecture, Info-Tech Research Group.

      Milena Litoiu
      Principal/Senior Director, Enterprise Architecture
      Info-Tech Research Group

      Accelerated digital transformation elevates the importance of EA

      The Digital transformation journey brings Business and technology increasingly closer.

      Because the two become more and more intertwined, the role OF Enterprise Architecture increases in importance, aligning the two in providing additional efficiencies.

      THE Current need for an accelerated Digital transformation elevates the importance of Enterprise Architecture.

      More than 70% of organizations revamp their enterprise architecture programs. (Info-Tech Tech Trends 2022 Survey)

      Most organizations still see a significant gap between the business and IT.

      Enterprise Architecture (EA) is impacted and has an increasing role in the following areas

      Accelerated Digital Transformation

      • Business agility Business agility, needed more that ever, increases reliance on enterprise strategies.
        EA creates alignment between business and IT to improve business nimbleness.
      • Security More sophisticated attacks require more EA coordination.
        EA helps adjust to the increasing sophistication of external threats. Partnering with the CISO office to develop strategies to protect the enterprise becomes a prerequisite for survival.
      • Innovation EA's role in an innovation increases synergies at the enterprise level.
        EA plays an increasingly stronger role in innovation, from business endeavors to technology, across business units, etc.
      • Collaborative EA Collaborative EA requires new ways of working.
        Enterprise collaboration gains new meaning, replacing stiff governance.
      • Tools & automation Tools-based automation becomes increasingly common.
        Tools support as well as new artificial intelligence or machine- learning- powered approaches help achieve tools-assisted coordination across viewpoints and teams.

      Info-Tech Insight

      EA's role in brokering and negotiating overlapping areas can lead to the creation of additional efficiencies at the enterprise level.

      EA Enabling Business Agility

      Trend 01 — Business Agility is needed more than ever and THIS increases reliance on enterprise Strategies. to achieve nimbleness, organizations need to adapt timely to changes in the environment.

      Approaches:
      A plethora of approaches are needed (e.g. architecture modularity, data integration, AI/ML) in addition to other Agile/iterative approaches for the entire organization.

      Evolve Your Business Through Innovation

      • Buy Link or Shortcode: {j2store}330|cart{/j2store}
      • member rating overall impact (scale of 10): N/A
      • member rating average dollars saved: N/A
      • member rating average days saved: N/A
      • Parent Category Name: Innovation
      • Parent Category Link: /innovation
      • Innovation teams are tasked with the responsibility of ensuring that their organizations are in the best position to succeed while the world is in a period of turmoil, chaos, and uncertainty.
      • CIOs have been expected to help the organization transition to remote work and collaboration instantaneously.
      • CEOs are under pressure to redesign, and in some cases reinvent, their business model to cope with and compete in a new normal.

      Our Advice

      Critical Insight

      It is easy to get swept up during a crisis and cling to past notions of normal. Unfortunately, there is no controlling the fact that things have changed fundamentally, and it is now incumbent upon you to help your organization adapt and evolve. Treat this as an opportunity because that is precisely what this is.

      Impact and Result

      There are some lessons we can learn from innovators who have succeeded through past crises and from those who are succeeding now.

      There are a number of tactics an innovation team can employ to help their business evolve during this time:

      1. Double down on digital transformation (DX)
      2. Establish a foresight capability
      3. Become a platform for good

      Evolve Your Business Through Innovation Research & Tools

      Besides the small introduction, subscribers and consulting clients within this management domain have access to:

      1. Evolve your business through innovation

      Download our guide to learn what you can do to evolve your business and innovate your way through uncertainty.

      • Evolve Your Business Through Innovation Storyboard
      [infographic]

      Enhance Your Solution Architecture Practices

      • Buy Link or Shortcode: {j2store}157|cart{/j2store}
      • member rating overall impact (scale of 10): 9.0/10 Overall Impact
      • member rating average dollars saved: $33,359 Average $ Saved
      • member rating average days saved: 11 Average Days Saved
      • Parent Category Name: Development
      • Parent Category Link: /development
      • In today’s world, business agility is essential to stay competitive. Quick responses to business needs through efficient development and deployment practices is critical for business value delivery.
      • A mature solution architecture practice is the basic necessity for a business to have technical agility.

      Our Advice

      Critical Insight

      Don’t architect for normal situations. That is a shallow approach and leads to decisions that may seem “right” but will not be able to stand up to system elasticity needs.

      Impact and Result

      • Understand the different parts of a continuous security architecture framework and how they may apply to your decisions.
      • Develop a solution architecture for upcoming work (or if there is a desire to reduce tech debt).

      Enhance Your Solution Architecture Practices Research & Tools

      Besides the small introduction, subscribers and consulting clients within this management domain have access to:

      1. Solution Architecture Practices Deck – A deck to help you develop an approach for or validate existing solution architecture capability.

      Translate stakeholder objectives into architecture requirements, solutions, and changes. Incorporate architecture quality attributes in decisions to increase your architecture’s life. Evaluate your solution architecture from multiple views to obtain a holistic perspective of the range of issues, risks, and opportunities.

      • Enhance Your Solution Architecture Practices – Phases 1-3

      2. Solution Architecture Template – A template to record the results from the exercises to help you define, detail, and make real your digital product vision.

      Identify and detail the value maps that support the business, and discover the architectural quality attribute that is most important for the value maps. Brainstorm solutions for design decisions for data, security, scalability, and performance.

      • Solution Architecture Template
      [infographic]

      Workshop: Enhance Your Solution Architecture Practices

      Workshops offer an easy way to accelerate your project. If you are unable to do the project yourself, and a Guided Implementation isn't enough, we offer low-cost delivery of our project workshops. We take you through every phase of your project and ensure that you have a roadmap in place to complete your project successfully.

      1 Vision and Value Maps

      The Purpose

      Document a vision statement for the solution architecture practice (in general) and/or a specific vision statement, if using a single project as an example.

      Document business architecture and capabilities.

      Decompose capabilities into use cases.

      Key Benefits Achieved

      Provide a great foundation for an actionable vision and goals that people can align to.

      Develop a collaborative understanding of business capabilities.

      Develop a collaborative understanding of use cases and personas that are relevant for the business.

      Activities

      1.1 Develop vision statement.

      1.2 Document list of value stream maps and their associated use cases.

      1.3 Document architectural quality attributes needed for use cases using SRME.

      Outputs

      Solution Architecture Template with sections filled out for vision statement canvas and value maps

      2 Continue Vision and Value Maps, Begin Phase 2

      The Purpose

      Map value stream to required architectural attributes.

      Prioritize architecture decisions.

      Discuss and document data architecture.

      Key Benefits Achieved

      An understanding of architectural attributes needed for value streams.

      Conceptual understanding of data architecture.

      Activities

      2.1 Map value stream to required architectural attributes.

      2.2 Prioritize architecture decisions.

      2.3 Discuss and document data architecture.

      Outputs

      Solution Architecture Template with sections filled out for value stream and architecture attribute mapping; a prioritized list of architecture design decisions; and data architecture

      3 Continue Phase 2, Begin Phase 3

      The Purpose

      Discuss security and threat assessment.

      Discuss resolutions to threats via security architecture decisions.

      Discuss system’s scalability needs.

      Key Benefits Achieved

      Decisions for security architecture.

      Decisions for scalability architecture.

      Activities

      3.1 Discuss security and threat assessment.

      3.2 Discuss resolutions to threats via security architecture decisions.

      3.3 Discuss system’s scalability needs.

      Outputs

      Solution Architecture Template with sections filled out for security architecture and scalability design

      4 Continue Phase 3, Start and Finish Phase 4

      The Purpose

      Discuss performance architecture.

      Compile all the architectural decisions into a solutions architecture list.

      Key Benefits Achieved

      A complete solution architecture.

      A set of principles that will form the foundation of solution architecture practices.

      Activities

      4.1 Discuss performance architecture.

      4.2 Compile all the architectural decisions into a solutions architecture list.

      Outputs

      Solution Architecture Template with sections filled out for performance and a complete solution architecture

      Further reading

      Enhance Your Solution Architecture Practice

      Ensure your software systems solution is architected to reflect stakeholders’ short- and long-term needs.

      Analyst Perspective

      Application architecture is a critical foundation for supporting the growth and evolution of application systems. However, the business is willing to exchange the extension of the architecture’s life with quality best practices for the quick delivery of new or enhanced application functionalities. This trade-off may generate immediate benefits to stakeholders, but it will come with high maintenance and upgrade costs in the future, rendering your system legacy early.

      Technical teams know the importance of implementing quality attributes into architecture but are unable to gain approval for the investments. Overcoming this challenge requires a focus of architectural enhancements on specific problem areas with significant business visibility. Then, demonstrate how quality solutions are vital enablers for supporting valuable application functionalities by tracing these solutions to stakeholder objectives and conducting business and technical risk and impact assessments through multiple business and technical perspectives.

      this is a picture of Andrew Kum-Seun

      Andrew Kum-Seun
      Research Manager, Applications
      Info-Tech Research Group

      Enhance Your Solution Architecture

      Ensure your software systems solution is architected to reflect stakeholders’ short- and long-term needs.

      EXECUTIVE BRIEF

      Executive Summary

      Your Challenge

      • Most organizations have some form of solution architecture; however, it may not accurately and sufficiently support the current and rapidly changing business and technical environments.
      • To enable quick delivery, applications are built and integrated haphazardly, typically omitting architecture quality practices.

      Common Obstacles

      • Failing to involve development and stakeholder perspectives in design can lead to short-lived architecture and critical development, testing, and deployment constraints and risks being omitted.
      • Architects are experiencing little traction implementing solutions to improve architecture quality due to the challenge of tracing these solutions back to the right stakeholder objectives.

      Info-Tech's Approach

      • Translate stakeholder objectives into architecture requirements, solutions, and changes. Incorporate architecture quality attributes in decisions to increase your architecture’s life.
      • Evaluate your solution architecture from multiple views to obtain a holistic perspective of the range of issues, risks, and opportunities.
      • Regularly review and recalibrate your solution architecture so that it accurately reflects and supports current stakeholder needs and technical environments.

      Info-Tech Insight

      Well-received applications can have poor architectural qualities. Functional needs often take precedence over quality architecture. Quality must be baked into design, execution, and decision-making practices to ensure the right tradeoffs are made.

      A badly designed solution architecture is the root of all technical evils

      A well-thought-through and strategically designed solution architecture is essential for the long-term success of any software system, and by extension, the organization because:

      1. It will help achieve quality attribute requirements (security, scalability, performance, usability, resiliency, etc.) for a software system.
      2. It can define and refine architectural guiding principles. A solution architecture is not only important for today but also a vision for the future of the system’s ability to react positively to changing business needs.
      3. It can help build usable (and reusable) services. In a fast-moving environment, the convenience of having pre-made plug-and-play architectural objects reduces the risk incurred from knee-jerk reactions in response to unexpected demands.
      4. It can be used to create a roadmap to an IT future state. Architectural concerns support transition planning activities that can lead to the successful implementation of a strategic IT plan.

      Demand for quick delivery makes teams omit architectural best practices, increasing downstream risks

      In its need for speed, a business often doesn’t see the value in making sure architecture is maintainable, reusable, and scalable. This demand leads to an organizational desire for development practices and the procurement of vendors that favor time-to-market over long-term maintainability. Unfortunately, technical teams are pushed to omit design quality and validation best practices.

      What are the business impacts of omitting architecture design practices?

      Poor quality application architecture impedes business growth opportunities, exposes enterprise systems to risks, and consumes precious IT budgets in maintenance that could otherwise be used for innovation and new projects.

      Previous estimations indicate that roughly 50% of security problems are the result of software design. […] Flaws in the architecture of a software system can have a greater impact on various security concerns in the system, and as a result, give more space and flexibility for malicious users.(Source: IEEE Software)

      Errors in software requirements and software design documents are more frequent than errors in the source code itself according to Computer Finance Magazine. Defects introduced during the requirements and design phase are not only more probable but also more severe and more difficult to remove. (Source: iSixSigma)

      Design a solution architecture that can be successful within the constraints and complexities set before you

      APPLICATION ARCHITECTURE…

      … describes the dependencies, structures, constraints, standards, and development guidelines to successfully deliver functional and long-living applications. This artifact lays the foundation to discuss the enhancement of the use and operations of your systems considering existing complexities.

      Good architecture design practices can give you a number of benefits:

      Lowers maintenance costs by revealing key issues and risks early. The Systems Sciences Institute at IBM has reported that the cost to fix an error found after product release was 4 to 5 times as much as one uncovered during design.(iSixSigma)

      Supports the design and implementation activities by providing key insights for project scheduling, work allocation, cost analysis, risk management, and skills development.(IBM: developerWorks)

      Eliminates unnecessary creativity and activities on the part of designers and implementers, which is achieved by imposing the necessary constraints on what they can do and making it clear that deviation from constraints can break the architecture.(IBM: developerWorks)

      Use Info-Tech’s Continuous Solution Architecture (CSA) Framework for designing adaptable systems

      Solution architecture is not a one-size-fits-all conversation. There are many design considerations and trade-offs to keep in mind as a product or services solution is conceptualized, evaluated, tested, and confirmed. The following is a list of good practices that should inform most architecture design decisions.

      Principle 1: Design your solution to have at least two of everything.

      Principle 2: Include a “kill switch” in your fault-isolation design. You should be able to turn off everything you release.

      Principle 3: If it can be monitored, it should be. Use server and audit logs where possible.

      Principle 4: Asynchronous is better than synchronous. Asynchronous design is more complex but worth the processing efficiency it introduces.

      Principle 5: Stateless over stateful: State data should only be used if necessary.

      Principle 6: Go horizonal (scale out) over vertical (scale up).

      Principle 7: Good architecture comes in small packages.

      Principle 8: Practice just-in-time architecture. Delay finalizing an approach for as long as you can.

      Principle 9: X-ilities over features. Quality of an architecture is the foundation over which features exist. A weak foundation can never be obfuscated through shiny features.

      Principle 10: Architect for products not projects. A product is an ongoing concern, while a project is short lived and therefore only focused on what is. A product mindset forces architects to think about what can or should be.

      Principle 11: Design for rollback: When all else fails, you should be able to stand up the previous best state of the system.

      Principle 12: Test the solution architecture like you test your solution’s features.

      CSA should be used for every step in designing a solution’s architecture

      Solution architecture is a technical response to a business need, and like all complex evolutionary systems, must adapt its design for changing circumstances.

      The triggers for changes to existing solution architectures can come from, at least, three sources:

      1. Changing business goals
      2. Existing backlog of technical debt
      3. Solution architecture roadmap

      A solution’s architecture is cross-cutting and multi-dimensional and at the minimum includes:

      • Product Portfolio Strategy
      • Application Architecture
      • Data Architecture
      • Information Architecture
      • Operational Architecture

      along with several qualitative attributes (also called non-functional requirements).

      This image contains a chart which demonstrates the relationship between changing hanging business goals, Existing backlog of technical debt, Solution architecture roadmap, and Product Portfolio Strategy, Application Architecture, Data Architecture, Information Architecture and, Operational Architecture

      Related Research: Product Portfolio Strategy

      Integrate Portfolios to Create Exceptional Customer Value

      • Define an organizing principle that will structure your projects and applications in a way that matters to your stakeholders.
      • Bridge application and project portfolio data using the organizing principle that matters to communicate with stakeholders across the organization.
      • Create a dashboard that brings together the benefits of both project and application portfolio management to improve visibility and decision making.

      Deliver on Your Digital Portfolio Vision

      • Recognize that a vision is only as good as the data that backs it up. Lay out a comprehensive backlog with quality built in that can be effectively communicated and understood through roadmaps.
      • Your intent is only a dream if it cannot be implemented ; define what goes into a release plan via the release canvas.
      • Define a communication approach that lets everyone know where you are heading.

      Related Research: Data, Information & Integration Architecture

      Build a Data Architecture Roadmap

      • Have a framework in place to identify the appropriate solution for the challenge at hand. Our three-phase practical approach will help you build a custom and modernized data architecture.
      • Identify and prioritize the business drivers in which data architecture changes would create the largest overall benefit and determine the corresponding data architecture tiers that need to be addressed.
      • Discover the best-practice trends, measure your current state, and define the targets for your data architecture tactics.
      • Build a cohesive and personalized roadmap for restructuring your data architecture. Manage your decisions and resulting changes.

      Build a Data Pipeline for Reporting and Analytics

      • Understand your high-level business capabilities and interactions across them – your data repositories and flows should be just a digital reflection thereof.
      • Divide your data world in logical verticals overlaid with various speed data progression lanes, i.e. build your data pipeline – and conquer it one segment at a time.
      • Use the most appropriate database design pattern for a given phase/component in your data pipeline progression.

      Related Research:Operational Architecture

      Optimize Application Release Management

      • Acquire release management ownership. Ensure there is appropriate accountability for the speed and quality of the releases passing through the entire pipeline.
      • A release manager has oversight over the entire release process and facilitates the necessary communication between business stakeholders and various IT roles.
      • Instill holistic thinking. Release management includes all steps required to push release and change requests to production along with the hand-off to Operations and Support. Increase the transparency and visibility of the entire pipeline to ensure local optimizations do not generate bottlenecks in other areas.
      • Standardize and lay a strong release management foundation. Optimize the key areas where you are experiencing the most pain and continually improve.

      Build Your Infrastructure Roadmap

      • Increased communication. More information being shared to more people who need it.
      • Better planning. More accurate information being shared.
      • Reduced lead times. Less due diligence or discovery work required as part of project implementations.
      • Faster delivery times. Less low-value work, freeing up more time for project work.

      Related Research:Security Architecture

      Identify Opportunities to Mature the Security Architecture

      • A right-sized security architecture can be created by assessing the complexity of the IT department, the operations currently underway for security, and the perceived value of a security architecture within the organization. This will bring about a deeper understanding of the organizational infrastructure.
      • Developing a security architecture should also result in a list of opportunities (i.e. initiatives) that an organization can integrate into a roadmap. These initiatives will seek to improve security operations and strengthen the IT department’s understanding of security’s role within the organization.
      • A better understanding of the infrastructure will help to save time on determining the correct technologies required from vendors, and therefore, cut down on the amount of vendor noise.
      • Creating a defensible roadmap will assist with justifying future security spend.

      Key deliverable:

      Solution Architecture Template
      Record the results from the exercises to help you define, detail, and make real your digital product vision.

      Blueprint Deliverables

      Each step of this blueprint is accompanied by supporting deliverables to help you accomplish your goals:

      This image contains screenshots of the deliverables which will be discussed later in this blueprint

      Info-Tech offers various levels of support to best suit your needs

      DIY Toolkit

      Our team has already made this critical project a priority, and we have the time and capability, but some guidance along the way would be helpful.

      Guided Implementation

      Our team knows that we need to fix a process, but we need assistance to determine where to focus. some check-ins along the way would help keep us on track

      Workshop

      We need to hit the ground running and get this project kicked off immediately. Our team has the ability to take this over once we get a framework and strategy in place

      Consulting

      Our team does not have the time or the knowledge to take this project on. we need assistance through the entirety of this project.

      Diagnostics and consistent frameworks are used throughout all four options

      Workshop Overview

      Contact your account representative for more information. workshops@infotech.com 1-888-670-8889

      Day 1 Day 2 Day 3 Day 4
      Exercises
      1. Articulate an architectural vision
      2. Develop dynamic value stream maps
      1. Create a conceptual map between the value stream, use case, and required architectural attribute
      2. Create a prioritized list of architectural attributes
      3. Develop a data architecture that supports transactional and analytical needs
      1. Document security architecture risks and mitigations
      2. Document scalability architecture
      1. Document performance-enhancing architecture
      2. Bring it all together
      Outcomes
      1. Architecture vision
      2. Dynamic value stream maps (including user stories/personas)
      1. List of required architectural attributes
      2. Architectural attributes prioritized
      3. Data architecture design decisions
      1. Security threat and risk analysis
      2. Security design decisions
      3. Scalability design decisions
      1. Performance design decisions
      2. Finalized decisions

      Guided Implementation

      What does a typical GI on this topic look like?

      A Guided Implementation (GI) is series of calls with an Info-Tech analyst to help implement our best practices in your organization.
      This GI is between 8 to 10 calls over the course of approximately four to six months.

      Phase 1 Phase 2 Phase 2
      Call #1:
      Articulate an architectural vision.
      Call #4:
      Continue discussion on value stream mapping and related use cases.
      Call #6:
      Document security design decisions.
      Call #2:
      Discuss value stream mapping and related use cases.
      Call #5:
      • Map the value streams to required architectural attribute.
      • Create a prioritized list of architectural attributes.
      Call #7:
      • Document scalability design decisions.
      • Document performance design decisions.
      Call #3:
      Continue discussion on value stream mapping and related use cases.
      Call #8:
      Bring it all together.

      Phase 1: Visions and Value Maps

      Phase 1

      1.1 Articulate an Architectural Vision
      1.2 Develop Dynamic Value Stream Maps
      1.3 Map Value Streams, Use Cases, and Required Architectural Attributes
      1.4 Create a Prioritized List of Architectural Attributes

      Phase 2

      2.1 Develop a Data Architecture That Supports Transactional and Analytical Needs
      2.2 Document Security Architecture Risks and Mitigations

      Phase 3

      3.1 Document Scalability Architecture
      3.2 Document Performance Enhancing Architecture
      3.3 Combine the Different Architecture Design Decisions Into a Unified Solution Architecture

      This phase will walk you through the following activities:

      • Determine a vision for architecture outcomes
      • Draw dynamic value stream maps
      • Derive architectural design decisions
      • Prioritize design decisions

      This phase involves the following participants:

      • Business Architect
      • Product Owner
      • Application Architect
      • Integration Architect
      • Database Architect
      • Enterprise Architect

      Enhance Your Solution Architecture Practice

      Let’s get this straight: You need an architectural vision

      If you start off by saying I want to architect a system, you’ve already lost. Remember what a vision is for!

      An architectural vision...

      … is your North Star

      Your product vision serves as the single fixed point for product development and delivery.

      … aligns stakeholders

      It gets everyone on the same page.

      … helps focus on meaningful work

      There is no pride in being a rudderless ship. It can also be very expensive.

      And eventually...

      … kick-starts your strategy

      We know where to go, we know who to bring along, and we know the steps to get there. Let’s plan this out.

      An architectural vision is multi-dimensional

      Who is the target customer (or customers)?

      What is the key benefit a customer can get from using our service or product?

      Why should they be engaged with you?

      What makes our service or product better than our competitors?

      (Adapted from Crossing the Chasm)

      Info-Tech Insight

      It doesn’t matter if you are delivering value to internal or external stakeholders, you need a product vision to ensure everyone understands the “why.”

      Use a canvas as the dashboard for your architecture

      The solution architecture canvas provides a single dashboard to quickly define and communicate the most important information about the vision. A canvas is an effective tool for aligning teams and providing an executive summary view.

      This image contains a sample canvas for you to use as the dashboard for your architecture. The sections are: Solution Name, Tracking Info, Vision, Business Goals, Metrics, Personas, and Stakeholders.

      Leverage the solution architecture canvas to state and inform your architecture vision

      This image contains the sample canvas from the previous section, with annotations explaining what to do for each of the headings.

      1.1 Craft a vision statement for your solution’s architecture

      1. Use the product canvas template provided for articulating your solution’s architecture.

      *If needed, remove or add additional data points to fit your purposes.

      There are different statement templates available to help form your product vision statements. Some include:

      • For [our target customer], who [customer’s need], the [product] is a [product category or description] that [unique benefits and selling points]. Unlike [competitors or current methods], our product [main differentiators].
      • We believe (in) a [noun: world, time, state, etc.] where [persona] can [verb: do, make, offer, etc.], for/by/with [benefit/goal].
      • To [verb: empower, unlock, enable, create, etc.] [persona] to [benefit, goal, future state].
      • Our vision is to [verb: build, design, provide] the [goal, future state] to [verb: help, enable, make it easier to...] [persona].

      (Adapted from Crossing the Chasm)

      Download the Solution Architecture Template and document your vision statement.

      Input

      • Business Goals
      • Product Portfolio Vision

      Output

      • Solution Architecture Vision

      Materials

      • Whiteboard/Flip Charts

      Participants

      • Business Architect
      • Product Owner
      • IT Leadership
      • Business Leadership

      Solution Architecture Canvas: Refine your vision statement

      This image contains a screenshot of the canvas from earlier in the blueprint, with only the annotation for Solution Name: Vision, unique value proposition, elevator pitch, or positioning statement.

      Understand your value streams before determining your solution’s architecture

      Business Strategy

      Sets and communicates the direction of the entire organization.

      Value Stream

      Segments, groups, and creates a coherent narrative as to how an organization creates value.

      Business Capability Map

      Decomposes an organization into its component parts to establish a common language across the organization.

      Execution

      Implements the business strategy through capability building or improvement projects.

      Identify your organization’s goals and define the value streams that support them

      Goal

      Revenue Growth

      Value Streams

      Stream 1- Product Purchase
      Stream 2- Customer Acquisition
      stream 3- Product Financing

      There are many techniques that help with constructing value streams and their capabilities.

      Domain-driven design is a technique that can be used for hypothesizing the value maps, their capabilities, and associated solution architecture.

      Read more about domain-driven design here.

      Value streams can be external (deliver value to customers) or internal (support operations)

        External Perspective

      1. Core value streams are mostly externally facing: they deliver value to either an external/internal customer and they tie to the customer perspective of the strategy map.
      • E.g. customer acquisition, product purchase, product delivery

      Internal Perspective

    • Support value streams are internally facing: they provide the foundational support for an organization to operate.
      • E.g. employee recruitment to retirement

      Key Questions to Ask While Evaluating Value Streams

      • Who are your customers?
      • What benefits do we deliver to them?
      • How do we deliver those benefits?
      • How does the customer receive the benefits?
      This image contains an example of value streams. The main headings are: Customer Acquisitions, Product Purchase, Product Delivery, Confirm Order, Product Financing, and Product Release.

      Value streams highlight the what, not the how

      Value chains set a high-level context, but architectural decisions still need to be made to deal with the dynamism of user interaction and their subsequent expectations. User stories (and/or use cases) and themes are great tools for developing such decisions.

      Product Delivery

      1. Order Confirmation
      2. Order Dispatching
      3. Warehouse Management
      4. Fill Order
      5. Ship Order
      6. Deliver Order

      Use Case and User Story Theme: Confirm Order

      This image shows the relationship between confirming the customer's order online, and the Online Buyer, the Online Catalog, the Integrated Payment, and the Inventory Lookup.

      The use case Confirming Customer’s Online Order has four actors:

      1. An Online Buyer who should be provided with a catalog of products to purchase from.
      2. An Online Catalog that is invoked to display its contents on demand.
      3. An Integrated Payment system for accepting an online form of payment (credit card, Bitcoins, etc.) in a secure transaction.
      4. An Inventory Lookup module that confirms there is stock available to satisfy the Online Buyer’s order.

      Info-Tech Insight

      Each use case theme links back to a feature(s) in the product backlog.

      Related Research

      Deliver on Your Digital Portfolio Vision

      • Recognize that a vision is only as good as the data that backs it up. Lay out a comprehensive backlog with quality built in that can be effectively communicated and understood through roadmaps.
      • Your intent is only a dream if it cannot be implemented – define what goes into a release plan via the release canvas.
      • Define a communication approach that lets everyone know where you are heading.

      Document Your Business Architecture

      • Recognize the opportunity for architecture work, analyze the current and target states of your business strategy, and identify and engage the right stakeholders.
      • Model the business in the form of architectural blueprints.
      • Apply business architecture techniques such as strategy maps, value streams, and business capability maps to design usable and accurate blueprints of the business.
      • Drive business architecture forward to promote real value to the organization.
      • Assess your current projects to determine if you are investing in the right capabilities. Conduct business capability assessments to identify opportunities and to prioritize projects.

      1.2 Document dynamic value stream maps

      1. Create value stream maps that support your business objectives.
      • The value stream maps could belong to existing or new business objectives.
    • For each value stream map:
      • Determine use case(s), the actors, and their expected activity.

      *Refer to the next slide for an example of a dynamic value stream map.

      Download the Solution Architecture Template for documentation of dynamic value stream map

      Input

      • Business Goals
      • Some or All Existing Business Processes
      • Some or All Proposed New Business Processes

      Output

      • Dynamic Value Stream Maps for Multiple Use Roles and Use Cases

      Materials

      • Whiteboard/Flip Charts

      Participants

      • Business Architect
      • Product Owner
      • Application Architect
      • Integration Architect

      Example: Dynamic value stream map

      Loan Provision*

      *Value Stream Name: Usually has the same name as the capability it illustrates.

      Loan Application**; Disbursement of Fund**; Risk Management**; Service Accounts**

      **Value Stream Components: Specific functions that support the successful delivery of a value stream.

      Disbursement of Funds

      This image shows the relationship between depositing the load into the applicant's bank account, and the Applicant's bank, the Loan Applicant, and the Loan Supplier.

      Style #1:

      The use case Disbursement of Funds has three actors:

      1. A Loan Applicant who applied for a loan and got approved for one.
      2. A Loan Supplier who is the source for the funds.
      3. The Applicant’s Bank that has an account into which the funds are deposited.

      Style # 2:

      Loan Provision: Disbursement of Funds
      Use Case Actors Expectation
      Deposit Loan Into Applicant’s Bank Account
      1. Loan Applicant
      2. Loan Supplier
      3. Applicant’s Bank
      1. Should be able to see deposit in bank account
      2. Deposit funds into account
      3. Accept funds into account

      Mid-Phase 1 Checkpoint

      By now, the following items are ideally completed:

      • Mid-Phase 1 Checkpoint

      Start with an investigation of your architecture’s qualitative needs

      Quality attributes can be viewed as the -ilities (e.g. scalability, usability, reliability) that a software system needs to provide. A system not meeting any of its quality attribute requirements will likely not function as required. Examples of quality attributes are:

      1. Slow system response time
      2. Security breaches that result in loss of personal data
      3. A product feature upgrade that is not compatible with previous versions
      Examples of Qualitative Attributes
      Performance Compatibility Usability Reliability Security Maintainability
      • Response Time
      • Resource Utilization
      • System Capacity
      • Interoperability
      • Accessibility
      • User Interface
      • Intuitiveness
      • Availability
      • Fault Tolerance
      • Recoverability
      • Integrity
      • Non-Repudiation
      • Modularity
      • Reusability
      • Modifiability
      • Testability

      Focus on quality attributes that are architecturally significant.

      • Not every system requires every quality attribute.
      • Pay attention to those attributes without which the solution will not be able to satisfy a user’s abstract* expectation.
      • This set can be considered Architecturally Significant Requirements (ASR). ASR concern scenarios have the most impact on the architecture of the software system.
      • ASR are fundamental needs of the system and changing them in the future can be a costly and difficult exercise.

      *Abstract since attributes like performance and reliability are not directly measurable by a user.

      Stimulus Response Measurement Environmental Context

      For applicable use cases: (*Adapted from S Carnegie Mellon University, 2000)

      1. Determine the Stimulus (temporal, external, or internal) that puts stress on the system. For example, a VPN-accessed hospital management system is used for nurses to login at 8am every weekday.
      2. Describe how the system should Respond to the stimulus. For example, the hospital management system should complete a nurse login under 10ms on initiation of the HTTPS request.
      3. Set a Measurement criteria for determining the success of the response to the stimulus. For example, the system should be able to successfully respond to 98% of the HTTPS requests the first time.
      4. Note the environmental context under which the stimulus occurs, including any unusual conditions in effect.
      • The hospital management system needs to respond in under 10ms under typical load or peak load?
      • What is the time variance of peak loads, for example, an e-commerce system during a Black Friday sale?
      • How big is the peak load?

      Info-Tech Insight

      Three out of four is bad. Don’t architect for normal situations because the solution will be fragile and prone to catastrophic failure under unexpected events.
      Read article: Retail sites crash under weight of online Black Friday shoppers.

      Discover and evaluate the qualitative attributes needed for use cases or user stories

      Deposit Loan Into Applicant’s Bank Account

      Assume analysis is being done for a to-be developed system.

      User Loan Applicant
      Expectations On login to the web system, should be able to see accurate bank balance after loan funds are deposited.
      User signs into the online portal and opens their account balance page.
      Expected Response From System System creates a connection to the data source and renders it on the screen in under 10ms.
      Measurement Under Normal Loads:
      • Response in 10ms or less
      • Data should not be stale
      Under Peak Loads:
      • Response in 15ms or less
      • Data should not be stale
      Quality Attribute Required Required Attribute # 1: Performance
      • Design Decision: Reduce latency by placing authorization components closer to user’s location.
      Required Attribute # 2: Data Reliability
      • Design Decision: Use event-driven ETL pipelines.
      Required Attribute # 3: Scalability
      • Design Decision: Following Principle # 4 of the CSA (JIT Architecture), delay decision until necessary.

      Use cases developed in Phase 1.2 should be used here. (Adapted from the ATAM Utility Tree Method for Quality Attribute Engineering)

      Reduce technical debt while you are at it

      Deposit Loan Into Applicant’s Bank Account

      Assume analysis is being done for a to-be developed system.

      UserLoan Applicant
      ExpectationsOn login to the web system, should be able to see accurate bank balance after loan funds are deposited.
      User signs into the online portal and opens their account balance page.
      Expected Response From SystemSystem creates a connection to the data source and renders it on the screen in under 10ms.
      MeasurementUnder Normal Loads:
      • Response in 10ms or less
      • Data should not be stale
      Under Peak Loads:
      • Response in 15ms or less
      • Data should not be stale
      Quality Attribute RequiredRequired Attribute # 1: Performance
      • Design Decision: Reduce latency by placing authorization components closer to user’s location.

      Required Attribute # 2: Data Reliability

      • Expected is 15ms or less under peak loads, but average latency is 21ms.
      • Design Decision: Use event-driven ETL pipelines.

      Required Attribute # 3: Scalability

      • Data should not be stale and should sync instantaneously, but in some zip codes data synchronization is taking 8 hours.
      • Design Decision: Investigate integrations and flows across application, database, and infrastructure. (Note: A dedicated section for discussing scalability is presented in Phase 2.)

      1.3 Create a conceptual map between the value streams, use cases, and required architectural attributes

      1. For selected use cases completed in Phase 1.2:
      • Map the value stream to its associated use cases.
      • For each use case, list the required architectural quality attributes.

      Download the Solution Architecture Template for mapping value stream components to their required architectural attribute.

      Input

      • Use Cases
      • User Roles
      • Stimulus to System
      • Response From System
      • Response Measurement

      Output

      • List of Architectural Quality Attributes

      Materials

      • Whiteboard/Flip Charts

      Participants

      • Business Architect
      • Application Architect
      • Integration Architect
      • Database Architect
      • Infrastructure Architect

      Example for Phase 1.3

      Loan Provision

      Loan Application → Disbursement of Funds → Risk Management → Service Accounts

      Value Stream Component Use Case Required Architectural Attribute
      Loan Application UC1: Submit Loan Application
      UC2: Review Loan Application
      UC3: Approve Loan Application
      UCn: ……..
      UC1: Resilience, Data Reliability
      UC2: Data Reliability
      UC3: Scalability, Security, Performance
      UCn: …..
      Disbursement of Funds UC1: Deposit Funds Into Applicant’s Bank Account
      UCn: ……..
      UC1: Performance, Scalability, Data Reliability
      Risk Management ….. …..
      Service Accounts ….. …..

      1.2 Document dynamic value stream maps

      1. Create value stream maps that support your business objectives.
      • The value stream maps could belong to existing or new business objectives.
    • For each value stream map:
      • Determine use case(s), the actors, and their expected activity.

      *Refer to the next slide for an example of a dynamic value stream map.

      Download the Solution Architecture Template for documentation of dynamic value stream map

      Input

      • Business Goals
      • Some or All Existing Business Processes
      • Some or All Proposed New Business Processes

      Output

      • Dynamic Value Stream Maps for Multiple Use Roles and Use Cases

      Materials

      • Whiteboard/Flip Charts

      Participants

      • Business Architect
      • Product Owner
      • Application Architect
      • Integration Architect

      Example: Dynamic value stream map

      Loan Provision*

      *Value Stream Name: Usually has the same name as the capability it illustrates.

      Loan Application**; Disbursement of Fund**; Risk Management**; Service Accounts**

      **Value Stream Components: Specific functions that support the successful delivery of a value stream.

      Disbursement of Funds

      This image shows the relationship between depositing the load into the applicant's bank account, and the Applicant's bank, the Loan Applicant, and the Loan Supplier.

      Style #1:

      The use case Disbursement of Funds has three actors:

      1. A Loan Applicant who applied for a loan and got approved for one.
      2. A Loan Supplier who is the source for the funds.
      3. The Applicant’s Bank that has an account into which the funds are deposited.

      Style # 2:

      Loan Provision: Disbursement of Funds
      Use Case Actors Expectation
      Deposit Loan Into Applicant’s Bank Account
      1. Loan Applicant
      2. Loan Supplier
      3. Applicant’s Bank
      1. Should be able to see deposit in bank account
      2. Deposit funds into account
      3. Accept funds into account

      Mid-Phase 1 Checkpoint

      By now, the following items are ideally completed:

      • Mid-Phase 1 Checkpoint

      Start with an investigation of your architecture’s qualitative needs

      Quality attributes can be viewed as the -ilities (e.g. scalability, usability, reliability) that a software system needs to provide. A system not meeting any of its quality attribute requirements will likely not function as required. Examples of quality attributes are:

      1. Slow system response time
      2. Security breaches that result in loss of personal data
      3. A product feature upgrade that is not compatible with previous versions
      Examples of Qualitative Attributes
      Performance Compatibility Usability Reliability Security Maintainability
      • Response Time
      • Resource Utilization
      • System Capacity
      • Interoperability
      • Accessibility
      • User Interface
      • Intuitiveness
      • Availability
      • Fault Tolerance
      • Recoverability
      • Integrity
      • Non-Repudiation
      • Modularity
      • Reusability
      • Modifiability
      • Testability

      Focus on quality attributes that are architecturally significant.

      • Not every system requires every quality attribute.
      • Pay attention to those attributes without which the solution will not be able to satisfy a user’s abstract* expectation.
      • This set can be considered Architecturally Significant Requirements (ASR). ASR concern scenarios have the most impact on the architecture of the software system.
      • ASR are fundamental needs of the system and changing them in the future can be a costly and difficult exercise.

      *Abstract since attributes like performance and reliability are not directly measurable by a user.

      Stimulus Response Measurement Environmental Context

      For applicable use cases: (*Adapted from S Carnegie Mellon University, 2000)

      1. Determine the Stimulus (temporal, external, or internal) that puts stress on the system. For example, a VPN-accessed hospital management system is used for nurses to login at 8am every weekday.
      2. Describe how the system should Respond to the stimulus. For example, the hospital management system should complete a nurse login under 10ms on initiation of the HTTPS request.
      3. Set a Measurement criteria for determining the success of the response to the stimulus. For example, the system should be able to successfully respond to 98% of the HTTPS requests the first time.
      4. Note the environmental context under which the stimulus occurs, including any unusual conditions in effect.
      • The hospital management system needs to respond in under 10ms under typical load or peak load?
      • What is the time variance of peak loads, for example, an e-commerce system during a Black Friday sale?
      • How big is the peak load?

      Info-Tech Insight

      Three out of four is bad. Don’t architect for normal situations because the solution will be fragile and prone to catastrophic failure under unexpected events.
      Read article: Retail sites crash under weight of online Black Friday shoppers.

      Discover and evaluate the qualitative attributes needed for use cases or user stories

      Deposit Loan Into Applicant’s Bank Account

      Assume analysis is being done for a to-be developed system.

      User Loan Applicant
      Expectations On login to the web system, should be able to see accurate bank balance after loan funds are deposited.
      User signs into the online portal and opens their account balance page.
      Expected Response From System System creates a connection to the data source and renders it on the screen in under 10ms.
      Measurement Under Normal Loads:
      • Response in 10ms or less
      • Data should not be stale
      Under Peak Loads:
      • Response in 15ms or less
      • Data should not be stale
      Quality Attribute Required Required Attribute # 1: Performance
      • Design Decision: Reduce latency by placing authorization components closer to user’s location.
      Required Attribute # 2: Data Reliability
      • Design Decision: Use event-driven ETL pipelines.
      Required Attribute # 3: Scalability
      • Design Decision: Following Principle # 4 of the CSA (JIT Architecture), delay decision until necessary.

      Use cases developed in Phase 1.2 should be used here. (Adapted from the ATAM Utility Tree Method for Quality Attribute Engineering)

      Reduce technical debt while you are at it

      Deposit Loan Into Applicant’s Bank Account

      Assume analysis is being done for a to-be developed system.

      UserLoan Applicant
      ExpectationsOn login to the web system, should be able to see accurate bank balance after loan funds are deposited.
      User signs into the online portal and opens their account balance page.
      Expected Response From SystemSystem creates a connection to the data source and renders it on the screen in under 10ms.
      MeasurementUnder Normal Loads:
      • Response in 10ms or less
      • Data should not be stale
      Under Peak Loads:
      • Response in 15ms or less
      • Data should not be stale
      Quality Attribute RequiredRequired Attribute # 1: Performance
      • Design Decision: Reduce latency by placing authorization components closer to user’s location.

      Required Attribute # 2: Data Reliability

      • Expected is 15ms or less under peak loads, but average latency is 21ms.
      • Design Decision: Use event-driven ETL pipelines.

      Required Attribute # 3: Scalability

      • Data should not be stale and should sync instantaneously, but in some zip codes data synchronization is taking 8 hours.
      • Design Decision: Investigate integrations and flows across application, database, and infrastructure. (Note: A dedicated section for discussing scalability is presented in Phase 2.)

      1.3 Create a conceptual map between the value streams, use cases, and required architectural attributes

      1. For selected use cases completed in Phase 1.2:
      • Map the value stream to its associated use cases.
      • For each use case, list the required architectural quality attributes.

      Download the Solution Architecture Template for mapping value stream components to their required architectural attribute.

      Input

      • Use Cases
      • User Roles
      • Stimulus to System
      • Response From System
      • Response Measurement

      Output

      • List of Architectural Quality Attributes

      Materials

      • Whiteboard/Flip Charts

      Participants

      • Business Architect
      • Application Architect
      • Integration Architect
      • Database Architect
      • Infrastructure Architect

      Prioritize architectural quality attributes to ensure a right-engineered solution

      Trade-offs are inherent in solution architecture. Scaling systems may impact performance and weaken security, while fault-tolerance and redundancy may improve availability but at higher than desired costs. In the end, the best solution is not always perfect, but balanced and right-engineered (versus over- or under-engineered).

      Loan Provision

      Loan Application → Disbursement of Funds → Risk Management → Service Accounts

      1. Map architecture attributes against the value stream components.
      • Use individual use cases to determine which attributes are needed for a value stream component.
      This image contains a screenshot of the table showing the importance of scalability, resiliance, performance, security, and data reliability for loan application, disbursement of funds, risk management, and service accounts.

      In our example, the prioritized list of architectural attributes are:

      • Security (4 votes for Very Important)
      • Data Reliability (2 votes for Very Important)
      • Scalability (1 vote for Very Important and 1 vote for Fairly Important) and finally
      • Resilience (1 vote for Very Important, 0 votes for Fairly Important and 1 vote for Mildly Important)
      • Performance (0 votes for Very Important, 2 votes for Fairly Important)

      1.4 Create a prioritized list of architectural attributes (from 1.3)

      1. Using the tabular structure shown on the previous slide:
      • Map each value stream component against architectural quality attributes.
      • For each mapping, indicate its importance using the green, blue, and yellow color scheme.

      Download the Solution Architecture Template and document the list of architectural attributes by priority.

      Input

      • List of Architectural Attributes From 1.3

      Output

      • Prioritized List of Architectural Attributes

      Materials

      • Whiteboard/Flip Charts

      Participants

      • Business Architect
      • Application Architect
      • Integration Architect
      • Database Architect
      • Infrastructure Architect

      End of Phase 1

      At the end of this Phase, you should have completed the following activities:

      • Documented a set of dynamic value stream maps along with selected use cases.
      • Using the SRME framework, identified quality attributes for the system under investigation.
      • Prioritized quality attributes for system use cases.

      Phase 2: Multi-Purpose Data and Security Architecture

      Phase 1

      1.1 Articulate an Architectural Vision
      1.2 Develop Dynamic Value Stream Maps
      1.3 Map Value Streams, Use Cases, and Required Architectural Attributes
      1.4 Create a Prioritized List of Architectural Attributes

      Phase 2

      2.1 Develop a Data Architecture That Supports Transactional and Analytical Needs
      2.2 Document Security Architecture Risks and Mitigations

      Phase 3

      3.1 Document Scalability Architecture
      3.2 Document Performance Enhancing Architecture
      3.3 Combine the Different Architecture Design Decisions Into a Unified Solution Architecture

      This phase will walk you through the following activities:

      • Understand the scalability, performance, resilience, and security needs of the business.

      This phase involves the following participants:

      • Business Architect
      • Product Owner
      • Application Architect
      • Integration Architect
      • Database Architect
      • Enterprise Architect

      Enhance Your Solution Architecture Practice

      Fragmented data environments need something to sew them together

      • A full 93% of enterprises have a multi-cloud strategy, with 87% having a hybrid-cloud environment in place.
      • On average, companies have data stored in 2.2 public and 2.2 private clouds as well as in various on-premises data repositories.
      This image contains a breakdown of the cloud infrastructure, including single cloud versus multi-cloud.

      Source: Flexera

      In addition, companies are faced with:

      • Access and integration challenges (Who is sending the data? Who is getting it? Can we trust them?)
      • Data format challenges as data may differ for each consumer and sender of data
      • Infrastructure challenges as data repositories/processors are spread out over public and private clouds, are on premises, or in multi-cloud and hybrid ecosystems
      • Structured vs. unstructured data

      A robust and reliable integrated data architecture is essential for any organization that aspires to be relevant and impactful in its industry.

      Data’s context and influence on a solution’s architecture cannot be overestimated

      Data used to be the new oil. Now it’s the life force of any organization that has serious aspirations of providing profit-generating products and services to customers. Architectural decisions about managing data have a significant impact on the sustainability of a software system as well as on quality attributes such as security, scalability, performance, and availability.

      Storage and Processing go hand in hand and are the mainstay of any data architecture. Due to their central position of importance, an architecture decision for storage and processing must be well thought through or they become the bottleneck in an otherwise sound system.

      Ingestion refers to a system’s ability to accept data as an input from heterogenous sources, in different formats, and at different intervals.

      Dissemination is the set of architectural design decisions that make a system’s data accessible to external consumers. Major concerns involve security for the data in motion, authorization, data format, concurrent requests for data, etc.

      Orchestration takes care of ensuring data is current and reliable, especially for systems that are decentralized and distributed.

      Data architecture requires alignment with a hybrid data management plan

      Most companies have a combination of data. They have data they own using on-premises data sources and on the cloud. Hybrid data management also includes external data, such as social network feeds, financial data, and legal information amongst many others.

      Data integration architectures have typically been put in one of two major integration patterns:

      Application to Application Integration (or “speed matters”) Analytical Data Integrations (or “send it to me when its all done”)
      • This domain is concerned with ensuring communication between processes.
      • Examples include patterns such as Service-Oriented Architecture, REST, Event Hubs and Enterprise Service Buses.
      • This domain is focused on integrating data from transactional processes towards enterprise business intelligence. It supports activities that require well-managed data to generate evidence-based insights.
      • Examples of this pattern are ELT, enterprise data warehouses, and data marts.

      Sidebar

      Difference between real-time, batch, and streaming data movements

      Real-Time

      • Reacts to data in seconds or even quicker.
      • Real-time systems are hard to implement.

      Batch

      • Batch processing deals with a large volume of data all at once and data-related jobs are typically completed simultaneously in non-stop, sequential order.
      • Batch processing is an efficient and low-cost means of data processing.
      • Execution of batch processing jobs can be controlled manually, providing further control over how the system treats its data assets.
      • Batch processing is only useful if there are no requirements for data to be fresh and current. Real-time systems are suited to processing data that requires these attributes.

      Streaming

      • Stream processing allows almost instantaneous analysis of data as it streams from one device to another.
      • Since data is analyzed quickly, storage may not be a concern (since only computed data is stored while raw data can be dispersed).
      • Streaming requires the flow of data into the system to equal the flow of data computing, otherwise issues of data storage and performance can rise.

      Modern data ingestion and dissemination frameworks keep core data assets current and accessible

      Data ingestion and dissemination frameworks are critical for keeping enterprise data current and relevant.

      Data ingestion/dissemination frameworks capture/share data from/to multiple data sources.

      Factors to consider when designing a data ingestion/dissemination architecture

      What is the mode for data movement?

      • The mode for data movement is directly influenced by the size of data being moved and the downstream requirements for data currency.
      • Data can move in real-time, as a batch, or as a stream.

      What is the ingestion/dissemination architecture deployment strategy?

      • Outside of critical security concerns, hosting on the cloud vs. on premises leads to a lower total cost of ownership (TCO) and a higher return on investment (ROI).

      How many different and disparate data sources are sending/receiving data?

      • Stability comes if there is a good idea about the data sources/recipient and their requirements.

      What are the different formats flowing through?

      • Is the data in the form of data blocks? Is it structured, semi-unstructured, or unstructured?

      What are expected performance SLAs as data flow rate changes?

      • Data change rate is defined as the size of changes occurring every hour. It helps in selecting the appropriate tool for data movement.
      • Performance is a derivative of latency and throughput, and therefore, data on a cloud is going to have higher latency and lower throughput then if it is kept on premises.
      • What is the transfer data size? Are there any file compression and/or file splits applied on the data? What is the average and maximum size of a block object per ingestion/dissemination operation?

      What are the security requirements for the data being stored?

      • The ingestion/dissemination framework should be able to work through a secure tunnel to collect/share data if needed.

      Sensible storage and processing strategy can improve performance and scalability and be cost-effective

      The range of options for data storage is staggering...

      … but that’s a good thing because the range of data formats that organizations must deal with is also richer than in the past.

      Different strokes for different workloads.

      The data processing tool to use may depend upon the workloads the system has to manage.

      Expanding upon the Risk Management use case (as part of the Loan Provision Capability), one of the outputs for risk assessment is a report that conducts a statistical analysis of customer profiles and separates those that are possibly risky. The data for this report is spread out across different data systems and will need to be collected in a master data management storage location. The business and data architecture team have discussed three critical system needs, noted below:

      Data Management Requirements for Risk Management Reporting Data Design Decision
      Needs to query millions of relational records quickly
      • Strong indexing
      • Strong caching
      • Message queue
      Needs a storage space for later retrieval of relational data
      • Data storage that scales as needed
      Needs turnkey geo-replication mechanism with document retrieval in milliseconds
      • Add NoSQL with geo-replication and quick document access

      Keep every core data source on the same page through orchestration

      Data orchestration, at its simplest, is the combination of data integration, data processing, and data concurrency management.

      Data pipeline orchestration is a cross-cutting process that manages the dependencies between your data integration tasks and scheduled data jobs.

      A task or application may periodically fail, and therefore, as a part of our data architecture strategy, there must be provisions for scheduling, rescheduling, replaying, monitoring, retrying, and debugging the entire data pipeline in a holistic way.

      Some of the functionality provided by orchestration frameworks are:

      • Job scheduling
      • Job parametrization
      • SLAs tracking, alerting, and notification
      • Dependency management
      • Error management and retries
      • History and audit
      • Data storage for metadata
      • Log aggregation
      Data Orchestration Has Three Stages
      Organize Transform Publicize
      Organizations may have legacy data that needs to be combined with new data. It’s important for the orchestration tool to understand the data it deals with. Transform the data from different sources into one standard type. Make transformed data easily accessible to stakeholders.

      2.1 Discuss and document data architecture decisions

      1. Using the value maps and associated use cases from Phase 1, determine the data system quality attributes.
      2. Use the sample tabular layout on the next slide or develop one of your own.

      Download the Solution Architecture Template for documenting data architecture decisions.

      Input

      • Value Maps and Use Cases

      Output

      • Initial Set of Data Design Decisions

      Materials

      • Whiteboard/Flip Charts

      Participants

      • Business Architect
      • Application Architect
      • Integration Architect
      • Database Architect
      • Infrastructure Architect

      Example: Data Architecture

      Data Management Requirements for Risk Management Reporting Data Design Decision
      Needs to query millions of relational records quickly
      • Strong indexing
      • Strong caching
      • Message queue
      Needs a storage space for later retrieval of relational data
      • Data storage that scales as needed
      Needs turnkey geo-replication mechanism with document retrieval in milliseconds
      • Add NoSQL with geo-replication and quick document access

      There is no free lunch when making the most sensible security architecture decision; tradeoffs are a necessity

      Ensuring that any real system is secure is a complex process involving tradeoffs against other important quality attributes (such as performance and usability). When architecting a system, we must understand:

      • Its security needs.
      • Its security threat landscape.
      • Known mitigations for those threats to ensure that we create a system with sound security fundamentals.

      The first thing to do when determining security architecture is to conduct a threat and risk assessment (TRA).

      This image contains a sample threat and risk assessment. The steps are Understand: Until we thoroughly understand what we are building, we cannot secure it. Structure what you are building, including: System boundary, System structure, Databases, Deployment platform; Analyze: Use techniques like STRIDE and attack trees to analyze what can go wrong and what security problems this will cause; Mitigate: The security technologies to use, to mitigate your concerns, are discussed here. Decisions about using single sign-on (SSO) or role-based access control (RBAC), encryption, digital signatures, or JWT tokens are made. An important part of this step is to consider tradeoffs when implementing security mechanisms; validate: Validation can be done by experimenting with proposed mitigations, peer discussion, or expert interviews.

      Related Research

      Optimize Security Mitigation Effectiveness Using STRIDE

      • Have a clear picture of:
        • Critical data and data flows
        • Organizational threat exposure
        • Security countermeasure deployment and coverage
      • Understand which threats are appropriately mitigated and which are not.
      • Generate a list of initiatives to close security gaps.
      • Create a quantified risk and security model to reassess program and track improvement.
      • Develop measurable information to present to stakeholders.

      The 3A’s of strong security: authentication, authorization, and auditing

      Authentication

      Authentication mechanisms help systems verify that a user is who they claim to be.

      Examples of authentication mechanisms are:

      • Two-Factor Authentication
      • Single Sign-On
      • Multi-Factor Authentication
      • JWT Over OAUTH

      Authorization

      Authorization helps systems limit access to allowed features, once a user has been authenticated.

      Examples of authentication mechanisms are:

      • RBAC
      • Certificate Based
      • Token Based

      Auditing

      Securely recording security events through auditing proves that our security mechanisms are working as intended.

      Auditing is a function where security teams must collaborate with software engineers early and often to ensure the right kind of audit logs are being captured and recorded.

      Info-Tech Insight

      Defects in your application software can compromise privacy and integrity even if cryptographic controls are in place. A security architecture made after thorough TRA does not override security risk introduced due to irresponsible software design.

      Examples of threat and risk assessments using STRIDE and attack trees

      STRIDE is a threat modeling framework and is composed of:

      • Spoofing or impersonation of someone other than oneself
      • Tampering with data and destroying its integrity
      • Repudiation by bypassing system identity controls
      • Information disclosure to unauthorized persons
      • Denial of service that prevents system or parts of it from being used
      • Elevation of privilege so that attackers get rights they should not have
      Example of using STRIDE for a TRA on a solution using a payment system This image contains a sample attack tree.
      Spoofing PayPal Bad actor can send fraudulent payment request for obtaining funds.
      Tampering PayPal Bad actor accesses data base and can resend fraudulent payment request for obtaining funds.
      Repudiation PayPal Customer claims, incorrectly, their account made a payment they did not authorize.
      Disclosure PayPal Private service database has details leaked and made public.
      Denial of Service PayPal Service is made to slow down through creating a load on the network, causing massive build up of requests
      Elevation of Privilege PayPal Bad actor attempts to enter someone else’s account by entering incorrect password a number of times.

      2.2 Document security architecture risks and mitigations

      1. Using STRIDE, attack tree, or any other framework of choice:
      • Conduct a TRA for use cases identified in Phase 1.2
    • For each threat identified through the TRA, think through the implications of using authentication, authorization, and auditing as a security mechanism.
    • Download the Solution Architecture Template for documenting data architecture decisions.

      Input

      • Dynamic Value Stream Maps

      Output

      • Security Architecture Risks and Mitigations

      Materials

      • Whiteboard/Flip Charts

      Participants

      • Business Architect
      • Product Owner
      • Security Team
      • Application Architect
      • Integration Architect

      Examples of threat and risk assessments using STRIDE

      Example of using STRIDE for a TRA on a solution using a payment system
      Threat System Component Description Quality Attribute Impacted Resolution
      Spoofing PayPal Bad actor can send fraudulent payment request for obtaining funds. Confidentiality Authorization
      Tampering PayPal Bad actor accesses data base and can resend fraudulent payment request for obtaining funds. Integrity Authorization
      Repudiation PayPal Customer claims, incorrectly, their account made a payment they did not authorize. Integrity Authentication and Logging
      Disclosure PayPal Private service database has details leaked and made public. Confidentiality Authorization
      Denial of Service PayPal Service is made to slow down through creating a load on the network, causing massive build up of requests Availability N/A
      Elevation of Privilege PayPal Bad actor attempts to enter someone else’s account by entering incorrect password a number of times. Confidentiality, Integrity, and Availability Authorization

      Phase 3: Upgrade Your System’s Availability

      Phase 1

      1.1 Articulate an Architectural Vision
      1.2 Develop Dynamic Value Stream Maps
      1.3 Map Value Streams, Use Cases, and Required Architectural Attributes
      1.4 Create a Prioritized List of Architectural Attributes

      Phase 2

      2.1 Develop a Data Architecture That Supports Transactional and Analytical Needs
      2.2 Document Security Architecture Risks and Mitigations

      Phase 3

      3.1 Document Scalability Architecture
      3.2 Document Performance Enhancing Architecture
      3.3 Combine the Different Architecture Design Decisions Into a Unified Solution Architecture

      This phase will walk you through the following activities:

      • Examine architecture for scalable and performant system designs
      • Integrate all design decisions made so far into a solution design decision log

      This phase involves the following participants:

      • Business Architect
      • Product Owner
      • Application Architect
      • Integration Architect
      • Database Architect
      • Enterprise Architect

      Enhance Your Solution Architecture Practice

      In a cloud-inspired system architecture, scalability takes center stage as an architectural concern

      Scale and scope of workloads are more important now than they were, perhaps, a decade and half back. Architects realize that scalability is not an afterthought. Not dealing with it at the outset can have serious consequences should an application workload suddenly exceed expectations.

      Scalability is …

      … the ability of a system to handle varying workloads by either increasing or decreasing the computing resources of the system.

      An increased workload could include:

      • Higher transaction volumes
      • A greater number of users

      Architecting for scalability is …

      … not easy since organizations may not be able to accurately judge, outside of known circumstances, when and why workloads may unexpectedly increase.

      A scalable architecture should be planned at the:

      • Application Level
      • Infrastructure Level
      • Database Level

      The right amount and kind of scalability is …

      … balancing the demands of the system with the supply of attributes.

      If demand from system > supply from system:

      • Services and products are not useable and deny value to customers.

      If supply from system > demand from system:

      • Excess resources have been paid for that are not being used.

      When discussing the scalability needs of a system, investigate the following, at a minimum:

      • In case workloads increase due to higher transaction volumes, will the system be able to cope with the additional stress?
      • In situations where workloads increase, will the system be able to support the additional stress without any major modifications being made to the system?
      • Is the cost associated with handling the increased workloads reasonable for the benefit it provides to the business?
      • Assuming the system doesn’t scale, is there any mechanism for graceful degradation?

      Use evidence-based decision making to ensure a cost-effective yet appropriate scaling strategy

      The best input for an effective scaling strategy is previously gathered traffic data mapped to specific circumstances.

      In some cases, either due to lack of monitoring or the business not being sure of its needs, scalability requirements are hard to determine. In such cases, use stated tactical business objectives to design for scalability. For example, the business might state its desire to achieve a target revenue goal. To accommodate this, a certain number of transactions would need to be conducted, assuming a particular conversion rate.

      Scaling strategies can be based on Vertical or Horizontal expansion of resources.
      Pros Cons
      Vertical
      Scale up through use of more powerful but limited number of resources
      • May not require frequent upgrades.
      • Since data is managed through a limited number of resources, it is easier to share and keep current.
      • Costly upfront.
      • Application, database, and infrastructure may not be able to make optimal use of extra processing power.
      • As the new, more powerful resource is provisioned, systems may experience downtime.
      • Lacks redundancy due to limited points of failure.
      • Performance is constrained by the upper limits of the infrastructure involved.
      Horizontal
      Scale out through use of similarly powered but larger quantity of resources
      • Cost-effective upfront.
      • System downtime is minimal, when scaling is being performed.
      • More redundance and fault-tolerance is possible since there are many nodes involved, and therefore, can replace failed nodes.
      • Performance can scale out as more nodes are added.
      • Upgrades may occur more often than in vertical scaling.
      • Increases machine footprints and administrative costs over time.
      • Data may be partitioned on multiple nodes, leading to administrative and data currency challenges.

      Info-Tech Insight

      • Scalability is the one attribute that sparks a lot of trade-off discussions. Scalable solutions may have to compromise on performance, cost, and data reliability.
      • Horizontal scalability is mostly always preferable over vertical scalability.

      Sidebar

      The many flavors of horizontal scaling

      Traffic Shard-ing

      Through this mechanism, incoming traffic is partitioned around a characteristic of the workload flowing in. Examples of partitioning characteristics are user groups, geo-location, and transaction type.

      Beware of:

      • Lack of data currency across shards.

      Copy and Paste

      As the name suggests, clone the compute resources along with the underlying databases. The systems will use a load balancer as the first point of contact between itself and the workload flowing in.

      Beware of:

      • Though this is a highly scalable model, it does introduce risks related to data currency across all databases.
      • In case master database writes are frequent, it could become a bottleneck for the entire system.

      Productization Through Containers

      This involves breaking up the system into specific functions and services and bundling their business rules/databases into deployable containers.

      Beware of:

      • Too many containers introduce the need to orchestrate the distributed architecture that results from a service-oriented approach.

      Start a scalability overview with a look at the database(s)

      To know where to go, you must know where you are. Before introducing architectural changes to database designs, use the right metrics to get an insight into the root cause of the problem(s).

      In a nutshell, the purpose of scaling solutions is to have the technology stack do less work for the most requested services/features or be able to effectively distribute the additional workload across multiple resources.

      For databases, to ensure this happens, consider these techniques:

      • Reuse data through caching on the server and/or the client. This eliminates the need for looking up already accessed data. Examples of caching are:
        • In-memory caching of data
        • Caching database queries
      • Implement good data retrieval techniques like indexes.
      • Divide labor at the database level.
        • Through setting up primary-secondary distribution of data. In such a setup, the primary node is involved in writing data to itself and passes on requests to secondary nodes for fulfillment.
        • Through setting up database shards (either horizontally or vertically).
          • In a horizontal shard, a data table is broken into smaller pieces with the same data model but unique data in it. The sum total of the shared databases contains all the data in the primary data table.
          • In a vertical shard, a data table is broken into smaller pieces, but each piece may have a subset of the data columns. The data’s corresponding columns are put into the table where the column resides.

      Info-Tech Insight

      A non-scalable architecture has more than just technology-related ramifications. Hoping that load balancers or cloud services will manage scalability-related issues is bound to have economic impacts as well.

      Sidebar

      Caching Options

      CSA PRINCIPLE 5 applies to any decision that supports system scalability.
      “X-ilities Over Features”

      Database Caching
      Fetches and stores result of database queries in memory. Subsequent requests to the database for the same queries will investigate the cache before making a connection with the database.
      Tools like Memcached or Redis are used for database caching.

      Precompute Database Caching
      Unlike database caching, this style of caching precomputes results of queries that are popular and frequently used. For example, a database trigger could execute several predetermined queries and have them ready for consumption. The precomputed results may be stored in a database cache.

      Application Object Caching
      Stores computed results in a cache for later retrieval. For data sources, which are not changing frequently and are part of a computation output, application caching will remove the need to connect with a database.

      Proxy Caching
      Caches retrieved web pages on a proxy server and makes them available for the next time the page is requested.

      The intra- and inter-process communication of the systems middle tier can become a bottleneck

      To synchronize or not to synchronize?

      A synchronous request (doing one thing at a time) means that code execution will wait for the request to be responded to before continuing.

      • A synchronous request is a blocking event and until it is completed, all following requests will have to wait for getting their responses.
      • An increasing workload on a synchronous system may impact performance.
      • Synchronous interactions are less costly in terms of design, implementation, and maintenance.
      • Scaling options include:
      1. Vertical scale up
      2. Horizontal scale out of application servers behind a load balancer and a caching technique (to minimize data retrieval roundtrips)
      3. Horizonal scale out of database servers with data partitioning and/or data caching technique

      Use synchronous requests when…

      • Each request to a system sets the necessary precondition for a following request.
      • Data reliability is important, especially in real-time systems.
      • System flows are simple.
      • Tasks that are typically time consuming, such as I/O, data access, pre-loading of assets, are completed quickly.

      Asynchronous requests (doing many things at the same time) do not block the system they are targeting.

      • It is a “fire and forget” mechanism.
      • Execution on a server/processor is triggered by the request, however, additional technical components (callbacks) for checking the state of the execution must be designed and implemented.
      • Asynchronous interactions require additional time to be spent on implementation and testing.
      • With asynchronous interactions, there is no guarantee the request initiated any processing until the callbacks check the status of the executed thread.

      Use asynchronous requests when…

      • Tasks are independent in nature and don’t require inter-task communication.
      • Systems flows need to be efficient.
      • The system is using event-driven techniques for processing.
      • Many I/O tasks are involved.
      • The tasks are long running.

      Sidebar

      Other architectural tactics for inter-process communication

      STATELESS SERVICES VERSUS STATEFUL SERVICES
      • Does not require any additional data, apart from the bits sent through with the request.
      • Without implementing a caching solution, it is impossible to access the previous data trail for a transaction session.
      • In addition to the data sent through with the request, require previous data sent to complete processing.
      • Requires server memory to store the additional state data. With increasing workloads, this could start impacting the server’s performance.
      It is generally accepted that stateless services are better for system scalability, especially if vertical scaling is costly and there is expectation that workloads will increase.
      MICROSERVICES VERSUS SERVERLESS FUNCTIONS
      • Services are designed as small units of code with a single responsibility and are available on demand.
      • A microservices architecture is easily scaled horizontally by adding a load balancer and a caching mechanism.
      • Like microservices, these are small pieces of code designed to fulfill a single purpose.
      • Are provided only through cloud vendors, and therefore, there is no need to worry about provisioning of infrastructure as needs increase.
      • Stateless by design but the life cycle of a serverless function is vendor controlled.
      Serverless function is an evolving technology and tightly controlled by the vendor. As and when vendors make changes to their serverless products, your own systems may need to be modified to make the best use of these upgrades.

      A team that does not measure their system’s scalability is a team bound to get a 5xx HTTP response code

      A critical aspect of any system is its ability to monitor and report on its operational outcomes.

      • Using the principle of continuous testing, every time an architectural change is introduced, a thorough load and stress testing cycle should be executed.
      • Effective logging and use of insightful metrics helps system design teams make data-driven decisions.
      • Using principle of site reliability engineering and predictive analytics, teams can be prepared for any unplanned exaggerated stimulus on the system and proactively set up remedial steps.

      Any system, however well architected, will break one day. Strategically place kill-switches to counter any failures and thoroughly test their functioning before releasing to production.

      • Using Principles 2 and 9 of the CSA, (include kill-switches and architect for x-ilities over features), introduce tactics at the code and higher levels that can be used to put a system in its previous best state in case of failure.
      • Examples of such tactics are:
        • Feature flags for turning on/off code modules that impact x-ilities.
        • Implement design patterns like throttling, autoscaling, and circuit breaking.
        • Writing extensive log messages that bubble up as exceptions/error handling from the code base. *Logging can be a performance drag. Use with caution as even logging code is still code that needs CPU and data storage.

      Performance is a system’s ability to satisfy time-bound expectations

      Performance can also be defined as the ability for a system to achieve its timing requirements, using available resources, under expected full-peak load:

      (International Organization for Standardization, 2011)

      • Performance and scalability are two peas in a pod. They are related to each other but are distinct attributes. Where scalability refers to the ability of a system to initiate multiple simultaneous processes, performance is the system’s ability to complete the processes within a mandated average time period.
      • Degrading performance is one of the first red flags about a system’s ability to scale up to workload demands.
      • Mitigation tactics for performance are very similar to the tactics for scalability.

      System performance needs to be monitored and measured consistently.

      Measurement Category 1: System performance in terms of end-user experience during different load scenarios.

      • Response time/latency: Length of time it takes for an interaction with the system to complete.
      • Turnaround time: Time taken to complete a batch of tasks.
      • Throughput: Amount of workload a system is capable of handling in a unit time period.

      Measurement Category 2: System performance in terms of load managed by computational resources.

      • Resource utilization: The average usage of a resource (like CPU) over a period. Peaks and troughs indicate excess vs. normal load times.
      • Number of concurrent connections: Simultaneous user requests that a resource like a server can successfully deal with at once.
      • Queue time: The turnaround time for a specific interaction or category of interactions to complete.

      Architectural tactics for performance management are the same as those used for system scalability

      Application Layer

      • Using a balanced approach that combines CSA Principle 7 (Good architecture comes in small packages) and Principle 10 (Architect for products, not projects), a microservices architecture based on domain-driven design helps process performance. Microservices use lightweight HTTP protocols and have loose coupling, adding a degree of resilience to the system as well. *An overly-engineered microservices architecture can become an orchestration challenge.
      • The code design must follow standards that support performance. Example of standards is SOLID*.
      • Serverless architectures can run application code from anywhere – for example, from edge servers close to an end user – thereby reducing latency.

      Database Layer

      • Using the right database technologies for persistence. Relational databases have implicit performance bottlenecks (which get exaggerated as data size grows along with indexes), and document store database technologies (key-value or wide-column) can improve performance in high-read environments.
      • Data sources, especially those that are frequently accessed, should ideally be located close to the application servers. Hybrid infrastructures (cloud and on premises mixed) can lead to latency when a cloud-application is accessing on-premises data.
      • Using a data partitioning strategy, especially in a domain-driven design architecture, can improve the performance of a system.

      Performance modeling and continuous testing makes the SRE a happy engineer

      Performance modeling and testing helps architecture teams predict performance risks as the solution is being developed.
      (CSA Principle 12: Test the solution architecture like you test your solution’s features)

      Create a model for your system’s hypothetical performance testing by breaking an end-to-end process or use case into its components. *Use the SIPOC framework for decomposition.

      This image contains an example of modeled performance, showing the latency in the data flowing from different data sources to the processing of the data.

      In the hypothetical example of modeled performance above:

      • The longest period of latency is 15ms.
      • The processing of data takes 30ms, while the baseline was established at 25ms.
      • Average latency in sending back user responses is 21ms – 13ms slower than expected.

      The model helps architects:

      • Get evidence for their assumptions
      • Quantitatively isolate bottlenecks at a granular level

      Model the performance flow once but test it periodically

      Performance testing measures the performance of a software system under normal and abnormal loads.

      Performance testing process should be fully integrated with software development activities and as automated as possible. In a fast-moving Agile environment, teams should attempt to:

      • Shift-left performance testing activities.
      • Use performance testing to pinpoint performance bottlenecks.
      • Take corrective action, as quickly as possible.

      Performance testing techniques

      • Normal load testing: Verifies the system’s behavior under the expected normal load to ensure that its performance requirements are met. Load testing can be used to measure response time, responsiveness, turnaround time, and throughput.
      • Expected maximum load testing: Like the normal load testing process, ensures system meets its performance requirements under expected maximum load.
      • Stress testing: Evaluates system behavior when processing loads beyond the expected maximum.

      *In a real production scenario, a combination of these tests are executed on a regular basis to monitor the performance of the system over a given period.

      3.1-3.2 Discuss and document initial decisions made for architecture scalability and performance

      1. Use the outcomes from either or both Phases 1.3 and 1.4.
      • For each value stream component, list the architecture decisions taken to ensure scalability and performance at client-facing and/or business-rule layers.

      Download the Solution Architecture Template for documenting data architecture decisions.

      Input

      • Output From Phase 1.3 and/or From Phase 1.4

      Output

      • Initial Set of Design Decisions Made for System Scalability and Performance

      Materials

      • Whiteboard/Flip Charts

      Participants

      • Business Architect
      • Application Architect
      • Integration Architect
      • Database Architect
      • Infrastructure Architect

      Example: Architecture decisions for scalability and performance

      Value Stream Component Design Decision for User Interface Layer Design Decisions for Middle Processing Layer
      Loan Application Scalability: N/A
      Resilience: Include circuit breaker design in both mobile app and responsive websites.
      Performance: Cache data client.
      Scalability: Scale vertically (up) since loan application processing is very compute intensive.
      Resilience: Set up fail-over replica.
      Performance: Keep servers in the same geo-area.
      Disbursement of Funds *Does not have a user interface Scalability: Scale horizontal when traffic reaches X requests/second.
      Resilience: Create microservices using domain-driven design; include circuit breakers.
      Performance: Set up application cache; synchronous communication since order of data input is important.
      …. …. ….

      3.3 Combine the different architecture design decisions into a unified solution architecture

      Download the Solution Architecture Template for documenting data architecture decisions.

      Input

      • Output From Phase 1.3 and/or From Phase 1.4
      • Output From Phase 2.1
      • Output From Phase 2.2
      • Output From 3.1 and 3.2

      Output

      • List of Design Decisions for the Solution

      Materials

      • Whiteboard/Flip Charts

      Participants

      • Business Architect
      • Application Architect
      • Integration Architect
      • Database Architect
      • Infrastructure Architect

      Putting it all together is the bow that finally ties this gift

      This blueprint covered the domains tagged with the yellow star.

      This image contains a screenshot of the solution architecture framework found earlier in this blueprint, with stars next to Data Architecture, Security, Performance, and Stability.

      TRADEOFF ALERT

      The right design decision is never the same for all perspectives. Along with varying opinions, comes the “at odds with each other set” of needs (scalability vs. performance, or access vs. security).

      An evidence-based decision-making approach using a domain-driven design strategy is a good mix of techniques for creating the best (right?) solution architecture.

      This image contains a screenshot of a table that summarizes the themes discussed in this blueprint.

      Summary of accomplishment

      • Gained understanding and clarification of the stakeholder objectives placed on your application architecture.
      • Completed detailed use cases and persona-driven scenario analysis and their architectural needs through SRME.
      • Created a set of design decisions for data, security, scalability, and performance.
      • Merged the different architecture domains dealt with in this blueprint to create a holistic view.

      Bibliography

      Ambysoft Inc. “UML 2 Sequence Diagrams: An Agile Introduction.” Agile Modeling, n.d. Web.

      Bass, Len, Paul Clements, and Rick Kazman. Software Architecture in Practices: Third Edition. Pearson Education, Inc. 2003.

      Eeles, Peter. “The benefits of software architecting.” IBM: developerWorks, 15 May 2006. Web.

      Flexera 2020 State of the Cloud Report. Flexera, 2020. Web. 19 October 2021.

      Furdik, Karol, Gabriel Lukac, Tomas Sabol, and Peter Kostelnik. “The Network Architecture Designed for an Adaptable IoT-based Smart Office Solution.” International Journal of Computer Networks and Communications Security, November 2013. Web.

      Ganzinger, Matthias, and Petra Knaup. “Requirements for data integration platforms in biomedical research networks: a reference model.” PeerJ, 5 February 2015. (https://peerj.com/articles/755/).

      Garlan, David, and Mary Shaw. An Introduction to Software Architecture. CMU-CS-94-166, School of Computer Science Carnegie Mellon University, January 1994.

      Gupta, Arun. “Microservice Design Patterns.” Java Code Geeks, 14 April 2015. Web.

      How, Matt. The Modern Data Warehouse in Azure. O’Reilly, 2020.

      ISO/IEC 17788:2014: Information technology – Cloud computing, International Organization for Standardization, October 2014. Web.

      ISO/IEC 18384-1:2016: Information technology – Reference Architecture for Service Oriented Architecture (SOA RA), International Organization for Standardization, June 2016. Web.

      ISO/IEC 25010:2011(en) Systems and software engineering — Systems and software Quality Requirements and Evaluation (SQuaRE) — System and software quality models. International Organization for Standardization, March 2011. Web.

      Kazman, R., M. Klein, and P. Clements. ATAM: Method for Architecture Evaluation. S Carnegie Mellon University, August 2000. Web.

      Microsoft Developer Network. “Chapter 16: Quality Attributes.” Microsoft Application Architecture Guide. 2nd Ed., 13 January 2010. Web.

      Microsoft Developer Network. “Chapter 2: Key Principles of Software Architecture.” Microsoft Application Architecture Guide. 2nd Ed., 13 January 2010. Web.

      Microsoft Developer Network. “Chapter 3: Architectural Patterns and Styles.” Microsoft Application Architecture Guide. 2nd Ed., 14 January 2010. Web.

      Microsoft Developer Network. “Chapter 5: Layered Application Guidelines.” Microsoft Application Architecture Guide. 2nd Ed., 13 January 2010. Web.

      Mirakhorli, Mehdi. “Common Architecture Weakness Enumeration (CAWE).” IEEE Software, 2016. Web.

      Moore, G. A. Crossing the Chasm, 3rd Edition: Marketing and Selling Disruptive Products to Mainstream Customers (Collins Business Essentials) (3rd ed.). Harper Business, 2014.

      OASIS. “Oasis SOA Reference Model (SOA RM) TC.” OASIS Open, n.d. Web.

      Soni, Mukesh. “Defect Prevention: Reducing Costs and Enhancing Quality.” iSixSigma, n.d. Web.

      The Open Group. TOGAF 8.1.1 Online, Part IV: Resource Base, Developing Architecture Views. TOGAF, 2006. Web.

      The Open Group. Welcome to the TOGAF® Standard, Version 9.2, a standard of The Open Group. TOGAF, 2018. Web.

      Watts, S. “The importance of solid design principles.” BMC Blogs, 15 June 2020. 19 October 2021.

      Young, Charles. “Hexagonal Architecture–The Great Reconciler?” Geeks with Blogs, 20 Dec 2014. Web.

      APPENDIX A

      Techniques to enhance application architecture.

      Consider the numerous solutions to address architecture issues or how they will impact your application architecture

      Many solutions exist for improving the layers of the application stack that may address architecture issues or impact your current architecture. Solutions range from capability changes to full stack replacement.

      Method Description Potential Benefits Risks Related Blueprints
      Business Capabilities:
      Enablement and enhancement
      • Introduce new business capabilities by leveraging unused application functionalities or consolidate redundant business capabilities.
      • Increase value delivery to stakeholders.
      • Lower IT costs through elimination of applications.
      • Increased use of an application could overload current infrastructure.
      • IT cannot authorize business capability changes.
      Use Info-Tech’s Document Your Business Architecture blueprint to gain better understanding of business and IT alignment.
      Removal
      • Remove existing business capabilities that don’t contribute value to the business.
      • Lower operational costs through elimination of unused and irrelevant capabilities.
      • Business capabilities may be seen as relevant or critical by different stakeholder groups.
      • IT cannot authorize business capability changes.
      Use Info-Tech’s Build an Application Rationalization Framework to rationalize your application portfolio.
      Business Process:
      Process integration and consolidation
      • Combine multiple business processes into a single process.
      • Improved utilization of applications in each step of the process.
      • Reduce business costs through efficient business processes.
      • Minimize number of applications required to execute a single process.
      • Significant business disruption if an application goes down and is the primary support for business processes.
      • Organizational pushback if process integration involves multiple business groups.
      Business Process (continued):
      Process automation
      • Automate manual business processing tasks.
      • Reduce manual processing errors.
      • Improve speed of delivery.
      • Significant costs to implement automation.
      • Automation payoffs are not immediate.
      Lean business processes
      • Eliminate redundant steps.
      • Streamline existing processes by focusing on value-driven steps.
      • Improve efficiency of business process through removal of wasteful steps.
      • Increase value delivered at the end of the process.
      • Stakeholder pushback from consistently changing processes.
      • Investment from business is required to fit documentation to the process.
      Outsource the process
      • Outsource a portion of or the entire business process to a third party.
      • Leverage unavailable resources and skills to execute the business process.
      • Loss of control over process.
      • Can be costly to bring the process back into the business if desired in the future.
      Business Process (continued):
      Standardization
      • Implement standards for business processes to improve uniformity and reusability.
      • Consistently apply the same process across multiple business units.
      • Transparency of what is expected from the process.
      • Improve predictability of process execution.
      • Process bottlenecks may occur if a single group is required to sign off on deliverables.
      • Lack of enforcement and maintenance of standards can lead to chaos if left unchecked.
      User Interface:
      Improve user experience (UX)
      • Eliminate end-user emotional, mechanical, and functional friction by improving the experience of using the application.
      • UX encompasses both the interface and the user’s behavior.
      • Increase satisfaction and adoption rate from end users.
      • Increase brand awareness and user retention.
      • UX optimizations are only focused on a few user personas.
      • Current development processes do not accommodate UX assessments
      Code:
      Update coding language
      Translate legacy code into modern coding language.
      • Coding errors in modern languages can have lesser impact on the business processes they support.
      • Modern languages tend to have larger pools of coders to hire.
      • Increase availability of tools to support modern languages.
      • Coding language changes can create incompatibilities with existing infrastructure.
      • Existing coding translation tools do not offer 100% guarantee of legacy function retention.
      Code (continued):
      Open source code
      • Download pre-built code freely available in open source communities.
      • Code is rapidly evolving in the community to meet current business needs.
      • Avoid vendor lock-in from proprietary software
      • Community rules may require divulgence of work done with open source code.
      • Support is primarily provided through community, which may not address specific concerns.
      Update the development toolchain
      • Acquire new or optimize development tools with increased testing, build, and deployment capabilities.
      • Increase developer productivity.
      • Increase speed of delivery and test coverage with automation.
      • Drastic IT overhauls required to implement new tools such as code conversion, data migration, and development process revisions.
      Update source code management
      • Optimize source code management to improve coding governance, versioning, and development collaboration.
      • Ability to easily roll back to previous build versions and promote code to other environments.
      • Enable multi-user development capabilities.
      • Improve conflict management.
      • Some source code management tools cannot support legacy code.
      • Source code management tools may be incompatible with existing development toolchain.
      Data:
      Outsource extraction
      • Outsource your data analysis and extraction to a third party.
      • Lower costs to extract and mine data.
      • Leverage unavailable resources and skills to translate mined data to a usable form.
      • Data security risks associated with off-location storage.
      • Data access and control risks associated with a third party.
      Update data structure
      • Update your data elements, types (e.g. transactional, big data), and formats (e.g. table columns).
      • Standardize on a common data definition throughout the entire organization.
      • Ease data cleansing, mining, analysis, extraction, and management activities.
      • New data structures may be incompatible with other applications.
      • Implementing data management improvements may be costly and difficult to acquire stakeholder buy-in.
      Update data mining and data warehousing tools
      • Optimize how data is extracted and stored.
      • Increase the speed and reliability of the data mined.
      • Perform complex analysis with modern data mining and data warehousing tools.
      • Data warehouses are regularly updated with the latest data.
      • Updating data mining and warehousing tools may create incompatibilities with existing infrastructure and data sets.
      Integration:
      Move from point-to-point to enterprise service bus (ESB)
      • Change your application integration approach from point-to-point to an ESB.
      • Increase the scalability of enterprise services by exposing applications to a centralized middleware.
      • Reduce the number of integration tests to complete with an ESB.
      • Single point of failure can cripple the entire system.
      • Security threats arising from centralized communication node.
      Leverage API integration
      • Leverage application programming interfaces (APIs) to integrate applications.
      • Quicker and more frequent transfers of lightweight data compared to extract, load, transfer (ETL) practices.
      • Increase integration opportunities with other modern applications and infrastructure (including mobile devices).
      • APIs are not as efficient as ETL when handling large data sets.
      • Changing APIs can break compatibility between applications if not versioned properly.

      Initiate Your Service Management Program

      • Buy Link or Shortcode: {j2store}398|cart{/j2store}
      • member rating overall impact (scale of 10): N/A
      • member rating average dollars saved: N/A
      • member rating average days saved: N/A
      • Parent Category Name: Service Management
      • Parent Category Link: /service-management
      • IT organizations continue attempting to implement service management, often based on ITIL, with limited success and without visible value.
      • More than half of service management implementations have failed beyond simply implementing the service desk and the incident, change, and request management processes.
      • Organizational structure, goals, and cultural factors are not considered during service management implementation and improvement.
      • The business lacks engagement and understanding of service management.

      Our Advice

      Critical Insight

      • Service management is an organizational approach. Focus on producing successful and valuable services and service outcomes for the customers.
      • All areas of the organization are accountable for governing and executing service management. Ensure that you create a service management strategy that improves business outcomes and provides the value and quality expected.

      Impact and Result

      • Identified structure for how your service management model should be run and governed.
      • Identified forces that impact your ability to oversee and drive service management success.
      • Mitigation approach to restraining forces.

      Initiate Your Service Management Program Research & Tools

      Start here – read the Executive Brief

      Read this Executive Brief to understand why service management implementations often fail and why you should establish governance for service management.

      Besides the small introduction, subscribers and consulting clients within this management domain have access to:

      1. Identify the level of oversight you need

      Use Info-Tech’s methodology to establish an effective service management program with proper oversight.

      • Service Management Program Initiation Plan
      [infographic]

      Go the Extra Mile With Blockchain

      • Buy Link or Shortcode: {j2store}130|cart{/j2store}
      • member rating overall impact (scale of 10): N/A
      • member rating average dollars saved: N/A
      • member rating average days saved: N/A
      • Parent Category Name: Data Management
      • Parent Category Link: /data-management
      • The transportation and logistics industry is facing a set of inherent flaws, such as high processing fees, fraudulent information, and lack of transparency, that blockchain is set to transform and alleviate.
      • Many companies have FOMO (fear of missing out), causing them to rush toward blockchain adoption without first identifying the optimal use case.

      Our Advice

      Critical Insight

      • Understand how blockchain can alleviate your pain points before rushing to adopt the technology. You have been hearing about blockchain for some time now and are feeling pressured to adopt it. Moreover, the series of issues hindering the transportation and logistics industry, such as the lack of transparency, poor cash flow management, and high processing fees, are frustrating business leaders and thereby adding additional pressure on CIOs to adopt the technology. While blockchain is complex, you should focus on its key features of transparency, integrity, efficiency, and security to identify how it can help your organization.
      • Ensure your use case is actually useful and can be valuable to your organization by selecting a business idea that is viable, feasible, and desirable. Applying design thinking tactics to your evaluation process provides a practical approach that will help you avoid wasting resources (both time and money) and hurting IT’s image in the eyes of the business. While it is easy to get excited and invest in a new technology to help maintain your image as a thought leader, you must ensure that your use case is fully developed prior to doing so.

      Impact and Result

      • Understand blockchain’s transformative potential for the transportation and logistics industry by breaking down how its key benefits can alleviate inherent industry flaws.
      • Identify business processes and stakeholders that could benefit from blockchain.
      • Build and evaluate an inventory of use cases to determine where blockchain could have the greatest impact on your organization.
      • Articulate the value and organizational fit of your proposed use case to the business to gain their buy-in and support.

      Go the Extra Mile With Blockchain Research & Tools

      Start here – read the Executive Brief

      Read our concise Executive Brief to find out why your organization should care about blockchain’s transformative potential for the transportation and logistics industry and how Info-Tech will support you as you identify and build your blockchain use case.

      Besides the small introduction, subscribers and consulting clients within this management domain have access to:

      1. Evaluate why blockchain can disrupt the transportation and logistics industry

      Analyze the four key benefits of blockchain as they relate to the transportation and logistics industry to understand how the technology can resolve issues being experienced by industry incumbents.

      • Go the Extra Mile With Blockchain – Phase 1: Evaluate Why Blockchain Can Disrupt the Transportation and Logistics Industry
      • Blockchain Glossary

      2. Build and evaluate an inventory of use cases

      Brainstorm a set of blockchain use cases for your organization and apply design thinking tactics to evaluate and select the optimal one to pitch to your executives for prototyping.

      • Go the Extra Mile With Blockchain – Phase 2: Build and Evaluate an Inventory of Use Cases
      • Blockchain Use Case Evaluation Tool
      • Prototype One Pager
      [infographic]

      Implement Lean Management Practices That Work

      • Buy Link or Shortcode: {j2store}116|cart{/j2store}
      • member rating overall impact (scale of 10): N/A
      • member rating average dollars saved: N/A
      • member rating average days saved: N/A
      • Parent Category Name: Performance Measurement
      • Parent Category Link: /performance-measurement
      • Service delivery teams do not measure, or have difficulty demonstrating, the value they provide.
      • There is a lack of continuous improvement.
      • There is low morale within the IT teams leading to low productivity.

      Our Advice

      Critical Insight

      • Create a problem-solving culture. Frequent problem solving is the differentiator between sustaining Lean or falling back to old management methods.
      • Commit to employee growth. Empower teams to problem solve and multiply your organizational effectiveness.

      Impact and Result

      • Apply Lean management principles to IT to create alignment and transparency and drive continuous improvement and customer value.
      • Implement huddles and visual management.
      • Build team capabilities.
      • Focus on customer value.
      • Use metrics and data to make better decisions.
      • Systematically solve problems and improve performance.
      • Develop an operating rhythm to promote adherence to Lean.

      Implement Lean Management Practices That Work Research & Tools

      Start here – read the Executive Brief

      Read our concise Executive Brief to find out how a Lean management system can help you increase transparency, demonstrate value, engage your teams and customers, continuously improve, and create alignment.

      Besides the small introduction, subscribers and consulting clients within this management domain have access to:

      1. Understand Lean concepts

      Understand what a Lean management system is, review Lean philosophies, and examine simple Lean tools and activities.

      • Implement Lean Management Practices That Work – Phase 1: Understand Lean Concepts
      • Lean Management Education Deck

      2. Determine the scope of your implementation

      Understand the implications of the scope of your Lean management program.

      • Implement Lean Management Practices That Work – Phase 2: Determine the Scope of Your Implementation
      • Lean Management Scoping Tool

      3. Design huddle board

      Examine the sections and content to include in your huddle board design.

      • Implement Lean Management Practices That Work – Phase 3: Design Huddle Board
      • Lean Management Huddle Board Template

      4. Design Leader Standard Work and operating rhythm

      Determine the actions required by leaders and the operating rhythm.

      • Implement Lean Management Practices That Work – Phase 4: Design Leader Standard Work and Operating Rhythm
      • Leader Standard Work Tracking Template
      [infographic]

      Workshop: Implement Lean Management Practices That Work

      Workshops offer an easy way to accelerate your project. If you are unable to do the project yourself, and a Guided Implementation isn't enough, we offer low-cost delivery of our project workshops. We take you through every phase of your project and ensure that you have a roadmap in place to complete your project successfully.

      1 Understand Lean Concepts

      The Purpose

      Understand Lean management.

      Key Benefits Achieved

      Gain a common understanding of Lean management, the Lean management thought model, Lean philosophies, huddles, visual management, team growth, and voice of customer.

      Activities

      1.1 Define Lean management in your organization.

      1.2 Create training materials.

      Outputs

      Lean management definition

      Customized training materials

      2 Understand Lean Concepts (Continued) and Determine Scope

      The Purpose

      Understand Lean management.

      Determine the scope of your program.

      Key Benefits Achieved

      Understand metrics and performance review.

      Understand problem identification and continuous improvement.

      Understand Kanban.

      Understand Leader Standard Work.

      Define the scope of the Lean management program.

      Activities

      2.1 Develop example operational metrics

      2.2 Simulate problem section.

      2.3 Simulate Kanban.

      2.4 Build scoping tool.

      Outputs

      Understand how to use operational metrics

      Understand problem identification

      Understand Kanban/daily tasks section

      Defined scope for your program

      3 Huddle Board Design and Huddle Facilitation Coaching

      The Purpose

      Design the sections and content for your huddle board.

      Key Benefits Achieved

      Initial huddle board design.

      Activities

      3.1 Design and build each section in your huddle board.

      3.2 Simulate coaching conversations.

      Outputs

      Initial huddle board design

      Understanding of how to conduct a huddle

      4 Design and Build Leader Standard Work

      The Purpose

      Design your Leader Standard Work activities.

      Develop a schedule for executing Leader Standard Work.

      Key Benefits Achieved

      Standard activities identified and documented.

      Sample schedule developed.

      Activities

      4.1 Identify standard activities for leaders.

      4.2 Develop a schedule for executing Leader Standard Work.

      Outputs

      Leader Standard Work activities documented

      Initial schedule for Leader Standard Work activities

      Drive Technology Adoption

      • Buy Link or Shortcode: {j2store}111|cart{/j2store}
      • member rating overall impact (scale of 10): N/A
      • member rating average dollars saved: N/A
      • member rating average days saved: N/A
      • Parent Category Name: Strategy and Organizational Design
      • Parent Category Link: /strategy-and-organizational-design

      The project isn’t over if the new product or system isn’t being used. How do you ensure that what you’ve put in place isn’t going to be ignored or only partially adopted? People are more complicated than any new system and managing them through the change needs careful planning.

      Our Advice

      Critical Insight

      Cultivating a herd mentality, where people adopt new technology merely because everyone else is, is an important goal in getting the bulk of users using the new product or system. The herd needs to gather momentum though and this can be done by using the more tech-able and enthused to lead the rest on the journey. Identifying and engaging these key resources early in the process will greatly assist in starting the flow.

      Impact and Result

      While communication is key throughout, involving staff in proof-of-concept activities and contests and using the train-the-trainer techniques and technology champions will all start the momentum toward technology adoption. Group activities will address the bulk of users, but laggards may need special attention.

      Drive Technology Adoption Research & Tools

      Besides the small introduction, subscribers and consulting clients within this management domain have access to:

      1. Drive Technology Adoption – A brief deck describing how to encourage users to adopt newly implemented technology.

      This document will help you to ensure that newly implemented systems and technologies are correctly adopted by the intended recipients.

      • Drive Technology Adoption Storyboard
      [infographic]

      Further reading

      Drive Technology Adoption

      The project is over. The new technology is implemented. Now how do we make sure it's used?

      Executive Summary

      Your Challenge

      Technology endlessly changes and evolves. Similarly, business directions and requirements change, and these changes need to be supported by technology. Improved functionality and evolvement of systems, along with systems becoming redundant or unsupported, means that maintaining a static environment is virtually impossible.

      Enormous amounts of IT budget are allocated to these changes each year. But once the project is over, how do you manage that change and ensure the systems are being used? Planning your technology adoption is vital.

      Common Obstacles

      The obstacles to technology adoption can be many and various, covering a broad spectrum of areas including:

      • Reluctance of staff to let go of familiar processes and procedures.
      • Perception that any change will add complications but not add value, thereby hampering enthusiasm to adopt.
      • Lack of awareness of the change.
      • General fear of change.
      • Lack of personal confidence.

      Info-Tech’s Approach

      Start by identifying, understanding, categorizing, and defining barriers and put in place a system to:

      • Gain an early understanding of the different types of users and their attitudes to technology and change.
      • Review different adoption techniques and analyze which are most appropriate for your user types.
      • Use a “Follow the Leader” approach, by having technical enthusiasts and champions to show the way.
      • Prevent access to old systems and methods.

      Info-Tech Insight

      For every IT initiative that will be directly used by users, consider the question, “Will the final product be readily accepted by those who are going to use it?” There is no point in implementing a product that no one is prepared to use. Gaining user acceptance is much more than just ticking a box in a project plan once UAT is complete.

      The way change should happen is clear

      Prosci specializes in change. Its ADKAR model outlines what’s required to bring individuals along on the change journey.

      AWARENESS

      • Awareness means more than just knowing there’s a change occurring,
      • it means understanding the need for change.

      DESIRE

      • To achieve desire, there needs to be motivation, whether it be from an
      • organizational perspective or personal.

      KNOWLEDGE

      • Both knowledge on how to train during the transition and knowledge
      • on being effective after the change are required. This can only be done
      • once awareness and desire are achieved.

      ABILITY

      • Ability is not knowledge. Knowing how to do something doesn’t necessarily translate to having the skills to do it.

      REINFORCEMENT

      • Without reinforcement there can be a tendency to revert.

      When things go wrong

      New technology is not being used

      The project is seen as complete. Significant investments have been made, but the technology either isn’t being used or is only partially in use.

      Duplicate systems are now in place

      Even worse. The failure to adopt the new technology by some means that the older systems are still being used. There are now two systems that fail to interact; business processes are being affected and there is widespread confusion.

      Benefits not being realized

      Benefits promised to the business are not being realized. Projected revenue increases, savings, or efficiencies that were forecast are now starting to be seen as under threat.

      There is project blowout

      The project should be over, but the fact that the technology is not being used has created a perception that the implementation is not complete and the project needs to continue.

      Info-Tech Insight

      People are far more complicated than any technology being implemented.

      Consider carefully your approach.

      Why does it happen?

      POOR COMMUNICATION

      There isn’t always adequate communications about what’s changing in the workplace.

      FEAR

      Fear of change is natural and often not rational. Whether the fear is about job loss or not being able to adapt to change; it needs to be managed.

      TRAINING

      Training can be insufficient or ineffective and when this happens people are left feeling like they don’t have the skills to make the change.

      LACK OF EXECUTIVE SUPPORT

      A lack of executive support for change means the change is seen as less important.

      CONFLICTING VIEWS OF CHANGE

      The excitement the project team and business feels about the change is not necessarily shared throughout the business. Some may just see the change as more work, changing something that already works, or a reason to reduce staff levels.

      LACK OF CONFIDENCE

      Whether it’s a lack of confidence generally with technology or concern about a new or changing tool, a lack of confidence is a huge barrier.

      BUDGETARY CONSTRAINTS

      There is a cost with managing people during a change, and budget must be allocated to allow for it.

      Communications

      Info-Tech Insight

      Since Sigmund Freud there has been endless work to understand people’s minds.
      Don’t underestimate the effect that people’s reactions to change can have on your project.

      This is a Kubler-ross change curve graph, plotting the following Strategies: Create Alignment; Maximize Communication; Spark Motivation; Develop Capability; Share Knowledge

      Communication plans are designed to properly manage change. Managing change can be easier when we have the right tools and information to adapt to new circumstances. The Kubler-Ross change curve illustrates the expected steps on the path to acceptance of change. With the proper communications strategy, each can be managed appropriately

      Analyst perspective

      Paul Binns – Principal Research Advisor, Info-Tech

      The rapidly changing technology landscape in our world has always meant that an enthusiasm or willingness to embrace change has been advantageous. Many of us have seen how the older generation has struggled with that change and been left behind.

      In the work environment, the events of the past two years have increased pressure on those slow to adopt as in many cases they couldn't perform their tasks without new tools. Previously, for example, those who may have been reluctant to use digital tools and would instead opt for face-to-face meetings, suddenly found themselves without an option as physical meetings were no longer possible. Similarly, digital collaboration tools that had been present in the market for some time were suddenly more heavily used so everyone could continue to work together in the “online world.”

      At this stage no one is sure what the "new normal" will be in the post-pandemic world, but what has been clearly revealed is that people are prepared to change given the right motivation.

      “Technology adoption is about the psychology of change.”
      Bryan Tutor – Executive Counsellor, Info-Tech

      The Fix

      • Categorize Users
        • Gain a clear understanding of your user types.
      • Identify Adoption Techniques
        • Understand the range of different tools and techniques available.
      • Match Techniques To Categories
        • Determine the most appropriate techniques for your user base.
      • Follow-the-Leader
        • Be aware of the different skills in your environment and use them to your advantage.
      • Refresh, Retrain, Restrain
        • Prevent reversion to old methods or systems.

      Categories

      Client-Driven Insight

      Consider your staff and industry when looking at the Everett Rogers curve. A technology organization may have less laggards than a traditional manufacturing one.

      In Everett Rogers’ book Diffusion of Innovations 5th Edition (Free Press, 2005), Rogers places adopters of innovations into five different categories.

      This is an image of an Innovation Adoption Curve from Everett Rogers' book Diffusion of Innovations 5th Edition

      Category 1: The Innovator – 2.5%

      Innovators are technology enthusiasts. Technology is a central interest of theirs, either at work, at home, or both. They tend to aggressively pursue new products and technologies and are likely to want to be involved in any new technology being implemented as soon as possible, even before the product is ready to be released.

      For people like this the completeness of the new technology or the performance can often be secondary because of their drive to get new technology as soon as possible. They are trailblazers and are not only happy to step out of their comfort zone but also actively seek to do so.

      Although they only make up about 2.5% of the total, their enthusiasm, and hopefully endorsement of new technology, offers reassurance to others.

      Info-Tech Insight

      Innovators can be very useful for testing before implementation but are generally more interested in the technology itself rather than the value the technology will add to the business.

      Category 2: The Early Adopter – 13.5%

      Whereas Innovators tend to be technologists, Early Adopters are visionaries that like to be on board with new technologies very early in the lifecycle. Because they are visionaries, they tend to be looking for more than just improvement – a revolutionary breakthrough. They are prepared to take high risks to try something new and although they are very demanding as far as product features and performance are concerned, they are less price-sensitive than other groups.

      Early Adopters are often motivated by personal success. They are willing to serve as references to other adopter groups. They are influential, seen as trendsetters, and are of utmost importance to win over.

      Info-Tech Insight

      Early adopters are key. Their enthusiasm for technology, personal drive, and influence make them a powerful tool in driving adoption.

      Category 3: The Early Majority – 34%

      This group is comprised of pragmatists. The first two adopter groups belong to early adoption, but for a product to be fully adopted the mainstream needs to be won over, starting with the Early Majority.

      The Early Majority share some of the Early Adopters’ ability to relate to technology. However, they are driven by a strong sense of practicality. They know that new products aren’t always successful. Consequently, they are content to wait and see how others fare with the technology before investing in it themselves. They want to see well-established references before adopting the technology and to be shown there is no risk.

      Because there are so many people in this segment (roughly 34%), winning these people over is essential for the technology to be adopted.

      Category 4: The Late Majority – 34%

      The Late Majority are the conservatives. This group is generally about the same size as the Early Majority. They share all the concerns of the Early Majority; however, they are more resistant to change and are more content with the status quo than eager to progress to new technology. People in the Early Majority group are comfortable with their ability to handle new technology. People in the Late Majority are not.

      As a result, these conservatives prefer to wait until something has become an established standard and take part only at the end of the adoption period. Even then, they want to see lots of support and ensure that there is proof there is no risk in them adopting it.

      Category 5: The Laggard – 16%

      This group is made up of the skeptics and constitutes 16% of the total. These people want nothing to do with new technology and are generally only content with technological change when it is invisible to them. These skeptics have a strong belief that disruptive new technologies rarely deliver the value promised and are almost always worried about unintended consequences.

      Laggards need to be dealt with carefully as their criticism can be damaging and without them it is difficult for a product to become fully adopted. Unfortunately, the effort required for this to happen is often disproportional to the size of the group.

      Info-Tech Insight

      People aren’t born laggards. Technology projects that have failed in the past can alter people’s attitudes, especially if there was a negative impact on their working lives. Use empathy when dealing with people and respect their hesitancy.

      Adoption Techniques

      Different strokes for different folks

      Technology adoption is all about people; and therefore, the techniques required to drive that adoption need to be people oriented.

      The following techniques are carefully selected with the intention of being impactful on all the different categories described previously.

      Technology Adoption: Herd Mentality; Champions; Force; Group Training; One-on-One; Contests; Marketing; Proof of Concept; Train the Trainer

      There are multitudes of different methods to get people to adopt new technology, but which is the most appropriate for your situation? Generally, it’s a combination.

      Technology Adoption: Herd Mentality; Champions; Force; Group Training; One-on-One; Contests; Marketing; Proof of Concept; Train the Trainer

      Train the Trainer

      Use your staff to get your message across.

      Abstract

      This technique involves training key members of staff so they can train others. It is important that those selected are strong communicators, are well respected by others, and have some expertise in technology.

      Advantages

      • Cost effective
      • Efficient dissemination of information
      • Trusted internal staff

      Disadvantages

      • Chance of inconsistent delivery
      • May feel threatened by co-worker

      Best to worst candidates

      • Early Adopter: Influential trendsetters. Others receptive of their lead.
      • Innovator: Comfortable and enthusiastic about new technology, but not necessarily a trainer.
      • Early Majority: Tendency to take others’ lead.
      • Late Majority: Risk averse and tend to follow others, only after success is proven.
      • Laggard: Last to adopt usually. Unsuitable as Trainer.

      Marketing

      Marketing should be continuous throughout the change to encourage familiarity.

      Abstract

      Communication is key as people are comfortable with what is familiar to them. Marketing is an important tool for convincing adopters that the new product is mainstream, widely adopted and successful.

      Advantages

      • Wide communication
      • Makes technology appear commonplace
      • Promotes effectiveness of new technology

      Disadvantages

      • Reliant on staff interest
      • Can be expensive

      Best to worst candidates

      • Early Majority: Pragmatic about change. Marketing is effective encouragement.
      • Early Adopter: Receptive and interested in change. Marketing is supplemental.
      • Innovator: Actively seeks new technology. Does not need extensive encouragement.
      • Late Majority: Requires more personal approach.
      • Laggard: Resistant to most enticements.

      One-on-One

      Tailored for individuals.

      Abstract

      One-on-one training sometimes is the only way to train if you have staff with special needs or who are performing unique tasks.
      It is generally highly effective but inefficient as it only addresses individuals.

      Advantages

      • Tailored to specific need(s)
      • Only relevant information addressed
      • Low stress environment

      Disadvantages

      • Expensive
      • Possibility of inconsistent delivery
      • Personal conflict may render it ineffective

      Best to worst candidates

      • Laggard: Encouragement and cajoling can be used during training.
      • Late Majority: Proof can be given of effectiveness of new product.
      • Early Majority: Effective, but not cost efficient.
      • Early Adopter: Effective, but not cost-efficient.
      • Innovator: Effective, but not cost-efficient.

      Group Training

      Similar roles, attitudes, and abilities.

      Abstract

      Group training is one of the most common methods to start people on their journey toward new technology. Its effectiveness with the two largest groups, Early Majority and Late Majority, make it a primary tool in technology adoption.

      Advantages

      • Cost effective
      • Time effective
      • Good for team building

      Disadvantages

      • Single method may not work for all
      • Difficult to create single learning pace for all

      Best to worst candidates

      • Early Majority: Receptive. The formality of group training will give confidence.
      • Late Majority: Conservative attitude will be receptive to traditional training.
      • Early Adopter: Receptive and attentive. Excited about the change.
      • Innovator: Will tend to want to be ahead or want to move ahead of group.
      • Laggard: Laggards in group training may have a negative impact.

      Force

      The last resort.

      Abstract

      The transition can’t go on forever.

      At some point the new technology needs to be fully adopted and if necessary, force may have to be used.

      Advantages

      • Immediate full transition
      • Fixed delivery timeline

      Disadvantages

      • Alienation of some staff
      • Loss of faith in product if there are issues

      Best to worst candidates

      • Laggard: No choice but to adopt. Forces the issue.
      • Late Majority: Removes issue of reluctance to change.
      • Early Majority: Content, but worried about possible problems.
      • Early Adopter: Feel less personal involvement in change process.
      • Innovator: Feel less personal involvement in change process.

      Contests

      Abstract

      Contests can generate excitement and create an explorative approach to new technology. People should not feel pressured. It should be enjoyable and not compulsory.

      Advantages

      • Rapid improvement of skills
      • Bring excitement to the new technology
      • Good for team building

      Disadvantages

      • Those less competitive or with lower skills may feel alienated
      • May discourage collaboration

      Best to worst candidates

      • Early Adopter: Seeks personal success. Risk taker. Effective.
      • Innovator: Enthusiastic to explore limits of technology.
      • Early Majority: Less enthusiastic. Pragmatic. Less competitive.
      • Late Majority: Conservative. Not enthusiastic about new technology.
      • Laggard: Reluctant to get involved.

      Incentives

      Incentives don’t have to be large.

      Abstract

      For some staff, merely taking management’s lead is not enough. Using “Nudge” techniques to give that extra incentive is quite effective. Incentivizing staff either financially or through rewards, recognition, or promotion is a successful adoption technique for some.

      Advantages

      Encouragement to adopt from receiving tangible benefit

      Draws more attention to the new technology

      Disadvantages

      Additional expense to business or project

      Possible poor precedent for subsequent changes

      Best to worst candidates

      Early Adopter: Desire for personal success makes incentives enticing.

      Early Majority: Prepared to change, but extra incentive will assist.

      Late Majority: Conservative attitude means incentive may need to be larger.

      Innovator: Enthusiasm for new technology means incentive not necessary.

      Laggard: Sceptical about change. Only a large incentive likely to make a difference.

      Champions

      Strong internal advocates for your new technology are very powerful.

      Abstract

      Champions take on new technology and then use their influence to promote it in the organization. Using managers as champions to actively and vigorously promote the change is particularly effective.

      Advantages

      • Infectious enthusiasm encourages those who tend to be reluctant
      • Use of trusted internal staff

      Disadvantages

      • Removes internal staff from regular duties
      • Ineffective if champion not respected

      Best to worst candidates

      • Early Majority: Champions as references of success provide encouragement.
      • Late Majority: Management champions in particular are effective.
      • Laggard: Close contact with champions may be effective.
      • Early Adopter: Receptive of technology, less effective.
      • Innovator: No encouragement or promotion required.

      Herd Mentality

      Follow the crowd.

      Abstract

      Herd behavior is when people discount their own information and follow others. Ideally all adopters would understand the reason and advantages in adopting new technology, but practically, the result is most important.

      Advantages

      • New technology is adopted without question
      • Increase in velocity of adoption

      Disadvantages

      • Staff may not have clear understanding of the reason for change and resent it later
      • Some may adopt the change before they are ready to do so

      Best to worst candidates

      • Early Majority: Follow others’ success.
      • Late Majority: Likely follow an established proven standard.
      • Early Adopter: Less effective as they prefer to set trends rather than follow.
      • Innovator: Seeks new technology rather than following others.
      • Laggard: Suspicious and reluctant to change.

      Proof of Concepts

      Gain early input and encourage buy-in.

      Abstract

      Proof of concept projects give early indications of the viability of a new initiative. Involving the end users in these projects can be beneficial in gaining their support

      Advantages

      Involve adopters early on

      Valuable feedback and indications of future issues

      Disadvantages

      If POC isn’t fully successful, it may leave lingering negativity

      Usually, involvement from small selection of staff

      Best to worst candidates

      • Innovator: Strong interest in getting involved in new products.
      • Early Adopter: Comfortable with new technology and are influencers.
      • Early Majority: Less interest. Prefer others to try first.
      • Late Majority: Conservative attitude makes this an unlikely option.
      • Laggard: Highly unlikely to get involved.

      Match techniques to categories

      What works for who?

      This clustered column chart categorizes techniques by category

      Follow the leader

      Engage your technology enthusiasts early to help refine your product, train other staff, and act as champions. A combination of marketing and group training will develop a herd mentality. Finally, don’t neglect the laggards as they can prevent project completion.

      This is an inverted funnel chart with the output of: Change Destination.  The inputs are: 16% Laggards; 34% Late Majority; 34% Early Majority; 13.3% Early Adopters; 2% Innovators

      Info-Tech Insight

      Although there are different size categories, none can be ignored. Consider your budget when dealing with smaller groups, but also consider their impact.

      Refresh, retrain, restrain

      We don’t want people to revert.

      Don’t assume that because your staff have been trained and have access to the new technology that they will keep using it in the way they were trained. Or that they won’t revert back to their old methods or system.

      Put in place methods to remove completely or remove access to old systems. Schedule refresh training or skill enhancement sessions and stay vigilant.

      Research Authors

      Paul Binns

      Paul Binns

      Principal Research Advisor, Info-Tech Research Group

      With over 30 years in the IT industry, Paul brings to his work his experience as a Strategic Planner, Consultant, Enterprise Architect, IT Business Owner, Technologist, and Manager. Paul has worked with both small and large companies, local and international, and has had senior roles in government and the finance industry.

      Scott Young

      Scott Young

      Principal Research Advisor, Info-Tech Research Group

      Scott Young is a Director of Infrastructure Research at Info-Tech Research Group. Scott has worked in the technology field for over 17 years, with a strong focus on telecommunications and enterprise infrastructure architecture. He brings extensive practical experience in these areas of specialization, including IP networks, server hardware and OS, storage, and virtualization.

      Related Info-Tech Research

      User Group Analysis Workbook

      Use Info-Tech’s workbook to gather information about user groups, business processes, and day-to-day tasks to gain familiarity with your adopters.

      Governance and Management of Enterprise Software Implementation

      Use our research to engage users and receive timely feedback through demonstrations. Our iterative methodology with a task list focused on the business’ must-have functionality allows staff to return to their daily work sooner.

      Quality Management User Satisfaction Survey

      This IT satisfaction survey will assist you with early information to use for categorizing your users.

      Master Organizational Change Management Practices

      Using a soft, empathetic approach to change management is something that all PMOs should understand. Use our research to ensure you have an effective OCM plan that will ensure project success.

      Bibliography

      Beylis, Guillermo. “COVID-19 accelerates technology adoption and deepens inequality among workers in Latin America and the Caribbean.” World Bank Blogs, 4 March 2021. Web.

      Cleland, Kelley. “Successful User Adoption Strategies.” Insight Voices, 25 Apr. 2017. Web.

      Hiatt, Jeff. “The Prosci ADKAR ® Model.” PROSCI, 1994. Web.

      Malik, Priyanka. “The Kübler Ross Change Curve in the Workplace.” whatfix, 24 Feb. 2022. Web.

      Medhaugir, Tore. “6 Ways to Encourage Software Adoption.” XAIT, 9 March 2021. Web.

      Narayanan, Vishy. “What PwC Australia learned about fast tracking tech adoption during COVID-19” PWC, 13 Oct. 2020. Web.

      Sridharan, Mithun. “Crossing the Chasm: Technology Adoption Lifecycle.” Think Insights, 28 Jun 2022. Web.

      Disaster Recovery Planning

      • Buy Link or Shortcode: {j2store}38|cart{/j2store}
      • Related Products: {j2store}38|crosssells{/j2store}
      • Teaser Video: Visit Website
      • Teaser Video Title: Disaster Recovery Planning
      • member rating overall impact (scale of 10): 9.6/10
      • member rating average dollars saved: $92,268
      • member rating average days saved: 36
      • Parent Category Name: Security and Risk
      • Parent Category Link: /security-and-risk
      The show must go on. Make sure your IT has right-sized DR capabilities.

      Determine the Future of Microsoft Project in Your Organization

      • Buy Link or Shortcode: {j2store}357|cart{/j2store}
      • member rating overall impact (scale of 10): 10.0/10 Overall Impact
      • member rating average dollars saved: $125,999 Average $ Saved
      • member rating average days saved: 50 Average Days Saved
      • Parent Category Name: Project Management Office
      • Parent Category Link: /project-management-office
      • You use Microsoft tools to manage your work, projects, and/or project portfolio.
      • Its latest offering, Project for the web, is new and you’re not sure what to make of it. Microsoft says it will soon replace Microsoft Project and Project Online, but the new software doesn’t seem to do what the old software did.
      • The organization has adopted M365 for collaboration and work management. Meetings happen on Teams, projects are scoped a bit with Planner, and the operations group uses Azure Boards to keep track of what they need to get done.
      • Despite your reservations about the new project management software, Microsoft software has become even more ubiquitous.

      Our Advice

      Critical Insight

      • The various MS Project offerings (but most notably the latest, Project for the web) hold the promise of integrating with the rest of M365 into a unified work management solution. However, out of the box, Project for the web and the various platforms within M365 are all disparate utilities that need to be pieced together in a purpose-built manner to make use of them for holistic work management purposes. If you’re looking for a cohesive product out of the box, look elsewhere. If you’re looking to assemble a wide array of work, project, and portfolio management functions across different functions and departments, you may have found what you seek.
      • Rather than choosing tools based on your gaps, assess your current maturity level so that you optimize your investment in the Microsoft landscape.

      Impact and Result

      Follow Info-Tech’s path in this blueprint to:

      • Perform a tool audit to trim your work management tool landscape.
      • Navigate the MS Project and M365 licensing landscape.
      • Make sense of what to do with Project for the web and take the right approach to rolling it out (i.e. DIY or MS Gold Partner driven) based upon your needs.
      • Create an action plan to inform next steps.

      After following the program in this blueprint, you will be prepared to advise the organization on how to best leverage the rapidly shifting work management options within M365 and the place of MS Project within it.

      Determine the Future of Microsoft Project in Your Organization Research & Tools

      Start here – read the Executive Brief

      Read our concise Executive Brief to find out why you should make sense of the MS Project and M365 landscapes, review Info-Tech’s methodology, and understand the four ways we can support you in completing this project.

      Besides the small introduction, subscribers and consulting clients within this management domain have access to:

      1. Determine your tool needs

      Assess your work management tool landscape, current state maturity, and licensing needs to inform a purpose-built work management action plan.

      • M365 Task Management Tool Guide
      • M365 Project Management Tool Guide
      • M365 Project Portfolio Management Tool Guide
      • Tool Audit Workbook
      • Force Field Analysis Tool
      • Microsoft Project & M365 Licensing Tool
      • Project Portfolio Management Maturity Assessment Workbook (With Tool Analysis)
      • Project Management Maturity Assessment Workbook (With Tool Analysis)

      2. Weigh your MS Project implementation options

      Get familiar with Project for the web’s extensibility as well as the MS Gold Partner ecosystem as you contemplate the best implementation approach(s) for your organization.

      • None
      • None

      3. Finalize your implementation approach

      Prepare a boardroom-ready presentation that will help you communicate your MS Project and M365 action plan to PMO and organizational stakeholders.

      • Microsoft Project & M365 Action Plan Template

      Infographic

      Workshop: Determine the Future of Microsoft Project in Your Organization

      Workshops offer an easy way to accelerate your project. If you are unable to do the project yourself, and a Guided Implementation isn't enough, we offer low-cost delivery of our project workshops. We take you through every phase of your project and ensure that you have a roadmap in place to complete your project successfully.

      1 Assess Driving Forces and Risks

      The Purpose

      Assess the goals and needs as well as the risks and constraints of a work management optimization.

      Take stock of your organization’s current work management tool landscape.

      Key Benefits Achieved

      Clear goals and alignment across workshop participants as well as an understanding of the risks and constraints that will need to be mitigated to succeed.

      Current-state insight into the organization’s work management tool landscape.

      Activities

      1.1 Review the business context.

      1.2 Explore the M365 work management landscape.

      1.3 Identify driving forces for change.

      1.4 Analyze potential risks.

      1.5 Perform current-state analysis on work management tools.

      Outputs

      Business context

      Current-state understanding of the task, project, and portfolio management options in M365 and how they align with the organization’s ways of working

      Goals and needs analysis

      Risks and constraints analysis

      Work management tool overview

      2 Determine Tool Needs and Process Maturity

      The Purpose

      Determine your organization’s work management tool needs as well as its current level of project management and project portfolio management process maturity.

      Key Benefits Achieved

      An understanding of your tooling needs and your current levels of process maturity.

      Activities

      2.1 Review tool audit dashboard and conduct the final audit.

      2.2 Identify current Microsoft licensing.

      2.3 Assess current-state maturity for project management.

      2.4 Define target state for project management.

      2.5 Assess current-state maturity for project portfolio management.

      2.6 Define target state for project portfolio management.

      Outputs

      Tool audit

      An understanding of licensing options and what’s needed to optimize MS Project options

      Project management current-state analysis

      Project management gap analysis

      Project portfolio management current-state analysis

      Project portfolio management gap analysis

      3 Weigh Your Implementation Options

      The Purpose

      Take stock of your implementation options for Microsoft old project tech and new project tech.

      Key Benefits Achieved

      An optimized implementation approach based upon your organization’s current state and needs.

      Activities

      3.1 Prepare a needs assessment for Microsoft 365 and Project Plan licenses.

      3.2 Review the business case for Microsoft licensing.

      3.3 Get familiar with Project for the web.

      3.4 Assess the MS Gold Partner Community.

      3.5 Conduct a feasibility test for PFTW.

      Outputs

      M365 and Project Plan needs assessment

      Business case for additional M365 and MS Project licensing

      An understand of Project for the web and how to extend it

      MS Gold Partner outreach plan

      A go/no-go decision for extending Project for the web on your own

      4 Finalize Implementation Approach

      The Purpose

      Determine the best implementation approach for your organization and prepare an action plan.

      Key Benefits Achieved

      A purpose-built implementation approach to help communicate recommendations and needs to key stakeholders.

      Activities

      4.1 Decide on the implementation approach.

      4.2 Identify the audience for your proposal.

      4.3 Determine timeline and assign accountabilities.

      4.4 Develop executive summary presentation.

      Outputs

      An implementation plan

      Stakeholder analysis

      A communication plan

      Initial executive presentation

      5 Next Steps and Wrap-Up (offsite)

      The Purpose

      Finalize your M365 and MS Project work management recommendations and get ready to communicate them to key stakeholders.

      Key Benefits Achieved

      Time saved in developing and communicating an action plan.

      Stakeholder buy-in.

      Activities

      5.1 Complete in-progress deliverables from previous four days.

      5.2 Set up review time for workshop deliverables and to discuss next steps.

      Outputs

      Finalized executive presentation

      A gameplan to communicate your recommendations to key stakeholders as well as a roadmap for future optimization

      Further reading

      Determine the Future of Microsoft Project in Your Organization

      View your task management, project management, and project portfolio management options through the lens of M365.

      EXECUTIVE BRIEF

      Analyst Perspective

      Microsoft Project is an enigma

      Microsoft Project has dominated its market since being introduced in the 1980s, yet the level of adoption and usage per license is incredibly low.

      The software is ubiquitous, mostly considered to represent its category for “Project Management.” Yet, the software is conflated with its “Portfolio Management” offerings as organizations make platform decisions with Microsoft Project as the incorrectly identified incumbent.

      And incredibly, Microsoft has dominated the next era of productivity software with the “365” offerings. Yet, it froze the “Project” family of offerings and introduced the not-yet-functional “Project for the web.”

      Having a difficult time understanding what to do with, and about, Microsoft Project? You’re hardly alone. It’s not simply a question of tolerating, embracing, or rejecting the product: many who choose a competitor find they’re still paying for Microsoft Project-related licensing for years to come.

      If you’re in the Microsoft 365 ecosystem, use this research to understand your rapidly shifting landscape of options.

      (Barry Cousins, Project Portfolio Management Practice Lead, Info-Tech Research Group)

      Executive Summary

      Your Challenge

      You use Microsoft (MS) tools to manage your work, projects, and/or project portfolio.

      Their latest offering, Project for the web, is new and you’re not sure what to make of it. Microsoft says it will soon replace Microsoft Project and Project Online, but the new software doesn’t seem to do what the old software did.

      The organization has adopted M365 for collaboration and work management. Meetings happen on Teams, projects are scoped a bit with Planner, and the operations group uses Azure Boards to keep track of what they need to get done.

      Despite your reservations about the new project management software, Microsoft software has become even more ubiquitous.

      Common Obstacles

      M365 provides the basic components for managing tasks, projects, and project portfolios, but there is no instruction manual for making those parts work together.

      M365 isn’t the only set of tools at play. Business units and teams across the organization have procured other non-Microsoft tools for work management without involving IT.

      Microsoft’s latest project offering, Project for the web, is still evolving and you’re never sure if it is stable or ready for prime time. The missing function seems to involve the more sophisticated project planning disciplines, which are still important to larger, longer, and costlier projects.

      Common Obstacles

      Follow Info-Tech’s path in this blueprint to:

      • Perform a tool audit to trim your work management tool landscape.
      • Navigate the MS Project and M365 licensing landscape.
      • Make sense of what to do with Project for the web and take the right approach to rolling it out (i.e. DIY or MS Gold Partner driven) for your needs.
      • Create an action plan to inform next steps.

      After following the program in this blueprint, you will be prepared to advise the organization on how to best leverage the rapidly shifting work management options within M365 and the place of MS Project within it.

      M365 and, within it, O365 are taking over

      Accelerated partly by the pandemic and the move to remote work, Microsoft’s market share in the work productivity space has grown exponentially in the last two years.

      70% of Fortune 500 companies purchased 365 from Sept. 2019 to Sept. 2020. (Thexyz blog, 2020)

      In its FY21 Q2 report, Microsoft reported 47.5 million M365 consumer subscribers – an 11.2% increase from its FY20 Q4 reporting. (Office 365 for IT Pros, 2021)

      As of September 2020, there were 258,000,000 licensed O365 users. (Thexyz blog, 2020)

      In this blueprint, we’ll look at what the what the phenomenal growth of M365 means for PMOs and project portfolio practitioners who identify as Microsoft shops

      The market share of M365 warrants a fresh look at Microsoft’s suite of project offerings

      For many PMO and project portfolio practitioners, the footprint of M365 in their organizations’ work management cultures is forcing a renewed look at Microsoft’s suite of project offerings.

      The complicating factor is this renewed look comes at a transitional time in Microsoft’s suite of project and portfolio offerings.

      • The market dominance of MS Project Server and Project Online are wanning, with Microsoft promising the end-of-life for Online sometime in the coming years.
      • Project Online’s replacement, Project for the web, is a viable task management and lightweight project management tool, but its viability as a replacement for the rigor of Project Online is at present largely a question mark.
      • Related to the uncertainty and promise around Project for the web, the Dataverse and the Power Platform offer a glimpse into a democratized future of work management tools but anything specific about that future has yet to solidify.

      Microsoft Project has 66% market share in the project management tool space. (Celoxis, 2018)

      A copy of MS project is sold or licensed every 20 seconds. (Integent, 2013)

      MS Project is evolving to meet new work management realities

      It also evolved to not meet the old project management realities.

      • The lines between traditional project management and operational task management solutions are blurring as organizations struggle to keep up with demands.
      • To make the software easier to use, modern work management doesn’t involve the complexities from days past. You won’t find anywhere to introduce complex predecessor-successor relationships, unbalanced assignments with front-loading or back-loading, early-start/late-finish, critical path, etc.
      • “Work management” is among the latest buzzwords in IT consulting. With Project for the web (PFTW), Azure Boards, and Planner, Microsoft is attempting to compete with lighter and better-adopted tools like Trello, Basecamp, Asana, Wrike, and Monday.com.
      • Buyers of project and work management software have struggled to understand how PFTW will still be usable if it gets the missing project management function from MS Project.

      Info-Tech Insight

      Beware of the Software Granularity Paradox.

      Common opinion 1: “Plans and estimates that are granular enough to be believable are too detailed to manage and maintain.”

      Common opinion 2: “Plans simple enough to publish aren’t detailed enough to produce believable estimates.”

      In other words, software simple enough to get widely adopted doesn’t produce believable plans. Software that can produce believable plans is too complex to use at scale.

      A viable task and project management option must walk the line between these dichotomies.

      M365 gives you the pieces, but it’s on PMO users to piece them together in a viable way

      With the new MS Project and M365, it’s on PMOs to avoid the granularity paradox and produce a functioning solution that fits with the organization’s ways of working.

      Common perception still sees Microsoft Project as a rich software tool. Thus, when we consider the next generation of Microsoft Project, it’s easy to expect a newer and friendlier version of what we knew before.

      In truth, the new solution is a collection of partially integrated but largely disparate tools that each satisfy a portion of the market’s needs. While it looks like a rich collection of function when viewed through high-level requirements, users will find:

      • Overlaps, where multiple tools satisfy the same functional requirement (e.g. “assign a task”)
      • Gaps, where a tool doesn’t quite do enough and you’re forced to incorporate another tool (e.g. reverting back to Microsoft Project for advanced resource planning)
      • Islands, where tools don’t fluently talk to each other (e.g. Planner data integrated in real-time with portfolio data, which requires clunky, unstable, decentralized end-user integrations with Microsoft Power Automate)
      A colourful arrangement of Microsoft programs arranged around a pile of puzzle pieces.

      Info-Tech's approach

      Use our framework to best leverage the right MS Project offerings and M365 components for your organization’s work management needs.

      The Info-Tech difference:

      1. A simple to follow framework to help you make sense of a chaotic landscape.
      2. Practical and tactical tools that will help you save time.
      3. Leverage industry best practices and practitioner-based insights.
      An Info-Tech framework titled 'Determine the Future of Microsoft Project in Your Organization, subtitle 'View your task, project, and portfolio management options through the lens of Microsoft 365'. There are four main sections titled 'Background', 'Approaches', 'Deployments', and 'Portfolio Outcomes'. In '1) Background' are 'Analyze Content', 'Assess Constraints', and 'Determine Goals and Needs'. In '2) Approaches' are 'DIY: Are you ready to do it yourself?' 'Info-Tech: Can our analysts help?', and 'MS Gold Partner: Are you better off with a third party?'. In '3) Deployments' are five sections: 'Personal Task Management', Barriers to Portfolio Outcomes: Isolated to One Person. 'Team Task Management', Barriers to Portfolio Outcomes: Isolated to One Team. 'Project Portfolio Management', Barriers to Portfolio Outcomes: Isolated to One Project. 'Project Management', Barriers to Portfolio Outcomes: Functionally Incomplete. 'Enterprise Project and Portfolio Management', Barriers to Portfolio Outcomes: Underadopted. In '4) Portfolio Outcomes' are 'Informed Steering Committee', 'Increased Project Throughput', 'Improved Portfolio Responsiveness', 'Optimized Resource Utilization', and 'Reduced Monetary Waste'.

      Determine the Future of Microsoft Project in Your Organization

      View your task, project, and portfolio management options through the lens of Microsoft 365.

      1. Background

      • Analyze Content
      • Assess Constraints
      • Determine Goals and Needs

      2. Approaches

      • DIY – Are you ready to do it yourself?
      • Info-Tech – Can our analysts help?
      • MS Gold Partner – Are you better off with a third party?

      3. Deployments

        Task Management

      • Personal Task Management
        • Who does it? Knowledge workers
        • What is it? To-do lists
        • Common Approaches
          • Paper list and sticky notes
          • Light task tools
        • Applications
          • Planner
          • To Do
        • Level of Rigor 1/5
        • Barriers to Portfolio Outcomes: Isolated to One Person
      • Team Task Management
        • Who does it? Groups of knowledge workers
        • What is it? Collaborative to-do lists
        • Common Approaches
          • Kanban boards
          • Spreadsheets
          • Light task tools
        • Applications
          • Planner
          • Azure Boards
          • Teams
        • Level of Rigor 2/5
        • Barriers to Portfolio Outcomes: Isolated to One Team
      • Project Management

      • Project Portfolio Management
        • Who does it? PMO Directors, Portfolio Managers
        • What is it?
          • Centralized list of projects
          • Request and intake handling
          • Aggregating reporting
        • Common Approaches
          • Spreadsheets
          • PPM software
          • Roadmaps
        • Applications
          • Project for the Web
          • Power Platform
        • Level of Rigor 3/5
        • Barriers to Portfolio Outcomes: Isolated to One Project
      • Project Management
        • Who does it? Project Managers
        • What is it? Deterministic scheduling of related tasks
        • Common Approaches
          • Spreadsheets
          • Lists
          • PM software
          • PPM software
        • Applications
          • Project Desktop Client
        • Level of Rigor 4/5
        • Barriers to Portfolio Outcomes: Functionally Incomplete
      • Enterprise Project and Portfolio Management

      • Enterprise Project and Portfolio Management
        • Who does it? PMO and ePMO Directors, Portfolio Managers, Project Managers
        • What is it?
          • Centralized request and intake handling
          • Resource capacity management
          • Deterministic scheduling of related tasks
        • Common Approaches
          • PPM software
        • Applications
          • Project Online
          • Project Desktop Client
          • Project Server
        • Level of Rigor 5/5
        • Barriers to Portfolio Outcomes: Underadopted

      4. Portfolio Outcomes

      • Informed Steering Committee
      • Increased Project Throughput
      • Improved Portfolio Responsiveness
      • Optimized Resource Utilization
      • Reduced Monetary Waste

      Info-Tech's methodology for Determine the Future of MS Project for Your Organization

      1. Determine Your Tool Needs

      2. Weigh Your MS Project Implementation Options

      3. Finalize Your Implementation Approach

      Phase Steps

      1. Survey the M365 Work Management Tools
      2. Perform a Process Maturity Assessment to Help Inform Your M365 Starting Point
      3. Consider the Right MS Project Licenses for Your Stakeholders
      1. Get Familiar With Extending Project for the Web Using Power Apps
      2. Assess the MS Gold Partner Community
      1. Prepare an Action Plan

      Phase Outcomes

      1. Work Management Tool Audit
      2. MS Project and Power Platform Licensing Needs
      3. Project Management and Project Portfolio Management Maturity Assessment
      1. Project for the Web Readiness Assessment
      2. MS Gold Partner Outreach Plan
      1. MS Project and M365 Action Plan Presentation

      Insight Summary

      Overarching blueprint insight: Microsoft Parts Sold Separately. Assembly required.

      The various MS Project offerings (but most notably the latest, Project for the web) hold the promise of integrating with the rest of M365 into a unified work management solution. However, out of the box, Project for the web and the various platforms within M365 are all disparate utilities that need to be pieced together in a purpose-built manner to make use of them for holistic work management purposes.

      If you’re looking for a cohesive product out of the box, look elsewhere. If you’re looking to assemble a wide array of work, project, and portfolio management functions across different functions and departments, you may have found what you seek

      Phase 1 insight: Align your tool choice to your process maturity level.

      Rather than choosing tools based on your gaps, make sure to assess your current maturity level so that you optimize your investment in the Microsoft landscape.

      Phase 2 insight: Weigh your options before jumping into Microsoft’s new tech.

      Microsoft’s new Project plans (P1, P3, and P5) suggest there is a meaningful connection out of the box between its old tech (Project desktop, Project Server, and Project Online) and its new tech (Project for the web).

      However, the offerings are not always interoperable.

      Phase 3 insight: Keep the iterations small as you move ahead with trials and implementations.

      Organizations are changing as fast as the software we use to run them.

      If you’re implementing parts of this platform, keep the changes small as you monitor the vendors for new software versions and integrations.

      Blueprint deliverables

      Each step of this blueprint is accompanied by supporting deliverables to help you accomplish your goals:

      Key deliverable: Microsoft Project & M365 Action Plan Template

      The Action Plan will help culminate and present:

      • Context and Constraints
      • DIY Implementation Approach
      Or
      • MS Partner Implementation Approach
      • Future-State Vision and Goals
      Samples of Info-Tech's key deliverable 'Microsoft Project and M365 Action Plan Template'.

      Tool Audit Workbook

      Sample of Info-Tech deliverable 'Tool Audit Workbook'.

      Assess your organization's current work management tool landscape and determine what tools drive value for individual users and teams and which ones can be rationalized.

      Force Field Analysis

      Sample of Info-Tech deliverable 'Force Field Analysis'.

      Document the driving and resisting forces for making a change to your work management tools.

      Maturity Assessments

      Sample of Info-Tech deliverable 'Maturity Assessments'.

      Use these assessments to identify gaps in project management and project portfolio management processes. The results will help guide process improvement efforts and measure success and progress.

      Microsoft Project & M365 Licensing Tool

      Sample of Info-Tech deliverable 'Microsoft Project and M365 Licensing Tool'.

      Determine the best licensing options and approaches for your implementation of Microsoft Project.

      Curate your work management tools to harness valuable portfolio outcomes

      • Increase Project Throughput

        Do more projects by ensuring the right projects and the right amount of projects are approved and executed.
      • Support an Informed Steering Committee

        Easily compare progress of projects across the portfolio and enable the leadership team to make decisions.
      • Improve portfolio responsiveness

        Make the portfolio responsive to executive steering when new projects and changing priorities need rapid action.
      • Optimize Resource Utilization

        Assign the right resources to approved projects and minimize the chronic over-allocation of resources that leads to burnout.
      • Reduce Monetary Waste

        Terminate low-value projects early and avoid sinking additional funds into unsuccessful ventures.

      Info-Tech offers various levels of support to best suit your needs

      DIY Toolkit

      Guided Implementation

      Workshop

      Consulting

      "Our team has already made this critical project a priority, and we have the time and capability, but some guidance along the way would be helpful." "Our team knows that we need to fix a process, but we need assistance to determine where to focus. Some check-ins along the way would help keep us on track." "We need to hit the ground running and get this project kicked off immediately. Our team has the ability to take this over once we get a framework and strategy in place." "Our team does not have the time or the knowledge to take this project on. We need assistance through the entirety of this project."

      Diagnostics and consistent frameworks used throughout all four options

      Guided Implementation

      What does a typical GI on this topic look like?

      A Guided Implementation (GI) is a series of calls with an Info-Tech analyst to help implement our best practices in your organization.

      A typical GI is between 6 to 8 calls over the course of 3 to 4 months.

        Introduction

      • Call #1: Scope requirements, objectives, and your specific challenges.
      • Phase 1

      • Call #2: Explore the M365 work management landscape.
      • Call #3: Discuss Microsoft Project Plans and their capabilities.
      • Call #4: Assess current-state maturity.
      • Phase 2

      • Call #5: Get familiar with extending Project for the web using Power Apps.
      • Call #6: Assess the MS Gold Partner Community.
      • Phase 3

      • Call #7: Determine approach and deployment.
      • Call #8: Discuss action plan.

      Workshop Overview

      Contact your account representative for more information.
      workshops@infotech.com 1-888-670-8889

      Day 1
      Assess Driving Forces and Risks

      Day 2
      Determine Tool Needs and Process Maturity

      Day 3
      Weigh Your Implementation Options

      Day 4
      Finalize Implementation Approach

      Day 5
      Next Steps and Wrap-Up (offsite)

      Activities

      • 1.1 Review the business context.
      • 1.2 Explore the M365 work management landscape.
      • 1.3 Identify driving forces for change.
      • 1.4 Analyze potential risks.
      • 1.5 Perform current-state analysis on work management tools.
      • 2.1 Review tool audit dashboard and conduct the final audit.
      • 2.2 Identify current Microsoft licensing.
      • 2.3 Assess current-state maturity for project management.
      • 2.4 Define target state for project management.
      • 2.5 Assess current-state maturity for project portfolio management.
      • 2.6 Define target state for project portfolio management.
      • 3.1 Prepare a needs assessment for Microsoft 365 and Project Plan licenses.
      • 3.2 Review the business case for Microsoft licensing.
      • 3.3 Get familiar with Project for the web.
      • 3.4 Assess the MS Gold Partner Community.
      • 3.5 Conduct a feasibility test for PFTW.
      • 4.1 Decide on the implementation approach.
      • 4.2 Identify the audience for your proposal.
      • 4.3 Determine timeline and assign accountabilities.
      • 4.4 Develop executive summary presentation.
      • 5.1 Complete in-progress deliverables from previous four days.
      • 5.2 Set up review time for workshop deliverables and to discuss next steps.

      Deliverables

      1. Force Field Analysis
      2. Tool Audit Workbook
      1. Tool Audit Workbook
      2. Project Management Maturity Assessment
      3. Portfolio Management Maturity Assessment
      1. Microsoft Project and M365 Licensing Tool
      1. Microsoft Project & M365 Action Plan
      1. Microsoft Project & M365 Action Plan

      Determine the Future of Microsoft Project for Your Organization

      Phase 1: Determine Your Tool Needs

      Phase 1: Determine Your Tool Needs

      Phase 2: Weigh Your Implementation Options Phase 3: Finalize Your Implementation Approach
      • Step 1.1: Survey the M365 work management landscape
      • Step 1.2: Explore the Microsoft Project Plans and their capabilities
      • Step 1.3: Assess the maturity of your current PM & PPM capabilities
      • Step 2.1: Get familiar with extending Project for the web using Power Apps
      • Step 2.2: Assess the MS Gold Partner Community
      • Step 3.1: Prepare an action plan

      Phase Outcomes

      • Tool Audit
      • Microsoft Project Licensing Analysis
      • Project Management Maturity Assessment
      • Project Portfolio Management Maturity Assessments

      Step 1.1

      Survey the M365 Work Management Landscape

      Activities

      • 1.1.1 Distinguish between task, project, and portfolio capabilities
      • 1.1.2 Review Microsoft’s offering for task, project, and portfolio management needs
      • 1.1.4 Assess your organizational context and constraints
      • 1.1.3 Explore typical deployment options

      This step will walk you through the following activities:

      • Assessing your organization’s context for project and project portfolio management
      • Documenting the organization’s constraints
      • Establishing the organization’s goals and needs

      This step involves the following participants:

      • PMO Director
      • Resource Managers
      • Project Managers
      • Knowledge Workers

      Outcomes of Step

      • Knowledge of the Microsoft ecosystem as it relates to task, project, and portfolio management
      • Current organizational context and constraints

      Don’t underestimate the value of interoperability

      The whole Microsoft suite is worth more than the sum of its parts … if you know how to put it together.

      38% of the worldwide office suite market belongs to Microsoft. (Source: Statistica, 2021)

      1 in 3 small to mid-sized organizations moving to Microsoft Project say they are doing so because it integrates well with Office 365. (Source: CBT Nuggets, 2018)

      There’s a gravity to the Microsoft ecosystem.

      And while there is no argument that there are standalone task management tools, project management tools, or portfolio management tools that are likely more robust, feature-rich, and easier to adopt, it’s rare that you find an ecosystem that can do it all, to an acceptable level.

      That is the value proposition of Microsoft: the ubiquity, familiarity, and versatility. It’s the Swiss army knife of software products.

      The work management landscape is evolving

      With M365, Microsoft is angling to become the industry leader, and your organization’s hub, for work management.

      Workers lose up to 40% of their time multi-tasking and switching between applications. (Bluescape, 2018)

      25 Context switches – On average, workers switch between 10 apps, 25 times a day. (Asana, 2021)

      “Work management” is among the latest buzzwords in IT consulting.

      What is work management? It was born of a blurring of the traditional lines between operational or day-to-day tasks and project management tasks, as organizations struggle to keep up with both operational and project demands.

      To make the software easier to use, modern work management doesn’t involve the complexities from days past. You won’t find anywhere to introduce complex predecessor-successor relationships, unbalanced assignments with front-loading or back-loading, early-start/late-finish, critical path, etc.

      Indeed, with Project for the web, Azure Boards, Planner, and other M365 utilities, Microsoft is attempting to compete with lighter and better-adopted tools (e.g. Trello, Wike, Monday.com).

      The Microsoft world of work management can be understood across three broad categories

      1. Task Management

        Task management is essentially the same as keeping track of a to-do list. While you can have a project-related task, you can also have a non-project-related task. The sum of project and non-project tasks make up the work that you need to complete.
      2. Project Management

        Project management (PM) is a methodical approach to planning and guiding project processes from start to finish. Implementing PM processes helps establish repeatable steps and controls that enable project success. Documentation of PM processes leads to consistent results and dependable delivery on expectations.
      3. Portfolio Management

        Project portfolio management (PPM) is a strategic approach to approving, prioritizing, resourcing, and reporting on project. In addition, effective PPM should nurture the completion of projects in the portfolio in the most efficient way and track the extent to which the organization is realizing the intended benefits from completed projects.

      The slides ahead explain each of these modes of working in the Microsoft ecosystem in turn. Further, Info-Tech’s Task, Project, and Project Portfolio Management Tool Guides explain these areas in more detail.

      Use Info-Tech’s Tool Guides assess your MS Project and M365 work management options

      Lean on Info-Tech’s Tool Guides as you navigate Microsoft’s tasks management, project management, and project portfolio management options.

      • The slides ahead take you through a bird’s-eye view of what your MS Project and M365 work management options look like across Info-Tech’s three broad categories
      • In addition to these slides, Info-Tech has three in-depth tool guides that take you through your operational task management, project management, and project portfolio management options in MS Project and M365.
      • These tool guides can be leveraged as you determine whether Microsoft has the required toolset for your organization’s task, project, and project portfolio management needs.

      Download Info-Tech’s Task Management, Project Management, and Project Portfolio Management Tool Guides

      Task Management Overview

      What is task management?

      • It is essentially the same as keeping track of a to-do list. While you can have a project-related task, you can also have a non-project-related task. The sum of project and non-project tasks make up the work that you need to complete.

      What are the benefits of task management using applications within the MS suite?

      • Many organizations already own the tools and don't have to go out and buy something separately.
      • There is easy integration with other MS applications.

      What is personal task management?

      • Tools that allow you to structure work that is visible only to you. This can include work from tasks you are going to be completing for yourself and tasks you are completing as part of a larger work effort.

      What is team task management?

      • Tools that allow users to structure work that is visible to a group. When something is moved or changed, it affects what the group is seeing because it is a shared platform.

      Get familiar with the Microsoft product offerings for task management

      A diagram of Microsoft products and what they can help accomplish. It starts on the right with 'Teams' and 'Outlook'. Both can flow through to 'Personal Task Management' with products 'Teams Tasks' and 'To-Do', but Teams also flows into 'Team Task Management' with products 'Planner' and 'Project for the web'. See the next two slides for more details on these modes of working.

      Download the M365 Task Management Tool Guide

      Personal Task Management

      The To-Do list

      • Who does it?
        • Knowledge workers
      • What is it?
        • How each knowledge worker organizes their individual work tasks in M365
      • When is it done?
        • As needed throughout the day
      • Where is it done?
        • Paper
        • Digital location
      • How is it done?
        • DIY and self-developed
        • Usually not repeatable and evolves depending on work location and tools available
        • Not governed

      Microsoft differentiator:

      Utilities like Planner and To-Do make it easier to turn what are often ad hoc approaches into a more repeatable process.

      Team Task Management

      The SharedTo-Do list

      • Who does it?
        • Groups of knowledge workers
      • What is it?
        • Temporary and permanent collections of knowledge workers
      • When is it done?
        • As needed or on a pre-determined cadence
      • Where is it done?
        • Paper
        • Digital location
      • How is it done?
        • User norms are established organically and adapted based upon the needs of the team.
        • To whatever extent processes are repeatable in the first place, they remain repeatable only if the team is a collective.
        • Usually governed within the team and not subject to wider visibility.

      Microsoft differentiator:

      Teams has opened personal task management tactics up to more collaborative approaches.

      Project Management Overview

      2003

      Project Server: This product serves many large enterprise clients, but Microsoft has stated that it is at end of life. It is appealing to industries and organizations where privacy is paramount. This is an on-premises system that combines servers like SharePoint, SQL, and BI to report on information from Project Desktop Client. To realize the value of this product, there must be adoption across the organization and engagement at the project-task level for all projects within the portfolio.

      2013

      Project Online: This product serves many medium enterprise clients. It is appealing for IT departments who want to get a rich set of features that can be used to intake projects, assign resources, and report on project portfolio health. It is a cloud solution built on the SharePoint platform, which provides many users a sense of familiarity. However, due to the bottom-up reporting nature of this product, again, adoption across the organization and engagement at the project task level for all projects within the portfolio is critical.

      2020

      Project for the web: This product is the newest on the market and is quickly being evolved. Many O365 enthusiasts have been early adopters of Project for the web despite its limited features when compared to Project Online. It is also a cloud solution that encourages citizen developers by being built on the MS Power Platform. This positions the product well to integrate with Power BI, Power Automate, and Power Apps. It is, so far, the only MS product that lends itself to abstracted portfolio management, which means it doesn’t rely on project task level engagement to produce portfolio reports. The portfolio can also run with a mixed methodology by funneling Project, Azure Boards, and Planner boards into its roadmap function.

      Get familiar with the Microsoft product offerings for project management

      A diagram of Microsoft products and what they can help accomplish in Personal and Team Project Management. Products listed include 'Project Desktop Client', 'Project Online', 'SharePoint', 'Power Platform', 'Azure DevOps', 'Project for the web', Project Roadmap', 'Project Home', and 'Project Server'. See the next slide for more details on personal and team project management as modes of working.

      Download the M365 Project Management Tool Guide

      Project Management

      Orchestrating the delivery of project work

      • Who does it?
        • Project managers
      • What is it?
        • Individual project managers developing project plans and schedules in the MS Project Desktop Client
      • When is it done?
        • Throughout the lifecycle of the project
      • Where is it done?
        • Digital location
      • How is it done?
        • Used by individual project managers to develop and manage project plans.
        • Common approaches may or may not involve reconciliation of resource capacity through integration with Active Directory.
        • Sometimes usage norms are established by organizational project management governance standards, though individual use of the desktop client is largely ungoverned.

      Microsoft differentiator:

      For better or worse, Microsoft’s core solution is veritably synonymous with project management itself and has formally contributed to the definition of the project management space.

      Project Portfolio Management Overview

      Optimize what you’re already using and get familiar with the Power Platform.

      What does PPM look like within M365?

      • The Office suite in the Microsoft 365 suite boasts the world’s most widely used application for the purposes of abstracted and strategic PPM: Excel. For the purposes of PPM, Excel is largely implemented in a suboptimal fashion, and as a result, organizations fail to gain PPM adoption and maturation through its use.
      • Until very recently, Microsoft toolset did not explicitly address abstracted PPM needs.
      • However, with the latest version of M365 and Project for the web, Microsoft is boasting of renewed PPM capabilities from its toolset. These capabilities are largely facilitated through what Microsoft is calling its Power Platform (i.e. a suite of products that includes Power, Power Apps, and Power Automate).

      Explore the Microsoft product offering for abstracted project portfolio management

      A diagram of Microsoft products for 'Adaptive or Abstracted Portfolio Management'. Products listed include 'Excel', 'MS Lists', 'Forms', 'Teams', and the 'Power Platform' products 'Power BI', 'Power Apps', and 'Power Automate'. See the next slide for more details on adaptive or abstracted portfolio management as a mode of working.

      Download the M365 Project Portfolio Management Tool Guide

      Project Portfolio Management

      Doing the right projects, at the right time, with the right resources

      • Who does it?
        • PMO directors; portfolio managers
      • What is it?
        A strategic approach to approving, prioritizing, resourcing, and reporting on projects using applications in M365 and Project for the web. In distinction to enterprise PPM, a top-down or abstracted approach is applied, meaning PPM data is not tied to project task details.
      • Where is it done?
        • Digital tool, either homegrown or commercial
      • How is it done?
        • Currently in M365, PPM approaches are largely self-developed, though Microsoft Gold Partners are commonly involved.
        • User norms are still evolving, along with the software’s (Project for the web) function.

      Microsoft differentiator:

      Integration between Project for the web and Power Apps allows for custom approaches.

      Project Portfolio Management Overview

      Microsoft’s legacy project management toolset has contributed to the definition of traditional or enterprise PPM space.

      A robust and intensive bottom-up approach that requires task level roll-ups from projects to inform portfolio level data. For this model to work, reconciliation of individual resource capacity must be universal and perpetually current.

      If your organization has low or no maturity with PPM, this approach will be tough to make successful.

      In fact, most organizations under adopt the tools required to effectively operate with the traditional project portfolio management. Once adopted and operationalized, this combination of tools gives the executives the most precise view of the current state of projects within the portfolio.

      Explore the Microsoft product offering for enterprise project portfolio management

      A diagram of Microsoft products for 'Enterprise or Traditional Portfolio Management'. Products listed include 'Project Desktop Client', 'SharePoint', 'Project Online', 'Azure DevOps', 'Project Roadmaps', and 'Project Home'. See the next slide for more details on this as a mode of working.

      Download the M365 Project Portfolio Management Tool Guide

      Enterprise Project and Portfolio Management

      Bottom-up approach to managing the project portfolio

      • Who does it?
        • PMO and ePMO directors; portfolio managers
        • Project managers
      • What is it?
        • A strategic approach to approving, prioritizing, resourcing, and reporting on projects using applications in M365 and Project for the web. In distinction to enterprise PPM, a top-down or abstracted approach is applied, meaning PPM data is not tied to project task details.
      • Where is it done?
        • Digital tool that is usually commercial.
      • How is it done?
        • Microsoft Gold Partner involvement is highly likely in successful implementations.
        • Usage norms are long established and customized solutions are prevalent.
        • To be successful, use must be highly governed.
        • Reconciliation of individual resource capacity must be universal and perpetually current.

      Microsoft differentiator:

      Microsoft’s established network of Gold Partners helps to make this deployment a viable option.

      Assess your current tool ecosystem across work management categories

      Use Info-Tech’s Tool Audit Workbook to assess the value and satisfaction for the work management tools currently in use.

      • With the modes of working in mind that have been addressed in the previous slides and in Info-Tech’s Tool Guides, the activity slides ahead encourage you to engage your wider organization to determine all of the ways of working across individuals and teams.
      • Depending on the scope of your work management optimization, these engagements may be limited to IT or may extend to the business.
      • Use Info-Tech’s Tool Audit Workbook to help you gather and make sense of the tool data you collect. The result of this activity is to gain insight into the tools that drive value and fail to drive value across your work management categories with a view to streamline the organization’s tool ecosystem.

      Download Info-Tech’s Tool Audit Workbook

      Sample of Info-Tech's Tool Audit Workbook.

      1.2.1 Compile list of tools

      1-3 hours

      Input: Information on tools used to complete task, project, and portfolio tasks

      Output: Analyzed list of tools

      Materials: Whiteboard/Flip Charts, Tool Audit Workbook

      Participants: Portfolio Manager (PMO Director), PMO Admin Team, Project Managers, Business Stakeholders

      1. Identify the stakeholder groups that are in scope. For each group that you’ve identified, brainstorm the different tools and artifacts that are necessary to get the task, project, and project portfolio management functions done.
      2. Make sure to record the tool name and specify its category (standard document, artifact, homegrown solution, or commercial solution).
      3. Think about and discuss how often the tool is being used for each use case across the organization. Document whether its use is required. Then assess reporting functionality, data accuracy, and cost.
      4. Lastly, give a satisfaction rating for each use case.

      Excerpt from the Tool Audit Workbook

      Excerpt from Info-Tech's Tool Audit Workbook on compiling tools.

      1.2.1 Review dashboard

      1-3 hours

      Input: List of key PPM decision points, List of who is accountable for PPM decisions, List of who has PPM decision-making authority

      Output: Prioritized list of PPM decision-making support needs

      Materials: Whiteboard/Flip Charts, Tool Audit Workbook

      Participants: Portfolio Manager (PMO Director), PMO Admin Team, CIO

      Discuss the outputs of the Dashboards tab to inform your decision maker on whether to pass or fail the tool for each use case.

      Sample of a BI dashboard used to evaluate the usefulness of tools. Written notes include: 'Slice the data based on stakeholder group, tool, use case, and category', and 'Review the results of the questionnaire by comparing cost and satisfaction'.

      1.2.1 Execute final audit

      1 hour

      Input: List of key PPM decision points, List of who is accountable for PPM decisions, List of who has PPM decision-making authority

      Output: Prioritized list of PPM decision-making support needs

      Materials: Whiteboard/Flip Charts, Tool Audit Workbook

      Participants: Portfolio Manager (PMO Director), PMO Admin Team, CIO

      1. Using the information available, schedule time with the leadership team to present the results.
      2. Identify the accountable party to make the final decision on what current tools pass or fail the final audit.
      3. Mind the gap presented by the failed tools and look to possibilities within the M365 and Microsoft Project suite. For each tool that is deemed unsatisfactory for the future state, mark it as “Fail” in column O on tab 2 of the Tool Audit Workbook. This will ensure the item shows in the “Fail” column on tab 4 of the tool when you refresh the data.
      4. For each of the tools that “fail” your audit and that you’re going to make recommendations to rationalize in a future state, try to capture the annual total current-state spending on licenses, and the work modes the tool currently supports (i.e. task, project, and/or portfolio management).
      5. Additionally, start to think about future-state replacements for each tool within or outside of the M365/MS Project platforms. As we move forward to finalize your action plan in the last phase of this blueprint, we will capture and present this information to key stakeholders.

      Document your goals, needs, and constraints before proceeding

      Use Info-Tech’s Force Field Analysis Tool to help weigh goals and needs against risks and constraints associated with a work management change.

      • Now that you have discussed the organization’s ways of working and assessed its tool landscape – and made some initial decisions on some tool options that might need to change across that landscape – gather key stakeholders to define (a) why a change is needed at this time and (b) to document some of the risks and constraints associated with changing.
      • Info-Tech’s Force Field Analysis Tool can be used to capture these data points. It takes an organizational change management approach and asks you to consider the positive and negative forces associated with a work management tool change at this time.
      • The slides ahead walk you through a force field analysis activity and help you to navigate the relevant tabs in the Tool.

      Download Info-Tech's Force Field Analysis Tool

      Sample of Info-Tech's Force Field Analysis Tool.

      1.2.1 Identify goals and needs (1 of 2)

      Use tab 1 of the Force Field Analysis Workbook to assess goals and needs.

      30 minutes

      Input: Opportunities associated with determining the use case for Microsoft Project and M365 in your organization

      Output: Plotted opportunities based on probability and impact

      Materials: Whiteboard/Flip Charts, Force Field Analysis Tool

      Participants: Portfolio Manager (PMO Director), PMO Admin Team, Project Managers

      1. Brainstorm opportunities associated with exploring and/or implementing Microsoft Project and the Microsoft 365 suite of products for task, project, and project portfolio management.
      2. Document relevant opportunities in tab 1 of the Force Field Analysis Tool. For each driving force for the change (note: a driving force can include goals and needs) that is identified, provide a category that explains why the driving force is a concern (i.e. with this force is the organization looking to mature, integrate, scape, or accelerate?).
      3. In addition, assess the ease of achieving or realizing each goal or need and the impact of realizing them on the PMO and/or the organization.
      4. See the next slide for a screenshot that helps you navigate tab 1 of the Tool.

      Download the Force Field Analysis Tool

      1.2.1 Identify goals and needs (2 of 2)

      Screenshot of tab 1 of the Force Field Analysis Workbook.

      Screenshot of tab 1 of the Force Field Analysis Workbook. There are five columns referred to as columns B through F with the headings 'Opportunities', 'Category', 'Source', 'Ease of Achieving', and 'Impact on PMO/Organization'.

      In column B on tab 1, note the specific opportunities the group would like to call out.

      In column C, categorize the goal or need being articulated by the list of drop-down options: will it accelerate the time to benefit? Will it help to integrate systems and data sources? Will it mature processes and the organization overall? Will it help to scale across the organization? Choose the option that best aligns with the opportunity.

      In column D, categorize the source of the goal or need as internal or external.

      In column E, use the drop-down menus to indicate the ease of realizing each goal or need for the organization. Will it be relatively easy to manifest or will there be complexities to implementing it?

      In column F, use the drop-down menus to indicate the positive impact of realizing or achieving each need on the PMO and/or the organization.

      On tab 3 of the Force Field Analysis Workbook, your inputs on tab 1 are summarized in graphical form from columns B to G. On tab 3, these goals and needs results are contrasted with your inputs on tab 2 (see next slide).

      1.2.2 Identify risk and constraints (1 of 2)

      Use tab 2 of the Force Field Analysis Workbook to assess opposing forces to change.

      30 minutes

      Input: Risks associated with determining the use case for Microsoft Project and M365 in your organization

      Output: Plotted risks based on probability and impact

      Materials: Whiteboard/Flip Charts, Force Field Analysis Tool

      Participants: Portfolio Manager (PMO Director), PMO Admin Team, Project Managers

      1. With the same working group from 1.2.1, brainstorm risks, constraints, and other opposing forces pertaining to your potential future state.
      2. Document relevant opposing forces in tab 2 of the Force Field Analysis Tool. For each opposing force for the change (note: a driving force can include goals and needs) that is identified, provide a category that explains why the opposing force is a concern (i.e. will it impact or is it impacted by time, resources, maturity, budget, or culture?).
      3. In addition, assess the likelihood of the risk or constraint coming to light and the negative impact of it coming to light for your proposed change.
      4. See the next slide for a screenshot that helps you navigate tab 2 of the Force Field Analysis Tool.

      Download the Force Field Analysis Tool

      1.2.2 Identify risk and constraints (2 of 2)

      Screenshot of tab 2 of the Force Field Analysis Workbook.

      Screenshot of tab 2 of the Force Field Analysis Workbook. There are five columns referred to as columns B through F with the headings 'Risks and Constraints', 'Category', 'Source', 'Likelihood of Constraint/Risk/Resisting Force Being Felt', and 'Impact to Derailing Goals and Needs'.

      In column B on tab 2, note the specific risks and constraints the group would like to call out.

      In column C, categorize the risk or constraint being articulated by the list of drop-down options: will it impact or is it impacted by time, resources, budget, culture or maturity?

      In column D, categorize the source of the goal or need as internal or external.

      In column E, use the drop-down menus to indicate the likelihood of each risk or constraint materializing during your implementation. Will it definitely occur or is there just a small chance it could come to light?

      In column F, use the drop-down menus to indicate the negative impact of the risk or constraint to achieving your goals and needs.

      On tab 3 of the Force Field Analysis Workbook, your inputs on tab 2 are summarized in graphical form from columns I to N. On tab 3, your risk and constraint results are contrasted with your inputs on tab 1 to help you gauge the relative weight of driving vs. opposing forces.

      Step 1.2

      Explore the Microsoft Project Plans and their capabilities

      Activities

      • 1.1.1 Review the Microsoft 365 licensing features
      • 1.1.2 Explore the Microsoft Project Plan licenses
      • 1.1.3 Prepare a needs assessment for Microsoft 365 and Project Plan licenses

      This step will walk you through the following activities:

      • Review the suite of task management, project management, and project portfolio management options available in Microsoft 365.
      • Prepare a preliminary checklist of required M365 apps for your stakeholders.

      This step usually involves the following participants:

      • PMO/Portfolio Manager
      • Project Managers
      • CIO and other executive stakeholders
      • Other project portfolio stakeholders (project and IT workers)

      Outcomes of Step

      • Preliminary requirements for an M365 project management and project portfolio management tool implementation

      Microsoft recently revamped its project plans to balance its old and new tech

      Access to the new tech, Project for the web, comes with all license types, while Project Online Professional and Premium licenses have been revamped as P3 and P5.

      Navigating Microsoft licensing is never easy, and Project for the web has further complicated licensing needs for project professionals.

      As we’ll cover in step 2.1 of this blueprint, Project for the web can be extended beyond its base lightweight work management functionality using the Power Platform (Power Apps, Power Automate, and Power BI). Depending on the scope of your implementation, this can require additional Power Platform licensing.

      • In this step, we will help you understand the basics of what’s already included in your enterprise M365 licensing as well as what’s new in Microsoft’s recent Project licensing plans (P1, P3, and P5).
      • As we cover toward the end of this step, you can use Info-Tech’s MS Project and M365 Licensing Tool to help you understand your plan and licensing needs. Further assistance on licensing can be found in the Task, Project, and Portfolio Management Tool Guides that accompany this blueprint and Info-Tech’s Modernize Your Microsoft Licensing for the Cloud Era.

      Download Info-Tech’s Modernize Your Microsoft Licensing for the Cloud Era

      Licensing features for knowledge workers

      Please note that licensing packages are frequently subject to change. This is up to date as of August 2021. For the most up-to-date information on licensing, visit the Microsoft website.

      Bundles are extremely common and can be more cost effective than à la carte options for the Microsoft products.

      The biggest differentiator between M365 and O365 is that the M365 product also includes Windows 10 and Enterprise Mobility and Security.

      The color coding in the diagram indicates that the same platform/application suite is available.

      Platform or Application M365 E3 M365 E5 O365 E1 O365 E3 O365 E5
      Microsoft Forms X X X X X
      Microsoft Lists X X X X X
      OneDrive X X X X X
      Planner X X X X X
      Power Apps for Office 365 X X X X X
      Power Automate for Office X X X X X
      Power BI Pro X X
      Power Virtual Agents for Teams X X X X X
      SharePoint X X X X X
      Stream X X X X X
      Sway X X X X X
      Teams X X X X X
      To Do X X X X X

      Get familiar with Microsoft Project Plan 1

      Please note that licensing packages are frequently subject to change. This is up to date as of August 2021. For the most up to date information on licensing, visit the Microsoft website.

      Who is a good fit?

      • New project managers
      • Zero-allocation project managers
      • Individuals and organizations who want to move out of Excel into something less fragile (easily breaking formulas)

      What does it include?

      • Access to Project Home, a landing page to access all project plans you’ve created or have been assigned to.
      • Access to Grid View, Board View, and Timeline (Gantt) View to plan and manage your projects with Project for the web
      • Sharing Project for the web plans across Microsoft Teams channels
      • Co-authoring on project plans

      When does it make sense?

      • Lightweight project management
      • No process to use bottom-up approach for resourcing data
      • Critical-path analysis is not required
      • Organization does not have an appetite for project management rigor

      Get familiar with Microsoft Project Plan 3

      Please note that licensing packages are frequently subject to change. This is up to date as of August 2021. For the most up to date information on licensing, visit the Microsoft website.

      Who is a good fit?

      • Experienced and dedicated project managers
      • Organizations with complex projects
      • Large project teams are required to complete project work
      • Organizations have experience using project management software

      What does it include?

      Everything in Project Plan 1 plus the following:

      • Reporting through Power BI Report template apps (note that there are no pre-built reports for Project for the web)
      • Access to build a Roadmap of projects from Project for the web and Azure DevOps with key milestones, statuses, and deadlines
      • Project Online to submit and track timesheets for project teams
      • MS Project Desktop Client to support resource management

      When does it make sense?

      • Project management is an established discipline at the organization
      • Critical-path analysis is commonly used
      • Organization has some appetite for project management rigor
      • Resources are expected to submit timesheets to allow for more precise resource management data

      Get familiar with Microsoft Project Plan 5

      Please note that licensing packages are frequently subject to change. This is up to date as of August 2021. For the most up to date information on licensing, visit the Microsoft website.

      Who is a good fit?

      • Experienced and dedicated project managers
      • Experienced and dedicated PMO directors
      • Dedicated portfolio managers
      • Organizations proficient at sustaining data in a standard tool

      What does it include?

      Everything in Project Plan 3 plus the following:

      • Portfolio selection and optimization
      • Demand management
      • Enterprise resource planning and management through deterministic task and resource scheduling
      • MS Project Desktop Client to support resource management

      When does it make sense?

      • Project management is a key success factor at the organization
      • Organization employs a bottom-up approach for resourcing data
      • Critical-path analysis is required
      • Formal project portfolio management processes are well established
      • The organization is willing to either put in the time, energy, and resources to learn to configure the system through DIY or is willing to leverage a Microsoft Partner to help them do so

      What’s included in each plan (1 of 2)

      Plan details are up to date as of September 2021. Plans and pricing can change often. Visit the Microsoft website to validate plan options and get pricing details.
      MS Project Capabilities Info-Tech's Editorial Description P1 P3 P5
      Project Home Essentially a landing page that allows you to access all the project plans you've created or that you're assigned to. It amalgamates plans created in Project for the web, the Project for the web app in Power Apps, and Project Online. X X X
      Grid view One of three options in which to create your project plans in Project for the web (board view and timeline view are the other options). You can switch back and forth between the options. X X X
      Board view One of three options in which to create your project plans in Project for the web (grid view and timeline view are the other options). You can switch back and forth between the options. X X X
      Timeline (Gantt) view One of three options in which to create your project plans in Project for the web (board view and grid view are the other options). You can switch back and forth between the options. X X X
      Collaboration and communication This references the ability to add Project for the web project plans to Teams channels. X X X
      Coauthoring Many people can have access to the same project plan and can update tasks. X X X
      Project planning and scheduling For this the marketing lingo says "includes familiar scheduling tools to assign project tasks to team members and use different views like Grid, Board, and Timeline (Gantt chart) to oversee the schedule." Unclear how this is different than the project plans in the three view options above. X X X

      X - Functionality Included in Plan

      O - Functionality Not Included in Plan

      What’s included in each plan (2 of 2)

      Plan details are up to date as of September 2021. Plans and pricing can change often. Visit the Microsoft website to validate plan options and get pricing details.
      MS Project Capabilities Info-Tech's Editorial Description P1 P3 P5
      Reporting This seems to reference Excel reports and the Power BI Report Template App, which can be used if you're using Project Online. There are no pre-built reports for Project for the web, but third-party Power Apps are available. O X X
      Roadmap Roadmap is a platform that allows you to take one or more projects from Project for the web and Azure DevOps and create an organizational roadmap. Once your projects are loaded into Roadmap you can perform additional customizations like color status reporting and adding key days and milestones. O X X
      Timesheet submission Project Online and Server 2013 and 2016 allow team members to submit timesheets if the functionality is required. O X X
      Resource management The rich MS Project client supports old school, deterministic project scheduling at the project level. O X X
      Desktop client The full desktop client comes with P3 and P5, where it acts as the rich editor for project plans. The software enjoys a multi-decade market dominance as a project management tool but was never paired with an enterprise collaboration server engine that enjoyed the same level of success. O X X
      Portfolio selection and optimization Portfolio selection and optimization has been offered as part of the enterprise project and portfolio suite for many years. Most people taking advantage of this capability have used a Microsoft Partner to formalize and operationalize the feature. O O X
      Demand Management Enterprise demand management is targeted at the most rigorous of project portfolio management practices. Most people taking advantage of this capability have used a Microsoft Partner to formalize and operationalize the feature. O O X
      Enterprise resource planning and management The legacy MS Project Online/Server platform supports enterprise-wide resource capacity management through an old-school, deterministic task and resource scheduling engine, assuming scaled-out deployment of Active Directory. Most people succeeding with this capability have used a Microsoft Partner to formalize and operationalize the feature. O O X

      X - Functionality Included in Plan

      O - Functionality Not Included in Plan

      Use Info-Tech’s MS Project and M365 Licensing Tool

      Leverage the analysis in Info-Tech’s MS Project & M365 Licensing Tool to help inform your initial assumptions about what you need and how much to budget for it.

      • The Licensing Tool can help you determine what Project Plan licensing different user groups might need as well as additional Power Platform licensing that may be required.
      • It consists of four main tabs: two set-up tabs where you can validate the plan and pricing information for M365 and MS Project; an analysis tab where you set up your user groups and follow a survey to assess their Project Plan needs; and another analysis tab where you can document your Power Platform licensing needs across your user groups.
      • There is also a business case tab that breaks down your total licensing needs. The outputs of this tab can be used in your MS Project & M365 Action Plan Template, which we will help you develop in phase three of this blueprint.

      Download Info-Tech's Microsoft Project & M365 Licensing Tool

      Sample of Info-Tech's Microsoft Project and M365 Licensing Tool.

      1.2.1 Conduct a needs assessment

      1-2 hours

      Input: List of key user groups/profiles, Number of users and current licenses

      Output: List of Microsoft applications/capabilities included with each license, Analysis of user group needs for Microsoft Project Plan licenses

      Materials: Microsoft Project & 365 Licensing Tool

      Participants: Portfolio Manager (PMO Director), PMO Admin Team, Project Managers

      1. As a group, analyze the applications included in your current or desired 365 license and calculate any additional Power Platform licensing needs.
      2. Screenshot of the 'Application/Capabilities' screen from the 'Microsoft Project and M365 Licensing Tool'.
      3. Within the same group, use the drop-down menus to analyze your high-level MS Project requirements by selecting whether each capability is necessary or not.
      4. Your inputs to the needs assessment will determine the figures in the Business Case tab. Consider exporting this information to PDF or other format to distribute to stakeholders.
      5. Screenshot of the 'Business Case' tab from the 'Microsoft Project and M365 Licensing Tool'.

      Download Info-Tech's Microsoft Project & M365 Licensing Tool

      Step 1.3

      Assess the maturity of your current PM & PPM capabilities

      Activities

      • Assess current state project and project portfolio management processes and tools
      • Determine target state project and project portfolio management processes and tools

      This step will walk you through the following activities:

      • Assess current state project and project portfolio management processes and tools
      • Determine target state project and project portfolio management processes and tools

      This step usually involves the following participants:

      • PMO/Portfolio Manager
      • Project Managers
      • CIO and other executive stakeholders
      • Other project portfolio stakeholders (project and IT workers)

      Outcomes of Step

      • Current and target state maturity for project management and project portfolio management processes

      Project portfolio management and project management are more than tools

      Implementing commercial tools without a matching level of process discipline is a futile exercise, leaving organizations frustrated at the wasted time and money.

      • The tool is only as good as the data that is input. There is often a misunderstanding that a tool will be “automatic.” While it is true that a tool can help make certain processes easier and more convenient by aggregating information, enhancing reporting, and coauthoring, it will not make up the data. If data becomes stale, the tool is no longer valid for accurate decision making.
      • Getting people onboard and establishing a clear process is often the hardest part. As IT folk, it can be easy to get wrapped up in the technology. All too often excitement around tools can drown out the important requisites around people and process. The reality is people and process are a necessary condition for a tool to be successful. Having a tool will not be sufficient to overcome obstacles like poor stakeholder buy-in, inadequate governance, and the absence of a standard operating procedure.

      • Slow is the way to go. When deciding what tools to purchase, start small and scale up rather than going all in and all too often ending up with many unused features and fees.

      "There's been a chicken-egg debate raging in the PPM world for decades: What comes first, the tool or the process? It seems reasonable to say, ‘We don't have a process now, so we'll just adopt the one in the tool.’ But you'll soon find out that the tool doesn't have a process, and you needed to do more planning and analysis before buying the tool." (Barry Cousins, Practice Lead, Project Portfolio Management)

      Assess your process maturity to determine the right tool approach

      Take the time to consider and reflect on the current and target state of the processes for project portfolio management and project management.

      Project Portfolio Management

      • Status and Progress Reporting
        1. Intake, Approval, and Prioritization

          PPM is the practice of selecting the right projects and ensuring the organization has the necessary resources to complete them. PPM should enable executive decision makers to make sense of the excess of demand and give IT the ability to prioritize those projects that are most valuable to the business.
        2. Resource Management

        3. Project Management

          1. Initiation
          2. Planning
          3. Execution
          4. Monitoring and Controlling
          5. Closing
          Tailor a project management framework to fit your organization. Formal methodologies aren’t always the best fit. Take what you can use from formal frameworks and define a right-sized approach to your project management processes.
        4. Project Closure

        5. Benefits Tracking

      Info-Tech’s maturity assessment tools can help you match your tools to your maturity level

      Use Info-Tech’s Project Portfolio Management Maturity Assessment Tool and Project Management Maturity Assessment Tool.

      • The next few slides in this step take you through using our maturity assessment tools to help gauge your current-state and target-state maturity levels for project management (PM) and project portfolio management (PPM).
      • In addition to the process maturity assessments, these workbooks also help you document current-state support tools and desired target-state tools.
      • The outputs of these workbooks can be used in your MS Project & M365 Action Plan Template, which we will help you develop in phase three of this blueprint.

      Download Info-Tech’s Project Portfolio Management Maturity Assessment Tool and Project Management Maturity Assessment Tool

      Samples of Info-Tech's Project Portfolio Management Maturity Assessment Tool and Project Management Maturity Assessment Tool.

      Conduct a gap analysis survey for both project and project portfolio management.

      • Review the category and activity statements: For each gap analysis tab in the maturity assessments, use the comprehensive activity statements to identify gaps for the organization.
      • Assess the current state: To assess the current state, evaluate whether the statement should be labeled as:
        • Absent: There is no evidence of any activities supporting this process.
        • Initial: Activity is ad hoc and not well defined.
        • Defined: Activity is established and there is moderate adherence to its execution.
        • Repeatable: Activity is established, documented, repeatable, and integrated with other phases of the process.
        • Managed: Activity execution is tracked by gathering qualitative and quantitative feedback

      Once this is documented, take some time to describe the type of tool being used to do this (commercial, home-grown, standardized document) and provide additional details, where applicable.

      Define the target state: Repeat the assessment of activity statements for the target state. Then gauge the organizational impact and complexity of improving each capability on a scale of very low to very high.

      Excerpt from Info-Tech's Project Portfolio Management Maturity Assessment Tool, the 'PPM Current State Target State Maturity Assessment Survey'. It has five columns whose purpose is denoted in notes. Column 1 'Category within the respective discipline'; Column 2 'Statement to consider'; Column 3 'Select the appropriate answer for current and target state'; Column 4 'Define the tool type'; Column 5 'Provide addition detail about the tool'.

      Analyze survey results for project and project portfolio management maturity

      Take stock of the gap between current state and target state.

      • What process areas have the biggest gap between current and target state?
      • What areas are aligned across current and target state?

      Identify what areas are currently the least and most mature.

      • What process area causes the most pain in the organization?
      • What process area is the organization’s lowest priority?

      Note the overall current process maturity.

      • After having done this exercise, does the overall maturity come as a surprise?
      • If so, what are some of the areas that were previously overlooked?
      A table and bar graph documenting and analysis of maturity survey results. The table has four columns labelled 'Process Area', 'Current Process Completeness', 'Current Maturity Level', and 'Target State Maturity'. Rows headers in the 'Process Area' column are 'Intake, Approval, and Prioritization', 'Resource Management', 'Portfolio Reporting', 'Project Closure and Benefits Realization', 'Portfolio Administration', and finally 'Overall Maturity'. The 'Current Process Completeness' column's values are in percentages. The 'Current Maturity Level' and 'Target State Maturity' columns' values can be one of the following: 'Absent', 'Initial', 'Defined', 'Repeatable', or 'Managed'. The bar chart visualizes the levels of the 'Target State' and 'Current State' with 'Absent' from 0-20%, 'Initial' from 20-40%, 'Defined' from 40-60%, 'Repeatable' from 60-80%, and 'Managed' from 80-100%.
      • Identify process areas with low levels of maturity
      • Spot areas of inconsistency between current and target state.
      • Assess the overall gap to get a sense of the magnitude of the effort required to get to the target state.
      • 100% doesn’t need to be the goal. Set a goal that is sustainable and always consider the value to effort ratio.

      Screenshot your results and put them into the MS Project and M365 Action Plan Template.

      Review the tool overview and plan to address gaps (tabs 3 & 4)

      Tool Overview:

      Analyze the applications used to support your project management and project portfolio management processes.

      Look for:

      • Tools that help with processes across the entire PM or PPM lifecycle.
      • Tools that are only used for one specific process.

      Reflect on the overlap between process areas with pain points and the current tools being used to complete this process.

      Consider the sustainability of the target-state tool choice

      Screenshot of a 'Tool Overview' table. Chart titled 'Current-to-Target State Supporting Tools by PPM Activity' documenting the current and target states of different supporting tools by PPM Activity. Tools listed are 'N/A', 'Standardized Document', 'Homegrown Tool', and 'Commercial Tool'.

      You have the option to create an action plan for each of the areas of improvement coming out of your maturity assessment.

      This can include:

      • Tactical Optimization Action: What is the main action needed to improve capability?
      • Related Actions: Is there a cross-over with any actions for other capabilities?
      • Timeframe: Is this near-term, mid-term, or long-term?
      • Proposed Start Date
      • Proposed Go-Live Date
      • RACI: Who will be responsible, accountable, consulted, and informed?
      • Status: What is the status of this action item over time?

      Determine the Future of Microsoft Project for Your Organization

      Phase 2: Weigh Your Implementation Options

      Phase 1: Determine Your Tool Needs

      Phase 2: Weigh Your Implementation Options

      Phase 3: Finalize Your Implementation Approach
      • Step 1.1: Survey the M365 work management landscape
      • Step 1.2: Perform a process maturity assessment to help inform your M365 starting point
      • Step 1.3: Consider the right MS Project licenses for your stakeholders
      • Step 2.1: Get familiar with extending Project for the web using Power Apps
      • Step 2.2: Assess the MS Gold Partner Community
      • Step 3.1: Prepare an action plan

      Phase Outcomes

      • A decision on how best to proceed (or not proceed) with Project for the web
      • A Partner outreach plan

      Step 2.1

      Get familiar with extending Project for the web using Power Apps

      Activities

      • Get familiar with Project for the web: how it differs from Microsoft’s traditional project offerings and where it is going
      • Understand the basics of how to extend Project for the web in Power Apps
      • Perform a feasibility test

      This step will walk you through the following activities:

      • Get familiar with Project for the web
      • Understand the basics of how to extend Project for the web in Power Apps
      • Perform a feasibility test to determine if taking a DIY approach to extending Project for the web is right for your organization currently

      This step usually involves the following participants:

      • Portfolio Manager (PMO Director)
      • Project Managers
      • Other relevant PMO stakeholders

      Outcomes of Step

      • A decision on how best to proceed (or not proceed) with Project for the web

      Project for the web is the latest of Microsoft’s project management offerings

      What is Project for the web?

      • First introduced in 2019 as Project Service, Project for the web (PFTW) is Microsoft’s entry into the world of cloud-based work management and lightweight project management options.
      • Built on the Power Platform and leveraging the Dataverse for data storage, PFTW integrates with the many applications that M365 users are already employing in their day-to-day work management and collaboration activities.
      • It is available as a part of your M365 subscription with the minimum activation of P1 license – it comes with P3 and P5 licenses as well.
      • From a functionality and user experience perspective, PFTW is closer to applications like Planner or Azure Boards than it is to traditional MS Project options.

      What does it do?

      • PFTW allows for task and dependency tracking and basic timeline creation and scheduling and offers board and grid view options. It also allows real-time coauthoring of tasks among team members scheduled to the same project.
      • PFTW also comes with a product/functionality Microsoft calls Roadmap, which allows users to aggregate multiple project timelines into a single view for reporting purposes.

      What doesn't it do?

      • With PFTW, Microsoft is offering noticeably less traditional project management functionality than its existing solutions. Absent are table stakes project management capabilities like critical path, baselining, resource load balancing, etc.

      Who is it for?

      • Currently, in its base lightweight project management option, PFTW is targeted toward occasional or part-time project managers (not the PMP-certified set) tasked with overseeing and/or collaborating on small to mid-sized initiatives and projects.

      Put Project for the web in perspective

      Out of the box, PFTW occupies a liminal space when it comes to work management options

      • More than a task management tool, but not quite a full project management tool
      • Not exactly a portfolio management tool, yet some PPM reporting functionality is inherent in the PFTW through Roadmap

      The table to the right shows some of the functionality in PFTW in relation to the task management functionality of Planner and the enterprise project and portfolio management functionality of Project Online.

      Table 2.1a Planner Project for the web Project Online
      Coauthoring on Tasks X X
      Task Planning X X X
      Resource Assignments X X X
      Board Views X X X
      MS Teams Integration X X X
      Roadmap X X
      Table and Gantt Views X X
      Task Dependency Tracking X X
      Timesheets X
      Financial Planning X
      Risks and Issues Tracking X
      Program Management X
      Advanced Portfolio Management X

      Project for the web will eventually replace Project Online

      • As early as 2018 Microsoft has been foreshadowing a transition away from the SharePoint-backed Project environments of Server and Online toward something based in Common Data Service (CDS) – now rebranded as the Dataverse.
      • Indeed, as recently as the spring of 2021, at its Reimagine Project Management online event, Microsoft reiterated its plans to sunset Project Online and transition existing Online users to the new environment of Project for the web – though it provided no firm dates when this might occur.
        • The reason for this move away from Online appears to be an acknowledgment that the rigidity of the tool is awkward in our current dynamic, collaborative, and overhead-adverse work management paradigm.
        • To paraphrase a point made by George Bullock, Sr. Product Marketing Manager, for Microsoft at the Reimagine Project Management event, teams want to manage work as they see fit, but the rigidity of legacy solutions doesn’t allow for this, leading to a proliferation of tools and data sprawl. (This comment was made during the “Overview of Microsoft Project” session during the Reimagine event.)

      PFTW is Microsoft’s proposed future-state antidote to this challenge. Its success will depend on how well users are able to integrate the solution into a wider M365 work management setting.

      "We are committed to supporting our customers on Project Online and helping them transition to Project for the Web. No end-of-support has been set for Project Online, but when the time comes, we will communicate our plans on the transition path and give you plenty of advance notice." (Heather Heide, Program Manager, Microsoft Planner and Project. This comment was made during the “Overview of Microsoft Project” session during the Reimagine event.)

      Project for the web can be extended beyond its base lightweight functionality

      Project for the web can be extended to add more traditional and robust project and project portfolio management functionality using the Power Platform.

      Microsoft plans to sunset Project Online in favor of PFTW will at first be a head-scratcher for those familiar with the extensive PPM functionality in Project Online and underwhelmed by the project and portfolio management in PFTW.

      However, having built the solution upon the Power Platform, Microsoft has made it possible to take the base functionality in PFTW and extend it to create a more custom, organizationally specific user experience.

      • With a little taste of what can be done with PFTW by leveraging the Power Platform – and, in particular, Power Apps – it becomes more obvious how we, as users, can begin to evolve the base tool toward a more traditional PPM solution and how, in time, Microsoft’s developers may develop the next iteration of PFTW into something more closely resembling Project Online.

      Before users get too excited about using these tools to build a custom PPM approach, we should consider the time, effort, and skills required. The slides ahead will take you through a series of considerations to help you gauge whether your PMO is ready to go it alone in extending the solution.

      Extending the tool enhances functionality

      Table 2.1a in this step displayed the functionality in PFTW in relation to the task management tool Planner and the robust PPM functionality in Online.

      The table to the right shows how the functionality in PFTW can differ from the base solution and Project Online when it is extended using the model-driven app option in Power Apps.

      Caveat: The list of functionality and processes in this table is sample data.

      This functionality is not inherent in the solution as soon as you integrate with Power Apps. Rather it must be built – and your success in developing these functions will depend upon the time and skills you have available.

      Table 2.1b Project for the web PFTW extended with PowerApps Project Online
      Critical Path X
      Timesheets X
      Financial Planning X X
      Risks and Issues Tracking X X
      Program Management X
      Status Updates X
      Project Requests X
      Business Cases X
      Project Charters X
      Resource Planning and Capacity Management X X
      Project Change Requests X

      Get familiar with the basics of Power Apps before you decide to go it alone

      While the concept of being able to customize and grow a commercial PPM tool is enticing, the reality of low-code development and application maintenance may be too much for resource-constrained PMOs.

      Long story short: Extending PFTW in Power Apps is time consuming and can be frustrating for the novice to intermediate user.

      It can take days, even weeks, just to find your feet in Power Apps, let alone to determine requirements to start building out a custom model-driven app. The latter activity can entail creating custom columns and tables, determining relationships between tables to get required outputs, in addition to basic design activities.

      Time-strapped and resource-constrained practitioners should pause before committing to this deployment approach. To help better understand the commitment, the slides ahead cover the basics of extending PFTW in Power Apps:

      1. Dataverse environments.
      2. Navigating Power App Designer and Sitemap Designer
      3. Customizing tables and forms in the Dataverse

      See Info-Tech’s M365 Project Portfolio Management Tool Guide for more information on Power Apps in general.

      Get familiar with Power Apps licensing

      Power Apps for 365 comes with E1 through E5 M365 licenses (and F3 and F5 licenses), though additional functionality can be purchased if required.

      While extending Project for the web with Power Apps does not at this time, in normal deployments, require additional licensing from what is included in a E3 or E5 license, it is not out of the realm of possibility that a more complex deployment could incur costs not included in the Power Apps for 365 that comes with your enterprise agreement.

      The table to the right shows current additional licensing options.

      Power Apps, Per User, Per App Plan

      Per User Plan

      Cost: US$10 per user per app per month, with a daily Dataverse database capacity of 40 MB and a daily Power Platform request capacity of 1,000. Cost: US$40 per user per month, with a daily Dataverse database capacity of 250 MB and a daily Power Platform request capacity of 5,000.
      What's included? This option is marketed as the option that allows organizations to “get started with the platform at a lower entry point … [or those] that run only a few apps.” Users can run an application for a specific business case scenario with “the full capabilities of Power Apps” (meaning, we believe, that unlicensed users can still submit data via an app created by a licensed user). What's included? A per-user plan allows licensed users to run unlimited canvas apps and model-driven apps – portal apps, the licensing guide says, can be “provisioned by customers on demand.” Dataverse database limits (the 250 MB and 5,000 request capacity mentioned above) are pooled at the per tenant, not the per user plan license, capacity.

      For more on Power Apps licensing, refer to Info-Tech’s Modernize Your Microsoft Licensing for the Cloud Era for more information.

      What needs to be configured?

      Extending Project for the web requires working with your IT peers to get the right environments configured based upon your needs.

      • PFTW data is stored in the Microsoft Dataverse (formerly Common Data Service or CDS).
      • The organization’s Dataverse can be made up of one to many environments based upon its needs. Environments are individual databases with unique proprieties in terms of who can access them and what applications can store data in them.
      • Project for the web supports three different types of environments: default, production, and sandbox.
      • You can have multiple instances of a custom PFTW app deployed across these environments and across different users – and the environment you choose depends upon the use case of each instance.

      Types of Environments

      • Default Environment

        • It is the easiest to deploy and get started with the PFTW Power App in the default environment. However, it is also the most restricted environment with the least room for configuration.
        • Microsoft recommends this environment for simple deployments or for projects that span the organization. This is because everyone in the organization is by default a member of this environment – and, with the least room for configuration, the app is relatively straightforward.
        • At minimum, you need one project license to deploy PFTW in the default environment.
      • Production Environment

        • This environment affords more flexibility for how a custom app can be configured and deployed. Unlike the default environment, deploying a production environment is a manual process (through the Power Platform Admin Center) and security roles need to be set to limit users who can access the environment.
        • Because users can be limited, production environments can be used to support more advanced deployments and can support diverse processes for different teams.
        • At present, you need at least five Project licenses to deploy to production environments.
      • Sandbox Environment

        • This environment is for users who are responsible for the creation of custom apps. It offers the same functionality as a production environment but allows users to make changes without jeopardizing a production environment.

      Resources to provide your IT colleagues with to help in your PFTW deployment:

      1. Project for the web admin help (Product Documentation, Microsoft)
      2. Advanced deployment for Project for the web (Video, Microsoft)
      3. Get Started with Project Power App (Product Support Documentation, Microsoft)
      4. Project for the Web Security Roles (Product Support Documentation, Microsoft)

      Get started creating or customizing a model-driven app

      With the proper environments procured, you can now start extending Project for the web.

      • Navigate to the environment you would like to extend PFTW within. For the purposes of the slides ahead, we’ll be using a sandbox environment for an example. Ensure you have the right access set up for production and sandbox environments of your own (see links on previous slide for more assistance).
      • To begin extending PFTW, the two core features you need to be familiar with before you start in Power Apps are (1) Tables/Entities and (2) the Power Apps Designer – and in particular the Site Map.

      From the Power Apps main page in 365, you can change your environment by selecting from the options in the top right-hand corner of the screen.

      Screenshot of the Power Apps “Apps” page in a sandbox environment. The Project App will appear as “Project” when the application is installed, though it is also easy to create an app from scratch.

      Model-driven apps are built around tables

      In Power Apps, tables (formerly called entities and still referred to as entities in the Power Apps Designer) function much like tables in Excel: they are containers of columns of data for tracking purposes. Tables define the data for your app, and you build your app around them.

      In general, there are three types of tables:

      • Standard: These are out-of-the box tables included with a Dataverse environment. Most standard tables can be customized.
      • Managed: These are tables that get imported into an environment as part of a managed solution. Managed tables cannot be customized.
      • Custom: These types of tables can either be imported from another solution or created directly in the Dataverse environment. To create custom tables, users need to have System Administrator or System Customizer security roles within the Dataverse.

      Tables can be accessed under Data banner on the left-hand panel of your Power Apps screen.

      The below is a list of standard tables that can be used to customize your Project App.

      A screenshot of the 'Data' banner in 'Power Apps' and a list of table names.

      Table Name

      Display Name

      msdyn_project Project
      msdyn_projectchange Change
      msdyn_projectprogram Program
      msdyn_projectrequest Request
      msdyn_projectrisk Risk
      msdyn_projectissue Issue
      msdyn_projectstatusreport Status

      App layouts are designed in the Power App Designer

      You configure tables with a view to using them in the design of your app in the Power Apps Designer.

      • If you’re customizing a Project for the web app manually installed into your production or sandbox environment, you can access Designer by highlighting the app from your list of apps on the Apps page and clicking “Edit” in the ribbon above.
        • If you’re creating a model-driven app from scratch, Designer will open past the “Create a New App” intro screen.
        • If you need to create separate apps in your environment for different PMOs or business units, it is as easy to create an app from scratch as it is to customize the manual install.
      • The App Designer is where you can design the layout of your model-driven app and employ the right data tables.
      Screenshot of the 'App Designer' screen in 'Power Apps'.

      The Site Map determines the navigation for your app, i.e. it is where you establish the links and pages users will navigate. We will review the basics of the sitemap on the next few slides.

      The tables that come loaded into your Project Power App environment (at this time, 37) via the manual install will appear in the Power Apps Designer in the Entity View pane at the bottom of the page. You do not have to use all of them in your design.

      Navigate the Sitemap Designer

      With the components of the previous two slides in mind, let’s walk through how to use them together in the development of a Project app.

      As addressed in the previous slide, the sitemap determines the navigation for your app, i.e. it is where you establish the links and the pages that users will navigate.

      To get to the Sitemap Designer, highlight the Project App from your list of apps on the Apps page and click “Edit” in the ribbon above. If you’re creating a model-driven app from scratch, Designer will open past the “Create a New App” intro screen.

      • To start designing your app layout, click the pencil icon beside the Site Map logo on the App Designer screen.
      • This will take you into the Sitemap Designer (see screenshot to the right). This is where you determine the layout of your app and the relevant data points (and related tables from within the Dataverse) that will factor into your Project App.
      • In the Sitemap Designer, you simply drag and drop the areas, groups, and subareas you want to see in your app’s user interface (see next slide for more details).
      Screenshot of the 'Sitemap Designer' in 'Power Apps'.

      Use Areas, Groups, and Subareas as building blocks for your App

      Screenshots of the main window and the right-hand panel in the 'Sitemap Designer', and of the subarea pop-up panel where you connect components to data tables. The first two separate elements into 'Area', 'Group', and 'Subarea'.

      Drag and drop the relevant components from the panel on the right-hand side of the screen into the main window to design the core pieces that will be present within your user interface.

      For each subarea in your design, use the pop-up panel on the right-hand side of the screen to connect your component the relevant table from within your Dataverse environment.

      How do Areas, Groups, and Subareas translate into an app?

      Screenshots of the main window in the 'Sitemap Designer' and of a left-hand panel from a published 'Project App'. There are notes defining the terms 'Area', 'Group', and 'Subarea' in the context of the screenshot.

      The names or titles for your Areas and Groups can be customized within the Sitemap Designer.

      The names or titles for your Subareas is dependent upon your table name within the Dataverse.

      Area: App users can toggle the arrows to switch between Areas.

      Group: These will change to reflect the chosen Area.

      Subarea: The tables and forms associated with each subarea.

      How to properly save and publish your changes made in the Sitemap Designer and Power Apps Designer:

      1. When you are done making changes to your components within the Sitemap Designer, and want your changes to go live, hit the “Publish” button in the top right corner; when it has successfully published, select “Save and Close.”
      2. You will be taken back to the Power App Designer homepage. Hit “Save,” then “Publish,” and then finally “Play,” to go to your app or “Save and Close.”

      How to find the right tables in the Dataverse

      While you determine which tables will play into your app in the Sitemap Designer, you use the Tables link to customize tables and forms.

      Screenshots of the tables search screen and the 'Tables' page under the 'Data' banner in 'Power Apps'.

      The Tables page under the Data banner in Power Apps houses all of the tables available in your Dataverse environment. Do not be overwhelmed or get too excited. Only a small portion of the tables in the Tables folder in Power Apps will be relevant when it comes to extending PFTW.

      Find the table you would like to customize and/or employ in your app and select it. The next slides will look at customizing the table (if you need to) and designing an app based upon the table.

      To access all the tables in your environment, you’ll need to ensure your filter is set correctly on the top right-hand corner of the screen, otherwise you will only see a small portion of the tables in your Dataverse environment.

      If you’re a novice, it will take you some time to get familiar with the table structure in the Dataverse.

      We recommend you start with the list of tables listed on slide. You can likely find something there that you can use or build from for most PPM purposes.

      How to customize a table (1 of 3)

      You won’t necessarily need to customize a table, but if you do here are some steps to help you get familiar with the basics.

      Screenshot of the 'Columns' tab, open in the 'msdyn_project table' in 'Power Apps'.

      In this screenshot, we are clicked into the msdyn_project (display name: Project) table. As you can see, there are a series of tabs below the name of the table, and we are clicked into the Columns tab. This is where you can see all of the data points included in the table.

      You are not able to customize all columns. If a column that you are not able to customize does not meet your needs, you will need to create a custom column from the “+Add column” option.

      “Required” or “Optional” status pertains to when the column or field is used within your app. For customizable or custom columns this status can be set when you click into each column.

      How to customize a table (2 of 3)

      Create a custom “Status” column.

      By way of illustrating how you might need to customize a table, we’ll highlight the “msdyn_project_statecode” (display name: Project Status) column that comes preloaded in the Project (msdyn_project) table.

      • The Project Status column only gives you a binary choice. While you are able to customize what that binary choice is (it comes preloaded with “Active” and “Inactive” as the options) you cannot add additional choices – so you cannot set it to red/yellow/green, the most universally adopted options for status in the project portfolio management world.
      • Because of this, let’s look at the effort involved in creating a choice and adding a custom column to your table based upon that choice.
      Screenshots of the '+New choice' button in the 'Choices' tab and the 'New choice' pane that opens when you click it.

      From within the Choices tab, click “+New choice” option to create a custom choice.

      A pane will appear to the right of your screen. From there you can give your choice a name, and under the “Items” header, add your list of options.

      Click save. Your custom choice is now saved to the Choices tab in the Dataverse environment and can be used in your table. Further customizations can be made to your choice if need be.

      How to customize a table (3 of 3)

      Back in the Tables tab, you can put your new choice to work by adding a column to a table and selecting your custom choice.

      Screenshots of the pop-up window that appear when you click '+Add Column', and details of what happens when you select the data type 'Choice'.

      Start by selecting “+ Add Column” at the top left-hand side of your table. A window will appear on the right-hand side of the page, and you will have options to name your column and choose the data type.

      As you can see in this screenshot to the left, data type options include text, number and date types, and many more. Because we are looking to use our custom choice for this example, we are going to choose “Choice.”

      When you select “Choice” as your data type, all of the choice options available or created in your Dataverse environment will appear. Find your custom choice – in this example the one name “RYG Status” – and click done. When the window closes, be sure to select “Save Table.”

      How to develop a Form based upon your table (1 of 3 – open the form editor)

      A form is the interface users will engage with when using your Project app.

      When the Project app is first installed in your environment, the main user form will be lacking, with only a few basic data options.

      This form can be customized and additional tabs can be added to your user interface.

      1. To do this, go to the table you want to customize.
      2. In the horizontal series of tabs at the top of the screen, below the table title select the “Forms” option.
      3. Click on the main information option or select Edit Form for the form with “Main” under its form type. A new window will open where you can customize your form.
      Screenshot of the 'Forms' tab, open in the 'msdyn_project' table in 'Power Apps'.

      Select the Forms tab.

      Start with the form that has “Main” as its Format Type.

      How to develop a Form based upon your table (2 of 3 – add a component)

      Screenshot of the 'Components' window in 'Power Apps' with a list of layouts as a window to the right of the main screen where you can name and format the chosen layout.

      You can add element like columns or sections to your form by selecting the Components window.

      In this example, we are adding a 1-Column section. When you select that option from the menu options on the left of the screen, a window will open to the right of the screen where you can name and format the section.

      Choose the component you would like to add from the layout options. Depending on the table element you are looking to use, you can also add input options like number inputs and star ratings and pull in related data elements like a project timeline.

      How to develop a Form based upon your table (3 of 3 – add table columns)

      Screenshot of the 'Table Columns' window in 'Power Apps' and instructions for adding table columns.

      If you click on the “Table Columns” option on the left-hand pane, all of the column options from within your table will appear in alphabetical order.

      When clicked within the form section you would like to add the new column to, select the column from the list of option in the left-hand pane. The new data point will appear within the section. You can order and format section elements as you would like.

      When you are done editing the form, click the “Save” icon in the top right-hand corner. If you are ready for your changes to go live within your Project App, select the “Publish” icon in the top right-hand corner. Your updated form will go live within all of the apps that use it.

      The good and the bad of extending Project for the web

      The content in this step has not instructed users how to extend PFTW; rather, it has covered three basic core pieces of Power Apps that those interesting in PFTW need to be aware of: Dataverse environments, the Power Apps and Sitemaps Designers, and Tables and associated Forms.

      Because we have only covered the very tip of the iceberg, those interested in going further and taking a DIY approach to extending PFTW will need to build upon these basics to unlock further functionality. Indeed, it takes work to develop the product into something that begins to resemble a viable enterprise project and portfolio management solution. Here are some of the good and the bad elements associated with that work:

      The Good:

      • You can right-size and purpose build: add as much or as little project management rigor as your process requires. Related, you can customize the solution in multiple ways to suit the needs of specific business units or portfolios.
      • Speed to market: it is possible to get up and running quickly with a minimum-viable product.

      The Bad:

      • Work required: to build anything beyond MVP requires independent research and trial and error.
      • Time required: to build anything beyond MVP requires time and skills that many PMOs don’t have.
      • Shadow support costs: ungoverned app creation could have negative support and maintenance impacts across IT.

      "The move to Power Platform and low code development will […increase] maintenance overhead. Will low code solution hit problems at scale? [H]ow easy will it be to support hundreds or thousands of small applications?

      I can hear the IT support desks already complaining at the thought of this. This part of the puzzle is yet to hit real world realities of support because non developers are busy creating lots of low code applications." (Ben Hosking, Software Developer and Blogger, "Why low code software development is eating the world")

      Quick start your extension with the Accelerator

      For those starting out, there is a pre-built app you can import into your environment to extend the Project for the web app without any custom development.

      • If the DIY approach in the previous slides was overwhelming, and you don’t have the budget for a MS Partner route in the near-term, this doesn’t mean that evolving your Project for the web app is unattainable.
      • Thanks to a partnership between OnePlan (one of the MS Gold Partners we detail in the next step) and Microsoft, Project for the web users have access to a free resource to help them evolve the base Project app. It’s called the “Project for the web Accelerator” (commonly referred to as “the Accelerator” for short).
      • Users interested in learning more about, and accessing, this free resource should refer to the links below:
        1. The Future of Microsoft Project Online (source: OnePlan).
        2. Introducing the Project Accelerator (source: Microsoft).
        3. Project for the web Accelerator (source: GitHub)
      Screen shot from one of the dashboards that comes with the Accelerator (image source: GitHub).

      2.1.1 Perform a feasibility test (1 of 2)

      15 mins

      As we’ve suggested, and as the material in this step indicates, extending PFTW in a DIY fashion is not small task. You need a knowledge of the Dataverse and Power Apps, and access to the requisite skills, time, and resources to develop the solution.

      To determine whether your PMO and organization are ready to go it alone in extending PFTW, perform the following activity:

      1. Convene a collection of portfolio, project, and PMO staff.
      2. Using the six-question survey on tab 5 of the Microsoft Project & M365 Licensing Tool (see screenshot to the right) as a jumping off point for a discussion, consider the readiness of your PMO or project organization to undertake a DIY approach to extending and implementing PFTW at this time.
      3. You can use the recommendations on tab 5 of the Microsoft Project & 365 Licensing Tool to inform your next steps, and input the gauge graphic in section 4 of the Microsoft Project & M365 Action Plan Template.
      Screenshots from the 'Project for the Web Extensibility Feasibility Test'.

      Go to tab 5 of the Microsoft Project & M365 Licensing Tool

      See next slide for additional activity details

      2.1.1 Perform a feasibility test (2 of 2)

      Input: The contents of this step, The Project for the Web Extensibility Feasibility Test (tab 5 in the Microsoft Project & 365 Licensing Tool)

      Output: Initial recommendations on whether to proceed and how to proceed with a DIY approach to extending Project for the web

      Materials: The Project for the Web Extensibility Feasibility Test (tab 5 in the Microsoft Project & 365 Licensing Tool)

      Participants: Portfolio Manager (PMO Director), Project Managers, Other relevant PMO stakeholders

      Step 2.2

      Assess the Microsoft Gold Partner Community

      Activities

      • Review what to look for in a Microsoft Partner
      • Determine whether your needs would benefit from reaching out to a Microsoft Partner
      • Review three key Partners from the North American market
      • Create a Partner outreach plan

      This step will walk you through the following activities:

      • Review what to look for in a Microsoft Partner.
      • Determine whether your needs would benefit from reaching out to a Microsoft Partner.
      • Review three key Partners from the North American market.

      This step usually involves the following participants:

      • Portfolio Manager (PMO Director)
      • Project Managers
      • Other relevant PMO stakeholders

      Outcomes of Step

      • A better understanding of MS Partners
      • A Partner outreach plan

      You don’t have to go it alone

      Microsoft has an established community of Partners who can help in your customizations and implementations of Project for the web and other MS Project offerings.

      If the content in the previous step seemed too technical or overly complex in a way that scared you away from a DIY approach to extending Microsoft’s latest project offering (and at some point in the near future, soon to be its only project offering), Project for the web, fear not.

      You do not have to wade into the waters of extending Project for the web alone, or for that matter, in implementing any other MS Project solution.

      Instead, Microsoft nurtures a community of Silver and Gold partners who offer hands-on technical assistance and tool implementation services. While the specific services provided vary from partner to partner, all can assist in the customization and implementation of any of Microsoft’s Project offerings.

      In this step we will cover what to look for in a Partner and how to assess whether you are a good candidate for the services of a Partner. We will also highlight three Partners from within the North American market.

      The basics of the Partner community

      What is a Microsoft Partner?

      Simply put, an MS Gold Partner is a software or professional services organization that provides sales and services related to Microsoft products.

      They’re resellers, implementors, integrators, software manufacturers, trainers, and virtually any other technology-related business service.

      • Microsoft has for decades opted out of being a professional services organization, outside of its very “leading edge” offerings from MCS (Microsoft Consulting Services) for only those technologies that are so new that they aren’t yet supported by MS Partners.
      • As you can see in the chart on the next slide, to become a silver or gold certified partner, firms must demonstrate expertise in specific areas of business and technology in 18 competency areas that are divided into four categories: applications and infrastructure, business applications, data and AI, and modern workplace and security.

      More information on what it takes to become a Microsoft Partner:

      1. Partner Center (Document Center, Microsoft)
      2. Differentiate your business by attaining Microsoft competencies (Document Center, Microsoft)
      3. Partner Network Homepage (Webpage, Microsoft)
      4. See which partner offer is right for you (Webpage, Microsoft)

      Types of partnerships and qualifications

      Microsoft Partner Network

      Microsoft Action Pack

      Silver Competency

      Gold Competency

      What is it?

      The Microsoft Partner Network (MPN) is a community that offers members tools, information, and training. Joining the MPN is an entry-level step for all partners. The Action Pack is an annual subscription offered to entry-level partners. It provides training and marketing materials and access to expensive products and licenses at a vastly reduced price. Approximately 5% of firms in the Microsoft Partner Network (MPN) are silver partners. These partners are subject to audits and annual competency exams to maintain silver status. Approximately 1% of firms in the Microsoft Partner Network (MPN) are gold partners. These partners are subject to audits and annual competency exams to maintain Gold status.

      Requirements

      Sign up for a membership Annual subscription fee While requirements can vary across competency area, broadly speaking, to become a silver partner firms must:
      • Pass regular exams and skills assessments, with at least two individuals on staff with Microsoft Certified Professional Status.
      • Hit annual customer, revenue, and licensing metrics.
      • Pay the annual subscription fee.
      While requirements can vary across competency area, broadly speaking, to become a gold partner firms must:
      • Pass regular exams and skills assessments, with at least two individuals on staff with Microsoft Certified Professional Status.
      • Hit annual customer, revenue, and licensing metrics.
      • Pay the annual subscription fee.

      Annual Fee

      No Cost $530 $1800 $5300

      When would a MS Partner be helpful?

      • Project management and portfolio management practitioners might look into procuring the services of a Microsoft Partner for a variety of reasons.
      • Because services vary from partner to partner (help to extend Project for the web, implement Project Server or Project Online, augment PMO staffing, etc.) we won’t comment on specific needs here.
      • Instead, the three most common conditions that trigger the need are listed to the right.

      Speed

      When you need to get results faster than your staff can grow the needed capabilities.

      Cost

      When the complexity of the purchase decision, implementation, communication, training, configuration, and/or customization cannot be cost-justified for internal staff, often because you’ll only do it once.

      Expertise & Skills

      When your needs cannot be met by the core Microsoft technology without significant extension or customization.

      Canadian Microsoft Partners Spotlight

      As part of our research process for this blueprint, Info-Tech asked Microsoft Canada for referrals and introductions to leading Microsoft Partners. We spent six months collaborating with them on fresh research into the underlying platform.

      These vendors are listed below and are highlighted in subsequent slides.

      Spotlighted Partners:

      Logo for One Plan. Logo for PMO Outsource Ltd. Logo for Western Principles.

      Please Note: While these vendors were referred to us by Microsoft Canada and have a footprint in the Canadian market, their footprints extend beyond this to the North American and global markets.

      A word about our approach

      Photo of Barry Cousins, Project Portfolio Management Practice Lead, Info-Tech Research Group.
      Barry Cousins
      Project Portfolio Management Practice Lead
      Info-Tech Research Group

      Our researchers have been working with Microsoft Project Online and Microsoft Project Server clients for years, and it’s fair to say that most of these clients (at some point) used a Microsoft Partner in their deployment. They’re not really software products, per se; they’re platforms. As a Microsoft Partner in 2003 when Project Server got its first big push, I heard it loud and clear: “Some assembly required. You might only make 7% on the licensing, but the world’s your oyster for services.”

      In the past few years, Microsoft froze the market for major Microsoft Project decisions by making it clear that the existing offering is not getting updates while the new offering (Project for the web) doesn’t do what the old one did. And in a fascinating timing coincidence, the market substantially adopted Microsoft 365 during that period, which enables access to Project for the web.

      Many of Info-Tech’s clients are justifiably curious, confused, and concerned, while the Microsoft Partners have persisted in their knowledge and capability. So, we asked Microsoft Canada for referrals and introductions to leading Microsoft Partners and spent six months collaborating with them on fresh research into the underlying platform.

      Disclosure: Info-Tech conducted collaborative research with the partners listed on the previous slide to produce this publication. Market trends and reactions were studied, but the only clients identified were in case studies provided by the Microsoft Partners. Info-Tech’s customers have been, and remain, anonymous. (Barry Cousins, Project Portfolio Management Practice Lead, Info-Tech Research Group)

      MS Gold Partner Spotlight:

      OnePlan

      Logo for One Plan.
      Headquarters: San Marcos, California, and Toronto, Ontario
      Number of Employees: ~80
      Active Since: 2007 (as EPMLive)
      Website: www.oneplan.ai

      Who are they?

      • While the OnePlan brand has only been the marketplace for a few years, the company has been a major player in MS Gold Partner space for well over a decade.
      • Born out of EPMLive in the mid-aughts, OnePlan Solutions has evolved through a series of acquisitions, including Upland, Tivitie, and most recently Wicresoft.

      What do they do?

      • Software: Its recent rebranding is largely because OnePlan Solutions is as much a software company as it is a professional services firm. The OnePlan software product is an impressive solution that can be used on its own to facilitate the portfolio approaches outlined on the next slide and that can also integrate with the tools your organization is already using to manage tasks (see here for a full rundown of the solutions within the Microsoft stack and beyond OnePlan can integrate with).
      • Beyond its ability to integrate with existing solutions, as a software product, OnePlan has modules for resource planning, strategic portfolio planning, financial planning, time tracking, and more.

      • PPM Consulting Services: The OnePlan team also offers portfolio management consulting services. See the next slide for a list of its approaches to project portfolio management.

      Markets served

      • US, Canada, Europe, and Australia

      Channel Differentiation

      • OnePlan scales to all the PPM needs of all industry types.
      • Additionally, OnePlan offers insights and functionality specific to the needs of BioTech-Pharma.

      What differentiates OnePlan?

      • OnePlan co-developed the Project Accelerator for Project for the web with Microsoft. The OnePlan team’s involvement in developing the Accelerator and making it free for users to access suggests it is aligned to and has expertise in the purpose-built and collaborative vision behind Microsoft’s move away from Project Online and toward the Power Platform and Teams collaboration.
      • 2021 MS Gold Partner of the Year. At Microsoft’s recent Microsoft Inspire event, OnePlan was recognized as the Gold Partner of the Year for Project and Portfolio Management as well as a finalist for Power Apps and Power Automate.
      • OnePlan Approaches: Below is a list of the services or approaches to project portfolio management that OnePlan provides. See its website for more details.
        • Strategic Portfolio Management: Align work to objectives and business outcomes. Track performance against the proposed objectives outcomes.
        • Agile Portfolio Management: Implement Agile practices across the organization, both at the team and executive level.
        • Adaptive Portfolio Management: Allow teams to use the project methodology and tools that best suit the work/team. Maintain visibility and decision making across the entire portfolio.
        • Professional Services Automation: Use automation to operate with greater efficiency.

      "OnePlan offers a strategic portfolio, financial and resource management solution that fits the needs of every PMO. Optimize your portfolio, financials and resources enterprise wide." (Paul Estabrooks, Vice President at OnePlan)

      OnePlan Case Study

      This case study was provided to Info-Tech by OnePlan.

      Brambles

      INDUSTRY: Supply Chain & Logistics
      SOURCE: OnePlan

      Overview: Brambles plays a key role in the delivery or return of products amongst global trading partners such as manufacturers, distributors and retailers.

      Challenge

      Brambles had a variety of Project Management tools with no easy way of consolidating project management data. The proliferation of project management solutions was hindering the execution of a long-term business transformation strategy. Brambles needed certain common and strategic project management processes and enterprise project reporting while still allowing individual project management solutions to be used as part of the PPM platform.

      Solution

      As part of the PMO-driven business transformation strategy, Brambles implemented a project management “operating system” acting as a foundation for core processes such as project intake, portfolio management, resource, and financial planning and reporting while providing integration capability for a variety of tools used for project execution.

      OnePlan’s new Adaptive PPM platform, combining the use of PowerApps and OnePlan, gives Brambles the desired PPM operating system while allowing for tool flexibility at the execution level.

      Results

      • Comprehensive picture of progress across the portfolio.
      • Greater adoption by allowing flexibility of work management tools.
      • Modern portfolio management solution that enables leadership to make confident decision.

      Solution Details

      • OnePlan
      • Project
      • Power Apps
      • Power Automate
      • Power BI
      • Teams

      Contacting OnePlan Solutions

      www.oneplan.ai

      Joe Larscheid: jlarscheid@oneplan.ai
      Paul Estabrooks: pestabrooks@oneplan.ai
      Contact Us: contact@oneplan.ai
      Partners: partner@oneplan.ai

      Partner Resources. OnePlan facilitates regular ongoing live webinars on PPM topics that anyone can sign up for on the OnePlan website.

      For more information on upcoming webinars, or to access recordings of past webinars, see here.

      Additional OnePlan Resources

      1. How to Extend Microsoft Teams into a Collaborative Project, Portfolio and Work Management Solution (on-demand webinar, OnePlan’s YouTube channel)
      2. What Does Agile PPM Mean To The Modern PMO (on-demand webinar, OnePlan’s YouTube channel)
      3. OnePlan is fused with the Microsoft User Experience (blog article, OnePlan)
      4. Adaptive Portfolio Management Demo – Bringing Order to the Tool Chaos with OnePlan (product demo, OnePlan’s YouTube channel)
      5. How OnePlan is aligning with Microsoft’s Project and Portfolio Management Vision (blog article, OnePlan)
      6. Accelerating Office 365 Value with a Hybrid Project Portfolio Management Solution (product demo, OnePlan’s YouTube channel)

      MS Gold Partner Spotlight:

      PMO Outsource Ltd.

      Logo for PMO Outsource Ltd.

      Headquarters: Calgary, Alberta, and Mississauga, Ontario
      Website: www.pmooutsource.com

      Who are they?

      • PMO Outsource Ltd. is a Microsoft Gold Partner and PMI certified professional services firm based in Alberta and Ontario, Canada.
      • It offers comprehensive project and portfolio management offerings with a specific focus on project lifecycle management, including demand management, resource management, and governance and communication practices.

      What do they do?

      • Project Online and Power Platform Expertise. The PMO Outsource Ltd. team has extensive knowledge in both Microsoft’s old tech (Project Server and Desktop) and in its newer, cloud-based technologies (Project Online, Project for the web, the Power Platform, and Dynamics 365). As the case study in two slides demonstrates, PMO Outsource Ltd. Uses its in-depth knowledge of the Microsoft suite to help organizations automate project and portfolio data collection process, create efficiencies, and encourage cloud adoption.
      • PPM Consulting Services: In addition to its Microsoft platform expertise, the PMO Outsource Ltd. team also offers project and portfolio management consulting services, helping organizations evolve their process and governance structures as well as their approaches to PPM tooling.

      Markets served

      • Global

      Channel Differentiation

      • PMO Outsource Ltd. scales to all the PPM needs of all industry types.

      What differentiates PMO Outsource Ltd.?

      • PMO Staff Augmentation. In addition to its technology and consulting services, PMO Outsource Ltd. offers PMO staff augmentation services. As advertised on its website, it offers “scalable PMO staffing solutions. Whether you require Project Managers, Business Analysts, Admins or Coordinators, [PMO Outsource Ltd.] can fulfill your talent search requirements from a skilled pool of resources.”
      • Multiple and easy-to-understand service contract packages. PMO Outsource Ltd. offers many prepackaged service offerings to suit PMOs’ needs. Those packages include “PMO Management, Admin, and Support,” “PPM Solution, Site and Workflow Configuration,” and “Add-Ons.” For full details of what’s included in these services packages, see the PMO Outsource Ltd. website.
      • PMO Outsource Ltd. Services: Below is a list of the services or approaches to project portfolio management that PMO Outsource Ltd. Provides. See its website for more details.
        • Process Automation, Workflows, and Tools. Facilitate line of sight by tailoring Microsoft’s technology to your organization’s needs and creating custom workflows.
        • PMO Management Framework. Receive a professionally managed PPM methodology as well as governance standardization of processes, tools, and templates.
        • Custom BI Reports. Leverage its expertise in reporting and dashboarding to create the visibility your organization needs.

      "While selecting an appropriate PPM tool, the PMO should not only evaluate the standard industry tools but also analyze which tool will best fit the organization’s strategy, budget, and culture in the long run." (Neeta Manghnani, PMO Strategist, PMO Outsource Ltd.)

      PMO Outsource Ltd. Case Study

      This case study was provided to Info-Tech by PMO Outsource Ltd.

      SAMUEL

      INDUSTRY: Manufacturing
      SOURCE: PMO Outsource Ltd.

      Challenge

      • MS Project 2013 Server (Legacy/OnPrem)
      • Out-of-support application and compliance with Office 365
      • Out-of-support third-party application for workflows
      • No capability for resource management
      • Too many manual processes for data maintenance and server administration

      Solution

      • Migrate project data to MS Project Online
      • Recreate workflows using Power Automate solution
      • Configure Power BI content packs for Portfolio reporting and resource management dashboards
      • Recreate OLAP reports from legacy environment using Power BI
      • Cut down nearly 50% of administrative time by automating PMO/PPM processes
      • Save costs on Server hardware/application maintenance by nearly 75%

      Full Case Study Link

      • For full details about how PMO Outsource Ltd. assisted Samuel in modernizing its solution and creating efficiencies, visit the Microsoft website where this case study is highlighted.

      Contacting PMO Outsource Ltd.

      www.pmooutsource.com

      700 8th Ave SW, #108
      Calgary, AB T2P 1H2
      Telephone : +1 (587) 355-3745
      6045 Creditview Road, #169
      Mississauga, ON L5V 0B1
      Telephone : +1 (289) 334-1228
      Information: info@pmooutsource.com
      LinkedIn: https://www.linkedin.com/company/pmo-outsource/

      Partner Resources. PMO Outsource Ltd.’s approach is rooted within a robust and comprehensive PPM framework that is focused on driving strategic outcomes and business success.

      For a full overview of its PPM framework, see here.

      Additional PMO Outsource Ltd. Resources

      1. 5 Benefits of PPM tools and PMO process automation (blog article, PMO Outsource Ltd.)
      2. Importance of PMO (blog article, PMO Outsource Ltd.)
      3. Meet the Powerful and Reimagined PPM tool for Everyone! (video, PMO Outsource Ltd. LinkedIn page)
      4. MS Project Tips: How to add #Sprints to an existing Project? (video, PMO Outsource Ltd. LinkedIn page)
      5. MS Project Tips: How to add a milestone to your project? (video, PMO Outsource Ltd. LinkedIn page)
      6. 5 Benefits of implementing Project Online Tools (video, PMO Outsource Ltd. LinkedIn page)

      MS Gold Partner Spotlight:

      Western Principles

      Logo for Western Principles.

      Headquarters: Vancouver, British Columbia
      Years Active: 16 Years
      Website: www.westernprinciples.com

      Who are they?

      • Western Principles is a Microsoft Gold Partner and UMT 360 PPM software provider based in British Columbia with a network of consultants across Canada.
      • In the last sixteen years, it has successfully conducted over 150 PPM implementations, helping in the implementation, training, and support of Microsoft Project offerings as well as UMT360 – a software solution provider that, much like OnePlan, enhances the PPM capabilities of the Microsoft platform.

      What do they do?

      • Technology expertise. The Western Principles team helps organizations maximize the value they are getting form the Microsoft Platform. Not only does it offer expertise in all the solutions in the MS Project ecosystem, it also helps organizations optimize their use and understanding of Teams, SharePoint, the Power Platform, and more. In addition to the Microsoft platform, Western Principles is partnered with many other technology providers, including UMT360 for strategic portfolio management, the Simplex Group for project document controls, HMS for time sheets, and FluentPro for integration, back-ups, and migrations.
      • PPM Consulting Services: In addition to its technical services and solutions, Western Principles offers PPM consulting and staff augmentation services.

      Markets served

      • Canada

      Channel Differentiation

      • Western Principles scales to all the PPM needs of all industry types, public and private sector.
      • In addition, its website offers persona-specific information based on the PPM needs of engineering and construction, new product development, marketing, and more.

      What differentiates Western Principles?

      • Gold-certified UMT 360 partner. In addition to being a Microsoft Gold Partner, Western Principles is a gold-certified UMT 360 partner. UMT 360 is a strategic portfolio management tool that integrates with many other work management solutions to offer holistic line of sight into the organization’s supply-demand pain points and strategic portfolio management needs. Some of the solutions UMT 360 integrates with include Project Online and Project for the web, Azure DevOps, Jira, and many more. See here for more information on the impressive functionality in UMT360.
      • Sustainment Services. Adoption can be the bane of most PPM tool implementations. Among the many services Western Principles offers, its “sustainment services” stand out. According to Western Principles’ website, these services are addressed to those who require “continual maintenance, change, and repair activities” to keep PPM systems in “good working order” to help maximize ROI.
      • Western Principles Services: In addition to the above, below is a list of some of the services that Western Principles offers. See its website for a full list of services.
        • Process Optimization: Determine your requirements and process needs.
        • Integration: Create a single source of truth.
        • Training: Ensure your team knows how to use the systems you implement.
        • Staff Augmentation: Provide experienced project team members based upon your needs.

      "One of our principles is to begin with the end in mind. This means that we will work with you to define a roadmap to help you advance your strategic portfolio … and project management capabilities. The roadmap for each customer is different and based on where you are today, and where you need to get to." (Western Principles, “Your Strategic Portfolio Management roadmap,” Whitepaper)

      Contacting Western Principles

      www.westernprinciples.com

      610 – 700 West Pender St.
      Vancouver, BC V6C 1G8
      +1 (800) 578-4155
      Information: info@westernprinciples.com
      LinkedIn: https://www.linkedin.com/company/western-principle...

      Partner Resources. Western Principles provides a multitude of current case studies on its home page. These case studies let you know what the firm is working on this year and the type of support it provides to its clientele.

      To access these case studies, see here.

      Additional Western Principles Resources

      1. Program and Portfolio Roll ups with Microsoft Project and Power BI (video, Western Principles YouTube Channel)
      2. Dump the Spreadsheets for Microsoft Project Online (video, Western Principles YouTube Channel)
      3. Power BI for Project for the web (video, Western Principles YouTube Channel)
      4. How to do Capacity Planning and Resource Management in Microsoft Project Online [Part 1 & Part 2] (video, Western Principles YouTube Channel)
      5. Extend & Integrate Microsoft Project (whitepaper, Western Principles)
      6. Your COVID-19 Return-to-Work Plan (whitepaper, Western Principles)

      Watch Info-Tech’s Analyst-Partner Briefing Videos to lean more

      Info-Tech was able to sit down with the partners spotlighted in this step to discuss the current state of the PPM market and Microsoft’s place within it.

      • All three partners spotlighted in this step contributed to Info-Tech’s research process for this publication.
      • For two of the partners, OnePlan and PMO Outsource Ltd., Info-Tech was able to record a conversation where our analysts and the partners discuss Microsoft’s current MS Project offerings, the current state of the PPM tool market, and the services and the approaches of each respective partner.
      • A third video briefing with Western Principles has not happened yet due to logistical reasons. We are hoping we can include a video chat with our peers at Western Principles in the near future.
      Screenshot form the Analyst-Partner Briefing Videos. In addition to the content covered in this step, you can use these videos for further information about the partners to inform your next steps.

      Download Info-Tech’s Analyst-Partner Briefing Videos (OnePlan & PMO Outsource Ltd.)

      2.2.1 Create a partner outreach plan

      1-3 hours

      Input: Contents of this step, List of additional MS Gold Partners

      Output: A completed partner outreach program

      Materials: MS Project & M365 Action Plan Template

      Participants: Portfolio Manager (PMO Director), PMO Admin Team, Project Managers, CIO

      1. With an understanding of the partner ecosystem, compile a working group of PMO peers and stakeholders to produce a gameplan for engaging the MS Gold Partner ecosystem.
        • For additional partner options see Microsoft’s Partner Page.
      2. Using slide 20 in Info-Tech’s MS Project and M365 Action Plan Template, document the Partners you would want or have scheduled briefings with.
        • As you go through the briefings and research process, document the pros and cons and areas of specialized associated with each vendor for your particular work management implementation.

      Download the Microsoft Project & M365 Action Plan Template

      2.2.2 Document your PM and PPM requirements

      1-3 hours

      Input: Project Portfolio Management Maturity Assessment, Project Management Maturity Assessment

      Output: MS Project & M365 Action Plan Template

      Materials: Project Portfolio Management Maturity Assessment, Project Management Maturity Assessment, MS Project & M365 Action Plan Template

      Participants: Portfolio Manager (PMO Director), PMO Admin Team, Project Managers, CIO

      1. As you prepare to engage the Partner Community, you should have a sense of where your project management and project portfolio management gaps are to better communicate your tooling needs.
      2. Leverage tab 4 from both your Project Portfolio Management Assessment and Project Management Assessment from step 1.3 of this blueprint to help document and communicate your requirements. Those tabs prioritize your project and portfolio management needs by highest impact for the organization.
      3. You can use the outputs of the tab to inform your inputs on slide 23 of the MS Project & M365 Action Plan Template to present to organizational stakeholders and share with the Partners you are briefing with.

      Download the Microsoft Project & M365 Action Plan Template

      Determine the Future of Microsoft Project for Your Organization

      Phase 3: Finalize Your Implementation Approach

      Phase 1: Determine Your Tool NeedsPhase 2: Weigh Your Implementation Options

      Phase 3: Finalize Your Implementation Approach

      • Step 1.1: Survey the M365 work management landscape
      • Step 1.2: Perform a process maturity assessment to help inform your M365 starting point
      • Step 1.3: Consider the right MS Project licenses for your stakeholders
      • Step 2.1: Get familiar with extending Project for the web using Power Apps
      • Step 2.2: Assess the MS Gold Partner Community
      • Step 3.1: Prepare an action plan

      Phase Outcomes

      An action plan concerning what to do with MS Project and M365 for your PMO or project organization.

      Step 3.1

      Prepare an action plan

      Activities

      • Compile the current state results
      • Prepare an Implementation Roadmap
      • Complete your presentation deck

      This step will walk you through the following activities:

      • Assess the impact of organizational change for the project
      • Develop your vision for stakeholders
      • Compile the current state results and document the implementation approach
      • Create clarity through a RACI and proposed implementation timeline

      This step usually involves the following participants:

      • Portfolio Manager (PMO Director)
      • PMO Admin Team
      • Business Analysts
      • Project Managers

      Outcomes of Step

      • Microsoft Project and M365 Action Plan

      Assess the impact of organizational change

      Be prepared to answer: “What’s in it for me?”

      Before jumping into licensing and third-party negotiations, ensure you’ve clearly assessed the impact of change.

      Tailor the work effort involved in each step, as necessary:

      1. Assess the impact
        • Use the impact assessment questions to identify change impacts.
      2. Plan for change
        • Document the impact on each stakeholder group.
        • Anticipate their response.
        • Curate a compelling message for each stakeholder group.
        • Develop a communication plan.
      3. Act according to plan
        • Identify your executive sponsor.
        • Enable the sponsor to drive change communication.
        • Coach managers on how they can drive change at the individual level.

      Impact Assessment Questions

      • Will the change impact how our clients/customers receive, consume, or engage with our products/services?
      • Will there be a price increase?
      • Will there be a change to compensation and/or rewards?
      • Will the vision or mission of the job change?
      • Will the change span multiple locations/time zones?
      • Are multiple products/services impacted by this change?
      • Will staffing levels change?
      • Will this change increase the workload?
      • Will the tools of the job be substantially different?
      • Will a new or different set of skills be needed?
      • Will there be a change in reporting relationships?
      • Will the workflow and approvals be changed?
      • Will there be a substantial change to scheduling and logistics?

      Master Organizational Change Management Practices blueprint

      Develop your vision for stakeholders

      After careful analysis and planning, it’s time to synthesize your findings to those most impacted by the change.

      Executive Brief

      • Prepare a compelling message about the current situation.
      • Outline the considerations the working group took into account when developing the action plan.
      • Succinctly describe the recommendations proposed by the working group.

      Goals

      • Identify the goals for the project.
      • Explain the details for each goal to develop the organizational rationale for the project.
      • These goals are the building blocks for the change communication that the executive sponsor will use to build a coalition of sponsors.

      Future State Vision

      • Quantify the high-level costs and benefits of moving forward with this project.
      • Articulate the future- state maturity level for both the project and project portfolio management process.
      • Reiterate the organizational rationale and drivers for change.

      "In failed transformations, you often find plenty of plans, directives, and programs, but no vision…A useful rule of thumb: If you can’t communicate the vision to someone in five minutes or less and get a reaction that signifies both understanding and interest, you are not yet done…" (John P. Kotter, Leading Change)

      Get ready to compile the analysis completed throughout this blueprint in the subsequent activities. The outputs will come together in your Microsoft Project and M365 Action Plan.

      Use the Microsoft Project & M365 Action Plan Template to help communicate your vision

      Our boardroom-ready presentation and communication template can be customized using the outputs of this blueprint.

      • Getting stakeholders to understand why you are recommending specific work management changes and then communicating exactly what those changes are and what they will cost is key to the success of your work management implementation.
      • To that end, the slides ahead walk you through how to customize the Microsoft Project & M365 Action Plan Template.
      • Many of the current-state analysis activities you completed during phase 1 of this blueprint can be directly made use of within the template as can the decisions you made and requirements you documented during phase 2.
      • By the end of this step, you will have a boardroom-ready presentation that will help you communicate your future-state vision.
      Screenshot of Info-Tech's Microsoft Project and M365 Action Plan Template with a note to 'Update the presentation or distribution date and insert your name, role, and organization'.

      Download Info-Tech’s Microsoft Project & M365 Action Plan Template

      3.1.1 Compile current state results

      1-3 hours

      Input: Force Field Analysis Tool, Tool Audit Workbook, Project Management Maturity Assessment Tool, Project Portfolio Management Maturity Assessment Tool

      Output: Section 1: Executive Brief, Section 2: Context and Constraints

      Materials: Microsoft Project and M365 Action Plan Template

      Participants: PMO Director, PMO Admin Team, Business Analysts, Project Managers

      1. As a group, review the results of the tools introduced throughout this blueprint. Use this information along with organizational knowledge to document the business context and current state.
      2. Update the driving forces for change and risks and constraints slides using your outputs from the Force Field Analysis Tool.
      3. Update the current tool landscape, tool satisfaction, and tool audit results slides using your outputs from the Tool Audit Workbook.
      4. Update the gap analysis results slides using your outputs from the Project Management and Project Portfolio Management Maturity Assessment Tools.

      Screenshots of 'Business Context and Current State' screen from the 'Force Field Analysis Tool', the 'Tool Audit Results' screen from the 'Tool Audit Workbook', and the 'Project Portfolio Management Gap Analysis Results' screen from the 'PM and PPM Maturity Assessments Tool'.

      Download the Microsoft Project & M365 Action Plan Template

      3.2.1 Option A: Prepare a DIY roadmap

      1-3 hours; Note: This is only applicable if you have chosen the DIY route

      Input: List of key PPM decision points, List of who is accountable for PPM decisions, List of who has PPM decision-making authority

      Output: Section 3: DIY Implementation Approach

      Materials: Microsoft Project and M365 Action Plan Template

      Participants: PMO Director, PMO Admin Team, Business Analysts, Project Managers

      1. As a group, review the results of the Microsoft Project and M365 Licensing Tool. Use this information along with organizational knowledge and discussion with the working group to complete Section 3: DIY Implementation Approach.
      2. Copy and paste your results from tab 5 of the Microsoft Project and M365 Licensing Tool. Update the Implementation Approach slide to detail the rationale for selecting this option.
      3. Update the Action Plan to articulate the details for total and annual costs of the proposed licensing solution.
      4. Facilitate a discussion to determine roles and responsibilities for the implementation. Based on the size, risk, and complexity of the implementation, create a reasonable timeline.
      Screenshots from the 'Microsoft Project and M365 Action Plan Template' outlining the 'DIY Implementation Approach'.

      Download the Microsoft Project and M365 Action Plan Template

      3.2.1 Option b: Prepare a Partner roadmap

      1-3 hours; Note: This is only applicable if you have chosen the Partner route

      Input: Microsoft Project and M365 Licensing Tool, Information on Microsoft Partners

      Output: Section 4: Microsoft Partner Implementation Route

      Materials: Microsoft Project and M365 Action Plan Template

      Participants: PMO Director, PMO Admin Team, Business Analysts, Project Managers

      1. As a group, review the results of the Microsoft Project and M365 Licensing Tool. Use this information along with organizational knowledge and discussion with the working group to complete Section 4: Microsoft Partner Implementation Route.
      2. Copy and paste your results from tab 5 of the Microsoft Project and M365 Licensing Tool. Update the Implementation Approach slide to detail the rationale for selecting this option.
      3. Develop an outreach plan for the Microsoft Partners you are planning to survey. Set targets for briefing dates and assign an individual to own any back-and-forth communication. Document the pros and cons of each Partner and gauge interest in continuing to analyze the vendor as a possible solution.
      4. Facilitate a discussion to determine roles and responsibilities for the implementation. Based on the size, risk, and complexity of the implementation, create a reasonable timeline.

      Screenshots from the 'Microsoft Project and M365 Action Plan Template' outlining the 'Microsoft Partner Implementation Route'.

      Microsoft Project and M365 Action Plan Template

      3.1.2 Complete your presentation deck

      1-2 hours

      Input: Outputs from the exercises in this blueprint

      Output: Section 5: Future-State Vision and Goals

      Materials: Microsoft Project and M365 Action Plan Template

      Participants: PMO Director, PMO Admin Team, Business Analysts, Project Managers

      1. Put the finishing touches on your presentation deck by documenting your future- state vision and goals.
      2. Prepare to present to your stakeholders.
        • Understand your audience, their needs and priorities, and their degree of knowledge and experiences with technology. This informs what to include in your presentation and how to position the message and goal.
      3. Review the deck beginning to end and check for spelling, grammar, and vertical logic.
      4. Practice delivering the vision for the project through several practice sessions.

      Screenshots from the 'Microsoft Project and M365 Action Plan Template' regarding finishing touches.

      Microsoft Project and M365 Action Plan Template

      Pitch your vision to key stakeholders

      There are multiple audiences for your pitch, and each audience requires a different level of detail when addressed. Depending on the outcomes expected from each audience, a suitable approach must be chosen. The format and information presented will vary significantly from group to group.

      Audience

      Key Contents

      Outcome

      Business Executives

      • Section 1: Executive Brief
      • Section 2: Context and Constraints
      • Section 5: Future-State Vision and Goals
      • Identify executive sponsor

      IT Leadership

      • Sections 1-5 with a focus on Section 3 or 4 depending on implementation approach
      • Get buy-in on proposed project
      • Identify skills or resourcing constraints

      Business Managers

      • Section 1: Executive Brief
      • Section 2: Context and Constraints
      • Section 5: Future-State Vision and Goals
      • Get feedback on proposed plan
      • Identify any unassessed risks and organizational impacts

      Business Users

      • Section 1: Executive Brief
      • Support the organizational change management process

      Summary of Accomplishment

      Problem Solved

      Knowledge Gained
      • How you work: Work management and the various ways of working (personal and team task management, strategic project portfolio management, formal project management, and enterprise project and portfolio management).
      • Where you need to go: Project portfolio management and project management current- and target-state maturity levels.
      • What you need: Microsoft Project Plans and requisite M365 licensing.
      • The skills you need: Extending Project for the web.
      • Who you need to work with: Get to know the Microsoft Gold Partner community.
      Deliverables Completed
      • M365 Tool Guides
      • Tool Audit Workbook
      • Force Field Analysis Tool
      • Project Portfolio Management Maturity Assessment Tool
      • Project Management Maturity Assessment Tool
      • Microsoft Project & M365 Action Plan Template

      If you would like additional support, have our analysts guide you through other phases as part of an Info-Tech workshop

      Contact your account representative for more information
      workshops@infotech.com
      1-888-670-8889

      Additional Support

      If you would like additional support, have our analysts guide you through other phases as part of an Info-Tech Workshop.

      Photo of Barry Cousins.
      Contact your account representative for more information
      workshops@infotech.com 1-888-670-8889

      To accelerate this project, engage your IT team in an Info-Tech workshop with an Info-Tech analyst team.

      Info-Tech analysts will join you and your team at your location or welcome you to Info-Tech’s historic Toronto office to participate in an innovative onsite workshop.

      The following are sample activities that will be conducted by Info-Tech analysts with your team:

      Perform a work management tool audit

      Gain insight into the tools that drive value or fail to drive value across your work management landscape with a view to streamline the organization’s tool ecosystem.

      Prepare an action plan for your tool needs

      Prepare the right work management tool recommendations for your IT teams and/or business units and develop a boardroom-ready presentation to communicate needs and next steps.

      Research Contributors and Experts

      Neeta Manghnani
      PMO Strategist
      PMO Outsource Ltd.

      Photo of Neeta Manghnani, PMO Strategist, PMO Outsource Ltd.
      • Innovative, performance-driven executive with significant experience managing Portfolios, Programs & Projects, and technical systems for international corporations with complex requirements. A hands-on, dynamic leader with over 20 years of experience guiding and motivating cross-functional teams. Highly creative and brings a blend of business acumen and expertise in multiple IT disciplines, to maximize the corporate benefit from capital investments.
      • Successfully deploys inventive solutions to automate processes and improve the functionality, scalability and security of critical business systems and applications. Leverages PMO/PPM management and leadership skills to meet the strategic goals and business initiatives.

      Robert Strickland
      Principal Consultant & Owner
      PMO Outsource Ltd.

      Photo of Robert Strickland, Principal Consultant and Owner, PMO Outsource Ltd.
      • Successful entrepreneur, leader, and technologist for over 15 years, is passionate about helping organizations leverage the value of SharePoint, O365, Project Online, Teams and the Power Platform. Expertise in implementing portals, workflows and collaboration experiences that create business value. Strategic manager with years of successful experience building businesses, developing custom solutions, delivering projects, and managing budgets. Strong transformational leader on large implementations with a technical pedigree.
      • A digital transformation leader helping clients move to the cloud, collaborate, automate their business processes and eliminate paper forms, spreadsheets and other manual practices.

      Related Info-Tech Research

      • Develop a Project Portfolio Management Strategy
        Time is money; spend it wisely.
      • Establish Realistic IT Resource Management Practices
        Holistically balance IT supply and demand to avoid overallocation.
      • Tailor Project Management Processes to Fit Your Projects
        Spend less time managing processes and more time delivering results

      Bibliography

      “13 Reasons not to use Microsoft Project.” Celoxis, 14 Sept. 2018. Accessed 17 Sept. 2021.

      Advisicon. “Project Online vs Project for the Web.” YouTube, 13 Nov. 2013. Accessed 17 Sept. 2021.

      Branscombe, Mary. “Is Project Online ready to replace Microsoft Project?” TechRepublic, 23 Jan. 2020. Accessed 17 Sept. 2021.

      Chemistruck, Dan. “The Complete Office 365 and Microsoft 365 Licensing Comparison.” Infused Innovations, 4 April 2019. Accessed 17 Sept. 2021.

      “Compare Project management solutions and costs.” Microsoft. Accessed 17 Sept. 2021.

      Day to Day Dynamics 365. “Microsoft Project for the web - Model-driven app.” YouTube, 29 Oct. 2019. Accessed 17 Sept. 2021.

      “Deploying Project for the web.” Microsoft, 24 Aug. 2021. Accessed 17 Sept. 2021.

      “Differentiate your business by attaining Microsoft competencies.” Microsoft, 26 Jan. 2021. Accessed 17 Sept. 2021.

      “Extend & Integrate Microsoft Project.” Western Principles. Accessed 17 Sept. 2021.

      “Get Started with Project Power App.” Microsoft. Accessed 17 Sept. 2021.

      Hosking, Ben. “Why low code software development is eating the world.” DevGenius, May 2021. Accessed 17 Sept. 2021.

      “How in the World is MS Project Still a Leading PM Software?” CBT Nuggets, 12 Nov. 2018. Accessed 17 Sept. 2021.

      Integent. “Project for the Web - Create a Program Entity and a model-driven app then expose in Microsoft Teams.” YouTube, 25 Mar. 2020. Accessed 17 Sept. 2021.

      “Introducing the Project Accelerator.” Microsoft, 10 Mar. 2021. Accessed 17 Sept. 2021.

      “Join the Microsoft Partner Network.” Microsoft. Accessed 17 Sept. 2021.

      Kaneko, Judy. “How Productivity Tools Can Lead to a Loss of Productivity.” Bluescape, 2 Mar. 2018 Accessed 17 Sept. 2021.

      Kotter, John. Leading Change. Harvard Business School Press, 1996.

      Leis, Merily. “What is Work Management.” Scoro. Accessed 17 Sept. 2021.

      Liu, Shanhong. “Number of Office 365 company users worldwide as of June 2021, by leading country.” Statistica, 2021. Web.

      Manghnani, Neeta. “5 Benefits of PPM tools and PMO process automation.” PMO Outsource Ltd., 11 Apr. 2021. Accessed 17 Sept. 2021.

      “Microsoft 365 and Office 365 plan options.” Microsoft, 31 Aug. 2021. Accessed 17 Sept. 2021.

      “Microsoft 365 for enterprise.” Microsoft. Accessed 17 Sept. 2021

      “Microsoft Office 365 Usage Statistics.” Thexyz blog, 18 Sept. 2020. Accessed 17 Sept. 2021.

      “Microsoft Power Apps, Microsoft Power Automate and Microsoft Power Virtual Agents Licensing Guide.” Microsoft, June 2021. Web.

      “Microsoft Project service description.” Microsoft, 31 Aug. 2021. Accessed 17 Sept. 2021.

      “Microsoft Project Statistics.” Integent Blog, 12 Dec. 2013. Accessed 17 Sept. 2021.

      Nanji, Aadil . Modernize Your Microsoft Licensing for the Cloud Era. Info-Tech Research Group, 12 Mar. 2020. Accessed 17 Sept. 2021.

      “Number of Office 365 company users worldwide as of June 2021, by leading country.” Statista, 8 June 2021. Accessed 17 Sept. 2021.

      “Overcoming disruption in a digital world.” Asana. Accessed 17 Sept. 2021.

      Pajunen, Antti. “Customizing and extending Project for the web.” Day to Day Dynamics 365, 20 Jan. 2020. Accessed 17 Sept. 2021.

      “Partner Center Documentation.” Microsoft. Accessed 17 Sept. 2021.

      Pragmatic Works. “Building First Power Apps Model Driven Application.” YouTube, 21 June 2019. Accessed 17 Sept. 2021.

      “Project architecture overview.” Microsoft, 27 Mar. 2020. Accessed 17 Sept. 2021.

      “Project for the web Accelerator.” GitHub. Accessed 17 Sept. 2021.

      “Project for the web admin help.” Microsoft, 28 Oct. 2019. Accessed 17 Sept. 2021.

      “Project for the Web – The New Microsoft Project.” TPG. Accessed 17 Sept. 2021.

      “Project for the Web Security Roles.” Microsoft, 1 July 2021. Accessed 17 Sept. 2021.

      “Project Online: Project For The Web vs Microsoft Project vs Planner vs Project Online.” PM Connection, 30 Nov. 2020. Accessed 17 Sept. 2021.

      Redmond, Tony. “Office 365 Insights from Microsoft’s FY21 Q2 Results.” Office 365 for IT Pros, 28 Jan. 2021. Accessed 17 Sept. 2021.

      Reimagine Project Management with Microsoft. “Advanced deployment for Project for the web.” YouTube, 4 Aug. 2021. Accessed 17 Sept. 2021.

      Reimagine Project Management with Microsoft. “Overview of Microsoft Project.” YouTube, 29 July 2021. Accessed 17 Sept. 2021.

      “See which partner offer is right for you.” Microsoft. Accessed 17 Sept. 2021.

      Shalomova, Anna. “Microsoft Project for Web 2019 vs. Project Online: What’s Best for Enterprise Project Management?” FluentPro, 23 July 2020. Accessed 17 Sept. 2021.

      Speed, Richard. “One Project to rule them all: Microsoft plots end to Project Online while nervous Server looks on.” The Register, 28 Sept. 2018. Accessed 17 Sept. 2021.

      Spataro, Jared. “A new vision for modern work management with Microsoft Project.” Microsoft, 25 Sept. 2018. Accessed 17 Sept. 2021.

      Stickel, Robert. “OnePlan Recognized as Winner of 2021 Microsoft Project & Portfolio Management Partner of the Year.” OnePlan, 8 July 2021. Accessed 17 Sept. 2021.

      Stickel, Robert. “The Future of Project Online.” OnePlan, 2 Mar. 2021. Accessed 17 Sept. 2021.

      Stickel, Robert. “What It Means to be Adaptive.” OnePlan, 24 May 2021. Accessed 17 Sept. 2021.

      “The Future of Microsoft Project Online.” OnePlan. Accessed 17 Sept. 2021.

      Weller, Joe. “Demystifying Microsoft Project Licensing.” Smartsheet, 10 Mar. 2016. Accessed 17 Sept. 2021.

      Western Principles Inc. “Dump the Spreadsheets for Microsoft Project Online.” YouTube, 2 July 2020. Accessed 17 Sept. 2021.

      Western Principles Inc. “Project Online or Project for the web? Which project management system should you use?” YouTube, 11 Aug. 2020. Accessed 17 Sept. 2021.

      “What is Power Query?” Microsoft, 22 July 2021. Web.

      Wicresoft. “The Power of the New Microsoft Project and Microsoft 365.” YouTube, 29 May 2020. Accessed 17 Sept. 2021.

      Wicresoft. “Why the Microsoft Power Platform is the Future of PPM.” YouTube, 11 June 2020. Accessed 17 Sept. 2021.

      Formalize Your Digital Business Strategy

      • Buy Link or Shortcode: {j2store}101|cart{/j2store}
      • member rating overall impact (scale of 10): N/A
      • member rating average dollars saved: N/A
      • member rating average days saved: N/A
      • Parent Category Name: Innovation
      • Parent Category Link: /innovation

      Your organization already has a digital strategy, but there is a lack of understanding of what digital means across the enterprise. Digital investments have been made in the past but failed to yield or demonstrate business value. Given the pace of change, the current digital strategy is outdated, and new digital opportunities need to be identified to inform the technology innovation roadmap.

      Our Advice

      Critical Insight

      Turn your digital strategy into a compelling change story that will create a unified vision of how you want to transform your business.

      Impact and Result

      • Identify new digitally enabled growth opportunities.
      • Understand which digital ideas yield the biggest return and the value they generate for the organization.
      • Understand the impact of opportunities on your business capabilities.
      • Map a customer journey to identify opportunities to transform stakeholder experiences.

      Formalize Your Digital Business Strategy Research & Tools

      Besides the small introduction, subscribers and consulting clients within this management domain have access to:

      1. Formalize Your Digital Business Strategy – a document that walks you through a series of activities to help brainstorm and ideate on possible new digital opportunities as an input into building your business case for a new IT innovation roadmap.

      Knowing which digital opportunities create the greatest business value requires a structured approach to ideate, prioritize, and understand the value they create for the business to help inform the creation of your business case for investment approval.

      • Formalize Your Digital Strategy Storyboard

      Infographic

      Further reading

      Formalize Your Digital Business Strategy

      Stay relevant in an evolving digital economy

      Executive Summary

      Your Challenge

      Common Obstacles

      Solution

      • Since 2020, the environment has been volatile, leading many CIOs to rethink their priorities and strategies.
      • The organization already has a digital strategy, but there is a lack of understanding of what digital means across the enterprise.
      • Digital investments have been made but fail to demonstrate the business value.
      • The current digital strategy was developed in isolation and failed to garner consensus on a common understanding of the digital vision from across the business.
      • CIOs struggle to understand what existing capabilities need to transform or what new digital capabilities are needed to support the digital ambitions.
      • The existing Digital Strategy is synonymous with the IT Strategy.
      • Identify new digitally enabled growth opportunities.
      • Understand which digital ideas yield the biggest return and the value they generate for the organization.
      • Understand the impact of opportunities on your business capabilities.
      • Map the customer journey to identify opportunities to transform the stakeholder experience.

      Info-Tech Insight

      Turn your existing digital strategy into a compelling change story that will create a unified vision of how you want to transform your business.

      Info-Tech’s Digital Transformation Journey

      Your journey: An IT roadmap for your Digital Business Strategy

      The image contains a screenshot of Info-Tech's Digital Transformation Journey.

      By now, you understand your current business context and capabilities

      The image contains a screenshot of the IT roadmap for your Digital Business Strategy.

      By this point you have leveraged industry roundtables to better understand the art of the possible, exploring global trends, shifts in market forces, customer needs, emerging technologies, and economic forecasts to establish your business objectives and innovation goals.

      Now you need to formalize digital business strategy.

      Phase 1: Industry Trends Report

      The image contains a screenshot of phase 1 industry trends report.

      Phase 2: Digital Maturity Assessment

      The image contains a screenshot of phase 2 digital maturity assessment.

      Phase 3: Zero-In on Business Objectives

      The image contains a screenshot of phase 3 Zero-in on business objectives.

      Business and innovation goals are established through stakeholder interviews and a heatmap of your current capabilities for transformation.

      Since 2020, market dynamics have forced organizations to reassess their strategies

      The unprecedented pace of global disruptions has become both a curse and a silver lining for many CIOs. The ability to maximize the value of digital will be vital to remain relevant in the new digital economy.

      The image contains a screenshot of an image that demonstrates how market dynamics force organizations to reassess their strategies.

      Formalize your digital strategy to address industry trends and market dynamics

      The goal of this phase is to ensure the scope of the current digital strategy reflects the right opportunities to allocate capital to resources, assets, and capabilities to drive strategic growth and operational efficiency.

      There are three key activities outlined in this deck that that can be undertaken by industry members to help evolve their current digital business strategy.

      1. Identify New Digitally Enabled Growth Opportunities
        • Host an ideation session to identify new leapfrog ideas
        • Discuss assumptions, value drivers, and risks
        • Translate ideas into opportunities and consolidate
      2. Evaluate New Digital Opportunities and Business Capabilities
        • Build an opportunity profile
        • Identify business capabilities for transformation
      3. Transform Stakeholder Journeys
        • Understand the impact of opportunities on value-chains
        • Identify stakeholder personas
        • Build a stakeholder journey map
        • Compile your new list of digital opportunities
      The image contains a screenshot of Formalize your digital business strategy.

      Info-Tech’s approach

      1. Identify New Digital Opportunities
        • Conduct an ideation session
        • Identify leapfrog ideas from trends
        • Evaluate each leapfrog idea to define opportunity
      2. Evaluate Opportunities and Business Capabilities
        • Build Opportunity Profile
        • Understand the impact of opportunities on business capabilities
      3. Transform Stakeholder Journeys
        • Analyze value chains
        • Map your Stakeholder Journey
        • Breakdown opportunities into initiatives

      Overview of Key Activities

      Formalize your digital business strategy

      Methodology

      Members Engaged

      • CIO
      • Business Executives

      Info-Tech

      • Industry Analyst
      • Executive Advisor

      Phase 1: New Digital Opportunities

      Phase 2: Evaluate Opportunities and Business Capabilities

      Phase 3: Transform Stakeholder Journeys

      Content Leveraged

      • Digital Business Strategy blueprint
      • Client’s Business Architecture
      1. Hold an ideation session with business executives.
        • Review relevant reports on industry trends, market shifts, and emerging technologies.
        • Establish guiding principles for digital transformation.
        • Leverage a trend-analysis approach to determine the most impactful and relevant trends.
        • From tends, elicit leapfrog ideas for growth opportunities.
        • For each idea, engage in discussion on assumptions, value drivers, benefits, and risks.
      1. Create opportunity profiles.
        • Evaluate each opportunity to determine if it is important to turn into initiatives
      2. Evaluate the impact of opportunities on your business capabilities.
        • Leverage a value-chain analysis to assess the impact of the opportunity across value chains in order to understand the impact across your business capabilities.
      1. Map stakeholder journey:
        • Identify stakeholder personas
        • Identify one journey scenario
        • Map stakeholder journey
        • Consolidate opportunities
      2. Breakdown opportunities into actional initiatives
        • Brainstorm priority initiatives against opportunities.

      Deliverable:

      Client’s Digital Business Strategy

      Phase 1: Deliverable

      1. Compiled list of leapfrog ideas for new growth opportunities

      Phase 2: Deliverables

      1. Opportunity Profile
      2. Business Capability Impact

      Phase 3: Deliverables

      1. Opportunity Profile
      2. Business Capability Impact

      Glossary of Terms

      LEAPFROG IDEAS

      The concept was originally developed in the area of industrial organizations and economic growth. Leapfrogging is the notion that organizations can identify opportunities to skip one or several stages ahead of their competitors.

      DIGITAL OPPORTUNITIES

      Opening of new possibilities to transform or change your business model and create operational efficiencies and customer experiences through the adoption of digital platforms, solutions, and capabilities.

      INITIATIVES

      Breakdown of opportunities into actionable initiatives that creates value for organizations through new or changes to business models, operational efficiencies, and customer experiences.

      1. LEAPFROG IDEAS:
        • Precision medicine
      2. DIGITAL OPPORTUNITY:
        • Machine Learning to sniff out pre-cancer cells
      3. INITIATIVES:
        1. Define genomic analytics capabilities and recruit
        2. Data quality and cleansing review
        3. Implement Machine Learning SW

      Identify Digitally Enabled Opportunities

      Host an ideation session to turn trends into growth opportunities with new leapfrog ideas.

      Phase 1Phase 2Phase 3

      Identify New Digitally Enabled Opportunities

      Evaluate Opportunities and Business Capabilities

      Transform Stakeholder Journeys

      Phase 1

      Host an Ideation Session to Identify New Digital Opportunities

      1.1

      IDENTIFY AND ASSEMBLE YOUR KEY STAKEHOLDERS

      Build support and eliminate blind spots

      It is important to make sure the right stakeholders participate in this working group. Designing a digital strategy will require debate, insights, and business decisions from a broad perspective across the enterprise. The focus is on the value to be generated from digital.

      Consider:

      • Who are the decision makers and key influencers?
      • Who will impact the business?
      • Who has a vested interest in the success or failure of the practice? Who has the skills and competencies necessary to help you be successful?

      Avoid:

      • Don’t focus on the organizational structure and hierarchy. Often stakeholder groups don’t fit the traditional structure.
      • Don’t ignore subject matter experts on either the business or IT side. You will need to consider both.
      1.2

      ESTABLISH GUIDING PRINCIPLES

      Define the guardrails to focus your ideas

      All ideas are great until you need one that works. Establish guiding principles that will help you establish the perimeters for turning big ideas into opportunities.

      Consider:

      • Focus on the breadth and alignment to support business objectives
      • This should help narrow conceptual ideas into actionable initiatives

      Avoid:

      • Don’t recreate the corporate guiding principles
      • Focus on what will help define strategic growth opportunities and operational efficiencies
      1.3

      LEVERAGE STRATEGIC FORESIGHT TO IDENTIFY LEAPFROG IDEAS

      Create space to elicit “big ideas”

      Leverage industry roundtables and trend reports imagining how digital solutions can help drive strategic growth and operational efficiency. Brainstorm new opportunities and discuss their viability to create value and better experiences for your stakeholders.

      Consider:

      • Accelerate this exercise by leveraging stakeholder insights from:
        • Your corporate strategy and financial plan
        • Outputs from stakeholder interviews
        • Market research

      Avoid:

      • Don’t simply go with the existing documented strategic objectives for the business. Ensure they are up to date and interview the decision makers to validate their perspectives if needed.

      Host an Ideation Session

      Identify digitally enabled opportunities

      Industry Roundtables and Trend Reports

      Industry Trends Report

      The image contains a screenshot of phase 1 industry trends report.

      Business Documents

      The image contains a screenshot of Business Documents.

      Digital Maturity Assessment

      The image contains a screenshot of phase 2 digital maturity assessment.

      Activity: 2-4 hours

      Members Engaged

      • CIO
      • Business Executives

      Info-Tech

      • Industry Analyst
      • Executive Advisor

      Hold a visioning session with key business executives (e.g., CIO, CEO, CFO, CCO, and COO) and others as needed. Here is a proposed agenda of activities for the ideation session:

      1. Leverage current trend reports and relevant emerging trend reports, market analysis, and customer research to envision future possibilities.
      2. Establish guiding principles for defining your digital strategy and scope.
      3. Leverage insights from trend reports and market analysis to generate leapfrog ideas that can be turned into opportunities.
      4. For each leapfrog idea, engage in a discussion on assumptions, value drivers, benefits, and risks.

      Content Leveraged

      • Digital Trends Report
      • Industry roundtables and trend reports
      • Digital Maturity Assessment
      • Digital Business Strategy v1.0

      Deliverable:

      1. Guiding principles
      2. Strategic growth opportunities

      1.1 Executive Stakeholder Engagement

      Assemble Executive Stakeholders

      Set yourself up for success with these three steps.

      CIOs tasked with designing digital strategies must add value to the business. Given the goal of digital is to transform the business, CIOs will need to ensure they have both the mandate and support from the business executives.

      Designing the digital strategy is more than just writing up a document. It is an integrated set of business decisions to create a competitive advantage and financial returns. Establishing a forum for debates, decisions, and dialogue will increase the likelihood of success and support during execution.

      1. Confirm your role

      2. Identify Stakeholders

      3. Diverse Perspective

      The digital strategy aims to transform the business. Given the scope, validate your role and mandate to lead this work. Identify a business executive to co-sponsor.

      Identify key decision-makers and influencers who can help make rapid decisions as well as garner support across the enterprise.

      Don’t be afraid to include contrarians or naysayers. They will help reduce any blind spots but can also become the greatest allies through participation.

      1.2 Guiding Principles

      Set the Guiding Principles

      Guiding principles help define the parameters of your digital strategy. They act as priori decisions that establish the guardrails to limit the scope of opportunities from the perspective of people, assets, capabilities, and budgets that are aligned with the business objectives. Consider these components when brainstorming guiding principles:

      Consider these three components when brainstorming

      Breadth

      Digital strategy should span people, culture, organizational structure, governance, capabilities, assets, and technology. The guiding principle should cover a 3600 view across the entire organization.

      Planning Horizon

      Timing should anchor stakeholders to look to the long-term with an eye on the foreseeable future i.e., business value realization in one, two, and three years.

      Depth

      Needs to encompass more than the enterprise view of lofty opportunities but establish boundaries to help define actionable initiatives (i.e., individual projects).

      1.2 Guiding Principles

      Examples of Guiding Principles

      IT Principle NameIT Principle Statement
      1.Enterprise value focusWe aim to provide maximum long-term benefits to the enterprise as a whole while optimizing total costs of ownership and risks.
      2.Fit for purposeWe maintain capability levels and create solutions that are fit for purpose without over engineering them.
      3.SimplicityWe choose the simplest solutions and aim to reduce operational complexity of the enterprise.
      4.Reuse > buy > buildWe maximize reuse of existing assets. If we can’t reuse, we procure externally. As a last resort, we build custom solutions.
      5.Managed dataWe handle data creation and modification and use it enterprise-wide in compliance with our data governance policy.
      6.Controlled technical diversityWe control the variety of what technology platforms we use.
      7.Managed securityWe manage security enterprise-wide in compliance with our security governance policy.
      8.Compliance to laws and regulationsWe operate in compliance with all applicable laws and regulations.
      9.InnovationWe seek innovative ways to use technology for business advantage.
      10.Customer centricityWe deliver best experiences to our customers with our services and products.
      11.Digital by default We always put digital solutions at the core of our plans for all viable solutions across the organization.
      12.Customer-centricity by designWe design new products and services with the goal to drive greater engagement and experiences with our customers.

      1.3 Trend-Analysis

      Leverage strategic foresight to identify growth opportunities

      What is Strategic Foresight?

      In times of increasing uncertainty, rapid change, market volatility, and complexity, the development of strategies can be difficult. Strategic foresight offers a solution.
      Strategic foresight refers to an approach that uses a range of methodologies, such as scanning the horizon for emerging changes and signals, analyzing megatrends, and developing multiple scenarios to identify opportunities (source: OECD, 2022). However, it cannot predict the future and is distinct from:

      • Forecasting tools
      • Strategic planning
      • Scenario planning (only)
      • Predictive analyses of the future

      Why is Strategic Foresight useful?

      • Reduce uncertainties about the future
      • Better anticipate changes
      • Future-proof to stress test proposed strategies
      • Explore innovation to reveal new products, services, and approaches

      Explore Info-Tech’s Strategic Foresight Process Tool

      “When situations lack analogies to the past, it’s hard to envision the future.”

      - J. Peter Scoblic, HBR, 2020

      1.3 Trend-Analysis

      Leverage industry roundtables and trend reports to understand the art of the possible

      Uncover important business and industry trends that can inform possibilities for technology innovation.

      Explore trends in areas such as:

      • Machine Learning
      • Citizen Dev 2.0
      • Venture Architecture
      • Autonomous Organizations
      • Self-Sovereign Cloud
      • Digital Sustainability

      Market research is critical in identifying factors external to your organization and identifying technology innovation that will provide a competitive edge. It’s important to evaluate the impact each trend or opportunity will have in your organization and market.

      Visit Info-Tech’s Trends & Priorities Research Center

      Visit Info-Tech’s Industry Coverage Research to get started.

      The image contains screenshots from Info-Tech blueprints.

      Images are from Info-Tech’s Rethinking Higher Education Report and 2023 Tech Trends Report

      1.3 Trend-Analysis

      Scan the Horizon

      Understand how the environment is evolving in your industry

      Scan the horizon to detect early signs of future changes or threats.

      Horizon scanning involves scanning, analyzing, and communicating changes in an organization’s environment to prepare for potential threats and opportunities. Much of what we know about the future is based around the interactions and trajectory of macro trends, trends, and drivers. These form the foundations for future intelligence.

      Macro Trends

      A macro trend captures a large-scale transformative trend on a global scale that could impact your addressable market

      Industry Trend

      An industry trend captures specific use cases of the macro trend in relation to your market and industry. Consider this in terms of shifts in your market dynamics i.e., competitors, size, transaction, international trade, supply/demand, etc.

      Driver(s)

      A driver is an underlying force causing the trend to occur. There can be multiple causal forces, or drivers, that influence a trend, and multiple trends can be influenced by the same causal force.

      Identify signals of change in the present and their potential future impacts.

      1.3 Trend-Analysis

      Identify macro trends

      Macro trends capture a global shift that can change the market and the industry. Here are examples of macro-trends to consider when scanning the horizon for your own organization:

      Talent Availability

      Customer Expectations

      Emerging Technologies

      Regulatory System

      Supply Chain Continuity

      Decentralized workforce

      Hybrid workforce

      Diverse workforce

      Skills gap

      Digital workforce

      Multigenerational workforce

      Personalization

      Digital experience

      Data ownership

      Transparency

      Accessibility

      On-demand

      Mobility

      AI & robotics

      Virtual world

      Ubiquitous connectivity

      Genomics (nano, bio, smart….)

      Big data

      Market control

      Economic shifts

      Digital regulation

      Consumer protection

      Global green

      Resource scarcity

      Sustainability

      Supply chain digitization

      Circular supply chains

      Agility

      Outsource

      1.3 Trend-Analysis

      Determine impact and relevance of trends

      Understand which trends create opportunities or risks for your organization.

      Key Concepts:

      Once an organization has uncovered a set of trends that are of potential importance, a judgment must be made on which of the trends should be prioritized to understand their impact on your market and ultimately, the implications for your business or organization. Consider the following criteria to help you prioritize your trends.

      Impact to Industry: The degree of impact the trend will have on your industry and market to create possibilities or risks for your business. Will this trend create opportunities for the business? Or does it pose a risk that we need to mitigate?

      Relevance to Organization. The relevance of the trend to your organization. Does the trend align with the mission, vision, and business objectives of your organization?

      Activity: 2-4hours

      In order to determine which trends will have an impact on your industry and are relevant to your organization, you need to use a gating approach to short-list those that may create opportunities to capitalize on while you need to manage the ones that pose risk.

      Impact

      What does this trend mean for my industry and market?

      • Degree – how broad or narrow is the impact
      • Likelihood – the reality of disrupting an industry or market
      • Timing – when do we expect disruption?

      Relevance

      What opportunity or risk does it pose to my business/organization?

      • Significance – depth and breadth across the enterprise
      • Duration – how long is the anticipated impact?

      1.3 Trend-Analysis

      Prioritize Trends for Exploration

      The image contains a screenshot of a table to demonstrate the trends.The image contains a graph that demonstrates the trends from the table on a graph to show how to prioritze them based on relevance and impact.

      Info-Tech Insight

      While the scorecard may produce a ranking based on weighted metrics, you need to leverage the group discussion to help contextualize and challenge assumptions when validating the priority. The room for debate is important to truly understand whether a trend is a fad or a fact that needs to be addressed.

      1.3 Trend-Analysis

      Discuss the driver(s) behind the trend

      Determining the root cause(s) of a trend is an important precursor to understanding the how, why, and to what extent a trend will impact your industry and market.

      Trend analysis can be a valuable approach to reduce uncertainties about the future and an opportunity to understand the underlying drivers (forces) that may be contributing to a shift in pattern. Understanding the drivers is important to help determine implication on your organization and potential opportunities.

      The image contains a screenshot of a driver diagram.

      1.3 Trend-Analysis

      Examples of driver(s)

      INDUSTRY

      Healthcare Exemplar

      Macro Trends

      (Transformative change)

      Industry Trend

      (A pattern of change…)

      Drivers

      (“Why”….)

      Accessibility

      Increase in wait times

      Aging population leading to global workforce shortage

      New models of care e.g., diversify scope of practice

      Address capacity issues

      Understanding the drivers is not about predicting the future. Don’t get stuck in “analysis paralysis.” The key objective is to determine what opportunities and risks the trend and its underlying driver pose to your business. This will help elicit leapfrog opportunities that can be funneled into actionable initiatives.

      Other examples…

      Dimensions

      Macro-Trends

      Industry Trend

      Driver

      Social

      Demographic shift

      Global shortage of healthcare workers

      Workforce age

      Customer expectations

      Patients as partners

      Customer demographics

      Technology

      AI and robotics

      Early detection of cancer

      Patient outcomes

      Ubiquitous connectivity

      Virtual health

      Capacity

      Economic

      Recession

      Cost-savings

      Sustainability

      Consumer spending

      Value-for-money

      Prioritization

      Environment

      Climate change

      Shift in manufacturers

      ESG compliant vendors

      Pandemic

      Supply chain disruption

      Local production

      Political

      Regulatory

      Consolidation of professional colleges

      Operational efficiency

      De-regulation

      New models of care

      New service (business) model

      1.3 Trend-Analysis

      Case Study

      Industry

      Healthcare

      Artificial Intelligence (AI) in Precision Medicine (Genomics)

      Precision Medicine has become very popular over the recent years fueled by research but also political and patient demands to focus more on better outcomes vs. profits. A cancer care center in Canada wanted to look at what was driving this popularity but more importantly, what this potentially meant to their current service delivery model and operations and what opportunities and risks they needed to address in the foreseeable future. They determined the following drivers:

      • Improve patient outcomes
      • Earlier detection of cancer
      • Better patient experience
      • Ability to compute vast amounts of data to reduce manual effort and errors
      • Accelerate from research to clinical trials to delivery

      The image contains a screenshot of AI in Genomics.

      1.3 Trend-Analysis

      INDUSTRY

      Healthcare Exemplar

      Category

      Macro-Trends

      Industry Trends

      (Use-Case)

      Drivers

      Impact to Industry

      Impact to Business

      Talent Availability

      Diverse workforce

      Aboriginal health

      Systemic inequities

      Brand and legal

      Policies in place

      Hybrid workforce

      Virtual care

      COVID-19 and infectious disease

      New models of care

      New digital talent

      Customer Expectation

      Personalization

      On-demand care

      Patient experience

      Patients as consumers

      New operating model

      Digital experience

      Patient portals

      Democratization of data

      Privacy and security

      Capacity

      Emerging Technologies

      Internet of Things (IoT)

      Smart glucometers

      Greater mobility

      System redesign

      Shift from hospital to home care

      Quantum computing

      Genomic sequencing

      Accelerate analysis

      Improve quality of data analysis

      Faster to clinical trial and delivery

      Regulatory System

      Consumer protection

      Protect access to sensitive patient data

      HIPPA legislation

      Restrict access to health record

      Electronic health records

      Global green

      Green certification for redev. projects

      Political optics

      Higher costs

      Contract management

      Supply Chain

      Supply chain disruptions

      Surgical strategic sourcing

      Preference cards

      Quality

      Organizational change management

      New pharma entrants

      Telco’s move into healthcare

      Demand/supply

      Funding model

      Resource competition

      Sample Output From Trend Analysis

      1.3 Elicit New Opportunities

      Leapfrog into the future

      Turn trends into growth opportunities.

      To thrive in the digital age, organizations must innovate big, leverage internal creativity, and prepare for flexibility.

      In this digital era, organizations are often playing catch up to a rapidly evolving technological landscape and following a strict linear approach to innovation. However, this linear catch-up approach does not help companies get ahead of competitors. Instead, organizations must identify avenues to skip one or several stages of technological development to leapfrog ahead of their competitors.

      “The best way to predict the future is to invent it.”

      – Alan Kay

      Leapfrogging takes place when an organization introduces disruptive innovation into the market and sidesteps competitors, who are unable to mobilize to respond to the opportunities.

      1.3 Elicit New Opportunities

      Funnel trends into leapfrog ideas

      Go from trend insights into ideas for opportunities

      Brainstorm ways to generate leapfrog ideas from trend insights.

      Dealing with trends is one of the most important tasks for innovation. It provides the basis of developing the future orientation of the organization. However, being aware of a trend is one thing, to develop strategies for response is another.

      To identify the impact the trend has on the organization, consider the four areas of growth for the organization:

      1. New Customers: Leverage the trend to target new customers for existing products or services.
      2. New Business Models: Adjust the business model to capture a change in how the organization delivers value.
      3. New Markets: Enter or create new markets by applying existing products or services to different problems.
      4. New Product or Service Offerings: Introduce new products or services to the existing market.

      1.3 Elicit New Opportunities

      INDUSTRY: Healthcare

      SOURCE: Memorial Sloan Kettering Cancer Center

      Case Study

      Machine Learning Sensor to Sniff Out Cancer

      Challenge

      Solution

      Results

      Timely access to diagnostic services is a key indicator of a cancer patient’s prognosis i.e., outcome. Early detection of cancer means the difference between life and death for cancer patients.

      Typically, cancer biomarkers need to be present to detect cancer. Often the presence of these biomarkers is late in the disease state when the cancer cells have likely spread, resulting in suspicions of cancer only when the patient does not feel well or suspects something is wrong.

      Researchers in partnership with IBM Watson at Memorial Sloan Kettering Cancer Center (MSK) have created a tool that can sniff for and identify cancer in a blood sample using machine learning.

      Originally, MSK worked with IBM Watson to identify machine learning as an emerging technology that could drive early cancer detection without the use of cancer biomarkers. But they needed to find specific use cases. After a series of concept prototypes, they were able to use machine learning to detect patterns in blood cells vs. cancer biomarkers to detect cancer disease.

      Machine learning was an emerging trend that researchers at MSK felt held great promise. They needed to turn the trend into tangible opportunities by identifying some key use cases that could be prototyped.

      Computational tools in oncology have the ability to greatly reduce clinician labor, improve the consistency of variant classification, and help accelerate the analytics of vast amounts of clinical data that would be prone to errors and delays when done manually.

      From trends to leapfrog ideas

      Additional Examples in the Appendix

      Example of leapfrog ideas that can generate opportunities for consideration

      Trend

      New Customer

      New Market

      New Business or Operating Model

      New Service Offering

      What trend(s) pose a significant impact on your business?

      New stakeholder segment

      Enter or create new markets

      Adjust the business or operating model to capture change in how the business creates and delivers value

      Introduce new digital products, services and experiences

      Virtualize Registration

      Empower patients as consumers of healthcare partners

      Direct B2C to close gap between providers and patients by removing middle administrative overhead.

      24/7 On-Demand Patient Portal

      Leverage AI to develop chatbots and on-demand

      Phase 1: Deliverable

      Phase 1 Deliverable

      Example of output from phase 1 ideation session

      Business Objectives

      New Customers

      (Customer Experience)

      New Markets

      (Health Outcomes)

      New Business or

      Operating Models

      (Operational Excellence)

      New Service Offering

      (Value for Money)

      Description:

      Focus on improving experiences for patients and providers

      Improve quality and standards of care to continually drive better health outcomes

      Deliver care better, faster, and more efficiently

      Reduce cost per capital of delivery care and increase value for services

      Trends:

      • Global workforce shortage due to ageing demographics
      • Clinicians are burnt-out and unable to practice at the top of their profession
      • On-demand care/mobile/wearables
      • Virtual care
      • Faster access to quality service
      • Help navigating complex medical ecosystem from primary to acute to community
      • Standardize care across regions
      • New models of care to expand capacity
      • Improve medication errors
      • Opportunities to use genomics to design personalized medicine
      • Automate tasks
      • Leverage AI and robotics more effectively
      • Regulatory colleges consolidation mandate
      • Use data and analytics to forecast capacity and health outcomes
      • Upskill vs. virtualize workforce
      • Payment reform i.e., move to value-based care vs. fee-for-service
      • Consolidation of back-office functions like HR, supply chain, IT, etc. to reduce cost i.e., shared services model

      Digital Opportunities:

      1. Virtual health command center
      2. Self-scheduling patient portal
      3. Patient way-finder
      4. Smart glucometer for diabetes
      1. Machine learning for early detection of cancer
      2. Visualization tools for capacity planning and forecasting
      3. Contact tracing apps for public health
      1. Build advanced analytics capabilities with new skills and business intelligence tools
      2. Pharmacy robotics
      3. Automate registration
      1. Automate provider billing solution
      2. Payment gateways – supplier portal in the cloud

      Phase 2

      Evaluate Opportunities and Business Capabilities

      Build a better understanding of the opportunities and their impact on your business.

      Phase 1Phase 2Phase 3

      Identify New Digitally Enabled Opportunities

      Evaluate Opportunities and Business Capabilities

      Transform Stakeholder Journeys

      Phase 2

      Evaluate Opportunities and Business Capabilities

      2.1

      CREATE OPPORTUNITY PROFILES

      Evaluate each opportunity

      Some opportunities will have an immediate and significant impact on your business. Some may have a significant impact but on a longer time scale or some may be unlikely to have a significant impact at all. Understanding these trends is an important context for your digital business strategy.

      Consider:

      • Does this opportunity conform with your guiding principles?
      • Can this opportunity feasibly deliver the anticipated benefits?
      • Is this opportunity desired by your stakeholders?

      Avoid:

      • Overly vague language. Opportunities need to be specific enough to evaluate what impact they will have.
      • Simply following what competitors are doing. Be ambitious and tailor your digital strategy to your organizational values, goals, and priorities.
      2.2

      UNDERSTAND THE IMPACT OF OPPORTUNITIES ON BUSINESS CAPABILITIES

      Understand the impact across your value chains

      Each opportunity has the potential to impact multiple areas of your business. Prioritize where to start acting on new opportunities based on your business objectives and capabilities. You need to assess their impacts across value chains. Does the opportunity impact existing value chain(s) or create a new value chain?

      Consider:

      • How well does this opportunity align with your digital vision, mission, and goals?
      • What will be the overall impact of this opportunity?
      • How urgently must you act?

      Avoid:

      • Guessing. Validate assumptions and use clear, unbiased information to make decisions. Info-Tech has extensive resources to assist in evaluating trends, opportunities, and solutions.
      • Making everything a high priority. Most organizations can only prioritize one to two initiatives at a time.

      2.1 Build an opportunity profile

      Evaluate each opportunity

      Discussion Framework:

      In your discussion, evaluate each opportunity to assess assumptions, value drivers, and benefits.

      Ideas matter, but not all ideas are created equal. Now that you have elicited opportunities, discuss the assumptions, risks, and benefits associated with each new digital opportunity.

      Design Thinking

      Leverage the guiding principles as the guardrails to limit the scope of your new digital opportunities. You may want to consider taking a design-thinking approach to innovation by discussing the merits of each opportunity based on:

      • DesirabilityDesirability: People want it. Does the solution enable the organization to meet the expectations of stakeholders?
      • Feasibility
      • Feasibility: Able to Execute. Do we have the capabilities to deliver e.g., the right skills, partners, technology, and leadership?

      • Viability
      • Viability: Delivers Value. Will this idea meet business goals e.g., cost, revenue, and benefits?

      Source: Adapted from IDEO

      Transform the Business

      Must Prioritize

      Should Plan

      Drive Digital Experiences

      Build Digital Capabilities

      High Value/Low Complexity

      • stakeholders want it
      • easy to implement
      • capabilities exist to deliver
      • creates significant value
      • strategic growth = competitive advantage

      High Value/High Complexity

      • customers want it
      • not easy to implement without carefully planning
      • need to invest in developing capabilities
      • Competitive differentiator

      Low Value/Low Complexity

      • stakeholders don’t want it
      • easy to implement but takes resources away from priority
      • some capabilities exist
      • creates marginal value
      • minimal growth

      Low Value/High Complexity

      • stakeholders don’t want it
      • difficult to implement
      • need to invest in developing capabilities
      • no real strategic growth

      Could Have

      Don’t Need

      Transform Operations

      IMPACT

      COMPLEXITY

      Source: Adapted from MoSCoW prioritization model

      Exemplar: Opportunity Profile

      Example:

      An example of a template to capture the output of discussion.

      Automate the Registration Process Around Admission, Discharge, and Transfer (ADT)

      Description of Opportunity:

      ADT is a critical function of registration that triggers patient identification to support services and billing. Currently, ADT is a heavily manual process with a high degree of errors as a result of human intervention. There is an opportunity to leverage intelligent automation by using RPA and AI.

      Alignment With Business Objectives

      Improve patient outcome

      Drive operational efficiency and effectiveness

      Better experiences for patients

      Business Architecture

      This opportunity may impact the following business capabilities:

      • Referral evaluation
      • Admission, discharge, and transfer management
      • Scheduling management
      • Patient registry management
      • Provider registry management
      • Patient billing
      • Provider billing
      • Finance management
      • EHR/EMR integration management
      • Enterprise data warehouse for reporting
      • Provincial/state quality reporting

      Benefits & Outcomes

      • Reduce errors by manual registration
      • Improve turnaround time for registration
      • Create a consistent customer experience
      • Improve capacity
      • Virtualize low-value work

      Key Risks & Assumptions

      • Need to add skills & knowledge to maintain systems
      • Perception of job loss or change by unions
      • assume documentation of standard work for automation vs. non-standard

      Opportunity Owner

      VP, Health Information Management (HIM)

      Incremental Value

      Reduce errors in patient identity

      • Next Steps
      • Investigate use cases for RPA and AI in registration
      • Build business case for funding

      2.2 Business capabilities impact

      Understand the impact on your business capabilities

      Each opportunity has the potential to impact multiple areas of your business. Prioritize where to start acting on new opportunities based on your business objectives and capabilities.

      You will need:

      Industry Reference Architecture.Industry Reference Architecture

      Activity: 1-2 hours

      1. Using your industry reference architecture, highlight the business capabilities that may be impacted by the opportunity. Use a value chain analysis approach to help with this exercise.
      2. Referring to your Prioritized Opportunities for Transformation, prioritize areas to transform. Priority should be given to low maturity areas that are highly or urgently relevant to your overall strategic goals.
      +
      Prioritized Opportunities for Transformation.Prioritized Opportunities for TransformationPrioritized Business Capability Map.

      2.2 Business capabilities impact

      Start with a value chain analysis

      This will help identify the impact on your business capabilities.

      As we identify and prioritize the opportunities available to us, we need to assess impacts on value chains. Does the opportunity directly impact an existing value chain? Or does it open us to the creation of a new value chain?

      The image contains a screenshot of the value chain analysis.

      The value chain perspective allows an organization to identify how to best minimize or enhance impacts and generate value.

      As we move from opportunity to impact, it is important to break down opportunities into the relevant pieces so we can see a holistic picture of the sources of differentiation.

      Exemplar: Prioritized Business Capability Map

      The image contains a screenshot of the exemplar prioritized business capability map.

      In this example, intelligent automation for referral and admission would create opportunity to virtualize repeatable tasks.

      Phase 3

      ETransform Stakeholder Journeys

      Understand the impact of opportunities across the value chain and possibilities of new or better stakeholder experiences.

      Phase 1Phase 2Phase 3

      Identify New Digitally Enabled Opportunities

      Evaluate Opportunities and Business Capabilities

      Transform Stakeholder Journeys

      Phase 3

      Identify opportunities to transform stakeholder experiences

      3.1 IDENTIFY STAKEHOLDER PERSONA

      Understand WHO gains value from the value chain

      To define a stakeholder scenario, you need to understand whom we are mapping for. Developing stakeholder personas is a great way to understand their needs through a lens of empathy.

      Consider:

      • Keep your stakeholder persona groupings to the core clusters typical of your industry.
      • See it from their perspective not the business’s.

      Avoid:

      • Don’t create a multitude of personas based on discrete nuances.
      3.2 BUILD A STAKEHOLDER JOURNEY

      Identify opportunities to transform the stakeholder experience

      A stakeholder or customer journey helps teams visualize the impact of a given opportunity through a value chain. This exercise uncovers the specific initiatives and features that should be considered in the evolution of the digital strategy.

      Consider:

      • Which stakeholders may be most affected by this opportunity?
      • How might stakeholders feel about a given solution as they move through the journey? What pain points can be solved?

      Avoid:

      • Simply listing steps in a process. Put yourself in the shoes of whoever’s journey you are mapping. What do they care about?
      • Choosing a stakeholder with limited involvement in the process.
      3.3 BREAKDOWN OPPORTUNITIES INTO INITIATIVES ALIGNED TO BUSINESS OBJECTIVES

      Unlock key initiatives to deliver value

      Opportunities need to be broken down into actionable initiatives that can be turned into business cases with clear goals, benefits realization, scope, work plans, and investment ask.

      Consider:

      • Multiple initiatives can be grouped into one opportunity that is similar or in phases.
      • Ensure the initiatives support and enable the business goals.

      Avoid:

      • Creating a laundry list of initiatives.
      • Initiatives that don’t align with business goals.

      Map Stakeholder Journey

      Conduct a journey mapping exercise to further refine and identify value streams to transform.

      Stakeholder Journey Mapping

      Digital Business Strategy Blueprint

      Activity: 4-6 hours

      Our analysts can guide and support you, where needed.

      1. First download the Define Your Digital Business Strategy blueprint to review the Stakeholder Journey Mapping exercise.
      2. Identify a stakeholder persona and a one-journey scenario.
      3. Map a stakeholder journey using a single persona across one-journey scenarios to identify pain points and opportunities to improve experiences and generate value.
      4. Consolidate a list of opportunities for business case prioritization.

      Key Concepts:

      Value Stream: a set of activities to create and capture value for and from the end consumer.

      Value Chain: a string of end-to-end processes that creates value for the consumer.

      Journey Scenario: a specific use case across a value chain (s).

      Members Engaged

      • CIO
      • Business Executives

      Info-Tech

      • Industry Analyst
      • Executive Advisor

      Stakeholder Persona.Stakeholder Persona

      1-Journey Use Case.1-Journey Use Case

      Map Stakeholder Journey 
Map Stakeholder Journey

      Content Leveraged

      • Stakeholder Persona
      • Journey Use Case
      • Map Stakeholder Journey

      Deliverable:

      1. Guiding principles
      2. Strategic growth opportunities

      Download the Define Your Digital Business Strategy blueprint for Customer Journey Mapping Activities

      3.1 Persona identification

      Identify a stakeholder persona and journey scenario

      From value chain to journey scenario.

      Stakeholder personas and scenarios help us build empathy towards our customers. It helps put us into the shoes of a stakeholder and relate to their experience to solve problems or understand how they experience the steps or processes required to accomplish a goal. A user persona is a valuable basis for stakeholder journey mapping.

      A stakeholder persona is a fictitious profile to represent a customer or a user segment. Creating this persona helps us understand who your customers really are and why they are using your service or product.

      A stakeholder scenario describes the situation the journey map addresses. Scenarios can be real (for existing products and services) or anticipated.

      Learn more about applying design thinking methodologies

      3.1 Persona identification

      Identify a stakeholder persona

      Who are you transforming for?

      To define a stakeholder scenario, we need to understand who we are mapping for. In each value chain, we identified a stakeholder who gains value from that value chain. We now need to develop a stakeholder persona: a representation of the end user to gain a strong understanding of who they are, what they need, and their pains and gains.

      One of the best ways to flesh out your stakeholder persona is to engage with the stakeholders directly or to gather the input of those who may engage with them within the organization.

      For example, if we want to define a journey map for a student, we might want to gather the input of students or teaching faculty that have firsthand encounters with different student types and are able to define a common student type.

      Info-Tech Insight

      Run a survey to understand your end users and develop a stronger picture of who they are and what they are seeking to gain from your organization.

      3.1 Persona identification

      Identify stakeholder scenarios to map

      For your digital strategy, leverage the existing and opportunity value chains identified in phases 1 and 2 for journey mapping.

      Identify two existing value chains to be transformed.

      In section 1, we identified existing value chains to be transformed. For example, your stakeholder persona is a registration clerk who is part of the Health Information Management team responsible for registering and adjudicating patient identity.

      The image contains a screenshot example of two existing value chains to be transformed.

      Identify one new value chain.

      In section 2, we identified a new value chain. However, for a new opportunity, the scenario is more complex as it may capture many different areas of a value chain. Subsequently, a journey map for a new opportunity may require mapping all parts of the value chain.

      The image contains a screenshot of one value chain.

      3.1 Persona identification

      Example Stakeholder Persona

      Stakeholder demographics

      Name: Anne

      Age: 35

      Occupation: HIM Clerk

      Location: Unity Hospital System

      Pains

      What are their frustrations, fears, and anxieties?

      • Volume of patients to schedule
      • Too many applications to access
      • Data quality is an error
      • Extensive manual entry of data prone to errors
      • Disruptions with calls from patients, doctors, and FOI requests

      What do they need to do?

      What do they want to get done? How will they know they are successful?

      • Automate some non-valuable tasks that can also reduce human errors. Allow patients to self-schedule online or answer FAQs via a chatbox. Would love to have a virtual triage to alleviate volume of calls and redirects.

      Gains

      What are their wants, needs, hopes, and dreams?

      • Reduce errors in data entry for patient identity (reduce manual look-ups).
      • Have standard requests go through a chatbot.
      • Have physicians automate billing through front-end speech recognition software.

      3.1 Persona identification

      Define a journey statement for mapping

      Now that we understand who we are mapping for, we need to define a journey statement to capture the stakeholder journey.

      Leverage the following format to define the journey statement.

      “As a [stakeholder], I need to [prioritized value chain task], so that I can [desired result or overall goal].”

      The image contains a screenshot of a journey statement for mapping.

      3.2 Stakeholder Journey-Map

      Leverage customer journey mapping to capture value chains to be transformed

      Conduct a journey mapping exercise to identify opportunities for innovation or automation.

      A journey-based approach helps an organization understand how a stakeholder moves through a process and interacts with the organization in the form of touch points, channels, and supporting characters. By identifying pain points in the journey and the activity types, we can identify opportunities for innovation and automation along the journey.

      The image contains a screenshot of an example of journey mapping.

      Embrace design-thinking methodologies to elevate the stakeholder journey and build a competitive advantage for your organization.

      3.2 Stakeholder Journey-Map

      Key Concepts

      0. Name: Annie Smith

      Age: 35

      Occupation: HIM Registration Clerk for Unity Hospital System

      Key Concepts.0.Stakeholder Persona

      A fictitious profile of a representative stakeholder group that shares a common yet discrete set of characteristics that embodies how they think, feel, and act.

      1. Journey (Value Chain)

      Describes the end-to-end steps or processes that a customer takes across the value chain that groups a set of activities, interactions, touch-points, and experiences.

      2. Persona’s Goals

      Exemplifies what the persona is thinking and wanting across each specific step of their journey.

      3. Nature of Activity (see detailed definition in this section)

      This section captures two key components: 1) the description of the action or interaction between the personas to achieve their goals, and 2) the classification of the activity to determine the feasibility for automation. The type is based on four main characteristics: 1) routine cognitive, 2) non-routine cognitive , 3) routine manual, and 4) non-routine manual.

      4. Type of Touch-Point

      The channel by which a persona interacts or touches products, services, the organization, or information.

      5. Key Moments & Pain Points

      Captures the emotional experience and value of the persona across each step and interaction.

      6. Metrics

      This section captures the KPIs used to measure the experience, process or activity today. Future KPIs will need to be developed to measure the opportunities.

      7. Opportunities refer to both the possible initiatives to address the persona’s pain points, and the ability to enable business goals.

      3.2 Stakeholder Journey-Map

      Opportunities for Automation: Nature of Activity

      Example
      We identified opportunities for automation

      Categorize the activity type to identify opportunities for automation. While there is no perfect framework for automation, this 4x4 matrix provides a general guide to identifying automation opportunities for consideration.

      Automation example list.Automation Quadrant Analysis

      Info-Tech Insight

      Automation is more than a 1:1 relationship between the defined task or job and automation. When considering automation, look for opportunities to: 1) streamline across multiple processes, 2) utilize artificial intelligence to augment or virtualize manual tasks, and 3) create more structured data to allow for improved data quality over the long-term.

      3.2 Stakeholder Journey-Map

      Example of stakeholder journey output: Healthcare

      Stakeholder: HIM Clerks

      Journey: Follow-up visit of 80-year-old diabetes patient at diabetic clinic outpatient

      Journey

      (Value Chain)

      AppointmentRegistrationIdentity ReconciliationEligibility VerificationTreatment Consult

      Persona’s Goals

      • Confirm appointment
      • Verify referral through provider registry
      • Request medical insurance or care card
      • Enroll patient into CIS
      • Patient registry validation
      • Secondary identification request
      • Verify eligibility through the patient registry
      • Schedule follow referrals & appointments
      • Coding for billing

      Nature of Activity

      Priority

      Priority

      Investigate – ROI

      Investigate – ROI

      Defer

      Type of Touchpoint

      • Telephone (land/mobile)
      • Email
      • CIS Application
      • Verbal
      • Patient registry system
      • Telephone
      • Patient and provider registry
      • CIS
      • Email, call, verbal
      • Physician billing
      • Hospital ERP
      • CIS
      • Paper appointments

      Pain Points & Gains

      • Volume of calls
      • Manual scheduling
      • Too many applications
      • Data entry errors
      • Limited languages
      • Too many applications
      • Data entry errors
      • Too many applications
      • Limited languages
      • Ask patients to repeat info
      • Data entry errors
      • Too many applications
      • Limited languages
      • Ask patients to repeat info
      • Patient identity not linked to physician billing
      • Manual coding entry

      Metrics

      Time to appointment

      Time to enrollment

      Patient mis-match

      Provider mis-match

      Percentage of errors in billing codes

      Opportunities

      • Patient scheduling portal (24/7)
      • Use of AI and chatbots
      • Automate patient matching index digitalization and integration
      • Automate provider matching index digitalization and integration
      • Natural language processing using front-end speech recognition software for billing

      Break opportunities into a series of initiatives aligned to business objectives

      Opportunity 1

      Virtual Registration

      »

      Business Goals

      Initiatives

      Health Outcomes

      Stakeholder Experience

      New Models of Care

      Operational Efficiency

      • Enterprise master patient index integration with patient registry
      • Intelligent automation for outpatient department
      • Customer service chat box for triage FOI1
      • Front-end speech recognition for billing (FESR)

      Opportunity 2

      Machine Learning Pre-Cancer Diagnosis

      »

      Business Goals

      Initiatives

      Health Outcomes

      Stakeholder Experience

      New Models of Care

      Operational Efficiency

      • Enterprise Datawarehouse architecture (build data lake)
      • Build genomics analytics capabilities e.g., recruitment, data-quality review
      • Implementation of machine learning software
      • Supply chain integration with ERP for medical and research supplies
      FOI = Freedom of Information

      Info-Tech Insight

      Evaluate if an opportunity will require a series of discrete activities to execute and/or if they can be a stand-alone initiative.

      Now you are ready to select and prioritize digital initiatives for business case development

      After completing all three phases of activities in this blueprint, you will have compiled a list of new and planned digital initiatives for prioritization and business case development in the next phase.

      Consolidated List of Digital Initiatives.

      Example: Consolidated List of Digital Initiatives

      The next step will focus on prioritizing and building a business case for your top digital initiatives.

      IT Roadmap for your Digital Business Strategy.

      Appendix: Additional Examples

      From trend to leapfrog ideas

      Every idea is a good one, unless you need one that works.

      Additional Examples
      Examples of leapfrog ideas that can generate opportunities for consideration

      Example 1 Finance

      Trend

      New Customer

      New Market

      New Business or Operating Model

      New Service Offering

      What trend(s) pose a significant impact on your business?

      New customer segments

      Enter or create new markets

      Adjust the business or operating model to capture change in how the business creates and delivers value

      Introduce new digital products, services, and experiences

      Open banking

      Account integrators (AISPs)

      Payment integrators
      (PISPs)

      Data monetization

      Social payments

      Example 2: Retail

      Trend

      New Customer

      New Market

      New Business or Operating Model

      New Service Offering

      What trend(s) pose a significant impact on your business?

      New customer segments

      Enter or create new markets

      Adjust the business or operating model to capture change in how the business creates and delivers value

      Introduce new digital products, services, and experiences

      Virtual cashier

      (RFID Enablement)

      Big-box retailers

      Brick & mortar stores

      Automated stores driving new customer experiences

      Digital cart

      From trend to leapfrog ideas

      Every idea is a good one, unless you need one that works.

      Additional Exemplars in Appendix

      Examples of leapfrog ideas that can generate opportunities for consideration

      Example 3:

      Manufacturing

      Trend

      New Customer

      New Market

      New Business or

      Operating Model

      New Service Offering

      What trend(s) pose a significant impact on your business?

      New customer segments

      Enter or create new markets

      Adjust the business or operating model to capture change in how the business creates and delivers value

      Introduce new digital products, services, and experiences

      IT/OT convergence

      Value-added resellers

      New geographies

      Train quality-control algorithms and sell as a service to other manufacturers

      Quality control as a service

      Case Study: International Airport

      Persona Journey Map: International/Domestic Departure

      Persona: Super Traveler

      Name: Annie Smith

      Age: 35

      Occupation: Engineer, Global Consultant

      Journey Activity Name: Inspired to Travel

      Persona’s Goals

      What Am I Thinking?

      • I am planning on traveling to Copenhagen, Denmark for work.
      • It’s my first time and I need to gather information about the destination, accommodation, costs, departure information, bag weight, etc..

      Nature of Activity

      What Am I Doing?

      • Logging onto airline website
      • Confirming departure gates

      Type of Touchpoint

      • Airport rewards program
      • Airport Website
      • Online hotel eCommerce
      • Social media
      • Transportation services on mobile

      Key moments & pain points

      How Am I Feeling?

      • Frustrated because the airport website is difficult to navigate to get information
      • Annoyed because there is no FAQ online and I have to call; there’s a long wait to speak to someone.
      • Stress & uncertainty (cancellation, logistics, insurance, etc..)

      Metrics

      • Travel dates
      • Trip price & budget

      Opportunities

      • Tailored communication based on search history
      • Specific messaging (e.g., alerts for COVID-19, changes in events, etc.)
      • Interactive VR experience that guides customers through the airport as a navigator

      Related Info-Tech Research

      Tech Trends and Priorities Research Center

      • Access Info-Tech’s Tech Trends reports and research center to learn about current industry trends, shifts in markets, and disruptions that are impacting your industry and sector. This is a great starting place to gain insights into how the ecosystem is changing your business and the impact of these changes on IT.

      Digital Business Strategy

      • Leverage Info-Tech’s Digital Business Strategy to identify opportunities to transform the customer experience.

      Industry Reference Architecture

      • Access Info-Tech’s Industry coverage to accelerate your understanding of your business capabilities and opportunities for automation.

      Contact Your Account Manager

      Research Contributors and Experts

      Joanne Lee

      Joanne Lee

      Principal, Research Director, CIO Strategy

      Info-Tech Research Group

      Kim Osborne-Rodgriguez

      Kim Osborne-Rodgriguez

      Research Director, CIO Strategy

      Info-Tech Research Group

      Joanne is an executive with over 25 years of in digital technology and management consulting across both public and private entities from solution delivery to organizational redesign across Canada and globally.

      Prior to joining Info-Tech Research Group, Joanne was a management consultant within KPMG’s CIO management consulting services and the Western Canada Digital Health Practice lead. She has held several executive roles in the industry with the most recent position as Chief Program Officer for a large $450M EHR implementation. Her expertise spans cloud strategy, organizational design, data and analytics, governance, process redesign, transformation, and PPM. She is passionate about connecting people, concepts, and capital.

      Joanne holds a Master’s in Business and Health Policy from the University of Toronto and a Bachelor of Science (Nursing) from the University of British Columbia.

      Kim is a professional engineer and Registered Communications Distribution Designer (RCDD) with over a decade of experience in management and engineering consulting spanning healthcare, higher education, and commercial sectors. She has worked on some of the largest hospital construction projects in Canada, from early visioning and IT strategy through to design, specifications, and construction administration. She brings a practical and evidence-based approach to digital transformation, with a track record of supporting successful implementations.

      Kim holds a Bachelor’s degree in Mechatronics Engineering from University of Waterloo.

      Research Contributors and Experts

      Jack Hakimian

      Jack Hakimian

      Vice President, Research

      Info-Tech Research Group

      Charl Lombard.

      Charl Lombard

      President, Digital Transformation Consulting

      Info-Tech Research Group

      Jack has more than 25 years of technology and management consulting experience. He has served multi-billion dollar organizations in multiple industries including Financial Services and Telecommunications. Jack also served a number of large public sector institutions.

      Prior to joining the Info-Tech Research Group, he worked for leading consulting players such as Accenture, Deloitte, EY, and IBM.

      Jack led digital business strategy engagements as well as corporate strategy and M&A advisory services for clients across North America, Europe, the Middle East, and Africa. He is a seasoned technology consultant who has developed IT strategies and technology roadmaps, led large business transformations, established data governance programs, and managed the deployment of mission-critical CRM and ERP applications.

      He is a frequent speaker and panelist at technology and innovation conferences and events and holds a Master’s degree in Computer Engineering as well as an MBA from the ESCP-EAP European School of Management.

      Charl has more than 20 years of professional services experience, “majoring” in digital transformation and strategic topics. He has led multiple successful Digital Transformation programs across a range of industries like Information technology, hospitality, Advanced Industries, High Tech, Entertainment, Travel and Transport, Insurance & Financial Services, Metals & Mining, Electric Power, Renewable Energy, Telecoms, Manufacturing) across different geographics (i.e., North America, EU, Africa) in both private and public sectors.

      Prior to joining Info-Tech Research Group, Charl was the Vice President of Global Product Management and Strategy (Saber Hospitality Solution), Associate President, McKinsey Transformation Practice, e-Business Practice for PwC, and tech start-up founder and investor.

      Charl is a frequent speaker at innovation and digital transformation conferences and holds an MBA from the University of Cape Town Graduate School of Business, and a bachelor’s degree from the University of Pretoria, South Africa.

      Research Contributors and Experts

      Mike Tweedie

      Mike Tweedie

      Practice Lead, CIO Strategy

      Info-Tech Research Group

      Michael Alemany

      Michael Alemany

      Vice President, Digital Transformation Consulting

      Info-Tech Research Group

      Mike Tweedie brings over 25 years of experience as a technology executive. He’s led several large transformation projects across core infrastructure, application, and IT services as the head of Technology at ADP Canada. He was also the Head of Engineering and Service Offerings for a large French IT services firm, focused on cloud adoption and complex ERP deployment and management.

      Mike holds a Bachelor’s degree in Architecture from Ryerson University.

      Michael is a leader in Info-Tech’s digital transformation consulting practice. He brings over 10 years of experience working with companies across a range of industries. His work experience includes ~4.5 years at McKinsey & Company where he led large-scale transformations for fortune 500 companies. Prior to joining Info-Tech, he worked for Sabre Corp., an SaaS platform provider for the travel and hospitality sector, leading Product Strategy & Operations. Michael holds an MBA from the Tuck School of Business at Dartmouth and a B.S in Business Strategy from Brigham Young University.

      Research Contributors and Experts

      Duane Cooney

      Duane Cooney

      Executive Counselor, Healthcare

      Info-Tech Research Group

      Denis Goulet

      Denis Goulet

      Senior Workshop Director

      Info-Tech Research Group

      Duane brings over 30 years of experiences a healthcare IT leader with a passion for the transformation of people, processes, and technology. He has led large-scale health technology transformation and operations across the enterprise. Before joining Info-Tech, Duane served as the Deputy CIO, Senior Information Technology Director, and Enterprise Architect for both public not-for-profit and private sectors. He has a Bachelors in Computer Science and is a graduate of EDS Operations. He holds certifications in EHR, LEAN/Agile, ITIL, and PMP.

      Denis is an IAF Certified Professional Facilitator who has helped organizations and technology executives develop IT strategies for small to large global enterprises. He firmly believes in a collaborative value-driven approach. Prior to joining Info-Tech Research Group, Denis held several industry positions as CIO, Chief Administrative Office (City Manager), General Manager, and Vice President of Engineering. Denis holds an MBA from Queen’s University and a Diploma in Technology Engineering and Executive Municipal Management.

      Jay Cappis.

      Jay Cappis

      Executive Advisor, Real-Estate

      Info-Tech Research Group

      Christine Brick.

      Christine Brick

      Executive Advisor, Financial Services
      Info-Tech Research Group

      Jay brings over 30 years of experience in management and technology across small and medium enterprises to large global enterprises including Exxon and Xerox. His cross-industry experience includes professional services, commercial real estate, oil and gas, digital start-ups, insurance, and aerospace. Jay has led business process improvements and change management and has expertise in software development lifecycle management and DevOps practices.

      Christine brings over 20 years in IT transformation across DevOps, infrastructure, operations, supply chain, IT Strategy, modernization, cost optimization, data management, and operational risk. She brings expertise in business transformation, mergers and acquisitions, vendor selection, and contract management.

      Bibliography

      Bhatia, AD. “Transforming through disruptions: A conversation with Dan Antonelli. Transformation Insights.” McKinsey & Company. January 31, 2022. Web
      Bertoletti, Antonella and Peter Eeles. “Use an IT Maturity Model.” IBM Garage Methodology. Web. accessed May 30, 2022.
      Catlin, Tanguy, Jay Scanlan, and Paul Willmott. “Raising your Digital Quotient.” McKinsey Quarterly. June 1, 2015. Article
      Custers, Heidi. “Digital Blueprint. Reference Architecture. Deloitte Digital.Accessed May 15, 2022.
      Coundouris, Anthony. “Reviewed: The Top 5 Digital Transformation Frameworks in 2020.” Run-frictionless Blog. Accessed May 15, 2022. Web.
      Daub, Matthias and Anna Wiesinger. “Acquiring the Capabilities you need to go digital.” Business Technology Office – McKinsey and Company. March 2015. Web.
      De La Boutetiere, Alberto Montagner and Angelika Reich. “Unlocking success in digital transformations.” McKinsey and Company. October 2018. Web.
      “Design Thinking Defined.” IDEO.com. November 21, 2022. Web.
      Dorner, Karle and David Edelman. “What ‘Digital’ really means.” McKinsey Digital. July 2015. Web
      “Everything Changed. Or Did it? Harvey Nash KPMG CIO Survey 2020.” KPMG, 2020
      Kane, Gerald C., Doug Palmer, Ahn Nguyen Phillips, David Kiron, Natasha Buckley. “Aligning the organization for its digital future.” Findings from the 2016 Digital Business Global Executive Study and Research Project. MIT Sloan Management Review. July 26, 2016. Web
      LaBerge, Laura, et al. “How COVID-19 has pushed companies over the technology tipping point—and transformed business forever.” McKinsey, 5 Oct. 2020. Accessed 14 June 2021
      Mindtools Content Team. “Cause and Effect Analysis.” Mindtools.com. November 21, 2022. Web.
      “Strategic Foresight.” OECD.org. November 21, 2022, Web
      Sall, Sherman, Dan Lichtenfeld. “The Digital ME Method. Turning digital opportunities into customer engagement and business growth.” Sygnific. 2017. Web.
      Scoblic, J. Peter. “Learning from the Future. How to make robust strategy in times of deep uncertainty.” Harvard Business Review, August 2020.
      Silva, Bernardo and Schoenwaelder, Tom. ‘Why Good Strategies fail. Addressing the three critical strategic tensions.” Deloitte Monitor Group. 2019.

      Security Priorities 2023

      • Buy Link or Shortcode: {j2store}254|cart{/j2store}
      • member rating overall impact (scale of 10): 9.0/10 Overall Impact
      • member rating average dollars saved: $909 Average $ Saved
      • member rating average days saved: 1 Average Days Saved
      • Parent Category Name: Security Strategy & Budgeting
      • Parent Category Link: /security-strategy-and-budgeting
      • Most people still want a hybrid work model but there is a shortage in security workforce to maintain secure remote work, which impacts confidence in the security practice.
      • Pressure of operational excellence drives organizational modernization with the consequence of higher risks of security attacks that impact not only cyber but also physical systems.
      • The number of regulations with stricter requirements and reporting is increasing, along with high sanctions for violations.
      • Accurate assessment of readiness and benefits to adopt next-gen cybersecurity technologies can be difficult. Additionally, regulation often faces challenges to keep up with next-gen cybersecurity technologies implications and risks of adoption, which may not always be explicit.
      • Software is usually produced as part of a supply chain instead in a silo. Thus, a vulnerability in any part of the supply chain can become a threat surface.

      Our Advice

      Critical Insight

      • Secure remote work still needs to be maintained to facilitate the hybrid work model post pandemic.
      • Despite all the cybersecurity risks, organizations continue modernization plans due to the long-term overall benefits. Hence, we need to secure organization modernization.
      • Organizations should use regulatory changes to improve security practices, instead of treating them as a compliance burden.
      • Next-gen cybersecurity technologies alone are not the silver bullet. A combination of technologies with skilled talent, useful data, and best practices will give a competitive advantage.

      Impact and Result

      • Use this report to help decide your 2023 security priorities by:
        • Collecting and analyzing your own related data, such as your organization 2022 incident reports. Use Info-Tech’s Security Priorities 2023 material for guidance.
        • Identifying your needs and analyzing your capabilities. Use Info-Tech's template to explain the priorities you need to your stakeholders.
        • Determining the next steps. Refer to Info-Tech's recommendations and related research.

      Security Priorities 2023 Research & Tools

      Besides the small introduction, subscribers and consulting clients within this management domain have access to:

      1. Security Priorities 2023 Report – A report to help decide your 2023 security priorities.

      Each organization is different, so a generic list of security priorities will not be applicable to every organization. Thus, you need to:

    • Collect and analyze your own related data such as your organization 2022 incident reports. Use Info-Tech’s Security Priorities 2023 material for guidance.
    • Identify your needs and analyze your capabilities. Use Info-Tech's template to explain the priorities you need to your stakeholders.
    • Refer to Info-Tech's recommendations and related research for guidance on the next steps.
      • Security Priorities 2023 Report

      Infographic

      Further reading

      Security Priorities 2023

      How we live post pandemic

      Each organization is different, so a generic list of priorities will not be applicable to every organization.

      During 2022, ransomware campaigns declined from quarter to quarter due to the collapse of experienced groups. Several smaller groups are developing to recapture the lost ransomware market. However, ransomware is still the most worrying cyber threat.

      Also in 2022, people returned to normal activities such as traveling and attending sports or music events but not yet to the office. The reasons behind this trend can be many fold, such as employees perceive that work from home (WFH) has positive productivity effects and time flexibility for employees, especially for those with families with younger children. On the other side of the spectrum, some employers perceive that WFH has negative productivity effects and thus are urging employees to return to the office. However, employers also understand the competition to retain skilled workers is harder. Thus, the trend is to have hybrid work where eligible employees can WFH for a certain portion of their work week.

      Besides ransomware and the hybrid work model, in 2022, we saw an evolving threat landscape, regulatory changes, and the potential for a recession by the end of 2023, which can impact how we prioritize cybersecurity this year. Furthermore, organizations are still facing the ongoing issues of insufficient cybersecurity resources and organization modernization.

      This report will explore important security trends, the security priorities that stem from these trends, and how to customize these priorities for your organization.

      In Q2 2022, the median ransom payment was $36,360 (-51% from Q1 2022), a continuation of a downward trend since Q4 2021 when the ransom payment median was $117,116.
      Source: Coveware, 2022

      From January until October 2022, hybrid work grew in almost all industries in Canada especially finance, insurance, real estate, rental and leasing (+14.7%), public administration and professional services (+11.8%), and scientific and technical services (+10.8%).
      Source: Statistics Canada, Labour Force Survey, October 2022; N=3,701

      Hybrid work changes processes and infrastructure

      Investment on remote work due to changes in processes and infrastructure

      As part of our research process for the 2023 Security Priorities Report, we used the results from our State of Hybrid Work in IT Survey, which collected responses between July 10 and July 29, 2022 (total N=745, with n=518 completed surveys). This survey details what changes in processes and IT infrastructure are likely due to hybrid work.

      Process changes to support hybrid work

      A bar graph is depicted with the following dataset: None of the above - 12%; Change management - 29%; Asset management - 34%; Service request support - 41%; Incident management - 42%

      Survey respondents (n=518) were asked what processes had the highest degree of change in response to supporting hybrid work. Incident management is the #1 result and service request support is #2. This is unsurprising considering that remote work changed how people communicate, how they access company assets, and how they connect to the company network and infrastructure.

      Infrastructure changes to support hybrid work

      A bar graph is depicted with the following dataset: Changed queue management and ticketing system(s) - 11%; Changed incident and service request processes - 23%; Addition of chatbots as part of the Service Desk intake process - 29%; Reduced the need for recovery office spaces and alternative work mitigations - 40%; Structure & day-to-day operation of Service Desk - 41%; Updated network architecture - 44%

      For 2023, we believe that hybrid work will remain. The first driver is that employees still prefer to work remotely for certain days of the week. The second driver is the investment from employers on enabling WFH during the pandemic, such as updated network architecture (44%) and the infrastructure and day-to-day operations (41%) as shown on our survey.

      Top cybersecurity concerns and organizational preparedness for them

      Concerns may correspond to readiness.

      In the Info-Tech Research Group 2023 Trends and Priorities Survey of IT professionals, we asked about cybersecurity concerns and the perception about readiness to meet current and future government legislation regarding cybersecurity requirements.

      Cybersecurity issues

      A bar graph is depicted with the following dataset: Cyber risks are not on the radar of the executive leaders or board of directors - 3.19; Organization is not prepared to respond to a cyber attack - 3.08; Supply chain risks related to cyber threats - 3.18; Talent shortages leading to capacity constraints in cyber security - 3.51; New government or industry-imposed regulations - 3.15

      Survey respondents were asked how concerned they are about certain cybersecurity issues from 1 (not concerned at all) to 5 (very concerned). The #1 concern was talent shortages. Other issues with similar concerns included cyber risks not on leadership's radar, supply chain risks, and new regulations (n=507).

      Cybersecurity legislation readiness

      A bar graph is depicted with the following dataset: 1 (Not confident at all) - 2.4%; 2 - 11.2%; 3 - 39.7%; 4 - 33.3%; 5 (Very confident) - 13.4%

      When asked about how confident organizations are about being prepared to meet current and future government legislation regarding cybersecurity requirements, from 1 (not confident at all) to 5 (very confident), the #1 response was 3 (n=499).

      Unsurprisingly, the ever-changing government legislation environment in a world emerging from a pandemic and ongoing wars may not give us the highest confidence.

      We know the concerns and readiness…

      But what is the overall security maturity?

      As part of our research process for the 2023 Security Priorities Report, we reviewed results of completed Info-Tech Research Group Security Governance and Management Benchmark diagnostics (N=912). This report details what we see in our clients' security governance maturity. Setting aside the perception on readiness – what are their actual security maturity levels?

      A bar graph is depicted with the following dataset: Security Culture - 47%; Policy and Process Governance - 47%; Event and Incident Management - 58%; Vulnerability - 57%; Auditing - 52%; Compliance Management - 58%; Risk Analysis - 52%

      Overall, assessed organizations are still scoring low (47%) on Security Culture and Policy and Process Governance. This justifies why most security incidents are still due to gaps in foundational security and security awareness, not lack of advanced controls such as event and incident management (58%).

      And how will the potential recession impact security?

      Organizations are preparing for recession, but opportunities for growth during recession should be well planned too.

      As part of our research process for the 2023 Security Priorities Report, we reviewed the results of the Info-Tech Research Group 2023 Trends and Priorities Survey of IT professionals, which collected responses between August 9 and September 9, 2022 (total N=813 with n=521 completed surveys).

      Expected organizational spending on cybersecurity compared to the previous fiscal year

      A bar graph is depicted with the following dataset: A decrease of more than 10% - 2.2%; A decrease of between 1-10% - 2.6%; About the same - 41.4%; An increase of between 1-10% - 39.6%; An increase of more than 10% - 14.3%

      Keeping the same spending is the #1 result and #2 is increasing spending up to 10%. This is a surprising finding considering the survey was conducted after the middle of 2022 and a recession has been predicted since early 2022 (n=489).

      An infographic titled Cloudy with a Chance of Recession

      Source: Statista, 2022, CC BY-ND

      US recession forecast

      Contingency planning for recessions normally includes tight budgeting; however, it can also include opportunities for growth such as hiring talent who have been laid off by competitors and are difficult to acquire in normal conditions. This can support our previous findings on increasing cybersecurity spending.

      Five Security Priorities for 2023

      This image describes the Five Security Priorities for 2023.

      Maintain Secure Hybrid Work

      PRIORITY 01

      • HOW TO STRATEGICALLY ACQUIRE, RETAIN, OR UPSKILL TALENT TO MAINTAIN SECURE SYSTEMS.

      Executive summary

      Background

      If anything can be learned from COVID-19 pandemic, it is that humans are resilient. We swiftly changed to remote workplaces and adjusted people, processes, and technologies accordingly. We had some hiccups along the way, but overall, we demonstrated that our ability to adjust is amazing.

      The pandemic changed how people work and how and where they choose to work, and most people still want a hybrid work model. However, the number of days for hybrid work itself varies. For example, from our survey in July 2022 (n=516), 55.8% of employees have the option of 2-3 days per week to work offsite, 21.0% for 1 day per week, and 17.8% for 4 days per week.

      Furthermore, the investment (e.g. on infrastructure and networks) to initiate remote work was huge, and the cost doesn't end there, as we need to maintain the secure remote work infrastructure to facilitate the hybrid work model.

      Current situation

      Remote work: A 2022 survey by WFH Research (N=16,451) reports that ~14% of full-time employees are fully remote and ~29% are in a hybrid arrangement as of Summer-Fall 2022.

      Security workforce shortage: A 2022 survey by Bridewell (N=521) reports that 68% of leaders say it has become harder to recruit the right people, impacting organizational ability to secure and monitor systems.

      Confidence in the security practice: A 2022 diagnostic survey by Info-Tech Research Group (N=55) reports that importance may not correspond to confidence; for example, the most important selected cybersecurity area, namely Data Access/Integrity (93.7%), surprisingly has the lowest confidence of the practice (80.5%).

      "WFH doubled every 15 years pre-pandemic. The increase in WFH during the pandemic was equal to 30 years of pre-pandemic growth."

      Source: National Bureau of Economic Research, 2021

      Leaders must do more to increase confidence in the security practice

      Importance may not correspond to confidence

      As part of our research process for the 2023 Security Priorities Report, we analyzed results from the Info-Tech Research Group diagnostics. This report details what we see in our clients' perceived importance of security and their confidence in existing security practices.

      Cybersecurity importance

      A bar graph is depicted with the following dataset: Importance to the Organization - 94.3%; Importance to My Department	92.2%

      Cybersecurity importance areas

      A bar graph is depicted with the following dataset: Mobility (Remote & Mobile Access) - 90.2%; Regulatory Compliance - 90.1%; Desktop Computing - 90.9%; Data Access / Integrity - 93.7%

      Confidence in cybersecurity practice

      A bar graph is depicted with the following dataset: Confidence in the Organization's Overall Security - 79.4%; Confidence in Security for My Department - 79.8%

      Confidence in cybersecurity practice areas

      A bar graph is depicted with the following dataset: Mobility (Remote & Mobile Access) - 75.8%; Regulatory Compliance - 81.5%; Desktop Computing - 80.9%; Data Access / Integrity - 80.5%

      Diagnostics respondents (N=55) were asked about how important security is to their organization or department. Importance to the overall organization is 2.1 percentage points (pp) higher, but confidence in the organization's overall security is slightly lower (-0.4 pp).

      If we break down to security areas, we can see that the most important area, Data Access/Integrity (93.7%), surprisingly has the lowest confidence of the practice: 80.5%. From this data we can conclude that leaders must build a strong cybersecurity workforce to increase confidence in the security practice.

      Use this template to explain the priorities you need your stakeholders to know about.

      Maintain secure hybrid work plan

      Provide a brief value statement for the initiative.

      Build a strong cybersecurity workforce to increase confidence in the security practice to facilitate hybrid work.

      Initiative Description:

      • Description must include what organization will undertake to complete the initiative.
      • Review your security strategy for hybrid work.
      • Identify skills gaps that hinder the successful execution of the hybrid work security strategy.
      • Use the identified skill gaps to define the technical skill requirements for current and future work roles.
      • Conduct a skills assessment on your current workforce to identify employee skill gaps.
      • Decide whether to train, hire, contract, or outsource each skill gap.

      Drivers:

      List initiative drivers.

      • Employees still prefer to WFH for certain days of the week.
      • The investment on WFH during pandemic such as updated network architecture and infrastructure and day-to-day operations.
      • Tech companies' huge layoffs, e.g. Meta laid off more than 11,000 employees.

      Risks:

      List initiative risks and impacts.

      • Unskilled workers lacking certificates or years of experience who are trained and become skilled workers then quit or are hijacked by competitors.
      • Organizational and cultural changes cause friction with work-life balance.
      • Increased attack surface of remote/hybrid workforce.

      Benefits:

      List initiative benefits and align to business benefits or benefits for the stakeholder groups that it impacts.

      • Increase perceived productivity by employees and increase retention.
      • Increase job satisfaction and work-life balance.
      • Hiring talent that has been laid off who are difficult to acquire in normal conditions.

      Related Info-Tech Research:

      Recommended Actions

      1. Identify skill requirements to maintain secure hybrid work

      Review your security strategy for hybrid work.

      Determine the skill needs of your security strategy.

      2. Identify skill gaps

      Identify skills gaps that hinder the successful execution of the hybrid work security strategy.

      Use the identified skill gaps to define the technical skill requirements for work roles.

      3. Decide whether to build or buy skills

      Conduct a skills assessment on your current workforce to identify employee skill gaps.

      Decide whether to train, hire, contract, or outsource each skill gap.

      Source: Close the InfoSec Skills Gap: Develop a Technical Skills Sourcing Plan, Info-Tech

      Secure Organization Modernization

      PRIORITY 02

      • TRENDS SUGGEST MODERNIZATION SUCH AS DIGITAL
        TRANSFORMATION TO THE CLOUD, OPERATIONAL TECHNOLOGY (OT),
        AND THE INTERNET OF THINGS (IOT) IS RISING; ADDRESSING THE RISK
        OF CONVERGING ENVIRONMENTS CAN NO LONGER BE DEFERRED.

      Executive summary

      From computerized milk-handling systems in Wisconsin farms, to automated railway systems in Europe, to Ausgrid's Distribution Network Management System (DNMS) in Australia, to smart cities and beyond; system modernization poses unique challenges to cybersecurity.

      The threats can be safety, such as the trains stopped in Denmark during the last weekend of October 2022 for several hours due to an attack on a third-party IT service provider; economics, such as a cream cheese production shutdown that occurred at the peak of cream cheese demand in October 2021 due to hackers compromising a large cheese manufacturer's plants and distribution centers; and reliability, such as the significant loss of communication for the Ukrainian military, which relied on Viasat's services.

      Despite all the cybersecurity risks, organizations continue modernization plans due to the long-term overall benefits.

      Current situation

      • Pressure of operational excellence: Competitive markets cannot keep pace with demand without modernization. For example, in automated milking systems, the labor time saved from milking can be used to focus on other essential tasks such as the decision-making process.
      • Technology offerings: Technologies are available and affordable such as automated equipment, versatile communication systems, high-performance human machine interaction (HMI), IIoT/Edge integration, and big data analytics.
      • Higher risks of cyberattacks: Modernization enlarges attack surfaces, which are not only cyber but also physical systems. Most incidents indicate that attackers gained access through the IT network, which was followed by infiltration into OT networks.

      IIoT market size is USD 323.62 billion in 2022 and projected to be around USD 1 trillion in 2028.

      Source: Statista,
      March 2022

      Modernization brings new opportunities and new threats

      Higher risks of cyberattacks on Industrial Control System (ICS)

      Target: Australian sewage plant.

      Method: Insider attack. Impact: 265,000 gallons of untreated sewage released.

      Target: Middle East energy companies.

      Method: Shamoon.

      Impact: Overwritten Windows-based systems files.

      Target: German Steel Mill

      Method: Spear-phishing

      Impact: Blast furnace control shutdown failure.

      Target: Middle East Safety Instrumented System (SIS).

      Method: TRISIS/TRITON.

      Impact: Modified safety system ladder logic.

      Target: Viasat's KA-SAT Network.

      Method: AcidRain.

      Impact: Significant loss of communication for the Ukrainian military, which relied on Viasat's services.

      A timeline displaying the years 1903; 2000; 2010; 2012; 2013; 2014; 2018; 2019; 2021; 2022 is displayed.

      Target: Marconi wireless telegraphs presentation. Method: Morse code.

      Impact: Fake message sent "Rats, rats, rats, rats. There was a young fellow of Italy, Who diddled the public quite prettily."

      Target: Iranian uranium enrichment plant.

      Method: Stuxnet.

      Impact: Compromised programmable logic controllers (PLCs).

      Target: ICS supply chain.

      Method: Havex.

      Impact: Remote Access Trojan (RAT) collected information and uploaded data to command-and-control (C&C) servers.

      Target: Ukraine power grid.

      Method: BlackEnergy.

      Impact: Manipulation of HMI View causing 1-6 hour power outages for 230,000 consumers.

      Target: Colonial Pipeline.

      Method: DarkSide ransomware.

      Impact: Compromised billing infrastructure halted the pipeline operation.

      Sources:

      • DOE, 2018
      • CSIS, 2022
      • MIT Technology Review, 2022

      Info-Tech Insight

      Most OT incidents start with attacks against IT networks and then move laterally into the OT environment. Therefore, converging IT and OT security will help protect the entire organization.

      Use this template to explain the priorities you need your stakeholders to know about.

      Secure organization modernization

      Provide a brief value statement for the initiative.

      The systems (OT, IT, IIoT) are evolving now – ensure your security plan has you covered.

      Initiative Description:

      • Description must include what organization will undertake to complete the initiative.
      • Identify the drivers to align with your organization's business objectives.
      • Build your case by leveraging a cost-benefit analysis and update your security strategy.
      • Identify people, process, and technology gaps that hinder the modernization security strategy.
      • Use the identified skill gaps to update risks, policies and procedures, IR, DR, and BCP.
      • Evaluate and enable modernization technology top focus areas and refine security processes.
      • Decide whether to train, hire, contract, or outsource to fill the security workforce gap.

      Drivers:

      List initiative drivers.

      • Pressure of operational excellence
      • Technology offerings
      • Higher risks of cyberattacks

      Risks:

      List initiative risks and impacts.

      • Complex systems with many components to implement and manage require diligent change management.
      • Organizational and cultural changes cause friction between humans and machines.
      • Increased attack surface of cyber and physical systems.

      Benefits:

      List initiative benefits and align to business benefits or benefits for the stakeholder groups that it impacts.

      • Improve service reliability through continuous and real-time operation.
      • Enhance efficiency through operations visibility and transparency.
      • Gain cost savings and efficiency to automate operations of complex and large equipment and instrumentations.

      Related Info-Tech Research:

      Recommended Actions

      1. Identify modernization business cases to secure

      Identify the drivers to align with your organization's business objectives.

      Build your case by leveraging a cost-benefit analysis, and update your security strategy.

      2. Identify gaps

      Identify people, process, and technology gaps that hinder the modernization
      security strategy.

      Use the identified skill gaps to update risks, policies and procedures, IR, DR, and BCP.

      3. Decide whether to build or buy capabilities

      Evaluate and enable modernization technology top focus areas and refine
      security processes.

      Decide whether to train, hire, contract, or outsource to fill the security workforce gap.

      Sources:

      Industrial Control System (ICS) Modernization: Unlock the Value of Automation in Utilities, Info-Tech

      Secure IT-OT Convergence, Info-Tech

      Develop a cost-benefit analysis

      Identify a modernization business case for security.

      Benefits

      Metrics

      Operational Efficiency and Cost Savings

      • Reduction in truck rolls and staff time of manual operations of equipment or instrumentation.
      • Cost reduction in energy usage such as substation power voltage level or water treatment chemical level.

      Improve Reliability and Resilience

      • Reduction in field crew time to identify the outage locations by remotely accessing field equipment to narrow down the
        fault areas.
      • Reduction in outage time impacting customers and avoiding financial penalty in service quality metrics.
      • Improve operating reliability through continuous and real-time trend analysis of equipment performance.

      Energy & Capacity Savings

      • Optimize energy usage of operation to reduce overall operating cost and contribution to organizational net-zero targets.

      Customers & Society Benefits

      • Improve customer safety for essential services such as drinkable water consumption.
      • Improve reliability of services and address service equity issues based on data.

      Cost

      Metrics

      Equipment and Infrastructure

      Upgrade existing security equipment or instrumentation or deploy new, e.g. IPS on Enterprise DMZ and Operations DMZ.

      Implement communication network equipment and labor to install and configure.

      Upgrade or construct server room including cooling/heating, power backup, and server and rack hardware.

      Software and Commission

      The SCADA/HMI software and maintenance fee as well as lifecycle upgrade implementation project cost.

      Labor cost of field commissioning and troubleshooting.

      Integration with security systems, e.g. log management and continuous monitoring.

      Support and Resources

      Cost to hire/outsource security FTEs for ongoing managing and operating security devices, e.g. SOC.

      Cost to hire/outsource IT/OT FTEs to support and troubleshoot systems and its integrations with security systems, e.g. MSSP.

      An example of a cost-benefit analysis for ICS modernization

      Sources:

      Industrial Control System (ICS) Modernization: Unlock the Value of Automation in Utilities, Info-Tech

      Lawrence Berkeley National Laboratory, 2021

      IT-OT convergence demands new security approach and solutions

      Identify gaps

      Attack Vectors

      IT

      • User's compromised credentials
      • User's access device, e.g. laptop, smartphone
      • Access method, e.g. denial-of-service to modem, session hijacking, bad data injection

      OT

      • Site operations, e.g. SCADA server, engineering workstation, historian
      • Controls, e.g. SCADA Client, HMI, PLCs, RTUs
      • Process devices, e.g. sensors, actuators, field devices

      Defense Strategies

      • Limit exposure of system information
      • Identify and secure remote access points
      • Restrict tools and scripts
      • Conduct regular security audits
      • Implement a dynamic network environment

      (Control System Defense: Know the Opponent, CISA)

      An example of a high-level architecture of an electric utility's control system and its interaction with IT systems.

      An example of a high-level architecture of an electric utility's control system and its interaction with IT systems.

      Source: ISA-99, 2007

      RESPOND TO REGULATORY CHANGES

      PRIORITY 03

      • GOVERNMENT-ENACTED POLICY CHANGES AND INDUSTRY REGULATORY CHANGES COULD BE A COMPLIANCE BURDEN … OR PREVENT YOUR NEXT SECURITY INCIDENT.

      Executive summary

      Background

      Government-enacted regulatory changes are occurring at an ever-increasing rate these days. As one example, on November 10, 2022, the EU Parliament introduced two EU cybersecurity laws: the Network and Information Security (NIS2) Directive (applicable to organizations located within the EU and organizations outside the EU that are essential within an EU country) and the Digital Operational Resilience Act (DORA). There are also industry regulatory changes such as PCI DSS v4.0 for the payment sector and the North American Electric Reliability Corporation Critical Infrastructure Protection (NERC CIP) for Bulk Electric Systems (BES).

      Organizations should use regulatory changes as a means to improve security practices, instead of treating them as a compliance burden. As said by lead member of EU Parliament Bart Groothuis on NIS2, "This European directive is going to help around 160,000 entities tighten their grip on security […] It will also enable information sharing with the private sector and partners around the world. If we are being attacked on an industrial scale, we need to respond on an industrial scale."

      Current situation

      Stricter requirements and reporting: Regulations such as NIS2 include provisions for incident response, supply chain security, and encryption and vulnerability disclosure and set tighter cybersecurity obligations for risk management reporting obligations.

      Broader sectors: For example, the original NIS directive covers 19 sectors such as Healthcare, Digital Infrastructure, Transport, and Energy. Meanwhile, the new NIS2 directive increases to 35 sectors by adding other sectors such as providers of public electronic communications networks or services, manufacturing of certain critical products (e.g. pharmaceuticals), food, and digital services.

      High sanctions for violations: For example, Digital Services Act (DSA) includes fines of up to 6% of global turnover and a ban on operating in the EU single market in case of repeated serious breaches.

      Approximately 100 cross-border data flow regulations exist in 2022.

      Source: McKinsey, 2022

      Stricter requirements for payments

      Obligation changes to keep up with emerging threats and technologies

      64 New requirements were added
      A total of 64 requirements have been added to version 4.0 of the PCI DSS.

      13 New requirements become effective March 31, 2024
      The other 51 new requirements are considered best practice until March 31, 2025, at which point they will become effective.

      11 New requirements only for service providers
      11 of the new requirements are applicable only to entities that provide third-party services to merchants.

      Defined roles must be assigned for requirements.

      Focus on periodically assessing and documenting scope.

      Entities may choose a defined approach or a customized approach to requirements.

      An example of new requirements for PCI DSS v4.0

      Source: Prepare for PCI DSS v4.0, Info-Tech

      Use this template to explain the priorities you need your stakeholders to know about.

      Respond to regulatory changes

      Provide a brief value statement for the initiative.

      The compliance obligations are evolving – ensure your security plan has you covered.

      Initiative Description:

      Description must include what organization will undertake to complete the initiative.

      • Identify relevant security and privacy compliance and conformance levels.
      • Identify gaps for updated obligations, and map obligations into control framework.
      • Review, update, and implement policies and strategy.
      • Develop compliance exception process and forms.
      • Develop test scripts.
      • Track status and exceptions

      Drivers:

      List initiative drivers.

      • Pressure of new regulations
      • Governance, risk & compliance (GRC) tool offerings
      • High administrative or criminal penalties of non-compliance

      Risks:

      List initiative risks and impacts.

      • Complex structures and a great number of compliance requirements
      • Restricted budget and lack of skilled workforce for organizations such as local municipalities and small or medium organizations compared to private counterparts
      • Personal liability for some regulations for non-compliance

      Benefits:

      List initiative benefits and align to business benefits or benefits for the stakeholder groups that it impacts.

      • Reduces compliance risk.
      • Reduces complexity within the control environment by using a single framework to align multiple compliance regimes.
      • Reduces costs and efforts related to managing IT audits through planning and preparation.

      Related Info-Tech Research:

      Recommended Actions

      1. Identify compliance obligations

      Identify relevant security and privacy obligations and conformance levels.

      Identify gaps for updated obligations, and map obligations into control framework.

      2. Implement compliance strategy

      Review, update, and implement policies and strategy.

      Develop compliance exception process.

      3. Track and report

      Develop test scripts to check your remediations to ensure they are effective.

      Track and report status and exceptions.

      Sources: Build a Security Compliance Program and Prepare for PCI DSS v4.0, Info-Tech

      Identify relevant security and privacy compliance obligations

      Identify obligations

      # Security Jurisdiction
      1 Network and Information Security (NIS2) Directive European Union (EU) and organizations outside the EU that are essential within an EU country
      2 North American Electric Reliability Corporation (NERC) Critical Infrastructure Protection (CIP) North American electrical utilities
      3 Executive Order (EO) 14028: Improving the Nation's Cybersecurity, The White House, 2021 United States

      #

      Privacy Jurisdiction
      1 General Data Protection Regulation (GDPR) EU and EU citizens
      2 Personal Information Protection and Electronic Documents Act (PIPEDA) Canada
      3 California Consumer Privacy Act (CCPA) California, USA
      4 Personal Information Protection Law of the People’s Republic of China (PIPL) China

      An example of security and privacy compliance obligations

      How much does it cost to become compliant?

      • It is important to understand the various frameworks and to adhere to the appropriate compliance obligations.
      • Many factors influence the cost of compliance, such as the size of organization, the size of network, and current security readiness.
      • To manage compliance obligations, it is important to use a platform that not only performs internal and external monitoring but also provides third-party vendors (if applicable) with visibility into potential threats in their organization.

      Adopt Next-Generation Cybersecurity Technologies

      PRIORITY 04

      • GOVERNMENTS AND HACKERS ARE RECOGNIZING THE IMPORTANCE OF EMERGING TECHNOLOGIES, SUCH AS ZERO TRUST ARCHITECTURE AND AI-BASED CYBERSECURITY. SO SHOULD YOUR ORGANIZATION.

      Executive summary

      Background

      The cat and mouse game between threat actors and defenders is continuing. The looming question "can defenders do better?" has been answered with rapid development of technology. This includes the automation of threat analysis (signature-based, specification-based, anomaly-based, flow-based, content-based, sandboxing) not only on IT but also on other relevant environments, e.g. IoT, IIoT, and OT based on AI/ML.

      More fundamental approaches such as post-quantum cryptography and zero trust (ZT) are also emerging.
      ZT is a principle, a model, and also an architecture focused on resource protection by always verifying transactions using the least privilege principle. Hopefully in 2023, ZT will be more practical and not just a vendor marketing buzzword.

      Next-gen cybersecurity technologies alone are not a silver bullet. A combination of skilled talent, useful data, and best practices will give a competitive advantage. The key concepts are explainable, transparent, and trustworthy. Furthermore, regulation often faces challenges to keep up with next-gen cybersecurity technologies, especially with the implications and risks of adoption, which may not always be explicit.

      Current situation

      ZT: Performing an accurate assessment of readiness and benefits to adopt ZT can be difficult due to ZT's many components. Thus, an organization needs to develop a ZT roadmap that aligns with organizational goals and focuses on access to data, assets, applications, and services; don't select solutions or vendors too early.

      Post-quantum cryptography: Current cryptographic applications, such as RSA for PKI, rely on factorization. However, algorithms such as Shor's show quantum speedup for factorization, which can break current crypto when sufficient quantum computing devices are available. Thus, threat actors can intercept current encrypted information and store it to decrypt in the future.

      AI-based threat management: AI helps in analyzing and correlating data extremely fast compared to humans. Millions of telemetries, malware samples, raw events, and vulnerability data feed into the AI system, which humans cannot process manually. Furthermore, AI does not get tired in processing this big data, thus avoiding human error and negligence.

      Data breach mitigation cost without AI: USD 6.20 million; and with AI: USD 3.15 million

      Source: IBM, 2022

      Traditional security is not working

      Alert Fatigue

      Too many false alarms and too many events to process. Evolving threat landscapes waste your analysts' valuable time on mundane tasks, such as evidence collection. Meanwhile, only limited time is spared for decisions and conclusions, which results in the fear of missing an incident and alert fatigue.

      Lack of Insight

      To report progress, clear metrics are needed. However, cybersecurity still lacks in this area as the system itself is complex and some systems work in silos. Furthermore, lessons learned are not yet distilled into insights for improving future accuracy.

      Lack of Visibility

      System integration is required to create consistent workflows across the organization and to ensure complete visibility of the threat landscape, risks, and assets. Also, the convergence of OT, IoT, and IT enhances this challenge.

      Source: IBM Security Intelligence, 2020

      A business case for AI-based cybersecurity

      Threat management

      Prevention

      Risk scores are generated by machine learning based on variables such as behavioral patterns and geolocation. Zero trust architecture is combined with machine learning. Asset management leverages visibility using machine learning. Comply with regulations by improving discovery, classification, and protection of data using machine learning. Data security and data privacy services use machine learning for data discovery.

      Detection

      AI, advanced machine learning, and static approaches, such as code file analysis, combine to automatically detect and analyze threats and prevent threats from spreading, assisted by threat intelligence.

      Response

      AI helps in orchestrating security technologies for organizations to reduce the number of security agents installed, which may not talk to each other or, worse, may conflict with each other.

      Recovery

      AI continuously tunes based on lessons learned, such as creating security policies for improving future accuracy. AI also does not get fatigue, and it assists humans in a faster recovery.

      Prevention; Detection; Response; Recovery

      AI has been around since the 1940s, but why is it only gaining traction now? Because supporting technologies are only now available, including faster GPUs for complex computations and cheaper storage for massive volumes of data.

      Use this template to explain the priorities you need your stakeholders to know about.

      Adopt next-gen cybersecurity technologies

      Use this template to explain the priorities you need your stakeholders to know about.

      Develop a practical roadmap that shows the business value of next-gen cybersecurity technologies investment.

      Initiative Description:

      Description must include what organization will undertake to complete the initiative.

      • Identify the stakeholders who will be affected by the next-gen cybersecurity technologies implementation and define responsibilities based on skillsets and the degree of support.
      • Adopt well-established data governance practices for cross-functional teams.
      • Conduct a maturity assessment of key processes and highlight interdependencies.
      • Develop a baseline and periodically review risks, policies and procedures, and business plan.
      • Develop a roadmap and deploy next-gen cybersecurity architecture and controls step by step, working with trusted technology partners.
      • Monitor metrics on effectiveness and efficiency.

      Drivers:

      List initiative drivers.

      • Pressure of attacks by sophisticated threat actors
      • Next-gen cybersecurity technologies tool offerings
      • High cost of traditional security, e.g. longer breach lifecycle

      Risks:

      List initiative risks and impacts.

      • Lack of transparency of the model or bias, leading to non-compliance with policies/regulations
      • Risks related with data quality and inadequate data for model training
      • Adversarial attacks, including, but not limited to, adversarial input and model extraction

      Benefits:

      List initiative benefits and align to business benefits or benefits for the stakeholder groups that it impacts.

      • Reduces the number of alerts, thus reduces alert fatigue.
      • Increases the identification of unknown threats.
      • Leads to faster detection and response.
      • Closes skills gap and increases productivity.

      Related Info-Tech Research:

      Recommended Actions

      1. People

      Identify the stakeholders who will be affected by the next-gen cybersecurity technologies implementation and define responsibilities based on skillsets and the degree of support.

      Adopt well-established data governance practices for cross-functional teams.

      2. Process

      Conduct a maturity assessment of key processes and highlight interdependencies.

      Develop a baseline and periodically review risks, policies and procedures, and business plan.

      3. Technology

      Develop a roadmap and deploy next-gen cybersecurity architecture and controls step by step, working with trusted technology partners.

      Monitor metrics on effectiveness and efficiency.

      Source: Leverage AI in Threat Management (keynote presentation), Info-Tech

      Secure Services and Applications

      PRIORITY 05

      • APIS ARE STILL THE #1 THREAT TO APPLICATION SECURITY.

      Executive summary

      Background

      Software is usually produced as part of a supply chain instead of in silos. A vulnerability in any part of the supply chain can become a threat surface. We have learned this from recent incidents such as Log4j, SolarWinds, and Kaseya where attackers compromised a Virtual System Administrator tool used by managed service providers to attack around 1,500 organizations.

      DevSecOps is a culture and philosophy that unifies development, security, and operations to answer this challenge. DevSecOps shifts security left by automating, as much as possible, development and testing. DevSecOps provides many benefits such as rapid development of secure software and assurance that, prior to formal release and delivery, tests are reliably performed and passed.

      DevSecOps practices can apply to IT, OT, IoT, and other technology environments, for example, by integrating a Secure Software Development Framework (SSDF).

      Current situation

      Secure Software Supply Chain: Logging is a fundamental feature of most software, and recently the use of software components, especially open source, are based on trust. From the Log4j incident we learned that more could be done to improve the supply chain by adopting ZT to identify related components and data flows between systems and to apply the least privilege principle.

      DevSecOps: A software error wiped out wireless services for thousands of Rogers customers across Canada in 2021. Emergency services were also impacted, even though outgoing 911 calls were always accessible. Losing such services could have been avoided, if tests were reliably performed and passed prior to release.

      OT insecure-by-design: In OT, insecurity-by-design is still a norm, which causes many vulnerabilities such as insecure protocols implementation, weak authentication schemes, or insecure firmware updates. Additional challenges are the lack of CVEs or CVE duplication, the lack of Software Bill of Materials (SBOM), and product supply chains issues such as vulnerable products that are certified because of the scoping limitation and emphasis on functional testing.

      Technical causes of cybersecurity incidents in EU critical service providers in 2019-2021 shows: software bug (12%) and faulty software changes/update (9%).

      Source: CIRAS Incident reporting, ENISA (N=1,239)

      Software development keeps evolving

      DOD Maturation of Software Development Best Practices

      Best Practices 30 Years Ago 15 Years Ago Present Day
      Lifecycle Years or Months Months or Weeks Weeks or Days
      Development Process Waterfall Agile DevSecOps
      Architecture Monolithic N-Tier Microservices
      Deployment & Packaging Physical Virtual Container
      Hosting Infrastructure Server Data Center Cloud
      Cybersecurity Posture Firewall + SIEM + Zero Trust

      Best practices in software development are evolving as shown on the diagram to the left. For example, 30 years ago the lifecycle was "Years or Months," while in the present day it is "Weeks or Days."

      These changes also impact security such as the software architecture, which is no longer "Monolithic" but "Microservices" normally built within the supply chain.

      The software supply chain has known integrity attacks that can happen on each part of it. Starting from bad code submitted by a developer, to compromised source control platform (e.g. PHP git server compromised), to compromised build platform (e.g. malicious behavior injected on SolarWinds build), to a compromised package repository where users are deceived into using the bad package by the similarity between the malicious and the original package name.

      Therefore, we must secure each part of the link to avoid attacks on the weakest link.

      Software supply chain guidance

      Secure each part of the link to avoid attacks on the weakest link.

      Guide for Developers

      Guide for Suppliers

      Guide for Customers

      Secure product criteria and management, develop secure code, verify third-party components, harden build environment, and deliver code.

      Define criteria for software security checks, protect software, produce well-secured software, and respond to vulnerabilities.

      Secure procurement and acquisition, secure deployment, and secure software operations.

      Source: "Securing the Software Supply Chain" series, Enduring Security Framework (ESF), 2022

      "Most software today relies on one or more third-party components, yet organizations often have little or no visibility into and understanding of how these software components are developed, integrated, and deployed, as well as the practices used to ensure the components' security."

      Source: NIST – NCCoE, 2022

      Use this template to explain the priorities you need your stakeholders to know about.

      Secure services and applications

      Provide a brief value statement for the initiative.

      Adopt recommended practices for securing the software supply chain.

      Initiative Description:

      Description must include what organization will undertake to complete the initiative.

      • Define and keep security requirements and risk assessments up to date.
      • Require visibility into provenance of product, and require suppliers' self-attestation of security hygiene.
      • Verify distribution infrastructure, product and individual components integrity, and SBOM.
      • Use multi-layered defenses, e.g. ZT for integration and control configuration.
      • Train users on how to detect and report anomalies and when to apply updates to a system.
      • Ensure updates from authorized and authenticated sources and verify the integrity of the updated SBOM.

      Drivers:

      List initiative drivers.

      • Cyberattacks exploit the vulnerabilities of weak software supply chain
      • Increased need to enhance software supply chain security, e.g. under the White House Executive Order (EO) 14028
      • OT insecure-by-design hinders OT modernization

      Risks:

      List initiative risks and impacts.

      Only a few developers and suppliers explicitly address software security in detail.

      Time pressure to deliver functionality over security.

      Lack of security awareness and lack of trained workforce.

      Benefits:

      List initiative benefits and align to business benefits or benefits for the stakeholder groups that it impacts.

      Customers (acquiring organizations) achieve secure acquisition, deployment, and operation of software.

      Developers and suppliers provide software security with minimal vulnerabilities in its releases.

      Automated processes such as automated testing avoid error-prone and labor-intensive manual test cases.

      Related Info-Tech Research:

      Recommended Actions

      1. Procurement and Acquisition

      Define and keep security requirements and risk assessments up to date.

      Perform analysis on current market and supplier solutions and acquire security evaluation.

      Require visibility into provenance of product, and require suppliers' self-attestation of security hygiene

      2. Deployment

      Verify distribution infrastructure, product and individual components integrity, and SBOM.

      Save and store the tests and test environment and review and verify the
      self-attestation mechanism.

      Use multi-layered defenses, e.g. ZT for integration and control configuration.

      3. Software Operations

      Train users on how to detect and report anomalies and when to apply updates to a system.

      Ensure updates from authorized and authenticated sources and verify the integrity of the updated SBOM.

      Apply supply chain risk management (SCRM) operations.

      Source: "Securing the Software Supply Chain" series, Enduring Security Framework (ESF), 2022

      Bibliography

      Aksoy, Cevat Giray, Jose Maria Barrero, Nicholas Bloom, Steven J. Davis, Mathias Dolls, and Pablo Zarate. "Working from Home Around the World." Brookings Papers on Economic Activity, 2022.
      Barrero, Jose Maria, Nicholas Bloom, and Steven J. Davis. "Why working from home will stick." WFH Research, National Bureau of Economic Research, Working Paper 28731, 2021.
      Boehm, Jim, Dennis Dias, Charlie Lewis, Kathleen Li, and Daniel Wallance. "Cybersecurity trends: Looking over the horizon." McKinsey & Company, March 2022. Accessed
      31 Oct. 2022.
      "China: TC260 issues list of national standards supporting implementation of PIPL." OneTrust, 8 Nov. 2022. Accessed 17 Nov. 2022.
      Chmielewski, Stéphane. "What is the potential of artificial intelligence to improve cybersecurity posture?" before.ai blog, 7 Aug. 2022. Accessed 15 Aug. 2022.
      Conerly, Bill. "The Recession Will Begin Late 2023 Or Early 2024." Forbes, 1 Nov. 2022. Accessed 8 Nov. 2022.
      "Control System Defense: Know the Opponent." CISA, 22 Sep. 2022. Accessed 17 Nov. 2022.
      "Cost of a Data Breach Report 2022." IBM, 2022.
      "Cybersecurity: Parliament adopts new law to strengthen EU-wide resilience." European Parliament News, 10 Nov. 2022. Press Release.
      "Cyber Security in Critical National Infrastructure Organisations: 2022." Bridewell, 2022. Accessed 7 Nov. 2022.
      Davis, Steven. "The Big Shift to Working from Home." NBER Macro Annual Session On
      "The Future of Work," 1 April 2022.
      "Digital Services Act: EU's landmark rules for online platforms enter into force."
      EU Commission, 16 Nov. 2022. Accessed 16 Nov. 2022.
      "DoD Enterprise DevSecOps Fundamentals." DoD CIO, 12 May 2022. Accessed 21 Nov. 2022.
      Elkin, Elizabeth, and Deena Shanker. "That Cream Cheese Shortage You Heard About? Cyberattacks Played a Part." Bloomberg, 09 Dec. 2021. Accessed 27 Oct. 2022.
      Evan, Pete. "What happened at Rogers? Day-long outage is over, but questions remain." CBC News, 21 April 2022. Accessed 15 Nov. 2022.
      "Fewer Ransomware Victims Pay, as Median Ransom Falls in Q2 2022." Coveware,
      28 July 2022. Accessed 18 Nov. 2022.
      "Fighting cybercrime: new EU cybersecurity laws explained." EU Commission, 10 Nov. 2022. Accessed 16 Nov. 2022.
      "Guide to PCI compliance cost." Vanta. Accessed 18 Nov. 2022.
      Hammond, Susannah, and Mike Cowan. "Cost of Compliance 2022: Competing priorities." Thomson Reuters, 2022. Accessed 18 Nov. 2022.
      Hemsley, Kevin, and Ronald Fisher. "History of Industrial Control System Cyber Incidents." Department of Energy (DOE), 2018. Accessed 29 Aug. 2022.
      Hofmann, Sarah. "What Is The NIS2 And How Will It Impact Your Organisation?" CyberPilot,
      5 Aug. 2022. Accessed 16 Nov. 2022.
      "Incident reporting." CIRAS Incident Reporting, ENISA. Accessed 21 Nov. 2022.
      "Introducing SLSA, an End-to-End Framework for Supply Chain Integrity." Google,
      16 June 2021. Accessed 25 Nov. 2022.
      Kovacs, Eduard. "Trains Vulnerable to Hacker Attacks: Researchers." SecurityWeek, 29 Dec. 2015. Accessed 15 Nov. 2022.
      "Labour Force Survey, October 2022." Statistics Canada, 4 Nov. 2022. Accessed 7 Nov. 2022.
      Malacco, Victor. "Promises and potential of automated milking systems." Michigan State University Extension, 28 Feb. 2022. Accessed 15 Nov. 2022.
      Maxim, Merritt, et al. "Planning Guide 2023: Security & Risk." Forrester, 23 Aug. 2022. Accessed 31 Oct. 2022.
      "National Cyber Threat Assessment 2023-2024." Canadian Centre for Cyber Security, 2022. Accessed 18 Nov. 2022.
      Nicaise, Vincent. "EU NIS2 Directive: what's changing?" Stormshield, 20 Oct. 2022. Accessed
      17 Nov. 2022.
      O'Neill, Patrick. "Russia hacked an American satellite company one hour before the Ukraine invasion." MIT Technology Review, 10 May 2022. Accessed 26 Aug. 2022.
      "OT ICEFALL: The legacy of 'insecure by design' and its implications for certifications and risk management." Forescout, 2022. Accessed 21 Nov. 2022.
      Palmer, Danny. "Your cybersecurity staff are burned out - and many have thought about quitting." ZDNet, 8 Aug. 2022. Accessed 19 Aug. 2022.
      Placek, Martin. "Industrial Internet of Things (IIoT) market size worldwide from 2020 to 2028 (in billion U.S. dollars)." Statista, 14 March 2022. Accessed 15 Nov. 2022.
      "Revised Proposal Attachment 5.13.N.1 ADMS Business Case PUBLIC." Ausgrid, Jan. 2019. Accessed 15 Nov. 2022.
      Richter, Felix. "Cloudy With a Chance of Recession." Statista, 6 April 2022. Web.
      "Securing the Software Supply Chain: Recommended Practices Guide for Developers." Enduring Security Framework (ESF), Aug. 2022. Accessed 22 Sep. 2022.
      "Securing the Software Supply Chain: Recommended Practices Guide for Suppliers." Enduring Security Framework (ESF), Sep. 2022. Accessed 21 Nov. 2022.
      "Securing the Software Supply Chain: Recommended Practices Guide for Customers." Enduring Security Framework (ESF), Oct. 2022. Accessed 21 Nov. 2022.
      "Security Guidelines for the Electricity Sector: Control System Electronic Connectivity."
      North American Electric Reliability Corporation (NERC), 28 Oct. 2013. Accessed 25 Nov. 2022.
      Shepel, Jan. "Schreiber Foods hit with cyberattack; plants closed." Wisconsin State Farmer,
      26 Oct. 2022. Accessed 15 Nov. 2022.
      "Significant Cyber Incidents." Center for Strategic and International Studies (CSIS). Accessed
      1 Sep. 2022.
      Souppaya, Murugiah, Michael Ogata, Paul Watrobski, and Karen Scarfone. "Software Supply Chain and DevOps Security Practices: Implementing a Risk-Based Approach to DevSecOps." NIST - National Cybersecurity Center of Excellence (NCCoE), Nov. 2022. Accessed
      22 Nov. 2022.
      "Ten Things Will Change Cybersecurity in 2023." SOCRadar, 23 Sep. 2022. Accessed
      31 Oct. 2022.
      "The Nature of Cybersecurity Defense: Pentagon To Reveal Updated Zero-Trust Cybersecurity Strategy & Guidelines." Cybersecurity Insiders. Accessed 21 Nov. 2022.
      What Is Threat Management? Common Challenges and Best Practices." IBM Security Intelligence, 2020.
      Woolf, Tim, et al. "Benefit-Cost Analysis for Utility-Facing Grid Modernization Investments: Trends, Challenges, and Considerations." Lawrence Berkeley National Laboratory, Feb. 2021. Accessed 15 Nov. 2022.
      Violino, Bob. "5 key considerations for your 2023 cybersecurity budget planning." CSO Online,
      14 July 2022. Accessed 27 Oct. 2022

      Research Contributors and Experts

      Andrew Reese
      Cybersecurity Practice Lead
      Zones

      Ashok Rutthan
      Chief Information Security Officer (CISO)
      Massmart

      Chris Weedall
      Chief Information Security Officer (CISO)
      Cheshire East Council

      Jeff Kramer
      EVP Digital Transformation and Cybersecurity
      Aprio

      Kris Arthur
      Chief Information Security Officer (CISO)
      SEKO Logistics

      Mike Toland
      Chief Information Security Officer (CISO)
      Mutual Benefit Group

      Select a Marketing Management Suite

      • Buy Link or Shortcode: {j2store}533|cart{/j2store}
      • member rating overall impact (scale of 10): 10.0/10 Overall Impact
      • member rating average dollars saved: $6,560 Average $ Saved
      • member rating average days saved: 50 Average Days Saved
      • Parent Category Name: Customer Relationship Management
      • Parent Category Link: /customer-relationship-management
      • Time, money, and effort are wasted on channels and campaigns that are not resonating with your customer base.
      • Email marketing, social marketing, and/or lead management alone are often not enough to meet more sophisticated marketing needs.
      • Many organizations struggle with taking a systematic approach to selection that pairs functional requirements with specific marketing workflows, and as a result they choose a marketing management suite (MMS) that is not well aligned to their needs, wasting resources and causing end-user frustration.
      • For IT managers or marketing professionals, the task to incorporate MMS technology into the organization requires not only receiving the buy-in for the MMS investment but also determining the vendor and solution that best fit the organization’s particular marketing management needs.

      Our Advice

      Critical Insight

      • An MMS enables complex campaigns across many channels, product lines, customer segments, and marketing groups throughout the enterprise.
      • Selecting an MMS has become increasingly difficult because the number of players in the marketplace has ballooned. Moreover, picking the wrong marketing solution has a direct impact on revenue.
      • Determine whether the investment in an MMS is worthwhile or the funds are better allocated elsewhere. For organizations with a large audience or varied product offerings, an MMS enables complex campaigns across many channels, product lines, customer segments, and marketing groups throughout the enterprise.

      Impact and Result

      • Maximize your success and credibility with a proposal that emphasizes the areas relevant to your situation.
      • Perform more effective customer targeting and campaign management. Having an MMS equips marketers with the tools they need to make informed decisions around campaign execution, resulting in better targeting, acquisition, and customer retention. This means more revenue.
      • Maximize marketing impact with analytics-based decision making. Understanding users’/customers’ behaviors and preferences will allow you to run effective marketing initiatives.

      Select a Marketing Management Suite Research & Tools

      Start here – read the Executive Brief

      Read our concise Executive Brief to find out how to approach selecting an MMS, review Info-Tech’s methodology, and understand the four ways we can support you in completing this project.

      Besides the small introduction, subscribers and consulting clients within this management domain have access to:

      1. Launch the MMS project and collect requirements

      Assess the organization’s fit for MMS technology and structure the MMS selection project.

      • Select a Marketing Management Suite – Phase 1: Launch the MMS Project and Collect Requirements
      • MMS Readiness Assessment Checklist

      2. Shortlist marketing management suites

      Produce a vendor shortlist for your MMS.

      • Select a Marketing Management Suite – Phase 2: Shortlist Marketing Management Suites

      3. Select vendor and communicate decision to stakeholders

      Evaluate RFPs, conduct vendor demonstrations, and select an MMS.

      • Select a Marketing Management Suite – Phase 3: Select Vendor and Communicate Decision to Stakeholders
      • MMS Requirements Picklist Tool
      • MMS Request for Proposal Template
      • MMS Vendor Demo Script
      • MMS Selection Executive Presentation Template
      [infographic]

      Workshop: Select a Marketing Management Suite

      Workshops offer an easy way to accelerate your project. If you are unable to do the project yourself, and a Guided Implementation isn't enough, we offer low-cost delivery of our project workshops. We take you through every phase of your project and ensure that you have a roadmap in place to complete your project successfully.

      1 Launch the MMS Project and Collect Requirements

      The Purpose

      Determine a “right-size” approach to marketing enablement applications.

      Key Benefits Achieved

      Confirmation of the goals, objectives, and direction of the organization is marketing application strategy.

      Activities

      1.1 Assess the value and identify the organization’s fit for MMS technology.

      1.2 Understand the art of the possible.

      1.3 Understand CXM strategy and identify your fit for MMS technology.

      1.4 Build procurement team and project customer experience management (CXM) strategy.

      1.5 Identify your MMS requirements.

      Outputs

      Project team list.

      Preliminary requirements list.

      2 Shortlist Marketing Management Suites

      The Purpose

      Enumerate relevant marketing management suites and point solutions.

      Key Benefits Achieved

      List of marketing enablement applications based on requirements articulated in the preliminary requirements list strategy.

      Activities

      2.1 Identify relevant use cases.

      2.2 Discuss the vendor landscape.

      Outputs

      Vendor shortlist.

      3 Select Vendor and Communicate Decision to Stakeholders

      The Purpose

      Develop a rationale for selecting a specific MMS vendor.

      Key Benefits Achieved

      MMS Vendor decision.

      A template to communicate the decision to executives.

      Activities

      3.1 Create a procurement strategy.

      3.2 Discuss the executive presentation.

      3.3 Plan the procurement process.

      Outputs

      Executive/stakeholder PowerPoint presentation.

      Selection of an MMS.

      Further reading

      Select a Marketing Management Suite

      A best-fit solution balances needs, cost, and capability.

      Table of contents

      1. Project Rationale
      2. Execute the Project/DIY Guide
      3. Appendices

      ANALYST PERSPECTIVE

      Navigate the complexity of a vast ecosystem by taking a structured approach to marketing management suite (MMS) selection.

      Marketing applications are in high demand, but it is difficult to select a suite that is right for your organization. Market offerings have grown from 50 vendors to over 800 in the past five years. Much of the process of identifying an appropriate vendor is not about the vendor at all, but rather about having a comprehensive understanding of internal needs. There are instances where a smaller-point solution is necessary to satisfy requirements and a full marketing management suite is an overinvestment.

      Likewise, a partner with differentiating features such as AI-driven workflows and a mobile software development kit can act as a powerful extension of an overall customer experience management strategy. It is crucial to make the right decision; missing the mark on an MMS selection will have a direct impact on the business’ bottom line.

      Ben Dickie
      Research Director, Enterprise Applications
      Info-Tech Research Group

      Phase milestones

      Launch the MMS Project and Collect Requirements — Phase 1

      • Understand the MMS market space.
      • Assess organizational and project readiness for MMS selection.
      • Structure your MMS selection and implementation project by refining your MMS roadmap.
      • Align organizational use-case fit with market use cases.
      • Collect, prioritize, and document MMS requirements.

      Shortlist MMS Tool — Phase 2

      • Review MMS market leaders and players within your aligned use case.
      • Review MMS vendor profiles and capabilities.
      • Shortlist MMS vendors based on organizational fit.

      Select an MMS — Phase 3

      • Submit request for proposal (RFP) to shortlisted vendors.
      • Evaluate vendor responses and develop vendor demonstration scripts.
      • Score vendor demonstrations and select the final product.

      Stop! Are you ready for this project?

      This Research Is Designed For:
      • IT applications directors and business analysts supporting their marketing teams in selecting and implementing a robust marketing solution.
      • Any organization looking to procure an MMS tool that will allow it to automate its marketing processes or learn more about the MMS vendor landscape.
      This Research Will Help You:
      • Understand today’s MMS market, specific to marketing automation, marketing intelligence, and social marketing use-case scenarios.
      • Understand MMS functionality as well as marketing terminology.
      • Follow best practices to prepare for and execute on selection, including requirements gathering and vendor evaluation.
      This Research Will Also Assist:
      • Marketing managers, brand managers, and any marketing professional looking to build a cohesive marketing platform.
      • MMS project teams or working groups tasked with managing an RFP process for vendor selection.
      This Research Will Help Them
      • Assess organizational and project readiness for embarking on MMS selection.
      • Draft an RFP, manage the vendor and product review process, and select a vendor.

      Executive summary

      Situation

      The MMS market is a landscape of vendors offering campaign management, multichannel support, analytics, and publishing tools. Many vendors specialize in some of these areas but not all. Sometimes multiple products are necessary – but determining which feature sets the organization truly needs can be a challenging task. The right technology stack is critical in order to bring automation to marketing initiatives.

      Complication

      • The first challenge is deciding whether to implement a full marketing suite or a point solution.
      • The number of marketing suites and point solutions has increased from 50 to more than 800 just in the past five years.
      • IT is receiving a growing number of marketing analytics requests and must be prepared to speak intelligently about marketing management vendor selection.

      Resolution

      • Leverage Info-Tech’s comprehensive three-phase approach to MMS selection projects: assess your organization’s preparedness to go into the selection stage, move through technology selection, and present decisions to stakeholders.
      • Conduct an MMS project preparedness assessment to ensure you maximize the value of your time, effort, and spend.
      • Determine whether your organization’s needs will best be met by a marketing management suite or a point solution.
      • Determine which use case your organization fits into and review the relevant vendor landscape, common capability, and areas of product differentiation. Consult Info-Tech’s market analysis to shortlist vendors for your RFP process.
      • Take advantage of traceable and auditable selection tools to run an effective evaluation and selection process. Be prepared to answer the retroactive question “Why this MMS?” with documentation of your selection process and outputs.

      Info-Tech Insight

      1. The new MMS market. Selecting a marketing management solution has become increasingly difficult, with the number of players in the marketplace ballooning to meet buyer demand.
      2. Direct translation to revenue. Picking the wrong marketing solution has a direct impact on the bottom line. However, the right MMS can lead to a 7.3x greater year-over-year increase in annual revenue.
      3. Don’t buy best-of-breed; buy best-for-you. Base your vendor selection on your requirements and use case, not on the vendor’s overall performance.

      MMS is a key piece of the CRM puzzle

      In order to optimize cross-sell opportunities and marketing effectiveness, there needs to be a master customer database, which belongs in the customer relationship management (CRM) suite.

      When it comes to marketing automation capabilities, using CRM is like building a car from a kit. All the parts are there, but you need the time and skill to put it all together. Using marketing automation is like buying the car you want or need, with all the features you want already installed and some gas in the tank, ready to drive. In either case, you still need to know how to drive and where you want to go.” (Mac McIntosh, Marketo Inc.) 'CRM' surrounded by its components with 'MMS' highlighted. A master database – the central place where all up-to-the-minute data on a customer profile is stored – is essential for MMS success. This is particularly true for real-time capability effectiveness and to minimize customer fatigue.

      Understand what an MMS can do for you

      Take time to learn the capabilities of modern marketing applications. Understanding the “art of the possible” will help you to get the most out of your MMS.

      MMS helps marketers in two primary ways:
      1. It allows them to efficiently execute and manage campaigns across dozens of channels and products.
      2. It allows them to analyze the outcomes of campaigns.
      Marketing suites accomplish these tasks by:
      • Leveraging workflow automation to reduce the amount of time spent creating marketing campaigns
      • Using internal or third-party data to increase conversion effectiveness from customer databases across the organization
      A strong MMS provides marketers with the data they need for actionable insights about their customers.
      A marketing automation solution delivers essentially all the benefits of an email marketing solution along with integrated capabilities that would otherwise need to be cobbled together using various standalone technologies.” (Marketo Inc.)

      Review Info-Tech’s vendor profiles of the MMS market to identify vendors that meet your requirements

      Logos of multiple vendors including 'Hubspot', 'IBM', 'Salesforce marketing cloud', etc.

      Use Info-Tech’s MMS implementation methodology as a starting point for your organization’s MMS selection

      Info-Tech’s implementation methodology is not a step-by-step approach to vendor selection, but rather it highlights the pertinent considerations for MMS selection at each of the five steps outlined below.

      1

      2

      3

      4

      5

      Establish Resources Gather Requirements Write and Assemble RFP Exercise Due Diligence Evaluate Candidate Solutions
      • Determine work initiative dependencies and project milestones.
      • Establish the project timeline.
      • Designate project resources.
      • Prioritize rollout of functionality.
      • Link business goals with the MMS selection project.
      • Determine user roles and profiles.
      • Conduct stakeholder interviews.
      • Build communication and change management plan.
      • Draft an RFP.
      • Make a plan for soliciting feedback and publishing the RFP.
      • Customize a vendor demo script and scorecard.
      • Conduct vendor demos.
      • Speak with vendor references.
      • Evaluate nonfunctional requirements.
      • Understand upgrade schedules.
      • Define a vendor evaluation framework.
      • Prepare the final evaluation.
      • Prepare a presentation for management.

      Contact your account representative or email Workshops@InfoTech.com for more information.

      Professional services provider engages Info-Tech to guide it through its MMS selection journey

      CASE STUDY

      Industry: Professional Services | Source: Info-Tech Consulting

      Challenge

      A large professional services firm specializing in knowledge development was looking to modernize an outdated marketing services stack.

      Previous investments in marketing tools ranging from email automation to marketing analytics led to system fragmentation. As a result, there was no 360-degree overview of marketing operations and no way to run campaigns at scale.

      To satisfy the organization’s aspirations, a comprehensive marketing management suite had to be selected that met needs for the foreseeable future.

      Solution

      The Info-Tech consulting team was brought in to assist in the MMS selection process.

      After meeting with several stakeholders, MMS requirements were developed and weighted. An RFP was then created from these requirements.

      Following a market scan, four vendors were selected to complete the organization’s RFP. Demonstration scripts were then developed as the RFPs were completed by vendors.

      Shortlisted vendors progressed to the demonstration phase.

      Results

      Vendor scorecards were utilized during the two-day demonstrations with the core project team to score each vendor.

      During the scoring process the team also identified the need to replace the organization’s core customer repository (a legacy CRM).

      The decision was made to select a CRM before finalizing the MMS selection. Doing so ensured uniform system architecture and strong interoperability between the firm’s MMS and its CRM.

      Info-Tech offers various levels of support to best suit your needs

      DIY Toolkit

      Guided Implementation

      Workshop

      Consulting

      "Our team has already made this critical project a priority, and we have the time and capability, but some guidance along the way would be helpful." "Our team knows that we need to fix a process, but we need assistance to determine where to focus. Some check-ins along the way would help keep us on track." "We need to hit the ground running and get this project kicked off immediately. Our team has the ability to take this over once we get a framework and strategy in place." "Our team does not have the time or the knowledge to take this project on. We need assistance through the entirety of this project."

      Diagnostics and consistent frameworks used throughout all four options

      Select a Marketing Management Suite – project overview

      1. Launch the MMS Project and Collect Requirements 2. Shortlist Marketing Management Suites 3. Select Vendor and Communicate Decision to Stakeholders
      Supporting Tool icon

      Best-Practice Toolkit

      1.1 Assess the value and identify your organization’s fit for MMS technology.

      1.2 Build your procurement team and project customer experience management (CXM) strategy.

      1.3 Identify your MMS requirements.

      2.1 Produce your shortlist

      3.1 Select your MMS

      3.2 Present selection

      Guided Implementations

      • Understand CXM strategy and identify your fit for MMS technology.
      • Identify staffing needs.
      • Plan requirements gathering steps.
      • Discuss use-case fit assessment results.
      • Discuss vendor landscape.
      • Create a procurement strategy.
      • Discuss executive presentation.
      • Conduct a proposal review.
      Associated Activity icon

      Onsite Workshop

      Module 1:
      Launch Your MMS Selection Project
      Module 2:
      Analyze MMS Requirements and Shortlist Vendors
      Module 3:
      Plan Your Procurement Process
      Phase 1 Outcome:
      • Launch of MMS selection project
      Phase 2 Outcome:
      • Shortlist of vendors
      Phase 3 Outcome:
      • Selection of MMS

      Use these icons to help direct you as you navigate this research

      Use these icons to help guide you through each step of the blueprint and direct you to content related to the recommended activities.

      A small monochrome icon of a wrench and screwdriver creating an X.

      This icon denotes a slide where a supporting Info-Tech tool or template will help you perform the activity or step associated with the slide. Refer to the supporting tool or template to get the best results and proceed to the next step of the project.

      A small monochrome icon depicting a person in front of a blank slide.

      This icon denotes a slide with an associated activity. The activity can be performed either as part of your project or with the support of Info-Tech team members who will come onsite to facilitate a workshop for your organization.

      A small monochrome icon depicting a descending bar graph.

      This icon denotes a slide that pertains directly to the Info-Tech vendor profiles on marketing management technology. Use these slides to support and guide your evaluation of the MMS vendors included in the research.

      Select a Marketing Management Suite

      PHASE 1

      Launch the MMS Project and Collect Requirements

      Phase 1 outline

      Associated Activity icon Call 1-888-670-8889 or email GuidedImplementations@InfoTech.com for more information.

      Complete these steps on your own, or call us to complete a guided implementation. A guided implementation is a series of 2-3 advisory calls that help you execute each phase of a project. They are included in most advisory memberships.

      Guided Implementation 1: Launch Your MMS Project and Collect Requirements

      Proposed Time to Completion: 3 weeks
      Step 1.2: Structure the Project Step 1.3: Gather Requirements
      Start with an analyst kick-off call:
      • Review readiness requirements for an MMS project.
      • Understand the work initiatives involved in MMS selection.
      Review findings with analyst:
      • Determine use case based on your organizational alignment.
      • Discuss core MMS requirements.
      Then complete these activities…
      • Conduct an organizational MMS readiness assessment.
      Then complete these activities…
      • Identify best-fit use case.
      • Elicit, capture, and prioritize requirements.
      With these tools & templates:
      • MMS Readiness Assessment Checklist
      With these tools & templates:
      • MMS Requirements Picklist Tool
      Phase 1 Results:
      • Completed readiness assessment.
      • Refined project plan to incorporate selection and implementation.

      Phase 1 milestones

      Launch the MMS Project and Collect Requirements — Phase 1

      • Understand the MMS market space.
      • Assess organizational and project readiness for MMS selection.
      • Structure your MMS selection and implementation project by refining your MMS roadmap.
      • Align organizational use-case fit with market use cases.
      • Collect, prioritize, and document MMS requirements.

      Shortlist MMS Tool — Phase 2

      • Review MMS market leaders and players within your aligned use case.
      • Review MMS vendor profiles and capabilities.
      • Shortlist MMS vendors based on organizational fit.

      Select an MMS — Phase 3

      • Submit request for proposal (RFP) to shortlisted vendors.
      • Evaluate vendor responses and develop vendor demonstration scripts.
      • Score vendor demonstrations and select the final product.

      Step 1.1: Understand the MMS market

      1.1

      1.2

      1.3

      Understand the MMS Market Structure the Project Gather MMS Requirements

      This step will walk you through the following activities:

      • MMS market overview

      This step involves the following participants:

      • Project team
      • Project manager
      • Project sponsor

      Outcomes of this step

      • An understanding of the evolution of the MMS market space and how it helps today’s organizations.
      • An evaluation of new and upcoming trends sought by MMS clients.
      • Verification of whether an MMS is a fit with your organization.

      Speak the same language as the marketing department to deliver the most business value

      Marketing Management Suite Glossary

      Analytics The practice of measuring marketing performance to improve return on investment (ROI). It is often carried out through the visualization of meaningful patterns in data as a result of marketing initiatives.
      Channels The different places where marketers can reach customers (e.g. social media, print mail, television).
      Click-through rate The percentage of individuals who proceed (click-through) from one part of a marketing campaign to the next.
      Content management Curating, creating, editing, and keeping track of content and client-facing assets.
      Customer relationship management (CRM) A core enterprise application that provides a broad feature set for supporting customer interaction processes. The CRM frequently serves as a core customer data repository.
      Customer experience management (CXM) The holistic management of customer interaction processes across marketing, sales, and customer service to create valuable, mutually beneficial customer experiences.
      Engagement rate A social media metric used to describe the amount of likes, comments, shares, etc., that a piece of content receives.
      Lead An individual or organization who has shown interest in the product or service being marketed.
      Omnichannel The portfolio of interaction channels you use.

      MMS is a key piece of the customer experience ecosystem

      Within the broader CXM ecosystem, an MMS typically lives within the CRM platform. Interfacing with the CRM’s master customer database allows an MMS to optimize cross-sell opportunities and marketing effectiveness.

      A master database – the central place where all up-to-the-minute data on a customer profile is stored – is essential for MMS success. This is particularly true for real-time capability effectiveness and to minimize customer fatigue.

      If you have customer records in multiple places, you risk missing customer opportunities and potentially upsetting clients. For example, if a client has communicated preferences or disinterest through one channel, and this is not effectively recorded throughout the organization, another representative is likely to contact them in the same method again – possibly alienating the customer for good.

      A master database requires automatic synchronization with all point solutions, POS, billing systems, agencies, etc. If you don’t have up-to-the-minute information, you can’t score prospects effectively and you lose out on the benefits of the MMS.

      'CRM' surrounded by its components with 'MMS' highlighted.
      Focus on the fundamentals before proceeding. Secure organizational readiness to reduce project risk using Info-Tech’s Build a Strong Technology Foundation for CXM and Select and Implement a CRM Platform blueprints.

      Understanding the “art of the possible”

      The world of marketing technology changes rapidly! Understand how modern marketing management suites are used in most organizations.

      An MMS helps marketers in two primary ways:

      1. It allows them to efficiently execute and manage campaigns across dozens of channels and products.
      2. It allows them to analyze the outcomes of campaigns.

      Marketing suites accomplish these tasks by:

      • Leveraging workflow automation to reduce the amount of time spent creating marketing campaigns.
      • Using internal or third-party data to increase conversion effectiveness from customer databases across the organization.

      A strong MMS provides marketers with the data they need for actionable insights about their customers.

      A marketing automation solution delivers essentially all the benefits of an email marketing solution along with integrated capabilities that would otherwise need to be cobbled together using various standalone technologies.” (Marketo Inc.)

      Inform your way of thinking by understanding the capabilities of modern marketing applications.

      A tree with icons related to knowledge.

      Expect the marketing department to drive suite adoption, but don’t count out the benefits MMS will also provide to IT

      MMS adoption is driven by the need for better campaign execution and marketing intelligence. MMS technologies are adopted to create faster, easier, more intelligent, and more measurable campaigns and make managing complex channels easy and repeatable.

      Top Drivers for Adopting Marketing Management Technologies

      Bar chart of top drivers for adopting marketing management technology. The first four bars are highlighted and the largest, they are labelled 'Campaign Measurement & Effectiveness', 'Execute Multi-channel Campaigns', 'Shorten Marketing Campaign Cycle', and 'Reduce Manual Campaign Creation'.
      (Source: Info-Tech Research Group; N=23)

      The key drivers for MMS are business-related, not IT-related. However, this does not mean that there are no benefits to IT. In fact, the IT department will see numerous benefits, including time and resource savings. Further, not having an MMS creates more work for your IT department. IT must serve as a valued partner for selection and implementation.

      Additional benefits to IT driven by MMS

      Marketing management suites are ideal for large organizations with multiple product lines in complex marketing environments. IT is often more centralized than its counterparts in the business, making it uniquely positioned to encourage greater coordination by helping the business units understand the shared goals and the benefits of working together to roll out suites for marketing workflow management, intelligence, and channel management.

      Cross-Segmentation Additional Revenue Generation Real-Time Capabilities Lead Growth/ Conversion Rate
      Business Value
      • Share resources between brands and product lines.
      • Increase database size with populated client data.
      • Track customer lifetime value.
      • Increase average deal size.
      • Decrease time to execute campaigns.
      • Decrease lead acquisition costs while collecting higher quality leads.
      • Improve retention rates.
      • Reduce cost to serve.
      • Increase customer retention due to effective service.
      • Higher campaign and response rates.
      • Track, measure, and prove the value of marketing activities.
      • Broaden reach through social channels.
      IT Value
      • Reduce reliance on IT for routine tasks such as list creation and data cleansing.
      • Free up IT resources for the sectors of the business where the ROI is greatest.
      • Reduce need for IT to cleanse, modify, or merge data lists because most suites include CRM connectors.
      • Reduce need for constant customization on status reports on lead value and campaign success.

      Info-Tech Insight

      Don’t forget that MMS technologies deliver on the overarching suite value proposition: a robust solution within one integrated offering. Without an MMS in play, organizations in need of this functionality are forced to piece together point solutions (or ad hoc management). This not only increases costs but also is an integration nightmare for IT.

      Step 1.2: Structure the project

      1.1

      1.2

      1.3

      Understand the MMS MarketStructure the ProjectGather MMS Requirements

      This step will walk you through the following activities:

      • Determine if you are ready to kick off the MMS selection project.
      • Align project goals with CXM strategy and business goals.

      This step involves the following participants:

      • Core project team
      • Project manager
      • Project sponsor

      Outcomes of this step

      • Assurance that you have completed adequate preparation, obtained stakeholder and sponsor buy-in, secured sufficient resources, and completed strategy and planning activities to move forward with selection.
      • An approach to remedy organizational readiness to prepare for MMS selection.
      • An understanding of stakeholder goals.

      Identify the scope and purpose of your MMS selection process

      Vendor Profiles icon

      Sample Project Overview

      [Organization] plans to select and implement a marketing management suite in order to introduce better campaign management to the business’ processes. This procurement and implementation of an MMS tool will enable the business to improve the efficiency and effectiveness of marketing campaign execution.

      This project will oversee the assessment and shortlisting of MMS vendors, selection of an MMS tool, the configuration of the solution, and the implementation of the technology into the business environment.

      Rationale Behind the Project

      Consider the business drivers behind the interest in MMS technology.

      Be specific to business units impacted and identify key considerations (both opportunities and risks).

      Business Drivers

      • Organizational productivity
      • Customer satisfaction
      • Marketing management costs
      • Risk management

      Info-Tech Insights

      Creating repeatable and streamlined marketing processes is a common overarching business objective that is driven by multiple factors. To ensure this objective is achieved, confirm that the primary drivers are following the implementation of the first automated marketing channels.

      Activity: Understand your business’ goals for MMS by parsing your formal CXM strategy

      Associated Activity icon 1.2.1 1 hour

      INPUT: Stakeholder user stories

      OUTPUT: Understanding of ideal outcomes from MMS implementation

      MATERIALS: Whiteboard and marker or sticky notes

      PARTICIPANTS: Project sponsor, Project stakeholders, Business analysts, Business unit reps

      Instructions

      1. Outline the purpose of the future MMS tool and the drivers behind this business decision with the project’s key stakeholders.
      2. Document plans to ensure that these drivers are taken into consideration and realized following implementation. Example:
        Improve Reduce/Eliminate KPIs
        Multichannel marketing Duplication of effort Number of customer interaction channels supported
        Social integration Process inefficiencies Number of social signals received (likes, shares, etc.)

      If you do not have a well-defined CXM strategy, leverage Info-Tech’s research to Build a Strong Technology Foundation for Customer Experience Management.

      Understanding marketing suites

      Vendor Profiles icon

      This blueprint focuses on complete, integrated marketing management suites

      An integrated suite is a single product that is designed to assist with multiple marketing processes. Information from these suites is deeply connected to the core CRM. Changing a piece of information for one process will update all affected.

      'MMS' surrounded by its integrated processes, including 'Marketing Operations Management', 'Breadth of Channel Support', 'Marketing Asset Management', etc.

      Understanding marketing point solutions

      Vendor Profiles icon

      A point solution typically interfaces with a single customer interaction channel with minimal CRM integration.

      Why use a marketing point solution?

      1. A marketing point solution is a standalone application used to manage a unique process.
      2. Point solutions can be implemented and updated relatively quickly.
      3. They cost less than full-feature, integrated marketing suites.
      4. Some point solutions integrate with CRM platforms or MMS platforms.

      Refer to Phase 2 for a bird’s-eye view of the point solution marketplace.

      Marketing Point Solutions

      • Twitter Analytics
      • Search Engine Optimization
      • Customer Portals
      • Livechat
      • Marketing Attribution
      • Demand Side Platform

      Determine if MMS is right for your organization

      Vendor Profiles icon

      Adopt an MMS if:

      1. Your organization is actively pursuing a multichannel marketing strategy, particularly if its marketing campaigns are complex and multifaceted, involving consumer-specific conditional messaging.
      2. Your enterprise serves a high volume of customers and marketing needs extend to formally managing budgets and resources, lead generation and segmentation, and measuring channel effectiveness.
      3. Your organizations has multiple product lines and is interested in increasing cross-sale opportunities.

      Bypass an MMS if:

      • Your organization does not participate in multichannel campaigns and is primarily using email or web channels to generate leads. You may find the advanced features and capabilities of an MMS to be overkill and should consider lead marketing automation (LMA) or email marketing services first.
      • You are a small to midsize business (SMB) with a limited budget or fewer than five marketing professionals. Don’t buy what you don’t need; organizations with fewer than five people in the marketing department are unlikely to need an MMS.
      • Sales generation is not a priority for the business or a primary goal for the marketing department.

      Info-Tech Insight

      Using an MMS is ideal for organizations with multiple brands and product portfolios (e.g. consumer packaged goods). Ad hoc management and email marketing services are best for small organizations with a client base that requires only bare bones engagement.

      Determine if you are ready to kick off your MMS selection and implementation project

      Supporting Tool icon 1.2.2 MMS Readiness Assessment Checklist
      Use Info-Tech’s MMS Readiness Assessment Checklist to determine if your organization has sufficient process and campaign maturity to warrant the investment in a consolidated marketing management suite.

      Sections of the Tool:

      1. Goals & Objectives
      2. Project Team
      3. Current State Understanding
      4. Future State Vision
      5. Business Process Improvement
      6. Project Metrics
      7. Executive Sponsorship
      8. Stakeholder Buy-In & Change Management
      9. Risk Management
      10. Cost & Budget

      INFO-TECH DELIVERABLE

      Sample of Info-Tech's MMS Readiness Assessment Checklist.

      Complete the MMS Readiness Assessment Checklist by following the instructions in Activity 1.2.3.

      Activity: Determine if you are ready to kick off your MMS selection project

      Associated Activity icon 1.2.3 30 minutes

      INPUT: MMS foundation, MMS strategy

      OUTPUT: Readiness remediation approach, Validation of MMS project readiness

      MATERIALS: Info-Tech’s MMS Readiness Assessment Checklist

      PARTICIPANTS: Project sponsor, Core project team

      Instructions

      1. Download the MMS Readiness Assessment Checklist.
      2. Review Section 1 of the checklist with the core project team and/or project sponsor, item by item. For completed items, tick the relative checkbox.
      3. Once the whole checklist has been reviewed, document all incomplete items in the table under Section 1 in the first table column (“Incomplete Readiness Item”).
      4. For each incomplete item, use your discretion to determine whether its completion is critical in preparation for MMS selection and implementation. This may vary given the complexity of your MMS project. If the item is critical to the project, indicate this with “Y” in the second column (“Criticality (Y/N)”).
      5. For each critical item, reflect on the barriers that have prevented or are preventing its completion. Possible barriers include incomplete task dependencies, low value-to-effort determination, lack of organizational knowledge or resources, pressure of deadlines, etc. Document these barriers in the third column (“Barriers to Completion”).
      6. Based on the barriers determined in Step 5, determine a remediation approach for each item. Document the approach in the fourth column (“Remediation Approach”).
      7. For each remediation activity, designate a due date and remediation owner. Document this in the fifth column (“Due Date & Owner”).
      8. Carry out the remediation of critical tasks and return to this blueprint to kickstart your selection and implementation project.

      Step 1.3: Gather MMS requirements

      1.1

      1.2

      1.3

      Understand the MMS MarketStructure the ProjectGather MMS Requirements

      This step will walk you through the following activities:

      • Understand your MMS use case.
      • Elicit and capture your MMS requirements.
      • Prioritize your solution requirements.

      This step involves the following participants:

      • Core project team
      • Project manager
      • Business analysts
      • Procurement subject-matter experts (SMEs)

      Outcomes of this step

      • Project alignment with MMS market use case.
      • Inventory of categorized and prioritized MMS business requirements.

      Understand the dominant use-case scenarios for MMS across organizations

      Vendor Profiles icon

      USE CASES

      While an organization may be product- or service-centric, most fall into one of the three use cases described on this slide.

      1) Marketing Automation

      Workflow Management

      Managing complex marketing campaigns and building and tracking marketing workflows are the mainstay responsibilities of brand managers and other senior marketing professionals. In this category, we evaluated vendors that provide marketers with comprehensive tools for marketing campaign automation, workflow building and tracking, lead management, and marketing resource planning for campaigns that need to reach a large segment of customers.

      Omnichannel Management

      The proliferation of marketing channels has created significant challenges for many organizations. In this use case, we executed a special evaluation of vendors that are well suited for the intricacies of juggling multiple channels, particularly mobile, social, and email marketing.

      2) Marketing Intelligence

      Sifting through data from a myriad of sources and coming up with actionable intelligence and insights remains a critical activity for marketing departments, particularly for market researchers. In this category, we evaluated solutions that aggregate, analyze, and visualize complex marketing data from multiple sources to allow decision makers to execute informed decisions.

      3) Social Marketing

      The proliferation of social networks, customer data, and use cases has made ad hoc social media management challenging. In this category we evaluated vendors that bring uniformity to an organization’s social media capabilities and contribute to a 360-degree customer view.

      Activity: Understand which type of MMS you need

      Associated Activity icon 1.3.1 30 minutes

      INPUT: Use-case breakdown

      OUTPUT: Project use-case alignments

      Materials: Whiteboard, markers

      Participants: Project manager, Core project team (optional)

      Instructions

      1. Familiarize your team with Info-Tech’s MMS use-case breakdown from the previous slide.
      2. Determine which use case is best aligned with your organization’s MMS project objectives. If you need assistance with this, consider the relevance of the cases studies and statements on the following slides.
      3. If your team agrees with most or all statements under a given use case, this indicates strong alignment towards that use case. It is possible for an organization to align with more than one use case. Your use-case alignment will guide you in creating a vendor shortlist later in this project.

      Use Info-Tech’s vendor research and use-case scenarios to support your organization’s vendor analysis

      The use-case view of vendor and product performance provides multiple opportunities for vendors to fit into your application architecture depending on their product and market performance. The use cases selected are based on market research and client demand.

      Determining your use case is crucial for:

      1. Selecting an application that is the right fit
      2. Establishing a business case for MMS

      The following slides illustrate how the three most common use cases (marketing automation, marketing intelligence, and social marketing) align with business needs. As shown by the case studies, the right MMS can result in great benefits to your organization.

      Use-case alignment and business need

      Vendor Profiles icon

      Marketing Automation

      Marketing Need Manage customer experience across multiple channels Manage multiple campaigns simultaneously Integrate web-enabled devices (IoT) into marketing campaigns Run and track email marketing campaigns
      A line of arrows pointing down.
      Corresponding Feature End-to-end management of email marketing Visual workflow editor Customer journey mapping Business rules engine A/B tracking

      The Portland Trail Blazers utilize an MMS to amplify their message with marketing automation technology

      CASE STUDY

      Industry: Entertainment | Source: Marketo

      Challenge

      The Portland Trail Blazers, an NBA franchise, were looking to expand their appeal beyond the city of Portland and into the greater Pacific Northwest Region.

      The team’s management group also wanted to showcase the full range of events that were hosted in the team’s multipurpose stadium.

      The Trail Blazers were looking to engage fans in a more targeted fashion than their CRM allowed for. Ultimately, they hoped to move from “batch and blast” email campaigns to an automated and targeted approach.

      Solution

      The Trail Blazers implemented an MMS that allowed it to rapidly build different types of campaigns. These campaigns could be executed across a variety of channels and target multiple demographics at various points in the fan journey.

      Contextual ads were implemented using the marketing suite’s automated customer journey mapping feature. Targeted ads were served based on a fan’s location in the journey and interactions with the Trail Blazers’ online collateral.

      Results

      The automated campaigns led to a 75% email open rate, which contributed to a 96% renewal rate for season ticket holders – a franchise record.

      Other benefits resulting from the improved conversion rate included an increased cohesion between the Trail Blazers’ marketing, analytics, and ticket sales operations.

      Use-case alignment and business need

      Vendor Profiles icon

      Marketing Intelligence

      Marketing Need Capture marketing- and customer-related data from multiple sources Analyze large quantities of marketing data Visualize marketing-related data in a manner that is easy for decision makers to consume Perform trend and predictive analysis
      A line of arrows pointing down.
      Corresponding Feature Integrate data across customer segments Analysis through machine learning Assign attributers to unstructured data Displays featuring data from external sources Create complex customer data visualizations

      Chico’s FAS uses marketing intelligence to drive customer loyalty

      CASE STUDY

      Industry: Retail | Source: SAS

      Challenge

      Women’s apparel retailer Chico’s FAS was looking to capitalize on customer data from in-store and online experiences.

      Chico’s hoped to consolidate customer data from multiple online and brick-and-mortar retail channels to get a complete view of the customer.

      Doing so would satisfy Chico’s need to create more highly segmented, cost-effective marketing campaigns

      Solution

      Chico’s selected an MMS with strong marketing intelligence, analysis, and data visualization capability.

      The MMS could consolidate and analyze customer and transactional information. The suite’s functionality enabled Chico’s marketing team to work directly with the data, without help from statisticians or IT staff.

      Results

      The approach to marketing indigence led to customers getting deals on products that were actually relevant to them, increasing sales and brand loyalty.

      Moreover, the time it took to perform data consolidation decreased dramatically, from 17 hours to two hours, allowing the process to be performed daily instead of weekly.

      Use-case alignment and business need

      Vendor Profiles icon

      Social Marketing

      Marketing Need Understand customers' likes and dislikes Manage and analyze social media channels like Facebook and Twitter Foster a conversation around specific products Engage international audiences through regional messaging apps
      A line of arrows pointing down.
      Corresponding Feature Social listening capabilities Tools for curating customer community content Ability to aggregate social data Integration with popular social networks Ability to conduct trend reporting

      Bayer leverages MMS technology to cultivate a social presence

      CASE STUDY

      Industry: Life Sciences | Source: Adobe

      Challenge

      Bayer, a Fortune 500 health and life sciences company, was looking for a new way to communicate its complex medical breakthroughs to the general public.

      The decision was made to share the science behind its products via social channels in order to generate excitement.

      Bayer needed tools to publish content across a variety of social media platforms while fostering conversations that were more focused on the science behind products.

      Solution

      Based on the requirements, Bayer decided that an MMS would be the best fit.

      After conducting a market scan, the company selected an MMS with a comprehensive social media suite.

      The suite included tools for social listening and moderation and tools to guide conversations initiated by both marketers and customers.

      Results

      The MMS provided Bayer with the toolkit to engage its audience.

      Bayer took control of the conversation about its products by serving potential customers with relevant video content on social media.

      Its social strategy coupled with advanced engagement tools resulted in new business opportunities and more than 65,000 views on YouTube and more than 87,000 Facebook views in a single month.

      Leverage Info-Tech’s requirements gathering framework to serve as the basis for capturing your MMS requirements

      An important step in selecting an MMS that will have widespread user adoption is creating archetypal customer personas. This will enable you to talk concretely about them as consumers of the application you select and allow you to build buyer scenarios around them.
      REQUIREMENTS GATHERING
      Info-Tech’s requirements gathering framework is a comprehensive approach to requirements management that can be scaled to any size of project or organization. This framework ensures that the application created will capture the needs of all stakeholders and deliver business value. Develop and right-size a proven standard operating procedure for requirements gathering with Info-Tech’s blueprint Build a Strong Approach to Business Requirements Gathering.
      Stock photo of a Jenga tower with title: Build a Strong Approach to Business Requirements Gathering
      KEY INPUTS TO MMS REQUIREMENTS GATHERING
      Requirements Gathering Methodology

      Sample of Requirements Gathering Blueprint.

      Requirements Gathering Blueprint Slide 25: Understand the best-practice framework for requirements gathering for enterprise applications projects.

      Requirements Gathering SOP

      Sample of Requirements Gathering Blueprint.

      Requirements Gathering Blueprint Activities 1.2.2-1.2.5, 2.1.1, 2.1.2, 3.1.1, 3.2.1, 4.1.1-4.1.3, 4.2.2: Consolidate outputs to right-size a best-practice SOP for your organization.

      Project Level Selection Tool

      Sample of Requirements Gathering Blueprint.

      Requirements Gathering Blueprint Activity 1.2.4: Determine project-level selection guidelines to inform the due diligence required in your MMS requirements gathering.

      Activity: Elicit and capture your MMS requirements

      Associated Activity icon 1.3.2 Varies

      INPUT: MMS tool user expertise, MMS Requirements Picklist Tool

      OUTPUT: A list of needs from the MMS tool user perspective

      Materials: Note-taking materials, Whiteboard or flip chart, markers

      Participants: MMS users in the organization, MMS selection committee

      Instructions

      1. Identify stakeholders for the requirements gathering exercise. Consider holding one-on-one sessions or large focus groups with key stakeholders or the project sponsor to gather business requirements for an MMS.
      2. Use the MMS Requirements Picklist Tool as a starting point for conducting the requirements elicitation session(s).
      3. Begin by reading the instructions in the template and then move to the “Requirements” worksheet. Read each defined requirement in the worksheet and indicate in the “Requirement Status” column whether the requirement is a “Must,” “High,” or “Low.” Confirming the status is an important part of the exercise. The status will help filter vendors for final selection later on in the process.
      4. Decide whether additional requirements are necessary by asking the MMS tool users. If so, add the requirements to the bottom of the “Requirements” worksheet and indicate their “Requirement Status.”

      Download the MMS Requirements Picklist Tool to help with completing this activity.

      Show the measurable benefits of MMS with metrics

      The return on investment (ROI) and perceived value of the organization’s marketing solution will be a critical indication of the likelihood of success of the suite’s selection and implementation.

      EXAMPLE
      METRICS

      MMS and Technology Adoption

      Marketing Performance Metrics
      Average revenue gain per campaign Quantity and quality of marketing insights
      Average time to execute a campaign Customer acquisition rates
      Savings from automated processes Marketing cycle times
      User Adoption and Business Feedback Metrics
      User satisfaction feedback User satisfaction survey with the technology
      Business adoption rates Application overhead cost reduction

      Info-Tech Insight

      Even if marketing metrics are difficult to track right now, the implementation of an MMS brings access to valuable customer intelligence from data that was once kept in silos.

      If you want additional support, have our analysts guide you through this phase as part of an Info-Tech Workshop Associated Activity icon

      Book a workshop with our Info-Tech analysts:

      Photo of an Info-Tech analyst.
      • To accelerate this project, engage your IT team in an Info-Tech workshop with an Info-Tech analyst team.
      • Info-Tech analyst will join you and your team onsite at your location or welcome you to Info-Tech's historic Toronto office to participate in an innovative onsite workshop.
      • Contact your account manager (www.infotech.com/account), or email Workshops@InfoTech.com for more information.

      The following are sample activities that will be conducted by Info-Tech analysts with your team:

      1.2.1

      Sample of activity 1.2.1 'Understand your business' goals for MMS by parsing your formal CXM strategy'. Align the CXM strategy value proposition to MMS capabilities

      Our facilitator will help your team identify the IT CXM strategy and marketing goals. The analyst will then work with the team to map the strategy to technological drivers available in the MMS market.

      1.3.2

      Sample of activity 1.3.2 'Elicit and capture your MMS requirements'. Define the needs of MMS users

      Our facilitator will work with your team to identify user requirements for the MMS Requirements Picklist Tool. The analyst will facilitate a discussion with your team to prioritize identified requirements.

      Select a Marketing Management Suite

      PHASE 2

      Shortlist Marketing Management Suites

      Phase 2 outline

      Associated Activity icon Call 1-888-670-8889 or email GuidedImplementations@InfoTech.com for more information.

      Complete these steps on your own, or call us to complete a guided implementation. A guided implementation is a series of 2-3 advisory calls that help you execute each phase of a project. They are included in most advisory memberships.

      Guided Implementation 2: Shortlist Marketing Management Suites

      Proposed Time to Completion: 1-3 months
      Step 2.1: Analyze and Shortlist MMS Vendors
      Start with an analyst kick-off call:
      • Review requirements gathering findings.
      • Review the MMS market space.
      Then complete these activities…
      • Review vendor profiles and analysis.
      • Weigh the evaluation criteria’s importance in product capabilities and vendor characteristics.
      • Shortlist MMS vendors.
      With these tools & templates:
      Phase 2 Results:
      • Shortlist of MMS tools

      Phase 2 milestones

      Launch the MMS Project and Collect Requirements — Phase 1

      • Understand the MMS market space.
      • Assess organizational and project readiness for MMS selection.
      • Structure your MMS selection and implementation project by refining your MMS roadmap.
      • Align organizational use-case fit with market use cases.
      • Collect, prioritize, and document MMS requirements.

      Shortlist MMS Tool — Phase 2

      • Review MMS market leaders and players within your aligned use case.
      • Review MMS vendor profiles and capabilities.
      • Shortlist MMS vendors based on organizational fit.

      Select an MMS — Phase 3

      • Submit request for proposal (RFP) to shortlisted vendors.
      • Evaluate vendor responses and develop vendor demonstration scripts.
      • Score vendor demonstrations and select the final product.

      Step 2.1: Analyze and shortlist MMS vendors

      2.1

      Analyze and Shortlist MMS Vendors

      This step will walk you through the following activities:

      • Review MMS vendor landscape.
      • Take note of relevant point solutions.
      • Shortlist vendors for the RFP process.

      This step involves the following participants:

      • Core project team

      Outcomes of this step

      • Understanding of Info-Tech’s use-case scenarios for MMS: marketing automation, marketing intelligence, and social marketing.
      • Familiarity with the MMS vendor landscape.
      • Shortlist of MMS vendors for RFP process.

      Familiarize yourself with the MMS market: How it got here

      Vendor Profiles icon

      Loosely Tied Together

      Originally the sales and marketing enterprise application space was highly fragmented, with disparate best-of-breed point solutions patched together. Soon after, vendors in the late 1990s started bundling automation technologies into a single suite offering. Marketing capabilities of CRM suites were minimal at best and often restricted to web and email only.

      Limited to Large Enterprises

      Many vendors started to combine all marketing tools into a single, comprehensive marketing suite, but cost and complexity limited them to large enterprises and marketing agencies.

      Best-of-breed solutions targeting new channels and new goals, like closed-loop sales and marketing, continued driving new marketing software genres, like dedicated lead management suites.

      In today’s volatile business environment, judgment built from past experience is increasingly unreliable. With consumer behaviors in flux, once-valid assumptions (e.g. ‘older consumers don’t use Facebook or send text messages’) can quickly become outdated.” (SAS Magazine)

      Info-Tech Insight

      As the market evolves, capabilities that were once cutting edge become default and new functionality becomes differentiating. Some features, like basic CRM integration, have become table stakes capabilities. Focus on advanced analytics features and omnichannel integration capabilities to get the best fit for your requirements.

      Familiarize yourself with the MMS market: Where it’s going

      Vendor Profiles icon

      AI and Machine Learning

      Vendors are beginning to offer AI capabilities across MMS for data-driven customer engagement scoring and social listening insights. Machine learning capability is being leveraged to determine optimal customer journey and suggest next steps to users.

      Marketplace Fragmentation

      The number of players in the marketing application space has grown exponentially. The majority of these new vendors offer point solutions rather than full-blown marketing suites. Fragmentation is leading to tougher choices when looking to augment an existing platform with specific functionality.

      Improving Application Integration

      MMS vendors are fostering deeper integrations between their marketing products and core CRM products, leading to improved data hygiene. At the same time, vendors are improving flexibility in the marketing suite so that new channels can be added easily.

      Greater Self-Service

      Vendors have an increased emphasis on application usability. Their goal is to enable marketers to execute campaigns without relying on specialists.

      There’s a firehose of customer data coming at marketers today, and with more interconnected devices emerging (wearables, smart watches, etc.), cultivating a seamless customer experience is likely to grow even more challenging.

      Building out a data-driven marketing strategy and technology stack that enables you to capture behaviors across channels is key.” (IBM, Ideas for Exceeding Customer Expectations)

      Review Info-Tech’s vendor profiles of the MMS market to identify vendors that meet your requirements

      Vendors & Products Evaluated

      Vendor logos including 'Adobe', 'ORACLE', and 'IBM'.

      VENDOR PROFILES

      Review the MMS Vendor Evaluation

      Large icon of a descending bar graph for vendor profiles title page.

      Table stakes are the minimum standard; without these, a product doesn’t even get reviewed

      Vendor Profiles icon

      TABLE STAKES

      Feature Table Stake Functionality
      Basic Workflow Automation Simple automation of common marketing tasks (e.g. handling inbound leads).
      Basic Channel Integration Integration with minimum two or more marketing channels (e.g. email and direct mail).
      Customizable User Interface A user interface that can be changed and optimized to users’ preferences. This includes customizable dashboards for displaying relevant marketing metrics.
      Basic Mobile UX Accessible from a mobile device in some fashion.
      Cloud Compatibility Able to offer integration within pre-existing or proprietary cloud server. Many vendors only have SaaS products.

      What does this mean?

      The products assessed in these vendor profiles meet, at the very least, the requirements outlined as table stakes.

      Many of the vendors go above and beyond the outlined table stakes; some even do so in multiple categories. This section aims to highlight the products’ capabilities in excess of the criteria listed here.

      Info-Tech Insight

      If table stakes are all you need from your MMS, determine whether your existing CRM platform already satisfies your requirements. Otherwise, dig deeper to find the best price-to-value ratio for your needs.

      Take a holistic approach to vendor and product evaluation

      Almost – or equally – as important as evaluating vendor feature capabilities is the need to evaluate vendor viability and non-functional aspects of the MMS. Include an evaluation of the following criteria in your vendor scoring methodology:

      Vendor Attribute Description
      Vendor Stability and Variability The vendor’s proven ability to execute on constant product improvement, deliberate strategic direction, and overall commitment to research and development efforts in responding to emerging trends.
      Security Model The potential to integrate the application to existing security models and the vendor's approach to handling customer data.
      Deployment Style The choice to deploy a single or multi-tenant SaaS environment via a perpetual license.
      Ease of Customization The relative ease with which a system can be customized to accommodate niche or industry-specific business or functional needs.
      Vendor Support Options The availability of vendor support options, including selection consulting, application development resources, implementation assistance, and ongoing support resources.
      Size of Partner Ecosystem The quantity of enterprise applications and third-party add-ons that can be linked to the MMS, as well as the number of system integrators available.
      Ease of Data Integration The relative ease with which the system can be integrated with an organization’s existing application environment, including legacy systems, point solutions, and other large enterprise applications.

      Info-Tech Insight

      Evaluate vendor capabilities, not just product capabilities. An MMS is typically a long-term commitment; ensure that your organization is teaming up with a vendor or provider that you feel you can work well with and depend on.

      Advanced features are the capabilities that allow for granular differentiation of market players and use-case performance

      Vendor Profiles icon

      Evaluation Methodology

      These product features were assessed as part of the classification of vendors into use cases. In determining use-case leaders and players, select features were considered based on best alignment with the use case.

      Feature Advanced Functionality
      Advanced Campaign Management End-to-end marketing campaign management: customer journey mapping, campaign initiation, monitoring, and dynamic reporting and adjustment.
      Marketing Asset Management Content repository functionality (or tight ECM integration) for marketing assets and campaign collateral (static, multimedia, e-commerce–related, etc.).
      Marketing Analytics
      • Predictive analytics; machine learning; capabilities for data ingestion and visualization across various marketing research/marketing intelligence categories (demographic, psychographic, etc.).
      • Data segmentation; drill-down ability to assign attributes to unstructured data; ability to construct complex customer/competitive data visualizations from segmented data.
      Breadth of Channel Support Ability to support and manage a wide range of marketing channels (e-commerce, SEO/SEM, paid advertising, email, traditional [print, multimedia], etc.).
      Marketing Workflow Management Visual workflow editors and business rules engine creation.

      Advanced features are the capabilities that allow for granular differentiation of market players and use-case performance

      Vendor Profiles icon

      Evaluation Methodology

      These product features were assessed as part of the classification of vendors into use cases. In determining use-case leaders and players, select features were considered based on best alignment with the use case.

      Feature Advanced Functionality
      Community Marketing Management Branded customer communities (e.g. community support forums) and DMB/DSP.
      Email Marketing Automation End-to-end management of email marketing: email templates, email previews, spam testing, A/B tracking, multivariate testing, and email metrics tracking.
      Social Marketing Ability to integrate with popular social media networks and manage social properties and to aggregate and analyze social data for trend reporting.
      Mobile Marketing Ability to manage SMS, push, and mobile application marketing.
      Marketing Operations Management Project management tools for marketers (timelines, performance indicators, budgeting/resourcing tools, etc.).

      Use the information in the MMS vendor profiles to streamline your vendor analysis process

      Vendor Profiles icon This section includes profiles of the vendors evaluated against the previously outlined framework.
      Review the use-case scenarios relevant to your organization’s use case to identify a vendor’s fit to your organization’s MMS needs.
      • L = Use-case leader
      • P = Use-case player
      Three column headers: 'Marketing Automation', 'Marketing Intelligence', and 'Social Media Marketing'.
      Understand your organization’s size and whether it falls within the product’s market focus.
      • Large enterprise: 2,000+ employees and revenue of $250M+
      • Small-medium enterprise: 30-2,000 employees and revenue of $25M-$250M
      Column header 'MARKET FOCUS' with row headers 'Small-Medium' and 'Large Enterprise'.
      Review the differentiating features to identify where the application performs best. A list of features.
      Colors signify a feature’s performance. A key for color-coding: Blue - 'Best of Breed', Green - 'Present: Competitive Strength', Yellow-Green - 'Present: Competitive Parity', Yellow - 'Semi-Present', Grey - 'Absent'.

      Adobe Marketing Cloud

      Vendor Profiles icon
      Logo for Adobe. FUNCTIONAL SPOTLIGHT

      Creative Cloud Integration: To make for a more seamless cross-product experience, projects can be sent between Marketing Cloud and Creative Cloud apps such as Photoshop and After Effects.

      Sensei: Adobe has revamped its machine learning and AI platform in an effort to integrate AI into all of its marketing applications. Sensei includes data from Microsoft in a new partnership program.

      Anomaly Detection: Adobe’s Anomaly Detection contextualizes data and provides a statistical method to determine how a given metric has changed in relation to previous metrics.

      USE-CASE PERFORMANCE
      Marketing
      Automation
      Marketing
      Intelligence
      Social
      Marketing

      L

      L

      P

      MARKET FOCUS
      Small-Medium
      Large Enterprise
      Adobe’s goal with Marketing Cloud is to help businesses provide customers with cohesive, seamless experiences by surfacing customer profiles in relevant situations quickly. Adobe Marketing Cloud has traditionally been used in the B2C space but has seen an increase in B2C use cases driven by the finance and technology sectors. FEATURES
      Color-coded ranking of each feature for Adobe.
      Employees (2018): 17,000 Presence: Global Founded: 1982 NASDAQ: ADBE

      HubSpot

      Vendor Profiles icon

      Logo for Hubspot.FUNCTIONAL SPOTLIGHT

      Content Optimization System (COS): The fully integrated system stores assets and serves them to their designated channels at relevant times. The COS is integrated into HubSpot's marketing platform.

      Email Automation: HubSpot provides basic email that can be linked to a specific part of an organization’s marketing funnel. These emails can also be added to pre-existing automated workflows.

      Email Deliverability Tool: HubSpot identifies HTML or content that will be flagged by spam filters. It also validates links and minimizes email load times.

      USE-CASE PERFORMANCE
      Marketing
      Automation
      Marketing
      Intelligence
      Social
      Marketing

      P

      P

      P

      MARKET FOCUS
      Small-Medium
      Large Enterprise
      Hubspot’s primary focus has been on email marketing campaigns. It has put effort into developing solid “click not code” email marketing capabilities. Also, Hubspot has an official integration with Salesforce for expanded operations management and analytics capabilities. FEATURES
      Color-coded ranking of each feature for Hubspot.
      Employees (2018): 1,400 Presence: Global Founded: 2006 NYSE: HUBS

      IBM Marketing Cloud

      Vendor Profiles icon

      Logo for IBM.FUNCTIONAL SPOTLIGHT

      Watson: IBM is leveraging its popular Watson AI brand to generate marketing insights for automated campaigns.

      Weather Effects: Set campaign rules based on connections between weather conditions and customer behavior relative to zip code made by Watson.

      Real-Time Personalization: IBM has made efforts to remove campaign interaction latency and optimize live customer engagement by acting on information about what customers are doing in the current moment.

      USE-CASE PERFORMANCE
      Marketing
      Automation
      Marketing
      Intelligence
      Social
      Marketing

      L

      L

      P

      MARKET FOCUS
      Small-Medium
      Large Enterprise
      IBM has remained ahead of the curve by incorporating its well-known AI technology throughout Marketing Cloud. The application’s integration with the wide array of IBM products makes it a powerful tool for users already in the IBM ecosystem. FEATURES
      Color-coded ranking of each feature for IBM.
      Employees (2018): 380,000 Presence: Global Founded: 1911 NYSE: IBM

      Marketo

      Vendor Profiles icon

      Logo for Marketo.FUNCTIONAL SPOTLIGHT

      Content AI: Marketo has leveraged its investments in machine learning to intelligently fetch marketing assets and serve them to customers based on their interactions with a campaign.

      Email A/B Testing: To improve lead generation from email campaigns, Marketo features the ability to execute A/B testing for customized campaigns.

      Partnership with Google: Marketo is now hosted on Google’s cloud platform, enabling it to provide support for larger enterprise clients and improve GDPR compliance.

      USE-CASE PERFORMANCE
      Marketing
      Automation
      Marketing
      Intelligence
      Social
      Marketing

      P

      P

      P

      MARKET FOCUS
      Small-Medium
      Large Enterprise
      Marketo has strong capabilities for lead management but has recently bolstered its analytics capabilities. Marketo is hoping to capture some of the analytics application market share by offering tools with varying complexity and to cater to firms with a wide range of analytics needs. FEATURES
      Color-coded ranking of each feature for Marketo.
      Employees (2018): 1,000 Presence: Global Founded: 2006 Private Corporation

      Oracle Marketing Cloud

      Vendor Profiles icon

      Logo for Oracle.FUNCTIONAL SPOTLIGHT

      Data Visualization: To make for a more seamless cross-product experience, marketing projects can be sent between Marketing Cloud and Creative Cloud apps such as Dreamweaver.

      ID Graph: Use ID Graph to unite disparate data sources to form a singular profile of leads, making the personalization and contextualization of campaigns more efficient.

      Interest-Based Messaging: Pause a campaign to update a segment or content based on aggregated customer activity and interaction data.

      USE-CASE PERFORMANCE
      Marketing
      Automation
      Marketing
      Intelligence
      Social
      Marketing

      P

      P

      P

      MARKET FOCUS
      Small-Medium
      Large Enterprise
      Oracle Marketing Cloud is known for its balance between campaigns and analytics products. Oracle has taken the lead on expanding its marketing channel mix to include international options such as WeChat. Users already using Oracle’s CRM/CEM products will derive the most value from Marketing Cloud. FEATURES
      Color-coded ranking of each feature for Oracle.
      Employees (2018): 138,000 Presence: Global Founded: 1977 NYSE: ORCL

      Salesforce Marketing Cloud

      Vendor Profiles icon

      Logo for Salesforce Marketing Cloud.FUNCTIONAL SPOTLIGHT

      Einstein: Salesforce is putting effort into integrating AI into all of its applications. The Einstein AI platform provides marketers with predictive analytics and insights into customer behavior.

      Mobile Studio: Salesforce has a robust mobile marketing offering that encompasses SMS/MMS, in-app engagement, and group messaging platforms.

      Journey Builder: Salesforce created Journey Builder, which is a workflow automation tool. Its user-friendly drag-and-drop interface makes it easy to automate responses to customer actions.

      USE-CASE PERFORMANCE
      Marketing
      Automation
      Marketing
      Intelligence
      Social
      Marketing

      L

      P

      L

      MARKET FOCUS
      Small-Medium
      Large Enterprise
      Salesforce Marketing Cloud is primarily used by organizations in the B2C space. It has strong Sales Cloud CRM integration. Pardot is positioning itself as a tool for sales teams in addition to marketers. FEATURES
      Color-coded ranking of each feature for Salesforce Marketing Cloud.
      Employees (2018): 1,800 Presence: Global Founded: 2000 NYSE: CRM

      Salesforce Pardot

      Vendor Profiles icon

      Logo for Salesforce Pardot.FUNCTIONAL SPOTLIGHT

      Engagement Studio: Salesforce is putting marketing capabilities in the hands of sales reps by giving them access to a team email engagement platform.

      Einstein: Salesforce’s Einstein AI platform helps marketers and sales reps identify the right accounts to target with predictive lead scoring.

      Program Steps: Salesforce developed a distinct own workflow building tool for Pardot. Workflows are made of “Program Steps” that have the functionality to initiate campaigns based on insights from Einstein.

      USE-CASE PERFORMANCE
      Marketing
      Automation
      Marketing
      Intelligence
      Social
      Marketing

      P

      P

      -

      MARKET FOCUS
      Small-Medium
      Large Enterprise
      Pardot is Salesforce’s B2B marketing solution. Pardot has focused on developing tools that enable sales teams and marketers to work in lockstep in order to achieve lead-generation goals. Pardot has deep integration with Salesforce’s CRM and customer service management products. FEATURES
      Color-coded ranking of each feature for Salesforce Pardot.
      Employees (2018): 1,800 Presence: Global Founded: 2000 NYSE: CRM

      SAP Hybris Marketing

      Vendor Profiles icon

      Logo for SAP.FUNCTIONAL SPOTLIGHT

      CMO Dashboard: The specialized dashboard is aimed at providing overviews for the executive level. It includes the ability to coordinate marketing activities and project budgets, KPIs, and timelines.

      Loyalty Management: SAP features in-app tools to manage campaigns specifically geared toward customer loyalty with digital coupons and iBeacons.

      Customer Segmentation: SAP’s predictive capabilities dynamically suggest relevant customer profiles for new campaigns.

      USE-CASE PERFORMANCE
      Marketing
      Automation
      Marketing
      Intelligence
      Social
      Marketing

      P

      L

      P

      MARKET FOCUS
      Small-Medium
      Large Enterprise
      SAP Hybris Marketing Cloud optimizes marketing strategies in real time with accurate attribution and measurements. SAP’s operations management capabilities are robust, including the ability to view consolidated data streams from ongoing marketing plans, performance targets, and budgets. FEATURES
      Color-coded ranking of each feature for SAP.
      Employees (2018): 84,000 Presence: Global Founded: 1972 NYSE: SAP

      SAS Marketing Intelligence

      Vendor Profiles icon

      Logo for SAS.FUNCTIONAL SPOTLIGHT

      Activity Map: A user-friendly workflow builder that can be used to execute campaigns. Multiple activities can be simultaneously A/B tested within the Activity Map UI. The outcome of the test can automatically adjust the workflow.

      Spots: A native digital asset manager that can store property that is part of existing and future campaigns.

      Viya: A framework for fully integrating third-party data sources into SAS Marketing Intelligence. Viya assists with pairing on-premises databases with a cloud platform for use with the SAS suite.

      USE-CASE PERFORMANCE
      Marketing
      Automation
      Marketing
      Intelligence
      Social
      Marketing

      P

      L

      MARKET FOCUS
      Small-Medium
      Large Enterprise
      SAS has been a leading BI and analytics provider for more than 35 years. Rooted in statistical analysis of data, SAS products provide forward-looking strategic insights. Organizations that require extensive customer intelligence capabilities and the ability to “slice and dice” segments should have SAS on their shortlist. FEATURES
      Color-coded ranking of each feature for SAS.
      Employees (2018): 14,000 Presence: Global Founded: 1976 Private Corporation

      Consider alternative MMS vendors not included in Info-Tech’s vendor profiles

      Info-Tech evaluated only a portion of vendors in the MMS market. In order for a vendor to be included in this landscape, the company needed to meet three baseline criteria:
      1. Our clients must be talking about the solution.
      2. Our analysts must believe the solution will play well within the evaluation.
      3. The vendor must meet table stakes criteria.
      Below is a list of notable vendors in the space that did not meet all of Info-Tech’s inclusion requirements.

      Additional vendors in the MMS market:

      Logo for act-on. Logo for SharpSpring.

      See the next slides for suggested point solutions.

      Leverage Info-Tech’s WXM and SMMP vendor landscapes to select platforms that fit with your CXM strategy

      Web experience management (WXM) and social media management platforms (SMMP) act in concert with your MMS to execute complex campaigns.

      Social Media Management

      Info-Tech’s SMMP selection guide enables you to find a solution that satisfies your objectives across marketing, sales, public relations, HR, and customer service. Create a unified framework for driving successful implementation and adoption of your SMMP that fully addresses CRM and marketing automation integration, end-user adoption, and social analytics with Info-Tech’s blueprint Select and Implement a Social Media Management Platform.

      Stock image with the title Select and Implement a Social Media Management Platform.
      Web Experience Management

      Info-Tech’s approach to WXM ensures you have the right suite of tools for web content management, experience design, and web analytics. Put your best foot forward by conducting due diligence as the selection project advances. Ensure that your organization will see quick results with Info-Tech’s blueprint Select and Implement a Web Experience Management Solution.

      Stock image with the title Select and Implement a Web Experience Management Solution.

      POINT SOLUTION PROFILES

      Review this cursory list of point solutions by use case

      Consider point solutions if a full suite is not required

      Large icon of a target for point solution profiles title page.

      Consider point solutions if a full suite is not required

      Email Marketing

      Logos of companies for Email Marketing including MailChimp and emma.

      Consider point solutions if a full suite is not required

      Search Engine Optimization (SEO)

      Logos of companies for Search Engine Optimization including SpyFu and SerpStat.

      Consider point solutions if a full suite is not required

      Demand-Side Platform (DSP)

      Logos of companies for Demand-Side Platform including MediaMath and rocketfuel.

      Consider point solutions if a full suite is not required

      Customer Portal Software

      Logos of companies for Customer Portal Software including LifeRay and lithium.

      Select a Marketing Management Suite

      PHASE 3

      Select Vendor and Communicate Decision to Stakeholders

      Phase 3 outline

      Associated Activity icon Call 1-888-670-8889 or email GuidedImplementations@InfoTech.com for more information.

      Complete these steps on your own, or call us to complete a guided implementation. A guided implementation is a series of 2-3 advisory calls that help you execute each phase of a project. They are included in most advisory memberships.

      Guided Implementation 3: Plan Your MMS Implementation

      Proposed Time to Completion: 2 weeks
      Step 3.1: Select Your MMS Step 3.2: Communicate the Decision to Stakeholders
      Start with an analyst kick-off call:
      • Review the MMS shortlist.
      • Discuss how to link RFP questions and demo script scenarios to gathered requirements.
      Review findings with analyst:
      • Review the alignment between MMS capability and the business’ CXM strategy.
      • Discuss how to present the decision to stakeholders.
      Then complete these activities…
      • Build a vendor response template.
      • Evaluate RFP responses from vendors.
      • Build demo scripts and set up product demonstrations.
      • Establish evaluation criteria.
      • Select MMS product and vendor.
      Then complete these activities…
      • Present decision rationale to stakeholders.
      With these tools & templates:
      • MMS Request for Proposal Template
      • MMS Vendor Demo Script
      With these tools & templates:
      • MMS Selection Executive Presentation Template
      Phase 3 Results
      • Select an MMS that meets requirements and is approved by stakeholders.

      Phase 3 milestones

      Launch the MMS Project and Collect Requirements — Phase 1

      • Understand the MMS market space.
      • Assess organizational and project readiness for MMS selection.
      • Structure your MMS selection and implementation project by refining your MMS roadmap.
      • Align organizational use-case fit with market use cases.
      • Collect, prioritize, and document MMS requirements.

      Shortlist MMS Tool — Phase 2

      • Review MMS market leaders and players within your aligned use case.
      • Review MMS vendor profiles and capabilities.
      • Shortlist MMS vendors based on organizational fit.

      Select an MMS — Phase 3

      • Submit request for proposal (RFP) to shortlisted vendors.
      • Evaluate vendor responses and develop vendor demonstration scripts.
      • Score vendor demonstrations and select the final product.

      Step 2.1: Analyze and shortlist MMS vendors

      3.1

      3.2

      Select Your MMS Communicate Decision to Stakeholders

      This step will walk you through the following activities:

      • Build a response template to standardize potential vendor responses and streamline your evaluation process.
      • Evaluate the RFPs you receive with a clear scoring process and evaluation framework.
      • Build a demo script to evaluate product demonstrations by vendors.
      • Select your solution.

      This step involves the following participants:

      • Core project team
      • Procurement SMEs
      • Project sponsor

      Outcomes of this step

      • Completed MMS RFP vendor response template
      • Completed MMS demo script(s)
      • Established product and vendor evaluation criteria
      • Final MMS selection

      Activity: Shortlist vendors for the RFP process

      Associated Activity icon 3.1.1 30 minutes

      INPUT: Organizational use-case fit

      OUTPUT: MMS vendor shortlist

      Materials: Info-Tech’s MMS use cases, Info-Tech’s vendor profiles, Whiteboard, markers

      Participants: Core project team

      Instructions

      1. Collectively with the core project team, determine any knock-out criteria for shortlisting MMS vendors. For example, if your team is executing on a strategy that favors mobile deployment, vendors who do not have a mobile offering may be off the table.
      2. Based on the results in Activity 1.3.2, write a longlist of vendors. In most cases, this list will consist of all the vendors that fall into your organization’s use-case scenario. If your organization fits into more than one use case (e.g. your organization has both product-centric and service-centric MMS needs), look for the overlap of vendors between the use cases.
      3. Review the profiles of the vendors that fall into your use-case scenario. Based on your knock-out criteria established in Step 1, eliminate any vendors as applicable.
      4. Finalize and record your shortlist of MMS vendors.

      Use Info-Tech’s MMS Request for Proposal Template to document and communicate your requirements to vendors

      Supporting Tool icon 3.1.2 MMS Request for Proposal Template

      Use the MMS Request for Proposal Template as a step-by-step guide on how to request interested vendors to submit written proposals that meet your set of requirements.

      If interested in bidding for your project, vendors will respond with a description of the techniques they would employ to address your organizational challenges and meet your requirements, along with a plan of work and detailed budget for the project.

      The RFP is an important piece of setting and aligning your expectations with the vendors’ product offerings. Make sure to address the following elements in the RFP:

      Sections of the Tool:

      1. Statement of work
      2. General information
      3. Proposal preparation instructions
      4. Scope of work, specifications, and requirements
      5. Vendor qualifications and references
      6. Budget and estimated pricing
      7. Additional terms and conditions
      8. Vendor certification

      INFO-TECH DELIVERABLE

      Sample of Info-Tech's MMS Request Proposal Template.

      Complete the MMS Request for Proposal Template by following the instructions in Activity 3.1.3.

      Activity: Create an RFP to submit to MMS vendors

      Associated Activity icon 3.1.3 1-2 hours

      INPUT: Business requirements document, Procurement procedures

      OUTPUT: MMS RFP

      Materials: Internal RFP tools or templates (if available), Info-Tech’s MMS Request for Proposal Template (optional)

      Participants: Procurement SMEs, Project manager, Core project team (optional)

      Instructions

      1. Download Info-Tech’s MMS Request for Proposal Template or prepare internal best-practice RFP tools.
      2. Build your RFP:
        1. Complete the statement of work and general information sections to provide organizational context to your longlisted vendors.
        2. Outline the organization’s procurement instructions for vendors, including due diligence, assessment criteria, and dates.
        3. Input the business requirements document as created in Activity 1.3.2.
        4. Create a scenario overview to provide vendors with an opportunity to give an estimate price.
      3. Obtain approval for your RFP. Each organization has a unique procurement process; follow your own organization’s process as you submit your RFPs to vendors. Ensure compliance with your organization’s standards and gain approval for submitting your RFP.

      Establish vendor evaluation criteria

      Vendor demonstrations are an integral part of the selection process. Having clearly defined selection criteria will help with setting up relevant demos as well as inform the vendor scorecards.

      EXAMPLE EVALUATION CRITERIAPie chart indicating the weight of each 'Vendor Evaluation Criteria': 'Functionality, 30%', 'Ease of Use, 25%', 'Cost, 15%', 'Vendor, 15%', and 'Technology, 15%'.
      Functionality (30%)
      • Breadth of capability
      • Tactical capability
      • Operational capability
      Ease of Use (25%)
      • End-user usability
      • Administrative usability
      • UI attractiveness
      • Self-service options
      Cost (15%)
      • Maintenance
      • Support
      • Licensing
      • Implementation (internal and external costs)
      Vendor (15%)
      • Support model
      • Customer base
      • Sustainability
      • Product roadmap
      • Proof of concept
      • Implementation model
      Technology (15%)
      • Configurability options
      • Customization requirements
      • Deployment options
      • Security and authentication
      • Integration environment
      • Ubiquity of access (mobile)

      Info-Tech Insight

      Base your vendor evaluations not on the capabilities of the solutions but instead on how the solutions align with your organization’s process automation requirements and considerations.

      Vendor demonstrations

      Examine how the vendor’s solution performs against your evaluation framework.

      What is the value of a vendor demonstration?

      Vendor demonstrations create a valuable opportunity for your organization to confirm that the vendor’s claims in the RFP are actually true.

      A display of the vendor’s functional capabilities and its execution of the scenarios given in your demo script will help to support your assessment of whether a vendor aligns with your MMS requirements.

      What should be included in a vendor demonstration?

      1. Vendor’s display of its solution for the scenarios provided in the demo script.
      2. Display of functional capabilities of the tool.
      3. Briefing on integration capabilities.

      Activity: Invite top performing vendors for product demonstrations

      Associated Activity icon 3.1.4 1-2 hours

      INPUT: Business requirements document, Logistical considerations, Usage scenarios by functional area

      OUTPUT: MMS demo script

      Materials: Info-Tech’s MMS Vendor Demo Script

      Participants: Procurement SMEs, Core project team

      Instructions

      1. Have your evaluation team (selected at the onset of the project) present to evaluate each vendor’s presentation. In some cases you may choose to bring in a subject matter expert (SME) to evaluate a specific area of the tool.
      2. Outline the logistics of the demonstration in the Introduction section of the template. Be sure to outline the total length of the demo and the amount of time that should be dedicated to the following:
        • Product demonstration in response to the demo script
        • Showcase of unique product elements, not reflective of the demo script
        • Question and answer session
        • Breaks and other potential interruptions
      3. Provide prompts for the vendor to display the capabilities by listing and describing usage scenarios by functional area. For example, when asking a vendor to demo financial and accounting management capabilities, you may break scenarios out by task (e.g. general ledger, accounts payable) or user role (e.g. finance manager, administrator).

      Info-Tech Insight

      Challenge vendor project teams during product demonstrations. Asking the vendor to make adjustments or customizations on the fly will allow you to get an authentic feel of product capability and flexibility, as well as of the degree of adaptability of the vendor project team. Ask the vendor to demonstrate how to do things not listed in your user scenarios, such as change system visualizations or design, change underlying data, add additional datasets, demonstrate analytics capabilities, or channel specific automation.

      Use Info-Tech’s MMS Vendor Demo Script template to set expectations for vendor product demonstration

      Vendor Profiles icon MMS Vendor Demo Script

      Customize and use Info-Tech’s MMS Vendor Demo Script to help identify how a vendor’s solution will fit your organization’s particular business capability needs.

      This tool assists with outlining logistical considerations for the demo itself and the scenarios with which the vendors should script their demonstration.

      Sections of the Tool:

      1. Introduction
      2. Demo scenarios by functional area

      Info-Tech Best Practice

      Avoid providing vendors with a rigid script for product demonstration; instead, provide user scenarios. Part of the value of a vendor demonstration is the opportunity to assess whether or not the vendor project team has a solid understanding of your organization’s MMS challenges and requirements and can work with your team to determine the best solution possible. A rigid script may result in your inability to assess whether the vendor will adjust for and scale with your project and organization as a technology partner.

      INFO-TECH DELIVERABLE

      Sample of Info-Tech's MMS Vendor Demo Script.

      Use the MMS Vendor Demo Script by following the instructions in Activity 3.1.4.

      Leverage Info-Tech’s vendor selection and negotiation models as the basis for a streamlined MMS selection process

      Design a procurement process that is robust, ruthless, and reasonable. Rooting out bias during negotiation is vital to making unbiased vendor selections.

      Vendor Selection

      Info-Tech’s approach to vendor selection gets you to design a procurement process that is robust, ruthless, and reasonable. This approach enables you to take control of vendor communications. Implement formal processes with an engaged team to achieve the right price, the right functionality, and the right fit for the organization with Info-Tech's blueprint Implement a Proactive and Consistent Vendor Selection Process.

      Stock image with the title Implement a Proactive and Consistent Vendor Selection Process.
      Vendor Negotiation

      Info-Tech’s SaaS negotiation strategy focuses on taking control of implementation from the beginning. The strategy allows you to work with your internal stakeholders to make sure they do not team up with the vendor instead of you. Reach an agreement with your vendor that takes into account both parties’ best interests with Info-Tech’s blueprint Negotiate SaaS Agreements That Are Built to Last.

      Stock image with the title Negotiate SaaS Agreements That Are Built to Last.

      Step 3.2: Communicate decision to stakeholders

      3.1

      3.2

      Select Your MMS Communicate Decision to Stakeholders

      This step will walk you through the following activities:

      • Collect project rationale documentation.
      • Create a presentation to communicate your selection decision to stakeholders.

      This step involves the following participants:

      • Core project team
      • Procurement SMEs
      • Project sponsor
      • Business stakeholders
      • Relevant management

      Outcomes of this step

      • Completed MMS Selection Executive Presentation Template
      • Affirmation of MMS selection by stakeholders

      Inform internal stakeholders of the final decision

      Ensure traceability from the selected tool to the needs identified in the first phase. Internal stakeholders must understand the reasoning behind the final selection and see the alignment to their defined requirements and needs.

      Document the selection process to show how the selected tool aligns to stakeholder needs:

      A large arrow labelled 'Application Benefits', underlaid beneath two smaller arrows labelled 'MMS stakeholder needs' and 'MMS technology needs', all pointing to the right.

      Documentation will assist with:

      1. Adopting the selected MMS.
      2. Demonstrating that proper due diligence was performed during the selection process.
      3. Providing direct traceability between the selected applications and internal stakeholder needs.

      Activity: Prepare a presentation deck to communicate the selection process and decision to internal stakeholders

      Associated Activity icon 3.2.1 1 week

      INPUT: MMS tool selection committee expertise

      OUTPUT: Decision to invest or not invest in an MMS tool

      Materials: Note-taking materials, Whiteboard or flip chart, markers

      Participants: MMS tool selection committee

      Instructions

      1. Download Info-Tech’s MMS Selection Executive Presentation Template.
      2. Read the instructions on slide 2 of the template. Then, on slide 3, decide if any portion of the selection process should be removed from the communication. Discuss with the team and make adjustments to slide 3 as necessary.
      3. Work with the MMS selection committee to populate the slides that remain after the adjustments. Follow the instructions on each slide to help complete the content.
      4. Refer to the square brackets on each slide (e.g. [X.X]) to identify the activity numbers in this storyboard that correspond to the slide in the MMS Selection Executive Presentation Template. Use the outputs produced from the corresponding activities in this deck and populate each slide in the MMS Selection Executive Presentation Template.
      5. Use the completed template to present to internal stakeholders.

      Info-Tech Insight

      Documenting the process of how the selection decision was made will avoid major headaches down the road. Without a documented process, internal stakeholders and even vendors can challenge and discredit the selection process.

      Vendor participation

      Vendors Who Briefed with Info-Tech Research Group

      Logos of vendors who participated in this blueprint: Salesforce Pardot, SAS, Adobe, Marketo, and Salesforce Marketing Cloud.

      Professionals Who Contributed to Our Evaluation and Research

      • Sara Camden, Digital Change Agent, Equifax
      • Caren Carrasco, Lifecycle Marketing and Automation, Benjamin David Group
      • 10 anonymous contributors participated in the vendor briefings

      Works cited

      Adobe Systems Incorporated. “Bayer builds understanding, socially.” Adobe.com, 2017. Web.

      IBM Corporation, “10 Key Marketing Trends for 2017.” IBM.com, 2017. Web.

      Marketo, Inc. “The Definitive Guide to Marketing Automation.” Marketo.com, 2013. Web.

      Marketo, Inc. “NBA franchise amplifies its message with help from Marketo’s marketing automation technology.” Marketo.com, 2017. Web.

      Salesforce Pardot. “Marketing Automation & Your CRM: The Dynamic Duo.” Pardot.com, 2017. Web.

      SAS Institute Inc. “Marketing Analytics: How, why and what’s next.” SAS Magazine, 2013. Web.

      SAS Institute Inc. “Give shoppers offers they’ll love.” SAS.com, 2017. Web.

      2021 Q3 Research Highlights

      • member rating overall impact (scale of 10): N/A
      • member rating average dollars saved: N/A
      • member rating average days saved: N/A
      • Parent Category Name: The Briefs
      • Parent Category Link: /the-briefs
      Our research team is a prolific bunch! Every quarter we produce lots of research to help you get the most value out of your organization. This PDF contains a selection of our most compelling research from the third quarter of 2021.

      Build a Reporting and Analytics Strategy

      • Buy Link or Shortcode: {j2store}128|cart{/j2store}
      • member rating overall impact (scale of 10): 9.1/10 Overall Impact
      • member rating average dollars saved: $49,748 Average $ Saved
      • member rating average days saved: 28 Average Days Saved
      • Parent Category Name: Business Intelligence Strategy
      • Parent Category Link: /business-intelligence-strategy
      • In respect to business intelligence (BI) matureness, you can’t expect the whole organization to be at the same place at the same time. Your BI strategy needs to recognize this and should strive to align rather than dictate.
      • Technology is just one aspect of your BI and analytics strategy and is not a quick solution or a guarantee for long-term success.

      Our Advice

      Critical Insight

      • The BI strategy drives data warehouse and integration strategies and the data needed to support business decisions.
      • The solution to better BI often lies in improving the BI practice, not acquiring the latest and greatest tool.

      Impact and Result

      • Align BI with corporate vision, mission, goals, and strategic direction.
      • Understand the needs of business partners.
      • BI & analytics informs data warehouse and integration layers for required content, latency, and quality.

      Build a Reporting and Analytics Strategy Research & Tools

      Start here – read the Executive Brief

      Read our concise Executive Brief to find out why you should create or refresh the BI Strategy and review Info-Tech’s approach to developing a BI strategy that meets business needs.

      Besides the small introduction, subscribers and consulting clients within this management domain have access to:

      1. Understand the business context and BI landscape

      Lay the foundation for the BI strategy by detailing key business information and analyzing current BI usage.

      • Build a Reporting and Analytics Strategy – Phase 1: Understand the Business Context and BI Landscape
      • BI Strategy and Roadmap Template
      • BI End-User Satisfaction Survey Framework

      2. Evaluate the current BI practice

      Assess the maturity level of the current BI practice and envision a future state.

      • Build a Reporting and Analytics Strategy – Phase 2: Evaluate the Current BI Practice
      • BI Practice Assessment Tool

      3. Create a BI roadmap for continuous improvement

      Create BI-focused initiatives to build an improvement roadmap.

      • Build a Reporting and Analytics Strategy – Phase 3: Create a BI Roadmap for Continuous Improvement
      • BI Initiatives and Roadmap Tool
      • BI Strategy and Roadmap Executive Presentation Template
      [infographic]

      Workshop: Build a Reporting and Analytics Strategy

      Workshops offer an easy way to accelerate your project. If you are unable to do the project yourself, and a Guided Implementation isn't enough, we offer low-cost delivery of our project workshops. We take you through every phase of your project and ensure that you have a roadmap in place to complete your project successfully.

      1 Establish Business Vision and Understand the Current BI Landscape

      The Purpose

      Document overall business vision, mission, and key objectives; assemble project team.

      Collect in-depth information around current BI usage and BI user perception.

      Create requirements gathering principles and gather requirements for a BI platform.

      Key Benefits Achieved

      Increased IT–business alignment by using the business context as the project starting point

      Identified project sponsor and project team

      Detailed understanding of trends in BI usage and BI perception of consumers

      Refreshed requirements for a BI solution

      Activities

      1.1 Gather key business information (overall mission, goals, objectives, drivers).

      1.2 Establish a high-level ROI.

      1.3 Identify ideal candidates for carrying out a BI project.

      1.4 Undertake BI usage analyses, BI user perception survey, and a BI artifact inventory.

      1.5 Develop requirements gathering principles and approaches.

      1.6 Gather and organize BI requirements

      Outputs

      Articulated business context that will guide BI strategy development

      ROI for refreshing the BI strategy

      BI project team

      Comprehensive summary of current BI usage that has quantitative and qualitative perspectives

      BI requirements are confirmed

      2 Evaluate Current BI Maturity and Identify the BI Patterns for the Future State

      The Purpose

      Define current maturity level of BI practice.

      Envision the future state of your BI practice and identify desired BI patterns.

      Key Benefits Achieved

      Know the correct migration method for Exchange Online.

      Prepare user profiles for the rest of the Office 365 implementation.

      Activities

      2.1 Perform BI SWOT analyses.

      2.2 Assess current state of the BI practice and review results.

      2.3 Create guiding principles for the future BI practice.

      2.4 Identify desired BI patterns and the associated BI functionalities/requirements.

      2.5 Define the future state of the BI practice.

      2.6 Establish the critical success factors for the future BI, identify potential risks, and create a mitigation plan.

      Outputs

      Exchange migration strategy

      Current state of BI practice is documented from multiple perspectives

      Guiding principles for future BI practice are established, along with the desired BI patterns linked to functional requirements

      Future BI practice is defined

      Critical success factors, potential risks, and a risk mitigation plan are defined

      3 Build Improvement Initiatives and Create a BI Development Roadmap

      The Purpose

      Build overall BI improvement initiatives and create a BI improvement roadmap.

      Identify supplementary initiatives for enhancing your BI program.

      Key Benefits Achieved

      Defined roadmap composed of robust improvement initiatives

      Activities

      3.1 Create BI improvement initiatives based on outputs from phase 1 and 2 activities. Build an improvement roadmap.

      3.2 Build an improvement roadmap.

      3.3 Create an Excel governance policy.

      3.4 Create a plan for a BI ambassador network.

      Outputs

      Comprehensive BI initiatives placed on an improvement roadmap

      Excel governance policy is created

      Internal BI ambassadors are identified

      Further reading

      Build a Reporting and Analytics Strategy

      Deliver actionable business insights by creating a business-aligned reporting and analytics strategy.

      Terminology

      As the reporting and analytics space matured over the last decade, software suppliers used different terminology to differentiate their products from others’. This caused a great deal of confusion within the business communities.

      Following are two definitions of the term Business Intelligence:

      Business intelligence (BI) leverages software and services to transform data into actionable insights that inform an organization’s strategic and tactical business decisions. BI tools access and analyze data sets and present analytical findings in reports, summaries, dashboards, graphs, charts, and maps to provide users with detailed intelligence about the state of the business.

      The term business intelligence often also refers to a range of tools that provide quick, easy-to-digest access to insights about an organization's current state, based on available data.

      CIO Magazine

      Business intelligence (BI) comprises the strategies and technologies used by enterprises for the data analysis of business information. BI technologies provide historical, current, and predictive views of business operations.

      Common functions of business intelligence technologies include reporting, online analytical processing, analytics, data mining, process mining, complex event processing, business performance management, benchmarking, text mining, predictive analytics, and prescriptive analytics.

      Wikipedia

      This blueprint will use the terms “BI,” “BI and Analytics,” and “Reporting and Analytics” interchangeably in different contexts, but always in compliance to the above definitions.

      ANALYST PERSPECTIVE

      A fresh analytics & reporting strategy enables new BI opportunities.

      We need data to inform the business of past and current performance and to support strategic decisions. But we can also drown in a flood of data. Without a clear strategy for business intelligence, a promising new solution will produce only noise.

      BI and Analytics teams must provide the right quantitative and qualitative insights for the business to base their decisions on.

      Your Business Intelligence and Analytics strategy must support the organization’s strategy. Your strategy for BI & Analytics provides direction and requirements for data warehousing and data integration, and further paves the way for predictive analytics, big data analytics, market/industry intelligence, and social network analytics.

      Dirk Coetsee,

      Director, Data and Analytics Info-Tech Research Group

      Our understanding of the problem

      This Research is Designed For:

      • A CIO or Business Unit (BU) Leader looking to improve reporting and analytics, reduce time to information, and embrace fact-based decision making with analytics, reporting, and business intelligence (BI).
      • Application Directors experiencing poor results from an initial BI tool deployment who are looking to improve the outcome.

      This Research Will Also Assist:

      • Project Managers and Business Analysts assigned to a BI project team to collect and analyze requirements.
      • Business units that have their own BI platforms and would like to partner with IT to take their BI to an enterprise level.

      This Research Will Help You:

      • Align your reporting and analytics strategy with the business’ strategic objectives before you rebuild or buy your Business Intelligence platform.
      • Identify reporting and analytics objectives to inform the data warehouse and integration requirements gathering process.
      • Avoid common pitfalls that derail BI and analytic deployments and lower their adoption.
      • Identify Business Intelligence gaps prior to deployment and incorporate remedies within your plans.

      This Research Will Help Them:

      • Recruit the right resources for the program.
      • Align BI with corporate vision, mission, goals, and strategic direction.
      • Understand the needs of business partners.
      • Assess BI maturity and plan for target state.
      • Develop a BI strategy and roadmap.
      • Track the success of the BI initiative.

      Executive summary

      Situation:

      BI drives a new reality. Uber is the world’s largest taxi company and they own no vehicles; Alibaba is the world’s most valuable retailer and they have no inventory; Airbnb is the world’s largest accommodation provider and they own no real estate. How did they disrupt their markets and get past business entry barriers? A deep understanding of their market through impeccable business intelligence!

      Complication:

      • In respect to BI matureness, you can’t expect the whole organization to be at the same place at the same time. Your BI strategy needs to recognize this and should strive to align rather than dictate.
      • Technology is just one aspect of your BI and Analytics strategy and is not a quick solution or a guarantee for long term success.

      Resolution:

      • Drive strategy development by establishing the business context upfront in order to align business intelligence providers with the most important needs of their BI consumers and the strategic priorities of the organization.
      • Revamp or create a BI strategy to update your BI program to make it fit for purpose.
      • Understand your existing BI baggage – e.g. your existing BI program, the artifacts generated from the program, and the users it supports. Those will inform the creation of the strategy and roadmap.
      • Assess current BI maturity and determine your future state BI maturity.
      • BI needs governance to ensure consistent planning, communication, and execution of the BI strategy.
      • Create a network of BI ambassadors across the organization to promote BI.
      • Plan for the future to ensure that required data will be available when the organization needs it.

      Info-Tech Insight

      1. Put the “B” back in BI. Don’t have IT doing BI for IT’s sake; ensure the voice and needs of the business are the primary drivers of your strategy.
      2. The BI strategy drives data warehouse and integration strategies and the data needs to support business decisions.
      3. Go beyond the platform. The solution to better BI often lies in improving the BI practice, not acquiring the latest and greatest tool.

      Metrics to track BI & Analytical program progress

      Goals for BI:

      • Understand business context and needs. Identify business processes that can leverage BI.
      • Define the Reporting & Analytics Roadmap. Develop data initiatives, and create a strategy and roadmap for Business Intelligence.
      • Continuous improvements. Your BI program is evolving and improving over time. The program should allow you to have faster, better, and more comprehensive information.

      Info-Tech’s Suggested Metrics for Tracking the BI Program

      Practice Improvement Metrics Data Collection and Calculation Expected Improvement
      Program Level Metrics Efficiency
      • Time to information
      • Self-service penetration
      • Derive from the ticket management system
      • Derive from the BI platform
      • 10% reduction in time to information
      • Achieve 10-15% self-service penetration
      • Effectiveness
      • BI Usage
      • Data quality
      • Derive from the BI platform
      • Data quality perception
      • Majority of the users use BI on a daily basis
      • 15% increase in data quality perception
      Comprehensiveness
      • # of integrated datasets
      • # of strategic decisions made
      • Derive from the data integration platform
      • Decision-making perception
      • Onboard 2-3 new data domains per year
      • 20% increase in decision-making perception

      Intangible Metrics:

      Tap into the results of Info-Tech’s CIO Business Vision diagnostic to monitor the changes in business-user satisfaction as you implement the initiatives in your BI improvement roadmap.

      Your Enterprise BI and Analytics Strategy is driven by your organization’s Vision and Corporate Strategy

      Formulating an Enterprise Reporting and Analytics Strategy requires the business vision and strategies to first be substantiated. Any optimization to the Data Warehouse, Integration and Source layer is in turn driven by the Enterprise Reporting and Analytics Strategy

      Flow chart showing 'Business Vision Strategies'

      The current state of your Integration and Warehouse platforms determine what data can be utilized for BI and Analytics

      Where we are, and how we got here

      How we got here

      • In the beginning was BI 1.0. Business intelligence began as an IT-driven centralized solution that was highly governed. Business users were typically the consumers of reports and dashboards created by IT, an analytics-trained minority, upon request.
      • In the last five to ten years, we have seen a fundamental shift in the business intelligence and analytics market, moving away from such large-scale, centralized IT-driven solutions focused on basic reporting and administration, towards more advanced user-friendly data discovery and visualization platforms. This has come to be known as BI 2.0.
      • Many incumbent market leaders were disrupted by the demand for more user-friendly business intelligence solutions, allowing “pure-play” BI software vendors to carve out a niche and rapidly expand into more enterprise environments.
      • BI-on-the-cloud has established itself as a solid alternative to in-house implementation and operation.

      Where we are now

      • BI 3.0 has arrived. This involves the democratization of data and analytics and a predominantly app-centric approach to BI, identifiable by an anywhere, anytime, and device-or-platform-independent collaborative methodology. Social workgroups and self-guided content creation, delivery, analysis, and management is prominent.
      • Where the need for reporting and dashboards remains, we’re seeing data discovery platforms fulfilling the needs of non-technical business users by providing easy-to-use interactive solutions to increase adoption across enterprises.
      • With more end users demanding access to data and the tools to extract business insights, IT is looking to meet these needs while continuing to maintain governance and administration over a much larger base of users. The race for governed data discovery is heated and will be a market differentiator.
      • The next kid on the block is Artificial Intelligence that put further demands on data quality and availability.

      RICOH Canada used this methodology to develop their BI strategy in consultation with their business stakeholders

      CASE STUDY

      Industry: Manufacturing and Retail

      Source: RICOH

      Ricoh Canada transforms the way people work with breakthrough technologies that help businesses innovate and grow. Its focus has always been to envision what the future will look like so that it can help its customers prepare for success. Ricoh empowers digital workplaces with a broad portfolio of services, solutions, and technologies – helping customers remove obstacles to sustained growth by optimizing the flow of information and automating antiquated processes to increase workplace productivity. In their commitment towards a customer-centric approach, Ricoh Canada recognized that BI and analytics can be used to inform business leaders in making strategic decisions.

      Enterprise BI and analytics Initiative

      Ricoh Canada enrolled in the ITRG Reporting & Analytics strategy workshop with the aim to create a BI strategy that will allow the business to harvest it strengths and build for the future. The workshop acted as a forum for the different business units to communicate, share ideas, and hear from each other what their pains are and what should be done to provide a full customer 360 view.

      Results

      “This workshop allowed us to collectively identify the various stakeholders and their unique requirements. This is a key factor in the development of an effective BI Analytics tool.” David Farrar

      The Customer 360 Initiative included the following components

      The Customer 360 Initiative includes the components shown in the image

      Improve BI Adoption Rates

      Graph showing Product Adoption Rates

      Sisense

      Reasons for low BI adoption

      • Employees that never used BI tools are slow to adopt new technology.
      • Lack of trust in data leads to lack of trust in the insights.
      • Complex data structures deter usage due to long learning curves and contained nuances.
      • Difficult to translate business requirements into tool linguistics due to lack of training or technical ineptness.
      • Business has not taken ownership of data, which affects access to data.

      How to foster BI adoption

      • Senior management proclaim data as a strategic asset and involved in the promotion of BI
      • Role Requirement that any business decision should be backed up by analytics
      • Communication of internal BI use case studies and successes
      • Exceptional data lineage to act as proof for the numbers
      • A Business Data glossary with clearly defined business terms. Use the Business Data Glossary in conjunction with data lineage and semantic layers to ensure that businesses are clearly defined and traced to sources.
      • Training in business to take ownership of data from inception to analytics.

      Why bother with analytics?

      In today’s ever-changing and global environment, organizations of every size need to effectively leverage their data assets to facilitate three key business drivers: customer intimacy, product/service innovation, and operational excellence. Plus, they need to manage their operational risk efficiently.

      Investing in a comprehensive business intelligence strategy allows for a multidimensional view of your organization’s data assets that can be operationalized to create a competitive edge:

      Historical Data

      Without a BI strategy, creating meaningful reports for business users that highlight trends in past performance and draw relationships between different data sources becomes a more complex task. Also, the ever growing need to identify and assess risks in new ways is driving many companies to BI.

      Data Democracy

      The core purpose of BI is to provide the right data, to the right users, at the right time, and in a format that is easily consumable and actionable. In developing a BI strategy, remember the driver for managed cross-functional access to data assets and features such as interactive dashboards, mobile BI, and self-service BI.

      Predictive and Big Data Analytics

      As the volume, variety, and velocity of data increases rapidly, businesses will need a strategy to outline how they plan to consume the new data in a manner that does not overwhelm their current capabilities and aligns with their desired future state. This same strategy further provides a foundation upon which organizations can transition from ad hoc reporting to using data assets in a codified BI platform for decision support.

      Business intelligence serves as the layer that translates data, information, and organizational knowledge into insights

      As executive decision making shifts to more fact-based, data-driven thinking, there is an urgent need for data assets to be organized and presented in a manner that enables immediate action.

      Typically, business decisions are based on a mix of intuition, opinion, emotion, organizational culture, and data. Though business users may be aware of its potential value in driving operational change, data is often viewed as inaccessible.

      Business intelligence bridges the gap between an organization’s data assets and consumable information that facilitates insight generation and informed decision making.

      Most organizations realize that they need a BI strategy; it’s no longer a nice-to-have, it’s a must-have.

      – Albert Hui, Principal, Data Economist

      A triangle grapg depicting the layers of business itelligence

      Business intelligence and business analytics: what is the difference and should you care

      Ask 100 people and you will get 100 answers. We like the prevailing view that BI looks at today and backward for improving who we are, while BA is forward-looking to support change decisions.

      The image depicts a chart flowing from Time Past to Future. Business Intelligence joins with Business Analytics over the Present
      • Business intelligence is concerned with looking at present and historical data.
      • Use this data to create reports/dashboards to inform a wide variety of information consumers of the past and current state of affairs.
      • Almost all organizations, regardless of size and maturity, use some level of BI even if it’s just very basic reporting.
      • Business analytics, on the other hand, is a forward-facing use of data, concerned with the present to the future.
      • Analytics uses data to both describe the present, and more importantly, predict the future, enabling strategic business decisions.
      • Although adoption is rapidly increasing, many organizations still do not utilize any advanced analytics in their environment.

      However, establishing a strong business intelligence program is a necessary precursor to an organization’s development of its business analytics capabilities.

      Organizations that successfully grow their BI capabilities are reaping the rewards

      Evidence is piling up: if planned well, BI contributes to the organization’s bottom line.

      It’s expected that there will be nearly 45 billion connected devices and a 42% increase in data volume each year posing a high business opportunity for the BI market (BERoE, 2020).

      The global business intelligence market size to grow from US$23.1 billion in 2020 to US$33.3 billion by 2025, at a compound annual growth rate (CAGR) of 7.6% (Global News Wire, 2020)

      In the coming years, 69% of companies plan on increasing their cloud business intelligence usage (BARC Research and Eckerson Group Study, 2017).

      Call to Action

      Small organizations of up to 100 employees had the highest rate of business intelligence penetration last year (Forbes, 2018).

      Graph depicting business value from 0 months to more than 24 months

      Source: IBM Business Value, 2015

      For the New England Patriots, establishing a greater level of customer intimacy was driven by a tactical analytics initiative

      CASE STUDY

      Industry: Professional Sports

      Source Target Marketing

      Problem

      Despite continued success as a franchise with a loyal fan base, the New England Patriots experienced one of their lowest season ticket renewal rates in over a decade for the 2009 season. Given the numerous email addresses that potential and current season-ticket holders used to engage with the organization, it was difficult for Kraft Sports Group to define how to effectively reach customers.

      Turning to a Tactical Analytics Approach

      Kraft Sports Group turned to the customer data that it had been collecting since 2007 and chose to leverage analytics in order to glean insight into season ticket holder behavior. By monitoring and reporting on customer activity online and in attendance at games, Kraft Sports Group was able to establish that customer engagement improved when communication from the organization was specifically tailored to customer preferences and historical behavior.

      Results

      By operationalizing their data assets with the help of analytics, the Patriots were able to achieve a record 97% renewal rate for the 2010 season. KSG was able to take their customer engagement to the next level and proactively look for signs of attrition in season-ticket renewals.

      We're very analytically focused and I consider us to be the voice of the customer within the organization… Ultimately, we should know when renewal might not happen and be able to market and communicate to change that behavior.

      – Jessica Gelman,

      VP Customer Marketing and Strategy, Kraft Sports Group

      A large percentage of all BI projects fail to meet the organization’s needs; avoid falling victim to common pitfalls

      Tool Usage Pitfalls

      • Business units are overwhelmed with the amount and type of data presented.
      • Poor data quality erodes trust, resulting in a decline in usage.
      • Analysis performed for the sake of analysis and doesn’t focus on obtaining relevant business-driven insights.

      Selection Pitfalls

      • Inadequate requirements gathering.
      • No business involvement in the selection process.
      • User experience is not considered.
      • Focus is on license fees and not total cost.

      Implementation Pitfalls

      • Absence of upfront planning
      • Lack of change management to facilitate adoption of the new platform
      • No quick wins that establish the value of the project early on
      • Inadequate initial or ongoing training

      Strategic Pitfalls

      • Poor alignment of BI goals with organization goals
      • Absence of CSFs/KPIs that can measure the qualitative and quantitative success of the project
      • No executive support during or after the project

      BI pitfalls are lurking around every corner, but a comprehensive strategy drafted upfront can help your organization overcome these obstacles. Info-Tech’s approach to BI has involvement from the business units built right into the process from the start and it equips IT to interact with key stakeholders early and often.

      Only 62% of Big Data and AI projects in 2019 provided measurable results.

      Source: NewVantage Partners LLC

      Business and IT have different priorities for a BI tool

      Business executives look for:

      • Ease of use
      • Speed and agility
      • Clear and concise information
      • Sustainability

      IT professionals are concerned about:

      • Solid security
      • Access controls on data
      • Compliance with regulations
      • Ease of integration

      Info-Tech Insight

      Combining these priorities will lead to better tool selection and more synergy.

      Elizabeth Mazenko

      The top-down BI Opportunity Analysis is a tool for senior executives to discover where Business Intelligence can provide value

      The image is of a top-down BI Opportunity Analysis.

      Example: Uncover BI opportunities with an opportunity analysis

      Industry Drivers Private label Rising input prices Retail consolidation
      Company strategies Win at supply chain execution Win at customer service Expand gross margins
      Value disciplines Strategic cost management Operational excellence Customer service
      Core processes Purchasing Inbound logistics Sales, service & distribution
      Enterprise management: Planning, budgeting, control, process improvement, HR
      BI Opportunities Customer service analysis Cost and financial analysis Demand management

      Williams (2016)

      Bridge the gap between business drivers and business intelligence features with a three-tiered framework

      Info-Tech’s approach to formulating a fit-for-purpose BI strategy is focused on making the link between factors that are the most important to the business users and the ways that BI providers can enable those consumers.

      Drivers to Establish Competitive Advantage

      • Operational Excellence
      • Client Intimacy
      • Innovation

      BI and Analytics Spectrum

      • Strategic Analytics
      • Tactical Analytics
      • Operational Analytics

      Info-Tech’s BI Patterns

      • Delivery
      • User Experience
      • Deep Analytics
      • Supporting

      This is the content for Layout H3 Tag

      Though business intelligence is primarily thought of as enabling executives, a comprehensive BI strategy involves a spectrum of analytics that can provide data-driven insight to all levels of an organization.

      Recommended

      Strategic Analytics

      • Typically focused on predictive modeling
      • Leverages data integrated from multiple sources (structured through unstructured)
      • Assists in identifying trends that may shift organizational focus and direction
      • Sample objectives:
        • Drive market share growth
        • Identify new markets, products, services, locations, and acquisitions
        • Build wider and deeper customer relationships earning more wallet share and keeping more customers

      Tactical Analytics

      • Often considered Response Analytics and used to react to situations that arise, or opportunities at a department level.
      • Sample objectives:
        • Staff productivity or cost analysis
        • Heuristics/algorithms for better risk management
        • Product bundling and packaging
        • Customer satisfaction response techniques

      Operational Analytics

      • Analytics that drive business process improvement whether internal, with external partners, or customers.
      • Sample objectives:
        • Process step elimination
        • Best opportunities for automation

      Business Intelligence Terminology

      Styles of BI New age BI New age data Functional Analytics Tools
      Reporting Agile BI Social Media data Performance management analytics Scorecarding dashboarding
      Ad hoc query SaaS BI Unstructured data Financial analytics Query & reporting
      Parameterized queries Pervasive BI Mobile data Supply chain analytics Statistics & data mining
      OLAP Cognitive Business Big data Customer analytics OLAP cubes
      Advanced analytics Self service analytics Sensor data Operations analytics ETL
      Cognitive business techniques Real-time Analytics Machine data HR Analytics Master data management
      Scorecards & dashboards Mobile Reporting & Analytics “fill in the blanks” analytics Data Governance

      Williams (2016)

      "BI can be confusing and overwhelming…"

      – Dirk Coetsee,

      Research Director,

      Info-Tech Research Group

      Business intelligence lies in the Information Dimensions layer of Info-Tech’s Data Management Framework

      The interactions between the information dimensions and overlying data management enablers such as data governance, data architecture, and data quality underscore the importance of building a robust process surrounding the other data practices in order to fully leverage your BI platform.

      Within this framework BI and analytics are grouped as one lens through which data assets at the business information level can be viewed.

      The image is the Information Dimensions layer of Info-Tech’s Data Management Framework

      Use Info-Tech’s three-phase approach to a Reporting & Analytics strategy and roadmap development

      Project Insight

      A BI program is not a static project that is created once and remains unchanged. Your strategy must be treated as a living platform to be revisited and revitalized in order to effectively enable business decision making. Develop a reporting and analytics strategy that propels your organization by building it on business goals and objectives, as well as comprehensive assessments that quantitatively and qualitatively evaluate your current reporting and analytical capabilities.

      Phase 1: Understand the Business Context and BI Landscape Phase 2: Evaluate Your Current BI Practice Phase 3: Create a BI Roadmap for Continuous Improvement
      1.1 Establish the Business Context
      • Business Vision, Goals, Key Drivers
      • Business Case Presentation
      • High-Level ROI
      2.1 Assess Your Current BI Maturity
      • BI Practice Assessment
      • Summary of Current State
      3.1 Construct a BI Initiative Roadmap
      • BI Improvement Initiatives
      • RACI
      • BI Strategy and Roadmap
      1.2 Assess Existing BI Environment
      • BI Perception Survey Framework
      • Usage Analyses
      • BI Report Inventory
      2.2 Envision BI Future State
      • BI Style Requirements
      • BI Practice Assessment
      3.2 Plan for Continuous Improvement
      • Excel/Access Governance Policy
      • BI Ambassador Network Draft
      1.3 Develop BI Solution Requirements
      • Requirements Gathering Principles
      • Overall BI Requirements

      Stand on the shoulders of Information Management giants

      As part of our research process, we leveraged the frameworks of COBIT5, Mike 2.0, and DAMA DMBOK2. Contextualizing business intelligence within these frameworks clarifies its importance and role and ensures that our assessment tool is focused on key priority areas.

      The DMBOK2 Data Management framework by the Data Asset Management Association (DAMA) provided a starting point for our classification of the components in our IM framework.

      Mike 2.0 is a data management framework that helped guide the development of our framework through its core solutions and composite solutions.

      The Cobit 5 framework and its business enablers were used as a starting point for assessing the performance capabilities of the different components of information management, including business intelligence.

      Info-Tech has a series of deliverables to facilitate the evolution of your BI strategy

      BI Strategy Roadmap Template

      BI Practice Assessment Tool

      BI Initiatives and Roadmap Tool

      BI Strategy and Roadmap Executive Presentation Template

      Info-Tech offers various levels of support to best suit your needs

      DIY Toolkit Guided Implementation Workshop Consulting
      “Our team has already made this critical project a priority, and we have the time and capability, but some guidance along the way would be helpful.” “Our team knows that we need to fix a process, but we need assistance to determine where to focus. Some check-ins along the way would help keep us on track.” “We need to hit the ground running and get this project kicked off immediately. Our team has the ability to take this over once we get a framework and strategy in place.” “Our team does not have the time or the knowledge to take this project on. We need assistance through the entirety of this project.”

      Diagnostics and consistent frameworks used throughout all four options

      Build a Reporting and Analytics Strategy – Project Overview

      1. Understand the Business Context and BI Landscape 2. Evaluate the Current BI Practice 3. Create a BI Roadmap for Continuous Improvement
      Best-Practice Toolkit

      1.1 Document overall business vision, mission, industry drivers, and key objectives; assemble a project team

      1.2 Collect in-depth information around current BI usage and BI user perception

      1.3 Create requirements gathering principles and gather requirements for a BI platform

      2.1 Define current maturity level of BI practice

      2.2 Envision the future state of your BI practice and identify desired BI patterns

      3.1 Build overall BI improvement initiatives and create a BI improvement roadmap

      3.2 Identify supplementary initiatives for enhancing your BI program

      Guided Implementations
      • Discuss Info-Tech’s approach for using business information to drive BI strategy formation
      • Review business context and discuss approaches for conducting BI usage and user analyses
      • Discuss strategies for BI requirements gathering
      • Discuss BI maturity model
      • Review practice capability gaps and discuss potential BI patterns for future state
      • Discuss initiative building
      • Review completed roadmap and next steps
      Onsite Workshop Module 1:

      Establish Business Vision and Understand the Current BI Landscape

      Module 2:

      Evaluate Current BI Maturity Identify the BI Patterns for the Future State

      Module 3:

      Build Improvement Initiatives and Create a BI Development Roadmap

      Phase 1 Outcome:
      • Business context
      • Project team
      • BI usage information, user perception, and new BI requirements
      Phase 2 Outcome:
      • Current and future state assessment
      • Identified BI patterns
      Phase 3 Outcome:
      • BI improvement strategy and initiative roadmap

      Workshop overview

      Contact your account representative or email Workshops@InfoTech.com for more information.

      Workshop Day 1 Workshop Day 2 Workshop Day 3 Workshop Day 4
      Activities

      Understand Business Context and Structure the Project

      1.1 Make the case for a BI strategy refresh.

      1.2 Understand business context.

      1.3 Determine high-level ROI.

      1.4 Structure the BI strategy refresh project.

      Understand Existing BI and Revisit Requirements

      2.1 Understand the usage of your existing BI.

      2.2 Gather perception of the current BI users.

      2.3 Document existing information artifacts.

      2.4 Develop a requirements gathering framework.

      2.5 Gather requirements.

      Revisit Requirements and Current Practice Assessment

      3.1 Gather requirements.

      3.2 Determine BI Maturity Level.

      3.3 Perform a SWOT for your existing BI program.

      3.4 Develop a current state summary.

      Roadmap Develop and Plan for Continuous Improvements

      5.1 Develop BI strategy.

      5.2 Develop a roadmap for the strategy.

      5.3 Plan for continuous improvement opportunities.

      5.4 Develop a re-strategy plan.

      Deliverables
      1. Business and BI Vision, Goals, Key Drivers
      2. Business Case Presentation
      3. High-Level ROI
      4. Project RACI
      1. BI Perception Survey
      2. BI Requirements Gathering Framework
      3. BI User Stories and Requirements
      1. BI User Stories and Requirements
      2. BI SWOT for your Current BI Program
      3. BI Maturity Level
      4. Current State Summary
      1. BI Strategy
      2. Roadmap accompanying the strategy with timeline
      3. A plan for improving BI
      4. Strategy plan

      Phase 2

      Understand the Business Context and BI Landscape

      Build a Reporting and Analytics Strategy

      Phase 1 overview

      Detailed Overview

      Step 1: Establish the business context in terms of business vision, mission, objectives, industry drivers, and business processes that can leverage Business Intelligence

      Step 2: Understand your BI Landscape

      Step 3: Understand business needs

      Outcomes

      • Clearly articulated high-level mission, vision, and key drivers from the business, as well as objectives related to business intelligence.
      • In-depth documentation regarding your organization’s BI usage, user perception, and outputs.
      • Consolidated list of requirements, existing and desired, that will direct the deployment of your BI solution.

      Benefits

      • Align business context and drivers with IT plans for BI and Analytics improvement.
      • Understand your current BI ecosystem’s performance.

      Understand your business context and BI landscape

      Phase 1 Overarching Insight

      The closer you align your new BI platform to real business interests, the stronger the buy-in, realized value, and groundswell of enthusiastic adoption will be. Get this phase right to realize a high ROI on your investment in the people, processes, and technology that will be your next generation BI platform.

      Understand the Business Context to Rationalize Your BI Landscape Evaluate Your Current BI Practice Create a BI Roadmap for Continuous Improvement
      Establish the Business Context
      • Business Vision, Goals, Key Drivers
      • Business Case Presentation
      • High-Level ROI
      Assess Your Current BI Maturity
      • SWOT Analysis
      • BI Practice Assessment
      • Summary of Current State
      Construct a BI Initiative Roadmap
      • BI Improvement Initiatives
      • BI Strategy and Roadmap
      Access Existing BI Environment
      • BI Perception Survey Framework
      • Usage Analyses
      • BI Report Inventory
      Envision BI Future State
      • BI Patterns
      • BI Practice Assessment
      • List of Functions
      Plan for Continuous Improvement
      • Excel Governance Policy
      • BI Ambassador Network Draft
      Undergo Requirements Gathering
      • Requirements Gathering Principles
      • Overall BI Requirements

      Track these metrics to measure your progress through Phase 1

      Goals for Phase 1:

      • Understand the business context. Determine if BI can be used to improve business outcomes by identifying benefits, costs, opportunities, and gaps.
      • Understand your existing BI. Plan your next generation BI based on a solid understanding of your existing BI.
      • Identify business needs. Determine the business processes that can leverage BI and Analytics.

      Info-Tech’s Suggested Metrics for Tracking Phase 1 Goals

      Practice Improvement Metrics Data Collection and Calculation Expected Improvement
      Monetary ROI
      • Quality of the ROI
      • # of user cases, benefits, and costs quantified
      Derive the number of the use cases, benefits, and costs in the scoping. Ask business SMEs to verify the quality. High-quality ROI studies are created for at least three use cases
      Response Rate of the BI Perception Survey Sourced from your survey delivery system Aim for 40% response rate
      # of BI Reworks Sourced from your project management system Reduction of 10% in BI reworks

      Intangible Metrics:

      1. Executives’ understanding of the BI program and what BI can do for the organization.
      2. Improved trust between IT and the business by re-opening the dialogue.
      3. Closer alignment with the organization strategy and business plan leading to higher value delivered.
      4. Increased business engagement and input into the Analytics strategy.

      Use advisory support to accelerate your completion of Phase 1 activities

      Call 1-888-670-8889 or email GuidedImplementations@InfoTech.com for more information.

      Complete these steps on your own, or call us to complete a guided implementation. A guided implementation is a series of two to three advisory calls that help you execute each phase of a project. They are included in most advisory memberships.

      Guided Implementation 1: Understand the Business Context and BI Landscape

      Proposed Time to Completion: 2-4 weeks

      Step 1.0: Assemble Your Project Team

      Start with an analyst kick-off call:

      • Discuss Info-Tech’s viewpoint and definitions of business intelligence.
      • Discuss the project sponsorship, ideal team members and compositions.

      Then complete these activities…

      • Identify a project sponsor and the project team members.

      Step 1.1: Understand Your Business Context

      Start with an analyst kick-off call:

      • Discuss Info-Tech’s approach to BI strategy development around using business information as the key driver.

      Then complete these activities…

      • Detail the business context (vision, mission, goals, objectives, etc.).
      • Establish business–IT alignment for your BI strategy by detailing the business context.

      Step 1.2: Establish the Current BI Landscape

      Review findings with analyst:

      • Review the business context outputs from Step 1.1 activities.
      • Review Info-Tech’s approach for documenting your current BI landscape.
      • Review the findings of your BI landscape.

      Then complete these activities…

      • Gather information on current BI usage and perform a BI artifact inventory.
      • Construct and conduct a user perception survey.

      With these tools & templates:

      BI Strategy and Roadmap Template

      Step 1.0

      Assemble the Project Team

      Select a BI project sponsor

      Info-Tech recommends you select a senior executive with close ties to BI be the sponsor for this project (e.g. CDO, CFO or CMO). To maximize the chance of success, Info-Tech recommends you start with the CDO, CMO, CFO, or a business unit (BU) leader who represents strategic enterprise portfolios.

      Initial Sponsor

      CFO or Chief Risk Officer (CRO)

      • The CFO is responsible for key business metrics and cost control. BI is on the CFO’s radar as it can be used for both cost optimization and elimination of low-value activity costs.
      • The CRO is tasked with the need to identify, address, and when possible, exploit risk for business security and benefit.
      • Both of these roles are good initial sponsors but aren’t ideal for the long term.

      CDO or a Business Unit (BU) Leader

      • The CDO (Chief Data Officer) is responsible for enterprise-wide governance and utilization of information as an asset via data processing, analysis, data mining, information trading, and other means, and is the ideal sponsor.
      • BU leaders who represent a growth engine for a company look for ways to mine BI to help set direction.

      Ultimate Sponsor

      CEO

      • As a the primary driver of enterprise-wide strategy, the CEO is the ideal evangelist and project sponsor for your BI strategy.
      • Establishing a CEO–CIO partnership helps elevate IT to the level of a strategic partner, as opposed to the traditional view that IT’s only job is to “keep the lights on.”
      • An endorsement from the CEO may make other C-level executives more inclined to work with IT and have their business unit be the starting point for growing a BI program organically.

      "In the energy sector, achieving production KPIs are the key to financial success. The CFO is motivated to work with IT to create BI applications that drive higher revenue, identify operational bottlenecks, and maintain gross margin."

      – Yogi Schulz, Partner, Corvelle Consulting

      Select a BI project team

      Create a project team with the right skills, experience, and perspectives to develop a comprehensive strategy aligned to business needs.

      You may need to involve external experts as well as individuals within the organization who have the needed skills.

      A detailed understanding of what to look for in potential candidates is essential before moving forward with your BI project.

      Leverage several of Info-Tech’s Job Description Templates to aid in the process of selecting the right people to involve in constructing your BI strategy.

      Roles to Consider

      Business Stakeholders

      Business Intelligence Specialist

      Business Analyst

      Data Mining Specialist

      Data Warehouse Architect

      Enterprise Data Architect

      Data Steward

      "In developing the ideal BI team, your key person to have is a strong data architect, but you also need buy-in from the highest levels of the organization. Buy-in from different levels of the organization are indicators of success more than anything else."

      – Rob Anderson, Database Administrator and BI Manager, IT Research and Advisory Firm

      Create a RACI matrix to clearly define the roles and responsibilities for the parties involved

      A common project management pitfall for any endeavour is unclear definition of responsibilities amongst the individuals involved.

      As a business intelligence project requires a significant amount of back and forth between business and IT – bridged by the BI Steering Committee – clear guidelines at the project outset with a RACI chart provide a basic framework for assigning tasks and lines of communication for the later stages.

      Responsible Accountable Consulted Informed

      Obtaining Buy-in Project Charter Requirements Design Development Program Creation
      BI Steering Committee A C I I I C
      Project Sponsor - C I I I C
      Project Manager - R A I I C
      VP of BI R I I I I A
      CIO A I I I I R
      Business Analyst I I R C C C
      Solution Architect - - C A C C
      Data Architect - - C A C C
      BI Developer - - C C R C
      Data Steward - - C R C C
      Business SME C C C C C C

      Note: This RACI is an example of how role expectations would be broken down across the different steps of the project. Develop your own RACI based on project scope and participants.

      STEP 1.1

      Understand Your Business Context and Structure the Project

      Establish business–IT alignment for your BI strategy by detailing the business context

      Step Objectives

      • Engage the business units to find out where users need BI enablement.
      • Ideate preliminary points for improvement that will further business goals and calculate their value.

      Step Activities

      1.1.1 Craft the vision and mission statements for the Analytics program using the vision, mission, and strategies of your organization as basis.

      1.1.2 Articulate program goals and objectives

      1.1.3 Determine business differentiators and key drivers

      1.1.4 Brainstorm BI-specific constraints and improvement objectives

      Outcomes

      • Clearly articulated business context that will provide a starting point for formulating a BI strategy
      • High-level improvement objectives and ROI for the overall project
      • Vision, mission, and objectives of the analytics program

      Research Support

      • Info-Tech’s BI Strategy and Roadmap Template

      Proposed Participants in this Step

      • Project Manager
      • Project Team
      • Relevant Business Stakeholders and Subject Matter Experts

      Transform the way the business makes decisions

      Your BI strategy should enable the business to make fast, effective, and comprehensive decisions.

      Fast Effective Comprehensive
      Reduce time spent on decision-making by designing a BI strategy around information needs of key decision makers. Make the right data available to key decision makers. Make strategic high-value, impactful decisions as well as operational decisions.

      "We can improve BI environments in several ways. First, we can improve the speed with which we create BI objects by insisting that the environments are designed with flexibility and adaptability in mind. Second, we can produce higher quality deliverables by ensuring that IT collaborate with the business on every deliverable. Finally, we can reduce the costs of BI by giving access to the environment to knowledgeable business users and encouraging a self-service function."

      – Claudia Imhoff, Founder, Boulder BI Brain Trust, Intelligent Solutions Inc.

      Assess needs of various stakeholders using personas

      User groups/user personas

      Different users have different consumption and usage patterns. Categorize users into user groups and visualize the usage patterns. The user groups are the connection between the BI capabilities and the users.

      User groups Mindset Usage Pattern Requirements
      Front-line workers Get my job done; perform my job quickly. Reports (standard reports, prompted reports, etc.) Examples:
      • Report bursting
      • Prompted reports
      Analysts I have some ideas; I need data to validate and support my ideas. Dashboards, self-service BI, forecasting/budgeting, collaboration Examples:
      • Self-service datasets
      • Data mashup capability
      Management I need a big-picture view and yet I need to play around with the data to find trends to drive my business. Dashboards, scorecards, mobile BI, forecasting/budgeting Examples:
      • Multi-tab dashboards
      • Scorecard capability
      Data scientists I need to combine existing data, as well as external or new, unexplored data sources and types to find nuggets in the data. Data mashup, connections to data sources Examples:
      • Connectivity to big data
      • Social media analyses

      The pains of inadequate BI are felt across the entire organization – and land squarely on the shoulders of the CIO

      Organization:

      • Insufficient information to make decisions.
      • Unable to measure internal performance.
      • Losses incurred from bad decisions or delayed decisions.
      • Canned reports fail to uncover key insights.
      • Multiple versions of information exist in silos.

      IT Department

      • End users are completely dependent on IT for reports.
      • Ad hoc BI requests take time away from core duties.
      • Spreadsheet-driven BI is overly manual.
      • Business losing trust in IT.

      CIO

      • Under great pressure and has a strong desire to improve BI.
      • Ad hoc BI requests are consuming IT resources and funds.
      • My organization finds value in using data and having decision support to make informed decisions.

      The overarching question that needs to be continually asked to create an effective BI strategy is:

      How do I create an environment that makes information accessible and consumable to users, and facilitates a collaborative dialogue between the business and IT?

      Pre-requisites for success

      Prerequisite #1: Secure Executive Sponsorship

      Sponsorship of BI that is outside of IT and at the highest levels of the organization is essential to the success of your BI strategy. Without it, there is a high chance that your BI program will fail. Note that it may not be an epic fail, but it is a subtle drying out in many cases.

      Prerequisite #2: Understand Business Context

      Providing the right tools for business decision making doesn’t need to be a guessing game if the business context is laid as the project foundation and the most pressing decisions serve as starting points. And business is engaged in formulating and executing the strategy.

      Prerequisite #3: Deliver insights that lead to action

      Start with understanding the business processes and where analytics can improve outcomes. “Think business backwards, not data forward.” (McKinsey)

      11 reasons BI projects fail

      Lack of Executive support

      Old Technology

      Lack of business support

      Too many KPIs

      No methodology for gathering requirements

      Overly long project timeframes

      Bad user experience

      Lack of user adoption

      Bad data

      Lack of proper human resources

      No upfront definition of true ROI

      Mico Yuk, 2019

      Make it clear to the business that IT is committed to building and supporting a BI platform that is intimately tied to enabling changing business objectives.

      Leverage Info-Tech’s BI Strategy and Roadmap Template to accelerate BI planning

      How to accelerate BI planning using the template

      1. Prepopulated text that you can use for your strategy formulation:
      2. Prepopulated text that can be used for your strategy formulation
      3. Sample bullet points that you can pick and choose from:
      4. Sample bullet points to pick and choose from

      Document the BI program planning in Info-Tech’s

      BI Strategy and Roadmap Template.

      Activity: Describe your organization’s vision and mission

      1.1.1

      30-40 minutes

      Compelling vision and mission statements will help guide your internal members toward your company’s target state. These will drive your business intelligence strategy.

      1. Your vision clearly represents where your organization aspires to be in the future and aligns the entire organization. Write down a future-looking, inspirational, and realizable vision in one concise statement. Consider:
      • “Five years from now, our business will be _______.”
      • What do we want to do tomorrow? For whom? What is the benefit?
    • Your mission tells why your organization currently exists and clearly expresses how it will achieve your vision for the future. Write down a mission statement in one clear and concise paragraph consisting of, at most, five sentences. Consider:
      • Why does the business exist? What problems does it solve? Who are its customers?
      • How does the business accomplish strategic tasks or reach its target?
    • Reconvene stakeholders to share ideas and develop one concise vision statement and mission statement. Focus on clarity and message over wording.
    • Input

      • Business vision and mission statements

      Output

      • Alignment and understanding on business vision

      Materials

      Participants

      • BI project lead
      • Executive business stakeholders

      Info-Tech Insight

      Adjust your statements until you feel that you can elicit a firm understanding of both your vision and mission in three minutes or less.

      Formulating an Enterprise BI and Analytics Strategy: Top-down BI Opportunity analysis

      Top-down BI Opportunity analysis

      Example of deriving BI opportunities using BI Opportunity Analysis

      Industry Drivers Private label Rising input prices Retail consolidation
      Company strategies Win at supply chain execution Win at customer service Expand gross margins
      Value disciplines Strategic cost management Operational excellence Customer service
      Core processes Purchasing Inbound logistics Sales, service & distribution
      Enterprise management: Planning, budgeting, control, process improvement, HR
      BI Opportunities Customer service analysis Cost and financial analysis Demand management

      Williams 2016

      Get your organization buzzing about BI – leverage Info-Tech’s Executive Brief as an internal marketing tool

      Two key tasks of a project sponsor are to:

      1. Evangelize the realizable benefits of investing in a business intelligence strategy.
      2. Help to shift the corporate culture to one that places emphasis on data-driven insight.

      Arm your project sponsor with our Executive Brief for this blueprint as a quick way to convey the value of this project to potential stakeholders.

      Bolster this presentation by adding use cases and metrics that are most relevant to your organization.

      Develop a business framework

      Identifying organizational goals and how data can support those goals is key to creating a successful BI & Analytical strategy. Rounding out the business model with technology drivers, environmental factors (as described in previous steps), and internal barriers and enablers creates a holistic view of Business Intelligence within the context of the organization as a whole.

      Through business engagement and contribution, the following holistic model can be created to understand the needs of the business.

      business framework holistic model

      Activity: Describe the Industry Drivers and Organization strategy to mitigate the risk

      1.1.2

      30-45 minutes

      Industry drivers are external influencers that has an effect on a business such as economic conditions, competitor actions, trade relations, climate etc. These drivers can differ significantly by industry and even organizations within the same industry.

      1. List the industry drivers that influences your organization:
      • Public sentiment in regards to energy source
      • Rising cost of raw materials due to increase demand
    • List the company strategies, goals, objectives to counteract the external influencers:
      • Change production process to become more energy efficient
      • Win at customer service
    • Identify the value disciplines :
      • Strategic cost management
      • Operational Excellence
    • List the core process that implements the value disciplines :
      • Purchasing
      • Sales
    • Identify the BI Opportunities:
      • Cost and financial analysis
      • Customer service analysis

      Input

      • Industry drivers

      Output

      • BI Opportunities that business can leverage

      Materials

      • Industry driver section in the BI Strategy and Roadmap Template

      Participants

      • BI project lead
      • Executive business stakeholders

      Understand BI and analytics drivers and organizational objectives

      Environmental Factors Organizational Goals Business Needs Technology Drivers
      Definition External considerations are factors taking place outside the organization that are impacting the way business is conducted inside the organization. These are often outside the control of the business. Organizational drivers can be thought of as business-level metrics. These are tangible benefits the business can measure, such as customer retention, operation excellence, and/or financial performance. A requirement that specifies the behavior and the functions of a system. Technology drivers are technological changes that have created the need for a new BI solution. Many organizations turn to technology systems to help them obtain a competitive edge.
      Examples
      • Economy and politics
      • Laws and regulations
      • Competitive influencers
      • Time to market
      • Quality
      • Delivery reliability
      • Audit tracking
      • Authorization levels
      • Business rules
      • Deployment in the cloud
      • Integration
      • Reporting capabilities

      Activity: Discuss BI/Analytics drivers and organizational objectives

      1.1.3

      30-45 minutes

      1. Use the industry drivers and business goals identified in activity 1.1.2 as a starting point.
      2. Understand how the company runs today and what the organization’s future will look like. Try to identify the purpose for becoming an integrated organization. Use a whiteboard and markers to capture key findings.
      3. Take into account External Considerations, Organizational Drivers, Technology Drivers, and Key Functional Requirements.
      External Considerations Organizational Drivers Technology Considerations Functional Requirements
      • Funding Constraints
      • Regulations
      • Compliance
      • Scalability
      • Operational Efficiency
      • Data Accuracy
      • Data Quality
      • Better Reporting
      • Information Availability
      • Integration Between Systems
      • Secure Data

      Identify challenges and barriers to the BI project

      There are several factors that may stifle the success of a BI implementation. Scan the current environment to identify internal barriers and challenges to identify potential challenges so you can meet them head-on.

      Common Internal Barriers

      Management Support
      Organizational Culture
      Organizational Structure
      IT Readiness
      Definition The degree of management understanding and acceptance towards BI solutions. The collective shared values and beliefs. The functional relationships between people and departments in an organization. The degree to which the organization’s people and processes are prepared for a new BI solution.
      Questions
      • Is a BI project recognized as a top priority?
      • Will management commit time to the project?
      • Are employees resistant to change?
      • Is the organization highly individualized?
      • Is the organization centralized?
      • Is the organization highly formalized?
      • Is there strong technical expertise?
      • Is there strong infrastructure?
      Impact
      • Funding
      • Resources
      • Knowledge sharing
      • User acceptance
      • Flow of knowledge
      • Poor implementation
      • Reliance on consultants

      Activity: Discuss BI/Analytics challenges and pain points

      1.1.4

      30-45 minutes

      1. Identify challenges with the process identified in step 1.1.2.
      2. Brainstorm potential barriers to successful BI implementation and adoption. Use a whiteboard and marker to capture key findings.
      3. Consider Functional Gaps, Technical Gaps, Process Gaps, and Barriers to BI Success.
      Functional Gaps Technical Gaps Process Gaps Barriers to Success
      • No online purchase order requisition
      • Inconsistent reporting – data quality concerns
      • Duplication of data
      • Lack of system integration
      • Cultural mindset
      • Resistance to change
      • Lack of training
      • Funding

      Activity: Discuss opportunities and benefits

      1.1.5

      30-45 minutes

      1. Identify opportunities and benefits from an integrated system.
      2. Brainstorm potential enablers for successful BI implementation and adoption. Use a whiteboard and markers to capture key findings.
      3. Consider Business Benefits, IT Benefits, Organizational Benefits, and Enablers of BI success.
      Business Benefits IT Benefits Organizational Benefits Enablers of Success
      • Business-IT alignment
      • Compliance
      • Scalability
      • Operational Efficiency
      • Data Accuracy
      • Data Quality
      • Better Reporting
      • Change management
      • Training
      • Alignment to strategic objectives

      Your organization’s framework for Business Intelligence Strategy

      Blank organization framework for Business Intelligence Strategy

      Example: Business Framework for Data & Analytics Strategy

      The following diagram represents [Client]’s business model for BI and data. This holistic view of [Client]’s current environment serves as the basis for the generation of the business-aligned Data & Analytics Strategy.

      The image is an example of Business Framework for Data & Analytics Strategy.

      Info-Tech recommends balancing a top-down approach with bottom up for building your BI strateg

      Taking a top-down approach will ensure senior management’s involvement and support throughout the project. This ensures that the most critical decisions are supported by the right data/information, aligning the entire organization with the BI strategy. Furthermore, the gains from BI will be much more significant and visible to the rest of the organization.

      Two charts showing the top-down and bottom-up approach.

      Far too often, organizations taking a bottom-up approach to BI will fail to generate sufficient buy-in and awareness from senior management. Not only does a lack of senior involvement result in lower adoption from the tactical and operational levels, but more importantly, it also means that the strategic decision makers aren’t taking advantage of BI.

      Estimate the ROI of your BI and analytics strategy to secure executive support

      The value of creating a new strategy – or revamping an existing one – needs to be conveyed effectively to a high-level stakeholder, ideally a C-level executive. That executive buy-in is more likely to be acquired when effort has been made to determine the return on investment for the overall initiative.

      1. Business Impacts
        New revenue
        Cost savings
        Time to market
        Internal Benefits
        Productivity gain
        Process optimization
        Investment
        People – employees’ time, external resources
        Data – cost for new datasets
        Technology – cost for new technologies
      2. QuantifyCan you put a number or a percentage to the impacts and benefits? QuantifyCan you estimate the investments you need to put in?
      3. TranslateTranslate the quantities into dollar value
      4. The image depicts an equation for ROI estimate

      Example

      One percent increase in revenue; three more employees $225,000/yr, $150,000/yr 50%

      Activity: Establish a high-level ROI as part of an overall use case for developing a fit-for-purpose BI strategy

      1.1.6

      1.5 hours

      Communicating an ROI that is impactful and reasonable is essential for locking in executive-level support for any initiative. Use this activity as an initial touchpoint to bring business and IT perspectives as part of building a robust business case for developing your BI strategy.

      1. Revisit the business context detailed in the previous sections of this phase. Use priority objectives to identify use case(s), ideally where there are easily defined revenue generators/cost reductions (e.g. streamlining the process of mailing physical marketing materials to customers).
      2. Assign research tasks around establishing concrete numbers and dollar values.
      • Have a subject matter expert weigh in to validate your figures.
      • When calculating ROI, consider how you might leverage BI to create opportunities for upsell, cross-sell, or increased customer retention.
    • Reconvene the stakeholder group and discuss your findings.
      • This is the point where expectation management is important. Separate the need-to-haves from the nice-to-haves.

      Emphasize that ROI is not fully realized after the first implementation, but comes as the platform is built upon iteratively and in an integrated fashion to mature capabilities over time.

      Input

      • Vision statement
      • Mission statement

      Output

      • Business differentiators and key drivers

      Materials

      • Benefit Cost Analysis section of the BI Strategy and Roadmap Template

      Participants

      • BI project lead
      • Executive IT & business stakeholders

      An effective BI strategy positions business intelligence in the larger data lifecycle

      In an effort to keep users satisfied, many organizations rush into implementing a BI platform and generating reports for their business users. BI is, first and foremost, a presentation layer; there are several stages in the data lifecycle where the data that BI visualizes can be compromised.

      Without paying the appropriate amount of attention to the underlying data architecture and application integration, even the most sophisticated BI platforms will fall short of providing business users with a holistic view of company information.

      Example

      In moving away from single application-level reporting, a strategy around data integration practices and technology is necessary before the resultant data can be passed to the BI platform for additional analyses and visualization.

      BI doesn’t exist in a vacuum – develop an awareness of other key data management practices

      As business intelligence is primarily a presentation layer that allows business users to visualize data and turn information into actionable decisions, there are a number of data management practices that precede BI in the flow of data.

      Data Warehousing

      The data warehouse structures source data in a manner that is more operationally focused. The Reporting & Analytics Strategy must inform the warehouse strategy on data needs and building a data warehouse to meet those needs.

      Data Integration, MDM & RDM

      The data warehouse is built from different sources that must be integrated and normalized to enable Business Intelligence. The Info-Tech integration and MDM blueprints will guide with their implementation.

      Data Quality

      A major roadblock to building an effective BI solution is a lack of accurate, timely, consistent, and relevant data. Use Info-Tech’s blueprint to refine your approach to data quality management.

      Data quality, poor integration/P2P integration, poor data architecture are the primary barriers to truly leveraging BI, and a lot of companies haven’t gotten better in these areas.

      – Shari Lava, Associate Vice-President, IT Research and Advisory Firm

      Building consensus around data definitions across business units is a critical step in carrying out a BI strategy

      Business intelligence is heavily reliant on the ability of an organization to mesh data from different sources together and create a holistic and accurate source of truth for users.

      Useful analytics cannot be conducted if your business units define key business terms differently.

      Example

      Finance may label customers as those who have transactional records with the organization, but Marketing includes leads who have not yet had any transactions as customers. Neglecting to note these seemingly small discrepancies in data definition will undermine efforts to combine data assets from traditionally siloed functional units.

      In the stages prior to implementing any kind of BI platform, a top priority should be establishing common definitions for key business terms (customers, products, accounts, prospects, contacts, product groups, etc.).

      As a preliminary step, document different definitions for the same business terms so that business users are aware of these differences before attempting to combine data to create custom reports.

      Self-Assessment

      Do you have common definitions of business terms?

      • If not, identify common business terms.
      • At the very least, document different definitions of the same business terms so the corporate can compare and contrast them.

      STEP 1.2

      Assess the Current BI Landscape

      Establish an in-depth understanding of your current BI landscape

      Step Objectives

      • Inventory and assess the state of your current BI landscape
      • Document the artifacts of your BI environment

      Step Activities

      1.2.1 Analyze the usage levels of your current BI programs/platform

      1.2.2 Perform a survey to gather user perception of your current BI environment

      1.2.3 Take an inventory of your current BI artifacts

      Outcomes

      • Summarize the qualitative and quantitative performance of your existing BI environment
      • Understand the outputs coming from your BI sources

      Research Support

      • Info-Tech’s BI Strategy and Roadmap Template

      Project Manager

      Data Architect(s) or Enterprise Architect

      Project Team

      Understand your current BI landscape before you rationalize

      Relying too heavily on technology as the sole way to solve BI problems results in a more complex environment that will ultimately frustrate business users. Take the time to thoroughly assess the current state of your business intelligence landscape using a qualitative (user perception) and quantitative (usage statistics) approach. The insights and gaps identified in this step will serve as building blocks for strategy and roadmap development in later phases.

      Phase 1

      Current State Summary of BI Landscape

      1.2.1 1.2.2 1.2.3 1.2.4
      Usage Insights Perception Insights BI Inventory Insights Requirements Insights

      PHASE 2

      Strategy and Roadmap Formulation

      Gather usage insights to pinpoint the hot spots for BI usage amongst your users

      Usage data reflects the consumption patterns of end users. By reviewing usage data, you can identify aspects of your BI program that are popular and those that are underutilized. It may present some opportunities for trimming some of the underutilized content.

      Benefits of analyzing usage data:

      • Usage is a proxy for popularity and usability of the BI artifacts. The popular content should be kept and improved in your next generation BI.
      • Usage information provides insight on what, when, where, and how much users are consuming BI artifacts.
      • Unlike methods such as user interviews and focus groups, usage information is fact based and is not subject to peer pressure or “toning down.”

      Sample Sources of Usage Data:

      1. Usage reports from your BI platform Many BI platforms have out-of-the-box usage reports that log and summarize usage data. This is your ideal source for usage data.
      2. Administrator console in your BI platformBI platforms usually have an administrator console that allows BI administrators to configure settings and to monitor activities that include usage. You may obtain some usage data in the console. Note that the usage data is usually real-time in nature, and you may not have access to a historical view of the BI usage.

      Info-Tech Insight

      Don’t forget some of the power users. They may perform analytics by accessing datasets directly or with the help of a query tool (even straight SQL statements). Their usage information is important. The next generation BI should provide consumption options for them.

      Accelerate the process of gathering user feedback with Info-Tech’s Application Portfolio Assessment (APA)

      In an environment where multiple BI tools are being used, discovering what works for users and what doesn’t is an important first step to rationalizing the BI landscape.

      Info-Tech’s Application Portfolio Assessment allows you to create a custom survey based on your current applications, generate a custom report that will help you visualize user satisfaction levels, and pinpoint areas for improvement.

      Activity: Review and analyze usage data

      1.2.1

      2 hours

      This activity helps you to locate usage data in your existing environment. It also helps you to review and analyze usage data to come up with a few findings.

      1. Get to the usage source. You may obtain usage data from one of the below options. Usage reports are your ideal choice, followed by some alternative options:
      2. a. Administrator console – limited to real-time or daily usage data. You may need to track usage data over for several days to identify patterns.

        b. Info-Tech’s Application Portfolio Assessment (APA).

        c. Other – be creative. Some may use an IT usage monitoring system or web analytics to track time users spent on the BI portal.

      3. Develop categories for classifying the different sources of usage data in your current BI environment. Use the following table as starting point for creating these groups:

      This is the content for Layout H4 Tag

      By Frequency Real Time Daily Weekly Yearly
      By Presentation Format Report Dashboard Alert Scorecard
      By Delivery Web portal Excel PDF Mobile application

      INPUT

      • Usage reports
      • Usage statistics

      OUTPUT

      • Insights pertaining to usage patterns

      Materials

      • Usage Insights of the BI Strategy and Roadmap Template

      Participants

      • BA
      • BI Administrator
      • PM

      Activity: Review and analyze usage (cont.)

      1.2.1

      2 hours

      3. Sort your collection of BI artifacts by usage. Discuss some of the reasons why some content is popular whereas some has no usage at all.

      Popular BI Artifacts – Discuss improvements, opportunities and new artifacts

      Unpopular BI Artifacts – Discuss retirement, improvements, and realigning information needs

      4. Summarize your findings in the Usage Insights section of the BI Strategy and Roadmap Template.

      INPUT

      • Usage reports
      • Usage statistics

      OUTPUT

      • Insights pertaining to usage patterns

      Materials

      • Usage Insights section of the BI Strategy and Roadmap Template

      Participants

      • BA
      • BI Administrator
      • PM

      Gather perception to understand the existing BI users

      In 1.2.1, we gathered the statistics for BI usage; it’s the hard data telling who uses what. However, it does not tell you the rationale, or the why, behind the usage. Gathering user perception and having conversations with your BI consumers is the key to bridging the gap.

      User Perception Survey

      Helps you to:

      1. Get general insights on user perception
      2. Narrow down to selected areas

      User Interviews

      Perception can be gathered by user interviews and surveys. Conducting user interviews takes time so it is a good practice to get some primary insights via survey before doing in-depth interviews in selected areas.

      – Shari Lava, Associate Vice-President, IT Research and Advisory Firm

      Define problem statements to create proof-of-concept initiatives

      Info-Tech’s Four Column Model of Data Flow

      Find a data-related problem or opportunity

      Ask open-ended discovery questions about stakeholder fears, hopes, and frustrations to identify a data-related problem that is clear, contained, and fixable. This is then to be written as a problem/opportunity statement.

      1. Fear: What is the number one risk you need to alleviate?
      2. Hope: What is the number one opportunity you wish to realize?
      3. Frustration: What is the number one annoying pet peeve you wish to scratch?
      4. Next, gather information to support a problem/opportunity statement:

      5. What are your challenges in performing the activity or process today?
      6. What does amazing look like if we solve this perfectly?
      7. What other business activities/processes will be impacted/improved if we solve this?
      8. What compliance/regulatory/policy concerns do we need to consider in any solution?
      9. What measures of success/change should we use to prove value of the effort (KPIs/ROI)?
      10. What are the steps in the process/activity?
      11. What are the applications/systems used at each step and from step to step?
      12. What data elements are created, used, and/or transformed at each step?

      Leverage Info-Tech’s BI survey framework to initiate a 360° perception survey

      Info-Tech has developed a BI survey framework to help existing BI practices gather user perception via survey. The framework is built upon best practices developed by McLean & Company.

      1. Communicate the survey
      2. Create a survey
      3. Conduct the survey
      4. Collect and clean survey data
      5. Analyze survey data
      6. Conduct follow-up interviews
      7. Identify and prioritize improvement initiatives

      The survey takes a comprehensive approach by examining your existing BI practices through the following lenses:

      360° Perception

      Demographics Who are the users? From which department?
      Usage How is the current BI being used?
      People Web portal
      Process How good is your BI team from a user perspective?
      Data How good is the BI data in terms of quality and usability?
      Technology How good are your existing BI/reporting tools?
      Textual Feedback The sky’s the limit. Tell us your comments and ideas via open-ended questions.

      Use Info-Tech’s BI End-User Satisfaction Survey Framework to develop a comprehensive BI survey tailored to your organization.

      Activity: Develop a plan to gather user perception of your current BI program

      1.2.2

      2 hours

      This activity helps you to plan for a BI perception survey and subsequent interviews.

      1. Proper communication while conducting surveys helps to boost response rate. The project team should have a meeting with business executives to decide:
      • The survey goals
      • Which areas to cover
      • Which trends and hypotheses you want to confirm
      • Which pre-, during, and post-survey communications should be sent out
    • Have the project team create the first draft of the survey for subsequent review by select business stakeholders. Several iterations may be needed before finalizing.
    • In planning for the conclusion of the survey, the project team should engage a data analyst to:
      1. Organize the data in a useful format
      2. Clean up the survey data when there are gaps
      3. Summarize the data into a presentable/distributable format

      Collectively, the project team and the BI consuming departments should review the presentation and discuss these items:

      Misalignment

      Opportunities

      Inefficiencies

      Trends

      Need detailed interviews?

      INPUT

      • Usage information and analyses

      OUTPUT

      • User-perception survey

      Materials

      • Perception Insights section of the BI Strategy and Roadmap Template

      Participants

      • BA
      • BI Administrator
      • PM
      • Business SMEs

      Create a comprehensive inventory of your BI artifacts

      Taking an inventory of your BI artifacts allows you to understand what deliverables have been developed over the years. Inventory taking should go beyond the BI content. You may want to include additional information products such as Excel spreadsheets, reports that are coming out of an Access database, and reports that are generated from front-end applications (e.g. Salesforce).

      1. Existing Reports from BI platform

      2. If you are currently using a BI platform, you have some BI artifacts (reports, scorecards, dashboards) that are developed within the platform itself.

      • BI Usage Reports (refer to step 2.1) – if you are getting a comprehensive BI usage reports for all your BI artifacts, there is your inventory report too.
      • BI Inventory Reports – Your BI platform may provide out-of-the-box inventory reports. You can use them as your inventory.
      • If the above options are not feasible, you may need to manually create the BI inventory. You may build that from some of your existing BI documentations to save time.
    • Excel and Access

      • Work with the business units to identify if Excel and Access are used to generate reports.
    • Application Reports

      • Data applications such as Salesforce, CRM, and ERP often provide reports as an out-of-the-box feature.
      • Those reports only include data within their respective applications. However, this may present opportunities for integrating application data with additional data sources.

      Activity: Inventory your BI artifacts

      1.2.3

      2+ hours

      This activity helps you to inventory your BI information artifacts and other related information artifacts.

      1. Define the scope of your inventory. Work with the project sponsor and CIO to define which sources should be captured in the inventory process. Consider: BI inventory, Excel spreadsheets, Access reports, and application reporting.
      2. Define the depth of your inventory. Work with the project sponsor and CIO to define the level of granularity. In some settings, the artifact name and a short description may be sufficient. In other cases, you may need to document users and business logic of the artifacts.
      3. Review the inventory results. Discuss findings and opportunities around the following areas:

      Interpret your Inventory

      Duplicated reports/ dashboards Similar reports/ dashboards that may be able to merge Excel and Access reports that are using undocumented, unconventional business logics Application reports that need to be enhanced by additional data Classify artifacts by BI Type

      INPUT

      • Current BI artifacts and documents
      • BI Type classification

      OUTPUT

      • Summary of BI artifacts

      Materials

      • BI Inventory Insights section of the BI Strategy and Roadmap Template

      Participants

      • BA
      • Data analyst
      • PM
      • Project sponsor

      Project sponsor

      1.2.4

      2+ hours

      This activity helps you to inventory your BI by report type.

      1. Classify BI artifacts by type. Use the BI Type tool to classify Work with the project sponsor and CIO to define which sources should be captured in the inventory process. Consider: BI inventory, Excel spreadsheets, Access reports, and application reporting.
      2. Define the depth of your inventory. Work with the project sponsor and CIO to define the level of granularity. In some settings, the artifact name and a short description may be sufficient. In other cases, you may need to document users and business logic of the artifacts.
      3. Review the inventory results. Discuss findings and opportunities around the following areas:

      Interpretation of your Inventory

      Duplicated reports/dashboards Similar reports/dashboards that may be able to merge Excel and Access reports that are using undocumented, unconventional business logics Application reports that need to be enhanced by additional data

      INPUT

      • The BI Type as used by different business units
      • Business BI requirements

      OUTPUT

      • Summary of BI type usage across the organization

      Materials

      • BI Inventory Insights section of the BI Strategy and Roadmap Template

      Participants

      • BA
      • Data analyst
      • PM
      • Project sponsor

      STEP 1.3

      Undergo BI Requirements Gathering

      Perform requirements gathering for revamping your BI environment

      Step Objectives

      • Create principles that will direct effective requirements gathering
      • Create a list of existing and desired BI requirements

      Step Activities

      1.3.1 Create requirements gathering principles

      1.3.2 Gather appropriate requirements

      1.3.3 Organize and consolidate the outputs of requirements gathering activities

      Outcomes

      • Requirements gathering principles that are flexible and repeatable
      • List of BI requirements

      Research Support

      • Info-Tech’s BI Strategy and Roadmap Template

      Proposed Participants in this Step

      Project Manager

      Data Architect(s) or Enterprise Architect

      Project Team

      Business Users

      Don’t let your new BI platform become a victim of poor requirements gathering

      The challenges in requirements management often have underlying causes; find and eliminate the root causes rather than focusing on the symptoms.

      Root Causes of Poor Requirements Gathering:

      • Requirements gathering procedures exist but aren’t followed.
      • There isn't enough time allocated to the requirements gathering phase.
      • There isn't enough involvement or investment secured from business partners.
      • There is no senior leadership involvement or mandate to fix requirements gathering.
      • There are inadequate efforts put towards obtaining and enforcing sign off.

      Outcomes of Poor Requirements Gathering:

      • Rework due to poor requirements leads to costly overruns.
      • Final deliverables are of poor quality and are implemented late.
      • Predicted gains from deployed applications are not realized.
      • There are low feature utilization rates by end users.
      • Teams are frustrated within IT and the business.

      Info-Tech Insight

      Requirements gathering is the number one failure point for most development or procurement projects that don’t deliver value. This has been, and continues to be, the case as most organizations still don't get requirements gathering right. Overcoming organizational cynicism can be a major obstacle to clear when it is time to optimize the requirements gathering process.

      Define the attributes of a good requirement to help shape your requirements gathering principles

      A good requirement has the following attributes:

      Verifiable It is stated in a way that can be tested.
      Unambiguous It is free of subjective terms and can only be interpreted in one way.
      Complete It contains all relevant information.
      Consistent It does not conflict with other requirements.
      Achievable It is possible to accomplish given the budgetary and technological constraints.
      Traceable It can be tracked from inception to testing.
      Unitary It addresses only one thing and cannot be deconstructed into multiple requirements.
      Accurate It is based on proven facts and correct information.

      Other Considerations

      Organizations can also track a requirement owner, rationale, priority level (must have vs. nice to have), and current status (approved, tested, etc.).

      Info-Tech Insight

      Requirements must be solution agnostic – they should focus on the underlying need rather than the technology required to satisfy the need.

      Activity: Define requirements gathering principles

      1.3.1

      1 hour

      1. Invite representatives from the project management office, project management team, and BA team, as well as some key business stakeholders.
      2. Use the sample categories and principles in the table below as starting points for creating your own requirements gathering principles.
      3. Document the requirements gathering principles in the BI Strategy and Roadmap Template.
      4. Communicate the requirements gathering principles to the affected BI stakeholders.

      Sample Principles to Start With

      Effectiveness Face-to-face interviews are preferred over phone interviews.
      Alignment Clarify any misalignments, even the tiniest ones.
      Validation Rephrase requirements at the end to validate requirements.
      Ideation Use drawings and charts to explain ideas.
      Demonstration Make use of Joint Application Development (JAD) sessions.

      INPUT

      • Existing requirement principles (if any)

      OUTPUT

      • Requirements gathering principles that can be revisited and reused

      Materials

      • Requirements Insights section of the BI Strategy and Roadmap Template

      Participants

      • BA Team
      • PM
      • Business stakeholders
      • PMO

      Info-Tech Insight

      Turn requirements gathering principles into house rules. The house rules should be available in every single requirements gathering session and the participants should revisit them when there are disagreements, confusion, or silence.

      Right-size your approach to BI requirements management

      Info-Tech suggests four requirements management approaches based on project complexity and business significance. BI projects usually require the Strategic Approach in requirements management.

      Requirements Management Process Explanations

      Approach Definition Recommended Strategy
      Strategic Approach High business significance and high project complexity merits a significant investment of time and resources in requirements gathering. Treat the requirements gathering phase as a project within a project. A large amount of time should be dedicated to elicitation, business process mapping, and solution design.
      Fundamental Approach High business significance and low project complexity merits a heavy emphasis on the elicitation phase to ensure that the project bases are covered and business value is realized. Look to achieve quick wins and try to survey a broad cross-section of stakeholders during elicitation and validation. The elicitation phase should be highly iterative. Do not over-complicate the analysis and validation of a straightforward project.
      Calculated Approach Low business significance and high project complexity merits a heavy emphasis on the analysis and validation phases to ensure that the solution meets the needs of users. Allocate a significant amount of time to business process modeling, requirements categorization, prioritization, and solution modeling.
      Elementary Approach Low business significance and low project complexity does not merit a high amount of rigor for requirements gathering. Do not rush or skip steps, but aim to be efficient. Focus on basic elicitation techniques (e.g. unstructured interviews, open-ended surveys) and consider capturing requirements as user stories. Focus on efficiency to prevent project delays and avoid squandering resources.

      Vary the modes used in eliciting requirements from your user base

      Requirements Gathering Modes

      Info-Tech has identified four effective requirements gathering modes. During the requirements gathering process, you may need to switch between the four gathering modes to establish a thorough understanding of the information needs.

      Dream Mode

      • Mentality: Let users’ imaginations go wild. The sky’s the limit.
      • How it works: Ask users to dream up the ideal future state and ask how analytics can support those dreams.
      • Limitations: Not all dreams can be fulfilled. A variety of constraints (budget, personnel, technical skills) may prevent the dreams from becoming reality.

      Pain Mode

      • Mentality: Users are currently experiencing pains related to information needs.
      • How it works: Vent the pains. Allow end users to share their information pains, ask them how their pains can be relieved, then convert those pains to requirements.
      • Limitations: Users are limited by the current situation and aren’t looking to innovate.

      Decode Mode

      • Mentality: Read the hidden messages from users. Speculate as to what the users really want.
      • How it works: Decode the underlying messages. Be innovative to develop hypotheses and then validate with the users.
      • Limitations: Speculations and hypothesis could be invalid. They may direct the users into some pre-determined directions.

      Profile Mode

      • Mentality: “I think you may want XYZ because you fall into that profile.”
      • How it works: The information user may fall into some existing user group profile or their information needs may be similar to some existing users.
      • Limitations: This mode doesn’t address very specific needs.

      Supplement BI requirements with user stories and prototyping to ensure BI is fit for purpose

      BI is a continually evolving program. BI artifacts that were developed in the past may not be relevant to the business anymore due to changes in the business and information usage. Revamping your BI program entails revisiting some of the BI requirements and/or gathering new BI requirements.

      Three-Step Process for Gathering Requirements

      Requirements User Stories Rapid Prototyping
      Gather requirements. Most importantly, understand the business needs and wants. Leverage user stories to organize and make sense of the requirements. Use a prototype to confirm requirements and show the initial draft to end users.

      Pain Mode: “I can’t access and manipulate data on my own...”

      Decode Mode: Dig deeper: could this hint at a self-service use case?

      Dream Mode: E.g. a sandbox area where I can play around with clean, integrated, well-represented data.

      Profile Mode: E.g. another marketing analyst is currently using something similar.

      ExampleMary has a spreadmart that keeps track of all campaigns. Maintaining and executing that spreadmart is time consuming.

      Mary is asking for a mash-up data set that she can pivot on her own…

      Upon reviewing the data and the prototype, Mary decided to use a heat map and included two more data points – tenure and lifetime value.

      Identify which BI styles best meet user requirements

      A spectrum of Business Intelligence solutions styles are available. Use Info-Tech’s BI Styles Tool to assess which business stakeholder will be best served by which style.

      Style Description Strategic Importance (1-5) Popularity (1-5) Effort (1-5)
      Standards Preformatted reports Standard, preformatted information for backward-looking analysis. 5 5 1
      User-defined analyses Pre-staged information where “pick lists” enable business users to filter (select) the information they wish to analyze, such as sales for a selected region during a selected previous timeframe. 5 4 2
      Ad-hoc analyses Power users write their own queries to extract self-selected pre-staged information and then use the information to perform a user-created analysis. 5 4 3
      Scorecards and dashboards Predefined business performance metrics about performance variables that are important to the organization, presented in a tabular or graphical format that enables business users to see at a glance how the organization is performing. 4 4 3
      Multidimensional analysis (OLAP) Multidimensional analysis (also known as on-line analytical processing): Flexible tool-based, user-defined analysis of business performance and the underlying drivers or root causes of that performance. 4 3 3
      Alerts Predefined analyses of key business performance variables, comparison to a performance standard or range, and communication to designated businesspeople when performance is outside the predefined performance standard or range. 4 3 3
      Advanced Analytics Application of long-established statistical and/or operations research methods to historical business information to look backward and characterize a relevant aspect of business performance, typically by using descriptive statistics. 5 3 4
      Predictive Analytics Application of long-established statistical and/or operations research methods and historical business information to predict, model, or simulate future business and/or economic performance and potentially prescribe a favored course of action for the future. 5 3 5

      Activity: Gather BI requirements

      1.3.2

      2-6 hours

      Using the approaches discussed on previous slides, start a dialogue with business users to confirm existing requirements and develop new ones.

      1. Invite business stakeholders to a requirements gathering session.
      2. For existing BI artifacts – Invite existing users of those artifacts.

        For new BI development – Invite stakeholders at the executive level to understand the business operation and their needs and wants. This is especially important if their department is new to BI.

      3. Discuss the business requirements. Systematically switch between the four requirements gathering modes to get a holistic view of the requirements.
      4. Once requirements are gathered, organize them to tell a story. A story usually has these components:
      The Setting The Characters The Venues The Activities The Future
      Example Customers are asking for a bundle discount. CMO and the marketing analysts want to… …the information should be available in the portal, mobile, and Excel. …information is then used in the bi-weekly pricing meeting to discuss… …bundle information should contain historical data in a graphical format to help executives.

      INPUT

      • Existing documentations on BI artifacts

      OUTPUT

      • Preliminary, uncategorized list of BI requirements

      Materials

      • Requirements Insights section of the BI Strategy and Roadmap Template

      Participants

      • BA team
      • Business stakeholders
      • Business SMEs
      • BI developers

      Clarify consumer needs by categorizing BI requirements

      Requirements are too broad in some situations and too detailed in others. In the previous step we developed user stories to provide context. Now you need to define requirement categories and gather detailed requirements.

      Considerations for Requirement Categories

      Category Subcategory Sample Requirements
      Data Granularity Individual transaction
      Transformation Transform activation date to YYYY-MM format
      Selection Criteria Client type: consumer. Exclude SMB and business clients. US only. Recent three years
      Fields Required Consumer band, Region, Submarket…
      Functionality Filters Filters required on the dashboard: date range filter, region filter…
      Drill Down Path Drill down from a summary report to individual transactions
      Analysis Required Cross-tab, time series, pie chart
      Visual Requirements Mock-up See attached drawing
      Section The dashboard will be presented using three sections
      Conditional Formatting Below-average numbers are highlighted
      Security Mobile The dashboard needs to be accessed from mobile devices
      Role Regional managers will get a subset of the dashboard according to the region
      Users John, Mary, Tom, Bob, and Dave
      Export Dashboard data cannot be exported into PDF, text, or Excel formats
      Performance Speed A BI artifact must be loaded in three seconds
      Latency Two seconds response time when a filter is changed
      Capacity Be able to serve 50 concurrent users with the performance expected
      Control Governance Govern by the corporate BI standards
      Regulations Meet HIPPA requirements
      Compliance Meet ISO requirements

      Prioritize requirements to assist with solution modeling

      Prioritization ensures that the development team focuses on the right requirements.

      The MoSCoW Model of Prioritization

      Must Have Requirements that mustbe implemented for the solution to be considered successful.
      Should Have Requirements that are high priority and should be included in the solution if possible.
      Could Have Requirements that are desirable but not necessary and could be included if resources are available.
      Won't Have Requirements that won’t be in the next release but will be considered for the future releases.

      The MoSCoW model was introduced by Dai Clegg of Oracle UK in 1994.

      Prioritization is the process of ranking each requirement based on its importance to project success. Hold a separate meeting for the domain SMEs, implementation SMEs, project managers, and project sponsors to prioritize the requirements list. At the conclusion of the meeting, each requirement should be assigned a priority level. The implementation SMEs will use these priority levels to ensure that efforts are targeted towards the proper requirements and the plan features available on each release. Use the MoSCoW Model of Prioritization to effectively order requirements.

      Activity: Finalize the list of BI requirements

      1.3.3

      1-4 hours

      Requirement Category Framework

      Category Subcategory
      Data Granularity
      Transformation
      Selection Criteria
      Fields Required
      Functionality Filters
      Drill Down Path
      Analysis Required
      Visual Requirements Mock-up
      Section
      Conditional Formatting
      Security Mobile
      Role
      Users
      Export
      Performance Speed
      Latency
      Capacity
      Control Governance
      Regulations
      Compliance

      Create requirement buckets and classify requirements.

      1. Define requirement categories according to the framework.
      2. Review the user story and requirements you collected in Step 1.3.2. Classify the requirements within requirement categories.
      3. Review the preliminary list of categorized requirements and look for gaps in this detailed view. You may need to gather additional requirements to fill the gaps.
      4. Prioritize the requirements according to the MoSCoW framework.
      5. Document your final list of requirements in the BI Strategy and Roadmap Template.

      INPUT

      • Existing requirements and new requirements from step 1.3.2

      OUTPUT

      • Prioritized and categorized requirements

      Materials

      • Requirements Insights section of the BI Strategy and Roadmap Template

      Participants

      • BA
      • Business stakeholders
      • PMO

      Translate your findings and ideas into actions that will be integrated into the BI Strategy and Roadmap Template

      As you progress through each phase, document findings and ideas as they arise. At phase end, hold a brainstorming session with the project team focused on documenting findings and ideas and substantiating them into improvement actions.

      Translating findings and ideas into actions that will be integrated into the BI Strategy and Roadmap Template

      Ask yourself how BI or analytics can be used to address the gaps and explore opportunities uncovered in each phase. For example, in Phase 1, how do current BI capabilities impede the realization of the business vision?

      Document and prioritize Phase 1 findings, ideas, and action items

      1.3.4

      1-2 hours

      1. Reconvene as a group to review findings, ideas, and actions harvested in Phase 1. Write the findings, ideas, and actions on sticky notes.
      2. Prioritize the sticky notes to yield those with high business value and low implementation effort. View some sample findings below:
      3. High Business Value, Low Effort High Business Value, High Effort
        Low Business Value, High Effort Low Business Value, High Effort

        Phase 1

        Sample Phase 1 Findings Found two business objectives that are not supported by BI/analytics
        Some executives still think BI is reporting
        Some confusion around operational reporting and BI
        Data quality plays a big role in BI
        Many executives are not sure about the BI ROI or asking for one
      4. Select the top findings and document them in the “Other Phase 1 Findings” section of the BI Strategy and Roadmap Template. The findings will be used again in Phase 3.

      INPUT

      • Phase 1 activities
      • Business context (vision, mission, goals, etc.

      OUTPUT

      • Other Phase 1 Findings section of the BI Strategy and Roadmap Template

      Materials

      • Whiteboard
      • Sticky notes

      Participants

      • Project manger
      • Project team
      • Business stakeholders

      If you want additional support, have our analysts guide you through this phase as part of an Info-Tech workshop

      Book a workshop with our Info-Tech analysts:

      • To accelerate this project, engage your IT team in an Info-Tech workshop with an Info-Tech analyst team.
      • Info-Tech analysts will join you and your team onsite at your location or welcome you to Info-Tech’s historic Toronto office to participate in an innovative onsite workshop.
      • Contact your account manager (www.infotech.com/account), or email Workshops@InfoTech.com for more information.

      The following are sample activities that will be conducted by Info-Tech analysts with your team:

      1.1.1-1.1.5

      Establish the business context

      To begin the workshop, your project team will be taken through a series of activities to establish the overall business vision, mission, objectives, goals, and key drivers. This information will serve as the foundation for discerning how the revamped BI strategy needs to enable business users.

      1.2.1- 1.2.3

      Create a comprehensive documentation of your current BI environment

      Our analysts will take your project team through a series of activities that will facilitate an assessment of current BI usage and artifacts, and help you design an end-user interview survey to elicit context around BI usage patterns.

      If you want additional support, have our analysts guide you through this phase as part of an Info-Tech workshop

      Book a workshop with our Info-tech analysts

      1.3.1-1.3.3

      Establish new BI requirements

      Our analysts will guide your project team through frameworks for eliciting and organizing requirements from business users, and then use those frameworks in exercises to gather some actual requirements from business stakeholders.

      Phase 2

      Evaluate Your Current BI Practice

      Build a Reporting and Analytics Strategy

      Revisit project metrics to track phase progress

      Goals for Phase 2:

      • Assess your current BI practice. Determine the maturity of your current BI practice from different viewpoints.
      • Develop your BI target state. Plan your next generation BI with Info-Tech’s BI patterns and best practices.
      • Safeguard your target state. Avoid BI pitfalls by proactively monitoring BI risks.

      Info-Tech’s Suggested Metrics for Tracking Phase 2 Goals

      Practice Improvement Metrics Data Collection and Calculation Expected Improvement
      # of groups participated in the current state assessment The number of groups joined the current assessment using Info-Tech’s BI Practice Assessment Tool Varies; the tool can accommodate up to five groups
      # of risks mitigated Derive from your risk register At least two to five risks will be identified and mitigated

      Intangible Metrics:

      • Prototyping approach allows the BI group to understand more about business requirements, and in the meantime, allows the business to understand how to partner with the BI group.
      • The BI group and the business have more confidence in the BI program as risks are monitored and mitigated on an ad hoc basis.

      Evaluate your current BI practice

      Phase 2 Overarching Insight

      BI success is not based solely on the technology it runs on; technology cannot mask gaps in capabilities. You must be capable in your environment, and data management, data quality, and related data practices must be strong. Otherwise, the usefulness of the intelligence suffers. The best BI solution does not only provide a technology platform, but also addresses the elements that surround the platform. Look beyond tools and holistically assess the maturity of your BI practice with input from both the BI consumer and provider perspectives.

      Understand the Business Context to Rationalize Your BI Landscape Evaluate Your Current BI Practice Create a BI Roadmap for Continuous Improvement
      Establish the Business Context
      • Business Vision, Goals, Key Drivers
      • Business Case Presentation
      • High-Level ROI
      Assess Your Current BI Maturity
      • SWOT Analysis
      • BI Practice Assessment
      • Summary of Current State
      Construct a BI Initiative Roadmap
      • BI Improvement Initiatives
      • BI Strategy and Roadmap
      Access Existing BI Environment
      • BI Perception Survey Framework
      • Usage Analyses
      • BI Report Inventory
      Envision BI Future State
      • BI Patterns
      • BI Practice Assessment
      • List of Functions
      Plan for Continuous Improvement
      • Excel Governance Policy
      • BI Ambassador Network Draft
      Undergo Requirements Gathering
      • Requirements Gathering Principles
      • Overall BI Requirements

      Phase 2 overview

      Detailed Overview

      Step 1: Assess Your Current BI Practice

      Step 2: Envision a Future State for Your BI Practice

      Outcomes

      • A comprehensive assessment of current BI practice maturity and capabilities.
      • Articulation of your future BI practice.
      • Improvement objectives and activities for developing your current BI program.

      Benefits

      • Identification of clear gaps in BI practice maturity.
      • A current state assessment that includes the perspectives of both BI providers and consumers to highlight alignment and/or discrepancies.
      • A future state is defined to provide a benchmark for your BI program.
      • Gaps between the future and current states are identified; recommendations for the gaps are defined.

      Phase 2 outline

      Call 1-888-670-8889 or email GuidedImplementations@InfoTech.com for more information.

      Complete these steps on your own, or call us to complete a guided implementation. A guided implementation is a series of 2-3 advisory calls that help you execute each phase of a project. They are included in most advisory memberships.

      Guided Implementation 2: Evaluate Your Current BI Practice

      Proposed Time to Completion: 1-2 weeks

      Step 2.1: Assess Your Current BI Practice

      Start with an analyst kick-off call:

      • Detail the benefits of conducting multidimensional assessments that involve BI providers as well as consumers.
      • Review Info-Tech’s BI Maturity Model.

      Then complete these activities…

      • SWOT analyses
      • Identification of BI maturity level through a current state assessment

      With these tools & templates:

      BI Practice Assessment Tool

      BI Strategy and Roadmap Template

      Step 2.2: Envision a Future State for Your BI Practice

      Review findings with an analyst:

      • Discuss overall maturity gaps and patterns in BI perception amongst different units of your organization.
      • Discuss how to translate activity findings into robust initiatives, defining critical success factors for BI development and risk mitigation.

      Then complete these activities…

      • Identify your desired BI patterns and functionalities.
      • Complete a target state assessment for your BI practice.
      • Review capability practice gaps and phase-level metrics.

      With these tools & templates:

      BI Practice Assessment Tool

      BI Strategy and Roadmap Template

      Phase 2 Results & Insights:

      • A comprehensive assessment of the organization’s current BI practice capabilities and gaps
      • Visualization of BI perception from a variety of business users as well as IT
      • A list of tasks and initiatives for constructing a strategic BI improvement roadmap

      STEP 2.1

      Assess the Current State of Your BI Practice

      Assess your organization’s current BI capabilities

      Step Objectives

      • Understand the definitions and roles of each component of BI.
      • Contextualize BI components to your organization’s environment and current practices.

      Step Activities

      2.1.1 Perform multidimensional SWOT analyses

      2.1.2 Assess current BI and analytical capabilities, Document challenges, constraints, opportunities

      2.1.3 Review the results of your current state assessment

      Outcomes

      • Holistic perspective of current BI strengths and weaknesses according to BI users and providers
      • Current maturity in BI and related data management practices

      Research Support

      • Info-Tech’s Data Management Framework
      • Info-Tech’s BI Practice Assessment Tool
      • Info-Tech’s BI Strategy and Roadmap Template

      Proposed Participants in this Step

      Project Manager

      Data Architect(s) or Enterprise Architect

      Project Team

      Gather multiple BI perspectives with comprehensive SWOT analyses

      SWOT analysis is an effective tool that helps establish a high-level context for where your practice stands, where it can improve, and the factors that will influence development.

      Strengths

      Best practices, what is working well

      Weaknesses

      Inefficiencies, errors, gaps, shortcomings

      Opportunities

      Review internal and external drivers

      Threats

      Market trends, disruptive forces

      While SWOT is not a new concept, you can add value to SWOT by:

      • Conducting a multi-dimensional SWOT to diversify perspectives – involve the existing BI team, BI management, business executives and other business users.
      • SWOT analyses traditionally provide a retrospective view of your environment. Add a future-looking element by creating improvement tasks/activities at the same time as you detail historical and current performance.

      Info-Tech Insight

      Consider a SWOT with two formats: a private SWOT worksheet and a public SWOT session. Participants will be providing suggestions anonymously while solicited suggestions will be discussed in the public SWOT session to further the discussion.

      Activity: Perform a SWOT analysis in groups to get a holistic view

      2.1.1

      1-2 hours

      This activity will take your project team through a holistic SWOT analysis to gather a variety of stakeholder perception of the current BI practice.

      1. Identify individuals to involve in the SWOT activity. Aim for a diverse pool of participants that are part of the BI practice in different capacities and roles. Solution architects, application managers, business analysts, and business functional unit leaders are a good starting point.
      2. Review the findings summary from Phase 1. You may opt to facilitate this activity with insights from the business context. Each group will be performing the SWOT individually.
      3. The group results will be collected and consolidated to pinpoint common ideas and opinions. Individual group results should be represented by a different color. The core program team will be reviewing the consolidated result as a group.
      4. Document the results of these SWOT activities in the appropriate section of the BI Strategy and Roadmap Template.

      SWOT

      Group 1 Provider Group E.g. The BI Team

      Group 2 Consumer Group E.g. Business End Users

      INPUT

      • IT and business stakeholder perception

      OUTPUT

      • Multi-faceted SWOT analyses
      • Potential BI improvement activities/objectives

      Materials

      • SWOT Analysis section of the BI Strategy and Roadmap Template

      Participants

      • Selected individuals in the enterprise (variable)

      Your organization’s BI maturity is determined by several factors and the degree of immersion into your enterprise

      BI Maturity Level

      A way to categorize your analytics maturity to understand where you are currently and what next steps would be best to increase your BI maturity.

      There are several factors used to determine BI maturity:

      Buy-in and Data Culture

      Determines if there is enterprise-wide buy-in for developing business intelligence and if a data-driven culture exists.

      Business–IT Alignment

      Examines if current BI and analytics operations are appropriately enabling the business objectives.

      Governance Structure

      Focuses on whether or not there is adequate governance in place to provide guidance and structure for BI activities.

      Organization Structure and Talent

      Pertains to how BI operations are distributed across the overall organizational structure and the capabilities of the individuals involved.

      Process

      Reviews analytics-related processes and policies and how they are created and enforced throughout the organization.

      Data

      Deals with analytical data in terms of the level of integration, data quality, and usability.

      Technology

      Explores the opportunities in building a fit-for-purpose analytics platform and consolidation opportunities.

      Evaluate Your Current BI Practice with the CMMI model

      To assess BI, Info-Tech uses the CMMI model for rating capabilities in each of the function areas on a scale of 1-5. (“0” and “0.5” values are used for non-existent or emerging capabilities.)

      The image shows an example of a CMMI model

      Use Info-Tech’s BI Maturity Model as a guide for identifying your current analytics competence

      Leverage a BI strategy to revamp your BI program to strive for a high analytics maturity level. In the future you should be doing more than just traditional BI. You will perform self-service BI, predictive analytics, and data science.

      Ad Hoc Developing Defined Managed Trend Setting
      Questions What’s wrong? What happened? What is happening? What happened, is happening, and will happen? What if? So what?
      Scope One business problem at a time One particular functional area Multiple functional areas Multiple functional areas in an integrated fashion Internal plus internet scale data
      Toolset Excel, Access, primitive query tools Reporting tools or BI BI BI, business analytics tools Plus predictive platforms, data science tools
      Delivery Model IT delivers ad hoc reports IT delivers BI reports IT delivers BI reports and some self-service BI Self-service BI and report creation at the business units Plus predictive models and data science projects
      Mindset Firefighting using data Manage using data Analyze using data; shared tooling Data is an asset, shared data Data driven
      BI Org. Structure Data analysts in IT BI BI program BI CoE Data Innovation CoE

      Leverage Info-Tech’s BI Practice Assessment Tool to define your BI current state

      BI Practice Assessment Tool

      1. Assess Current State
      • Eight BI practice areas to assess maturity.
      • Based on CMMI maturity scale.
    • Visualize Current State Results
      • Determine your BI maturity level.
      • Identify areas with outstanding maturity.
      • Uncover areas with low maturity.
      • Visualize the presence of misalignments.
    • Target State
      • Tackle target state from two views: business and IT.
      • Calculate gaps between target and current state.
    • Visualize Target State and Gaps
      • A heat map diagram to compare the target state and the current state.
      • Show both current and target maturity levels.
      • Detailed charts to show results for each area.
      • Detailed list of recommendations.

      Purposes:

      • Assess your BI maturity.
      • Visualize maturity assessment to quickly spot misalignments, gaps, and opportunities.
      • Provide right-sized recommendations.

      Info-Tech Insight

      Assessing current and target states is only the beginning. The real value comes from the interpretation and analysis of the results. Use visualizations of multiple viewpoints and discuss the results in groups to come up with the most effective ideas for your strategy and roadmap.

      Activity: Conduct a current state assessment of your BI practice maturity

      2.1.2

      2-3 hours

      Use the BI Practice Assessment Tool to establish a baseline for your current BI capabilities and maturity.

      1. Navigate to Tab 2. Current State Assessment in the BI Practice Assessment Tool and complete the current state assessment together or in small groups. If running a series of assessments, do not star or scratch every time. Use the previous group’s results to start the conversation with the users.
      2. Info-Tech suggests the following groups participate in the completion of the assessment to holistically assess BI and to uncover misalignment:

        Providers Consumers
        CIO & BI Management BI Work Groups (developers, analysts, modelers) Business Unit #1 Business Unit #2 Business Unit #3
      3. For each assessment question, answer the current level of maturity in terms of:
        1. Initial/Ad hoc – the starting point for use of a new or undocumented repeat process
        2. Developing – the process is documented such that it is repeatable
        3. Defined – the process is defined/confirmed as a standard business process
        4. Managed and Measurable – the process is quantitatively managed in accordance with agreed-upon metrics.
        5. Optimized – the process includes process optimization/improvement.

      INPUT

      • Observations of current maturity

      OUTPUT

      • Comprehensive current state assessment

      Materials

      • BI Practice Assessment Tool
      • Current State Assessment section of the BI Strategy and Roadmap Template

      Participants

      • Selected individuals as suggested by the assessment tool

      Info-Tech Insight

      Discuss the rationale for your answers as a group. Document the comments and observations as they may be helpful in formulating the final strategy and roadmap.

      Activity: Review and analyze the results of the current state assessment

      2.1.3

      2-3 hours

      1. Navigate to Tab 3. Current State Results in the BI Practice Assessment Tool and review the findings:

      The tool provides a brief synopsis of your current BI state. Review the details of your maturity level and see where this description fits your organization and where there may be some discrepancies. Add additional comments to your current state summary in the BI Strategy and Roadmap Document.

      In addition to reviewing the attributes of your maturity level, consider the following:

      1. What are the knowns – The knowns confirm your understanding on the current landscape.
    • What are the unknowns – The unknowns show you the blind spots. They are very important to give you an alternative view of the your current state. The group should discuss those blind spots and determine what to do with them.
    • Activity: Review and analyze the results of the current state assessment (cont.)

      2.1.3

      2-3 hours

      2. Tab 3 will also visualize a breakdown of your maturity by BI practice dimension. Use this graphic as a preliminary method to identify where your organization is excelling and where it may need improvement.

      Better Practices

      Consider: What have you done in the areas where you perform well?

      Candidates for Improvement

      Consider: What can you do to improve these areas? What are potential barriers to improvement?

      STEP 2.2

      Envision a Future State for Your Organization’s BI Practice

      Detail the capabilities of your next generation BI practice

      Step Objectives

      • Create guiding principles that will shape your organization’s ideal BI program.
      • Pinpoint where your organization needs to improve across several BI practice dimensions.
      • Develop approaches to remedy current impediments to BI evolution.
      • Step Activities

        2.2.1 Define guiding principles for the future state

        2.2.2 Define the target state of your BI practice

        2.2.3 Confirm requirements for BI Styles by management group

        2.2.4 Analyze gaps in your BI practice and generate improvement activities and objectives

        2.2.5 Define the critical success factors for future BI

        2.2.6 Identify potential risks for your future state and create a mitigation plan

      Outcomes

      • Defined landscape for future BI capabilities, including desired BI functionalities.
      • Identification of crucial gaps and improvement points to include in a BI roadmap.
      • Updated BI Styles Usage sheet.

      Research Support

      • Info-Tech’s Data Management Framework
      • Info-Tech’s BI Practice Assessment Tool
      • Info-Tech’s BI Strategy and Roadmap Template

      Proposed Participants in this Step

      Project Manager

      Data Architect(s) or Enterprise Architect

      Project Team

      Define guiding principles to drive your future state envisioning

      Envisioning a BI future state is essentially architecting the future for your BI program. It is very similar to enterprise architecture (EA). Guiding principles are widely used in enterprise architecture. This best practice should also be used in BI envisioning.

      Benefits of Guiding Principles in a BI Context

      • BI planning involves a number of business units. Defining high-level future state principles helps to establish a common ground for those different business units.
      • Ensure the next generation BI aligns with the corporate enterprise architecture and data architecture principles.
      • Provide high-level guidance without depicting detailed solutioning by leaving room for innovation.

      Sample Principles for BI Future State

      1. BI should be fit for purpose. BI is a business technology that helps business users.
      2. Business–IT collaboration should be encouraged to ensure deliverables are relevant to the business.
      3. Focus on continuous improvement on data quality.
      4. Explore opportunities to onboard and integrate new datasets to create a holistic view of your data.
      5. Organize and present data in an easy-to-consume, easy-to-digest fashion.
      6. BI should be accessible to everything, as soon as they have a business case.
      7. Do not train just on using the platform. Train on the underlying data and business model as well.
      8. Develop a training platform where trainees can play around with the data without worrying about messing it up.

      Activity: Define future state guiding principles for your BI practice

      2.2.1

      1-2 hours

      Guiding principles are broad statements that are fundamental to how your organization will go about its activities. Use this as an opportunity to gather relevant stakeholders and solidify how your BI practice should perform moving forward.

      1. To ensure holistic and comprehensive future state principles, invite participants from the business, the data management team, and the enterprise architecture team. If you do not have an enterprise architecture practice, invite people that are involved in building the enterprise architecture. Five to ten people is ideal.
      2. BI Future State

        Awareness Buy-in Business-IT Alignment Governance Org. Structure; People Process; Policies; Standards Data Technology
      3. Once the group has some high-level ideas on what the future state looks like, brainstorm guiding principles that will facilitate the achievement of the future state (see above).
      4. Document the future state principles in the Future State Principles for BI section of the BI Strategy and Roadmap Template

      INPUT

      • Existing enterprise architecture guiding principles
      • High-level concept of future state BI

      OUTPUT

      • Guiding principles for prospective BI practice

      Materials

      • Future State Principles section of the BI Strategy and Roadmap Template

      Participants

      • Business representatives
      • IT representatives
      • The EA group

      Leverage prototypes to facilitate a continuous dialogue with end users en route to creating the final deliverable

      At the end of the day, BI makes data and information available to the business communities. It has to be fit for purpose and relevant to the business. Prototypes are an effective way to ensure relevant deliverables are provided to the necessary users. Prototyping makes your future state a lot closer and a lot more business friendly.

      Simple Prototypes

      • Simple paper-based, whiteboard-based prototypes with same notes.
      • The most basic communication tool that facilitates the exchange of ideas.
      • Often used in Joint Application Development (JAD) sessions.
      • Improve business and IT collaboration.
      • Can be used to amend requirements documents.

      Discussion Possibilities

      • Initial ideation at the beginning
      • Align everyone on the same page
      • Explain complex ideas/layouts
      • Improve collaboration

      Elaborated Prototypes

      • Demonstrates the possibilities of BI in a risk-free environment.
      • Creates initial business value with your new BI platform.
      • Validates the benefits of BI to the organization.
      • Generates interest and support for BI from senior management.
      • Prepares BI team for the eventual enterprise-wide deployment.

      Discussion Possibilities

      • Validate and refine requirements
      • Fail fast, succeed fast
      • Acts as checkpoints
      • Proxy for the final working deliverable

      Leverage Info-Tech’s BI Practice Assessment Tool to define your BI target state and visualize capability gaps

      BI Practice Assessment Tool

      1. Assess Current State
      • Eight BI practice areas to assess maturity.
      • Based on CMMI maturity scale.
    • Visualize Current State Results
      • Determine your BI maturity level.
      • Identify areas with outstanding maturity.
      • Uncover areas with low maturity.
      • Visualize the presence of misalignments.
    • Target State
      • Tackle target state from two views: business and IT.
      • Calculate gaps between target and current state.
    • Visualize Target State and Gaps
      • A heat map diagram to compare the target state and the current state.
      • Show both current and target maturity levels.
      • Detailed charts to show results for each area.
      • Detailed list of recommendations.

      Purposes:

      • Assess your BI maturity.
      • Visualize maturity assessment to quickly spot misalignments, gaps, and opportunities.
      • Provide right-sized recommendations.

      Document essential findings in Info-Tech’s BI Strategy and Roadmap Template.

      Info-Tech Insight

      Assessing current and target states is only the beginning. The real value comes from the interpretation and analyses of the results. Use visualizations of multiple viewpoints and discuss the results in groups to come up with the most effective ideas for your strategy and roadmap.

      Activity: Define the target state for your BI practice

      2.2.2

      2 hours

      This exercise takes your team through establishing the future maturity of your BI practice across several dimensions.

      1. Envisioning of the future state will involve input from the business side as well as the IT department.
      2. The business and IT groups should get together separately and determine the target state maturity of each of the BI practice components:

      The image is a screenshot of Tab 4: Target State Evaluation of the BI Practice Assessment Tool

      INPUT

      • Desired future practice capabilities

      OUTPUT

      • Target state assessment

      Materials

      • Tab 4 of the BI Practice Assessment Tool

      Participants

      • Business representatives
      • IT representatives

      Activity: Define the target state for your BI practice (cont.)

      2.2.2

      2 hours

      2. The target state levels from the two groups will be averaged in the column “Target State Level.” The assessment tool will automatically calculate the gaps between future state value and the current state maturity determined in Step 2.1. Significant gaps in practice maturity will be highlighted in red; smaller or non-existent gaps will appear green.

      The image is a screenshot of Tab 4: Target State Evaluation of the BI Practice Assessment Tool with Gap highlighted.

      INPUT

      • Desired future practice capabilities

      OUTPUT

      • Target state assessment

      Materials

      • Tab 4 of the BI Practice Assessment Tool

      Participants

      • Business representatives
      • IT representatives

      Activity: Revisit the BI Style Analysis sheet to define new report and analytical requirements by C-Level

      2.2.3

      1-2 hours

      The information needs for each executive is unique to their requirements and management style. During this exercise you will determine the reporting and analytical needs for an executive in regards to content, presentation and cadence and then select the BI style that suite them best.

      1. To ensure a holistic and comprehensive need assessment, invite participants from the business and BI team. Discuss what data the executive currently use to base decisions on and explore how the different BI styles may assist. Sample reports or mock-ups can be used for this purpose.
      2. Document the type of report and required content using the BI Style Tool.
      3. The BI Style Tool will then guide the BI team in the type of reporting to develop and the level of Self-Service BI that is required. The tool can also be used for product selection.

      INPUT

      • Information requirements for C-Level Executives

      OUTPUT

      • BI style(s) that are appropriate for an executive’s needs

      Materials

      • BI Style Usage sheet from BI Strategy and Roadmap Template
      • Sample Reports

      Participants

      • Business representatives
      • BI representatives

      Visualization tools facilitate a more comprehensive understanding of gaps in your existing BI practice

      Having completed both current and target state assessments, the BI Practice Assessment Tool allows you to compare the results from multiple angles.

      At a higher level, you can look at your maturity level:

      At a detailed level, you can drill down to the dimensional level and item level.

      The image is a screenshots from Tab 4: Target State Evaluation of the BI Practice Assessment Tool

      At a detailed level, you can drill down to the dimensional level and item level.

      Activity: Analyze gaps in BI practice capabilities and generate improvement objectives/activities

      2.2.4

      2 hours

      This interpretation exercise helps you to make sense of the BI practice assessment results to provide valuable inputs for subsequent strategy and roadmap formulation.

      1. IT management and the BI team should be involved in this exercise. Business SMEs should be consulted frequently to obtain clarifications on what their ideal future state entails.
      2. Begin this exercise by reviewing the heat map and identifying:

      • Areas with very large gaps
      • Areas with small gaps

      Areas with large gaps

      Consider: Is the target state feasible and achievable? What are ways we can improve incrementally in this area? What is the priority for addressing this gap?

      Areas with small/no gaps

      Consider: Can we learn from those areas? Are we setting the bar too low for our capabilities?

      INPUT

      • Current and target state visualizations

      OUTPUT

      • Gap analysis (Tab 5)

      Materials

      • Tab 5 of the BI Practice Assessment Tool
      • Future State Assessment Results section of the BI Strategy and Roadmap Template

      Participants

      • Business representatives
      • IT representatives

      Activity: Analyze gaps in BI practice capabilities and generate improvement objectives/activities (cont.)

      2.2.4

      2 hours

      2. Discuss the differences in the current and target state maturity level descriptions. Questions to ask include:

      • What are the prerequisites before we can begin to build the future state?
      • Is the organization ready for that future state? If not, how do we set expectations and vision for the future state?
      • Do we have the necessary competencies, time, and support to achieve our BI vision?

      INPUT

      • Current and target state visualizations

      OUTPUT

      • Gap analysis (Tab 5)

      Materials

      • Tab 5 of the BI Practice Assessment Tool
      • Future State Assessment Results section of the BI Strategy and Roadmap Template

      Participants

      • Business representatives
      • IT representatives

      Activity: Analyze gaps in BI practice capabilities and generate improvement objectives/activities (cont.)

      2.2.4

      2 hours

      3. Have the same group members reconvene and discuss the recommendations at the BI practice dimension level on Tab 5. of the BI Practice Assessment Tool. These recommendations can be used as improvement actions or translated into objectives for building your BI capabilities.

      Example

      The heat map displayed the largest gap between target state and current state in the technology dimension. The detailed drill-down chart will further illustrate which aspect(s) of the technology dimension is/are showing the most room for improvement in order to better direct your objective and initiative creation.

      The image is of an example and recommendations.

      Considerations:

      • What dimension parameters have the largest gaps? And why?
      • Is there a different set of expectations for the future state?

      Define critical success factors to direct your future state

      Critical success factors (CSFs) are the essential factors or elements required for ensuring the success of your BI program. They are used to inform organizations with things they should focus on to be successful.

      Common Provider (IT Department) CSFs

      • BI governance structure and organization is created.
      • Training is provided for the BI users and the BI team.
      • BI standards are in place.
      • BI artifacts rely on quality data.
      • Data is organized and presented in a usable fashion.
      • A hybrid BI delivery model is established.
      • BI on BI; a measuring plan has to be in place.

      Common Consumer (Business) CSFs

      • Measurable business results have been improved.
      • Business targets met/exceeded.
      • Growth plans accelerated.
      • World-class training to empower BI users.
      • Continuous promotion of a data-driven culture.
      • IT–business partnership is established.
      • Collaborative requirements gathering processes.
      • Different BI use cases are supported.

      …a data culture is essential to the success of analytics. Being involved in a lot of Bay Area start-ups has shown me that those entrepreneurs that are born with the data DNA, adopt the data culture and BI naturally. Other companies should learn from these start-ups and grow the data culture to ensure BI adoption.

      – Cameran Hetrick, Senior Director of Data Science & Analytics, thredUP

      Activity: Define provider and consumer critical success factors for your future BI capabilities

      2.2.5

      2 hours

      Create critical success factors that are important to both BI providers and BI consumers.

      1. Divide relevant stakeholders into two groups:
      2. BI Provider (aka IT) BI Consumer (aka Business)
      3. Write two headings on the board: Objective and Critical Success Factors. Write down each of the objectives created in Phase 1.
      4. Divide the group into small teams and assign each team an objective. For each objective, ask the following question:
      5. What needs to be put in place to ensure that this objective is achieved?

        The answer to the question is your candidate CSF. Write CSFs on sticky notes and stick them by the relevant objective.

      6. Rationalize and consolidate CSFs. Evaluate the list of candidate CSFs to find the essential elements for achieving success.
      7. For each CSF, identify at least one key performance indicator that will serve as an appropriate metric for tracking achievement.

      As you evaluate candidate CSFs, you may uncover new objectives for achieving your future state BI.

      INPUT

      • Business objectives

      OUTPUT

      • A list of critical success factors mapped to business objectives

      Materials

      • Whiteboard and colored sticky notes
      • CSFs for the Future State section of the BI Strategy and Roadmap Template

      Participants

      • Business and IT representatives
      • CIO
      • Head of BI

      Round out your strategy for BI growth by evaluating risks and developing mitigation plans

      A risk matrix is a useful tool that allows you to track risks on two dimensions: probability and impact. Use this matrix to help organize and prioritize risk, as well as develop mitigation strategies and contingency plans appropriately.

      Example of a risk matrix using colour coding

      Info-Tech Insight

      Tackling risk mitigation is essentially purchasing insurance. You cannot insure everything – focus your investments on mitigating risks with a reasonably high impact and high probability.

      Be aware of some common barriers that arise in the process of implementing a BI strategy

      These are some of the most common BI risks based on Info-Tech’s research:

      Low Impact Medium Impact High Impact
      High Probability
      • Users revert back to Microsoft Excel to analyze data.
      • BI solution does not satisfy the business need.
      • BI tools become out of sync with new strategic direction.
      • Poor documentation creates confusion and reduces user adoption.
      • Fail to address data issues: quality, integration, definition.
      • Inadequate communication with stakeholders throughout the project.
      • Users find the BI tool interface too confusing.
      Medium Probability
      • Fail to define and monitor KPIs.
      • Poor training results in low user adoption.
      • Organization culture is resistant to the change.
      • Lack of support from the sponsors.
      • No governance over BI.
      • Poor training results in misinformed users.
      Low Probability
      • Business units independently invest in BI as silos.

      Activity: Identify potential risks for your future state and create a mitigation plan

      2.2.6

      1 hour

      As part of developing your improvement actions, use this activity to brainstorm some high-level plans for mitigating risks associated with those actions.

      Example:

      Users find the BI tool interface too confusing.

      1. Use the probability-impact matrix to identify risks systematically. Collectively vote on the probability and impact for each risk.
      2. Risk mitigation. Risk can be mitigated by three approaches:
      3. A. Reducing its probability

        B. Reducing its impact

        C. Reducing both

        Option A: Brainstorm ways to reduce risk probability

        E.g. The probability of the above risk may be reduced by user training. With training, the probability of confused end users will be reduced.

        Option B: Brainstorm ways to reduce risk impact

        E.g. The impact can be reduced by ensuring having two end users validate each other’s reports before making a major decision.

      4. Document your high-level mitigation strategies in the BI Strategy and Roadmap Template.

      INPUT

      • Step 2.2 outputs

      OUTPUT

      • High-level risk mitigation plans

      Materials

      • Risks and Mitigation section of the BI Strategy and Roadmap Template

      Participants

      • BI sponsor
      • CIO
      • Head of BI

      Translate your findings and ideas into actions that will be integrated into the BI strategy and roadmap

      As you progress through each phase, document findings and ideas as they arise. By phase end, hold a brainstorming session with the project team focused on documenting findings and ideas and substantiating them into improvement actions.

      Translated findings and ideas into actions that will be integrated into the BI strategy and roadmap.

      Ask yourself how BI or analytics can be used to address the gaps and explore opportunities uncovered in each phase. For example, in Phase 1, how do current BI capabilities impede the realization of the business vision?

      Document and prioritize Phase 2 findings, ideas, and action items

      2.2.7

      1-2 hours

      1. Reconvene as a group to review the findings, ideas, and actions harvested in Phase 2. Write the findings, ideas, and actions on sticky notes.
      2. Prioritize the sticky notes to yield those with high business value and low implementation effort. View some sample findings below:
      3. High Business Value, Low Effort High Business Value, High Effort
        Low Business Value, High Effort Low Business Value, High Effort

        Phase 2

        Sample Phase 2 Findings Found a gap between the business expectation and the existing BI content they are getting.
        Our current maturity level is “Level 2 – Operational.” Almost everyone thinks we should be at least “Level 3 – Tactical” with some level 4 elements.
        Found an error in a sales report. A quick fix is identified.
        The current BI program is not able to keep up with the demand.
      4. Select the top items and document the findings in the BI Strategy Roadmap Template. The findings will be used to build a Roadmap in Phase 3.

      INPUT

      • Phase 2 activities

      OUTPUT

      • Other Phase 2 Findings section of the BI Strategy and Roadmap Template

      Materials

      • Whiteboard
      • Sticky notes

      Participants

      • Project manger
      • Project team
      • Business stakeholders

      If you want additional support, have our analysts guide you through this phase as part of an Info-Tech workshop

      Book a workshop with our Info-Tech analysts:

      • To accelerate this project, engage your IT team in an Info-Tech workshop with an Info-Tech analyst team.
      • Info-Tech analysts will join you and your team onsite at your location or welcome you to Info-Tech’s historic Toronto office to participate in an innovative onsite workshop.
      • Contact your account manager (www.infotech.com/account), or email Workshops@InfoTech.com for more information.

      The following are sample activities that will be conducted by Info-Tech analysts with your team:

      2.1.1

      Determine your current BI maturity level

      The analyst will take your project team through Info-Tech’s BI Practice Assessment Tool, which collects perspectives from BI consumer and provider groups on multiple facets of your BI practice in order to establish a current maturity level.

      If you want additional support, have our analysts guide you through this phase as part of an Info-Tech workshop

      Book a workshop with our Info-Tech analysts

      2.2.1

      Define guiding principles for your target BI state

      Using enterprise architecture principles as a starting point, our analyst will facilitate exercises to help your team establish high-level standards for your future BI practice.

      2.2.2-2.2.3

      Establish your desired BI patterns and matching functionalities

      In developing your BI practice, your project team will have to decide what BI-specific capabilities are most important to your organization. Our analyst will take your team through several BI patterns that Info-Tech has identified and discuss how to bridge the gap between these patterns, linking them to specific functional requirements in a BI solution.

      2.2.4-2.2.5

      Analyze the gaps in your BI practice capabilities

      Our analyst will guide your project team through a number of visualizations and explanations produced by our assessment tool in order to pinpoint the problem areas and generate improvement ideas.

      Phase 3

      Create a BI Roadmap for Continuous Improvement

      Build a Reporting and Analytics Strategy

      Create a BI roadmap for continuous improvement

      Phase 3 Overarching Insight

      The benefit of creating a comprehensive and actionable roadmap is twofold: not only does it keep BI providers accountable and focused on creating incremental improvement, but a roadmap helps to build momentum around the overall project, provides a continuous delivery of success stories, and garners grassroots-level support throughout the organization for BI as a key strategic imperative.

      Understand the Business Context to Rationalize Your BI Landscape Evaluate Your Current BI Practice Create a BI Roadmap for Continuous Improvement
      Establish the Business Context
      • Business Vision, Goals, Key Drivers
      • Business Case Presentation
      • High-Level ROI
      Assess Your Current BI Maturity
      • SWOT Analysis
      • BI Practice Assessment
      • Summary of Current State
      Construct a BI Initiative Roadmap
      • BI Improvement Initiatives
      • BI Strategy and Roadmap
      Access Existing BI Environment
      • BI Perception Survey Framework
      • Usage Analyses
      • BI Report Inventory
      Envision BI Future State
      • BI Patterns
      • BI Practice Assessment
      • List of Functions
      Plan for Continuous Improvement
      • Excel Governance Policy
      • BI Ambassador Network Draft
      Undergo Requirements Gathering
      • Requirements Gathering Principles
      • Overall BI Requirements

      Phase 3 overview

      Detailed Overview

      Step 1: Establish Your BI Initiative Roadmap

      Step 2: Identify Opportunities to Enhance Your BI Practice

      Step 3: Create Analytics Strategy

      Step 4: Define CSF and metrics to monitor success of BI and analytics

      Outcomes

      • Consolidate business intelligence improvement objectives into robust initiatives.
      • Prioritize improvement initiatives by cost, effort, and urgency.
      • Create a one-year, two-year, or three-year timeline for completion of your BI improvement initiatives.
      • Identify supplementary programs that will facilitate the smooth execution of road-mapped initiatives.

      Benefits

      • Clear characterization of comprehensive initiatives with a detailed timeline to keep team members accountable.

      Revisit project metrics to track phase progress

      Goals for Phase 3:

      • Put everything together. Findings and observations from Phase 1 and 2 are rationalized in this phase to develop data initiatives and create a strategy and roadmap for BI.
      • Continuous improvements. Your BI program is evolving and improving over time. The program should allow you to have faster, better, and more comprehensive information.

      Info-Tech’s Suggested Metrics for Tracking Phase 3 Goals

      Practice Improvement Metrics Data Collection and Calculation Expected Improvement
      Program Level Metrics Efficiency
      • Time to information
      • Self-service penetration
      • Derive from the ticket management system
      • Derive from the BI platform
      • 10% reduction in time to information
      • Achieve 10-15% self-service penetration
      • Effectiveness
      • BI Usage
      • Data quality
      • Derive from the BI platform
      • Data quality perception
      • Majority of the users use BI on a daily basis
      • 15% increase in data quality perception
      Comprehensiveness
      • # of integrated datasets
      • # of strategic decisions made
      • Derive from the data integration platform
      • Decision-making perception
      • Onboard 2-3 new data domains per year
      • 20% increase in decision-making perception

      Learn more about the CIO Business Vision program.

      Intangible Metrics:

      Tap into the results of Info-Tech’s CIO Business Vision diagnostic to monitor the changes in business-user satisfaction as you implement the initiatives in your BI improvement roadmap.

      Phase 3 outline

      Call 1-888-670-8889 or email GuidedImplementations@InfoTech.com for more information.

      Complete these steps on your own or call us to complete a guided implementation. A guided implementation is a series of 2-3 advisory calls that helps you execute each phase of a project. They are included in most advisory memberships.

      Guided Implementation 3: Create a BI Roadmap for Continuous Improvement

      Proposed Time to Completion: 1-2 weeks

      Step 3.1: Construct a BI Improvement Initiative Roadmap

      Start with an analyst kick off call:

      • Review findings and insights from completion of activities pertaining to current and future state assessments
      • Discuss challenges around consolidating activities into initiatives

      Then complete these activities…

      • Collect improvement objectives/tasks from previous phases
      • Develop comprehensive improvement initiatives
      • Leverage value-effort matrix activities to prioritize these initiatives and place them along an improvement roadmap

      With these tools & templates:

      BI Initiatives and Roadmap Tool

      BI Strategy and Roadmap Template

      Step 3.2: Continuous Improvement Opportunities for BI

      Review findings with analyst:

      • Review completed BI improvement initiatives and roadmap
      • Discuss guidelines presenting a finalized improvement to the relevant committee or stakeholders
      • Discuss additional policies and programs that can serve to enhance your established BI improvement roadmap

      Then complete these activities…

      • Present BI improvement roadmap to relevant stakeholders
      • Develop Info-Tech’s recommended supplementary policies and programs for BI

      With these tools & templates:

      BI Strategy and Roadmap Executive Presentation Template

      Phase 3 Results & Insights:

      • Comprehensive initiatives with associated tasks/activities consolidated and prioritized in an improvement roadmap

      STEP 3.1

      Construct a BI Improvement Initiative Roadmap

      Build an improvement initiative roadmap to solidify your revamped BI strategy

      Step Objectives

      • Bring together activities and objectives for BI improvement to form initiatives
      • Develop a fit-for-purpose roadmap aligned with your BI strategy

      Step Activities

      3.1.1 Characterize individual improvement objectives and activities ideated in previous phases.

      3.1.2 Synthesize and detail overall BI improvement initiatives.

      3.1.3 Create a plan of action by placing initiatives on a roadmap.

      Outcomes

      • Detailed BI improvement initiatives, prioritized by value and effort
      • Defined roadmap for completion of tasks associated with each initiative and accountability

      Research Support

      • Info-Tech’s BI Initiatives and Roadmap Tool

      Proposed Participants in this Step

      Project Manager

      Project Team

      Create detailed BI strategy initiatives by bringing together the objectives listed in the previous phases

      When developing initiatives, all components of the initiative need to be considered, from its objectives and goals to its benefits, risks, costs, effort required, and relevant stakeholders.

      Use outputs from previous project steps as inputs to the initiative and roadmap building:

      The image shows the previous project steps as inputs to the initiative and roadmap building, with arrow pointing from one to the next.

      Determining the dependencies that exist between objectives will enable the creation of unique initiatives with associated to-do items or tasks.

      • Group objectives into similar buckets with dependencies
      • Select one overarching initiative
      • Adapt remaining objectives into tasks of the main initiative
      • Add any additional tasks

      Leverage Info-Tech’s BI Initiatives and Roadmap Tool to build a fit-for-purpose improvement roadmap

      BI Initiatives and Roadmap Tool

      Overview

      Use the BI Initiatives and Roadmap Tool to develop comprehensive improvement initiatives and add them to a BI strategy improvement roadmap.

      Recommended Participants

      • BI project team

      Tool Guideline

      Tab 1. Instructions Use this tab to get an understanding as to how the tool works.
      Tab 2. Inputs Use this tab to customize the inputs used in the tool.
      Tab 3. Activities Repository Use this tab to list and prioritize activities, to determine dependencies between them, and build comprehensive initiatives with them.
      Tab 4. Improvement Initiatives Use this tab to develop detailed improvement initiatives that will form the basis of the roadmap. Map these initiatives to activities from Tab 3.
      Tab 5. Improvement Roadmap Use this tab to create your BI strategy improvement roadmap, assigning timelines and accountability to initiatives and tasks, and to monitor your project performance over time.

      Activity: Consolidate BI activities into the tool and assign dependencies and priorities

      3.1.1

    • 2 hours
      1. Have one person from the BI project team populate Tab 3. Activities Repository with the BI strategy activities that were compiled in Phases 1 and 2. Use drop-downs to indicate in which phase the objective was originally ideated.
      2. With BI project team executives, discuss and assign dependencies between activities in the Dependencies columns. A dependency exists if:
      • An activity requires consideration of another activity.
      • An activity requires the completion of another activity.
      • Two activities should be part of the same initiative.
      • Two activities are very similar in nature.
    • Then discuss and assign priorities to each activity in the Priority column using input from previous Phases. For example, if an activity was previously indicated as critical to the business, if a similar activity appears multiple times, or if an activity has several dependencies, it should be higher priority.
    • Inputs

      • BI improvement activities created in Phases 1 and 2

      Output

      • Activities with dependencies and priorities

      Materials

      • BI Initiatives and Roadmap Tool

      Participants

      • BI project team

      Activity: Consolidate BI activities into the tool and assign dependencies and priorities (cont’d.)

      3.1.1

      2 hours

      Screenshot of Tab 3. BI Activities Repository, with samples improvement activities, dependencies, statuses, and priorities

      The image is of a screenshot of Tab 3. BI Activities Repository, with samples improvement activities, dependencies, statuses, and priorities.

      Revisit the outputs of your current state assessment and note which activities have already been completed in the “Status” column, to avoid duplication of your efforts.

      When classifying the status of items in your activity repository, distinguish between broader activities (potential initiatives) and granular activities (tasks).

      Activity: Customize project inputs and build out detailed improvement initiatives

      3.1.2

      1.5 hours

      1. Follow instructions on Tab 2. Inputs to customize inputs you would like to use for your project.
      2. Review the activities repository and select up to 12 overarching initiatives based on the activities with extreme or highest priority and your own considerations.
      • Rewording where necessary, transfer the names of your initiatives in the banners provided on Tab 4. Improvement Initiatives.
      • On Tab 3, indicate these activities as “Selected (initiatives)” in the Status column.
    • In Tab 4, develop detailed improvement initiatives by indicating the owner, taxonomy, start and end periods, cost and effort estimates, goal, benefit/value, and risks of each initiative.
    • Use drop-downs to list “Related activities,” which will become tasks under each initiative.
      • activities with dependency to the initiative
      • activities that lead to the same goal or benefit/value of the main initiative

      Screenshot of the Improvement Initiative template, to be used for developing comprehensive initiatives

      <p data-verified=The image is a screenshot of the Improvement Initiative template, to be used for developing comprehensive initiatives.">

      Inputs

      • Tab 3. Activities Repository

      Output

      • Unique and detailed improvement initiatives

      Materials

      • BI Initiatives and Roadmap Tool
      • BI Initiatives section of the BI Strategy and Roadmap Template

      Participants

      • BI project team

      Visual representations of your initiative landscape can aid in prioritizing tasks and executing the roadmap

      Building a comprehensive BI program will be a gradual process involving a variety of stakeholders. Different initiatives in your roadmap will either be completed sequentially or in parallel to one another, given dependencies and available resources. The improvement roadmap should capture and represent this information.

      To determine the order in which main initiatives should be completed, exercises such as a value–effort map can be very useful.

      Example: Value–Effort Map for a BI Project

      Initiatives that are high value–low effort are found in the upper left quadrant and are bolded; These may be your four primary initiatives. In addition, initiative five is valuable to the business and critical to the project’s success, so it too is a priority despite requiring high effort. Note that you need to consider dependencies to prioritize these key initiatives.

      Value–Effort Map for a BI Project
      1. Data profiling techniques training
      2. Improve usage metrics
      3. Communication plan for BI
      4. Staff competency evaluation
      5. Formalize practice capabilities
      6. Competency improvement plan program
      7. Metadata architecture improvements
      8. EDW capability improvements
      9. Formalize oversight for data manipulation

      This exercise is best performed using a white board and sticky notes, and axes can be customized to fit your needs (E.g. cost, risk, time, etc.).

      Activity: Build an overall BI strategy improvement roadmap for the entire project

      3.1.3

      45 minutes

      The BI Strategy Improvement Roadmap (Tab 5 of the BI Initiatives and Roadmap Tool) has been populated with your primary initiatives and related tasks. Read the instructions provided at the top of Tab 5.

      1. Use drop-downs to assign a Start Period and End Period to each initiative (already known) and each task (determined here). As you do so, the roadmap will automatically fill itself in. This is where the value–effort map or other prioritization exercises may help.
      2. Assign Task Owners reporting Managers.
      3. Update the Status and Notes columns on an ongoing basis. Hold meetings with task owners and managers about blocked or overdue items.
      • Updating status should also be an ongoing maintenance requirement for Tab 3 in order to stay up to date on which activities have been selected as initiatives or tasks, are completed, or are not yet acted upon.

      Screenshot of the BI Improvement Roadmap (Gantt chart) showing an example initiative with tasks, and assigned timeframes, owners, and status updates.

      INPUTS

      • Tab 3. Activities Repository
      • Tab 4. Improvement Initiatives

      OUTPUT

      • BI roadmap

      Materials

      • BI Initiatives and Roadmap Tool
      • Roadmap section of the BI Strategy and Roadmap Template

      Participants

      • BI project team

      Obtain approval for your BI strategy roadmap by organizing and presenting project findings

      Use a proprietary presentation template

      Recommended Participants

      • Project sponsor
      • Relevant IT & business executives
      • CIO
      • BI project team

      Materials & Requirements

      Develop your proprietary presentation template with:

      • Results from Phases 1 and 2 and Step 3.1
      • Information from:
        • Info-Tech’s Build a Reporting and Analytics Strategy
      • Screen shots of outputs from the:
        • BI Practice Assessment Tool
        • BI Initiatives and Roadmap Tool

      Next Steps

      Following the approval of your roadmap, begin to plan the implementation of your first initiatives.

      Overall Guidelines

      • Invite recommended participants to an approval meeting.
      • Present your project’s findings with the goal of gaining key stakeholder support for implementing the roadmap.
      1. Set the scene using BI vision & objectives.
      2. Present the results and roadmap next.
      3. Dig deeper into specific issues by touching on the important components of this blueprint to generate a succinct and cohesive presentation.
    • Make the necessary changes and updates stemming from discussion notes during this meeting.
    • Submit a formal summary of findings and roadmap to your governing body for review and approval (e.g. BI steering committee, BI CoE).
    • Info-Tech Insight

      At this point, it is likely that you already have the support to implement a data quality improvement roadmap. This meeting is about the specifics and the ROI.

      Maximize support by articulating the value of the data quality improvement strategy for the organization’s greater information management capabilities. Emphasize the business requirements and objectives that will be enhanced as a result of tackling the recommended initiatives, and note any additional ramifications of not doing so.

      Leverage Info-Tech’s presentation template to present your BI strategy to the executives

      Use the BI Strategy and Roadmap Executive Presentation Template to present your most important findings and brilliant ideas to the business executives and ensure your BI program is endorsed. Business executives can also learn about how the BI strategy empowers them and how they can help in the BI journey.

      Important Messages to Convey

      • Executive summary of the presentation
      • Current challenges faced by the business
      • BI benefits and associated opportunities
      • SWOT analyses of the current BI
      • BI end-user satisfaction survey
      • BI vision, mission, and goals
      • BI initiatives that take you to the future state
      • (Updated) Analytical Strategy
      • Roadmap that depicts the timeline

      STEP 3.2

      Continuous Improvement Opportunities for BI

      Create supplementary policies and programs to augment your BI strategy

      Step Objectives

      • Develop a plan for encouraging users to continue to use Excel, but in a way that does not compromise overall BI effectiveness.
      • Take steps to establish a positive organizational culture around BI.

      Step Activities

      3.2.1 Construct a concrete policy to integrate Excel use with your new BI strategy.

      3.2.2 Map out the foundation for a BI Ambassador network.

      Outcomes

      • Business user understanding of where Excel manipulation should and should not occur
      • Foundation for recognizing exceptional BI users and encouraging development of enterprise-wide business intelligence

      Research Support

      • Info-Tech’s BI Initiatives and Roadmap Tool
      • Info-Tech’s BI Strategy and Roadmap Template

      Proposed Participants in this Step

      Project Manager

      Project Team

      Additional Business Users

      Establish Excel governance to better serve Excel users while making sure they comply with policies

      Excel is the number one BI tool

      • BI applications are developed to support information needs.
      • The reality is that you will never migrate all Excel users to BI. Some Excel users will continue to use it. The key is to support them while imposing governance.
      • The goal is to direct them to use the data in BI or in the data warehouse instead of extracting their own data from various source systems.

      The Tactic: Centralize data extraction and customize delivery

      • Excel users formerly extracted data directly from the production system, cleaned up the data, manipulated the data by including their own business logic, and presented the data in graphs and pivot tables.
      • With BI, the Excel users can still use Excel to look at the information. The only difference is that BI or data warehouse will be the data source of their Excel workbook.

      Top-Down Approach

      • An Excel policy should be created at the enterprise level to outline which Excel use cases are allowed, and which are not.
      • Excel use cases that involve extracting data from source systems and transforming that data using undisclosed business rules should be banned.
      • Excel should be a tool for manipulating, filtering, and presenting data, not a tool for extracting data and running business rules.

      Excel

      Bottom-Up Approach

      • Show empathy to your users. They just want information to get their work done.
      • A sub-optimal information landscape is the root cause, and they are the victims. Excel spreadmarts are the by-products.
      • Make the Excel users aware of the risks associated with Excel, train them in BI, and provide them with better information in the BI platform.

      Activity: Create an Excel governance policy

      3.2.1

      4 hours

      Construct a policy around Excel use to ensure that Excel documents are created and shared in a manner that does not compromise the integrity of your overall BI program.

      1. Review the information artifact list harvested from Step 2.1 and identify all existing Excel-related use cases.
      2. Categorize the Excel use cases into “allowed,” “not allowed,” and “not sure.” For each category define:
      3. Category To Do: Policy Context
        Allowed Discuss what makes these use cases ideal for BI. Document use cases, scenarios, examples, and reasons that allow Excel as an information artifact.
        Not Allowed Discuss why these cases should be avoided. Document forbidden use cases, scenarios, examples, and reasons that use Excel to generate information artifacts.
        Not Sure Discuss the confusions; clarify the gray area. Document clarifications and advise how end users can get help in those “gray area” cases.
      4. Document the findings in the BI Strategy and Roadmap Template in the Manage and Sustain BI Strategy section, or a proprietary template. You may also need to create a separate Excel policy to communicate the Dos and Don’ts.

      Inputs

      • Step 2.1 – A list of information artifacts

      Output

      • Excel-for-BI Use Policy

      Materials

      • BI Strategy Roadmap and Template, or proprietary document

      Participants

      • Business executives
      • CIO
      • Head of BI
      • BI team

      Build a network of ambassadors to promote BI and report to IT with end-user feedback and requests

      The Building of an Insider Network: The BI Ambassador Network

      BI ambassadors are influential individuals in the organization that may be proficient at using BI tools but are passionate about analytics. The network of ambassadors will be IT’s eyes, ears, and even mouth on the frontline with users. Ambassadors will promote BI, communicate any messages IT may have, and keep tabs on user satisfaction.

      Ideal candidate:

      • A good relationship with IT.
      • A large breadth of experience with BI, not just one dashboard.
      • Approachable and well-respected amongst peers.
      • Has a passion for driving organizational change using BI and continually looking for opportunities to innovate.

      Push

      • Key BI Messages
      • Best Practices
      • Training Materials

      Pull

      • Feedback
      • Complaints
      • Thoughts and New Ideas

      Motivate BI ambassadors with perks

      You need to motivate ambassadors to take on this additional responsibility. Make sure the BI ambassadors are recognized in their business units when they go above and beyond in promoting BI.

      Reward Approach Reward Type Description
      Privileges High Priority Requests Given their high usage and high visibility, ambassadors’ BI information requests should be given a higher priority.
      First Look at New BI Development Share the latest BI updates with ambassadors before introducing them to the organization. Ambassadors may even be excited to test out new functionality.
      Recognition Featured in Communications BI ambassadors’ use cases and testimonials can be featured in BI communications. Be sure to create a formal announcement introducing the ambassadors to the organization.
      BI Ambassador Certificate A certificate is a formal way to recognize their efforts. They can also publicly display the certificate in their workspace.
      Rewards Appointed by Senior Executives Have the initial request to be a BI ambassador come from a senior executive to flatter the ambassador and position the role as a reward or an opportunity for success.
      BI Ambassador Awards Award an outstanding BI ambassador for the year. The award should be given by the CEO in a major corporate event.

      Activity: Plan for a BI ambassador network

      3.2.2

      2 hours

      Identify individuals within your organization to act as ambassadors for BI and a bridge between IT and business users.

      1. Obtain a copy of your latest organizational chart. Review your most up-to-date organizational chart and identify key BI consumers across a variety of functional units. In selecting potential BI ambassadors, reflect on the following questions:
      • Does this individual have a good relationship with IT?
      • What is the depth of their experience with developing/consuming business intelligence?
      • Is this individual respected and influential amongst their respective business units?
      • Has this individual shown a passion for innovating within their role?
    • Create a mandate and collateral detailing the roles and responsibilities for the ambassador role, e.g.:
      • Promote BI to members of your group
      • Represent the “voice of the data consumers”
    • Approach the ambassador candidates and explain the responsibilities and perks of the role, with the goal of enlisting about 10-15 ambassadors
    • Inputs

      • An updated organizational chart
      • A list of BI users

      Output

      • Draft framework for BI ambassador network

      Materials

      • BI Strategy and Roadmap Template or proprietary document

      Participants

      • Business executives
      • CIO
      • Head of BI
      • BI team

      Keeping tabs on metadata is essential to creating a data democracy with BI

      A next generation BI not only provides a platform that mirrors business requirements, but also creates a flexible environment that empowers business users to explore data assets without having to go back and forth with IT to complete queries.

      Business users are generally not interested in the underlying architecture or the exact data lineages; they want access to the data that matters most for decision-making purposes.

      Metadata is data about data

      It comes in the form of structural metadata (information about the spaces that contain data) and descriptive metadata (information pertaining to the data elements themselves), in order to answer questions such as:

      • What is the intended purpose of this data?
      • How up-to-date is this information?
      • Who owns this data?
      • Where is this data coming from?
      • How have these data elements been transformed?

      By creating effective metadata, business users are able to make connections between and bring together data sources from multiple areas, creating the opportunity for holistic insight generation.

      Like BI, metadata lies in the Information Dimension layer of our data management framework.

      The metadata needs to be understood before building anything. You need to identify fundamentals of the data, who owns not only that data, but also its metadata. You need to understand where the consolidation is happening and who owns it. Metadata is the core driver and cost saver for building warehouses and requirements gathering.

      – Albert Hui, Principal, Data Economist

      Deliver timely, high quality, and affordable information to enable fast and effective business decisions

      In order to maximize your ROI on business intelligence, it needs to be treated less like a one-time endeavor and more like a practice to be continually improved upon.

      Though the BI strategy provides the overall direction, the BI operating model – which encompasses organization structure, processes, people, and application functionality – is the primary determinant of efficacy with respect to information delivery. The alterations made to the operating model occur in the short term to improve the final deliverables for business users.

      An optimal BI operating model satisfies three core requirements:

      Timeliness

      Effectiveness

    • Affordability
    • Bring tangible benefits of your revamped BI strategy to business users by critically assessing how your organization delivers business intelligence and identifying opportunities for increased operational efficiency.

      Assess and Optimize BI Operations

      Focus on delivering timely, quality, and affordable information to enable fast and effective business decisions

      Implement a fit-for-purpose BI and analytics solution to augment your next generation BI strategy

      Organizations new to business intelligence or with immature BI capabilities are under the impression that simply getting the latest-and-greatest tool will provide the insights business users are looking for.

      BI technology can only be as effective as the processes surrounding it and the people leveraging it. Organizations need to take the time to select and implement a BI suite that aligns with business goals and fosters end-user adoption.

      As an increasing number of companies turn to business intelligence technology, vendors are responding by providing BI and analytics platforms with more and more features.

      Our vendor landscape will simplify the process of selecting a BI and analytics solution by:

      Differentiating between the platforms and features vendors are offering.

      Detailing a robust framework for requirements gathering to pinpoint your organization’s needs.

      Developing a high-level plan for implementation.

      Select and Implement a Business Intelligence and Analytics Solution

      Find the diamond in your data-rough using the right BI & Analytics solution

      If you want additional support, have our analysts guide you through this phase as part of an Info-Tech workshop

      Book a workshop with our Info-tech analysts:

      • To accelerate this project, engage your IT team in an Info-Tech workshop with an Info-Tech analyst team.
      • Info-Tech analysts will join you and your team onsite at your location or welcome you to Info-Tech’s historic Toronto office to participate in an innovative onsite workshop.
      • Contact your account manager (www.infotech.com/account), or email Workshops@InfoTech.com for more information.

      The following are sample activities that will be conducted by Info-tech analysts with your team:

      3.1.1-3.1.3

      Construct a BI improvement initiative roadmap

      During these activities, your team will consolidate the list of BI initiatives generated from the assessments conducted in previous phases, assign timelines to each action, prioritize them using a value–effort matrix, and finally produce a roadmap for implementing your organization’s BI improvement strategy.

      3.2

      Identify continuous improvement opportunities for BI

      Our analyst team will work with your organization to ideate supplementary programs to support your BI strategy. Defining Excel use cases that are permitted and prohibited in conjunction with your BI strategy, as well as structuring an internal BI ambassador network, are a few extra initiatives that can enhance your BI improvement plans.

      Insight breakdown

      Your BI platform is not a one-and-done initiative.

      A BI program is not a static project that is created once and remains unchanged. Your strategy must be treated as a living platform to be revisited and revitalized in order to provide effective enablement of business decision making. Develop a BI strategy that propels your organization by building it on business goals and objectives, as well as comprehensive assessments that quantitatively and qualitatively evaluate your current BI capabilities.

      Put the “B” back in “BI.”

      The closer you align your new BI platform to real business interests, the stronger will be the buy-in, realized value, and groundswell of enthusiastic adoption. Ultimately, getting this phase right sets the stage to best realize a strong ROI for your investment in the people, processes, and technology that will be your next generation BI platform.

      Go beyond the platform.

      BI success is not based solely on the technology it runs on; technology cannot mask gaps in capabilities. You must be capable in your environment – data management, data quality, and related data practices must be strong, otherwise the usefulness of the intelligence suffers. The best BI solution does not only provide a technology platform, but also addresses the elements that surround the platform. Look beyond tools and holistically assess the maturity of your BI practice with input from both the BI consumer and provider perspectives.

      Appendix

      Detailed list of BI Types

      Style Description Strategic Importance (1-5) Popularity (1-5) Effort (1-5)
      Standards Preformatted reports Standard, preformatted information for backward-looking analysis. 5 5 1
      User-defined analyses Pre-staged information where “pick lists” enable business users to filter (select) the information they wish to analyze, such as sales for a selected region during a selected previous timeframe. 5 4 2
      Ad-hoc analyses Power users write their own queries to extract self-selected pre-staged information and then use the information to perform a user-created analysis. 5 4 3
      Scorecards and dashboards Predefined business performance metrics about performance variables that are important to the organization, presented in a tabular or graphical format that enables business users to see at a glance how the organization is performing. 4 4 3
      Multidimensional analysis (OLAP) Multidimensional analysis (also known as On-line analytical processing): Flexible tool-based user-defined analysis of business performance and the underlying drivers or root causes of that performance. 4 3 3
      Alerts Predefined analyses of key business performance variables, comparison to a performance standard or range, and communication to designated businesspeople when performance is outside the predefined performance standard or range. 4 3 3
      Advanced Analytics Application of long-established statistical and/or operations research methods to historical business information to look backward and characterize a relevant aspect of business performance, typically by using descriptive statistics 5 3 4
      Predictive Analytics Application of long-established statistical and/or operations research methods to historical business information to predict, model, or simulate future business and/or economic performance and potentially prescribe a favored course of action for the future 5 3 5

      Our BI strategy approach follows Info-Tech’s popular IT Strategy Framework

      A comprehensive BI strategy needs to be developed under the umbrella of an overall IT strategy. Specifically, creating a BI strategy is contributing to helping IT mature from a firefighter to a strategic partner that has close ties with business units.

      1. Determine mandate and scope 2. Assess drivers and constraints 3. Evaluate current state of IT 4. Develop a target state vision 5. Analyze gaps and define initiatives 6. Build a roadmap 8. Revamp 7. Execute
      Mandate Business drivers Holistic assessments Vision and mission Initiatives Business-driven priorities
      Scope External drivers Focus-area specific assessments Guiding principles Risks
      Project charter Opportunities to innovate Target state vision Execution schedule
      Implications Objectives and measures

      This BI strategy blueprint is rooted in our road-tested and proven IT strategy framework as a systematic method of tackling strategy development.

      Research contributors

      Internal Contributors

      • Andy Woyzbun, Executive Advisor
      • Natalia Nygren Modjeska, Director, Data & Analytics
      • Crystal Singh, Director, Data & Analytic
      • Andrea Malick, Director, Data & Analytics
      • Raj Parab, Director, Data & Analytics
      • Igor Ikonnikov, Director, Data & Analytics
      • Andy Neill, Practice Lead, Data & Analytics
      • Rob Anderson, Manager Sales Operations
      • Shari Lava, Associate Vice-President, Vendor Advisory Practice

      External Contributors

      • Albert Hui, Principal, DataEconomist
      • Cameran Hetrick, Senior Director of Data Science & Analytics, thredUP
      • David Farrar, Director – Marketing Planning & Operations, Ricoh Canada Inc
      • Emilie Harrington, Manager of Analytics Operations Development, Lowe’s
      • Sharon Blanton, VP and CIO, The College of New Jersey
      • Raul Vomisescu, Independent Consultant

      Research contributors and experts

      Albert Hui

      Consultant, Data Economist

      Albert Hui is a cofounder of Data Economist, a data-consulting firm based in Toronto, Canada. His current assignment is to redesign Scotiabank’s Asset Liability Management for its Basel III liquidity compliance using Big Data technology. Passionate about technology and problem solving, Albert is an entrepreneur and result-oriented IT technology leader with 18 years of experience in consulting and software industry. His area of focus is on data management, specializing in Big Data, business intelligence, and data warehousing. Beside his day job, he also contributes to the IT community by writing blogs and whitepapers, book editing, and speaking at technology conferences. His recent research and speaking engagement is on machine learning on Big Data.

      Albert holds an MBA from the University of Toronto and a master’s degree in Industrial Engineering. He has twin boys and enjoys camping and cycling with them in his spare time.

      Albert Hui Consultant, Data Economist

      Cameran Hetrick

      Senior Director of Analytics and Data Science, thredUP

      Cameran is the Senior Director of Analytics and Data Science at thredUP, a startup inspiring a new generation to think second hand first. There she helps drives top line growth through advanced and predictive analytics. Previously, she served as the Director of Data Science at VMware where she built and led the data team for End User Computing. Before moving to the tech industry, she spent five years at The Disneyland Resort setting ticket and hotel prices and building models to forecast attendance. Cameran holds an undergraduate degree in Economics/Mathematics from UC Santa Barbara and graduated with honors from UC Irvine's MBA program.

      Cameran Hetrick Senior Director of Analytics and Data Science, thredUP

      Bibliography

      Bange, Carsten and Wayne Eckerson. “BI and Data Management in the Cloud: Issues and Trends.” BARC and Eckerson Group, January 2017. Web.

      Business Intelligence: The Strategy Imperative for CIOs. Tech. Information Builders. 2007. Web. 1 Dec. 2015.

      COBIT 5: Enabling Information. Rolling Meadows, IL: ISACA, 2013. Web.

      Dag, Naslund, Emma Sikander, and Sofia Oberg. "Business Intelligence - a Maturity Model Covering Common Challenges." Lund University Publications. Lund University, 2014. Web. 23 Oct. 2015.

      “DAMA Guide to the Data Management Body of Knowledge (DAMA-DMBOK Guide).” First Edition. DAMA International. 2009. Digital. April 2014.

      Davenport, Thomas H. and Bean, Randy. “Big Data and AI Executive Survey 2019.” NewVantage Partners LLC. 2019. Web.

      "Debunking the Business of Analytics." Experian Data Quality. Sept. 2013. Web.

      Bibliography

      Drouin, Sue. "Value Chain." SAP Analytics. February 27, 2015.

      Farrar, David. “BI & Data analytics workshop feedback.” Ricoh Canada. Sept. 2019.

      Fletcher, Heather. "New England Patriots Use Analytics & Trigger Emails to Retain Season Ticket Holders." Target Marketing. 1 Dec. 2011. Web.

      Gonçalves, Alex. "Social Media Analytics Strategy - Using Data to Optimize Business Performance.” Apress. 2017.

      Imhoff, Claudia, and Colin White. "Self Service Business Intelligence: Empowering Users to Generate Insights." SAS Resource Page. The Data Warehouse Institute, 2011. Web.

      Khamassi, Ahmed. "Building An Analytical Roadmap : A Real Life Example." Wipro. 2014.

      Kuntz, Jerry, Pierre Haren, and Rebecca Shockley. IBM Insight 2015 Teleconference Series. Proc. of Analytics: The Upside of Disruption. IBM Institute for Business Value, 19 Oct. 2015. Web.

      Kwan, Anne , Maximillian Schroeck, Jon Kawamura. “Architecting and operating model, A platform for accelerating digital transformation.” Part of a Deliotte Series on Digital Industrial Transformation, 2019. Web.

      Bibliography

      Lebied, Mona. "11 Steps on Your BI Roadmap To Implement A Successful Business Intelligence Strategy." Business Intelligence. July 20, 2018. Web.

      Light, Rob. “Make Business Intelligence a Necessity: How to Drive User Adoption.” Sisense Blog. 30 July 2018.

      Mazenko, Elizabeth. “Avoid the Pitfalls: 3 Reasons 80% of BI Projects Fail.” BetterBuys. October 2015.

      Marr, Bernard. "Why Every Business Needs A Data And Analytics Strategy.” Bernard Marr & Co. 2019.

      Mohr, Niko and Hürtgen, Holger. “Achieving Business Impact with Data.” McKinsey. April 2018.

      MIT Sloan Management

      Quinn, Kevin R. "Worst Practices in Business Intelligence: Why BI Applications Succeed Where BI Tools Fail." (2007): 1-19. BeyeNetwork. Information Builders, 2007. Web. 1 Dec. 2015.

      Ringdal, Kristen. "Learning multilevel Analysis." European social Survey. 2019.

      Bibliography

      Schaefer, Dave, Ajay Chandramouly, Burt Carmak, and Kireeti Kesavamurthy. "Delivering Self-Service BI, Data Visualization, and Big Data Analytics." IT@Intel White Paper (2013): 1-11. June 2013. Web. 30 Nov. 2015.

      Schultz, Yogi. “About.” Corvelle Consulting. 2019.

      "The Current State of Analytics: Where Do We Go From Here?" SAS Resource Page. SAS & Bloomberg Businessweek, 2011. Web.

      "The Four Steps to Defining a Customer Analytics Strategy." CCG Analytics Solutions & Services. Nov 10,2017.

      Traore, Moulaye. "Without a strategic plan, your analytics initiatives are risky." Advisor. March 12, 2018. web.

      Wells, Dave. "Ten Mistakes to Avoid When Gathering BI Requirements." Engineering for Industry. The Data Warehouse Institute, 2008. Web.

      “What is a Business Intelligence Strategy and do you need one?” Hydra. Sept 2019. Web.

      Williams, Steve. “Business Intelligence Strategy and Big Data Analytics.” Morgan Kaufman. 2016.

      Wolpe, Toby. "Case Study: How One Firm Used BI Analytics to Track Staff Performance | ZDNet." ZDNet. 3 May 2013. Web.

      Yuk, Mico. “11 Reasons Why Most Business Intelligence Projects Fail.” Innovative enterprise Channels. May 2019.

      Manage the Active Directory in the Service Desk

      • Buy Link or Shortcode: {j2store}489|cart{/j2store}
      • member rating overall impact (scale of 10): N/A
      • member rating average dollars saved: N/A
      • member rating average days saved: N/A
      • Parent Category Name: Service Desk
      • Parent Category Link: /service-desk
      • Actively maintaining the Active Directory is a difficult task that only gets more difficult with issues like stale accounts and privilege creep.
      • Adding permissions without removing them in lateral transfers creates access issues, especially when regulatory requirements like HIPAA require tight controls.
      • With the importance of maintaining and granting permissions within the Active Directory, organizations are hesitant to grant domain admin access to Tier 1 of the service desk. However, inundating Tier 2 analysts with requests to grant permissions takes away project time.

      Our Advice

      Critical Insight

      • Do not treat the Active Directory like a black box. Strive for accurate data and be proactive by managing your monitoring and audit schedules.
      • Catch outage problems before they happen by splitting monitoring tasks between daily, weekly, and monthly routines.
      • Shift left to save resourcing by employing workflow automation or scripted authorization for Tier 1 technicians.
      • Design actionable metrics to monitor and manage your Active Directory.

      Impact and Result

      • Consistent and right-sized monitoring and updating of the Active Directory is key to clean data.
      • Split monitoring activities between daily, weekly, and monthly checklists to raise efficiency.
      • If need be, shift-left strategies can be implemented for identity and access management by scripting the process so that it can be done by Tier 1 technicians.

      Manage the Active Directory in the Service Desk Research & Tools

      Start here – read the Executive Brief

      Read our concise Executive Brief to find out why you should manage your Active Directory in the service desk, review Info-Tech’s methodology, and understand the four ways we can support you in completing this project.

      Besides the small introduction, subscribers and consulting clients within this management domain have access to:

      1. Maintain your Active Directory with clean data

      Building and maintaining your Active Directory does not have to be difficult. Standardized organization and monitoring with the proper metrics help you keep your data accurate and up to date.

      • Active Directory Standard Operating Procedure
      • Active Directory Metrics Tool

      2. Structure your service desk Active Directory processes

      Build a comprehensive Active Directory workflow library for service desk technicians to follow.

      • Active Directory Process Workflows (Visio)
      • Active Directory Process Workflows (PDF)
      [infographic]

      Build a Better Manager

      • Buy Link or Shortcode: {j2store}603|cart{/j2store}
      • member rating overall impact (scale of 10): N/A
      • member rating average dollars saved: N/A
      • member rating average days saved: N/A
      • Parent Category Name: Train & Develop
      • Parent Category Link: /train-and-develop
      • Management skills training is needed, but organizations are struggling to provide training that makes a long-term difference in the skills managers actually use in their day to day.
      • Many training programs are ineffective because they offer the wrong content, deliver it in a way that is not memorable, and are not aligned with the IT department’s business objectives.

      Our Advice

      Critical Insight

      • More of the typical manager training is not enough to solve the problem of underprepared first-time IT managers.
      • You must overcome the key pitfalls of ineffective training to deliver training that is better than the norm.
      • Offer tailored training that focuses on skill building and is aligned with measurable business goals to make your manager training a tangible success.

      Impact and Result

      Use Info-Tech’s tactical, practical training materials to deliver training that is:

      • Specifically tailored to first-time IT managers.
      • Designed around practical application of new skills.
      • Aligned with your department’s business goals.

      Build a Better Manager Research & Tools

      Besides the small introduction, subscribers and consulting clients within this management domain have access to:

      1. Build a Better Manager Capstone Deck – This deck will guide you through identifying the critical skills your managers need to succeed and planning out a training program tailored to your team and organization.

      This deck presents a behind-the-scenes explanation for the training materials, enabling a facilitator to deliver the training.

      • Build a Better Manager – Phases 1-3

      2. Facilitation Guides – These ready-to-deliver presentation decks span 8 modules. Each module covers a key management skill. The modules can be delivered independently or as a series.

      The modules are complete with presentation slides, speaker’s notes, and accompanying participant workbooks and provide everything you need to deliver the training to your team.

      • Accountability Facilitation Guide
      • Coaching and Feedback Facilitation Guide
      • Communicate Effectively Facilitation Guide
      • Manage Conflict Constructively Facilitation Guide
      • Your Role in Decision Making Facilitation Guide
      • Master Time Facilitation Guide
      • Performance Management Facilitation Guide
      • Your Role in the Organization Facilitation Guide

      3. Participant Workbooks and Supporting Materials – Each training module comes with a corresponding participant workbook to help trainees record insights and formulate individual skill development plans.

      Each workbook is tailored to the presentation slides in its corresponding facilitation guide. Some workbooks have additional materials, such as role play scenarios, to aid in practice. Every workbook comes with example entries to help participants make the most of their training.

      • Communicate Effectively Participant Workbook
      • Performance Management Participant Workbook
      • Coaching and Feedback Participant Workbook
      • Effective Feedback Training Role Play Scenarios
      • Your Role in the Organization Participant Workbook
      • Your Role in Decision Making Participant Workbook
      • Decision Making Case Study
      • Manage Conflict Constructively Participant Workbook
      • Conflict Resolution Role Play Scenarios
      • Master Time Participant Workbook
      • Accountability Participant Workbook
      [infographic]

      Workshop: Build a Better Manager

      Workshops offer an easy way to accelerate your project. If you are unable to do the project yourself, and a Guided Implementation isn't enough, we offer low-cost delivery of our project workshops. We take you through every phase of your project and ensure that you have a roadmap in place to complete your project successfully.

      1 Build a Better Manager

      The Purpose

      Attend training on the specific topics necessary for each individual management team.

      Each workshop consists of four days, one 3-hour training session per day. One module is delivered per day, selecting from the following pool of topics:

      Master Time

      Accountability

      Your Role in the Organization

      Your Role in Decision Making

      Manage Conflict Constructively

      Effective Communication

      Performance Management

      Coaching & Feedback

      Key Benefits Achieved

      Managers learn about best practices, practice their application, and formulate individual skill development plans.

      Activities

      1.1 Training on one topic per day, for four days (selected from a pool of eight possible topics)

      Outputs

      Completed workbook and action plan

      Further reading

      Build a Better Manager

      Support IT success with a solid management foundation.

      Analyst Perspective

      Training that delivers results.

      Jane Koupstova.

      Ninety-eight percent of managers say they need more training, but 93% of managers already receive some level of manager training. Unfortunately, the training typically provided, although copious, is not working. More of the same will never get you better outcomes.

      How many times have you sat through training that was so long, you had no hope of implementing half of it?

      How many times have you been taught best practices, with zero guidance on how to apply them?

      To truly support our managers, we need to rethink manager training. Move from fulfilling an HR mandate to providing truly trainee-centric instruction. Teach only the right skills – no fluff – and encourage and enable their application in the day to day.

      Jane Kouptsova
      Research Director, People & Leadership
      Info-Tech Research Group

      Executive Summary

      Your Challenge

      Common Obstacles

      Info-Tech’s Approach

      IT departments often promote staff based on technical skill, resulting in new managers feeling unprepared for their new responsibilities in leading people.

      The success of your organization hinges on managers’ ability to lead their staff; by failing to equip new managers adequately, you are risking the productivity of your entire department.

      Despite the fact that $14 billion is spent annually on leadership training in the US alone (Freedman, 2016), only one in ten CIOs believe their department is very effective at leadership, culture, and values (Info-Tech, 2019).

      Training programs do not deliver results due to trainee overwhelm, ineffective skill development, and a lack of business alignment.

      Use Info-Tech’s tactical, practical approach to management training to deliver training that:

      • Is specifically tailored to first-time IT managers.
      • Is designed around practical application of new skills.
      • Is aligned with your department’s business goals.
      • Equips your new managers with essential skills and foundational competencies

      Info-Tech Insight

      When it comes to manager training, more is not more. Attending training is not equal to being trained. Even good information is useless when it doesn’t get applied. If your role hasn’t required you to use your training within 48 hours, you were not trained on the most relevant skills.

      Effective managers drive effective departments by engaging their teams

      The image contains a screenshot to demonstrate effective managers.

      Engaged teams are:

      • 52% more willing to innovate*
      • 70% more likely to be at the organization a year from now**
      • 57% more likely to exceed their role’s expectations**

      Engaged teams are driven by managers:

      • 70% of team-level engagement is accounted for by managers***
      *McLean & Company; N=3,395; **McLean & Company; N=5,902; ***Gallup, 2018

      Despite the criticality of their role, IT organizations are failing at supporting new managers

      87% of middle managers wish they had more training when they were first promoted

      98% of managers say they need more training

      Source: Grovo, 2016

      IT must take notice:

      IT as an industry tends to promote staff on the basis of technical skill. As a result, new managers find themselves suddenly out of their comfort zone, tasked with leading teams using management skills they have not been trained in and, more often than not, having to learn on the job. This is further complicated because many new IT managers must go from a position of team member to leader, which can be a very complex transition.

      The truth is, many organizations do try and provide some degree of manager training, it just is not effective

      99% of companies offer management training*

      93% of managers attend it*

      $14 billion spent annually in the US on leadership training**

      Fewer than one in ten CIOs believe their IT department is highly effective at leadership, culture, and values.

      The image contains a screenshot of a pie chart that demonstrates the effectiveness of the IT department at leadership, culture, and values.

      *Grovo, 2016; **Chief Executive, 2016
      Info-Tech’s Management & Governance Diagnostic, N=337 CIOs

      There are three key reasons why manager training fails

      1. Information Overload

      Seventy-five percent of managers report that their training was too long to remember or to apply in their day to day (Grovo, 2016). Trying to cover too much useful information results in overwhelm and does not deliver on key training objectives.

      2. Limited Implementation

      Thirty-three percent of managers find that their training had insufficient follow-up to help them apply it on the job (Grovo, 2016). Learning is only the beginning. The real results are obtained when learning is followed by practice, which turns new knowledge into reliable habits.

      3. Lack of departmental alignment

      Implementing training without a clear link to departmental and organizational objectives leaves you unable to clearly communicate its value, undermines your ability to secure buy-in from attendees and executives, and leaves you unable to verify that the training is actually improving departmental effectiveness.

      Overcome those common training pitfalls with tactical solutions

      MOVE FROM

      TO

      1. Information Overload

      Timely, tailored topics

      The more training managers attend, the less likely they are to apply any particular element of it. Combat trainee overwhelm by offering highly tactical, practical training that presents only the essential skills needed at the managers’ current stage of development.

      2. Limited Implementation

      Skills-focused framework

      Many training programs end when the last manager walks out of the last training session. Ensure managers apply their new knowledge in the months and years after the training by relying on a research-based framework that supports long-term skill building.

      3. Lack of Departmental Alignment

      Outcome-based measurement

      Setting organizational goals and accompanying metrics ahead of time enables you to communicate the value of the training to attendees and stakeholders, track whether the training is delivering a return on your investment, and course correct if necessary.

      This research combats common training challenges by focusing on building habits, not just learning ideas

      Manager training is only useful if the skills it builds are implemented in the day-to-day.

      Research supports three drivers of successful skill building from training:

      Habits

      Organizational Support

      The training modules include committing to implementing new skills on the job and scheduling opportunities for feedback.

      Learning Structure

      Training activities are customizable, flexible, and accompanied by continuous learning self-evaluation.

      Personal Commitment

      Info-Tech’s methodology builds in activities that foster accountability and an attitude of continuous improvement.

      Learning

      Info-Tech Insight

      When it comes to manager training, stop thinking about learning, and start thinking about practice. In difficult situations, we fall back on habits, not theoretical knowledge. If a manager is only as good as their habits, we need to support them in translating knowledge into practice.

      This research focuses on building good management habits to drive enterprise success

      Set up your first-time managers for success by leveraging Info-Tech’s training to focus on three key areas of management:

      • Managing people as a team
      • Managing people as individuals
      • Managing yourself as a developing leader

      Each of these areas:

      • Is immediately important for a first-time manager
      • Includes practical, tactical skills that can be implemented quickly
      • Translates to departmental and organizational benefits

      Info-Tech Insight

      There is no such thing as “effective management training.” Various topics will be effective at different times for different roles. Delivering only the highest-impact learning at strategic points in your leadership development program will ensure the learning is retained and translates to results.

      This blueprint covers foundational training in three key domains of effective management

      Effective Managers

      • Self
        • Conflict & Difficult Conversations
        • Your Role in the Organization
        • Your Role in Decisions
      • Team
        • Communication
        • Feedback & Coaching
        • Performance Management
      • People
        • Master Time
        • Delegate
        • Accountability

      Each topic corresponds to a module, which can be used individually or as a series in any order.

      Choose topics that resonate with your managers and relate directly to their day-to-day tasks. Training on topics that may be useful in the future, while interesting, is less likely to generate lasting skill development.

      Info-Tech Best Practice

      This blueprint is not a replacement for formal leadership or management certification. It is designed as a practical, tactical, and foundational introduction to key management capabilities.

      Info-Tech’s training tools guide participants through successful skill building

      Practical facilitation guides equip you with the information, activities, and speaker’s notes necessary to deliver focused, tactical training to your management team.

      The participant’s workbook guides trainees through applying the three drivers of skill building to solidify their training into habits.

      Measure the effectiveness of your manager training with outcomes-focused metrics

      Linking manager training with measurable outcomes allows you to verify that the program is achieving the intended benefits, course correct as needed, and secure buy-in from stakeholders and participants by articulating and documenting value.

      Use the metrics suggested below to monitor your training program’s effectiveness at three key stages:

      Program Metric

      Calculation

      Program enrolment and attendance

      Attendance at each session / Total number enrolled in session

      First-time manager (FTM) turnover rate

      Turnover rate: Number of FTM departures / Total number of FTMs

      FTM turnover cost

      Number of departing FTMs this year * Cost of replacing an employee

      Manager Effectiveness Metric

      Calculation

      Engagement scores of FTM's direct reports

      Use Info-Tech's Employee Engagement surveys to monitor scores

      Departures as a result of poor management

      Number of times "manager relationships" is selected as a reason for leaving on an exit survey / Total number of departures

      Cost of departures due to poor management

      Number of times "manager relationships" is selected as a reason for leaving on an exit survey * Cost associated with replacing an employee

      Organizational Outcome Metric

      Calculation

      On-target delivery

      % projects completed on-target = (Projects successfully completed on time and on budget / Total number of projects started) * 100

      Business stakeholder satisfaction with IT

      Use Info-Tech’s business satisfaction surveys to monitor scores

      High-performer turnover rate

      Number of permanent, high-performing employee departures / Average number of permanent, high-performing employees

      Info-Tech offers various levels of support to best suit your needs

      DIY Toolkit

      Guided Implementation

      Workshop

      Consulting

      “Our team has already made this critical project a priority, and we have the time and capability, but some guidance along the way would be helpful.” “Our team knows that we need to fix a process, but we need assistance to determine where to focus. Some check-ins along the way would help keep us on track.” “We need to hit the ground running and get this project kicked off immediately. Our team has the ability to take this over once we get a framework and strategy in place.” “Our team does not have the time or the knowledge to take this project on. We need assistance through the entirety of this project.”

      Diagnostics and consistent frameworks used throughout all four options

      Guided Implementation

      What does a typical GI on this topic look like?

      Phase 1 Phase 2 Phase 3

      Call #1: Scope requirements, objectives, and your specific challenges.

      Call #2: Review selected modules and discuss training delivery.

      Call #3: Review training delivery, discuss lessons learned. Review long-term skill development plan.

      A Guided Implementation (GI) is a series

      of calls with an Info-Tech analyst to help implement our best practices in your organization.

      A typical GI is 1 to 3 calls over the course of several months, depending on training schedule.

      Workshop Overview

      Contact your account representative for more information.
      workshops@infotech.com 1-888-670-8889

      Day 1 Day 2 Day 3 Day 4

      3-Hour Training Session

      3-Hour Training Session

      3-Hour Training Session

      3-Hour Training Session

      Activities

      Training on topic 1 (selected from a pool of 8 possible topics)

      Training on topic 2 (selected from a pool of 8 possible topics)

      Training on topic 3 (selected from a pool of 8 possible topics)

      Training on topic 4 (selected from a pool of 8 possible topics)

      Deliverables

      Completed workbook and action plan

      Completed workbook and action plan

      Completed workbook and action plan

      Completed workbook and action plan

      Pool of topics:

      • Master Time
      • Accountability
      • Your Role in the Organization
      • Your Role in Decision Making
      • Manage Conflict Constructively
      • Effective Communication
      • Performance Management
      • Coaching & Feedback

      Phase 1

      Prepare to facilitate training

      Phase 1 Phase 2 Phase 3
      • Select training topics
      • Customize the training facilitation guide for your organization
      • Deliver training modules
      • Confirm skill development action plan with trainees
      • Secure organizational support from trainees' supervisors

      Outcomes of this phase:

      • Training facilitation deck customized to organizational norms
      • Training workbook distributed to participants
      • Training dates and facilitator finalized

      1.1 Select training modules

      1-3 hours

      1. Review the module descriptions on the following slides.
      2. Identify modules that will address managers’ most pressing development needs.
        To help make this decision, consult the following:
        • Trainees’ development plans
        • Trainees’ supervisors
      Input Output
      • Module descriptions
      • Trainees’ development goals and needs
      • Prioritized list of training modules
      Materials Participants
      • Prioritized list of training modules
      • Training sponsor
      • Trainees’ supervisors

      Effective Communication

      Effective communication is the cornerstone of good management

      Effective communication can make or break your IT team’s effectiveness and engagement and a manager’s reputation in the organization. Effective stakeholder management and communication has a myriad of benefits – yet this is a key area where IT leaders continue to struggle.


      There are multiple ways in which you communicate with your staff. The tactics you will learn in this section will help you to:

      1. Understand communication styles. Every staff member has a predisposition in terms of how they give, receive, and digest information. To drive effective communication new managers need to understand the profiles of each of their team members and adjust their communicate style to suit.
      2. Understand what your team members want communicated to them and how. Communication is highly personal, and a good manager needs to clearly understand what their team wants to be informed about, their desired interactions, and when they need to be involved in decision making. They also must determine the appropriate channels for communication exchanges.
      3. Make meetings matter. Many new managers never receive training on what differentiates a good and bad meeting. Effective meetings have a myriad of benefits, but more often than not meetings are ineffective, wasting both the participants’ and organizer’s time. This training will help you to ensure that every team meeting drives a solid outcome and gets results.

      Benefits:

      • Better buy-in, understanding, and communication.
      • Improved IT reputation with the organization.
      • Improved team engagement.
      • Improved stakeholder satisfaction.
      • Better-quality decision making.
      • Improved transparency, trust, and credibility.
      • Less waste and rework.
      • Greater ability to secure support and execute the agenda.
      • More effective cooperation on activities, better quality information, and greater value from stakeholder input.
      • Better understanding of IT performance and contribution.

      Effective Communication

      Effective manager communication has a direct impact on employee engagement

      35% Of organizations say they have lost an employee due to poor internal communication (project.co, 2021).

      59% Of business leaders lose work time to mistakes caused by poor communication (Grammarly, 2022).

      $1.2 trillion Lost to US organizations as a result of poor communication (Grammarly, 2022).

      Effective Communication

      Effective communication is crucial to all parts of the business

      Operations

      Human Resources

      Finance

      Marketing

      Increases production by boosting revenue.

      Reduces the cost of litigation and increases revenue through productivity improvements.

      Reduces the cost of failing to comply with regulations.

      Increases attraction and retention of key talent.

      Effective Communication

      The Communicate Effectively Facilitation Guide covers the following topics:

      • Understand Communication Styles
      • Tailor Communication Methods to Activities
      • Make Meetings Matter

      Learning outcomes:

      Main goal: Become a better communicator across a variety of personal styles and work contexts.

      Key objectives:

      • Reaffirm why effective communication matters.
      • Work with people with different communication styles.
      • Communicate clearly and effectively within a team.
      • Make meetings more effective.

      Info-Tech Insight

      First-time IT managers face specific communication challenges that come with managing people for the first time: learning to communicate a greater variety of information to different kinds of people, in a variety of venues. Tailored training in these areas helps managers focus and fast-track critical skill development.

      Performance Management

      Meaningful performance measures drive employee engagement, which in turn drives business success

      Meaningful performance measures help employees understand the rationale behind business decisions, help managers guide their staff, and clarify expectations for employees. These factors are all strong predictors of team engagement:

      The image contains a screenshot to demonstrate the relationship and success between performance measures and employee engagement.

      Performance Management

      Clear performance measures benefit employees and the organization

      Talent Management Outcomes

      Organizational Outcomes

      Performance measure are key throughout the talent management process.

      Candidates:

      • Want to know how they will be assessed
      • Rely on measures to become productive as soon as possible

      Employees:

      • Benefit from training centered on measures that are aligned with business outcomes
      • Are rewarded, recognized, and compensated based on measurable guidelines

      Promotions and Evaluations:

      • Are more effective when informed by meaningful performance measures that align with what leadership believes is important

      Performance measures benefit the organization by:

      • Helping employees know the steps to take to improve their performance
      • Ensuring alignment between team objectives and organizational goals
      • Providing a standardized way to support decision making related to compensation, promotions, and succession planning
      • Reducing “gaming” of metrics, when properly structured, thereby reducing risk to the organization
      • Affording legal defensibility by providing an objective basis for decision making

      Performance Management

      The Performance Management Facilitation Guide covers the following topics:

      • Develop Meaningful Goals
      • Set Meaningful Metrics

      Learning outcomes:

      Main goal: Become proficient in setting, tracking, and communicating around performance management goals.

      Key objectives:

      • Understand the role of managers and employees in the performance management process.
      • Learn to set SMART, business-aligned goals for your team.
      • Learn to help employees set useful individual goals.
      • Learn to set meaningful, holistic metrics to track goal progression.
      • Understand the relationship between goals, metrics, and feedback.

      Info-Tech Insight

      Goal and metric development holds special significance for first-time IT managers because it now impacts not only their personal performance, but that of their employees and their team collectively. Training on these topics with a practical team- and employee-development approach is a focused way to build these skills.

      Coaching & Feedback

      Coaching and feedback are effective methods to influence employees and drive business outcomes

      COACHING is a conversation in which a manager asks an employee questions to guide them to solve problems themselves, instead of just telling them the answer.

      Coaching increases employee happiness, and decreases turnover.1

      Coaching promotes innovation.2

      Coaching increases employee engagement, effort and performance.3

      FEEDBACK is information about the past, given in the present, with the goal of influencing behavior or performance for the future. It includes information given for reinforcement and redirection.

      Honest feedback enhances team psychological safety.4

      Feedback increases employee engagement.5

      Feedback boosts feelings of autonomy and drives innovation.6

      1. Administrative Sciences, 2022
      2. International Review of Management and Marketing, 2020
      3. Current Psychology, 2021
      4. Quantum Workplace, 2021
      5. Issues and Perspectives in Business and Social Sciences, 2022
      6. Sustainability, 2021

      Coaching & Feedback

      The Coaching & Feedback Facilitation Guide covers the following topics:

      • The 4 A’s of Coaching
      • Effective Feedback

      Learning outcomes:

      Main goal: Get prepared to coach and offer feedback to your staff as appropriate.

      Key objectives:

      • Understand the difference between coaching and feedback and when to apply each one.
      • Learn the importance of a coaching mindset.
      • Learn effective coaching via the 4 A’s framework.
      • Understand the actions that make up feedback and the factors that make it successful.
      • Learn to deal with resistance to feedback.

      Info-Tech Insight

      First-time managers often shy away from giving coaching and feedback, stalling their team’s performance. A focused and practical approach to building these skills equips new managers with the tools and confidence to tackle these challenges as soon as they arise.

      Your Role in the Organization

      IT managers who understand the business context provide more value to the organization

      Managers who don’t understand the business cannot effect positive change. The greater understanding that IT managers have of business context, the more value they provide to the organization as seen by the positive relationship between IT’s understanding of business needs and the business’ perception of IT value.

      The image contains a screenshot of a scatter plot grid demonstrating business satisfaction with IT Understanding of Needs across Overall IT Value.

      Source: Info-Tech Research Group

      Your Role in the Organization

      Knowing your stakeholders is key to understanding your role in the business and providing value to the organization

      To understand your role in the business, you need to know who your stakeholders are and what value you and your team provide to the organization. Knowing how you help each stakeholder meet their wants needs and goals means that you have the know-how to balance experience and outcome-based behaviors. This is the key to being an attentive leader.


      The tactics you will learn in this section will help you to:

      1. Know your stakeholders. There are five key stakeholders the majority of IT managers have: management, peers, direct reports, internal users, and external users or customers. Managers need to understand the goals, needs, and wants of each of these groups to successfully provide value to the organization.
      2. Understand the value you provide to each stakeholder. Stakeholder relationship management requires IT managers to exhibit drive and support behaviors based on the situation. By knowing how you drive and support each stakeholder, you understand how you provide value to the organization and support its mission, vision, and values.
      3. Communicate the value your team provides to the organization to your team. Employees need to understand the impact of their work. As an IT manager, you are responsible for communicating how your team provides value to the organization. Mission statements on how you provide value to each stakeholder is an easy way to clearly communicate purpose to your team.

      Benefits:

      • Faster and higher growth.
      • Improved team engagement.
      • Improved stakeholder satisfaction.
      • Better quality decision making.
      • More innovation and motivation to complete goals and tasks.
      • Greater ability to secure support and execute on goals and tasks.
      • More effective cooperation on activities, better quality information, and greater value from stakeholder input.
      • Better understanding of IT performance and contribution.

      Your Role in the Organization

      The Your Role in the Organization Facilitation Guide covers the following topics:

      • Know Your Stakeholders
      • Understand the Value You Provide to the Organization
      • Develop Learnings Into Habits

      Learning outcomes:

      Main goal: Understand how your role and the role of your team serves the business.

      Key objectives:

      • Learn who your stakeholders are.
      • Understand how you drive and support different stakeholder relationships.
      • Relate your team’s tasks back to the mission, vision, and values of the organization.
      • Create a mission statement for each stakeholder to bring back to your team.

      Info-Tech Insight

      Before training first-time IT managers, take some time as the facilitator to review how you will serve the wants and needs of those you are training and your stakeholders in the organization.

      Decision Making

      Bad decisions have tangible costs, so managers must be trained in how to make effective decisions

      To understand your role in the decision-making process, you need to know what is expected of you and you must understand what goes into making a good decision. The majority of managers report they have no trouble making decisions and that they are good decision makers, but the statistics say otherwise. This ease at decision making is due to being overly confident in their expertise and an inability to recognize their own ignorance.1


      The tactics you will learn in this section will help you to:

      1. Effectively communicate decisions. Often, first-time managers are either sharing their decision recommendations with their manager or they are communicating a decision down to their team. Managers need to understand how to have these conversations so their recommendations provide value to management and top-down decisions are successfully implemented.
      2. Provide valuable feedback on decisions. Evaluating decisions is just as critical as making decisions. If decisions aren’t reviewed, there is no data or feedback to discover why a decision was a success or failure. Having a plan in place before the decision is made facilitates the decision review process and makes it easier to provide valuable feedback.
      3. Avoid common decision-making mistakes. Heuristics and bias are common decision pitfalls even senior leaders are susceptible to. By learning what the common decision-making mistakes are and being able to recognize them when they appear in their decision-making process, first-time managers can improve their decision-making ability.

      20% Of respondents say their organizations excel at decision making (McKinsey, 2018).

      87% “Diverse teams are 87% better at making decisions” (Upskillist, 2022).

      86% of employees in leadership positions blame the lack of collaboration as the top reason for workplace failures (Upskillist, 2022).

      Decision Making

      A decision-making process is imperative, even though most managers don’t have a formal one

      1. Identify the Problem and Define Objectives
      2. Establish Decision Criteria
      3. Generate and Evaluate Alternatives
      4. Select an Alternative and Implement
      5. Evaluate the Decision

      Managers tend to rely on their own intuition which is often colored by heuristics and biases. By using a formal decision-making process, these pitfalls of intuition can be mitigated or avoided. This leads to better decisions.

      First-time managers are able to apply this framework when making decision recommendations to management to increase their likelihood of success, and having a process will improve their decisions throughout their career and the financial returns correlated with them.

      Decision Making

      Recognizing personal heuristics and bias in the decision-making process improves more than just decision results

      Employees are able to recognize bias in the workplace, even when management can’t. This affects everything from how involved they are in the decision-making process to their level of effort and productivity in implementing decisions. Without employee support, even good decisions are less likely to have positive results. Employees who perceive bias:

      Innovation

      • Hold back ideas and solutions
      • Intentionally fail to follow through on important projects and tasks

      Brand Reputation

      • Speak negatively about the company on social media
      • Do not refer open positions to qualified persons in their network

      Engagement

      • Feel alienated
      • Actively seek new employment
      • Say they are not proud to work for the company

      Decision Making

      The Decision Making Facilitation Guide covers the following topics:

      • Effectively Communicate Decisions
      • Provide Valuable Feedback on Decisions
      • Avoid Common Decision-Making Mistakes

      Learning outcomes:

      Main goal: Understand how to successfully perform your role in the decision process.

      Key objectives:

      • Understand the decision-making process and how to assess decisions.
      • Learn how to communicate with your manager regarding your decision recommendations.
      • Learn how to effectively communicate decisions to your team.
      • Understand how to avoid common decision-making errors.

      Info-Tech Insight

      Before training a decision-making framework, ensure it is in alignment with how decisions are made in your organization. Alternatively, make sure leadership is on board with making a change.

      Manage Conflict Constructively

      Enable leaders to resolve conflicts while minimizing costs

      If you are successful in your talent acquisition, you likely have a variety of personalities and diverse individuals within your IT organization and in the business, which means that conflict is inevitable. However, conflict does not have to be negative – it can take on many forms. The presence of conflict in an organization can actually be a very positive thing: the ability to freely express opinions and openly debate can lead to better, more strategic decisions being made.

      The effect that the conflict is having on individuals and the work environment will determine whether the conflict is positive or counterproductive.

      As a new manager you need to know how to manage potential negative outcomes of conflict by managing difficult conversations and understanding how to respond to conflict in the workplace.


      The tactics you will learn in this section will help you to:

      1. Apply strategies to prepare for and navigate through difficult conversations.
      2. Expand your comfort level when handling conflict, and engage in constructive conflict resolution approaches.

      Benefits:

      • Relieve stress for yourself and your co-workers.
      • Save yourself time and energy.
      • Positively impact relationships with your employees.
      • Improve your team dynamic.
      • Remove roadblocks to your work and get things done.
      • Save the organization money.
      • Improve performance.
      • Prevent negative issues from reoccurring.

      Manage Conflict Constructively

      Addressing difficult conversations is beneficial to you, your people, and the organization

      When you face a difficult conversation you…

      • Relieve stress on you and your co-workers.
      • Save yourself time and energy.
      • Positively impact relationships with your employees.
      • Improve your team dynamic.
      • Remove roadblocks to your work
      • Save the organization money.
      • Improve performance.
      • Prevent negative issues from reoccurring.

      40% Of employees who experience conflict report being less motivated as a result (Acas, 2021).

      30.6% Of employees report coming off as aggressive when trying to resolve a conflict
      (Niagara Institute, 2022).

      Manage Conflict Constructively

      The Manage Conflict Constructively Facilitation Guide covers the following topics:

      • Know Your Ideal Time Mix
      • Calendar Diligence
      • Effective Delegation
      • Limit Interruptions

      Learning outcomes:

      Main goal: Effectively manage your time and know which tasks are your priority and which tasks to delegate.

      Key objectives:

      • Understand common reasons for difficult conversations.
      • Learn Info-Tech’s six-step process to best to prepare for difficult conversations.
      • Follow best practices to approach difficult conversations.
      • Learn the five approaches to conflict management.
      • Practice conflict management skills.

      Info-Tech Insight

      Conflict does not have to be negative. The presence of conflict in an organization can actually be a very positive thing: the ability to freely express opinions and openly debate can lead to better, more strategic decisions being made.

      Master Time

      Effective leaders spend their time in specific ways

      How effective leaders average their time spent across the six key roles:

      Leaders with effective time management skills spend their time across six key manager roles: strategy, projects, management, operations, innovation, and personal. While there is no magic formula, providing more value to the business starts with little practices like:

      • Spending time with the right stakeholders and focusing on the right priorities.
      • Evaluating which meetings are important and productive.
      • Benchmarking yourself against your peers in the industry so you constantly learn from them and improve yourself.


      The keys to providing this value is time management and delegation. The tactics in this section will help first-time managers to:

      1. Discover your ideal time. By analyzing how you currently spend your time, you can see which roles you are under/over using and, using your job description and performance metrics, discover your ideal time mix.
      2. Practice calendar diligence. Time blocking is an effective way to use your time, see your week, and quickly understand what roles you are spending your time in. Scheduling priority tasks first gives insight into which tasks should be delegated.
      3. Effectively delegation. Clear expectations and knowing the strengths of your team are the cornerstone to effective delegation. By understanding the information you need to communicate and identifying the best person on your team to delegate to, tasks and goals will be successfully completed.
      4. Limit interruptions. By learning how to limit interruptions from your team and your manager, you are better able to control your time and make sure your tasks and goals get completed.

      Strategy

      23%

      Projects

      23%

      Management

      19%

      Operations

      19%

      Innovation

      13%

      Personal

      4%

      Source: Info-Tech, N=85

      Master Time

      Signs you struggle with time management

      Too many interruptions in a day to stay focused.

      Too busy to focus on strategic initiatives.

      Spending time on the wrong things.

      The image contains a screenshot of a bar graph that demonstrates struggle with time management.

      Master Time

      The Master Time Facilitation Guide covers the following topics:

      • Understand Communication Styles
      • Tailor Communication Methods to Activities
      • Make Meetings Matter

      Learning outcomes:

      Main goal: Become a better communicator across a variety of personal styles and work contexts.

      Key objectives:

      • Understand how you spend your time.
      • Learn how to use your calendar effectively.
      • Understand the actions to take to successfully delegate.
      • Learn how to successfully limit interruptions.

      Info-Tech Insight

      There is a right and wrong way to manage your calendar as a first-time manager and it has nothing to do with your personal preference.

      Accountability

      Accountability creates organizational and team benefits

      Improves culture and innovation

      Improves individual performance

      Increases employee engagement

      Increases profitability

      Increases trust and productivity

      Enables employees to see how they contribute

      Increases ownership employees feel over their work and outcomes

      Enables employees to focus on activities that drive the business forward

      Source: Forbes, 2019

      Accountability

      Accountability increases employee empowerment

      Employee empowerment is the number one driver of employee engagement. The extent to which you can hold employees accountable for their own actions and decisions is closely related to how empowered they are and how empowered they feel; accountability and empowerment go hand in hand. To feel empowered, employees must understand what is expected of them, have input into decisions that affect their work, and have the tools they need to demonstrate their talents.

      The image contains a screenshot to demonstrate how accountability increases employee empowerment.

      Source: McLean & Company Engagement Database, 2018; N=71,794

      Accountability

      The Accountability Facilitation Guide covers the following topics:

      • Create Clarity and Transparency
      • Articulate Expectations and Evaluation
      • Help Your Team Remove Roadblocks
      • Clearly Introduce Accountability to Your Team

      Learning outcomes:

      Main goal: Create a personal accountability plan and learn how to hold yourself and your team accountable.

      Key objectives:

      • Understand why accountability matters.
      • Learn how to create clarity and transparency.
      • Understand how to successfully hold people accountable through clearly articulating expectations and evaluation.
      • Know how to remove roadblocks to accountability for your team.

      Info-Tech Insight

      Accountability is about focusing on the results of a task, rather than just completing the task. Create team accountability by keeping the team focused on the result and not “doing their jobs.” First-time managers need to clearly communicate expectations and evaluation to successfully develop team accountability.

      Use the Build a Better Manager Participant Workbooks to help participants set accountabilities and track their progress

      A key feature of this blueprint is built-in guidance on transferring your managers’ new knowledge into practical skills and habits they can fall back on when their job requires it.

      The Participant Workbooks, one for each module, are structured around the three key principles of learning transfer to help participants optimally structure their own learning:

      • Track your learning. This section guides participants through conducting self-assessments, setting learning goals, recording key insights, and brainstorming relapse-prevention strategies
      • Establish your personal commitment. This section helps participants record the actions they personally commit to taking to continually practice their new skills
      • Secure organizational support. This section guides participants in recording the steps they will take to seek out support from their supervisor and peers.

      The image contains a screenshot of the Build a Better Manager Participant Workbooks.

      Info-Tech Insight

      Participants should use this workbook throughout their training and continue to review it for at least three months after. Practical skills take an extended amount of time to solidify, and using the workbook for several months will ensure that participants stay on track with regular practice and check-ins.

      Set your trainees up for success by reviewing these training best practices

      Cultural alignment

      It is critical that the department leadership team understand and agree with the best practices being presented. Senior team leads should be comfortable coaching first-time managers in implementing the skills developed through the training. If there is any question about alignment with departmental culture or if senior team leads would benefit from a refresher course, conduct a training session for them as well.

      Structured training

      Ensure the facilitator takes a structured approach to the training. It is important to complete all the activities and record the outputs in the workbook where appropriate. The activities are structured to ensure participants successfully use the knowledge gained during the workshop to build practical skills.

      Attendees

      Who should attend the training? Although this training is designed for first-time IT managers, you may find it helpful to run the training for the entire management team as a refresher and to get everyone on the same page about best practices. It is also helpful for senior leadership to be aware of the training because the attendees may come to their supervisors with requests to discuss the material or coaching around it.

      Info-Tech Insight

      Participants should use this workbook throughout their training and continue to review it for at least three months after. Practical skills take an extended amount of time to solidify, and using the workbook for several months will ensure that participants stay on track with regular practice and check-ins.

      1.2 Customize the facilitation guides

      1-3 hours

      Prior to facilitating your first session, ensure you complete the following steps:

      1. Read through all the module content, including the speaker’s notes, to familiarize yourself with the material and ensure the tactics presented align with your department’s culture and established best practices.
      2. Customize the slides with a pencil icon with information relevant to your organization.
      3. Ensure you are comfortable with all material to be presented and are prepared to answer questions. If you require clarification on any of the material, book a call with your Info-Tech analyst for guidance.
      4. Ensure you do not delete or heavily customize the self-assessment activities and the activities in the Review and Action Plan section of the module. These activities are structured around a skill building framework and designed to aid your trainees in applying their new knowledge in their day to day. If you have any concerns about activities in these sections, book a call with your Info-Tech analyst for guidance.
      Input Output
      • List of selected modules
      • Customized facilitation guides
      Materials Participants
      • Facilitation guides from selected modules
      • Training facilitator

      1.3 Prepare to deliver training

      1-3 hours

      Complete these steps in preparation for delivering the training to your first-time managers:

      1. Select a facilitator.
        • The right person to facilitate the meeting depends on the dynamics within your department. Having a senior IT leader can lend additional weight to the training best practices but may not be feasible in a large department. In these cases, an HR partner or external third party can be asked to facilitate.
      2. Distribute the workbooks to attendees before the first training session.
        • Change the header on the workbook templates to your own organization’s, if desired.
        • Email the workbooks to attendees prior to the first session. There is no pre-work to be completed.
      Input Output
      • List of selected modules
      • Facilitator selected
      • Workbook distributed
      Materials Participants
      • Workbooks from selected modules
      • Training sponsor
      • Training facilitator

      Phase 2

      Deliver training

      Phase 1 Phase 2 Phase 3
      • Select training topics
      • Customize the training facilitation guide for your organization
      • Deliver training modules
      • Confirm skill development action plan with trainees
      • Secure organizational support from trainees' supervisors

      Outcomes of this phase:

      • Training delivered
      • Development goals set by attendees
      • Action plan created by attendees

      2.1 Deliver training

      3 hours

      When you are ready, deliver the training. Ensure you complete all activities and that participants record the outcomes in their workbooks.

      Tips for activity facilitation:

      • Encourage and support participation from everyone. And be sure no one on the team dismisses anyone’s thoughts or opinions – they present the opportunity for further discussion and deeper insight.
      • Debrief after each activity, outlining any lessons learned, action items, and next steps.
      • Encourage participants to record all outcomes, key insights, and action plans in their workbooks.
      Input Output
      • Facilitation guides and workbooks for selected modules
      • Training delivered
      • Workbooks completed
      Materials Participants
      • Facilitation guides and workbooks for selected modules
      • Training facilitator
      • Trainees

      Phase 3

      Enable long-term skill development

      Phase 1Phase 2Phase 3
      • Select training topics
      • Customize the training facilitation guide for your organization
      • Deliver training modules
      • Confirm skill development action plan with trainees
      • Secure organizational support from trainees' supervisors

      Outcomes of this phase:

      • Attendees reminded of action plan and personal commitment
      • Supervisors reminded of the need to support trainees' development

      3.1 Email trainees with action steps

      0.5 hours

      After the training, send an email to attendees thanking them for participating and summarizing key next steps for the group. Use the template below, or write your own:

      “Hi team,

      I want to thank you personally for attending the Communicate Effectively training module. Our group led some great discussion.

      A reminder that the next time you will reconvene as a group will be on [Date] to discuss your progress and challenges to date.

      Additionally, your manager is aware and supportive of the training program, so be sure to follow through on the commitments you’ve made to secure the support you need from them to build your new skills.

      I am always open for questions if you run into any challenges.

      Regards,

      [Your name]”

      InputOutput
      • The date of participants’ next discussion meeting
      • Attendees reminded of next meeting date and encouraged to follow through on action plan
      MaterialsParticipants
      • Training facilitator

      3.2 Secure support from trainees’ supervisors

      0.5 hours

      An important part of the training is securing organizational support, which includes support from your trainees’ supervisors. After the trainees have committed to some action items to seek support from their supervisors, it is important to express your support for this and remind the supervisors of their role in guiding your first-time managers. Use the template below, or write your own, to remind your trainees’ supervisors of this at the end of training (if you are going through all three modules in a short period of time, you may want to wait until the end of the entire training to send this email):

      “Hi team,

      We have just completed Info-Tech’s first-time manager training with our new manager team. The trainees will be seeking your support in developing their new skills. This could be in the form of coaching, feedback on their progress, reviewing their development plan, etc.

      Supervisor support is a crucial component of skill building, so I hope I can count on all of you to support our new managers in their learning. If you are not sure how to handle these requests, or would like a refresher of the material our trainees covered, please let me know.

      I am always open for questions if you run into any challenges.

      Regards,

      [Your name]”

      InputOutput
      • List of trainees’ direct supervisors
      • Supervisors reminded to support trainees’ skill practice
      MaterialsParticipants
      • Training facilitator

      Contributors

      Brad Armstrong

      Brad Armstrong, Senior Engineering Manager, Code42 Software

      I am a pragmatic engineering leader with a deep technical background, now focused on building great teams. I'm energized by difficult, high-impact problems at scale and with the cloud technologies and emerging architectures that we can use to solve them. But it's the power of people and organizations that ultimately lead to our success, and the complex challenge of bringing all that together is the work I find most rewarding.

      We thank the expert contributors who chose to keep their contributions anonymous.

      Bibliography

      360Solutions, LLC. “The High Cost of Poor Communication: How to Improve Productivity and Empower Employees Through Effective Communication.” 360Solutions, 2009. Web.

      Ali, M., B. Raza, W. Ali, and N. Imtaiz. Linking Managerial Coaching with Employees’ Innovative Work Behaviors through Affective Supervisory Commitment: Evidence from Pakistan. International Review of Management and Marketing, vol. 10, no. 4, 2020, pp. 11-16.

      Allen, Frederick E. “The Terrible Management Technique That Cost Microsoft Its Creativity.” Forbes.com, 3 July 2012. Web.

      Allen, Renee. “Generational Differences Chart.” West Midland Family Center, n.d. Web.

      American Management Association. “Leading the Four Generations at Work.” American Management Association, Sept. 2014. Web.

      Aminov, Iskandar, Aaron De Smet, Gregor Jost, and David Mendelsohn. “Decision making in the age of urgency.” McKinsey & Company, 30 April 2019. Web.

      AON Hewitt. “Aon Hewitt Study Reveals Strong Link Between Employee Engagement and Employee Perceptions of Total Rewards. Honest Leader Communication Also Influences Engagement.” PR Newswire, 8 April 2015. Web.

      Armstrong, Brad. “How to Fail as a New Engineering Manager.” Noteworthy - The Journal Blog, 19 Feb. 2018. Web.

      Asmus, Mary Jo. “Coaching vs. Feedback.” Aspire-CS, 9 Dec. 2009. Web.

      Baldwin, Timothy T., et al. “The State of Transfer of Training Research: Moving Toward More Consumer-Centric Inquiry.” Human Resource Development Quarterly, vol. 28, no. 1, March 2017, pp. 17-28. Crossref, doi:10.1002/hrdq.21278.

      Batista, Ed. “Building a Feedback-Rich Culture from the Middle.” Ed Batista, April 2015. Web.

      Bilalic, Merim, Peter McLeod, and Fernand Gobet. Specialization Effect and Its Influence on Memory and Problem Solving in Expert Chess Players. Wiley Online Journal, 23 July 2009, doi: https://doi.org/10.1111/j.1551-6709.2009.01030.x

      Blume, Brian D., et al. “Transfer of Training: A Meta-Analytic Review.” Journal of Management, vol. 36, no. 4, July 2010, pp. 1065-105. Crossref, doi:10.1177/0149206309352880.

      BOH Training Guide. Wild Wing, Jan. 2017. Web.

      Bosler, Shana. “9 Strategies to Create Psychological Safety at Work.” Quantum Workplace, 3 June 2021. Web.

      Building Communication Skills. ACQUIRE Project/EngenderHealth, n.d. Web.

      Bucaro, Frank C. “The real issue in conflict is never about things…” Frank Bucaro blog, 7 March 2014. Web.

      Burke, Lisa A., and Holly M. Hutchins. “Training Transfer: An Integrative Literature Review.” Human Resource Development Review, vol. 6, no. 3, Sept. 2007, pp. 263-96. Crossref, doi:10.1177/1534484307303035.

      Caprino, Kathy. “Separating Performance Management from Compensation: New Trend for Thriving Organizations.” Forbes, 13 Dec. 2016. Web.

      Caprino, Kathy. “Why the Annual Review Process Damages Employee Engagement.” Forbes, 1 March 2016. Web.

      Carpineanu, Silvana. “7 Mistakes You Might Be Making When Writing A Meeting Agenda.” Time Doctor, 12 January 2021. Web.

      Cecchi-Dimeglio, Paola. “How Gender Bias Corrupts Performance Reviews, and What to Do About It.” Harvard Business Review, 12 April 2017. Web.

      Chartered Institute of Personnel and Development (CIPD). “PESTLE Analysis.” Chartered Institute of Personnel and Development, 2010. Web.

      Chiaburu, Dan S., et al. “Social Support in the Workplace and Training Transfer: A Longitudinal Analysis: Social Support and Training Transfer.” International Journal of Selection and Assessment, vol. 18, no. 2, June 2010, pp. 187-200. Crossref, doi:10.1111/j.1468-2389.2010.00500.x.

      Christensen, Ulrik Juul. “How to Teach Employees Skills They Don’t Know They Lack.” Harvard Business Review, 29 Sept. 2017. Web.

      CIPD. “Rapid evidence assessment of the research literature on the effect of goal setting on workplace performance.” Charted Institute of Personnel and Development, Dec. 2016. Web.

      CIPD. Annual Survey Report: Learning & Development 2015. Charted Institute of Personnel and Development, 2015. Web.

      Communication and Organizational Skills: NPHW Training Manual. Population Health Research Institute (PHRI), 17 Sept. 2015. Web.

      Cookson, Phil. “It’s time to see performance management as a benefit, not a burden.” CIPD. 17 March 2017. Web.

      Communication Statistics 2021. Project.co, 2021. Web.

      Connors, Roger. “Why Accountability?” The Oz Principle, Partners In Leadership, 2014.

      Coutifaris, Constantinos G. V., and Adam M. Grant “Taking Your Team Behind the Curtain: The Effects of Leader Feedback-Sharing and Feedback-Seeking on Team Psychological Safety.” Organization Science, vol. 33,
      no. 4, 2021, pp. 1574-1598. https://doi.org/10.1287/orsc.2021.1498

      Coy, Charles. “Peer Feedback: 6 Tips for Successful Crowdsourcing.” Rework, 25 June 2014. Web.

      “CQ Learn What Really Matters.” CQ Evidence-Based Management Learning Platform, n.d. Web.

      Darwant, Sarah. Coaching Training Course Book. Elite Training, 2012. Web.

      De Smet, Aaron, et al. How Companies Manage the Front Line Today: McKinsey Survey Results. McKinsey, Feb. 2010. Web.

      DeNault, Charles. “Employee Coaching Survey Results: Important and Engaging.” Saba, 22 April 2015. Web.

      Dermol, Valerij, and Tomaž Čater. “The Influence of Training and Training Transfer Factors on Organisational Learning and Performance.” Personnel Review, vol. 42, no. 3, April 2013, pp. 324–48. Crossref, doi:10.1108/00483481311320435.

      dgdotto. “Fail to Plan, Plan to Fail.” visual.ly, 30 April 2013. Web.

      Duggan, Kris. “Why the Annual Performance Review is Going Extinct.” Fast Company, 20 Oct. 2015. Web.

      Duhigg, Charles. “What Google Learned From Its Quest to Build the Perfect Team.” The New York Times, 25 Feb. 2016. Web.

      Earley, P. Christopher, and Randall S. Peterson. “The Elusive Cultural Chameleon: Cultural Intelligence as a New Approach to Intercultural Training for the Global Manager.” Academy of Management Learning & Education, vol. 3, no. 1, March 2004, pp. 100-15. Crossref, doi:10.5465/amle.2004.12436826.

      Edmondson, Amy. “Psychological Safety and Learning Behavior in Work Teams.” Administrative Science Quarterly, vol. 44, no. 2, June 1999, pp. 350-383. Web.

      “Effective Employee Communications Fosters Corporate Reputation.” The Harris Poll, 10 June 2015. Web.

      Eichenwald, Kurt. “How Microsoft Lost its Mojo: Steve Ballmer and Corporate American’s Most Spectacular Decline.” Vanity Fair, 24 July 2012. Web.

      Essential Supervisory Skills. University of Washington, 2016. Web.

      “Estimating the Costs of Workplace Conflict.” Acas, 11 May 2021. Web.

      Falcone, Paul. “Viewpoint: How to Redesign Your Performance Appraisal Template.” Society for Human Resource Management, 7 June 2017. Web.

      Fermin, Jeff. “Statistics On The Importance Of Employee Feedback.” Officevibe, 7 Oct. 2014. Web.

      Filipkowski, Jenna, et al. Building a Coaching Culture with Millennial Leaders. Human Capital Institute, 18 Sept. 2017. Web.

      First Time Manager Training to Help New Managers Develop Essential Skills. The Ken Blanchard Companies, n.d. Web.

      Fisher, Dan. Feedback vs. Coaching, What’s the Difference? Menemsha Group, 28 June 2018. Web.

      Freedman, Erica. “How to Build an Internal Leadership Development Program.” Chief Executive, 2016. Web.

      "Futureproof Your Organization with These 8 Manager Effectiveness Metrics.” Visier Inc., 8 Aug. 2017. Web.

      Gallo, Amy. “How to Manage Your Former Peers.” Harvard Business Review, Dec. 2012. Web.

      Gandhi, Vipula. “Want to Improve Productivity? Hire Better Managers.” Gallup, 3 Aug. 2018. Web.

      Gallup. State of the Global Workplace. 1st edition, Gallup Press, 2017. Web.

      Global Workplace Analytics. “Latest Telecommuting Statistics.” Global Workplace Analytics. Sept. 2013. Web.

      Goldsmith, Marshall. “Try Feedforward Instead of Feedback.” Leader to Leader Institute, 5 April 2011. Web.

      Goldsmith, Marshall. "11 Guidelines for Influencing Top Decision Makers." Marshall Goldsmith, n.d. Web.

      Goldsmith, Marshall. "I Know Less Than You Do – and It’s Okay!" Marshall Goldsmith, n.d. Web.

      Goldsmith, Marshall. "Is It Worth It to Add Value? Not Always." Marshall Goldsmith, n.d. Web.

      Goler, L., J. Gale, and A. Grant. “Let’s Not Kill Performance Evaluations Yet.” Harvard Business Review, Nov. 2016. Web.

      Good Manager, Bad Manager. Grovo, 2016. Web.

      Google People Operations. “Guide: Understand Team Effectiveness.” Google, n.d. Web.

      Google’s New Manager Student Workbook. re:Work with Google, n.d. Web.

      Google’s New Manager Training Facilitator Guide. re:Work with Google, n.d. Web.

      Gossen, Paul. A Coaching Culture Transformation ~ Case Study. Athena Training and Consulting, 1 April 2011. Web.

      Goudreau, Jenna. “How to Communicate in the New Multi-Generational Office.” Forbes Magazine, Feb. 2013. Web.

      Govaerts, Natalie, and Filip Dochy. “Disentangling the Role of the Supervisor in Transfer of Training.” Educational Research Review, vol. 12, June 2014, pp. 77-93. Crossref, doi:10.1016/j.edurev.2014.05.002.

      Grenchus, Gabrielle. “Keep employees engaged with clear priorities and crowdsourced recognition.” IBM thinkLeaders. 8 June 2015. Web.

      Grossman, Rebecca, and Eduardo Salas. “The Transfer of Training: What Really Matters: The Transfer of Training.” International Journal of Training and Development, vol. 15, no. 2, June 2011, pp. 103-20. Crossref, doi:10.1111/j.1468-2419.2011.00373.x.

      Grote, Dick. “3 Popular Goal-Setting Techniques Managers Should Avoid.” Harvard Business Review. 2 Jan. 2017. Web.

      Hall, John. “Why Accountability Is Vital To Your Company.” Forbes, 6 Oct. 2019. Web.

      Hancock, Bryan, et al. “The Fairness Factor in Performance Management.” McKinsey, 5 April 2018. Web.

      Harkins, Phil. “10 Leadership Techniques for Building High-Performing Teams.” Linkage Inc., 2014. Web.

      HCI. Building a Coaching Culture with Managers and Leaders. Human Capital Institute, 2016. Web.

      Heathfield, Susan M. “Tips to Create Successful Performance Appraisal Goals.” The Balance, Aug. 2016. Web.

      Hills, Jan. Brain-Savvy Business: 8 Principles From Neuroscience and How to Apply Them. Head Heart + Brain, 2016. Print.

      Hoffman, Mitchell, and Steven Tadelis. People Management Skills, Employee Attrition, and Manager Rewards: An Empirical Analysis. p. 96.

      “How to Create an Effective Feedback Culture.” eXplorance Inc. Feb. 2013. Web.

      “Importance of Performance Management Process & Best Practices To Optimize Monitoring Performance Work Reviews/Feedback and Goal Management.” SAP Success Factors, n.d. Web.

      Jacobson, Darcy. “How Bad Performance Management Killed Microsoft’s Edge.” Globoforce Blog, 5 July 2012. Web.

      Jaidev, Uma Pricilda, and Susan Chirayath. Pre-Training, During-Training and Post-Training Activities as Predictors of Transfer of Training. no. 4, 2012, p. 18.

      Jensen, Michael C. “Paying People to Lie: The Truth about the Budgeting Process.” European Financial Management, vol. 9, no. 3, 2003, pp. 379-406. Print.

      Kahneman, Daniel, and Ram Charan. HBR's 10 Must Reads on Making Smart Decisions. Harvard Business Review, 26 March 2013. Ebook.

      Kirkpatrick, J., and W. Kirkpatrick. “The Kirkpatrick Four Levels: A Fresh Look After 50 Years 1959-2009.” Kirkpatrickpartners.com, 2009. Web.

      Kirwan, Cyril. Improving Learning Transfer. Routledge, 2016.

      Kline, Theresa J.B., and Lorne M. Sulsky. “Measurement and Assessment Issues in Performance Appraisal.” Canadian Psychology, vol. 50, no. 3, 2009, pp. 161-171. Proquest. Web.

      Kowalski, Kyle. “Create a Daily Routine with Calendar Time Blocking (+ 7 Pro Tips).” Sloww, 29 May 2018. Web.

      Krentz, Susanna E., et al. ”Staying on Course with Strategic Metrics.” Healthcare Financial Management, vol. 60, no. 5, 2006, pp. 86-94. Proquest. Web.

      Kuligowski, Kiely. Tips for First-Time Managers. 15 Feb. 2019. Web.

      Laker, Dennis R., and Jimmy L. Powell. “The Differences between Hard and Soft Skills and Their Relative Impact on Training Transfer.” Human Resource Development Quarterly, vol. 22, no. 1, March 2011, pp. 111-22. Crossref, doi:10.1002/hrdq.20063.

      Lawrence, Paul. “Managerial coaching – A literature review.” International Journal of Evidence Based Coaching and Mentoring, vol. 15, no. 2, 2017, pp. 43-66. Web.

      Ledford, Gerald E. Jr., George Benson, and Edward E. Lawler III. “Cutting-Edge Performance Management.” WorldatWork Research, Aug. 2016. Web.

      Lee, W.R.; Choi, S.B.; Kang, S.-W. How Leaders’ Positive Feedback Influences Employees’ Innovative Behavior: The Mediating Role of Voice Behavior and Job Autonomy. Sustainability, vol. 13, no. 4, 2021, pp. 1901. https://doi.org/10.3390/su13041901

      Leopold, Till Alexander, Vesselina Ratcheva, and Saadia Zahidi. The Future of Jobs. World Economic Forum, 2016. Web.

      Levy, Dan. “How to Build a Culture That Embraces Feedback.” Inc. Magazine, March 2014. Web.

      Lighthouse Research & Advisory. “Insights from the CHRO Panel at Workhuman 2017.” Lighthouse Research & Advisory, June 2017. Web.

      Lipman, Victor. “For New Managers, Boundaries Matter (A Lot).” Forbes, 19 March 2018. Web.

      Lipman, Victor. “The Hardest Thing For New Managers.” Forbes, 1 June 2016. Web.

      Lipman, Victor. “The Move To New Manager May Be The Hardest Transition In Business.” Forbes, 2 Jan. 2018. Web.

      Lyons, Rich. “Feedback: You Need To Lead It.” Forbes, 10 July 2017. Web.

      “Managing Email Effectively.” MindTools, n.d. Web.

      Managing Performance Workbook. Trainer Bubble, 16 Feb. 2013. Web.

      Mayfield, Clifton, et al. “Psychological Collectivism and Team Effectiveness: Moderating Effects of Trust and Psychological Safety.” Journal of Organizational Culture, Communications and Conflict, vol. 20, no. 1, Jan. 2016, pp. 78-94. Web.

      McAlpin, Kevin and Hans Vaagenes. “Critical Decision Making.” Performance Coaching International. 17 Nov. 2017. Web.

      McCoy, Jim. “How to Align Employee Performance with Business Strategy.” Workforce Management, vol. 86, no. 12, 2007, pp. S5. Proquest. Web.

      “Measuring Time-To-Full Productivity.” FeverBee, n.d. Web.

      Meister, Jeanne. The 2020 Workplace: How Innovative Companies Attract, Develop, and Keep Tomorrow's Employees Today. HarperBusiness, 2010. Print.

      Meyer, Erin. “The Four Keys To Success With Virtual Teams.” Forbes Magazine, 19 Aug. 2010. Web.

      Morris, Donna. “Death to the Performance Review: How Adobe Reinvented Performance Management and Transformed Its Business.” WorldatWork, 2016, p. 10. Web.

      Myers-Briggs Company. “New Research: Time Spent on Workplace Conflict Has Doubled Since 2008.” Yahoo! Finance, 18 Oct. 2022. Web.

      Murdoch, Elisabeth. “Elisabeth Murdoch's MacTaggart lecture: full text.” The Guardian, 23 Aug. 2012. Web.

      NASA Governance and Strategic Management Handbook (NPD 1000.0B). NASA, June 2014. Web.

      NASA Space Flight Program and Project Management Handbook (NASA/SP-2014-3705). NASA, Sept. 2014. Web.

      New Manager Training: Management & Leadership Skills. Schulich School of Business, n.d. Web.

      O’Hanlon, Margaret. “It’s a Scandal! Manager Training Exposed! [Implementation Part 4].” Compensation Cafe, 16 Feb. 2012. Web.

      Ordonez, Lisa D., et al. “Goals Gone Wild: The Systematic Side Effects of Over-Prescribing Goal Setting.” Social Science Research Network. Harvard Business School, 11 Feb. 2009. Web.

      Paczka, Nina. “Meeting in the Workplace | 2023 Statistics.” LiveCareer, 25 July 2022. Web.

      Pavlou, Christina. “How to Calculate Employee Turnover Rate | Workable.” Recruiting Resources: How to Recruit and Hire Better, 13 July 2016. Web.

      Performance Management 101 Workbook. Halogen Software, 2015. Web.

      Personal Development and Review. Oxford Learning Institute, n.d. Web.

      Personal Development Plan. MindTools, 2014. Web.

      Porath, Christine, et al. “The Effects of Civility on Advice, Leadership, and Performance.” Journal of Applied Psychology, vol. 44, no. 5, Sept. 2015, pp. 1527-1541. Web.

      Project Management Institute. “PMI’s Pulse of The Profession: In-Depth Report.” PMI, May 2013. Web. June 2015.

      Quay, C. C., and A. Yusof. “The influence of employee participation, rewards and recognition, job security, and performance feedback on employee engagement.” Issues and Perspectives in Business and Social Sciences, vol. 2, no. 1, 2022, pp. 20. https://doi.org/10.33093/ipbss.2022.2.1.3

      Quinn, R. E., and J. Rohrbaugh. “A spatial model of effectiveness criteria: Towards a competing values approach to organizational analysis.” Management Science, vol. 29, 1983, pp. 363–377.

      Re:Work Guide: Develop and Support Managers. re:Work with Google, n.d. Web.

      Reardon, Kathleen Kelley. “7 Things to Say When a Conversation Turns Negative.” Harvard Business Review, 11 May 2016. Web.

      Reh, F. John. “Here Is a List of Mistakes New Managers Make and How to Avoid Them.” The Balance Careers, 30 Dec. 2018. Web.

      Richards, Leigh. “Why Is Employee Empowerment a Common Cornerstone of Organizational Development & Change Programs?” Houston Chronicle, Hearts Newspapers, LLC. 5 July 2013. Web.

      Robson, Fiona. Southwood School – A Case Study: Performance Management Systems. Society for Human Resource Management, 2009. Crossref, doi:10.4135/9781473959552.

      Rock, David, and Beth Jones. “Why More and More Companies are Ditching Performance Ratings.” Harvard Business Review, 8 Sept. 2015. Web.

      Rock, David. “SCARF: A Brain-Based Model for Collaborating With and Influencing Others.” NeuroLeadership Journal, 2008. Web..

      Romão, Soraia, Neuza Ribeiro, Daniel Roque Gomes, and Sharda Singh. “The Impact of Leaders’ Coaching Skills on Employees’ Happiness and Turnover Intention.” Administrative Sciences, vol. 12, no. 84, 2022. https://doi.org/10.3390/ admsci12030084

      Romero, Joseluis. “Yes - you can build a feedback culture.” Skills 2 Lead, Aug. 2014. Web.

      Runde, Craig E., and Tim A. Flanagan. “Conflict Competent Leadership.” Leader to Leader, Executive Forum, Winter 2008. PDF.

      Saks, Alan M., and Lisa A. Burke-Smalley. “Is Transfer of Training Related to Firm Performance?: Transfer and Firm Performance.” International Journal of Training and Development, vol. 18, no. 2, June 2014, pp. 104–15. Crossref, doi:10.1111/ijtd.12029.

      Saks, Alan M., et al. “The Transfer of Training: The Transfer of Training.” International Journal of Training and Development, vol. 18, no. 2, June 2014, pp. 81–83. Crossref, doi:10.1111/ijtd.12032.

      Salomonsen, Summer. Grovo’s First-Time Manager Microlearning® Program Will Help Your New Managers Thrive in 2018. Grovo, 2018. Web.

      Schwartz, Dan. “3 Topics Every New Manager Training Should Include.” Training Industry, 12 April 2017. Web.

      Scott, Dow, Tom McMullen, and Mark Royal. “Retention of Key Talent and the Role of Rewards.” WorldatWork, June 2012. Web.

      “Seeking Agility in Performance Management.” Human Resource Executive, 2016. Web.

      “Should You Always Involve Your Team in Decision Making?” Upskillist, 25 April 2022. Web.

      “SHRM Workplace Forecast.” The Top Workplace Trends According to HR Professionals, May 2013. Web.

      Singhal, Nikhyl. “Eight Tips for First Time Managers.” Medium, 20 Aug. 2017. Web.

      Singhania, Prakriti, et al. “2020 Global Marketing Trends.” Deloitte, 2019. Web.

      SMART Goals: A How to Guide. University of California, n.d. Web.

      Smith, Benson, and Tony Rutigliano. “Scrap Your Performance Appraisal System.” Gallup, 2002. Article.

      “State of the Modern Meeting 2015.” BlueJeans, Aug. 2015. Web.

      Sternberg, Larry, and Kim Turnage. “Why Make Managers A Strategic Priority?” Great Leadership, 12 Oct. 2017. Web.

      Sullivan, Dr. John. “Facebook’s Difference: A Unique Approach For Managing Employees.”TLNT, Sept. 2013. Web.

      Tal, David. “A 'Culture of Coaching' Is Your Company's Most Important Ingredient for Success.” Entrepreneur, 27 Sept. 2017. Web.

      Tenut, Jeff. “How Management Development Training Reduces Turnover.” DiscoverLink, 3 July 2018. Web.

      “The 5 Biggest Biases That Affect Decision-Making.” NeuroLeadership Institute, 2 August 2022. Web.

      “The Different Impact of Good and Bad Leadership.” Barna Group, 2015. Web.

      “The Engaged Workplace.” Gallup, 2017. Web.

      “The Individual Development Plan Guide.” Wildland Fire Leadership Development Program, April 2010, p. 15.

      The State of Business Communication. Grammarly, 2022. Web.

      Thomas, Kenneth. “Conflict and Conflict Management.” The Handbook of Industrial and Organizational Psychology, Rand McNally, 1976. In “The Five Conflict-Handling Modes.” The Myers Briggs Company, n.d. PDF.

      Thompson, Rachel. “What Is Stakeholder Management?” MindTools, n.d. Web.

      Tollet, Francoise. “Distracted? Learn how to (re)focus.” Business Digest, 12 July 2021. Podcast.

      Tonhauser, Cornelia, and Laura Buker. Determinants of Transfer of Training: A Comprehensive Literature Review, p. 40.

      Towers Watson. “Clear Direction in a Complex World: How Top Companies Create Clarity, Confidence and Community to Build Sustainable Performance.” Change and Communication ROI Study Report, 2011-2012. Web.

      Trudel, Natalie. “Improve Your Coaching Skills by Understanding the Psychology of Feedback.” TLNT, 12 July 2017. Web.

      “Understanding When to Give Feedback.” Harvard Business Review, Dec. 2014. Web.

      Vacassin, Daniel. “There are no 'good' performance management systems – there are just good line managers.” LinkedIn, 4 Oct. 2016. Web.

      van der Locht, Martijn, et al. “Getting the Most of Management Training: The Role of Identical Elements for Training Transfer.” Personnel Review, vol. 42, no. 4, May 2013, pp. 422–39. Crossref, doi:10.1108/PR-05-2011-0072.

      Vaughan, Liam. “Banks Find New Ways to Measure Staff.” Financial News, 10 Jan. 2011. Web.

      Watkins, Michael, et al. “Hit the Ground Running:Transitioning to New Leadership Roles.” IMD Business School, May 2014. Web.

      Whitney, Kelley. “Kimberly-Clark Corp.: Redesigning Performance Management.” Talent Management Magazine, vol. 2, no. 1, 2006. Web.

      “Whole Foods 2015 Report.” The Predictive Index, n.d. Web.

      “Whole Foods Market Reports Fourth Quarter and Fiscal Year 2016 Results.” Whole Foods, 2 Feb. 2016. Web.

      Wisniewski, Dan. “Here's why everybody hates meetings.” HR Morning, 14 Dec. 2012. Web.

      Woolum, Janet, and Brent Stockwell. Aligning Performance Measurement to Mission, Goals, and Strategy Workbook. Arizona State University, Jan. 2016. Web.

      Worall, Les, et al. The Quality of Working Life. Chartered Management Institute, 2016. Web.

      “Workplace Conflict Statistics: How We Approach Conflict at Work.” Niagara Institute, 11 Aug. 2022. Web.

      “You Waste a Lot of Time at Work Infographic.” Atlassian, 23 August 2012. Web.

      Zenger, Jack, and Joe Folkman. “Feedback: The Leadership Conundrum.” Talent Quarterly: The Feedback Issue, 2015. Web.

      Zuberbühler, P., et al. “Development and validation of the coaching-based leadership scale and its relationship with psychological capital, work engagement, and performance.” Current Psychology, vol. 42, no. 10, 2021, pp. 1-22.

      Capture and Market the ROI of Your VMO

      • Buy Link or Shortcode: {j2store}212|cart{/j2store}
      • member rating overall impact (scale of 10): 9.0/10 Overall Impact
      • member rating average dollars saved: $108,234 Average $ Saved
      • member rating average days saved: 9 Average Days Saved
      • Parent Category Name: Vendor Management
      • Parent Category Link: /vendor-management
      • All IT organizations are dependent on their vendors for technology products, services, and solutions to support critical business functions.
      • Measuring the impact of and establishing goals for the vendor management office (VMO) to maximize its effectiveness requires an objective and quantitative approach whenever possible.
      • Sharing the VMO’s impact internally is a balancing act between demonstrating value and self-promotion.

      Our Advice

      Critical Insight

      • The return on investment (ROI) calculation for your VMO must be customized. The ROI components selected must match your VMO ROI maturity, resources, and roadmap. There is no one-size-fits-all approach to calculating VMO ROI.
      • ROI contributions come from many areas and sources. To maximize the VMO’s ROI, look outside the traditional framework of savings and cost avoidance to vendor-facing interactions and the impact the VMO has on internal departments.

      Impact and Result

      • Quantifying the contributions of the VMO takes the guess work out of whether the VMO is performing adequately.
      • Taking a comprehensive approach to measuring the value created by the VMO and the ROI associated with it will help the organization appreciate the importance of the VMO.
      • Establishing goals for the VMO with the help of the executives and key stakeholders ensures that the VMO is supporting the needs of the entire organization.

      Capture and Market the ROI of Your VMO Research & Tools

      Start here – read the Executive Brief

      Read our concise Executive Brief to find out why you should calculate and market internally your VMO’s ROI, review Info-Tech’s methodology, and understand the ways we can support you in completing this project.

      Besides the small introduction, subscribers and consulting clients within this management domain have access to:

      1. Get organized

      Begin the process by identifying your VMO’s ROI maturity level and which calculation components are most appropriate for your situation.

      • Capture and Market the ROI of the VMO – Phase 1: Get Organized
      • VMO ROI Maturity Assessment Tool
      • VMO ROI Calculator and Tracker
      • VMO ROI Data Source Inventory and Evaluation Tool
      • VMO ROI Summary Template

      2. Establish baseline

      Set measurement baselines and goals for the next measurement cycle.

      • Capture and Market the ROI of the VMO – Phase 2: Establish Baseline
      • VMO ROI Baseline and Goals Tool

      3. Measure and monitor results

      Measure the VMO's ROI and value created by the VMO’s efforts and the overall internal satisfaction with the VMO.

      • Capture and Market the ROI of the VMO – Phase 3: Measure and Monitor Results
      • RFP Cost Estimator
      • Improvements in Working Capital Estimator
      • Risk Estimator
      • General Process Cost Estimator and Delta Estimator
      • VMO Internal Client Satisfaction Survey
      • Vendor Security Questionnaire
      • Value Creation Worksheet
      • Deal Summary Report Template

      4. Report results

      Report the results to key stakeholders and executives in a way that demonstrates the value added by the VMO to the entire organization.

      • Capture and Market the ROI of the VMO – Phase 4: Report Results
      • Internal Business Review Agenda Template
      • IT Spend Analytics
      • VMO ROI Reporting Worksheet
      • VMO ROI Stakeholder Report Template
      [infographic]

      Workshop: Capture and Market the ROI of Your VMO

      Workshops offer an easy way to accelerate your project. If you are unable to do the project yourself, and a Guided Implementation isn't enough, we offer low-cost delivery of our project workshops. We take you through every phase of your project and ensure that you have a roadmap in place to complete your project successfully.

      1 Get Organized

      The Purpose

      Determine how you will measure the VMO’s ROI.

      Key Benefits Achieved

      Focus your measurement on the appropriate activities.

      Activities

      1.1 Determine your VMO’s maturity level and identify applicable ROI measurement categories.

      1.2 Review and select the appropriate ROI formula components for each applicable measurement category.

      1.3 Compile a list of potential data sources, evaluate the viability of each data source selected, and assign data collection and analysis responsibilities.

      1.4 Communicate progress and proposed ROI formula components to executives and key stakeholders for feedback and/or approval/alignment.

      Outputs

      VMO ROI maturity level and first step of customizing the ROI formula components.

      Second and final step of customizing the ROI formula components…what will actually be measured.

      Viable data sources and assignments for team members.

      A progress report for key stakeholders and executives.

      2 Establish Baseline

      The Purpose

      Set baselines to measure created value against.

      Key Benefits Achieved

      ROI contributions cannot be objectively measured without baselines.

      Activities

      2.1 Gather baseline data.

      2.2 Calculate/set baselines.

      2.3 Set SMART goals.

      2.4 Communicate progress and proposed ROI formula components to executives and key stakeholders for feedback and/or approval/alignment.

      Outputs

      Data to use for calculating baselines.

      Baselines for measuring ROI contributions.

      Value creation goals for the next measurement cycle.

      An updated progress report for key stakeholders and executives.

      3 Measure and Monitor Results

      The Purpose

      Calculate the VMO’s ROI.

      Key Benefits Achieved

      An understanding of whether the VMO is paying for itself.

      Activities

      3.1 Assemble the data and calculate the VMO’s ROI.

      3.2 Organize the data for the reporting step.

      Outputs

      The VMO’s ROI expressed in terms of how many times it pays for itself (e.g. 1X, 3X, 5X).

      Determine which supporting data will be reported.

      4 Report Results

      The Purpose

      Report results to stakeholders.

      Key Benefits Achieved

      Stakeholders understand the value of the VMO.

      Activities

      4.1 Create a reporting template.

      4.2 Determine reporting frequency.

      4.3 Decide how the reports will be distributed or presented.

      4.4 Send out a draft report and update based on feedback.

      Outputs

      A template for reporting ROI and supporting data.

      A decision about quarterly or annual reports.

      A decision regarding email, video, and in-person presentation of the ROI reports.

      Final ROI reports.

      Identify and Manage Reputational Risk Impacts on Your Organization

      • Buy Link or Shortcode: {j2store}220|cart{/j2store}
      • member rating overall impact (scale of 10): N/A
      • member rating average dollars saved: N/A
      • member rating average days saved: N/A
      • Parent Category Name: Vendor Management
      • Parent Category Link: /vendor-management

      Access to information about companies is more available to consumers than ever. Organizations must implement mechanisms to monitor and manage how information is perceived to avoid potentially disastrous consequences to their brand reputation.

      A negative event could impact your organization's reputation at any given time. Make sure you understand where such events may come from and have a plan to manage the inevitable consequences.

      Our Advice

      Critical Insight

      • Identifying and managing a vendor’s potential impact on your organization’s reputation requires efforts from multiple people in the organization across several functions. Those people all need coaching on the potential changes in the market and how social media can affect your brand.
      • Organizational leadership is often caught unaware during crises, and their response plans lack the flexibility to adjust to significant market upheavals.

      Impact and Result

      • Vendor management practices educate organizations on the different potential risks to vendors in your market and suggest creative and alternative ways to avoid and help manage them.
      • Prioritize and classify your vendors with quantifiable, standardized rankings.
      • Prioritize focus on your high-risk vendors.
      • Standardize your processes for identifying and monitoring vendor risks to manage potential impacts on your reputation and brand with our Reputational Risk Impact Tool.

      Identify and Manage Reputational Risk Impacts on Your Organization Research & Tools

      Besides the small introduction, subscribers and consulting clients within this management domain have access to:

      1. Identify and Manage Reputational Risk Impacts on Your Organization Deck – Use the research to better understand the negative impacts of vendor actions on your brand reputation.

      Use this research to identify and quantify the potential reputational impacts caused by vendors. Use Info-Tech's approach to look at the reputational impact from various perspectives to better prepare for issues that may arise.

      • Identify and Manage Reputational Risk Impacts on Your Organization Storyboard

      2. Reputational Risk Impact Tool – Use this tool to help identify and quantify the reputational impacts of negative vendor actions.

      By playing the “what if” game and asking probing questions to draw out – or eliminate - possible negative outcomes, everyone involved adds their insight into parts of the organization to gather a comprehensive picture of potential impacts.

      • Reputational Risk Impact Tool
      [infographic]

      Further reading

      Identify and Manage Reputational Risk Impacts on Your Organization

      Brand reputation is the most valuable asset an organization can protect.

      Analyst Perspective

      Organizations must diligently assess and protect their reputations, both in the market and internally.

      Social media, unprecedented access to good and bad information, and consumer reliance on others’ online opinions force organizations to dedicate more resources to protecting their brand reputation than ever before. Perceptions matter, and you should monitor and protect the perception of your organization with as much rigor as possible to ensure your brand remains recognizable and trusted.

      Photo of Frank Sewell, Research Director, Vendor Management, Info-Tech Research Group.

      Frank Sewell
      Research Director, Vendor Management
      Info-Tech Research Group

      Executive Summary

      Your Challenge

      Access to information about companies is more available to consumers than ever. A negative event could impact your organizational reputation at any time. As a result, organizations must implement mechanisms to monitor and manage how information is perceived to avoid potentially disastrous consequences to their brand reputation.

      Make sure you understand where negative events may come from and have a plan to manage the inevitable consequences.

      Common Obstacles

      Identifying and managing a vendor’s potential impact on your organization’s reputation requires efforts from multiple people in the organization across several functions. Those people all need coaching on the potential changes in the market and how social media can affect your brand.

      Organizational leadership is often caught unaware during crises, and their response plans lack the flexibility to adjust to significant market upheavals.

      Info-Tech’s Approach

      Vendor management practices educate organizations on the different potential risks to vendors in your market and suggest creative and alternative ways to avoid and help manage them.

      Prioritize and classify your vendors with quantifiable, standardized rankings.

      Prioritize focus on your high-risk vendors.

      Standardize your processes for identifying and monitoring vendor risks to manage potential impacts on your reputation and brand with our Reputational Risk Impact Tool.

      Info-Tech Insight

      Organizations must evolve their risk assessments to be more adaptive to respond to rapid changes in online media. Ongoing monitoring of social media and the vendors tied to their company is imperative to achieving success and avoiding reputational disasters.

      Info-Tech’s multi-blueprint series on vendor risk assessment

      There are many individual components of vendor risk beyond cybersecurity.

      Cube with each multiple colors on each face, similar to a Rubix cube, and individual components of vendor risk branching off of it: 'Financial', 'Reputational', 'Operational', 'Strategic', 'Security', and 'Regulatory & Compliance'.

      This series will focus on the individual components of vendor risk and how vendor management practices can facilitate organizations’ understanding of those risks.

      Out of scope:
      This series will not tackle risk governance, determining overall risk tolerance and appetite, or quantifying inherent risk.

      Reputational risk impacts

      Potential losses to the organization due to risks to its reputation and brand

      In this blueprint, we’ll explore reputational risks (risks to the brand reputation of the organization) and their impacts.

      Identify potentially negative events to assess the overall impact on your organization and implement adaptive measures to respond and correct.

      Cube with each multiple colors on each face, similar to a Rubix cube, and the vendor risk component 'Reputational' highlighted.

      Protect your most valuable asset: your brand

      25%

      of a company’s market value is due to reputation (Transmission Private, 2021)

      94%

      of consumers say that a bad review has convinced them to avoid a business (ReviewTrackers, 2022)

      14 hours

      is the average time it takes for a false claim to be corrected on social media (Risk Analysis, 2018)
      Image of an umbrella covering the word 'BRAND' and three arrows approaching from above.

      What is brand recognition?

      And the cost of rebranding

      Brand recognition is the ability of consumers to recognize an identifying characteristic of one company versus a competitor.” (Investopedia)

      Most trademark valuation is based directly on its projected future earning power, based on income history. For a new brand with no history, evaluators must apply experience and common sense to predict the brand's earning potential. They can also use feedback from industry experts, market surveys, and other studies.” (UpCounsel)

      The cost of rebranding for small to medium businesses is about 10 to 20% of the recommended overall marketing budget and can take six to eight months (Ignyte).

      Stock image of a house with a money sign chimney.

      "All we are at our core is our reputation and our brand, and they are intertwined." (Phil Bode, Principal Research Director, Info-Tech Research Group)

      What your vendor associations say about you

      Arrows of multiple colors coalescing in an Earth labelled 'Your Brand', and then a red arrow that reads 'Reputation' points to the terms on the right.

      Bad Customer Reviews

      Breach of Data

      Poor Security Posture

      Negative News Articles

      Public Lawsuits

      Poor Performance

      How a major vendor protects its brand

      An ideal state
      • There is a dedicated brand protection department.
      • All employees are educated annually on brand protection policies and procedures.
      • Brand protection is tied to cybersecurity.
      • The organization actively monitors its brand and reputation through various media formats.
      • The organization has criteria for assessing x-party vendors and holds them accountable through ongoing monitoring and validation of their activities.

      Brand Protection
      Done Right

      Sticker for a '5 Star Rating'.

      Never underestimate the power of local media on your profits

      Info-Tech Insight

      Keep in mind that too much exposure to media can be a negative in that it heightens the awareness of your organization to outside actors. If you do go through a period of increased exposure, make sure to advance your monitoring practices and vigilance.

      Story: Restaurant data breach

      Losing customer faith

      A popular local restaurant’s point of service (POS) machines were breached and the credit card data of their customers over a two-week period was stolen. The restaurant did the right thing: they privately notified the affected people, helped them set up credit monitoring services, and replaced their compromised POS system.

      Unfortunately, the local newspaper got wind of the breach. It published the story, leaving out that the restaurant had already notified affected customers and had replaced their POS machines.

      In response, the restaurant launched a campaign in the local paper and on social media to repair their reputation in the community and reassure people that they could safely transact at their business.

      For at least a month, the restaurant experienced a drastic decrease in revenue as customers either refused to come in to eat or paid only in cash. During this same period the restaurant was spending outside their budget on the advertising.
      Broken trust.

      Story: Monitor your subcontractors

      Trust but verify

      A successful general contractor with a reputation for fairness in their dealings needed a specialist to perform some expert carpentry work for a few of their clients.

      The contractor gave the specialist the clients’ contact information and trusted them to arrange the work.

      Weeks later, the contractor checked in with the clients and received a ton of negative feedback:

      • The specialist called them once and never called back.
      • The specialist refused to do the work as described and wanted to charge extra.
      • The specialist performed work to “fix” the issue but cut corners to lessen their costs.

      As a result, the contractor took extreme measures to regain the clients’ confidence and trust and lost other opportunities in the process.

      Stock image of a sad construction site supervisor.

      You work hard for your reputation. Don’t let others ruin it.

      Don’t forget to look within as well as without

      Stock image of a frustrated desk worker.

      Story: Internal reputation is vital

      Trust works both ways

      An organization’s relatively new IT and InfoSec department leadership have been upgrading the organization's systems and policies as fast as resources allow when the organization encounters a major breach of security.

      Trust in the developing IT and InfoSec departments' leadership wanes throughout the organization as people search for the root cause and blame the systems. This degradation of trust limits the effectiveness of the newly implemented process, procedures, and tools of the departments.

      The new leaders' abilities are called into question, and they must now rigorously defend and justify their decisions and positions to the executives and board.

      It will be some time before the two departments gain their prior trust and respect, and the new leaders face some tough times ahead regaining the organization's confidence.

      How could the new leaders approach the situation to mend their reputations in the wake of this (perhaps unfair) reputational hit?

      It is not enough to identify the potential risks; there must also be adequate controls in place to monitor and manage them

      Stock image of a fingerprint on a computer chip under a blacklight.

      Identify, manage, and monitor reputational risks

      Global markets
      • Organizations need to learn how to assess the likelihood of potential risks in the changing global markets and recognize how their partnerships and subcontracts affect their brand.
      • Now more than ever, organizations need to be mindful of the larger global landscape and how their interactions within various regions can impact their reputation.
      Social media
      • Understanding how to monitor social media activity and online content will give you an edge in the current environment.
      • Changes in social media generally happen faster than companies can recognize them. If you are not actively monitoring those risks, the damage could set in before you even have a chance to respond.
      Global shortages
      • Organizations need to accept that shortages will recur periodically and that preparing for them will significantly increase the success potential of long-term plans.
      • Customers don’t always understand what is happening in the global supply chain and may blame you for poor service if you cannot meet demands as you have in the past.

      Which way is your reputation heading?

      • Do you understand and track items that might affect your reputation?
      • Do you understand the impact they may have on your business?

      Visualization of a Newton's Cradle perpetual motion device, aka clacky balls. The lifted ball is colored green with a smiley face and is labelled 'Your Brand Reputation'. The other four balls are red with a frowny face and are labelled 'Data Breach/ Lawsuit', 'Service Disruption', 'Customer Complaint', and 'Poor Delivery'.

      Identifying and understanding potential risks is essential to adapting to the ever-changing online landscape

      Info-Tech Insight

      Few organizations are good at identifying risks. As a result, almost none realistically plan to monitor, manage, and adapt their plans to mitigate those risks.

      Reputational risks

      Not protecting your brand can have disastrous consequences to your organization

      • Data breaches & lawsuits
      • Poor vendor performance
      • Service disruptions
      • Negative reviews

      Stock image of a smiling person on their phone rating something five stars.

      What to look for in vendors

      Identify potential reputational risk impacts
      • Check online reviews from both customers and employees.
      • Check news sites:
        • Has the vendor been affected by a breach?
        • Is the vendor frequently in the news – good or bad? Greater exposure can cause an uptick in hostile attacks, so make sure the vendor has adequate protections in line with its exposure.
      • Review its financials. Is it prime for an acquisition/bankruptcy or other significant change?
      • Review your contractual protections to ensure that you are made whole in the event something goes wrong. Has anything changed with the vendor that requires you to increase your protections?
      • Has anything changed in the vendor’s market? Is a competitor taking its business, or are its resources stretched on multiple projects due to increased demand?
      Illustration of business people in a city above various icons.

      Assessing Reputational Risk Impacts

      Zigzagging icons and numbers one through 7 alternating sides downward. Review Organizational Strategy
      Understand the organizational strategy to prepare for the “what if” game exercise.
      Identify & Understand Potential Risks
      Play the “what if” game with the right people at the table.
      Create a Risk Profile Packet for Leadership
      Pull all the information together in a presentation document.
      Validate the Risks
      Work with leadership to ensure that the proposed risks are in line with their thoughts.
      Plan to Manage the Risks
      Lower the overall risk potential by putting mitigations in place.
      Communicate the Plan
      It is important not only to have a plan but also to socialize it in the organization for awareness.
      Enact the Plan
      Once the plan is finalized and socialized put it in place with continued monitoring for success.
      (Adapted from Harvard Law School Forum on Corporate Governance)

      Insight Summary

      Reputational risk impacts are often unanticipated, causing catastrophic downstream effects. Continuously monitoring your vendors’ actions in the market can help organizations head off brand disasters before they occur.

      Insight 1

      Understanding how to monitor social media activity and online content will give you an edge in the current environment.

      Do you have dedicated individuals or teams to monitor your organization's online presence? Most organizations review and approve the online content, but many forget the need to have analysts reviewing what others are saying about them.

      Insight 2

      Organizations need to learn how to assess the likelihood of potential risks in the rapidly changing online environments and recognize how their partnerships and subcontractors’ actions can affect their brand.

      For example, do you understand how a simple news article raises your profile for short-term and long-term adverse events?

      Insight 3

      Socialize the risk management process throughout the organization to heighten awareness and enable employees to help protect the company’s reputation.

      Do you include a social media and brand protection policy in your annual education?

      Identify reputational risk

      Who should be included in the discussion?
      • While it is true that executive-level leadership defines the strategy for an organization, it is vital for those making decisions to make INFORMED decisions.
      • Getting input from your organization's marketing experts will enhance your brand's long-term protection.
      • Involving those who directly manage vendors and understand the market will aid in determining the forward path for relationships with your current vendors and identifying new emerging potential partners.
      • Organizations have a wealth of experience in their marketing departments that can help identify real-world negative scenarios.
      • Include vendor relationship managers to help track what is happening in the media for those vendors.
      Keep in mind: (R=L*I)
      Risk = Likelihood x Impact

      Impact tends to remain the same, while likelihood is a very flexible variable.

      Stock image of a flowchart asking 'Risk?', 'Yes', 'No'.

      Manage and monitor reputational risk impacts

      What can we realistically do about the risks?
      • Re-evaluate corporate policies frequently.
      • Ensure proper protections in contracts:
        • Limit the use of your brand name in the publicity and trademark clauses.
        • Make sure to include security protections for your data in the event of a breach; understand that reputation can rarely be made whole again once trust is breached.
      • Introduce continual risk assessment to monitor the relevant vendor markets.
      • Be adaptable and allow for innovations that arise from the current needs.
        • Capture lessons learned from prior incidents to improve over time and adjust your strategy based on the lessons.
      • Monitor your company’s and associated vendors’ online presence.
      • Track similar companies’ brand reputations to see how yours compares in the market.

      Social media is driving the need for perpetual diligence.

      Organizations need to monitor their brand reputation considering the pace of incidents in the modern age.

      Stock image of a person on a phone that is connected to other people.

      The “what if” game

      1-3 hours

      Input: List of identified potential risk scenarios scored by likelihood and financial impact, List of potential management of the scenarios to reduce the risk

      Output: Comprehensive reputational risk profile on the specific vendor solution

      Materials: Whiteboard/flip charts, Reputational Risk Impact Tool to help drive discussion

      Participants: Vendor Management Coordinator, Organizational Leadership, Operations Experts (SMEs), Legal/Compliance/Risk Manager, Marketing

      Vendor management professionals are in an excellent position to help senior leadership identify and pull together resources across the organization to determine potential risks. By playing the "what if" game and asking probing questions to draw out – or eliminate – possible negative outcomes, everyone involved adds their insight into parts of the organization to gather a comprehensive picture of potential impacts.

      1. Break into smaller groups (or if too small, continue as a single group).
      2. Use the Reputational Risk Impact Tool to prompt discussion on potential risks. Keep this discussion flowing organically to explore all potential risk but manage the overall process to keep the discussion on track.
      3. Collect the outputs and ask the subject matter experts for management options for each one in order to present a comprehensive risk strategy. You will use this to educate senior leadership so that they can make an informed decision to accept or reject the solution.

      Download the Reputational Risk Impact Tool

      Example: Low reputational risk

      We can see clearly in this example that the contractor suffered minimal impact from the specialist's behavior. Though they did take a hit to their overall reputation with a few customers, they should be able to course-correct with a minimal outlay of effort and almost no loss of revenue.

      Stock image of construction workers.

      Sample table of 'Sample Questions to Ask to Identify Reputational Impacts'. Column headers are 'Score', 'Weight', 'Question', and 'Comments or Notes'. At the bottom the 'Reputational Score' row has a low average score of '1.3' and '%100' total weight in their respective columns.

      Example: High reputational risk

      Note in the example how the tool can represent different weights for each of the criteria depending on your needs.

      Stock image of an older person looking out a window.

      Sample table of 'Sample Questions to Ask to Identify Reputational Impacts'. Column headers are 'Score', 'Weight', 'Question', and 'Comments or Notes'. At the bottom the 'Reputational Score' row has a high average score of '3.1' and '%100' total weight in their respective columns.

      Summary

      Be vigilant and adaptable to change
      • Organizations need to learn how to assess the likelihood of potential risks in the changing global markets and recognize how their partnerships and subcontracts affect their brand.
      • Understanding how to monitor social media activity and online content will give you an edge in the current environment.
      • Bring the right people to the table to outline potential risks to your organization’s brand reputation.
      • Socialize the risk management process throughout the organization to heighten awareness and enable employees to help protect the company’s reputation.
      • Incorporate lessons learned from incidents into your risk management process to build better plans for future issues.
      Stock image of a person's face overlaid with many different images.

      Organizations must evolve their risk assessments to be more adaptive to respond to global factors in the market.

      Ongoing monitoring of online media and the vendors tied to company visibility is imperative to avoiding disaster.

      Bibliography

      "The CEO Reputation Premium: Gaining Advantage in the Engagement Era." Weber Shandwick, March 2015. Accessed June 2022.

      Glidden, Donna. "Don't Underestimate the Need to Protect Your Brand in Publicity Clauses." Info-Tech Research Group, June 2022.

      Greenaway, Jordan. "Managing Reputation Risk: A start-to-finish guide." Transmission Private, July 2020. Accessed June 2022.

      Jagiello, Robert D., and Thomas T. Hills. “Bad News Has Wings: Dread Risk Mediates Social Amplification in Risk Communication.” Risk Analysis, vol. 38, no. 10, 2018, pp. 2193-2207.

      Kenton, Will. "Brand Recognition.” Investopedia, Aug. 2021. Accessed June 2022.

      Lischer, Brian. "How Much Does it Cost to Rebrand Your Company?" Ignyte, October 2017. Accessed June 2022.

      "Powerful Examples of How to Respond to Negative Reviews." ReviewTrackers, 16 Feb. 2022. Accessed June 2022.

      Tonello, Matteo. “Strategic Risk Management: A Primer for Directors.” Harvard Law School Forum on Corporate Governance, 23 Aug. 2012. Web.

      "Valuation of Trademarks: Everything You Need to Know." UpCounsel, 2022. Accessed June 2022.

      Related Info-Tech Research

      Sample of 'Assessing Financial Risk Management'. Identify and Manage Financial Risk Impacts on Your Organization
      • Identifying and managing a vendor’s potential financial impact requires multiple people in the organization across several functions – and those people all need educating on the potential risks.
      • Organizational leadership is often unaware of decisions on organizational risk appetite and tolerance, and they assume there are more protections in place against risk impact than there truly are.
      Sample of 'How to Assess Strategic Risk'. Identify and Manage Strategic Risk Impacts on Your Organization
      • Identifying and managing a vendor’s potential strategic impact requires multiple people in the organization across several functions – and those people all need coaching on the potential changes in the market and how these changes affect strategic plans.
      • Organizational leadership is often caught unaware during crises, and their plans lack the flexibility needed to adjust to significant market upheavals.
      Research coming soon. Jump Start Your Vendor Management Initiative
      • Vendor management is not “plug and play” – each organization’s vendor management initiative (VMI) needs to fit its culture, environment, and goals. The key is to adapt vendor management principles to fit your needs…not the other way around.
      • All vendors are not of equal importance to an organization. Classifying or segmenting your vendors allows you to focus your efforts on the most important vendors first, allowing your VMI to have the greatest impact possible.

      Research Contributors and Experts

      Frank Sewell

      Research Director
      Info-Tech Research Group

      Donna Glidden

      Research Director
      Info-Tech Research Group

      Steven Jeffery

      Principal Research Director
      Info-Tech Research Group

      Mark Roman

      Managing Partner
      Info-Tech Research Group

      Phil Bode

      Principal Research Director
      Info-Tech Research Group

      Sarah Pletcher

      Executive Advisor
      Info-Tech Research Group

      Scott Bickley

      Practice Lead
      Info-Tech Research Group

      Service Desk

      • Buy Link or Shortcode: {j2store}11|cart{/j2store}
      • Related Products: {j2store}11|crosssells{/j2store}
      • Up-Sell: {j2store}11|upsells{/j2store}
      • member rating overall impact (scale of 10): 9.4/10
      • member rating average dollars saved: $22,900
      • member rating average days saved: 20
      • Parent Category Name: Infra and Operations
      • Parent Category Link: /infra-and-operations
      The service desk is typically the first point of contact for clients and staff who need something. Make sure your team is engaged, involved, knowledgeable, and gives excellent customer service.

      Build a Data Classification MVP for M365

      • Buy Link or Shortcode: {j2store}67|cart{/j2store}
      • member rating overall impact (scale of 10): N/A
      • member rating average dollars saved: N/A
      • member rating average days saved: N/A
      • Parent Category Name: End-User Computing Applications
      • Parent Category Link: /end-user-computing-applications
      • Resources are the primary obstacle to getting a foot hold in O365 governance, whether it is funding or FTE resources.
      • Data is segmented and is difficult to analyze when you can’t see it or manage the relationships between sources.
      • Organizations expect results early and quickly and a common obstacle is that building a proper data classification framework can take more than two years and the business can't wait that long.

      Our Advice

      Critical Insight

      • Data classification is the lynchpin to ANY effective governance of O/M365 and your objective is to navigate through this easily and effectively and build a robust, secure, and viable governance model.
      • Start your journey by identifying what and where your data is and how much data you have. You need to understand what sensitive data you have and where it is stored before you can protect it or govern that data.
      • Ensure there is a high-level leader who is the champion of the governance objective.

      Impact and Result

      • Using least complex sensitivity labels in your classification are your building blocks to compliance and security in your data management schema; they are your foundational steps.

      Build a Data Classification MVP for M365 Research & Tools

      Besides the small introduction, subscribers and consulting clients within this management domain have access to:

      1. Build a Data Classification MVP for M365 Deck – A guide for how to build a minimum-viable product for data classification that end users will actually use.

      Discover where your data resides, what governance helps you do, and what types of data you're classifying. Then build your data and security protection baselines for your retention policy, sensitivity labels, workload containers, and both forced and unforced policies.

      • Build a Data Classification MVP for M365 Storyboard
      [infographic]

      Further reading

      Build a Data Classification MVP for M365

      Kickstart your governance with data classification users will actually use!

      Executive Summary

      Info-Tech Insight

      • Creating an MVP gets you started in data governance
        Information protection and governance are not something you do once and then you are done. It is a constant process where you start with the basics (a minimum-viable product or MVP) and enhance your schema over time. The objective of the MVP is reducing obstacles to establishing an initial governance position, and then enabling rapid development of the solution to address a variety of real risks, including data loss prevention (DLP), data retention, legal holds, and data labeling.
      • Define your information and protection strategy
        The initial strategy is to start looking across your organization and identifying your customer data, regulatory data, and sensitive information. To have a successful data protection strategy you will include lifecycle management, risk management, data protection policies, and DLP. All key stakeholders need to be kept in the loop. Ensure you keep track of all available data and conduct a risk analysis early. Remember, data is your highest valued intangible asset.
      • Planning and resourcing are central to getting started on MVP
        A governance plan and governance decisions are your initial focus. Create a team of stakeholders that include IT and business leaders (including Legal, Finance, HR, and Risk), and ensure there is a top-level leader who is the champion of the governance objective, which is to ensure your data is safe, secure, and not prone to leakage or theft, and maintain confidentiality where it is warranted.

      Executive Summary

      Your Challenge
      • Today, the amount of data companies are gathering is growing at an explosive rate. New tools are enabling unforeseen channels and ways of collaborating.
      • Combined with increased regulatory oversight and reporting obligations, this makes the discovery and management of data a massive undertaking. IT can’t find and protect the data when the business has difficulty defining its data.
      • The challenge is to build a framework that can easily categorize and classify data yet allows for sufficient regulatory compliance and granularity to be useful. Also, to do it now because tomorrow is too late.
      Common Obstacles

      Data governance has several obstacles that impact a successful launch, especially if governing M365 is not a planned strategy. Below are some of the more common obstacles:

      • Resources are the primary obstacle to starting O365 governance, whether it is funding or people.
      • Data is segmented and is difficult to analyze when you can’t see it or manage the relationships between sources.
      • Organizations expect results early and quickly and a common obstacle is that building a "proper data classification framework” is a 2+ year project and the business can't wait that long.
      Info-Tech’s Approach
      • Start with the basics: build a minimum-viable product (MVP) to get started on the path to sustainable governance.
      • Identify what and where your data resides, how much data you have, and understand what sensitive data needs to be protected.
      • Create your team of stakeholders, including Legal, records managers, and privacy officers. Remember, they own the data and should manage it.
      • Categorization comes before classification, and discovery comes before categorization. Use easy-to-understand terms like high, medium, or low risk.

      Info-Tech Insight

      Data classification is the lynchpin to any effective governance of O/M365 and your objective is to navigate through this easily and effectively and build a robust, secure, and viable governance model. Start your journey by identifying what and where your data is and how much data do you have. You need to understand what sensitive data you have and where it is stored before you can protect or govern it. Ensure there is a high-level leader who is the champion of the governance objectives. Data classification fulfills the governance objectives of risk mitigation, governance and compliance, efficiency and optimization, and analytics.

      Questions you need to ask

      Four key questions to kick off your MVP.

      1

      Know Your Data

      Do you know where your critical and sensitive data resides and what is being done with it?

      Trying to understand where your information is can be a significant project.

      2

      Protect Your Data

      Do you have control of your data as it traverses across the organization and externally to partners?

      You want to protect information wherever it goes through encryption, etc.

      3

      Prevent Data Loss

      Are you able to detect unsafe activities that prevent sharing of sensitive information?

      Data loss prevention (DLP) is the practice of detecting and preventing data breaches, exfiltration, or unwanted destruction of sensitive data.

      4

      Govern Your Data

      Are you using multiple solutions (or any) to classify, label, and protect sensitive data?

      Many organizations use more than one solution to protect and govern their data, making it difficult to determine if there are any coverage gaps.

      Classification tiers

      Build your schema.

      Pyramid visualization for classification tiers. The top represents 'Simplicity', and the bottom 'Complexity' with the length of the sides at each level representing the '# of policies' and '# of labels'. At the top level is 'MVP (Minimum-Viable Product) - Confidential, Internal (Subcategory: Personal), Public'. At the middle level is 'Regulated - Highly Confidential, Confidential, Sensitive, General, Internal, Restricted, Personal, Sub-Private, Public'. And a the bottom level is 'Government (DOD) - Top Secret (TS), Secret, Confidential, Restricted, Official, Unclassified, Clearance'

      Info-Tech Insight

      Deciding on how granular you go into data classification will chiefly be governed by what industry you are in and your regulatory obligations – the more highly regulated your industry, the more classification levels you will be mandated to enforce. The more complexity you introduce into your organization, the more operational overhead both in cost and resources you will have to endure and build.

      Microsoft MIP Topology

      Microsoft Information Protection (MIP), which is Microsoft’s Data Classification Services, is the key to achieving your governance goals. Without an MVP, data classification will be overwhelming; simplifying is the first step in achieving governance.

      A diagram of multiple offerings all connected to 'MIP Data Classification Service'. Circled is 'Sensitivity Labels' with an arrow pointing back to 'MIP' at the center.
      (Source: Microsoft, “Microsoft Purview compliance portal”)

      Info-Tech Insight

      Using least-complex sensitivity labels in your classification are your building blocks to compliance and security in your data management schema; they are your foundational steps.

      MVP RACI Chart

      Data governance is a "takes a whole village" kind of effort.

      Clarify who is expected to do what with a RACI chart.

      End User M365 Administrator Security/ Compliance Data Owner
      Define classification divisions R A
      Appy classification label to data – at point of creation A R
      Apply classification label to data – legacy items R A
      Map classification divisions to relevant policies R A
      Define governance objectives R A
      Backup R A
      Retention R A
      Establish minimum baseline A R

      What and where your data resides

      Data types that require classification.

      Logos for 'Microsoft', 'Office 365', and icons for each program included in that package.
      M365 Workload Containers
      Icon for MS Exchange. Icon for MS SharePoint.Icon for MS Teams. Icon for MS OneDrive. Icon for MS Project Online.
      Email
      • Attachments
      Site Collections, Sites Sites Project Databases
      Contacts Teams and Group Site Collections, Sites Libraries and Lists Sites
      Metadata Libraries and Lists Documents
      • Versions
      Libraries and Lists
      Teams Conversations Documents
      • Versions
      Metadata Documents
      • Versions
      Teams Chats Metadata Permissions
      • Internal Sharing
      • External Sharing
      Metadata
      Permissions
      • Internal Sharing
      • External Sharing
      Files Shared via Teams Chats Permissions
      • Internal Sharing
      • External Sharing

      Info-Tech Insight

      Knowing where your data resides will ensure you do not miss any applicable data that needs to be classified. These are examples of the workload containers; you may have others.

      Discover and classify on- premises files using AIP

      AIP helps you manage sensitive data prior to migrating to Office 365:
      • Use discover mode to identify and report on files containing sensitive data.
      • Use enforce mode to automatically classify, label, and protect files with sensitive data.
      Can be configured to scan:
      • SMB files
      • SharePoint Server 2016, 2013
      Stock image of a laptop uploading to the cloud with a padlock and key in front of it.
      • Map your network and find over-exposed file shares.
      • Protect files using MIP encryption.
      • Inspect the content in file repositories and discover sensitive information.
      • Classify and label file per MIP policy.
      Azure Information Protection scanner helps discover, classify, label, and protect sensitive information in on-premises file servers. You can run the scanner and get immediate insight into risks with on-premises data. Discover mode helps you identify and report on files containing sensitive data (Microsoft Inside Track and CIAOPS, 2022). Enforce mode automatically classifies, labels, and protects files with sensitive data.

      Info-Tech Insight

      Any asset deployed to the cloud must have approved data classification. Enforcing this policy is a must to control your data.

      Understanding governance

      Microsoft Information Governance

      Information Governance
      • Retention policies for workloads
      • Inactive and archive mailboxes

      Arrow pointing down-right

      Records Management
      • Retention labels for items
      • Disposition review

      Arrow pointing down-left

      Retention and Deletion

      ‹——— Connectors for Third-Party Data ———›

      Information governance manages your content lifecycle using solutions to import, store, and classify business-critical data so you can keep what you need and delete what you do not. Backup should not be used as a retention methodology since information governance is managed as a “living entity” and backup is a stored information block that is “suspended in time.” Records management uses intelligent classification to automate and simplify the retention schedule for regulatory, legal, and business-critical records in your organization. It is for that discrete set of content that needs to be immutable.
      (Source: Microsoft, “Microsoft Purview compliance portal”)

      Retention and backup policy decision

      Retention is not backup.

      Info-Tech Insight

      Retention is not backup. Retention means something different: “the content must be available for discovery and legal document production while being able to defend its provenance, chain of custody, and its deletion or destruction” (AvePoint Blog, 2021).

      Microsoft Responsibility (Microsoft Protection) Weeks to Months Customer Responsibility (DLP, Backup, Retention Policy) Months to Years
      Loss of service due to natural disaster or data center outage Loss of data due to departing employees or deactivated accounts
      Loss of service due to hardware or infrastructure failure Loss of data due to malicious insiders or hackers deleting content
      Short-term (30 days) user error with recycle bin/ version history (including OneDrive “File Restore”) Loss of data due to malware or ransomware
      Short-term (14 days) administrative error with soft- delete for groups, mailboxes, or service-led rollback Recovery from prolonged outages
      Long-term accidental deletion coverage with selective rollback

      Understand retention policy

      What are retention policies used for? Why you need them as part of your MVP?

      Do not confuse retention labels and policies with backup.

      Remember: “retention [policies are] auto-applied whereas retention label policies are only applied if the content is tagged with the associated retention label” (AvePoint Blog, 2021).

      E-discovery tool retention policies are not turned on automatically.

      Retention policies are not a backup tool – when you activate this feature you are unable to delete anyone.

      “Data retention policy tools enable a business to:

      • “Decide proactively whether to retain content, delete content, or retain and then delete the content when needed.
      • “Apply a policy to all content or just content meeting certain conditions, such as items with specific keywords or specific types of sensitive information.
      • “Apply a single policy to the entire organization or specific locations or users.
      • “Maintain discoverability of content for lawyers and auditors, while protecting it from change or access by other users. […] ‘Retention Policies’ are different than ‘Retention Label Policies’ – they do the same thing – but a retention policy is auto-applied, whereas retention label policies are only applied if the content is tagged with the associated retention label.

      “It is also important to remember that ‘Retention Label Policies’ do not move a copy of the content to the ‘Preservation Holds’ folder until the content under policy is changed next.” (Source: AvePoint Blog, 2021)

      Definitions

      Data classification is a focused term used in the fields of cybersecurity and information governance to describe the process of identifying, categorizing, and protecting content according to its sensitivity or impact level. In its most basic form, data classification is a means of protecting your data from unauthorized disclosure, alteration, or destruction based on how sensitive or impactful it is.

      Once data is classified, you can then create policies; sensitive data types, trainable classifiers, and sensitivity labels function as inputs to policies. Policies define behaviors, like if there will be a default label, if labeling is mandatory, what locations the label will be applied to, and under what conditions. A policy is created when you configure Microsoft 365 to publish or automatically apply sensitive information types, trainable classifiers, or labels.

      Sensitivity label policies show one or more labels to Office apps (like Outlook and Word), SharePoint sites, and Office 365 groups. Once published, users can apply the labels to protect their content.

      Data loss prevention (DLP) policies help identify and protect your organization's sensitive info (Microsoft Docs, April 2022). For example, you can set up policies to help make sure information in email and documents is not shared with the wrong people. DLP policies can use sensitive information types and retention labels to identify content containing information that might need protection.

      Retention policies and retention label policies help you keep what you want and get rid of what you do not. They also play a significant role in records management.

      Data examples for MVP classification

      • Examples of the type of data you consider to be Confidential, Internal, or Public.
      • This will help you determine what to classify and where it is.
      Internal Personal, Employment, and Job Performance Data
      • Social Security Number
      • Date of birth
      • Marital status
      • Job application data
      • Mailing address
      • Resume
      • Background checks
      • Interview notes
      • Employment contract
      • Pay rate
      • Bonuses
      • Benefits
      • Performance reviews
      • Disciplinary notes or warnings
      Confidential Information
      • Business and marketing plans
      • Company initiatives
      • Customer information and lists
      • Information relating to intellectual property
      • Invention or patent
      • Research data
      • Passwords and IT-related information
      • Information received from third parties
      • Company financial account information
      • Social Security Number
      • Payroll and personnel records
      • Health information
      • Self-restricted personal data
      • Credit card information
      Internal Data
      • Sales data
      • Website data
      • Customer information
      • Job application data
      • Financial data
      • Marketing data
      • Resource data
      Public Data
      • Press releases
      • Job descriptions
      • Marketing material intended for general public
      • Research publications

      New container sensitivity labels (MIP)

      New container sensitivity labels

      Public Private
      Privacy
      1. Membership to group is open; anyone can join
      2. “Everyone except external guest” ACL onsite; content available in search to all tenants
      1. Only owner can add members
      2. No access beyond the group membership until someone shares it or changes permissions
      Allowed Not Allowed
      External guest policy
      1. Membership to group is open; anyone can join
      2. “Everyone except external guest” ACL onsite; content available in search to all tenants
      1. Only owner can add members
      2. No access beyond the group membership until someone shares it or changes permissions

      What users will see when they create or label a Team/Group/Site

      Table of what users will see when they create or label a team/group/site highlighting 'External guest policy' and 'Privacy policy options' as referenced above.
      (Source: Microsoft, “Microsoft Purview compliance portal”)

      Info-Tech Insights

      Why you need sensitivity container labels:
      • Manage privacy of Teams Sites and M365 Groups
      • Manage external user access to SPO sites and teams
      • Manage external sharing from SPO sites
      • Manage access from unmanaged devices

      Data protection and security baselines

      Data Protection Baseline

      “Microsoft provides a default assessment in Compliance Manager for the Microsoft 365 data protection baseline" (Microsoft Docs, June 2022). This baseline assessment has a set of controls for key regulations and standards for data protection and general data governance. This baseline draws elements primarily from NIST CSF (National Institute of Standards and Technology Cybersecurity Framework) and ISO (International Organization for Standardization) as well as from FedRAMP (Federal Risk and Authorization Management Program) and GDPR (General Data Protection Regulation of the European Union).

      Security Baseline

      The final stage in M365 governance is security. You need to implement a governance policy that clearly defines storage locations for certain types of data and who has permission to access it. You need to record and track who accesses content and how they share it externally. “Part of your process should involve monitoring unusual external sharing to ensure staff only share documents that they are allowed to” (Rencore, 2021).

      Info-Tech Insights

      • Controls are already in place to set data protection policy. This assists in the MVP activities.
      • Finally, you need to set your security baseline to ensure proper permissions are in place.

      Prerequisite baseline

      Icon of crosshairs.
      Security

      MFA or SSO to access from anywhere, any device

      Banned password list

      BYOD sync with corporate network

      Icon of a group.
      Users

      Sign out inactive users automatically

      Enable guest users

      External sharing

      Block client forwarding rules

      Icon of a database.
      Resources

      Account lockout threshold

      OneDrive

      SharePoint

      Icon of gears.
      Controls

      Sensitivity labels, retention labels and policies, DLP

      Mobile application management policy

      Building baselines

      Sensitivity Profiles: Public, Internal, Confidential; Subcategory: Highly Confidential

      Microsoft 365 Collaboration Protection Profiles

      Sensitivity Public External Collaboration Internal Highly Confidential
      Description Data that is specifically prepared for public consumption Not approved for public consumption, but OK for external collaboration External collaboration highly discouraged and must be justified Data of the highest sensitivity: avoid oversharing, internal collaboration only
      Label details
      • No content marking
      • No encryption
      • Public site
      • External collaboration allowed
      • Unmanaged devices: allow full access
      • No content marking
      • No encryption
      • Private site
      • External collaboration allowed
      • Unmanaged devices: allow full access
      • Content marking
      • Encryption
      • Private site
      • External collaboration allowed but monitored
      • Unmanaged devices: limited web access
      • Content marking
      • Encryption
      • Private site
      • External collaboration disabled
      • Unmanaged devices: block access
      Teams or Site details Public Team or Site open discovery, guests are allowed Private Team or Site members are invited, guests are allowed Private Team or Site members are invited, guests are not allowed
      DLP None Warn Block

      Please Note: Global/Compliance Admins go to the 365 Groups platform, the compliance center (Purview), and Teams services (Source: Microsoft Documentation, “Microsoft Purview compliance documentation”)

      Info-Tech Insights

      • Building baseline profiles will be a part of your MVP. You will understand what type of information you are addressing and label it accordingly.
      • Sensitivity labels are a way to classify your organization's data in a way that specifies how sensitive the data is. This helps you decrease risks in sharing information that shouldn't be accessible to anyone outside your organization or department. Applying sensitivity labels allows you to protect all your data easily.

      MVP activities

      PRIMARY
      ACTIVITIES
      Define Your Governance
      The objective of the MVP is reducing barriers to establishing an initial governance position, and then enabling rapid progression of the solution to address a variety of tangible risks, including DLP, data retention, legal holds, and labeling.
      Decide on your classification labels early.

      CATEGORIZATION


      CLASSIFICATION

      MVP
      Data Discovery and Management
      AIP (Azure Information Protection) scanner helps discover, classify, label, and protect sensitive information in on-premises file servers. You can run the scanner and get immediate insight into risks with on-premises data.
      Baseline Setup
      Building baseline profiles will be a part of your MVP. You will understand what type of information you are addressing and label it accordingly. Microsoft provides a default assessment in Compliance Manager for the Microsoft 365 data protection baseline.
      Default M365 settings
      Microsoft provides a default assessment in Compliance Manager for the Microsoft 365 data protection baseline. This baseline assessment has a set of controls for key regulations and standards for data protection and general data governance.
      SUPPORT
      ACTIVITIES
      Retention Policy
      Retention policy is auto-applied. Decide whether to retain content, delete content, or retain and then delete the content.
      Sensitivity Labels
      Automatically enforce policies on groups through labels; classify groups.
      Workload Containers
      M365: SharePoint, Teams, OneDrive, and Exchange, where your data is stored for labels and policies.
      Unforced Policies
      Written policies that are not enforceable by controls in Compliance Manager such as acceptable use policy.
      Forced Policies
      Restrict sharing controls to outside organizations. Enforce prefix or suffix to group or team names.

      ACME Company MVP for M/O365

      PRIMARY
      ACTIVITIES
      Define Your Governance


      Focus on ability to use legal hold and GDPR compliance.

      CATEGORIZATION


      CLASSIFICATION

      MVP
      Data Discovery and Management


      Three classification levels (public, internal, confidential), which are applied by the user when data is created. Same three levels are used for AIP to scan legacy sources.

      Baseline Setup


      All data must at least be classified before it is uploaded to an M/O365 cloud service.

      Default M365 settings


      Turn on templates 1 8 the letter q and the number z

      SUPPORT
      ACTIVITIES
      Retention Policy


      Retention policy is auto-applied. Decide whether to retain content, delete content, or retain and then delete the content.

      Sensitivity Labels


      Automatically enforce policies on groups through labels; classify groups.

      Workload Containers


      M365: SharePoint, Teams, OneDrive, and Exchange, where your data is stored for labels and policies.

      Unforced Policies


      Written policies that are not enforceable by controls in Compliance Manager such as acceptable use policy.

      Forced Policies


      Restrict sharing controls to outside organizations. Enforce prefix or suffix to group or team names.

      Related Blueprints

      Govern Office 365

      Office 365 is as difficult to wrangle as it is valuable. Leverage best practices to produce governance outcomes aligned with your goals.

      Map your organizational goals to the administration features available in the Office 365 console. Your governance should reflect your requirements.

      Migrate to Office 365 Now

      Jumping into an Office 365 migration project without careful thought of the risks of a cloud migration will lead to project halt and interruption. Intentionally plan in order to expose risk and to develop project foresight for a smooth migration.

      Microsoft Teams Cookbook

      Remote work calls for leveraging your Office 365 license to use Microsoft Teams – but IT is unsure about best practices for governance and permissions. Moreover, IT has few resources to help train end users with Teams best practices

      IT Governance, Risk & Compliance

      Several blueprints are available on a broader topic of governance, from Make Your IT Governance Adaptable to Improve IT Governance to Drive Business Results and Build an IT Risk Management Program.

      Bibliography

      “Best practices for sharing files and folders with unauthenticated users.” Microsoft Build, 28 April 2022. Accessed 2 April 2022.

      “Build and manage assessments in Compliance Manager.” Microsoft Docs, 15 June 2022. Web.

      “Building a modern workplace with Microsoft 365.” Microsoft Inside Track, n.d. Web.

      Crane, Robert. “June 2020 Microsoft 365 Need to Know Webinar.” CIAOPS, SlideShare, 26 June 2020. Web.

      “Data Classification: Overview, Types, and Examples.” Simplilearn, 27 Dec. 2021. Accessed 11 April 2022.

      “Data loss prevention in Exchange Online.” Microsoft Docs, 19 April 2022. Web.

      Davies, Nahla. “5 Common Data Governance Challenges (and How to Overcome Them).” Dataversity. 25 October 2021. Accessed 5 April 2022.

      “Default labels and policies to protect your data.” Microsoft Build, April 2022. Accessed 3 April 2022.

      M., Peter. "Guide: The difference between Microsoft Backup and Retention." AvePoint Blog, 9 Oct. 2021. Accessed 4 April 2022.

      Meyer, Guillaume. “Sensitivity Labels: What They Are, Why You Need Them, and How to Apply Them.” nBold, 6 October 2021. Accessed 2 April 2022.

      “Microsoft 365 guidance for security & compliance.” Microsoft, 27 April 2022. Accessed 28 April 2022.

      “Microsoft Purview compliance portal.” Microsoft, 19 April 2022. Accessed 22 April 2022.

      “Microsoft Purview compliance documentation.” Microsoft, n.d. Accessed 22 April 2022.

      “Microsoft Trust Center: Products and services that run on trust.” Microsoft, 2022. Accessed 3 April 2022.

      “Protect your sensitive data with Microsoft Purview.” Microsoft Build, April 2022. Accessed 3 April 2022.

      Zimmergren, Tobias. “4 steps to successful cloud governance in Office 365.” Rencore, 9 Sept. 2021. Accessed 5 April 2022.

      Develop a COVID-19 Pandemic Response Plan

      • Buy Link or Shortcode: {j2store}420|cart{/j2store}
      • member rating overall impact (scale of 10): N/A
      • member rating average dollars saved: N/A
      • member rating average days saved: N/A
      • Parent Category Name: DR and Business Continuity
      • Parent Category Link: /business-continuity
      • IT departments are being asked to rapidly ramp up work-from-home capabilities and other business process workarounds.
      • Crisis managers are experiencing a pandemic more severe than what they’ve managed in the past.
      • Organizations are scrambling to determine how they can keep their businesses running through this pandemic.

      Our Advice

      Critical Insight

      • Obstacles to working from home go beyond internet speed and needing a laptop. Business input is critical to uncover unexpected obstacles.
      • IT needs to address a range of issues from security risk to increased service desk demand from users who don’t normally work from home.
      • Resist the temptation to bypass IT processes – your future-self will thank you for tracking all those assets about to go out the door.

      Impact and Result

      • Start with crisis management fundamentals – identify crisis management roles and exercise appropriate crisis communication.
      • Prioritize business processes and work-from-home requirements. Not everyone can be set up on day one.
      • Don’t over-complicate your work-from-home deployment plan. A simple spreadsheet (see the Work-from-Home Requirements Tool) to track requirements can be very effective.

      Develop a COVID-19 Pandemic Response Plan Research & Tools

      Start here

      Stay up to date on COVID-19 and the resources available to you.

      Besides the small introduction, subscribers and consulting clients within this management domain have access to:

      • Develop a COVID-19 Pandemic Response Plan Storyboard

      1. Manage the pandemic crisis

      Identify key roles and immediate steps to manage this crisis.

      • Pandemic Response Plan Example

      2. Create IT’s plan to support the pandemic response plan

      Plan the deployment of a work-from-home initiative.

      • Work-From-Home Requirements Tool
      [infographic]

      Into the Metaverse

      • Buy Link or Shortcode: {j2store}95|cart{/j2store}
      • member rating overall impact (scale of 10): N/A
      • member rating average dollars saved: N/A
      • member rating average days saved: N/A
      • Parent Category Name: Innovation
      • Parent Category Link: /innovation
      • Define the metaverse.
      • Understand where Meta and Microsoft are going and what their metaverse looks like today.
      • Learn about other solution providers implementing the enterprise metaverse.
      • Identify risks in deploying metaverse solutions and how to mitigate them.

      Our Advice

      Critical Insight

      • A metaverse experience must combine the three Ps: user presence is represented, the world is persistent, and data is portable.

      Impact and Result

      • Understand how Meta and Microsoft define the Metaverse and the coming challenges that enterprises will need to solve to harness this new digital capability.

      Into the Metaverse Research & Tools

      Besides the small introduction, subscribers and consulting clients within this management domain have access to:

      1. Into the Metaverse – A deck that examines how IT can prepare for the new digital world

      Push past the hype and understand what the metaverse really means for IT.

      • Into the Metaverse Storyboard

      Infographic

      Further reading

      Into the Metaverse

      How IT can prepare for the new digital world.

      Analyst Perspective

      The metaverse is still a vision of the future.

      Photo of Brian Jackson, Research Director, CIO, Info-Tech Research Group.

      On October 28, 2021, Mark Zuckerberg got up on stage and announced Facebook's rebranding to Meta and its intent to build out a new business line around the metaverse concept. Just a few days later, Microsoft's CEO Satya Nadella put forward his own idea of the metaverse at Microsoft Ignite. Seeing two of Silicon Valley's most influential companies pitch a vision of avatar-driven virtual reality collaboration sparked our collective curiosity. At the heart of it lies the question, "What is the metaverse, anyway?“

      If you strip back the narrative of the companies selling you the solutions, the metaverse can be viewed as technological convergence. Years of development on mixed reality, AI, immersive digital environments, and real-time communication are culminating in a totally new user experience. The metaverse makes the digital as real as the physical. At least, that's the vision.

      It will be years yet before the metaverse visions pitched to us from Silicon Valley stages are realized. In the meantime, understanding the individual technologies contributing to that vision can help CIOs realize business value today. Join me as we delve into the metaverse.

      Brian Jackson
      Research Director, CIO
      Info-Tech Research Group

      From pop culture to Silicon Valley

      Sci-fi visionaries are directly involved in creating the metaverse concept

      The term “metaverse” was coined by author Neal Stephenson in the 1992 novel “Snow Crash.” In the novel, main character Hiro Protagonist interacts with others in a digitally defined space. Twenty-five years after its release, the cult classic is influential among Silicon Valley's elite. Stephenson has played some key roles in Silicon Valley firms. He became the first employee at Blue Origin, the space venture founded by Jeff Bezos, in 2006, and later became chief futurist at augmented reality firm Magic Leap in 2014. Stephenson also popularized the Hindu concept "avatar" in his writing, paving the way for people to embody digitally rendered models to participate in the metaverse (Vanity Fair, 2017).

      Even earlier concepts of the metaverse were examined in the 1980s, with William Gibson’s “Neuromancer” exploring the same idea as cyberspace. Gibson's novel was influenced by his time in Seattle, where friend and Microsoft executive Eileen Gunn took him to hacker bars where he'd eavesdrop on "the poetics of the technological subculture" (Medium, 2022). Other visions of a virtual reality mecca were brought to life in the movies, including the 1982 Disney release “Tron,” the 1999 flick “The Matrix,” and 2018’s “Ready Player One.”

      There's a common set of traits among these sci-fi narratives that help us understand what Silicon Valley tech firms are now set to commercialize: users interact with one another in a digitally rendered virtual world, with a sense of presence provided through the use of a head-mounted display.

      Cover of the book Snow Crash by Neal Stephenson.

      Image courtesy nealstephenson.com

      Meta’s view of the metaverse

      CEO Mark Zuckerberg rebranded Facebook to make his intent clear

      Mark Zuckerberg is all in on the metaverse, announcing October 28, 2021, that Facebook would be rebranded to Meta. The new brand took effect on December 1, and Facebook began trading under the new stock ticker MVRS on certain exchanges. On February 15, 2022, Zuckerberg announced at a company meeting that his employees will be known as Metamates. The company's new values are to live in the future, build awesome things, and focus on long-term impact. Its motto is simply "Meta, Metamates, me" (“Out With the Facebookers. In With the Metamates,” The New York Times, 2022).

      Meta's Reality Labs division will be responsible for developing its metaverse product, using Meta Quest, its virtual reality head-mounted displays. Meta's early metaverse environment, Horizon Worlds, rolled out to Quest users in the US and Canada in early December 2021. This drove a growth in its monthly user base by ten times, to 300,000 people. The product includes Horizon Venues, tailored to attending live events in VR, but not Horizon Workrooms, a VR conferencing experience that remains invite-only. Horizon Worlds provides users tools to construct their own 3D digital environments and had been used to create 10,000 separate worlds by mid-February 2022 (“Meta’s Social VR Platform Horizon Hits 300,000 Users,“ The Verge, 2022).

      In the future, Meta plans to amplify the building tools in its metaverse platform with generative AI. For example, users can give speech commands to create scenes and objects in VR. Project CAIRaoke brings a voice assistant to an augmented reality headset that can help users complete tasks like cooking a stew. Zuckerberg also announced Meta is working on a universal speech translator across all languages (Reuters, 2022).

      Investment in the metaverse:
      $10 billion in 2021

      Key People:
      CEO Mark Zuckerberg
      CTO Andrew Bosworth
      Chief Product Officer Chris Cox

      (Source: “Meta Spent $10 Billion on the Metaverse in 2021, Dragging Down Profit,” The New York Times, 2022)

      Microsoft’s view of the metaverse

      CEO Satya Nadella showcased a mixed reality metaverse at Microsoft Ignite

      In March 2021 Microsoft announced Mesh, an application that allows organizations to build out a metaverse environment. Mesh is being integrated into other Microsoft hardware and software, including its head-mounted display, the HoloLens, a mixed reality device. The Mesh for HoloLens experience allows users to collaborate around digital content projected into the real world. In November, Microsoft announced a Mesh integration with Microsoft Teams. This integration brings users into an immersive experience in a fully virtual world. This VR environment makes use of AltspaceVR, a VR application Microsoft first released in May 2015 (Microsoft Innovation Stories, 2021).

      Last Fall, Microsoft also announced it is rebranding its Dynamics 365 Connected Store solution to Dynamics 365 Connected Spaces, signaling its expansion from retail to all spaces. The solution uses cognitive vision to create a digital twin of an organization’s physical space and generate analytics about people’s behavior (Microsoft Dynamics 365 Blog, 2021).

      In the future, Microsoft wants to make "holoportation" a part of its metaverse experience. Under development at Microsoft Research, the technology captures people and things in photorealistic 3D to be projected into mixed reality environments (Microsoft Research, 2022). It also has plans to offer developers AI-powered tools for avatars, session management, spatial rendering, and synchronization across multiple users. Open standards will allow Mesh to be accessed across a range of devices, from AR and VR headsets, smartphones, tablets, and PCs.

      Microsoft has been developing multi-user experiences in immersive 3D environments though its video game division for more than two decades. Its capabilities here will help advance its efforts to create metaverse environments for the enterprise.

      Investment in the metaverse:
      In January 2022, Microsoft agreed to acquire Activision Blizzard for $68.7 billion. In addition to acquiring several major gaming studios for its own gaming platforms, Microsoft said the acquisition will play a key role in the development of its metaverse.

      Key People:
      CEO Satya Nadella
      CEO of Microsoft Gaming Phil Spencer
      Microsoft Technical Research Fellow Alex Kipman

      Current state of metaverse applications from Meta and Microsoft

      Meta

      • Horizon Worlds (formerly Facebook Horizon). Requires an Oculus Rift S or Quest 2 headset to engage in an immersive 3D world complete with no-code building tools for users to construct their own environments. Users can either interact in the space designed by Meta or travel to other user-designed worlds through the plaza.
      • Horizon Workrooms (beta, invite only). An offshoot of Horizon Worlds but more tailored for business collaboration. Users can bring in their physical desks and keyboards and connect to PC screens from within the virtual setting. Integrates with Facebook’s Workplace solution.

      Microsoft

      • Dynamics 365 Connected Spaces (preview). Cognitive vision combined with surveillance cameras provide analytics on people's movement through a facility.
      • Mesh for Microsoft Teams (not released). Collaborate with your colleagues in a virtual reality space using personalized avatars. Use new 2D and 3D meeting experiences.
      • Mesh App for HoloLens (preview). Interact with colleagues virtually in a persistent digital environment that is overlaid on top of the real world.
      • AltspaceVR. A VR space accessible via headset or desktop computer that's been available since 2015. Interact through use of an avatar to participate in daily events

      Current providers of an “enterprise metaverse”

      Other providers designing mixed reality or digital twin tools may not have used the “metaverse” label but provide the same capabilities via platforms

      Logo for NVIDIA Omniverse. Logo for TeamViewer.
      NVIDIA Omniverse
      “The metaverse for engineers,” Omniverse is a developer toolset to allow organizations to build out their own unique metaverse visions.
      • Omniverse Nucleus is the platform database that allows clients to publish digital assets or subscribe to receive changes to them in real-time.
      • Omniverse Connectors are used to connect to Nucleus and publish or subscribe to individual assets and entire worlds.
      • NVIDIA’s core physics engine provides a scalable and physically accurate world simulation.
      TeamViewer’s Remote as a Service Platform
      Initially focusing on providing workers remote connectivity to work desktops, devices, and robotics, TeamViewer offers a range of software as a service products. Recent acquisitions to this platform see it connecting enterprise workflows to frontline workers using mixed reality headsets and adding more 3D visualization development tools to create digital twins. Clients include Coca-Cola and BMW.

      “The metaverse matters in the future. TeamViewer is already making the metaverse tangible in terms of the value that it brings.” (Dr. Hendrik Witt, Chief Product Officer, TeamViewer)

      The metaverse is a technological convergence

      The metaverse is a platform combining multiple technologies to enable social and economic activity in a digital world that is connected to the physical world.

      A Venn diagram with four circles intersecting and one circle unconnected on the side, 'Blockchain, Emerging'. The four circles, clock-wise from top, are 'Artificial Intelligence', 'Real-Time Communication', 'Immersive Digital Space', and 'Mixed Reality'. The two-circle crossover sections, clock-wise from top-right are AI + RTC: 'Smart Agent-Facilitated Communication', RTC + IDS: 'Avatar-Based Social Interaction', IDS + MR: 'Digital Immersive UX', and MR + AI: 'Perception AI'. There are only two three-circle crossover sections labelled, AI + RTC + MR: 'Generative Sensory Environments' and RTC + IDS + MR: 'Presence'. The main cross-section is 'METAVERSE'.

      Info-Tech Insight

      A metaverse experience must combine the three P’s: user presence is represented, the world is persistent, and data is portable.

      Mixed reality provides the user experience (UX) for the metaverse

      Both virtual and augmented reality will be part of the picture

      Mixed reality encompasses both virtual reality and augmented reality. Both involve allowing users to immerse themselves in digital content using a head-mounted device or with a smartphone for a less immersive effect. Virtual reality is a completely digital world that is constructed as separate from the physical world. VR headsets take up a user's entire field of vision and must also have a mechanism to allow the user to interact in their virtual environment. Augmented reality is a digital overlay mapped on top of the real world. These headsets are transparent, allowing the user to clearly see their real environment, and projects digital content on top of it. These headsets must have a way to map the surrounding environment in 3D in order to project digital content in the right place and at the right scale.

      Meta’s Plans

      Meta acquired virtual reality developer Oculus VR Inc. and its set of head-mounted displays in 2014. It continues to develop new hardware under the Oculus brand, most recently releasing the Oculus Quest 2. Oculus Quest hardware is required to access Meta's early metaverse platform, Horizon Worlds.

      Microsoft’s Plans

      Microsoft's HoloLens hardware is a mixed reality headset. Its visor that can project digital content into the main portion of the user's field of vision and speakers capable of spatial audio. The HoloLens has been deployed at enterprises around the world, particularly in scenarios where workers typically have their hands busy. For example, it can be used to view digital schematics of a machine while a worker is performing maintenance or to allow a remote expert to "see through the eyes" of a worker.

      Microsoft's Mesh metaverse platform, which allows for remote collaboration around digital content, was demonstrated on a HoloLens at Microsoft Ignite in November 2021. Mesh is also being integrated into AltspaceVR, an application that allows companies to hold meetings in VR with “enterprise-grade security features including secure sign-ins, session management and privacy compliance" (Microsoft Innovation Stories, 2021).

      Immersive digital environments provide context in the metaverse

      The interactive environment will be a mix of digital and physical worlds

      If you've played a video game in the past decade, you've experienced an immersive 3D environment, perhaps even in a multiplayer environment with many other users at the same time. The video game industry grew quickly during the pandemic, with users spending more time and money on video games. Massive multiplayer online games like Fortnite provide more than a gaming environment. Users socialize with their friends and attend concerts featuring famous performers. They also spend money on different appearances or gestures to express themselves in the environment. When they are not playing the game, they are often watching other players stream their experience in the game. In many ways, the consumer metaverse already exists on platforms like Fortnite. At the same time, gaming developers are improving the engines for these experiences and getting closer to approximating the real world both visually and in terms of physics.

      In the enterprise space, immersive 3D environments are also becoming more popular. Manufacturing firms are building digital twins to represent entire factories, modeling their real physical environments in digital space. For example, BMW’s “factory of the future” uses NVIDIA Omniverse to create a digital twin of its assembly system, simulated down to the detail of digital workers. BMW uses this simulation to plan reconfiguration of its factory to accommodate new car models and to train robots with synthetic data (“NVIDIA Omniverse,” NVIDIA, 2021).

      Meta’s Plans

      Horizon Workrooms is Meta's business-focused application of Horizon Worlds. It facilitates a VR workspace where colleagues can interact with others’ avatars, access their computer, use videoconferencing, and sketch out ideas on a whiteboard. With the Oculus Quest 2 headset, passthrough mode allows users to add their physical desk to the virtual environment (Oculus, 2022).

      Microsoft’s Plans

      AltspaceVR is Microsoft's early metaverse environment and it can be accessed with Oculus, HTC Vive, Windows Mixed Reality, or in desktop mode. Separately, Microsoft Studios has been developing digital 3D environments for its Xbox video game platform for yeas. In January 2022, Microsoft acquired games studio Activision Blizzard for $68.7 billion, saying the games studio would play a key role in the development of the metaverse.

      Real-time communications allow for synchronous collaboration

      Project your voice to a room full of avatars for a presentation or whisper in someone’s ear

      If the metaverse is going to be a good place to collaborate, then communication must feel as natural as it does in the real world. At the same time, it will need to have a few more controls at the users’ disposal so they can focus in on the conversation they choose. Audio will be a major part of the communication experience, augmented by expressive avatars and text.

      Mixed reality headsets come with integrated microphones and speakers to enable voice communications. Spatial audio will also be an important component of voice exchange in the metaverse. When you are in a videoconference conversation with 50 participants, every one of those people will sound as though they are sitting right next to you. In the metaverse, each person will sound louder or quieter based on how distant their avatar is from you. This will allow large groups of people to get together in one digital space and have multiple conversations happening simultaneously. In some situations, there will also be a need for groups to form a “party” as they navigate the metaverse, meaning they would stay linked through a live audio connection even if their avatars were not in the same digital space. Augmented reality headsets also allow remote users to “see through the eyes” of the person wearing the headset through a front-facing camera. This is useful for hands-on tasks where expert guidance is required.

      People will also need to communicate with people not in the metaverse. More conventional videoconference windows or chat boxes will be imported into these environments as 2D panels, allowing users to integrate them into the context of their digital space.

      Meta’s Plans

      Facebook Messenger is a text chat and video chat application that is already integrated into Facebook’s platform. Facebook also owns WhatsApp, a messaging platform that offers group chat and encrypted messaging.

      Microsoft’s Plans

      Microsoft Teams is Microsoft’s application that combines presence-based text chat and videoconferencing between individuals and groups. Dynamics 365 Remote Assist is its augmented reality application designed for HoloLens wearers or mobile device users to share their real-time view with experts.

      Generative AI will fill the metaverse with content at the command of the user

      No-code and low-code creation tools will be taken to the next level in the metaverse

      Metaverse platforms provide users with no-code and low-code options to build out their own environments. So far this looks like playing a game of Minecraft. Users in the digital environment use native tools to place geometric shapes and add textures. Other metaverse platforms allow users to design models or textures with tools outside the platform, often even programming behaviors for the objects, and then import them into the metaverse. These tools can be used effectively, but it can be a tedious way to create a customized digital space.

      Generative AI will address that by taking direction from users and quickly generating content to provide the desired metaverse setting. Generative AI can create content that’s meaningful based on natural inputs like language or visual information. For example, a user might give voice commands to a smart assistant and have a metaverse environment created or take photos of a real-world object from different angles to have its likeness digitally imported.

      Synthetic data will also play a role in the metaverse. Instead of relying only on people to create a lot of relevant data to train AI, metaverse platform providers will also use simulated data to provide context. NVIDIA’s Omniverse Replicator engine provides this capability and can be used to train self-driving cars and manipulator robots for a factory environment (NVIDIA Newsroom, 2021).

      Meta’s Plans

      Meta is planning to use generative AI to allow users to construct their VR environments. It will allow users to describe a world to a voice assistant and have it created for them. Users could also speak to each other in different languages with the aid of a universal translator. Separately, Project CAIRaoke combines cognitive vision with a voice assistant to help a user cook dinner. It keeps track of where the ingredients are in the kitchen and guides the user through the steps (Reuters, 2022).

      Microsoft’s Plans

      Microsoft Mesh includes AI resources to help create natural interactions through speech and vision learning models. HoloLens 2 already uses AI models to track users’ hands and eye movements as well as map content onto the physical world. This will be reinforced in the cloud through Microsoft Azure’s AI capabilities (Microsoft Innovation Stories, 2021).

      Blockchain will provide a way to manage digital identity and assets across metaverse platforms

      Users will want a way to own their metaverse identity and valued digital possessions

      Blockchain technology provides a decentralized digital ledger that immutably records transactions. A specific blockchain can either be permissioned, with one central party determining who gets access, or permissionless, in which anyone with the means can transact on the blockchain. The permissionless variety emerged in 2008 as the foundation of Bitcoin. It's been a disruptive force in the financial industry, with Bitcoin inspiring a long list of offshoot cryptocurrencies, and now even central banks are examining moving to a digital currency standard.

      In the past couple of years, blockchain has spurred a new economy around digital assets. Smart contracts can be used to create a token on a blockchain and bind it to a specific digital asset. These assets are called non-fungible tokens (NFTs). Owners of NFTs can prove their chain of ownership and sell their tokens to others on a variety of marketplaces.

      Blockchain could be useful in the metaverse to track digital identity, manage digital assets, and enable data portability. Users could register their own avatars as NFTs to prove they are the real person behind their digital representation. They may also want a way to verify they own a virtual plot of land or demonstrate the scarcity of the digital clothing they are wearing in the metaverse. If users want to leave a certain metaverse platform, they could export their avatar and digital assets to a digital wallet and transfer them to another platform that supports the same standards.

      In the past, centralized platforms that create economies in a virtual world were able to create digital currencies and sell specific assets to users without the need for blockchain. Second Life is a good example, with Linden Labs providing a virtual token called Linden Dollars that users can exchange to buy goods and services from each other within the virtual world. Second Life processes 345 million transactions a year for virtual goods and reports a GDP of $650 million, which would put it ahead of some countries (VentureBeat, 2022). However, the value is trapped within Second Life and can't be exported elsewhere.

      Meta’s Plans

      Meta ended its Diem project in early 2022, winding down its plan to offer a digital currency pegged to US dollars. Assets were sold to Silvergate Bank for $182 million. On February 24, blockchain developer Atmos announced it wanted to bring the project back to life. Composed of many of the original developers that created Diem while it was still a Facebook project, the firm plans to raise funds based on the pitch that the new iteration will be "Libra without Facebook“ (CoinDesk, 2022).

      Microsoft’s Plans

      Microsoft expanded its team of blockchain developers after its lead executive in this area stated the firm is closely watching cryptocurrencies and NFTs. Blockchain Director York Rhodes tweeted on November 8, 2021, that he was expanding his team and was interested to connect with candidates "obsessed with Turing complete, scarce programmable objects that you can own & transfer & link to the real world through a social contract.”

      The enterprise metaverse holds implications for IT across several functional areas

      Improve maturity in these four areas first

      • Infrastructure & Operations
        • Lay the foundation
      • Security & Risk
        • Mitigate the risks
      • Apps
        • Deploy the precursors
      • Data & BI
        • Prepare to integrate
      Info-Tech and COBIT5's IT Management & Governance Framework with processes arranged like a periodic table. Highlighted process groups are 'Infrastructure & Operations', 'Security & Risk', 'Apps', and 'Data & BI'.

      Infrastructure & Operations

      Make space for the metaverse

      Risks

      • Network congestion: Connecting more devices that will be delivering highly graphical content will put new pressures on networks. Access points will have more connections to maintain and transit pathways more bandwidth to accommodate.
      • Device fragmentation: Currently many different vendors are selling augmented reality headsets used in the enterprise, including Google, Epson, Vuzix, and RealWear. More may enter soon, creating various types of endpoints that have different capabilities and different points of failure.
      • New workflows: Enterprises will only be able to benefit from deploying mixed reality devices if they're able to make them very useful to workers. Serving up relevant information in the context of a hands-free interface will become a new competency for enterprises to master.

      Mitigations

      • Dedicated network: Some companies are avoiding the congestion issue by creating a separate network for IoT devices on different infrastructure. For example, they might complement the Wi-Fi network with a wireless network on 5G or LoRaWAN standards.
      • Partner with systems integrators: Solutions vendors bringing metaverse solutions to the enterprise are already working with systems integrator partners to overcome integration barriers. These vendors are solving the problems of delivering enterprise content to a variety of new mixed reality touchpoints and determining just the right information to expose to users, at the right time.

      Security & Risk

      Mitigate metaverse risks before they take root

      Risks

      • Broader attack surface: Adding new mixed reality devices to the enterprise network will create more potential points of ingress for a cyberattack. Previous enterprise experiences with IoT in the enterprise have seen them exploited as weak points and used to create botnets or further infiltrate company networks.
      • More data in transit: Enterprise data will be flowing between these new devices and sometimes outside the company firewall to remote connections. Data from industrial IoT could also be integrated into these solutions and exposed.
      • New fraud opportunities: When Web 1.0 was first rolling out, not every company was able to secure the rights to the URL address matching its brand. Those not quick enough on the draw saw "domain squatters" use their brand equity to negotiate for a big pay day or, worse yet, to commit fraud. With blockchain opening up similar new digital real estate in Web3, the same risk arises.

      Mitigations

      • Mobile device management (MDM): New mixed reality headsets can be secured using existing MDM solutions on the market.
      • Encryption: Encrypting data end to end as it flows between IoT devices ensures that even if it does leak, it's not likely to be useful to a hacker.
      • Stake your claim: Claiming your brand's name in new Web3 domains may seems tedious, but it is likely to be cheap and might save you a headache down the line.

      Apps

      Deploy to your existing touchpoints

      Risks

      • Learning curves: Using new metaverse applications to complete tasks and collaborate with colleagues won’t be a natural progression for everyone. New headsets, gesture-based controls, and learning how to navigate the metaverse will present hurdles for users to overcome before they can be productive.
      • Is there a dress code in the metaverse? Avatars in the metaverse won’t necessarily look like the people behind the controls. What new norms will be needed to ensure avatars are appropriate for a work setting?
      • Fragmentation: Metaverse experiences are already creating islands. Users of Horizon Worlds can’t connect with colleagues using AltspaceVR. Similar to the challenges around different videoconferencing software, users could find they are divided by applications.

      Mitigations

      • Introduce concepts over time: Ask users to experiment with meeting in a VR context in a small group before expanding to a companywide conference event. Or have them use a headset for a simple video chat before they use it to complete a task in the field.
      • Administrative controls: Ensure that employees have some boundaries when designing their avatars, enforced either through controls placed on the software or through policies from HR.
      • Explore but don’t commit: It’s early days for these metaverse applications. Explore opportunities that become available through free trials and new releases to existing software suites but maintain flexibility to pivot should the need arise.

      Data & BI

      Deploy to your existing touchpoints

      Risks

      • Interoperability: There is no established standard for digital objects or behaviors in the metaverse. Meta and Microsoft say they are committed to open standards that will ensure portability of data across platforms, but how that will be executed isn’t clear yet.
      • Privacy: Sending data to another platform carries risks that it will be exfiltrated and stored elsewhere, presenting some challenges for companies that need to be compliant with legislation such as GDPR.
      • High-fidelity models: 3D models with photorealistic textures will come with high CPU requirements to render properly. Some head-mounted displays will run into limitations.

      Mitigations

      • Adopt standard interfaces: Using open APIs will be the most common path to integrating enterprise systems to metaverse applications.
      • Maintain compliance: The current approach enterprises take to creating data lakes and presenting them to platforms will extend to the metaverse. Building good controls and anonymizing data that resides in these locations will enable firms to interact in new platforms and remain compliant.
      • Right-sized rendering: Providing enough data to a device to make it useful without overburdening the CPU will be an important consideration. For example, TeamViewer uses polygon reduction to display 3D models on lower-powered head-mounted displays.

      More Info-Tech research to explore

      CIO Priorities 2022
      Priorities to compete in the digital economy.

      Microsoft Teams Cookbook
      Recipes for best practices and use cases for Microsoft Teams.

      Run Better Meetings
      Hybrid, virtual, or in person – set meeting best practices that support your desired meeting norms.

      Double Your Organization’s Effectiveness With a Digital Twin
      Digital twin: A living, breathing reflection.

      Contributing experts

      Photo of Dr. Hendrik Witt, Chief Product Officer, TeamViewer

      Dr. Hendrik Witt
      Chief Product Officer,
      TeamViewer

      Photo of Kevin Tucker, Principal Research Director, Industry Practice, INFO-TECH RESEARCH GROUP

      Kevin Tucker
      Principal Research Director, Industry Practice,
      INFO-TECH RESEARCH GROUP

      Bibliography

      Cannavò, Alberto, and F. Lamberti. “How Blockchain, Virtual Reality and Augmented Reality Are Converging, and Why.” IEEE Consumer Electronics Magazine, vol. 10, no. 5, Sept. 2020, pp. 6-13. IEEE Xplore. Web.

      Culliford, Elizabeth. “Meta’s Zuckerberg Unveils AI Projects Aimed at Building Metaverse Future.” Reuters, 24 Feb. 2022. Web.

      Davies, Nahla. “Cybersecurity and the Metaverse: Pioneering Safely into a New Digital World.” GlobalSign Blog, 10 Dec. 2021. GlobalSign by GMO. Web.

      Doctorow, Cory. “Neuromancer Today.” Medium, 10 Feb. 2022. Web.

      Heath, Alex. “Meta’s Social VR Platform Horizon Hits 300,000 Users.” The Verge, 17 Feb. 2022. Web.

      “Holoportation™.” Microsoft Research, 22 Feb. 2022. Microsoft. Accessed 3 March 2022.

      Isaac, Mike. “Meta Spent $10 Billion on the Metaverse in 2021, Dragging down Profit.” The New York Times, 2 Feb. 2022. Web.

      Isaac, Mike, and Sheera Frenkel. “Out With the Facebookers. In With the Metamates.” The New York Times, 15 Feb. 2022. Web.

      Langston, Jennifer. “‘You Can Actually Feel like You’re in the Same Place’: Microsoft Mesh Powers Shared Experiences in Mixed Reality.” Microsoft Innovation Stories, 2 Mar. 2021. Microsoft. Web.

      “Maple Leaf Sports & Entertainment and AWS Team Up to Transform Experiences for Canadian Sports Fans.” Amazon Press Center, 23 Feb. 2022. Amazon.com. Accessed 24 Feb. 2022. Web.

      Marquez, Reynaldo. “How Microsoft Will Move To The Web 3.0, Blockchain Division To Expand.” Bitcoinist.com, 8 Nov. 2021. Web.

      Metinko, Chris. “Securing The Metaverse—What’s Needed For The Next Chapter Of The Internet.” Crunchbase News, 6 Dec. 2021. Web.

      Metz, Rachel Metz. “Why You Can’t Have Legs in Virtual Reality (Yet).” CNN, 15 Feb. 2022. Accessed 16 Feb. 2022.

      “Microsoft to Acquire Activision Blizzard to Bring the Joy and Community of Gaming to Everyone, across Every Device.” Microsoft News Center, 18 Jan. 2022. Microsoft. Web.

      Nath, Ojasvi. “Big Tech Is Betting Big on Metaverse: Should Enterprises Follow Suit?” Toolbox, 15 Feb. 2022. Accessed 24 Feb. 2022.

      “NVIDIA Announces Omniverse Replicator Synthetic-Data-Generation Engine for Training AIs.” NVIDIA Newsroom, 9 Nov. 2021. NVIDIA. Accessed 9 Mar. 2022.

      “NVIDIA Omniverse - Designing, Optimizing and Operating the Factory of the Future. 2021. YouTube, uploaded by NVIDIA, 13 April 2021. Web.

      Peters, Jay. “Disney Has Appointed a Leader for Its Metaverse Strategy.” The Verge, 15 Feb. 2022. Web.

      Robinson, Joanna. The Sci-Fi Guru Who Predicted Google Earth Explains Silicon Valley’s Latest Obsession.” Vanity Fair, 23 June 2017. Accessed 13 Feb. 2022.

      Scoble, Robert. “New Startup Mixes Reality with Computer Vision and Sets the Stage for an Entire Industry.” Scobleizer, 17 Feb. 2022. Web.

      Seward, Zack. “Ex-Meta Coders Raising $200M to Bring Diem Blockchain to Life: Sources.” CoinDesk, 24 Feb. 2022. Web.

      Shrestha, Rakesh, et al. “A New Type of Blockchain for Secure Message Exchange in VANET.” Digital Communications and Networks, vol. 6, no. 2, May 2020, pp. 177-186. ScienceDirect. Web.

      Sood, Vishal. “Gain a New Perspective with Dynamics 365 Connected Spaces.” Microsoft Dynamics 365 Blog, 2 Nov. 2021. Microsoft. Web.

      Takahashi, Dean. “Philip Rosedale’s High Fidelity Cuts Deal with Second Life Maker Linden Lab.” VentureBeat, 13 Jan. 2022 Web.

      “TeamViewer Capital Markets Day 2021.” TeamViewer, 10 Nov. 2021. Accessed 22 Feb. 2022.

      VR for Work. Oculus.com. Accessed 1 Mar. 2022.

      Wunderman Thompson Intelligence. “New Trend Report: Into the Metaverse.” Wunderman Thompson, 14 Sept. 2021. Accessed 16 Feb. 2022.

      Execute an Emergency Remote Work Plan

      • Buy Link or Shortcode: {j2store}421|cart{/j2store}
      • member rating overall impact (scale of 10): N/A
      • member rating average dollars saved: N/A
      • member rating average days saved: N/A
      • Parent Category Name: DR and Business Continuity
      • Parent Category Link: /business-continuity
      • Many organizations do not have developed plans for how to turn on-premises employees into remote workers in an emergency.
      • In an emergency situation, such as a pandemic, sending employees home to work remotely without time to prepare presents daunting challenges, such as trying to comprehend and prioritize the myriad of tasks that need accomplishing for human resources, the business, and IT in a VUCA (volatile, uncertain, complex, and ambiguous) world.
      • Security issues may arise from employees not used to working remotely. Indeed, employees sent home to work remotely in an emergency may not have been eligible otherwise. This creates security risks, including the proliferation of shadow IT.

      Our Advice

      Critical Insight

      • The emergency will restructure the business: make sure it’s done right. While your organization may need quick fixes for day one of an emergency remote work plan, these are not viable long-term solutions. The emergency will vividly reinforce to the business side that more resources need to be directed to IT to enable strong business continuity and employee safety. Make sure the right plan is put in place during the crucial first weeks. The next emergency is just around the corner.
      • Prioritize key business processes. Before getting into the details of a work from home policy, identify which crucial business processes need to continue for the company to survive. Build the remote work policy around supporting those workflows.
      • Where the “carrot” is not possible, emergencies may require the “stick.” To ensure secure endpoints and prevent proliferation of shadow IT, you may need to enforce certain rules through policy. However, disenfranchising employees is not a long-term solution: once the emergency subsides, use this basis to explore end-user requirements properly and ensure employee-driven adoption plans. Where possible, for this latter scenario, always use the carrot.

      Impact and Result

      • A prioritized plan for IT processes through Info-Tech’s cascading responsibility checklists for emergency remote work.
      • A codified emergency remote work policy document to better prepare for future emergencies.

      Execute an Emergency Remote Work Plan Research & Tools

      Start here

      Read our concise Executive Brief for why you need prioritized emergency remote work checklists and an accompanying policy document and review Info-Tech’s methodology.

      Besides the small introduction, subscribers and consulting clients within this management domain have access to:

      • Execute an Emergency Remote Work Plan Storyboard

      1. Day one preparations

      Prioritize key action items on day one of sending your employees home to remotely work during an emergency.

      • Emergency Remote Work Plan Checklists
      • Home Office Survey
      • Checklist for Securing Remote Workers
      • None
      • Remote Access Policy
      • Equipment Loan Policy
      • None
      • Develop a Security Awareness and Training Program That Empowers End Users – Phases 1-2
      • Remote Work Assignment Log
      • Wiki Collection for Collaboration Tools
      • Pandemic Preparation: The People Playbook

      2. One-to-two weeks preparations

      Address key action items in the one-to-two weeks following an emergency that forced your employees to work remotely.

      • None

      3. Codify an emergency remote work policy

      Turn your emergency remote work checklists into policy.

      • Emergency Remote Work Policy
      • Execute an Emergency Remote Work Plan Executive Presentation
      [infographic]

      IT Asset Management (ITAM) Market Overview

      • Buy Link or Shortcode: {j2store}62|cart{/j2store}
      • member rating overall impact (scale of 10): 8.5/10 Overall Impact
      • member rating average dollars saved: $12,999 Average $ Saved
      • member rating average days saved: 24 Average Days Saved
      • Parent Category Name: Asset Management
      • Parent Category Link: /asset-management
      • Data management is challenging at the best of times but managing assets that change on a daily basis are difficult without automation and a good asset tool.
      • For organizations moving beyond basic hardware inventory, knowing what to look for to prepare for future processes seems impossible.
      • Using price as the leading criteria or just as an add-on to your ITSM solution may frustrate your efforts, especially if managing complex licensing is part of your mandate.

      Our Advice

      Critical Insight

      • If the purchase is happening independent of process design or review, it’s easy to end up with a solution that doesn’t fit your environment.
      • The complexity of your environment should be a significant factor in choosing an IT asset management solution.
      • Imagining the possibilities and understanding the differences between IT asset tools will drive you to the right solution for long term gain in managing dynamic assets.

      Impact and Result

      • Regardless of whether your IT environment is on-premises, in the cloud, or a complex hybrid of the two, knowing where your asset funds are allocated is key to right-sizing costs and reducing risks of non-compliance or lost assets.
      • Choosing the right tools for the job will be key to your success.

      IT Asset Management (ITAM) Market Overview Research & Tools

      Start here: Read the Market Overview

      Read the Market Overview to understand what features and capabilities are available in ITAM tools. The right features match is key to making a data heavy and challenging process easier for your team.

      Besides the small introduction, subscribers and consulting clients within this management domain have access to:

      • IT Asset Management Market Overview

      1. Prepare your project plan and selection process

      Use the Info-Tech templates to identify and document your requirements, plan your project, and prepare to engage with vendors.

      • ITAM Project Charter Template
      • ITAM Demonstration Script Template
      • Proof of Concept Template
      • ITAM Vendor Evaluation Workbook
      [infographic]

      Adopt Design Thinking in Your Organization

      • Buy Link or Shortcode: {j2store}327|cart{/j2store}
      • member rating overall impact (scale of 10): 9.6/10 Overall Impact
      • member rating average dollars saved: $23,245 Average $ Saved
      • member rating average days saved: 13 Average Days Saved
      • Parent Category Name: Innovation
      • Parent Category Link: /innovation
      • End users often have a disjointed experience while interacting with your organization in using its products and services.
      • You have been asked by your senior leadership to start a new or revive an existing design or innovation function within your organization. However, your organization has dismissed design thinking as the latest “management fad” and does not buy into the depth and rigor that design thinking brings.
      • The design or innovation function lives on the fringes of your organization due to its apathy towards design thinking or tumultuous internal politics.
      • You, as a CIO, want to improve the user satisfaction with the IT services your team provides to both internal and external users.

      Our Advice

      Critical Insight

      • A user’s perspective while interacting with the products and services is very different from the organization’s internal perspective while implementing and provisioning those. A design-based organization balances the two perspectives to drive user-satisfaction over end-to-end journeys.
      • Top management must have a design thinker – the guardian angel of the balance between exploration (i.e. discovering new business models) and exploitation (i.e. leveraging existing business models).
      • Your approach to adopt design thinking must consider your organization’s specific goals and culture. There’s no one-size-fits-all approach.

      Impact and Result

      • User satisfaction, with the end-to-end journeys orchestrated by your organization, will significantly increase.
      • Design-centric organizations enjoy disproportionate financial rewards.

      Adopt Design Thinking in Your Organization Research & Tools

      Start here – read the Executive Brief

      Read our concise Executive Brief to find out why you should adopt design thinking in your organization, review Info-Tech’s methodology, and understand the four ways we can support you in completing this project.

      Besides the small introduction, subscribers and consulting clients within this management domain have access to:

      1. What is design thinking?

      The focus of this phase is on revealing what designers do during the activity of designing, and on building an understanding of the nature of design ability. We will formally examine the many definitions of design thinking from experts in this field. At the core of this phase are several case studies that illuminate the various aspects of design thinking.

      • Adopt Design Thinking in Your Organization – Phase 1: What Is Design Thinking?
      • Victor Scheinman's Experiment for Design

      2. How does an organization benefit from design thinking?

      This phase will illustrate the relevance of design in strategy formulation and in service-design. At the core of this phase are several case studies that illuminate these aspects of design thinking. We will also identify the trends impacting your organization and establish a baseline of user-experience with the journeys orchestrated by your organization.

      • Adopt Design Thinking in Your Organization – Phase 2: How Does an Organization Benefit From Design Thinking?
      • Trends Matrix (Sample)

      3. How do you build a design organization?

      The focus of this phase is to:

    • Measure the design-centricity of your organization and subsequently, identify the areas for improvement.
    • Define an approach for a design program that suites your organization’s specific goals and culture.
      • Adopt Design Thinking in Your Organization – Phase 3: How Do You Build a Design Organization?
      • Report on How Design-Centric Is Your Organization (Sample)
      • Approach for the Design Program (Sample)
      • Interview With David Dunne on Design Thinking
      • Interview With David Dunne on Design Thinking (mp3)
      [infographic]

      Workshop: Adopt Design Thinking in Your Organization

      Workshops offer an easy way to accelerate your project. If you are unable to do the project yourself, and a Guided Implementation isn't enough, we offer low-cost delivery of our project workshops. We take you through every phase of your project and ensure that you have a roadmap in place to complete your project successfully.

      1 What Is Design Thinking?

      The Purpose

      The focus of this module is on revealing what designers do during the activity of designing, and on building an understanding of the nature of design ability. We will also review the report on the design-centricity of your organization and subsequently, earmark the areas for improvement.

      Key Benefits Achieved

      An intimate understanding of the design thinking

      An assessment of design-centricity of your organization and identification of areas for improvement

      Activities

      1.1 Discuss case studies on how designers think and work

      1.2 Define design thinking

      1.3 Review report from Info-Tech’s diagnostic: How design-centric is your organization?

      1.4 Earmark areas for improvement to raise the design-centricity of your organization

      Outputs

      Report from Info-Tech’s diagnostic: ‘How design-centric is your organization?’ with identified areas for improvement.

      2 How Does an Organization Benefit From Design Thinking?

      The Purpose

      In this module, we will discuss the relevance of design in strategy formulation and service design. At the core of this module are several case studies that illuminate these aspects of design thinking. We will also identify the trends impacting your organization. We will establish a baseline of user experience with the journeys orchestrated by your organization.

      Key Benefits Achieved

      An in-depth understanding of the relevance of design in strategy formulation and service design

      An understanding of the trends that impact your organization

      A taxonomy of critical customer journeys and a baseline of customers’ satisfaction with those

      Activities

      2.1 Discuss relevance of design in strategy through case studies

      2.2 Articulate trends that impact your organization

      2.3 Discuss service design through case studies

      2.4 Identify critical customer journeys and baseline customers’ satisfaction with those

      2.5 Run a simulation of design in practice

      Outputs

      Trends that impact your organization.

      Taxonomy of critical customer journeys and a baseline of customers’ satisfaction with those.

      3 How to Build a Design Organization

      The Purpose

      The focus of this module is to define an approach for a design program that suits your organization’s specific goals and culture.

      Key Benefits Achieved

      An approach for the design program in your organization. This includes aspects of the design program such as its objectives and measures, its model (one of the five archetypes or a hybrid one), and its governance.

      Activities

      3.1 Identify objectives and key measures for your design thinking program

      3.2 Structure your program after reviewing five main archetypes of a design program

      3.3 Balance between incremental and disruptive innovation

      3.4 Review best practices of a design organization

      Outputs

      An approach for your design thinking program: objectives and key measures; structure of the program, etc.

      Ensure Cloud Security in IaaS, PaaS, and SaaS Environments

      • Buy Link or Shortcode: {j2store}386|cart{/j2store}
      • member rating overall impact (scale of 10): N/A
      • member rating average dollars saved: N/A
      • member rating average days saved: N/A
      • Parent Category Name: Secure Cloud & Network Architecture
      • Parent Category Link: /secure-cloud-network-architecture
      • Security remains a large impediment to realizing cloud benefits. Numerous concerns still exist around the ability for data privacy, confidentiality, and integrity to be maintained in a cloud environment.
      • Even if adoption is agreed upon, it becomes hard to evaluate vendors that have strong security offerings and even harder to utilize security controls that are internally deployed in the cloud environment.

      Our Advice

      Critical Insight

      • The cloud can be secure despite unique security threats.
      • Securing a cloud environment is a balancing act of who is responsible for meeting specific security requirements.
      • Most security challenges and concerns can be minimized through our structured process (CAGI) of selecting a trusted cloud security provider (CSP) partner.

      Impact and Result

      • The business is adopting a cloud environment and it must be secured, which includes:
        • Ensuring business data cannot be leaked or stolen.
        • Maintaining privacy of data and other information.
        • Securing the network connection points.
      • Determine your balancing act between yourself and your CSP; through contractual and configuration requirements, determine what security requirements your CSP can meet and cover the rest through internal deployment.
      • This blueprint and associated tools are scalable for all types of organizations within various industry sectors.

      Ensure Cloud Security in IaaS, PaaS, and SaaS Environments Research & Tools

      Start here – read the Executive Brief

      Read our concise Executive Brief to find out why you should prioritize security in the cloud, review Info-Tech’s methodology, and understand the ways we can support you in completing this project.

      Besides the small introduction, subscribers and consulting clients within this management domain have access to:

      1. Determine your cloud risk profile

      Determine your organization’s rationale for cloud adoption and what that means for your security obligations.

      • Ensure Cloud Security in IaaS, PaaS, and SaaS Environments – Phase 1: Determine Your Cloud Risk Profile
      • Secure Cloud Usage Policy

      2. Identify your cloud security requirements

      Use the Cloud Security CAGI Tool to perform four unique assessments that will be used to identify secure cloud vendors.

      • Ensure Cloud Security in IaaS, PaaS, and SaaS Environments – Phase 2: Identify Your Cloud Security Requirements
      • Cloud Security CAGI Tool

      3. Evaluate vendors from a security perspective

      Learn how to assess and communicate with cloud vendors with security in mind.

      • Ensure Cloud Security in IaaS, PaaS, and SaaS Environments – Phase 3: Evaluate Vendors From a Security Perspective
      • IaaS and PaaS Service Level Agreement Template
      • SaaS Service Level Agreement Template
      • Cloud Security Communication Deck

      4. Implement your secure cloud program

      Turn your security requirements into specific tasks and develop your implementation roadmap.

      • Ensure Cloud Security in IaaS, PaaS, and SaaS Environments – Phase 4: Implement Your Secure Cloud Program
      • Cloud Security Roadmap Tool

      5. Build a cloud security governance program

      Build the organizational structure of your cloud security governance program.

      • Ensure Cloud Security in IaaS, PaaS, and SaaS Environments – Phase 5: Build a Cloud Security Governance Program
      • Cloud Security Governance Program Template
      [infographic]

      Effectively Manage CxO Relations

      • Buy Link or Shortcode: {j2store}384|cart{/j2store}
      • member rating overall impact (scale of 10): N/A
      • member rating average dollars saved: N/A
      • member rating average days saved: N/A
      • Parent Category Name: Manage Business Relationships
      • Parent Category Link: /manage-business-relationships

      With the exponential pace of technological change, an organization's success will depend largely on how well CIOs can evolve from technology evangelists to strategic business partners. This will require CIOs to effectively broker relationships to improve IT's effectiveness and create business value. A confidential journal can help you stay committed to fostering productive relationships while building trust to expand your sphere of influence.

      Our Advice

      Critical Insight

      Highly effective executives have in common the ability to successfully balance three things: time, personal capabilities, and relationships. Whether you are a new CIO or an experienced leader, the relentless demands on your time and unpredictable shifts in the organization’s strategy require a personal game plan to deliver business value. Rather than managing stakeholders one IT project at a time, you need an action plan that is tailored for unique work styles.

      Impact and Result

      A personal relationship journal will help you:

      • Understand the context in which key stakeholders operate.
      • Identify the best communication approach to engage with different workstyles.
      • Stay committed to fostering relationships through difficult periods.

      Effectively Manage CxO Relations Research & Tools

      Besides the small introduction, subscribers and consulting clients within this management domain have access to:

      1. Effectively Manage CxO Relations Storyboard – A guide to creating a personal action plan to help effectively manage relationships across key stakeholders.

      Use this research to create a personal relationship journal in four steps:

      • Effectively Manage CxO Relations Storyboard

      2. Personal Relationship Management Journal Template – An exemplar to help you build your personal relationship journal.

      Use this exemplar to build a journal that is readily accessible, flexible, and easy to maintain.

      • Personal Relationship Management Journal Template

      Infographic

      Further reading

      Effectively Manage CxO Relations

      Make relationship management a daily habit with a personalized action plan.

      Analyst Perspective

      "Technology does not run an enterprise, relationships do." – Patricia Fripp

      As technology becomes increasingly important, an organization's success depends on the evolution of the modern CIO from a technology evangelist to a strategic business leader. The modern CIO will need to leverage their expansive partnerships to demonstrate the value of technology to the business while safeguarding their time and effort on activities that support their strategic priorities. CIOs struggling to transition risk obsolescence with the emergence of new C-suite roles like the Digital Transformation Officer, Chief Digital Officer, Chief Data Officer, and so on.

      CIOs will need to flex new social skills to accommodate diverse styles of work and better predict dynamic situations. This means expanding beyond their comfort level to acquire new social skills. Having a clear understanding of one's own work style (preferences, natural tendencies, motivations, and blind spots) is critical to identify effective communication and engagement tactics.

      Building trust is an art. Striking a balance between fulfilling your own goals and supporting others will require a carefully curated approach to navigate the myriad of personalities and work styles. A personal relationship journal will help you stay committed through these peaks and troughs to foster productive partnerships and expand your sphere of influence over the long term.

      Photo of Joanne Lee
      Joanne Lee
      Principal, Research Director, CIO Advisory
      Info-Tech Research Group

      Executive Summary

      Your Challenge

      In today's unpredictable markets and rapid pace of technological disruptions, CIOs need to create business value by effectively brokering relationships to improve IT's performance. Challenges they face:

      • Operate in silos to run the IT factory.
      • Lack insights into their stakeholders and the context in which they operate.
      • Competing priorities and limited time to spend on fostering relationships.
      • Relationship management programs are narrowly focused on associated change management in IT project delivery.

      Common Obstacles

      Limited span of influence.

      Mistaking formal roles in organizations for influence.

      Understanding what key individuals want and, more importantly, what they don't want.

      Lack of situational awareness to adapt communication styles to individual preferences and context.

      Leveraging different work styles to create a tangible action plan.

      Perceiving relationships as "one and done."

      Info-Tech's Approach

      A personal relationship journal will help you stay committed to fostering productive relationships while building trust to expand your sphere of influence.

      • Identify your key stakeholders.
      • Understand the context in which they operate to define a profile of their mandate, priorities, commitments, and situation.
      • Choose the most effective engagement and communication strategies for different work styles.
      • Create an action plan to monitor and measure your progress.

      Info-Tech Insight

      Highly effective executives have in common the ability to balance three things: time, personal capabilities, and relationships. Whether you are a new CIO or an experienced leader, the relentless demand on your time and unpredictable shifts in the organization's strategy will require a personal game plan to deliver business value. This will require more than managing stakeholders one IT project at a time: It requires an action plan that fosters relationships over the long term.

      Key Concepts

      Stakeholder Management
      A common term used in project management to describe the successful delivery of any project, program, or activity that is associated with organizational change management. The goal of stakeholder management is intricately tied to the goals of the project or activity with a finite end. Not the focus of this advisory research.

      Relationship Management
      A broad term used to describe the relationship between two parties (individuals and/or stakeholder groups) that exists to create connection, inclusion, and influence. The goals are typically associated with the individual's personal objectives and the nature of the interaction is seen as ongoing and long-term.

      Continuum of Commitment
      Info-Tech's framework that illustrates the different levels of commitment in a relationship. It spans from active resistance to those who are committed to actively supporting your personal priorities and objectives. This can be used to baseline where you are today and where you want the relationship to be in the future.

      Work Style
      A reference to an individual's natural tendencies and expectations that manifest itself in their communication, motivations, and leadership skills. This is not a behavior assessment nor a commentary on different personalities but observable behaviors that can indicate different ways people communicate, interact, and lead.

      Glossary
      CDxO: Chief Digital Officer
      CDO: Chief Data Officer
      CxO: C-Suite Executives

      The C-suite is getting crowded, and CIOs need to foster relationships to remain relevant

      The span of influence and authority for CIOs is diminishing with the emergence of Chief Digital Officers and Chief Data Officers.

      63% of CDxOs report directly to the CEO ("Rise of the Chief Digital Officer," CIO.com)

      44% of organizations with a dedicated CDxO in place have a clear digital strategy versus 22% of those without a CDxO (KPMG/Harvey Nash CIO Survey)

      The "good news": CIOs tend to have a longer tenure than CDxOs.

      A diagram that shows the average tenure of C-Suites in years.
      Source: "Age and Tenure of C-Suites," Korn Ferry

      The "bad news": The c-suite is getting overcrowded with other roles like Chief Data Officer.

      A diagram that shows the number of CDOs hired from 2017 to 2021.
      Source: "Chief Data Officer Study," PwC, 2022

      An image of 7 lies technology executives tell ourselves.

      Info-Tech Insight

      The digital evolution has created the emergence of new roles like the Chief Digital Officer and Chief Data Officer. They are a response to bridge the skill gap that exists between the business and technology. CIOs need to focus on building effective partnerships to better communicate the business value generated by technology or they risk becoming obsolete.

      Create a relationship journal to effectively manage your stakeholders

      A diagram of relationship journal

      Info-Tech's approach

      From managing relationships with friends to key business partners, your success will come from having the right game plan. Productive relationships are more than managing stakeholders to support IT initiatives. You need to effectively influence those who have the potential to champion or derail your strategic priorities. Understanding differences in work styles is fundamental to adapting your communication approach to various personalities and situations.

      A diagram that shows from 1.1 to 4.1

      A diagram of business archetypes

      Summary of Insights

      Insight 1: Expand your sphere of influence
      It's not just about gaining a volume of acquaintances. Figure out where you want to spend your limited time, energy, and effort to develop a network of professional allies who will support and help you achieve your strategic priorities.

      Insight 2: Know thyself first and foremost
      Healthy relationships start with understanding your own working style, preferences, and underlying motivations that drive your behavior and ultimately your expectations of others. A win/win scenario emerges when both parties' needs for inclusion, influence, and connection are met or mutually conceded.

      Insight 3: Walk a mile in their shoes
      If you want to build successful partnerships, you need to understand the context in which your stakeholder operates: their motivations, desires, priorities, commitments, and challenges. This will help you adapt as their needs shift and, moreover, leverage empathy to identify the best tactics for different working styles.

      Insight 4: Nurturing relationships is a daily commitment
      Building, fostering, and maintaining professional relationships requires a daily commitment to a plan to get through tough times, competing priorities, and conflicts to build trust, respect, and a shared sense of purpose.

      Related Info-Tech Research

      Supplement your CIO journey with these related blueprints.

      Photo of First 100 Days as CIO

      First 100 Days as CIO

      Photo of Become a Strategic CIO

      Become a Strategic CIO

      Photo of Improve IT Team Effectiveness

      Improve IT Team Effectiveness

      Photo of Become a Transformational CIO

      Become a Transformational CIO

      Executive Brief Case Study

      Logo of Multicap Limited

      • Industry: Community Services
      • Source: Scott Lawry, Head of Digital

      Conversation From Down Under

      What are the hallmarks of a healthy relationship with your key stakeholders?
      "In my view, I work with partners like they are an extension of my team, as we rely on each other to achieve mutual success. Partnerships involve a deeper, more intimate relationship, where both parties are invested in the long-term success of the business."

      Why is it important to understand your stakeholder's situation?
      "It's crucial to remember that every IT project is a business project, and vice versa. As technology leaders, our role is to demystify technology by focusing on its business value. Empathy is a critical trait in this endeavor, as it allows us to see a stakeholder's situation from a business perspective, align better with the business vision and goals, and ultimately connect with people, rather than just technology."

      How do you stay committed during tough times?
      "I strive to leave emotions at the door and avoid taking a defensive stance. It's important to remain neutral and not personalize the issue. Instead, stay focused on the bigger picture and goals, and try to find a common purpose. To build credibility, it's also essential to fact-check assumptions regularly. By following these principles, I approach situations with a clear mind and better perspective, which ultimately helps achieve success."

      Photo of Scott Lawry, Head Of Digital at Multicap Limited

      Key Takeaways

      In a recent conversation with a business executive about the evolving role of CIOs, she expressed: "It's the worst time to be perceived as a technology evangelist and even worse to be perceived as an average CIO who can't communicate the business value of technology."

      This highlights the immense pressure many CIOs face when evolving beyond just managing the IT factory.

      The modern CIO is a business leader who can forge relationships and expand their influence to transform IT into a core driver of business value.

      Stakeholder Sentiment

      Identify key stakeholders and their perception of IT's effectiveness

      1.1 Identify Key Stakeholders

      A diagram of Identify Key Stakeholders

      Identify and prioritize your key stakeholders. Be diligent with stakeholder identification. Use a broad view to identify stakeholders who are known versus those who are "hidden." If stakeholders are missed, then so are opportunities to expand your sphere of influence.

      1.2 Understand Stakeholder's Perception of IT

      A diagram that shows Info-Tech's Diagnostic Reports and Hospital Authority XYZ

      Assess stakeholder sentiments from Info-Tech's diagnostic reports and/or your organization's satisfaction surveys to help identify individuals who may have the greatest influence to support or detract IT's performance and those who are passive observers that can become your greatest allies. Determine where best to focus your limited time amid competing priorities by focusing on the long-term goals that support the organization's vision.

      Info-Tech Insight

      Understand which individuals can directly or indirectly influence your ability to achieve your priorities. Look inside and out, as you may find influencers beyond the obvious peers or executives in an organization. Influence can result from expansive connections, power of persuasion, and trust to get things done.

      Visit Info-Tech's Diagnostic Programs

      Activity: Identify and Prioritize Stakeholders

      30-60 minutes

      1.1 Identify Key Stakeholders

      Start with the key stakeholders that are known to you. Take a 360-degree view of both internal and external connections. Leverage external professional & network platforms (e.g. LinkedIn), alumni connections, professional associations, forums, and others that can help flush out hidden stakeholders.

      1.2 Prioritize Key Stakeholders

      Use stakeholder satisfaction surveys like Info-Tech's Business Vision diagnostic as a starting point to identify those who are your allies and those who have the potential to derail IT's success, your professional brand, and your strategic priorities. Review the results of the diagnostic reports to flush out those who are:

      • Resisters: Vocal about their dissatisfaction with IT's performance and actively sabotage or disrupt
      • Skeptics: Disengaged, passive observers
      • Ambassadors: Aligned but don't proactively support
      • Champions: Actively engaged and will proactively support your success

      Consider the following:

      • Influencers may not have formal authority within an organization but have relationships with your stakeholders.
      • Influencers may be hiding in many places, like the coach of your daughter's soccer team who rows with your CEO.
      • Prioritize, i.e. three degrees of separation due to potential diverse reach of influence.

      Key Output: Create a tab for your most critical stakeholders.

      A diagram that shows profile tabs

      Download the Personal Relationship Management Journal Template.

      Understand stakeholders' business

      Create a stakeholder profile to understand the context in which stakeholders operate.

      2.1 Create individual profile for each stakeholder

      A diagram that shows different stakeholder questions

      Collect and analyze key information to understand the context in which your stakeholders operate. Use the information to derive insights about their mandate, accountabilities, strategic goals, investment priorities, and performance metrics and challenges they may be facing.

      Stakeholder profiles can be used to help design the best approach for personal interactions with individuals as their business context changes.

      If you are short on time, use this checklist to gather information:

      • Stakeholder's business unit (BU) strategy goals
      • High-level organizational chart
      • BU operational model or capability map
      • Key performance metrics
      • Projects underway and planned
      • Financial budget (if available)
      • Milestone dates for key commitments and events
      • External platforms like LinkedIn, Facebook, Twitter, Slack, Instagram, Meetup, blogs

      Info-Tech Insight

      Understanding what stakeholders want (and more importantly, what they don't) requires knowing their business and the personal and social circumstances underlying their priorities and behaviors.

      Activity: Create a stakeholder profile

      30-60 minutes

      2.1.0 Understand stakeholder's business context

      Create a profile for each of your priority stakeholders to document their business context. Review all the information collected to understand their mandate, core accountability, and business capabilities. The context in which individuals operate is a window into the motivations, pressures, and vested interests that will influence the intersectionality between their expectations and yours.

      2.1.1 Document Observable Challenges as Private Notes

      Crushing demands and competing priorities can lead to tension and stress as people jockey to safeguard their time. Identify some observable challenges to create greater situational awareness. Possible underlying factors:

      • Sudden shifts/changes in mandate
      • Performance (operations, projects)
      • Finance
      • Resource and talent gaps
      • Politics
      • Personal circumstances
      • Capability gaps/limitations
      • Capacity challenges

      A diagram that shows considerations of this activity.

      Analyze Stakeholder's Work Style

      Adapt communication styles to the situational context in which your stakeholders operate

      2.2 Determine the ideal approach for engaging each stakeholder

      Each stakeholder has a preferred modality of working which is further influenced by dynamic situations. Some prefer to meet frequently to collaborate on solutions while others prefer to analyze data in solitude before presenting information to substantiate recommendations. However, fostering trust requires:

      1. Understanding your preferred default when engaging others.
      2. Knowing where you need to expand your skills.
      3. Identifying which skills to activate for different professional scenarios.

      Adapting your communication style to create productive interactions will require a diverse arsenal of interpersonal skills that you can draw upon as situations shift. The ability to adapt your work style to dial any specific trait up or down will help to increase your powers of persuasion and influence.

      "There are only two ways to influence human behavior: you can manipulate it, or you can inspire it." – Simon Sinek

      Activity: Identify Engagement Strategies

      30 minutes

      2.2.0 Establish work styles

      Every individual has a preferred style of working. Determine work styles starting with self-awareness:

      • Express myself - How you communicate and interact with others
      • Expression by others - How you want others to communicate and interact with you

      Through observation and situational awareness, we can make inferences about people's work style.

      • Observations - Observable traits of other people's work style
      • Situations - Personal and professional circumstances that influence how we communicate and interact with one another

      Where appropriate and when opportunities arise, ask individuals directly about their preferred work styles and method for communication. What is their preferred method of communication? During a normal course of interaction vs. for urgent priorities?

      2.2.1 Brainstorm possible engagement strategies

      Consider the following when brainstorming engagement strategies for different work styles.

      A table of involvement, influence, and connection.

      Think engagement strategies in different professional scenarios:

      • Meetings - Where and how you connect
      • Communicating - How and what you communicate to create connection
      • Collaborating - What degree of involved in shared activities
      • Persuading - How you influence or direct others to get things done

      Expand New Interpersonal Skills

      Use the Business Archetypes to brainstorm possible approaches for engaging with different work styles. Additional communication and engagement tactics may need to be considered based on circumstances and changing situations.

      A diagram that shows business archetypes and engagement strategies.

      Communicate Effectively

      Productive communication is a dialogue that requires active listening, tailoring messages to fluid situations, and seeking feedback to adapt.

      A diagram of elements that contributes to better align intention and impact

      Be Relevant

      • Understand why you need to communicate
      • Determine what you need to convey
      • Tailor your message to what matters to the audience and their context
      • Identify the most appropriate medium based on the situation

      Be Consistent and Accurate

      • Say what you mean and mean what you say to avoid duplicity
      • Information should be accurate and complete
      • Communicate truthfully; do not make false promises or hide bad news
      • Don't gossip

      Be Clear and Concise

      • Keep it simple and avoid excessive jargon
      • State asks upfront to set intention and transparency
      • Avoid ambiguity and focus on outcomes over details
      • Be brief and to the point or risk losing stakeholder's attention

      Be Attentive and Authentic

      • Stay engaged and listen actively
      • Be curious and inquire for clarification or explanation
      • Be flexible to adapt to both verbal and non-verbal cues
      • Be authentic in your approach to sharing yourself
      • Avoid "canned" approaches

      A diagram of listen, observe, reflect.


      "Good communication is the bridge between confusion and clarity."– Nat Turner (LinkedIn, 2020)

      Exemplar: Engaging With Jane

      A diagram that shows Exemplar: Engaging With Jane

      Exemplar: Engaging With Ali

      A diagram that shows Exemplar: Engaging With Ali

      Develop an Action Plan

      Moving from intent to action requires a plan to ensure you stay committed through the peaks and troughs.

      Create Your 120-Day Plan

      An action plan example

      Key elements of the action plan:

      • Strategic priorities – Your top focus
      • Objective – Your goals
      • 30-60-90-120 Day Topics – Key agenda items
      • Meeting Progress Notes – Key takeaways from meetings
      • Private Notes – Confidential observations

      Investing in relationships is a long-term process. You need to accumulate enough trust to trade or establish coalitions to expand your sphere of influence. Even the strongest of professional ties will have their bouts of discord. To remain committed to building the relationship during difficult periods, use an action plan that helps you stay grounded around:

      • Shared purpose
      • Removing emotion from the situation
      • Continuously learning from every interaction

      Photo of Angela Diop
      "Make intentional actions to set intentionality. Plans are good to keep you grounded and focused especially when relationship go through ups and down and there are changes: to new people and new relationships."
      – Angela Diop, Senior Director, Executive Services, Info-Tech & former VP of Information Services with Unity Health Care

      Activity: Design a Tailored Action Plan

      30-60 minutes

      3.1.0 Determine your personal expectations

      Establish your personal goals and expectations around what you are seeking from the relationship. Determine the strength of your current connection and identify where you want to move the relationship across the continuum of commitment.

      Use insights from your stakeholder's profile to explore their span of influence and degree of interest in supporting your strategic priorities.

      3.1.1 Determine what you want from the relationship

      Based on your personal goals, identify where you want to move the relationship across the continuum of commitment: What are you hoping to achieve from the relationship? How will this help create a win/win situation for both you and the key stakeholder?

      A diagram of Continuum of Commitment.

      3.1.2 Identify your metrics for progress

      Fostering relationships take time and commitment. Utilizing metrics or personal success criteria for each of your focus areas will help you stay on track and find opportunities to make each engagement valuable instead of being transactional.

      A graph that shows influence vs interest.

      Make your action plan impactful

      Level of Connection

      The strength of the relationship will help inform the level of time and effort needed to achieve your goals.

      • Is this a new or existing relationship?
      • How often do you connect with this individual?
      • Are the connections driven by a shared purpose or transactional as needs arise?

      Focus on Relational Value

      Cultivate your network and relationship with the goal of building emotional connection, understanding, and trust around your shared purpose and organization's vision through regular dialogue. Be mindful of transactional exchanges ("quid pro quo") to be strategic about its use. Treat every interaction as equally important regardless of agenda, duration, or channel of communication.

      Plan and Prepare

      Everyone's time is valuable, and you need to come prepared with a clear understanding of why you are engaging. Think about the intentionality of the conversation:

      • Gain buy-in
      • Create transparency
      • Specific ask
      • Build trust and respect
      • Provide information to clarify, clear, or contain a situation

      Non-Verbal Communication Matters

      Communication is built on both overt expressions and subtext. While verbal communication is the most recognizable form, non-lexical components of verbal communication (i.e. paralanguage) can alter stated vs. intended meaning. Engage with the following in mind:

      • Tone, pitch, speed, and hesitation
      • Facial expressions and gestures
      • Choice of channel for engagement

      Exemplar: Action Plan for VP, Digital

      A diagram that shows Exemplar: Action Plan for VP, Digital

      Make Relationship Management a Daily Habit

      Management plans are living documents and need to be flexible to adapt to changes in stakeholder context.

      Monitor and Adjust to Communicate Strategically

      A diagram that shows Principles for Effective Communication and Key Measures

      Building trust takes time and commitment. Treat every conversation with your key stakeholders as an investment in building the social capital to expand your span of influence when and where you need it to go. This requires making relationship management a daily habit. Action plans need to be a living document that is your personal journal to document your observations, feelings, and actions. Such a plan enables you to make constant adjustments along the relationship journey.

      "Without involvement, there is no commitment. Mark it down, asterisk it, circle it, underline it."– Stephen Convey (LinkedIn, 2016)

      Capture some simple metrics

      If you can't measure your actions, you can't manage the relationship.

      An example of measures: what, why, how - metrics, and intended outcome.

      While a personal relationship journal is not a formal performance management tool, identifying some tangible measures will improve the likelihood of aligning your intent with outcomes. Good measures will help you focus your efforts, time, and resources appropriately.

      Keep the following in mind:

      1. WHAT are you trying to measure?
        Specific to the situation or scenario
      2. WHY is this important?
        Relevant to your personal goals
      3. HOW will you measure?
        Achievable and quantifiable
      4. WHAT will the results tell you?
        Intended outcome that is directional

      Summary of accomplishments

      Knowledge Gained

      • Relationship management is critical to a CIO's success
      • A personal relationship journal will help build:
        • Customized approach to engaging stakeholders
        • New communication skills to adapt to different work styles

      New Concepts

      • Work style assessment framework and engagement strategies
      • Effective communication strategies
      • Continuum of commitment to establish personal goals

      Approach to Creating a Personal Journal

      • Step-by-step approach to create a personal journal
      • Key elements for inclusion in a journal
      • Exemplar and recommendations

      Related Info-Tech Research

      Photo of Tech Trends and Priorities Research Centre

      Tech Trends and Priorities Research Centre

      Access Info-Tech's Tech Trend reports and research center to learn about current industry trends, shifts in markets, and disruptions that are impacting your industry and sector. This is a great starting place to gain insights into how the ecosystem is changing your business and the role of IT within it.

      Photo of Embed Business Relationship Management in IT

      Embed Business Relationship Management in IT

      Create a business relationship management (BRM) function in your program to foster a more effective partnership with the business and drive IT's value to the organization.

      Photo of Become a Transformational CIO

      Become a Transformational CIO

      Collaborate with the business to lead transformation and leave behind a legacy of growth.

      Appendix: Framework

      Content:

      • Adaptation of DiSC profile assessment
      • DiSC Profile Assessment
      • FIRO-B Framework
      • Experience Cube

      Info-Tech's Adaption of DiSC Assessment

      A diagram of business archetypes

      Info-Tech's Business Archetypes was created based on our analysis of the DiSC Profile and Myers-Briggs FIRO-B personality assessment tools that are focused on assessing interpersonal traits to better understand personalities.

      The adaptation is due in part to Info-Tech's focus on not designing a personality assessment tool as this is neither the intent nor the expertise of our services. Instead, the primary purpose of this adaptation is to create a simple framework for our members to base their observations of behavioral cues to identify appropriate communication styles to better interact with key stakeholders.

      Cautionary note:
      Business archetypes are personas and should not be used to label, make assumptions and/or any other biased judgements about individual personalities. Every individual has all elements and aspects of traits across various spectrums. This must always remain at the forefront when utilizing any type of personality assessments or frameworks.

      Click here to learn about DiSC Profile
      Click here learn about FIRO-B
      Click here learn about Experience Cube

      DiSC Profile Assessment

      A photo of DiSC Profile Assessment

      What is DiSC?

      DisC® is a personal assessment tool that was originally developed in 1928 by psychologist William Moulton Marston, who designed it to predict job performance. The tool has evolved and is now widely used by thousands of organizations around the world, from large government agencies and Fortune 500 companies to nonprofit and small businesses, to help improve teamwork, communication, and productivity in the workplace. The tool provides a common language people can use to better understand themselves and those they interact with - and use this knowledge to reduce conflict and improve working relationships.

      What does DiSC mean?

      DiSC is an acronym that stands for the four main personality profiles described in the Everything DiSC model: (D)ominance, (i)nfluence, (S)teadiness, (C)onscientiousness

      People with (D) personalities tend to be confident and emphasize accomplishing bottom-line results.
      People with (i) personalities tend to be more open and emphasize relationships and influencing or persuading others.
      People with (S) personalities tend to be dependable and emphasize cooperation and sincerity.
      People with (C) personalities tend to emphasize quality, accuracy, expertise, and competency.

      Go to this link to explore the DiSC styles

      FIRO-B® – Interpersonal Assessment

      A diagram of FIRO framework

      What is FIRO workplace relations?

      The Fundamental Interpersonal Relations Orientation Behavior (FIRO-B®) tool has been around for forty years. The tool assesses your interpersonal needs and the impact of your behavior in the workplace. The framework reveals how individuals can shape and adapt their individual behaviors, influence others effectively, and build trust among colleagues. It has been an excellent resource for coaching individuals and teams about the underlying drivers behind their interactions with others to effectively build successful working relationships.

      What does the FIRO framework measure?

      The FIRO framework addresses five key questions that revolve around three interpersonal needs. Fundamentally, the framework focuses on how you want to express yourself toward others and how you want others to behave toward you. This interaction will ultimately result in the universal needs for (a) inclusion, (b) control, and (c) affection. The insights from the results are intended to help individuals adjust their behavior in relationships to get what they need while also building trust with others. This will allow you to better predict and adapt to different situations in the workplace.

      How can FIRO influence individual and team performance in the workplace?

      FIRO helps people recognize where they may be giving out mixed messages and prompts them to adapt their exhibited behaviors to build trust in their relationships. It also reveals ways of improving relationships by showing individuals how they are seen by others, and how this external view may differ from how they see themselves. Using this lens empowers people to adjust their behavior, enabling them to effectively influence others to achieve high performance.

      In team settings, it is a rich source of information to explore motivations, underlying tensions, inconsistent behaviors, and the mixed messages that can lead to mistrust and derailment. It demonstrates how people may approach teamwork differently and explains the potential for inefficiencies and delays in delivery. Through the concept of behavioral flexibility, it helps defuse cultural stereotypes and streamline cross-cultural teams within organizations.

      Go to this link to explore FIRO-B for Business

      Experience Cube

      A diagram of experience cube model.

      What is an experience cube?

      The Experience Cube model was developed by Gervase Bushe, a professor of Leadership and Organization at the Simon Fraser University's school of Business and a thought leader in the field of organizational behavior. The experience cube is intended as a tool to plan and manage conversations to communicate more effectively in the moment. It does this by promoting self-awareness to better reduce anxiety and adapt to evolving and uncertain situations.

      How does the experience cube work?

      Using the four elements of the experience cube (Observations, Thoughts, Feelings, and Wants) helps you to separate your experience with the situation from your potential judgements about the situation. This approach removes blame and minimizes defensiveness, facilitating a positive discussion. The goal is to engage in a continuous internal feedback loop that allows you to walk through all four quadrants in the moment to help promote self-awareness. With heightened self-awareness, you may (1) remain curious and ask questions, (2) check-in for understanding and clarification, and (3) build consensus through agreement on shared purpose and next steps.

      Observations: Sensory data (information you take in through your senses), primarily what you see and hear. What a video camera would record.

      Thoughts: The meaning you add to your observations (i.e. the way you make sense of them, including your beliefs, expectations, assumptions, judgments, values, and principles). We call this the "story you make up."

      Feelings: Your emotional or physiological response to the thoughts and observations. Feelings words such as sad, mad, glad, scared, or a description of what is happening in your body.

      Wants: Clear description of the outcome you seek. Wants go deeper than a simple request for action. Once you clearly state what you want, there may be different ways to achieve it.

      Go to this link to explore more: Experience Cube

      Research Contributors and Experts

      Photo of Joanne Lee
      Joanne Lee
      Principal, Research Director, CIO Advisory
      Info-Tech Research Group

      Joanne is a professional executive with over twenty-five years of experience in digital technology and management consulting spanning healthcare, government, municipal, and commercial sectors across Canada and globally. She has successfully led several large, complex digital and business transformation programs. A consummate strategist, her expertise spans digital and technology strategy, organizational redesign, large complex digital and business transformation, governance, process redesign, and PPM. Prior to joining Info-Tech Research Group, Joanne was a Director with KPMG's CIO Advisory management consulting services and the Digital Health practice lead for Western Canada. She brings a practical and evidence-based approach to complex problems enabled by technology.

      Joanne holds a Master's degree in Business and Health Policy from the University of Toronto and a Bachelor of Science (Nursing) from the University of British Columbia.


      Photo of Gord Harrison
      Gord Harrison
      Senior Vice President, Research and Advisory
      Info-Tech Research Group

      Gord Harrison, SVP, Research and Consulting, has been with Info-Tech Research Group since 2002. In that time, Gord leveraged his experience as the company's CIO, VP Research Operations, and SVP Research to bring the consulting and research teams together under his current role, and to further develop Info-Tech's practical, tactical, and value-oriented research product to the benefit of both organizations.

      Prior to Info-Tech, Gord was an IT consultant for many years with a focus on business analysis, software development, technical architecture, and project management. His background of educational game software development, and later, insurance industry application development gave him a well-rounded foundation in many IT topics. Gord prides himself on bringing order out of chaos and his customer-first, early value agile philosophy keeps him focused on delivering exceptional experiences to our customers.


      Photo of Angela Diop
      Angela Diop
      Senior Director, Executive Services
      Info-Tech Research Group

      Angela has over twenty-five years of experience in healthcare, as both a healthcare provider and IT professional. She has spent over fifteen years leading technology departments and implementing, integrating, managing, and optimizing patient-facing and clinical information systems. She believes that a key to a healthcare organization's ability to optimize health information systems and infrastructure is to break the silos that exist in healthcare organizations.

      Prior to joining Info-Tech, Angela was the Vice President of Information Services with Unity Health Care. She has demonstrated leadership and success in this area by fostering environments where business and IT collaborate to create systems and governance that are critical to providing patient care and sustaining organizational health.

      Angela has a Bachelor of Science in Systems Engineering and Design from the University of Illinois and a Doctorate of Naturopathic Medicine from Bastyr University. She is a Certified CIO with the College of Healthcare Information Management Executives. She is a two-time Health Information Systems Society (HIMSS) Davies winner.


      Photo of Edison Barreto
      Edison Barreto
      Senior Director, Executive Services
      Info-Tech Research Group

      Edison is a dynamic technology leader with experience growing different enterprises and changing IT through creating fast-paced organizations with cultural, modernization, and digital transformation initiatives. He is well versed in creating IT and business cross-functional leadership teams to align business goals with IT modernization and revenue growth. Over twenty-five years of Gaming, Hospitality, Retail, and F&B experience has given him a unique perspective on guiding and coaching the creation of IT department roadmaps to focus on business needs and execute successful changes.

      Edison has broad business sector experience, including:
      Hospitality, Gaming, Sports and Entertainment, IT policy and oversight, IT modernization, Cloud first programs, R&D, PCI, GRDP, Regulatory oversight, Mergers acquisitions and divestitures.


      Photo of Mike Tweedie
      Mike Tweedie
      Practice Lead, CIO Strategy
      Info-Tech Research Group

      Michael Tweedie is the Practice Lead, CIO – IT Strategy at Info-Tech Research Group, specializing in creating and delivering client-driven, project-based, practical research, and advisory. He brings more than twenty-five years of experience in technology and IT services as well as success in large enterprise digital transformations.

      Prior to joining Info-Tech, Mike was responsible for technology at ADP Canada. In that role, Mike led several large transformation projects that covered core infrastructure, applications, and services and worked closely with and aligned vendors and partners. The results were seamless and transparent migrations to current services, like public cloud, and a completely revamped end-user landscape that allowed for and supported a fully remote workforce.

      Prior to ADP, Mike was the North American Head of Engineering and Service Offerings for a large French IT services firm, with a focus on cloud adoption and complex ERP deployment and management; he managed large, diverse global teams and had responsibilities for end-to-end P&L management.

      Mike holds a Bachelor's degree in Architecture from Ryerson University.


      Photo of Carlene McCubbin
      Carlene McCubbin
      Practice Lead, People and Leadership
      Info-Tech Research Group

      Carlene McCubbin is a Research Lead for the CIO Advisory Practice at Info-Tech Research Group covering key topics in operating models & design, governance, and human capital development.

      During her tenure at Info-Tech, Carlene has led the development of Info-Tech's Organization and Leadership practice and worked with multiple clients to leverage the methodologies by creating custom programs to fit each organization's needs.

      Before joining Info-Tech, Carlene received her Master of Communications Management from McGill University, where she studied development of internal and external communications, government relations, and change management. Her education honed her abilities in rigorous research, data analysis, writing, and understanding the organization holistically, which has served her well in the business IT world.


      Photo of Anubhav Sharma
      Anubhav Sharma
      Research Director, CIO Strategy
      Info-Tech Research Group

      Anubhav is a digital strategy and execution professional with extensive experience in leading large-scale transformation mandates for organizations both in North America and globally, including defining digital strategies for leading banks and spearheading a large-scale transformation project for a global logistics pioneer across ten countries. Prior to joining Info-Tech Research Group, he held several industry and consulting positions in Fortune 500 companies driving their business and technology strategies. In 2023, he was recognized as a "Top 50 Digital Innovator in Banking" by industry peers.

      Anubhav holds an MBA in Strategy from HEC Paris, a Master's degree in Finance from IIT-Delhi, and a Bachelor's degree in Engineering.


      Photo of Kim Osborne-Rodriguez
      Kim Osborne-Rodriguez
      Research Director, CIO Strategy
      Info-Tech Research Group

      Kim is a professional engineer and Registered Communications Distribution Designer (RCDD) with over a decade of experience in management and engineering consulting spanning healthcare, higher education, and commercial sectors. She has worked on some of the largest hospital construction projects in Canada, from early visioning and IT strategy through to design, specifications, and construction administration. She brings a practical and evidence-based approach to digital transformation, with a track record of supporting successful implementations.

      Kim holds a Bachelor's degree in Mechatronics Engineering from University of Waterloo.


      Photo of Amanda Mathieson
      Amanda Mathieson
      Research Director, People and Leadership
      Info-Tech Research Group

      Amanda joined Info-Tech Research Group in 2019 and brings twenty years of expertise working in Canada, the US, and globally. Her expertise in leadership development, organizational change management, and performance and talent management comes from her experience in various industries spanning pharmaceutical, retail insurance, and financial services. She takes a practical, experiential approach to people and leadership development that is grounded in adult learning methodologies and leadership theory. She is passionate about identifying and developing potential talent, as well as ensuring the success of leaders as they transition into more senior roles.

      Amanda has a Bachelor of Commerce degree and Master of Arts in Organization and Leadership Development from Fielding Graduate University, as well as a post-graduate diploma in Adult Learning Methodologies from St. Francis Xavier University. She also has certifications in Emotional Intelligence – EQ-i 2.0 & 360, Prosci ADKAR® Change Management, and Myers-Briggs Type Indicator Step I and II.

      Bibliography

      Bacey, Christopher. "KPMG/Harvey Nash CIO Survey finds most organizations lack enterprise-wide digital strategy." Harvey Nash/KPMG CIO Survey. Accessed Jan. 6, 2023. KPMG News Perspective - KPMG.us.com

      Calvert, Wu-Pong Susanna. "The Importance of Rapport. Five tips for creating conversational reciprocity." Psychology Today Magazine. June 30, 2022. Accessed Feb. 10, 2023. psychologytoday.com/blog

      Coaches Council. "14 Ways to Build More Meaningful Professional Relationships." Forbes Magazine. September 16, 2020. Accessed Feb. 20, 2023. forbes.com/forbescoachescouncil

      Council members. "How to Build Authentic Business Relationships." Forbes Magazine. June 15, 2021. Accessed Jan. 15, 2023. Forbes.com/business council

      Deloitte. "Chief Information Officer (CIO) Labs. Transform and advance the role of the CIO." The CIO program. Accessed Feb. 5, 2021.

      Dharsarathy, Anusha et al. "The CIO challenge: Modern business needs a new kind of tech leader." McKinsey and Company. January 27, 2020. Accessed Feb 2023. Mckinsey.com

      DiSC profile. "What is DiSC?" DiSC Profile Website. Accessed Feb. 5, 2023. discprofile.com

      FIRO Assessment. "Better working relationships". Myers Brigg Website. Resource document downloaded Feb. 10, 2023. myersbriggs.com/article

      Fripp, Patricia. "Frippicisms." Website. Accessed Feb. 25, 2023. fripp.com

      Grossman, Rhys. "The Rise of the Chief Digital Officer." Russell Reynolds Insights, January 1, 2012. Accessed Jan. 5, 2023. Rise of the Chief Digital Officer - russellreynolds.com

      Kambil, Ajit. "Influencing stakeholders: Persuade, trade, or compel." Deloitte Article. August 9, 2017. Accessed Feb. 19, 2023. www2.deloitte.com/insights

      Kambil, Ajit. "Navigating the C-suite: Managing Stakeholder Relationships." Deloitte Article. March 8, 2017. Accessed Feb. 19, 2023. www2.deloitte.com/insights

      Korn Ferry. "Age and tenure in the C-suite." Kornferry.com. Accessed Jan. 6, 2023. Korn Ferry Study Reveals Trends by Title and Industry

      Kumthekar, Uday. "Communication Channels in Project". Linkedin.com, 3 March 2020. Accessed April 27, 2023. Linkedin.com/Pulse/Communication Channels

      McWilliams, Allison. "Why You Need Effective Relationships at Work." Psychology Today Magazine. May 5, 2022. Accessed Feb. 11, 2023. psychologytoday.com/blog

      McKinsey & Company. "Why do most transformations fail? A conversation with Harry Robinson." Transformation Practice. July 2019. Accessed Jan. 10, 2023. Mckinsey.com

      Mind Tools Content Team. "Building Good Work Relationships." MindTools Article. Accessed Feb. 11, 2023. mindtools.com/building good work relationships

      Pratt, Mary. "Why the CIO-CFO relationship is key to digital success." TechTarget Magazine. November 11, 2021. Accessed Feb. 2023. Techtarget.com

      LaMountain, Dennis. "Quote of the Week: No Involvement, No Commitment". Linkedin.com, 3 April 2016. Accessed April 27, 2023. Linkedin.com/pulse/quote-week-involvement

      PwC Pulse Survey. "Managing Business Risks". PwC Library. 2022. Accessed Jan. 30, 2023. pwc.com/pulse-survey

      Rowell, Darin. "3 Traits of a Strong Professional Relationship." Harvard Business Review. August 8, 2019. Accessed Feb. 20, 2023. hbr.org/2019/Traits of a strong professional relationship

      Sinek, Simon. "The Optimism Company from Simon Sinek." Website. Image Source. Accessed, Feb. 21, 2023. simonsinek.com

      Sinek, Simon. "There are only two ways to influence human behavior: you can manipulate it or you can inspire it." Twitter. Dec 9, 2022. Accessed Feb. 20, 2023. twitter.com/simonsinek

      Whitbourne, Susan Krauss. "10 Ways to Measure the Health of Relationship." Psychology Today Magazine. Aug. 7, 2021. Accessed Jan. 30, 2023. psychologytoday.com/blog

      Select and Prioritize Digital Initiatives

      • Buy Link or Shortcode: {j2store}102|cart{/j2store}
      • member rating overall impact (scale of 10): N/A
      • member rating average dollars saved: N/A
      • member rating average days saved: N/A
      • Parent Category Name: Innovation
      • Parent Category Link: /innovation

      The business has embarked on its digital transformation journey. As CIO, you are being relied on to help triage what is most important – initiatives that will move the needle to achieve and fulfill the digital goals and ambitions of the organization.

      • If selection criteria are not identified and well defined, then digital initiatives risk being misprioritized or, worse yet, incorrectly labelled as having high ROI.
      • Like any other project, net-new digital initiatives must be triaged according to the value they bring to the organization.
      • Just as importantly, the complexity of each initiative must also be weighed as a critical factor of success.

      Our Advice

      Critical Insight

      Once the scope of the digital strategy and its goals are finalized, the heavy lifting begins. CIOs must prepare for this change by evaluating opportunities and prioritizing which will become digital initiatives.

      Impact and Result

      By using an appropriate selection process, CIOs can prioritize the digital initiatives that will matter most to the organization and drive business value.

      Select and Prioritize Digital Initiatives Research & Tools

      Besides the small introduction, subscribers and consulting clients within this management domain have access to:

      1. Select and Prioritize Digital Initiatives Storyboard – A step-by-step document that walks you through how to prepare an IT department to embrace innovation and support the organization’s digital initiatives.

      Part of Info-Tech’s seven-phase approach for aligning IT with the business’ digital strategy, this deck focuses the core and enabling initiatives that define IT’s innovation goals. By the end of this deck, the IT leader will have a roadmap of prioritized initiatives that enable the organization’s digital business initiatives.

      • Select and Prioritize Digital Initiatives Storyboard
      [infographic]

      Further reading

      Select and Prioritize Digital Initiatives

      Build your digital investment business case.

      Info-Tech Research Group

      Info-Tech is a provider of best-practice IT research advisory services that make every IT leader’s job easier.
      35,000 members sharing best practices you can leverage. Millions spent annually developing tools and templates. Leverage direct access to over 100 analysts as an extension of your team. Use our massive database of benchmarks and vendor assessments. Get up to speed in a fraction of the time.

      Key Concepts

      Digital initiative

      A project – or a group of interdependent projects – whose primary purpose is to enable digital technologies and/or digital business models. These technologies and models may be net new to the organization, or they may be existing ones that are optimized and improved by the initiative itself.

      The feasibility of any initiative is gauged by answering:

      • What amount of return on investment (ROI) or value does it bring to the organization?
      • What level of complexity does it pose to project execution?
      • To what extent does it solve a problem or leverage an opportunity?
      • To what degree is it aligned with digital business goals?

      Digital strategy

      The plan to deploy existing/emerging technologies to look at developing new products and services, new business models, and operational efficiency to meet or exceed performance targets.

      IT strategy

      The plan for deploying and maintaining applications, hardware, infrastructure, and IT services that support the business goals in a secure/regulatory-compliant manner to ensure reliability.

      Digital transformation

      Digital transformation is an at-scale change program – planned and executed over a finite time period – with the aspiration of creating material and sustainable improvement in the performance of an organization. Techniques include deploying a programmatic approach to innovation along with enabling technologies, capabilities, and practices that drive efficiency and create new products, markets, and business models.

      Your Challenge

      • Once the scope of the digital strategy and its goals are finalized, the heavy lifting begins.
      • The CIO must prepare for this change by evaluating opportunities and prioritizing which will become digital initiatives.
      • But where to start with prioritization? What should the selection criteria be?
      • To answer these all-important questions, the CIO must identify what success actually looks like.

      Common Obstacles

      • If selection criteria are not identified and well-defined, then digital initiatives risk being neglected or worse yet, incorrectly labelled as having high ROI.
      • Like any other project, net-new digital initiatives must be triaged according to the value they bring to the organization.
      • Just as importantly, the complexity of each initiative must also be weighed as a critical factor of success.

      Solution

      • Determine and set your selection criteria by leveraging the matrix provided in this deck.
      • Evaluate each proposed initiative against this repeatable process in order to test your assumptions.
      • Develop a business case for each high priority digital initiative that captures its benefits and business value.
      • Assemble your prioritized list of digital initiatives to present to stakeholders.

      Info-Tech Insight

      The business has embarked on its digital transformation journey. As CIO, you are being relied on to help triage what is most important – initiatives that will move the needle to achieve and fulfill the digital goals and ambitions of the organization.

      Analyst Perspective

      Prioritization follows ideation, and it’s not always easy.

      Ross Armstrong

      Your stakeholders have spent considerable time and effort identifying and articulating a digital business strategy. Now that ideas have turned into opportunities, the CIO must prioritize those opportunities as actual initiatives. Where to begin?

      Your first task is to identify the criteria that will be used to conduct prioritization activities. These criteria should be immutable and rigorously applied.

      Your second task will be to develop business cases for each opportunity that passes muster. But don’t worry, you won’t need an MBA to get the job done properly.

      Ross Armstrong

      Principal Research Director
      Info-Tech Research Group

      Info-Tech’s digital transformation journey

      Info-Tech’s digital transformation journey: 1 - Visualize the art of the digitally possible, 2 - Evolve your digital business strategy, 3 - Execute with confidence

      Info-Tech's digital transformation journey for industry members. Table shows the stakeholders, advisory support and deliverables for each industry members

      By now, you have established your current strategic context

      You have reviewed trends to reimagine the future of your industry and undertaken a digital maturity assessment to validate your business objectives and innovation goals. Now you need to evolve the current scope of your digital vision and opportunities.

      • Phase 1.1: Industry Trends Report

      • Phase 1.2: Digital Maturity Assessment

      • Phase 2.1: Zero In on Business Objectives

      By this point you have leveraged industry roundtables to better understand the art of the possible – exploring global trends, shifts in market forces or industry, customer needs, emerging technologies, and economic forecasts and creating opportunities out of these disruptions.

      In Phase 2.1, you identified your business and innovation goals and documented your current capabilities, prioritized for transformation.

      Business and innovation goals have been established through stakeholder interviews and business document review.

      Current capabilities have been prioritized for transformation and heat mapped.

      You have also formalized your digital strategy

      Throughout the course of Phase 2.2, you identified new digital opportunities, identified the business capabilities required to capitalize those opportunities, and updated the digital goals of your organization, accordingly.

      An example of a formalized digital strategy from Phase 2.2.

      The end result of this exercise is a new goals cascade that aligns digital goals and capabilities with those of the business. Digital initiatives were also identified but not yet selected or prioritized for execution at the project level.

      Now you will select and prioritize digital initiatives

      The goal of this phase is to ensure that initiatives that are green-lit for execution have been successfully assessed against your chosen criteria and that the business case for each initiative is firmly established and documented.

      Info-Tech’s digital transformation journey for industry members.

      There are three key activities outlined here that describe the actions that can be undertaken by industry members to help select and prioritize digital initiatives for the business.

      1. Identify your selection criteria

      2. Evaluate initiatives against criteria

      3. Determine a prioritized list of initiatives

      Info-Tech’s approach

      1

      Identify your selection criteria

      • Define what viability actually looks like.
      • Conduct an evaluation session to test your assumptions
      2

      Evaluate initiatives against criteria

      • Evaluate and validate an initiative to determine its viability.
      • Map the benefits and value proposition for each initiative.
      • Build a business case and profile for each selected initiative.
      3

      Determine a prioritized list of initiatives

      • Finalize your initiatives list and compile all relevant information.
      • Communicate the list to stakeholders.

      Step 1: Identify Your Selection Criteria

      Understand which conditions must be met in order to turn an opportunity into a digital initiative.

      Step 1: Identify Your Selection Criteria

      Step 1

      Identify Your Selection Criteria

      1.1

      Define what "viable" looks like

      Set criteria types and thresholds.

      It is impossible to gauge whether or not an opportunity is worthwhile if you don’t have a yardstick to measure it by. However, what is viable for one organization in a particular industry may not be viable for a company elsewhere.

      Consider:
      • Use the criteria already set forth in this deck.
      • If for any reason you cannot use these criteria, work with stakeholders to establish viability factors that suit both the business and IT.
      Avoid:
      • Vague language when establishing your own criteria.
      • Ambiguity in both measures and their definitions. Be crystal clear.

      1.2

      Conduct an evaluation session

      Test your assumptions by piloting prioritization.

      Select an initiative from one of the opportunity profiles from Phase 2.2 and run it through the selection criteria. From there, determine if your assumptions are sound. If not, tweak the criteria and test again until all stakeholders have confidence in the process.

      Consider:
      • Most if not all projects must go through the IT project management office (PMO) or project management leader, so why not create a “digital-only” track for digital business initiatives?
      • Which digital initiatives also represent a sound strategic fit to the organization?
      • Have we undertaken previous projects that are similar? Were those successful? Why or why not?
      Avoid:
      • Making too many initiatives high priority. IT resources are limited, so be ruthless.
      • Taking on too many initiatives at once. Most IT organizations can only work on a small number at any given time.

      Use these selection criteria to prioritize initiatives

      Ideas matter, but not all ideas are created equal. Now that you have elicited ideas and identified opportunities, discuss the assumptions, risks, and benefits associated with each proposed digital business initiative.

      Complexity versus Impact. Shows initiatives that have a business Must Prioritize (High value/low complexity), Should Plan (High value/high complexity), Could Have (Low Value/ Low complexity), and Don't need (Low value/high complexity)

      Prioritize opportunities into initiatives

      Recall that the opportunities identified in Phase 2.2 also became proposed digital initiatives demonstrated in your goals cascade.

      In your discussion, evaluate each opportunity through a matrix to create tension between value and complexity or other dimensions. Capture the information based on measurable business benefits-realization; risks or considerations; assumptions; and competencies, talent, and assets needed to deliver.

      Prioritize opportunities into Initiatives. For example: new digital products and services, intelligent fleet management via automation, ERP automation etc.

      Leverage opportunity profiles from your digital strategy

      To start, take one of the opportunity profiles you created in Phase 2.2, Build Your Digital Vision and Strategy, and use it throughout the following steps. Once done, repeat with the next opportunity profile until all have been vetted against criteria. If you did not use Info-Tech’s approach, simply use whatever list of digital business opportunities provided to you from stakeholders.

      Robotic process automation Template.

      Prioritization Criteria

      Run each initiative through the following evaluation criteria. When finished, any opportunities that appear in the top left quadrant (high value/low complexity) are now your highest priority digital initiatives.

      Instructions:

      Assign each initiative a letter. As you decide on each one, move a copy of the circled letter to its appropriate place on the 2x2 selection matrix.

      List of digital opportunities.

      Complexity versus Impact. Shows initiatives that have a business Must Prioritize (High value/low complexity), Should Plan (High value/high complexity), Could Have (Low Value/ Low complexity), and Don't need (Low value/high complexity)

      Info-Tech Insight

      Evaluation should be based on the insights from analysis across all criteria. Leverage group discussion to help contextualize and challenge assumptions when validating opportunities.

      Digital initiative ≠ IT project

      Every idea is a good one, unless you need one that works. What “works” as a digital initiative is not the same thing as a straightforward IT project that would be typically managed by a project manager or PMO. These latter projects will be addressed in Phase 3.1 of the digital journey.

      Opportunities and business needs > Business model > Impact > Mandatory > Innovation path forward

      Digital Track

      Focus: Transform the business and operations

      1. Problem may not be well defined.
      2. “Initiative” is not clear.
      3. Based on market research, customer needs, trend analysis, and economic forecast, risk to the business if fit-for-purpose initiative is not identified.
      4. Previous delivery results not as expected, or uncertain how to continue the project.
      5. Highly complex with significant impact to transform the business or operations.
      6. Execution approach is not clear.
      7. Capabilities may not exist within IT.

      IT PMO

      1. Emerging technology trends create opportunities to modernize IT, not transform business.
      2. Problem is well defined and understood.
      3. Initiative is clearly identified.
      4. New IT project.
      5. Can be complex but does not transform the business.
      6. Standard PMP approach is a good fit.
      7. Capabilities exist to execute within IT.
      8. Software vendor or systems integrator is initiative provider.

      Step 2: Evaluate Initiatives Against Criteria

      Ruthlessly prioritize which opportunities will deliver the greatest business value and pose the best chance of success.

      Step 2: Evaluate initiatives against criteria.

      Step 2

      Evaluate Initiatives Against Criteria

      2.1

      Evaluate and validate

      Evaluate and validate (or invalidate) opportunities.

      Now that you have tested and refined the selection criteria, take each opportunity profile from Phase 2.2 and run it through its paces. Once plotted on the 2x2 matrix, you will have a clear and concise view of high priority digital initiatives.

      Consider:
      • What are the timing, relevance, and impact of each initiative being evaluated?
      • What are the merits of each opportunity?
      • What are the extent and reach of their impacts?
      Avoid:
      • Guesswork. Stick with what you know based on the available information and data at hand.

      2.2

      Determine benefits

      Document benefits and value proposition.

      Identify and determine the benefits of each high priority initiative, including the benefit type (e.g. observable, financial, etc.). In addition, discuss and articulate the value proposition for each high priority initiative.

      Consider:
      • Tangible and intangible benefits.
      • Creating a vision statement for each initiative selected as high priority.
      Avoid:
      • Don’t reach too much when identifying benefits. Be realistic.

      2.3

      Make your case

      Build a business case for each initiative.

      Once you have enunciated the value and benefits of each high priority initiative, create a business case and profile for each one that includes known costs, risks, and so on. These materials will be crucial for project execution and IT capability planning in Phase 2.3 of your digital journey.

      Consider:
      • All forms of costs, both in terms of time, labor, and physical assets and resources.
      • Stick with a short-form business case for now to save time. You can always expand it into full-form business case later on, if necessary.
      Avoid:
      • Generalities. Be conservative in your estimates and keep them grounded in what has transpired in past initiatives at the organization.

      Exemplar: Prioritization criteria

      Your prioritization matrix should look something like this. Initiatives B and C will now have short-form business cases developed for them. Initiatives in the “Should Plan” quadrant can be dealt with later.

      List of initiatives for digital opportunities. Complexity versus Impact. Shows initiatives that have a business Must Prioritize (High value/low complexity), Should Plan (High value/high complexity), Could Have (Low Value/ Low complexity), and Don't need (Low value/high complexity)

      Draw information from the opportunity profiles

      You created opportunity profiles in Phase 2.2 to clarify, validate and evaluate specific ideas for digital initiatives. In these profiles, you considered the timing, relevance, and impact of those opportunities.

      Some prioritized initiatives will have an immediate and significant impact on your business. Some may have a significant impact, but on a longer timeline. Understanding this is important context for your overall digital business strategy.

      Above all, you must be able to communicate to stakeholders how the newly prioritized digital initiatives are relevant to driving the strategic growth of the business.

      Start by elucidating further on initiative benefits and business value as outlined in the opportunity profile. This will become crucial for completing your next step – building a short-form business case for each prioritized initiative.

      Robotics Process Automation Template. Benefits and outcomes as well as incremental value are highlighted. The next slide is a template for the short-form business case, while the slides after that contain instructions on how to fill out each section of the business case.

      Short-Form Business Case Template

      Short form business case template. Shows value proposition, initiative benefits and initiative roadmap.

      Prepare your business case for each initiative

      Tasks:

      1. On a whiteboard, draw the visual initiative canvas supplied below.
      2. For each prioritized initiative, leverage its opportunity profile (if used) to list the resulting customer or stakeholder products/services and its pain relievers and gain creators in the associated sections of the canvas.
      3. Ensure that the top pains, gains, and jobs are addressed by products/services, pain relievers, and gain creators.
      4. Use this information as a basis for further exercises in this section, such as defining benefits, articulating value proposition and vision, and cost estimates.
      Initiative canvas example.

      Input

      • The initiative’s opportunity profile from Phase 2.2 of the Digital Journey series (if used)

      Output

      • Short-form initiative business case

      Materials

      • Whiteboard and markers

      Participants

      • Opportunity owner
      • Opportunity group/team

      Expand on the key benefits of each initiative

      Business cases are not just a vehicle with which to acquire resources for investments, they are a mechanism that helps ensure the benefits of an investment are realized. To accomplish this, a business case must have a set of clearly defined benefits, combined with an understanding of how they will be measured and an explicitly stated beneficiary who can corroborate that the benefit has been realized.

      What is a benefit?

      Benefits are the advantages, or outcomes, that specific groups or individuals realize as a result of the proposed initiative’s implementation.

      Initiative inputs

      Initiative inputs are the time, resources, and scope dedicated to the endeavor of implementing an initiative.

      Benefits of initiative and initiative inputs diagram.

      Identify how to measure benefit achievement

      Benefits are realized when an organization either starts doing something new, stops doing something, or improves the way something is already being done. The impact of these changes must be measured in order to determine whether the change is positive and if the case warrants more resources in order to scale.

      Types of benefits

      • Observable: These are measured by opinion or judgement.
      • Measurable: These can be identified when there is an existing measure in place for the benefit (or when one can be easily created).
      • Quantifiable: Similar to measurable benefits; however, these benefits additionally feature size or magnitude (if it can be reliably estimated).
      • Financial: These are benefits that can be communicated in monetary terms. A benefit should only be classified as financial when sufficient evidence is available to show that the stated value is likely to be achieved.

      Benefit owners and responsibilities

      1. Each benefit should have assigned to it an explicit owner who gains an advantage as a result of the initiative’s implementation.
      2. For most benefits, the owner will be the primary beneficiary of the initiative.
      3. These individuals are the ones who must corroborate that a benefit has been realized.
      4. Assigning an owner to each benefit will foster a sense of accountability in terms of benefits realization and will also create a traceable path that helps track the success of the initiative.

      Complete the benefits section of the business case

      Tasks:

      1. Use the Short-Form Business Case Template included in this deck.
      2. Arrange a meeting with the key beneficiary or beneficiaries of your initiative. Refer back to the benefits and outcomes section of the initiative’s opportunity profile (if used) as a starting point.
      3. Clearly define what the key benefits of your initiative will be and list them in the Short-Form Business Case Template.
      4. Assign an owner to each benefit – the individual who will corroborate that the benefit has accrued.
      5. Come to a mutual agreement with the beneficiaries as to whether each benefit is:
        • Financial
        • Quantifiable
        • Measurable
        • Observable
      6. Discuss and list the methods that will be used to measure each benefit and list them in the Short-Form Business Case Template.

      Input

      • Key benefits of the initiative, how they will be measured, and who owns the benefits

      Output

      • Completed benefits section of the Short-Form Business Case Template

      Materials

      • Short-Form Business Case Template

      Participants

      • Opportunity owner
      • Key beneficiary

      Craft value proposition and vision statements

      The way one articulates the value an initiative provides is just as important as the initiative itself. Use the previous exercises as inputs to craft a statement that reflects the value your initiative will provide, but also describes how the initiative will create value. Specifically, a value proposition should answer the following questions:

      1. Who is the initiative for?
      2. What is the initiative?
      3. What does the initiative do?
      4. How is the initiative different from others?

      Complete value prop and vision statement sections of the business case

      Tasks:

      1. Having already completed the benefits section of the Short-Form Business Case Template, turn your attention to the value proposition section.
      2. Using your problem and initiative canvases, in addition to the benefits section, craft a value proposition statement that answers the following questions in one or two sentences:
        • Who is the initiative for?
        • What is the initiative?
        • What does the initiative do?
        • How is the initiative different?
      3. Input the value proposition statement into the value proposition section of the Short-Form Business Case Template.

      Input

      • Initiative canvas
      • Benefits section of the Short-Form Business Case Template

      Output

      • Completed value proposition section of the Short-Form Business Case Template

      Materials

      • Short-Form Business Case Template

      Participants

      • Opportunity owner
      • Opportunity group/team

      Identify initiative steps and add to business case

      Tasks:

      Turn your attention to the roadmap section of the Short-Form Business Case Template and fill it in through the following steps:

      1. Select which scope, resource, and/or time reduction tactics to apply given the context of the project.
      2. Use the test, run, gauge, and collect framework supplied, unless you elect to generate your own project phases. If that is the case, ensure that phases are mutually exclusive and completely exhaustive (MECE).
      3. For each phase, supply a brief description of the activities to be undertaken for that phase.
      4. Map the benefits to be accrued within each phase.
      5. For each phase, supply a set of two to three potential factors that create risk toward the benefits listed.
      6. For each risk, supply a mitigation tactic that could be employed to diffuse the risk or to mitigate it completely.

      Input

      • Project benefits
      • Scope, resource, and time reduction tactics

      Output

      • Roadmap section of the Short-Form Business Case Template

      Materials

      • Short-Form Business Case Template

      Participants

      • Opportunity owner

      Fill out the cost section of the business case

      Tasks:

      1. Having already completed the roadmap part of the Short-Form Business Case Template, turn your attention to the cost section.
      2. Use the scope, resource, and time reduction tactics and roadmap to estimate the cost necessary to execute the project. Remember that costs are a factor of the resources required and the cost type.
        • Resources:
          • Hardware
          • Software
          • Human
          • Network and communications
          • Facilities
        • Cost Types:
          • Acquisition
          • Operation
          • Growth and change
      3. Complete the cost section of the Short-Form Business Case Template with the cost estimate for the project.

      Input

      • Roadmap
      • Scope, resource, and time reduction tactics

      Output

      • Cost section of the Short-Form Business Case Template

      Materials

      • Short-Form Business Case Template

      Participants

      • Opportunity owner
      • Opportunity group/team

      Exemplar: Short-Form Business Case

      Short form business case template. Shows value proposition, initiative benefits and initiative roadmap.

      Step 3: Determine a Prioritized List of Initiatives

      Green-light opportunities for digital investment and create your list of high-priority digital initiatives.

      Step 3: Determine a prioritized list of initiatives.

      Step 3

      Determine a Prioritized List of Initiatives

      3.1

      Compile information

      Finalize your list of high priority initiatives.

      This list should also include the short-form business cases that you completed in the previous step. This compilation of initiative information will be used in the next phase of your digital journey and is critical for its successful completion.

      Consider:
      • Checking your work. Does it ring true? Does it create excitement? People will be working on these initiatives in the near future, so it’s ideal if they feel good about the outcomes.
      • Integrating with your IT strategy, if you have one. These digital initiatives will figure prominently in the fiscal quarters to come.
      Avoid:
      • Dramatic effect. While you want stakeholders and IT staff to be enthusiastic about the work ahead, don’t dress up the initiatives as something they’re not.

      3.2

      Communicate

      It’s time to communicate with stakeholders.

      By now you should have a relatively short yet potent list of digital business initiatives – plus a business case for each – that has been thoroughly vetted and prioritized. Stakeholders are eager to learn more about these initiatives, though the details that matter most may differ from stakeholder to stakeholder.

      Consider:
      • Socializing the business cases before formally presenting to stakeholders for approval.
      • You will want to first elicit feedback and make any recommended changes to messaging.
      • Tailoring your message depending on stakeholder type, their priorities and concerns, and so on.
      Avoid:
      • Sugar coating. Many, if not all, of these stakeholders have the authority to invalidate or disapprove any business case that fails to pass muster. Give it to them straight.

      Compile your prioritized initiatives

      There are two follow-up actions to do with your newly prioritized list of digital initiative business cases: present them to stakeholders for approval and then add them to your IT strategic roadmap.

      Compile prioritized initiatives. Present to stakeholders and then add them to your IT strategic roadmap.

      Present business cases to stakeholders

      For most high-profile digital business initiatives, the short-form business case will not be the first time stakeholders hear about them. By this point, securing approval should only be a formality if the initiative has been effectively socialized beforehand. If this is not the case, one must build an adequate understanding of the stakeholder landscape and then use this understanding to effectively present business cases for digital initiative and receive approval to proceed with them.

      Gauge the importance of various stakeholders and tailor your message according to their concerns and the requirements of their role. Consider the following important questions about each stakeholder:

      • Authority: How much influence does the stakeholder have? Enough to drive the initiative forward?
      • Involvement: How interested is the stakeholder? How involved is the stakeholder in the initiative already?
      • Impact: To what degree will the stakeholder be impacted? Will this significantly change how they do their job?
      • Support: Is the stakeholder a supporter of the initiative? Neutral? A resistor?

      Develop a stakeholder map

      A stakeholder map helps visualize the importance of various stakeholders and their concerns so you can prioritize your time according to those stakeholders who are most impacted by a digital initiative, as well as those who have the authority to green-light them.

      1. Evaluate each stakeholder in terms of authority, involvement, impact, and support, as discussed in the previous slide.
      2. Map each stakeholder to an area on the right template (slide four) based upon the level of their authority and involvement (high or low).
        • Vary the size of the circle to distinguish stakeholders that are highly impacted by the IT strategy from those who are not. Color each circle to show each stakeholder’s estimated or gauged level of support for the project.
      3. Ask yourself if the stakeholder map looks accurate. Is there someone who has no involvement in digital initiatives, but should?
        • A) For example, if a CFO who has the authority to disapprove project funding is heavily impacted and not involved, the success of the business cases will be put at risk.
      4. Draw a dotted circle to show where that stakeholder needs to be located (increased involvement and support), and an arrow with a dotted line to signify the needed change. Some stakeholders may have influence over others.
        • B) For example, a COO who highly values the opinion of the director of operations would be influenced by that director. Draw an arrow from one stakeholder to another to signify this relationship.

      Focus on key players: Relevant stakeholders who have high power are highly impacted and should have high involvement. Engage the stakeholders that are impacted most and have the authority to influence digital initiatives and approve business cases.

      Stakeholder map. Authority versus involvement of key players.

      Summary of key insights

      By now, you should have a firm understanding of the principles and desired actions, behaviors, and outcomes that have been presented in this methodology. Furthermore:

      1. Prioritization of digital opportunities can be a relatively straightforward task as long as the correct stakeholders are involved and use a common and agreed upon set of criteria.
      2. Developing a business case for a digital initiative in an agile manner need not be a grueling exercise provided that a vetted and repeatable process is used.
      3. Above all, remember that this is a journey. Going from an intangible (macro-trend, problem, or opportunity) to a tangible (actual project or initiative) does not happen all at once.

      Related Info-Tech Research

      Understand Industry Trends

      Assess how the external environment presents opportunities or threats to your organization.

      Build a Business-Aligned IT Strategy

      Align with the business by creating an IT strategy that documents the business context, key initiatives, and a strategic roadmap.

      Define Your Digital Business Strategy

      Design a strategy that applies innovation to your business model, streamlines and transforms processes, and makes use of technologies to enhance interactions with customers and employees.

      Research Contributors and Experts

      Ross Armstrong

      Ross Armstrong

      Principal Research Director, CIO Advisory
      Info-Tech Research Group

      Ross Armstrong is a Principal Research Director in the CIO Advisory practice at Info-Tech Research Group, covering the areas of IT strategic planning, digital strategy, digital transformation, and IT innovation.

      Ross has worked in a variety of public and private sector industries including automotive, IT, mobile/telecom, and higher education. All of his roles over the years have centered around data-driven market research – in pursuit of insightful and successful product development and product management – at their core.

      In addition to his long tenure as an Info-Tech Research Group analyst, Ross has worked in research and product innovation positions at Autodata initiatives (J.D. Power), BlackBerry, and Ivey Business School (Western University).

      Ross holds a Master of Arts degree in English Language and Literature from Western University (UWO) and has served as an advisory board member for a number of not-for-profit and educational institutions.

      Joanne Lee

      Joanne Lee

      Principal Research Director, CIO Advisory
      Info-Tech Research Group

      Joanne is an executive with over 25 years of experience providing leadership in digital technology and management consulting across both public and private entities from initiative delivery to organizational redesign across BC, Ontario, and Globally.

      A Director within KPMG’s CIO Advisory Management Consulting services and practice lead for Digital Health in BC, Joanne has led various client engagements from ERP Cloud Strategy, IT Operating Models, Data and Analytics maturity, to process redesign. More recently, Joanne was the Chief Program Officer and Executive Director responsible for leading the implementation of a $450M technology and business transformation initiative across 13 hospitals and community services for one of the largest health authorities in BC.

      A former clinician, Joanne has held progressive leadership roles in healthcare with accountabilities across IT operations and service management, data analytics, project management office (PMO), clinical informatics, and privacy and contract management. Joanne is passionate about connecting people, concepts, and capital.

      Bibliography

      “AI: From Data to ROI.” Cognizant, September 2020. Accessed November 2022.

      Bughin, Jacques, et al. “The Case for Digital Reinvention.” McKinsey Quarterly, February 2017. Accessed November 2022.

      “The Business Case for Digital Transformation.” CPA Canada, June 2021. Accessed November 2022.

      “The Case for Digital Transformation.” The National Center for the Middle Market, Ohio State University, 2020. Accessed October 2022.

      “Digital Transformation in Government Case Study.” Ionology, April 2020. Accessed October 2022.

      Louis, Peter, et al. “Internet of Things – From Buzzword to Business Case.” Siemens, 11 January 2021. Accessed December 2022.

      Miesen, Nick. “Case Studies of Digital Transformations in Process and Aerospace Industries.” Jugaad, 2018. Accessed November 2022.

      Proff, Harald, and Claudia Bittrich. “The Digital Business Case - Done Right!” Deloitte, August 2019. Accessed October 2022.

      “Propelling an Aerospace Innovator.” Accenture, 2021. Accessed October 2022.

      Schmidt-Subramanian, Maxie. “The ROI of CX Transformation.” Forrester, 15 August 2019. Accessed November 2022.

      Ward, John, et al. “Building Better Business Cases for IT Investments.” California Management Review, Sept. 2007. Web.

      Microsoft Teams Cookbook

      • Buy Link or Shortcode: {j2store}408|cart{/j2store}
      • member rating overall impact (scale of 10): 8.8/10 Overall Impact
      • member rating average dollars saved: $6,299 Average $ Saved
      • member rating average days saved: 27 Average Days Saved
      • Parent Category Name: DR and Business Continuity
      • Parent Category Link: /business-continuity

      Remote work calls for leveraging your Office 365 license to use Microsoft Teams – but IT is unsure about best practices for governance and permissions. Moreover, IT has few resources to help train end users with Teams best practices.

      Our Advice

      Critical Insight

      Microsoft Teams is not a standalone app. Successful utilization of Teams occurs when conceived in the broader context of how it integrates with Office 365. Understanding how information flows between Teams, SharePoint Online, and OneDrive for Business, for instance, will aid governance with permissions, information storage, and file sharing.

      Impact and Result

      Use Info-Tech’s Microsoft Teams Cookbook to successfully implement and use Teams. This cookbook includes recipes for:

      • IT best practices concerning governance of the creation process and Teams rollout.
      • End-user best practices for Teams functionality and common use cases.

      Microsoft Teams Cookbook Research & Tools

      Start here – read the Executive Brief

      Learn critical insights for an effective Teams rollout.

      Besides the small introduction, subscribers and consulting clients within this management domain have access to:

      • Microsoft Teams Cookbook – Sections 1-2

      1. Teams for IT

      Understand best practices for governance of the Teams creation process and Teams rollout.

      • Microsoft Teams Cookbook – Section 1: Teams for IT

      2. Teams for end users

      Get end users on board with this series of how-tos and common use cases for Teams.

      • Microsoft Teams Cookbook – Section 2: Teams for End Users

      [infographic]


      Further reading

      Microsoft Teams Cookbook

      Recipes for best practices and use cases for Microsoft Teams.

      Table of contents

      Executive Brief

      Section 1: Teams for IT

      Section 2: Teams for End Users

      Executive Summary

      Situation

      Remote work calls for leveraging your Office 365 license to utilize Teams – but IT is unsure about best practices for governance and permissions.

      Without a framework or plan for governing the rollout of Teams, IT risks overlooking secure use of Teams, the phenomenon of “teams sprawl,” and not realizing how Teams integrates with Office 365 more broadly.

      Complication

      Teams needs to be rolled out quickly, but IT has few resources to help train end users with Teams best practices.

      With teams, channels, chats, meetings, and live events to choose from, end users may get frustrated with lack of guidance on how to use Teams’ many capabilities.

      Resolution

      Use Info-Tech’s Microsoft Teams Cookbook to successfully implement and utilize Teams. This cookbook includes recipes for:

      • IT best practices concerning governance of the creation process and Teams rollout.
      • End-user best practices for Teams functionality and common use cases.

      Key Insights

      Teams is not a standalone app

      Successful utilization of Teams occurs when conceived in the broader context of how it integrates with Office 365. Understanding how information flows between Teams, SharePoint Online, and OneDrive for Business, for instance, will aid governance with permissions, information storage, and file sharing.

      IT should paint the first picture for team creation

      No initial governance for team creation can lead to “teams sprawl.” While Teams was built to allow end users’ creativity to flow in creating teams and channels, this can create problems with a cluttered interface and keeping track of information. To prevent end-user dissatisfaction here, IT’s initial Teams rollout should offer a basic structure for end users to work with first, limiting early teams sprawl.

      The Teams admin center can only take you so far with permissions

      Knowing how Teams integrates with other Office 365 apps will help with rolling out sensitivity labels to protect important information being accidentally shared in Teams. Of course, technology only does so much – proper processes to train and hold people accountable for their actions with data sharing must be implemented, too.

      Related Info-Tech Research

      Establish a Communication and Collaboration System Strategy

      Don’t waste your time deploying yet another collaboration tool that won’t get used.

      Modernize Communication and Collaboration Infrastructure

      Your legacy telephony infrastructure is dragging you down – modern communications and collaboration technology will dramatically improve productivity.

      Migrate to Office 365 Now

      One small step to cloud, one big leap to Office 365. The key is to look before you leap.

      Section 1: Teams for IT

      Governance best practices and use cases for IT

      Section 1

      Teams for IT

      Section 2

      Teams for end users

      From determining prerequisites to engaging end users.

      IT fundamentals
      • Creation process
      • Teams rollout
      Use cases
      • Retain and search for legal/regulatory compliance
      • Add an external user to a team
      • Delete/archive a team

      Overview: Creation process

      IT needs to be prepared to manage other dependent services when rolling out Teams. See the figure below for how Teams integrates with these other Office 365 applications.

      A flow chart outlining how Teams integrates with other Office 365 applications. Along the side are different applications, from the top: 'Teams client', 'OneDrive for Business', 'Sharepoint Online', 'Planner (Tasks for Teams)', 'Exchange Online', and 'Stream'. Along the top are services of 'Teams client', 'Files', 'Teams', 'Chat', 'Meeting', and 'Calls'.

      Which Microsoft 365 license do I need to access Teams?

      • Microsoft 365 Business Essentials
      • Microsoft 365 Business Premium
      • Office 365 Enterprise, E1, E3, or E5
      • Office 365 Enterprise E4 (if purchased prior to its retirement)

      Please note: To appeal to the majority of Info-Tech’s members, this blueprint refers to Teams in the context of Office 365 Enterprise licenses.

      Assign admin roles

      You will already have at least one global administrator from setting up Office 365.

      Global administrators have almost unlimited access to settings and most of the data within the software, so Microsoft recommends having only two to four IT and business owners responsible for data and security.

      Info-Tech Best Practice

      Configure multifactor authentication for your dedicated Office 365 global administrator accounts and set up two-step verification.

      Once you have organized your global administrators, you can designate your other administrators with “just-enough” access for managing Teams. There are four administrator roles:

      Teams Service Administrator Manage the Teams service; manage and create Microsoft 365 groups.
      Teams Communications Administrator Manage calling and meetings features with Teams.
      Teams Communications Support Engineer Troubleshoot communications issues within Teams using the advanced troubleshooting toolset.
      Teams Communications Support Specialist Troubleshoot communications issues using Call Analytics.

      Prepare the network

      There are three prerequisites before Teams can be rolled out:

      • UDP ports 3478 through 3481 are opened.
      • You have a verified domain for Office 365.
      • Office 365 has been rolled out, including Exchange Online and SharePoint Online.

      Microsoft then recommends the following checklist to optimize your Teams utilization:

      • Optimize calls and performance using the Call Quality Dashboard.
      • Assess network requirements in the Network Planner in the Teams admin center.
      • Ensure all computers running Teams client can resolve external DNS queries.
      • Check adequate public IP addresses are assigned to the NAT pools to prevent port exhaustion.
      • Route to local or regional Microsoft data centers.
      • Whitelist all Office 365 URLs to move through security layers, especially IDS/IPS.
      • Split tunnel Teams traffic so it bypasses your organization’s VPN.

      Info-Tech Best Practice

      For online support and walkthroughs, utilize Advisor for Teams. This assistant can be found in the Teams admin center.

      Team Creation

      You can create and manage Teams through the Teams PowerShell module and the Teams admin center. Only the global administrator and Teams service administrator have full administrative capabilities in this center.

      Governance over team creation intends to prevent “teams sprawl” – the phenomenon whereby end users create team upon team without guidance. This creates a disorganized interface, with issues over finding the correct team and sharing the right information.

      Prevent teams sprawl by painting the first picture for end users:

      1. Decide what kind of team grouping would best fit your organization: by department or by project.
      2. Start with a small number of teams before letting end users’ creativity take over. This will prevent initial death by notifications and support adoption.
      3. Add people or groups to these teams. Assign multiple owners for each team in case people move around at the start of rollout or someone leaves the organization.
      4. Each team has a general channel that cannot be removed. Use it for sharing an overview of the team’s goals, onboarding, and announcements.

      Info-Tech Best Practice

      For smaller organizations that are project-driven, organize teams by projects. For larger organizations with established, siloed departments, organize by department; projects within departments can become channels.

      Integrations with SharePoint Online

      Teams does not integrate with SharePoint Server.

      Governance of Teams is important because of how tightly it integrates with other Office 365 apps, including SharePoint Online.

      A poor rollout of Teams will have ramifications in SharePoint. A good rollout will optimize these apps for the organization.

      Teams and SharePoint integrate in the following ways:

      • Each team created in Teams automatically generates a SharePoint team site behind it. All documents and chat shared through a team are stored in that team’s SharePoint document library.
      • As such, all files shared through Teams are subject to SharePoint permissions.
      • Existing SharePoint folders can be tied to a team without needing to create a new one.
      • If governance over resource sharing in Teams is poor, information can get lost, duplicated, or cluttered throughout both Teams and SharePoint.

      Info-Tech Best Practice

      End users should be encouraged to integrate their teams and channels with existing SharePoint folders and, where no folder exists, to create one in SharePoint first before then attaching a team to it.

      Permissions

      Within the Teams admin center, the global or Teams service administrator can manage Teams policies.

      Typical Teams policies requiring governance include:

      • The extent end users can discover or create private teams or channels
      • Messaging policies
      • Third-party app use

      Chosen policies can be either applied globally or assigned to specific users.

      Info-Tech Best Practice

      If organizations need to share sensitive information within the bounds of a certain group, private channels help protect this data. However, inviting users into that channel will enable them to see all shared history.

      External and guest access

      Within the security and compliance center, the global or Teams service administrator can set external and guest access.

      External access (federation) – turned on by default.

      • Lets you find, call, and chat with users in other domains. External users will have no access to the organization’s teams or team resources.

      Guest access – turned off by default.

      • Lets you add individual users with their own email address. You do this when you want external users to access teams and team resources. Approved guests will be added to the organization’s active directory.

      If guest access is enabled, it is subject to Azure AD and Office 365 licensing and service limits. Guests will have no access to the following, which cannot be changed:

      • OneDrive for Business
      • An organization’s calendar/meetings
      • PSTN
      • Organization’s hierarchical chart
      • The ability to create, revise, or browse a team
      • Upload files to one-on-one chat

      Info-Tech Best Practice

      Within the security and compliance center, you can allow users to add sensitivity labels to their teams that can prevent external and guest access.

      Expiration and archiving

      To reduce the number of unused teams and channels, or delete information permanently, the global or Teams service administrator can implement an Office 365 group expiration and archiving policy through the Teams admin center.

      If a team has an expiration policy applied to it, the team owner will receive a notification for team renewal 30 days, 15 days, and 1 day before the expiry date. They can renew their team at any point within this time.

      • To prevent accidental deletion, auto-renewal is enabled for a team. If the team owner is unable to manually respond, any team that has one channel visit from a team member before expiry is automatically renewed.
      • A deleted Office 365 group is retained for 30 days and can be restored at any point within this time.

      Alternatively, teams and their channels (including private) can be archived. This will mean that all activity for the team ceases. However, you can still add, remove, and update roles of the members.

      Retention and data loss prevention

      Retention policies can be created and managed in the Microsoft 365 Compliance Center or the security and compliance center PowerShell cmdlets. This can be applied globally or to specific users.

      By default, information shared through Teams is retained forever.

      However, setting up retention policies ensures data is retained for a specified time regardless of what happens to that data within Teams (e.g. user deletes).

      Info-Tech Best Practice

      To prevent external or guest users accessing and deleting sensitive data, Teams is able to block this content when shared by internal users. Ensure this is configured appropriately in your organization:

      • For guest access in teams and channels
      • For external access in meetings and chat

      Please note the following limitations of Teams’ retention and data loss prevention:

      • Organization-wide retention policies will need to be manually inputted into Teams. This is because Teams requires a retention policy that is independent of other workloads.
      • As of May 2020, retention policies apply to all information in Teams except private channel messages. Files shared in private channels, though, are subject to retention policies.
      • Teams does not support advanced retention settings, such as a policy that pertains to specific keywords or sensitive information.
      • It will take three to seven days to permanently delete expired messages.

      Teams telephony

      Teams has built-in functionality to call any team member within the organization through VoIP.

      However, Teams does not automatically connect to the PSTN, meaning that calling or receiving calls from external users is not immediately possible.

      Bridging VoIP calls with the PSTN through Teams is available as an add-on that can be attached to an E3 license or as part of an E5 license.

      There are two options to enable this capability:

      • Enable Phone System. This allows for call control and PBX capabilities in Office 365.
      • Use direct routing. You can use an existing PSTN connection via a Session Border Controller that links with Teams (Amaxra).

      Steps to implement Teams telephony:

      1. Ensure Phone System and required (non-Microsoft-related) services are available in your country or region.
      2. Purchase and assign Phone System and Calling Plan licenses. If Calling Plans are not available in your country or region, Microsoft recommends using Direct Routing.
      3. Get phone numbers and/or service numbers. There are three ways to do this:
        • Get new numbers through the Teams admin center.
        • If you cannot get new numbers through the Teams admin center, you can request new numbers from Microsoft directly.
        • Port or transfer existing numbers. To do this, you need to send Microsoft a letter of authorization, giving them permission to request and transfer existing numbers on your behalf.
      4. To enable service numbers, including toll-free numbers, Microsoft recommends setting up Communications Credits for your Calling Plans and Audio Conferencing.

      Overview: Teams rollout

      1. From Skype (and Slack) to Teams
      2. Gain stakeholder purchase
      3. Employ a phased deployment
      4. Engage end users

      Skype for Business is being retired; Microsoft offers a range of transitions to Teams.

      Combine the best transition mode with Info-Tech’s adoption best practices to successfully onboard and socialize Teams.

      From Skype to Teams

      Skype for Business Online will be retired on July 31, 2021. Choose from the options below to see which transition mode is right for your organization.

      Skype for Business On-Premises will be retired in 2024. To upgrade to Teams, first configure hybrid connectivity to Skype for Business Online.

      Islands mode (default)

      • Skype for Business and Teams coexist while Teams is rolled out.
      • Recommended for phased rollouts or when Teams is ready to use for chat, calling, and meetings.
      • Interoperability is limited. Teams and Skype for Business only transfer information if an internal Teams user sends communications to an external Skype for Business user.

      Teams only mode (final)

      • All capabilities are enabled in Teams and Skype for Business is disabled.
      • Recommended when end users are ready to switch fully to Teams.
      • End users may retain Skype for Business to join meetings with non-upgraded or external parties. However, this communication is only initiated from the Skype for Business external user.

      Collaboration first mode

      • Skype for Business and Teams coexist, but only Teams’ collaboration capabilities are enabled. Teams communications capabilities are turned off.
      • Recommended to leverage Skype for Business communications yet utilize Teams for collaboration.

      Meetings first mode

      • Skype for Business and Teams coexist, but only Teams’ meetings capabilities are enabled.
      • Recommended for organizations that want to leverage their Skype for Business On-Premises’ Enterprise Voice capability but want to benefit from Teams’ meetings through VoIP.

      From Slack to Teams

      The more that’s left behind in Slack, the easier the transition. As a prerequisite, pull together the following information:

      • Usage statistics of Slack workspaces and channels
      • What apps end users utilize in Slack
      • What message history you want to export
      • A list of users whose Slack accounts can map on to required Microsoft accounts
      Test content migration

      Your Slack service plan will determine what you can and can’t migrate. By default, public channels content can be exported. However, private channels may not be exportable, and a third-party app is needed to migrate Direct Messages.

      Files migration

      Once you have set up your teams and channels in Teams, you can programmatically copy files from Slack into the target Teams channel.

      Apps migration

      Once you have a list of apps and their configurations used in Slack’s workspaces, you can search in Teams’ app store to see if they’re available for Teams.

      User identity migration

      Slack user identities may not map onto a Microsoft account. This will cause migration issues, such as problems with exporting text content posted by that user.

      Follow the migration steps to the right.

      Importantly, determine which Slack workspaces and channels should become teams and channels within Teams.

      Usage statistics from Slack can help pinpoint which workspaces and channels are redundant.

      This will help IT paint an ordered first picture for new Teams end users.

      1. Create teams and channels in Teams
      2. Copy files into Teams
      3. Install apps, configure Office 365 Connecters
      4. Import Slack history
      5. Disable Slack user accounts

      Info-Tech Best Practice

      Avoid data-handling violations. Determine what privacy and compliance regulations (if any) apply to the handling, storage, and processing of data during this migration.

      Gain stakeholder purchase

      Change management is a challenging aspect of implementing a new collaboration tool. Creating a communication and adoption plan is crucial to achieving universal buy-in for Teams.

      To start, define SMART objectives and create a goals cascade.

      Specific Measurable Actionable Realistic Time Bound
      Make sure the objective is clear and detailed. Objectives are `measurable` if there are specific metrics assigned to measure success. Metrics should be objective. Objectives become actionable when specific initiatives designed to achieve the objective are identified. Objectives must be achievable given your current resources or known available resources. An objective without a timeline can be put off indefinitely. Furthermore, measuring success is challenging without a timeline.
      Who, what, where, why? How will you measure the extent to which the goal is met? What is the action-oriented verb? Is this within my capabilities? By when: deadline, frequency?

      Sample list of stakeholder-specific benefits from improving collaboration

      Stakeholder Driver Benefits
      Senior Leadership Resource optimization Increased transparency into IT operational costs.
      Better ability to forecast hardware, resourcing costs.
      All employees Increasing productivity Apps deployed faster.
      Issues fixed faster.
      Easier access to files.
      Able to work more easily offsite.
      LBU-HR, legal, finance Mitigating risk Better able to verify compliance with external regulations.
      Better understanding of IT risks.
      Service desk Resource optimization Able to resolve issues faster.
      Fewer issues stemming from updates.
      Tier 2 Increasing productivity Less time spent on routine maintenance.

      Use these activities to define what pain points stakeholders face and how Teams can directly mitigate those pain points.

      (Source: Rationalize Your Collaboration Tools (coming soon), Activities: 3.1C – 3.1D)

      Employ a phased deployment

      Info-Tech Best Practice

      Deploy Teams over a series of phases. As such, if you are already using Skype for Business, choose one of the coexistence phases to start.

        1. Identify and pilot Teams with early adopters that will become your champions. These champions should be formally trained, be encouraged to help and train their colleagues, and be positively reinforced for their efforts.
        2. Iron out bugs identified with the pilot group and train middle management. Enterprise collaboration tool adoption is strongly correlated with leadership adoption.
          1. Top-level management
            Control and direct overall organization.
          2. Middle management
            Execute top-level management’s plans in accordance with organization’s norms.
          3. First-level management
            Execute day-to-day activities.
        3. Use Info-Tech’s one-pager marketing template to advertise the new tool to stakeholders. Highlight how the new tool addresses specific pain points. Address questions stemming from fear and uncertainty to avoid employees’ embarrassment or their rejection of the tool.
      A screenshot of Info-Tech's one-pager marketing template.
      1. Extend the pilot to other departments and continue this process for the whole organization.

      (Source: Rationalize Your Collaboration Tools (coming soon), Tools:GANTT Chart and Marketing Materials, Activities: 3.2A – 3.2B)

      Info-Tech Insight

      Be in control of setting and maintaining expectations. Aligning expectations with reality and the needs of employees will lower onboarding resistance.

      Engage end users

      Short-term best practices

      Launch day:
      • Hold a “lunch and learn” targeted training session to walk end users through common use cases.
      • Open a booth or virtual session (through Teams!) and have tool representatives available to answer questions.
      • Create a game to get users exploring the new tool – from scavenger hunts to bingo.
      Launch week:
      • Offer incentives for using the tool and helping others, including small gift cards.
      • Publicize achievements if departments hit adoption milestones.

      Long-term best practices

      • Make available additional training past launch week. End users should keep learning new features to improve familiarity.
      • Distribute frequent training clips, slowly exposing end users to more complex ways of utilizing Teams.
      • Continue to positively reinforce and recognize those who use Teams well. This could be celebrating those that help others use the tool, how active certain users are, and attendance at learning events.

      Info-Tech Best Practice

      Microsoft has a range of training support that can be utilized. From instructor-led training to “Coffee in the Cloud” sessions, leverage all the support you can.

      Use case #1: Retain and search data for legal/regulatory compliance

      Scenario:

      Your organization requires you to retain data and documents for a certain period of time; however, after this period, your organization wishes to delete or archive the data instead of maintaining it indefinitely. Within the timeframe of the retention policy, the admin may be asked to retrieve information that has been requested through a legal channel.

      Purpose:
      • Maintain compliance with the legal and regulatory standards to which the organization is subject.
      Jobs:
      • Ensure the data is retained for the approved time period.
      • Ensure the policy applies to all relevant data and users.
      Solution: Retention Policies
      • Ensure that your organization has an Office 365 E3 or higher license.
      • Set the desired retention policy through the Security & Compliance Center or PowerShell by deciding which teams, channels, chats, and users the policies will apply to and what will happen once the retention period ends.
      • Ensure that matching retention policies are applied to SharePoint and OneDrive, since this is where files shared in Teams are stored.
      • Be aware that Teams retention policies cannot be applied to messages in private channels.
      Solution: e-Discovery
      • If legally necessary, place users or Teams on legal hold in order to retain data that would be otherwise deleted by your organization’s retention policies.
      • Perform e-discovery on Teams messages, files, and summaries of meetings and calls through the Security & Compliance Center.
      • See Microsoft’s chart on the next slide for what is e-discoverable.

      Content subject to e-discovery

      Content type eDiscoverable Notes
      Teams chat messages Yes Chat messages from chats where guest users are the only participants in a 1:1 or 1:N chat are not e-discoverable.
      Audio recordings No  
      Private channel messages Yes  
      Emojis, GIFs, stickers Yes  
      Code snippets No  
      Chat links Yes  
      Reactions (likes, hearts, etc) No  
      Edited messages Yes If the user is on hold, previous versions of edited messages are preserved.
      Inline images Yes  
      Tables Yes  
      Subject Yes  
      Quotes Yes Quoted content is searchable. However, search results don’t indicate that the content was quoted.
      Name of channel No  

      E-discovery does not capture audio messages and read receipts in MS Teams.

      Since files shared in private channels are stored separately from the rest of a team, follow Microsoft’s directions for how to include private channels in e-discovery. (Source: “Conduct an eDiscovery investigation of content in Microsoft Teams,” Microsoft, 2020.)

      Use case #2: Add external person to a team

      Scenario:

      A team in your organization needs to work in an ongoing way with someone external to the company. This user needs access to the relevant team’s work environment, but they should not be privy to the goings-on in the other parts of the organization.

      Jobs:

      This external person needs to be able to:

      • Attend meetings
      • Join calls
      • Chat with individual team members
      • View and collaborate on the team’s files
      Solution:
      • If necessary, set a data loss prevention policy to prevent your users from sharing certain types of information or files with external users present in your organization’s Teams chats and public channels.
      • Ensure that your Microsoft license includes DLP protection. However:
        • DLP cannot be applied to private channel messages.
        • DLP cannot block messages from external Skype for Business users nor external users who are not in “Teams only” mode.
      • Ensure that you have a team set up for the project that you wish the external user to join. The external user will be able to see all the channels in this team, unless you create a private channel they are restricted from.
      • Complete Microsoft’s “Guest Access Checklist” to enable guest access in Teams, if it isn’t already enabled.
      • As admin, give the external user guest access through the Teams admin center or Azure AD B2B collaboration. (If given permission, team owners can also add guests through the Teams client).
      • Decide whether to set a policy to monitor and audit external user activity.

      Use case #3: Delete/archive a team

      Scenario:

      In order to avoid teams sprawl, organizations may want IT to periodically delete or archive unused teams within the Teams client in order to improve the user interface.

      Alternately, if you are using a project-based approach to organizing Teams, you may wish to formalize a process to archive a team once the project is complete.

      Delete:
      • Determine if the team owner anticipates the team will need to be restored one day.
      • Ensure that deletion does not contradict the organization’s retention policy.
      • If not, proceed with deletion. Find the team in the Teams admin center and delete.
      • Restore a deleted team within 30 days of its initial deletion through PowerShell.
      Archive:
      • Determine if the team owner anticipates the team will need to be restored one day.
      • Find the relevant team in the Teams admin center and change its status to “Archived.”
      • Restore the archived team if the workspace becomes relevant once again.

      Info-Tech Best Practice

      Remind end users that they can hide teams or channels they do not wish to see in their Teams interface. Knowing a team can be hidden may impact a team owner’s decision to delete it.

      Section 2: Teams for End Users

      Best practices for utilizing teams, channels, chat, meetings, and live events

      Section 1

      Teams for IT

      Section 2

      Teams for end users

      From Teams how-tos to common use cases for end users.

      End user basics
      • Teams, channels, and chat
      • Meetings and live events
      Common use cases: Workspaces
      • WS#1: Departments
      • WS#2: A cross-functional committee
      • WS#3: An innovation day event
      • WS#4: A non-work-related social event
      • WS#5: A project team with a defined end time
      Common use cases: Meetings
      • M#1: Job interview with an external candidate
      • M#2: Quarterly board meeting
      • M#3: Weekly recurring team meeting
      • M#4: Morning stand-up/scrum
      • M#5: Phone call between two people

      Overview: Teams, channels, and chat

      Teams

      • Team: A workspace for a group of collaborative individuals.
        • Public channel: A focused area where all members of a team can meet, communicate, and share ideas and content.
        • Private channel: Like a public channel but restricted to a subset of team members, defined by channel owner.

      Chat

      • Chat: Two or more users collected into a common conversation thread.
      (Source: “Overview of teams and channels in Microsoft Teams,” Microsoft, 2020.)

      For any Microsoft Teams newcomer, the differences between teams, channels, and chat can be confusing.

      Use Microsoft’s figure (left) to see how these three mediums differ in their role and function.

      Best practices: Workspaces 1/2

        Team
      A workspace for a group of collaborative individuals.
      Public Channel
      A focused area where all members of a team can meet, communicate, and share ideas and content.
      Private Channel
      Like a public channel but restricted to a subset of team members, defined by channel owner.
      Group Chat
      Two or more users collected into a common conversation thread.
      Limits and Administrative Control
      Who can create? Default setting: All users in an organization can create a team

      Maximum 500,000 teams per tenant

      Any member of a team can create a public channel within the team

      Maximum 200 public channels per team

      Any member of a team can create a private channel and define its members

      Maximum 30 private channels per team

      Anyone
      Who can add members? Team owner(s); max 5,000 members per team N/A Channel owner(s) can add up to 250 members Anyone can bring new members into the chat (and decide if they can see the previous history) up to 100 members
      Who can delete? Team owner/admin can delete Any team member Channel owner(s) Anyone can leave a chat but cannot delete chat, but they are never effectively deleted
      Social Context
      Who can see it? Public teams are indexed and searchable

      Private teams are not indexed and are visible only to joined members

      All members of the team can see all public channels. Channels may be hidden from view for the purposes of cleaning up the UI. Individuals will only see private channels for which they have membership Only participants in the group chat can see the group chat
      Who can see the content? Team members can see any content that is not otherwise part of a private channel All team members All members of the private channel Only members of the group chat

      When does a Group Chat become a Channel?

      • When it’s appropriate for the conversation to have a gallery – an audience of members who may not be actively participating in the discussion.
      • When control over who joins the conversation needs to be centrally governed and not left up to anyone in the discussion.
      • When the discussion will persist over a longer time period.
      • When the number of participants approaches 100.

      When does a Channel become a Team?

      • When a team approaches 30 private channels, many of those private channels are likely candidates to become their own team.
      • When the channel membership needs to extend beyond the boundary of the team membership.

      Best practices: Workspaces 2/2

        Team
      A workspace for a group of collaborative individuals.
      Public Channel
      A focused area where all members of a team can meet, communicate, and share ideas and content.
      Private Channel
      Like a public channel but restricted to a subset of team members, defined by channel owner.
      Group Chat
      Two or more users collected into a common conversation thread.
      Data and Applications
      Where does the content live? SharePoint: Every team resides in its own SharePoint site SharePoint: Each team (public and private) has its own folder off the root of the SharePoint site’s repository SharePoint: Each team (public and private) has its own folder off the root of the SharePoint site’s repository OneDrive: Files that are shared in a chat are stored in the OneDrive folder of the original poster and shared to the other members
      How does the data persist or be retained? If a team expires/is deleted, its corresponding SharePoint site and those artifacts are also deleted Available for 21 days after deletion. Any member of the team can delete a public channel. The team owner and private channel owner can delete/restore a private channel Chats are never effectively deleted. They can be hidden to clean up the user interface.
      Video N/A Yes, select “Meet now” in channel below text entry box Yes, select “Meet now” in channel below text entry box Yes
      Phone calls N/A Yes, select “Meet now” in channel below text entry box Yes, select “Meet now” in channel below text entry box Yes
      Shared computer audio/screen N/A Yes, select “Meet now” in channel below text entry box Yes, select “Meet now” in channel below text entry box Yes
      File-sharing Within channels Yes. Frequently used/collaborated files can be turned into discrete tab. Yes. Frequently used/collaborated files can be turned into discrete tab. Yes
      Wikis Within channels Yes Yes No
      Whiteboarding No No No No

      When does a Team become a Channel?

      • When a team’s purpose for existing can logically be subsumed by another team that has a larger scope.

      When does a Channel become a Group Chat?

      • When a conversation within a channel between select users does not pertain to that channel’s scope (or any other existing channel), they should move the conversation to a group chat.
      • However, this is until that group chat desires to form a channel of its own.

      Create a new team

      Team owner: The person who creates the team. It is possible for the team owner to then invite other members of the team to become co-owners to distribute administrative responsibilities.

      Team members: People who have accepted their invitation to be a part of the team.

      NB: Your organization can control who has permission to set up a team. If you can’t set a up a team, contact your IT department.

      Screenshots detailing how to create a new team in Microsoft Teams, steps 1 to 3. Step 1: 'Click the <Teams data-verified= tab on the left-hand side of the app'. Step 2: 'At the bottom of the app, click '. Step 3: 'Under the banner , click '.">

      Create a new team

      Screenshot detailing how to create a new team in Microsoft Teams, the step 4 starting point with an arrow pointing to the 'Build a team from scratch' button.

      Decide from these two options:

      • Building a team from scratch, which will create a new group with no prior history imported (steps 4.1–4.3).
      • Creating a team from an existing group in Office 365, including an already existing team (steps 4.4–4.6).

      NB: You cannot create a team from an existing group if:

      • That group has 5,000 members or more.
      • That group is in Yammer.

      Screenshot detailing how to create a new team in Microsoft Teams, step 4.1. There are buttons for 'Private' and 'Public'.

      Decide if you want you new team from scratch to be private or public. If you set up a private team, any internal or external user you invite into the team will have access to all team history and files shared.

      Screenshot detailing how to create a new team in Microsoft Teams, step 4.2 and 4.3. 4.2 has a space to give your team a name and another for a description. 4.3 says 'Then click <Create data-verified='.">

      Create a new team

      Screenshot detailing how to create a new team in Microsoft Teams, the step 4 starting point with an arrow pointing to the 'Create from...' button.

      Decide from these two options:

      • Building a team from scratch, which will create a new group with no prior history imported (steps 4.1–4.3).
      • Creating a team from an existing group in Office 365, including an already existing team (steps 4.4–4.6).

      NB: You cannot create a team from an existing group if:

      • That group has 5,000 members or more.
      • That group is in Yammer.

      Screenshot detailing how to create a new team in Microsoft Teams, step 4.4. It reads 'Create a new team from something you already own' with a button for 'Team'.

      Configure your new team settings, including privacy, apps, tabs, and members.

      Screenshot detailing how to create a new team in Microsoft Teams, step 4.5 and 4.6. 4.5 has a space to give your team a name, a description, choose privacy settings, and what you'd like to include from the original team. 4.6 says 'Then click <Create data-verified='.">

      Add team members

      Remove team members

      Screenshot detailing how to add team members in Microsoft Teams, step 1.

      To add a team member, on the right-hand side of the team name, click “More options.”

      Then, from the drop-down menu, click “Add member.”

      Screenshot detailing how to remove team members in Microsoft Teams, step 1.

      Only team owners can remove a team member. To do so, on the right-hand side of the team name, click “More options.”

      Then, from the drop-down menu, click “Manage team.”

      Screenshot detailing how to add team members in Microsoft Teams, step 2.

      If you’re a team owner, you can then type a name or an email address to add another member to the team.

      If you’re a team member, typing a name or an email address will send a request to the team owner to consider adding the member.

      Screenshot detailing how to remove team members in Microsoft Teams, step 2.

      Under the “Members” tab, you’ll see a list of the members in the team. Click the “X” at the far right of the member’s name to remove them.

      Team owners can only be removed if they change their role to team member first.

      Create a new channel

      Screenshot detailing how to create a new channel in Microsoft Teams, step 1.

      On the right-hand side of the team name, click “More options.”

      Then, from the drop-down menu, click “Add channel.”

      Screenshot detailing how to create a new channel in Microsoft Teams, step 2.

      Name your channel, give a description, and set your channel’s privacy.

      Screenshot detailing how to create a new channel in Microsoft Teams, step 3.

      To manage subsequent permissions, on the right-hand side of the channel name, click “More options.”

      Then, from the drop-down menu, click “Manage channel.”

      Adding and removing members from channels:

      Only members in a team can see that team’s channels. Setting channel privacy as “standard” means that the channel can be accessed by anyone in a team. Unless privacy settings for a channel are set as “private” (from which the channel creator can choose who can be in that channel), there is no current way to remove members from channels.

      It will be up to the end user to decide which channels they want to hide.

      Link team/channel to SharePoint folder

      Screenshot detailing how to link a team or channel to a SharePoint folder in Microsoft Teams, steps 1, 2, and 3. Step 1: 'Along the top of the team/channel tab bar, click the “+” symbol'. Step 2: 'Select “Document Library” to link the team/channel to a SharePoint folder'. Step 3: 'Copy and paste the SharePoint URL for the desired folder, or search in “Relevant sites” if the folder can be found there'.

      Need to find the SharePoint URL?

      Screenshot detailing how to find the SharePoint URL in Microsoft Teams. 'Locate the folder in SharePoint and click <Show actions data-verified=', 'Click to access the folder's SharePoint URL.'">

      Hide/unhide teams

      Hide/unhide channels

      Screenshot detailing how to hide and unhide teams in Microsoft Teams, step 1.

      To hide a team, on the right-hand side of the team name, click “More options.”

      Then, from the drop-down menu, click “Hide.” Hidden teams are moved to the “hidden teams” menu at the bottom of your team list.

      Screenshot detailing how to hide and unhide channels in Microsoft Teams, step 1.

      To hide a channel, on the right-hand side of the channel name, click “More options.”

      Then, from the drop-down menu, click “Hide.” Hidden channels are moved to the “hidden channels” menu at the bottom of your channel list in that team.

      Screenshot detailing how to hide and unhide teams in Microsoft Teams, step 2. Screenshot of a button that says 'Hidden teams'.

      To unhide a team, click on the “hidden teams” menu. On the right-hand side of the team name, click “More options.”

      Then, from the drop-down menu, click “Show.”

      Screenshot detailing how to hide and unhide channels in Microsoft Teams, step 2.

      To unhide a channel, click on the “hidden channels” menu at the bottom of the team. This will produce a drop-down menu of all hidden channels in that team.

      Hover over the channel you want to unhide and click “Show.”

      Find/join teams

      Leave teams

      Screenshot detailing how to find and join teams in Microsoft Teams, step 1. Click the “Teams” tab on the left-hand side of the app. Screenshot detailing how to find and join teams in Microsoft Teams, step 2.

      At the bottom of the app, click “Join or create a team.” Teams will then suggest a range of teams that you might be looking for. You can join public teams immediately. You will have to request approval to join a private team.

      Screenshot detailing how to leave teams in Microsoft Teams.

      To leave a team, on the right-hand side of the team name, click “More options.”

      Then, from the drop-down menu, click “Leave the team.”

      NB: If the owner of a private team has switched off discoverability, you will have to contact that owner to join that team. Screenshot detailing how to find and join teams in Microsoft Teams, step 3. If you can’t immediately see the team, you have two options: either search for the team or enter that team’s code under the banner “Join a team with a code.” Can I find a channel?

      No. To join a channel, you need to first join the team that channel belongs to.

      Can I leave a channel?

      No. The most you can do is hide the channel. By default, if you join a team you will have access to all the channels within that team (unless a channel is private, in which case you’ll have to request access to that channel).

      Create a chat

      Screenshots detailing how to create a chat in Microsoft Teams, steps 1 to 5. Step 1:'Click the “Chat” tab on the left hand side of the app (or keyboard shortcut Ctrl+N)'. Step 2: 'Search the name of the person you want to chat with'. Step 3: 'You’re now ready to start the chat! You can also send a chat message while working in a separate channel by typing/chat into the search bar and entering the recipient’s name'. Step 4: 'For group chat, click the “Add people” button in the top right hand corner of the app to add other persons into the existing chat'. Step 5: 'You can then rename the group chat (if there are 3+ people) by clicking the “Name group chat” option to the right of the group chat members’ names'.

      Hide a chat

      Unhide a chat

      Screenshots detailing how to hide a chat in Microsoft Teams, steps 1 to 3. Step 1:'Click the “Chat” tab on the left-hand side of the app'. Step 2: 'Search the name of the chat or group chat that you want to hide'. Step 3: In either 'Single person chat options' or 'Group chat options' Click “More options.” Then click “Hide.”' To unhide a chat, search for the hidden person or name of the group chat in the search bar. Click “More options.” Then click “Unhide.” Screenshot detailing how to unhide a chat in Microsoft Teams.

      Leave a chat

      You can only leave group chats. To do so, click “More options.” Then click “Leave.” Screenshot detailing how to leave a chat in Microsoft Teams.

      Overview: Meetings and live events

      Teams Meetings: Real-time communication and collaboration between a group, limited to 250 people.

      Teams Live Events: designed for presentations and webinars to a large audience of up to 10,000 people, in which attendees watch rather than interact.


      Office 365 and Microsoft 365 Licenses

      I want to: F1 F3 E1 E3 E5 Audio conferencing add-on
      Join a Teams meeting No license required. Any email address can participate in a Teams meeting.
      Attend a Teams meeting with a dial-in phone number No license required. Any phone number can dial into a Teams meeting. (Meeting organizers need to have an Audio Conferencing add-on license to send an invite that includes dial-in conferencing.)
      Attend a Teams live event No license required. Any phone number can dial into a Teams live event.
      Create a Teams meeting for up to 250 attendees   One of these licensing plans
      Create a Teams meeting for up to 250 attendees with a dial-in phone number   One of these licensing plans + Audio Conferencing (Meeting organizers need to have an Audio Conferencing add-on license to send an invite that includes dial-in conferencing.)
      Create a Teams live event for up to 10,000 attendees     One of these licensing plans
      Dial out from a Teams meeting to add someone at their Call me at number   One of these licensing plans + Audio Conferencing (Meeting dial out to a Call me at number requires organizers to have an E5 or Audio Conference add-in license. A dial plan may also be needed.)

      Depending on the use case, end users will have to determine whether they need to hold a meeting or a live event.

      Use Microsoft’s table (left) to see what license your organization needs to perform meetings and live events.

      (Source: “Admin quick start – Meetings and live events in Microsoft Teams,” Microsoft, 2020.)

      Best practices: Meetings

        Ad Hoc Call
      Direct audio/video call
      Scheduled Meeting Live Event
      Limits and Administrative Control
      Who can create? Anyone Anyone Anyone, unless altered by admin (permission to create MS Stream events also required if external production tools are used).
      Who can add members? Anyone in the session. The meeting organizer can add new attendees to the meeting. The event creator (the “organizer”) sets attendee permissions and assigns event group roles (“producer” and “presenter”).
      Can external stakeholders attend? Yes, through email invite. However, collaboration tools are restricted. Yes, through email invite. However, collaboration tools are restricted. Public events: yes, through shared invite link.
      Org-wide event: yes, if guest/external access granted.
      Who can delete? Anyone can leave the session. There is no artifact to delete. The meeting organizer Any attendee can leave the session.
      The organizer can cancel the event.
      Maximum attendees 100 250 10,000 attendees and 10 active presenters/producers (250 presenters and producers can be present at the event).
      Social Context
      How does the request come in? Unscheduled.
      Notification of an incoming audio or video call.
      Scheduled.
      Meeting invite, populated in the calendar, at a scheduled time.
      Meeting only auto-populated in event group’s calendars. Organizer must circulate event invite link to attendees – for instance, by pasting link into an Outlook meeting invite.
      Available Functionality
      Screen-sharing Yes Yes Producers and Presenters (through Teams, no third-party app).
      Whiteboard No Yes Yes
      OneNote (for minutes) Yes (from a member’s OneDrive) Yes, part of the meeting construct. No. A Meeting Notes tab is available instead.
      Dedicated chat space Yes. Derived from a group chat. Meeting has its own chat room. The organizer can set up a moderated Q&A (not chat) when creating the event. Only Presenters and Producers can chat.
      Recording Yes Yes Yes. Event can last up to 4 hours.

      When should an Ad Hoc Call become a Scheduled Meeting?

      • When the participants need time to prepare content for the call.
      • When an answer is not required immediately.
      • When bringing a group of people together requires logistical organizing.

      When should a Scheduled Meeting become an Ad Hoc Call?

      • When the participants can meet on short notice.
      • When a topic under discussion requires creating alignment quickly.

      When should a Live Event be created?

      • When the expected attendance exceeds 250 people.
      • If the event does not require collaboration and is mostly a presenter conveying information.

      Create a scheduled meeting

      Screenshots detailing how to create a scheduled meeting in Microsoft Teams, steps 1 to 4. Step 1:'Click the “Calendar” tab on the left-hand side of the app'. Step 2: 'On the top-right of the app, click the drop-down menu for “+ New meeting” and then “Schedule meeting.”' Step 3: 'Fill in the meeting details. When inputting internal attendees, their names will drop down without needing their email. You will need to input email addresses for external attendees'. Step 4: 'To determine internal attendees’ availability, click “Scheduling assistant” on the top left. Then click “Save” to create the meeting'.

      Create an ad hoc meeting

      Screenshots detailing how to create an ad hoc meeting in Microsoft Teams, steps 1 to 4. Step 1:'Click the “Calendar” tab on the left-hand side of the app'. Step 2: 'Along the top-right, click “Meet now.”' Step 3: 'Name your meeting, choose your audio and video settings, and click “Join now.”'. Step 4: 'To determine internal attendees’ availability, click “Scheduling assistant” on the top left. Then click “Save” to create the meeting. You’ll then be prompted to fill in the meeting details. When inputting internal attendees, their names will drop down without needing their email. You will need to input email addresses for external attendees'.

      Tip: Use existing channels to host the chatrooms for your online meetings

      When you host a meeting online with Microsoft Teams, there will always be a chatroom associated with the meeting. While this is a great place for meeting participants to interact, there is one particular downside.

      Problem: The never-ending chat. Often the activity in these chatrooms can persist long after the meeting. The chatroom itself becomes, unofficially, a channel. When end users can’t keep up with the deluge of communication, the tools have failed them.

      Solution: Adding an existing channel to the meeting. This ensures that discussion activity is already hosted in the appropriate venue for the group, during and after the meeting. Furthermore, it provides non-attendees with a means to catch up on the discussion they have missed.

      In section two of this cookbook, we will often refer to this tactic.

      A screenshot detailing how to add an existing channel to a meeting in Microsoft Teams. 'Break the habit of online booking meetings in Outlook – use the Teams Calendar View instead! In order to make use of this function, the meeting must be setup in Microsoft Teams, not Microsoft Outlook. The option to assign a channel to the meeting will then be available to the meeting organizer.'

      Don’t have a channel for the chat session of your online meeting? Perhaps you should!

      If your meeting is with a group of individuals that will be collaborating frequently, they may need a workspace that persists beyond the meeting.

      Guests can still attend the meeting, but they can’t chat!

      If there are attendees in your meeting that do not have access to the channel you select to host the chat, they will not see the chat discussion nor have any ability to use this function.

      This may be appropriate in some cases – for example, a vendor providing a briefing as part of a regular team meeting.

      However, if there are attendees outside the channel membership that need to see the meeting chat, consider another channel or simply default to not assigning one.

      Meeting settings explained

      Show device settings. For settings concerning audio, video, and whether viewing is private.

      Show meeting notes. Use to take notes throughout the meeting. The notes will stay attached to this event.

      Show meeting details. Find meeting information for: a dial-in number, conference ID, and link to join.

      Enter full screen.

      Show background effects. Choose from a range of video backgrounds to hide/blur your location.

      Turn on the captions (preview). Turn on live speech-to-text captions.

      Keypad. For dialing a number within the meeting (when enabled as an add-on with E3 or as part of E5).

      Start recording. Recorded and saved using Microsoft Stream.

      End meeting.

      Turn off incoming video. To save network bandwidth, you can decline receiving attendee’s video.

      Click “More options” to access the meetings settings.

      Screen share. In the tool tray, select “Share” to share your screen. Select particular applications if you only want to share certain information; otherwise, you can share your whole desktop.

      System audio share. To share your device’s audio while screen sharing, checkbox the “Include system audio” option upon clicking “Share.”

      If you didn’t click that option at the start but now want to share audio during screen share, click the “Include systems audio” option in the tool tray along the top of the screen.

      Give/take control of screen share. To give control, click “Give control” in the tool tray along the top of the screen when sharing content. Choose from the drop-down who you would like to give control to. In the same spot, click “Take back control” when required.

      To request control, click “Request control” in the same space when viewing someone sharing their content. Click “Release control” once finished.

      Start whiteboarding

      1. You’ll first need to enable Microsoft Whiteboard in the Microsoft 365 admin center. Ask your relevant admin to do so if Whiteboard is not already enabled.
      2. Once enabled, click “Share” in a meeting. This feature only appears if you have 3+ participants in the meeting.
      3. Under the “Whiteboard” section in the bottom right, click “Microsoft Whiteboard.”
      4. Click the pen icons to the right of the screen to begin sketching.

      NB: Anonymous, federated, or guest users are currently not supported to start, view, or ink a whiteboard in a Teams meeting.

      Will the whiteboard session be recorded if the meeting is being recorded?

      No. However, the final whiteboard will be available to all meeting attendees after the meeting, under “Board Gallery” in the Microsoft Whiteboard app. Attendees can then continue to work on the whiteboard after the meeting has ended.

      Create a live event

      Screenshots detailing how to create a live event in Microsoft Teams, steps 1 to 3. Step 1: 'Click the “Calendar” tab on the left-hand side of the app'. Step 2: 'On the top right of the app, click the drop-down menu for “+ New meeting” and then “Live event.”' Step 3: 'You will be labeled the “Event organizer.” First, fill in the live event details on the left'. Screenshot detailing how to create a live event in Microsoft Teams, step 4.

      As the organizer, you can invite other people to the event who will be the “producers” or “presenters.”

      Producers: Control the live event stream, including being able to start and stop the event, share their own and others’ video, share desktop or window, and select layout.

      Presenters: Present audio, video, or a screen.

      Screenshot detailing how to create a live event in Microsoft Teams, step 5.

      Select who your audience will be for your live event from three options: specified people and groups, the organization, or the public with no sign-in required.

      Edit the setting for whether you want recording to be available for attendees.

      Then click “Schedule” to finish.

      Live event settings explained

      When you join the live event as a producer/presenter, nothing will be immediately broadcast. You’ll be in a pre-live state. Decide what content to share and in what order. Along the bottom of the screen, you can share your video and audio, share your screen, and mute incoming attendees.

      Once your content is ready to share along the bottom of the screen, add it to the screen on the left, in order of viewing. This is your queue – your “Pre-live” state. Then, click “Send now.”

      This content will now move to the right-hand screen, ready for broadcasting. Once you’re ready to broadcast, click “Start.” Your state will change from “Pre-live” to “Live.”

      Along the top right of the app will be a tools bar.

      Screenshot listing live events settings icons in Microsoft Teams. Beside the heart monitor icon is 'Monitor health and performance of network, devices, and media sharing'. Beside the notepad icon is 'Take meeting notes'. Beside the chatbox icon is 'Chat function'. Beside the two little people with a plus sign icon is 'Invite and show participants'. Beside the gear icon is 'Device settings'. Beside the small 'i' in a circle is 'Meeting details, including schedule, meeting link, and dial-in number'.

      Workspace #1: Departments

      Scenario: Most of your organization’s communication and collaboration occurs within its pre-existing departmental divisions.

      Conventional communication channels:

      • Oral communication: Employees work in proximity to each other and communicate in person, by phone, in department meetings
      • Email: Department-wide announcements
      • Memos: Typically posted/circulated in mailboxes

      Solution: Determine the best way to organize your organization’s departments in Teams based on its size and your requirements to keep information private between departments.

      Option A:

      • Create a team for the organization/division.
      • Create channels for each department. Remember that all members of a team can view all public channels created in that team and the default General channel.
      • Create private channels if you wish to have a channel that only select members of that team can see. Remember that private channels have some limitations in functionality.

      Option B:

      • Create a new team for each department.
      • Create channels within this team for projects or topics that are recurring workflows for the department members. Only department members can view the content of these channels.

      Option C:

      • Post departmental memos and announcements in the General channel.
      • Use “Meet now” in channels for ad hoc meetings. For regular department meetings, create a recurring Teams calendar event for the specific department channel (Option A) or the General channel (Option B). Remember that all members of a team can join a public channel meeting.

      Workspace #2: A cross-functional committee

      Scenario: Your organization has struck a committee composed of members from different departments. The rest of the organization should not have access to the work done in the committee.

      Purpose: To analyze a particular organizational challenge and produce a plan or report; to confidentially develop or carry out a series of processes that affect the whole organization.

      Jobs: Committee members must be able to:

      • Attend private meetings.
      • Share files confidentially.

      Solution:

      Ingredients:

      • Private team

      Construction:

      • Create a new private team for the cross-functional committee.
      • Add only committee members to the team.
      • Create channels based on the topics likely to be the focal point of the committee work.
      • Decide how you will use the mandatory General channel. If the committee is small and the work limited in scope, this channel may be the main communication space. If the committee is larger or the work more complex, use the General channel for announcements and move discussions to new topic-related channels.
      • Schedule recurring committee meetings in the Teams calendar. Add the relevant channel to the meeting invite to keep the meeting chat attached to this team and channel (as meeting organizer, put your name in the meeting invite notes, as the channel will show as the organizer in the Outlook invite).
      • Remember that all members of this team will have access to these meetings and be able to view that they are occurring.

      Workspace #3: An innovation day event

      Scenario: The organization holds a yearly innovation day event in which employees form small groups and work on a defined, short-term problem or project.

      Purpose: To develop innovative solutions and ideas.

      Jobs:

      • Convene small groups.
      • Work toward time-sensitive goals.
      • Communicate synchronously.
      • Share files.

      Solution:

      Ingredients:

      • Public team
      • Channel tabs
      • Whiteboard
      • Planner

      Construction:

      • Create a team for the innovation day event.
      • Add channels for each project working group.
      • Communicate to participants the schedule for the day and their assigned channel.
      • Use the General channel for announcements and instructions throughout the day. Ensure someone moderates the General channel for participants’ questions.
      • Pre-populate the channel tabs with files the participants need to work with. To add a scrum board, refer to M#4 (Morning stand-up/Scrum) in this slide deck.
      • For breakouts, instruct participants to use the “meet now” feature in their channel and how to use the Whiteboard during these meetings.
      • Arrange to have your IT admin archive the team after a certain point so the material is still viewable but not editable.

      Workspace #4: A non-work-related social event

      Scenario: Employees within the organization wish to organize social events around shared interests: board game clubs, book clubs, TV show discussion groups, trivia nights, etc.

      Purpose: To encourage cohesion among coworkers and boost morale.

      Jobs:

      • Schedule the event.
      • Invite participants.
      • Prepare the activity.
      • Host and moderate the discussion.

      Solution:

      Ingredients:

      • Public team
      • Private channels
      • Screen-sharing

      Construction:

      • Create a public team for the social event so that interested people can find and join it.
      • Example: Trivia Night
        • Schedule the event in the Teams calendar.
        • Publish the link to the Trivia Night team where other employees will see it.
        • Create private channels for each trivia team so they cannot see the other competitors’ discussions. Add yourself to each private channel so you can see their answers.
        • As the host, begin a meeting in the General channel. Pose the trivia questions live or present the questions on PowerPoint via screen-sharing.
        • Ask each team to post its answers to its private channel.
      • To avoid teams sprawl, ask your IT admin to set a deletion policy for the team, as long as this request does not contradict your organization’s policies on data retention. If the team becomes moribund, it can be set to auto-delete after a certain period of time.

      Workspace #5: A project team with a defined end time

      Scenario: Within a department/workplace team, employees are assigned to projects with defined end times, after which they will be assigned to a new project.

      Purpose: To complete project-based work that fulfills business needs.

      Jobs:

      • Oral communication with team members.
      • Synchronous and asynchronous work on project files.
      • The ability to attend scheduled meetings and ad hoc meetings.
      • The ability to access shared resources related to the project.

      Solution:

      If your working group already has its own team within Teams:

      • Create a new public or private channel for the project. Remember that some functionality is not available in private channels (such as Microsoft Planner).
      • Use the channel for the project team’s meetings (scheduled in Teams calendar or through Meet Now).
      • Add a tab that links to the team’s project folder in SharePoint.

      If your workplace team does not already have its own team in Teams:

      • Determine if there is a natural fit for this project as a new channel in an existing team. Remember that all team members will be able to see the channel if it is public and that all relevant project members need to belong to the Team to participate in the channel.
      • If necessary, create a new team for the project. Add the project members.
      • Create channels based on the type of work that comprises the project.
      • Use the channel for the project team’s meetings (scheduled in Teams calendar or through Meet Now)
      • Add a tab to link to the team’s project folder in SharePoint.

      Info-tech Best Practice

      Hide the channel after the project concludes to de-clutter your Teams user interface.

      Meeting #1: Job interview with external candidate

      Scenario: The organization must interview a slate of candidates to fill an open position.

      Purpose:

      • Select the most qualified candidate for the job.

      Jobs:

      • Create a meeting, ensuring the candidate and other attendees know when and where the meeting will happen.
      • Ensure the meeting is secure to protect confidential information.
      • Ensure the meeting is accessible, allowing the candidate to present themselves through audio and/or visual means.
      • Create a professional environment for the meeting to take place.
      • Engender a space for the candidate to share their CV, research, or other relevant file.
      • The interview must be transcribed and recorded.

      Solution:

      Ingredients:

      • Private Teams meeting
      • Screen-sharing
      • Microsoft Stream

      Construction:

      • Create a Teams meeting, inviting the candidate with their email, alongside other internal attendees. The Teams meeting invite will auto-generate a link to the meeting itself.
      • The host can control who joins the meeting through settings for the “lobby.”
      • Through the Teams meeting, the attendees will be able to use the voice and video chat functionality.
      • All attendees can opt to blur their backgrounds to maintain a professional online presence.
      • The candidate can share their screen, either specific applications or their whole desktop, during the Teams meeting.
      • A Teams meeting can be recorded and transcribed through Stream. After the meeting, the transcript can be searched, edited, and shared

      NB: The external candidate does not need the Teams application. Through the meeting invite, the external candidate will join via a web browser.

      Meeting #2: Quarterly board meeting

      Scenario: Every quarter, the organization holds its regular board meeting.

      Purpose: To discuss agenda items and determine the company’s future direction.

      Jobs:

      During meeting:
        • Attendance and minutes must be taken.
        • Votes must be recorded.
        • In-camera sessions must occur.
        • External experts must be included.
      After meeting:
      • Follow-up items must be assigned.
      • Reports must be submitted.

      Solution:

      Ingredients:

      • Teams calendar invite
      • Planner; Forms
      • Private channel
      • Microsoft Stream

      Construction:

      • Guest Invite: Invites can be sent to any non-domain-joined email address to join a private, invitation-only channel within the team controlled by the board chair.
      • SharePoint & Flow: Documents are emailed to the Team addresses, which kicks off an MS Flow routine to collect review notes.
      • Planner: Any board member can assign tasks to any employee.
      • Forms/Add-On: Chair puts down the form of the question and individual votes are tracked.
      • Teams cloud meeting recording: Recording available through Stream. Manual edits can be made to VTT caption file. Greater than acceptable transcription error rate.
      • Meeting Log: Real-time attendance is viewable but a point-in-time record needs admin access.

      NB: The external guests do not need the Teams application. Through the meeting invite, the guests will join via a web browser.

      Meeting #3: Weekly team meeting

      Scenario: A team meets for a weekly recurring meeting. The meeting is facilitated by the team lead (or manager) who addresses through agenda items and invites participation from the attendees.

      Purpose: The purpose of the meeting is to:

      • Share information verbally
      • Present content visually
      • Achieve consensus
      • Build team morale

      Jobs: The facilitator must:

      • Determine participants
      • Book room
      • Book meeting in calendar

      Solution:

      Ingredients:

      • Meeting Place: A channel in Microsoft Teams (must be public) where all members of the meeting make up the entirety of the audience.
      • Calendar Recurrence: A meeting is booked through Teams and appears in all participants’ Outlook calendar.
      • Collaboration Space: Participants join the meeting through video or audio and can share screens and contribute text, images, and links to the meeting chat.

      Construction:

      • Ensure your team already has a channel created for it. If not, create one in the appropriate team.
      • Create the meeting using the calendar view within Microsoft Teams:
        • Set the meeting’s name, attendees, time, and recurrence.
        • Add the team channel that serves as the most appropriate workplace for the meeting. (Any discussion in the meeting chat will be posted to this channel.)

      NB: Create the meeting in the Teams calendar, not Outlook, or you will not be able to add the Teams channel. As meeting organizer, put your name in the meeting invite notes, as the channel will show as the organizer in the Outlook invite.

      Meeting #4: Morning stand-up/scrum

      Scenario: Each morning, at 9am, members of the team meet online.

      Purpose: After some pleasantries, the team discusses what tasks they each plan to complete in the day.

      Jobs: The team leader (or scrum master) must:

      • Place all tasks on a scrum board, each represented by a sticky note denoting the task name and owner.
      • Move the sticky notes through the columns, adjusting assignments as needed.
      • Sort tasks into the following columns: “Not Started,” “In Progress,” and “Done.”

      Solution:

      Ingredients:

      • Meeting Place: A channel in Microsoft Teams (must be public) where all members of the meeting make up the entirety of the audience.
      • Scrum Board: A tab within that channel where a persistent scrum board has been created and is visible to all team members.

      Meeting Place Construction:

      • Create the meeting using the calendar view in Teams.
      • Set the meeting’s name, attendees, time, and work-week daily recurrence (see left).
      • Add the channel that is the most appropriate workplace for the meeting. Any meeting chat will be posted to this channel rather than a separate chat.

      Scrum Board Construction:

      • Add a tab to the channel using Microsoft Planner as the app. (You can use other task management apps such as Trello, but the identity integration of first-party Office 365 tools may be less hassle.)
      • Create a new (or import an existing) Plan to the channel. This will be used as the focal point.

      Meeting #5: Weekly team meeting

      Scenario: An audio-only conversation that could be a regularly scheduled event but is more often conducted on an ad-hoc basis.

      Purpose: To quickly share information, achieve consensus, or clarify misunderstandings.

      Jobs:

      • Dial recipient
      • See missed calls
      • Leave/check voicemail
      • Create speed-dial list
      • Conference call

      Solution:

      Ingredients:

      • Audio call begun through Teams chat.

      Construction:

      • Voice over IP calls between users in the same MS Teams tenant can begin in multiple ways:
        • A call can be initiated through any appearance of a user’s profile picture: hover over user’s profile photo in the Chat list and select the phone icon.
        • Enter your last chat with a user and click phone icon in upper-right corner.
        • Go to the Calls section and type the name in the “Make a call” text entry form.
      • Voicemail: Voicemail, missed calls, and call history are available in the Calls section.
      • Speed dial: Speed dial lists can be created in the Calls section.
      • Conference call: Other users can be added to an ongoing call.

      NB: Microsoft Teams can be configured to provide an organization’s telephony for external calls, but this requires an E5 license. Additional audio-conferencing licenses are required to call in to a Teams meeting over a phone.

      Bibliography 1/4

      Section 1: Teams for IT › Creation Process

      Overview: Creation process
      Assign admin roles
      Prepare the network
      Team creation
      Integrations with SharePoint Online
      Permissions

      Bibliography 2/4

      Section 1: Teams for IT › Creation Process (cont'd.)

      External and guest access
      Expiration and archiving
      Retention and data loss prevention
      Teams telephony

      Bibliography 3/4

      Section 1: Teams for IT › Teams Rollout

      From Skype to Teams
      From Slack to Teams
      Teams adoption

      Section 1: Teams for IT › Use Cases

      Bibliography 4/4

      Section 2: Teams for End Users › Teams, Channels, Chat

      Section 2: Teams for End Users › Meetings and Live Events

      Section 2: Teams for End Users › Use Cases

      Drive Digital Transformation With Platform Strategies

      • Buy Link or Shortcode: {j2store}78|cart{/j2store}
      • member rating overall impact (scale of 10): 8.5/10 Overall Impact
      • member rating average dollars saved: $3,750 Average $ Saved
      • member rating average days saved: 4 Average Days Saved
      • Parent Category Name: IT Strategy
      • Parent Category Link: /it-strategy
      • Enterprise is grappling with the challenges of existing business models and strategies not leading to desired outcomes.
      • Enterprise is struggling to remain competitive.
      • Enterprise wants to understand how to leverage platform strategies and a digital platform.

      Our Advice

      Critical Insight

      To remain competitive enterprises must renew and refresh their business model strategies and design/develop digital platforms – this requires enterprises to:

      • Understand how digital-native enterprises are using platform business models and associated strategies.
      • Understand their core assets and strengths and how these can be leveraged for transformation.
      • Understand the core characteristics and components of a digital platform so that they can design digital platform(s) for their enterprise.
      • Ask if the client’s digital transformation (DX) strategy is aligned with a digital platform enablement strategy.
      • Ask if the enterprise has paid attention to the structure, culture, principles, and practices of platform teams.

      Impact and Result

      Organizations that implement this project will gain benefits in five ways:

      • Awareness and understanding of various platform strategies.
      • Application of specific platform strategies within the context of the enterprise.
      • Awareness of their existing business mode, core assets, value proposition, and strengths.
      • Alignment between DX themes and platform enablement themes so enterprises can develop roadmaps that gauge successful DX.
      • Design of a digital platform, including characteristics, components, and team characteristics, culture, principles, and practices.

      Drive Digital Transformation With Platform Strategies Research & Tools

      Start here – read the Executive Brief

      Read our concise Executive Brief to find out why you should consider the platform business model and a digital platform to remain competitive.

      Besides the small introduction, subscribers and consulting clients within this management domain have access to:

      1. Set goals for your platform business model

      Understand the platform business model and strategies and then set your platform business model goals.

      • Drive Digital Transformation With Platform Strategies – Phase 1: Set Goals for Your Platform Business Model
      • Business Platform Playbook

      2. Configure digital platform

      Define design goals for your digital platform. Align your DX strategy with digital platform capabilities and understand key components of the digital platform.

      • Drive Digital Transformation With Platform Strategies – Phase 2: Configure Your Digital Platform
      • Digital Platform Playbook
      [infographic]

      Workshop: Drive Digital Transformation With Platform Strategies

      Workshops offer an easy way to accelerate your project. If you are unable to do the project yourself, and a Guided Implementation isn't enough, we offer low-cost delivery of our project workshops. We take you through every phase of your project and ensure that you have a roadmap in place to complete your project successfully.

      1 Understand Platform Business Model and Strategies

      The Purpose

      Understand existing business model, value proposition, and key assets.

      Understand platform business model and strategies.

      Key Benefits Achieved

      Understanding the current assets helps with knowing what can be leveraged in the new business model/transformation.

      Understanding the platform strategies can help the enterprise renew/refresh their business model.

      Activities

      1.1 Document the current business model along with value proposition and key assets (that provide competitive advantage).

      1.2 Transformation narrative.

      1.3 Platform model canvas.

      1.4 Document the platform strategies in the context of the enterprise.

      Outputs

      Documentation of current business model along with value proposition and key assets (that provide competitive advantage).

      Documentation of the selected platform strategies.

      2 Planning for Platform Business Model

      The Purpose

      Understand transformation approaches.

      Understand various layers of platforms.

      Ask fundamental and evolutionary questions about the platform.

      Key Benefits Achieved

      Understanding of the transformational model so that the enterprise can realize the differences.

      Understanding of the organization’s strengths and weaknesses for a DX.

      Extraction of strategic themes to plan and develop a digital platform roadmap.

      Activities

      2.1 Discuss and document decision about DX approach and next steps.

      2.2 Discuss and document high-level strategic themes for platform business model and associated roadmap.

      Outputs

      Documented decision about DX approach and next steps.

      Documented high-level strategic themes for platform business model and associated roadmap.

      3 Digital Platform Strategy

      The Purpose

      Understand the design goals for the digital platform.

      Understand gaps between the platform’s capabilities and the DX strategy.

      Key Benefits Achieved

      Design goals set for the digital platform that are visible to all stakeholders.

      Gap analysis performed between enterprise’s digital strategy and platform capabilities; this helps understand the current situation and thus informs strategies and roadmaps.

      Activities

      3.1 Discuss and document design goals for digital platform.

      3.2 Discuss DX themes and platform capabilities – document the gaps.

      3.3 Discuss gaps and strategies along with timelines.

      Outputs

      Documented design goals for digital platform.

      Documented DX themes and platform capabilities.

      DX themes and platform capabilities map.

      4 Digital Platform Design: Key Components

      The Purpose

      Understanding of key components of a digital platform, including technology and teams.

      Key Benefits Achieved

      Understanding of the key components of a digital platform and designing the platform.

      Understanding of the team structure, culture, and practices needed for successful platform engineering teams.

      Activities

      4.1 Confirmation and discussion on existing UX/UI and API strategies.

      4.2 Understanding of microservices architecture and filling of microservices canvas.

      4.3 Real-time stream processing data pipeline and tool map.

      4.4 High-level architectural view.

      4.5 Discussion on platform engineering teams, including culture, structure, principles, and practices.

      Outputs

      Filled microservices canvas.

      Documented real-time stream processing data pipeline and tool map.

      Documented high-level architectural view.

      Foster Data-Driven Culture With Data Literacy

      • Buy Link or Shortcode: {j2store}132|cart{/j2store}
      • member rating overall impact (scale of 10): 10.0/10 Overall Impact
      • member rating average dollars saved: $12,999 Average $ Saved
      • member rating average days saved: 115 Average Days Saved
      • Parent Category Name: Data Management
      • Parent Category Link: /data-management

      Organizations are joining the wave and adopting machine learning and artificial intelligence (AI) to unlock the value in their data and power their competitive advantage. But to succeed with these complex analytics programs, they need to begin by looking at their data – empowering their people to realize and embrace the valuable insights within the organization’s data.

      The key to achieve becoming a data-driven organization is to foster a strong data culture and equip employees with data skills through an organization-wide data literacy program.

      Our Advice

      Critical Insight

      • Start with real business problems in a hands-on format to demonstrate the value of data.
      • Use a formalized organization-wide approach to data literacy program to bridge the data skills gap.
      • Provide relevant and practical training programs tailored to different learning styles and tenures (e.g. onboarding, development plan).

      Impact and Result

      Data literacy is critical to the success of digital transformation and AI analytics. Info-Tech’s approach to creating a sustainable and effective data literacy program is recognizing it is:

      • More than just technical training. A data literacy program isn’t just about data; it encompasses aspects of business, IT, and data.
      • More than a one-off exercise. To keep the literacy skills alive the program must be regular, sustainable, and tailored to different needs across all levels of the organization.
      • More than one delivery format. Different delivery methods need to be considered to suit various learning styles to ensure an effective delivery.

      Foster Data-Driven Culture With Data Literacy Research & Tools

      Besides the small introduction, subscribers and consulting clients within this management domain have access to:

      1. Foster Data-Driven Culture With Data Literacy Storyboard – A step-by-step guide to help organizations build an effective and sustainable data literacy program that benefits all employees who work with data.

      Data literacy as part of the data governance strategic program should be launched to all levels of employees that will help your organization bridge the data knowledge gap at all levels of the organization. This research recommends approaches to different learning styles to address data skill needs and helps members create a practical and sustainable data literacy program.

      • Foster Data-Driven Culture With Data Literacy Storyboard

      2. Fundamental Data Literacy Program Template – A document that provides an example of a fundamental data literacy program.

      Kick off a data awareness program that explains the fundamental understanding of data and its lifecycle. Explore ways to create or mature the data literacy program with smaller amounts of information on a more frequent basis.

      • Fundamental Data Literacy Program Template
      [infographic]

      Further reading

      Foster Data-Driven Culture With Data Literacy

      Data literacy is an essential part of a data-driven culture, bridging the data knowledge gaps across all levels of the organization.

      Analyst Perspective

      Data literacy is the missing link to becoming a data-driven organization.

      “Digital transformation” and “data driven” are two terms that are inseparable. With organizations accelerating in their digital transformation roadmap implementation, organizations need to invest in developing data skills with their people. Talent is scarce and the demand for data skills is huge, with 70% of employees expected to work heavily with data by 2025. There is no time like the present to launch an organization-wide data literacy program to bridge the data knowledge gap and foster a data-driven culture.

      Data literacy training is as important as your cybersecurity training. It impacts all levels of the organization. Data literacy is critical to success with digital transformation and AI analytics.

      Annabel Lui

      Principal Advisory Director, Data & Analytics Practice
      Info-Tech Research Group

      Executive Summary

      Your Challenge

      Organizations are joining the wave and adopting machine learning (ML) and artificial intelligence (AI) to unlock the value in their data and power their competitive advantage. But to succeed with these complex analytics programs, they need to begin by empowering their people to realize and embrace the valuable insights within the organization’s data.

      The key to becoming a data-driven organization is to foster a strong data culture and equip people with data skills through an organization-wide data literacy program.

      Common Obstacles

      Challenges the data leadership is likely to face as digital transformation initiatives drive intensified competition:

      • Resistance to change
      • Technological distractions
      • “Shadow data”
      • Difficulty securing resources and skilled data professionals
      • Inability to appreciate the value of data and its meaning for users – even fear of it

      Info-Tech's Approach

      We interviewed data leaders and instructors to gather insights about investing in data:

      • Start with real business problems in a hands-on format to demonstrate the value of data.
      • Implement a formalized organization-wide approach to data literacy program to bridge the data skill gap.
      • Provide relevant and practical training programs tailored to different learning styles and tenures (e.g. onboarding,development plan).

      Info-Tech Insight

      By thoughtfully designing a data literacy training program for the audience's own experience, maturity level, and learning style, organizations build the data-driven and engaged culture that helps them to unlock their data's full potential and outperform other organizations.

      Your Challenge

      Data literacy is the missing link to drive business outcomes from data.

      • Having a data-driven culture as an organization’s mission statement without implementing a data literacy program is like making an empty promise and leaving the value unrealized and unattainable.
      • A study conducted by the Data Literacy Project clearly indicates that organizations with aggressive data literacy programs will outperform those who do not have such programs. By 2030, data literacy will be one of the most sought-after skill sets. All employees require data literacy skills.
      • Everyone has a role in data. From employees who are actively involved in data collection to operational teams who create reports with analytics tools and finally to executives who use data to make business decisions – they all require continuous data literacy training in a data-driven organization. Because of differences in maturity, data literacy strategies cannot be one-size-fits-all.

      “Data literacy is the ability to read, work with, analyze, and communicate with data. It's a skill that empowers all levels of workers to ask the right questions of data and machines, build knowledge, make decisions, and communicate meaning to others.” – Qlik, n.d.

      75% of organizational employees have access to data tools – only 21% demonstrated confidence in their data skills.

      Source: Accenture, 2020.

      89% of C-level executives expect team members to explain how data has informed their decisions, but only 11% employees are fully confident in their ability to read, analyze, work with, and communicate with data

      Source: Qlik, 2022.

      Data debt or data asset?

      Manage your data as strategic assets.

      “[Data debt is] when you have undocumented, unused, incomplete, and inconsistent data,” according to Secoda (2023). “When … data debt is not solved, data teams could risk wasting time managing reports no one uses and producing data that no one understands.”

      Signs of data debt when considering investing in data literacy:

      • Lack of definition and understanding of data terms, therefore they don’t speak the same language. Without data literacy, an organization will not succeed in becoming a data-driven organization.
      • Putting data literacy as a low priority. Organization sees this as “another” training to put on the list and keeps it on the back burner.
      • Data literacy is not seen as the number one skill set needed in the organization. However, anyone who works with data requires data skills.
      • End users are not trained on self-serve features and tools.
      • Focusing on a minority group of people rather than everyone in the organization or seeing it as a one-off exercise.
      • Delays or failure to deliver digital transformation projects due to lack of data skills and data access issues.

      66%

      of organizations say a backlog of data debt is impacting new data management initiatives.

      40%

      of organizations say individuals within the business do not trust data insights.

      30%

      of organizations are unable to become data-driven.

      Source: Experian, 2020

      Info-Tech’s Approach

      Data literacy is critical to success with digital transformation and AI analytics.

      Diagram showing components of Data literacy: 1 - Data: understand your data, 2 - Business: define the purpose, 3 - IT: Introduce new ways of working

      The Info-Tech difference:

      1. More than just technical training. Data literacy program isn’t just about data but rather encompasses aspects of business, IT, and data.
      2. More than a one-off exercise. To keep literacy skills alive, the program must be routine and sustainable, tailored to different needs across all levels of the organization.
      3. More than one delivery format. Different delivery methods need to be considered to suit various learning styles.

      Data needs to be processed

      Data – facts – are organized, processed, and given meaning to become insights.

      Data, information, knowledge, insight, wisdom

      Image source: Welocalize, 2020.

      Data represents a discrete fact or event without relation to other things (e.g. it is raining). Data is unorganized and not useful on its own.

      Information organizes and structures data so that it is meaningful and valuable for a specific purpose (i.e. it answers questions). Information is a refined form of data.

      When information is combined with experience and intuition, it results in knowledge. It is our personal map/model of the world.

      Knowledge set with context generates insight. We become knowledgeable as a result of reading, researching, and memorizing (i.e. accumulating information).

      Wisdom means the ability to make sound judgments. Wisdom synthesizes knowledge and experiences into insights.

      Investment in data literacy is a game changer.

      Data literacy is the ability to collect, manage, evaluate, and apply data in a critical manner.

      A data-driven culture is “an operating environment that seeks to leverage data whenever and wherever possible to enhance business efficiency and effectiveness” (Forbes).

      Info-Tech Insight

      Data-driven culture refers to a workplace where decisions are made based on data evidence, not on gut instinct.

      Info-Tech’s methodology for building a data literacy program

      Phase Steps

      1. Define Data Literacy Objectives

      1.1 Understand organization’s needs

      1.2 Create vision and objective for data literacy program

      2. Assess Learning Style and Align to Program Design

      2.1 Create persona and identify audience

      2.2 Assess learning style and align to program design

      2.3 Determine the right delivery method

      3. Socialize Roadmap and Milestones

      3.1 Establish a roadmap

      3.2 Set key performance metrics and milestones

      Phase Outcomes

      Identify key objectives to establish and grow the data literacy program by articulating the problem and solutions proposed.

      Assess each audience’s learning style and adapt the program to their unique needs.

      Show a roadmap with key performance indicators to track each milestone and tell a data story.

      Insight Summary

      “In a world of more data, the companies with more data-literate people are the ones that are going to win.”

      – Miro Kazakoff, senior lecturer, MIT Sloan, in MIT Sloan School of Management, 2021

      Overarching insight

      By thoughtfully designing a data literacy training program personalized to each audience's maturity level, learning style, and experience, organizations can develop and grow a data-driven culture that unlocks the data's full potential for competitive differentiation.

      Module 1 insight

      We can learn a lot from each other. Literacy works both ways – business data stewards learn to “speak data” while IT data custodians understand the business context and value. Everyone should strive to exchange knowledge.

      Module 2 insight

      Avoid traditional classroom teaching – create a data literacy program that is learner-centric to allow participants to learn and experiment with data.

      Aligning program design to those learning styles will make participants more likely to be receptive to learning a new skill.

      Module 3 insight

      A data literacy program isn’t just about data but rather encompasses aspects of business, IT, and data. With executive support and partnership with business, running a data literacy program means that it won’t end up being just another technical training. The program needs to address why, what, how questions.

      Tactical insight

      A lot of programs don’t include the fundamentals. To get data concepts to stick, focus on socializing the data/information/knowledge/wisdom foundation.

      Tactical insight

      Many programs speak in abstract terms. We present case studies and tangible use cases to personalize training to the audience’s world and showcase opportunities enabled through data.

      Key performance indicators (KPIs) for your data literacy program

      How do you know if your data literacy program is successful? Here are some useful KPIs:

      Program Adoption Metrics

      • Percentage of employees attending data literacy training
      • Percentage of participants who report gains in data management knowledge after training sessions
      • Maturity assessment result
      • Survey and diagnostic feedback before and after training
      • Trend analysis of overall data literacy program

      Operational Metrics

      • Number of requests for analytics/reporting services
      • Number of reports created by users
      • Speed and quality of business decisions
      • User satisfaction with reports and analytics services
      • Improved business performance (customer satisfaction)
      • Improved valuation of organization data

      A data-driven culture builds tools and skills, builds users’ trust in the quality of data across sources, and raises the skills and understanding among the frontlines by encouraging everyone to leverage data for critical thinking and innovation.

      Info-Tech offers various levels of support to best suit your needs

      DIY Toolkit

      "Our team has already made this critical project a priority, and we have the time and capability, but some guidance along the way would be helpful."

      Guided Implementation

      "Our team knows that we need to fix a process, but we need assistance to determine where to focus. Some check-ins along the way would help keep us on track."

      Workshop

      "We need to hit the ground running and get this project kicked off immediately. Our team has the ability to take this over once we get a framework and strategy in place."

      Consulting

      "Our team does not have the time or the knowledge to take this project on. We need assistance through the entirety of the project."

      Diagnostics and consistent frameworks are used throughout all four options.

      Workshop Overview

      Contact your account representative for more information.
      workshops@infotech.com 1-888-670-8889

      Session 1

      Session 2

      Session 3

      Session 4

      Activities

      Define Data Literacy Objectives

      1.1 Review Data Culture Diagnostic results

      1.2 Identify business context: business goals, initiatives

      1.3 Create vision and objective for data literacy program

      Assess Learning Style and Align to Program Design

      2.1 Identify audience

      2.2 Assess learning style and align to program design

      2.3 Determine the right delivery method

      Build a Data Literacy Roadmap and Milestones

      3.1 Identify program initiatives and topics

      3.2 Determine delivery methods

      3.3 Build the data literacy roadmap

      Operational Strategy to implement Data Literacy

      4.1 Identify key performance metrics

      4.2 Identify owners and document RACI matrix

      4.3 Discuss next steps and wrap up.

      Deliverables

      1. Diagnostics reports (data culture survey)
      2. Vision and value statement
      1. Assessment of audience covering all levels of organization
      1. List of key program initiatives and topics
      2. Allocation of delivery methods
      3. Roadmap
      1. Data literacy metrics
      2. List of owners and roles and responsibilities
      3. Next step and implementation schedule

      Phase 1

      Define Data Literacy Objectives

      Phase 1: step 1 - Understand organization's needs, step 2 - Create vision and objective for data literacy program.

      Foster Data-Driven Culture With Data Literacy

      This phase will walk you through the following activities:

      • Understand the organization’s needs.
      • Create vision and objective for data literacy program.

      This phase involves the following participants:

      • Data governance sponsor
      • Data owners
      • Data stewards
      • Data custodians

      1.1 Gauge your organization’s current data culture

      Conduct data culture survey or diagnostic.

      1. Identify members of the data user base, data consumers, and other key stakeholders for surveying.
      2. Conduct an information session to introduce Info-Tech’s Data Culture Diagnostic survey. Explain the objective and importance of the survey and its role in helping to understand the organization’s current data culture and inform the improvement of that culture.
      3. Roll out the Info-Tech Data Culture Diagnostic survey to the identified users and stakeholders.
      4. Debrief and document the results and scorecard in the Data Strategy Stakeholder Interview Guide and Findings document.

      Input

      • Email addresses of participants in your organization who should receive the survey

      Output

      • Your organization’s Data Culture Scorecard for understanding current data culture as it relates to the use and consumption of data
      • An understanding of whether data is currently perceived to be an asset to the organization

      Materials

      • Info-Tech’s Data Culture Diagnostic service

      Participants

      • Participants include those at the senior leadership level through to middle management, as well as other business stakeholders at varying levels across the organization
      • Data owners, stewards, and custodians
      • Core data users and consumers

      Contact your Info-Tech Account Representative for details on launching a Data Culture Diagnostic.

      1.2 Define data literacy objectives

      1. Understand the organization’s needs by identifying opportunities and challenges relating to data. Document the described real-life examples.
      2. Categorize the list and identify areas where data literacy can address the business problem.
      3. Create a vision statement for the data literacy program, ensuring that it covers all levels of the organization.
      4. Articulate the intended targets and goals in planning for a data literacy program.

      Input

      • List of opportunities and challenges relating to data
      • Relevant business real-life examples

      Output

      • Categorized list of data literacy needs
      • Vision for literacy program
      • Targets and goals

      Materials

      • Whiteboard/flip charts
      • Sticky notes

      Participants

      • CDO or sponsor
      • Key business stakeholders
      • Data stewards
      • Data custodians
      • Data governance working group

      Quick wins for improving data literacy

      Data collected through Info-Tech’s Data Culture Diagnostic suggests three ways to improve data literacy:

      87%

      think more can be done to define and document commonly used terms with methods such as a business data glossary.

      68%

      think they can have a better understanding of the meaning of all data elements that are being captured or managed.

      86%

      feel that they can have more training in terms of tools as well as on what data is available at the organization.

      Source: Info-Tech Research Group's Data Culture Diagnostic, 2022; N=2,652

      Quick Wins

      • Create a business data glossary to document and define common terms.
      • Provide easy access to the business data glossary and procedures on how data is captured and managed.
      • Launch an organization-wide data literacy program.

      Delivering value is a means and the goal

      Start with real business problems in a hands-on format to demonstrate the value of data.

      Identify business problem:

      • Business decisions without facts are just guesses.
      • Management spends a lot of time finding and fixing data.
      • Unknown challenges on data assets and risk.
      • Incomplete view of customer/client and industry.
      • Not ready for modern data opportunities (e.g. artificial intelligence).

      Create an objective

      Treat data as a strategic asset to gain insight into our customers for all levels of organization.

      The solution: Data-driven culture powered by people who speak data.

      • Data dictionary
      • Data literacy
      • Trusted single source
      • Access to analytics tools
      • Decision making

      "According to Forrester, 91% of organizations find it challenging to improve the use of data insights for decision-making – even though 90% see it as a priority. Why the disconnect? A lack of data literacy."

      – Alation, 2020

      Fundamental data literacy

      Data literacy is more than just a technical training or a one-off exercise.

      Info-Tech provides various topics suited for a data literacy program that can accommodate different data skill requirements and encompasses relevant aspects of business, IT, and data.

      Info-Tech Research Group’s Data Literacy Program

      Use discovery and diagnostics to understand users’ comfort level and maturity with data.

      Data lunch 'n' learn

      • The power and value of data
      • Everyone is a data steward
      • Becoming data literate
      • Data 101
      • The future is data
      1 hour
      For: General audience, senior leadership, data leads, change management

      Speak data

      • What is data
      • Meet the data team
      • Day in the life of a steward
      • How data impacts you
      • Tools of the trade
      1/2 day
      For: New stewards, data owners, pre-data strategy workshop

      Your data story

      • Ask the right questions
      • Find the top five data elements
      • Understand your data
      • Present your data story
      • Lessons from COVID-19
      1/2 day
      For: New stewards, business data owners, pre-BI/analytics workshop

      Phase 2

      Assess Learning Style and Align to Program Design

      Phase 2: step 1 - Identify audience, step 2 - Access learning style and align to program design, step 3 - Determine the right delivery method.

      Foster Data-Driven Culture With Data Literacy

      This phase will walk you through the following activities:

      • Identify your audience.
      • Assess learning styles and align them to the data program design.
      • Determine the right delivery method.

      This phase involves the following participants:

      • Data governance sponsor
      • Data owners
      • Data stewards
      • Data custodians

      Avoid common pitfalls

      75%

      feel that training was too long to remember or to apply in their day-to-day work.

      21%

      find training had insufficient follow-up to help them apply on the job.

      Source: Grovo, 2018.

      1. Information Overload

        Trying to cover too much useful information results in overwhelm and does not deliver on key training objectives.
      2. Limited Implementation

        Learning is only the beginning. The real results are obtained when learning is followed by practice, which turns new knowledge into reliable habits.
      3. Lack of Organizational Alignment

        Implementing training without a clear link to organizational objectives leaves you unable to clearly communicate its value, undermines your ability to secure buy-in from attendees and executives, and leaves you unable to verify that the training is actually improving effectiveness.

      2.1 Understand learning style

      1. Create persona and identify the audiences and their roles in data across all levels of the organization.
      2. Identify the data program initiatives and assign the best delivery method to each initiative.
      3. Assign participants to each program initiative based on their skill gap and learning style.

      Input

      • List of audiences, their roles, and tenures
      • Data skill gap assessment
      • List of literacy program initiatives/topics

      Output

      • Target audience grouping
      • List of program initiatives with assigned groups

      Materials

      • Whiteboard/flip charts
      • Sticky notes

      Participants

      • CDO or sponsor
      • Key business stakeholders
      • Data stewards
      • Data custodians
      • Data governance working group

      You and data

      Is data an integral part of your work?

      Do you feel comfortable finding and using data in your organization?

      • Many people feel intimidated by data and therefore miss out on what data can do for them.
      • Often the obstacle is language. If you don’t understand the semantics around data, you will not feel confident to contribute to discussions around data.
      • You use data every day but need additional vocabulary to understand how to handle it properly.
      • Data literacy is the ability to “speak data” and to understand what data means (i.e. how to read charts and graphs, draw valid conclusions, and recognize when data is misinterpreted or used inappropriately to be misleading).
      • The business often doesn’t understand its role in data governance and how it informs and assists IT in responsible data management.

      Info-Tech Insight

      IT and data professionals need to understand the business as much as business needs to talk about data. Bidirectional learning and feedback improves the synergy between business and IT.

      Create personas

      Persona creation is a way to brainstorm ideas for the data literacy program.

      Choose a data role (e.g. data steward, data owner, data scientist).

      Describe the persona based on goals, priorities, tenures, preferred learning style, type of work with data.

      Identify data skill and level of skills required.

      Persona 1: Denise - Manager, People and Culture. Goals, priorities, tenure, data role, learning style, skill level

      Consider these other ways to brainstorm:

      • Review current in-flight projects.
      • Analyze types of data requests.
      • Understand needs by department.
      • Share learnings in a community of practice.

      Program design

      Categorize into six data skill areas

      Not everyone needs the same level of skill sets

      Bullseye board with skill levels (Innermost going outward): Expert, advanced, intermediate and Basic. The six data skill areas: 1. Understanding Data, 2. Find and Obtain Data, 3. Read, Interpret and Evaluate Data, 4. Manage Data, 5. Create and Use Data, 6. Tell a Story and Share Data are placed equally around in sections.

      Map the personas to the program

      Bridging the data knowledge gap.

      • Each component will promote the value of data to all levels of employees when demonstrating the right way for data to be understood, managed, and consumed in the organization.
      • Categorizing the data literacy program into six areas and levels of skill sets will provide clarity into which areas to focus on.
      • The program is intended to be implemented in stages, allowing the audience to learn and adopt the new skills. Leveraging in-flight projects for rolling out training will have a higher success because the need is already built into the project.
      Personas are placed at different points in the data skill area and skill level.

      Align program design to learning styles

      The four methods (Discussion, Information, Coaching, and Self-Discovery) are based on learner-centered model design rather than the traditional teacher-centered model.

      Info-Tech Insight

      Tailor your data literacy program to meet your organization’s needs, filling your range of knowledge gaps and catering to different levels of users.

      When it comes to rolling out a data literacy program, there is no one-size-fits-all solution. Your data literacy program is intended to spread knowledge throughout your organization. It should target everyone from executive leadership to management to subject matter experts across all functions of the business.

      Discussion method

      Delivery Method

      • Interactive format between instructor and learner
      • Instructor empowers and motivates learner through dialogues and exercises

      The imaginative learner

      The imaginative learner group likes to engage in feelings and spend time on reflection. This type of learner desires personal meaning and involvement. They focus on personal values for themselves and others and make connections quickly.

      For this group of learners, their question is: why should I learn this?

      Learning characteristics

      • Seek meaning
      • Need to be personally involved
      • Learn by listening and sharing ideas
      • Function through social interaction

      Information method

      Delivery Method

      • Instructor does most of the talking in the training
      • Instructor is teaching the content, delivering the training content, and demonstrating

      Analytical learner

      The analytical learner group likes to listen, to think about information, and to come up with ideas. They are interested in acquiring facts and delving into concepts and processes. They can learn effectively and enjoy doing independent research.

      For this group of learners, their question is: what should I learn?

      Learning characteristics

      • Seek and examine the facts
      • Need to know what experts think
      • Interested in ideas and concepts
      • Critique information and collect data
      • Function by adapting to experts

      Coaching method

      Delivery Method

      • Learning has on-the-job training or learning through role-play exercises
      • Instructor is coaching and facilitating learner

      Common sense learner

      The common sense learner group likes thinking and doing. They are satisfied when they can carry out experiments, build and design, and create usability. They like tinkering and applying useful ideas.

      For this group of learners, their question is: how should I learn?

      Learning characteristics

      • Seek usability
      • Need to know how things work
      • Learn by testing theories using practical methods
      • Use factual data to build concepts
      • Enjoy hands-on experience

      Self-discovery method

      Delivery Method

      • Interactive format between instructor and learner
      • Instructor provides evaluation and remedial instruction

      Common sense learner

      The dynamic learner group learns through doing and experiencing. They are continually looking for hidden possibilities and researching ideas to make original adjustments. They learn through trial and error and self-discovery.

      For this group of learners, their question is: what if I learn this?

      Learning characteristics

      • Seek hidden possibilities
      • Need to know what can be done with things
      • Learn by trial and error
      • Enjoy variety and excel in being flexible

      Delivery method considerations

      There are four common ways to learn a new skill: by watching, conceptualizing, doing, and experiencing. The following are some suggestions on ways to implement your data literacy program through different delivery methods.

      There are four common ways to learn a new skill: by watching, conceptualizing, doing, and experiencing. The following are some suggestions on ways to implement your data literacy program through different delivery methods.

      Phase 3

      Map Out Data Literacy Roadmap and Milestones

      Phase 3: step 1 - Roadmap exercise, step 2 - Set key performance metrics and milestones.

      Foster Data-Driven Culture With Data Literacy

      This phase will walk you through the following activities:

      • Complete a roadmap exercise.
      • Set key performance metrics and milestones.

      This phase involves the following participants:

      • Data governance sponsor
      • Data owners
      • Data stewards
      • Data custodians

      3.1 Build the data literacy roadmap and milestones

      1-3 hours
      1. Gather the data literacy objectives and list of program initiatives with their assigned groups.
      2. Discuss each program initiative with the data literacy creation team, assigning content owners and estimating effort required to build the content.

      For the Gantt chart:

      • Input the roadmap start year.
      • List each data literacy topic and delivery method.
      • Populate the planned start and end dates for the prepopulated list of program initiatives.

      Input

      • List of data literacy topics with assigned groups
      • Vision statement of data literacy program
      • Data literacy objectives

      Output

      • Roadmap Gantt chart
      • List of program initiatives with start and end date
      • Content owner assignment

      Materials

      • Whiteboard/flip charts
      • Sticky notes
      • MS Projects/Excel

      Participants

      • CDO or sponsor
      • Key business stakeholders
      • Data stewards
      • Data custodians
      • Data governance working group

      Data literacy journey mapping

      Making it sustainable

      • Deliver the literacy program in stages to make it easier for the audience to consume the content.
      • Allow opportunities to apply the learnings at work.
      • Map out the data literacy trainings as they get delivered and identify gaps, if any. Continue to refine and adjust the program and delivery method for better outcome.
      • Set clear goals and KPIs measurement up front.
      • Conduct Info-Tech Research Group’s Data Culture Diagnostics to set the baseline and repeat the assessment in 12 to 18 months.
      • Assign champions to lead change and influence end users to adopt better processes.
      Data Literacy journey mapping. Different departments need different skills in data literacy.

      Research contributors

      Name

      Position

      Andrea Malick Advisory Director, Info-Tech Research Group
      Andy Neill AVP, Data and Analytics, Chief Enterprise Architect, Info-Tech Research Group
      Crystal Singh Research Director, Info-Tech Research Group
      Imad Jawadi Senior Manager, Consulting Advisory, Info-Tech Research Group
      Irina Sedenko Research Director, Info-Tech Research Group
      Reddy Doddipalli Senior Workshop Director, Info-Tech Research Group
      Sherwick Min Technical Counselor, Info-Tech Research Group
      Wayne Cain Principal Advisory Director, Info-Tech Research Group

      Info-Tech’s Data Literacy Program

      Contact your account representative for more information.
      workshops@infotech.com 1-888-670-8889

      Session 1

      Session 2

      Session 3

      Session 4

      Activities

      Understand the WHY and Value of Data

      1.1 Business context, business objectives, and goals

      1.2 You and data

      1.3 Data journey from data to insights

      1.4 Speak data – common terminology

      Learn about the WHAT Through Data Flow

      2.1 Data creation

      2.2 Data ingestion

      2.3 Data accumulation

      2.4 Data augmentation

      2.5 Data delivery

      2.6 Data consumption

      Explore the HOW Through Data Visualization Training

      3.1 Ask the right questions

      3.2 Find the top five data elements

      3.3 Understand your data

      3.4 Present your data story

      3.5 Sharing of lessons learned

      Put Them All Together Through Data Governance Awareness

      4.1 Data governance framework

      4.2 Data roles and responsibilities

      4.3 Data domain and owners

      Deliverables

      1. Learning material for understanding the data fundamental and its terminology
      1. Learning material for data flow elements
      1. Learning material for data visualization
      1. Learning material for data governance awareness program

      Related Info-Tech Research

      Establish Data Governance

      Deliver measurable business value.

      Build a Robust and Comprehensive Data Strategy

      Key to building and fostering a data-driven culture.

      Create a Data Management Roadmap

      Streamline your data management program with our simplified framework.

      Bibliography

      About Learning. “4MAT overview.” About Learning., 16 Aug. 2001. Web.

      Accenture. “The Human Impact of Data Literacy,” Accenture, 2020. Web.

      Anand, Shivani. “IDC Reveals India Data and Content Technologies Predictions for 2022 and onwards; Focus on Data Literacy for an Elevated data Culture.” IDC, 14 Mar. 2022. Web.

      Belissent, Jennifer, and Aaron Kalb. “Data Literacy: The Key to Data-Driven Decision Making.” Alation, April 2020. Web.

      Brown, Sara. “How to build data literacy in your company.” MIT Sloan School of Management, 9 Feb 2021. Web.

      ---. “How to build a data-driven company.” MIT Sloan School of Management, 24 Sept. 2020. Web.

      Domo. “Data Never Sleeps 9.0.” Domo, 2021. Web.

      Dykes, Brent. “Creating A Data-Driven Culture: Why Leading By Example Is Essential.” Forbes, 26 Oct. 2017. Web.

      Experian. “10 signs you are sitting on a pile of data debt.” Experian, 2020. Accessed 25 June 2021. Web.

      Experian. “2019 Global Data Management Research.” Experian, 2019. Web.

      Knight, Michelle. “Data Literacy Trends in 2023: Formalizing Programs.” Dataversity, 3 Jan. 2023. Web.

      Ghosh, Paramita. “Data Literacy Skills Every Organization Should Build.” Dataversity, 2 Nov. 2022. Web.

      Johnson, A., et al., “How to Build a Strategy in a Digital World,” Compact, 2018, vol. 2. Web.

      LifeTrain. “Learning Style Quiz.” EMTrain, Web.

      Lambers, E., et al. “How to become data literate and support a data-drive culture.” Compact, 2018, vol. 4. Web.

      Marr, Benard. “Why is data literacy important for any business?” Bernard Marr & Co., 16 Aug. 2022. Web.

      Marr, Benard. “8 simple ways to enhance your data literacy skills.” Bernard Marr & Co., 16 Aug. 2022. Web/

      Mendoza, N.F. “Data literacy: Time to cure data phobia” Tech Republic, 27 Sept. 2022. Web.

      Mizrahi, Etai. “How to stay ahead of data debt and downtime?” Secoda, 17 April 2023. Web.

      Needham, Mass., “IDC FutureScape: Top 10 Predictions for the Future of Intelligence.” IDC, 5 Dec. 2022. Web.

      Paton, J., and M.A.P. op het Veld. “Trusted Analytics.” Compact, 2017, vol. 2. Web.

      Qlik. “Data Literacy to be Most In-Demand Skill by 2030 as AI Transforms Global Workplaces.” Qlik., 16 Mar 2022. Web.

      Qlik. “What is data literacy?” Qlik, n.d. Web.

      Reed, David. Becoming Data Literate. Harriman House Publishing, 1 Sept. 2021. Print.

      Salomonsen, Summer. “Grovo’s First-Time Manager Microlearning® Program Will Help Your New Managers Thrive in 2018.” Grovos Blog, 5 Dec. 2018. Web.

      Webb, Ryan. “More Than Just Reporting: Uncovering Actionable Insights From Data.” Welocalize, 1 Sept. 2020. Web.

      The MVP Major Incident Manager

      The time has come to hire a new major incident manager. How do you go about that? How do you choose the right candidate? Major incident managers must have several typically conflicting traits, so how do you pick the right person? Let's dive into that.

      Continue reading

      Resilience, It's about your business

      • member rating overall impact (scale of 10): N/A
      • member rating average dollars saved: N/A
      • member rating average days saved: N/A

      January 17th, 2025 is when your ability to serve clients without interruption is legislated. At least when you are in the financial services sector, or when you supply such firms.  If you are not active in the financial arena, don’t click away. Many of these requirements can just give you an edge over your competition.

      Many firms underestimated the impact of the legislation, but let’s be honest, so did the European Union. The last pieces of the puzzle are still not delivered only two days before the law comes into effect.

      What is DORA all about again? It is the Digital Operational Resilience Act. In essence, it is about your ability to withstand adverse events that may impact your clients or the financial system.

      Aside from some nasty details, this really is just common sense. You need to be organized so that the right people know what is expected of them, from the accountable top to the staff executing the day to day operations. You need to know what to do when things go wrong. You need to know your suppliers, especially those who supply services to your critical business services. You need to test your defenses and your IT. You may want to share intelligence around cyber-attacks.

      There, all of the 45 business-relevant DORA articles and technical standards in a single paragraph. The remaining articles deal with the competent authorities and make for good reading as they provide some insights into the workings of the regulatory body. The same goes for the preamble of the law. No less than 104 “musings” that elaborate on the operating environment and intent of the law.

      If you’re firm is still in the thick of things trying to become compliant, you are not alone. I have seen at least one regulator indicating that they will be understanding of that situation, but you must have a clear roadmap to compliance in the near future. Your regulator may or may not be in line with that position. In the eastern-most countries of the EU, signals are that the regulator will take a much tougher stance.

      (This kind of negates one of the musings of the law; the need for a single view on what financial services firms must adhere to to be considered compliant and resilient. But I think this is an unavoidable byproduct of having culturally diverse member states.)

      I dare to say that firms typically have the governance in place as well as the IM processes and testing requirements. The biggest open items seem to be in the actual IT hard operational resilience, monitoring and BCM.

      Take a look at your own firm and make an honest assessment in those areas. They key resilience (DORA-related or not) is knowing how your service works and is performing from a client perspective.

      You need to know how a client achieves all their interaction goals with your company. Typically this is mapped in the client journey. Unfortunately, this usually only maps the business flow, not the technical flow. And usually you look at it from the client UX perspective. This is obviously very important, but it does not help you to understand the elements that ensure you that your clients can always complete that journey.

      The other day, I had a customer journey with an online ski-shop. I had bought two ski helmets in size M, the same size my adult son and I had. When the helmets arrived it turned out they were too small. So, ok, no worries, I start the return process online. Once we complete the initial steps, after a few days I notice that the price for only one helmet is shown on the site. This, despite the indicators that both helmets are approved to be returned. Later both helmets are shown as effectively returned. Refund still shows one helmet’s price. What gives? I give it some more time, but after ten days, I decide to enquire. The site still shows refund for one helmet.

      Then I receive an email that both helmets will be refunded as they accepted the state of the helmets (unused) and amount of the refund is now correct. Site still shows the wrong amount.

      This is obviously a small inconvenience, but it does show that the IT team does not have a full view of the entire customer journey and systems interactions. You need to fix this.

      Suppose this is not about two ski helmets, but about ski or home insurance. Or about the sale of a car or a B2B transaction involving tens or hundreds of thousands of dollars or euro, or any other currency? Does your system show the real-time correct status of the transaction? If not, I would, as a consumer, decide to change provider. Why? Because the trust is gone.

      Resilience is about withstanding events that threaten your service to your clients. Events are nit just earthquakes or floods. Events are also wrong or missing information. To protect against that, you need to know what the (value) chain is that leads to you providing that service. Additionally, you need to know if that service chain has any impediments at any moment in time. Aka, you need to know that any service request can be fulfilled at any given time. And to have the right processes and resources in place to fix whatever is not working at that time.

      And that is in my opinion the biggest task still outstanding with many companies to ensure true resilience and customer service.

      Adopt Change Management Practices and Succeed at IT Organizational Redesign

      • Buy Link or Shortcode: {j2store}393|cart{/j2store}
      • member rating overall impact (scale of 10): N/A
      • member rating average dollars saved: N/A
      • member rating average days saved: N/A
      • Parent Category Name: Organizational Design
      • Parent Category Link: /organizational-design

      Organizational redesigns frequently fail when it comes to being executed. This leads to:

      • The loss of critical talent and institutional knowledge.
      • An inability to deliver on strategic goals and objectives.
      • Financial and time losses to the organization.

      Organizational redesigns fail during implementation primarily because they do not consider the change management required to succeed.

      Our Advice

      Critical Insight

      Implementing your organizational design with good change management practices is more important than defining the new organizational structure.

      Implementation is often negatively impacted due to:

      • Employees not understanding the need to redesign the organizational structure or operating model.
      • Employees not being communicated with or engaged throughout the process, which can cause chaos.
      • Managers not being prepared or trained to have difficult conversations with employees.

      Impact and Result

      When good change management practices are used and embedded into the implementation process:

      • Employees feel respected and engaged, reducing turnover and productivity loss.
      • The desired operating structure can be implemented faster, enabling the delivery of strategic objectives.
      • Gaps and disorganization are avoided, saving the organization time and money.

      Invest change management for your IT redesign.

      Adopt Change Management Practices and Succeed at IT Organizational Redesign Research & Tools

      Besides the small introduction, subscribers and consulting clients within this management domain have access to:

      1. Adopt Change Management Practices and Succeed at IT Organizational Redesign Deck – Succeed at implementing your IT organizational structure by adopting the necessary change management practices.

      The best IT organizational structure will still fail to be implemented if the organization does not leverage and use good change management practices. Consider practices such as aligning the structure to a meaningful vision, preparing leadership, communicating frequently, including employees, and measuring adoption to succeed at organizational redesign implementation.

      • Adopt Change Management Practices and Succeed at IT Organizational Redesign Storyboard

      2. IT Organizational Redesign Pulse Survey Template – A survey template that can be used to measure the success of your change management practices during organizational redesign implementation.

      Taking regular pulse checks of employees and managers during the transition will enable IT Leaders to focus on the right practices to enable adoption.

      • IT Organizational Redesign Pulse Survey Template
      [infographic]

      Further reading

      Adopt Change Management Practices & Succeed at IT Organizational Redesign

      The perfect IT organizational structure will fail to be implemented if there is no change management.

      Analyst Perspective

      Don’t doom your organizational redesign efforts

      The image contains a picture of Brittany Lutes.

      After helping hundreds of organizations across public and private sector industries redesign their organizational structure, we can say there is one thing that will always doom this effort: A failure to properly identify and implement change management efforts into the process.

      Employees will not simply move forward with the changes you suggest just because you as the CIO are making them. You need to be prepared to describe the individual benefits each employee can expect to receive from the new structure. Moreover, it has to be clear why this change was needed in the first place. Redesign efforts should be driven by a clear need to align to the organization’s vision and support the various objectives that will need to take place.

      Most organizations do a great job defining a new organizational structure. They identify a way of operating that tells them how they need to align their IT capabilities to deliver on strategic objectives. What most organizations do poorly is invest in their people to ensure they can adopt this new way of operating.

      Brittany Lutes
      Research Director, Organizational Transformation

      Info-Tech Research Group

      Executive Summary

      Your Challenge

      Common Obstacles

      Info-Tech’s Approach

      Organizational redesigns frequently fail when it comes to being executed. This leads to:

      • The loss of critical talent and institutional knowledge.
      • An inability to deliver on strategic goals and objectives.
      • Financial and time losses to the organization.

      Organizational redesigns fail during implementation primarily because they do not consider the change management required to succeed.

      Implementation of the organizational redesign is often impacted when:

      • Employees do not understand the need to redesign the organizational structure or operating model.
      • Employees are not communicated with or engaged throughout the process, which can cause chaos.
      • Managers are not prepared or trained to have difficult conversations with employees.

      Essentially, implementation is impacted when change management is not included in the redesign process.

      When good change management practices are used and embedded into the implementation process:

      • Employees feel respected and engaged, reducing turnover and productivity loss.
      • The desired operating structure can be implemented faster, enabling the delivery of strategic objectives.
      • Gaps and disorganization are avoided, saving the organization time and money.

      Invest in change management for your IT redesign.

      Info-Tech Insight

      Implementing your organizational design with good change management practices is more important than defining the new organizational structure.

      Your challenge

      This research enables organizations to succeed at their organizational redesign:

      • By implementing the right change management practices. These methods prevent:
        • The loss of critical IT employees who will voluntarily exit the organization.
        • Employees from creating rumors that will be detrimental to the change.
        • Confusion about why the change was needed and how it will benefit the strategic objectives the organization is seeking to achieve.
        • Spending resources (time, money, and people) on the initiative longer than is necessary.

      McKinsey reported less than 25% of organizational redesigns are successful. Which is worse than the average change initiative, which has a 70% failure rate.

      Source: AlignOrg, 2020.

      The value of the organizational redesign efforts is determined by the percentage of individuals who adopt the changes and operate in the desired way of working.

      When organizations properly use organizational design processes, they are:

      4× more likely to delight customers

      13× more effective at innovation

      27× more likely to retain employees

      Source: The Josh Bersin Company, 2022

      Common obstacles

      These barriers make implementing an organizational redesign difficult to address for many organizations:

      • You communicated the wrong message to the wrong audience at the wrong time. Repeatedly.
      • There is a lack of clarity around the drivers for an organizational redesign.
      • A readiness assessment was not completed ahead of the changes.
      • There is no flexibility built into the implementation approach.
      • The structure is not aligned to the strategic goals of IT and the organization.
      • IT leadership is not involved in their staff’s day-to-day activities, making it difficult to suggest realistic changes.

      Don’t doom your organizational redesign with poor change management

      Only 17% of frontline employees believe the lines of communication are open.

      Source: Taylor Reach Group, 2019

      43% Percentage of organizations that are ineffective at the organizational design methodology.

      Source: The Josh Bersin Company, 2022.

      Change management is a must for org design

      Forgetting change management is the easiest way to fail at redesigning your IT organizational structure

      • Change management is not a business transformation.
      • Change management consists of the practices and approaches your organization takes to support your people through a transformation.
      • Like governance, change management happens regardless of whether it is planned or ad hoc.
      • However, good change management will be intentional and agile, using data to help inform the next action steps you will take.
      • Change management is 100% focused on the people and how to best support them as they learn to understand the need for the change, what skills they must have to support and adopt the change, and eventually to advocate for the change.

      "Organizational transformation efforts rarely fail because of bad design, but rather from lack of sufficient attention to the transition from the old organization to the new one."

      – Michael D. Watkins & Janet Spencer. ”10 Reason Why Organizational Change Fails.”

      Info-Tech’s approach

      Redesigning the IT structure depends on good change management

      The image contains a screenshot of Info-Tech's approach, and good change management.

      Common changes in organizational redesigns

      Entirely New Teams

      Additions, reductions, or new creations. The individuals that make up a functional team can shift.

      New Team Members

      As roles become defined, some members might be required to shift and join already established groups.

      New Responsibilities

      The capabilities individuals will be accountable or responsible for become defined.

      New Ways of Operating

      From waterfall to Agile, collaborative to siloed, your operating model provides insight into the ways roles will engage one another.

      Top reasons organizational redesigns fail

      1. The rationale for the redesign is not clear.
      2. Managers do not have the skills to lead their teams through a change initiative like organizational redesign.
      3. You communicated the wrong messages at the wrong times to the wrong audiences.
      4. Frontline employees were not included in the process.
      5. The metrics you have to support the initiative are countering one another – if you have metrics at all.
      6. Change management and project management are being treated interchangeably.

      Case study: restructuring to reduce

      Clear Communication & Continuous Support

      Situation

      On July 26th, 2022, employees at Shopify – an eCommerce platform – were communicated to by their CEO that a round of layoffs was about to take place. Effective that day, 1,000 employees or 10% of the workforce would be laid off.

      In his message to staff, CEO Tobi Lutke admitted he had assumed continual growth in the eCommerce market when the COVID-19 pandemic forced many consumers into online shopping. Unfortunately, it was clear that was not the case.

      In his communications, Tobi let people know what to expect throughout the day, and he informed people what supports would be made available to those laid off. Mainly, employees could expect to see a transparent approach to severance pay; support in finding new jobs through coaching, connections, or resume creation; and ongoing payment for new laptops and internet to support those who depend on this connectivity to find new jobs.

      Results

      Unlike many of the other organizations (e.g. Wayfair and Peloton) that have had to conduct layoffs in 2022, Shopify had a very positive reaction. Many employees took to LinkedIn to thank their previous employer for all that they had learned with the organization and to ask their network to support them in finding new opportunities. Below is a letter from the CEO:

      The image contains a screenshot of a letter from the CEO.

      Shopify, 2022.
      Forbes, 2022.

      Aligned to a Meaningful Vision

      An organizational redesign must be aligned to a clear and meaningful vision of the organization.

      Define the drivers for organizational redesign

      And align the structure to execute on those drivers.

      • Your structure should follow your strategy. However, 83% of people in an organization do not fully understand the strategy (PWC, 2017).
      • How can employees be expected to understand why the IT organization needs to be restructured to meet a strategy if the strategy itself is still vague and unclear?
      • When organizations pursue a structural redesign, there are often a few major reasons:
        • Digital/organizational transformation
        • New organizational strategy
        • Acquisition or growth of products, services, or capabilities
        • The need to increase effectiveness
        • Cost savings
      • Creating a line of sight for your employees and leadership team will increase the likelihood that they want to adopt this structure.

      “The goal is to align your operating model with your strategy, so it directly supports your differentiating capabilities.”

      – PWC, 2017.

      How to align structure to strategy

      Recommended action steps:

      • Describe the end state of the organizational structure and how long you anticipate it will take to reach that state. It's important that employees be able to visualize the end state of the changes being made.
      • Ensure people understand the vision and goals of the IT organization. Are you having discussions about these? Are managers discussing these? Do people understand that their day-to-day job is intended to support those goals?
      • Create a visual:
        • The goals of the organization → align to the initiatives IT → which require this exact structure to deliver.
      • Do not assume people are willing to move forward with this vision. If people are not willing, assess why and determine if there are benefits specific to the individual that can support them in adopting the future state.
      • Define and communicate the risks of not making the organizational structure changes.

      Info-Tech Insight

      A trending organizational structure or operating model should never be the driver for an organizational redesign.

      IT Leaders Are Not Set Up To Succeed

      Empower these leaders to have difficult conversations.

      Lacking key leadership capabilities in managers

      Technical leaders are common in IT, but people leaders are necessary during the implementation of an organizational structure.

      • Managers are important during a transformational change for many reasons:
        • Managers play a critical role in being able to identify the skill gaps in employees and to help define the next steps in their career path.
        • After the sponsor (CIO) has communicated to the group the what and the why, the personal elements of the change fall to managers.
        • Managers’ displays of disapproval for the redesign can halt the transformation.
      • However, many managers (37%) feel uncomfortable talking to employees and providing feedback if they think it will elicit a negative response (Taylor Reach Group, 2019).
      • Unfortunately, organizational redesign is known for eliciting negative responses from employees as it generates fears around the unknown.
      • Therefore, managers must be able to have conversations with employees to further the successful implementation and adoption of the structure.

      “Successful organizational redesign is dependent on the active involvement of different managerial levels."

      – Marianne Livijn, “Managing Organizational Redesign: How Organizations Relate Macro and Micro Design.”

      They might be managers, but are they leaders?

      Recommended action steps:

      • Take time to speak with managers one on one and understand their thoughts, feelings, and understanding of the change.
      • Ensure that middle-managers have an opportunity to express the benefits they believe will be realized through the proposed changes to the organizational chart.
      • Provide IT leaders with leadership training courses (e.g. Info-Tech’s Leadership Programs).
      • Do not allow managers to start sharing and communicating the changes to the organizational structure if they are not demonstrating support for this change. Going forward, the group is all-in or not, but they should never demonstrate not being bought-in when speaking to employees.
      • Ensure IT leaders want to manage people, not just progress to a management position because they cannot climb a technical career ladder within the proposed structure. Provide both types of development opportunities to all employees.
      • Reduce the managers’ span of control to ensure they can properly engage all direct reports and there is no strain on the managers' time.

      Info-Tech Insight

      47% of direct reports do not agree that their leader is demonstrating the change behaviors. Often, a big reason is that many middle-managers do not understand their own attitudes and beliefs about the change.

      Source: McKinsey & Company “How Do We Manage the Change Journey?”

      Check out Info-Tech’s Build a Better Manager series to support leadership development

      These blueprints will help you create strong IT leaders who can manage their staff and themselves through a transformation.

      Build a Better Manager: Basic Management Skills

      Build a Better Manager: Personal Leadership

      Build a Better Manager: Manage Your People

      Build Successful Teams

      Transparent & Frequent Communication

      Provide employees with several opportunities to hear information and ask questions about the changes.

      Communication must be done with intention

      Include employees in the conversation to get the most out of your change management.

      • Whether it is a part of a large transformation or a redesign to support a specific goal of IT, begin thinking about how you will communicate the anticipated changes and who you will communicate those changes to right away.
      • The first group of people who need to understand why this initiative is important are the other IT leaders. If they are not included in the process and able to understand the foundational drivers of the initiative, you should not continue to try and gain the support of other members within IT.
      • Communication is critical to the success of the organizational redesign.
      • Communicating the right information at the right time will make the difference between losing critical talent and emerging from the transition successfully.
      • The sponsor of this redesign initiative must be able to communicate the rationale of the changes to the other members of leadership, management, and employees.
      • The sponsor and their change management team must then be prepared to accept the questions, comments, and ideas that members of IT might have around the changes.

      "Details about the new organization, along with details of the selection process, should be communicated as they are finalized to all levels of the organization.”

      – Courtney Jackson, “7 Reasons Why Organizational Structures Fail.”

      Two-way communication is necessary

      Recommended action steps:

      • Don't allow rumors to disrupt this initiative – be transparent with people as early as possible.
      • If the organizational restructure will not result in a reduction of staff – let them know! If someone's livelihood (job) is on the line, it increases the likelihood of panic. Let's avoid panic.
      • Provide employees with an opportunity to voice their concerns, questions, and recommendations – so long as you are willing to take that information and address it. Even if the answer to a recommendation is "no" or the answer to a question is "I don't know, but I will find out," you've still let them know their voice was heard in the process.
      • As the CIO, ensure that you are the first person to communicate the changes. You are the sponsor of this initiative – no one else.
      • Create communications that are clear and understandable. Imagine someone who does not work for your organization is hearing the information for the first time. Would they be able to comprehend the changes being suggested?
      • Conduct a pulse survey on the changes to identify whether employees understand the changes and feel heard by the management team.

      Info-Tech Insight

      The project manager of the organizational redesign should not be the communicator. The CIO and the employees’ direct supervisor should always be the communicators of key change messages.

      Communication spectrum

      An approach to communication based on the type of redesign taking place

      ← Business-Mandated Organizational Redesign

      Enable Alignment & Increased Effectiveness

      IT-Driven & Strategic Organizational Redesign →

      Reduction in roles

      Cost savings

      Requires champions who will maintain employee morale throughout

      Communicate with key individuals ahead of time

      Restructure of IT roles

      Increase effectiveness

      Lean on managers & supervisors to provide consistent messaging

      Communicate the individual benefits of the change

      Increase in IT Roles

      Alignment to business model

      Frequent and ongoing communication from the beginning

      Collaborate with IT groups for input on best structure

      Include Employees in the Redesign Process

      Stop talking at employees and ensure they are involved in the changes impacting their day-to-day lives.

      Employees will enable the change

      Old-school approaches to organizational redesign have argued employee engagement is a hinderance to success – it’s not.

      • We often fail to include the employees most impacted by a restructuring in the redesign process. As a result, one of the top reasons employees do not support the change is that they were not included in the change.
      • A big benefit of including employees in the process is it mitigates the emergence of a rumor mill.
      • Moreover, being open to suggestions from staff will help the transformation succeed.
      • Employees can best describe what this transition might entail on a day-to-day basis and the supports they will require to succeed in moving from their current state to their future state.
        • CIOs and other IT leaders are often too far removed from the day-to-day to best describe what will or will not work.
      • When employees feel included in the process, they are more likely to feel like they had a choice in what and how things change.

      "To enlist employees, leadership has to be willing to let things get somewhat messy, through intensive, authentic engagement and the involvement of employees in making the transformation work."

      – Michael D. Watkins & Janet Spencer, “10 Reasons Why Organizational Change Fails.”

      Empowering employees as change agents

      Recommended action steps:

      • Do not tell employees what benefits they will gain from this new change. Instead, ask them what benefits they anticipate.
      • Ask employees what challenges they anticipate, and identify actions that can be taken to minimize those challenges.
      • Identify who the social influencers are in the organization by completing an influencer map. The informal social networks in your organization can be powerful drivers of change when the right individuals are brought onboard.
      • Create a change network using those influencers. The change network includes individuals who represent all levels within the organization and can represent the employee perspective. Use them to help communicate the change and identify opportunities to increase the success of adoption: “Engaging influencers in change programs makes them 3.8 times more likely to succeed," (McKinsey & Company, 2020).
      • Ask members of the change network to identify possible resistors of the new IT structure and inform you of why they might be resisting the changes.

      Info-Tech Insight

      Despite the persistent misconceptions, including employees in the process of a redesign reduces uncertainty and rumors.

      Monitor employee engagement & adoption throughout the redesign

      Only 22% of organizations include the employee experience as a part of the design process

      – The Josh Bersin Company, 2022.
      1 2 3
      Monitor IT Employee Experience

      When Prosci designed their Change Impact Analysis, they identified the ways in which roles will be impacted across 10 different components:

      • Location
      • Process
      • Systems
      • Tools
      • Job roles
      • Critical behaviors
      • Mindset/attitudes/beliefs
      • Reporting structure
      • Performance reviews
      • Compensation

      Engaging employees in the process so that they can define how their role might be impacted across these 10 categories not only empowers the employee, but also ensures they are a part of the process.

      Source: Prosci, 2019.

      Conduct an employee pulse survey

      See the next slide for more information on how to create and distribute this survey.

      Employee Pulse Survey

      Conduct mindful and frequent check-ins with employees

      Process to conduct survey:

      1. Using your desired survey solution (e.g. MS Forms, SurveyMonkey, Qualtrics) input the questions into the survey and send to staff. A template of the survey in MS Forms is available here: IT Organizational Redesign Pulse Survey Template.
      2. When sending to staff, ensure that the survey is anonymous and reinforce this message.
      3. Leverage the responses from the survey to learn where there might be opportunities to improve the transformation experience (aligning the structure to the vision, employee inclusion, communication, or managerial support for the change). Review the recommended action steps in this research set for help.
      4. This assessment is intended for frequent but purposeful use. Only send out the survey when you have taken actions in order to improve adoption of the change or have provided communications. The Employee Pulse Survey should be reevaluated on a regular basis until adoption across all four categories reaches the desired state (80-100% adoption is recommended).

      The image contains a screenshot of the employee pulse survey.

      Define Key Metrics of Adoption & Success

      Metrics have a dual benefit of measuring successful implementation and meeting the original drivers.

      Measuring the implementation is a two-pronged approach

      Both employee adoption and the transformation of the IT structure need to be measured during implementation

      • Organizations that are going through any sort of transformation – such as organizational redesign – should be measuring whether they are successfully on track to meet their target or have already met that goal.
      • Throughout the organizational structure transition, a major factor that will impact the success of that goal is employee willingness to move forward with the changes.
      • However, rather than measuring these two components using hard data, we rely on gut checks that let us know if we think we are on track to gaining adoption and operating in the desired future state.
      • Given how fluid employees and their responses to change can be, conducting a pulse survey at a regular (but strategically identified) interval will provide insight into where the changes will be adopted or resisted.

      “Think about intentionally measuring at the moments in the change storyline where feedback will allow leaders to make strategic decisions and interventions.”

      – Bradley Wilson, “Employee Survey Questions: The Ultimate Guide.”

      Report that the organizational redesign for IT was a success

      Recommended action steps:

      • Create clear metrics related to how you will measure the success of the organizational redesign, and communicate those metrics to people. Ensure the metrics are not contrary to the goals of other initiatives or team outcomes.
      • Create one set of metrics related to adoption and another set of metrics tied to the successful completion of the project objective.
        • Are people changing their attitudes and behaviors to reflect the required outcome?
        • Are you meeting the desired outcome of the organizational redesign?
      • Use the metrics to inform how you move forward. Do not attempt the next phase of the organizational transformation before employees have clearly indicated a solid understanding of the changes.
      • Ensure that any metrics used to measure success will not negatively interfere with another team’s progress. The metrics of the group need to work together, not against each other.

      Info-Tech Insight

      Getting 100% adoption from employees is unlikely. However, if employee adoption is not sitting in the 80-90% range, it is not recommended that you move forward with the next phase of the transformation.

      Example sustainment metrics

      Driver Goal Measurement Key Performance Indicator (KPI)
      Workforce Challenges and Increased Effectiveness Employee Engagement The change in employee engagement before, during, and after the new organizational structure is communicated and implemented.
      Increased Effectiveness Alignment of Demand to Resources Does your organization have sufficient resources to meet the demands being placed on your IT organization?
      Increased Effectiveness and Workforce Challenges Role Clarity An increase in role clarity or a decrease in role ambiguity.

      Increased Effectiveness

      Reduction in Silos

      Employee effectiveness increases by 27% and efficiency by 53% when provided with role clarity (Effectory, 2019).
      Increased Effectiveness Reduction in Silos Frequency of communication channels created (scrum meetings, Teams channels, etc.) specific to the organizational structure intended to reduce silos.
      Operating in a New Org. Structure Change Adoption Rate The percentage of employees who have adopted their defined role within the new organizational chart in 3-, 6-, and 12-month increments.
      Workforce Challenges Turnover Rate The number of employees who voluntarily leave the organization, citing the organizational redesign.
      Workforce Challenges Active Resistors The number of active resistors anticipated related to the change in organizational structure versus the number of active resistors that actually present themselves to the organizational restructuring.
      New Capabilities Needed Gap in Capability Delivery The increase in effectiveness in delivering on new capabilities to the IT organization.
      Operating in a New Org. Structure Change Adoption Rate The percentage of employees who found the communication around the new organizational structure clear, easy to understand, and open to expressing feedback.
      Lack of Business Understanding or Increased Effectiveness Business Satisfaction with IT Increase in business satisfaction toward IT products and services.
      Workforce Challenges Employee Performance Increase in individual employee performances on annual/bi-annual reviews.
      Adoption Pulse Assessment Increase in overall adoption scores on pulse survey.
      Adoption Communication Effectiveness Reduction in the number of employees who are still unsure why the changes are required.
      Adoption Leadership Training Percentage of members of leadership attending training to support their development at the managerial level.

      Change Management ≠ Project Management

      Stop treating the two interchangeably.

      IT organizations struggle to mature their OCM capabilities

      Because frankly they didn’t need it

      • Change management is all about people.
      • If the success of your organization is dependent on this IT restructuring, it is important to invest the time to do it right.
      • This means it should not be something done off the side of someone's desk.
      • Hire a change manager or look to roles that have a responsibility to deliver on organizational change management.
      • While project success is often measured by if it was delivered on time, on budget, and in scope, change management is adaptable. It can move backward in the process to secure people's willingness to adopt the required behaviors.
      • Strategic organizations recognize it’s not just about pushing an initiative or project forward. It’s about making sure that your employees are willing to move that initiative forward too.
      • A major organizational transformation initiative like restructuring requires you lean into employee adoption and buy-in.

      “Only if you have your employees in mind can you implement change effectively and sustainably.”

      – Creaholic Pulse Feedback, “Change Management – And Why It Has to Change.”

      Take the time to educate & communicate

      Recommended action steps:

      • Do not treat change management and project management as synonymous.
      • Hire a change manager to support the organizational redesign transformation.
      • Invest the resources (time, money, people) that can support the change and enable its success. This can look like:
        • Training and development.
        • Hiring the right people.
        • Requesting funds during the redesign process to support the transition.
      • Create a change management plan – and be willing to adjust the timelines or actions of this plan based on the feedback you receive from employees.
      • Implement the new organizational structure in a phased approach. This allows time to receive feedback and address any fears expressed by staff.

      Info-Tech Insight

      OCM is often not included or used due to a lack of understanding of how it differs from project management.

      And an additional five experts across a variety of organizations who wish to remain anonymous.

      Research Contributors and Experts

      Info-Tech Research Group

      Amanda Mathieson Research Director Heather Munoz Executive Counselor Valence Howden Principal Research Director
      Ugbad Farah Research Director Lisa Hager Duncan Executive Counselor Alaisdar Graham Executive Counselor
      Carlene McCubbin Practice Lead

      Related Info-Tech Research

      Redesign Your IT Organizational Structure

      Build a Strategic IT Workforce Plan

      Implement a New IT Organizational Structure

      • Organizational redesign is only as successful as the process leaders engage in.
      • Benchmarking your organizational redesign to other organizations will not work.
      • You could have the best IT employees in the world, but if they aren’t structured well, your organization will still fail in reaching its vision.
      • A well-defined strategic workforce plan (SWP) isn’t just a nice-to-have, it’s a must-have.
      • Integrate as much data as possible into your workforce plan to best prepare you for the future. Without knowledge of your future initiatives, you are filling hypothetical holes.
      • To be successful, you need to understand your strategic initiatives, workforce landscape, and external and internal trends.
      • Organizational design implementations can be highly disruptive for IT staff and business partners. Without a structured approach, IT leaders may experience high turnover, decreased productivity, and resistance to change.
      • CIOs walk a tightrope as they manage operational and emotional turbulence while aiming to improve business satisfaction with IT. Failure to achieve balance could result in irreparable failure.

      Bibliography

      Aronowitz, Steven, et al. “Getting Organizational Design Right,” McKinsey, 2015. Web.
      Ayers, Peg. “5 Ways to Engage Your Front-Line Staff.” Taylor Reach Group, 2019. Web.
      Bushard, Brian, and Carlie Porterfield. “Meta Reportedly Scales Down, Again – Here Are the Major US Layoffs This Year.” Forbes, September 28, 2022. Web.
      Caruci, Ron. “4 Organizational Design Issues that Most Leaders Misdiagnose.” Harvard Business Review, 2019.
      “Change Management – And Why It Has to Change.” Creaholic Pulse Feedback. Web.
      “Communication Checklist for Achieving Change Management.” Prosci, 27 Oct. 2022. Web.
      “Defining Change Impact.” Prosci. 29 May 2019. Web.
      “The Definitive Guide To Organization Design.” The Josh Bersin Company, 2022.
      Deshler, Reed. “Five Reasons Organizational Redesigns Fail to Deliver.” AlignOrg. 28 Jan. 2020. Web.
      The Fit for Growth Mini Book. PwC, 12 Jan. 2017.
      Helfand, Heidi. Dynamic Reteaming: The Art and Wisdom of Changing Teams. 2nd ed., O’Reilly Media, 2020.
      Jackson, Courtney. “7 Reasons Why Organizational Structures Fail.” Scott Madden Consultants. Web.
      Livijn, Marianne. Managing Organizational Redesign: How Organizations Relate Macro and Micro Design. Doctoral dissertation. Department of Management, Aarhus University, 2020.
      Lutke, Tobias. “Changes to Shopify’s Team.” Shopify. 26 July 2022.
      McKinsey & Company. “How Do We Manage the Change Journey?” McKinsey & Company.2020.
      Pijnacker, Lieke. “HR Analytics: Role Clarity Impacts Performance.” Effectory, 29 Sept. 2019. Web.
      Tompkins, Teri C., and Bruce G. Barkis. “Conspiracies in the Workplace: Symptoms and Remedies.” Graziadio Business Review, vol. 21, no. 1, 2021.Web.
      “Understanding Organizational Structures.” SHRM,2022.
      Watkins, Michael D., and Janet Spencer. “10 Reasons Why Organizational Change Fails.” I by IMD, 10 March 2021. Web.
      Wilson, Bradley. “Employee Survey Questions: The Ultimate Guide.” Perceptyx, 1 July 2020. Web.

      Take Action on Service Desk Customer Feedback

      • Buy Link or Shortcode: {j2store}494|cart{/j2store}
      • member rating overall impact (scale of 10): 10.0/10 Overall Impact
      • member rating average dollars saved: $27,500 Average $ Saved
      • member rating average days saved: 110 Average Days Saved
      • Parent Category Name: Service Desk
      • Parent Category Link: /service-desk
      • IT leaders lack information to help inform and prioritize where improvements are most needed.
      • The service desk relies only on traditional metrics such as time to respond or percentage of SLAs met, but no measures of customer satisfaction with the service they receive.
      • There are signs of dissatisfied users, but no mechanism in place to formally capture those perceptions in order to address them.
      • Even if transactional (ticket) surveys are in use, often nothing is done with the data collected or there is a low response rate, and no broader satisfaction survey is in place.

      Our Advice

      Critical Insight

      • If customer satisfaction is not being measured, it’s often because service desk leaders don’t know how to design customer satisfaction surveys, don’t have a mechanism in place to collect feedback, or lack the resources to take accountability for a customer feedback program.
      • If customer satisfaction surveys are in place, it can be difficult to get full value out of them if there is a low response rate due to poor survey design or administration, or if leadership doesn’t understand the value of / know how to analyze the data.
      • It can actually be worse to ask your customers for feedback and do nothing with it than not asking for feedback at all. Customers may end up more dissatisfied if they take the time to provide value then see nothing done with it.

      Impact and Result

      • Understand how to ask the right questions to avoid survey fatigue.
      • Design and implement two complementary satisfaction surveys: a transactional survey to capture satisfaction with individual ticket experiences and inform immediate improvements, and a relationship survey to capture broader satisfaction among the entire user base and inform longer-term improvements.
      • Build a plan and assign accountability for customer feedback management, including analyzing feedback, prioritizing customer satisfaction insights and using them to improve performance, and communicating the results back to your users and stakeholders.

      Take Action on Service Desk Customer Feedback Research & Tools

      Besides the small introduction, subscribers and consulting clients within this management domain have access to:

      1. Take Action on Service Desk Customer Feedback Deck – A step-by-step document that walks you through how to measure customer satisfaction, design and implement transactional and relationship surveys, and analyze and act on user feedback.

      Whether you have no Service Desk customer feedback program in place or you need to improve your existing process for gathering and responding to feedback, this deck will help you design your surveys and act on their results to improve CSAT scores.

      • Take Action on Service Desk Customer Feedback Storyboard

      2. Transactional Service Desk Survey Template – A template to design a ticket satisfaction survey.

      This template provides a sample transactional (ticket) satisfaction survey. If your ITSM tool or other survey mechanism allows you to design or write your own survey, use this template as a starting point.

      • Transactional Service Desk Survey Template

      3. Sample Size Calculator – A tool to calculate the sample size needed for your survey.

      Use the Sample Size Calculator to calculate your ideal sample size for your relationship surveys.

    • Desired confidence level
    • Acceptable margin of error
    • Company population size
    • Ideal sample size
      • Sample Size Calculator

      4. End-User Satisfaction Survey Review Workflows – Visio templates to map your review process for both transactional and relationship surveys

      This template will help you map out the step-by-step process to review collected feedback from your end-user satisfaction surveys, analyze the data, and act on it.

      • End-User Satisfaction Survey Review Workflows

      Infographic

      Further reading

      Take Action on Service Desk Customer Feedback

      Drive up CSAT scores by asking the right questions and effectively responding to user feedback.

      EXECUTIVE BRIEF

      Analyst Perspective

      Collecting feedback is only half the equation.

      The image contains a picture of Natalie Sansone.

      Natalie Sansone, PhD


      Research Director, Infrastructure & Operations

      Info-Tech Research Group

      Often when we ask service desk leaders where they need to improve and if they’re measuring customer satisfaction, they either aren’t measuring it at all, or their ticket surveys are turned on but they get very few responses (or only positive responses). They fail to see the value of collecting feedback when this is their experience with it.

      Feedback is important because traditional service desk metrics can only tell us so much. We often see what’s called the “watermelon effect”: metrics appear “green”, but under the surface they’re “red” because customers are in fact dissatisfied for reasons unmeasured by standard internal IT metrics. Customer satisfaction should always be the goal of service delivery, and directly measuring satisfaction in addition to traditional metrics will help you get a clearer picture of your strengths and weaknesses, and where to prioritize improvements.

      It’s not as simple as asking customers if they were satisfied with their ticket, however. There are two steps necessary for success. The first is collecting feedback, which should be done purposefully, with clear goals in mind in order to maximize the response rate and value of responses received. The second – and most critical – is acting on that feedback. Use it to inform improvements and communicate those improvements. Doing so will not only make your service desk better, increasing satisfaction through better service delivery, but also will make your customers feel heard and valued, which alone increases satisfaction.

      The image contains a picture of Emily Sugerman.

      Emily Sugerman, PhD


      Research Analyst, Infrastructure & Operations

      Info-Tech Research Group

      Executive Summary

      Your Challenge

      Common Obstacles

      Info-Tech’s Approach

      • The service desk relies only on traditional metrics such as time to respond, or percentage of SLAs met, but not on measures of customer satisfaction with the service they receive.
      • There are signs of dissatisfied users (e.g. shadow IT, users avoid the service desk, go only to their favorite technician) but no mechanism in place to formally capture those perceptions.
      • Transactional ticket surveys were turned on when the ITSM tool was implemented, but either nobody responds to them, or nobody does anything with the data received.
      • IT leaders lack information to help inform and prioritize where improvements are most needed.
      • Service desk leaders don’t know how to design survey questions to ask their users for feedback and/or they don’t have a mechanism in place to survey users.
      • If customer satisfaction surveys are in place, nothing is done with the results because service desk leaders either don’t understand the value of analyzing the data or don’t know how to analyze the data.
      • Executives only want a single satisfaction number to track and don’t understand the value of collecting more detailed feedback.
      • IT lacks the resources to take accountability for the feedback program, or existing resources don’t have time to do anything with the feedback they receive.
      • Understand how to ask the right questions to avoid survey fatigue (where users get overwhelmed and stop responding).
      • Design and implement a transactional survey to capture satisfaction with individual ticket experiences and use the results to inform immediate improvements.
      • Design and implement a relationship survey to capture broader satisfaction among the entire user base and use the results to inform longer-term improvements.
      • Build a plan and assign accountability for analyzing feedback, using it to prioritize and make actionable improvements to address feedback, and communicating the results back to your users and stakeholders.

      Info-Tech Insight

      Asking your customers for feedback then doing nothing with it is worse than not asking for feedback at all. Your customers may end up more dissatisfied than they were before, if their opinion is sought out and then ignored. It’s valuable to collect feedback, but the true value for both IT and its customers comes from acting on that feedback and communicating those actions back to your users.

      Traditional service desk metrics can be misleading

      The watermelon effect

      When a service desk appears to hit all its targets according to the metrics it tracks, but service delivery is poor and customer satisfaction is low, this is known as the “watermelon effect”. Service metrics appear green on the outside, but under the surface (unmeasured), they’re red because customers are dissatisfied.

      Traditional SLAs and service desk metrics (such as time to respond, average resolution time, percentage of SLAs met) can help you understand service desk performance internally to prioritize your work and identify process improvements. However, they don’t tell you how customers perceive the service or how satisfied they are.

      Providing good service to your customers should be your end goal. Failing to measure, monitor, and act on customer feedback means you don’t have the whole picture of how your service desk is performing and whether or where improvements are needed to maximize satisfaction.

      There is a shift in ITSM to focus more on customer experience metrics over traditional ones

      The Service Desk Institute (SDI) suggests that customer satisfaction is the most important indicator of service desk success, and that traditional metrics around SLA targets – currently the most common way to measure service desk performance – may become less valuable or even obsolete in the future as customer experience-focused targets become more popular. (Service Desk Institute, 2021)

      SDI conducted a Customer Experience survey of service desk professionals from a range of organizations, both public and private, from January to March 2018. The majority of respondents said that customer experience is more important than other metrics such as speed of service or adherence to SLAs, and that customer satisfaction is more valuable than traditional metrics. (SDI, 2018).

      The image contains a screenshot of two pie graphs. The graph on the left is labelled: which of these is most important to your service desk? Customer experience is first with 54%. The graph on the right is labelled: Which measures do you find more value in? Customer satisfaction is first with 65%.

      However, many service desk leaders aren’t effectively measuring customer feedback

      Not only is it important to measure customer experience and satisfaction levels, but it’s equally important to act on that data and feed it into a service improvement program. However, many IT leaders are neglecting either one or both of those components.

      Obstacles to collecting feedback

      Obstacles to acting on collected feedback

      • Don’t understand the value of measuring customer feedback.
      • Don’t have a good mechanism in place to collect feedback.
      • Don’t think that users would respond to a survey (either generally unresponsive or already inundated with surveys).
      • Worried that results would be negative or misleading.
      • Don’t know what questions to ask or how to design a survey.
      • Don’t understand the importance of analyzing and acting on feedback collected.
      • Don’t know how to analyze survey data.
      • Lack of resources to take accountability over customer feedback (including analyzing data, monitoring trends, communicating results).
      • Executives or stakeholders only want a satisfaction score.

      A strong customer feedback program brings many benefits to IT and the business

      Insight into customer experience

      Gather insight into both the overall customer relationship with the service desk and individual transactions to get a holistic picture of the customer experience.

      Data to inform decisions

      Collect data to inform decisions about where to spend limited resources or time on improvement, rather than guessing or wasting effort on the wrong thing.

      Identification of areas for improvement

      Better understand your strengths and weaknesses from the customer’s point of view to help you identify gaps and priorities for improvement.

      Customers feel valued

      Make customers feel heard and valued; this will improve your relationship and their satisfaction.

      Ability to monitor trends over time

      Use the same annual relationship survey to be able to monitor trends and progress in making improvements by comparing data year over year.

      Foresight to prevent problems from occurring

      Understand where potential problems may occur so you can address and prevent them, or who is at risk of becoming a detractor so you can repair the relationship.

      IT staff coaching and engagement opportunities

      Turn negative survey feedback into coaching and improvement opportunities and use positive feedback to boost morale and engagement.

      Take Action on Service Desk Customer Feedback

      The image contains a screenshot of a Thought Model titled: Take Action on Service Desk Customer Feedback.

      Info-Tech’s methodology for measuring and acting on service desk customer feedback

      Phase

      1. Understand how to measure customer satisfaction

      2. Design and implement transactional surveys

      3. Design and implement relationship surveys

      4. Analyze and act on feedback

      Phase outcomes

      Understand the main types of customer satisfaction surveys, principles for survey design, and best practices for surveying your users.

      Learn why and how to design a simple survey to assess satisfaction with individual service desk transactions (tickets) and a methodology for survey delivery that will improve response rates.

      Understand why and how to design a survey to assess overall satisfaction with the service desk across your organization, or use Info-Tech’s diagnostic.

      Measure and analyze the results of both surveys and build a plan to act on both positive and negative feedback and communicate the results with the organization.

      Insight Summary

      Key Insight:

      Asking your customers for feedback then doing nothing with it is worse than not asking for feedback at all. Your customers may end up more dissatisfied than they were before if they’re asked for their opinion then see nothing done with it. It’s valuable to collect feedback, but the true value for both IT and its customers comes from acting on that feedback and communicating those actions back to your users.

      Additional insights:

      Insight 1

      Take the time to define the goals of your transactional survey program before launching it – it’s not as simple as just deploying the default survey of your ITSM tool out of the box. The objectives of the survey – including whether you want to keep a pulse on average satisfaction or immediately act on any negative experiences – will influence a range of key decisions about the survey configuration.

      Insight 2

      While transactional surveys provide useful indicators of customer satisfaction with specific tickets and interactions, they tend to have low response rates and can leave out many users who may rarely or never contact the service desk, but still have helpful feedback. Include a relationship survey in your customer feedback program to capture a more holistic picture of what your overall user base thinks about the service desk and where you most need to improve.

      Insight 3

      Satisfaction scores provide valuable data about how your customers feel, but don’t tell you why they feel that way. Don’t neglect the qualitative data you can gather from open-ended comments and questions in both types of satisfaction surveys. Take the time to read through these responses and categorize them in at least a basic way to gain deeper insight and determine where to prioritize your efforts.

      Understand how to measure customer satisfaction

      Phase 1

      Understand the main types of customer satisfaction surveys, principles for survey design, and best practices for surveying your users.

      Phase 1:

      Phase 2:

      Phase 3:

      Phase 4:

      Understand how to measure customer satisfaction

      Design and implement transactional surveys

      Design and implement relationship surveys

      Analyze and act on feedback

      Three methods of surveying your customers

      Transactional

      Relationship

      One-off

      Also known as

      Ticket surveys, incident follow-up surveys, on-going surveys

      Annual, semi-annual, periodic, comprehensive, relational

      One-time, single, targeted

      Definition

      • Survey that is tied to a specific customer interaction with the service desk (i.e. a ticket).
      • Assesses how satisfied customers are with how the ticket was handled and resolved.
      • Sent immediately after ticket is closed.
      • Short – usually 1 to 3 questions.
      • Survey that is sent periodically (i.e. semi-annually or annually) to the entire customer base to measure overall relationship with the service desk.
      • Assesses customer satisfaction with their overall service experience over a longer time period.
      • Longer – around 15-20 questions.
      • One-time survey sent at a specific, targeted point in time to either all customers or a subset.
      • Often event-driven or project-related.
      • Assesses satisfaction at one time point, or about a specific change that was implemented, or to inform a specific initiative that will be implemented.

      Pros and cons of the three methods

      Transactional

      Relationship

      One-off

      Pros

      • Immediate feedback
      • Actionable insights to immediately improve service or experience
      • Feeds into team coaching
      • Multiple touchpoints allow for trending and monitoring
      • Comprehensive insight from broad user base to improve overall satisfaction
      • Reach users who don’t contact the service desk often or respond to ticket surveys
      • Identify unhappy customers and reasons for dissatisfaction
      • Monitor broader trends over time
      • Targeted insights to measure the impact of a specific change or perception at a specific point of time

      Cons

      • Customer may become frustrated being asked to fill out too many surveys
      • Can lead to survey fatigue and low response rates
      • Tend to only see responses for very positive or negative experiences
      • High volume of data to analyze
      • Feedback is at a high-level
      • Covers the entire customer journey, not a specific interaction
      • Users may not remember past interactions accurately
      • A lot of detailed data to analyze and more difficult to turn into immediate action
      • Not as valuable without multiple surveys to see trends or change

      Which survey method should you choose?

      Only relying on one type of survey will leave gaps in your understanding of customer satisfaction. Include both transactional and relationship surveys to provide a holistic picture of customer satisfaction with the service desk.

      If you can only start with one type, choose the type that best aligns with your goals and priorities:

      If your priority is to identify larger improvement initiatives the service desk can take to improve overall customer satisfaction and trust in the service desk:

      If your priority is to provide customers with the opportunity to let you know when transactions do not go well so you can take immediate action to make improvements:

      Start with a relationship survey

      Start with a transactional survey

      The image contains a screenshot of a bar graph on SDI's 2018 Customer Experience in ITSM report.

      Info-Tech Insight

      One-off surveys can be useful to assess whether a specific change has impacted satisfaction, or to inform a planned change/initiative. However, as they aren’t typically part of an on-going customer feedback program, the focus of this research will be on transactional and relationship surveys.

      3 common customer satisfaction measures

      The three most utilized measures of customer satisfaction include CSAT, CES, and NPS.

      CSAT CES NPS
      Name Customer Satisfaction Customer Effort Score Net Promoter score
      What it measures Customer happiness Customer effort Customer loyalty
      Description Measures satisfaction with a company overall, or a specific offering or interaction Measures how much effort a customer feels they need to put forth in order to accomplish what they wanted Single question that asks consumers how likely they are to recommend your product, service, or company to other people
      Survey question How satisfied are/were you with [company/service/interaction/product]? How easy was it to [solve your problem/interact with company/handle my issue]? Or: The [company] made it easy for me to handle my issue How likely are you to recommend [company/service/product] to a friend?
      Scale 5, 7, or 10 pt scale, or using images/emojis 5, 7, or 10 pt scale 10-pt scale from highly unlikely to highly likely
      Scoring Result is usually expressed as a percentage of satisfaction Result usually expressed as an average Responses are divided into 3 groups where 0-6 are detractors, 7-8 are passives, 9-10 are promoters
      Pros
      • Well-suited for specific transactions
      • Simple and able to compare scores
      • Simple number, easy to analyze
      • Effort tends to predict future behavior
      • Actionable data
      • Simple to run and analyze
      • Widely used and can compare to other organizations
      • Allows for targeting customer segments
      Cons
      • Need high response rate to have representative numberEasy to ask the wrong questions
      • Not as useful without qualitative questions
      • Only measures a small aspect of the interaction
      • Only useful for transactions
      • Not useful for improvement without qualitative follow-up questions
      • Not as applicable to a service desk as it measures brand loyalty

      When to use each satisfaction measure

      The image contains a screenshot of a diagram that demonstrates which measure to use based off of what you would like to access, and which surveys it aligns with.

      How to choose which measure(s) to incorporate in your surveys

      The best measures are the ones that align with your specific goals for collecting feedback.

      • Most companies will use multiple satisfaction measures. For example, NPS can be tracked to monitor the overall customer sentiment, and CSAT used for more targeted feedback.
      • For internal-facing IT departments, CSAT is the most popular of the three methods, and NPS may not be as useful.
      • Choose your measure and survey types based on what you are trying to achieve and what kind of information you need to make improvements.
      • Remember that one measure alone isn’t going to give you actionable feedback; you’ll need to follow up with additional measures (especially for NPS and CES).
      • For CSAT surveys, customize the satisfaction measures in as many ways as you need to target the questions toward the areas you’re most interested in.
      • Don’t stick to just these three measures or types of surveys – there are other ways to collect feedback. Experiment to find what works for you.
      • If you’re designing your own survey, keep in mind the principles on the next slide.

      Info-Tech Insight

      While we focus mainly on traditional survey-based approaches to measuring customer satisfaction in this blueprint, there’s no need to limit yourselves to surveys as your only method. Consider multiple techniques to capture a wider audience, including:

      • Customer journey mapping
      • Focus groups with stakeholders
      • Lunch and learns or workshop sessions
      • Interviews – phone, chat, in-person
      • Kiosks

      Principles for survey design

      As you design your satisfaction survey – whether transactional or relational – follow these guidelines to ensure the survey delivers value and gets responses.

      1. Focus on your goal
      2. Don’t include unnecessary questions that won’t give you actionable information; it will only waste respondents’ time.

      3. Be brief
      4. Keep each question as short as possible and limit the total number of survey questions to avoid survey fatigue.

      5. Include open-ended questions
      6. Most of your measures will be close-ended, but include at least one comment box to allow for qualitative feedback.

      7. Keep questions clear and concise
      8. Ensure that question wording is clear and specific so that all respondents interpret it the same way.

      9. Avoid biased or leading questions
      10. You won’t get accurate results if your question leads respondents into thinking or answering a certain way.

      11. Avoid double-barreled questions
      12. Don’t ask about two different things in the same question – it will confuse respondents and make your data hard to interpret.

      13. Don’t restrict responses
      14. Response options should include all possible opinions (including “don’t know”) to avoid frustrating respondents.

      15. Make the survey easy to complete
      16. Pre-populate information where possible (e.g. name, department) and ensure the survey is responsive on mobile devices.

      17. Keep questions optional
      18. If every question is mandatory, respondents may leave the survey altogether if they can’t or don’t want to answer one question.

      19. Test your survey
      20. Test your survey with your target audience before launching, and incorporate feedback - they may catch issues you didn’t notice.

      Prevent survey fatigue to increase response rates

      If it takes too much time or effort to complete your survey – whether transactional or relational – your respondents won’t bother. Balance your need to collect relevant data with users’ needs for a simple and worthwhile task in order to get the most value out of your surveys.

      There are two types of survey fatigue:

      1. Survey response fatigue
      2. Occurs when users are overwhelmed by too many requests for feedback and stop responding.

      3. Survey taking fatigue
      4. Occurs when the survey is too long or irrelevant to users, so they grow tired and abandon the survey.

      Fight survey fatigue:

      • Make it as easy as possible to answer your survey:
        • Keep the survey as short as possible.
        • For transactional surveys, allow respondents to answer directly from email without having to click a separate link if possible.
        • Don’t make all questions mandatory or users may abandon it if they get to a difficult or unapplicable question.
        • Test the survey experience across devices for mobile users.
      • Communicate the survey’s value so users will be more likely to donate their time.
      • Act on feedback: follow up on both positive and negative responses so users see the value in responding.
      • Consider attaching an incentive to responding (e.g. name entered in a monthly draw).

      Design and implement transactional surveys

      Phase 2

      Learn why and how to design a simple survey to assess satisfaction with individual service desk transactions (tickets) and a methodology for survey delivery that will improve response rates.

      Phase 1:

      Phase 2:

      Phase 3:

      Phase 4:

      Understand how to measure customer satisfaction

      Design and implement transactional surveys

      Design and implement relationship surveys

      Analyze and act on feedback

      Use transactional surveys to collect immediate and actionable feedback

      Recall the definition of a transactional survey:

      • Survey that is tied to a specific customer interaction with the service desk (i.e. a ticket).
      • Assesses how satisfied customers are with how the ticket was handled and resolved.
      • Sent immediately after ticket is closed.
      • Short – usually 1 to 3 questions.

      Info-Tech Insight

      While feedback on transactional surveys is specific to a single transaction, even one negative experience can impact the overall perception of the service desk. Pair your transactional surveys with an annual relationship survey to capture broader sentiment toward the service desk.

      Transactional surveys serve several purposes:

      • Gives end users a mechanism to provide feedback when they want to.
      • Provides continual insight into customer satisfaction throughout the year to monitor for trends or issues in between broader surveys.
      • Provides IT leaders with actionable insights into areas for improvement in their processes, knowledge and skills, or customer service.
      • Gives the service desk the opportunity to address any negative experiences or perceptions with customers, to repair the relationship.
      • Feeds into individual or team coaching for service desk staff.

      Make key decisions ahead of launching your transactional surveys

      If you want to get the most of your surveys, you need to do more than just click a button to enable out-of-the-box surveys through your ITSM tool. Make these decisions ahead of time:

      Decision Considerations For more guidance, see
      What are the goals of your survey? Are you hoping to get an accurate pulse of customer sentiment (if so, you may want to randomly send surveys) or give customers the ability to provide feedback any time they have some (if so, send a survey after every ticket)? Slide 25
      How many questions will you ask? Keep the survey as short as possible – ideally only one mandatory question. Slide 26
      What questions will you ask? Do you want a measure of NPS, CES, or CSAT? Do you want to measure overall satisfaction with the interaction or something more specific about the interaction? Slide 27
      What will be the response options/scale? Keep it simple and think about how you will use the data after. Slide 28
      How often will you send the survey? Will it be sent after every ticket, every third ticket, or randomly to a select percentage of tickets, etc.? Slide 29
      What conditions would apply? For example, is there a subset of users who you never want to receive a survey or who you always want to receive a survey? Slide 30
      What mechanism/tool will you use to send the survey? Will your ITSM tool allow you to make all the configurations you need, or will you need to use a separate survey tool? If so, can it integrate to your ITSM solution? Slide 30

      Key decisions, continued

      Decision Considerations For more guidance, see
      What will trigger the survey? Typically, marking the ticket as either ‘resolved’ or ‘closed’ will trigger the survey. Slide 31
      How long after the ticket is closed will you send the survey? You’ll want to leave enough time for the user to respond if the ticket wasn’t resolved properly before completing a survey, but not so much time that they don’t remember the ticket. Slide 31
      Will the survey be sent in a separate email or as part of the ticket resolution email? A separate email might feel like too many emails for the user, but a link within the ticket closure email may be less noticeable. Slide 32
      Will the survey be embedded in email or accessed through a link? If the survey can be embedded into the email, users will be more likely to respond. Slide 32
      How long will the survey link remain active, and will you send any reminders? Leave enough time for the user to respond if they are busy or away, but not so much time that the data would be irrelevant. Balance the need to remind busy end users with the possibility of overwhelming them with survey fatigue. Slide 32
      What other text will be in the main body of the survey email and/or thank you page? Keep messaging short and straightforward and remind users of the benefit to them. Slide 33
      Where will completed surveys be sent/who will have access? Will the technician assigned to the ticket have access or only the manager? What email address/DL will surveys be sent to? Slide 33

      Define the goals of your transactional survey program

      Every survey should have a goal in mind to ensure only relevant and useful data is collected.

      • Your survey program must be backed by clear and actionable goals that will inform all decisions about the survey.
      • Survey questions should be structured around that goal, with every question serving a distinct purpose.
      • If you don’t have a clear plan for how you will action the data from a particular question, exclude it.
      • Don’t run a survey just for the sake of it; wait until you have a clear plan. If customers respond and then see nothing is done with the data, they will learn to avoid your surveys.

      Your survey objectives will also determine how often to send the survey:

      If your objective is:

      Keep a continual pulse on average customer satisfaction

      Gain the opportunity to act on negative feedback for any poor experience

      Then:

      Send survey randomly

      Send survey after every ticket

      Rationale:

      Sending a survey less often will help avoid survey fatigue and increase the chances of users responding whether they have good, bad, or neutral feedback

      Always having a survey available means users can provide feedback every time they want to, including for any poor experience – giving you the chance to act on it.

      Info-Tech Insight

      Service Managers often get caught up in running a transactional survey program because they think it’s standard practice, or they need to report a satisfaction metric. If that’s your only objective, you will fail to derive value from the data and will only turn customers away from responding.

      Design survey content and length

      As you design your survey, keep in mind the following principles:

      1. Keep it short. Your customers won’t bother responding if they see a survey with multiple questions or long questions that require a lot of reading, effort, or time.
      2. Make it simple. This not only makes it easier for your customers to complete, but easier for you to track and monitor.
      3. Tie your survey to your goals. Remember that every question should have a clear and actionable purpose.
      4. Don’t measure anything you can’t control. If you won’t be able to make changes based on the feedback, there’s no value asking about it.
      5. Include an (optional) open-ended question. This will allow customers to provide more detailed feedback or suggestions.

      Q: How many questions should the survey contain?

      A: Ideally, your survey will have only one mandatory question that captures overall satisfaction with the interaction.

      This question can be followed up with an optional open-ended question prompting the respondent for more details. This will provide a lot more context to the overall rating.

      If there are additional questions you need to ask based on your goals, clearly make these questions optional so they don’t deter respondents from completing the survey. For example, they can appear only after the respondent has submitted their overall satisfaction response (i.e. on a separate, thank you page).

      Additional (optional) measures may include:

      • Customer effort score (how easy or difficult was it to get your issue resolved?)
      • Customer service skills of the service desk
      • Technical skills/knowledge of the agents
      • Speed or response or resolution

      Design question wording

      Tips for writing survey questions:

      • Be clear and concise
      • Keep questions as short as possible
      • Cut out any unnecessary words or phrasing
      • Avoid biasing, or leading respondents to select a certain answer
      • Don’t attempt to measure multiple constructs in a single question.

      Sample question wording:

      How satisfied are you with this support experience?

      How would you rate your support experience?

      Please rate your overall satisfaction with the way your issue was handled.

      Instead of this….

      Ask this….

      “We strive to provide excellent service with every interaction. Please rate how satisfied you are with this interaction.”

      “How satisfied were you with this interaction?”

      “How satisfied were you with the customer service skills, knowledge, and responsiveness of the technicians?”

      Choose only one to ask about.

      “How much do you agree that the service you received was excellent?”

      “Please rate the service you received.”

      “On a scale of 1-10, thinking about your most recent experience, how satisfied would you say that you were overall with the way that your ticket was resolved?”

      “How satisfied were you with your ticket resolution?”

      Choose response options

      Once you’ve written your survey question, you need to design the response options for the question. Put careful thought into balancing ease of responding for the user with what will give you the actionable data you need to meet your goals. Keep the following in mind:

      When planning your response options, remember to keep the survey as easy to respond to as possible – this means allowing a one-click response and a scale that’s intuitive and simple to interpret.

      Think about how you will use the responses and interpret the data. If you choose a 10-point scale, for example, what would you classify as a negative vs positive response? Would a 5-point scale suffice to get the same data?

      Again, use your goals to inform your response options. If you need a satisfaction metric, you may need a numerical scale. If your goal is just to capture negative responses, you may only need two response options: good vs bad.

      Common response options:

      • Numerical scale (e.g. very dissatisfied to very satisfied on a 5-point scale)
      • Star rating (E.g. rate the experience out of 5 stars)
      • Smiley face scale
      • 2 response options: Good vs Bad (or Satisfied vs Dissatisfied)

      Investigate the capabilities of your ITSM tool. It may only allow one built-in response option style. But if you have the choice, choose the simplest option that aligns with your goals.

      Decide how often to send surveys

      There are two common choices for when to send ticket satisfaction surveys:

      After random tickets

      After every ticket

      Pros

      • May increase response rate by avoiding survey fatigue.
      • May be more likely to capture a range of responses that more accurately reflect sentiment (versus only negative).
      • Gives you the opportunity to receive feedback whenever users have it.
      • If your goal is to act on negative feedback whenever it arises, that’s only possible if you send a survey after every ticket.

      Cons

      • Overrepresents frequent service desk users and underrepresents infrequent users.
      • Users who have feedback to give may not get the chance to give it/service desk can’t act on it.
      • Customers who frequently contact the service desk will be overwhelmed by surveys and may stop responding.
      • Customers may only reply if they have very negative or positive feedback.

      SDI’s 2018 Customer Experience in ITSM survey of service desk professionals found:

      Almost two-thirds (65%) send surveys after every ticket.

      One-third (33%) send surveys after randomly selected tickets are closed.

      Info-Tech Recommendation:

      Send a survey after every ticket so that anyone who has feedback gets the opportunity to provide it – and you always get the chance to act on negative feedback. But, limit how often any one customer receives a ticket to avoid over-surveying them – restrict to anywhere between one survey a week to one per month per customer.

      Plan detailed survey logistics

      Decision #1

      Decision #2

      What tool will you use to deliver the survey?

      What (if any) conditions apply to your survey?

      Considerations

      • How much configuration does your ITSM tool allow? Will it allow you to configure the survey according to your decisions? Many ITSM tools, especially mid-market, do not allow you to change the response options or how often the survey is sent.
      • How does the survey look and act on mobile devices? If a customer receives the survey on their phone, they need to be able to easily respond from there or they won’t bother at all.
      • If you wish to use a different survey tool, does it integrate with your ITSM solution? Would agents have to manually send the survey? If so, how would they choose who to send the survey to, and when?

      Considerations

      Is there a subset of users who you never want to receive a survey (e.g. a specific department, location, role, or title)?

      Is there a subset of users who you always want to receive a survey, no matter how often they contact the service desk (e.g. VIP users, a department that scored low on the annual satisfaction survey, etc.)?

      Are there certain times of the year that you don’t want surveys to go out (e.g. fiscal year end, holidays)?

      Are there times of the day that you don’t want surveys to be sent (e.g. only during business hours; not at the end of the day)?

      Recommendations

      The built-in functionality of your ITSM tool’s surveys will be easiest to send and track; use it if possible. However, if your tool’s survey module is limited and won’t give you the value you need, consider a third-party solution or survey tool that integrates with your ITSM solution and won’t require significant manual effort to send or review the surveys.

      Recommendations

      If your survey module allows you to apply conditions, think about whether any are necessary to apply to either maximize your response rate (e.g. don’t send a survey on a holiday), avoid annoying certain users, or seek extra feedback from dissatisfied users.

      Plan detailed survey logistics

      Decision #2

      Decision #1

      What will trigger the survey?

      When will the survey be sent?

      Considerations

      • Usually a change of ticket status triggers the survey, but you may have the option to send it after the ticket is marked ‘resolved’ or ‘closed’. The risk of sending the survey after the ticket is ‘resolved’ is the issue may not actually be resolved yet, but waiting until it’s ‘closed’ means the user may be less likely to respond as more time has passed.
      • Some tools allow for a survey to be sent after every agent reply.
      • Some have the option to manually generate a survey, which may be useful in some cases; those cases would need to be well defined.

      Considerations

      • Once you’ve decided the trigger for the survey, decide how much time should pass after that trigger before the survey is sent.
      • The amount of time you choose will be highly dependent on the trigger you choose. For example, if you want the ‘resolved’ status to send a survey, you may want to wait 24h to send the survey in case the user responds that their issue hasn’t been properly resolved.
      • If you choose ‘closed’ as your trigger, you may want the survey to be sent immediately, as waiting any longer could further reduce the response rate.
      • Your average resolution time may also impact the survey wait time.

      Recommendations

      Only send the survey once you’re sure the issue has actually been resolved; you could further upset the customer if you ask them how happy they are with the resolution if resolution wasn’t achieved. This means sending the survey once the user confirms resolution (which closes ticket) or the agent closes the ticket.

      Recommendations

      If you are sending the survey upon ticket status moving to ‘resolved’, wait at least 24 hours before sending the survey in case the user responds that their issue wasn’t actually resolved. However, if you are sending the survey after the ticket has been verified resolved and closed, you can send the survey immediately while the experience is still fresh in their memory.

      Plan detailed survey logistics

      Decision #1

      Decision #2

      How will the survey appear in email?

      How long will the survey remain active?

      Considerations

      • If the survey link is included within the ticket resolution email, it’s one less email to fatigue users, but users may not notice there is a survey in the email.
      • If the survey link is included in its own separate email, it will be more noticeable to users, but could risk overwhelming users with too many emails.
      • Can users view the entire survey in the email and respond directly within the email, or do they need to click on a link and respond to the survey elsewhere?

      Considerations

      • Leaving the survey open at least a week will give users who are out of office or busy more time to respond.
      • However, if users respond to the survey too long after their ticket was resolved, they may not remember the interaction well enough to give any meaningful response.
      • Will you send any reminders to users to complete the survey? It may improve response rate, or may lead to survey fatigue from reaching out too often.

      Recommendations

      Send the survey separately from the ticket resolution email or users will never notice it. However, if possible, have the entire survey embedded within the email so users can click to respond directly from their email without having to open a separate link. Reduce effort, to make users more likely to respond.

      Recommendations

      Leave enough time for the user to respond if they are busy or away, but not so much time that the data will be irrelevant. Balance the need to remind busy end users, with the possibility of overwhelming them with survey fatigue. About a week is typical.

      Plan detailed survey logistics

      Decision #1

      Decision #2

      What will the body of the email/messaging say?

      Where will completed surveys be sent?

      Considerations

      • Communicate the value of responding to the survey.
      • Remember, the survey should be as short and concise as possible. A lengthy body of text before the actual survey can deter respondents.
      • Depending on your survey configuration, you may have a ‘thank you’ page that appears after respondents complete the survey. Think about what messaging you can save for that page and what needs to be up front.
      • Ensure there is a clear reference to which ticket the survey is referencing (with the subject of the ticket, not just ticket number).

      Considerations

      • Depending on the complexity of your ITSM tool, you may designate email addresses to receive completed surveys, or configure entire dashboards to display results.
      • Decide who needs to receive all completed surveys in order to take action.
      • Decide whether the agent who resolved the ticket will have access to the full survey response. Note that if they see negative feedback, it may affect morale.
      • Are there any other stakeholders who should receive the immediate completed surveys, or can they view summary reports and dashboards of the results?

      Recommendations

      Most users won’t read a long message, especially if they see it multiple times, so keep the email short and simple. Tell users you value their feedback, indicate which interaction you’re asking about, and say how long the survey should take. Thank them after they submit and tell them you will act on their feedback.

      Recommendations

      Survey results should be sent to the Service Manager, Customer Experience Lead, or whoever is the person responsible for managing the survey feedback. They can choose how to share feedback with specific agents and the service desk team.

      Response rates for transactional surveys are typically low…

      Most IT organizations see transactional survey response rates of less than 20%.

      The image contains a screenshot of a SDI survey taken to demonstrate customer satisfaction respond rate.

      Source: SDI, 2018

      SDI’s 2018 Customer Experience in ITSM survey of service desk professionals found that 69% of respondents had survey response rates of 20% or less. However, they did not distinguish between transactional and relationship surveys.

      Reasons for low response rates:

      • Users tend to only respond if they had a very positive or very negative experience worth writing about, but don’t typically respond for interactions that go as expected or were average.
      • Survey is too long or complicated.
      • Users receive too many requests for feedback.
      • Too much time has passed since the ticket was submitted/resolved and the user doesn’t remember the interaction.
      • Users think their responses disappear into a black hole or aren’t acted upon so they don’t see the value in taking the time to respond. Or, they don’t trust the confidentiality of their responses.

      “In my experience, single digits are a sign of a problem. And a downward trend in response rate is also a sign of a problem. World-class survey response rates for brands with highly engaged customers can be as high as 60%. But I’ve never seen it that high for internal support teams. In my experience, if you get a response rate of 15-20% from your internal customers then you’re doing okay. That’s not to say you should be content with the status quo, you should always be looking for ways to increase it.”

      – David O’Reardon, Founder & CEO of Silversix

      … but there are steps you can take to maximize your response rate

      It is still difficult to achieve high response rates to transactional surveys, but you can at least increase your response rate with these strategies:

      1. Reduce frequency
      2. Don’t over-survey any one user or they will start to ignore the surveys.

      3. Send immediately
      4. Ask for feedback soon after the ticket was resolved so it’s fresh in the user’s memory.

      5. Make it short and simple
      6. Keep the survey short, concise, and simple to respond to.

      7. Make it easy to complete
      8. Minimize effort involved as much as possible. Allow users to respond directly from email and from any device.

      9. Change email messaging
      10. Experiment with your subject line or email messaging to draw more attention.

      11. Respond to feedback
      12. Respond to customers who provide feedback – especially negative – so they know you’re listening.

      13. Act on feedback
      14. Demonstrate that you are acting on feedback so users see the value in responding.

      Use Info-Tech’s survey template as a starting point

      Once you’ve worked through all the decisions in this step, you’re ready to configure your transactional survey in your ITSM solution or survey tool.

      As a starting point, you can leverage Info-Tech’s Transactional Service Desk Survey Templatee to design your templates and wording.

      Make adjustments to match your decisions or your configuration limitations as needed.

      Refer to the key decisions tables on slides 24 and 25 to ensure you’ve made all the configurations necessary as you set up your survey.

      The image contains a screenshot of Info-Tech's survey templates.

      Design and implement relationship surveys

      Phase 3

      Understand why and how to design a survey to assess overall satisfaction with the service desk across your organization, or use Info-Tech’s diagnostic.

      Phase 1:

      Phase 2:

      Phase 3:

      Phase 4:

      Understand how to measure customer satisfaction

      Design and implement transactional surveys

      Design and implement relationship surveys

      Analyze and act on feedback

      How can we evaluate overall Service Desk service quality?

      Evaluating service quality in any industry is challenging for both those seeking feedback and those consuming the service: “service quality is more difficult for the consumer to evaluate than goods quality.”

      You are in the position of trying to measure something intangible: customer perception, which “result[s] from a comparison of consumer expectations with actual service performance,” which includes both the service outcome and also “the process of service delivery”

      (Source: Parasuraman et al, 1985, 42).

      Your mission is to design a relationship survey that is:

      • Comprehensive but not too long.
      • Easy to understand but complex enough to capture enough detail.
      • Able to capture satisfaction with both the outcome and the experience of receiving the service.

      Use relationship surveys to measure overall service desk service quality

      Recall the definition of a relationship survey:

      • Survey that is sent periodically (i.e. semi-annually or annually) to the entire customer base to measure the overall relationship with the service desk.
      • Shows you where your customer experience is doing well and where it needs improving.
      • Asks customers to rate you based on their overall experience rather than on a specific product or interaction.
      • Longer and more comprehensive than transactional surveys, covering multiple dimensions/ topics.

      Relationship surveys serve several purposes:

      • Gives end users an opportunity to provide overall feedback on a wider range of experiences with IT.
      • Gives IT the opportunity to respond to feedback and show users their voices are heard.
      • Provides insight into year-over-year trends and customer satisfaction.
      • Provides IT leaders the opportunity to segment the results by demographic (e.g. by department, location, or seniority) and target improvements where needed most.
      • Feeds into strategic planning and annual reports on user experience and satisfaction

      Info-Tech Insight

      Annual relationship surveys provide great value in the form of year-over-year internal benchmarking data, which you can use to track improvements and validate the impact of your service improvement efforts.

      Understand the gaps that decrease service quality

      The Service Quality Model (Parasuraman, Zeithaml and Berry, 1985) shows how perceived service quality is negatively impacted by the gap between expectations for quality service and the perceptions of actual service delivery:

      Gap 1: Consumer expectation – Management perception gap:

      Are there differences between your assumptions about what users want from a service and what those users expect?

      Gap 2: Management perception – Service quality specification gap:

      Do you have challenges translating user expectations for service into standardized processes and guidelines that can meet those expectations?

      Gap 3: Service quality specifications – Service delivery gap:

      Do staff members struggle to carry out the service quality processes when delivering service?

      Gap 4: Service delivery – External communications gap:

      Have users been led to expect more than you can deliver? Alternatively, are users unaware of how the organization ensures quality service, and therefore unable to appreciate the quality of service they receive?

      Gap 5: Expected service – Perceived service gap:

      Is there a discrepancy between users’ expectations and their perception of the service they received (regardless of any user misunderstanding)?

      The image contains a screenshot of the Service Quality Model to demonstrate the consumer and consumers.

      Your survey questions about service and support should provide insight into where these gaps exist in your organization

      Make key decisions ahead of launch

      Decision/step Considerations
      Align the relationship survey with your goals Align what is motivating you to launch the survey at this time and the outcomes it is intended to feed into.
      Identify what you’re measuring Clarify the purpose of the questions. Are you measuring feedback on your service desk, specifically? On all of IT? Are you trying to capture user effort? User satisfaction? These decisions will affect how you word your questions.
      Determine a framework for your survey Reporting on results and tracking year-over-year changes will be easier if you design a basic framework that your survey questions fall into. Consider drawing on an existing service quality framework to match best practices in other industries.
      Cover logistical details Designing a relationship survey requires attention to many details that may initially be overlooked: the survey’s length and timing, who it should be sent to and how, what demographic info you need to collect to slice and dice the results, and if it will be possible to conduct the survey anonymously.
      Design question wording It is important to keep questions clear and concise and to avoid overly lengthy surveys.
      Select answer scales The answer scales you select will depend on how you have worded the questions. There is a wide range of answer scales available to you; decide which ones will produce the most meaningful data.
      Test the survey Testing the survey before widely distributing it is key. When collecting feedback, conduct at least a few in person observations of someone taking the survey to get their unvarnished first impressions.
      Monitor and maximize your response rate Ensure success by staying on top of the survey during the period it is open.

      Align the relationship survey with your goals

      What is motivating you to launch the survey at this time?

      Is there a renewed focus on customer service satisfaction? If so, this survey will track the initiative’s success, so its questions must align with the sponsors’ expectations.

      Are you surveying customer satisfaction in order to comply with legislation, or directives to measure customer service quality?

      What objectives/outcomes will this survey feed into?

      What do you need to report on to your stakeholders? Have they communicated any expectations regarding the data they expect to see?

      Does the CIO want the annual survey to measure end-user satisfaction with all of IT?

      • Or do you only want to measure satisfaction with one set of processes (e.g. Service Desk)?
      • Are you seeking feedback on a project (e.g. implementation of new ERP)?
      • Are you seeking feedback on the application portfolio?

      In 1993 the U.S. president issued an Executive Order requiring executive agencies to “survey customers to determine the kind and quality of services they want and their level of satisfaction with existing services” and “post service standards and measure results against them.” (Clinton, 1993)

      Identify what you’re measuring

      Examples of Measures

      Clarify the purpose of the questions

      Each question should measure something specific you want to track and be phrased accordingly.

      Are you measuring feedback on the service desk?

      Service desk professionalism

      Are you measuring user satisfaction?

      Service desk timeliness

      Your customers’ happiness with aspects of IT’s service offerings and customer service

      Trust in agents’ knowledge

      Users’ preferred ticket intake channel (e.g. portal vs phone)

      Satisfaction with self-serve features

      Are you measuring user effort?

      Are you measuring feedback on IT overall?

      Satisfaction with IT’s ability to enable the business

      How much effort your customer needs to put forth to accomplish what they wanted/how much friction your service causes or alleviates

      Satisfaction with company-issued devices

      Satisfaction with network/Wi-Fi

      Satisfaction with applications

      Info-Tech Insight

      As you compose survey questions, decide whether they are intended to capture user satisfaction or effort: this will influence how the question is worded. Include a mix of both.

      Determine a framework for your survey

      If your relationship survey covers satisfaction with service support, ensure the questions cover the major aspects of service quality. You may wish to align your questions on support with existing frameworks: for example, the SERVQUAL service quality measurement instrument identifies 5 dimensions of service quality: Reliability, Assurance, Tangibles, Empathy, and Responsiveness (see below). As you design the survey, consider if the questions relate to these five dimensions. If you have overlooked any of the dimensions, consider if you need to revise or add questions.

      Service dimension

      Definition

      Sample questions

      Reliability

      “Ability to perform the promised service dependably and accurately”1

      • How satisfied are you with the effectiveness of Service Desk’s ability to resolve reported issues?

      Assurance

      “Knowledge and courtesy of employees and their ability to convey trust and confidence”2

      • How satisfied are you with the technical knowledge of the Service Desk staff?
      • When you have an IT issue, how likely are you to contact Service Desk by phone?

      Tangibles

      “Appearance of physical facilities, equipment, personnel, and communication materials”3

      • How satisfied are you that employees in your department have all the necessary technology to ensure optimal job performance?
      • How satisfied are you with IT’s ability to communicate to you regarding the information you need to perform your job effectively?

      Empathy

      “Caring, individualized attention the firm provides its customers”4

      • How satisfied are you that IT staff interact with end users in a respectful and professional manner?

      Responsiveness

      “Willingness to help customers and provide prompt service”5

      • How satisfied are you with the timeliness of Service Desk’s resolution to reported issues?
      1-5. Arlen, Chris,2022. Paraphrasing Zeithaml, Parasuraman, and Berry, 1990.

      Cover logistical details of the survey

      Identify who you will send it to

      Will you survey your entire user base or a specific subsection? For example, a higher education institution may choose to survey students separately from staff and faculty. If you are gathering data on customer satisfaction with a specific implementation, only survey the affected stakeholders.

      Determine timing

      Avoid sending out the survey during known periods of time pressure or absence (e.g. financial year-end, summer vacation).

      Decide upon its length

      Consider what survey length your users can tolerate. Configure the survey to show the respondents’ progression or their percentage complete.

      Clearly introduce the survey

      The survey should begin with an introduction that thanks users for completing the survey, indicates its length and anonymity status, and conveys how the data will be used, along with who the participants should contact with any questions about the survey.

      Decide upon incentives

      Will you incentivize participation (e.g. by entering the participants in a draw or rewarding highest-participating department)?

      Collect demographic information

      Ensure your data can be “sliced and diced” to give you more granular insights into the results. Ask respondents for information such as department, location, seniority, and tenure to help with your trend analysis later.

      Clarify if anonymous

      Users may be more comfortable participating if they can do so anonymously (Quantisoft, n.d.). If you promise anonymity, ensure your survey software/ partner can support this claim. Note the difference between anonymity (identity of participant is not collected) and confidentiality (identifying data is collected but removed from the reported results).

      Decide how to deliver the survey

      Will you be distributing the survey yourself through your own licensed software (e.g. through Microsoft Forms if you are an MS shop)? Or, will you be partnering with a third-party provider? Is the survey optimized for mobile? Some find up to 1/3 of participants use mobile devices for their surveys (O’Reardon, 2018).

      Use the Sample Size Calculator to determine your ideal sample size

      Use Info-Tech’s Sample Size Calculator to calculate the number of people you need to complete your survey to have statistically representative results.

      The image contains a screenshot of the Sample Size Calculator.

      In the example above, the service desk supports 1000 total users (and sent the survey to each one). To be 95% confident that the survey results fall within 5% of the true value (if every user responded), they would need 278 respondents to complete their survey. In other words, to have a sample that is representative of the whole population, they would need 278 completed surveys.

      Explanation of terms:

      Confidence Level: A measure of how reliable your survey is. It represents the probability that your sample accurately reflects the true population (e.g. your entire user base). The industry standard is typically 95%. This means that 95 times out of 100, the true data value that you would get if you surveyed the entire population would fall within the margin of error.

      Margin of Error: A measure of how accurate the data is, also known as the confidence interval. It represents the degree of error around the data point, or the range of values above and below the actual results from a survey. A typical margin of error is 5%. This means that if your survey sample had a score of 70%, the true value if you sampled the entire population would be between 65% and 75%. To narrow the margin of error, you would need a bigger sample size.

      Population Size: The total set of people you want to study with your survey. For example, the total number of users you support.

      Sample Size: The number of people who participate in your survey (i.e. complete the survey) out of the total population.

      Info-Tech’s End-User Satisfaction Diagnostics

      If you choose to leverage a third-party partner, an Info-Tech satisfaction survey may already be part of your membership. There are two options, depending on your needs:

      I need to measure and report customer satisfaction with all of IT:

      • IT’s ability to enable the organization to meet its existing goals, innovate, adapt to business needs, and provide the necessary technology.
      • IT’s ability to provide training, respond to feedback, and behave professionally.
      • Satisfaction with IT services and applications.

      Both products measure end-user satisfaction

      One is more general to IT

      One is more specific to service desk

      I need to measure and report more granularly on Service Desk customer satisfaction:

      • Efficacy and timeliness of resolutions
      • Technical and communication skills
      • Ease of contacting the service desk
      • Effectiveness of portal/ website
      • Ability to collect and apply user feedback

      Choose Info-Tech's End User Satisfaction Survey

      Choose Info-Tech’s Service Desk Satisfaction Survey

      Design question wording

      Write accessible questions:

      Instead of this….

      Ask this….

      48% of US adults meet or exceed PIACC literacy level 3 and thus able to deal with texts that are “often dense or lengthy.”

      52% of US adults meet level 2 or lower.

      Keep questions clear and concise. Avoid overly lengthy surveys.

      Source: Highlights of the 2017 U.S. PIAAC Results Web Report
      1. How satisfied are you with the response times of the service desk?
      2. How satisfied are you with the timeliness of the service desk?

      Users will have difficulty perceiving the difference between these two questions.

      1. How satisfied are you with the time we take to acknowledge receipt of your ticket?
      2. How satisfied are you with the time we take to completely resolve your ticket?

      Tips for writing survey questions:

      “How satisfied are you with the customer service skills, knowledge, and responsiveness of the technicians?”

      This question measures too many things and the data will not be useful.

      Choose only one to ask about.

      • Cut out any unnecessary words or phrasing. Highlight/bold key words or phrases.
      • Avoid biasing or leading respondents to select a certain answer.
      • Don’t attempt to measure multiple constructs in a single question.

      “On a scale of 1-10, thinking about the past year, how satisfied would you say that you were overall with the way that your tickets were resolved?”

      This question is too wordy.

      “How satisfied were you with your ticket resolution?”

      Choose answer scales that best fit your questions and reporting needs

      Likert scale

      Respondents select from a range of statements the position with which they most agree:

      E.g. How satisfied are you with how long it generally takes to resolve your issue completely?

      E.g. Very dissatisfied/Somewhat dissatisfied/ Neutral/ Somewhat satisfied/ Very satisfied/ NA

      Frequency scale

      How often does the respondent have to do something, or how often do they encounter something?

      E.g. How frequently do you need to re-open tickets that have been closed without being satisfactorily resolved?

      E.g. Never/ Rarely/ Sometimes/ Often/ Always/ NA

      Numeric scale

      By asking users to rate their satisfaction on a numeric scale (e.g., 1-5, 1-10), you can facilitate reporting on averages:

      E.g. How satisfied are you with IS’s ability to provide services to allow the organization to meet its goals?

      E.g. 1 – Not at all Satisfied to 10 – Fully Satisfied / NA

      Forced ranking

      Learn more about your users’ priorities by asking them to rank answers from most to least important, or selecting their top choices (Sauro, 2018):

      E.g. From the following list, drag and drop the 3 aspects of our service that are most important to you into the box on the right.

      Info-Tech Insight

      Always include an optional open-ended question, which allows customers to provide more feedback or suggestions.

      Test the survey before launching

      Review your questions for repetition and ask for feedback on your survey draft to discover if readers interpret the questions differently than you intended.

      Test the survey with different stakeholder groups:

      • IT staff: To discover overlooked topics.
      • Representatives of your end-user population: To discover whether they understand the intention of the questions.
      • Executives: To validate whether you are capturing the data they are interested in reporting on.

      Testing methodology:

      • Ask your test subjects to take the survey in your presence so you can monitor their experience as they take it.
      • Ask them to narrate their experience as they take the survey.
      • Watch for:
        • The time it takes to complete the survey.
        • Moments when they struggle or are uncertain with the survey’s wording.
        • Questions they find repetitive or pointless.

      Info-Tech Insight

      In the survey testing phase, try to capture at least a few real-time responses to the survey. If you collect survey feedback only once the test is over, you may miss some key insights into the user experience of navigating the survey.

      “Follow the golden rule: think of your audience and what they may or may not know. Think about what kinds of outside pressures they may bring to the work you’re giving them. What time constraints do they have?”

      – Sally Colwell, Project Officer, Government of Canada Pension Centre

      Monitor and maximize your response rate

      Ensure success by staying on top of the survey during the period it is open.

      • When will your users complete the survey? You know your own organization’s culture best, but SurveyMonkey found that weekday survey responses peaked at mid-morning and mid-afternoon (Wronski). Ensure you send the communication at a time it will not be overlooked. For example, some studies found Mondays to have higher response rates; however, the data is not consistent (Amaresan, 2021). Send the survey at a time you believe your users are least likely to be inundated with other notifications.
      • Have a trusted leader send out the first communication informing the end-user base of the survey. Ensure the recipient understands your motivation and how their responses will be used to benefit them (O’Reardon, 2016). Remind them that participating in the survey benefits them: since IT is taking actions based on their feedback, it’s their chance to improve their employee experience of the IT services and tools they use to do their job.
      • In the introductory communication, test different email subject lines and email body content to learn which versions increase respondents’ rates of opening the survey link, and “keep it short and clear” (O’Reardon, 2016).
      • If your users tend to mistrust emailed links due to security training, tell them how to confirm the legitimacy of the survey.

      “[Send] one reminder to those who haven’t completed the survey after a few days. Don’t use the word ‘reminder’ because that’ll go straight in the bin, better to say something like, ‘Another chance to provide your feedback’”

      – David O’Reardon, Founder & CEO of Silversix

      Analyze and act on feedback

      Phase 4

      Measure and analyze the results of both surveys and build a plan to act on both positive and negative feedback and communicate the results with the organization.

      Phase 1:

      Phase 2:

      Phase 3:

      Phase 4:

      Understand how to measure customer satisfaction

      Design and implement transactional surveys

      Design and implement relationship surveys

      Analyze and act on feedback

      Leverage the service recovery paradox to improve customer satisfaction

      The image contains a screenshot of a graph to demonstrate the service recovery paradox.

      A service failure or a poor experience isn’t what determines customer satisfaction – it’s how you respond to the issue and take steps to fix it that really matters.

      This means one poor experience with the service desk doesn’t necessarily lead to an unhappy user; if you quickly and effectively respond to negative feedback to repair the relationship, the customer may be even happier afterwards because you demonstrated that you value them.

      “Every complaint becomes an opportunity to turn a bad IT customer experience into a great one.”

      – David O’Reardon, Founder & CEO of Silversix

      Collecting feedback is only the first step in the customer feedback loop

      Closing the feedback loop is one of the most important yet forgotten steps in the process.

      1. Collect Feedback
      • Send transactional surveys after every ticket is resolved.
      • Send a broader annual relationship survey to all users.
    • Analyze Feedback
      • Calculate satisfaction scores.
      • Read open-ended comments.
      • Analyze for trends, categories, common issues and priorities.
    • Act on Feedback
      • Respond to users who provided feedback.
      • Make improvements based on feedback.
    • Communicate Results
      • Communicate feedback results and improvements made to respondents and to service desk staff.
      • Summarize results and actions to key stakeholders and business leaders.

      Act on feedback to get the true value of your satisfaction program

      • SDI (2018) survey data shows that the majority of service desk professionals are using their customer satisfaction data to feed into service improvements. However, 30% still aren’t doing anything with the feedback they collect.
      • Collecting feedback is only one half of a good customer feedback program. Acting on that feedback is critical to the success of the program.
      • Using feedback to make improvements not only benefits the service desk but shows users the value of responding and will increase future response rates.
      The image contains a screenshot of a bar graph that demonstrates SDI: What do service desk professionals do with customer satisfaction data?

      “Your IT service desk’s CSAT survey should be the means of improving your service (and the employee experience), and something that encourages people to provide even more feedback, not just the means for understanding how well it’s doing”

      – Joe the IT Guy, SysAid

      Assign responsibility for acting on feedback

      If collecting and analyzing customer feedback is something that happens off the side of your desk, it either won’t get done or won’t get done well.

      • Formalize the customer satisfaction program. It’s not a one-time task, but an ongoing initiative that requires significant time and dedication.
      • Be clear on who is accountable for the program and who is responsible for all the tasks involved for both transactional and relationship survey data collection, analysis, and communication.

      Assign accountability for the customer feedback program to one person (i.e. Service Desk Manager, Service Manager, Infrastructure & Operations Lead, IT Director), who may take on or assign responsibilities such as:

      • Designing surveys, including survey questions and response options.
      • Configuring survey(s) in ITSM or survey tool.
      • Sending relationship surveys and subsequent reminders to the organization.
      • Communicating results of both surveys to internal staff, business leaders, and end users.
      • Analyzing results.
      • Feeding results into improvement plans, coaching, and training.
      • Creating reports and dashboards to monitor scores and trends.

      Info-Tech Insight

      While feedback can feed into internal coaching and training, the goal should never be to place blame or use metrics to punish agents with poor results. The focus should always be on improving the experience for end users.

      Determine how and how often to analyze feedback data

      • Analyze and report scores from both transactional and relationship surveys to get a more holistic picture of satisfaction across the organization.
      • Determine how you will calculate and present satisfaction ratings/scores, both overall and for individual questions. See tips on the right for calculating and presenting NPS and CSAT scores.
      • A single satisfaction score doesn’t tell the full story; calculate satisfaction scores at multiple levels to determine where improvements are most needed.
        • For example, satisfaction by service desk tier, team or location, by business department or location, by customer group, etc.
      • Analyze survey data regularly to ensure you communicate and act on feedback promptly and avoid further alienating dissatisfied users. Transactional survey feedback should be reviewed at least weekly, but ideally in real time, as resources allow.

      Calculating NPS Scores

      Categorize respondents into 3 groups:

      • 9-10 = Promoters, 7-8 = Neutral, 1-6 = Detractors

      Calculate overall NPS score:

      • % Promoters - % Detractors

      Calculating CSAT Scores

      • CSAT is usually presented as a percentage representing the average score.
      • To calculate, take the total of all scores, divide by the maximum possible score, then multiply by 100. For example, a satisfaction rating of 80% means on average, users gave a rating of 4/5 or 8/10.
      • Note that some organizations present CSAT as the percentage of “satisfied” users, with satisfied being defined as either “yes” on a two-point scale or a score of 4 or 5 on a 5-point scale. Be clear how you are defining your satisfaction rating.

      Don’t neglect qualitative feedback

      While it may be more difficult and time-consuming to analyze, the reward is also greater in terms of value derived from the data.

      Why analyze qualitative data

      How to analyze qualitative data

      • Quantitative data (i.e. numerical satisfaction scores) tells you how many people are satisfied vs dissatisfied, but it doesn’t tell you why they feel that way.
      • If you limit your data analysis to only reporting numerical scores, you will miss out on key insights that can be derived from open-ended feedback.
      • Qualitative data from open-ended survey questions provides:
        • Explanations for the numbers
        • More detailed insight into why respondents feel a certain way
        • More honest and open feedback
        • Insight into areas you may not have thought to ask about
        • New ideas and recommendations

      Methods range in sophistication; choose a technique depending on your tools available and goals of your program.

      1. Manual 2. Semi-automated 3. AI & Analysis Tools
      • Read all comments.
      • Sort into positive vs negative groups.
      • Add tags to categorize comments (e.g. by theme, keyword, service).
      • Look for trends and priorities, differences across groups.
      • Run a script to search for specific keywords.
      • Use a word cloud generator to visualize the most commonly mentioned words (e.g. laptop, email).
      • Due to limitations, manual analysis will still be necessary.
      • Use a feedback analysis/text analysis tool to mine feedback.
      • Software will present reports and data visualizations of common themes.
      • AI-powered tools can automatically detect sentiment or emotion in comments or run a topic analysis.

      Define a process to respond to both negative and positive feedback

      Successful customer satisfaction programs respond effectively to both positive and negative outcomes. Late or lack of responses to negative comments may increase customer frustration, while not responding at all to the positive comments may give the perception of indifference.

      1. Define what qualifies as a positive vs negative score
      2. E.g. Scores of 1 to 2 out of 5 are negative, scores of 4 to 5 out of 5 are positive.

      3. Define process to respond to negative feedback
      • Negative responses should go directly to the Service Desk Manager or whoever is accountable for feedback.
      • Set an SLO for when the user will be contacted. It should be within 24h but ideally much sooner.
      • Investigate the issue to understand exactly what happened and get to the root cause.
      • Identify remediation steps to ensure the issue does not occur again.
      • Communicate to the customer the action you have taken to improve.
    • Define process to respond to positive feedback
      • Positive responses should also be reviewed by the person accountable for feedback, but the timeline to respond may be longer.
      • Show respondents that you value their time by thanking them for responding. Showing appreciate helps to build a long-term relationship with the user.
      • Share positive results with the team to improve morale, and as a coaching/training mechanism.
      • Consider how to use positive feedback as an incentive or reward.

      Build a plan to communicate results to various stakeholders

      Regular communication about your feedback results and action plan tied to those results is critical to the success of your feedback program. Build your communication plan around these questions:

      1. Who should receive communication?

      Each audience will require different messaging, so start by identifying who those audiences are. At a minimum, you should communicate to your end users who provided feedback, your service desk/IT team, and business leaders or stakeholders.

      2. What information do they need?

      End users: Thank them for providing feedback. Demonstrate what you will do with that feedback.

      IT team: Share results and what you need them to do differently as a result.

      Business leaders: Share results, highlight successes, share action plan for improvement.

      3. Who is responsible for communication?

      Typically, this will be the person who is accountable for the customer feedback program, but you may have different people responsible for communicating to different audiences.

      4. When will you communicate?

      Frequency of communication will depend on the survey type – relationship or transactional – as well as the audience, with internal communication being much more frequent than end-user communication.

      5. How will you communicate?

      Again, cater your approach to the audience and choose a method that will resonate with them. End users may view an email, an update on the portal, a video, or update in a company meeting; your internal IT team can view results on a dashboard and have regular meetings.

      Communication to your users impacts both response rates and satisfaction

      Based on the Customer Communication Cycle by David O’Reardon, 2018
      1. Ask users to provide feedback through transactional and relationship surveys.
      2. Thank them for completing the survey – show that you value their time, regardless of the type of feedback they submitted.
      3. Be transparent and summarize the results of the survey(s). Make it easy to digest with simple satisfaction scores and a summary of the main insights or priorities revealed.
      4. Before asking for feedback, explain how you will use feedback to improve the service. After collecting feedback, share your plan for making improvements based on what the data told you.
      5. After you’ve made changes, communicate again to share the results with respondents. Make it clear that their feedback had a direct result on the service they receive. Communicating this before running another survey will also increase the likelihood of respondents providing feedback again.

      Info-Tech Insight

      Focus your communications to users around them, not you. Demonstrate that you need feedback to improve their experience, not just for you to collect data.

      Translate feedback into actionable improvements

      Taking action on feedback is arguably the most important step of the whole customer feedback program.

      Prioritize improvements

      Prioritize improvements based on low scores and most commonly received feedback, then build into an action plan.

      Take immediate action on negative feedback

      Investigate the issue, diagnose the root cause, and repair both the relationship and issue – just like you would an incident.

      Apply lessons learned from positive feedback

      Don’t neglect actions you can take from positive feedback – identify how you can expand upon or leverage the things you’re doing well.

      Use feedback in coaching and training

      Share positive experiences with the team as lessons learned, and use negative feedback as an input to coaching and training.

      Make the change stick

      After making a change, train and communicate it to your team to ensure the change sticks and any negative experiences don’t happen again.

      “Without converting feedback into actions, surveys can become just a pointless exercise in number watching.”

      – David O’Reardon, Founder & CEO of Silversix

      Info-Tech Insight

      Outline exactly what you plan to do to address customer feedback in an action plan, and regularly review that action plan to select and prioritize initiatives and monitor progress.

      For more guidance on tracking and prioritizing ongoing improvement initiatives, see the blueprints Optimize the Service Desk with a Shift Left Strategy and Build a Continual Improvement Plan for the Service Desk.

      Leverage Info-Tech resources to guide your improvement efforts

      Map your identified improvements to the relevant resource that can help:

      Improve service desk processes:

      Improve end-user self-service options:

      Assess and optimize service desk staffing:

      Improve ease of contacting the service desk:

      Standardize the Service Desk Optimize the Service Desk With a Shift-Left Strategy Staff the Service Desk to Meet Demand Improve Service Desk Ticket Intake

      Improve service desk processes:

      Improve end-user self-service options:

      Assess and optimize service desk staffing:

      Improve ease of contacting the service desk::

      Improve Incident and Problem Management Improve Incident and Problem Management Deliver a Customer Service Training Program to Your IT Department Modernize and Transform Your End-User Computing Strategy

      Map process for acting on relationship survey feedback

      Use Info-Tech’s Relationship Satisfaction Survey Review Process workflow as a template to define your own process.

      The image contains a screenshot of the Relationship Satisfaction Survey Review Process.

      Map process for acting on transactional survey feedback

      Use Info-Tech’s Transactional Satisfaction Survey Review Process workflow as a template to define your own process.

      The image contains a screenshot of the Transactional Satisfaction Survey Review Process.

      Related Info-Tech Research

      Standardize the Service Desk

      This project will help you build and improve essential service desk processes, including incident management, request fulfillment, and knowledge management to create a sustainable service desk.

      Optimize the Service Desk With a Shift-Left Strategy

      This project will help you build a strategy to shift service support left to optimize your service desk operations and increase end-user satisfaction.

      Build a Continual Improvement Plan

      This project will help you build a continual improvement plan for the service desk to review key processes and services and manage the progress of improvement initiatives.

      Deliver a Customer Service Training Program to Your IT Department

      This project will help you deliver a targeted customer service training program to your IT team to enhance their customer service skills when dealing with end users, improve overall service delivery and increase customer satisfaction.

      Sources Cited

      Amaresan, Swetha. “The best time to send a survey, according to 5 studies.” Hubspot. 15 Jun 2021. Accessed October 2022.
      Arlen, Chris. “The 5 Service Dimensions All Customers Care About.” Service Performance Inc. n.d. Accessed October 2022.
      Clinton, William Jefferson. “Setting Customer Service Standards.” (1993). Federal Register, 58(176).
      “Understanding Confidentiality and Anonymity.” The Evergreen State College. 2022. Accessed October 2022.
      "Highlights of the 2017 U.S. PIAAC Results Web Report" (NCES 2020-777). U.S. Department of Education. Institute of Education Sciences, National Center for Education Statistics.
      Joe the IT Guy. “Are IT Support’s Customer Satisfaction Surveys Their Own Worst Enemy?” Joe the IT Guy. 29 August 2018. Accessed October 2022.
      O’Reardon, David. “10 Ways to Get the Most out of your ITSM Ticket Surveys.” LinkedIn. 2 July 2019. Accessed October 2022.
      O'Reardon, David. "13 Ways to increase the response rate of your Service Desk surveys".LinkedIn. 8 June 2016. Accessed October 2022.
      O’Reardon, David. “IT Customer Feedback Management – A Why & How Q&A with an Expert.” LinkedIn. 13 March 2018. Accessed October 2022.
      Parasuraman, A., Zeithaml, V. A., & Berry, L. L. (1985). "A Conceptual Model of Service Quality and Its Implications for Future Research." Journal of Marketing, 49(4), 41–50.
      Quantisoft. "How to Increase IT Help Desk Customer Satisfaction and IT Help Desk Performance.“ Quantisoft. n.d. Accessed November 2022.
      Rumberg, Jeff. “Metric of the Month: Customer Effort.” HDI. 26 Mar 2020. Accessed September 2022.
      Sauro, Jeff. “15 Common Rating Scales Explained.” MeasuringU. 15 August 2018. Accessed October 2022.
      SDI. “Customer Experience in ITSM.” SDI. 2018. Accessed October 2022.
      SDI. “CX: Delivering Happiness – The Series, Part 1.” SDI. 12 January 2021. Accessed October 2022.
      Wronski, Laura. “Who responds to online surveys at each hour of the day?” SurveyMonkey. n.d. Accessed October 2022.

      Research contributors

      Sally Colwell

      Project Officer

      Government of Canada Pension Centre

      Develop an IT Strategy to Support Customer Service

      • Buy Link or Shortcode: {j2store}528|cart{/j2store}
      • member rating overall impact (scale of 10): N/A
      • member rating average dollars saved: N/A
      • member rating average days saved: N/A
      • Parent Category Name: Customer Relationship Management
      • Parent Category Link: /customer-relationship-management
      • Customer expectations regarding service are rapidly evolving. As your current IT systems may be viewed as ineffective at delivering upon these expectations, a transformation is called for.
      • It is unclear whether IT has the system architecture/infrastructure to support modern Customer Service channels and technologies.
      • The relationship between Customer Service and IT is strained. Strategic system-related decisions are being made without the inclusions of IT, and IT is only engaged post-purchase to address integration or issues as they arise.
      • Scope: An ABPM-centric approach is taken to model the desired future state, and retrospectively look into the current state to derive gaps and sequential requirements. The requirements are bundled into logical IT initiatives to be plotted on a roadmap and strategy document.
      • Challenge: The extent to which business processes can be mapped down to task-based Level 5 can be challenging depending on the maturity of the organization.
      • Pain/Risk: The health of the relationship between IT and Customer Service may determine project viability. Poor collaboration and execution may strain the relationship further.

      Our Advice

      Critical Insight

      • When transformation is called for, start with future state visioning. Current state analysis can impede your ability to see future needs and possibilities.
      • Solve your own problems by enhancing core or “traditional” Customer Service functionality first, and then move on to more ambitious business enabling functionality.
      • The more rapidly businesses can launch applications in today’s market, the better positioned they are to improve customer experience and reap the associated benefits. Ensure that technology is implemented with a solid strategy to support the initiative.

      Impact and Result

      • The right technology is established to support current and future Customer Service needs.
      • Streamlined and optimized Customer Service processes that drive efficiency and improve Customer Service quality are established.
      • The IT and Customer Service functions are both transformed from a cost center into a competitive advantage.

      Develop an IT Strategy to Support Customer Service Research & Tools

      Besides the small introduction, subscribers and consulting clients within this management domain have access to:

      1. Structure the project

      Identify project stakeholders, define roles, and create the project charter.

      • Develop an IT Strategy to Support Customer Service Storyboard
      • Project RACI Chart
      • Project Charter

      2. Define vision for future state

      Identify and model the future state of key business processes.

      • Customer Service Business Process Shortlisting Tool
      • Customer Service Systems Strategy Tool

      3. Document current state and assess gaps

      Model the current state of key business processes and assess gaps.

      4. Evaluate solution options

      Review the outputs of the current state architecture health assessment and adopt a preliminary posture on architecture.

      5. Evaluate application options

      Evaluate the marketplace applications to understand the “art of the possible.”

      6. Frame desired state and develop roadmap

      Compile and score a list of initiatives to bridge the gaps, and plot the initiatives on a strategic roadmap.

      • Customer Service Initiative Scoring and Roadmap
      [infographic]

      Workshop: Develop an IT Strategy to Support Customer Service

      Workshops offer an easy way to accelerate your project. If you are unable to do the project yourself, and a Guided Implementation isn't enough, we offer low-cost delivery of our project workshops. We take you through every phase of your project and ensure that you have a roadmap in place to complete your project successfully.

      1 Define Vision for Future State

      The Purpose

      Discuss Customer Service-related organizational goals and align goals with potential strategies for implementation.

      Score level 5 Customer Service business processes against organizational goals to come up with a shortlist for modeling.

      Create a future state model for one of the shortlisted business processes.

      Draft the requirements as they relate to the business process.

      Key Benefits Achieved

      Preliminary list of Customer Service-related business goals

      List of Customer Service business processes (Task Level 5)

      Pre-selected Customer Service business process for modeling

      Activities

      1.1 Outline and prioritize your customer goals and link their relevance and value to your Customer Service processes with the Customer Service Business Process Shortlisting Tool.

      1.2 Score customer service business processes against organizational goals with the Customer Service Systems Strategy Tool.

      Outputs

      Initial position on viable Customer Service strategies

      Shortlist of key business processes

      Documented future state business process model

      Business/functional/non-functional requirements

      2 Document Current State and Assess Gaps

      The Purpose

      Create a current state model for the shortlisted business processes.

      Score the functionality and integration of current supporting applications.

      Revise future state model and business requirements.

      Key Benefits Achieved

      Inventory of Customer Service supporting applications

      Inventory of related system interfaces

      Activities

      2.1 Holistically assess multiple aspects of Customer Service-related IT assets with the Customer Service Systems Strategy Tool.

      Outputs

      Documented current state business process model

      Customer Service systems health assessment

      3 Adopt an Architectural Posture

      The Purpose

      Review the Customer Service systems health assessment results.

      Discuss options.

      Key Benefits Achieved

      Completed Customer Service systems health assessment

      Application options

      Activities

      3.1 Analyze CS Systems Strategy and review results with the Customer Service Systems Strategy Tool

      Outputs

      Posture on system architecture

      4 Frame Desired State and Develop Roadmap

      The Purpose

      Draft a list of initiatives based on requirements.

      Score and prioritize the initiatives.

      Plot the initiatives on a roadmap.

      Key Benefits Achieved

      Business/functional/non-functional requirements

      Activities

      4.1 Help project and management stakeholders visualize the implementation of Customer Service IT initiatives with the Customer Service Initiative Scoring and Roadmap Tool.

      Outputs

      Scored and prioritized list of initiatives

      Customer Service implementation roadmap

      Further reading

      Develop an IT Strategy to Support Customer Service

      E-commerce is accelerating, and with it, customer expectations for exceptional digital service.

      Analyst Perspective

      The future of Customer Service is digital. Your organization needs an IT strategy to meet this demand.

      The image contains a picture of Thomas E. Randall.

      As the pandemic closed brick-and-mortar stores, the acceleration of ecommerce has cemented Customer Service’s digital future. However, the pandemic also revealed severe cracks in the IT strategy of organizations’ Customer Service – no matter the industry. These cracks may include low resolution and high wait times through the contact center, or a lack of analytics that fuel a reactive environment. Unfortunately, organizations have no time to waste in resolving these issues. Customer patience for poor digital service has only decreased since March 2020, leaving organizations with little to no runway for ramping up their IT strategy.

      Organizations that quickly mature their digital Customer Service will come out the other side of COVID-19 more competitive and with a stronger reputation. This move necessitates a concrete IT strategy for coordinating what the organization’s future state should look like and agreeing on the technologies and software required to meet this state across the entire organization.

      Thomas E. Randall, Ph.D.

      Senior Research Analyst, Info-Tech Research Group

      Executive Summary

      Your Challenge

      Common Obstacles

      Info-Tech’s Solution

      • COVID-19 has accelerated ecommerce, rapidly evolving customer expectations about the service they should receive. Without a robust IT strategy for enabling remote, contactless points of service, your organization will quickly fall behind.
      • The organization would like to use modern channels and technologies to enhance customer service, but it is unclear whether IT has the infrastructure to support them.
      • The relationship between Customer Service and IT is strained. Strategic system-related decisions are being made without the inclusion of IT.
      • IT is in a permanent reactive state, only engaged post-purchase to fix issues as they arise and to offer workarounds.
      • Use Info-Tech’s methodology to produce an IT strategy for Customer Service:
        • Phase 1: Define Project and Future State
        • Phase 2: Evaluate Current State
        • Phase 3: Build a Roadmap to Future State
      • Each phase contributes toward this blueprint’s key deliverable: the Strategic Roadmap.

      Info-Tech Insight

      IT must proactively engage with the organization to define what good customer service should look like. This ensures IT has a fair say in what kinds of architectural solutions are feasible for any projected future state. In this proactive scenario, IT can help build the roadmap for implementing and maintaining customer service infrastructure and operations, reducing the time and resources spent on putting out preventable fires or trying to achieve an unworkable goal set by the organization.

      Key insights

      Develop an IT Strategy to Support Customer Service

      Ecommerce growth has increased customer expectations

      Despite the huge obstacles that organizations are having to overcome to meet accelerating ecommerce from the pandemic, customers have not increased their tolerance for organizations with poor service. Indeed, customer expectations for excellent digital service have only increased since March 2020. If organizations cannot meet these demands, they will become uncompetitive.

      The future of customer service is tied up in analytics

      Without a coordinated IT strategy for leveraging technology and data to improve Customer Service, the organization will quickly be left behind. Analytics and reporting are crucial for proactively engaging with customers, planning marketing campaigns, and building customer profiles. Failing to do so leaves the organization blind to customer needs and will constantly be in firefighting mode.

      Meet the customer wherever they are – no matter the channel

      Providing an omnichannel experience is fast becoming a table stakes offering for customers. To maximize customer engagement and service, the organization must connect with the customer on whatever channel the customer prefers – be it social media, SMS, or by phone. While voice will continue to dominate how Customer Service connects with customers, demographics are shifting toward a digital-first generation. Organizations must be ready to capture this rapidly expanding audience.

      This blueprint will achieve:

      Increased customer satisfaction

      • An IT strategy for Customer Service that proactively meets customer demand, improving overall customer satisfaction with the organization’s services.
      • A process for identifying the organization’s future state of Customer Service and developing a concrete gap analysis.

      Time saved

      • Ready-to-use deliverables that analyze and provide a roadmap toward the organization’s desired future state.
      • Market analyses and rapid application selection through SoftwareReviews to streamline project time-to-completion.

      Increased ROI

      • A modernization process that aids Customer Service digital transformation, with a view to achieve high ROI.
      • Save costs through an effective requirements gathering method.
      • Building and expanding the organization’s customer base to increase revenues by meeting the customers where they are – no matter what channel.

      An IT strategy for customer service is imperative for a post-COVID world

      COVID-19 has accelerated ecommerce, rapidly evolving customer expectations for remote, contactless service.

      59% Of customers agree that the pandemic has raised their standards for service (Salesforce, 2020).

      • With COVID-19, most customer demand and employment moved online and turned remote.
      • Retailers had to rapidly respond, meeting customer demand through ecommerce. This not only entailed a complete shift in how customers could buy their goods but how retailers could provide a remote customer journey from discovery to post-purchase support.

      Info-Tech Insight

      The pandemic did not improve customer tolerance for bad service – instead, the demand for good service increased dramatically. Organizations need an IT strategy to meet customer support demands wherever the customer is located.

      The technology to provide remote customer support is surging

      IT needs to be at the forefront of learning about and suggesting new technologies, working with Customer Service to deliver a consistent, business-driven approach.

      78%

      Of decision makers say they’ve invested in new technology as a result of the pandemic (Salesforce, 2020).

      OMNICHANNEL SUPPORT

      Rapidly changing demographics and modes of communications require an evolution toward omnichannel engagement. Agents need customer information synced across each channel they use, meeting the customer’s needs where they are.

      78%

      Of customers have increased their use of self-service during the pandemic (Salesforce, 2020).

      INTELLIGENT SELF-SERVICE PORTALS

      Customers want their issues resolved as quickly as possible. Machine-learning self-service options deliver personalized customer experiences, which also reduce both agent call volume and support costs for the organization.

      90%

      Of global executives who use data analytics report that they improved their ability to deliver a great customer experience (Gottlieb, 2019).

      LEVERAGING ANALYTICS

      The future of customer service is tied up with analytics: from AI-driven capabilities that include agent assist and using biometric data (e.g., speech) for security, to feeding real insights about how customers and agents are doing and performing.

      Executive Brief – Case Study

      Self-service options improve quality of service and boost organization’s competitiveness in a digital marketspace.

      INDUSTRY: Financial Services

      SOURCE: TSB

      Situation

      Solution

      Results

      • The pandemic increased pressure on TSB’s Customer Service, with higher call loads from their five million customers who were anxious about their financial situation.
      • TSB needed to speed up its processing times to ensure loan programs and other assistances were provided as quickly as possible.
      • As meeting in-person became impossible due to the lockdown, TSB had to step up its digital abilities to serve their customers.
      • TSB sought to boost its competitiveness by shifting as far as possible to digital services.
      • TSB launched government loan programs in 36 hours, ahead of its competitors.
      • TSB created and released 21 digital self-service forms for customers to complete without needing to interact with bank staff.
      • TSB processed 140,000 forms in three months, replacing 15,000 branch visits.
      • TSB increased digital self-service rate by nine percent.

      IT can demonstrate its value to business by enhancing remote customer service

      IT must engage with Customer Service – otherwise, IT risks being perennially reactive and dictated to as remote customer service needs increase.

      IT benefits

      Customer Service benefits

      • The right technology is established to support Customer Service.
      • IT is viewed as a strategic partner and innovator, not just a cost center and support function.
      • Streamlined and optimized Customer Service processes that drive efficiency and improve Customer Service quality.
      • Transformation of the Customer Service function into a competitive advantage.

      Info-Tech Insight

      Change to how Customer Service will operate is inevitable. This is an opportunity for IT to establish their value to the business and improve their autonomy in how new technologies should be onboarded and utilized.

      Customer Service and IT need to work together to mitigate their pain points

      IT and Customer Service have an opportunity to reinforce and build their organization’s customer base by working together to streamline operations.

      IT pain points

      Customer Service pain points

      • IT lacks understanding of Customer Service challenges and pain points.
      • IT has technical debt or constrained technology funding.
      • The IT department is viewed as a cost center and support organization, not an engine of innovation, growth, and service delivery performance.
      • Processes supporting Customer Service delivery may be sub-optimal.
      • The existing technology cannot support the increasingly advanced needs of Customer Service functions.
      • Customer Service isn’t fully aware of what your customers think of your service quality. There is little to no monitoring of customer sentiment.
      • There is a lack of value-based segmentation of customers and information on their channel usage and preferences.
      • Competitor actions are not actively monitored.

      IT often cannot spark a debate with Customer Service on whether a decision made without IT is misaligned with corporate direction. It’s almost always an uphill battle for IT.

      Sahri Lava, Research Director, IDC

      Develop an IT Strategy to Support Customer Service

      DON’T FALL BEHIND

      70% of companies either have a digital transformation strategy in place or are working on one (Tech Pro Research, 2018). Unless IT can enable technology that meets the customer where they are, the organization will quickly fall behind in an age of accelerating ecommerce.

      DEVELOP FUTURE STATES

      Many customer journeys are now exclusively digital – 63% of customers expect to receive service over social media (Ringshall, 2020). Organization’s need an IT strategy to develop the future of their customer service – from leveraging analytics to self-service AI portals.

      BUILD GAP ANALYSIS

      73% of customers prefer to shop across multiple channels (Sopadjieva et al., 2017). Assess your current state’s application integrations and functionality to ensure your future state can accurately sync customer information across each channel.

      SHORTLIST SOLUTIONS

      Customer relationship management software is one of the world's fastest growing industries (Kuligowski, 2022). Choosing a best-fit solution requires an intricate analysis of the market, future trends, and your organization’s requirements.

      ADVANCE CHANGE

      95% of customers cite service as key to their brand loyalty (Microsoft, 2019). Build out your roadmap for the future state to retain and build your customer base moving forward.

      Use Info-Tech’s method to produce an IT strategy for Customer Service:

      PHASE 1: Define Project and Future State

      Output: Project Charter and Future State Business Processes

      1.1 Structure the Project

      1.2 Define a Vision for Future State

      1.3 Document Preliminary Requirements

      KEY DELIVERABLE:

      Strategic Roadmap

      The image contains a screenshot of the strategic roadmap.

      PHASE 2: Evaluate Current State

      Output: Requirements Identified to Bridge Current to Future State

      2.1 Document Current State Business Processes

      2.2 Assess Current State Architecture

      2.3 Review and Finalize Requirements for Future State

      PHASE 3: Build a Roadmap to Future State

      Output: Initiatives and Strategic Roadmap

      3.1 Evaluate Architectural and Application Options

      3.2 Understand the Marketplace

      3.3 Score and Plot Initiatives Along Your Strategic Roadmap

      Key deliverable and tools outline

      Each step of this blueprint is accompanied by supporting materials to help you accomplish your goals.

      Project RACI Chart

      Activity 1.1a Organize roles and responsibilities for carrying out project steps.

      The image contains a screenshot of the Project RACI Chart.

      Key Deliverable:

      Strategic Roadmap

      Develop, prioritize, and implement key initiatives for your customer service IT strategy, plotting and tracking them on an easy-to-read timeline.

      The image contains a screenshot of the Strategic Roadmap.

      Business Process Shortlisting Tool

      Activities 1.2a, 1.2b, and 2.1aOutline and prioritize customer service goals.

      The image contains a screenshot of the Business Process Shortlisting Tool.

      Project Charter Template

      Activity 1.1b Define the project, its key deliverables, and metrics for success.

      The image contains a screenshot of the Project Charter Template.

      Systems Strategy Tool

      Activities 1.3a, Phase 2, 3.1a Prioritize requirements, assess current state customer service functions, and decide what to do with your current systems going forward.

      .The image contains a screenshot of the Systems Strategy Tool.

      Looking ahead: defining metrics for success

      Phase 1 of this blueprint will help solidify how to measure this project’s success. Start looking ahead now.

      For example, the metrics below show the potential business benefits for several stakeholders through building an IT strategy for Customer Service. These stakeholders include agents, customers, senior leadership, and IT. The benefits of this project are listed to the right.

      Metric Description

      Current Metric

      Future Goal

      Number of channels for customer contact

      1

      6

      Customer self-service resolution

      0%

      50%

      % ROI

      - 4%

      11%

      Agent satisfaction

      42%

      75%

      As this project nears completion:

      1. Customers will have more opportunities for self-service resolution.
      2. Agents will experience higher satisfaction, improving attrition rates.
      3. The organization will experience higher ROI from its digital Customer Service investments.
      4. Customers can engage the contact center via a communication channel that suits them.

      Info-Tech offers various levels of support to best suit your needs

      DIY Toolkit

      Guided Implementation

      Workshop

      Consulting

      “Our team has already made this critical project a priority, and we have the time and capability, but some guidance along the way would be helpful.”“Our team knows that we need to fix a process, but we need assistance to determine where to focus. Some check-ins along the way would help keep us on track.”“We need to hit the ground running and get this project kicked off immediately. Our team has the ability to take this over once we get a framework and strategy in place.”“Our team does not have the time or the knowledge to take this project on. We need assistance through the entirety of this project.”

      Diagnostics and consistent frameworks used throughout all four options

      Guided Implementation

      What does a typical Guided Implementation on this topic look like?

      Define Project and Future StateDocument and Assess Current StateEvaluate Architectural and Application OptionsBuild Roadmap to Future State

      Call #1: Introduce project, defining its vision and metrics of success.

      Call #2: Review environmental scan to define future state vision.

      Call #3: Examine future state business processes to compile initial requirements.

      Call #4: Document current state business processes.

      Call #5: Assess current customer service IT architecture.

      Call #6: Refine and prioritize list of requirements for future state.

      Call #7: Evaluate architectural options.

      Call #8: Evaluate application options.

      Call #9:Develop and score initiatives to future state.

      Call #10: Develop timeline and roadmap.

      Call #11: Review progress and wrap-up project.

      A Guided Implementation is a series of calls with an Info-Tech analyst to help implement our best practices in your organization.

      A typical Guided Implementation is two to 12 calls over the course of four to six months.

      Workshop Overview

      Contact your account representative for more information.
      workshops@infotech.com1-888-670-8889

      Day 1Day 2Day 3Day 4Day 5

      Define Your Vision for Future State

      Document Current State and Assess Gaps

      Adopt an Architectural Posture

      Frame Desired State and Develop Roadmap

      Communicate and Implement

      Activities

      1.1 Outline and prioritize your customer goals.

      1.2 Link customer service goals’ relevance and value to your Customer Service processes.

      1.3 Score Customer Service business processes against organizational goals.

      2.1 Holistically assess multiple aspects of Customer Service-related IT assets with Customer Service Systems Strategy Tool.

      3.1 Analyze Customer Service Systems Strategy and review results with the Customer Service Systems Strategy Tool.

      4.1 Help project management stakeholders visualize implementation of Customer Service IT initiatives.

      4.2 Build strategic roadmap and plot initiatives.

      5.1 Finalize deliverables.

      5.2 Support communication efforts.

      5.3 Identify resources in support of priority initiatives.

      Deliverables

      1. Initial position on viable Customer Service strategies.
      2. Shortlist of key business processes.
      3. Documented future-state business process model.
      4. Business/functional/non-functional requirements.
      1. Documented current state business process model.
      2. Customer Service systems health assessment.
      3. Inventory of Customer Service supporting applications.
      4. Inventory of related system interfaces.
      1. Posture on system architecture.
      2. Completed Customer Service systems health assessment.
      3. List of application options.
      1. Scored and prioritized list of initiatives.
      2. Customer Service implementation roadmap.
      1. Customer Service IT Strategy Roadmap.
      2. Mapping of Info-Tech resources against individual initiatives.

      Phase 1

      Define Project and Future State

      Phase 1

      Phase 2

      Phase 3

      1.1 Structure the Project

      1.2 Define Vision for Future State

      1.3 Document Preliminary Requirements

      2.1 Document Current State Business Processes

      2.2 Assess Current State Architecture

      2.3 Review and Finalize Requirements for Future State

      3.1 Evaluate Architectural and Application Options

      3.2 Understand the Marketplace

      3.3 Score and Plot Initiatives Along Strategic Roadmap

      This phase will guide you through the following activities:

      1.1a Create your project’s RACI chart to establish key roles throughout the timeline of the project.

      1.1b Finalize your project charter that captures the key goals of the project, ready to communicate to stakeholders for approval.

      1.2a Begin documenting business processes to establish potential future states.

      1.2b Model future state business processes for looking beyond current constraints and building the ideal scenario.

      1.3a Document your preliminary requirements for concretizing a future state and performing a gap analysis.

      Participants required for Phase 1:

      • Applications Director
      • Customer Service Director
      • IT and Customer Service Representatives

      1.1 Identify process owners early for successful project execution

      IT and Customer Service must work in tandem throughout the project. Both teams’ involvement ensures all stakeholders are heard and support the final decision.

      Customer Service Perspective

      IT Perspective

      • Customer Service is the victim of pain points resulting from suboptimal systems and it stands to gain the most benefits from a well-planned systems strategy.
      • Looking to reduce pain points, Customer Service will likely initiate, own, and participate heavily in the project.
      • Customer Service must avoid the tendency to make IT-independent decisions. This could lead to disparate systems that contribute little to the overall organizational goals.
      • IT owns the application and back-end support of all Customer Service business processes. Any technological aspect of processes will need IT involvement.
      • IT may or may not have the mandate to run the Customer Service strategy project. Responsibility for systems decisions remains with IT.
      • IT should own the task of filtering out unnecessary or infeasible application and technology decisions. IT capabilities to support such acquisitions and post-purchase maintenance must be considered.

      Info-Tech Insight

      While involving management is important for high-level strategic decisions, input from those who interact day-to-day with the systems is a crucial component to a well-planned strategy.

      1.1 Define project roles and responsibilities to improve progress tracking

      Assign responsibilities, accountabilities, and other project involvement roles using a RACI chart.

      • IT should involve Customer Service from the beginning of project planning to implementation and execution. The project requires input and knowledge from both functions to succeed.
      • Do not let the tasks be forgotten within inter-functional communication. Define roles and responsibilities for the project as early as possible.
      • Each member of the project team should be given a RACI designation, which will vary for each task to ensure clear ownership, execution, and progress tracking.
      • Assigning RACI early can:
        • Improve project quality by assigning the right people to the right tasks.
        • Improve chances of project task completion by assigning clear accountabilities.
        • Improve project buy-in by ensuring that stakeholders are kept informed of project progress, risks, and successes.

      R – Responsibility

      A – Accountability

      C – Consulted

      I – Informed

      1.1 Use Info-Tech’s recommended process owners and roles for this blueprint

      Customer Service Head

      Customer Service Director

      CIO

      Applications Director*

      CEO/COO

      Marketing Head

      Sales Head

      Determine Project Suitability

      ARCCCII

      Phase 1.1

      CCARIII

      Phases 1.2 – 1.3

      ARCCICC

      Phase 2

      ARICIII

      Phase 3.1

      (Architectural options)

      CCARIII

      Phase 3.1

      (Application options)

      ACIRICC

      Phases 3.2 – 3.3

      CCARCII

      * The Applications Director is to compile a list of Customer Service systems; the Customer Service Director is responsible for vetting a list and mapping it to Customer Service functions.

      ** The Applications Director is responsible for technology-related decisions (e.g. SaaS or on-premise, integration issues); the Customer Service Director is responsible for functionality-related decisions.

      1.1a Create your project’s RACI chart

      1 hour

      1. The Applications Director and Customer Service Head should identify key participants and stakeholders of the project.
      2. Use Info-Tech’s Project RACI Chart to identify ownership of tasks.
      3. Record roles in the Project RACI Chart.
      The image contains a screenshot of the project RACI chart.
      InputOutput
      • Identification of key project participants and stakeholders.
      • Identification of key project participants and stakeholders.

      Materials

      Participants

      • Project RACI Chart
      • Applications Director
      • Customer Service Director

      Download the Project RACI Chart

      1.1 Start developing the project charter

      A project charter should address the following:

      • Executive Summary and Project Overview
        • Goals
        • Benefits
        • Critical Success Factors
      • Scope
      • Key Deliverables
      • Stakeholders and RACI
      • Risk Assessment
        • What are some risks you may encounter during project execution?
      • Projected Timeline and Key Milestones
      • Review and Approval Process

      What is a project charter?

      • The project charter defines the project and lays the foundation for all subsequent project planning.
      • Once approved by the business, the charter gives the project lead formal authority to initiate the project.

      Why create a project charter?

      • The project charter allows all parties involved to reach an agreement and document major aspects of the project.
      • It also supports the decision-making process and can be used as a communication tool.

      Stakeholders must:

      • Understand and agree on the objectives and important characteristics of the project charter before the project is initiated.
      • Be given the opportunity to adjust the project charter to better address their needs and concerns.

      1.1b Finalize the project charter

      1-2 hours

      1. Request relevant individuals and parties to complete sections of Info-Tech’s Project Charter Template.
      2. Input the simplified RACI output from tab 3 in Info-Tech’s Project RACI Chart tool into the RACI section of the charter.
      3. Send the completed template to the CIO and Customer Service Head for approval.
      4. Communicate the document to stakeholders for changes and finalization.
      The image contains a screenshot of the Project Charter Template.

      Input

      Output

      • Customer Service and IT strategies
      • Justification of impetus to begin this project
      • Timeline estimates
      • A completed project charter that captures the key goals of the project, ready to communicate to stakeholders for approval.

      Materials

      Participants

      • Project RACI Chart
      • Project Charter Template
      • Applications Director
      • Customer Service Director

      Download the Project Charter Template

      1.2 IT must play a role shaping Customer Service’s future vision

      IT is only one or two degrees of separation from the end customer – their involvement can significantly impact the customer experience.

      IT

      Customer Service

      Customer

      Customer Service-Facing Application

      Customer-Facing Application

      • IT enables, supports, and maintains the applications used by the Customer Service organization to service customers. IT provides the infrastructural and technical foundation to operate the function.
      • IT supports customer-facing interfaces and channels for Customer Service interaction.
      • Channel examples include web pages, mobile device applications and optimization, and interactive voice response for callers.

      1.2 Establish a vision for Customer Service excellence

      Info-Tech has identified three prominent Customer Service strategic patterns. Evaluate which fits best with your situation and organization.

      Retention

      Efficiency

      Cross-Sell/Up-Sell

      Ensuring customers remain customers by providing proactive customer service and a seamless omnichannel strategy.

      Reducing costs by diverting customers to lower cost channels and empowering agents to solve problems quickly.

      Maximizing the value of existing customers by capitalizing on cross-sell and up-sell opportunities.

      1.2 Let profitability goals help reveal which strategy to pursue

      Profitability goals are tied to the enabling of customer service strategies.

      • If looking to drive cost decreases across the organization, pursue cost efficiency strategies such as customer volume diversion in order to lower cost channels and avoid costly escalations for customer complaints and inquiries.
      • Ongoing Contribution Margin is positive only once customer acquisition costs (CAC) have been paid back. For every customer lost, another customer has to be acquired in order to experience no loss. In this way, customer retention strategies help decrease your overall costs.
      • Once cost reduction and customer retention measures are in place, look to increase overall revenue through cross-selling and up-selling activities with your customers.
      The image contains a screenshot of a diagram to demonstrate the relationship between goals and enabling strategies.

      Info-Tech Insight

      Purely driving efficiency is not the goal. Create a balance that does not compromise customer satisfaction.

      Customer Service strategies: Case studies

      Efficiency

      • Volume diversion to lower cost channels
      • Agent empowerment

      MISS DIG 811 – a utility notification system – sought to make their customer service more efficient by moving to softphones. Using the Cisco Customer Journey Platform, Miss Dig saw a 9% YoY increase in agent productivity and 83% reduction in phone equipment costs. Source: (Cisco, 2018).

      Retention

      • Proactive Customer Service
      • Seamless omnichannel strategy

      VoiceSage worked with Home Retail Group – a general merchandise retailer – to proactively increase customer outreach, reducing the number of routine customer order and delivery queries received. In four weeks, Home Retail Group increased their 30-40% answer rate from customers to 100%, with 90% of incoming calls answered and 60% of contacts made via SMS. Source: (VoiceSage, 2018)

      Cross-Sell/

      Up-Sell

      • Cross-Sell and Up-Sell opportunities

      A global brand selling language-learning software utilized Callzilla to help improve their call conversion rate of 2%. After six months of agent and supervisor training, this company increased their call conversion rate to 16% and their upsell rate to 40%. Their average order value increased from < $300 to $465. Source: (Callzilla, n.d.)

      1.2 Performing an environmental scan can help IT optimize Customer Service support

      Though typically executed by Customer Service, IT can gain valuable insights for best supporting infrastructure, applications, and operations from an environmental scan.

      An environmental scan seeks to understand your organization’s customers from multiple directions. It considers:

      • Customers’ value-based segmentations.
      • The interaction channels customers prefer to use.
      • Customers’ likes and dislikes.
      • The general sentiment of your customer service quality.
      • What your competitors are doing in this space.
      The image contains a screenshot of a diagram to demonstrate how performing an environmental scan can help IT optimize Customer Service support.

      Info-Tech Insight

      Business processes must directly relate to customer service. Failing to correlate customer experience with business performance outcomes overlooks the enormous cost of negative sentiment.

      1.2 The environmental scan results should drive IT’s strategy and resource spend

      Insights derived from this scan can help frame IT’s contributions to Customer Service’s future vision.

      Why IT should care:

      Implications:

      Each customer experience, from product/service selection to post-transaction support, can have a significant impact on business performance.

      It is not just IT or Customer Service that should care; rather, it should be an organizational responsibility to care about what customers say.

      Customers have little tolerance for mediocrity or poor service and simply switch their allegiances to those that can satisfy their expectations.

      Do not ignore your competitors; they may be doing something well in Customer Service technology which may serve as your organization’s benchmark.

      With maturing mobile and social technologies, customers want to be treated as individuals rather than as a series of disconnected accounts

      Do not ignore your customers’ plea for individuality through mobile and social. Assess your customers’ technology channel preferences.

      Customer service’s perception of service quality may be drastically different than what is expected by the customers.

      Prevent your organization from investing in technology that will have no positive impact on your customer experience.

      Some customers may not provide your organization the business value that surpasses your cost to serve them.

      Focus on enhancing the technology and customer service experience for your high-value customers.

      1.2 Have Customer Service examine feedback across channels for a holistic view

      Your method of listening needs to evolve to include active listening on social and mobile channels.

      Insights and Implications for Customer Service

      Limitations of conventional listening:

      • Solicited customer feedback, such as surveys, do not provide an accurate feedback method since customers only have one channel to express their views.
      • Sentiment, voice, and text analytics within social media channels provide the most accurate and timely intelligence.

      How IT Can Help

      IT can help facilitate the customer feedback process by:

      • Conducting customer feedback with voice recognition software.
      • Monitoring customer sentiment on mobile and social channels.
      • Utilizing customer data analytic engines on social media management platforms.
      • Referring Customer Service to customer advisory councils and their databases.

      1.2 Benchmark IT assets by examining your competitors’ Customer Service capabilities

      The availability of the internet means almost complete transparency between your products and services, and those of your competitors.

      Insights and implications from Customer Service

      How IT can help

      Competitor actions are crucial. Watch your competitors to learn how they use Customer Service as a competitive differentiator and a customer acquisition tool.

      Do not learn about a competitor’s actions because your customers are already switching to them. Track your competitors before getting a harsh surprise from your customers.

      View the customer service experience from the outside in. Assessing from the inside out gives an internal perspective on how good the service is, rather than what customers are experiencing.

      Take a data and analytics-driven approach to mine insights on what customers are saying about your competitors. Negative sentiment and specific complaints can be used as reference for IT and Customer Service to:

      • Avoid repeating the competitor’s mistakes.
      • Utilize sentiment as a benchmark for goal setting and improvements.
      • Duplicate successful technology initiatives to realize business value.

      Info-Tech Insight

      Look to your competitors for comparative models but do not pursue to solely replicate what they currently have. Aim higher and attempt to surpass their capabilities and brand value.

      1.2 Collaborate with Customer Service to understand customer value segments

      Let segmentation help you gain intelligence on customers’ expectations.

      Insights and implications from customer service

      • Segment your customers based on their value relative to the cost to serve. The easiest way to do so is with channel preference categorization.
      • If the cost for retention attempts are higher than the value that those customers provide, there is little business case to pursue retention action.

      How IT can help

      • Couple value-based segmentation with channel preference and satisfaction levels of your most-valued customers to effectively target IT investments in channels that maximize service customization and quality.
      • Correlate the customers’ channel and technology usage with their business value to see which IT assets are delivering on their investments.

      The image contains a screenshot of a graph to demonstrate the relationship between cost of retention and value.

      “If you're developing a Customer Service strategy, it has to start with who your clients are, what [they are] trying to do, and through what channels […] and then your decision around processes have to fall out of that. If IT is trying to lead the conversation, or bring people together to lead the conversation, then marketing and whoever does segmentation has to be at the table as a huge component of this.”

      Lisa Woznica, Director of Client Experience, BMO Financial Group

      1.2 Be mindful of trends in the consumer and technology landscape

      Building a future vision of customer service requires knowing what upcoming technologies can aid the organization.

      OMNICHANNEL SUPPORT

      Rapidly changing demographics and modes of communication requires an evolution toward omnichannel engagement. 63% of customers now expect to communicate with contact centers over their social media (Ringshall 2020). Agents need customer information synced across each channel they use, meeting the customer’s needs where they are.

      INTELLIGENT SELF-SERVICE PORTALS

      Customers want their issues resolved as quickly as possible. Machine learning self-service options deliver personalized customer experiences, which also reduce both agent call volume and support costs for the organization. 60% of contact centers are using or plan to use AI in the next 12 months to improve their customer (Canam Research 2020).

      LEVERAGING ANALYTICS

      The future of customer service is tied up with analytics. This not only entails AI-driven capabilities that fetch the agent relevant information, but it finds skills-based routing and uses biometric data (e.g., speech) for security. It also feeds operations leaders’ need for easy access to real insights about how their customers and agents are doing.

      Phase 1 – Case Study

      Omnichannel support delivers a financial services firm immediate customer service results.

      INDUSTRY: Financial Services

      SOURCE: Mattsen Kumar

      Situation

      Solution

      Results

      • A financial services firm’s fast growth began to show cracks in their legacy customer service system.
      • Costs to support the number of customer queries increased.
      • There was a lack of visibility into incoming customer communications and their resolutions.
      • Business opportunities were lost due to a lack of information on customers’ preferences and challenges. Customer satisfaction was decreasing, negatively impacting the firm’s brand.
      • Mattsen Kumar diagnosed that the firm’s major issue was that their customer service processes required a high percentage of manual interventions.
      • Mattsen Kumar developed an omnichannel strategy, including a mix of social channels joined together by a CRM.
      • A key aspect of this omnichannel experience was designing automated processes with minimal manual intervention.
      • 25% reduction in callbacks from customers.
      • $50,000 reduction in operational costs.
      • Two minutes wait time reduction for chat process.
      • 14% decrease in average handle time.
      • Scaled up from 6000 to 50,000 monthly calls that could be handled by the current team.
      • Enabled more than 10,000 customer queries over chats.

      1.2 Construct your future state using a business process management approach

      Documenting and evaluating your business processes serves as a good starting point for defining the overall Customer Service strategy.

      • Examining key Customer Service business processes can unlock clues around the following:
        • Driving operational effectiveness.
        • Identifying, implementing, and maintaining reusable enterprise systems.
        • Identifying gaps that can be addressed by acquisition of additional systems.
      • Business process modeling facilitates the collaboration between business and IT, recording the sequence of events, tasks performed, by whom they are performed, and the levels of interaction with the various supporting applications.
      • By identifying the events and decision points in the process, and overlaying the people that perform the functions and technologies that support them, organizations are better positioned to identify gaps that need to be bridged.
      • Encourage the analysis by compiling the inventory of Customer Service business processes that are relevant to the organization.

      Info-Tech Insight

      A process-oriented approach helps organizations see the complete view of the system by linking strategic requirements to business requirements, and business requirements to system requirements.

      1.2 Use the APQC Framework to define your Customer Service-related processes

      • APQC’s Process Classification Framework (PCF) is a taxonomy of cross-functional business processes intended to allow the objective comparison of organizational performance within and among organizations.
      • Section 5 of the PCF details various levels of Customer Service business processes, useful for mapping on to your own organization’s current state.
      • The APQC Framework can be accessed through the following link: APQC’s Process Classification Framework.

      The APQC Framework serves as a high-level, industry-neutral enterprise model that allows organizations to see activities from a cross-industry process perspective.

      The image contains a screenshot example of the APQC Process Classification Framework.
      Source: (Ziemba and Eisenbardt 2015)

      Info-Tech Caution

      The APQC framework does not list all processes within a specific organization, nor are the processes which are listed in the framework present in every organization. It is designed as a framework and global standard to be customized for use in any organization.

      1.2 Each APQC process has five levels that represent its logical components

      The image contains a screenshot of the APQC five levels. The levels include: category, process group, process, and activity.

      The PCF provides L1 through 4 for the Customer Service Framework.

      L5 processes are task- and industry-specific and need to be defined by the organization.

      Source: (APQC 2020)
      This Industry Process Classification Framework was jointly developed by APQC and IBM to facilitate improvement through process management and benchmarking. ©2018 APQC and IBM. ALL RIGHTS RESERVED.

      1.2a Begin documenting business processes

      4 hours

      1. Using Info-Tech’s Customer Service Business Process Shortlisting Tool, list the Customer Service goals and rank them by importance.
      2. Score the APQC L4 processes by relevance to the defined goals and perceived satisfaction index.
      3. Define the L5 processes for the top scoring L4 process.
      4. Leave Tab 5, Columns G – I for now. These columns will be revisited in activities 1.2b and 2.1a.
      The image contains a screenshot of the Customer Service Process Shortlisting Tool.

      Input

      Output

      • List of Customer Service goals
      • A detailed prioritization of Customer Service business processes to model for future states

      Materials

      Participants

      • Whiteboard
      • Writing materials
      • Customer Service Business Process Shortlisting Tool
      • Applications Director
      • Customer Service Director
      • IT and Customer Service Representatives

      Download the Customer Service Business Process Shortlisting Tool

      1.2 Start designing the future state of key business processes

      If Customer Service transformation is called for, start with your future-state vision. Don’t get stuck in current state and the “art of the possible” within its context.

      Future-State Analysis

      Start by designing your future state business processes (based on the key processes shortlisting exercise). Design these processes as they would exist as your “ideal scenario.” Next, analyze your current state to help better your understanding of:

      • The gaps that exist and must be bridged to achieve the future-state vision.
      • Whether or not any critical functions that support your business were omitted accidentally from the future-state processes.
      • Whether or not any of the supporting applications or architecture can be salvaged and used toward delivery of your future-state vision.

      Though it’s a commonly used approach, documenting your current-state business processes first can have several drawbacks:

      • Current-state analysis can impede your ability to see future possibility.
      • Teams will spend a great deal of time and effort on documenting current state and inevitably succumb to “analysis paralysis.”
      • Current state assessment, when done first, limits the development of the future (or target) state, constraining thinking to the limitations of the current environment rather than the requirements of the business strategy.

      Current-State Analysis

      “If you're fairly immature and looking for a paradigm shift or different approach [because] you recognize you're totally doing it wrong today, then starting with documenting current state doesn't do a lot except make you sad. You don't want to get stuck in [the mindset of] ‘Here's the current state, and here’s the art of the possible.’”

      Trevor Timbeck, Executive Coach, Parachute Executive Coaching

      1.2 Start modeling future-state processes

      Build buy-in and accountability in process owners through workshops and whiteboarding – either in-person or remotely.

      Getting consensus on the process definition (who does what, when, where, why, and how) is one of the hardest parts of BPM.

      Gathering process owners for a process-defining workshop isn’t easy. Getting them to cooperate can be even harder. To help manage these difficulties during the workshop, make sure to:

      • Keep the scope contained to the processes being defined in order to make best use of everyone’s time, as taking time away from employees is a cost too.
      • Prior to the workshop, gather information about the processes with interviews, questionnaires, and/or system data gathering and analysis.
      • Use the information gathered to have real-life examples of the processes in question so that time isn’t wasted.

      Info-Tech Insight

      Keep meetings short and on task as tangents are inevitable. Set ground rules at the beginning of any brainstorming or whiteboarding session to ensure that all participants are aligned.

      1.2 Use the five W’s to help map out your future-state processes

      Define the “who, what, why, where, when, and how” of the process to gain a better understanding of individual activities.

      Owner

      Who

      What

      When

      Where

      Why

      How

      Record Claim

      Customer Service

      Customer Service Rep.

      Claim

      Accident

      Claims system

      Customer notification

      Agent enters claim into the system and notifies claims department

      Manage Claim

      Claims Department

      Claims Clerk

      Claim

      Agent submitted the claim

      Claims system

      Agent notification

      Clerk enters claim into the claims system

      Investigate Claim

      Claims Investigation

      Adjuster

      Claim

      Claim notification

      Property where claim is being made

      Assess damage

      Evaluation and expert input

      Settle Claim

      Claims Department

      Claim Approver

      Claim and Adjuster’s evaluation

      Receipt of Adjuster’s report

      Claims system

      Evaluation

      Approval or denial

      Administer Claim

      Finance Department

      Finance Clerk

      Claim amount

      Claim approval notification

      Finance system

      Payment required

      Create payment voucher and cut check

      Close Claim

      Claims Department

      Claims Clerk

      Claim and all supporting documentation

      Payment issued

      Claims system

      Claim processed

      Close the claim in the system

      Info-Tech Insight

      It’s not just about your internal processes. To achieve higher customer retention and satisfaction, it’s also useful to map the customer service process from the customer perspective to identify customer pain points and disconnects.

      1.2 Use existing in-house software as a simplistic entry point to process modeling

      A diagramming tool like Visio enables you to plot process participants and actions using dedicated symbols and connectors that indicate causality.

      • Models can use a stick-figure format, a cross-functional workflow format, or BPMN notation.
      • Plot the key activities and decision points in the process using standard flowcharting shapes. Identify the data that belongs to each step in a separate document or as call-outs on the diagram.
      • Document the flow control between steps, i.e., what causes one step to finish and another to start?

      The image contains a screenshot of the sample cross-functional diagram using the claims process.

      Info-Tech Best Practice

      Diagramming tools can force the process designer into a specific layout: linear or cross-functional/swim lane.

      • A linear format is recommended for single function and system processes.
      • A swim lane format is recommended for cross-functional and cross-departmental processes.

      1.2 Introduce low investment alternatives for process modeling for modeling disciplines

      SaaS and low-cost modeling tools are emerging to help organizations with low to medium BPM maturity visualize their processes.

      • Formal modeling tools allow a designer to model in any view and easily switch to other views to gain new perspectives on the process.
      • Subscription-based, best-of-breed SaaS tools provide scalable and flexible process modeling capabilities.
      • Open source and lower cost tools also exist to help distribute BPM modeling discipline and standards.
      • BPMS suites incorporate advanced modeling tools with process execution engines for end-to-end business process management. Integrate process discovery with modeling, process simulation, and analysis. Deploy, monitor, and measure process models in process automation engines.

      The image contains a screenshot of a diagram of the claims process.

      Explore SoftwareReviews’ Business Process Management market analysis by clicking here.

      1.2b Model future state business processes

      4 hours

      1. Model the future state of the most critical business processes.
      2. Use Tab 5, Columns G – H of Info-Tech’s Customer Service Business Process Shortlisting Tool to keep stock of what processes are targeted for modeling, and whether the models have been completed.
      The image contains a screenshot of the Customer Service Business Process Shortlisting Tool.

      Input

      Output

      • Modeled future Customer Service business processes
      • An inventory of modeled future states for critical Customer Service business processes

      Materials

      Participants

      • Whiteboard
      • Writing materials
      • Customer Service Business Process Shortlisting Tool
      • Applications Director
      • Customer Service Director

      Download the Customer Service Business Process Shortlisting Tool

      1.3 Start a preliminary inventory of your requirements

      Use the future state business process models as a source for software requirements.

      • Business process modeling deals with business requirements that can be used as the foundation for elicitation of system (functional and non-functional) requirements.
      • Modeling creates an understanding of the various steps and transfers in each business process, as well as the inputs and outputs of the process.
      • The future state models form an understanding of what information is needed and how it flows from one point to another in each process.
      • Understand what technologies are (or can be) leveraged to facilitate the exchange of information and facilitate the process.

      For each task or event in the process, ask the following questions:

      • What is the input?
      • What is the output?
      • What are the underlying risks and how can they be mitigated?
      • What conditions should be met to mitigate or eliminate each risk?
      • What are the improvement opportunities?
      • What conditions should be met to enable these opportunities?

      Info-Tech Insight

      Incorporate future considerations into the requirements. How will the system need to adapt over time to accommodate additional processes, process variations, introduction of additional channels and capabilities, etc. Do not overreach by identifying system capabilities that cannot possibly be met.

      1.3 Understand the four different requirements to document

      Have a holistic view for capturing the various requirements the organization has for a Customer Service strategy.

      Business requirements

      High-level requirements that management would typically understand.

      User requirements

      High-level requirements on how the tool should empower users’ lives.

      Non-functional requirements

      Criteria that can be used to judge the operation of a contact center. It defines how the system should perform for the organization.

      Functional requirements

      Outline the technical requirements for the desired contact center.

      1.3 Extract requirements from the business process models

      To see how, let us examine our earlier example for the Claims Process, extracting requirements from the “Record Claim” task.

      The image contains an example of the claims process, and focuses on the record claim task.

      1.3a Document your preliminary requirements

      4 hours

      1. The Applications Director and Customer Service Head are to identify participants based on the business processes that will be reviewed.
      2. They are to conduct a workshop to gather all requirements that can be taken from the business process models.
      3. Use Tab 4 of Info-Tech’s Customer Service Systems Strategy Tool to document your preliminary requirements.
      The image contains a screenshot of the Customer Service Systems Strategy Tool.
      InputOutput
      • Half-day workshop to review the proposed future-state diagrams and distill from them the business, functional, and non-functional requirements
      • Future state business process models from activities 1.2a and 1.2b
      • An inventory of preliminary requirements for modeled future states
      MaterialsParticipants
      • Whiteboard
      • Writing materials
      • Customer Service Systems Strategy Tool
      • Results of activities 1.2a and 1.2b
      • Applications Director
      • Customer Service Director
      • IT and Customer Service Representatives

      Download the Customer Service Systems Strategy Tool

      Phase 2

      Evaluate Current State

      Phase 1

      Phase 2

      Phase 3

      1.1 Structure the Project

      1.2 Define Vision for Future State

      1.3 Document Preliminary Requirements

      2.1 Document Current State Business Processes

      2.2 Assess Current State Architecture

      2.3 Review and Finalize Requirements for Future State

      3.1 Evaluate Architectural and Application Options

      3.2 Understand the Marketplace

      3.3 Score and Plot Initiatives Along Strategic Roadmap

      This phase will guide you through the following activities:

      2.1a Model current-state business processes for an inventory to compare against future-state models.

      2.1b Compare future and current business states for a preliminary gap analysis.

      2.1c Begin compiling an inventory of CS Systems by function for an overview of your current state map.

      2.2a Rate your functional and integration quality to assess the performance of your application portfolio.

      2.3a Compare states and propose action to bridge current business processes with viable future alternatives.

      2.3b Document finalized requirements, ready to enact change.

      Participants required for Phase 2:

      • Applications Director
      • Customer Service Director
      • IT and Customer Service Representatives
      • IT Managers

      2.1 Document the current state of your key business processes

      Doing so will solidify your understanding of the gaps, help identify any accidental omissions from the future state vision, and provide clues as to what can be salvaged.

      • Analysis of the current state is important in the context of gap analysis. It aids in understanding the discrepancies between your baseline and the future-state vision, and ensuring that these gaps are recorded as part of the overall requirements.
      • By analyzing the current state of key business processes, you may identify critical functions that are in place today that were not taken into consideration during the future-state business process visioning exercise.
      • By overlaying the current state process models with the applications that support them, the current state models will indicate what systems and interfaces can be salvaged.
      • The baseline feeds the business case, allowing the team to establish proposed benefits and improvements from implementing the future-state vision. Seek to understand the following:
        • The volumes of work
        • Major exceptions
        • Number of employees involved
        • Amount of time spent in each area of the process

      2.1 Assess the current state to drive the gap analysis

      Before you choose any solution, identify what needs to be done to your current state in order to achieve the vision you have defined.

      • By beginning with the future state in mind, you have likely already envisioned some potential solutions.
      • By reviewing your current situation in contrast with your desired future state, you can deliberate what needs to be done to bridge the gap. The differences between the models allow you to define a set of changes that must be enacted in sequence or in parallel. These represent the gaps.
      • The gaps, once identified, translate themselves into additional requirements.

      Assessment Example

      Future State

      Current Situation

      Next Actions/ Proposals

      Incorporate social channels for responding to customer inquiries.

      No social media monitoring or channels for interaction exist at present.

      1. Implement a social media monitoring platform tool and integrate it with the current CSM.
      2. Recruit additional Customer Service representatives to monitor and respond to inquiries via social channels.
      3. Develop report(s) for analyzing volumes of inquiries received through social channels.

      Info-Tech Insight

      It is important to allot time for the current-state analysis, confine it to the minimum effort required to understand the gaps, and identify any missing pieces from your future-state vision. Make sure the work expended is proportional to the benefit derived from this exercise.

      2.1a Model current-state business processes

      2 hours

      1. Model the current state of the most critical business processes, using the work done in activities 1.2a and 1.2b to help identify these processes.
      2. Use Tab 5, Column I of Info-Tech’s Customer Service Business Process Shortlisting Tool to keep stock of what models have been completed.
      3. This tool is now complete.
      The image contains a screenshot of the Customer Service Business Process Shortlisting Tool.
      InputOutput
      • Modeled current-state Customer Service business processes
      • An inventory of modeled current states for critical Customer Service business processes
      MaterialsParticipants
      • Whiteboard
      • Writing materials
      • Customer Service Business Process Shortlisting Tool
      • Results of activities 1.2a and 1.2b.
      • Applications Director
      • Customer Service Director

      Download the Customer Service Business Process Shortlisting Tool

      2.1b Compare future and current business states

      2 hours

      1. Use Tab 9 of Info-Tech’s Customer Service Systems Strategy Tool to record a summary of the future state, current state, and actions proposed in order to bridge the gaps.
        • Fill out the desired future state of the business processes and IT architecture.
        • Fill out the current state of the business processes and IT architecture.
        • Fill out the actions required to mitigate the gaps between the future and current state.
      The image contains a screenshot of thr Customer Service Systems Strategy Tool.
      InputOutput
      • The results of activities 1.2a, 1.2b, and 2.1a.
      • Modeled future- and current-state business processes
      • An overview and analysis of how to reach certain future states from the current state.
      • A preliminary list of next steps through bridging the gap between current and future states.
      MaterialsParticipants
      • Whiteboard
      • Writing materials
      • Customer Service Business Process Shortlisting Tool
      • Applications Director
      • Customer Service Director

      Download the Customer Service Systems Strategy Tool

      2.1 Assess whether Customer Service architecture can meet future-state vision

      Approach your CS systems holistically to identify opportunities for system architecture optimization.

      • Organizations often do not have a holistic view of their Customer Service systems. These systems are often cobbled together from disparate parts, such as:
        • Point solutions (both SaaS and on-premise).
        • Custom interfaces between applications and databases.
        • Spreadsheets and other manual workarounds.
      • A high degree of interaction between multiple systems can cause distention in the application portfolio and databases, creating room for error and more work for CS and IT staff. Mapping your systems and architectural landscape can help you:
        • Identify the number of manual processes you currently employ.
        • Eliminate redundancies.
        • Allow for consolidation and/or integration.

      Consider the following metrics when tracking your CS systems:

      Time needed to perform core tasks (i.e., resolving a customer complaint)

      Accuracy of basic information (customer history, customer product portfolio)

      CSR time spent on manual process/workarounds

      Info-Tech Insight

      There is a two-step process to document the current state of your Customer Service systems:

      1. Compile an inventory of systems by function
      2. Identify points of integration across systems

      2.1c Begin compiling an inventory of CS systems by function

      2 hours

      1. Using Tab 2 of Info-Tech’s Customer Service Systems Strategy Tool, request that the CS managers fill in the application inventory template with all the CS systems that they use.
      2. Questions to trigger exercise:
        • Which applications am I using?
        • Which CS function does the application support?
        • How many applications support the same function?
        • What spreadsheets or manual workarounds do I use to fill in system gaps?
      3. Send the filled-in template to IT Managers to validate and fill in missing system information.
      InputOutput
      • Applications Directors’ knowledge of the current state
      • IT Managers’ validation of this state
      • A corroborated inventory of the current state for Customer Service systems
      MaterialsParticipants
      • Customer Service Systems Strategy Tool
      • Applications Director
      • IT managers

      Download the Customer Service Systems Strategy Tool

      2.1 Use activity 2.1c for an overview of your current state map

      The image contains a screenshot of activity 2.1.

      Info-Tech Insight

      A current-state map of CS systems can offer insight on:

      • Coverage, i.e. whether all functional areas are supported by systems.
      • Redundancies, i.e. functional areas with multiple systems. If a customer’s records are spread across multiple systems, it may be difficult to obtain a single source of truth.

      2.2 Assess current state with user interface architecture diagrams

      Understand a high-level overview of how your current state integrates together to rate its overall quality.

      • If IT already has an architecture diagram, use this in conjunction with your application inventory for the basis of current state discussions.
      • If your organization does not already have an architecture diagram for review and discussion, consider creating one in its most simplistic form using the following guidelines (see illustrative example on next slide):

      Represent each of your systems as a labelled shape with a unique number (this number can be referenced in other artifacts that can provide more detail).

      Color coding can also be applied to differentiate these objects, e.g., to indicate an internal system (where development is owned by your organization) vs. an external system (where development is outside of your organization’s control).

      2.2 Example: Current state with user interface architecture diagrams

      The image contains a screenshot of an example of current state with user interface architecture diagrams.

      2.2 Evaluate application functionality and functional coverage

      Use this documentation of the current state as an opportunity to spot areas for rationalizing your application portfolio.

      If an application is well-received by the organization and is an overall good platform, consider acquiring more modules from the same vendor application.

      The image contains a screenshot of a diagram to demonstrate functionality and functional coverage.

      If you have more than one application for a function, consider why that is and how you might consolidate into a single application.

      Measure the effectiveness of applications under consideration. For example, consider the number of failures when an application attempts a function (by ticket numbers), and overall satisfaction/ease of use.

      The above steps will reveal capability overlaps and application pain points and show how the overall portfolio could be made more efficient.

      2.2 Determine the degree of integration between systems

      Data and system integration are key components of an effective CS system portfolio.

      The needed level of integration will depend on three major factors:

      Integration between systems helps facilitate reporting. The required reports will vary from organization to organization:

      How many other systems benefit from the data of the application?

      Large workforces will benefit from more detailed WFM reports for optimizing workforce planning and talent acquisition.

      Will automating the integration between systems alleviate a significant amount of manual effort?

      Organizations with competitive sales and incentives will want to strategize around talent management and compensation.

      What kind of reports will your organization require in order to perform core and business-enabling functions?

      Aging workforces or organizations with highly specialized skills can benefit from detailed analysis around succession planning.

      Phase 2 – Case Study

      Integrating customer relationship information streamlines customer service and increases ROI for the organization.

      INDUSTRY: Retail and Wholesale

      SOURCE: inContact

      Situation

      Solution

      Results

      • Hall Automotive – a group of 14 multi-franchise auto dealerships located throughout Virginia and North Carolina – had customer information segmented throughout their CRM system at each dealership.
      • Call center agents lacked the technology to synthesize this information, leading customers to receive multiple and unrelated service calls.
      • Hall Automotive wanted to avoid embarrassing information gaps, integrate multiple CRM systems, and help agents focus on customers.
      • Hall Automotive utilized an inContact solution that included Automated Call Distributor, Computer Telephony Integration, and IVR technologies.
      • This created a complete customer-centric system that interfaced with multiple CRM and back-office systems.
      • The inContact solution simplified intelligent call flows, routed contacts to the right agent, and provided comprehensive customer information.
      • Call time decreased from five minutes to one minute and 23 seconds.
      • 350% increase in production.
      • Market response time down from three months to one day.
      • Cost per call cut from 83 cents to 23 cents.
      • Increased agents’ calls-per-hour from 12 to 43.
      • Scalability matched seasonal fluctuations in sales.

      2.2a Rate your functional and integration quality

      2 hours

      1. Using Tab 5 of Info-Tech’s Customer Service Systems Strategy Tool, evaluate the functionality of your applications.
      2. Then, use Tab 6 of the Customer Service Systems Strategy Tool to evaluate the integration of your applications.
      The image contains screenshots of the Customer Service Systems Strategy Tool.
      InputOutput
      • Applications Directors’ knowledge of the current state
      • IT Managers’ validation of this state
      • A documented evaluation of the organization’s application portfolio regarding functional and integration quality
      MaterialsParticipants
      • Customer Service Systems Strategy Tool
      • Applications Director
      • IT managers

      Download the Customer Service Systems Strategy Tool

      2.3 Revisit and refine the future-state business processes and list of requirements

      With a better understanding of the current state, determine whether the future-state models hold up. Ensure that the requirements are updated accordingly to reflect the full set of gaps identified.

      • Future-state versus current-state modeling is an iterative process.
      • By assessing the gaps between target state and current state, you may decide that:
        • The future state model was overly ambitious for what can reasonably be delivered in the near-term.
        • Core functions that exist today were accidentally omitted from the future state models and need to be incorporated.
        • There are systems or processes that your organization would like to salvage, and they must be worked into the future-state model.
      • Once the future state vision is stabilized, ensure that all gaps have been translated into business requirements.
        • If possible, categorize all gaps by functional and non-functional requirements.

      2.3a Compare states and propose action

      3 hours

      • Revisit Tab 9 of Info-Tech’s Customer Service Systems Strategy Tool to more accurately compare your organization’s current- and future-state business processes.
      • Ensure that gaps in the system architecture have been captured.
      The image contains a screenshot of the Customer Service Systems Strategy Tool.
      InputOutput
      • Modeled future- and current-state business processes
      • Refined and prioritized list of requirements
      • An accurate list of action steps for bridging current and future state business processes
      MaterialsParticipants
      • Whiteboard
      • Writing materials
      • Customer Service Systems Strategy Tool
      • Applications Director
      • IT managers

      Download the Customer Service Systems Strategy Tool

      2.3 Prioritize and finalize the requirements

      Prioritizing requirements will help to itemize initiatives and the timing with which they need to occur.

      Requirements are to be prioritized based on relative important and the timing of the respective initiatives.

      Prioritize the full set of requirements by assigning a priority to each:

      1. High/Critical: A critical requirement; without it, the product is not acceptable to the stakeholders.
      2. Medium/Important: A necessary but deferrable requirement that makes the product less usable but still functional.
      3. Low/Desirable: A nice feature to have if there are resources, but the product can function well without it.

      Requirements prioritization must be completed in collaboration with all key stakeholders (business and IT).

      Consider the following criteria when assigning the priority:

      • Business value
      • Business or technical risk
      • Implementation difficulty
      • Likelihood of success
      • Regulatory compliance
      • Relationship to other requirements
      • Urgency
      • Unified stakeholder agreement

      Stakeholders must ask themselves:

      • What are the consequences to the business objectives if this requirement is omitted?
      • Is there an existing system or manual process/workaround that could compensate for it?
      • Why can’t this requirement be deferred to the next release?
      • What business risk is being introduced if a particular requirement cannot be implemented right away?

      2.3b Document finalized requirements

      4 hours

      1. Using Tab 4 of Info-Tech’s Customer Service Systems Strategy Tool, evaluate your applications’ functionality, review, refine, prioritize, and finalize your requirements.
      2. Review the proposed future state diagrams in activity 2.3a and distill from them the business, functional, and non-functional requirements.
      3. The Applications Director and Customer Service Head are to identify participants based on the business processes that will be reviewed. They are to conduct a workshop to gather all the requirements that can be taken from the business process models.
      The image contains a screenshot of the Customer Service Systems Strategy Tool.
      InputOutput
      • Modeled future- and current-state business processes
      • Refined and prioritized list of requirements
      • A documented finalized list of requirements to achieve future state business processes
      MaterialsParticipants
      • Whiteboard
      • Writing materials
      • Customer Service Systems Strategy Tool
      • IT Applications Director
      • Customer Service Director
      • IT and Customer Service Representatives

      Download the Customer Service Systems Strategy Tool

      Phase 3

      Build Roadmap to Future State

      Phase 1

      Phase 2

      Phase 3

      1.1 Structure the Project

      1.2 Define Vision for Future State

      1.3 Document Preliminary Requirements

      2.1 Document Current State Business Processes

      2.2 Assess Current State Architecture

      2.3 Review and Finalize Requirements for Future State

      3.1 Evaluate Architectural and Application Options

      3.2 Understand the Marketplace

      3.3 Score and Plot Initiatives Along Strategic Roadmap

      This phase will guide you through the following activities:

      3.1a Analyze future architectural posture to understand how applications within the organization ought to be arranged.

      3.3a Develop a Customer Service IT Systems initiative roadmap to reach your future state.

      Participants required for Phase 3:

      • Applications Director
      • CIO
      • Customer Service Director
      • Customer Service Head
      • IT and Customer Service Representatives
      • IT Applications Director

      3.1a Analyze future architectural posture

      1 hour

      Review Tab 8 of the Customer Service Systems Strategy Tool.

      This tab plots each system that supports Customer Service on a 2x2 framework based on its functionality and integration scores. Where these systems plot on each 2x2 provides clues as to whether they should be considered for retention, functional enhancement (upgrade), increased system integration, or replacement.

      • Integrate: The application is functionally rich, so integrate it with other modules by building or enhancing interfaces.
      • Retain: The application satisfies both functionality and integration requirements, so it should be considered for retention.
      • Replace: The application neither offers the functionality sought, nor is it integrated with other modules.
      • Replace/Enhance: The module offers poor functionality but is well integrated with other modules. If enhancing for functionality is easy (e.g., through configuration or custom development), consider enhancement or replace it altogether.
      The image contains a screenshot of tab 8 of the Customer Service Systems Strategy Tool.
      InputOutput
      • Review Tab 8 of the Customer Service Systems Strategy Tool
      • An overview of how different applications in the organization ought to be assessed
      MaterialsParticipants
      • Customer Service Systems Strategy Tool
      • IT Applications Director
      • Customer Service Director
      • IT and Customer Service Representatives

      Download the Customer Service Systems Strategy Tool

      3.1 Interpret 3.1a’s results for next steps

      Involving both sales and marketing in these discussions will provide a 360-degree view on what the modifications should accomplish.

      If the majority of applications are plotted in the “Integrate” quadrant:

      The applications are performing well in terms of functionality but have poor integration. Determine what improvements can be made to enhance integration between the systems where required (e.g. re-working existing interfaces to accommodate additional data elements, automating interfaces, or creating brand new custom interfaces where warranted).

      If the applications are spread across “Integrate,” “Retain,” and “Replace/Enhance”:

      There is no clear recommended direction in this case. Weigh the effort required to replace/enhance/integrate specific applications critical for supporting processes. If resource usage for piecemeal solutions is too high, consider replacement with suite.

      If the majority of applications are plotted in the “Retain” quadrant:

      All applications satisfy both functionality and integration requirements. There is no evidence that significant action is required.

      If the application placements are split between the “Retain” and “Replace/Enhance” quadrants:

      Consider whether or not IT has the capabilities to execute application replacement procedures. If considering replacement, consider the downstream impact on applications that the system in question is currently integrated with. Enhancing an application usually implies upgrading or adding a module to an existing application. Consider the current satisfaction with the application vendor and whether the upgrade or additional module will satisfy your customer service needs.

      3.1 Work through architectural considerations to narrow future states

      Best-of-breeds vs. suite

      Integration and consolidation

      Deployment

      Does the organization only need a point solution or an entire platform of solutions?

      Does the current state enable interoperability between software? Is there room for rationalization?

      Should any new software be SaaS-based, on-premises, or a hybrid?

      Info-Tech Insight

      Decommissioning and replacing entire applications can put well-functioning modules at risk. Make sure to drill down into the granular features to assess if the feature level performance prompts change. The goal is to make the architecture more efficient for Customer Service and easier to manage for IT. If integration has been chosen as a course of action, make sure that the spend on resources and effort is less than that on system replacement. Also make sure that the intended architecture streamlines usability for agents.

      3.1 Considerations: Best-of-breeds vs. suite

      If requirements extend beyond the capabilities of a best-of-breed solution, a suite of tools may be required.

      Best-of-breed

      Suite

      Benefits

      • Features may be more advanced for specific functional areas and a higher degree of customization may be possible.
      • If a potential delay in real-time customer data transfer is acceptable, best-of-breeds provide a similar level of functionality to suites for a lower price.
      • Best-of-breeds allow value to be realized faster than suites, as they are easier and faster to implement and configure.
      • Rip and replace is easier and vendor updates are relatively quick to market.

      Benefits

      • Everyone in the organization works from the same set of customer data.
      • There is a “lowest common denominator” for agent learning as consistent user interfaces lower learning curves and increase efficiency in usage.
      • There is a broader range of functionality using modules.
      • Integration between functional areas will be strong and the organization will be in a better position to enable version upgrades without risking invalidation of an integration point between separate systems.

      Challenges

      • Best-of-breeds typically cover less breadth of functionality than suites.
      • There is a lack of uniformity in user experience across best-of-breeds.
      • Data integrity risks are higher.
      • Variable infrastructure may be implemented due to multiple disparate systems, which adds to architecture complexity and increased maintenance.
      • There is potential for redundant functionality across multiple best-of-breeds.

      Challenges

      • Suites exhibit significantly higher costs compared to point solutions.
      • Suite module functionality may not have the same depth as point solutions.
      • Due to high configuration availability and larger-scale implementation requirements, the time to deploy is longer than point solutions.

      3.1 Considerations: Integration and consolidation

      Use Tab 7 of Info-Tech’s Customer Service Systems Strategy Tool to gauge the need for consolidation.

      IT benefits

      • Decreased spend on infrastructure, application acquisition, and development.
      • Reduced complexity in vendor management.
      • Less resources and effort spent on internal integration and functional customization.

      Customer Service benefits

      • Reduced user confusion and application usage efficiency.
      • Increased operational visibility and ease process mapping.
      • Improved data management and integrity.

      Theoretical scenarios and recommendations

      The image contains a screenshot of an example of a customer service functional purpose.

      Problem:

      • Large Redundancy – multiple applications address the same function, but one application performs better than others.

      Recommendation:

      • Consolidate the functions into Application 1 and consider decommissioning Applications 2 to 4.
      The image contains a screenshot of an example of a customer service functional purpose.

      Problem:

      • Large Redundancy – multiple applications address the same function, but none of them do it well.

      Recommendation:

      • None of the applications perform well in functional support. Consider replacing with suite or leveraging the Application 3 vendor for functional module expansion, if feasible.

      3.1 Considerations: Deployment

      SaaS is typically recommended as it reduces IT support needs. However, customization limitations and higher long-term TCO values continue to be a challenge for SaaS.

      On-premises deployment

      Hybrid deployment

      Public cloud deployment

      Benefits

      • Solution and deployment are highly customizable.
      • There are fewer compliance and security risks because customer data is kept on premises.

      Challenges

      • There is slower physical deployment.
      • Physical hardware and software are required.
      • There are higher upfront costs.

      Benefits

      • Pick-and-mix which aspects to keep on premises and which to outsource.
      • Benefits of scaling and flexibility for outsourced solution.

      Challenges

      • Expensive to maintain.
      • Requires in-house skillset for on-premises option.
      • Some control is lost over outsourced customization.

      Benefits

      • Physical hardware is not required.
      • There is rapid deployment, vendor managed product updates, and server maintenance.
      • There are lower upfront costs.

      Challenges

      • There is higher TCO over time.
      • There are perceived security risks.
      • There are service availability and reliability risks.
      • There is limited customization.

      3.1 Considerations: Public cloud deployment

      Functionality is only one aspect of a broader range of issues to narrow down the viability of a cloud-based architecture.

      Security/Privacy Concerns:

      Whether the data is stored on premise or in the cloud, it is never 100% safe. The risk increases with a multi-tenant cloud solution where a single vendor manages the data of multiple clients. If your data is particularly sensitive, heavily scrutinize the security infrastructure of potential vendors or store the data internally if internal security is deemed stronger than that of a vendor.

      Location:

      If there are individuals that need to access the system database and work in different locations, centralizing the system and its database in the cloud may be an effective approach.

      Compatibility:

      Assess the compatibility of the cloud solutions with your internal IT systems. Cloud solutions should be well-integrated with internal systems for data flow to ensure efficiency in service operations.

      Cost/Budget Constraints:

      SaaS allows conversion of up-front CapEx to periodic OpEx. It assists in bolstering a business case as costs in the short-run are much more manageable. On-premise solutions have a much higher upfront TCO than cloud solutions. However, the TCO for the long-term usage of cloud solutions under the licensing model will exceed that of an on-premise solution, especially with a growing business and user base.

      Functionality/Customization:

      Ensure that the function or feature that you need is available on the cloud solution market and that the feature is robust enough to meet service quality standards. If the available cloud solution does not support the processes that fit your future-state vision and gaps, it has little business value. If high levels of customization are required to meet functionality, the amount of effort and cost in dealing with the cloud vendor may outweigh the benefits.

      Maintenance/Downtime:

      For most organizations, lapses in cloud-service availability can become disastrous for customer satisfaction and service quality. Organizations should be prepared for potential outages since customers require constant access to customer support.

      3.2 Explore the customer service technology marketplace

      Your requirements, gap analysis, and assessment of current applications architecture may have prompted the need for a new solutions purchase.

      • Customer service technology has come a long way since PABX in 1960s call centers. Let Info-Tech give you a quick overview of the market and the major systems that revolve around Customer Service.
      • The image contains a screenshot of a timeline of the market and major systems that revolve  around customer service.

      Info-Tech Insight

      While Customer Relationships Management systems interlock several aspects of the customer journey, best-of-breed software for specific aspects of this journey could provide a better ROI if the organization’s coverage of these aspects are only “good enough” and need boosting.

      3.2 The CRM software market will continue to grow at an aggressive rate

      • In recent years, CRM suite solutions have matured significantly in their customer support capabilities. Much of this can be attributed to their acquisitions of smaller best-of-breed Customer Service vendors.
      • Many of the larger CRM solutions (like those offered by Salesforce) have now added social media engagement, knowledge bases, and multi-channel capabilities into their foundational offering.
      • CRM systems are capable of huge sophistication and integration with the core ERP, but they also have heavy license and implementation costs, and therefore may not be for everyone.
      • In some cases, customers are looking to augment upon very specific capabilities that are lacking from their customer service foundation. In these cases, best-of-breed solutions ought to be integrated with a CRM, ERP, or with one another through API integration.
      The image contains a screenshot of a graph that demonstrates the CRM global market growth, 2019-2027.

      3.2 Utilize SoftwareReviews to focus on which CS area needs enhancing

      Contact Center as a Service (CCaaS)

      Cloud-based customer experience solution that allows organizations to utilize a provider’s software to administer incoming support or inquiries from consumers in a hosted, subscription model.

      Customer Service Management (CSM)

      Supports an organization's interaction with current and potential customers. It uses data-driven tools designed to help organizations drive sales and deliver exceptional customer experiences.

      Customer Intelligence Platform

      Gather and analyze data from both structured and unstructured sources regarding your customers, including their demographic/firmographic details and activities, to build deeper and more effective customer relationships and improve business outcomes.

      Enterprise Social Media Management

      Software for monitoring social media activity with the goal of gaining insight into user opinion and optimizing social media campaigns.

      Customer Relationship Management (CRM)

      Consists of applications designed to automate and manage the customer life cycle. CRM software optimizes customer data management, lead tracking, communication logging, and marketing campaigns.

      Virtual Assistants and Chatbots

      interactive applications that use Artificial Intelligence (AI) to engage in conversation via speech or text. These applications simulate human interaction by employing natural language input and feedback.

      3.2 SoftwareReviews’ data accelerates and improves the software selection process

      SoftwareReviews collects and analyzes detailed reviews on enterprise software from real users to give you an unprecedented view into the product and vendor before you buy.

      With SoftwareReviews:

      • Access premium reports to understand the marketspace of 193 software categories.
      • Compare vendors with SoftwareReviews’ Data Quadrant Reports.
      • Discover which vendors have better customer relations management with SoftwareReviews’ Emotional Footprint Reports.
      • Explore the Product Scorecards of single vendors for a detailed analysis of their software offerings.
      The image contains a screenshot of the Software Reviews offerings.

      3.2 Speak with category experts to dive deeper into the vendor landscape

      Fact-based reviews of business software from IT professionals.

      Product and category reports with state-of-the-art data visualization.

      Top-tier data quality backed by a rigorous quality assurance process.

      User-experience insight that reveals the intangibles of working with a vendor.

      CLICK HERE to access SoftwareReviews

      Comprehensive software reviews to make better IT decisions.

      We collect and analyze the most detailed reviews on enterprise software from real users to give you an unprecedented view into the product and vendor before you buy.

      SoftwareReviews is powered by Info-Tech.

      Technology coverage is a priority for Info-Tech, and SoftwareReviews provides the most comprehensive unbiased data on today’s technology. The insights of our expert analysts provide unparalleled support to our members at every step of their buying journey.

      3.2 Leverage Info-Tech’s Rapid Application Selection Framework

      Improve your key software selection metrics for best-of-breed customer service software.

      The image contains a screenshot of an example of Info-Tech's Rapid Application Selection Framework.

      A simple measurement of the number of days from intake to decision.

      Use our Project Satisfaction Tool to measure stakeholder project satisfaction.

      Use our Application Portfolio Assessment Tool annually to measure application satisfaction.

      Use our Contract Review Service to benchmark and optimize your technology spending.

      Learn more about Info-Tech’s The Rapid Application Selection Framework

      The Rapid Application Selection Framework (RASF) is best geared toward commodity and mid-tier enterprise applications

      Not all software selection projects are created equal – some are very small, some span the entire enterprise. To ensure that IT is using the right framework, understand the cost and complexity profile of the application you’re looking to select. The RASF approach is best for commodity and mid-tier enterprise applications; selecting complex applications is better handled by the methodology described in Implement a Proactive and Consistent Vendor Selection Process.

      RASF Methodology

      Commodity & Personal Applications

      • Simple, straightforward applications (think OneNote vs. Evernote)
      • Total application spend of up to $10,000; limited risk and complexity
      • Selection done as a single, rigorous, one-day session

      Complex Mid-Tier Applications

      • More differentiated, department-wide applications (Marketo vs. Pardot)
      • Total application spend of up to $100,000; medium risk and complexity
      • RASF approach done over the course of an intensive 40-hour engagement

      Consulting Engagement

      Enterprise Applications

      Sophisticated, enterprise-wide applications (Salesforce vs. Dynamics)

      Total application spend of over $100,000; high risk and complexity

      Info-Tech can assist with tailored, custom engagements

      3.3 Translate gathered requirements and gaps into project-based initiatives

      Identify initiatives that can address multiple requirements simultaneously.

      The Process

      • You now have a list of requirements from assessing business processes and the current Customer Service IT systems architecture.
      • With a viable architecture and application posture, you can now begin scoring and plotting key initiatives along a roadmap.
      • Group similar requirements into categories of need and formulate logical initiatives to fulfill the requirements.
      • Ensure that all requirements are related to business needs, measurable, sufficiently detailed, and prioritized, and identify initiatives that meet the requirements.

      Consider this case:

      Paul’s organization, a midsize consumer packaged goods retailer, needs to monitor social media for sentiment, use social analytics to gain intelligence, and receive and respond to inquiries made over Twitter.

      The initiative:

      Implement a social media management platform (SMMP): A SMMP is able to deliver on all of the above requirements. SMMPs are highly capable platforms that have social listening modules and allow costumer service representatives to post to and monitor social media.

      3.3 Prioritize your initiatives and plan the order of rollout

      Initiatives should not and cannot be tackled all at once. There are three key factors that dictate the prioritization of initiatives.

      1. Value
        • What is the monetary value/perceived business value?
        • Are there regulatory or security related impacts if the initiative is not undertaken?
        • What is the time to market and is it an easily achievable goal?
        • How well does it align with the strategic direction?
      2. Risk
        • How technically complex is it?
        • Does it impact existing business processes?
        • Are there ample resources and right skillsets to support it?
      3. Dependencies
        • What initiatives must be undertaken first?
        • Which subsequent initiatives will it support?

      Example scenario using Info-Tech’s Initiative Scoring and Roadmap Tool

      An electronics distributor wants to implement social media monitoring and response. Its existing CRM does not have robust channel management functions. The organization plans to replace its CRM in the future, but because of project size and impact and budgetary constraints, the replacement project has been scheduled to occur two years from now.

      • The SMMP solution proposed for implementation has a high perceived value and is low risk.
      • The CRM replacement has higher value, but also carries significantly more risk.
      • Option 1: Complete the CRM replacement first, and overlay the social media monitoring component afterward (as the SMMP must be integrated with the CRM).
      • Option 2: Seize the easily achievable nature of the SMMP initiative. Implement it now and plan to re-work the CRM integration later.
      The image contains a screenshot of an example scenario using Info-Tech's Initiative Scoring and Roadmap Tool.

      3.3a Develop a Customer Service IT Systems initiative roadmap

      1 hour

      • Complete the tool as a team during a one-hour meeting to collaborate and agree on criteria and weighting.
        1. Input initiative information.
        2. Determine value and risk evaluation criteria.
        3. Evaluate each initiative to determine its priority.
        4. Create a roadmap of prioritized initiatives.
      The image contains a screenshot of the Customer Service Initiative Scoring and Roadmap Tool.
      InputOutput
      • Input the initiative information including the start date, end date, owner, and dependencies
      • Adjust the evaluation criteria, i.e., the value and risk factors
      • A list of initiatives and a roadmap toward the organization’s future state of Customer Service IT Systems
      MaterialsParticipants
      • Customer Service Initiative Scoring and Roadmap Tool
      • Applications Director
      • CIO
      • Customer Service Head

      Download the Customer Service Initiative Scoring and Roadmap Tool

      Document and communicate the strategy

      Leverage the artifacts of this blueprint to summarize your findings and communicate the outcomes of the strategy project to the necessary stakeholders.

      Document Section

      Proposed Content

      Leverage the Following Artifacts

      Executive Summary

      • Introduction
      • The opportunity
      • The scope
      • The stakeholders
      • Project success measures

      Project Charter section:

      • 1.1 Project Overview
      • 1.2 Project Objectives
      • 1.3 Project Benefits
      • 2.0 Scope

      Project RACI Chart Tool:

      • Tab 3. Simplified Output
      The image contains screenshots from the Project Charter, and the RACI Chart Tool.

      Background

      • The project approach
      • Current situation overview
      • Results of the environmental scan

      Blueprint slides:

      • Info-Tech’s methodology to develop your IT Strategy for CS Systems
      The image contains a screenshot from the blueprint slides.

      Future-State Vision

      • Customer service goals
      • Future-state modeling findings

      Customer Service Business Process Shortlisting Tool:

      • Tab 2. Customer Service Goals
      • Tab 5. Level 5 Process Inventory

      Future State Business Process Models

      The image contains screenshots from the Customer Service Business Process Shortlisting Tool.

      Current Situation

      • Current-state modeling findings
      • Current-state architecture findings
      • Gap assessment
      • Requirements

      Customer Service Systems Strategy Tool:

      • Tab 2. Inventory of Applications
      • Tab 7. Systems Health Heat Map
      • Tab 8. Systems Health Dashboard
      • Tab 9. Future vs. Current State
      • Tab 4. Requirements Collection
      The image contains screenshots from the Customer Service Systems Strategy Tool.

      Summary of Recommendations

      • Optimization opportunities
      • New capabilities

      N/A

      IT Strategy Implementation Plan

      • Implementation plan
      • Business case

      Customer Service Initiative Scoring and Roadmap Tool:

      • Tab 2. CS Initiative Definition
      • Tab 4. CS Technology Roadmap
      The image contains screenshots from the Customer Service Initiative Scoring and Roadmap Tool.

      Summary of Accomplishment

      Develop an IT Strategy to Support Customer Service

      With ecommerce accelerating and customer expectations rising with it, organizations must have an IT strategy to support Customer Service.

      The deliverable you have produced from this blueprint provides a solution to this problem: a roadmap to a desired future state for how IT can ground an effective customer service engagement. From omnichannel to self-service, IT will be critical to enabling the tools required to digitally meet customer needs.

      Begin implementing your roadmap!

      If you would like additional support, have our analysts guide you through other phases as part of an Info-Tech workshop.

      Contact your account representative for more information.

      workshops@infotech.com

      1-888-670-8889

      Related Info-Tech Research

      Deliver a Customer Service Training Program to Your IT Department

      • One training session is not enough to make a change. Leaders must embed the habits, create a culture of engagement and positivity, provide continual coaching and development, regularly gather customer feedback, and seek ways to improve.

      Build a Chatbot Proof of Concept

      • When implemented effectively, chatbots can help save costs, generate new revenue, and ultimately increase customer satisfaction for both external- and internal-facing customers.

      The Rapid Application Selection Framework

      • Application selection is a critical activity for IT departments. Implement a repeatable, data-driven approach that accelerates application selection efforts.

      Bibliography (1/2)

      • Callzilla. "Software Maker Compares Call Center Companies, Switches to Callzilla After 6 Months of Results." Callzilla. N.d. Accessed: 4 Jul. 2022.
      • Cisco. “Transforming Customer Service.” Cisco. 2018. Accessed: 8 Feb. 2021.
      • Gottlieb, Giorgina. “The Importance of Data for Superior Customer Experience and Business Success.” Medium. 23 May 2019. Accessed: 8 Feb. 2021.
      • Grand View Research. “Customer Relationship Management Market Size, Share & Trends Analysis Report By Solution, By Deployment, By Enterprise Size, By End Use, By Region, And Segment Forecasts, 2020 – 2027.” Grand View Research. April 2020. Accessed: 17 Feb. 2021.
      • inContact. “Hall Automotive Accelerates Customer Relations with inContact.” inContact. N.d. Accessed: 8 Feb. 2021.
      • Kulbyte, Toma. “37 Customer Experience Statistics to Know in 2021.” Super Office. 4 Jan. 2021. Accessed: 5 Feb. 2021.
      • Kuligowski, Kiely. "11 Benefits of CRM Systems." Business News Daily. 29 Jun. 2022. Accessed: 4 Jul. 2022.
      • Mattsen Kumar. “Ominchannel Support Transforms Customer Experience for Leading Fintech Player in India.” Mattsen Kumar. 4 Apr. 2020. Accessed: 8 Feb. 2021.
      • Microsoft. “State of Global Customer Service Report.” Microsoft. Mar. 2019. Accessed: 8 Feb. 2021.
      • Ringshall, Ben. “Contact Center Trends 2020: A New Age for the Contact Center.” Fonolo. 20 Oct. 2020. Accessed 2 Nov. 2020.
      • Salesforce. “State of Service.” Salesforce. 4th ed. 2020. Accessed: 8 Feb. 2021.
      • Sopadjieva, Emma, Utpal M. Dholakia, and Beth Benjamin. “A Study of 46,000 Shoppers Shows That Omnichannel Retailing Works.” Harvard Business Review. 3 Jan. 2017. Accessed: 8 Feb. 2021.

      Bibliography (2/2)

      • Tech Pro Research. “Digital Transformation Research Report 2018: Strategy, Returns on Investment, and Challenges.” Tech Pro Research. 29 Jul. 2018. Accessed: 5 Feb. 2021.
      • TSB. “TSB Bank Self-Serve Banking Increases 9% with Adobe Sign.” TSB. N.d. Accessed: 8 Feb. 2021.
      • VoiceSage. “VoiceSage Helps Home Retail Group Transform Customer Experience.” VoiceSage. 4 May 2018. Accessed: 8 Feb. 2021.

      Kick-Start IT-Led Business Innovation

      • Buy Link or Shortcode: {j2store}87|cart{/j2store}
      • member rating overall impact (scale of 10): 9.2/10 Overall Impact
      • member rating average dollars saved: $38,844 Average $ Saved
      • member rating average days saved: 8 Average Days Saved
      • Parent Category Name: Innovation
      • Parent Category Link: /innovation
      • The CIO is not considered a strategic partner. The business may be satisfied with IT services, but no one is looking to IT to solve business problems or drive the enterprise forward.
      • Even if IT staff do generate ideas that will improve operational efficiency or enable the business, few are ever assessed or executed upon.

      Our Advice

      Critical Insight

      • Business demand for new technology is creating added pressure to innovate and executive stakeholders expect more from IT. If IT is not viewed as a source of innovation, its perceived value will decrease and the threat of shadow IT will grow. Do not wait to start finding and capitalizing on opportunities for IT-led innovation.

      Impact and Result

      • Start innovating right away. All you need are business pains and people willing to ideate around them.
      • Assemble a small team and arm them with proven techniques for identifying unique opportunities for innovation, developing impactful solutions, and prototyping quickly and effectively. Incubate a reservoir of ideas, both big and small, so that you are ready to execute on innovative projects when the timing is right.
      • Once you have demonstrated IT’s ability to innovate, mature your capability with a permanent innovation process and program.

      Kick-Start IT-Led Business Innovation Research & Tools

      Start here – read the Executive Brief

      Read our concise Executive Brief to find out why you should create innovation processes, review Info-Tech’s methodology, and understand the four ways we can support you in completing this project.

      Besides the small introduction, subscribers and consulting clients within this management domain have access to:

      1. Launch innovation

      Sponsor a mandate for innovation and assemble a small team to start sourcing ideas with IT staff.

      • Kick-Start IT-Led Business Innovation – Phase 1: Launch Innovation
      • Innovation Working Group Charter

      2. Ideate

      Identify critical opportunities for innovation and brainstorm effective solutions.

      • Kick-Start IT-Led Business Innovation – Phase 2: Ideate
      • Idea Document
      • Idea Reservoir Tool

      3. Prototype

      Prototype ideas rapidly to gain user feedback, refine solutions, and make a compelling case for project investment.

      • Kick-Start IT-Led Business Innovation – Phase 3: Prototype
      • Prototyping Workbook
      • Prototype Assessment

      4. Mature innovation capability

      Formalize the innovation process and implement a program to create a strong culture of innovation in IT.

      • Kick-Start IT-Led Business Innovation – Phase 4: Mature Innovation Capability

      Infographic

      Workshop: Kick-Start IT-Led Business Innovation

      Workshops offer an easy way to accelerate your project. If you are unable to do the project yourself, and a Guided Implementation isn't enough, we offer low-cost delivery of our project workshops. We take you through every phase of your project and ensure that you have a roadmap in place to complete your project successfully.

      1 Launch Innovation

      The Purpose

      Introduce innovation.

      Assess overall IT maturity to understand what you want to achieve with innovation.

      Define the innovation mandate.

      Introduce ideation.

      Key Benefits Achieved

      A set of shared objectives for innovation will be defined.

      A mandate will be created to help focus innovation efforts on what is most critical to the advancement of IT's maturity.

      The group will be introduced to ideation and prepared to begin addressing critical IT or business pains.

      Activities

      1.1 Define workshop goals and objectives.

      1.2 Introduce innovation.

      1.3 Assess IT maturity.

      1.4 Define the innovation mandate.

      1.5 Introduce ideation.

      Outputs

      Workshop goals and objectives.

      An understanding of innovation.

      IT maturity assessment.

      Sponsored innovation mandate.

      An understanding of ideation.

      2 Ideate, Part I

      The Purpose

      Identify and prioritize opportunities for IT-led innovation.

      Map critical processes to identify the pains that should be ideated around.

      Brainstorm potential solutions.

      Assess, pitch, and prioritize ideas that should be investigated further.

      Key Benefits Achieved

      The team will learn best practices for ideation.

      Critical pain points that might be addressed through innovation will be identified and well understood.

      A number of ideas will be generated that can solve identified pains and potentially feed the project pipeline.

      The team will prioritize the ideas that should be investigated further and prototyped after the workshop.

      Activities

      2.1 Identify processes that present opportunities for IT-led innovation.

      2.2 Map selected processes.

      2.3 Finalize problem statements.

      2.4 Generate ideas.

      2.5 Assess ideas.

      2.6 Pitch and prioritize ideas.

      Outputs

      A list of processes with high opportunity for IT-enablement.

      Detailed process maps that highlight pain points and stakeholder needs.

      Problem statements to ideate around.

      A long list of ideas to address pain points.

      Detailed idea documents.

      A shortlist of prioritized ideas to investigate further.

      3 Ideate, Part II

      The Purpose

      Ideate around a more complex problem that presents opportunity for IT-led innovation.

      Map the associated process to define pain points and stakeholder needs in detail.

      Brainstorm potential solutions.

      Assess, pitch, and prioritize ideas that should be investigated further.

      Introduce prototyping.

      Map the user journey for prioritized ideas.

      Key Benefits Achieved

      The team will be ready to facilitate ideation independently with other staff after the workshop.

      A critical problem that might be addressed through innovation will be defined and well understood.

      A number of innovative ideas will be generated that can solve this problem and help IT position itself as a source of innovative projects.

      Ideas will be assessed and prioritized for further investigation and prototyping after the workshop.

      The team will learn best practices for prototyping.

      The team will identify the assumptions that need to be tested when top ideas are prototyped.

      Activities

      3.1 Select an urgent opportunity for IT-led innovation.

      3.2 Map the associated process.

      3.3 Finalize the problem statement.

      3.4 Generate ideas.

      3.5 Assess ideas.

      3.6 Pitch and prioritize ideas.

      3.7 Introduce prototyping.

      3.8 Map the user journey for top ideas.

      Outputs

      Selection of a process which presents a critical opportunity for IT-enablement.

      Detailed process map that highlights pain points and stakeholder needs.

      Problem statement to ideate around.

      A long list of ideas to solve the problem.

      Detailed idea documents.

      A shortlist of prioritized ideas to investigate further.

      An understanding of effective prototyping techniques.

      A user journey for at least one of the top ideas.

      4 Implement an Innovation Process and Program

      The Purpose

      Establish a process for generating, managing, prototyping, prioritizing, and approving new ideas.

      Create an action plan to operationalize your new process.

      Develop a program to help support the innovation process and nurture your innovators.

      Create an action plan to implement your innovation program.

      Decide how innovation success will be measured.

      Key Benefits Achieved

      The team will learn best practices for managing innovation.

      The team will be ready to operationalize an effective process for IT-led innovation. You can start scheduling ideation sessions as soon as the workshop is complete.

      The team will understand the current innovation ecosystem: drivers, barriers, and enablers.

      The team will be ready to roll out an innovation program that will help generate wider engagement with IT-led innovation.

      You will be ready to measure and report on the success of your program.

      Activities

      4.1 Design an IT-led innovation process.

      4.2 Assign roles and responsibilities.

      4.3 Generate an action plan to roll out the process.

      4.4 Determine critical process metrics to track.

      4.5 Identify innovation drivers, enablers, and barriers.

      4.6 Develop a program to nurture a culture of innovation.

      4.7 Create an action plan to jumpstart each of your program components.

      4.8 Determine critical metrics to track.

      4.9 Summarize findings and gather feedback.

      Outputs

      A process for IT-led innovation.

      Defined process roles and responsibilities.

      An action plan for operationalizing the process.

      Critical process metrics to measure success.

      A list of innovation drivers, enablers, and barriers.

      A program for innovation that will leverage enablers and minimize barriers.

      An action plan to roll out your innovation program.

      Critical program metrics to track.

      Overview of workshop results and feedback.

      ChatGPT Beyond the hype. What can it do for you?

      Summary of the deck.

      ChatGPT is a generative AI tool developed by OpenAI, a non-profit founded by Silicon Valley titans, including Elon Musk and Sam Altman. It is designed to interact with users in a way that mimics human dialogue. The tool became available via a research release on November 30, 2022, and was an immediate hit – within a week; it attracted more than a million users. Functionally, ChatGPT is designed to answer questions, but it is not the first one. The concept has existed for decades. While it is very powerful, it has also attracted criticism. 

      IT Operations, strategy

      Register to read more …

      Learn the right way to manage metrics

      • Parent Category Name: Improve Your Processes
      • Parent Category Link: /improve-your-processes

      Learn to use metrics in the right way. Avoid staff (subconciously) gaming the numbers, as it is only natural to try to achieve the objective. This is really a case of be careful what you wish for, you may just get it.

      Register to read more …

      Identify and Manage Operational Risk Impacts on Your Organization

      • Buy Link or Shortcode: {j2store}230|cart{/j2store}
      • member rating overall impact (scale of 10): N/A
      • member rating average dollars saved: N/A
      • member rating average days saved: N/A
      • Parent Category Name: Vendor Management
      • Parent Category Link: /vendor-management

      More than any other time, our world is changing. As a result, organizations – and their vendors – need to be able to adapt their plans to accommodate risk on an unprecedented level.

      A new threat will impact your organization's operations at some point. Make sure your plans are flexible enough to manage the inevitable consequences and that you understand where those threats may originate.

      Our Advice

      Critical Insight

      • Identifying and managing a vendor’s potential operational impact on your organization requires multiple people in the organization across several functions. Those people all need coaching on the potential changes in the market and how these changes may affect operations.
      • Organizational leadership is often taken unaware during crises, and their plans lack the flexibility to adjust to significant market upheavals.

      Impact and Result

      Vendor management practices educate organizations on the different potential risks from vendors in your market and suggest creative and alternative ways to avoid and help manage them.

      • Prioritize and classify your vendors with quantifiable, standardized rankings.
      • Prioritize focus on your high-risk vendors.
      • Standardize your processes for identifying and monitoring vendor risks to manage potential impacts with our Operational Risk Impact Tool.

      Identify and Manage Operational Risk Impacts on Your Organization Research & Tools

      Besides the small introduction, subscribers and consulting clients within this management domain have access to:

      1. Identify and Manage Operational Risk Impacts to Your Organization Storyboard – Use this research to better understand the negative impacts of vendor actions to your brand reputation.

      Use this research to identify and quantify the potential operational impacts caused by vendors. Utilize Info-Tech's approach to look at the operational impact from various perspectives to better prepare for issues that may arise.

      • Identify and Manage Operational Risk Impacts to Your Organization Storyboard

      2. Operational Risk Impact Tool – Use this tool to help identify and quantify the operational impacts of negative vendor actions.

      By playing the “what if” game and asking probing questions to draw out – or eliminate - possible negative outcomes, everyone involved adds their insight into parts of the organization to gather a comprehensive picture of potential impacts.

      • Operational Risk Impact Tool
      [infographic]

      Further reading

      Identify and Manage Operational Risk Impacts on Your Organization

      Understand internal and external vendor risks to avoid potential disaster.

      Analyst perspective

      Organizations need to be aware of the operational damage vendors may cause to plan around those impacts effectively.

      Frank Sewell

      Organizations must be mindful that operational risks come from internal and external vendor sources. Missing either component in the overall risk assessment can significantly impact day-to-day business processes that cost revenue, delay projects, and lead to customer dissatisfaction.

      Frank Sewell,

      Research Director, Vendor Management
      Info-Tech Research Group

      Executive Summary

      Your Challenge

      More than any other time, our world is changing rapidly. As a result, organizations – and their vendors – need to be able to adapt their plans to accommodate risk on an unprecedented level.

      A new threat will impact your organization's operations at some point. Make sure your plans are flexible enough to manage the inevitable consequences and that you understand where those threats may originate.

      Common Obstacles

      Identifying and managing a vendor’s potential operational impact on your organization requires multiple people in the organization across several functions. Those people all need coaching on the potential changes in the market and how these changes may affect operations.

      Organizational leadership is often taken unaware during crises, and their plans lack the flexibility to adjust to significant market upheavals.

      Info-Tech's Approach

      Vendor management practices educate organizations on the different potential risks from vendors in your market and suggest creative and alternative ways to avoid and help manage them.

      Prioritize and classify your vendors with quantifiable, standardized rankings.

      Prioritize focus on your high-risk vendors.

      Standardize your processes for identifying and monitoring vendor risks to manage potential impacts with our Operational Risk Impact Tool.

      Info-Tech Insight

      Organizations must evolve their risk assessments to be more adaptive to respond to threats in the market. Ongoing monitoring of the vendors tied to company operations, and understanding where those vendors impact your operations, is imperative to avoiding disasters.

      Info-Tech’s multi-blueprint series on vendor risk assessment

      There are many individual components of vendor risk beyond cybersecurity.

      There are many components to vendor risk, including: Financial, Reputational, Operational, Strategic, Security, Regulatory & Compliance.

      This series will focus on the individual components of vendor risk and how vendor management practices can facilitate organizations’ understanding of those risks.

      Out of Scope:
      This series will not tackle risk governance, determining overall risk tolerance and appetite, or quantifying inherent risk.

      Operational risk impacts

      Potential losses to the organization due to incidents that affect operations.

      • In this blueprint we’ll explore operational risks, particularly from third-party vendors, and their impacts.
      • Identify potentially disruptive events to assess the overall impact on organizations and implement adaptive measures to identify, manage, and monitor vendor performance.
      Operational

      The world is constantly changing

      The IT market is constantly reacting to global influences. By anticipating changes, leaders can set expectations and work with their vendors to accommodate them.

      When the unexpected happens, being able to adapt quickly to new priorities ensures continued long-term business success.

      Below are some things no one expected to happen in the last few years:

      27%

      Businesses are changing their internal processes around TPRM in response to the Pandemic.

      70%

      Of organizations attribute a third-party breach to too much privileged access.

      85%

      Of breaches involved human factors (phishing, poor passwords, etc.).

      Assess internal and external operational risk impacts

      Due diligence and consistent monitoring are the keys to safeguarding your organization.

      Two sides of the Same Coin

      Internal

      • Poorly vetted supplemental staff
      • Bad system configurations
      • Lack of relevant skills
      • Poor vendor performance
      • Failure to follow established processes
      • Weak contractual accountability
      • Unsupportable or end-of-life system components

      External

      • Cyberattacks
      • Supply Chain Issues
      • Geopolitical Disruptions
      • Vendor Acquisitions
      • N-Party Non-Compliance
      • Vendor Fraud

      Operational risk is the risk of losses caused by flawed or failed processes, policies, systems, or events that disrupt business operations.

      - Wikipedia

      Internal operational risk

      Vendors operating within your secure perimeter can open your organization to substantial risk.

      Frequently monitor your internal process around vendor management to ensure safe operations.

      • Poorly vetted supplemental staff
      • Bad system configurations
      • Lack of relevant skills
      • Poor vendor performance
      • Failure to follow established processes
      • Weak contractual accountability
      • Unsupportable or end-of-life system components

      Info-Tech Insight

      You may have solid policies, but if your employees and vendors are not following them, they will not protect the organization.

      External operational risks

      • Cyberattacks
      • Supplier issues and geopolitical instability
      • Vendor acquisitions
      • N-party vendor non-compliance

      Identify and manage operational risks

      Poorly configured systems

      Failing to ensure that your vendor-supported systems are properly configured and that your vendors are meeting your IT change control and configuration standards is more commonplace than expected. Proper oversight and management of your support vendors are crucial to ensure they are meeting expectations in this regard.

      Failure to follow processes

      Most companies have policies and procedures around IT change and configuration control, security standards, risk management, vendor performance standards, etc. While having these processes is a good start, failure to perform continuous monitoring and management of these leads to increased risks of incidents.

      Supply chain disruptions

      Awareness of the supply chain's complications, and each organization's dependencies, are increasing for everyone. However, most organizations still do not understand the chain of n-party vendors that support their specific vendors or how interruptions in their supply chains could affect them. The 2022 Toyota shutdown due to Kojima is a perfect example of how one essential parts vendor could shut down your operations.

      What to look for

      Identify operational risk impacts

      • Does the vendor have a business continuity plan they will share for your review?
      • Is the vendor operating on old hardware that may be out of warranty or at end of life?
      • Is the vendor operating on older software or shareware that may lack the necessary patches?
      • Does the vendor self-audit, or do they use a vetted third-party audit firm to issue a SOC report annually?
      • Does the vendor have sufficient personnel in acceptable regions to support your operations?
      • Is the vendor willing to make concessions on contractual protections, or are they only offering “one-sided” agreements with “as-is” warranties?

      Operational risks

      Not knowing where your risks come from creates additional risks to operations.

      • Supply chain disruptions and global shortages.
        • Geopolitical disruptions and natural disasters have caused unprecedented interruptions to business. Do you know where your critical vendors are getting their supplies? Are you aware of their business continuity plans to accommodate for those interruptions?
      • Poor vendor performance.
        • Organizations need to understand where vendors are acting in their operations and manage the impact of replacing that vendor and cutting their losses rather than continuing to throw good money away after a bad performance.
      • Vendor acquisitions.
        • A lot of acquisition is going on in the market today. Large companies are buying competitors, imposing new terms on customers, or removing competing products from the market. Understand your options if a vendor is acquired by a company with which you do not wish to be in a relationship.

      It is important to identify where potential risks to your operations may come from to manage and potentially eliminate them from impacting your organization.

      Info-Tech Insight

      Most organizations realize that their vendors could operationally affect them if an incident occurs. Still, they fail to follow the chain of events that might arise from those incidents to understand the impact fully.

      Prepare your vendor risk management for success

      Due diligence will enable successful outcomes.

      1. Obtain top-level buy-in; it is critical to success.
      2. Build enterprise risk management (ERM) through incremental improvement.
      3. Focus initial efforts on the “big wins” to prove the process works.
      4. Use existing resources.
      5. Build on any risk management activities that already exist in the organization.
      6. Socialize ERM throughout the organization to gain additional buy‑in.
      7. Normalize the process long term with ongoing updates and continuing education for the organization.

      How to assess third-party operational risk

      1. Review Organizational Operations

        Understand the organization’s operational risks to prepare for the “what if” game exercise.
      2. Identify and Understand Potential Operational Risks

        Play the “what if” game with the right people at the table.
      3. Create a Risk Profile Packet for Leadership

        Pull all the information together in a presentation document.
      4. Validate the Risks

        Work with leadership to ensure that the proposed risks are in line with their thoughts.
      5. Plan to Manage the Risks

        Lower the overall risk potential by putting mitigations in place.
      6. Communicate the Plan

        It is important not only to have a plan but also to socialize it in the organization for awareness.
      7. Enact the Plan

        Once the plan is finalized and socialized, put it in place with continued monitoring for success.

      Insight summary

      Operational risk impacts often come from unexpected places and have unforeseen impacts. Knowing where your vendors place in critical business processes and those vendors' business continuity plans concerning your organization should be a priority for those who manage the vendors.

      Insight 1

      Organizations fail to plan for vendor acquisitions appropriately.

      Vendors routinely get acquired in the IT space. Does your organization have appropriate safeguards from inadvertently entering a negative relationship? Do you have plans around replacing critical vendors purchased in such a manner?

      Insight 2

      Organizations often fail to understand how they factor into a vendor’s business continuity plan.

      If one of your critical vendors goes down, do you know how they intend to re-establish business? Do you know how you factor into their priorities?

      Insight 3

      Organizations need to have a comprehensive understanding of how their vendor-managed systems integrate with Operations.

      Do you understand where in the business processes vendor-supported systems lie? Do you have contingencies around disruptions that account for those pieces missing from the process?

      Identifying operational vendor risk

      Who should be included in the discussion

      • While it is true that executive-level leadership defines the strategy for an organization, it is vital for those making decisions to make informed decisions.
      • Getting input from operational experts at your organization will enhance your organization's long-term potential for success.
      • Involving those who not only directly manage vendors but also understand your business processes will aid in determining the forward path for relationships with your current vendors and identifying new emerging potential partners.

      See the blueprint Build an IT Risk Management Program

      Review your operational plans for new risks on a regular basis.

      Keep in mind Risk = Likelihood x Impact (R=L*I).

      Impact (I) tends to remain the same, while Likelihood (L) is becoming closer to 100% as threat actors become more prevalent

      Managing vendor operational risk impacts

      What can we realistically do about the risks?

      • Review vendors’ business continuity plans and disaster recovery testing.
        • Understand your priority in their plans.
      • Institute proper contract lifecycle management.
        • Make sure to follow corporate due diligence and risk assessment policies and procedures.
        • Failure to do so consistently can be a recipe for disaster.
      • Develop IT governance and change control.
      • Introduce continual risk assessment to monitor the relevant vendor markets.
        • Regularly review your operational plans for new risks and evolving likelihoods.
        • Risk = Likelihood x Impact (R=L*I).
          • Impact (I) tends to remain the same and be well understood, while Likelihood (L) may often be considered 100%.
      • Be adaptable and allow for innovations that arise from the current needs.
        • Capture lessons learned from prior incidents to improve over time and adjust your plans accordingly.

      Organizations need to review their organizational risk plans, considering the placement of vendors in their operations.

      Pandemics, extreme weather, and wars that affect global supply chains are current realities, not unlikely scenarios.

      Ongoing improvement

      Incorporating lessons learned

      • Over time, despite everyone’s best observations and plans, incidents will catch us off guard.
      • When it happens, follow your incident response plans and act accordingly.
      • An essential step is to document what worked and what did not – collectively known as the “lessons learned.”
      • Use the lessons learned document to devise, incorporate, and enact a better risk management process.

      Sometimes disasters occur despite our best plans to manage them.

      When this happens, it is important to document the lessons learned and improve our plans going forward.

      The "what if" game

      1-3 hours

      Vendor management professionals are in an excellent position to help senior leadership identify and pull together resources across the organization to determine potential risks. By playing the "what if" game and asking probing questions to draw out – or eliminate – possible adverse outcomes, everyone involved adds their insight into parts of the organization to gather a comprehensive picture of potential impacts.

      • Break into smaller groups (or if too small, continue as a single group).
      • Use the Operational Risk Impact Tool to prompt discussion on potential risks. Keep this discussion flowing organically to explore all potentials but manage the overall process to keep the discussion pertinent and on track.
      • Collect the outputs and ask the subject matter experts (SMEs) for management options for each one in order to present a comprehensive risk strategy. You will use this to educate senior leadership so that they can make an informed decision to accept or reject the solution.

      Download the Operational Risk Impact Tool

      Input

      • List of identified potential risk scenarios scored by likelihood and operational impact
      • List of potential management of the scenarios to reduce the risk

      Output

      • Comprehensive operational risk profile on the specific vendor solution

      Materials

      • Whiteboard/flip charts
      • Operational Risk Impact Tool to help drive discussion

      Participants

      • Vendor Management – Coordinator
      • Organizational Leadership
      • Operations Experts (SMEs)
      • Legal/Compliance/Risk Manager

      High risk example from tool

      Sample Questions to Ask to Identify Impacts. Lists questions impact score, weight, question and comments or notes.

      Being overly reliant on a single talented individual can impose risk to your operations. Make sure you include resiliency in your skill sets for critical business practices.

      Impact score and level. Each score for impacts are unique to the organization.

      Low risk example from tool

      Sample Questions to Ask to Identify Impacts. Lists questions impact score, weight, question and comments or notes. Impact score and level. Each score for impacts are unique to the organization.

      Summary

      Seek to understand all aspects of your operations.

      • Organizations need to understand and map out where vendors are critical to their operations.
      • Those organizations that consistently follow their established risk assessment and due diligence processes will be better positioned to avoid disasters.
      • Bring the right people to the table to outline potential risks in the market and your organization.
      • Understand how your vendors prioritize your organization in their business continuity processes.
      • Incorporate “lessons learned” from prior incidents into your risk management process to build better plans for future issues.

      Organizations must evolve their operational risk assessments considering their vendor portfolio.

      Ongoing monitoring of the market and the vendors tied to company operations is imperative to avoiding disaster.

      Related Info-Tech Research

      Identify and Manage Financial Risk Impacts on Your Organization

      • Vendor management practices educate organizations on the different potential financial impacts that vendors may incur and suggest systems to help manage them.
      • Standardize your processes for identifying and monitoring vendor risks to manage financial impacts with our Financial Risk Impact Tool.

      Identify and Manage Reputational Risk Impacts on Your Organization

      • Vendor management practices educate organizations on the different potential risks to vendors in your market and suggest creative and alternative ways to avoid and help manage them.
      • Standardize your processes for identifying and monitoring vendor risks to manage potential impacts on your reputation and brand with our Reputational Risk Impact Tool.

      Identify and Manage Strategic Risk Impacts on Your Organization

      • Vendor management practices educate organizations on the different potential risks to vendors in your market and suggest creative and alternative ways to avoid and help manage them.
      • Standardize your processes for identifying and monitoring vendor risks to manage potential impacts on your strategic plan with our Strategic Risk Impact Tool.

      Bibliography

      “Weak Cybersecurity is taking a toll on Small Businesses.” Tripwire. August 7, 2022.

      SecureLink 2022 White Paper SL_Page_EA+PAM (rocketcdn.me)

      Member Poll March 2021 "Guide: Evolving Work Environments Impact of Covid-19 on Profile and Management of Third Parties.“ Shared Assessments. March 2021.

      “Operational Risk.” Wikipedia.

      Tonello, Matteo. “Strategic Risk Management: A Primer for Directors.” Harvard Law School Forum on Corporate Governance, August 23, 2012.

      Frigo, Mark L., and Richard J. Anderson. “Embracing Enterprise Risk Management: Practical Approaches for Getting Started.” COSO, 2011.

      Organizational Change Management

      • Buy Link or Shortcode: {j2store}35|cart{/j2store}
      • Related Products: {j2store}35|crosssells{/j2store}
      • member rating overall impact (scale of 10): 9.6/10
      • member rating average dollars saved: $19,055
      • member rating average days saved: 24
      • Parent Category Name: Project Portfolio Management and Projects
      • Parent Category Link: /ppm-and-projects
      If you don't know who is responsible for organizational change, it's you.

      Modernize Your Corporate Website to Drive Business Value

      • Buy Link or Shortcode: {j2store}524|cart{/j2store}
      • member rating overall impact (scale of 10): 8.0/10 Overall Impact
      • member rating average dollars saved: $10,399 Average $ Saved
      • member rating average days saved: 10 Average Days Saved
      • Parent Category Name: Marketing Solutions
      • Parent Category Link: /marketing-solutions
      • Users are demanding more valuable web functionalities and improved access to your website services. They are expecting development teams to keep up with their changing needs.
      • The criteria of user acceptance and satisfaction involves more than an aesthetically pleasing user interface (UI). It also includes how emotionally attached the user is to the website and how it accommodates user behaviors.

      Our Advice

      Critical Insight

      Complication

      • Organizations are focusing too much on the UI when they optimize the user experience of their websites. The UI is only one of many components involved in successful websites with good user experience.
      • User experience (UX) is often an afterthought in development, risking late and costly fixes to improve end-user reception after deployment.

      Insights

      • Organizations often misinterpret UX as UI. In fact, UX incorporates both the functional and emotional needs of the user, going beyond the website’s UI.
      • Human behaviors and tendencies are commonly left out of the define and design phases of website development, putting user satisfaction and adoption at risk.

      Impact and Result

      • Gain a deep understanding of user needs and behaviors. Become familiar with the human behaviors, emotions, and pain points of your users in order to shortlist the design elements and website functions that will receive the highest user satisfaction.
      • Perform a comprehensive website review. Leverage satisfaction surveys, user feedback, and user monitoring tools (e.g. heat maps) to reveal high-level UX issues. Use these insights to drill down into the execution and composition of your website to identify the root causes of issues.
      • Incorporate modern UX trends in your design. New web technologies are continuously emerging in the industry to enhance user experience. Stay updated on today’s UX trends and validate their fit for the specific needs of your target audience.

      Modernize Your Corporate Website to Drive Business Value Research & Tools

      Start here – read the Executive Brief

      Read our concise Executive Brief to find out why you should modernize your website, review Info-Tech’s methodology, and discover the four ways we can support you in completing this project.

      Besides the small introduction, subscribers and consulting clients within this management domain have access to:

      1. Define UX requirements

      Reveal the opportunities to heighten the user experience of your website through a deep understanding of the behaviors, emotions, and needs of your end users in order to design a receptive and valuable website.

      • Modernize Your Corporate Website to Drive Business Value – Phase 1: Define UX Requirements
      • Website Design Document Template

      2. Design UX-driven website

      Design a satisfying and receptive website by leveraging industry best practices and modern UX trends and ensuring the website is supported with reliable and scalable data and infrastructure.

      • Modernize Your Corporate Website to Drive Business Value – Phase 2: Design UX-Driven Website
      [infographic]

      Workshop: Modernize Your Corporate Website to Drive Business Value

      Workshops offer an easy way to accelerate your project. If you are unable to do the project yourself, and a Guided Implementation isn't enough, we offer low-cost delivery of our project workshops. We take you through every phase of your project and ensure that you have a roadmap in place to complete your project successfully.

      1 Define Your UX Requirements

      The Purpose

      List the business objectives of your website.

      Describe your user personas, use cases, and user workflow.

      Identify current UX issues through simulations, website design, and system reviews.

      Key Benefits Achieved

      Strong understanding of the business goals of your website.

      Knowledge of the behaviors and needs of your website’s users.

      Realization of the root causes behind the UX issues of your website.

      Activities

      1.1 Define the business objectives for the website you want to optimize

      1.2 Define your end-user personas and map them to use cases

      1.3 Build your website user workflow

      1.4 Conduct a SWOT analysis of your website to drive out UX issues

      1.5 Gauge the UX competencies of your web development team

      1.6 Simulate your user workflow to identify the steps driving down UX

      1.7 Assess the composition and construction of your website

      1.8 Understand the execution of your website with a system architecture

      1.9 Pinpoint the technical reason behind your UX issues

      1.10 Clarify and prioritize your UX issues

      Outputs

      Business objectives

      End-user personas and use cases

      User workflows

      Website SWOT analysis

      UX competency assessment

      User workflow simulation

      Website design assessment

      Current state of web system architecture

      Gap analysis of web system architecture

      Prioritized UX issues

      2 Design Your UX-Driven Website

      The Purpose

      Design wireframes and storyboards to be aligned to high priority use cases.

      Design a web system architecture that can sufficiently support the website.

      Identify UX metrics to gauge the success of the website.

      Establish a website design process flow.

      Key Benefits Achieved

      Implementation of key design elements and website functions that users will find stimulating and valuable.

      Optimized web system architecture to better support the website.

      Website design process aligned to your current context.

      Rollout plan for your UX optimization initiatives.

      Activities

      2.1 Define the roles of your UX development team

      2.2 Build your wireframes and user storyboards

      2.3 Design the target state of your web environment

      2.4 List your UX metrics

      2.5 Draw your website design process flow

      2.6 Define your UX optimization roadmap

      2.7 Identify and engage your stakeholders

      Outputs

      Roles of UX development team

      Wireframes and user storyboards

      Target state of web system architecture

      List of UX metrics

      List of your suppliers, inputs, processes, outputs, and customers

      Website design process flow

      UX optimization rollout roadmap

      Define Your Cloud Vision

      • Buy Link or Shortcode: {j2store}448|cart{/j2store}
      • member rating overall impact (scale of 10): 9.5/10 Overall Impact
      • member rating average dollars saved: $182,333 Average $ Saved
      • member rating average days saved: 28 Average Days Saved
      • Parent Category Name: Cloud Strategy
      • Parent Category Link: /cloud-strategy

      The cloud permeates the enterprise technology discussion. It can be difficult to separate the hype from the value. Should everything go to the cloud, or is that sentiment stoked by vendors looking to boost their bottom lines? Not everything should go to the cloud, but coming up with a systematic way to determine what belongs where is increasingly difficult as offerings get more complex.

      Our Advice

      Critical Insight

      Don’t think about the cloud as an inevitable next step for all workloads. The cloud is merely another tool in the toolbox, ready to be used when appropriate and put away when it’s not needed. Cloud-first isn’t always the way to go.

      Impact and Result

      • Evaluate workloads’ suitability for the cloud using Info-Tech’s methodology to select the optimal migration (or non-migration) path based on the value of cloud characteristics.
      • Codify risks tied to workloads’ cloud suitability and plan mitigations.
      • Build a roadmap of initiatives for actions by workload and risk mitigation.
      • Define a cloud vision to share with stakeholders.

      Define Your Cloud Vision Research & Tools

      Besides the small introduction, subscribers and consulting clients within this management domain have access to:

      1. Define Your Cloud Vision – A step-by-step guide to generating, validating, and formalizing your cloud vision.

      The cloud vision storyboard walks readers through the process of generating, validating and formalizing a cloud vision, providing a framework and tools to assess workloads for their cloud suitability and risk.

      • Define Your Cloud Vision – Phases 1-4

      2. Cloud Vision Executive Presentation – A document that captures the results of the exercises, articulating use cases for cloud/non-cloud, risks, challenges, and high-level initiative items.

      The executive summary captures the results of the vision exercise, including decision criteria for moving to the cloud, risks, roadblocks, and mitigations.

      • Cloud Vision Executive Presentation

      3. Cloud Vision Workbook – A tool that facilitates the assessment of workloads for appropriate service model, delivery model, support model, and risks and roadblocks.

      The cloud vision workbook comprises several assessments that will help you understand what service model, delivery model, support model, and risks and roadblocks you can expect to encounter at the workload level.

      • Cloud Vision Workbook
      [infographic]

      Workshop: Define Your Cloud Vision

      Workshops offer an easy way to accelerate your project. If you are unable to do the project yourself, and a Guided Implementation isn't enough, we offer low-cost delivery of our project workshops. We take you through every phase of your project and ensure that you have a roadmap in place to complete your project successfully.

      1 Understand the Cloud

      The Purpose

      Align organizational goals to cloud characteristics.

      Key Benefits Achieved

      An understanding of how the characteristics particular to cloud can support organizational goals.

      Activities

      1.1 Generate corporate goals and cloud drivers.

      1.2 Identify success indicators.

      1.3 Explore cloud characteristics.

      1.4 Explore cloud service and delivery models.

      1.5 Define cloud support models and strategy components.

      1.6 Create state summaries for the different service and delivery models.

      1.7 Select workloads for further analysis.

      Outputs

      Corporate cloud goals and drivers

      Success indicators

      Current state summaries

      List of workloads for further analysis

      2 Assess Workloads

      The Purpose

      Evaluate workloads for cloud value and action plan.

      Key Benefits Achieved

      Action plan for each workload.

      Activities

      2.1 Conduct workload assessment using the Cloud Strategy Workbook tool.

      2.2 Discuss assessments and make preliminary determinations about the workloads.

      Outputs

      Completed workload assessments

      Workload summary statements

      3 Identify and Mitigate Risks

      The Purpose

      Identify and plan to mitigate potential risks in the cloud project.

      Key Benefits Achieved

      A list of potential risks and plans to mitigate them.

      Activities

      3.1 Generate a list of risks and potential roadblocks associated with the cloud.

      3.2 Sort risks and roadblocks and define categories.

      3.3 Identify mitigations for each identified risk and roadblock

      3.4 Generate initiatives from the mitigations.

      Outputs

      List of risks and roadblocks, categorized

      List of mitigations

      List of initiatives

      4 Bridge the Gap and Create the Strategy

      The Purpose

      Clarify your vision of how the organization can best make use of cloud and build a project roadmap.

      Key Benefits Achieved

      A clear vision and a concrete action plan to move forward with the project.

      Activities

      4.1 Review and assign work items.

      4.2 Finalize the decision framework for each of the following areas: service model, delivery model, and support model.

      4.3 Create a cloud vision statement

      Outputs

      Cloud roadmap

      Finalized task list

      Formal cloud decision rubric

      Cloud vision statement

      5 Next Steps and Wrap-Up

      The Purpose

      Complete your cloud vision by building a compelling executive-facing presentation.

      Key Benefits Achieved

      Simple, straightforward communication of your cloud vision to key stakeholders.

      Activities

      5.1 Build the Cloud Vision Executive Presentation

      Outputs

      Completed cloud strategy executive presentation

      Completed Cloud Vision Workbook.

      Further reading

      Define Your Cloud Vision

      Define your cloud vision before it defines you

      Analyst perspective

      Use the cloud’s strengths. Mitigate its weaknesses.

      The cloud isn’t magic. It’s not necessarily cheaper, better, or even available for the thing you want it to do. It’s not mysterious or a cure-all, and it does take a bit of effort to systematize your approach and make consistent, defensible decisions about your cloud services. That’s where this blueprint comes in.

      Your cloud vision is the culmination of this effort all boiled down into a single statement: “This is how we want to use the cloud.” That simple statement should, of course, be representative of – and built from – a broader, contextual strategy discussion that answers the following questions: What should go to the cloud? What kind of cloud makes sense? Should the cloud deployment be public, private, or hybrid? What does a migration look like? What risks and roadblocks need to be considered when exploring your cloud migration options? What are the “day 2” activities that you will need to undertake after you’ve gotten the ball rolling?

      Taken as a whole, answering these questions is difficult task. But with the framework provided here, it’s as easy as – well, let’s just say it’s easier.

      Jeremy Roberts

      Research Director, Infrastructure and Operations

      Info-Tech Research Group

      Executive Summary

      Your Challenge

      • You are both extrinsically motivated to move to the cloud (e.g. by vendors) and intrinsically motivated by internal digital transformation initiatives.
      • You need to define the cloud’s true value proposition for your organization without assuming it is an outsourcing opportunity or will save you money.
      • Your industry, once cloud-averse, is now normalizing the use of cloud services, but you have not established a basic cloud vision from which to develop a strategy at a later point.

      Common Obstacles

      • Organizations jump to the cloud before defining their cloud vision and without any clear plan for realizing the cloud’s benefits.
      • Many organizations have a foot in the cloud already, but these decisions have been made in an ad hoc rather than systematic fashion.
      • You lack a consistent framework to assess your workloads’ suitability for the cloud.

      Info-Tech's Approach

      • Evaluate workloads’ suitability for the cloud using Info-Tech’s methodology to select the optimal migration (or non-migration) path based on the value of cloud characteristics.
      • Codify risks tied to workloads’ cloud suitability and plan mitigations.
      • Build a roadmap of initiatives for actions by workload and risk mitigation.
      • Define a cloud vision to share with stakeholders.

      Info-Tech Insight: 1) Base migration decisions on cloud characteristics. If your justification for the migration is simply getting your workload out of the data center, think again. 2) Address the risks up front in your migration plan. 3) The cloud changes roles and calls for different skill sets, but Ops is here to stay.

      Your challenge

      This research is designed to help organizations who need to:

      • Identify workloads that are good candidates for the cloud.
      • Develop a consistent, cost-effective approach to cloud services.
      • Outline and mitigate risks.
      • Define your organization’s cloud archetype.
      • Map initiatives on a roadmap.
      • Communicate your cloud vision to stakeholders so they can understand the reasons behind a cloud decision and differentiate between different cloud service and deployment models.
      • Understand the risks, roadblocks, and limitations of the cloud.

      “We’re moving from a world where companies like Oracle and Microsoft and HP and Dell were all critically important to a world where Microsoft is still important, but Amazon is now really important, and Google also matters. The technology has changed, but most of the major vendors they’re betting their business on have also changed. And that’s super hard for people..” –David Chappell, Author and Speaker

      Common obstacles

      These barriers make this challenge difficult to address for many organizations:

      • Organizations jump to the cloud before defining their cloud vision and without any clear plan for realizing the cloud’s benefits.
      • Many organizations already have a foot in the cloud, but the choice to explore these solutions was made in an ad hoc rather than systematic fashion. The cloud just sort of happened.
      • The lack of a consistent assessment framework means that some workloads that probably belong in the cloud are kept on premises or with hosted services providers – and vice versa.
      • Securing cloud expertise is remarkably difficult – especially in a labor market roiled by the global pandemic and the increasing importance of cloud services.

      Standard cloud challenges

      30% of all cloud spend is self-reported as waste. Many workloads that end up in the cloud don’t belong there. Many workloads that do belong in the cloud aren’t properly migrated. (Flexera, 2021)

      44% of respondents report themselves as under-skilled in the cloud management space. (Pluralsight, 2021)

      Info-Tech’s approach

      Goals and drivers

      • Service model
        • What type of cloud makes the most sense for workload archetypes? When does it make sense to pick SaaS over IaaS, for example?
      • Delivery model
        • Will services be delivered over the public cloud, a private cloud, or a hybrid cloud? What challenges accompany this decision?
      • Migration Path
        • What does the migration path look like? What does the transition to the cloud look like, and how much effort will be required? Amazon’s 6Rs framework captures migration options: rehosting, repurchasing, replatforming, and refactoring, along with retaining and retiring. Each workload should be assessed for its suitability for one or more of these paths.
      • Support model
        • How will services be provided? Will staff be trained, new staff hired, a service provider retained for ongoing operations, or will a consultant with cloud expertise be brought on board for a defined period? The appropriate support model is highly dependent on goals along with expected outcomes for different workloads.

      Highlight risks and roadblocks

      Formalize cloud vision

      Document your cloud strategy

      The Info-Tech difference:

      1. Determine the hypothesized value of cloud for your organization.
      2. Evaluate workloads with 6Rs framework.
      3. Identify and mitigate risks.
      4. Identify cloud archetype.
      5. Plot initiatives on a roadmap.
      6. Write action plan statement and goal statement.

      What is the cloud, how is it deployed, and how is service provided?

      Cloud Characteristics

      1. On-demand self-service: the ability to access reosurces instantly without vendor interaction
      2. Broad network access: all services delivered over the network
      3. Resource pooling: multi-tenant environment (shared)
      4. Rapid elasticity: the ability to expand and retract capabilities as needed
      5. Measured service: transparent metering

      Service Model:

      1. Software-as-a-Service: all but the most minor configuration is done by the vendor
      2. Platform-as-a-Service: customer builds the application using tools provided by the provider
      3. Infrastructure-as-a-Service: the customer manages OS, storage, and the application

      Delivery Model

      1. Public cloud: accessible to anyone over the internet; multi-tenant environment
      2. Private cloud: provisioned for a single organization with multiple units
      3. Hybrid cloud: two or more connected clouds; data is portage across them
      4. Community cloud: provisioned for a specific group of organizations

      (National Institute of Standards and Technology)

      A workload-first approach will allow you to take full advantage of the cloud’s strengths

      • Under all but the most exceptional circumstances, good cloud strategies will incorporate different service models. Very few organizations are “IaaS shops” or “SaaS shops,” even if they lean heavily in one direction.
      • These different service models (including non-cloud options like colocation and on-premises infrastructure) each have different strengths. Part of your cloud strategy should involve determining which of the services makes the most sense for you.
      • Own the cloud by understanding which cloud (or non-cloud!) offering makes the most sense for you given your unique context.

      Migration paths

      In a 2016 blog post, Amazon introduced a framework for understanding cloud migration strategies. The framework presented here is slightly modified – including a “relocate” component rather than a “retire” component – but otherwise hews close to the standard.

      These migration paths reflect organizational capabilities and desired outcomes in terms of service models – cloud or otherwise. Retention means keeping the workload where it is, in a datacenter or a colocation service, or relocating to a colocation or hosted software environment. These represent the “non-cloud” migration paths.

      In the graphic on the right, the paths within the red box lead to the cloud. Rehosting means lifting and shifting to an infrastructure environment. Migrating a virtual machine from your VMware environment on premises to Azure Virtual machines is a quick way to realize some benefits from the cloud. Migrating from SQL Server on premises to a cloud-based SQL solution looks a bit more like changing platforms (replatforming). It involves basic infrastructure modification without a substantial architectural component.

      Refactoring is the most expensive of the options and involves engaging the software development lifecycle to build a custom solution, fundamentally rewriting the solution to be cloud native and take advantage of cloud-native architectures. This can result in a PaaS or an IaaS solution.

      Finally, repurchasing means simply going to market and procuring a new solution. This may involve migrating data, but it does not require the migration of components.

      Migration Paths

      Retain (Revisit)

      • Keep the application in its current form, at least for now. This doesn’t preclude revisiting it in the future.

      Relocate

      • Move the workload between datacenters or to a hosted software/colocation provider.

      Rehost

      • Move the application to the cloud (IaaS) and continue to run it in more or less the same form as it currently runs.

      Replatform

      • Move the application to the cloud and perform a few changes for cloud optimizations.

      Refactor

      • Rewrite the application, taking advantage of cloud-native architectures.

      Repurchase

      • Replace with an alternative, cloud-native application and migrate the data.

      Support model

      Support models by characteristic

      Duration of engagement Specialization Flexibility
      Internal IT Indefinite Varies based on nature of business Fixed, permanent staff
      Managed Service Provider Contractually defined General, some specialization Standard offering
      Consultant Project-based Specific, domain-based Entirely negotiable

      IT services, including cloud services, can be delivered and managed in multiple ways depending on the nature of the workload and the organization’s intended path forward. Three high-level options are presented here and may be more or less valuable based on the duration of the expected engagement with the service (temporary or permanent), the skills specialization required, and the flexibility necessary to complete the job.

      By way of example, a highly technical, short-term project with significant flexibility requirements might be a good fit for an expensive consultant, whereas post-implementation maintenance of a cloud email system requires relatively little specialization and flexibility and would therefore be a better fit for internal management.

      There is no universally applicable rule here, but there are some workloads that are generally a good fit for the cloud and others that are not as effective, with that fit being conditional on the appropriate support model being employed.

      Risks, roadblocks, and strategy components

      No two cloud strategies are exactly alike, but all should address 14 key areas. A key step in defining your cloud vision is an assessment of these strategy components. Lower maturity does not preclude an aggressive cloud strategy, but it does indicate that higher effort will be required to make the transition.

      Component Description Component Description
      Monitoring What will system owners/administrators need visibility into? How will they achieve this? Vendor Management What practices must change to ensure effective management of cloud vendors?
      Provisioning Who will be responsible for deploying cloud workloads? What governance will this process be subject to? Finance Management How will costs be managed with the transition away from capital expenditure?
      Migration How will cloud migrations be conducted? What best practices/standards must be employed? Security What steps must be taken to ensure that cloud services meet security requirements?
      Operations management What is the process for managing operations as they change in the cloud? Data Controls How will data residency, compliance, and protection requirements be met in the cloud?
      Architecture What general principles must apply in the cloud environment? Skills and roles What skills become necessary in the cloud? What steps must be taken to acquire those skills?
      Integration and interoperability How will services be integrated? What standards must apply? Culture and adoption Is there a cultural aversion to the cloud? What steps must be taken to ensure broad cloud acceptance?
      Portfolio Management Who will be responsible for managing the growth of the cloud portfolio? Governing bodies What formal governance must be put in place? Who will be responsible for setting standards?

      Cloud archetypes – a cloud vision component

      Once you understand the value of the cloud, your workloads’ general suitability for cloud, and your proposed risks and mitigations, the next step is to define your cloud archetype.

      Your organization’s cloud archetype is the strategic posture that IT adopts to best support the organization’s goals. Info-Tech’s model recognizes seven archetypes, divided into three high-level archetypes.

      After consultation with your stakeholders, and based on the results of the suitability and risk assessment activities, define your archetype. The archetype feeds into the overall cloud vision and provides simple insight into the cloud future state for all stakeholders.

      The cloud vision itself is captured in a “vision statement,” a short summary of the overall approach that includes the overall cloud archetype.

      We can best support the organization's goals by:

      More Cloud

      Less Cloud

      Cloud Focused Cloud-Centric Providing all workloads through cloud delivery.
      Cloud-First Using the cloud as our default deployment model. For each workload, we should ask “why NOT cloud?”
      Cloud Opportunistic Hybrid Enabling the ability to transition seamlessly between on-premises and cloud resources for many workloads.
      Integrated Combining cloud and traditional infrastructure resources, integrating data and applications through APIs or middleware.
      Split Using the cloud for some workloads and traditional infrastructure resources for others.
      Cloud Averse Cloud-Light Using traditional infrastructure resources and limiting our use of the cloud to when it is absolutely necessary.
      Anti-Cloud Using traditional infrastructure resources and avoiding use of the cloud wherever possible.

      Info-Tech’s methodology for defining your cloud vision

      1. Understand the Cloud 2. Assess Workloads 3. Identify and Mitigate Risks 4. Bridge the Gap and Create the Vision
      Phase Steps
      1. Generate goals and drivers
      2. Explore cloud characteristics
      3. Create a current state summary
      4. Select workloads for analysis
      1. Conduct workload assessments
      2. Determine workload future state
      1. Generate risks and roadblocks
      2. Mitigate risks and roadblocks
      3. Define roadmap initiatives
      1. Review and assign work items
      2. Finalize cloud decision framework
      3. Create cloud vision
      Phase Outcomes
      1. List of goals and drivers
      2. Shared understanding of cloud terms
      3. Current state of cloud in the organization
      4. List of workloads to be assessed
      1. Completed workload assessments
      2. Defined workload future state
      1. List of risks and roadblocks
      2. List of mitigations
      3. Defined roadmap initiatives
      1. Cloud roadmap
      2. Cloud decision framework
      3. Completed Cloud Vision Executive Presentation

      Insight summary

      The cloud may not be right for you – and that’s okay!

      Don’t think about the cloud as an inevitable next step for all workloads. The cloud is merely another tool in the toolbox, ready to be used when appropriate and put away when it’s not needed. Cloud first isn’t always the way to go.

      Not all clouds are equal

      It’s not “should I go to the cloud?” but “what service and delivery models make sense based on my needs and risk tolerance?” Thinking about the cloud as a binary can force workloads into the cloud that don’t belong (and vice versa).

      Bottom-up is best

      A workload assessment is the only way to truly understand the cloud’s value. Work from the bottom up, not the top down, understand what characteristics make a workload cloud suitable, and strategize on that basis.

      Your accountability doesn’t change

      You are still accountable for maintaining available, secure, functional applications and services. Cloud providers share some responsibility, but the buck stops where it always has: with you.

      Don’t customize for the sake of customization

      SaaS providers make money selling the same thing to everyone. When migrating a workload to SaaS, work with stakeholders to pursue standardization around a selected platform and avoid customization where possible.

      Best of both worlds, worst of both worlds

      Hybrid clouds are in fashion, but true hybridity comes with additional cost, administration, and other constraints. A convoy moves at the speed of its slowest member.

      The journey matters as much as the destination

      How you get there is as important as what “there” actually is. Any strategy that focuses solely on the destination misses out on a key part of the value conversation: the migration strategy.

      Blueprint benefits

      Cloud Vision Executive Presentation

      This presentation captures the results of the exercises and presents a complete vision to stakeholders including a desired target state, a rubric for decision making, the results of the workload assessments, and an overall risk profile.

      Cloud Vision Workbook

      This workbook includes the standard cloud workload assessment questionnaire along with the results of the assessment. It also includes the milestone timeline for the implementation of the cloud vision.

      Blueprint benefits

      IT Benefits

      • A consistent approach to the cloud takes the guesswork out of deployment decisions and makes it easier for IT to move on to the execution stage.
      • When properly incorporated, cloud services come with many benefits, including automation, elasticity, and alternative architectures (micro-services, containers). The cloud vision project will help IT readers articulate expected benefits and work towards achieving them.
      • A clear framework for incorporating organizational goals into cloud plans.

      Business benefits

      • Simple, well-governed access to high-quality IT resources.
      • Access to the latest and greatest in technology to facilitate remote work.
      • Framework for cost management in the cloud that incorporates OpEx and chargebacks/showbacks. A clear understanding of expected changes to cost modeling is also a benefit of a cloud vision.
      • Clarity for stakeholders about IT’s response (and contribution to) IT strategic initiatives.

      Measure the value of this blueprint

      Don’t take our word for it:

      • The cloud vision material in various forms has been offered for several years, and members have generally benefited substantially, both from cloud vision workshops and from guided implementations led by analysts.
      • After each engagement, we send a survey that asks members how they benefited from the experience. Of 30 responses, the cloud vision research has received an average score of 9.8/10. Real members have found significant value in the process.
      • Additionally, members reported saving between 2 and 120 days (for an average of 17), and financial savings ranged from $1,920 all the way up to $1.27 million, for an average of $170,577.90! If we drop outliers on both ends, the average reported value of a cloud vision engagement is $37, 613.
      • Measure the value by calculating the time saved from using Info-Tech’s framework vs. a home-brewed cloud strategy alternative and by comparing the overall cost of a guided implementation or workshop with the equivalent offering from another firm. We’re confident you’ll come out ahead.

      9.8/10 Average reported satisfaction

      17 Days Average reported time savings

      $37, 613 Average cost savings (adj.)

      Executive Brief Case Study

      Industry: Financial

      Source: Info-Tech workshop

      Anonymous financial institution

      A small East Coast financial institution was required to develop a cloud strategy. This strategy had to meet several important requirements, including alignment with strategic priorities and best practices, along with regulatory compliance, including with the Office of the Comptroller of the Currency.

      The bank already had a significant cloud footprint and was looking to organize and formalize the strategy going forward.

      Leadership needed a comprehensive strategy that touched on key areas including the delivery model, service models, individual workload assessments, cost management, risk management and governance. The output had to be consumable by a variety of audiences with varying levels of technical expertise and had to speak to IT’s role in the broader strategic goals articulated earlier in the year.

      Results

      The bank engaged Info-Tech for a cloud vision workshop and worked through four days of exercises with various IT team members. The bank ultimately decided on a multi-cloud strategy that prioritized SaaS while also allowing for PaaS and IaaS solutions, along with some non-cloud hosted solutions, based on organizational circumstances.

      Bank cloud vision

      [Bank] will provide innovative financial and related services by taking advantage of the multiplicity of best-of-breed solutions available in the cloud. These solutions make it possible to benefit from industry-level innovations, while ensuring efficiency, redundancy, and enhanced security.

      Bank cloud decision workflow

      • SaaS
        • Platform?
          • Yes
            • PaaS
          • No
            • Hosted
          • IaaS
            • Other

      Non-cloud

      Cloud

      Info-Tech offers various levels of support to best suit your needs

      DIY Toolkit

      "Our team has already made this crticial project a priority, and we have the time and capability, but some guidance along the way would be helpful."

      Guided Implementation

      "Our team knows that we need to fix a process, but we need assistance to determine where to focus. Some check-ins along the way would help keep us on track."

      Workshop

      "We need to hit the ground running and get this project kicked off imediately. Our team has the ability to take this over once we get a framework and strategy in place."

      Consulting

      "Our team does not have the time or the knowledge the take this project on. We need assistance through the entirety of this project."

      Diagnostics and consistent frameworks are used throughout all four options.

      Guided Implementation

      What does a typical GI on this topic look like?

      A Guided Implementation (GI) is a series of calls with an Info-Tech analyst to help implement our best practices in your organization.

      A typical GI is between 8 to 12 calls over the course of 4 to 6 months.

      Phase 1

      • Call #1: Discuss current state, challenges, etc.
      • Call #2: Goals, drivers, and current state.

      Phase 2

      • Call #3: Conduct cloud suitability assessment for selected workloads.

      Phase 3

      • Call #4: Generate and categorize risks.
      • Call #5: Begin the risk mitigation conversation.

      Phase 4

      • Call #6: Complete the risk mitigation process
      • Call #7: Finalize vision statement and cloud decision framework.

      Workshop Overview

      Contact your account representative for more information.

      workshops@infotech.com 1-888-670-8889

      Day 1 Day 2 Day 3 Day 4 Offsite day
      Understand the cloud Assess workloads Identify and mitigate risks Bridge the gap and create the strategy Next steps and wrap-up (offsite)
      Activities

      1.1 Introduction

      1.2 Generate corporate goals and cloud drivers

      1.3 Identify success indicators

      1.4 Explore cloud characteristics

      1.5 Explore cloud service and delivery models

      1.6 Define cloud support models and strategy components

      1.7 Create current state summaries for the different service and delivery models

      1.8 Select workloads for further analysis

      2.1 Conduct workload assessments using the cloud strategy workbook tool

      2.2 Discuss assessments and make preliminary determinations about workloads

      3.1 Generate a list of risks and potential roadblocks associated with the cloud

      3.2 Sort risks and roadblocks and define categories

      3.3 Identify mitigations for each identified risk and roadblock

      3.4 Generate initiatives from the mitigations

      4.1 Review and assign work items

      4.2 Finalize the decision framework for each of the following areas:

      • Service model
      • Delivery model
      • Support model

      4.3 Create a cloud vision statement

      5.1 Build the Cloud Vision Executive Presentation
      Deliverables
      1. Corporate goals and cloud drivers
      2. Success indicators
      3. Current state summaries
      4. List of workloads for further analysis
      1. Completed workload assessments
      2. Workload summary statements
      1. List of risks and roadblocks, categorized
      2. List of mitigations
      3. List of initiatives
      1. Finalized task list
      2. Formal cloud decision rubric
      3. Cloud vision statement
      1. Completed cloud strategy executive presentation
      2. Completed cloud vision workbook

      Understand the cloud

      Build the foundations of your cloud vision

      Phase 1

      Phase 1

      Understand the Cloud

      Phase 1

      1.1 Generate goals and drivers

      1.2 Explore cloud characteristics

      1.3 Create a current state summary

      1.4 Select workloads for analysis

      Phase 2

      2.1 Conduct workload assessments

      2.2 Determine workload future states

      Phase 3

      3.1 Generate risks and roadblocks

      3.2 Mitigate risks and roadblocks

      3.3 Define roadmap initiatives

      Phase 4

      4.1 Review and assign work items

      4.2 Finalize cloud decision framework

      4.3 Create cloud vision

      This phase will walk you through the following activities:

      1.1.1 Generate organizational goals

      1.1.2 Define cloud drivers

      1.1.3 Define success indicators

      1.3.1 Record your current state

      1.4.1 Select workloads for further assessment

      This phase involves the following participants:

      IT management, the core working group, security, infrastructure, operations, architecture, engineering, applications, non-IT stakeholders.

      It starts with shared understanding

      Stakeholders must agree on overall goals and what “cloud” means

      The cloud is a nebulous term that can reasonably describe services ranging from infrastructure as a service as delivered by providers like Amazon Web Services and Microsoft through its Azure platform, right up to software as a service solutions like Jira or Salesforce. These solutions solve different problems – just because your CRM would be a good fit for a migration to Salesforce doesn’t mean the same system would make sense in Azure or AWS.

      This is important because the language we use to talk about the cloud can color our approach to cloud services. A “cloud-first” strategy will mean something different to a CEO with a concept of the cloud rooted in Salesforce than it will to a system administrator who interprets it to mean a transition to cloud-hosted virtual machines.

      Add to this the fact that not all cloud services are hosted externally by providers (public clouds) and the fact that multiple delivery models can be engaged at once through hybrid or multi-cloud approaches, and it’s apparent that a shared understanding of the cloud is necessary for a coherent strategy to take form.

      This phase proceeds in four steps, each governed by the principle of shared understanding. The first requires a shared understanding of corporate goals and drivers. Step 2 involves coming to a shared understanding of the cloud’s unique characteristics. Step 3 requires a review of the current state. Finally, in Step 4, participants will identify workloads that are suitable for analysis as candidates for the cloud.

      Step 1.1

      Generate goals and drivers

      Activities

      1.1.1 Define organizational goals

      1.1.2 Define cloud drivers

      1.1.3 Define success indicators

      Generate goals and drivers

      Explore cloud characteristics

      Create a current state summary

      Select workloads for analysis

      This step involves the following participants:

      • IT management
      • Core working group
      • Security
      • Applications
      • Infrastructure
      • Service management
      • Leadership

      Outcomes of this step

      • List of organizational goals
      • List of cloud drivers
      • Defined success indicators

      What can the cloud do for you?

      The cloud is not valuable for its own sake, and not all users derive the same value

      • The cloud is characterized by on-demand self-service, broad network access, resource pooling, rapid elasticity, and measured service. Any or all of those characteristics might be enough to make the cloud appealing, but in most cases, there is an overriding driver.
      • Multiple paths may lead to the cloud. Consider an organization with a need to control costs by showing back to business units, or perhaps by reducing capital expenditure – the cloud may be the most appropriate way to effect these changes. Conversely, an organization expanding rapidly and with a need to access the latest and greatest technology might benefit from the elasticity and pooled resources that major cloud providers can offer.
      • In these cases, the destination might be the same (a cloud solution) but the delivery model – public, private, or hybrid – and the decisions made around the key strategy components, including architecture, provisioning, and cost management, will almost certainly be different.
      • Defining goals, understanding cloud drivers, and – crucially – understanding what success means, are all therefore essential elements of the cloud vision process.

      1.1.1 Generate organizational goals

      1-3 hours

      Input

      • Strategy documentation

      Output

      • Organizational goals

      Materials

      • Whiteboard (digital/physical)

      Participants

      • IT leadership
      • Infrastructure
      • Applications
      • Security
      1. As a group, brainstorm organizational goals, ideally based on existing documentation
        • Review relevant corporate and IT strategies.
        • If you do not have access to internal documentation, review the standard goals on the next slide and select those that are most relevant for you.
      2. Record the most important business goals in the Cloud Vision Executive Presentation. Include descriptions where possible to ensure wide readability.
      3. Make note of these goals. They should inform the answers to prompts offered in the Cloud Vision Workbook and should be a consistent presence in the remainder of the visioning exercise. If you’re conducting the session in person, leave the goals up on a whiteboard and make reference to them throughout the workshop.

      Cloud Vision Executive Presentation

      Standard COBIT 19 enterprise goals

      1. Portfolio of competitive products and services
      2. Managed business risk
      3. Compliance with external laws and regulations
      4. Quality of financial information
      5. Customer-oriented service culture
      6. Business service continuity and availability
      7. Quality of management information
      8. Optimization of internal business process functionality
      9. Optimization of business process costs
      10. Staff skills, motivation, and productivity
      11. Compliance with internal policies
      12. Managed digital transformation programs
      13. Product and business innovation

      1.1.2 Define cloud drivers

      30-60 minutes

      Input

      • Organizational goals
      • Strategy documentation
      • Management/staff perspective

      Output

      • List of cloud drivers

      Materials

      • Sticky notes
      • Whiteboard
      • Markers

      Participants

      • IT leadership
      • Infrastructure
      • Applications
      • Security
      1. Cloud drivers sit at a level of abstraction below organizational goals. Keeping your organizational goals in mind, have each participant in the session write down how they expect to benefit from the cloud on a sticky note.
      2. Solicit input one at a time and group similar responses. Encourage participants to bring forward their cloud goals even if similar goals have been mentioned previously. The number of mentions is a useful way to gauge the relative weight of the drivers.
      3. Once this is done, you should have a few groups of similar drivers. Work with the group to name each category. This name will be the driver reported in the documentation.
      4. Input the results of the exercise into the Cloud Vision Executive Presentation, and include descriptions based on the constituent drivers. For example, if a driver is titled “do more valuable work,” the constituent drivers might be “build cloud skills,” “focus on core products,” and “avoid administration work where possible.” The description would be based on these components.

      Cloud Vision Executive Presentation

      1.1.3 Define success indicators

      1 hour

      Input

      • Cloud drivers
      • Organizational goals

      Output

      • List of cloud driver success indicators

      Materials

      • Whiteboard
      • Markers

      Participants

      • IT leadership
      • Infrastructure
      • Applications
      • Security
      1. On a whiteboard, draw a table with each of the cloud drivers (identified in 1.1.2) across the top.
      2. Work collectively to generate success indicators for each cloud driver. In this case, a success indicator is some way you can report your progress with the stated driver. It is a real-world proxy for the sometimes abstract phenomena that make up your drivers. Think about what would be true if your driver was realized.
        1. For example, if your driver is “faster access to resources,” you might consider indicators like developer satisfaction, project completion time, average time to provision, etc.
      3. Once you are satisfied with your list of indicators, populate the slide in the Cloud Vision Executive Presentation for validation from stakeholders.

      Cloud Vision Executive Presentation

      Step 1.2

      Explore cloud characteristics

      Activities

      Understand the value of the cloud:

      • Review delivery models
      • Review support models
      • Review service models
      • Review migration paths

      Understand the Cloud

      Generate goals and drivers

      Explore cloud characteristics

      Create a current state summary

      Select workloads for analysis

      This step involves the following participants:

      • Core working group
      • Architecture
      • Engineering
      • Security

      Outcomes of this step

      • Understanding of cloud service models and value

      Defining the cloud

      Per NIST, the cloud has five fundamental characteristics. All clouds have these characteristics, even if they are executed in somewhat different ways between delivery models, service models, and even individual providers.

      Cloud characteristics

      On-demand self-service

      Cloud customers are capable of provisioning cloud resources without human interaction (e.g. contacting sales), generally through a web console.

      Broad network access

      Capabilities are designed to be delivered over a network and are generally intended for access by a wide variety of platform types (cloud services are generally device-agnostic).

      Resource pooling

      Multiple customers (internal, in the case of private clouds) make use of a highly abstracted shared infrastructure managed by the cloud provider.

      Rapid elasticity

      Customers are capable of provisioning additional resources as required, pulling from a functionally infinite pool of capacity. Cloud resources can be spun-down when no longer needed.

      Measured service

      Consumption is metered based on an appropriate unit of analysis (number of licenses, storage used, compute cycles, etc.) and billing is transparent and granular.

      Cloud delivery models

      The NIST definition of cloud computing outlines four cloud delivery models: public, private, hybrid, and community clouds. A community cloud is like a private cloud, but it is provisioned for the exclusive use of a like-minded group of organizations, usually in a mutually beneficial, non-competitive arrangement. Universities and hospitals are examples of organizations that can pool their resources in this way without impacting competitiveness. The Info-Tech model covers three key delivery models – public, private, and hybrid, and an overarching model (multi-cloud) that can comprise more than one of the other models – public + public, public + hybrid, etc.

      Public

      The cloud service is provisioned for access by the general public (customers).

      Private

      A private cloud has the five key characteristics, but is provisioned for use by a single entity, like a company or organization.

      Hybrid

      Hybridity essentially refers to interoperability between multiple cloud delivery models (public +private).

      Multi

      A multi-cloud deployment requires only that multiple clouds are used without any necessary interoperability (Nutanix, 2019).

      Public cloud

      This is what people generally think about when they talk about cloud

      • The public cloud is, well, public! Anyone can make use of its resources, and in the case of the major providers, capacity is functionally unlimited. Need to store exabytes of data in the cloud? No problem! Amazon will drive a modified shipping container to your datacenter, load it up, and “migrate” it to a datacenter.
      • Public clouds offer significant variety on the infrastructure side. Major IaaS providers, like Microsoft and Amazon, offer dozens of services across many different categories including compute, networking, and storage, but also identity, containers, machine learning, virtual desktops, and much, much more. (See a list from Microsoft here, and Amazon here)
      • There are undoubtedly strengths to the public cloud model. Providers offer the “latest and greatest” and customers need not worry about the details, including managing infrastructure and physical locations. Providers offer built-in redundancy, multi-regional deployments, automation tools, management and governance solutions, and a variety of leading-edge technologies that would not be feasible for organizations to run in-house, like high performance compute, blockchain, or quantum computing.
      • Of course, the public cloud is not all sunshine and rainbows – there are downsides as well. It can be expensive; it can introduce regulatory complications to have to trust another entity with your key information. Additionally, there can be performance hiccups, and with SaaS products, it can be difficult to monitor at the appropriate (per-transaction) level.

      Prominent examples include:

      AWS

      Microsoft

      Azure

      Salesforce.com

      Workday

      SAP

      Private cloud

      A lower-risk cloud for cloud-averse customers?

      • A cloud is a cloud, no matter how small. Some IT shops deploy private clouds that make use of the five key cloud characteristics but provisioned for the exclusive use of a single entity, like a corporation.
      • Private clouds have numerous benefits. Some potential cloud customers might be uncomfortable with the shared responsibility that is inherent in the public cloud. Private clouds allow customers to deliver flexible, measured services without having to surrender control, but they require significant overhead, capital expenditure, administrative effort, and technical expertise.
      • According to the 2021 State of the Cloud Report, private cloud use is common, and the most frequently cited toolset is VMware vSphere, followed by Azure Stack, OpenStack, and AWS Outposts. Private cloud deployments are more common in larger organizations, which makes sense given the overhead required to manage such an environment.

      Private cloud adoption

      The images shows a graph titled Private Cloud Adoption for Enterprises. It is a horizontal bar graph, with three segments in each bar: dark blue marking currently use; mid blue marking experimenting; and light blue marking plan to use.

      VMware and Microsoft lead the pack among private cloud customers, with Amazon and Red Hat also substantially present across private cloud environments.

      Hybrid cloud

      The best of both worlds?

      Hybrid cloud architectures combine multiple cloud delivery models and facilitate some level of interoperability. NIST suggests bursting and load balancing as examples of hybrid cloud use cases. Note: it is not sufficient to simply have multiple clouds running in parallel – there must be a toolset that allows for an element of cross-cloud functionality.

      This delivery model is attractive because it allows users to take advantage of the strengths of multiple service models using a single management pane. Bursting across clouds to take advantage of additional capacity or disaster recovery capabilities are two obvious use cases that appeal to hybrid cloud users.

      But while hybridity is all the rage (especially given the impact Covid-19 has had on the workplace), the reality is that any hybrid cloud user must take the good with the bad. Multiple clouds and a management layer can be technically complex, expensive, and require maintaining a physical infrastructure that is not especially valuable (“I thought we were moving to the cloud to get out of the datacenter!”).

      Before selecting a hybrid approach through services like VMware Cloud on AWS or Microsoft’s Azure Stack, consider the cost, complexity, and actual expected benefit.

      Amazon, Microsoft, and Google dominate public cloud IaaS, but IBM is betting big on hybrid cloud:

      The image is a screencap of a tweet from IBM News. The tweet reads: IBM CEO Ginni Rometty: Hybrid cloud is a trillion dollar market and we'll be number one #Think2019.

      With its acquisition of Red Hat in 2019 for $34 billion, Big Blue put its money where its mouth is and acquired a substantial hybrid cloud business. At the time of the acquisition, Red Hat’s CEO, Jim Whitehurst, spoke about the benefit IBM expected to receive:

      “Joining forces with IBM gives Red Hat the opportunity to bring more open source innovation to an even broader range of organizations and will enable us to scale to meet the need for hybrid cloud solutions that deliver true choice and agility” (Red Hat, 2019).

      Multi-cloud

      For most organizations, the multi-cloud is the most realistic option.

      Multi-cloud is popular!

      The image shows a graph titled Multi-Cloud Architectures Used, % of all Respondents. The largest percentage is Apps siloed on different clouds, followed by DAta integration between clouds.

      Multi-cloud solutions exist at a different layer of abstraction from public, private, and even hybrid cloud delivery models. A multi-cloud architecture, as the name suggests, requires the user to be a customer of more than one cloud provider, and it can certainly include a hybrid cloud deployment, but it is not bound by the same rules of interoperability.

      Many organizations – especially those with fewer resources or a lack of a use case for a private cloud – rely on a multi-cloud architecture to build applications where they belong, and they manage each environment separately (or occasionally with the help of cloud management platforms).

      If your data team wants to work in AWS and your enterprise services run on basic virtual machines in Azure, that might be the most effective architecture. As the Flexera 2021 State of the Cloud Report suggests, this architecture is far more common than the more complicated bursting or brokering architectures characteristic of hybrid clouds.

      NIST cloud service models

      Software as a service

      SaaS has exploded in popularity with consumers who wish to avail themselves of the cloud’s benefits without having to manage underlying infrastructure components. SaaS is simple, generally billed per-user per-month, and is almost entirely provider-managed.

      Platform as a service

      PaaS providers offer a toolset for their customers to run custom applications and services without the requirement to manage underlying infrastructure components. This service model is ideal for custom applications/services that don’t benefit from highly granular infrastructure control.

      Infrastructure as a service

      IaaS represents the sale of components. Instead of a service, IaaS providers sell access to components, like compute, storage, and networking, allowing for customers to build anything they want on top of the providers’ infrastructure.

      Cloud service models

      • This research focuses on five key service models, each of which has its own strengths and weaknesses. Moving right from “on-prem,” customers gradually give up more control over their environments to cloud service providers.
      • An entirely premises-based environment means that the customer is responsible for everything ranging from the dirt under the datacenter to application-level configurations. Conversely, in a SaaS environment, the provider is responsible for everything but those top-level application configurations.
      • A managed service provider or other third party can manage any or of the components of the infrastructure stack. A service provider may, for example, build a SaaS solution on top of another provider’s IaaS, or might offer configuration assistance with a commercially available SaaS.

      Info-Tech Insight

      Not all workloads fit well in the cloud. Many environments will mix service models (e.g. SaaS for some workloads, some in IaaS, some on-premises), and this can be perfectly effective. It must be consistent and intentional, however.

      On-prem Co-Lo IaaS PaaS SaaS
      Application Application Application Application Application
      Database Database Database Database Database
      Runtime/ Middleware Runtime/ Middleware Runtime/ Middleware Runtime/ Middleware Runtime/ Middleware
      OS OS OS OS OS
      Hypervisor Hypervisor Hypervisor Hypervisor Hypervisor
      Server Network Storage Server Network Storage Server Network Storage Server Network Storage Server Network Storage
      Facilities Facilities Facilities Facilities Facilities

      Organization has control

      Organization or vendor may control

      Vendor has control

      Analytics folly

      SaaS is good, but it’s not a panacea

      Industry: Healthcare

      Source: Info-Tech workshop

      Situation

      A healthcare analytics provider had already moved a significant number of “non-core workloads” to the cloud, including email, HRIS, and related services.

      The company CEO was satisfied with the reduced effort required by IT to manage SaaS-based workloads and sought to extend the same benefits to the core analytics platform where there was an opportunity to reduce overhead.

      Complication

      Many components of the health analytics service were designed to run specifically in a datacenter and were not ready to be migrated to the cloud without significant effort/refactoring. SaaS was not an option because this was a core platform – a SaaS provider would have been the competition.

      That left IaaS, which was expensive and would not bring the expected benefits (reduced overhead).

      Results

      The organization determined that there were no short-term gains from migrating to the cloud. Due to the nature of the application (its extensive customization, the fact that it was a core product sold by the company) any steps to reduce operational overhead were not feasible.

      The CEO recognized that the analytics platform was not a good candidate for the cloud and what distinguished the analytics platform from more suitable workloads.

      Migration paths

      In a 2016 blog post, Amazon Web Services articulated a framework for cloud migration that incorporates elements of the journey as well as the destination. If workload owners do not choose to retain or retire their workloads, there are four alternatives. These alternatives all stack up differently along five key dimensions:

      1. Value: does the workload stand to benefit from unique cloud characteristics? To what degree?
      2. Effort: how much work would be required to make the transition?
      3. Cost: how much money is the migration expected to cost?
      4. Time: how long will the migration take?
      5. Skills: what skills must be brought to bear to complete the migration?

      Not all migration paths can lead to all destinations. Rehosting generally means IaaS, while repurchasing leads to SaaS. Refactoring and replatforming have some variety of outcomes, and it becomes possible to take advantage of new IaaS architectures or migrate workloads over fully to SaaS.

      As part of the workload assessment process, use the five dimensions (expanded upon on the next slide) to determine what migration path makes sense. Preferred migration paths form an important part of the overall cloud vision process.

      Retain (Revisit)

      • Keep the application in its current form, at least for now. This doesn’t preclude revisiting it in the future.

      Retire

      • Get rid of the application completely.

      Rehost

      • Move the application to the cloud (IaaS) and continue to run it in more or less the same form as it currently runs.

      Replatform

      • Move the application to the cloud and perform a few changes for cloud optimizations.

      Refactor

      • Rewrite the application, taking advantage of cloud native architectures.

      Repurchase

      • Replace with an alternative, cloud-native application and migrate the data.

      Migration paths – relative value

      Migration path Value Effort Cost Time Skills
      Retain No real change in the absolute value of the workload if it is retained. No effort beyond ongoing workload maintenance. No immediate hard dollar costs, but opportunity costs and technical debt abound. No time required! (At least not right away…) Retaining requires the same skills it has always required (which may be more difficult to acquire in the future).
      Rehire A retired workload can provide no value, but it is not a drain! Spinning a service down requires engaging that part of the lifecycle. N/A Retiring the service may be simple or complicated depending on its current role. N/A
      Rehost Some value comes with rehosting, but generally components stay the same (VM here vs. a VM there). Minimal effort required, especially with automated tools. The effort will depend on the environment being migrated. Relatively cheap compared to other options. Rehosting infrastructure is the simplest cloud migration path and is useful for anyone in a hurry. Rehosting is the simplest cloud migration path for most workloads, but it does require basic familiarity with cloud IaaS.

      Replatform

      Replatformed workloads can take advantage of cloud-native services (SQL vs. SQLaaS). Replatforming is more effortful than rehosting, but less effortful than refactoring. Moderate cost – does not require fundamental rearchitecture, just some tweaking. Relatively more complicated than a simple rehost, but less demanding than a refactor. Platform and workload expertise is required; more substantial than a simple rehost.
      Refactor A fully formed, customized cloud-based workload that can take advantage of cloud-native architectures is generally quite valuable. Significant effort required based on the requirement to engage the full SDLC. Significant cost required to engage SDLC and rebuild the application/service. The most complicated and time-consuming. The most complicated and time-consuming.
      Repurchase Repurchasing is the quickest way to achieve cloud-native value. There are compromises, however (high cost, vendor-lock-in). Repurchasing is the quickest way to achieve cloud-native value. There are compromises, however (high cost, vendor-lock-in). Repurchasing is the quickest way to achieve cloud-native value. There are compromises, however (high cost, vendor-lock-in). Configuration – especially for massive projects – can be time consuming, but in general repurchasing can be quite fast. Buying software does require knowledge of requirements and integrations, but is otherwise quite simple.

      Where should you get your cloud skills?

      Cloud skills are certainly top of mind right now. With the great upheaval in both work patterns and in the labor market more generally, expertise in cloud-related areas is simultaneously more valuable and more difficult to procure. According to Pluralsight’s 2021 “State of Upskilling” report, 44% of respondents report themselves under-skilled in the cloud management area, making cloud management the most significant skill gap reported on the survey.

      Everyone left the office. Work as we know it is fundamentally altered for a generation or more. Cloud services shot up in popularity by enabling the transition. And yet there is a gap – a prominent gap – in skilling up for this critically important future. What is the cloud manager to do?

      Per the framework presented here, that manager has three essential options. They may take somewhat different forms depending on specific requirements and the quirks of the local market, but the options are:

      1. Train or hire internal resources: This might be easier said than done, especially for more niche skills, but makes sense for workloads that are critical to operations for the long term.
      2. Engage a managed service provider: MSPs are often engaged to manage services where internal IT lacks bandwidth or expertise.
      3. Hire a consultant: Consultants are great for time-bound implementation projects where highly specific expertise is required, such as a migration or implementation project.

      Each model makes sense to some degree. When evaluating individual workloads for cloud suitability, it is critical to consider the support model – both immediate and long term. What makes sense from a value perspective?

      Cloud decisions – summary

      A key component of the Info-Tech cloud vision model is that it is multi-layered. Not every decision must be made at every level. At the workload level, it makes sense to select service models that make sense, but each workload does not need its own defined vision. Workload-level decisions should be guided by an overall strategy but applied tactically, based on individual workload characteristics and circumstances.

      Conversely, some decisions will inevitably be applied at the environment level. With some exceptions, it is unlikely that cloud customers will build an entire private/hybrid cloud environment around a single solution; instead, they will define a broader strategy and fit individual workloads into that strategy.

      Some considerations exist at both the workload and environment levels. Risks and roadblocks, as well as the preferred support model, are concerns that exist at both the environment level and at the workload level.

      The image is a Venn diagram, with the left side titled Workload level, and the right side titled Environment Level. In the left section are: service model and migration path. On the right section are: Overall vision and Delivery model. In the centre section are: support model and Risks and roadblocks.

      Step 1.3

      Create a current state summary

      Activities

      1.3.1 Record your current state

      Understand the Cloud

      Generate goals and drivers

      Explore cloud characteristics

      Create a current state summary

      Select workloads for analysis

      This step involves the following participants: Core working group

      Outcomes of this step

      • Current state summary of cloud solutions

      1.3.1 Record your current state

      30 minutes

      Input

      • Knowledge of existing cloud workloads

      Output

      • Current state cloud summary for service, delivery, and support models

      Materials

      • Whiteboard

      Participants

      • Core working group
      • Infrastructure team
      • Service owners
      1. On a whiteboard (real or virtual) draw a table with each of the cloud service models across the top. Leave a cell below each to list examples.
      2. Under each service model, record examples present in your environment. The purpose of the exercise is to illustrate the existence of cloud services in your environment or the lack thereof, so there is no need to be exhaustive. Complete this in turn for each service model until you are satisfied that you have created an effective picture of your current cloud SaaS state, IaaS state, etc.
      3. Input the results into their own slide titled “current state summary” in the Cloud Vision Executive Presentation.
      4. Repeat for the cloud delivery models and support models and include the results of those exercises as well.
      5. Create a short summary statement (“We are primarily a public cloud consumer with a large SaaS footprint and minimal presence in PaaS and IaaS. We retain an MSP to manage our hosted telephony solution; otherwise, everything is handled in house.”

      Cloud Vision Executive Presentation

      Step 1.4

      Select workloads for current analysis

      Activities

      1.4.1 Select workloads for assessment

      This step involves the following participants:

      • Core working group

      Outcomes of this step

      • List of workloads for assessment

      Understand the cloud

      Generate goals and drivers

      Explore cloud characteristics

      Create a current state summary

      Select workloads for analysis

      1.4.1 Select workloads for assessment

      30 minutes

      Input

      • Knowledge of existing cloud workloads

      Output

      • List of workloads to be assessed

      Materials

      • Whiteboard
      • Cloud Vision Workbook

      Participants

      • Core working group
      • IT management
      1. In many cases, the cloud project is inspired by a desire to move a particular workload or set of workloads. Solicit feedback from the core working group about what these workloads might be. Ask everyone in the meeting to suggest a workload and record each one on a sticky note or white board (virtual or physical).
      2. Discuss the results with the group and begin grouping similar workloads together. They will be subject to the assessments in the Cloud Vision Workbook, so try to avoid selecting too many workloads that will produce similar answers. It might not be obvious, but try to think about workloads that have similar usage patterns, risk levels, and performance requirements, and select a representative group.
      3. You should embrace counterintuition by selecting a workload that you think is unlikely to be a good fit for the cloud if you can and subjecting it to the assessment as well for validation purposes.
      4. When you have a list of 4-6 workloads, record them on tab 2 of the Cloud Vision Workbook.

      Cloud Vision Workbook

      Assess your cloud workloads

      Build the foundations of your cloud vision

      Phase 2

      Phase 2

      Evaluate Cloud Workloads

      Phase 1

      1.1 Generate goals and drivers

      1.2 Explore cloud characteristics

      1.3 Create a current state summary

      1.4 Select workloads for analysis

      Phase 2

      2.1 Conduct workload assessments

      2.2 Determine workload future states

      Phase 3

      3.1 Generate risks and roadblocks

      3.2 Mitigate risks and roadblocks

      3.3 Define roadmap initiatives

      Phase 4

      4.1 Review and assign work items

      4.2 Finalize cloud decision framework

      4.3 Create cloud vision

      This phase will walk you through the following activities:

      • Conduct workload assessments
      • Determine workload future state

      This phase involves the following participants:

      • Subject matter experts
      • Core working group
      • IT management

      Define Your Cloud Vision

      Work from the bottom up and assess your workloads

      A workload-first approach will help you create a realistic vision.

      The concept of a cloud vision should unquestionably be informed by the nature of the workloads that IT is expected to provide for the wider organization. The overall cloud vision is no greater than the sum of its parts. You cannot migrate to the cloud in the abstract. Workloads need to go – and not all workloads are equally suitable for the transition.

      It is therefore imperative to understand which workloads are a good fit for the cloud, which cloud service models make the most sense, how to execute the migration, what support should look like, and what risks and roadblocks you are likely to encounter as part of the process.

      That’s where the Cloud Vision Workbook comes into play. You can use this tool to assess as many workloads as you’d like – most people get the idea after about four – and by the end of the exercise, you should have a pretty good idea about where your workloads belong, and you’ll have a tool to assess any net new or previously unconsidered workloads.

      It’s not so much about the results of the assessment – though these are undeniably important – but about the learnings gleaned from the collaborative assessment exercise. While you can certainly fill out the assessment without any additional input, this exercise is most effective when completed as part of a group.

      Introducing the Cloud Vision Workbook

      • The Cloud Vision Workbook is an Excel tool that answers the age old question: “What should I do with my workloads?”
      • It is divided into eight tabs, each of which offers unique value. Start by reading the introduction and inputting your list of workloads. Work your way through tabs 3-6, completing the suitability, migration, management, and risk and roadblock assessments, and review the results on tab 7.
      • If you choose to go through the full battery of assessments for each workload, expect to answer and weight 111 unique questions across the four assessments. This is an intensive exercise, so carefully consider which assessments are valuable to you, and what workloads you have time to assess.
      • Tab 8 hosts the milestone timeline and captures the results of the phase 3 risk and mitigation exercise.

      Understand Cloud Vision Workbook outputs

      The image shows a graphic with several graphs and lists on it, with sections highlighted with notes. At the top, there's the title Database with the note Workload title (populated from tab 2). Below that, there is a graph with the note Relative suitability of the five service models. The Risks and roadblocks section includes the note: The strategy components – the risks and roadblocks – are captured relative to one another to highlight key focus areas. To the left of that, there is a Notes section with the note Notes populated based on post-assessment discussion. At the bottom, there is a section titled Where should skills be procured?, with the note The radar diagram captures the recommended support model relative to the others (MSP, consultant, internal IT). To the right of that, there is a section titled Migration path, with the note that Ordered list of migration paths. Note: a disconnect here with the suggested service model may indicate an unrealistic goal state.

      Step 2.1

      Conduct workload assessments

      Activities

      2.1.1 Conduct workload assessments

      2.1.2 Interpret your results

      Phase Title

      Conduct workload assessments

      Determine workload future state

      This step involves the following participants:

      • Core working group
      • Workload subject matter experts

      Outcomes of this step

      • Completed workload assessments

      2.1.1 Conduct workload assessments

      2 hours per workload

      Input

      • List of workloads to be assessed

      Output

      • Completed cloud vision assessments

      Materials

      • Cloud Vision Workbook

      Participants

      • Core working group
      • Service owners/workload SMEs
      1. The Cloud Vision Workbook is your one stop shop for all things workload assessment. Open the tool to tab 2 and review the workloads you identified at the end of phase 1. Ensure that these are correct. Once satisfied, project the tool (virtually, if necessary) so that all participants can see the assessment questions.
      2. Work through tabs 3-6, answering the questions and assigning a multiplier for each one. A higher multiplier increases the relative weight of the question, giving it a greater impact on the overall outcome.
      3. Do your best to induce participants to offer opinions. Consensus is not absolutely necessary, but it is a good goal. Ask your participants if they agree with initial responses and occasionally take the opposite position (“I’m surprised you said agree – I would have thought we didn’t care about CapEx vs. OpEx”). Stimulate discussion.
      4. Highlight any questions that you will need to return to or run by someone not present. Include a placeholder answer, as the tool requires all cells to be filled for computation.

      Cloud Vision Workbook

      2.1.2 Interpret your results

      10 minutes

      Input

      • Completed cloud vision assessments

      Output

      • Shared understanding of implications

      Materials

      • Cloud Vision Workbook

      Participants

      • Core working group
      • Service owners/workload SMEs
      1. Once you’ve completed all 111 questions for each workload, you can review your results on tab 7. On tab 7, you will see four populated graphics: cloud suitability, migration path, “where should skills be procured?”, and risks and roadblocks. These represent the components of the overall cloud vision that you will present to stakeholders.
      2. The “cloud suitability” chart captures the service model that the assessment judges to be most suitable for the workload. Ask those present if any are surprised by the output. If there is any disagreement, discuss the source of the surprise and what a more realistic outcome would be. Revisit the assessment if necessary.
      3. Conduct a similar exercise with each of the other outputs. Does it make sense to refactor the workload based on its cloud suitability? Does the fact that we scored so highly on the “consultant” support model indicate something about how we handle upskilling internally? Does the profile of risks and roadblocks identified here align with expectations? What should be ranked higher? What about lower?
      4. Once everyone is generally satisfied with the results, close the tool and take a break! You’ve earned it.

      Cloud Vision Workbook

      Understand the cloud strategy components

      Each cloud strategy will take a slightly different form, but all should contain echoes of each of these components. This process will help you define your vision and direction, but you will need to take steps to execute on that vision. The remainder of the cloud strategy, covered in the related blueprint Document Your Cloud Strategy comprises these fourteen topics divided across three categories: people, governance, and technology. The workload assessment covers these under risks and roadblocks and highlights areas that may require specific additional attention. When interpreting the results, think of these areas as comprising things that you will need to do to make your vision a reality.

      People

      • Skills and roles
      • Culture and adoption
      • Governing bodies

      Governance

      • Architecture
      • Integration and interoperability
      • Operations management
      • Cloud portfolio management
      • Cloud vendor management
      • Finance management
      • Security
      • Data controls

      Technology

      • Monitoring
      • Provisioning
      • Migration

      Strategy component: People

      People form the core of any good strategy. As part of your cloud vision, you will need to understand the implications a cloud transition will have on your staff and users, whether those users are internal or external.

      Component Description Challenges
      Skills and roles The move to the cloud will require staff to learn how to handle new technology and new operational processes. The cloud is a different way of procuring IT resources and may require the definition of new roles to handle things like cost management and provisioning. Staff may not have the necessary experience to migrate to a cloud environment or to effectively manage resources once the cloud transition is made. Cloud skills are difficult to hire for, and with the ever-changing nature of the platforms themselves, this shows no sign of abating. Redefining roles can also be politically challenging and should be done with due care and consideration.
      Culture and adoption If you build it, they will come…right? It is not always the case that a new service immediately attracts users. Ensuring that organizational culture aligns with the cloud vision is a critical success factor. Equally important is ensuring that cloud resources are used as intended. Those unfamiliar with cloud resources may be less willing to learn to use them. If alternatives exist (e.g. a legacy service that has not been shut down), or if those detractors are influential, this resistance may impede your cloud execution. Also, if the cloud transition involves significant effort or a fundamental rework (e.g. a DevOps transition) this role redefinition could cause some internal turmoil.
      Governing bodies A large-scale cloud deployment requires formal governance. Formal governance requires a governing body that is ultimately responsible for designing the said governance. This could take the form of a “center of excellence” or may rest with a single cloud architect in a smaller, less complicated environment. Governance is difficult. Defining responsibilities in a way that includes all relevant stakeholders without paralyzing the decision-making process is difficult. Implementing suggestions is a challenge. Navigating the changing nature of service provision (who can provision their own instances or assign licenses?) can be difficult as well. All these concerns must be addressed in a cloud strategy.

      Strategy component: Governance

      Without guardrails, the cloud deployment will grow organically. This has strengths (people tend to adopt solutions that they select and deploy themselves), but these are more than balanced out by the drawbacks that come with inconsistency, poor administration, duplication of services, suboptimal costing, and any number of other unique challenges. The solution is to develop and deploy governance. The following list captures some of the necessary governance-related components of a cloud strategy.

      Component Description Challenges
      Architecture Enterprise architecture is an important function in any environment with more than one interacting workload component (read: any environment). The cloud strategy should include an approach to defining and implementing a standard cloud architecture and should assign responsibility to an individual or group. Sometimes the cloud transition is inspired by the desire to rearchitect. The necessary skills and knowledge may not be readily available to design and transition to a microservices-based environment, for example, vs. a traditional monolithic application architecture. The appropriateness of a serverless environment may not be well understood, and it may be the case that architects are unfamiliar with cloud best practices and reference architectures.
      Integration and interoperability Many services are only highly functional when integrated with other services. What is a database without its front-end? What is an analytics platform without its data lake? For the cloud vision to be properly implemented, a strategy for handling integration and interoperability must be developed. It may be as simple as “all SaaS apps must be compatible with Okta” but it must be there. Migration to the cloud may require a fundamentally new approach to integration, moving away from a point-to-point integrations and towards an ESB or data lake. In many cases, this is easier said than done. Centralization of management may be appealing, but legacy applications – or those acquired informally in a one-off fashion – might not be so easy to integrate into a central management platform.
      Operations management Service management (ITIL processes) must be aligned with your overall cloud strategy. Migrating to the cloud (where applicable) will require refining these processes, including incident, problem, request, change, and configuration management, to make them more suitable for the cloud environment. Operations management doesn’t go away in the cloud, but it does change in line with the transition to shared responsibility. Responding to incidents may be more difficult on the cloud when troubleshooting is a vendor’s responsibility. Change management in a SaaS environment may be more receptive than staff are used to as cloud providers push changes out that cannot be rolled back.

      Strategy component: Governance (cont.)

      Component Description Challenges
      Cloud portfolio management This component refers to the act of managing the portfolio of cloud services that is available to IT and to business users. What requirements must a SaaS service meet to be onboarded into the environment? How do we account for exceptions to our IaaS policy? What about services that are only available from a certain provider? Rationalizing services offers administrative benefits, but may make some tasks more difficult for end users who have learned things a certain way or rely on niche toolsets. Managing access through a service catalog can also be challenging based on buy-in and ongoing administration. It is necessary to develop and implement policy.
      Cloud vendor management Who owns the vendor management function, and what do their duties entail? What contract language must be standard? What does due diligence look like? How should negotiations be conducted? What does a severing of the relationship look like? Cloud service models are generally different from traditional hosted software and even from each other (e.g. SaaS vs. PaaS). There is a bit of a learning curve when it comes to dealing with vendors. Also relevant: the skills that it takes to build and maintain a system are not necessarily the same as those required to coherently interact with a cloud vendor.
      Finance management Cloud services are, by definition, subject to a kind of granular, operational billing that many shops might not be used to. Someone will need to accurately project and allocate costs, while ensuring that services are monitored for cost abnormalities. Cloud cost challenges often relate to overall expense (“the cloud is more expensive than an alternative solution”), expense variability (“I don’t know what my budget needs to be this quarter”), and cost complexity (“I don’t understand what I’m paying for – what’s an Elastic Beanstalk?”).
      Security The cloud is not inherently more or less secure than a premises-based alternative, though the risk profile can be different. Applying appropriate security governance to ensure workloads are compliant with security requirements is an essential component of the strategy.

      Technical security architecture can be a challenge, as well as navigating the shared responsibility that comes with a cloud transition. There are also a plethora of cloud-specific security tools like cloud access security brokers (CASBs), cloud security posture management (CSPM) solutions, and even secure access services edge (SASE) technology.

      Data controls Data residency, classification, quality, and protection are important considerations for any cloud strategy. With cloud providers taking on outsized responsibility, understanding and governing data is essential. Cloud providers like to abstract away from the end user, and while some may be able to guarantee residency, others may not. Additionally, regulations may prevent some data from going to the cloud, and you may need to develop a new organizational backup strategy to account for the cloud.

      Strategy component: Technology

      Good technology will never replace good people and effective process, but it remains important in its own right. A migration that neglects the undeniable technical components of a solid cloud strategy is doomed to mediocrity at best and failure at worst. Understanding the technical implications of the cloud vision – particularly in terms of monitoring, provisioning, and migration – makes all the difference. You can interpret the results of the cloud workload assessments by reviewing the details presented here.

      Component Description Challenges
      Monitoring The cloud must be monitored in line with performance requirements. Staff must ensure that appropriate tools are in place to properly monitor cloud workloads and that they are capturing adequate and relevant data. Defining requirements for monitoring a potentially unfamiliar environment can be difficult, as can consolidating on a monitoring solution that both meets requirements and covers all relevant areas. There may be some upskilling and integration work required to ensure that monitoring works as required.
      Provisioning How will provisioning be done? Who will be responsible for ensuring the right people have access to the right resources? What tooling must be deployed to support provisioning goals? What technical steps must be taken to ensure that the provisioning is as seamless as possible? There is the inevitable challenge of assigning responsibility and accountability in a changing infrastructure and operations environment, especially if the changes are substantial (e.g. a fundamental operating model shift, reoriented around the cloud). Staff may also need to familiarize themselves with cloud-based provisioning tools like Ansible, Terraform, or even CloudFormation.
      Migration The act of migrating is important as well. In some cases, the migration is as simple as configuring the new environment and turning it up (e.g. with a net new SaaS service). In other cases, the migration itself can be a substantial undertaking, involving large amounts of data, a complicated replatforming/refactoring, and/or a significant configuration exercise.

      Not all migration journeys are created equal, and challenges include a general lack of understanding of the requirements of a migration, the techniques that might be necessary to migrate to a particular cloud (there are many) and the disruption/risk associated with moving large amounts of data. All of these challenges must be considered as part of the overall cloud strategy, whether in terms of architectural principles or skill acquisition (or both!).

      Step 2.2

      Determine workload future state

      Activities

      2.2.1 Determine workload future state

      Conduct workload assessments

      Determine workload future state

      This step involves the following participants:

      • IT management
      • Core working group

      Outcomes of this step

      • Completed workload assessments
      • Defined workload future state

      2.2.1 Determine workload future state

      1-3 hours

      Input

      • Completed workload assessments

      Output

      • Preliminary future state outputs

      Materials

      • Cloud Vision Workbook
      • Cloud Vision Executive Presentation

      Participants

      • Core working group
      • Service owners
      • IT management
      1. After you’ve had a chance to validate your results, refer to tab 7 of the tool, where you will find a blank notes section.
      2. With the working group, capture your answers to each of the following questions:
        1. What service model is the most suitable for the workload? Why?
        2. How will we conduct the migration? Which of the six models makes the most sense? Do we have a backup plan if our primary plan doesn’t work out?
        3. What should the support model look like?
        4. What are some workload-specific risks and considerations that must be taken into account for the workload?
      3. Once you’ve got answers to each of these questions for each of the workloads, include your summary in the “notes” section of tab 7.

      Cloud Vision Executive Presentation

      Paste the output into the Cloud Vision Executive Presentation

      • The Cloud Vision Workbook output is a compact, consumable summary of each workload’s planned future state. Paste each assessment in as necessary.
      • There is no absolutely correct way to present the information, but the output is a good place to start. Do note that, while the presentation is designed to lead with the vision statement, because the process is workload-first, the assessments are populated prior to the overall vision in a bottom-up manner.
      • Be sure to anticipate the questions you are likely to receive from any stakeholders. You may consider preparing for questions like: “What other workloads fit this profile?” “What do we expect the impact on the budget to be?” “How long will this take?” Keep these and other questions in mind as you progress through the vision definition process.

      The image shows the Cloud Vision Workbook output, which was described in an annotated version in an earlier section.

      Info-Tech Insight

      Keep your audience in mind. You may want to include some additional context in the presentation if the results are going to be presented to non-technical stakeholders or those who are not familiar with the terms or how to interpret the outputs.

      Identify and Mitigate Risks

      Build the foundations of your cloud vision

      PHASE 3

      Phase 3

      Identify and Mitigate Risks

      Phase 1

      1.1 Generate goals and drivers

      1.2 Explore cloud characteristics

      1.3 Create a current state summary

      1.4 Select workloads for analysis

      Phase 2

      2.1 Conduct workload assessments

      2.2 Determine workload future states

      Phase 3

      3.1 Generate risks and roadblocks

      3.2 Mitigate risks and roadblocks

      3.3 Define roadmap initiatives

      Phase 4

      4.1 Review and assign work items

      4.2 Finalize cloud decision framework

      4.3 Create cloud vision

      This phase will walk you through the following activities:

      • Generate risks and roadblocks
      • Mitigate risks and roadblocks
      • Define roadmap initiatives

      This phase involves the following participants:

      • Core working group
      • Workload subject matter experts

      You know what you want to do, but what do you have to do?

      What questions remain unanswered?

      There are workload-level risks and roadblocks, and there are environment-level risks. This phase is focused primarily on environment-level risks and roadblocks, or those that are likely to span multiple workloads (but this is not hard and fast rule – anything that you deem worth discussing is worth discussing). The framework here calls for an open forum where all stakeholders – technical and non-technical, pro-cloud and anti-cloud, management and individual contributor – have an opportunity to articulate their concerns, however specific or general, and receive feedback and possible mitigation.

      Start by soliciting feedback. You can do this over time or in a single session. Encourage anyone with an opinion to share it. Focus on those who are likely to have a perspective that will become relevant at some point during the creation of the cloud strategy and the execution of any migration. Explain the preliminary direction; highlight any major changes that you foresee. Remind participants that you are not looking for solutions (yet), but that you want to make sure you hear any and every concern as early as possible. You will get feedback and it will all be valuable.

      Before cutting your participants loose, remind them that, as with all business decisions, the cloud comes with trade-offs. Not everyone will have every wish fulfilled, and in some cases, significant effort may be needed to get around a roadblock, risks may need to be accepted, and workloads that looked like promising candidates for one service model or another may not be able to realize that potential. This is a normal and expected part of the cloud vision process.

      Once the risks and roadblocks conversation is complete, it is the core working group’s job to propose and validate mitigations. Not every risk can be completely resolved, but the cloud has been around for decades – chances are someone else has faced a similar challenge and made it through relatively unscathed. That work will inevitably result in initiatives for immediate execution. Those initiatives will form the core of the initiative roadmap that accompanies the completed Cloud Vision Executive Presentation.

      Step 3.1

      Generate risks and roadblocks

      Activities

      3.1.1 Generate risks and roadblocks

      3.1.2 Generate mitigations

      Identify and mitigate risks

      Generate risks and roadblocks

      Mitigate risks and roadblocks

      Define roadmap initiatives

      This step involves the following participants:

      • Core working group
      • IT management
      • Infrastructure
      • Applications
      • Security
      • Architecture

      Outcomes of this step

      • List of risks and roadblocks

      Understand risks and roadblocks

      Risk

      • Something that could potentially go wrong.
      • You can respond to risks by mitigating them:
        • Eliminate: take action to prevent the risk from causing issues.
        • Reduce: take action to minimize the likelihood/severity of the risk.
        • Transfer: shift responsibility for the risk away from IT, towards another division of the company.
        • Accept: where the likelihood or severity is low, it may be prudent to accept that the risk could come to fruition.

      Roadblock

      • There are things that aren’t “risks” that we care about when migrating to the cloud.
      • We know, for example, that a complicated integration situation will create work items for any migration – this is not an “unknown.”
      • We respond to roadblocks by generating work items.

      3.1.1 Generate risks and roadblocks

      1.5 hours

      Input

      • Completed cloud vision assessments

      Output

      • List of risks and roadblocks

      Materials

      • Whiteboard
      • Sticky notes

      Participants

      • Core working group
      • Service owners/workload SMEs
      • Anyone with concerns about the cloud
      1. Gather your core working group – and really anyone with an intelligent opinion on the cloud – into a single meeting space. Give the group 5-10 minutes to list anything they think could present a difficulty in transitioning workloads to the cloud. Write each risk/roadblock on its own sticky note. You will never be 100% exhaustive, but don’t let anything your users care about go unaddressed.
      2. Once everyone has had time to write down their risks and roadblocks, have everyone share one by one. Make sure you get them all. Overlap in risks and roadblocks is okay! Group similar concerns together to give a sort of heat map of what your participants are concerned about. (This is called “affinity diagramming.”)
      3. Assign names to these categories. Many of these categories will align with the strategy components discussed in the previous phase (governance, security, etc.) but some will be specific whether by nature or by degree.
      4. Sort each of the individual risks into its respective category, collapsing any exact duplicates, and leaving room for notes and mitigations (see the next slide for a visual).

      Understand risks and roadblocks

      The image is two columns--on the left, the column is titled Affinity Diagramming. Below the title, there are many colored blocks, randomly arranged. There is an arrow pointing right, to the same coloured blocks, now sorted by colour. In the right column--titled Categorization--each colour has been assigned a category, with subcategories.

      Step 3.2

      Mitigate risks and roadblocks

      Activities

      3.2.1 Generate mitigations

      Identify and mitigate risks

      Generate risks and roadblocks

      Mitigate risks and roadblocks

      Define roadmap initiatives

      This step involves the following participants:

      • Core working group

      Outcomes of this step

      • List of mitigations

      Is the public cloud less secure?

      This is the key risk-related question that most cloud customers will have to answer at some point: does migrating to the cloud for some services increase their exposure and create a security problem?

      As with all good questions, the answer is “it depends.” But what does it depend on? Consider these cloud risks and potential mitigations:

      1. Misconfiguration: An error grants access to unauthorized parties (as happened to Capital One in 2019). This can be mitigated by careful configuration management and third-party tooling.
      2. Unauthorized access by cloud provider/partner employees: Though rare, it is possible that a cloud provider or partner can be a vector for a breach. Careful contract language, choosing to own your own encryption keys, and a hybrid approach (storing data on-premises) are some possible ways to address this problem.
      3. Unauthorized access to systems: Cloud services are designed to be accessed from anywhere and may be accessed by malicious actors. Possible mitigations include risk-based conditional access, careful identity access management, and logging and detection.

      “The cloud is definitely more secure in that you have much more control, you have much more security tooling, much more visibility, and much more automation. So it is more secure. The caveat is that there is more risk. It is easier to accidentally expose data in the cloud than it is on-premises, but, especially for security, the amount of tooling and visibility you get in cloud is much more than anything we’ve had in our careers on-premises, and that’s why I think cloud in general is more secure.” –Abdul Kittana, Founder, ASecureCloud

      Breach bests bank

      No cloud provider can protect against every misconfiguration

      Industry: Finance

      Source: The New York Times, CNET

      Background

      Capital One is a major Amazon Web Services customer and is even featured on Amazon’s site as a case study. That case study emphasizes the bank’s commitment to the cloud and highlights how central security and compliance were. From the CTO: “Before we moved a single workload, we engaged groups from across the company to build a risk framework for the cloud that met the same high bar for security and compliance that we meet in our on-premises environments. AWS worked with us every step of the way.”

      Complication

      The cloud migration was humming along until July 2019, when the bank suffered a serious breach at the hands of a hacker. That hacker was able to steal millions of credit card applications and hundreds of thousands of Social Security numbers, bank account numbers, and Canadian social insurance numbers.

      According to investigators and to AWS, the breach was caused by an open reverse proxy attack against a misconfigured web app firewall, not by an underlying vulnerability in the cloud infrastructure.

      Results

      Capital One reported that the breach was expected to cost it $150 million, and AWS fervently denied any blame. The US Senate got involved, as did national media, and Capital One’s CEO issued a public apology, writing, “I sincerely apologize for the understandable worry this incident must be causing those affected, and I am committed to making it right.”

      It was a bad few months for IT at Capital One.

      3.2.1 Generate mitigations

      3-4.5 hours

      Input

      • Completed cloud vision assessments

      Output

      • List of risks and roadblocks

      Materials

      • Whiteboard
      • Sticky notes

      Participants

      • Core working group
      • Service owners/workload SMEs
      • Anyone with concerns about the cloud
      1. Recall the four mitigation strategies: eliminate, reduce, transfer, or accept. Keep these in mind as you work through the list of risks and roadblocks with the core working group. For every individual risk or roadblock raised in the initial generation session, suggest a specific mitigation. If the concern is “SaaS providers having access to confidential information,” a mitigation might be encryption, specific contract language, or proof of certifications (or all the above).
      2. Work through this for each of the risks and roadblocks, identifying the steps you need to take that would satisfy your requirements as you understand them.
      3. Once you have gone through the whole list – ideally with input from SMEs in particular areas like security, engineering, and compliance/legal – populate the Cloud Vision Workbook (tab 8) with the risks, roadblocks, and mitigations (sorted by category). Review tab 8 for an example of the output of this exercise.

      Cloud Vision Workbook

      Cloud Vision Workbook – mitigations

      The image shows a large chart titled Risks, roadblocks, and mitigations, which has been annotated with notes.

      Step 3.3

      Define roadmap initiatives

      Activities

      3.3.1 Generate roadmap initiatives

      Identify and mitigate risks

      Generate risks and roadblocks

      Mitigate risks and roadblocks

      Define roadmap initiatives

      This step involves the following participants:

      • Core working group

      Outcomes of this step

      • Defined roadmap initiatives

      3.3.1 Generate roadmap initiatives

      1 hour

      Input

      • List of risk and roadblock mitigations

      Output

      • List of cloud initiatives

      Materials

      • Cloud Vision Workbook

      Participants

      • Core working group
      1. Executing on your cloud vision will likely require you to undertake some key initiatives, many of which have already been identified as part of your mitigation exercise. On tab 8 of the Cloud Vision Workbook, review the mitigations you created in response to the risks and roadblocks identified. Initiatives should generally be assignable to a party and should have a defined scope/duration. For example, “assess all net new applications for cloud suitability” might not be counted as an initiative, but “design a cloud application assessment” would likely be.
      2. Design a timeline appropriate for your specific needs. Generally short-term (less than 3 months), medium-term (3-6 months), and long-term (greater than 6 months) will work, but this is entirely based on preference.
      3. Review and validate the parameters with the working group. Consider creating additional color-coding (highlighting certain tasks that might be dependent on a decision or have ongoing components).

      Cloud Vision Workbook

      Bridge the gap and create the vision

      Build the foundations of your cloud vision

      Phase 4

      Phase 4

      Bridge the Gap and Create the Vision

      Phase 1

      1.1 Generate goals and drivers

      1.2 Explore cloud characteristics

      1.3 Create a current state summary

      1.4 Select workloads for analysis

      Phase 2

      2.1 Conduct workload assessments

      2.2 Determine workload future states

      Phase 3

      3.1 Generate risks and roadblocks

      3.2 Mitigate risks and roadblocks

      3.3 Define roadmap initiatives

      Phase 4

      4.1 Review and assign work items

      4.2 Finalize cloud decision framework

      4.3 Create cloud vision

      This phase will walk you through the following activities:

      • Assign initiatives and propose timelines
      • Build a delivery model rubric
      • Build a service model rubric
      • Built a support model rubric
      • Create a cloud vision statement
      • Map cloud workloads
      • Complete the Cloud Vision presentation

      This phase involves the following participants:

      • IT management, the core working group, security, infrastructure, operations, architecture, engineering, applications, non-IT stakeholders

      Step 4.1

      Review and assign work items

      Activities

      4.1.1 Assign initiatives and propose timelines

      Bridge the gap and create the vision

      Review and assign work items

      Finalize cloud decision framework

      Create cloud vision

      This step involves the following participants:

      • Core working group
      • IT management

      Outcomes of this step

      • Populated cloud vision roadmap

      4.1.1 Assign initiatives and propose timelines

      1 hour

      Input

      • List of cloud initiatives

      Output

      • Initiatives assigned by responsibility and timeline

      Materials

      • Cloud Vision Workbook

      Participants

      • Core working group
      1. Once the list is populated, begin assigning responsibility for execution. This is not a RACI exercise, so focus on the functional responsibility. Once you have determined who is responsible, assign a timeline and include any notes. This will form the basis of a more formal project plan.
      2. To assign the initiative to a party, consider 1) who will be responsible for execution and 2) if that responsibility will be shared. Be as specific as possible, but be sure to be consistent to make it easier for you to sort responsibility later on.
      3. When assigning timelines, we suggest including the end date (when you expect the project to be complete) rather than the start date, though whatever you choose, be sure to be consistent. Make use of the notes column to record anything that you think any other readers will need to be aware of in the future, or details that may not be possible to commit to memory.

      Cloud Vision Workbook

      Step 4.2

      Finalize cloud decision framework

      Activities

      4.2.1 Build a delivery model rubric

      4.2.2 Build a service model rubric

      4.2.3 Build a support model rubric

      Bridge the gap and create the vision

      Review and assign work items

      Finalize cloud decision framework

      Create cloud vision

      This step involves the following participants:

      • Core working group

      Outcomes of this step

      • Cloud decision framework

      4.2.1 Build a delivery model rubric

      1 hour

      Input

      • List of cloud initiatives

      Output

      • Initiatives assigned by responsibility and timeline

      Materials

      Participants

      • Core working group
      1. Now that we have a good understanding of the cloud’s key characteristics, the relative suitability of different workloads for the cloud, and a good understanding of some of the risks and roadblocks that may need to be overcome if a cloud transition is to take place, it is time to formalize a delivery model rubric. Start by listing the delivery models on a white board vertically – public, private, hybrid, and multi-cloud. Include a community cloud option as well if that is feasible for you. Strike any models that do not figure into your vision.
      2. Create a table style rubric for each delivery model. Confer with the working group to determine what characteristics best define workloads suitable for each model. If you have a hybrid cloud option, you may consider workloads that are highly dynamic; a private cloud hosted on-premises may be more suitable for workloads that have extensive regulatory requirements.
      3. Once the table is complete, include it in the Cloud Vision Executive Presentation.

      Cloud Vision Executive Presentation

      Vision for the cloud future state (example)

      Delivery model Decision criteria
      Public cloud
      • Public cloud is the primary destination for all workloads as the goal is to eliminate facilities and infrastructure management
      • Offers features, broad accessibility, and managed updates along with provider-managed facilities and hardware
      Legacy datacenter
      • Any workload that is not a good fit for the public cloud
      • Dependency (like a USB key for license validation)
      • Performance requirements (e.g. workloads highly sensitive to transaction thresholds)
      • Local infrastructure components (firewall, switches, NVR)

      Summary statement: Everything must go! Public cloud is a top priority. Anything that is not compatible (for whatever reason) with a public cloud deployment will be retained in a premises-based server closet (downgraded from a full datacenter). The private cloud does not align with the overall organizational vision, nor does a hybrid solution.

      4.2.2 Build a service model rubric

      1 hour

      Input

      • Output of workload assessments
      • Output of risk and mitigation exercise

      Output

      • Service model rubric

      Materials

      • Whiteboard
      • Cloud Vision Executive Presentation

      Participants

      • Core working group
      1. This next activity is like the delivery model activity, but covers the relevant cloud service models. On a whiteboard, make a vertical list of the cloud service models (SaaS, PaaS, IaaS, etc.) that will be considered for workloads. If you have an order of preference, place your most preferred at the top, your least preferred at the bottom.
      2. Describe the circumstances under which you would select each service model. Do your best to focus on differentiators. If a decision criterion appears for multiple service models, consider refining or excluding it. (For additional information, check out Info-Tech’s Reimagine IT Operations for a Cloud-First World blueprint.)
      3. Create a summary statement to capture your overall service model position. See the next slide for an example. Note: this can be incorporated into your cloud vision statement, so be sure that it reflects your genuine cloud preferences.
      4. Record the results in the Cloud Vision Executive Presentation.

      Cloud Vision Executive Presentation

      Vision for the cloud future state (example)

      Service model Decision criteria
      SaaS

      SaaS first; opt for SaaS when:

      • A SaaS option exists that meets all key business requirements
      • There is a strong desire to have someone else (the vendor) manage infrastructure components/the platform
      • Not particularly sensitive to performance thresholds
      • The goal is to transition management of the workload outside of IT
      • SaaS is the only feasible way to consume the desired service
      PaaS
      • Highly customized service/workload – SaaS not feasible
      • Still preferable to offload as much management as possible to third parties
      • Customization required, but not at the platform level
      • The workload is built using a standard framework
      • We have the time/resources to replatform
      IaaS
      • Service needs to be lifted and shifted out of the datacenter quickly
      • Customization is required at the platform level/there is value in managing components
      • There is no need to manage facilities
      • Performance is not impacted by hosting the workload offsite
      • There is value in right-sizing the workload over time
      On-premises Anything that does not fit in the cloud for performance or other reasons (e.g. licensing key)

      Summary statement: SaaS will be the primary service model. All workloads will migrate to the public cloud where possible. Anything that cannot be migrated to SaaS will be migrated to PaaS. IaaS is a transitory step.

      4.2.3 Build a support model rubric

      1 hour

      Input

      • Results of the cloud workload assessments

      Output

      • Support model rubric

      Materials

      • Whiteboard
      • Cloud Vision Executive Presentation

      Participants

      • Core working group
      1. The final rubric covered here is that for the support model. Where will you procure the skills necessary to ensure the vision’s proper execution? Much like the other rubric activities, write the three support models vertically (in order of preference, if you have one) on a whiteboard.
      2. Next to each model, describe the circumstances under which you would select each support model. Focus on the dimensions: the duration of the engagement, specialization required, and flexibility required. If you have existing rules/practices around hiring consultants/MSPs, consider those as well.
      3. Once you have a good list of decision criteria, form a summary statement. This should encapsulate your position on support models and should mention any notable criteria that will contribute to most decisions.
      4. Record the results in the Cloud Vision Executive Presentation.

      Cloud Vision Executive Presentation

      Vision for the cloud future state (example)

      Support model Decision criteria
      Internal IT

      The primary support model will be internal IT going forward

      • Chosen where the primary work required is administrative
      • Where existing staff can manage the service in the cloud easily and effectively
      • Where the chosen solution fits the SaaS service model
      Consultant
      • Where the work required is time-bound (e.g. a migration/refactoring exercise)
      • Where the skills do not exist in house, and where the skills cannot easily be procured (specific technical expertise required in areas of the cloud unfamiliar to staff)
      • Where opportunities for staff to learn from consultant SMEs are valuable
      • Where ongoing management and maintenance can be handled in house
      MSP
      • Where an ongoing relationship is valued
      • Where ongoing administration and maintenance are disproportionately burdensome on IT staff (or where this administration and maintenance is likely to be burdensome)
      • Where the managed services model has already been proven out
      • Where specific expertise in an area of technology is required but this does not rise to the need to hire an FTE (e.g. telephony)

      Summary statement: Most workloads will be managed in house. A consultant will be employed to facilitate the transition to micro-services in a cloud container environment, but this will be transitioned to in-house staff. An MSP will continue to manage backups and telephony.

      Step 4.3

      Create cloud vision

      Activities

      4.3.1 Create a cloud vision statement

      4.3.2 Map cloud workloads

      4.3.3 Complete the Cloud Vision Presentation

      Review and assign work items

      Finalize cloud decision framework

      Create cloud vision

      This step involves the following participants:

      • Core working group
      • IT management

      Outcomes of this step

      Completed Cloud Vision Executive Presentation

      4.3.1 Create a cloud vision statement

      1 hour

      Input

      • List of cloud initiatives

      Output

      • Initiatives assigned by responsibility and timeline

      Materials

      • Cloud Vision Workbook

      Participants

      • Core working group
      1. Now that you know what service models are appropriate, it’s time to summarize your cloud vision in a succinct, consumable way. A good vision statement should have three components:
        • Scope: Which parts of the organization will the strategy impact?
        • Goal: What is the strategy intended to accomplish?
        • Key differentiator: What makes the new strategy special?
      2. On a whiteboard, make a chart with three columns (one column for each of the features of a good mission statement). Have the group generate a list of words to describe each of the categories. Ideally, the group will produce multiple answers for each category.
      3. Once you’ve gathered a few different responses for each category, have the team put their heads down and generate pithy mission statements that capture the sentiments underlying each category.
      4. Have participants read their vision statements in front of the group. Use the rest of the session to produce a final statement. Record the results in the Cloud Strategy Executive Presentation.

      Example vision statement outputs

      “IT at ACME Corp. hereby commits to providing clients and end users with an unparalleled, productivity-enabling technology experience, leveraging, insofar as it is possible and practical, cloud-based services.”

      “At ACME Corp. our employees and customers are our first priority. Using new, agile cloud services, IT is devoted to eliminating inefficiency, providing cutting-edge solutions for a fast-paced world, and making a positive difference in the lives of our colleagues and the people we serve.”

      As a global leader in technology, ACME Corp. is committed to taking full advantage of new cloud services, looking first to agile cloud options to optimize internal processes wherever efficiency gaps exist. Improved efficiency will allow associates to spend more time on ACME’s core mission: providing an unrivalled customer experience.”

      Scope

      Goal

      Key differentiator

      4.3.2 Map cloud workloads

      1 hour

      Input

      • List of workloads
      • List of acceptable service models
      • List of acceptable migration paths

      Output

      • Workloads mapped by service model/migration path

      Materials

      • Whiteboard
      • Sticky notes

      Participants

      • Core working group
      1. Now that you have defined your overall cloud vision as well as your service model options, consider aligning your service model preferences with your migration path preferences. Draw a table with your expected migration strategies across the top (retain, retire, rehost, replatform, refactor, repurchase, or some of these) and your expected service models across the side.
      2. On individual sticky notes, write a list of workloads in your environment. In a smaller environment, this list can be exhaustive. Otherwise take advantage of the list you created as part of phase 1 along with any additional workloads that warrant discussion.
      3. As a group, go through the list, placing the sticky notes first in the appropriate row based on their characteristics and the decision criteria that have already been defined, and then in the appropriate column based on the appropriate migration path. (See the next slide for an example of what this looks like.)
      4. Record the results in the Cloud Vision Executive Presentation. Note: not every cell will be filled; some migration path/service model combinations are impossible or otherwise undesirable.

      Cloud Vision Executive Presentation

      Example cloud workload map

      Repurchase Replatform Rehost Retain
      SaaS

      Office suite

      AD

      PaaS SQL Database
      IaaS File Storage DR environment
      Other

      CCTV

      Door access

      4.3.3 Complete the Cloud Vision Presentation

      1 hour

      Input

      • List of cloud initiatives

      Output

      • Initiatives assigned by responsibility and timeline

      Materials

      • Cloud Vision Workbook

      Participants

      • Core working group
      1. Open the Cloud Vision Executive Presentation to the second slide and review the templated executive brief. This comprises several sections (see the next slide). Populate each one:
        • Summary of the exercise
        • The cloud vision statement
        • Key cloud drivers
        • Risks and roadblocks
        • Top initiatives and next steps
      2. Review the remainder of the presentation. Be sure to elaborate on any significant initiatives and changes (where applicable) and to delete any slides that you no longer require.

      Cloud Vision Workbook

      Sample cloud vision executive summary

      • From [date to date], a cross-functional group representing IT and its constituents met to discuss the cloud.
      • Over the course of the week, the group identified drivers for cloud computing and developed a shared vision, evaluated several workloads through an assessment framework, identified risks, roadblocks, and mitigations, and finally generated initiatives and next steps.
      • From the process, the group produced a summary and a cloud suitability assessment framework that can be applied at the level of the workload.

      Cloud Vision Statement

      [Organization] will leverage public cloud solutions and retire existing datacenter and colocation facilities. This transition will simplify infrastructure administration, support, and security, while modernizing legacy infrastructure and reducing the need for additional capital expenditure.

      Cloud Drivers Retire the datacenter Do more valuable work
      Right-size the environment Reduce CapEx
      Facilitate ease of mgmt. Work from anywhere
      Reduce capital expenditure Take advantage of elasticity
      Performance and availability Governance Risks and roadblocks
      Security Rationalization
      Cost Skills
      Migration Remaining premises resources
      BC, backup, and DR Control

      Initiatives and next steps

      • Close the datacenter and colocation site in favor of a SaaS-first cloud approach.
      • Some workloads will migrate to infrastructure-as-a-service in the short term with the assistance of third-party consultants.

      Document your cloud strategy

      You did it!

      Congratulations! If you’ve made it this far, you’ve successfully articulated a cloud vision, assessed workloads, developed an understanding (shared with your team and stakeholders) of cloud concepts, and mitigated risks and roadblocks that you may encounter along your cloud journey. From this exercise, you should understand your mission and vision, how your cloud plans will interact with any other relevant strategic plans, and what successful execution looks like, as well as developing a good understanding of overall guiding principles. These are several components of your overall strategy, but they do not comprise the strategy in its entirety.

      How do you fix this?

      First, validate the results of the vision exercise with your stakeholders. Socialize it and collect feedback. Make changes where you think changes should be made. This will become a key foundational piece. The next step is to formally document your cloud strategy. This is a separate project and is covered in the Info-Tech blueprint Document Your Cloud Strategy.

      The vision exercise tells you where you want to go and offers some clues as to how to get there. The formal strategy exercise is a formal documentation of the target state, but also captures in detail the steps you’ll need to take, the processes you’ll need to refine, and the people you’ll need to hire.

      A cloud strategy should comprise your organizational stance on how the cloud will change your approach to people and human resources, technology, and governance. Once you are confident that you can make and enforce decisions in these areas, you should consider moving on to Document Your Cloud Strategy. This blueprint, Define Your Cloud Vision, often serves as a prerequisite for the strategy documentation conversation(s).

      Appendix

      Summary of Accomplishment

      Additional Support

      Research Contributors

      Related Info-Tech Research

      Vendor Resources

      Bibliography

      Summary of Accomplishment

      Problem Solved

      You have now documented what you want from the cloud, what you mean when you say “cloud,” and some preliminary steps you can take to make your vision a reality.

      You now have at your disposal a framework for identifying and evaluating candidates for their cloud suitability, as well as a series of techniques for generating risks and mitigations associated with your cloud journey. The next step is to formalize your cloud strategy using the takeaways from this exercise. You’re well on your way to a completed cloud strategy!

      If you would like additional support, have our analysts guide you through other phases as part of an Info-Tech workshop.

      Contact your account representative for more information.

      workshops@infotech.com

      1-888-670-8889

      Additional Support

      If you would like additional support, have our analysts guide you through other phases as part of an Info-Tech Workshop.

      Contact your account representative for more information.

      workshops@infotech.com 1-888-670-8889

      To accelerate this project, engage your IT team in an Info-Tech workshop with an Info-Tech analyst team.

      Info-Tech analysts will join you and your team at your location or welcome you to Info-Tech’s historic Toronto office to participate in an innovative onsite workshop.

      The following are sample activities that will be conducted by Info-Tech analysts with your team:

      Generate drivers for cloud adoption

      Work with stakeholders to understand the expected benefits of the cloud migration and how these drivers will impact the overall vision.

      Conduct workload assessments

      Assess your individual cloud workloads for their suitability as candidates for the cloud migration.

      Bibliography

      “2021 State of the Cloud Report.” Flexera, 2021. Web.

      “2021 State of Upskilling Report.” Pluralsight, 2021. Web.

      “AWS Snowmobile.” Amazon Web Services, n.d. Web.

      “Azure products.” Microsoft, n.d. Web.

      “Azure Migrate Documentation.” Microsoft, n.d. Web.

      Bell, Harold. “Multi-Cloud vs. Hybrid Cloud: What’s the Difference?” Nutanix, 2019. Web.

      “Cloud Products.” Amazon Web Services, n.d. Web.

      “COBIT 2019 Framework: Introduction and Methodology.” ISACA, 2019. Web.

      Edmead, Mark T. “Using COBIT 2019 to Plan and Execute an Organization’s Transformation Strategy.” ISACA, 2020. Web.

      Flitter, Emily, and Karen Weise. “Capital One Data Breach Compromises Data of Over 100 Million.” The New York Times, 29 July 2019. Web.

      Gillis, Alexander S. “Cloud Security Posture Management (CSPM).” TechTarget, 2021. Web.

      “’How to Cloud’ with Capital One.” Amazon Web Services, n.d. Web.

      “IBM Closes Landmark Acquisition of Red Hat for $34 Billion; Defines Open, Hybrid Cloud Future.” Red Hat, 9 July 2019. Web.

      Mell, Peter, and Timothy Grance. “The NIST Definition of Cloud Computing.” National Institute of Standards and Technology, Sept. 2011. Web.

      Ng, Alfred. “Amazon Tells Senators it Isn't to Blame for Capital One Breach.” CNET, 2019. Web.

      Orban, Stephen. “6 Strategies for Migrating Applications to the Cloud.” Amazon Web Services, 2016. Web.

      Sullivan, Dan. “Cloud Access Security Broker (CASB).” TechTarget, 2021. Web.

      “What Is Secure Access Service Edge (SASE)?” Cisco, n.d. Web.

      Configuration management

      • Buy Link or Shortcode: {j2store}4|cart{/j2store}
      • Related Products: {j2store}4|crosssells{/j2store}
      • Up-Sell: {j2store}4|upsells{/j2store}
      • Download01-Title: Harness the power of Configuration Management Executive Brief
      • Download-01: Visit Link
      • member rating overall impact (scale of 10): 8.0/10
      • member rating average dollars saved: N/A
      • member rating average days saved: N/A
      • Parent Category Name: Infra and Operations
      • Parent Category Link: /infra-and-operations
      Configuration management is all about being able to manage your assets within the support processes. That means to record what you need. Not less than that, and not more either.

      Asset Management, Configuration Management, Lifecycle Management

      What is resilience?

      • member rating overall impact (scale of 10): N/A
      • member rating average dollars saved: N/A
      • member rating average days saved: N/A

      Aside from the fact that operational resilience is mandated by law as of January 2025 (yes, next year), having your systems and applications available to your customers whenever they need your services is always a good idea. Customers, both existing and new ones, typically prefer smooth operations over new functionality. If you have any roadblocks in your current customer journey, then solving those is also part of operational resilience (and excellence).

      Does this mean you should not market new products or services? Of course not! Solving a customer journey roadblock is ensuring that your company is resilient. The Happy Meal is a prime example: it solved a product roadblock for small children and a profits roadblock for the company. For more info, just google it. But before you bring a new service online, be sure that it can withstand the punches that will be thrown at it. 

      What is resilience? 

      Resilience is the art of making sure your services are available to your customers whenever they can use them. Note I did not say 24/7/365. Your business may require that, but perhaps your systems need "only" to be available during "normal" business hours.

      Resilient systems can withstand adverse events that impair their ability to perform normal functions, and, like in the case the Happy Meals, increased peak demands. Events can include simple breakdowns (like a storage device, an internet connection that fails, or a file that fails to load) or something worse, like a cyber attack or a larger failure in your data center.

      Your client does not care what the cause is; what counts for the client is, "Can I access your service? (or buy that meal for my kid.)"

      Resilience entails several aspects:

      • availability
      • performance
      • right-sizing
      • hardening
      • restore-ability
      • testing
      • monitoring
      • management and governance

      It is now tempting to apply these aspects only to your organization's IT or technical parts. That is insufficient. Your operations, management, and even e.g. sales must ensure that services rendered result in happy clients and happy shareholders/owners. The reason is that resilient operations are a symphony. Not one single department or set of actions will achieve this. When you have product development working with the technical teams to develop a resilient flow at the right level for its earning potential, then you maximize profits.

      This synergy ensures that you invest exactly the right level of resources. There are no exaggerated technical or operational elements for ancillary services. That frees resources to ensure your main services receive the full attention they deserve.

      Resilience, in other words, is the result of a mindset and a way of operating that helps your business remain at the top of its game and provides a top service to clients while keeping the bottom line in the black. 

      Why do we need to spend on this?

      I mean, if it ain't broke, don't fix it. That old adage is true, and yet not. Services can remain up and running for a long time with single points of failure. But can you afford to have them break at any time? If yes, and your customers don't mind waiting for you to patch things up, then you can "risk-accept" that situation. But how realistic is that these days? If I cannot buy it at your shop today, I'll more than likely get it from another. If I'm in a contract with you, yet you cannot deliver, we will have a conversation, or at the very least, a moment of disappointment. If you have enough "disappointments," you will lose the customer. Lose enough customers, and you will have a reputational problem or worse.

      We don't like to spend resources on something that "may"go wrong. We do risk assessments to determine the true cost of non-delivery and the likelihood of that happening. And there are different ways to deal with that assessment's outcome. Not everything needs to have double the number of people working on it, just in case one resignes. Not every system needs an availability of 99,999%.

      But sometimes, we do not have a choice. When lives are at stake, like in medical or aviation services, being sorry is not a good starting point. The same goes for financial services. the DORA and NIS2 legislation in the EU, the CEA, FISMA, and GLBA in the US, and ESPA in Japan, to name a few, are legislations that require your company, if active in the relevant regulated sectors, to comply and ensure that your services continue to perform.

      Most of these elements have one thing in common: we need to know what is important for our service delivery and what is not.

      Business service

      That brings us to the core subject of what needs to be resilient. The answer is very short and very complex at the same time. It is the service that you offer to your customers which must meet reliance levels.

      Take the example of a hospital. When there is a power outage, the most critical systems must continue operating for a given period. That also means that sufficient capable staff must be present to operate said equipment; it even means that the paths leading to said hospital should remain available; if not by road, then, e.g., by helicopter. If these inroads are unavailable, an alternate hospital should be able to take on the workload. 

      Not everything here in this example is the responsibility of the hospital administrators! This is why the management and governance parts of the resilience ecosystem are so important in the bigger picture. 

      If we look at the financial sector, the EU DORA (Digital Operational Resilience Act) specifically states that you must start with your business services. Like many others, the financial sector can no longer function without its digital landscape. If a bank is unexpectedly disconnected from its payment network, especially SWIFT, it will not be long before there are existential issues. A trading department stands to lose millions if the trading system fails. 

      Look in your own environment; you will see many such points. What if your internet connection goes down, and you rely on it for most of your business? How long can you afford to be out? How long before your clients notice and take action? Do you supply a small but critical service to an institution? Then, you may fall under the aforementioned laws (it's called third-party requirements, and your client may be liable to follow them.)

      But also, outside of the technology, we see points in the supply chain that require resilience. Do you still rely on a single person or provider for a critical function? Do you have backup procedures if the tech stops working, yet your clients require you to continue to service them? 

      In all these and other cases, you must know what your critical services are so that you can analyze the requirements and put the right measures in place.

      Once you have defined your critical business services and have analyzed their operational requirements, you can start to look at what you need to implement the aforementioned areas of availability, monitoring, hardening, and others. Remember we're still at the level of business service. The tech comes later and will require a deeper analysis. 

      In conclusion.

      Resilient operations ensure that you continue to function, at the right price, in the face of adverse events. If you can, resilience starts at the business level from the moment of product conception. If the products have long been developed, look at how they are delivered to the client and upgrade operations, resources, and tech where needed.

      In some cases, you are legally required to undertake this exercise. But in all cases, it is important that you understand your business services and the needs of your clients and put sufficient resources in the right places of your delivery chain. 

      If you want to discuss this further, please contact me for a free talk.


      IT Operations

      Threat Preparedness Using MITRE ATT&CK®

      • Buy Link or Shortcode: {j2store}252|cart{/j2store}
      • member rating overall impact (scale of 10): N/A
      • member rating average dollars saved: N/A
      • member rating average days saved: N/A
      • Parent Category Name: Security Strategy & Budgeting
      • Parent Category Link: /security-strategy-and-budgeting
      • To effectively protect your business interests, you need to be able to address what the most pressing vulnerabilities in your network are. Which attack vectors should you model first? How do you adequately understand your threat vectors when attacks continually change and adapt?
      • Security can often be asked the world but given a minimal budget with which to accomplish it.
      • Security decisions are always under pressure from varying demands that pull even the most well-balanced security team in every direction.
      • Adequately modeling any and every possible scenario is ineffective and haphazard at best. Hoping that you have chosen the most pressing attack vectors to model will not work in the modern day of threat tactics.

      Our Advice

      Critical Insight

      • Precision is critical to being able to successfully defend against threats.
        • Traditional threat modeling such as STRIDE or PASTA is based on a spray-and-pray approach to identifying your next potential threat vector. Instead, take a structured risk-based approach to understanding both an attacker’s tactics and how they may be used against your enterprise. Threat preparedness requires precision, not guesswork.
      • Knowing is half the battle.
        • You may be doing better than you think. Undoubtedly, there is a large surface area to cover with threat modeling. By preparing beforehand, you can separate what’s important from what’s not and identify which attack vectors are the most pressing for your business.
      • Be realistic and measured.
        • Do not try to remediate everything. Some attack vectors and approaches are nearly impossible to account for. Take control of the areas that have reasonable mitigation methods and act on those.
      • Identify blind spots.
        • Understand what is out there and how other enterprises are being attacked and breached. See how you stack up to the myriad of attack tactics that have been used in real-life breaches and how prepared you are. Know what you’re ready for and what you’re not ready for.
      • Analyze the most pressing vectors.
        • Prioritize the attack vectors that are relevant to you. If an attack vector is an area of concern for your business, start there. Do not cover the entire tactics list if certain areas are not relevant.
      • Detection and mitigation lead to better remediation.
        • For each relevant tactic and techniques, there are actionable detection and mitigation methods to add to your list of remediation efforts.

      Impact and Result

      Using the MITRE ATT&CK® framework, Info-Tech’s approach helps you understand your preparedness and effective detection and mitigation actions.

      • Learn about potential attack vectors and the techniques that hostile actors will use to breach and maintain a presence on your network.
      • Analyze your current protocols versus the impact of an attack technique on your network.
      • Discover detection and mitigation actions.
      • Create a prioritized series of security considerations, with basic actionable remediation items. Plan your next threat model by knowing what you’re vulnerable to.
      • Ensure business data cannot be leaked or stolen.
      • Maintain privacy of data and other information.
      • Secure the network connection points.
      • Mitigate risks with the appropriate services.

      This blueprint and associated tool are scalable for all types of organizations within various industry sectors, allowing them to know what types of risk they are facing and what security services are recommended to mitigate those risks.

      Threat Preparedness Using MITRE ATT&CK® Research & Tools

      Start here – read the Executive Brief

      Read our concise Executive Brief to find out why threat preparedness is a crucial first step in defending your network against any attack type. Review Info-Tech’s methodology and understand the ways we can support you in completing this project.

      Besides the small introduction, subscribers and consulting clients within this management domain have access to:

      1. Attack tactics and techniques

      Review a breakdown of each of the various attack vectors and their techniques for additional context and insight into the most prevalent attack tactics.

      • Threat Preparedness Using MITRE ATT&CK® – Phase 1: Attack Tactics and Techniques

      2. Threat Preparedness Workbook mapping

      Map your current security protocols against the impacts of various techniques on your network to determine your risk preparedness.

      • Threat Preparedness Using MITRE ATT&CK® – Phase 2: Threat Preparedness Workbook Mapping
      • Enterprise Threat Preparedness Workbook

      3. Execute remediation and detective measures

      Use your prioritized attack vectors to plan your next threat modeling session with confidence that the most pressing security concerns are being addressed with substantive remediation actions.

      • Threat Preparedness Using MITRE ATT&CK® – Phase 3: Execute Remediation and Detective Measures
      [infographic]

      Embrace Business-Managed Applications

      • Buy Link or Shortcode: {j2store}179|cart{/j2store}
      • member rating overall impact (scale of 10): 9.0/10 Overall Impact
      • member rating average dollars saved: $64,999 Average $ Saved
      • member rating average days saved: 18 Average Days Saved
      • Parent Category Name: Architecture & Strategy
      • Parent Category Link: /architecture-and-strategy
      • The traditional model of managing applications does not address the demands of today’s rapidly changing market and digitally minded business, putting stress on scarce IT resources. The business is fed up with slow IT responses and overbearing desktop and system controls.
      • The business wants more control over the tools they use. Software as a service (SaaS), business process management (BPM), robotic process automation (RPA), artificial intelligence (AI), and low-code development platforms are all on their radar.
      • However, your current governance and management structures do not accommodate the risks and shifts in responsibilities to business-managed applications.

      Our Advice

      Critical Insight

      • IT is a business partner, not just an operator. Effective business operations hinge on high-quality, valuable, fit-for-purpose applications. IT provides the critical insights, guidance, and assistance to ensure applications are implemented and leveraged in a way that maximizes return on investment, whether it is being managed by end users or lines of business (LOBs). This can only happen if the organization views IT as a critical asset, not just a supporting player.
      • All applications should be business owned. You have applications because LOBs need them to meet the objectives and key performance indicators defined in the business strategy. Without LOBs, there would be no need for business applications. LOBs define what the application should be and do for it to be successful, so LOBs should own them.
      • Everything boils down to trust. The business is empowered to make their own decisions on how they want to implement and use their applications and, thus, be accountable for the resulting outcomes. Guardrails, role-based access, application monitoring, and other controls can help curb some risk factors, but it should not come at the expense of business innovation and time-sensitive opportunities. IT must trust the business will make rational application decisions, and the business must trust IT to support them in good times and bad.

      Impact and Result

      • Focus on the business units that matter. BMA can provide significant value to LOBs if teams and stakeholders are encouraged and motivated to adopt organizational and operational changes.
      • Reimagine the role of IT. IT is no longer the gatekeeper that blocks application adoption. Rather, IT enables the business to adopt the tools they need to be productive and they guide the business on successful BMA practices.
      • Instill business accountability. With great power comes great responsibility. If the business wants more control of their applications, they must be willing to take ownership of the outcomes of their decisions.

      Embrace Business-Managed Applications Research & Tools

      Start here – read the Executive Brief

      Read our concise Executive Brief to find out why you should embrace business-managed applications, review Info-Tech’s methodology, and understand the four ways we can support you in completing this project.

      Besides the small introduction, subscribers and consulting clients within this management domain have access to:

      • Embrace Business-Managed Applications – Phases 1-3
      • Business-Managed Applications Communication Template

      1. State your objectives

      Level-set the expectations for your business-managed applications.

      • Embrace Business- Managed Applications – Phase 1: State Your Objectives

      2. Design your framework and governance

      Identify and define your application managers and owners and build a fit-for-purpose governance model.

      • Embrace Business-Managed Applications – Phase 2: Design Your Framework & Governance

      3. Build your roadmap

      Build a roadmap that illustrates the key initiatives to implement your BMA and governance models.

      • Embrace Business-Managed Applications – Phase 3: Build Your Roadmap

      [infographic]

      Workshop: Embrace Business-Managed Applications

      Workshops offer an easy way to accelerate your project. If you are unable to do the project yourself, and a Guided Implementation isn't enough, we offer low-cost delivery of our project workshops. We take you through every phase of your project and ensure that you have a roadmap in place to complete your project successfully.

      1 State Your Objectives

      The Purpose

      Define business-managed applications in your context.

      Identify your business-managed application objectives.

      State the value opportunities with business-managed applications.

      Key Benefits Achieved

      A consensus definition and list of business-managed applications goals

      Understanding of the business value business-managed applications can deliver

      Activities

      1.1 Define business-managed applications.

      1.2 List your objectives and metrics.

      1.3 State the value opportunities.

      Outputs

      Grounded definition of a business-managed application

      Goals and objectives of your business-managed applications

      Business value opportunity with business-managed applications

      2 Design Your Framework & Governance

      The Purpose

      Develop your application management framework.

      Tailor your application delivery and ownership structure to fit business-managed applications.

      Discuss the value of an applications committee.

      Discuss technologies to enable business-managed applications.

      Key Benefits Achieved

      Fit-for-purpose and repeatable application management selection framework

      Enhanced application governance model

      Applications committee design that meets your organization’s needs

      Shortlist of solutions to enable business-managed applications

      Activities

      2.1 Develop your management framework.

      2.2 Tune your delivery and ownership accountabilities.

      2.3 Design your applications committee.

      2.4 Uncover your solution needs.

      Outputs

      Tailored application management selection framework

      Roles definitions of application owners and managers

      Applications committee design

      List of business-managed application solution features and services

      3 Build Your Roadmap

      The Purpose

      Build your roadmap to implement busines-managed applications and build the foundations of your optimized governance model.

      Key Benefits Achieved

      Implementation initiatives

      Adoption roadmap

      Activities

      3.1 Build your roadmap.

      Outputs

      Business-managed application adoption roadmap


      Digital Data Ethics

      • Download01-Title: Tech Trend Update: If Digital Ethics Then Data Equity
      • Download-01: Visit Link
      • member rating overall impact (scale of 10): 9/10
      • member rating average dollars saved: N/A
      • member rating average days saved: N/A
      • Parent Category Name: Innovation
      • Parent Category Link: /innovation

      In the past two years, we've seen that we need quick technology solutions for acute issues. We quickly moved to homeworking and then to a hybrid form. We promptly moved many of our offline habits online.

      That necessitated a boost in data collection from us towards our customers and employees, and business partners.
      Are you sure how to approach this structurally? What is the right thing to do?

      Impact and Results

      • When you partner with another company, set clear expectations
      • When you are building your custom solution, invite constructive criticism
      • When you present yourself as the authority, consider the most vulnerable in the relationship

      innovation

      CIO Priorities 2022

      • Buy Link or Shortcode: {j2store}328|cart{/j2store}
      • member rating overall impact (scale of 10): 10.0/10 Overall Impact
      • member rating average dollars saved: $31,499 Average $ Saved
      • member rating average days saved: 9 Average Days Saved
      • Parent Category Name: Innovation
      • Parent Category Link: /innovation
      • Understand how to respond to trends affecting your organization.
      • Determine your priorities based on current state and relevant internal factors.
      • Assign the right amount of resources to accomplish your vision.
      • Consider what new challenges outside of your control will demand a response.

      Our Advice

      Critical Insight

      A priority is created when external factors hold strong synergy with internal goals and an organization responds by committing resources to either avert risk or seize opportunity. These are the priorities identified in the report:

      1. Reduce Friction in the Hybrid Operating Model
      2. Improve Your Ransomware Readiness
      3. Support an Employee-Centric Retention Strategy
      4. Design an Automation Platform
      5. Prepare to Report on New Environmental, Social, and Governance Metrics

      Impact and Result

      Update your strategic roadmap to include priorities that are critical and relevant for your organization based on a balance of external and internal factors.

      CIO Priorities 2022 Research & Tools

      Besides the small introduction, subscribers and consulting clients within this management domain have access to:

      1. CIO Priorities 2022 – A report on the key priorities for competing in the digital economy.

      Discover Info-Tech’s five priorities for CIOs in 2022.

      • CIO Priorities Report for 2022

      2. Listen to the podcast series

      Hear directly from our contributing experts as they discuss their case studies with Brian Jackson.

      • Frictionless hybrid working: How the Harvard Business School did it
      • Close call with ransomware: A CIO recounts a near security nightmare
      • How a financial services company dodged "The Great Resignation"
      • How Allianz took a blockchain platform from pilot to 1 million transactions
      • CVS Health chairman David Dorman on healthcare's hybrid future

      Infographic

      Further reading

      CIO Priorities 2022

      A jumble of business-related words. Info-Tech’s 2022 Tech Trends survey asked CIOs for their top three priorities. Cluster analysis of their open-ended responses shows four key themes:
      1. Business process improvements
      2. Digital transformation or modernization
      3. Security
      4. Supporting revenue growth or recovery

      Info-Tech’s annual CIO priorities are formed from proprietary primary data and consultation with our internal experts with CIO stature

      2022 Tech Trends Survey CIO Demographic N=123

      Info-Tech’s Tech Trends 2022 survey was conducted between August and September 2021 and collected a total of 475 responses from IT decision makers, 123 of which were at the C-level. Fourteen countries and 16 industries are represented in the survey.

      2022 IT Talent Trends Survey CIO Demographic N=44

      Info-Tech’s IT Talent Trends 2022 survey was conducted between September and October 2021 and collected a total of 245 responses from IT decision makers, 44 of which were at the C-level. A broad range of countries from around the world are represented in the survey.

      Internal CIO Panels’ 125 Years Of Combined C-Level IT Experience

      Panels of former CIOs at Info-Tech focused on interpreting tech trends data and relating it to client experiences. Panels were conducted between November 2021 and January 2022.

      CEO-CIO Alignment Survey Benchmark Completed By 107 Different Organizations

      Info-Tech’s CEO-CIO Alignment program helps CIOs align with their supervisors by asking the right questions to ensure that IT stays on the right path. It determines how IT can best support the business’ top priorities and address the gaps in your strategy. In 2021, the benchmark was formed by 107 different organizations.

      Build IT alignment

      IT Management & Governance Diagnostic Benchmark Completed By 320 Different Organizations

      Info-Tech’s Management and Governance Diagnostic helps IT departments assess their strengths and weaknesses, prioritize their processes and build an improvement roadmap, and establish clear ownership of IT processes. In 2021, the benchmark was formed by data from 320 different organizations.

      Assess your IT processes

      The CIO priorities are informed by Info-Tech’s trends research reports and surveys

      Priority: “The fact or condition of being regarded or treated as more important than others.” (Lexico/Oxford)

      Trend: “A general direction in which something is developing or changing.” (Lexico/Oxford)

      A sequence of processes beginning with 'Sensing', 'Hypothesis', 'Validation', and ending with 'Trends, 'Priorities'. Under Sensing is Technology Research, Interviews & Insights, Gathering, and PESTLE. Under Hypothesis is Near-Future Probabilities, Identify Patterns, Identify Uncertainties, and Identify Human Benefits. Under Validation is Test Hypothesis, Case Studies, and Data-Driven Insights. Under Trends is Technology, Talent, and Industry. Under Priorities is CIO, Applications, Infrastructure, and Security.

      Visit Info-Tech’s Trends & Priorities Research Center

      Image called 'Defining the CIO Priorities for 2022'. Image shows 4 columns, Implications, Resource Investment, Amplifiers, and Actions and Outcomes, with 2 dotted lines, labeled External Context and Internal Context, running through all 4 columns and leading to bottom-right label called CIO Priorities Formed

      The Five Priorities

      Priorities to compete in the digital economy

      1. Reduce Friction in the Hybrid Operating Model
      2. Improve Your Ransomware Readiness
      3. Support an Employee-Centric Retention Strategy
      4. Design an Automation Platform
      5. Prepare to Report on New Environmental, Social, and Governance Metrics

      Reduce friction in the hybrid operating model

      Priority 01 | APO07 Human Resources Management

      Deliver solutions that create equity between remote workers and office workers and make collaboration a joy.

      Hybrid work is here to stay

      CIOs must deal with new pain points related to friction of collaboration

      In 2020, CIOs adapted to the pandemic’s disruption to offices by investing in capabilities to enable remote work. With restrictions on gathering in offices, even digital laggards had to shift to an all-remote work model for non-essential workers.

      Most popular technologies already invested in to facilitate better collaboration

      • 24% Web Conferencing
      • 23% Instant Messaging
      • 20% Document Collaboration

      In 2022, the focus shifts to solving problems created by the new hybrid operating model where some employees are in the office and some are working remotely. Without the ease of collaborating in a central hub, technology can play a role in reducing friction in several areas:

      • Foster more connections between employees. Remote workers are less likely to collaborate with people outside of their department and less likely to spontaneously collaborate with their peers. CIOs should provide a digital employee experience that fosters collaboration habits and keeps workers engaged.
      • Prevent employee attrition. With more workers reevaluating their careers and leaving their jobs, CIOs can help employees feel connected to the overall purpose of the organization. Finding a way to maintain culture in the new context will require new solutions. While conference room technology can be a bane to IT departments, making hybrid meetings effortless to facilitate will be more important.
      • Provide new standards for mediated collaboration. Meeting isn’t as easy as simply gathering around the same table anymore. CIOs need to provide structure around how hybrid meetings are conducted to create equity between all participants. Business continuity processes must also consider potential outages for collaboration services so employees can continue the work despite a major outage.

      Three in four organizations have a “hybrid” approach to work. (Tech Trends 2022 Survey)

      In most organizations, a hybrid model is being implemented. Only 14.9% of organizations are planning for almost everyone to return to the office, and only 9.9% for almost everyone to work remotely.

      Elizabeth Clark

      CIO, Harvard Business School

      "I want to create experiences that are sticky. That keep people coming back and engaging with their colleagues."

      Photo of Elizabeth Clark, CIO, Harvard Business School.

      Listen to the Tech Insights podcast:
      Frictionless hybrid working: How the Harvard Business School did it

      Internal interpretation: Harvard Business School

      • March 2020
        The pandemic disrupts in-class education at Harvard Business School. Their case study method of instruction that depends on in-person, high-quality student engagement is at risk. While students and faculty completed the winter semester remotely, the Dean and administration make the goal to restore the integrity of the classroom experience with equity for both remote and in-person students.
      • May 2020
        A cross-functional task force of about 100 people work intensively, conducting seven formal experiments, 80 smaller tests, and hundreds of polling data points, and a technology and facilities solution is designed: two 4K video cameras capturing both the faculty and the in-class students, new ceiling mics, three 85-inch TV screens, and students joining the videoconference from their laptops. A custom Zoom room, combining three separate rooms, integrated all the elements in one place and integrated with the lecture capture system and learning management system.
      • October 2020
        Sixteen classrooms are renovated to install the new solution. Students return to the classroom but in lower numbers due to limits on in-room capacity, but students rotate between the in-person and remote experience.
      • September 2021
        Renovations for the hybrid solution are complete in 26 classrooms and HBS has determined this will be its standard model for the classroom. The case method of teaching is kept alive and faculty and students are thrilled with the results.
      • November 2021
        HBS is adapting its solution for the classroom to its conference rooms and has built out eight different rooms for a hybrid experience. The 4K cameras and TV screens capture all participants in high fidelity as well as the blackboard.

      Photo of a renovated classroom with Zoom participants integrated with the in-person students.
      The renovated classrooms integrate all students, whether they are participating remotely or in person. (Image courtesy of Harvard Business School.)

      Implications: Organization, Process, Technology

      External

      • Organization – About half of IT practitioners in the Tech Trends 2022 survey feel that IT leaders, infrastructure and operations teams, and security teams were “very busy” in 2021. Capacity to adapt to hybrid work could be constrained by these factors.
      • Process – Organizations that want employees to benefit from being back in the office will have to rethink how workers can get more value out of in-person meetings that also require videoconference participation with remote workers.
      • Technology – Fifty-four percent of surveyed IT practitioners say the pandemic raised IT spending compared to the projections they made in 2020. Much of that investment went into adapting to a remote work environment.

      Internal

      • Organization – HBS added 30 people to its IT staff on term appointments to develop and implement its hybrid classroom solutions. Hires included instructional designers, support technicians, coordinators, and project managers.
      • Process – Only 25 students out of the full capacity of 95 could be in the classroom due to COVID-19 regulations. On-campus students rotated through the classroom seats. An app was created to post last-minute seat availability to keep the class full.
      • Technology – A Zoom room was created that combines three rooms to provide the full classroom experience: a view of the instructor, a clear view of each student that enlarges when they are speaking, and a view of the blackboard.

      Resources Applied

      Appetite for Technology

      CIOs and their direct supervisors both ranked internal collaboration tools as being a “critical need to adopt” in 2021, according to Info-Tech’s CEO-CIO Alignment Benchmark Report.

      Intent to Invest

      Ninety-seven percent of IT practitioners plan to invest in technology to facilitate better collaboration between employees in the office and outside the office by the end of 2022, according to Info-Tech’s 2022 Tech Trends survey.

      “We got so many nice compliments, which you don’t get in IT all the time. You get all the complaints, but it’s a rare case when people are enthusiastic about something that was delivered.” (Elizabeth Clark, CIO, Harvard Business School)

      Harvard Business School

      • IT staff were reassigned from other projects to prioritize building a hybrid classroom solution. A cloud migration and other portfolio projects were put on pause.
      • The annual capital A/V investment was doubled. The amount of spend on conference rooms was tripled.
      • Employees were hired to the media services team at a time when other areas of the organization were frozen.

      Outcomes at Harvard Business School

      The new normal at Harvard Business School

      New normal: HBS has found its new default operating model for the classroom and is extending its solution to its operating environment.

      Improved CX: The high-quality experience for students has helped avoid attrition despite the challenges of the pandemic.

      Engaged employees: The IT team is also engaged and feels connected to the mission of the school.

      Photo of a custom Zoom room bringing together multiple view of the classroom as well as all remote students.
      A custom Zoom room brings together multiple different views of the classroom into one single experience for remote students. (Image courtesy of Harvard Business School.)

      From Priorities to Action

      Make hybrid collaboration a joy

      Align with your organization’s goals for collaboration and customer interaction, with the target of high satisfaction for both customers and employees. Invest in capital projects to improve the fidelity of conference rooms, develop and test a new way of working, and increase IT capacity to alleviate pressure points.

      Foster both asynchronous and synchronous collaboration approaches to avoid calendars filling up with videoconference meetings to get things done and to accommodate workers contributing from across different time zones.

      “We’ll always have hybrid now. It’s opened people’s eyes and now we’re thinking about the future state. What new markets could we explore?” (Elizabeth Clark, CIO, Harvard Business School)

      Take the next step

      Run Better Meetings
      Hybrid, virtual, or in person – set meeting best practices that support your desired meeting norms.

      Prepare People Leaders for the Hybrid Work Environment
      Set hybrid work up for success by providing people leaders with the tools they need to lead within the new model.

      Hoteling and Hot-Desking: A Primer
      What you need to know regarding facilities, IT infrastructure, maintenance, security, and vendor solutions for desk hoteling and hot-desking.

      “Human Resources Management” gap between importance and effectiveness
      Info-Tech Research Group Management and Governance Diagnostic Benchmark 2021

      A bar chart illustrating the Human Resources Management gap between importance and effectiveness. The difference is marked as Delta 2.3.

      Improve your ransomware readiness

      Priority 02 | APO13 Security Strategy

      Mitigate the damage of successful ransomware intrusions and make recovery as painless as possible.

      The ransomware crisis threatens every organization

      Prevention alone won’t be enough against the forces behind ransomware.

      Cybersecurity is always top of mind for CIOs but tends to be deprioritized due to other demands related to digital transformation or due to cost pressures. That’s the case when we examine our data for this report.

      Cybersecurity ranked as the fourth-most important priority by CIOs in Info-Tech’s 2022 Tech Trends survey, behind business process improvement, digital transformation, and modernization. Popular ways to prepare for a successful attack include creating offline backups, purchasing insurance, and deploying new solutions to eradicate ransomware.

      CIOs and their direct supervisors ranked “Manage IT-Related Security” as the third-most important top IT priority on Info-Tech’s CEO-CIO Alignment Benchmark for 2021, in support of business goals to manage risk, comply with external regulation, and ensure service continuity.

      Most popular ways for organizations to prepare for the event of a successful ransomware attack:

      • 25% Created offline backups
      • 18% Purchased cyberinsurance
      • 19% New tech to eradicate ransomware

      Whatever priority an organization places on cybersecurity, when ransomware strikes, it quickly becomes a red alert scenario that disrupts normal operations and requires all hands on deck to respond. Sophisticated attacks executed at wide scale demonstrate that security can be bypassed without creating an alert. After that’s accomplished, the perpetrators build their leverage by exfiltrating data and encrypting critical systems.

      CIOs can plan to mitigate ransomware attacks in several constructive ways:

      • Business impact analysis. Determine the costs of an outage for specific periods and the system and data recovery points in time.
      • Engage a partner for 24/7 monitoring. Gain real-time awareness of your critical systems.
      • Review your identity access management (IAM) policies. Use of multi-factor authentication and limiting access to only the roles that need it reduces ransomware risk.

      50% of all organizations spent time and money specifically to prevent ransomware in the past year. (Info-Tech Tech Trends 2022 Survey)

      John Doe

      CIO, mid-sized manufacturing firm in the US

      "I want to create experiences that are sticky. That keep people coming back and engaging with their colleagues."

      Blank photo.

      Listen to the Tech Insights podcast:
      Close call with ransomware: a CIO recounts a near security nightmare

      Internal interpretation: US-based, mid-sized manufacturing firm

      • May 1, 2021
        A mid-sized manufacturing firm (“The Firm”) CIO gets a call from his head of security about odd things happening on the network. A call is made to Microsoft for support. Later that night, the report is that an unwanted crypto-mining application is the culprit. But a couple of hours later, that assessment is proven wrong when it’s realized that hundreds of systems are staged for a ransomware attack. All the attacker has to do is push the button.
      • May 2, 2021
        The Firm disconnects all its global sites to cut off new pathways for the malware to infect. All normal operations cease for 24 hours. It launches its cybersecurity insurance process. The CIO engages a new security vendor, CrowdStrike, to help respond. Employees begin working from home if they can so they can make use of their own internet service. The Firm has cut off its public internet connectivity and is severed from cloud services such as Azure storage and collaboration software.
      • May 4, 2021
        The hackers behind the attack are revealed by security forensics experts. A state-sponsored agency in Russia set up the ransomware and left it ready to execute. It sold the staged attack to a cybercriminal group, Doppel Spider. According to CrowdStrike, the group uses malware to run “big game hunting operations” and targets 18 different countries including the US and multiple industries, including manufacturing.
      • May 10, 2021
        The Firm has totally recovered from the ransomware incident and avoided any serious breach or paying a ransom. The CIO worked more hours than at any other point in his career, logging an estimated 130 hours over the two weeks.
      • November 2021
        The Firm never previously considered itself a ransomware target but has now reevaluated that stance. It has hired a service provider to run a security operations center on a 24/7 basis. It's implemented a more sophisticated detection and response model and implemented multi-factor authentication. It’s doubled its security spend in 2021 and will invest more in 2022.

      “Now we take the approach that if someone does get in, we're going to find them out.” (John Doe, CIO, “The Firm”)

      Implications: Organization, Process, Technology

      External

      • Organization – Organizations must consider how their employees play a role in preventing ransomware and plan for training to recognize phishing and other common traps. They must make plans for employees to continue their work if systems are disrupted by ransomware.
      • Process – Backup processes across multiple systems should be harmonized to have both recent and common points to recover from. Work with the understanding IT will have to take systems offline if ransomware is discovered and there is no time to ask for permission.
      • Technology – Organizations can benefit from security services provided by a forensics-focused vendor. Putting cybersecurity insurance in place not only provides financial protection but also guidance in what to do and which vendors to work with to prevent and recover from ransomware.

      Internal

      • Organization – The Firm was prepared with a business continuity plan to allow many of its employees to work remotely, which was necessary because the office network was incapacitated for ten days during recovery.
      • Process – Executives didn’t seek to assign blame for the security incident but took it as a signal there were some new costs involved to stay in business. It initiated new outsource relationships and hired one more full-time employee to shore up security resources.
      • Technology – New ransomware eradication software was deployed to 2,000 computers. Scripted processes automated much of the work, but in some cases full system rebuilds were required. Backup systems were disconnected from the network as soon as the malware was discovered.

      Resources Applied

      Consider the Alternative

      Organizations should consider how much a ransomware attack on critical systems would cost them if they were down for a minimum of 24-48 hours. Plan to invest an amount at least equal to the costs of that downtime.

      Ask for ID

      Implementing across-the-board multi-factor authentication reduces chances of infection and is cheap, with enterprise solutions ranging from $2 to $5 per user on average. Be strict and deny access when connections don’t authenticate.

      “You'll never stop everything from getting into the network. You can still focus on stopping the bad actors, but then if they do make it in, make sure they don't get far.” (John Doe, CIO, “The Firm”)

      “The Firm” (Mid-Sized Manufacturer)

      • During the crisis, The Firm paused all activities and focused solely on isolating and eliminating the ransomware threat.
      • New outsourcing relationship with a vendor provides a 24/7 Security Operations Center.
      • One more full-time employee on the security team.
      • Doubled investment in security in 2021 and will spend more in 2022.

      Outcomes at “The Firm” (Mid-Sized Manufacturer)

      The new cost of doing business

      Real-time security: While The Firm is still investing in prevention-based security, it is also developing its real-time detection and response capabilities. When ransomware makes it through the cracks, it wants to know as soon as possible and stop it.

      Leadership commitment: The C-suite is taking the experience as a wake-up call that more investment is required in today’s threat landscape. The Firm rates security more highly as an overall organizational goal, not just something for IT to worry about.

      Stock photo of someone using their phone while sitting at a computer, implying multi-factor authentication.
      The Firm now uses multi-factor authentication as part of its employee sign-on process. For employees, authenticating is commonly achieved by using a mobile app that receives a secret code from the issuer.

      From Priorities to Action

      Cybersecurity is everyone’s responsibility

      In Info-Tech’s CEO-CIO Alignment Benchmark for 2021, the business goal of “Manage Risk” was the single biggest point of disagreement between CIOs and their direct supervisors. CIOs rank it as the second-most important business goal, while CEOs rank it as sixth-most important.

      Organizations should align on managing risk as a top priority given the severity of the ransomware threat. The threat actors and nature of the attacks are such that top leadership must prepare for when ransomware hits. This includes halting operations quickly to contain damage, engaging third-party security forensics experts, and coordinating with government regulators.

      Cybersecurity strategies may be challenged to be effective without creating some friction for users. Organizations should look beyond multi-layer prevention strategies and lean toward quick detection and response, spending evenly across prevention, detection, and response solutions.

      Take the next step

      Create a Ransomware Incident Response Plan
      Don’t be the next headline. Determine your current readiness, response plan, and projects to close gaps.

      Simplify Identity and Access Management
      Select and implement IAM and produce vendor RFPs that will contain the capabilities you need, including multi-factor authentication.

      Cybersecurity Series Featuring Sandy Silk
      More from Info-Tech’s Senior Workshop Director Sandy Silk in this video series created while she was still at Harvard University.

      Gap between CIOs and CEOs in points allocated to “Manage risk” as a top business goal

      A bar chart illustrating the gap between CIOs and CEOs in points allocated to 'Manage risk' as a top business goal. The difference is marked as Delta 1.5.

      Support an employee-centric retention strategy

      Priority 03 | ITRG02 Leadership, Culture & Values

      Avoid being a victim of “The Great Resignation” by putting employees at the center of an experience that will engage them with clear career path development, purposeful work, and transparent feedback.

      Defining an employee-first culture that improves retention

      The Great resignation isn’t good for firms

      In 2021, many workers decided to leave their jobs. Working contexts were disrupted by the pandemic and that saw non-essential workers sent home to work, while essential workers were asked to continue to come into work despite the risks of COVID-19. These disruptions may have contributed to many workers reevaluating their professional goals and weighing their values differently. At the same time, 2021 saw a surging economy and many new job opportunities to create a talent-hungry market. Many workers could have been motivated to take a new opportunity to increase their salary or receive other benefits such as more flexibility.

      Annual turnover rate for all us employees on the rise

      • 20% – Jan.-Aug. 2020, Dipped from 22% in 2019
      • 25% Jan.-Aug. 2021, New record high
      • Data from Visier Inc.

      When you can’t pay them, develop them

      IT may be less affected than other departments by this trend. Info-Tech’s 2022 IT Talent Trends Report shows that on average, estimated turnover rate in IT is lower than the rest of the organization. Almost half of respondents estimated their organization’s voluntary turnover rate was 10% or higher. Only 30% of respondents estimate that IT’s voluntary turnover rate is in the same range. However, CIOs working in industries with the highest turnover rates will have to work to keep their workers engaged and satisfied, as IT skills are easily transferred to other industries.

      49% ranked “enabling learning & development within IT” as high priority, more than any other single challenge. (IT Talent Trends 2022 Survey, N=227)

      A bar chart of 'Industries with highest turnover rates (%)' with 'Leisure and Hospitality' at 6.4%, 'Trade, Transportation & Utilities' at 3.6%, 'Professional and Business' at 3.3%, and 'Other Services' at 3.1%. U.S. Bureau of Labor Statistics, 2022.

      Jeff Previte

      Executive Vice-President of IT, CrossCountry Mortgage

      “We have to get to know the individual at a personal level … Not just talking about the business, but getting to know the person."

      Photo of Jeff Previte, Executive Vice-President of IT, CrossCountry Mortgage.

      Listen to the Tech Insights podcast:
      How a financial services company dodged ‘The Great Resignation’

      Internal interpretation: CrossCountry Mortgage

      • May 2019
        Jeff Previte joins Cleveland, Ohio-based CrossCountry Mortgage in the CIO role. The company faces a challenge with employee turnover, particularly in IT. The firm is a sales-focused organization and saw its turnover rate reach as high as 60%. Yet Previte recognized that IT had some meaningful goals to achieve and would need to attract – and retain – some higher caliber talent. His first objective in his new role was to meet with IT employees and business leadership to set priorities.
      • July 2019
        Previte takes a “people-first” approach to leadership and meets his staff face-to-face to understand their personal situations. He sets to work on defining roles and responsibilities in the organization, spending about a fifth of his time on defining the strategy.
      • June 2020
        Previte assigned his leadership team to McLean & Company’s Design an Impactful Employee Development Program. From there, the team developed a Salesforce tool called the Career Development Workbook. “We had some very passionate developers and admins that wanted to build a home-grown tool,” he says. It turns McLean & Company’s process into a digital tool employees can use to reflect on their careers and explore their next steps. It helps facilitate development conversations with managers.
      • January 2021
        CrossCountry Mortgage changes its approach to career development activities. Going to external conferences and training courses is reduced to just 30% of that effort. The rest is by doing hands-on work at the company. Previte aligned with his executives and road-mapped IT projects annually. Based on employee’s interests, opportunities are found to carve out time from usual day-to-day activities to spend time on a project in a new area. When there’s a business need, someone internally can be ready to transition roles.
      • June 2021
        In the two years since joining the company, Previte has reduced the turnover rate to just 12%. The IT department has grown to more adequately meet the needs of the business and employees are engaged with more opportunities to develop their careers. Instead of focusing on compensation, Previte focused more on engaging employees with a developmentally dedicated environment and continuous hands-on learning.

      “It’s come down to a culture shift. Folks have an idea of where we’re headed as an organization, where we’re headed as an IT team, and how their role contributes to that.” (Jeff Previte, EVP of IT, CrossCountry Mortgage)

      Implications: Organization, Process, Technology

      External

      • Organization – A high priority is being placed on improving IT’s maturity through its talent. Enabling learning and development in IT, enabling departmental innovation, and recruiting are the top three highest priorities according to IT Talent Trends 2022 survey responses.
      • Process – Recruiting is more challenging for industries that operate primarily onsite, according to McLean & Company's 2022 HR Trends Report. They face more challenges attracting applications, more rejected offers, and more candidate ghosting compared to remote-capable industries.
      • Technology – Providing a great employee experience through digital tools is more important as many organizations see a mix of workers in the office and at home. These tools can help connect colleagues, foster professional development, and improve the candidate experience.

      Internal

      • Organization – CrossCountry Mortgage faced a situation where IT employees did not have clarity on their roles and responsibilities. In terms of salary, it wasn’t offering at the high end compared to other employers in Cleveland.
      • Process – To foster a culture of growth and development, CrossCountry Mortgage put in place a performance assessment system that encouraged reflection and goal setting, aided by collaboration with a manager.
      • Technology – The high turnover rate was limiting CrossCountry Mortgage from achieving the level of maturity it needed to support the company’s goals. It ingrained its new PA process with a custom build of a Salesforce tool.

      Resources Applied

      Show me the money

      Almost six in ten Talent Trends survey respondents identified salary and compensation as the reason that employees resigned in the past year. Organizations looking to engage employees must first pay a fair salary according to market and industry conditions.

      Build me up

      Professional development and opportunity for innovative work are the next two most common reasons for resignations. Organizations must ensure they create enough capacity to allow workers time to spend on development.

      “Building our own solution created an element of engagement. There was a sense of ownership that the team had in thinking through this.” (Jeff Previte, CrossCountry Mortgage)

      CrossCountry Mortgage

      • Executive time: CIO spends 10-20% of his time on activities related to designing the approach.
      • Leveraged memberships with Info-Tech Research Group and McLean & Company to define professional development process.
      • Internal IT develops automated workflow in Salesforce.
      • Hired additional IT staff to build out overall capacity and create time for development activities.

      Outcomes at CrossCountry Mortgage

      Engaged IT workforce

      The Great Maturation: IT staff turnover rate dropped to 10-12% and IT talent is developing on the job to improve the department’s overall skill level. More IT staff on hand and more engaged workers mean IT can deliver higher maturity level results.

      Alignment achieved: Connecting IT’s initiatives to the vision of the C-suite creates a clear purpose for IT in its initiatives. Staff understand what they need to achieve to progress their careers and can grow while they work.

      Photo of employees from CrossCountry Mortgage assisting with a distribution event.
      Employees from CrossCountry Mortgage headquarters assist with a drive-thru distribution event for the Cleveland Food Bank on Dec. 17, 2021. (Image courtesy of CrossCountry Mortgage.)

      From Priorities to Action

      Staff retention is a leadership priority

      The Great Resignation trend is bringing attention to employee engagement and staff retention. IT departments are busier than ever during the pandemic as they work overtime to keep up with a remote workforce and new security threats. At the same time, IT talent is among the most coveted on the market.

      CIOs need to develop a people-first approach to improve the employee experience. Beyond compensation, IT workers need clarity in terms of their career paths, a direct connection between their work and the goals of the organization, and time set aside for professional development.

      Info-Tech’s 2021 benchmark for “Leadership, Culture & Values” shows that most organizations rate this capability very highly (9) but see room to improve on their effectiveness (6.9).

      Take the next step

      IT Talent Trends 2022
      See how IT talent trends are shifting through the pandemic and understand how themes like The Great Resignation has impacted IT.

      McLean & Company’s Modernize Performance Management
      Customize the building blocks of performance management to best fit organizational needs to impact individual and organizational performance, productivity, and engagement.

      Redesign Your IT Organizational Structure
      Define future-state work units, roles, and responsibilities that will enable the IT organization to complete the work that needs to be done.

      “Leadership, Culture & Values” gap between importance and effectiveness
      Info-Tech Research Group Management and Governance Diagnostic Benchmark 2021

      A bar chart illustrating the 'Leadership, Culture & Values' gap between importance and effectiveness. The difference is marked as Delta 2.1.

      Design an automation platform

      Priority 04 | APO04 Innovation

      Position yourself to buy or build a platform that will enable new automation opportunities through seamless integration.

      Build it or buy it, but platform integration can yield great benefits

      Necessity is the mother of innovation

      When it’s said that digital transformation accelerated during the pandemic, what’s really meant is that processes that were formerly done manually became automated through software. In responses to the Tech Trends survey, CIOs say digital transformation was more of a focus during the pandemic, and eight in ten CIOs also say they shifted more than 20% of their organization’s processes to digital during the pandemic. Automating tasks through software can be called digitalization.

      Most organizations became more digitalized during the pandemic. But how they pursued it depends on their IT maturity. For digital laggards, partnering with a technology services platform is the path of least resistance. For sophisticated innovators, they can consider building a platform to address the specific needs of their business process. Doing so requires the foundation of an existing “digital factory” or innovation arm where new technologies can be tested, proofs of concept developed, and external partnerships formed. Patience is key with these efforts, as not every investment will yield immediate returns and some will fail outright.

      Build it or buy it, platform participants integrate with their existing systems through application programming interfaces (APIs). Organizations should determine their platform strategies based on maturity, then look to integrate the business processes that will yield the most gains.

      What role should you play in the platform ecosystem?

      A table with levels on the maturity ladder laid out as a sprint. Column headers are maturity levels 'Struggle', 'Support', 'Optimize', 'Expand', and 'Transform', row headers are 'Maturity' and 'Role'. Roles are assigned to one or many levels. 'Improve' is solely under Struggle. 'Integrate' spans from Support to Transform. 'Buy' spans Support to Expand. 'Build' begins midway through Expand and all of Transform. 'Partner' spans from Optimize to halfway through Transform.

      68% of CIOs say digital transformation became much more of a focus for their organization during the pandemic (Info-Tech Tech Trends 2022 Survey)

      Bob Crozier

      Chief Architect, Allianz Technology & Global Head of Blockchain, Allianz Technology SE

      "Smart contracts are really just workflows between counterparties."

      Photo of Bob Crozier, Chief Architect, Allianz Technology & Global Head of Blockchain, Allianz Technology SE.

      Listen to the Tech Insights podcast:
      How Allianz took a blockchain platform from pilot to 1 million transactions

      Internal interpretation: Allianz Technology

      • 2015
        After smart contracts are demonstrated on the Ethereum blockchain, Allianz and other insurers recognize the business value. There is potential to use the capability to administer a complex, multi-party contract where the presence of the reinsurer in the risk transfer ecosystem is required. Manual contracts could be turned into code and automated. Allianz organized an early proof of concept around a theoretical pandemic excessive loss contract.
      • 2018
        Allianz Chief Architect Bob Crozier is leading the Global Blockchain Center of Competence for Allianz. They educate Allianz on the value of blockchain for business. They also partner with a joint venture between the Technology University of Munich and the state of Bavaria. A cohort of Masters students is looking for real business problems to solve with open-source distributed ledger technology. Allianz puts its problem statement in front of the group. A student team presents a proof of concept for an international motor insurance claims settlement and it comes in second place at a pitch day competition.
      • 2019
        Allianz brings the concept back in-house, and its business leaders return to the concept. Startup Luther Systems is engaged to build a minimum-viable product for the solution, with the goal being a pilot involving three or four subsidiaries in different countries. The Blockchain Center begins communicating with 25 Allianz subsidiaries that will eventually deploy the platform.
      • 2020
        Allianz is in build mode on its international motor insurance claims platform. It leverages its internal Dev/SecOps teams based in Munich and in India.
      • May 2021
        Allianz goes live with its new platform on May 17, decommissioning its old system and migrating all live claims data onto the new blockchain platform. It sees 400 concurrent users go live across Europe.
      • January 2022
        Allianz mines its one-millionth block to its ledger on Jan. 19, with each block representing a peer-to-peer transaction across its 25 subsidiaries in different countries. The platform has settled hundreds of millions of dollars.

      Stock photo of two people arguing over a car crash.

      Implications: Organization, Process, Technology

      External

      • Organization – To explore emerging technologies like blockchain, organizations need staff that are accountable for innovation and have leeway to develop proofs of concept. External partners are often required to bring in fresh ideas and move quickly towards an MVP.
      • Process – According to the Tech Trends 2022 survey, 84% of CIOs consider automation a high-value digital capability, and 77% say identity verification is a high-value capability. A blockchain platform using smart contracts can deliver those.
      • Technology – The Linux Foundation’s Hyperledger Fabric is an open-source blockchain technology that’s become popular in the financial industry for its method of forming consensus and its modular architecture. It’s been adopted by USAA, MasterCard, and PayPal. It also underpins the IBM Blockchain Platform and is supported by Azure Blockchain.

      Internal

      • Organization – Allianz is a holding company that owns Allianz Technology and 25 operating entities across Europe. It uses the technology arm to innovate on the business process and creates shared platforms that its entities can integrate with to automate across the value chain.
      • Process – Initial interest in smart contracts on blockchain were funneled into a student competition, where a proof of concept was developed. Allianz partnered with a startup to develop an MVP, then developed the platform while aligning with its business units ahead of launch.
      • Technology – Allianz built its blockchain platform on Hyperledger Fabric because it was a permissioned system, unlike other public permissionless blockchains such as Ethereum, and because its mining mechanism was much more energy efficient compared to other blockchains using Proof of Work consensus models.

      Resources Applied

      Time to innovate

      Exploring emerging technology for potential use cases is difficult for staff tasked with running day-to-day operations. Organizations serious about innovation create a separate team that can focus on “moonshot” projects and connect with external partners.

      Long-term ROI

      Automation of new business processes often requires a high upfront initial investment for a long-term efficiency gain. A proof of concept should demonstrate clear business value that can be repeated often and for a long period.

      “My next project has to deliver in the tens of millions of value in return. The bar is high and that’s what it should be for a business of our size.” (Bob Crozier, Allianz)

      Allianz

      • Several operating entities from different countries supplied subject matter expertise and helped with the testing process.
      • Allianz Technology team has eight staff members. It is augmented by Luther Systems and the team at industry group B3i.
      • Funding of less than $5 million to develop. Dev team continues to add improvements.
      • Operating requires just one full-time employee plus infrastructure costs, mostly for public cloud hosting.

      Outcomes at Allianz

      From insurer to platform provider

      Deliver your own SaaS: Allianz Technology built its blockchain-based claims settlement platform and its subsidiaries consume it as software as a service. The platform runs on a distributed architecture across Europe, with each node running the same version of the software. Operating entities can also integrate their own systems to the platform via APIs and further automate business processes such as billing.

      Ready to scale: After processing one million transactions, the international claims settlement platform is proven and ready to add more participants. Crozier sees auto repair shops and auto manufacturers as the next logical users.

      Stock photo of Blockchain.
      Allianz is a shareholder of the Blockchain Insurance Industry Initiative (B3i). It is providing a platform used by a group of insurance companies in the commercial and reinsurance space.

      When should we use blockchain? THREE key criteria:

      • Redundant processes
        Different entities follow the same process to achieve the desired outcome.
      • Audit trail
        Accountability in the decision making must be documented.
      • Reconciliation
        Parties need to be able to resolve disputes by tracing back to the truth.

      From Priorities to Action

      It’s a build vs. buy question for platforms

      Allianz was able to build a platform for its group of European subsidiaries because of its established digital factory and commitment to innovation. Allianz Technology is at the “innovate” level of IT maturity, allowing it to create a platform that subsidiaries can integrate with via APIs. For firms that are lower on the IT maturity scale, buying a platform solution is the better path to automation. These firms will be concerned with integrating their legacy systems to platforms that can reduce the friction of their operating environments and introduce modern new capabilities.

      From Info-Tech’s Build a Winning Business Process Automation Playbook

      An infographic comparing pros and cons of Build versus Buy. On the 'Build: High Delivery Capacity & Capability' side is 'Custom Development', 'Data Integration', 'AI/ML', 'Configuration', 'Native Workflow', and 'Low & No Code'. On the 'Buy: Low Delivery Capacity & Capability' side is 'Outsource Development', 'iPaaS', 'Chatbots', 'iBPMS & Rules Engines', 'RPA', and 'Point Solutions'.

      Take the next step

      Accelerate Your Automation Processes
      Integrate automation solutions and take the first steps to building an automation suite.

      Build Effective Enterprise Integration on the Back of Business Process
      From the backend to the frontlines – let enterprise integration help your business processes fly.

      Evolve Your Business Through Innovation
      Innovation teams are tasked with the responsibility of ensuring that their organizations are in the best position to succeed while the world is in a period of turmoil, chaos, and uncertainty.

      “Innovation” gap between importance and effectiveness Info-Tech Research Group Management and Governance Diagnostic Benchmark 2021

      A bar chart illustrating the 'Innovation' gap between importance and effectiveness. The difference is marked as Delta 2.1.

      Prepare to report on new environmental, social, and governance (ESG) metrics

      Priority 05 | ITRG06 Business Intelligence and Reporting

      Be ready to either lead or support initiatives to meet the criteria of new ESG reporting mandates and work toward disclosure reporting solutions.

      Time to get serious about ESG

      What does CSR or ESG mean to a CIO?

      Humans are putting increasing pressure on the planet’s natural environment and creating catastrophic risks as a result. Efforts to mitigate these risks have been underway for the past 30 years, but in the decade ahead regulators are likely to impose more strict requirements that will be linked to the financial value of an organization. Various voluntary frameworks exist for reporting on environmental, social, and governance (ESG) or corporate social responsibility (CSR) metrics. But now there are efforts underway to unify and clarify those standards.

      The most advanced effort toward a global set of standards is in the environmental area. At the United Nations’ COP26 summit in Scotland last November, the International Sustainability Standards Board (ISSB) announced its headquarters (Frankfurt) and three other international office locations (Montreal, San Francisco, and London) and its roadmap for public consultations. It is working with an array of voluntary standards groups toward a consensus.

      In Info-Tech’s 2022 Tech Trends survey, two-thirds of CIOs say their organization is committed to reducing greenhouse gas emissions, yet only 40% say their organizational leadership is very concerned with reducing those emissions. CIOs will need to consider how to align organizational concern with internal commitments and new regulatory pressures. They may investigate new real-time reporting solutions that could serve as a competitive differentiator on ESG.

      Standards informing the ISSB’s global set of climate standards

      A row of logos of organizations that inform ISSB's global set of climate standards.

      67% of CIOs say their organization is committed to reducing greenhouse gases, with one-third saying that commitment is public. (Info-Tech Tech Trends 2022 Survey)

      40% of CIOs say their organizational leadership is very concerned with reducing greenhouse gas emissions.

      David W. Dorman

      Chairman of the board, CVS Health

      “ESG is a question of what you do in the microcosm of your company to make sure there is a clear, level playing field – that there is a color-blind, gender-blind meritocracy available – that you are aware that not in every case can you achieve that without really focusing on it. It’s not going to happen on its own. That’s why our commitments have real dollars behind them and real focus behind them because we want to be the very best at doing them.”

      Photo of David W. Dorman, Chairman of the Board, CVS Health.

      Listen to the Tech Insights podcast:
      CVS Health chairman David Dorman on healthcare's hybrid future

      Internal interpretation: CVS Health

      CVS Health established a new steering committee of senior leaders in 2020 to oversee ESG commitments. It designs its corporate social responsibility strategy, Transform Health 2030, by aligning company activities in four key areas: healthy people, healthy business, healthy planet, and healthy community. The strategy aligns with the United Nations’ Sustainable Development Goals. In alignment with these goals, CVS identifies material topics where the company has the most ability to make an impact. In 2020, its top three topics were:

      1. Access to quality health care
      2. Patient and customer safety
      3. Data protection and privacy
      Material Topic
      Access to quality health care
      Material Topic
      Patient and customer safety
      Material Topic
      Data protection and privacy
      Technology Initiative
      MinuteClinic’s Virtual Collaboration for Nurses

      CVS provided Apple iPads compliant with the Health Insurance Portability and Accountability Act (HIPAA) to clinics in a phased approach, providing training to more than 700 providers in 26 states by February 2021. Nurses could use the iPads to attend virtual morning huddles and access clinical education. Nurses could connect virtually with other healthcare experts to collaborate on delivering patient care in real-time. The project was able to scale across the country through a $50,000 American Nurses Credentialing Center Pathway Award. (Wolters Kluwer Health, Inc.)

      Technology Initiative
      MinuteClinic’s E-Clinic

      MinuteClinics launched this telehealth solution in response to the pandemic, rolling it out in three weeks. The solution complemented video visits delivered in partnership with the Teladoc platform. Visits cost $59 and are covered by Aetna insurance plans, a subsidiary of CVS Health. It hosted more than 20,000 E-Clinic visits through the end of 2020. CVS connected its HealthHUBs to the solution to increase capacity in place of walk-in appointments and managed patients via phone for medication adherence and care plans. CVS also helped behavioral health providers transition patients to virtual visits. (CVS Health)

      Technology Initiative
      Next Generation Authentication Platform

      CVS patented this solution to authenticate customers accessing digital channels. It makes use of the available biometrics data and contextual information to validate identity without the need for a password. CVS planned to extend the platform to voice channels as well, using voiceprint technology. The solution prevents unauthorized access to sensitive health data while providing seamless access for customers. (LinkedIn)

      Implications: Organization, Process, Technology

      External

      • Organization – Since the mid-2010s, younger investors have demonstrated reliance on ESG data when making investment decisions, resulting in the creation of voluntary standards that offered varied approaches. Organizations in ESG exchange-traded funds are outperforming the overall S&P 500 (S&P Global Market Intelligence).
      • Process – Organizations are issuing ESG reports today despite the absence of clear rules to follow for reporting results. With regulators expected to step in to establish more rigid guidelines, many organizations will need to revisit their approach to ESG reports.
      • Technology – Real-time reporting of ESG metrics will become a competitive advantage before 2030. Engineering a solution that can alert organizations to poor performance on ESG measures and allow them to respond could avert losing market value.

      Internal

      • Organization – CVS Health established an ESG Steering Committee in 2020 composed of senior leaders including its chief governance officers, chief sustainability officer, chief risk officer, and controller and SVP of investor relations. It is supported by the ESG Operating Committee.
      • Process – CVS conducts a materiality assessment in accordance with Global Reporting Initiative standards to determine the most significant ESG impacts it can make and what topics most influence the decisions of stakeholders. It engages with various stakeholder groups on CSR topics.
      • Technology – CVS technology initiatives during the pandemic focused on supporting patients and employees in collaborating on health care delivery using virtual solutions, providing rich digital experiences that are easily accessible while upholding high security and privacy standards.

      Resources Applied

      Lack of commitment

      While 83% of businesses state support for the Sustainable Development Goals outlined by the Global Reporting Initiative (GRI), only 40% make measurable commitments to their goals.

      Show your work

      The GRI recommends organizations not only align their activities with sustainable development goals but also demonstrate contributions to specific targets in reporting on the positive actions they carry out. (GRI, “State of Progress: Business Contributions to the SDGS.”)

      “We end up with a longstanding commitment to diversity because that’s what our customer base looks like.” (David Dorman, CVS Health)

      CVS Health

      • The MinuteClinic Virtual Collaboration solution was piloted in Houston, demonstrated success, and won additional $50,000 funding from the Pathway to Excellence Award to scale the program across the country (Wolters Kluwer Health, Inc.).
      • The Next-Gen Authentication solution is provided by the vendor HYPR. It is deployed to ten million users and looking to scale to 30 million more. Pricing for enterprises is quoted at $1 per user, but volume pricing would apply to CVS (HYPR).

      Outcomes at CVS Health

      Delivering on hybrid healthcare solutions

      iPads for collaboration: Healthcare practitioners in the MinuteClinic Virtual Collaboration initiative agreed that it improved the use of interprofessional teams, working well virtually with others, and improved access to professional resources (Wolters Kluwer Health, Inc.)

      Remote healthcare: Saw a 400% increase in MinuteClinic virtual visits in 2020 (CVS Health).

      Verified ID: The Next Generation Authentication platform allowed customers to register for a COVID-19 vaccination appointment. CVS has delivered more than 50 million vaccines (LinkedIn).

      Stock photo of a doctor with an iPad.
      CVS Health is making use of digital channels to connect its customers and health practitioners to a services platform that can supplement visits to a retail or clinic location to receive diagnostics and first-hand care.

      From Priorities to Action

      Become your organization’s ESG Expert

      The risks posed to organizations and wider society are becoming more severe, driving a transition from voluntary frameworks for ESG goals to a mandatory one that’s enforced by investors and governments. Organizations will be expected to tie their core activities to a defined set of ESG goals and maintain a balance sheet of their positive and negative impacts. CIOs should become experts in ESG disclosure requirements and recommend the steps needed to meet or exceed competitors’ efforts. If a leadership vacuum for ESG accountability exists, CIOs can either seek to support their peers that are likely to become accountable or take a leadership role in overseeing the area. CIOs should start working toward solutions that deliver real-time reporting on ESG goals to make reporting frictionless.

      “If you don’t have ESG oversight at the highest levels of the company, it won’t wind up getting the focus. That’s why we review it at the Board multiple times per year. We have an annual report, we compare how we did, what we intended to do, where did we fall short, where did we exceed, and where we can run for daylight to do more.” (David Dorman, CVS Health)

      Take the next step

      ESG Disclosures: How Will We Record Status Updates on the World We Are Creating?
      Prepare for the era of mandated environmental, social, and governance disclosures.

      Private Equity and Venture Capital Growing Impact of ESG Report
      Learn about how the growing impact of ESG affects both your organization and IT specifically, including challenges and opportunities, with expert assistance.

      “Business Intelligence and Reporting” gap between importance and effectiveness
      Info-Tech Research Group Management and Governance Diagnostic Benchmark 2021

      A bar chart illustrating the 'BI and Reporting' gap between importance and effectiveness. The difference is marked as Delta 2.4.

      The Five Priorities

      Priorities to compete in the digital economy

      1. Reduce Friction in the Hybrid Operating Model
      2. Improve Your Ransomware Readiness
      3. Support an Employee-Centric Retention Strategy
      4. Design an Automation Platform
      5. Prepare to Report on New Environmental, Social, and Governance Metrics

      Contributing Experts

      Elizabeth Clark

      CIO, Harvard Business School
      Photo of Elizabeth Clark, CIO, Harvard Business School.

      Jeff Previte

      Executive Vice-President of IT, CrossCountry Mortgage
      Photo of Jeff Previte, Executive Vice-President of IT, CrossCountry Mortgage.

      Bob Crozier

      Chief Architect, Allianz Technology & Global Head of Blockchain, Allianz Technology SE
      Photo of Bob Crozier, Chief Architect, Allianz Technology & Global Head of Blockchain, Allianz Technology SE.

      David W. Dorman

      Chairman of the Board, CVS Health
      Photo of David W. Dorman, Chairman of the Board, CVS Health.

      Info-Tech’s internal CIO panel contributors

      • Bryan Tutor
      • John Kemp
      • Mike Schembri
      • Janice Clatterbuck
      • Sandy Silk
      • Sallie Wright
      • David Wallace
      • Ken McGee
      • Mike Tweedie
      • Cole Cioran
      • Kevin Tucker
      • Angelina Atkins
      • Yakov Kofner
      Photo of an internal CIO panel contributor. Photo of an internal CIO panel contributor.Photo of an internal CIO panel contributor.
      Photo of an internal CIO panel contributor.Photo of an internal CIO panel contributor.Photo of an internal CIO panel contributor.Photo of an internal CIO panel contributor.
      Photo of an internal CIO panel contributor.Photo of an internal CIO panel contributor.Photo of an internal CIO panel contributor.

      Thank you for your support

      Logo for the Blockchain Research Institute.
      Blockchain Research Institute

      Bibliography – CIO Priorities 2022

      “2020 Corporate Social Responsibility Report.” CVS Health, 2020, p. 127. Web.

      “Adversary: Doppel Spider - Threat Actor.” Crowdstrike Adversary Universe, 2021. Accessed 29 Dec. 2021.

      “Aetna CVS Health Success Story.” HYPR, n.d. Accessed 6 Feb. 2022.

      Baig, Aamer. “The CIO agenda for the next 12 months: Six make-or-break priorities.” McKinsey Digital, 1 Nov. 2021. Web.

      Ball, Sarah, Kristene Diggins, Nairobi Martindale, Angela Patterson, Anne M. Pohnert, Jacinta Thomas, Tammy Todd, and Melissa Bates. “2020 ANCC Pathway Award® winner.” Wolters Kluwer Health, Inc., 2021. Accessed 6 Feb. 2022.

      “Canadian Universities Propose Designs for a Central Bank Digital Currency.” Bank of Canada, 11 Feb. 2021. Accessed 14 Dec. 2021.

      “Carbon Sequestration in Wetlands.” MN Board of Water and Soil Resources, n.d. Accessed 15 Nov. 2021.

      “CCM Honored as a NorthCoast 99 Award Winner.” CrossCountry Mortgage, 1 Dec. 2021. Web.

      Cheek, Catherine. “Four Things We Learned About the Resignation Wave–and What to Do Next.” Visier Inc. (blog), 5 Oct. 2021. Web.

      “Companies Using Hyperledger Fabric, Market Share, Customers and Competitors.” HG Insights, 2022. Accessed 25 Jan. 2022.

      “IFRS Foundation Announces International Sustainability Standards Board, Consolidation with CDSB and VRF, and Publication of Prototype Disclosure Requirements.” IFRS, 3 Nov. 2021. Web.

      “IT Priorities for 2022: A CIO Report.” Mindsight, 28 Oct. 2021. Web.

      “Job Openings and Labor Turnover Survey.” Databases, Tables & Calculators by Subject, U.S. Bureau of Labor Statistics, 2022. Accessed 9 Feb. 2022.

      Kumar, Rashmi, and Michael Krigsman. “CIO Planning and Investment Strategy 2022.” CXOTalk, 13 Sept. 2021. Web.

      Leonhardt, Megan. “The Great Resignation Is Hitting These Industries Hardest.” Fortune, 16 Nov. 2021. Accessed 7 Jan. 2022.

      “Most companies align with SDGs – but more to do on assessing progress.” Global Reporting Initiative (GRI), 17 Jan. 2022. Web.

      Navagamuwa, Roshan. “Beyond Passwords: Enhancing Data Protection and Consumer Experience.” LinkedIn, 15 Dec. 2020.

      Ojo, Oluwaseyi. “Achieving Digital Business Transformation Using COBIT 2019.” ISACA, 19 Aug. 2019. Web.

      “Priority.” Lexico.com, Oxford University Press, 2021. Web.

      Riebold, Jan, and Yannick Bartens. “Reinventing the Digital IT Operating Model for the ‘New Normal.’” Capgemini Worldwide, 3 Nov. 2020. Web.

      Samuels, Mark. “The CIO’s next priority: Using the tech budget for growth.” ZDNet, 1 Sept. 2021. Accessed 1 Nov. 2021.

      Sayer, Peter. “Exclusive Survey: CIOs Outline Tech Priorities for 2021-22.” CIO, 5 Oct. 2021. Web.

      Shacklett, Mary E. “Where IT Leaders Are Likely to Spend Budget in 2022.” InformationWeek, 10 Aug. 2021. Web.

      “Table 4. Quits Levels and Rates by Industry and Region, Seasonally Adjusted - 2021 M11 Results.” U.S. Bureau of Labor Statistics, Economic News Release, 1 Jan. 2022. Accessed 7 Jan. 2022.

      “Technology Priorities CIOs Must Address in 2022.” Gartner, 19 Oct. 2021. Accessed 1 Nov. 2021.

      Thomson, Joel. Technology, Talent, and the Future Workplace: Canadian CIO Outlook 2021. The Conference Board of Canada, 7 Dec. 2021. Web.

      “Trend.” Lexico.com, Oxford University Press, 2021. Web.

      Vellante, Dave. “CIOs signal hybrid work will power tech spending through 2022.” SiliconANGLE, 25 Sept. 2021. Web.

      Whieldon, Esther, and Robert Clark. “ESG funds beat out S&P 500 in 1st year of COVID-19; how 1 fund shot to the top.” S&P Global Market Intelligence, April 2021. Accessed Dec. 2021.

      Adapt Your Customer Experience Strategy to Successfully Weather COVID-19

      • Buy Link or Shortcode: {j2store}536|cart{/j2store}
      • member rating overall impact (scale of 10): N/A
      • member rating average dollars saved: N/A
      • member rating average days saved: N/A
      • Parent Category Name: Customer Relationship Management
      • Parent Category Link: /customer-relationship-management
      • COVID-19 is an unprecedented global pandemic. It’s creating significant challenges across every sector.
      • Collapse of financial markets and a steep decline in consumer confidence has most firms nervous about revenue shortfalls and cash burn rates.
      • The economic impact of COVID-19 is freezing IT budgets and sharply changing IT priorities.
      • The human impact of COVID-19 is likely to lead to staffing shortfalls and knowledge gaps.
      • COVID-19 may be in play for up to two years.

      Our Advice

      Critical Insight

      The challenges posed by the virus are compounded by the fact that consumer expectations for strong service delivery remain high:

      • Customers still expect timely, on-demand service from the businesses they engage with.
      • There is uncertainty about how to maintain strong, revenue-driving experiences when faced with the operational challenges posed by the virus.
      • COVID-19 is changing how organizations prioritize spending priorities within their CXM strategies.

      Impact and Result

      • Info-Tech recommends rapidly updating your strategy for customer experience management to ensure it can rise to the occasion.
      • Start by assessing the risk COVID-19 poses to your CXM approach and how it’ll impact marketing, sales, and customer service functions.
      • Implement actionable measures to blunt the threat of COVID-19 while protecting revenue, maintaining consistent product and service delivery, and improving the integrity of your brand. We’ll dive into five proven techniques in this brief!

      Adapt Your Customer Experience Strategy to Successfully Weather COVID-19 Research & Tools

      Start here

      Read our concise Executive Brief to find out why you should examine the impact of COVID-19 on customer experience strategy, review Info-Tech’s methodology, and understand the four ways we can support you in completing this project.

      Besides the small introduction, subscribers and consulting clients within this management domain have access to:

      • Adapt Your Customer Experience Strategy to Successfully Weather COVID-19 Storyboard

      1. Assess the impact of COVID-19 on your CXM strategy

      Create a consolidated, updated view of your current customer experience management strategy and identify which elements can be capitalized on to dampen the impact of COVID-19 and which elements are vulnerabilities that the pandemic may threaten to exacerbate.

      2. Blunt the damage of COVID-19 with new CXM tactics

      Create a roadmap of business and technology initiatives through the lens of customer experience management that can be used to help your organization protect its revenue, maintain customer engagement, and enhance its brand integrity.

      [infographic]

      Get Started With Customer Advocacy

      • Buy Link or Shortcode: {j2store}565|cart{/j2store}
      • member rating overall impact (scale of 10): N/A
      • member rating average dollars saved: N/A
      • member rating average days saved: N/A
      • Parent Category Name: Marketing Solutions
      • Parent Category Link: /marketing-solutions

      Getting started with customer advocacy (CA) is no easy task. Many customer success professionals carry out ad hoc customer advocacy activities to address immediate needs but lack a more strategic approach.

      Our Advice

      Critical Insight

      • Customer success leaders must reposition their CA program around growth; the recognition that customer advocacy is a strategic growth initiative is necessary to succeed in today’s competitive market.
      • Get key stakeholders on board early – especially Sales!
      • Always link your CA efforts back to retention and growth.
      • Make building genuine relationships with your advocates the cornerstone of your CA program.

      Impact and Result

      • Enable the organization to identify and develop meaningful relationships with top customers and advocates.
      • Understand the concepts and benefits of CA and how CA can be used to improve marketing and sales and fuel growth and competitiveness.
      • Follow SoftwareReviews’ methodology to identify where to start to apply CA within the organization.
      • Develop a customer advocacy proof of concept/pilot program to gain stakeholder approval and funding to get started with or expand efforts around customer advocacy.

      Get Started With Customer Advocacy Research & Tools

      Besides the small introduction, subscribers and consulting clients within this management domain have access to:

      1. Get Started With Customer Advocacy Executive Brief – An overview of why customer advocacy is critical to your organization and the recommended approach for getting started with a pilot program.

      Understand the strategic benefits and process for building a formal customer advocacy program. To be successful, you must reposition CA as a strategic growth initiative and continually link any CA efforts back to growth.

      • Get Started With Customer Advocacy Storyboard

      2. Define Your Advocacy Requirements – Assess your current customer advocacy efforts, identify gaps, and define your program requirements.

      With the assessment tool and steps outlined in the storyboard, you will be able to understand the gaps and pain points, where and how to improve your efforts, and how to establish program requirements.

      • Customer Advocacy Maturity Assessment Tool

      3. Win Executive Approval and Launch Pilot – Develop goals, success metrics, and timelines, and gain approval for your customer advocacy pilot.

      Align on pilot goals, key milestones, and program elements using the template and storyboard to effectively communicate with stakeholders and gain executive buy-in for your customer advocacy pilot.

      • Get Started With Customer Advocacy Executive Presentation Template

      Infographic

      Further reading

      Get Started With Customer Advocacy

      Develop a customer advocacy program to transform customer satisfaction into revenue growth.

      EXECUTIVE BRIEF

      Analyst perspective

      Customer advocacy is critical to driving revenue growth

      The image contains a picture of Emily Wright.

      Customer advocacy puts the customer at the center of everything your organization does. By cultivating a deep understanding of customer needs and how they define value and by delivering positive experiences throughout the customer journey, organizations inspire and empower customers to become evangelists for their brands or products. Both the client and solution provider enjoy satisfying and ongoing business outcomes as a result.

      Focusing on customer advocacy is critical for software solutions providers. Business-to-business (B2B) buyers are increasingly looking to their peers and third-party resources to arm themselves with information on solutions they feel they can trust before they choose to engage with solution providers. Your satisfied customers are now your most trusted and powerful resource.

      Customer advocacy helps build strong relationships with your customers, nurtures brand advocacy, gives your marketing messaging credibility, and differentiates your company from the competition; it’s critical to driving revenue growth. Companies that develop mature advocacy programs can increase Customer Lifetime Value (CLV) by 16% (Wharton Business School, 2009), increase customer retention by 35% (Deloitte, 2011), and give themselves a strong competitive advantage in an increasingly competitive marketplace.

      Emily Wright
      Senior Research Analyst, Advisory
      SoftwareReviews

      Executive summary

      Your Challenge

      Ad hoc customer advocacy (CA) efforts and reference programs, while still useful, are not enough to drive growth. Providers increase their chance for success by assessing if they face the following challenges:

      • Lack of referenceable customers that can turn into passionate advocates, or a limited pool that is at risk of burnout.
      • Lack of references for all key customer types, verticals, etc., especially in new growth segments or those that are hard to recruit.
      • Lack of a consistent program for gathering customer feedback and input to make improvements and increase customer satisfaction.
      • Lack of executive and stakeholder (e.g. Sales, Customer Success, channel partners, etc.) buy-in for the importance and value of customer advocacy.

      Building a strong customer advocacy program must be a high priority for customer service/success leaders in today’s highly competitive software markets.

      Common Obstacles

      Getting started with customer advocacy is no easy task. Many customer success professionals carry out ad hoc customer advocacy activities to address immediate needs but lack a more strategic approach. What separates them from success are several nagging obstacles:

      • Efforts lack funding and buy-in from stakeholders.
      • Senior management doesn’t fully understand the business value of a customer advocacy program.
      • Duplicate efforts are taking place between Sales, Marketing, product teams, etc., because ownership, roles, and responsibilities have not been determined.
      • Relationships are guarded/hoarded by those who feel they own the relationship (e.g. Sales, Customer Success, channel partners, etc.).
      • Customer-facing staff often lack the necessary skills to foster customer advocacy.

      SoftwareReviews’ Approach

      This blueprint will help leaders of customer advocacy programs get started with developing a formalized pilot program that will demonstrate the value of customer advocacy and lay a strong foundation to justify rollout. Through SoftwareReviews’ approach, customer advocacy leaders will:

      • Enable the organization to identify and develop meaningful relationships with top customers and advocates.
      • Understand the concepts and benefits of CA and how CA can be used to improve marketing and sales and fuel growth and competitiveness.
      • Follow SoftwareReviews’ methodology to identify where to start to apply CA within the organization.
      • Develop a customer advocacy proof of concept/pilot program to gain stakeholder approval and funding to get started with or expand efforts around customer advocacy.

      What is customer advocacy?

      “Customer advocacy is the act of putting customer needs first and working to deliver solution-based assistance through your products and services." – Testimonial Hero, 2021

      Customer advocacy is designed to keep customers loyal through customer engagement and advocacy marketing campaigns. Successful customer advocacy leaders experience decreased churn while increasing return on investment (ROI) through retention, acquisition, and cost savings.

      Businesses that implement customer advocacy throughout their organizations find new ways of supporting customers, provide additional customer value, and ensure their brands stand unique among the competition.

      Customer Advocacy Is…

      • An integral part of any marketing and/or business strategy.
      • Essential to improving and maintaining high levels of customer satisfaction.
      • Focused on delivering value to customers.
      • Not only a set of actions, but a mindset that should be fostered and reinforced through a customer-centric culture.
      • Mutually beneficial relationships for both company and customer.

      Customer Advocacy Is Not…

      • Only referrals and testimonials.
      • Solely about what you can get from your advocates.
      • Brand advocacy. Brand advocacy is the desired outcome of customer advocacy.
      • Transactional. Brand advocates must be engaged.
      • A nice-to-have.
      • Solved entirely by software. Think about what you want to achieve and how a software solution can you help you reach those goals.

      SoftwareReviews Insight

      Customer advocacy has evolved into being a valued company asset versus a simple referral program – success requires an organization-wide customer-first mindset and the recognition that customer advocacy is a strategic growth initiative necessary to succeed in today’s competitive market.

      Customer advocacy: Essential to high retention

      When customers advocate for your company and products, they are eager to retain the value they receive

      • Customer acts of advocacy correlate to high retention.
      • Acts of advocacy won’t happen unless customers feel their interests are placed ahead of your company’s, thereby increasing satisfaction and customer success. That’s the definition of a customer-centric culture.
      • And yet your company does receive significant benefits from customer advocacy:
        • When customers advocate and renew, your costs go down and margins rise because it costs less to keep a happy customer than it does to bring a new customer onboard.
        • When renewal rates are high, customer lifetime value increases, also increasing profitability.

      Acquiring a new customer can cost five times more than retaining an existing customer (Huify, 2018).

      Increasing customer retention by 5% can increase profits by 25% to 95% (Bain & Company, cited in Harvard Business Review, 2014).

      SoftwareReviews Insight

      Don’t overlook the value of customer advocacy to retention! Despite the common knowledge that it’s far easier and cheaper to sell to an existing customer than to sell to a new prospect, most companies fail to leverage their customer advocacy programs and continue to put pressure on Marketing to focus their budgets on customer acquisition.

      Customer advocacy can also be your ultimate growth strategy

      In your marketing and sales messaging, acts of advocacy serve as excellent proof points for value delivered.

      Forty-five percent of businesses rank online reviews as a top source of information for selecting software during this (top of funnel) stage, followed closely by recommendations and referrals at 42%. These sources are topped only by company websites at 54% (Clutch, 2020).

      With referrals coming from customer advocates to prospects via your lead gen engine and through seller talk tracks, customer advocacy is central to sales, marketing, and customer experience success.

      ✓ Advocates can help your new customers learn your solution and ensure higher adoption and satisfaction.
      ✓ Advocates can provide valuable, honest feedback on new updates and features.

      The image contains a picture to demonstrate the cycle of customer advocacy. The image has four circles, with one big circle in the middle and three circles surrounding with arrows pointing in both directions in between them. The middle circle is labelled customer advocacy. The three circles are labelled: sales, customer success, marketing.

      “A customer advocacy program is not just a fancy buzz word or a marketing tool that’s nice to have. It’s a core discipline that every major brand needs to integrate into their overall marketing, sales and customer success strategies if they expect to survive in this trust economy. Customer advocacy arguably is the common asset that runs throughout all marketing, sales and customer success activities regardless of the stage of the buyer’s journey and ties it all together.” – RO Innovation, 2017

      Positive experience drives acts of advocacy

      More than price or product, experience now leads the way in customer advocacy and retention

      Advocacy happens when customers recommend your product. Our research shows that the biggest drivers of likeliness to recommend and acts of customer advocacy are the positive experiences customers have with vendors and their products, not product features or cost savings. Customers want to feel that:

      1. Their productivity and performance is enhanced and the vendor is helping them to innovate and grow as a company.
      2. Their vendor inspires them and helps them to continually improve.
      3. They can rely on the vendor and the product they purchased.
      4. They are respected by the vendor.
      5. They can trust that the vendor will be on their side and save them time.

      The image contains a graph to demonstrate the correlation of likeliness to recommend a satisfaction driver. Where anything above a 0.5 indicates a strong driver of satisfaction.

      Note that anything above 0.5 indicates a strong driver of satisfaction.
      Source: SoftwareReviews buyer reviews (based on 82,560 unique reviews).

      SoftwareReviews Insight

      True customer satisfaction comes from helping customers innovate, enhancing their performance, inspiring them to continually improve, and being reliable, respectful, trustworthy, and conscious of their time. These true drivers of satisfaction should be considered in your customer advocacy and retention efforts. The experience customers have with your product and brand is what will differentiate your brand from competitors, drive advocacy, and ultimately, power business growth. Talk to a SoftwareReviews advisor to learn how users rate your product on these satisfaction drivers in the SoftwareReviews Emotional Footprint Report.

      Yet challenges exist for customer advocacy program leaders

      Customer success leaders without a strong customer advocacy program feel numerous avoidable pains:

      • Lack of compelling stories and proof points for the sales team, causing long sales cycles.
      • Heavy reliance on a small pool of worn-out references.
      • Lack of references for all needed customer types, verticals, etc.
      • Lack of a reliable customer feedback process for solution improvements.
      • Overspending on acquiring new customers due to a lack of customer proof points.
      • Missed opportunities that could grow the business (customer lifetime value, upsell/cross-sell, etc.).

      Marketing, customer success, and sales teams experiencing any one of the above challenges must consider getting started with a more formalized customer advocacy program.

      Obstacles to customer advocacy programs

      Leaders must overcome several barriers in developing a customer advocacy program:

      • Stakeholders are often unclear on the value customer advocacy programs can bring and require proof of benefits to invest.
      • Efforts are duplicated among sales, marketing, product, and customer success teams, given ownership and collaboration practices are ill-defined or nonexistent.
      • There is a culture of guarding or hoarding customer relationships by those who feel they own the relationship, or there’s high turnover among employees who own the customer relationships.
      • The governance, technology, people, skills, and/or processes to take customer advocacy to the next level are lacking.
      • Leaders don’t know where to start with customer advocacy, what needs to be improved, or what to focus on first.

      A lack of customer centricity hurts organizations

      12% of people believe when a company says they put customers first. (Source: HubSpot, 2019)

      Brands struggle to follow through on brand promises, and a mismatch between expectations and lived experience emerges. Customer advocacy can help close this gap and help companies live up to their customer-first messaging.

      42% of companies don’t conduct any customer surveys or collect feedback. (Source: HubSpot, 2019)

      Too many companies are not truly listening to their customers. Companies that don’t collect feedback aren’t going to know what to change to improve customer satisfaction. Customer advocacy will orient companies around their customer and create a reliable feedback loop that informs product and service enhancements.

      Customer advocacy is no longer a nice-to-have but a necessity for solution providers

      B2B buyers increasingly turn to peers to learn about solutions:

      “84% of B2B decision makers start the buying process with a referral.” (Source: Influitive, Gainsight & Pendo, 2020)

      “46% of B2B buyers rely on customer references for information before purchasing.” (Source: RO Innovation, 2017)

      “91% of B2B purchasers’ buying decisions are influenced by word-of-mouth recommendations.” (Source: ReferralRock, 2022)

      “76% of individuals admit that they’re more likely to trust content shared by ‘normal’ people than content shared by brands.” (Source: TrustPilot, 2020)

      By ignoring the importance of customer advocacy, companies and brands are risking stagnation and missing out on opportunities to gain competitive advantage and achieve growth.

      Getting Started With Customer Advocacy: SoftwareReviews' Approach

      1 BUILD
      Build the business case
      Identify your key stakeholders, steering committee, and working team, understand key customer advocacy principles, and note success barriers and ways to overcome them as your first steps.

      2 DEVELOP
      Develop your advocacy requirements
      Assess your current customer advocacy maturity, identify gaps in your current efforts, and develop your ideal advocate profile.

      3 WIN
      Win executive approval and implement pilot
      Determine goals and success metrics for the pilot, establish a timeline and key project milestones, create advocate communication materials, and finally gain executive buy-in and implement the pilot.

      SoftwareReviews Insight
      Building and implementing a customer advocacy pilot will help lay the foundation for a full program and demonstrate to executives and key stakeholders the impact on revenue, retention, and CLV that can be achieved through coordinated and well-planned customer advocacy efforts.

      Customer advocacy benefits

      Our research benefits customer advocacy program managers by enabling them to:

      • Explain why having a centralized, proactive customer advocacy program is important.
      • Clearly communicate the benefits and business case for having a formalized customer advocacy program.
      • Develop a customer advocacy pilot to provide a proof of concept (POC) and demonstrate the value of customer advocacy.
      • Assess the maturity of your current customer advocacy efforts and identify what to improve and how to improve to grow your customer advocacy function.

      "Advocacy is the currency for business and the fuel for explosive growth. Successful marketing executives who understand this make advocacy programs an essential part of their go-to-market strategy. They also know that advocacy isn't something you simply 'turn on': ... ultimately, it's about making human connections and building relationships that have enduring value for everyone involved."
      - Dan Cote, Influitive, Dec. 2021

      Case Study: Advocate impact on sales at Genesys

      Genesys' Goal

      Provide sales team with compelling customer reviews, quotes, stories, videos, and references.

      Approach to Advocacy

      • Customers were able to share their stories through Genesys' customer hub GCAP as quotes, reviews, etc., and could sign up to host reference forum sessions for prospective customers.
      • Content was developed that demonstrated ROI with using Genesys' solutions, including "top-tier logos, inspiring quotes, and reference forums featuring some of their top advocates" (Influitive, 2021).
      • Leveraged customer advocacy-specific software solution integration with the CRM to easily identify reference recommendations for Sales.

      Advocate Impact on Sales

      According to Influitive (2021), the impacts were:

      • 386% increase in revenue influences from references calls
      • 82% of revenue has been influence by reference calls
      • 78 reference calls resulted in closed-won opportunities
      • 250 customers and prospects attended 7 reference forums
      • 112 reference slides created for sales enablement
      • 100+ quotes were collect and transformed into 78 quote slides

      Who benefits from getting started with customer advocacy?

      This Research Is Designed for:

      • Customer advocacy leaders and marketers who are looking to:
        • Take a more strategic, proactive, and structured approach to customer advocacy.
        • Find a more effective and reliable way to gather customer feedback and input on products and services.
        • Develop and nurture a customer-oriented mindset throughout the organization.
        • Improve marketing credibility both within the company and outside to prospective customers.

      This Research Will Help You:

      • Explain why having a centralized, proactive customer advocacy program is important.
      • Clearly communicate the benefits and business case for having a formalized customer advocacy program.
      • Develop a customer advocacy pilot to provide a proof of concept (POC) and demonstrate the value of customer advocacy.
      • Assess the maturity of your current customer advocacy efforts and identify what to improve and how to improve to grow your customer advocacy function.

      This Research Will Also Assist:

      • Customer success leaders and sales directors who are responsible for:
        • Gathering customer references and testimonials.
        • Referral or voice of the customer (VoC) programs.

      This Research Will Help Them:

      • Align stakeholders on an overall program of identifying ideal advocates.
      • Coordinate customer advocacy efforts and actions.
      • Gather and make use of customer feedback to improve products, solutions, and service provided.
      • Provide an amazing customer experience throughout the entirety of the customer journey.

      SoftwareReviews’ methodology for getting started with customer advocacy

      Phase Steps

      1. Build the business case

      1. Identify your key stakeholders, steering committee, and working team
      2. Understand the concepts and benefits of customer advocacy as they apply to your organization
      3. Outline barriers to success, risks, and risk mitigation tactics

      2. Develop your advocacy requirements

      1. Assess your customer advocacy maturity using the SoftwareReviews CA Maturity Assessment Tool
      2. Identify gaps/pains in current CA efforts and add tasks to your action plan
      3. Develop ideal advocate profile/identify target advocate segment(s)

      3. Create implementation plan and pitch CA pilot

      1. Determine pilot goals and success metrics
      2. Establish timeline and create advocate communication materials
      3. Gain executive buy-in and implement pilot

      Phase Outcomes

      1. Common understanding of CA concepts and benefits
      2. Buy-in from CEO and head of Sales
      3. List of opportunities, risks, and risk mitigation tactics
      1. Identification of gaps in current customer advocacy efforts and/or activities
      2. Understanding customer advocacy readiness
      3. Identification of ideal advocate profile/target segment
      4. Basic actions to bridge gaps in CA efforts
      1. Clear objective for CA pilot
      2. Key metrics for program success
      3. Pilot timelines and milestones
      4. Executive presentation with business case for CA

      Insight summary

      Customer advocacy is a critical strategic growth initiative
      Customer advocacy (CA) has evolved into being a highly valued company asset as opposed to a simple referral program, but not everyone in the organization sees it that way. Customer success leaders must reposition their CA program around growth instead of focusing solely on retention and communicate this to key stakeholders. The recognition that customer advocacy is a strategic growth initiative is necessary to succeed in today’s competitive market.

      Get key stakeholders on board early – especially Sales!
      Work to bring the CEO and the head of Sales on your side early. Sales is the gatekeeper – they need to open the door to customers to turn them into advocates. Clearly reposition CA for growth and communicate that to the CEO and head of Sales; wider buy-in will follow.

      Identify the highest priority segment for generating acts of advocacy
      By focusing on the highest priority segment, you accomplish a number of things: generating growth in a critical customer segment, proving the value of customer advocacy to key stakeholders (especially Sales), and setting a strong foundation for customer advocacy to build upon and expand the program out to other segments.

      Always link your CA efforts back to retention and growth
      By clearly demonstrating the impact that customer advocacy has on not only retention but also overall growth, marketers will gain buy-in from key stakeholders, secure funding for a full CA program, and gain the resources needed to expand customer advocacy efforts.

      Focus on providing value to advocates
      Many organizations take a transactional approach to customer advocacy, focusing on what their advocates can do for them. To truly succeed with CA, focus on providing your advocates with value first and put them in the spotlight.

      Make building genuine relationships with your advocates the cornerstone of your CA program
      "57% of small businesses say that having a relationship with their consumers is the primary driver of repeat business" (Factory360).

      Guided Implementation

      What does our GI on getting started with building customer advocacy look like?

      Build the Business Case

      Call #1: Identify key stakeholders. Map out motivations and anticipate any concerns or objections. Determine steering committee and working team. Plan next call – 1 week.

      Call #2: Discuss concepts and benefits of customer advocacy as they apply to organizational goals. Plan next call – 1 week.

      Call #3: Discuss barriers to success, risks, and risk mitigation tactics. Plan next call – 1 week.

      Call #4: Finalize CA goals, opportunities, and risks and develop business case. Plan next call – 2 weeks.

      Develop Your Advocacy Requirements

      Call #5: Review the SoftwareReviews CA Maturity Assessment Tool. Assess your current level of customer advocacy maturity. Plan next call – 1 week.

      Call #6: Review gaps and pains in current CA efforts. Discuss tactics and possible CA pilot program goals. Begin adding tasks to action plan. Plan next call – 2 weeks.

      Call #7: Discuss ideal advocate profile and target segments. Plan next call – 2 weeks.

      Call #8: Validate and finalize ideal advocate profile. Plan next call – 1 week.

      Win Executive Approval and Implement Pilot

      Call #9: Discuss CA pilot scope. Discuss performance metrics and KPIs. Plan next call – 3 days.

      Call #10: Determine timeline and key milestones. Plan next call –2 weeks.

      Call #11: Develop advocate communication materials. Plan next call – 3 days.

      Call #12: Review final business case and coach on executive presentation. Plan next call – 1 week.

      A Guided Implementation (GI) is series of calls with a SoftwareReviews Advisory analyst to help implement our best practices in your organization. For guidance on marketing applications, we can arrange a discussion with an Info-Tech analyst. Your engagement managers will work with you to schedule analyst calls.


      Customer Advocacy Workshop

      Pre-Workshop Day 1 Day 2 Day 3 Day 4 Day 5 Post-Workshop
      Activities Identify Stakeholders & CA Pilot Team Build the Business Case Assess Current CA Efforts Develop Advocacy Goals & Ideal Advocate Profile Develop Project Timelines, Materials, and Exec Presentation Next Steps and Wrap-Up (offsite) Pitch CA Pilot
      0.1 Identify key stakeholders to involve in customer advocacy pilot and workshop; understand their motivations and anticipate possible concerns. 1.1 Review key CA concepts and identify benefits of CA for the organization.
      1.2 Outline barriers to success, risks, and risk mitigation tactics.
      2.1 Assess your customer advocacy maturity using the SoftwareReviews CA Maturity Assessment Tool.
      2.2 Identify gaps/pains in current CA efforts.
      2.3 Prioritize gaps from diagnostic and any other critical pain points.
      3.1 Identify and document the ideal advocate profile and target customer segment for pilot.
      3.2 Determine goal(s) and success metrics for program pilot.
      4.1 Develop pilot timelines and key milestones.
      4.2 Outline materials needed and possible messaging.
      4.3 Build the executive buy-in presentation.
      5.1 Complete in-progress deliverables from the previous four days. 6.1 Present to executive team and stakeholders.
      6.2 Gain executive buy-in and key stakeholder approval.
      6.3 Execute CA pilot.
      Deliverables
      1. Rationale for CA pilot; clear benefits, and how they apply to the organization.
      2. Documented barriers to success, risks, and risk mitigation tactics.
      1. CA Maturity Assessment results.
      2. Identification of gaps in current customer advocacy efforts and/or activities.
      1. Documented ideal advocate profile/target customer segment.
      2. Clear goal(s) and success metrics for CA pilot.
      1. Documented pilot timelines and key milestones.
      2. Draft/outlines of advocate materials.
      3. Draft executive presentation with business case for CA.
      1. Finalized implementation plan for CA pilot.
      2. Finalized executive presentation with business case for CA.
      1. Buy-in from decision makers and key stakeholders.

      Contact your account representative for more information.
      workshops@infotech.com
      1-888-670-8889

      Get started!

      Know your target market and audience, deploy well-designed strategies based on shared values, and make meaningful connections with people.

      Phase 1
      Build the Business Case

      Phase 2
      Develop Your Advocacy Requirements

      Phase 3
      Win Executive Approval and Implement Pilot

      Phase 1: Build the Business Case

      Steps
      1.1 Identify your key stakeholders, steering committee, and working team
      1.2 Understand the concepts and benefits of customer advocacy as they apply to your organization
      1.3 Outline barriers to success, risks, and risk mitigation tactics

      Phase Outcome

      • Common understanding of CA concepts and benefits
      • Buy-in from CEO and head of Sales
      • List of barriers to success, risks, and risk mitigation tactics

      Build the business case

      Step 1.1 Identify your key stakeholders, steering committee, and working team

      Total duration: 2.5-8.0 hours

      Objective
      Identify, document, and finalize your key stakeholders to know who to involve and how to get them onboard by truly understanding the forces of influence.

      Output

      • Robust stakeholder list with key stakeholders identified.
      • Steering committee and working team decided.

      Participants

      • Customer advocacy lead
      • Identified stakeholders
      • Workstream leads

      MarTech
      None

      Tools

      1.1.1 Identify Stakeholders
      (60-120 min.)

      Identify
      Using the guidance on slide 28, identify all stakeholders who would be involved or impacted by your customer advocacy pilot by entering names and titles into columns A and B on slide 27 "Stakeholder List Worksheet."

      Document
      Document as much information about each stakeholder as possible in columns C, D, E, and F into the table on slide 27.

      1.1.2 Select Steering Committee & Working Team
      (60-90 min.)

      Select
      Using the guidance on slides 28 and 29 and the information collected in the table on slide 27, identify the stakeholders that are steering committee members, functional workstream leads, or operations; document in column G on slide 27.

      Document
      Open the Executive Presentation Template to slides 5 and 6 and document your final steering committee and working team selections. Be sure to note the Executive Sponsor and Program Manager on slide 5.

      Tips & Reminders

      1. It is critical to identify "key stakeholders"; a single missed key stakeholder can disrupt an initiative. A good way to ensure that nobody is missed is to first uncover as many stakeholders as possible and later decide how important they are.
      2. Ensure steering committee representation from each department this initiative would impact or that may need to be involved in decision-making or problem-solving endeavors.

      Consult Info-Tech's Manage Stakeholder Relations blueprint for additional guidance on identifying and managing stakeholders, or contact one of our analysts for more personalized assistance and guidance.

      Stakeholder List Worksheet

      *Possible Roles
      Executive Sponsor
      Program Manager
      Workstream Lead
      Functional Lead
      Steering Committee
      Operations
      A B C D E F G
      Name Position Decision Involvement
      (Driver / Approver / Contributor / Informe
      Direct Benefit?
      (Yes / No)
      Motivation Concerns *Role in Customer Advocacy Pilot
      E.g. Jane Doe VP, Customer Success A N
      • Increase customer retention
      • Customer advocate burnout
      Workstream Lead

      Customer advocacy stakeholders

      What to consider when identifying stakeholders required for CA:
      Customer advocacy should be done as a part of a cross-functional company initiative. When identifying stakeholders, consider:

      • Who can make the ultimate decision on approving the CA program?
      • Who are the senior leadership members you need buy-in from?
      • Who do you need to support the CA program?
      • Who is affected by the CA program?
      • Who will help you build the CA program?
      • Where and among who is there enthusiasm for customer advocacy?
      • Consider stakeholders from Customer Success, Marketing, Sales, Product, PR & Social, etc.
      Key Roles Supporting an Effective Customer Advocacy Pilot
      Executive Sponsor
      • Owns the function at the management/C-suite level
      • Responsible for breaking down barriers and ensuring alignment with organizational strategy
      • CMO, VP of Marketing, and in SMB providers, the CEO
      Program Manager
      • Typically, a senior member of the marketing team
      • Responsible for organizing the customer advocacy pilot, preparing summary executive-level communications, and approval requests
      • Program manages the customer advocacy pilot, and in many cases, the continued formal program
      • Product Marketing Director, or other Marketing Director, who has strong program management skills, has run large-scale marketing or product programs, and is familiar with the stakeholder roles and enabling technologies
      Functional / Workstream Leads
      • Works alongside the Program Manager on planning and implementing the customer advocacy pilot and ensures functional workstreams are aligned with pilot objectives
      • Typical customer advocacy pilots will have a team comprised of representatives from Marketing, Sales, and Customer Success
      Steering Committee
      • Comprised of C-suite/management-level individuals that guide key decisions, approve requests, and mitigate any functional conflicts
      • Responsible for validating goals and priorities, enabling adequate resourcing, and critical decision making
      • CMO, CRO/Head of Sales, Head of Customer Success
      Operations
      • Comprised of individuals whose application and tech tools knowledge and skills support integration of customer advocacy functions into existing tech stack/CRM (e.g. adding custom fields into CRM)
      • Responsible for helping select technology that enables customer advocacy program activities
      • CRM, Marketing Applications, and Analytics Managers, IT Managers

      Customer advocacy working team

      Consider the skills and knowledge required for planning and executing a customer advocacy pilot.

      Workstream leads should have strong project management and collaboration skills and deep understanding of both product and customers (persona, journeys, satisfaction, etc.).

      Required Skills Suggested Functions
      • Project management
      • CRM knowledge
      • Marketing automation experience
      • MarTech knowledge
      • Understanding of buyer persona and journey
      • Product knowledge
      • Understanding of executive-level goals for the pilot
      • Content creation
      • Customer advocacy experience, if possible
      • Customer satisfaction
      • Email and event marketing experience
      • Customer Success
      • Marketing
      • Sales
      • Product
      • PR/Corporate Comms.

      Build the business case

      Step 1.2 Understand key concepts and benefits of customer advocacy

      Total duration: 2.0-4.0 hours

      Objective
      Understand customer advocacy and what benefits you seek from your customer advocacy program, and get set up to best communicate them to executives and decision makers.

      Output

      • Documented customer advocacy benefits

      Participants

      • Customer advocacy lead

      MarTech
      None

      Tools

      1.2.1 Discuss Key Concepts
      (60-120 min.)

      Envision
      Schedule a visioning session with key stakeholders and share the Get Started With Customer Advocacy Executive Brief (slides 3-23 in this deck).

      Discuss how key customer advocacy concepts can apply to your organization and how CA can contribute to organizational growth.

      Document
      Determine the top benefits sought from the customer advocacy program pilot and record them on slides 4 and 12 in the Executive Presentation Template.

      Finalize
      Work with the Executive Sponsor to finalize the "Message from the CMO" on slide 4 in the Executive Presentation Template.

      Tips & Reminders

      Keep in mind that while we're starting off broadly, the pilot for your customer advocacy program should be narrow and focused in scope.

      Build the business case

      Step 1.3 Understand barriers to success, risks, and risk mitigation tactics

      Total duration: 2.0-8.0 hours

      Objective
      Anticipate threats to pilot success; identify barriers to success, any possible risks, and what can be done to reduce the chances of a negative pilot outcome.

      Output

      • Awareness of barriers
      • Tactics to mitigate risk

      Participants

      • Customer advocacy lead
      • Key stakeholders

      MarTech
      None

      Tools

      1.3.1 Brainstorm Barriers to Success & Possible Risks
      (60-120 min.)

      Identify
      Using slide 7 of the Executive Presentation Template, brainstorm any barriers to success that may exist and risks to the customer advocacy program pilot success. Consider the people, processes, and technology that may be required.

      Document
      Document all information on slide 7 of the Executive Presentation Template.

      1.3.2 Develop Risk Mitigation Tactics
      (60-300 min.)

      Develop
      Brainstorm different ways to address any of the identified barriers to success and reduce any risks. Consider the people, processes, and technology that may be required.

      Document
      Document all risk mitigation tactics on slide 7 of the Executive Presentation Template.

      Tips & Reminders
      There are several types of risk to explore. Consider the following when brainstorming possible risks:

      • Damage to brand (if advocate guidance not provided)
      • Legal (compliance with regulations and laws around contact, incentives, etc.)
      • Advocate burnout
      • Negative advocate feedback

      Phase 2: Develop Your Advocacy Requirements

      Steps
      2.1 Assess your customer advocacy maturity
      2.2 Identify and document gaps and pain points
      2.3 Develop your ideal advocate profile

      Phase Outcome

      • Identification of gaps in current customer advocacy efforts or activities
      • Understanding of customer advocacy readiness and maturity
      • Identification of ideal advocate profile/target segment
      • Basic actions to bridge gaps in CA efforts

      Develop your advocacy requirements

      Step 2.1 Assess your customer advocacy maturity

      Total duration: 2.0-8.0 hours

      Objective
      Use the Customer Advocacy Maturity Assessment Tool to understand your organization's current level of customer advocacy maturity and what to prioritize in the program pilot.

      Output

      • Current level of customer advocacy maturity
      • Know areas to focus on in program pilot

      Participants

      • Customer advocacy lead
      • Key stakeholders

      MarTech
      None

      Tools

      2.1.1 Diagnose Current Customer Advocacy Maturity
      (60-120 min.)

      Diagnose
      Begin on tab 1 of the Customer Advocacy Maturity Assessment Tool and read all instructions.

      Navigate to tab 2. Considering the current state of customer advocacy efforts, answer the diagnostic questions in the Diagnostic tab of the Customer Advocacy Maturity Assessment Tool.

      After completing the questions, you will receive a diagnostic result on tab 3 that will identify areas of strength and weakness and make high-level recommendations for your customer advocacy program pilot.

      2.1.2 Discuss Results
      (60-300 min.)

      Discuss
      Schedule a call to discuss your customer advocacy maturity diagnostic results with a SoftwareReviews Advisor.

      Prioritize the recommendations from the diagnostic, noting which will be included in the program pilot and which require funding and resources to advance.

      Transfer
      Transfer results into slides 8 and 11 of the Executive Presentation Template.

      Tips & Reminders
      Complete the diagnostic with a handful of key stakeholders identified in the previous phase. This will help provide a more balanced and accurate assessment of your organization’s current level of customer advocacy maturity.

      Develop your advocacy requirements

      Step 2.2 Identify and document gaps and pain points

      Total duration: 2.5-8.0 hours

      Objective
      Understand the current pain points within key customer-related processes and within any current customer advocacy efforts taking place.

      Output

      • Prioritized list of pain points that could be addressed by a customer advocacy program.

      Participants

      • Customer advocacy lead
      • Key stakeholders

      MarTech
      None

      Tools

      2.2.1 Identify Pain Points
      (60-120 min.)

      Identify
      Identify and list current pain points being experienced around customer advocacy efforts and processes around sales, marketing, customer success, and product feedback.

      Add any gaps identified in the diagnostic to the list.

      Transfer
      Transfer key information into slide 9 of Executive Presentation Template.

      2.2.2 Prioritize Pain Points
      (60-300 min.)

      Prioritize
      Indicate which pains are the most important and that a customer advocacy program could help improve.

      Schedule a call to discuss the outputs of this step with a SoftwareReviews Advisor.

      Document
      Document priorities on slide 9 of Executive Presentation Template.

      Tips & Reminders

      Customer advocacy won't solve for everything; it's important to be clear about what pain points can and can't be addressed through a customer advocacy program.

      Develop your advocacy requirements

      Step 2.3 Develop your ideal advocate profile

      Total duration: 3.0-9.0 hours

      Objective
      Develop an ideal advocate persona profile that can be used to identify potential advocates, guide campaign messaging, and facilitate advocate engagement.

      Output

      • Ideal advocate persona profile

      Participants

      • Customer advocacy lead
      • Key stakeholders
      • Sales lead
      • Marketing lead
      • Customer Success lead
      • Product lead

      MarTech
      May require the use of:

      • CRM or marketing automation platform
      • Available and up-to-date customer database

      Tools

      2.3.1 Brainstorm Session Around Ideal Advocate Persona
      (60-150 min.)

      Brainstorm
      Lead the team to prioritize an initial, single, most important persona and to collaborate to complete the template.

      Choose your ideal advocate for the pilot based on your most important audience. Start with firmographics like company size, industry, and geography.

      Next, consider satisfaction levels and behavioral attributes, such as renewals, engagement, usage, and satisfaction scores.

      Identify motivations and possible incentives for advocate activities.

      Document
      Use slide 10 of the Executive Presentation Template to complete this exercise.

      2.3.2 Review and Refine Advocate Persona
      (60-300 min.)

      Review & Refine
      Place the Executive Presentation Template in a shared drive for team collaboration. Encourage the team to share persona knowledge within the shared drive version.

      Hold any necessary follow-up sessions to further refine persona.

      Validate
      Interview advocates that best represent your ideal advocate profile on their type of preferred involvement with your company, their role and needs when it comes to your solution, ways they'd be willing to advocate, and rewards sought.

      Confirm
      Incorporate feedback and inputs into slide 10 of the Executive Presentation Template. Ensure everyone agrees on persona developed.

      Tips & Reminders

      1. When identifying potential advocates, choose based on your most important audience.
      2. Ensure you're selecting those with the highest satisfaction scores.
      3. Ideally, select candidates that have, on their own, advocated previously such as in social posts, who may have acted as a reference, or who have been highly visible as a positive influence at customer events.
      4. Knowing motivations will determine the type of acts of advocacy they would be most willing to perform and the incentives for participating in the program.

      Consider the following criteria when identifying advocates and developing your ideal advocate persona:

      Demographics Firmographics Satisfaction & Needs/Value Sought Behavior Motivation
      Role - user, decision-maker, etc. Company size: # of employees Satisfaction score Purchase frequency & repeat purchases (renewals), upgrades Career building/promotion
      Department Company size: revenue NPS score Usage Collaboration with peers
      Geography CLV score Engagement (e.g. email opens, response, meetings) Educate others
      Industry Value delivered (outcomes, occasions used, etc.) Social media interaction, posts Influence (on product, service)
      Tenure as client Benefits sought
      Account size ($) Minimal and resolved service tickets, escalations
      1. When identifying potential advocates, choose based on your most important audience/segments. 2. Ensure you're selecting those with the highest satisfaction, NPS, and CLV scores. 3. When identifying potential advocates, choose based on high engagement and interaction, regular renewals, and high usage. 4. Knowing motivations will determine the type of acts of advocacy they would be most willing to perform and incentives for participating in the program.

      Phase 3: Win Executive Approval and Implement Pilot

      Steps
      3.1 Determine pilot goals and success metrics
      3.2 Establish timeline and create advocate communication materials
      3.3 Gain executive buy-in and implement pilot

      Phase Outcome

      • Clear objective for CA pilot
      • Key metrics for program success
      • Pilot timelines and milestones
      • Executive presentation with business case for CA

      Win executive approval and implement pilot

      Step 3.1 Determine pilot goals and success metrics

      Total duration: 2.0-4.0 hours

      Objective
      Set goals and determine the scope for the customer advocacy program pilot.

      Output

      • Documented business objectives for the pilot
      • Documented success metrics

      Participants

      • Customer advocacy lead
      • Key stakeholders
      • Sales lead
      • Marketing lead
      • Customer Success lead
      • Product lead

      MarTech
      May require to use, set up, or install platforms like:

      • Register to a survey platform
      • CRM or marketing automation platform

      Tools

      3.1.1 Establish Pilot Goals
      (60-120 min.)

      Set
      Organize a meeting with department heads and review organizational and individual department goals.

      Using the Venn diagram on slide 39 in this deck, identify customer advocacy goals that align with business goals. Select the highest priority goal for the pilot.

      Check that the goal aligns with benefits sought or addresses pain points identified in the previous phase.

      Document
      Document the goals on slides 9 and 16 of the Executive Presentation Template.

      3.1.2 Establish Pilot Success Metrics
      (60-120 min.)

      Decide
      Decide how you will measure the success of your program pilot using slide 40 in this document.

      Document
      Document metrics on slide 16 of the Executive Presentation Template.

      Tips & Reminders

      1. Don't boil the ocean. Pick the most important goal that can be achieved through the customer advocacy pilot to gain executive buy-in and support or resources for a formal customer advocacy program. Once successfully completed, you'll be able to tackle new goals and expand the program.
      2. Keep your metrics simple, few in number, and relatively easy to track

      Connect customer advocacy goals with organizational goals

      List possible customer advocacy goals, identifying areas of overlap with organizational goals by taking the following steps:

      1. List organizational/departmental goals in the green oval.
      2. List possible customer advocacy program goals in the purple oval.
      3. Enter goals that are covered in both the Organizational Goals and Customer Advocacy Goals sections into the Shared Goals section in the center.
      4. Highlight the highest priority goal for the customer advocacy program pilot to tackle.
      Organizational Goals Shared Goals Customer Advocacy Goals
      Example Example: Gain customer references to help advance sales and improve win rates Example: Develop pool of customer references
      [insert goal] [insert goal] Example: Gather customer feedback
      [insert goal] [insert goal] [insert goal]
      [insert goal] [insert goal] [insert goal]

      Customer advocacy success metrics for consideration

      This table provides a starting point for measuring the success of your customer advocacy pilot depending on the goals you've set.

      This list is by no means exhaustive; the metrics here can be used, or new metrics that would better capture success measurement can be created and tracked.

      Metric
      Revenue influenced by reference calls ($ / % increase)
      # of reference calls resulting in closed-won opportunities
      # of quotes collected
      % of community growth YoY
      # of pieces of product feedback collected
      # of acts of advocacy
      % membership growth
      % product usage amongst community members
      # of social shares, clicks
      CSAT score for community members
      % of registered qualified leads
      # of leads registered
      # of member sign-ups
      # of net-new referenceable customers
      % growth rate of products used by members
      % engagement rate
      # of published third-party reviews
      % increase in fulfilled RFPs

      When selecting metrics, remember:
      When choosing metrics for your customer advocacy pilot, be sure to align them to your specific goals. If possible, try to connect your advocacy efforts back to retention, growth, or revenue.

      Do not choose too many metrics; one per goal should suffice.

      Ensure that you can track the metrics you select to measure - the data is available and measuring won't be overly manual or time-consuming.

      Win executive approval and implement pilot

      Step 3.2 Establish timeline and create advocate communication materials

      Total duration: 2.5-8.0 hours

      Objective
      Outline who will be involved in what roles and capacities and what tasks and activities need to completed.

      Output

      • Timeline and milestones
      • Advocate program materials

      Participants

      • Customer advocacy lead
      • Key stakeholders
      • Sales lead
      • Marketing lead
      • Customer Success lead
      • Product lead

      MarTech
      None

      Tools

      3.2.1 Establish Timeline & Milestones
      (30-60 min.)

      List & Assign
      List all key tasks, phases, and milestones on slides 13, 14, and 15 in the Executive Presentation Template.

      Include any activities that help close gaps or address pain points from slide 9 in the Executive Presentation Template.

      Assign workstream leads on slide 15 in the Executive Presentation Template.

      Finalize all tasks and activities with working team.

      3.2.2 Design & Build Advocate Program Materials
      (180-300 min.)

      Decide
      Determine materials needed to recruit advocates and explain the program to advocate candidates.

      Determine the types of acts of advocacy you are looking for.

      Determine incentives/rewards that will be provided to advocates, such as access to new products or services.

      Build
      Build out all communication materials.

      Obtain incentives.

      Tips & Reminders

      1. When determining incentives, use the validated ideal advocate profile for guidance (i.e. what motivates your advocates?).
      2. Ensure to leave a buffer in the timeline if the need to adjust course arises.

      Win executive approval and implement pilot

      Step 3.3 Implement pilot and gain executive buy-in

      Total duration: 2.5-8.0 hours

      Objective
      Successfully implement the customer advocacy pilot program and communicate results to gain approval for full-fledged program.

      Output

      • Deliver Executive Presentation
      • Successful customer advocacy pilot
      • Provide regular updates to stakeholders, executives

      Participants

      • Customer advocacy lead
      • Workstream leads

      MarTech
      May require the use of:

      • CRM or Marketing Automation Platform
      • Available and up-to-date customer database

      Tools

      3.3.1 Complete & Deliver Executive Presentation
      (60-120 min.)

      Present
      Finalize the Executive Presentation.

      Hold stakeholder meeting and introduce the program pilot.

      3.3.2 Gain Executive Buy-in
      (60-300 min.)

      Pitch
      Present the final results of the customer advocacy pilot using the Executive Presentation Template and gain approval.

      3.3.3 Implement the Customer Advocacy Program Pilot
      (30-60 min.)

      Launch
      Launch the customer advocacy program pilot. Follow the timelines and activities outlined in the Executive Presentation Template. Track/document all advocate outreach, activity, and progress against success metrics.

      Communicate
      Establish a regular cadence to communicate with steering committee, stakeholders. Use the Executive Presentation Template to present progress and resolve roadblocks if/as they arise.

      Tips & Reminders

      1. Continually collect feedback and input from advocates and stakeholders throughout the process.
      2. Don't be afraid to make changes on the go if it helps to achieve the end goal of your pilot.
      3. If the pilot program was successful, consider scaling it up and rolling it out to more customers.

      Summary of Accomplishment

      Mission Accomplished

      • You successfully launched your customer advocacy program pilot and demonstrated clear benefits and ROI. By identifying the needs of the business and aligning those needs with key customer advocacy activities, marketers and customer advocacy leaders can prioritize the most important tasks for the pilot while also identifying potential opportunities for expansion pending executive approval.
      • SoftwareReviews' comprehensive and tactical approach takes you through the steps to build the foundation for a strategic customer advocacy program. Our methodology ensures that a customer advocacy pilot is developed to deliver the desired outcomes and ROI, increasing stakeholder buy-in and setting up your organization for customer advocacy success.

      If you would like additional support, contact us and we'll make sure you get the professional expertise you need.

      Contact your account representative for more information.
      info@softwarereviews.com
      1-888-670-8889

      Related SoftwareReviews Research

      Measure and Manage the Customer Satisfaction Metrics That Matter the Most
      Understand what truly keeps your customer satisfied. Measure what matters to improve customer experience and increase satisfaction and advocacy.

      • Understand the true drivers of satisfaction and dissatisfaction among your customer segments.
      • Establish process and cadence for effective satisfaction measurement and monitoring.
      • Know where resources are needed most to improve satisfaction levels and increase retention.

      Develop the Right Message to Engage Buyers
      Sixty percent of marketers find it hard to produce high-quality content consistently. SaaS marketers have an even more difficult job due to the technical nature of content production.

      • Create more compelling and relevant content that aligns with a buyer's needs and journey.
      • Shrink marketing and sales cycles.
      • Increase the pace of content production.

      Create a Buyer Persona and Journey
      Get deeper buyer understanding and achieve product-market fit, with easier access to market and sales.

      • Reduce time and resources wasted chasing the wrong prospects.
      • Increase open and click-through rates.
      • Perform more effective sales discovery.
      • Increase win rate.

      Bibliography

      "15 Award-Winning Customer Advocacy Success Stories." Influitive, 2021. Accessed 8 June 2023.

      "Advocacy Marketing." Influitive, June 2016. Accessed 26 Oct. 2021.

      Andrews, Marcus. "42% of Companies Don’t Listen to their Customers. Yikes." HubSpot, June 2019. Accessed 2 Nov. 2021.

      "Before you leap! Webcast." Point of Reference, Sept. 2019. Accessed 4 Nov. 2021.

      "Brand Loyalty: 5 Interesting Statistics." Factory360, Jan. 2016. Accessed 2 Nov. 2021.

      Brenner, Michael. "The Data Driven Guide to Customer Advocacy." Marketing Insider Group, Sept. 2021. Accessed 3 Feb. 2022.

      Carroll, Brian. "Why Customer Advocacy Should Be at the Heart of Your Marketing." Marketing Insider Group, Sept. 2017. Accessed 3 Feb. 2022.

      Cote, Dan. "Advocacy Blooms and Business Booms When Customers and Employees Engage." Influitive, Dec. 2021. Accessed 3 Feb. 2022.

      "Customer Success Strategy Guide." ON24, Jan. 2021. Accessed 2 Nov. 2021.

      Dalao, Kat. "Customer Advocacy: The Revenue-Driving Secret Weapon." ReferralRock, June 2017. Accessed 7 Dec. 2021.

      Frichou, Flora. "Your guide to customer advocacy: What is it, and why is it important?" TrustPilot, Jan. 2020. Accessed 26 Oct. 2021.

      Gallo, Amy. "The Value of Keeping the Right Customers." Harvard Business Review, Oct. 2014. Accessed 10 March 2022.

      Huhn, Jessica. "61 B2B Referral Marketing Statistics and Quotes." ReferralRock, March 2022. Accessed 10 March 2022.

      Kemper, Grayson. "B2B Buying Process: How Businesses Purchase B2B Services and Software." Clutch, Feb. 2020. Accessed 6 Jan. 2022.

      Kettner, Kyle. "The Evolution of Ambassador Marketing." BrandChamp.io, Oct. 2018. Accessed 2 Nov. 2021.

      Landis, Taylor. "Customer Retention Marketing vs. Customer Acquisition Marketing." OutboundEngine, April 2022. Accessed 23 April 2022.

      Miels, Emily. "What is customer advocacy? Definition and strategies." Zendesk Blog, June 2021. Accessed 27 Oct. 2021.

      Mohammad, Qasim. "The 5 Biggest Obstacles to Implementing a Successful B2B Customer Advocacy Program." HubSpot, June 2018. Accessed 6 Jan. 2022.

      Murphy, Brandon. "Brand Advocacy and Social Media - 2009 GMA Conference." Deloitte, Dec. 2009. Accessed 8 June 2023.

      Patel, Neil. "Why SaaS Brand Advocacy is More Important than Ever in 2021." Neil Patel, Feb. 2021. Accessed 4 Nov. 2021.

      Pieri, Carl. "The Plain-English Guide to Customer Advocacy." HubSpot, Apr. 2020. Accessed 27 Oct. 2021.

      Schmitt, Philipp; Skiera, Bernd; Van den Bulte, Christophe. "Referral Programs and Customer Value." Wharton Journal of Marketing, Jan. 2011. Accessed 8 June 2023.

      "The Complete Guide to Customer Advocacy." Gray Group International, 2020. Accessed 15 Oct. 2021.

      "The Customer-powered Enterprise: Playbook." Influitive, Gainsight & Pendo. 2020. Accessed 26 Oct. 2021.

      "The Winning Case for a Customer Advocacy Solution." RO Innovation, 2017. Accessed 26 Oct. 2021.

      Tidey, Will. "Acquisition vs. Retention: The Importance of Customer Lifetime Value." Huify, Feb. 2018. Accessed 10 Mar. 2022.

      "What a Brand Advocate Is and Why Your Company Needs One." RockContent, Jan. 2021. Accessed 7 Feb. 2022.

      "What is Customer Advocacy? A Definition and Strategies to Implement It." Testimonial Hero, Oct. 2021. Accessed 26 Jan. 2022.

      The latest burning platform: Exit Plans in a shifting world

      • member rating overall impact (scale of 10): N/A
      • member rating average dollars saved: N/A
      • member rating average days saved: N/A

      The current global situation, marked by significant trade tensions and retaliatory measures between major economic powers, has elevated the importance of more detailed, robust, and executable exit plans for businesses in nearly all industries. The current geopolitical headwinds create an unpredictable environment that can severely impact supply chains, technology partnerships, and overall business operations. What was once a prudent measure is now a critical necessity – a “burning platform” – for ensuring business continuity and resilience.

      Here I will delve deeper into the essential components of an effective exit plan, outline the practical steps for its implementation, and explain the crucial role of testing in validating its readiness.

      exit plan

      Continue reading

      DORA - Article 7 — Explained

      • member rating overall impact (scale of 10): N/A
      • member rating average dollars saved: N/A
      • member rating average days saved: N/A

      Intro

      While this text is about DORA requirements, it is really about resilient availability of your service. Even if you are not bound to this regulation, maybe you are not a financial services provider, the requirements and tips on how to get there are invaluable to your client satisfaction.

      Legal text

      In order to address and manage ICT risk, financial entities shall use and maintain updated ICT systems, protocols and tools that are:
      (a) appropriate to the magnitude of operations supporting the conduct of their activities, in accordance with the
      proportionality principle as referred to in Article 4;
      (b) reliable;
      (c) equipped with sufficient capacity to accurately process the data necessary for the performance of activities and the timely provision of services, and to deal with peak orders, message or transaction volumes, as needed, including where new technology is introduced;
      (d) technologically resilient in order to adequately deal with additional information processing needs as required under
      stressed market conditions or other adverse situations.

      What do you need to do?

      • Determine what systems you need.
      • Inventory the systems you have.
      • Make sure your systems and applications are sized right for your business
        • and made resilient according to the business functions they support
          in relation to the size of the business functions they support (proportionality)
        • and are reliable, meaning they produce consistent results
        • and are resilient, meaning they can withstand adverse effects where needed 

      How do you do this?

      For requirement (a)

      • Identify the capacity requirements for your services
      • Also identify the capacity requirements in case of serious decapacitating events (Business continuity)
      • Detail your capacity management plan so that you can meet the requirements
      • Test your systems for compliamce with these requirements

      For requirement (b)

      • Show the parts of your IT policy that deals with availability, 
      • Show the technical Disaster recovery plans and their execution reports (ideally over a number of years)
      • Show the availability reports for your systems.
      • Show the vulnerability management reports for your systems (optional)

      For requirement (C)

      • Show the availability reports for your systems: this is really the end-result: if you can show that your systems are available even under heavy load, you have won half the battle.
      • Show the capacity requirements for your systems. This is where you can prove you really thought about demad for your service.
      • Show the capacity monitoring plans, plans and roadmaps and reports for your systems
      •  Show the load testing reports executed on your systems

       For requirement (d)

      • Show the identified attacks scenarios and you defend against them
      •  Show the results of your resilience test plans: talk about High availability, Disaster recovery, and manual workaround or alternative workflows (that is business continuity.)

      Many of these solutions will depend on the the solutions and responses to other DORA requirements.


      dora

      Map Your Business Architecture to Define Your Strategy

      • Buy Link or Shortcode: {j2store}579|cart{/j2store}
      • member rating overall impact (scale of 10): 9.4/10 Overall Impact
      • member rating average dollars saved: $357,799 Average $ Saved
      • member rating average days saved: 30 Average Days Saved
      • Parent Category Name: Strategy & Operating Model
      • Parent Category Link: /strategy-and-operating-model
      • Organizations need to innovate rapidly to respond to the changing forces in their industry, but their IT initiatives often fail to deliver meaningful outcomes.
      • Planners face challenges in understanding the relationships between the important customer-focused innovations they’re trying to introduce and the resources (capabilities) that make them possible, including applications, human resources, information, and processes. For example, are we risking the success of a new service offering by underpinning it with a legacy or manual solution?

      Our Advice

      Critical Insight

      Successful execution of business strategy requires planning that:

      1. Accurately reflects organizational capabilities.
      2. Is traceable so all levels can understand how decisions are made.
      3. Makes efficient use of organizational resources.

      To accomplish this, the business architect must engage stakeholders, model the business, and drive planning with business architecture.

      • Business architecture is often regarded as an IT function when its role and tools should be fixtures within the business planning and innovation practice.
      • Any size of organization – from start-ups to global enterprises -- can benefit from using a common language and modeling rigor to identify the opportunities that will produce the greatest impact and value.
      • You don’t need sophisticated modeling software to build an effective business architecture knowledgebase. In fact, the best format for engaging business stakeholders is intuitive visuals using business language.

      Impact and Result

      • Execute more quickly on innovation and transformation initiatives.
      • More effectively target investments in resources and IT according to what goals and requirements are most important.
      • Identify problematic areas (e.g. legacy applications, manual processes) that hinder the business strategy and create inefficiencies in our information technology operation.

      Map Your Business Architecture to Define Your Strategy Research & Tools

      Besides the small introduction, subscribers and consulting clients within this management domain have access to:

      1. Map Your Business Architecture Deck – A step-by-step document that walks you through how to properly engage business and IT in applying a common language and process rigor to build key capabilities required to achieve innovation and growth goals.

      Build a structured, repeatable framework for both IT and business stakeholders to appraise the activities that deliver value to consumers; and assess the readiness of their capabilities to enable them.

      • Map Your Business Architecture to Define Your Strategy – Phases 1-3

      2. Stakeholder Engagement Strategy Template – A best-of-breed template to help you build a clear, concise, and compelling strategy document for identifying and engaging stakeholders.

      This template helps you ensure that your business architecture practice receives the resources, visibility, and support it needs to be successful, by helping you develop a strategy to engage the key stakeholders involved.

      • Stakeholder Engagement Strategy Template

      3. Value Stream Map Template – A template to walk through the value streams that are tied to your strategic goals.

      Record the complete value stream and decompose it into stages. Add a description of the expected outcome of the value stream and metrics for each stage.

      • Value Stream Map Template

      4. Value Stream Capability Mapping Template – A template to define capabilities and align them to selected value streams.

      Build a business capability model for the organization and map capabilities to the selected value stream.

      • Value Stream – Capability Mapping Template
      [infographic]

      Workshop: Map Your Business Architecture to Define Your Strategy

      Workshops offer an easy way to accelerate your project. If you are unable to do the project yourself, and a Guided Implementation isn't enough, we offer low-cost delivery of our project workshops. We take you through every phase of your project and ensure that you have a roadmap in place to complete your project successfully.

      1 Discover the Business Context

      The Purpose

      Identify and consult stakeholders to discover the business goals and value proposition for the customer.

      Key Benefits Achieved

      Engage stakeholders and SMEs in describing the business and its priorities and culture.

      Identify focus for the areas we will analyze and work on.

      Activities

      1.1 Select key stakeholders

      1.2 Plan for engaging stakeholders

      1.3 Gather business goals and priorities

      Outputs

      Stakeholder roles

      Engagement plan

      Business strategy, value proposition

      2 Define Value Streams

      The Purpose

      Describe the main value-adding activities of the business from the consumer’s point of view, e.g. provide product or service.

      Key Benefits Achieved

      Shared understanding of why we build resources and do what we do.

      Starting point for analyzing resources and investing in innovation.

      Activities

      2.1 Define or update value streams

      2.2 Decompose selected value stream(s) into value stages and identify problematic areas and opportunities

      Outputs

      Value streams for the enterprise

      Value stages breakdown for selected value stream(s)

      3 Build Business Capability Map

      The Purpose

      Describe all the capabilities that make up an organization and enable the important customer-facing activities in the value streams.

      Key Benefits Achieved

      Basis for understanding what resources the organization has and their ability to support its growth and success.

      Activities

      3.1 Define and describe all business capabilities (Level 1)

      3.2 Decompose and analyze capabilities for a selected priority value stream.

      Outputs

      Business Capability Map (Level 1)

      Business Capabilities Level 2 for selected value stream

      4 Develop a Roadmap

      The Purpose

      Use the Business Capability Map to identify key capabilities (e.g. cost advantage creator), and look more closely at what applications or information or business processes are doing to support or hinder that critical capability.

      Key Benefits Achieved

      Basis for developing a roadmap of IT initiatives, focused on key business capabilities and business priorities.

      Activities

      4.1 Identify key capabilities (cost advantage creators, competitive advantage creators)

      4.2 Assess capabilities with the perspective of how well applications, business processes, or information support the capability and identify gaps

      4.3 Apply analysis tool to rank initiatives

      Outputs

      Business Capability Map with key capabilities: cost advantage creators and competitive advantage creators

      Assessment of applications or business processes or information for key capabilities

      Roadmap of IT initiatives

      Further reading

      Map Your Business Architecture to Define Your Strategy

      Plan your organization’s capabilities for best impact and value.

      Info-Tech Research Group

      Info-Tech is a provider of best-practice IT research advisory services that make every IT leader’s job easier.

      35,000 members sharing best practices you can leverage Millions spent developing tools and templates annually Leverage direct access to over 100 analysts as an extension of your team Use our massive database of benchmarks and vendor assessments Get up to speed in a fraction of the time

      Analyst perspective

      Know your organization’s capabilities to build a digital and customer-driven culture.

      Business architecture provides a holistic and unified view of:

      • All the organization’s activities that provide value to their clients (value streams).
      • The resources that make them possible and effective (capabilities, i.e. its employees, software, processes, information).
      • How they inter-relate, i.e. depend on and impact each other to help deliver value.

      Without a business architecture it is difficult to see the connections between the business’s activities for the customer and the IT resources supporting them – to demonstrate that what we do in IT is customer-driven.

      As a map of your business, the business architecture is an essential input to the digital strategy:

      • Develop a plan to transform the business by investing in the most important capabilities.
      • Ensure project initiatives are aligned with business goals as they evolve.
      • Respond more quickly to customer requirements and to disruptions in the industry by streamlining operations and information sharing across the enterprise.

      Crystal Singh, Research Director, Data and Analytics

      Crystal Singh
      Research Director, Data and Analytics
      Info-Tech Research Group

      Andrea Malick, Research Director, Data and Analytics

      Andrea Malick
      Research Director, Data and Analytics
      Info-Tech Research Group

      Executive summary

      Your Challenge Common Obstacles Info-Tech’s Approach

      Organizations need to innovate rapidly to respond to ever-changing forces and demands in their industry. But they often fail to deliver meaningful outcomes from their IT initiatives within a reasonable time.

      Successful companies are transforming, i.e. adopting fluid strategies that direct their resources to customer-driven initiatives and execute more quickly on those initiatives. In a responsive and digital organization, strategies, capabilities, information, people, and technology are all aligned, so work and investment are consistently allocated to deliver maximum value.

      You don’t have a complete reference map of your organization’s capabilities on which to base strategic decisions.

      You don’t know how to prioritize and identify the capabilities that are essential for achieving the organization’s customer-driven objectives.

      You don’t have a shared enterprise vision, where everyone understands how the organization delivers value and to whom.

      Begin important business decisions with a map of your organization – a business reference architecture. Model the business in the form of architectural blueprints.

      Engage your stakeholders. Recognize the opportunity for mapping work, and identify and engage the right stakeholders.

      Drive business architecture forward to promote real value to the organization. Assess your current projects to determine if you are investing in the right capabilities. Conduct business capability assessments to identify opportunities and prioritize projects.

      Info-Tech Insight
      Business architecture is the set of strategic planning techniques that connects organization strategy to execution in a manner that is accurate and traceable and promotes the efficient use of organizational resources.

      Blueprint activities summary

      Phase Purpose Activity Outcome
      1. Business context:
      Identify organization goals, industry drivers, and regulatory requirements in consultation with business stakeholders.
      Identify forces within and outside the organization to consider when planning the focus and timing of digital growth, through conducting interviews and surveys and reviewing existing strategies. Business value canvas, business strategy on a page, customer journey
      2. Customer activities (value stream):
      What is the customer doing? What is our reason for being as a company? What products and services are we trying to deliver?
      Define or update value streams, e.g. purchase product from supplier, customer order, and deliver product to customer. Value streams enterprise-wide (there may be more than one set of value streams, e.g. a medical school and community clinic)
      Prioritize value streams:
      Select key value streams for deeper analysis and focus.
      Assess value streams. Priority value streams
      Value stages:
      Break down the selected value stream into its stages.
      Define stages for selected value streams. Selected value stream stages
      3. Business capability map, level 1 enterprise:
      What resources and capabilities at a high level do we have to support the value streams?
      Define or update the business capabilities that align with and support the value streams. Business capability map, enterprise-wide capabilities level 1
      Business capability map, level 2 for selected area:
      List resources and capabilities that we have at a more detailed level.
      Define or update business capabilities for selected value stream to level 2. Business capability map, selected value stream, capability level 2
      Heatmap Business Capability Map: Flag focus areas in supporting technology, applications, data and information.

      Info-Tech’s workshop methodology

      Day 1: Discover Business Context Day 2: Define Value Streams Day 3: Build Business Capability Map Day 4: Roadmap Business Architecture
      Phase Steps

      1.1 Collect corporate goals and strategies

      1.2 Identify stakeholders

      2.1 Build or update value streams

      2.2 Decompose selected value stream into value stages and analyze for opportunities

      3.1 Update business capabilities to level 1 for enterprise

      3.2 For selected value streams, break down level 1 to level 2

      3.3 Use business architecture to heatmap focus areas: technology, information, and processes

      3.4 Build roadmap of future business architecture initiatives

      Phase Outcomes
      • Organizational context and goals
      • Business strategy on a page, customer journey map, business model canvas
      • Roles and responsibilities
      • Value stream map and definitions
      • Selected value stream(s) decomposed into value stages
      • Enterprise business capabilities map to level 1
      • Business architecture to level 2 for prioritized value stream
      • Heatmap business architecture
      • Business architecture roadmap, select additional initiatives

      Key concepts for this blueprint

      INDUSTRY VALUE CHAIN DIGITAL TRANSFORMATION BUSINESS ARCHITECTURE
      A high-level analysis of how the industry creates value for the consumer as an overall end-to-end process. The adoption of digital technologies to innovate and re-invent existing business, talent ,and operating models to drive growth, business value, and improved customer experience. A holistic, multidimensional business view of capabilities, end-to-end value, and operating model in relation to the business strategy.
      INDUSTRY VALUE STREAM STRATEGIC OBJECTIVES CAPABILITY ASSESSMENTS
      A set of activities, tasks, and processes undertaken by a business or a business unit across the entire end-to-end business function to realize value. A set of standard objectives that most industry players will feature in their corporate plans. A heat-mapping effort to analyze the maturity and priority of each capability relative to the strategic priorities that they serve.

      Info-Tech’s approach

      1 Understand the business context and drivers
      Deepen your understanding of the organization’s priorities by gathering business strategies and goals. Talking to key stakeholders will allow you to get a holistic view of the business strategy and forces shaping the strategy, e.g. economy, workforce, and compliance.
      2 Define value streams; understand the value you provide
      Work with senior leadership to understand your customers’ experience with you and the ways your industry provides value to them.
      Assess the value streams for areas to explore and focus on.
      3 Customize the industry business architecture; develop business capability map
      Work with business architects and enterprise architects to customize Info-Tech’s business architecture for your industry as an enterprise-wide map of the organization and its capabilities.
      Extend the business capability map to more detail (Level 2) for the value stream stages you select to focus on.

      Business architecture is a planning function that connects strategy to execution

      Business architecture provides a framework that connects business strategy and IT strategy to project execution through a set of models that provide clarity and actionable insights. How well do you know your business?

      Business architecture is:

      • Inter-disciplinary: Business architecture is a core planning activity that supports all important decisions in the organization, for example, organizational resources planning. It’s not just about IT.
      • Foundational: The best way to answer the question, “Where do we start?” or “Where is our investment best directed?”, comes from knowing your organization, what its core functions and capabilities are (i.e. what’s important to us as an organization), and where there is work to do.
      • Connecting: Digital transformation and modernization cannot work with siloes. Connecting siloes means first knowing the organization and its functions and recognizing where the siloes are not communicating.

      Business architecture must be branded as a front-end planning function to be appropriately embedded in the organization’s planning process.

      Brand business architecture as an early planning pre-requisite on the basis of maintaining clarity of communication and spreading an accurate awareness of how strategic decisions are being made.

      As an organization moves from strategy toward execution, it is often unclear as to exactly how decisions pertaining to execution are being made, why priority is given to certain areas, and how the planning function operates.

      The business architect’s primary role is to model this process and document it.

      In doing so, the business architect creates a unified view as to how strategy connects to execution so it is clearly understood by all levels of the organization.

      Business architecture is part of the enterprise architecture framework

      Business Architecture
      Business strategy map Business model canvas Value streams
      Business capability map Business process flows Service portfolio
      Data Architecture Application Architecture Infrastructure Architecture
      Conceptual data model Application portfolio catalog Technology standards catalog
      Logical data model Application capability map Technology landscape
      Physical data model Application communication model Environments location model
      Data flow diagram Interface catalog Platform decomposition diagram
      Data lifecycle diagram Application use-case diagram Network computing / hardware diagram
      Security Architecture
      Enterprise security model Data security model Application security model

      Business architecture is a set of shared and practical views of the enterprise

      The key characteristic of the business architecture is that it represents real-world aspects of a business, along with how they interact.

      Many different views of an organization are typically developed. Each view is a diagram that illustrates a way of understanding the enterprise by highlighting specific information about it:

      • Business strategy view captures the tactical and strategic goals that drive an organization forward.
      • Business capabilities view describes the primary business functions of an enterprise and the pieces of the organization that perform those functions.
      • Value stream view defines the end-to-end set of activities that deliver value to external and internal stakeholders.
      • Business knowledge view establishes the shared semantics (e.g. customer, order, and supplier) within an organization and relationships between those semantics (e.g. customer name, order date, supplier name) – an information map.
      • Organizational view captures the relationships among roles, capabilities, and business units, the decomposition of those business units into subunits, and the internal or external management of those units.

      Business architect connects all the pieces

      The business owns the strategy and operating model; the business architect connects all the pieces together.

      R Business Architect (Responsible)
      A Business Unit Leads (Accountable)
      C Subject Matter Experts (Consulted)
      – Business Lines, Operations, Data, Technology Systems & Infrastructure Leads
      I Business Operators (Informed)
      – Process, Data, Technology Systems & Infrastructure

      Choose a key business challenge to address with business architecture

       Choose a key business challenge to address with business architecture

      Picking the right project is critical to setting the tone for business architecture work in the organization.

      Best practices for business architecture success

      Consider these best practices to maintain a high level of engagement from key stakeholders throughout the process of establishing or applying business architecture.

      Balance short-term cost savings with long-term benefits

      Participate in project governance to facilitate compliance

      Create a center of excellence to foster dialogue

      Identify strategic business objectives

      Value streams: Understand how you deliver value today

      It is important to understand the different value-generating activities that deliver an outcome for and from your customers.

      We do this by looking at value streams, which refer to the specific set of activities an industry player undertakes to create and capture value for and from the end consumer (and so the question to ask is, how do you make money as an organization?).

      Our approach helps you to strengthen and transform those value streams that generate the most value for your organization.

      Understand how you deliver value today

      An organization can have more than one set of streams.
      For example, an enterprise can provide both retail shopping and financial services, such as credit cards.

      Define the organization’s value streams

      • Value streams connect business goals to the organization’s value realization activities. They enable an organization to create and capture value in the market place by engaging in a set of interconnected activities. Those activities are dependent on the specific industry segment an organization operates within. Value streams can extend beyond the organization into the supporting ecosystem, whereas business processes are contained within and the organization has complete control over them.
      • There are two types of value streams: core value streams and support value streams. Core value streams are mostly externally facing: they deliver value to either an external or internal customer and they tie to the customer perspective of the strategy map. Support value streams are internally facing and provide the foundational support for an organization to operate.
      • An effective method for ensuring all value streams have been considered is to understand that there can be different end-value receivers. Info-Tech recommends identifying and organizing the value streams with customers and partners as end-value receivers.

      Example: Value stream descriptions for the retail industry

      Value Streams Create or Purchase the Product Manage Inventory Distribute Product Sell Product, Make Product Available to Customers
      • Product is developed before company sells it.
      • Make these products by obtaining raw materials from external suppliers or using their own resources.
      • Retailers purchase the products they are going to sell to customers from manufacturers or wholesale distributors.
      • Retailer success depends on its ability to source products that customers want and are willing to buy.
      • Inventory products are tracked as they arrive in the warehouse, counted, stored, and prepared for delivery.
      • Estimate the value of your inventory using retail inventory management software.
      • Optimizing distribution activities is an important capability for retailers. The right inventory needs to be at a particular store in the right quantities exactly when it is needed. This helps to maximize sales and minimize how much cash is held up in inventory.
      • Proper supply chain management can not only reduce costs for retailers but drive revenues by enhancing shopping experiences.
      • Once produced, retailers need to sell the products. This is done through many channels including physical stores, online, the mail, or catalogs.
      • After the sale, retailers typically have to deliver the product, provide customer care, and manage complaints.
      • Retailers can use loyalty programs, pricing, and promotions to foster repeat business.

      Value streams describe your core business

      Value streams describe your core business

      Value streams – the activities we do to provide value to customers – require business capabilities.

      Value streams are broken down further into value stages, for example, the Sell Product value stream has value stages Evaluate Options, Place Order, and Make Payment.

      Think of value streams as the core operations: the reason for your organization’s being. A professional consulting organization may have a legal team but it does not brand itself as a law firm. A core value stream is providing research products and services; a business capability that supports it is legal counsel.

      Decompose the value stream into stages

      The stages of a value stream are usually action-oriented statements or verbs that make up the individual steps involved throughout the scope of the value stream, e.g. Place Order or Make Payment.

      Each value stream should have a trigger or starting point and an end result for a client or receiver.

      Decompose the value stream into stages

      There should be measurable value or benefits at each stage. These are key performance indicators (KPIs). Spot problem areas in the stream.

      Value streams usually fall into one of these categories:

      1. Fulfillment of products and services
      2. Manufacturing
      3. Software products
      4. Supporting value streams (procurement of supplies, product planning)

      Value streams need capabilities

      • Value streams connect business goals to the organization’s value realization activities. They enable an organization to create and capture value in the market place by engaging in a set of interconnected activities.
      • There are two types of value streams: core value streams and support value streams. Core value streams are mostly externally facing: they deliver value to either an external or internal customer and they tie to the customer perspective of the strategy map. Support value streams are internally facing and provide the foundational support for an organization to operate.
      • There can be different end-value receivers. Info-Tech recommends identifying and organizing the value streams with customers and partners as end-value receivers.

      Value streams need business capabilities

      Business capabilities are built up to allow the business to perform the activities that bring value to customers. Map capabilities to the value-add activities in the value stream. Business capabilities lie at the top layer of the business architecture:

      • They are the most stable reference for planning organizations.
      • They make strategy more tangible.
      • If properly defined, they can help overcome organizational silos.

      Value streams need business capabilities

      Example business capability map – Higher Education

      A business capability map can be thought of as a visual representation of your organization’s business capabilities and represents a view of what your data program must support.

      Validate your business capability map with the right stakeholders, including your executive team, business unit leaders, and/or other key stakeholders.

      Example business capability map for: Higher Education

      Example business capability map for Higher Education

      Example business capability map – Local Government

      Validate your business capability map with the right stakeholders, including your executive team, business unit leaders, and/or other key stakeholders.

      A business capability map can be thought of as a visual representation of your organization’s business capabilities and represents a view of what your data program must support.

      Example business capability map for: Local Government

      Example business capability map for Local Government

      Value streams need business capabilities

      Value streams – the activities we do to provide value to customers – require business capabilities. Value streams are broken down further into value stages.

      Business capabilities are built up to allow the business to perform the activities that bring value to customers. Map capabilities to the activities in the value stage to spot opportunities and problems in delivering services and value.

      Business processes fulfill capabilities. They are a step-by-step description of who is performing what to achieve a goal. Capabilities consist of networks of processes and the resources – people, technology, materials – to execute them.

      Capability = Processes + Software, Infrastructure + People

      Prioritize a value stream and identify its supporting capabilities

      Prioritize your improvement objectives and business goals and identify a value stream to transform.

      Align the business objectives of your organization to your value streams (the critical actions that take place within your organization to add value to a customer).

      Prioritize a value stream to transform based on the number of priorities aligned to a value stream, and/or the business value (e.g. revenue, EBITDA earnings, competitive differentiation, or cost efficiency).

      Decompose the selected value stream into value stages.

      Align capabilities level 1 and 2 to value stages. One capability may support several value stages in the stream.

      Build a business architecture for the prioritized value stream with a map of business capabilities up to level 2.

      NOTE: We can’t map all capabilities all at once: business architecture is an ongoing practice; select key mapping initiatives each year based on business goals.

      Prioritize a value stream and identify its supporting capabilities

      Map business capabilities to Level 2

       Map business capabilities to Level 2

      Map capabilities to value stage

      Map capabilities to value stage

      Business value realization

      Business value defines the success criteria of an organization as manifested through organizational goals and outcomes, and it is interpreted from four perspectives:

      • Profit generation: The revenue generated from a business capability with a product that is enabled with modern technologies.
      • Cost reduction: The cost reduction when performing business capabilities with a product that is enabled with modern technologies.
      • Service enablement: The productivity and efficiency gains of internal business operations from products and capabilities enhanced with modern technologies.
      • Customer and market reach: The improved reach and insights of the business in existing or new markets.

      Business Value Matrix

      Value, goals, and outcomes cannot be achieved without business capabilities

      Break down your business goals into strategic and achievable initiatives focused on specific value streams and business capabilities.

      Business goals and outcomes

      Accelerate the process with an industry business architecture

      It’s never a good idea to start with a blank page.

      The business capability map available from Info-Tech and with industry standard models can be used as an accelerator. Assemble the relevant stakeholders – business unit leads and product/service owners – and modify the business capability map to suit your organization’s context.

      Acceleration path: Customize generic capability maps with the assistance of our industry analysts.

      Accelerate the process with an industry business architecture

      Identify goals and drivers

      Consider organizational goals and industry forces when planning.

      Business context Define value streams Build business capability map
      1.1 Select key stakeholders
      1.2 Collect and understand corporate goals
      2.1 Update or define value streams
      2.2 Decompose and analyze selected value stream
      3.1 Build level 1 capability map
      3.2 Build level 2 capability map
      3.3 Heatmap capability map
      3.4 Roadmap

      Use inputs from business goals and strategies to understand priorities.

      It is not necessary to have a comprehensive business strategy document to start – with key stakeholders, the business architect should be able to gather a one-page business value canvas or customer journey.

      Determine how the organization creates value

      Begin the process by identifying and locating the business mission and vision statements.

      What is business context?

      “The business context encompasses an understanding of the factors impacting the business from various perspectives, including how decisions are made and what the business is ultimately trying to achieve. The business context is used by IT to identify key implications for the execution of its strategic initiatives.”

      Source: Businesswire, 2018

      Identify the key stakeholders who can help you promote the value of business architecture

      First, as the CIO, you must engage executive stakeholders and secure their support.
      Focus on key players who have high power and high interest in business architecture.

      Engage the stakeholders who are impacted the most and have the power to impede the success of business architecture.

      For example, if the CFO – who has the power to block funding – is disengaged, business architecture will be put at risk.

      Use Info-Tech’s Stakeholder Power Map Template to help prioritize time spent with stakeholders.

      Sample power map

      Identify the key stakeholders concerned with the business architecture project

      A business architecture project may involve the following stakeholders:

      Business architecture project stakeholders

      You must identify who the stakeholders are for your business architecture work.

      Think about:

      • Who are the decision makers and key influencers?
      • Who will impact the business architecture work? Who will the work impact?
      • Who has vested interest in the success or failure of the practice?
      • Who has the skills and competencies necessary to help us be successful?

      Avoid these common mistakes:

      • Don’t focus on the organizational structure and hierarchy. Often stakeholder groups don’t fit the traditional structure.
      • Don’t ignore subject-matter experts on either the business or IT side. You will need to consider both.

      1.1 Identify and assemble key stakeholders

      1-3 hours

      Build an accurate depiction of the business.

      1. It is important to make sure the right stakeholders participate in this exercise. The exercise of identifying capabilities for an organization is very introspective and requires deep analysis.
      2. Consider:
        1. Who are the decision makers and key influencers?
        2. Who will impact the business capability work? Who has a vested interest in the success or failure of the outcome?
        3. Who has the skills and competencies necessary to help you be successful?
      3. Avoid:
        1. Don’t focus on the organizational structure and hierarchy. Often stakeholder groups don’t fit the traditional structure.
        2. Don’t ignore subject matter experts on either the business or IT side. You will need to consider both.
      Input Output
      • List of who is accountable for key business areas and decisions
      • Organizational chart
      • List of who has decision-making authority
      • A list of the key stakeholders
      Materials Participants
      • Whiteboard/Flip Charts
      • Modeling software (e.g. Visio, ArchiMate)
      • Business capability map industry models
      • CIO
      • Enterprise/Business Architect
      • Business Analysts
      • Business Unit Leads
      • Departmental Executives & Senior Managers

      Conduct interviews with the business to gather intelligence for strategy

      Talking to key stakeholders will allow you to get a holistic view of the business strategy.

      Stakeholder interviews provide holistic view of business strategy

      Build a strategy on a page through executive interviews and document reviews

      Understanding the business mandate and priorities ensures alignment across the enterprise.

      A business strategy must articulate the long-term destination the business is moving into. This illustration shapes all the strategies and activities in every other part of the business, including what IT capabilities and resources are required to support business goals. Ultimately, the benefits of a well-defined business strategy increase as the organization scales and as business units or functions are better equipped to align the strategic planning process in a manner that reflects the complexity of the organization.

      Using the Business Strategy on a Page canvas, consider the questions in each bucket to elicit the overall strategic context of the organization and uncover the right information to build your digital strategy. Interview key executives including your CEO, CIO, CMO, COO, CFO, and CRO, and review documents from your board or overall organizational strategy to uncover insights.

      Info-Tech Insight
      A well-articulated and clear business strategy helps different functional and business units work together and ensures that individual decisions support the overall direction of the business.

      Focus on business value and establish a common goal

      Business architecture is a strategic planning function and the focus must be on delivering business value.

      Examples business objectives:

      • Digitally transform the business, redefining its customer interactions.
      • Identify the root cause for escalating customer complaints and eroding satisfaction.
      • Identify reuse opportunities to increase operational efficiency.
      • Identify capabilities to efficiently leverage suppliers to handle demand fluctuations.

      Info-Tech Insight
      CIOs are ideally positioned to be the sponsors of business architecture given that their current top priorities are digital transformation, innovation catalyzation, and business alignment.

      1.2 Collect and understand business objectives

      1-3 hours

      Having a clear understanding of the business is crucial to executing on the strategic IT initiatives.

      1. Discover the strategic CIO initiatives your organization will pursue:
      • Schedule interviews.
      • Use the CIO Business Vision diagnostic or Business Context Discovery Tool.
    • Document the business goals.
    • Update and finalize business goals.
    • InputOutput
      • Existing business goals and strategies
      • Existing IT strategies
      • Interview findings
      • Diagnostic results
      • List of business goals
      • Strategy on a page
      • Business model canvas
      • Customer journey
      MaterialsParticipants
      • CIO Business Vision diagnostic
      • Interview questionnaire
      • CIO
      • Enterprise/Business Architect
      • Business Analysts
      • Business Unit Leads
      • Departmental Executives & Senior Managers

      CIO Business Vision Diagnostic

      CEO

      Vision

      Where do you want to go?
      What is the problem your organization is addressing?

      Mission/Mandate

      What do you do?
      How do you do?
      Whom do you do it for?

      Value Streams

      Why are you in business? What do you do?
      What products and services do you provide?
      Where has your business seen persistent demand?

      Key Products & Services

      What are your top three to five products and services?

      Key Customer Segments

      Who are you trying to serve or target?
      What are the customer segments that decide your value proposition?

      Value Proposition

      What is the value you deliver to your customers?

      Future Value Proposition

      What is your value proposition in three to five years’ time?

      Digital Experience Aspirations

      How can you create a more effective value stream?
      For example, greater value to customers or better supplier relationships.

      Business Resilience Aspirations

      How can you reduce business risks?
      For example, compliance, operational, security, or reputational.

      Sustainability (or ESG) Aspirations

      How can you deliver ESG and sustainability goals?

      Interview the following executives for each business goal area.

      CEO
      CRO
      COO

      Core Business Goals

      What are the core business goals to meet business objectives?

      Top Priorities & Initiatives

      What are the top initiatives and priorities over the planning horizon?

      Performance Insights/Metrics

      What do we need to achieve?
      How can the success be measured?

      CMO
      COO
      CFO

      Shared Business Goals

      What are the shared (operational) business goals to meet business objectives?

      Top Priorities & Initiatives

      What are the top initiatives and priorities over the planning horizon?

      Performance Insights/Metrics

      What do we need to achieve?
      How can the success be measured?

      CFO
      CIO
      COO
      CHRO

      Enabling Business Goals

      What are the enabling (supporting/enterprise) business goals to meet business objectives?

      Top Priorities & Initiatives

      What are the top initiatives and priorities over the planning horizon?

      Performance Insights/Metrics

      What do we need to achieve?
      How can the success be measured?

      Craft a strategy to increase stakeholder support and participation

      The BA practice’s supporters are potential champions who will help you market the value of BA; engage with them first to create positive momentum. Map out the concerns of each group of stakeholders so you can develop marketing tactics and communications vehicles to address them.

      Example Communication Strategy

      Stakeholder Concerns Tactics to Address Concerns Communication Vehicles Frequency
      Supporters
      (High Priority)
      • Build ability to execute BA techniques
      • Build executive support
      • Build understanding of how they can contribute to the success of the BA practice
      • Communicate the secured executive support
      • Help them apply BA techniques in their projects
      • Show examples of BA work (case studies)
      • Personalized meetings and interviews
      • Department/functional meetings
      • Communities of practice or centers of excellent (education and case studies)
      Bi-Monthly
      Indifferent
      (Medium Priority)
      • Build awareness and/or confidence
      • Feel like BA has nothing to do with them
      • Show quick wins and case studies
      • Centers of excellence (education and case studies
      • Use the support of the champions
      Quarterly
      Resistors
      (Medium Priority)
      • BA will cause delays
      • BA will step in their territory
      • BA’s scope is too broad
      • Lack of understanding
      • Prove the value of BA – case studies and metrics
      • Educate how BA complements their work
      • Educate them on the changes resulting from the BA practice’s work, and involve them in crafting the process
      • Individual meetings and interviews
      • Political jockeying
      • Use the support of the champions
      Tailored to individual groups

      1.3 Craft a strategy to increase stakeholder support and participation

      1-2 hours

      Now that you have organized and categorized your stakeholders based on their power, influence, interest, and knowledge of business architecture, it is time to brainstorm how you are going to gain their support and participation.

      Think about the following:

      • What are your stakeholders’ concerns?
      • How can you address them?
      • How will you deliver the message?
      • How often will you deliver the message?

      Avoid these common mistakes:

      • Your communication strategy development should be an iterative process. Do not assume to know the absolute best way to get through to every resistor right away. Instead, engage with your supporters for their input on how to communicate to resistors and repeat the process for indifferent stakeholders as well.
      Input Output
    • Stakeholder Engagement Map
      • Stakeholder Communications Strategy
      Materials Participants
      • Stakeholder Engagement Strategy Template
      • A computer
      • A whiteboard and markers CIO
      • Business Architect
      • IT Department Leads

      Download the Stakeholder Engagement Strategy Template for this project.

      Engaging the right stakeholders

      CASE STUDY

      Industry
      Financial - Banking

      Source
      Anonymous

      Situation Complication Result

      To achieve success with the business architecture initiative, the bank’s CIO needed to put together a plan to engage the right stakeholders in the process.

      Without the right stakeholders, the initiative would suffer from inadequate information and thus would run the risk of delivering an ineffective solution.

      The bank’s culture was resistant to change and each business unit had its own understanding of the business strategy. This was a big part of the problem that led to decreasing customer satisfaction.

      The CIO needed a unified vision for the business architecture practice involving people, process, and technology that all stakeholders could support.

      Starting with enlisting executive support in the form of a business sponsor, the CIO identified the rest of the key stakeholders, in this case, the business unit heads, who were necessary to engage for the initiative.

      Once identified, the CIO promoted the benefits of business architecture to each of the business unit heads while taking stock of their individual needs.

      1.4 Develop a plan to engage key stakeholders

      1 hour

      Using your stakeholder power map as a starting point, focus on the three most important quadrants: those that contain stakeholders you must keep informed, those to keep satisfied, and the key players.

      Plot the stakeholders from those quadrants on a stakeholder engagement map.

      Think about the following:

      • Who are your resistors? These individuals will actively detract from project’s success if you don’t address their concerns.
      • Who is indifferent? These individuals need to be educated more on the benefits of business architecture to have an opinion either way.
      • Who are your supporters? These individuals will support you and spread your message if you equip them to do so.

      Avoid these common mistakes:

      • Do not jump to addressing resistor concerns first. Instead, equip your supporters with the info they need to help your cause and gain positive momentum before approaching resistors.
      InputOutput
      • Stakeholder Engagement Map
      • Stakeholder Communications Strategy
      MaterialsParticipants
      • Stakeholder Engagement Strategy Template
      • A computer
      • A whiteboard and markers
      • CIO
      • Business Architect
      • IT Department Leads

      Download the Stakeholder Engagement Strategy Template for this project.

      1.5 Craft a strategy to increase stakeholder support and participation

      1-2 hours

      Now that you have organized and categorized your stakeholders based on their power, influence, interest, and knowledge of business architecture, it is time to brainstorm how you are going to gain their support and participation.

      Think about the following:

      • What are your stakeholders’ concerns?
      • How can you address them?
      • How will you deliver the message?
      • How often will you deliver the message?

      Avoid these common mistakes:

      • Your communication strategy development should be an iterative process. Do not assume to know the absolute best way to get through to every resistor right away. Instead, engage with your supporters for their input on how to communicate to resistors and repeat the process for indifferent stakeholders as well.
      InputOutput
      • Stakeholder Engagement Map
      • Stakeholder Communications Strategy
      MaterialsParticipants
      • Stakeholder Engagement Strategy Template
      • A computer
      • A whiteboard and markers
      • CIO
      • Business Architect
      • IT Department Leads

      Download the Stakeholder Engagement Strategy Template for this project.

      Define value streams

      Identify the core activities your organization does to provide value to your customers.

      Business context Define value streams Build business capability map

      1.1 Select key stakeholders
      1.2 Collect and understand corporate goals

      2.1 Update or define value streams
      2.2 Decompose and analyze selected value stream

      3.1 Build Level 1 capability map
      3.2 Build Level 2 capability map
      3.3 Heatmap capability map
      3.4 Roadmap

      This phase will walk you through the following activities:

      • Note: It is recommended that you gather and leverage relevant industry standard business architecture models you may have available to you. Example: Info-Tech Industry Business Architecture, BIZBOK, APQC.
      • Defining or updating the organization’s value streams.
      • Selecting priority value streams for deeper analysis.

      This phase involves the following participants:

      • Business Architect, Enterprise Architect
      • Relevant Business Stakeholder(s): Business Unit Leads, Departmental Executives, Senior Mangers, Business Analysts

      Define the organization’s value streams

      • Value streams connect business goals to the organization’s value realization activities. They enable an organization to create and capture value in the marketplace by engaging in a set of interconnected activities. Those activities are dependent on the specific industry segment an organization operates within. Value streams can extend beyond the organization into the supporting ecosystem, whereas business processes are contained within and the organization has complete control over them.
      • There are two types of value streams: core value streams and support value streams. Core value streams are mostly externally facing: they deliver value to either an external or internal customer and they tie to the customer perspective of the strategy map. Support value streams are internally facing and provide the foundational support for an organization to operate.
      • An effective method for ensuring all value streams have been considered is to understand that there can be different end-value receivers. Info-Tech recommends identifying and organizing the value streams with customers and partners as end-value receivers.

      Connect business goals to value streams

      Example strategy map and value stream

      Identifying value streams

      Value streams connect business goals to organization’s value realization activities. They enable an organization to create and capture value in the market place by engaging in a set of interconnected activities.

      There are several key questions to ask when endeavoring to identify value streams.

      Key Questions
      • Who are your customers?
      • What are the benefits we deliver to them?
      • How do we deliver those benefits?
      • How does the customer receive the benefits?

      Example: Value stream descriptions for the retail industry

      Value StreamsCreate or Purchase ProductManage InventoryDistribute ProductSell Product
      • Retailers need to purchase the products they are going to sell to customers from manufacturers or wholesale distributors.
      • A retailer’s success depends on its ability to source products that customers want and are willing to buy.
      • In addition, they need to purchase the right amount and assortment of products based on anticipated demand.
      • The right inventory needs to be at a particular store in the right quantities exactly when it is needed. This helps to maximize sales and minimize how much cash is held up in inventory.
      • Inventory management includes tracking, ordering, and stocking products, e.g. raw materials, finished products, buffer inventory.
      • Optimizing distribution activities is important for retailers.
      • Proper supply chain management can not only reduce costs for retailers but also drive revenues by enhancing shopping experiences.
      • Distribution includes transportation, packaging and delivery.
      • As business becomes global, it is important to ensure the whole distribution channel is effective.
      • Once produced, retailers need to sell the products. This is done through many channels including physical stores, online, the mail, or catalogs.
      • After the sale, retailers typically have to deliver the product, provide customer care, and manage complaints.
      • Retailers can use loyalty programs, pricing, and promotions to foster repeat business.

      Value streams describe your core business

      Value streams – the activities we do to provide value to customers – require business capabilities.

      Value streams are broken down further into value stages, for example, Sell Product value stream has value stages Evaluate Options, Place Order, and Make Payment.

      Think of value streams as the core operations, the reason for our organization’s being. A professional consulting organization may have a legal team but it does not brand itself as a law firm. A core value stream is providing research products and services – a business capability that supports it is legal counsel.

      2.1 Define value streams

      1-3 hours

      Unify the organization’s perspective on how it creates value.

      1. Write a short description of the value stream that includes a statement about the value provided and a clear start and end for the value stream. Validate the accuracy of the descriptions with your key stakeholders.
      2. Consider:
        1. How does the organization deliver those benefits?
        2. How does the customer receive the benefits?
        3. What is the scope of your value stream? What will trigger the stream to start and what will the final value be?
      3. Avoid: Don’t start with a blank page. Use Info-Tech’s business architecture models for sample value streams.
      Input Output
      • Business strategy or goals
      • Financial statements
      • Info-Tech’s industry-specific business architecture
      • List of organizational specific value streams
      • Detailed value stream definition(s)
      Materials Participants
      • Whiteboard / Kanban Board
      • Reference Architecture Template – See your Account Representative for details
      • Other industry standard reference architecture models: BIZBOK, APQC, etc.
      • Info-Tech Archi Models
      • Enterprise/Business Architect
      • Business Analysts
      • Business Unit Leads
      • CIO
      • Departmental Executives & Senior Managers

      See your Info-Tech Account Representative for access to the Reference Architecture Template

      Decompose the value stream into stages

      The stages of a value stream are usually action-oriented statements or verbs that make up the individual steps involved throughout the scope of the value stream, e.g. Place Order or Make Payment.

      Each value stream should have a trigger or starting point and an end result for a client or receiver.

      Decompose the value stream into stages

      There should be measurable value or benefits at each stage.
      These are key performance indicators (KPIs).
      Spot problem areas in the stream.

      Value streams usually fall into one of these categories:

      1. Fulfillment of products and services
      2. Manufacturing
      3. Software products
      4. Supporting value streams (procurement of supplies, product planning)

      Value stream and value stages examples

      Customer Acquisitions
      Identify Prospects > Contact Prospects > Verify Interests

      Sell Product
      Identify Options > Evaluate Options > Negotiate Price and Delivery Date > Place Order > Get Invoice > Make Payment

      Product Delivery
      Confirm Order > Plan Load > Receive Warehouse > Fill Order > Ship Order > Deliver Order > Invoice Customer

      Product Financing
      Initiate Loan Application > Decide on Application > Submit Documents > Review & Satisfy T&C > Finalize Documents > Conduct Funding > Conduct Funding Audits

      Product Release
      Ideate > Design > Build > Release

      Sell Product is a value stream, made up of value stages Identify options, Evaluate options, and so on.

      2.2 Decompose selected value streams

      1-3 hours

      Once we have a good understanding of our value streams, we need to decide which ones to focus on for deeper analysis and modeling, e.g. extend the business architecture to more detailed level 2 capabilities.

      Organization has goals and delivers products or services.

      1. Identify which value propositions are most important, e.g. be more productive or manage money more simply.
      2. Identify the value stream(s) that create the value proposition.
      3. Break the selected value stream into value stages.
      4. Analyze value stages for opportunities.

      Practical Guide to Agile Strategy Execution

      InputOutput
      • Value stream maps and definitions
      • Business goals, business model canvas, customer journey (value proposition) Selected value streams decomposed into value stages
      • Analysis of selected value streams for opportunities
      • Value stream map
      MaterialsParticipants
      • Whiteboard / Kanban Board
      • Reference Architecture Template – See your Account Representative for details
      • Other industry standard reference architecture models: BIZBOK, APQC, etc.
      • Enterprise/Business Architect
      • Business Analysts
      • Business Unit Leads
      • CIO
      • Departmental Executives & Senior Managers

      Build your value stream one layer at a time to ensure clarity and comprehensiveness

      The first step of creating a value stream is defining it.

      • In this step, you create the parameters around the value stream and document them in a list format.
      • This allows you to know where each value stream starts and ends and the unique value it provides.

      The second step is the value stream mapping.

      • The majority of the mapping is done here where you break down your value stream into each of its component stages.
      • Analysis of these stages allows for a deeper understanding of the value stream.
      • The mapping layer connects the value stream to organizational capabilities.

      Define the value streams that are tied to your strategic goals and document them in a list

      Title

      • Create a title for your value stream that indicates the value it achieves.
      • Ensure your title is clear and will be understood the same way across the organization.
      • The common naming convention for value streams is to use nouns, e.g. product purchase.

      Scope

      • Determine the scope of your value stream by defining the trigger to start the value stream and final value delivered to end the value stream.
      • Be precise with your trigger to ensure you do not mistakenly include actions that would not trigger your value stream.
      • A useful tip is creating a decision tree and outlining the path that results in your trigger.

      Objectives

      • Determine the objectives of the value stream by highlighting the outcome it delivers.
      • Identify the desired outcomes of the value stream from the perspective of your organization.

      Example Value Streams List

      Title Scope Objectives
      Sell Product From option identification to payment Revenue Growth

      Create a value stream map

      A Decompose the Value Stream Into Stages B Add the Customer Perspective
      • Determine the different stages that comprise the value stream.
      • Place the stages in the correct order.
      • Outline the likely sentiment and meaningful needs of the customer at each value stage.
      C Add the Expected Outcome D Define the Entry and Exit Criteria
      • Define the desired outcome of each stage from the perspective of the organization.
      • Define both the entry and exit criteria for each stage.
      • Note that the entry criteria of the first stage is what triggers the value stream.
      E Outline the Metrics F Assess the Stages
      • For each stage of the value stream, outline the metrics the organization can use to identify its ability to attain the desired outcome.
      • Assess how well each stage of the value stream is performing against its target metrics and use this as the basis to drill down into how/where improvements can be made.

      Decompose the value stream into its value stages

      The first step in creating a value stream map is breaking it up into its component stages.

      The stages of a value stream are usually action-oriented statements or verbs that make up the individual steps involved throughout the scope of the value stream.

      Illustration of decomposing value stream into its value stages

      The Benefit
      Segmenting your value stream into individual stages will give you a better understanding of the steps involved in creating value.

      Connect the stages of the value stream to a specific customer perspective

      Example of a sell product value stream

      The Benefit
      Adding the customer’s perspective will inform you of their priorities at each stage of the value stream.

      Connect the stages of the value stream to a desired outcome

      Example of a sell product value stream

      The Benefit
      Understanding the organization’s desired outcome at each stage of the value stream will help set objectives and establish metrics.

      Define the entry and exit criteria of each stage

      Example of entry and exit criteria for each stage

      The Benefit
      Establishing the entry and exit criteria for each stage will help you understand how the customer experience flows from one end of the stream to the other.

      Outline the key metric(s) for each stage

      Outline the key metrics for each stage

      The Benefit
      Setting metrics for each stage will facilitate the tracking of success and inform the business architecture practitioner of where investments should be made.

      Example value stream map: Sell Product

      Assess the stages of your value stream map to determine which capabilities to examine further

      To determine which specific business capabilities you should seek to assess and potentially refine, you must review performance toward target metrics at each stage of the value stream.

      Stages that are not performing to their targets should be examined further by assessing the capabilities that enable them.

      Value Stage Metric Description Metric Target Current Measure Meets Objective?
      Evaluate Options Number of Product Demonstrations 12,000/month 9,000/month No
      Identify Options Google Searches 100K/month 100K/month Yes
      Identify Options Product Mentions 1M/month 1M/month Yes
      Website Traffic (Hits)
      Average Deal Size
      Number of Deals
      Time to Complete an Order
      Percentage of Invoices Without Error
      Average Time to Acquire Payment in Full

      Determine the business capabilities that support the value stage corresponding with the failing metric

      Sell Product

      Identify Options > Evaluate Options > Negotiate Price and Delivery Date > Place Order > Get Invoice > Make Payment

      The value stage(s) that doesn’t meet its objective metrics should be examined further.

      • This is done through business capability mapping and assessment.
      • Starting at the highest level (level 0) view of a business, the business architecture practitioner must drill down into the lower level capabilities that support the specific value stage to diagnose/improve an issue.

      Info-Tech Insight
      In the absence of tangible metrics, you will have to make a qualitative judgement about which stage(s) of the value stream warrant further examination for problems and opportunities.

      Build business capability map

      Align supporting capabilities to priority activities.

      Business context Define value streams Build business capability map
      1.1 Select key stakeholders
      1.2 Collect and understand corporate goals
      2.1 Update or define value streams
      2.2 Decompose and analyze selected value stream
      3.1 Build Level 1 capability map
      3.2 Build Level 2 capability map
      3.3 Heatmap capability map
      3.4 Roadmap

      This step will walk you through the following activities:

      • Determine which business capabilities support value streams
      • Accelerate the process with an industry reference architecture
      • Validate the business capability map
      • Establish level 2 capability

      This step involves the following participants:

      • Enterprise/Business Architect
      • Business Analysts
      • Business Unit Leads
      • CIO
      • Departmental Executives & Senior Managers

      Outcomes of this step

    • A validated level 1 business capability map
    • Level 2 capabilities for selected value stream(s)
    • Heatmapped business capability map
    • Business architecture initiatives roadmap
    • Develop a business capability map – level 1

      • Business architecture consists of a set of techniques to create multiple views of an organization; the primary view is known as a business capability map.
      • A business capability defines what a business does to enable value creation and achieve outcomes, rather than how. Business capabilities are business terms defined using descriptive nouns such as “Marketing” or “Research and Development.” They represent stable business functions, are unique and independent of each other, and typically will have a defined business outcome. Business capabilities should not be defined as organizational units and are typically longer lasting than organizational structures.
      • A business capability mapping process should begin at the highest-level view of an organization, the level 1, which presents the entire business on a page.
      • An effective method of organizing business capabilities is to split them into logical groupings or categories. At the highest level, capabilities are either “core” (customer-facing functions) or “enabling” (supporting functions).
      • As a best practice, Info-Tech recommends dividing business capabilities into the categories illustrated to the right.

      The Business Capability Map is the primary visual representation of the organization’s key abilities or services that are delivered to stakeholders. This model forms the basis of strategic planning discussions.

      Example of a business capability map

      Example business capability map – Higher Education

      A business capability map can be thought of as a visual representation of your organization’s business capabilities and represents a view of what your data program must support.

      Validate your business capability map with the right stakeholders, including your executive team, business unit leaders, and/or other key stakeholders.

      Example business capability map for: Higher Education

      Example business capability map for higher education

      Example business capability map – Local Government

      A business capability map can be thought of as a visual representation of your organization’s business capabilities and represents a view of what your data program must support.

      Validate your business capability map with the right stakeholders, including your executive team, business unit leaders, and/or other key stakeholders.

      Example business capability map for: Local Government

      Example business capability map for local government

      Map capabilities to value stage

      Example of a value stage

      Source: Lambert, “Practical Guide to Agile Strategy Execution”

      3.1 Build level 1 business capability map

      1-3 hours

      1. Analyze the value streams to identify and describe the organization’s capabilities that support them. This stage requires a good understanding of the business and will be a critical foundation for the business capability map. Use the reference business architecture’s business capability map for your industry for examples of level 1 and 2 business capabilities and the capability map template to work in.
      2. Avoid:
        1. Don’t repeat capabilities. Capabilities are typically mutually exclusive activities.
        2. Don’t include temporary initiatives. Capabilities should be stable over time. The people, processes, and technologies that support capabilities will change continuously.

      Ensure you engage with the right stakeholders:

      Don’t waste your efforts building an inaccurate depiction of the business: The exercise of identifying capabilities for an organization is very introspective and requires deep analysis.

      It is challenging to develop a common language that everyone will understand and be able to apply. Invest in the time to ensure the right stakeholders are brought into the fold and bring their business area expertise and understanding to the table.

      InputOutput
      • Existing business capability maps
      • Value stream map
      • Info-Tech’s industry-specific business architecture
      • Level 1 business capability map for enterprise
      MaterialsParticipants
      • Whiteboard
      • Reference Architecture Template – See your Account Representative for details
      • Other industry standard reference architecture models: BIZBOK, APQC, etc.
      • Archi Models
      • Enterprise/Business Architect
      • Business Analysts
      • Business Unit Leads
      • CIO
      • Departmental Executives & Senior Managers

      Prioritize one value stream and build a business architecture to level 2 capabilities

      Prioritize your innovation objectives and business goals, and identify a value stream to transform.

      Align the innovation goals and business objectives of your organization to your value streams (the critical actions that take place within your organization to add value to a customer).
      Prioritize a value stream to transform based on the number of priorities aligned to a value stream and/or the business value (e.g. revenue, EBITDA earnings, competitive differentiation, or cost efficiency).
      Working alongside a business or enterprise architect, build a reference architecture for the prioritized value stream up to level 2.

      Example of a value stream to business architecture level 2 capabilities

      Info-Tech Insight
      To produce maximum impact, focus on value streams that provide two-thirds of your enterprise value (EBITDA earnings).

      From level 1 to level 2 business capabilities

      Example moving from level 1 to level 2 business capabilities

      3.2 Build level 2 business capability map

      1-3 hours

      It is only at level 2 and further that we can pinpoint the business capabilities – the exact resources, whether applications or data or processes – that we need to focus on to realize improvements in the organization’s performance and customer experience.

      1. Gather industry reference models and any existing business capability maps.
      2. For the selected value stream, further break down its level 1 business capabilities into level 2 capabilities.
      3. You can often represent the business capabilities on a single page, providing a holistic visual for decision makers.
      4. Use meaningful names for business capabilities so that planners, stakeholders, and subject matter experts can easily search the map.
      InputOutput
      • Existing business capability maps
      • Value stream map
      • Info-Tech’s industry-specific business architecture
      • Level 1 business capability map
      • Level 2 Business Capability Map for selected Value Stream
      MaterialsParticipants
      • Whiteboard
      • Reference Architecture Template – See your Account Representative for details.
      • Other industry standard reference architecture models: BIZBOK, APQC, etc.
      • Archi Models
      • Enterprise/Business Architect
      • Business Analysts
      • Business Unit Leads
      • CIO
      • Departmental Executives & Senior Managers

      Download: See your Account Representative for access to Info-Tech’s Reference Architecture Template

      3.3 Heatmap business capability map

      1-3 hours

      Determine the organization’s key capabilities.

      1. Determine cost advantage creators. If your organization has a cost advantage over competitors, the capabilities that enable it should be identified and prioritized. Highlight these capabilities and prioritize the programs that support them.
      2. Determine competitive advantage creators. If your organization does not have a cost advantage over competitors, determine if it can deliver differentiated end-customer experiences. Once you have identified the competitive advantages, understand which capabilities enable them. These capabilities are critical to the success of the organization and should be highly supported.
      3. Define key future state capabilities. In addition to the current and competitive advantage creators, the organization may have the intention to enhance new capabilities. Discuss and select the capabilities that will help drive the attainment of future goals.
      4. Assess how well information, applications, and processes support capabilities.
      InputOutput
      • Business capability map
      • Cost advantage creators
      • Competitive advantage creators
      • IT and business assessments
      • Key business capabilities
      • Business process review
      • Information assessment
      • Application assessment
      • List of IT implications
      MaterialsParticipants
      • Whiteboard
      • Reference Architecture Template – See your Account Representative for details.
      • Other industry standard reference architecture models: BIZBOK, APQC, etc.
      • Archi Models
      • Enterprise/Business Architect
      • Business Analysts
      • Business Unit Leads
      • CIO
      • Departmental Executives & Senior Managers

      Download: See your Account Representative for access to Info-Tech’s Reference Architecture Template

      Business capability map: Education

      Illustrative example of a business capability map for education

      Define key capabilities

      Illustrative example of Define key capabilities

      Note: Illustrative Example

      Business process review

      Illustrative example of a business process review

      Note: Illustrative Example

      Information assessment

       Illustrative example of an Information assessment

      Note: Illustrative Example

      Application assessment

       Illustrative example of an Application assessment

      Note: Illustrative Example

      MoSCoW analysis for business capabilities

       Illustrative example of a MoSCoW analysis for business capabilities

      Note: Illustrative Example

      Ranked list of IT implications

      MoSCoW Rank IT Implication Value Stream Impacted Comments/Actions
      M [Implication] [Value Stream]
      M [Implication] [Value Stream]
      M [Implication] [Value Stream]
      S [Implication] [Value Stream]
      S [Implication] [Value Stream]
      S [Implication] [Value Stream]
      C [Implication] [Value Stream]
      C [Implication] [Value Stream]
      C [Implication] [Value Stream]
      W [Implication] [Value Stream]
      W [Implication] [Value Stream]
      W [Implication] [Value Stream]

      3.4 Roadmap business architecture initiatives

      1-3 hours

      Unify the organization’s perspective on how it creates value.

      1. Write a short description of the value stream that includes a statement about the value provided and a clear start and end for the value stream. Validate the accuracy of the descriptions with your key stakeholders.
      2. Consider:
        1. How does the organization deliver those benefits?
        2. How does the customer receive the benefits?
        3. What is the scope of your value stream? What will trigger the stream to start and what will the final value be?
      3. Don’t start with a blank page. Use Info-Tech’s business architecture models for sample value streams.
      InputOutput
      • Existing business capability maps
      • Value stream map
      • Info-Tech’s industry-specific business architecture
      • Level 1 business capability map
      • Heatmapped business capability map
      MaterialsParticipants
      • Whiteboard
      • Reference Architecture Template – See your Account Representative for details.
      • Other industry standard reference architecture models: BIZBOK, APQC, etc.
      • Archi Models
      • Enterprise/Business Architect
      • Business Analysts
      • Business Unit Leads
      • CIO
      • Departmental Executives & Senior Managers

      Download: See your Account Representative for access to Info-Tech’s Reference Architecture Template

      Example: Business architecture deliverables

      Enterprise Architecture Domain Architectural View Selection
      Business Architecture Business strategy map Required
      Business Architecture Business model canvas Optional
      Business Architecture Value streams Required
      Business Architecture Business capability map Not Used
      Business Architecture Business process flows
      Business Architecture Service portfolio
      Data Architecture Conceptual data model
      Data Architecture Logical data model
      Data Architecture Physical data model
      Data Architecture Data flow diagram
      Data Architecture Data lineage diagram

      Tools and templates to compile and communicate your business architecture work

      The Industry Business Reference Architecture Template for your industry is a place for you to collect all of the activity outputs and outcomes you’ve completed for use in next-steps.

      Download the Industry Business Reference Architecture Template for your industry

      Info-Tech offers various levels of support to best suit your needs

      DIY Toolkit Guided Implementation Workshop Consulting
      "Our team has already made this critical project a priority, and we have the time and capability, but some guidance along the way would be helpful." "Our team knows that we need to fix a process, but we need assistance to determine where to focus. Some check-ins along the way would help keep us on track." "We need to hit the ground running and get this project kicked off immediately. Our team has the ability to take this over once we get a framework and strategy in place." "Our team does not have the time or the knowledge to take this project on. We need assistance through the entirety of this project."

      Diagnostics and consistent frameworks are used throughout all four options

      Research Contributors and Experts

      Name Role Organization
      Ibrahim Abdel-Kader Research Analyst, Data & Analytics Info-Tech Research Group
      Ben Abrishami-Shirazi Technical Counselor, Enterprise Architecture Info-Tech Research Group
      Andrew Bailey Consulting, Manager Info-Tech Research Group
      Dana Dahar Research & Advisory Director, CIO / Digital Business Strategy Info-Tech Research Group
      Larry Fretz VP Info-Tech Research Group
      Shibly Hamidur Enterprise Architect Toronto Transit Commission (TTC)
      Rahul Jaiswal Principal Research Director, Industry Info-Tech Research Group
      John Kemp Executive Counselor, Executive Services Info-Tech Research Group
      Gerald Khoury Senior Executive Advisor Info-Tech Research Group
      Igor Ikonnikov Principal Advisory Director, Data & Analytics Info-Tech Research Group
      Daniel Lambert VP Benchmark Consulting
      Milena Litoiu Principal Research Director, Enterprise Architecture Info-Tech Research Group
      Andy Neill AVP Data & Analytics, Chief Enterprise Architect Info-Tech Research Group
      Rajesh Parab Research Director, Data & Analytics Info-Tech Research Group
      Rick Pittman VP, Research Info-Tech Research Group
      Irina Sedenko Research Director, Data & Analytics Info-Tech Research Group

      Bibliography

      Andriole, Steve. “Why No One Understands Enterprise Architecture & Why Technology Abstractions Always Fail.” Forbes, 18 September 2020. Web.

      “APQC Process Classification Framework (PCF) – Retail.” American Productivity & Quality Center, 9 January 2019. Web.

      Brose, Cari. “Who’s on First? Architecture Roles and Responsibilities in SAFe.” Business Architecture Guild, 9 March 2017. Web.

      Burlton, Roger, Jim Ryne, and Daniel St. George. “Value Streams and Business Processes: The Business Architecture Perspective.” Business Architecture Guild, December 2019. Web.

      “Business Architecture: An overview of the business architecture professional.” Capstera, 5 January 2022. Web.

      Business Architecture Guild. “What is Business Architecture?” Business Analyst Mentor, 18 November 2022. Web.

      “Business Architecture Overview.” The Business Architecture Working Group of the Object Management Group (OMG), n.d. Web.

      “Delivering on your strategic vision.” The Business Architecture Guild, n.d. Web.

      Ecker, Grant. “Deploying business architecture.” LinkedIn, 11 November 2021. (Presentation)

      IRIS. “Retail Business Architecture Framework and Examples.” IRIS Business Architect, n.d. Web.

      IRIS. “What Is Business Architecture?” IRIS Business Architect, 8 May 2014. Web.

      IRIS. “Your Enterprise Architecture Practice Maturity 2021 Assessment.” IRIS Business Architect, 17 May 2021. Web.

      Khuen, Whynde. “How Business Architecture Breaks Down and Bridges Silos.” Biz Arch Mastery, January 2020. Web.

      Lambert, Daniel. “Practical Guide to Agile Strategy Execution.” 18 February 2020.

      Lankhorst, Marc, and Bernd Ihnen. “Mapping the BIZBOK Metamodel to the ArchiMate Language.” Bizzdesign, 2 September 2021. Web.

      Ramias, Alan, and Andrew Spanyi, “Demystifying the Relationship Between Processes and Capabilities: A Modest Proposal.” BPTrends, 2 February 2015. Web.

      Newman, Daniel. “NRF 2022: 4 Key Trends From This Year’s Big Show.” Forbes, 20 January 2022. Web.

      Research and Markets. “Define the Business Context Needed to Complete Strategic IT Initiatives: 2018 Blueprint.” Business Wire, 1 February 2018. Web.

      Sabanoglu, Tugba. “Retail market worldwide - Statistics & Facts.” Statista, 21 April 2022. Web.

      Spacey, John. “Capability vs Process.” Simplicable, 18 November 2016. Web.

      “The Definitive Guide to Business Capabilities.” LeanIX, n.d. Web.

      TOGAF 9. Version 9.1. The Open Group, 2011. Web.

      “What is Business Architecture?” STA Group, 2017. PDF.

      Whittie, Ralph. “The Business Architecture, Value Streams and Value Chains.” BA Institute, n.d. Web.

      Master the Secrets of Adobe’s Creative Cloud Contracts to Right-Size Your Adobe Spend

      • Buy Link or Shortcode: {j2store}139|cart{/j2store}
      • member rating overall impact (scale of 10): 10.0/10 Overall Impact
      • member rating average dollars saved: $63,667 Average $ Saved
      • member rating average days saved: 110 Average Days Saved
      • Parent Category Name: Licensing
      • Parent Category Link: /licensing
      • Adobe operates in its own niche in the creative space, and Adobe users have grown accustomed to their products, making switching very difficult.
      • With Adobe’s transition to a cloud-based subscription model, it’s important for organizations to actively manage licenses, software provisioning, and consumption.
      • Without a detailed understanding of Adobe’s various purchasing models, overspending often occurs.
      • Organizations have experienced issues in identifying commercial licensed packages with their install files, making it difficult to track and assign licenses.

      Our Advice

      Critical Insight

      • Focus on user needs first. Examine which products are truly needed versus nice to have to prevent overspending on the Creative Cloud suite.
      • Examine what has been deployed. Knowing what has been deployed and what is being used will greatly aid in completing your true-up.
      • Compliance is not automatic with products that are in the cloud. Shared logins or computers that have desktop installs that can be access by multiple users can cause noncompliance.

      Impact and Result

      • Visibility into license deployments and needs
      • Compliance with internal audits

      Master the Secrets of Adobe’s Creative Cloud Contracts to Right-Size Your Adobe Spend Research & Tools

      Start here – read the Executive Brief

      Procuring Adobe software is not the same game as it was just a few years ago. Adopt a comprehensive approach to understanding Adobe licensing to avoid overspending and to maximize negotiation leverage.

      Besides the small introduction, subscribers and consulting clients within this management domain have access to:

      1. Manage your Adobe agreements

      Use Info-Tech’s licensing best practices to avoid overspending on Adobe licensing and to remain compliant in case of audit.

      • Adobe ETLA vs. VIP Pricing Table
      • Adobe ETLA Forecasted Costs and Benefits
      • Adobe ETLA Deployment Forecast
      [infographic]

      Further reading

      Master the Secrets of Adobe’s Creative Cloud Contracts to Right-Size Your Adobe Spend

      Learn the essential steps to avoid overspending and to maximize negotiation leverage with Adobe.

      ANALYST PERSPECTIVE

      Only 18% of Adobe licenses are genuine copies: are yours?

      "Adobe has designed and executed the most comprehensive evolution to the subscription model of pre-cloud software publishers with Creative Cloud. Adobe's release of Document Cloud (replacement for the Acrobat series of software) is the final nail in the coffin for legacy licensing for Adobe. Technology procurement functions have run out of time in which to act while they still retain leverage, with the exception of some late adopter organizations that were able to run on legacy versions (e.g. CS6) for the past five years. Procuring Adobe software is not the same game as it was just a few years ago. Adopt a comprehensive approach to understanding Adobe licensing, contract, and delivery models in order to accurately forecast your software needs, transact against the optimal purchase plan, and maximize negotiation leverage. "

      Scott Bickley

      Research Lead, Vendor Practice

      Info-Tech Research Group

      Our understanding of the problem

      This Research is Designed For:

      • IT managers scoping their Adobe licensing requirements and compliance position.
      • CIOs, CTOs, CPOs, and IT directors negotiating licensing agreements in search of cost savings.
      • ITAM/Software asset managers responsible for tracking and managing Adobe licensing.
      • IT and business leaders seeking to better understand Adobe licensing options (Creative Cloud).
      • Vendor management offices in the process of a contract renewal.

      This Research Will Help You:

      • Understand and simplify licensing per product to help optimize spend.
      • Ensure agreement type is aligned to needs.
      • Navigate the purchase process to negotiate from a position of strength.
      • Manage licenses more effectively to avoid compliance issues, audits, and unnecessary purchases.

      This Research Will Also Assist:

      • CFOs and the finance department
      • Enterprise architects
      • ITAM/SAM team
      • Network and IT architects
      • Legal
      • Procurement and sourcing

      This Research Will Help Them:

      • Understand licensing methods in order to make educated and informed decisions.
      • Understand the future of the cloud in your Adobe licensing roadmap.

      Executive summary

      Situation

      • Adobe’s dominant market position and ownership of the creative software market is forcing customers to refocus the software acquisition process to ensure a positive ROI on every license.
      • In early 2017, Adobe announced it would stop selling perpetual Creative Suite 6 products, forcing future purchases to be transitioned to the cloud.

      Complication

      • Adobe operates in its own niche in the creative space, and Adobe users have grown accustomed to their products, making switching very difficult.
      • With transition to a cloud-based subscription model, organizations need to actively manage licenses, software provisioning, and consumption.
      • Without a detailed understanding of Adobe’s various purchasing models, overspending often occurs.
      • Organizations have experienced issues in identifying commercial licensed packages with their install files, making it difficult to track and assign licenses.

      Resolution

      • Gain visibility into license deployments and needs with a strong SAM program/tool; this will go a long way toward optimizing spend.
        • Number of users versus number of installs are not the same, and confusing the two can result in overspending. Device-based licensing historically would have required two licenses, but now only one may be required.
      • Ensure compliance with internal audits. Adobe has a very high rate of piracy stemming from issues such as license overuse, misunderstanding of contract language, using cracks/keygens, virtualized environments, indirect access, and sharing of accounts.
      • A handful of products are still sold as perpetual – Acrobat Standard/Pro, Captivate, ColdFusion, Photoshop, and Premiere Elements – but be aware of what is being purchased and used in the organization.
        • Beware of products deployed on server, where the number of users accessing that product cannot easily be counted.

      Info-Tech Insight

      1. Your user-need analysis has shifted in the new subscription-based model. Determine which products are needed versus nice to have to prevent overspending on the Creative Cloud suite.
      2. Examine what you need, not what you have. You can no longer mix and match applications.
      3. Compliance is not automatic with products that are in the cloud. Shared logins or computers with desktop installs that can be accessed by multiple users can cause noncompliance.

      The aim of this blueprint is to provide a foundational understanding of Adobe

      Why Adobe

      In 2011 Adobe took the strategic but radical move toward converting its legacy on-premises licensing to a cloud-based subscription model, in spite of material pushback from its customer base. While revenues initially dipped, Adobe’s resolve paid off; the transition is mostly complete and revenues have doubled. This was the first enterprise software offering to effect the transition to the cloud in a holistic manner. It now serves as a case study for those following suit, such as Microsoft, Autodesk, and Oracle.

      What to know

      Adobe elected to make this market pivot in a dramatic fashion, foregoing a gradual transition process. Enterprise clients were temporarily allowed to survive on legacy on-premises editions of Adobe software; however, as the Adobe Creative Cloud functionality was quickly enhanced and new applications were launched, customer capitulation to the new subscription model was assured.

      The Future

      Adobe is now leveraging the power of connected customers, the availability of massive data streams, and the ongoing digitalization trend globally to supplement the core Creative Cloud products with online services and analytics in the areas of Creative Cloud for content, Marketing Cloud for marketers, and Document Cloud for document management and workflows. This blueprint focuses on Adobe's Creative Cloud and Document Cloud solutions and the enterprise term license agreement (ETLA).

      Info-Tech Insight

      Beware of your contract being auto-renewed and getting locked into the quantities and product subset that you have in your current agreement. Determining the number of licenses you need is critical. If you overestimate, you're locked in for three years. If you underestimate, you have to pay a big premium in the true-up process.

      Learn the “Adobe way,” whether you are reviewing existing spend or considering the purchase of new products

      1. Legacy on-premises Adobe Creative Suite products used to be available in multiple package configurations, enabling right-sized spend with functionality. Adobe’s support for legacy Creative Suites CS6 products ended in May 2017.
      2. While early ETLAs allowed customer application packaging at a lower price than the full Creative Cloud suite, this practice has been discontinued. Now, the only purchasing options are the full suite or single-application subscriptions.
      3. Buyers must now assess alternative Adobe products as an option for non-power users. For example, QuarkXPress, Corel PaintShop Pro, CorelDRAW, Bloom, and Affinity Designer are possible replacements for some Creative Cloud applications.
      4. Document Cloud, Adobe’s latest step in creating an Acrobat-focused subscription model, limits the ability to reduce costs with an extended upgrade cycle. These changes go beyond the licensing model.
      5. Organizations need to perform a cost-benefit analysis of single app purchases vs. the full suite to right-size spend with functionality.

      As Adobe’s dominance continues to grow, organizations must find new ways to maintain a value-added relationship

      Adobe estimates the total addressable market for creative and document cloud to be $21 billion. With no sign of growth slowing down, Adobe customers must learn how to work within the current design monopoly.

      The image contains two pie graphs. The first is labelled FY2014 Revenue Mix, and the second graph is titled FY2017E Revenue Mix.

      Source: Adobe, 2017

      "Adobe is not only witnessing a steady increase in Creative Cloud subscriptions, but it also gained more visibility into customers’ product usage, which enables it to consistently push out software updates relevant to user needs. The company also successfully transformed its sales organization to support the recurring revenue model."

      – Omid Razavi, Global Head of Success, ServiceNow

      Consider your route forward

      Consider your route forward, as ETLA contract commitments, scope, and mechanisms differ in structure to the perpetual models previously utilized. The new model shortchanges technology procurement leaders in their expectations of cost-usage alignment and opex flexibility (White, 2016).

      ☑ Implement a user profile to assign licenses by version and limit expenditures. Alternatives can include existing legacy perpetual and Acrobat classic versions that may already be owned by the organization.

      ☑ Examine the suitability and/or dependency on Document Cloud functions, such as existing business workflows and e-signature integration.

      ☑ Involve stakeholders in the evaluation of alternate products for use cases where dependency on Acrobat-specific functionality is limited.

      ☑ Identify not just the installs and active use of the applications but also the depth and breadth of use across the various features so that the appropriate products can be selected.

      The image contains a screenshot of a diagram listing the adobe toolkit. The toolkit includes: Adobe ETLA Deployment Forecast Tool, Adobe ETLA Forecasted Cost and Benefits, Adobe ETLA vs. VIP Pricing Table.

      Use Info-Tech’s Adobe toolkit to prepare for your new purchases or contract renewal

      Info-Tech Insight

      IT asset management (ITAM) and software asset management (SAM) are critical! An error made in a true-up can cost the organization for the remaining years of the ETLA. Info-Tech worked with one client that incurred a $600k error in the true-up that they were not able to recoup from Adobe.

      Apply licensing best practices and examine the potential for cost savings through an unbiased third-party perspective

      Establish Licensing Requirements

      • Understand Adobe’s product landscape and transition to cloud.
      • Analyze users and match to correct Adobe SKU.
      • Conduct an internal software assessment.
      • Build an effective licensing position.

      Evaluate Licensing Options

      • Value Incentive Plan (VIP)
      • Cumulative Licensing Program (CLP)
      • Transactional Licensing Program (TLP)
      • Enterprise Term License Agreement (ETLA)

      Evaluate Agreement Options

      • Price
      • Discounts
      • Price protection
      • Terms and conditions

      Purchase and Manage Licenses

      • Learn negotiation tactics to enhance your current strategy.
      • Control the flow of communication.
      • Assign the right people to manage the environment.

      Preventive practices can help find measured value ($)

      Time and resource disruption to business if audited

      Lost estimated synergies in M&A

      Cost of new licensing

      Cost of software audit, penalties, and back support

      Lost resource allocation and time

      Third party, legal/SAM partners

      Cost of poor negotiation tactics

      Lost discount percentage

      Terms and conditions improved

      Explore Adobe licensing and optimize spend – project overview

      Establish Licensing Requirements

      Evaluate Licensing Options

      Evaluate Agreement Options

      Purchase and Manage Licenses

      Best-Practice Toolkit

      • Assess current state and align goals; review business feedback.
      • Interview key stakeholders to define business objectives and drivers.
      • Review licensing options.
      • Review licensing rules.
      • Determine the ideal contract type.
      • Review final contract.
      • Discuss negotiation points.
      • License management.
      • Future licensing strategy.

      Guided Implementations

      • Engage in a scoping call.
      • Assess the current state.
      • Determine licensing position.
      • Review product options.
      • Review licensing rules.
      • Review contract option types.
      • Determine negotiation points.
      • Finalize the contract.
      • Discuss license management.
      • Evaluate and develop a roadmap for future licensing.

      PHASE 1

      Manage Your Adobe Agreements

      Phase 1 outline

      Call 1-888-670-8889 or email GuidedImplementations@InfoTech.com for more information.

      Complete these steps on your own, or call us to complete a guided implementation. A guided implementation is a series of 2-3 advisory calls that help you execute each phase of a project. They are included in most advisory memberships.

      Guided Implementation 1: Managing Adobe Contracts

      Proposed Time to Completion: 3-6 weeks

      Step 1.1: Establish Licensing Requirements

      Start with a kick-off call:

      • Assess the current state.
      • Determine licensing position.

      Then complete these activities…

      • Complete a deployment count, needs analysis, and internal audit.

      With these tools & templates:

      Adobe ETLA Deployment Forecast

      Step 1.2: Determine Licensing Options

      Review findings with analyst:

      • Review licensing options.
      • Review licensing rules.
      • Review contract option types.

      Then complete these activities…

      • Select licensing option.
      • Document forecasted costs and benefits.

      With these tools & templates:

      Adobe ETLA vs. VIP Pricing Table

      Adobe ETLA Forecasted Costs and Benefits

      Step 1.3: Purchase and Manage Licenses

      Review findings with analyst:

      • Review final contract.
      • Discuss negotiation points.
      • Plan a roadmap for SAM.

      Then complete these activities…

      • Negotiate final contract.
      • Evaluate and develop a roadmap for SAM.

      With these tools & templates:

      Adobe ETLA Deployment Forecast

      Adobe’s Cloud – Snapshot of what has changed

      1. Since Adobe has limited the procurement and licensing options with the introduction of Creative Cloud, there are three main choices:
        1. Direct online purchase at Adobe.com
        2. Value Incentive Plan (VIP): Creative Cloud for teams–based purchase with a volume discount (minimal, usually ~10%); may have some incentives or promotional pricing
        3. Enterprise Term License Agreement (ETLA): Creative Cloud for Enterprise (CCE)
      2. Adobe has discontinued support for legacy perpetual licenses, with the latest version being CS6, which is steering organizations to prioritize their options for products in the creative and document management space.
      3. Document Cloud (DC) is the cloud product replacing the Acrobat perpetual licensing model. DC extends the subscription-based model further and limits options to extend the lifespan of legacy on-premises licenses through a protracted upgrade process.
      4. The subscription model, coupled with limited discount options on transactional purchases, forces enterprises to consider the ETLA option. The ETLA brings with it unique term commitments, new pricing structures, and true-up mechanisms and inserts the "land and expand" model vs. license reassignment.

      Info-Tech Insight

      Adobe’s move from a perpetual license to a per-user subscription model can be positive in some scenarios for organizations that experienced challenges with deployment, management of named users vs. devices, and license tracking.

      Core concepts of Adobe agreements: Discounting, pricing, and bundling

      ETLA

      Adobe has been systematically reducing discounts on ETLAs as they enter the second renewal cycle of the original three-year terms.

      Adobe Cloud Bundling

      Adobe cloud services are being bundled with ETLAs with a mandate that companies that do not accept the services at the proposed cost have Adobe management’s approval to unbundle the deal, generally with no price relief.

      Custom Bundling

      The option for custom bundling of legacy Creative Suite component applications has been removed, effectively raising the price across the board for licensees that require more than two Adobe applications who must now purchase the full Creative Cloud suite.

      Higher and Public Education

      Higher education/public education agreements have been revamped over the past couple of years, increasing prices for campus-wide agreements by double-digit percentages (~10-30%+). While they still receive an 80% discount over list price, IT departments in this industry are not prepared to absorb the budget increase.

      Info-Tech Insight

      Adobe has moved to an all-or-one bundle model. If you need more than two application products, you will likely need to purchase the full Creative Cloud suite. Therefore, it is important to focus on creating accurate user profiles to identify usage needs.

      Use Info-Tech’s Adobe deployment tool for SAM: Track deployment and needs

      The image contains a screenshot of Info-Tech's Adobe deployment tool for SAM: Track deployment and needs.

      Use Info-Tech’s Adobe deployment tool for SAM: Audit

      The image contains a screenshot of the Adobe Deployment Tool for SAM, specifically the Audit tab.

      Use Info-Tech’s Adobe deployment tool for SAM: Cost

      The image contains a screenshot of the Adobe Deployment Tool for SAM, specifically the Cost tab.

      Use Info-Tech’s tools to compare ETLA vs. VIP and to document forecasted costs and benefits

      Is the ETLA or VIP option better for your organization?

      Use Info-Tech’s Adobe ETLA vs. VIP Pricing Table tool to compare ETLA costs against VIP costs.

      The image contains a screenshot of Info-Tech's Adobe ETLA vs. VIP Pricing Table.

      Your ETLA contains multiple products and is a multi-year agreement.

      Use Info-Tech’s ETLA Forecasted Costs and Benefits tool to forecast your ETLA costs and document benefits.

      The image contains a screenshot of Info-Tech's ETLA Forecasted Costs and Benefits.

      Adobe’s Creative Cloud Complete offering provides access to all Adobe creative products and ongoing upgrades

      Why subscription model?

      The subscription model forces customers to an annuity-based pricing model, so Adobe has recurring revenue from a subscription-based product. This increases customer lifetime value (CLTV) for Adobe while providing ongoing functionality updates that are not version/edition dependent.

      Key Characteristics:

      • Available as a month-to-month or annual subscription license
      • Can be purchased for one user, for a team, or for an enterprise
      • Subject to annual payment and true-up of license fees
      • Can only true-up during lifespan of contract; quantities cannot be reduced until renewal
      • May contain auto-renewal clauses – beware!

      Key things to know:

      1. Applications can be purchased individually if users require only one specific product. A few products continue to have on-premises licensing options, but most are offered by per-user subscriptions.
      2. At the end of the subscription period, the organization no longer has any rights to the software and would have to return to a previously owned version.
      3. True-downs are not possible (in contrast to Microsoft’s Office 365).
      4. Downgrade rights are not included or are limited by default.

      Which products are in the Creative Cloud bundle?

      Adobe Acrobat® XI Pro

      Adobe After Effects® CC

      Adobe Audition® CC

      Adobe Digital Publishing Suite, Single Edition

      Adobe InDesign® CC

      Adobe Dreamweaver® CC

      Adobe Edge Animate

      Adobe Edge Code preview

      Adobe Edge Inspect

      Adobe Photoshop CC

      Adobe Edge Reflow preview

      Adobe Edge Web Fonts

      Adobe Extension Manager

      ExtendScript Toolkit

      Adobe Fireworks® CS6

      Adobe Flash® Builder® 4.7 Premium Edition

      Adobe Flash Professional CC

      Adobe Illustrator® CC

      Adobe Prelude® CC

      Adobe Premiere® Pro CC

      Adobe Scout

      Adobe SpeedGrade® CC

      Adobe Muse CC

      Adobe Photoshop Lightroom 6

      Adobe offers different solutions for teams vs. enterprise licensing

      Evaluate the various options for Creative Cloud, as they can be purchased individually, for teams, or for enterprise.

      Bundle Name

      Target Customer

      Included Applications

      Features

      CC (for Individuals)

      Individual users

      The individual chooses

      • Sync, store, and share assets
      • Adobe Portfolio website
      • Adobe Typekit font collection
      • Microsoft Teams integration
      • Can only be purchased through credit card

      CC for Teams (CCT)

      Small to midsize organizations with a small number of Adobe users who are all within the same team

      Depends on your team’s requirements. You can select all applications or specific applications.

      Everything that CC (for individuals) does, plus

      • One license per user; can reassign CC licenses
      • Web-based admin console
      • Centralized deployment
      • Usage tracking and reporting
      • 100GB of storage per user
      • Volume discounts for 10+ seats

      CC for Enterprise (CCE)

      Large organizations with users who regularly use multiple Adobe products on multiple machines

      All applications including Adobe Stock for images and Adobe Enterprise Dashboard for managing user accounts

      Everything that CCT does, plus

      • Employees can activate a second copy of software on another device (e.g. home computer) as long as they share the same Adobe ID and are not used simultaneously
      • Ability to reassign licenses from old users to new users
      • Custom storage options
      • Greater integration with other Adobe products
      • Larger volume discounts with more seats

      For further information on specific functionality differences, reference Adobe’s comparison table.

      A Cloud-ish solution: Considerations and implications for IT organizations

      ☑ True cloud products are typically service-based, scalable and elastic, shared resources, have usage metering, and rely upon internet technologies. Currently, Adobe’s Creative Cloud and Document Cloud products lack these characteristics. In fact, the core products are still downloaded and physically installed on endpoint devices, then anchored to the cloud provisioning system, where the software can be automatically updated and continuously verified for compliance by ensuring the subscription is active.

      ☑ Adobe Cloud allows Adobe to increase end-user productivity by releasing new features and products to market faster, but the customer will increase lock-in to the Adobe product suite. The fast-release approach poses a different challenge for IT departments, as they must prepare to test and support new functionality and ensure compatibility with endpoint devices.

      ☑ There are options at the enterprise level that enable IT to exert more granular control over new feature releases, but these are tied to the ETLA and the provided enterprise portal and are not available on other subscription plans. This is another mechanism by which Adobe has been able to spur ETLA adoption.

      Not all CIOs consider SaaS/subscription applications their first choice, but the Adobe’s dominant position in the content and document management marketplace is forcing the shift regardless. It is significant that Adobe bypassed the typical hybrid transition model by effectively disrupting the ability to continue with perpetual licensing without falling behind the functionality curve.

      VIP plans do allow for annual terms and payment, but you lose the price elasticity that comes with multi-year terms.

      Download Info-Tech’s Adobe ETLA vs. VIP Pricing Table tool to compare ETLA costs against VIP costs.

      When moving to Adobe cloud, validate that license requirements meet organizational needs, not a sales quota

      Follow these steps in your transition to Creative Cloud.

      Step 1: Make sure you have a software asset management (SAM) tool to determine Adobe installs and usage within your environment.

      Step 2: Look at the current Adobe install base and usage. We recommend reviewing three months’ worth of reliable usage data to decide which users should have which licenses going forward.

      Step 3: Understand the changes in Adobe packages for Creative Cloud (CC). Also, take into account that the license types are based on users, not devices.

      Step 4: Identify those users who only need a single license for a single application (e.g. Photoshop, InDesign, Muse).

      Step 5: Identify the users who require CC suites. Look at their usage of previous Adobe suites to get an idea of which CC suite they require. Did they have Design Suite Standard installed but only use one or two elements? This is a good way to ensure you do not overspend on Adobe licenses.

      Source: The ITAM Review

      Download Info-Tech’s Adobe ETLA Deployment Forecast tool to track Adobe installs within your environment and to determine usage needs.

      Acquiring Adobe Software

      Adobe offers four common licensing methods, which are reviewed in detail in the following slides.

      Most common purchasing models

      Points for consideration

      • Value Incentive Plan (VIP)
      • Cumulative Licensing Program (CLP)
      • Transactional Licensing Program (TLP)
      • Enterprise Term License Agreement (ETLA)
      • Adobe, as with many other large software providers, includes special benefits and rights when its products are purchased through volume licensing channels.
      • Businesses should typically refrain from purchasing individual OEM (shrink wrap) licenses or those meant for personal use.
      • Purchase record history is available online, making it easier for your organization to manage entitlements in the case of an audit.

      "Customers are not even obliged to manage all the licenses themselves. The reseller partners have access to the cloud console and can manage licenses on behalf of their customers. Even better, they can seize cross and upsell opportunities and provide good insight into the environment. Additionally, Adobe itself provides optimization services."

      B-lay

      CLP and TLP

      The CLP and TLP are transactional agreements generally used for the purchase of perpetual licenses. For example, they could be used for making Acrobat purchases if Creative Suite products are purchased on the ETLA.

      The image contains a screenshot of a table comparing CLP and TLP.

      Source: “Adobe Buying Programs Comparison Guide for Commercial and Government Organizations”

      VIP and ETLA

      The Value Incentive Plan is aimed at small- to medium-sized organizations with no minimum quantity required. However, there is limited flexibility to reduce licenses and limited price protection for future purchases. The ETLA is aimed at large organizations who wish to have new functionality as it comes out, license management portal, services, and security/IT control aspects.

      The image contains a screenshot of a table comparing VIP and ETLA.

      Source: “Adobe Buying Programs Comparison Guide for Commercial and Government Organizations”

      ETLA commitments risk creating “shelfware-as-a-service”

      The Adobe ETLA’s rigid contract parameters, true-up process, and unique deployment/provisioning mechanisms give technology/IT procurement leaders fewer options to maximize cost-usage alignment and to streamline opex costs.

      ☑ No ETLA price book is publicly published; pricing is controlled by the Adobe enterprise sales team.

      ☑ Adobe's retail pricing is a good starting point for negotiating discounted pricing.

      ☑ ETLA commitments are usually for three years, and the lack of a true-down option increases the risk involved in overbuying licenses should the organization encounter a business downturn or adverse event.

      ☑ Pricing discounts are the highest at the initial ETLA signing for the upfront volume commitment. The true-up pricing is discounted from retail but still higher than the signing cost per license.

      ☑ Technical support is included in the ETLA.

      ☑ While purchases typically go through value-added resellers (VARs), procurement can negotiate directly with Adobe.

      "For cloud products, it is less complex when it comes to purchasing and pricing. If larger quantities are purchased on a longer term, the discount may reach up to 15%. As soon as you enroll in the VIP program, you can control all your licenses from an ‘admin console’. Any updates or new functionalities are included in the original price. When the licenses expire, you may choose to renew your subscriptions or remove them. Partial renewal is also accepted. Of course, you can also re-negotiate your price if more subscriptions are added to your console."

      B-lay

      ETLA recommendations

      1. Assess the end-user requirements with a high degree of scrutiny. Perform an analysis that matches the licensee with the correct Adobe product SKU to reduce the risk of overspending.
      • Leverage metering data that identifies actual usage and lack thereof, match to user profile functional requirements, and then determine end users’ actual license requirements.
    • Build in time to evaluate alternative products where possible and position the organization to leverage a Plan B vendor to replace or mitigate growth on the Adobe platform. Re-evaluate options well in advance of the ETLA renewal.
    • Secure price protection through negotiating a price cap or an extended ETLA term beyond the standard three-year term. Short of obtaining an escalation cap, which Adobe is strongly resisting, build in price increases for the ETLA renewal years.
      • Demand price transparency and granularity in the proposal process.
      • Validate that volume discounts are appropriate and show through to the true-up line item pricing.
    • Negotiate a true-down mechanism upfront with Adobe if usage decline is inevitable or expected due to a merger or acquisition, divestiture, or material restructuring event.
    • INFO-TECH TIP: For further guidance on ETLAs and pricing, contact your Info-Tech representative to set up a call with an analyst.

      Use Info-Tech’s Adobe ETLA Deployment Forecast tool to match licensees with Adobe product SKUs.

      Prepare for Adobe’s true-up process

      How the true-up process works

      When adding a license, the true-up price will be prorated to 50% of the license cost for previous year’s usage plus 100% of the license cost for the next year. This back-charging adds up to 150% of the overall true-up license cost. In some rare cases, Adobe has provided an “unlimited” quantity for certain SKUs; these Unlimited ETLAs generally align with FTE counts and limit FTE increases to about 5%. Procurement must monitor and work with SAM/ITAM and stakeholder groups to restrain unnecessary growth during the term of an Unlimited ETLA to avoid the risk of cost escalation at renewal time.

      Higher-education specific

      Higher-education clients can license under the ETLA based on a prescribed number of user and classroom/lab devices and/or on a FTE basis. In these cases, the combination of Creative Cloud and Acrobat Pro volume must equal the FTE total, creating an enterprise footprint. FTE calculations establish the full-time faculty plus one-third of part-time faculty plus one-half of part-time staff.

      Info-Tech Insight

      Compliance takes a different form in terms of the ETLA true-up process. The completion of Adobe's transition to cloud-based licensing and verification has improved compliance rates via phone home telemetry such that pirated software is less available and more easily detected. Adobe has actually decommissioned its audit arm in the Americas and EMEA.

      Audits and software asset management with Adobe

      Watch out for:

      • Virtual desktops, freeware, and test and trial licenses
      • Adobe products that may be bundled into a suite; a manual check will be needed to ensure the suite isn’t recognized as a standalone license
      • Pirated licenses with a “crack” built into the software

      Simplify your process – from start to finish – with these steps:

      Determine License Entitlements

      Obtain documentation from internal records and Adobe to track licenses and upgrades to determine what licenses you own and have the right to use.

      Gather Deployment Information

      Leverage a software asset management tool or process to determine what software is deployed and what is/is not being used.

      Determine Effective License Position

      Compare license entitlements with deployment data to uncover surpluses and deficits in licensing. Look for opportunities.

      Plan Changes to License Position

      Meet with IT stakeholders to discuss the enterprise license program (ELP), short- and long-term project plans, and budget allocation. Plan and document licensing requirements.

      Adobe Genuine Software Integrity Service

      • This service was started in 2014 to combat non-genuine software sold by non-authorized resellers.
      • The service works hand in hand with the cloud movement to reduce piracy.
      • Every Adobe product now contains an executable file that will scan your machine for non-genuine software.
      • If non-genuine software is detected, the user will be notified and directed to the official Adobe website for next steps.

      Detailed list of Adobe licensing contract types

      The table below describes Adobe contract types beyond the four typical purchasing models explained in the previous slides:

      Option

      What is it?

      What’s included?

      For

      Term

      CLP (Cumulative Licensing Program)

      10,000 plus points, support and maintenance optional

      Select Adobe perpetual desktop products

      Business

      2 years

      EA (Adobe Enterprise Agreement)

      100 licenses plus maintenance and support for eligible Adobe products

      All applications

      100+ users requirement

      3 years

      EEA (Adobe Enterprise Education Agreement)

      Creative Cloud enterprise agreement for education establishments

      Creative Cloud applications without services

      Education

      1 or 2 years

      ETLA (Enterprise Term License Agreement)

      Licensing program designed for Adobe’s top commercial, government, and education customers

      All Creative Cloud applications

      Large enterprise companies

      3 years

      K-12 – Enterprise Agreement

      Enterprise agreement for primary and secondary schools

      Creative Cloud applications without services

      Education

      1 year

      K-12 – School Site License

      Allows a school to install a Creative Cloud on up to 500 school-owned computers regardless of school size

      Creative Cloud applications without services

      Education

      1 year

      TLP (Transactional Licensing Program)

      Agreement for SMBs that want volume licensing bonuses

      Perpetual desktop products only

      Aimed at SMBs, but Enterprise customers can use the TLP for smaller requirements

      N/A

      Upgrade Plan

      Insurance program for software purchased under a perpetual license program such as CLP or TLP for Creative Cloud upgrade

      Dependent on the existing perpetual estate

      Anyone

      N/A

      VIP (Value Incentive Plan)

      VIP allows customers to purchase, deploy, and manage software through a term-based subscription license model

      Creative Cloud of teams

      Business, government, and education

      Insight breakdown

      Insight 1

      Adobe operates in its own niche in the creative space, and Adobe users have grown accustomed to their products, making switching very difficult.

      Insight 2

      Adobe has transitioned the vast majority of its software offerings to the cloud-based subscription model. Active management of licenses, software provisioning, and consumption of cloud services is now an ongoing job.

      Insight 3

      With the vendor lock-in process nearly complete via the transition to a SaaS subscription model, Adobe is raising prices on an annual basis. Advance planning and strategic use of the ETLA is key to avoid budget-breaking surprises.

      Summary of accomplishment

      Knowledge Gained

      • The key pieces of licensing information that should be gathered about the current state of your own organization.
      • An in-depth understanding of the required licenses across all of your products.
      • Clear methodology for selecting the most effective contract type.
      • Development of measurable, relevant metrics to help track future project success and identify areas of strength and weakness within your licensing program.

      Processes Optimized

      • Understanding of the importance of licensing in relation to business objectives.
      • Understanding of the various licensing considerations that need to be made.
      • Contract negotiation.

      Deliverables Completed

      • Adobe ETLA Deployment Forecast
      • Adobe ETLA Forecasted Cost and Benefits
      • Adobe ETLA vs. VIP Pricing Table

      Related Info-Tech Research

      Take Control of Microsoft Licensing and Optimize Spend

      Create an Effective Plan to Implement IT Asset Management

      Establish an Effective System of Internal IT Controls to Mitigate Risks

      Optimize Software Asset Management

      Take Control of Compliance Improvement to Conquer Every Audit

      Cut PCI Compliance and Audit Costs in Half

      Bibliography

      “Adobe Buying Programs: At-a-glance comparison guide for Commercial and government organizations.” Adobe Systems Incorporated, 2014. Web. 1 Feb. 2018.

      “Adobe Buying Programs Comparison Guide for Commercial and Government Organizations.” Adobe Systems Incorporated, 2018. Web.

      “Adobe Buying Programs Comparison Guide for Education.” Adobe Systems Incorporated, 2018. Web. 1 Feb 2018.

      “Adobe Education Enterprise Agreement: Give your school access to the latest industry-leading creative tools.” Adobe Systems Incorporated, 2014. Web. 1 Feb. 2018.

      “Adobe Enterprise Term License Agreement for commercial and government organizations.” Adobe Systems Incorporated, 2016. Web. 1 Feb. 2018.

      Adobe Investor Presentation – October 2017. Adobe Systems Incorporated, 2017. Web. 1 Feb. 2018.

      Cabral, Amanda. “Students react to end of UConn-Adobe contract.” The Daily Campus (Uconn), 5 April 2017. Web. 1 Feb. 2018.

      de Veer, Patrick and Alecsandra Vintilescu. “Quick Guide to Adobe Licensing.” B-lay, Web. 1 Feb. 2018.

      “Find the best program for your organization.” Adobe, Web. 1 Feb 2018.

      Foxen, David. “Adobe Upgrade Simplified.” Snow Software, 7 Oct. 2016. Web.

      Frazer, Bryant. “Adobe Stops Reporting Subscription Figures for Creative Cloud.” Studio Daily. Access Intelligence, LLC. 17 March 2016. Web.

      “Give your students the power to create bright futures.” Adobe, Web. 1 Feb 2018.

      Jones, Noah. “Adobe changes subscription prices, colleges forced to pay more.” BG Falcon Media. Bowling Green State University, 18 Feb. 2015. Web. 1 Feb. 2018.

      Mansfield, Adam. “Is Your Organization Prepared for Adobe’s Enterprise Term License Agreements (ETLA)?” UpperEdge,30 April 2013. Web. 1 Feb. 2018.

      Murray, Corey. “6 Things Every School Should Know About Adobe’s Move to Creative Cloud.” EdTech: Focus on K-12. CDW LLC, 10 June 2013. Web.

      “Navigating an Adobe Software Audit: Tips for Emerging Unscathed.” Nitro, Web. 1 Feb. 2018.

      Razavi, Omid. “Challenges of Traditional Software Companies Transitioning to SaaS.” Sand Hill, 12 May 2015. Web. 1 Feb. 2018.

      Rivard, Ry. “Confusion in the Cloud.” Inside Higher Ed. 22 May 2013. Web. 1 Feb. 2018.

      Sharwood, Simon. “Adobe stops software licence audits in Americas, Europe.” The Register. Situation Publishing. 12 Aug. 2016. Web. 1 Feb. 2018.

      “Software Licensing Challenges Faced In The Cloud: How Can The Cloud Benefit You?” The ITAM Review. Enterprise Opinions Limited. 20 Nov. 2015. Web.

      White, Stephen. “Understanding the Impacts of Adobe’s Cloud Strategy and Subscriptions Before Negotiating an ETLA.” Gartner, 22 Feb. 2016. Web.

      Plan Your Digital Transformation on a Page

      • Buy Link or Shortcode: {j2store}81|cart{/j2store}
      • member rating overall impact (scale of 10): 8.0/10 Overall Impact
      • member rating average dollars saved: $34,649 Average $ Saved
      • member rating average days saved: 20 Average Days Saved
      • Parent Category Name: IT Strategy
      • Parent Category Link: /it-strategy
      • Digital investments often under deliver on expectations of return, and there is no cohesive approach to managing the flow of capital into digital.
      • The focus of the business has historically been to survive technological disruption rather than to thrive in it.
      • Strategy is based mostly on opinion rather than an objective analysis of the outcomes customers want from the organization.
      • Digital is considered a buzzword – nobody has a clear understanding of what it is and what it means in the organization’s context.

      Our Advice

      Critical Insight

      • The purpose of going digital is getting one step closer to the customer. The mark of a digital organization lies in how they answer the question, “How does what we’re doing contribute to what the customer wants from us?”
      • The goal of digital strategy is digital enablement. An organization that is digitally enabled no longer needs a digital strategy, it’s just “the strategy.”

      Impact and Result

      • Focus strategy making on delivering the digital outcomes that customers want.
        • Leverage the talent, expertise, and perspectives within the organization to build a customer-centric digital strategy.
      • Design a balanced digital strategy that creates value across the five digital value pools:
        • Digital marketing, digital channels, digital products, digital supporting capabilities, and business model innovation.
      • Ask how disruption can be leveraged, or even become the disruptor.
        • Manage disruption through quick-win approaches and empowering staff to innovate.
      • Use a Digital Strategy-on-a-Page to spark the digital transformation.
        • Drive awareness and alignment on the digital vision and spark your organization’s imagination around digital.

      Plan Your Digital Transformation on a Page Research & Tools

      Start here – read the Executive Brief

      Read our concise Executive Brief to understand how digital disruption is driving the need for transformation, and how Info-Tech’s methodology can help.

      Besides the small introduction, subscribers and consulting clients within this management domain have access to:

      1. Scope the digital transformation

      Learn how to apply the Digital Value Pools thought model and scope strategy around them.

      • Plan Your Digital Transformation on a Page – Phase 1: Scope the Digital Transformation

      2. Design the digital future state vision

      Identify business imperatives, define digital outcomes, and define the strategy’s guiding principles.

      • Plan Your Digital Transformation on a Page – Phase 2: Design the Digital Future State Vision
      • Digital Strategy on a Page

      3. Define the digital roadmap

      Define, prioritize, and roadmap digital initiatives and plan contingencies.

      • Plan Your Digital Transformation on a Page – Phase 3: Define the Digital Roadmap

      4. Sustain digital transformation

      Create, polish, and socialize the Digital Strategy-on-a-Page.

      • Plan Your Digital Transformation on a Page – Phase 4: Sustain Digital Transformation
      [infographic]

      Workshop: Plan Your Digital Transformation on a Page

      Workshops offer an easy way to accelerate your project. If you are unable to do the project yourself, and a Guided Implementation isn't enough, we offer low-cost delivery of our project workshops. We take you through every phase of your project and ensure that you have a roadmap in place to complete your project successfully.

      1 Scope the Digital Transformation

      The Purpose

      Identify the need for and use of digital strategy and determine a realistic scope for the digital strategy.

      Key Benefits Achieved

      The digital strategy project is planned and scoped around a subset of the five digital value pools.

      Activities

      1.1 Introduction to digital strategy.

      1.2 Establish motivation for digital.

      1.3 Discuss in-flight digital investments.

      1.4 Define the scope of digital.

      1.5 Identify stakeholders.

      1.6 Perform discovery interviews.

      1.7 Select two value pools to focus day 2, 3, and 4 activities.

      Outputs

      Business model canvas

      Stakeholder power map

      Discovery interview results

      Two value pools for focus throughout the workshop

      2 Design the Digital Future State Vision

      The Purpose

      Create guiding principles to help define future digital initiatives. Generate the target state with the help of strategic goals.

      Key Benefits Achieved

      Establish the basis for planning out the initiatives needed to achieve the target state from the current state.

      Activities

      2.1 Identify digital imperatives.

      2.2 Define key digital outcomes.

      2.3 Create a digital investment thesis.

      2.4 Define digital guiding principles.

      Outputs

      Corporate strategy analysis, PESTLE analysis, documented operational pain points (value streams)

      Customer needs assessment (journey maps)

      Digital investment thesis

      Digital guiding principles

      3 Define the Digital Roadmap

      The Purpose

      Understand the gap between the current and target state. Create transition options and assessment against qualitative and quantitative metrics to generate a list of initiatives the organization will pursue to reach the target state. Build a roadmap to plan out when each transition initiative will be implemented.

      Key Benefits Achieved

      Finalize the initiatives the organization will use to achieve the target digital state. Create a roadmap to plan out the timing of each initiative and generate an easy-to-present document for digital strategy approval.

      Activities

      3.1 Identify initiatives to achieve digital outcomes.

      3.2 Align in-flight initiatives to digital initiatives.

      3.3 Prioritize digital initiatives.

      3.4 Document architecturally significant requirements for high-priority initiatives.

      Outputs

      Digital outcomes and KPIs

      Investment/value pool matrix

      Digital initiative prioritization

      Architecturally significant requirements for high-priority initiatives

      4 Define the Digital Roadmap

      The Purpose

      Plan your approach to socializing the digital strategy to help facilitate the cultural changes necessary for digital transformation.

      Key Benefits Achieved

      Plant the seed of digital and innovation to start making digital a part of the organization’s DNA.

      Activities

      4.1 Review and refine Digital Strategy on a Page.

      4.2 Assess company culture.

      4.3 Define high-level cultural changes needed for successful transformation.

      4.4 Define the role of the digital transformation team.

      4.5 Establish digital transformation team membership and desired outcomes.

      Outputs

      Digital Strategy on a Page

      Strategyzer Culture Map

      Digital transformation team charter

      Exploit Disruptive Infrastructure Technology

      • Buy Link or Shortcode: {j2store}298|cart{/j2store}
      • member rating overall impact (scale of 10): N/A
      • member rating average dollars saved: N/A
      • member rating average days saved: N/A
      • Parent Category Name: Disruptive & Emerging Technologies
      • Parent Category Link: /disruptive-emerging-technologies
      • New technology can hit like a meteor. Not only disruptive to IT, technology provides opportunities for organization-wide advantage.
      • Your role is endangered. If you don’t prepare for the most disruptive technologies, you could be overshadowed. Don’t let the Chief Marketing Officer (CMO) set the technological innovation agenda
      • Predicting the future isn’t easy. Most IT leaders fail to realize how quickly technology increases in capability. Even for the tech savvy, predicting which specific technologies will become disruptive is difficult.
      • Communication is difficult when the sky is falling. Even forward-looking IT leaders struggle with convincing others to devote time and resources to monitoring technologies with a formal process.

      Our Advice

      Critical Insight

      • Establish the core working group, select a leader, and select a group of visionaries to help brainstorm emerging technologies.
      • Brainstorm about creating a better future, begin brainstorming an initial longlist.
      • Train the group to think like futurists.
      • Evaluate the shortlist.
      • Define your PoC list and schedule.
      • Finalize, present the plan to stakeholders and repeat.

      Impact and Result

      • Create a disruptive technology working group.
      • Produce a longlist of disruptive technologies.
      • Evaluate the longlist to produce a shortlist of disruptive technologies.
      • Develop a plan for a proof-of-concept project for each shortlisted technology.

      Exploit Disruptive Infrastructure Technology Research & Tools

      Besides the small introduction, subscribers and consulting clients within this management domain have access to:

      1. Exploit Disruptive Infrastructure Technology – A guide to help IT leaders make the most of disruptive impacts.

      As a CIO, there is a need to move beyond day-to-day technology management with an ever-increasing need to forecast technology impacts. Not just from a technical perspective but to map out the technical understandings aligned to potential business impacts and improvements. Technology transformation and innovation is moving more quickly than ever before and as an innovation champion, the CIO or CTO should have foresight in specific technologies with the understanding of how the company could be disrupted in the near future.

      • Exploit Disruptive Infrastructure Technology – Phases 1-3

      2. Disruptive Technology Exploitation Plan Template – A guide to develop the plan for exploiting disruptive technology.

      The Disruptive Technology Exploitation Plan Template acts as an implementation plan for developing a long-term strategy for monitoring and implementing disruptive technologies.

      • Disruptive Technology Exploitation Plan Template

      3. Disruptive Technology Look to the Past Tool – A tool to keep track of the missed technology disruption from previous opportunities.

      The Disruptive Technology Look to the Past Tool will assist you to collect reasonability test notes when evaluating potential disruptive technologies.

      • Disruptive Technology Look to the Past Tool

      4. Disruptive Technology Research Database Tool – A tool to keep track of the research conducted by members of the working group.

      The Disruptive Technology Research Database Tool will help you to keep track of the independent research that is conducted by members of the disruptive technology exploitation working group.

      • Disruptive Technology Research Database Tool

      5. Disruptive Technology Shortlisting Tool

      The Disruptive Technology Shortlisting Tool will help you to codify the results of the disruptive technology working group's longlist winnowing process.

      • Disruptive Technology Shortlisting Tool

      6. Disruptive Technology Value-Readiness and SWOT Analysis Tool – A tool to systematize notional evaluations of the value and readiness of potential disruptive technologies.

      The Disruptive Technology Value Readiness & SWOT Analysis Tool will assist you to systematize notional evaluations of the value and readiness of potential disruptive technologies.

      • Disruptive Technology Value-Readiness and SWOT Analysis Tool

      7. Proof of Concept Template – A handbook to serve as a reference when deciding how to proceed with your proposed solution.

      The Proof of Concept Template will guide you through the creation of a minimum-viable proof-of-concept project.

      • Proof of Concept Template

      8. Disruptive Technology Executive Presentation Template – A template to help you create a brief progress report presentation summarizing your project and program progress.

      The Disruptive Technology Executive Presentation Template will assist you to present an overview of the disruptive technology process, outlining the value to your company.

      • Disruptive Technology Executive Presentation Template

      Infographic

      Workshop: Exploit Disruptive Infrastructure Technology

      Workshops offer an easy way to accelerate your project. If you are unable to do the project yourself, and a Guided Implementation isn't enough, we offer low-cost delivery of our project workshops. We take you through every phase of your project and ensure that you have a roadmap in place to complete your project successfully.

      1 Pre-work: Establish the Disruptive Tech Process

      The Purpose

      Discuss the general overview of the disruptive technology exploitation process.

      Develop an initial disruptive technology exploitation plan.

      Key Benefits Achieved

      Stakeholders are on board, the project’s goals are outlined, and the working group is selected.

      Activities

      1.1 Get execs and stakeholders on board.

      1.2 Review the process of analyzing disruptive tech.

      1.3 Select members for the working group.

      1.4 Choose a schedule and time commitment.

      1.5 Select a group of visionaries.

      Outputs

      Initialized disruptive tech exploitation plan

      Meeting agenda, schedule, and participants

      2 Hold the Initial Meeting

      The Purpose

      Understand how disruption will affect the organization, and develop an initial list of technologies to explore.

      Key Benefits Achieved

      Knowledge of how to think like a futurist.

      Understanding of organizational processes vulnerable to disruption.

      Outline of potentially disruptive technologies.

      Activities

      2.1 Start the meeting with introductions.

      2.2 Train the group to think like futurists.

      2.3 Brainstorm about disruptive processes.

      2.4 Brainstorm a longlist.

      2.5 Research and brainstorm separate longlists.

      Outputs

      List of disruptive organizational processes

      Initial longlist of disruptive tech

      3 Create a Longlist and Assess Shortlist

      The Purpose

      Evaluate the specific value of longlisted technologies to the organization.

      Key Benefits Achieved

      Defined list of the disruptive technologies worth escalating to the proof of concept stage.

      Activities

      3.1 Converge the longlists developed by the team.

      3.2 Narrow the longlist to a shortlist.

      3.3 Assess readiness and value.

      3.4 Perform a SWOT analysis.

      Outputs

      Finalized longlist of disruptive tech

      Shortlist of disruptive tech

      Value-readiness analysis

      SWOT analysis

      Candidate(s) for proof of concept charter

      4 Create an Action Plan

      The Purpose

      Understand how the technologies in question will impact the organization.

      Key Benefits Achieved

      Understanding of the specific effects of the new technology on the business processes it is intended to disrupt.

      Business case for the proof-of-concept project.

      Activities

      4.1 Build a problem canvas.

      4.2 Identify affected business units.

      4.3 Outline and map the business processes likely to be disrupted.

      4.4 Map disrupted business processes.

      4.5 Recognize how the new technology will impact business processes.

      4.6 Make the case.

      Outputs

      Problem canvas

      Map of business processes: current state

      Map of disrupted business processes

      Business case for each technology

      Further reading

      Analyst Perspective

      The key is in anticipation.

      “We all encounter unexpected changes and our responses are often determined by how we perceive and understand those changes. We react according to the unexpected occurrence. Business organizations are no different.

      When a company faces a major technology disruption in its markets – one that could fundamentally change the business or impact its processes and technology – the way its management perceive and understand the disruption influences how they describe and plan for it. In other words, the way management sets the context of a disruption – the way they frame it – shapes the strategy they adopt. Technology leaders can vastly influence business strategy by adopting a proactive approach to understanding disruptive and innovative technologies by simply adopting a process to review and evaluate technology impacts to the company’s lines of business.”

      This is a picture of Troy Cheeseman

      Troy Cheeseman
      Practice Lead, Infrastructure & Operations Research
      Info-Tech Research Group

      Executive Summary

      Your Challenge

      • New technology can hit like a meteor. Not only disruptive to IT, technology provides opportunities for organization-wide advantage.
      • Your role is endangered. If you don’t prepare for the most disruptive technologies, you could be overshadowed. Don’t let the chief marketing officer (CMO) set the technological innovation agenda.

      Common Obstacles

      • Predicting the future isn’t easy. Most IT leaders fail to realize how quickly technology increases in capability. Even for the tech savvy, predicting which specific technologies will become disruptive is difficult.
      • Communication is difficult when the sky is falling. Even forward-looking IT leaders struggle with convincing others to devote time and resources to monitoring technologies with a formal process.

      Info-Tech’s Approach

      • Identify, resolve, and evaluate. Use an annual process as described in this blueprint: a formal evaluation of new technology that turns analysis into action.
      • Lead the analysis from IT. Establish a team to carry out the annual process as a cure for the causes of “airline magazine syndrome” and to prevent it from happening in the future.
      • Train your team on the patterns of progress, track technology over time in a central database, and read Info-Tech’s analysis of upcoming technology.
      • Create your KPIs. Establish your success indicators to create measurable value when presenting to your executive.
      • Produce a comprehensive proof-of-concept plan that will allow your company to minimize risk and maximize reward when engaging with new technology.

      Info-Tech Insight

      Proactively monitoring, evaluating, and exploiting disruptive tech isn’t optional.
      This will protect your role, IT’s role, and the future of the organization.

      A diverse working group maximizes the insight brought to bear.
      An IT background is not a prerequisite.

      The best technology is only the best when it brings immediate value.
      Good technology might not be ready; ready technology might not be good.

      Review

      We help IT leaders make the most of disruptive impacts.

      This research is designed for:

      Target Audience: CIO, CTO, Head of Infrastructure

      This research will help you:

      • Develop a process for anticipating, analyzing, and exploiting disruptive technology.
      • Communicate the business case for investing in disruptive technology.
      • Categorize emerging technologies to decide what to do with them.
      • Develop a plan for taking action to exploit the technology that will most affect your organization.

      Problem statement:

      As a CIO, there is a need to move beyond day-to-day technology management with an ever-increasing need to forecast technology impacts. Not just from a technical perspective but to map out the technical understandings aligned to potential business impacts and improvements. Technology transformation and innovation is moving more quickly than ever before and as an innovation champion, the CIO or CTO should have foresight in specific technologies with the understanding of how the company could be disrupted in the near future. Foresight + Current Technology + Business Understanding = Understanding the Business Disruption. This should be a repeatable process, not an exception or reactionary response.

      Insight Summary

      Establish the core working group, select a leader, and select a group of visionaries to help brainstorm emerging technologies.

      The right team matters. A core working group will keep focus through the process and a leader will keep everyone accountable. Visionaries are out-of-the-box thinkers and once they understand how to think like a "futurists," they will drive the longlist and shortlist actions.

      Train the group to think like futurists

      To keep up with exponential technology growth you need to take a multi-threaded approach.

      Brainstorm about creating a better future; begin brainstorming an initial longlist

      Establish the longlist. The longlist helps create a holistic view of most technologies that could impact the business. Assigning values and quadrant scoring will shortlist the options and focus your PoC option.

      Converge everyone’s longlists

      Long to short...that's the short of it. Using SWOT, value readiness, and quadrant mapping review sessions will focus the longlist, creating a shortlist of potential POC candidates to review and consider.

      Evaluate the shortlist

      There is no such thing as a risk-free endeavor. Use a systematic process to ensure that the risks your organization takes have the potential to produce significant rewards.

      Define your PoC list and schedule

      Don’t be afraid to fail! Inevitably, some proof-of-concept projects will not benefit the organization. The projects that are successful will more than cover the costs of the failed projects. Roll out small scale and minimize losses.

      Finalize, present the plan to stakeholders, and repeat!

      Don't forget the C-suite. Effectively communicate and present the working group’s finding with a well-defined and succinct presentation. Start the process again!

      This is a screenshot of the Thought map for Exploit disruptive infrastructure Technology.
      1. Identify
        • Establish the core working group and select a leader; select a group of visionaries
        • Train the group to think like futurists
        • Hold your initial meeting
      2. Resolve
      • Create and winnow a longlist
      • Assess and create the shortlist
    • Evaluate
      • Create process maps
      • Develop proof of concept charter
    • The Key Is in Anticipation!

      Use Info-Tech’s approach for analyzing disruptive technology in your own disruptive tech working group

      Phase 1: Identify Phase 2: Resolve Phase 3: Evaluate

      Phase Steps

      1. Establish the disruptive technology working group
      2. Think like a futurist (Training)
      3. Hold initial meeting or create an agenda for the meeting
      1. Create and winnow a longlist
      2. Assess shortlist
      1. Create process maps
      2. Develop proof of concept charter

      Phase Outcomes

      • Establish a team of subject matter experts that will evaluate new, emerging, and potentially disruptive technologies.
      • Establish a process for including visionaries from outside of the working group who will provide insight and direction.
      • Introduce the core working group members.
      • Gain a better understanding of how technology advances.
      • Brainstorm a list of organizational processes.
      • Brainstorm an initial longlist.
      • Finalized longlist
      • Finalized shortlist
      • Initial analysis of each technology on the shortlist
      • Finalized shortlist
      • Initial analysis of each technology on the shortlist
      • Business process maps before and after disruption
      • Proof of concept charter
      • Key performance indicators
      • Estimation of required resources
      • Executive presentation

      Four key challenges make it essential for you to become a champion for exploiting disruptive technology

      1. New technology can hit like a meteor. It doesn’t only disrupt IT; technology provides opportunities for organization-wide advantage.
      2. Your role is endangered. If you don’t prepare for the most disruptive technologies, you could be overshadowed. Don’t let the CMO rule technological innovation.
      3. Predicting the future isn’t easy. Most IT leaders fail to realize how quickly technology increases in capability. Even for the tech savvy, predicting which specific technologies will become disruptive is difficult.
      4. Communication is difficult when the sky is falling. Even forward-looking IT leaders struggle with convincing others to devote time and resources to monitoring emerging technologies with a formal process.

      “Look, you have never had this amount of opportunity for innovation. Don’t forget to capitalize on it. If you do not capitalize on it, you will go the way of the dinosaur.”
      – Dave Evans, Co-Founder and CTO, Stringify

      Technology can hit like a meteor

      “ By 2025:

      • 38.6 billion smart devices will be collecting, analyzing, and sharing data.
      • The web hosting services market is to reach $77.8 billion in 2025.
      • 70% of all tech spending is expected to go for cloud solutions.
      • There are 1.35 million tech startups.
      • Global AI market is expected to reach $89.8 billion.”

      – Nick Gabov

      IT Disruption

      Technology disrupts IT by:

      • Affecting the infrastructure and applications that IT needs to use internally.
      • Affecting the technology of end users that IT needs to support and deploy, especially for technologies with a consumer focus.
      • Allowing IT to run more efficiently and to increase the efficiency of other business units.
      • Example: The rise of the smartphone required many organizations to rethink endpoint devices.

      Business Disruption

      Technology disrupts the business by:

      • Affecting the viability of the business.
      • Affecting the business’ standing in relation to competitors that better deal with disruptive technology.
      • Affecting efficiency and business strategy. IT should have a role in technology-related business decisions.
      • Example: BlackBerry failed to anticipate the rise of the apps ecosystem. The company struggled as it was unable to react with competitive products.

      Senior IT leaders are expected to predict disruptions to IT and the business, while tending to today’s needs

      You are expected to be both a firefighter and a forecaster

      • Anticipating upcoming disruptions is part of your job, and you will be blamed if you fail to anticipate future business disruptions because you are focusing on the present.
      • However, keeping IT running smoothly is also part of your job, and you will be blamed if today’s IT environment breaks down because you are focusing on the future.

      You’re caught between the present and the future

      • You don’t have a process that anticipates future disruptions but runs alongside and integrates with operations in the present.
      • You can’t do it alone. Tending to both the present and the future will require a team that can help you keep the process running.

      Info-Tech Insight

      Be prepared when disruptions start coming down, even though it isn’t easy. Use this research to reduce the effort to a simple process that can be performed alongside everyday firefighting.

      Make disruptive tech analysis and exploitation part of your innovation agenda

      A scatter plot graph is depicted, plotting IT Innovative Leadership (X axis), and Satisfaction with IT(Y axis). IT innovative leadership explains 75% of variation in satisfaction with IT

      Organizations without high satisfaction with IT innovation leadership are only 20% likely to be highly satisfied with IT

      “You rarely see a real-world correlation of .86!”
      – Mike Battista, Staff Scientist, Cambridge Brain Sciences, PhD in Measurement

      There is a clear relationship between satisfaction with IT and the IT department’s innovation leadership.

      Prevent “airline magazine syndrome” by proactively analyzing disruptive technologies

      “The last thing the CIO needs is an executive saying ‘I don’t what it is or what it does…but I want two of them!”
      – Tim Lalonde

      Airline magazine syndrome happens to IT leaders caught between the business and IT. It usually occurs in this manner:

      1. While on a flight, a senior executive reads about an emerging technology that has exciting implications for the business in an airline magazine.
      2. The executive returns and approaches IT, demanding that action be taken to address the disruptive technology – and that it should have been (ideally) completed already.

      Without a Disruptive Technology Exploitation Plan:

      “I don’t know”

      With a Disruptive Technology Exploitation Plan:

      “Here in IT, we have already considered that technology and decided it was overhyped. Let me show you our analysis and invite you to join our working group.”

      OR

      “We have already considered that technology and have started testing it. Let me show you our testing lab and invite you to join our working group.”

      Info-Tech Insight

      Airline magazine syndrome is a symptom of a wider problem: poor CEO-CIO alignment. Solve this problem with improved communication and documentation. Info-Tech’s disruptive tech iterative process will make airline magazine syndrome a thing of the past!

      IT leaders who do not keep up with disruptive technology will find their roles diminished

      “Today’s CIO dominion is in a decaying orbit with CIOs in existential threat mode.”
      – Ken Magee

      Protect your role within IT

      • IT is threatened by disruptive technology:
        • Trends like cloud services, increased automation, and consumerization reduce the need for IT to be involved in every aspect of deploying and using technology.
        • In the long term, machines will replace even intellectually demanding IT jobs, such as infrastructure admin and high-level planning.
      • Protect your role in IT by:
        • Anticipating new technology that will disrupt the IT department and your place within it.
        • Defining new IT roles and responsibilities that accurately reflect the reality of technology today.
        • Having a process for the above that does not diminish your ability to keep up with everyday operations that remain a priority today.

      Protect your role against other departments

      • Your role in the business is threatened by disruptive technology:
        • The trends that make IT less involved with technology allow other executives – such as the CMO – to make IT investments.
        • As the CMO gains the power and data necessary to embrace new trends, the CIO and IT managers have less pull.
      • Protect your role in the business by:
        • Being the individual to consult about new technology. It isn’t just a power play; IT leaders should be the ones who know technology thoroughly.
        • Becoming an indispensable part of the entire business’ innovation strategy through proposing and executing a process for exploiting disruptive technology.

      IT leaders who do keep up have an opportunity to solidify their roles as experts and aggregators

      “The IT department plays a critical role in [innovation]. What they can do is identify a technology that potentially might introduce improvements to the organization, whether it be through efficiency, or through additional services to constituents.”
      – Michael Maguire, Management Consultant

      The contemporary CIO is a conductor, ensuring that IT works in harmony with the rest of the business.

      The new CIO is a conductor, not a musician. The CIO is taking on the role of a business engineer, working with other executives to enable business innovation.

      The new CIO is an expert and an aggregator. Conductor CIOs increasingly need to keep up on the latest technologies. They will rely on experts in each area and provide strategic synthesis to decide if, and how, developments are relevant in order to tune their IT infrastructure.

      The pace of technological advances makes progress difficult to predict

      “An analysis of the history of technology shows that technological change is exponential, contrary to the common-sense ‘intuitive linear’ view. So we won’t experience 100 years of progress in the 21st century – it will be more like 20,000 years of progress (at today’s rate).”
      – Ray Kurzweil

      Technology advances exponentially. Rather than improving by the same amount of capability each year, it multiplies in capability each year.

      Think like a futurist to anticipate technology before it goes mainstream.

      Exponential growth happens much faster than linear growth, especially when it hits the knee of the curve. Even those who acknowledge exponential growth underestimate how capabilities can improve.

      To predict new advances, turn innovation into a process

      “We spend 70 percent of our time on core search and ads. We spend 20 percent on adjacent businesses, ones related to the core businesses in some interesting way. Examples of that would be Google News, Google Earth, and Google Local. And then 10 percent of our time should be on things that are truly new.”
      – Eric Schmidt, Google

      • Don’t get caught in the trap of refining your core processes to the exclusion of innovation. You should always be looking for new processes to improve, new technology to pilot, and where possible, new businesses to get into.
      • Devote about 10% of your time and resources to exploring new technology: the potential rewards are huge.

      You and your team need to analyze technology every year to predict where it’s going.

      A bar graph is shown which depicts the proportion of technology use from 2018-2022. the included devices are: Tablets; PCs; TVs; Non-smartphones; Smartphones; M2M
      • Foundational technologies, such as computing power, storage, and networks, are improving exponentially.
      • Disruptive technologies are specific manifestations of foundational advancements. Advancements of greater magnitude give rise to more manifestations; therefore, there will be more disruptive technologies every year.
      • There is a lot of noise to cut through. Remember Google Glasses? As technology becomes ubiquitous and consumerization reigns, everybody is a technology expert. How do you decide which technologies to focus on?

      Protect IT and the business from disruption by implementing a simple, repeatable disruptive technology exploitation process

      “One of the most consistent patterns in business is the failure of leading companies to stay at the top of their industries when technologies or markets change […] Managers must beware of ignoring new technologies that can’t initially meet the needs of their mainstream customers.”
      – Joseph L. Bower and Clayton M. Christensen

      Challenge

      Solution

      New technology can hit like a meteor, but it doesn’t have to leave a crater:

      Use the annual process described in this blueprint to create a formal evaluation of new technology that turns analysis into action.

      Predicting the future isn’t easy, but it can be done:

      Lead the analysis from the office of the CIO. Establish a team to carry out the annual process as a cure for airline magazine syndrome.

      Your role is endangered, but you can survive:

      Train your team on the patterns of progress, track technology over time in a central database, and read Info-Tech’s analysis of upcoming technology.

      Communication is difficult when the sky is falling, so have a simple way to get the message across:

      Track metrics that communicate your progress, and summarize the results in a single, easy-to-read exploitation plan.

      Info-Tech Insight

      Use Info-Tech’s tools and templates, along with this storyboard, to walk you through creating and executing an exploitation process in six steps.

      Create measurable value by using Info-Tech’s process for evaluating the disruptive potential of technology

      This image contains a bar graph with the following Title: Which are the primary benefits you've either realized or expect to realize by deploying hyperconverged infrastructure in the near term.

      No business process is perfect.

      • Use Info-Tech’s Proof of Concept Template to create a disruptive technology proof of concept implementation plan.
      • Harness your company’s internal wisdom to systematically vet new technology. Engage only in calculated risk and maximize potential benefit.

      Info-Tech Insight

      Inevitably, some proof of concept projects will not benefit the organization. The projects that are successful will more than cover the costs of the failed projects. Roll out small scale and minimize losses.

      Establish your key performance indicators (KPIs)

      Key performance indicators allow for rigorous analysis, which generates insight into utilization by platform and consumption by business activity.

      • Brainstorm metrics that indicate when process improvement is actually taking place.
      • Have members of the group pitch KPIs; the facilitator should record each suggestion on a whiteboard.
      • Make sure to have everyone justify the inclusion of each metric: how does it relate to the improvement that the proof of concept project is intended to drive? How does it relate to the overall goals of the business?
      • Include a list of KPIs, along with a description and a target (ensuring that it aligns with SMART metrics).
      Key Performance Indicator Description Target Result

      Number of Longlist technologies

      Establish a range of Longlist technologies to evaluate 10-15
      Number of Shortlist technologies Establish a range of Shortlist technologies to evaluate 5-10
      number of "look to the past" likes/dislikes Minimum number of testing characteristics 6
      Number of POCs Total number of POCs Approved 3-5

      Communicate your plan with the Disruptive Technology Exploitation Plan Template

      Use the Disruptive Technology Exploitation Plan Template to summarize everything that the group does. Update the report continuously and use it to show others what is happening in the world of disruptive technology.

      Section Title Description
      1 Rationale and Summary of Exploitation Plan A summary of the current efforts that exist for exploring disruptive technology. A summary of the process for exploiting disruptive technology, the resources required, the team members, meeting schedules, and executive approval.
      2 Longlist of Potentially Disruptive Technologies A summary of the longlist of identified disruptive technologies that could affect the organization, shortened to six or less that have the largest potential impact based on Info-Tech’s Disruptive Technology Shortlisting Tool.
      3 Analysis of Shortlist Individually analyze each technology placed on the shortlist using Info-Tech’s Disruptive Technology Value-Readiness and SWOT Analysis Tool.
      4 Proof of Concept Plan Use the results from Section 3 to establish a plan for moving forward with the technologies on the shortlist. Determine the tasks required to implement the technologies and decide who will complete them and when.
      5 Hand-off Pass the project along to identified stakeholders with significant interest in its success. Continue to track metrics and prepare to repeat the disruptive technology exploitation process annually.

      Whether you need a process for exploiting disruptive technology, or an analysis of current trends, Info-Tech can help

      Two sets of research make up Info-Tech’s disruptive technology coverage:

      This image contains four screenshots from each of the following Info-Tech Blueprints: Exploit disruptive Infrastructure Technology; Infrastructure & operations priorities 2022

      This storyboard, and the associated tools and templates, will walk you through creating a disruptive technology working group of your own.

      Blueprint deliverables

      Each step of this blueprint is accompanied by supporting deliverables to help you accomplish your goals:

      Key deliverable:

      Disruptive Technology Exploitation Plan Template

      The Disruptive Technology Exploitation Plan Template acts as an implementation plan for developing a long-term strategy for monitoring and implementing disruptive technologies.

      Proof of Concept Template

      The Proof of Concept Template will guide you through the creation of a minimum-viable proof-of-concept project.

      Executive Presentation

      The Disruptive Technology Executive Presentation Template will assist you to present an overview of the disruptive technology process, outlining the value to your company.

      Disruptive Technology Value Readiness & SWOT Analysis Tool

      The Disruptive Technology Value Readiness & SWOT Analysis Tool will assist you to systematize notional evaluations of the value and readiness of potential disruptive technologies.

      Disruptive Technology Research Database Tool

      The Disruptive Technology Research Database Tool will help you to keep track of the independent research that is conducted by members of the disruptive technology exploitation working group.

      Disruptive Technology Shortlisting Tool

      The Disruptive Technology Shortlisting Tool will help you to codify the results of the disruptive technology working group's longlist winnowing process.

      Disruptive Technology Look to the Past Tool

      The Disruptive Technology Look to the Past Tool will assist you to collect reasonability test notes when evaluating potential disruptive technologies.

      Info-Tech offers various levels of support to best suit your needs

      DIY Toolkit

      “Our team has already made this critical project a priority, and we have the time and capability, but some guidance along the way would be helpful.”

      Guided Implementation

      “Our team knows that we need to fix a process, but we need assistance to determine where to focus. Some check-ins along the way would help keep us on track.”

      Workshop

      “We need to hit the ground running and get this project kicked off immediately. Our team has the ability to take this over once we get a framework and strategy in place.”

      Consulting

      “Our team does not have the time or the knowledge to take this project on. We need assistance through the entirety of this project.”

      Diagnostics and consistent frameworks used throughout all four options

      Guided Implementation

      What does a typical GI on this topic look like?

      Phase 1 Phase 2 Phase 3

      Call #1: Explore the need for a disruptive technology working group.

      Call #3: Review the agenda for the initial meeting.

      Call #5: Review how you’re brainstorming and your sources of information.

      Call #7: Review the final shortlist and assessment.

      Call #9: Review the progress of your team.

      Call #2: Review the team name, participants, and timeline.

      Call #4: Assess the results of the initial meeting.

      Call #6: Review the final longlist and begin narrowing it down.

      Call #8: Review the next steps.

      Call #10: Review the communication plan.

      A Guided Implementation (GI) is a series of calls with an Info-Tech analyst to help implement our best practices in your organization.

      A typical GI is 8 to 12 calls over the course of 4 to 6 months.

      Workshop Overview

      Contact your account representative for more information.
      workshops@infotech.com 1-888-670-8889

      Pre-Work Day 1 Day 2 Day 3 Day 4
      Establish the Disruptive Tech Process Hold Your Initial Meeting Create a Longlist and Assess Shortlist Create Process Maps Develop a Proof of Concept Charter

      Activities

      1.1.a Get executives and stakeholders on board.

      1.1.b Review the process of analyzing disruptive tech.

      1.1.c Select members for the working group.

      1.1.d Choose a schedule and time commitment.

      1.1.e Select a group of visionaries.

      1.2.a Start the meeting with introductions.

      1.2.b Train the group to think like futurists.

      1.2.c Brainstorm about disruptable processes.

      1.2.d Brainstorm a longlist.

      1.2.e Research and brainstorm separate longlists.

      2.1.a Converge the longlists developed by the team.

      2.2.b Narrow the longlist to a shortlist.

      2.2.c Assess readiness and value.

      2.2.d Perform a SWOT analysis.

      3.1.a Build a problem canvas.

      3.1.b Identify affected business units.

      3.1.c Outline and map the business processes likely to be disrupted.

      3.1.d Map disrupted business processes.

      3.1.e Recognize how the new technology will impact business processes.

      3.1.f Make the case.

      3.2.a Develop key performance indicators (KPIs).

      3.2.b Identify key success factors.

      3.2.c Outline project scope.

      3.2.d Identify responsible team.

      3.2.e Complete resource estimation.

      Deliverables

      1. Initialized Disruptive Tech Exploitation Plan
      1. List of Disruptable Organizational Processes
      2. Initial Longlist of Disruptive Tech
      1. Finalized Longlist of Disruptive Tech
      2. Shortlist of Disruptive Tech
      3. Value-Readiness Analysis
      4. SWOT Analysis
      5. Candidate(s) for Proof of Concept Charter
      1. Problem Canvas
      2. Map of Business Processes: Current State
      3. Map of Disrupted Business Processes
      4. Business Case for Each Technology
      1. Completed Proof of Concept Charter

      Exploit Disruptive Infrastructure Technology

      Disrupt or be disrupted.

      Identify

      Create your working group.

      PHASE 1

      Use Info-Tech’s approach for analyzing disruptive technology in your own disruptive tech working group

      1. Identify
        1. Establish the core working group and select a leader; select a group of visionaries
        2. Train the group to think like futurists
        3. Hold your initial meeting
      2. Resolve
        1. Create and winnow a longlist
        2. Assess and create the shortlist
      3. Evaluate
        1. Create process maps
        2. Develop proof of concept charter

      The Key Is in Anticipation!

      Phase 1: Identify

      Create your working group.

      Activities:

      Step 1.1: Establish the core working group and select a leader; select a group of visionaries
      Step 1.2: Train the group to think like futurists
      Step 1.3: Hold the initial meeting

      This step involves the following participants:

      IT Infrastructure Manager

      CIO or CTO

      Potential members and visionaries of the working group

      Outcomes of this step:

      • Establish a team of subject matter experts that will evaluate new, emerging, and potentially disruptive technologies.
      • Establish a process for including visionaries from outside of the working group who will provide insight and direction.
      • Introduce the core working group members.
      • Gain a better understanding of how technology advances.
      • Brainstorm a list of organizational processes.
      • Brainstorm an initial longlist.

      Step 1.1

      Establish the core working group and select a leader; select a group of visionaries.

      Activities:

      • Articulate the long- and short-term benefits and costs to the entire organization
      • Gain support by articulating the long- and short-term benefits and costs to the IT department
      • Gain commitment from key stakeholders and executives
      • Help stakeholders understand what goes into formally exploiting disruptive tech by reviewing this process
      • Establish the core working group and select a leader
      • Create a schedule with a time commitment appropriate to your organization’s size; it doesn’t need to take long
      • Select a group of visionaries external to IT to help the working group brainstorm disruptive technologies

      This step involves the following participants:

      • IT Infrastructure Manager
      • CIO or CTO
      • Potential members and visionaries of the working group

      Outcomes of this step

      • Establish a team of subject matter experts that will evaluate new, emerging, and potentially disruptive technologies.
      • Establish a process for including visionaries from outside of the working group that will provide insight and direction.

      1.1.A Articulate the long- and short-term benefits and costs to the entire organization

      A cost/benefit analysis will give stakeholders a picture of how disruptive technology could affect the business. Use the chart as a starting point and customize it based on your organization.

      Disruptive Technology Affects the Organization

      Benefits Costs

      Short Term

      • First-mover advantage from implementing new technology in the business before competitors – and before start-ups.
      • Better brand image as an organization focused on innovation.
      • Increased overall employee satisfaction by implementing new technology that increases employee capabilities or lowers effort.
      • Possibility of increased IT budget for integrating new technology.
      • Potential for employees to reject wide-scale use of unfamiliar technology.
      • Potential for technology to fail in the organization if it is not sufficiently tested.
      • Executive time required for making decisions about technology recommended by the team.

      Long Term

      • Increased internal business efficiencies from the integration of new technology (e.g. energy efficiency, fewer employees needed due to automation).
      • Better services or products for customers, resulting in increased long-term revenue.
      • Lowered costs of services or products and potential to grow market share.
      • Continued relevance of established organizations in a world changed by disruptive technologies.
      • Technology may not reach the capabilities initially expected, requiring waiting for increased value or readiness.
      • Potential for customers to reject new products resulting from technology.
      • Lack of focus on current core capabilities if technology is massively disruptive.

      1.1.B Gain support by articulating the long- and short-term benefits and costs to the IT department

      A cost/benefit analysis will give stakeholders a picture of how disruptive technology could affect the business. Use the chart as a starting point and customize it based on your organization.

      Disruptive Technology Affects IT

      BenefitsCosts

      Short Term

      • Perception of IT as a core component of business practices.
      • Increase IT’s capabilities to better serve employees (e.g. faster network speeds, better uptime, and storage and compute capacity that meet demands).
      • Cost for acquiring or implementing new technology and updating infrastructure to integrate with it.
      • Cost for training IT staff and end users on new IT technology and processes.
      • Minor costs for initial setup of disruptive technology exploitation process and time taken by members.

      Long Term

      • More efficient and powerful IT infrastructure that capitalizes on emerging trends at the right time.
      • Lower help desk load due to self-service and automation technology.
      • Increased satisfaction with IT due to implementation of improved enterprise technology and visible IT influence on improvements.
      • Increased end-user satisfaction with IT due to understanding and support of consumer technology that affects their lives.
      • New technology may result in lower need for specific IT roles. Cultural disruptions due to changing role of IT.
      • Perception of failure if technology is tested and never implemented.
      • Expectation that IT will continue to implement the newest technology available, even when it has been dismissed as not having value.

      1.1.C Gain commitment from key stakeholders and executives

      Gaining approval from executives and key stakeholders is the final obstacle. Ensure that you cover the following items to have the best chance for project approval.

      • Use a sample deck similar to this section for gaining buy-in, ensuring that you add/remove information to make it specific to your organization. Cover this section, including:
        • Who: Who will lead the team and who will be on it (working group)?
        • What: What resources will be required by the team (costs)?
        • Where/When: How often and where will the team meet (meeting schedule)?
        • Why: Why is there a need to exploit disruptive technology (benefits and examples)?
        • How: How is the team going to exploit disruptive technology (the process)?
      • Go through this blueprint prior to presenting the plan to stakeholders so that you have a strong understanding of the details behind each process and tool.
      • Frame the first iteration of the cycle as a pilot program. Use the completed results of the pilot to establish exploiting disruptive technology as a necessary company initiative.

      Insert the resources required by the disruptive tech exploitation team into Section 1.5 of the Disruptive Technology Exploitation Plan Template. Have executives sign-off on the project in Section 1.6.

      Disruption has undermined some of the most successful tech companies

      “The IT department plays a critical role in [innovation]. What they can do is identify a technology that potentially might introduce improvements to the organization, whether it be through efficiency or through additional services to constituents.”
      - Michael Maguire, Management Consultant

      VoIP’s transformative effects

      Disruptive technology:
      Voice over Internet Protocol (VoIP) is a modern means of making phone calls through the internet by sending voice packets using data, as opposed to the traditional circuit transmissions of the PSTN.

      Who won:
      Organizations that realized the cost savings that VoIP provided for businesses with a steady internet connection saved as much as 60% on telephony expenses. Even in the early stages, with a few more limitations, organizations were able to save a significant amount of money and the technology has continued to improve.

      Who lost?
      Telecom-related companies that failed to realize VoIP was a potential threat to their market, and organizations that lacked the ability to explore and implement the disruptive technology early.

      Digital photography — the new norm

      Disruptive technology:
      Digital photography refers to the storing of photographs in a digital format, as opposed to traditional photography, which exposes light to sensitive photographic film.

      Who won:
      Photography companies and new players that exploited the evolution of data storage and applied it to photography succeeded. Those that were able to balance providing traditional photography and exploiting and introducing digital photography, such as Nikon, left competitors behind. Smartphone manufacturers also benefited by integrating digital cameras.

      Who lost?
      Photography companies, such as Kodak, that failed to respond to the digital revolution found themselves outcompeted and insolvent.

      1.1.D Help stakeholders understand what goes into formally exploiting disruptive tech by reviewing this process

      There are five steps to formally exploiting disruptive technology, each with its own individual outputs and tools to take analysis to the next level.

      Step 1.2:
      Hold Initial Meeting

      Output:

      • Initial list of disruptable processes;
      • Initial longlist

      Step 2.1:

      Brainstorm Longlist

      Output:

      • Finalized longlist;
      • Shortlist

      Step 2.2:

      Assess Shortlist

      Output:

      • Final shortlist;
      • SWOT analysis;
      • Tech categorization

      Step 3.1:
      Create Process Maps

      Output:

      • Completed process maps

      Step 3.2:
      Develop a proof of concept charter

      Output:

      • Proof-of-concept template with KPIs

      Info-Tech Insight

      Before going to stakeholders, complete the entire blueprint to better understand the tools and outputs of the process.

      1.1.E Establish the core working group and select a leader

      • Selecting your core membership for the working group is a critical step to the group’s success. Ensure that you satisfy the following criteria:
        • This is a team of subject matter experts. They will be overseeing the learning and piloting of disruptive technologies. Their input will also be valuable for senior executives and for implementing these technologies.
        • Choose members that can take time away from firefighting tasks to dedicate time to meetings.
        • It may be necessary to reach outside of the organization now or in the future for expertise on certain technologies. Use Info-Tech as a source of information.
      Organization Size Working Group Size
      Small 02-Jan
      Medium 05-Mar
      Large 10-May
      • Once the team is established, you must decide who will lead the group. Ensure that you satisfy the following criteria:
        • A leader should be credible, creative, and savvy in both technology and business.
        • The leader should facilitate, acting as both an expert and an aggregator of the information gathered by the team.

      Choose a compelling name

      The working group needs a name. Be sure to select one with a positive connotation within your organization.

      Section 1.3 of the Disruptive Technology Exploitation Plan Template

      1.1.F Create a schedule with a time commitment appropriate to your organization’s size; it doesn’t need to take long

      Time the disruptive technology working group’s meetings to coincide and integrate with your organization’s strategic planning — at least annually.

      Size Meeting Frequency Time per Meeting Example Meeting Activities
      Small Annually One day A one-day meeting to run through phase 2 of the project (SWOT analysis and shortlist analysis).
      Medium Two days A two-day meeting to run through the project. The additional meeting involves phase 3 of this deck, developing a proof-of-concept plan.
      Large Two+ days Two meetings, each two days. Two days to create and winnow the longlist (phase 2), and two further days to develop a proof of concept plan.

      “Regardless of size, it’s incumbent upon every organization to have some familiarity of what’s happening over the next few years, [and to try] to anticipate what some of those trends may be. […] These trends are going to accelerate IT’s importance in terms of driving business strategy.”
      – Vern Brownell, CEO, D-Wave

      Section 1.4 of the Disruptive Technology Exploitation Plan Template

      1.1.G Select a group of visionaries external to IT to help the working group brainstorm disruptive technologies

      Selecting advisors for your group is an ongoing step, and the roster can change.

      Ensure that you satisfy the following criteria:

      • Look beyond IT to select a team representing several business units.
      • Check for self-professed “geeks” and fans of science fiction that may be happy to join.
      • Membership can be a reward for good performance.

      This group does not have to meet as regularly as the core working group. Input from external advisors can occur between meetings. You can also include them on every second or third iteration of the entire process.

      However, the more input you can get into the group, the more innovative it can become.

      “It is … important to develop design fictions based on engagement with directly or indirectly implicated publics and not to be designed by experts alone.”
      – Emmanuel Tsekleves, Senior Lecturer in Design Interactions, University of Lancaster

      Section 1.3 of the Disruptive Technology Exploitation Plan Template

      The following case study illustrates the innovative potential that is created when you include a diverse group of people

      INDUSTRY - Chip Manufacturing
      SOURCE - Clayton Christensen, Intel

      To achieve insight, you need to collaborate with people from outside of your department.

      Challenge

      • Headquartered in California, through the 1990s, Intel was the largest microprocessor chip manufacturer in the world, with revenue of $25 billion in 1997.
      • All was not perfect, however. Intel faced a challenge from Cyrix, a manufacturer of low-end chips. In 18 months, Cyrix’s share of the low-margin entry-level chip manufacturing business mushroomed from 10% to 70%.

      Solution

      • Troubled by the potential for significant disruption of the microprocessor market, Intel brought in external consultants to hold workshops to educate managers about disruptive innovation.
      • Managers would break into groups and discuss ways Intel could facilitate the disruption of its competitors. In one year, Intel hosted 18 workshops, and 2,000 managers went through the process.

      Results

      • Intel launched the Celeron chip to serve the lower end of the PC market and win market share back from Cyrix (which no longer exists as an independent company) and other competitors like AMD.
      • Within one year, Intel had captured 35% of the market.

      “[The models presented in the workshops] gave us a common language and a common way to frame the problem so that we could reach a consensus around a counterintuitive course of action.” – Andy Grove, then-CEO, Intel Corporation

      Phase 1: Identify

      Create your working group.

      Activities:

      Step 1.1: Establish the core working group and select a leader; select a group of visionaries
      Step 1.2: Train the group to think like futurists
      Step 1.3: Hold the initial meeting

      This step involves the following participants:

      • IT Infrastructure Manager
      • CIO or CTO
      • Potential members and visionaries of the working group

      Outcomes of this phase:

      • Establish a team of subject matter experts that will evaluate new, emerging, and potentially disruptive technologies.
      • Establish a process for including visionaries from outside of the working group who will provide insight and direction.
      • Introduce the core working group members.
      • Gain a better understanding of how technology advances.
      • Brainstorm a list of organizational processes.
      • Brainstorm an initial longlist.

      Step 1.2

      Train the group to think like futurists

      Activities:

      1. Look to the past to predict the future:
        • Step 1: Review the technology opportunities you missed
        • Step 2: Review and record what you liked about the tech
        • Step 3: Review and record your dislikes
        • Step 4: Record and test the reasonability
      2. Crash course on futurology principles
      3. Peek into the future

      This step involves the following participants:

      • IT Infrastructure Manager
      • CIO or CTO
      • Core working group members
      • Visionaries

      Outcomes of this step

      • Team members thinking like futurists
      • Better understanding of how technology advances
      • List of past examples and characteristics

      Info-Tech Insight

      Business buy-in is essential. Manage your business partners by providing a summary of the EDIT methodology and process. Validate the process value, which will allow you create a team of IT and business representatives.

      1.2 Train the group to think like futurists

      1 hour

      Ensure the team understands how technology advances and how they can identify patterns in upcoming technologies.

      1. Lead the group through a brainstorming session.
      2. Follow the next phases and steps.
      3. This session should be led by someone who can facilitate a thought-provoking discussion.
      4. This training deck finishes with a video.

      Input

      • Facilitated creativity
      • Training deck [following slides]

      Output

      • Inspiration
      • Anonymous ideas

      Materials

      • Futurist training “steps”
      • Pen and paper

      Participants

      • Core working group
      • Visionaries
      • Facilitator

      1.2.A Look to the past to predict the future

      30 minutes

      Step 1

      Step 2 Step 3 Step 4

      Review what you missed.

      What did you like?

      What did you dislike?

      Test the reasonability.

      Think about a time you missed a technical disruptive opportunity.

      Start with a list of technologies that changed your business and processes.

      Consider those specifically you could have identified with a repeatable process.

      What were the most impactful points about the technology?

      Define a list of “characteristics” you liked.

      Create a shortlist of items.

      Itemize the impact to process, people, and technology.

      Why did you pass on the tech?

      Define a list of “characteristics” you did not like.

      Create a shortlist of items.

      Itemize the impact to process, people, and technology.

      Avoid the “arm chair quarterback” view.

      Refer to the six positive and negative points.

      Check against your data points at the end of each phase.

      Record the list of missed opportunities

      Record 6 characteristics

      Record 6 characteristics

      Completed “Think like a Futurists” tool

      Use the Disruptive Technology Research Look to the Past Tool to record your output.

      Input

      • Facilitated creativity
      • Speaker’s notes

      Output

      • Inspiration
      • Anonymous ideas
      • Recorded missed opportunities
      • Recorded positive points
      • Recorded dislikes
      • Reasonability test list

      Materials

      • Futurist training “steps”
      • Pen and paper
      • “Look to the Past” tool

      Participants

      • Core working group
      • Visionaries
      • Facilitator

      Understand how the difference between linear and exponential growth will completely transform many organizations in the next decade

      “The last ten years have seen exponential growth in research on disruptive technologies and their impact on industries, supply chains, resources, training, education and employment markets … The debate is still open on who will be the winners and losers of future industries, but what is certain is that change has picked up pace and we are now in a new technology revolution whose impact is potentially greater than the industrial revolution.”
      – Gary L. Evans

      Exponential advancement will ensure that life in the next decade will be very different from life today.

      • Linear growth happens one step at a time.
      • The difference between linear and exponential is hard to notice, at first.
      • We are now at the knee of the curve.

      What about email?

      • Consider the amount of email you get daily
      • Double it
      • Triple it

      Exponential growth happens much faster than linear growth, especially when it hits the knee of the curve. Technology grows exponentially, and we are approaching the knee of the curve.

      This graph is adapted from research by Ray Kurzweil.

      Growth: Linear vs. Exponential

      This image contains a graph demonstrating examples of exponential and linear trends.

      1.2.B Crash course on futurology principles

      1 hour

      “An analysis of the history of technology shows that technological change is exponential, contrary to the common-sense ‘intuitive linear’ view. So we won’t experience 100 years of progress in the 21st century — it will be more like 20,000 years of progress (at today’s rate).”
      - Ray Kurzweil

      Review the differences between exponential and linear growth

      The pace of technological advances makes progress difficult to predict.

      Technology advances exponentially. Rather than improving by the same amount of capability each year, it multiplies in capability each year.

      Think like a futurist to anticipate technology before it goes mainstream.

      Exponential growth happens much faster than linear growth, especially when it hits the knee of the curve. Even those who acknowledge exponential growth underestimate how capabilities can improve.

      The following case study illustrates the rise of social media providers

      “There are 7.7 billion people in the world, with at least 3.5 billion of us online. This means social media platforms are used by one in three people in the world and more than two-thirds of all internet users.”
      – Esteban Ortiz-Ospina

      This graph depicts the trend of the number of people using social media platforms between 2005 and 2019

      The following case study illustrates the rapid growth of Machine to Machine (M2M) connections

      A bar graph is shown which depicts the proportion of technology use from 2018-2022. the included devices are: Tablets; PCs; TVs; Non-smartphones; Smartphones; M2M

      Ray Kurzweil’s Law of Accelerating Returns

      “Ray Kurzweil has been described as ‘the restless genius’ by The Wall Street Journal, and ‘the ultimate thinking machine’ by Forbes. He was ranked #8 among entrepreneurs in the United States by Inc Magazine, calling him the ‘rightful heir to Thomas Edison,’ and PBS included Ray as one of 16 ‘revolutionaries who made America,’ along with other inventors of the past two centuries.”
      Source: KurzweilAI.net

      Growth is linear?

      “Information technology is growing exponentially. That’s really my main thesis, and our intuition about the future is not exponential, it’s really linear. People think things will go at the current pace …1, 2, 3, 4, 5, and 30 steps later, you’re at 30.”

      Better IT strategy enables future business innovation

      “The reality of information technology like computers, like biological technologies now, is it goes exponentially … 2, 4, 8, 16. At step 30, you’re at a billion, and this is not an idle speculation about the future.” [emphasis added]

      “When I was a student at MIT, we all shared a computer that cost tens of millions of dollars. This computer [pulling his smartphone out of his pocket] is a million times cheaper, a thousand times more powerful — that’s a billion-fold increase in MIPS per dollar, bits per dollar… and we’ll do it again in 25 years.”
      Source: “IT growth and global change: A conversation with Ray Kurzweil,” McKinsey & Company

      1.2.C Peak into the future

      1 hour

      Leverage industry roundtables and trend reports to understand the art of the possible

      • Uncover important business and industry trends that can inform possibilities for technology disruption.
      • Market research is critical in identifying factors external to your organization and identifying technology innovation that will provide a competitive edge. It’s important to evaluate the impact each trend or opportunity will have in your organization and market.

      Visit Info-Tech’s Trends & Priorities Research Center

      Visit Info-Tech’s Industry Coverage Research to get started.

      Phase 1: Identify

      Create your working group

      Activities:

      Step 1.1: Establish the core working group and select a leader; select a group of visionaries
      Step 1.2: Train the group to think like futurists
      Step 1.3: Hold the initial meeting

      This step involves the following participants:

      • IT Infrastructure Manager
      • CIO or CTO
      • Potential members and visionaries of the working group

      Outcomes of this phase:

      • Establish a team of subject matter experts that will evaluate new, emerging, and potentially disruptive technologies.
      • Establish a process for including visionaries from outside of the working group who will provide insight and direction.
      • Introduce the core working group members.
      • Gain a better understanding of how technology advances.
      • Brainstorm a list of organizational processes.
      • Brainstorm an initial longlist.

      Info-Tech Insight

      Establish the longlist. The longlist help create a holistic view of most technologies that could impact the business. Assigning values and quadrant scoring will shortlist the options and focus your PoC option.

      Step 1.3

      Hold the initial meeting

      Activities:

      1. Create an agenda for the meeting
      2. Start the kick-off meeting with introductions and a recap
      3. Brainstorm about creating a better future
      4. Begin brainstorming an initial longlist
      5. Have team members develop separate longlists for their next meeting

      This step involves the following participants:

      • IT Infrastructure Manager
      • CIO or CTO
      • Core working group members
      • Visionaries

      Outcomes of this step

      • Introduce the core working group members
      • Gain a better understanding of how technology advances
      • Brainstorm a list of organizational processes
      • Brainstorm an initial longlist

      1.3.A Create an agenda for the meeting

      1 hour

      Kick-off this cycle of the disruptive technology process by welcoming your visionaries and introducing your core working group.

      The purpose of the initial meeting is to brainstorm where new technology will be the most disruptive within the organization. You’ll develop two longlists: one of business processes and one of disruptive technology. These longlists are in addition to the independent research your core working group will perform before Phase 2.

      • Find an outgoing facilitator. Sitting back will let you focus more on ideating, and an engaging presenter will help bring out ideas from your visionaries.
      • The training deck (see step 1.2c) includes presenting a video. We’ve included some of our top choices for you to choose from.
        • Feel free to find your own video or bring in a keynote speaker.
        • The object of the video is to get the group thinking about the future.
        • Customize the training deck as needed.
      • If a cycle has been completed, present your findings and all of the group’s completed deliverables in the first section.
      • This session is the only time you have with your visionaries. Get their ideas on what technologies will be disruptive to start forming a longlist.

      Info-Tech Insight

      The disruptive tech team is prestigious. If your organization is large enough or has the resources, consider having this meeting in an offsite location. This will drive excitement to join the working group if the opportunity arises and incentivize good work.

      Meeting Agenda (Sample)

      Time

      Activity

      8:00am-8:30am Introductions and previous meeting recap
      8:30am-9:30am Training deck
      9:30 AM-10:00am Brainstorming
      10:00am-10:15am Break
      10:15am-10:45am Develop good research techniques
      10:45am-12:00pm Begin compiling your longlist

      Info-Tech Insight

      The disruptive tech team is prestigious. If your organization is large enough or has the resources, consider having this meeting in an offsite location. This will drive excitement to join the working group if the opportunity arises and incentivize good work.

      1.3.B Start the kick-off meeting with introductions and a summary of what work has been done so far

      30 minutes

      1. Start the meeting off with an icebreaker activity. This isn’t an ordinary business meeting – or even group – so we recommend starting off with an activity that will emphasize this unique nature. To get the group in the right mindset, try this activity:
        1. Go around the group and have people present:
        2. Their names and roles
        3. Pose some or all of the following questions/prompts to the group:
          • “Tell me about something you have created.”
          • “Tell me about a time you created a process or program considered risky.”
          • “Tell me about a situation in which you had to come up with several new ideas in a hurry. Were they accepted? Were they successful?”
          • “Tell me about a time you took a risk.”
          • “Tell me about one of your greatest failures and what you learned from it.”
      2. Once everyone has been introduced, present any work that has already been completed.
        1. If you have already completed a cycle, give a summary of each technology that you investigated and the results from any piloting.
        2. If this is the first cycle for the working group, present the information decided in Step 1.1.

      Input

      • Disruptive technology exploitation plan

      Output

      • Networking
      • Brainstorming

      Materials

      • Meeting agenda

      Participants

      • Core working group
      • Visionaries
      • Facilitator

      1.3.C Brainstorm about creating a better future for the company, the stakeholders, and the employees

      30 minutes

      Three sticky notes are depicted, at the top of each note are the following titles: What can we do better; How can we make a better future; How can we continue being successful

      1. Have everyone put up at least two ideas for each chart paper.
      2. Go around the room and discuss their ideas. You may generate some new ideas here.

      These generated ideas are organizational processes that can be improved or disrupted with emerging technologies. This list will be referenced throughout Phases 2 and 3.

      Input

      • Inspiration
      • Anonymous ideas

      Output

      • List of processes

      Materials

      • Chart paper and markers
      • Pen and paper

      Participants

      • Core working group
      • Visionaries

      1.3.D Begin brainstorming a longlist of future technology, and discuss how these technologies will impact the business

      30 minutes

      • Use the Disruptive Technology Research Database Tool to organize technologies and ideas. Longstanding working groups can track technologies here over the course of several years, updating the tool between meetings.
      • Guide the discussion with the following questions, and make sure to focus on the processes generated from Step 1.2.d.

      Focus on

      The Technology

      • What is the technology and what does it do?
      • What processes can it support?

      Experts and Other Organizations

      • What are the vendors saying about the technology?
      • Are similar organizations implementing the technology?

      Your Organization

      • Is the technology ready for wide-scale distribution?
      • Can the technology be tested and implemented now?

      The Technology’s Value

      • Is there any indication of the cost of the technology?
      • How much value will the technology bring?

      Download the Disruptive Technology Database Tool

      Input

      • Inspiration
      • List of processes

      Output

      • Initial longlist

      Materials

      • Chart paper and markers
      • Pen and paper
      • Disruptive Technology Research Database Tool

      Participants

      • Core working group
      • Visionaries

      1.3.E Explore these sources to generate your disruptive technology longlist for the next meeting

      30 Minutes

      There are many sources of information on new and emerging technology. Explore as many sources as you can.

      Science fiction is a valid source of learning. It drives and is influenced by disruptive technology.

      “…the inventor of the first liquid-fuelled rocket … was inspired by H.G. Wells’ science fiction novel War of the Worlds (1898). More recent examples include the 3D gesture-based user interface used by Tom Cruise’s character in Minority Report (2002), which is found today in most touch screens and the motion sensing capability of Microsoft’s Kinect. Similarly, the tablet computer actually first appeared in Stanley Kubrick’s 2001: A Space Odyssey (1968) and the communicator – which we’ve come to refer today as the mobile phone – was first used by Captain Kirk in Star Trek (1966).”
      – Emmanuel Tsekleves, senior lecturer, University of Lancaster

      Right sources: blogs, tech news sites, tech magazines, the tech section of business sites, popular science books about technology, conferences, trade publications, and vendor announcements

      Quantity over quality: early research is not the time to dismiss ideas.

      Discuss with your peers: spark new and innovative ideas

      Insert a brief summary of how independent research is conducted in Section 2.1 of the Disruptive Technology Exploitation Plan Template.

      1.3.E (Cont.) Explore these sources to generate your disruptive technology longlist for the next meeting

      30 Minutes

      There are many sources of information on new and emerging technology. Use this list to kick-start your search.

      Connect with practitioners that are worth their weight in Reddit gold. Check out topic-based LinkedIn groups and subreddits such as r/sysadmin and r/tech. People experienced with technology frequent these groups.

      YouTube is for more than cat videos. Many vendors use YouTube for distributing their previous webinars. There are also videos showcasing various technologies that are uploaded by lecturers, geeks, researchers, and other technology enthusiasts.

      Test your reasonability. Check your “Think Like a Futurist” Tool

      Resolve

      Evaluate Disruptive Technologies

      PHASE 2

      Phase 2: Resolve

      Evaluate disrupted technologies

      Activities:

      Step 2.1: Create and Winnow a Longlist
      Step 2.2: Assess Shortlist

      Info-Tech Insight

      Long to short … that’s the short of it. Using SWOT, value readiness, and quadrant mapping review sessions will focus the longlist, creating a shortlist of potential PoC candidates to review and consider.

      This step involves the following participants:

      • Core working group
      • Infrastructure Management

      Outcomes of this step:

      • Finalized longlist
      • Finalized shortlist
      • Initial analysis of each technology on the shortlist

      Step 2.1

      Create and winnow a longlist

      Activities:

      1. Converge everyone’s longlists
      2. Narrow technologies from the longlist down to a shortlist using Info-Tech’s Disruptive Technology Shortlisting Tool
      3. Use the shortlisting tool to help participants visualize the potential
      4. Input the technologies on your longlist into the Disruptive Technology Shortlisting Tool to produce a shortlist

      This step involves the following participants:

      • Core working group members

      Outcomes of this step:

      • Finalized longlist
      • Finalized shortlist
      • Initial analysis of each technology on the shortlist

      2.1 Organize a meeting with the core working group to combine your longlists and create a shortlist

      1 hour

      Plan enough time to talk about each technology on the list. Each technology was included for a reason.

      • Start with the longlist. Review the longlist compiled at the initial meeting, and then have everyone present the lists that they independently researched.
      • Focus on the company’s context. Make sure that the working group analyzes these disruptive technologies in the context of the organization.
      • Start to compile the shortlist. Begin narrowing down the longlist by excluding technologies that are not relevant.

      Meeting Agenda (Sample)

      TimeActivity
      8:00am-9:30amConverge longlists
      9:30am-10:00amBreak
      10:00am-10:45amDiscuss tech in organizational context
      10:45am-11:15amBegin compiling the shortlist

      Disruptive Technology Exploitation Plan Template

      2.1.A Converge the longlists developed by your team

      90 minutes

      • Start with the longlist developed at the initial meeting. Write this list on the whiteboard.
      • If applicable, have a member present the longlist that was created in the last cycle. Remove technologies that:
        • Are no longer disruptive (e.g. have been implemented or rejected).
        • Have become foundational.
      • Eliminate redundancy: remove items that are very similar.
      • Have members “pitch” items on their lists:
        • Explain why their technologies will be disruptive (2-5 minutes maximum)
        • Add new technologies to the whiteboard
      • Record the following for metrics:
        • Each presented technology
        • Reasons the technology could be disruptive
        • Source of the information
      • Use Info-Tech’s Disruptive Technology Research Database Tool as a starting point.

      Insert the final longlist into Section 2.2 of your Disruptive Technology Exploitation Plan Template.

      Input

      • Longlist developed at first meeting
      • Independent research
      • Previous longlist

      Output

      • Finalized longlist

      Materials

      • Disruptive Technology Research Database Tool
      • Whiteboard and markers
      • Virtual whiteboard

      Participants

      • Core working group

      Review the list of processes that were brainstormed by the visionary group, and ask for input from others

      • IT innovation is most highly valued by the C-suite when it improves business processes, reduces costs, and improves core products and services.
      • By incorporating this insight into your working group’s analysis, you help to attract the attention of senior management and reinforce the group’s necessity.
      • Any input you can get from outside of IT will help your group understand how technology can be disruptive.
        • Visionaries consulted in Phase 1 are a great source for this insight.
      • The list of processes that they helped to brainstorm in Step 1.2 reflects processes that can be impacted by technology.
      • Info-Tech’s research has shown time and again that both CEOs and CIOs want IT to innovate around:
        • Improving business processes
        • Improving core products and services
        • Reducing costs

      Improved business processes

      80%

      Core product and service improvement

      48%

      Reduced costs

      48%

      Increased revenues

      23%

      Penetration into new markets

      21%

      N=364 CXOs & CIOs from the CEO-CIO Alignment Diagnostic Questions were asked on a 7-point scale of 1 = Not at all to 7 = Very strongly. Results are displayed as percentage of respondents selecting 6 or 7.

      Info-Tech Insight

      The disruptive tech team is prestigious. If your organization is large enough or has the resources, consider having this meeting in an offsite location. This will drive excitement to join the working group if the opportunity arises and incentivize good work.

      2.1.B Narrow technologies from the longlist down to a shortlist using Info-Tech’s Disruptive Technology Shortlisting Tool

      90 minutes

      To decide which technology has potential for your organization, have the working group or workshop participants evaluate each technology:

      1. Record each potentially disruptive technology in the longlist on a whiteboard.
      2. Making sure to carefully consider the meaning of the terms, have each member of the group evaluate each technology as “high” or “low” along each of the axes, innovation and transformation, on a piece of paper.
      3. The facilitator collects each piece of paper and inputs the results by technology into the Disruptive Technology Shortlisting Tool.
      Technology Innovation Transformation
      Conversational Commerce High High

      Insert the final shortlist into Section 2.2 of your Disruptive Technology Exploitation Plan Template.

      Input

      • Longlist
      • Futurist brainstorming

      Output

      • Shortlist

      Materials

      • Disruptive Technology Research Database Tool
      • Whiteboard and markers
      • Virtual whiteboard

      Participants

      • Core working group

      Disruptive technologies are innovative and transformational

      Innovation

      Transformation

      • Elements:
        • Creative solution to a problem that is relatively new on the scene.
        • It is different, counterintuitive, or insightful or has any combination of these qualities.
      • Questions to Ask:
        • How new is the technology?
        • How different is the technology?
        • Have you seen anything like it before? Is it counterintuitive?
        • Does it offer an insightful solution to a persistent problem?
      • Example:
        • The sharing economy: Today, simple platforms allow people to share rides and lodgings cheaply and have disrupted traditional services.
      • Elements:
        • Positive change to the business process.
        • Highly impactful: impacts a wide variety of roles in a company in a nontrivial way or impacts a smaller number of roles more significantly.
      • Questions to Ask:
        • Will this technology have a big impact on business operations?
        • Will it add substantial value? Will it change the structure of the company?
        • Will it impact a significant number of employees in the organization?
      • Example:
        • Flash memory improved storage technology incrementally by building on an existing foundation.

      Info-Tech Insight

      Technology can be transformational but not innovative. Not every new technology is disruptive. Even where technology has improved the efficiency of the business, if it does this in an incremental way, it might not be worth exploring using this storyboard.

      2.1.C Use the shortlisting tool to help participants visualize the potential

      1 hour

      Use the Disruptive Technology Shortlisting Tool, tabs 2 and 3.

      Assign quadrants

      • Input group members’ names and the entire longlist (up to 30 technologies) into tab 2 of the Disruptive Technology Shortlisting Tool.
      • On tab 3 of the Disruptive Technology Shortlisting Tool, input the quadrant number that corresponds to the innovation and transformation scores each participant has assigned to each technology.

      Note

      This is an assessment meant to serve as a guide. Use discretion when moving forward with a proof-of-concept project for any potentially disruptive technology.

      Participant Evaluation Quadrant
      High Innovation, High Transformation 1
      High Innovation, Low Transformation 2
      Low Innovation, Low Transformation 3
      Low Innovation, High Transformation 4

      four quadrants are depicted, labeled 1-4. The quadrants are coloured as follows: 1- green; 2- yellow; 3; red; 4; yellow

      2.1.D Use the Disruptive Technology Shortlisting Tool to produce a shortlist

      1 hour

      Use the Disruptive Technology Shortlisting Tool, tabs 3 and 4.

      Use the populated matrix and the discussion list to arrive at a shortlist of four to six potentially disruptive technologies.

      • The tool populates each quadrant based on how many votes it received in the voting exercise.
      • Technologies selected for a particular quadrant by a majority of participants are placed in the quadrant on the graph. Where there was no consensus, the technology is placed in the discussion list.
      • Technologies in the upper right quadrant – high transformation and high innovation – are more likely to be good candidates for a proof-of-concept project. Those in the bottom left are likely to be poor candidates, while those in the remaining quadrants are strong on one of the axes and are unlikely candidates for further systematic evaluation.

      This image contains a screenshot from tab 3 of the Disruptive Technology Shortlisting Tool.

      Input the results of the vote into tab 3 of the Disruptive Technology Shortlisting Tool.

      This image contains a screenshot from tab 4 of the Disruptive Technology Shortlisting Tool.

      View the results on tab 4.

      Phase 2: Resolve

      Evaluate disrupted technologies

      Activities:

      Step 2.1: Create and Winnow a Longlist
      Step 2.2:- Assess Shortlist

      This step involves the following participants:

      • Core working group
      • Infrastructure Management

      Outcomes of this step:

      • Finalized longlist
      • Finalized shortlist
      • Initial analysis of each technology on the shortlist

      Assess Shortlist

      Activities:

      1. Assess the value of each technology to your organization by breaking it down into quality and cost
      2. Investigate the overall readiness of the technologies on the shortlist
      3. Interpret each technology’s value score
      4. Conduct a SWOT analysis for each technology on the shortlist
      5. Use Info-Tech’s disruptive technology shortlist analysis to visualize the tool’s outputs
      6. Select the shortlisted technologies you would like to move forward with

      This step involves the following participants:

      • Core working group members
      • IT Management

      Outcomes of this step:

      • Finalized shortlist
      • Initial analysis of each technology on the shortlist

      2.2 Evaluate technologies based on their value and readiness, and conduct a SWOT analysis for each one

      Use the Disruptive Technology Value-Readiness and SWOT Analysis Tool

      • A technology monitor diagram prioritizes investment in technology by analyzing its readiness and value.
        • Readiness: how close the technology is to being practical and implementable in your industry and organization.
        • Value: how worthwhile the technology is, in terms of its quality and its cost.
      • Value and readiness questionnaires are included in the tool to help determine current and future values for each, and the next four slides explain the ratings further.
      • Categorize technology by its value-readiness score, and evaluate how much potential value each technology has and how soon your company can realize that value.
      • Use a SWOT analysis to qualitatively evaluate the potential that each technology has for your organization in each of the four categories (strengths, weaknesses, opportunities, and threats).

      The technology monitor diagram appears in tab 9 of the Disruptive Technology Value-Readiness and SWOT Analysis Tool

      This image depicts tab 9 of the Disruptive Technology Value-Readiness and SWOT Analysis Tool

      2.2.A Assess the value of each technology to your organization by breaking it down into quality and cost

      1 hour

      Update the Disruptive Technology Value-Readiness and SWOT Analysis Tool, tab 4.

      Populate the chart to produce a score for each technology’s overall value to the company conceptualized as the interaction of quality and cost.

      Overall Value

      Quality Cost

      Each technology, if it has a product associated with it, can be evaluated along eight dimensions of quality. Consider how well the product performs, its features, its reliability, its conformance, its durability, its serviceability, its aesthetics, and its perceived quality.

      IT budgets are broken down into capital and operating expenditures. A technology that requires a significant investment along either of these lines is unlikely to produce a positive return. Also consider how much time it will take to implement and operate each technology.

      The value assessment is part of the Disruptive Technology Value-Readiness and SWOT Analysis Tool

      This image contains a screenshot from tab 4 of the Disruptive Technology Value-Readiness and SWOT Analysis Tool.

      Info-Tech Insight

      Watch your costs: Technology that seems cheap at first can actually be expensive over time. Be sure to account for operational and opportunity costs as well.

      2.2.B Investigate the overall readiness of the technologies on the shortlist

      1 hour

      Update the Disruptive Technology Value-Readiness and SWOT Analysis Tool, tab 4.

      Overall Readiness

      Age

      How much time has the technology had to mature? Older technology is more likely to be ready for adoption.

      Venture Capital

      The amount of venture capital gathered by important firms in the space is an indicator of market faith.

      Market Size

      How big is the market for the technology? It is more difficult to break into a giant market than a niche market.

      Market Players

      Have any established vendors (Microsoft, Facebook, Google, etc.) thrown their weight behind the technology?

      Fragmentation

      A large number of small companies in the space indicates that the market has yet to reach equilibrium.

      The readiness assessment is part of the Disruptive Technology Value-Readiness and SWOT Analysis Tool

      This image contains a screenshot of the Readiness Scoring tab of the Disruptive Technology Value-Readiness and SWOT Analysis Tool.

      Use a variety of sources to populate the chart

      Google is your friend: search each shortlisted technology to find details about its development and important vendors.

      Websites like Crunchbase, VentureBeat, and Mashable are useful sources for information on the companies involved in a space and the amount of money they have each raised.

      2.2.C Interpret each technology’s value score

      1 hour

      Insert the result of the SWOT analysis into tab 7 of Info-Tech’s Disruptive Technology Value-Readiness and SWOT Analysis Tool.

      Visualize the results of the quality-cost analysis

      • Quality and cost are independently significant; it is essential to understand how each technology stacks up on the axes.
      • Use tab 6 of the Disruptive Technology Value-Readiness and SWOT Analysis Tool for an illustration of how quality and cost interact to produce each technology’s final position on the tech monitor graph.
      • Remember: the score is notional and reflects the values that you have assigned. Be sure to treat it accordingly.

      This image contains a screenshot of the Value Analysis tab of the Disruptive Technology Value-Readiness and SWOT Analysis Tool

      Green represents a technology that scores extremely high on one axis or the other, or quite high on both. These technologies are the best candidates for proof-of-concept projects from a value perspective.

      Red represents a technology that has scored very low on both axes. These technologies will be expensive, time consuming, and of poor quality.

      Yellow represents the fuzzy middle ground. These technologies score moderately on both axes. Be especially careful when considering the SWOT analysis of these technologies.

      2.2.D Conduct a SWOT analysis for each technology on the shortlist

      1 hour

      Use tab 6 of the Disruptive Technology Value-Readiness and SWOT Analysis Tool.

      A formal process for analyzing disruptive technology is the only way to ensure that it is taken seriously.

      Write each technology as a heading on a whiteboard. Spend 10-15 minutes on each technology conducting a SWOT analysis together.

      Consider four categories for each technology:

      • Strengths: Current uses of the technology or supporting technology and ways in which it helps your organization.
      • Weaknesses: Current limitations of the technology and challenges or barriers to adopting it in your organization.
      • Opportunities: Potential uses of the technology, especially as it advances or improves.
      • Threats: Potential negative disruptions resulting from the technology, especially as it advances or improves.

      The list of processes generated at the cycle’s initial meeting is a great source for opportunities and threats.

      Disruptive Technology Value-Readiness and SWOT Analysis Tool

      This image contains screenshots of the technology tab of the Disruptive Technology Value-Readiness and SWOT Analysis Tool.

      2.2.E Use Info-Tech’s disruptive technology shortlist analysis to visualize the tool’s outputs

      1 hour

      Disruptive Technology Value-Readiness and SWOT Analysis Tool, tab 9

      The tool’s final tab displays the results of the value-readiness analysis and the SWOT analysis in a single location.

      This image contains a screenshot from tab 9 of the Disruptive Technology Value-Readiness and SWOT Analysis Tool

      Insert the shortlist analysis report into Section 3 of your Disruptive Technology Exploitation Plan Template.

      2.2.F Select the shortlisted technologies you would like to move forward with

      1 hour

      Present your findings to the working group.

      • The Disruptive Technology Value-Readiness and SWOT Analysis Tool aggregates your inputs in an easy-to-read, consistent way.
      • Present the tool’s outputs to members of the core working group.
      • Explain the scoring and present the graphic to the group. Go over each technology’s strengths and weaknesses as well as the opportunities and threats it presents/poses to the organization.
      • Go through the proof-of-concept planning phase before striking any technologies from the list.

      This image contains a screenshot of the disruptive technology shortlist analysis from the Disruptive Technology Value-Readiness and SWOT Analysis Tool

      Info-Tech Insight

      A technology’s exceptional value and immediate usability make it the best. A technology can be promising and compelling, but it is unsuitable unless it can bring immediate and exceptional value to your organization. Don’t get caught up in the hype.

      Evaluate

      Create an Action Plan to Exploit Disruptive Technologies

      PHASE 3

      Phase 3: Evaluate

      Create an Action Plan to Exploit Disruptive Technologies

      Activities:

      Step 3.1: Create Process Maps
      Step 3.2: Develop Proof of Concept Charter

      This step involves the following participants:

      • Core working group
      • Infrastructure Management
      • Working group leader
      • CIO

      Outcomes of this step:

      • Business process maps before and after disruption
      • Proof of concept charter
      • Key performance indicators
      • Estimation of required resources

      Step 3.1

      Create Process Maps

      Activities:

      1. Creating a problem canvas by identifying stakeholders, jobs, pains, and gains
      2. Clarify the problem the proof-of-concept project will solve
      3. Identify jobs and stakeholders
      4. Outline how disruptive technology will solve the problem
      5. Map business processes
      6. Identify affected business units
      7. Outline and map the business processes likely to be disrupted
      8. Recognize how the new technology will impact business processes
      9. Make the case: Outline why the new business process is superior to the old

      This step involves the following participants:

      • Working group leader
      • CIO

      Outcomes of this step:

      • Business process maps before and after disruption

      3.1 Create an action plan to exploit disruptive technologies

      Clarify the problem in order to make the case. Fill in section 1.1 of Info-Tech’s Proof of Concept Template to clearly outline the problem each proof of concept is designed to solve.

      Establish roles and responsibilities. Use section 1.2 of the template to outline the roles and responsibilities that fall to each member of the team. Ensure that clear lines of authority are delineated and that the list of stakeholders is exhaustive: include the executives whose input will be required for project approval, all the way to the technicians on the frontline responsible for implementing it.

      Outline the solution to the problem. Demonstrate how each proof-of-concept project provides a solution to the problem outlined in section 1.1. Be sure to clarify what makes the particular technology under investigation a potential solution and record the results in section 1.3.

      This image contains a screenshot of the Proof of concept project template

      Use the Proof of Concept Project Template to track the information you gather throughout Phase 3.

      3.1.A Creating a problem canvas by identifying stakeholders, jobs, pains, and gains

      2 hours

      Instructions:

      1. On a whiteboard, draw the visual canvas supplied below.
      2. Select your issue area, and list jobs, pains, and gains in the associated sections.
      3. Record the pains, jobs, and gains in sections 1.1-1.3 of the Proof of Concept Template.

      Gains

      1. More revenue

      2. Job security

      3. ……

      Jobs

      1. Moving product

      2. Per sale value

      3. ……

      Pains

      1. Clunky website

      2. Bad site navigation

      3. ……

      Input

      • Inspiration
      • Anonymous ideas

      Output

      • List of processes

      Materials

      • Chart paper and markers
      • Pen and paper

      Participants

      • Core working group
      • Visionaries

      3.1.B Clarify the problem the proof-of-concept project will solve

      2 hours

      What is the problem?

      • Every technology is designed to solve a problem faced by somebody somewhere. For each technology that your team has decided to move forward with, identify and clearly state the problem it would solve.
      • A clear problem statement is a crucial part of a new technology’s business case. It is impossible to earn buy-in from the rest of the organization without demonstrating the necessity of a solution.
      • Perfection is impossible to achieve: during the course of their work, everyone encounters pain points. Identify those pain points to arrive at the problem that needs to be solved.

      Example:

      List of pains addressed by conversational commerce:

      • Search functions can be clunky and unresponsive.
      • Corporate websites can be difficult to navigate.
      • Customers are uncomfortable in unfamiliar internet environments.
      • Customers do not like waiting in a long queue to engage with customer service representatives when they have concerns.

      “If I were given one hour to solve a problem, I would spend 59 minutes defining the problem and one minute resolving it.”
      – Albert Einstein

      Input the results of this exercise into Section 1.1 of the Proof of Concept Template.

      3.1.C Identify jobs and stakeholders

      1 hour

      Jobs

      Job: Anything that the “customer” (the target of the solution) needs to get done but that is complicated by a pain.

      Examples:
      The job of the conversational commerce interface is to make selling products easier for the company.
      From the customer perspective, the job of the conversational interface is to make the act of purchasing a product simpler and easier.

      Stakeholders

      Stakeholder: Anyone who is impacted by the new technology and who will end up using, approving, or implementing it.

      Examples:
      The executive is responsible for changing the company’s direction and approving investment in a new sales platform.
      The IT team is responsible for implementing the new technology.
      Marketing will be responsible for selling the change to customers.
      Customers, the end users, will be the ones using the conversational commerce user interface.

      Input the results of this exercise into Section 1.2 of the Proof of Concept Template.

      Info-Tech Insight

      Process deconstruction reveals strengths and weaknesses. Promising technology should improve stakeholders’ abilities to do jobs.

      3.1.D Outline how disruptive technology will solve the problem

      1 hour

      How will the technology in question make jobs easier?

      • How will the disruptive technology you have elected to move forward with create gains for the organization?
      • First, identify the gains that are supposed to come with the project. Consider the benefits that the various stakeholders expect to derive from the jobs identified.
      • Second, make note of how the technology in question facilitates the gains you have noted. Be sure to articulate the exclusive features of the new technology that make it an improvement over the current state.

      Note: The goal of this exercise is to make the case for a particular technology. Sell it!

      Expected Gain: Increase in sales.

      Conversational Commerce’s Contribution: Customers are more likely to purchase products using interfaces they are comfortable with.

      Expected Gain: Decrease in costs.

      Conversational Commerce’s Contribution: Customers who are satisfied with the conversational interface are less likely to interact with live agents, saving labor costs.

      Input the results of this exercise into Section 1.3 of the Proof of Concept Template.

      3.1.E Map business processes

      1 hour

      Map the specific business processes the new technology will impact.

      • Disruptive technologies will impact a wide variety of business processes.
      • Map business processes to visualize what parts of your organization (departments, silos, divisions) will be impacted by the new technology, should it be adopted after the proof of concept.
      • Identify how the disruption will take place.
      • Demonstrate the value of each technology by including the results of the Disruptive Technology Value-Readiness and SWOT Analysis Tool with your process map.

      This image contains a screenshot of the Proof of concept project template

      Use the Proof of Concept Project Template to track the information you gather throughout Phase 3.

      3.1.F Identify affected business units

      30 minutes per technology

      Disruptive technology will impact business units.

      • Using the stakeholders identified earlier in the project, map each technology to the business units that will be affected.
      • Make your list exhaustive. While some technologies will have a limited impact on the business as a whole, others will have ripple effects throughout the organization.
      • Examine affected units at all scales: How will the technology impact operations at the team level? The department level? The division level?

      “The disruption is not just in the technology. Sometimes a good business model can be the disruptor.”
      – Jason Hong, Associate Professor, Carnegie Mellon

      Example:

      • Customer service teams: Conversational commerce will replace some of the duties of the customer service representative. They will have to reorganize to account for this development.
      • IT department: The IT department will be responsible for building/maintaining the conversational interface (or, more likely, they will be responsible for managing the contract with the vendor).
      • Sales analytics: New data from customers in natural language might provide a unique opportunity for the analytics team to develop new initiatives to drive sales growth.

      Input the results of this exercise into Section 2.1 of the Proof of Concept Template.

      3.1.G Outline and map the business processes likely to be disrupted

      15 minutes per technology

      Leverage the insights of the diverse working group.

      • Processes are designed to transform inputs into outputs. All business activities can be mapped into processes.
      • A process map illustrates the sequence of actions and decisions that transform an input into an output.
      • Effective mapping gives managers an “aerial” view of the company’s processes, making it easier to identify inefficiencies, reduce waste, and ultimately, streamline operations.
      • To identify business processes, have group members familiar with the affected business units identify how jobs are typically accomplished within those units.

      “To truly understand a business process, we need information from both the top-down and bottom-up points of view. Informants higher in the organizational hierarchy with a strategic focus are less likely to know process details or problems. But they might advocate and clearly articulate an end-to-end, customer-oriented philosophy that describes the process in an idealized form. Conversely, the salespeople, customer service representatives, order processors, shipping clerks, and others who actually carry out the processes will be experts about the processes, their associated documents, and problems or exception cases they encounter.”
      – Robert J. Glushko, Professor at UC Berkeley and Tim McGrath, Business Consultant

      Info-Tech Insight

      Opinions gathered from a group that reflect the process in question are far more likely to align with your organization’s reality. If you have any questions about a particular process, do not be afraid to go outside of the working group to ask someone who might know.

      3.1.G Outline and map the business processes likely to be disrupted (continued)

      15 minutes per technology

      Create a simple diagram of identified processes.

      • Use different shapes to identify different points in the process.
      • Rectangles represent actions, diamonds represent decisions.
      • On a whiteboard, map out the actions and decisions that take place to transform an input into an output.
      • Input the result into section 2.2 of the Proof of Concept Template.

      This image contains a screenshot of the Software Service Cross-Function Process tab from Edraw Visualization Solutions.

      Source: Edraw Visualization Solutions

      Example: simplified process map

      1. User: visits company website
      2. User: engages search function or browses links
      3. User: selects and purchases product from a menu
      4. Company: ships product to customer

      3.1.H Recognize how the new technology will impact business processes

      15 minutes per technology

      Using the information gleaned from the previous activities, develop a new process map that takes the new technology into account.

      Identify the new actions or decisions that the new technology will affect.

      User: visits company website; User: engages conversational; commerce platform; User: engages search function or browses links; User: makes a natural language query; User: selects and purchases product from a menu</p data-verified=

      User: selects and purchases product from a menu; Company: ships product to customer; Company: ships product to customer">

      Info-Tech Insight

      It’s ok to fail! The only way to know you’re getting close to the “knee of curve" is from multiple failed PoC tests. The more PoC options you have, the more likely it will be that you will have two to three successful results.

      3.1.I Make the case: Outline why the new business process is superior to the old

      15 minutes per technology

      Articulate the main benefits of the new process.

      • Using the revised process map, make the case for each new action.
      • Questions to consider: How does the new technology relieve end-user/customer pains? How does the new technology contribute to the streamlining of the business process? Who will benefit from the new action? What are the implications of those benefits?
      • Record the results of this exercise in section 2.4 of the Proof of Concept Template.

      This image contains an example of an outline comparing the benefits of new and the old business processes.

      Info-Tech Insight

      If you cannot articulate how a new technology will benefit a business process, reconsider moving forward with the proof-of-concept project.

      Phase 3: Evaluate

      Create an Action Plan to Exploit Disruptive Technologies

      Activities:

      Step 3.1: Create Process Maps
      Step 3.2: Develop Proof of Concept Charter

      Develop Proof of Concept Charter

      This step involves the following participants:

      • Core working group
      • Infrastructure Management
      • Working group leader
      • CIO

      Outcomes of this step:

      • Business process maps before and after disruption
      • Proof of concept charter
      • Key performance indicators
      • Estimation of required resources

      Step 3.2

      Develop Proof of Concept Charter

      Activities:

      1. Use SMART success metrics to define your objectives
      2. Develop key performance indicators (KPIs)
      3. Identify key success factors for the project
      4. Outline the project’s scope
      5. Identify the structure of the team responsible for the proof-of-concept project
      6. Estimate the resources required by the project
      7. Be aware of common IT project concerns
      8. Communicate your working group’s findings and successes to a wide audience
      9. Hand off the completed proof-of-concept project plan
      10. Disruption is constant: Repeat the evaluation process regularly to protect the business

      This step involves the following participants:

      • Working group leader
      • CIO

      Outcomes of this step:

      • Proof of concept charter
      • Key performance indicators
      • Estimation of required resources

      3.2 Develop a proof of concept charter

      Keep your proof of concept on track by defining five key dimensions.

      1. Objective: Giving an overview of the planned proof of concept will help to focus and clarify the rest of this section. What must the proof of concept achieve? Objectives should be: specific, measurable, attainable, relevant, and time bound. Outline and track key performance indicators.
      2. Key Success Factors: These are conditions that will positively impact the proof of concept’s success.
      3. Scope: High-level statement of scope. More specifically, state what is in scope and what is out of scope.
      4. Project Team: Identify the team’s structure, e.g. sponsors, subject-matter experts.
      5. Resource Estimation: Identify what resources (time, materials, space, tools, expertise, etc.) will be needed to build and socialize your prototype. How will they be secured?

      Input the results of this exercise into Section 3.0 of the Proof of Concept Template.

      3.2.A Use SMART success metrics to define your objectives

      Specific

      Measurable

      Actionable

      Realistic

      Time Bound

      Make sure the objective is clear and detailed.

      Objectives are measurable if there are specific metrics assigned to measure success. Metrics should be objective.

      Objectives become actionable when specific initiatives designed to achieve the objective are identified.

      Objectives must be achievable given your current resources or known available resources.

      An objective without a timeline can be put off indefinitely. Furthermore, measuring success is challenging without a timeline.

      Who, what, where, why?

      How will you measure the extent to which the goal is met?

      What is the action-oriented verb?

      Is this within my capabilities?

      By when: deadline, frequency?

      Examples:

      1. Increase in sales by $40,000 per month by the end of next quarter.
      2. Immediate increase in web traffic by 600 unique page views per day.
      3. Number of pilots approved per year.
      4. Number of successfully deployed solutions per year.

      Input the results of this exercise into Section 3.0 of the Proof of Concept Template.

      3.2.B Develop key performance indicators (KPIs)

      30 minutes per technology

      Key performance indicators allow for rigorous analysis, which generates insight into utilization by platform and consumption by business activity.

      • Use the process improvements identified in step 3.1 to brainstorm metrics that indicate when process improvement is actually taking place.
      • Have members of the group pitch KPIs; the facilitator should record each suggestion on a whiteboard.
      • Make sure to have everyone justify the inclusion of each metric: How does it relate to the improvement that the proof of concept project is intended to drive? How does it relate to the overall goals of the business?
      • Include a list of KPIs, along with a description and a target (ensuring that it aligns with SMART metrics) in section 3.1 of the Proof of Concept Template.

      “An estimated 70% of performance measurement systems fail after implementation. Carefully select your KPIs and avoid this trap!”
      Source: Collins et al. 2016

      Key Performance Indicator Description Target

      Result

      Conversion rate What percentage of customers who visit the site/open the conversational interface continue on to make a purchase? 40%
      Average order value

      How much does each customer spend per visit to the website?

      $212
      Repeat customer rate What percentage of customers have made more than one purchase over time? 65%
      Lifetime customer value Over the course of their interaction with the company, what is the typical value each customer brings? $1566

      Input the results of this exercise into Section 3.1 of the Proof of Concept Template.

      3.2.C Identify key success factors for the project

      30 minutes per technology

      Effective project management involves optimizing four key success factors (Clarke, 1999)

      • Communication: Communicate the expected changes to stakeholders, making sure that everyone who needs to know does know. Example: Make sure customer service representatives know their duties will be impacted by the conversational UI well before the proof-of-concept project begins.
      • Clarity: All involved in the project should be apprised of what the project is intended to accomplish and what the project is not intended to accomplish. Example: The conversational commerce project is not intended to be rolled out to the entire customer base all at once; it is not intended to disrupt normal online sales.
      • Compartmentalization: The working group should suggest some ways that the project can be broken down to facilitate its effective implementation. Example: Sales provides details of customers who might be amenable to a trial, IT secures a vendor, customer service writes a script.
      • Flexibility: The working group’s final output should not be treated as gospel. Ensure that the document can be altered to account for unexpected events. Example: The conversational commerce platform might drive sales of a particular product more than others, necessitating adjustments at the warehouse and shipping level.

      Input the results of this exercise into Section 3.0 of the Proof of Concept Template.

      3.2.D Outline the project’s scope

      10 minutes per technology

      Create a high-level outline of the project’s scope.

      • Questions to consider: Broadly speaking, what are the project’s goals? What is the desired future state? Where in the company will the project be rolled out? What are some of the company’s goals that the project is not designed to cover?
      • Be sure to avoid scope creep! Remember: The goal of the proof-of-concept project is to produce a minimum case for viability in a carefully defined area. Reserve a detailed accounting of costs and benefits for the post-proof-of-concept stage.
      • Example: The conversational user interface will only be rolled out in an e-commerce setting. Other business units (HR, for example) are beyond the scope of this particular project.

      “Although scope creep is not the only nemesis a project can have, it does tend to have the farthest reach. Without a properly defined project and/or allowing numerous changes along the way, a project can easily go over budget, miss the deadline, and wreak havoc on project success.”
      – University Alliance, Villanova University

      Input the results of this exercise into Section 3.0 of the Proof of Concept Template.

      3.2.E Identify the structure of the team responsible for the proof-of-concept project

      10 minutes per technology

      Brainstorm who will be involved in project implementation.

      • Refer back to the list of stakeholders identified in 3.1.a. Which stakeholders should be involved in implementing the proof-of-concept plan?
      • What business units do they represent?
      • Who should be accountable for the project? At a high level, sketch the roles of each of the participants. Who will be responsible for doing the work? Who will approve it? Who needs to be informed at every stage? Who are the company’s internal subject matter experts?

      Example

      Name/Title Role
      IT Manager Negotiate the contract for the software with vendor
      CMO Promote the conversational interface to customers

      Input the results of this exercise into Section 3.0 of the Proof of Concept Template.

      3.2.F Estimate the resources required by the project

      10 minutes per technology

      Time and Money

      • Recall: Costs can be operational, capital, or opportunity.
      • Revisit the Disruptive Technology Value-Readiness and SWOT Analysis Tool. Record the capital and operational expenses expected to be associated with each technology, and add detail where possible (use exact figures from particular vendors instead of percentages).
      • Write the names and titles of each expected participant in the project on a whiteboard. Next to each name, write the number of hours they are expected to devote to the project and include a rough estimate of the cost of their participation to the company. Use full-time employee equivalent (FTE measures) as a base.
      • Outline how other necessary resources (space, tools, expertise, etc.) will be secured.

      Example: Conversational Commerce

      • OpEx: $149/month + 2.9¢/transaction* (2,000 estimated transactions)
      • CapEx: $0!
      • IT Manager: 5 hours at $100/hour
      • IT Technician: 40 hours at $45/hour
      • CMO: 1 hour at $300/hour
      • Customer Service Representative: 10 hours at $35/hour
      • *Estimated total cost for a one-month proof-of-concept project: $3,157

      *This number is a sample taken from the vendor Rhombus

      Input the results of this exercise into Section 3.0 of the Proof of Concept Template.

      3.2.G Be aware of common IT project concerns

      Of projects that did not meet business expectations or were cancelled, how significant were the following issues?

      A bar graph is depicted, comparing small, medium, and large businesses for the following datasets: Over budget; Project failed to be delivered on time; Breach of scope; Low quality; Failed to deliver expected benefit or value

      This survey data did not specifically address innovation projects.

      • Disruptive technology projects will be under increased scrutiny in comparison to other projects.
      • Be sure to meet deadlines and stay within budget.
      • Be cognizant that your projects can go out of scope, and there will be projects that may have to be cancelled due to low quality. Remember: Even a failed test is a learning opportunity!

      Info-Tech’s CIO-CEO Alignment Survey, N=225

      Organization size was determined by the number of IT employees within the organization

      Small = 10 or fewer IT staff, medium = 11 to 25 IT staff, and large/enterprise = 26 or greater IT staff

      3.2.H Communicate your working group’s findings and successes to a wide audience

      Advertise the group’s successes and help prevent airline magazine syndrome from occurring.

      • Share your group’s results internally:
        • Run your own analysis by senior management and then share it across the organization.
        • Maintain a list of technologies that the working group has analyzed and solicit feedback from the wider organization.
        • Post summaries of the technologies in a publicly available repository. The C-suite may not read it right away, but it will be easy to provide when they ask.
        • If senior management has declined to proceed with a certain technology, avoid wasting time and resources on it. However, include notes about why the technology was rejected.
      • These postings will also act as an advertisement for the group. Use the garnered interest to attract visionaries for the next cycle.
      • These postings will help to reiterate the innovative value of the IT department and help bring you to the decision-making table.

      “Some CIOs will have to battle the bias that they belong in the back office and shouldn’t be included in product architecture planning. CIOs must ‘sell’ IT’s strength in information architecture.”
      – Chris Curran, Chief Technologist, PwC (Curran, 2014)

      Info-Tech Insight

      Cast a wide net. By sharing your results with as many people as possible within your organization, you’ll not only attract more attention to your working group, but you will also get more feedback and ideas.

      3.2.I Hand off the completed proof-of-concept project plan

      The proof of concept template is filled out – now what?

      • The core working group is responsible for producing a vision of the future and outlining new technology’s disruptive potential. The actual implementation of the proof of concept (purchasing the hardware, negotiating the SLA with the vendor) is beyond the working group’s responsibilities.
      • If the proof of concept goes ahead, the facilitator should block some time to evaluate the completed project against the key performance indicators identified in the initial plan.
      • A cure for airline magazine syndrome: Be prepared when executives ask about new technology. Present them with the results of the shortlist analysis and the proof-of-concept plan. A clear accounting of the value, readiness, strengths, weaknesses, opportunities, and threats posed by each technology, along with its impact on business processes, is an invaluable weapon against poor technology choices.

      Use section 3.2.b to identify the decision-making stakeholder who has the most to gain from a successful proof-of-concept project. Self-interest is a powerful motivator – the project is more likely to succeed in the hands of a passionate champion.

      Info-Tech Insight

      Set a date for the first meeting of the new iteration of the disruptive technology working group before the last meeting is done. Don’t risk pushing it back indefinitely.

      3.2.J Hand off the completed proof-of-concept project plan

      Record the results of the proof of concept. Keep track of what worked and what didn’t.

      Repeat the process regularly.

      • Finalize the proof of concept template, but don’t stop there: Keep your ear to the ground; follow tech developments using the sources identified in step 1.2.
      • Continue expanding the potential longlist with independent research: Be prepared to expand your longlist. Remember, the more technologies you have on the longlist, the more potential airline magazine syndrome cures you have access to.
      • Have the results of the previous session’s proof of concept plan on hand: At the start of each new iteration, conduct a review. What technologies were successful beyond the proof of concept phase? Which parts of the process worked? Which parts did not? How could they be improved?

      Info-Tech Insight

      The key is in anticipation. This is not a one-and-done exercise. Technology innovation operates at a faster pace than ever before, well below the Moores Law "18 month" timeline as an example. Success is in making EDIT a repeatable process.

      Related Info-Tech Research

      Define Your Digital Business Strategy
      After a major crisis, find your place in the digital economy.

      Develop a Project Portfolio Management Strategy
      Drive project throughput by throttling resource capacity.

      Adopt Design Thinking in Your Organization
      Innovation needs design thinking.

      Digital Maturity Improvement Service
      Prepare your organization for digital transformation – or risk falling behind.

      Research contributors and experts

      Nitin Babel

      Nitin Babel, Co-Founder, niki.ai

      Nitin Babel, MSc, co-created conversational commerce platform niki.ai in early 2015. Since then, the technology has been featured on the front page of the Economic Times, and has secured the backing of Ratan Tata, former chairman of the Tata Group, one of the largest companies in the world.

      Mark Hubbard

      Mark Hubbard, Senior Vice President, FirstOnSite

      Mark is the SVP for Information Technology in Canada with FirstOnSite, a full service disaster recovery and property restoration company. Mark has over 25 years of technology leadership guiding global organizations through the development of strategic and tactical plans to strengthen their technology platforms and implement business aligned technology strategies.

      Chris Green

      Chris Green, Enterprise Architect, Boston Private
      Chris is an IT architect with over 15 years’ experience designing, building, and implementing solutions. He is a results-driven leader and contributor, skilled in a broad set of methods, tools, and platforms. He is experienced with mobile, web, enterprise application integration, business process, and data design.

      Andrew Kope

      Andrew Kope, Head of Data Analytics
      Big Blue Bubble
      Andrew Kope, MSc, oversees a team that develops and maintains a user acquisition tracking solution and a real-time metrics dashboard. He also provides actionable recommendations to the executive leadership of Big Blue Bubble – one of Canada’s largest independent mobile game development studios.

      Jason Hong

      Jason Hong, Associate Professor, School of Computer Science, Human-Computer Interaction Institute, Carnegie Mellon University

      Jason Hong is a member of the faculty at Carnegie Mellon’s School of Computer Science. His research focus lies at the intersection of human-computer interaction, privacy and security, and systems. He is a New America National Cyber Security Fellow (2015-2017) and is widely published in academic and industry journals.

      Tim Lalonde

      Tim Lalonde, Vice President, Mid-Range

      Tim Lalonde is the VP of Technical Operations at Mid-Range. He works with leading-edge companies to be more competitive and effective in their industries. He specializes in developing business roadmaps leveraging technology that create and support change from within — with a focus on business process re-engineering, architecture and design, business case development and problem-solving. With over 30 years of experience in IT, Tim’s guiding principle remains simple: See a problem, fix a problem.

      Jon Mavor

      Jon Mavor, Co-Founder and CTO, Envelop VR
      Jon Mavor is a programmer and entrepreneur, whose past work includes writing the graphics engine for the PC game Total Annihilation. As Chief Technology Officer of Envelop VR, a virtual reality start-up focused on software for the enterprise, Jon has overseen the launch of Envelop for Windows’s first public beta.

      Dan Pitt

      Dan Pitt, President, Palo Alto Innovation Advisors
      Dan Pitt is a network architect who has extensive experience in both the academy and industry. Over the course of his career, Dan has served as Executive Director of the Open Networking Foundation, Dean of Engineering at Santa Clara University, Vice President of Technology and Academic Partnerships at Nortel, Vice President of the Architecture Lab at Bay Networks, and, currently, as President of Palo Alto Innovation Advisors, where he advises and serves as an executive for technology start-ups in the Palo Alto area and around the world.

      Courtney Smith

      Courtney Smith, Co-Founder, Executive Creative Director
      PureMatter

      Courtney Smith is an accomplished creative strategist, storyteller, writer, and designer. Under her leadership, PureMatter has earned hundreds of creative awards and been featured in the PRINT International Design Annual. Courtney has juried over 30 creative competitions, including Creativity International. She is an invited member of the Academy of Interactive and Visual Arts.

      Emmanuel Tsekleves

      Emmanuel Tsekleves, Senior Lecturer in Design Interactions, University of Lancaster
      Dr. Emmanuel Tsekleves is a senior lecturer and writer based out of the United Kingdom. Emmanuel designs interactions between people, places, and products by forging creative design methods along with digital technology. His design-led research in the areas of health, ageing, well-being, and defence has generated public interest and attracted media attention by the national press, such as the Daily Mail, Daily Mirror, The Times, the Daily Mail, Discovery News, and several other international online media outlets.

      Bibliography

      Airini Ab Rahman. “Emerging Technologies with Emerging Effects; A Review”. Universiti Teknologi Malaysia. PERINTIS eJournal, June 2017. Web.

      Anthony, Scott. “Kodak’s Downfall Wasn’t About Technology.” Harvard Business Review, 15 July 2016. Web.

      ARM. The Intelligent Flexible Cloud. 26 Feb. 2015. Web.

      Association of Computing Machinery. Communications of the ACM, n.d. Web.

      Barnett, Thomas. “Three Mobile Trends to Watch.” Cisco Blogs, 3 Feb. 2015. Web.

      Batelle, John. “The 70 Percent Solution.” CNN, 1 Dec 2005. Web.

      Booz Allen Hamilton. Managing Technological Change: 7 Ways to Talk Tech with Management, n.d. Web.

      Brynjolfsson, Erik, and Andrew McAfee. The Second Machine Age: Work, Progress, and Prosperity in a Time of Brilliant Technologies. W. W. Norton, 2014. Print.

      Christensen, Clayton M. “What is Disruptive Innovation?” Harvard Business Review, Dec 2015. Web.

      Christensen, Clayton M. and James Euchner. “Managing Disruption: An Interview With Clayton Christensen.” Research-Technology Management, 22 Dec 2015. vol. 54, no. 1. Web.

      Christensen, Clayton M., Rory McDonald, and Elizabeth J. Altman. “Disruptive Innovation: An Intellectual History and Directions for Future Research”. Wiley Online Library. Web.

      Christensen, Clayton M., Taddy Hall, Karen Dillon, and David S. Duncan. “Know Your Customers’ Jobs to be Done.” Harvard Business Review, Sept. 2016. Web.

      Cisco. “Cisco Annual Internet Report.” n.d. Web.

      Cisco. Cisco Visual Networking Index: Forecast and Methodology, 2014-2019, 27 May 2015. Web.

      Clark, Steven. “Elon Musk hopes SpaceX will send humans to Mars in 2024.” Spaceflight Now, 2 June 2016. Web.

      Clarke, Angela. “A practical use of key success factors to improve the effectiveness of project management,” International Journal of Project Management, June 1999 (17): 139-145.

      Collins, Andrew L., Patrick Hester, Barry Ezell, and John Horst. “An improvement selection methodology for key performance indicators.” Environmental Systems and Decisions, June 2016, 36 (2): 196-208.

      Computer Sciences Corporation. CSC Global CIO Survey: 2014-2015: CIOs Emerge as Disruptive Innovators: An Annual Barometer of Global CIOs’ Plans, Priorities, Threats, and Opportunities, 2014. Web.

      Constine, John. “Voice is Chat’s Next Battleground.” TechCrunch, 19 Sept. 2016. Web.

      Cressman, Daryl. “Disruptive Innovation and the Idea of Technology”. Maastricht University, June 2019. Web.

      Crown Prosecution Service. A Guide to Process Mapping and Improvement. n.d. Web.

      Curran, Chris. “The CIO’s Role in the Internet of Things.” PwC, 13 Mar. 2014. Web.

      Darbha, Sheta, Mike Shevenell, and Jason Normandin. “Impact of Software-Defined Networking on Infrastructure Management.” CA Technology Exchange, 4.3, Nov. 2013, pp. 33-43. Web.

      Denecken, Sven. Conquering Disruption Through Digital Transformation: Technologies, Leadership Strategies, and Best Practices to Create Opportunities for Innovation. SAP, 2014. Web.

      DHL Trend Research and Cisco Consulting Services. Internet of Things in Logistics: A Collaborative Report by DHL and Cisco on Implications and Use Cases for the Logistics Industry, 2015. Web.

      Dirican, Cüneyt. “The Impacts of Robotics, Artificial Intelligence on Business and Economics.” Procedia: Social and Behavioral Sciences, vol. 195, 2015, pp. 564-573. Web.

      Edraw Visualization Solutions. Examples of Flowcharts, Org Charts and More. “Cross-Function Flowchart Examples – Service Flowchart.”

      Emerson. Data Center 2025: Exploring the Possibilities, 2014. Web.

      Ericsson. Next-Generation Data Center Infrastructure, Feb. 2015. Web.

      Eurotech. Connecting M2M Applications to the Cloud to Bolster Hardware Sales, 2014. Web.

      Evans Gary, Llewellyn. “Disruptive Technology and the Board: The Tip of the Iceberg”. Economics and Business Review, n.d. Web.

      Evans Gary, Llewellyn. “Disruptive Technology and the Board: The Tip of the Iceberg”. Economics and Business Review, n.d. Web.

      Gage, Deborah. “The Venture Capital Secret: 3 Out of 4 Start-Ups Fail.” Wall Street Journal, 20 Sept. 2012. Web.

      Garvin, David A. “Competing on the Eight Dimensions of Quality.” Harvard Business Review, November 1987. Web.

      Gibbs, Colin. Augmented Reality in the Enterprise: Opportunities and Challenges. Gigaom Research, 26 Jan. 2015. Web.

      Glushko, Robert J. and Tim McGrath. Document Engineering: Analyzing and Designing Documents for Business Informatics and Web Services. MIT Press, 2005.

      Hadfield, Tom. “Facebook’s Messenger Bot Store could be the most important launch since the App Store.” TechCrunch, 17 March 2016. Web.

      Healey, Nic. “Microsoft's mixed reality vision: 80 million devices by 2020.” CNET, 1 June 2016. Web.

      Hewlett-Packard. Go Beyond Cost Reduction: Use Robotic Process Automation, Oct. 2015. Web.

      Hewlett-Packard. HP Composable Infrastructure: Bridging Traditional IT with the New Style of Business, June 2015. Web.

      Hewlett-Packard. HP Labs, n.d. Web.

      Hong, Jason. “Inside the Great Wall.” Communications of the ACM, 25 May 2016. Web.

      IBM Institute for Value. Your Cognitive Future: How Next-Gen Computing Changes the Way We Live and Work, 2015. Web.

      IBM. A New Way to Work: Futurist Insights to 2025 and Beyond, Jan. 2015. Web.

      Infinity. The Evolution of the Data Centre [sic], 2015. Web.

      Intel Corporation. Intel Annual Report, 1997. Web.

      Isaac, Mike. “Facebook Bets on Bots for its Messenger App.” New York Times, 12 April 2016. Web.

      ISACA. COBIT 5: Enabling Processes. ISACA, 2012. Print.

      K-12 Blueprint. “Planning a Proof of Concept.” 2014. Web.

      Kaushik Rukmini, Meenakshi. “The Impact of Pandemic COVID -19 in Workplace.” European Journal of Business Management and Research, May 2020. Web.

      Knight, Will. “Conversational Interfaces Powerful speech technology from China’s leading Internet company makes it much easier to use a smartphone.” MIT Technology Review, n.d. Web.

      Kostoff, Ronald N., Robert Boylan, and Gene R. Simons. “Disruptive Technology Roadmaps.” Technological Forecasting and Social Change, 2004. Vol. 71. Web.

      Kurzweil, Ray. “The Accelerating Power of Technology.” TED, Feb. 2005. Web.

      Kurzweil, Ray. Kurzweil: Accelerating Intelligence, 2015. Web.

      MacFarquhar, Larissa. “When Giants Fall: What Business Has Learned From Clayton Christensen,” New Yorker, 14 May 2012. Web.

      McClintock, Cat. “2016: The Year for Augmented Reality in the Enterprise.” PTC, n.d. Web.

      McKinsey & Company. IT Growth and Global Change: A Conversation with Ray Kurzweil. 29 Feb. 2012, YouTube. Web.

      Messina, Chris. “2016 Will be the Year of Conversational Commerce.” Medium, 19 Jan 2016. Web.

      Microsoft. Microsoft Research, n.d. Web.

      Miller, Ron. “Forget the Apple Watch, Think Drones in the Enterprise.” TechCrunch, 10 Sep. 2015. Web.

      Nokia Networks. FutureWorks [sic]: Teaching Networks to be Self-Aware: Technology Vision 2020. 2014. Web.

      Nokia Networks. Internet of Things. n.d. Web.

      O’Reilly, Charles, and Andrew J. M. Binns, “The Three Stages of Disruptive Innovation: Idea Generation, Incubation, and Scaling”. Sage Journals, n.d. Web.

      Pew Research Center. AI, Robotics, and the Future of Jobs: Experts Envision Automation and Intelligent Digital Agents Permeating Vast Areas of Our Work and Personal Lives by 2025, but they are Divided on Whether these Advances will Displace More Jobs than they Create. Aug. 2014. Web.

      Ramiller, Neil. “Airline Magazine Syndrome: Reading a Myth of Mismanagement.” Information Technology & People, Sept 2001. Print.

      Raymond James & Associates. The Internet of Things: A Study in Hype, Reality, Disruption, and Growth. 2014. Web.

      Richter, Felix. “No Growth in Sight for Global PC Market.” Statista, 14 March 2016. Web.

      Roy, Mekhala. “4 Examples of Digital Transformation Success in Business”. TechTarget, n.d. Web.

      Simon Weinreich, “How to Manage Disruptive Innovation - a conceptional methodology for value-oriented portfolio planning,” Sciencedirect. 31st CIRP Design Conference 2021.

      Spice Works. The Devices are Coming! How the “Internet of Things” will affect IT… and why resistance is futile. May 2014. Web.

      Spradlin, Dwayne. “Are You Solving the Right Problem?” Harvard Business Review, Sept. 2012. Web.

      Statista. “Number of smartphones sold to end users worldwide from 2007 to 2015 (in million units).” N.d. Web.

      Statista. “Worldwide tablet shipments from 2nd quarter 2010 to 2nd quarter 2016 (in million units).” N.d. Web.

      Sven Schimpf, “Disruptive Field Study; How Companies Identify, Evaluate, Develop and Implement Disruptive Technologies.” Fraunhofer Group for Innovation Research, 2020. Web.

      Tsekleves, Emmanuel. “Science fiction as fact: how desires drive discoveries.” The Guardian. 13 Aug. 2015. Web.

      Tsekleves, Emmanuel. “Science fiction as fact: how desires drive discoveries.” The Guardian, 13 Aug. 2015. Web.

      United States Department of Transportation. “National Motor Vehicle Crash Causation Survey: Report to Congress.” National Highway Traffic Safety Administration, July 2008. Web.

      United States Department of Transportation. “National Motor Vehicle Crash Causation Survey: Report to Congress.” National Highway Traffic Safety Administration, July 2008. Web.

      University Alliance (Villanova U). Managing Scope Creep in Project Management. N.d. Web.

      Vavoula, Giasemi N., and Mike Sharples. “Future Technology Workshop: A Collaborative Method for the Design of New Learning Technologies and Activities.” International Journal of Computer Supported Collaborative Learning, Dec 2007. Vol. 2 no. 4. Web.

      Walraven Pieter. “It’s Operating Systems Vs. Messaging Apps In The Battle For Tech’s Next Frontier.” TechCrunch, 11 Aug 2015. Web.

      Webb, Amy. “The Tech Trends You Can’t Ignore in 2015.” Harvard Business Review, 5 Jan. 2015. Web.

      Wenger, Albert. “The Great Bot Rush of 2015-16.” Continuations, 16 Dec 2015. Web.

      White, Chris. “IoT Tipping Point Propels Digital Experience Era.” Cisco Blogs, 12 Nov. 2014. Web.

      World Economic Forum and Accenture. Industrial Internet of Things: Unleashing the Potential of Connected Products and Services. 2015. Web.

      Yu Dan and Hang Chang Chieh, "A reflective review of disruptive innovation theory," PICMET '08 - 2008 Portland International Conference on Management of Engineering & Technology, 2008, pp. 402-414, doi: 10.1109/PICMET.2008.4599648.

      Automate Work Faster and More Easily With Robotic Process Automation

      • Buy Link or Shortcode: {j2store}237|cart{/j2store}
      • member rating overall impact (scale of 10): N/A
      • member rating average dollars saved: N/A
      • member rating average days saved: N/A
      • Parent Category Name: Optimization
      • Parent Category Link: /optimization
      • Your organization has many business processes that rely on repetitive, routine manual data collection and processing work, and there is high stakeholder interest in automating them.
      • You’re investigating whether robotic process automation (RPA) is a suitable technological enabler for automating such processes.
      • Being a trending technology, especially with its association with artificial intelligence (AI), there is much marketing fluff, hype, and misunderstanding about RPA.
      • Estimating the potential impact of RPA on business is difficult, as the relevant industry statistics often conflict each other and you aren’t sure how applicable it is to your business.

      Our Advice

      Critical Insight

      • There are no physical robots in RPA. RPA is about software “bots” that interact with applications as if they were human users to perform routine, repetitive work in your place. It’s for any business in any industry, not just for manufacturing.
      • RPA is lightweight IT; it reduces the cost of entry, maintenance, and teardown of automation as well as the technological requirement of resources that maintain it, as it complements existing automation solutions in your toolkit.
      • RPA is rules-based. While AI promises to relax the rigidity of rules, it adds business risks that are poorly understood by both businesses and subject-matter experts. Rules-based “RPA 1.0” is mature and may pose a stronger business case than AI-enabled RPA.
      • RPA’s sweet spot is “swivel chair automation”: processes that require human workers to act as a conduit between several systems, moving between applications, manually keying, re-keying, copying, and pasting information. A bot can take their place.

      Impact and Result

      • Discover RPA and how it differentiates from other automation solutions.
      • Understand the benefits and risks of complementing RPA with AI.
      • Identify existing business processes best suited for automation with RPA.
      • Communicate RPA’s potential business benefits to stakeholders.

      Automate Work Faster and More Easily With Robotic Process Automation Research & Tools

      Start here – read the Executive Brief

      Read our concise Executive Brief to find out why you should use RPA to automate routine, repetitive data collection and processing work, review Info-Tech’s methodology, and understand the ways we can support you.

      Besides the small introduction, subscribers and consulting clients within this management domain have access to:

      1. Discover robotic process automation

      Learn about RPA, including how it compares to IT-led automation rooted in business process management practices and the role of AI.

      • Automate Work Faster and More Easily With Robotic Process Automation – Phase 1: Discover Robotic Process Automation
      • Robotic Process Automation Communication Template

      2. Identify processes best suited for robotic process automation

      Identify and prioritize candidate processes for RPA.

      • Automate Work Faster and More Easily With Robotic Process Automation – Phase 2: Identify Processes Best Suited for Robotic Process Automation
      • Process Evaluation Tool for Robotic Process Automation
      • Minimum Viable Business Case Document
      [infographic]

      Identify the Components of Your Cloud Security Architecture

      • Buy Link or Shortcode: {j2store}354|cart{/j2store}
      • member rating overall impact (scale of 10): N/A
      • member rating average dollars saved: N/A
      • member rating average days saved: N/A
      • Parent Category Name: Security Strategy & Budgeting
      • Parent Category Link: /security-strategy-and-budgeting
      • Leveraging the cloud introduces IT professionals to a new world that they are tasked with securing. Consumers do not know what security services they need and when to implement them.
      • With many cloud vendors proposing to share the security responsibility, it can be a challenge for organizations to develop a clear understanding of how they can best secure their data off premises.

      Our Advice

      Critical Insight

      • Your cloud security architecture needs to be strategic, realistic, and based on risk. The NIST approach to cloud security is to include everything security into your cloud architecture to be deemed secure. However, you can still have a robust and secure cloud architecture by using a risk-based approach to identify the necessary controls and mitigating services for your environment.
      • The cloud is not the right choice for everyone. You’re not as unique as you think. Start with a reference model that is based on your risks and business attributes and optimize it from there.
      • Your responsibility doesn’t end at the vendor. Even if you outsource your security services to your vendors, you will still have security responsibilities to address.
      • Don’t boil the ocean; do what is realistic for your enterprise. Your cloud security architecture should be based on securing your most critical assets. Use our reference model to determine a launch point.
      • A successful strategy is holistic. Controlling for cloud risks comes from knowing what the risks are. Consider the full spectrum of security, including both processes and technologies.

      Impact and Result

      • The business is adopting a cloud environment and it must be secured, which includes:
        • Ensuring business data cannot be leaked or stolen.
        • Maintaining the privacy of data and other information.
        • Securing the network connection points.
        • Knowing the risks associated with the cloud and mitigating those risks with the appropriate services.
      • This blueprint and associated tools are scalable for all types of organizations within various industry sectors. It allows them to know what types of risk they are facing and what security services are strongly recommended to mitigate those risks.

      Identify the Components of Your Cloud Security Architecture Research & Tools

      Start Here – read the Executive Brief

      Read our concise Executive Brief to find out why you should create a cloud security architecture with security at the forefront, review Info-Tech’s methodology, and understand the four ways we can support you in completing this project.

      Besides the small introduction, subscribers and consulting clients within this management domain have access to:

      1. Cloud security alignment analysis

      Explore how the cloud changes and whether your enterprise is ready for the shift to the cloud.

      • Identify the Components of Your Cloud Security Architecture – Phase 1: Cloud Security Alignment Analysis
      • Cloud Security Architecture Workbook

      2. Business-critical workload analysis

      Analyze the workloads that will migrated to the cloud. Consider the various domains of security in the cloud, considering the cloud’s unique risks and challenges as they pertain to your workloads.

      • Identify the Components of Your Cloud Security Architecture – Phase 2: Business-Critical Workload Analysis

      3. Cloud security architecture mapping

      Map your risks to services in a reference model from which to build a robust launch point for your architecture.

      • Identify the Components of Your Cloud Security Architecture – Phase 3: Cloud Security Architecture Mapping
      • Cloud Security Architecture Archive Document
      • Cloud Security Architecture Reference Model (Visio)
      • Cloud Security Architecture Reference Model (PDF)

      4. Cloud security strategy planning

      Map your risks to services in a reference architecture to build a robust roadmap from.

      • Identify the Components of Your Cloud Security Architecture – Phase 4: Cloud Security Strategy Planning
      • Cloud Security Architecture Communication Deck

      Infographic

      Workshop: Identify the Components of Your Cloud Security Architecture

      Workshops offer an easy way to accelerate your project. If you are unable to do the project yourself, and a Guided Implementation isn't enough, we offer low-cost delivery of our project workshops. We take you through every phase of your project and ensure that you have a roadmap in place to complete your project successfully.

      1 Cloud Security Alignment Analysis

      The Purpose

      Understand your suitability and associated risks with your workloads as they are deployed into the cloud.

      Key Benefits Achieved

      An understanding of the organization’s readiness and optimal service level for cloud security.

      Activities

      1.1 Workload Deployment Plan

      1.2 Cloud Suitability Questionnaire

      1.3 Cloud Risk Assessment

      1.4 Cloud Suitability Analysis

      Outputs

      Workload deployment plan

      Determined the suitability of the cloud for your workloads

      Risk assessment of the associated workloads

      Overview of cloud suitability

      2 Business-Critical Workload Analysis

      The Purpose

      Explore your business-critical workloads and the associated controls and mitigating services to secure them.

      Key Benefits Achieved

      Address NIST 800-53 security controls and the appropriate security services that can mitigate the risks appropriately.

      Activities

      2.1 “A” Environment Analysis

      2.2 “B” Environment Analysis

      2.3 “C” Environment Analysis

      2.4 Prioritized Security Controls

      2.5 Effort and Risk Dashboard Overview

      Outputs

      NIST 800-53 control mappings and relevancy

      NIST 800-53 control mappings and relevancy

      NIST 800-53 control mappings and relevancy

      Prioritized security controls based on risk and environmental makeup

      Mitigating security services for controls

      Effort and Risk Dashboard

      3 Cloud Security Architecture Mapping

      The Purpose

      Identify security services to mitigate challenges posed by the cloud in various areas of security.

      Key Benefits Achieved

      Comprehensive list of security services, and their applicability to your network environment. Documentation of your “current” state of cloud security.

      Activities

      3.1 Cloud Security Control Mapping

      3.2 Cloud Security Architecture Reference Model Mapping

      Outputs

      1. Cloud Security Architecture Archive Document to codify and document each of the associated controls and their risk levels to security services

      2. Mapping of the codified controls onto Info-Tech’s Cloud Security Architecture Reference Model for clear security prioritization

      4 Cloud Security Strategy Planning

      The Purpose

      Prepare a communication deck for executive stakeholders to socialize them to the state of your cloud security initiatives and where you still have to go.

      Key Benefits Achieved

      A roadmap for improving security in the cloud.

      Activities

      4.1 Cloud Security Strategy Considerations

      4.2 Cloud Security Architecture Communication Deck

      Outputs

      Consider the additional security considerations of the cloud for preparation in the communication deck.

      Codify all your results into an easily communicable communication deck with a clear pathway for progression and implementation of security services to mitigate cloud risks.

      Service Management Integration With Agile Practices

      • Buy Link or Shortcode: {j2store}400|cart{/j2store}
      • member rating overall impact (scale of 10): N/A
      • member rating average dollars saved: N/A
      • member rating average days saved: N/A
      • Parent Category Name: Service Management
      • Parent Category Link: /service-management

      • Work efficiently and in harmony with Agile and service management to deliver business value.
      • Optimize the value stream of services and products.
      • Leverage the benefits of each practice.
      • Create a culture of collaboration to support a rapidly changing business.

      Our Advice

      Critical Insight

      Agile and Service Management are not necessarily at odds; find the integration points to solve specific problems.

      Impact and Result

      • Optimize the value stream of services and products.
      • Work efficiently and in harmony with Agile and service management to deliver business value.
      • Create a culture of collaboration to support a rapidly changing business.

      Service Management Integration With Agile Practices Research & Tools

      Besides the small introduction, subscribers and consulting clients within this management domain have access to:

      1. Service Management Integration With Agile Practices Storyboard – Use this deck to understand the integration points and how to overcome common challenges.

      Understand how service management integrates with Agile software development practices, and how to solve the most common challenges to work efficiently and deliver business value.

      • Service Management Integration With Agile Practices Storyboard

      2. Service Management Stakeholder Register Template – Use this tool to identify and document Service Management stakeholders.

      Use this tool to identify your stakeholders to engage when working on the service management integration.

      • ITSM Stakeholder Register Template

      3. Service Management Integration With Agile Practices Assessment Tool – Use this tool to identify key challenging integration points in your organization.

      Use this tool to identify which of your current practices might already be aligned with Agile mindset and which might need adjustment. Identify integration challenges with the current service management practices.

      • Service Management Integration With Agile Practices Assessment Tool
      [infographic]

      Further reading

      Service Management Integration With Agile Practices

      Understand how Agile transformation affects service management

      Analyst Perspective

      Don't forget about operations

      Many organizations believe that once they have implemented Agile that they no longer need any service management framework, like ITIL. They see service management as "old" and a roadblock to deliver products and services quickly. The culture clash is obvious, and it is the most common challenge people face when trying to integrate Agile and service management. However, it is not the only challenge. Agile methodologies are focused on optimized delivery. However, what happens after delivery is often overlooked. Operations may not receive proper communication or documentation, and processes are cumbersome or non-existent. This is a huge paradox if an organization is trying to become nimbler. You need to find ways to integrate your Agile practices with your existing Service Management processes.

      This is a picture of Renata Lopes

      Renata Lopes
      Senior Research Analyst
      Organizational Transformation Practice
      Info-Tech Research Group

      Executive Summary

      Your Challenge

      • Work efficiently and in harmony with Agile and service management to deliver business value.
      • Optimize the value stream of services and products.
      • Leverage the benefits of each practice.
      • Create a culture of collaboration to support a rapidly changing business.

      Common Obstacles

      • Culture clashes.
      • Inefficient or inexistent processes.
      • Lack of understanding of what Agile and service management mean.
      • Leadership doesn't understand the integration points of practices.
      • Development overlooks the operations requirement.

      Info-Tech's Approach

      • When integrating Agile and service management practices start by understanding the key integration points:
      • Processes
      • People and resources
      • Governance and org structure

      Info-Tech Insight

      Agile and Service Management are not necessarily at odds Find the integration points to solve specific problems.

      Your challenge

      Deliver seamless business value by integrating service management and Agile development.

      • Understand how Agile development impacts service management.
      • Identify bottlenecks and inefficiencies when integrating with service management.
      • Connect teams across the organization to collaborate toward the organizational goals.
      • Ensure operational requirements are considered while developing products in an Agile way.
      • Stay in alignment when designing and delivering services.

      The most significant Agile adoption barriers

      46% of respondents identified inconsistent processes and practices across teams as a challenge.
      Source: Digital.ai, 2021

      43% of respondents identified Culture clashes as a challenge.
      Source: Digital.ai, 2021

      What is Agile?

      Agile development is an umbrella term for several iterative and incremental development methodologies to develop products.

      In order to achieve Agile development, organizations will adopt frameworks and methodologies like Scaled Agile Framework (SAFe), Scrum, Large Scaled Scrum (LeSS), DevOps, Spotify Way of Working (WoW), etc.

      • DevOps
      • WoW
      • SAFe
      • Scrum
      • LeSS

      Next-Generation InfraOps

      • Buy Link or Shortcode: {j2store}457|cart{/j2store}
      • member rating overall impact (scale of 10): N/A
      • member rating average dollars saved: N/A
      • member rating average days saved: N/A
      • Parent Category Name: Operations Management
      • Parent Category Link: /i-and-o-process-management
      • Traditional IT capabilities, activities, organizational structures, and culture need to adjust to leverage the value of cloud, optimize spend, and manage risk.
      • Different stakeholders across previously separate teams rely on one another more than ever, but rules of engagement do not yet exist.

      Our Advice

      Critical Insight

      • By defining your end goals and framing solutions based on the type of visibility and features you need, you can enable speed and reliability without losing control of the work.

      Impact and Result

      • Understand the xOps spectrum and what approaches benefit your organization.
      • Make sense of the architectural approaches and enablement tools available to you.
      • Evolve from just improving your current operations to a continuous virtuous cycle of development and deployment.

      Next-Generation InfraOps Research & Tools

      Besides the small introduction, subscribers and consulting clients within this management domain have access to:

      1. Next-Generation InfraOps Storyboard – A deck that will help you use Ops methodologies to build a virtuous cycle.

      This storyboard will help you understand the spectrum of different Agile xOps working modes and how best to leverage them and build an architecture and toolset that support rapid continuous IT operations

      • Next-Generation InfraOps Storyboard
      [infographic]

      Further reading

      Next-Generation InfraOps

      Embrace the spectrum of Ops methodologies to build a virtuous cycle.

      Executive summary

      Your Challenge

      IT Operations continue to be challenged by increasing needs for scale and speed, often in the face of constrained resources and time. For most, Agile methodologies have become a foundational part of tackling this problem. Since then, we've seen Agile evolve into DevOps, which started a trend into different categories of "xOps" that are too many to count. How does one make sense of the xOps spectrum? What is InfraOps and where does it fit in?

      Common Obstacles

      Ultimately, all these methodologies and approaches are there to serve the same purpose: increase effectiveness through automation and improve governance through visibility. The key is to understand what tools and methodologies will deliver actual benefits to your IT operation and to the organization as a whole.

      Info-Tech's Approach

      By defining your end goals and framing solutions based on the type of visibility and features you need, you can enable speed and reliability without losing control of the work.

      1. Understand the xOps spectrum and what approaches will benefit your organization.
      2. Make sense of the architectural approaches and enablement tools available to you.
      3. Evolve from just improving your current operations to a continuous virtuous cycle of development and deployment.

      Info-Tech Insight

      InfraOps, when applied well, should be the embodiment of the governance policies as expressed by standards in architecture and automation.

      Project overview

      Understand the xOps spectrum

      There are as many different types of "xOps" as there are business models and IT teams. To pick the approaches that deliver the best value to your organization and that align to your way of operating, it's important to understand the different major categories in the spectrum and how they do or don't apply to your IT approach.

      How to optimize the Ops in DevOps

      InfraOps is one of the major methodologies to address a key problem in IT at cloud scale: eliminating friction and error from your deliveries and outputs. The good news is there are architectures, tools, and frameworks you can easily leverage to make adopting this approach easier.

      Evolve to integration and build a virtuous cycle

      Ultimately your DevOps and InfraOps approaches should embody your governance needs via architecture and process. As time goes on, however, both your IT footprint and your business environment will shift. Build your tools, telemetry, and governance to anticipate and adapt to change and build a virtuous cycle between development needs and IT Operations tools and governance.

      The xOps spectrum

      This is an image of the xOps spectrum. The three main parts are: Code Acceleration (left), Governance(middle), and Infrastructure Acceleration (right)

      xOps categories

      There is no definitive list of x's in the xOps spectrum. Different organizations and teams will divide and define these in different ways. In many cases, the definitions and domains of various xOps will overlap.

      Some of the commonly adopted and defined xOps models are listed here.

      Shift left? Shift right?

      Cutting through the jargon

      • Shifting left is about focusing on the code and development aspects of a delivery cycle.
      • Shifting right is about remembering that infrastructure and tools still do matter.

      Info-Tech Insight

      Shifting left or right isn't an either/or choice. They're more like opposite sides of the same coin. Like the different xOps approaches, usually more than one shift approach will apply to your IT Operations.

      IT Operations in the left-right spectrum

      Shifting from executing and deploying to defining the guardrails and standards

      This is an image of the left-right spectrum for your XOps position

      Take a middle-out approach

      InfraOps and DevOps aren't enemies; they're opposite sides of the same coin.

      • InfraOps is about the automation and standardization of execution. It's an essential element in any fully automated CI/CD pipeline.
      • Like DevOps, InfraOps is built on similar values (the pillars of DevOps).
      • It builds on the principle of Lean to focus on removing friction, or turn-and-type activities, from the pipeline/process.
      • In InfraOps, one of the key methods for removing friction is through automation of the interstitia between different phases of a DevOps or CI/CD cycle.

      Optimize the Ops in DevOps

      Focus on eliminating friction

      This is an image of an approach to optimizing the ops in DevOps.

      With the shift from execution to governing and validating, the role of deployment falls downstream of IT Operations.

      IT Operations needs to move to a mindset that focuses on creating the guardrails, enforced standards, and compliance rules that need to be used downstream, then apply those standards using automation and tooling to remove friction and error from the interstitia (the white spaces between chevrons) of the various phases.

      InfraOps tools

      Four quadrants in the shape of a human head, in the boxes are the following: Hyperconverged Infrastructure; Composable Infrastructure; Infrastructure as code and; Automation and Orchestration

      Info-Tech Insight

      Your tools can be broken into two categories:

      • Infrastructure Architecture
        • HCI vs. CI
      • Automation Tooling
        • IaC and A&O

      Keep in mind that while your infrastructure architecture is usually an either/or choice, your automation approach should use any and all tooling that helps.

      Infrastructure approach

      • Hyperconverged

      • Composable

      Hyperconverged Infrastructure (HCI)

      Hyperconvergence is the next phase of convergence, virtualizing servers, networks, and storage on a single server/storage appliance. Capacity scales as more appliances are added to a cluster or stack.
      The disruptive departure:

      • Even though servers, networks, and storage were each on their own convergence paths, the three remained separate management domains (or silos). Even single-SKU converged infrastructures like VCE Vblocks are still composed of distinct server, network, and storage devices.
      • In hyperconvergence, the silos collapse into single-software managed devices. This has been disruptive for both the vendors of technology solutions (especially storage) and for infrastructure management.
      • Large storage array vendors are challenged by hyperconvergence alternatives. IT departments need to adapt IT skills and roles away from individual management silos and to more holistic service management.

      A comparison between converged and hyperconverged systems.

      Info-Tech Insight

      HCI follows convergence trends of the past ten years but is also a departure from how IT infrastructure has traditionally been provisioned and managed.

      HCI is at the same time a logical progression of infrastructure convergence and a disruptive departure.

      Hyperconverged (HCI) – SWOT

      HCI can be the foundation block for a fully software defined data center, a prerequisite for private cloud.

      Strengths

      • Potentially lower TCO through further infrastructure consolidation, reducing CapEx and OpEx expenditures through facilities optimization and cost consolidation.
      • Operations in particular can be streamlined, since storage, network connections, and processors/memory are all managed as abstractions via a single control pane.
      • HCI comes with built-in automation and analytics that lead to quicker issue resolution.

      Opportunities

      • Increased business agility by paving the way for a fully software defined infrastructure stack and cloud automation.
      • Shift IT human assets from hardware asset maintainers and controllers to service delivery managers.
      • Better able to compete with external IT service alternatives.
      • Move toward a hybrid cloud service offering where the service catalog contains both internal and external offerings.

      Key attributes of a cloud are automation, resource elasticity, and self-service. This kind of agility is impossible if physical infrastructure needs intervention.

      Info-Tech Insight

      Virtualization alone does not a private cloud make, but complete stack virtualization (software defined) running on a hands-off preconfigured HCI appliance (or group of appliances) provides a solid foundation for building cloud services.

      Hyperconverged (HCI) – SWOT

      Silo-busting and private cloud sound great, but are your people and processes able to manage the change?

      Weaknesses

      • HCI typically scales out linearly (CPU & storage). This does not suit traditional scale-up applications such as high-performance databases and large-capacity data warehouses.
      • Infrastructure stacks are perceived as more flexible for variable growth across segments. For example, if storage is growing but processing is not, storage can scale separately from processing.

      Threats

      • HCI will be disruptive to roles within IT. Internal pushback is a real threat if necessary changes in skills and roles are not addressed.
      • HCI is not a simple component replacement but an adoption of a different kind of infrastructure. Different places in the lifecycles for each of storage, network, and processing devices could make HCI a solution where there is no immediate problem.

      In traditional infrastructure, performance and capacity are managed as distinct though complementary jobs. An all-in-one approach may not work.

      Composable Infrastructure (CI)

      • Composable infrastructure in many ways represents the opposite of an HCI approach. Its focus is on further disaggregating resources and components used to build systems.
        • Unlike traditional cloud virtual systems, composable infrastructure provides virtual bare metal resources, allowing tightly coupled resources like CPU, RAM, and GPU – or any device/card/module – to be released back and forth into the resource pool as required by a given workload.
        • This is enabled by the use of high-speed, low-latency PCI Express (PCI-e) and Compute Express Link (CXL) fabrics that allow these resources to be decoupled.
        • It also supports the ability to present other fabric types critical for building out enterprise systems (e.g. Ethernet, InfiniBand).
      • Accordingly, CI systems are also based on next-generation network architecture that supports moving critical functions to the network layer, which enables more efficient use of the application-layer resources.

      Composable Infrastructure (CI)

      • CI may also leverage network-resident data/infrastructure processing units (DPUs/IPUs), which offload many network, security, and storage functions.
        • As new devices and functions become available, they can be added into the catalog of resources/functions available in a CI pool.

      Use Case Example: Composable AI flow

      Data Ingestion > Data Cleaning/Tagging > Training > Conclusion

      • At each phase of the process, resources, including specialized hardware like memory and GPU cores, can be dynamically allocated and reallocated to the workload on demand

      Composable Infrastructure (CI)

      Use cases and considerations

      Where it's useful

      • Enable even more efficient allocation/utilization of resources for workloads.
      • Very large memory or shared memory requirements can benefit greatly.
      • Decouple purchasing decisions for underlying resources.
      • Leverage the fabric to make it easier to incrementally upgrade underlying resources as required.
      • Build "the Impossible Server."

      Considerations

      • Requires significant footprint/scale to justify in many cases
      • Not necessarily good value for environments that aren't very volatile and heterogeneous in terms of deployment requirements
      • May not be best value for environments where resource-stranding is not a significant issue

      Info-Tech Insight

      Many organizations using a traditional approach report resource stranding as having an impact of 20% or more on efficiency. When focusing specifically on the stranding of memory in workloads, the number can often approach 40%.

      The CI ecosystem

      This is an image of the CI ecosystem.

      • The CI ecosystem has many players, large and small!
      • Note that the CI ecosystem is dependent on a large ecosystem of underlying enablers and component builders to support the required technologies.

      Understanding the differences

      This image shows the similarities and differences between traditional, cloud, hyperconverged, and composable.

      Automation approach

      • Infrastructure as Code
      • Automation & Orchestration
      • Metaorchestration

      Infrastructure as Code (IaC)

      Infrastructure as code (IaC) is the process of managing and provisioning computer data centers through machine-readable definition files rather than physical hardware configuration or interactive configuration tools.

      Before IaC, IT personnel would have to manually change configurations to manage their infrastructure. Maybe they would use throwaway scripts to automate some tasks, but that was the extent of it.

      With IaC, your infrastructure's configuration takes the form of a code file, making it easy to edit, copy, and distribute.

      Info-Tech Insight
      IaC is a critical tool in enabling key benefits!

      • Reduced costs
      • Increased scalability, flexibility, and speed
      • Better consistency and version control
      • Reduced deployment errors

      Infrastructure as Code (IaC)

      1. IaC uses a high-level descriptive coding language to automate the provisioning of IT infrastructure. This eliminates the need to manually provision and manage servers, OS, database connections, storage, and other elements every time we want to develop, test, or deploy an application.
      2. IaC allows us to define the computer systems on which code needs to run. Most commonly, we use a framework like Chef, Ansible, Puppet, etc., to define their infrastructure. These automation and orchestration tools focus on the provisioning and configuring of base compute infrastructure.
      3. IaC is also an essential DevOps practice. It enables teams to rapidly create and version infrastructure in the same way they version source code and to track these versions so as to avoid inconsistency among IT environments that can lead to serious issues during deployment.
      • Idempotence is a principle of IaC. This means a deployment command always sets the target environment into the same configuration, regardless of the environment's starting state.
        • Idempotency is achieved by either automatically configuring an existing target or discarding the existing target and recreating a fresh environment.

      Automation/Orchestration

      Orchestration describes the automated arrangement, coordination, and management of complex computer systems, middleware, and services.

      This usage of orchestration is often discussed in the context of service-oriented architecture, virtualization, provisioning, converged infrastructure, and dynamic data center topics. Orchestration in this sense is about aligning the business request with the applications, data, and infrastructure.

      It defines the policies and service levels through automated workflows,
      provisioning, and change management. This creates an application-aligned infrastructure that can be scaled up or down based on the needs of each application.

      As the requirement for more resources or a new application is triggered, automated tools now can perform tasks that previously could only be done by multiple administrators operating on their individual pieces of the physical stack.

      Orchestration also provides centralized management of the resource pool, including billing, metering, and chargeback for consumption. For example, orchestration reduces the time and effort for deploying multiple instances of a single application.

      Info-Tech Insight

      Automation and orchestration tools can be key components of an effective governance toolkit too! Remember to understand what data can be pulled from your various tools and leveraged for other purposes such as cost management and portfolio roadmapping.

      Automation/Orchestration

      There are a wide variety of orchestration and automation tools and technologies.

      Configuration Management

      Configuration Management

      The logos for companies which fall in each of the categories in the column to the left of the image.

      CI/CD
      Orchestration

      Container
      Orchestration

      Cloud-Specific
      Orchestration

      PaaS
      Orchestration

      Info-Tech Insight

      Automation and orchestration tools and software offerings are plentiful, and many of them have a different focus on where in the application delivery ecosystem they provide automation functionality.

      Often there are different tools for different deployment and service models as well as for different functional phases for each service model.

      Automation/Orchestration

      Every tool focuses on different aspects or functions of the deployment of resources and applications.

      • Resources
        • Compute
        • Storage
        • Network
      • Extended Services
        • Platforms
        • Infrastructure Services
        • Web Services
      • Application Assets
        • Images
        • Templates
        • Containers
        • Code

      Info-Tech Insight

      Let the large ecosystem of tools be your ally. Leverage the right tools where needed and then address the complexity of tools using a master orchestration scheme.

      Metaorchestration

      A Flow chart for the approach to metaorchestration.

      Additionally, most tools do not cover all aspects required for most automation implementations, especially in hybrid cloud scenarios.

      As such, often multiple tools must be deployed, which can lead to fragmentation and loss of unified controls.

      Many enterprises address this fragmentation using a cloud management platform approach.

      One method of achieving this is to establish a higher layer of orchestration – an "orchestrator of orchestrators," or metaorchestration.

      In complex scenarios, this can be a challenge that requires customization and development.

      InfraOps tools ecosystem

      Toolkit Pros Cons Tips
      HCI Easy scale out Shift in skills required Good for enabling automation and hybridization with current-gen public cloud services
      CI Maximal workload resource efficiency Investment in new fabrics and technologies Useful for very dynamic or highly scalable workloads like AI
      IaC Error reduction and standardization Managing drift in standards and requirements Leverage a standards and exception process to keep track of drift
      A&O Key enabler of DevOps automation within phases Usually requires multiple toolsets/frameworks Use the right tools and stitch together at the metaorchestration layer
      Metaorchestration Reduces the complexity of a diverse A&O and IaC toolkit Requires understanding of the entire ecosystems of tools used Key layer of visibility and control for governance

      Build a virtuous cycle

      Remember, the goal is to increase speed AND reliability. That's why we focus on removing friction from our delivery pipelines.

      • The first step is to identify the points of friction in your cycle and understand the intensity and frequency of these friction points.
      • Depending on your delivery and project management methodology, you'll have a different posture of the different tools that make sense for your pipeline.
      • For example, if you are focused on delivering raw resources for sysadmins and/or you're in a Waterfall methodology where the friction points are large but infrequent, hyperconverged is likely to delivery good value, whereas tools like IaC and orchestration may not be as necessary.

      Info-Tech Insight

      Remember that, especially in modern and rapid methodologies, your IT footprint can drift unexpectedly. This means you need a real feedback mechanism on where the friction moves to next.

      This is particularly important in more Agile methodologies.

      Activity: Map your IT operations delivery

      Identify your high-friction interstitial points

      • Using the table below, or a table modified to your delivery phases, map out the activities and tasks that are not standardized and automated.
      • For the incoming and outgoing sections, think about what resources and activities need to be (or could be) created, destroyed, or repurposed to efficiently manage each cycle and the spaces between cycles.
      Plan Code Test Deploy Monitor
      Incoming Friction
      In-Cycle Friction
      Outgoing Friction

      Info-Tech Insight

      Map your ops groups to the delivery cycles in your pipeline. How many delivery cycles do you have or need?

      Good InfraOps is a reflection of governance policies, expressed by standards in architecture and automation.

      Related Info-Tech Research

      Evaluate Hyperconverged Infrastructure for Your Infrastructure Roadmap

      • This Info-Tech note covers evaluation of HCI platforms.

      Design Your Cloud Operations

      • This Info-Tech blueprint covers organization of operations teams for various deployment and Agile modes.

      Bibliography

      Banks, Ethan, host. "Choosing Your Next Infrastructure." Datanauts, episode 094, Packet Pushers, 26 July 2017. Podcast.
      "Composable Infrastructure Solutions." Hewlett Packard Canada, n.d. Web.
      "Composable Infrastructure Technology." Liqid Inc., n.d. Web.
      "DataOps architecture design." Azure Architecture Center, Microsoft Learn, n.d. Web.
      Tan, Pei Send. "Differences: DevOps, ITOps, MLOps, DataOps, ModelOps, AIOps, SecOps, DevSecOps." Medium, 5 July 2021. Web.

      IT Metrics and Dashboards During a Pandemic

      • Buy Link or Shortcode: {j2store}118|cart{/j2store}
      • member rating overall impact (scale of 10): N/A
      • member rating average dollars saved: N/A
      • member rating average days saved: N/A
      • Parent Category Name: Performance Measurement
      • Parent Category Link: /performance-measurement

      The ways you measure success as a business are based on the typical business environment, but during a crisis like a pandemic, the business environment is rapidly changing or significantly different.

      • How do you assess the scope of the risk?
      • How do you quickly align your team to manage new risks?
      • How do you remain flexible enough to adapt to a rapidly changing situation?

      Our Advice

      Critical Insight

      Measure what you have the data for and focus on managing the impacts to your employees, customers, and suppliers. Be willing to make decisions based on imperfect data. Don’t forget to keep an eye on the long-term objectives and remember that how you act now can reflect on your business for years to come.

      Impact and Result

      Use Info-Tech’s approach to:

      • Quickly assess the risk and identify critical items to manage.
      • Communicate what your decisions are based on so teams can either quickly align or challenge conclusions made from the data.
      • Quickly adjust your measures based on new information or changing circumstances.
      • Use the tools you already have and keep it simple.

      IT Metrics and Dashboards During a Pandemic Research & Tools

      Start here – read the Executive Brief

      Read our concise Executive Brief to find out how to develop your temporary crisis dashboard.

      Besides the small introduction, subscribers and consulting clients within this management domain have access to:

      1. Consider your organizational goals

      Identify the short-term goals for your organization and reconsider your long-term objectives.

      • Crisis Temporary Measures Dashboard Tool

      2. Build a temporary data collection and dashboard method

      Determine your tool for data collection and your data requirements and collect initial data.

      3. Implement a cadence for review and action

      Determine the appropriate cadence for reviewing the dashboard and action planning.

      [infographic]

      Improve IT Operations With AI and ML

      • Buy Link or Shortcode: {j2store}454|cart{/j2store}
      • member rating overall impact (scale of 10): 10.0/10 Overall Impact
      • member rating average dollars saved: After each Info-Tech experience, we ask our members to quantify the real-time savings, monetary impact, and project improvements our research helped them achieve.
      • member rating average days saved: Read what our members are saying
      • Parent Category Name: Operations Management
      • Parent Category Link: /i-and-o-process-management
      • Many IT departments experience difficulty with meeting the business' expectations for service delivery on a regular basis.
      • Despite significant investment in improving various areas of IT operations, you still feel like you’re constantly firefighting.
      • To tackle these issues, businesses tend to invest in purchasing multiple solutions. This not only complicates their IT operations, but also, in some cases, deteriorates functionality.

      Our Advice

      Critical Insight

      • To leverage AI capabilities, you first need to assess the current state of your IT operations and know what your priorities are.
      • Contemplate use cases that will get the most benefit from automation and start with processes that you are relatively comfortable handling.
      • Analyze your initial plan to identify easy wins, then expand your AIOps.

      Impact and Result

      • Perform a current state assessment to spot which areas within your operations management are the least mature and causing you the most grief. Identify which functional areas within operations management need to be prioritized for improvement.
      • Make a shortlist of use cases that will get the most benefit from AI-based technology.
      • Prepare a plan to deploy AI capabilities to improve your IT operations.

      Improve IT Operations With AI and ML Research & Tools

      Start here – read the Executive Brief

      Read our concise Executive Brief to find out about the latest improvements in AIOps and how these can help you improve your IT operations. Review Info-Tech’s methodology and understand the four ways we can support you in completing this project.

      Besides the small introduction, subscribers and consulting clients within this management domain have access to:

      1. Assess the current state of IT operations management

      Identify where your organization currently stands in its operations management practices.

      • AIOps Project Summary Template
      • AIOps Prerequisites Assessment Tool

      2. Identify initiatives that align with operations requirements

      Recognize the benefits of AI and ML for your business. Determine the necessary roles and responsibilities for potential initiatives, then develop and assess your shortlist.

      • AIOps RACI Template
      • AIOps Shortlisting Tool

      3. Develop the AI roadmap

      Analyze your ROI for AIOps and create an action plan. Communicate your AI and ML initiatives to stakeholders to obtain their support.

      • AIOps ROI Calculator
      • AIOps Roadmap Tool
      • AIOps Communications Plan Template
      [infographic]

      Release management

      • Buy Link or Shortcode: {j2store}9|cart{/j2store}
      • Related Products: {j2store}9|crosssells{/j2store}
      • Up-Sell: {j2store}9|upsells{/j2store}
      • member rating overall impact (scale of 10): 10.0/10
      • member rating average dollars saved: $35,731
      • member rating average days saved: 20
      • Parent Category Name: Infra and Operations
      • Parent Category Link: /infra-and-operations
      Today's world requires frequent and fast deployments. Stay in control with release management.

      Do you believe in absolute efficiency?

      Weekend read. Hence I post this a bit later on Friday.
      Lately, I've been fascinated by infinity. And in infinity, some weird algebra pops up. Yet that weirdness is very much akin to what our business stakeholders want, driven by what our clients demand, and hence our KPIs drive us. Do more with less. And that is what absolute efficiency means.

      Register to read more …

      Develop Necessary Documentation for GDPR Compliance

      • Buy Link or Shortcode: {j2store}258|cart{/j2store}
      • member rating overall impact (scale of 10): 10.0/10 Overall Impact
      • member rating average dollars saved: After each Info-Tech experience, we ask our members to quantify the real-time savings, monetary impact, and project improvements our research helped them achieve.
      • member rating average days saved: Read what our members are saying
      • Parent Category Name: Governance, Risk & Compliance
      • Parent Category Link: /governance-risk-compliance
      • It can be an overwhelming challenge to understand what documentation is required under the GDPR.

      Our Advice

      Critical Insight

      • Hiring the right data protection officer (DPO) isn’t always easy. The person you think might be best may result in a conflict of interest. Be aware of all requirements and be objective when hiring for this role.
      • Keep retention to the bare minimum. Limiting the amount of data you are responsible for limits your liability for protecting it.
      • Under the GDPR, cookies constitute personal data. They require a standalone policy, separate from the privacy policy. Ensure pop-up cookie notification banners require active consent and give users the clear opportunity to reject them.

      Impact and Result

      • Save time developing documents by leveraging ready-to-go templates for the DPO job description, retention documents, privacy notice, and cookie policy.
      • Establishing GDPR-compliance documentation will set the foundation for an overall compliant program.

      Develop Necessary Documentation for GDPR Compliance Research & Tools

      Besides the small introduction, subscribers and consulting clients within this management domain have access to:

      1. Hire a data protection officer

      Understand the need for a DPO and what qualities to look for in a strong candidate.

      • Develop Necessary Documentation for GDPR Compliance Storyboard
      • Data Protection Officer Job Description Template

      2. Define retention requirements

      Understand your data retention requirements under the GDPR. Develop the necessary documentation.

      • Data Retention Policy Template
      • Data Retention Schedule Tool – GDPR

      3. Develop privacy and cookie policies

      Understand your website or application’s GDPR requirements to inform users on how you process their personal data and how cookies are used. Develop the necessary documentation.

      • Privacy Notice Template – External Facing
      • Cookie Policy Template – External Facing
      [infographic]

      Pandemic Preparation – The People Playbook

      • Buy Link or Shortcode: {j2store}513|cart{/j2store}
      • member rating overall impact (scale of 10): N/A
      • member rating average dollars saved: N/A
      • member rating average days saved: N/A
      • Parent Category Name: Lead
      • Parent Category Link: /lead
      • Keeping employees safe – limiting exposure of employees to the virus and supporting them in the event they become ill.
      • Reducing potential disruption to business operations through employee absenteeism and travel restrictions.

      Our Advice

      Critical Insight

      • Communication of facts and definitive action plans from credible leaders is the key to maintaining some stability during a time of uncertainty.
      • Remote work is no longer a remote possibility – implementing alternative temporary work arrangements that keep large groups of employees from congregating reduce risk of employee exposure and operational downtime.
      • Pandemic travel protocols are necessary to support staff and their continuation of work while traveling for business and/or if stuck in a high-risk, restricted area.

      Impact and Result

      • Assign accountability of key planning decisions to members of a pandemic response team.
      • Craft key messages in preparation for communicating to employees.
      • Cascade communications from credible sources in a way that will establish pandemic travel protocols.

      Pandemic Preparation – The People Playbook Research & Tools

      Start here. Read the Pandemic Preparation: The People Playbook

      Read our concise Playbook to find out how you can immediately prepare for the people side of pandemic planning.

      Besides the small introduction, subscribers and consulting clients within this management domain have access to:

      • Pandemic Preparation: The People Playbook
      [infographic]

      Prepare for Post-Quantum Cryptography

      • Buy Link or Shortcode: {j2store}268|cart{/j2store}
      • member rating overall impact (scale of 10): N/A
      • member rating average dollars saved: N/A
      • member rating average days saved: N/A
      • Parent Category Name: Security Processes & Operations
      • Parent Category Link: /security-processes-and-operations
      • Fault-tolerant quantum computers, capable of breaking existing encryption algorithms and cryptographic systems, are widely expected to be available sooner than originally projected.
      • Data considered secure today may already be at risk due to the threat of harvest-now-decrypt-later schemes.
      • Many current security controls will be completely useless, including today's strongest encryption techniques.

      Our Advice

      Critical Insight

      The advent of quantum computing is closer than you think: some nations have already demonstrated capability with the potential to break current asymmetric-key encryption. Traditional encryption methods will no longer provide sufficient protection. You need to act now to begin your transformation to quantum-resistant encryption.

      Impact and Result

      • Developing quantum-resistant cryptography capabilities is crucial to maintaining data security and integrity for critical applications.
      • Organizations need to act now to begin their transformation to quantum-resistant encryption.
      • Data security (especially for sensitive data) should be an organization’s top priority. Organizations with particularly critical information need to be on top of this quantum movement.

      Prepare for Post-Quantum Cryptography Research & Tools

      Besides the small introduction, subscribers and consulting clients within this management domain have access to:

      1. Prepare for Post-Quantum Cryptography Storyboard – Research to help organizations to prepare and implement quantum-resistance cryptography solutions.

      Developing quantum-resistant cryptography capabilities is crucial to maintaining data security and integrity for critical applications. Organizations need to act now to begin their transformation to quantum-resistant encryption.

      • Prepare for Post-Quantum Cryptography Storyboard
      [infographic]

      Further reading

      Prepare for Post-Quantum Cryptography

      It is closer than you think, and you need to act now.

      Analyst Perspective

      It is closer than you think, and you need to act now.

      The quantum realm presents itself as a peculiar and captivating domain, shedding light on enigmas within our world while pushing the boundaries of computational capabilities. The widespread availability of quantum computers is expected to occur sooner than anticipated. This emerging technology holds the potential to tackle valuable problems that even the most powerful classical supercomputers will never be able to solve. Quantum computers possess the ability to operate millions of times faster than their current counterparts.

      As we venture further into the era of quantum mechanics, organizations relying on encryption must contemplate a future where these methods no longer suffice as effective safeguards. The astounding speed and power of quantum machines have the potential to render many existing security measures utterly ineffective, including the most robust encryption techniques used today. To illustrate, a task that currently takes ten years to crack through a brute force attack could be accomplished by a quantum computer in under five minutes.

      Amid this transition into a quantum future, the utmost priority for organizations remains data security, particularly safeguarding sensitive information. Organizations must proactively prepare for the development of countermeasures and essential resilience measures to attain a state of being "quantum safe."

      This is a picture of Alan Tang

      Alan Tang
      Principal Research Director, Security and Privacy
      Info-Tech Research Group

      Executive Summary

      Your Challenge

      • Anticipated advancements in fault-tolerant quantum computers, surpassing existing encryption algorithms and cryptographic systems, are expected to materialize sooner than previously projected. The timeframe for their availability is diminishing daily.
      • Data that is presently deemed secure faces potential vulnerability due to the emergence of harvest-now-decrypt-later strategies.
      • Numerous contemporary security controls, including the most robust encryption techniques, have become obsolete and offer little efficacy.

      Common Obstacles

      • The complexity involved makes it challenging for organizations to incorporate quantum-resistant cryptography into their current IT infrastructure.
      • The endeavor of transitioning to quantum-resilient cryptography demands significant effort and time, with the specific requirements varying for each organization.
      • A lack of comprehensive understanding regarding the cryptographic technologies employed in existing IT systems poses difficulties in identifying and prioritizing systems for upgrading to post-quantum cryptography.

      Info-Tech's Approach

      • The development of quantum-resistant cryptography capabilities is essential for safeguarding the security and integrity of critical applications.
      • Organizations must proactively initiate their transition toward quantum-resistant encryption to ensure data protection.
      • Ensuring the security of corporate data assets should be of utmost importance for organizations, with special emphasis on those possessing highly critical information in light of the advancements in quantum technology.

      Info-Tech Insight

      The advent of quantum computing (QC) is closer than you think: some nations have demonstrated capability with the potential to break current asymmetric-key encryption. Traditional encryption methods will no longer be sufficient as a means of protection. You need to act now to begin your transformation to quantum-resistant encryption.

      Evolvement of QC theory and technologies

      1900-1975

      1976-1997

      1998-2018

      2019-Now

      1. 1900: Max Planck – The energy of a particle is proportional to its frequency: E = hv, where h is a relational constant.
      2. 1926: Erwin Schrödinger – Since electrons can affect each other's states, their energies change in both time and space. The total energy of a particle is expressed as a probability function.
      1. 1976: Physicist Roman Stanisław Ingarden publishes the paper "Quantum Information Theory."
      2. 1980: Paul Benioff describes the first quantum mechanical model of a computer.
      3. 1994: Peter Shor publishes Shor's algorithm.
      1. 1998: A working 2-qubit NMR quantum computer is used to solve Deutsch's problem by Jonathan A. Jones and Michele Mosca at Oxford University.
      2. 2003: DARPA Quantum Network becomes fully operational.
      3. 2011: D-Wave claims to have developed the first commercially available quantum computer, D-Wave One.
      4. 2018: the National Quantum Initiative Act was signed into law by President Donald Trump.
      1. 2019: A paper by Google's quantum computer research team was briefly available, claiming the project has reached quantum supremacy.
      2. 2020: Chinese researchers claim to have achieved quantum supremacy, using a photonic peak 76-qubit system known as Jiuzhang.
      3. 2021: Chinese researchers reported that they have built the world's largest integrated quantum communication network.
      4. 2022: The Quantinuum System Model H1-2 doubled its performance claiming to be the first commercial quantum computer to pass quantum volume 4096.

      Info-Tech Insight

      The advent of QC will significantly change our perception of computing and have a crucial impact on the way we protect our digital economy using encryption. The technology's applicability is no longer a theory but a reality to be understood, strategized about, and planned for.

      Fundamental physical principles and business use cases

      Unlike conventional computers that rely on bits, quantum computers use quantum bits or qubits. QC technology surpasses the limitations of current processing powers. By leveraging the properties of superposition, interference, and entanglement, quantum computers have the capacity to simultaneously process millions of operations, thereby surpassing the capabilities of today's most advanced supercomputers.

      A 2021 Hyperion Research survey of over 400 key decision makers in North America, Europe, South Korea, and Japan showed nearly 70% of companies have some form of in-house QC program.

      Three fundamental QC physical principles

      1. Superposition
      2. Interference
      3. Entanglement

      This is an image of two headings, Optimization; and Simulation. there are five points under each heading, with an arrow above pointing left to right, labeled Qbit Count.

      Info-Tech Insight

      Organizations need to reap the substantial benefits of QC's power, while simultaneously shielding against the same technologies when used by cyber adversaries.

      Percentage of Surveyed Companies That Have QC Programs

      • 31% Have some form of in-house QC program
      • 69% Have no QC program

      Early adopters and business value

      QC early adopters see the promise of QC for a wide range of computational workloads, including machine learning applications, finance-oriented optimization, and logistics/supply chain management.

      This is an image of the Early Adopters, and the business value drivers.

      Info-Tech Insight

      Experienced attackers are likely to be the early adopters of quantum-enabled cryptographic solutions, harnessing the power of QC to exploit vulnerabilities in today's encryption methods. The risks are particularly high for industries that rely on critical infrastructure.

      The need of quantum-safe solution is immediate

      Critical components of classical cryptography will be at risk, potentially leading to the exposure of confidential and sensitive information to the general public. Business, technology, and security leaders are confronted with an immediate imperative to formulate a quantum-safe strategy and establish a roadmap without delay.

      Case Study – Google, 2019

      In 2019, Google claimed that "Our Sycamore processor takes about 200 seconds to sample one instance of a quantum circuit a million times—our benchmarks currently indicate that the equivalent task for a state-of-the-art classical supercomputer would take approximately 10,000 years."
      Source: Nature, 2019

      Why You Should Start Preparation Now

      • The complexity with integrating QC technology into existing IT infrastructure.
      • The effort to upgrade to quantum-resilient cryptography will be significant.
      • The amount of time remaining will decrease every day.

      Case Study – Development in China, 2020

      On December 3, 2020, a team of Chinese researchers claim to have achieved quantum supremacy, using a photonic peak 76-qubit system (43 average) known as Jiuzhang, which performed calculations at 100 trillion times the speed of classical supercomputers.
      Source: science.org, 2020

      Info-Tech Insight

      The emergence of QC brings forth cybersecurity threats. It is an opportunity to regroup, reassess, and revamp our approaches to cybersecurity.

      Security threats posed by QC

      Quantum computers have reached a level of advancement where even highly intricate calculations, such as factoring large numbers into their primes, which serve as the foundation for RSA encryption and other algorithms, can be solved within minutes.

      Threat to data confidentiality

      QC could lead to unauthorized decryption of confidential data in the future. Data confidentiality breaches also impact improperly disposed encrypted storage media.

      Threat to authentication protocols and digital governance

      A recovered private key, which is derived from a public key, can be used through remote control to fraudulently authenticate a critical system.

      Threat to data integrity

      Cybercriminals can use QC technology to recover private keys and manipulate digital documents and their digital signatures.

      Example:

      Consider RSA-2048, a widely used public-key cryptosystem that facilitates secure data transmission. In a 2021 survey, a majority of leading authorities believed that RSA-2048 could be cracked by quantum computers within a mere 24 hours.
      Source: Quantum-Readiness Working Group, 2022

      Info-Tech Insight

      The development of quantum-safe cryptography capabilities is of utmost importance in ensuring the security and integrity of critical applications' data.

      US Quantum Computing Cybersecurity Preparedness Act

      The US Congress considers cryptography essential for the national security of the US and the functioning of the US economy. The Quantum Computing Cybersecurity Preparedness Act was introduced on April 18, 2022, and became a public law (No: 117-260) on December 21, 2022.

      Purpose

      The purpose of this Act is to encourage the migration of Federal Government information technology systems to quantum-resistant cryptography, and for other purposes.

      Scope and Exemption

      • Scope: Systems of government agencies.
      • Exemption: This Act shall not apply to any national security system.

      Main Obligations

      Responsibilities

      Requirements
      Inventory Establishment Not later than 180 days after the date of enactment of this Act, the Director of OMB, shall issue guidance on the migration of information technology to post-quantum cryptography.
      Agency Reports "Not later than 1 year after the date of enactment of this Act, and on an ongoing basis thereafter, the head of each agency shall provide to the Director of OMB, the Director of CISA, and the National Cyber Director— (1) the inventory described in subsection (a)(1); and (2) any other information required to be reported under subsection (a)(1)(C)."
      Migration and Assessment "Not later than 1 year after the date on which the Director of NIST has issued post-quantum cryptography standards, the Director of OMB shall issue guidance requiring each agency to— (1) prioritize information technology described under subsection (a)(2)(A) for migration to post-quantum cryptography; and (2) develop a plan to migrate information technology of the agency to post-quantum cryptography consistent with the prioritization under paragraph (1)."

      "It is the sense of Congress that (1) a strategy for the migration of information technology of the Federal Government to post-quantum cryptography is needed; and (2) the government wide and industry-wide approach to post- quantum cryptography should prioritize developing applications, hardware intellectual property, and software that can be easily updated to support cryptographic agility." – Quantum Computing Cybersecurity Preparedness Act

      The development of post-quantum encryption

      Since 2016, the National Institute of Standards and Technology (NIST) has been actively engaged in the development of post-quantum encryption standards. The objective is to identify and establish standardized cryptographic algorithms that can withstand attacks from quantum computers.

      NIST QC Initiative Key Milestones

      Date Development
      Dec. 20, 2016 Round 1 call for proposals: Announcing request for nominations for public-key post-quantum cryptographic algorithms
      Nov. 30, 2017 Deadline for submissions – 82 submissions received
      Dec. 21, 2017 Round 1 algorithms announced (69 submissions accepted as "complete and proper")
      Jan. 30, 2019 Second round candidates announced (26 algorithms)

      July 22, 2020

      Third round candidates announced (7 finalists and 8 alternates)

      July 5, 2022

      Announcement of candidates to be standardized and fourth round candidates
      2022/2024 (Plan) Draft standards available

      Four Selected Candidates to be Standardized

      CRYSTALS – Kyber

      CRYSTALS – Dilithium

      FALCON

      SPHINCS+

      NIST recommends two primary algorithms to be implemented for most use cases: CRYSTALS-KYBER (key-establishment) and CRYSTALS-Dilithium (digital signatures). In addition, the signature schemes FALCON and SPHINCS+ will also be standardized.

      Info-Tech Insight

      There is no need to wait for formal NIST PQC standards selection to begin your post-quantum mitigation project. It is advisable to undertake the necessary steps and allocate resources in phases that can be accomplished prior to the finalization of the standards.

      Prepare for post-quantum cryptography

      The advent of QC is closer than you think: some nations have demonstrated capability with the potential to break current asymmetric-key encryption. Traditional encryption methods will no longer be sufficient as a means of protection. You need to act now to begin your transformation to quantum-resistant encryption.

      This is an infographic showing the three steps: Threat is Imminent; Risks are Profound; and Take Acton Now.

      Insight summary

      Overarching Insight

      The advent of QC is closer than you think as some nations have demonstrated capability with the potential to break current asymmetric-key encryption. Traditional encryption methods will no longer be sufficient as a means of protection. You need to act now to begin your transformation to quantum-resistant encryption.

      Business Impact Is High

      The advent of QC will significantly change our perception of computing and have a crucial impact on the way we protect our digital economy using encryption. The technology's applicability is no longer a theory but a reality to be understood, strategized about, and planned for.

      It's a Collaborative Effort

      Embedding quantum resistance into systems during the process of modernization requires collaboration beyond the scope of a Chief Information Security Officer (CISO) alone. It is a strategic endeavor shaped by leaders throughout the organization, as well as external partners. This comprehensive approach involves the collective input and collaboration of stakeholders from various areas of expertise within and outside the organization.

      Leverage Industry Standards

      There is no need to wait for formal NIST PQC standards selection to begin your post-quantum mitigation project. It is advisable to undertake the necessary steps and allocate resources in phases that can be accomplished prior to the finalization of the standards.

      Take a Holistic Approach

      The advent of QC poses threats to cybersecurity. It's a time to regroup, reassess, and revamp.

      Blueprint benefits

      IT Benefits

      Business Benefits

      • This blueprint will help organizations to discover and then prioritize the systems to be upgraded to post-quantum cryptography.
      • This blueprint will enable organizations to integrate quantum-resistant cryptography into existing IT infrastructure.
      • Developing quantum-resistant cryptography capabilities is crucial to maintaining data security and integrity for critical applications.
      • This blueprint will help organizations to save effort and time needed upgrade to quantum-resilient cryptography.
      • Organizations will reap the substantial benefits of QC's power, while simultaneously shielding against the same technologies when used by cyber adversaries.
      • Avoid reputation and brand image by preventing data breach and leakage.
      • This blueprint will empower organizations to protect corporate data assets in the post-quantum era.
      • Be compliant with various security and privacy laws and regulations.

      Info-Tech Project Value

      Time, value, and resources saved to obtain buy-in from senior leadership team using our research material:

      1 FTEs*10 days*$100,000/year = $6,000

      Time, value, and resources saved to implement quantum-resistant cryptography using our research guidance:

      2 FTEs* 30 days*$100,000/year = $24,000

      Estimated cost and time savings from this blueprint:

      $6,000 + $24,000 =$30,000

      Get prepared for a post-quantum world

      The advent of sufficiently powerful quantum computers poses a risk of compromising or weakening traditional forms of asymmetric and symmetric cryptography. To safeguard data security and integrity for critical applications, it is imperative to undertake substantial efforts in migrating an organization's cryptographic systems to post-quantum encryption. The development of quantum-safe cryptography capabilities is crucial in this regard.

      Phase 1 - Prepare

      • Obtain buy-in from leadership team.
      • Educate your workforce about the upcoming transition.
      • Create defined projects to reduce risks and improve crypto-agility.

      Phase 2 - Discover

      • Determine the extent of your exposed data, systems, and applications.
      • Establish an inventory of classical cryptographic use cases.

      Phase 3 - Assess

      • Assess the security and data protection risks posed by QC.
      • Assess the readiness of transforming existing classical cryptography to quantum-resilience solutions.

      Phase 4 - Prioritize

      • Prioritize transformation plan based on criteria such as business impact, near-term technical feasibility, and effort, etc.
      • Establish a roadmap.

      Phase 5 - Mitigate

      • Implement post-quantum mitigations.
      • Decommissioning old technology that will become unsupported upon publication of the new standard.
      • Validating and testing products that incorporate the new standard.

      Phase 1 – Prepare: Protect data assets in the post-quantum era

      The rise of sufficiently powerful quantum computers has the potential to compromise or weaken conventional asymmetric and symmetric cryptography methods. In anticipation of a quantum-safe future, it is essential to prioritize crypto-agility. Consequently, organizations should undertake specific tasks both presently and in the future to adequately prepare for forthcoming quantum threats and the accompanying transformations.

      Quantum-resistance preparations must address two different needs:

      Reinforce digital transformation initiatives

      To thrive in the digital landscape, organizations must strengthen their digital transformation initiatives by embracing emerging technologies and novel business practices. The transition to quantum-safe encryption presents a unique opportunity for transformation, allowing the integration of these capabilities to evolve business transactions and relationships in innovative ways.

      Protect data assets in the post-quantum era

      Organizations should prioritize supporting remediation efforts aimed at ensuring the quantum safety of existing data assets and services. The implementation of crypto-agility enables organizations to respond promptly to cryptographic vulnerabilities and adapt to future changes in cryptographic standards. This proactive approach is crucial, as the need for quantum-safe measures existed even before the complexities posed by QC emerged.

      Preparation for the post-quantum world has been recommended by the US government and other national bodies since 2016.

      In 2016, NIST, the National Security Agency (NSA), and Central Security Service stated in their Commercial National Security Algorithm Suite and QC FAQ: "NSA believes the time is now right [to start preparing for the post-quantum world] — consistent with advances in quantum computing."
      Source: Cloud Security Alliance, 2021

      Phase 1 – Prepare: Key tasks

      Preparing for quantum-resistant cryptography goes beyond simply acquiring knowledge and conducting experiments in QC. It is vital for senior management to receive comprehensive guidance on the challenges, risks, and potential mitigations associated with the post-quantum landscape. Quantum and post-quantum education should be tailored to individuals based on their specific roles and the impact of post-quantum mitigations on their responsibilities. This customized approach ensures that individuals are equipped with the necessary knowledge and skills relevant to their respective roles.

      Leadership Buy-In

      • Get senior management commitment to post-quantum project.
      • Determine the extent of exposed data, systems, and applications.
      • Identify near-term, achievable cryptographic maturity goals, creating defined projects to reduce risks and improve crypto-agility.

      Roles and Responsibilities

      • The ownership should be clearly defined regarding the quantum-resistant cryptography program.
      • This should be a cross-functional team within which members represent various business units.

      Awareness and Education

      • Senior management needs to understand the strategic threat to the organization and needs to adequately address the cybersecurity risk in a timely fashion.
      • Educate your workforce about the upcoming transition. All training and education should seek to achieve awareness of the following items with the appropriate stakeholders.

      Info-Tech Insight

      Embedding quantum resistance into systems during the process of modernization requires collaboration beyond the scope of a CISO alone. It is a strategic endeavor shaped by leaders throughout the organization, as well as external partners. This comprehensive approach involves the collective input and collaboration of stakeholders from various areas of expertise within and outside the organization.

      Phase 2 – Discover: Establish a data protection inventory

      During the discovery phase, it is crucial to locate and identify any critical data and devices that may require post-quantum protection. This step enables organizations to understand the algorithms in use and their specific locations. By conducting this thorough assessment, organizations gain valuable insights into their existing infrastructure and cryptographic systems, facilitating the implementation of appropriate post-quantum security measures.

      Inventory Core Components

      1. Description of devices and/or data
      2. Location of all sensitive data and devices
      3. Criticality of the data
      4. How long the data or devices need to be protected
      5. Effective cryptography in use and cryptographic type
      6. Data protection systems currently in place
      7. Current key size and maximum key size
      8. Vendor support timeline
      9. Post-quantum protection readiness

      Key Things to Consider

      • The accuracy and thoroughness of the discovery phase are critical factors that contribute to the success of a post-quantum project.
      • It is advisable to conduct this discovery phase comprehensively across all aspects, not solely limited to public-key algorithms.
      • Performing a data protection inventory can be a time-consuming and challenging phase of the project. Breaking it down into smaller subtasks can help facilitate the process.
      • Identifying all information can be particularly challenging since data is typically scattered throughout an organization. One approach to begin this identification process is by determining the inputs and outputs of data for each department and team within the organization.
      • To ensure accountability and effectiveness, it is recommended to assign a designated individual as the ultimate owner of the data protection inventory task. This person should have the necessary responsibilities and authority to successfully accomplish the task.

      Phase 3 – Assess: The workflow

      Quantum risk assessment entails evaluating the potential consequences of QC on existing security measures and devising strategies to mitigate these risks. This process involves analyzing the susceptibility of current systems to attacks by quantum computers and identifying robust security measures that can withstand QC threats.

      Risk Assessment Workflow

      This is an image of the Risk Assessment Workflow

      By identifying the security gaps that will arise with the advent of QC, organizations can gain insight into the substantial vulnerabilities that core business operations will face when QC becomes a prevalent reality. This proactive understanding enables organizations to prepare and implement appropriate measures to address these vulnerabilities in a timely manner.

      Phase 4 – Prioritize: Balance business value, security risks, and effort

      Organizations need to prioritize the mitigation initiatives based on various factors such as business value, level of security risk, and the effort needed to implement the mitigation controls. In the diagram below, the size of the circle reflects the degree of effort. The bigger the size, the more effort is needed.

      This is an image of a chart where the X axis represents Security Risk level, and the Y axis is Business Value.

      QC Adopters Anticipated Annual Budgets

      This is an image of a bar graph showing the Anticipated Annual Budgets for QC Adopters.
      Source: Hyperion Research, 2022

      Hyperion's survey found that the range of expected budget varies widely.

      • The most selected option, albeit by only 38% of respondents, was US$5 million to US$15 million.
      • About one-third of respondents foresaw annual budgets that exceeded US$15 million, and one-fifth expected budgets to exceed US$25 million.

      Build your risk mitigation roadmap

      2 hours

      1. Review the quantum-resistance initiatives generated in Phase 3 – Assessment.
      2. With input from all stakeholders, prioritize the initiatives based on business value, security risks, and effort using the 2x2 grid.
      3. Review the position of all initiatives and adjust accordingly considering other factors such as dependency, etc.
      4. Place prioritized initiatives to a wave chart.
      5. Assign ownership and target timeline for each initiative.

      This is an image the Security Risk Vs. Business value graph, above an image showing Initiatives Numbered 1-7, divided into Wave 1; Wave 2; and Wave 3.

      Input

      • Data protection inventory created in phase 2
      • Risk assessment produced in phase 3
      • Business unit leaders' and champions' understanding (high-level) of challenges posed by QC

      Output

      • Prioritization of quantum-resistance initiatives

      Materials

      • Whiteboard/flip charts
      • Sticky notes
      • Pen/whiteboard markers

      Participants

      • Quantum-resistance program owner
      • Senior leadership team
      • Business unit heads
      • Chief security officer
      • Chief privacy officer
      • Chief information officer
      • Representatives from legal, risk, and governance

      Phase 5 – Mitigate: Implement quantum-resistant encryption solutions

      To safeguard against cybersecurity risks and threats posed by powerful quantum computers, organizations need to adopt a robust defense-in-depth approach. This entails implementing a combination of well-defined policies, effective technical defenses, and comprehensive education initiatives. Organizations may need to consider implementing new cryptographic algorithms or upgrading existing protocols to incorporate post-quantum encryption methods. The selection and deployment of these measures should be cost-justified and tailored to meet the specific needs and risk profiles of each organization.

      Governance

      Implement solid governance mechanisms to promote visibility and to help ensure consistency

      • Update policies and documents
      • Update existing acceptable cryptography standards
      • Update security and privacy audit programs

      Industry Standards

      • Stay up to date with newly approved standards
      • Leverage industry standards (i.e. NIST's post-quantum cryptography) and test the new quantum-safe cryptographic algorithms

      Technical Mitigations

      Each type of quantum threat can be mitigated using one or more known defenses.

      • Physical isolation
      • Replacing quantum-susceptible cryptography with quantum-resistant cryptography
      • Using QKD
      • Using quantum random number generators
      • Increasing symmetric key sizes
      • Using hybrid solutions
      • Using quantum-enabled defenses

      Vendor Management

      • Work with key vendors on a common approach to quantum-safe governance
      • Assess vendors for possible inclusion in your organization's roadmap
      • Create acquisition policies regarding quantum-safe cryptography

      Research Contributors and Experts

      This is a picture of Adib Ghubril

      Adib Ghubril
      Executive Advisor, Executive Services
      Info-Tech Research Group

      This is a picture of Erik Avakian

      Erik Avakian
      Technical Counselor
      Info-Tech Research Group

      This is a picture of Alaisdar Graham

      Alaisdar Graham
      Executive Counselor
      Info-Tech Research Group

      This is a picture of Carlos Rivera

      Carlos Rivera
      Principal Research Advisor
      Info-Tech Research Group

      This is a picture of Hendra Hendrawan

      Hendra Hendrawan
      Technical Counselor
      Info-Tech Research Group

      This is a picture of Fritz Jean-Louis

      Fritz Jean-Louis
      Principal Cybersecurity Advisor
      Info-Tech Research Group

      Bibliography

      117th Congress (2021-2022). H.R.7535 - Quantum Computing Cybersecurity Preparedness Act. congress.gov, 21 Dec 2022.
      Arute, Frank, et al. Quantum supremacy using a programmable superconducting processor. Nature, 23 Oct 2019.
      Bernhardt, Chris. Quantum Computing for Everyone. The MIT Press, 2019.
      Bob Sorensen. Quantum Computing Early Adopters: Strong Prospects For Future QC Use Case Impact. Hyperion Research, Nov 2022.
      Candelon, François, et al. The U.S., China, and Europe are ramping up a quantum computing arms race. Here's what they'll need to do to win. Fortune, 2 Sept 2022.
      Curioni, Alessandro. How quantum-safe cryptography will ensure a secure computing future. World Economic Forum, 6 July 2022.
      Davis, Mel. Toxic Substance Exposure Requires Record Retention for 30 Years. Alert presented by CalChamber, 18 Feb 2022.
      Eddins, Andrew, et al. Doubling the size of quantum simulators by entanglement forging. arXiv, 22 April 2021.
      Gambetta, Jay. Expanding the IBM Quantum roadmap to anticipate the future of quantum-centric supercomputing. IBM Research Blog, 10 May 2022.
      Golden, Deborah, et al. Solutions for navigating uncertainty and achieving resilience in the quantum era. Deloitte, 2023.
      Grimes, Roger, et al. Practical Preparations for the Post-Quantum World. Cloud Security Alliance, 19 Oct 2021.
      Harishankar, Ray, et al. Security in the quantum computing era. IBM Institute for Business Value, 2023.
      Hayat, Zia. Digital trust: How to unleash the trillion-dollar opportunity for our global economy. World Economic Forum, 17 Aug 2022.
      Mateen, Abdul. What is post-quantum cryptography? Educative, 2023.
      Moody, Dustin. Let's Get Ready to Rumble—The NIST PQC 'Competition.' NIST, 11 Oct 2022.
      Mosca, Michele, Dr. and Dr. Marco Piani. 2021 Quantum Threat Timeline Report. Global Risk Institute, 24 Jan 2022.
      Muppidi, Sridhar and Walid Rjaibi. Transitioning to Quantum-Safe Encryption. Security Intelligence, 8 Dec 2022.
      Payraudeau, Jean-Stéphane, et al. Digital acceleration: Top technologies driving growth in a time of crisis. IBM Institute for Business Value, Nov 2020.
      Quantum-Readiness Working Group (QRWG). Canadian National Quantum-Readiness- Best Practices and Guidelines. Canadian Forum for Digital Infrastructure Resilience (CFDIR), 17 June 2022.
      Rotman, David. We're not prepared for the end of Moore's Law. MIT Technology Review, 24 Feb 2020.
      Saidi, Susan. Calculating a computing revolution. Roland Berger, 2018.
      Shorter., Ted. Why Companies Must Act Now To Prepare For Post-Quantum Cryptography. Forbes.com, 11 Feb 2022.
      Sieger, Lucy, et al. The Quantum Decade, Third edition. IBM, 2022.
      Sorensen, Bob. Broad Interest in Quantum Computing as a Driver of Commercial Success. Hyperion Research, 17 Nov 2021.
      Wise, Jason. How Much Data is Created Every Day in 2022? Earthweb, 22 Sept 2022.
      Wright, Lawrence. The Plague Year. The New Yorker, 28 Dec 2020.
      Yan, Bao, et al. Factoring integers with sublinear resources on a superconducting quantum processor. arXiv, 23 Dec 2022.
      Zhong, Han-Sen, et al. Quantum computational advantage using photons. science.org, 3 Dec 2020.

      Considerations to Optimize Container Management

      • Buy Link or Shortcode: {j2store}499|cart{/j2store}
      • member rating overall impact (scale of 10): N/A
      • member rating average dollars saved: N/A
      • member rating average days saved: N/A
      • Parent Category Name: Data Center & Facilities Strategy
      • Parent Category Link: /data-center-and-facilities-strategy

      Do you experience challenges with the following:

      • Equipping IT operations processes to manage containers.
      • Choosing the right container technology.
      • Optimizing your infrastructure strategy for containers.

      Our Advice

      Critical Insight

      • Plan ahead to ensure your container strategy aligns with your infrastructure roadmap. Before deciding between bare metal and cloud, understand the different components of a container management solution and plan for current and future infrastructure services.
      • When selecting tools from multiple sources, it is important to understand what each tool should and should not meet. This holistic approach is necessary to avoid gaps and duplication of effort.

      Impact and Result

      Use the reference architecture to plan for the solution you need and want to deploy. Infrastructure planning and strategy optimizes the container image supply chain, uses your current infrastructure, and reduces costs for compute and image scan time.

      Considerations to Optimize Container Management Research & Tools

      Besides the small introduction, subscribers and consulting clients within this management domain have access to:

      1. Considerations to Optimize Container Management Deck – A document to guide you design your container strategy.

      A document that walks you through the components of a container management solution and helps align your business objectives with your current infrastructure services and plan for your future assets.

      • Considerations to Optimize Container Management Storyboard

      2. Container Reference Architecture – A best-of-breed template to help you build a clear, concise, and compelling strategy document for container management.

      Complete the reference architecture tool to strategize your container management.

      • Container Reference Architecture
      [infographic]

      Further reading

      Considerations to Optimize Container Management

      Design a custom reference architecture that meets your requirements.

      Analyst Perspective

      Containers have become popular as enterprises use DevOps to develop and deploy applications faster. Containers require managed services because the sheer number of containers can become too complex for IT teams to handle. Orchestration platforms like Kubernetes can be complex, requiring management to automatically deploy container-based applications to operating systems and public clouds. IT operations staff need container management skills and training.

      Installing and setting up container orchestration tools can be laborious and error-prone. IT organizations must first implement the right infrastructure setup for containers by having a solid understanding of the scope and scale of containerization projects and developer requirements. IT administrators also need to know how parts of the existing infrastructure connect and communicate to maintain these relationships in a containerized environment. Containers can run on bare metal servers, virtual machines in the cloud, or hybrid configurations, depending on your IT needs

      Nitin Mukesh, Senior Research Analyst, Infrastructure and Operations

      Nitin Mukesh
      Senior Research Analyst, Infrastructure and Operations
      Info-Tech Research Group

      Executive Summary

      Your Challenge Common Obstacles Info-Tech’s Approach

      The container software market is constantly evolving. Organizations must consider many factors to choose the right container management software for their specific needs and fit their future plans.

      It's important to consider your organization's current and future infrastructure strategy and how it fits with your container management strategy. The container management platform you choose should be compatible with the existing network infrastructure and storage capabilities available to your organization.

      IT operations staff have not been thinking the same way as developers who have now been using an agile approach for some time. Container image builds are highly automated and have several dependencies including scheduling, testing, and deployment that the IT staff is not trained for or lack the ability to create anything more than a simple image.

      Use the reference architecture to plan for the solution you need and want to deploy. Infrastructure planning and strategy optimizes the container image supply chain and reduces costs for compute and image scan time.

      Plan ahead to ensure your container strategy aligns with your infrastructure roadmap. Before deciding between bare metal and cloud, understand the different components of a container management solution and plan for current and future infrastructure services.

      Your challenge

      Choosing the right container technology: IT is a rapidly changing and evolving market, with startups and seasoned technology vendors maintaining momentum in everything from container platforms to repositories to orchestration tools. The rapid evolution of container platform components such as orchestration, storage, networking, and system services such as load balancing has made the entire stack a moving target.

      However, waiting for the industry to be standardized can be a recipe for paralysis, and waiting too long to decide on solutions and approaches can put a company's IT operations in catch-up mode.

      Keeping containers secure: Security breaches in containers are almost identical to operating system level breaches in virtual machines in terms of potential application and system vulnerabilities. It is important for any DevOps team working on container and orchestration architecture and management to fully understand the potential vulnerabilities of the platforms they are using.

      Optimize your infrastructure strategy for containers: One of the challenges enterprise IT operations management teams face when it comes to containers is the need to rethink the underlying infrastructure to accommodate the technology. While you may not want to embrace the public cloud for your critical applications just yet, IT operations managers will need an on-premises infrastructure so that applications can scale up and down the same way as they are containerized.

      Common ways organizations use containers

      A Separation of responsibilities
      Containerization provides a clear separation of responsibilities as developers can focus on application logic and dependencies, while IT operations teams can focus on deployment and management instead of application details such as specific software versions and configurations.

      B Workload portability
      Containers can run almost anywhere: physical servers or on-premise data centers on virtual machines or developer machines, as well as public clouds on Linux, Windows, or Mac operating systems, greatly easing development and deployment.

      “Lift and shift” existing applications into a modern cloud architecture. Some organizations even use containers to migrate existing applications to more modern environments. While this approach provides some of the basic benefits of operating system virtualization, it does not provide all the benefits of a modular, container-based application architecture.

      C Application isolation
      Containers virtualize CPU, memory, storage, and network resources at the operating system level, providing developers with a logically isolated view of the operating system from other applications.

      Source: TechTarget, 2021

      What are containers and why should I containerize?

      A container is a partially isolated environment in which an application or parts of an application can run. You can use a single container to run anything from small microservices or software processes to larger applications. Inside the container are all the necessary executable, library, and configuration files. Containers do not contain operating system images. This makes them lighter and more portable with much less overhead. Large application deployments can deploy multiple containers into one or more container clusters (CapitalOne, 2020).

      Containers have the following advantages:

      • Reduce overhead costs: Because containers do not contain operating system images, they require fewer system resources than traditional or hardware virtual machine environments.
      • Enhanced portability: Applications running in containers can be easily deployed on a variety of operating systems and hardware platforms.
      • More consistent operations: DevOps teams know that applications in containers run the same no matter where they are deployed.
      • Efficiency improvement: Containers allow you to deploy, patch, or scale applications faster.
      • Develop better applications: Containers support Agile and DevOps efforts to accelerate development and production cycles.

      Source: CapitalOne, 2020

      Container on the cloud or on-premise?

      On-premises containers Public cloud-based containers

      Advantages:

      • Full control over your container environment.
      • Increased flexibility in networking and storage configurations.
      • Use any version of your chosen tool or container platform.
      • No need to worry about potential compliance issues with data stored in containers.
      • Full control over the host operating system and environment.

      Disadvantages:

      • Lack of easy scalability. This can be especially problematic if you're using containers because you want to be more agile from a DevOps perspective.
      • No turnkey container deployment solution. You must set up and maintain every component of the container stack yourself.

      Advantages:

      • Easy setup and management through platforms such as Amazon Elastic Container Service or Azure Container Service. These products require significant Docker expertise to use but require less installation and configuration than on-premise installations.
      • Integrates with other cloud-based tools for tasks such as monitoring.
      • Running containers in the cloud improves scalability by allowing you to add compute and storage resources as needed.

      Disadvantages:

      • You should almost certainly run containers on virtual machines. That can be a good thing for many people; however, you miss out on some of the potential benefits of running containers on bare metal servers, which can be easily done.
      • You lose control. To build a container stack, you must use the orchestrator provided by your cloud host or underlying operating system.

      Info-Tech Insight
      Start-ups and small businesses that don't typically need to be closely connected to hardware can easily move (or start) to the cloud. Large (e.g. enterprise-class) companies and companies that need to manage and control local hardware resources are more likely to prefer an on-premises infrastructure. For enterprises, on-premises container deployments can serve as a bridge to full public cloud deployments or hybrid private/public deployments. The answer to the question of public cloud versus on premises depends on the specific needs of your business.

      Container management

      From container labeling that identifies workloads and ownership to effective reporting that meets the needs of different stakeholders across the organization, it is important that organizations establish an effective framework for container management.

      Four key considerations for your container management strategy:

      01 Container Image Supply Chain
      How containers are built

      02 Container Infrastructure and Orchestration
      Where and how containers run together

      03 Container Runtime Security and Policy Enforcement
      How to make sure your containers only do what you want them to do

      04 Container Observability
      Runtime metrics and debugging

      To effectively understand container management solutions, it is useful to define the various components that make up a container management strategy.

      1: Container image supply chain

      To run a workload as a container, it must first be packaged into a container image. The image supply chain includes all libraries or components that make up a containerized application. This includes CI/CD tools to test and package code into container images, application security testing tools to check for vulnerabilities and logic errors, registries and mirroring tools for hosting container images, and attribution mechanisms such as image signatures for validating images in registries.

      Important functions of the supply chain include the ability to:

      • Scan container images in registries for security issues and policy compliance.
      • Verify in-use image hashes have been scanned and authorized.
      • Mirror images from public registries to isolate yourself from outages in these services.
      • Attributing images to the team that created them.

      Source: Rancher, 2022

      Info-Tech Insight
      It is important to consider disaster recovery for your image registry. As mentioned above, it is wise to isolate yourself from registry disruptions. However, external registry mirroring is only one part of the equation. You also want to make sure you have a high availability plan for your internal registry as well as proper backup and recovery processes. A highly available, fault-tolerant container management platform is not just a runtime environment.

      2: Container infrastructure and orchestration

      Orchestration tools

      Once you have a container image to run, you need a location to run it. That means both the computer the container runs on and the software that schedules it to run. If you're working with a few containers, you can make manual decisions about where to run container images, what to run with container images, and how best to manage storage and network connectivity. However, at scale, these kinds of decisions should be left to orchestration tools like Kubernetes, Swarm, or Mesos. These platforms can receive workload execution requests, determine where to run based on resource requirements and constraints, and then actually launch that workload on its target. And if a workload fails or resources are low, it can be restarted or moved as needed.

      Source: DevOpsCube, 2022

      Storage

      Storage is another important consideration. This includes both the storage used by the operating system and the storage used by the container itself. First, you need to consider the type of storage you actually need. Can I outsource my storage concerns to a cloud provider using something like Amazon Relational Database Service instead? If not, do you really need block storage (e.g. disk) or can an external object store like AWS S3 meet your needs? If your external object storage service can meet your performance and durability requirements as well as your governance and compliance needs, you're in luck. You may not have to worry about managing the container's persistent storage. Many external storage services can be provisioned on demand, support discrete snapshots, and some even allow dynamic scaling on demand.

      Networking

      Network connectivity inside and outside the containerized environment is also very important. For example, Kubernetes supports a variety of container networking interfaces (CNIs), each providing different functionality. Questions to consider here are whether you can set traffic control policies (and the OSI layer), how to handle encryption between workloads and between workloads and external entities, and how to manage traffic import for containerized workloads. The impact of these decisions also plays a role on performance.

      Backups

      Backups are still an important task in containerized environments, but the backup target is changing slightly. An immutable, read-only container file system can be recreated very easily from the original container image and does not need to be backed up. Backups or snapshots on permanent storage should still be considered. If you are using a cloud provider, you should also consider fault domain and geo-recovery scenarios depending on the provider's capabilities. For example, if you're using AWS, you can use S3 replication to ensure that EBS snapshots can be restored in another region in case of a full region outage.

      3: Container runtime security and policy enforcement

      Ensuring that containers run in a place that meets the resource requirements and constraints set for them is necessary, but not sufficient. It is equally important that your container management solution performs continuous validation and ensures that your workloads comply with all security and other policy requirements of your organization. Runtime security and policy enforcement tools include a function for detecting vulnerabilities in running containers, handling detected vulnerabilities, ensuring that workloads are not running with unnecessary or unintended privileges, and ensuring that only other workloads that need to be allowed can connect.

      One of the great benefits of (well implemented) containerized software is reducing the attackable surface of the application. But it doesn't completely remove it. This means you need to think about how to observe running applications to minimize security risks. Scanning as part of the build pipeline is not enough. This is because an image without vulnerabilities at build time can become a vulnerable container because new flaws are discovered in its code or support libraries. Instead, some modern tools focus on detecting unusual behavior at the system call level. As these types of tools mature, they can make a real difference to your workload’s security because they rely on actual observed behavior rather than up-to-date signature files.

      4: Container observability

      What’s going on in there?

      Finally, if your container images are being run somewhere by orchestration tools and well managed by security and policy enforcement tools, you need to know what your containers are doing and how well they are doing it. Orchestration tools will likely have their own logs and metrics, as will networking layers, and security and compliance checking tools; there is a lot to understand in a containerized environment. Container observability covers logging and metrics collection for both your workloads and the tools that run them.

      One very important element of observability is the importance of externalizing logs and metrics in a containerized environment. Containers come and go, and in many cases the nodes running on them also come and go, so relying on local storage is not recommended.

      The importance of a container management strategy

      A container management platform typically consists of a variety of tools from multiple sources. Some container management software vendors or container management services attempt to address all four key components of effective container management. However, many organizations already have tools that provide at least some of the features they need and don't want to waste existing licenses or make significant changes to their entire infrastructure just to run containers.

      When choosing tools from multiple sources, it's important to understand what needs each tool meets and what it doesn't. This holistic approach is necessary to avoid gaps and duplication of effort.

      For example, scanning an image as part of the build pipeline and then rescanning the image while the container is running is a waste of CPU cycles in the runtime environment. Similarly, using orchestration tools and separate host-based agents to aggregate logs or metrics can waste CPU cycles as well as storage and network resources.

      Planning a container management strategy

      1 DIY, Managed Services, or Packaged Products
      Developer satisfaction is important, but it's also wise to consider the team running the container management software. Migrating from bare metal or virtual machine-based deployment methodologies to containers can involve a significant learning curve, so it's a good idea to choose a tool that will help smooth this curve.
      2 Kubernetes
      In the world of container management, Kubernetes is fast becoming the de facto standard for container orchestration and scheduling. Most of the products that address the other aspects of container management discussed in this post (image supply chain, runtime security and policy enforcement, observability) integrate easily with Kubernetes. Kubernetes is open-source software and using it is possible if your team has the technical skills and the desire to implement it themselves. However, that doesn't mean you should automatically opt to build yourself.
      3 Managed Kubernetes
      Kubernetes is difficult to implement well. As a result, many solution providers offer packaged products or managed services to facilitate Kubernetes adoption. All major cloud providers now offer Kubernetes services that reduce the operational burden on your teams. Organizations that have invested heavily in the ecosystem of a particular cloud provider may find this route suitable. Other organizations may be able to find a fully managed service that provides container images and lets the service provider worry about running the images which, depending on the cost and capacity of the organization, may be the best option.
      4 Third-Party Orchestration Products
      A third approach is packaged products from providers that can be installed on the infrastructure (cloud or otherwise). These products can offer several potential advantages over DIY or cloud provider offerings, such as access to additional configuration options or cluster components, enhanced functionality, implementation assistance and training, post-installation product support, and reduced risk of cloud provider lock-in.

      Source: Kubernetes, 2022; Rancher, 2022

      Infrastructure considerations

      It's important to describe your organization’s current and future infrastructure strategy and how it fits into your container management strategy. It’s all basic for now, but if you plan to move to a virtual machine or cloud provider next year, your container management solution should be able to adapt to your environment now and in the future. Similarly, if you’ve already chosen a public cloud, you may want to make sure that the tool you choose supports some of the cloud options, but full compatibility may not be an important feature.

      Infrastructure considerations extend beyond computing. Choosing a container management platform should be compatible with the existing network infrastructure and storage capacity available to your organization. If you have existing policy enforcement, monitoring, and alerting tools, the ideal solution should be able to take advantage of them. Moving to containers can be a game changer for developers and operations teams, so continuing to use existing tools to reduce complexity where possible can save time and money.

      Leverage the reference architecture to guide your container management strategy

      Questions for support transition

      Using the examples as a guide, complete the tool to strategize your container management

      Download the Reference Architecture

      Bibliography

      Mell, Emily. “What is container management and why is it important?” TechTarget, April 2021.
      https://www.techtarget.com/searchitoperations/definition/container-management-software#:~:text=A%20container%20management%20ecosystem%20automates,operator%20to%20keep%20up%20with

      Conrad, John. “What is Container Orchestration?” CapitalOne, 24 August 2020.
      https://www.capitalone.com/tech/cloud/what-is-container-orchestration/?v=1673357442624

      Kubernetes. “Cluster Networking.” Kubernetes, 2022.
      https://kubernetes.io/docs/concepts/cluster-administration/networking/

      Rancher. “Comparing Kubernetes CNI Providers: Flannel, Calico, Canal, and Weave.” Rancher, 2022.
      https://www.suse.com/c/rancher_blog/comparing-kubernetes-cni-providers-flannel-calico-canal-and-weave/

      Wilson, Bob. “16 Best Container Orchestration Tools and Services.” DevopsCube, 5 January 2022.
      https://devopscube.com/docker-container-clustering-tools/

      Make the Case for Legacy Application Modernization

      • Buy Link or Shortcode: {j2store}613|cart{/j2store}
      • member rating overall impact (scale of 10): N/A
      • member rating average dollars saved: N/A
      • member rating average days saved: N/A
      • Parent Category Name: Selection & Implementation
      • Parent Category Link: /selection-and-implementation
      • Organizations are under continual pressure to deliver faster, with shorter time-to-market, while introducing new products and services at the same time.
      • You and your team have concerns that your existing portfolio of applications is not up to the task.
      • While you understand the need for more investments to modernize your portfolio, your leadership does not appreciate what is required.

      Our Advice

      Critical Insight

      • Legacy modernization is a process, not a single event.
      • Your modernization approach requires you to understand your landscape and decide on a path that minimizes business continuity risks, keeps the investments under control, and is prepared for surprises but always has your final state in mind.

      Impact and Result

      • Evaluate the current state, develop a legacy application strategy, and execute in an agile manner.
      • When coupled with a business case and communications strategy, this approach gives the organization a clear decision-making framework that will maximize business outcomes and deliver value where needed.

      Make the Case for Legacy Application Modernization Research & Tools

      Besides the small introduction, subscribers and consulting clients within this management domain have access to:

      1. Make the Case for Legacy Application Modernization Storyboard – Understand legacy application modernization in the context of your organization, assess your landscape of applications, and define prioritization and disposition.

      This blueprint provides the steps necessary to build your own enterprise application implementation playbook that can be deployed and leveraged by your implementation teams.

      • Make the Case for Legacy Application Modernization Storyboard

      2. Make the Case for Legacy Application Modernization Presentation Template – The key output from leveraging this research is a presentation to pitch the modernization process.

      Build a proposal deck to make the case for legacy application modernization for your stakeholders. This will contain a definition of what a legacy application is in the context of your organization, a list of candidate applications to modernize, and a disposition strategy for each selected application.

      • Make the Case for Legacy Application Modernization Presentation Template
      [infographic]

      Further reading

      Make the Case for Legacy Application Modernization

      Revamp your business potential to improve agility, security, and user experience while reducing costs.

      Analyst Perspective

      An old application may have served us reliably, but it can prevent us from pursuing future business needs.

      Legacy systems remain well-embedded in the fabric of many organizations' application portfolios. They were often custom-built to meet the needs of the business. Typically, these are core tools that the business leverages to accomplish its goals.

      A legacy application becomes something we need to address when it no longer supports our business goals, is no longer supportable, bears an unsustainable ownership cost, or poses a threat to the organization's cybersecurity or compliance.

      When approaching your legacy application strategy, you must navigate a complex web of business, stakeholder, software, hardware, resourcing, and financial decisions. To complicate matters, the full scope of required effort is not immediately clear. Years of development are embedded in these legacy applications, which must be uncovered and dealt with appropriately.

      IT leaders require a proactive approach for evaluating the current state, developing a legacy application strategy, and executing in an agile manner. When coupled with a business case and communications strategy, the organization will have a clear decision-making framework that will maximize business outcomes and deliver value where needed.

      Ricardo de Oliveira, Research Director, Enterprise Applications

      Ricardo de Oliveira
      Research Director, Enterprise Applications
      Info-Tech Research Group

      Executive Summary

      Your Challenge Common Obstacles Info-Tech's Approach
      • Organizations face continual pressure to decrease time-to-market while also introducing new products and services.
      • You and your team have concerns that the existing application portfolio is not up to the task.
      • While you may understand the need for greater investment to modernize your portfolio, leadership does not appreciate what is required.
      • For well-established organizations, applications can have a long lifespan. Employees who are used to existing tools and processes often resist change.
      • Modernization plans can be substantial, but budget and resources are limited.
      • Poor documentation of legacy applications can make it challenging to know what to modernize and how to do it effectively.
      • There are concerns that any changes will have material impacts on business continuity.
      • Info-Tech will enable you to build a proposal deck to make the case for legacy application modernization for your stakeholders. This will assist with:
        • Defining what a legacy application is in the context of your organization.
        • Creating a list of candidate applications for modernization.
        • Articulating the right disposition strategy for each selected applications.
        • Laying out what is next on your modernization journey.

      Info-Tech Insight
      Legacy modernization is a process, not a single event. Your modernization approach requires you to understand your landscape and decide on a path that minimizes business continuity risks, keeps investments under control, and is prepared for surprises but always has your final state in mind.

      An approach to making the case for legacy application modernization

      Understand
      Assess the challenges, lay out the reasons, define your legacy, and prepare to remove the barriers to modernization.
      Assess
      Determine the benefits by business capability. Leverage APM foundations to select the candidate applications and prioritize.
      Legacy Application Modernization
      Define
      Use the prioritized application list to drive the next steps to modernization.

      Legacy application modernization is perceived as necessary to remain competitive

      The 2022 State CIO Survey by NASCIO shows that legacy application modernization jumped from fifth to second in state CIO priorities.

      "Be patient and also impatient. Patient because all states have a lot of legacy tech they are inheriting and government is NOT easy. But also, impatient because there is a lot to do - make your priorities clear but also find out what the CIO needs to accomplish those priorities."

      Source: NASCIO, 2022

      State CIO Priorities

      US government agencies feel pressured to deal with legacy applications

      In fiscal year 2021, the US government planned to spend over $100 billion on information technology. Most of that was to be used to operate and maintain existing systems, including legacy applications, which can be both more expensive to maintain and more vulnerable to hackers. The Government Accountability Office (GAO) identified:

      • 10 critical federal IT legacy systems
      • In operation between 8 and 51 years
      • Collectively cost $337 million per year to operate and maintain

      Source: U.S. Government Accountability Office, 2021

      Example: In banking, modern platforms are essential

      Increasing competition from fintech 73% of financial services executives perceive retail banking as being the most susceptible to fintech disruption (PwC, 2016)
      Growing number of neo-banks The International Monetary Fund (IMF) notes the fast growth of fintech in financial services is creating systemic risk to global financial stability (IMF, 2022)
      Access to data and advanced analytics Estimated global bank revenue lost due to poor data is 15% to 25% (MIT, 2017)
      Shifting client expectations/demographics 50% of Gen X, millennials, and Gen Z use a digital bank to provide their primary checking account (Finextra, 2022)
      Generational transfer of wealth It is estimated that up to US$68 trillion in wealth will be transferred from baby boomers (Forbes, 2021)

      Case Study

      Delta takes off with a modernized blend of mainframes and cloud

      INDUSTRY: Transportation
      SOURCE: CIO Magazine, 2023

      Challenge
      The airline has hundreds of applications in the process of moving to the cloud, but most main capabilities are underpinned by workloads on the mainframe and will remain so for the foreseeable future.
      Some of those workloads include travel reservation systems and crew scheduling systems - mission-critical, 24/7 applications that are never turned off.
      Solution
      Delta has shifted to a hybrid architecture, with a customer experience transformation that makes the most of the cloud's agility and the mainframe's dependability.
      Delta's foray into the cloud began about two years ago as the pandemic brought travel to a virtual halt. The airline started migrating many front-end and distributed applications to the cloud while retaining traditional back-end workloads on the mainframe.
      Results
      Hybrid infrastructures are expected to remain in complex industries such as airlines and banking, where high availability and maximum reliability are non-negotiable.
      While some CIOs are sharpening their mainframe exit strategies by opting for a steep journey to the cloud, mainframes remain ideal for certain workloads.

      Phase 1: Make the Case for Legacy Application Modernization

      Phase 1
      1.1 Understand your challenges
      1.2 Define legacy applications
      1.3 Assess your barriers
      1.4 Find the impacted capabilities
      1.5 Define candidate applications
      1.6 Now, Next, Later

      This phase will walk you through the following activities:

      • Understand your challenges with modernization
      • Define legacy applications in your context
      • Assess your barriers to modernization
      • Find the impacted capabilities and their benefits
      • Define candidate applications and dispositions

      This phase involves the following participants:

      • Application group leaders
      • Individual application owners

      Cybersecurity Priorities in Times of Pandemic

      • Buy Link or Shortcode: {j2store}381|cart{/j2store}
      • member rating overall impact (scale of 10): N/A
      • member rating average dollars saved: N/A
      • member rating average days saved: N/A
      • Parent Category Name: Security Processes & Operations
      • Parent Category Link: /security-processes-and-operations
      • Novel coronavirus 2019 (COVID-19) has thrown organizations around the globe into chaos as they attempt to continue operations while keeping employees safe.
      • IT needs to support business continuity – juggling available capacity and ensuring that services are available to end users – without clarity of duration, amid conditions that change daily, on a scale never seen before.
      • Security has never been more important than now. But…where to start? What are the top priorities? How do we support remote work while remaining secure?

      Our Advice

      Critical Insight

      • There is intense pressure to enable employees to work remotely, as soon as possible. IT is scrambling to enable access, source equipment to stage, and deploy products to employees, many of whom are unfamiliar with working from home.
      • There is either too much security to allow people to be productive or too little security to ensure that the organization remains protected and secure.
      • These events are unprecedented, and no plan currently exists to sufficiently maintain a viable security posture during this interim new normal.

      Impact and Result

      • Don’t start from scratch. Leverage your current security framework, processes, and mechanisms but tailor them to accommodate the new way of remote working.
      • Address priority security items related to remote work capability and its implications in a logical sequence. Some security components may not be as time sensitive as others.
      • Remain diligent! Circumstances may have changed, but the importance of security has not. In fact, IT security is likely more important now than ever before.

      Cybersecurity Priorities in Times of Pandemic Research & Tools

      Start here – read our Cybersecurity Priorities research.

      Our recommendations and the accompanying checklist tool will help you quickly get a handle on supporting a remote workforce while maintaining security in your organization.

      Besides the small introduction, subscribers and consulting clients within this management domain have access to:

      • Cybersecurity Priorities in Times of Pandemic Storyboard
      • Cybersecurity Priorities Checklist Tool
      [infographic]

      2020 IT Talent Trend Report

      • Buy Link or Shortcode: {j2store}512|cart{/j2store}
      • member rating overall impact (scale of 10): N/A
      • member rating average dollars saved: N/A
      • member rating average days saved: N/A
      • Parent Category Name: Lead
      • Parent Category Link: /lead
      • IT is an employee’s market.
      • Automation, outsourcing, and emerging technologies are widening the skill gap and increasing the need for skilled staff.
      • IT departments must find new ways to attract and retain top talent.

      Our Advice

      Critical Insight

      • Improving talent management is the way forward, but many IT leaders are approaching it the wrong way.
      • Among the current climate of automating everything in the workplace, we need to bring the human element back into talent management.

      Impact and Result

      • Using talent management strategies that speak to employees as individuals, rather than cogs in a machine, produces more effective IT departments.
      • IT leaders who make use of these strategies see benefits across the talent lifecycle – from hiring, to training, to retention.

      2020 IT Talent Trend Report Research & Tools

      Start here – read the Executive Brief

      Read our concise Executive Brief to find out why you should focus on talent management and get an overview of what successful IT leaders are doing differently heading into 2020 – the six new talent management trends.

      Besides the small introduction, subscribers and consulting clients within this management domain have access to:

      1. IT takes ownership of talent acquisition

      IT leaders who get personally involved in recruitment see better results. Read this section to learn how leader are getting involved, and how to take the first steps.

      • 2020 IT Talent Trend Report – Trend 1: IT Takes Ownership of Talent Acquisition

      2. Flexible work becomes fluid work

      Heading into 2020, flexible work is table stakes. Read this section to learn what organizations offer and how you can take advantage of opportunities your competitors are missing.

      • 2020 IT Talent Trend Report – Trend 2: Flexible Work Becomes Fluid Work

      3. The age of radical transparency

      Ethics and transparency are emerging as key considerations for employees. How can you build a culture that supports this? Read this section to learn how.

      • 2020 IT Talent Trend Report – Trend 3: The Age of Radical Transparency

      4. People analytics is business analytics

      Your staff is the biggest line item in your budget, but are you using data to make decisions about your people they way you do in other areas of the business? Read this section to learn how analytics can be applied to the workforce no matter what level you are starting at.

      • 2020 IT Talent Trend Report – Trend 4: People Analytics Is Business Analytics

      5. IT departments become their own universities

      With the rapid pace of technological change, it is becoming increasingly harder to hire skilled people for critical roles. Read this section to learn how some IT departments are turning to in-house training to fill the skill gap.

      • 2020 IT Talent Trend Report – Trend 5: IT Departments Become Their Own Universities

      6. Offboarding: The missed opportunity

      What do an employee's last few days with your company look like? For most organizations, they are filled with writing rushed documentation, hosting last-minute training sessions and finishing up odd jobs. Read this section to understand the crucial opportunity most IT departments are missing when it comes to departing staff.

      • 2020 IT Talent Trend Report – Trend 6: Offboarding: The Missed Opportunity
      [infographic]

      Leadership, Culture and Values

      • Buy Link or Shortcode: {j2store}34|cart{/j2store}
      • Related Products: {j2store}34|crosssells{/j2store}
      • member rating overall impact (scale of 10): 9.4/10
      • member rating average dollars saved: $912
      • member rating average days saved: 7
      • Parent Category Name: People and Resources
      • Parent Category Link: /people-and-resources

      The challenge

      • Your talent pool determines IT performance and stakeholder satisfaction. You need to retain talent and continually motivate them to go the extra mile.
      • The market for IT talent is growing, in the sense that talent has many more options these days. Turnover is a serious threat to IT's ability to deliver top-notch service to your company.
      • Engagement is more than HR's responsibility. IT leadership is accountable for the retention of top talent and the overall productivity of IT employees.

      Our advice

      Insight

      • Engagement goes both ways. Your initiatives must address a real need, and employees must actively seek the outcomes. Engagement is not a management edict.
      • Engagement is not about access to the latest perks and gadgets. You must address the right and challenging issues. Use a systematic approach to find what lives among the employees and address these.
      • Your impact on your employees is many times bigger than HR's. Leverage your power to lead your team to success and peak performance.

      Impact and results 

      • Our engagement diagnostic and other tools will help get to the root of disengagement in your team.
      • Our guidance helps you to avoid common errors and engagement program pitfalls. They allow you to take control of your own team's engagement.

      The roadmap

      Besides the small introduction, subscribers and consulting clients within this management domain have access to:

      Get started

      Our concise executive brief shows you why engagement is critical to IT performance in your company. We'll show you our methodology and the ways we can help you in handling this.

      Measure your employee engagement

      You can use our full engagement surveys.

      • Improve Employee Engagement to Drive IT Performance – Phase 1: Measure Employee Engagement (ppt)
      • Engagement Strategy Record (doc)
      • Engagement Communication Template (doc)

      Analyze the results and brainstorm solutions

      Understand your employees' engagement drivers. Involve your team in brainstorming engagement initiatives.

      • Improve Employee Engagement to Drive IT Performance – Phase 2: Analyze Results and Ideate Solutions (ppt)
      • Engagement Survey Results Interpretation Guide (ppt)
      • Full Engagement Survey Focus Group Facilitation Guide (ppt)
      • Pulse Engagement Survey Focus Group Facilitation Guide (ppt)
      • Focus Group Facilitation Guide Driver Definitions (doc)
      • One-on-One Manager Meeting Worksheet (doc)

      Select and implement engagement initiatives

      Choose those initiatives that show the most promise with the most significant impact. Create your action plan and establish transparent and open, and ongoing communication with your team.

      • IT Knowledge Transfer Plan Template (xls)
      • IT Knowledge Identification Interview Guide Template (doc)

      Build your knowledge transfer roadmap

      Knowledge transfer is an ongoing effort. Prioritize and define your initiatives.

      • Improve Employee Engagement to Drive IT Performance – Phase 3: Select and Implement Engagement Initiatives (ppt)
      • Summary of Interdepartmental Engagement Initiatives (doc)
      • Engagement Progress One-Pager (ppt)


      Secure Your Hybrid Workforce

      • Buy Link or Shortcode: {j2store}271|cart{/j2store}
      • member rating overall impact (scale of 10): N/A
      • member rating average dollars saved: N/A
      • member rating average days saved: N/A
      • Parent Category Name: Secure Cloud & Network Architecture
      • Parent Category Link: /secure-cloud-network-architecture
      • Many IT and security leaders struggle to cope with the challenges associated with an hybrid workforce and how best to secure it.
      • Understanding the main principles of zero trust: never trust, always verify, assume breach, and verify explicitly.
      • How to go about achieving a zero trust framework.
      • Understanding the premise of SASE as it pertains to a hybrid workforce.

      Our Advice

      Critical Insight

      Securing your hybrid workforce should be an opportunity to get started on the zero trust journey. Realizing the core features needed to achieve this will assist you determine which of the options is a good fit for your organization.

      Impact and Result

      Every organization's strategy to secure their hybrid workforce should include introducing zero trust principles in certain areas. Our unique approach:

      • Assess the suitability of SASE/SSE and zero trust.
      • Present capabilities and feature benefits.
      • Procure SASE product and/or build a zero trust roadmap.

      Secure Your Hybrid Workforce Research & Tools

      Besides the small introduction, subscribers and consulting clients within this management domain have access to:

      1. Secure Your Hybrid Workforce Deck – The purpose of the storyboard is to provide a detailed description of the steps involved in securing your hybrid workforce with zero trust.

      The storyboard contains two easy-to-follow steps on securing your hybrid workforce with zero trust, from assessing the suitability of SASE/SSE to taking a step in building a zero trust roadmap.

      • Secure Your Hybrid Workforce – Phases 1-2

      2. Suitability Assessment Tool – A tool to identify whether SASE/SSE or a zero trust roadmap is a better fit for your organization.

      Use this tool to identify your next line of action in securing your hybrid workforce by assessing key components that conforms to the ideals and principles of Zero Trust.

      • Zero Trust - SASE Suitability Assessment Tool

      3. RFP Template – A document to guide you through requesting proposals from vendors.

      Use this document to request proposals from select vendors.

      • Request for Proposal (RFP) Template
      [infographic]

      Further reading

      Secure Your Hybrid Workforce

      SASE as a driver to zero trust.

      Analyst Perspective

      Consolidate your security and network.

      Remote connections like VPNs were not designed to be security tools or to have the capacity to handle a large hybrid workforce; hence, organizations are burdened with implementing controls that are perceived to be "security solutions." The COVID-19 pandemic forced a wave of remote work for employees that were not taken into consideration for most VPN implementations, and as a result, the understanding of the traditional network perimeter as we always knew it has shifted to include devices, applications, edges, and the internet. Additionally, remote work is here to stay as recruiting talent in the current market means you must make yourself attractive to potential hires.

      The shift in the network perimeter increases the risks associated with traditional VPN solutions as well as exposing the limitations of the solution. This is where zero trust as a principle introduces a more security-focused strategy that not only mitigates most (if not all) of the risks, but also eliminates limitations, which would enhance the business and improve customer/employee experience.

      There are several ways of achieving zero trust maturity, and one of those is SASE, which consolidates security and networking to better secure your hybrid workforce as implied trust is thrown out of the window and verification of everything becomes the new normal to defend the business.

      This is a picture of Victor Okorie

      Victor Okorie
      Senior Research Analyst, Security and Privacy
      Info-Tech Research Group

      Executive Summary

      Your Challenge

      CISOs are looking to zero trust to fill the gaps associated with their traditional remote setup as well as to build an adaptable security strategy. Some challenges faced include:

      • Understanding the main principles of zero trust: never trust, always verify, assume breach, and verify explicitly.
      • Understanding how to achieve a zero trust framework.
      • Understanding the premise of SASE as it pertains to a hybrid workforce.

      Common Obstacles

      The zero trust journey may seem tedious because of a few obstacles like:

      • Knowing what the principle is all about and the components that align with it.
      • Knowing where to start. Due to the lack of a standardized path for the zero trust journey, going about the journey can be confusing.
      • Not having a uniform definition of what makes up a SASE solution as it is heavily dependent on vendors.

      Info-Tech's Approach

      Info-Tech provides a three-service approach to helping organizations better secure their hybrid workforce.

      • Understand your current, existing technological capabilities and challenges with your hybrid infrastructure, and prioritize those challenges.
      • Gain insight into zero trust and SASE as a mitigation/control/tool to those challenges.
      • Identify the SASE features that are relevant to your needs and a source guide for a SASE vendor.

      Info-Tech Insight

      Securing your hybrid workforce should be an opportunity to get started on the zero trust journey. Realizing the core features needed to achieve this will assist you in determining which of the options is a good fit for your organization.

      Turn your challenges into opportunities

      Hybrid workforce is the new normal

      The pandemic has shown there is no going back to full on-prem work, and as such, security should be looked at differently with various considerations in mind.

      Understand that current hybrid solutions are susceptible to various forms of attack as the threat attack surface area has now expanded with users, devices, applications, locations, and data. The traditional perimeter as we know it has expanded beyond just the corporate network, and as such, it needs a more mature security strategy.

      Onboarding and offboarding have been done remotely, and with some growth recorded, the size of companies has also increased, leading to a scaling issue.

      Employees are now demanding remote work capabilities as part of contract negotiation before accepting a job.

      Attacks have increased far more quickly during the pandemic, and all indications point to them increasing even more.

      Scarce available security personnel in the job market for hire.

      Reality Today

      This image is a circle graph and 67% of it is coloured with the number 67% in the middle of the graph

      The number of breach incidents by identity theft.
      Source: Security Magazine, 2022.

      This image is a circle graph and 78% of it is coloured with the number 78% in the middle of the graph

      IT security teams want to adopt zero trust.
      Source: Cybersecurity Insiders, 2019.

      Reduce the risks of remote work by using zero trust

      $1.07m

      $1.76m

      235

      Increase in breaches related to remote work

      Cost difference in a breach where zero trust is deployed

      Days to identify a breach

      The average cost of a data breach where remote work was a factor rose by $1.07 million in 2021. COVID-19 brought about rapid changes in organizations, and digital transformation changes curbed some of its excesses. Organizations that did not make any digital transformation changes reported a $750,000 higher costs compared to global average.

      The average cost of a breach in an organization with no zero trust deployed was $5.04 million in 2021 compared to the average cost of a breach in an organization with zero trust deployed of $3.28 million. With a difference of $1.76 million, zero trust makes a significant difference.

      Organizations with a remote work adoption rate of 50% took 235 days to identify a breach and 81 days to contain that breach – this is in comparison to the average of 212 days to identify a breach and 75 days to contain that breach.

      Source: IBM, 2021.

      Network + Security = SASE

      What exactly is a SASE product?

      The convergence and consolidation of security and network brought about the formation of secure access service edge (SASE – pronounced like "sassy"). Digital transformation, hybrid workforce, high demand of availability, uninterrupted access for employees, and a host of other factors influenced the need for this convergence that is delivered as a cloud service.

      The capabilities of a SASE solution being delivered are based on certain criteria, such as the identity of the entity (users, devices, applications, data, services, location), real-time context, continuous assessment and verification of risk and "trust" throughout the lifetime of a session, and the security and compliance policies of the organization.

      SASE continuously identifies users and devices, applies security based on policy, and provides secure access to the appropriate and requested application or data regardless of location.

      image contains a list of the SASE Network Features and Security Features. the network Features are: WAN optimization; SD WAN; CDN; Network-as-a-service. The Security Features are: CASB; IDPS; ZTNA/VPN; FWaaS; Browser isolation; DLP; UEBA; Secure web gateway; Sandboxing

      Current Approach

      The traditional perimeter security using the castle and moat approach is depicted in the image here. The security shields valuable resources from external attack; however, it isn't foolproof for all kinds of external attacks. Furthermore, it does not protect those valuable resources from insider threat.

      This security perimeter also allows for lateral movement when it has been breached. Access to these resources is now considered "trusted" solely because it is now behind the wall/perimeter.

      This approach is no longer feasible in our world today where both external and internal threats pose continuous risk and need to be contained.

      Determine the suitability of SASE and zero trust

      The Challenge:

      Complications facing traditional infrastructure

      • Increased hybrid workforce
      • Regulatory compliance
      • Limited Infosec personnel
      • Poor threat detection
      • Increased attack surface

      Common vulnerabilities in traditional infrastructure

      • MITM attack
      • XSS attack
      • Session hijacking
      • Trust-based model
      • IP spoofing
      • Brute force attack
      • Distributed denial of service
      • DNS hijacking
      • Latency issues
      • Lateral movement once connection is established

      TRADITIONAL INFRASTRUCTURE

      NETWORK

      SECURITY

      AUTHENTICATION

      IDENTITY

      ACCESS

      • MPLS
      • Corporate Network
      • Antivirus installed
      • Traditional Firewall
      • Intrusion Detection and Prevention System
      • Allow and Deny rules
      • Businesses must respond to consumer requests to:
      • LDAP
      • AAA
      • Immature password complexity
      • Trusted device with improperly managed endpoint protection.
      • Little or no DNS security
      • Web portal (captive)
      • VPN client

      Candidate Solutions

      Proposed benefits of SASE

      • Access is only granted to the requested resource
      • Consolidated network and security as a service
      • Micro-segmentation on application and gateway
      • Adopts a zero trust security posture for all access
      • Managed detection and response
      • Uniform enforcement of policy
      • Distributed denial of service shield

      SASE

      NETWORK

      SECURITY

      AUTHENTICATION

      IDENTITY

      ACCESS

      • Software defined – WAN
      • Content delivery network
      • WAN optimization
      • Network-as-a-service
      • Firewall-as-a-service/NGFW
      • Zero trust network access
      • Endpoint detection & response
      • Secure web gateway
      • Cloud access security broker
      • Data loss prevention
      • Remote browser isolation
      • Multifactor authentication
      • Context-based security policy for authentication
      • Authorization managed with situational awareness and real-time risk analytics
      • Continuous verification throughout an access request lifecycle
      • Zero trust identity on users, devices, applications, and data.
      • Strong password complexity enforced
      • Privilege access management
      • Secure internet access
      • SASE client

      ZERO TRUST

      TENETS OF ZERO TRUST

      ZERO TRUST PILLARS

      • Continuous, dynamic authentication and verification
      • Principle of least privilege
      • Always assume a breach
      • Implement the tenets of zero trust across the following domains of your environment:
        • IDENTITY
        • APPLICATION
        • NETWORK
        • DEVICES
        • DATA

      Proposed benefits of zero trust

      • Identify and protect critical and non-critical resources in accordance with business objectives.
      • Produce initiatives that conform to the ideals of zero trust and are aligned with the corresponding pillars above.
      • Formulate policies to protect resources and aid segmentation.

      Info-Tech Insight

      Securing your hybrid workforce should be an opportunity to get started on the zero trust journey. Realizing the core features needed to achieve this will help you determine which of the options is a good fit for your organization.

      Measure the value of using Info-Tech's approach

      IT and business value

      PHASE 1

      PHASE 2

      Assess the benefits of adopting SASE or zero trust

      Vendors will try to control the narrative in terms of what they can do for you, but it's time for you to control the narrative and identify pain points to IT and the business, and with that, to understand and define what the vendor solution can do for you.

      Short-term benefits

      • Gain awareness of your zero trust readiness.
      • Embed a zero trust mindset across your architecture.
      • Control the narrative of what SASE brings to your organization.

      Long-term benefits

      • Identified controls to mitigate risks with current architecture while on a zero trust journey.
      • Improved security posture that reduces risk by increasing visibility into threats and user connections.
      • Reduced CapEx and OpEx due to the scalability, low staffing requirements, and improved time to respond to threats using a SASE or SSE solution.

      Determine SASE cost factors

      IT and business value

      Info-Tech Insight

      IT leaders need to examine different areas of their budget and determine how the adoption of a SASE solution could influence several areas of their budget breakdown.

      Determining the SASE cost factors early could accelerate the justification the business needs to move forward in making an informed decision.

      01- Infrastructure

      • Physical security
      • Cabling
      • Power supply and HVAC
      • Hosting

      02- Administration

      • Human hours to analyze logs and threats
      • Human hours to secure infrastructure
      • Fees associated with maintenance

      03- Inbound

      • DPI
      • DDoS
      • Web application firewall
      • VPN concentrators

      04- Outbound

      • IDPS
      • DLP on-prem
      • QoS
      • Sandbox & URL filtering

      04- Data Protection

      • Real-time URL
        insights
      • Threat hunting
      • Data loss prevention

      06- Monitoring

      • Log storage
      • Logging engine
      • Dashboards
      • Managed detection
        and response

      Info-Tech's methodology for securing your hybrid workforce

      1. Current state and future mitigation

      2. Assess the benefits of moving to SASE/zero trust

      Phase Steps

      1.1 Limitations of legacy infrastructure

      1.2 Zero trust principle as a control

      1.3 SASE as a driver of zero trust

      2.1 Sourcing out a SASE/SSE vendor

      2.2 Build a zero trust roadmap

      Phase Outcomes

      Identify and prioritize risks of current infrastructure and several ways to mitigate them.

      RFP template and build a zero trust roadmap.

      Consider several factors needed to protect your growing hybrid workforce and assess your current resource capabilities, solutions, and desire for a more mature security program. The outcome should either address a quick pain point or a long-term roadmap.

      The internet is the new corporate network

      The internet is the new corporate network, which opens the organization up to more risks not protected by the current security stack. Using Info-Tech's methodology of zero trust adoption is a sure way to reduce the attack surface, and SASE is one useful tool to take you on the zero trust journey.

      Current-state risks and future mitigation

      Securing your hybrid workforce via zero trust will inevitably include (but is not limited to) technological products/solutions.

      SASE and SSE features sit as an overlay here as technological solutions that will help on the zero trust journey by aggregating all the disparate solutions required for you to meet zero trust requirements into a single interface. The knowledge and implementation of this helps put things into perspective of where and what our target state is.

      The right solution for the right problem

      It is critical to choose a solution that addresses the security problems you are actually trying to solve.

      Don't allow the solution provider to tell you what you need – rather, start by understanding your capability gaps and then go to market to find the right partner.

      Take advantage of the RFP template to source a SASE or SSE vendor. Additionally, build a zero trust roadmap to develop and strategize initiatives and tasks.

      Blueprint deliverables

      Each step of this blueprint is accompanied by supporting deliverables to help you accomplish your goals:

      Zero Trust and SASE Suitability Tool
      Identify critical and vulnerable DAAS elements to protect and align them to business goals.

      Zero Trust Program Gap Analysis Tool
      Perform a gap analysis between current and target states to build a zero trust roadmap.

      Key deliverable:

      Secure Your Hybrid Workforce With Zero Trust Communication deck
      Present your zero trust strategy in a prepopulated document that summarizes the work you have completed as a part of this blueprint.

      Phase 1

      Current state and future mitigation

      Phase 1

      Phase 2

      1.1 Limitations of legacy infrastructure

      1.2 Zero trust principle as a control

      1.3 SASE as a driver of zero trust

      2.1 Sourcing out a SASE/SSE vendor

      2.2 Build a zero trust roadmap

      This phase will walk you through the following activities:

      • Introduction to the tool, how to use the input tabs to identify current challenges, technologies being used, and to prioritize the challenges. The prioritized list will highlight existing gaps and eventually be mapped to recommended mitigations in the following phase.

      This phase involves the following participants:

      • CIO
      • CISO
      • CSO
      • IT security team
      • IT network team

      Secure Your Hybrid Workforce

      1.1 Limitations of legacy infrastructure

      Traditional security & remote access solutions must be modernized

      Info-Tech Insight
      Traditional security is architected with a perimeter in mind and is poorly suited to the threats in hybrid or distributed environments.

      Ensure you minimize or eliminate weak points on all layers.

      • SECURITY
        • DDoS
        • DNS hijacking
        • Weak VPN protocols
      • IDENTITY
        • One-time verification allowing lateral movement
      • NETWORK
        • Risk perimeter stops at corporate network edge
        • Split tunneling
      • AUTHENTICATION
        • Weak authentication
        • Weak passwords
      • ACCESS
        • Man-in-the-middle attack
        • Cross-site scripting
        • Session hijacking

      1.1.1 For example: traditional VPNs are poorly suited to a hybrid workforce

      There are many limitations that make it difficult for traditional VPNs to adapt to an ever-growing hybrid workforce.

      The listed limitations are tied to associated risks of legacy infrastructure as well as security components that are almost non-existent in a VPN implementation today.

      Scaling

      VPNs were designed for small-scale remote access to corporate network. An increase in the remote workforce will require expensive hardware investment.

      Visibility

      Users and attackers are not restricted to specific network resources, and with an absence of activity logs, they can go undetected.

      Managed detection & response

      Due to the reduction in or lack of visibility, threat detections are poorly managed, and responses are already too late.

      Hardware

      Limited number of locations for VPN hardware to be situated as it can be expensive.

      Hybrid workforce

      The increase in the hybrid workforce requires the risk perimeter to be expanded from the corporate network to devices and applications. VPNs are built for privacy, not security.

      Info-Tech Insight

      Hybrid workforces are here to stay, and adopting a strategy that is adaptable, flexible, simple, and cost-effective is a recommended road to take on the journey to bettering your security and network.

      1.1 Identify risk from legacy infrastructure

      Estimated Time: 1-2 hours

      1. Ensure all vulnerabilities described on slide 17 are removed.
      2. Note any forecasted challenge you think you might have down the line with your current hybrid setup.
      3. Identify any trend that may be of interest to you with regards to your hybrid setup.

      This is a screenshot of the organizational profile table found in the Zero Trust - SASE Suitability Assessment Tool

      Download the Zero Trust - SASE Suitability Assessment Tool

      Input

      • List of key pain points and challenges
      • List of forecasted challenges and trends of interest

      Output

      • Prioritized list of pain points and/or challenges

      Materials

      • Excel tool
      • Whiteboard

      Participants

      • CISO
      • InfoSec team
      • IT manager
      • CIO
      • Infrastructure team

      1.2 Zero trust principle as a control

      A zero trust implementation comes with benefits/initiatives that mitigate the challenges identified in earlier activities.

      Info-Tech Insight

      Zero trust/"always verify" is applied to identity, workloads, devices, networks, and data to provide a greater control for risks associated with traditional network architecture.

      Improve IAM maturity

      Zero trust identity and access will lead to a mature IAM process in an organization with the removal of implicit trust.

      Secure your remote access

      With a zero trust network architecture (ZTNA), both the remote and on-prem network access are more secure than the traditional network deployment. The software-defined parameter ensures security on each network access.

      Reduce threat surface area

      With zero trust principle applied on identity, workload, devices, network, and data, the threat surface area which births some of the risks identified earlier will be significantly reduced.

      Improve hybrid workforce

      Scaling, visibility, network throughput, secure connection from anywhere, micro-segmentation, and a host of other benefits to improve your hybrid workforce.

      1.2 SASE as an overlay to zero trust

      Security and network initiatives of a zero trust roadmap converged into a single pane of glass.

      Info-Tech Insight

      Security and network converged into a single pane of glass giving you some of the benefits and initiatives of a zero trust implemented architecture in one package.

      Improve IAM maturity

      The identity-centric nature of SASE solutions helps to improve your IAM maturity as it applies the principle of least privilege. The removal of implicit trust and continuous verification helps foster this more.

      Secure your remote access

      With ZTNA, both the remote and on-prem network access are more secure than the traditional network deployment. The software defined parameter ensures security on each network access.

      Reduce threat surface area

      Secure web gateway, cloud access security broker, domain name system, next-generation firewall, data loss prevention, and ZTNA protect against data leaks, prevent lateral movement, and prevent malicious actors from coming in.

      Improve hybrid workforce

      Reduced costs and complexity of IT, faster user experience, and reduced risk as a result of the scalability, visibility, ease of IT administration, network throughput, secure connection from anywhere, micro-segmentation, and a host of other benefits will surely improve your hybrid workforce.

      Align SASE features to zero trust core capabilities

      Verify Identity

      • Authentication & verification are enforced for each app request or session.
      • Use of multifactor authentication.
      • RBAC/ABAC and principle of least privilege are applied on the identity regardless of user, device, or location.

      Verify Device

      • Device health is checked to ensure device is not compromised or vulnerable.
      • No admin permissions on user devices.
      • Device-based risk assessment is enforced as part of UEBA.

      Verify Access

      • Micro-segmentation built around network, user, device, location and roles.
      • Use of context and content-based policy enforced to the user, application, and device identity.
      • Network access only granted to specified application request and not to the entire network.

      Verify Services

      • Applications and services are checked before access is granted.
      • Connections to the application and services are inspected with the security controls built into the SASE solution.

      Info-Tech Insight

      These features of SASE and zero trust mitigate the risks associated with a traditional VPN and reduce the threat surface area. With security at the core, network optimization is not compromised.

      Security components of SASE

      Otherwise known as security service edge (SSE)

      Security service edge is the convergence of all security services typically found in SASE. At its core, SSE consists of three services which include:

      • Secure web gateway – secure access to the internet and web.
      • Cloud access security broker – secure access to SaaS and cloud applications.
      • Zero trust network access – secure remote access to private applications.

      SSE components are also mitigations or initiatives that make up a zero trust roadmap as they comply with the zero trust principle, and as a result, they sit up there with SASE as an overlay/driver of a zero trust implementation. SSE's benefits are identical to SASE's in that it provides zero trust access, risk reduction, low costs and complexity, and a better user experience. The difference is SSE's sole focus on security services and not the network component.

      SASE

      NETWORK FEATURES

      SECURITY FEATURES

      • WAN optimization
      • SD WAN
      • CDN
      • Network-as-a-service
      • CASB
      • IDPS
      • ZTNA/VPN
      • FWaaS
      • Browser isolation
      • DLP
      • UEBA
      • Secure web gateway
      • Sandboxing

      1.3 Pros & cons of zero trust and SASE

      Zero Trust

      SASE

      Pros

      Cons

      Pros

      Cons

      • Robust IAM process and technologies with role-based access control.
      • Strong and continuous verification of identity of user accounts, devices, data, location, and principle of least privilege applied.
      • Micro-segmentation applied around users, network, devices, roles, and applications to prevent lateral movement.
      • Threat attack surface eliminated, which reduces organizational risks.
      • Protection of data strengthened based on sensitivity and micro-segmentation.
      • Difficult to identify the scope of the zero trust initiative.
      • Requires continuous and ongoing update of access controls.
      • Zero trust journey/process could take years and is prone to being abandoned without commitment from executives.
      • Legacy systems can be hard to replace, which would require all stakeholders to prioritize resource allocation.
      • Can be expensive to implement.
      • Adopts a zero trust security posture for all access requests.
      • Converged and consolidated network and security delivered as a cloud service to the user rather than a single point of enforcement.
      • Centralized visibility of devices, data in transit and at rest, user activities, and threats.
      • Cheaper than a zero trust roadmap implementation.
      • Managed detection and response.
      • The limited knowledge of SASE.
      • No universally agreed upon SASE definition.
      • SASE products are still being developed and are open to vendors' interpretation.
      • Existing vendor relationships could be a hinderance to deployment.
      • Hard to manage MSSPs.

      Understand SASE and zero trust suitability for your needs

      Estimated Time: 1 hour

      Use the dashboard to understand the value assessment of adopting a SASE product or building a zero trust roadmap.

      This is an image of the SASE Suitability Assessment

      This is the image of the Zero Trust Suitability Assessment

      Info-Tech Insight

      This tool will help steer you on a path to take as a form of mitigation/control to some or all the identified challenges.

      Phase 2

      Make a decision and next steps

      Phase 1

      Phase 2

      1.1 Limitations of legacy infrastructure

      1.2 Zero trust principle as a control

      1.3 SASE as a driver of zero trust

      2.1 Sourcing out a SASE/SSE vendor

      2.2 Build a zero trust roadmap

      This phase will walk you through the following activities:

      • Introduction to the tool activity, how to use the input tabs and considerations to generate an output that could help understand the current state of your hybrid infrastructure and what direction is to be followed next to improve.

      This phase involves the following participants:

      • CIO
      • CISO
      • CSO
      • IT security
      • IT network team

      Secure Your Hybrid Workforce

      Step 2.1

      Sourcing out a SASE/SSE vendor

      Activities

      2.1.1 Use the RFP template to request proposal from vendors

      2.1.2 Use SoftwareReviews to compare vendors

      This step involves the following participants:

      • CIO, CISO, IT manager, Infosec team, executives.

      Outcomes of this step

      • Zero Trust Roadmap

      2.1.1 Use the RFP template to request proposal from vendors

      Estimated Time: 1-3 hours

      1. As a group, use the RFP Template to include technical capabilities of your desired SASE product and to request proposals from vendors.
      2. The features that are most important to your organization generated from phase one should be highlighted in the RFP.

      Input

      • List of SASE features
      • Technical capabilities

      Output

      • RFP

      Materials

      • RFP Template

      Participants

      • Security team
      • IT leadership

      Download the RFP Template

      2.1.2 Use SoftwareReviews to compare vendors

      SoftwareReviews

      • The Data Quadrant is a thorough evaluation and ranking of all software in an individual category to compare platforms across multiple dimensions.
      • Vendors are ranked by their Composite Score, based on individual feature evaluations, user satisfaction rankings, vendor capability comparisons, and likeliness to recommend the platform.
      • The Emotional Footprint is a powerful indicator of overall user sentiment toward the relationship with the vendor, capturing data across five dimensions.
      • Vendors are ranked by their Customer Experience (CX) Score, which combines the overall Emotional Footprint rating with a measure of the value delivered by the solution.

      Step 2.2

      Zero trust readiness and roadmap

      Activities

      2.2.1 Assess the maturity of your current zero trust implementation

      2.2.2 Understand business needs and current security projects

      2.2.3 Set target maturity state with timeframe

      This step involves the following participants:

      CIO, CISO, IT manager, Infosec team, executives.

      Outcomes of this step

      Zero Trust Roadmap

      2.2.1 Assess the maturity of your current zero trust implementation

      Estimated Time: 1-3 hours

      • Realizing that zero trust is a journey helps create a better roadmap and implementation. Identify the current controls or solutions in your organization that align with the principle of zero trust.
      • Break down these controls or solutions into different silos (e.g. identity, security, network, data, device, applications, etc.).
      • Determine your zero trust readiness.

      Input

      • List of zero trust controls/solutions
      • Siloed list of zero trust controls/solutions
      • Current state of zero trust maturity

      Output

      • Zero trust readiness and current maturity state

      Materials

      • Zero Trust Security Benefit Assessment tool

      Participants

      • Security team
      • IT leadership

      Download the Zero Trust Security Benefit Assessment tool

      2.2.2 Understand business needs and current security projects

      Estimated Time: 1-3 hours

      1. Identify the business and IT executives, application owners, and board members whose vision aligns with the zero trust journey.
      2. Identify existing projects within security, IT, and the business and highlight interdependencies or how they fit with the zero trust journey.
      3. Build a rough sketch of the roadmap that fits the business needs, current projects and the zero trust journey.

      Input

      • Meetings with stakeholders
      • List of current and future projects

      Output

      • Sketch of zero trust roadmap

      Materials

      • Whiteboard activity

      Participants

      • Security team
      • IT leadership
      • IT ops team
      • Business executives
      • Board members

      Download Zero Trust Protect Surface Mapping Tool

      2.2.3 Set target maturity state with a given timeframe

      Estimated Time: 1-3 hours

      1. With the zero trust readiness, current business, IT and security projects, current maturity state, and sketch of the roadmap, setting a target maturity state within some timeframe is at the top of the list. The target maturity state will include a list of initiatives that could be siloed and confined to a timeframe.
      2. A Gantt chart or graph could be used to complete this task.

      Input

      • Results from previous activity slides

      Output

      • Current state and target state assessment for gap analysis
      • List of initiatives and timeframe

      Materials

      • Zero Trust Program Gap Analysis Tool

      Participants

      • Security team
      • IT leadership
      • IT ops team
      • Business executives
      • Board members

      Download the Zero Trust Program Gap Analysis Tool

      Summary of Accomplishment

      Insights Gained

      • Difference between zero trust as a principle and SASE as a framework
      • Difference between SASE and SSE platforms.
      • Assessment of which path to take in securing your hybrid workforce

      Deliverables Completed

      If you would like additional support, have our analysts guide you through other phases as part of an Info-Tech workshop

      Contact your account representative for more information

      workshops@infotech.com

      1-888-670-8889

      Additional Support

      If you would like additional support, have our analysts guide you through other phases as part of an Info-Tech workshop

      To accelerate this project, engage your IT team in an Info-Tech workshop with an Info-Tech analyst team.

      Info-Tech analysts will join you and your team at your location or welcome you to Info-Tech's historic Toronto office to participate in an innovative onsite workshop.

      Contact your account representative for more information.
      workshops@infotech.com 1-888-670-8889

      The following are sample activities that will be conducted by Info-Tech analysts with your team:
      This is a screenshot from the Zero Trust - SASE Suitability Assessment Tool

      Zero Trust - SASE Suitability Assessment Tool

      Assess current security capabilities and build a roadmap of tasks and initiatives that close maturity gaps.

      Research Contributors

      • Aaron Shum, Vice President, Security & Privacy
      • Cameron Smith, Research Lead, Security & Privacy
      • Brad Mateski, Zones, Solutions Architect for CyberSecurity
      • Bob Smock, Info-Tech Research Group, Vice President of Consulting
      • Dr. Chase Cunningham, Ericom Software, Chief Strategy Officer
      • John Kindervag, ON2IT Cybersecurity, Senior Vice President, Cybersecurity Strategy and ON2IT Group Fellow
      • John Zhao, Fonterra, Enterprise Security Architect
      • Rongxing Lu, University of New Brunswick, Associate Professor
      • Sumanta Sarkar, University of Warwick, Assistant Professor
      • Tim Malone, J.B. Hunt Transport, Senior Director Information Security
      • Vana Matte, J.B. Hunt Transport, Senior Vice President of Technology Services

      Related Info-Tech Research

      This is a screenshot from Info-Tech's Security Strategy Model

      Build an Information Security Strategy

      Info-Tech has developed a highly effective approach to building an information security strategy – an approach that has been successfully tested and refined for over seven years with hundreds of organizations. This unique approach includes tools for ensuring alignment with business objectives, assessing organizational risk and stakeholder expectations, enabling a comprehensive current state assessment, prioritizing initiatives, and building out a security roadmap.

      This is a screenshot from Info-Tech's research: Determine Your Zero Trust Readiness

      Determine Your Zero Trust Readiness

      IT security was typified by perimeter security. However, the way the world does business has mandated a change to IT security. In response, zero trust is a set of principles that can add flexibility to planning your IT security strategy.

      Use this blueprint to determine your zero trust readiness and understand how zero trust can benefit both security and the business.

      This is a screenshot from Info-Tech's research: Mature Your Identity and Access Management Program

      Mature Your Identity and Access Management Program

      Many organizations are looking to improve their identity and access management (IAM) practices but struggle with where to start and whether all areas of IAM have been considered. This blueprint will help you improve the organization's IAM practices by following our three-phase methodology:

      • Assess identity and access requirements.
      • Identify initiatives using the identity lifecycle.
      • Prioritize initiatives and build a roadmap.

      Bibliography

      "2021 Data Breach Investigations Report." Verizon, 2021. Web.
      "Fortinet Brings Networking and Security to the Cloud" Fortinet, 2 Mar. 2021. Web.
      "A Zero Trust Strategy Has 3 Needs – Identify, Authenticate, and Monitor Users and Devices on and off the Network." Fortinet, 15 July 2021. Web.
      "Applying Zero Trust Principles to Enterprise Mobility." CISA, Mar. 2022. Web.
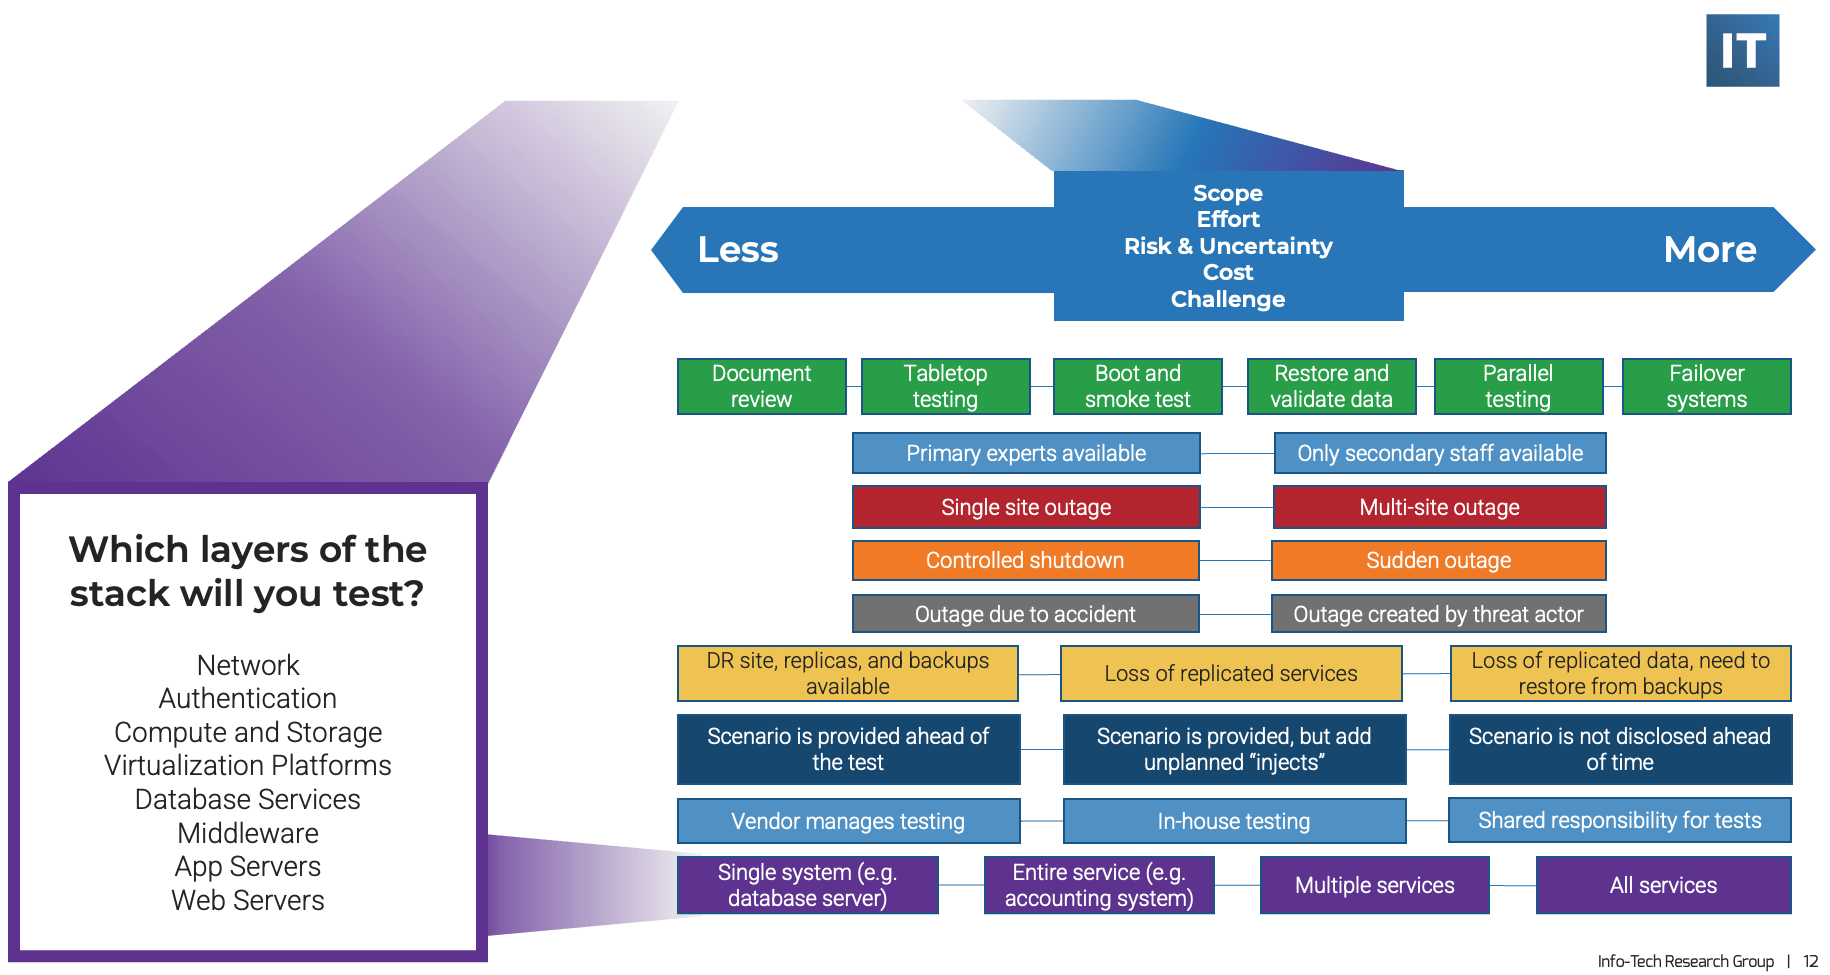
      "CISA Zero Trust Maturity Model." CISA, Cybersecurity Division, June 2021. Web.
      "Continuous Diagnostics and Mitigation Program Overview." CISA, Jan. 2022. Web.
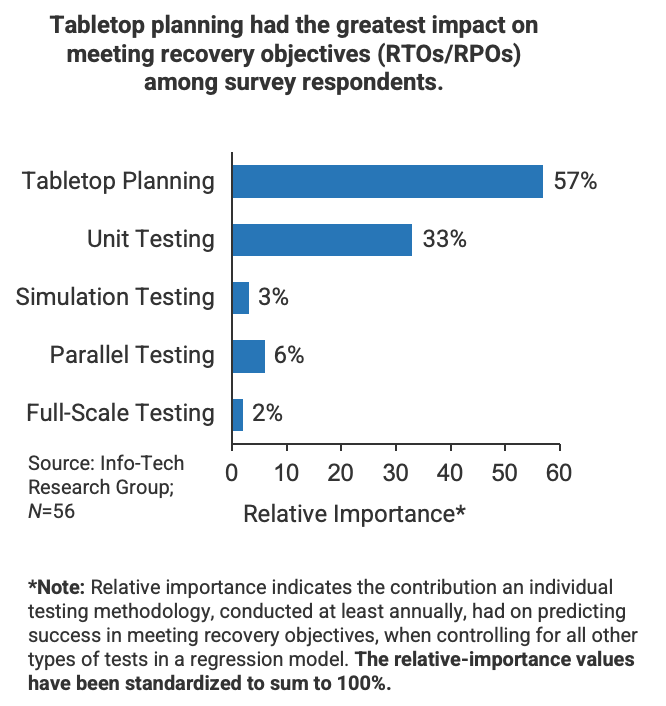
      "Cost of a Data Breach Report 2021 | IBM." IBM, July 2021. Web.
      English, Melanie. "5 Stats That Show The Cost Saving Effect of Zero Trust." Teramind, 29 Sept. 2021. Web.
      Hunter, Steve. "The Five Business Benefits of a Zero Trust Approach to Security." Security Brief - Australia, 19 Aug. 2020. Web.
      "Improve Application Access and Security With Fortinet Zero Trust Network Access." Fortinet, 2 Mar. 2021. Web.
      "Incorporating zero trust Strategies for Secure Network and Application Access." Fortinet, 21 Jul. 2021. Web.
      Jakkal, Vasu. "Zero Trust Adoption Report: How Does Your Organization Compare?" Microsoft, 28 July 2021. Web.
      "Jericho Forum™ Commandments." The Open Group, Jericho Forum, May 2007. Web.
      Schulze, Holger. "2019 Zero Trust Adoption Report." Cybersecurity Insiders, 2019. Web.
      "67% of Organizations Had Identity-Related Data Breaches Last Year." Security Magazine, 22 Aug. 2022. Web.
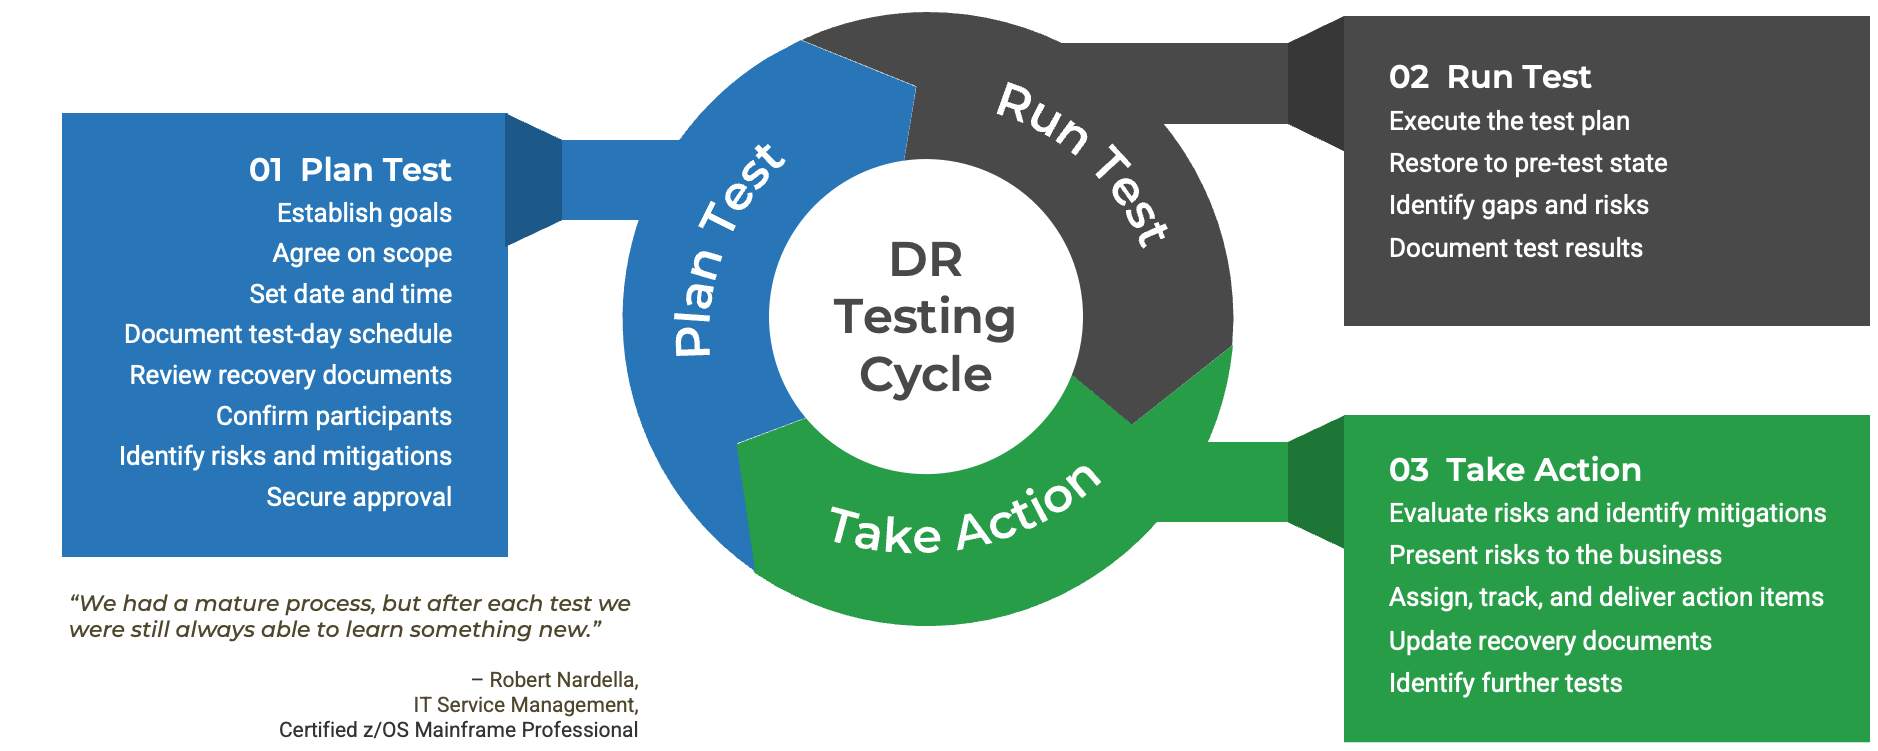
      United States, Executive Office of the President Joseph R. Biden, Jr. "Executive Order on Improving the Nation's Cybersecurity." The White House, 12 May 2021. Web.
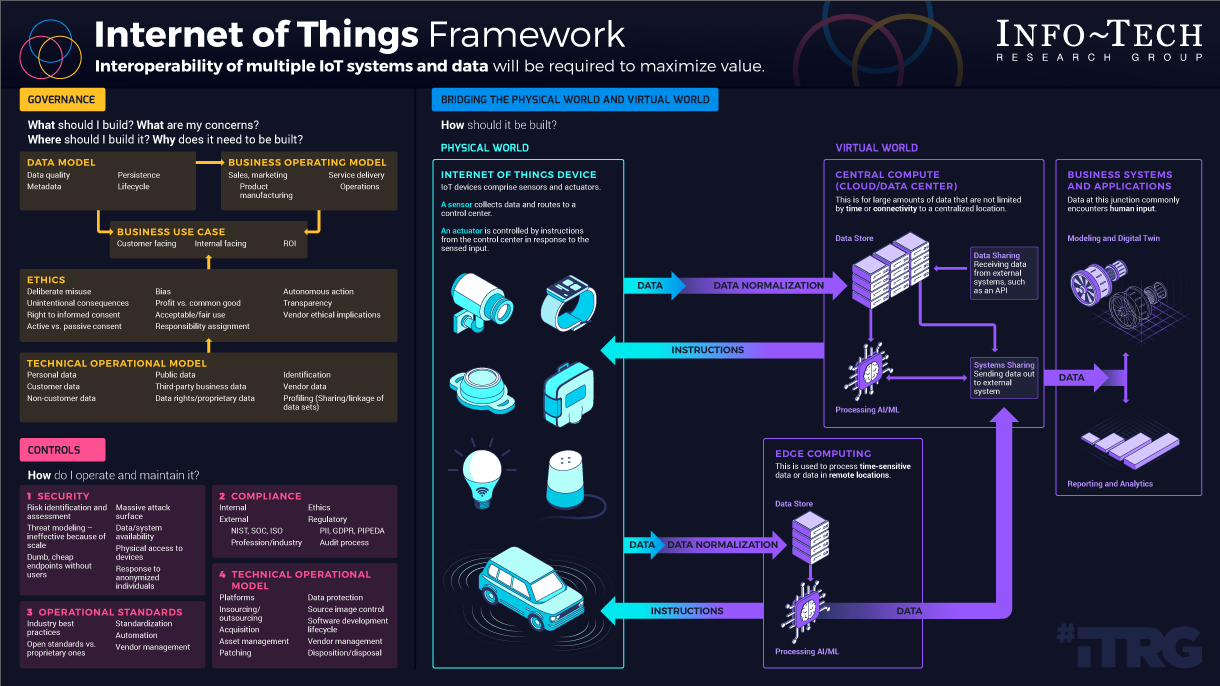
      Build a Data Pipeline for Reporting and Analytics

      • Buy Link or Shortcode: {j2store}126|cart{/j2store}
      • member rating overall impact (scale of 10): 9.3/10 Overall Impact
      • member rating average dollars saved: $61,999 Average $ Saved
      • member rating average days saved: 20 Average Days Saved
      • Parent Category Name: Data Management
      • Parent Category Link: /data-management
      • Continuous and disruptive database design updates while trying to have one design pattern to fit all use cases.
      • Sub-par performance while loading, retrieving, and querying data.
      • You want to shorten time-to-market of the projects aimed at data delivery and consumption.
      • Unnecessarily complicated database design limits usability of the data and requires knowledge of specific data structures for their effective use.

      Our Advice

      Critical Insight

      • Evolve your data architecture. Data pipeline is an evolutionary break away from the enterprise data warehouse methodology.
      • Avoid endless data projects. Building centralized all-in-one enterprise data warehouses takes forever to deliver a positive ROI.
      • Facilitate data self-service. Use-case optimized data delivery repositories facilitate data self-service.

      Impact and Result

      • Understand your high-level business capabilities and interactions across them – your data repositories and flows should be just a digital reflection thereof.
      • Divide your data world in logical verticals overlaid with various speed data progression lanes, i.e. build your data pipeline – and conquer it one segment at a time.
      • Use the most appropriate database design pattern for a given phase/component in your data pipeline progression.

      Build a Data Pipeline for Reporting and Analytics Research & Tools

      Start here – read the Executive Brief

      Build your data pipeline using the most appropriate data design patterns.

      Besides the small introduction, subscribers and consulting clients within this management domain have access to:

      1. Understand data progression

      Identify major business capabilities, business processes running inside and across them, and datasets produced or used by these business processes and activities performed thereupon.

      • Build a Data Pipeline for Reporting and Analytics – Phase 1: Understand Data Progression

      2. Identify data pipeline components

      Identify data pipeline vertical zones: data creation, accumulation, augmentation, and consumption, as well as horizontal lanes: fast, medium, and slow speed.

      • Build a Data Pipeline for Reporting and Analytics – Phase 2: Identify Data Pipeline Components

      3. Select data design patterns

      Select the right data design patterns for the data pipeline components, as well as an applicable data model industry standard (if available).

      • Build a Data Pipeline for Reporting and Analytics – Phase 3: Select Data Design Patterns
      [infographic]

      Workshop: Build a Data Pipeline for Reporting and Analytics

      Workshops offer an easy way to accelerate your project. If you are unable to do the project yourself, and a Guided Implementation isn't enough, we offer low-cost delivery of our project workshops. We take you through every phase of your project and ensure that you have a roadmap in place to complete your project successfully.

      1 Understand Data Progression

      The Purpose

      Identify major business capabilities, business processes running inside and across them, and datasets produced or used by these business processes and activities performed thereupon.

      Key Benefits Achieved

      Indicates the ownership of datasets and the high-level data flows across the organization.

      Activities

      1.1 Review & discuss typical pitfalls (and their causes) of major data management initiatives.

      1.2 Discuss the main business capabilities of the organization and how they interact.

      1.3 Discuss the business processes running inside and across business capabilities and the datasets involved.

      1.4 Create the Enterprise Business Process Model (EBPM).

      Outputs

      Understanding typical pitfalls (and their causes) of major data management initiatives.

      Business capabilities map

      Business processes map

      Enterprise Business Process Model (EBPM)

      2 Identify Data Pipeline Components

      The Purpose

      Identify data pipeline vertical zones: data creation, accumulation, augmentation, and consumption, as well as horizontal lanes: fast, medium, and slow speed.

      Key Benefits Achieved

      Design the high-level data progression pipeline.

      Activities

      2.1 Review and discuss the concept of a data pipeline in general, as well as the vertical zones: data creation, accumulation, augmentation, and consumption.

      2.2 Identify these zones in the enterprise business model.

      2.3 Review and discuss multi-lane data progression.

      2.4 Identify different speed lanes in the enterprise business model.

      Outputs

      Understanding of a data pipeline design, including its zones.

      EBPM mapping to Data Pipeline Zones

      Understanding of multi-lane data progression

      EBPM mapping to Multi-Speed Data Progression Lanes

      3 Develop the Roadmap

      The Purpose

      Select the right data design patterns for the data pipeline components, as well as an applicable data model industry standard (if available).

      Key Benefits Achieved

      Use of appropriate data design pattern for each zone with calibration on the data progression speed.

      Activities

      3.1 Review and discuss various data design patterns.

      3.2 Discuss and select the data design pattern selection for data pipeline components.

      3.3 Discuss applicability of data model industry standards (if available).

      Outputs

      Understanding of various data design patterns.

      Data Design Patterns mapping to the data pipeline.

      Selection of an applicable data model from available industry standards.

      Diagnose and Optimize Your Lead Gen Engine

      • Buy Link or Shortcode: {j2store}567|cart{/j2store}
      • member rating overall impact (scale of 10): N/A
      • member rating average dollars saved: N/A
      • member rating average days saved: N/A
      • Parent Category Name: Marketing Solutions
      • Parent Category Link: /marketing-solutions

      88% of marketing professionals are unsatisfied with their ability to convert leads (Convince & Convert), but poor lead conversion is just a symptom of much deeper problems.

      Globally, B2B SaaS marketers without a well-running lead gen engine will experience:

      • A low volume of quality leads from their website.
      • A low conversion rate from their website visitors.
      • A long lead conversion time compared to competitors.
      • A low volume of organic website visitors.

      If treated without a root cause analysis, these symptoms often result in higher-than-average marketing spend and wasted resources. Without an accurate lead gen engine diagnostic tool and a strategy to fix the misfires, marketers will continue to waste valuable time and resources.

      Our Advice

      Critical Insight

      The lead gen engine is foundational in building profitable long-term customer relationships. It is the process through which marketers build awareness, trust, and loyalty. Without the ability to continually diagnose lead gen engine flaws, marketers will fail to optimize new customer relationship creation and long-term satisfaction and loyalty.

      Impact and Result

      With a targeted set of diagnostic tools and an optimization strategy, you will:

      • Uncover the critical weakness in your lead generation engine.
      • Develop a best-in-class lead gen engine optimization strategy that builds relationships, creates awareness, and establishes trust and loyalty with prospects.
      • Build profitable long-term customer relationships.

      Organizations who activate the findings from their lead generation diagnostic and optimization strategy will decrease the time and budget spent on lead generation by 25% to 50%. They will quickly uncover inefficiencies in their lead gen engine and develop a proven lead generation optimization strategy based on the diagnostic findings.

      Diagnose and Optimize Your Lead Gen Engine Research & Tools

      Besides the small introduction, subscribers and consulting clients within this management domain have access to:

      1. Diagnose and Optimize Your Lead Gen Engine Deck – A deck to help you diagnose what’s not working in your lead gen engine so that you can remedy issues and get back on track, building new customer relationships and driving loyalty.

      Organizations who activate the findings from their lead generation diagnostic and optimization strategy will decrease the time and budget spent on lead generation by 25% to 50%. They will quickly uncover inefficiencies in their lead gen engine and develop a proven lead generation optimization strategy based on the diagnostic findings.

      • Diagnose and Optimize Your Lead Gen Engine Storyboard

      2. Lead Gen Engine Diagnostic Tool – An easy-to-use diagnostic tool that will help you pinpoint weakness within your lead gen engine.

      The diagnostic tool allows digital marketers to quickly and easily diagnose weakness within your lead gen engine.

      • Lead Gen Engine Diagnostic Tool

      3. Lead Gen Engine Optimization Strategy Template – A step-by-step document that walks you through how to properly optimize the performance of your lead gen engine.

      Develop a best-in-class lead gen engine optimization strategy that builds relationships, creates awareness, and establishes trust and loyalty with prospects.

      • Lead Gen Engine Optimization Strategy Template

      Infographic

      Further reading

      Diagnose and Optimize Your Lead Gen Engine

      Quickly and easily pinpoint any weakness in your lead gen engine so that you stop wasting money and effort on ineffective advertising and marketing.

      EXECUTIVE BRIEF

      Analyst Perspective

      Quickly and easily pinpoint any weakness in your lead gen engine so that you stop wasting money and effort on ineffective advertising and marketing.

      The image contains a photo of Terra Higginson.

      Senior digital marketing leaders are accountable for building relationships, creating awareness, and developing trust and loyalty with website visitors, thereby delivering high-quality, high-value leads that Sales can easily convert to wins. Unfortunately, many marketing leaders report that their website visitors are low-quality and either disengage quickly or, when they engage further with lead gen engine components, they just don’t convert. These marketing leaders urgently need to diagnose what’s not working in three key areas in their lead gen engine to quickly remedy the issue and get back on track, building new customer relationships and driving loyalty. This blueprint will provide you with a tool to quickly and easily diagnose weakness within your lead gen engine. You can use the results to create a strategy that builds relationships, creates awareness, and establishes trust and loyalty with prospects.

      Terra Higginson

      Marketing Research Director

      SoftwareReviews

      Executive Summary

      Your Challenge

      Globally, business-to-business (B2B) software-as-a-service (SaaS) marketers without a well-running lead gen engine will experience:

      • A low volume of quality leads from their website.
      • A low conversion rate from their website visitors.
      • A long lead conversion time compared to competitors.
      • A low volume of organic website visitors.

      88% of marketing professionals are unsatisfied with their ability to convert leads (Convince & Convert), but poor lead conversion is just a symptom of a much larger problem with the lead gen engine. Without an accurate lead gen engine diagnostic tool and a strategy to fix the leaks, marketers will continue to waste valuable time and resources.

      Common Obstacles

      Even though lead generation is a critical element of marketing success, marketers struggle to fix the problems with their lead gen engine due to:

      • A lack of resources.
      • A lack of budget.
      • A lack of experience in implementing effective lead generation strategies.

      Most marketers spend too much on acquiring leads and not enough on converting and keeping them. For every $92 spent acquiring customers, only $1 is spent converting them (Econsultancy, cited in Outgrow). Marketers are increasingly under pressure to deliver high-quality leads to sales but work under tight budgets with inadequate or inexperienced staff who don’t understand the importance of optimizing the lead generation process.

      SoftwareReviews’ Approach

      With a targeted set of diagnostic tools and an optimization strategy, you will:

      • Uncover the critical weakness in your lead generation engine.
      • Develop a best-in-class lead gen engine optimization strategy that builds relationships, creates awareness, and establishes trust and loyalty with prospects.
      • Build profitable long-term customer relationships.

      Organizations who activate the findings from their lead generation diagnostic and optimization strategy will decrease the time and budget spent on lead generation by 25% to 50%. They will quickly uncover inefficiencies in their lead gen engine and develop a proven lead generation optimization strategy based on the diagnostic findings.

      SoftwareReviews Insight

      The lead gen engine is foundational in building profitable long-term customer relationships. It is the process through which marketers build awareness, trust, and loyalty. Without the ability to continually diagnose lead gen engine flaws, marketers will fail to optimize new customer relationship creation and long-term satisfaction and loyalty.

      Your Challenge

      88% of marketing professionals are unsatisfied with their ability to convert leads, but poor lead conversion is just a symptom of much deeper problems.

      Globally, B2B SaaS marketers without a well-running lead gen engine will experience:

      • A low volume of organic website visitors.
      • A low volume of quality leads from their website.
      • A low conversion rate from their website visitors.
      • A longer lead conversion time than competitors in the same space.

      If treated without a root-cause analysis, these symptoms often result in higher-than-average marketing spend and wasted resources. Without an accurate lead gen engine diagnostic tool and a strategy to fix the misfires, marketers will continue to waste valuable time and resources.

      88% of marketers are unsatisfied with lead conversion (Convince & Convert).

      The image contains a diagram that demonstrates a flowchart of the areas where visitors fail to convert. It incorporates observations, benchmarks, and uses a flowchart to diagnose the root causes.

      Benchmarks

      Compare your lead gen engine metrics to industry benchmarks.

      For every 10,000 people that visit your website, 210 will become leads.

      For every 210 leads, 101 will become marketing qualified leads (MQLs).

      For every 101 MQLs, 47 will become sales qualified leads (SQLs).

      For every 47 SQLs, 23 will become opportunities.

      For every 23 opportunities, nine will become customers.

      .9% to 2.1%

      36% to 48%

      28% to 46%

      39% to 48%

      32% to 40%

      Leads Benchmark

      MQL Benchmark

      SQL Benchmark

      Opportunity Benchmark

      Closing Benchmark

      The percentage of website visitors that convert to leads.

      The percentage of leads that convert to marketing qualified leads.

      The percentage of MQLs that convert to sales qualified leads.

      The percentage of SQLs that convert to opportunities.

      The percentage of opportunities that are closed.

      Midmarket B2B SaaS Industry

      Source: “B2B SaaS Marketing KPIs,” First Page Sage, 2021

      Common obstacles

      Why do most organizations improperly diagnose a misfiring lead gen engine?

      Lack of Clear Starting Point

      The lead gen engine is complex, with many moving parts, and marketers and marketing ops are often overwhelmed about where to begin diagnosis.

      Lack of Benchmarks

      Marketers often call out metrics such as increasing website visitors, contact-to-lead conversions, numbers of qualified leads delivered to Sales, etc., without a proven benchmark to compare their results against.

      Lack of Alignment Between Marketing and Sales

      Definitions of a contact, a marketing qualified lead, a sales qualified lead, and a marketing influenced win often vary.

      Lack of Measurement Tools

      Integration gaps between the website, marketing automation, sales enablement, and analytics exist within some 70% of enterprises. The elements of the marketing (and sales) tech stack change constantly. It’s hard to keep up.

      Lack of Understanding of Marketing ROI

      This drives many marketers to push the “more” button – more assets, more emails, more ad spend – without first focusing on optimization and effectiveness.

      Lack of Resources

      Marketers have an endless list of to-dos that drive them to produce daily results. Especially among software startups and mid-sized companies, there are just not enough staff with the right skills to diagnose and fix today’s sophisticated lead gen engines.

      Implications of poor diagnostics

      Without proper lead gen engine diagnostics, marketing performs poorly

      • The lead gen engine builds relationships and trust. When a broken lead gen engine goes unoptimized, customer relationships are at risk.
      • When the lead gen engine isn’t working well, customer acquisition costs rise as more expensive sales resources are charged with prospect qualification.
      • Without a well-functioning lead gen engine, marketers lack the foundation they need to create awareness among prospects – growth suffers.
      • Marketers will throw money at content or ads to generate more leads without any real understanding of engine leakage and misfires – your cost per lead climbs and reduces marketing profitability.

      Most marketers are spending too much on acquiring leads and not enough on converting and keeping them. For every $92 spent acquiring customers, only $1 is spent converting them.

      Source: Econsultancy, cited in Outgrow

      Lead gen engine optimization increases the efficiency of your marketing efforts and has a 223% ROI.

      Source: WordStream

      Benefits of lead gen engine diagnostics

      Diagnosing your lead gen engine delivers key benefits:

      • Pinpoint weakness quickly. A quick and accurate lead gen engine diagnostic tool saves Marketing 50% of the effort spent uncovering the reason for low conversion and low-quality leads.
      • Optimize more easily. Marketing executives will save 70% of the time spent creating a lead gen optimization marketing strategy based upon the diagnostic findings.
      • Maximize marketing ROI. Build toward and maintain the golden 3:1 LTV:CAC (lifetime value to customer acquisition cost) ratio for B2B SaaS marketing.
      • Stop wasting money on ineffective advertising and marketing. Up to 75% of your marketing budget is being inefficiently spent if you are running on a broken lead gen engine.

      “It’s much easier to double your business by doubling your conversion rate than by doubling your traffic. Correct targeting and testing methods can increase conversion rates up to 300 percent.” – Jeff Eisenberg, IterateStudio

      Source: Lift Division

      True benefits of fixing the lead gen engine

      These numbers add up to a significant increase in marketing influenced wins.

      175%
      Buyer Personas Increase Revenue
      Source: Illumin8

      202%
      Personalized CTAs Increase Conversions
      Source: HubSpot

      50%
      Lead Magnets Increase Conversions
      Source: ClickyDrip

      79%
      Lead Scoring Increases Conversions
      Source: Bloominari

      50%
      Lead Nurturing Increases Conversions
      Source: KevinTPayne.com

      80%
      Personalized Landing Pages Increase Conversions
      Source: HubSpot

      Who benefits from an optimized lead gen engine?

      This Research Is Designed for:

      • Senior digital marketing leaders who are:
        • Looking to increase conversions.
        • Looking to increase the quality of leads.
        • Looking to increase the value of leads.

      This Research Will Help You:

      • Diagnose issues with your lead gen engine.
      • Create a lead gen optimization strategy and a roadmap.

      This Research Will Also Assist:

      • Digital marketing leaders and product marketing leaders who are:
        • Looking to decrease the effort needed by Sales to close leads.
        • Looking to increase leadership’s faith in Marketing’s ability to generate high-quality leads and conversions.

      This Research Will Help Them:

      • Align the Sales and Marketing teams.
      • Receive the necessary buy-in from management to increase marketing spend and headcount.
      • Avoid product failure.
      The image contains a screenshot of the thought model that is titled: Diagnose and Optimize your Lead Gen Engine. The image contains the screenshot of the previous image shown on Where Lead Gen Engines Fails, and includes new information. The flowchart connects to a box that says: STOP, Your engine is broken. It then explains phase 1, the diagnostic, and then phase 2 Optimization strategy.

      SoftwareReviews’ approach

      1. Diagnose Misfires in the Lead Gen Engine
      2. Identifying any areas of weakness within your lead gen engine is a fundamental first step in improving conversions, ROI, and lead quality.

      3. Create a Lead Gen Optimization Strategy
      4. Optimize your lead gen strategy with an easily customizable template that will provide your roadmap for future growth.

      The SoftwareReviews Methodology to Diagnose and Optimize Your Lead Gen Engine

      1. Lead Gen Engine Diagnostic

      2. Lead Gen Engine Optimization Strategy

      Phase Steps

      1. Select lead gen engine optimization steering committee & working team
      2. Gather baseline metrics
      3. Run the lead gen engine diagnostic
      4. Identify low-scoring areas & prioritize lead gen engine fixes
      1. Define the roadmap
      2. Create lead gen engine optimization strategy
      3. Present strategy to steering committee

      Phase Outcomes

      • Identify weakness within the lead gen engine.
      • Prioritize the most important fixes within the lead gen engine.
      • Create a best-in-class lead gen engine optimization strategy and roadmap that builds relationships, creates awareness, and develops trust and loyalty with website visitors.
      • Increase leadership’s faith in Marketing’s ability to generate high-quality leads and conversions.

      Insight Summary

      The lead gen engine is the foundation of marketing

      The lead gen engine is critical to building relationships. It is the foundation upon which marketers build awareness, trust, and loyalty.

      Misalignment between Sales and Marketing is costly

      Digital marketing leaders need to ensure agreement with Sales on the definition of a marketing qualified lead (MQL), as it is the most essential element of stakeholder alignment.

      Prioritization is necessary for today’s marketer

      By prioritizing the fixes within the lead gen engine that have the highest impact, a marketing leader will be able to focus their optimization efforts in the right place.

      Stop, your engine is broken

      Any advertising or effort expended while running marketing on a broken lead gen engine is time and money wasted. It is only once the lead gen engine is fixed that marketers will see the true results of their efforts.

      Tactical insight

      Without a well-functioning lead gen engine, marketers risk wasting valuable time and money because they aren’t creating relationships with prospects that will increase the quality of leads, conversion rate, and lifetime value.

      Tactical insight

      The foundational lead relationship must be built at the marketing level, or else Sales will be entirely responsible for creating these relationships with low-quality leads, risking product failure.

      Blueprint Deliverable:

      Each step of this blueprint is accompanied by supporting deliverables to help you accomplish your goals:

      Lead Gen Engine Diagnostic

      An efficient and easy-to-use diagnostic tool that uncovers weakness in your lead gen engine.

      The image contains a screenshot of the Lead Gen Engine Diagnostic is shown.

      Key Deliverable:

      Lead Gen Engine Optimization Strategy Template

      The image contains a screenshot of the Lead Gen Engine Optimization Strategy.

      A comprehensive strategy for optimizing conversions and increasing the quality of leads.

      SoftwareReviews Offers Various Levels of Support to Meet Your Needs

      Included within Advisory Membership:

      DIY Toolkit

      “Our team has already made this critical project a priority, and we have the time and capability, but some guidance along the way would be helpful.”

      Guided Implementation

      “Our team knows that we need to fix a process, but we need assistance to determine where to focus. Some check-ins along the way would help keep us on track.”

      Optional add-ons:

      Workshop

      “We need to hit the ground running and get this project kicked off immediately. Our team has the ability to take this over once we get a framework and strategy in place.”

      Consulting

      “Our team does not have the time or the knowledge to take this project on. We need assistance through the entirety of this project.”

      Guided Implementation

      What does a typical GI on lead gen engine diagnostics look like?

      Diagnose Your Lead Gen Engine

      Call #1: Scope requirements, objectives, and specific challenges with your lead gen engine.

      Call #2: Gather baseline metrics and discuss the steering committee and working team.

      Call #3: Review results from baseline metrics and answer questions.

      Call #4: Discuss the lead gen engine diagnostic tool and your steering committee.

      Call #5: Review results from the diagnostic tool and answer questions.

      Develop Your Lead Gen Engine Optimization Strategy

      Call #6: Identify components to include in the lead gen engine optimization strategy.

      Call #7: Discuss the roadmap for continued optimization.

      Call #8: Review final lead gen engine optimization strategy.

      Call #9: (optional) Follow-up quarterly to check in on progress and answer questions.

      A Guided Implementation (GI) is series of calls with a SoftwareReviews Advisory analyst to help implement our best practices in your organization. For guidance on marketing applications, we can arrange a discussion with an Info-Tech analyst. Your engagement managers will work with you to schedule analyst calls.

      Workshop Overview

      Day 1

      Day 2

      Activities

      Complete Lead Gen Engine Diagnostic

      1.1 Identify the previously selected lead gen engine steering committee and working team.

      1.2 Share the baseline metrics that were gathered in preparation for the workshop.

      1.3 Run the lead gen engine diagnostic.

      1.4 Identify low-scoring areas and prioritize lead gen engine fixes.

      Create Lead Gen Engine Optimization Strategy

      2.1 Define the roadmap.

      2.2 Create a lead gen engine optimization strategy.

      2.3 Present the strategy to the steering committee.

      Deliverables

      1. Lead gen engine diagnostic scorecard

      1. Lead gen engine optimization strategy

      Contact your account representative for more information.

      workshops@infotech.com1-888-670-8889

      Phase 1

      Lead Gen Engine Diagnostic

      Phase 1

      Phase 2

      1.1 Select lead gen engine steering committee & working team

      1.2 Gather baseline metrics

      1.3 Run the lead gen engine diagnostic

      1.4 Identify & prioritize low-scoring areas

      2.1 Define the roadmap

      2.2 Create lead gen engine optimization strategy

      2.3 Present strategy to steering committee

      This phase will walk you through the following activities:

      The diagnostic tool will allow you to quickly and easily identify the areas of weakness in the lead gen engine by answering some simple questions. The steps include:

      • Select the lead gen engine optimization committee and team.
      • Gather baseline metrics.
      • Run the lead gen engine diagnostic.
      • Identify and prioritize low-scoring areas.

      This phase involves the following participants:

      • Marketing lead
      • Lead gen engine steering committee

      Step 1.1

      Identify Lead Gen Engine Optimization Steering Committee & Working Team

      Activities

      1.1.1 Identify the lead gen engine optimization steering committee and document in the Lead Gen Engine Optimization Strategy Template

      1.1.2 Identify the lead gen engine optimization working team document in the Lead Gen Engine Optimization Strategy Template

      This step will walk you through the following activities:

      Identify the lead gen engine optimization steering committee.

      This step involves the following participants:

      • Marketing director
      • Leadership

      Outcomes of this step

      An understanding of who will be responsible and who will be accountable for accomplishing the lead gen engine diagnostic and optimization strategy.

      1.1.1 Identify the lead gen engine optimization steering committee

      1-2 hours

      1. The marketing lead should meet with leadership to determine who will make up the steering committee for the lead gen engine optimization.
      2. Document the steering committee members in the Lead Gen Engine Optimization Strategy Template slide entitled “The Steering Committee.”

      Input

      Output

      • Stakeholders and leaders across the various functions outlined on the next slide
      • List of the lead gen engine optimization strategy steering committee members

      Materials

      Participants

      • Lead Gen Engine Optimization Strategy Template
      • Marketing director
      • Executive leadership

      Download the Lead Gen Engine Optimization Strategy Template

      Lead gen engine optimization steering committee

      Consider the skills and knowledge required for the diagnostic and the implementation of the strategy. Constructing a cross-functional steering committee will be essential for the optimization of the lead gen engine. At least one stakeholder from each relevant department should be included in the steering committee.

      Required Skills/Knowledge

      Suggested Functions

      • Target Buyer
      • Product Roadmap
      • Brand
      • Competitors
      • Campaigns/Lead Gen
      • Sales Enablement
      • Media/Analysts
      • Customer Satisfaction
      • Data Analytics
      • Ad Campaigns
      • Competitive Intelligence
      • Product Marketing
      • Product Management
      • Creative Director
      • Competitive Intelligence
      • Field Marketing
      • Sales
      • PR/AR/Corporate Comms
      • Customer Success
      • Analytics Executive
      • Campaign Manager

      For small and mid-sized businesses (SMB), because employees wear many different hats, assign people that have the requisite skills and knowledge, not the role title.

      The image contains examples of small and mid-sized businesses, and the different employee recommendations.

      1.1.2 Identify the lead gen engine optimization working team

      1-2 hours

      1. The marketing director should meet with leadership to determine who will make up the working team for the lead gen engine optimization.
      2. Finalize selection of team members and fill out the slide entitled “The Working Team” in the Lead Gen Engine Optimization Strategy Template.

      Input

      Output

      • Executives and analysts responsible for execution of tasks across Marketing, Product, Sales, and IT
      • The lead gen engine optimization working team

      Materials

      Participants

      • The Lead Gen Engine Optimization Strategy Template
      • Marketing director
      • Executive leadership

      Download the Lead Gen Engine Optimization Strategy Template

      Lead gen engine working team

      Consider the working skills required for the diagnostic and implementation of the strategy and assign the working team.

      Required Skills/Knowledge

      Suggested Titles

      • SEO
      • Inbound Marketing
      • Paid Advertising
      • Website Development
      • Content Creation
      • Lead Scoring
      • Landing Pages
      • A/B Testing
      • Email Campaigns
      • Marketing and Sales Automation
      • SEO Analyst
      • Content Marketing Manager
      • Product Marketing Manager
      • Website Manager
      • Website Developer
      • Sales Manager
      • PR
      • Customer Success Manager
      • Analytics Executive
      • Campaign Manager

      Step 1.2

      Gather Baseline Metrics

      Activities

      1.2.1 Gather baseline metrics and document in the Lead Gen Engine Optimization Strategy Template

      This step will walk you through the following activities:

      Gather baseline metrics.

      This step involves the following participants:

      • Marketing director
      • Analytics lead

      Outcomes of this step

      Understand and document baseline marketing metrics.

      1.2.1 Gather baseline metrics and document in the Lead Gen Engine Optimization Strategy Template

      1-2 hours

      1. Use the example on the next slide to learn about the B2B SaaS industry-standard baseline metrics.
      2. Meet with the analytics lead to analyze and record the data within the “Baseline Metrics” slide of the Lead Gen Engine Optimization Strategy Template. The baseline metrics will include:
        • Unique monthly website visitors
        • Visitor to lead conversion rate
        • Lead to MQL conversion rate
        • Customer acquisition cost (CAC)
        • Lifetime customer value to customer acquisition cost (LTV to CAC) ratio
        • Campaign ROI

      Recording the baseline data allows you to measure the impact your lead gen engine optimization strategy has over the baseline.

      Input

      Output
      • Marketing and analytics data
      • Documentation of baseline marketing metrics

      Materials

      Participants

      • The lead gen engine optimization strategy
      • Marketing director
      • Analytics lead

      B2B SaaS baseline metrics

      Industry standard metrics for B2B SaaS in 2022

      Unique Monthly Visitors

      Industry standard is 5% to 10% growth month over month.

      Visitor to Lead Conversion

      Industry standard is between 0.9% to 2.1%.

      Lead to MQL Conversion

      Industry standard is between 36% to 48%.

      CAC

      Industry standard is a cost of $400 to $850 per customer acquired.

      LTV to CAC Ratio

      Industry standard is an LTV:CAC ratio between 3 to 6.

      Campaign ROI

      Email: 201%

      Pay-Per-Click (PPC): 36%

      LinkedIn Ads: 94%

      Source: “B2B SaaS Marketing KPIs,” First Page Sage, 2021

      Update the Lead Gen Optimization Strategy Template with your company’s baseline metrics.

      Download the Lead Gen Engine Optimization Strategy Template

      Step 1.3

      Run the Lead Gen Engine Diagnostic

      Activities

      1.3.1 Gather steering committee and working team to complete the Lead Gen Engine Diagnostic Tool

      This step will walk you through the following activities:

      Gather the steering committee and answer the questions within the Lead Gen Engine Diagnostic Tool.

      This step involves the following participants:

      • Lead gen engine optimization working team
      • Lead gen engine optimization steering committee

      Outcomes of this step

      Lead gen engine diagnostic and scorecard

      1.3.1 Gather the committee and team to complete the Lead Gen Engine Diagnostic Tool

      2-3 hours

      1. Schedule a two-hour meeting with the steering committee and working team to complete the Lead Gen Engine Diagnostic Tool. To ensure the alignment of all departments and the quality of results, all steering committee members must participate.
      2. Answer the questions within the tool and then review your company’s results in the Results tab.

      Input

      Output

      • Marketing and analytics data
      • Diagnostic scorecard for the lead gen engine

      Materials

      Participants

      • Lead Gen Engine Diagnostic Tool
      • Marketing director
      • Analytics lead

      Download the Lead Gen Engine Diagnostic Tool

      Step 1.4

      Identify & Prioritize Low-Scoring Areas

      Activities

      1.4.1 Identify and prioritize low-scoring areas from the diagnostic scorecard

      This step will walk you through the following activities:

      Identify and prioritize the low-scoring areas from the diagnostic scorecard.

      This step involves the following participants:

      • Marketing director

      Outcomes of this step

      A prioritized list of the lead gen engine problems to include in the Lead Gen Engine Optimization Strategy Template

      1.4.1 Identify and prioritize low-scoring areas from the diagnostic scorecard

      1 hour

      1. Transfer the results from the Lead Gen Engine Diagnostic Scorecard Results tab to the Lead Gen Engine Optimization Strategy Template slide entitled “Lead Gen Engine Diagnostic Scorecard.”
        • Results between 0 and 2 should be listed as high-priority fixes on the “Lead Gen Engine Diagnostic Scorecard” slide. You will use these areas for your strategy.
        • Results between 2 and 3 should be listed as medium-priority fixes on “Lead Gen Engine Diagnostic Scorecard” slide. You will use these areas for your strategy.
        • Results between 3 and 4 are within the industry standard and will require no fixes or only small adjustments.

      Input

      Output

      • Marketing and analytics data
      • Documentation of baseline marketing metrics

      Materials

      Participants

      • Lead Gen Engine Optimization Strategy Template
      • Marketing director
      • Analytics lead

      Download the Lead Gen Engine Diagnostic Tool

      Phase 2

      Lead Gen Engine Optimization Strategy

      Phase 1

      Phase 2

      1.1 Select lead gen engine steering committee & working team

      1.2 Gather baseline metrics

      1.3 Run the lead gen engine diagnostic

      1.4 Identify & prioritize low-scoring areas

      2.1 Define the roadmap

      2.2 Create lead gen engine optimization strategy

      2.3 Present strategy to steering committee

      This phase will walk you through the following activities:

      Create a best-in-class lead gen optimization strategy and roadmap based on the weaknesses found in the diagnostic tool. The steps include:

      • Define the roadmap.
      • Create a lead gen engine optimization strategy.
      • Present the strategy to the steering committee.

      This phase involves the following participants:

      • Marketing director

      Step 2.1

      Define the Roadmap

      Activities

      2.1.1 Create the roadmap for the lead gen optimization strategy

      This step will walk you through the following activities:

      Create the optimization roadmap for your lead gen engine strategy.

      This step involves the following participants:

      • Marketing director

      Outcomes of this step

      Strategy roadmap

      2.1.1 Create the roadmap for the lead gen optimization strategy

      1 hour

      1. Copy the results from "The Lead Gen Engine Diagnostic Scorecard" slide to the "Value, Resources & Roadmap Matrix" slide in the Lead Gen Engine Optimization Strategy Template. Adjust the Roadmap Quarter column after evaluating the internal resources of your company and expected value generated.
      2. Using these results, create your strategy roadmap by updating the slide entitled “The Strategy Roadmap” in the Lead Gen Engine Optimization Strategy Template.

      Input

      Output

      • Diagnostic scorecard
      • Strategy roadmap

      Materials

      Participants

      • Lead Gen Engine Optimization Strategy Template
      • Marketing Director

      Download the Lead Gen Engine Optimization Strategy Template

      Step 2.2

      Create the Lead Gen Engine Optimization Strategy

      Activities

      2.2.1 Customize your lead gen engine optimization strategy using the template

      This step will walk you through the following activities:

      Create a lead gen engine optimization strategy based on the results of your diagnostic scorecard.

      This step involves the following participants:

      Marketing director

      Outcomes of this step

      A leadership-facing lead gen optimization strategy

      2.2.1 Customize your lead gen engine optimization strategy using the template

      2-3 hours

      Review the strategy template:

      1. Use "The Strategy Roadmap" slide to organize the remaining slides from the Q1, Q2, and Q3 sections.
        1. Fixes listed in "The Strategy Roadmap" under Q1 should be placed within the Q1 section.
        2. Fixes listed in "The Strategy Roadmap" under Q2 should be placed within the Q2 section.
        3. Fixes listed in "The Strategy Roadmap" under Q3 should be placed within the Q3 section.

      Input

      Output

      • The strategy roadmap
      • Your new lead gen engine optimization strategy

      Materials

      Participants

      • Lead Gen Engine Optimization Strategy Template
      • Marketing director

      Download the Lead Gen Engine Optimization Strategy Template

      Step 2.3

      Present the strategy to the steering committee

      Activities

      2.3.1 Present the findings of the diagnostic and the lead gen optimization strategy to the steering committee.

      This step will walk you through the following activities:

      Get executive buy-in on the lead gen engine optimization strategy.

      This step involves the following participants:

      • Marketing director
      • Steering committee

      Outcomes of this step

      • Buy-in from leadership on the strategy

      2.3.1 Present findings of diagnostic and lead gen optimization strategy to steering committee

      1-2 hours

      1. Schedule a presentation to present the findings of the diagnostic, the lead gen engine optimization strategy, and the roadmap to the steering committee.
      InputOutput
      • Your company’s lead gen engine optimization strategy
      • Official outline of strategy and buy-in from executive leadership

      Materials

      Participants

      • Lead Gen Engine Optimization Strategy Template
      • Marketing director
      • Executive leadership
      • Steering committee

      Download the Lead Gen Engine Optimization Strategy Template

      Related SoftwareReviews Research

      Create a Buyer Persona and Journey

      Make it easier to market, sell, and achieve product-market fit with deeper buyer understanding.

      • Reduce time and treasure wasted chasing the wrong prospects.
      • Improve product-market fit.
      • Increase open and click-through rates in your lead gen engine.
      • Perform more effective sales discovery and increase eventual win rates.

      Optimize Lead Generation With Lead Scoring

      In today’s competitive environment, optimizing Sales’ resources by giving them qualified leads is key to B2B marketing success.

      • Lead scoring is a must-have capability for high-tech marketers.
      • Without lead scoring, marketers will see increased costs of lead generation and decreased SQL-to-opportunity conversion rates.
      • Lead scoring increases sales productivity and shortens sales cycles.

      Build a More Effective Go-to-Market Strategy

      Creating a compelling go-to-market strategy and keeping it current is a critical software company function – as important as financial strategy, sales operations, and even corporate business development – given its huge impact on the many drivers of sustainable growth.

      • Align stakeholders on a common vision and execution plan.
      • Build a foundation of buyer and competitive understanding.
      • Deliver a team-aligned launch plan that enables commercial success.

      Bibliography

      “11 Lead Magnet Statistics That Might Surprise You.” ClickyDrip, 28 Dec. 2020. Accessed April 2022.

      “45 Conversion Rate Optimization Statistics Every Marketer Should Know.” Outgrow, n.d. Accessed April 2022.

      Bailyn, Evan. “B2B SaaS Funnel Conversion Benchmarks.” First Page Sage, 24 Feb. 2021. Accessed April 2022.
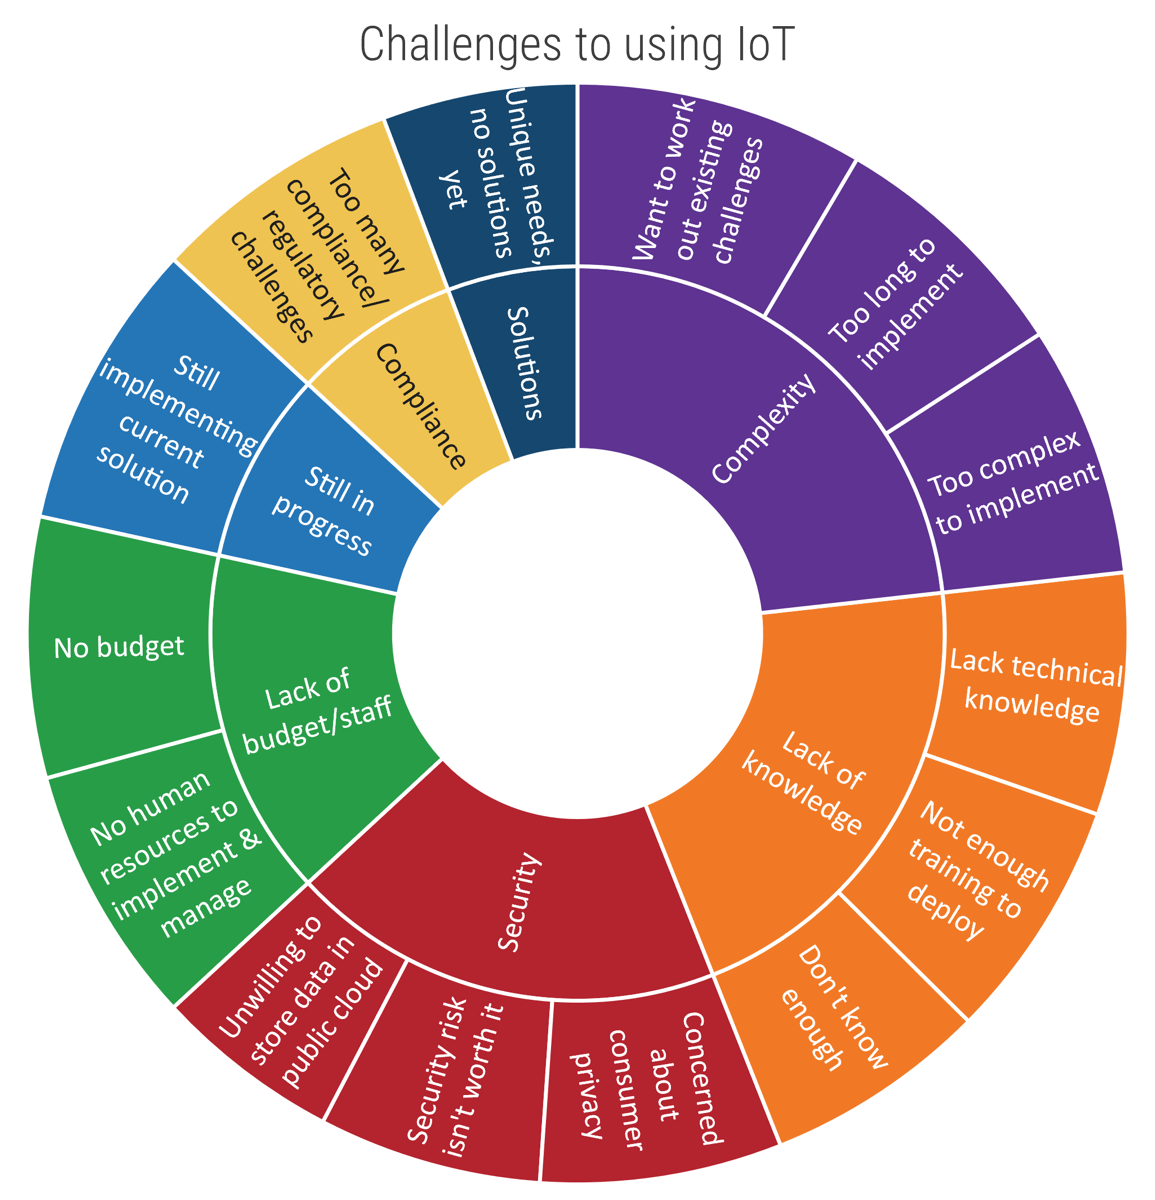
      Bailyn, Evan. “B2B SaaS Marketing KPIs: Behind the Numbers.” First Page Sage, 1 Sept. 2021. Accessed April 2022.
      Conversion Optimization.” Lift Division, n.d. Accessed April 2022.

      Corson, Sean. “LTV:CAC Ratio [2022 Guide] | Benchmarks, Formula, Tactics.” Daasity, 3 Nov. 2021. Accessed April 2022.

      Dudley, Carrie. “What are personas?” Illumin8, 26 Jan. 2018. Accessed April 2022.
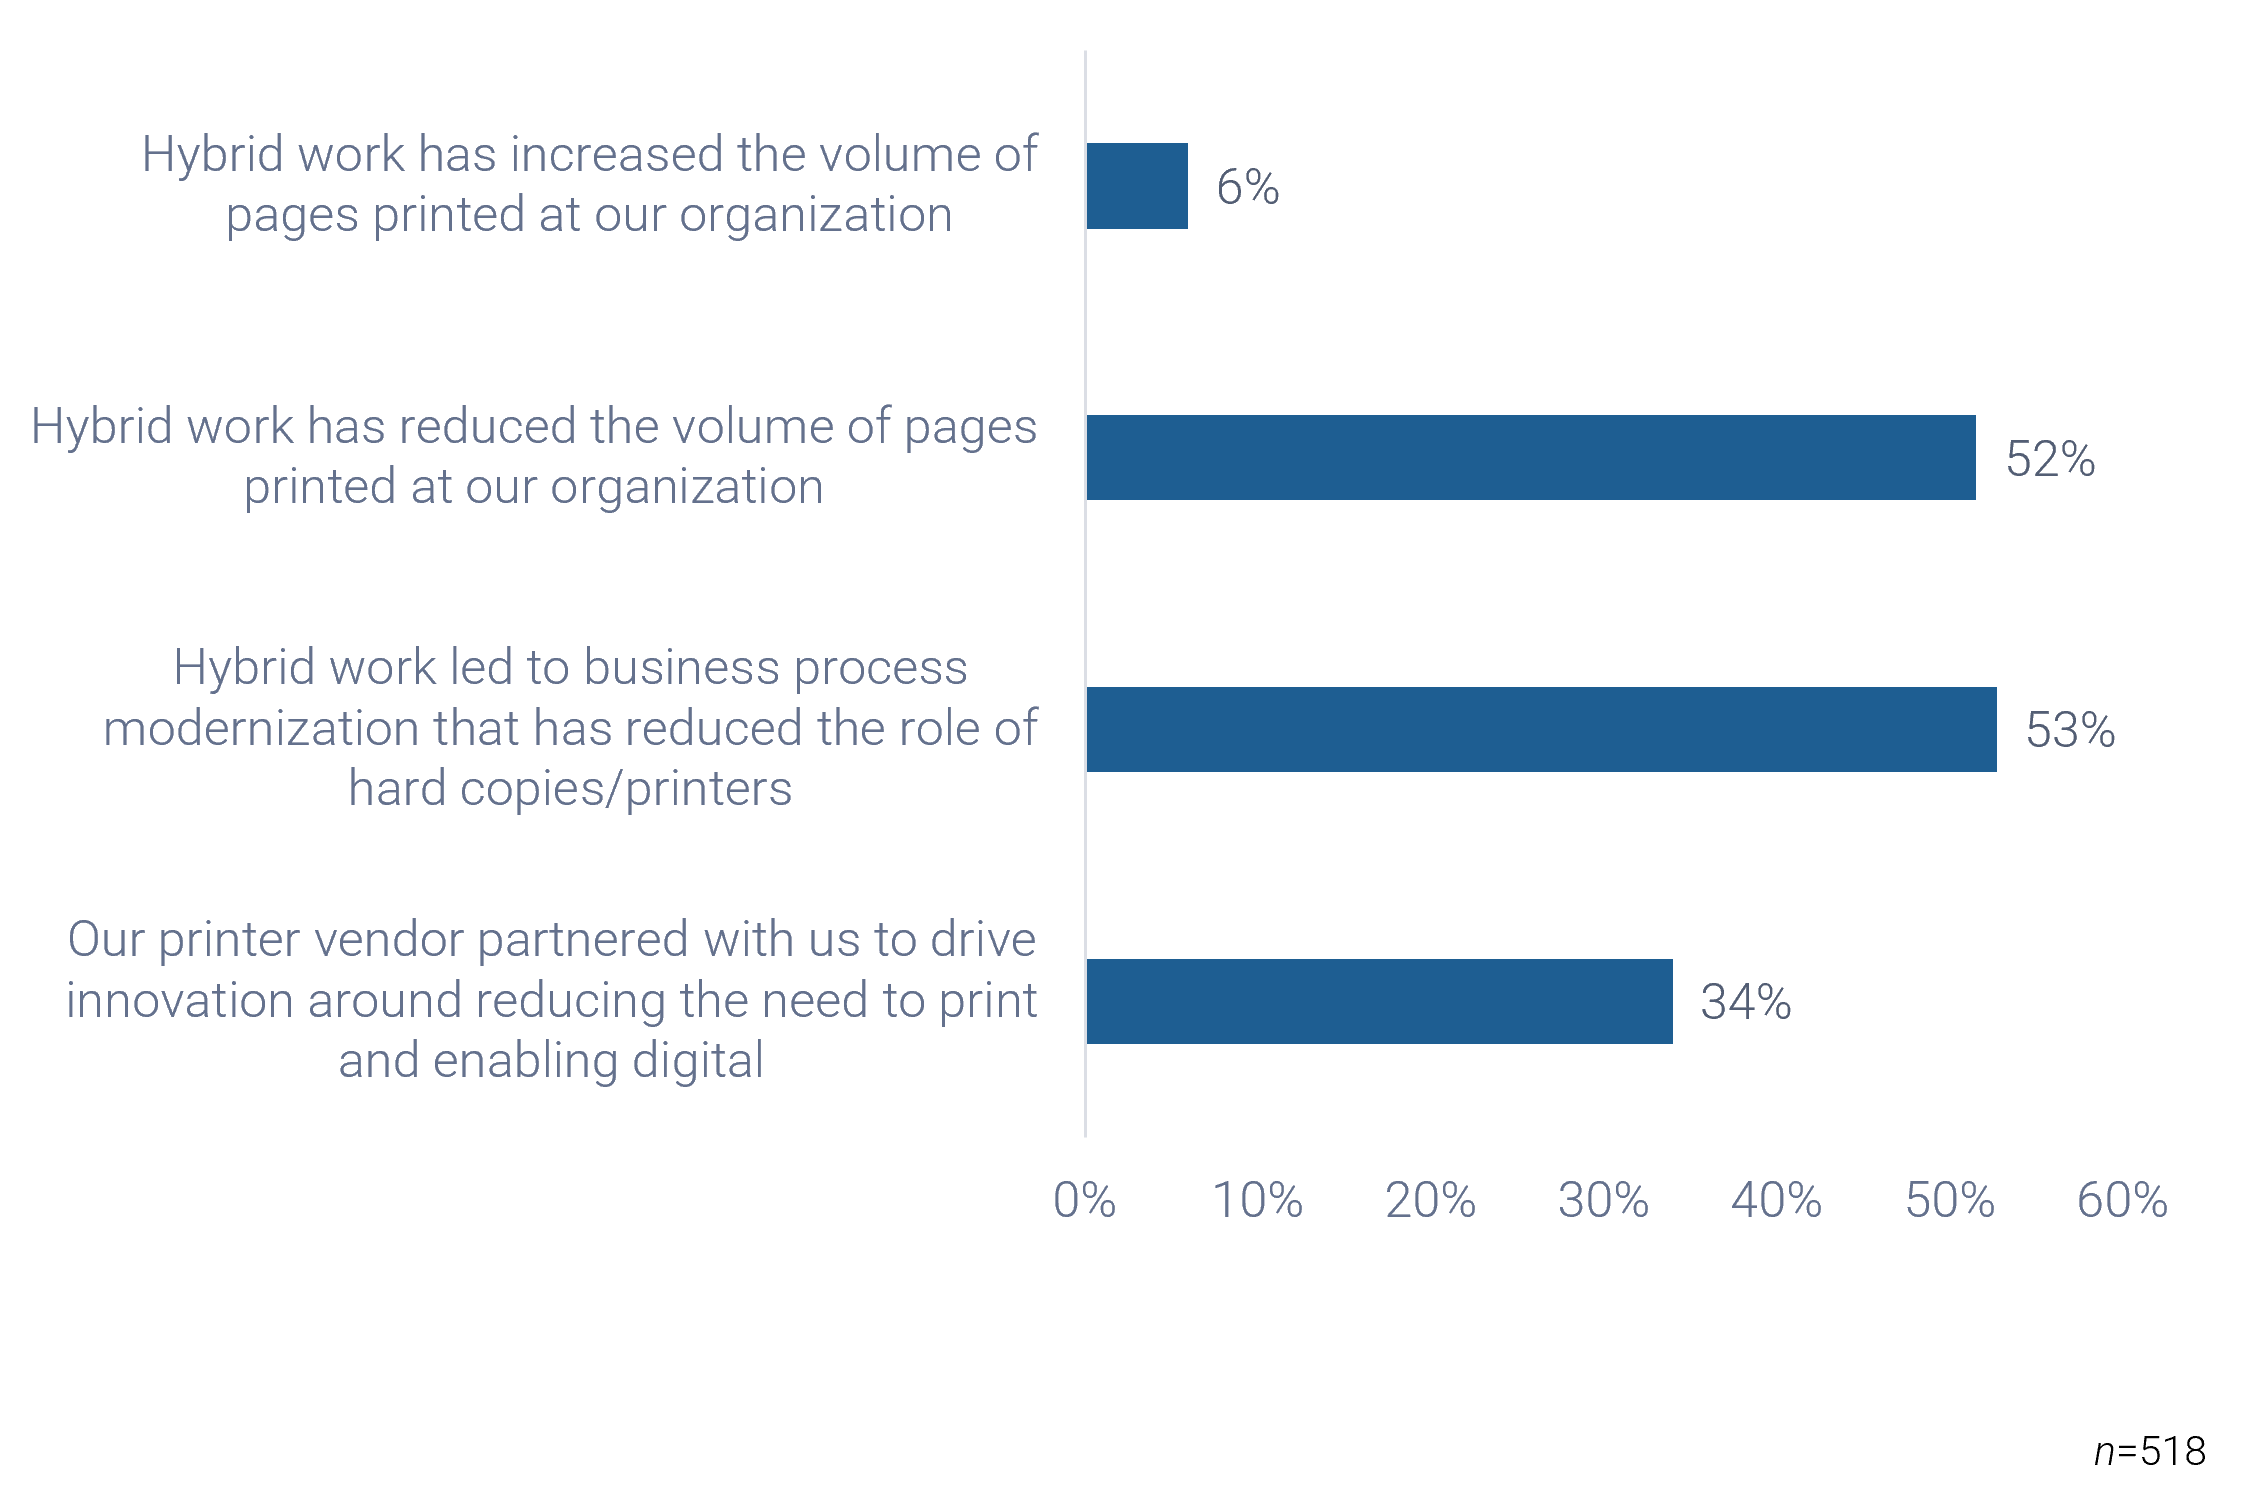
      Godin, Seth. “Permission Marketing.” Accenture, Oct. 2009. Accessed April 2022.

      Lebo, T. “Lead Conversion Statistics All B2B Marketers Need to Know.” Convince & Convert, n.d. Accessed April 2022.

      Lister, Mary. “33 CRO & Landing Page Optimization Stats to Fuel Your Strategy.” WordStream, 24 Nov. 2021. [Accessed April 2022].

      Nacach, Jamie. “How to Determine How Much Money to Spend on Lead Generation Software Per Month.” Bloominari, 18 Sept. 2018. Accessed April 2022.

      Needle, Flori. “11 Stats That Make a Case for Landing Pages.” HubSpot, 10 June 2021. Accessed April 2022.

      Payne, Kevin. “10 Effective Lead Nurturing Tactics to Boost Your Sales.” Kevintpayne.com, n.d. Accessed April 2022.

      Tam, Edwin. “ROI in Marketing: Lifetime Value (LTV) & Customer Acquisition Cost (CAC).” Construct Digital, 19 Jan. 2016. Accessed April 2022.