Further reading
Build a Reporting and Analytics Strategy
Deliver actionable business insights by creating a business-aligned reporting and analytics strategy.
Terminology
As the reporting and analytics space matured over the last decade, software suppliers used different terminology to differentiate their products from others’. This caused a great deal of confusion within the business communities.
Following are two definitions of the term Business Intelligence:
Business intelligence (BI) leverages software and services to transform data into actionable insights that inform an organization’s strategic and tactical business decisions. BI tools access and analyze data sets and present analytical findings in reports, summaries, dashboards, graphs, charts, and maps to provide users with detailed intelligence about the state of the business.
The term business intelligence often also refers to a range of tools that provide quick, easy-to-digest access to insights about an organization's current state, based on available data.
CIO Magazine
Business intelligence (BI) comprises the strategies and technologies used by enterprises for the data analysis of business information. BI technologies provide historical, current, and predictive views of business operations.
Common functions of business intelligence technologies include reporting, online analytical processing, analytics, data mining, process mining, complex event processing, business performance management, benchmarking, text mining, predictive analytics, and prescriptive analytics.
Wikipedia
This blueprint will use the terms “BI,” “BI and Analytics,” and “Reporting and Analytics” interchangeably in different contexts, but always in compliance to the above definitions.
ANALYST PERSPECTIVE
A fresh analytics & reporting strategy enables new BI opportunities.
We need data to inform the business of past and current performance and to support strategic decisions. But we can also drown in a flood of data. Without a clear strategy for business intelligence, a promising new solution will produce only noise.
BI and Analytics teams must provide the right quantitative and qualitative insights for the business to base their decisions on.
Your Business Intelligence and Analytics strategy must support the organization’s strategy. Your strategy for BI & Analytics provides direction and requirements for data warehousing and data integration, and further paves the way for predictive analytics, big data analytics, market/industry intelligence, and social network analytics.
Dirk Coetsee,
Director, Data and Analytics Info-Tech Research Group
Our understanding of the problem
This Research is Designed For:
- A CIO or Business Unit (BU) Leader looking to improve reporting and analytics, reduce time to information, and embrace fact-based decision making with analytics, reporting, and business intelligence (BI).
- Application Directors experiencing poor results from an initial BI tool deployment who are looking to improve the outcome.
This Research Will Also Assist:
- Project Managers and Business Analysts assigned to a BI project team to collect and analyze requirements.
- Business units that have their own BI platforms and would like to partner with IT to take their BI to an enterprise level.
This Research Will Help You:
- Align your reporting and analytics strategy with the business’ strategic objectives before you rebuild or buy your Business Intelligence platform.
- Identify reporting and analytics objectives to inform the data warehouse and integration requirements gathering process.
- Avoid common pitfalls that derail BI and analytic deployments and lower their adoption.
- Identify Business Intelligence gaps prior to deployment and incorporate remedies within your plans.
This Research Will Help Them:
- Recruit the right resources for the program.
- Align BI with corporate vision, mission, goals, and strategic direction.
- Understand the needs of business partners.
- Assess BI maturity and plan for target state.
- Develop a BI strategy and roadmap.
- Track the success of the BI initiative.
Executive summary
Situation:
BI drives a new reality. Uber is the world’s largest taxi company and they own no vehicles; Alibaba is the world’s most valuable retailer and they have no inventory; Airbnb is the world’s largest accommodation provider and they own no real estate. How did they disrupt their markets and get past business entry barriers? A deep understanding of their market through impeccable business intelligence!
Complication:
- In respect to BI matureness, you can’t expect the whole organization to be at the same place at the same time. Your BI strategy needs to recognize this and should strive to align rather than dictate.
- Technology is just one aspect of your BI and Analytics strategy and is not a quick solution or a guarantee for long term success.
Resolution:
- Drive strategy development by establishing the business context upfront in order to align business intelligence providers with the most important needs of their BI consumers and the strategic priorities of the organization.
- Revamp or create a BI strategy to update your BI program to make it fit for purpose.
- Understand your existing BI baggage – e.g. your existing BI program, the artifacts generated from the program, and the users it supports. Those will inform the creation of the strategy and roadmap.
- Assess current BI maturity and determine your future state BI maturity.
- BI needs governance to ensure consistent planning, communication, and execution of the BI strategy.
- Create a network of BI ambassadors across the organization to promote BI.
- Plan for the future to ensure that required data will be available when the organization needs it.
Info-Tech Insight
- Put the “B” back in BI. Don’t have IT doing BI for IT’s sake; ensure the voice and needs of the business are the primary drivers of your strategy.
- The BI strategy drives data warehouse and integration strategies and the data needs to support business decisions.
- Go beyond the platform. The solution to better BI often lies in improving the BI practice, not acquiring the latest and greatest tool.
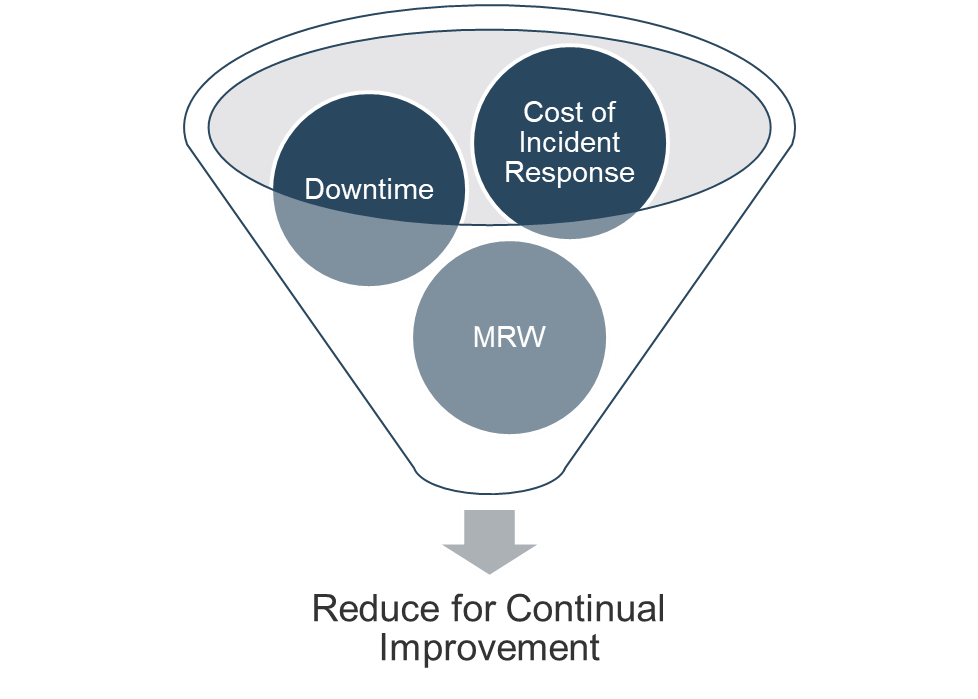
Metrics to track BI & Analytical program progress
Goals for BI:
- Understand business context and needs. Identify business processes that can leverage BI.
- Define the Reporting & Analytics Roadmap. Develop data initiatives, and create a strategy and roadmap for Business Intelligence.
- Continuous improvements. Your BI program is evolving and improving over time. The program should allow you to have faster, better, and more comprehensive information.
Info-Tech’s Suggested Metrics for Tracking the BI Program
| |
Practice Improvement Metrics |
Data Collection and Calculation |
Expected Improvement |
| Program Level Metrics |
Efficiency
- Time to information
- Self-service penetration
|
- Derive from the ticket management system
- Derive from the BI platform
|
- 10% reduction in time to information
- Achieve 10-15% self-service penetration
|
| |
- Effectiveness
- BI Usage
- Data quality
|
- Derive from the BI platform
- Data quality perception
|
- Majority of the users use BI on a daily basis
- 15% increase in data quality perception
|
| |
Comprehensiveness
- # of integrated datasets
- # of strategic decisions made
|
- Derive from the data integration platform
- Decision-making perception
|
- Onboard 2-3 new data domains per year
- 20% increase in decision-making perception
|
Intangible Metrics:
Tap into the results of Info-Tech’s CIO Business Vision diagnostic to monitor the changes in business-user satisfaction as you implement the initiatives in your BI improvement roadmap.
Your Enterprise BI and Analytics Strategy is driven by your organization’s Vision and Corporate Strategy
Formulating an Enterprise Reporting and Analytics Strategy requires the business vision and strategies to first be substantiated. Any optimization to the Data Warehouse, Integration and Source layer is in turn driven by the Enterprise Reporting and Analytics Strategy
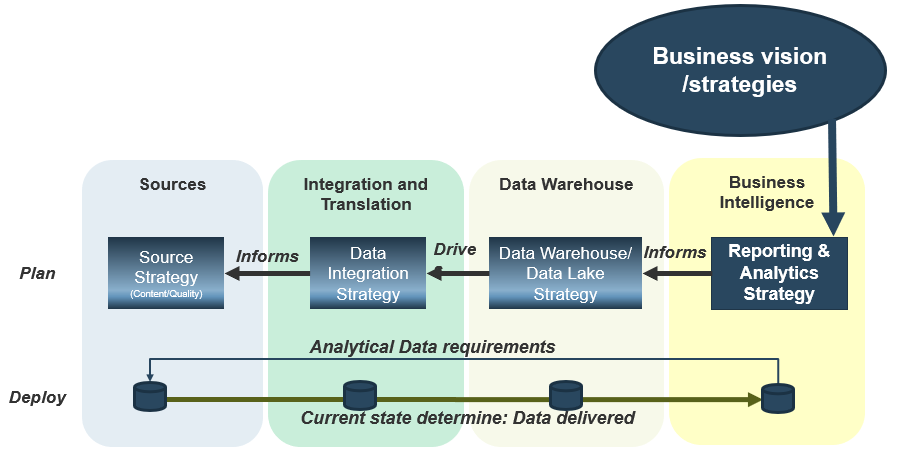
The current state of your Integration and Warehouse platforms determine what data can be utilized for BI and Analytics
Where we are, and how we got here
How we got here
- In the beginning was BI 1.0. Business intelligence began as an IT-driven centralized solution that was highly governed. Business users were typically the consumers of reports and dashboards created by IT, an analytics-trained minority, upon request.
- In the last five to ten years, we have seen a fundamental shift in the business intelligence and analytics market, moving away from such large-scale, centralized IT-driven solutions focused on basic reporting and administration, towards more advanced user-friendly data discovery and visualization platforms. This has come to be known as BI 2.0.
- Many incumbent market leaders were disrupted by the demand for more user-friendly business intelligence solutions, allowing “pure-play” BI software vendors to carve out a niche and rapidly expand into more enterprise environments.
- BI-on-the-cloud has established itself as a solid alternative to in-house implementation and operation.
Where we are now
- BI 3.0 has arrived. This involves the democratization of data and analytics and a predominantly app-centric approach to BI, identifiable by an anywhere, anytime, and device-or-platform-independent collaborative methodology. Social workgroups and self-guided content creation, delivery, analysis, and management is prominent.
- Where the need for reporting and dashboards remains, we’re seeing data discovery platforms fulfilling the needs of non-technical business users by providing easy-to-use interactive solutions to increase adoption across enterprises.
- With more end users demanding access to data and the tools to extract business insights, IT is looking to meet these needs while continuing to maintain governance and administration over a much larger base of users. The race for governed data discovery is heated and will be a market differentiator.
- The next kid on the block is Artificial Intelligence that put further demands on data quality and availability.
RICOH Canada used this methodology to develop their BI strategy in consultation with their business stakeholders
CASE STUDY
Industry: Manufacturing and Retail
Source: RICOH
Ricoh Canada transforms the way people work with breakthrough technologies that help businesses innovate and grow. Its focus has always been to envision what the future will look like so that it can help its customers prepare for success. Ricoh empowers digital workplaces with a broad portfolio of services, solutions, and technologies – helping customers remove obstacles to sustained growth by optimizing the flow of information and automating antiquated processes to increase workplace productivity. In their commitment towards a customer-centric approach, Ricoh Canada recognized that BI and analytics can be used to inform business leaders in making strategic decisions.
Enterprise BI and analytics Initiative
Ricoh Canada enrolled in the ITRG Reporting & Analytics strategy workshop with the aim to create a BI strategy that will allow the business to harvest it strengths and build for the future. The workshop acted as a forum for the different business units to communicate, share ideas, and hear from each other what their pains are and what should be done to provide a full customer 360 view.
Results
“This workshop allowed us to collectively identify the various stakeholders and their unique requirements. This is a key factor in the development of an effective BI Analytics tool.” David Farrar
The Customer 360 Initiative included the following components
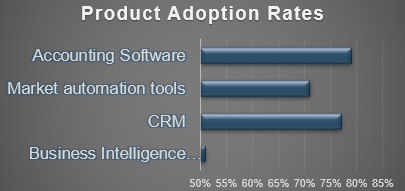
Improve BI Adoption Rates
Sisense
Reasons for low BI adoption
- Employees that never used BI tools are slow to adopt new technology.
- Lack of trust in data leads to lack of trust in the insights.
- Complex data structures deter usage due to long learning curves and contained nuances.
- Difficult to translate business requirements into tool linguistics due to lack of training or technical ineptness.
- Business has not taken ownership of data, which affects access to data.
How to foster BI adoption
- Senior management proclaim data as a strategic asset and involved in the promotion of BI
- Role Requirement that any business decision should be backed up by analytics
- Communication of internal BI use case studies and successes
- Exceptional data lineage to act as proof for the numbers
- A Business Data glossary with clearly defined business terms. Use the Business Data Glossary in conjunction with data lineage and semantic layers to ensure that businesses are clearly defined and traced to sources.
- Training in business to take ownership of data from inception to analytics.
Why bother with analytics?
In today’s ever-changing and global environment, organizations of every size need to effectively leverage their data assets to facilitate three key business drivers: customer intimacy, product/service innovation, and operational excellence. Plus, they need to manage their operational risk efficiently.
Investing in a comprehensive business intelligence strategy allows for a multidimensional view of your organization’s data assets that can be operationalized to create a competitive edge:
Historical Data
Without a BI strategy, creating meaningful reports for business users that highlight trends in past performance and draw relationships between different data sources becomes a more complex task. Also, the ever growing need to identify and assess risks in new ways is driving many companies to BI.
Data Democracy
The core purpose of BI is to provide the right data, to the right users, at the right time, and in a format that is easily consumable and actionable. In developing a BI strategy, remember the driver for managed cross-functional access to data assets and features such as interactive dashboards, mobile BI, and self-service BI.
Predictive and Big Data Analytics
As the volume, variety, and velocity of data increases rapidly, businesses will need a strategy to outline how they plan to consume the new data in a manner that does not overwhelm their current capabilities and aligns with their desired future state. This same strategy further provides a foundation upon which organizations can transition from ad hoc reporting to using data assets in a codified BI platform for decision support.
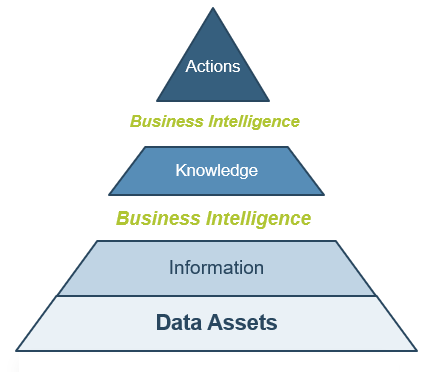
Business intelligence serves as the layer that translates data, information, and organizational knowledge into insights
As executive decision making shifts to more fact-based, data-driven thinking, there is an urgent need for data assets to be organized and presented in a manner that enables immediate action.
Typically, business decisions are based on a mix of intuition, opinion, emotion, organizational culture, and data. Though business users may be aware of its potential value in driving operational change, data is often viewed as inaccessible.
Business intelligence bridges the gap between an organization’s data assets and consumable information that facilitates insight generation and informed decision making.
Most organizations realize that they need a BI strategy; it’s no longer a nice-to-have, it’s a must-have.
– Albert Hui, Principal, Data Economist
Business intelligence and business analytics: what is the difference and should you care
Ask 100 people and you will get 100 answers. We like the prevailing view that BI looks at today and backward for improving who we are, while BA is forward-looking to support change decisions.
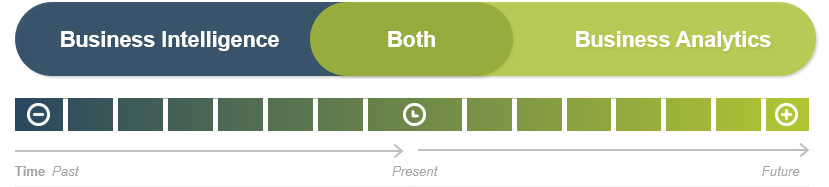
- Business intelligence is concerned with looking at present and historical data.
- Use this data to create reports/dashboards to inform a wide variety of information consumers of the past and current state of affairs.
- Almost all organizations, regardless of size and maturity, use some level of BI even if it’s just very basic reporting.
- Business analytics, on the other hand, is a forward-facing use of data, concerned with the present to the future.
- Analytics uses data to both describe the present, and more importantly, predict the future, enabling strategic business decisions.
- Although adoption is rapidly increasing, many organizations still do not utilize any advanced analytics in their environment.
However, establishing a strong business intelligence program is a necessary precursor to an organization’s development of its business analytics capabilities.
Organizations that successfully grow their BI capabilities are reaping the rewards
Evidence is piling up: if planned well, BI contributes to the organization’s bottom line.
It’s expected that there will be nearly 45 billion connected devices and a 42% increase in data volume each year posing a high business opportunity for the BI market (BERoE, 2020).
The global business intelligence market size to grow from US$23.1 billion in 2020 to US$33.3 billion by 2025, at a compound annual growth rate (CAGR) of 7.6% (Global News Wire, 2020)
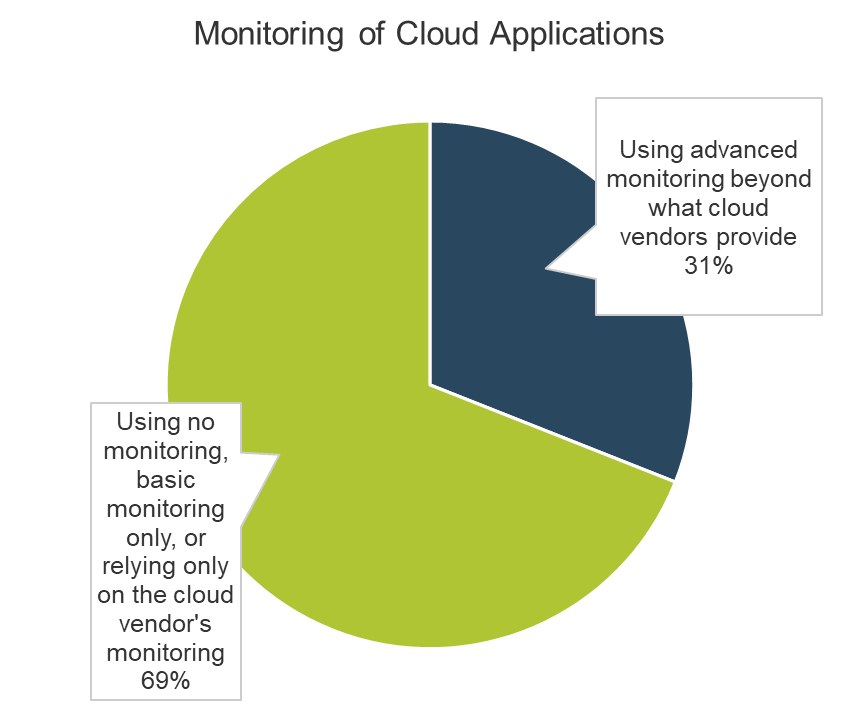
In the coming years, 69% of companies plan on increasing their cloud business intelligence usage (BARC Research and Eckerson Group Study, 2017).
Call to Action
Small organizations of up to 100 employees had the highest rate of business intelligence penetration last year (Forbes, 2018).
Source: IBM Business Value, 2015
For the New England Patriots, establishing a greater level of customer intimacy was driven by a tactical analytics initiative
CASE STUDY
Industry: Professional Sports
Source
Target Marketing
Problem
Despite continued success as a franchise with a loyal fan base, the New England Patriots experienced one of their lowest season ticket renewal rates in over a decade for the 2009 season. Given the numerous email addresses that potential and current season-ticket holders used to engage with the organization, it was difficult for Kraft Sports Group to define how to effectively reach customers.
Turning to a Tactical Analytics Approach
Kraft Sports Group turned to the customer data that it had been collecting since 2007 and chose to leverage analytics in order to glean insight into season ticket holder behavior. By monitoring and reporting on customer activity online and in attendance at games, Kraft Sports Group was able to establish that customer engagement improved when communication from the organization was specifically tailored to customer preferences and historical behavior.
Results
By operationalizing their data assets with the help of analytics, the Patriots were able to achieve a record 97% renewal rate for the 2010 season. KSG was able to take their customer engagement to the next level and proactively look for signs of attrition in season-ticket renewals.
We're very analytically focused and I consider us to be the voice of the customer within the organization… Ultimately, we should know when renewal might not happen and be able to market and communicate to change that behavior.
– Jessica Gelman,
VP Customer Marketing and Strategy, Kraft Sports Group
A large percentage of all BI projects fail to meet the organization’s needs; avoid falling victim to common pitfalls
Tool Usage Pitfalls
- Business units are overwhelmed with the amount and type of data presented.
- Poor data quality erodes trust, resulting in a decline in usage.
- Analysis performed for the sake of analysis and doesn’t focus on obtaining relevant business-driven insights.
Selection Pitfalls
- Inadequate requirements gathering.
- No business involvement in the selection process.
- User experience is not considered.
- Focus is on license fees and not total cost.
Implementation Pitfalls
- Absence of upfront planning
- Lack of change management to facilitate adoption of the new platform
- No quick wins that establish the value of the project early on
- Inadequate initial or ongoing training
Strategic Pitfalls
- Poor alignment of BI goals with organization goals
- Absence of CSFs/KPIs that can measure the qualitative and quantitative success of the project
- No executive support during or after the project
BI pitfalls are lurking around every corner, but a comprehensive strategy drafted upfront can help your organization overcome these obstacles. Info-Tech’s approach to BI has involvement from the business units built right into the process from the start and it equips IT to interact with key stakeholders early and often.
Only 62% of Big Data and AI projects in 2019 provided measurable results.
Source: NewVantage Partners LLC
Business and IT have different priorities for a BI tool
Business executives look for:
- Ease of use
- Speed and agility
- Clear and concise information
- Sustainability
IT professionals are concerned about:
- Solid security
- Access controls on data
- Compliance with regulations
- Ease of integration
Info-Tech Insight
Combining these priorities will lead to better tool selection and more synergy.
Elizabeth Mazenko
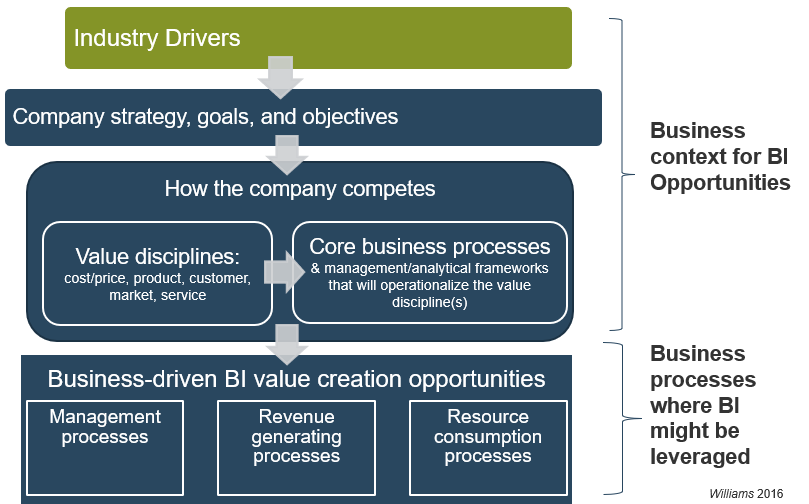
The top-down BI Opportunity Analysis is a tool for senior executives to discover where Business Intelligence can provide value
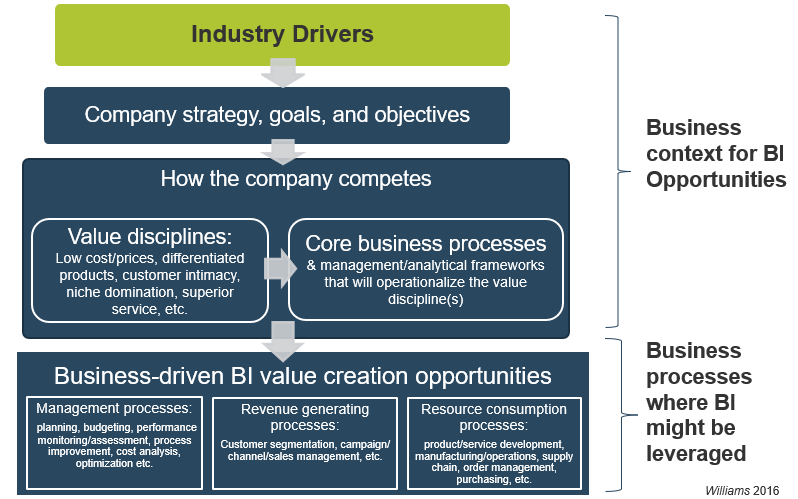
Example: Uncover BI opportunities with an opportunity analysis
| Industry Drivers |
Private label |
Rising input prices |
Retail consolidation |
| Company strategies |
Win at supply chain execution |
Win at customer service |
Expand gross margins |
| Value disciplines |
Strategic cost management |
Operational excellence |
Customer service |
| Core processes |
Purchasing |
Inbound logistics |
Sales, service & distribution |
| |
Enterprise management: Planning, budgeting, control, process improvement, HR |
|
|
| BI Opportunities |
Customer service analysis |
Cost and financial analysis |
Demand management |
Williams (2016)
Bridge the gap between business drivers and business intelligence features with a three-tiered framework
Info-Tech’s approach to formulating a fit-for-purpose BI strategy is focused on making the link between factors that are the most important to the business users and the ways that BI providers can enable those consumers.
Drivers to Establish Competitive Advantage
- Operational Excellence
- Client Intimacy
- Innovation
BI and Analytics Spectrum
- Strategic Analytics
- Tactical Analytics
- Operational Analytics
Info-Tech’s BI Patterns
- Delivery
- User Experience
- Deep Analytics
- Supporting
This is the content for Layout H3 Tag
Though business intelligence is primarily thought of as enabling executives, a comprehensive BI strategy involves a spectrum of analytics that can provide data-driven insight to all levels of an organization.
Recommended
Strategic Analytics
- Typically focused on predictive modeling
- Leverages data integrated from multiple sources (structured through unstructured)
- Assists in identifying trends that may shift organizational focus and direction
- Sample objectives:
- Drive market share growth
- Identify new markets, products, services, locations, and acquisitions
- Build wider and deeper customer relationships earning more wallet share and keeping more customers
Tactical Analytics
- Often considered Response Analytics and used to react to situations that arise, or opportunities at a department level.
- Sample objectives:
- Staff productivity or cost analysis
- Heuristics/algorithms for better risk management
- Product bundling and packaging
- Customer satisfaction response techniques
Operational Analytics
- Analytics that drive business process improvement whether internal, with external partners, or customers.
- Sample objectives:
- Process step elimination
- Best opportunities for automation
Business Intelligence Terminology
| Styles of BI |
New age BI |
New age data |
Functional Analytics |
Tools |
| Reporting |
Agile BI |
Social Media data |
Performance management analytics |
Scorecarding dashboarding |
| Ad hoc query |
SaaS BI |
Unstructured data |
Financial analytics |
Query & reporting |
| Parameterized queries |
Pervasive BI |
Mobile data |
Supply chain analytics |
Statistics & data mining |
| OLAP |
Cognitive Business |
Big data |
Customer analytics |
OLAP cubes |
| Advanced analytics |
Self service analytics |
Sensor data |
Operations analytics |
ETL |
| Cognitive business techniques |
Real-time Analytics |
Machine data |
HR Analytics |
Master data management |
| Scorecards & dashboards |
Mobile Reporting & Analytics |
|
“fill in the blanks” analytics |
Data Governance |
Williams (2016)
"BI can be confusing and overwhelming…"
– Dirk Coetsee,
Research Director,
Info-Tech Research Group
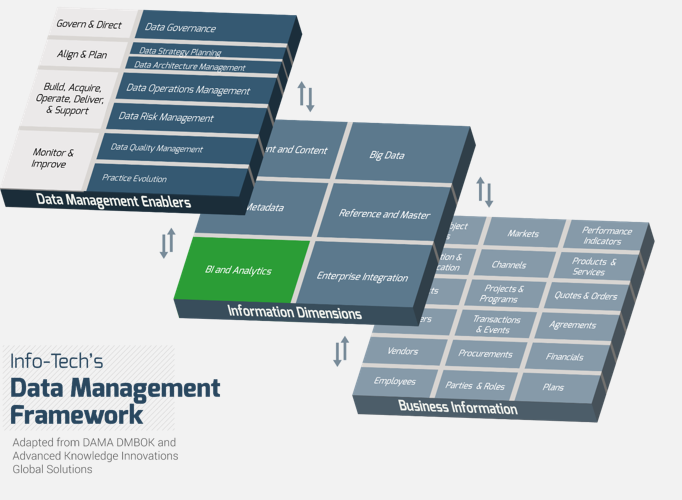
Business intelligence lies in the Information Dimensions layer of Info-Tech’s Data Management Framework
The interactions between the information dimensions and overlying data management enablers such as data governance, data architecture, and data quality underscore the importance of building a robust process surrounding the other data practices in order to fully leverage your BI platform.
Within this framework BI and analytics are grouped as one lens through which data assets at the business information level can be viewed.
Use Info-Tech’s three-phase approach to a Reporting & Analytics strategy and roadmap development
Project Insight
A BI program is not a static project that is created once and remains unchanged. Your strategy must be treated as a living platform to be revisited and revitalized in order to effectively enable business decision making. Develop a reporting and analytics strategy that propels your organization by building it on business goals and objectives, as well as comprehensive assessments that quantitatively and qualitatively evaluate your current reporting and analytical capabilities.
| Phase 1: Understand the Business Context and BI Landscape |
Phase 2: Evaluate Your Current BI Practice |
Phase 3: Create a BI Roadmap for Continuous Improvement |
1.1 Establish the Business Context
- Business Vision, Goals, Key Drivers
- Business Case Presentation
- High-Level ROI
|
2.1 Assess Your Current BI Maturity
- BI Practice Assessment
- Summary of Current State
|
3.1 Construct a BI Initiative Roadmap
- BI Improvement Initiatives
- RACI
- BI Strategy and Roadmap
|
1.2 Assess Existing BI Environment
- BI Perception Survey Framework
- Usage Analyses
- BI Report Inventory
|
2.2 Envision BI Future State
- BI Style Requirements
- BI Practice Assessment
|
3.2 Plan for Continuous Improvement
- Excel/Access Governance Policy
- BI Ambassador Network Draft
|
1.3 Develop BI Solution Requirements
- Requirements Gathering Principles
- Overall BI Requirements
|
|
|
Stand on the shoulders of Information Management giants
As part of our research process, we leveraged the frameworks of COBIT5, Mike 2.0, and DAMA DMBOK2. Contextualizing business intelligence within these frameworks clarifies its importance and role and ensures that our assessment tool is focused on key priority areas.
The DMBOK2 Data Management framework by the Data Asset Management Association (DAMA) provided a starting point for our classification of the components in our IM framework.
Mike 2.0 is a data management framework that helped guide the development of our framework through its core solutions and composite solutions.
The Cobit 5 framework and its business enablers were used as a starting point for assessing the performance capabilities of the different components of information management, including business intelligence.
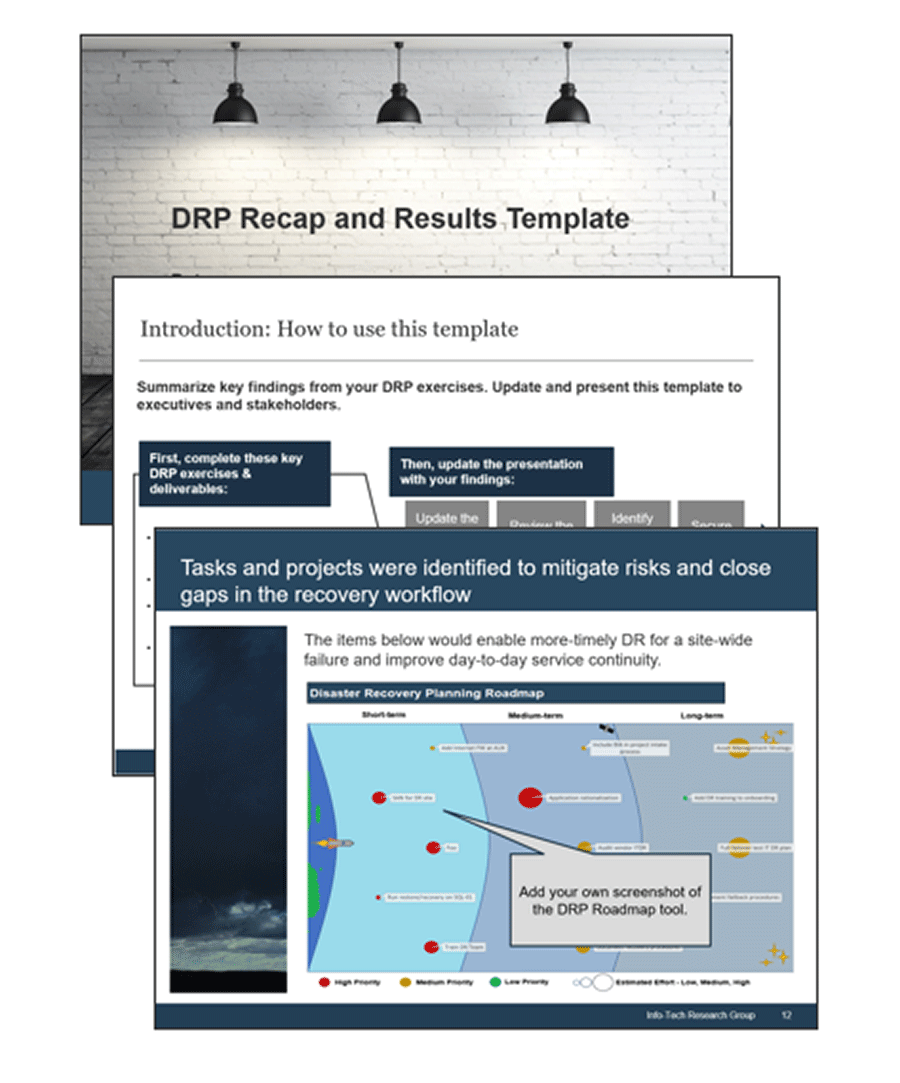
Info-Tech has a series of deliverables to facilitate the evolution of your BI strategy
BI Strategy Roadmap Template
BI Practice Assessment Tool
BI Initiatives and Roadmap Tool
BI Strategy and Roadmap Executive Presentation Template
Info-Tech offers various levels of support to best suit your needs
| DIY Toolkit |
Guided Implementation |
Workshop |
Consulting |
| “Our team has already made this critical project a priority, and we have the time and capability, but some guidance along the way would be helpful.” |
“Our team knows that we need to fix a process, but we need assistance to determine where to focus. Some check-ins along the way would help keep us on track.” |
“We need to hit the ground running and get this project kicked off immediately. Our team has the ability to take this over once we get a framework and strategy in place.” |
“Our team does not have the time or the knowledge to take this project on. We need assistance through the entirety of this project.” |
Diagnostics and consistent frameworks used throughout all four options
Build a Reporting and Analytics Strategy – Project Overview
| |
1. Understand the Business Context and BI Landscape |
2. Evaluate the Current BI Practice |
3. Create a BI Roadmap for Continuous Improvement |
| Best-Practice Toolkit |
1.1 Document overall business vision, mission, industry drivers, and key objectives; assemble a project team
1.2 Collect in-depth information around current BI usage and BI user perception
1.3 Create requirements gathering principles and gather requirements for a BI platform |
2.1 Define current maturity level of BI practice
2.2 Envision the future state of your BI practice and identify desired BI patterns |
3.1 Build overall BI improvement initiatives and create a BI improvement roadmap
3.2 Identify supplementary initiatives for enhancing your BI program |
| Guided Implementations |
- Discuss Info-Tech’s approach for using business information to drive BI strategy formation
- Review business context and discuss approaches for conducting BI usage and user analyses
- Discuss strategies for BI requirements gathering
|
- Discuss BI maturity model
- Review practice capability gaps and discuss potential BI patterns for future state
|
- Discuss initiative building
- Review completed roadmap and next steps
|
| Onsite Workshop |
Module 1: Establish Business Vision and Understand the Current BI Landscape |
Module 2: Evaluate Current BI Maturity
Identify the BI Patterns for the Future State |
Module 3: Build Improvement Initiatives and Create a BI Development Roadmap |
| |
Phase 1 Outcome:
- Business context
- Project team
- BI usage information, user perception, and new BI requirements
|
Phase 2 Outcome:
- Current and future state assessment
- Identified BI patterns
|
Phase 3 Outcome:
- BI improvement strategy and initiative roadmap
|
Workshop overview
Contact your account representative or email Workshops@InfoTech.com for more information.
| |
Workshop Day 1 |
Workshop Day 2 |
Workshop Day 3 |
Workshop Day 4 |
| Activities |
Understand Business Context and Structure the Project
1.1 Make the case for a BI strategy refresh.
1.2 Understand business context.
1.3 Determine high-level ROI.
1.4 Structure the BI strategy refresh project.
|
Understand Existing BI and Revisit Requirements
2.1 Understand the usage of your existing BI.
2.2 Gather perception of the current BI users.
2.3 Document existing information artifacts.
2.4 Develop a requirements gathering framework.
2.5 Gather requirements.
|
Revisit Requirements and Current Practice Assessment
3.1 Gather requirements.
3.2 Determine BI Maturity Level.
3.3 Perform a SWOT for your existing BI program.
3.4 Develop a current state summary.
|
Roadmap Develop and Plan for Continuous Improvements
5.1 Develop BI strategy.
5.2 Develop a roadmap for the strategy.
5.3 Plan for continuous improvement opportunities.
5.4 Develop a re-strategy plan.
|
| Deliverables |
- Business and BI Vision, Goals, Key Drivers
- Business Case Presentation
- High-Level ROI
- Project RACI
|
- BI Perception Survey
- BI Requirements Gathering Framework
- BI User Stories and Requirements
|
- BI User Stories and Requirements
- BI SWOT for your Current BI Program
- BI Maturity Level
- Current State Summary
|
- BI Strategy
- Roadmap accompanying the strategy with timeline
- A plan for improving BI
- Strategy plan
|
Phase 2
Understand the Business Context and BI Landscape
Build a Reporting and Analytics Strategy
Phase 1 overview
Detailed Overview
Step 1: Establish the business context in terms of business vision, mission, objectives, industry drivers, and business processes that can leverage Business Intelligence
Step 2: Understand your BI Landscape
Step 3: Understand business needs
Outcomes
- Clearly articulated high-level mission, vision, and key drivers from the business, as well as objectives related to business intelligence.
- In-depth documentation regarding your organization’s BI usage, user perception, and outputs.
- Consolidated list of requirements, existing and desired, that will direct the deployment of your BI solution.
Benefits
- Align business context and drivers with IT plans for BI and Analytics improvement.
- Understand your current BI ecosystem’s performance.
Understand your business context and BI landscape
Phase 1 Overarching Insight
The closer you align your new BI platform to real business interests, the stronger the buy-in, realized value, and groundswell of enthusiastic adoption will be. Get this phase right to realize a high ROI on your investment in the people, processes, and technology that will be your next generation BI platform.
| Understand the Business Context to Rationalize Your BI Landscape |
Evaluate Your Current BI Practice |
Create a BI Roadmap for Continuous Improvement |
Establish the Business Context
- Business Vision, Goals, Key Drivers
- Business Case Presentation
- High-Level ROI
|
Assess Your Current BI Maturity
- SWOT Analysis
- BI Practice Assessment
- Summary of Current State
|
Construct a BI Initiative Roadmap
- BI Improvement Initiatives
- BI Strategy and Roadmap
|
Access Existing BI Environment
- BI Perception Survey Framework
- Usage Analyses
- BI Report Inventory
|
Envision BI Future State
- BI Patterns
- BI Practice Assessment
- List of Functions
|
Plan for Continuous Improvement
- Excel Governance Policy
- BI Ambassador Network Draft
|
Undergo Requirements Gathering
- Requirements Gathering Principles
- Overall BI Requirements
|
|
|
Track these metrics to measure your progress through Phase 1
Goals for Phase 1:
- Understand the business context. Determine if BI can be used to improve business outcomes by identifying benefits, costs, opportunities, and gaps.
- Understand your existing BI. Plan your next generation BI based on a solid understanding of your existing BI.
- Identify business needs. Determine the business processes that can leverage BI and Analytics.
Info-Tech’s Suggested Metrics for Tracking Phase 1 Goals
| Practice Improvement Metrics |
Data Collection and Calculation |
Expected Improvement |
Monetary ROI
- Quality of the ROI
- # of user cases, benefits, and costs quantified
|
Derive the number of the use cases, benefits, and costs in the scoping. Ask business SMEs to verify the quality. |
High-quality ROI studies are created for at least three use cases |
| Response Rate of the BI Perception Survey |
Sourced from your survey delivery system |
Aim for 40% response rate |
| # of BI Reworks |
Sourced from your project management system |
Reduction of 10% in BI reworks |
Intangible Metrics:
- Executives’ understanding of the BI program and what BI can do for the organization.
- Improved trust between IT and the business by re-opening the dialogue.
- Closer alignment with the organization strategy and business plan leading to higher value delivered.
- Increased business engagement and input into the Analytics strategy.
Use advisory support to accelerate your completion of Phase 1 activities
Call 1-888-670-8889 or email GuidedImplementations@InfoTech.com for more information.
Complete these steps on your own, or call us to complete a guided implementation. A guided implementation is a series of two to three advisory calls that help you execute each phase of a project. They are included in most advisory memberships.
Guided Implementation 1: Understand the Business Context and BI Landscape
Proposed Time to Completion: 2-4 weeks
Step 1.0: Assemble Your Project Team
Start with an analyst kick-off call:
- Discuss Info-Tech’s viewpoint and definitions of business intelligence.
- Discuss the project sponsorship, ideal team members and compositions.
Then complete these activities…
- Identify a project sponsor and the project team members.
Step 1.1: Understand Your Business Context
Start with an analyst kick-off call:
- Discuss Info-Tech’s approach to BI strategy development around using business information as the key driver.
Then complete these activities…
- Detail the business context (vision, mission, goals, objectives, etc.).
- Establish business–IT alignment for your BI strategy by detailing the business context.
Step 1.2: Establish the Current BI Landscape
Review findings with analyst:
- Review the business context outputs from Step 1.1 activities.
- Review Info-Tech’s approach for documenting your current BI landscape.
- Review the findings of your BI landscape.
Then complete these activities…
- Gather information on current BI usage and perform a BI artifact inventory.
- Construct and conduct a user perception survey.
With these tools & templates:
BI Strategy and Roadmap Template
Step 1.0
Assemble the Project Team
Select a BI project sponsor
Info-Tech recommends you select a senior executive with close ties to BI be the sponsor for this project (e.g. CDO, CFO or CMO). To maximize the chance of success, Info-Tech recommends you start with the CDO, CMO, CFO, or a business unit (BU) leader who represents strategic enterprise portfolios.
Initial Sponsor
CFO or Chief Risk Officer (CRO)
- The CFO is responsible for key business metrics and cost control. BI is on the CFO’s radar as it can be used for both cost optimization and elimination of low-value activity costs.
- The CRO is tasked with the need to identify, address, and when possible, exploit risk for business security and benefit.
- Both of these roles are good initial sponsors but aren’t ideal for the long term.
CDO or a Business Unit (BU) Leader
- The CDO (Chief Data Officer) is responsible for enterprise-wide governance and utilization of information as an asset via data processing, analysis, data mining, information trading, and other means, and is the ideal sponsor.
- BU leaders who represent a growth engine for a company look for ways to mine BI to help set direction.
Ultimate Sponsor
CEO
- As a the primary driver of enterprise-wide strategy, the CEO is the ideal evangelist and project sponsor for your BI strategy.
- Establishing a CEO–CIO partnership helps elevate IT to the level of a strategic partner, as opposed to the traditional view that IT’s only job is to “keep the lights on.”
- An endorsement from the CEO may make other C-level executives more inclined to work with IT and have their business unit be the starting point for growing a BI program organically.
"In the energy sector, achieving production KPIs are the key to financial success. The CFO is motivated to work with IT to create BI applications that drive higher revenue, identify operational bottlenecks, and maintain gross margin."
– Yogi Schulz, Partner, Corvelle Consulting
Select a BI project team
Create a project team with the right skills, experience, and perspectives to develop a comprehensive strategy aligned to business needs.
You may need to involve external experts as well as individuals within the organization who have the needed skills.
A detailed understanding of what to look for in potential candidates is essential before moving forward with your BI project.
Leverage several of Info-Tech’s Job Description Templates to aid in the process of selecting the right people to involve in constructing your BI strategy.
Roles to Consider
Business Stakeholders
Business Intelligence Specialist
Business Analyst
Data Mining Specialist
Data Warehouse Architect
Enterprise Data Architect
Data Steward
"In developing the ideal BI team, your key person to have is a strong data architect, but you also need buy-in from the highest levels of the organization. Buy-in from different levels of the organization are indicators of success more than anything else."
– Rob Anderson, Database Administrator and BI Manager, IT Research and Advisory Firm
Create a RACI matrix to clearly define the roles and responsibilities for the parties involved
A common project management pitfall for any endeavour is unclear definition of responsibilities amongst the individuals involved.
As a business intelligence project requires a significant amount of back and forth between business and IT – bridged by the BI Steering Committee – clear guidelines at the project outset with a RACI chart provide a basic framework for assigning tasks and lines of communication for the later stages.
Responsible Accountable Consulted Informed
| |
Obtaining Buy-in |
Project Charter |
Requirements |
Design |
Development |
Program Creation |
| BI Steering Committee |
A |
C |
I |
I |
I |
C |
| Project Sponsor |
- |
C |
I |
I |
I |
C |
| Project Manager |
- |
R |
A |
I |
I |
C |
| VP of BI |
R |
I |
I |
I |
I |
A |
| CIO |
A |
I |
I |
I |
I |
R |
| Business Analyst |
I |
I |
R |
C |
C |
C |
| Solution Architect |
- |
- |
C |
A |
C |
C |
| Data Architect |
- |
- |
C |
A |
C |
C |
| BI Developer |
- |
- |
C |
C |
R |
C |
| Data Steward |
- |
- |
C |
R |
C |
C |
| Business SME |
C |
C |
C |
C |
C |
C |
Note: This RACI is an example of how role expectations would be broken down across the different steps of the project. Develop your own RACI based on project scope and participants.
STEP 1.1
Understand Your Business Context and Structure the Project
Establish business–IT alignment for your BI strategy by detailing the business context
Step Objectives
- Engage the business units to find out where users need BI enablement.
- Ideate preliminary points for improvement that will further business goals and calculate their value.
Step Activities
1.1.1 Craft the vision and mission statements for the Analytics program using the vision, mission, and strategies of your organization as basis.
1.1.2 Articulate program goals and objectives
1.1.3 Determine business differentiators and key drivers
1.1.4 Brainstorm BI-specific constraints and improvement objectives
Outcomes
- Clearly articulated business context that will provide a starting point for formulating a BI strategy
- High-level improvement objectives and ROI for the overall project
- Vision, mission, and objectives of the analytics program
Research Support
- Info-Tech’s BI Strategy and Roadmap Template
Proposed Participants in this Step
- Project Manager
- Project Team
- Relevant Business Stakeholders and Subject Matter Experts
Transform the way the business makes decisions
Your BI strategy should enable the business to make fast, effective, and comprehensive decisions.
| Fast |
Effective |
Comprehensive |
| Reduce time spent on decision-making by designing a BI strategy around information needs of key decision makers. |
Make the right data available to key decision makers. |
Make strategic high-value, impactful decisions as well as operational decisions. |
"We can improve BI environments in several ways. First, we can improve the speed with which we create BI objects by insisting that the environments are designed with flexibility and adaptability in mind. Second, we can produce higher quality deliverables by ensuring that IT collaborate with the business on every deliverable. Finally, we can reduce the costs of BI by giving access to the environment to knowledgeable business users and encouraging a self-service function."
– Claudia Imhoff, Founder, Boulder BI Brain Trust, Intelligent Solutions Inc.
Assess needs of various stakeholders using personas
User groups/user personas
Different users have different consumption and usage patterns. Categorize users into user groups and visualize the usage patterns. The user groups are the connection between the BI capabilities and the users.
| User groups |
Mindset |
Usage Pattern |
Requirements |
| Front-line workers |
Get my job done; perform my job quickly. |
Reports (standard reports, prompted reports, etc.) |
Examples:
- Report bursting
- Prompted reports
|
| Analysts |
I have some ideas; I need data to validate and support my ideas. |
Dashboards, self-service BI, forecasting/budgeting, collaboration |
Examples:
- Self-service datasets
- Data mashup capability
|
| Management |
I need a big-picture view and yet I need to play around with the data to find trends to drive my business. |
Dashboards, scorecards, mobile BI, forecasting/budgeting |
Examples:
- Multi-tab dashboards
- Scorecard capability
|
| Data scientists |
I need to combine existing data, as well as external or new, unexplored data sources and types to find nuggets in the data. |
Data mashup, connections to data sources |
Examples:
- Connectivity to big data
- Social media analyses
|
The pains of inadequate BI are felt across the entire organization – and land squarely on the shoulders of the CIO
Organization:
- Insufficient information to make decisions.
- Unable to measure internal performance.
- Losses incurred from bad decisions or delayed decisions.
- Canned reports fail to uncover key insights.
- Multiple versions of information exist in silos.
IT Department
- End users are completely dependent on IT for reports.
- Ad hoc BI requests take time away from core duties.
- Spreadsheet-driven BI is overly manual.
- Business losing trust in IT.
CIO
- Under great pressure and has a strong desire to improve BI.
- Ad hoc BI requests are consuming IT resources and funds.
- My organization finds value in using data and having decision support to make informed decisions.
The overarching question that needs to be continually asked to create an effective BI strategy is:
How do I create an environment that makes information accessible and consumable to users, and facilitates a collaborative dialogue between the business and IT?
Pre-requisites for success
Prerequisite #1: Secure Executive Sponsorship
Sponsorship of BI that is outside of IT and at the highest levels of the organization is essential to the success of your BI strategy. Without it, there is a high chance that your BI program will fail. Note that it may not be an epic fail, but it is a subtle drying out in many cases.
Prerequisite #2: Understand Business Context
Providing the right tools for business decision making doesn’t need to be a guessing game if the business context is laid as the project foundation and the most pressing decisions serve as starting points. And business is engaged in formulating and executing the strategy.
Prerequisite #3: Deliver insights that lead to action
Start with understanding the business processes and where analytics can improve outcomes. “Think business backwards, not data forward.” (McKinsey)
11 reasons BI projects fail
Lack of Executive support
Old Technology
Lack of business support
Too many KPIs
No methodology for gathering requirements
Overly long project timeframes
Bad user experience
Lack of user adoption
Bad data
Lack of proper human resources
No upfront definition of true ROI
Mico Yuk, 2019
Make it clear to the business that IT is committed to building and supporting a BI platform that is intimately tied to enabling changing business objectives.
Leverage Info-Tech’s BI Strategy and Roadmap Template to accelerate BI planning
How to accelerate BI planning using the template
- Prepopulated text that you can use for your strategy formulation:
- Sample bullet points that you can pick and choose from:
Document the BI program planning in Info-Tech’s
BI Strategy and Roadmap Template.
Activity: Describe your organization’s vision and mission
1.1.1
30-40 minutes
Compelling vision and mission statements will help guide your internal members toward your company’s target state. These will drive your business intelligence strategy.
- Your vision clearly represents where your organization aspires to be in the future and aligns the entire organization. Write down a future-looking, inspirational, and realizable vision in one concise statement. Consider:
- “Five years from now, our business will be _______.”
- What do we want to do tomorrow? For whom? What is the benefit?
Your mission tells why your organization currently exists and clearly expresses how it will achieve your vision for the future. Write down a mission statement in one clear and concise paragraph consisting of, at most, five sentences. Consider:
- Why does the business exist? What problems does it solve? Who are its customers?
- How does the business accomplish strategic tasks or reach its target?
Reconvene stakeholders to share ideas and develop one concise vision statement and mission statement. Focus on clarity and message over wording.
Input
- Business vision and mission statements
Output
- Alignment and understanding on business vision
Materials
Participants
- BI project lead
- Executive business stakeholders
Info-Tech Insight
Adjust your statements until you feel that you can elicit a firm understanding of both your vision and mission in three minutes or less.
Formulating an Enterprise BI and Analytics Strategy: Top-down BI Opportunity analysis
Example of deriving BI opportunities using BI Opportunity Analysis
| Industry Drivers |
Private label |
Rising input prices |
Retail consolidation |
| Company strategies |
Win at supply chain execution |
Win at customer service |
Expand gross margins |
| Value disciplines |
Strategic cost management |
Operational excellence |
Customer service |
| Core processes |
Purchasing |
Inbound logistics |
Sales, service & distribution |
| |
Enterprise management: Planning, budgeting, control, process improvement, HR |
|
|
| BI Opportunities |
Customer service analysis |
Cost and financial analysis |
Demand management |
Williams 2016
Get your organization buzzing about BI – leverage Info-Tech’s Executive Brief as an internal marketing tool
Two key tasks of a project sponsor are to:
- Evangelize the realizable benefits of investing in a business intelligence strategy.
- Help to shift the corporate culture to one that places emphasis on data-driven insight.
Arm your project sponsor with our Executive Brief for this blueprint as a quick way to convey the value of this project to potential stakeholders.
Bolster this presentation by adding use cases and metrics that are most relevant to your organization.
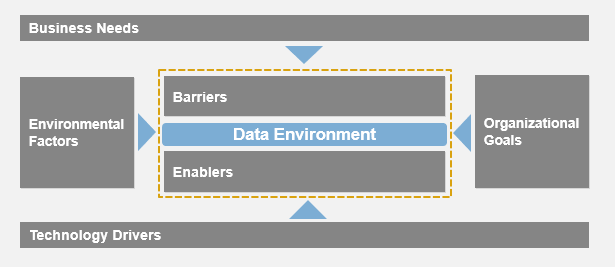
Develop a business framework
Identifying organizational goals and how data can support those goals is key to creating a successful BI & Analytical strategy. Rounding out the business model with technology drivers, environmental factors (as described in previous steps), and internal barriers and enablers creates a holistic view of Business Intelligence within the context of the organization as a whole.
Through business engagement and contribution, the following holistic model can be created to understand the needs of the business.
Activity: Describe the Industry Drivers and Organization strategy to mitigate the risk
1.1.2
30-45 minutes
Industry drivers are external influencers that has an effect on a business such as economic conditions, competitor actions, trade relations, climate etc. These drivers can differ significantly by industry and even organizations within the same industry.
- List the industry drivers that influences your organization:
- Public sentiment in regards to energy source
- Rising cost of raw materials due to increase demand
List the company strategies, goals, objectives to counteract the external influencers:
- Change production process to become more energy efficient
- Win at customer service
Identify the value disciplines :
- Strategic cost management
- Operational Excellence
List the core process that implements the value disciplines :
Identify the BI Opportunities:
- Cost and financial analysis
- Customer service analysis
Input
Output
- BI Opportunities that business can leverage
Materials
- Industry driver section in the BI Strategy and Roadmap Template
Participants
- BI project lead
- Executive business stakeholders
Understand BI and analytics drivers and organizational objectives
| |
Environmental Factors |
Organizational Goals |
Business Needs |
Technology Drivers |
| Definition |
External considerations are factors taking place outside the organization that are impacting the way business is conducted inside the organization. These are often outside the control of the business. |
Organizational drivers can be thought of as business-level metrics. These are tangible benefits the business can measure, such as customer retention, operation excellence, and/or financial performance. |
A requirement that specifies the behavior and the functions of a system. |
Technology drivers are technological changes that have created the need for a new BI solution. Many organizations turn to technology systems to help them obtain a competitive edge. |
| Examples |
- Economy and politics
- Laws and regulations
- Competitive influencers
|
- Time to market
- Quality
- Delivery reliability
|
- Audit tracking
- Authorization levels
- Business rules
|
- Deployment in the cloud
- Integration
- Reporting capabilities
|
Activity: Discuss BI/Analytics drivers and organizational objectives
1.1.3
30-45 minutes
- Use the industry drivers and business goals identified in activity 1.1.2 as a starting point.
- Understand how the company runs today and what the organization’s future will look like. Try to identify the purpose for becoming an integrated organization. Use a whiteboard and markers to capture key findings.
- Take into account External Considerations, Organizational Drivers, Technology Drivers, and Key Functional Requirements.
| External Considerations |
Organizational Drivers |
Technology Considerations |
Functional Requirements |
- Funding Constraints
- Regulations
|
- Compliance
- Scalability
- Operational Efficiency
|
- Data Accuracy
- Data Quality
- Better Reporting
|
- Information Availability
- Integration Between Systems
- Secure Data
|
Identify challenges and barriers to the BI project
There are several factors that may stifle the success of a BI implementation. Scan the current environment to identify internal barriers and challenges to identify potential challenges so you can meet them head-on.
Common Internal Barriers
Management Support
Organizational Culture
Organizational Structure
IT Readiness
| Definition |
The degree of management understanding and acceptance towards BI solutions. |
The collective shared values and beliefs. |
The functional relationships between people and departments in an organization. |
The degree to which the organization’s people and processes are prepared for a new BI solution. |
| Questions |
- Is a BI project recognized as a top priority?
- Will management commit time to the project?
|
- Are employees resistant to change?
- Is the organization highly individualized?
|
- Is the organization centralized?
- Is the organization highly formalized?
|
- Is there strong technical expertise?
- Is there strong infrastructure?
|
| Impact |
|
- Knowledge sharing
- User acceptance
|
|
- Poor implementation
- Reliance on consultants
|
Activity: Discuss BI/Analytics challenges and pain points
1.1.4
30-45 minutes
- Identify challenges with the process identified in step 1.1.2.
- Brainstorm potential barriers to successful BI implementation and adoption. Use a whiteboard and marker to capture key findings.
- Consider Functional Gaps, Technical Gaps, Process Gaps, and Barriers to BI Success.
| Functional Gaps |
Technical Gaps |
Process Gaps |
Barriers to Success |
- No online purchase order requisition
|
- Inconsistent reporting – data quality concerns
|
- Duplication of data
- Lack of system integration
|
- Cultural mindset
- Resistance to change
- Lack of training
- Funding
|
Activity: Discuss opportunities and benefits
1.1.5
30-45 minutes
- Identify opportunities and benefits from an integrated system.
- Brainstorm potential enablers for successful BI implementation and adoption. Use a whiteboard and markers to capture key findings.
- Consider Business Benefits, IT Benefits, Organizational Benefits, and Enablers of BI success.
| Business Benefits |
IT Benefits |
Organizational Benefits |
Enablers of Success |
| |
- Compliance
- Scalability
- Operational Efficiency
|
- Data Accuracy
- Data Quality
- Better Reporting
|
- Change management
- Training
- Alignment to strategic objectives
|
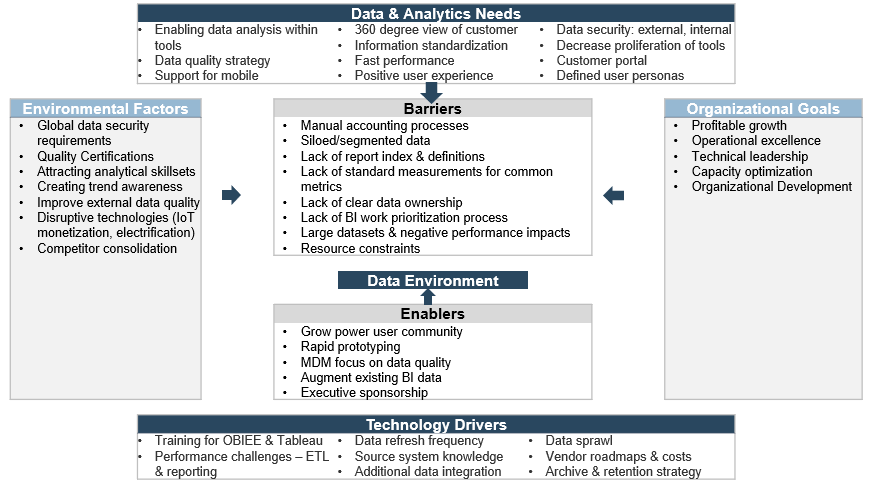
Your organization’s framework for Business Intelligence Strategy
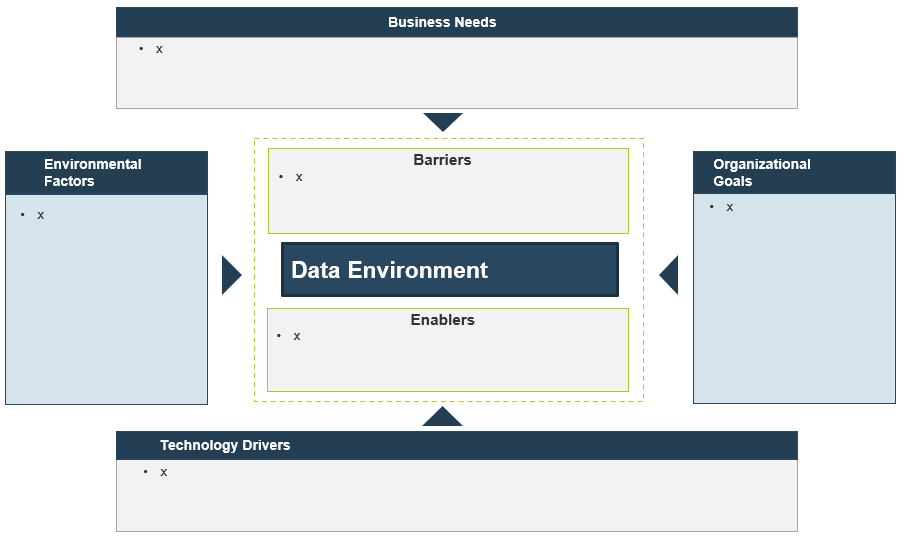
Example: Business Framework for Data & Analytics Strategy
The following diagram represents [Client]’s business model for BI and data. This holistic view of [Client]’s current environment serves as the basis for the generation of the business-aligned Data & Analytics Strategy.
Info-Tech recommends balancing a top-down approach with bottom up for building your BI strateg
Taking a top-down approach will ensure senior management’s involvement and support throughout the project. This ensures that the most critical decisions are supported by the right data/information, aligning the entire organization with the BI strategy. Furthermore, the gains from BI will be much more significant and visible to the rest of the organization.
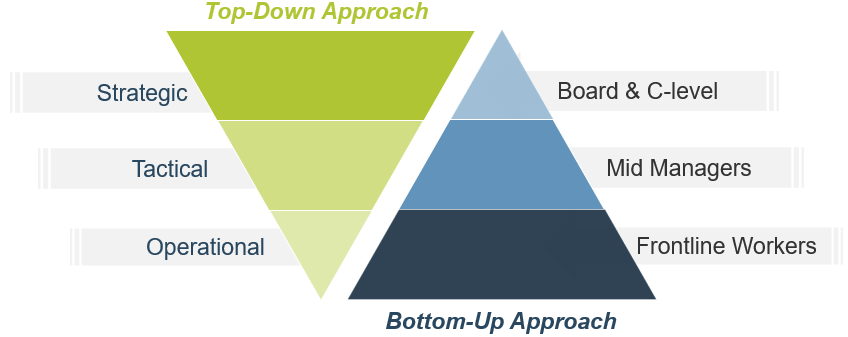
Far too often, organizations taking a bottom-up approach to BI will fail to generate sufficient buy-in and awareness from senior management. Not only does a lack of senior involvement result in lower adoption from the tactical and operational levels, but more importantly, it also means that the strategic decision makers aren’t taking advantage of BI.
Estimate the ROI of your BI and analytics strategy to secure executive support
The value of creating a new strategy – or revamping an existing one – needs to be conveyed effectively to a high-level stakeholder, ideally a C-level executive. That executive buy-in is more likely to be acquired when effort has been made to determine the return on investment for the overall initiative.
-
| Business Impacts |
| New revenue |
| Cost savings |
| Time to market |
| Internal Benefits |
| Productivity gain |
| Process optimization |
| Investment |
| People – employees’ time, external resources |
| Data – cost for new datasets |
| Technology – cost for new technologies |
-
QuantifyCan you put a number or a percentage to the impacts and benefits?
QuantifyCan you estimate the investments you need to put in?
-
TranslateTranslate the quantities into dollar value

Example
| One percent increase in revenue; three more employees |
$225,000/yr, $150,000/yr |
50% |
Activity: Establish a high-level ROI as part of an overall use case for developing a fit-for-purpose BI strategy
1.1.6
1.5 hours
Communicating an ROI that is impactful and reasonable is essential for locking in executive-level support for any initiative. Use this activity as an initial touchpoint to bring business and IT perspectives as part of building a robust business case for developing your BI strategy.
- Revisit the business context detailed in the previous sections of this phase. Use priority objectives to identify use case(s), ideally where there are easily defined revenue generators/cost reductions (e.g. streamlining the process of mailing physical marketing materials to customers).
- Assign research tasks around establishing concrete numbers and dollar values.
- Have a subject matter expert weigh in to validate your figures.
- When calculating ROI, consider how you might leverage BI to create opportunities for upsell, cross-sell, or increased customer retention.
Reconvene the stakeholder group and discuss your findings.- This is the point where expectation management is important. Separate the need-to-haves from the nice-to-haves.
Emphasize that ROI is not fully realized after the first implementation, but comes as the platform is built upon iteratively and in an integrated fashion to mature capabilities over time.
Input
- Vision statement
- Mission statement
Output
- Business differentiators and key drivers
Materials
- Benefit Cost Analysis section of the BI Strategy and Roadmap Template
Participants
- BI project lead
- Executive IT & business stakeholders
An effective BI strategy positions business intelligence in the larger data lifecycle
In an effort to keep users satisfied, many organizations rush into implementing a BI platform and generating reports for their business users. BI is, first and foremost, a presentation layer; there are several stages in the data lifecycle where the data that BI visualizes can be compromised.
Without paying the appropriate amount of attention to the underlying data architecture and application integration, even the most sophisticated BI platforms will fall short of providing business users with a holistic view of company information.
Example
In moving away from single application-level reporting, a strategy around data integration practices and technology is necessary before the resultant data can be passed to the BI platform for additional analyses and visualization.
BI doesn’t exist in a vacuum – develop an awareness of other key data management practices
As business intelligence is primarily a presentation layer that allows business users to visualize data and turn information into actionable decisions, there are a number of data management practices that precede BI in the flow of data.
Data Warehousing
The data warehouse structures source data in a manner that is more operationally focused. The Reporting & Analytics Strategy must inform the warehouse strategy on data needs and building a data warehouse to meet those needs.
Data Integration, MDM & RDM
The data warehouse is built from different sources that must be integrated and normalized to enable Business Intelligence. The Info-Tech integration and MDM blueprints will guide with their implementation.
Data Quality
A major roadblock to building an effective BI solution is a lack of accurate, timely, consistent, and relevant data. Use Info-Tech’s blueprint to refine your approach to data quality management.
Data quality, poor integration/P2P integration, poor data architecture are the primary barriers to truly leveraging BI, and a lot of companies haven’t gotten better in these areas.
– Shari Lava, Associate Vice-President, IT Research and Advisory Firm
Building consensus around data definitions across business units is a critical step in carrying out a BI strategy
Business intelligence is heavily reliant on the ability of an organization to mesh data from different sources together and create a holistic and accurate source of truth for users.
Useful analytics cannot be conducted if your business units define key business terms differently.
Example
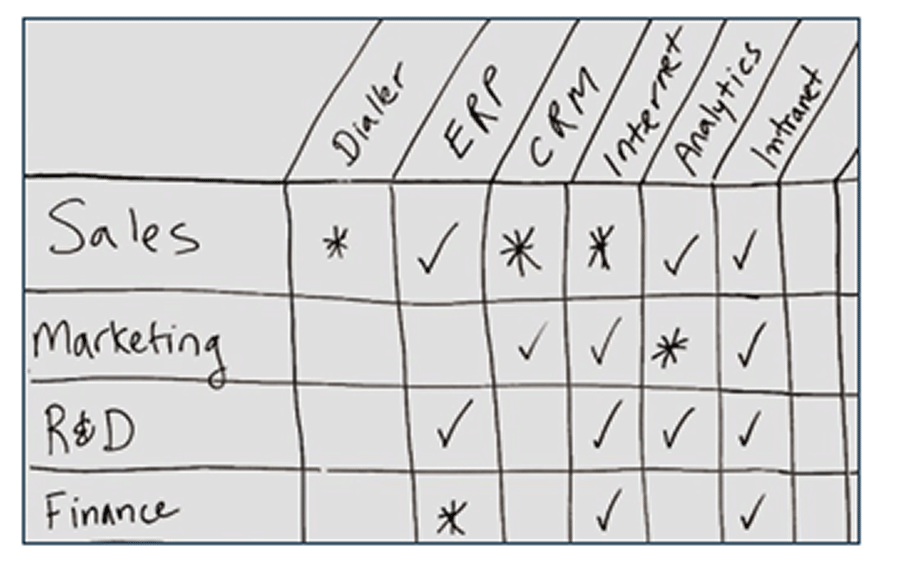
Finance may label customers as those who have transactional records with the organization, but Marketing includes leads who have not yet had any transactions as customers. Neglecting to note these seemingly small discrepancies in data definition will undermine efforts to combine data assets from traditionally siloed functional units.
In the stages prior to implementing any kind of BI platform, a top priority should be establishing common definitions for key business terms (customers, products, accounts, prospects, contacts, product groups, etc.).
As a preliminary step, document different definitions for the same business terms so that business users are aware of these differences before attempting to combine data to create custom reports.
Self-Assessment
Do you have common definitions of business terms?
- If not, identify common business terms.
- At the very least, document different definitions of the same business terms so the corporate can compare and contrast them.
STEP 1.2
Assess the Current BI Landscape
Establish an in-depth understanding of your current BI landscape
Step Objectives
- Inventory and assess the state of your current BI landscape
- Document the artifacts of your BI environment
Step Activities
1.2.1 Analyze the usage levels of your current BI programs/platform
1.2.2 Perform a survey to gather user perception of your current BI environment
1.2.3 Take an inventory of your current BI artifacts
Outcomes
- Summarize the qualitative and quantitative performance of your existing BI environment
- Understand the outputs coming from your BI sources
Research Support
- Info-Tech’s BI Strategy and Roadmap Template
Project Manager
Data Architect(s) or Enterprise Architect
Project Team
Understand your current BI landscape before you rationalize
Relying too heavily on technology as the sole way to solve BI problems results in a more complex environment that will ultimately frustrate business users. Take the time to thoroughly assess the current state of your business intelligence landscape using a qualitative (user perception) and quantitative (usage statistics) approach. The insights and gaps identified in this step will serve as building blocks for strategy and roadmap development in later phases.
Phase 1
Current State Summary of BI Landscape
| 1.2.1 |
1.2.2 |
1.2.3 |
1.2.4 |
| Usage Insights |
Perception Insights |
BI Inventory Insights |
Requirements Insights |
PHASE 2
Strategy and Roadmap Formulation
Gather usage insights to pinpoint the hot spots for BI usage amongst your users
Usage data reflects the consumption patterns of end users. By reviewing usage data, you can identify aspects of your BI program that are popular and those that are underutilized. It may present some opportunities for trimming some of the underutilized content.
Benefits of analyzing usage data:
- Usage is a proxy for popularity and usability of the BI artifacts. The popular content should be kept and improved in your next generation BI.
- Usage information provides insight on what, when, where, and how much users are consuming BI artifacts.
- Unlike methods such as user interviews and focus groups, usage information is fact based and is not subject to peer pressure or “toning down.”
Sample Sources of Usage Data:
- Usage reports from your BI platform Many BI platforms have out-of-the-box usage reports that log and summarize usage data. This is your ideal source for usage data.
- Administrator console in your BI platformBI platforms usually have an administrator console that allows BI administrators to configure settings and to monitor activities that include usage. You may obtain some usage data in the console. Note that the usage data is usually real-time in nature, and you may not have access to a historical view of the BI usage.
Info-Tech Insight
Don’t forget some of the power users. They may perform analytics by accessing datasets directly or with the help of a query tool (even straight SQL statements). Their usage information is important. The next generation BI should provide consumption options for them.
Accelerate the process of gathering user feedback with Info-Tech’s Application Portfolio Assessment (APA)
In an environment where multiple BI tools are being used, discovering what works for users and what doesn’t is an important first step to rationalizing the BI landscape.
Info-Tech’s Application Portfolio Assessment allows you to create a custom survey based on your current applications, generate a custom report that will help you visualize user satisfaction levels, and pinpoint areas for improvement.
Activity: Review and analyze usage data
1.2.1
2 hours
This activity helps you to locate usage data in your existing environment. It also helps you to review and analyze usage data to come up with a few findings.
- Get to the usage source. You may obtain usage data from one of the below options. Usage reports are your ideal choice, followed by some alternative options:
a. Administrator console – limited to real-time or daily usage data. You may need to track usage data over for several days to identify patterns.
b. Info-Tech’s Application Portfolio Assessment (APA).
c. Other – be creative. Some may use an IT usage monitoring system or web analytics to track time users spent on the BI portal.
- Develop categories for classifying the different sources of usage data in your current BI environment. Use the following table as starting point for creating these groups:
This is the content for Layout H4 Tag
| By Frequency |
Real Time |
Daily |
Weekly |
Yearly |
| By Presentation Format |
Report |
Dashboard |
Alert |
Scorecard |
| By Delivery |
Web portal |
Excel |
PDF |
Mobile application |
INPUT
- Usage reports
- Usage statistics
OUTPUT
- Insights pertaining to usage patterns
Materials
- Usage Insights of the BI Strategy and Roadmap Template
Participants
Activity: Review and analyze usage (cont.)
1.2.1
2 hours
3. Sort your collection of BI artifacts by usage. Discuss some of the reasons why some content is popular whereas some has no usage at all.
Popular BI Artifacts – Discuss improvements, opportunities and new artifacts
Unpopular BI Artifacts – Discuss retirement, improvements, and realigning information needs
4. Summarize your findings in the Usage Insights section of the BI Strategy and Roadmap Template.
INPUT
- Usage reports
- Usage statistics
OUTPUT
- Insights pertaining to usage patterns
Materials
- Usage Insights section of the BI Strategy and Roadmap Template
Participants
Gather perception to understand the existing BI users
In 1.2.1, we gathered the statistics for BI usage; it’s the hard data telling who uses what. However, it does not tell you the rationale, or the why, behind the usage. Gathering user perception and having conversations with your BI consumers is the key to bridging the gap.
User Perception Survey
Helps you to:
- Get general insights on user perception
- Narrow down to selected areas
User Interviews
Perception can be gathered by user interviews and surveys. Conducting user interviews takes time so it is a good practice to get some primary insights via survey before doing in-depth interviews in selected areas.
– Shari Lava, Associate Vice-President, IT Research and Advisory Firm
Define problem statements to create proof-of-concept initiatives
Info-Tech’s Four Column Model of Data Flow
Find a data-related problem or opportunity
Ask open-ended discovery questions about stakeholder fears, hopes, and frustrations to identify a data-related problem that is clear, contained, and fixable. This is then to be written as a problem/opportunity statement.
- Fear: What is the number one risk you need to alleviate?
- Hope: What is the number one opportunity you wish to realize?
- Frustration: What is the number one annoying pet peeve you wish to scratch?
Next, gather information to support a problem/opportunity statement:
- What are your challenges in performing the activity or process today?
- What does amazing look like if we solve this perfectly?
- What other business activities/processes will be impacted/improved if we solve this?
- What compliance/regulatory/policy concerns do we need to consider in any solution?
- What measures of success/change should we use to prove value of the effort (KPIs/ROI)?
- What are the steps in the process/activity?
- What are the applications/systems used at each step and from step to step?
- What data elements are created, used, and/or transformed at each step?
Leverage Info-Tech’s BI survey framework to initiate a 360° perception survey
Info-Tech has developed a BI survey framework to help existing BI practices gather user perception via survey. The framework is built upon best practices developed by McLean & Company.
- Communicate the survey
- Create a survey
- Conduct the survey
- Collect and clean survey data
- Analyze survey data
- Conduct follow-up interviews
- Identify and prioritize improvement initiatives
The survey takes a comprehensive approach by examining your existing BI practices through the following lenses:
360° Perception
| Demographics |
Who are the users? From which department? |
| Usage |
How is the current BI being used? |
| People |
Web portal |
| Process |
How good is your BI team from a user perspective? |
| Data |
How good is the BI data in terms of quality and usability? |
| Technology |
How good are your existing BI/reporting tools? |
| Textual Feedback |
The sky’s the limit. Tell us your comments and ideas via open-ended questions. |
Use Info-Tech’s BI End-User Satisfaction Survey Framework to develop a comprehensive BI survey tailored to your organization.
Activity: Develop a plan to gather user perception of your current BI program
1.2.2
2 hours
This activity helps you to plan for a BI perception survey and subsequent interviews.
- Proper communication while conducting surveys helps to boost response rate. The project team should have a meeting with business executives to decide:
- The survey goals
- Which areas to cover
- Which trends and hypotheses you want to confirm
- Which pre-, during, and post-survey communications should be sent out
Have the project team create the first draft of the survey for subsequent review by select business stakeholders. Several iterations may be needed before finalizing.
In planning for the conclusion of the survey, the project team should engage a data analyst to:
- Organize the data in a useful format
- Clean up the survey data when there are gaps
- Summarize the data into a presentable/distributable format
Collectively, the project team and the BI consuming departments should review the presentation and discuss these items:
Misalignment
Opportunities
Inefficiencies
Trends
Need detailed interviews?
INPUT
- Usage information and analyses
OUTPUT
Materials
- Perception Insights section of the BI Strategy and Roadmap Template
Participants
- BA
- BI Administrator
- PM
- Business SMEs
Create a comprehensive inventory of your BI artifacts
Taking an inventory of your BI artifacts allows you to understand what deliverables have been developed over the years. Inventory taking should go beyond the BI content. You may want to include additional information products such as Excel spreadsheets, reports that are coming out of an Access database, and reports that are generated from front-end applications (e.g. Salesforce).
Existing Reports from BI platform
If you are currently using a BI platform, you have some BI artifacts (reports, scorecards, dashboards) that are developed within the platform itself.
- BI Usage Reports (refer to step 2.1) – if you are getting a comprehensive BI usage reports for all your BI artifacts, there is your inventory report too.
- BI Inventory Reports – Your BI platform may provide out-of-the-box inventory reports. You can use them as your inventory.
- If the above options are not feasible, you may need to manually create the BI inventory. You may build that from some of your existing BI documentations to save time.
Excel and Access
Work with the business units to identify if Excel and Access are used to generate reports.
Application Reports
- Data applications such as Salesforce, CRM, and ERP often provide reports as an out-of-the-box feature.
- Those reports only include data within their respective applications. However, this may present opportunities for integrating application data with additional data sources.
Activity: Inventory your BI artifacts
1.2.3
2+ hours
This activity helps you to inventory your BI information artifacts and other related information artifacts.
- Define the scope of your inventory. Work with the project sponsor and CIO to define which sources should be captured in the inventory process. Consider: BI inventory, Excel spreadsheets, Access reports, and application reporting.
- Define the depth of your inventory. Work with the project sponsor and CIO to define the level of granularity. In some settings, the artifact name and a short description may be sufficient. In other cases, you may need to document users and business logic of the artifacts.
- Review the inventory results. Discuss findings and opportunities around the following areas:
Interpret your Inventory
| Duplicated reports/ dashboards |
Similar reports/ dashboards that may be able to merge |
Excel and Access reports that are using undocumented, unconventional business logics |
Application reports that need to be enhanced by additional data |
Classify artifacts by BI Type |
INPUT
- Current BI artifacts and documents
- BI Type classification
OUTPUT
Materials
- BI Inventory Insights section of the BI Strategy and Roadmap Template
Participants
- BA
- Data analyst
- PM
- Project sponsor
Project sponsor
1.2.4
2+ hours
This activity helps you to inventory your BI by report type.
- Classify BI artifacts by type. Use the BI Type tool to classify Work with the project sponsor and CIO to define which sources should be captured in the inventory process. Consider: BI inventory, Excel spreadsheets, Access reports, and application reporting.
- Define the depth of your inventory. Work with the project sponsor and CIO to define the level of granularity. In some settings, the artifact name and a short description may be sufficient. In other cases, you may need to document users and business logic of the artifacts.
- Review the inventory results. Discuss findings and opportunities around the following areas:
Interpretation of your Inventory
| Duplicated reports/dashboards |
Similar reports/dashboards that may be able to merge |
Excel and Access reports that are using undocumented, unconventional business logics |
Application reports that need to be enhanced by additional data |
INPUT
- The BI Type as used by different business units
- Business BI requirements
OUTPUT
- Summary of BI type usage across the organization
Materials
- BI Inventory Insights section of the BI Strategy and Roadmap Template
Participants
- BA
- Data analyst
- PM
- Project sponsor
STEP 1.3
Undergo BI Requirements Gathering
Perform requirements gathering for revamping your BI environment
Step Objectives
- Create principles that will direct effective requirements gathering
- Create a list of existing and desired BI requirements
Step Activities
1.3.1 Create requirements gathering principles
1.3.2 Gather appropriate requirements
1.3.3 Organize and consolidate the outputs of requirements gathering activities
Outcomes
- Requirements gathering principles that are flexible and repeatable
- List of BI requirements
Research Support
- Info-Tech’s BI Strategy and Roadmap Template
Proposed Participants in this Step
Project Manager
Data Architect(s) or Enterprise Architect
Project Team
Business Users
Don’t let your new BI platform become a victim of poor requirements gathering
The challenges in requirements management often have underlying causes; find and eliminate the root causes rather than focusing on the symptoms.
Root Causes of Poor Requirements Gathering:
- Requirements gathering procedures exist but aren’t followed.
- There isn't enough time allocated to the requirements gathering phase.
- There isn't enough involvement or investment secured from business partners.
- There is no senior leadership involvement or mandate to fix requirements gathering.
- There are inadequate efforts put towards obtaining and enforcing sign off.
Outcomes of Poor Requirements Gathering:
- Rework due to poor requirements leads to costly overruns.
- Final deliverables are of poor quality and are implemented late.
- Predicted gains from deployed applications are not realized.
- There are low feature utilization rates by end users.
- Teams are frustrated within IT and the business.
Info-Tech Insight
Requirements gathering is the number one failure point for most development or procurement projects that don’t deliver value. This has been, and continues to be, the case as most organizations still don't get requirements gathering right. Overcoming organizational cynicism can be a major obstacle to clear when it is time to optimize the requirements gathering process.
Define the attributes of a good requirement to help shape your requirements gathering principles
A good requirement has the following attributes:
| Verifiable |
It is stated in a way that can be tested. |
| Unambiguous |
It is free of subjective terms and can only be interpreted in one way. |
| Complete |
It contains all relevant information. |
| Consistent |
It does not conflict with other requirements. |
| Achievable |
It is possible to accomplish given the budgetary and technological constraints. |
| Traceable |
It can be tracked from inception to testing. |
| Unitary |
It addresses only one thing and cannot be deconstructed into multiple requirements. |
| Accurate |
It is based on proven facts and correct information. |
Other Considerations
Organizations can also track a requirement owner, rationale, priority level (must have vs. nice to have), and current status (approved, tested, etc.).
Info-Tech Insight
Requirements must be solution agnostic – they should focus on the underlying need rather than the technology required to satisfy the need.
Activity: Define requirements gathering principles
1.3.1
1 hour
- Invite representatives from the project management office, project management team, and BA team, as well as some key business stakeholders.
- Use the sample categories and principles in the table below as starting points for creating your own requirements gathering principles.
- Document the requirements gathering principles in the BI Strategy and Roadmap Template.
- Communicate the requirements gathering principles to the affected BI stakeholders.
Sample Principles to Start With
| Effectiveness |
Face-to-face interviews are preferred over phone interviews. |
| Alignment |
Clarify any misalignments, even the tiniest ones. |
| Validation |
Rephrase requirements at the end to validate requirements. |
| Ideation |
Use drawings and charts to explain ideas. |
| Demonstration |
Make use of Joint Application Development (JAD) sessions. |
INPUT
- Existing requirement principles (if any)
OUTPUT
- Requirements gathering principles that can be revisited and reused
Materials
- Requirements Insights section of the BI Strategy and Roadmap Template
Participants
- BA Team
- PM
- Business stakeholders
- PMO
Info-Tech Insight
Turn requirements gathering principles into house rules. The house rules should be available in every single requirements gathering session and the participants should revisit them when there are disagreements, confusion, or silence.
Right-size your approach to BI requirements management
Info-Tech suggests four requirements management approaches based on project complexity and business significance. BI projects usually require the Strategic Approach in requirements management.
Requirements Management Process Explanations
| Approach |
Definition |
Recommended Strategy |
| Strategic Approach |
High business significance and high project complexity merits a significant investment of time and resources in requirements gathering. |
Treat the requirements gathering phase as a project within a project. A large amount of time should be dedicated to elicitation, business process mapping, and solution design. |
| Fundamental Approach |
High business significance and low project complexity merits a heavy emphasis on the elicitation phase to ensure that the project bases are covered and business value is realized. |
Look to achieve quick wins and try to survey a broad cross-section of stakeholders during elicitation and validation. The elicitation phase should be highly iterative. Do not over-complicate the analysis and validation of a straightforward project. |
| Calculated Approach |
Low business significance and high project complexity merits a heavy emphasis on the analysis and validation phases to ensure that the solution meets the needs of users. |
Allocate a significant amount of time to business process modeling, requirements categorization, prioritization, and solution modeling. |
| Elementary Approach |
Low business significance and low project complexity does not merit a high amount of rigor for requirements gathering. Do not rush or skip steps, but aim to be efficient. |
Focus on basic elicitation techniques (e.g. unstructured interviews, open-ended surveys) and consider capturing requirements as user stories. Focus on efficiency to prevent project delays and avoid squandering resources. |
Vary the modes used in eliciting requirements from your user base
Requirements Gathering Modes
Info-Tech has identified four effective requirements gathering modes. During the requirements gathering process, you may need to switch between the four gathering modes to establish a thorough understanding of the information needs.
Dream Mode
- Mentality: Let users’ imaginations go wild. The sky’s the limit.
- How it works: Ask users to dream up the ideal future state and ask how analytics can support those dreams.
- Limitations: Not all dreams can be fulfilled. A variety of constraints (budget, personnel, technical skills) may prevent the dreams from becoming reality.
Pain Mode
- Mentality: Users are currently experiencing pains related to information needs.
- How it works: Vent the pains. Allow end users to share their information pains, ask them how their pains can be relieved, then convert those pains to requirements.
- Limitations: Users are limited by the current situation and aren’t looking to innovate.
Decode Mode
- Mentality: Read the hidden messages from users. Speculate as to what the users really want.
- How it works: Decode the underlying messages. Be innovative to develop hypotheses and then validate with the users.
- Limitations: Speculations and hypothesis could be invalid. They may direct the users into some pre-determined directions.
Profile Mode
- Mentality: “I think you may want XYZ because you fall into that profile.”
- How it works: The information user may fall into some existing user group profile or their information needs may be similar to some existing users.
- Limitations: This mode doesn’t address very specific needs.
Supplement BI requirements with user stories and prototyping to ensure BI is fit for purpose
BI is a continually evolving program. BI artifacts that were developed in the past may not be relevant to the business anymore due to changes in the business and information usage. Revamping your BI program entails revisiting some of the BI requirements and/or gathering new BI requirements.
Three-Step Process for Gathering Requirements
| Requirements |
User Stories |
Rapid Prototyping |
| Gather requirements. Most importantly, understand the business needs and wants. |
Leverage user stories to organize and make sense of the requirements. |
Use a prototype to confirm requirements and show the initial draft to end users. |
Pain Mode: “I can’t access and manipulate data on my own...”
Decode Mode: Dig deeper: could this hint at a self-service use case?
Dream Mode: E.g. a sandbox area where I can play around with clean, integrated, well-represented data.
Profile Mode: E.g. another marketing analyst is currently using something similar.
ExampleMary has a spreadmart that keeps track of all campaigns. Maintaining and executing that spreadmart is time consuming.
Mary is asking for a mash-up data set that she can pivot on her own…
Upon reviewing the data and the prototype, Mary decided to use a heat map and included two more data points – tenure and lifetime value.
Identify which BI styles best meet user requirements
A spectrum of Business Intelligence solutions styles are available. Use Info-Tech’s BI Styles Tool to assess which business stakeholder will be best served by which style.
| Style |
Description |
Strategic Importance (1-5) |
Popularity (1-5) |
Effort (1-5) |
| Standards Preformatted reports |
Standard, preformatted information for backward-looking analysis. |
5 |
5 |
1 |
| User-defined analyses |
Pre-staged information where “pick lists” enable business users to filter (select) the information they wish to analyze, such as sales for a selected region during a selected previous timeframe. |
5 |
4 |
2 |
| Ad-hoc analyses |
Power users write their own queries to extract self-selected pre-staged information and then use the information to perform a user-created analysis. |
5 |
4 |
3 |
| Scorecards and dashboards |
Predefined business performance metrics about performance variables that are important to the organization, presented in a tabular or graphical format that enables business users to see at a glance how the organization is performing. |
4 |
4 |
3 |
| Multidimensional analysis (OLAP) |
Multidimensional analysis (also known as on-line analytical processing): Flexible tool-based, user-defined analysis of business performance and the underlying drivers or root causes of that performance. |
4 |
3 |
3 |
| Alerts |
Predefined analyses of key business performance variables, comparison to a performance standard or range, and communication to designated businesspeople when performance is outside the predefined performance standard or range. |
4 |
3 |
3 |
| Advanced Analytics |
Application of long-established statistical and/or operations research methods to historical business information to look backward and characterize a relevant aspect of business performance, typically by using descriptive statistics. |
5 |
3 |
4 |
| Predictive Analytics |
Application of long-established statistical and/or operations research methods and historical business information to predict, model, or simulate future business and/or economic performance and potentially prescribe a favored course of action for the future. |
5 |
3 |
5 |
Activity: Gather BI requirements
1.3.2
2-6 hours
Using the approaches discussed on previous slides, start a dialogue with business users to confirm existing requirements and develop new ones.
- Invite business stakeholders to a requirements gathering session.
For existing BI artifacts – Invite existing users of those artifacts.
For new BI development – Invite stakeholders at the executive level to understand the business operation and their needs and wants. This is especially important if their department is new to BI.
- Discuss the business requirements. Systematically switch between the four requirements gathering modes to get a holistic view of the requirements.
- Once requirements are gathered, organize them to tell a story. A story usually has these components:
| |
The Setting |
The Characters |
The Venues |
The Activities |
The Future |
| Example |
Customers are asking for a bundle discount. |
CMO and the marketing analysts want to… |
…the information should be available in the portal, mobile, and Excel. |
…information is then used in the bi-weekly pricing meeting to discuss… |
…bundle information should contain historical data in a graphical format to help executives. |
INPUT
- Existing documentations on BI artifacts
OUTPUT
- Preliminary, uncategorized list of BI requirements
Materials
- Requirements Insights section of the BI Strategy and Roadmap Template
Participants
- BA team
- Business stakeholders
- Business SMEs
- BI developers
Clarify consumer needs by categorizing BI requirements
Requirements are too broad in some situations and too detailed in others. In the previous step we developed user stories to provide context. Now you need to define requirement categories and gather detailed requirements.
Considerations for Requirement Categories
| Category |
Subcategory |
Sample Requirements |
| Data |
Granularity |
Individual transaction |
| |
Transformation |
Transform activation date to YYYY-MM format |
| |
Selection Criteria |
Client type: consumer. Exclude SMB and business clients. US only. Recent three years |
| |
Fields Required |
Consumer band, Region, Submarket… |
| Functionality |
Filters |
Filters required on the dashboard: date range filter, region filter… |
| |
Drill Down Path |
Drill down from a summary report to individual transactions |
| |
Analysis Required |
Cross-tab, time series, pie chart |
| Visual Requirements |
Mock-up |
See attached drawing |
| |
Section |
The dashboard will be presented using three sections |
| |
Conditional Formatting |
Below-average numbers are highlighted |
| Security |
Mobile |
The dashboard needs to be accessed from mobile devices |
| |
Role |
Regional managers will get a subset of the dashboard according to the region |
| |
Users |
John, Mary, Tom, Bob, and Dave |
| |
Export |
Dashboard data cannot be exported into PDF, text, or Excel formats |
| Performance |
Speed |
A BI artifact must be loaded in three seconds |
| |
Latency |
Two seconds response time when a filter is changed |
| |
Capacity |
Be able to serve 50 concurrent users with the performance expected |
| Control |
Governance |
Govern by the corporate BI standards |
| |
Regulations |
Meet HIPPA requirements |
| |
Compliance |
Meet ISO requirements |
Prioritize requirements to assist with solution modeling
Prioritization ensures that the development team focuses on the right requirements.
The MoSCoW Model of Prioritization
| Must Have |
Requirements that mustbe implemented for the solution to be considered successful. |
| Should Have |
Requirements that are high priority and should be included in the solution if possible. |
| Could Have |
Requirements that are desirable but not necessary and could be included if resources are available. |
| Won't Have |
Requirements that won’t be in the next release but will be considered for the future releases. |
The MoSCoW model was introduced by Dai Clegg of Oracle UK in 1994.
Prioritization is the process of ranking each requirement based on its importance to project success. Hold a separate meeting for the domain SMEs, implementation SMEs, project managers, and project sponsors to prioritize the requirements list. At the conclusion of the meeting, each requirement should be assigned a priority level. The implementation SMEs will use these priority levels to ensure that efforts are targeted towards the proper requirements and the plan features available on each release. Use the MoSCoW Model of Prioritization to effectively order requirements.
Activity: Finalize the list of BI requirements
1.3.3
1-4 hours
Requirement Category
Framework
| Category |
Subcategory |
| Data |
Granularity |
| |
Transformation |
| |
Selection Criteria |
| |
Fields Required |
| Functionality |
Filters |
| |
Drill Down Path |
| |
Analysis Required |
| Visual Requirements |
Mock-up |
| |
Section |
| |
Conditional Formatting |
| Security |
Mobile |
| |
Role |
| |
Users |
| |
Export |
| Performance |
Speed |
| |
Latency |
| |
Capacity |
| Control |
Governance |
| |
Regulations |
| |
Compliance |
Create requirement buckets and classify requirements.
- Define requirement categories according to the framework.
- Review the user story and requirements you collected in Step 1.3.2. Classify the requirements within requirement categories.
- Review the preliminary list of categorized requirements and look for gaps in this detailed view. You may need to gather additional requirements to fill the gaps.
- Prioritize the requirements according to the MoSCoW framework.
- Document your final list of requirements in the BI Strategy and Roadmap Template.
INPUT
- Existing requirements and new requirements from step 1.3.2
OUTPUT
- Prioritized and categorized requirements
Materials
- Requirements Insights section of the BI Strategy and Roadmap Template
Participants
- BA
- Business stakeholders
- PMO
Translate your findings and ideas into actions that will be integrated into the BI Strategy and Roadmap Template
As you progress through each phase, document findings and ideas as they arise. At phase end, hold a brainstorming session with the project team focused on documenting findings and ideas and substantiating them into improvement actions.
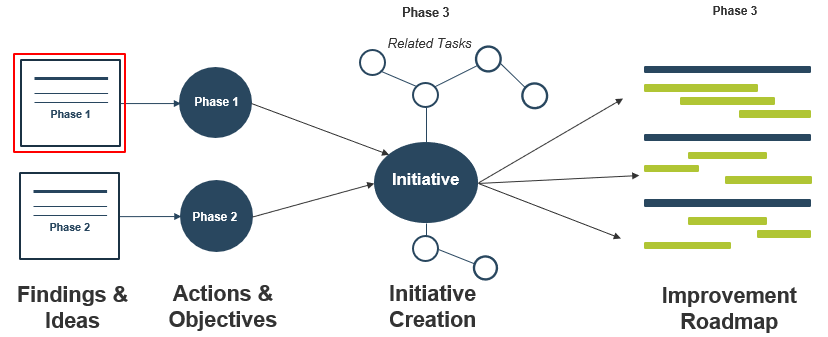
Ask yourself how BI or analytics can be used to address the gaps and explore opportunities uncovered in each phase. For example, in Phase 1, how do current BI capabilities impede the realization of the business vision?
Document and prioritize Phase 1 findings, ideas, and action items
1.3.4
1-2 hours
- Reconvene as a group to review findings, ideas, and actions harvested in Phase 1. Write the findings, ideas, and actions on sticky notes.
- Prioritize the sticky notes to yield those with high business value and low implementation effort. View some sample findings below:
| High Business Value, Low Effort |
High Business Value, High Effort |
| Low Business Value, High Effort |
Low Business Value, High Effort |
Phase 1
| Sample Phase 1 Findings |
Found two business objectives that are not supported by BI/analytics |
| |
Some executives still think BI is reporting |
| |
Some confusion around operational reporting and BI |
| |
Data quality plays a big role in BI |
| |
Many executives are not sure about the BI ROI or asking for one |
- Select the top findings and document them in the “Other Phase 1 Findings” section of the BI Strategy and Roadmap Template. The findings will be used again in Phase 3.
INPUT
- Phase 1 activities
- Business context (vision, mission, goals, etc.
OUTPUT
- Other Phase 1 Findings section of the BI Strategy and Roadmap Template
Materials
Participants
- Project manger
- Project team
- Business stakeholders
If you want additional support, have our analysts guide you through this phase as part of an Info-Tech workshop
Book a workshop with our Info-Tech analysts:
- To accelerate this project, engage your IT team in an Info-Tech workshop with an Info-Tech analyst team.
- Info-Tech analysts will join you and your team onsite at your location or welcome you to Info-Tech’s historic Toronto office to participate in an innovative onsite workshop.
- Contact your account manager (www.infotech.com/account), or email Workshops@InfoTech.com for more information.
The following are sample activities that will be conducted by Info-Tech analysts with your team:
1.1.1-1.1.5
Establish the business context
To begin the workshop, your project team will be taken through a series of activities to establish the overall business vision, mission, objectives, goals, and key drivers. This information will serve as the foundation for discerning how the revamped BI strategy needs to enable business users.
1.2.1- 1.2.3
Create a comprehensive documentation of your current BI environment
Our analysts will take your project team through a series of activities that will facilitate an assessment of current BI usage and artifacts, and help you design an end-user interview survey to elicit context around BI usage patterns.
If you want additional support, have our analysts guide you through this phase as part of an Info-Tech workshop
Book a workshop with our Info-tech analysts
1.3.1-1.3.3
Establish new BI requirements
Our analysts will guide your project team through frameworks for eliciting and organizing requirements from business users, and then use those frameworks in exercises to gather some actual requirements from business stakeholders.
Phase 2
Evaluate Your Current BI Practice
Build a Reporting and Analytics Strategy
Revisit project metrics to track phase progress
Goals for Phase 2:
- Assess your current BI practice. Determine the maturity of your current BI practice from different viewpoints.
- Develop your BI target state. Plan your next generation BI with Info-Tech’s BI patterns and best practices.
- Safeguard your target state. Avoid BI pitfalls by proactively monitoring BI risks.
Info-Tech’s Suggested Metrics for Tracking Phase 2 Goals
| Practice Improvement Metrics |
Data Collection and Calculation |
Expected Improvement |
| # of groups participated in the current state assessment |
The number of groups joined the current assessment using Info-Tech’s BI Practice Assessment Tool |
Varies; the tool can accommodate up to five groups |
| # of risks mitigated |
Derive from your risk register |
At least two to five risks will be identified and mitigated |
Intangible Metrics:
- Prototyping approach allows the BI group to understand more about business requirements, and in the meantime, allows the business to understand how to partner with the BI group.
- The BI group and the business have more confidence in the BI program as risks are monitored and mitigated on an ad hoc basis.
Evaluate your current BI practice
Phase 2 Overarching Insight
BI success is not based solely on the technology it runs on; technology cannot mask gaps in capabilities. You must be capable in your environment, and data management, data quality, and related data practices must be strong. Otherwise, the usefulness of the intelligence suffers. The best BI solution does not only provide a technology platform, but also addresses the elements that surround the platform. Look beyond tools and holistically assess the maturity of your BI practice with input from both the BI consumer and provider perspectives.
| Understand the Business Context to Rationalize Your BI Landscape |
Evaluate Your Current BI Practice |
Create a BI Roadmap for Continuous Improvement |
Establish the Business Context
- Business Vision, Goals, Key Drivers
- Business Case Presentation
- High-Level ROI
|
Assess Your Current BI Maturity
- SWOT Analysis
- BI Practice Assessment
- Summary of Current State
|
Construct a BI Initiative Roadmap
- BI Improvement Initiatives
- BI Strategy and Roadmap
|
Access Existing BI Environment
- BI Perception Survey Framework
- Usage Analyses
- BI Report Inventory
|
Envision BI Future State
- BI Patterns
- BI Practice Assessment
- List of Functions
|
Plan for Continuous Improvement
- Excel Governance Policy
- BI Ambassador Network Draft
|
Undergo Requirements Gathering
- Requirements Gathering Principles
- Overall BI Requirements
|
|
|
Phase 2 overview
Detailed Overview
Step 1: Assess Your Current BI Practice
Step 2: Envision a Future State for Your BI Practice
Outcomes
- A comprehensive assessment of current BI practice maturity and capabilities.
- Articulation of your future BI practice.
- Improvement objectives and activities for developing your current BI program.
Benefits
- Identification of clear gaps in BI practice maturity.
- A current state assessment that includes the perspectives of both BI providers and consumers to highlight alignment and/or discrepancies.
- A future state is defined to provide a benchmark for your BI program.
- Gaps between the future and current states are identified; recommendations for the gaps are defined.
Phase 2 outline
Call 1-888-670-8889 or email GuidedImplementations@InfoTech.com for more information.
Complete these steps on your own, or call us to complete a guided implementation. A guided implementation is a series of 2-3 advisory calls that help you execute each phase of a project. They are included in most advisory memberships.
Guided Implementation 2: Evaluate Your Current BI Practice
Proposed Time to Completion: 1-2 weeks
Step 2.1: Assess Your Current BI Practice
Start with an analyst kick-off call:
- Detail the benefits of conducting multidimensional assessments that involve BI providers as well as consumers.
- Review Info-Tech’s BI Maturity Model.
Then complete these activities…
- SWOT analyses
- Identification of BI maturity level through a current state assessment
With these tools & templates:
BI Practice Assessment Tool
BI Strategy and Roadmap Template
Step 2.2: Envision a Future State for Your BI Practice
Review findings with an analyst:
- Discuss overall maturity gaps and patterns in BI perception amongst different units of your organization.
- Discuss how to translate activity findings into robust initiatives, defining critical success factors for BI development and risk mitigation.
Then complete these activities…
- Identify your desired BI patterns and functionalities.
- Complete a target state assessment for your BI practice.
- Review capability practice gaps and phase-level metrics.
With these tools & templates:
BI Practice Assessment Tool
BI Strategy and Roadmap Template
Phase 2 Results & Insights:
- A comprehensive assessment of the organization’s current BI practice capabilities and gaps
- Visualization of BI perception from a variety of business users as well as IT
- A list of tasks and initiatives for constructing a strategic BI improvement roadmap
STEP 2.1
Assess the Current State of Your BI Practice
Assess your organization’s current BI capabilities
Step Objectives
- Understand the definitions and roles of each component of BI.
- Contextualize BI components to your organization’s environment and current practices.
Step Activities
2.1.1 Perform multidimensional SWOT analyses
2.1.2 Assess current BI and analytical capabilities, Document challenges, constraints, opportunities
2.1.3 Review the results of your current state assessment
Outcomes
- Holistic perspective of current BI strengths and weaknesses according to BI users and providers
- Current maturity in BI and related data management practices
Research Support
- Info-Tech’s Data Management Framework
- Info-Tech’s BI Practice Assessment Tool
- Info-Tech’s BI Strategy and Roadmap Template
Proposed Participants in this Step
Project Manager
Data Architect(s) or Enterprise Architect
Project Team
Gather multiple BI perspectives with comprehensive SWOT analyses
SWOT analysis is an effective tool that helps establish a high-level context for where your practice stands, where it can improve, and the factors that will influence development.
| Strengths Best practices, what is working well |
Weaknesses Inefficiencies, errors, gaps, shortcomings |
| Opportunities Review internal and external drivers |
Threats Market trends, disruptive forces |
While SWOT is not a new concept, you can add value to SWOT by:
- Conducting a multi-dimensional SWOT to diversify perspectives – involve the existing BI team, BI management, business executives and other business users.
- SWOT analyses traditionally provide a retrospective view of your environment. Add a future-looking element by creating improvement tasks/activities at the same time as you detail historical and current performance.
Info-Tech Insight
Consider a SWOT with two formats: a private SWOT worksheet and a public SWOT session. Participants will be providing suggestions anonymously while solicited suggestions will be discussed in the public SWOT session to further the discussion.
Activity: Perform a SWOT analysis in groups to get a holistic view
2.1.1
1-2 hours
This activity will take your project team through a holistic SWOT analysis to gather a variety of stakeholder perception of the current BI practice.
- Identify individuals to involve in the SWOT activity. Aim for a diverse pool of participants that are part of the BI practice in different capacities and roles. Solution architects, application managers, business analysts, and business functional unit leaders are a good starting point.
- Review the findings summary from Phase 1. You may opt to facilitate this activity with insights from the business context. Each group will be performing the SWOT individually.
- The group results will be collected and consolidated to pinpoint common ideas and opinions. Individual group results should be represented by a different color. The core program team will be reviewing the consolidated result as a group.
- Document the results of these SWOT activities in the appropriate section of the BI Strategy and Roadmap Template.
SWOT
Group 1 Provider Group E.g. The BI Team
Group 2 Consumer Group E.g. Business End Users
INPUT
- IT and business stakeholder perception
OUTPUT
- Multi-faceted SWOT analyses
- Potential BI improvement activities/objectives
Materials
- SWOT Analysis section of the BI Strategy and Roadmap Template
Participants
- Selected individuals in the enterprise (variable)
Your organization’s BI maturity is determined by several factors and the degree of immersion into your enterprise
BI Maturity Level
A way to categorize your analytics maturity to understand where you are currently and what next steps would be best to increase your BI maturity.
There are several factors used to determine BI maturity:
Buy-in and Data Culture
Determines if there is enterprise-wide buy-in for developing business intelligence and if a data-driven culture exists.
Business–IT Alignment
Examines if current BI and analytics operations are appropriately enabling the business objectives.
Governance Structure
Focuses on whether or not there is adequate governance in place to provide guidance and structure for BI activities.
Organization Structure and Talent
Pertains to how BI operations are distributed across the overall organizational structure and the capabilities of the individuals involved.
Process
Reviews analytics-related processes and policies and how they are created and enforced throughout the organization.
Data
Deals with analytical data in terms of the level of integration, data quality, and usability.
Technology
Explores the opportunities in building a fit-for-purpose analytics platform and consolidation opportunities.
Evaluate Your Current BI Practice with the CMMI model
To assess BI, Info-Tech uses the CMMI model for rating capabilities in each of the function areas on a scale of 1-5. (“0” and “0.5” values are used for non-existent or emerging capabilities.)
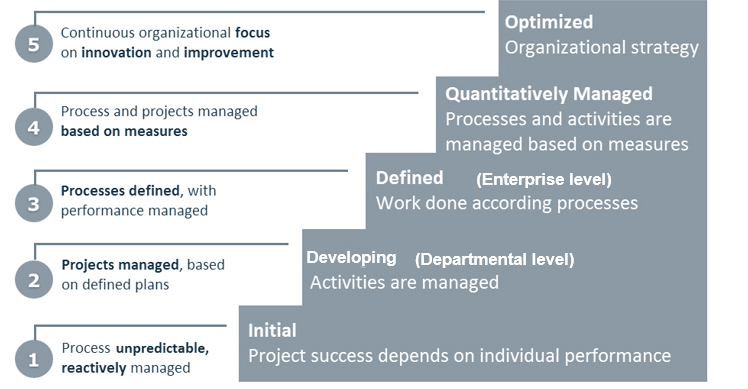
Use Info-Tech’s BI Maturity Model as a guide for identifying your current analytics competence
Leverage a BI strategy to revamp your BI program to strive for a high analytics maturity level. In the future you should be doing more than just traditional BI. You will perform self-service BI, predictive analytics, and data science.
| |
Ad Hoc |
Developing |
Defined |
Managed |
Trend Setting |
| Questions |
What’s wrong? |
What happened? |
What is happening? |
What happened, is happening, and will happen? |
What if? So what? |
| Scope |
One business problem at a time |
One particular functional area |
Multiple functional areas |
Multiple functional areas in an integrated fashion |
Internal plus internet scale data |
| Toolset |
Excel, Access, primitive query tools |
Reporting tools or BI |
BI |
BI, business analytics tools |
Plus predictive platforms, data science tools |
| Delivery Model |
IT delivers ad hoc reports |
IT delivers BI reports |
IT delivers BI reports and some self-service BI |
Self-service BI and report creation at the business units |
Plus predictive models and data science projects |
| Mindset |
Firefighting using data |
Manage using data |
Analyze using data; shared tooling |
Data is an asset, shared data |
Data driven |
| BI Org. Structure |
Data analysts in IT |
BI |
BI program |
BI CoE |
Data Innovation CoE |
Leverage Info-Tech’s BI Practice Assessment Tool to define your BI current state
BI Practice Assessment Tool
- Assess Current State
- Eight BI practice areas to assess maturity.
- Based on CMMI maturity scale.
Visualize Current State Results
- Determine your BI maturity level.
- Identify areas with outstanding maturity.
- Uncover areas with low maturity.
- Visualize the presence of misalignments.
Target State
- Tackle target state from two views: business and IT.
- Calculate gaps between target and current state.
Visualize Target State and Gaps
- A heat map diagram to compare the target state and the current state.
- Show both current and target maturity levels.
- Detailed charts to show results for each area.
- Detailed list of recommendations.
Purposes:
- Assess your BI maturity.
- Visualize maturity assessment to quickly spot misalignments, gaps, and opportunities.
- Provide right-sized recommendations.
Info-Tech Insight
Assessing current and target states is only the beginning. The real value comes from the interpretation and analysis of the results. Use visualizations of multiple viewpoints and discuss the results in groups to come up with the most effective ideas for your strategy and roadmap.
Activity: Conduct a current state assessment of your BI practice maturity
2.1.2
2-3 hours
Use the BI Practice Assessment Tool to establish a baseline for your current BI capabilities and maturity.
- Navigate to Tab 2. Current State Assessment in the BI Practice Assessment Tool and complete the current state assessment together or in small groups. If running a series of assessments, do not star or scratch every time. Use the previous group’s results to start the conversation with the users.
Info-Tech suggests the following groups participate in the completion of the assessment to holistically assess BI and to uncover misalignment:
| Providers |
|
Consumers |
|
|
| CIO & BI Management |
BI Work Groups (developers, analysts, modelers) |
Business Unit #1 |
Business Unit #2 |
Business Unit #3 |
- For each assessment question, answer the current level of maturity in terms of:
- Initial/Ad hoc – the starting point for use of a new or undocumented repeat process
- Developing – the process is documented such that it is repeatable
- Defined – the process is defined/confirmed as a standard business process
- Managed and Measurable – the process is quantitatively managed in accordance with agreed-upon metrics.
- Optimized – the process includes process optimization/improvement.
INPUT
- Observations of current maturity
OUTPUT
- Comprehensive current state assessment
Materials
- BI Practice Assessment Tool
- Current State Assessment section of the BI Strategy and Roadmap Template
Participants
- Selected individuals as suggested by the assessment tool
Info-Tech Insight
Discuss the rationale for your answers as a group. Document the comments and observations as they may be helpful in formulating the final strategy and roadmap.
Activity: Review and analyze the results of the current state assessment
2.1.3
2-3 hours
- Navigate to Tab 3. Current State Results in the BI Practice Assessment Tool and review the findings:
The tool provides a brief synopsis of your current BI state. Review the details of your maturity level and see where this description fits your organization and where there may be some discrepancies. Add additional comments to your current state summary in the BI Strategy and Roadmap Document.
In addition to reviewing the attributes of your maturity level, consider the following:
- What are the knowns – The knowns confirm your understanding on the current landscape.
What are the unknowns – The unknowns show you the blind spots. They are very important to give you an alternative view of the your current state. The group should discuss those blind spots and determine what to do with them.
Activity: Review and analyze the results of the current state assessment (cont.)
2.1.3
2-3 hours
2. Tab 3 will also visualize a breakdown of your maturity by BI practice dimension. Use this graphic as a preliminary method to identify where your organization is excelling and where it may need improvement.
Better Practices
Consider: What have you done in the areas where you perform well?
Candidates for Improvement
Consider: What can you do to improve these areas? What are potential barriers to improvement?
STEP 2.2
Envision a Future State for Your Organization’s BI Practice
Detail the capabilities of your next generation BI practice
Step Objectives
- Create guiding principles that will shape your organization’s ideal BI program.
- Pinpoint where your organization needs to improve across several BI practice dimensions.
- Develop approaches to remedy current impediments to BI evolution.
Step Activities
2.2.1 Define guiding principles for the future state
2.2.2 Define the target state of your BI practice
2.2.3 Confirm requirements for BI Styles by management group
2.2.4 Analyze gaps in your BI practice and generate improvement activities and objectives
2.2.5 Define the critical success factors for future BI
2.2.6 Identify potential risks for your future state and create a mitigation plan
Outcomes
- Defined landscape for future BI capabilities, including desired BI functionalities.
- Identification of crucial gaps and improvement points to include in a BI roadmap.
- Updated BI Styles Usage sheet.
Research Support
- Info-Tech’s Data Management Framework
- Info-Tech’s BI Practice Assessment Tool
- Info-Tech’s BI Strategy and Roadmap Template
Proposed Participants in this Step
Project Manager
Data Architect(s) or Enterprise Architect
Project Team
Define guiding principles to drive your future state envisioning
Envisioning a BI future state is essentially architecting the future for your BI program. It is very similar to enterprise architecture (EA). Guiding principles are widely used in enterprise architecture. This best practice should also be used in BI envisioning.
Benefits of Guiding Principles in a BI Context
- BI planning involves a number of business units. Defining high-level future state principles helps to establish a common ground for those different business units.
- Ensure the next generation BI aligns with the corporate enterprise architecture and data architecture principles.
- Provide high-level guidance without depicting detailed solutioning by leaving room for innovation.
Sample Principles for BI Future State
- BI should be fit for purpose. BI is a business technology that helps business users.
- Business–IT collaboration should be encouraged to ensure deliverables are relevant to the business.
- Focus on continuous improvement on data quality.
- Explore opportunities to onboard and integrate new datasets to create a holistic view of your data.
- Organize and present data in an easy-to-consume, easy-to-digest fashion.
- BI should be accessible to everything, as soon as they have a business case.
- Do not train just on using the platform. Train on the underlying data and business model as well.
- Develop a training platform where trainees can play around with the data without worrying about messing it up.
Activity: Define future state guiding principles for your BI practice
2.2.1
1-2 hours
Guiding principles are broad statements that are fundamental to how your organization will go about its activities. Use this as an opportunity to gather relevant stakeholders and solidify how your BI practice should perform moving forward.
- To ensure holistic and comprehensive future state principles, invite participants from the business, the data management team, and the enterprise architecture team. If you do not have an enterprise architecture practice, invite people that are involved in building the enterprise architecture. Five to ten people is ideal.
BI Future State
| Awareness |
Buy-in |
Business-IT Alignment |
Governance |
Org. Structure; People |
Process; Policies; Standards |
Data |
Technology |
- Once the group has some high-level ideas on what the future state looks like, brainstorm guiding principles that will facilitate the achievement of the future state (see above).
- Document the future state principles in the Future State Principles for BI section of the BI Strategy and Roadmap Template
INPUT
- Existing enterprise architecture guiding principles
- High-level concept of future state BI
OUTPUT
- Guiding principles for prospective BI practice
Materials
- Future State Principles section of the BI Strategy and Roadmap Template
Participants
- Business representatives
- IT representatives
- The EA group
Leverage prototypes to facilitate a continuous dialogue with end users en route to creating the final deliverable
At the end of the day, BI makes data and information available to the business communities. It has to be fit for purpose and relevant to the business. Prototypes are an effective way to ensure relevant deliverables are provided to the necessary users. Prototyping makes your future state a lot closer and a lot more business friendly.
Simple Prototypes
- Simple paper-based, whiteboard-based prototypes with same notes.
- The most basic communication tool that facilitates the exchange of ideas.
- Often used in Joint Application Development (JAD) sessions.
- Improve business and IT collaboration.
- Can be used to amend requirements documents.
Discussion Possibilities
- Initial ideation at the beginning
- Align everyone on the same page
- Explain complex ideas/layouts
- Improve collaboration
Elaborated Prototypes
- Demonstrates the possibilities of BI in a risk-free environment.
- Creates initial business value with your new BI platform.
- Validates the benefits of BI to the organization.
- Generates interest and support for BI from senior management.
- Prepares BI team for the eventual enterprise-wide deployment.
Discussion Possibilities
- Validate and refine requirements
- Fail fast, succeed fast
- Acts as checkpoints
- Proxy for the final working deliverable
Leverage Info-Tech’s BI Practice Assessment Tool to define your BI target state and visualize capability gaps
BI Practice Assessment Tool
- Assess Current State
- Eight BI practice areas to assess maturity.
- Based on CMMI maturity scale.
Visualize Current State Results- Determine your BI maturity level.
- Identify areas with outstanding maturity.
- Uncover areas with low maturity.
- Visualize the presence of misalignments.
Target State- Tackle target state from two views: business and IT.
- Calculate gaps between target and current state.
Visualize Target State and Gaps- A heat map diagram to compare the target state and the current state.
- Show both current and target maturity levels.
- Detailed charts to show results for each area.
- Detailed list of recommendations.
Purposes:
- Assess your BI maturity.
- Visualize maturity assessment to quickly spot misalignments, gaps, and opportunities.
- Provide right-sized recommendations.
Document essential findings in Info-Tech’s BI Strategy and Roadmap Template.
Info-Tech Insight
Assessing current and target states is only the beginning. The real value comes from the interpretation and analyses of the results. Use visualizations of multiple viewpoints and discuss the results in groups to come up with the most effective ideas for your strategy and roadmap.
Activity: Define the target state for your BI practice
2.2.2
2 hours
This exercise takes your team through establishing the future maturity of your BI practice across several dimensions.
- Envisioning of the future state will involve input from the business side as well as the IT department.
The business and IT groups should get together separately and determine the target state maturity of each of the BI practice components:
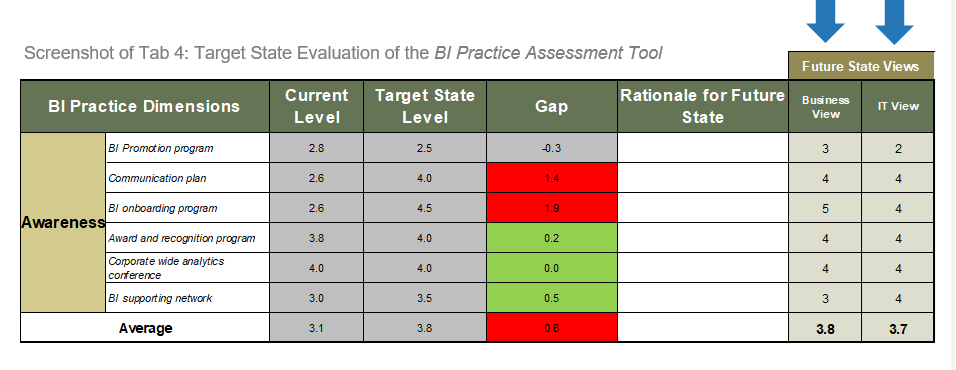
INPUT
- Desired future practice capabilities
OUTPUT
Materials
- Tab 4 of the BI Practice Assessment Tool
Participants
- Business representatives
- IT representatives
Activity: Define the target state for your BI practice (cont.)
2.2.2
2 hours
2. The target state levels from the two groups will be averaged in the column “Target State Level.” The assessment tool will automatically calculate the gaps between future state value and the current state maturity determined in Step 2.1. Significant gaps in practice maturity will be highlighted in red; smaller or non-existent gaps will appear green.
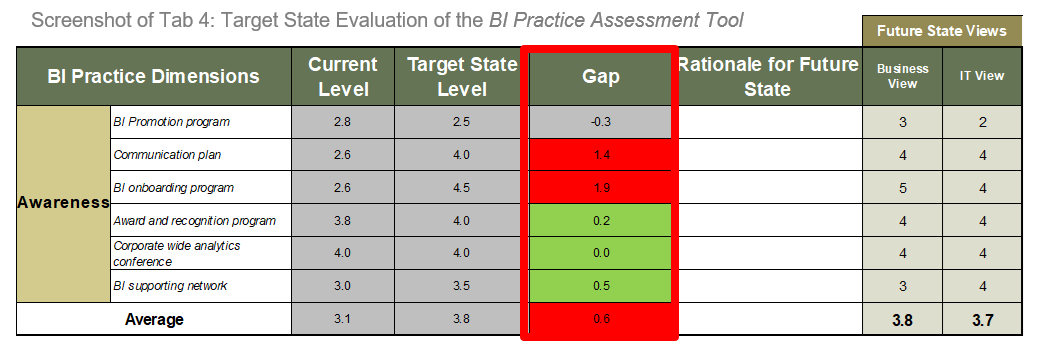
INPUT
- Desired future practice capabilities
OUTPUT
Materials
- Tab 4 of the BI Practice Assessment Tool
Participants
- Business representatives
- IT representatives
Activity: Revisit the BI Style Analysis sheet to define new report and analytical requirements by C-Level
2.2.3
1-2 hours
The information needs for each executive is unique to their requirements and management style. During this exercise you will determine the reporting and analytical needs for an executive in regards to content, presentation and cadence and then select the BI style that suite them best.
- To ensure a holistic and comprehensive need assessment, invite participants from the business and BI team. Discuss what data the executive currently use to base decisions on and explore how the different BI styles may assist. Sample reports or mock-ups can be used for this purpose.
- Document the type of report and required content using the BI Style Tool.
- The BI Style Tool will then guide the BI team in the type of reporting to develop and the level of Self-Service BI that is required. The tool can also be used for product selection.
INPUT
- Information requirements for C-Level Executives
OUTPUT
- BI style(s) that are appropriate for an executive’s needs
Materials
- BI Style Usage sheet from BI Strategy and Roadmap Template
- Sample Reports
Participants
- Business representatives
- BI representatives
Visualization tools facilitate a more comprehensive understanding of gaps in your existing BI practice
Having completed both current and target state assessments, the BI Practice Assessment Tool allows you to compare the results from multiple angles.
At a higher level, you can look at your maturity level:
At a detailed level, you can drill down to the dimensional level and item level.
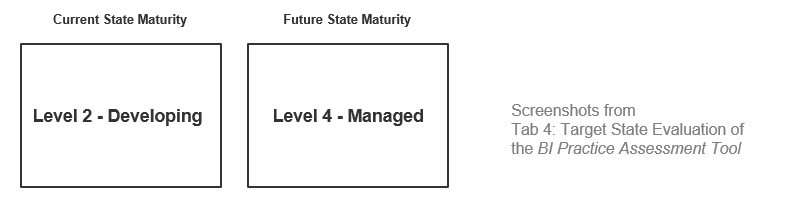
At a detailed level, you can drill down to the dimensional level and item level.
Activity: Analyze gaps in BI practice capabilities and generate improvement objectives/activities
2.2.4
2 hours
This interpretation exercise helps you to make sense of the BI practice assessment results to provide valuable inputs for subsequent strategy and roadmap formulation.
- IT management and the BI team should be involved in this exercise. Business SMEs should be consulted frequently to obtain clarifications on what their ideal future state entails.
Begin this exercise by reviewing the heat map and identifying:
- Areas with very large gaps
- Areas with small gaps
Areas with large gaps
Consider: Is the target state feasible and achievable? What are ways we can improve incrementally in this area? What is the priority for addressing this gap?
Areas with small/no gaps
Consider: Can we learn from those areas? Are we setting the bar too low for our capabilities?
INPUT
- Current and target state visualizations
OUTPUT
Materials
- Tab 5 of the BI Practice Assessment Tool
- Future State Assessment Results section of the BI Strategy and Roadmap Template
Participants
- Business representatives
- IT representatives
Activity: Analyze gaps in BI practice capabilities and generate improvement objectives/activities (cont.)
2.2.4
2 hours
2. Discuss the differences in the current and target state maturity level descriptions. Questions to ask include:
- What are the prerequisites before we can begin to build the future state?
- Is the organization ready for that future state? If not, how do we set expectations and vision for the future state?
- Do we have the necessary competencies, time, and support to achieve our BI vision?
INPUT
- Current and target state visualizations
OUTPUT
Materials
- Tab 5 of the BI Practice Assessment Tool
- Future State Assessment Results section of the BI Strategy and Roadmap Template
Participants
- Business representatives
- IT representatives
Activity: Analyze gaps in BI practice capabilities and generate improvement objectives/activities (cont.)
2.2.4
2 hours
3. Have the same group members reconvene and discuss the recommendations at the BI practice dimension level on Tab 5. of the BI Practice Assessment Tool. These recommendations can be used as improvement actions or translated into objectives for building your BI capabilities.
Example
The heat map displayed the largest gap between target state and current state in the technology dimension. The detailed drill-down chart will further illustrate which aspect(s) of the technology dimension is/are showing the most room for improvement in order to better direct your objective and initiative creation.
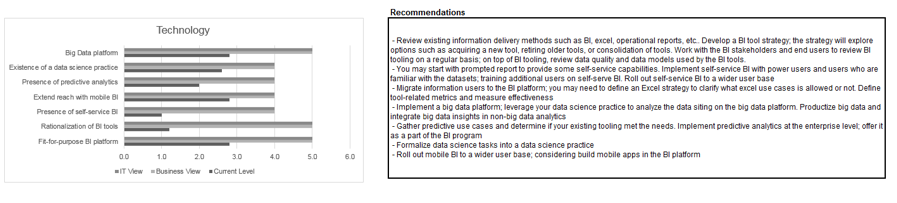
Considerations:
- What dimension parameters have the largest gaps? And why?
- Is there a different set of expectations for the future state?
Define critical success factors to direct your future state
Critical success factors (CSFs) are the essential factors or elements required for ensuring the success of your BI program. They are used to inform organizations with things they should focus on to be successful.
Common Provider (IT Department) CSFs
- BI governance structure and organization is created.
- Training is provided for the BI users and the BI team.
- BI standards are in place.
- BI artifacts rely on quality data.
- Data is organized and presented in a usable fashion.
- A hybrid BI delivery model is established.
- BI on BI; a measuring plan has to be in place.
Common Consumer (Business) CSFs
- Measurable business results have been improved.
- Business targets met/exceeded.
- Growth plans accelerated.
- World-class training to empower BI users.
- Continuous promotion of a data-driven culture.
- IT–business partnership is established.
- Collaborative requirements gathering processes.
- Different BI use cases are supported.
…a data culture is essential to the success of analytics. Being involved in a lot of Bay Area start-ups has shown me that those entrepreneurs that are born with the data DNA, adopt the data culture and BI naturally. Other companies should learn from these start-ups and grow the data culture to ensure BI adoption.
– Cameran Hetrick, Senior Director of Data Science & Analytics, thredUP
Activity: Define provider and consumer critical success factors for your future BI capabilities
2.2.5
2 hours
Create critical success factors that are important to both BI providers and BI consumers.
- Divide relevant stakeholders into two groups:
| BI Provider (aka IT) |
BI Consumer (aka Business) |
- Write two headings on the board: Objective and Critical Success Factors. Write down each of the objectives created in Phase 1.
- Divide the group into small teams and assign each team an objective. For each objective, ask the following question:
What needs to be put in place to ensure that this objective is achieved?
The answer to the question is your candidate CSF. Write CSFs on sticky notes and stick them by the relevant objective.
- Rationalize and consolidate CSFs. Evaluate the list of candidate CSFs to find the essential elements for achieving success.
- For each CSF, identify at least one key performance indicator that will serve as an appropriate metric for tracking achievement.
As you evaluate candidate CSFs, you may uncover new objectives for achieving your future state BI.
INPUT
OUTPUT
- A list of critical success factors mapped to business objectives
Materials
- Whiteboard and colored sticky notes
- CSFs for the Future State section of the BI Strategy and Roadmap Template
Participants
- Business and IT representatives
- CIO
- Head of BI
Round out your strategy for BI growth by evaluating risks and developing mitigation plans
A risk matrix is a useful tool that allows you to track risks on two dimensions: probability and impact. Use this matrix to help organize and prioritize risk, as well as develop mitigation strategies and contingency plans appropriately.
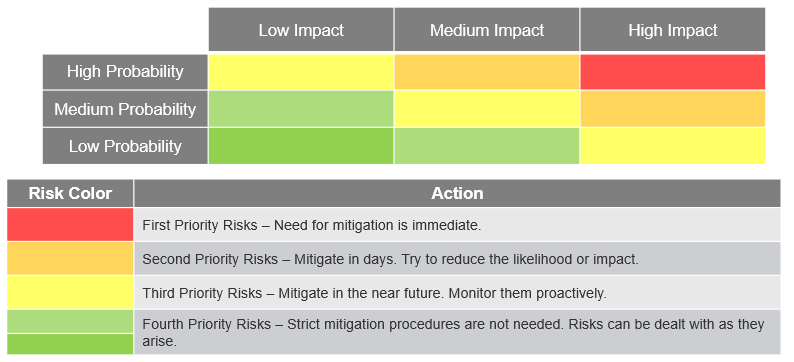
Info-Tech Insight
Tackling risk mitigation is essentially purchasing insurance. You cannot insure everything – focus your investments on mitigating risks with a reasonably high impact and high probability.
Be aware of some common barriers that arise in the process of implementing a BI strategy
These are some of the most common BI risks based on Info-Tech’s research:
| |
Low Impact |
Medium Impact |
High Impact |
| High Probability |
- Users revert back to Microsoft Excel to analyze data.
|
- BI solution does not satisfy the business need.
- BI tools become out of sync with new strategic direction.
- Poor documentation creates confusion and reduces user adoption.
|
- Fail to address data issues: quality, integration, definition.
- Inadequate communication with stakeholders throughout the project.
- Users find the BI tool interface too confusing.
|
| Medium Probability |
|
- Fail to define and monitor KPIs.
- Poor training results in low user adoption.
- Organization culture is resistant to the change.
|
- Lack of support from the sponsors.
- No governance over BI.
- Poor training results in misinformed users.
|
| Low Probability |
|
|
- Business units independently invest in BI as silos.
|
Activity: Identify potential risks for your future state and create a mitigation plan
2.2.6
1 hour
As part of developing your improvement actions, use this activity to brainstorm some high-level plans for mitigating risks associated with those actions.
Example:
Users find the BI tool interface too confusing.
- Use the probability-impact matrix to identify risks systematically. Collectively vote on the probability and impact for each risk.
- Risk mitigation. Risk can be mitigated by three approaches:
A. Reducing its probability
B. Reducing its impact
C. Reducing both
Option A: Brainstorm ways to reduce risk probability
E.g. The probability of the above risk may be reduced by user training. With training, the probability of confused end users will be reduced.
Option B: Brainstorm ways to reduce risk impact
E.g. The impact can be reduced by ensuring having two end users validate each other’s reports before making a major decision.
- Document your high-level mitigation strategies in the BI Strategy and Roadmap Template.
INPUT
OUTPUT
- High-level risk mitigation plans
Materials
- Risks and Mitigation section of the BI Strategy and Roadmap Template
Participants
Translate your findings and ideas into actions that will be integrated into the BI strategy and roadmap
As you progress through each phase, document findings and ideas as they arise. By phase end, hold a brainstorming session with the project team focused on documenting findings and ideas and substantiating them into improvement actions.
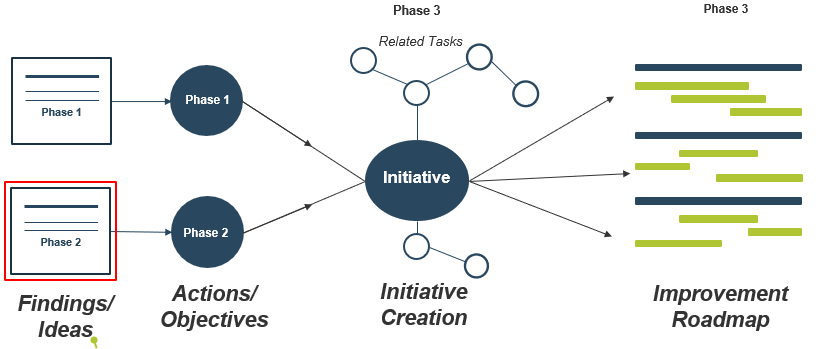
Ask yourself how BI or analytics can be used to address the gaps and explore opportunities uncovered in each phase. For example, in Phase 1, how do current BI capabilities impede the realization of the business vision?
Document and prioritize Phase 2 findings, ideas, and action items
2.2.7
1-2 hours
- Reconvene as a group to review the findings, ideas, and actions harvested in Phase 2. Write the findings, ideas, and actions on sticky notes.
- Prioritize the sticky notes to yield those with high business value and low implementation effort. View some sample findings below:
| High Business Value, Low Effort |
High Business Value, High Effort |
| Low Business Value, High Effort |
Low Business Value, High Effort |
Phase 2
| Sample Phase 2 Findings |
Found a gap between the business expectation and the existing BI content they are getting. |
| |
Our current maturity level is “Level 2 – Operational.” Almost everyone thinks we should be at least “Level 3 – Tactical” with some level 4 elements. |
| |
Found an error in a sales report. A quick fix is identified. |
| |
The current BI program is not able to keep up with the demand. |
- Select the top items and document the findings in the BI Strategy Roadmap Template. The findings will be used to build a Roadmap in Phase 3.
INPUT
OUTPUT
- Other Phase 2 Findings section of the BI Strategy and Roadmap Template
Materials
Participants
- Project manger
- Project team
- Business stakeholders
If you want additional support, have our analysts guide you through this phase as part of an Info-Tech workshop
Book a workshop with our Info-Tech analysts:
- To accelerate this project, engage your IT team in an Info-Tech workshop with an Info-Tech analyst team.
- Info-Tech analysts will join you and your team onsite at your location or welcome you to Info-Tech’s historic Toronto office to participate in an innovative onsite workshop.
- Contact your account manager (www.infotech.com/account), or email Workshops@InfoTech.com for more information.
The following are sample activities that will be conducted by Info-Tech analysts with your team:
2.1.1
Determine your current BI maturity level
The analyst will take your project team through Info-Tech’s BI Practice Assessment Tool, which collects perspectives from BI consumer and provider groups on multiple facets of your BI practice in order to establish a current maturity level.
If you want additional support, have our analysts guide you through this phase as part of an Info-Tech workshop
Book a workshop with our Info-Tech analysts
2.2.1
Define guiding principles for your target BI state
Using enterprise architecture principles as a starting point, our analyst will facilitate exercises to help your team establish high-level standards for your future BI practice.
2.2.2-2.2.3
Establish your desired BI patterns and matching functionalities
In developing your BI practice, your project team will have to decide what BI-specific capabilities are most important to your organization. Our analyst will take your team through several BI patterns that Info-Tech has identified and discuss how to bridge the gap between these patterns, linking them to specific functional requirements in a BI solution.
2.2.4-2.2.5
Analyze the gaps in your BI practice capabilities
Our analyst will guide your project team through a number of visualizations and explanations produced by our assessment tool in order to pinpoint the problem areas and generate improvement ideas.
Phase 3
Create a BI Roadmap for Continuous Improvement
Build a Reporting and Analytics Strategy
Create a BI roadmap for continuous improvement
Phase 3 Overarching Insight
The benefit of creating a comprehensive and actionable roadmap is twofold: not only does it keep BI providers accountable and focused on creating incremental improvement, but a roadmap helps to build momentum around the overall project, provides a continuous delivery of success stories, and garners grassroots-level support throughout the organization for BI as a key strategic imperative.
| Understand the Business Context to Rationalize Your BI Landscape | Evaluate Your Current BI Practice | Create a BI Roadmap for Continuous Improvement |
|---|
Establish the Business Context
- Business Vision, Goals, Key Drivers
- Business Case Presentation
- High-Level ROI
| Assess Your Current BI Maturity
- SWOT Analysis
- BI Practice Assessment
- Summary of Current State
| Construct a BI Initiative Roadmap
- BI Improvement Initiatives
- BI Strategy and Roadmap
|
Access Existing BI Environment
- BI Perception Survey Framework
- Usage Analyses
- BI Report Inventory
| Envision BI Future State
- BI Patterns
- BI Practice Assessment
- List of Functions
| Plan for Continuous Improvement
- Excel Governance Policy
- BI Ambassador Network Draft
|
Undergo Requirements Gathering
- Requirements Gathering Principles
- Overall BI Requirements
| | |
Phase 3 overview
Detailed Overview
Step 1: Establish Your BI Initiative Roadmap
Step 2: Identify Opportunities to Enhance Your BI Practice
Step 3: Create Analytics Strategy
Step 4: Define CSF and metrics to monitor success of BI and analytics
Outcomes
- Consolidate business intelligence improvement objectives into robust initiatives.
- Prioritize improvement initiatives by cost, effort, and urgency.
- Create a one-year, two-year, or three-year timeline for completion of your BI improvement initiatives.
- Identify supplementary programs that will facilitate the smooth execution of road-mapped initiatives.
Benefits
- Clear characterization of comprehensive initiatives with a detailed timeline to keep team members accountable.
Revisit project metrics to track phase progress
Goals for Phase 3:
- Put everything together. Findings and observations from Phase 1 and 2 are rationalized in this phase to develop data initiatives and create a strategy and roadmap for BI.
- Continuous improvements. Your BI program is evolving and improving over time. The program should allow you to have faster, better, and more comprehensive information.
Info-Tech’s Suggested Metrics for Tracking Phase 3 Goals
| |
Practice Improvement Metrics |
Data Collection and Calculation |
Expected Improvement |
| Program Level Metrics |
Efficiency
- Time to information
- Self-service penetration
|
- Derive from the ticket management system
- Derive from the BI platform
|
- 10% reduction in time to information
- Achieve 10-15% self-service penetration
|
| |
- Effectiveness
- BI Usage
- Data quality
|
- Derive from the BI platform
- Data quality perception
|
- Majority of the users use BI on a daily basis
- 15% increase in data quality perception
|
| |
Comprehensiveness
- # of integrated datasets
- # of strategic decisions made
|
- Derive from the data integration platform
- Decision-making perception
|
- Onboard 2-3 new data domains per year
- 20% increase in decision-making perception
|
Learn more about the CIO Business Vision program.
Intangible Metrics:
Tap into the results of Info-Tech’s CIO Business Vision diagnostic to monitor the changes in business-user satisfaction as you implement the initiatives in your BI improvement roadmap.
Phase 3 outline
Call 1-888-670-8889 or email GuidedImplementations@InfoTech.com for more information.
Complete these steps on your own or call us to complete a guided implementation. A guided implementation is a series of 2-3 advisory calls that helps you execute each phase of a project. They are included in most advisory memberships.
Guided Implementation 3: Create a BI Roadmap for Continuous Improvement
Proposed Time to Completion: 1-2 weeks
Step 3.1: Construct a BI Improvement Initiative Roadmap
Start with an analyst kick off call:
- Review findings and insights from completion of activities pertaining to current and future state assessments
- Discuss challenges around consolidating activities into initiatives
Then complete these activities…
- Collect improvement objectives/tasks from previous phases
- Develop comprehensive improvement initiatives
- Leverage value-effort matrix activities to prioritize these initiatives and place them along an improvement roadmap
With these tools & templates:
BI Initiatives and Roadmap Tool
BI Strategy and Roadmap Template
Step 3.2: Continuous Improvement Opportunities for BI
Review findings with analyst:
- Review completed BI improvement initiatives and roadmap
- Discuss guidelines presenting a finalized improvement to the relevant committee or stakeholders
- Discuss additional policies and programs that can serve to enhance your established BI improvement roadmap
Then complete these activities…
- Present BI improvement roadmap to relevant stakeholders
- Develop Info-Tech’s recommended supplementary policies and programs for BI
With these tools & templates:
BI Strategy and Roadmap Executive Presentation Template
Phase 3 Results & Insights:
- Comprehensive initiatives with associated tasks/activities consolidated and prioritized in an improvement roadmap
STEP 3.1
Construct a BI Improvement Initiative Roadmap
Build an improvement initiative roadmap to solidify your revamped BI strategy
Step Objectives
- Bring together activities and objectives for BI improvement to form initiatives
- Develop a fit-for-purpose roadmap aligned with your BI strategy
Step Activities
3.1.1 Characterize individual improvement objectives and activities ideated in previous phases.
3.1.2 Synthesize and detail overall BI improvement initiatives.
3.1.3 Create a plan of action by placing initiatives on a roadmap.
Outcomes
- Detailed BI improvement initiatives, prioritized by value and effort
- Defined roadmap for completion of tasks associated with each initiative and accountability
Research Support
- Info-Tech’s BI Initiatives and Roadmap Tool
Proposed Participants in this Step
Project Manager
Project Team
Create detailed BI strategy initiatives by bringing together the objectives listed in the previous phases
When developing initiatives, all components of the initiative need to be considered, from its objectives and goals to its benefits, risks, costs, effort required, and relevant stakeholders.
Use outputs from previous project steps as inputs to the initiative and roadmap building:
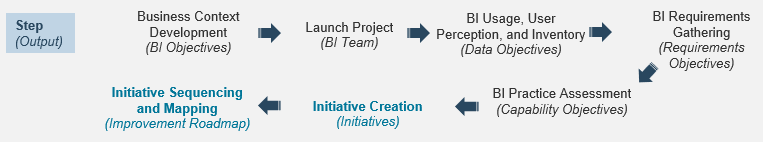
Determining the dependencies that exist between objectives will enable the creation of unique initiatives with associated to-do items or tasks.
- Group objectives into similar buckets with dependencies
- Select one overarching initiative
- Adapt remaining objectives into tasks of the main initiative
- Add any additional tasks
Leverage Info-Tech’s BI Initiatives and Roadmap Tool to build a fit-for-purpose improvement roadmap
BI Initiatives and Roadmap Tool
Overview
Use the BI Initiatives and Roadmap Tool to develop comprehensive improvement initiatives and add them to a BI strategy improvement roadmap.
Recommended Participants
Tool Guideline
| Tab 1. Instructions |
Use this tab to get an understanding as to how the tool works. |
| Tab 2. Inputs |
Use this tab to customize the inputs used in the tool. |
| Tab 3. Activities Repository |
Use this tab to list and prioritize activities, to determine dependencies between them, and build comprehensive initiatives with them. |
| Tab 4. Improvement Initiatives |
Use this tab to develop detailed improvement initiatives that will form the basis of the roadmap. Map these initiatives to activities from Tab 3. |
| Tab 5. Improvement Roadmap |
Use this tab to create your BI strategy improvement roadmap, assigning timelines and accountability to initiatives and tasks, and to monitor your project performance over time. |
Activity: Consolidate BI activities into the tool and assign dependencies and priorities
3.1.1
2 hours
- Have one person from the BI project team populate Tab 3. Activities Repository with the BI strategy activities that were compiled in Phases 1 and 2. Use drop-downs to indicate in which phase the objective was originally ideated.
- With BI project team executives, discuss and assign dependencies between activities in the Dependencies columns. A dependency exists if:
- An activity requires consideration of another activity.
- An activity requires the completion of another activity.
- Two activities should be part of the same initiative.
- Two activities are very similar in nature.
Then discuss and assign priorities to each activity in the Priority column using input from previous Phases. For example, if an activity was previously indicated as critical to the business, if a similar activity appears multiple times, or if an activity has several dependencies, it should be higher priority.
Inputs
- BI improvement activities created in Phases 1 and 2
Output
- Activities with dependencies and priorities
Materials
- BI Initiatives and Roadmap Tool
Participants
Activity: Consolidate BI activities into the tool and assign dependencies and priorities (cont’d.)
3.1.1
2 hours
Screenshot of Tab 3. BI Activities Repository, with samples improvement activities, dependencies, statuses, and priorities
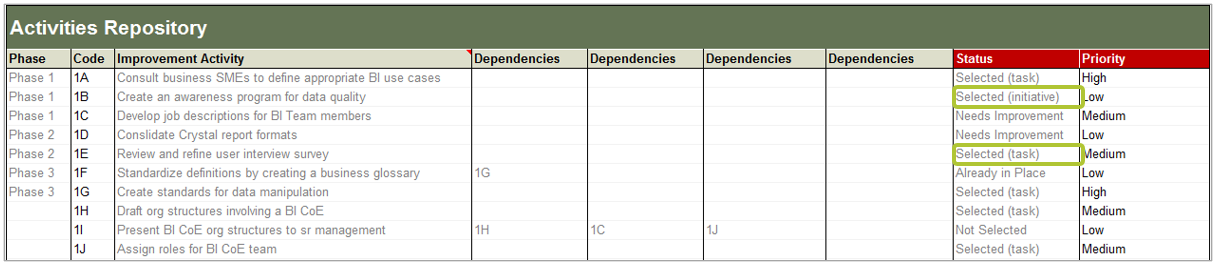
Revisit the outputs of your current state assessment and note which activities have already been completed in the “Status” column, to avoid duplication of your efforts.
When classifying the status of items in your activity repository, distinguish between broader activities (potential initiatives) and granular activities (tasks).
Activity: Customize project inputs and build out detailed improvement initiatives
3.1.2
1.5 hours
- Follow instructions on Tab 2. Inputs to customize inputs you would like to use for your project.
- Review the activities repository and select up to 12 overarching initiatives based on the activities with extreme or highest priority and your own considerations.
- Rewording where necessary, transfer the names of your initiatives in the banners provided on Tab 4. Improvement Initiatives.
- On Tab 3, indicate these activities as “Selected (initiatives)” in the Status column.
In Tab 4, develop detailed improvement initiatives by indicating the owner, taxonomy, start and end periods, cost and effort estimates, goal, benefit/value, and risks of each initiative.
Use drop-downs to list “Related activities,” which will become tasks under each initiative.
- activities with dependency to the initiative
- activities that lead to the same goal or benefit/value of the main initiative
Screenshot of the Improvement Initiative template, to be used for developing comprehensive initiatives
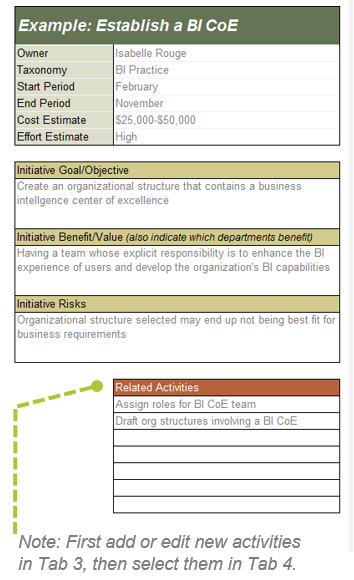 The image is a screenshot of the Improvement Initiative template, to be used for developing comprehensive initiatives.">
Inputs
- Tab 3. Activities Repository
Output
- Unique and detailed improvement initiatives
Materials
- BI Initiatives and Roadmap Tool
- BI Initiatives section of the BI Strategy and Roadmap Template
Participants
Visual representations of your initiative landscape can aid in prioritizing tasks and executing the roadmap
Building a comprehensive BI program will be a gradual process involving a variety of stakeholders. Different initiatives in your roadmap will either be completed sequentially or in parallel to one another, given dependencies and available resources. The improvement roadmap should capture and represent this information.
To determine the order in which main initiatives should be completed, exercises such as a value–effort map can be very useful.
Example: Value–Effort Map for a BI Project
Initiatives that are high value–low effort are found in the upper left quadrant and are bolded; These may be your four primary initiatives. In addition, initiative five is valuable to the business and critical to the project’s success, so it too is a priority despite requiring high effort. Note that you need to consider dependencies to prioritize these key initiatives.
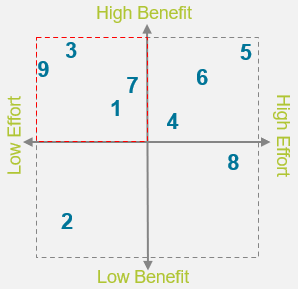
- Data profiling techniques training
- Improve usage metrics
- Communication plan for BI
- Staff competency evaluation
- Formalize practice capabilities
- Competency improvement plan program
- Metadata architecture improvements
- EDW capability improvements
- Formalize oversight for data manipulation
This exercise is best performed using a white board and sticky notes, and axes can be customized to fit your needs (E.g. cost, risk, time, etc.).
Activity: Build an overall BI strategy improvement roadmap for the entire project
3.1.3
45 minutes
The BI Strategy Improvement Roadmap (Tab 5 of the BI Initiatives and Roadmap Tool) has been populated with your primary initiatives and related tasks. Read the instructions provided at the top of Tab 5.
- Use drop-downs to assign a Start Period and End Period to each initiative (already known) and each task (determined here). As you do so, the roadmap will automatically fill itself in. This is where the value–effort map or other prioritization exercises may help.
- Assign Task Owners reporting Managers.
- Update the Status and Notes columns on an ongoing basis. Hold meetings with task owners and managers about blocked or overdue items.
- Updating status should also be an ongoing maintenance requirement for Tab 3 in order to stay up to date on which activities have been selected as initiatives or tasks, are completed, or are not yet acted upon.
.png)
INPUTS
- Tab 3. Activities Repository
- Tab 4. Improvement Initiatives
OUTPUT
Materials
- BI Initiatives and Roadmap Tool
- Roadmap section of the BI Strategy and Roadmap Template
Participants
Obtain approval for your BI strategy roadmap by organizing and presenting project findings
Use a proprietary presentation template
Recommended Participants
- Project sponsor
- Relevant IT & business executives
- CIO
- BI project team
Materials & Requirements
Develop your proprietary presentation template with:
- Results from Phases 1 and 2 and Step 3.1
- Information from:
- Info-Tech’s Build a Reporting and Analytics Strategy
- Screen shots of outputs from the:
- BI Practice Assessment Tool
- BI Initiatives and Roadmap Tool
Next Steps
Following the approval of your roadmap, begin to plan the implementation of your first initiatives.
Overall Guidelines
- Invite recommended participants to an approval meeting.
- Present your project’s findings with the goal of gaining key stakeholder support for implementing the roadmap.
- Set the scene using BI vision & objectives.
- Present the results and roadmap next.
- Dig deeper into specific issues by touching on the important components of this blueprint to generate a succinct and cohesive presentation.
Make the necessary changes and updates stemming from discussion notes during this meeting.
Submit a formal summary of findings and roadmap to your governing body for review and approval (e.g. BI steering committee, BI CoE).
Info-Tech Insight
At this point, it is likely that you already have the support to implement a data quality improvement roadmap. This meeting is about the specifics and the ROI.
Maximize support by articulating the value of the data quality improvement strategy for the organization’s greater information management capabilities. Emphasize the business requirements and objectives that will be enhanced as a result of tackling the recommended initiatives, and note any additional ramifications of not doing so.
Leverage Info-Tech’s presentation template to present your BI strategy to the executives
Use the BI Strategy and Roadmap Executive Presentation Template to present your most important findings and brilliant ideas to the business executives and ensure your BI program is endorsed. Business executives can also learn about how the BI strategy empowers them and how they can help in the BI journey.
Important Messages to Convey
- Executive summary of the presentation
- Current challenges faced by the business
- BI benefits and associated opportunities
- SWOT analyses of the current BI
- BI end-user satisfaction survey
- BI vision, mission, and goals
- BI initiatives that take you to the future state
- (Updated) Analytical Strategy
- Roadmap that depicts the timeline
STEP 3.2
Continuous Improvement Opportunities for BI
Create supplementary policies and programs to augment your BI strategy
Step Objectives
- Develop a plan for encouraging users to continue to use Excel, but in a way that does not compromise overall BI effectiveness.
- Take steps to establish a positive organizational culture around BI.
Step Activities
3.2.1 Construct a concrete policy to integrate Excel use with your new BI strategy.
3.2.2 Map out the foundation for a BI Ambassador network.
Outcomes
- Business user understanding of where Excel manipulation should and should not occur
- Foundation for recognizing exceptional BI users and encouraging development of enterprise-wide business intelligence
Research Support
- Info-Tech’s BI Initiatives and Roadmap Tool
- Info-Tech’s BI Strategy and Roadmap Template
Proposed Participants in this Step
Project Manager
Project Team
Additional Business Users
Establish Excel governance to better serve Excel users while making sure they comply with policies
Excel is the number one BI tool
- BI applications are developed to support information needs.
- The reality is that you will never migrate all Excel users to BI. Some Excel users will continue to use it. The key is to support them while imposing governance.
- The goal is to direct them to use the data in BI or in the data warehouse instead of extracting their own data from various source systems.
The Tactic: Centralize data extraction and customize delivery
- Excel users formerly extracted data directly from the production system, cleaned up the data, manipulated the data by including their own business logic, and presented the data in graphs and pivot tables.
- With BI, the Excel users can still use Excel to look at the information. The only difference is that BI or data warehouse will be the data source of their Excel workbook.
Top-Down Approach
- An Excel policy should be created at the enterprise level to outline which Excel use cases are allowed, and which are not.
- Excel use cases that involve extracting data from source systems and transforming that data using undisclosed business rules should be banned.
- Excel should be a tool for manipulating, filtering, and presenting data, not a tool for extracting data and running business rules.
Excel
Bottom-Up Approach
- Show empathy to your users. They just want information to get their work done.
- A sub-optimal information landscape is the root cause, and they are the victims. Excel spreadmarts are the by-products.
- Make the Excel users aware of the risks associated with Excel, train them in BI, and provide them with better information in the BI platform.
Activity: Create an Excel governance policy
3.2.1
4 hours
Construct a policy around Excel use to ensure that Excel documents are created and shared in a manner that does not compromise the integrity of your overall BI program.
- Review the information artifact list harvested from Step 2.1 and identify all existing Excel-related use cases.
- Categorize the Excel use cases into “allowed,” “not allowed,” and “not sure.” For each category define:
| Category |
To Do: |
Policy Context |
| Allowed |
Discuss what makes these use cases ideal for BI. |
Document use cases, scenarios, examples, and reasons that allow Excel as an information artifact. |
| Not Allowed |
Discuss why these cases should be avoided. |
Document forbidden use cases, scenarios, examples, and reasons that use Excel to generate information artifacts. |
| Not Sure |
Discuss the confusions; clarify the gray area. |
Document clarifications and advise how end users can get help in those “gray area” cases. |
- Document the findings in the BI Strategy and Roadmap Template in the Manage and Sustain BI Strategy section, or a proprietary template. You may also need to create a separate Excel policy to communicate the Dos and Don’ts.
Inputs
- Step 2.1 – A list of information artifacts
Output
Materials
- BI Strategy Roadmap and Template, or proprietary document
Participants
- Business executives
- CIO
- Head of BI
- BI team
Build a network of ambassadors to promote BI and report to IT with end-user feedback and requests
The Building of an Insider Network: The BI Ambassador Network
BI ambassadors are influential individuals in the organization that may be proficient at using BI tools but are passionate about analytics. The network of ambassadors will be IT’s eyes, ears, and even mouth on the frontline with users. Ambassadors will promote BI, communicate any messages IT may have, and keep tabs on user satisfaction.
Ideal candidate:
- A good relationship with IT.
- A large breadth of experience with BI, not just one dashboard.
- Approachable and well-respected amongst peers.
- Has a passion for driving organizational change using BI and continually looking for opportunities to innovate.
Push
- Key BI Messages
- Best Practices
- Training Materials
Pull
- Feedback
- Complaints
- Thoughts and New Ideas
Motivate BI ambassadors with perks
You need to motivate ambassadors to take on this additional responsibility. Make sure the BI ambassadors are recognized in their business units when they go above and beyond in promoting BI.
| Reward Approach |
Reward Type |
Description |
| Privileges |
High Priority Requests |
Given their high usage and high visibility, ambassadors’ BI information requests should be given a higher priority. |
| |
First Look at New BI Development |
Share the latest BI updates with ambassadors before introducing them to the organization. Ambassadors may even be excited to test out new functionality. |
| Recognition |
Featured in Communications |
BI ambassadors’ use cases and testimonials can be featured in BI communications. Be sure to create a formal announcement introducing the ambassadors to the organization. |
| |
BI Ambassador Certificate |
A certificate is a formal way to recognize their efforts. They can also publicly display the certificate in their workspace. |
| Rewards |
Appointed by Senior Executives |
Have the initial request to be a BI ambassador come from a senior executive to flatter the ambassador and position the role as a reward or an opportunity for success. |
| |
BI Ambassador Awards |
Award an outstanding BI ambassador for the year. The award should be given by the CEO in a major corporate event. |
Activity: Plan for a BI ambassador network
3.2.2
2 hours
Identify individuals within your organization to act as ambassadors for BI and a bridge between IT and business users.
- Obtain a copy of your latest organizational chart. Review your most up-to-date organizational chart and identify key BI consumers across a variety of functional units. In selecting potential BI ambassadors, reflect on the following questions:
- Does this individual have a good relationship with IT?
- What is the depth of their experience with developing/consuming business intelligence?
- Is this individual respected and influential amongst their respective business units?
- Has this individual shown a passion for innovating within their role?
Create a mandate and collateral detailing the roles and responsibilities for the ambassador role, e.g.:
- Promote BI to members of your group
- Represent the “voice of the data consumers”
Approach the ambassador candidates and explain the responsibilities and perks of the role, with the goal of enlisting about 10-15 ambassadors
Inputs
- An updated organizational chart
- A list of BI users
Output
- Draft framework for BI ambassador network
Materials
- BI Strategy and Roadmap Template or proprietary document
Participants
- Business executives
- CIO
- Head of BI
- BI team
Keeping tabs on metadata is essential to creating a data democracy with BI
A next generation BI not only provides a platform that mirrors business requirements, but also creates a flexible environment that empowers business users to explore data assets without having to go back and forth with IT to complete queries.
Business users are generally not interested in the underlying architecture or the exact data lineages; they want access to the data that matters most for decision-making purposes.
Metadata is data about data
It comes in the form of structural metadata (information about the spaces that contain data) and descriptive metadata (information pertaining to the data elements themselves), in order to answer questions such as:
- What is the intended purpose of this data?
- How up-to-date is this information?
- Who owns this data?
- Where is this data coming from?
- How have these data elements been transformed?
By creating effective metadata, business users are able to make connections between and bring together data sources from multiple areas, creating the opportunity for holistic insight generation.
Like BI, metadata lies in the Information Dimension layer of our data management framework.
The metadata needs to be understood before building anything. You need to identify fundamentals of the data, who owns not only that data, but also its metadata. You need to understand where the consolidation is happening and who owns it. Metadata is the core driver and cost saver for building warehouses and requirements gathering.
– Albert Hui, Principal, Data Economist
Deliver timely, high quality, and affordable information to enable fast and effective business decisions
In order to maximize your ROI on business intelligence, it needs to be treated less like a one-time endeavor and more like a practice to be continually improved upon.
Though the BI strategy provides the overall direction, the BI operating model – which encompasses organization structure, processes, people, and application functionality – is the primary determinant of efficacy with respect to information delivery. The alterations made to the operating model occur in the short term to improve the final deliverables for business users.
An optimal BI operating model satisfies three core requirements:
Timeliness
Effectiveness
Affordability
Bring tangible benefits of your revamped BI strategy to business users by critically assessing how your organization delivers business intelligence and identifying opportunities for increased operational efficiency.
Assess and Optimize BI Operations
Focus on delivering timely, quality, and affordable information to enable fast and effective business decisions
Implement a fit-for-purpose BI and analytics solution to augment your next generation BI strategy
Organizations new to business intelligence or with immature BI capabilities are under the impression that simply getting the latest-and-greatest tool will provide the insights business users are looking for.
BI technology can only be as effective as the processes surrounding it and the people leveraging it. Organizations need to take the time to select and implement a BI suite that aligns with business goals and fosters end-user adoption.
As an increasing number of companies turn to business intelligence technology, vendors are responding by providing BI and analytics platforms with more and more features.
Our vendor landscape will simplify the process of selecting a BI and analytics solution by:
Differentiating between the platforms and features vendors are offering.
Detailing a robust framework for requirements gathering to pinpoint your organization’s needs.
Developing a high-level plan for implementation.
Select and Implement a Business Intelligence and Analytics Solution
Find the diamond in your data-rough using the right BI & Analytics solution
If you want additional support, have our analysts guide you through this phase as part of an Info-Tech workshop
Book a workshop with our Info-tech analysts:
- To accelerate this project, engage your IT team in an Info-Tech workshop with an Info-Tech analyst team.
- Info-Tech analysts will join you and your team onsite at your location or welcome you to Info-Tech’s historic Toronto office to participate in an innovative onsite workshop.
- Contact your account manager (www.infotech.com/account), or email Workshops@InfoTech.com for more information.
The following are sample activities that will be conducted by Info-tech analysts with your team:
3.1.1-3.1.3
Construct a BI improvement initiative roadmap
During these activities, your team will consolidate the list of BI initiatives generated from the assessments conducted in previous phases, assign timelines to each action, prioritize them using a value–effort matrix, and finally produce a roadmap for implementing your organization’s BI improvement strategy.
3.2
Identify continuous improvement opportunities for BI
Our analyst team will work with your organization to ideate supplementary programs to support your BI strategy. Defining Excel use cases that are permitted and prohibited in conjunction with your BI strategy, as well as structuring an internal BI ambassador network, are a few extra initiatives that can enhance your BI improvement plans.
Insight breakdown
Your BI platform is not a one-and-done initiative.
A BI program is not a static project that is created once and remains unchanged. Your strategy must be treated as a living platform to be revisited and revitalized in order to provide effective enablement of business decision making. Develop a BI strategy that propels your organization by building it on business goals and objectives, as well as comprehensive assessments that quantitatively and qualitatively evaluate your current BI capabilities.
Put the “B” back in “BI.”
The closer you align your new BI platform to real business interests, the stronger will be the buy-in, realized value, and groundswell of enthusiastic adoption. Ultimately, getting this phase right sets the stage to best realize a strong ROI for your investment in the people, processes, and technology that will be your next generation BI platform.
Go beyond the platform.
BI success is not based solely on the technology it runs on; technology cannot mask gaps in capabilities. You must be capable in your environment – data management, data quality, and related data practices must be strong, otherwise the usefulness of the intelligence suffers. The best BI solution does not only provide a technology platform, but also addresses the elements that surround the platform. Look beyond tools and holistically assess the maturity of your BI practice with input from both the BI consumer and provider perspectives.
Detailed list of BI Types
| Style |
Description |
Strategic Importance (1-5) |
Popularity (1-5) |
Effort (1-5) |
| Standards Preformatted reports |
Standard, preformatted information for backward-looking analysis. |
5 |
5 |
1 |
| User-defined analyses |
Pre-staged information where “pick lists” enable business users to filter (select) the information they wish to analyze, such as sales for a selected region during a selected previous timeframe. |
5 |
4 |
2 |
| Ad-hoc analyses |
Power users write their own queries to extract self-selected pre-staged information and then use the information to perform a user-created analysis. |
5 |
4 |
3 |
| Scorecards and dashboards |
Predefined business performance metrics about performance variables that are important to the organization, presented in a tabular or graphical format that enables business users to see at a glance how the organization is performing. |
4 |
4 |
3 |
| Multidimensional analysis (OLAP) |
Multidimensional analysis (also known as On-line analytical processing): Flexible tool-based user-defined analysis of business performance and the underlying drivers or root causes of that performance. |
4 |
3 |
3 |
| Alerts |
Predefined analyses of key business performance variables, comparison to a performance standard or range, and communication to designated businesspeople when performance is outside the predefined performance standard or range. |
4 |
3 |
3 |
| Advanced Analytics |
Application of long-established statistical and/or operations research methods to historical business information to look backward and characterize a relevant aspect of business performance, typically by using descriptive statistics |
5 |
3 |
4 |
| Predictive Analytics |
Application of long-established statistical and/or operations research methods to historical business information to predict, model, or simulate future business and/or economic performance and potentially prescribe a favored course of action for the future |
5 |
3 |
5 |
Our BI strategy approach follows Info-Tech’s popular IT Strategy Framework
A comprehensive BI strategy needs to be developed under the umbrella of an overall IT strategy. Specifically, creating a BI strategy is contributing to helping IT mature from a firefighter to a strategic partner that has close ties with business units.
| 1. Determine mandate and scope |
2. Assess drivers and constraints |
3. Evaluate current state of IT |
4. Develop a target state vision |
5. Analyze gaps and define initiatives |
6. Build a roadmap |
8. Revamp |
7. Execute |
| Mandate |
Business drivers |
Holistic assessments |
Vision and mission |
Initiatives |
Business-driven priorities |
|
|
| Scope |
External drivers |
Focus-area specific assessments |
Guiding principles |
|
Risks |
|
|
| Project charter |
Opportunities to innovate |
|
Target state vision |
|
Execution schedule |
|
|
| |
Implications |
|
Objectives and measures |
|
|
|
|
This BI strategy blueprint is rooted in our road-tested and proven IT strategy framework as a systematic method of tackling strategy development.
Research contributors
Internal Contributors
- Andy Woyzbun, Executive Advisor
- Natalia Nygren Modjeska, Director, Data & Analytics
- Crystal Singh, Director, Data & Analytic
- Andrea Malick, Director, Data & Analytics
- Raj Parab, Director, Data & Analytics
- Igor Ikonnikov, Director, Data & Analytics
- Andy Neill, Practice Lead, Data & Analytics
- Rob Anderson, Manager Sales Operations
- Shari Lava, Associate Vice-President, Vendor Advisory Practice
External Contributors
- Albert Hui, Principal, DataEconomist
- Cameran Hetrick, Senior Director of Data Science & Analytics, thredUP
- David Farrar, Director – Marketing Planning & Operations, Ricoh Canada Inc
- Emilie Harrington, Manager of Analytics Operations Development, Lowe’s
- Sharon Blanton, VP and CIO, The College of New Jersey
- Raul Vomisescu, Independent Consultant
Research contributors and experts
Albert Hui
Consultant, Data Economist
Albert Hui is a cofounder of Data Economist, a data-consulting firm based in Toronto, Canada. His current assignment is to redesign Scotiabank’s Asset Liability Management for its Basel III liquidity compliance using Big Data technology. Passionate about technology and problem solving, Albert is an entrepreneur and result-oriented IT technology leader with 18 years of experience in consulting and software industry. His area of focus is on data management, specializing in Big Data, business intelligence, and data warehousing. Beside his day job, he also contributes to the IT community by writing blogs and whitepapers, book editing, and speaking at technology conferences. His recent research and speaking engagement is on machine learning on Big Data.
Albert holds an MBA from the University of Toronto and a master’s degree in Industrial Engineering. He has twin boys and enjoys camping and cycling with them in his spare time.

Cameran Hetrick
Senior Director of Analytics and Data Science, thredUP
Cameran is the Senior Director of Analytics and Data Science at thredUP, a startup inspiring a new generation to think second hand first. There she helps drives top line growth through advanced and predictive analytics. Previously, she served as the Director of Data Science at VMware where she built and led the data team for End User Computing. Before moving to the tech industry, she spent five years at The Disneyland Resort setting ticket and hotel prices and building models to forecast attendance. Cameran holds an undergraduate degree in Economics/Mathematics from UC Santa Barbara and graduated with honors from UC Irvine's MBA program.

Bibliography
Bange, Carsten and Wayne Eckerson. “BI and Data Management in the Cloud: Issues and Trends.” BARC and Eckerson Group, January 2017. Web.
Business Intelligence: The Strategy Imperative for CIOs. Tech. Information Builders. 2007. Web. 1 Dec. 2015.
COBIT 5: Enabling Information. Rolling Meadows, IL: ISACA, 2013. Web.
Dag, Naslund, Emma Sikander, and Sofia Oberg. "Business Intelligence - a Maturity Model Covering Common Challenges." Lund University Publications. Lund University, 2014. Web. 23 Oct. 2015.
“DAMA Guide to the Data Management Body of Knowledge (DAMA-DMBOK Guide).” First Edition. DAMA International. 2009. Digital. April 2014.
Davenport, Thomas H. and Bean, Randy. “Big Data and AI Executive Survey 2019.” NewVantage Partners LLC. 2019. Web.
"Debunking the Business of Analytics." Experian Data Quality. Sept. 2013. Web.
Bibliography
Drouin, Sue. "Value Chain." SAP Analytics. February 27, 2015.
Farrar, David. “BI & Data analytics workshop feedback.” Ricoh Canada. Sept. 2019.
Fletcher, Heather. "New England Patriots Use Analytics & Trigger Emails to Retain Season Ticket Holders." Target Marketing. 1 Dec. 2011. Web.
Gonçalves, Alex. "Social Media Analytics Strategy - Using Data to Optimize Business Performance.” Apress. 2017.
Imhoff, Claudia, and Colin White. "Self Service Business Intelligence: Empowering Users to Generate Insights." SAS Resource Page. The Data Warehouse Institute, 2011. Web.
Khamassi, Ahmed. "Building An Analytical Roadmap : A Real Life Example." Wipro. 2014.
Kuntz, Jerry, Pierre Haren, and Rebecca Shockley. IBM Insight 2015 Teleconference Series. Proc. of Analytics: The Upside of Disruption. IBM Institute for Business Value, 19 Oct. 2015. Web.
Kwan, Anne , Maximillian Schroeck, Jon Kawamura. “Architecting and operating model, A platform for accelerating digital transformation.” Part of a Deliotte Series on Digital Industrial Transformation, 2019. Web.
Bibliography
Lebied, Mona. "11 Steps on Your BI Roadmap To Implement A Successful Business Intelligence Strategy." Business Intelligence. July 20, 2018. Web.
Light, Rob. “Make Business Intelligence a Necessity: How to Drive User Adoption.” Sisense Blog. 30 July 2018.
Mazenko, Elizabeth. “Avoid the Pitfalls: 3 Reasons 80% of BI Projects Fail.” BetterBuys. October 2015.
Marr, Bernard. "Why Every Business Needs A Data And Analytics Strategy.” Bernard Marr & Co. 2019.
Mohr, Niko and Hürtgen, Holger. “Achieving Business Impact with Data.” McKinsey. April 2018.
MIT Sloan Management
Quinn, Kevin R. "Worst Practices in Business Intelligence: Why BI Applications Succeed Where BI Tools Fail." (2007): 1-19. BeyeNetwork. Information Builders, 2007. Web. 1 Dec. 2015.
Ringdal, Kristen. "Learning multilevel Analysis." European social Survey. 2019.
Bibliography
Schaefer, Dave, Ajay Chandramouly, Burt Carmak, and Kireeti Kesavamurthy. "Delivering Self-Service BI, Data Visualization, and Big Data Analytics." IT@Intel White Paper (2013): 1-11. June 2013. Web. 30 Nov. 2015.
Schultz, Yogi. “About.” Corvelle Consulting. 2019.
"The Current State of Analytics: Where Do We Go From Here?" SAS Resource Page. SAS & Bloomberg Businessweek, 2011. Web.
"The Four Steps to Defining a Customer Analytics Strategy." CCG Analytics Solutions & Services. Nov 10,2017.
Traore, Moulaye. "Without a strategic plan, your analytics initiatives are risky." Advisor. March 12, 2018. web.
Wells, Dave. "Ten Mistakes to Avoid When Gathering BI Requirements." Engineering for Industry. The Data Warehouse Institute, 2008. Web.
“What is a Business Intelligence Strategy and do you need one?” Hydra. Sept 2019. Web.
Williams, Steve. “Business Intelligence Strategy and Big Data Analytics.” Morgan Kaufman. 2016.
Wolpe, Toby. "Case Study: How One Firm Used BI Analytics to Track Staff Performance | ZDNet." ZDNet. 3 May 2013. Web.
Yuk, Mico. “11 Reasons Why Most Business Intelligence Projects Fail.” Innovative enterprise Channels. May 2019.

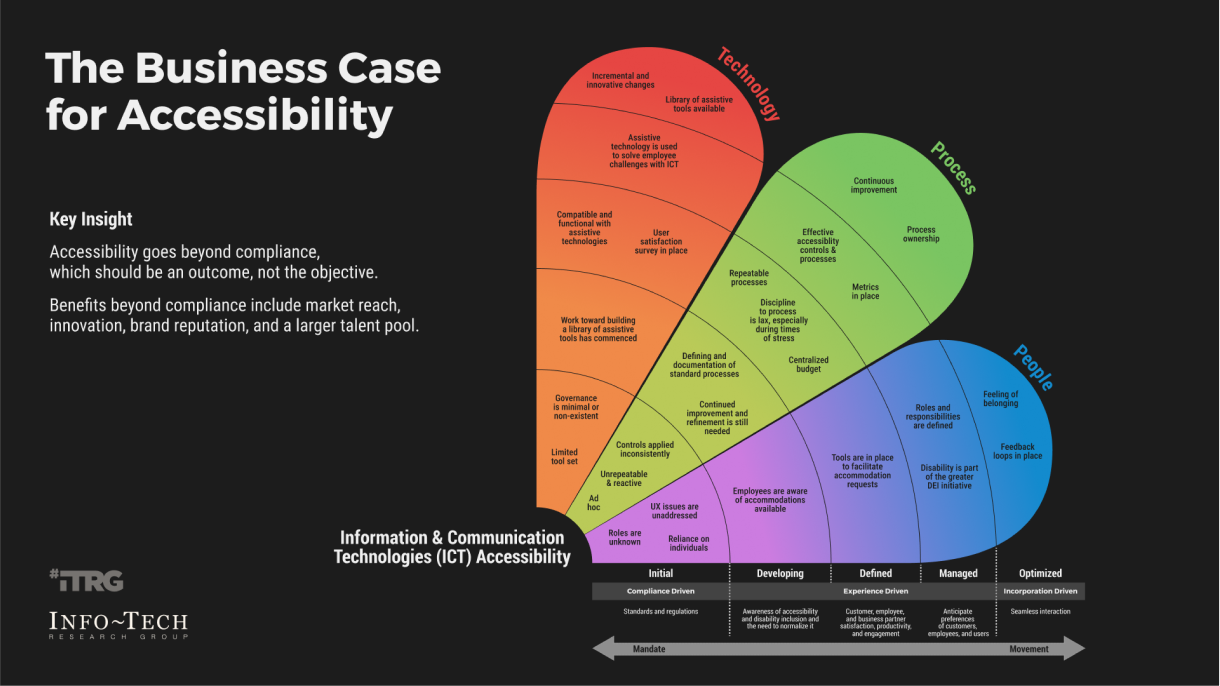

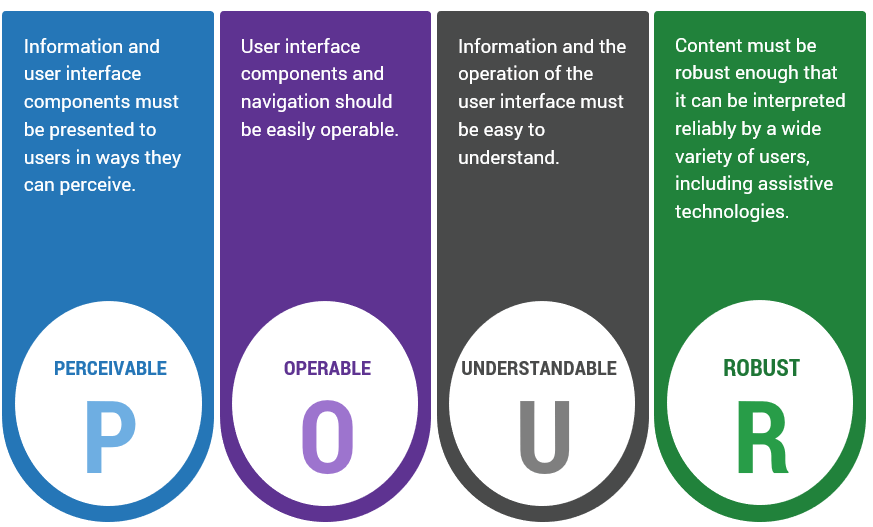
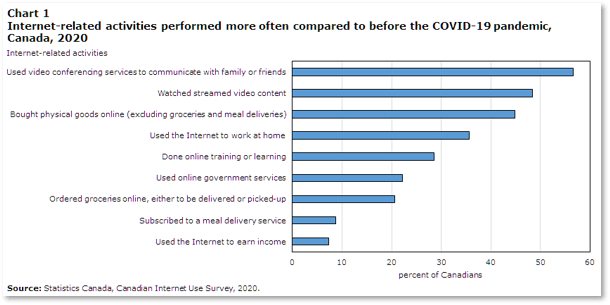
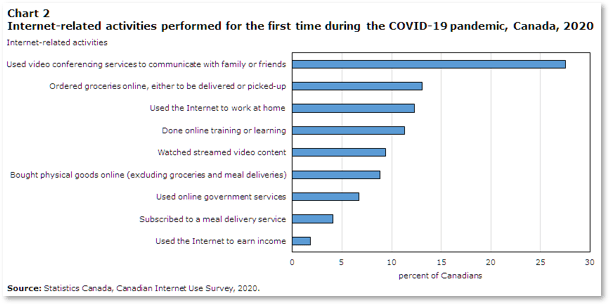
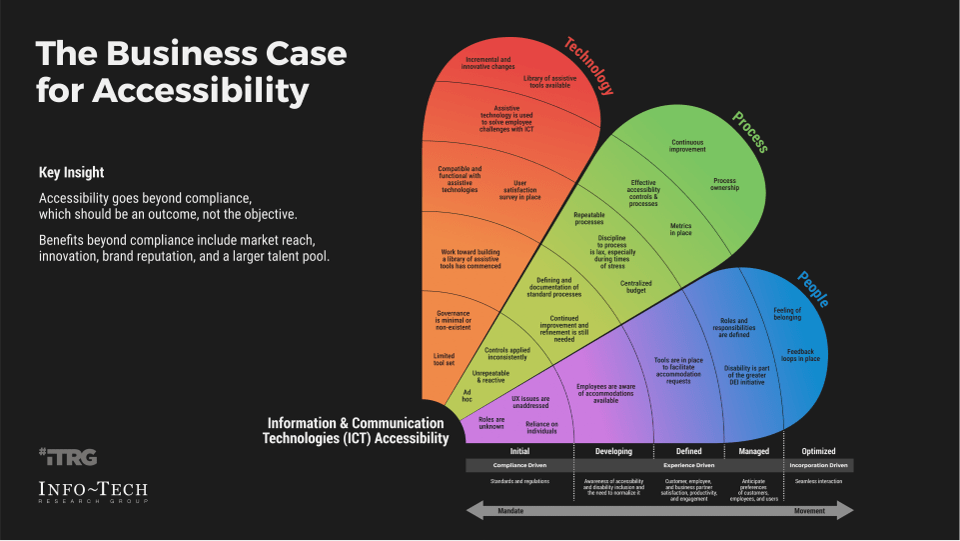
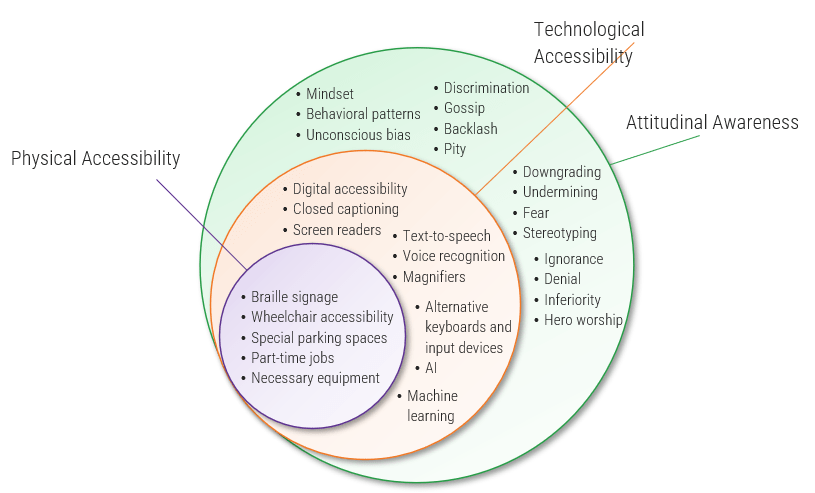
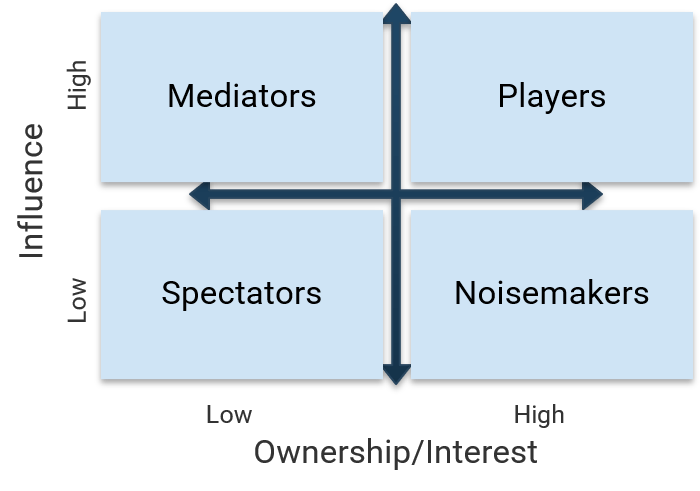
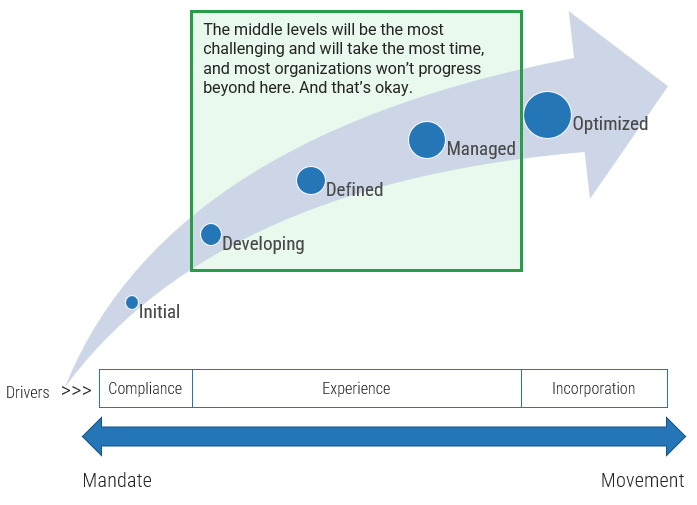


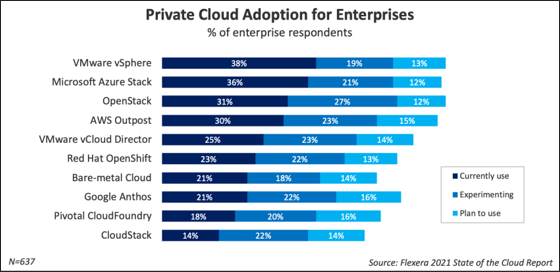

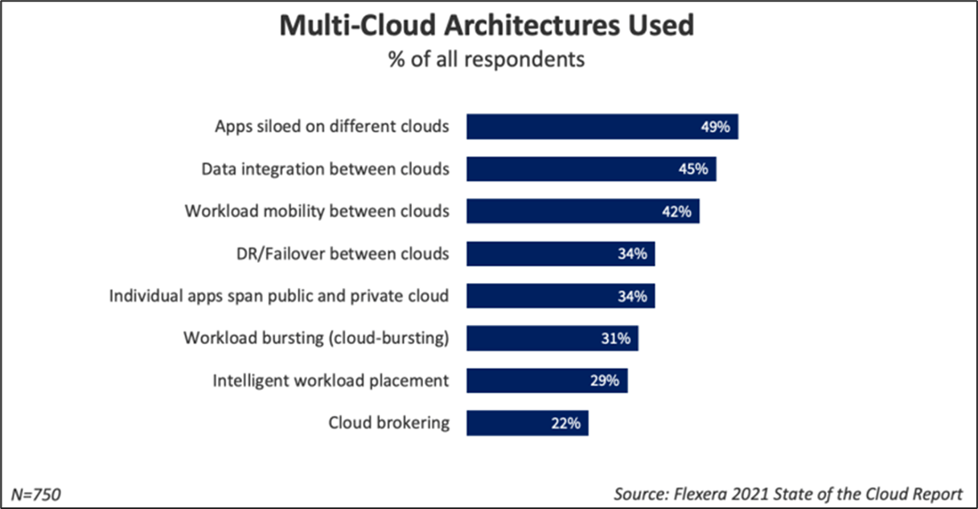
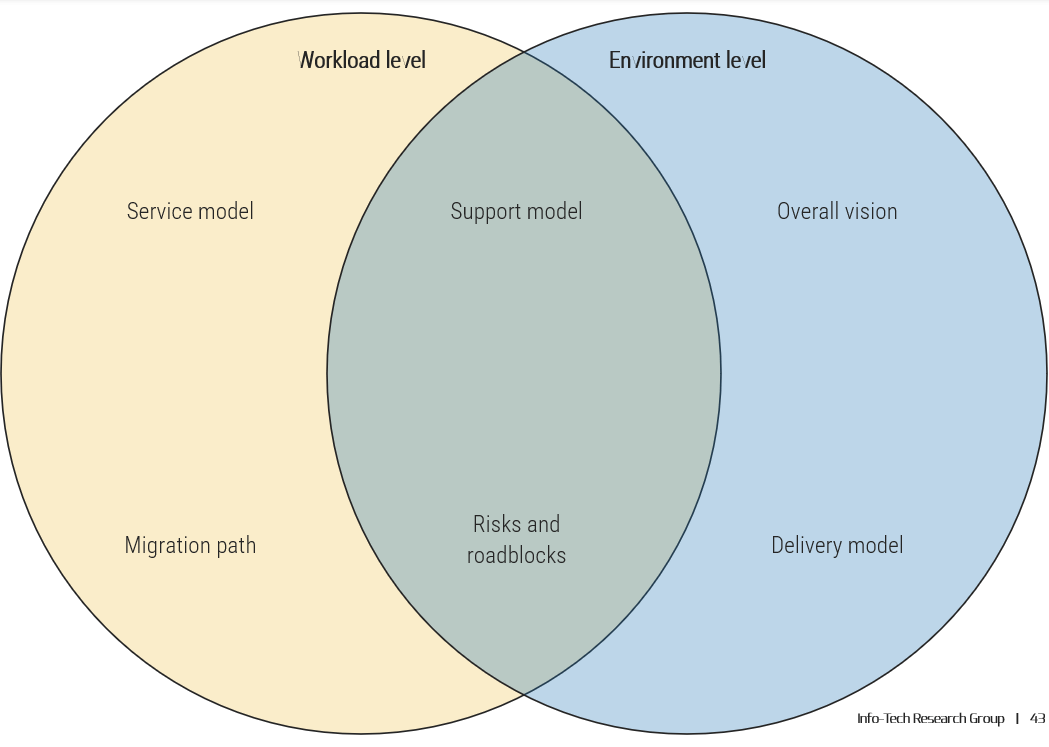
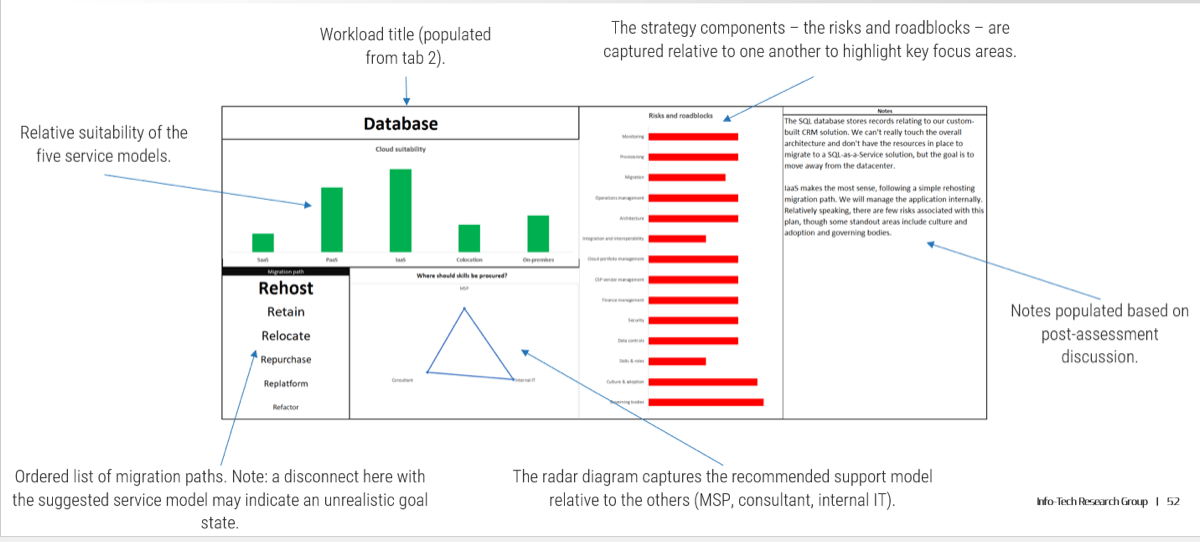
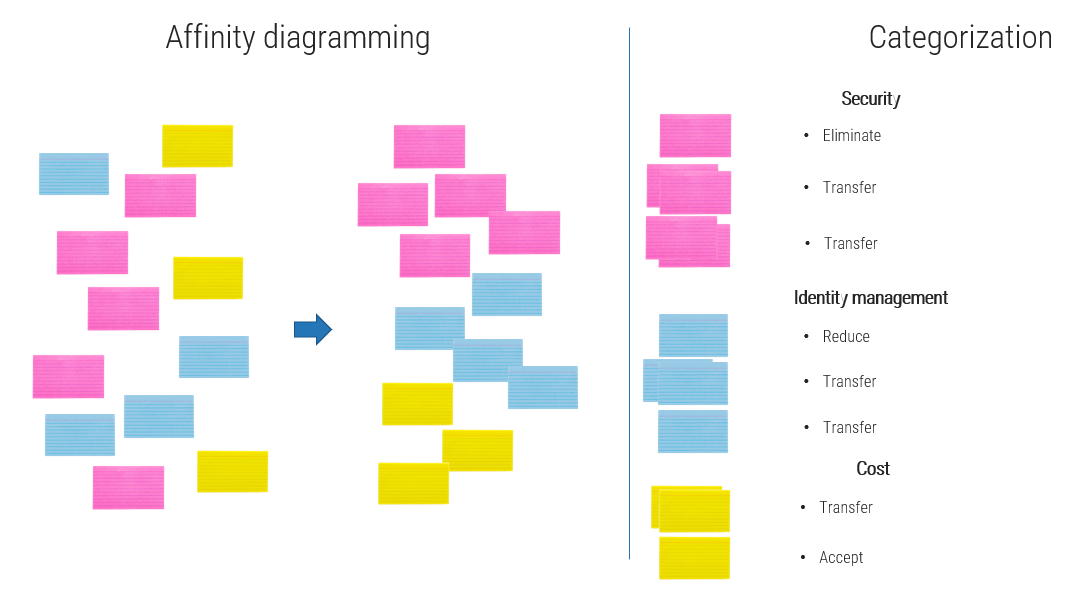
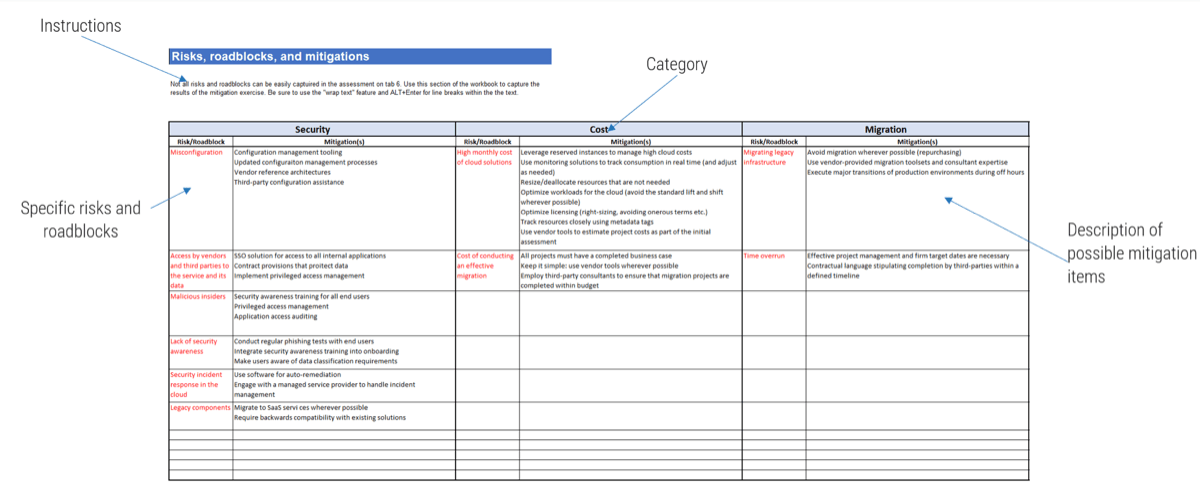


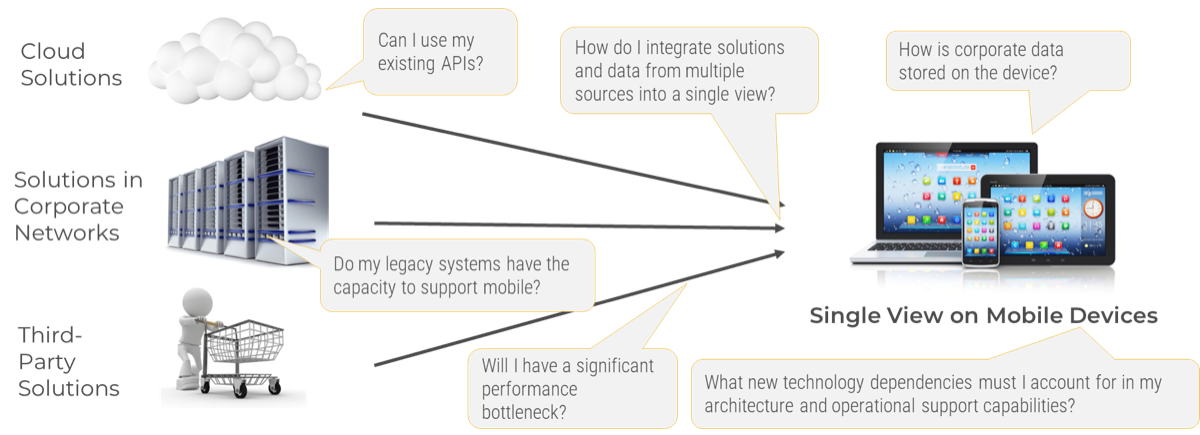
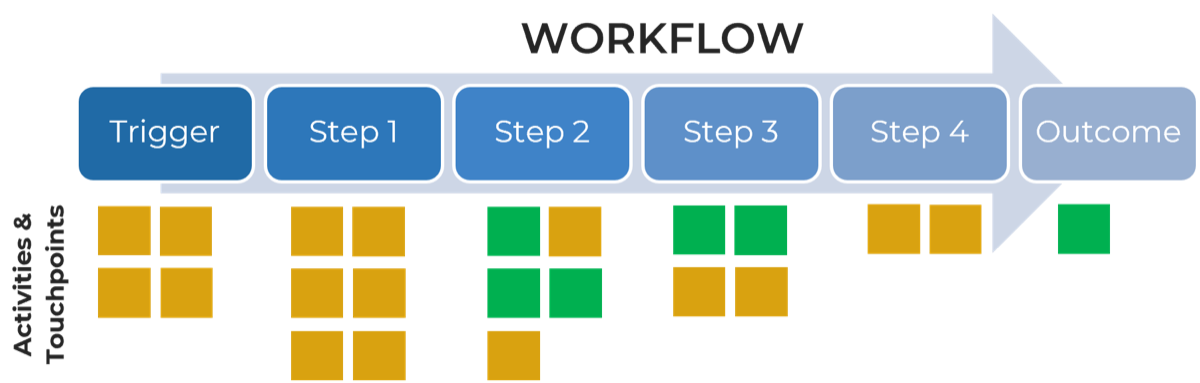
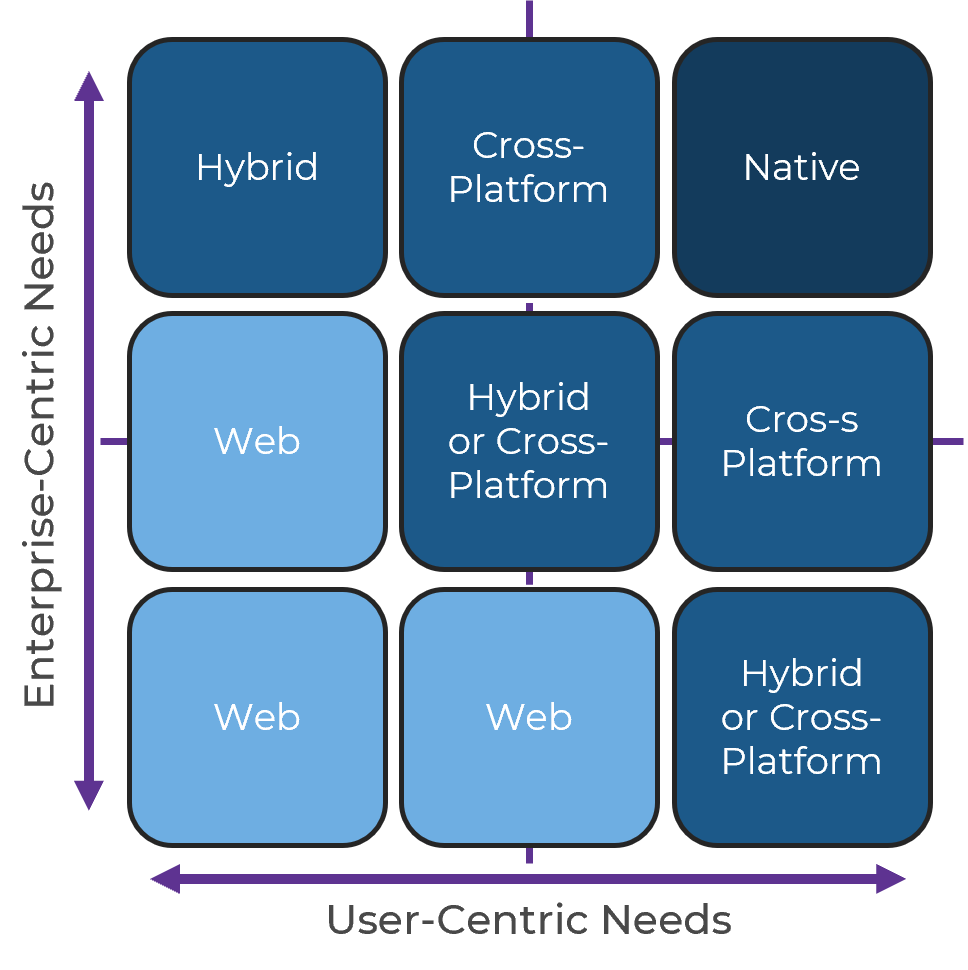
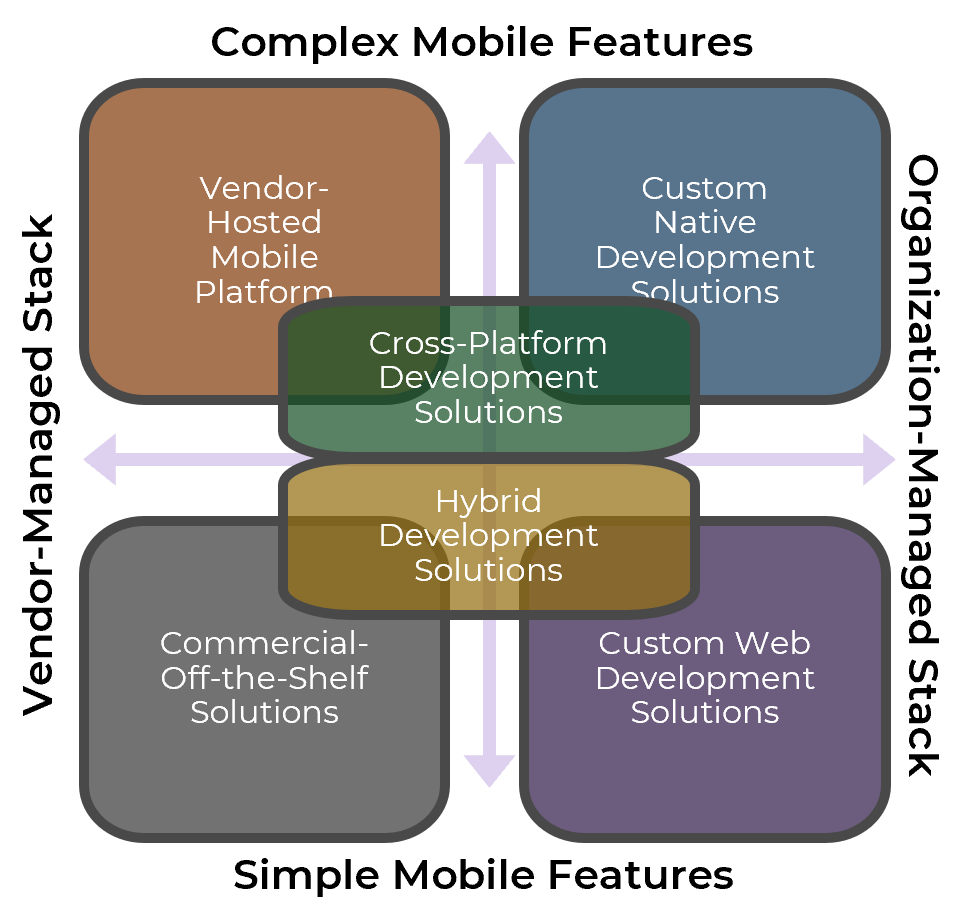
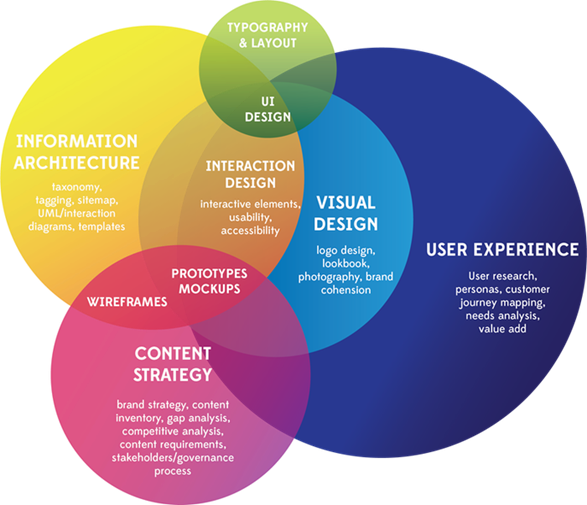
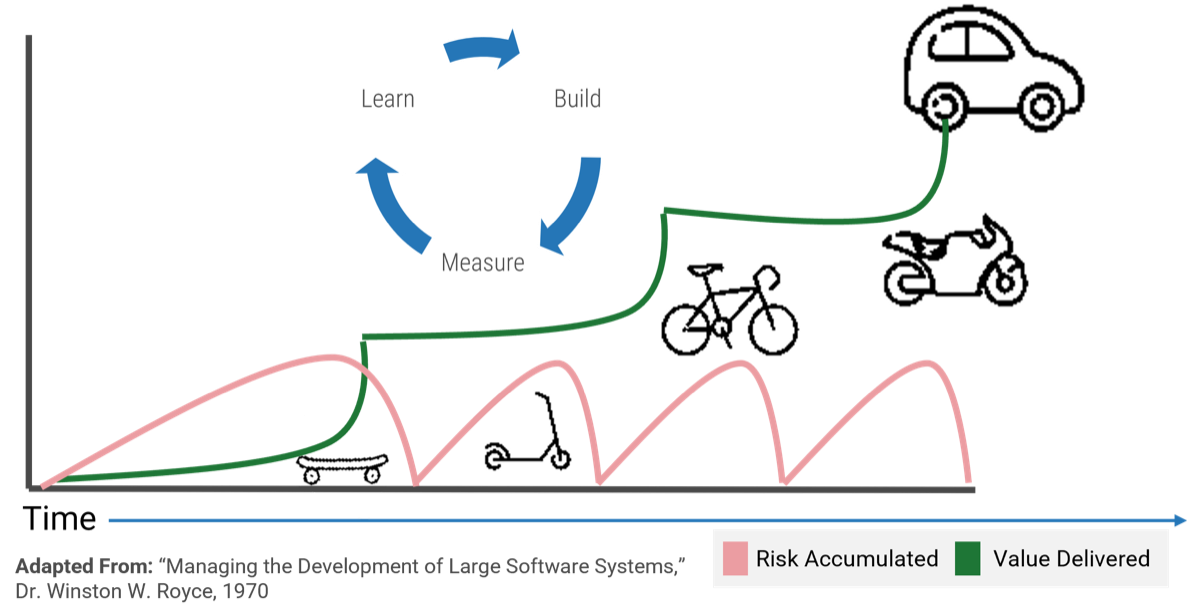
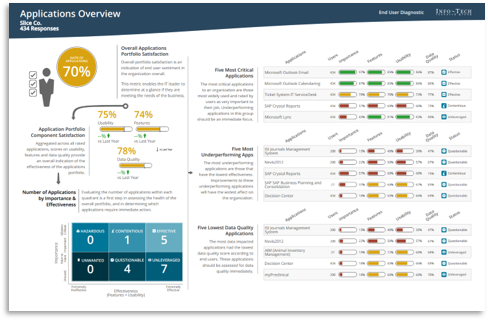
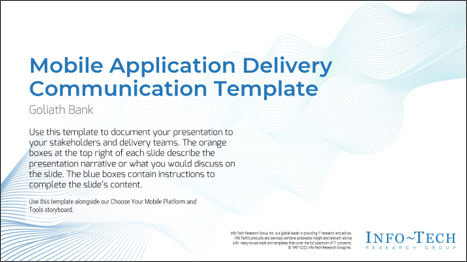
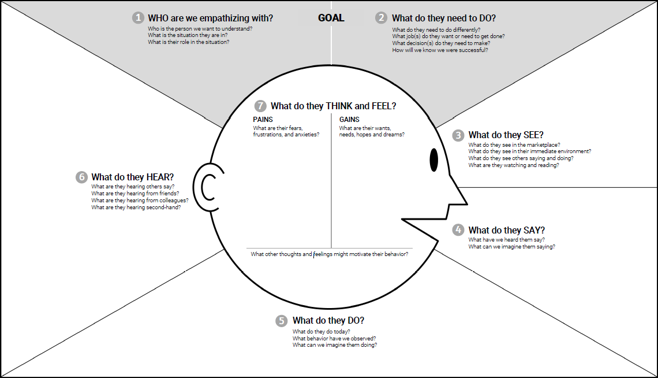
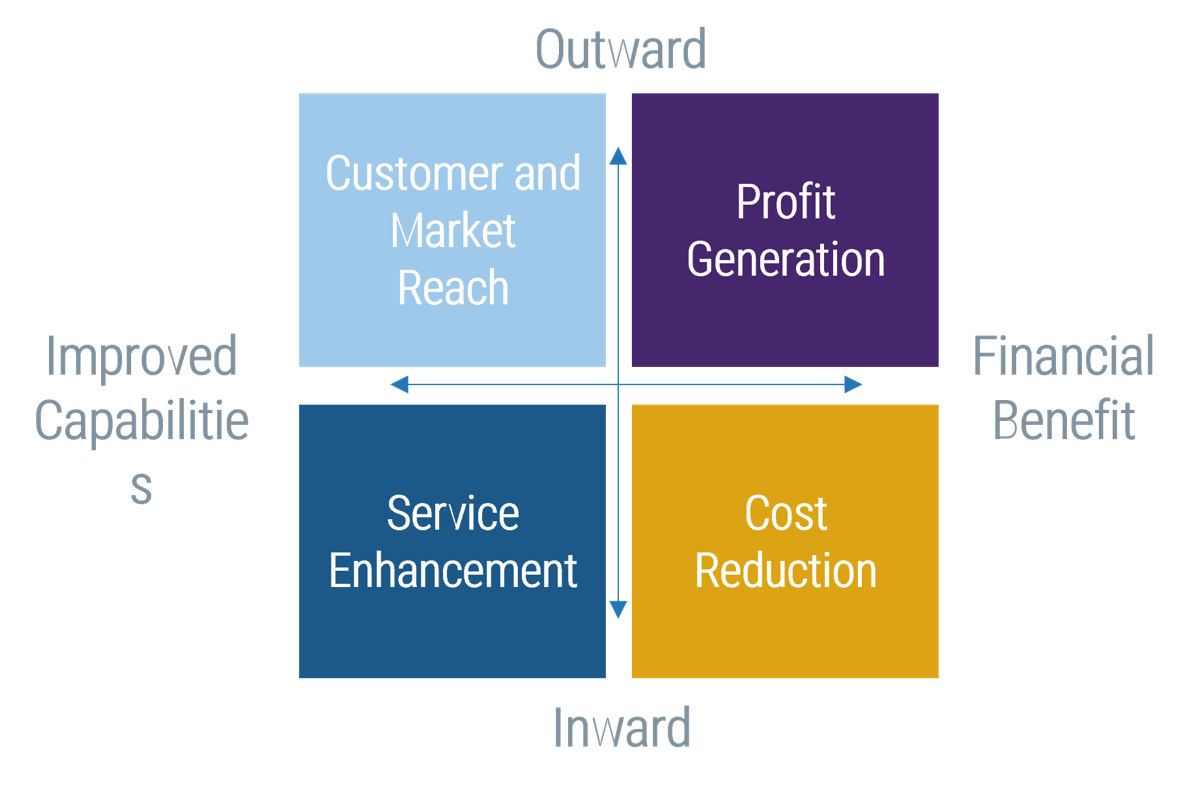
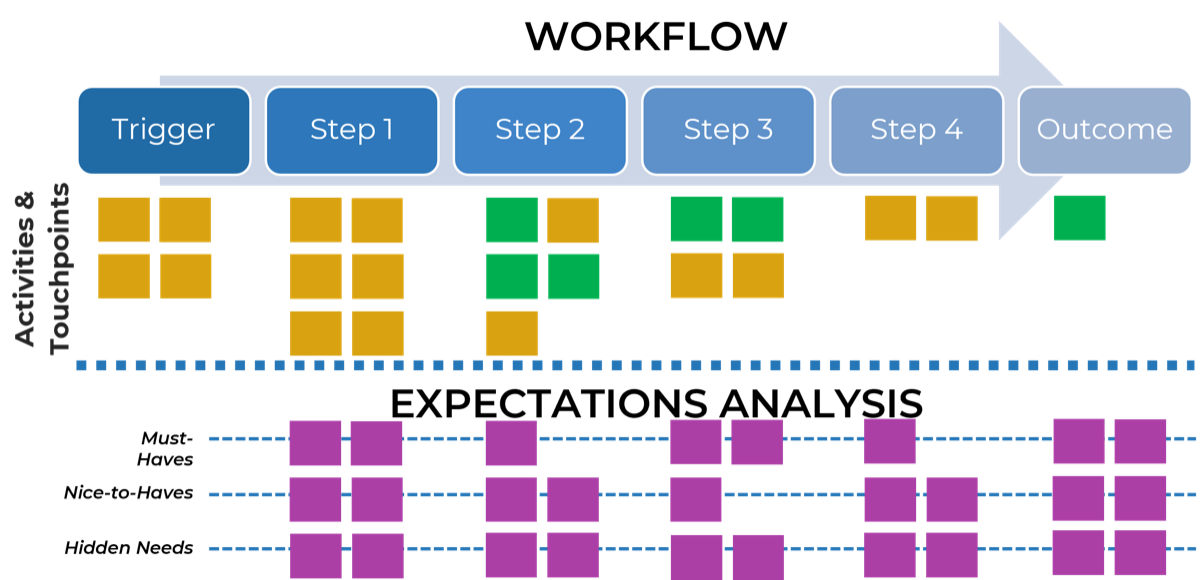
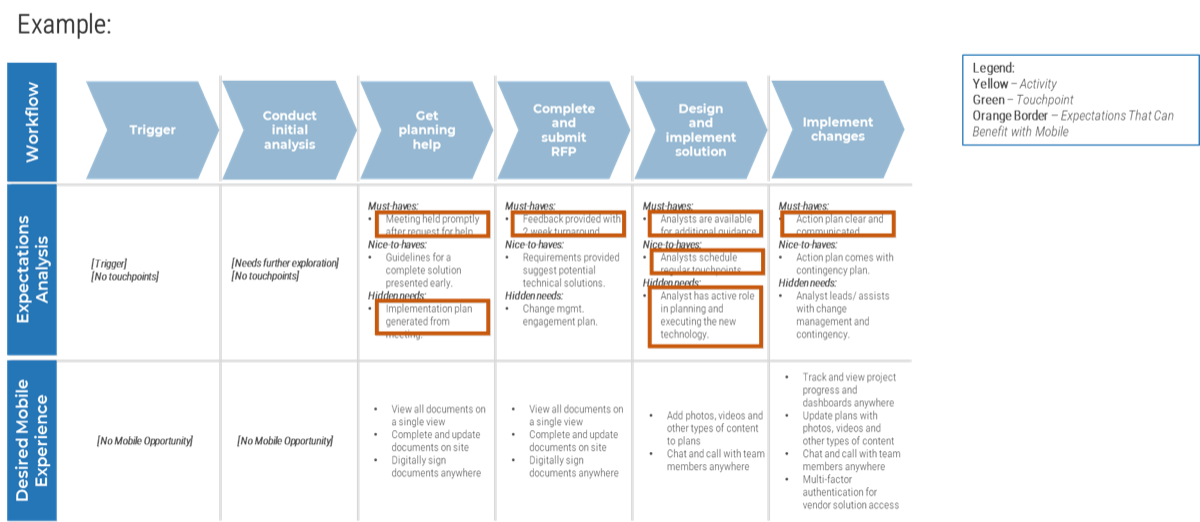
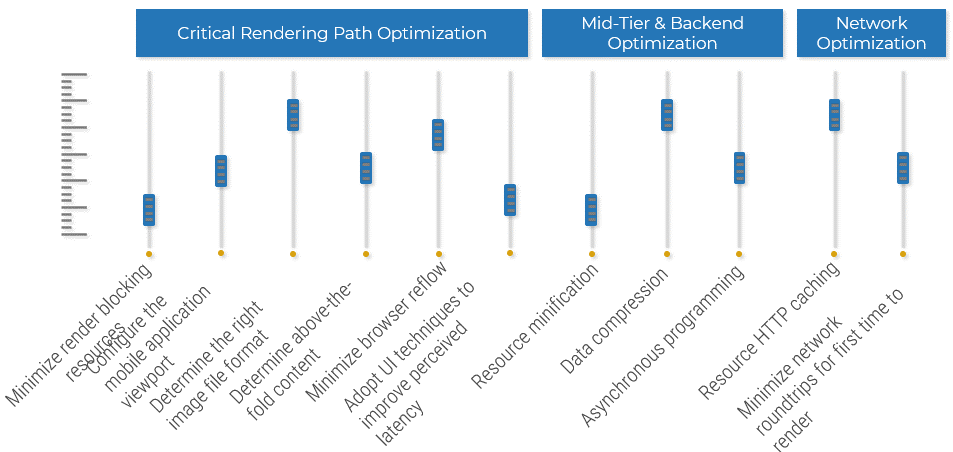
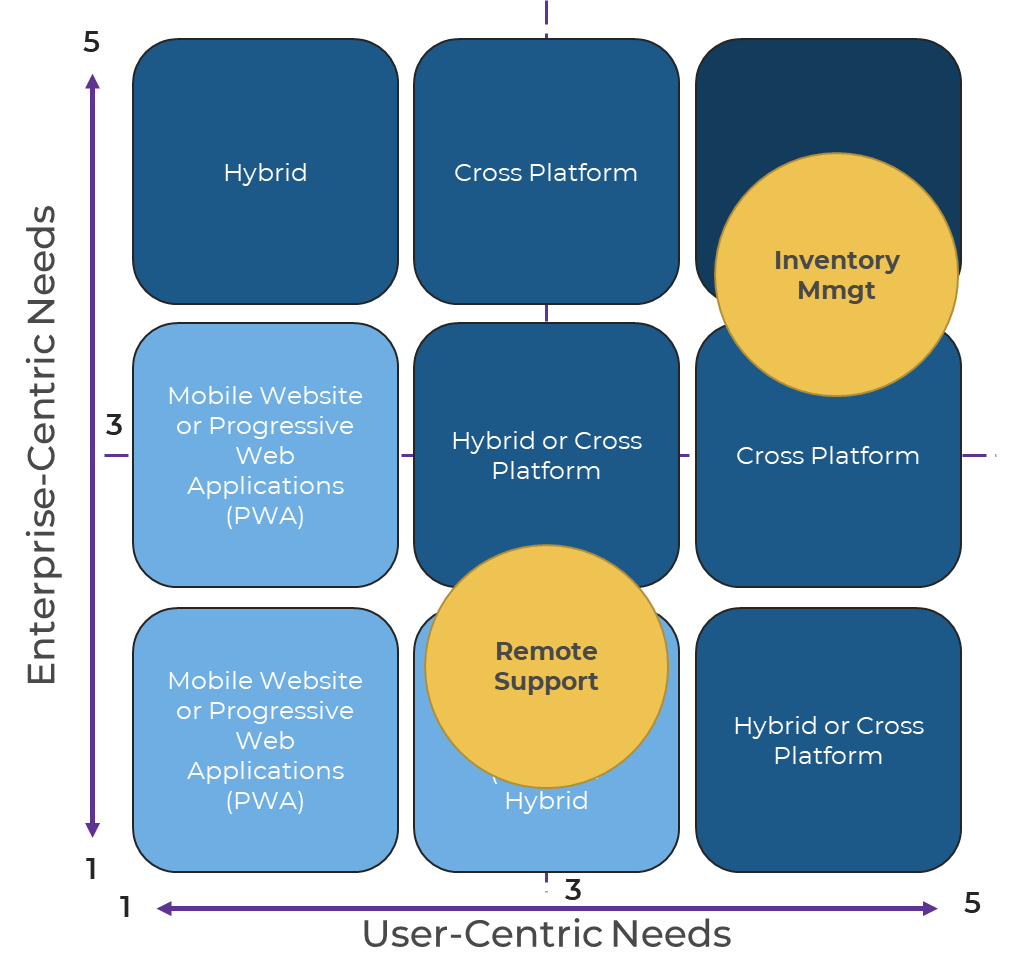
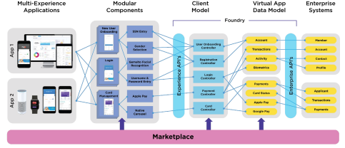
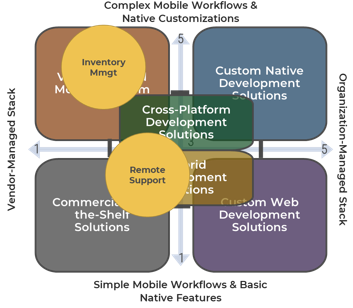
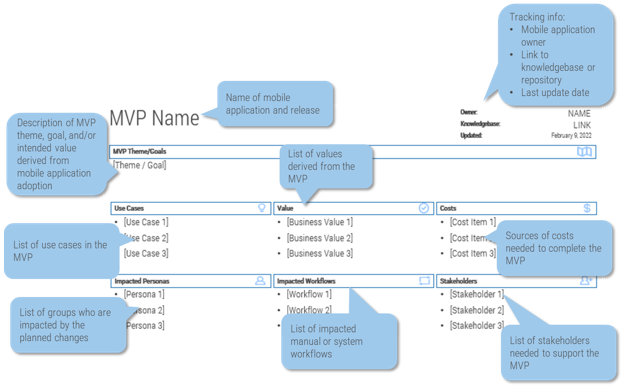
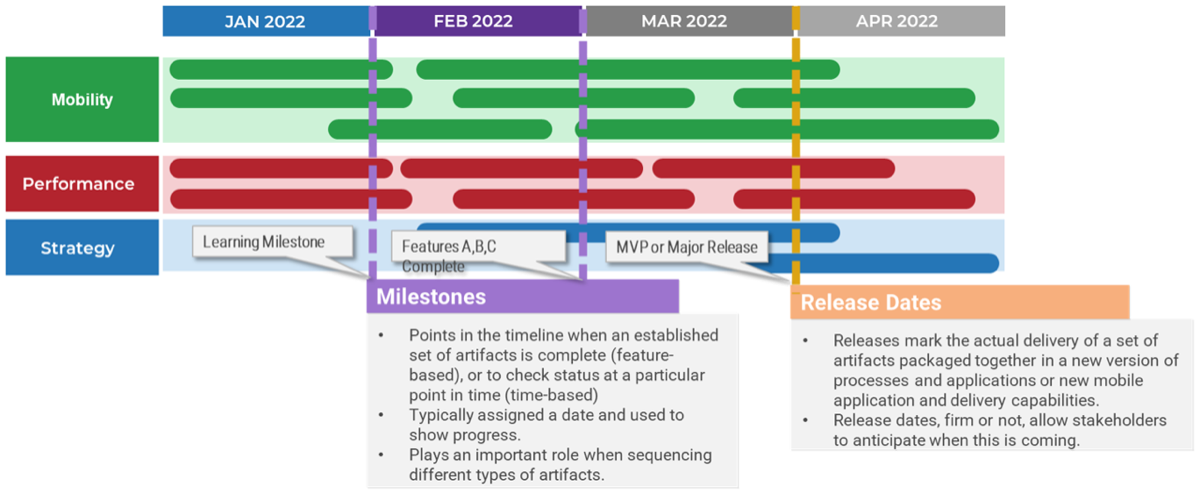
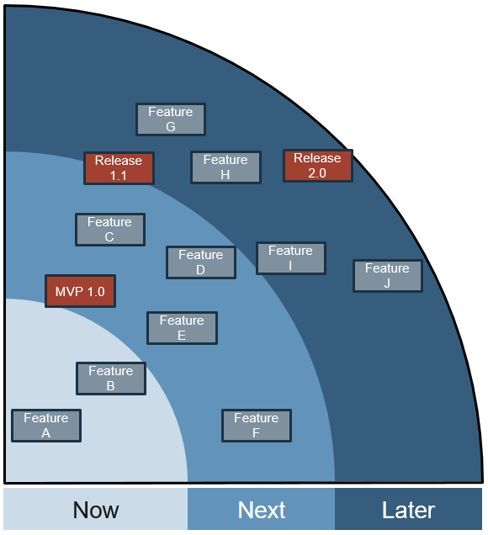

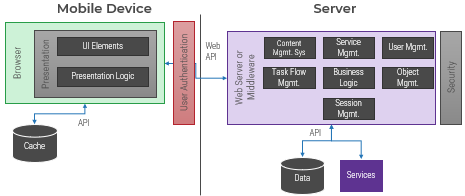
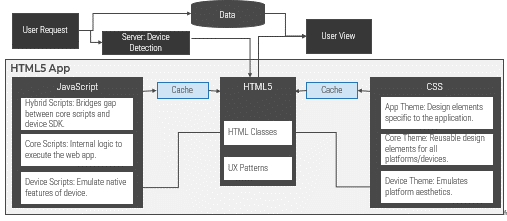
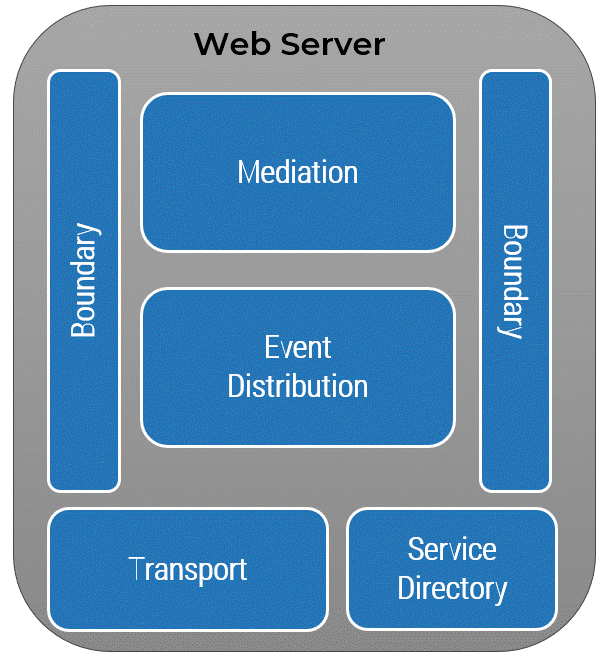
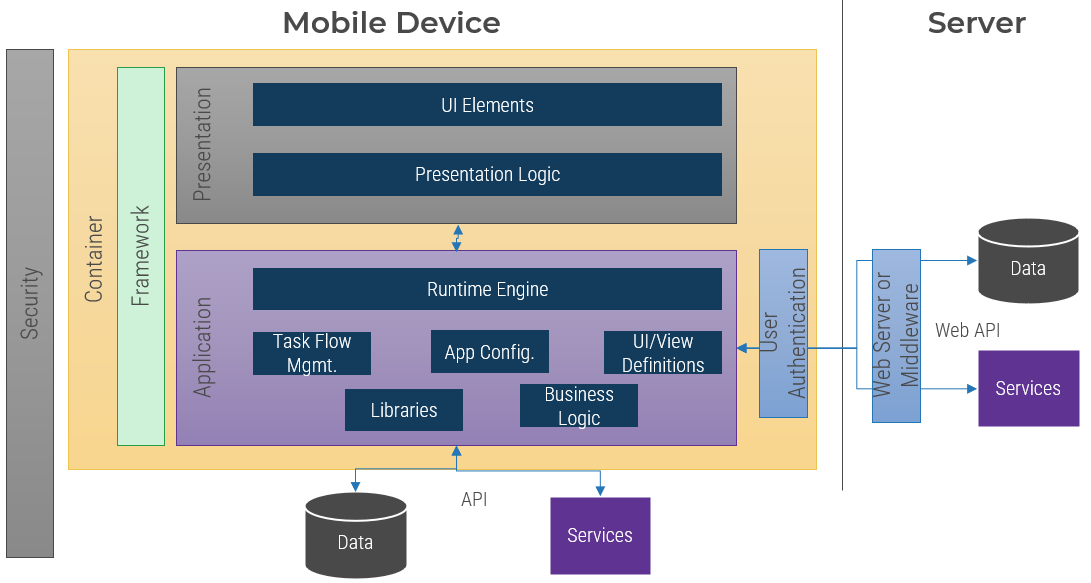
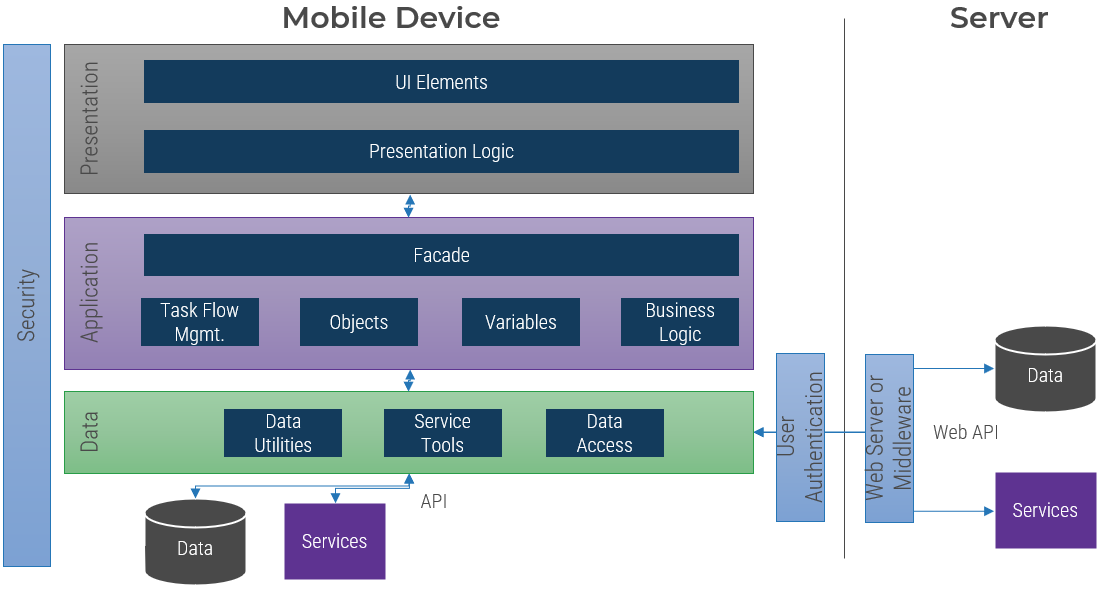

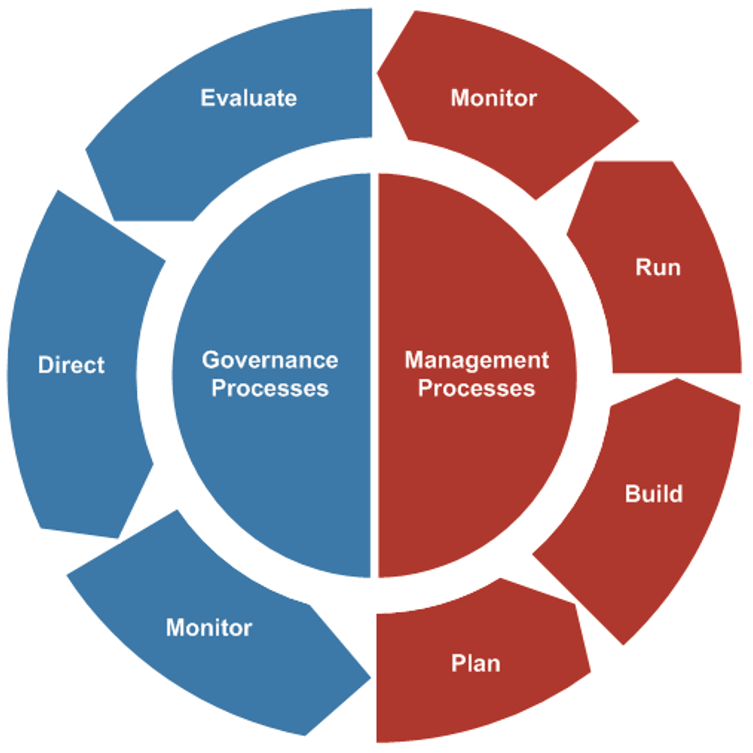
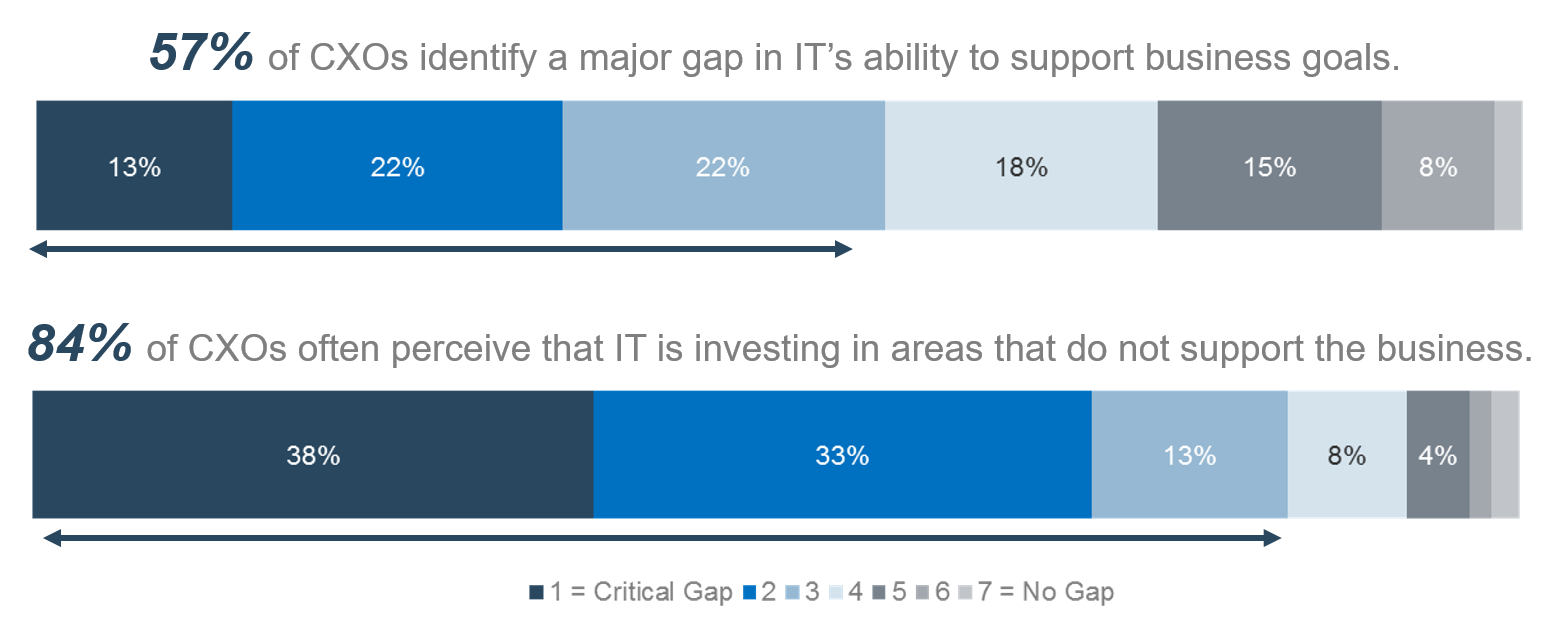

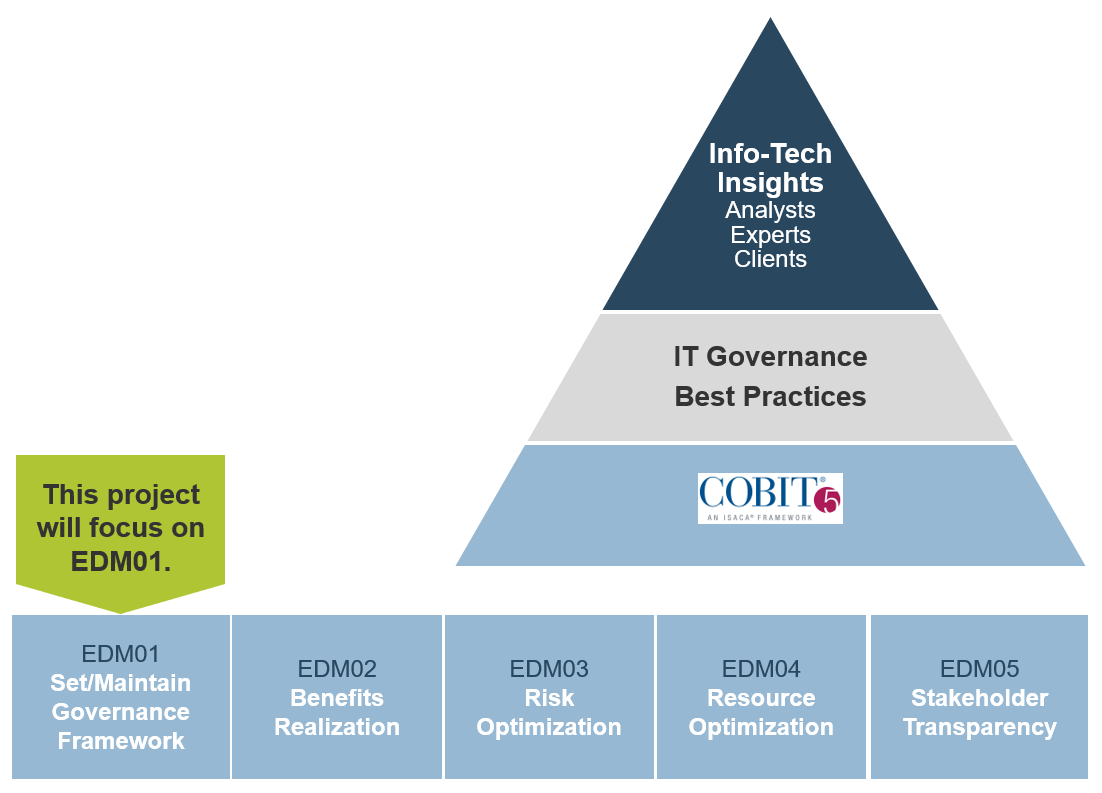


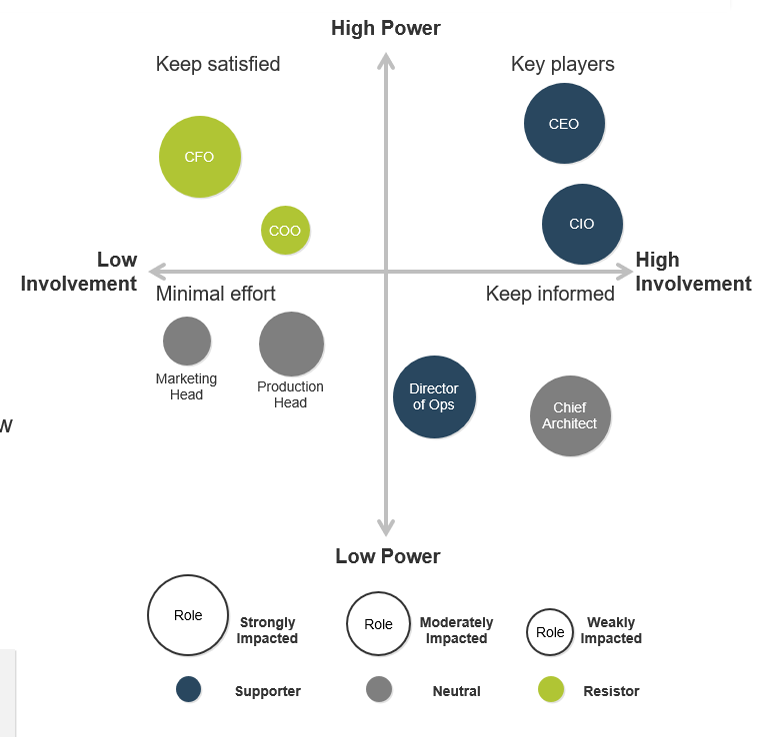
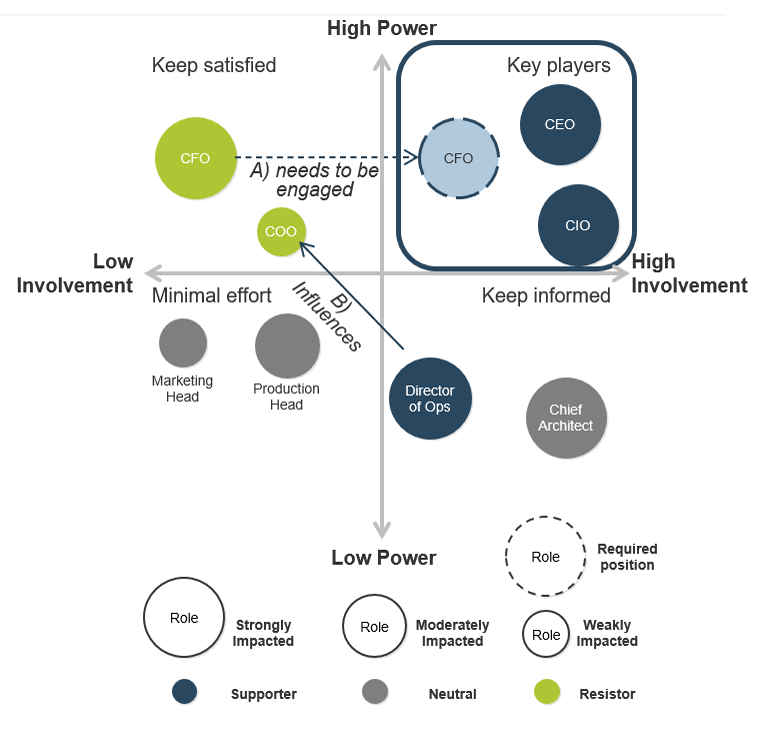
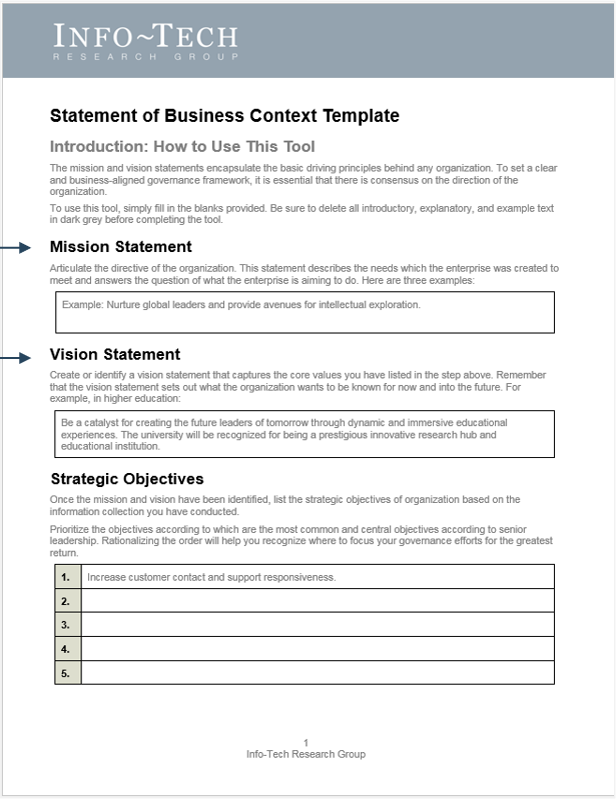
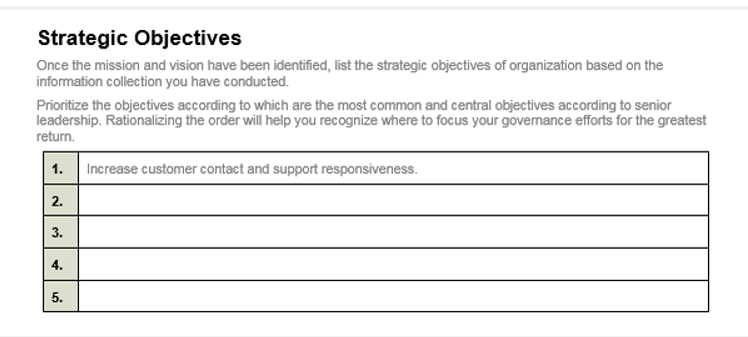
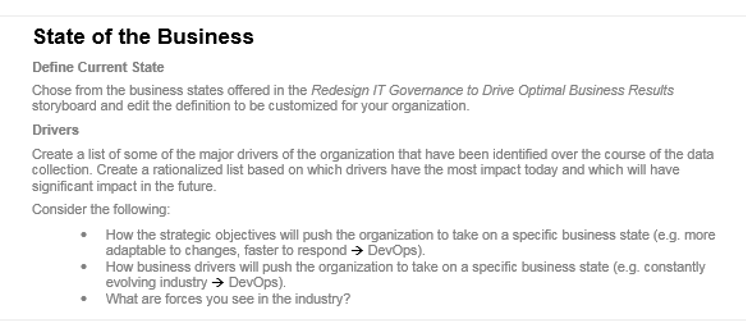

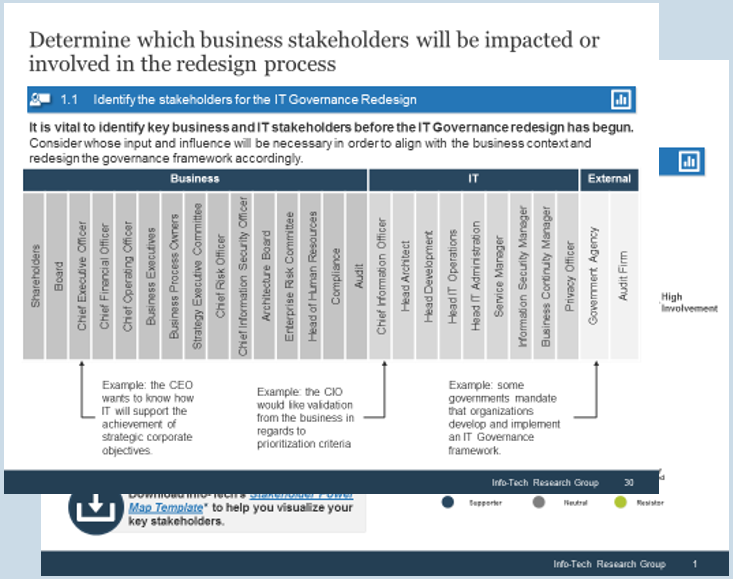
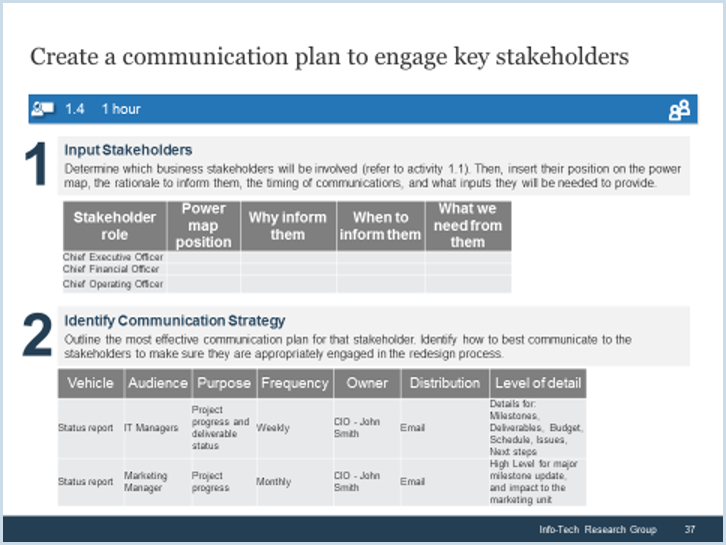
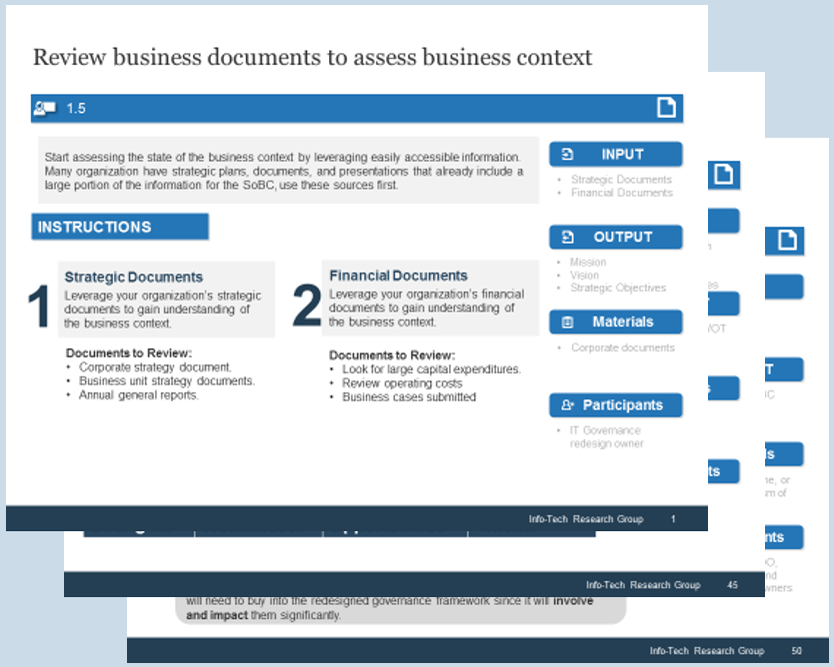
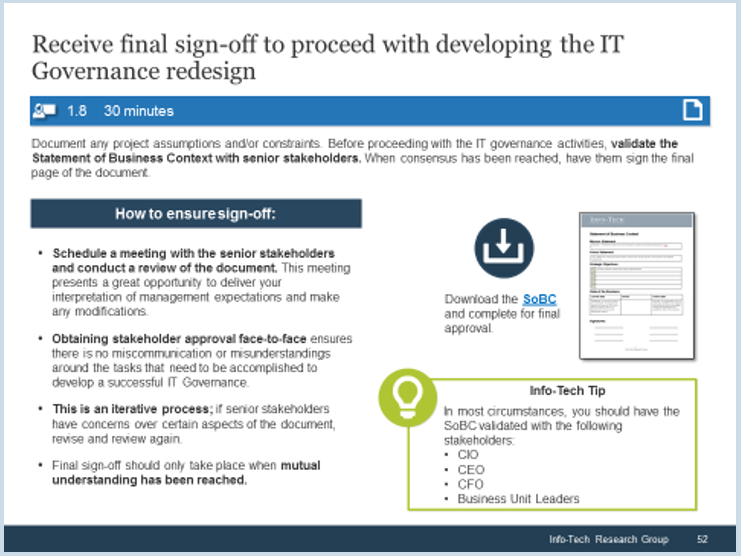
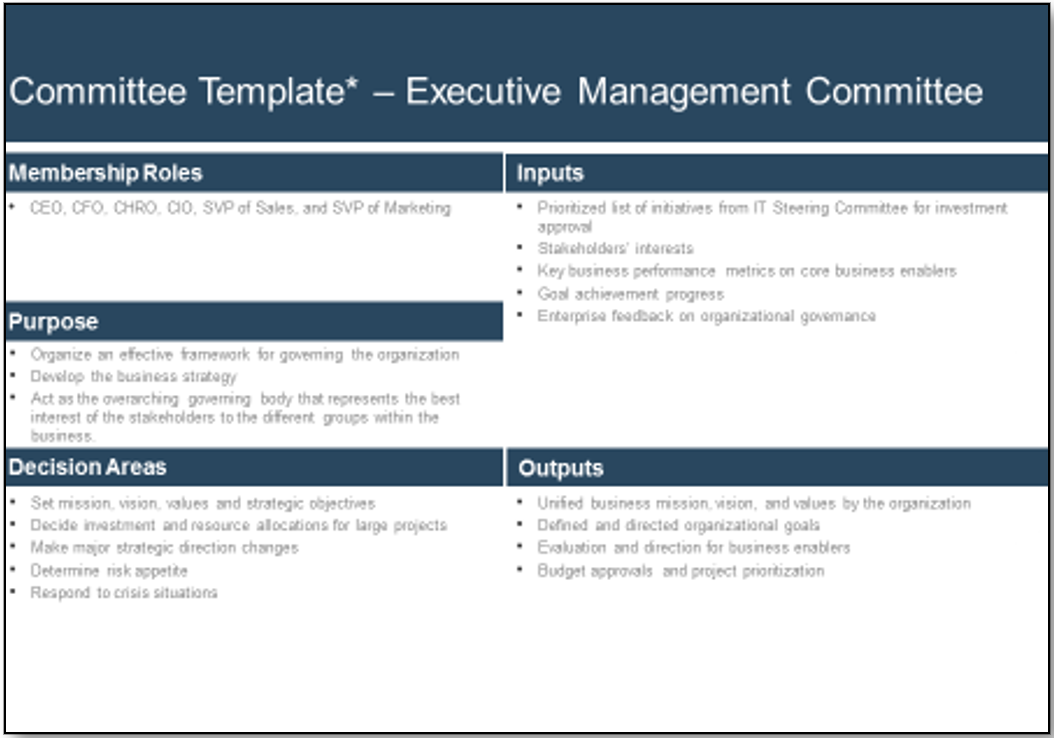
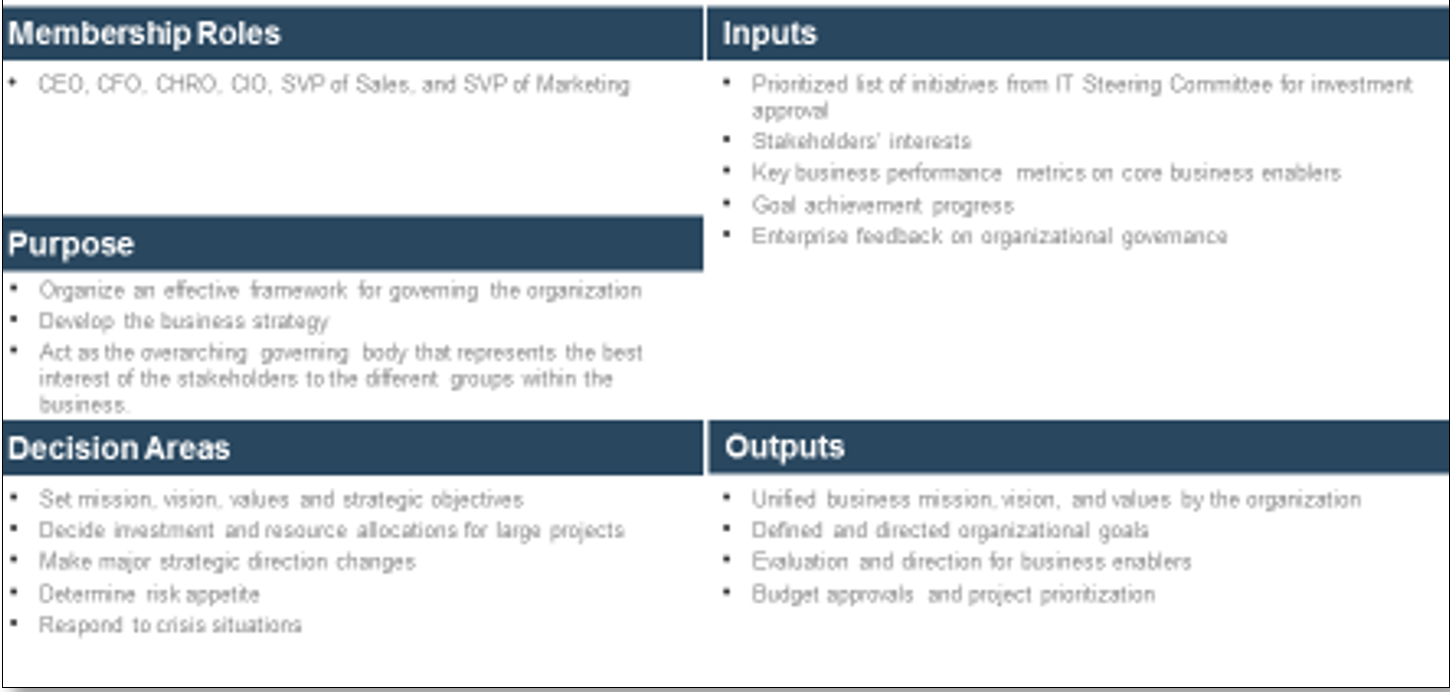
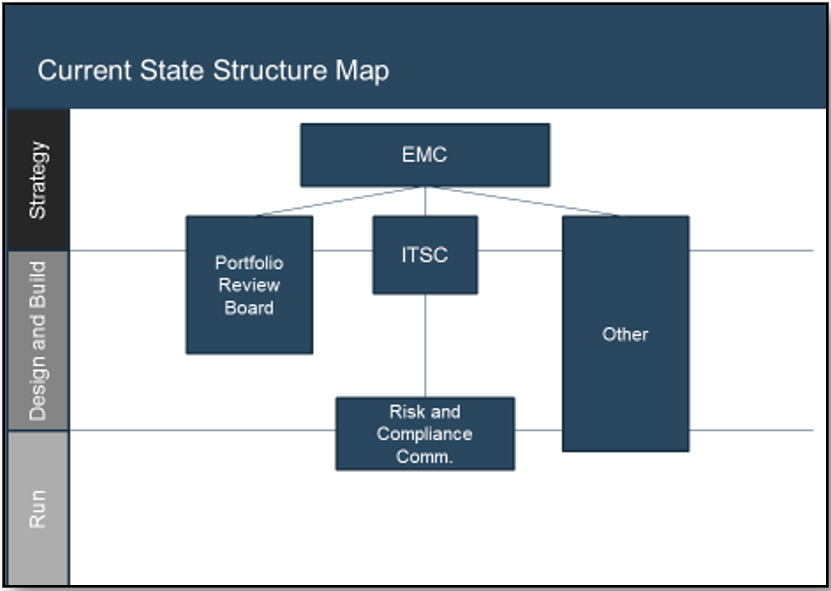 Using the outline provided, create your own governance structure map to represent the way the governing bodies interact and feed into each other.
This is crucial to ensure that the governing structure is streamlined. It will ensure that communication occurs efficiently and that there are no barriers to making decisions swiftly.
Using the outline provided, create your own governance structure map to represent the way the governing bodies interact and feed into each other.
This is crucial to ensure that the governing structure is streamlined. It will ensure that communication occurs efficiently and that there are no barriers to making decisions swiftly.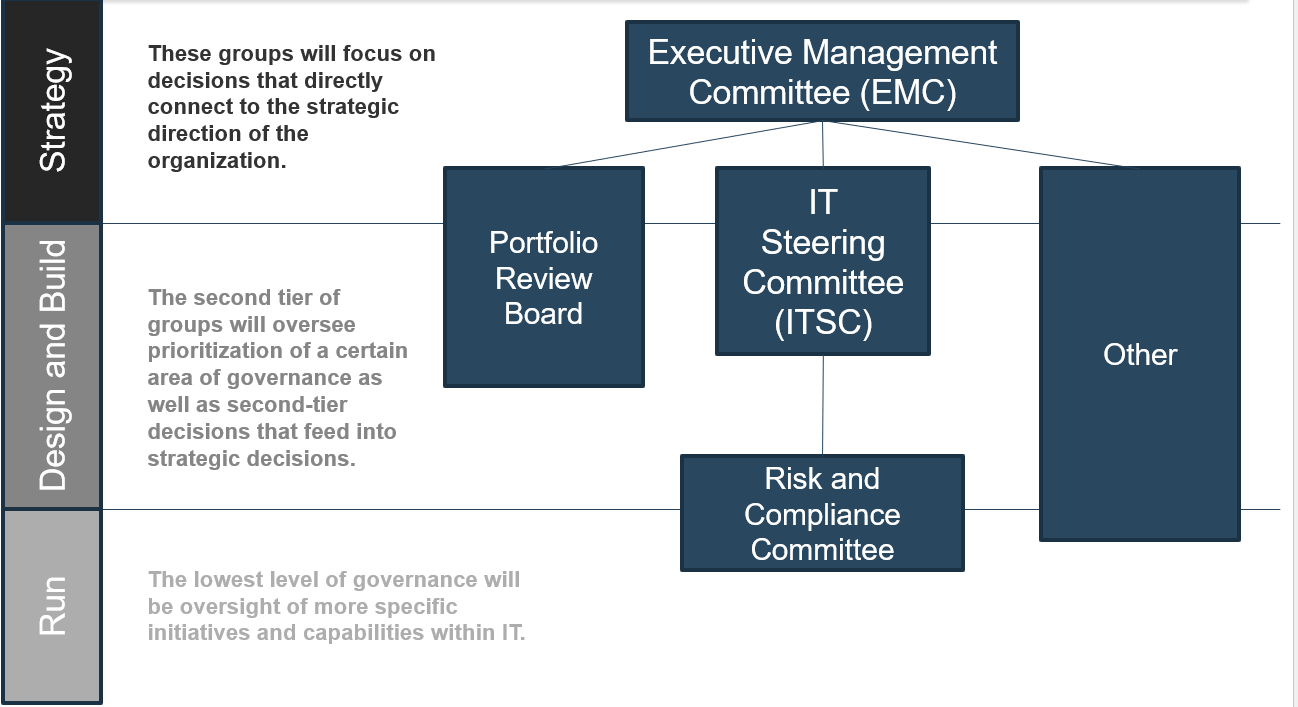
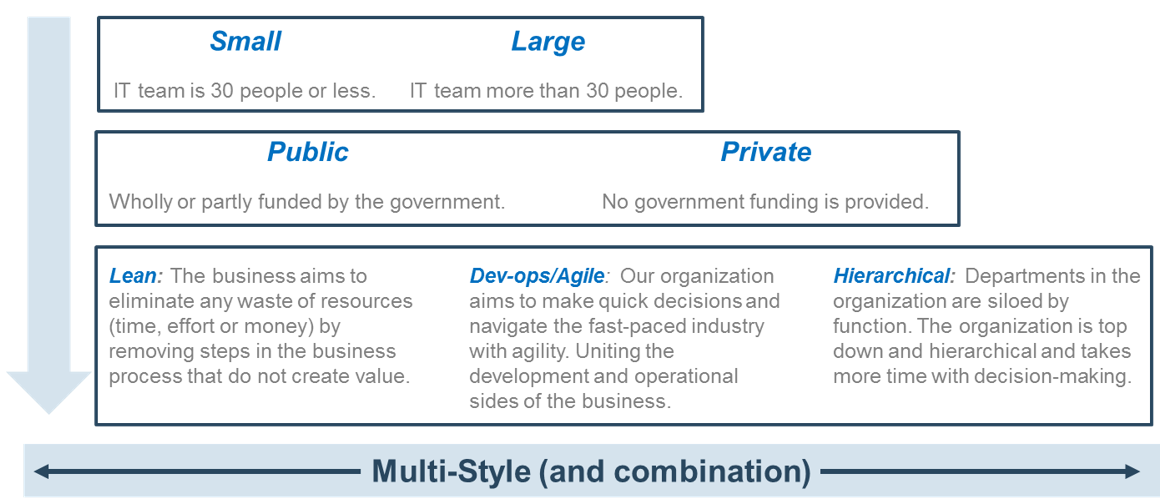
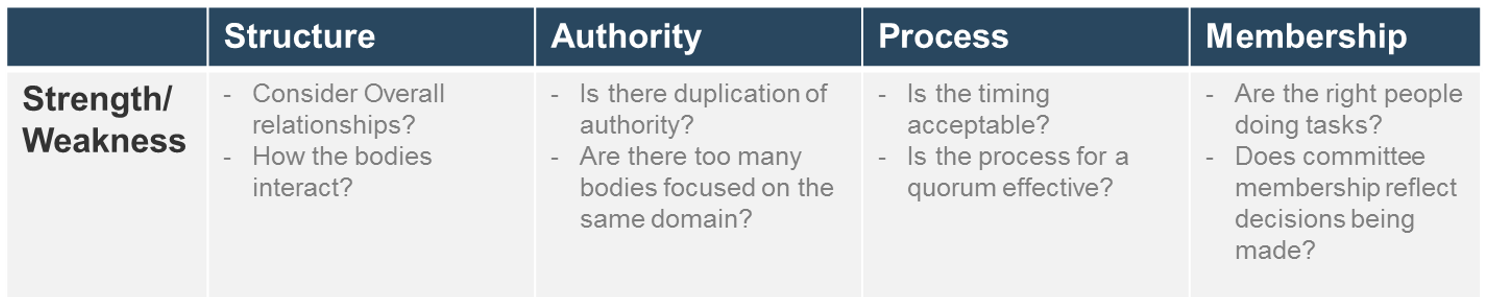
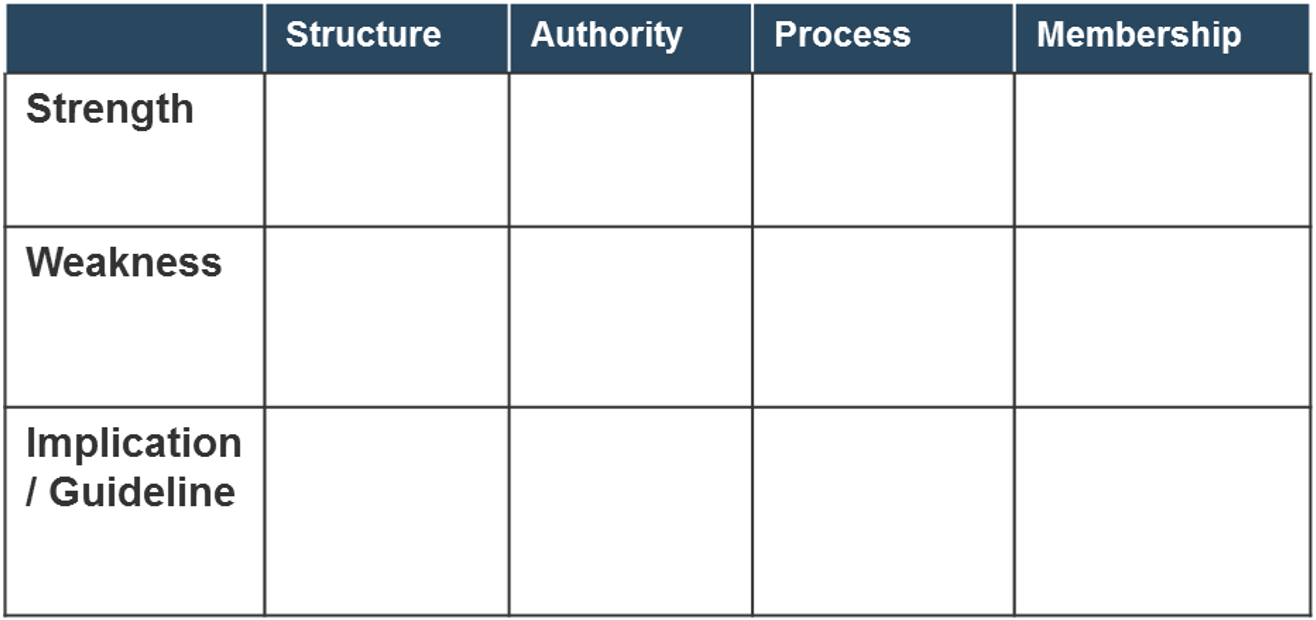 Note: Refer to the example guidelines in the
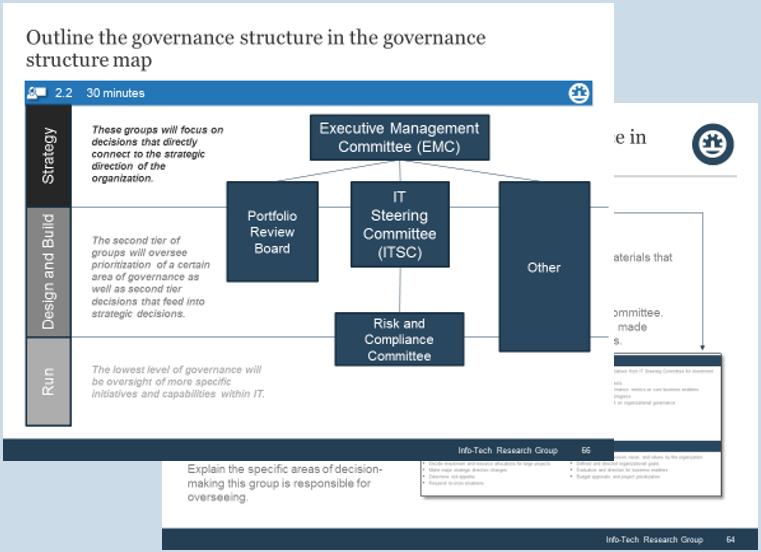
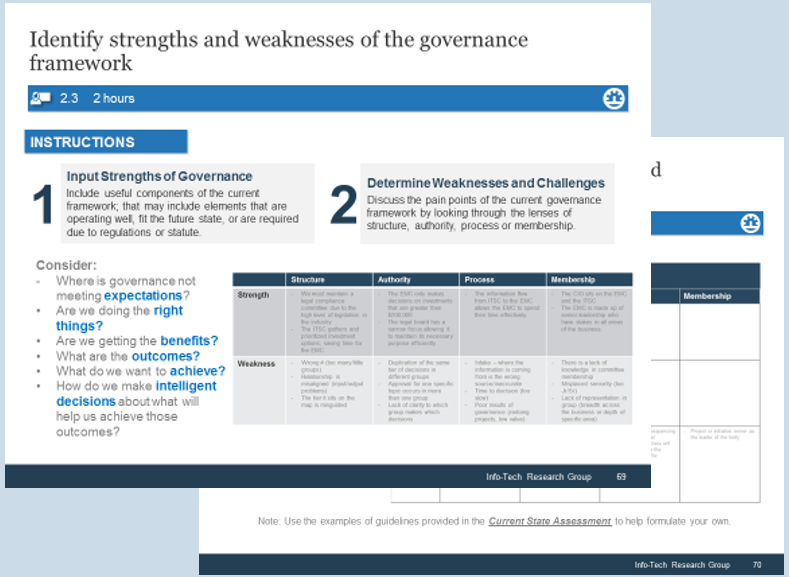
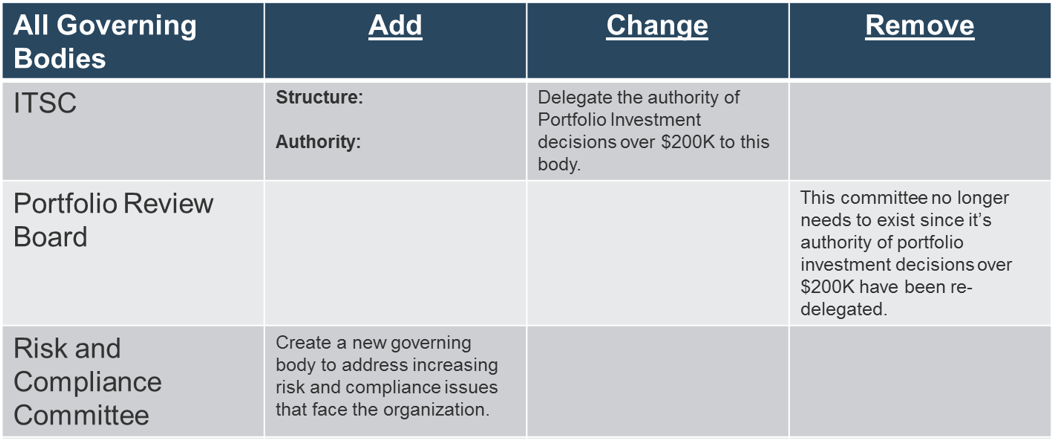
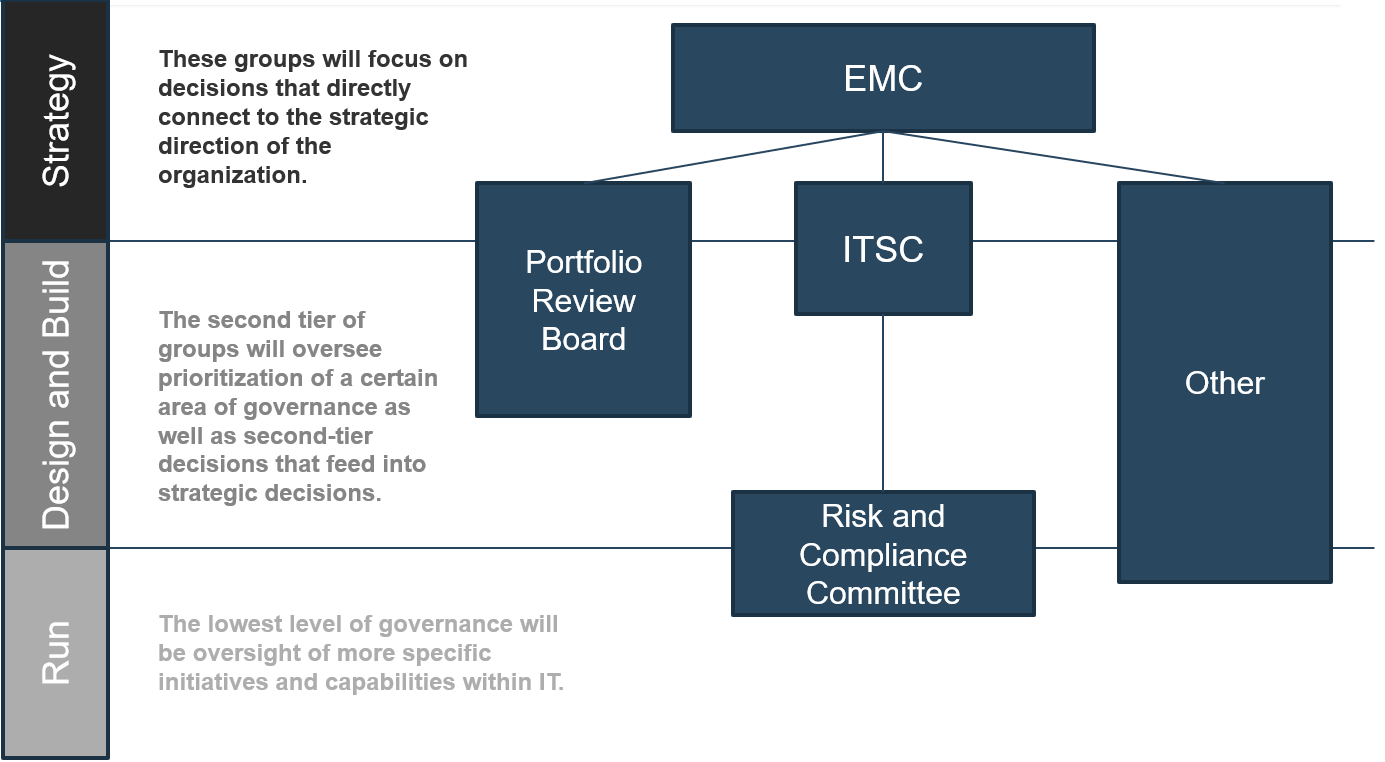
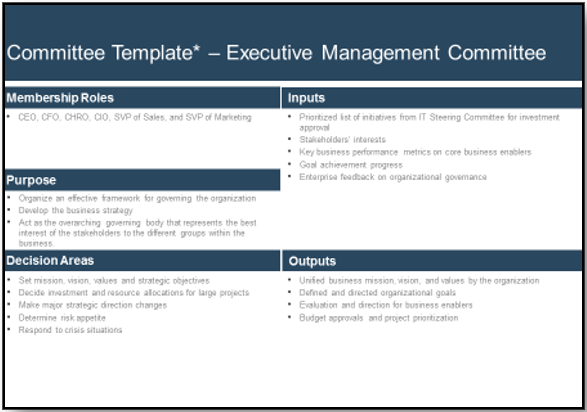
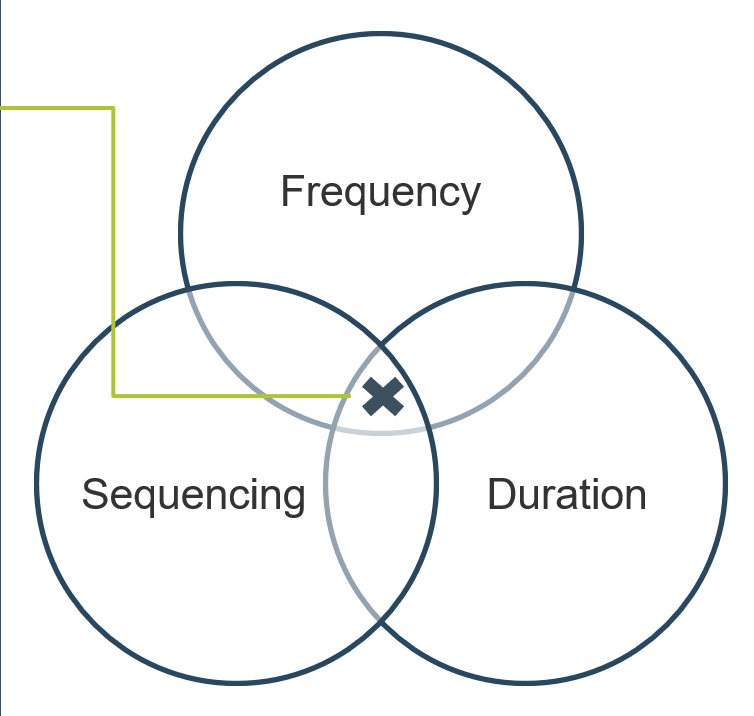
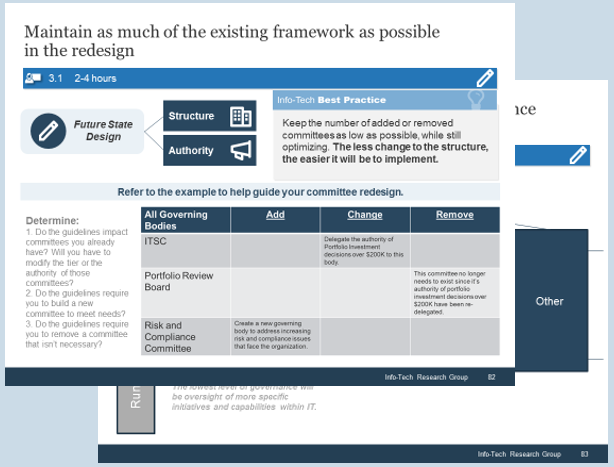
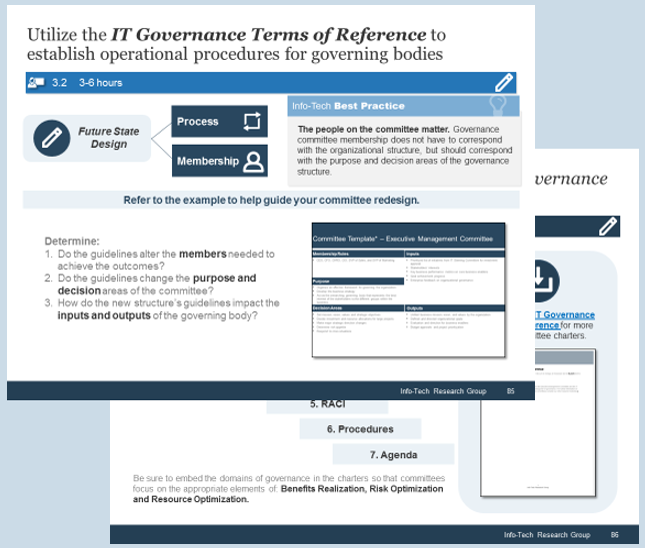
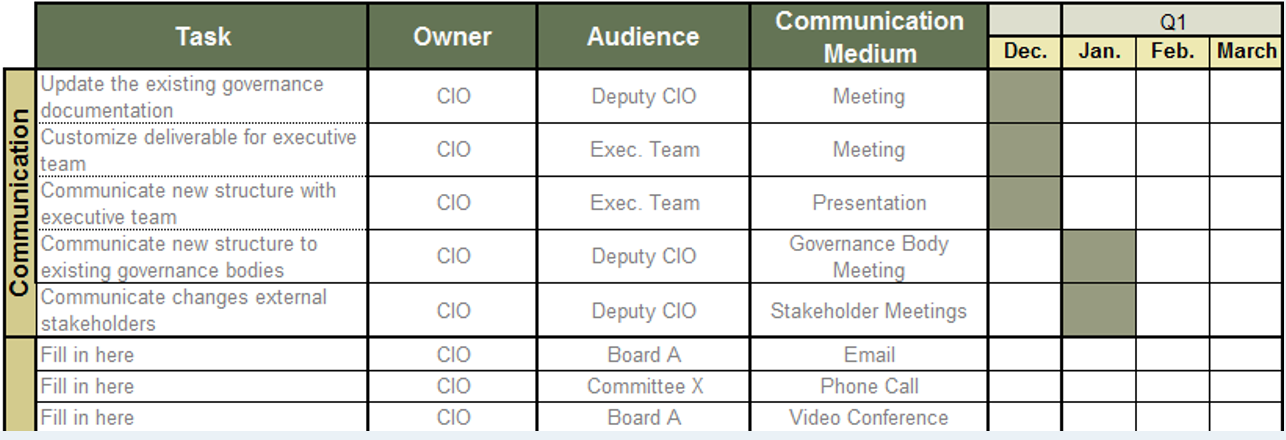


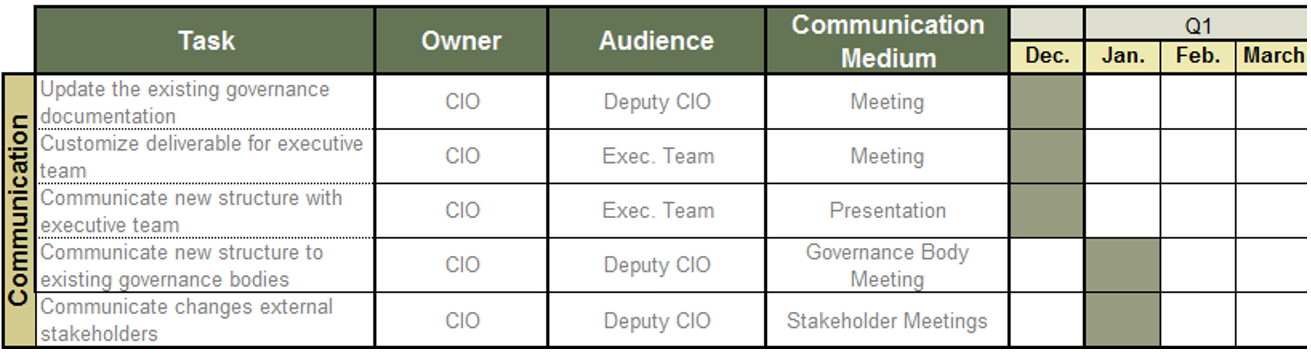
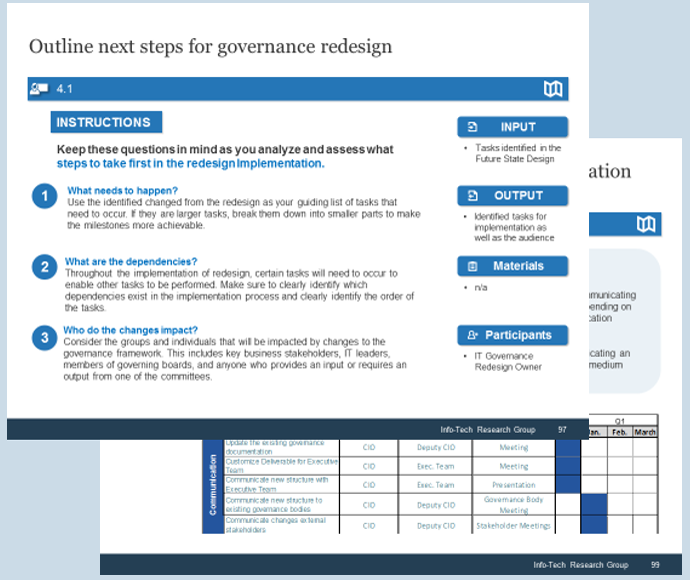
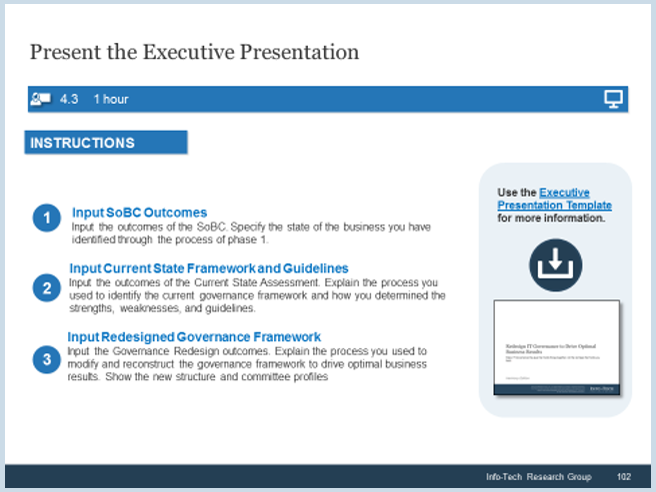

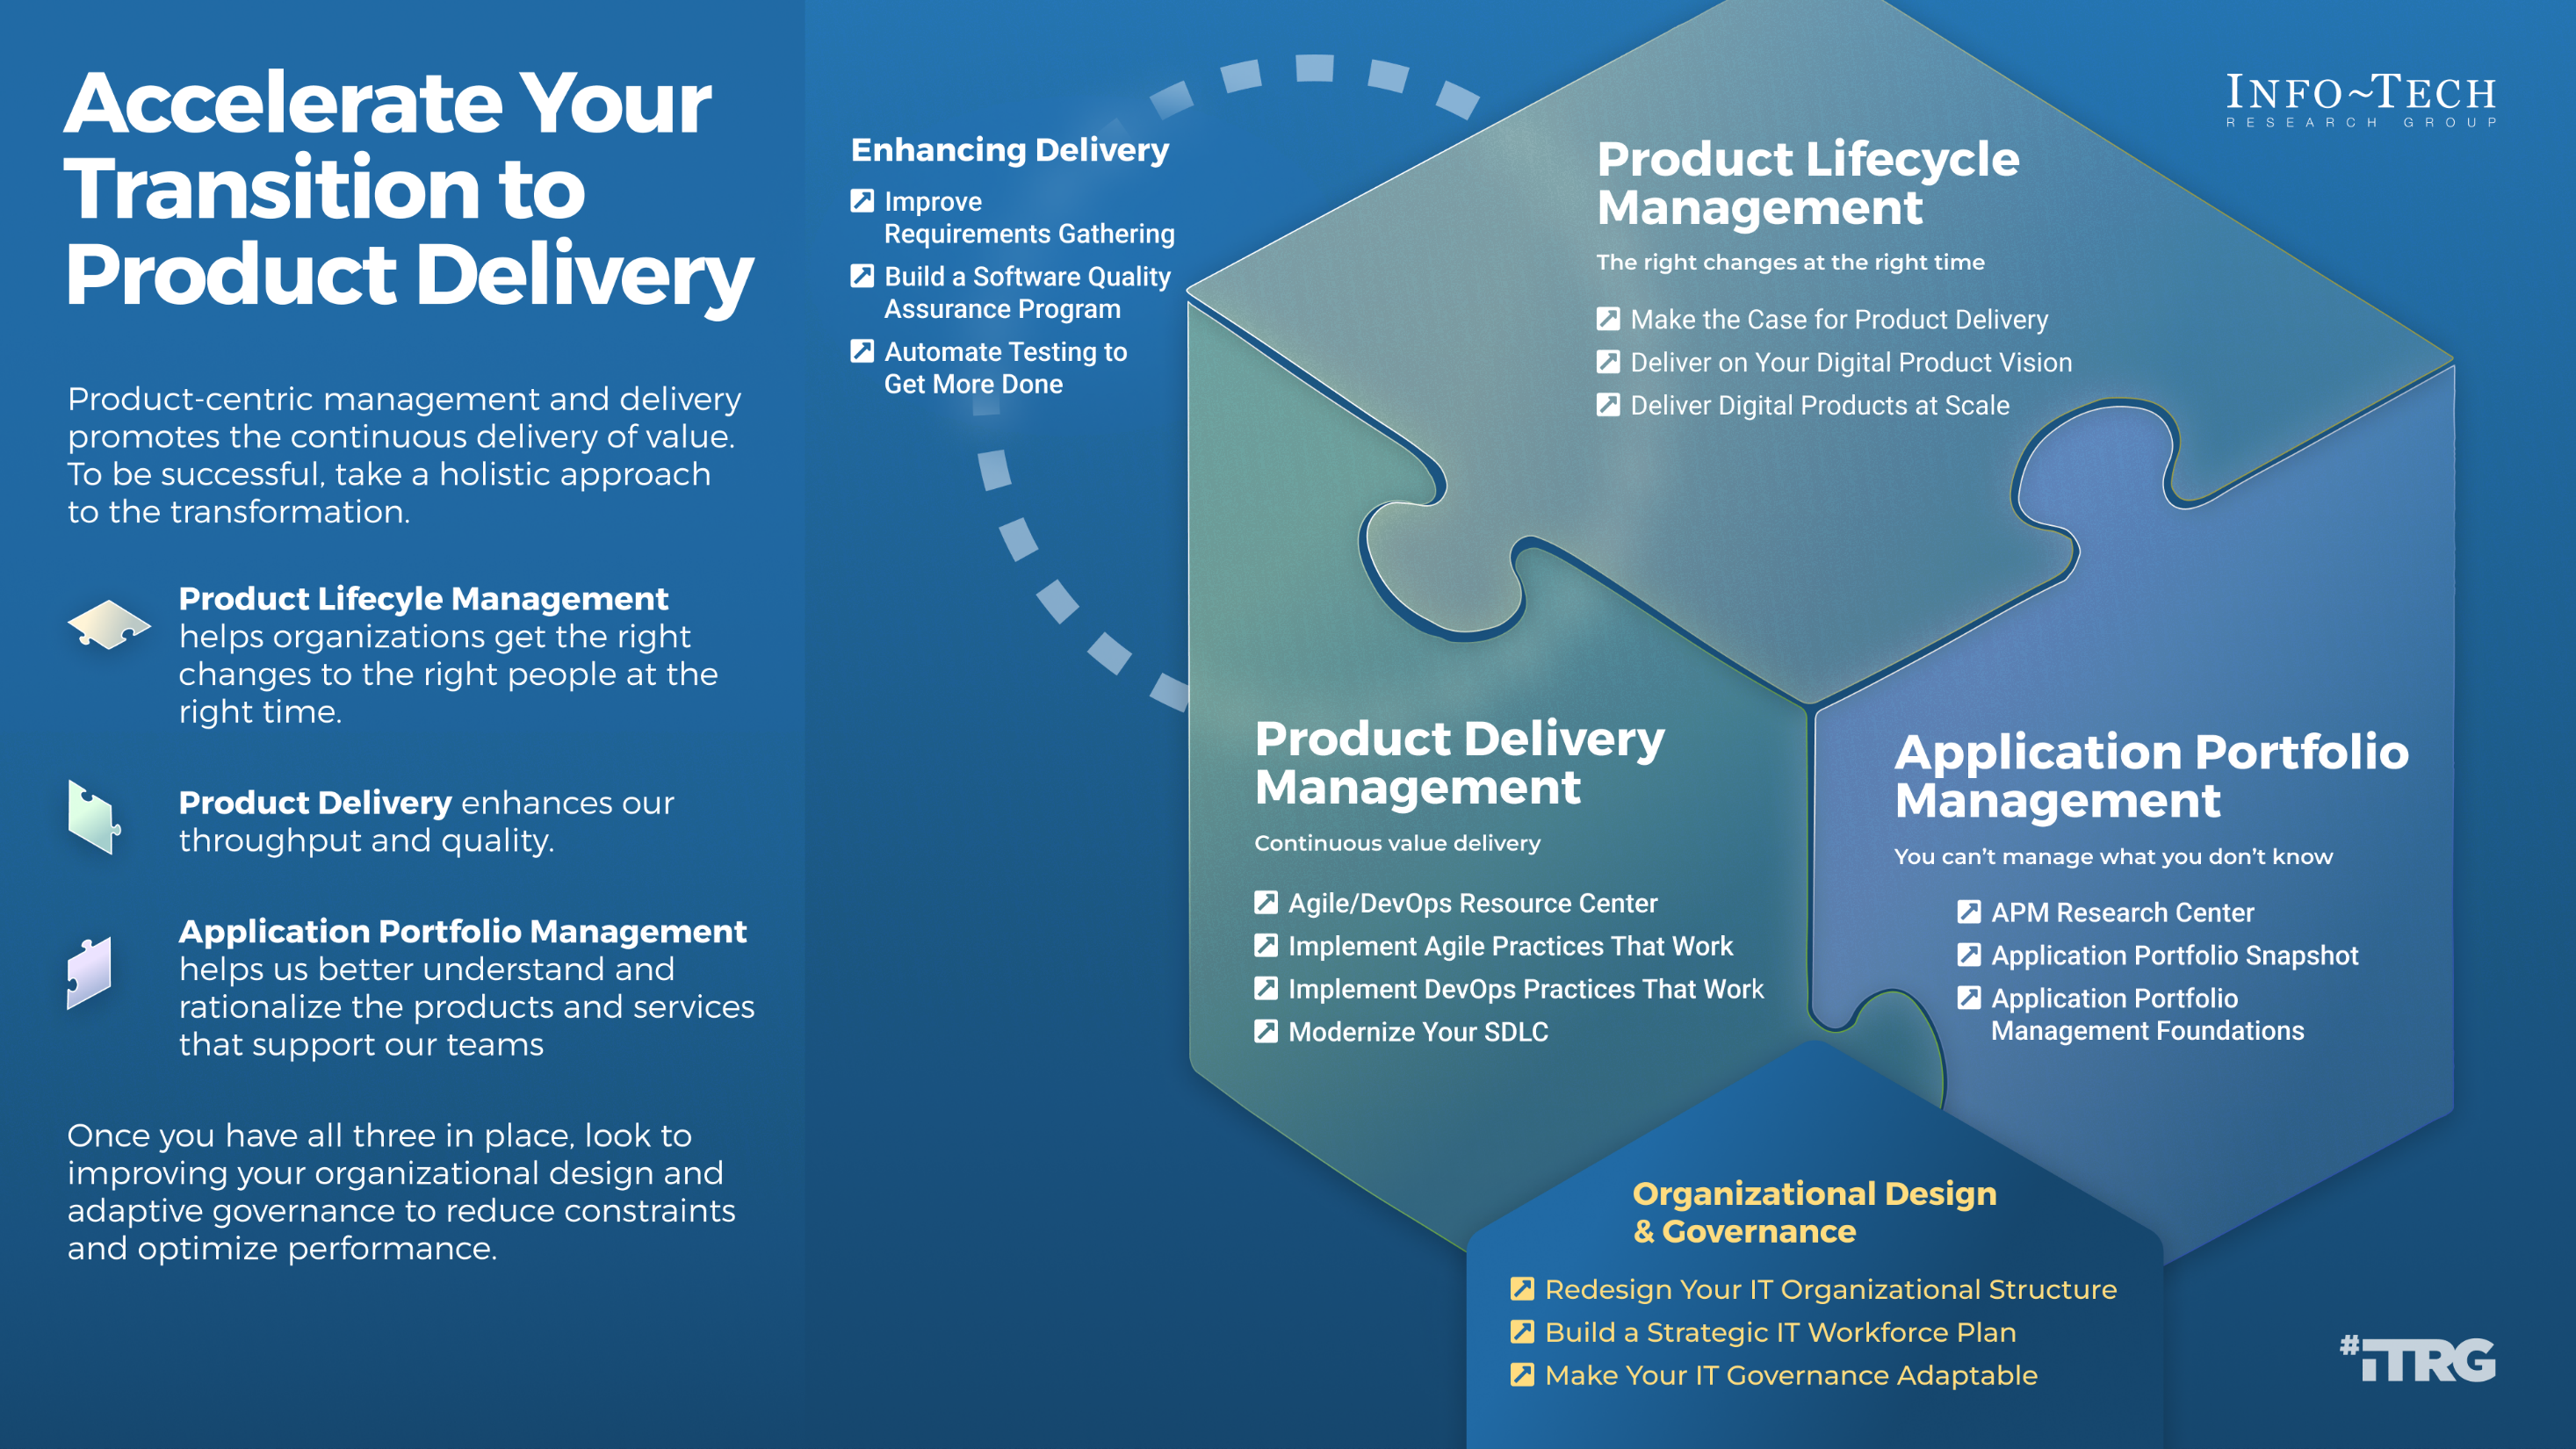
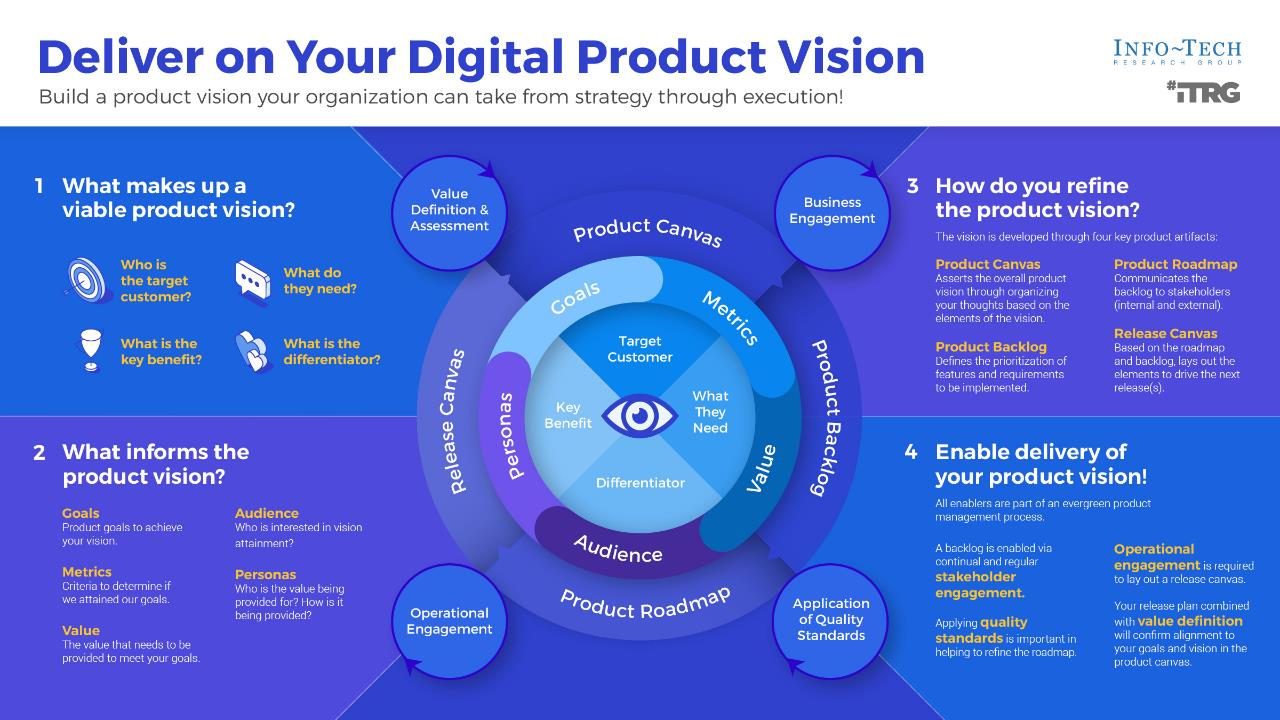
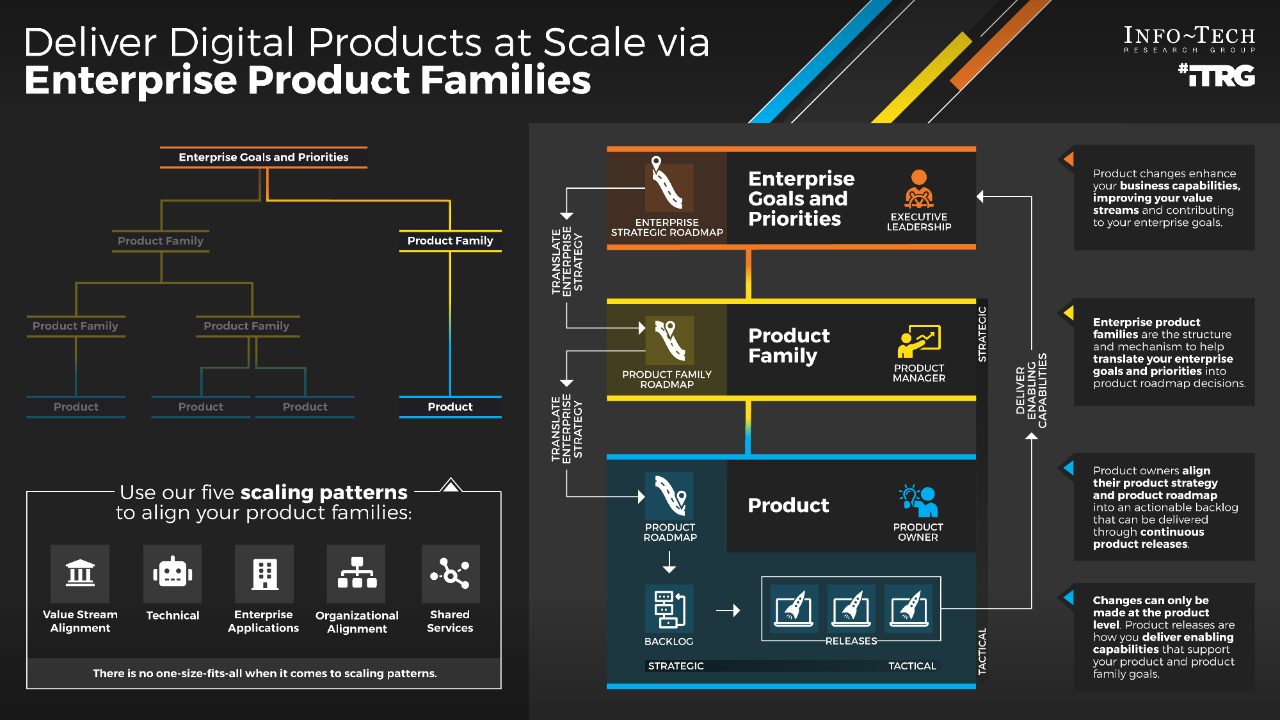
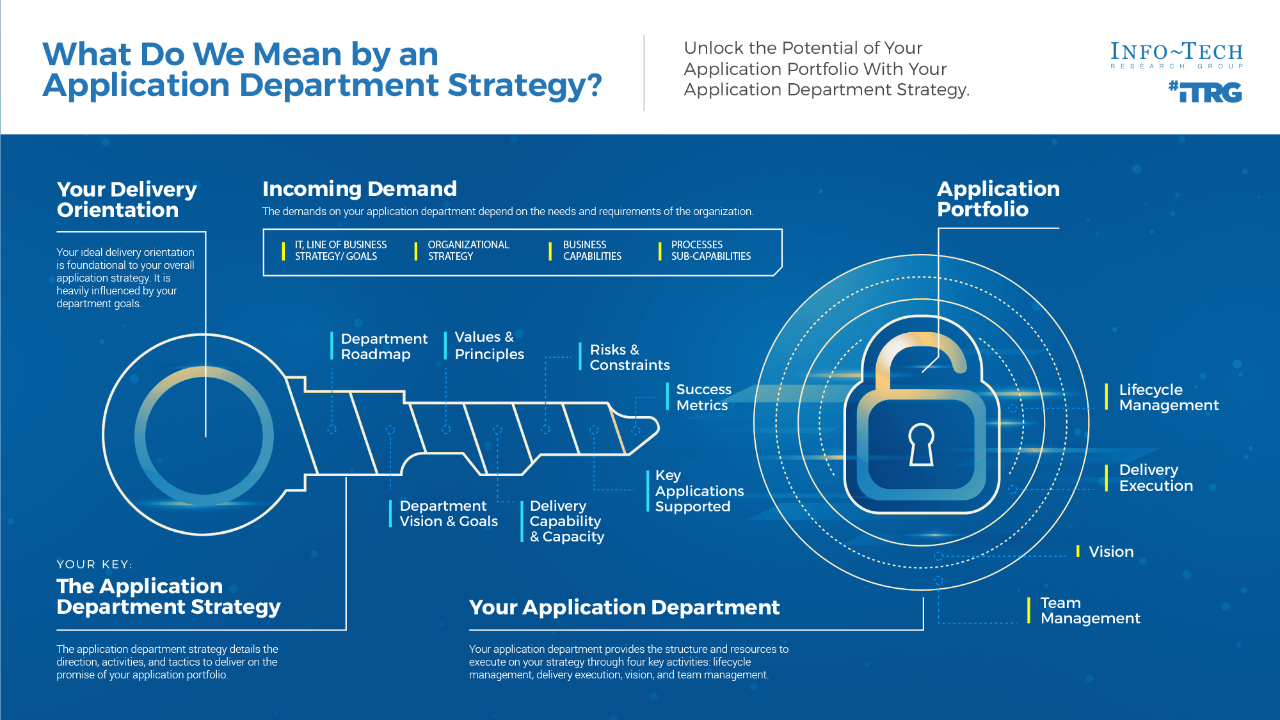
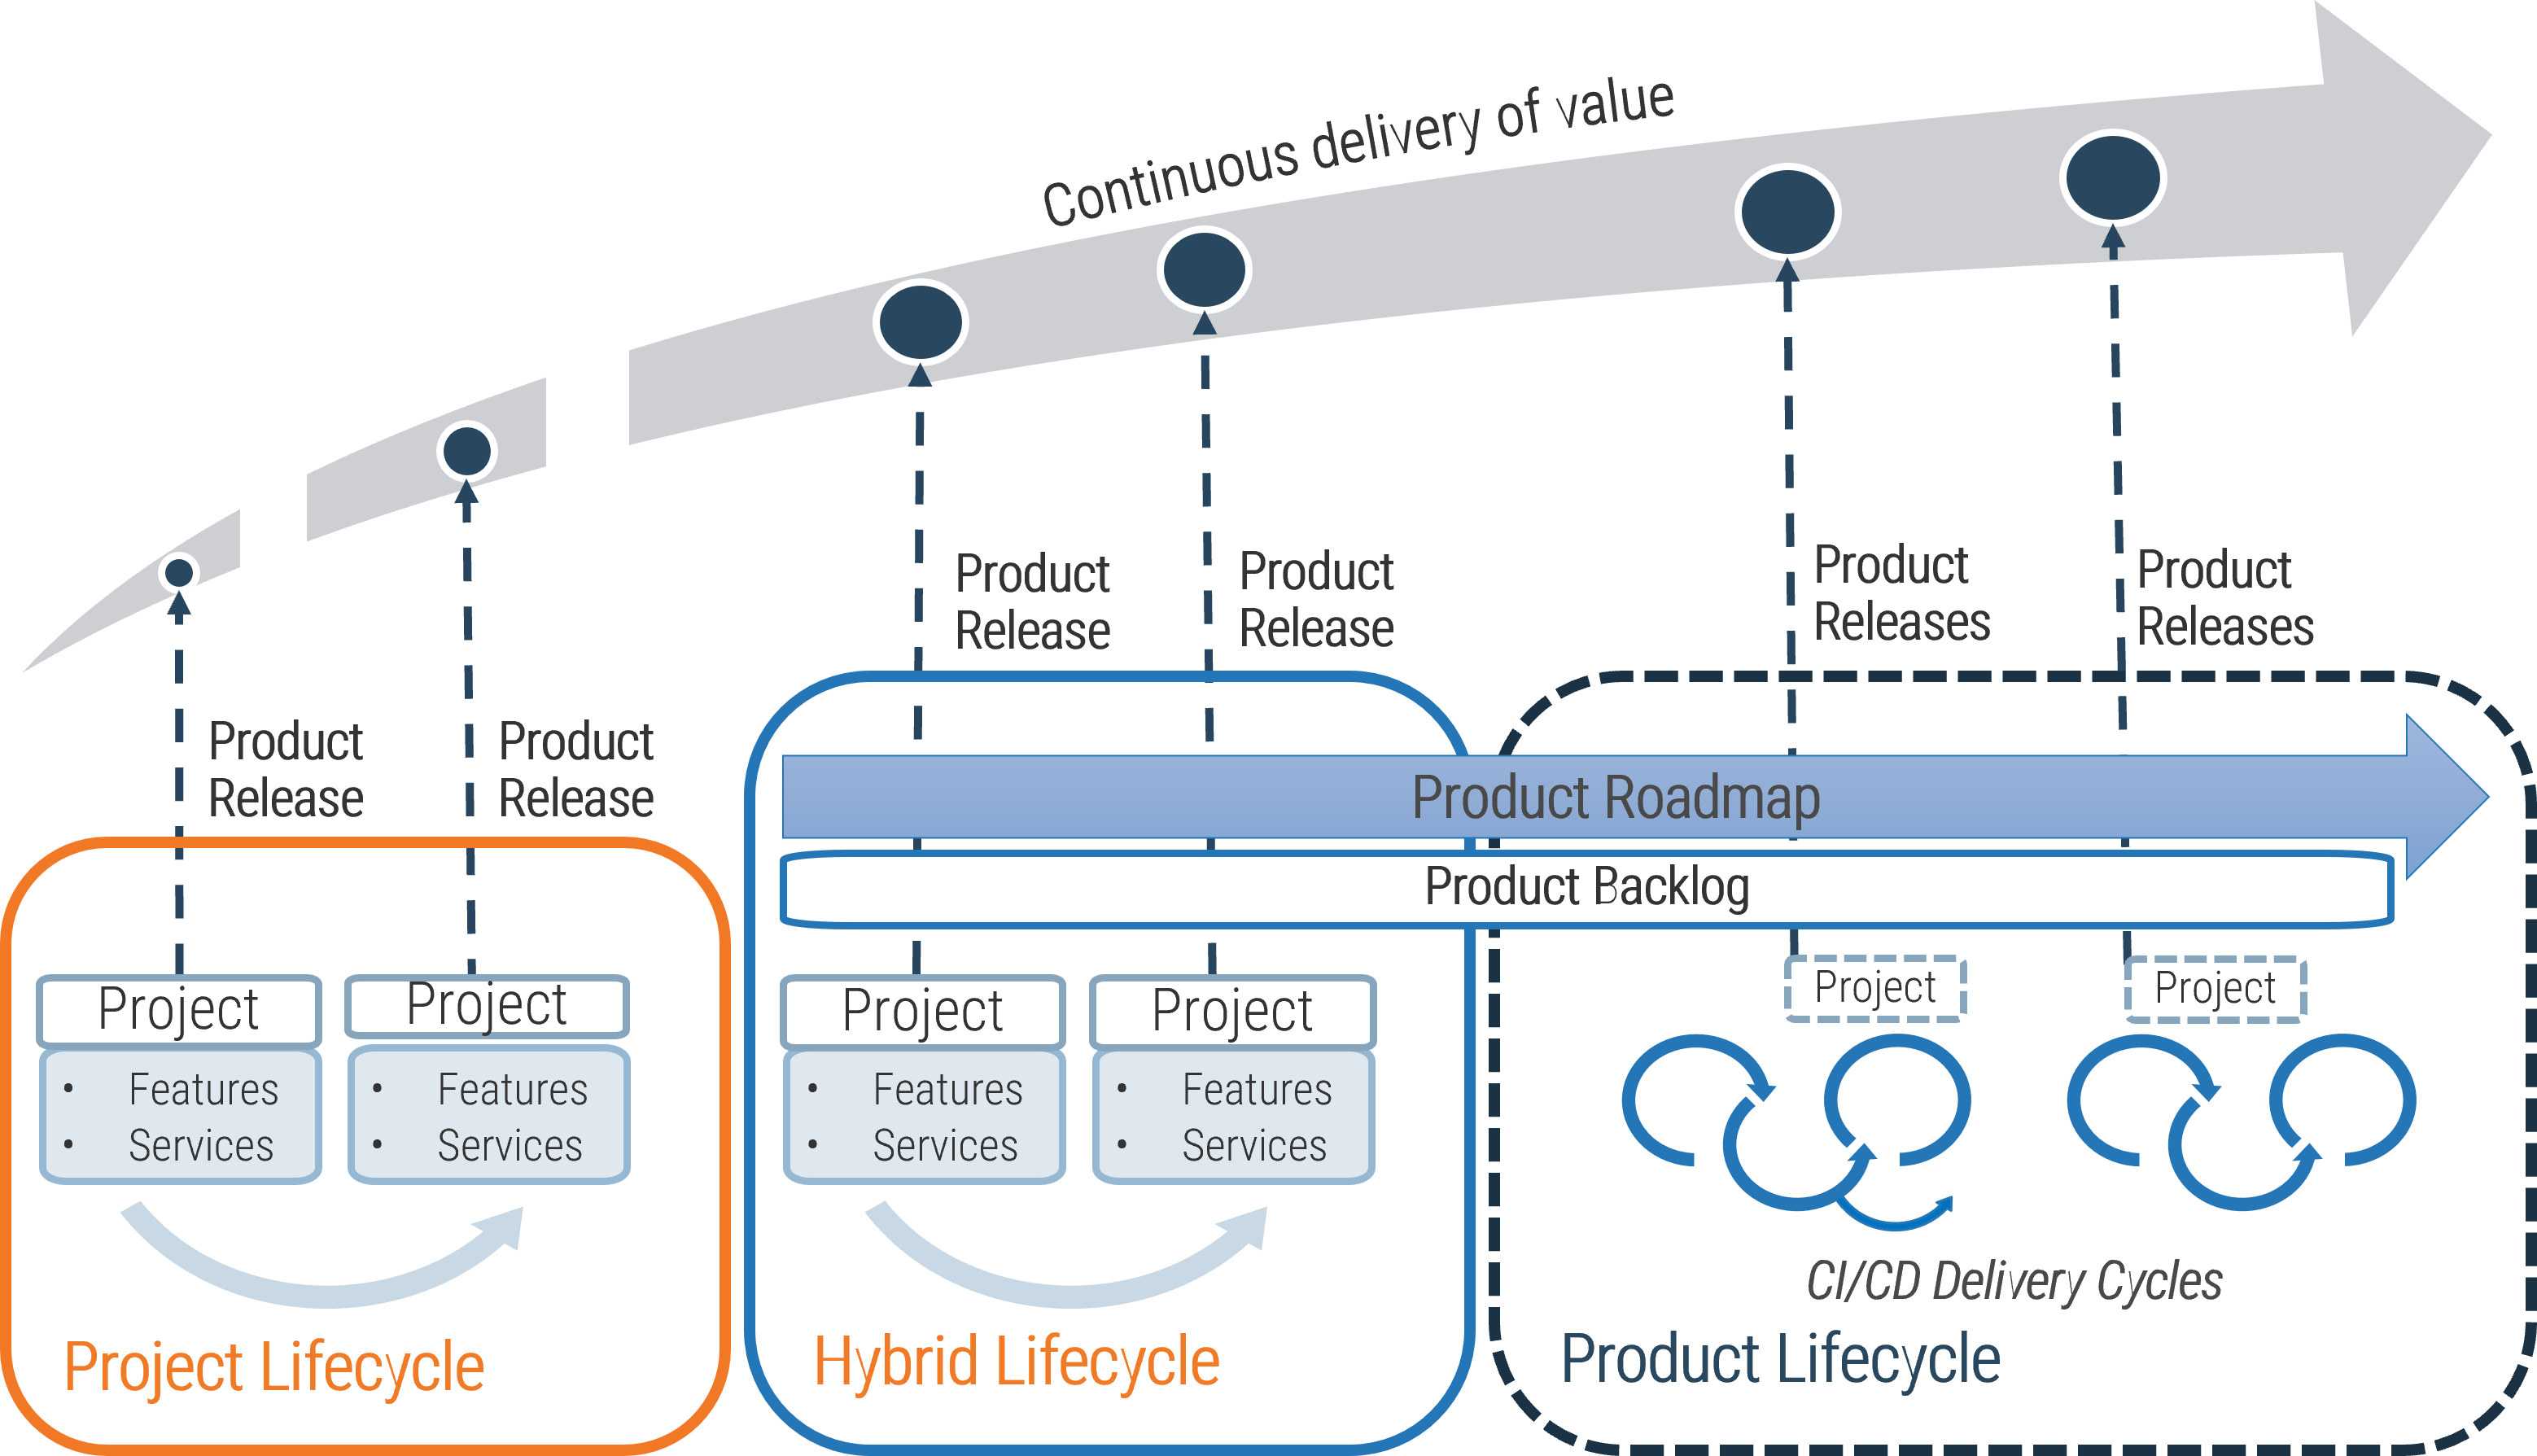
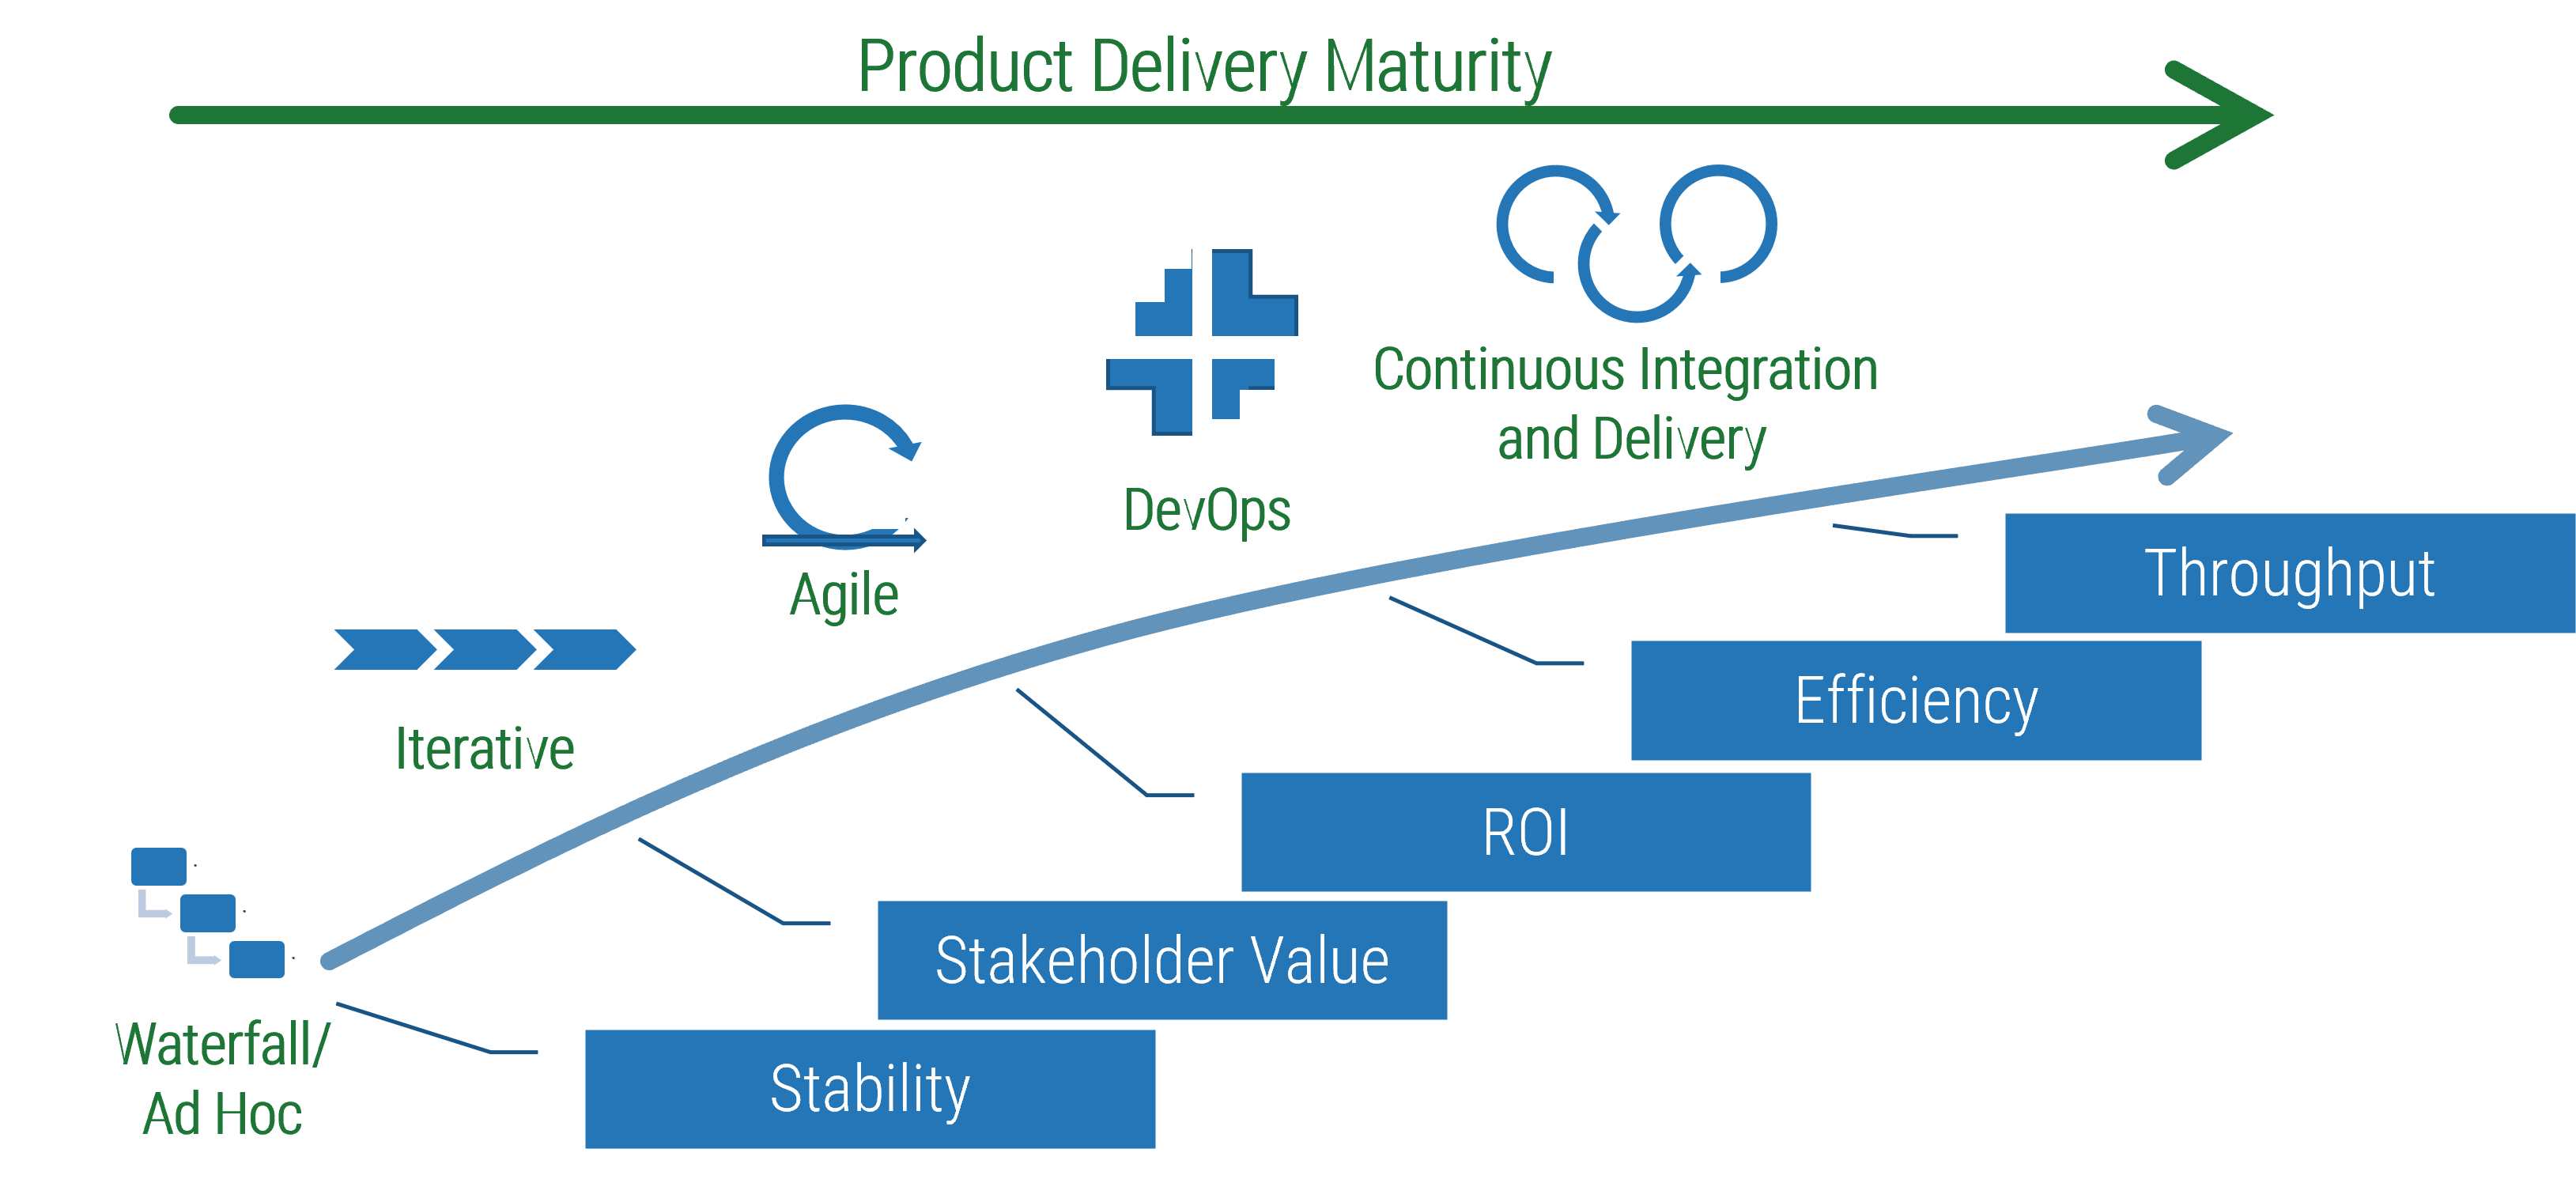
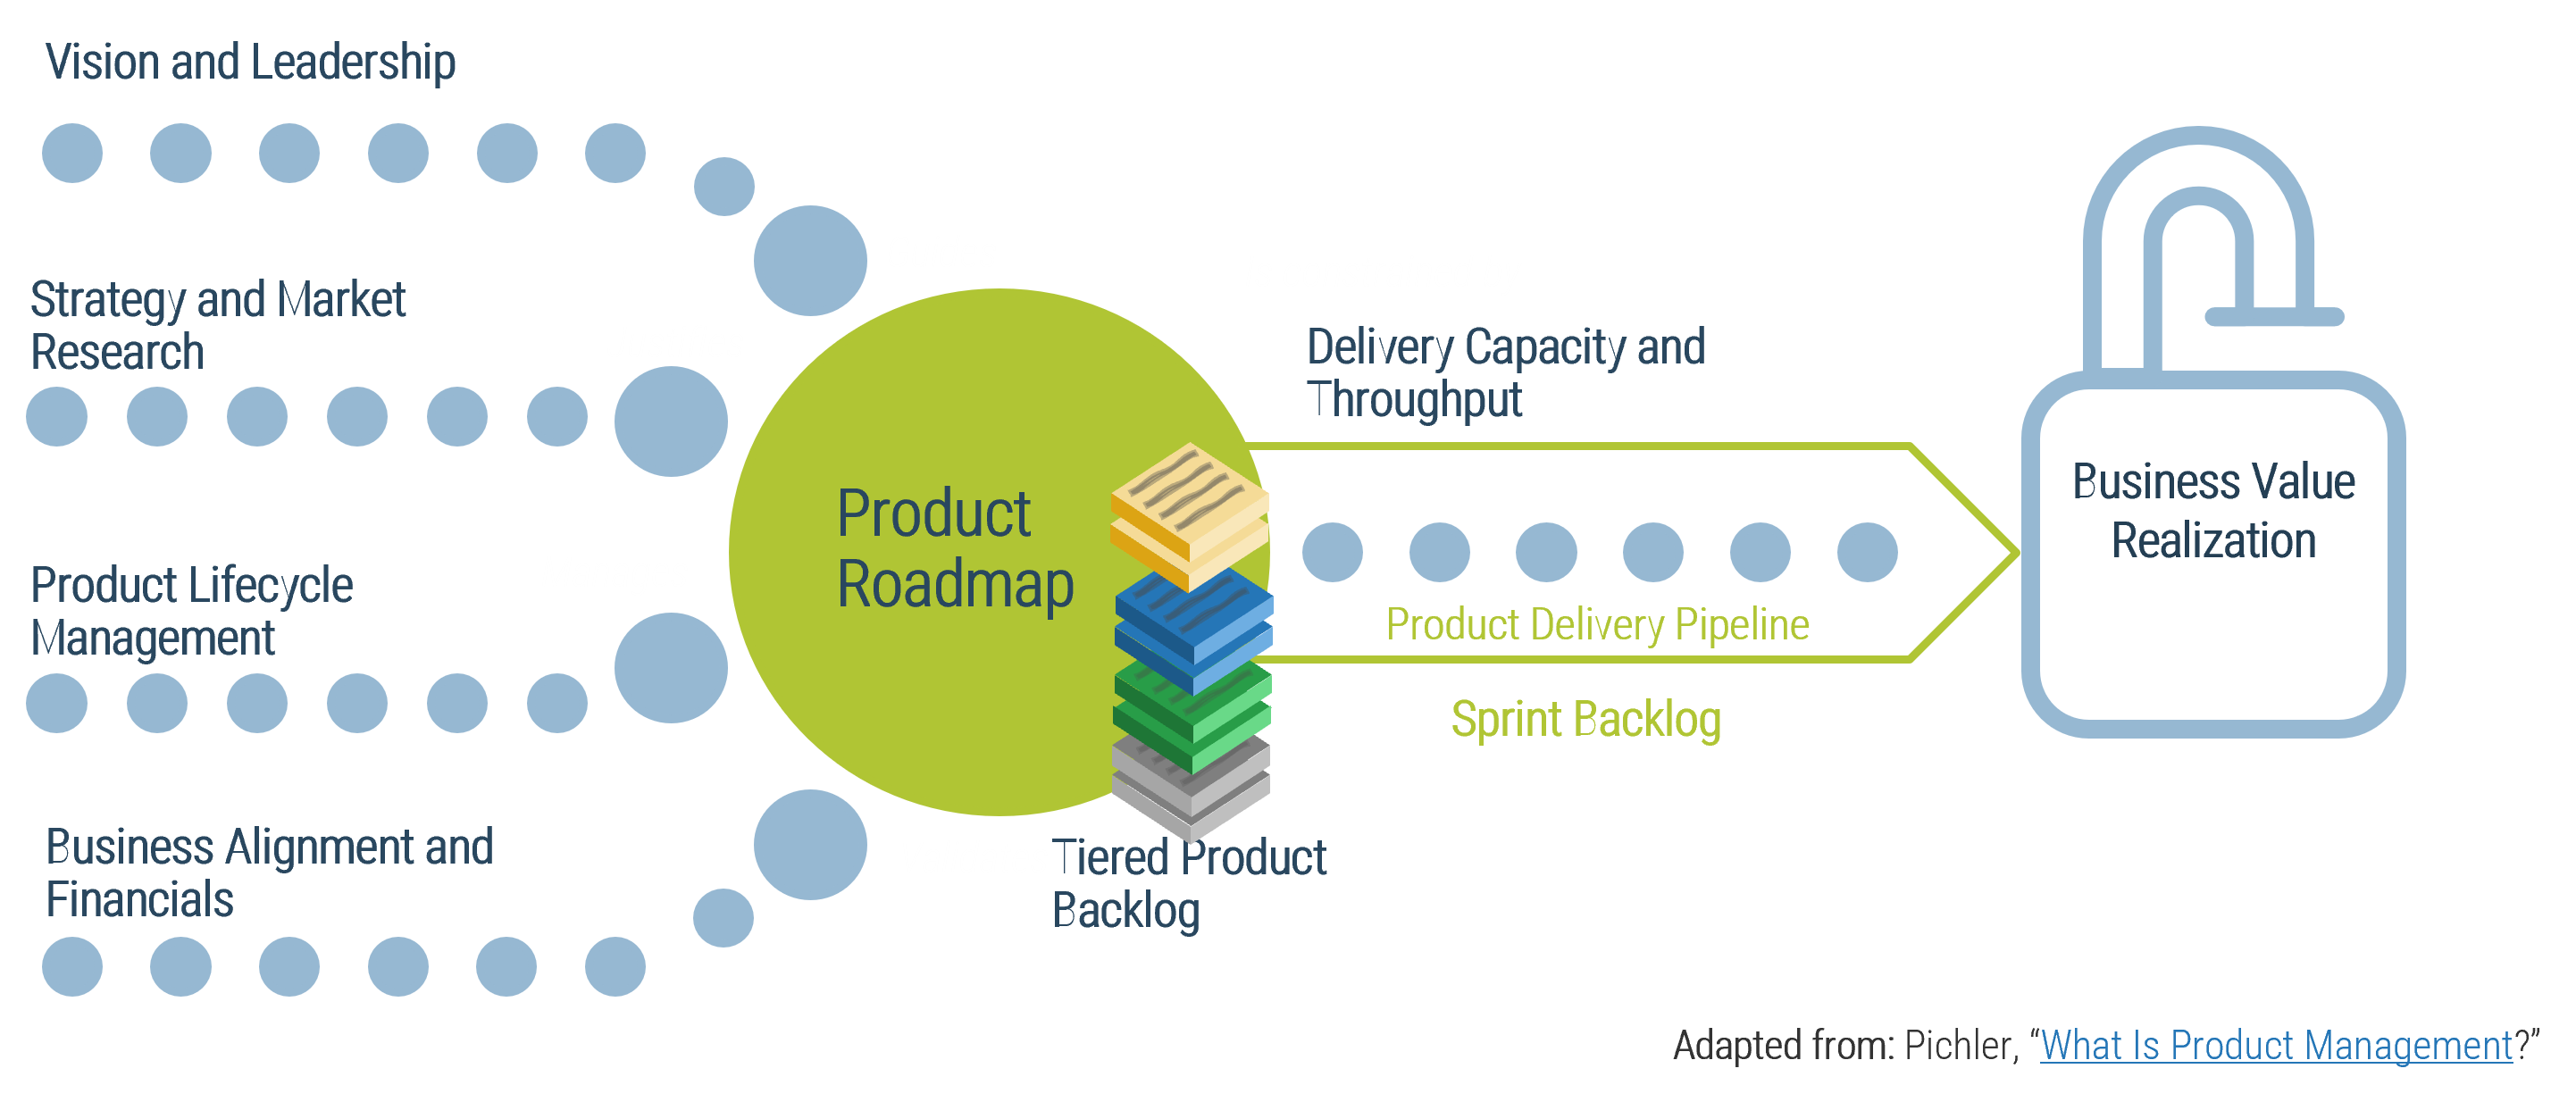


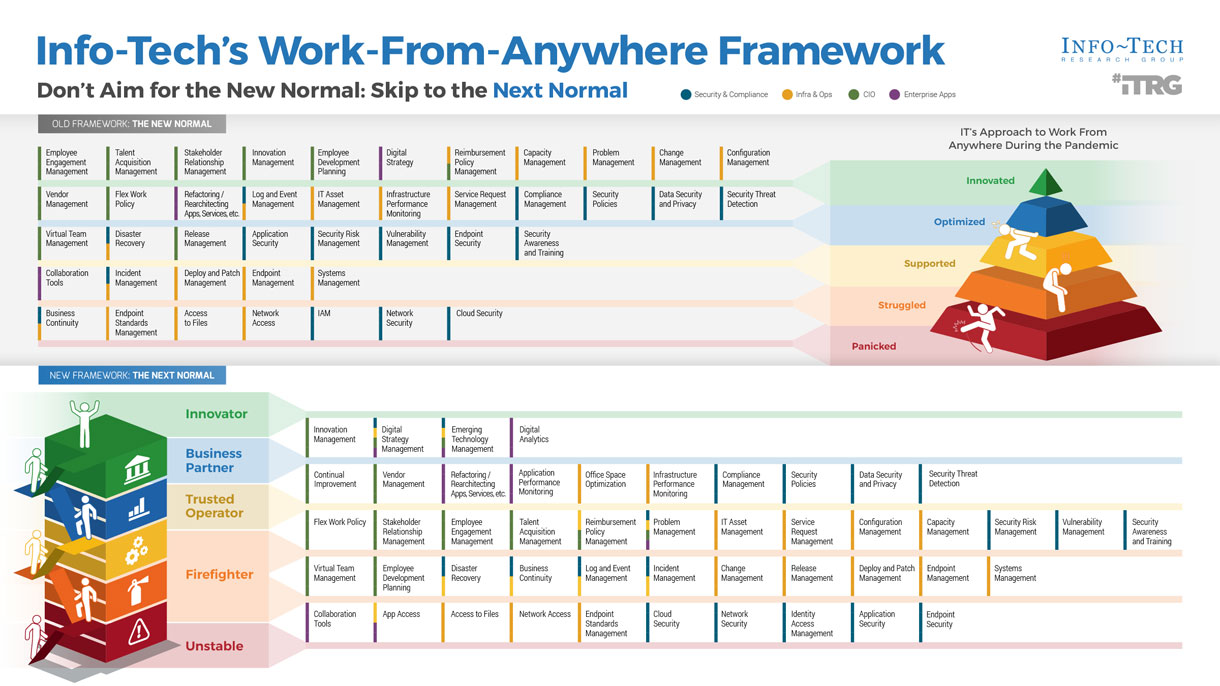


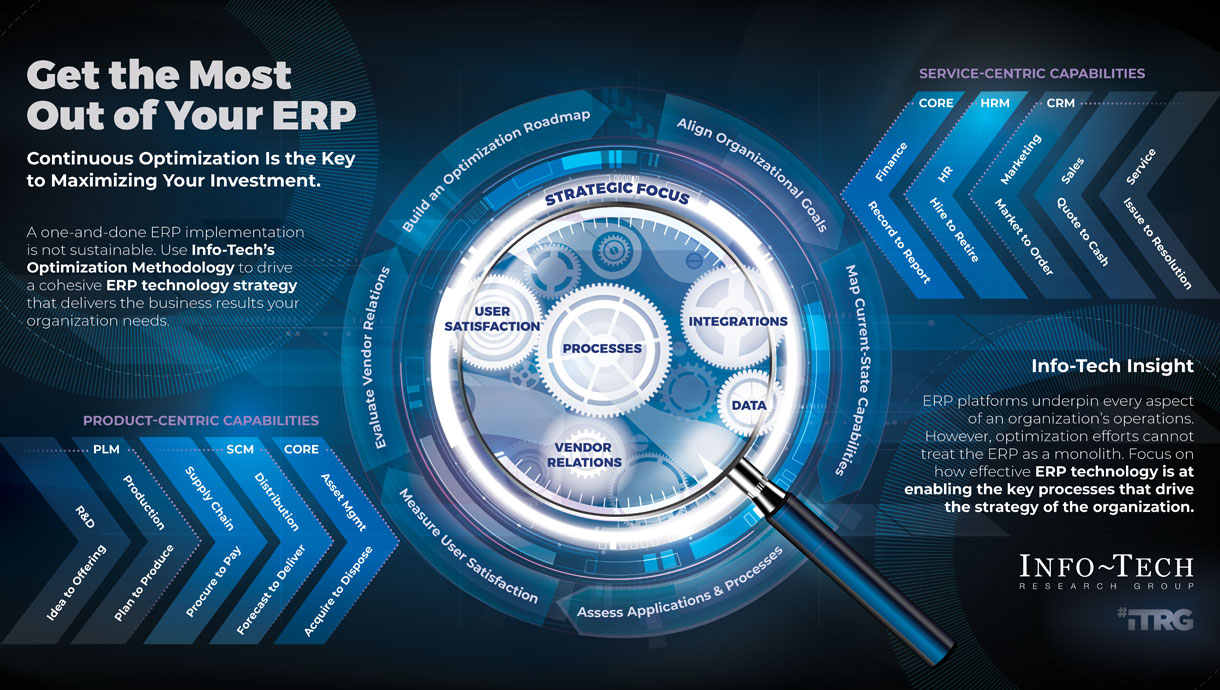


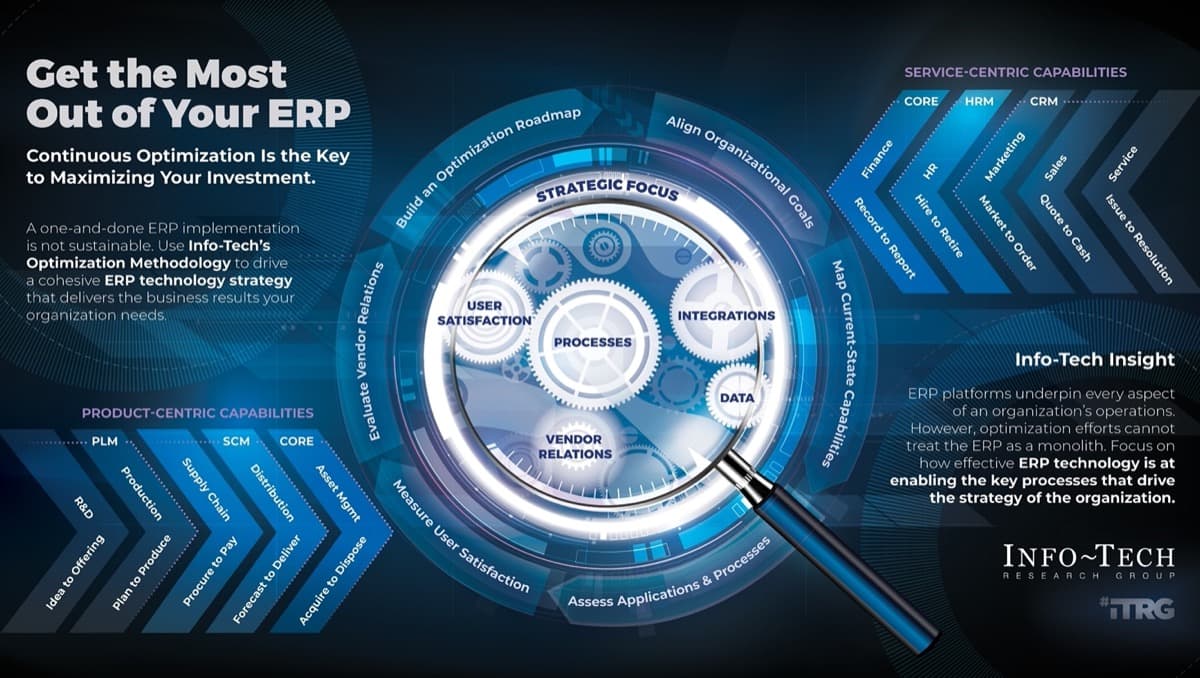
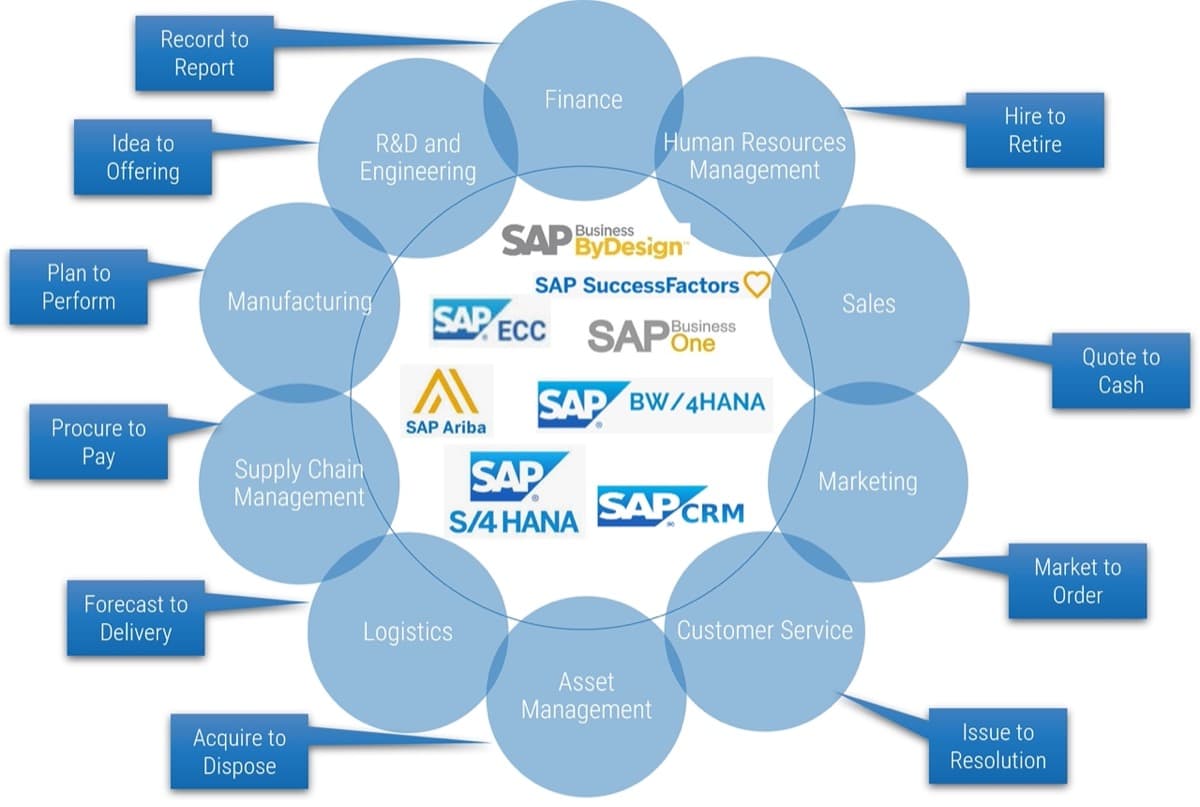
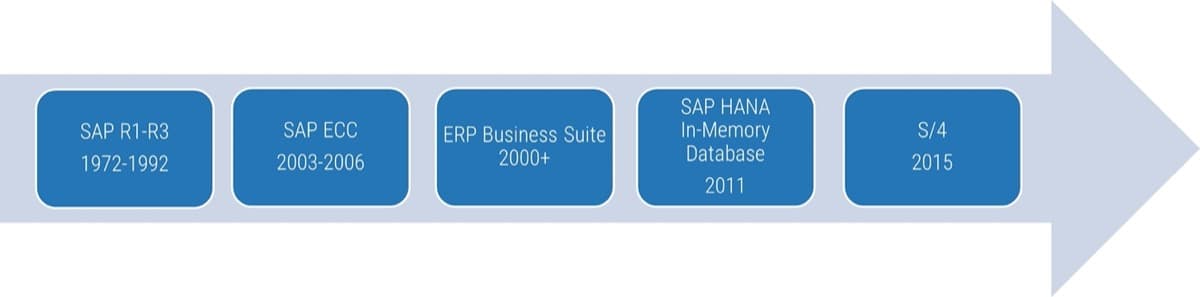
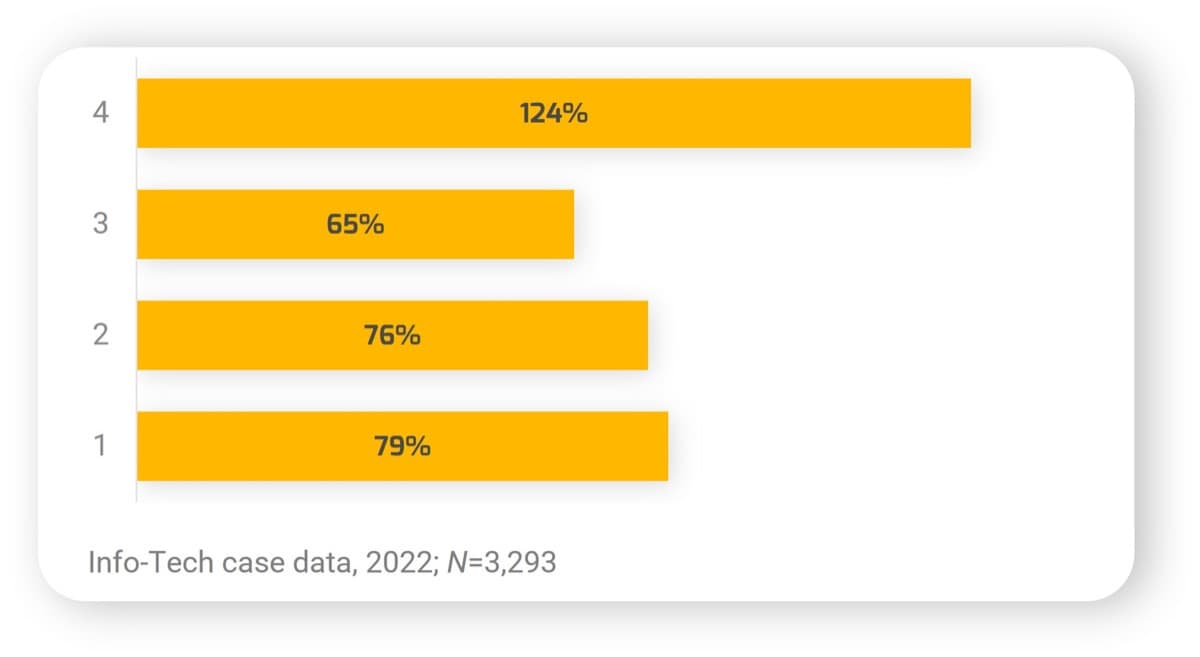
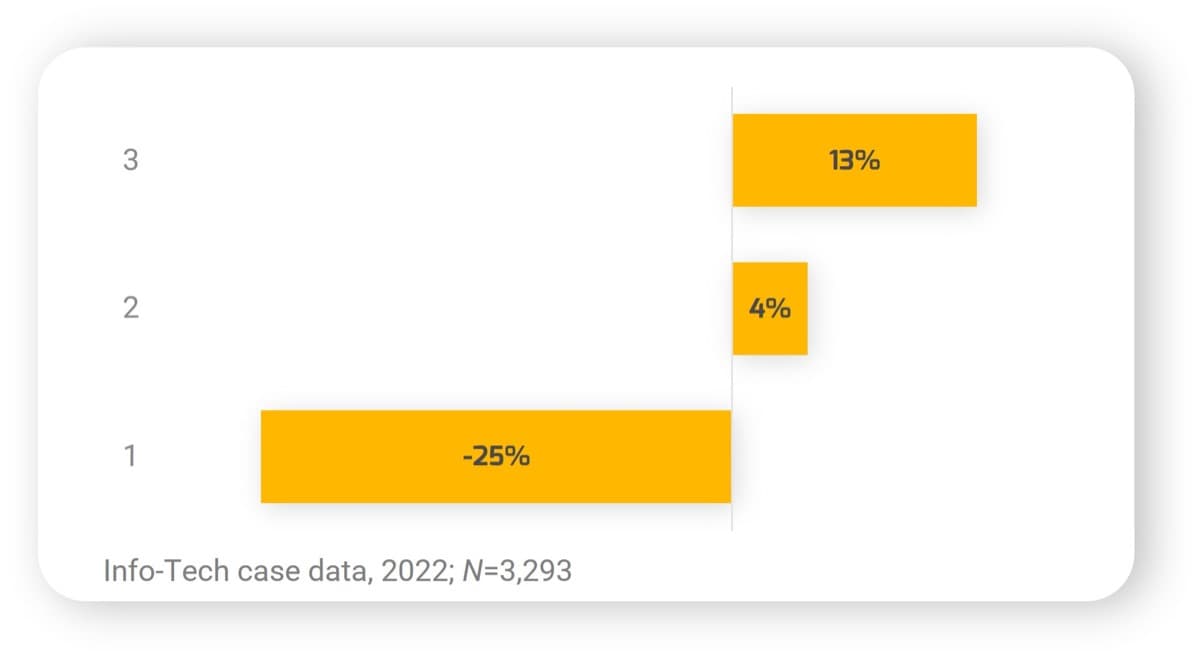
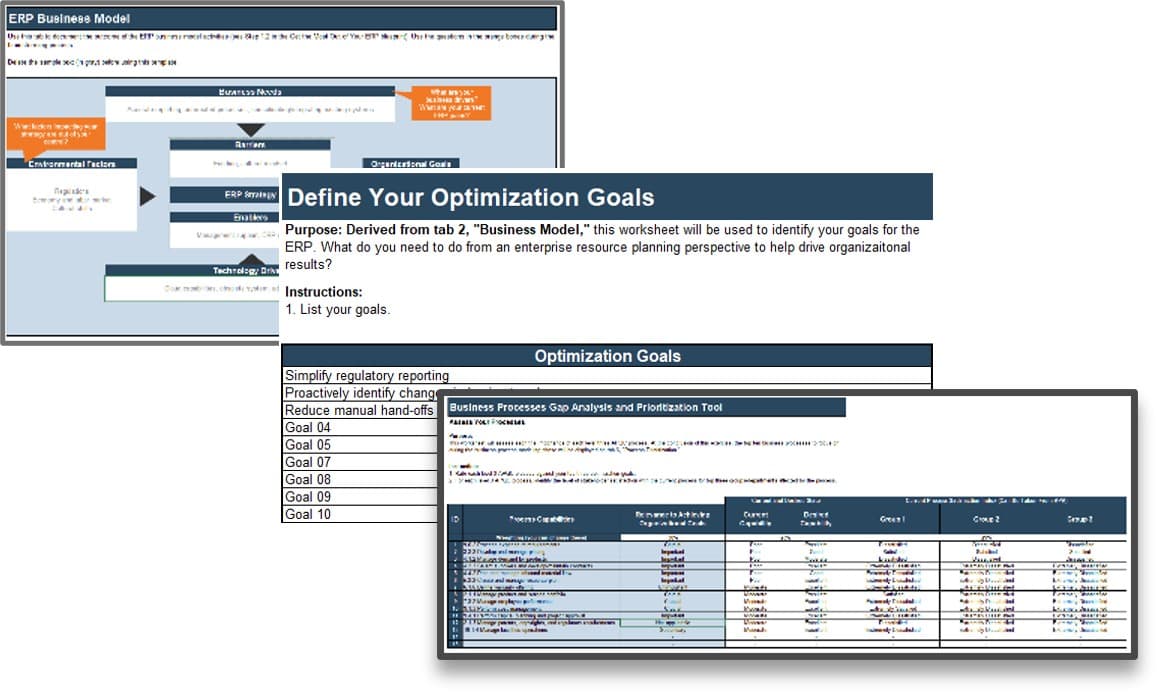
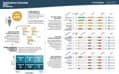
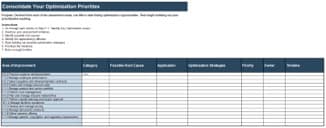
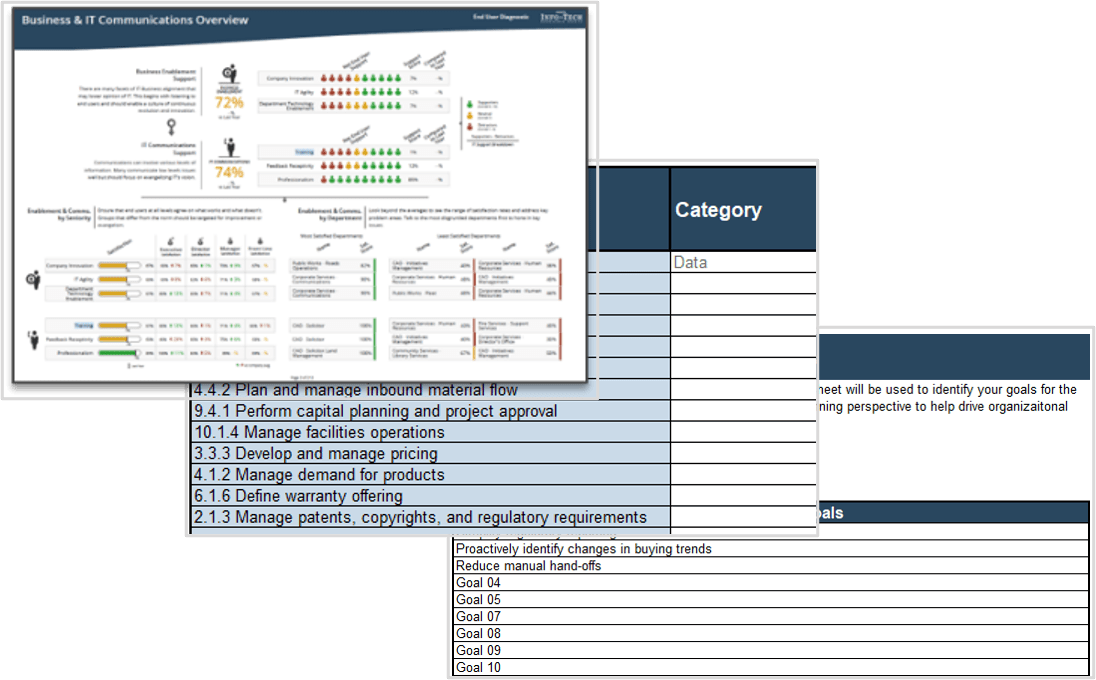
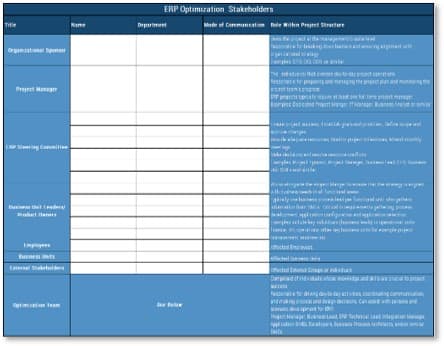
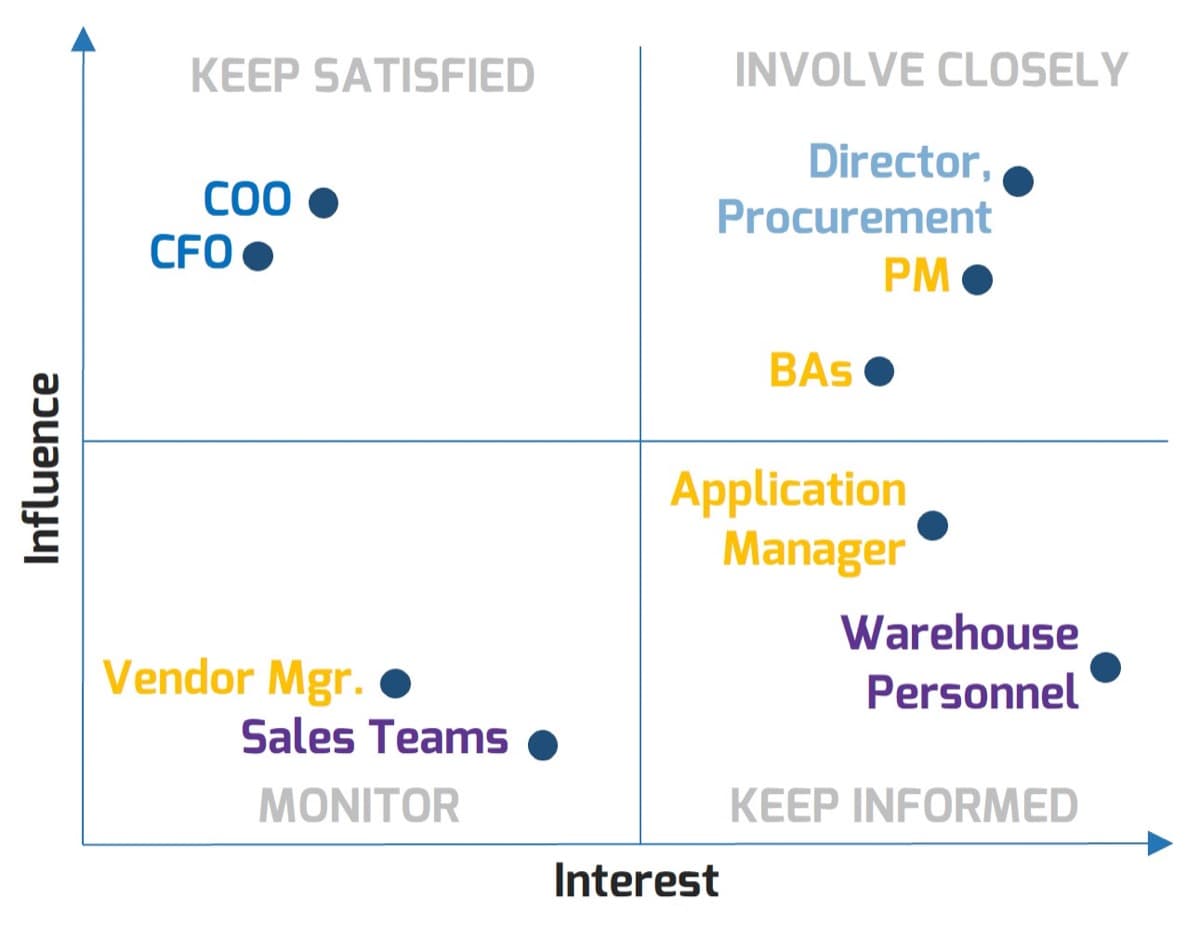
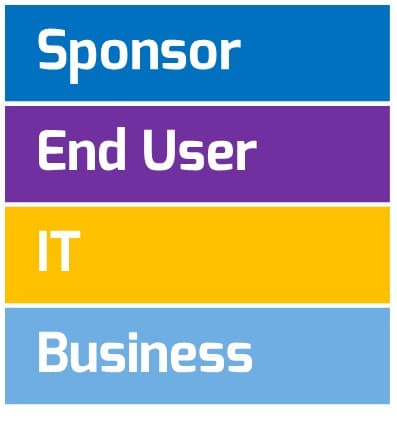
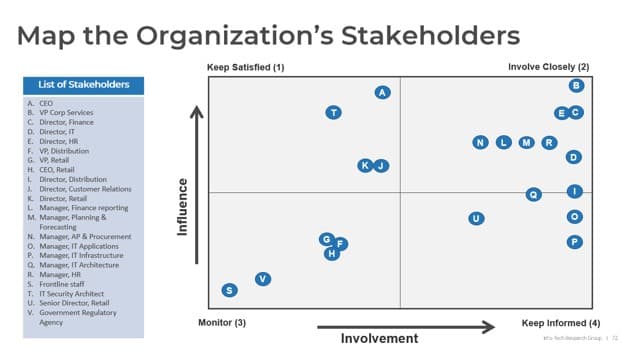
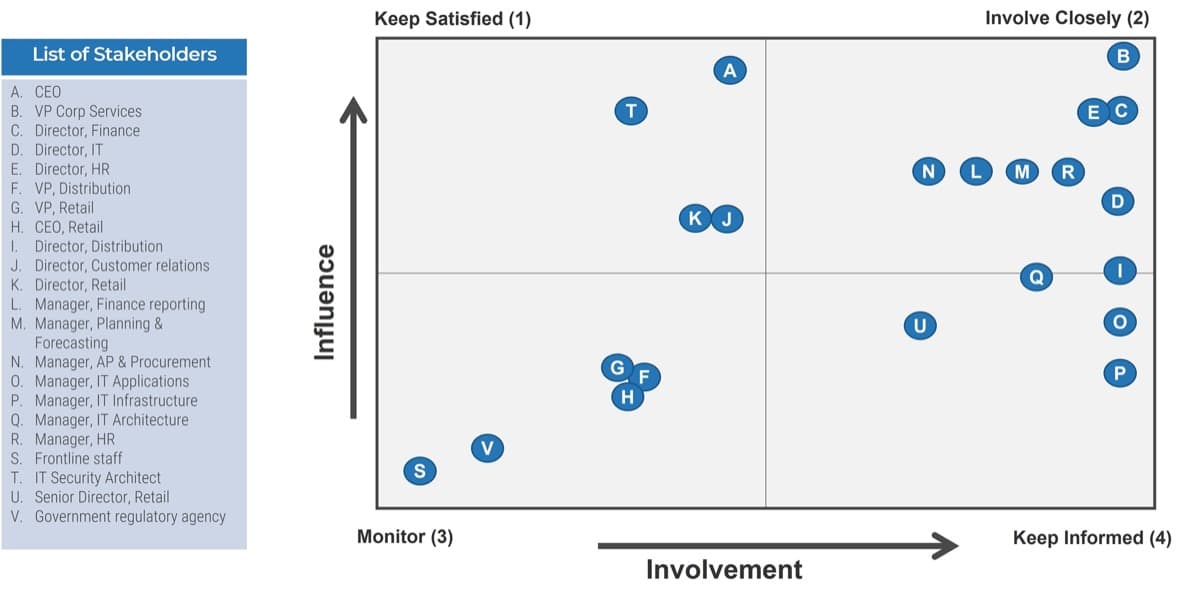
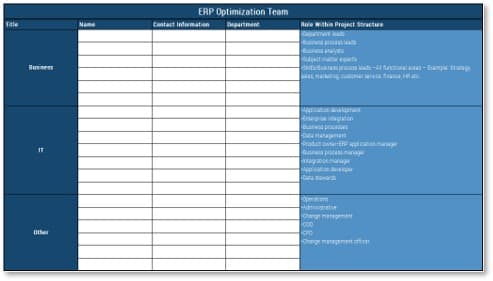
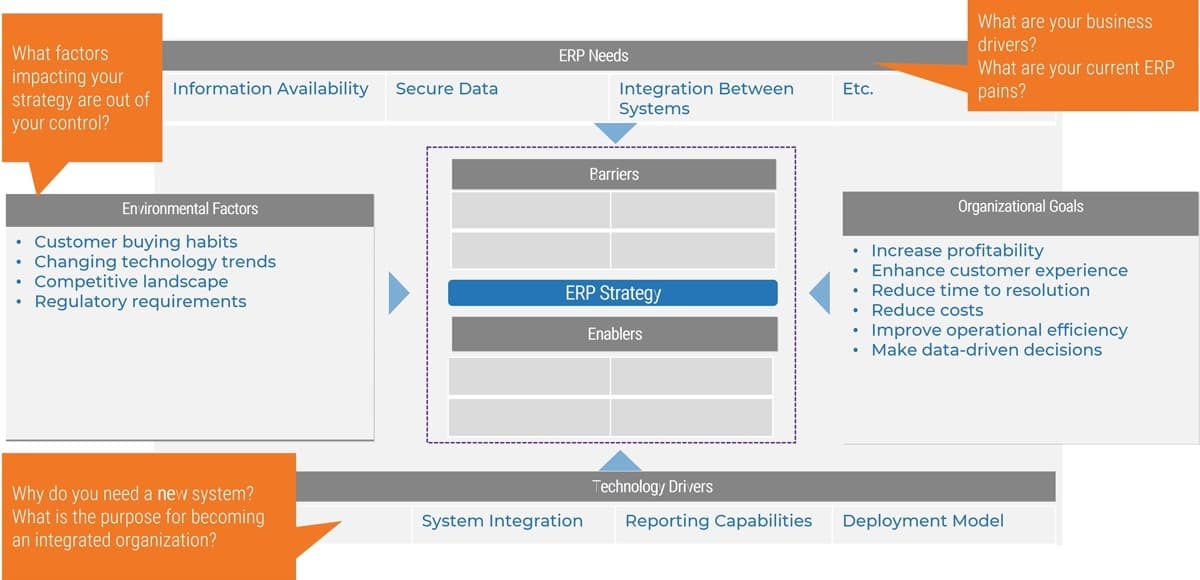
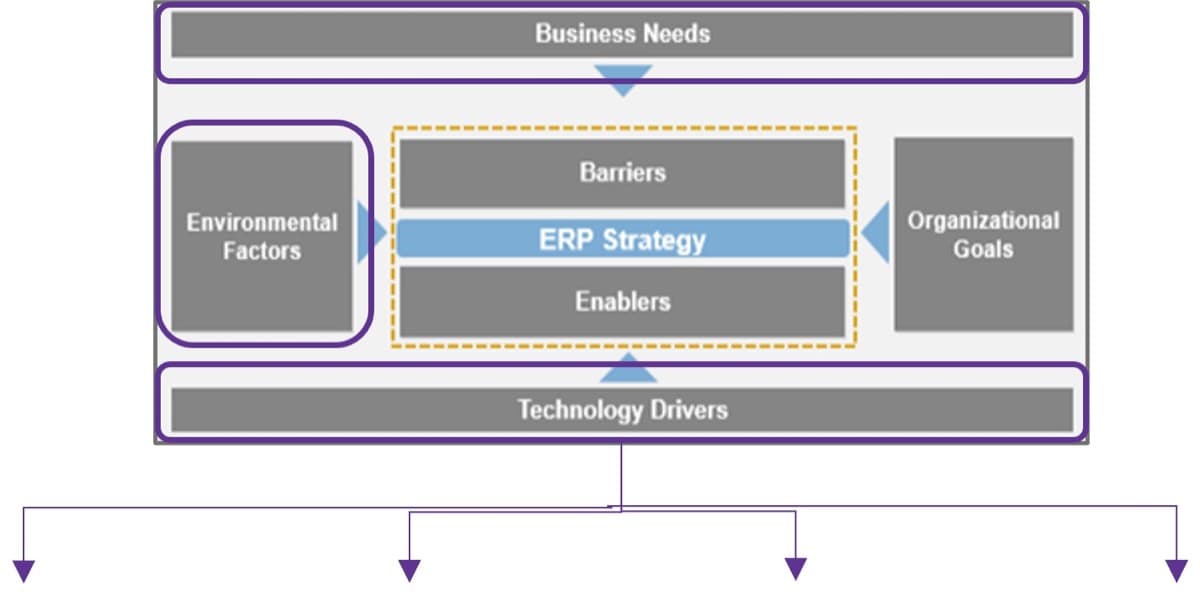
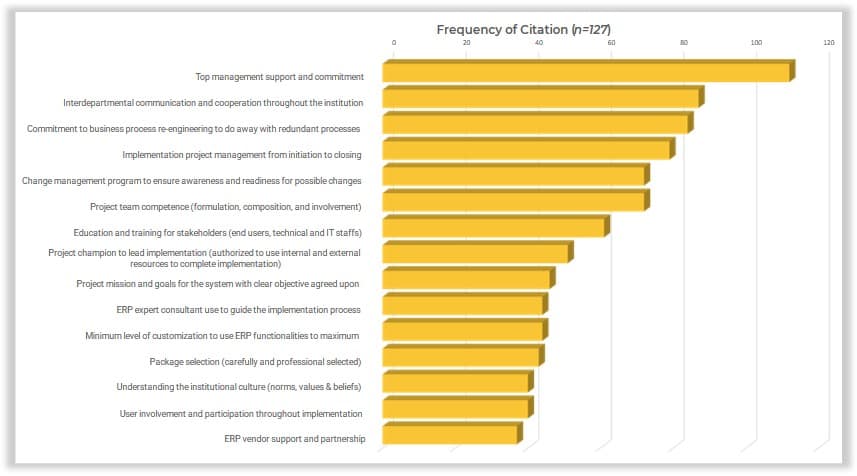
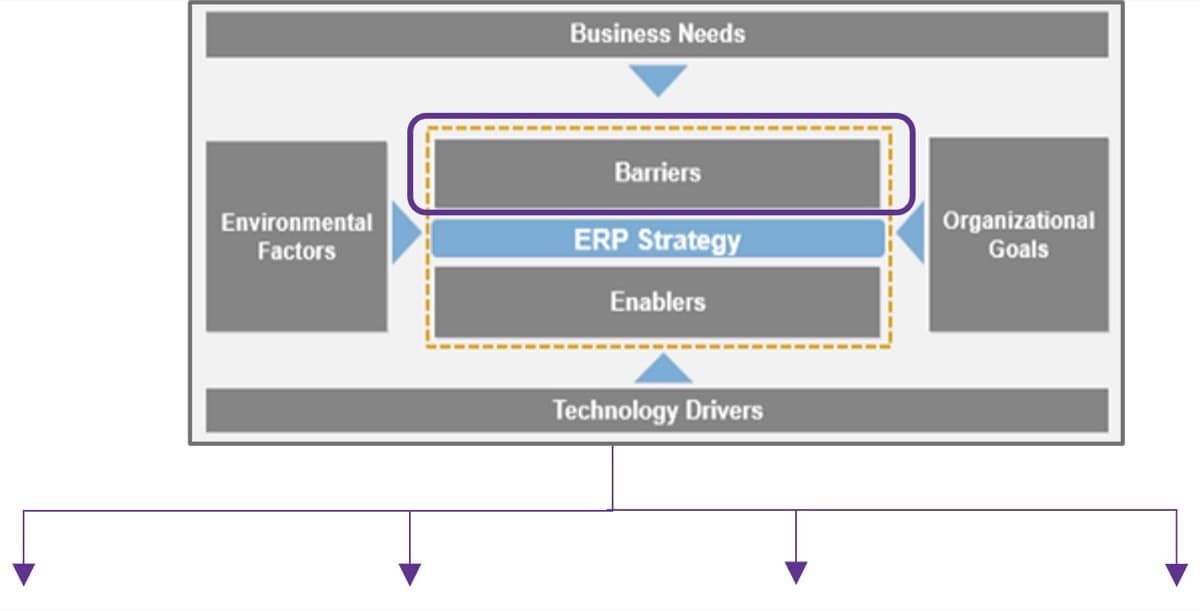
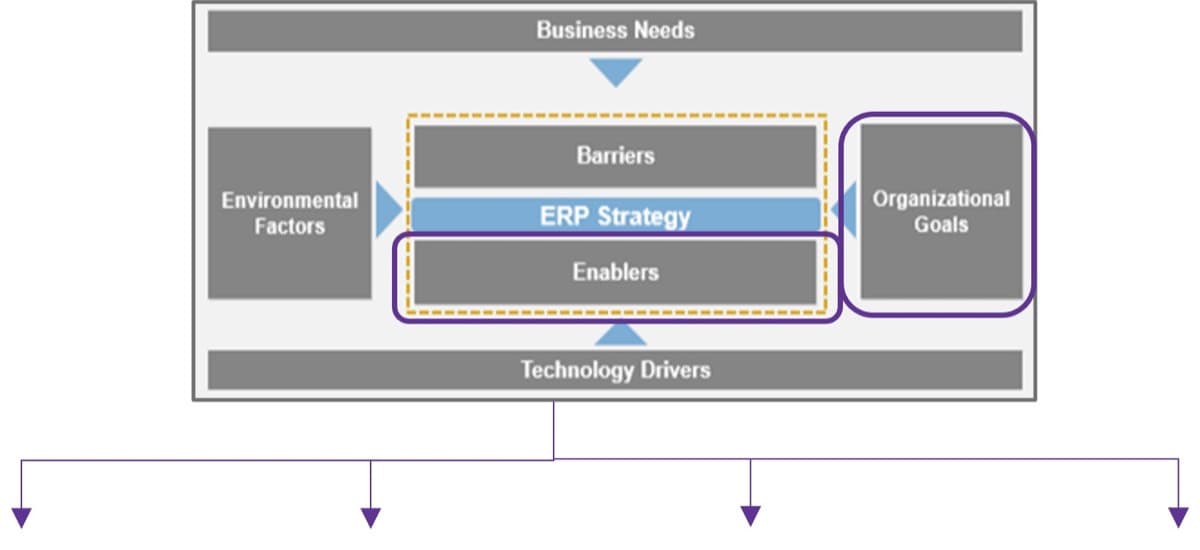
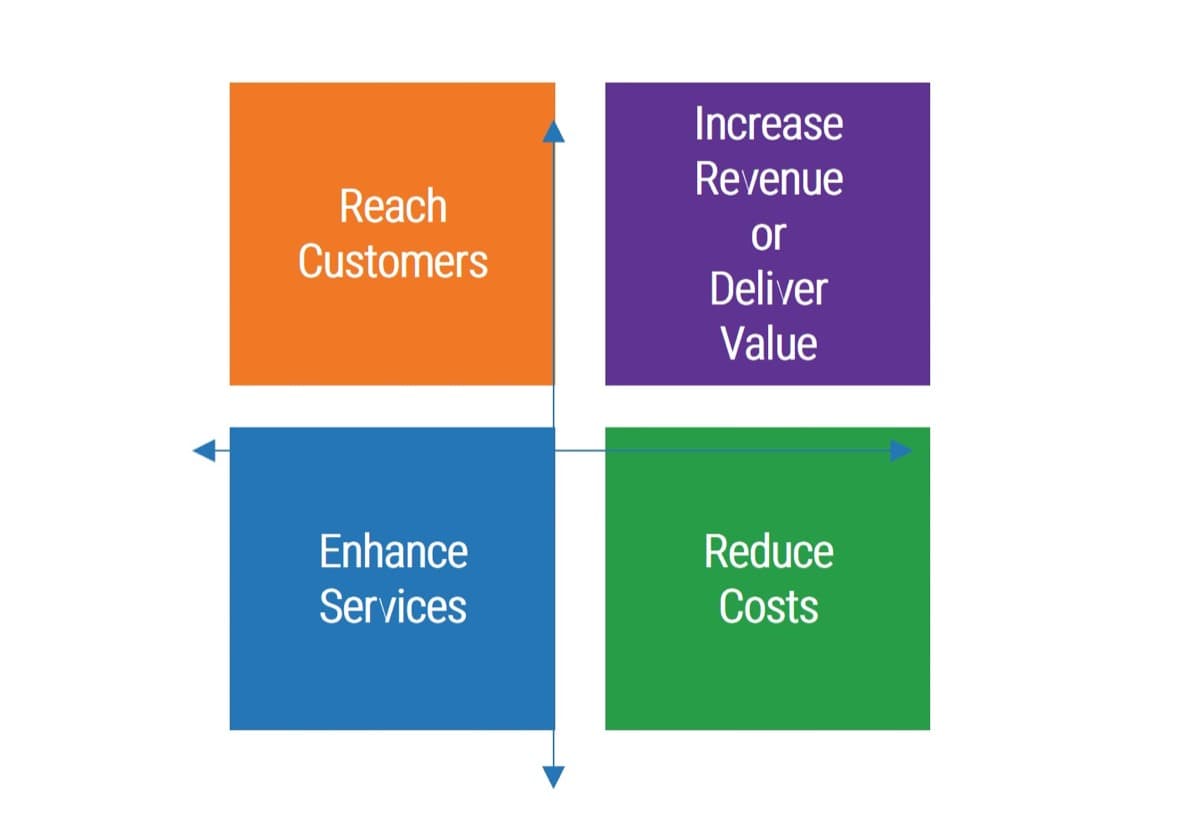
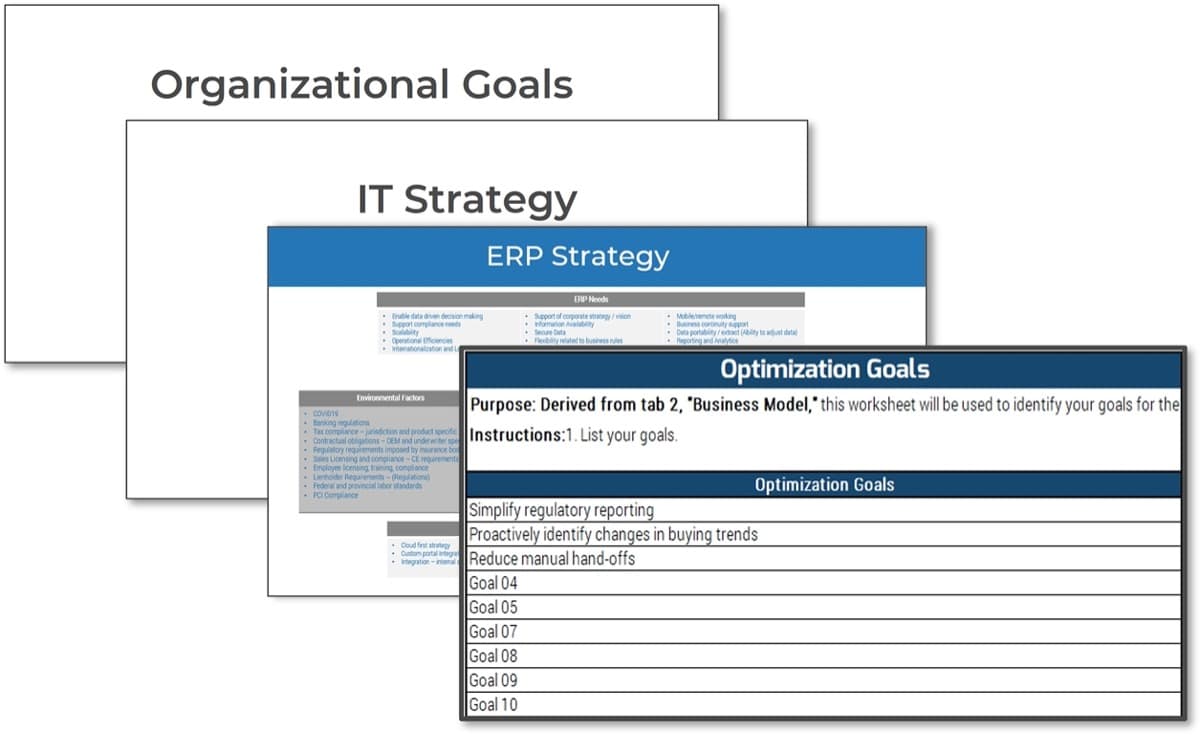
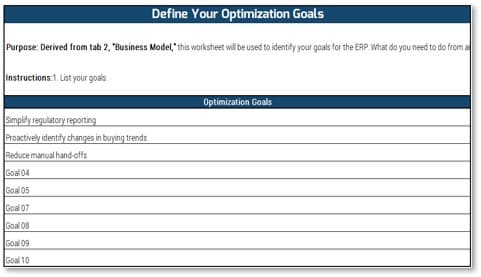
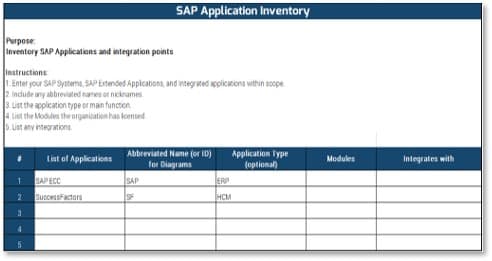
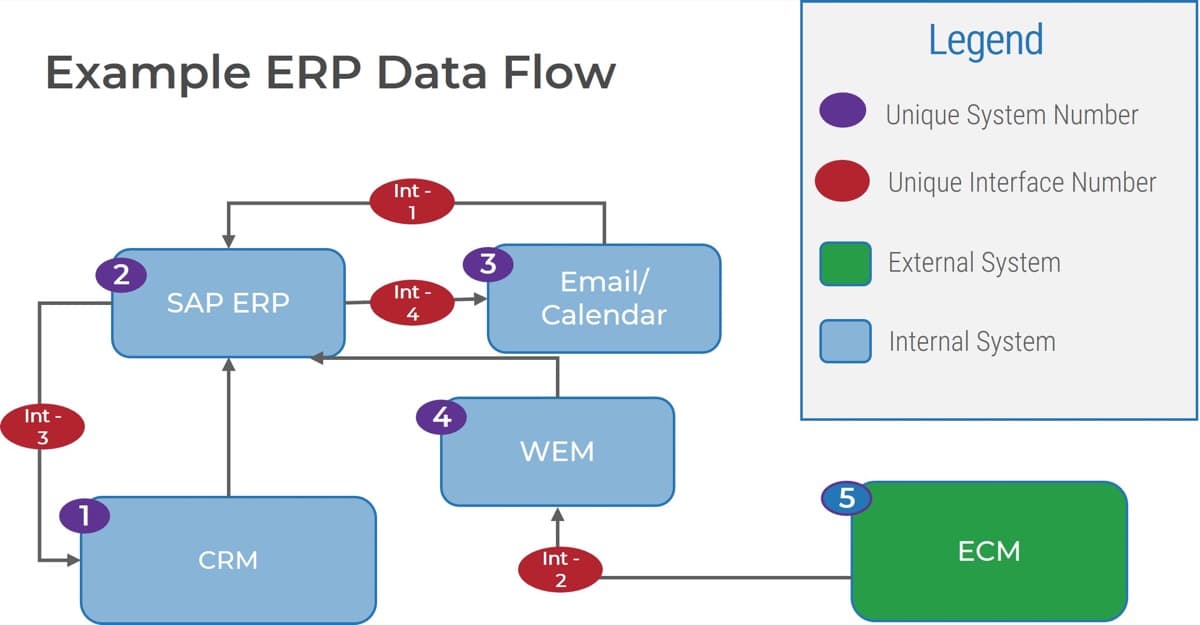
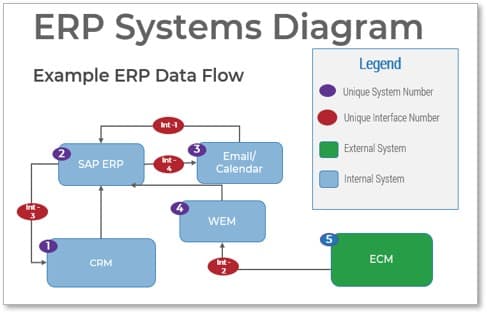
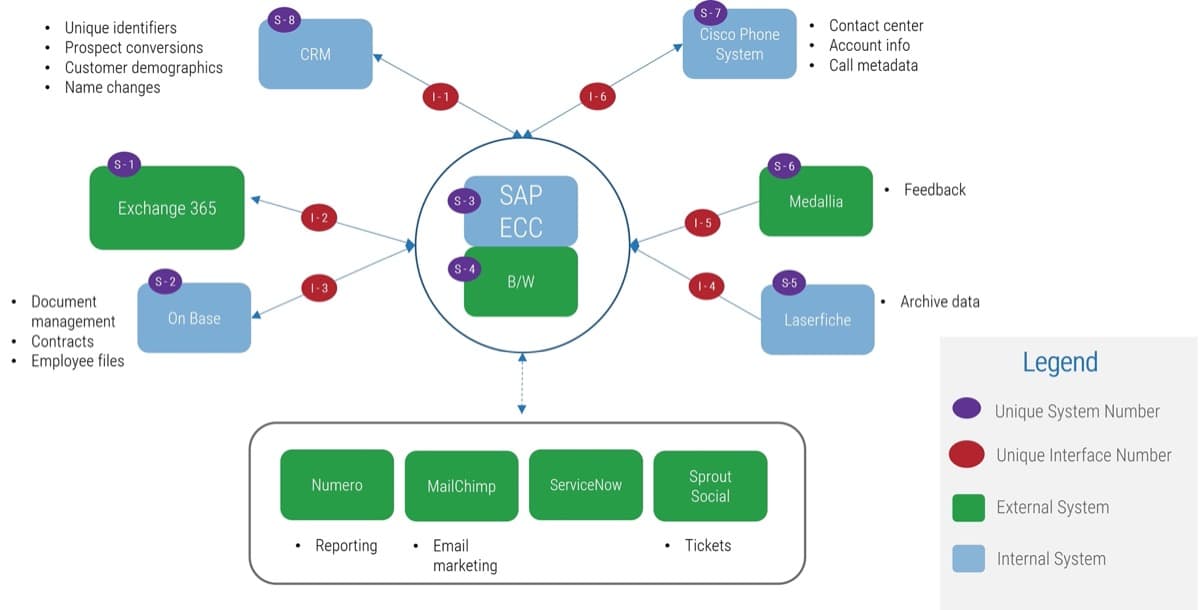
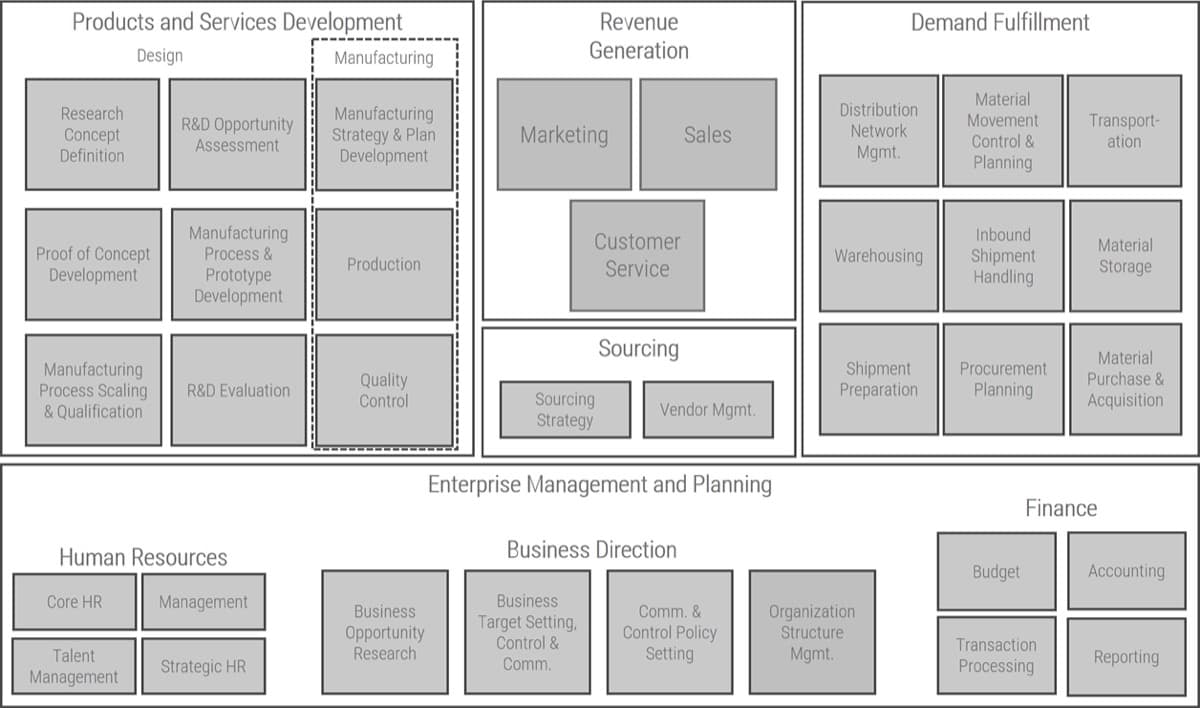
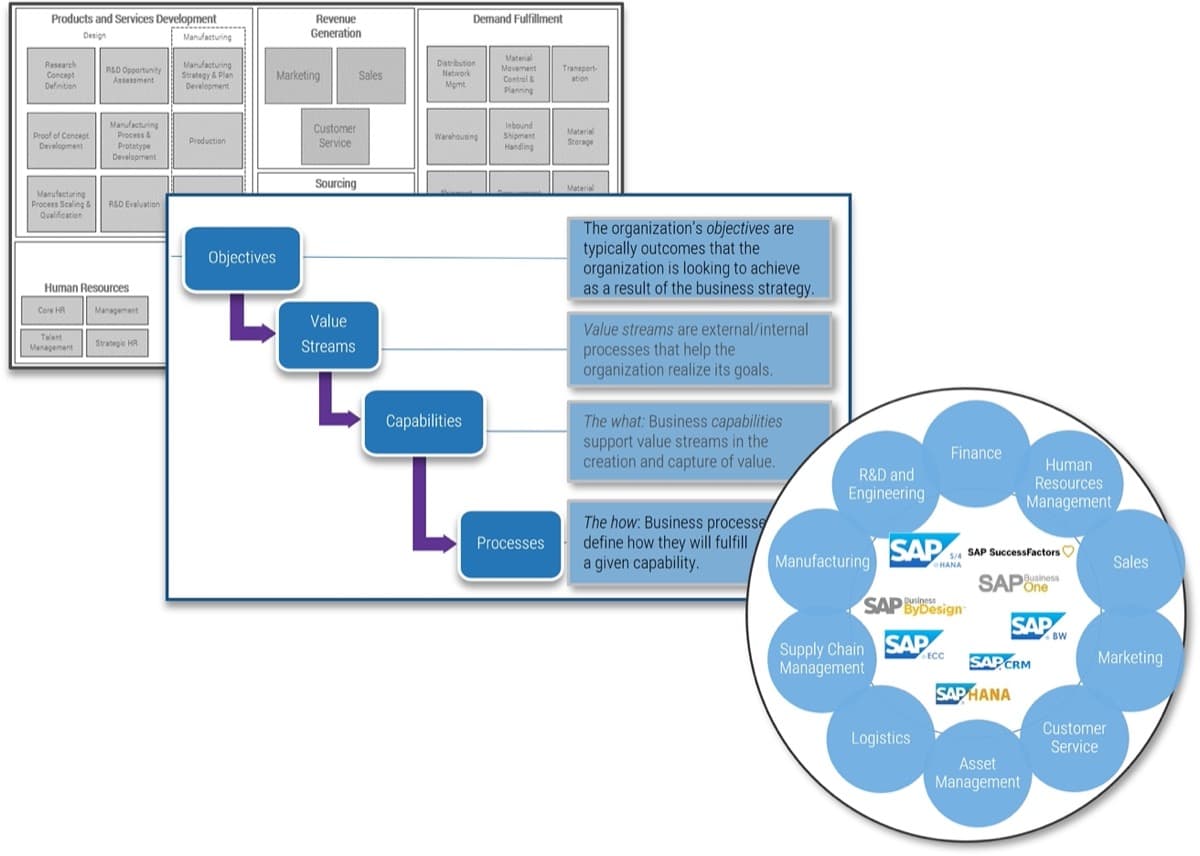
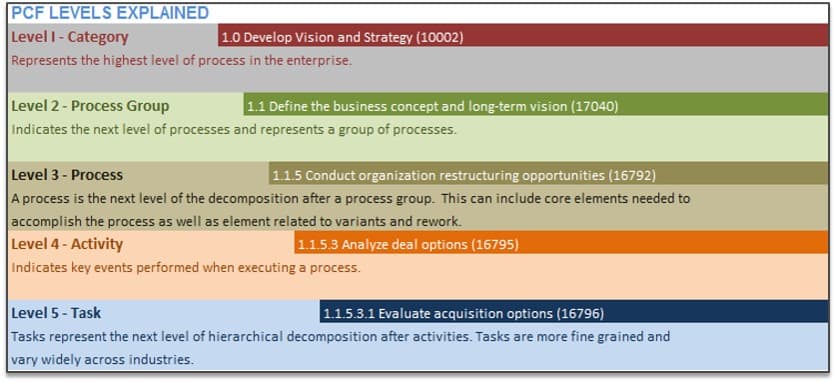
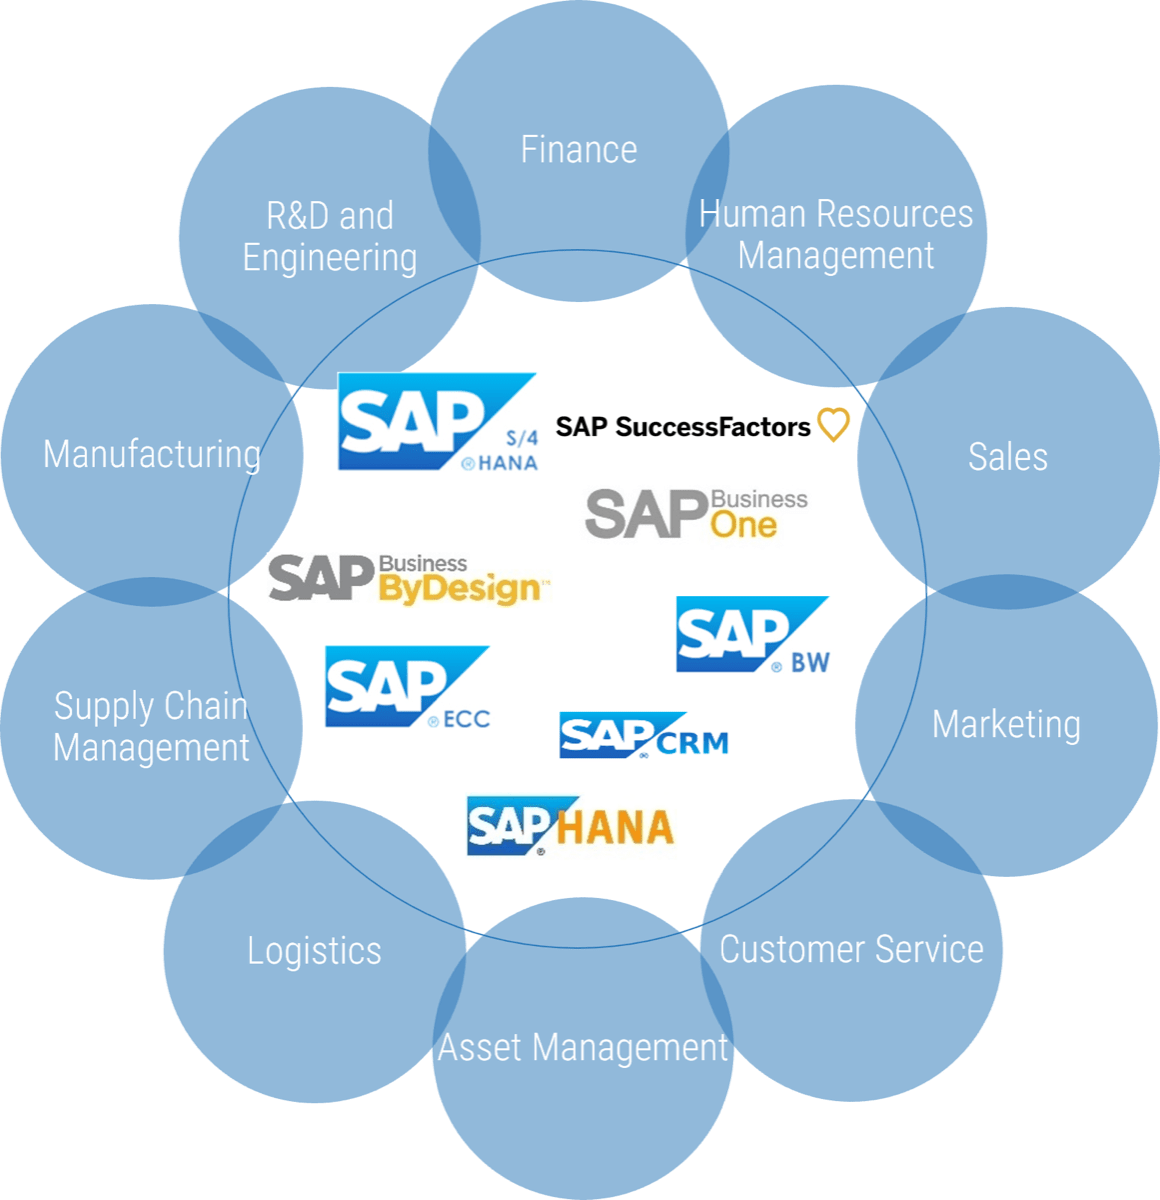
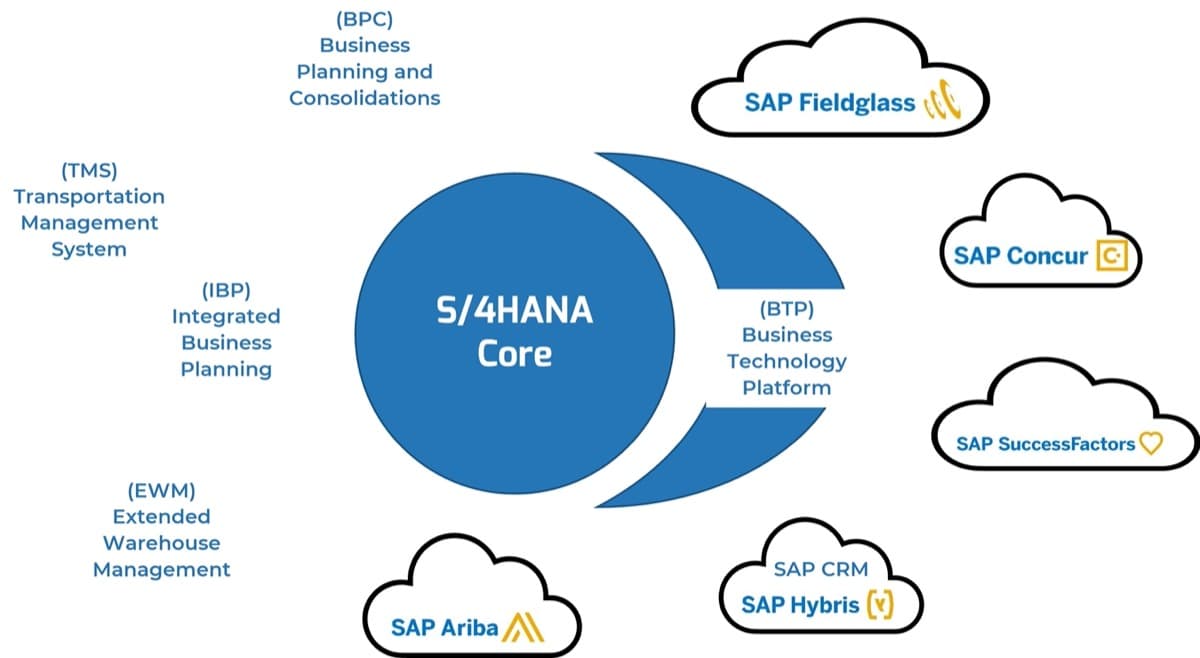
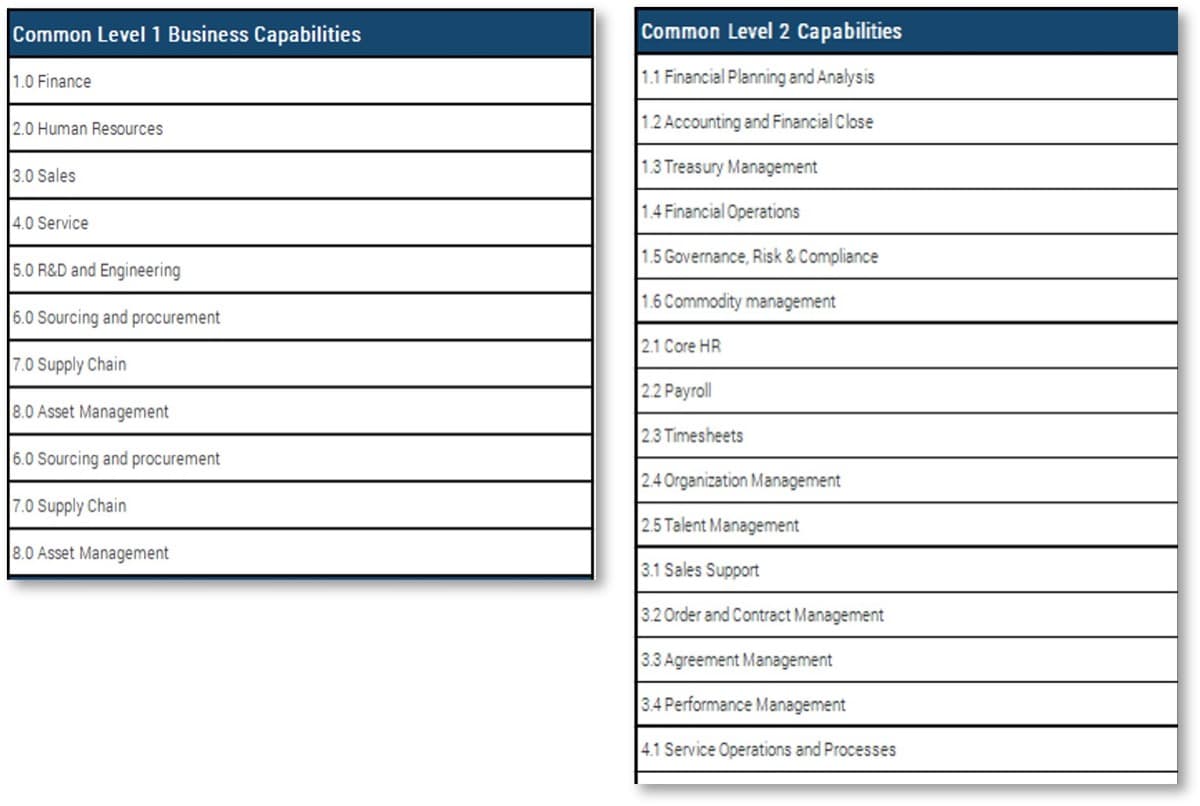
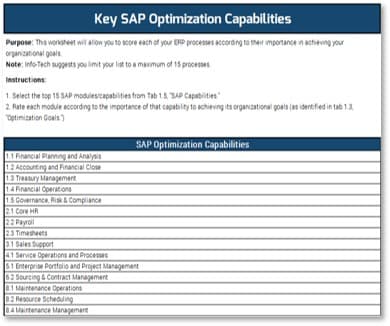
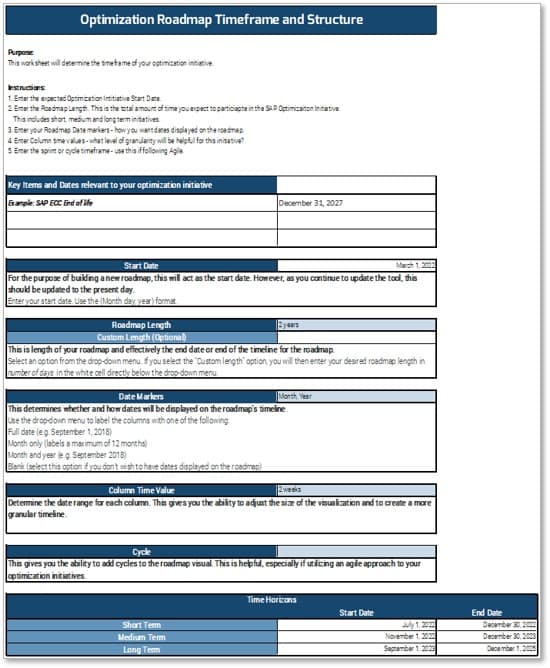
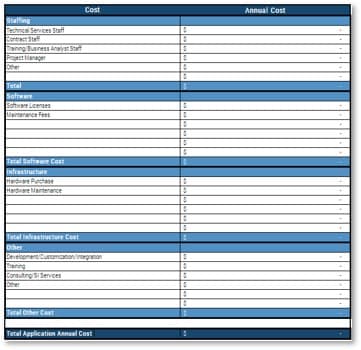
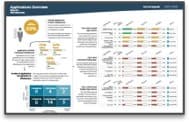
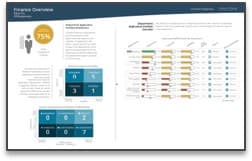
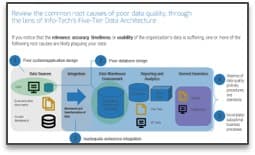
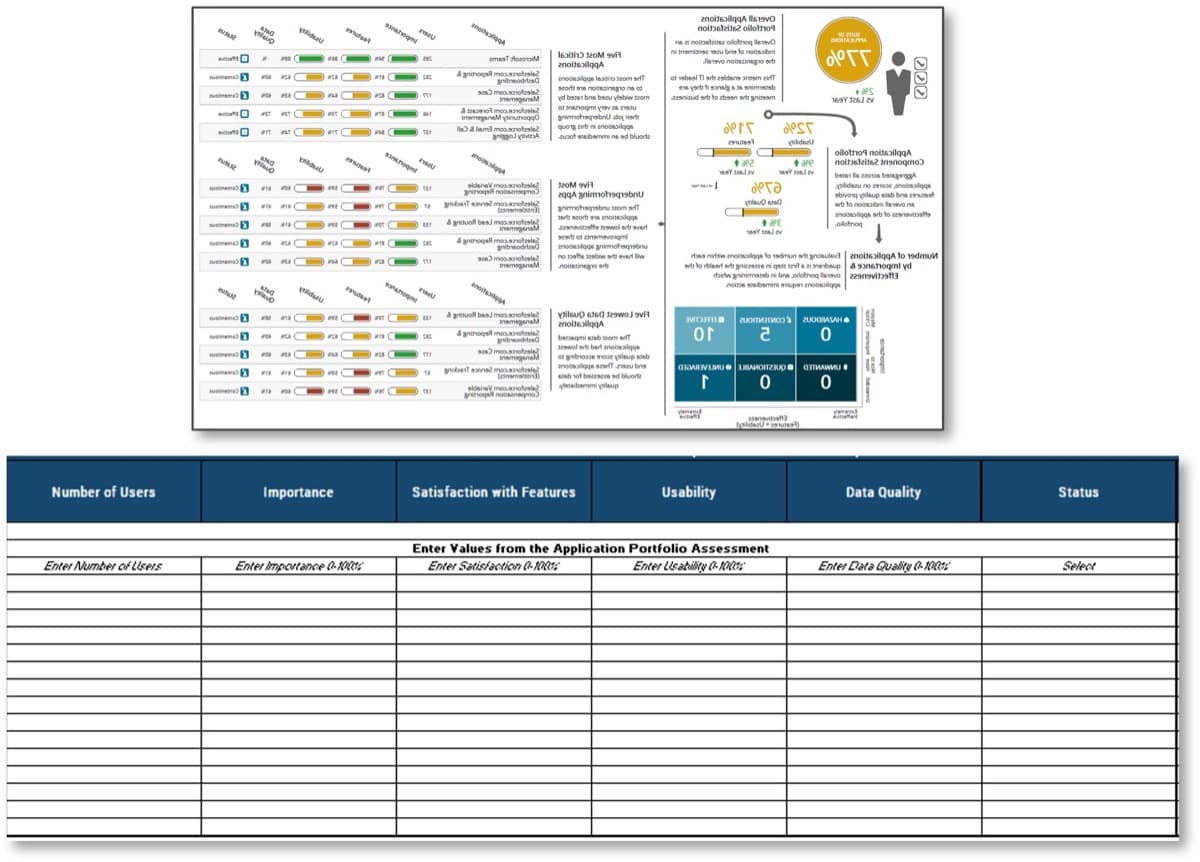
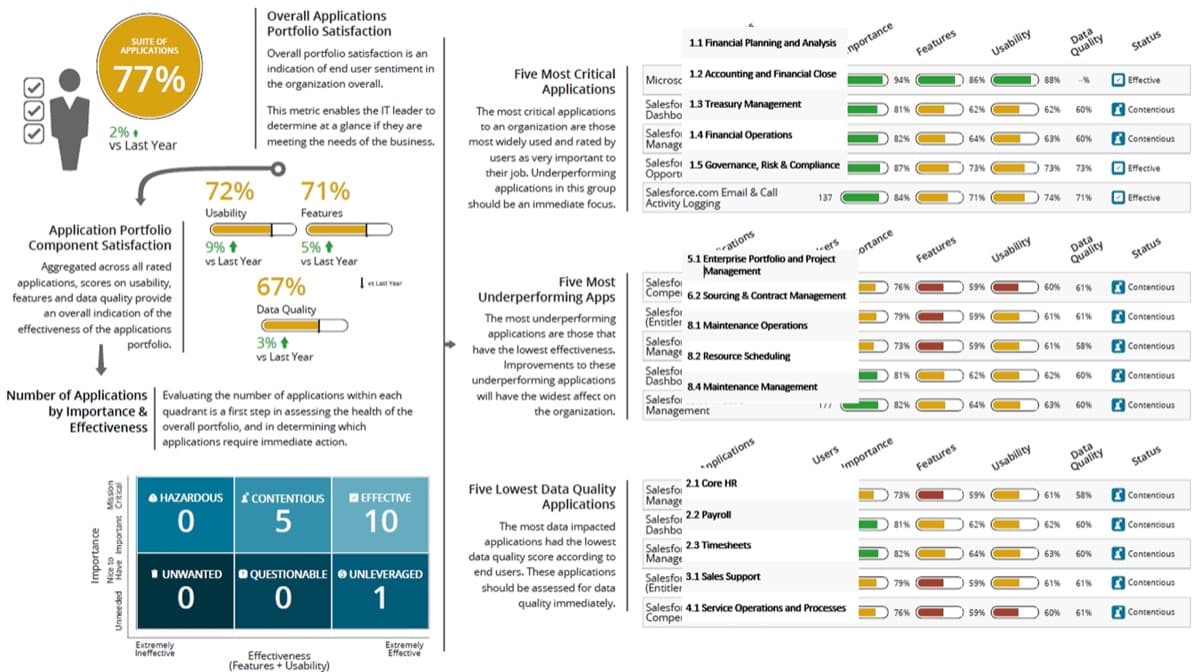
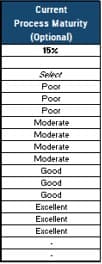
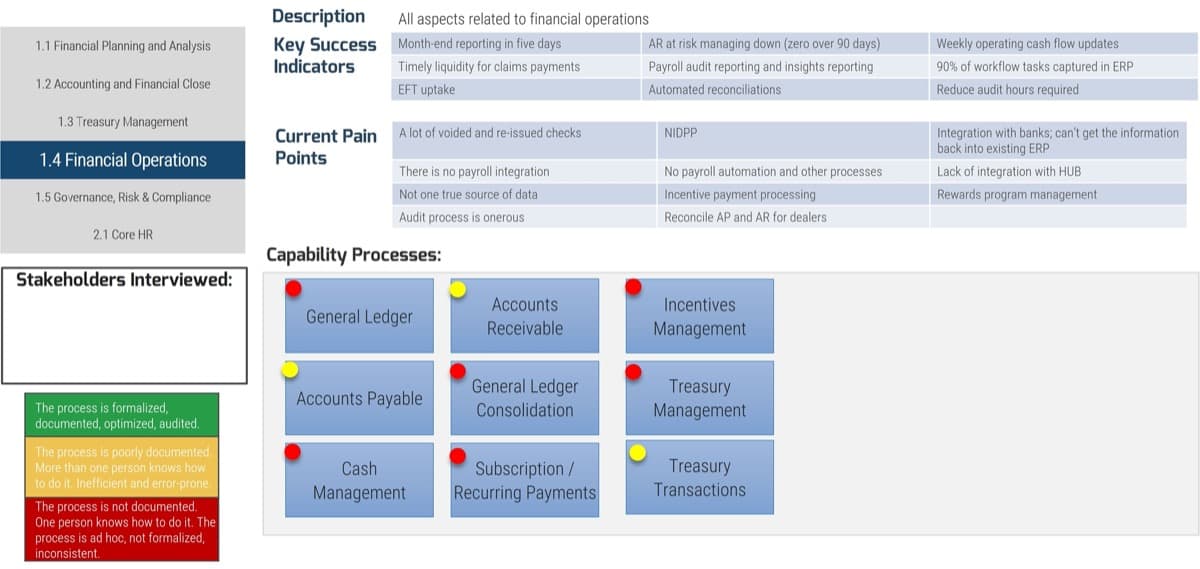
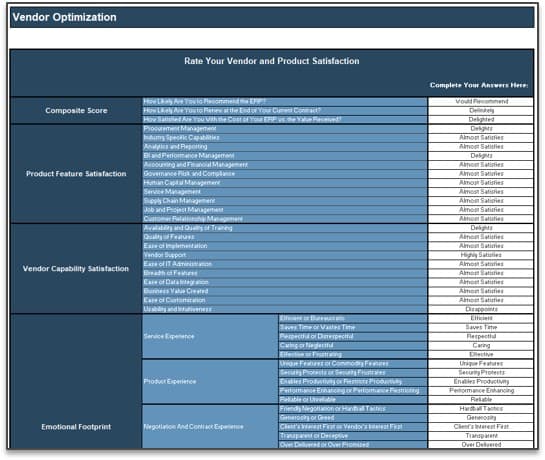
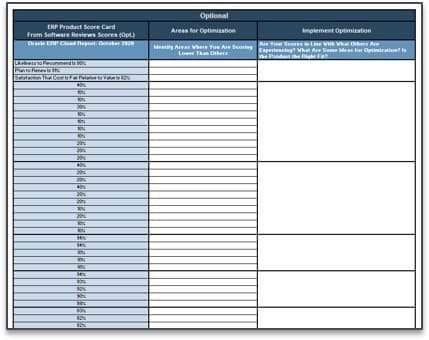
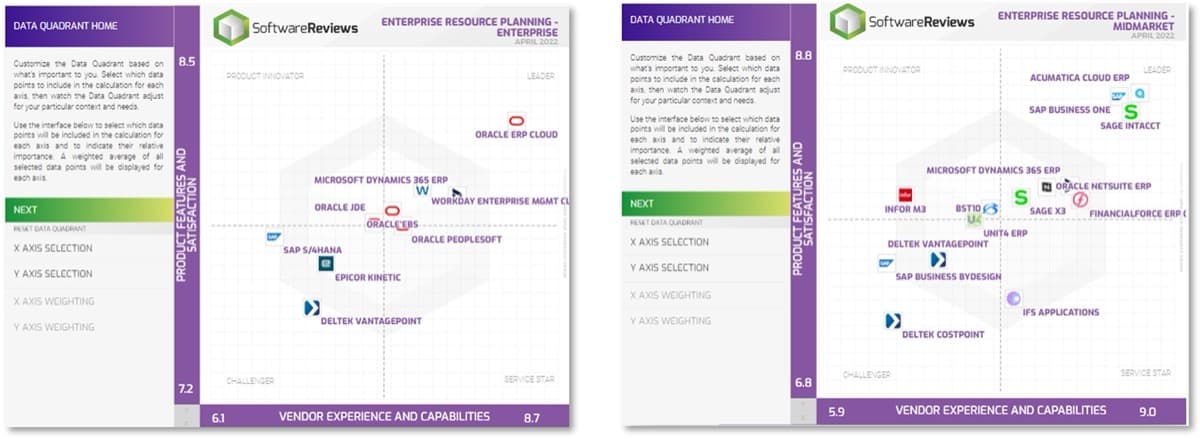
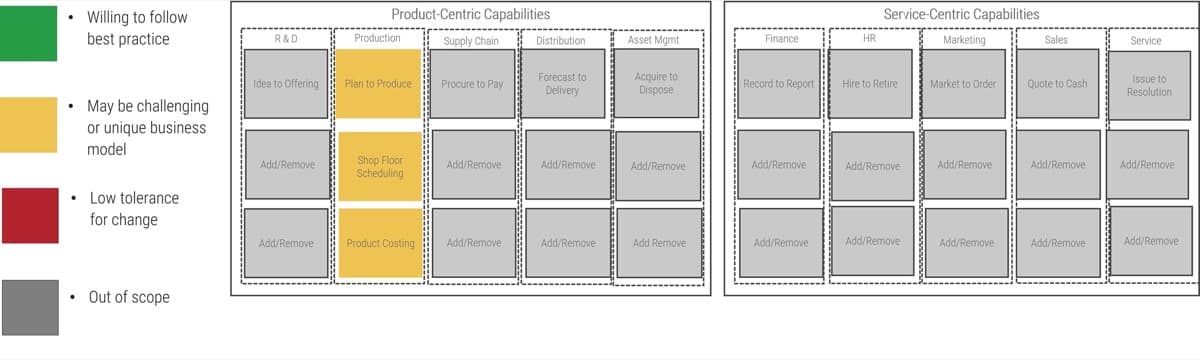
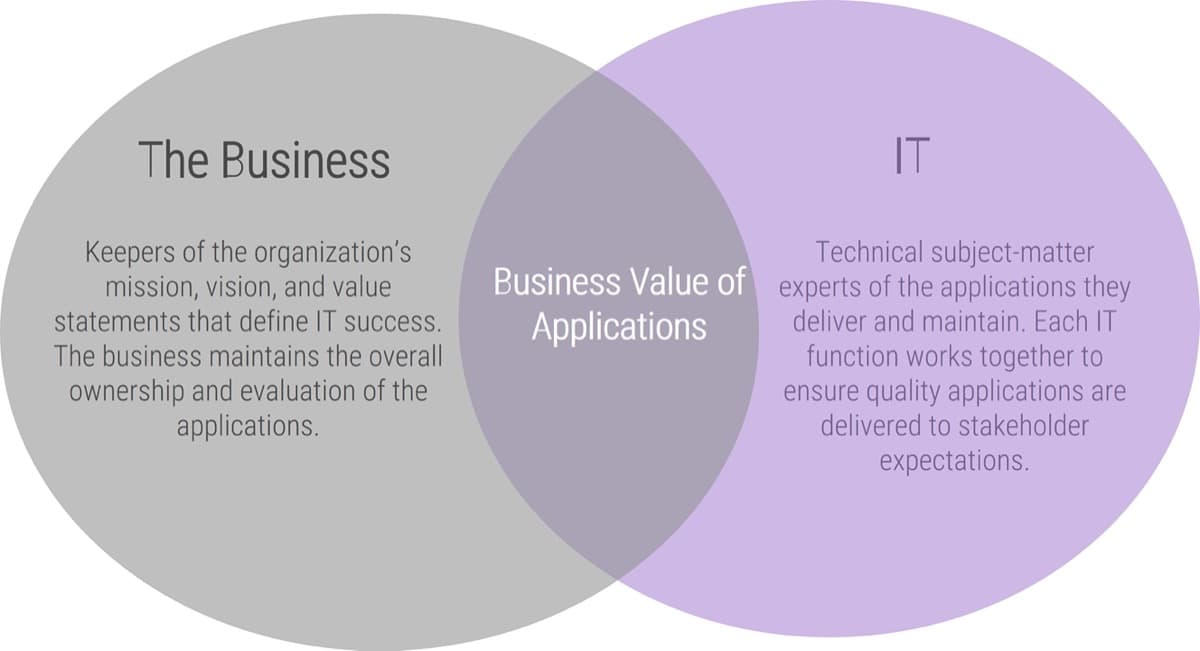
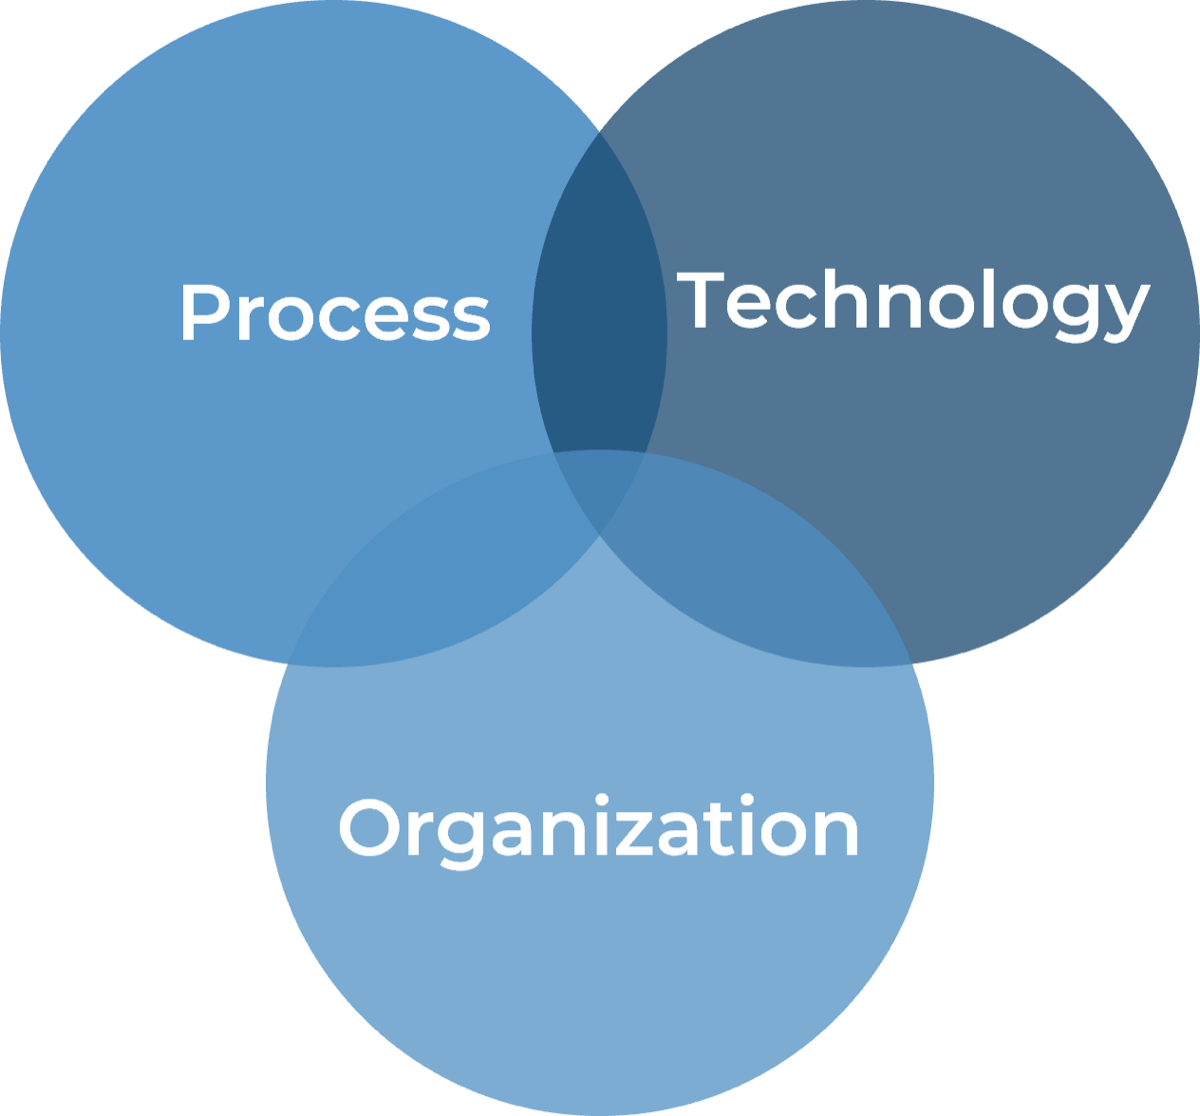
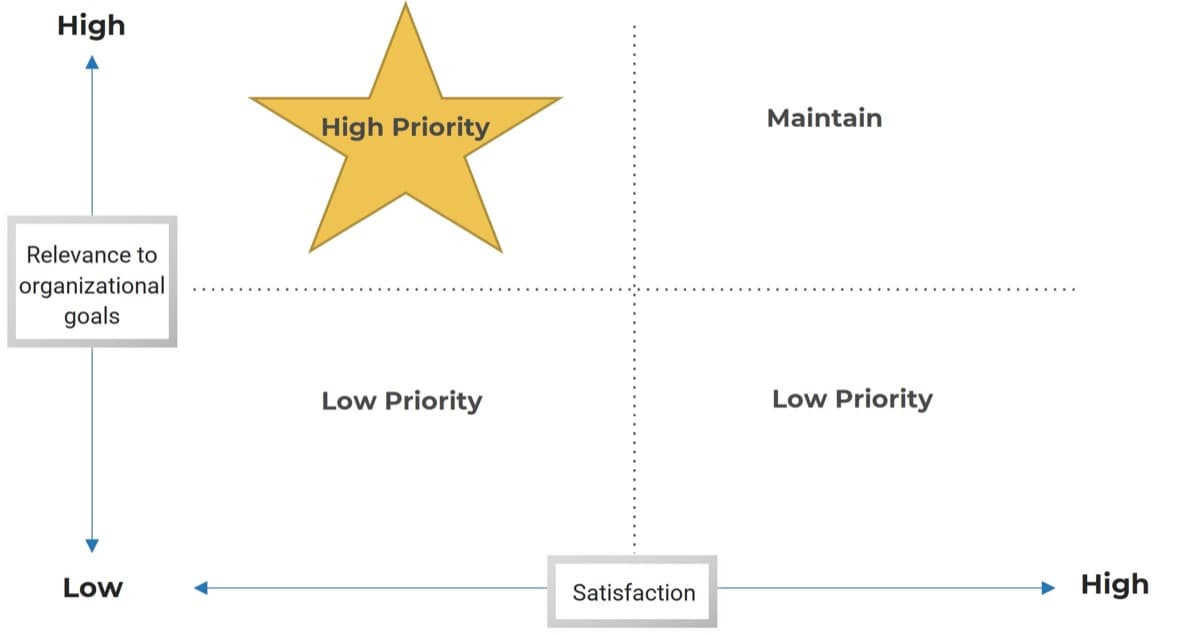
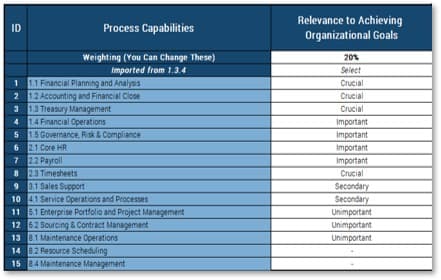
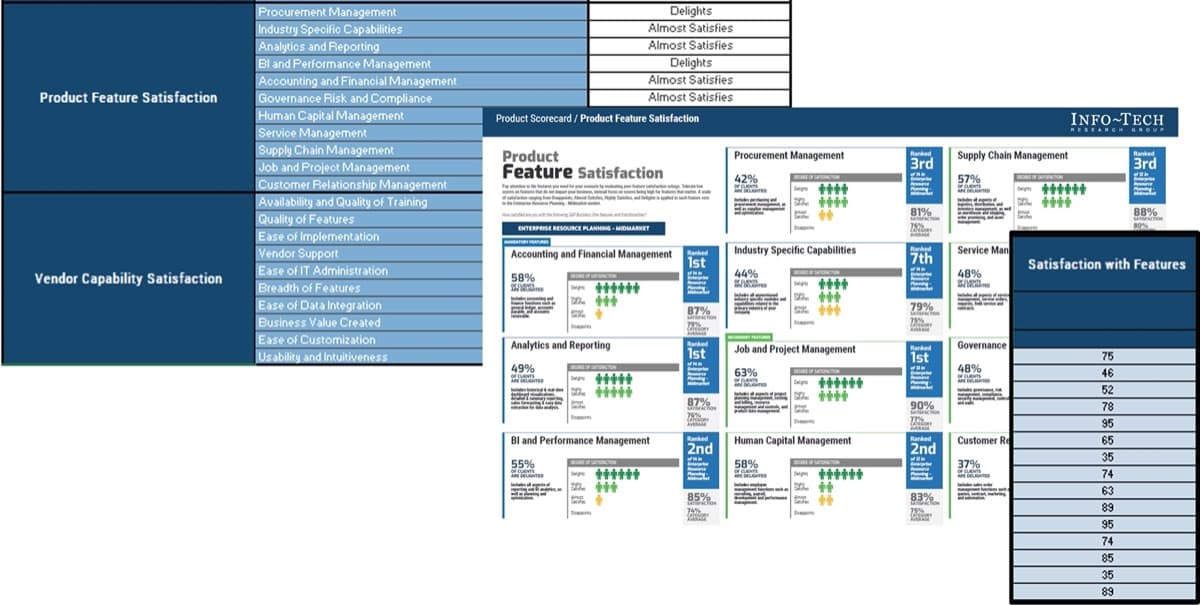
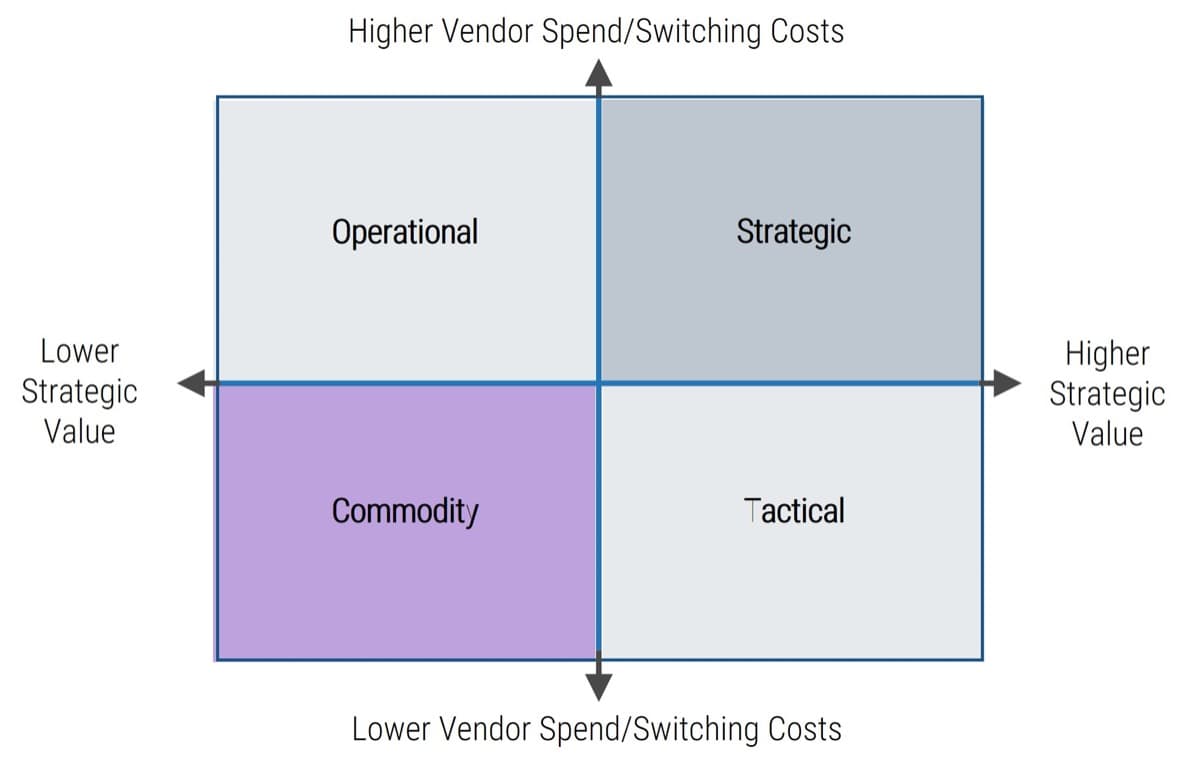
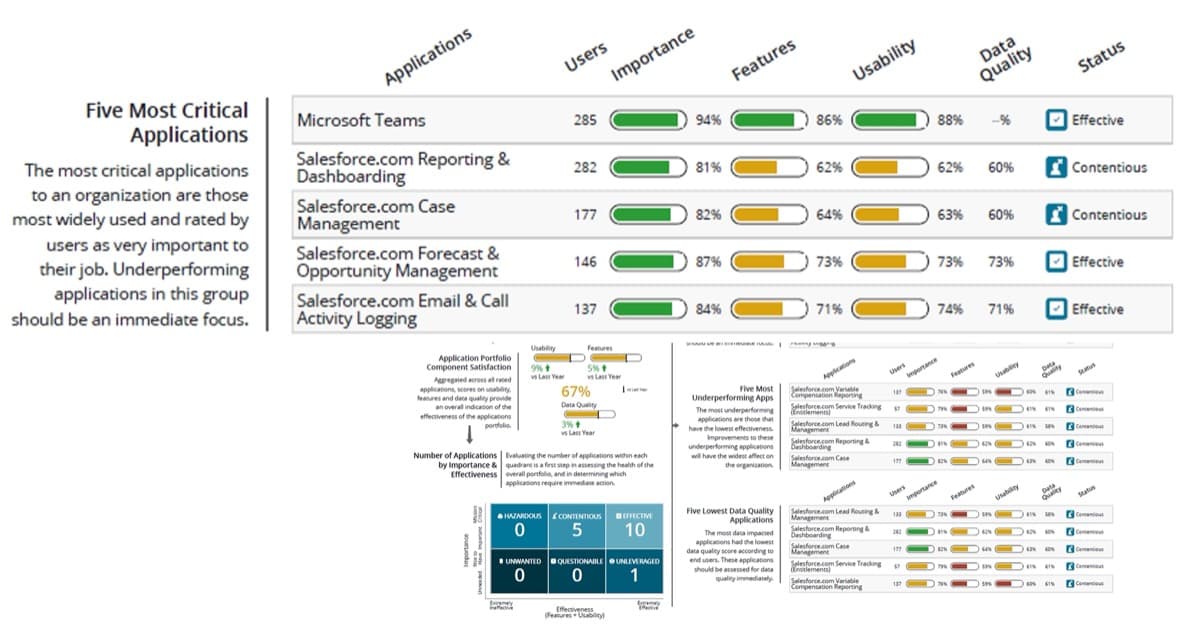
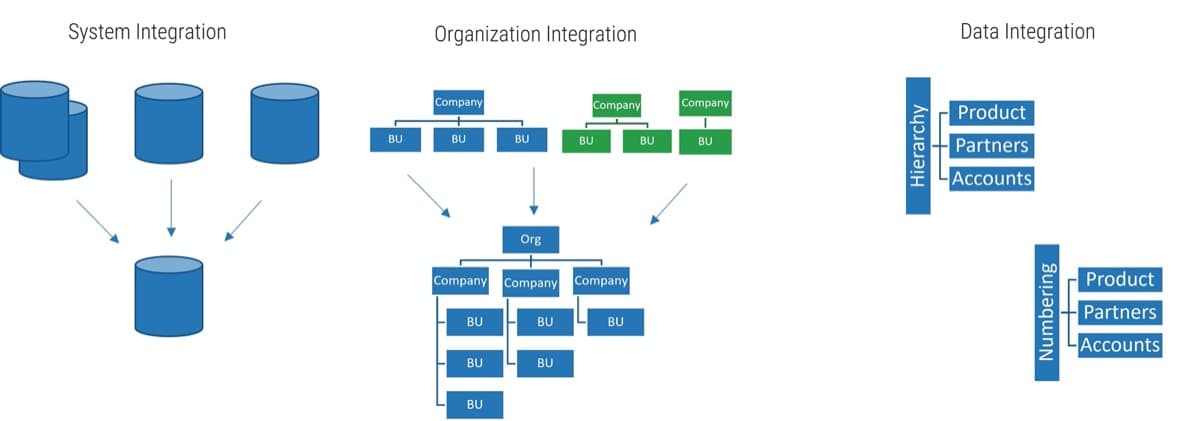


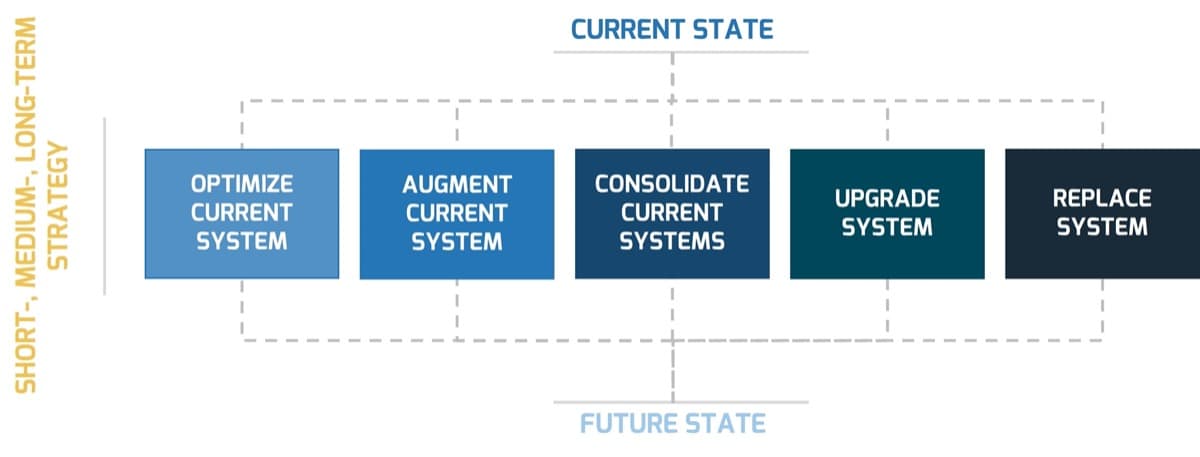
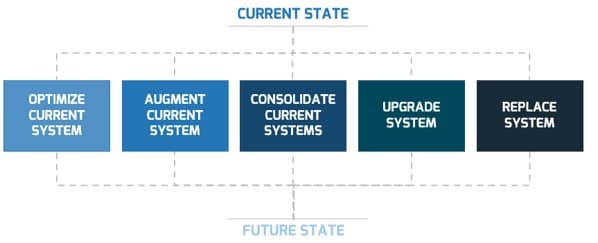
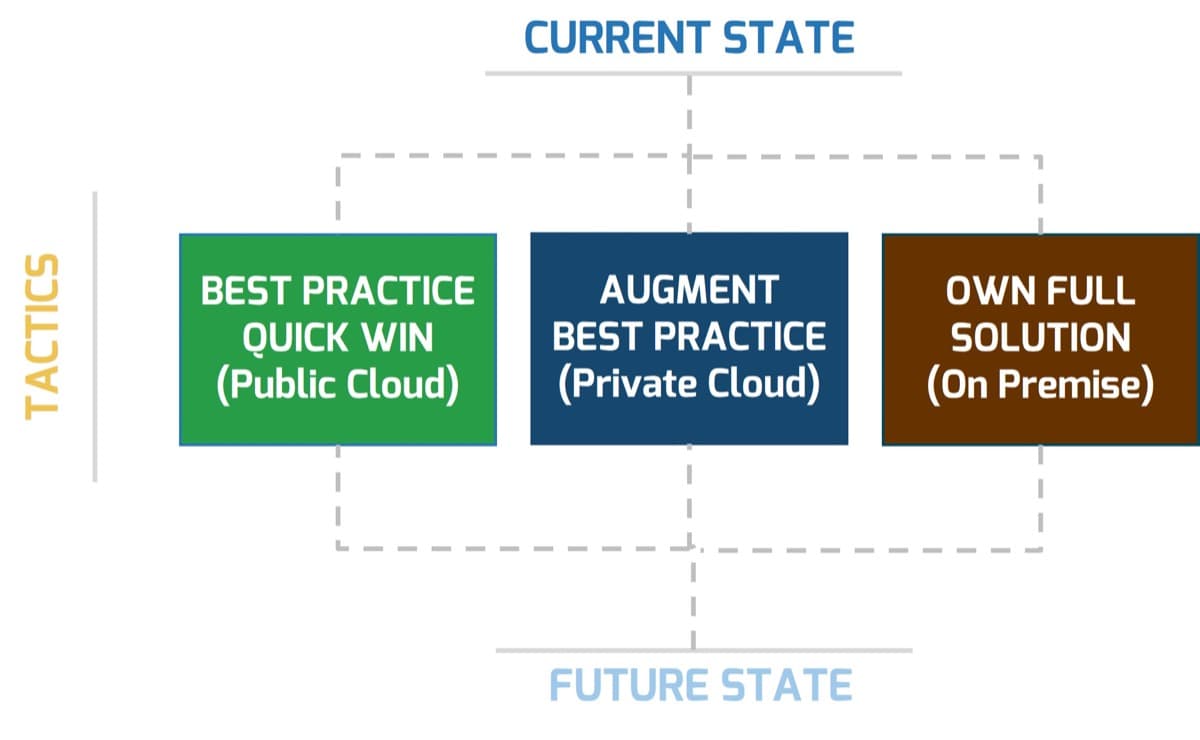
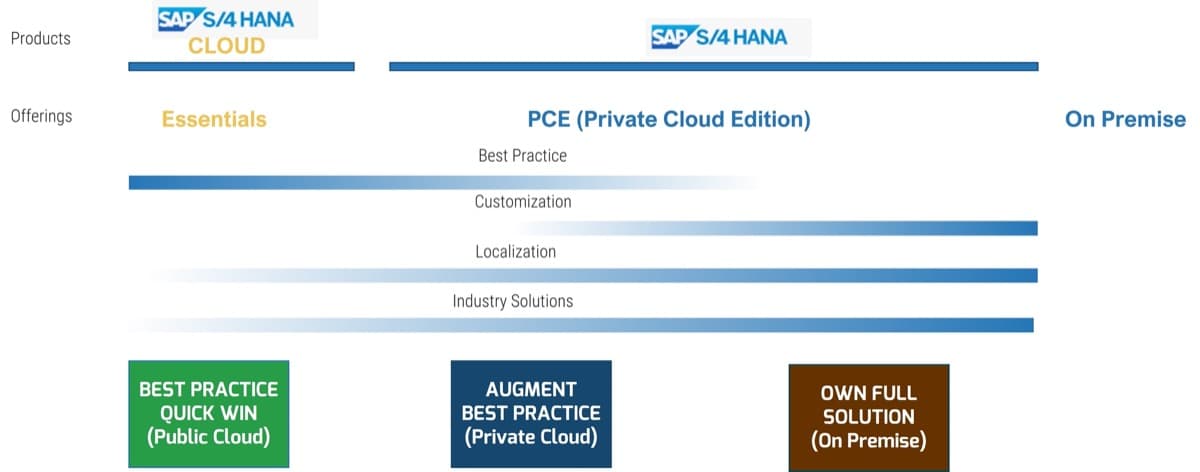
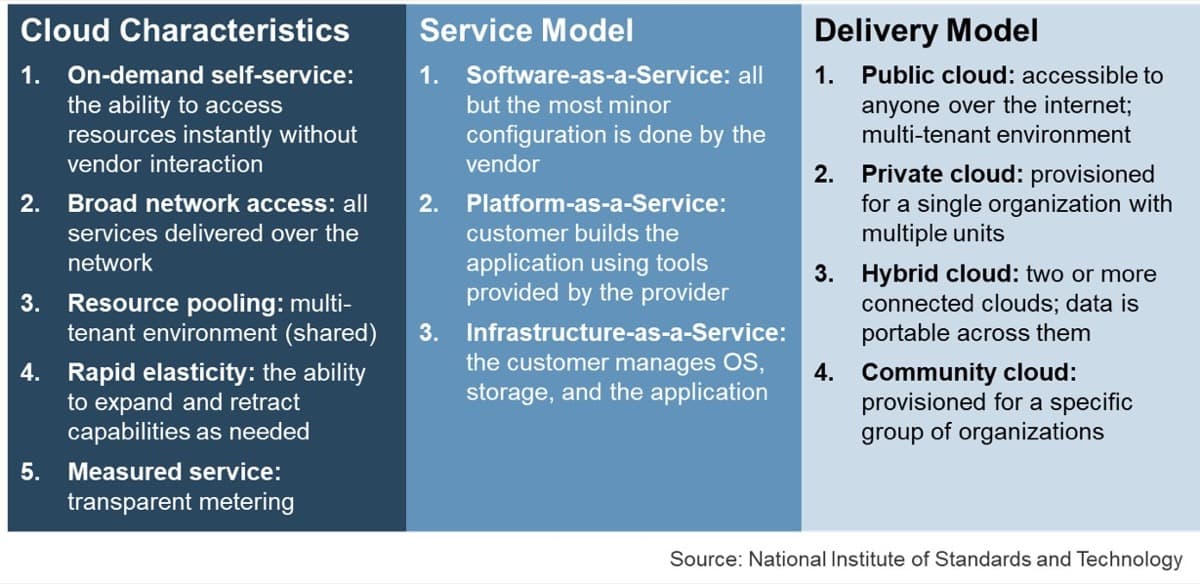
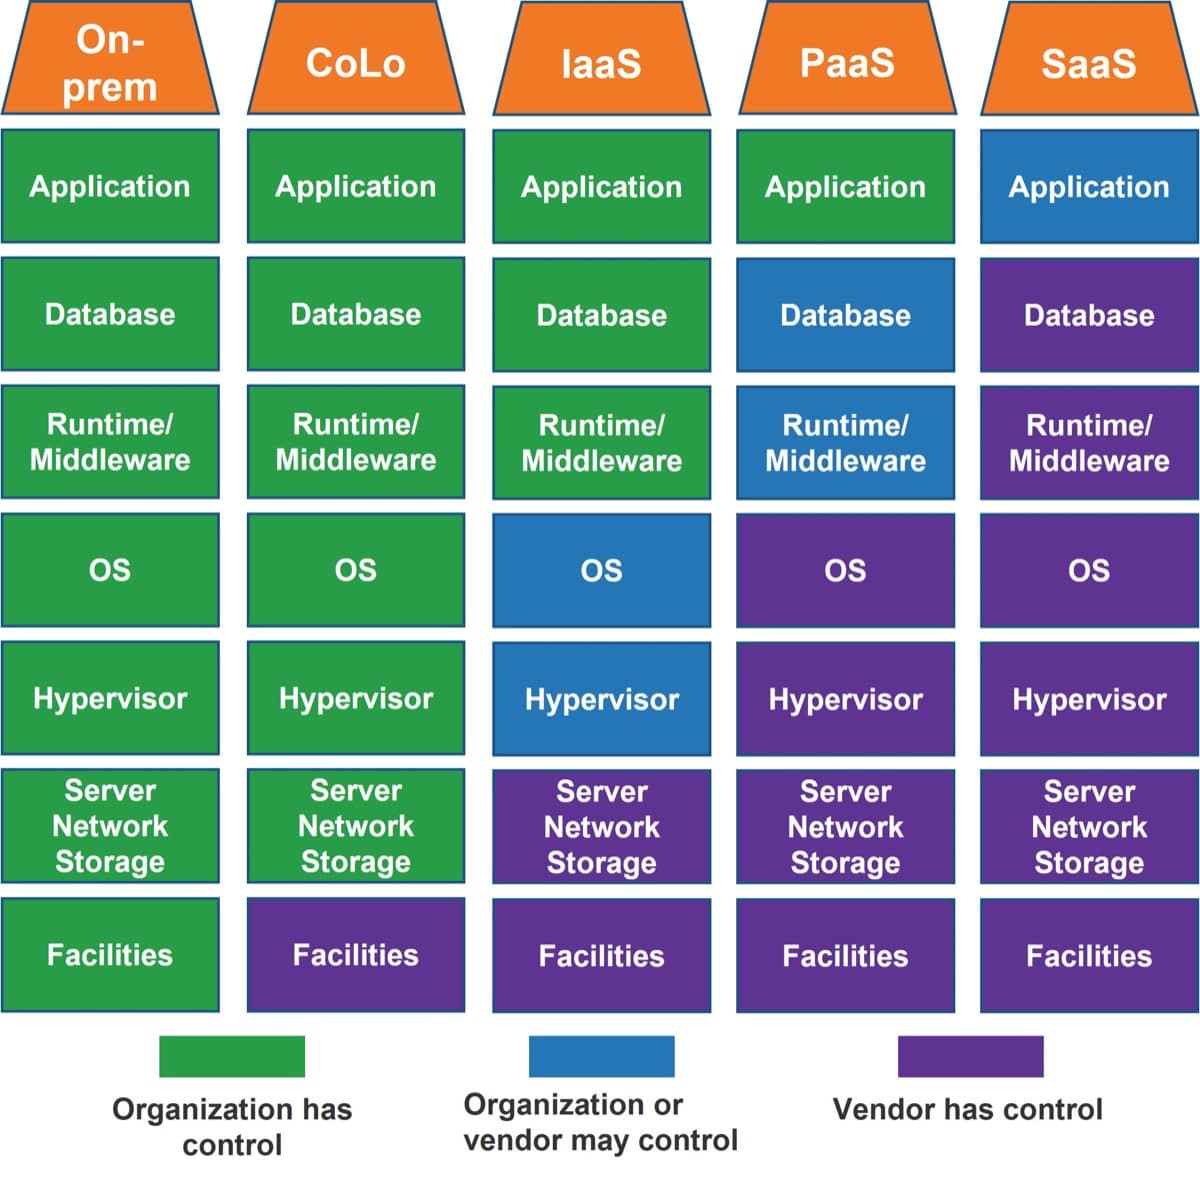
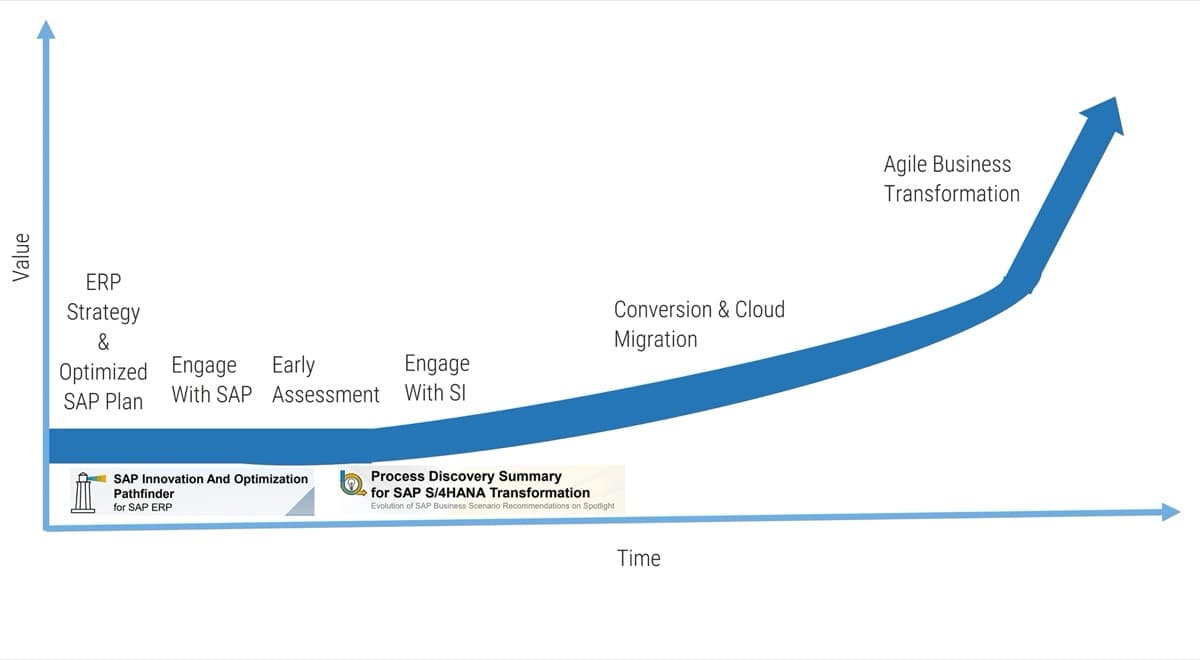
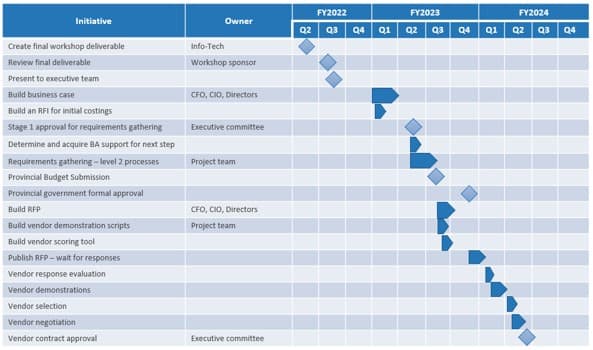
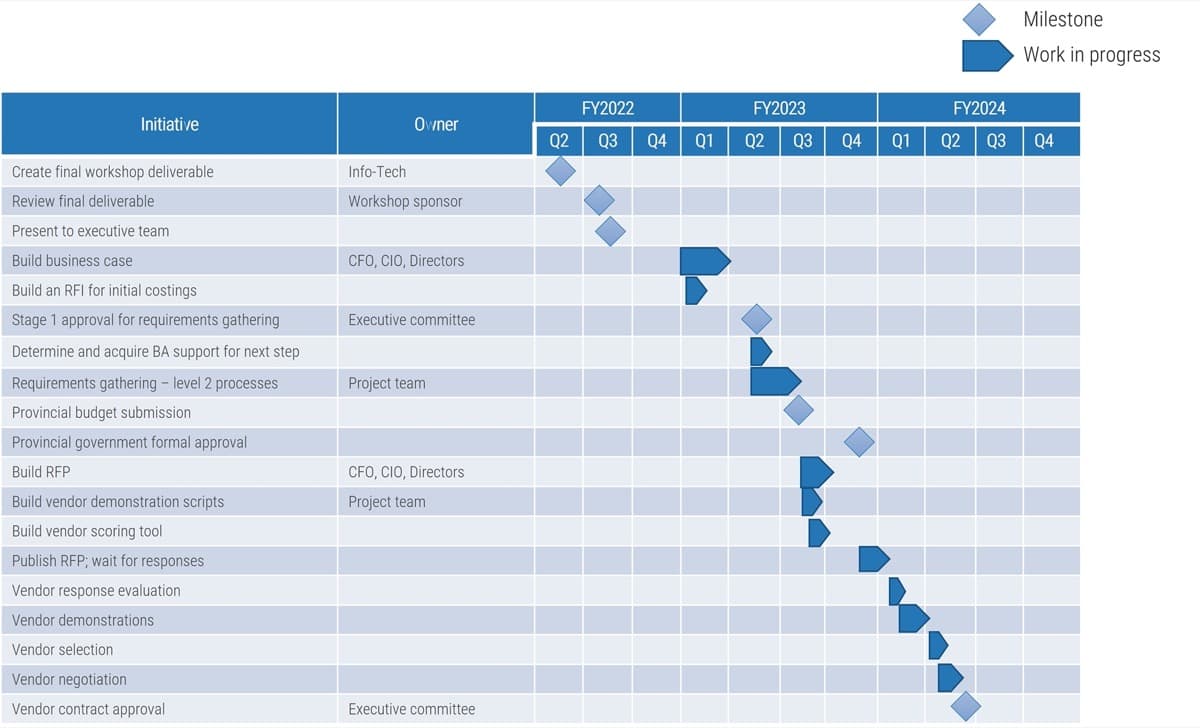


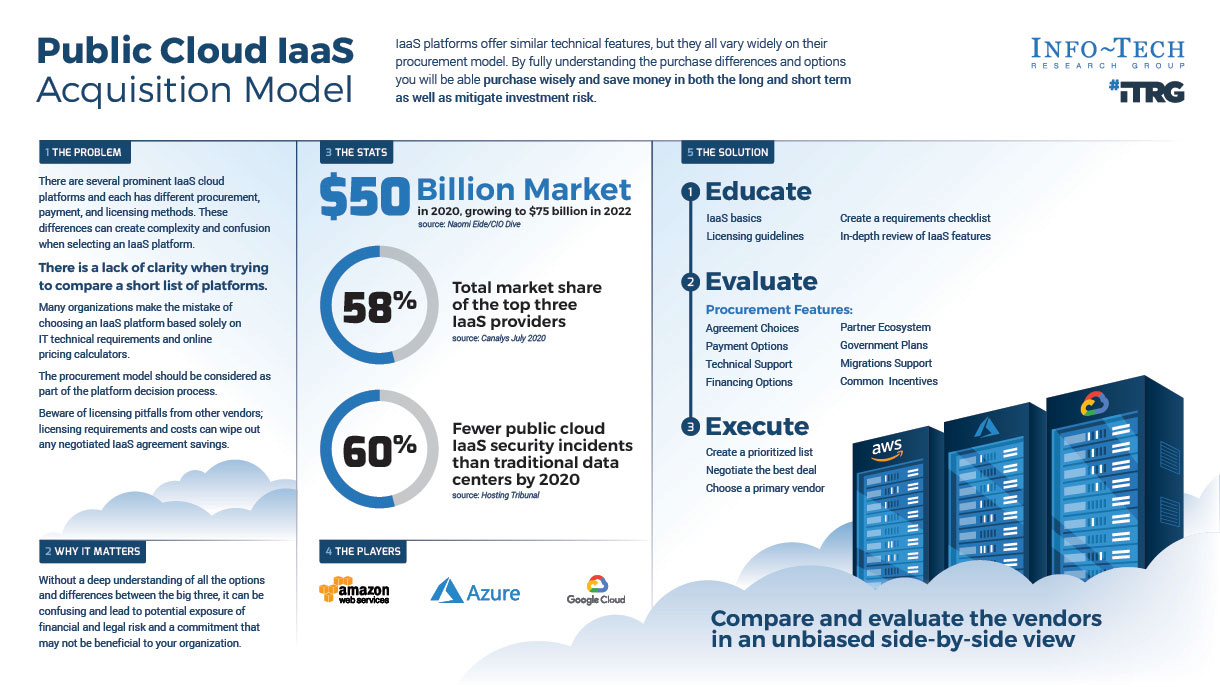


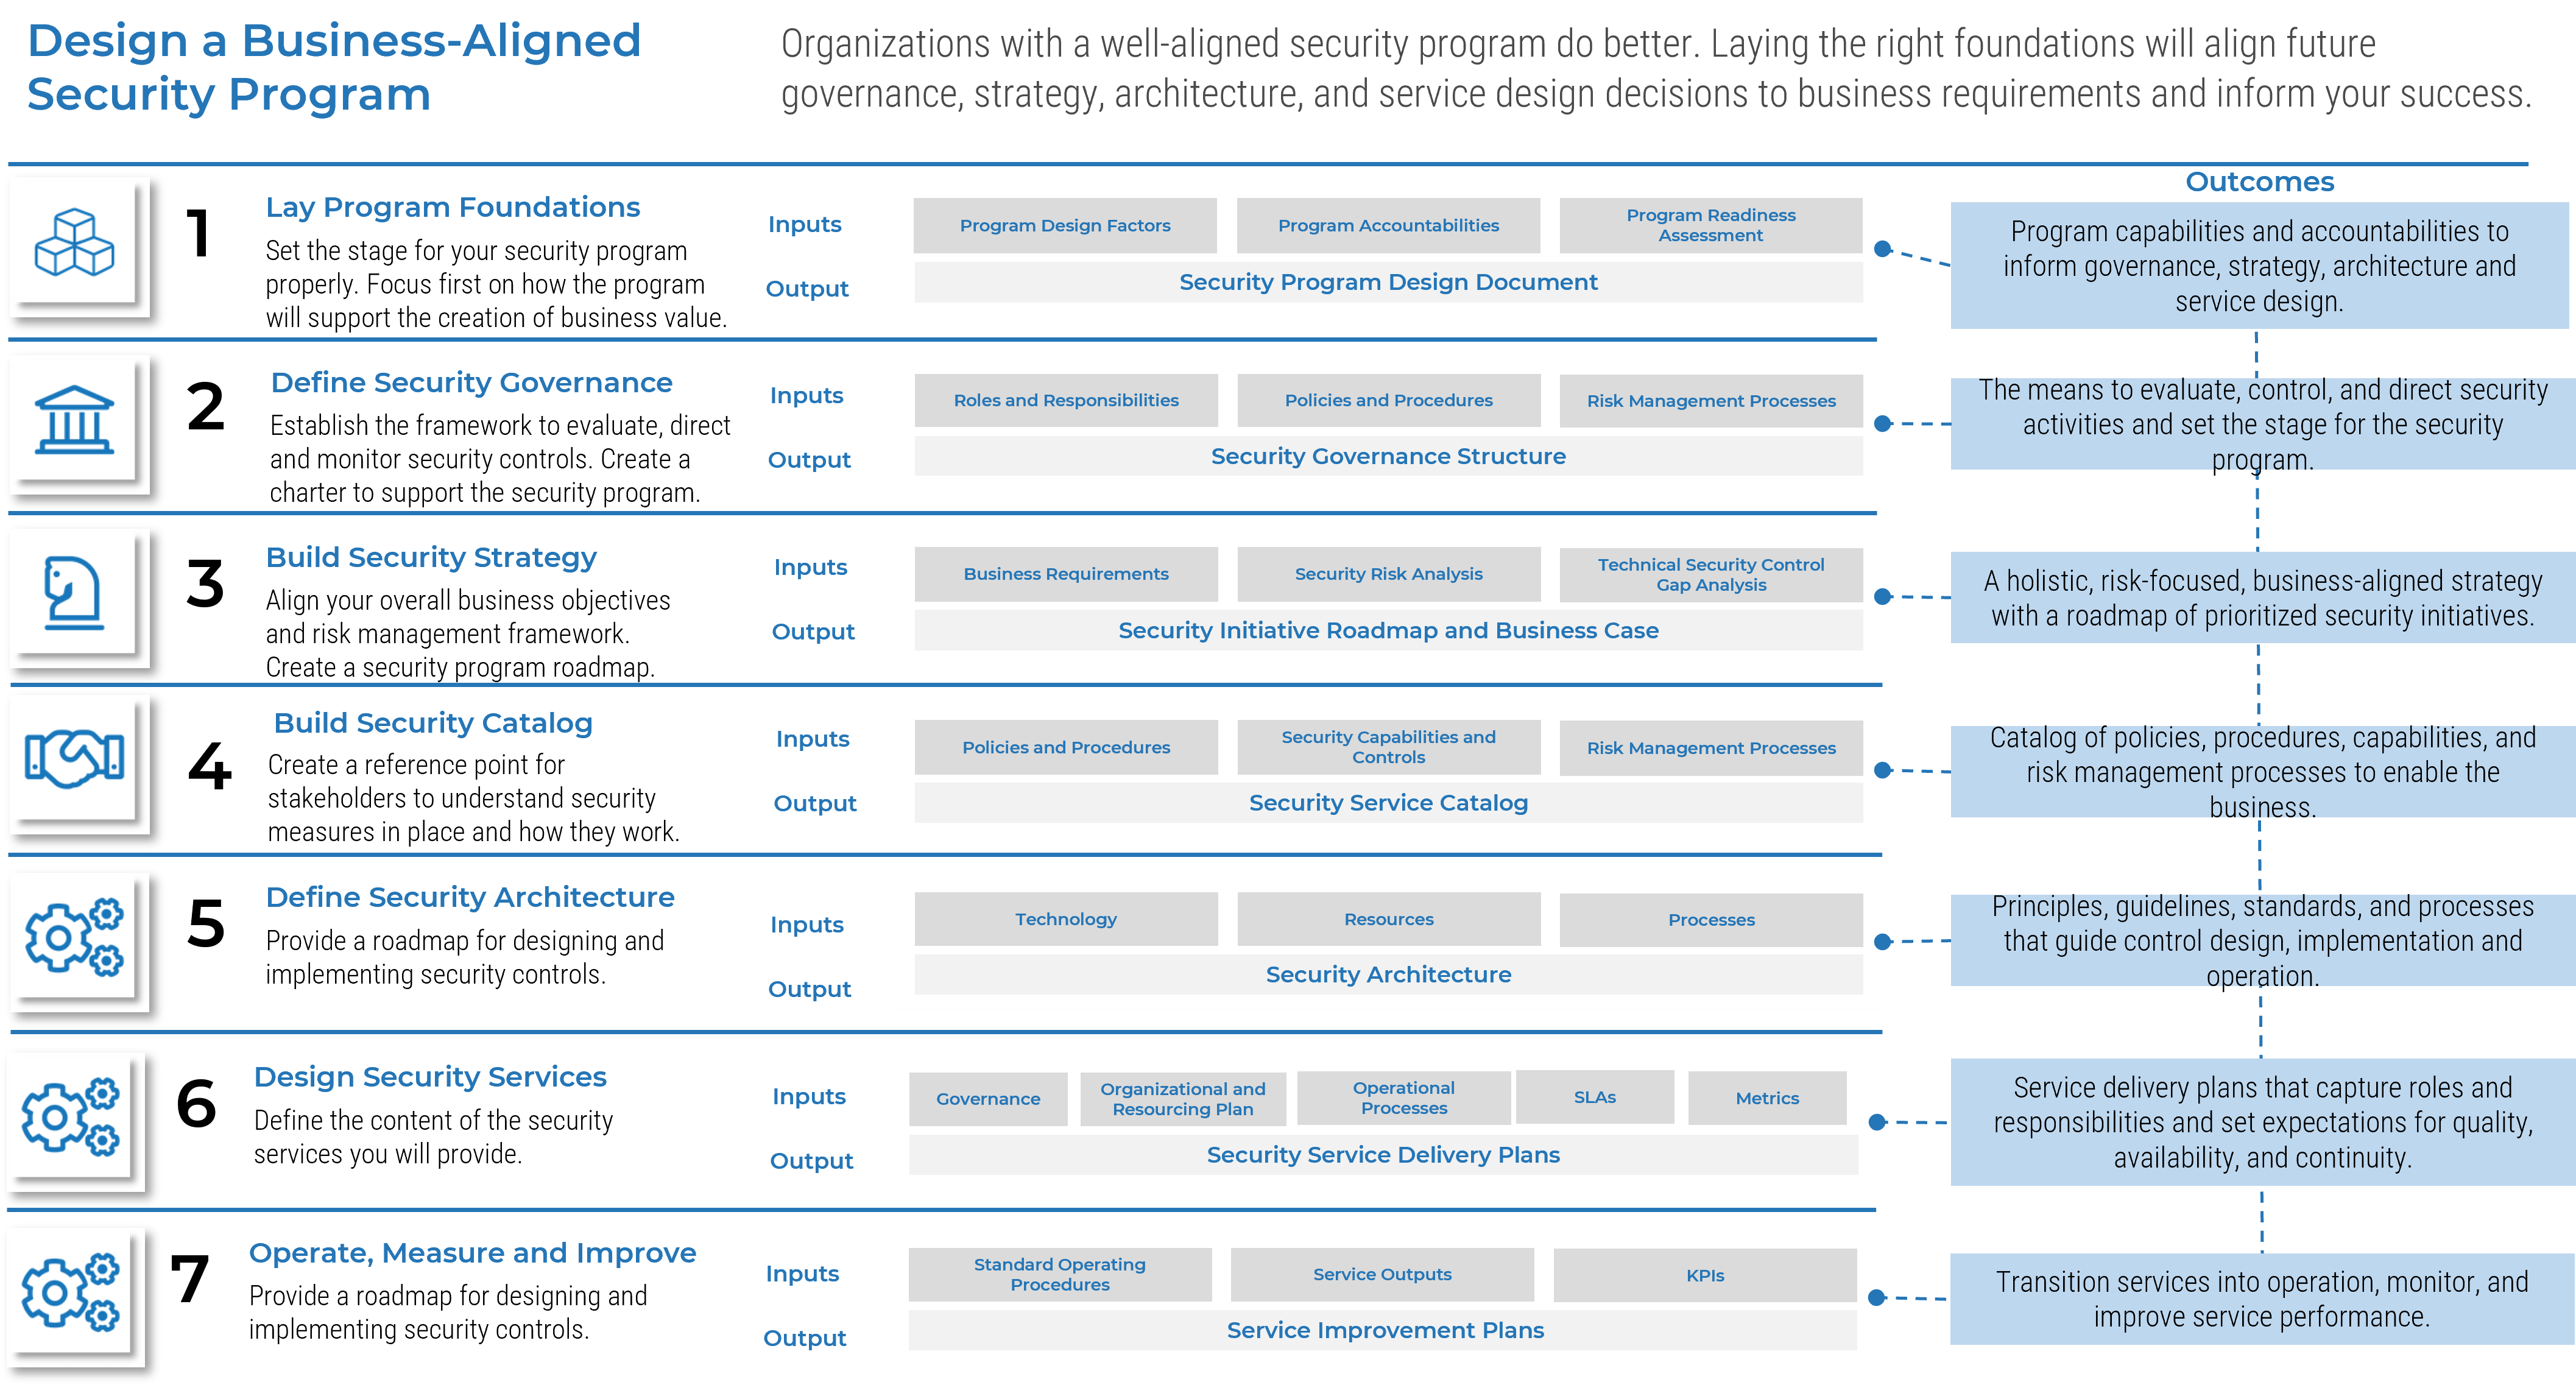
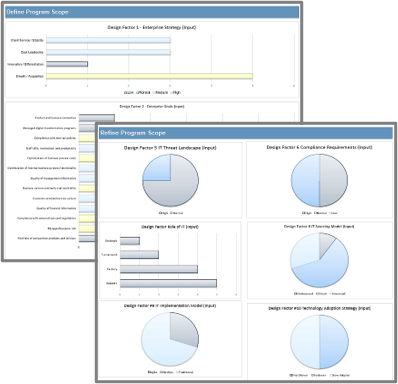


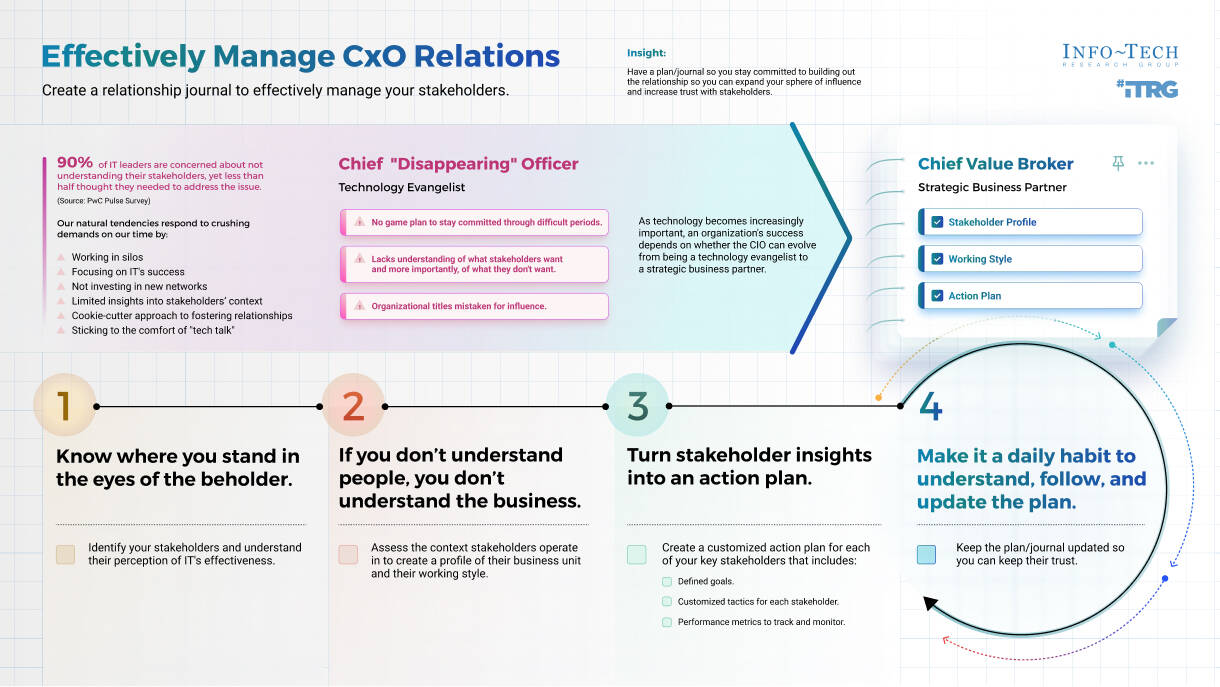

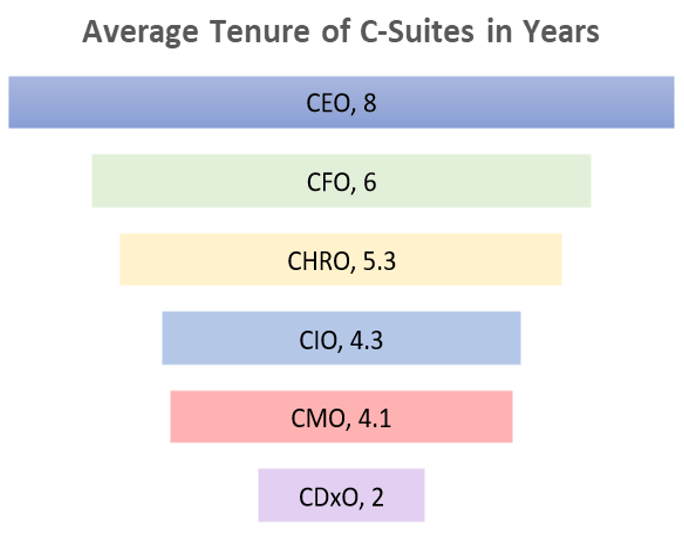
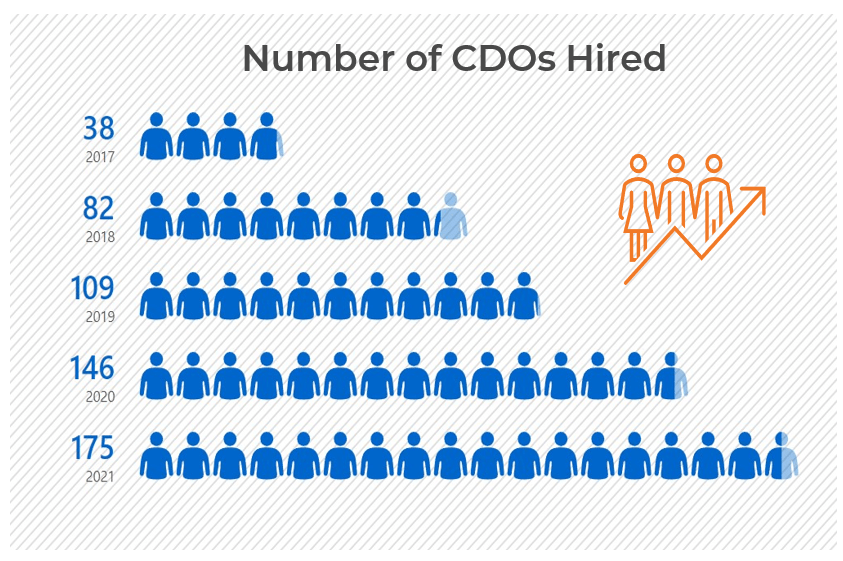
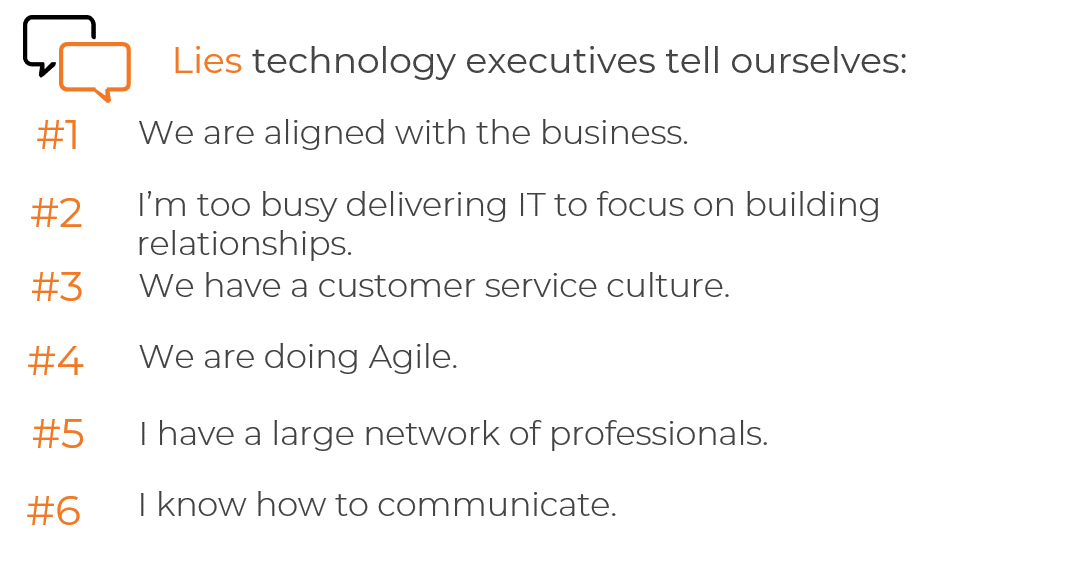

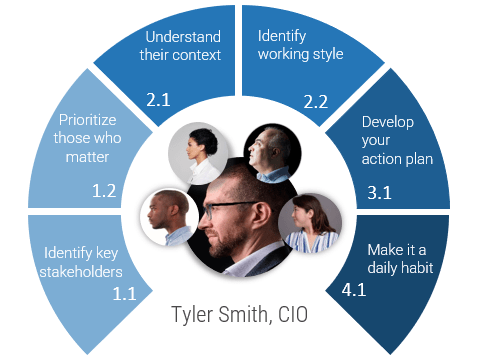
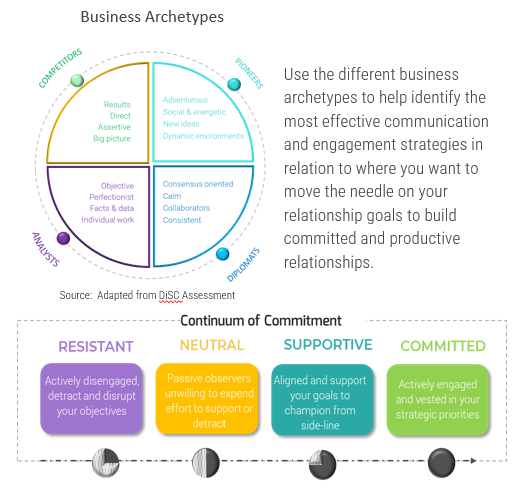


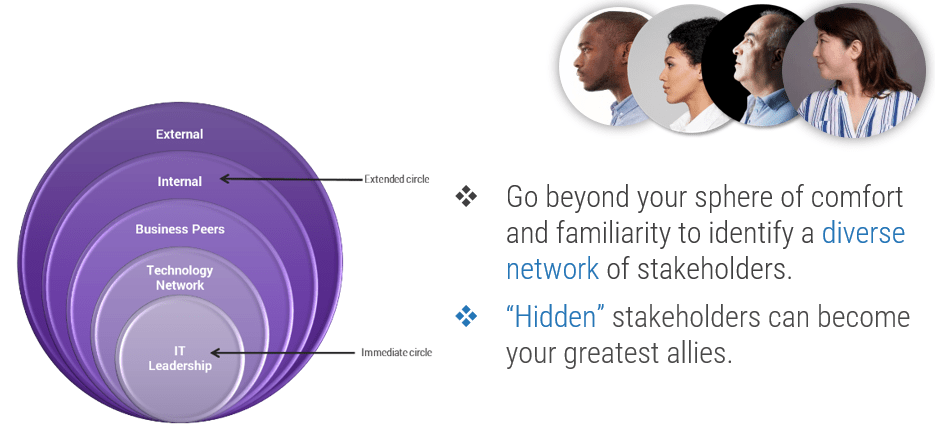
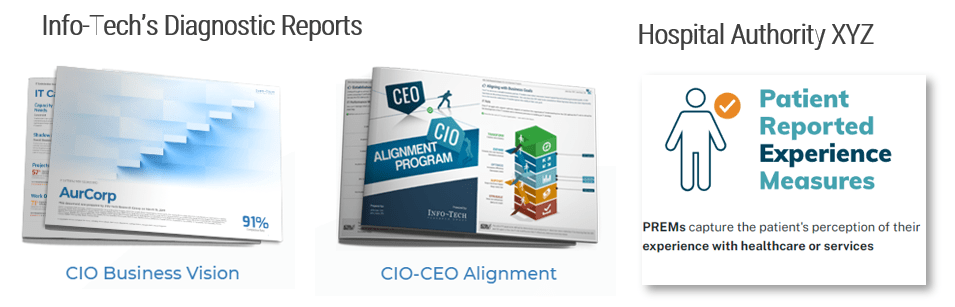
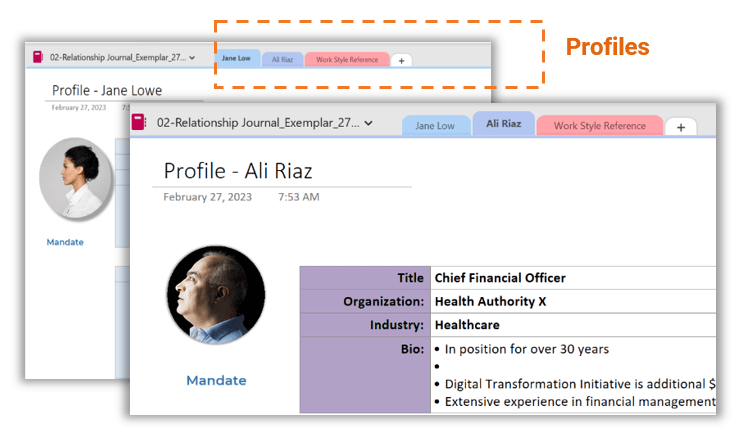
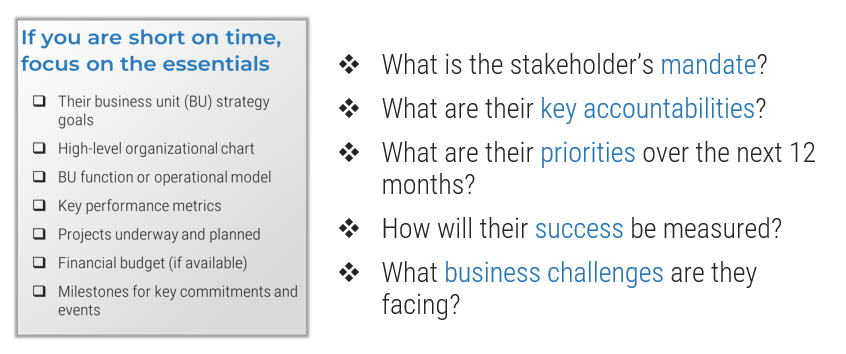
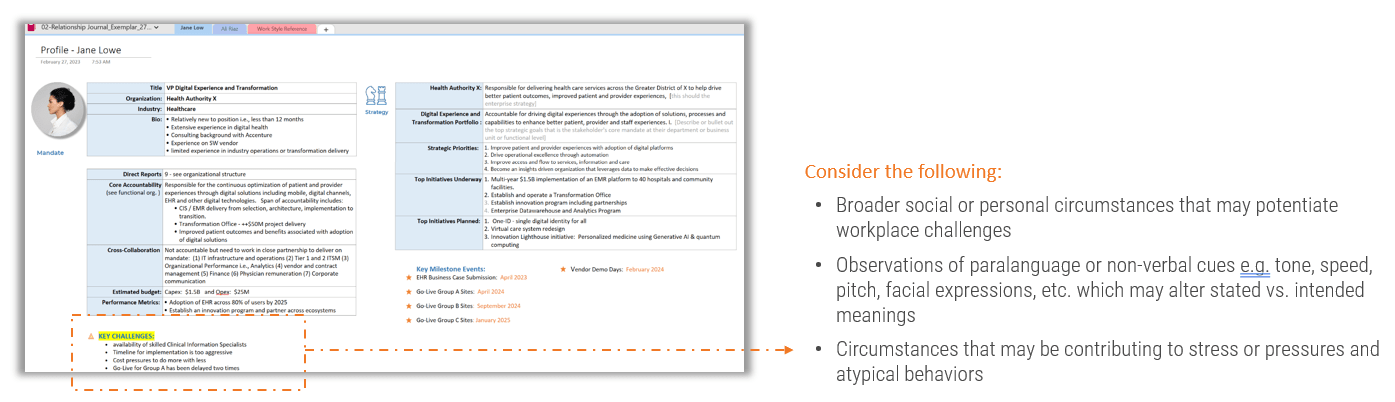
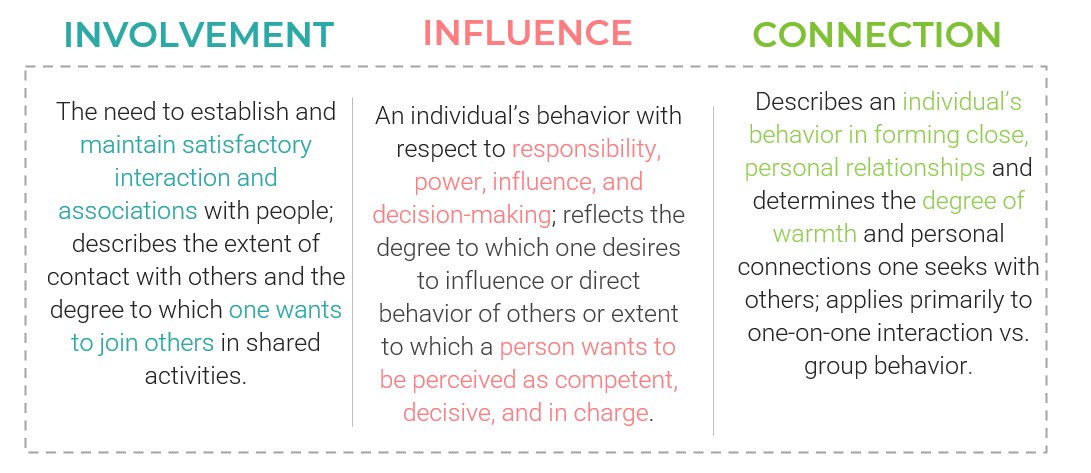
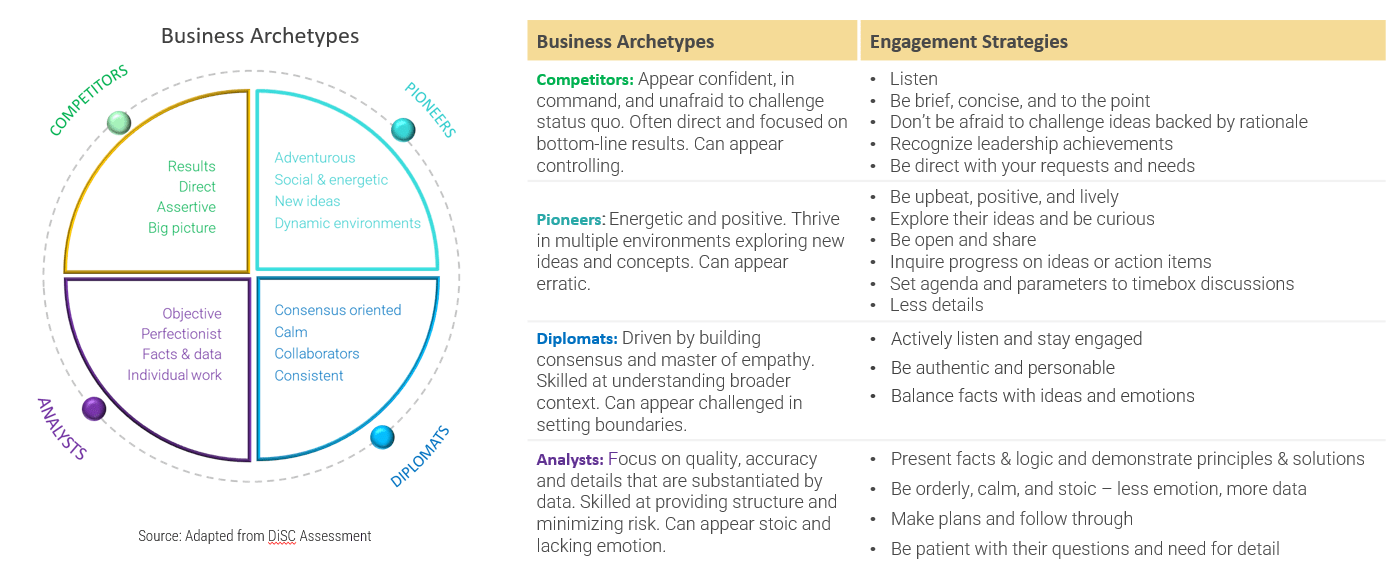


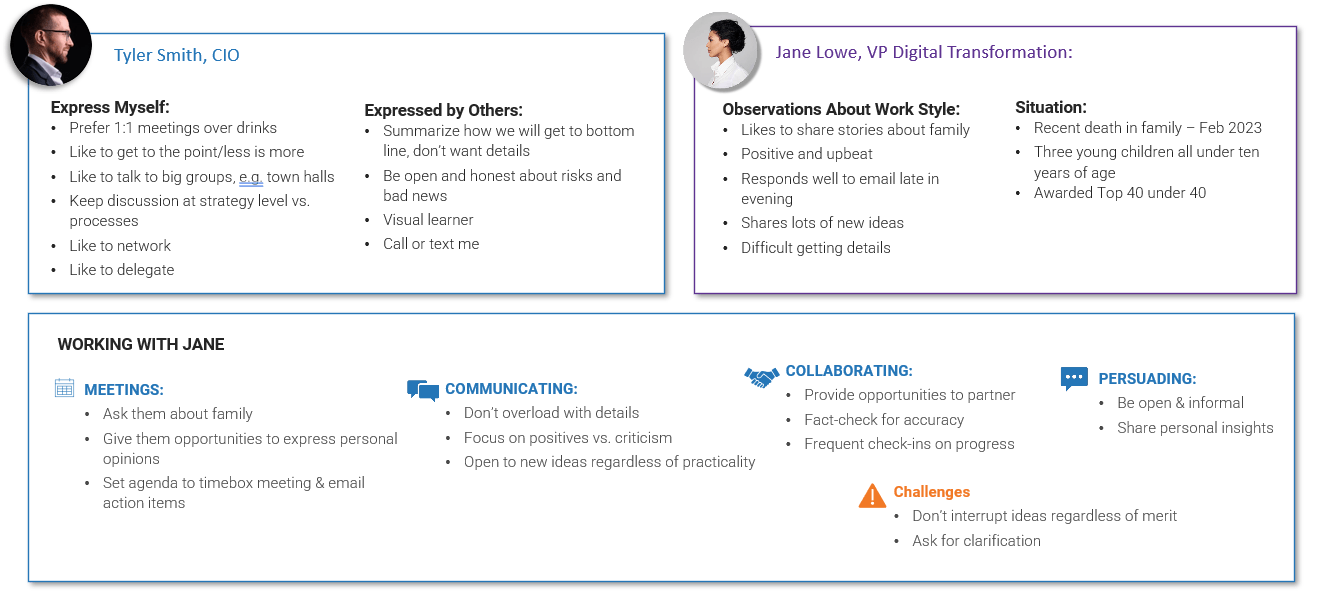
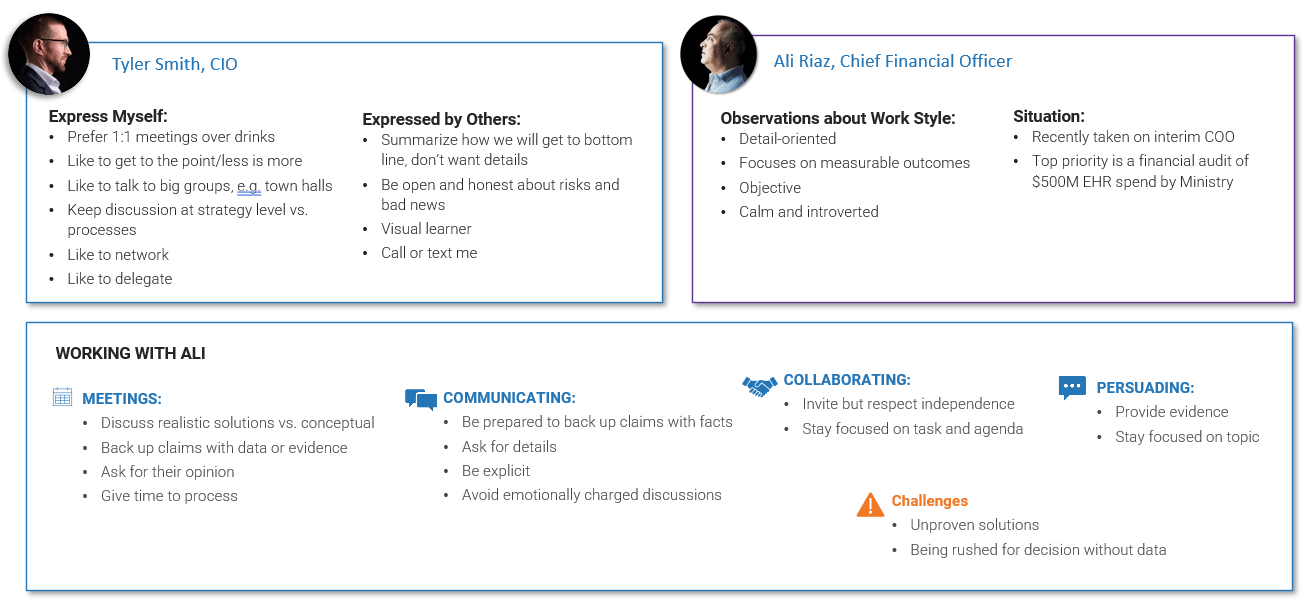
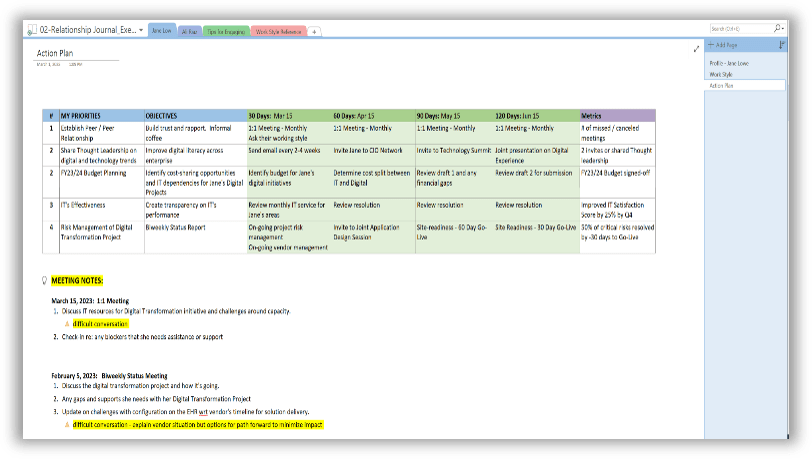

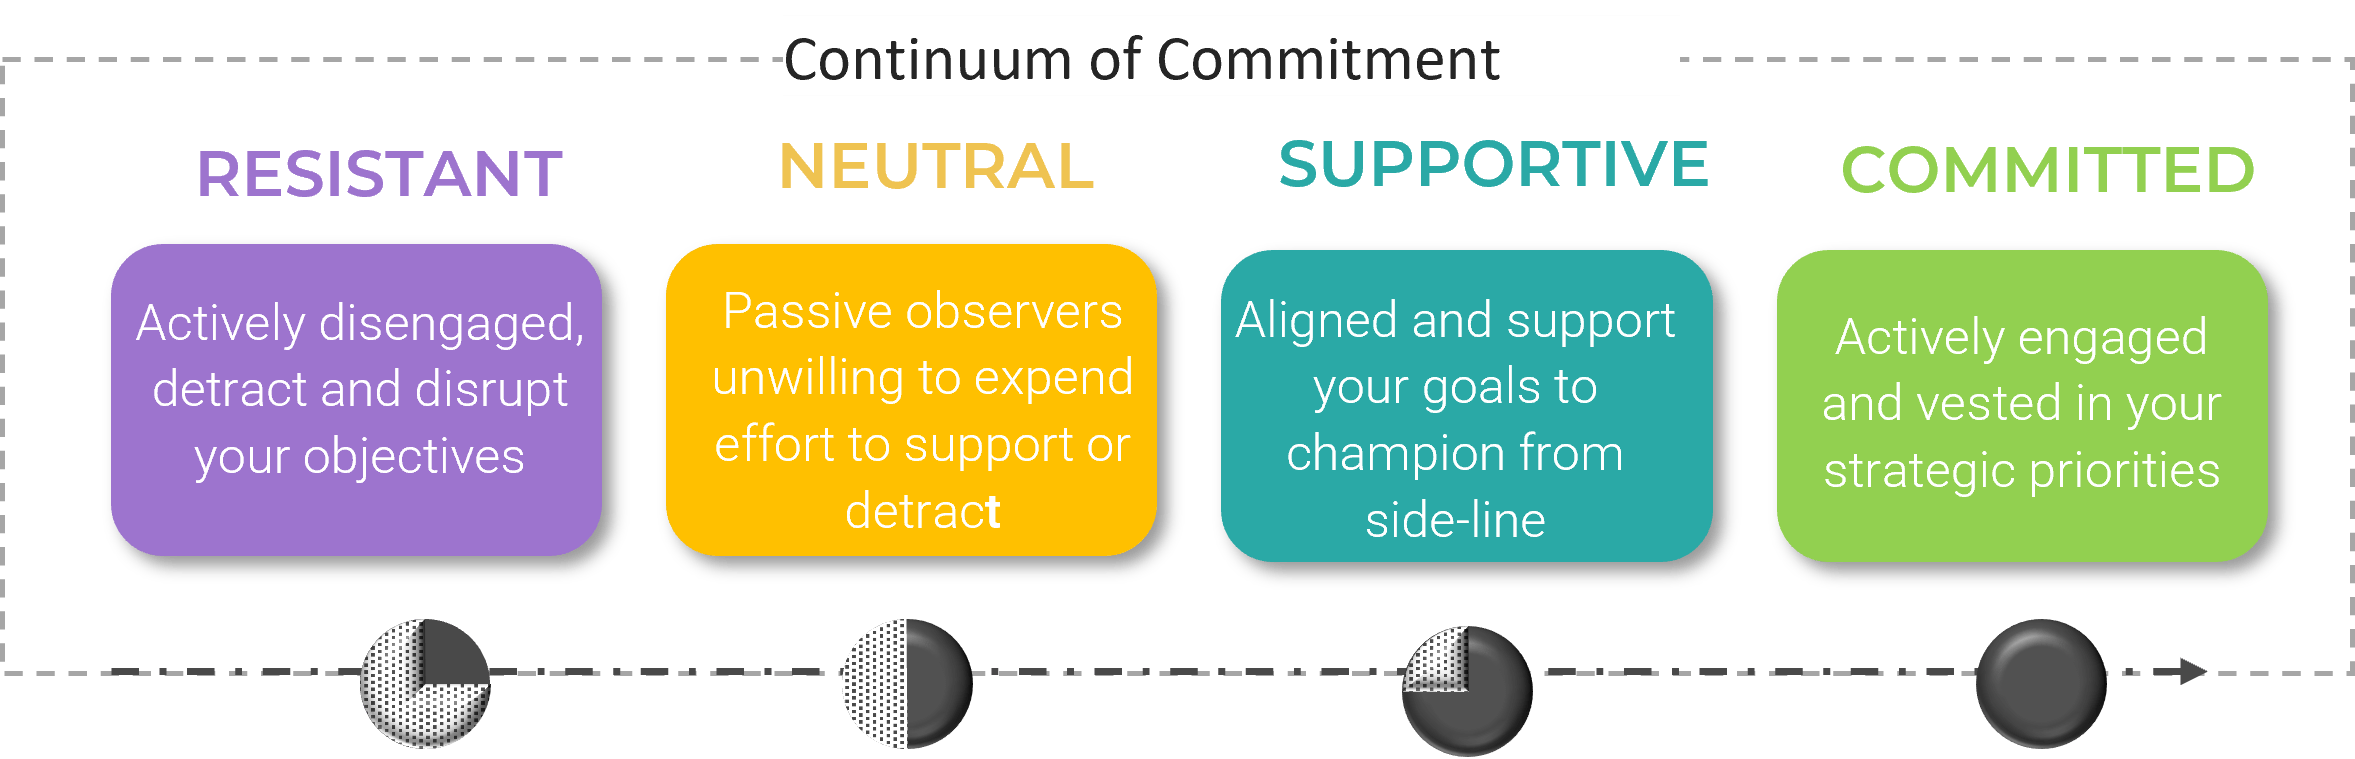
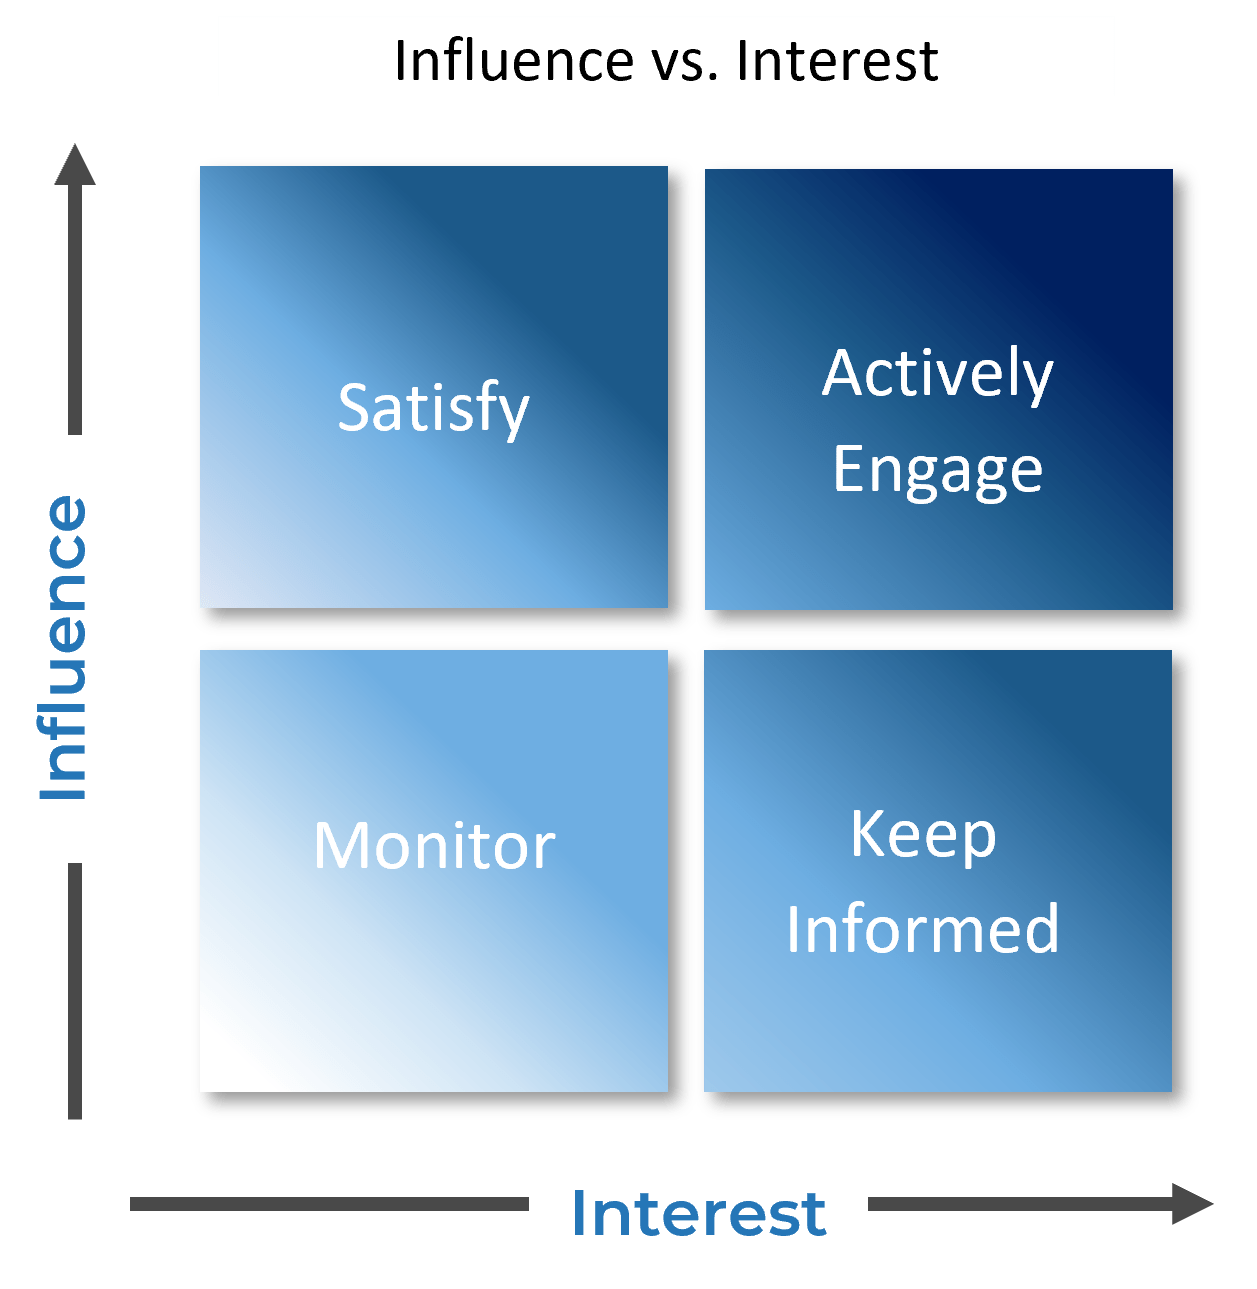
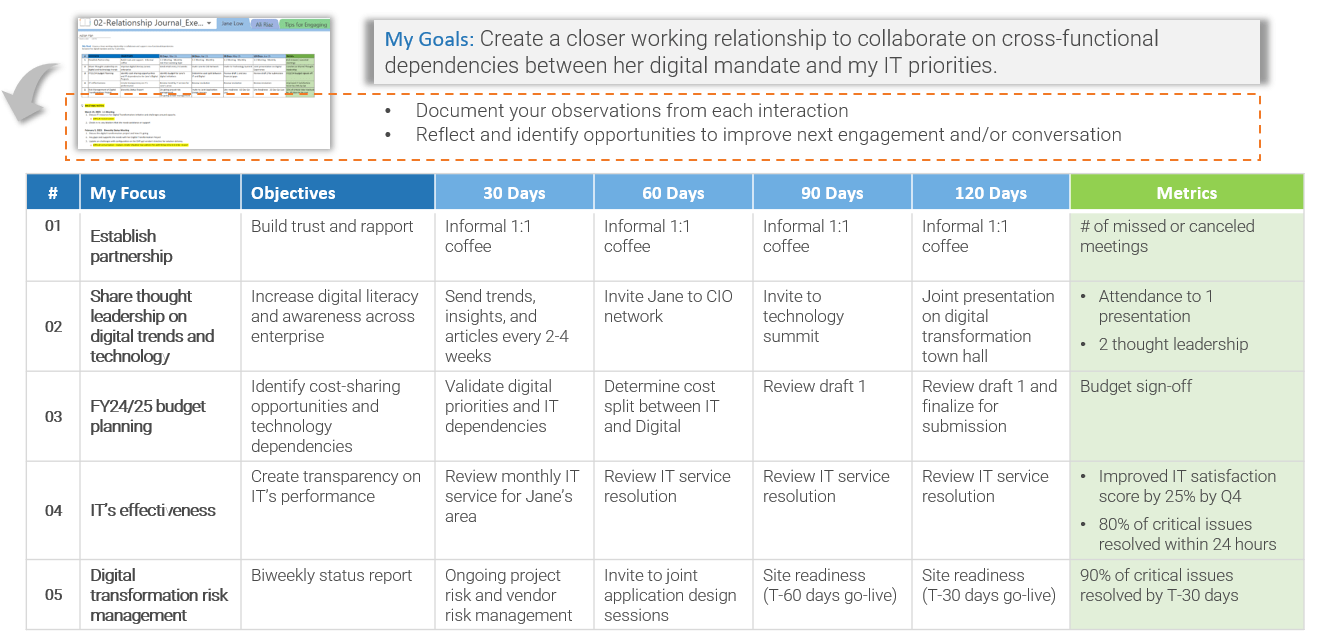
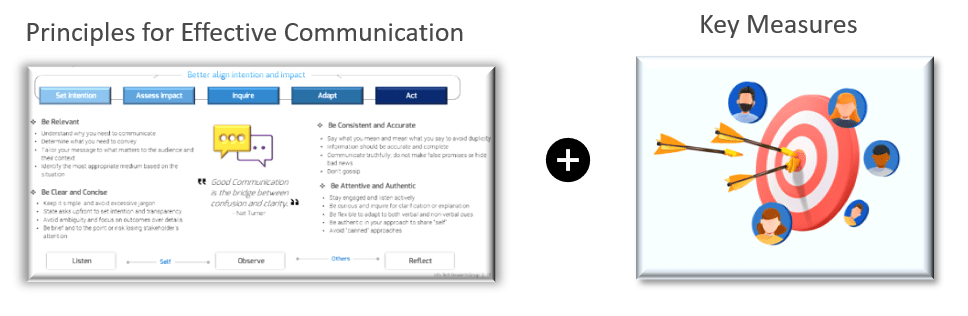
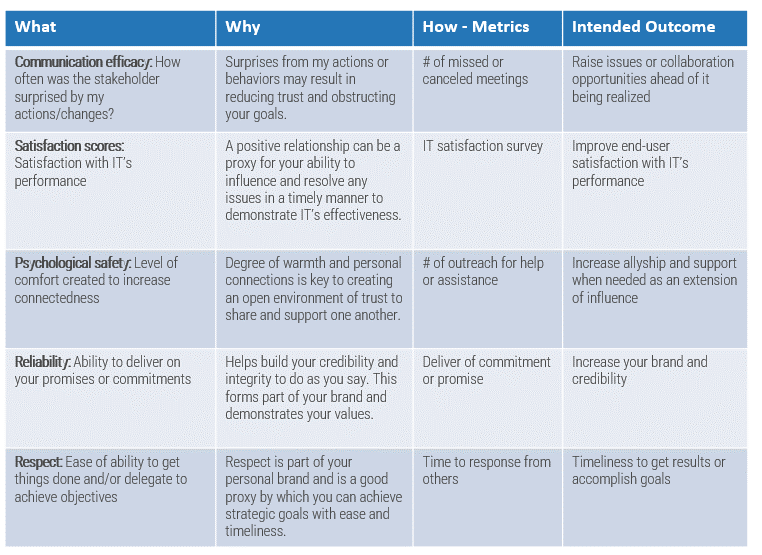


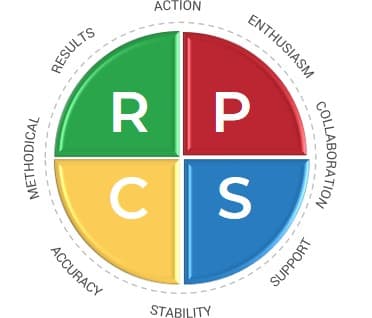
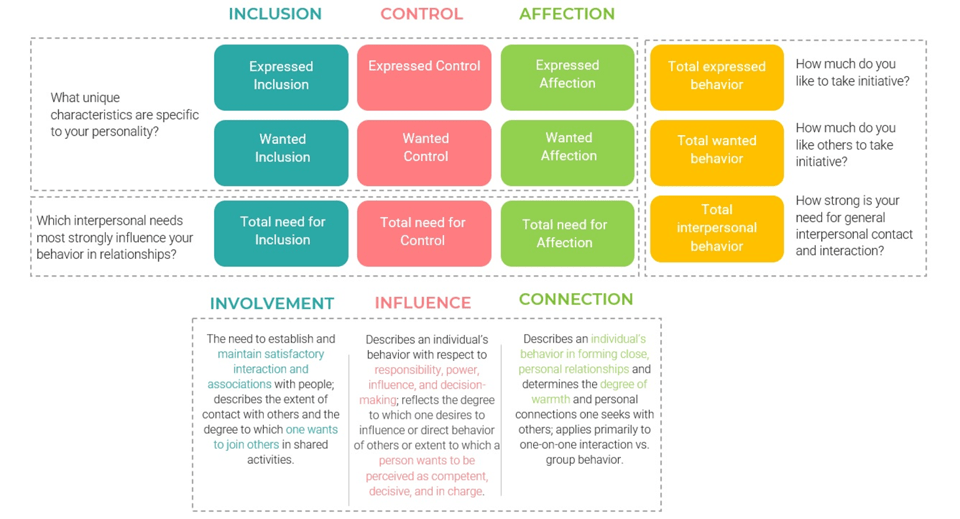
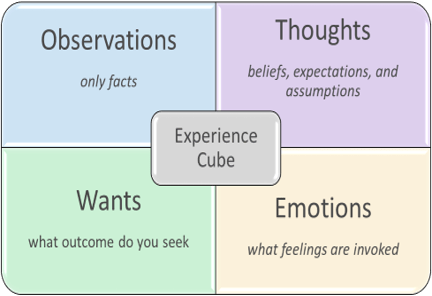


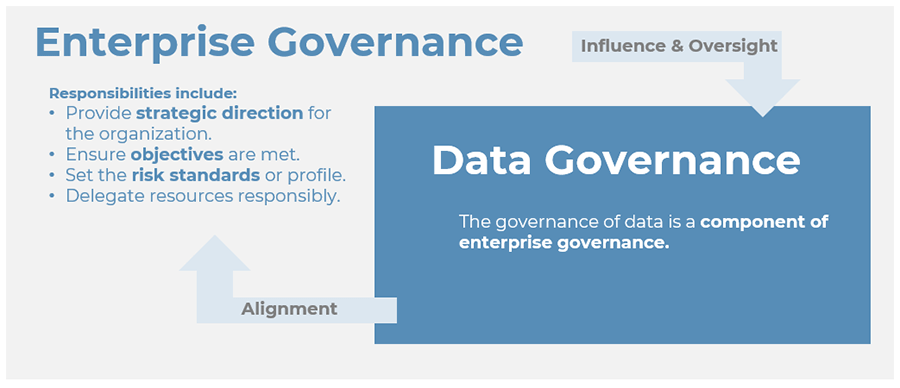
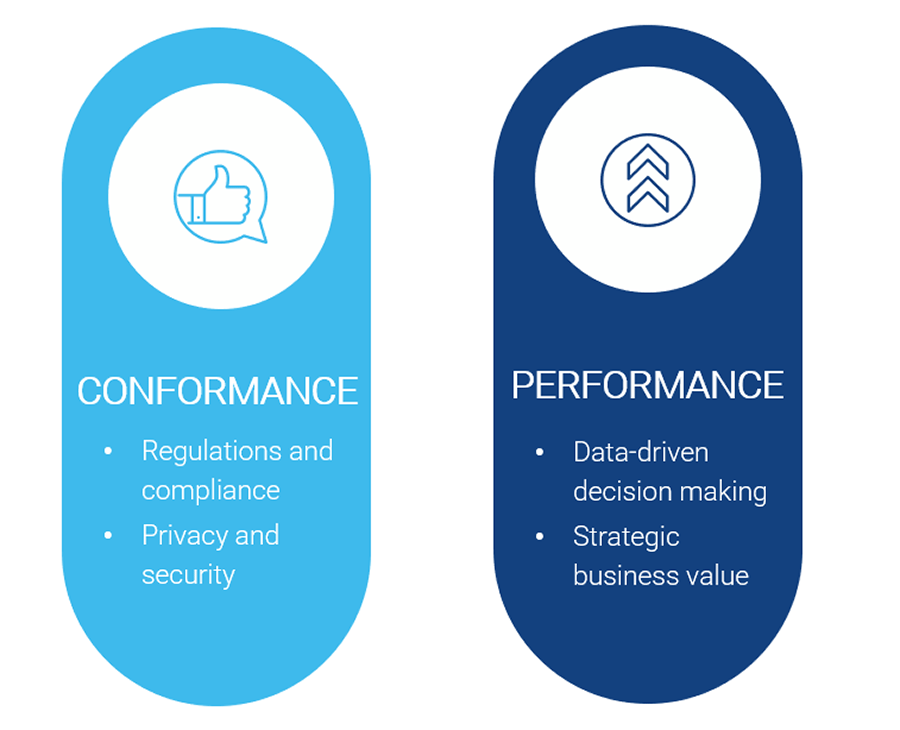


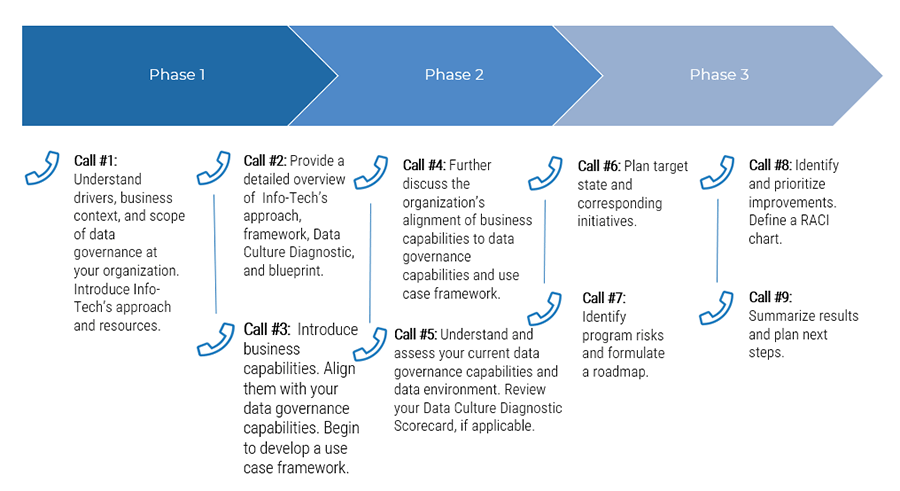


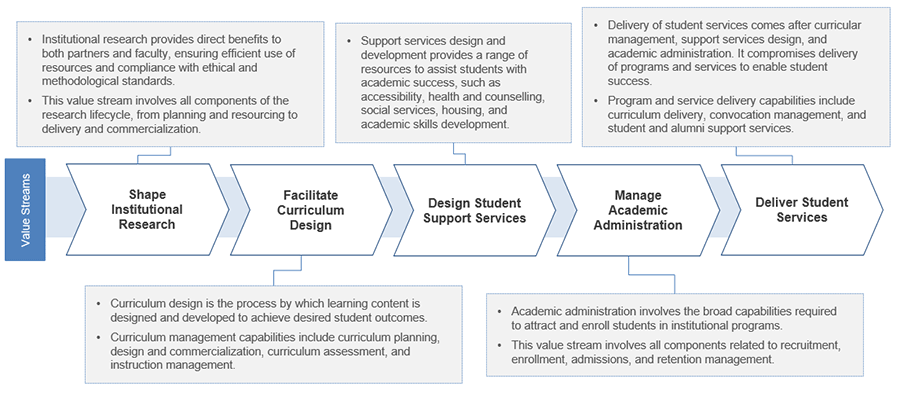
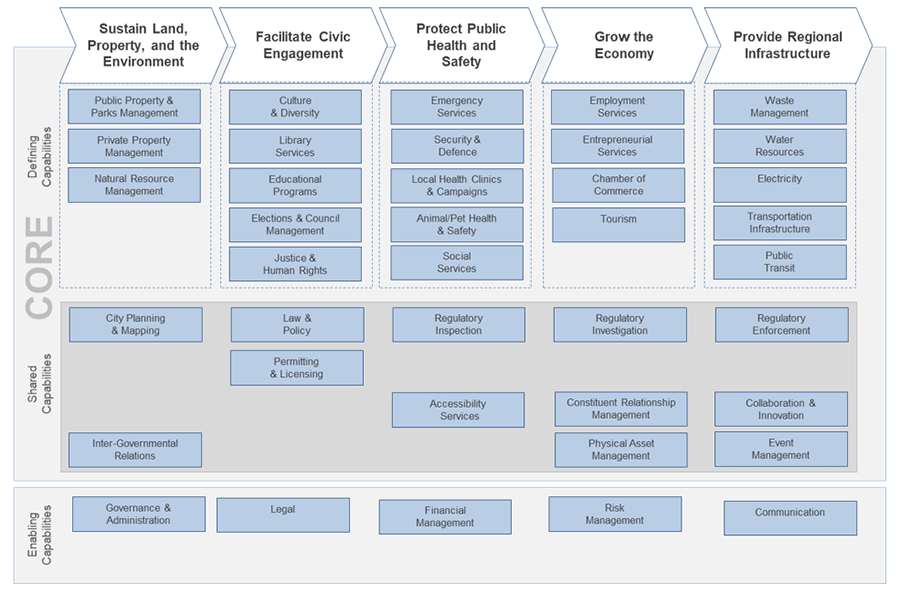
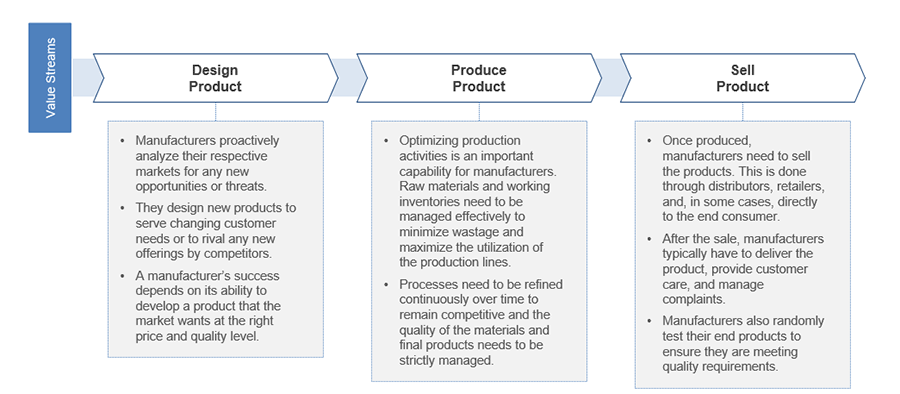
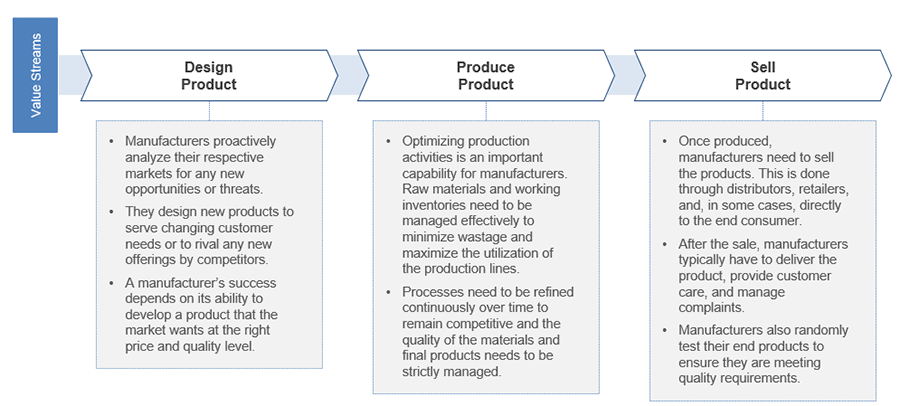

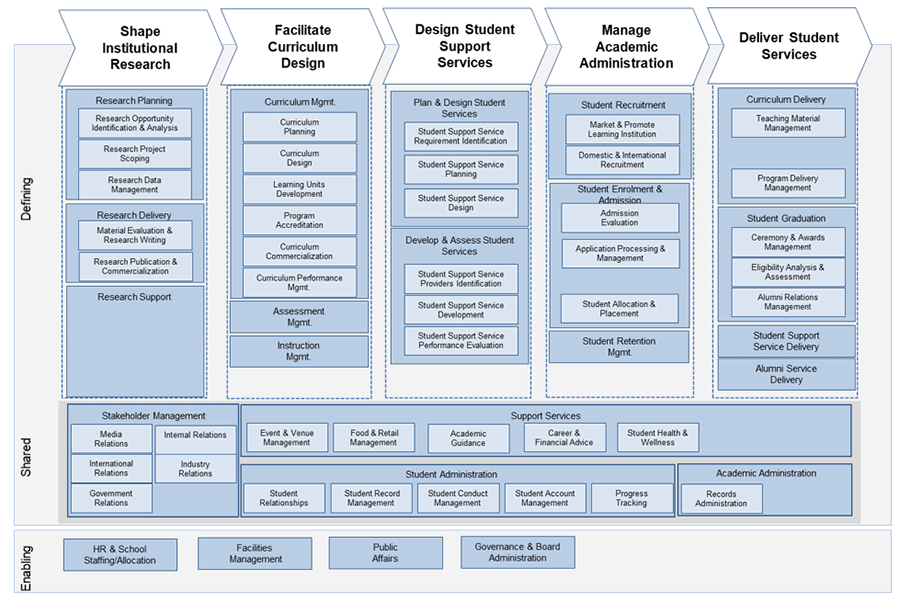


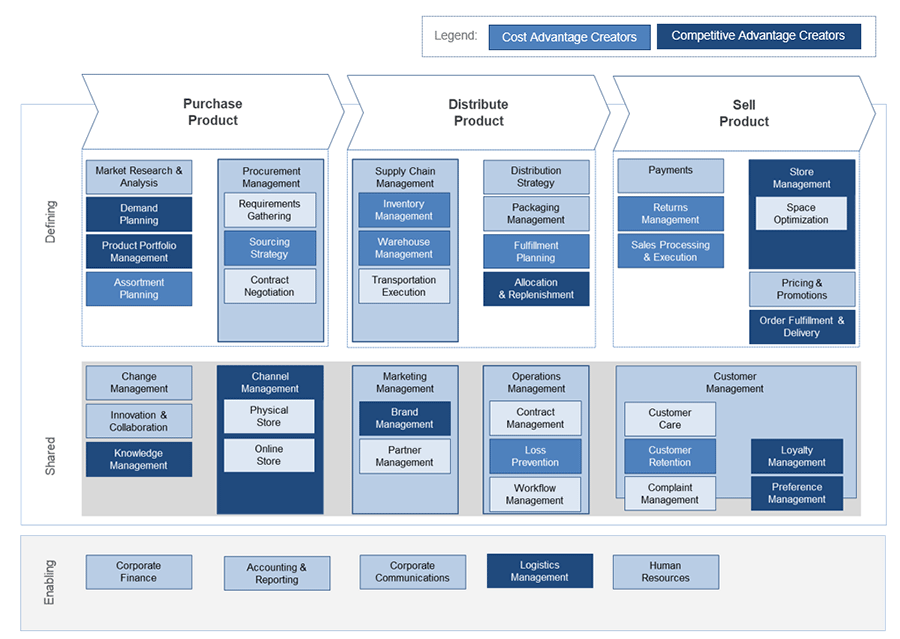
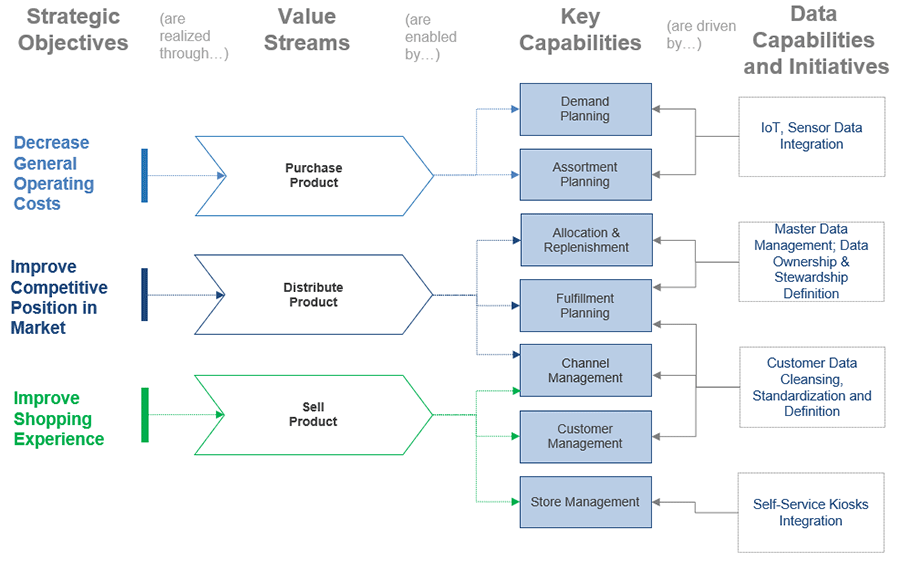
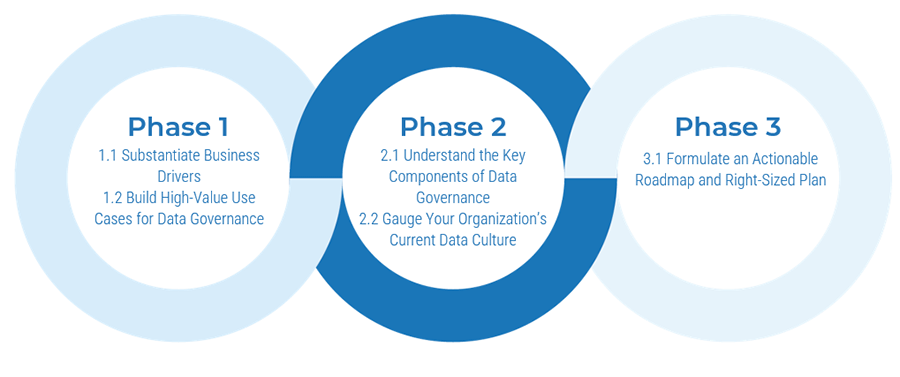

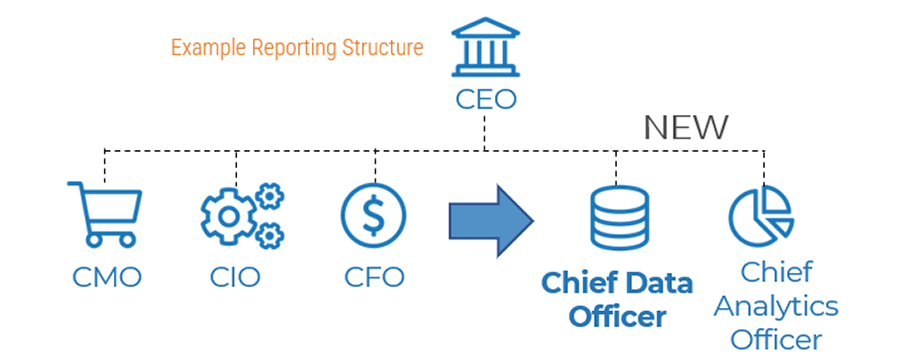
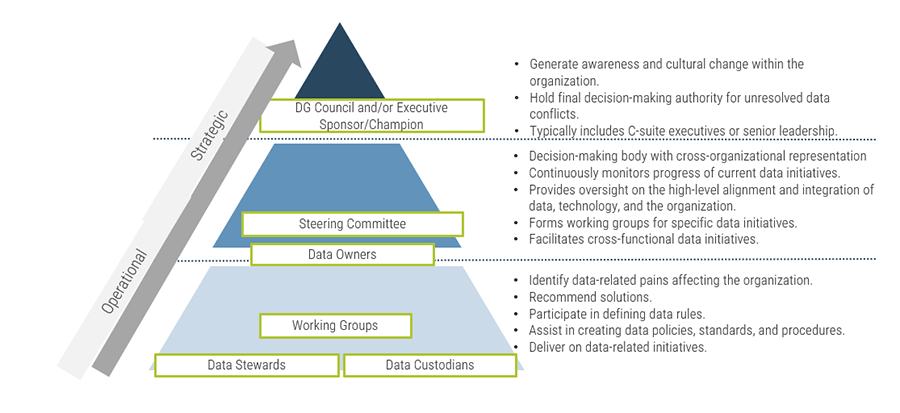
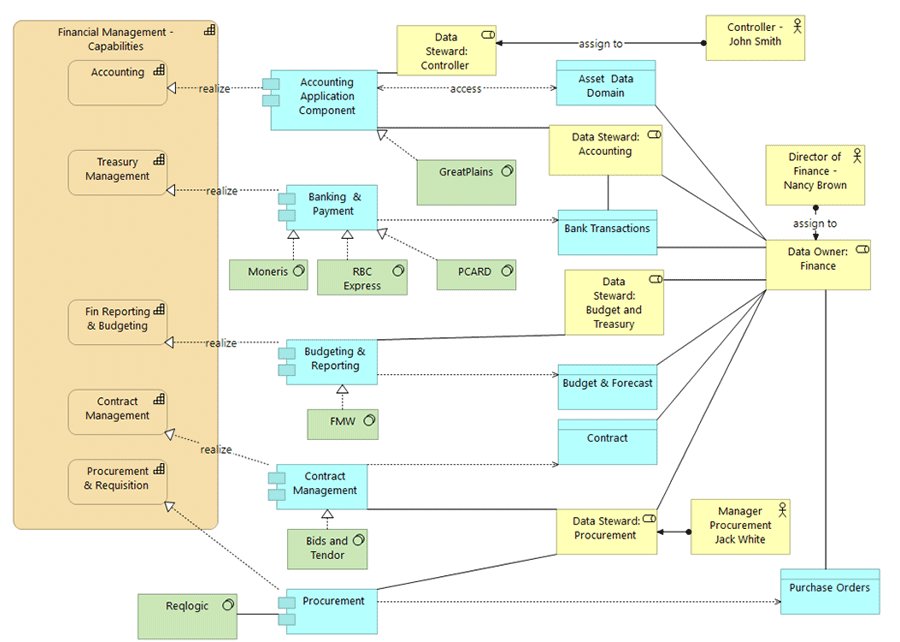
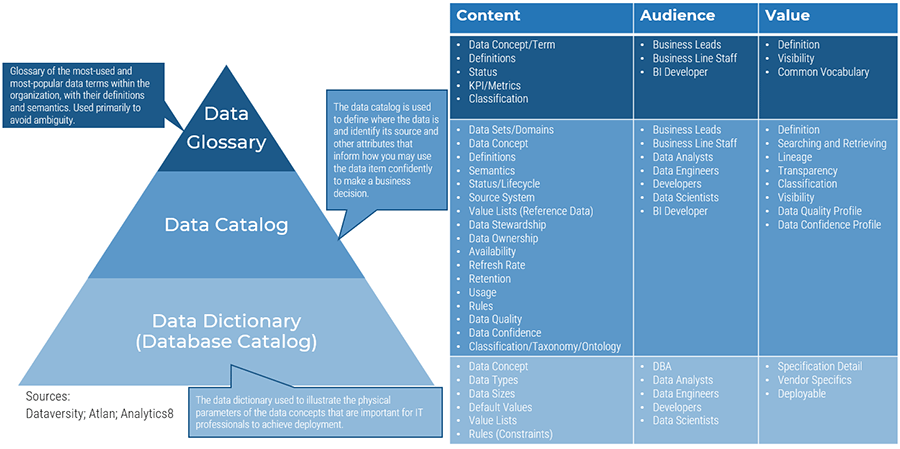


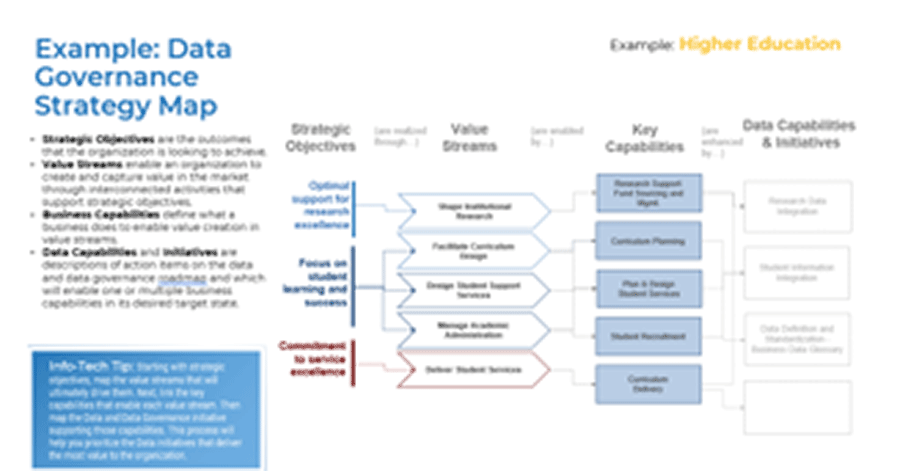


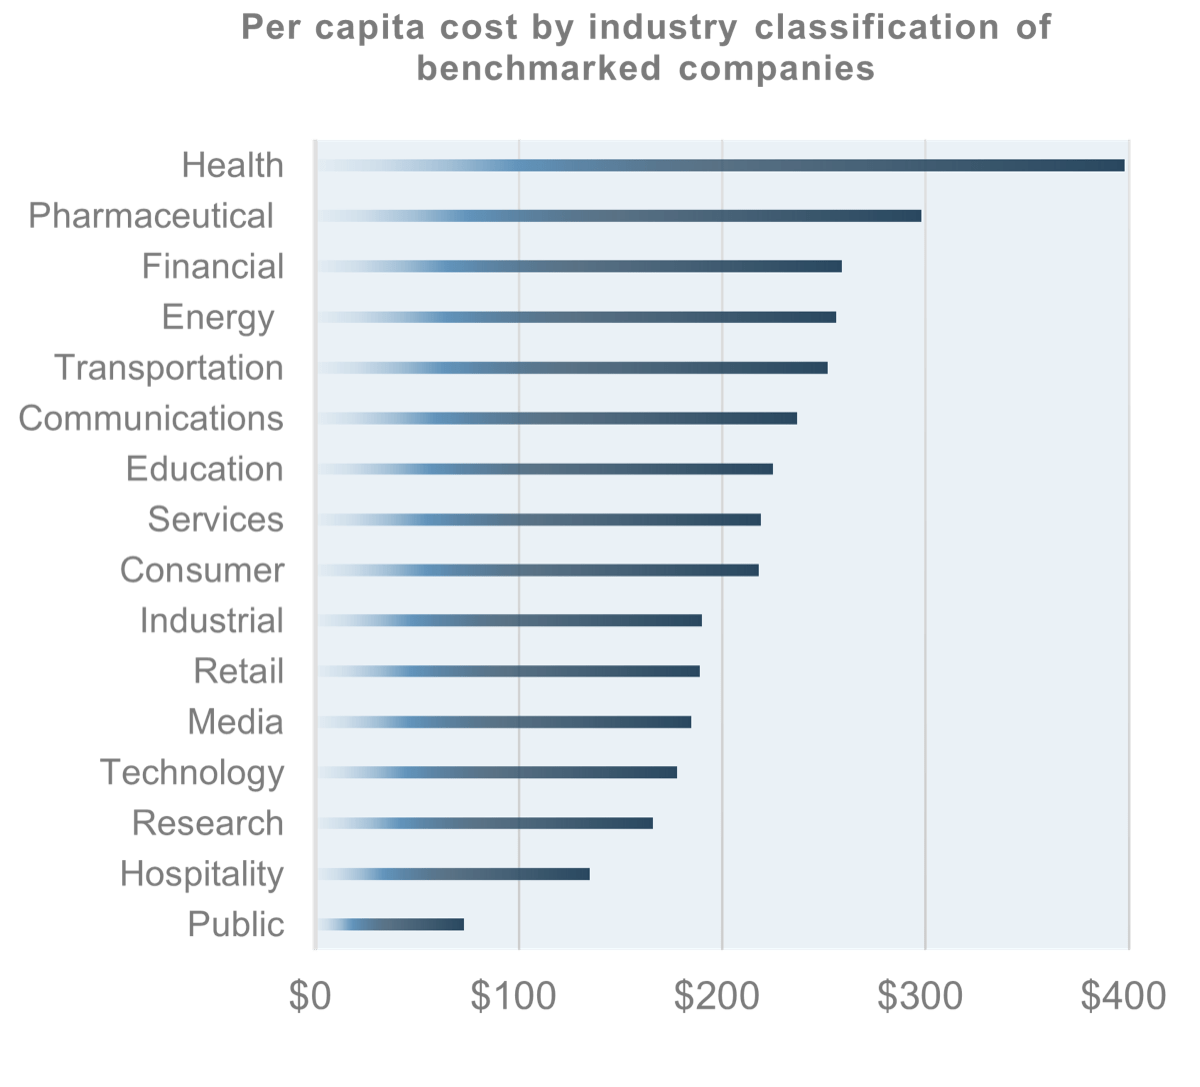
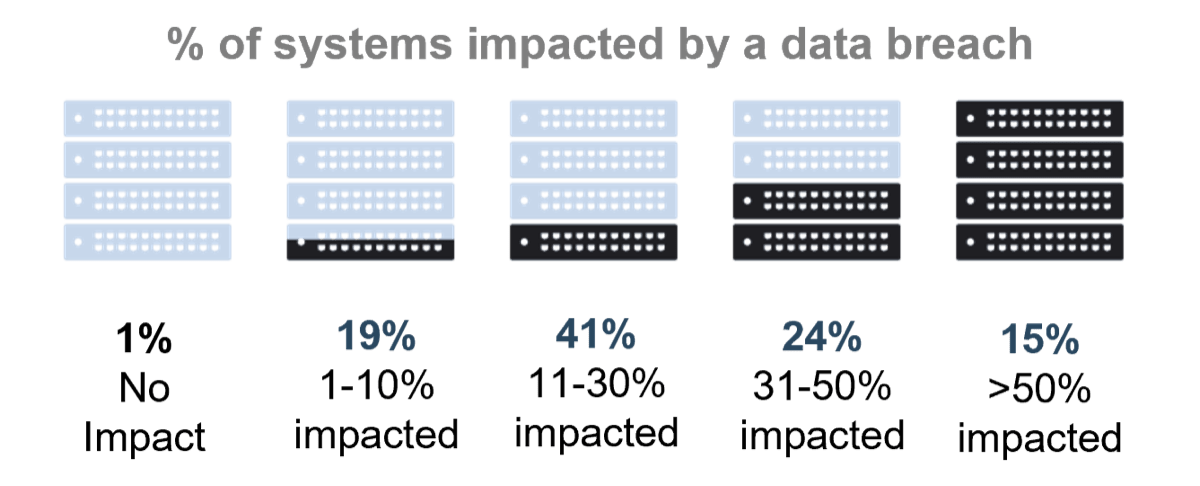

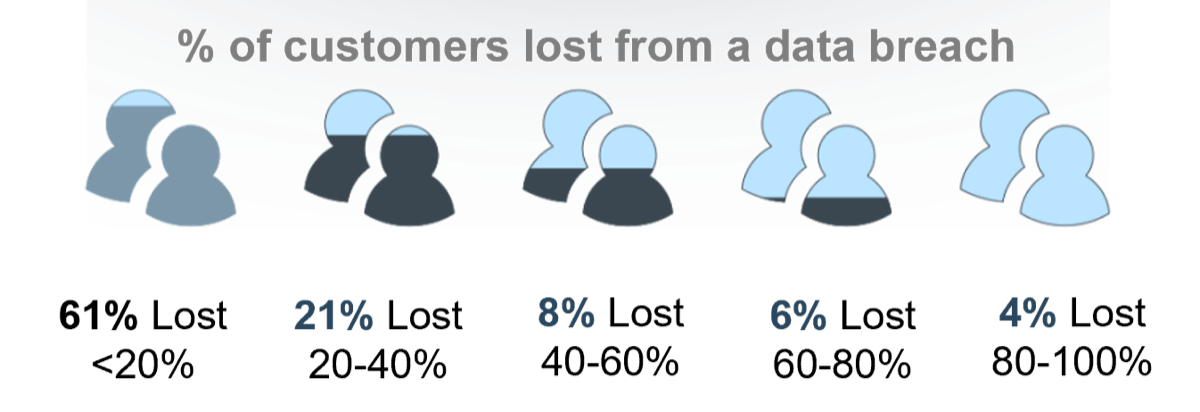
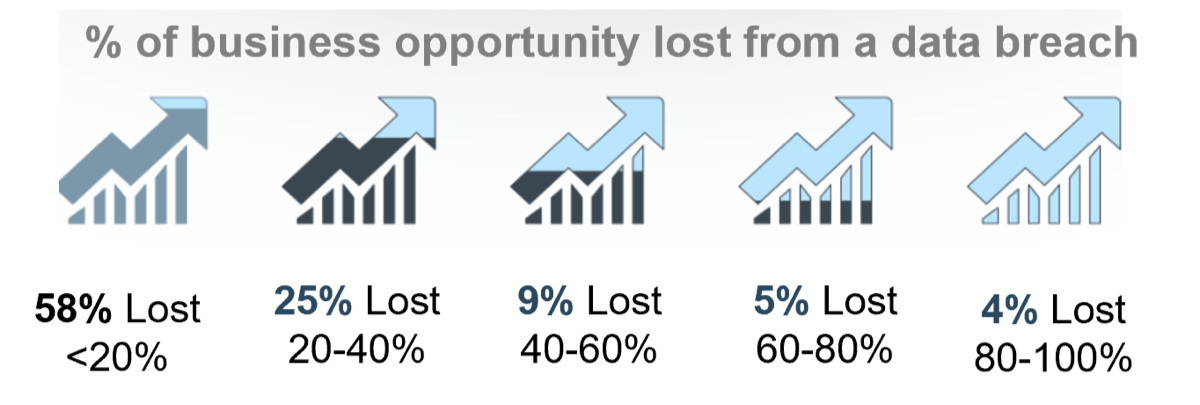
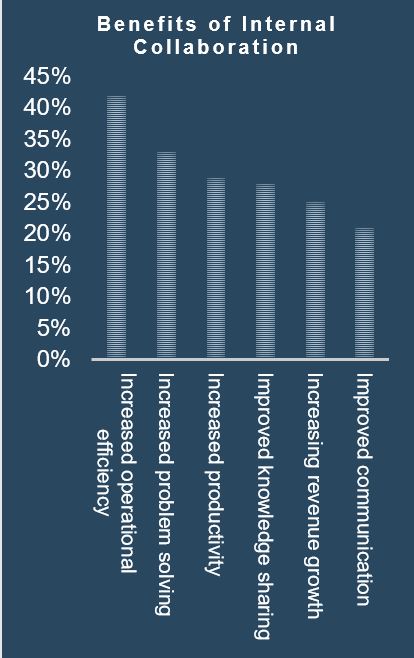
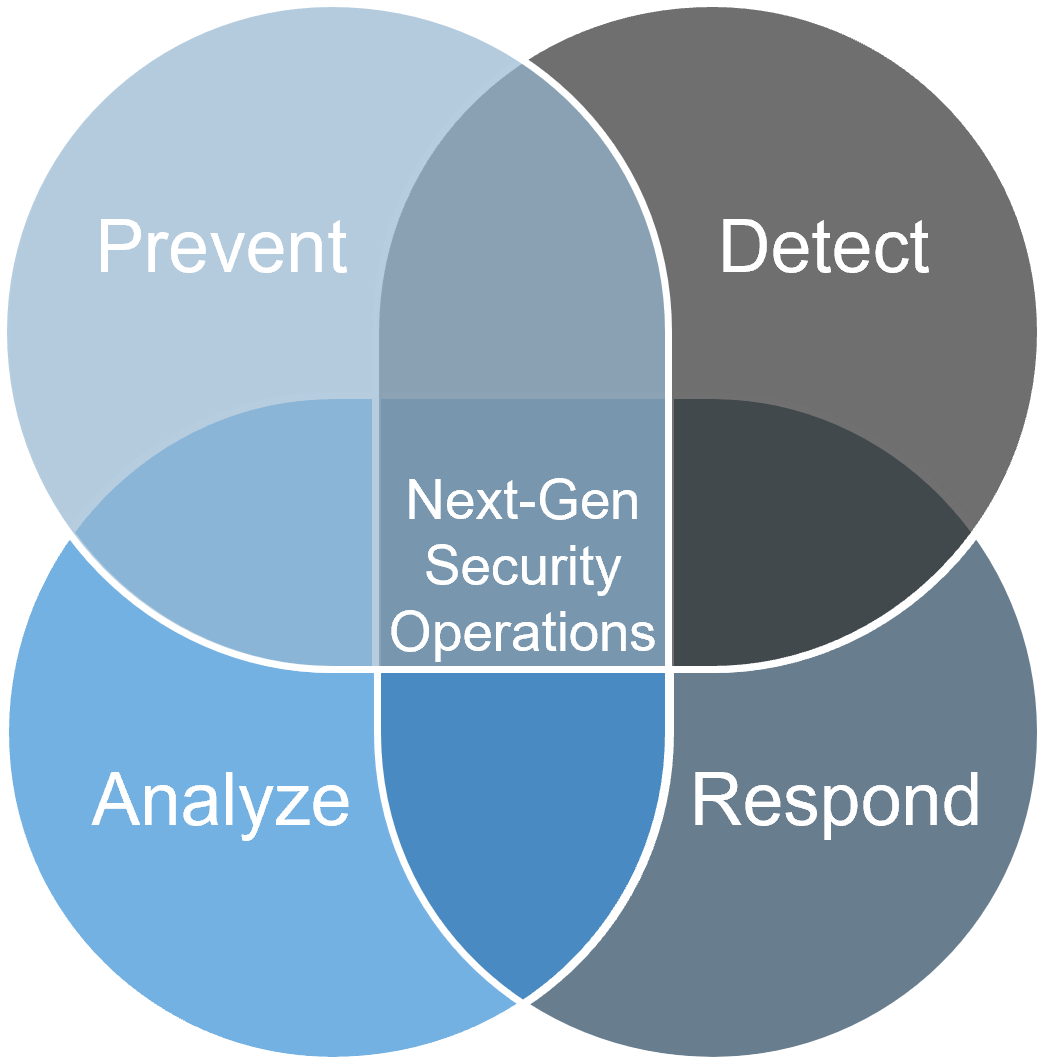


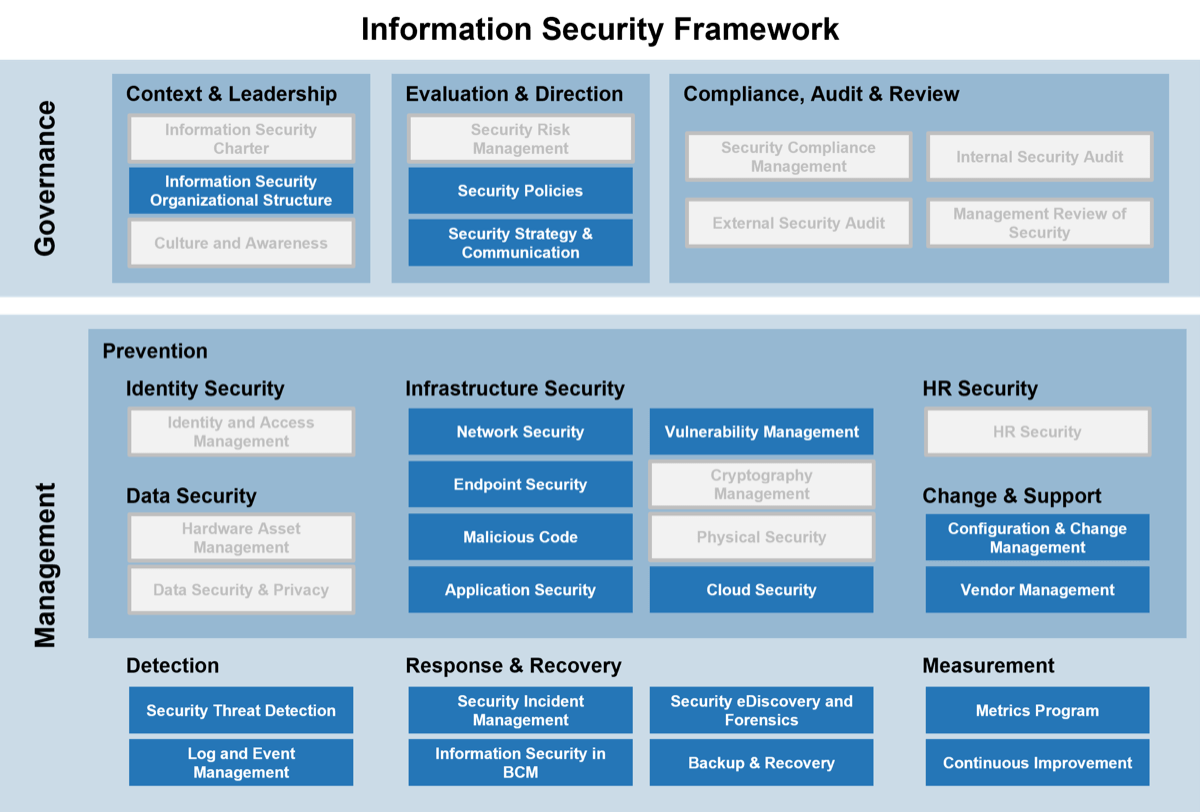
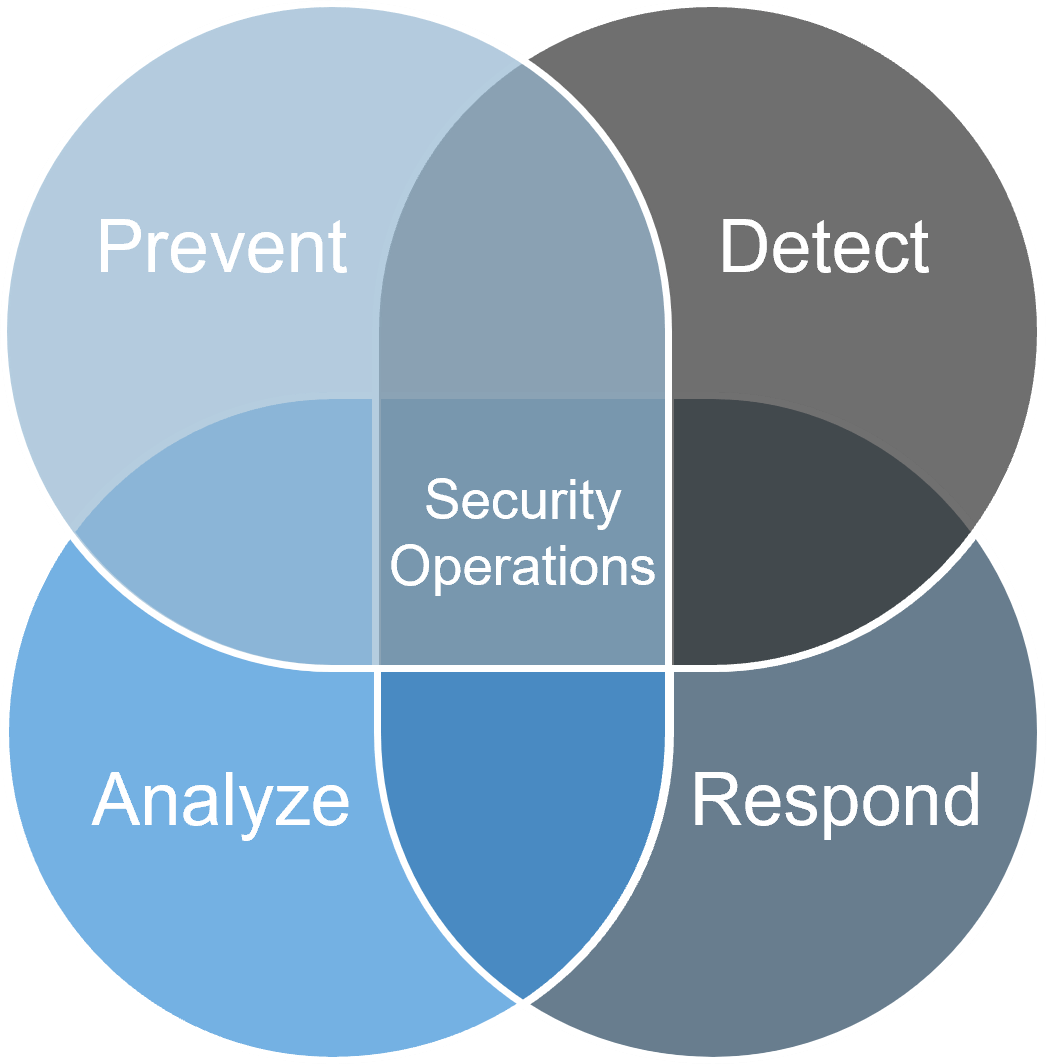

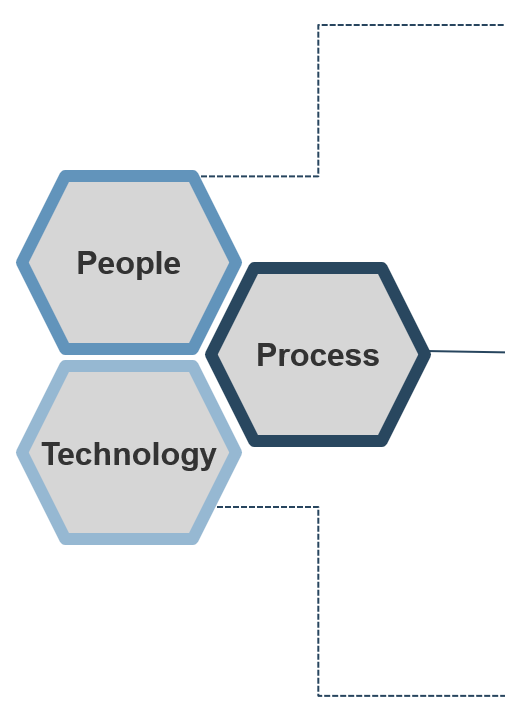
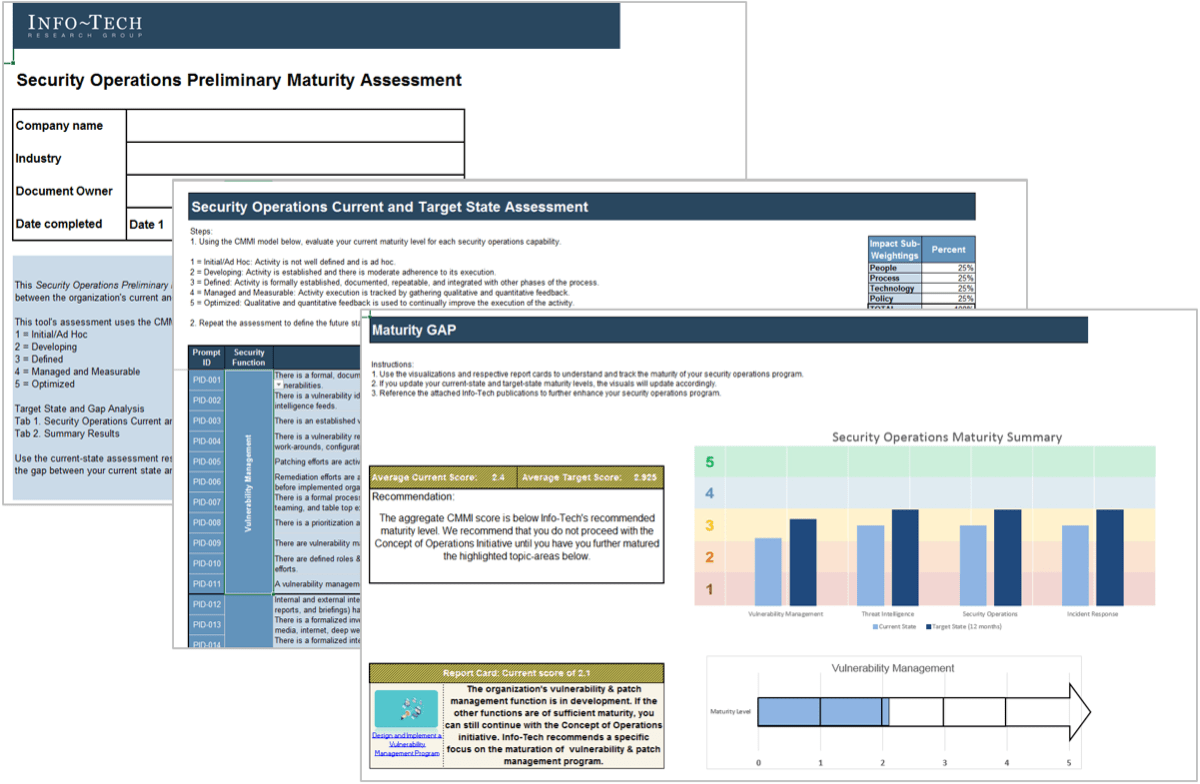
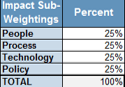
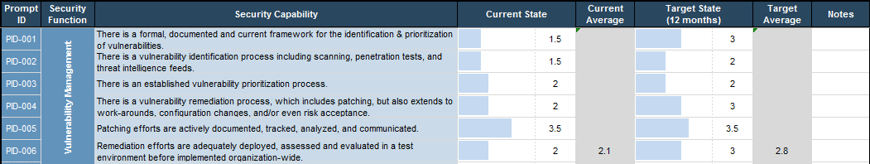
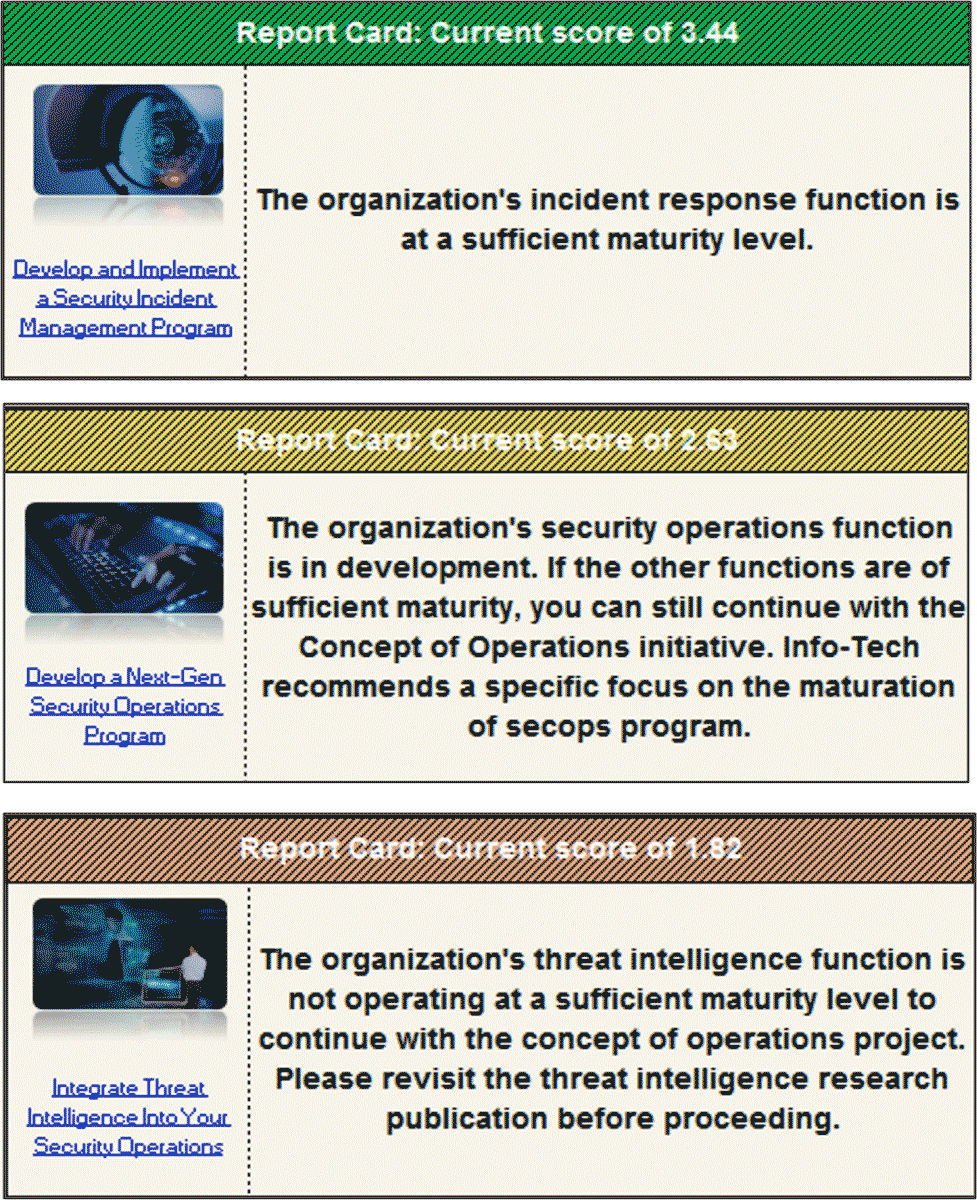
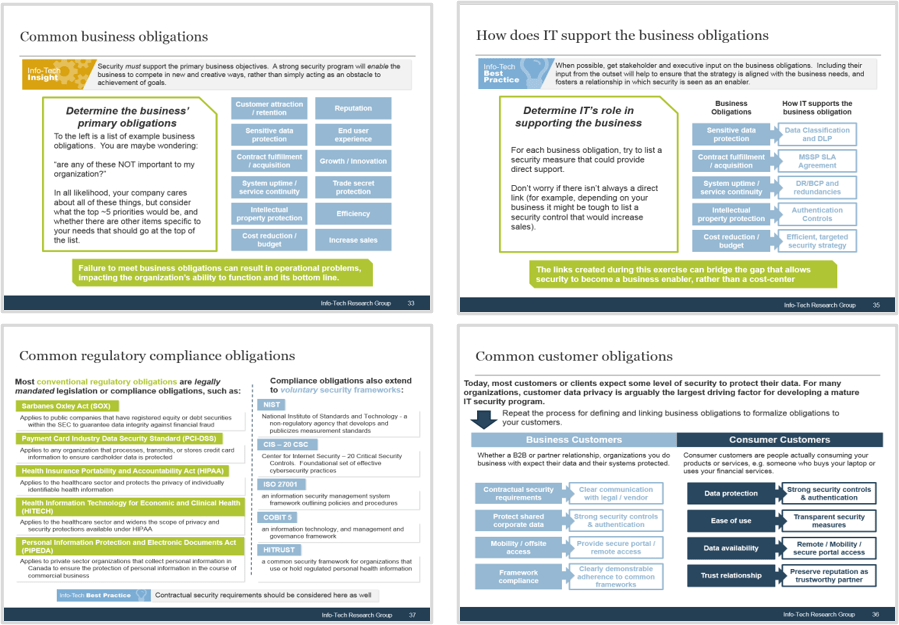
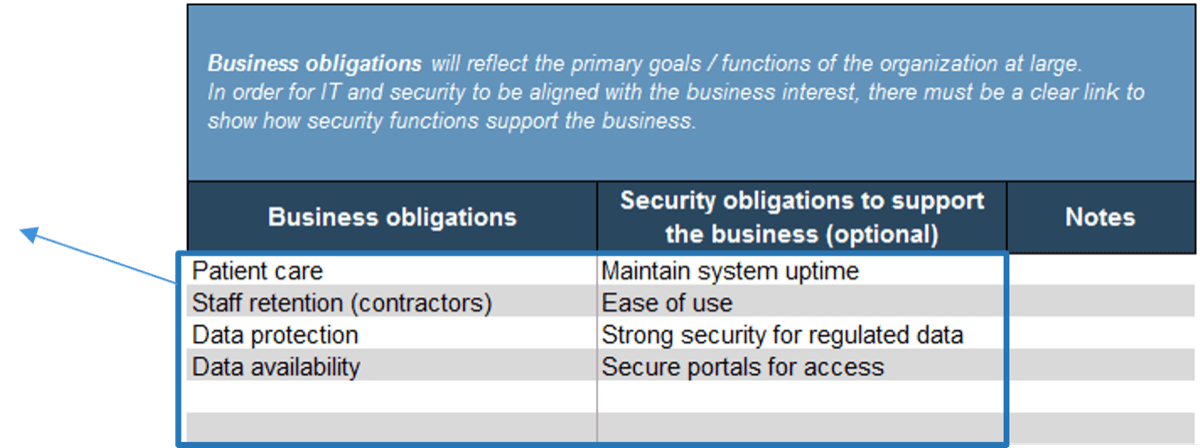
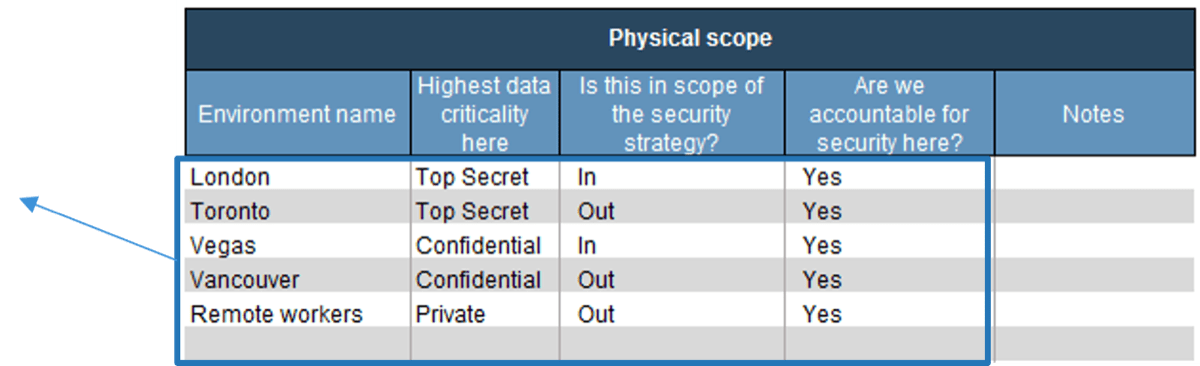
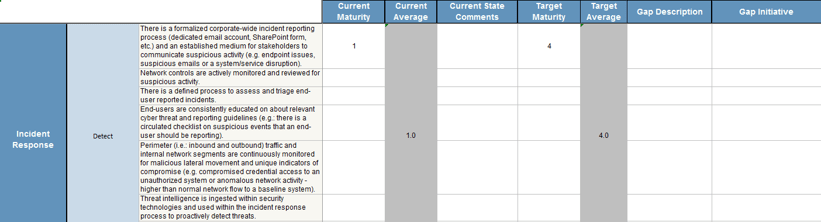
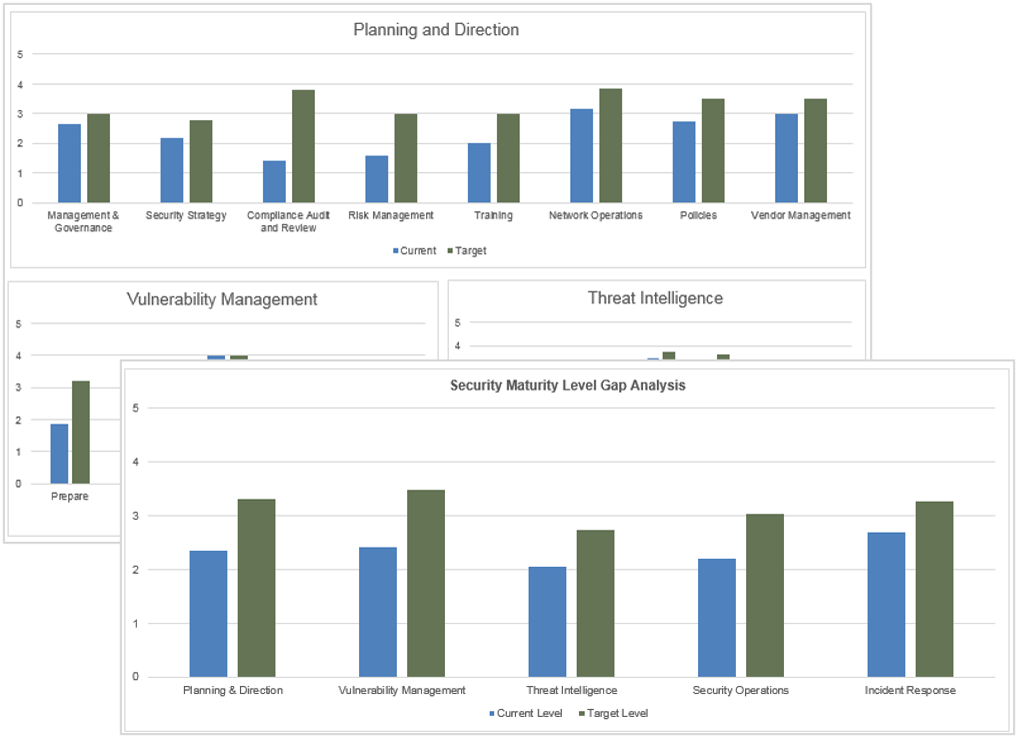
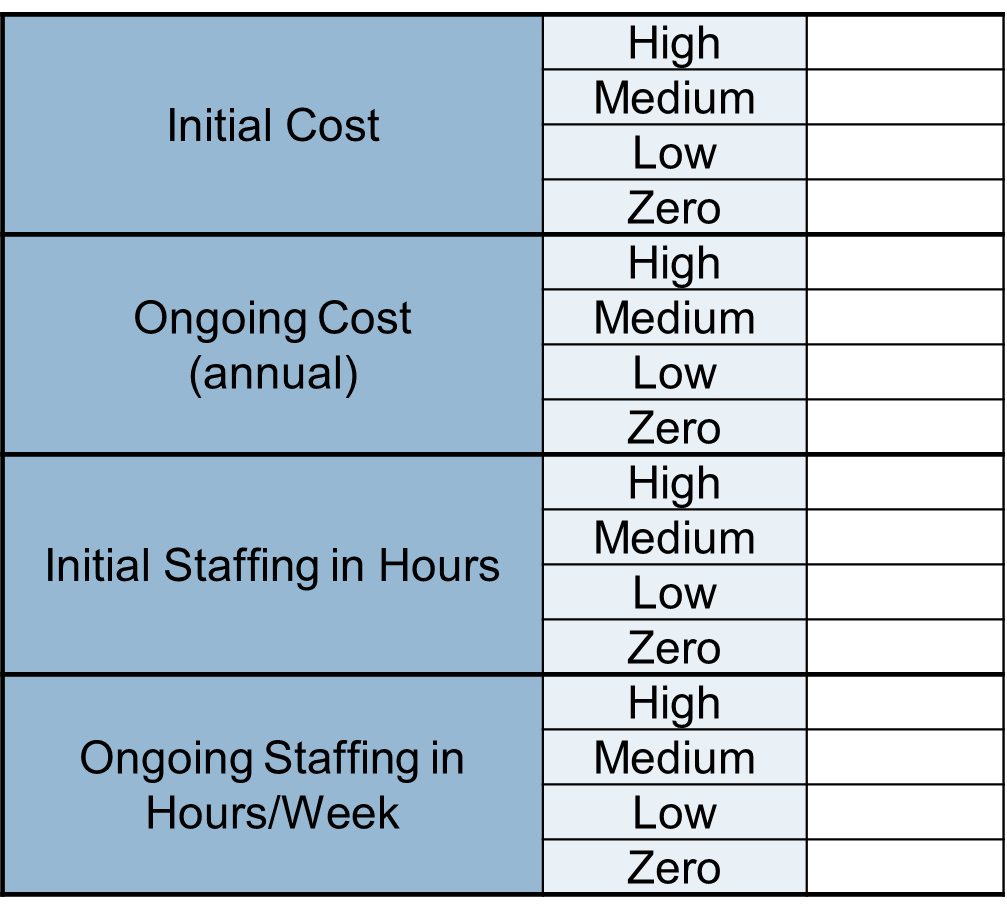
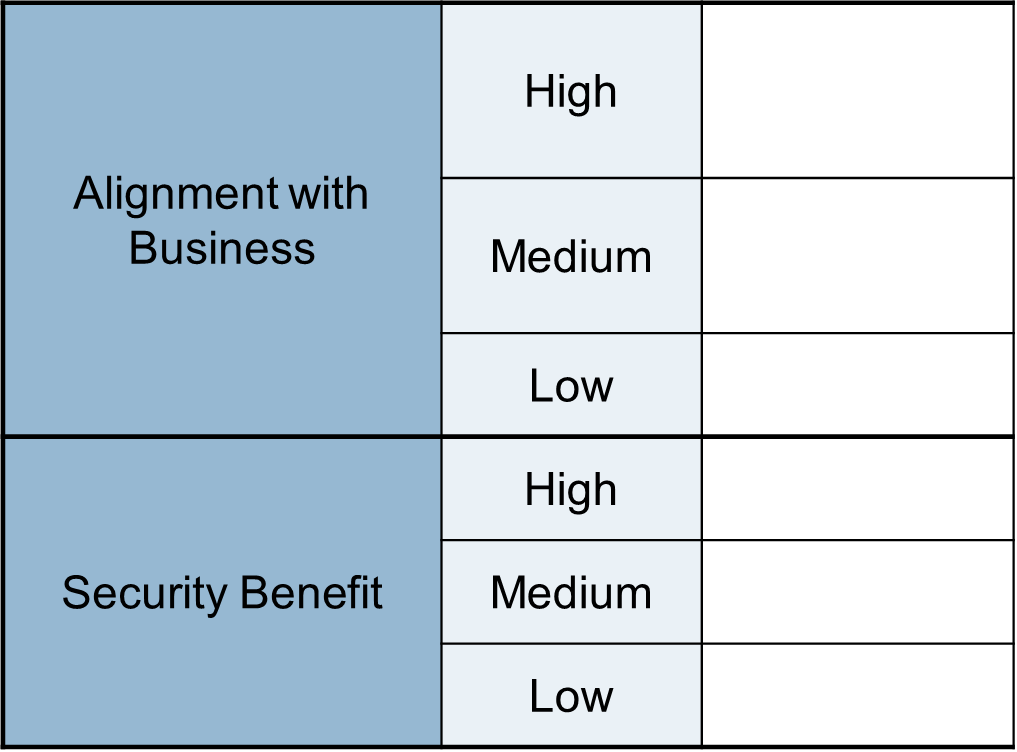
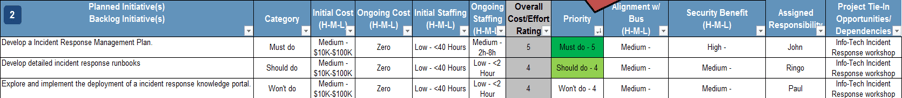
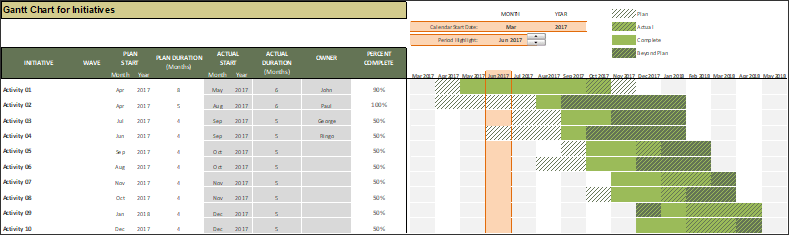


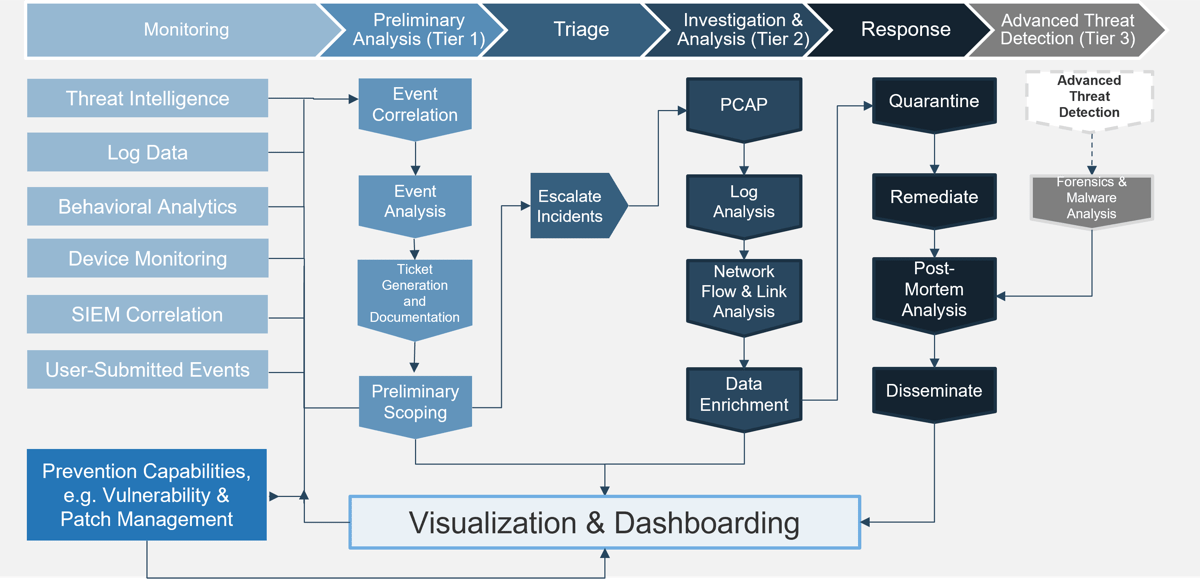
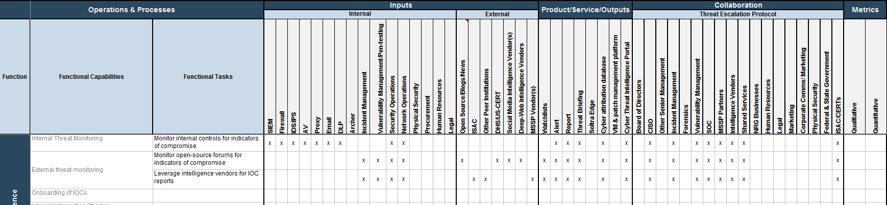
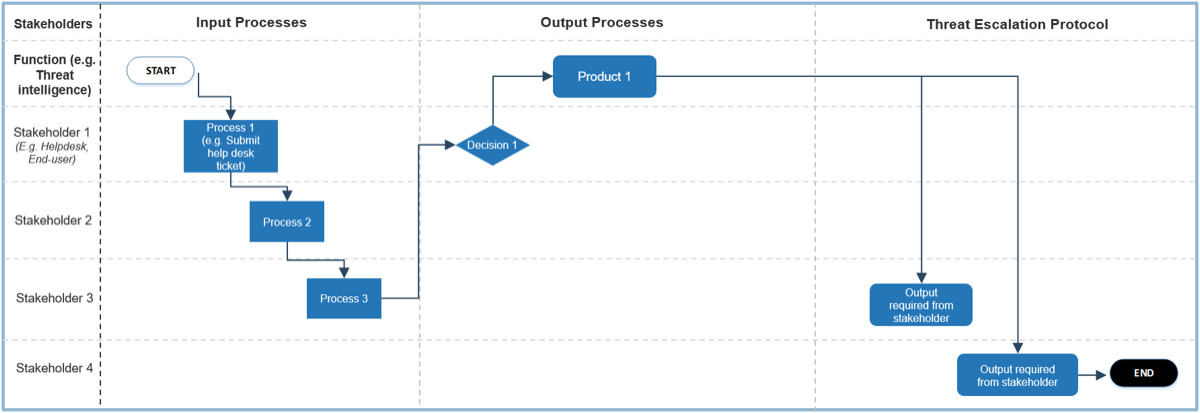
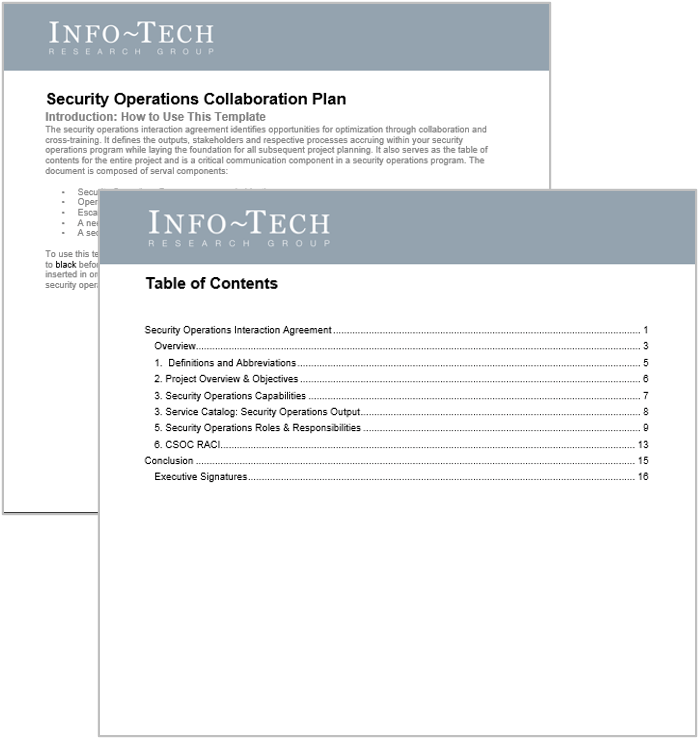
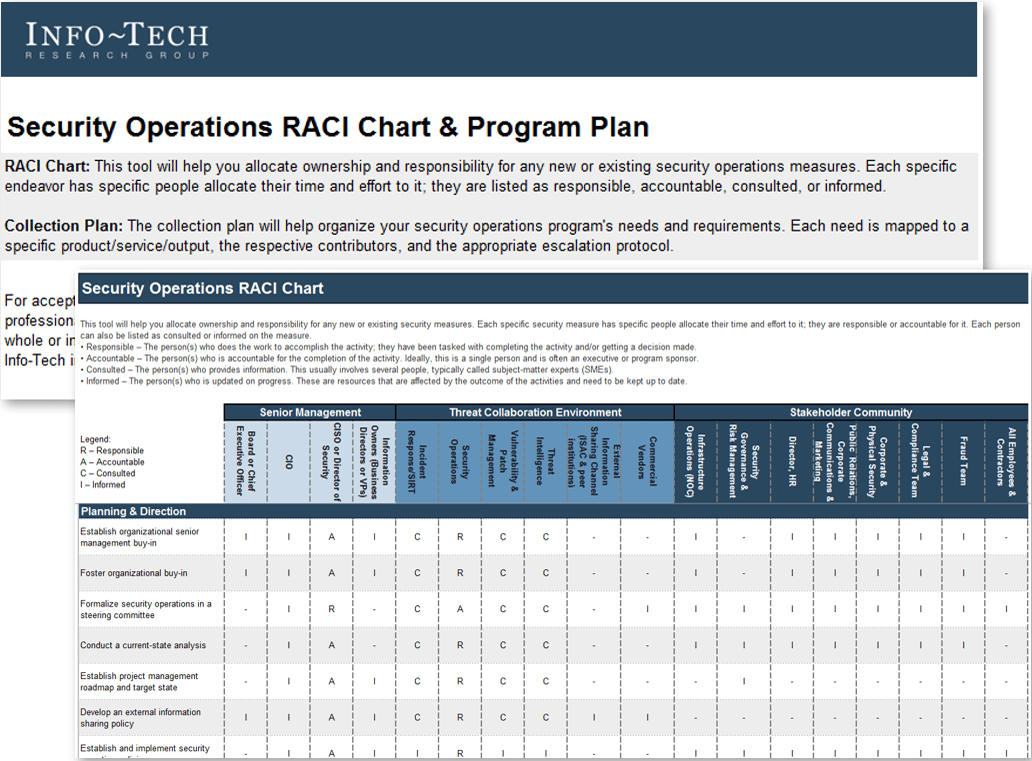
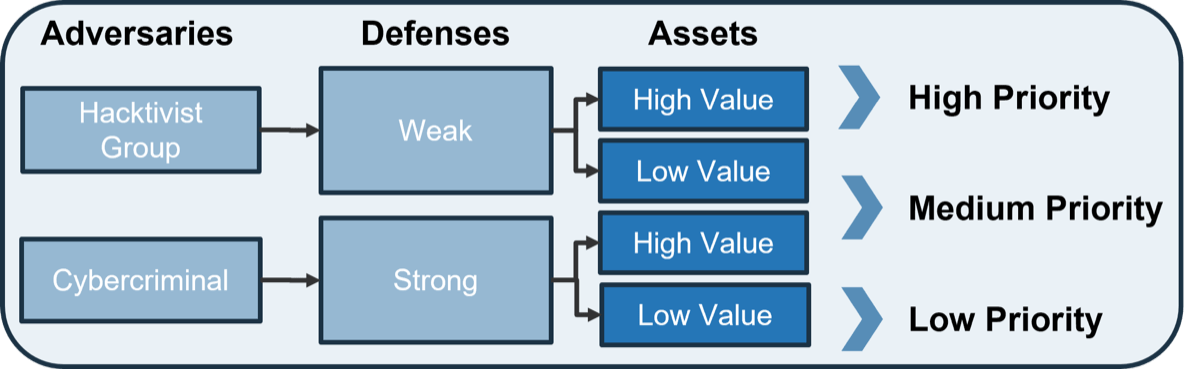
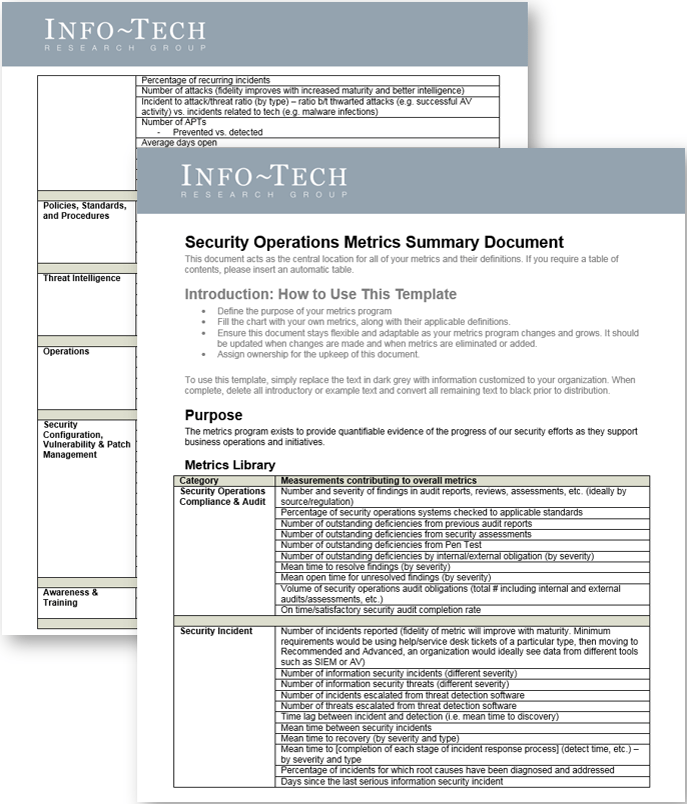
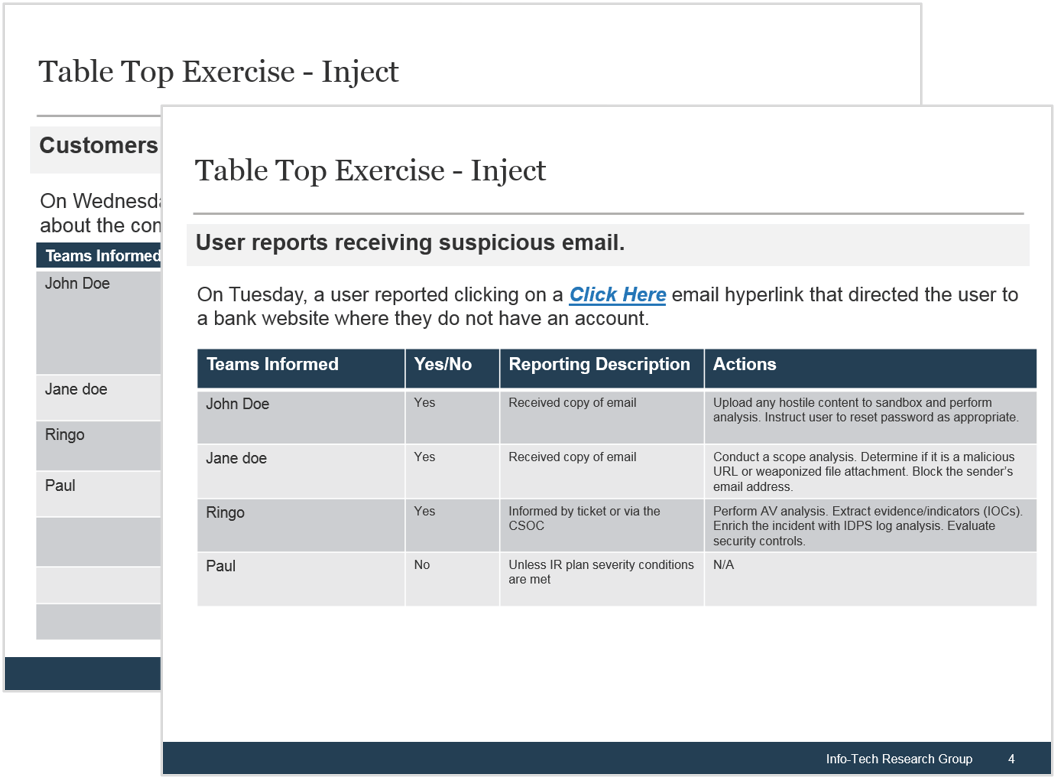


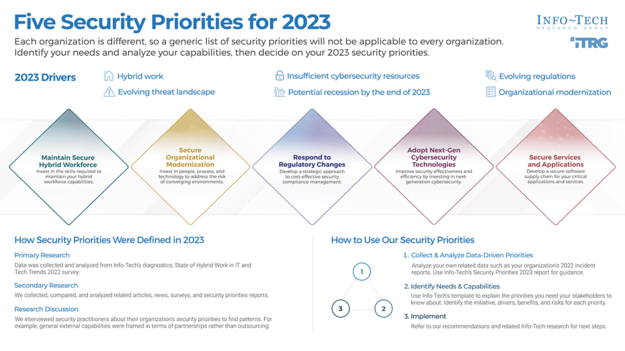
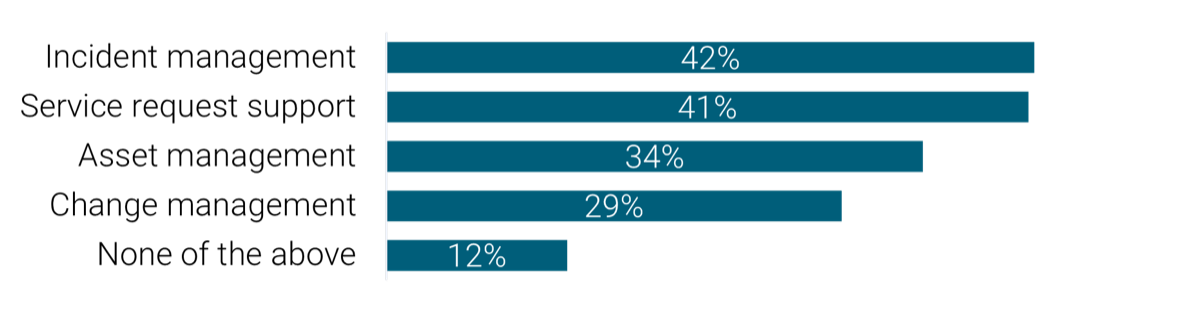


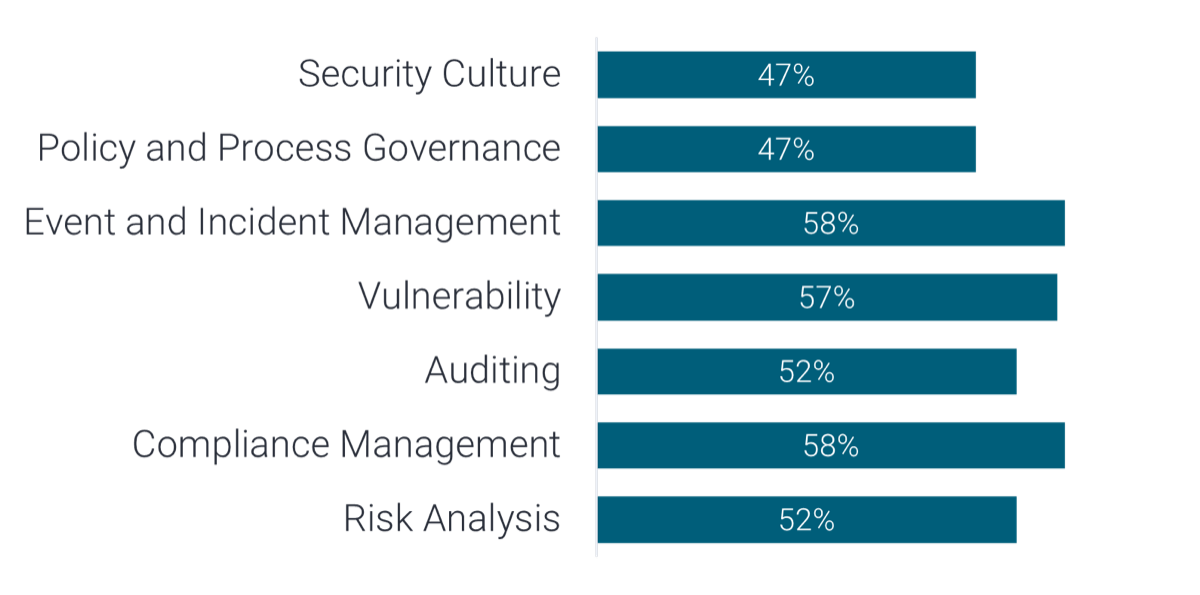


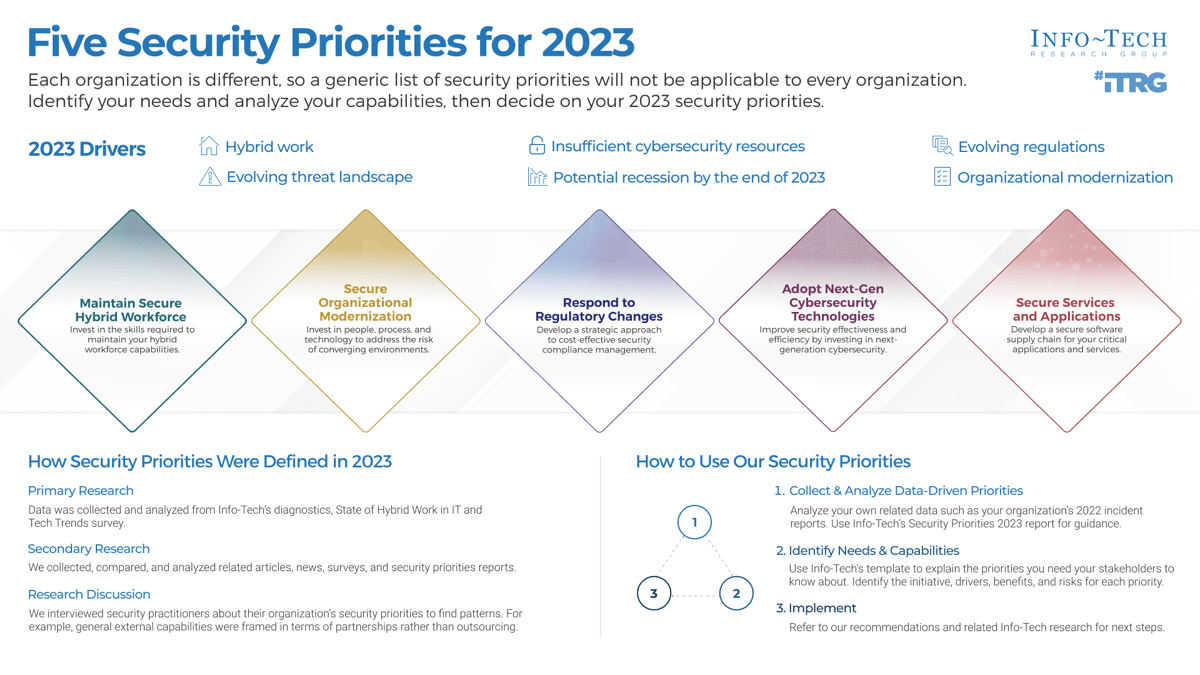

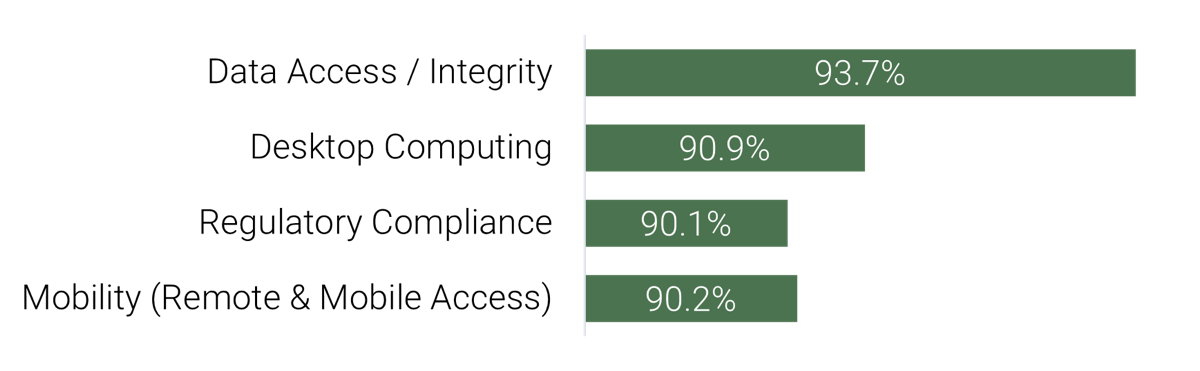

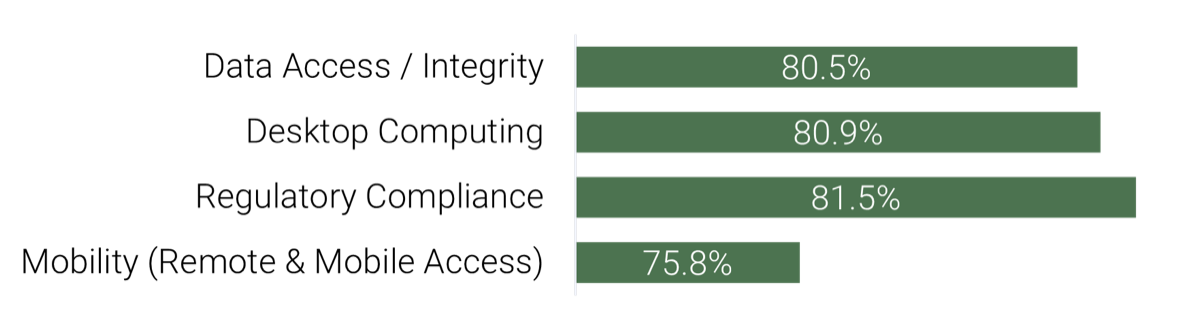


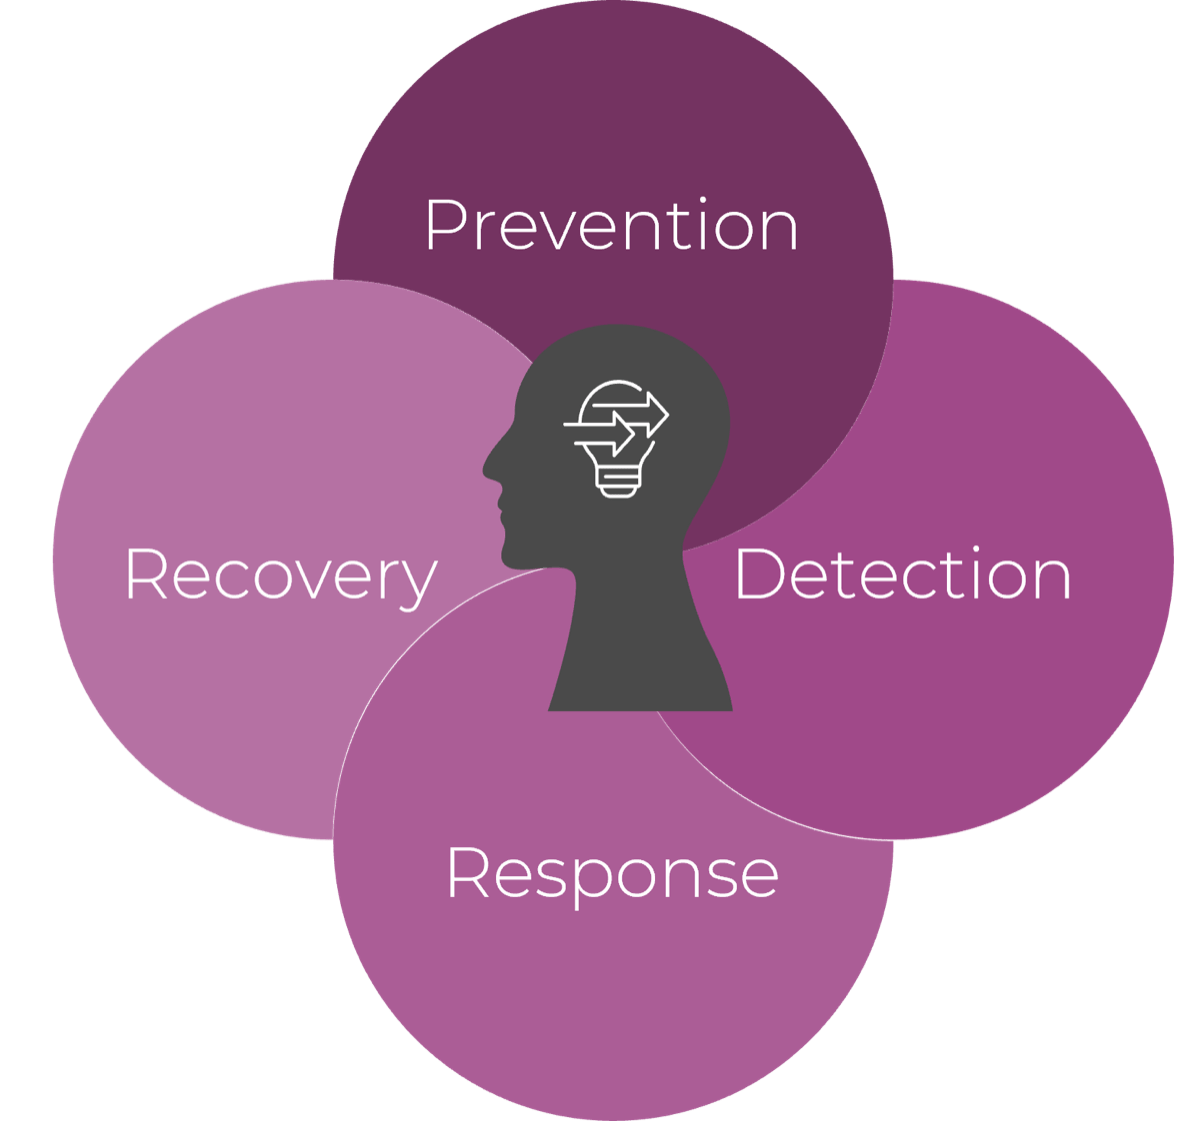


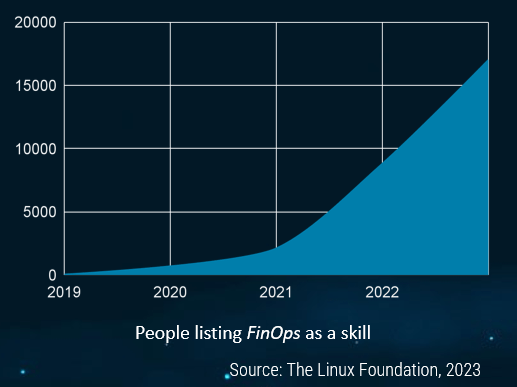
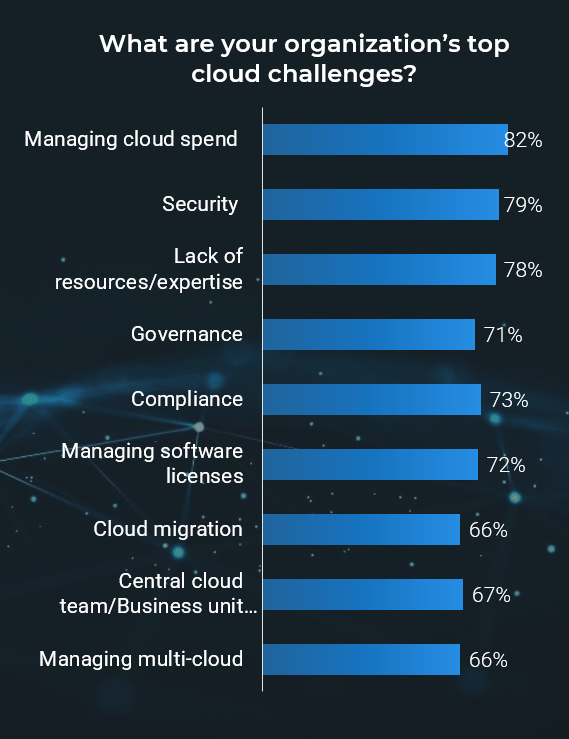


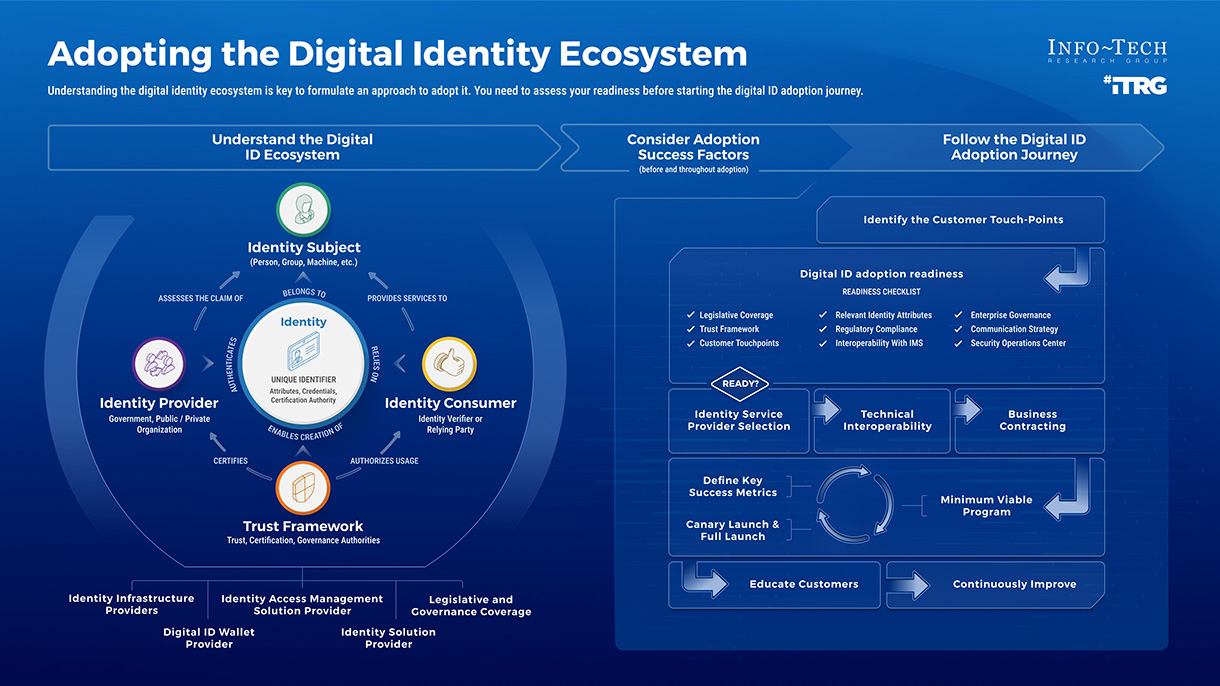

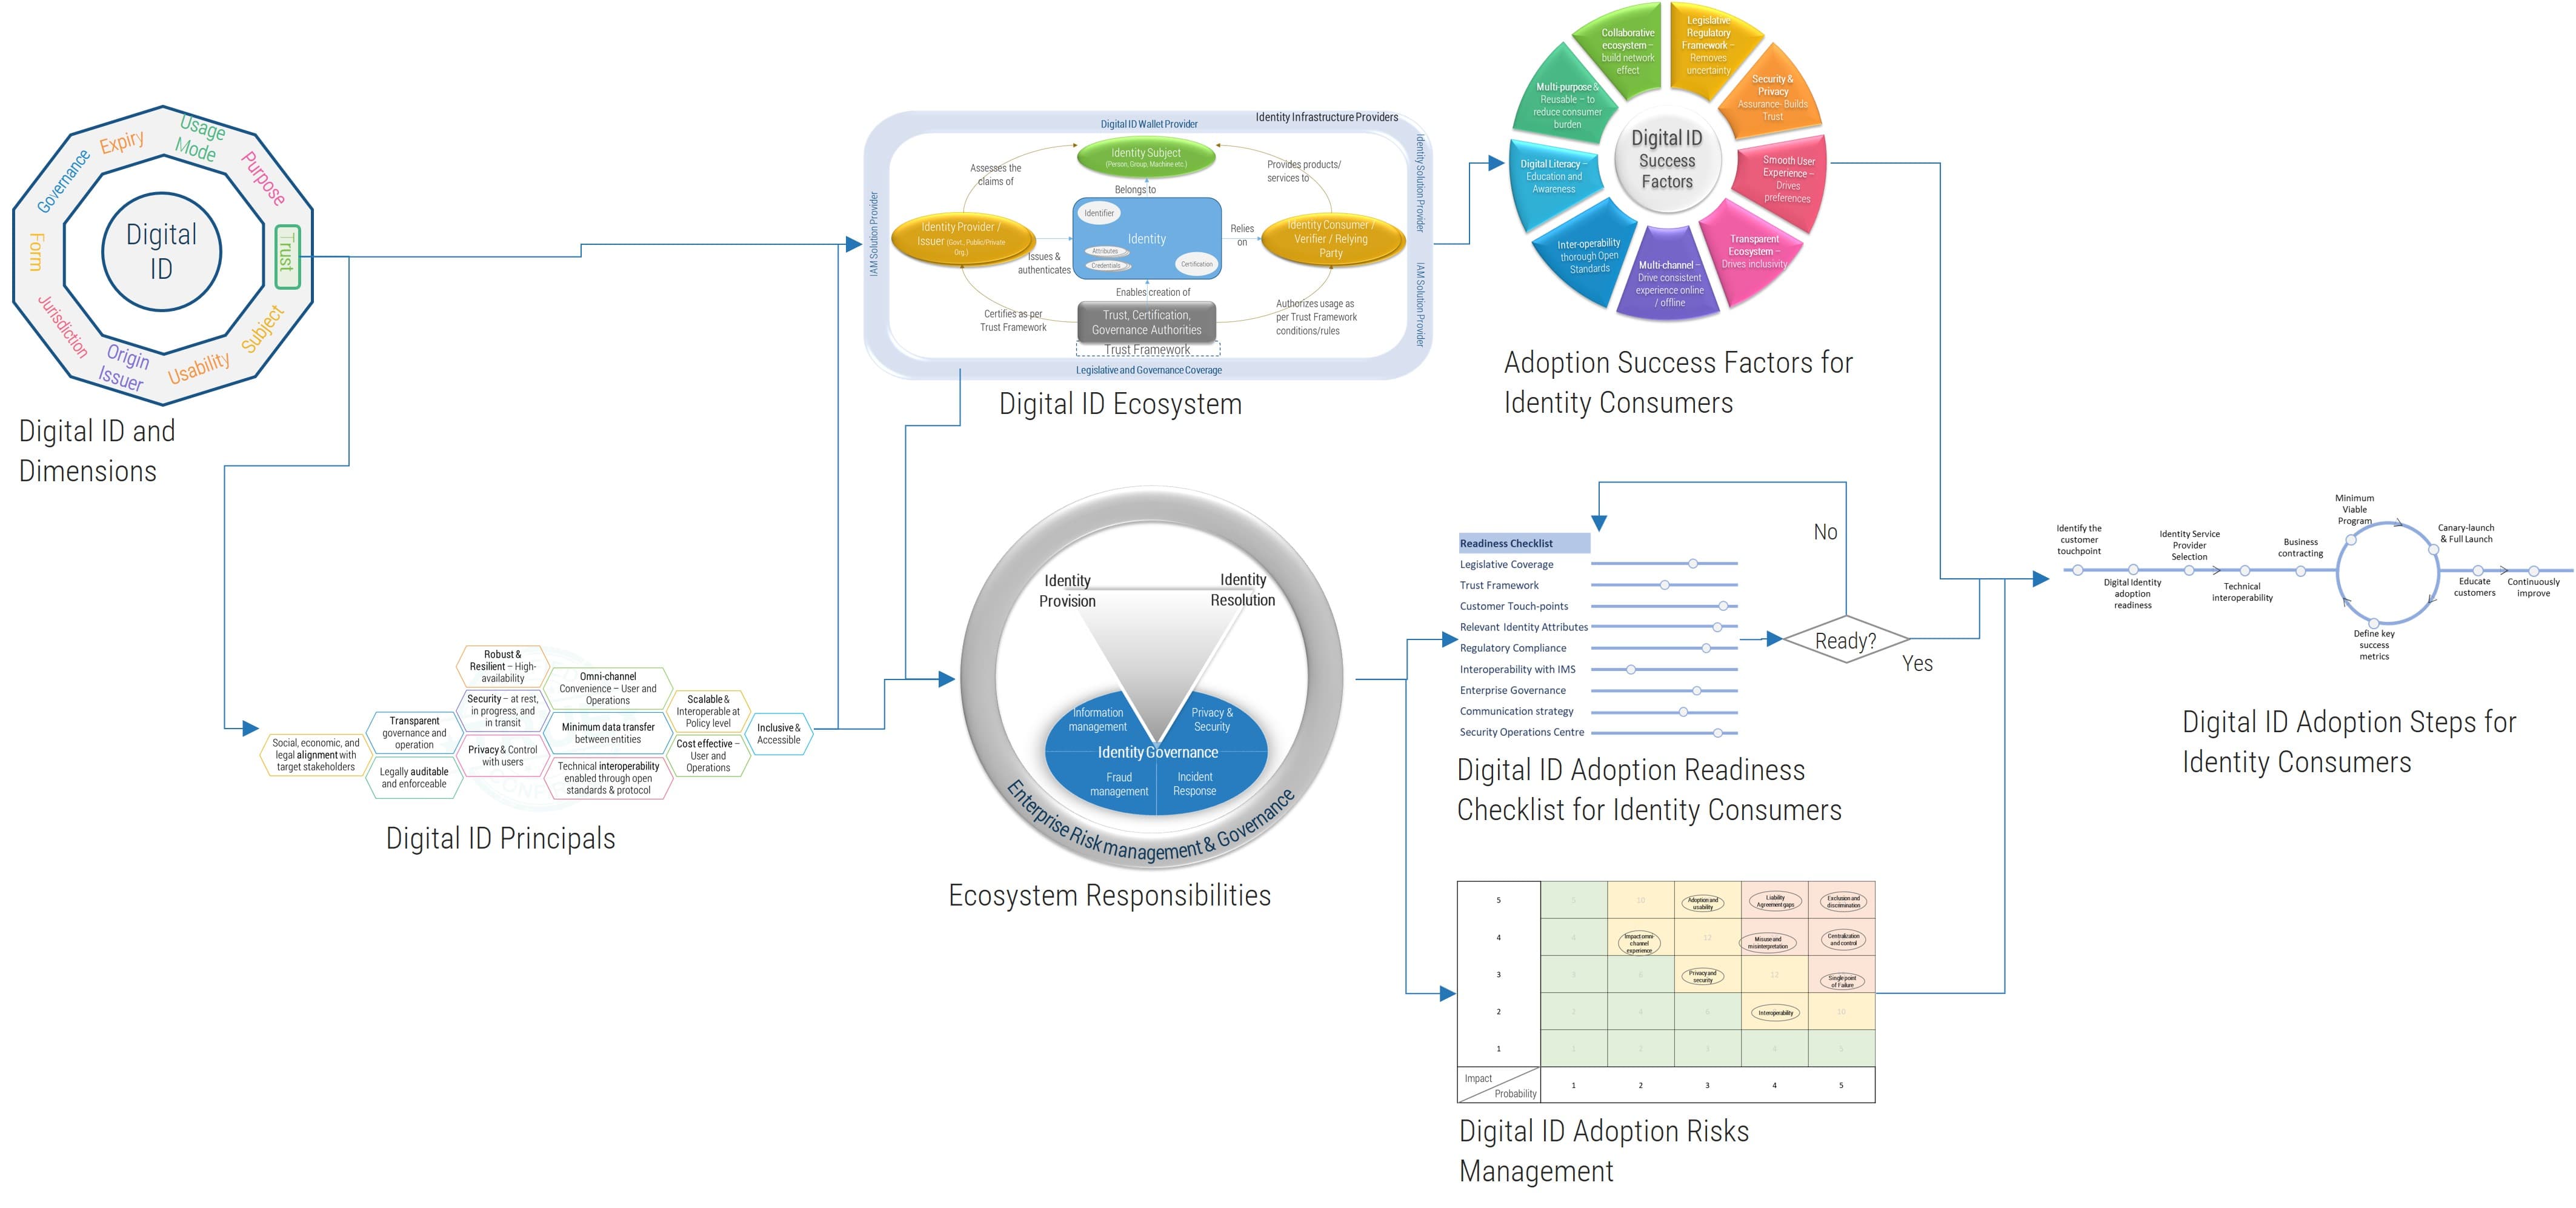
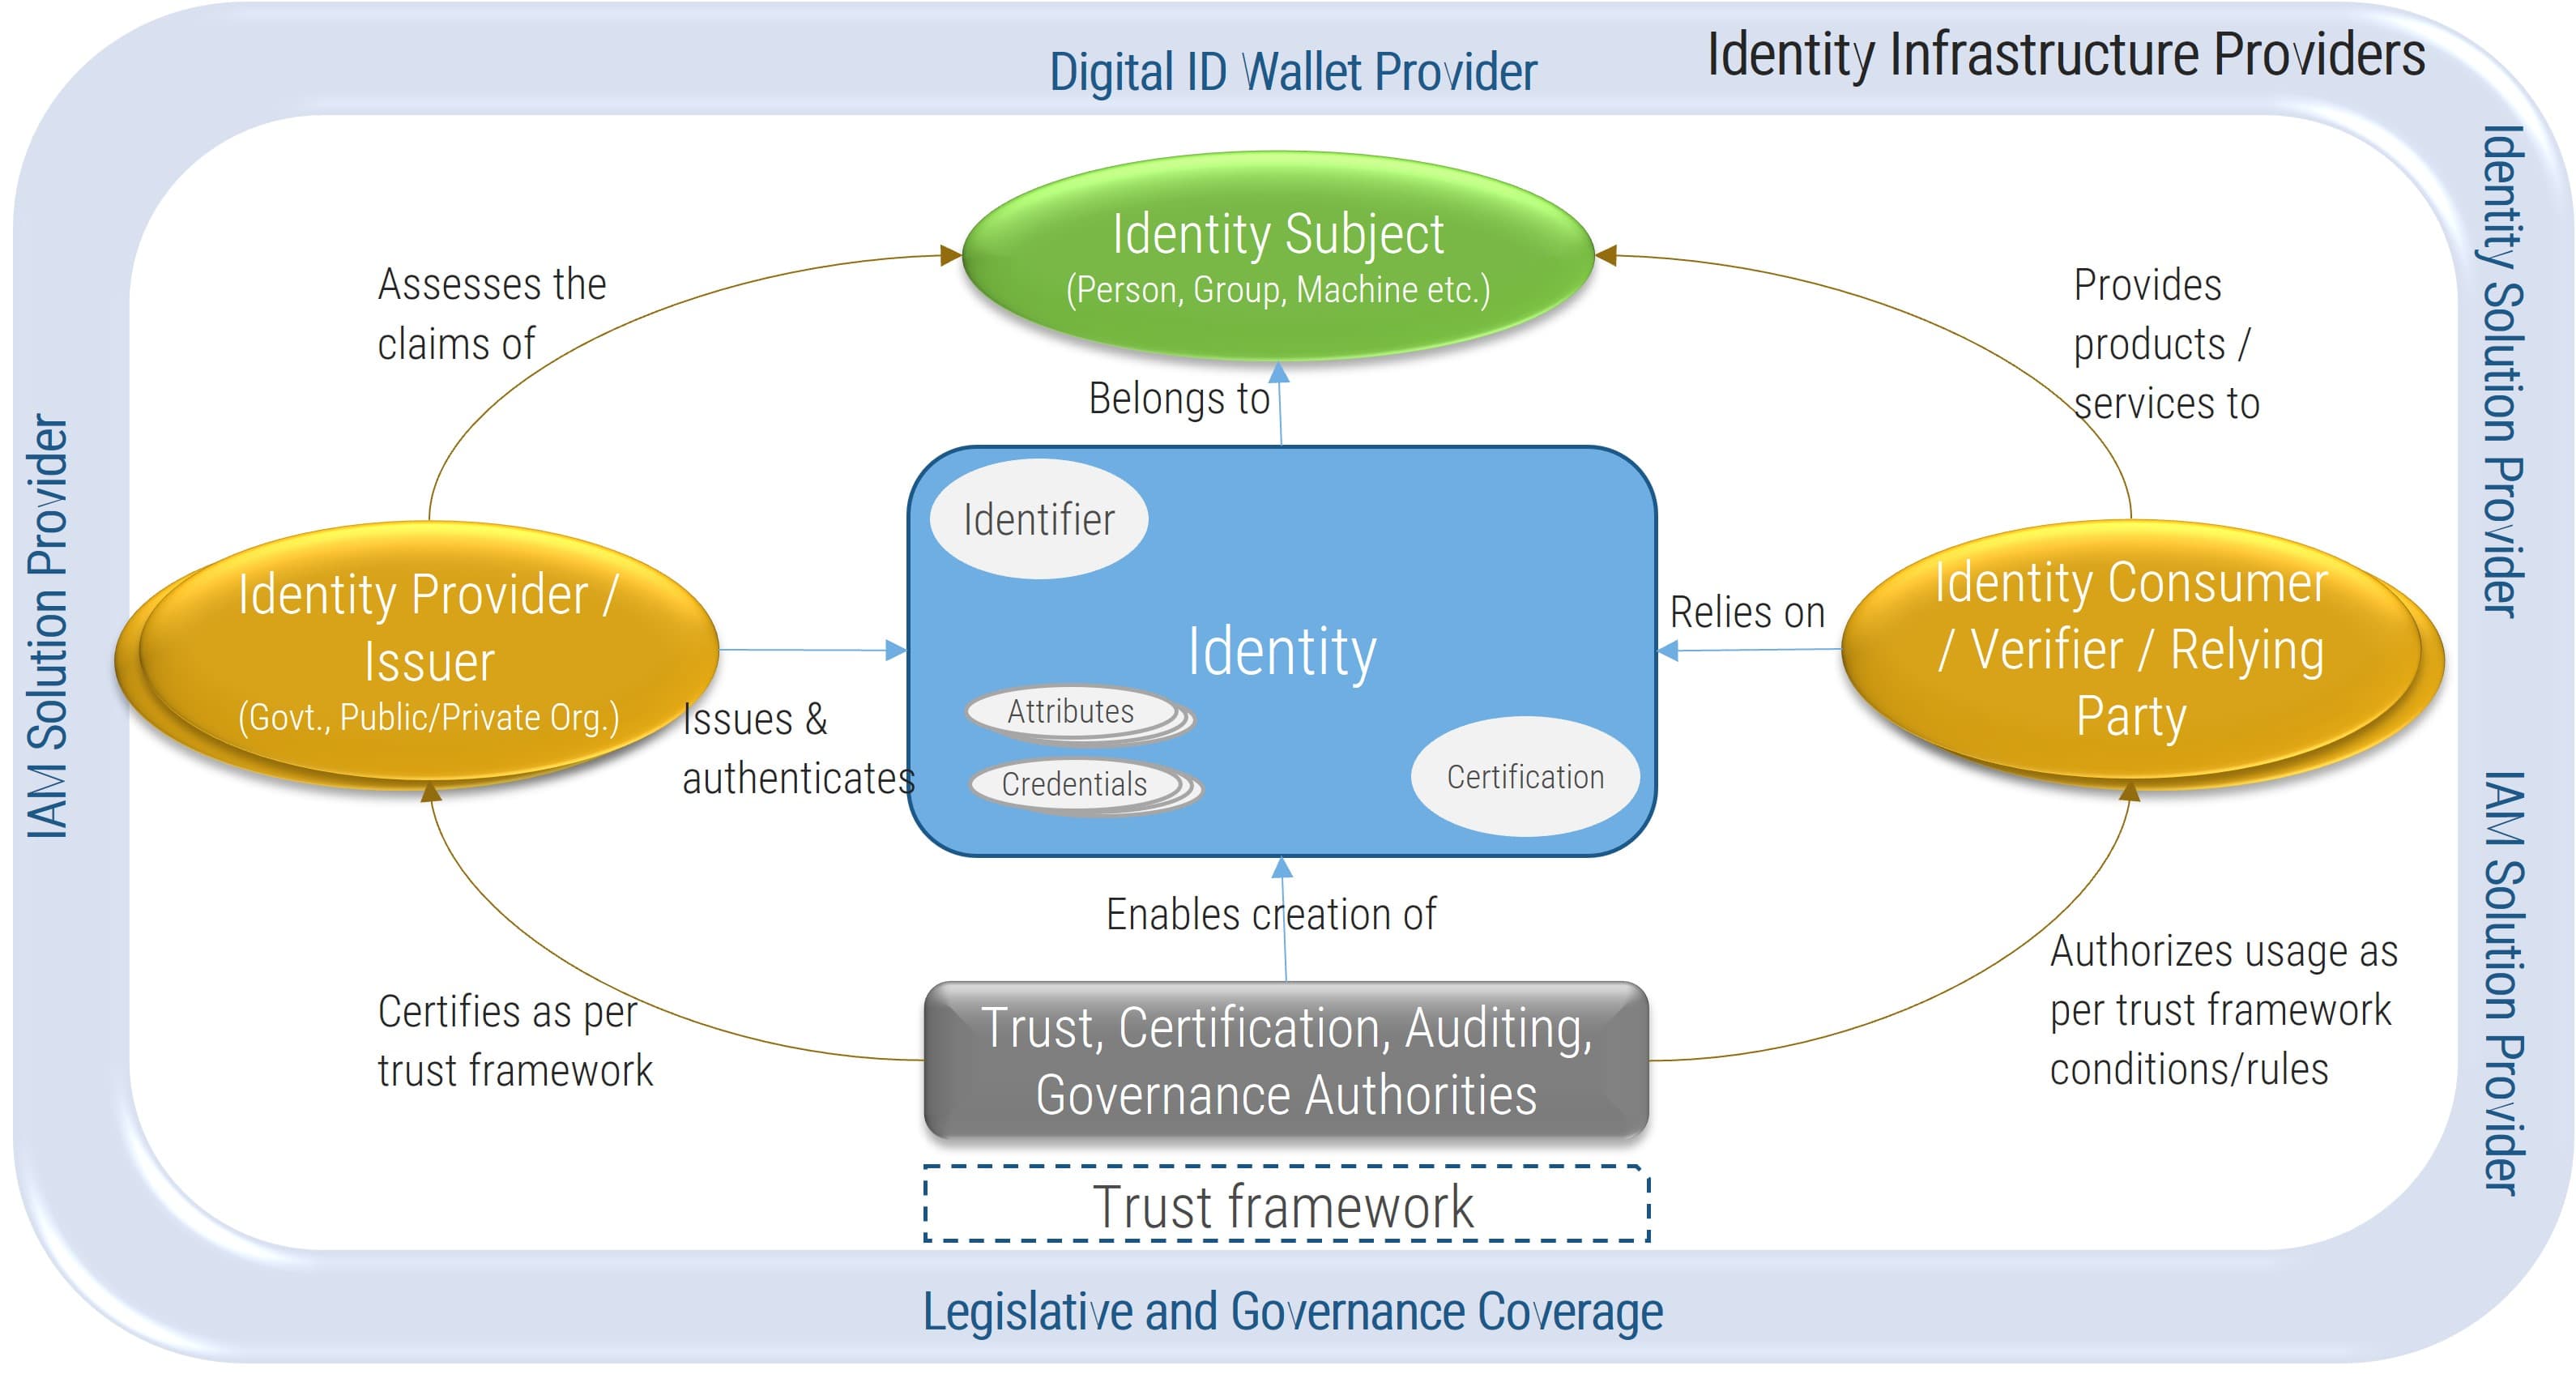
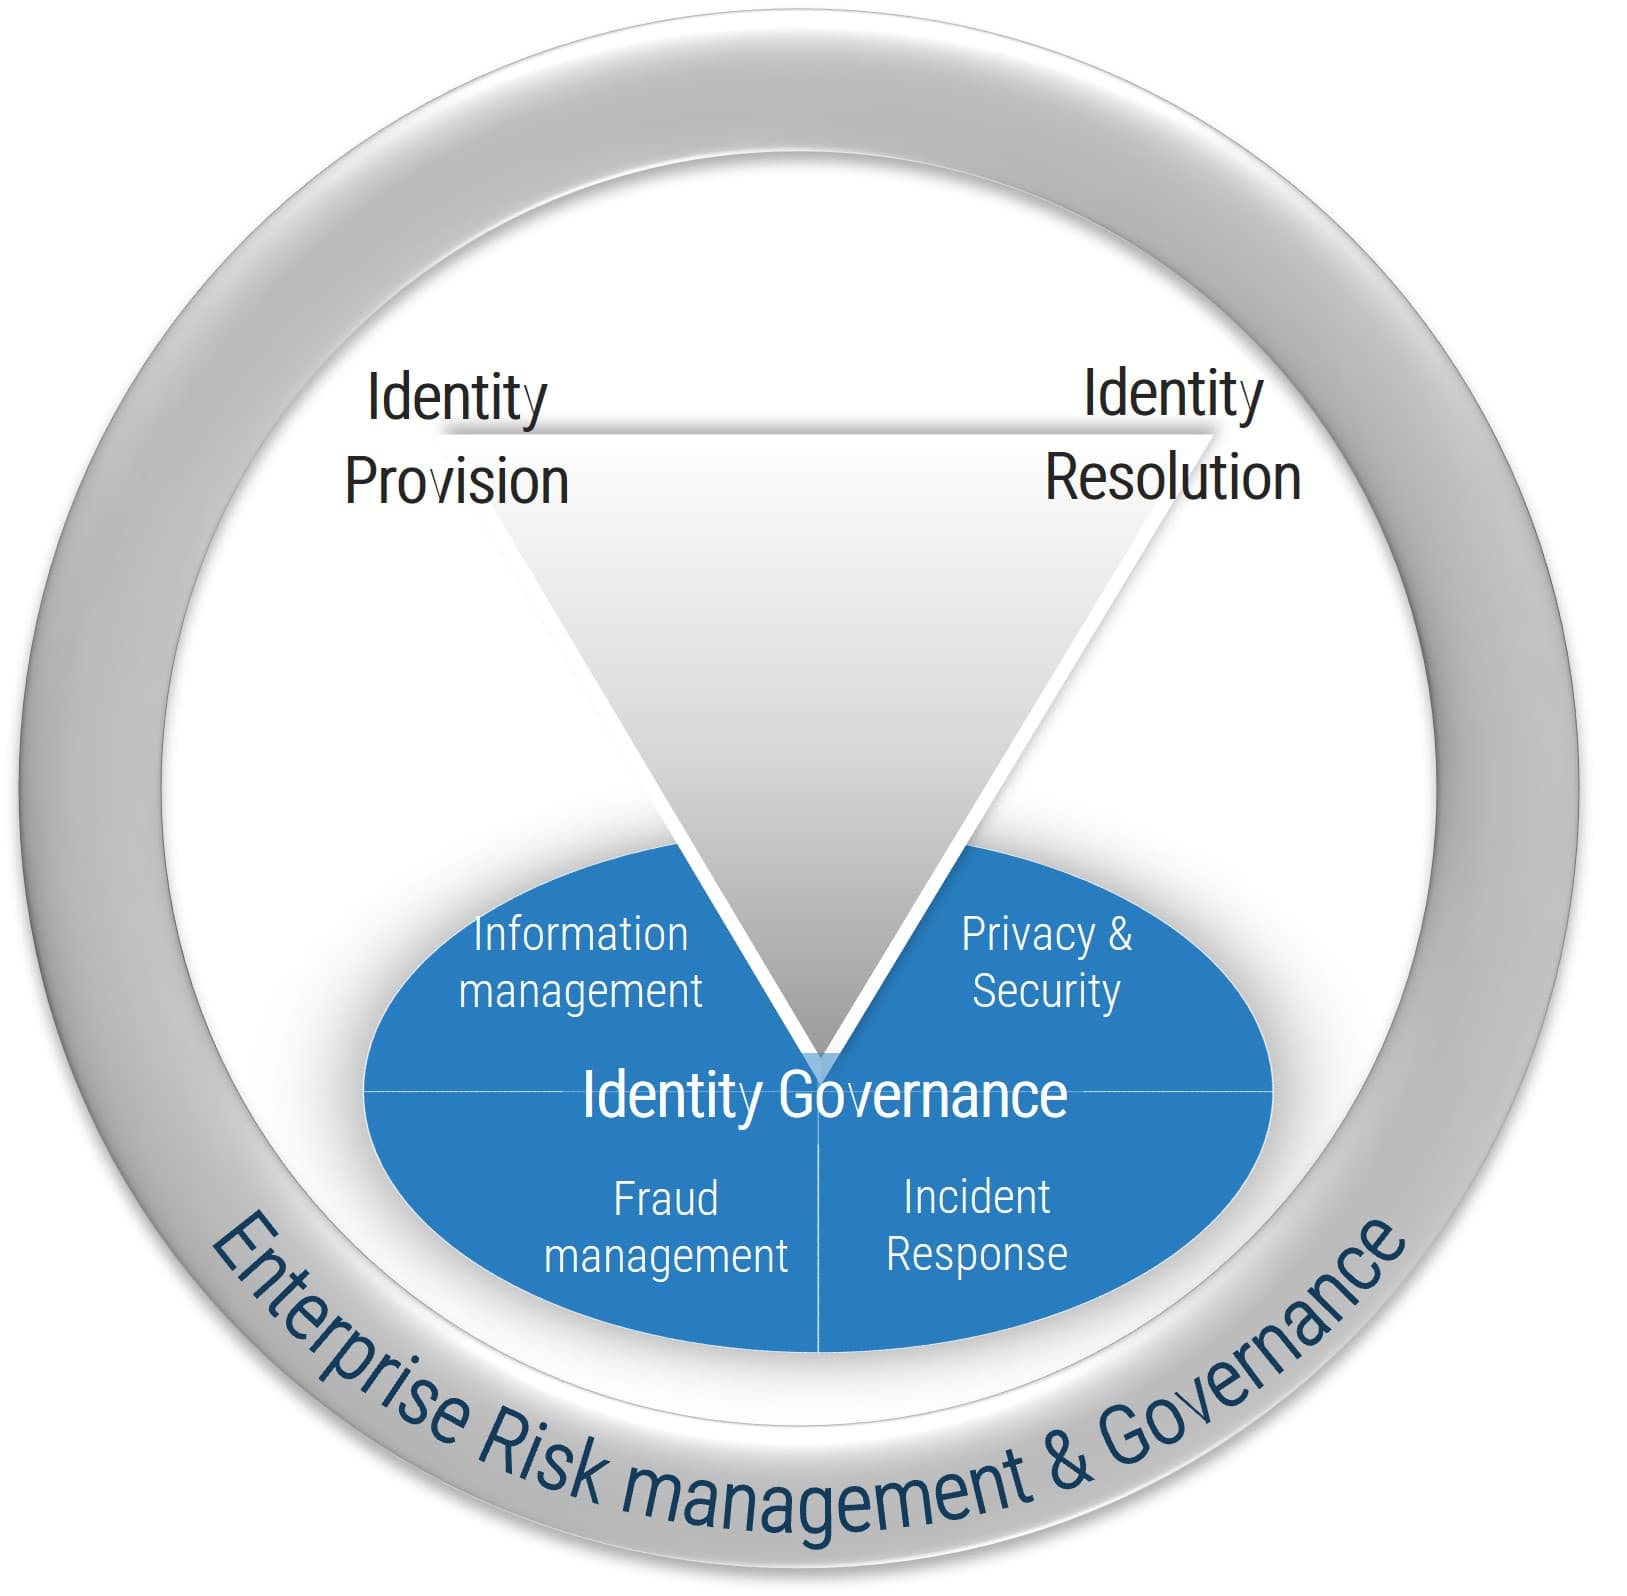
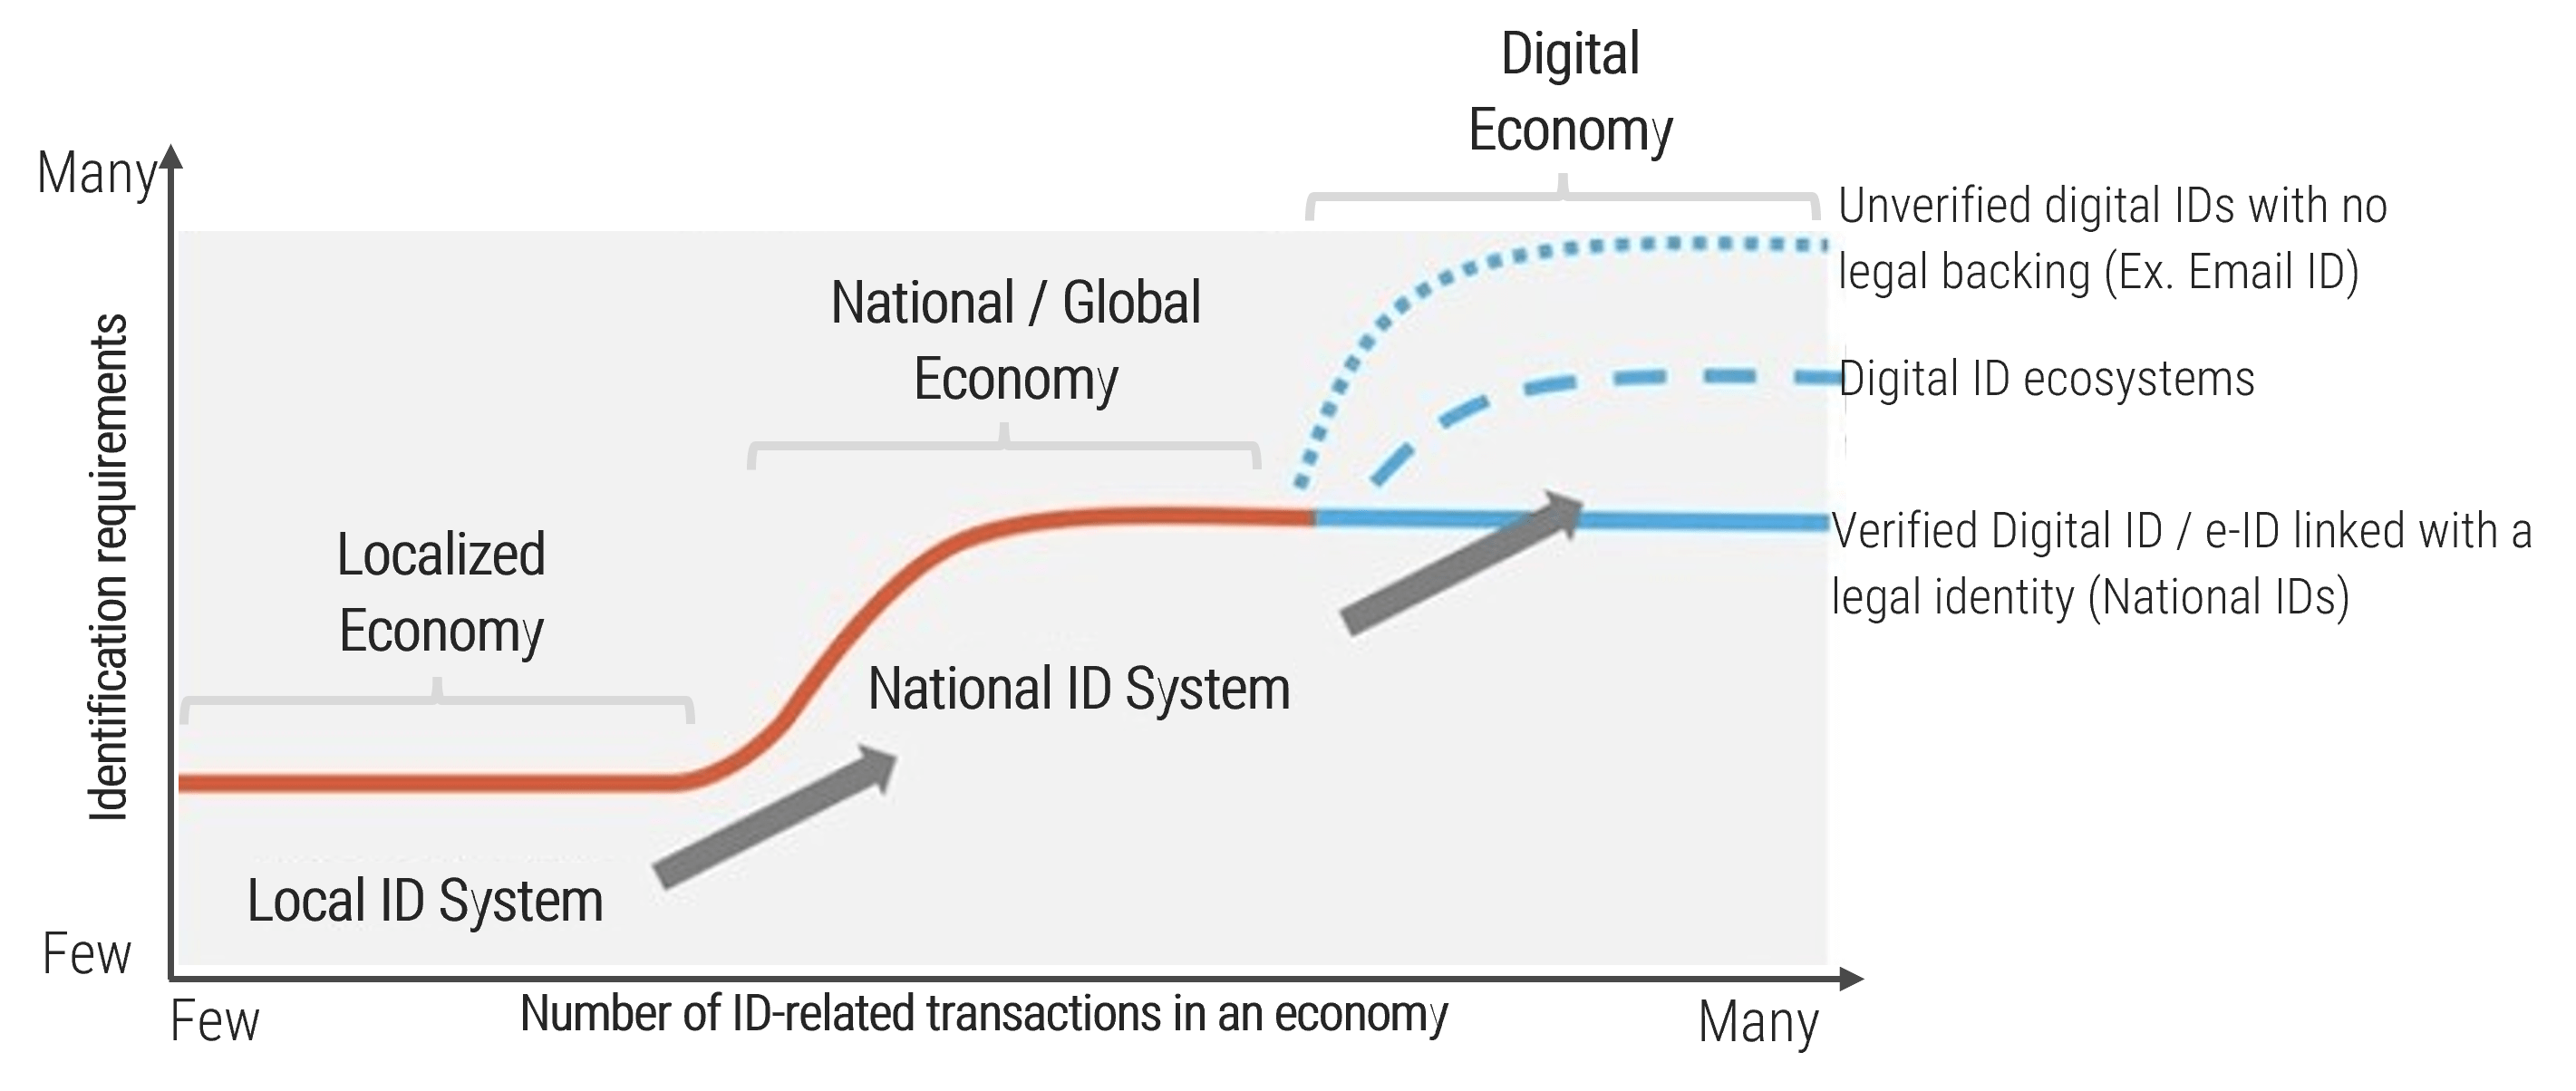
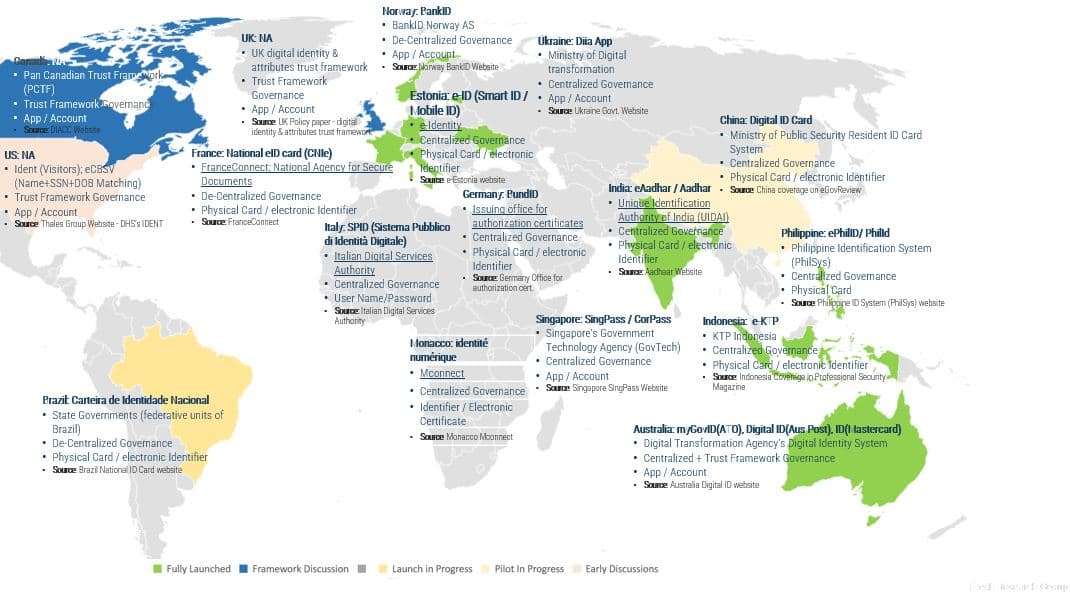
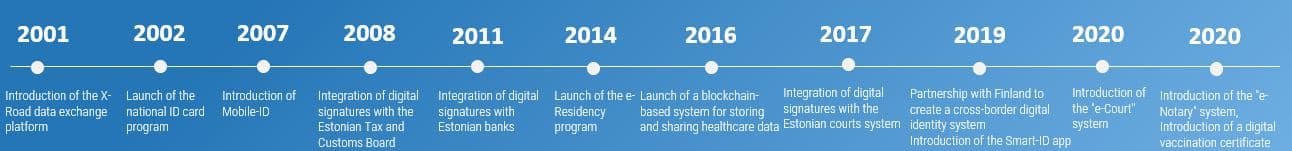
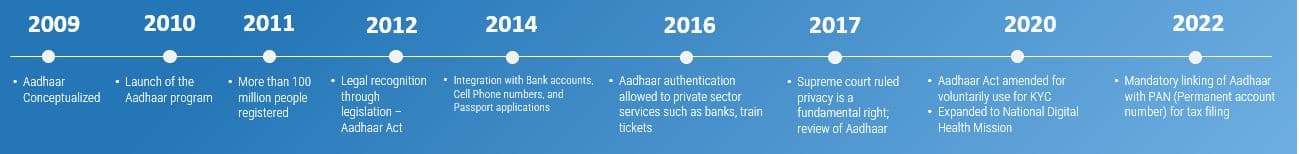

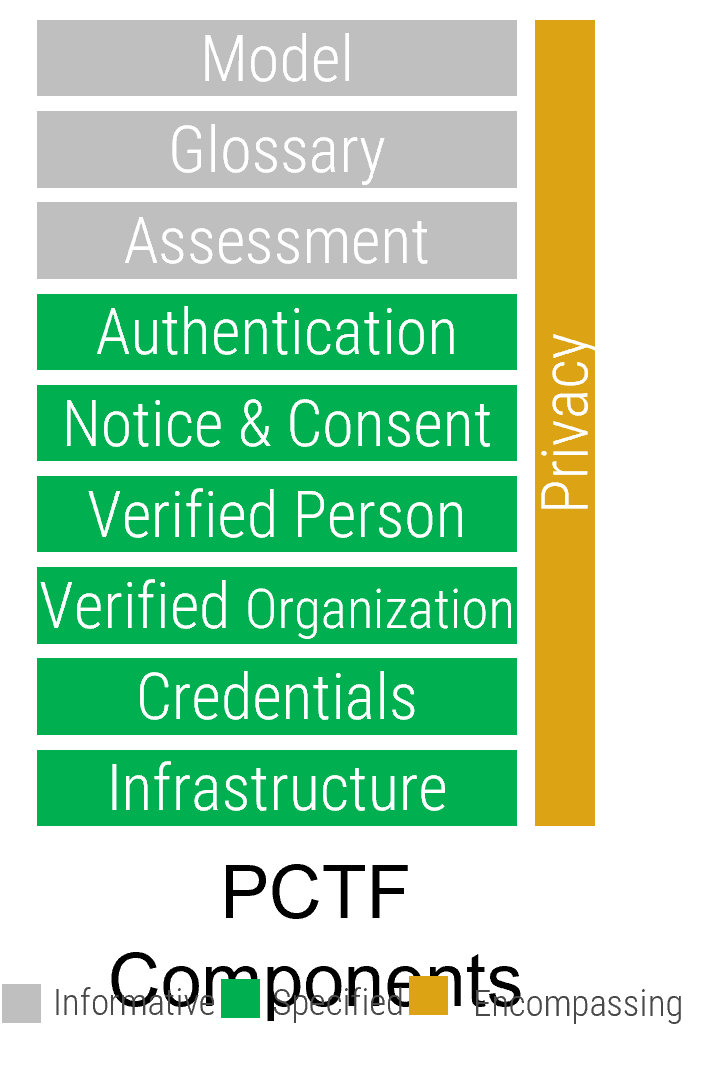
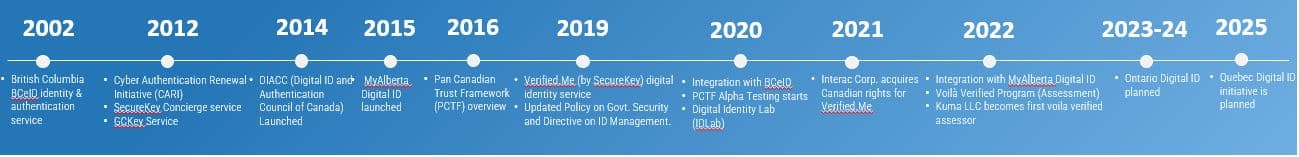
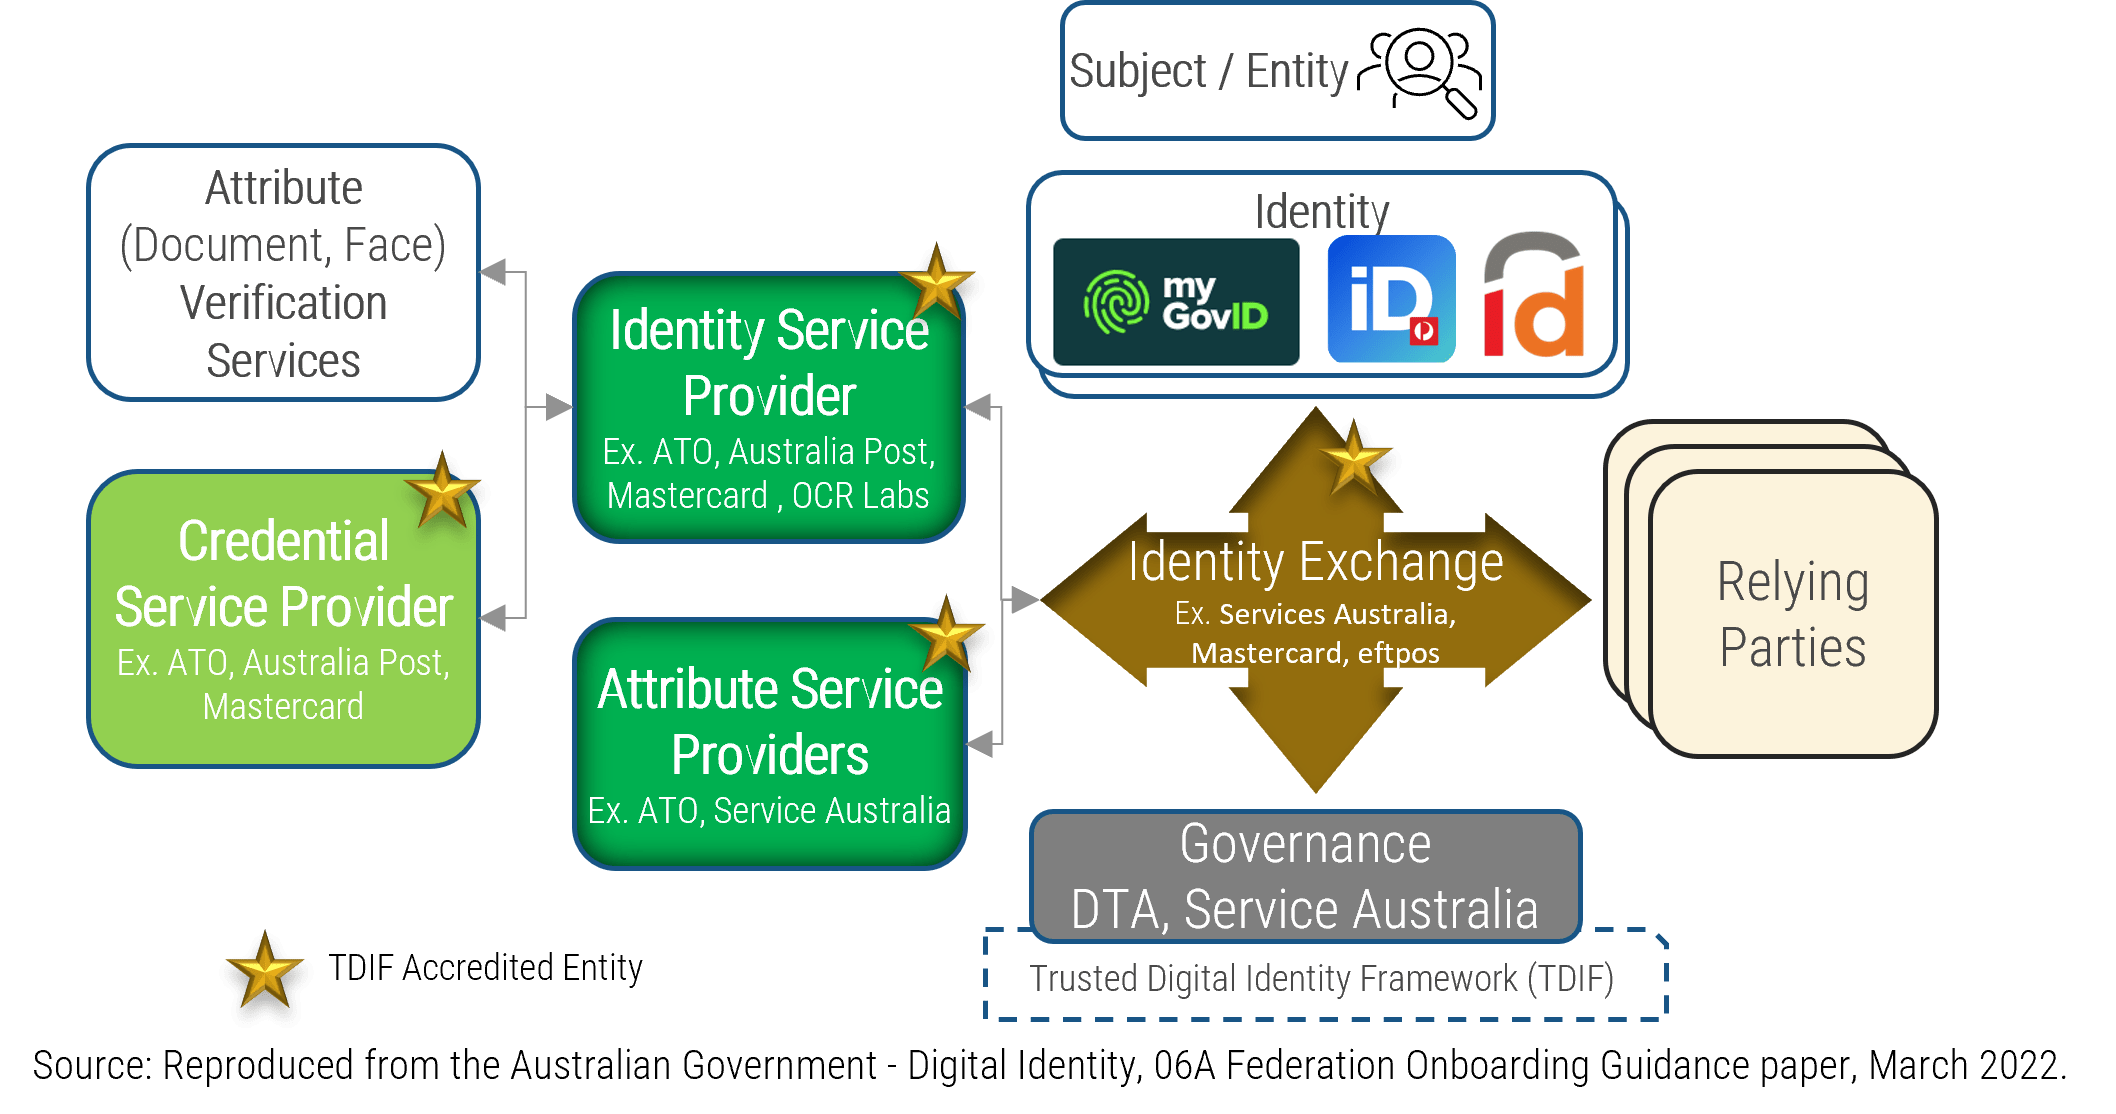
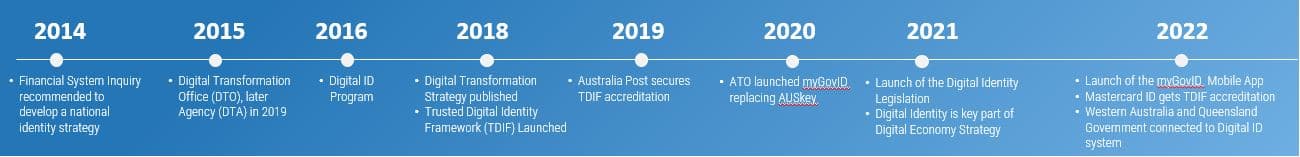
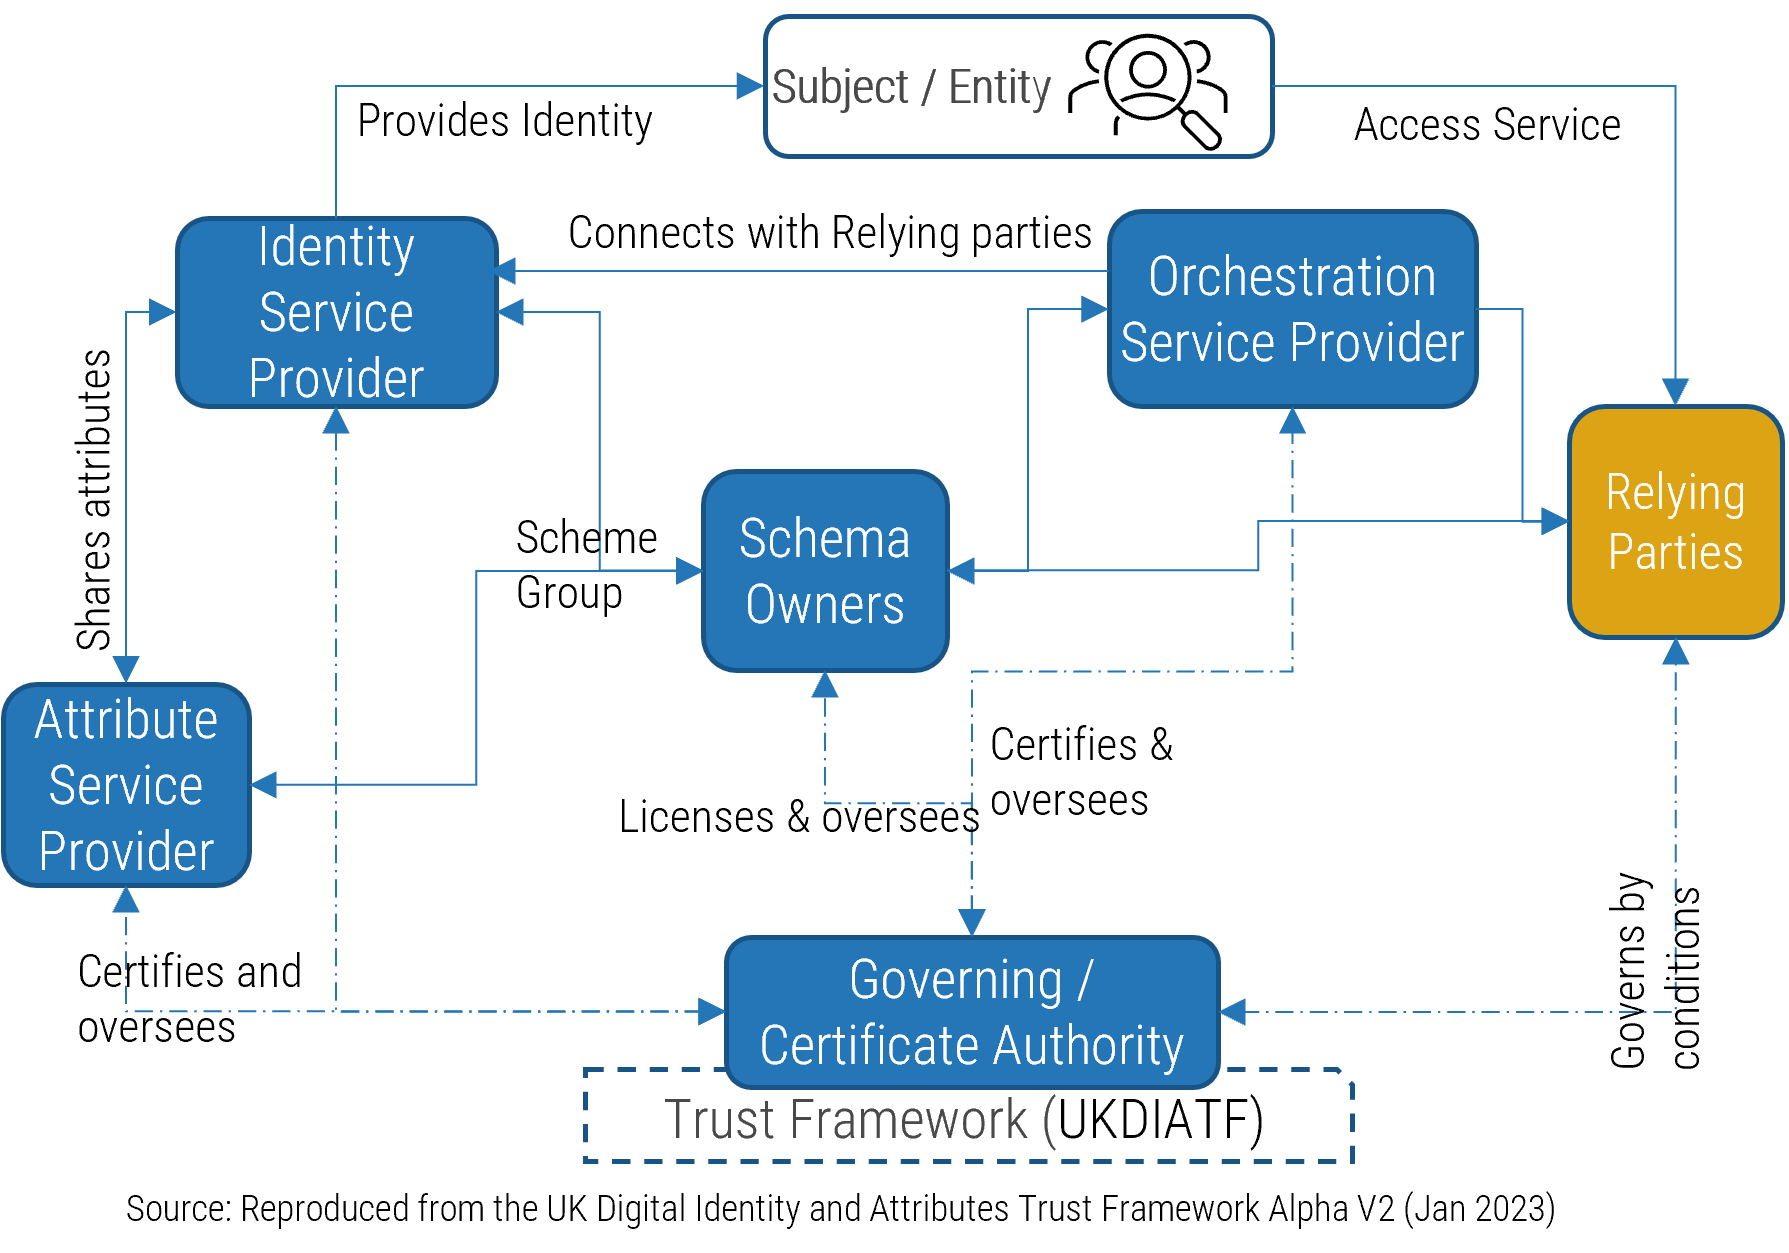
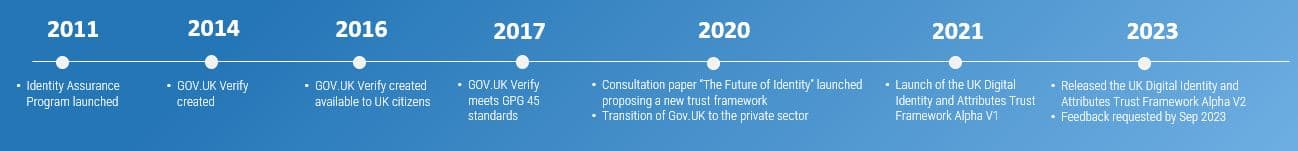
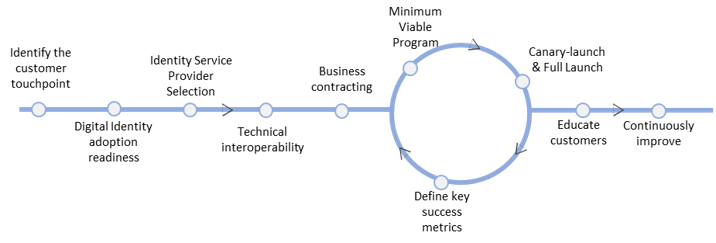
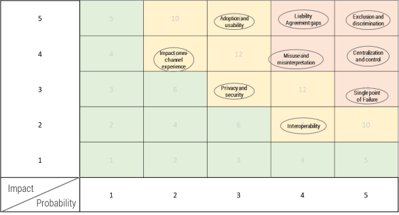


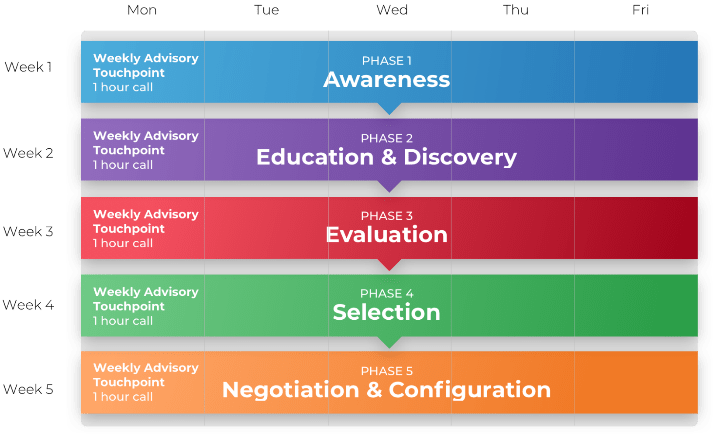
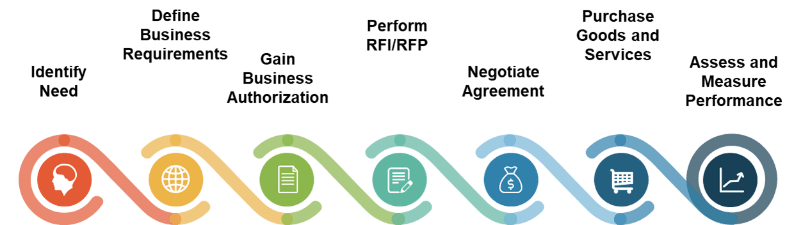
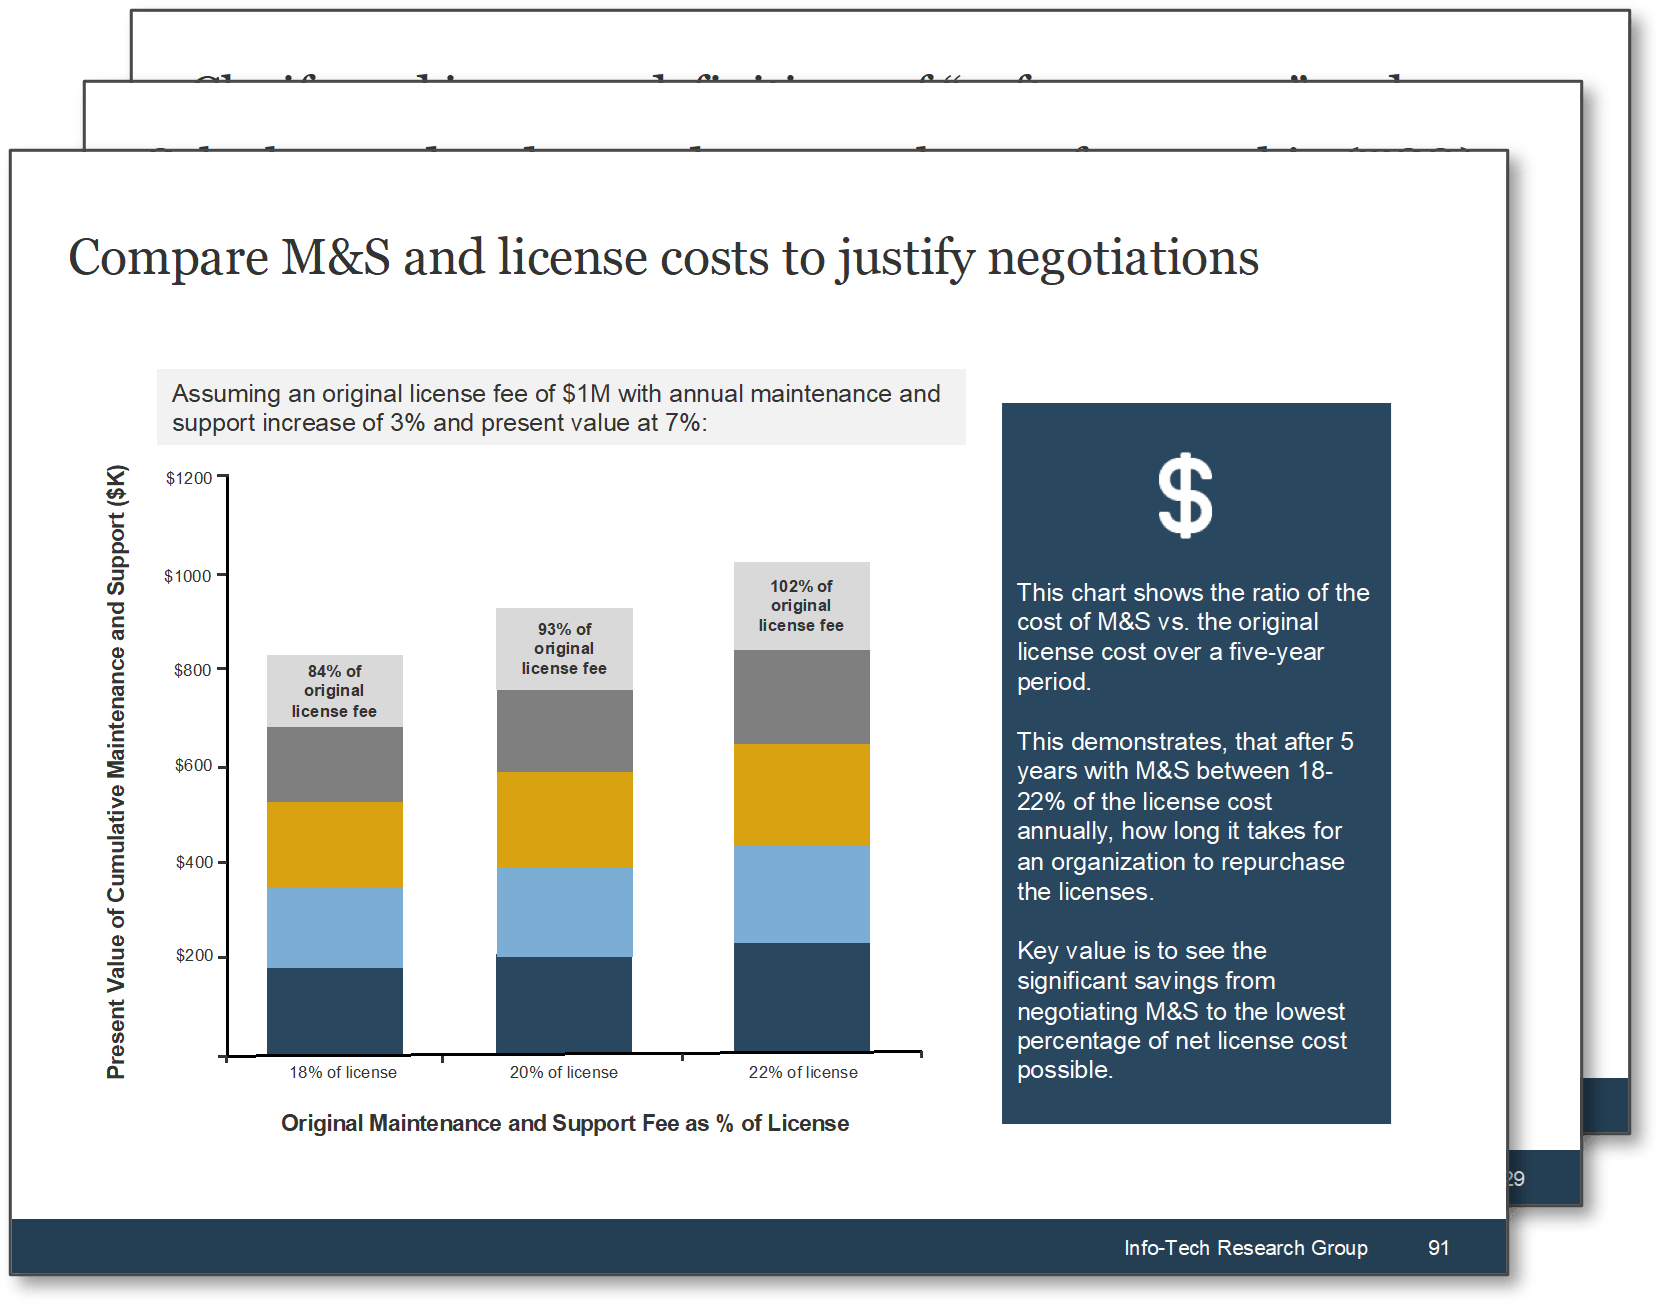
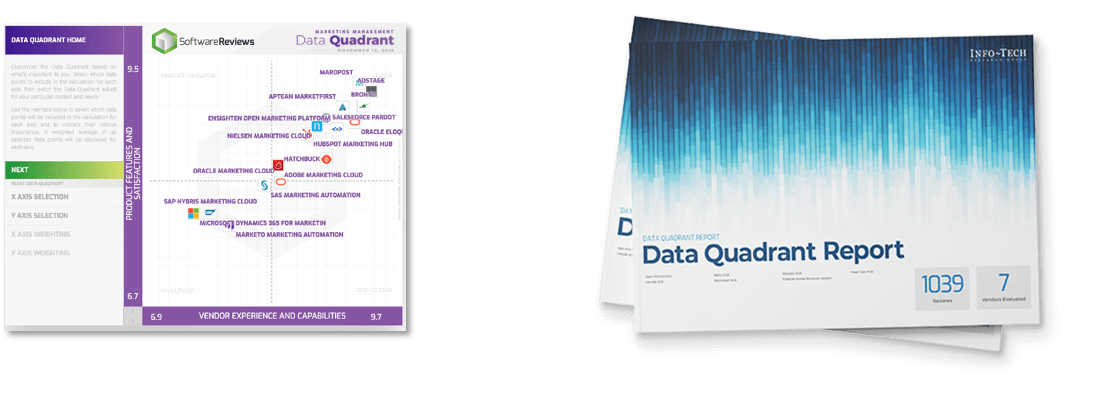

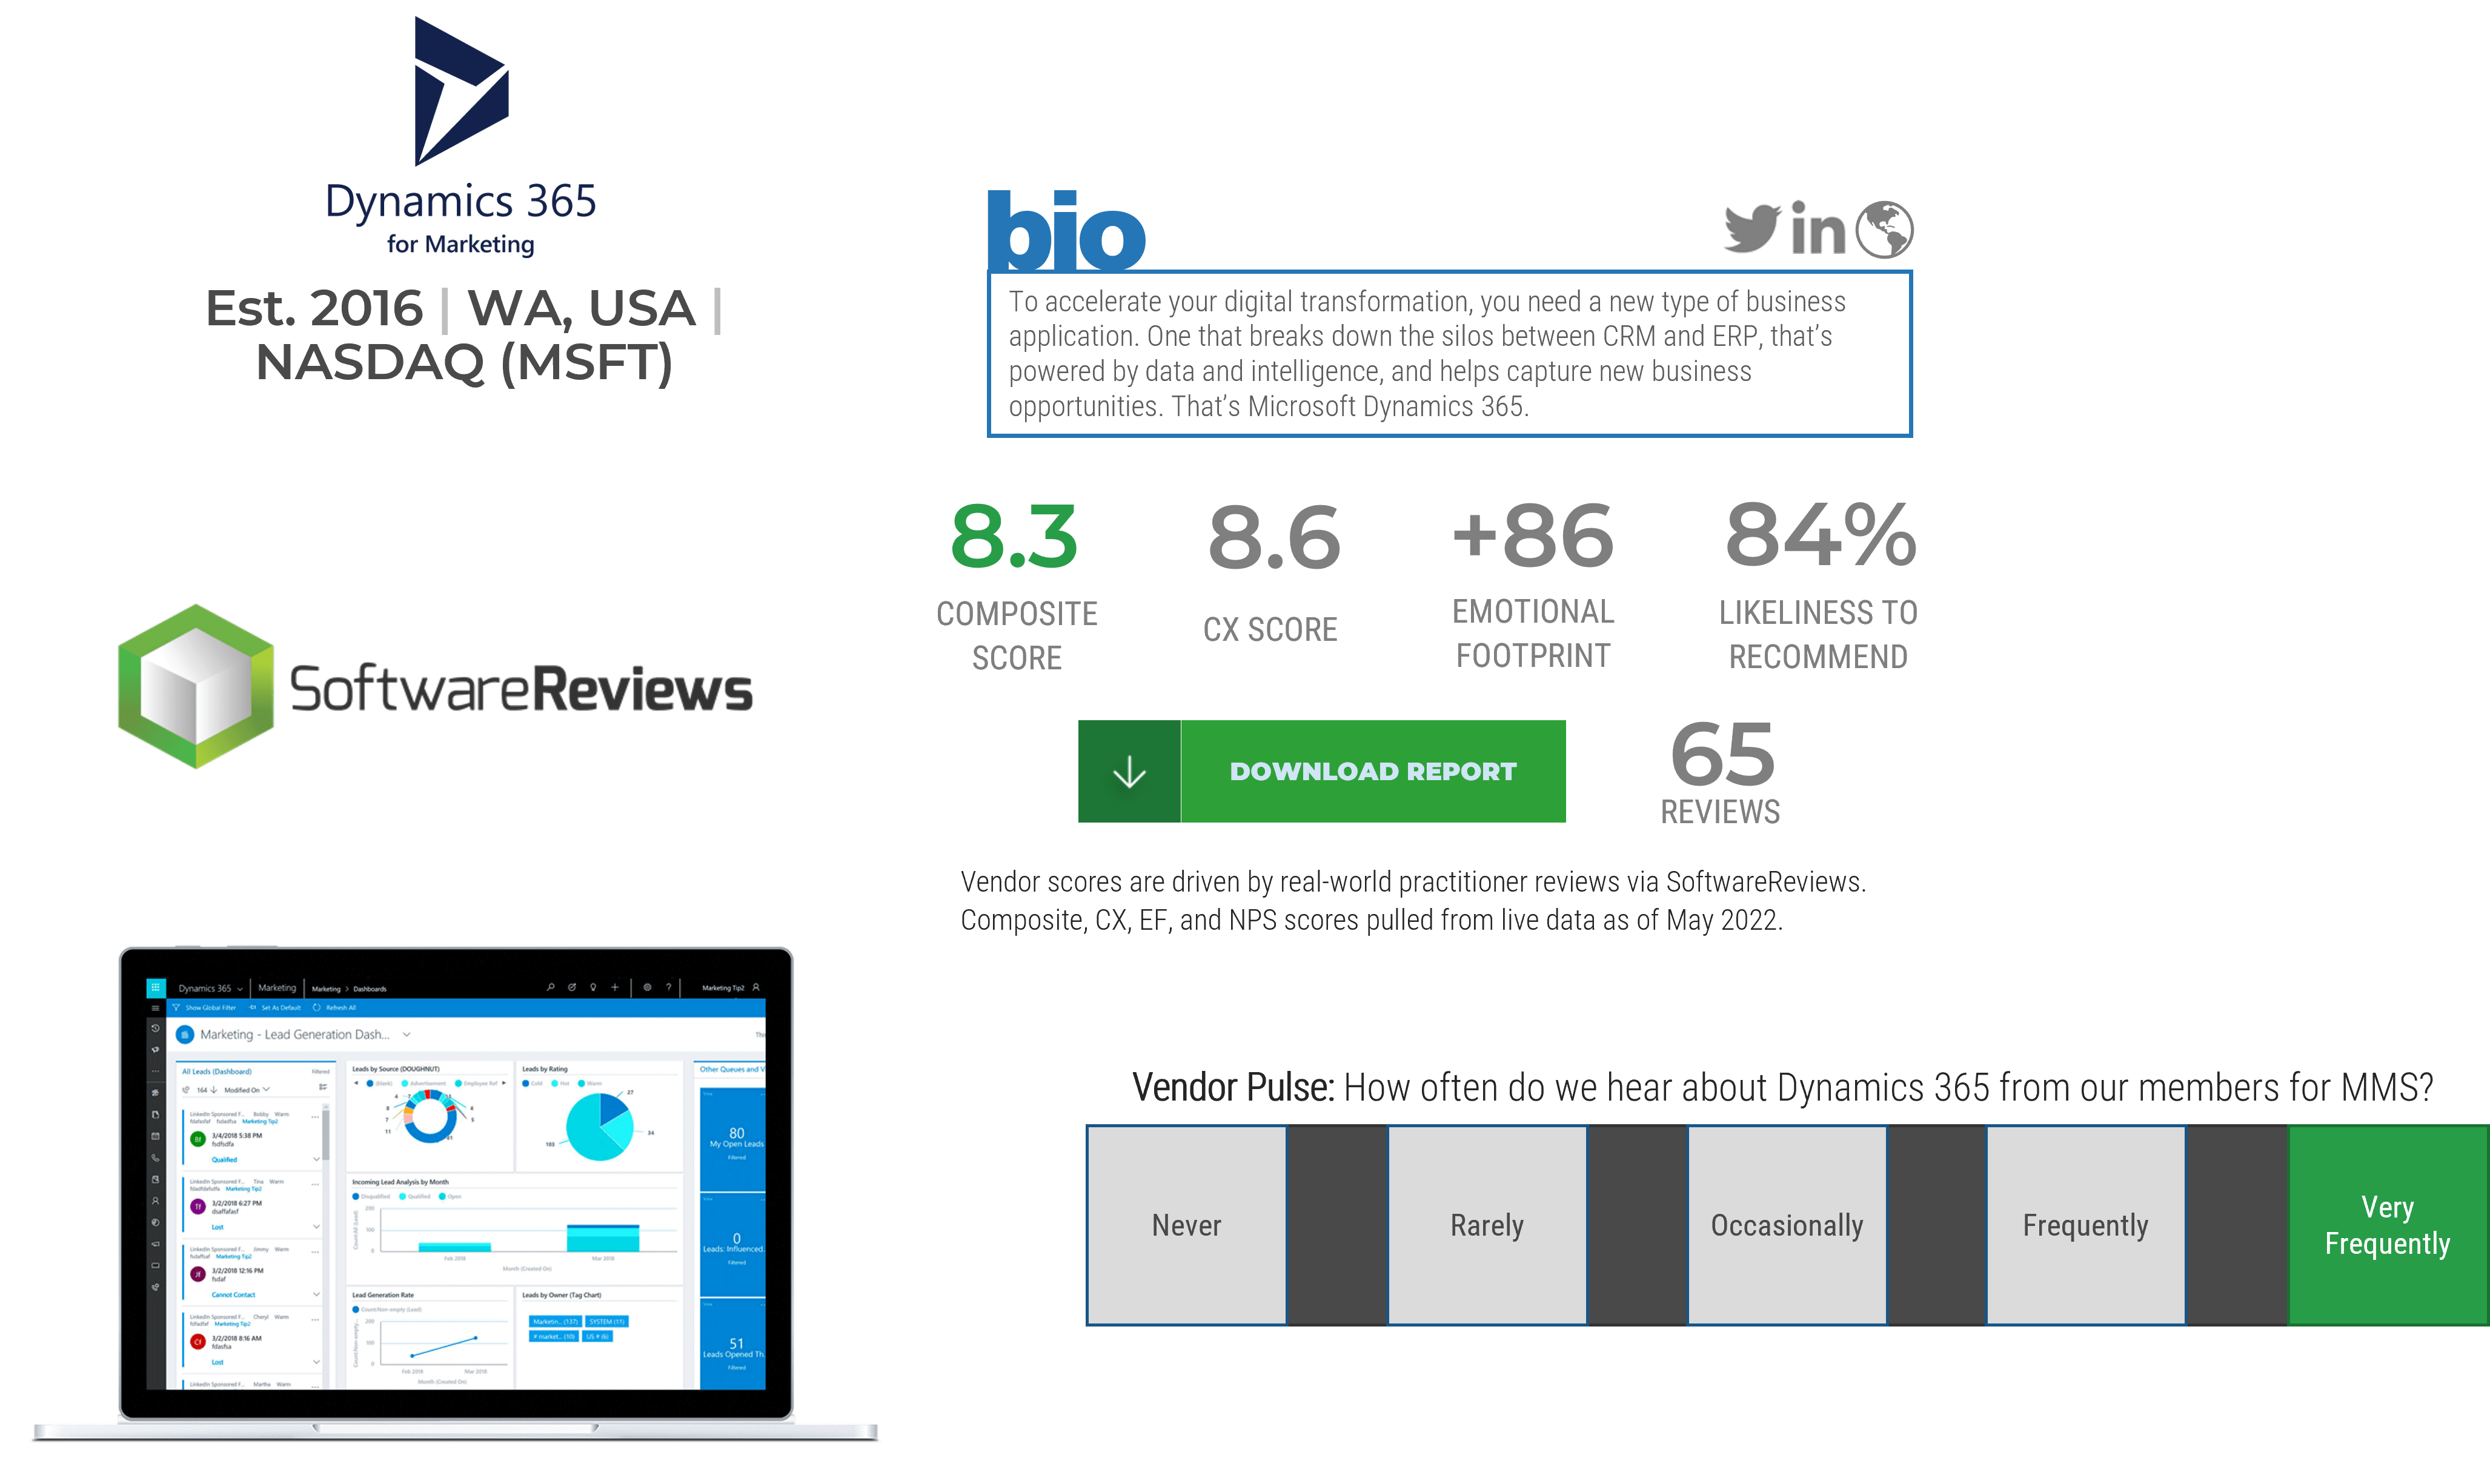
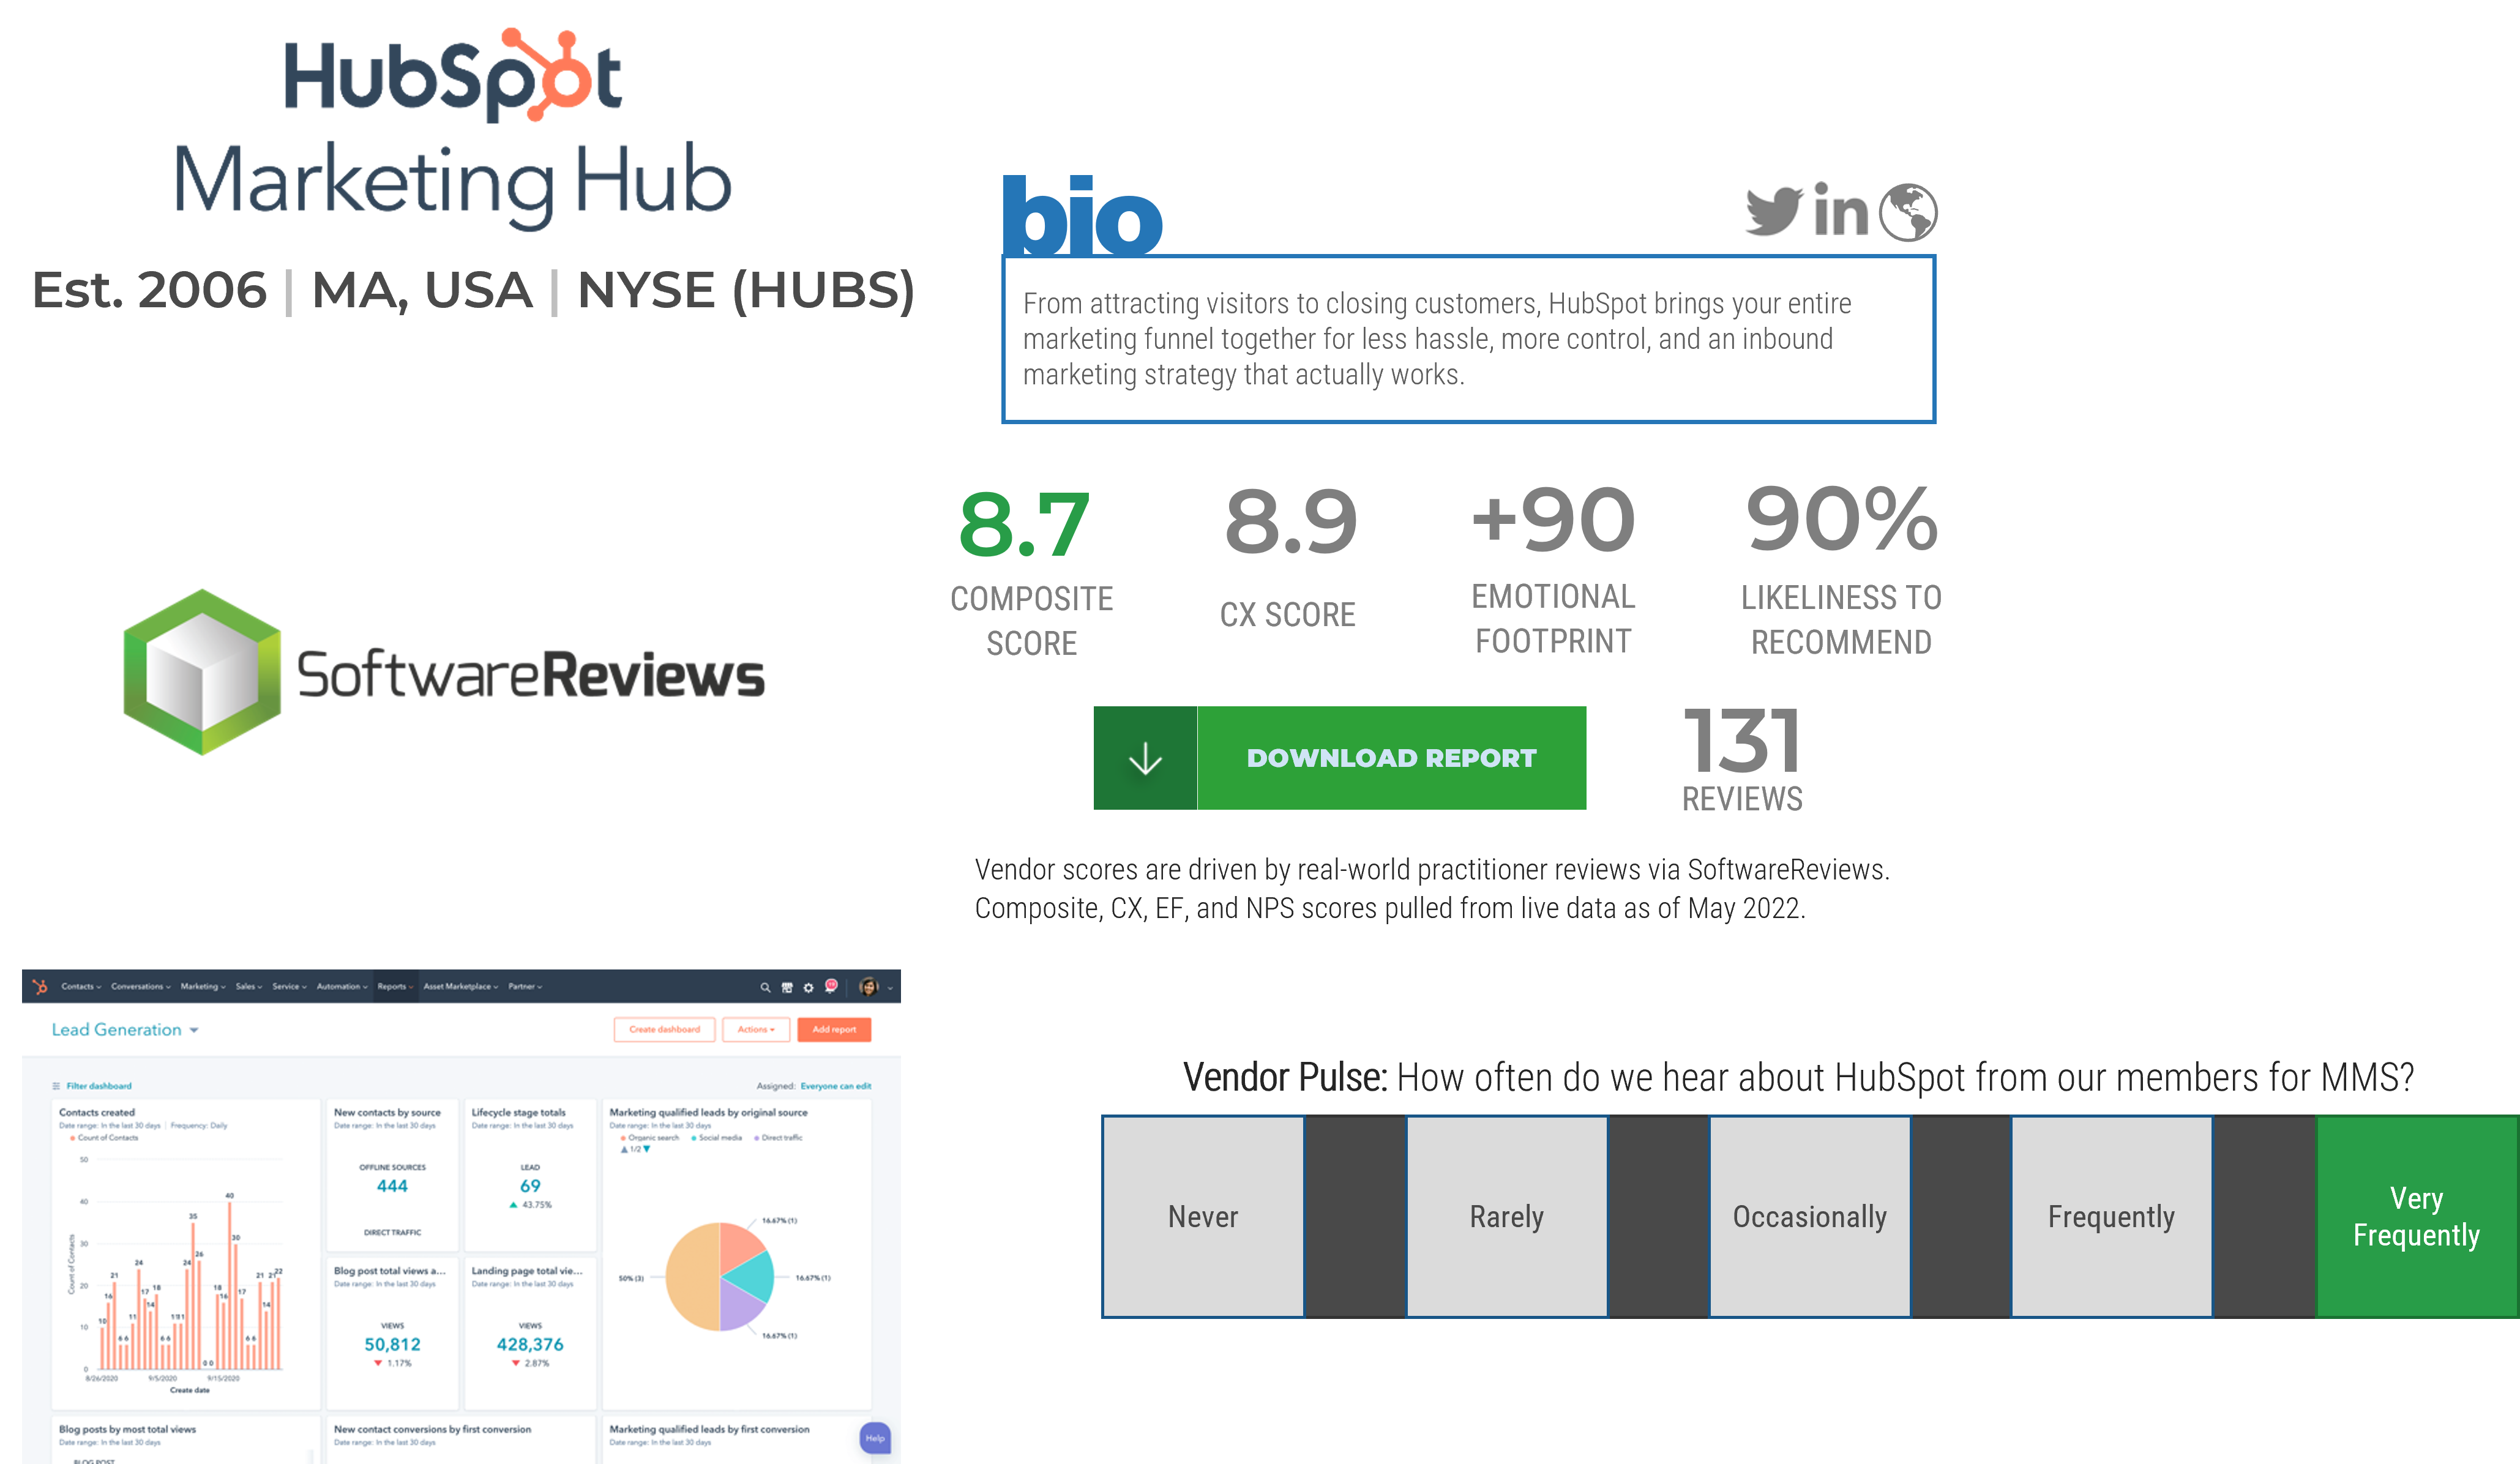

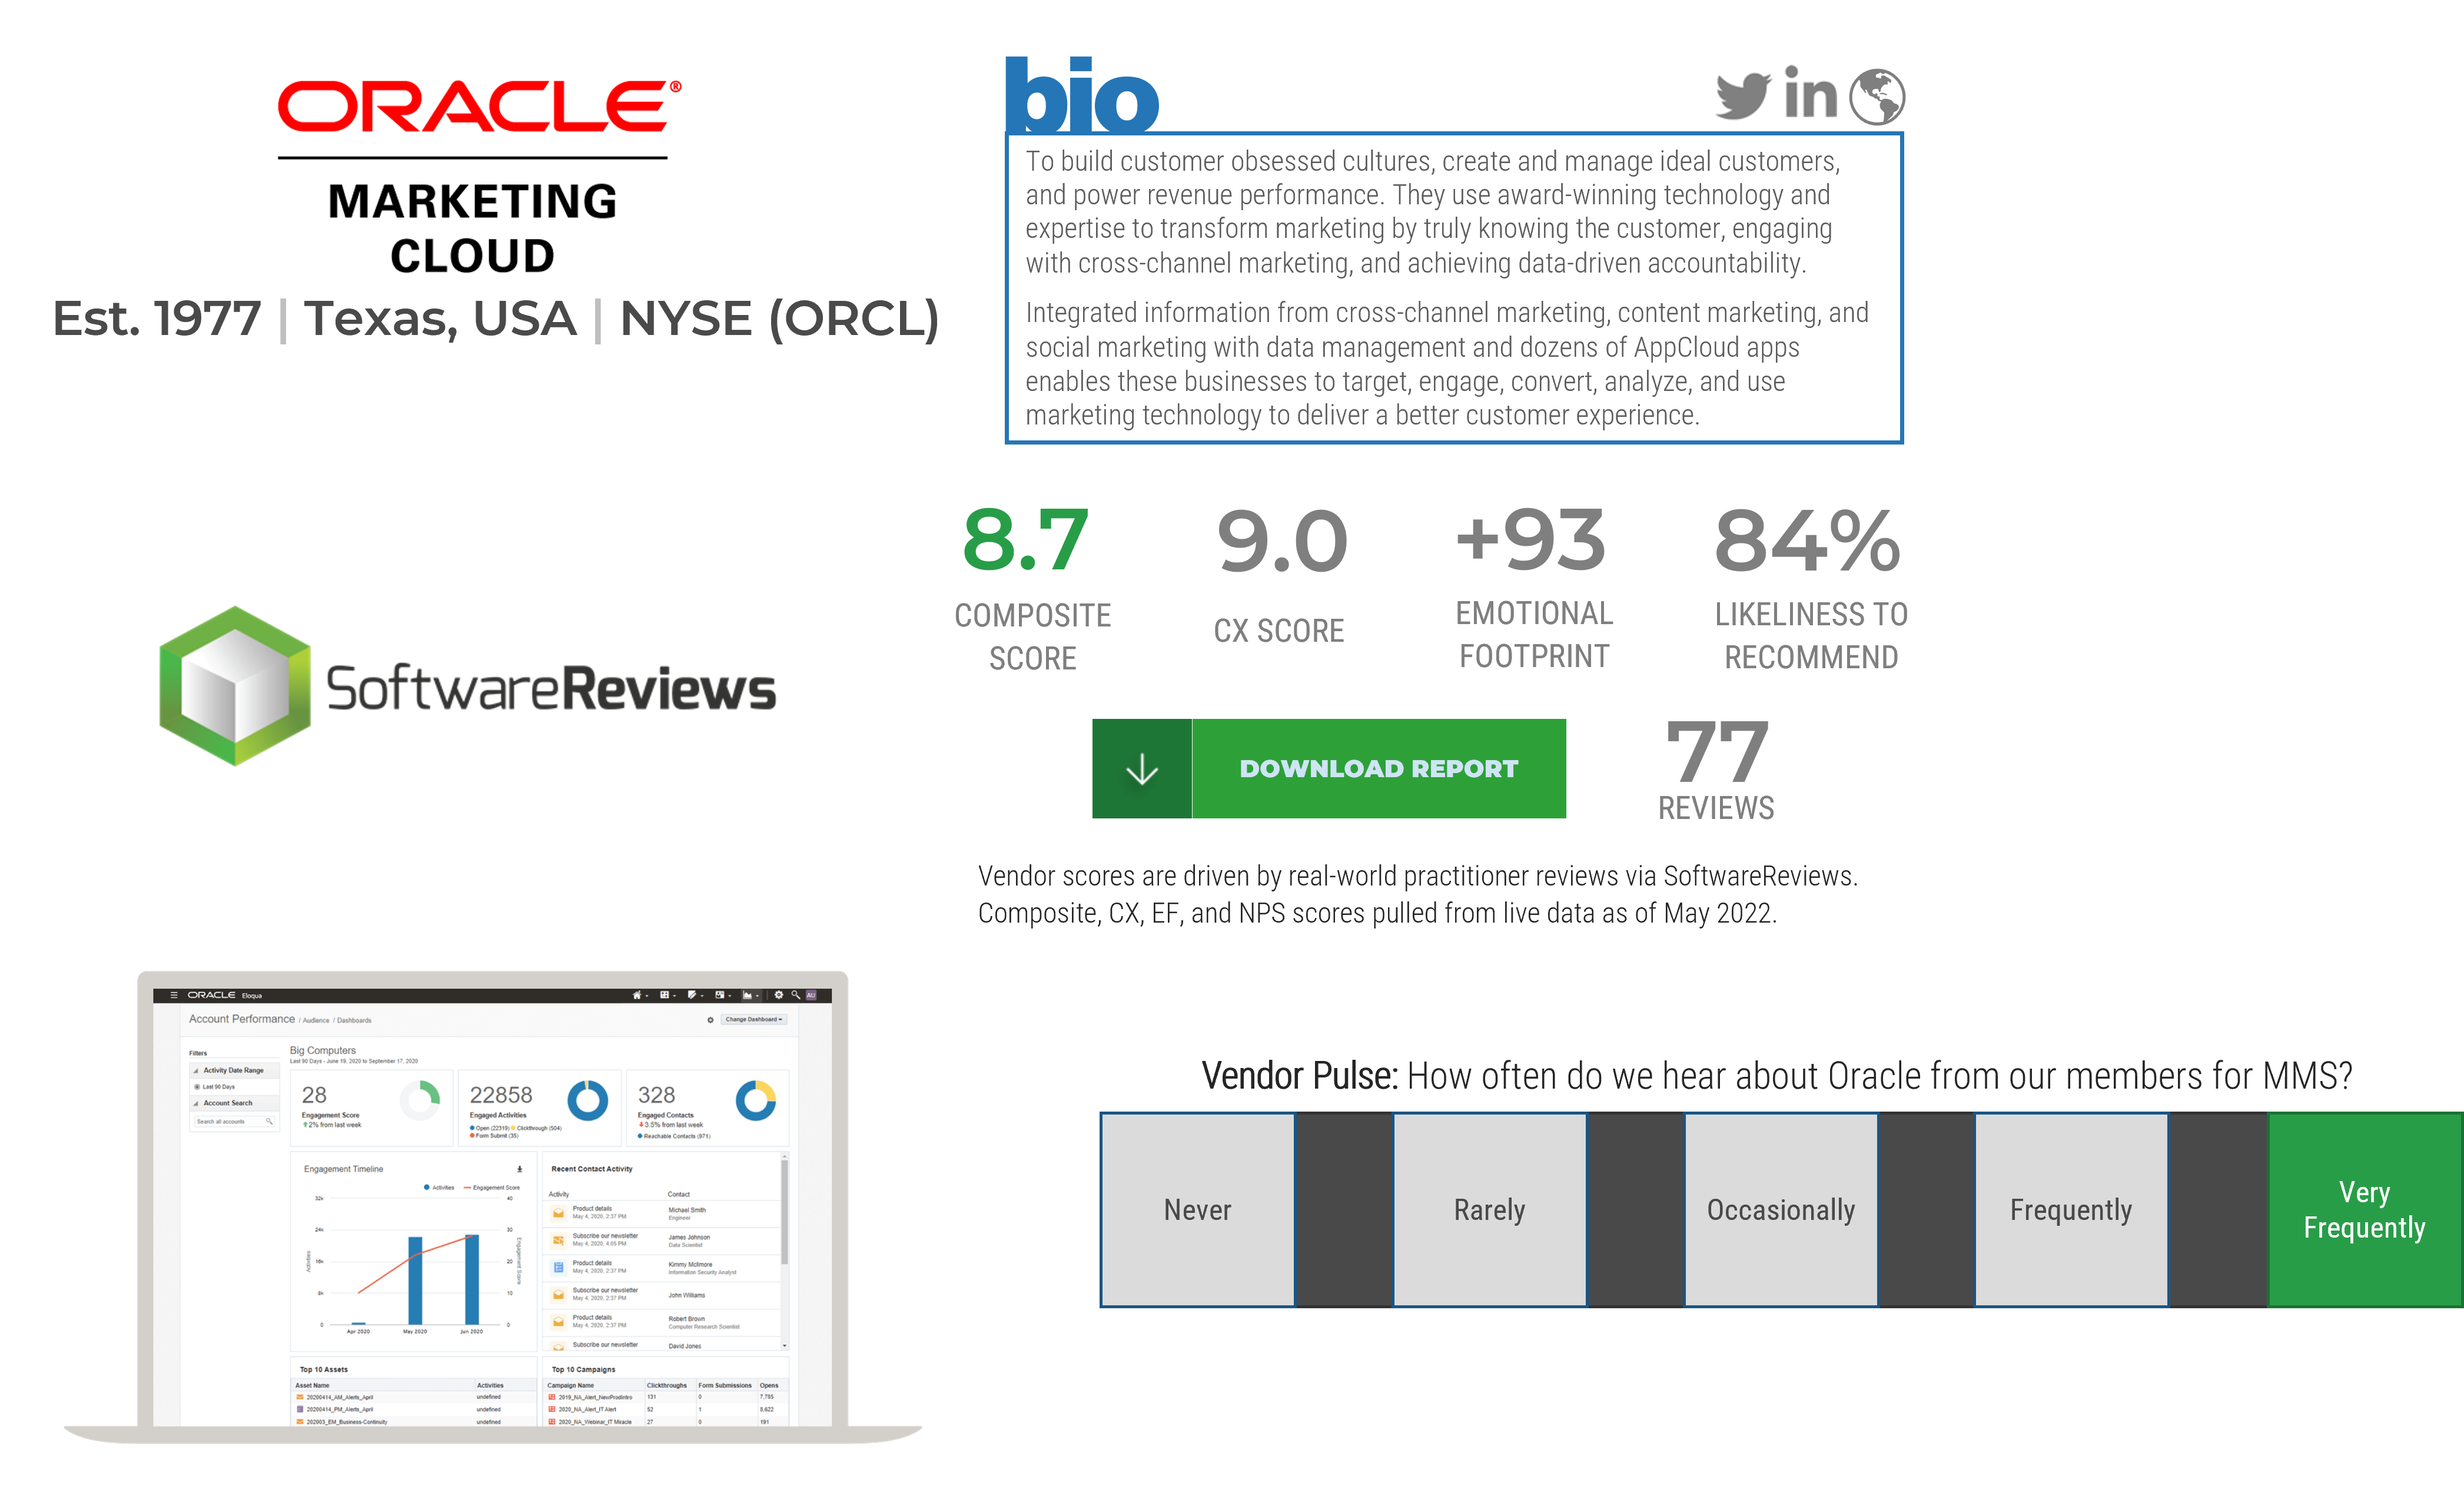
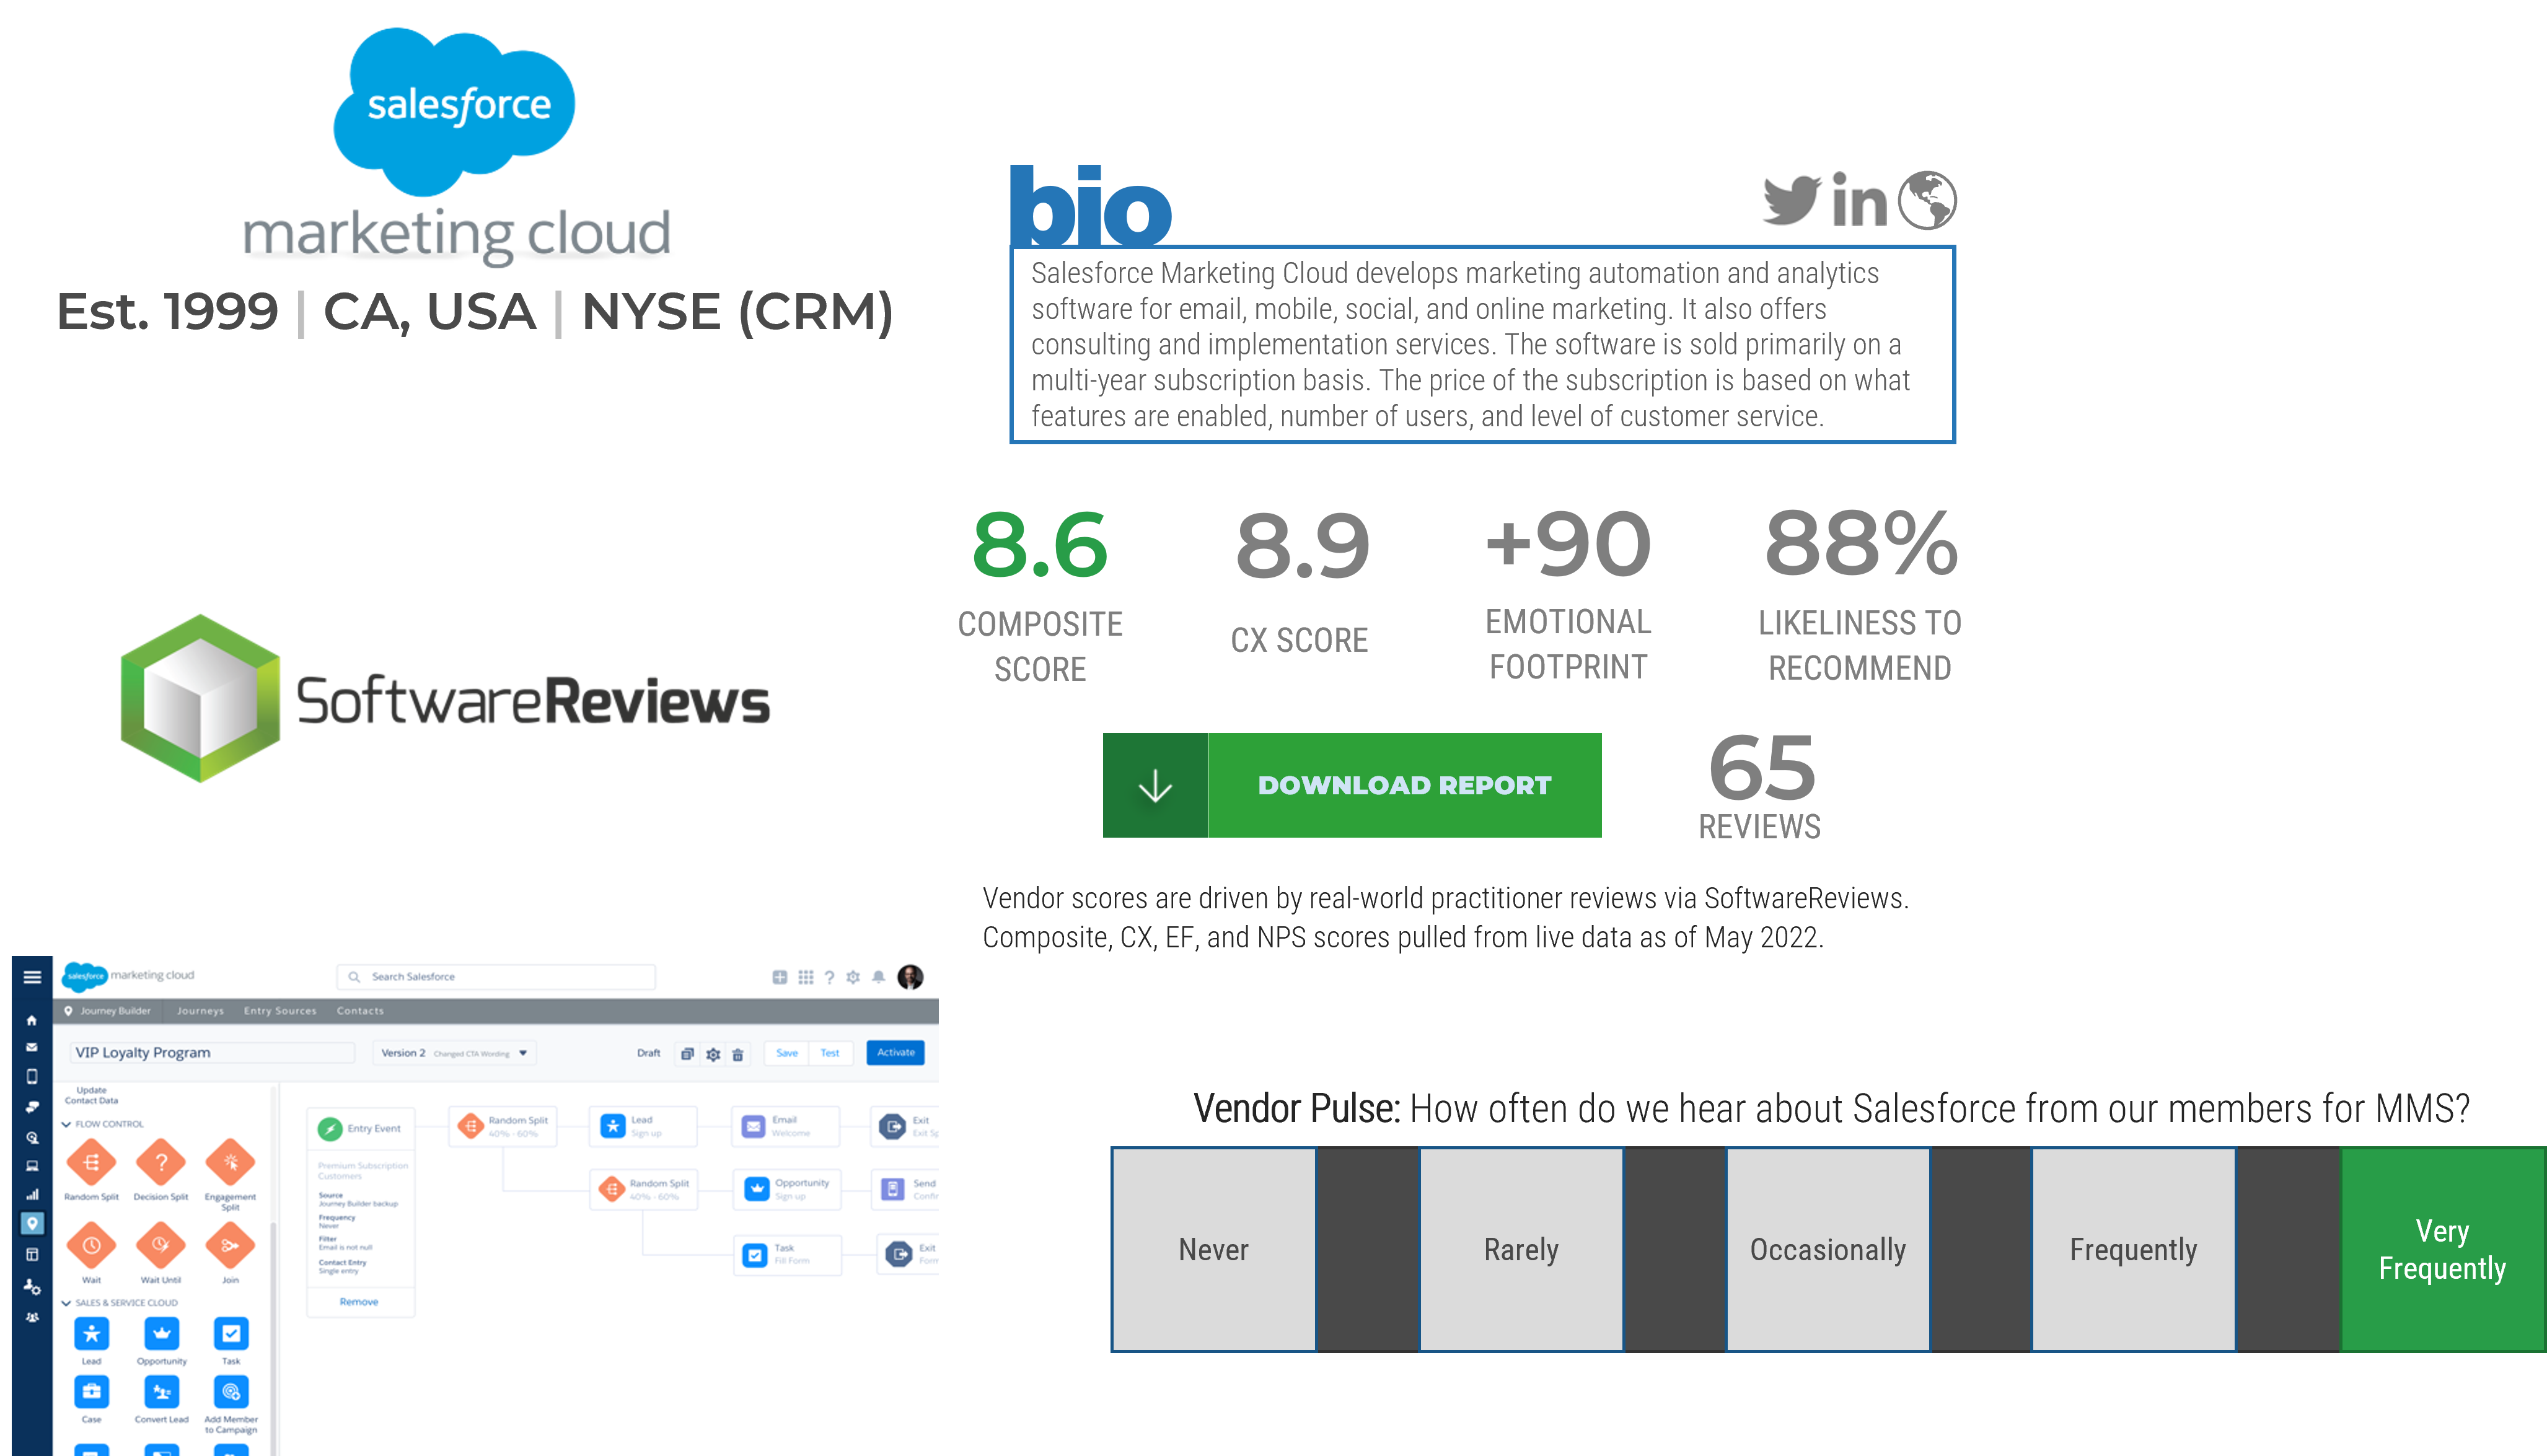
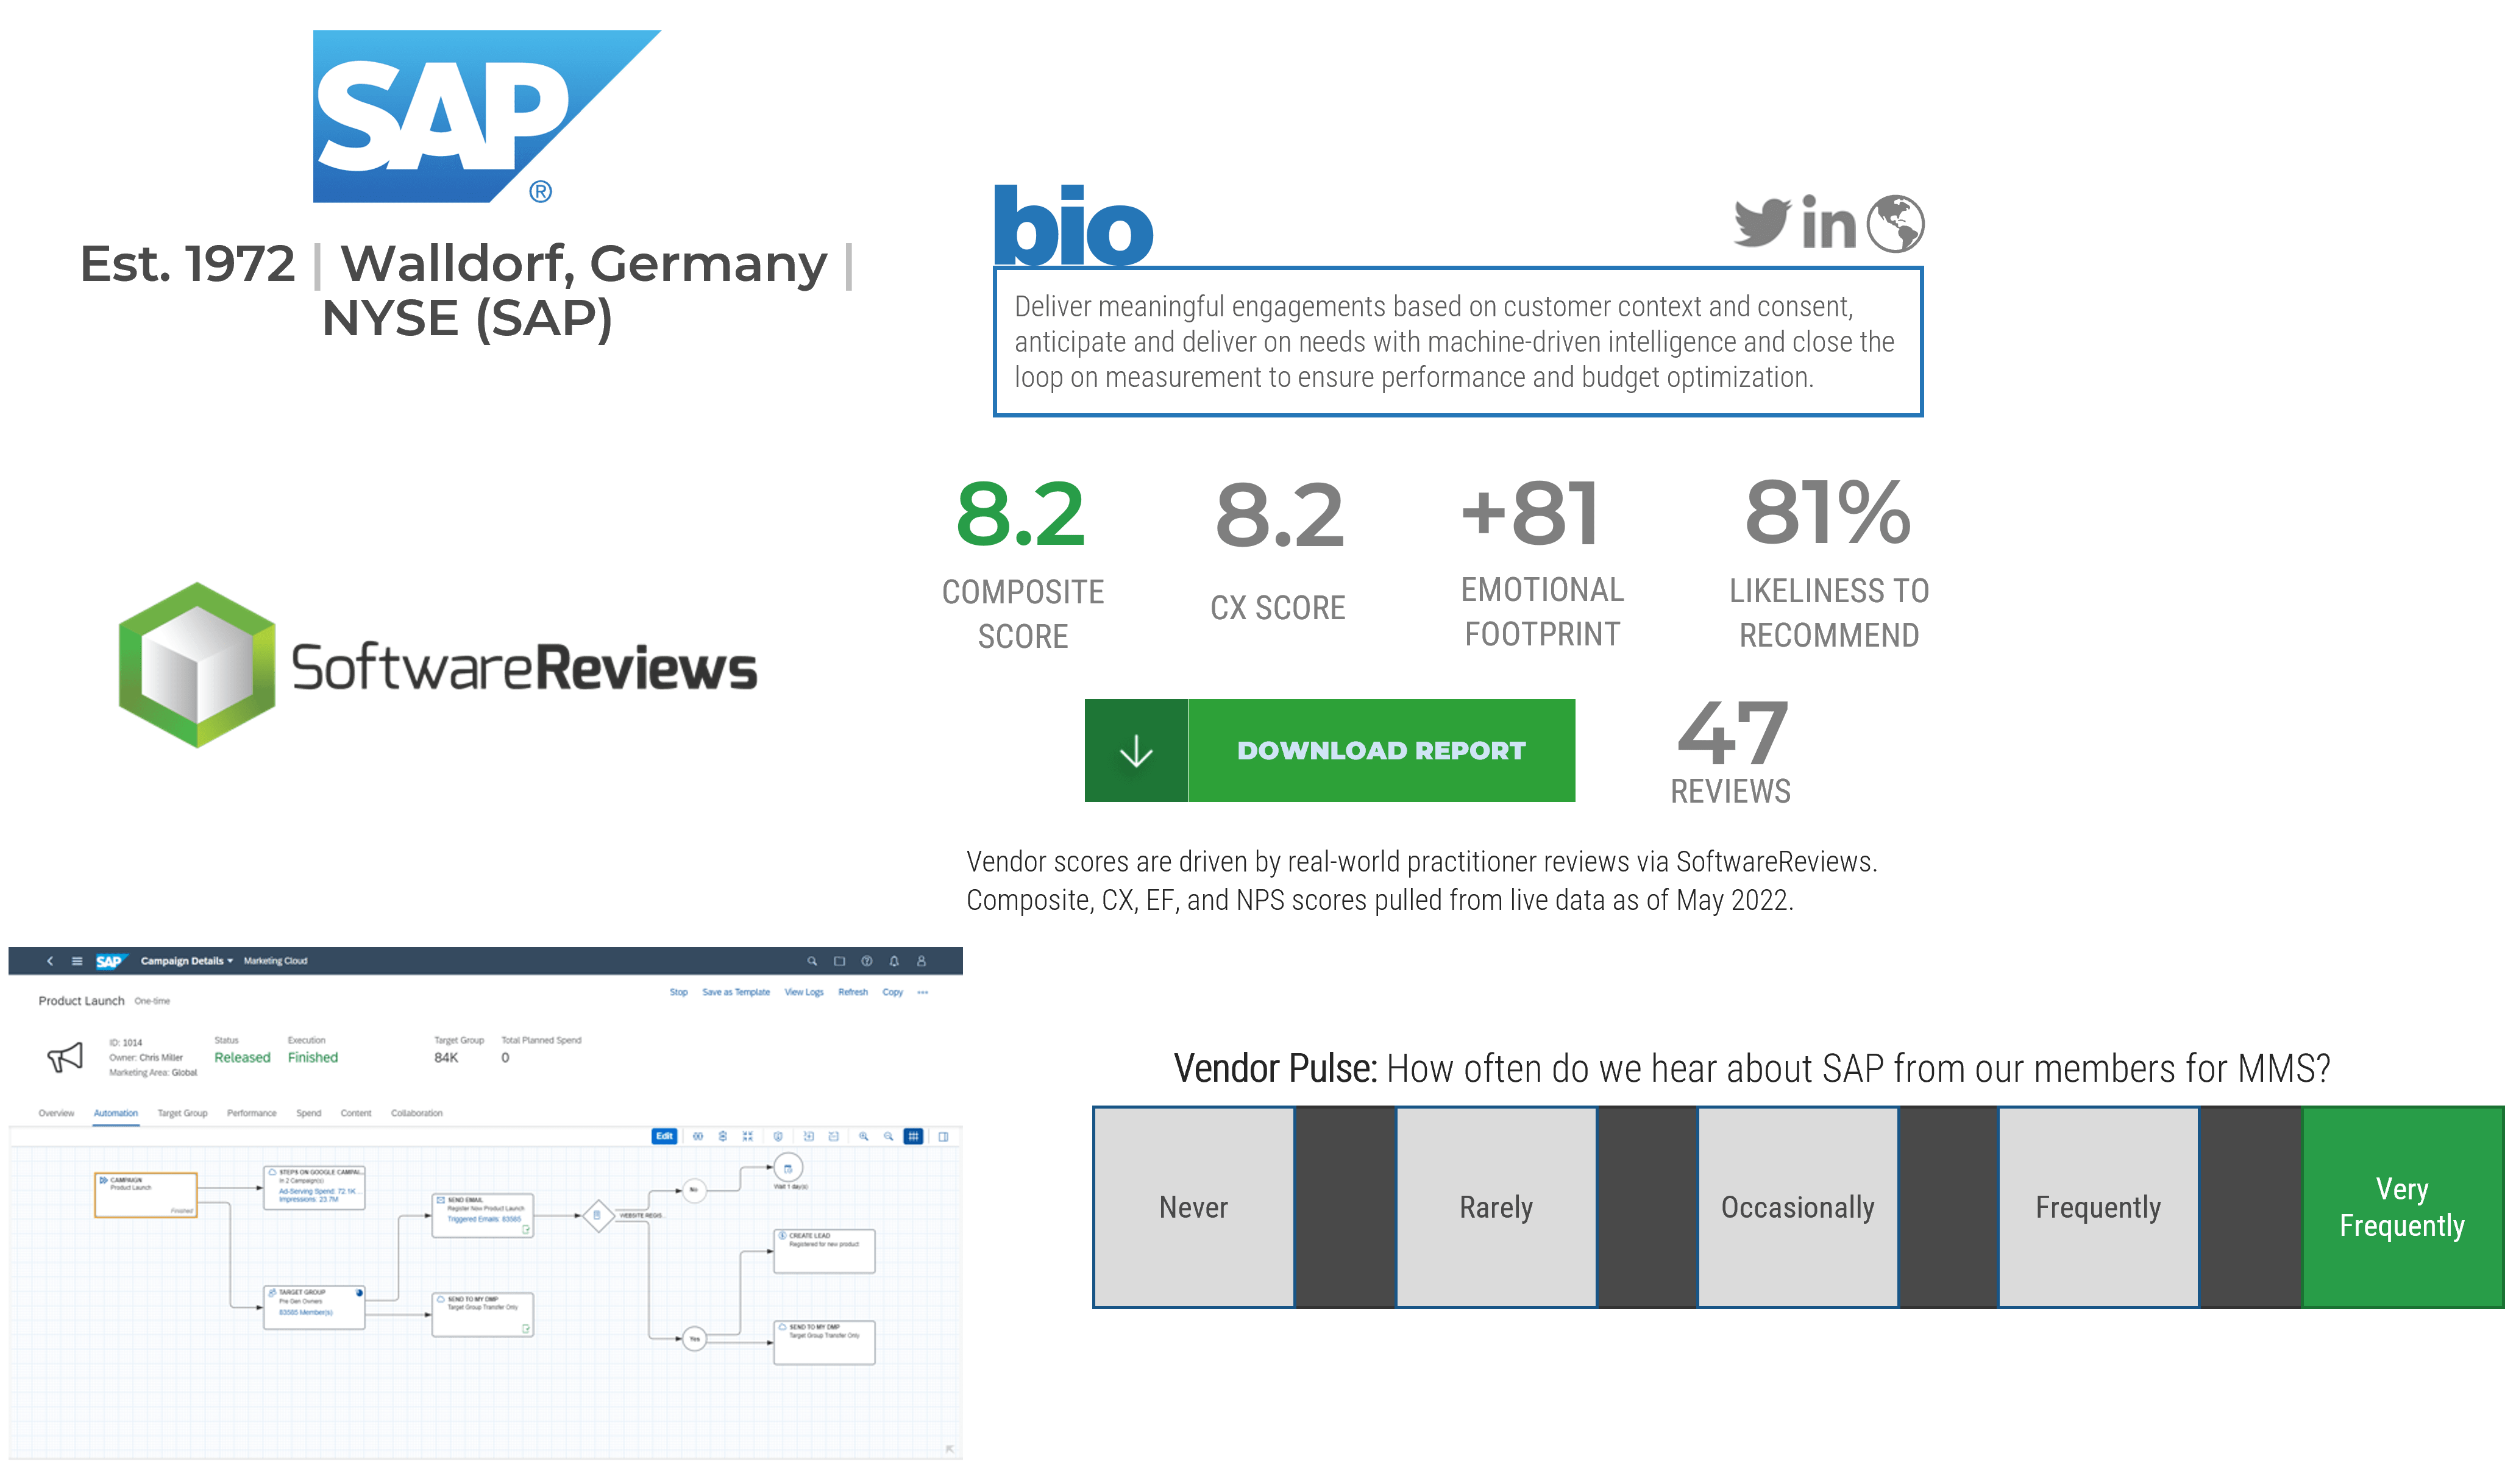


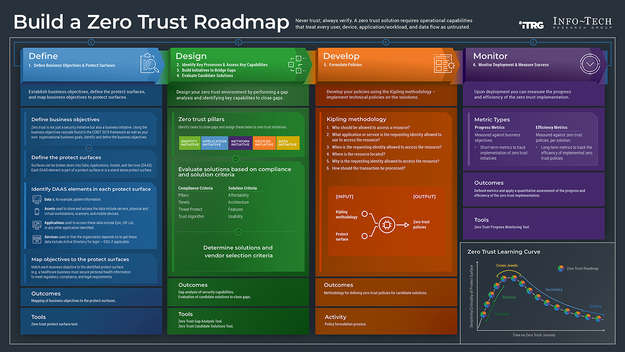
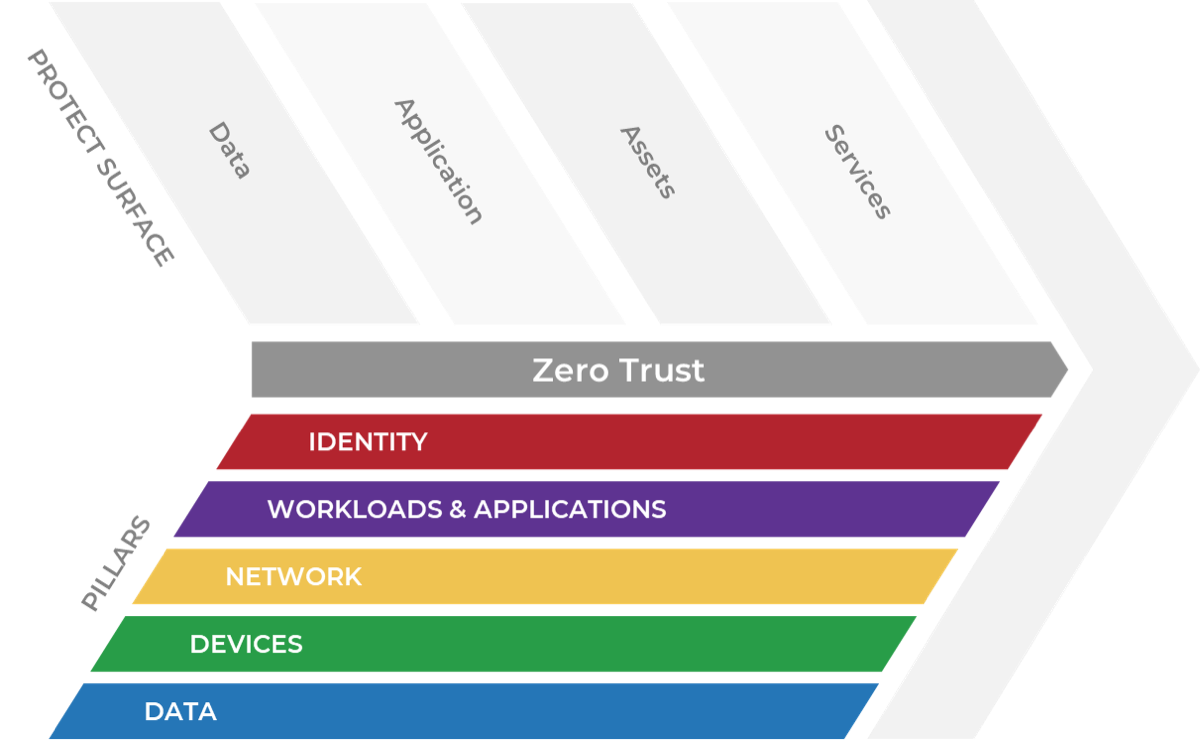
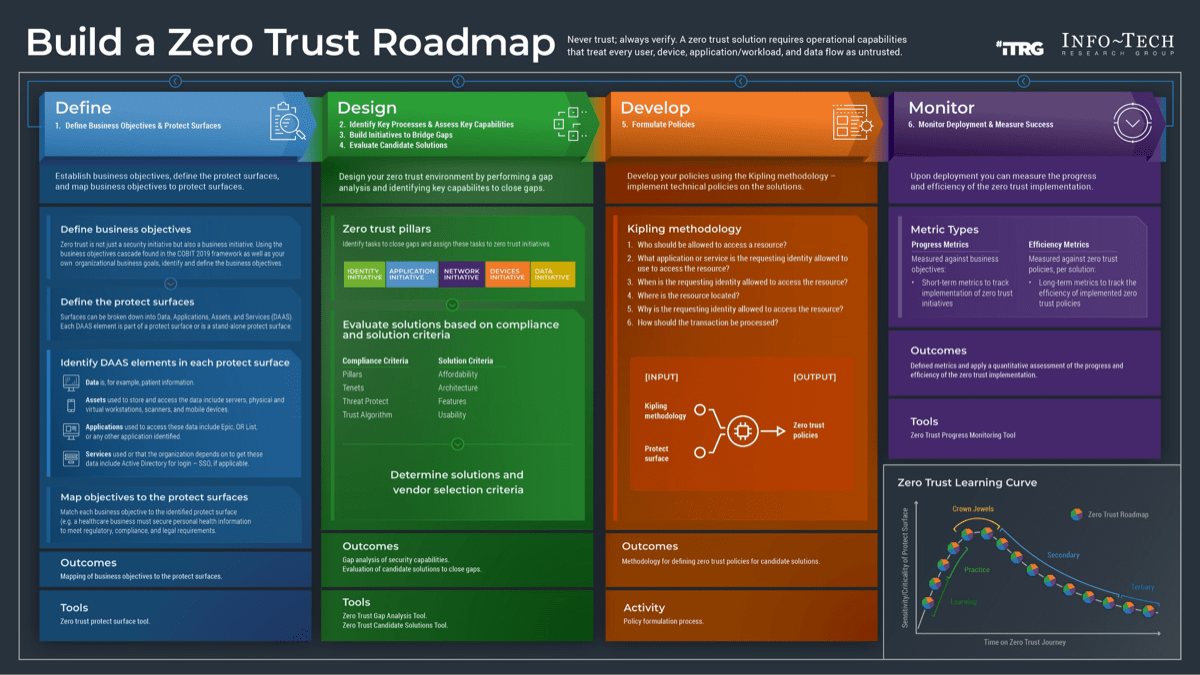
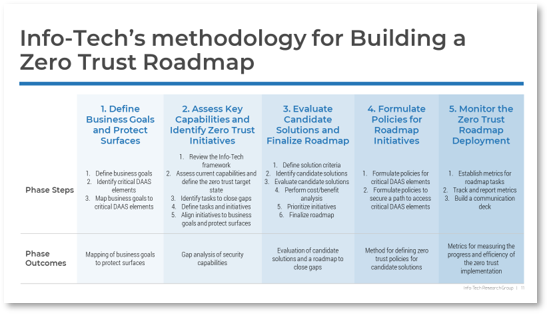
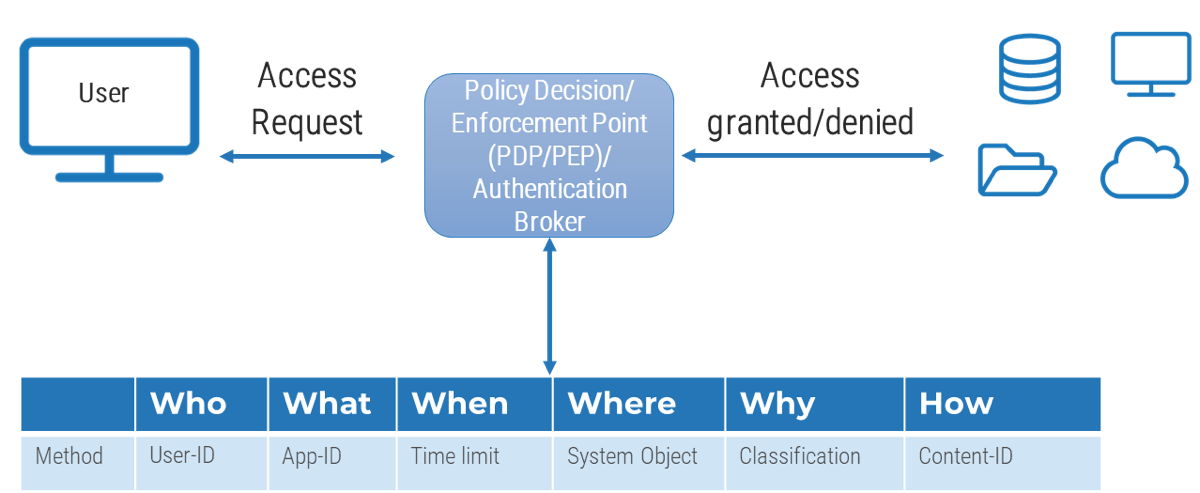
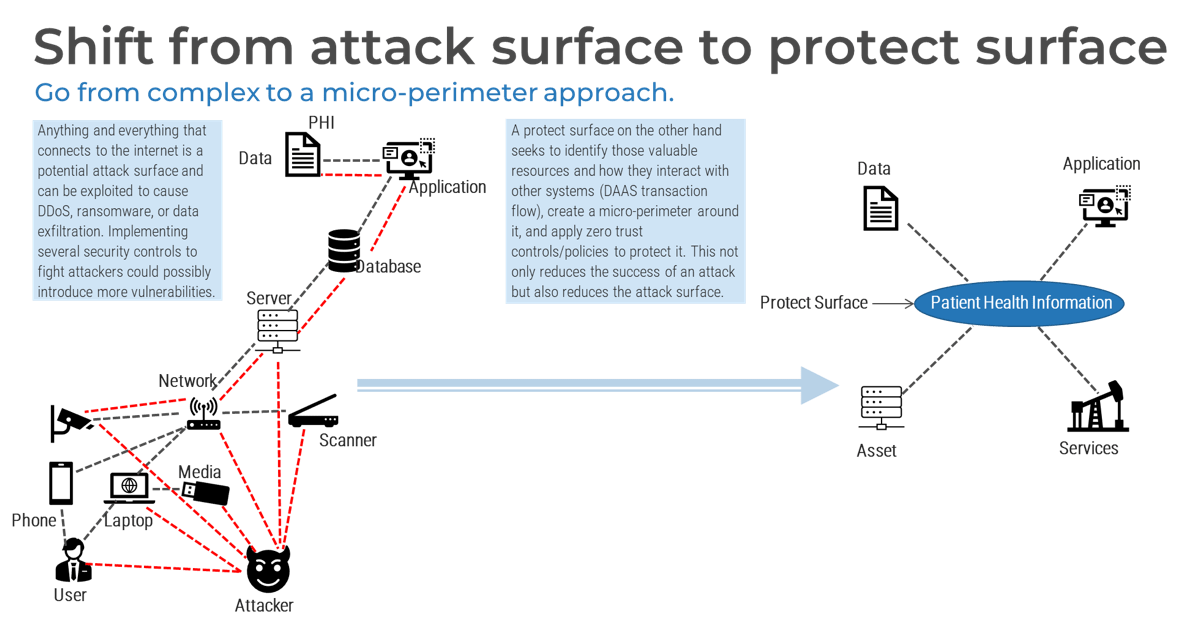
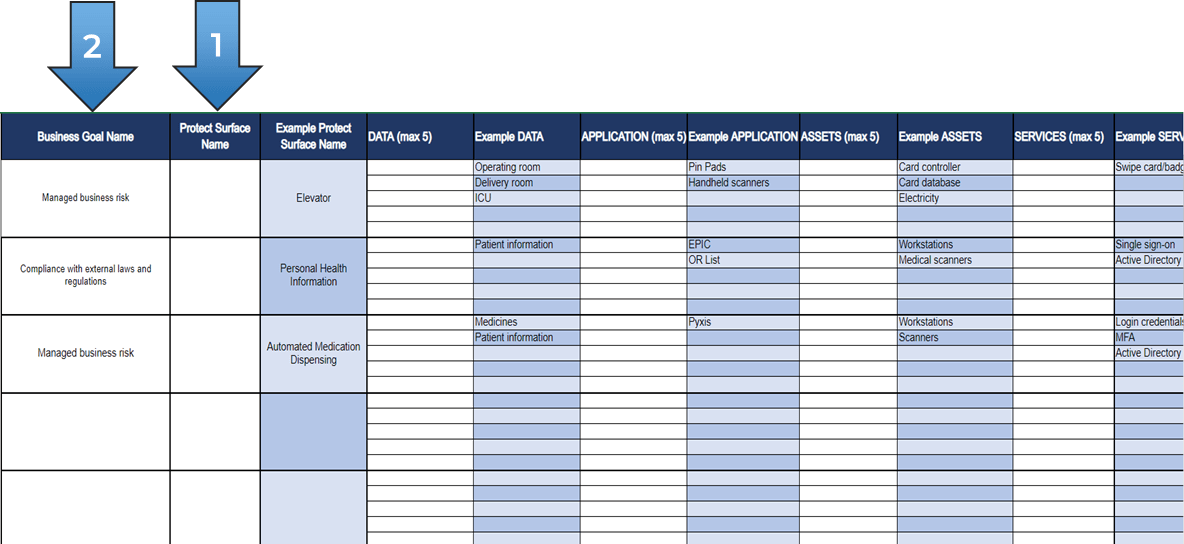
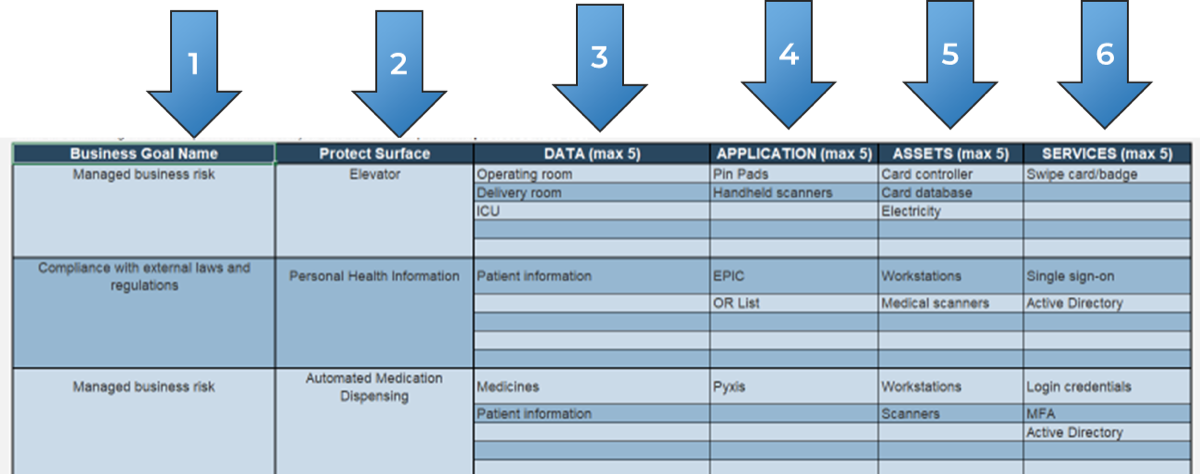
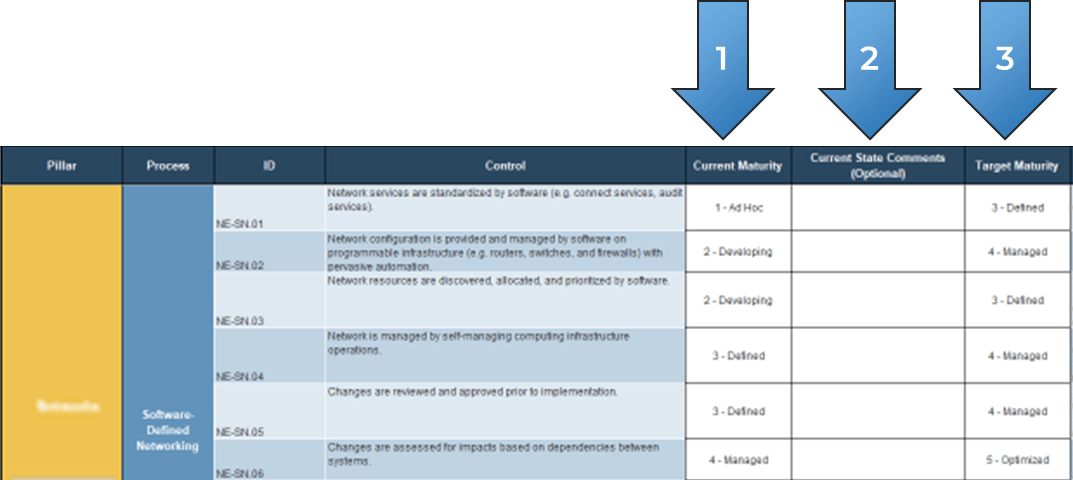
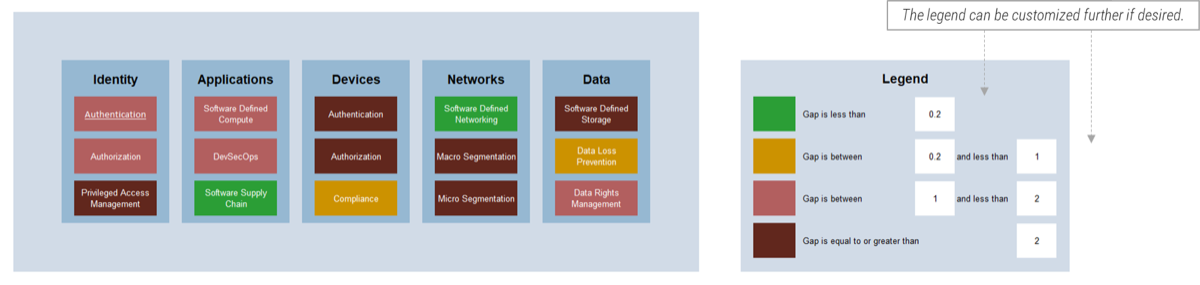
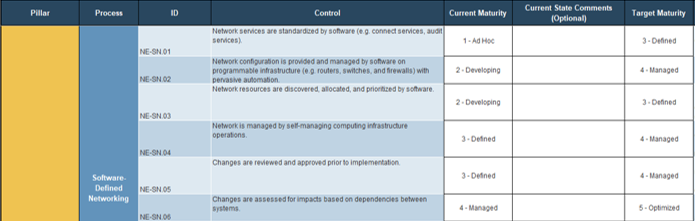
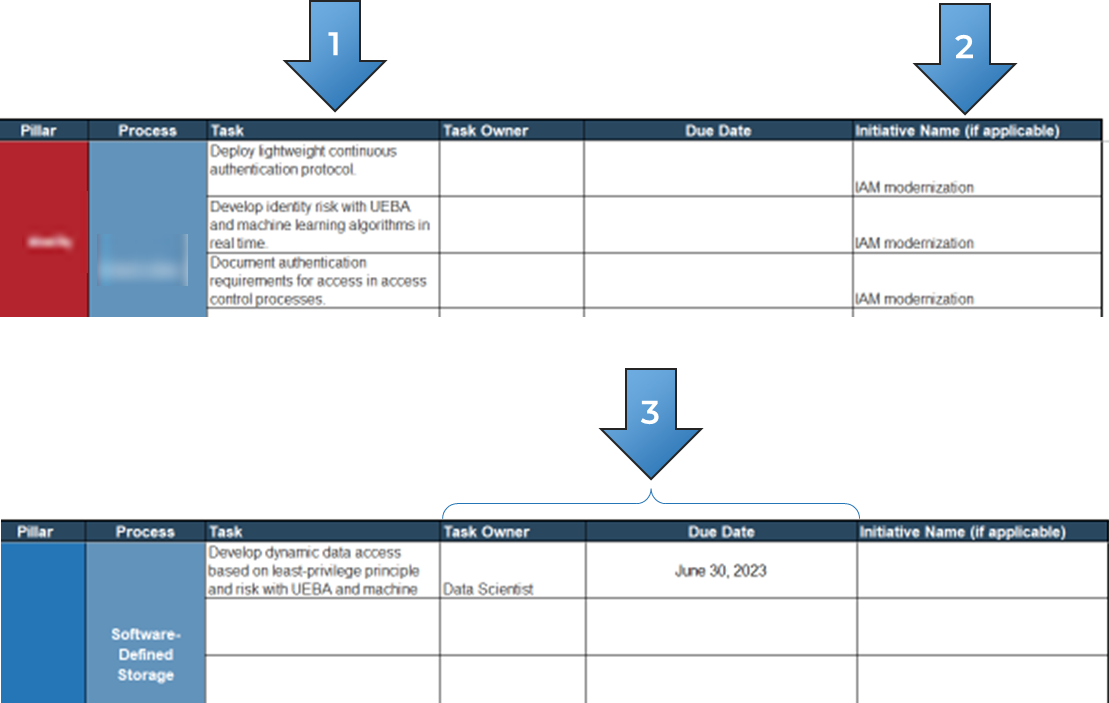
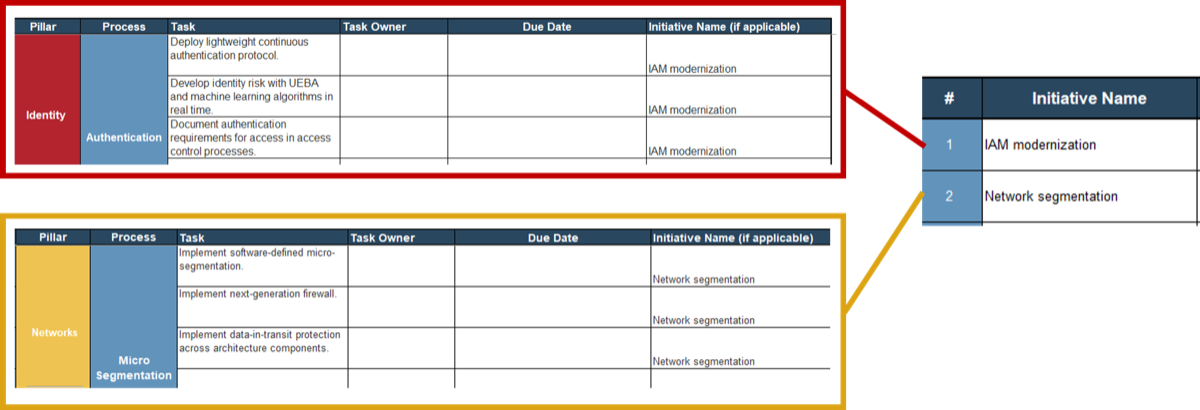
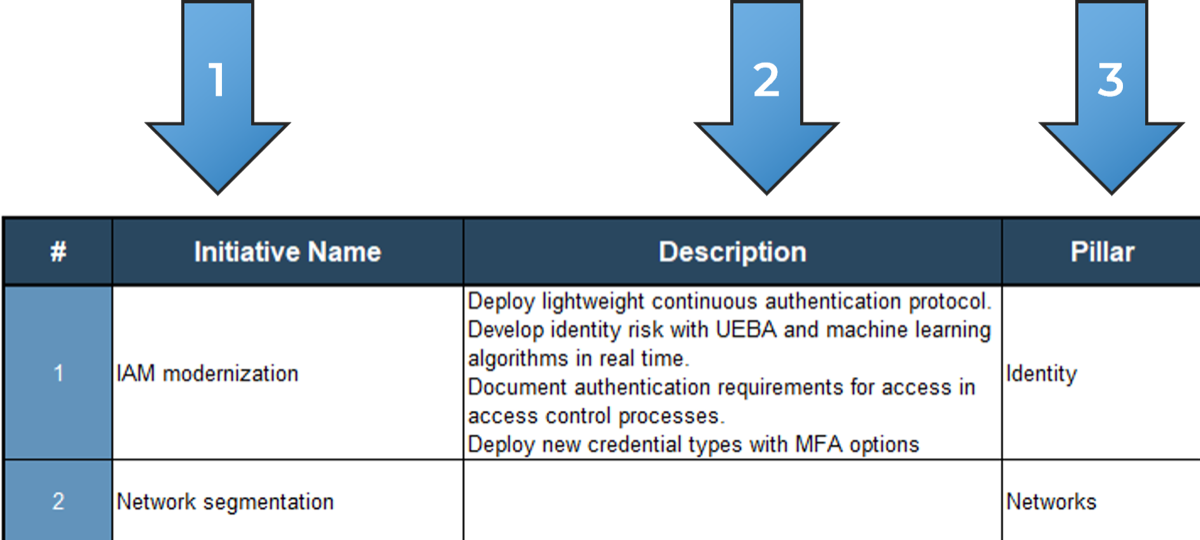
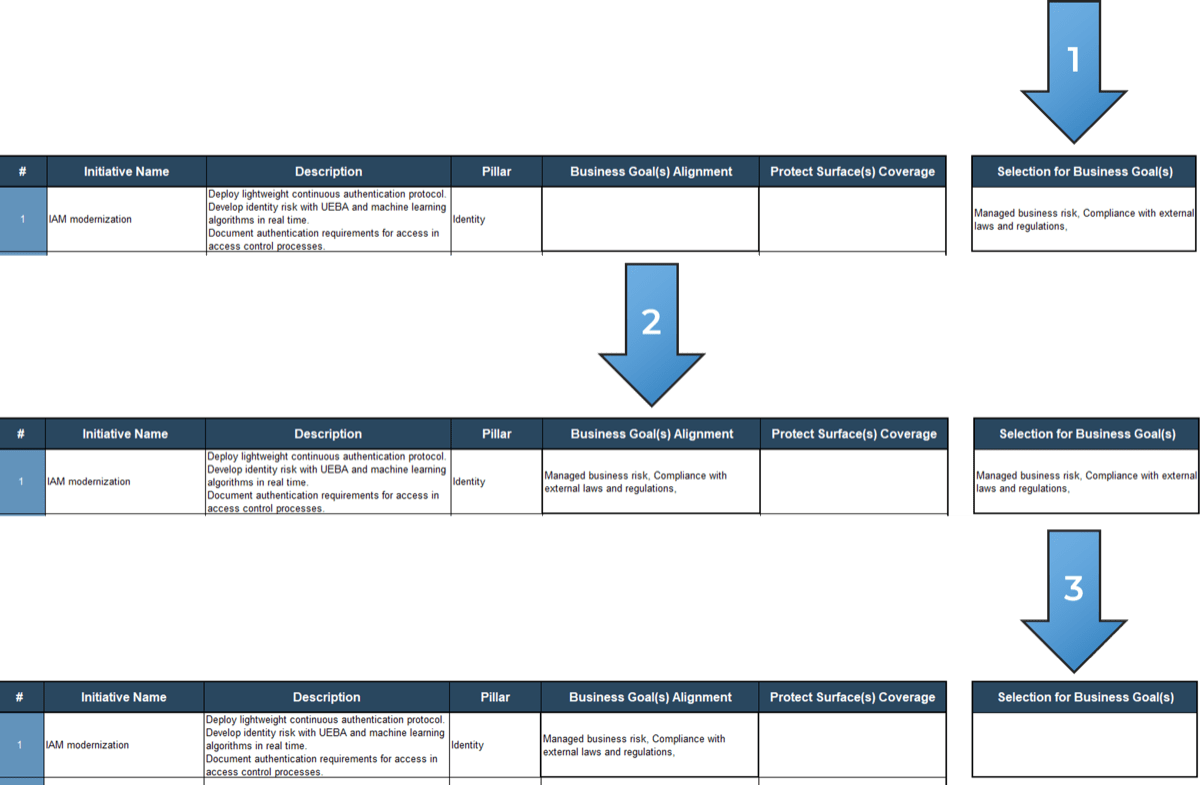
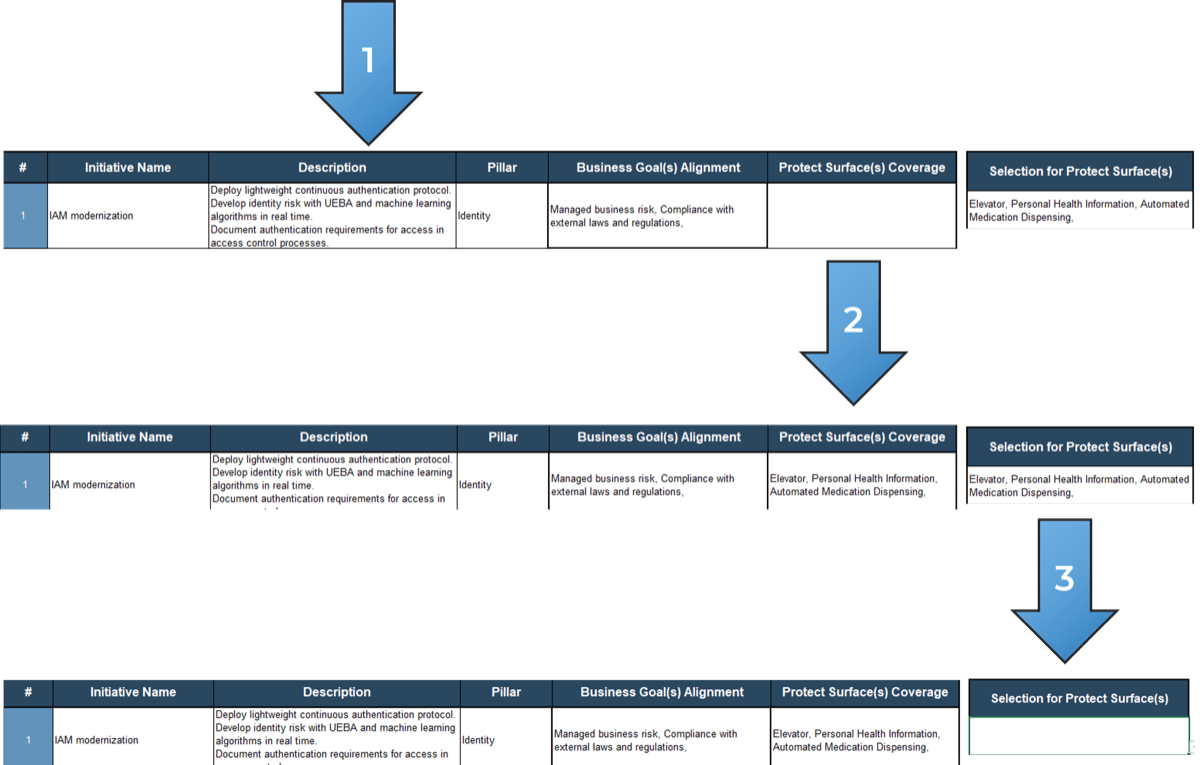
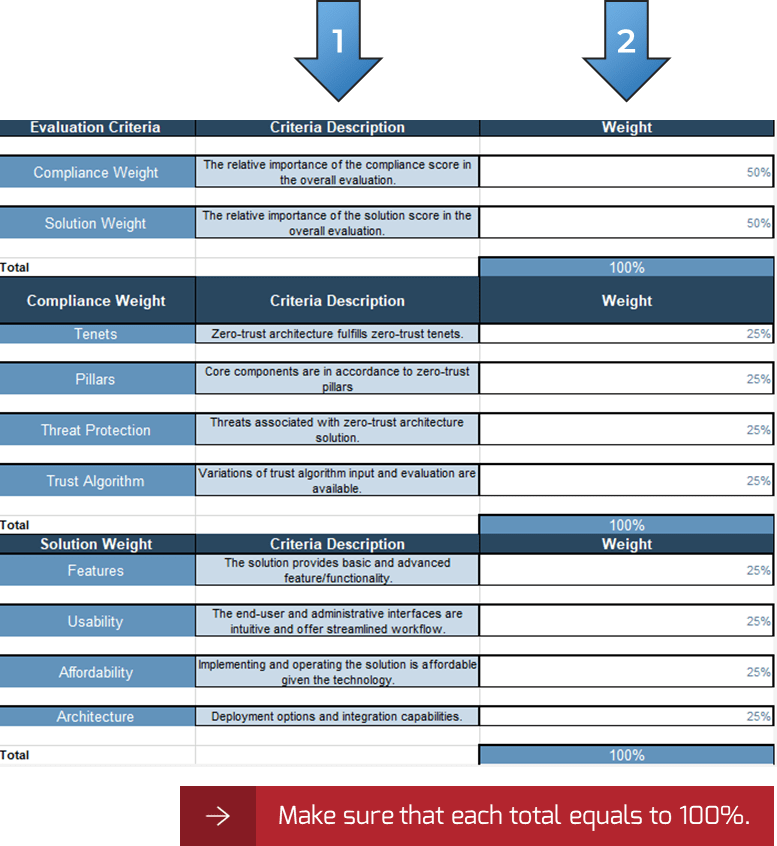
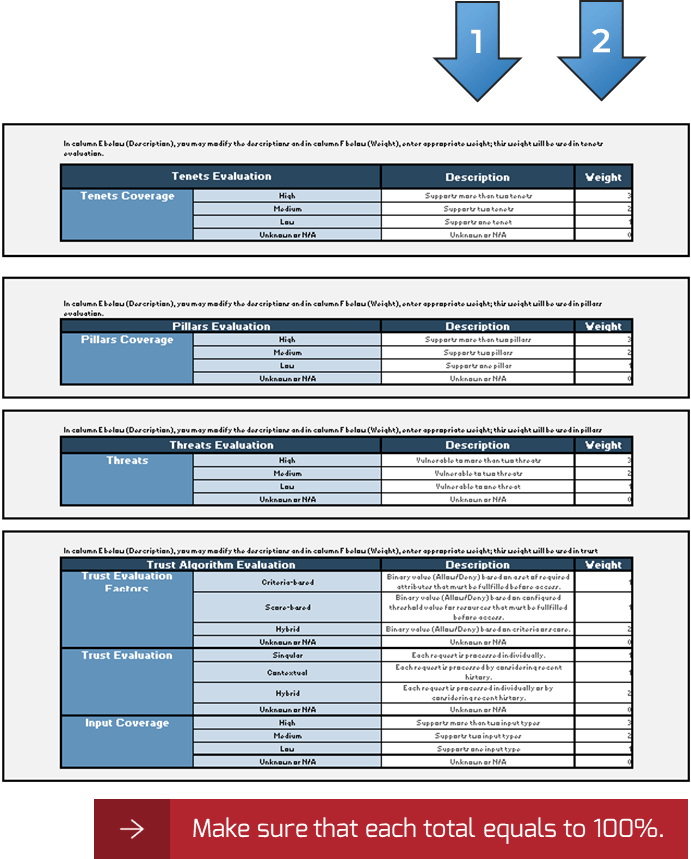
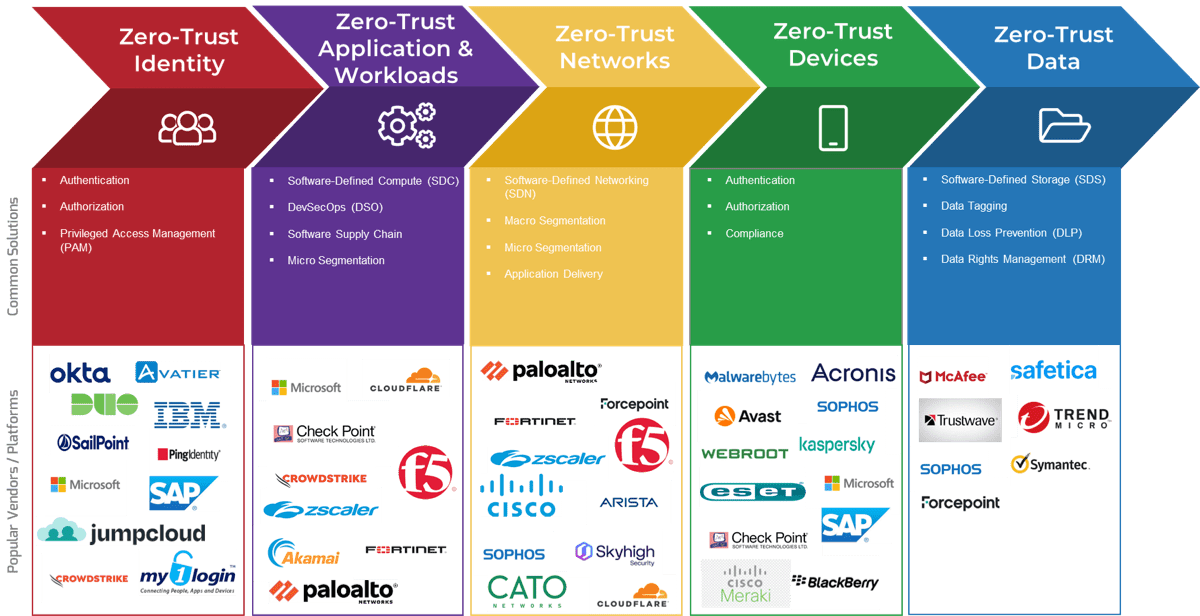
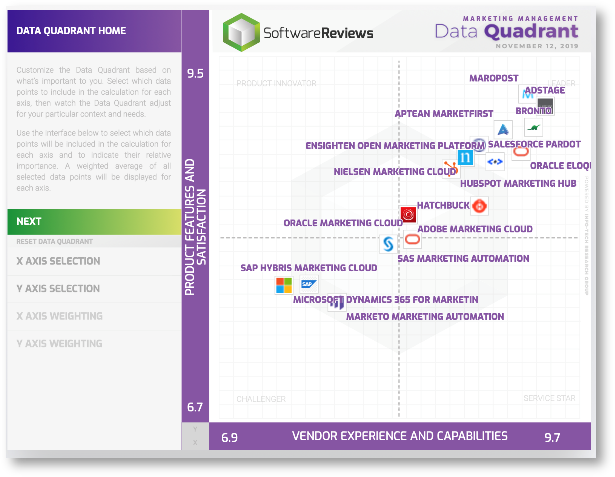
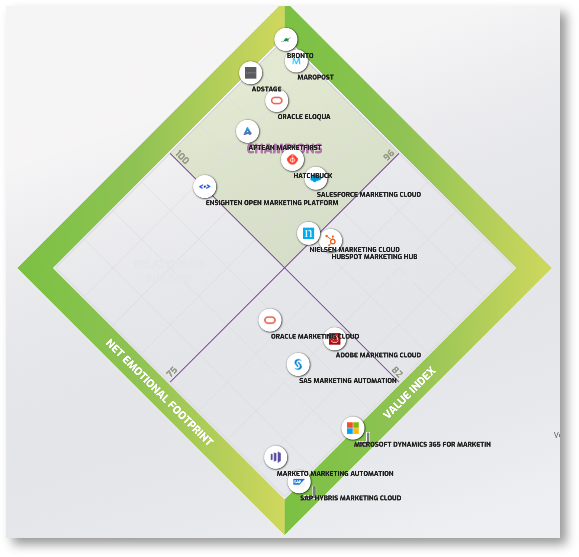
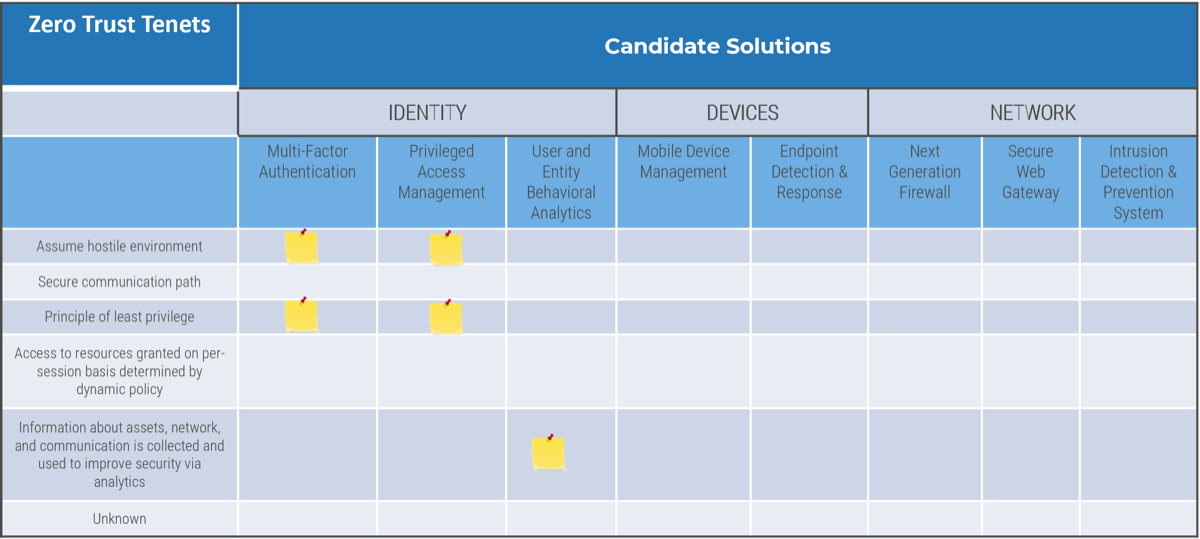
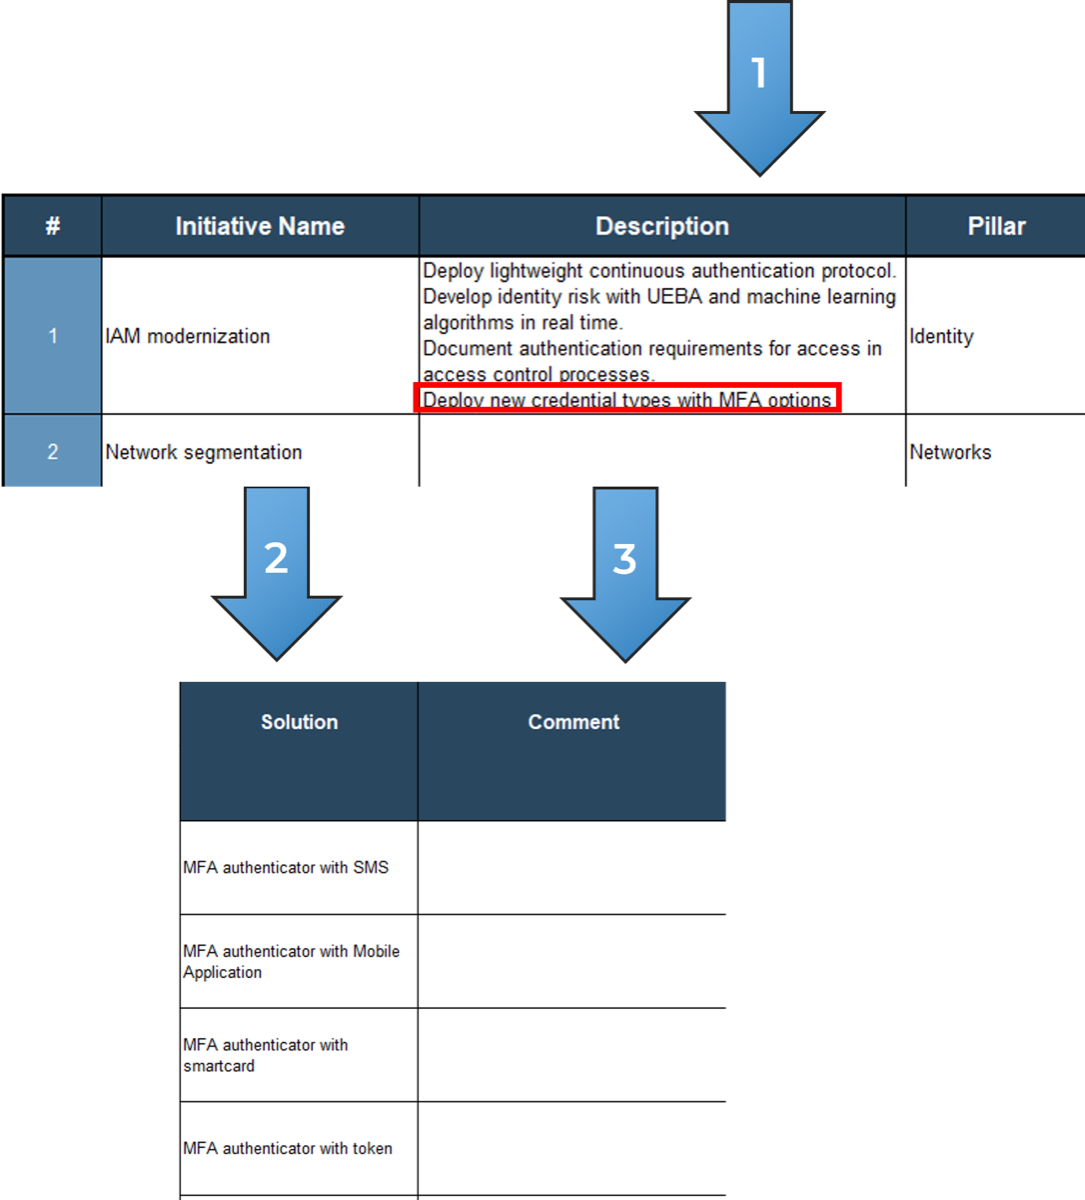
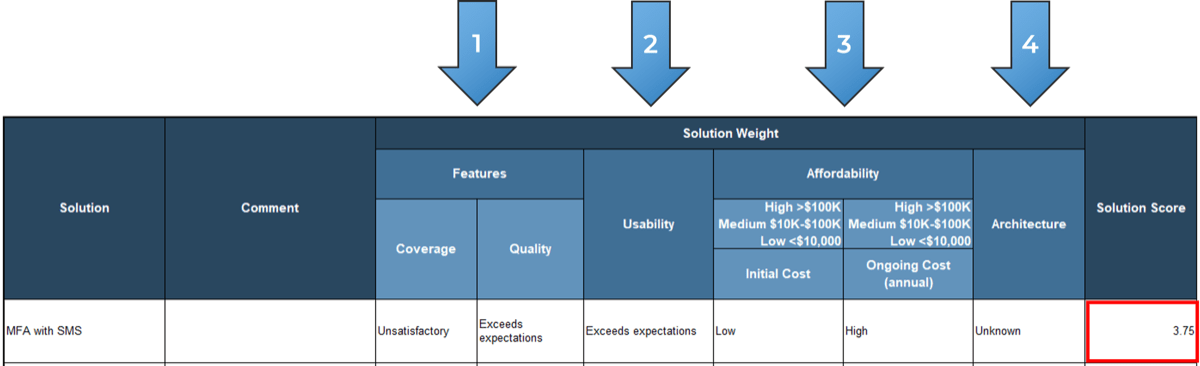
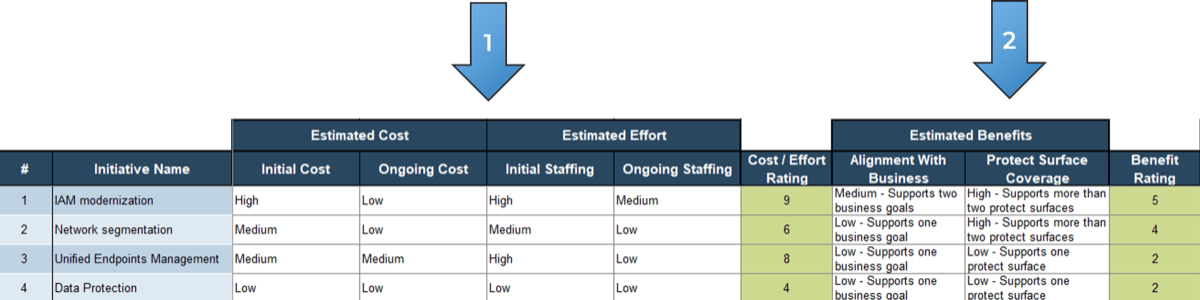
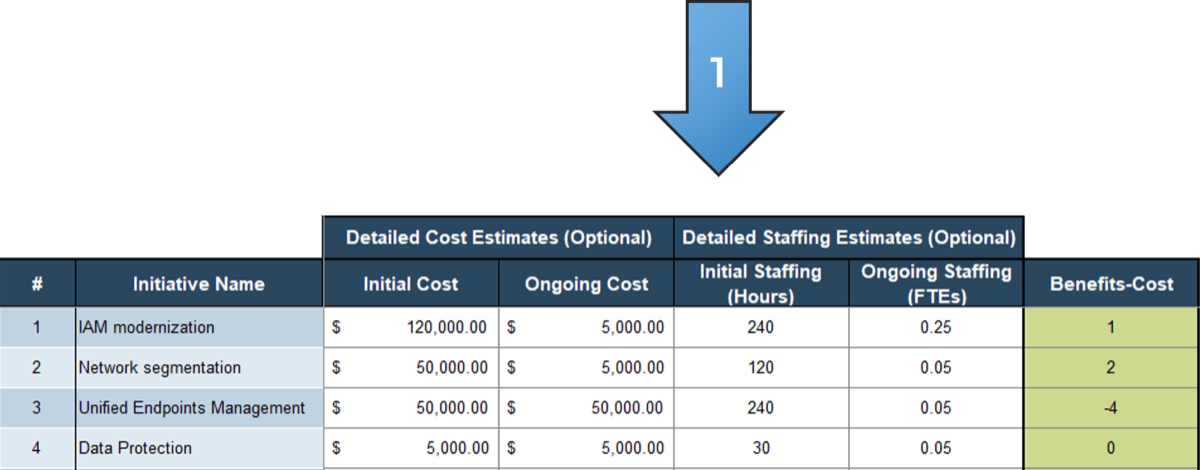
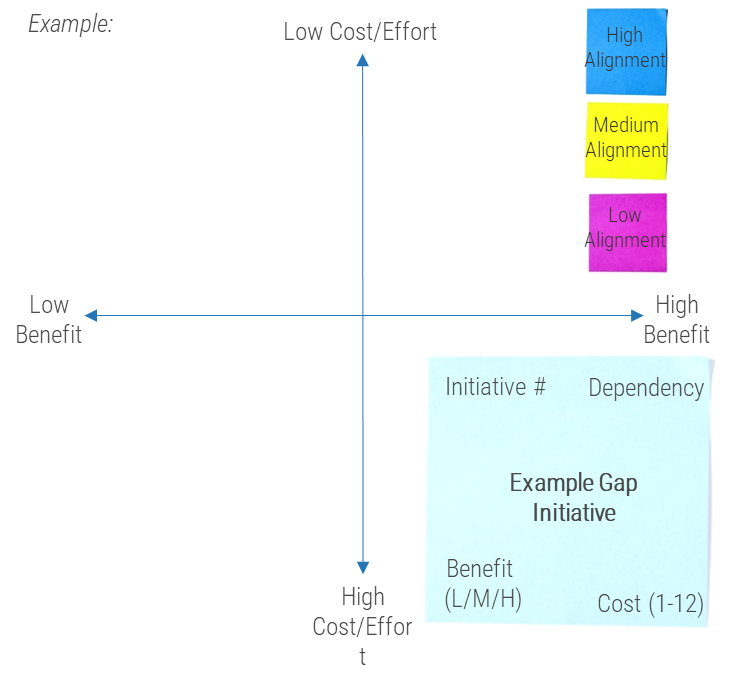
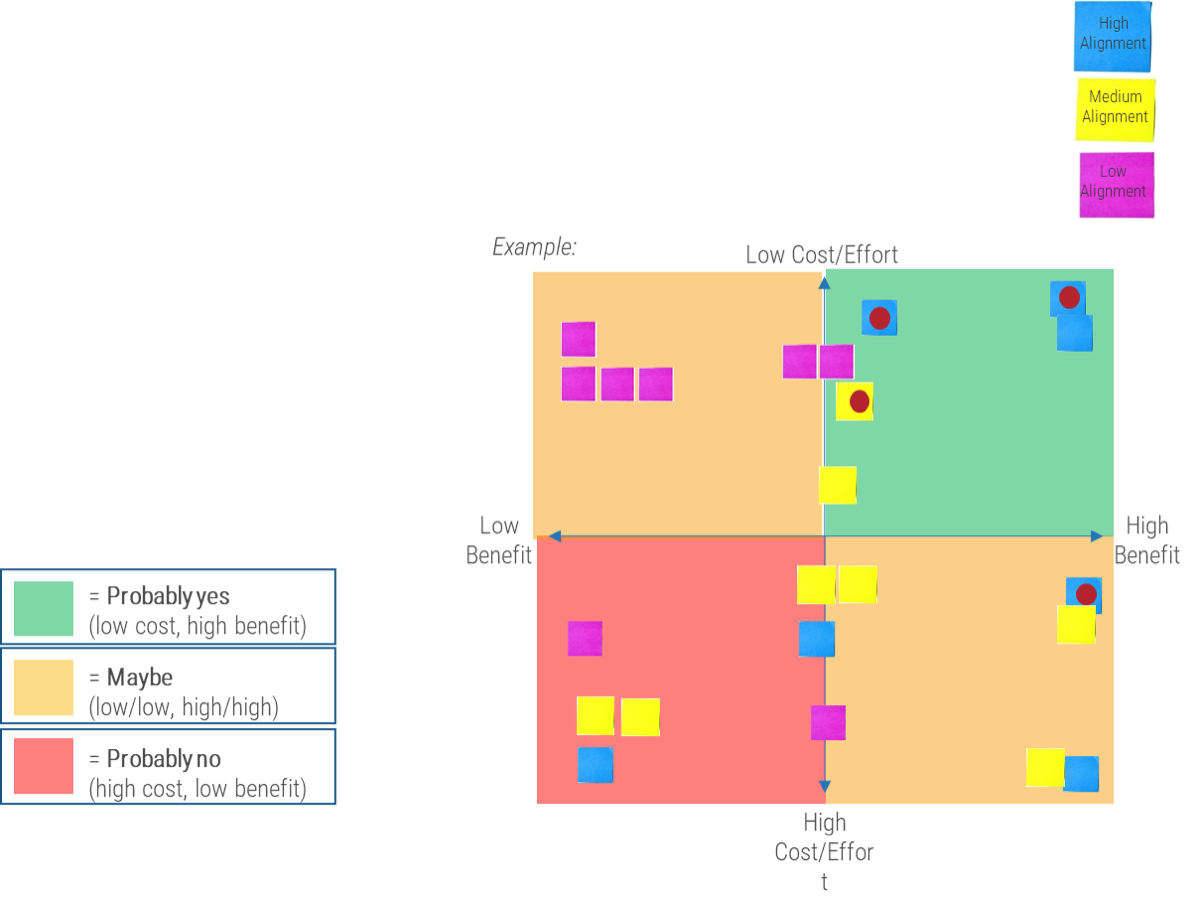
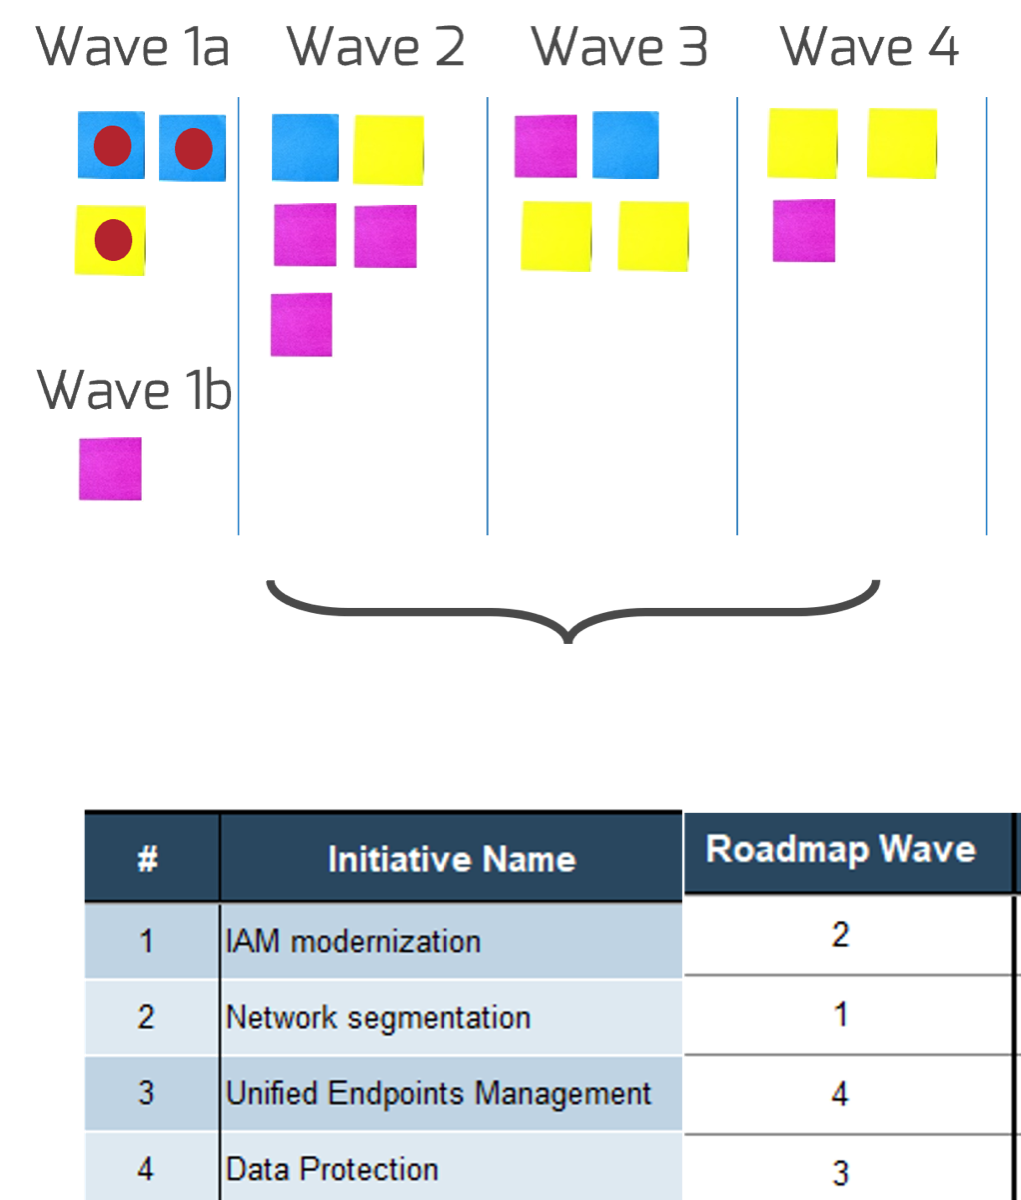
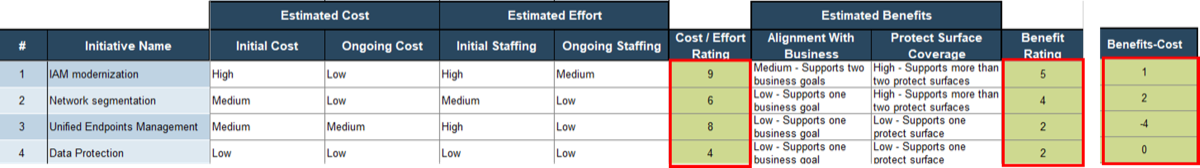
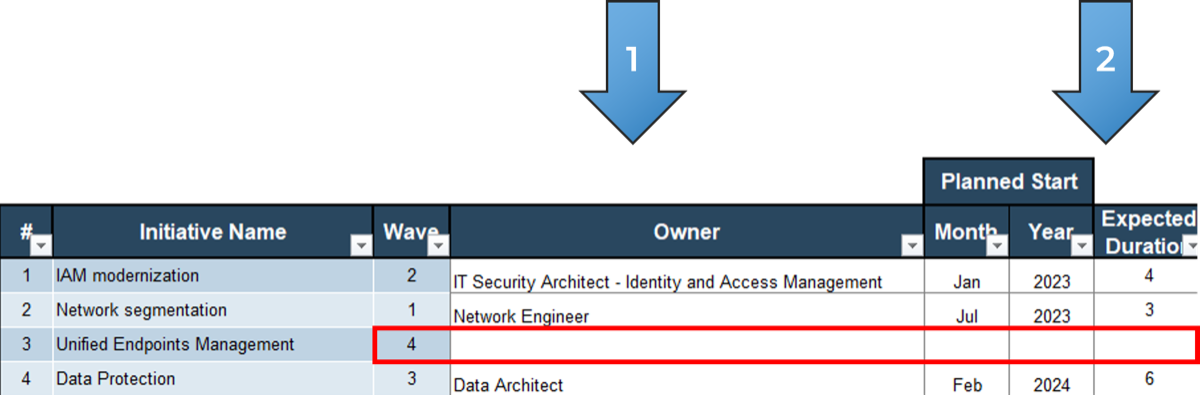
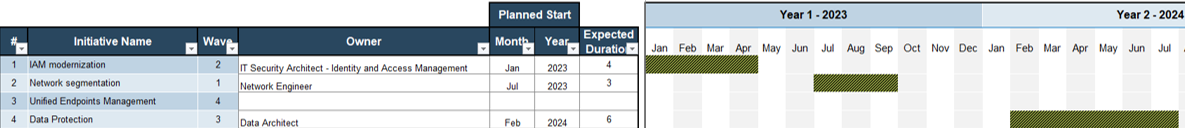
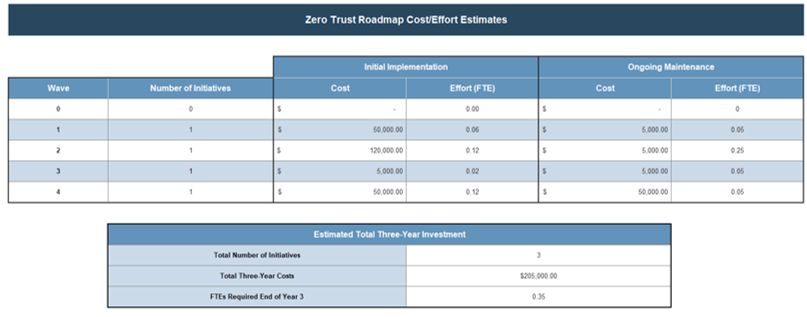
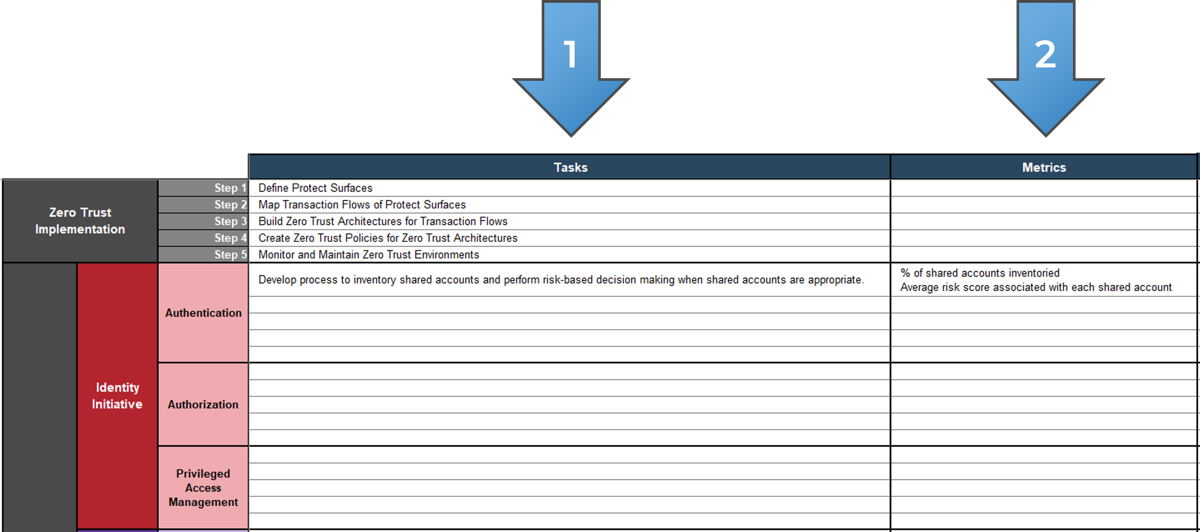
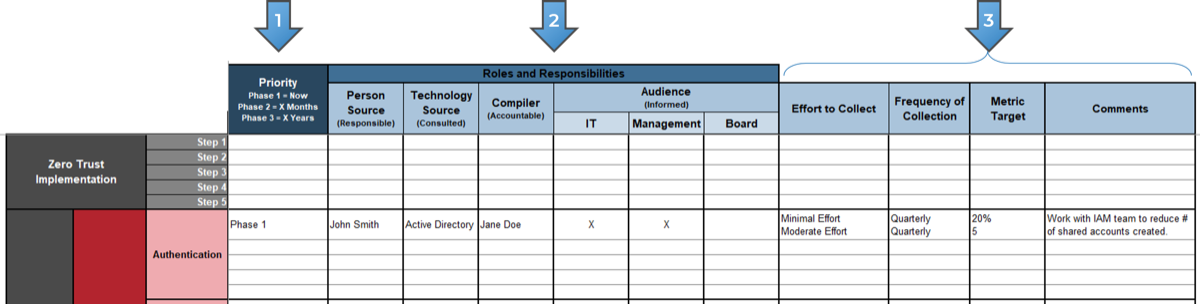
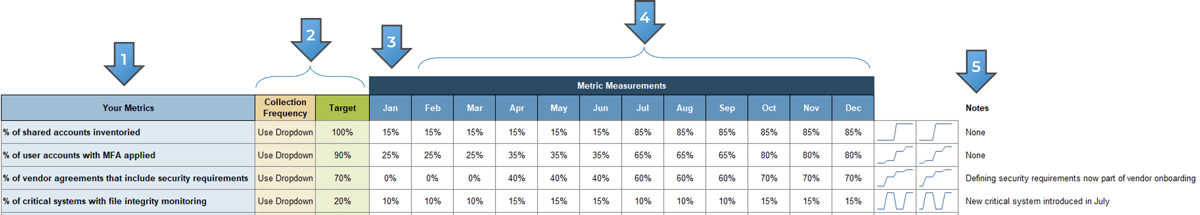
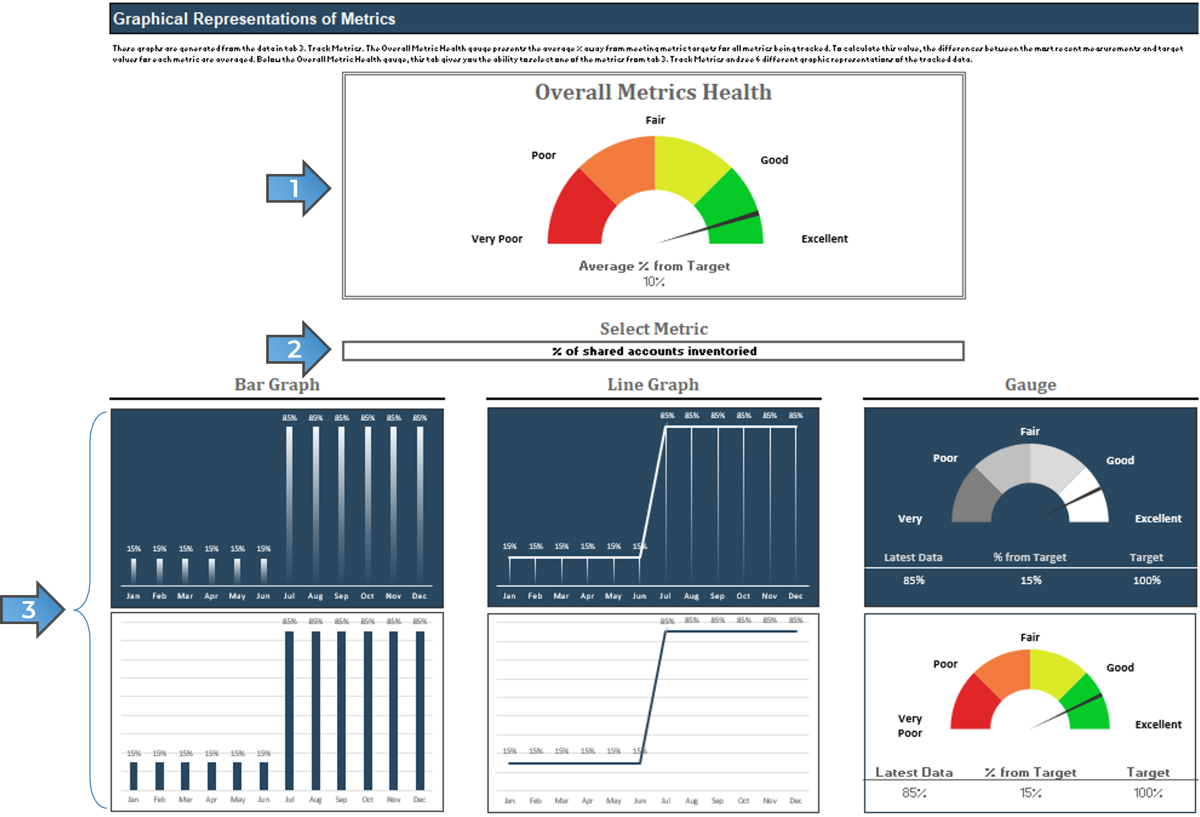

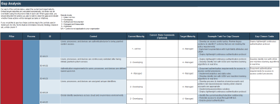
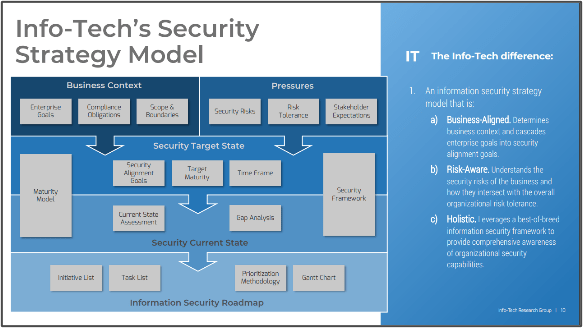
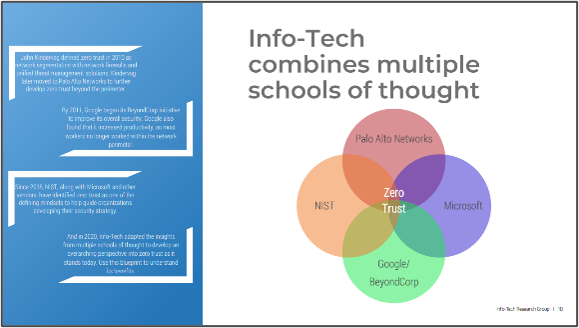
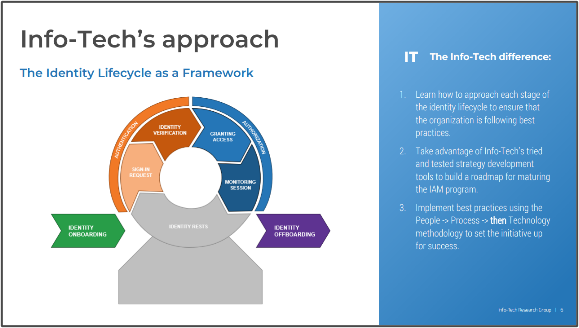


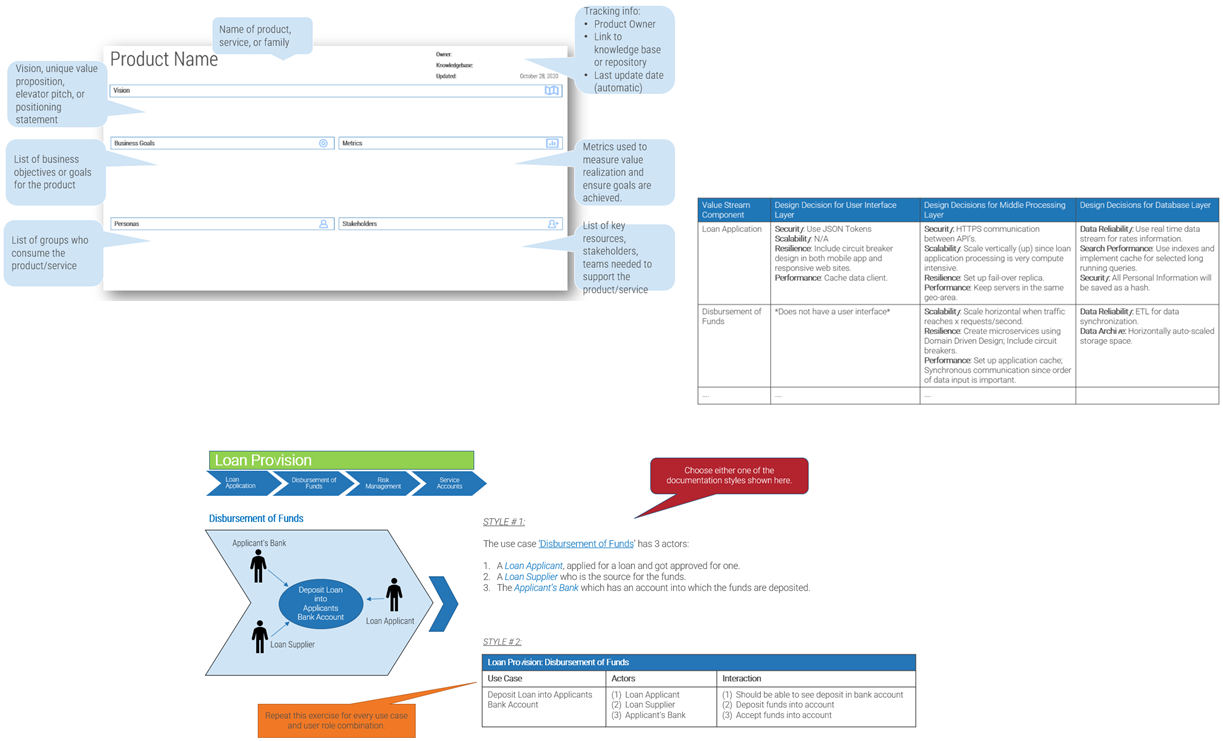
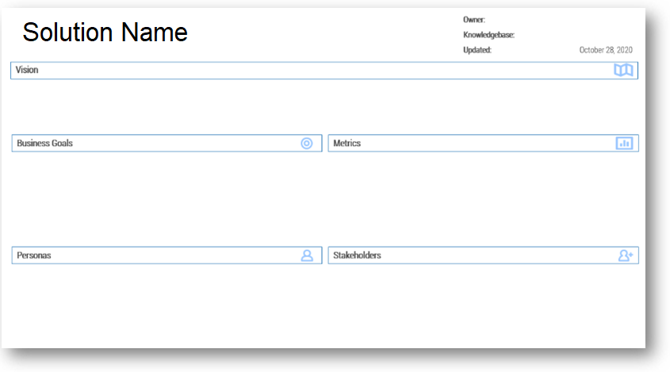
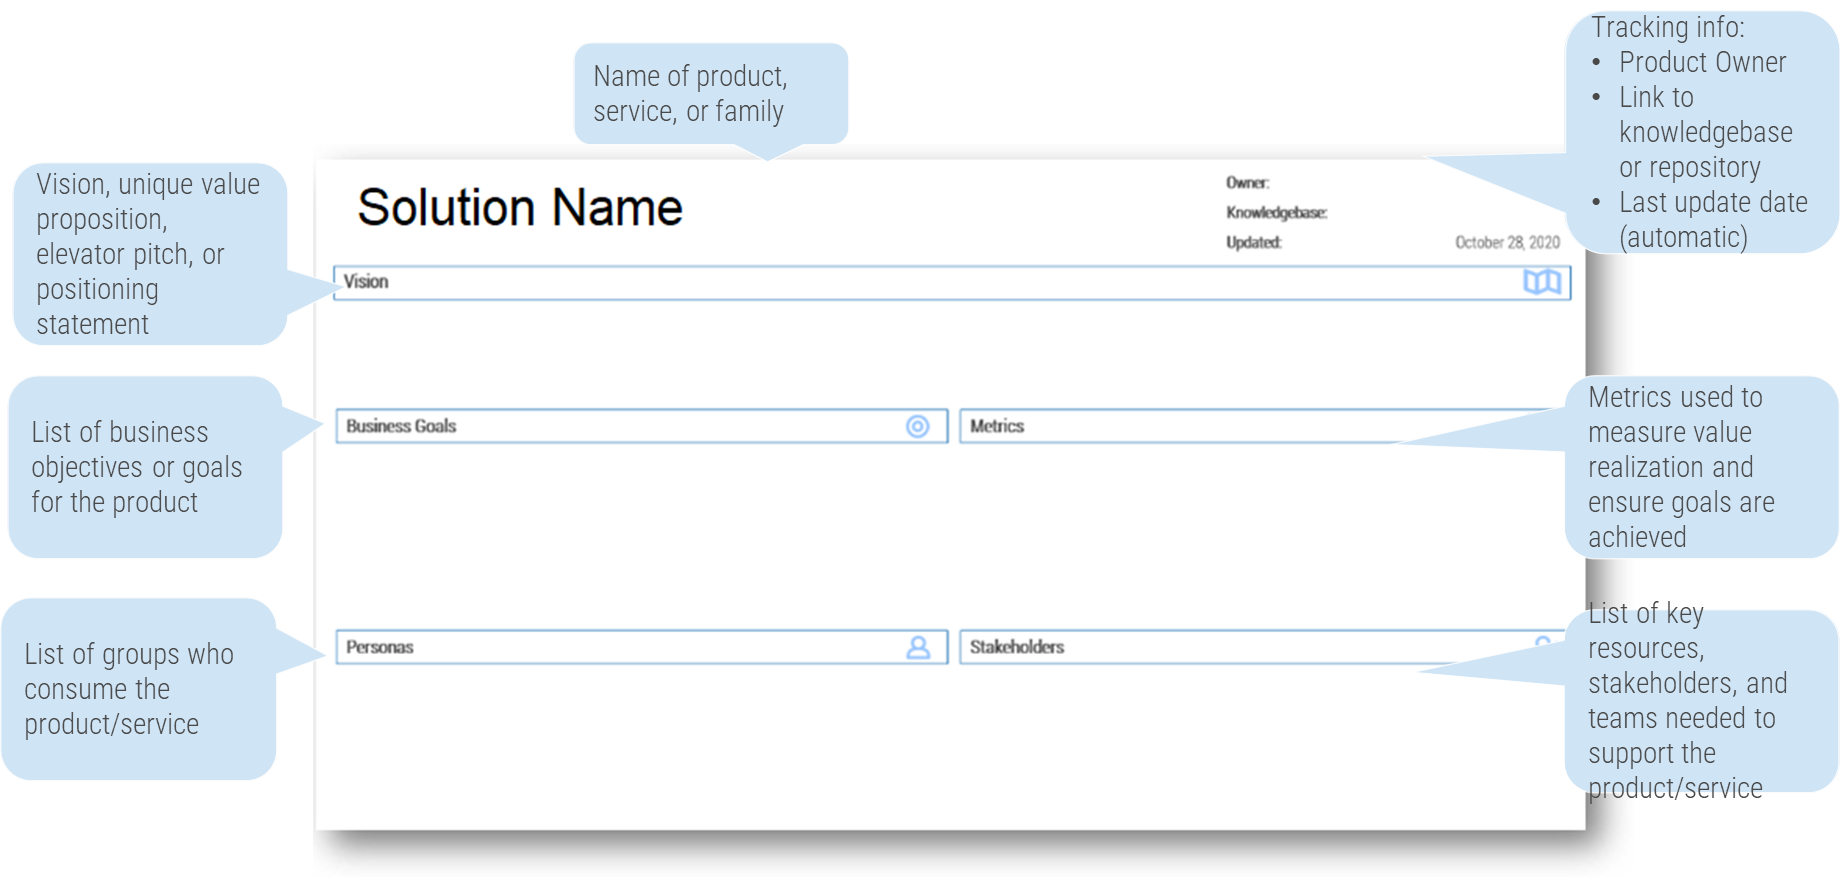
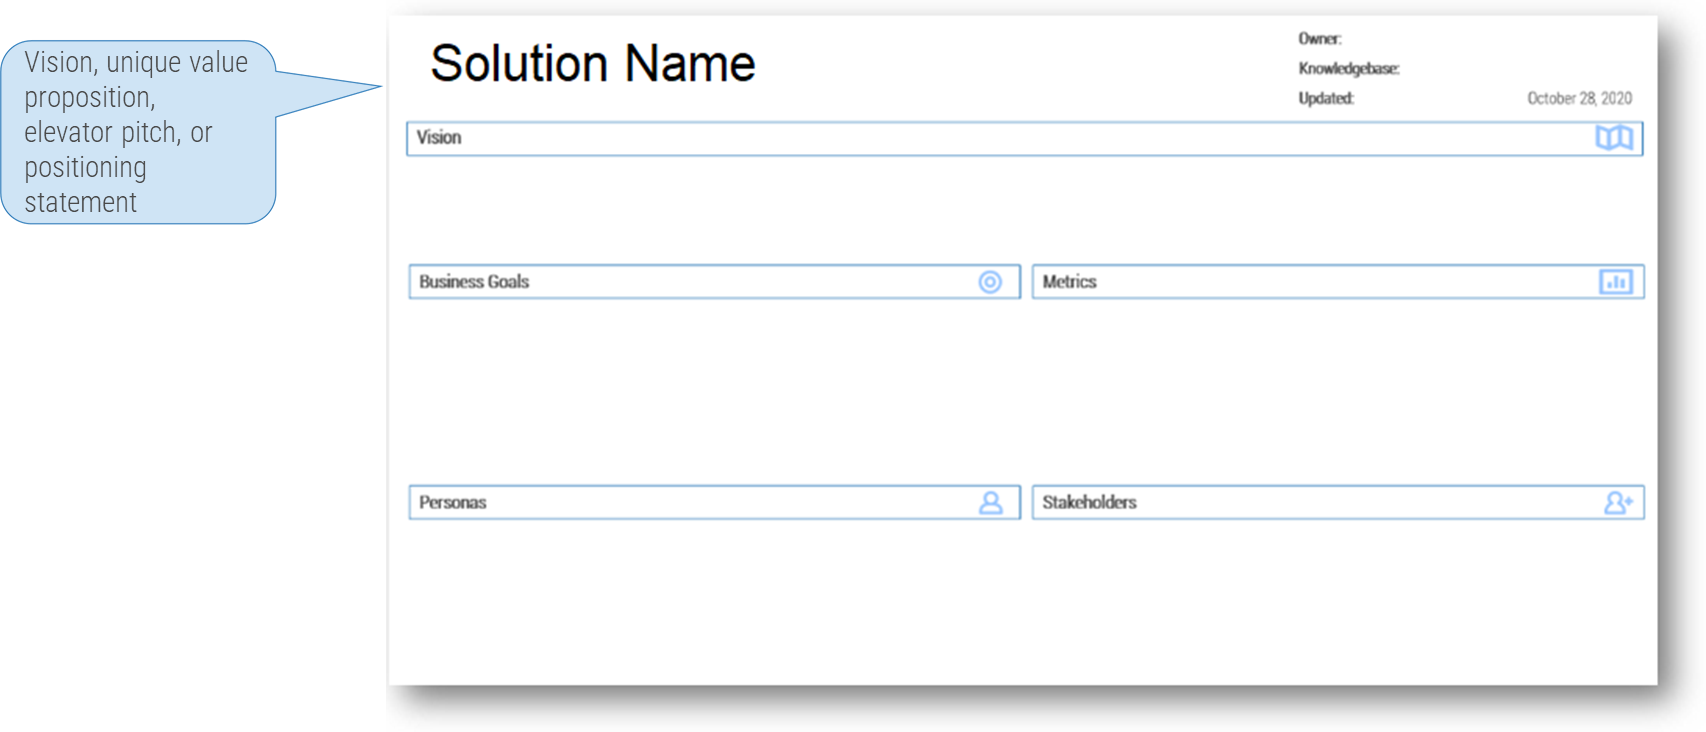
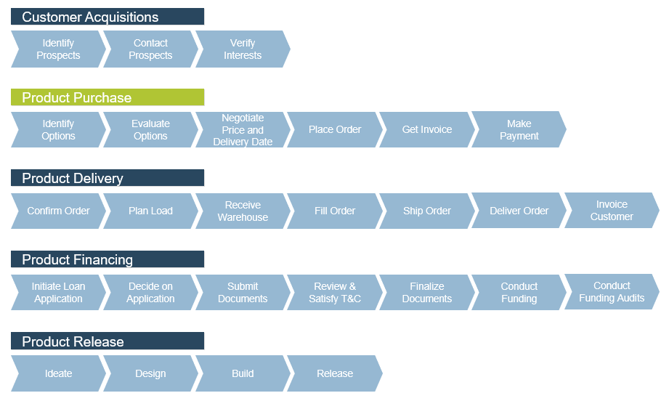
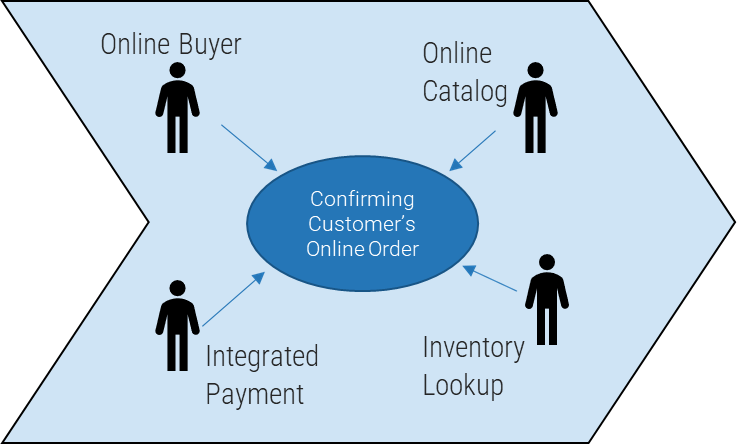
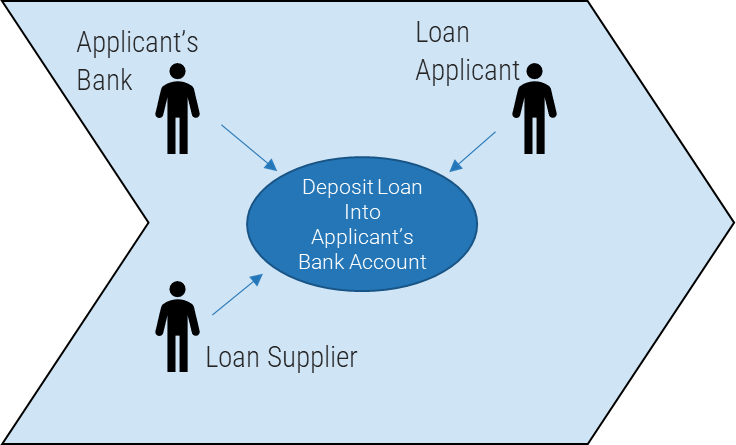
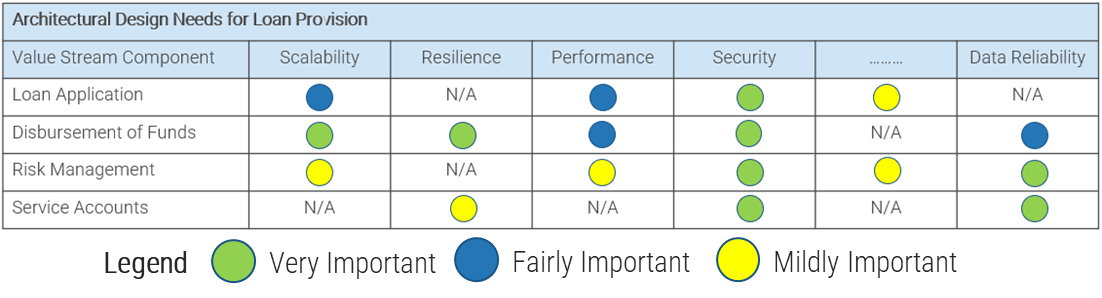
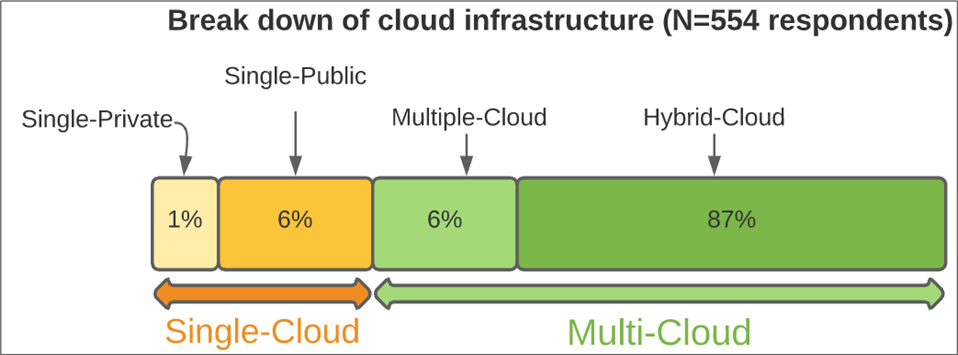
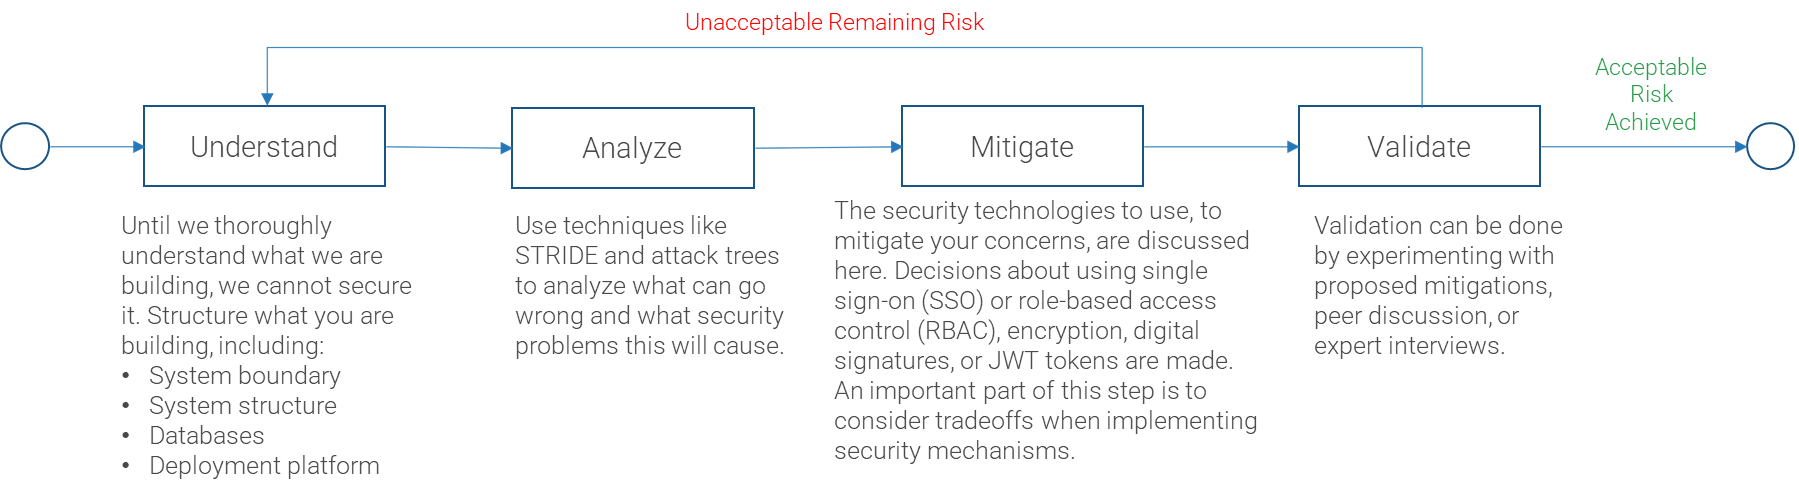
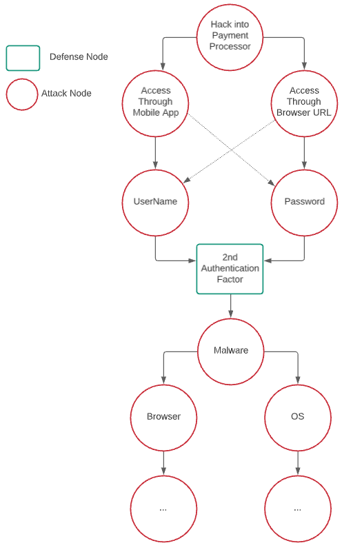
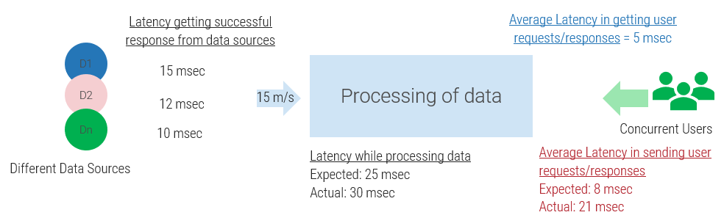
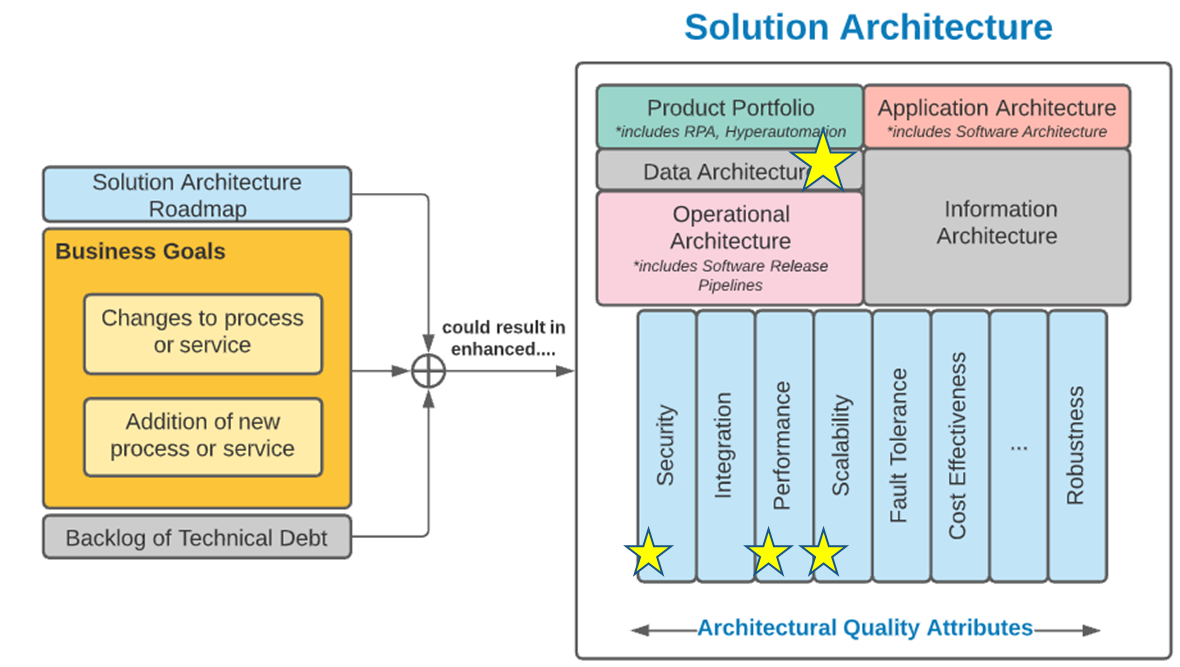
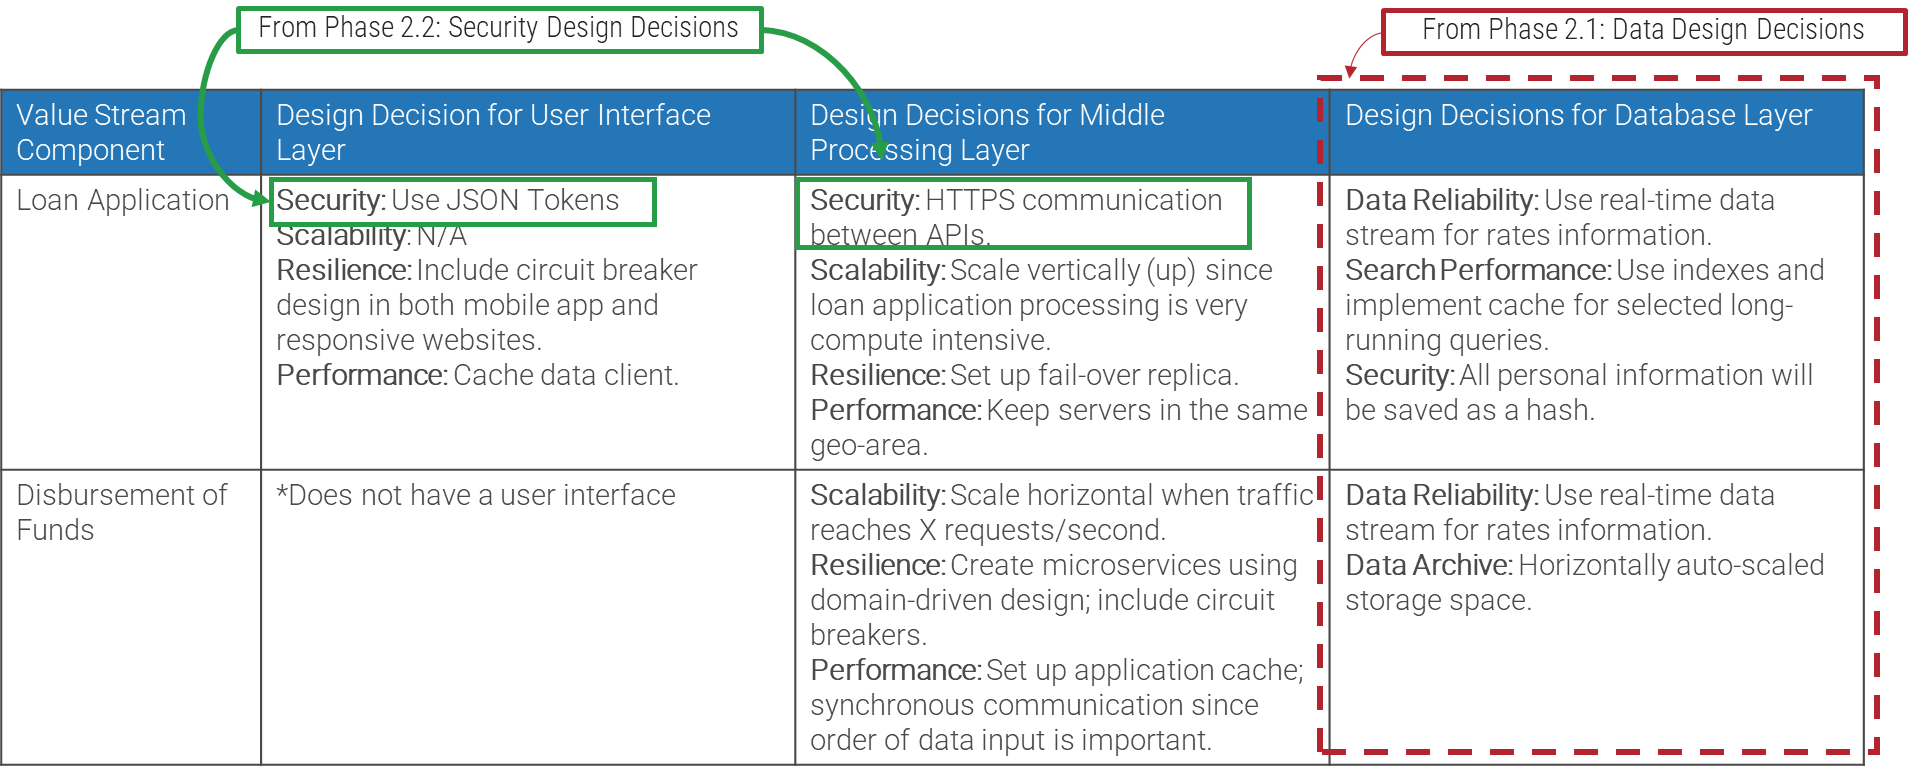

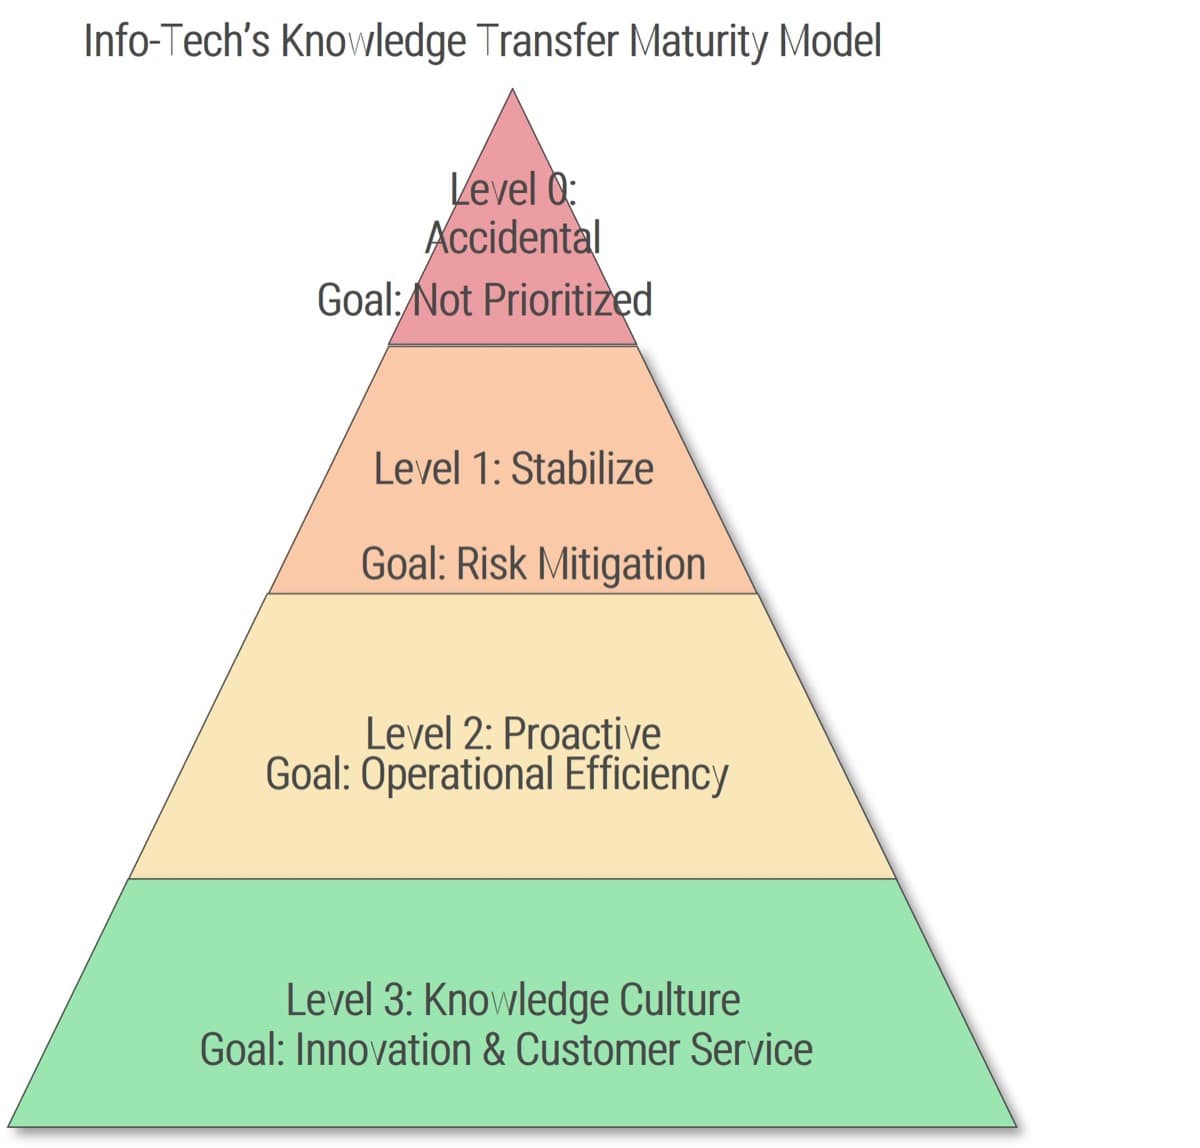
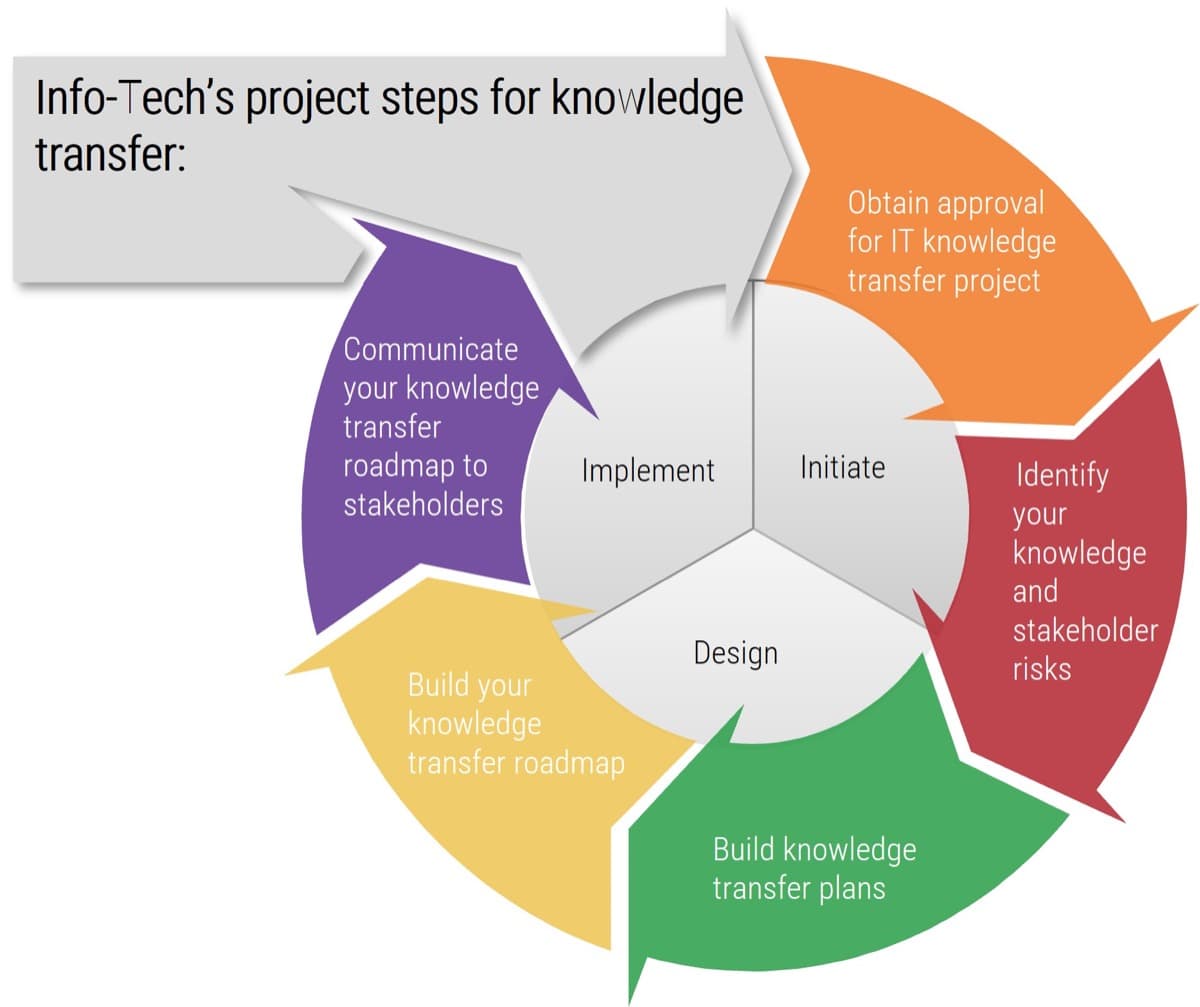
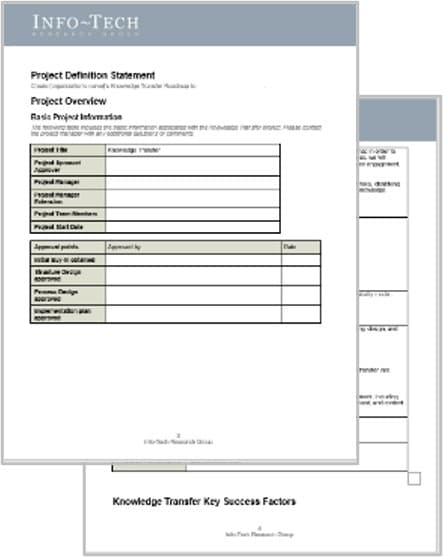
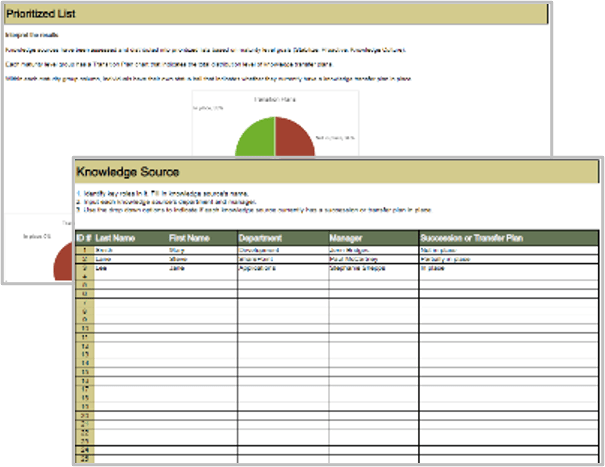
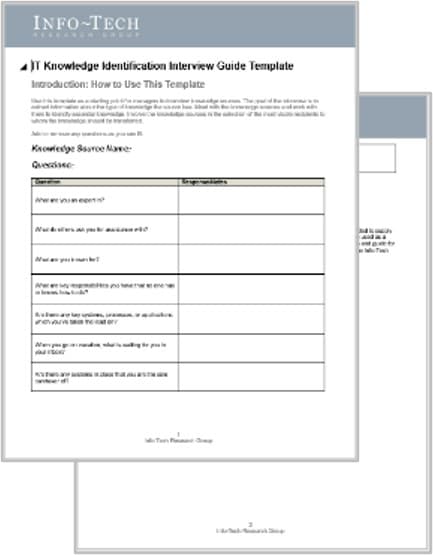
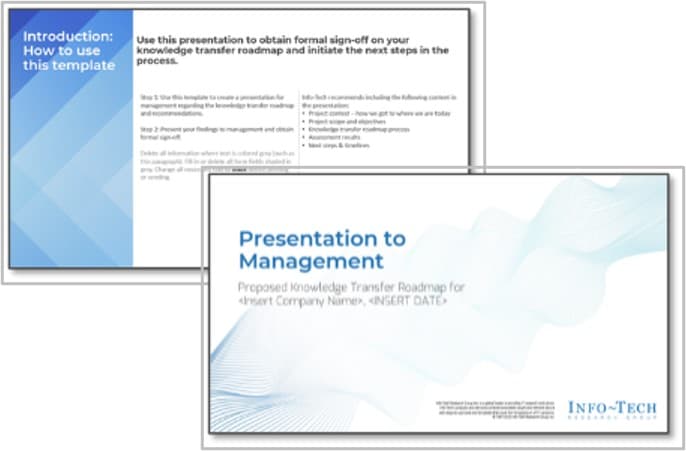
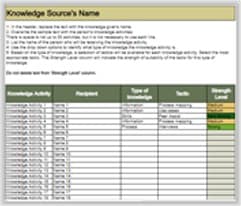
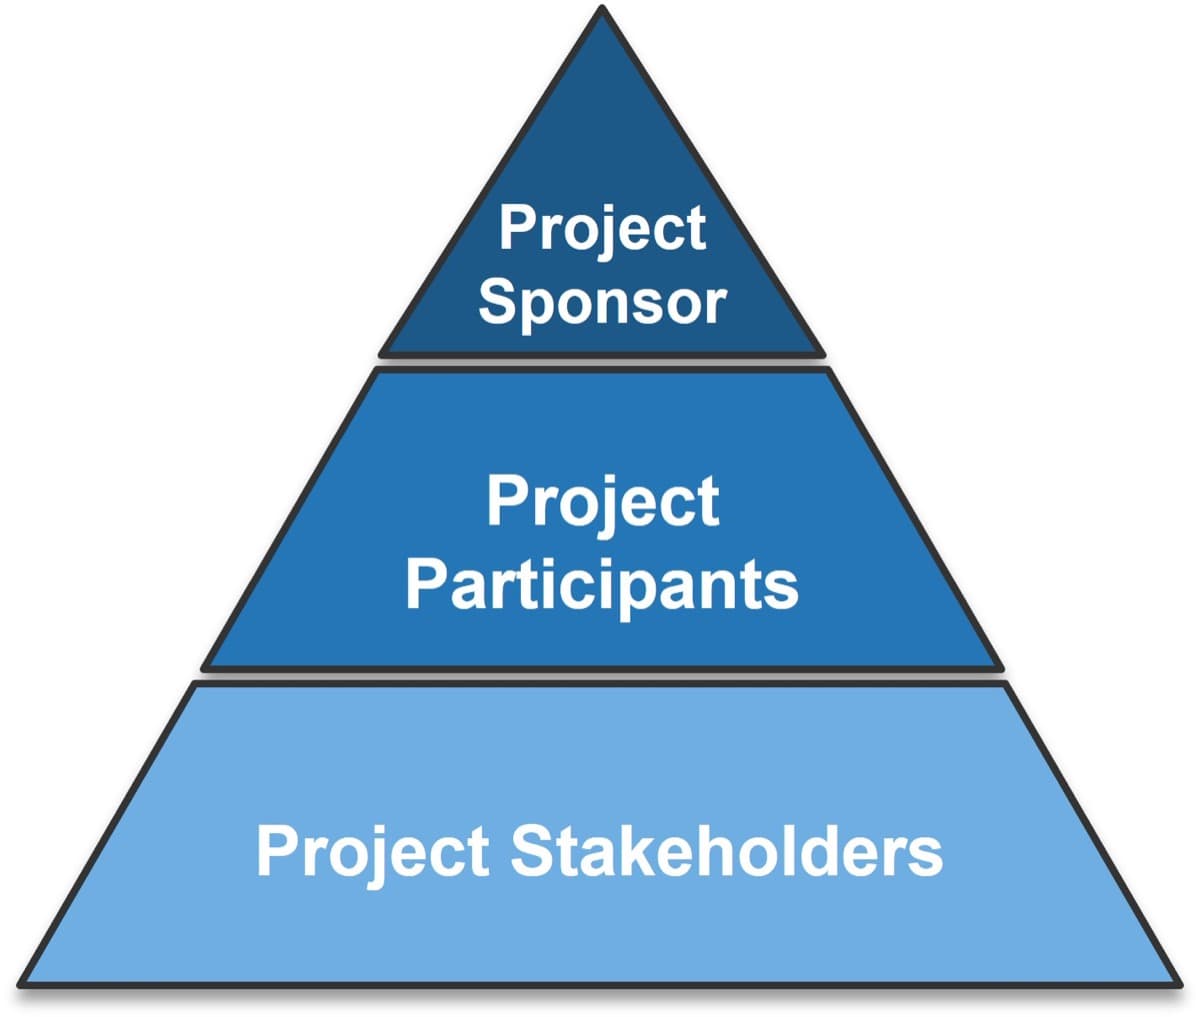
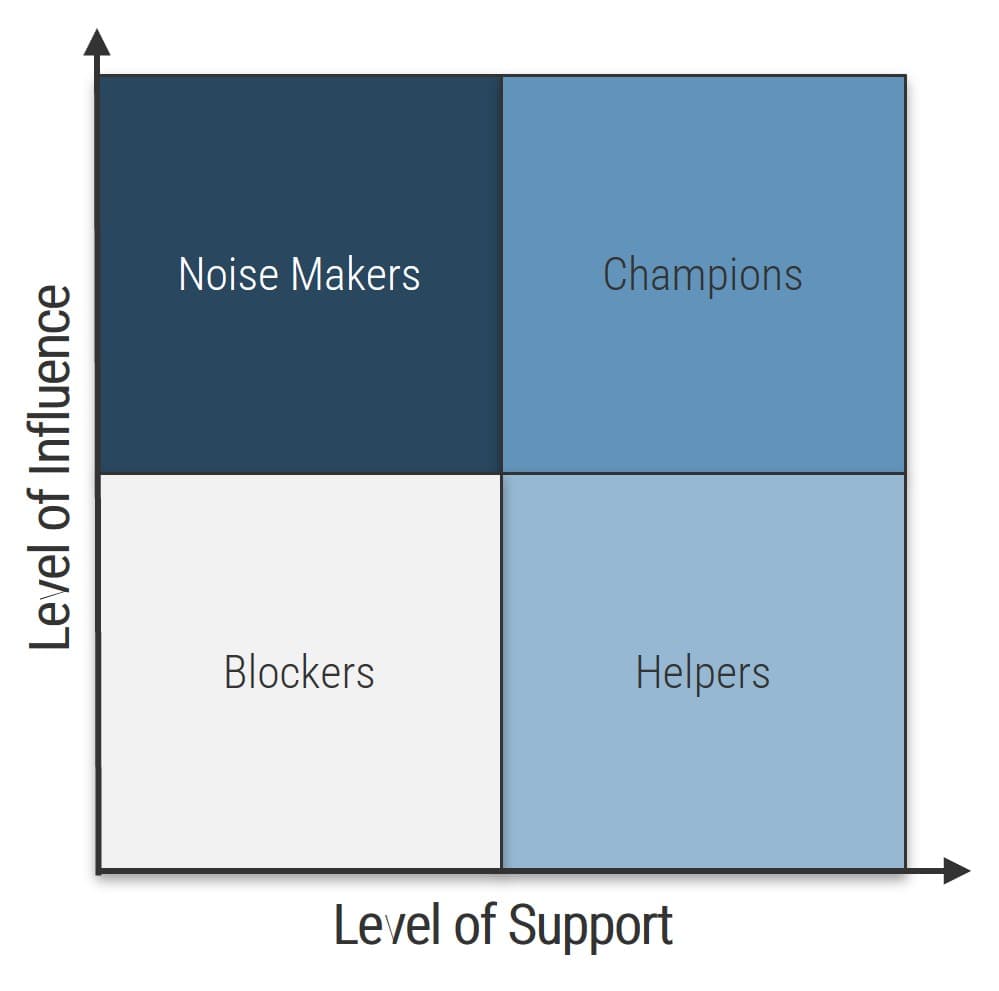
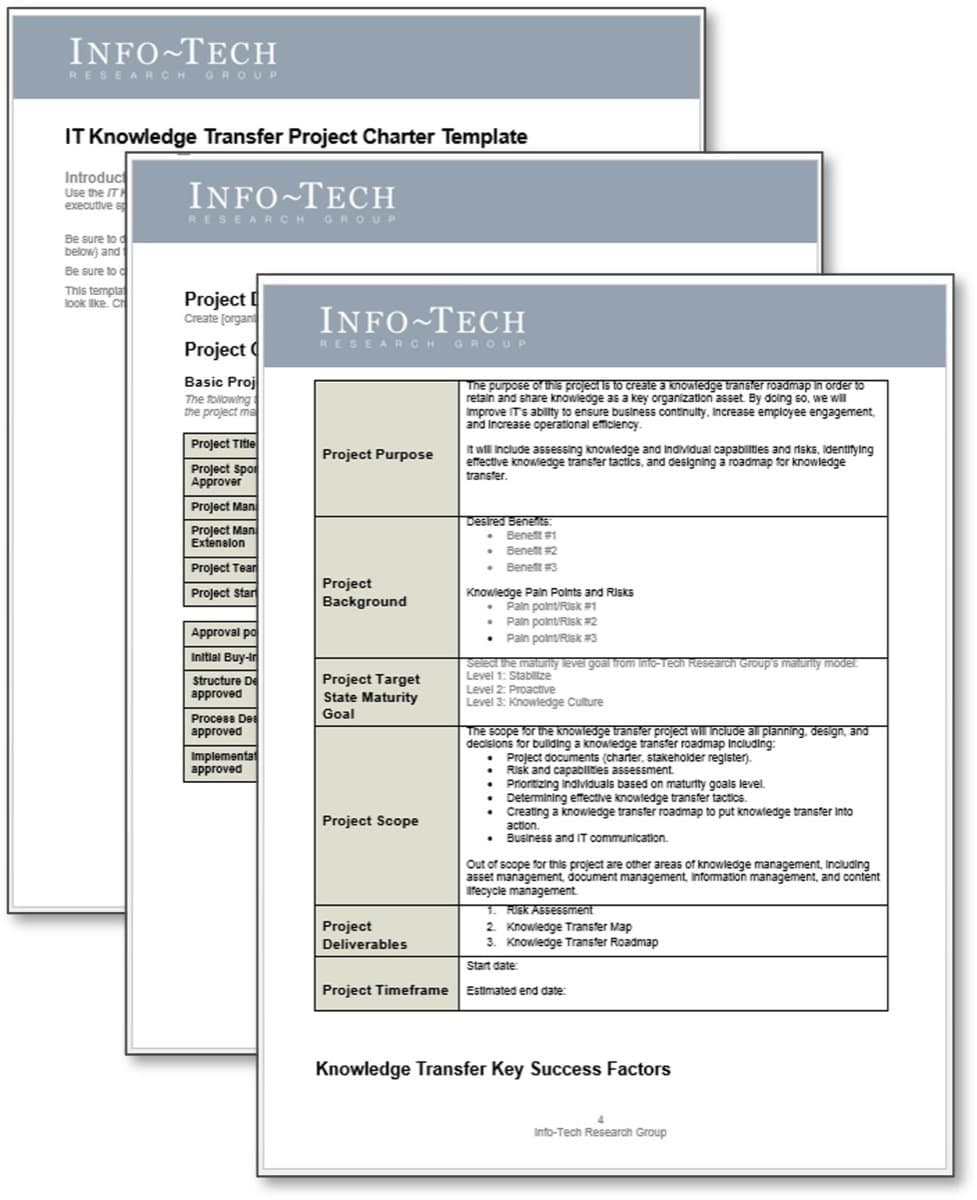
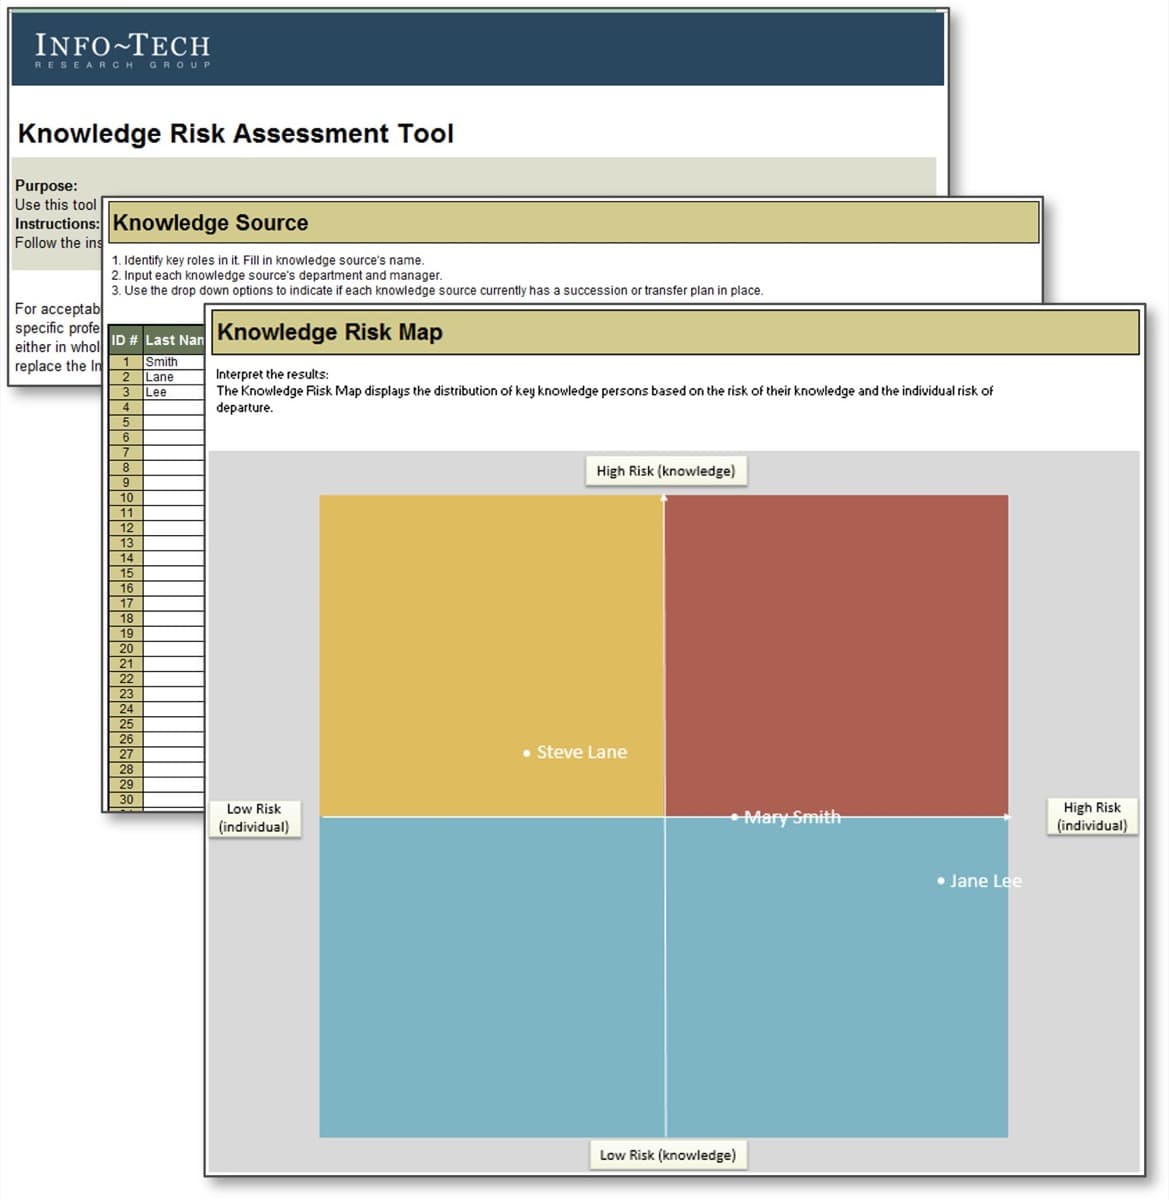
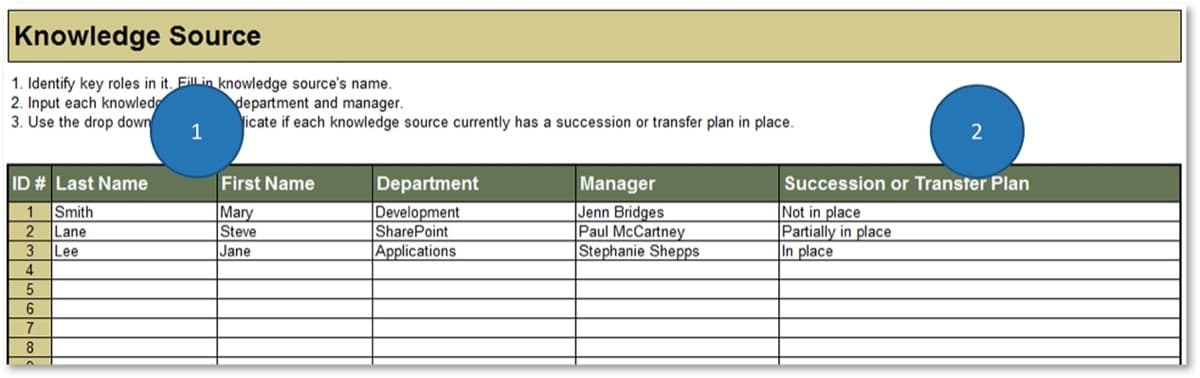
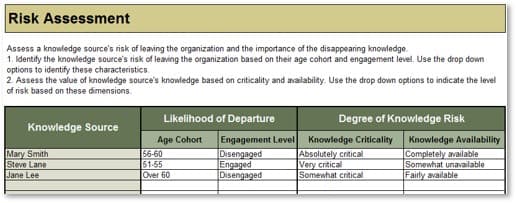
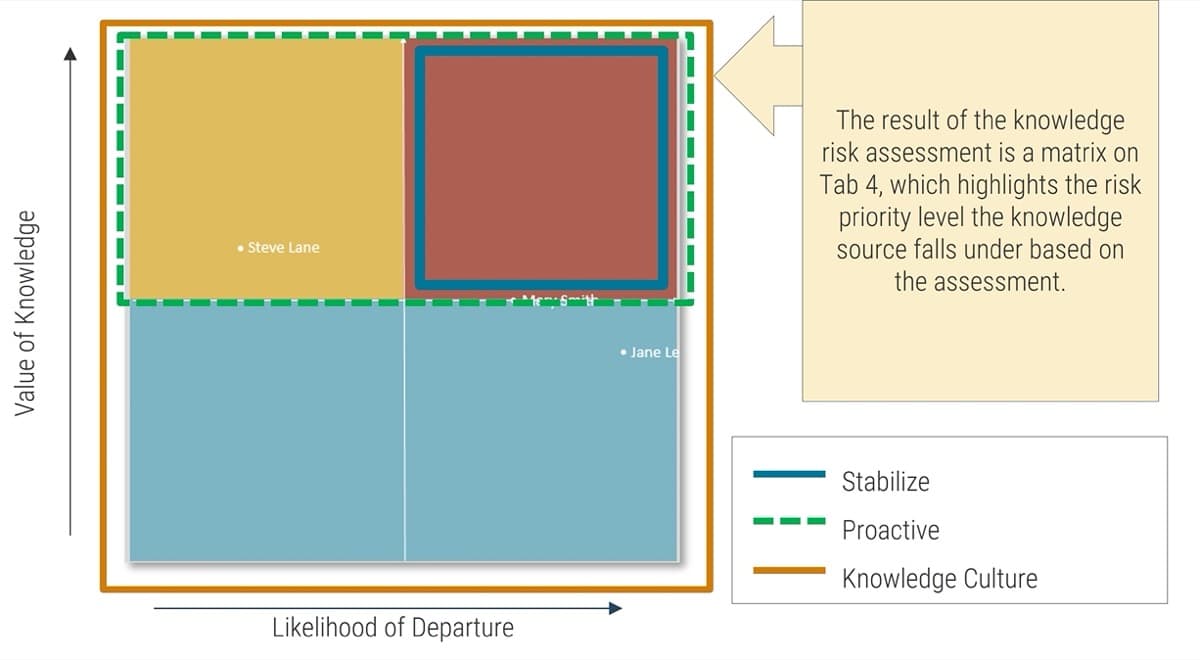
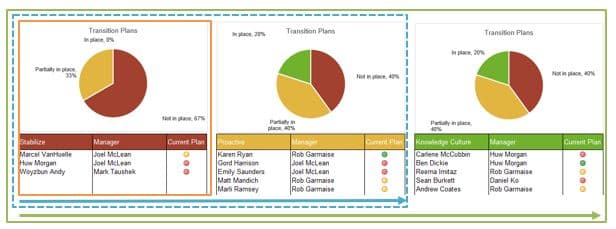
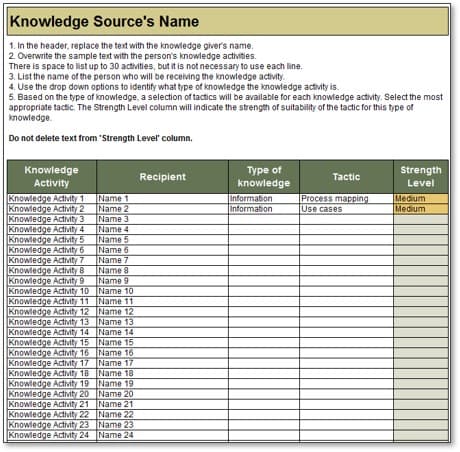
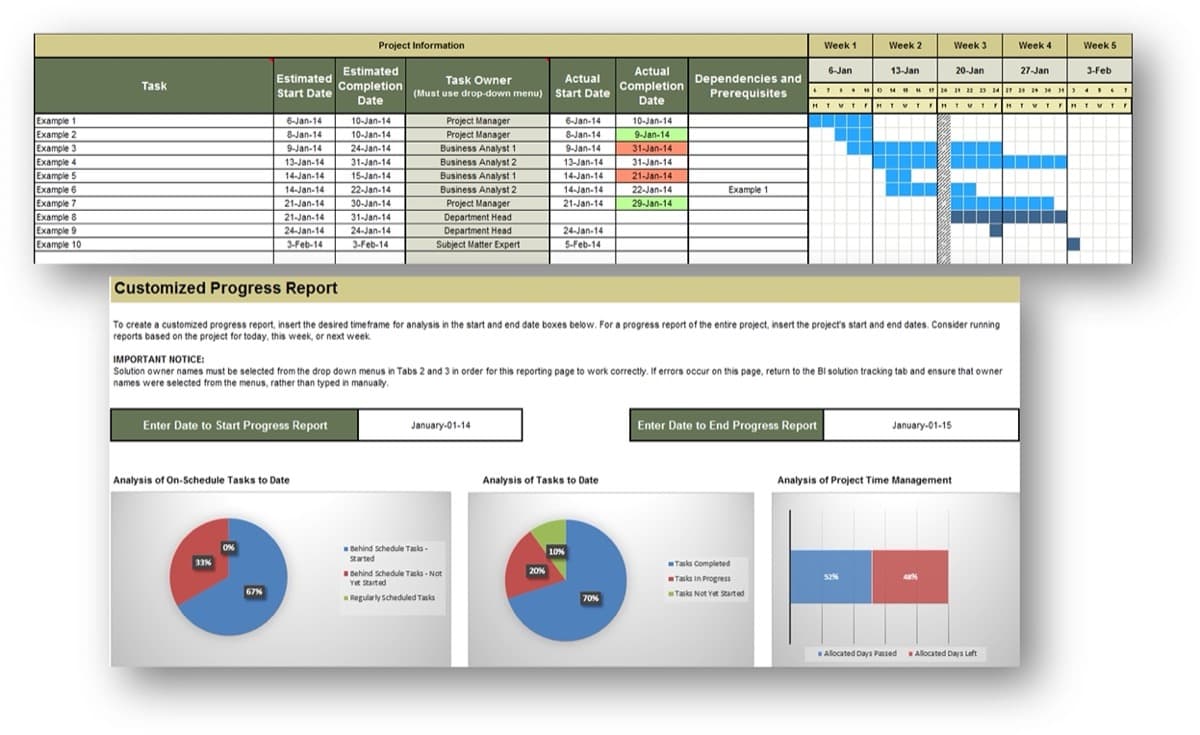
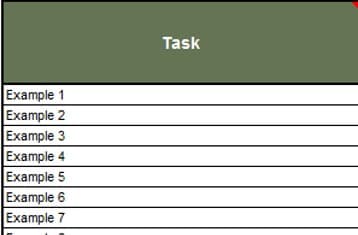
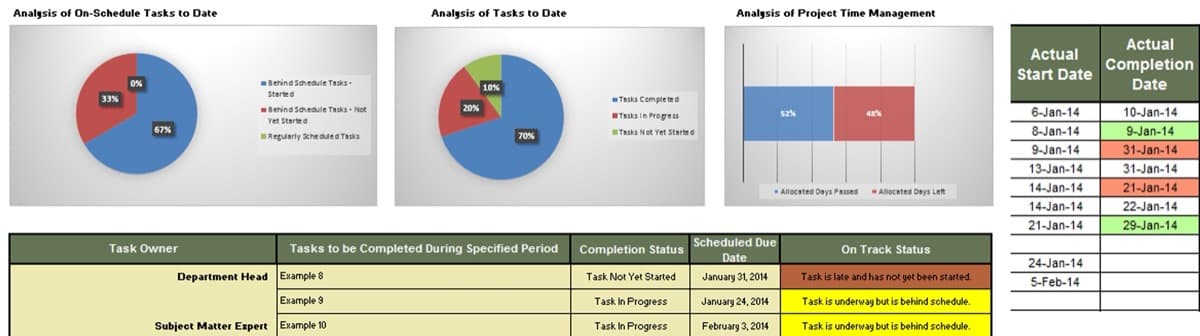
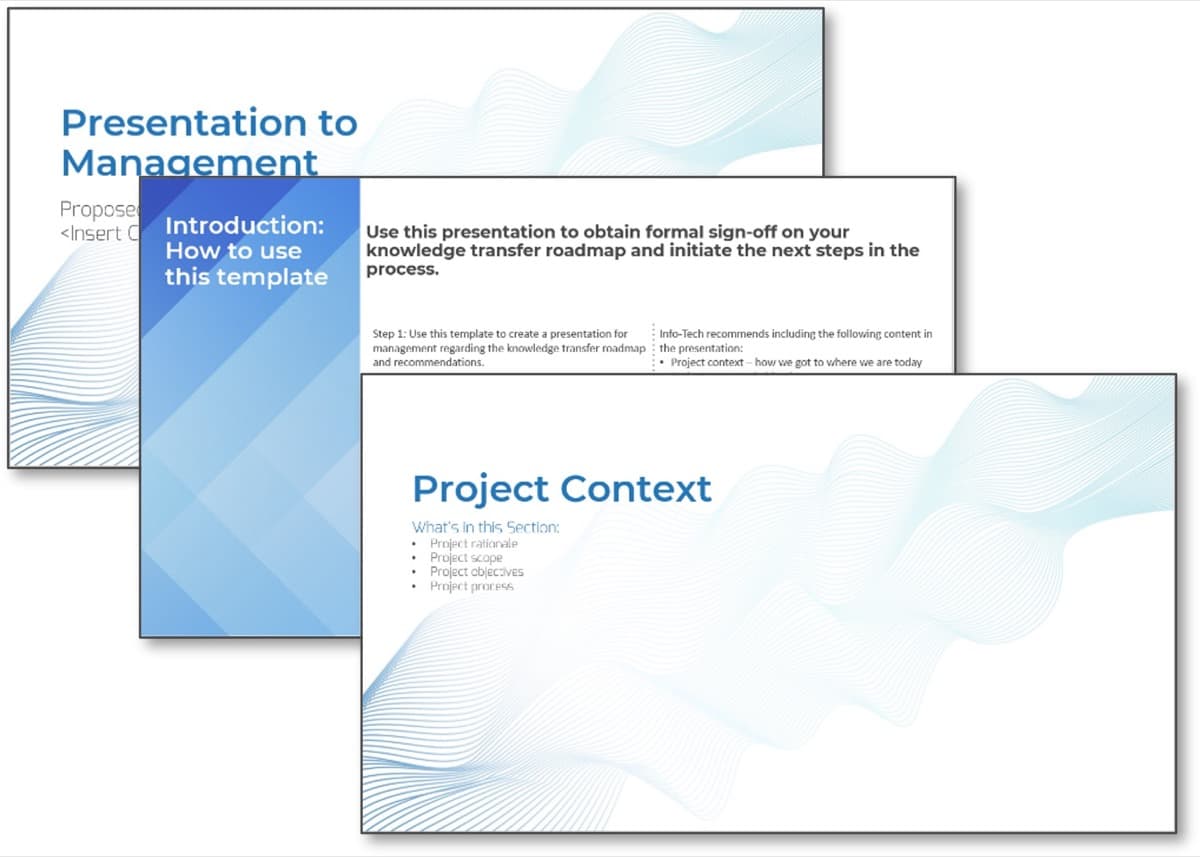


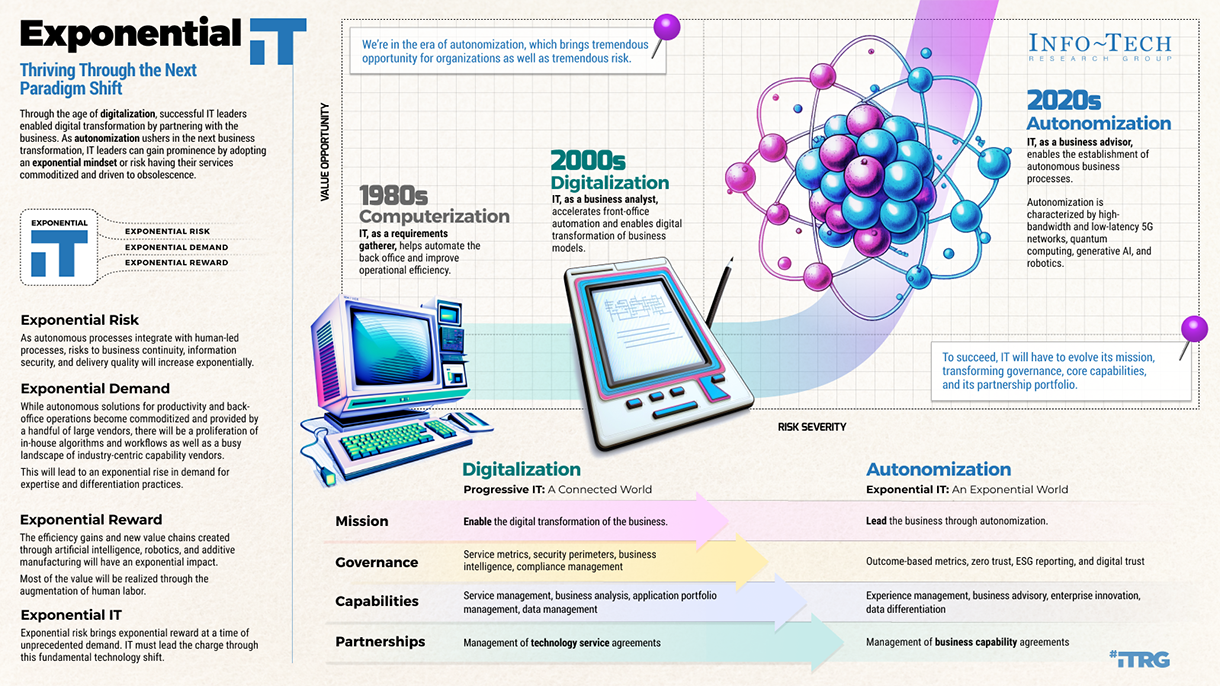


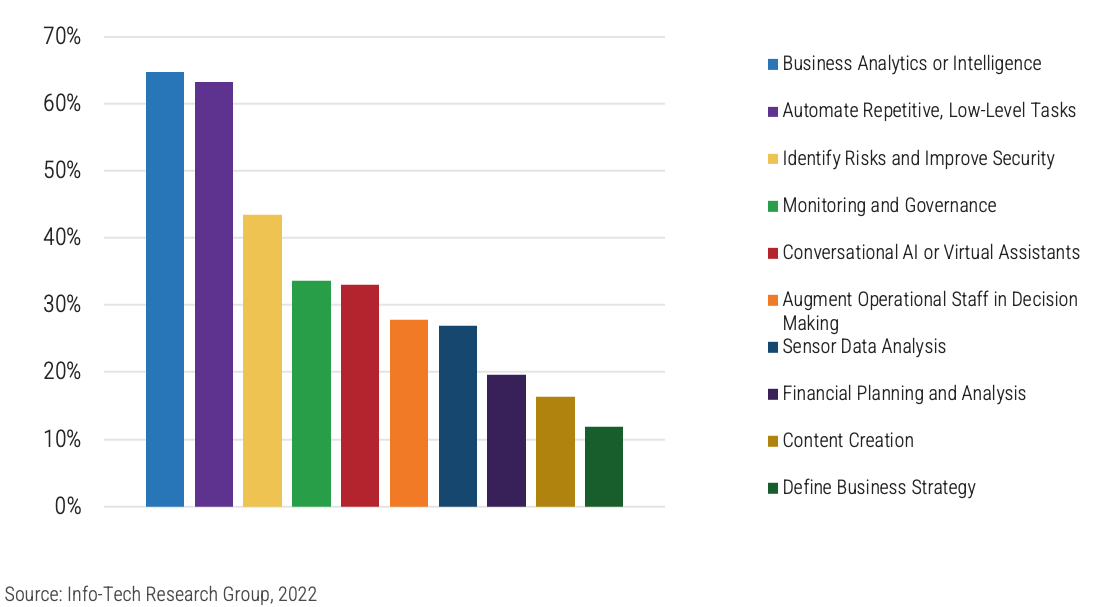
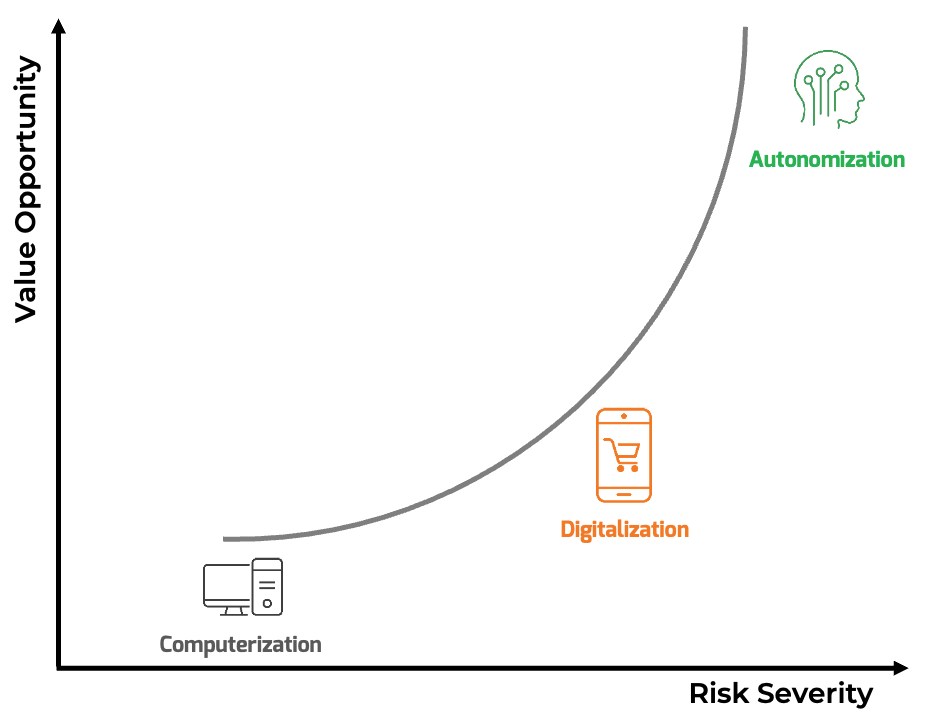
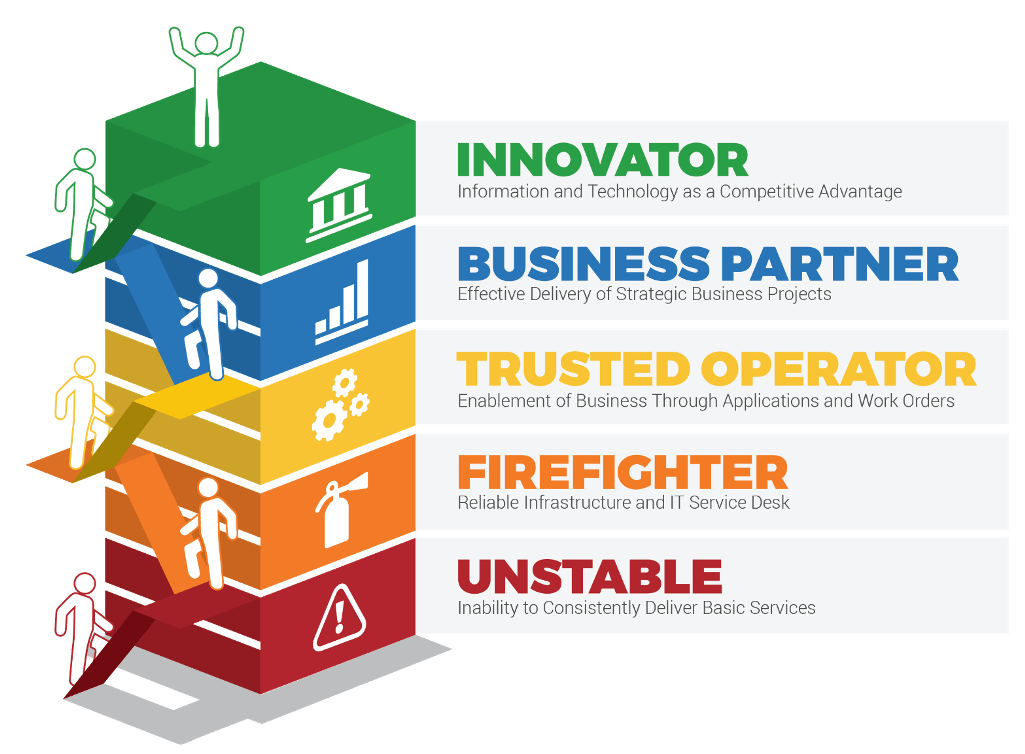


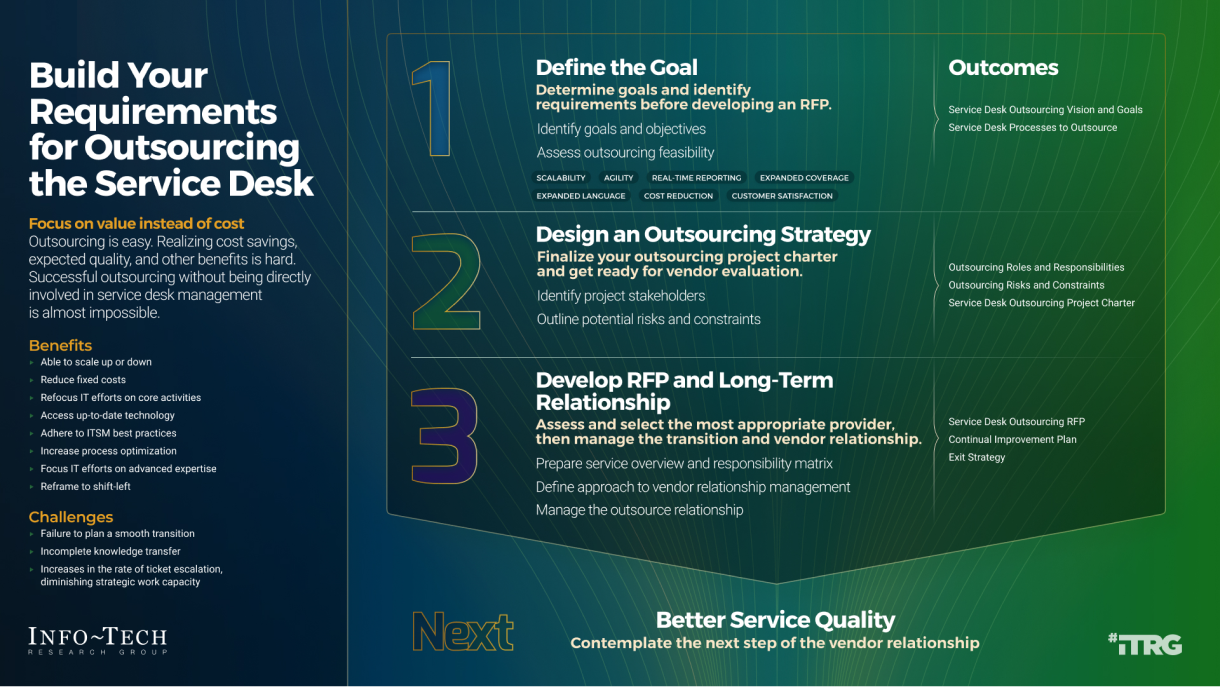

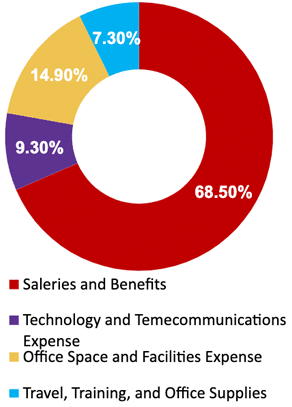
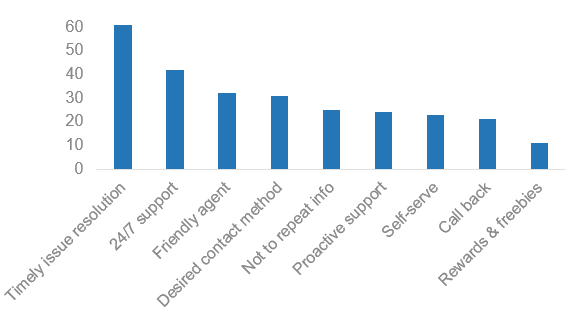
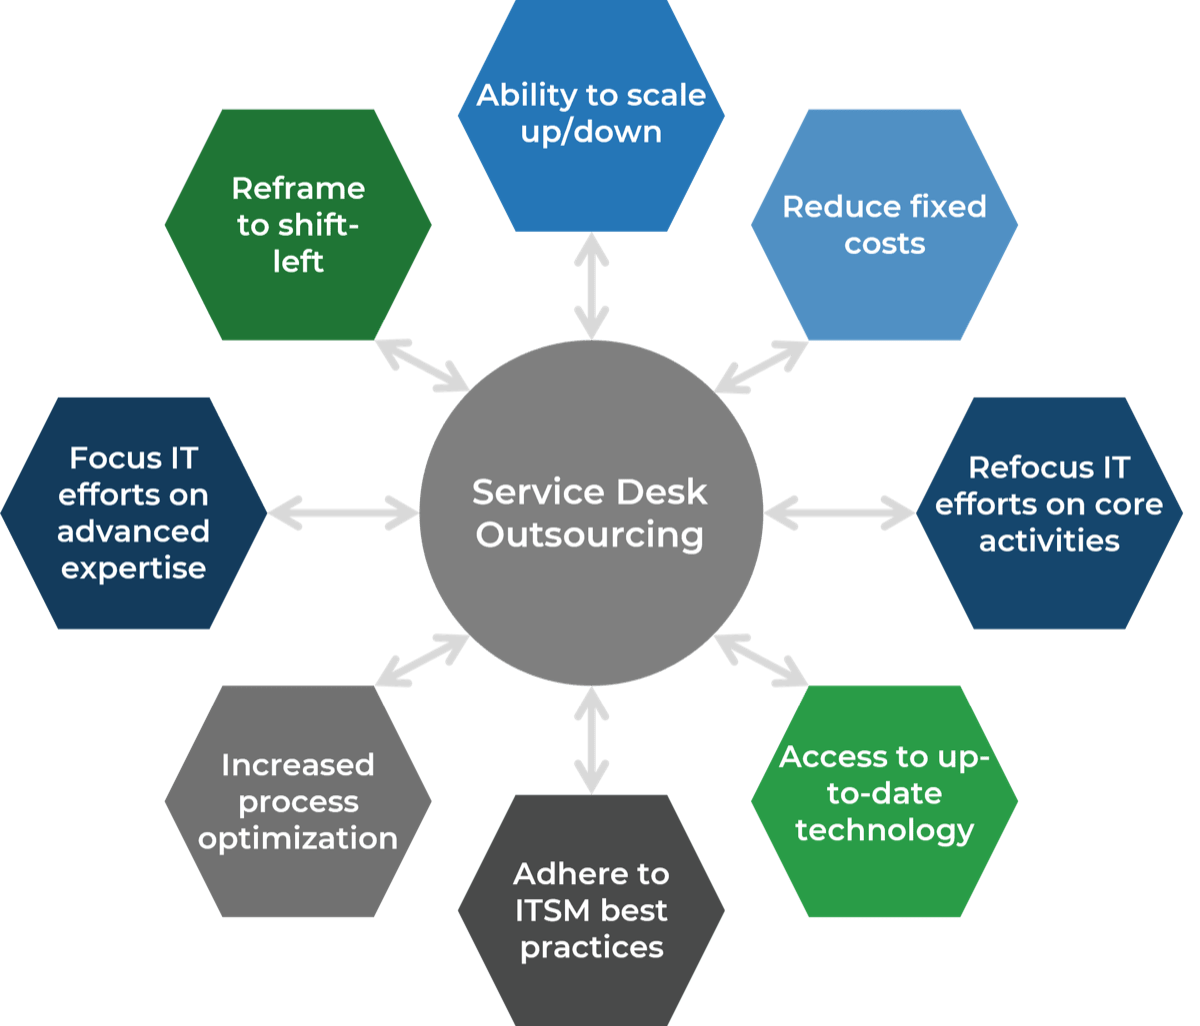
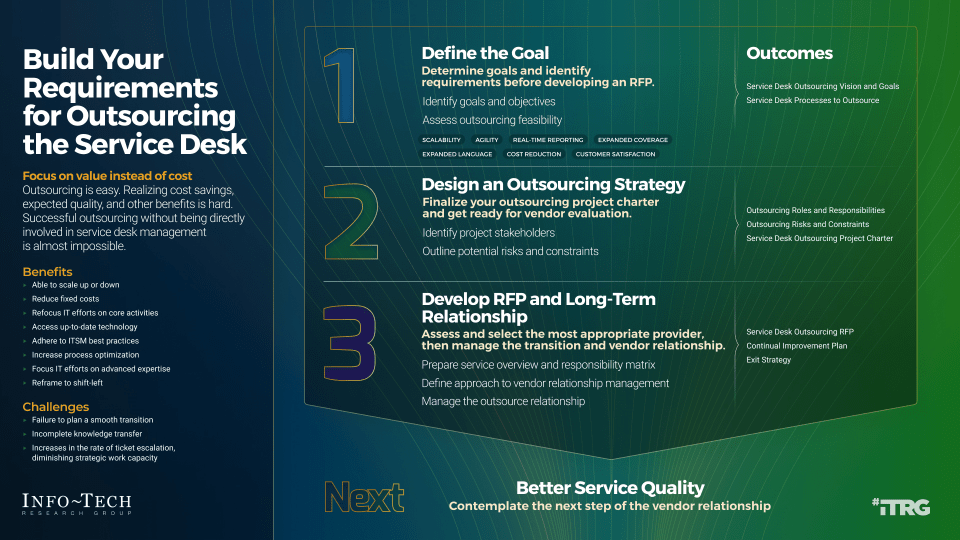
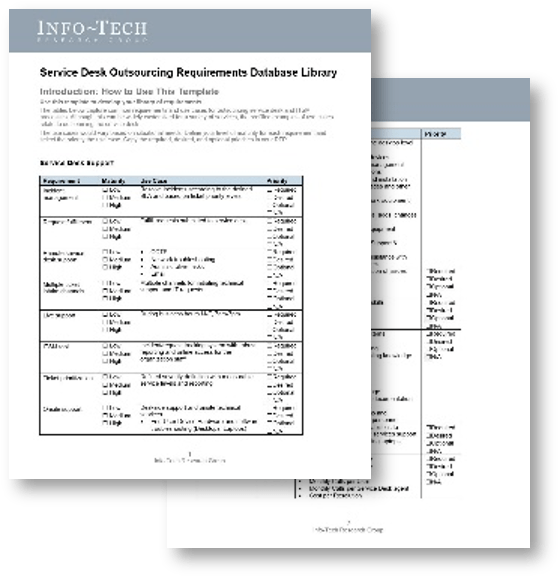
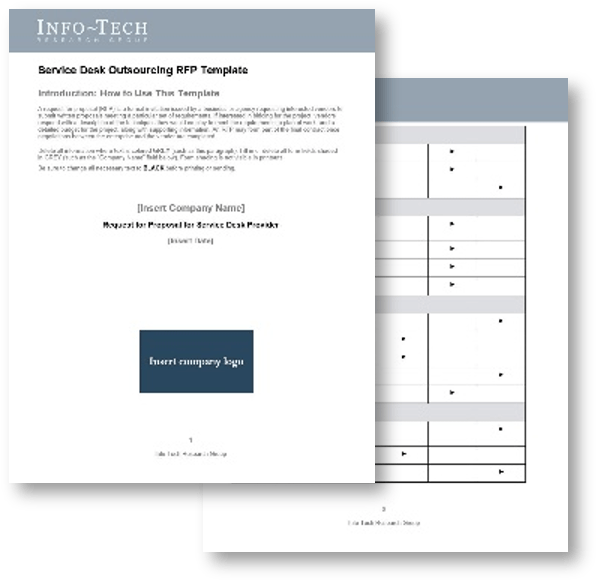
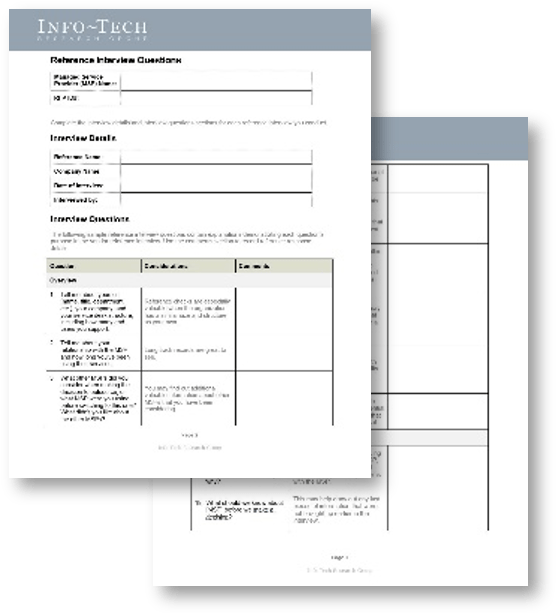
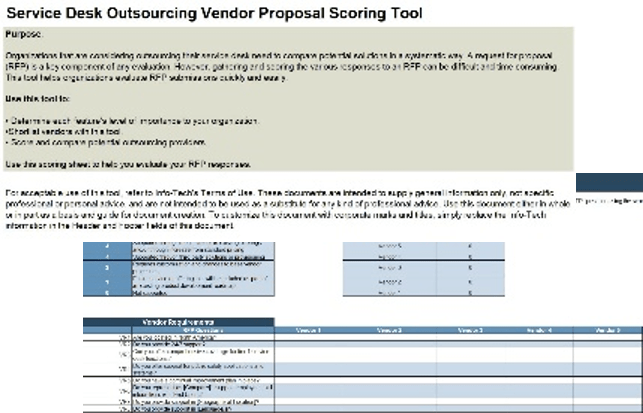
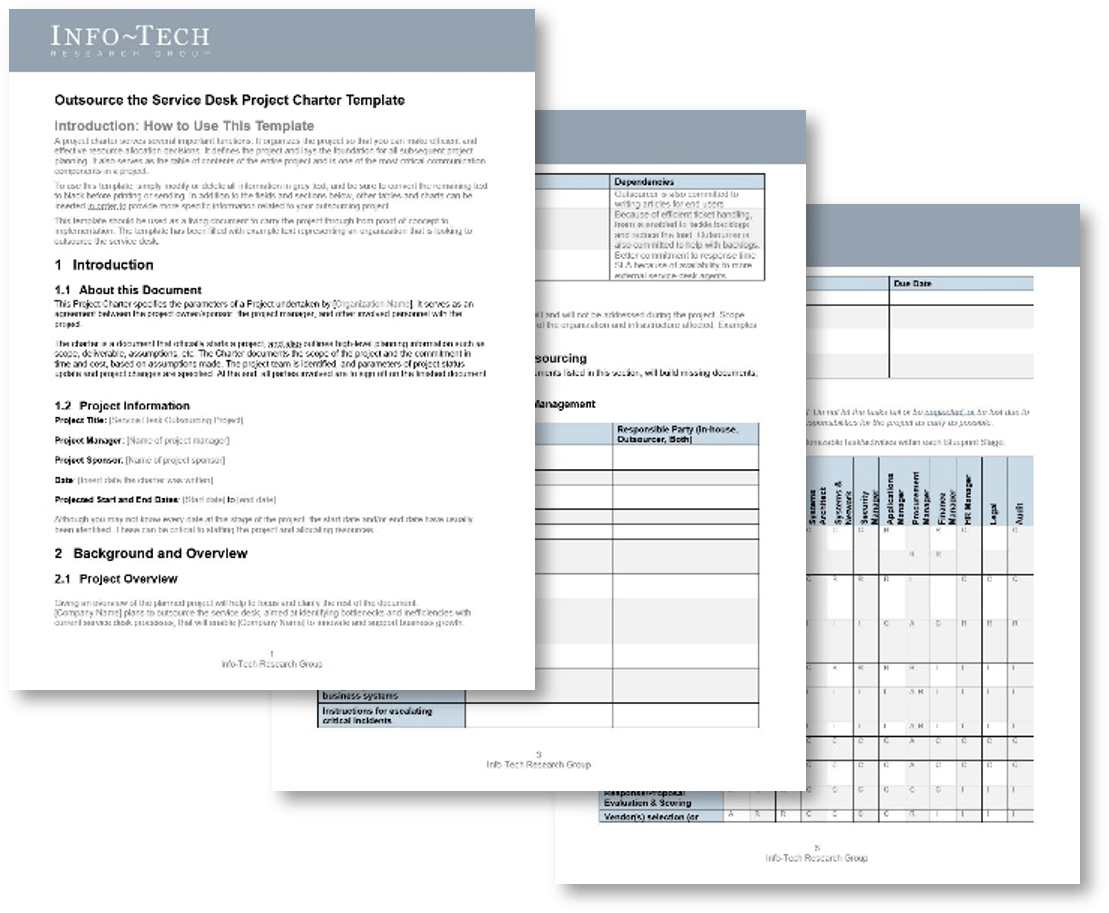
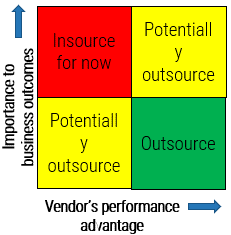
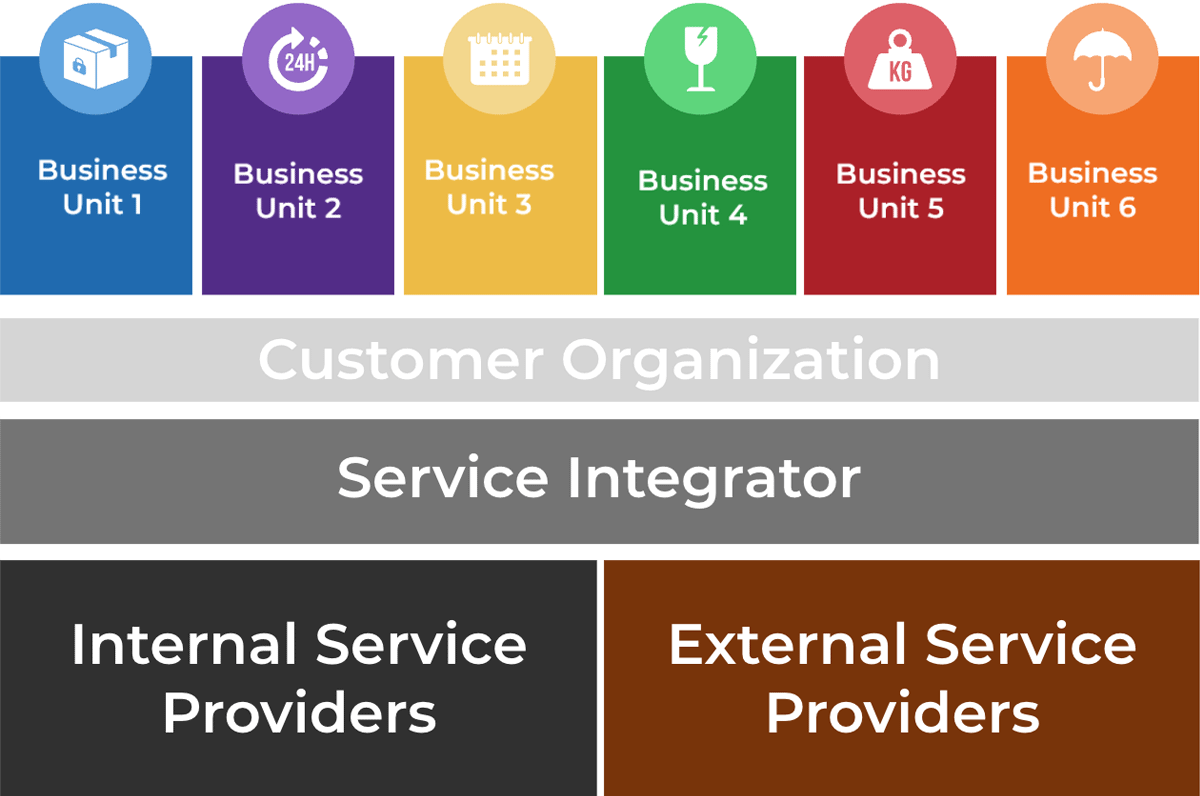
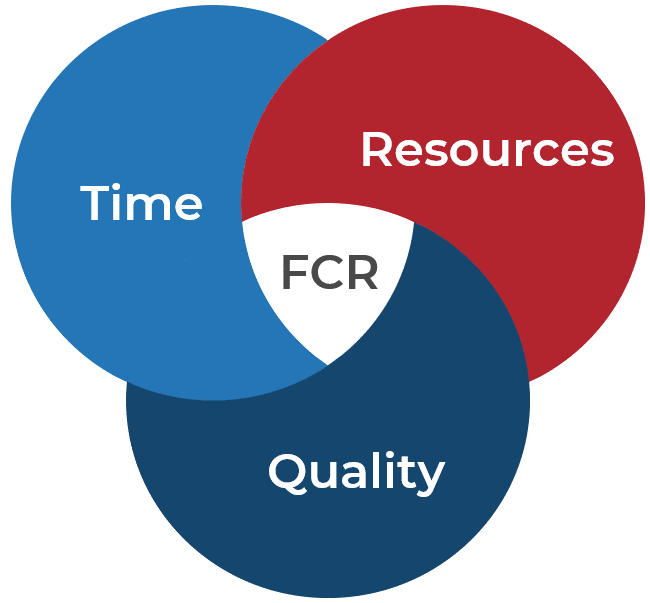
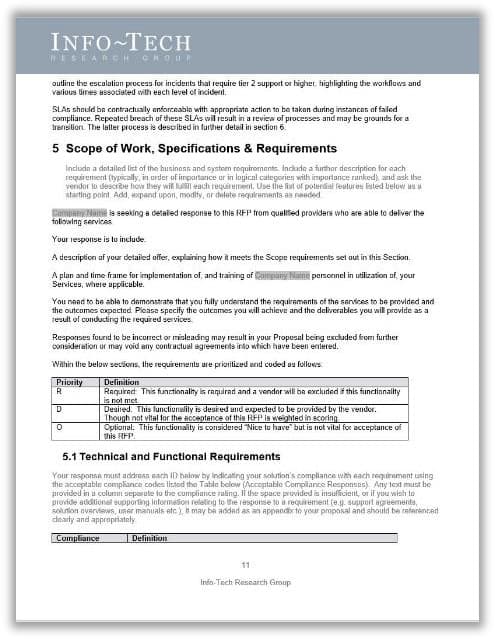
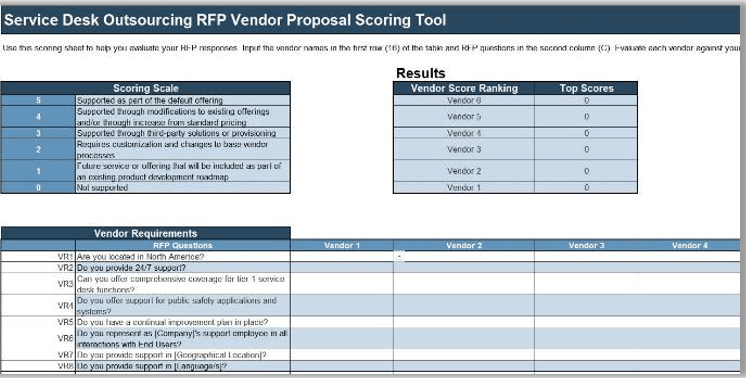
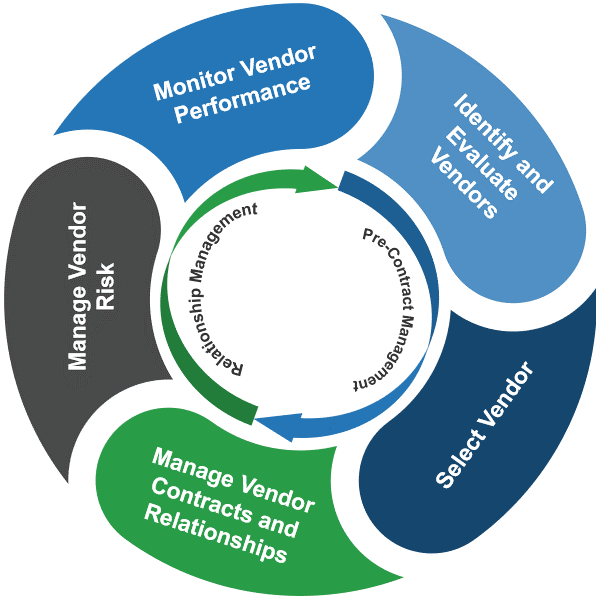


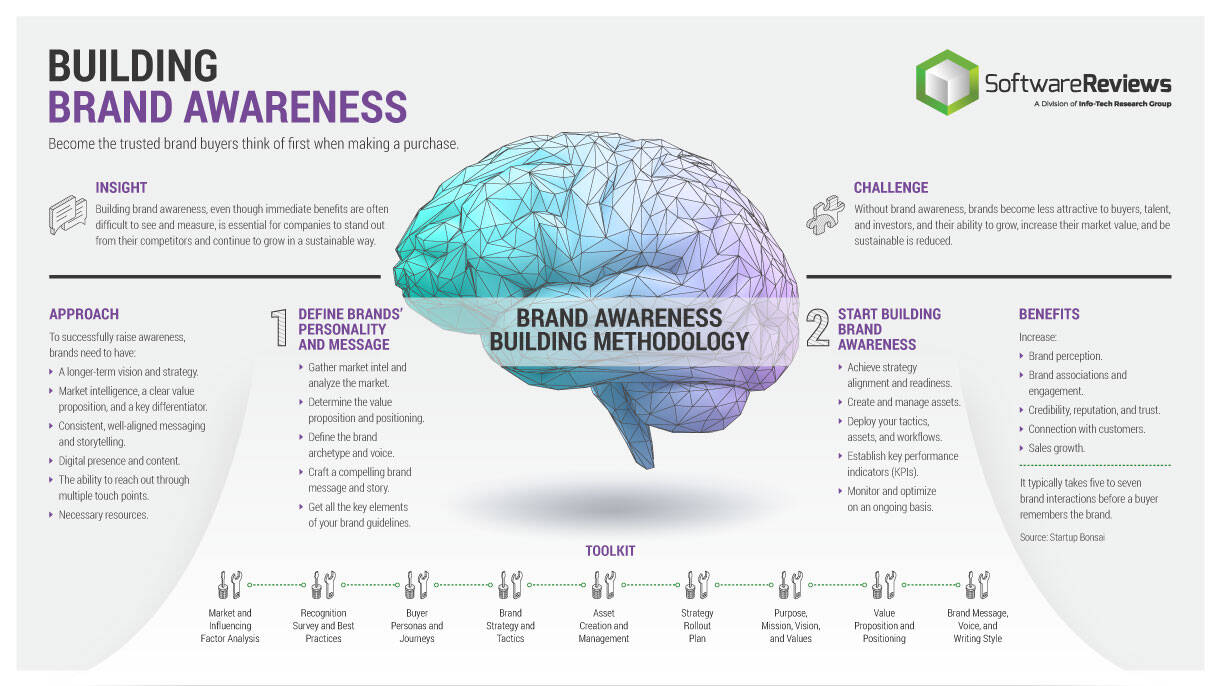

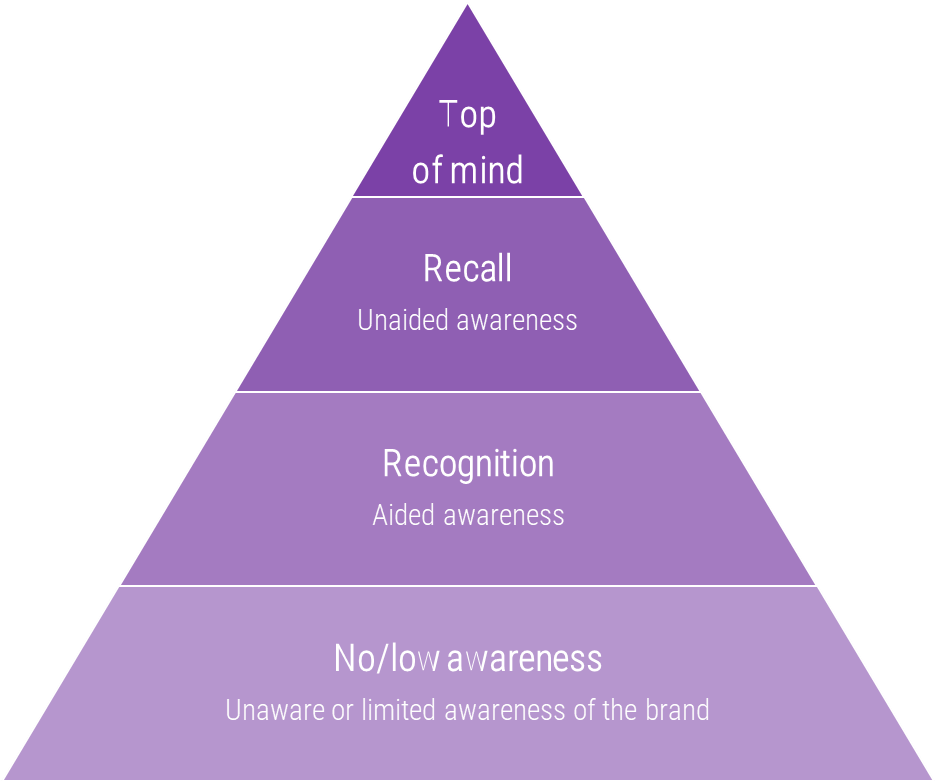
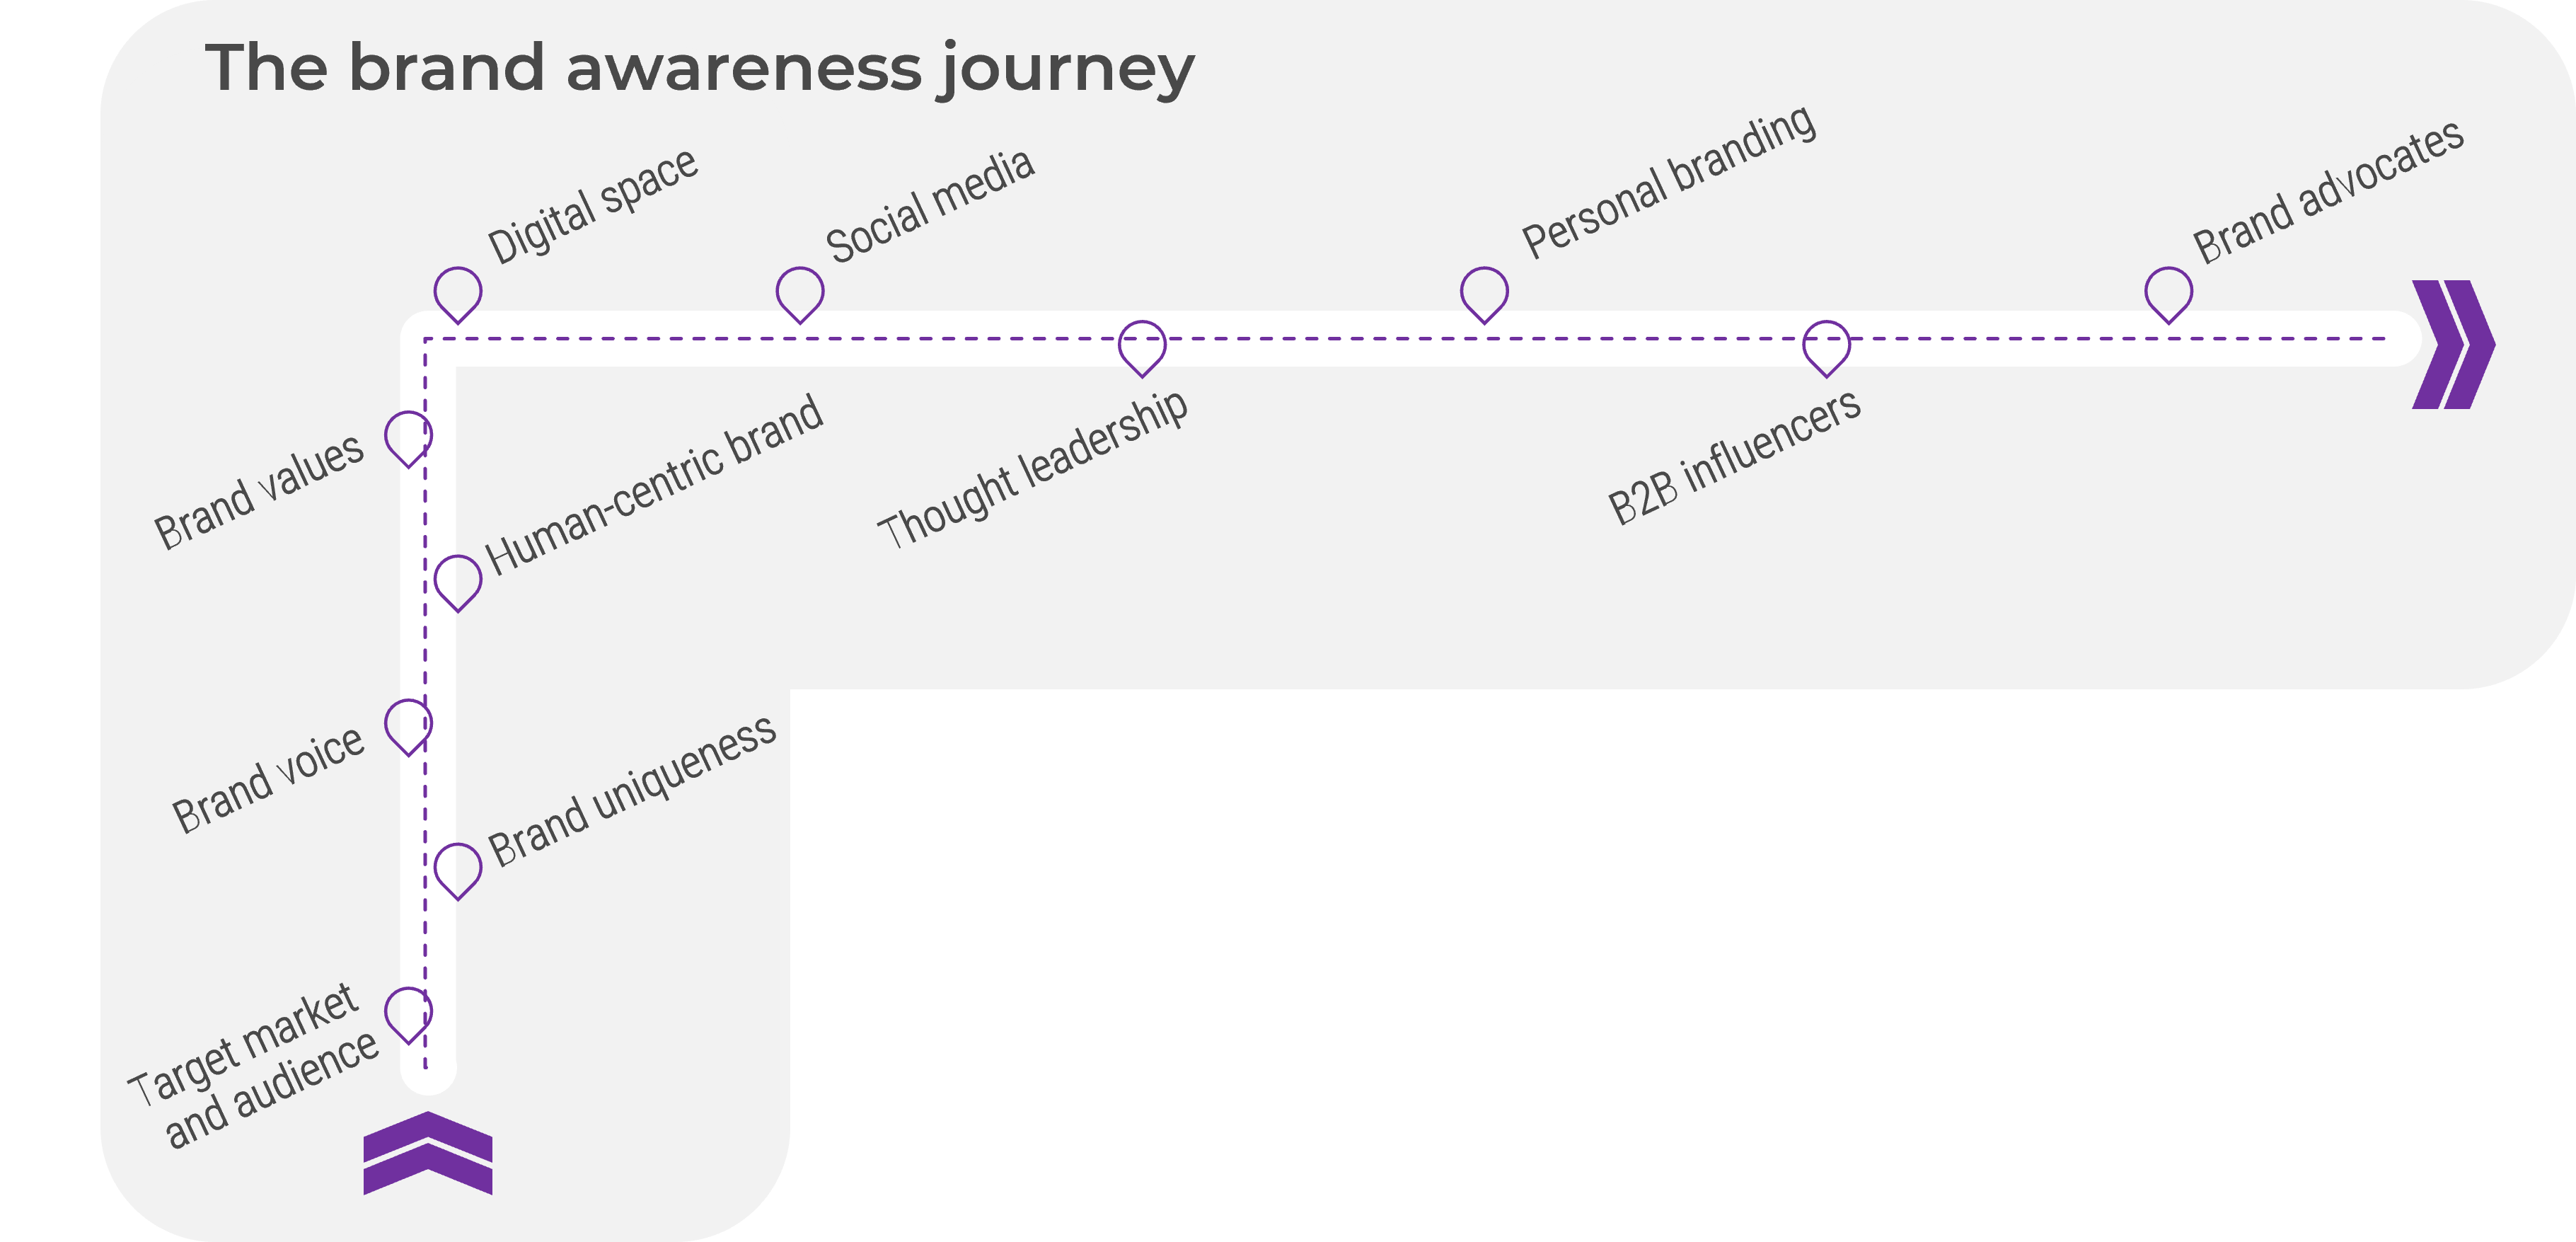
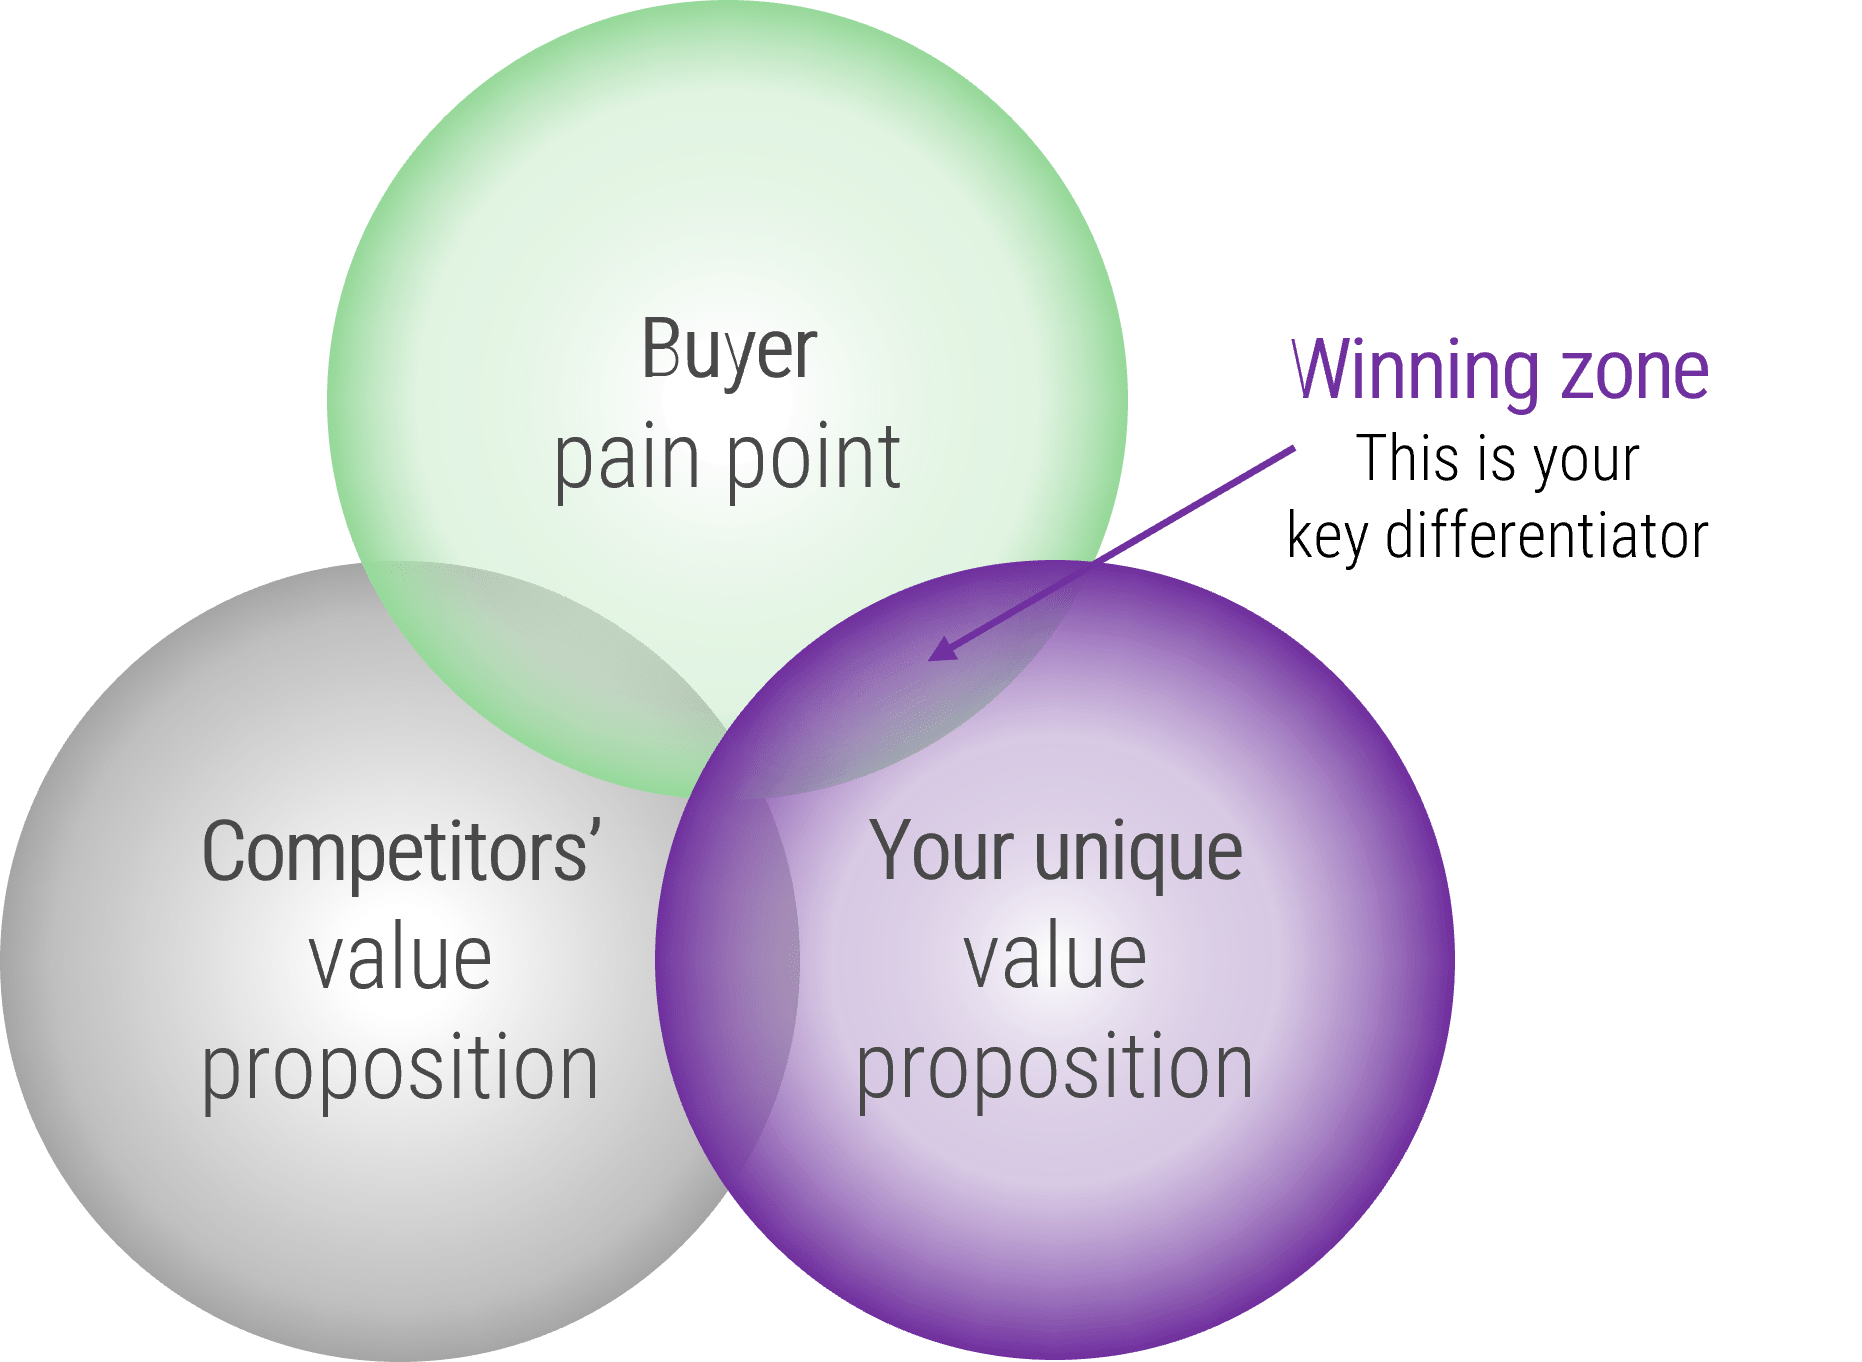
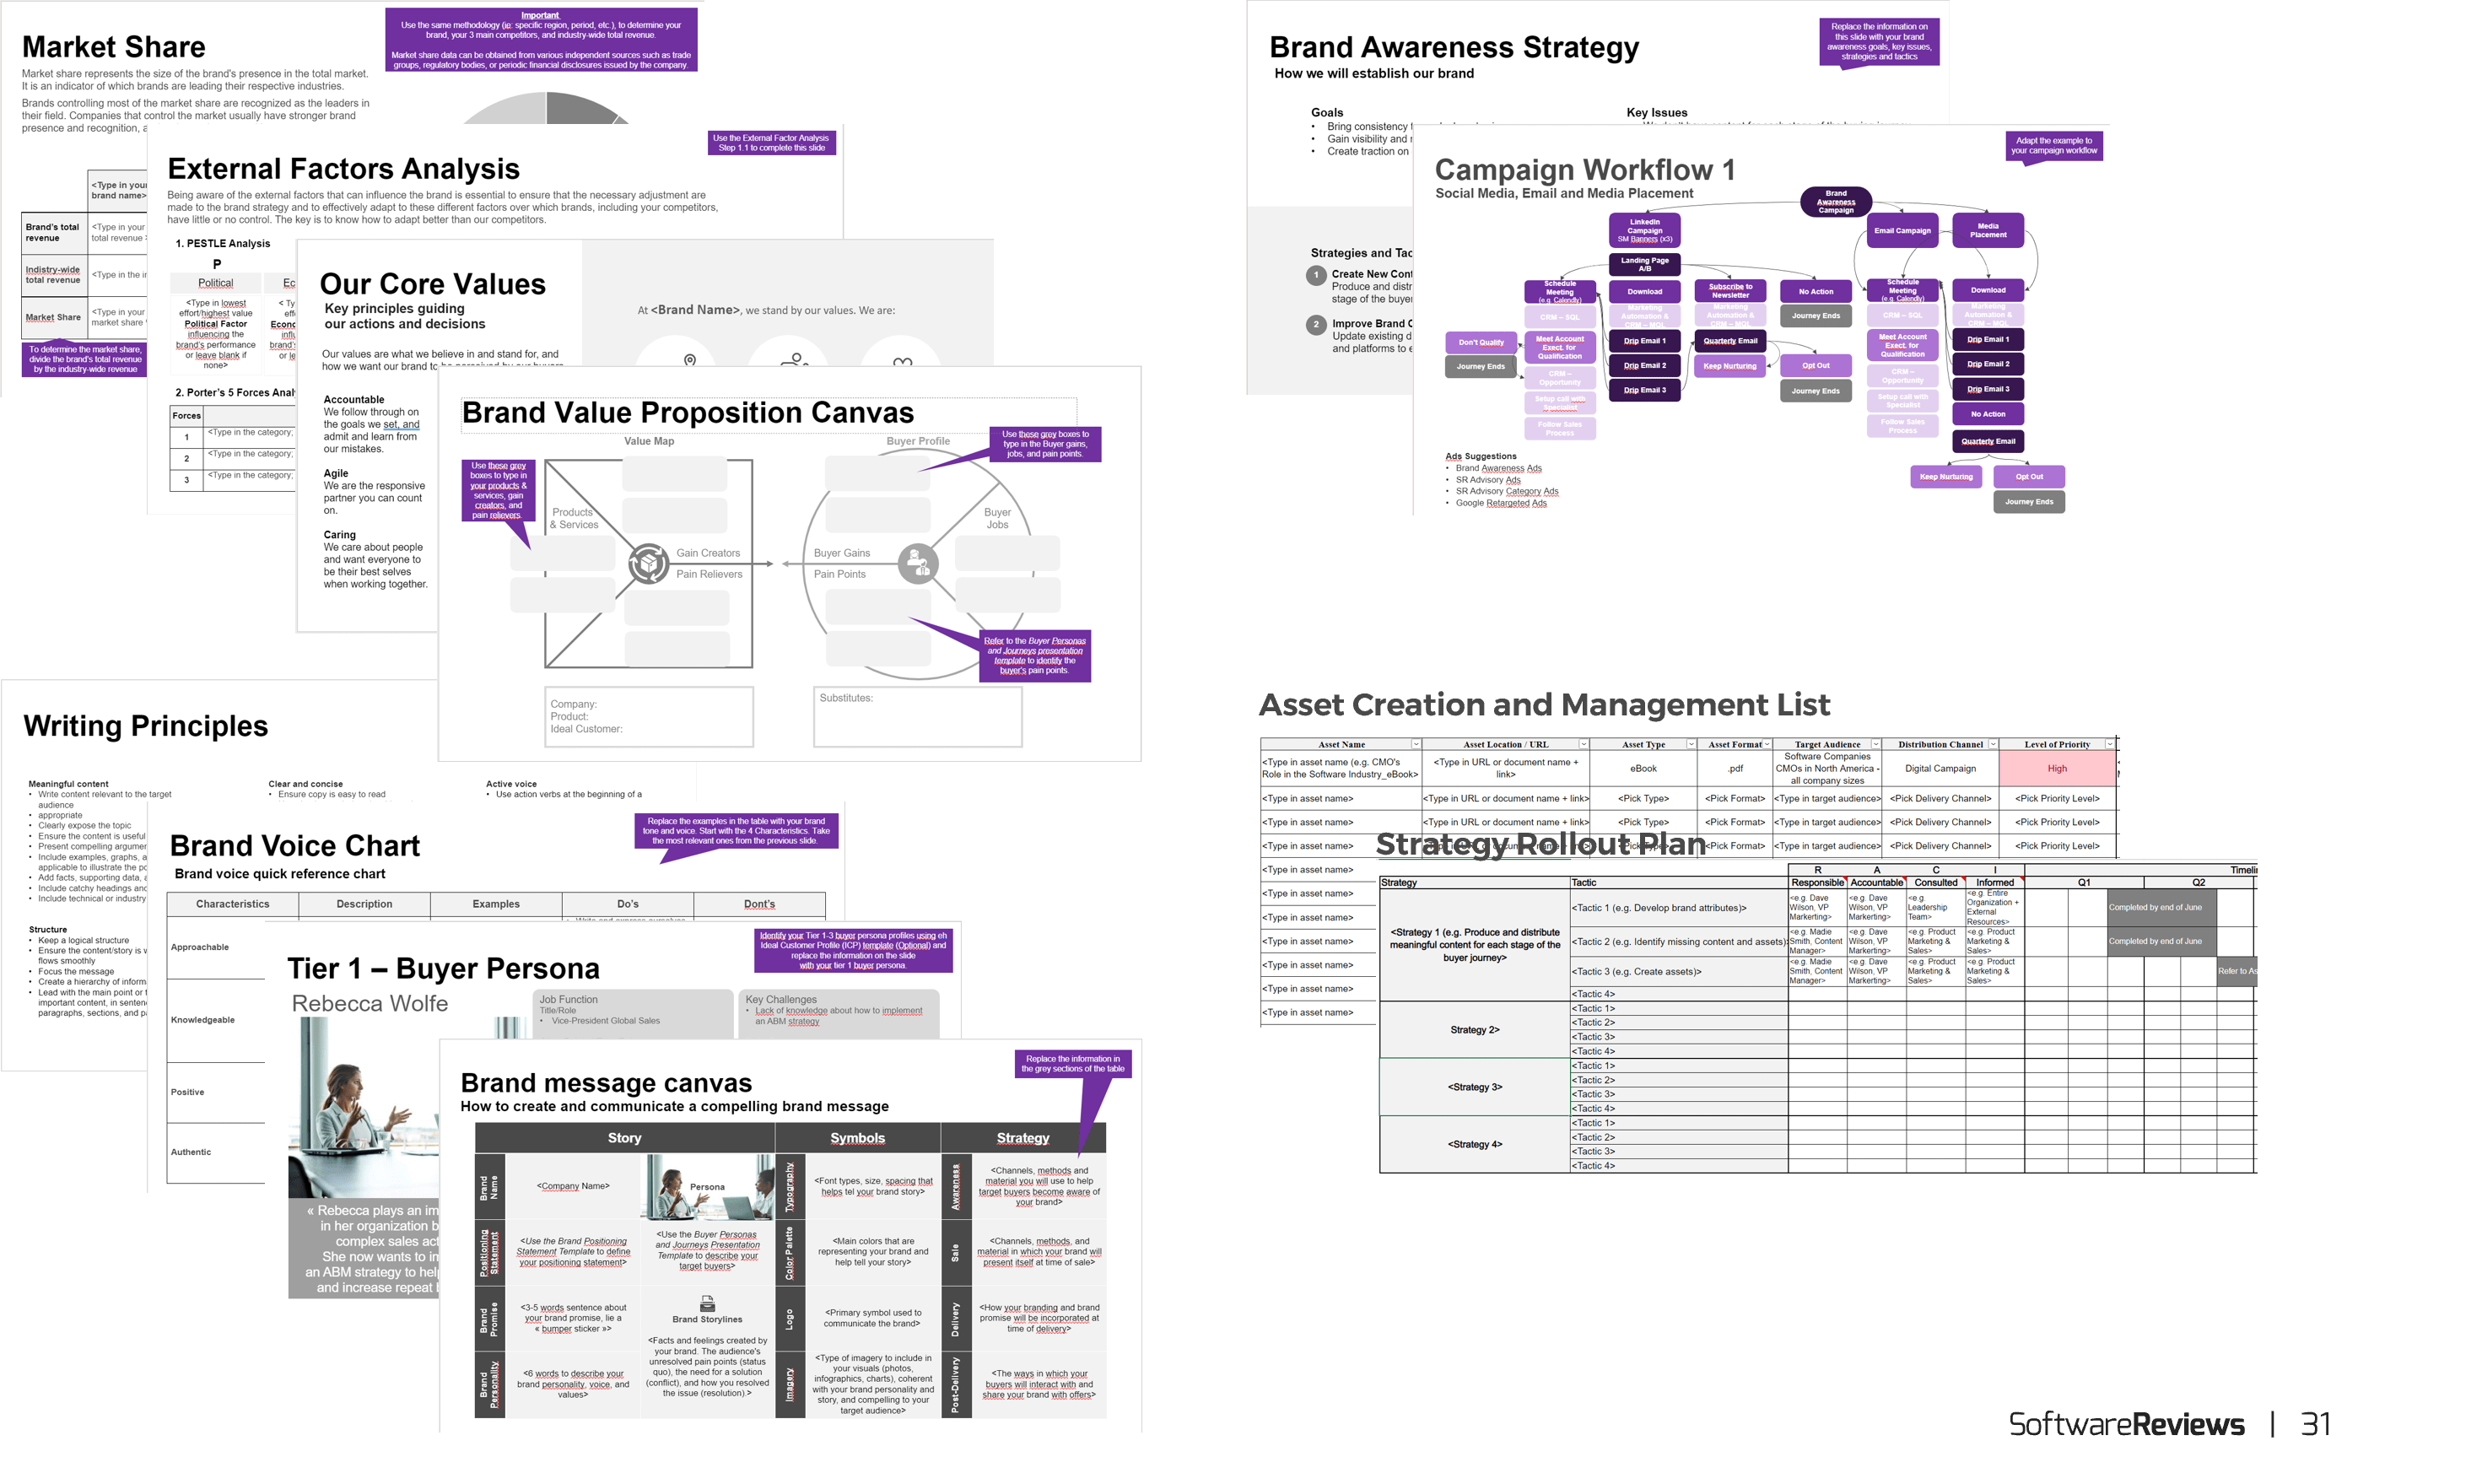


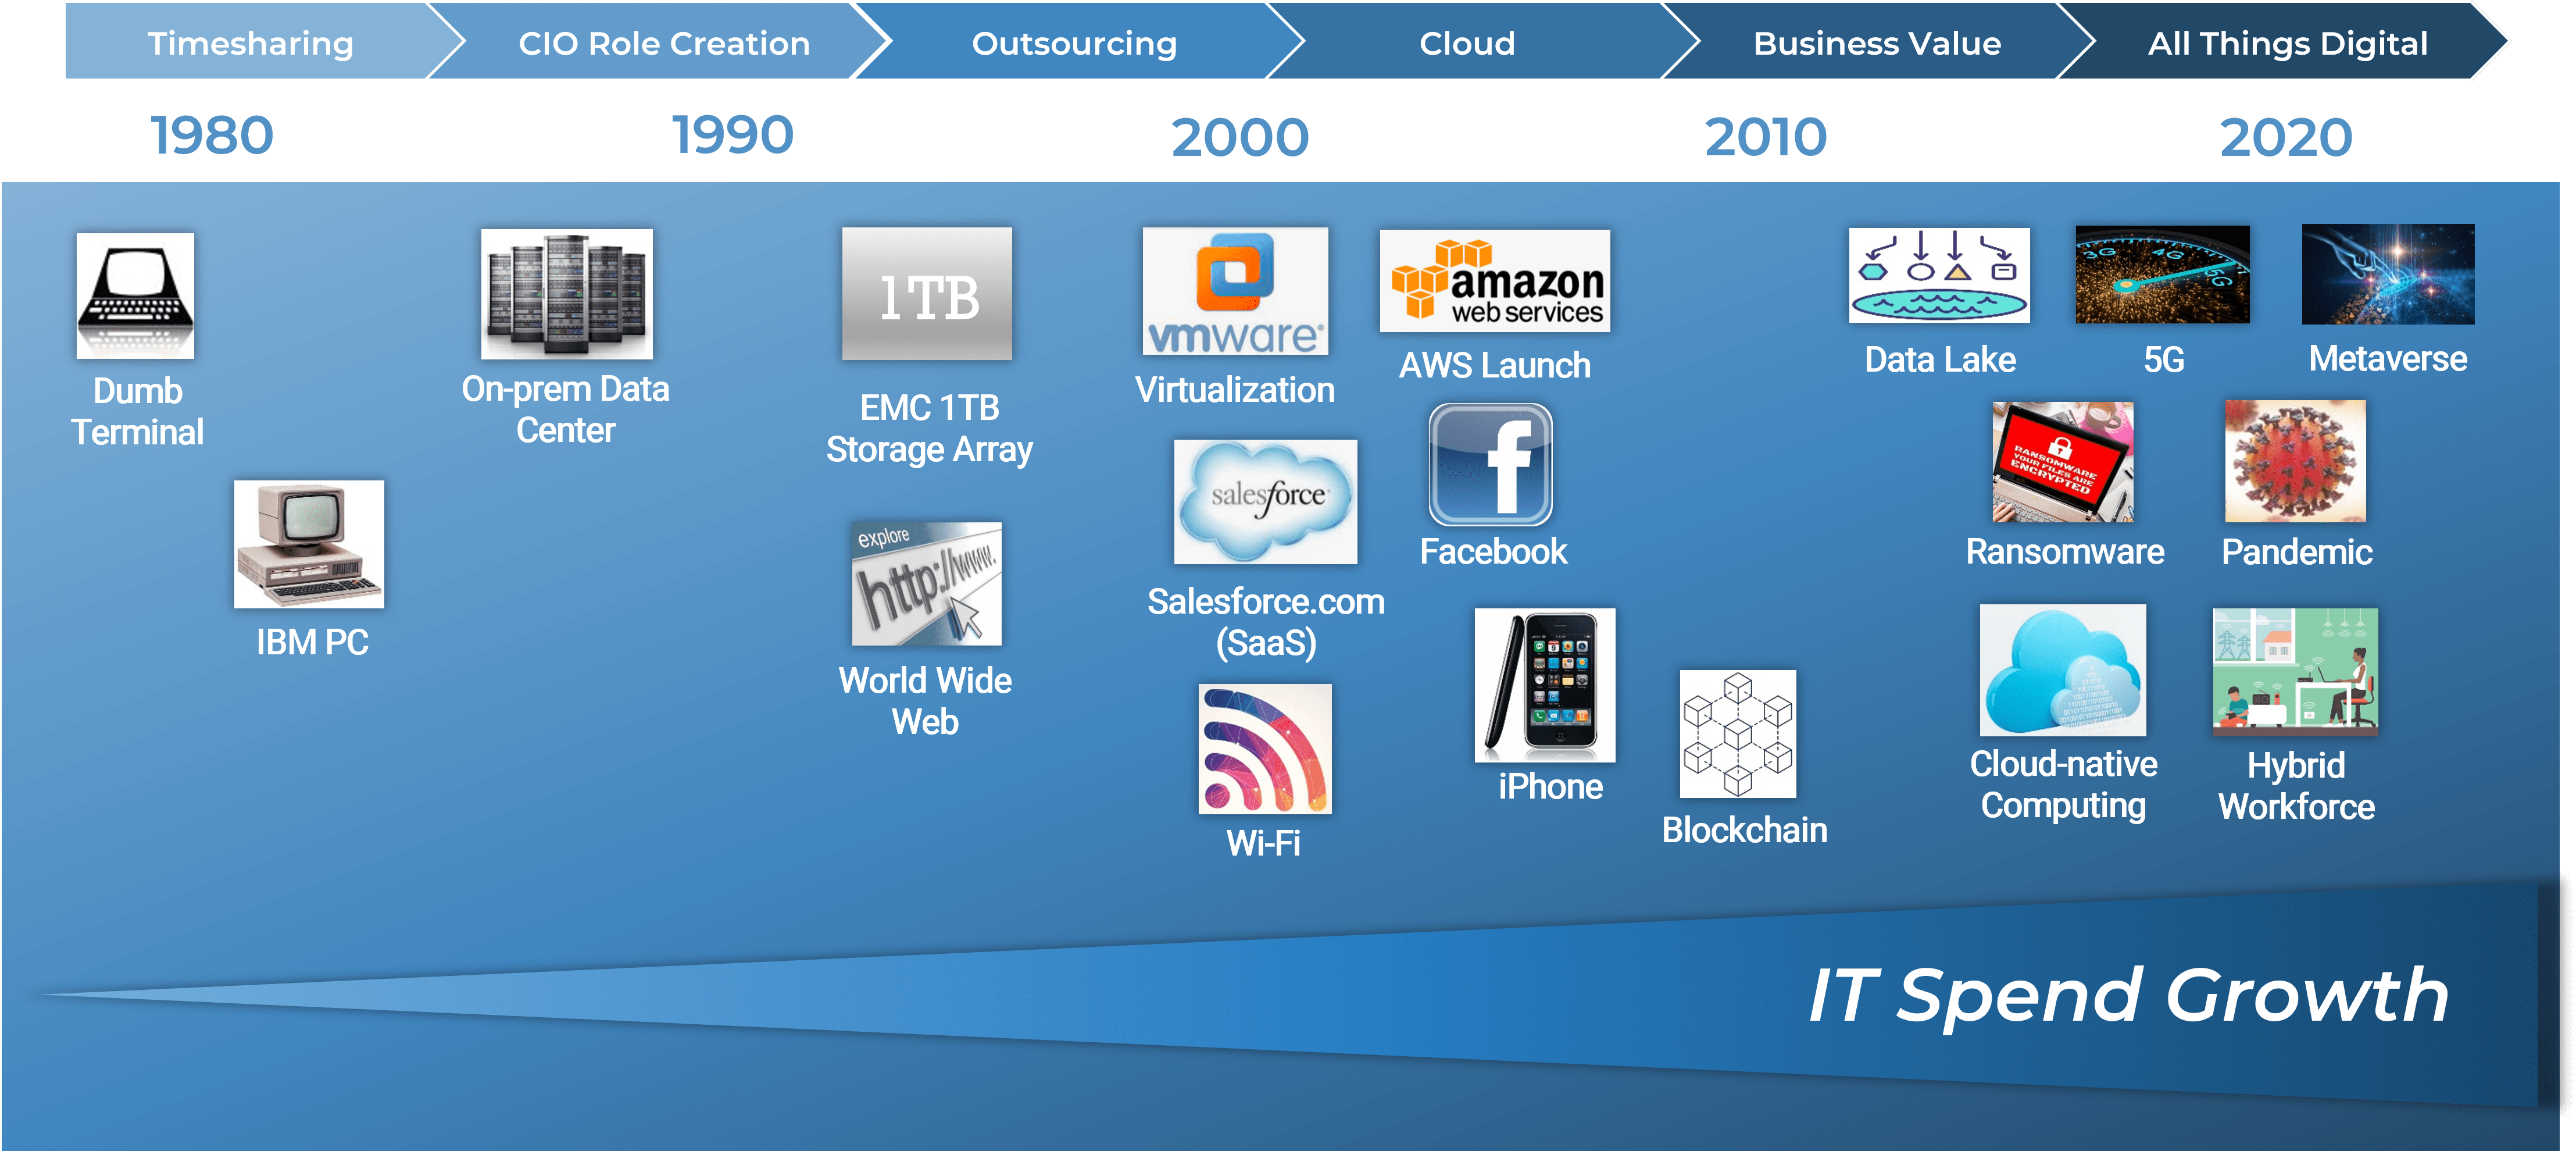
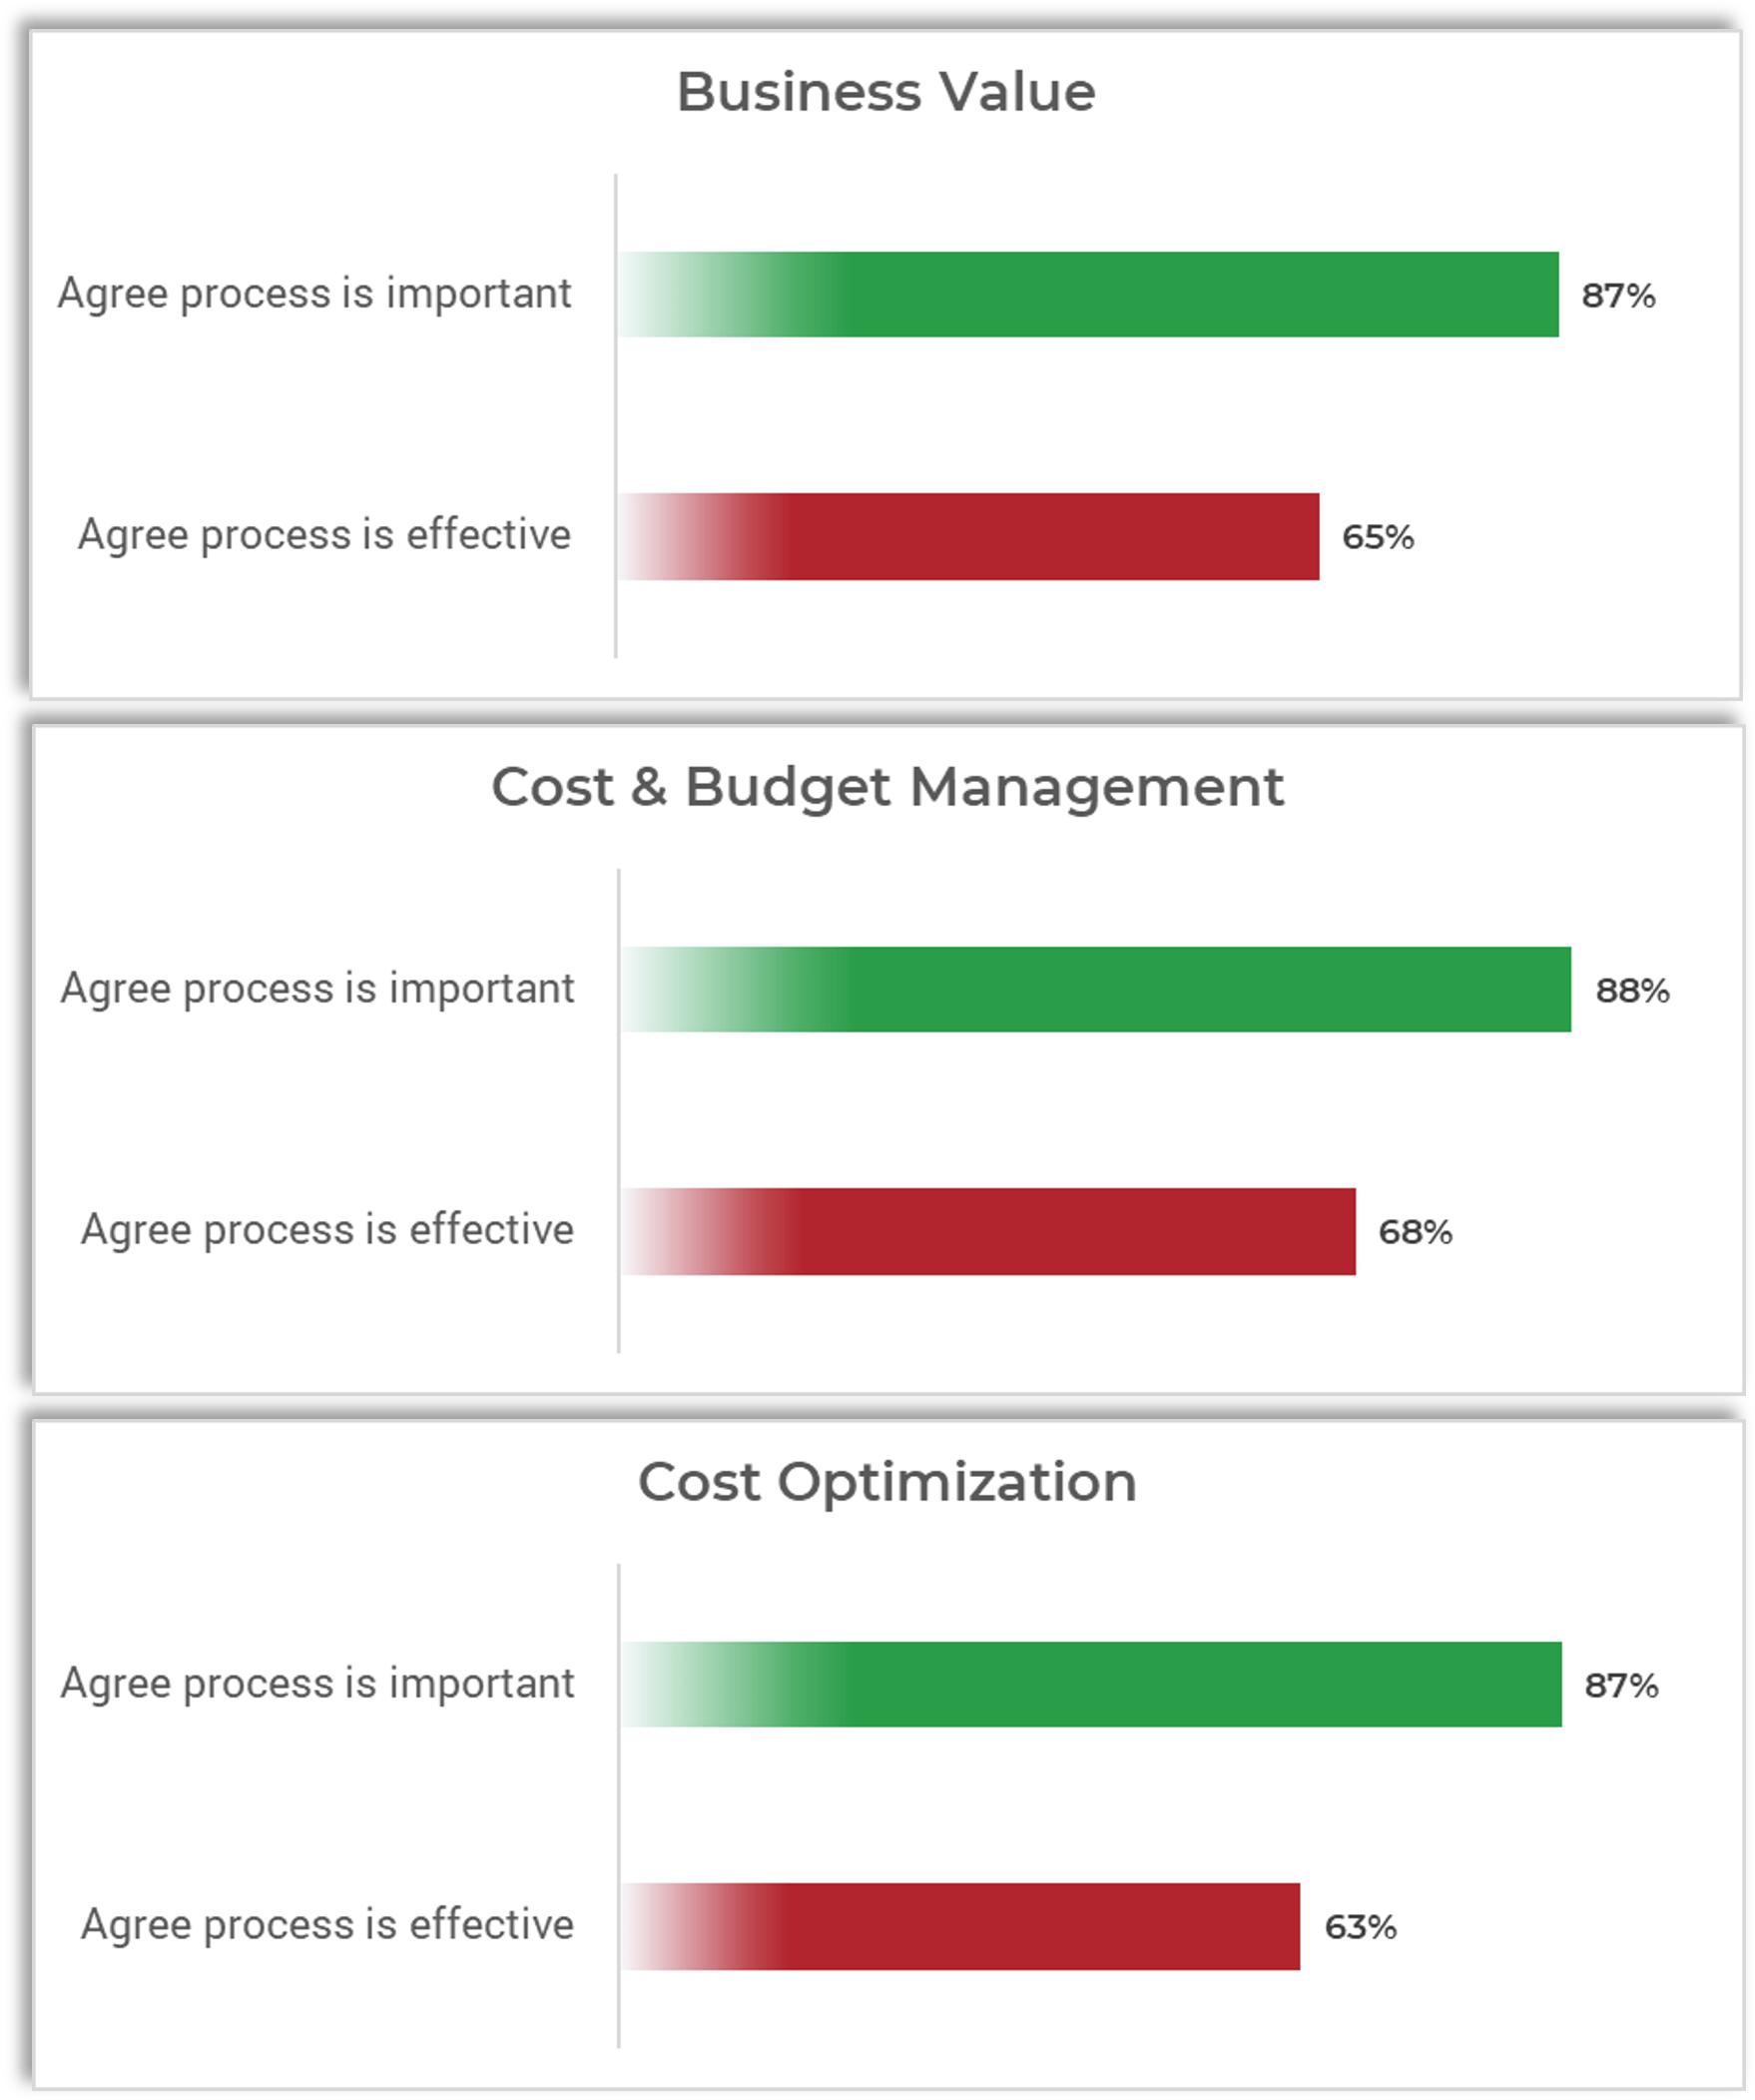
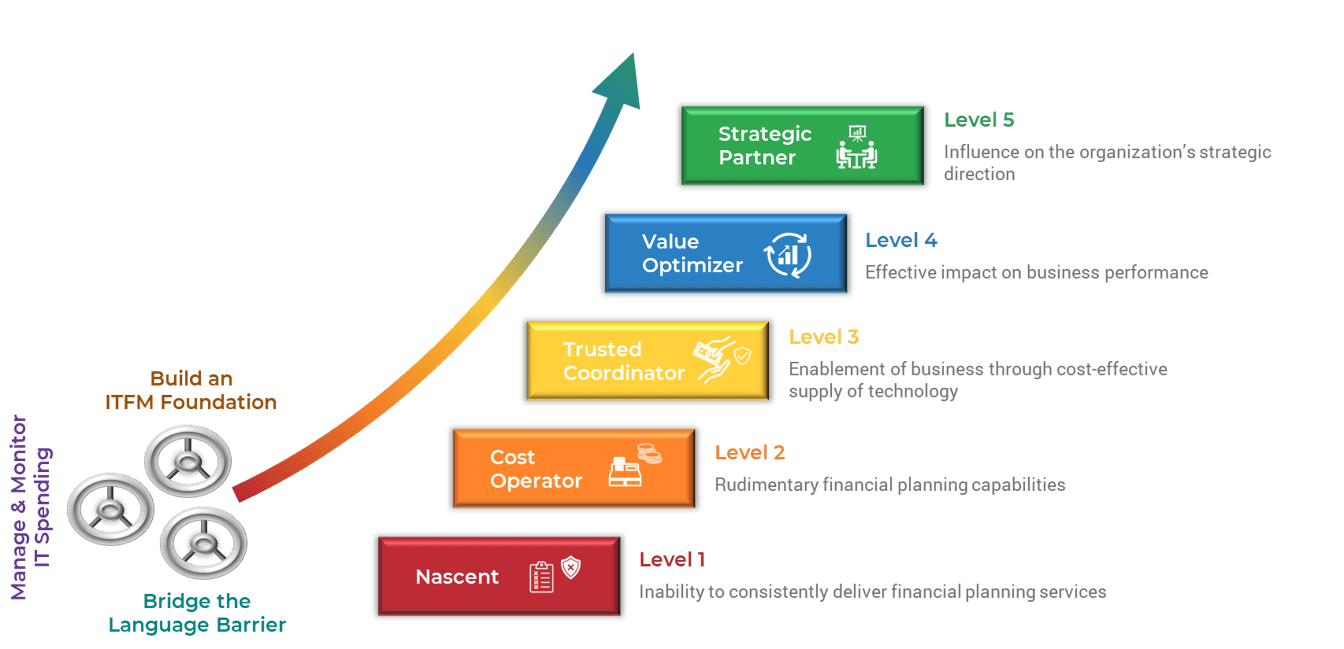
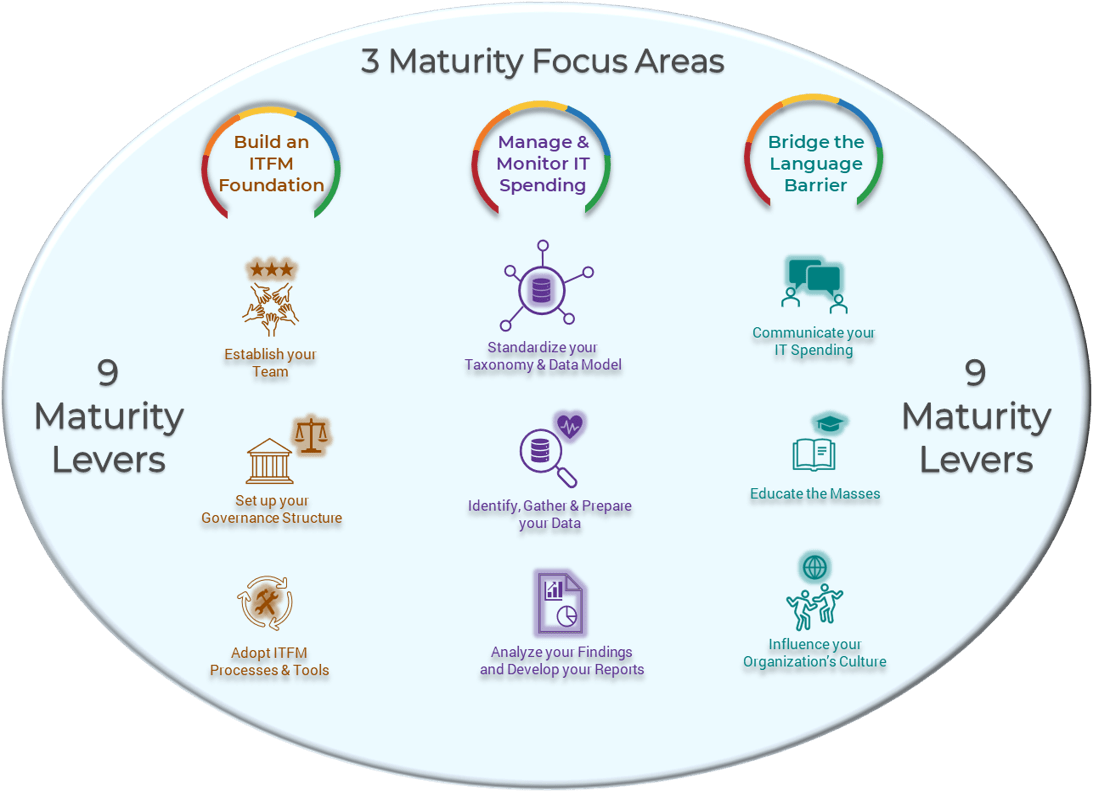
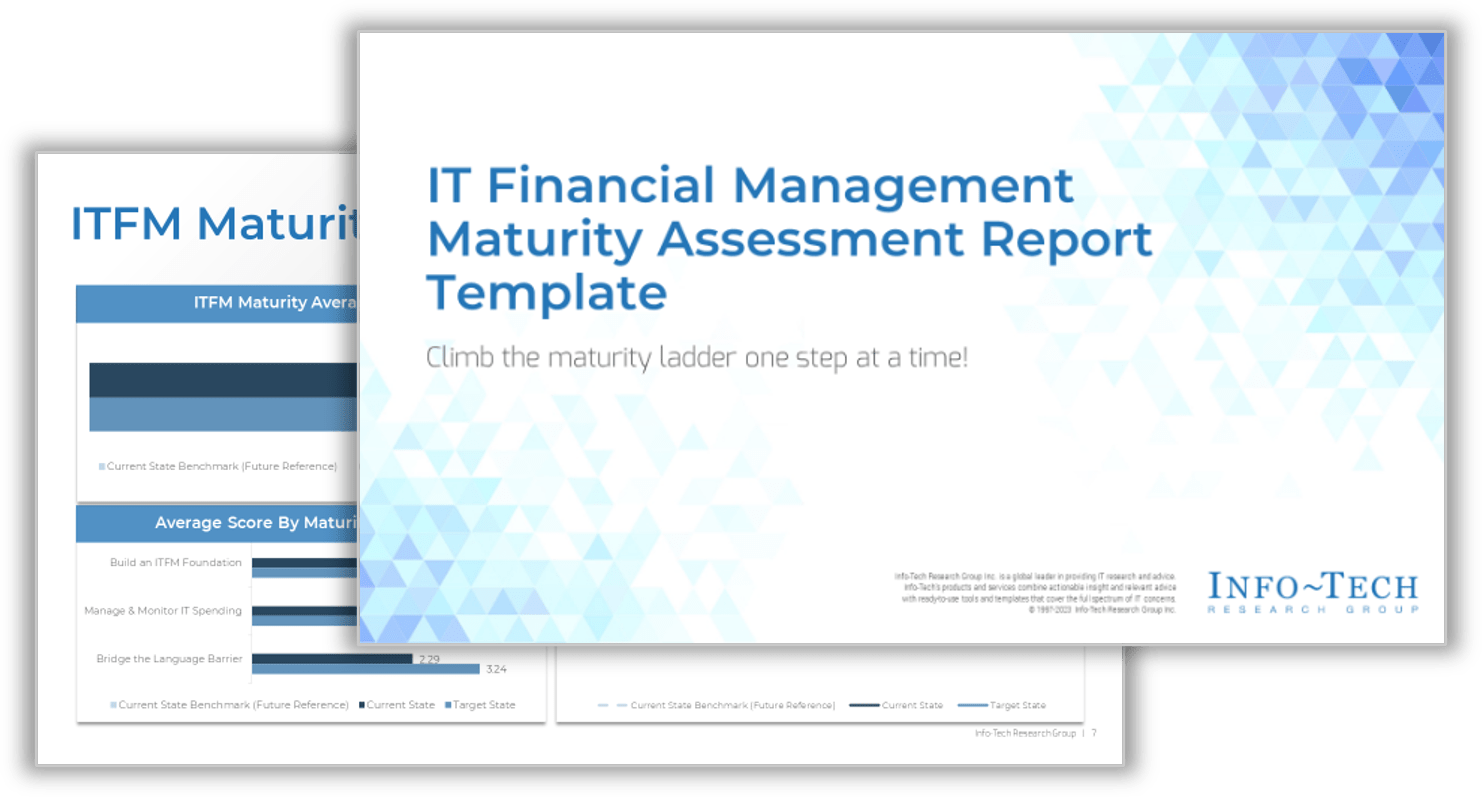
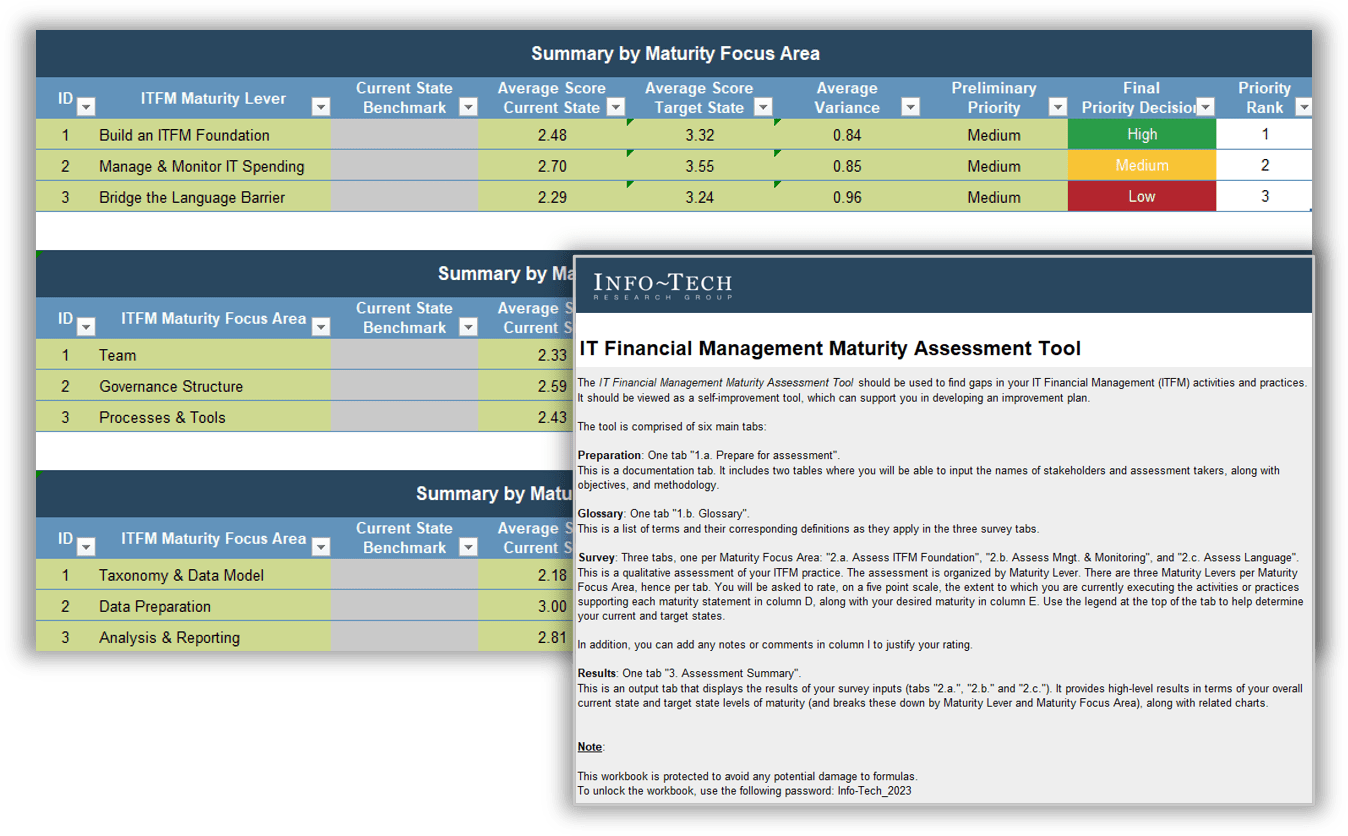
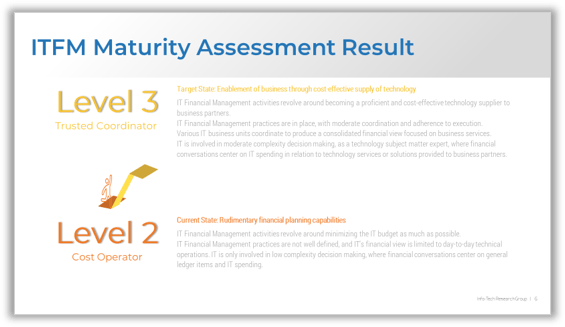
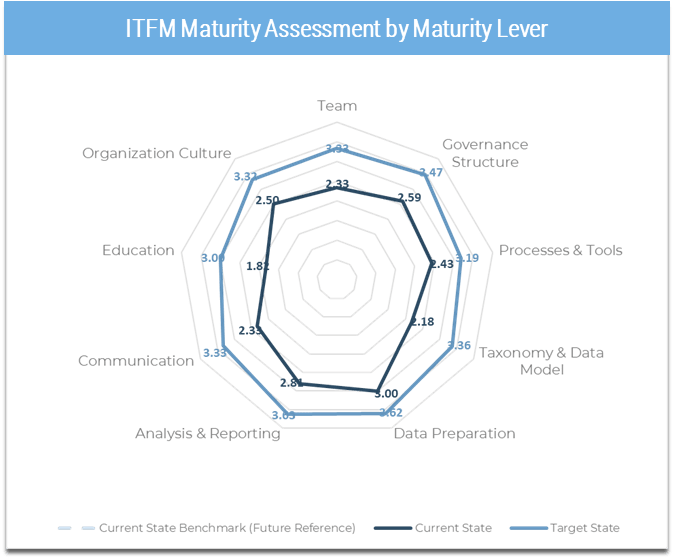
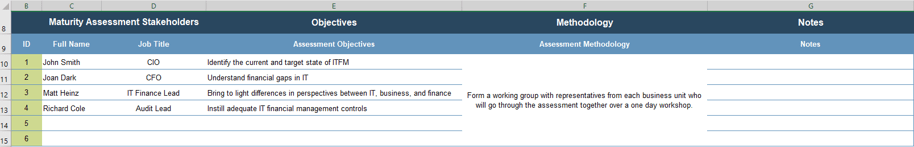
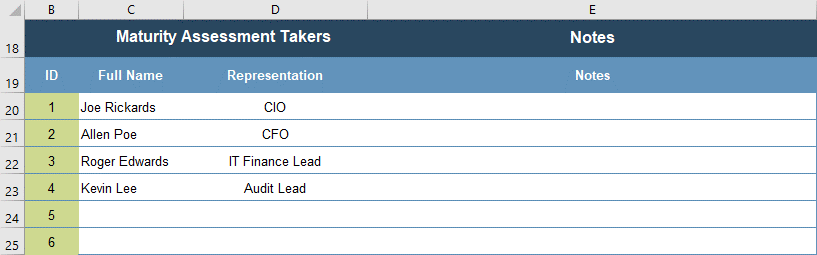
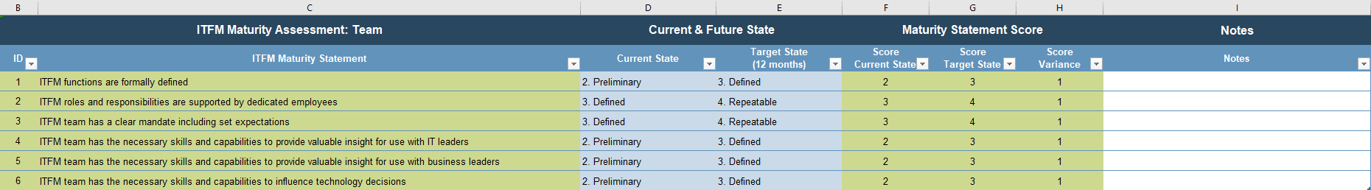
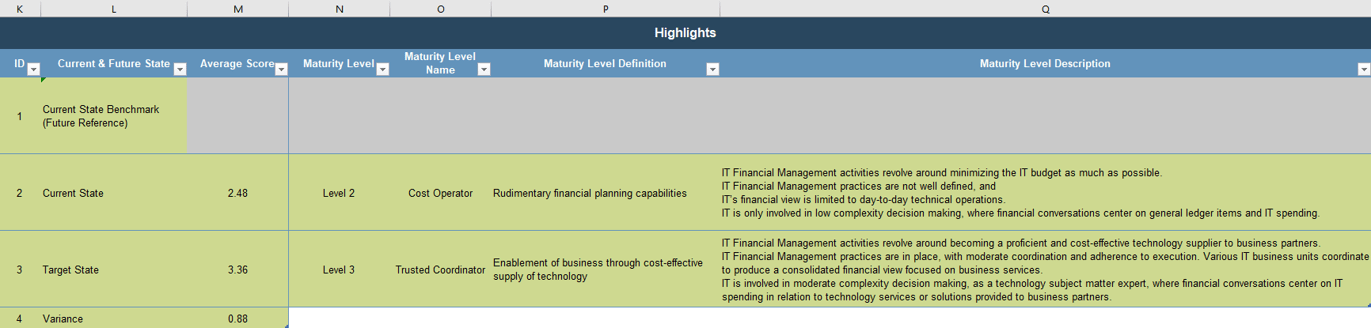
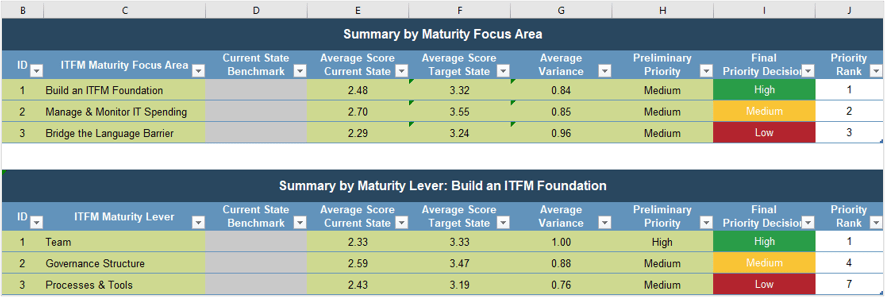
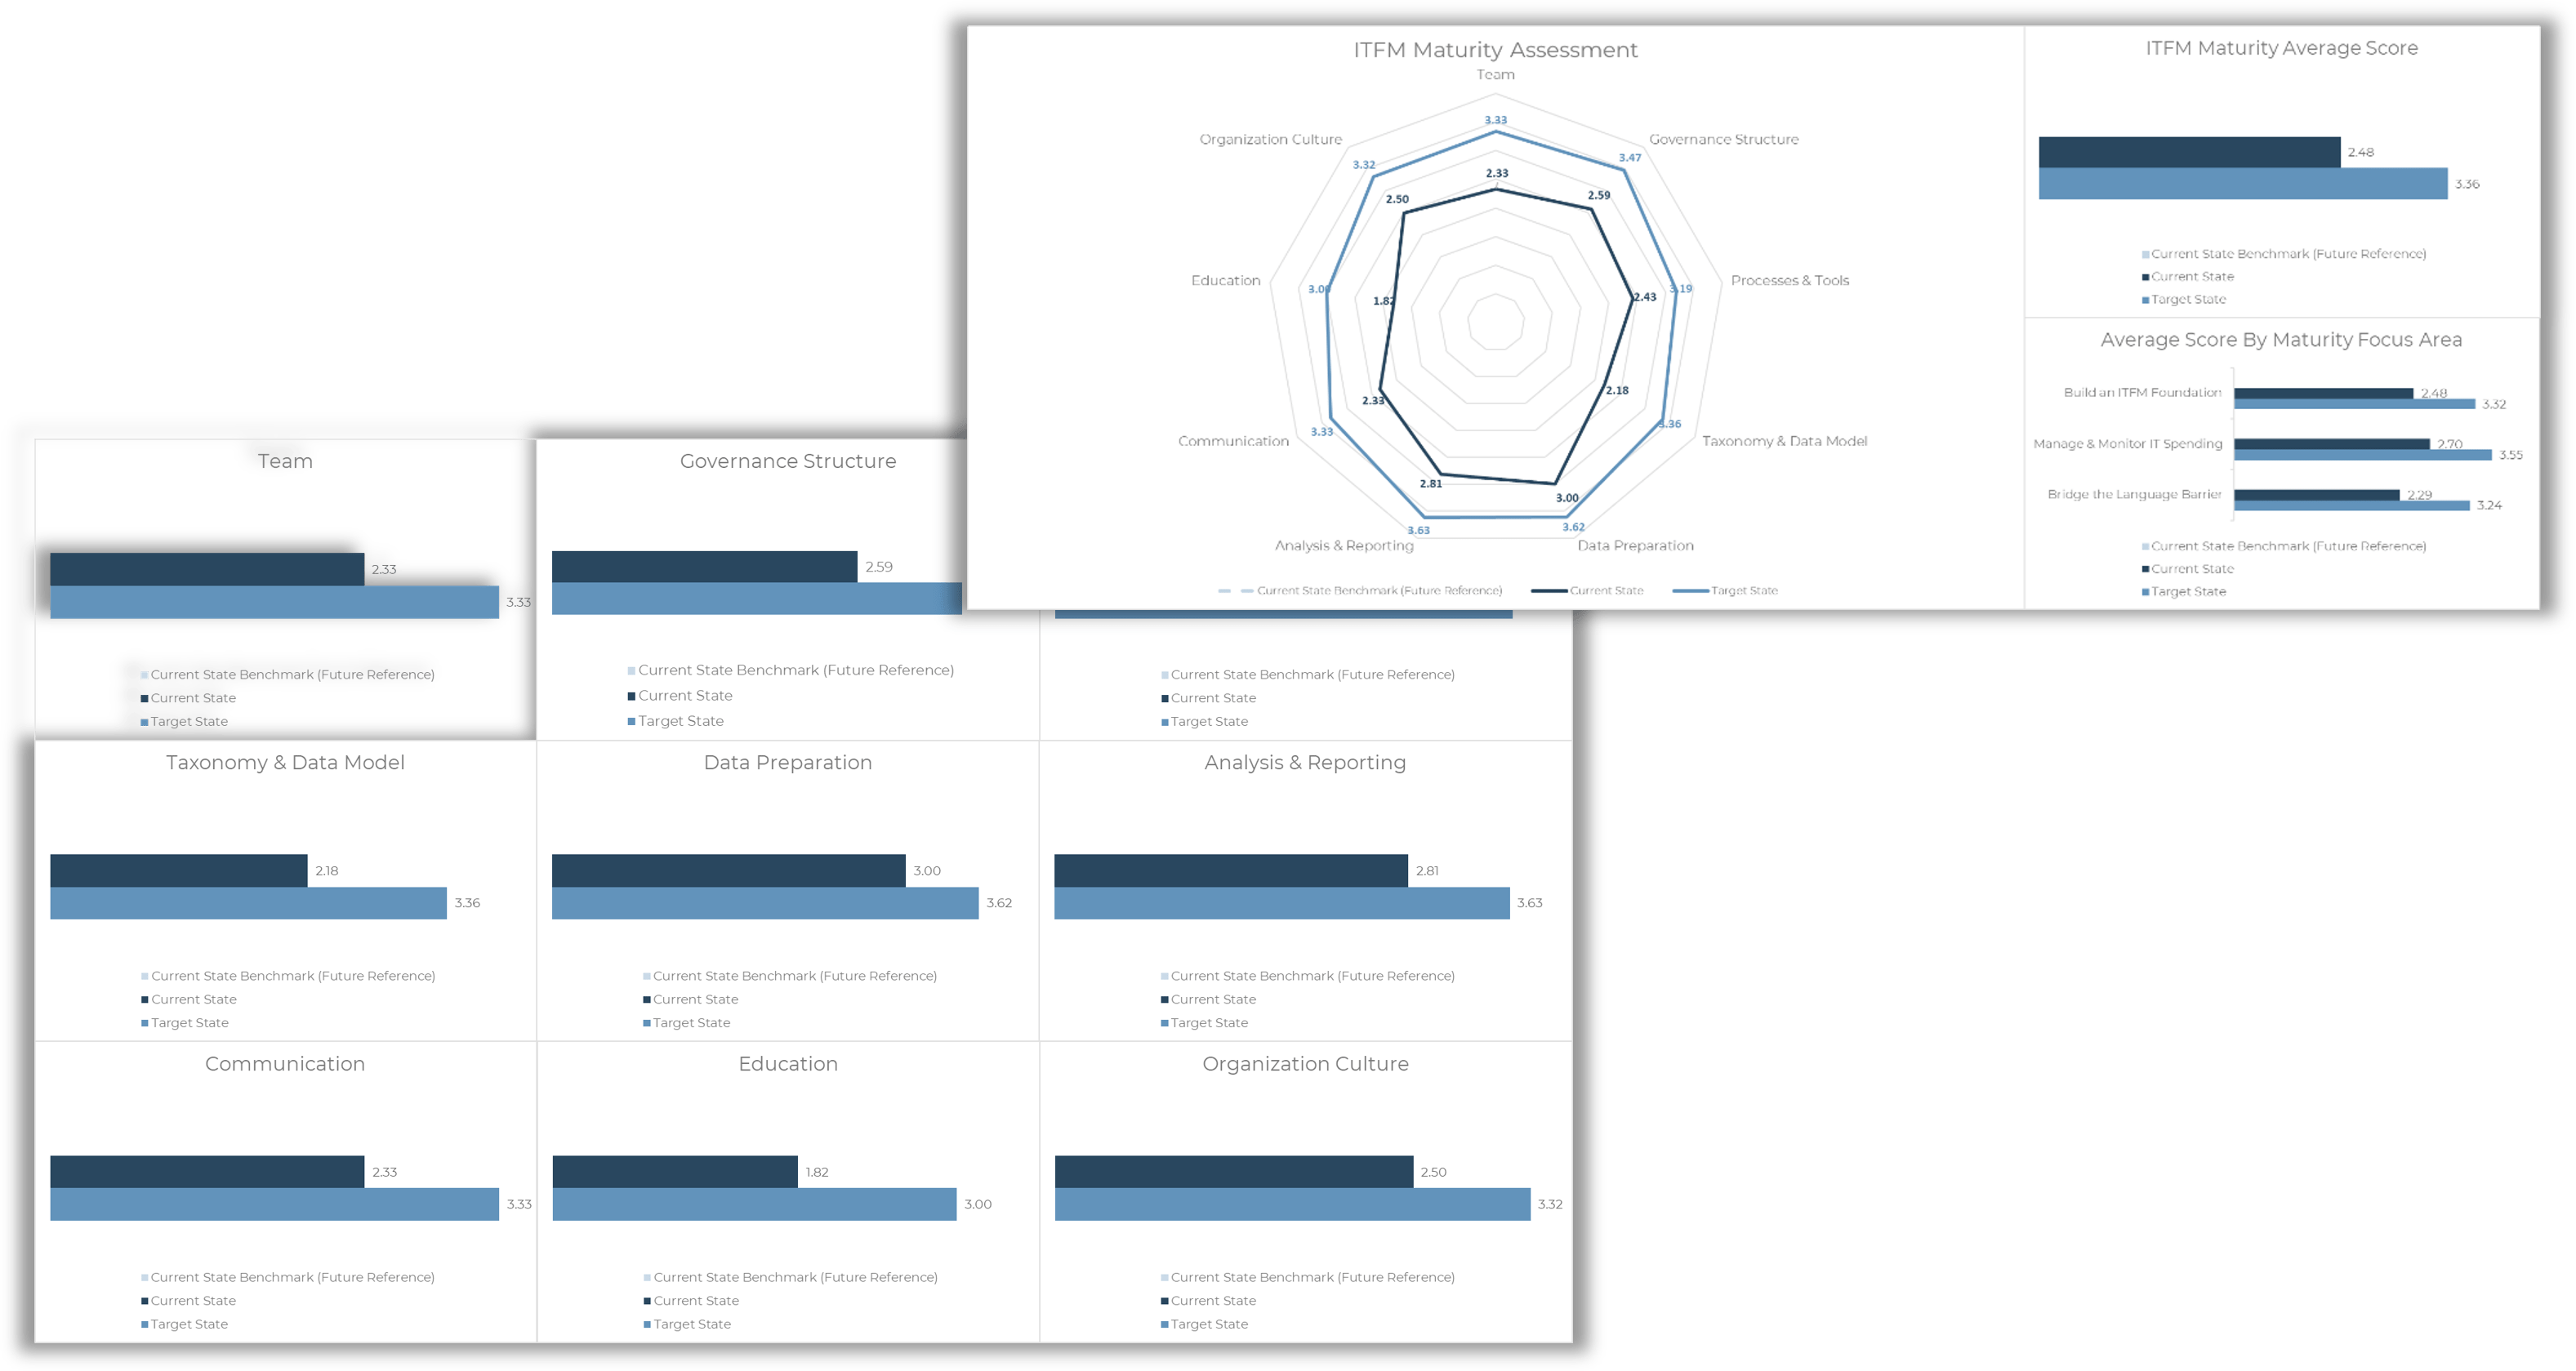
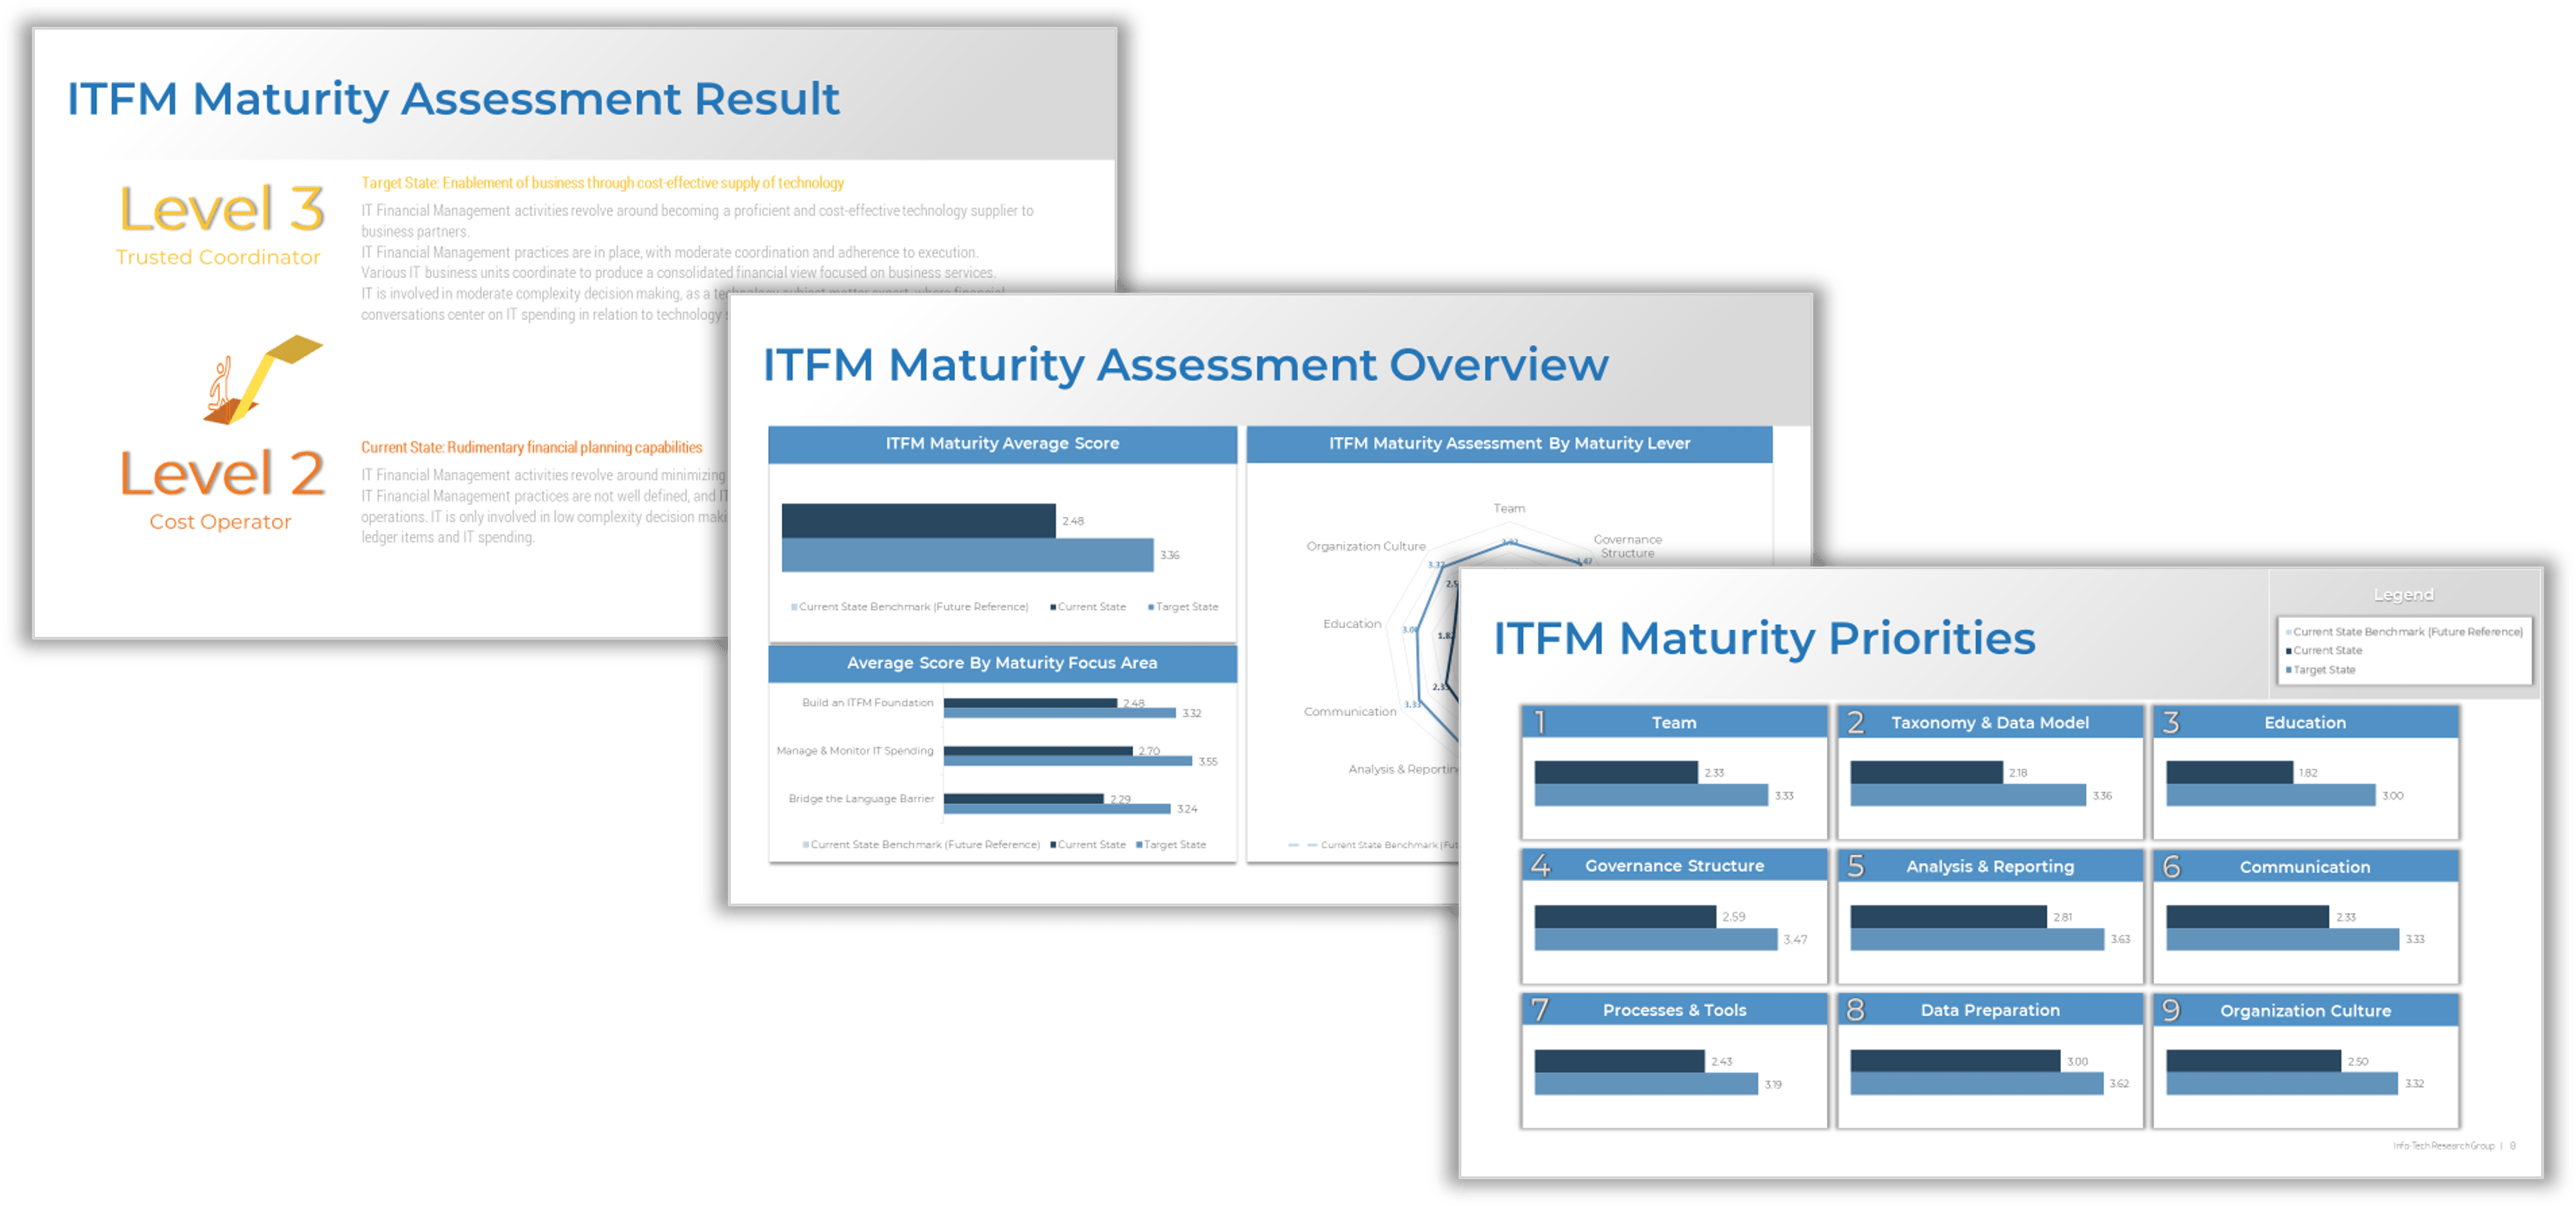


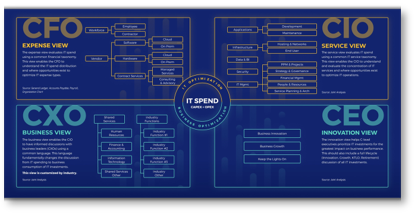
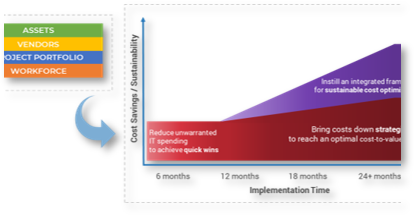


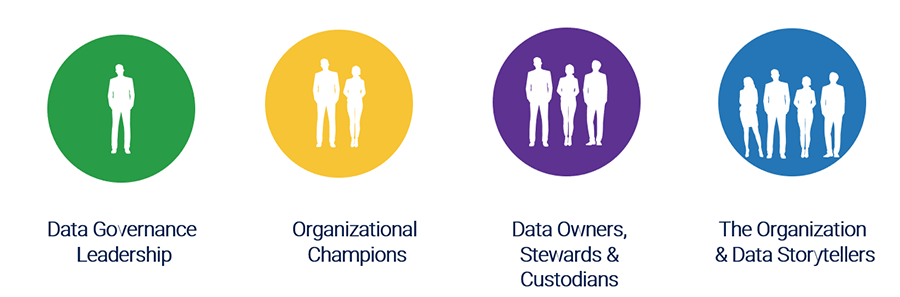


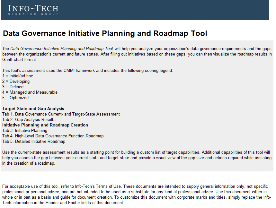
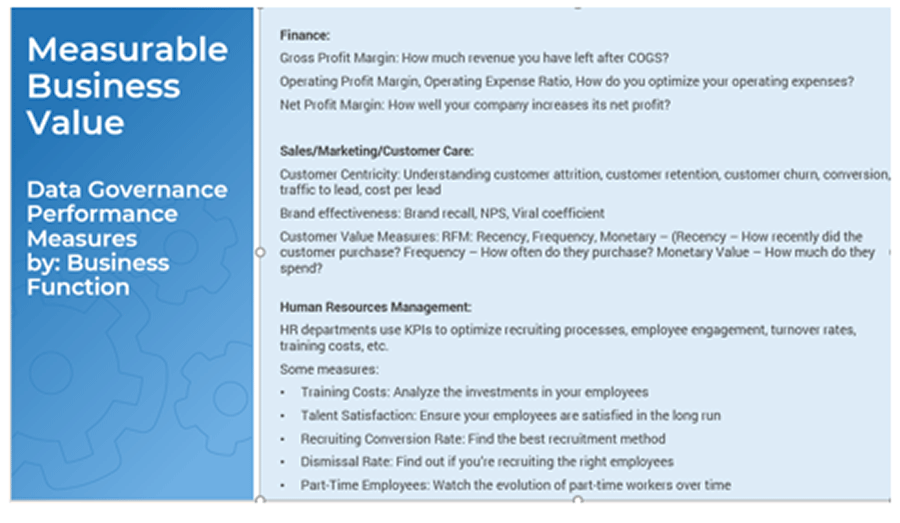

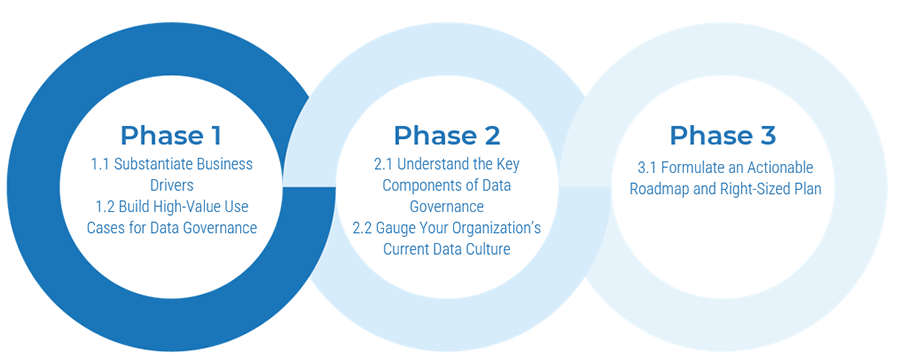
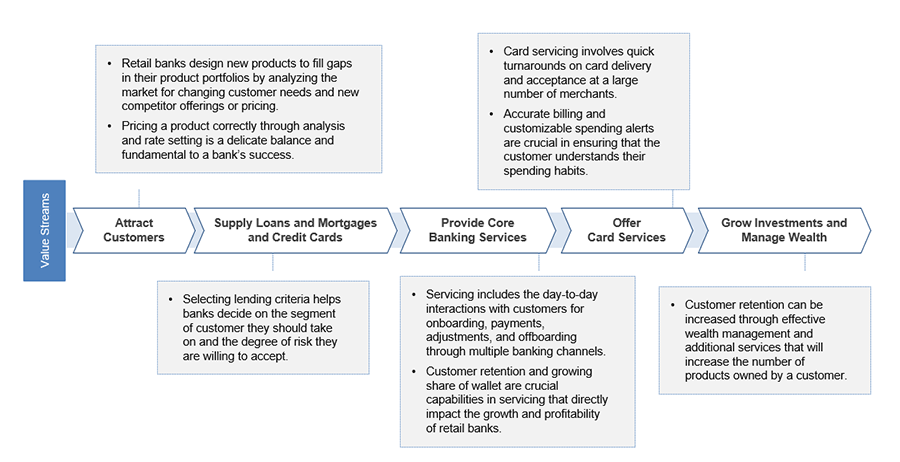


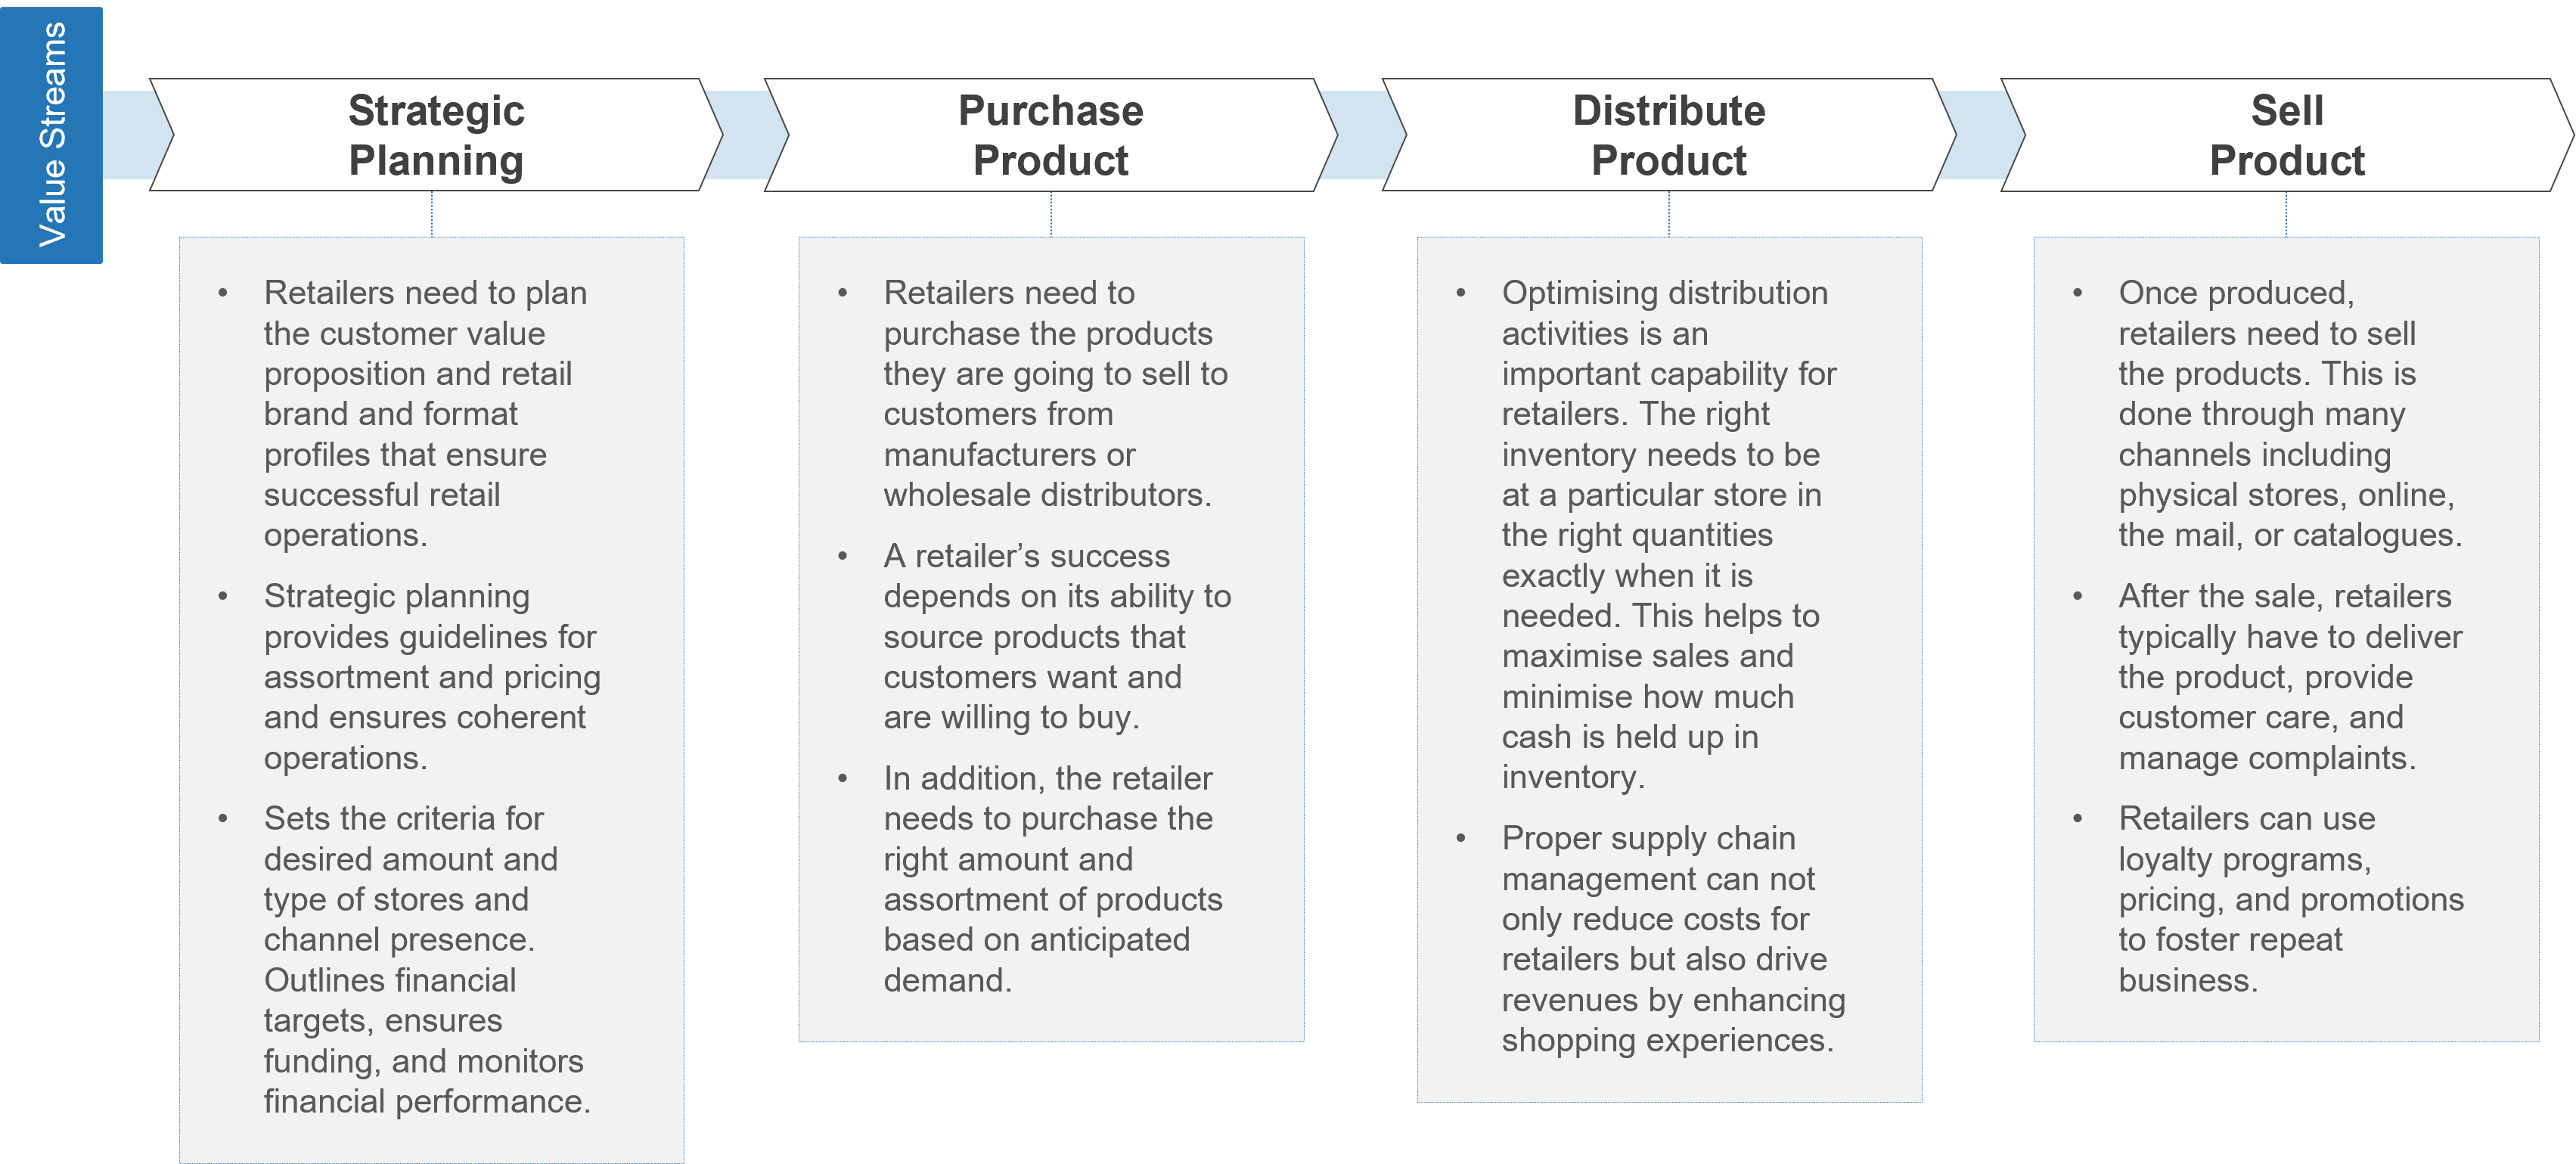
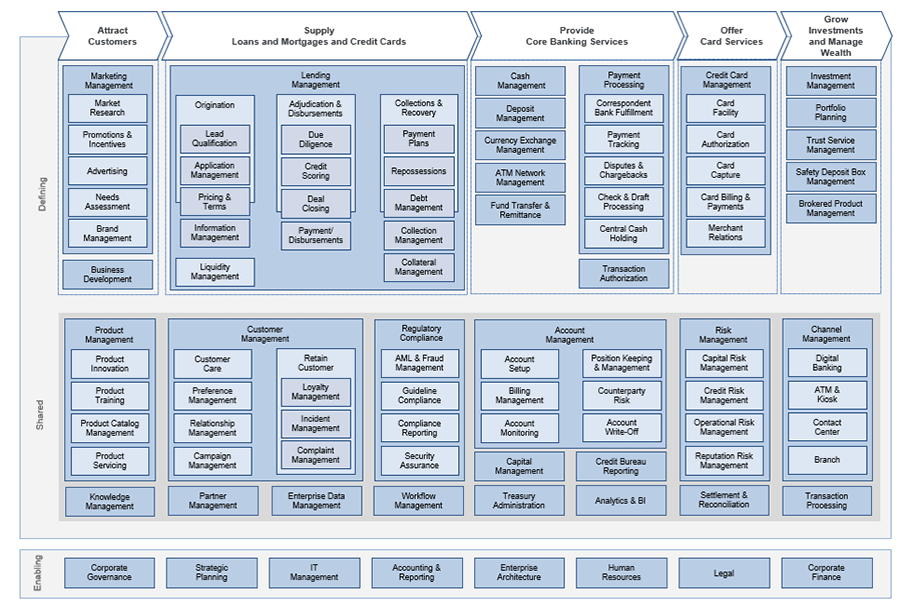

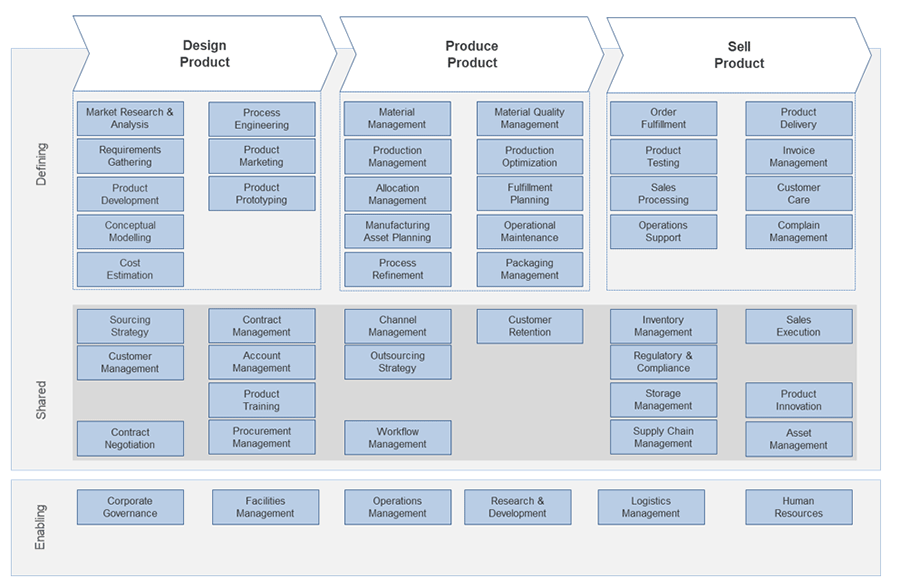
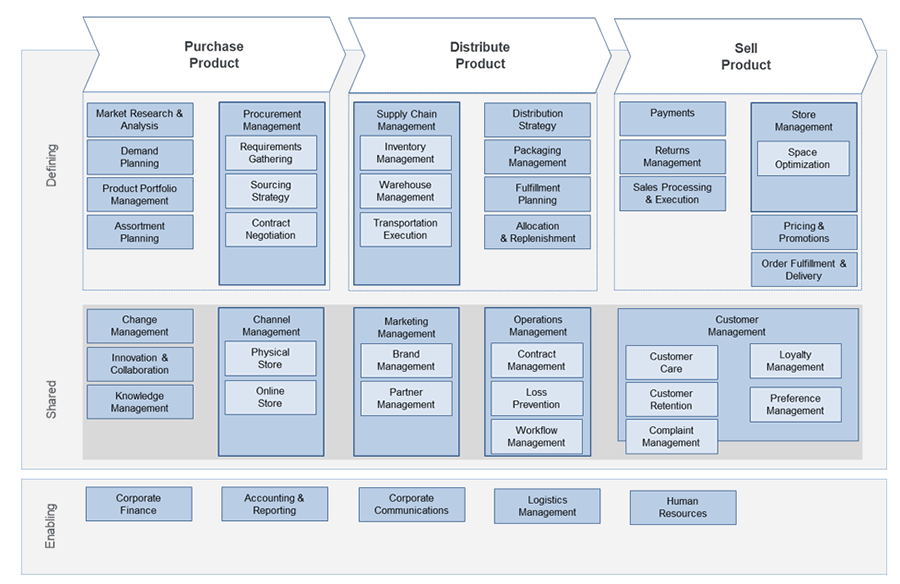


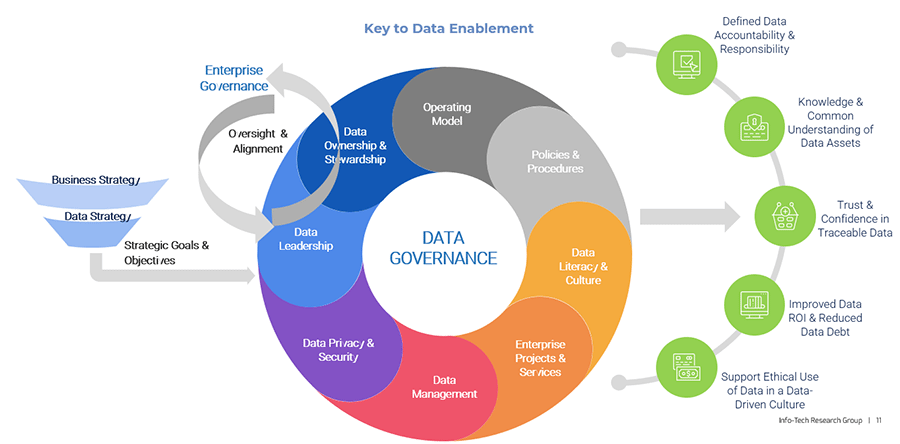


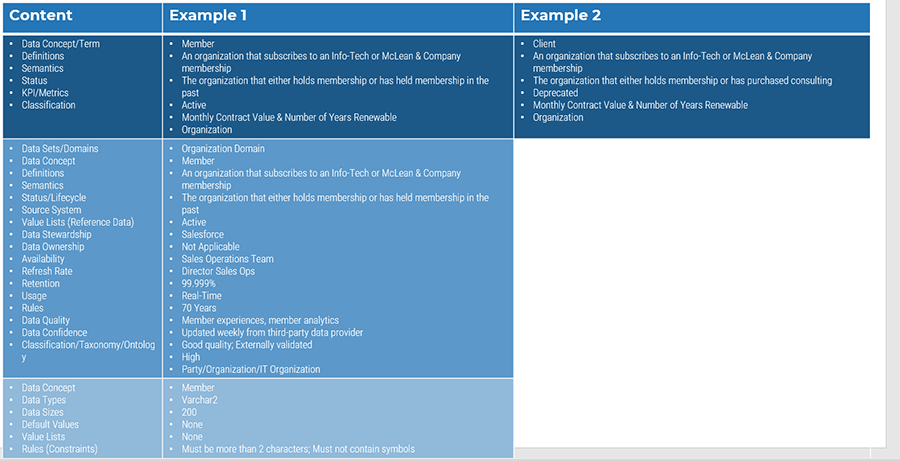

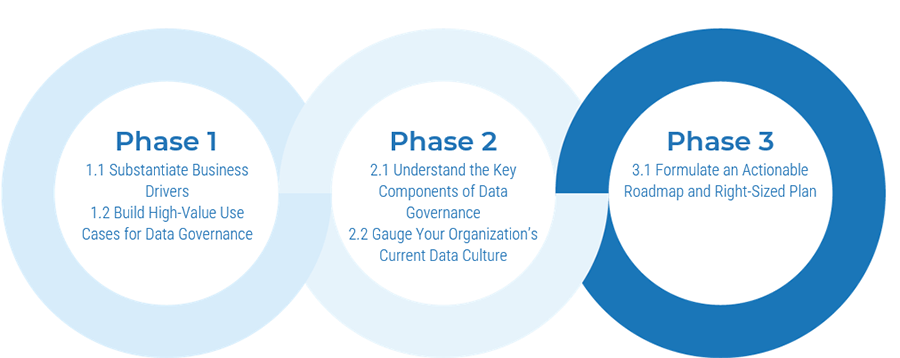
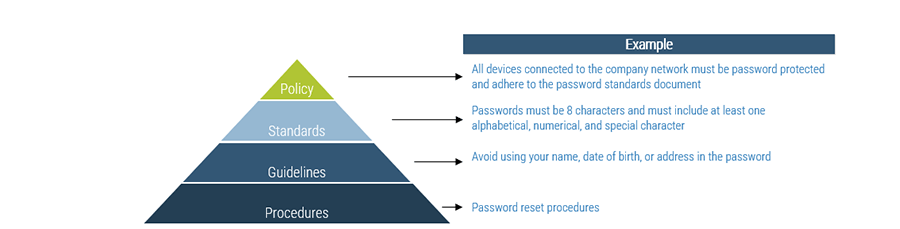

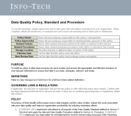


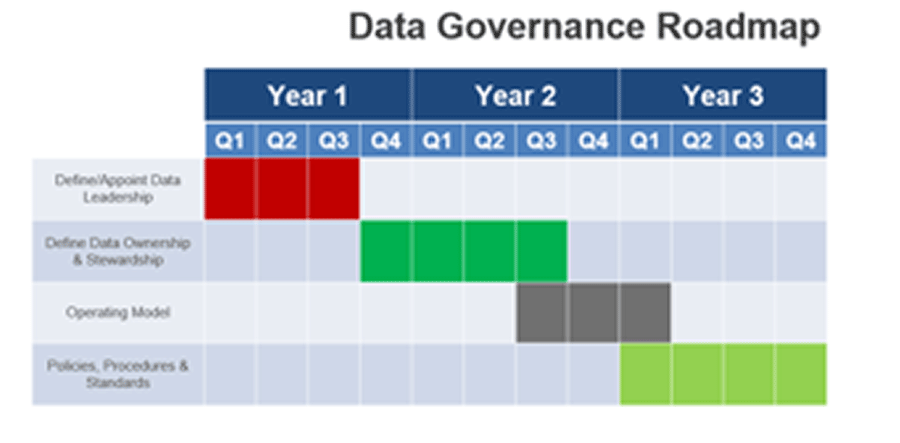


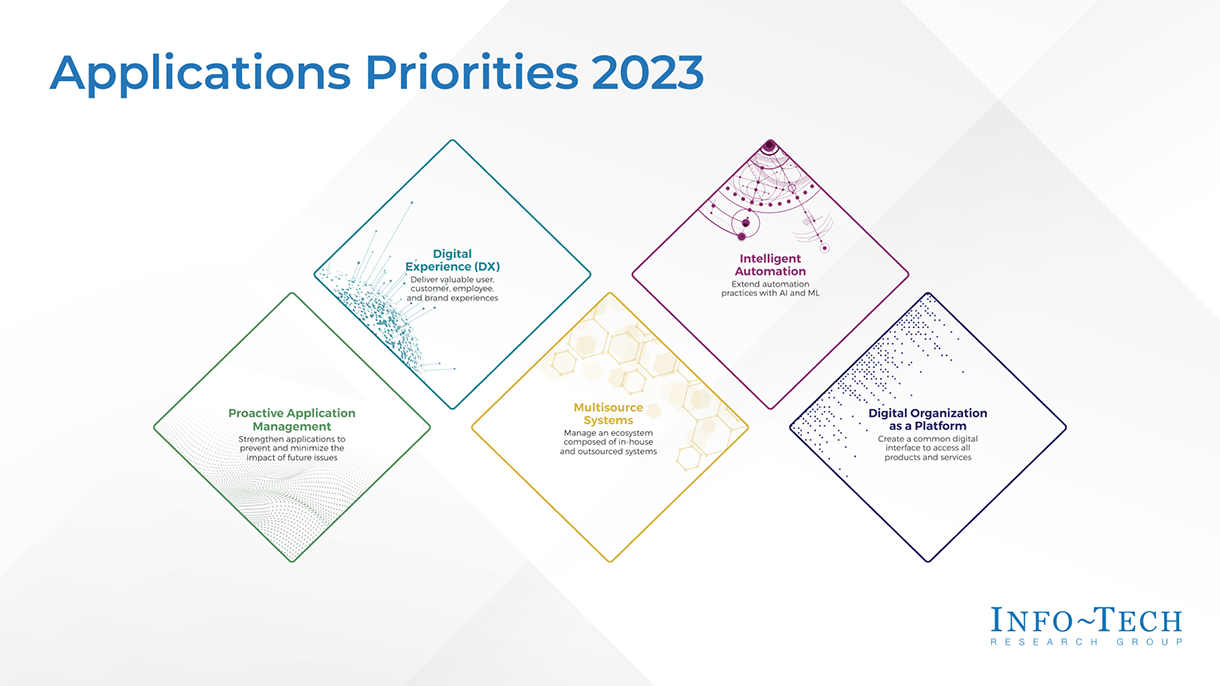
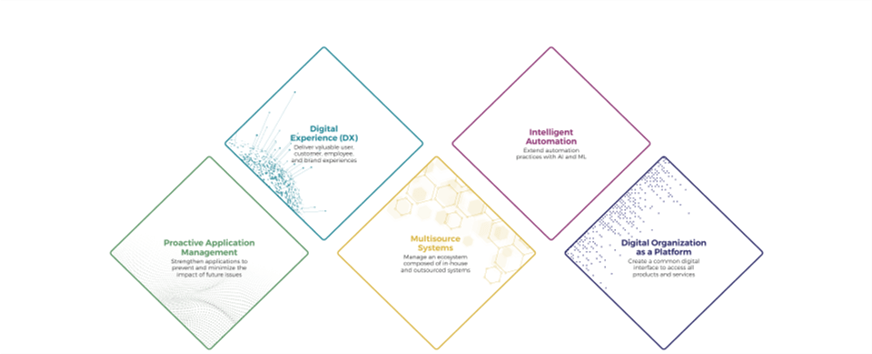
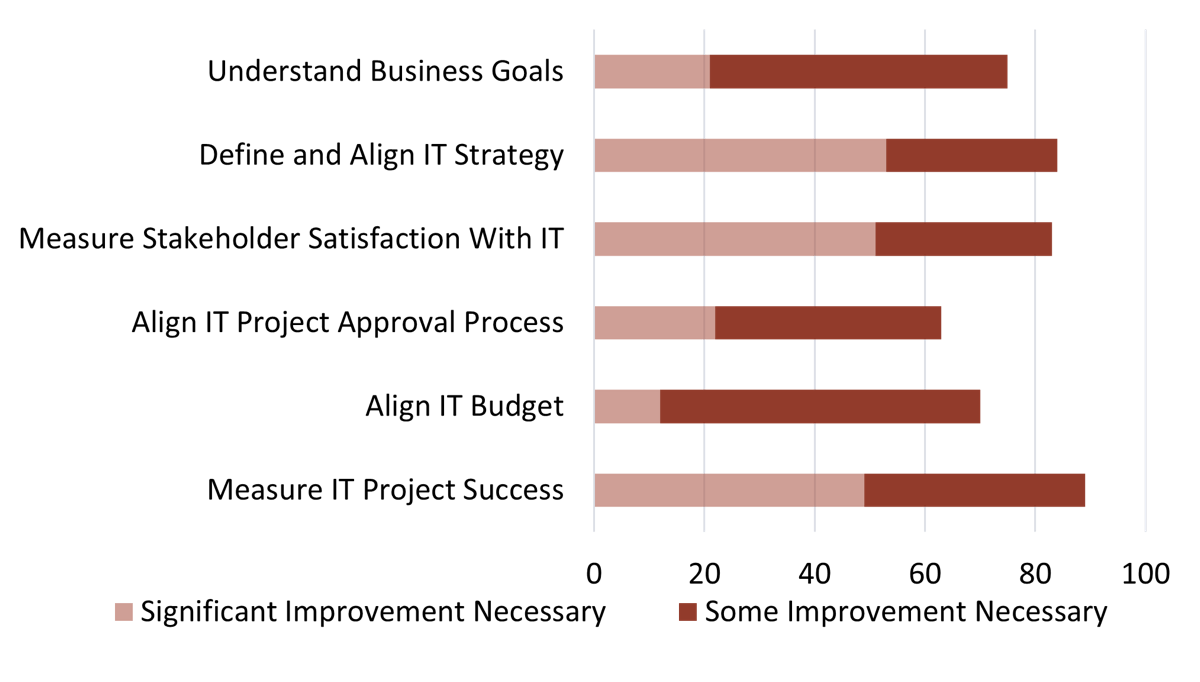
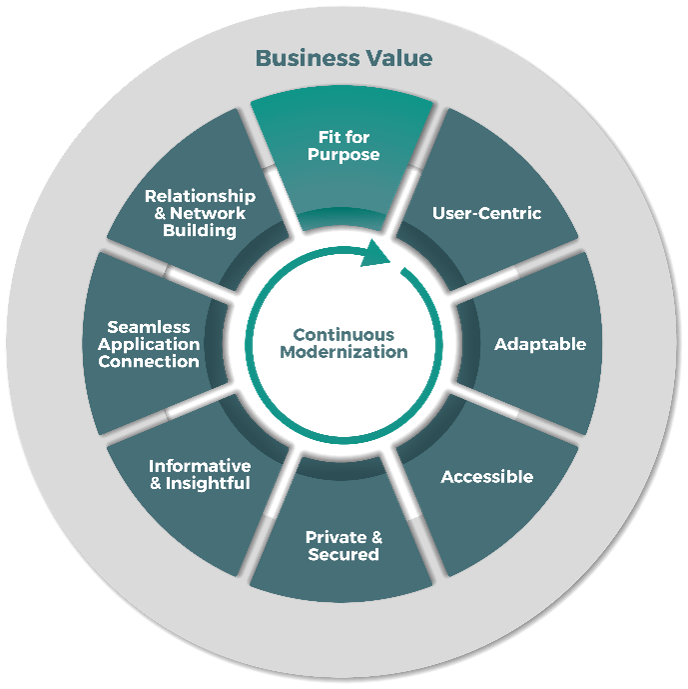


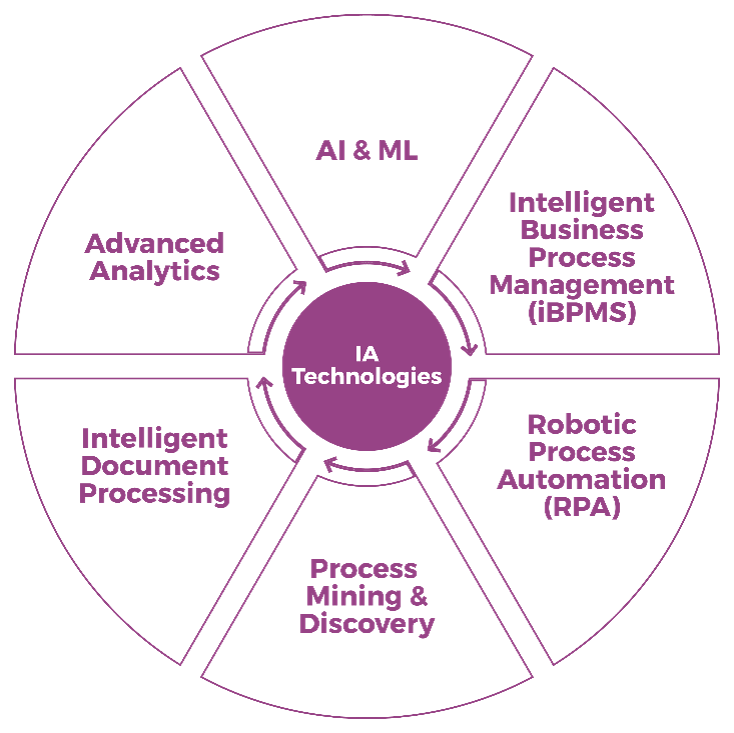


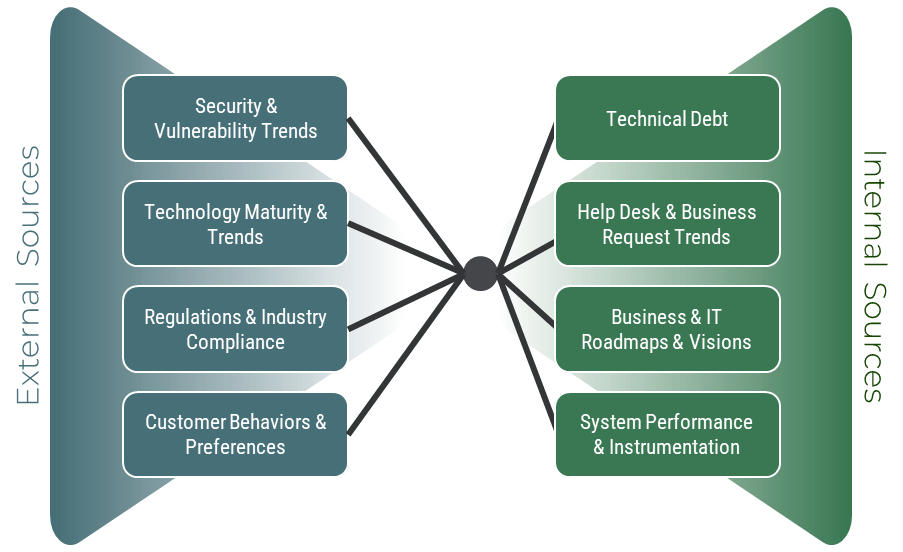

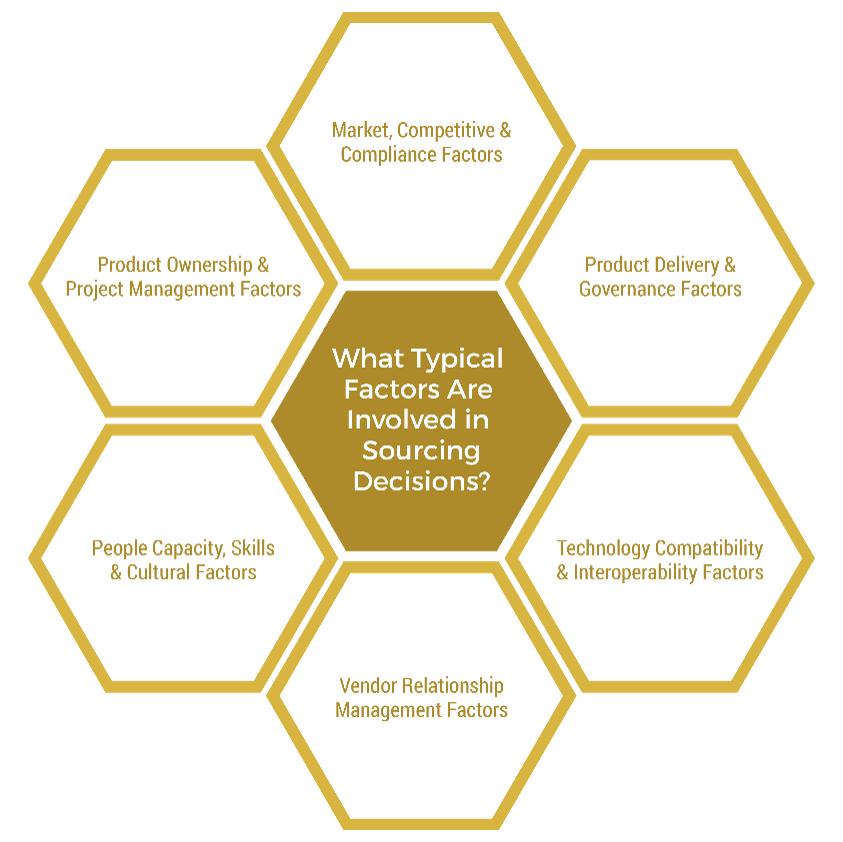


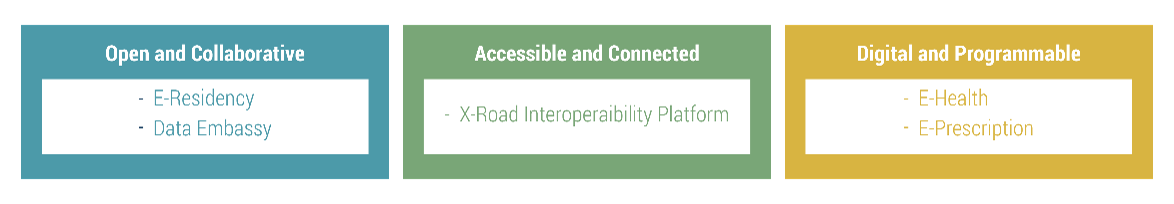


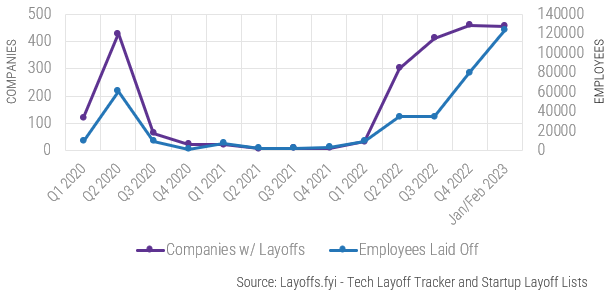
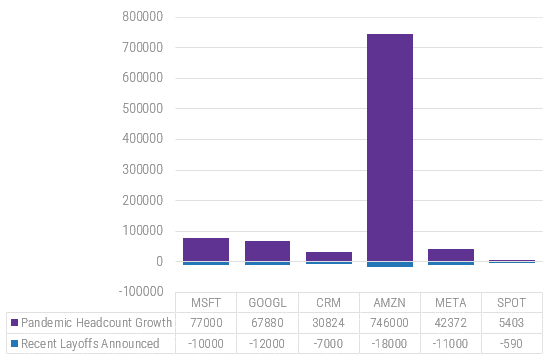
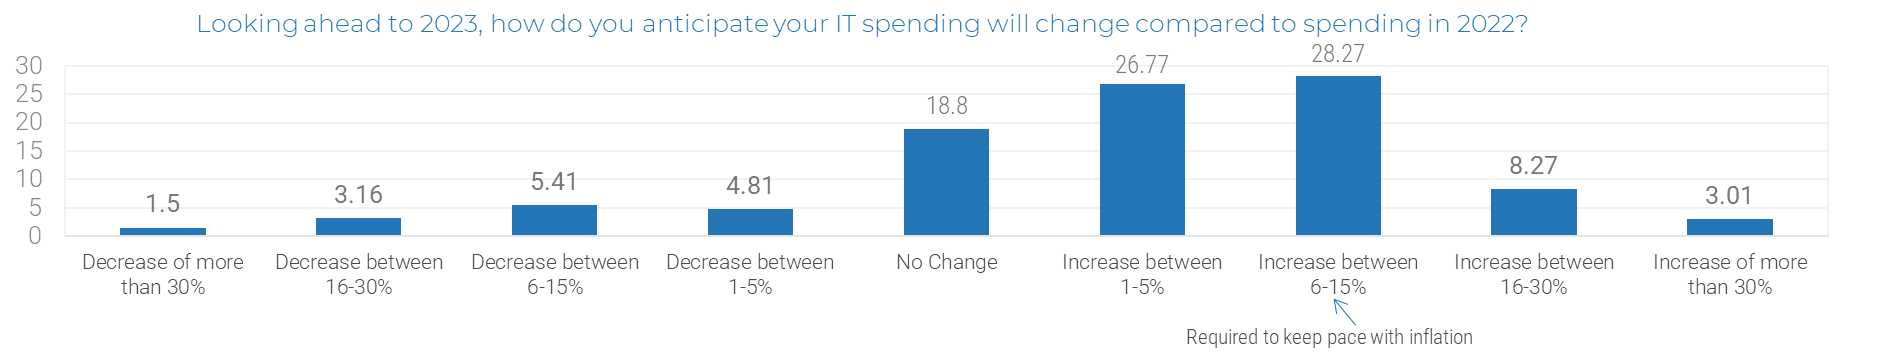

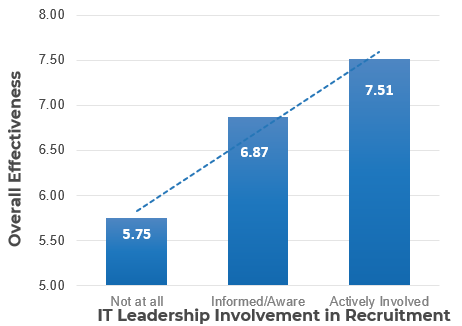
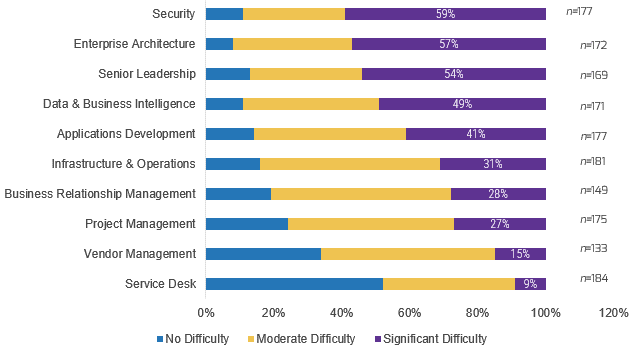
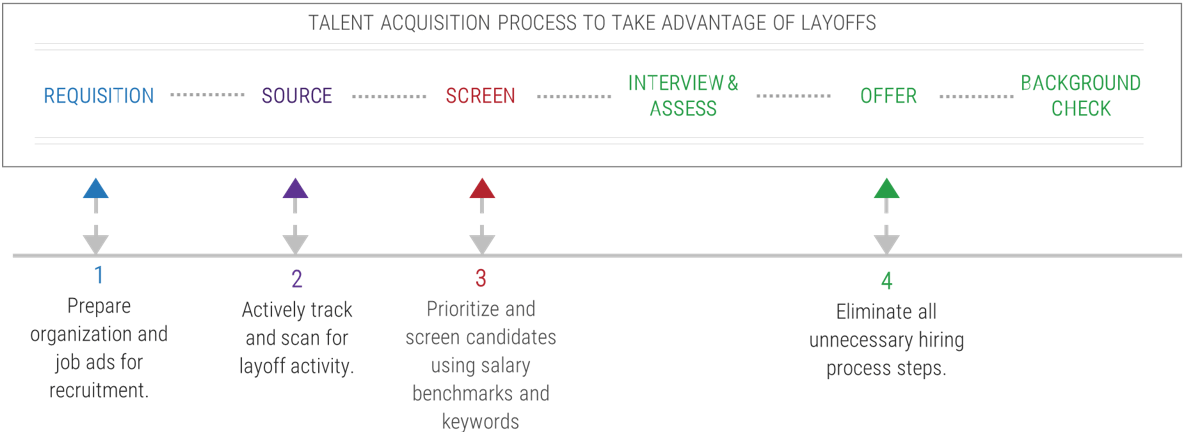
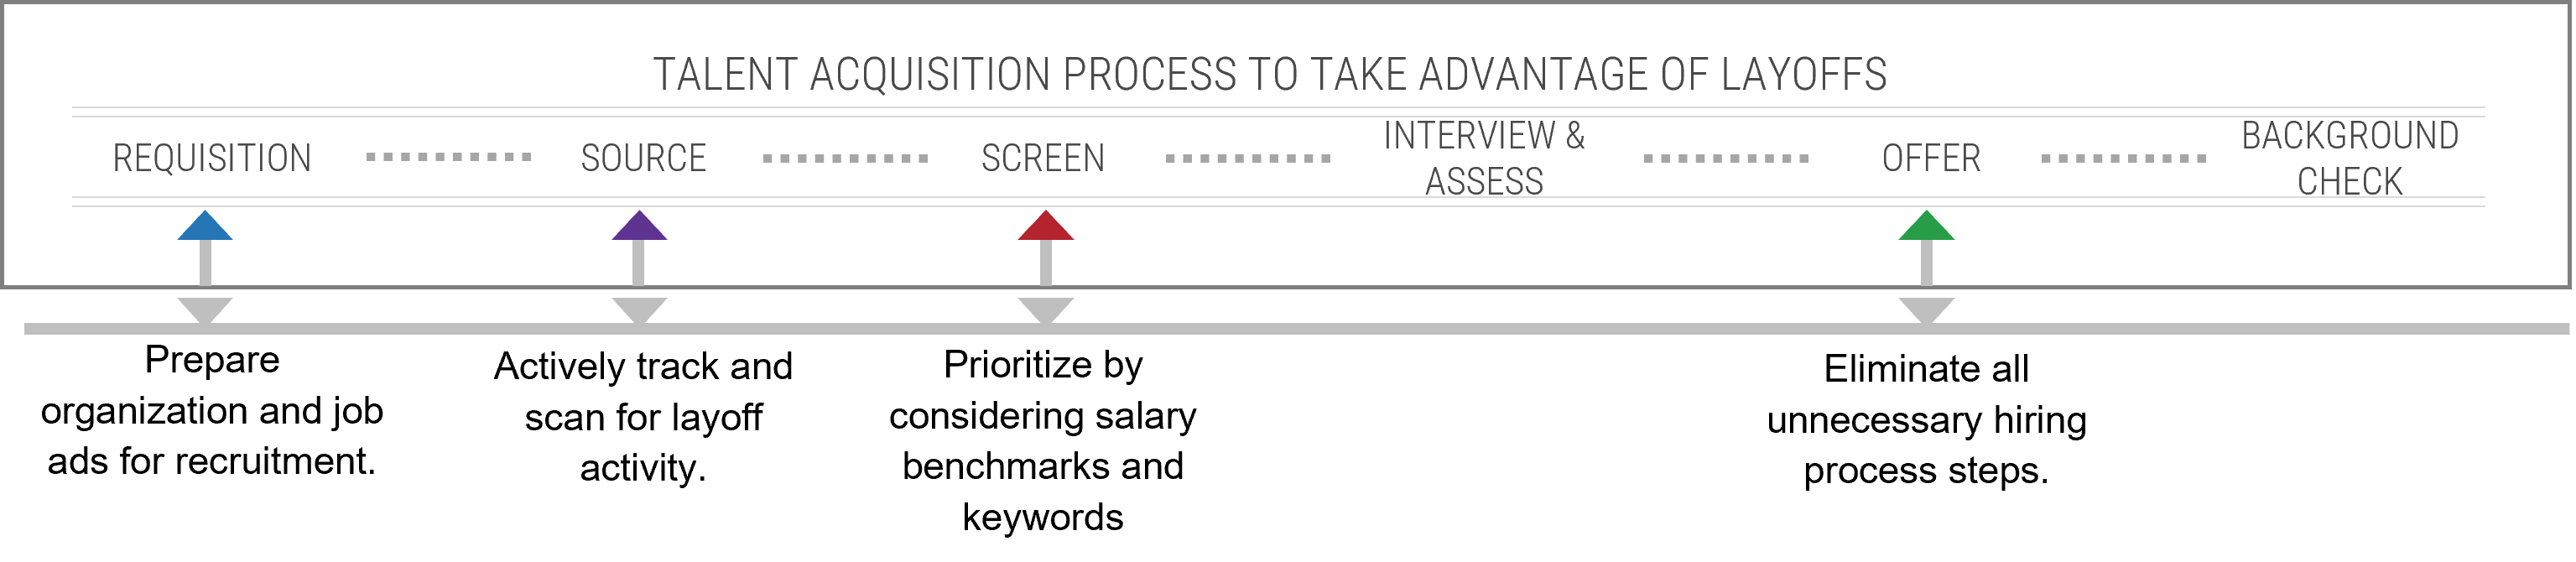

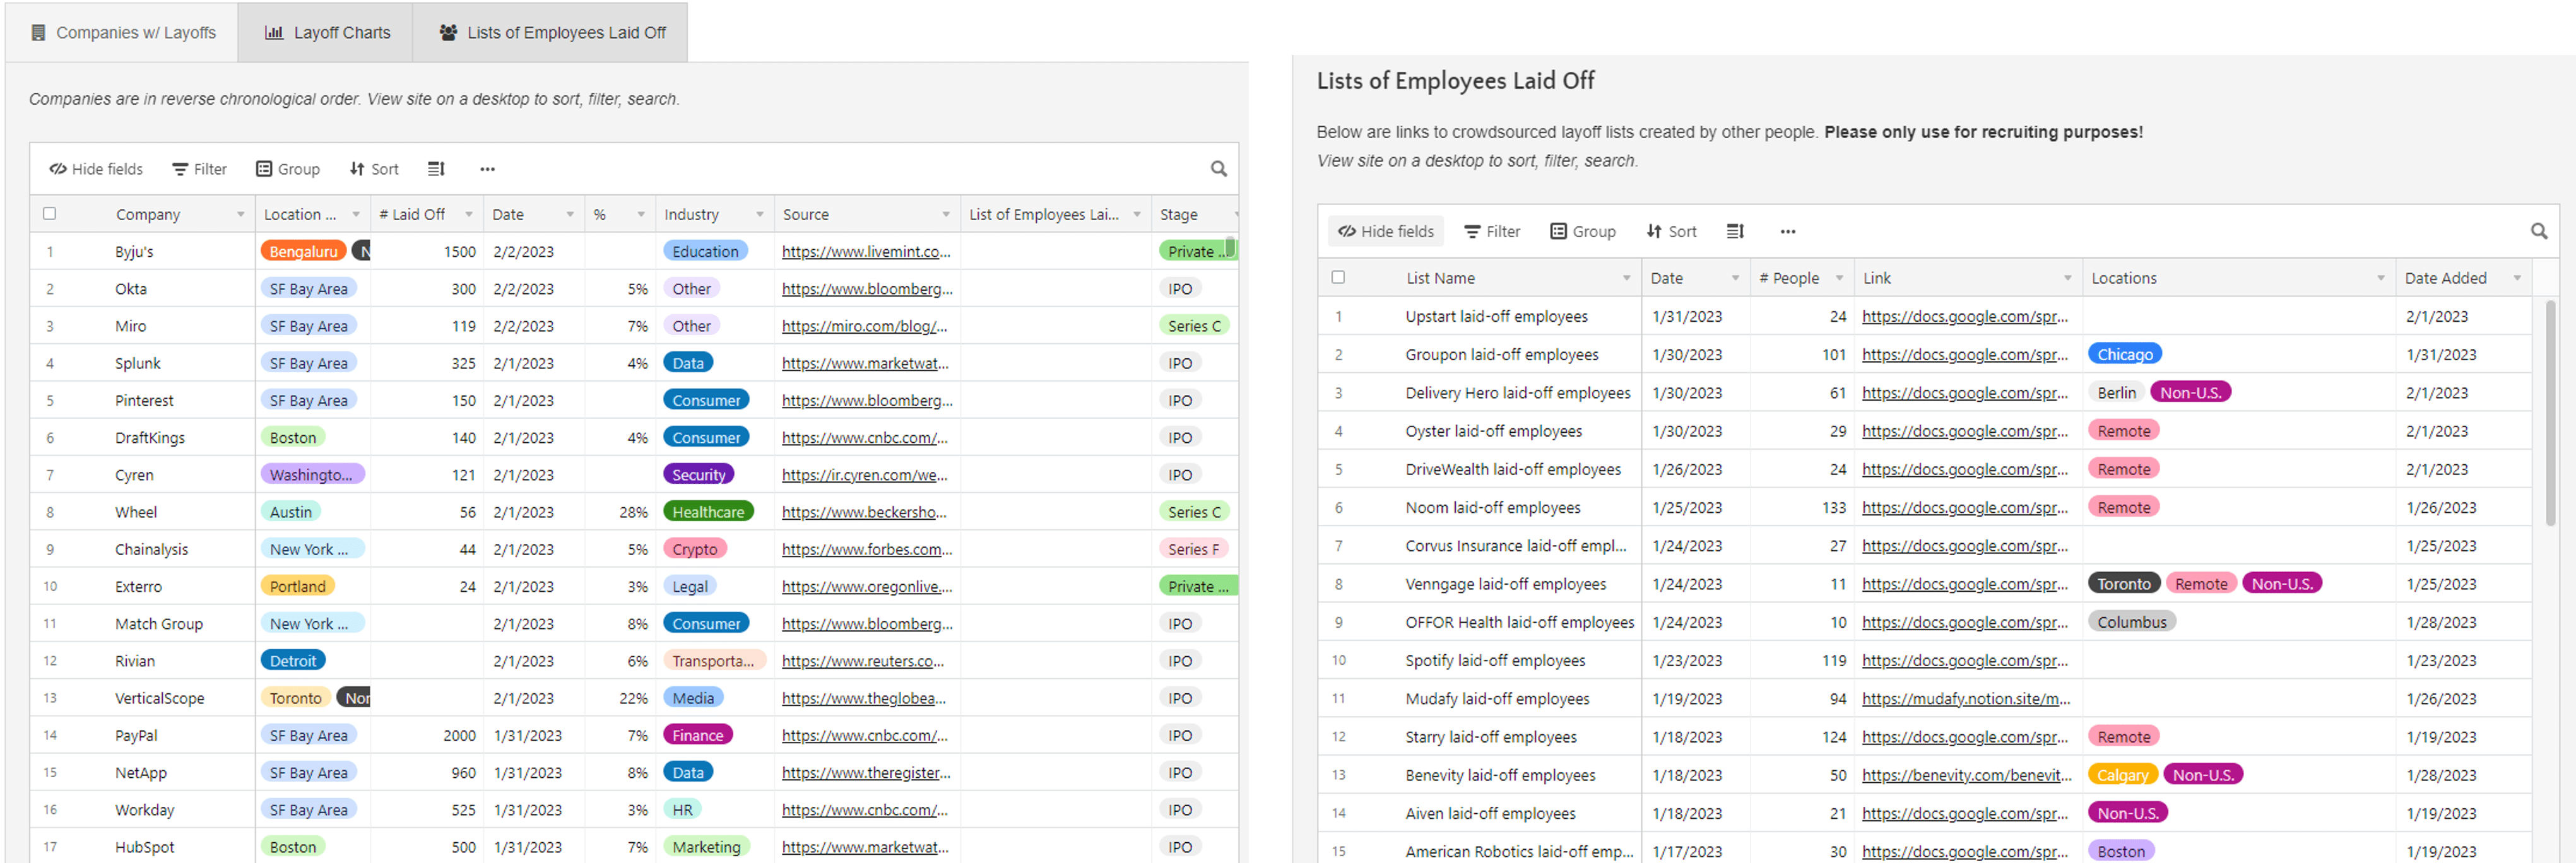
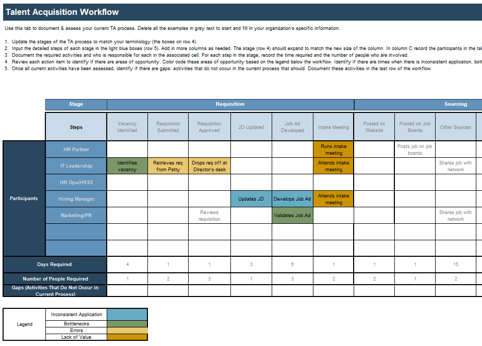
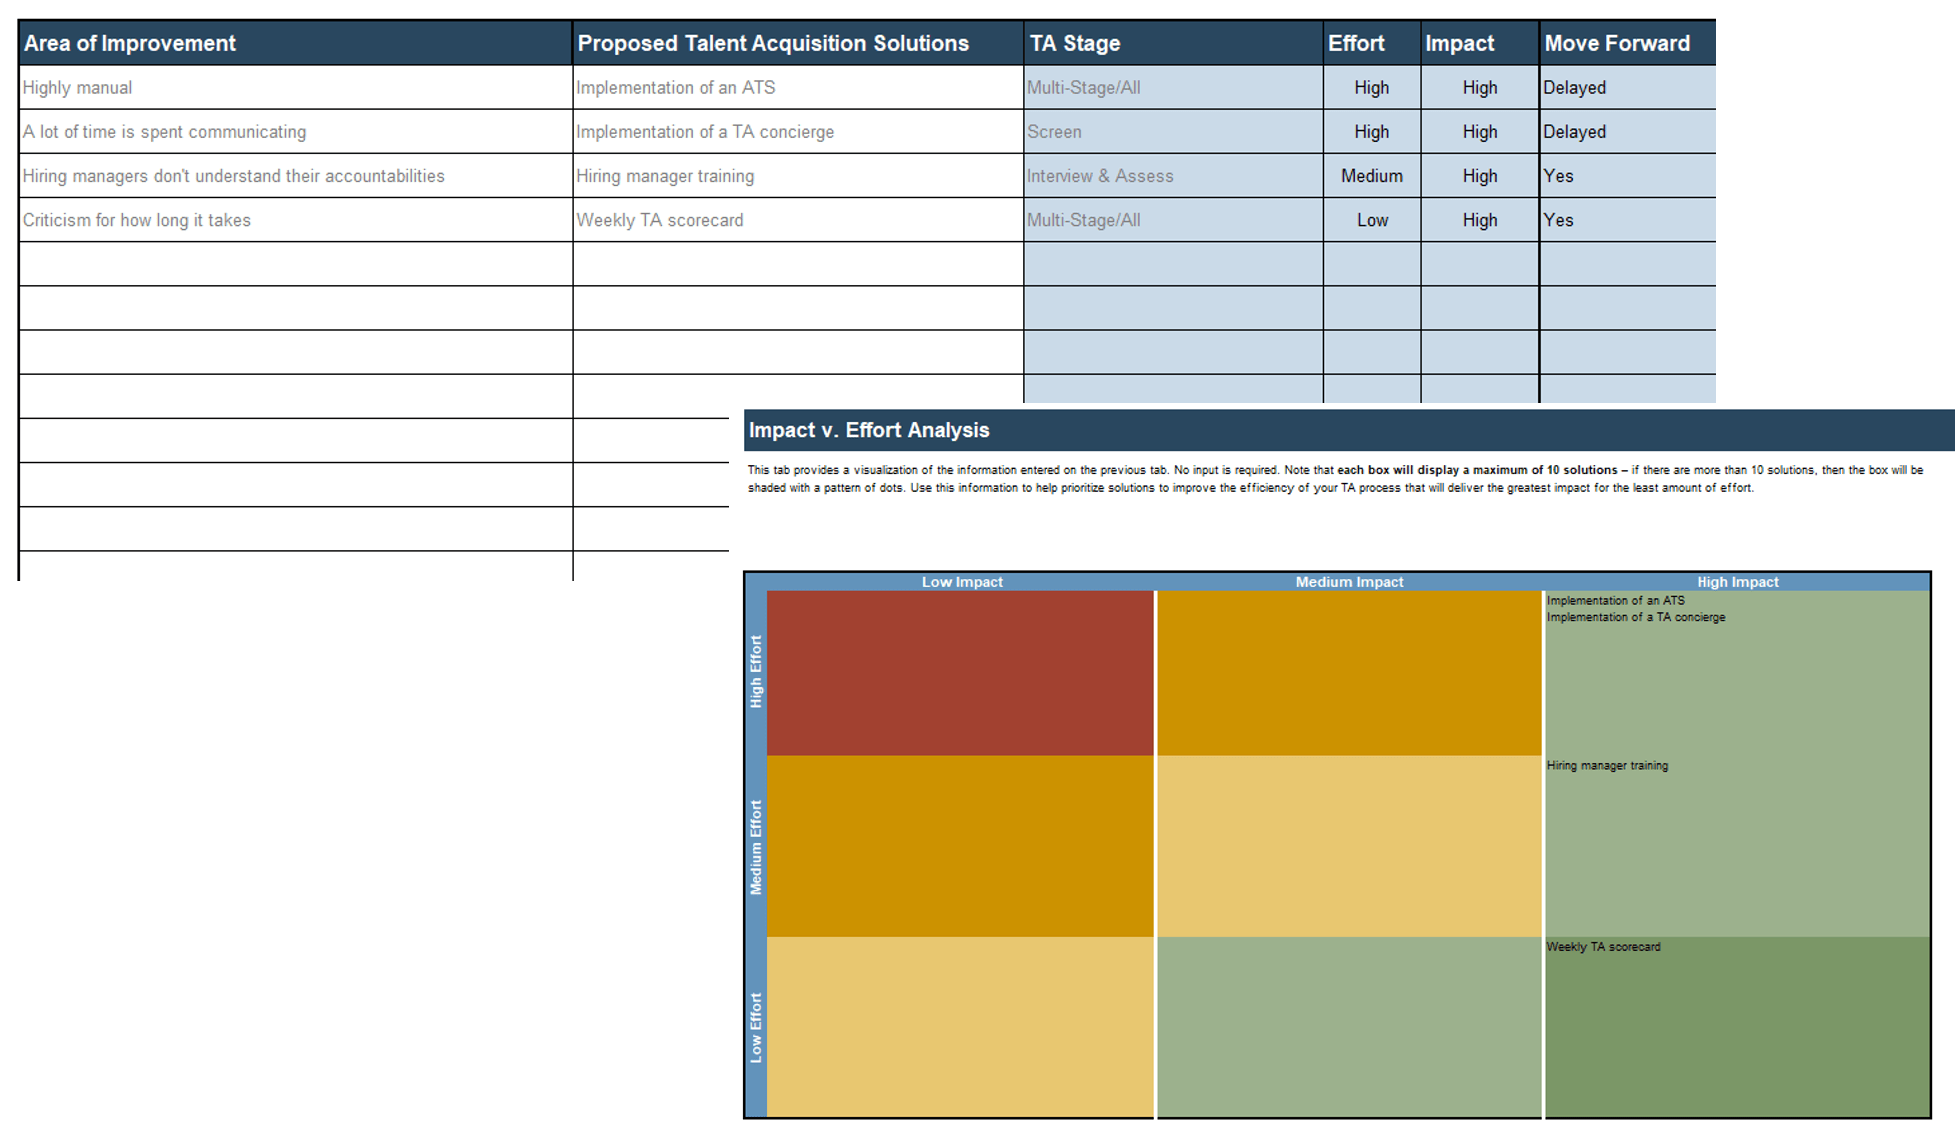


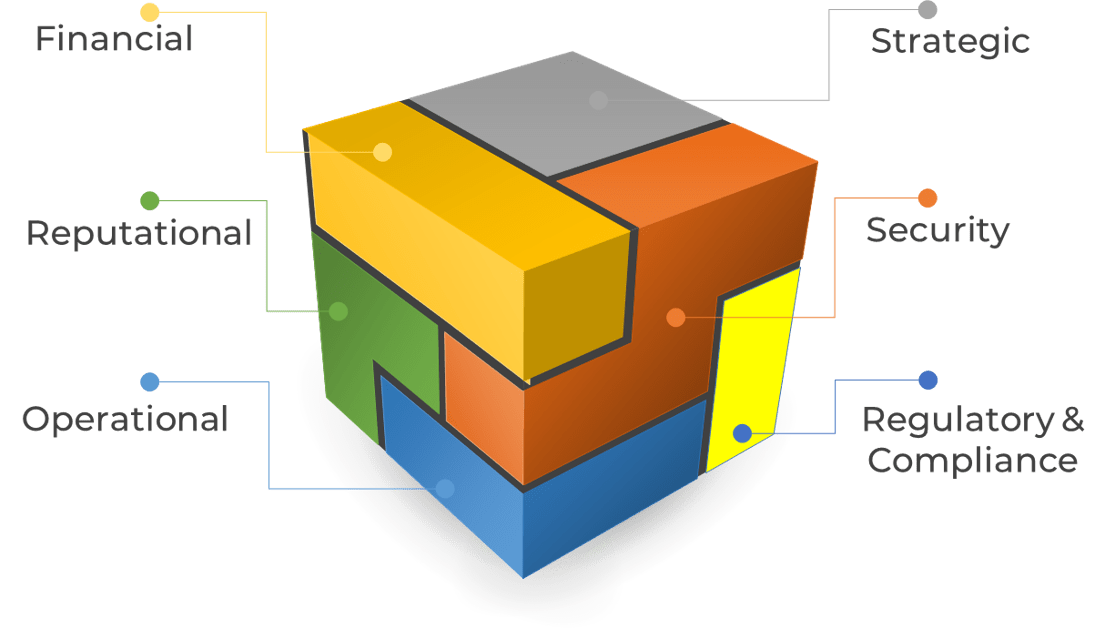
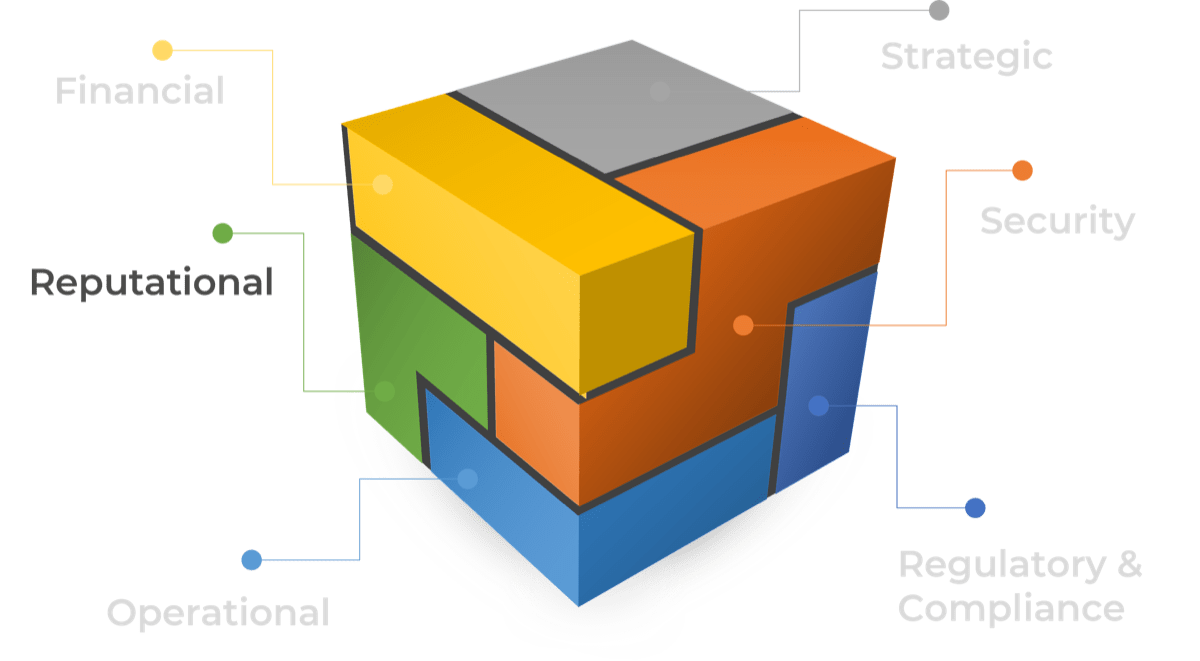


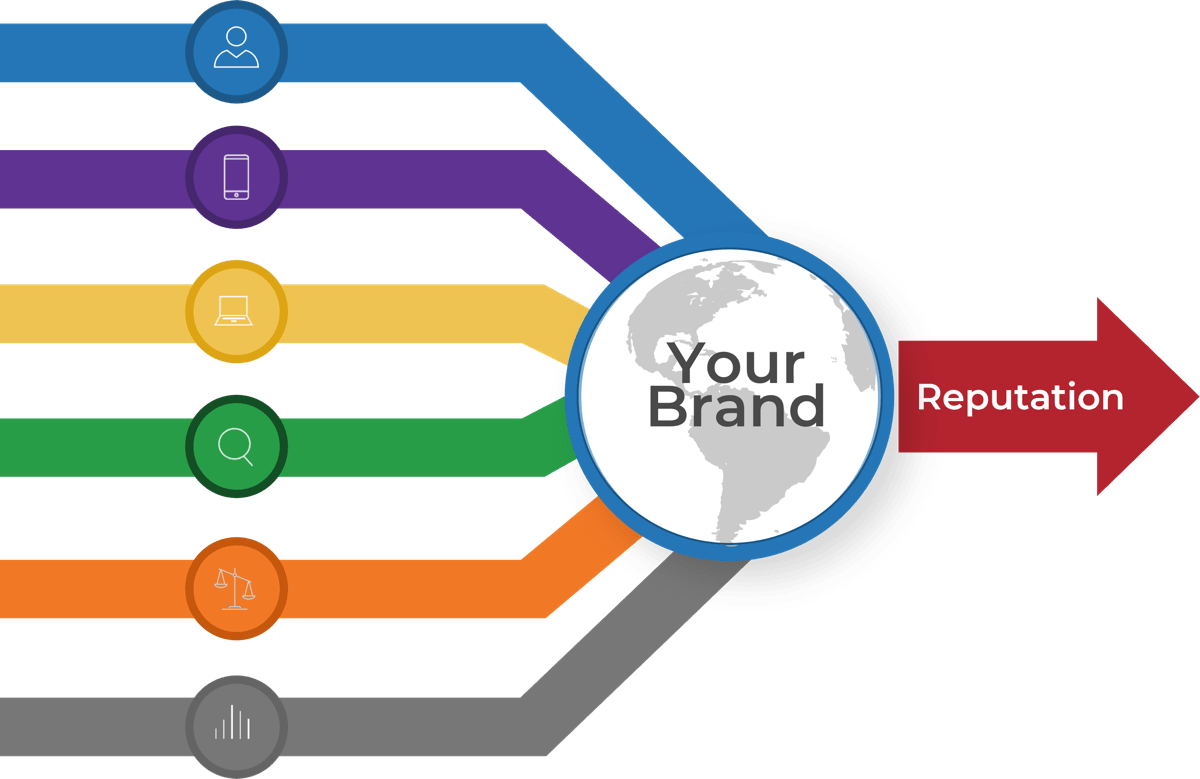


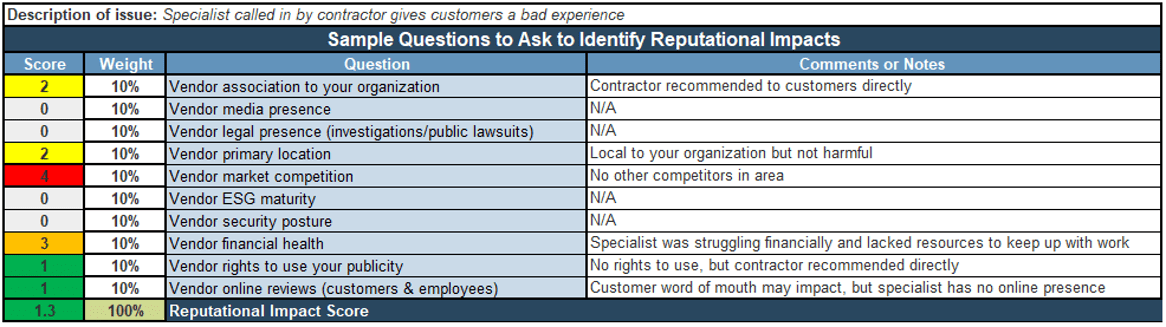

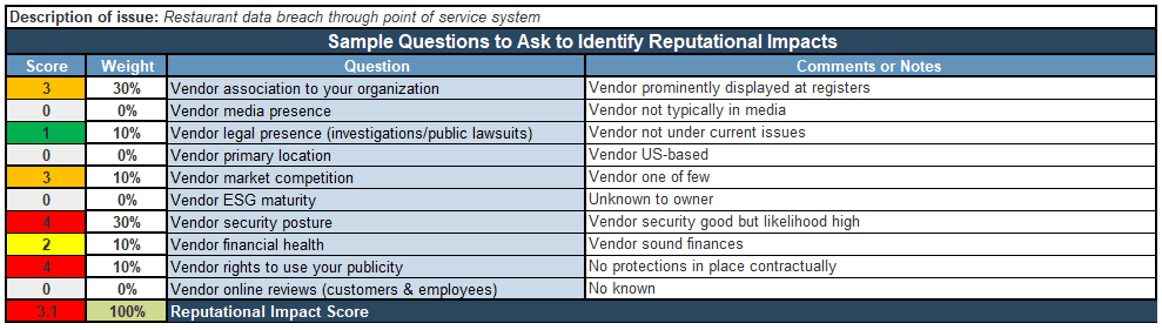

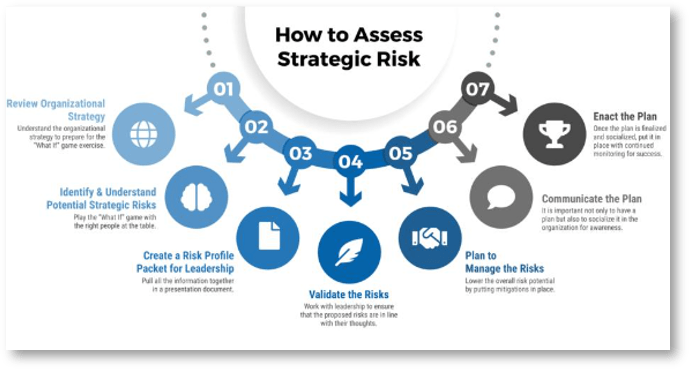


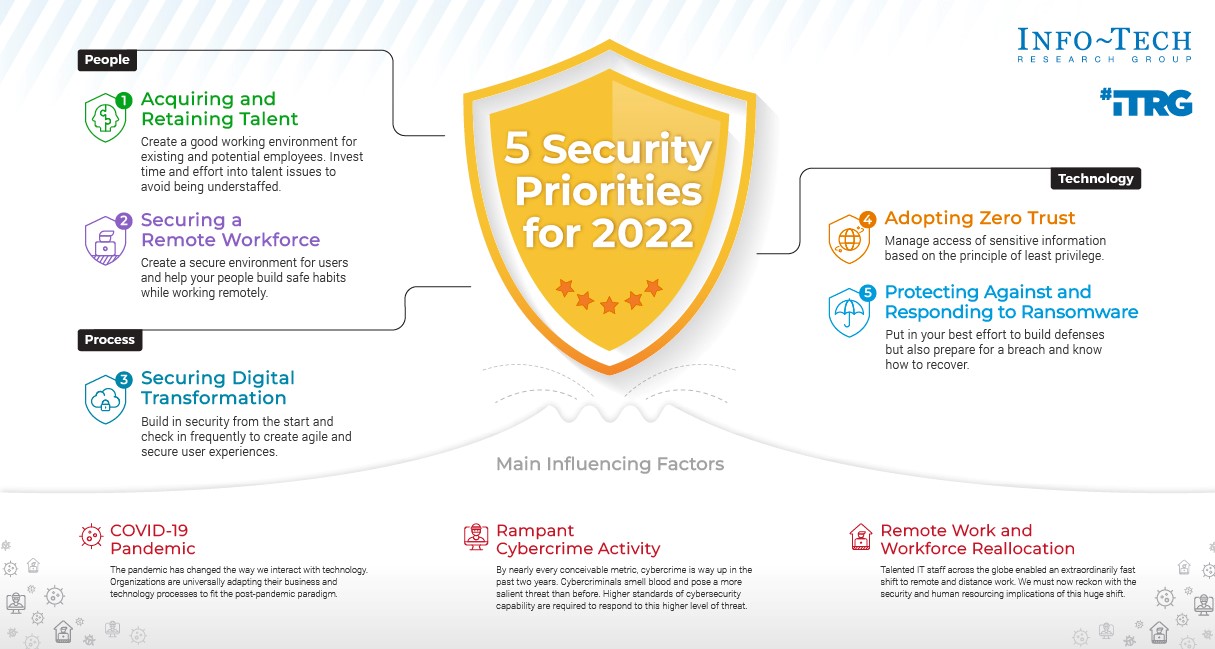
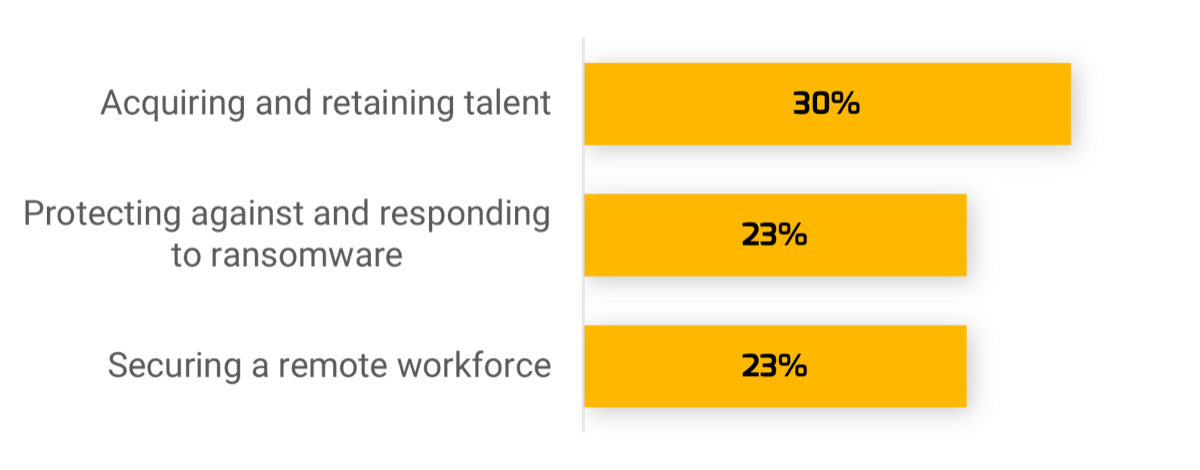
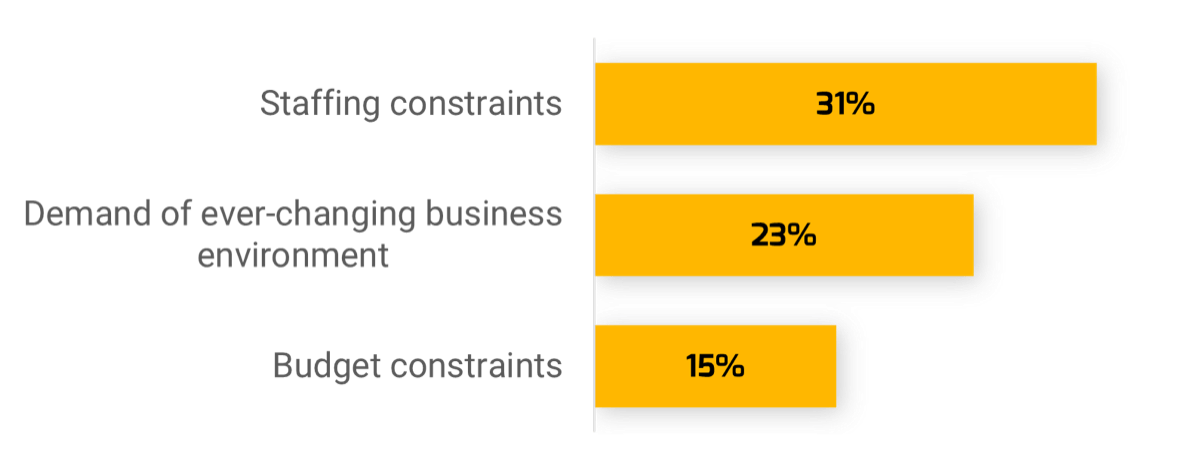
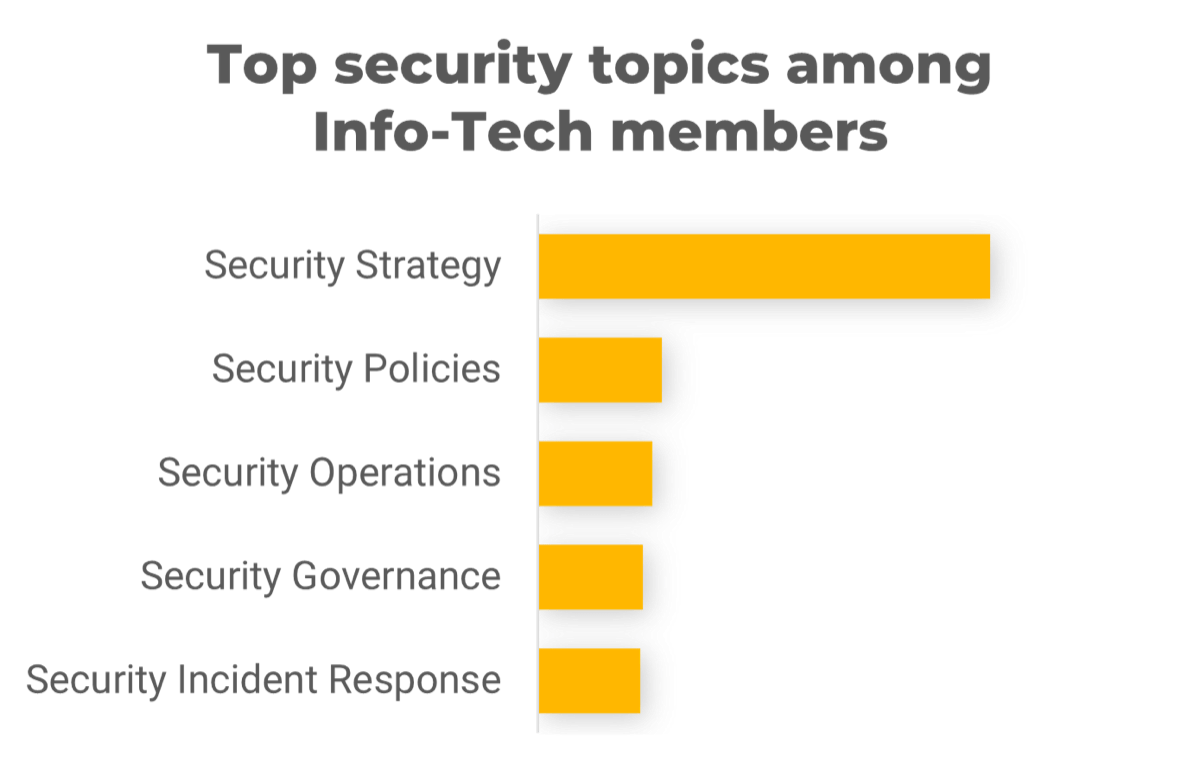
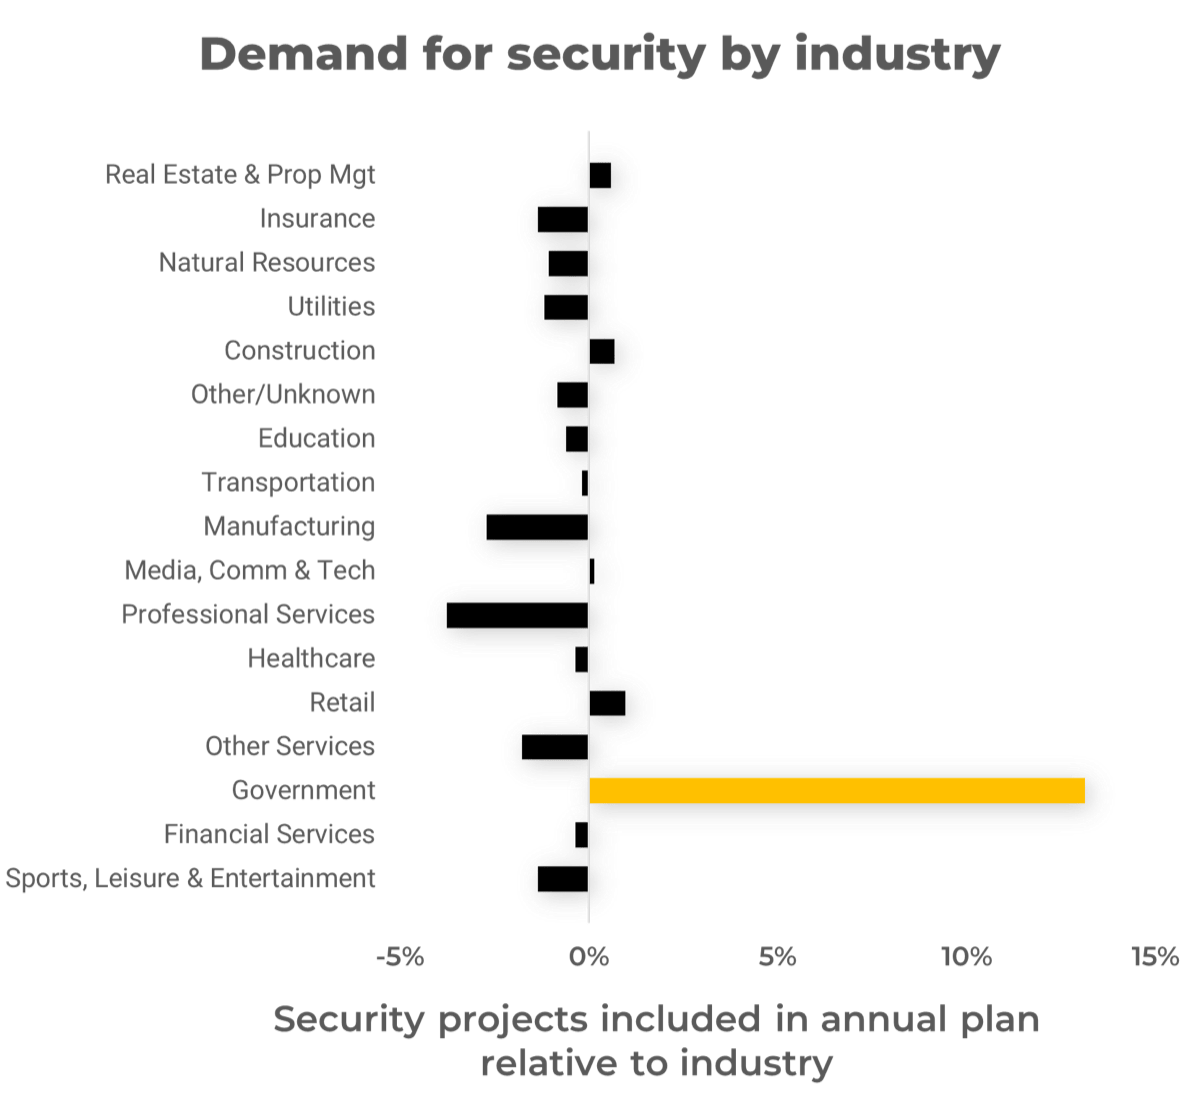

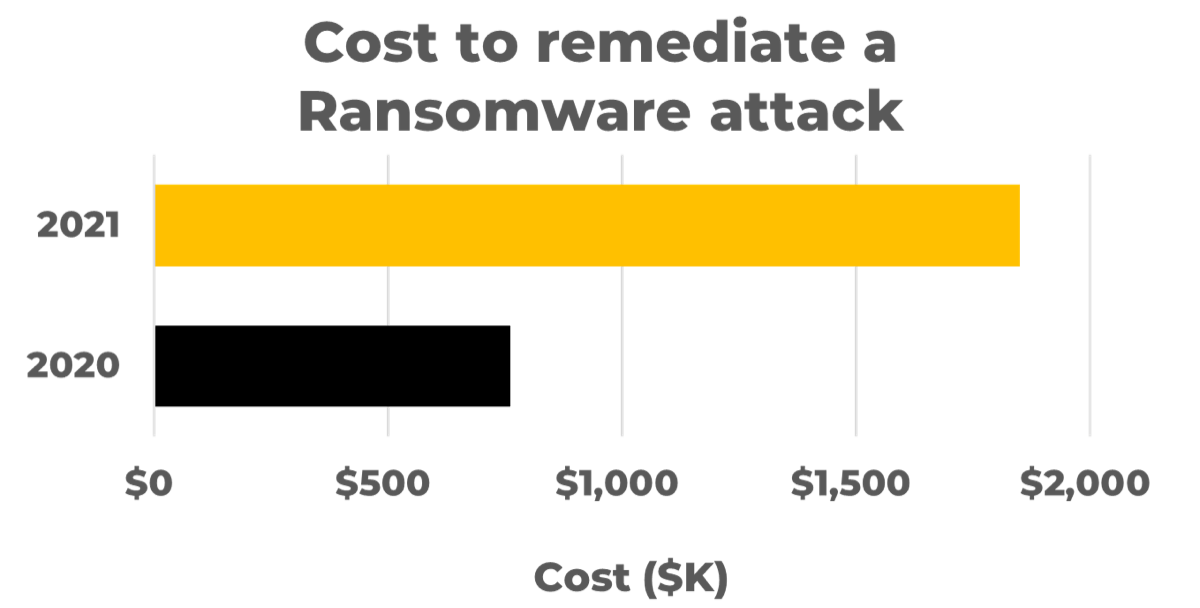

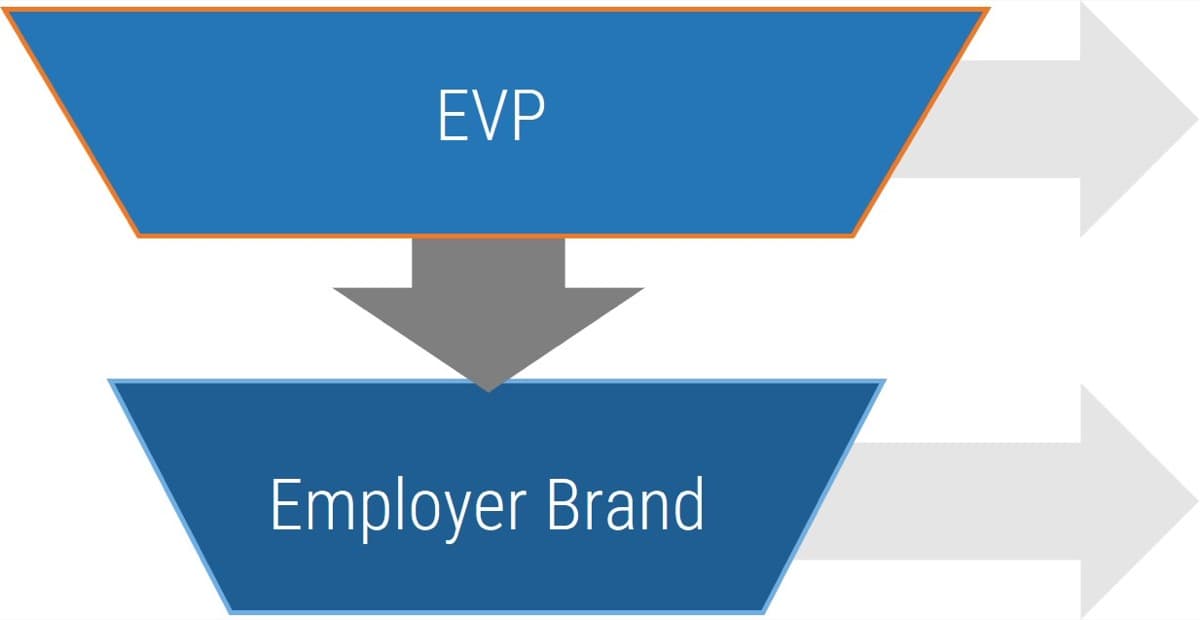


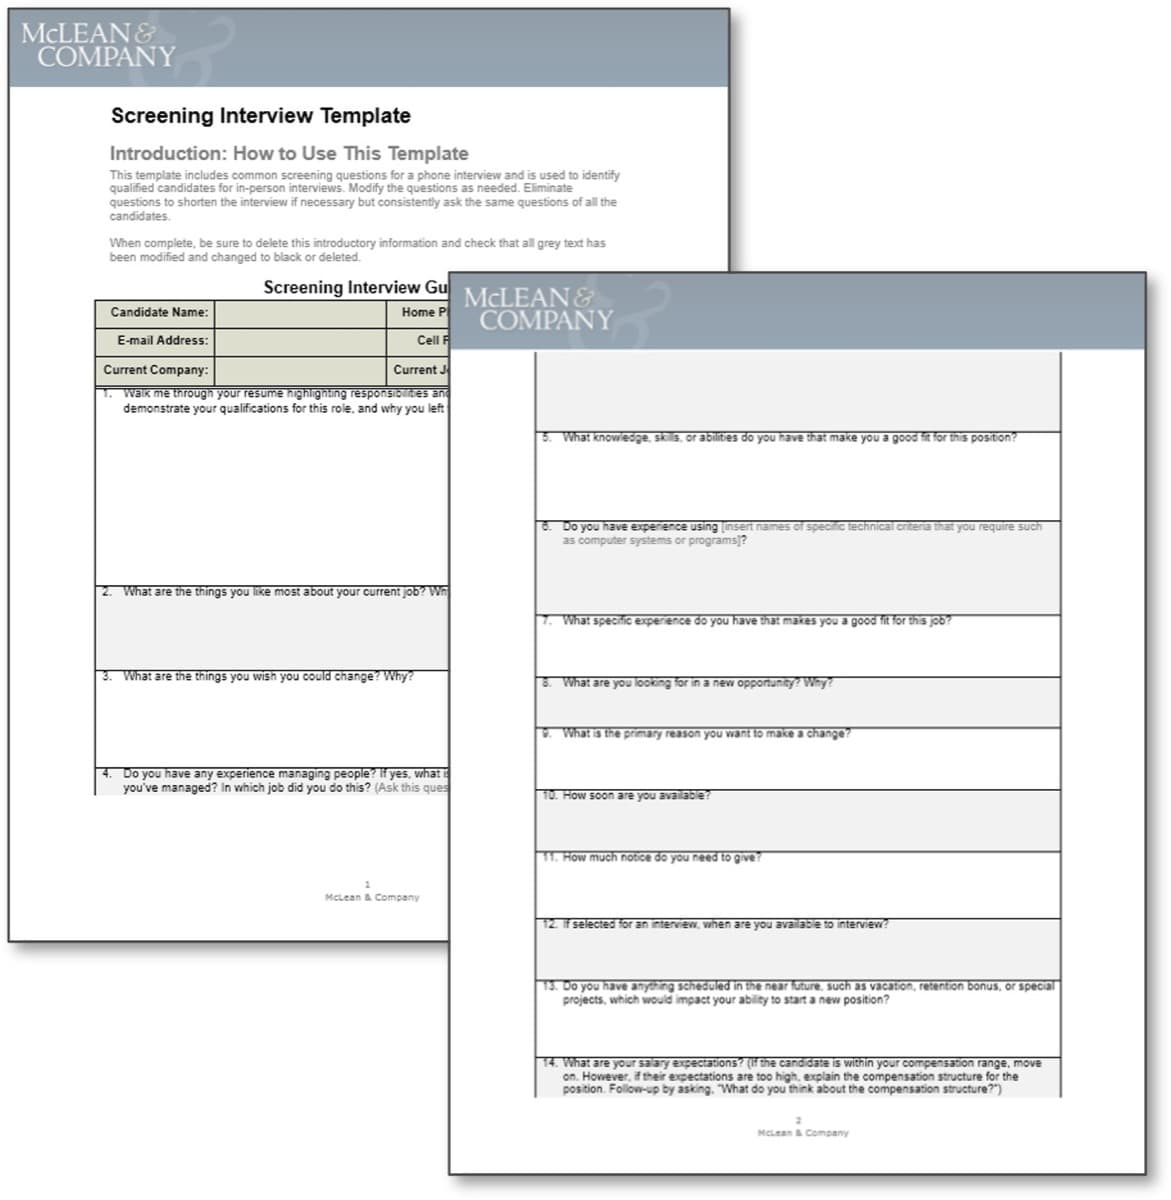
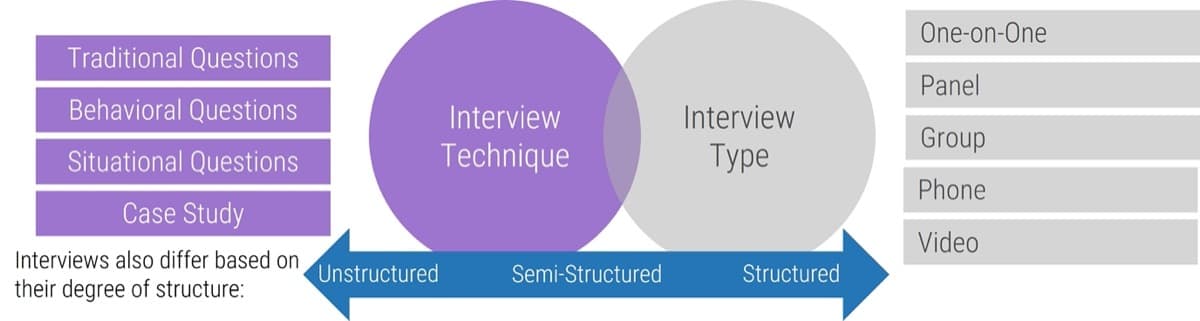
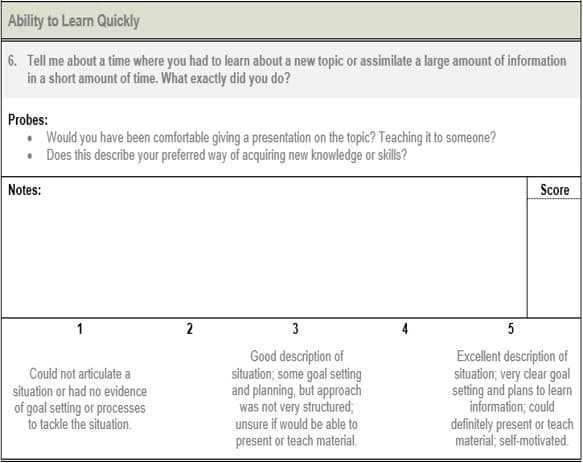
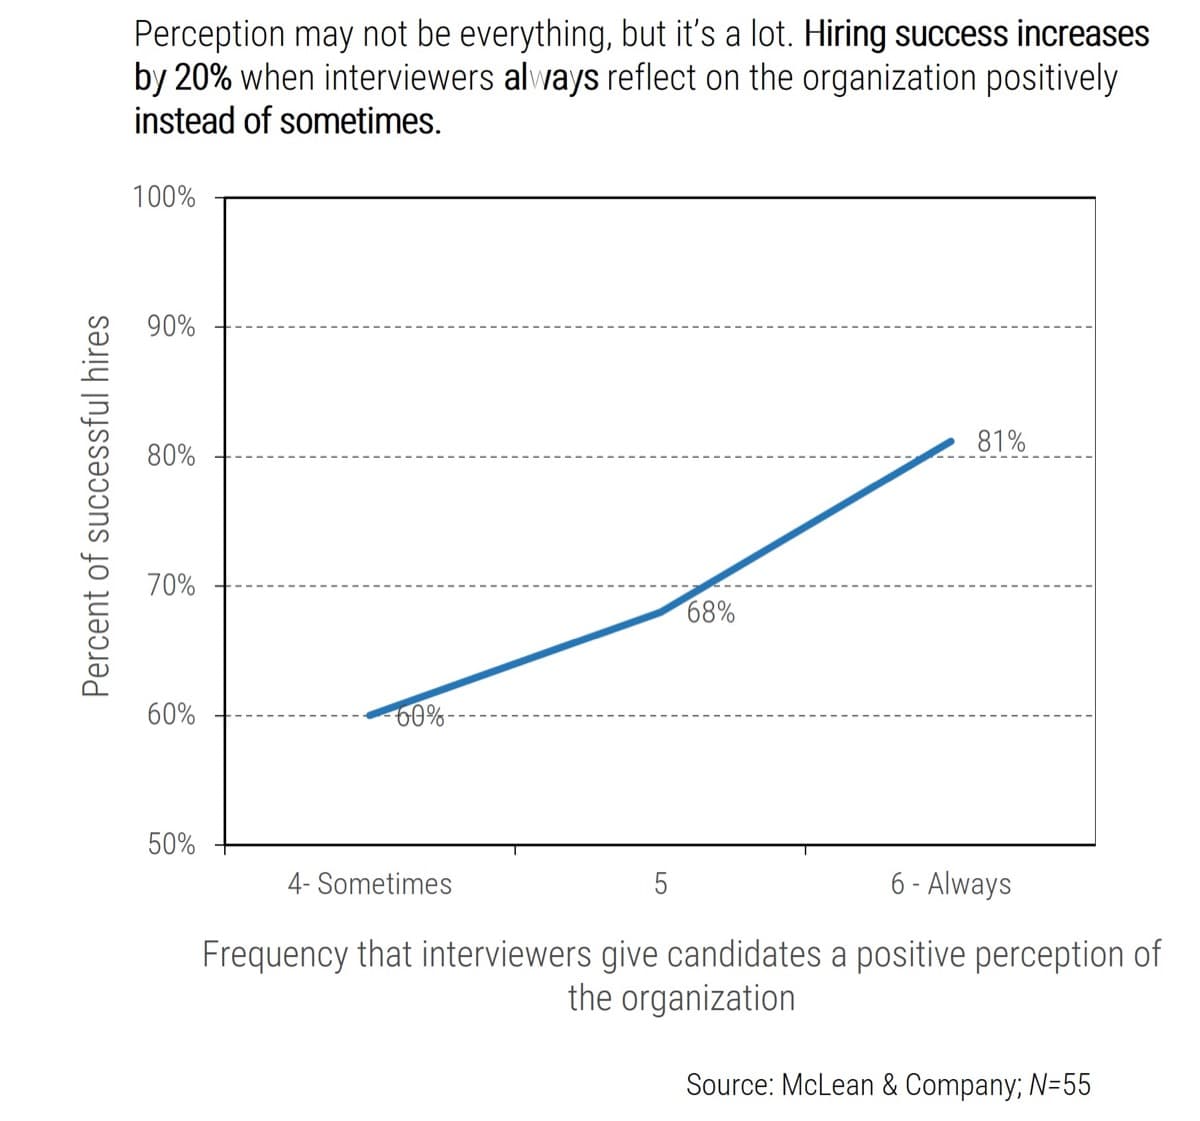
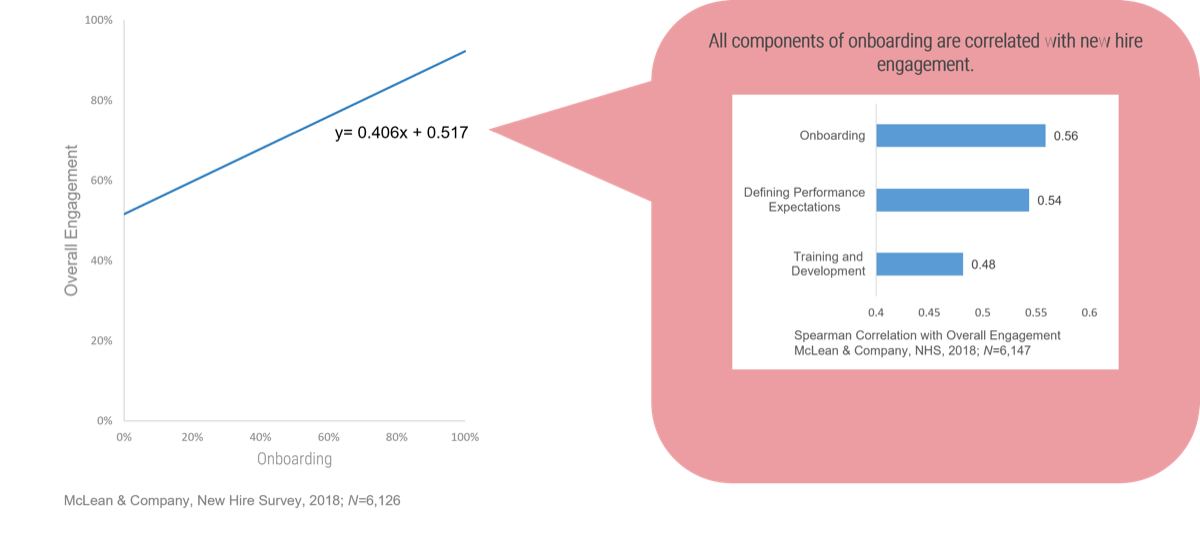

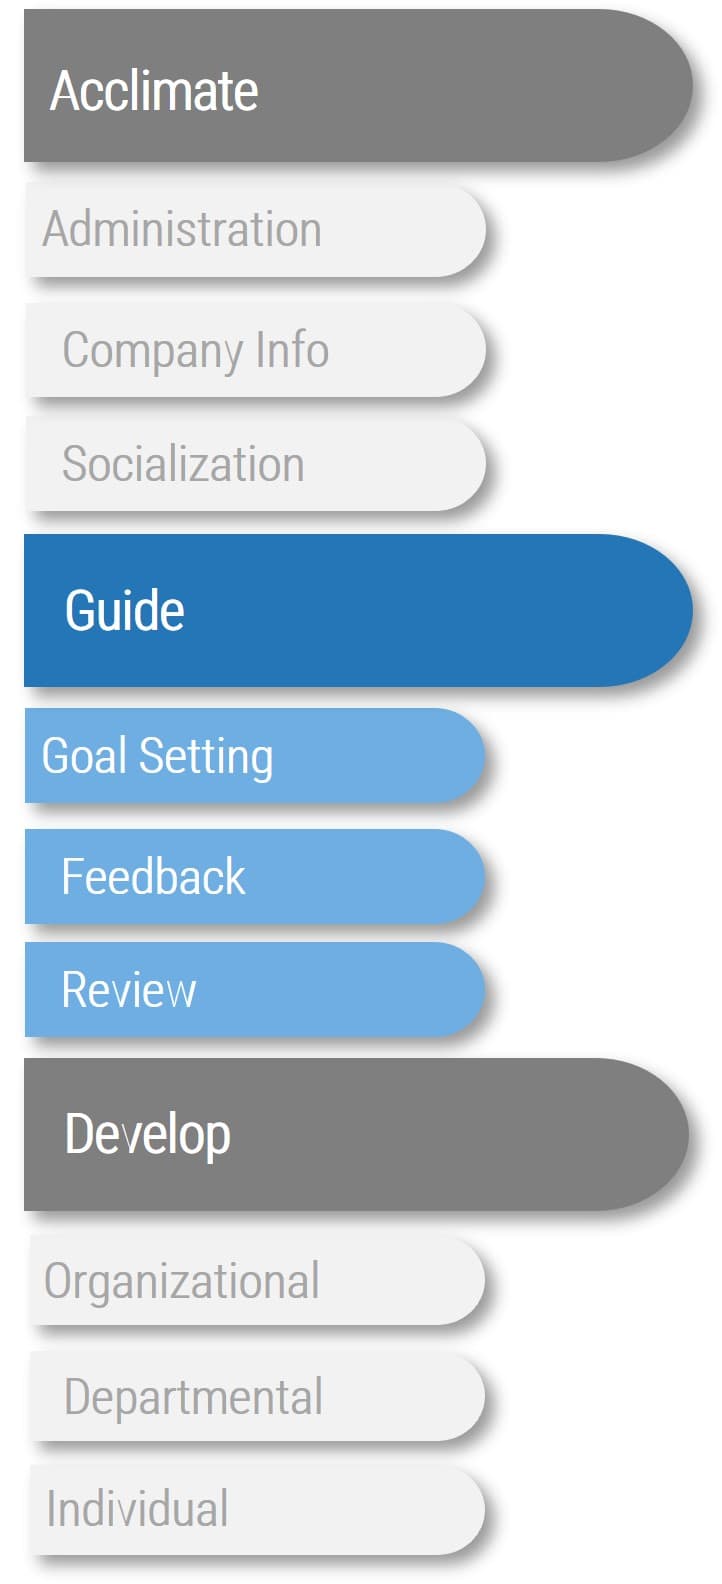
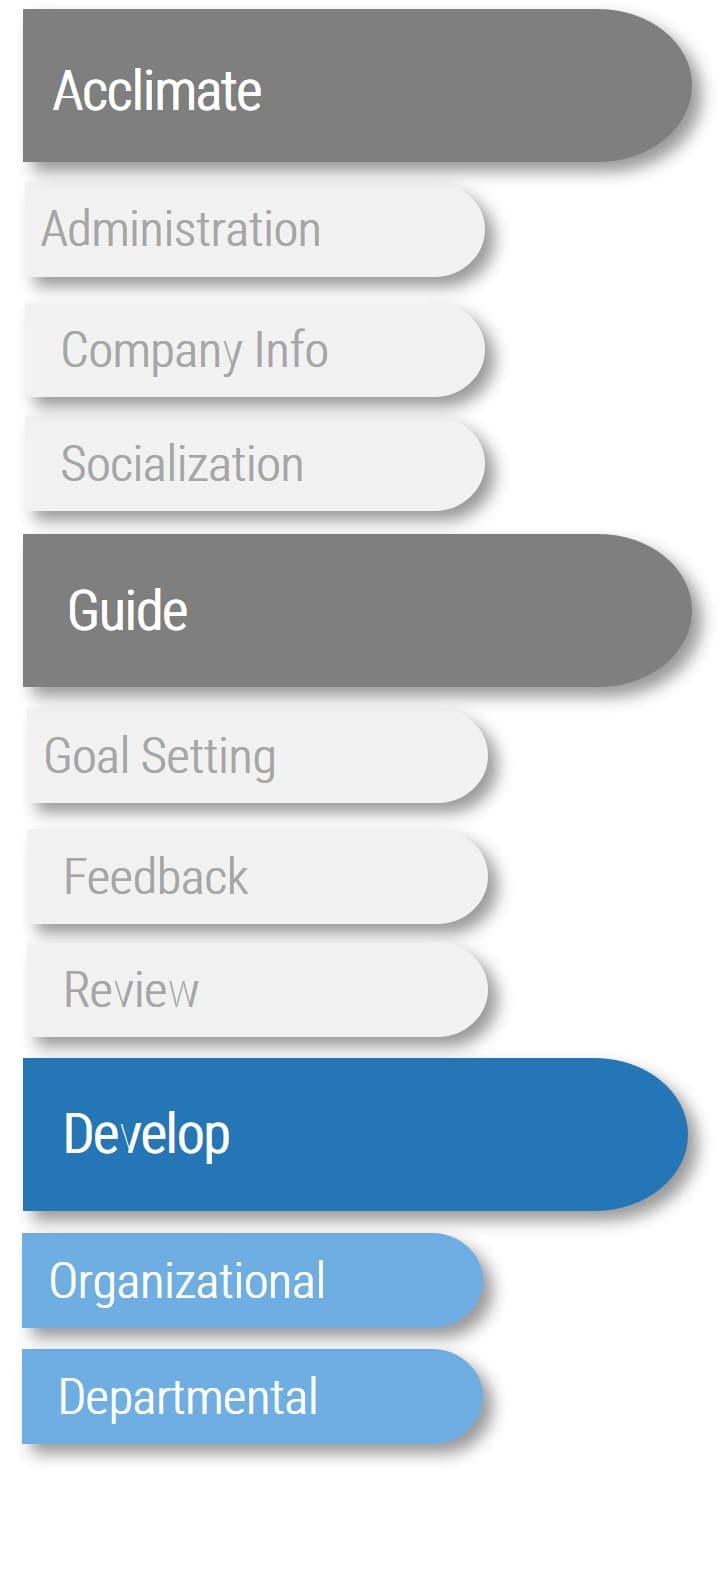


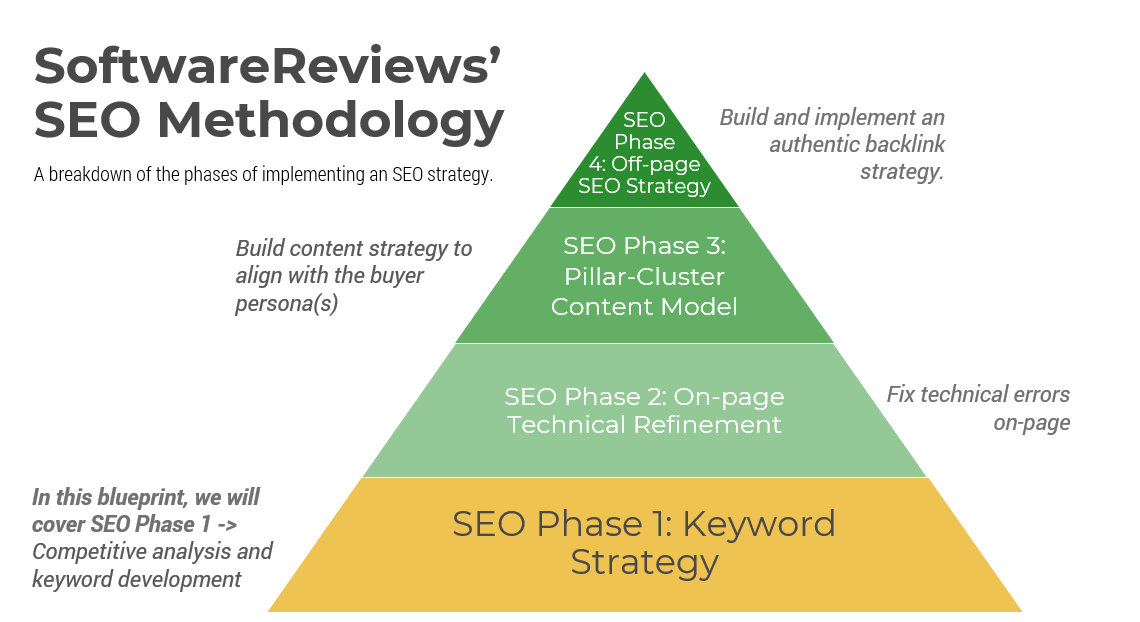
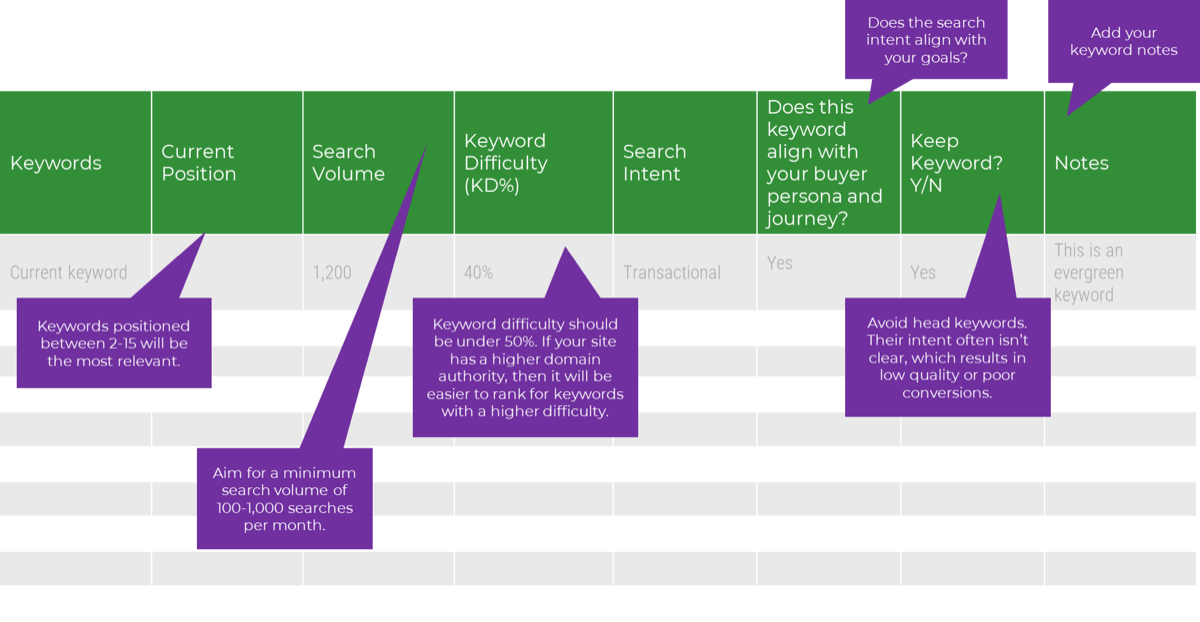
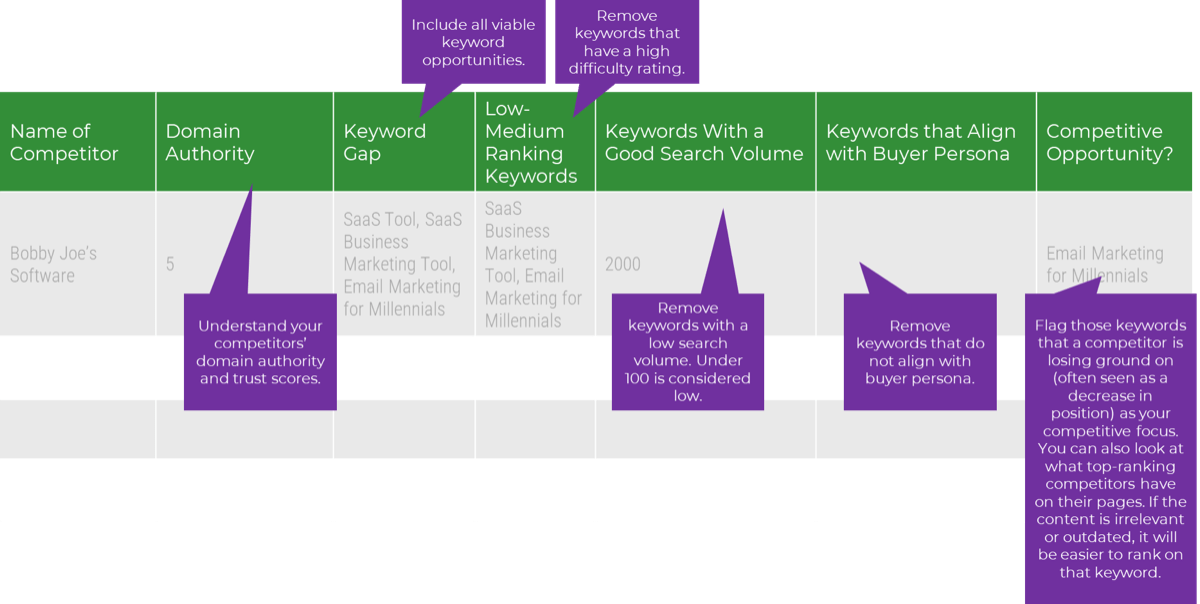
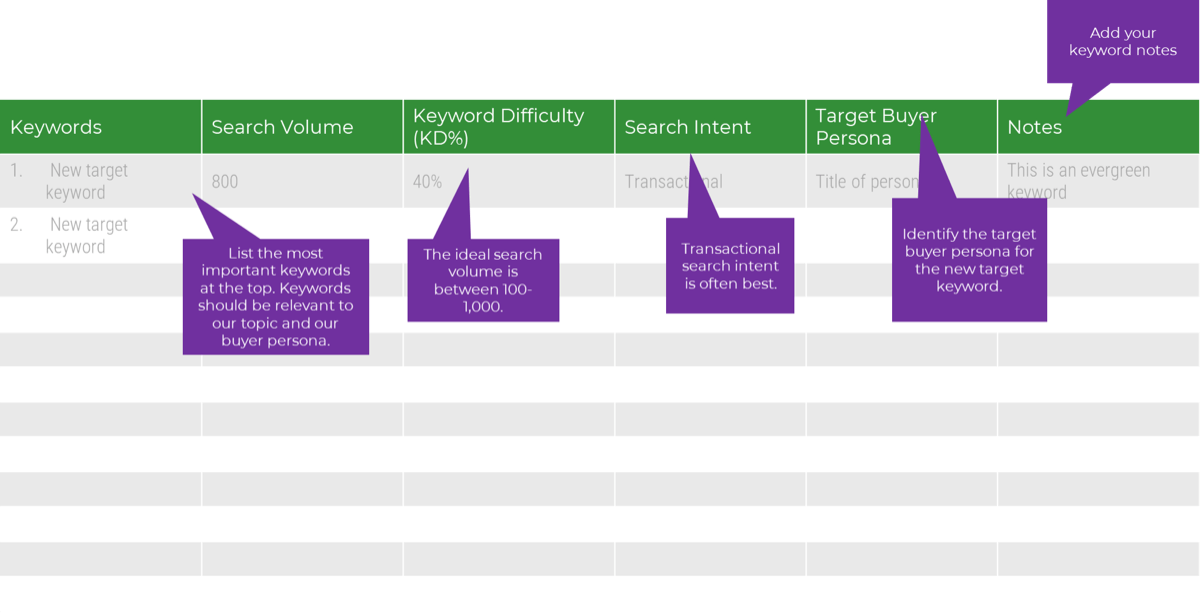

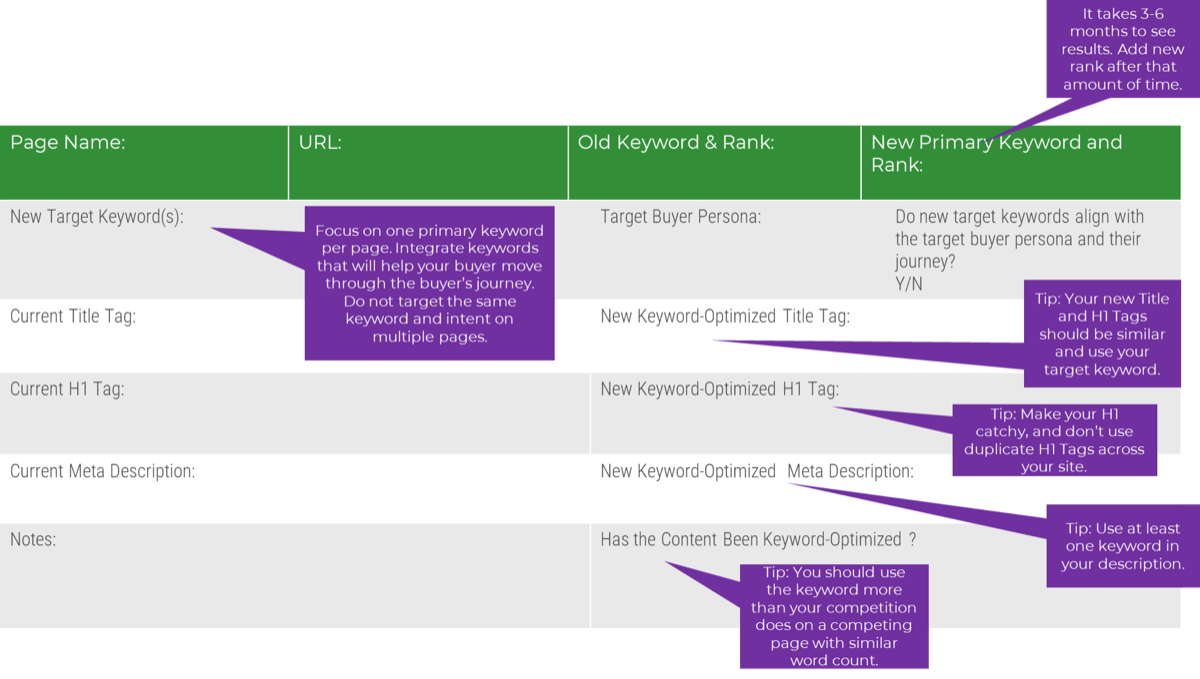


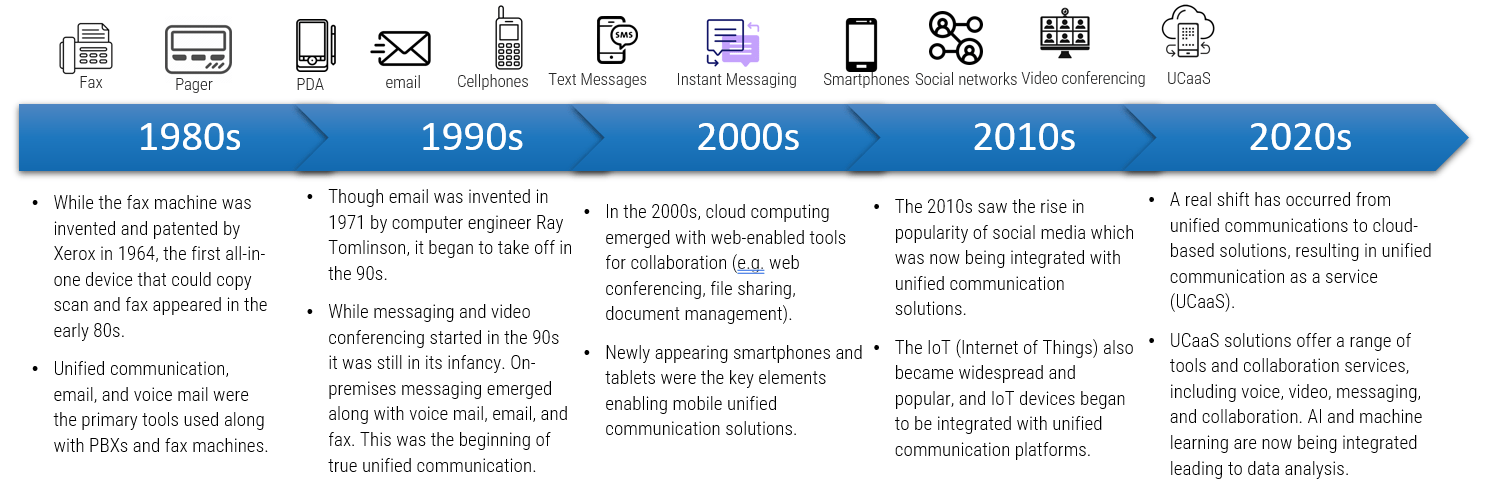
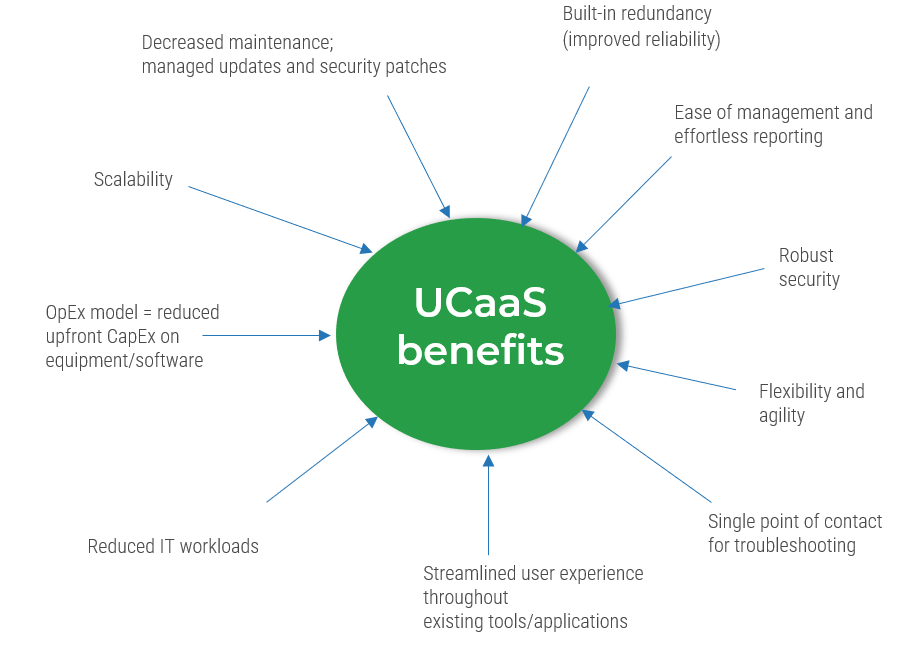
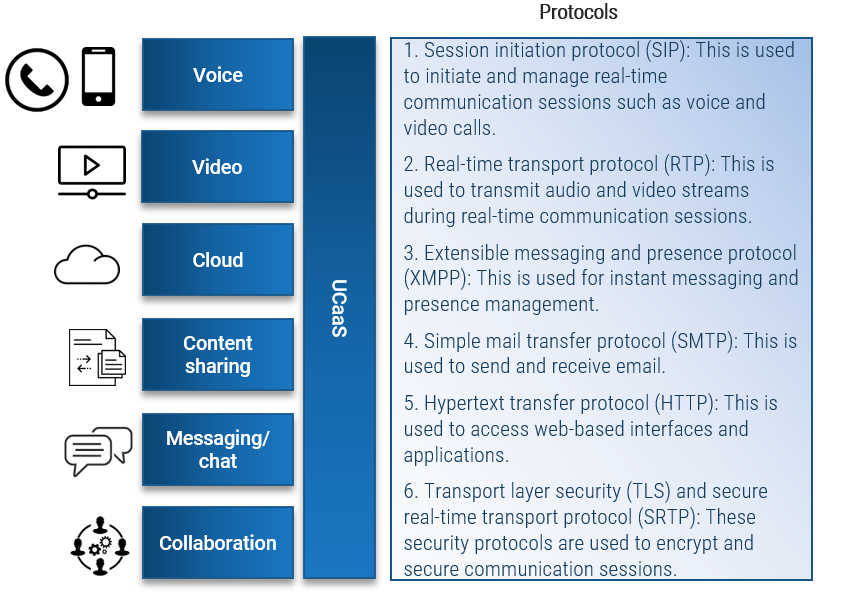
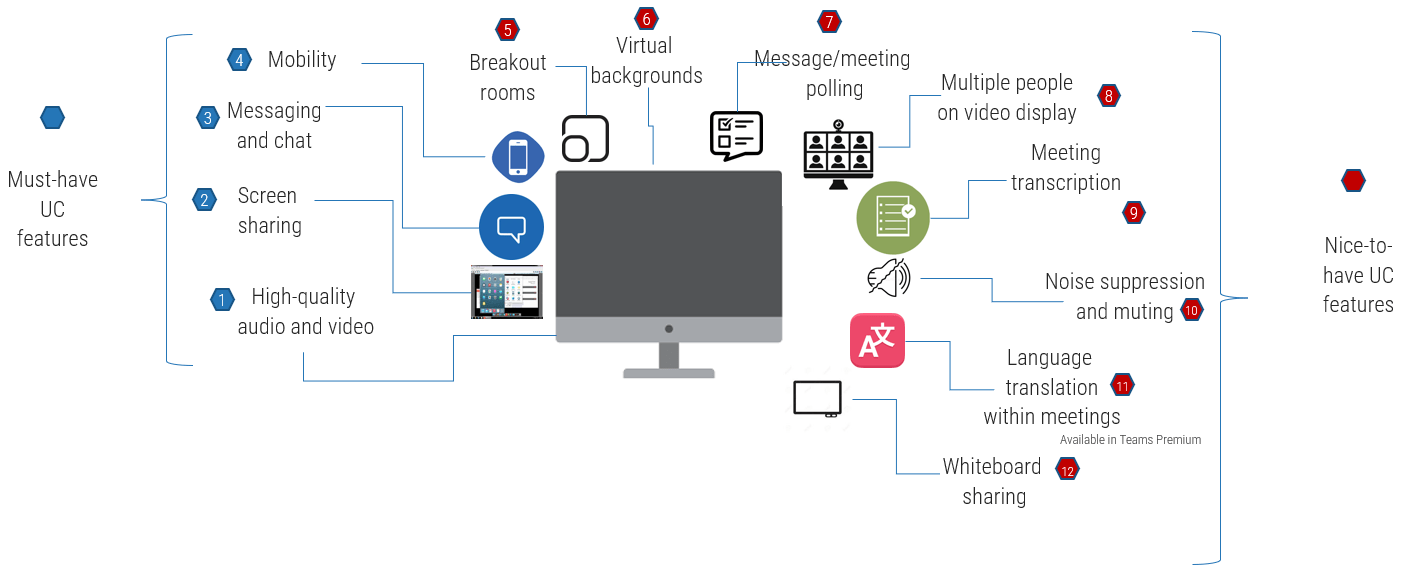


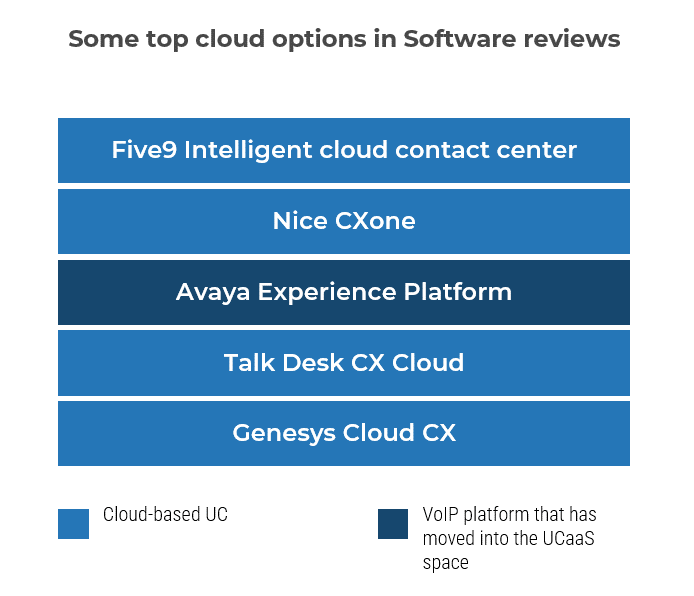
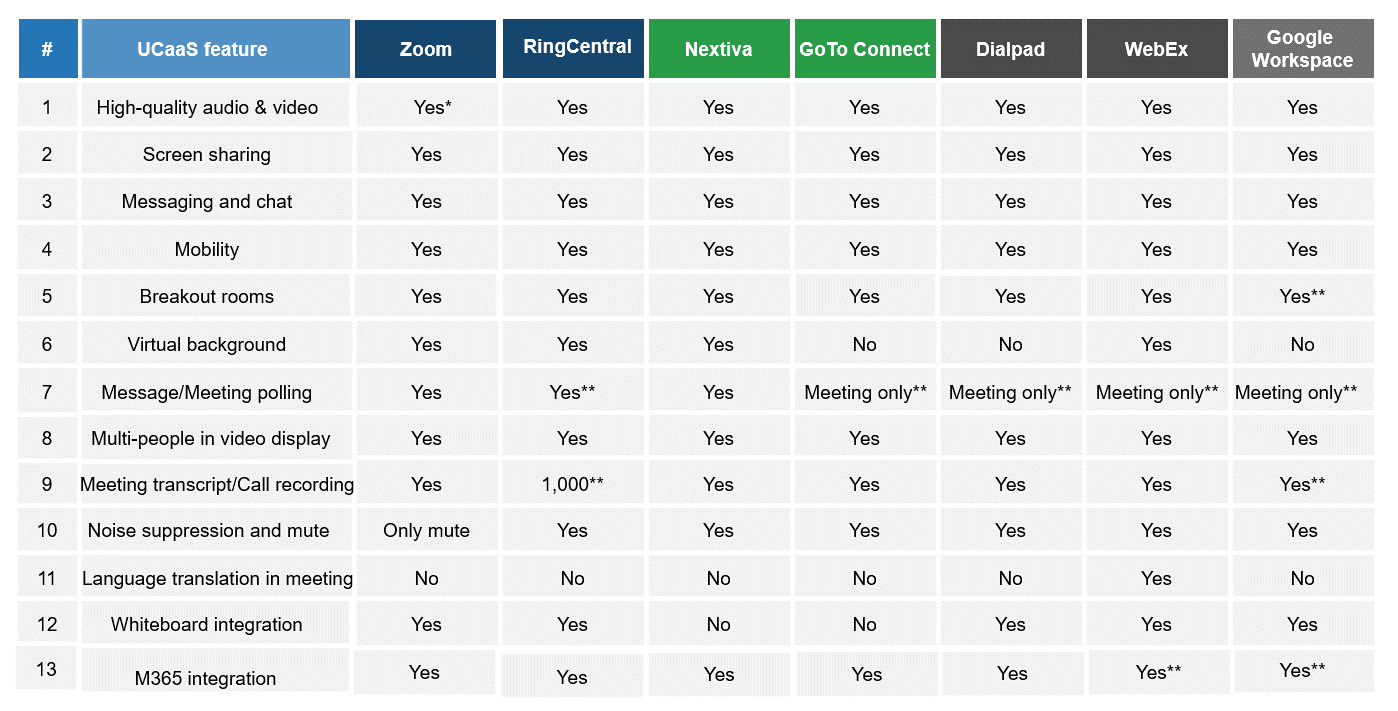
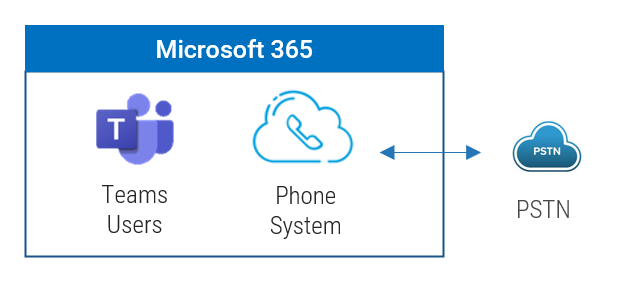
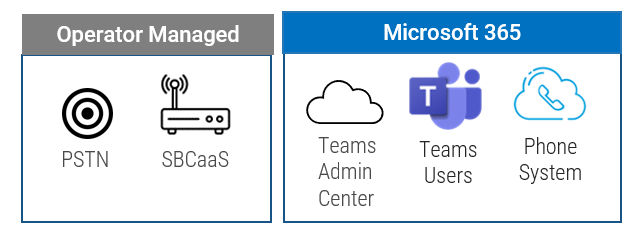
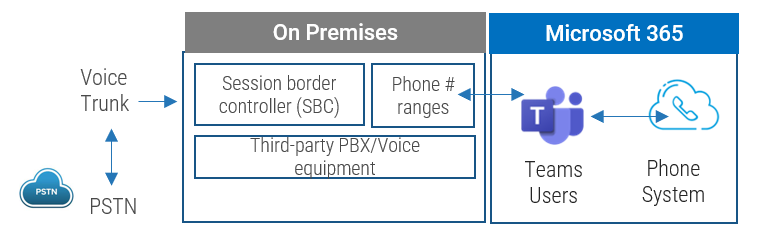
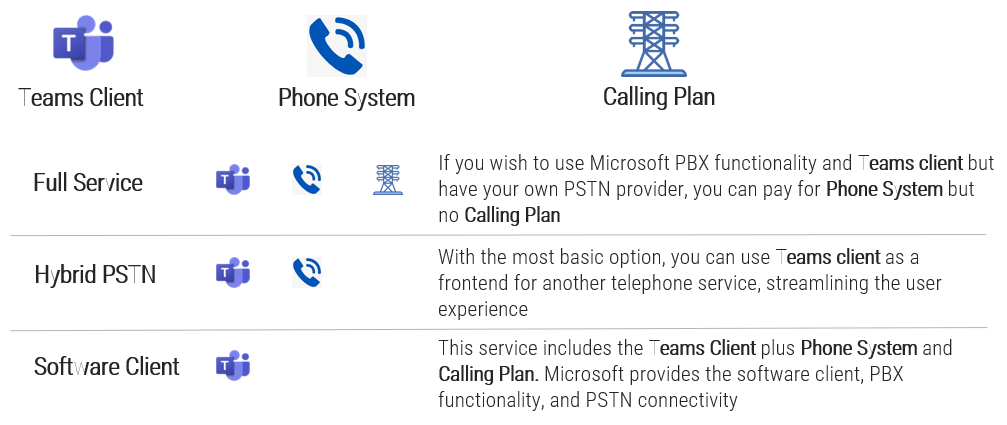
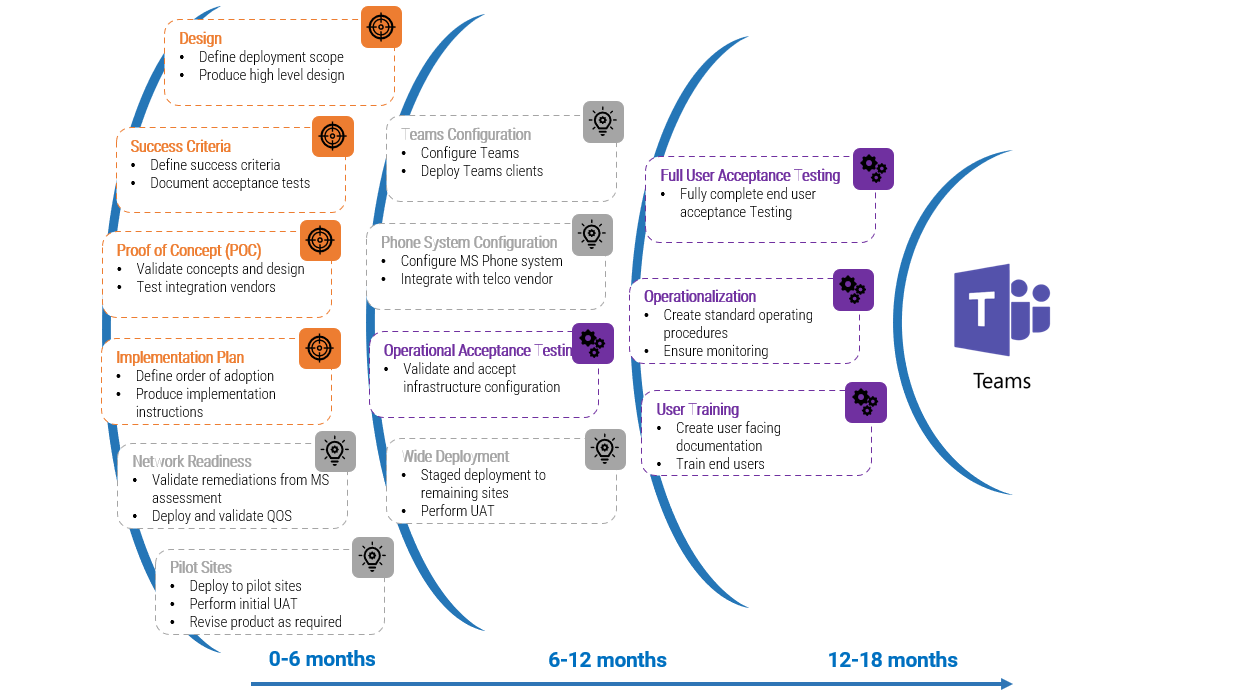
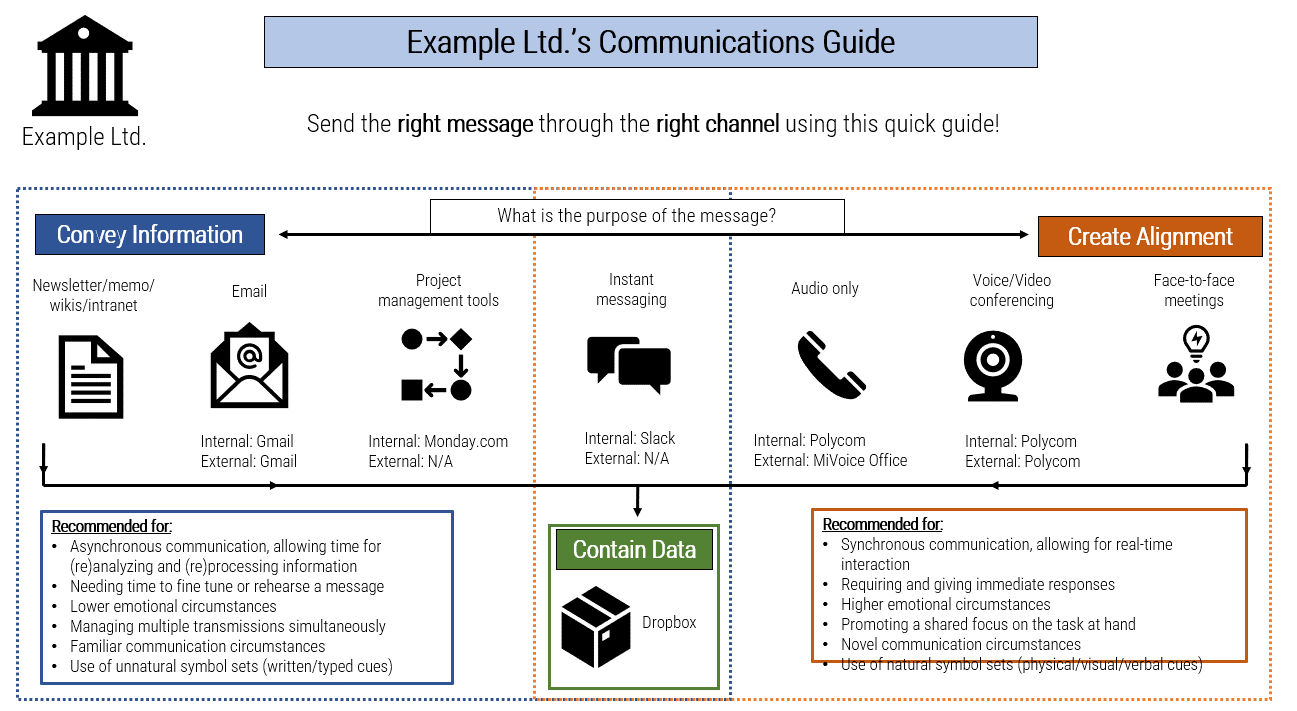
![A diagram that shows [Insert Organization Name]’s Communications Guide](/images/ITMGF/infra-and-operations/end-user-computing/voice-video-management/assess-your-readiness-to-implement-ucaas/030-communications-guide-template.png)