Further reading
Spread Best Practices With an Agile Center of Excellence
Achieve ongoing alignment between Agile teams and the business with a set of targeted service offerings.
ANALYST PERSPECTIVE
"Inconsistent processes and practices used across Agile teams is frequently cited as a challenge to adopting and scaling Agile within organizations. (VersionOne’s 13th Annual State of Agile Report [N=1,319]) Creating an Agile Center of Excellence (ACE) is a popular way to try to impose structure and improve performance. However, simply establishing an ACE does not guarantee you will be successful with Agile. When setting up an ACE you must: Define ACE services based on identified stakeholder needs. Staff the ACE with respected, “hands on” people, who deliver identifiable value to your Agile teams. Continuously evolve ACE service offerings to maximize stakeholder satisfaction and value delivered."
Alex Ciraco, Research Director, Applications Practice Info-Tech Research Group
Our understanding of the problem
This Research Is Designed For:
- A CIO who is looking for a way to optimize their Agile capabilities and ensure ongoing alignment with business objectives.
- An applications director who is looking for mechanisms to inject continuous improvement into organization-wide Agile practices.
This Research Will Help You:
- Align your Agile support structure with business objectives and the functional expectations of its users.
- Standardize the ways in which Agile teams develop and learn to create consistency in purpose and execution.
- Track and communicate successes to ensure the long-term viability of an Agile Center of Excellence (ACE).
This Research Will Also Assist
- Project managers who are tasked with managing Agile projects.
- Application development managers who are struggling with establishing consistency, transparency, and collaboration across their teams.
This Research Will Help Them:
- Provide service offerings to their team members that will help them personally and collectively to develop desired skills.
- Provide oversight and transparency into Agile projects and outcomes through ongoing monitoring.
Executive summary
Situation
- Your organization has had some success with Agile, but needs to drive consistency across Agile teams for better business results and alignment.
- You are seeking to organically grow Agile capabilities within the organization through a set of support services and facilitated through shared learning and capabilities.
Complication
- Organizational constraints, culture clash, and lack of continuous top-down support are hampering your Agile growth and maturity.
- Attempts to create consistency across Agile teams and processes fail to account for the expectations of users and stakeholders, leaving them detached from projects and creating resistance.
Resolution
- Align the service offerings of your ACE with both corporate objectives and the functional expectations of its stakeholders to ensure broad support and utilization of the invested resources.
- Understand some of the culture and process challenges you will face when forming an ACE, and address them using Info-Tech’s Agile adoption journey model.
- Track the progress of the ACE and your Agile teams. Use this data to find root causes for issues, and ideate to implement solutions for challenges as they arise over time.
- Effectively define and propagate improvements to your Agile teams in order to drive business-valued results.
- Communicate progress to interested stakeholders to ensure long-term viability of the Center of Excellence (CoE).
Info-Tech Insight
- Define ACE services based on stakeholder needs.Don’t assume you know what your stakeholders need without talking to them.
- Staff the ACE strategically. Choose those who are thought leaders and proven change agents.
- Continuously improve based on metrics and feedback.Constantly monitor how your ACE is performing and adjust to feedback.
Info-Tech’s Agile Journey related Blueprints
1. Stabilize
Implement Agile Practices That Work
Begin your Agile transformation with a comprehensive readiness assessment and a pilot project to adopt Agile development practices and behaviors that fit.
2. Sustain
YOU ARE HERE
Spread Best Practices with an Agile Center of Excellence
Form an ACE to support Agile development at all levels of the organization with thought leadership, strategic development support & process innovation.
3. Scale
Enable Organization-Wide Collaboration by Scaling Agile
Extend the benefits of your Agile pilot project into your organization by strategically scaling Agile initiatives that will meet stakeholders’ needs.
4. Satisfy
Transition to Product Delivery Introduce product-centric delivery practices to drive greater benefits and better delivery outcomes.
1.1 Determine the vision of your ACE
1.2 Define the service offerings of your ACE
2.1 Define an adoption plan for Agile teams
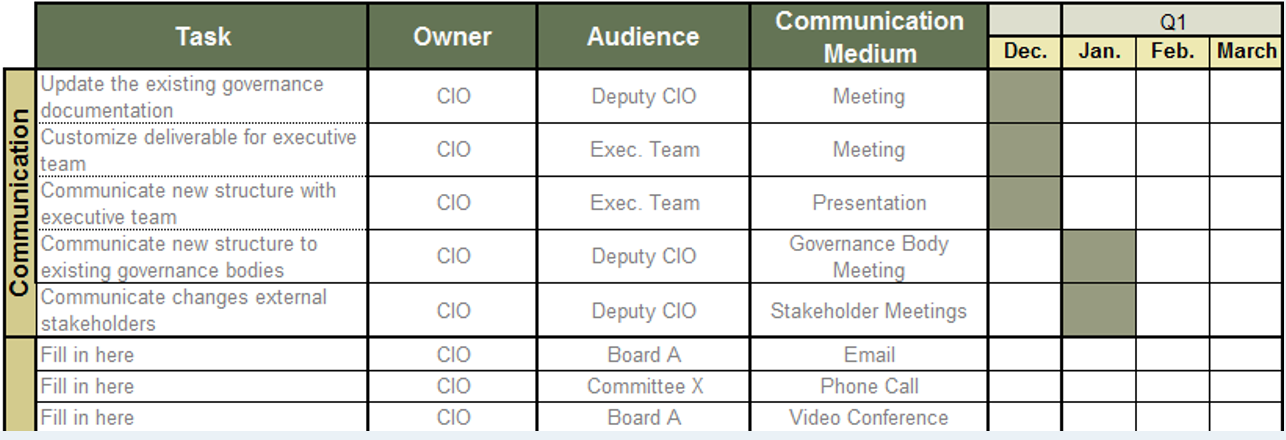
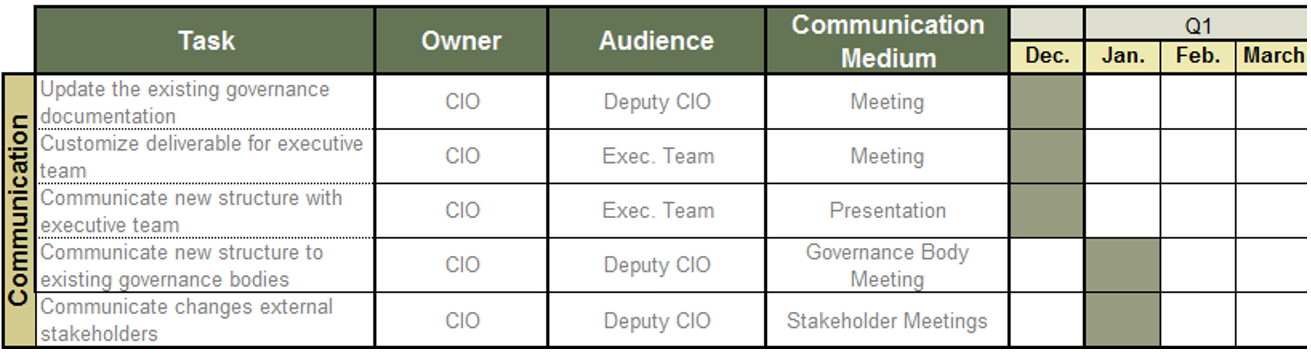
2.2 Create an ACE engagement plan
2.3 Define metrics to measure success
3.1 Optimize the success of your ACE
3.2 Plan change to enhance your Agile initiatives
3.3 Conduct ongoing retrospectives
Supporting Capabilities and Practices
Modernize Your SDLC
Remodel the stages of your lifecycle to standardize your definition of a successful product.
Build a Strong Foundation for Quality
Instill quality assurance practices and principles in each stage of your software development lifecycle.
Implement DevOps Practices That Work
Fix, deploy, and support applications quicker though development and operations collaboration.
What is an Agile Center of Excellence?
NOTE: Organizational change is hard and prone to failure. Determine your organization’s level of readiness for Agile transformation (and recommended actions) by completing Info-Tech’s Agile Transformation Readiness Tool.
An ACE amplifies good practices that have been successfully employed within your organization, effectively allowing you to extend the benefits obtained from your Agile pilot(s) to a wider audience.
From the viewpoint of the business, members of the ACE provide expertise and insights to the entire organization in order to facilitate Agile transformation and ensure standard application of Agile good practices.
From the viewpoint of your Agile teams, it provides a community of individuals that share experiences and lessons learned, propagate new ideas, and raise questions or concerns so that delivering business value is always top of mind.
An ACE provides the following:
- A mechanism to gather thought leadership to maximize the accessibility and reach of your Agile investment.
- A mechanism to share innovations and ideas to facilitate knowledge transfer and ensure broadly applicable innovations do not go to waste.
- Strategic alignment to ensure that Agile practices are driving value towards business objectives.
- Purposeful good practices to ensure that the service offerings provided align with expectations of both your Agile practitioners and stakeholders.
SIDEBAR: What is a Community of Practice?
(And how does it differ from a CoE?)
Some organizations prefer Communities of Practice (CoP) to Centers of Excellence (CoE). CoPs are different from CoEs:
“A CoP is an affiliation of people who share a common practice and who have a desire to further the practice itself … and of course to share knowledge, refine best practices, and introduce standards. CoPs are defined by their domain of interest, but the membership is a social structure comprised of volunteer practitioners”
– Wenger, E., R. A. McDermott, et al. (2002) Cultivating communities of practice: A guide to managing knowledge, Harvard Business Press.
“CoPs differ from a CoE mainly in that they tend to have no geographical boundaries, they hold no hierarchical power within a firm, and they definitely can never have structure determined by the company. However, one of the most obvious and telling differences lies in the stated motive of members – CoPs exist because they have active practitioner members who are passionate about a specific practice, and the goals of a CoP are to refine and improve their chosen domain of practice – and the members provide discretionary effort that is not paid for by the employer”
– Matthew Loxton (June 1, 2011) CoP vs CoE – What’s the difference, and Why Should You Care?, Wordpress.com
What to know about CoPs:
- Less formal than a CoE
- Loosely organized by volunteer practitioners who are interested in advancing the practice.
- Not the Authoritative Voice
- Stakeholders engage the CoP voluntarily, and are not bound by them.
- Not funded by Organization
- CoP members are typically volunteers who provide support in addition to their daily responsibilities.
- Not covered in this Blueprint
- In depth analysis on CoPs is outside the scope of this Blueprint.
What does an ACE do?
Six main functions derived from Info-Tech’s CLAIM+G Framework
- Learning
- Provide training and development and enable engagement based on identified interaction points to foster organizational growth.
Tooling
- Promote the use of standardized tooling to improve efficiency and consistency throughout the organization.
Supporting
- Enable your Agile teams to access subject-matter expertise by facilitating knowledge transfer and documenting good practices.
Governing
- Create operational boundaries for Agile teams, and monitor their progress and ability to meet business objectives within these boundaries.
Monitoring
- Demonstrate the value the CoE is providing through effective metric setting and ongoing monitoring of Agile’s effectiveness.
Guiding
- Provide guidance, methodology, and knowledge for teams to leverage to effectively meet organizational business objectives.
Many organizations encounter challenges to scaling Agile
Tackle the following barriers to Agile adoption with a business-aligned ACE.
List based on reported impediments from VersionOne’s 13th Annual State of Agile Report (N=1,319)
- Organizational culture at odds with Agile values
- The ACE identifies and measures the value of Agile to build support from senior business leaders for shifting the organizational culture and achieving tangible business benefits.
General organizational resistance to change
- Resistance comes from a lack of trust. Optimized value delivery from Info-Tech’s Agile adoption model will build the necessary social capital to drive cultural change.
Inadequate management support and sponsorship
- Establishing an ACE will require senior management support and sponsorship. Its formation sends a strong signal to the organizational leadership that Agile is here to stay.
Lack of skills/experience with Agile methods
- The ACE provides a vehicle to absorb external training into an internal development program so that Agile capabilities can be grown organically within the organization.
Inconsistent processes and practices across teams
- The ACE provides support to individual Agile teams and will guide them to adopt consistent processes and practices which have a proven track record in the organization.
Insufficient training and education
- The ACE will assist teams with obtaining the Agile skills training they need to be effective in the organization, and support a culture of continuous learning.
Overcome your Agile scaling challenges with a business aligned ACE
An ACE drives consistency and transparency without sacrificing the ability to innovate. It can build on the success of your Agile pilot(s) by encouraging practices known to work in your organization.
Support Agile Teams
Provide services designed to inject evolving good practices into workflows and remove impediments or roadblocks from your Agile team’s ability to deliver value.
Maintain Business Alignment
Maintain alignment with corporate objectives without impeding business agility in the long term. The ACE functions as an interface layer so that changing expectations can be adapted without negatively impacting Agile teams.
Facilitate Learning Events
Avoid the risk of innovation and subject-matter expertise being lost or siloed by facilitating knowledge transfer and fostering a continuous learning environment.
Govern Improvements
Set baselines, monitor metrics, and run retrospectives to help govern process improvements and ensure that Agile teams are delivering expected benefits.
Shift Culture
Instill Agile thinking and behavior into the organization. The ACE must encourage innovation and be an effective agent for change.
Use your ACE to go from “doing” Agile to “being” Agile
Organizations that do Agile without embracing the changes in behavior will not reap the benefits.
Doing what was done before
- Processes and Tools
- Comprehensive Documentation
- Contract Negotiation
- Following a Plan
Being Prescriptive
Going through the motions
- Uses SCRUM and tools such as Jira
- Plans multiple sprints in detail
- Talks to stakeholders once in a release
- Works off a fixed scope BRD
Doing Agile
Living the principles
- Individuals and Interactions
- Working Software
- Customer Collaboration
- Responding to Change
Being Agile
“(‘Doing Agile’ is) just some rituals but without significant change to support the real Agile approach as end-to-end, business integration, value focus, and team empowerment.” - Arie van Bennekum
Establishing a CoE does not guarantee success
Simply establishing a Center of Excellence for any discipline does not guarantee its success:
The 2019 State of DevOps Report found that organizations which had established DevOps CoEs underperformed compared to organizations which adopted other approaches for driving DevOps transformation. (Accelerate State of DevOps Report 2019 [N=~1,000])
Still, Agile Centers of Excellence can and do successfully drive Agile adoption in organizations. So what sets the successful examples apart from the others? Here’s what some have to say:
“The ACE must be staffed with qualified people with delivery experience! … [It is] effectively a consulting practice, that can evolve and continuously improve its services … These services are collectively about ‘enablement’ as an output, more than pure training … and above all, the ability to empirically measure the progress” – Paul Blaney, TD Bank
“When leaders haven’t themselves understood and adopted Agile approaches, they may try to scale up Agile the way they have attacked other change initiatives: through top-down plans and directives. The track record is better when they behave like an Agile team. That means viewing various parts of the organization as their customers.” – HBR, “Agile at Scale”
“the Agile CoE… is truly meant to be measured by the success of all the other groups, not their own…[it] is meant to be serving the teams and helping them improve, not by telling them what to do, but rather by listening, understanding and helping them adapt.” - Bart Gerardi, PMI
“The CoE must also avoid becoming static, as it’s crucial the team can adjust as quickly as business and customer needs change, and evolve the technology as necessary to remain competitive.” – Forbes, “RPA CoE (what you need to know)”
"The best CoEs are formed from thought leaders and change agents within the CoE domain. They are the process and team innovators who will influence your CoE roadmap and success. Select individuals who feel passionate about Agile." – Hans Eckman, InfoTech
To be successful with your ACE, do the following…
Info-Tech Insight
Simply establishing an Agile Center of Excellence does not guarantee its success. When setting up your ACE, optimize its impact on the organization by doing the following 3 things:
- Define ACE services based on stakeholder needs. Be sure to broadly survey your stakeholders and identify the ACE functions and services which will best meet their needs. ACE services must clearly deliver business value to the organization and the Agile teams it supports.
- Staff the ACE strategically. Select ACE team members who have real world, hands-on delivery experience, and are well respected by the Agile teams they will serve. Where possible, select internal thought leaders in your organization who have the credibility needed to effect positive change.
- Continuously improve ACE services based on metrics and feedback. The value your ACE brings to the organization must be clear and measurable, and do not assume that your functions and services will remain static. You must regularly monitor both your metrics and feedback from your Agile teams, and adjust ACE behavior to improve/maximize these over time.
Spread Best Practices With an Agile Center of Excellence
This blueprint will walk you through the steps needed to build the foundations for operational excellence within an Agile Center of Excellence.
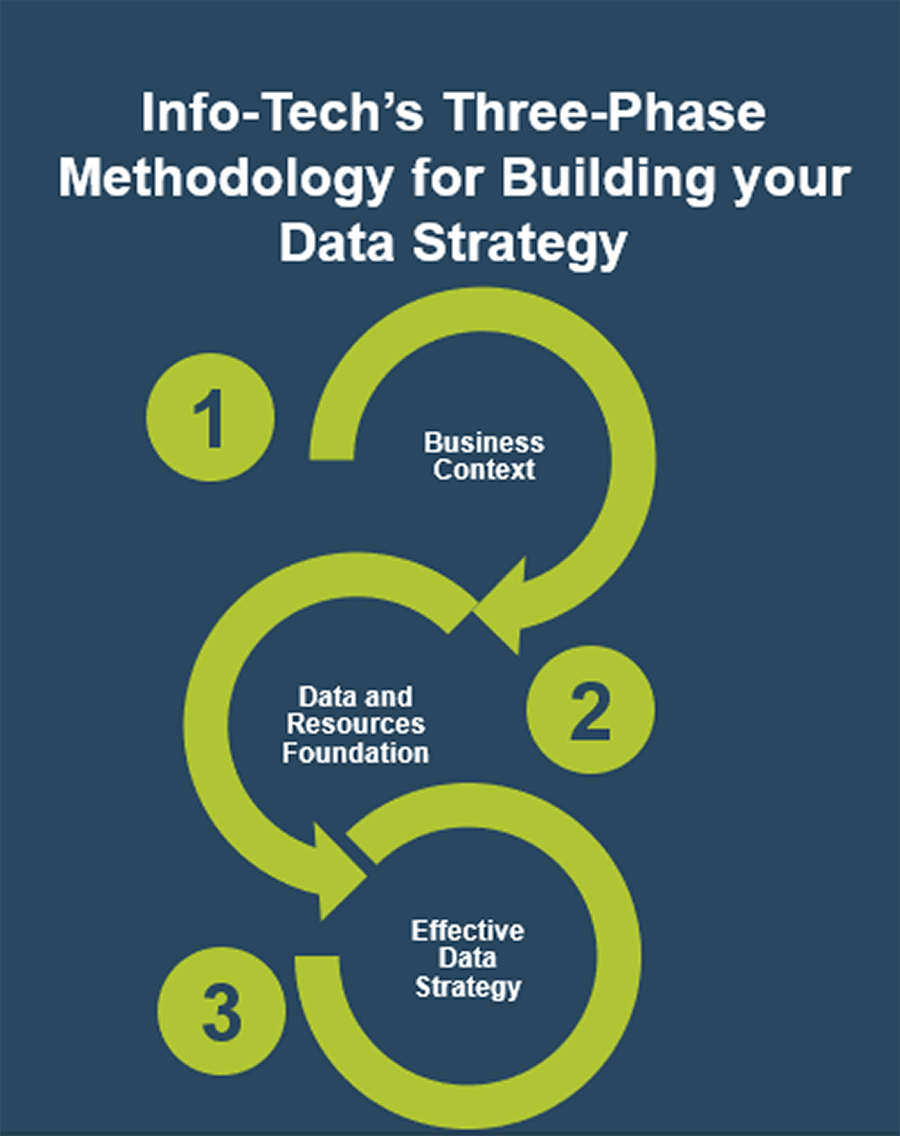
Phase 1 - Strategically Align the CoE
Create strategic alignment between the CoE and the organization’s goals, objectives, and vision. This alignment translates into the CoE mandate intended to enhance the way Agile will enable teams to meet business objectives.
Phase 2 - Standardize the CoEs Service Offerings
Build an engagement plan based on a standardized adoption model to ensure your CoE service offerings are accessible and consistent across the organization. Create and consolidate key performance indicators to measure the CoEs utility and whether or not the expected value is being translated to tangible results.
Phase 3 - Operate the CoE
Operate the CoE to provide service offerings to Agile teams, identify improvements to optimize the function of your Agile teams, and effectively manage and communicate change so that teams can grow within the Agile adoption model and optimize value delivery both within your Agile environment and across functions.
Info-Tech’s Practice Adoption Journey
Use Info-Tech’s Practice Adoption Journey model to establish your ACE. Building social capital (stakeholders’ trust in your ability to deliver positive outcomes) incrementally is vital to ensure that everyone is aligned to new mindsets and culture as your Agile practices scale.
Trust & Competency ↓
DEFINE
Begin to document your development workflow or value chain, implement a tracking system for KPIs, and start gathering metrics and reporting them transparently to the appropriate stakeholders.
ITERATE
Use collected metrics and retrospectives to stabilize team performance by reducing areas of variability in your workflow and increasing the consistency at which targets are met.
COLLABORATE
Use information to support changes and adopt appropriate practices to make incremental improvements to the existing environment.
EMPOWER
Drive behavioral and cultural changes that will empower teams to be accountable for their own success and learning.
INNOVATE
Use your built-up trust and support practice innovation, driving the definition and adoption of new practices.
Align your ACE with your organization’s strategy
This research set will assist you with aligning your ACEs services to the objectives of the business in order to justify the resources and funding required by your Agile program.
Business Objectives → Alignment ←ACE Functions
Business justification to continue to fund a Center of Excellence can be a challenge, especially with traditional thinking and rigid stakeholders. Hit the ground running and show value to your key influencers through business alignment and metrics that will ensure that the ACE is worth continuous investment.
Alignment leads to competitive advantage
The pace of change in customer expectations, competitive landscapes, and business strategy is continuously increasing. It is critical to develop a method to facilitate ongoing alignment to shifting business and development expectations seamlessly and ensure that your Agile teams are able to deliver expected business value.
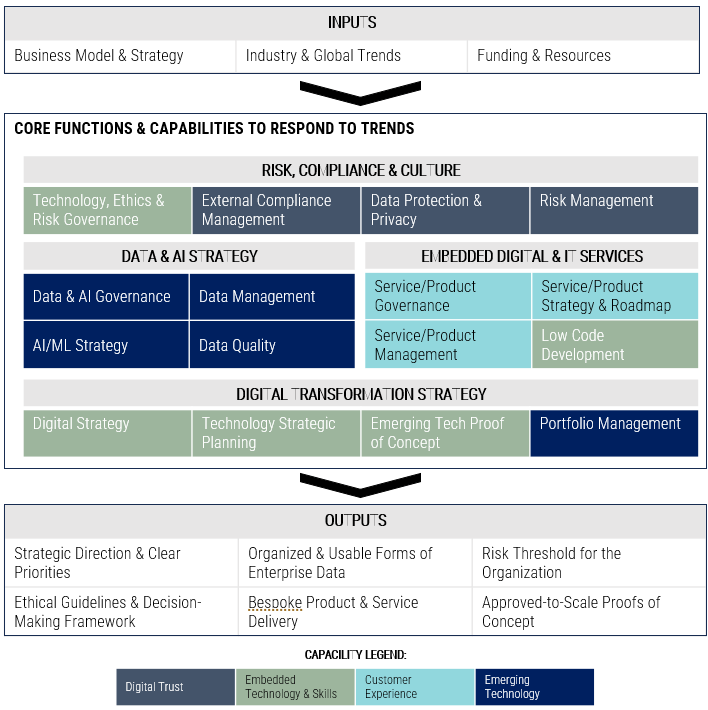
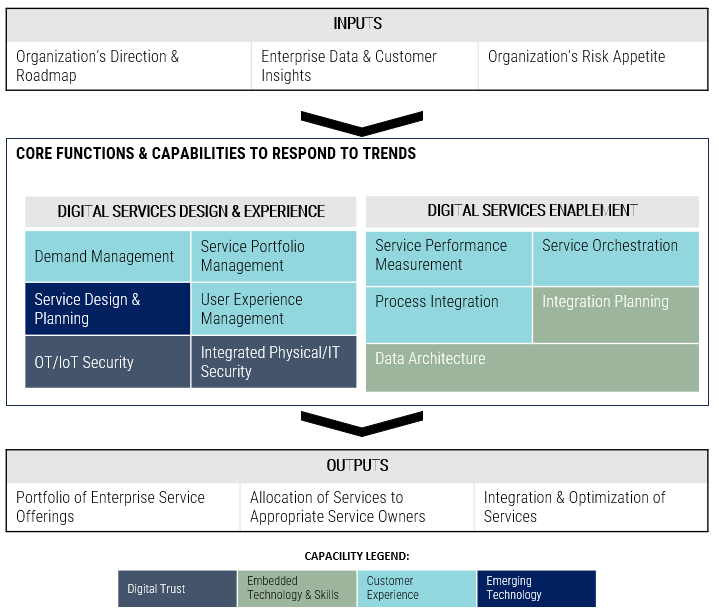
Use Info-Tech’s CoE Operating Model to define the service offerings of your ACE
Understand where your inputs and outputs lie to create an accessible set of service offerings for your Agile teams.
Continuously improve the ACE to ensure long-term viability
Improvement involves the continuous evaluation of the performance of your teams, using well-defined metrics and reasonable benchmarks that are supplemented by analogies and root-cause analysis in retrospectives.
Monitor
Monitor your metrics to ensure desired benefits are being realized. The ACE is responsible for ensuring that expected Agile benefits are achievable and on track. Monitor against your defined baselines to create transparency and accountability for desired outcomes.
Iterate
Run retrospectives to drive improvements and fixes into Agile projects and processes. Metrics falling short of expectations must be diagnosed and their root causes found, and fixes need to be communicated and injected back into the larger organization.
Define
Define metrics and set targets that align with the goals of the ACE. These metrics represent the ACEs expected value to the organization and must be measured against on a regular basis to demonstrate value to your key stakeholders.
Beware the common risks of implementing your ACE
Culture clash between Agile teams and larger organization
Agile leverages empowered teams, meritocracy, and broad collaboration for success, but typical organizations are siloed and hierarchical with top down decision making. There needs to be a plan to enable a smooth transition from the current state towards the Agile target state.
Persistence of tribal knowledge
Agile relies on easy and open knowledge sharing, but organizational knowledge can sit in siloes. Employees may also try to protect their expertise for job security. It is important to foster knowledge sharing to ensure that critical know-how is accessible and doesn’t leave the organization with the individual.
Rigid management structures
Rigidity in how managers operate (performance reviews, human resource management, etc.) can result in cultural rejection of Agile. People need to be assessed on how they enable their teams rather than as individual contributors. This can help ensure that they are given sufficient opportunities to succeed. More support and less strict governance is key.
Breakdown due to distributed teams
When face-to-face interactions are challenging, ensure that you invest in the right communication technologies and remove cultural and process impediments to facilitate organization-wide collaboration. Alternative approaches like using documentation or email will not provide the same experience and value as a face-to-face conversation.
The State of Maine used an ACE to foster positive cultural change
CASE STUDY
Industry - Government
Source - Cathy Novak, Agile Government Leadership
The State of Maine’s Agile Center of Excellence
“The Agile CoE in the State of Maine is completely focused on the discipline of the methodology. Every person who works with Agile, or wants to work with Agile, belongs to the CoE. Every member of the CoE tells the same story, approaches the methodology the same way, and uses the same tools. The CoE also functions as an Agile research lab, experimenting with different standards and tools.
The usual tools of project management – mission, goals, roles, and a high-level definition of done – can be found in Maine’s Agile CoE. For story mapping, teams use sticky notes on a large wall or whiteboard. Demonstrating progress this way provides for positive team dynamics and a psychological bang. The State of Maine uses a project management framework that serves as its single source of truth. Everyone knows what’s going on at all times and understands the purpose of what they are doing. The Agile team is continually looking for components that can be reused across other agencies and programs.”
Results:
- Realized positive culture change, leading to more collaborative and supportive teams.
- Increased visibility of Agile benefits across functional groups.
- Standardized methodology across Agile teams and increased innovation and experimentation with new standards and tools.
- Improved traceability of projects.
- Increased visibility and ability to determine root causes of problems and right the course when outcomes are not meeting expectations.
Info-Tech offers various levels of support to best suit your needs
DIY Toolkit
“Our team has already made this critical project a priority, and we have the time and capability, but some guidance along the way would be helpful.”
Guided Implementation
“Our team knows that we need to fix a process, but we need assistance to determine where to focus. Some check-ins along the way would help keep us on track.”
Workshop
“We need to hit the ground running and get this project kicked off immediately. Our team has the ability to take this over once we get a framework and strategy in place.”
Consulting
“Our team does not have the time or the knowledge to take this project on. We need assistance through the entirety of this project.”
Diagnostics and consistent frameworks used throughout all four options
Spread Best Practices With an Agile Center of Excellence – project overview
| |
1. Strategically align the Center of Excellence |
2. Standardize the CoEs service offerings |
3. Operate the Center of Excellence |
| Best-Practice Toolkit |
1.1 Determine the vision of your ACE.
1.2 Define the service offerings of your ACE. |
2.1 Define an adoption plan for your Agile teams.
2.2 Create an ACE engagement plan.
2.3 Define metrics to measure success. |
3.1 Optimize the success of your ACE.
3.2 Plan change to enhance your Agile initiatives.
3.3 Conduct ongoing retrospectives of your ACE. |
| Guided Implementations |
- Align your ACE with the business.
- Align your ACE with its users.
|
- Dissect the key attributes of Agile adoption.
- Form engagement plans for your Agile teams.
- Discuss effective ACE metrics.
|
- Conduct a baseline assessment of your Agile environment.
- Interface ACE with your change management function.
- Build a communications deck for key stakeholders.
|
| Onsite Workshop |
Module 1: Strategically align the ACE |
Module 2: Standardize the offerings of the ACE |
Module 3: Prepare for organizational change |
| |
Phase 1 Outcome: Create strategic alignment between the CoE and organizational goals. |
Phase 2 Outcome: Build engagement plans and key performance indicators based on a standardized Agile adoption plan. |
Phase 3 Outcome: Operate the CoEs monitoring function, identify improvements, and manage the change needed to continuously improve. |
Workshop overview
Contact your account representative or email Workshops@InfoTech.com for more information.
| |
Workshop Module 1 |
Workshop Module 2 |
Workshop Module 3 |
Workshop Module 4 |
| Activities |
Determine vision of CoE
1.1 Identify and prioritize organizational business objectives.
1.2 Form use cases for the points of alignment between your ACE and business objectives.
1.3 Prioritize your ACE stakeholders. |
Define service offerings of CoE
2.1 Form a solution matrix to organize your pain points and opportunities.
2.2 Refine your use cases to identify your ACE functions and services.
2.3 Visualize your ACE functions and service offerings with a capability map. |
Define engagement plans
3.1 Further categorize your use cases within the Agile adoption model.
3.2 Create an engagement plan for each level of adoption. |
Define metrics and plan communications
4.1 Define metrics that align with your Agile business objectives.
4.2 Define target ACE performance metrics.
4.3 Define Agile adoption metrics.
4.4 Assess the interaction and communication points of your Agile team.
4.5 Create a communication plan for change. |
| Deliverables |
- Prioritized business objectives
- Business-aligned use cases to form CoEs service offerings
- Prioritized list of stakeholders
|
- Classified pains and opportunities
- Refined use cases based on pains and opportunities identified during ACE requirements gathering
- ACE capability map
|
- Adoption-aligned service offerings
- Role-specific engagement plans
|
- Business objective-aligned metrics
- ACE performance metrics
- Agile adoption metrics
- Assessment of organization design
- ACE Communication Plan
|
Phase 1
Strategically Align the Center of Excellence
Spread Best Practices With an Agile Center of Excellence
Begin by strategically aligning your Center of Excellence
The first step to creating a high-functioning ACE is to create alignment and consensus amongst your key stakeholders regarding its purpose. Engage in a set of activities to drill down into the organization’s goals and objectives in order to create a set of high-level use cases that will evolve into the service offerings of the ACE.
Phase 1 - Strategically Align the CoE
Create strategic alignment between the CoE and the organization’s goals, objectives, and vision. This alignment translates into the CoE mandate intended to enhance the way Agile will enable teams to meet business objectives.
Phase 2 - Standardize the CoEs Service Offerings
Build an engagement plan based on a standardized adoption model to ensure your CoE service offerings are accessible and consistent across the organization. Create and consolidate key performance indicators to measure the CoEs utility and whether or not the expected value is being translated to tangible results.
Phase 3 - Operate the CoE
Operate the CoE to provide service offerings to Agile teams, identify improvements to optimize the function of your Agile teams, and effectively manage and communicate change so that teams can grow within the Agile adoption model and optimize value delivery both within your Agile environment and across functions.
Phase 1 outline
Call 1-888-670-8889 or email GuidedImplementations@InfoTech.com for more information.
Complete these steps on your own, or call us to complete a guided implementation. A guided implementation is a series of
2-3 advisory calls that help you execute each phase of a project. They are included in most advisory memberships.
Guided Implementation 1: Strategically align the ACE
Proposed Time to Completion (in weeks): 1
Step 1.1: Determine the vision of your ACE
Start with an analyst kick off call:
- Align your ACE with the business.
Then complete these activities…
1.1.1 Optional: Baseline your ACE maturity.
1.1.2 Identify and prioritize organizational business objectives.
1.1.3 Form use cases for the points of alignment between your ACE and business objectives.
1.1.4 Prioritize your ACE stakeholders.
1.1.5 Select a centralized or decentralized model for your ACE.
1.1.6 Staff your ACE strategically.
Step 1.2: Define the service offerings of your ACE
Start with an analyst kick off call:
- Align your ACE with its users.
Then complete these activities…
1.2.1 Form the Center of Excellence.
1.2.2 Gather and document your existing Agile practices for the CoE.
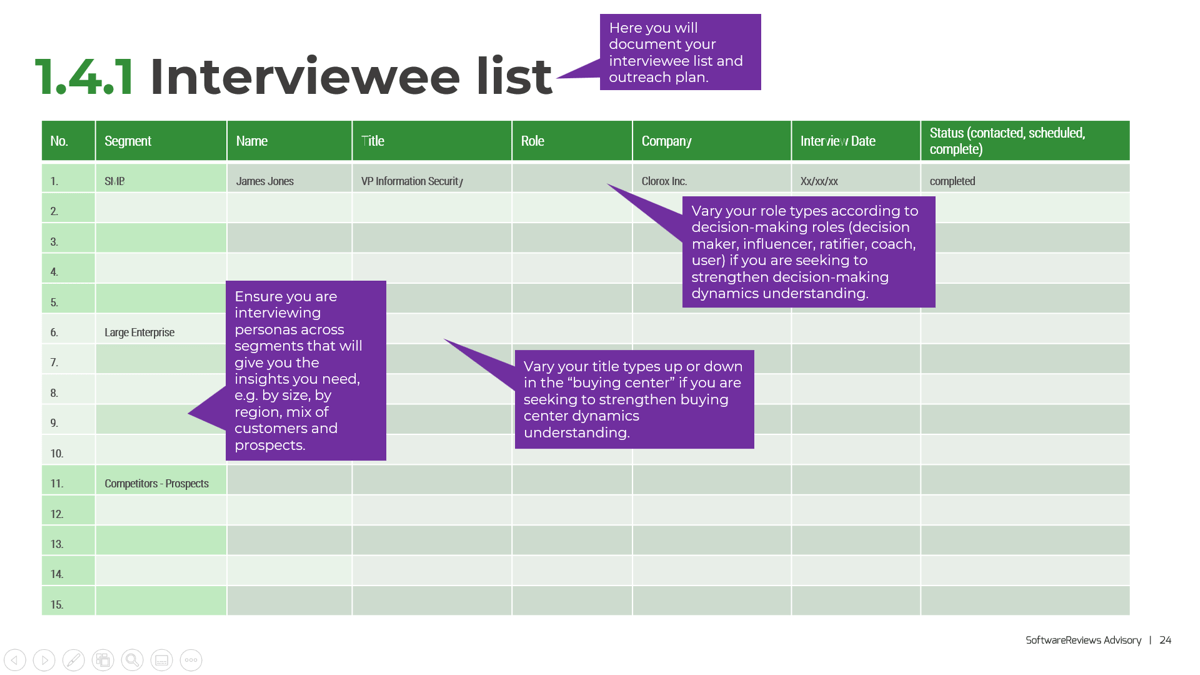
1.2.3 Interview stakeholders to align ACE requirements with functional expectations.
1.2.4 Form a solution matrix to organize your pain points and opportunities.
1.2.5 Refine your use cases to identify your ACE functions and services.
1.2.6 Visualize your ACE functions and service offerings with a capability map.
Phase 1 Results & Insights:
- Aligning your ACE with the functional expectations of its users is just as critical as aligning with the business. Invest the time to understand how the ACE fits at all levels of the organization to ensure its highest effectiveness.
Phase 1, Step 1: Determine the vision of your ACE
Phase 1
1.1 Determine the vision of your ACE
1.2 Define the service offerings of your ACE
Phase 2
2.1 Define an adoption plan for your Agile teams
2.2 Create an ACE engagement plan
2.3 Define metrics to measure success
Phase 3
3.1 Optimize the success of your ACE
3.2 Plan change to enhance your Agile initiatives
3.3 Conduct ongoing retrospectives of your ACE
Activities:
1.1.1 Optional: Baseline your ACE maturity.
1.1.2 Identify and prioritize organizational business objectives.
1.1.3 Form use cases for the points of alignment between your ACE and business objectives.
1.1.4 Prioritize your ACE stakeholders.
1.1.5 Select a centralized or decentralized model for your ACE.
1.1.6 Staff your ACE strategically.
Outcomes:
- Gather your leadership to position the ACE and align it with business priorities.
- Form a set of high-level use cases for services that will support the enablement of business priorities.
- Map the stakeholders of the ACE to visualize expected influence and current support levels for your initiative.
What does an ACE do?
Six main functions derived from Info-Tech’s CLAIM+G Framework
- Learning
- Provide training and development and enable engagement based on identified interaction points to foster organizational growth.
Tooling
- Promote the use of standardized tooling to improve efficiency and consistency throughout the organization.
Supporting
- Enable your Agile teams to access subject-matter expertise by facilitating knowledge transfer and documenting good practices.
Governing
- Create operational boundaries for Agile teams, and monitor their progress and ability to meet business objectives within these boundaries.
Monitoring
- Demonstrate the value the CoE is providing through effective metric setting and ongoing monitoring of Agile’s effectiveness.
Guiding
- Provide guidance, methodology, and knowledge for teams to leverage to effectively meet organizational business objectives.
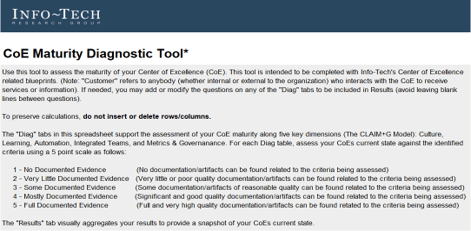
OPTIONAL: If you have an existing ACE, use Info-Tech’s CoE Maturity Diagnostic Tool to baseline current practices
1.1.1 Existing CoE Maturity Assessment
Purpose
If you already have established an ACE, use Info-Tech’s CoE Maturity Diagnostic Tool to baseline its current maturity level (this will act as a baseline for comparison after you complete this Blueprint). Assessing your ACEs maturity lets you know where you currently are, and where to look for improvements.
Steps
- Download the CoE Maturity Diagnostic Tool to assess the maturity of your ACE.
- Complete the assessment tool with all members of your ACE team to determine your current Maturity score.
- Document the results in the ACE Communications Deck.
Document results in the ACE Communications Deck.
INFO-TECH DELIVERABLE
Download the CoE Maturity Diagnostic Tool.
Get your Agile leadership together and position the ACE
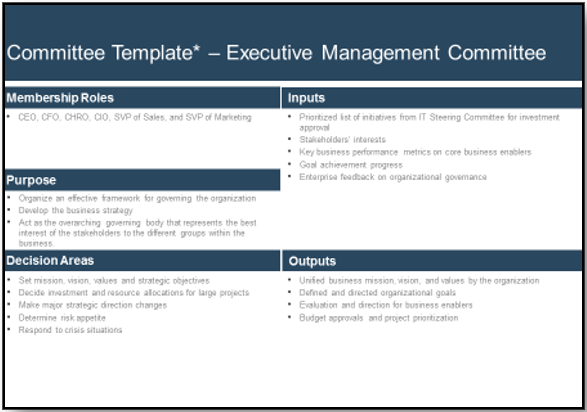
| Stakeholder |
Role |
Why they are essential players |
| CIO/ Head of IT |
Program sponsor: Champion and set the tone for the Agile program. Critical in gaining and maintaining buy-in and momentum for the spread of Agile service offerings. |
The head of IT has insight and influence to drive buy-in from executive stakeholders and ensure the long-term viability of the ACE. |
| Applications Director |
Program executor: Responsible for the formation of the CoE and will ensure the viability of the initial CoE objectives, use cases, and service offerings. |
Having a coordinator who is responsible for collating performance data, tracking results, and building data-driven action plans is essential to ensuring continuous success. |
| Agile Subject-Matter Experts |
Program contributor: Provide information on the viability of Agile practices and help build capabilities on existing best practices. |
Agile’s success relies on adoption. Leverage the insights of people who have implemented and evangelized Agile within your organization to build on top of a working foundation. |
| Functional Group Experts |
Program contributor: Provide information on the functional group’s typical processes and how Agile can achieve expected benefits. |
Agile’s primary function is to drive value to the business – it needs to align with the expected capabilities of existing functional groups in order to enhance them for the better. |
Align your ACE with your organization’s strategy
This research set will assist you with aligning your ACEs services to the objectives of the business in order to justify the resources and funding required by your Agile program.
Business Objectives → Alignment ←ACE Functions
Business justification to continue to fund a Center of Excellence can be a challenge, especially with traditional thinking and rigid stakeholders. Hit the ground running and show value to your key influencers through business alignment and metrics that will ensure that the ACE is worth continuous investment.
Alignment leads to competitive advantage
The pace of change in customer expectations, competitive landscapes, and business strategy is continuously increasing. It is critical to develop a method to facilitate ongoing alignment to shifting business and development expectations seamlessly and ensure that your Agile teams are able to deliver expected business value.
Activity: Identify and prioritize organizational business objectives
1.1.2 2 Hours
Input
- Organizational business objectives
Output
- Prioritized business objectives
Materials
Participants
- List the primary high-level business objectives that your organization aims to achieve over the course of the following year (focusing on those that ACE can impact/support).
- Prioritize these business objectives while considering the following:
- Criticality of completion: How critical is the initiative in enabling the business to achieve its goals?
- Transformational impact: To what degree is the foundational structure of the business affected by the initiative (rationale: Agile can support impact on transformational issues)?
Document the hypothesized role of Agile in supporting these business objectives. Take the top three prioritized objectives forward for the establishment of your ACE. While in future years or iterations you can inject more offerings, it is important to target your service offerings to specific critical business objectives to gain buy-in for long-term viability of the CoE.
Sample Business Objectives:
- Increase customer satisfaction.
- Reduce time-to-market of product releases.
- Foster a strong organizational culture.
- Innovate new feature sets to differentiate product. Increase utilization rates of services.
- Reduce product delivery costs.
- Effectively integrate teams from a merger.
- Offer more training programs for personal development.
- Undergo a digital transformation.
Understand potential hurdles when attempting to align with business objectives
While there is tremendous pressure to align IT functions and the business due to the accelerating pace of change and technology innovation, you need to be aware that there are limitations in achieving this goal. Keep these challenges at the top of mind as you bring together your stakeholders to position the service offerings of your ACE. It is beneficial to make your stakeholders self-aware of these biases as well, so they come to the table with an open mind and are willing to find common ground.
The search for total alignment
There are a plethora of moving pieces within an organization and total alignment is not a plausible outcome.
The aim of a group should not be to achieve total alignment, but rather reframe and consider ways to ensure that stakeholders are content with the ways they interact and that misalignment does not occur due to transparency or communication issues.
“The business” implies unity
While it may seem like the business is one unified body, the reality is that the business can include individuals or groups (CEO, CFO, IT, etc.) with conflicting priorities. While there are shared business goals, these entities may all have competing visions of how to achieve them. Alignment means compromise and agreement more than it means accommodating all competing views.
Cost vs. reputation
There is a political component to alignment, and sometimes individual aspirations can impede collective gain.
While the business side may be concerned with cost, those on the IT side of things can be concerned with taking on career-defining projects to bolster their own credentials. This conflict can lead to serious breakdowns in alignment.
Panera Bread used Agile to adapt to changing business needs
CASE STUDY
Industry Food Services
Source Scott Ambler and Associates, Case Study
Challenge
Being in an industry with high competition, Panera Bread needed to improve its ability to quickly deliver desired features to end customers and adapt to changing business demands from high internal growth.
Solution
Panera Bread engaged in an Agile transformation through a mixture of Agile coaching and workshops, absorbing best practices from these engagements to drive Agile delivery frameworks across the enterprise.
Results
Adopting Agile delivery practices resulted in increased frequency of solution delivery, improving the relationship between IT and the business. Business satisfaction increased both with the development process and the outcomes from delivery.
The transparency that was needed to achieve alignment to rapidly changing business needs resulted in improved communication and broad-scale reduced risk for the organization.
"Agile delivery changed perception entirely by building a level of transparency and accountability into not just our software development projects, but also in our everyday working relationships with our business stakeholders. The credibility gains this has provided our IT team has been immeasurable and immediate."
– Mike Nettles, VP IT Process and Architecture, Panera Bread
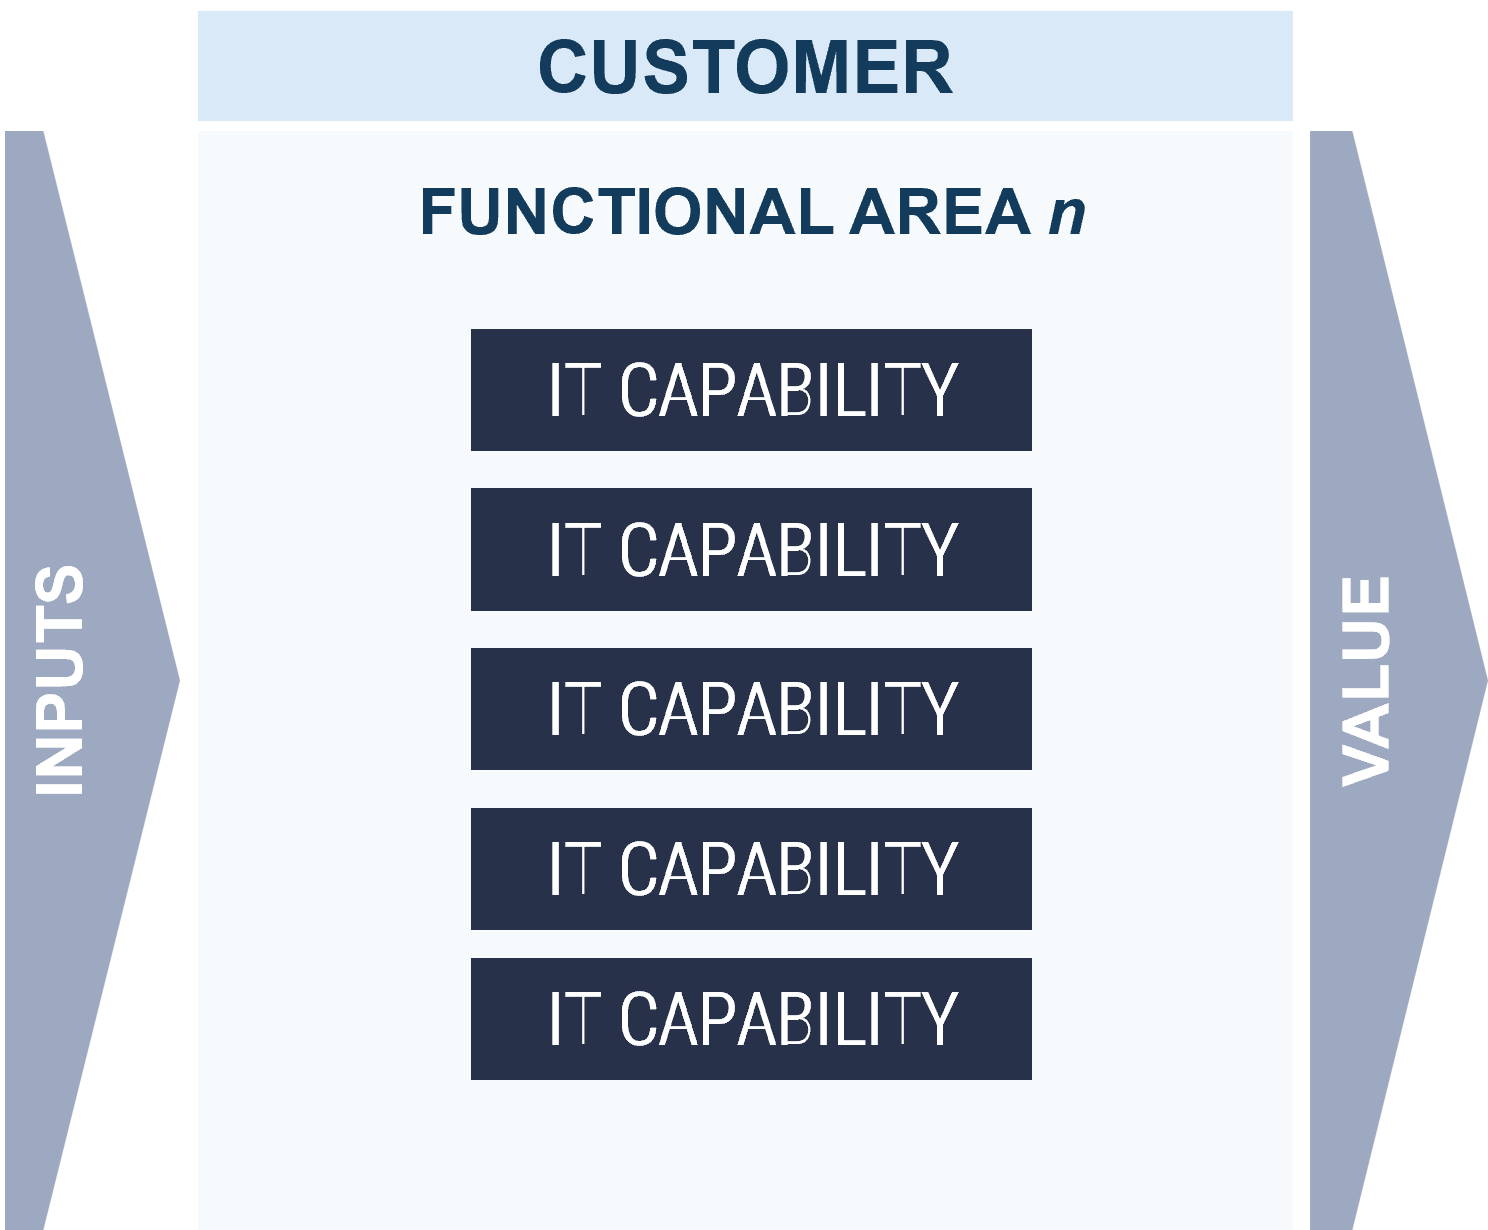
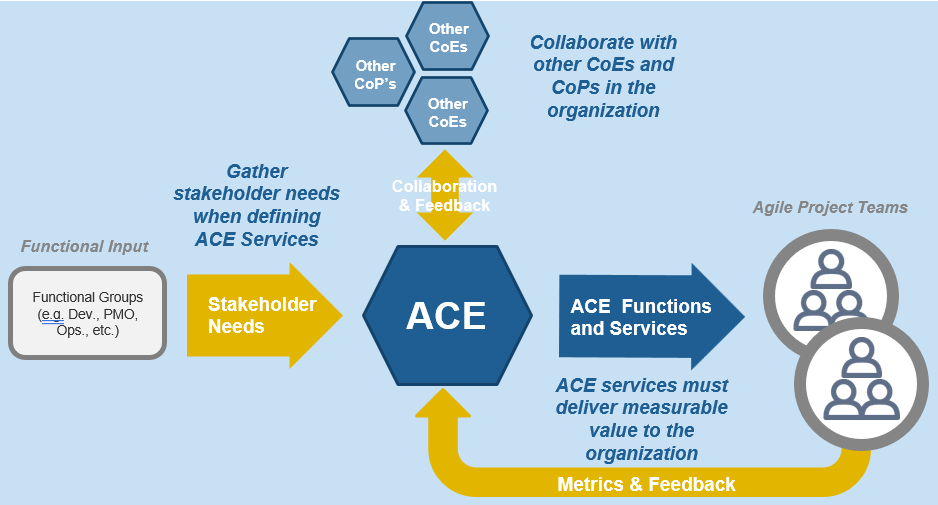
Use Info-Tech’s CoE Operating Model to define the service offerings of your ACE
Understand where your inputs and outputs lie to create an accessible set of service offerings for your Agile teams.
Functional Input
- Application Development
- Project Management
- CIO
- Enterprise Architecture
- Data Management
- Security
- Infrastructure & Operations
- Who else?
Input arrows represent functional group needs, feedback from Agile teams, and collaboration with other CoEs and CoPs
Output arrows represent the services the CoE delivers and the benefits realized across the organization.
ACE Operating Model: Governance & Metrics
Governance & Metrics involves enabling success through the management of the ACEs resources and services, and ensuring that organizational structures evolve in concert with Agile growth and maturity. Your focus should be on governing, measuring, implementing, and empowering improvements.
Effective governance will function to ensure the long-term effectiveness and viability of your ACE. Changes and improvements will happen continuously and you need a way to decide which to adopt as best practices.
"Organizations have lengthy policies and procedures (e.g. code deployment, systems design, how requirements are gathered in a traditional setting) that need to be addressed when starting to implement an Agile Center of Excellence. Legacy ideas that end up having legacy policy are the ones that are going to create bottlenecks, waste resources, and disrupt your progress." – Doug Birgfeld, Senior Partner, Agile Wave
Governance & Metrics
- Manage organizational Agile standards, policies, and procedures.
- Define organizational boundaries based on regulatory, compliance, and cultural requirements.
- Ensure ongoing alignment of service offerings with business objectives.
- Adapt organizational change management policies to reflect Agile practices.
- CoE governance functions include:
- Policy Management
- Change Management
- Risk Management
- Stakeholder Management
- Metrics/Feedback Monitoring
ACE Operating Model: Services
Services refers to the ability to deliver resourcing, guidance, and assistance across all Agile teams. By creating a set of shared services, you enable broad access to specialized resources, knowledge, and insights that will effectively scale to more teams and departments as Agile matures in your organization.
A Services model:
- Supports the organization by standardizing and centralizing service offerings, ensuring consistency of service delivery and accessibility across functional groups.
- Provides a mechanism for efficient knowledge transfer and on-demand support.
- Helps to drive productivity and project efficiencies through the organization by disseminating best practices.
Services
- Provide reference, support, and re-assurance to implement and adapt organizational best practices.
- Interface relevant parties and facilitate knowledge transfer through shared learning and communities of practice.
- Enable agreed-upon service levels through standardized support structures.
- Shared services functions include:
- Engagement Planning
- Knowledge Management
- Subject-Matter Expertise
- Agile Team Evaluation
ACE Operating Model: Technology
Technology refers to a broad range of supporting tools to enable employees to complete their day-to-day tasks and effectively report on their outcomes. The key to technological support is to strike the right balance between flexibility and control based on your organization's internal and external constraints (policy, equipment, people, regulatory, etc.).
"We sometimes forget the obvious truth that technology provides no value of its own; it is the application of technology to business opportunities that produces return on investment." – Robert McDowell, Author, In Search of Business Value
Technology
- Provide common software tools to enable alignment to organizational best practices.
- Enable access to locally desired tools while considering organizational, technical, and scaling constraints.
- Enable communication with a technical subject matter expert (SME).
- Enable reporting consistency through training and maintenance of reporting mechanisms.
- Technology functions can include:
- Vendor Management
- Application Support
- Tooling Standards
- Tooling Use Cases
ACE Operating Model: Staff
Staff is all about empowerment. The ACE should support and facilitate the sharing of ideas and knowledge sharing. Create processes and spaces where people are encouraged to come together, learn from, and share with each other. This setting will bring up new ideas to enhance productivity and efficiency in day-to-day activities while maintaining alignment with business objectives.
"An Agile CoE is legitimized by its ability to create a space where people can come together, share, and learn from one another. By empowering teams to grow by themselves and then re-connect with each other you allow the creativity of your employees to flow back into the CoE." – Anonymous, Founder, Agile consultancy group
Staff
- Develop and provide training and day-to-day coaching that are aligned with organizational engagement and growth plans.
- Include workflow change management to assist traditional roles with accommodating Agile practices.
- Support the facilitation of knowledge transfer from localized Agile teams into other areas of the organization.
- Achieve team buy-in and engagement with ACE services and capabilities. Provide a forum for collaboration and innovation.
- People functions can include:
- Onboarding
- Coaching
- Learning Facilitation
Form use cases to align your ACE with business objectives
What is a use case?
A use case tells a story about how a system will be used to achieve a goal from the perspective of a user of that system. The people or other systems that interact with the use case are called “actors.” Use cases describe what a system must be able to do, not how it will do it.
How does a use case play a role in building your ACE?
Use cases are used to guide design by allowing you to highlight the intended function of a service provided by the Center of Excellence while maintaining a business focus. Jumping too quickly to a solution without fully understanding user and business needs leads to the loss of stakeholder buy-in and the Centers of Excellence rejection by teams.
Hypothesized ACE user needs →Use Case←Business objective
Activity: Form use cases for the points of alignment between your ACE and business objectives
1.1.3 2 Hours
Input
- Prioritized business objectives
- ACE functions
Output
Materials
Participants
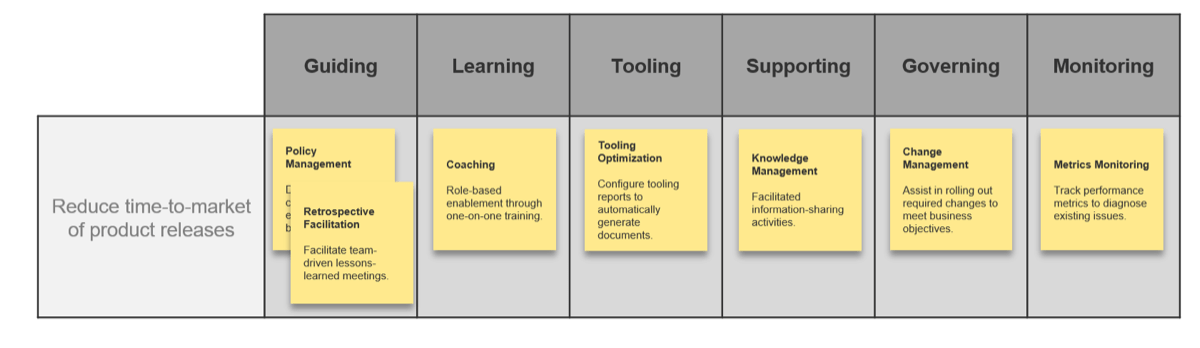
- Using your prioritized business objectives and the six functions of a CoE, create high-level use cases for each point of alignment that describe how the Center of Excellence will better facilitate the realization of that business objective.
- For each use case, define the following:
- Name: Generalized title for the use case.
- Description: A high-level description of the expected CoE action.
| |
|
AGILE CENTER OF EXCELLENCE FUNCTIONS: |
| |
|
Guiding |
Learning |
Tooling |
Supporting |
Governing |
Monitoring |
| BUSINESS OBJECTIVES |
Reduce time-to-market of product releases |
|
|
|
|
|
|
| Reduce product delivery costs |
|
|
|
|
|
|
| Effectively integrate teams from a merger |
|
|
|
|
|
|
Activity: Form use cases for the points of alignment between your ACE and business objectives (continued)
1.1.3 2 Hours
Your goal should be to keep these as high level and generally applicable as possible as they provide an initial framework to further develop your service offerings. Begin to talk about the ways in which the ACE can support the realization of your business objectives and what those interactions may look like to customers of the ACE.
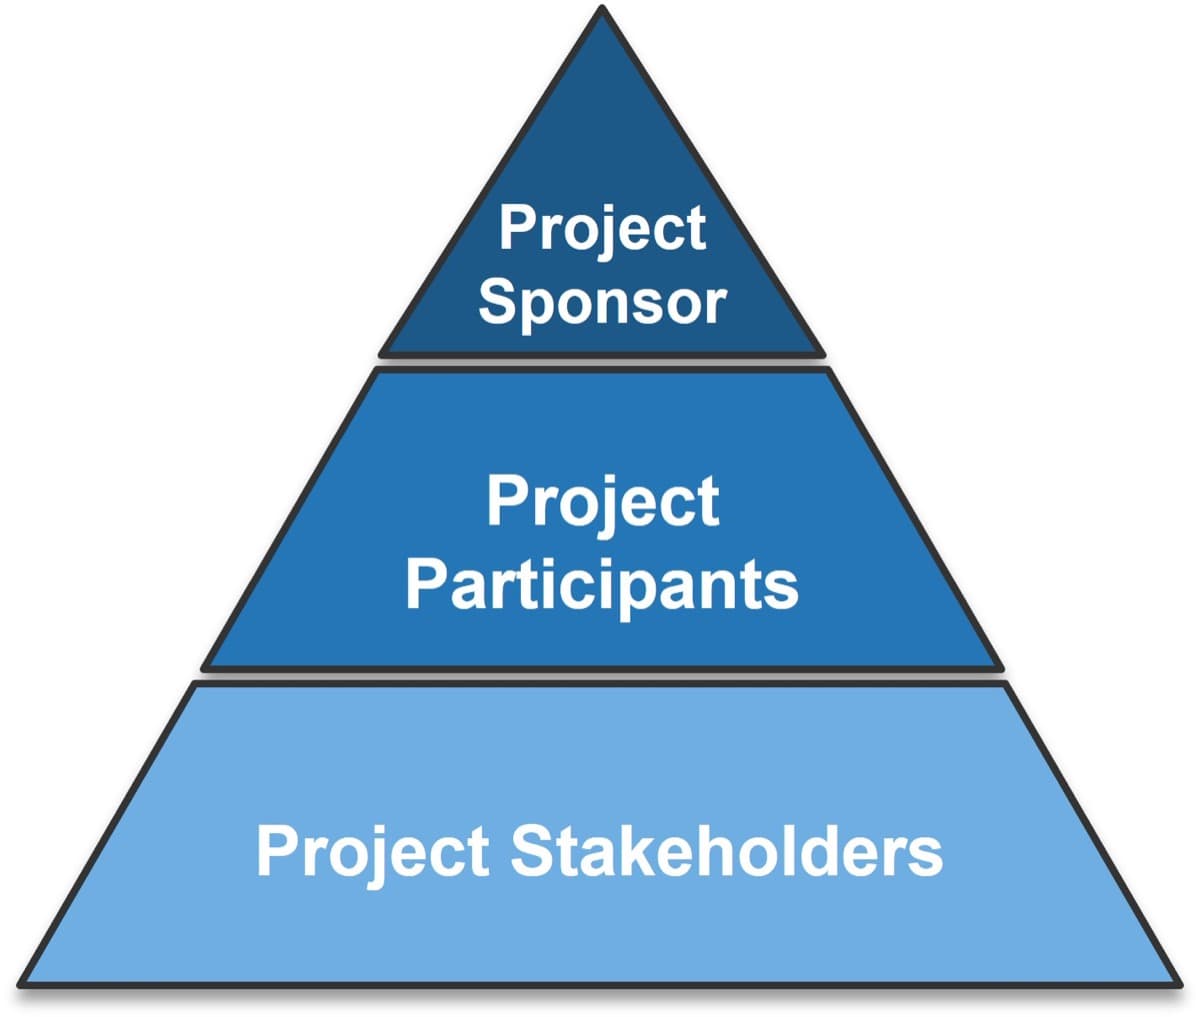
Involve all relevant stakeholders to discuss the organizational goals and objectives of your ACE
Avoid the rifts in stakeholder representation by ensuring you involve the relevant parties. Without representation and buy-in from all interested parties, your ACE may omit and fail to meet long-term organizational goals.
By ensuring every group receives representation, your service offerings will speak for the broad organization and in turn meet the needs of the organization as a whole.
- Business Units: Any functional groups that will be expected to engage with the ACE in order to achieve their business objectives.
- Team Leads: Representation from the internal Agile community who is aware of the backgrounds, capabilities, and environments of their respective Agile teams.
- Executive Sponsors: Those expected to evangelize and set the tone and direction for the ACE within the executive ranks of the organization. These roles are critical in gaining buy-in and maintaining momentum for ACE initiatives.
Organization
- ACE
- Executive Sponsors
- Team Leads
- Business Units
Activity: Prioritize your ACE stakeholders
1.1.4 1 Hour
Input
- Prioritized business objectives
Output
- Prioritized list of stakeholders
Materials
Participants
- Using your prioritized business objectives, brainstorm, as a group, the potential list of stakeholders (representatives from business units, team leads, and executive sponsors) that would need to be involved in setting the tone and direction of your ACE.
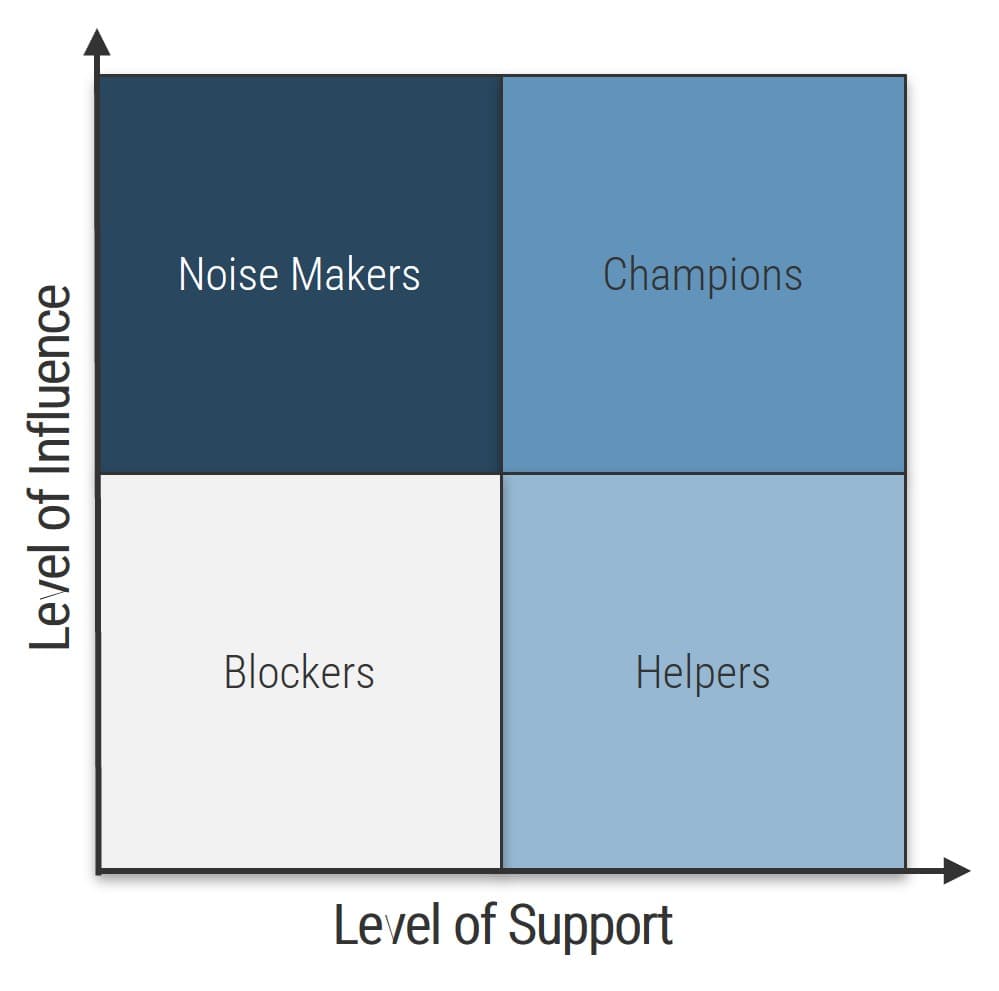
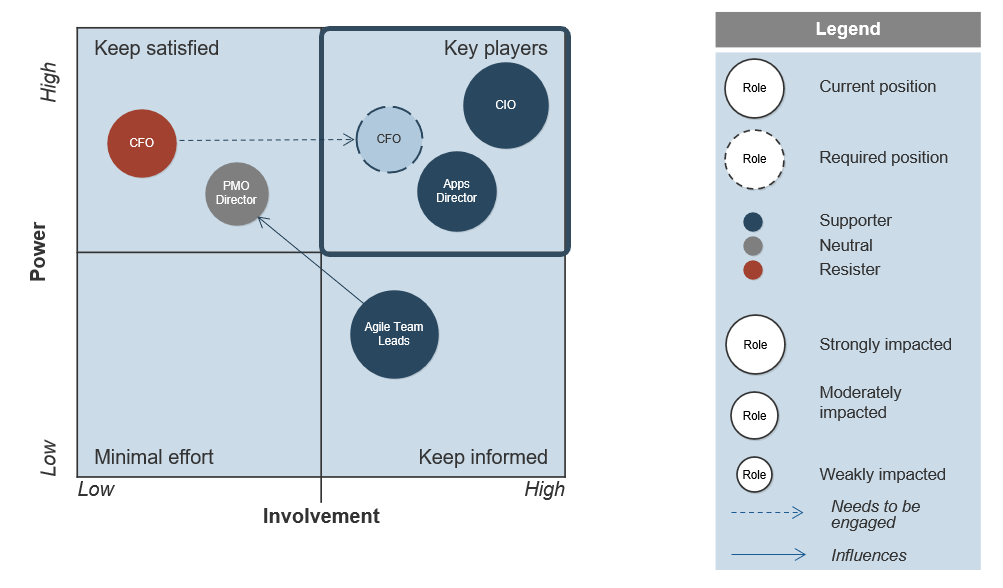
- Evaluate each stakeholder in terms of power, involvement, impact, and support.
- Power: How much influence does the stakeholder have? Enough to drive the CoE forward or into the ground?
- Involvement: How interested is the stakeholder? How involved is the stakeholder in the project already?
- Impact: To what degree will the stakeholder be impacted? Will this significantly change how they do their job?
- Support: Is the stakeholder a supporter of the project? Neutral? A resister?
Map each stakeholder to an area on the power map on the next slide based on his or her level of power and involvement.
Vary the size of the circle to distinguish stakeholders that are highly impacted by the ACE from those who are not. Color each circle to show each stakeholder’s estimated or gauged level of support for the project.
Prioritize your ACE stakeholders (continued)
1.1.4 1 Hour
Should your ACE be Centralized or Decentralized?
An ACE can be organized differently depending on your organization’s specific needs and culture.
The SAFe Model:©
“For smaller enterprises, a single centralized [ACE] can balance speed with economies of scale. However, in larger enterprises—typically those with more than 500 – 1,000 practitioners—it’s useful to consider employing either a decentralized model or a hub-and-spoke model.”
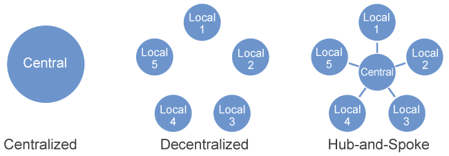
© Scaled Agile, Inc.
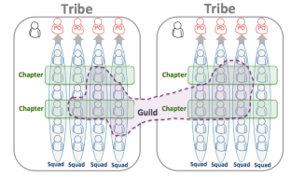
The Spotify Model:
Spotify avoids using an ACE and instead spreads agile practices using Squads, Tribes, Chapters, Guilds, etc.
It can be a challenging model to adopt because it is constantly changing, and must be fundamentally supported by your organization’s culture. (Linders, Ben. “Don't Copy the Spotify Model.” InfoQ.com. 6 Oct. 2016.)
Detailed analysis of The Spotify Model is out of scope for this Blueprint.
Activity: Select a Centralized or Decentralized ACE Model
1.1.5 30 minutes
Input
- Prioritized business objectives
- Use Cases
- Organization qualities
Output
- Centralized or decentralized ACE model
Materials
Participants
- Using your prioritized business objectives, your ACE use cases, your organization size, structure, and culture, brainstorm the relative pros and cons of a centralized vs decentralized ACE model.
- Consider this: to improve understanding and acceptance, ask participants who prefer a centralized model to brainstorm the pros and cons of a decentralized model, and vice-versa.
- Collectively decide whether your ACE should be centralized, decentralized or hub-and-spoke and document it.
| |
|
Centralized ACE |
Decentralized ACE |
| |
|
Pros |
Cons |
Pros |
Cons |
| Centralize Vs De-centralize Considerations |
Prioritized Business Objectives |
- Neutral (objectives don’t favor either model)
|
|
- Neutral (objectives don’t favor either model)
|
|
| ACE Use Cases |
- Neutral (use cases don’t favor either model)
|
|
- Neutral (use cases don’t favor either model)
|
|
| Organization Size |
- Org. is small enough for centralized ACE
|
|
|
- Overkill for a small org. like ours
|
| Organization Structure |
- All development done in one location
|
|
|
- Not all locations do development
|
| Organization Culture |
|
- All development done in one location
|
- Decentralized ACE may have yield more buy-in
|
|
SELECTED MODEL: Centralized ACE
Activity: Staff your ACE strategically
1.1.6 1 Hour
Input
- List of potential ACE staff
Output
Materials
Participants
- Identify your list of potential ACE staff (this may be a combination of full time and contract staff).
- Add/modify/delete the rating criteria to meet your specific needs.
- Discuss and adjust the relative weightings of the rating criteria to best suit your organization’s needs.
- Rate each potential staff member and compare results to determine the best suited staff for your ACE.
| Candidate: Jane Doe |
| Rating Criteria |
Criteria Weighting |
Candidate's Score (1-5) |
| Candidate has strong theoretical knowledge of Agile. |
8% |
4 |
| Candidate has strong hands on experience with Agile. |
18% |
5 |
| Candidate has strong hands on experience with Agile. |
10% |
4 |
| Candidate is highly respected by the Agile teams. |
18% |
5 |
| Candidate is seen as a thought leader in the organization. |
18% |
5 |
| Candidate is seen as a change agent in the organization. |
18% |
5 |
| Candidate has strong desire to be member of ACE staff. |
10% |
3 |
| Total Weighted Score |
4.6 |
Phase 1, Step 2: Define the service offerings of your ACE
Phase 1
1.1 Determine the vision of your ACE
1.2 Define the service offerings of your ACE
Phase 2
2.1 Define an adoption plan for your Agile teams
2.2 Create an ACE engagement plan
2.3 Define metrics to measure success
Phase 3
3.1 Optimize the success of your ACE
3.2 Plan change to enhance your Agile initiatives
3.3 Conduct ongoing retrospectives of your ACE
Activities:
1.2.1 Form the Center of Excellence.
1.2.2 Gather and document your existing Agile practices for the CoE.
1.2.3 Interview stakeholders to align ACE requirements with functional expectations.
1.2.4 Form a solution matrix to organize your pain points and opportunities.
1.2.5 Refine your use cases to identify your ACE functions and services.
1.2.6 Visualize your ACE functions and service offerings with a capability map.
Outcomes:
- Collect data regarding the functional expectations of the Agile teams.
- Refine your business-aligned use cases with your collected data to achieve both business and functional alignment.
- Create a capability map that visualizes and prioritizes your key service offerings.
Structure your ACE with representation from all of your key stakeholders
Now that you have a prioritized list of stakeholders, use their influence to position the ACE to ensure maximum representation with minimal bottlenecks.
By operating within a group of your key players, you can legitimize your Center of Excellence by propagating the needs and interests of those who interface and evangelize the CoE within the larger organization.
The group of key stakeholders will extend the business alignment you achieved earlier by refining your service offerings to meet the needs of the ACEs customers. Multiple representations at the table will generate a wide arrangement of valuable insights and perspectives.
Info-Tech Insight
While holistic representation is necessary, ensure that the list is not too comprehensive and will not lead to progress roadblocks. The goal is to ensure that all factors relevant to the organization are represented; too many conflicting opinions may create an obstruction moving forward.
ACE
- Executive Sponsors
- Team Leads
- Business Units
Determine how you will fund your ACE
Choose the ACE funding model which is most aligned to your current system based on the scenarios provided below. Both models will offer the necessary support to ensure the success of your Agile program going forward.
| Funding Model |
Funding Scenario I |
Funding Scenario II |
| Funded by the CIO |
Funded by the CIO office and a stated item within the general IT budget. |
Charged back to supported functional groups with all costs allocated to each functional group’s budget. |
| Funded by the PMO |
Charged back to supported functional groups with all costs allocated to each functional group’s budget. |
Charged back to supported functional groups with all costs allocated to each functional group’s budget. |
Info-Tech Insight
Your funding model may add additional key influencers into the mix. After you choose your funding model, ensure that you review your stakeholder map and add anyone who will have a direct impact in the viability and stability of your ACE.
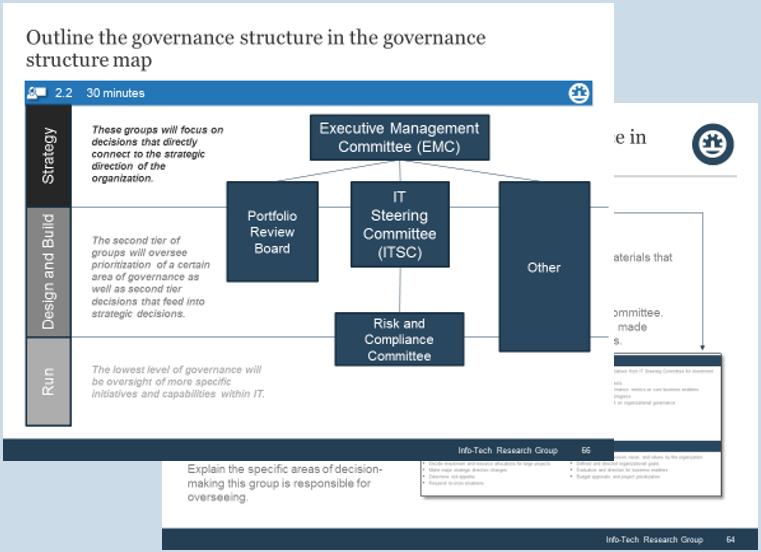
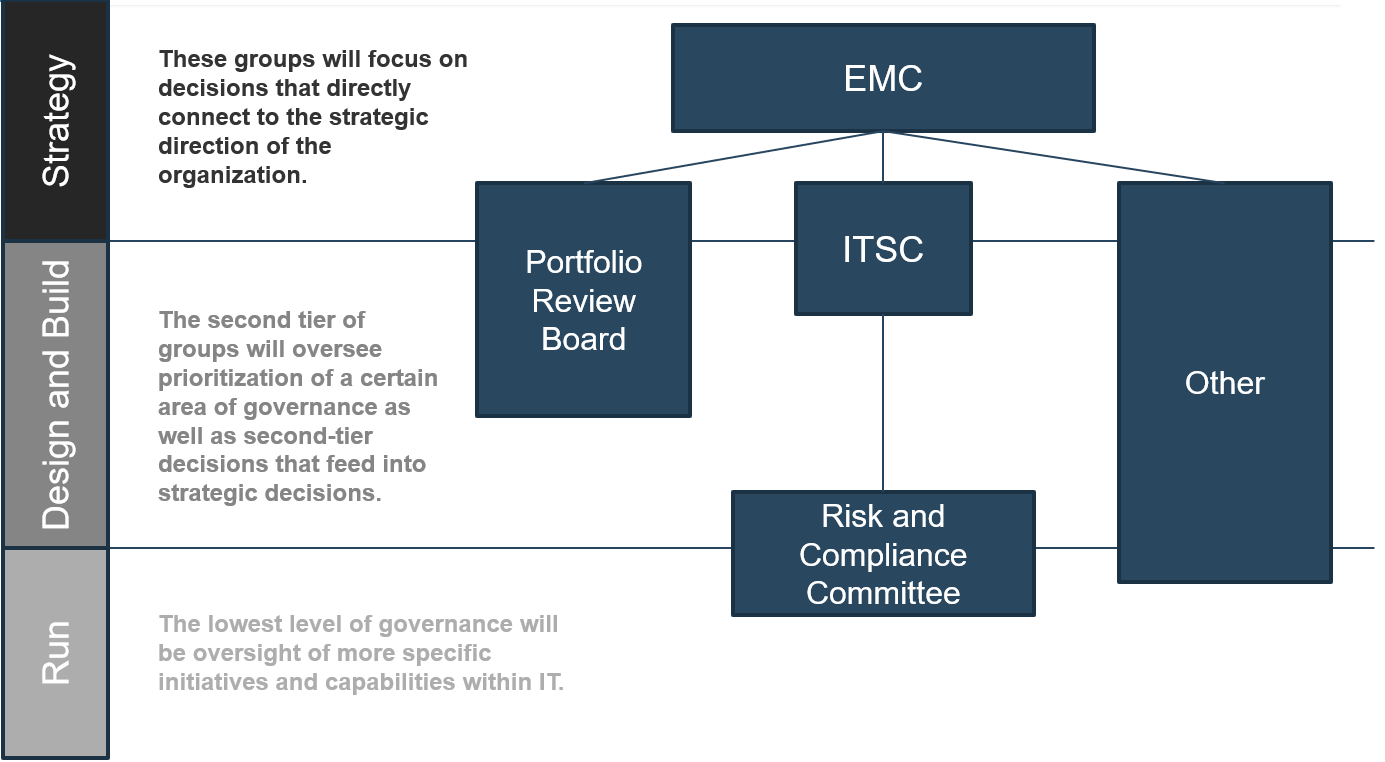
Determine how you will govern your ACE
An Agile Center of Excellence is unique in the way you must govern the actions of its customers. Enable “flexible governance” to ensure that Agile teams have the ability to locally optimize and innovate while still operating within expected boundaries.
ACE Governing Body
↑ Agile Team → ACE ← Agile Team ↑
Who should take on the governance role?
The governing body can be the existing executive or standing committees, or a newly formed committee involving your key ACE influencers and stakeholders.
Flexible governance means that your ACE set boundaries based on your cultural, regulatory, and compliance requirements, and your governance group monitors your Agile teams’ adherence to these boundaries.
Governing Body Responsibilities
- Review and approve ACE strategy annually and ensure that it is aligned with current business strategy.
- Provide detailed quality information for board members.
- Ensure that the ACE is adequately resourced and that the organization has the capacity to deliver the service offerings.
- Assure that the ACE is delivering benefits and achieving targets.
- Assure that the record keeping and reporting systems are capable of providing the information needed to properly assess the quality of service.
Modify your resourcing strategy based on organizational need
Your Agile Center of Excellence can be organized either in a dedicated or a virtual configuration, depending on your company’s organizational structure and complexity.
There is no right answer to how your Center of Excellence should be resourced. Consider your existing organizational structure and culture, the quality of relationships between functional groups, and the typical budgetary factors that would weigh on choosing between a virtual and dedicated CoE structure.
| COE |
Advantages |
Disadvantages |
| Virtual |
- No change in organization structure required, just additional task delegation to your Agile manager or program manager.
- Less effort and cost to implement.
- Investment in quality is proportional to return.
|
- Resources are shared between practice areas, and initiatives will take longer to implement.
- Development and enhancement of best practices can become difficult without a centralized knowledge repository.
|
| Dedicated |
- Demonstrates a commitment to the ACEs long-term existence.
- Allows for dedicated maintenance of best practices.
- Clear lines of accountability for Agile processes.
- Ability to develop highly skilled employees as their responsibilities are not shared.
|
- Requires dedicated resources that can in turn be more costly.
- Requires strong relationships with the functional groups that interface with the ACE.
|
Staffing the ACE: Understand virtual versus dedicated ACE organizational models
Virtual CoE
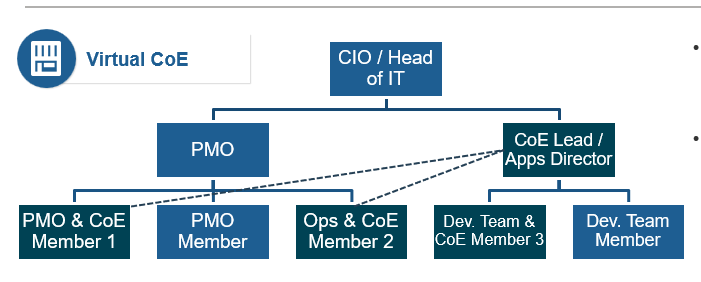
- Responsibilities for CoE are split and distributed throughout departments on a part-time basis.
- CoE members from the PMO report to apps director who also functions as the CoE lead on a part-time basis.
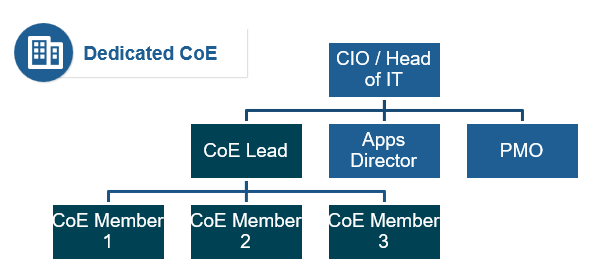
- Requires re-organization and dedicated full-time staff to run the CoE with clear lines of responsibility and accountability.
- Hiring or developing highly skilled employees who have a sole function to facilitate and monitor quality best practices within the IT department may be necessary.
Activity: Form the Center of Excellence
1.2.1 1 Hour
Input
Output
- ACE governance and resourcing plan
Materials
Participants
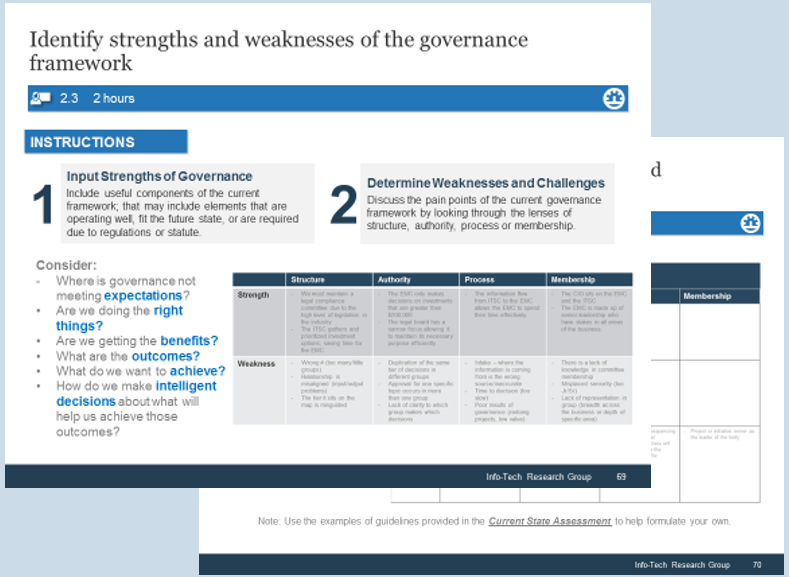
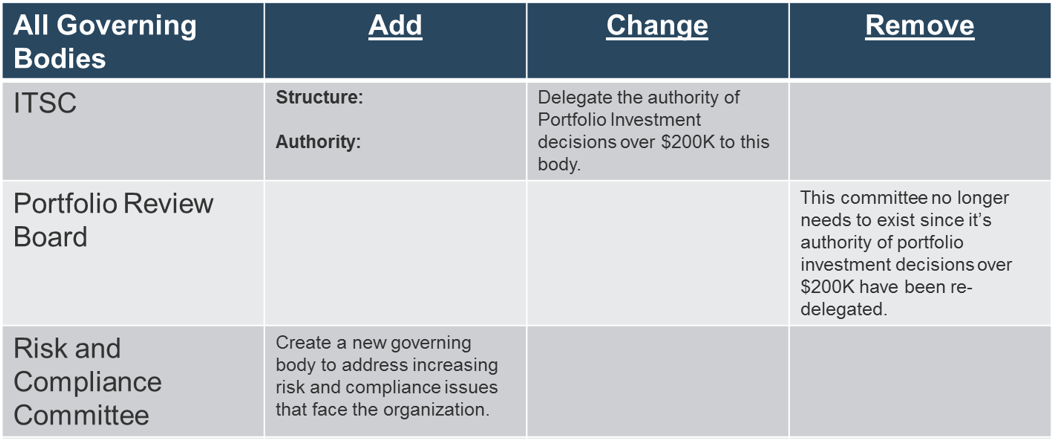
- As a group, discuss if there is an existing body that would be able to govern the Center of Excellence. This body will monitor progress on an ongoing basis and assess any change requests that would impact the CoEs operation or goals.
- List current governing bodies that are closely aligned with your current Agile environment and determine if the group could take on additional responsibilities.
- Alternatively, identify individuals who could form a new ACE governing body.
Using the results of Exercise 1.1.6 in Step 1, select the individuals who will participate in the Center of Excellence. As a rough rule of thumb for sizing, an ACE staffed with 3-5 people can support 8-12 Agile Teams.
Document results in the ACE Communications Deck.
Leverage your existing Agile practices and SMEs when establishing the ACE
The synergy between Agile and CoE relies on its ability to build on existing best practices. Agile cannot grow without a solid foundation. ACE gives you the way to disseminate these practices and facilitate knowledge transfer from a centralized sharing environment. As part of defining your service offerings, engage with stakeholders across the organization to evaluate what is already documented so that it can be accommodated in the ACE.
Documentation
- Are there any existing templates that can be leveraged (e.g. resource planning, sprint planning)?
- Are there any existing process documents that can be leveraged (e.g. SIPOC, program frameworks)?
- Are there any existing standards documents the CoE can incorporate (e.g. policies, procedures, guidelines)?
SMEs
- Interview existing subject-matter experts that can give you an idea of your current pains and opportunities.
- You already have feedback from those in your workshop group, so think about the rest of the organization:
- Agile practitioners
- Business stakeholders
- Operations
- Any other parties not represented in the workshop group
Metrics
- What are the current metrics being used to measure the success of Agile teams?
- What metrics are currently being used to measure the completion of business objectives?
- What tools or mediums are currently used for recording and communicating metrics?
Info-Tech Insight
When considering existing practices, it is important to evaluate the level of adherence to these practices. If they have been efficiently utilized, injecting them into ACE becomes an obvious decision. If they have been underutilized, however, it is important to understand why this occurred and discuss how you can drive higher adherence.
Examples of existing documents to leverage
People
- Agile onboarding planning documents
- Agile training documents
- Organizational Agile manifesto
- Team performance metrics dashboard
- Stakeholder engagement and communication plan
- Development team engagement plan
- Organizational design and structure
- Roles and responsibilities chart (i.e. RACI)
- Compensation plan Resourcing plan
Process
- Tailored Scrum process
- Requirements gathering process
- Quality stage-gate checklist (including definitions of ready and done)
- Business requirements document
- Use case document
- Business process diagrams
- Entity relationship diagrams
- Data flow diagrams
- Solution or system architecture
- Application documentation for deployment
- Organizational and user change management plan
- Disaster recovery and rollback process
- Test case templates
Technology
- Code review policies and procedures
- Systems design policies
- Build, test, deploy, and rollback scripts
- Coding guidelines
- Data governance and management policies
- Data definition and glossary
- Request for proposals (RFPs)
- Development tool standards and licensing agreements
- Permission to development, testing, staging, and production environments
- Application, system, and data integration policies
Build upon the lessons learned from your Agile pilots
The success of your Center of Excellence relies on the ability to build sound best practices within your organization’s context. Use your previous lessons learned and growing pains as shared knowledge of past Agile implementations within the ACE.
Implement Agile Practices That Work
Draw on the experiences of your initial pilot where you learned how to adapt the Agile manifesto and practices to your specific context. These lessons will help onboard new teams to Agile since they will likely experience some of the same challenges.
Download
Documents for review include:
- Tailored Scrum Process
- Agile Pilot Metrics
- Info-Tech’s Agile Pilot Playbook
Enable Organization-Wide Collaboration by Scaling Agile
Draw on previous scaling Agile experiences to help understand how to interface, facilitate, and orchestrate cross-functional teams and stakeholders for large and complex projects. These lessons will help your ACE teams develop collaboration and problem-solving techniques involving roles with different priorities and lines of thinking.
Download
Documents for review include:
- Agile Program Framework
- Agile Pilot Program Metrics
- Scaled Agile Development Process
- Info-Tech’s Scaling Agile Playbook
Activity: Gather and document your existing Agile practices for the CoE
1.2.2 Variable time commitment based on current documentation state
Input
Output
- Practices categorized within operating model
Materials
- Whiteboard
- Markers
- Sticky notes
Participants
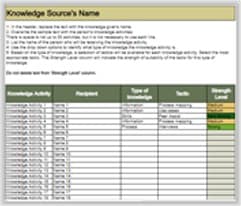
- Compile a list of existing practices that will be shared by the Center of Excellence. Consider any documents, templates, or tools that are used regularly by Agile teams.
- Evaluate the level of adherence to use of the practices (whether the practice is complied with regularly or not) with a high, medium, or low. Low compliance will need a root-cause analysis to understand why and how to remedy the situation.
- Determine the best fit for each practice under the ACE operational model.
| |
Name |
Type |
Adherence Level |
CoE Best Fit |
Source |
| 1 |
Tailored Scrum process |
Process |
High |
Shared Services |
Internal Wiki |
| 2 |
|
|
|
|
|
| 3 |
|
|
|
|
|
Activity: Interview stakeholders to understand the ACE functional expectations
1.2.3 30-60 Minutes per interview
Interview Stakeholders (from both Agile teams and functional areas) on their needs from the ACE. Ensure you capture both pain points and opportunities. Capture these as either Common Agile needs or Functional needs. Document using the tables below:
| Common Agile Needs |
| Common Agile Needs |
- Each Agile Team interprets Agile differently
- Need common approach to Agile with a proven track record within the organization
- Making sure all Team members have a good understanding of Agile
- Common set of tool(s) with a proven track record, along with a strong understanding of how to use the tool(s) efficiently and effectively
- Help troubleshooting process related questions
- Assistance with addressing the individual short comings of each Agile Team
- Determining what sort of help each Agile Team needs most
- Better understanding of the role played by Scrum Master and associated good practices
- When and how do security/privacy/regulatory requirements get incorporated into Agile projects
|
| Functional Needs |
Ent Arch Needs |
- How do we ensure Ent Arch has insight and influence on Agile software design
- Better understanding of Agile process
- How to measure compliance with reference architectures
|
PMO Needs
- Better understanding of Agile process
- Understanding role of PM in Agile
- Project status reports that determine current level of project risk
- How does project governance apply on Agile projects
- What deliverables/artifacts are produced by Agile projects and when are they completed
Operations Needs
- Alignment on approaches for doing releases
- Impact of Agile on change management and support desk processes
- How and when will installation and operation instructions be available in Agile
Activity: Form a solution matrix to organize your pain points and opportunities
1.2.4 Half day
Input
Output
- Classified pains and opportunities
Materials
- Whiteboard
- Markers
- Sticky notes
Participants
- Review the listed pain points from the data gathering process. Sort the pain points on sticky notes into technology, governance, people, and shared services.
- Consider opportunities under each defining element based on the identified business requirements.
- Document your findings.
- Discuss the results with the project team and prioritize the opportunities.
- Where do the most pains occur?
- What opportunities exist to alleviate pains?
| |
Governance |
Shared Services |
Technology |
People |
| Pain Points |
|
|
|
|
| Opportunities |
|
|
|
|
Document results in the ACE Communications Deck.
Activity: Refine your use cases to identify your ACE functions and services
1.2.5 1 Hour
Input
- Use cases from activity 1.1.2
Output
- Refined use cases based on data collection
Materials
- Whiteboard
- Markers
- Sticky notes
Participants
- Refine your initial use cases for the points of alignment between your ACE and business objectives using your classified pain points and opportunities.
- Add use cases to address newly realized pain points.
- Determine the functions and services the CoE can offer to address the identified requirements.
- Evaluate the outputs in the form of realized benefits and extracted inefficiencies.
Possible ACE use cases:
- Policy Management
- Change Management
- Risk Management
- Stakeholder Management
- Engagement Planning
- Knowledge Management
- Subject-Matter Expertise
- Agile Team Evaluation
- Operations Support
- Onboarding
- Coaching
- Learning Facilitation
- Communications Training
- Vendor Management
- Application Support
- Tooling Standards
Document results in the ACE Communications Deck.
Activity: Visualize your ACE functions and service offerings with a capability map
1.2.6 1 Hour
Input
- Use cases from activity 1.2.4
Output
Materials
- Whiteboard
- Markers
- Sticky notes
Participants
- Review the refined and categorized list of service offerings.
- Determine how these new capabilities will add, remove, or enhance your existing service and capabilities.
- Categorize the capabilities into the following groups:
- Governance and Metrics
- Services
- Staff
- Technology
Label the estimated impact of the service offering based on your business priorities for the year. This will guide your strategy for implementing your Agile Center of Excellence moving forward.
Document results in the ACE Communications Deck.
Activity: Visualize your ACE functions and service offerings with a capability map (continued)
Governance
Policy Management (Medium Potential)
Change Management (High Potential)
Risk Management (High Potential)
Stakeholder Management (High Potential)
Metrics/Feedback Monitoring (High Potential)
Shared Services
Engagement Planning (High Potential)
Knowledge Management (High Potential)
Subject-Matter Expertise (High Potential)
Agile Team Evaluation (High Potential)
Operations Support (High Potential)
People
Onboarding (Medium Potential)
Coaching (High Potential)
Learning Facilitation (High Potential)
Internal Certification Program (Low Potential)
Communications Training (Medium Potential)
Technology
Vendor Management (Medium Potential)
Application Support (Low Potential)
Tooling Standards (High Potential)
Checkpoint: Are you ready to standardize your CoEs service offerings?
Phase 1
1.1 Determine the vision of your ACE
1.2 Define the service offerings of your ACE
Phase 2
2.1 Define an adoption plan for your Agile teams
2.2 Create an ACE engagement plan
2.3 Define metrics to measure success
Self-Auditing Guidelines
- Have you identified and prioritized the key business objectives for the upcoming year that the ACE will align with?
- Do you have a high-level set of use cases for points of alignment between your ACE and business objectives?
- Have you mapped your stakeholders and identified the key players that will have an influence over the future success of your ACE?
- Have you identified how your organization will fund, resource, and govern the ACE?
- Have you collected data to understand the functional expectations of the users the ACE is intended to serve?
- Have you refined your use cases to align with both business objectives and functional expectations?
If you want additional support, have our analysts guide you through this phase as part of an Info-Tech workshop
Book a workshop with our Info-Tech analysts:
- To accelerate this project, engage your IT team in an Info-Tech workshop with an Info-Tech analyst team.
- Info-Tech analysts will join you and your team onsite at your location or welcome you to Info-Tech’s historic Toronto office to participate in an innovative onsite workshop.
- Contact your account manager (www.infotech.com/account), or email Workshops@InfoTech.com for more information.
The following are sample activities that will be conducted by Info-Tech analysts with your team:
1.1.2 Identify and prioritize organizational business objectives
Our analyst team will help you organize and prioritize your business objectives for the year in order to ensure that the service offerings the ACE offers are delivering consistent business value.
1.1.3 Form use cases for the points of alignment between your ACE and business objectives
Our analyst team will help you turn your prioritized business objectives into a set of high-level use cases that will provide the foundation for defining user-aligned services.
If you want additional support, have our analysts guide you through this phase as part of an Info-Tech workshop
Book a workshop with our Info-Tech analysts:
1.1.4 Prioritize your ACE stakeholders
Our analysts will walk you through an exercise of mapping and prioritizing your Centers of Excellence stakeholders based on impact and power within so you can ensure appropriate presentation of interests within the organization.
1.2.4 Form a solution matrix to organize your pain points and opportunities
Our analyst team will help you solidify the direction of your Center of Excellence by overlaying your identified needs, pain points, and potential opportunities in a matrix guided by Info-Tech’s CoE operating model.
1.2.5 Refine your use cases to identify your ACE functions and services
Our analyst team will help you further refine your business-aligned use cases with the functional expectations from your Agile teams and stakeholders, ensuring the ACEs long-term utility.
If you want additional support, have our analysts guide you through this phase as part of an Info-Tech workshop
Book a workshop with our Info-Tech analysts:
1.2.6 Visualize your ACE functions and service offerings with a capability map
Our analysts will walk you through creating your Agile Centers of Excellence capability map and help you to prioritize which service offerings are critical to the success of your Agile teams in meeting their objectives.
Phase 2
Standardize the Centers of Excellence Service Offerings
Spread Best Practices With an Agile Center of Excellence
The ACE needs to ensure consistency in service delivery
Now that you have aligned the CoE to the business and functional expectations, you need to ensure its service offerings are consistently accessible. To effectively ensure accessibility and delegation of shared services in an efficient way, the CoE needs to have a consistent framework to deliver its services.
Phase 1 - Strategically Align the CoE
Create strategic alignment between the CoE and the organization’s goals, objectives, and vision. This alignment translates into the CoE mandate intended to enhance the way Agile will enable teams to meet business objectives.
Phase 2 - Standardize the CoEs Service Offerings
Build an engagement plan based on a standardized adoption model to ensure your CoE service offerings are accessible and consistent across the organization. Create and consolidate key performance indicators to measure the CoEs utility and whether or not the expected value is being translated to tangible results.
Phase 3 - Operate the CoE
Operate the CoE to provide service offerings to Agile teams, identify improvements to optimize the function of your Agile teams, and effectively manage and communicate change so that teams can grow within the Agile adoption model and optimize value delivery both within your Agile environment and across functions.
Phase 2 outline
Call 1-888-670-8889 or email GuidedImplementations@InfoTech.com for more information.
Complete these steps on your own, or call us to complete a guided implementation. A guided implementation is a series of
2-3 advisory calls that help you execute each phase of a project. They are included in most advisory memberships.
Guided Implementation 2: Standardize the CoEs Service Offerings
Proposed Time to Completion (in weeks): 2
Step 2.1: Define an adoption plan for your Agile teams
Start with an analyst kick off call:
- Dissect the key attributes of Agile adoption.
Then complete these activities…
2.1.1 Further categorize your use cases within the Agile adoption model.
Step 2.2: Create an ACE engagement plan
Start with an analyst kick off call:
- Form engagement plans for your Agile teams.
Then complete these activities…
2.2.1 Create an engagement plan for each level of adoption.
Step 2.3: Define metrics to measure success
Finalize phase deliverable:
- Discuss effective ACE metrics.
Then complete these activities…
2.3.1 Collect existing team-level metrics.
2.3.2 Define metrics that align with your Agile business objectives.
2.3.3 Define target ACE performance metrics.
2.3.4 Define Agile adoption metrics.
2.3.5 Consolidate metrics for stakeholder impact.
2.3.6 Use Info-Tech’s ACE Benefits Tracking Tool to monitor, evaluate, refine, and ensure continued business value.
Phase 2 Results & Insights:
- Standardizing your service offerings allows you to have direct influence on the dissemination of best practices.
Phase 2, Step 1: Define an adoption plan for your Agile teams
Phase 1
1.1 Determine the vision of your ACE
1.2 Define the service offerings of your ACE
Phase 2
2.1 Define an adoption plan for your Agile teams
2.2 Create an ACE engagement plan
2.3 Define metrics to measure success
Phase 3
3.1 Optimize the success of your ACE
3.2 Plan change to enhance your Agile initiatives
3.3 Conduct ongoing retrospectives of your ACE
Activities:
2.1.1 Further categorize your use cases within the Agile adoption model.
Outcomes:
- Refine your previously determined use cases within the Agile adoption model to ensure that teams can be assisted at any level of Agile adoption.
- Understand the key attributes of Agile adoption and how they impact success.
Understand the implementation challenges that the ACE may face
Culture clash between ACE and larger organization
It is important to carefully consider the compatibility between the current organizational culture and Agile moving forward. Agile compels empowered teams, meritocracy, and broad collaboration for success; while typical organizational structures are siloed and hierarchical and decisions are delegated from the top down.
This is not to say that the culture of the ACE has to match the larger organizational culture; part of the overarching aim of the ACE is to evolve the current organizational culture for the better. The point is to ensure you enable a smooth transition with sufficient management support and a team of Agile champions.
The changing role of middle management
Very similar to the culture clash challenge, cultural rigidity in how middle managers operate (performance review, human resource management, etc.) can cause cultural rejection. They need to become enablers for high performance and give their teams the sufficient tools, skills, and opportunities to succeed and excel.
What impedes Agile adoption?
Based on a global survey of Agile practitioners (N=1,319)*:
52% Organizational culture at odds with agile values
44% Inadequate management support and sponsorship
48% General organization resistance to change
*Respondents were able to make multiple selections
(13th Annual State of Agile Report, VersionOne, 2019)
Build competency and trust through a structured Agile adoption plan
The reality of cultural incompatibility between Agile and traditional organization structures necessitates a structured adoption plan. Systematically build competency so teams can consistently achieve project success and solidify trust in your teams’ ability to meet business needs with Agile.
By incrementally gaining the trust of management as you build up your Agile capabilities, you enable a smooth cultural transition to an environment where teams are empowered, adapt quickly to changing needs, and are trusted to innovate and make successes out of their failures.
Optimized value delivery occurs when there is a direct relationship between competency and trust. There will be unrealized value when competency or trust outweigh the other. That value loss increases as either dimension of adoption continues to grow faster than the other.
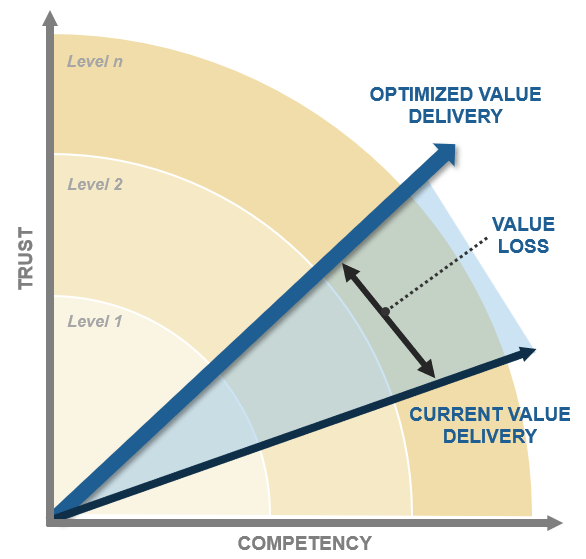
Use Info-Tech’s Practice Adoption Optimization Model to systematically increase your teams’ ability to deliver
Using Info-Tech’s Practice adoption optimization model will ensure you incrementally build competency and trust to optimize your value delivery.
Agile adoption at its core, is about building social capital. Your level of trust with key influencers increases as you continuously enhance your capabilities, enabling the necessary cultural changes away from traditional organizational structures.
Trust & Competency ↓
DEFINE
Begin to document your development workflow or value chain, implement a tracking system for KPIs, and start gathering metrics and reporting them transparently to the appropriate stakeholders.
ITERATE
Use collected metrics and retrospectives to stabilize team performance by reducing areas of variability in your workflow and increasing the consistency at which targets are met.
COLLABORATE
Use information to support changes and adopt appropriate practices to make incremental improvements to the existing environment.
EMPOWER
Drive behavioral and cultural changes that will empower teams to be accountable for their own success and learning.
INNOVATE
Use your built-up trust and support practice innovation, driving the definition and adoption of new practices.
Review these key attributes of Agile adoption
Agile adoption is unique to every organization. Consider these key attributes within your own organizational context when thinking about levels of Agile adoption.
Adoption Attributes
Team Organization
Considers the degree to which teams are able to self-organize based on internal organizational structures (hierarchy vs. meritocracy) and inter-team capabilities.
Team Coordination
Considers the degree to which teams can coordinate, both within and across functions.
Business Alignment
Considers the degree to which teams can understand and/or map to business objectives.
Coaching
Considers what kind of coaching/training is offered and how accessible the training is.
Empowerment
Considers the degree to which teams are able and capable to address project, process, and technical challenges without significant burden from process controls and bureaucracy.
Failure Tolerance
Considers the degree to which stakeholders are risk tolerant and if teams are capable of turning failures into learning outcomes.
Why are these important?
These key attributes function as qualities or characteristics that, when improved, will successively increase the degree to which the business trusts your Agile teams’ ability to meet their objectives.
Systematically improving these attributes as you graduate levels of the adoption model allows the business to acclimatize to the increased capability the Agile team is offering, and the risk of culture clash with the larger organization decreases.
Start to consider at what level of adoption each of your service offerings become useful. This will allow you to standardize the way your Agile teams interact with the CoE.
Activity: Further categorize your use cases within the Agile adoption model
2.1.1 1.5 Hours
Input
- List of service offerings
Output
- Service offerings categorized within adoption model
Materials
- Whiteboard
- Markers
- Sticky notes
Participants
- Gather the list of your categorized use cases.
- Based on Info-Tech’s Agile adoption model, categorize which use cases would be useful to help the Agile team graduate to the next level of adoption.
- Conceptualize: Begin to document your workflow or value chain, implement a tracking system for KPIs, and gather metrics and report them transparently to the appropriate stakeholders.
- Iterate: Use collected metrics to stabilize team performance by reducing areas of variability in your workflow and increasing the consistency at which targets are met.
- Collaborate: Use information to drive changes and adopt appropriate Agile practices to make incremental improvements to the existing environment.
- Empower: Drive behavioral and cultural changes that will empower teams to be accountable for their own successes given the appropriate resources.
- Innovate: Use your built-up trust to begin to make calculated risks and innovate more, driving new best practices into the CoE.
The same service offering could be offered at different levels of adoption. In these cases, you will need to re-visit the use case and differentiate how the service (if at all) will be delivered at different levels of adoption.
- Use this opportunity to brainstorm alternative or new use cases for any gaps identified. It is the CoEs goal to assist teams at every level of adoption to meet their business objectives. Use a different colored sticky note for these so you can re-visit and map out their inputs, outputs, metrics, etc.
Activity: Further categorize your use cases within the Agile adoption model (continued)
2.1.1 1.5 Hours
Input
- List of service offerings
Output
- Service offerings categorized within adoption model
Materials
- Whiteboard
- Markers
- Sticky notes
Participants
Example:
| |
Service Offerings |
| Level 5: Innovate |
|
| Level 4: Empower |
|
| Level 3: Collaborate |
Coaching -- Communications Training |
| Level 2: Iterate |
Tooling Standards |
| Level 1: Conceptualize |
|
Learning Facilitation
Draw on the service offerings identified in activity 1.2.4
Phase 2, Step 2: Create an ACE engagement plan
Phase 1
1.1 Determine the vision of your ACE
1.2 Define the service offerings of your ACE
Phase 2
2.1 Define an adoption plan for your Agile teams
2.2 Create an ACE engagement plan
2.3 Define metrics to measure success
Phase 3
3.1 Optimize the success of your ACE
3.2 Plan change to enhance your Agile initiatives
3.3 Conduct ongoing retrospectives of your ACE
Activities:
2.2.1 Create an engagement plan for each level of adoption.
Outcomes:
- Understand the importance of aligning with the functional expectations of your ACE customers.
- Understand the relationship between engagement and continuous improvement.
- Create an engagement plan for each level of adoption to standardize the way customers interact with the ACE.
Enable Agile teams to interface with ACE service offerings to meet their business objectives
A Center of Excellence aligned with your service offerings is only valuable if your CoEs customers can effectively access those services. At this stage, you have invested in ensuring that your CoE aligns to your business objectives and that your service offerings align to its customers. Now you need to ensure that these services are accessible in the day-to-day operation of your Agile teams.
Engagement Process → Service Offering
Use backwards induction from your delivery method to the service offering. This is an effective method to determine the optimal engagement action for the CoE, as it considers the end customer as the driver for best action for every possible situation.
Info-Tech Insight
Your engagement process should be largely informed by your ACE users. Teams have constraints as well as in-the-trenches concerns and issues. If your service offerings don’t account for these, it can lead to rejection of the culture you are trying to inspire.
Show the way, do not dictate
Do not fix problems for your Agile teams, give them the tools and knowledge to fix the problems themselves.
Facilitate learning to drive success
A primary function of your ACE is to transfer knowledge to Agile teams to increase their capability to achieve desired outcomes.
While this can take the form of coaching, training sessions, libraries, and wikis, a critical component of ACE is creating interactions where individuals from Agile teams can come together and share their knowledge.
Ideas come from different experiences. By creating communities of practice (CoP) around topics that the ACE is tasked with supporting (e.g. Agile business analysts), you foster social learning and decrease the likelihood that change will result in some sort of cultural rejection.
Consider whether creating CoPs would be beneficial in your organization’s context.
"Communities of practice are a practical way to frame the task of managing knowledge. They provide a concrete organizational infrastructure for realizing the dream of a learning organization." – Etienne Wenger, Digital Habitats: Stewarding technology for communities
A lack of top-down support will result in your ACE being underutilized
Top-down support is critical to validate the CoE to its customers and ensure they feel compelled to engage with its services. Relevancy is a real concern for the long-term viability of a CoE and championing its use from a position of authority will legitimize its function and deter its fading from relevancy of day-to-day use for Agile teams.
Although you are aligning your engagement processes to the customers of your Agile Center of Excellence, you still need your key influencers to champion its lasting organizational relevancy. Don’t let your employees think the ACE is just a coordinating body or a committee that is convenient but non-essential – make sure they know that it drives their own personal growth and makes everyone better as a collective.
"Even if a CoE is positioned to meet a real organizational need, without some measure of top-down support, it faces an uphill battle to remain relevant and avoid becoming simply one more committee in the eyes of the wider organization. Support from the highest levels of the organization help fight the tendency of the larger organization to view the CoE as a committee with no teeth and tip the scales toward relevancy for the CoE." – Joe Shepley, VP and Practice Lead, Doculabs
Info-Tech Insight
Stimulate top-down support with internal certifications. This allows your employees to gain accreditation while at the same time encouraging top-down support and creating a compliance check for the continual delivery and acknowledgement of your evolving best practices.
Ensure that best practices and lessons learned are injected back into the ACE
For your employees to continuously improve, so must the Center of Excellence. Ensure the ACE has the appropriate mechanisms to absorb and disseminate best practices that emerge from knowledge transfer facilitation events.
Facilitated Learning Session →Was the localized adaption well received by others in similar roles? →Document Localized Adaptation →Is there broad applicability and benefit to the proposed innovation? →CoE Absorbs as Best Practice
Continuous improvement starts with the CoE
While facilitating knowledge transfer is key, it is even more important that the Center of Excellence can take localized adaptations from Agile teams and standardize them as best practices when well received. If an individual were to leave without sharing their knowledge, the CoE and the larger organization will lose that knowledge and potential innovation opportunities.
Experience matters
To organically grow your ACE and be cost effective, you want your teams to continuously improve and to share that knowledge. As individual team members develop and climb the adoption model, they should participate as coaches and champions for less experienced groups so that their knowledge is reaching the widest audience possible.
Case study: Agile learning at Spotify
CASE STUDY
Industry Digital Media
Source Henrik Kniberg & Anders Ivarsson, 2012
Methods of Agile learning at Spotify
Spotify has continuously introduced innovative techniques to facilitate learning and ensure that that knowledge gets injected back into the organization. Some examples are the following:
- Hack days: Self-organizing teams, referred to as squads, come together, try new ideas, and share them with their co-workers. This facilitates a way to stay up to date with new tools and techniques and land new product innovations.
- Coaching: Every squad has access to an Agile coach to help inject best practices into their workflow – coaches run retrospectives, sprint planning meetings, facilitate one-on-one coaching, etc.
- Tribes: Collections of squads that hold regular gatherings to show the rest of the tribe what they’ve been working on so others can learn from what they are doing.
- Chapters: People with similar skills within a tribe come together to discuss their area of expertise and their specific challenges.
- Guilds: A wide-reaching community of interest where members from different tribes can come together to share knowledge, tools, and codes, and practice (e.g. a tester guild, an Agile coaching guild).
"As an example of guild work, we recently had a ‘Web Guild Unconference,’ an open space event where all web developers at Spotify gathered up in Stockholm to discuss challenges and solutions within their field."
Activity: Create an engagement plan for each level of adoption
2.2.1 30 Minutes per role
Input
Output
- Role-based engagement plans
Materials
- Whiteboard
- Markers
- Sticky notes
Participants
- On the top bar, define the role you are developing the engagement plan for. This will give you the ability to standardize service delivery across all individuals in similar roles.
- Import your categorized service offerings for each level of adoption that you think are applicable to the given role.
- Using backwards induction, determine the engagement processes that will ensure that those service offerings are accessible and fit the day-to-day operations of the role.
- Fill in the template available on the next slide with each role’s engagement plan.
Document results in the ACE Communications Deck.
Example engagement plan: Developer
2.2.1 30 Minutes per role
| |
Role: Developer |
| |
Level 1 |
Level 2 |
Level 3 |
Level 4 |
Level 5 |
| Service Offering |
- Onboarding
- Coaching
- Learning Facilitation
|
- Tooling Standards
- Learning Facilitation
|
- Communications Training
- Learning Facilitation
|
- Subject-Matter Expertise
- Coaching
|
- Knowledge Management
|
| Engagement Process |
- Based on service request or need identified by dev. manager.
- Based on service request or need identified by dev. manager.
- Weekly mandatory community of practice meetings.
|
- When determined to have graduated to level 2, receive standard Agile tooling standards training.
- Weekly mandatory community of practice meetings.
|
- When determined to have graduated to level 3, receive standard Agile communications training.
- Weekly mandatory community of practice meetings
|
- Peer-based training on how to effectively self-organize.
- Based on service request or need identified by dev. manager.
|
- Review captured key learnings from last and have CoE review KPIs related to any area changed.
|
Example engagement plan: Tester
2.2.1 30 Minutes per role
| | Role: Tester |
|---|
| | Level 1 | Level 2 | Level 3 | Level 4 | Level 5 |
|---|
| Service Offering |
- Onboarding
- Coaching
|
- Product Training
- Communications Training
|
- Communications Training
- Learning Facilitation
|
- Subject-Matter Expertise
- Coaching
|
- Tooling Standards
- Training
- Coaching
|
|---|
| Engagement Process |
- Based on service request or need identified by dev. manager.
|
- Weekly mandatory community of practice meetings.
- Provide training on effective methods for communicating with development teams based on organizational best practices.
|
- When determined to have graduated to level 3, receive standard training based on organizational testing best practices. Weekly mandatory community of practice meetings.
|
- Peer-to-peer training with level 5 certified coach.
- Based on service request or need identified by dev. manager. .
|
- Periodic updates of organizational tooling standards based on community of practice results.
- Automation training.
- Provide coaching to level 1 developers on a rotating basis to develop facilitation skills.
|
|---|
Example engagement plan: Product Owner
2.2.1 30 Minutes per role
| |
Role: Product Owner |
| |
Level 1 |
Level 2 |
Level 3 |
Level 4 |
Level 5 |
| Service Offering |
- Onboarding
- Coaching
|
- Coaching
- Learning Facilitation
|
- Coaching
- Communications Training
- Learning Facilitation
|
- Coaching
- Learning Facilitation
|
- Coaching
- Learning Facilitation
|
| Engagement Process |
- Provide onboarding materials for Agile product owners.
- Provide bi-weekly reviews and subsequent guidance at the end of retrospective processes.
|
- Provide monthly reviews and subsequent guidance based on retrospective results.
- Bi-weekly mandatory community of practice meetings
|
- When determined to have graduated to level 3, receive standard training based on organizational testing best practices.
- Bi-weekly mandatory community of practice meetings.
|
- Provide monthly reviews and subsequent guidance based on retrospective results.
- Bi-weekly mandatory community of practice meetings
|
- Provide quarterly reviews and subsequent guidance based on retrospective results.
- Bi-weekly mandatory community of practice meetings
|
Phase 2, Step 3: Define metrics to measure success
Phase 1
1.1 Determine the vision of your ACE
1.2 Define the service offerings of your ACE
Phase 2
2.1 Define an adoption plan for your Agile teams
2.2 Create an ACE engagement plan
2.3 Define metrics to measure success
Phase 3
3.1 Optimize the success of your ACE
3.2 Plan change to enhance your Agile initiatives
3.3 Conduct ongoing retrospectives of your ACE
Activities:
2.3.1 Define existing team-level metrics.
2.3.2 Define metrics that align with your Agile business objectives.
2.3.3 Define target ACE performance metrics.
2.3.4 Define Agile adoption metrics.
2.3.5 Consolidate your metrics for stakeholder impact.
2.3.6 Use Info-Tech’s ACE Benefits Tracking Tool to monitor, evaluate, refine, and ensure continued business value.
Outcomes:
- Understand the importance of aligning with the functional expectations of your ACE customers.
- Understand the relationship between engagement and continuous improvement.
- Create an engagement plan for each level of adoption to standardize the way customers interact with the ACE.
Craft metrics that will measure the success of your Agile teams
Quantify measures that demonstrate the effectiveness of your ACE by establishing distinct metrics for each of your service offerings. This will ensure that you have full transparency over the outputs of your CoE and that your service offerings maintain relevance and are utilized.
Questions to Ask
- What are leading indicators of improvements that directly affect the mandate of the CoE?
- How do you measure process efficiency and effectiveness?
Creating meaningful metrics
Specific
Measureable
Achievable
Realistic
Time-bound
Follow the SMART framework when developing metrics for each service offering.
Adhering to this methodology is a key component of the lean management methodology. This framework will help you avoid establishing general metrics that aren’t relevant.
"It’s not about telling people what they are doing wrong. It’s about constantly steering everyone on the team in the direction of success, and never letting any individual compromise the progress of the team toward success." – Mary Poppendieck, qtd. in “Questioning Servant Leadership”
For important advice on how to avoid the many risks associated with metrics, refer to Info-Tech’s Select and Use SDLC Metrics Effectively.
Ensure your metrics are addressing criteria from different levels of stakeholders and enterprise context
There will be a degree of overlap between the metrics from your business objectives, service offerings, and existing Agile teams. This is a positive thing. If a metric can speak to multiple benefits it is that much more powerful in commuting successes to your key stakeholders.
Existing metrics
Business objective metrics
Service offering metrics
Agile adoption metrics
Finding points of overlap means that you have multiple stakeholders with a vested interest in the positive trend of a specific metric. These consolidated metrics will be fundamental for your CoE as they will help build consensus through communicating the success of the ACE in a common language for a diverse audience.
Activity: Define existing team-level metrics
2.3.1 1 Hour
Input
Output
- Service offerings categorized within adoption model
Materials
- Whiteboard
- Markers
- Sticky notes
Participants
- Gather any metrics related documentation that you collected during your requirements gathering in Phase 1.
- Collect team-level metrics for your existing Agile teams:
- Examine outputs from any feedback mechanisms you have (satisfaction surveys, emails, existing SLAs, burndown charts, resourcing costs, licensing costs per sprint, etc.).
- Look at historical trends and figures when available. Be careful of frequent anomalies as these may indicate a root cause that needs to be addressed.
- Explore the definition of specific metrics across different functional teams to ensure consistency of measurement and reporting.
| Team Objective |
Expected Benefits |
Metrics |
| Improve productivity |
- Improve transparency with business decisions
|
- Team burndown and velocity
- Number of releases per milestone
|
| Increase team morale and motivation |
- Teams are engaged and motivated to develop new opportunities to deliver more value quicker.
|
- Team satisfaction with Agile environment
- Degree of engagement in ceremonies
|
| Improve transparency with business decisions |
- Teams are engaged and motivated to develop new opportunities to deliver more value quicker.
|
- Stakeholder satisfaction with completed product
- Number of revisions to products in demonstrations
|
Activity: Define metrics that align with your Agile business objectives
2.3.2 1 Hour
Input
- Organizational business objectives from Phase 1
Output
- Metrics aligned to organizational business objectives
Materials
- Whiteboard
- Markers
- Sticky notes
Participants
- List the business objectives that you determined in 1.1.2.
- Create a shortlist of expected benefits from those business objectives. These will help to drive metrics that align with the intended purpose of completing those business objectives, and affirm they are aligned to realizable benefits.
- Define metrics that speak to the benefits of your business objectives. While engaging in this process, ensure to document the collection method for each metrics.
| Business Objectives |
Expected Benefits |
Metrics |
| Decrease time-to-market of product releases |
- Faster feedback from customers.
- Increased customer satisfaction.
- Competitive advantage.
|
|
| Decrease time-to-market of product releases |
- Alignment to organizational best practices.
- Improved team productivity.
- Greater collaboration across functional teams.
|
- Policy and practice adherence and acknowledgement
- Number of requests for ACE services
- Number of suggestions to improve Agile best practices and ACE operations
|
Activity: Define target ACE performance metrics
2.3.3 1 Hour
Input
- Service offerings
- Satisfaction surveys
- Usage rates
Output
Materials
- Whiteboard
- Markers
- Sticky notes
Participants
- Define metrics to measure the success of each of your service offerings.
- Create a shortlist of expected benefits from those business objectives. These will help to drive metrics that align with the intended purpose of those service offerings, and affirm they are aligned to realizable benefits.
- Define metrics that speak to the benefits of your service offerings.
- Compare these to your team performance metrics.
| Service Offering |
Expected Benefits |
Metrics |
| Knowledge management |
- Comprehensive knowledgebase that accommodates various company products and office locations.
- Easily accessible resources.
|
- Number of practices extracted from ACE and utilized
- Frequency of updates to knowledgebase
|
| Tooling standards |
- Tools adhere to company policies, security guidelines, and regulations.
- Improved support of tools and technologies.
- Tools integrate and function well with enterprise systems.
|
- Number of teams and functional groups using standardized tools
- Number of supported standardized tools
- Number of new tools added to the standards list
- Number of tools removed from standards list
|
Activity: Define Agile adoption metrics
2.3.4 1 Hour
Input
Output
- Define metrics to measure the success of each of your service offerings.
- Create a shortlist of expected benefits from those business objectives. These will help to drive metrics that align with the intended purpose of those service offerings, and affirm they are aligned to realizable benefits.
- Define metrics that speak to the benefits of your service offerings.
- It is possible that you will need to adjust these metrics after baselines are established when you begin to operate the ACE. Keep this in mind moving forward.
| Adoption attributes |
Expected Benefits |
Metrics |
| Team organization |
- Acquisition of the appropriate roles and skills to successfully deliver products.
|
- Degree of flexibility to adjust team compositions on a per project basis
|
| Team coordination |
- Ability to successfully undertake large and complex projects involving multiple functional groups.
|
- Number of ceremonies involving teams across functional groups
|
| Business alignment |
- Increased delivery of business value from process optimizations.
|
- Number of business-objective metrics surpassing targets
|
| Coaching |
- Teams are regularly trained with new and better best practices.
|
- Number of coaching and training requests
|
| Empowerment |
- Teams can easily and quickly modify processes to improve productivity without following a formal, rigorous process.
|
- Number of implemented changes from team retrospectives
|
| Failure tolerance |
- Stakeholders trust teams will adjust when failures occur during a project.
|
- Degree of stakeholder trust to address project issues quickly and effectively
|
Activity: Consolidate your metrics for stakeholder impact
2.3.5 30 Minutes
Input
- New and existing Agile metrics
Output
- Consolidated Agile metrics
Materials
- Whiteboard
- Markers
- Sticky notes
Participants
- Take all the metrics defined from the previous activities and compare them as a group.
- If there are overlapping metrics that are measuring similar outcomes or providing similar benefits, see if there is a way to merge them together so that a single metric can report outcomes to multiple stakeholders. This reduces the amount of resources invested in metrics gathering and helps to show consensus or alignment between multiple stakeholder interests.
- Compare these to your existing Agile metrics, and explore ways to consolidate existing metrics that are established with some of your new metrics. Established metrics are trusted and if they can be continued it can be viewed as beneficial from a consensus and consistency perspective to your stakeholders.
Activity: Use Info-Tech’s ACE Benefits Tracking Tool to monitor, evaluate, refine, and ensure continued business value
2.3.6 1 Hour
Purpose
The CoE governance team can use this tool to take ownership of the project’s benefits, track progress, and act on any necessary changes to address gaps. In the long term, it can be used to identify whether the team is ahead, on track, or lagging in terms of benefits realization.
Steps
- Enter your identified metrics from the following activities into the ACE Benefits Tracking Tool.
- Input your baselines from your data collection (Phase 3) and a goal value for each metric.
- Document the results at key intervals as defined by the tool.
- Use the summary report to identify metrics that are not tracking well for root cause analysis and communicate with key stakeholders the outcomes of your Agile Center of Excellence based on your communication schedule from Phase 3, Step 3.
INFO-TECH DELIVERABLE
Download the ACE Benefits Tracking Tool.
Checkpoint: Are you ready to operate your ACE?
Phase 2
2.1 Define an adoption plan for your Agile teams
2.2 Create an ACE engagement plan
2.3 Define metrics to measure success
↓
Phase 3
3.1 Optimize the success of your ACE
3.2 Plan change to enhance your Agile initiatives
3.3 Conduct ongoing retrospectives of your ACE
Self Auditing Guidelines
- Have you categorized your ACE service offerings within Info-Tech’s Agile adoption model?
- Have you formalized engagement plans to standardize the access to your service offerings?
- Do you understand the function of learning events and their criticality to the function of the ACE?
- Do you understand the key attributes of Agile adoption and how social capital leads to optimized value delivery?
- Have you defined metrics for different goals (adoption, effective service offerings, business objectives) of the ACE?
- Do your defined metrics align to the SMART framework?
If you want additional support, have our analysts guide you through this phase as part of an Info-Tech workshop
Book a workshop with our Info-Tech analysts:
- To accelerate this project, engage your IT team in an Info-Tech workshop with an Info-Tech analyst team.
- Info-Tech analysts will join you and your team onsite at your location or welcome you to Info-Tech’s historic Toronto office to participate in an innovative onsite workshop.
- Contact your account manager (www.infotech.com/account), or email Workshops@InfoTech.com for more information.
The following are sample activities that will be conducted by Info-Tech analysts with your team:
2.1.1 Further categorize your use cases within the Agile adoption model
Our analyst team will help you categorize the Centers of Excellence service offerings within Info-Tech’s Agile adoption model to help standardize the way your organization engages with the Center of Excellence.
2.2.1 Create an engagement plan for each level of adoption
Our analyst team will help you structure engagement plans for each role within your Agile environment to provide a standardized pathway to personal development and consistency in practice.
If you want additional support, have our analysts guide you through this phase as part of an Info-Tech workshop
Book a workshop with our Info-Tech analysts:
2.3.2 Define metrics that align with your Agile business objectives
Our analysts will walk you through defining a set of metrics that align with your Agile business objectives identified in Phase 1 of the blueprint so the CoEs monitoring function can ensure ongoing alignment during operation.
2.3.3 Define target ACE performance metrics
Our analysts will walk you through defining a set of metrics that monitors how successful the ACE has been at providing its services so that business and IT stakeholders can ensure the effectiveness of the ACE.
2.3.4 Define Agile adoption metrics
Our analyst team will help you through defining a set of metrics that aligns with your organization’s fit of the Agile adoption model in order to provide a mechanism to track the progress of Agile teams maturing in capability and organizational trust.
Phase 3
Operationalize Your Agile Center of Excellence
Spread Best Practices With an Agile Center of Excellence
Operate your ACE to drive optimized value from your Agile teams
The final step is to engage in monitoring of your metrics program to identify areas for improvement. Using metrics as a driver for operating your ACE will allow you to identify and effectively manage needed change, as well as provide you with the data necessary to promote outcomes to your stakeholders to ensure the long-term viability of the ACE within your organization.
Phase 1 - Strategically Align the CoE
Create strategic alignment between the CoE and the organization’s goals, objectives, and vision. This alignment translates into the CoE mandate intended to enhance the way Agile will enable teams to meet business objectives.
Phase 2 - Standardize the CoEs Service Offerings
Build an engagement plan based on a standardized adoption model to ensure your CoE service offerings are accessible and consistent across the organization. Create and consolidate key performance indicators to measure the CoEs utility and whether or not the expected value is being translated to tangible results.
Phase 3 - Operate the CoE
Operate the CoE to provide service offerings to Agile teams, identify improvements to optimize the function of your Agile teams, and effectively manage and communicate change so that teams can grow within the Agile adoption model and optimize value delivery both within your Agile environment and across functions.
Phase 3 outline
Call 1-888-670-8889 or email GuidedImplementations@InfoTech.com for more information.
Complete these steps on your own, or call us to complete a guided implementation. A guided implementation is a series of
2-3 advisory calls that help you execute each phase of a project. They are included in most advisory memberships.
Guided Implementation 3: Operate the CoE
Proposed Time to Completion (in weeks): Variable depending on communication plan
Step 3.1: Optimize the success of your ACE
Start with an analyst kick off call:
- Conduct a baseline assessment of your Agile environment.
Then complete these activities…
3.1.1 Use Info-Tech’s ACE Satisfaction Survey to help establish your baseline.
3.1.2 Use Info-Tech’s CoE Maturity Diagnostic Tool to measure the maturity level of your ACE.
3.1.3 Prioritize ACE actions by monitoring your metrics.
Step 3.2: Plan change to enhance your Agile initiatives
Start with an analyst kick off call:
- Interface with the ACE with your change management function.
Then complete these activities…
3.2.1 Assess the interaction and communication points of your Agile teams.
3.2.2 Determine the root cause of each metric falling short of expectations.
3.2.3 Brainstorm solutions to identified issues.
3.2.4 Review your metrics program.
3.2.5 Create a communication plan for change.
Step 3.3: Conduct ongoing retrospectives of your ACE
Finalize phase deliverable:
- Build a communications deck for key stakeholders.
Then complete these activities…
3.3.1 Use the outputs from your metrics tracking tool to communicate progress.
3.3.2 Summarize adjustments in areas where the ACE fell short.
3.3.3 Review the effectiveness of your service offerings.
3.3.4 Evaluate your ACE Maturity.
3.3.5 Use Info-Tech’s ACE Communications Deck to deliver your outcomes to the key stakeholders.
Phase 3 Results & Insights:
Inject improvements into your Agile environment with operational excellence. Plan changes and communicate them effectively, monitor outcomes on a regular basis, and keep stakeholders in the loop to ensure that their interests are being looked after to ensure long-term viability of the CoE.
Phase 3, Step 1: Optimize the success of your ACE
Phase 1
1.1 Determine the vision of your ACE
1.2 Define the service offerings of your ACE
Phase 2
2.1 Define an adoption plan for your Agile teams
2.2 Create an ACE engagement plan
2.3 Define metrics to measure success
Phase 3
3.1 Optimize the success of your ACE
3.2 Plan change to enhance your Agile initiatives
3.3 Conduct ongoing retrospectives of your ACE
Tools:
3.1.1 Use Info-Tech’s ACE Satisfaction Survey to help establish your baseline.
3.1.2 Use Info-Tech’s CoE Maturity Diagnostic Tool to measure the maturity level of your ACE.
3.1.3 Prioritize ACE actions by monitoring your metrics.
Outcomes:
- Conduct a baseline assessment of your ACE to measure against using a variety of data sources, including interviews, satisfaction surveys, and historical data.
- Use the Benefits Tracking Tool to start monitoring the outcomes of the ACE and to keep track of trends.
Ensure the CoE is able to collect the necessary data to measure success
Establish your collection process to ensure that the CoE has the necessary resources to collect metrics and monitor progress, that there is alignment on what data sources are to be used when collecting data, and that you know which stakeholder is interested in the outcomes of that metric.
Responsibility
- Does the CoE have enough manpower to collect the metrics and monitor them?
- If automated through technology, is it clear who is responsible for its function?
Source of metric
- Is the method of data collection standardized so that multiple people could collect the data in the same way?
Impacted stakeholder
- Do you know which stakeholder is interested in this metric?
- How often should the interested stakeholder be informed of progress?
Intended function
- What is the expected benefit of increasing this metric?
- What does the metric intend to communicate to the stakeholder?
Conduct a baseline assessment of your ACE to measure success
Establishing the baseline performance of the ACE allows you to have a reasonable understanding of the impact it is having on meeting business objectives. Use user satisfaction surveys, stakeholder interviews, and any current metrics to establish a concept of how you are performing now. Setting new metrics can be a difficult task so it is important to collect as much current data as possible. After the metrics have been established and monitored for a period of time, you can revisit the targets you have set to ensure they are realistic and usable.
Without a baseline, you cannot effectively:
- Establish reasonable target metrics that reflect the performance of your Center of Excellence.
- Identify, diagnose, and resolve any data that deviates from expected outcomes.
- Measure ongoing business satisfaction given the level of service.
Info-Tech Insight
Invest the needed time to baseline your activities. These data points are critical to diagnose successes and failures of the CoE moving forward, and you will need them to be able to refine your service offerings as business conditions or user expectations change. While it may seem like something you can breeze past, the investment is critical.
Use a variety of sources to get the best picture of your current state; a combination of methods provides the richest insight
Interviews
What to do:
- Conduct interviews (or focus groups) with key influencers and Agile team members.
Benefits:
- Data comes from key business decision makers.
- Identify what is top of mind for your top-level stakeholders.
- Ask follow-up questions for detail.
Challenges:
- This will only provide a very high-level view.
- Interviewer biases may skew the results.
Surveys
What to do:
- Distribute an Agile-specific stakeholder satisfaction survey. The survey should be specific to identify factors of your current environment.
Benefits:
- Every end user/business stakeholder will be able to provide feedback.
- The survey will be simple to develop and distribute.
Challenges:
- Response rates can be low if stakeholders do not understand the value in their opinions.
Historical Data
What to do:
- Collect and analyze existing Agile data such as past retrospectives, Agile team metrics, etc.
Benefits:
- Get a full overview of current service offerings, past issues, and current service delivery.
- Allows you to get an objective view of what is really going on within your Agile teams.
Challenges:
- Requires a significant time investment and analytical skills to analyze the data and generate insights on business satisfaction and needs.
Use Info-Tech’s ACE Satisfaction Survey to help establish your baseline
3.1.1 Baseline satisfaction survey
Purpose
Conduct a user satisfaction survey prior to setting your baseline for your ACE. This will include high-level questions addressing your overall Agile environment and questions addressing teams’ current satisfaction with their processes and technology.
Steps
- Modify the satisfaction survey template to suit your organization and the service offerings you have defined for the Agile Center of Excellence.
- Distribute the satisfaction survey to any users who are expected to interface with the ACE.
- Document the results and communicate them with the relevant key stakeholders.
- Combine these results with historical data points (if available) and stakeholder interviews to get a holistic picture of your current state.
INFO-TECH DELIVERABLE
Download the ACE Satisfaction Survey.
Use Info-Tech’s CoE Maturity Diagnostic Tool to measure the maturity level of your ACE
3.1.2 CoE maturity assessment
Purpose
Assessing your ACEs maturity lets you know where they currently are and what to track to get them to the next step. This will help ensure your ACE is following good practices and has the appropriate mechanisms in place to serve your stakeholders.
Steps
- Download the CoE Maturity Diagnostic Tool to assess the maturity of your ACE.
- Complete the assessment tool with all members of your ACE team to determine your maturity score.
- Document the results and communicate them with the relevant key stakeholders.
- Combine these results with historical data points (if available) and stakeholder interviews to get a holistic picture of your ACE maturity level.
Document results in the ACE Communications Deck.
INFO-TECH DELIVERABLE
Download the CoE Maturity Diagnostic Tool.
Activity: Prioritize ACE actions by monitoring your metrics
3.1.3 Variable time commitment
Input
- Metrics from ACE Benefits Tracking Tool
Output
- Prioritized actions for the ACE
Materials
- ACE Benefits Tracking Tool
Participants
- Review your ACE Benefits Tracking Tool periodically (at the end of sprint cycles, quarterly, etc.) and document metrics that are trending or actively falling short of goals or expectations.
- Take the documented list and have the ACE staff consider what actions or decisions can be prioritized to help mend the identified gaps. Look for any trends that could potentially speak to a larger problem or a specific aspect of the ACE or the organizational Agile environment that is not functioning as expected.
- Take the opportunity to review metrics that are also tracking above expected value to see if there are any lessons learned that can be extended to other ACE service offerings (e.g. effective engagement or communication strategies) so that the organization can start to learn what is effective and what is not based on their internal struggles and challenges. Spreading successes is just as important as identifying challenges in a CoE model.
Phase 3, Step 2: Plan change to enhance your Agile initiatives
Phase 1
1.1 Determine the vision of your ACE
1.2 Define the service offerings of your ACE
Phase 2
2.1 Define an adoption plan for your Agile teams
2.2 Create an ACE engagement plan
2.3 Define metrics to measure success
Phase 3
3.1 Optimize the success of your ACE
3.2 Plan change to enhance your Agile initiatives
3.3 Conduct ongoing retrospectives of your ACE
Activities:
3.2.1 Assess the interaction and communication points of your Agile teams.
3.2.2 Determine the root cause of each metric falling short of expectations.
3.2.3 Brainstorm solutions to identified issues
3.2.4 Review your metrics program.
3.2.5 Create a communication plan for change.
Outcomes:
- Understand how your existing change management process interfaces with the Center of Excellence.
- Identify issues and ideate solutions to metrics falling short of expectations.
- Create a communication plan to prepare groups for any necessary change.
Manage the adaptation of teams as they adopt Agile capabilities
As Agile spreads, be cognizant of your cultural tolerance to change and its ability to deliver on such change. Change will happen more frequently and continuously, and there may be conceptual (change tolerance) or capability (delivery tolerance) roadblocks along the way that will need to be addressed.
The Agile adoption model will help to graduate both the tolerance to change and tolerance to deliver over time. As your level of competency to deliver change increases, organizational tolerance to change, especially amongst management, will increase as well. Remember that optimized value delivery comes from this careful balance of aptitude and trust.
Tolerance to change
Tolerance to change refers to the conceptual capacity of your people to consume and adopt change. Change tolerance may become a barrier to success because teams might be too engrained with current structures and processes and find any changes too disruptive and uncomfortable.
Tolerance to deliver
Tolerance to deliver refers to the capability to deliver on expected change. While teams may be tolerant, they may not have the necessary capacity, skills, or resources to deliver the necessary changes successfully. The ACE can help solve this problem with training and coaching, or possibly by obtaining outside help where necessary.
Understand how the ACE interfaces with your current change management process
As the ACE absorbs best practices and identifies areas for improvement, a change management process should be established to address the implementation and sustainability of change without introducing significant disruptions and costs.
To manage a continuously changing environment, your ACE will need to align and coordinate with organizational change management processes. This process should be capable of evaluating and incorporating multiple change initiatives continuously.
Desired changes will need to be validated, and localized adaptations will need to be disseminated to the larger organization, and current state policy and procedures will need to be amended as the adoption of Agile spreads and capabilities increase.
The goal here is to have the ACE governance group identify and interface with parties relevant to successfully implementing any specific change.
INFO-TECH RELATED RESEARCH:
Strategy and Leadership: Optimize Change Management
Optimize your stakeholder management process to identify, prioritize, and effectively manage key stakeholders.
Where should your Agile change requests come from?
Changes to the services, structure, or engagement model of your ACE can be triggered from various sources in your organization. You will see that proposed changes may be requested with the best intentions; however, the potential impacts they may have to other areas of the organization can be significant. Consult all sources of ACE change requests to obtain a consensus that your change requests will not deteriorate the ACEs performance and use.
ACE Governance
- Sources of ACE Change Requests
- ACE Policies/Stakeholders
- Triggers for Change:
- Changes in business and functional group objectives.
- Dependencies and legacy policies and procedures.
- ACE Customers
- Triggers for Change:
- Retrospectives and post-mortems.
- Poor fit of best practices to projects.
- Metrics
- Triggers for Change:
- Performance falling short of expectations.
- Lack of alignment with changing objectives.
- Tools and Technologies
- Triggers for Change:
- New or enhanced tools and technologies.
- Changes in development and technology standards.
Note: Each source of ACE change requests may require a different change management process to evaluate and implement the change.
Activity: Assess the interaction and communication points of your Agile teams
3.2.1 1.5 Hours
Input
- Understanding of team and organization structure
Output
- Current assessment of organizational design
Materials
- Whiteboard
- Markers
- Sticky notes
Participants
- Identify everyone who is directly or indirectly involved in projects completed by Agile teams. This can include those that are:
- Informed of a project’s progress.
- Expected to interface with the Agile team for solution delivery (e.g. DevOps).
- Impacted by the success of the delivered solutions.
- Responsible for the removal of impediments faced by the Agile team.
Indicate how each role interacts with the others and how frequently these interactions occur for a typical project. Do this by drawing a diagram on a whiteboard using labelled arrows to indicate types and frequency of interactions.
Identify the possible communication, collaboration, and alignment challenges the team will face when working with other groups.
| Agile Team n |
| Group |
Type of Interaction |
Potential challenges |
| Operations |
|
- Past challenges transitioning to DevOps.
- Communication barrier as an impediment.
|
| PMO |
|
- Product owner not located with team in organization.
- PMO still primarily waterfall; need Agile training/coaching
|
Activity: Determine the root cause of each metric falling short of expectations
3.2.2 30 Minutes per metric
Input
- Metrics from Benefits Tracking Tool
Output
Materials
Participants
- Take each metric from the ACE Benefits Tracking Tool that is lagging behind or has missed expectations and conduct an analysis of why it is performing that way.
- Conduct individual webbing sessions to clarify the issues. The goal is to drive out the reasons why these issues are present or why scaling Agile may introduce additional challenges.
- Share and discuss these findings with the entire team.
Example:
- Lack of best-practice documentation
- Why?
- Knowledge siloed within teams
- No centralized repository for best practices
- Why?
- No mechanisms to share between teams
- Why? Root causes
- Teams are not sharing localized adaptations
- CoE is not effectively monitoring team communications
- Access issues at team level to wiki
- Why? Root causes
- Administration issues with best-practice wiki
- Lack of ACE visibility into wiki access
Activity: Brainstorm solutions to identified issues
3.2.3 30 Minutes per metric
Input
Output
- Fixes and solutions to scaling Agile issues
Materials
- Whiteboard
- Markers
- Sticky notes
Participants
- Using the results from your root-cause analysis, brainstorm potential solutions to the identified problems. Frame your brainstorming within the following perspectives: people, process, and technology. Map these solutions using the matrix below.
- Synthesize your ideas to create a consolidated list of initiatives.
- Highlight the solutions that can address multiple issues.
- Collaborate on how solutions can be consolidated into a single initiative.
- Write your synthesized solutions on sticky notes.
| |
|
SOLUTION CATEGORY |
| |
|
People |
Process |
Technology |
| ISSUES |
Poor face-to-face communication |
|
|
|
| Lack of best-practice documentation |
|
|
|
Engage those teams affected by change early to ensure they are prepared
Strategically managing change is an essential component to ensure that the ACE achieves its desired function. If the change that comes with adopting Agile best practices is going to impact other functions and change their expected workflows, ensure they are well prepared and the benefits for said changes are clearly communicated to them.
Necessary change may be identified proactively (dependency assessments, system integrity, SME indicates need, etc.) or reactively (through retrospectives, discussions, completing root-cause analyses, etc.), but both types need to be handled the same way – through proper planning and communication with the affected parties.
Plan any necessary change
Understand the points where other groups will be affected by the adoption of Agile practices and recognize the potential challenges they may face. Plan changes to accommodate interactions between these groups without roadblocks or impediments.
Communicate the change
Structure a communication plan based on your identified challenges and proposed changes so that groups are well prepared to make the necessary adjustments to accommodate Agile workflows.
Review and modify your metrics and baselines to ensure they are achievable in changing environments
Consider the possible limitations that will exist from environmental complexities when measuring your Agile teams. Dependencies and legacy policies and procedures that pose a bottleneck to desired outcomes will need to be changed before teams can be measured justifiably. Take the time to ensure the metrics you crafted earlier are plausible in your current environment and there is not a need for transitional metrics.
Are your metrics achievable?
Specific
Measureable
Achievable
- Adopting Agile is a journey, not just a destination. Ensure that the metrics a team is measured against reflect expectations for the team’s current level of Agile adoption and consider external dependencies that may limit their ability to achieve intended results.
Realistic
Time-bound
Info-Tech Insight
Use metrics as diagnostics, not as motivation. Teams will find ways to meet metrics they are measured by making sacrifices and taking unneeded risk to do so. To avoid dysfunction in your monitoring, use metrics as analytical tools to inform decision making, not as a yardstick for judgement.
Activity: Review your metrics program
3.2.4 Variable time commitment
Input
- Identified gaps
- Agile team interaction points
Output
- ACE baselines
- Past measurements
Materials
- ACE Benefits Tracking Tool
Participants
- Now that you have identified gaps in your current state, see if those will have any impact on the achievability of your current metrics program.
- Review your root-cause analyses and brainstormed solutions, and hypothesize whether or not they will have any downstream impact to goal attainment. It is possible that there is no impact, but as cross-functional collaboration increases, the likelihood that groups will act as bottlenecks or impediments to expected performance will increase.
- Consider how any changes will impact the interaction points between teams based on the results from activity 3.2.1: Assess the interaction and communication points of your Agile teams. If there are too many negative impacts it may be a sign to re-consider the hypothesized solution to the problem and consider alternatives.
- In any cases where a metric has been altered, adjust its goal measurement to reflect its changes in the ACE Benefits Tracking Tool.
Case study: Agile change at the GSA
CASE STUDY
Industry Government
Source Navin Vembar, Agile Government Leadership
Challenge
The GSA is tasked with completed management of the Integrated Award Environment (IAE).
- The IAE manages ten federal information technology systems that enable registering, searching, and applying for federal awards, as well as tracking them.
- The IAE also manages the Federal Service Desk.
The IAE staff had to find a way to break down the problem of modernization into manageable chunks that would demonstrate progress, but also had to be sure to capture a wide variety of user needs with the ability to respond to those needs throughout development.
Had to work out the logistics of executing Agile change within the GSA, an agency that relies heavily on telework. In the case of modernization, they had a product owner in Florida while the development team was spread across the metro Washington, DC area.
Solution
Agile provided the ability to build incremental successes that allowed teams successful releases and built enthusiasm around the potential of adopting Agile practices offered.
- GSA put in place an organization framework that allowed for planning of change at the portfolio level to enable the change necessary to allow for teams to execute tasks at the project level.
- A four-year plan with incremental integration points allowed for larger changes on a quarterly basis while maintaining a bi-weekly sprint cycle.
- They adopted IBM’s RTC tool for a Scrum board and on Adobe Connect for daily Scrum sessions to ensure transparency and effectiveness of outcomes across their collocated teams.
Create a clear, concise communication plan
Communication is key to avoid surprises and lost productivity created by the implementation of changes.
User groups and the business need to be given sufficient notice of an impending change. Be concise, be comprehensive, and ensure that the message is reaching the right audience so that no one is blindsided and unable to deliver what is needed. This will allow them to make appropriate plans to accept the change, minimizing the impact of the change on productivity.
Key Aspects of a Communication Plan
- The method of communication (email, meetings, workshops, etc.).
- The delivery strategy (who will deliver the message?).
- The communication responsibility structure.
- The communication frequency.
- A feedback mechanism that allows you to review the effectiveness of your plan.
- The message that you need to present.
Communicating change
- What is the change?
- Why are we doing it?
- How are we going to go about it?
- What are we trying to achieve?
- How often will we be updated?
(Cornelius & Associates, The Qualities of Leadership: Leading Change)
Apply the following principles to enhance the clarity of your message
- Be Consistent
- "This is important because..."
- The core message must be consistent regardless of audience, channel, or medium.
- Test your communication and obtain feedback before delivering your message.
- A lack of consistency can be perceived as deception.
Be Clear
- "This means..."
- Say what you mean and mean what you say.
- Choice of language is important.
- Don’t use jargon.
Be Relevant
- "This affects you because..."
- Talk about what matters to the audience.
- Talk about what matters to the change initiative.
- Tailor the details of the message to each audience’s specific concerns.
- Communicate truthfully; do not make false promises or hide bad news.
Be Concise
- "In summary..."
- Keep communication short and to the point so key messages are not lost in the noise.
Activity: Create a communication plan for change
3.2.5 1.5 Hours
Input
- Desired messages
- Stakeholder list
Output
Materials
Participants
- Define the audience(s) for your communications. Consider who needs to be the audience of your different communication events and how it will impact them.
- Identify who the messenger will be to deliver the message.
- Identify your communication methods. Decide on the methods you will use to deliver each communication event. Your delivery method may vary depending on the audience it is targeting.
- Establish a timeline for communication releases. Set dates for your communication events. This can be recurring (weekly, monthly, etc.) or one-time events.
- Determine what the content of the message must include. Use the guidelines on the following slide to ensure the message is concise and impactful.
Note: It is important to establish a feedback mechanism to ensure that the communication has been effective in communicating the change to the intended audiences. This can be incorporated into your ACE satisfaction surveys.
| Audience |
Messenger |
Format |
Timing |
Message |
| Operations |
Development team |
Email |
- Monthly (major release)
- Ad hoc (minor release and fixes)
|
Build ready for release |
| Key stakeholders |
CIO |
Meeting |
- Monthly unless dictated otherwise
|
Updates on outcomes from past two sprint cycles |
Phase 3, Step 3: Conduct ongoing retrospectives of your ACE
Phase 1
1.1 Determine the vision of your ACE
1.2 Define the service offerings of your ACE
Phase 2
2.1 Define an adoption plan for your Agile teams
2.2 Create an ACE engagement plan
2.3 Define metrics to measure success
Phase 3
3.1 Optimize the success of your ACE
3.2 Plan change to enhance your Agile initiatives
3.3 Conduct ongoing retrospectives of your ACE
Activities/Tools:
3.3.1 Use the outputs from your metrics tracking tool to communicate progress.
3.3.2 Summarize adjustments in areas where the ACE fell short.
3.3.3 Re-conduct satisfaction surveys and compare against your baseline.
3.3.4 Use Info-Tech’s CoE Maturity Diagnostic Tool to baseline current practices
3.3.5 Use Info-Tech’s ACE Communications Deck to deliver your outcomes to the key stakeholders.
Outcomes:
- Conduct a retrospective of your ACE to enable the continuous improvement of your Agile program.
- Structure a communications deck to communicate with stakeholders the outcomes from introducing the ACE to the organization.
Reflect on your ACEs performance to lead the way to enterprise agility
After functioning for a period of time, it is imperative to review the function of your ACE to ensure its continual alignment and see in what ways it can improve.
At the end of the year, take the time to deliberately review and discuss:
- The effectiveness and use of your ACEs service offerings.
- What went well or wrong during the ACEs operation.
- What can be done differently to improve reach, usability, and effectiveness.
- Bring together Agile teams and discuss the processes they follow and inquire about suggestions for improvement.
What is involved?
- Use your metrics program to diagnose areas of issue and success. The diagnostic value of your metrics can help lead conversations with your Agile teams when attempting to inquire about suggestions for improvement.
- Leverage your satisfaction surveys from the creation of your ACE and compare them against satisfaction surveys run after a year of operation. What are the lessons learned between then and now?
- While it is primarily conducted by the ACE team, keep in mind it is a collaborative function and should involve all members, including Agile teams, product owners, Scrum masters, etc.
Communicating with your key influencers is vital to ensure long-term operation of the ACE
To ensure the long-term viability of your ACE and that your key influencers will continue funding, you need to demonstrate the ROI the Center of Excellence has provided.
The overlying purpose of your ACE is to effectively align your Agile teams with corporate objectives. This means that there have to be communicable benefits that point to the effort and resources invested being valuable to the organization. Re-visit your prioritized stakeholder list and get ready to show them the impact the ACE has had on business outcomes.
Communication with stakeholders is the primary method of building and developing a lasting relationship. Correct messaging can build bridges and tear down barriers, as well as soften opposition and bolster support.
This section will help you to prepare an effective communication piece that summarizes the metrics stakeholders are interested in, as well as some success stories or benefits that are not communicable through metrics to provide extra context to ongoing successes of the ACE.
INFO-TECH RELATED RESEARCH:
Strategy and Leadership: Manage Stakeholder Relations
Optimize your stakeholder management process to identify, prioritize, and effectively manage key stakeholders.
Involve key stakeholders in your retrospectives to justify the funding for your ACE
Those who fund the ACE have a large influence on the long-term success of your ACE. If you have not yet involved your stakeholders, you need to re-visit your organizational funding model for the ACE and ensure that your key stakeholders include the key decision makers for your funding. While they may have varying levels of interest and desires for granularity of data reporting, they need to at least be informed on a high level and kept as champions of the ACE so that there are no roadblocks to the long-term viability of this program.
Keep this in mind as the ACE begins to demonstrate success, as it is not uncommon to have additional members added to your funding model as your service scales, especially in the chargeback models.
As new key influencers are included, the ACEs governing group must ensure that collective interests may align and that more priorities don’t lead to derailment.
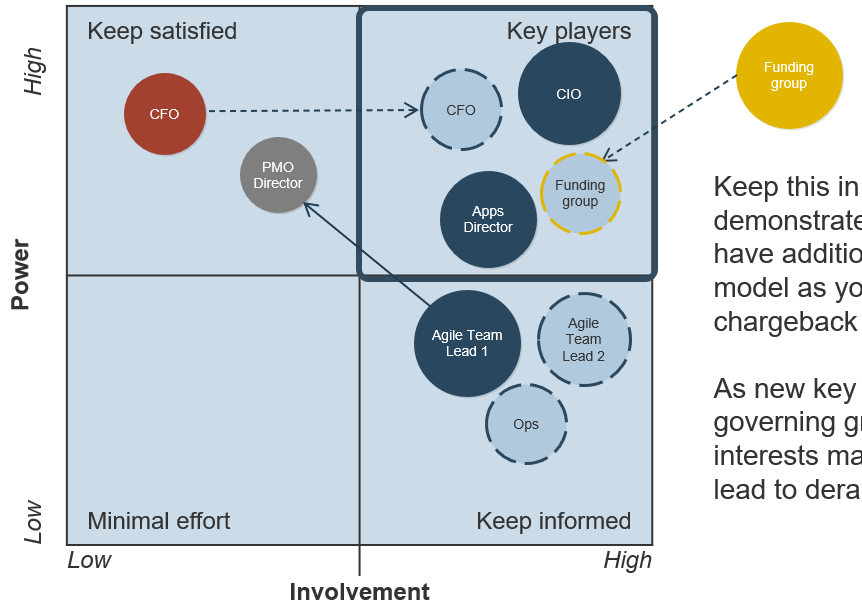
Use the outputs from your metrics tracking tool to communicate progress
3.3.1 1 Hour
Use the ACE Benefits Tracking Tool to track the progress of your Agile environment to monitor whether or not the ACE is having a positive impact on the business’ ability to meet its objectives. The outputs will allow you to communicate incremental benefits that have been realized and point towards positive trends that will ensure the long-term buy-in of your key influencers.
For communication purposes, use this tool to:
- Re-visit who the impacted or interested stakeholders are so you can tailor your communications to be as impactful as possible for each key influencer of the ACE.
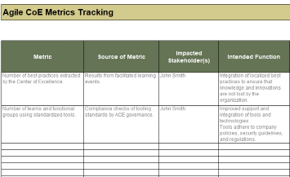
- Collate the benefits of the current projects undertaken by the Center of Excellence to give an overall recap of the ACEs impact.
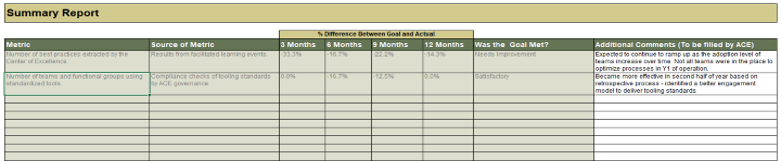
Communicate where the ACE fell short
Part of communicating the effectiveness of your ACE is to demonstrate that it is able to remedy projects and processes when they fall short of expectations and brainstorm solutions that effectively address these challenges. Take the opportunity to summarize where results were not as expected, and the ways in which the ACE used its influence or services to drive a positive outcome from a problem diagnosis. Stakeholders do not want a sugar-coated story – they want to see tangible results based on real scenarios.
Summarizing failures will demonstrate to key influencers that:
- You are not cherry-picking positive metrics to report and that the ACE faced challenges that it was able to overcome to drive positive business outcomes.
- You are being transparent with the successes and challenges faced by the ACE, fostering increased trust within your stakeholders regarding the capabilities of Agile.
- Resolution mechanisms are working as intended, successfully building failure tolerance and trust in change management policies and procedures.
Activity: Summarize adjustments in areas where the ACE fell short
3.3.2 15 Minutes per metric
Input
- Diagnosed problems from tracking tool
- Root-cause analyses
Output
- Summary of change management successes
Materials
Participants
- Create a list of items from the ACE Benefits Tracking Tool that fell short of expectations or set goals.
- For each point, create a brief synopsis of the root-cause analysis completed and summarize the brainstormed solution and its success in remedying the issue. If this process is not complete, create a to-date summary of any progress.
- Choose two to three pointed success stories from this list that will communicate broad success to your set of stakeholders.
| Name of metric that fell short |
| Baseline measurement |
65% of users satisfied with ACE services. |
| Goal measurement |
80% of users satisfied with ACE services. |
| Actual measurement |
70% of users satisfied with ACE services. |
| Results of root-cause analysis |
Onboarding was not extensive enough; teams were unaware of some of the services offered, rendering them unsatisfied. |
| Proposed solution |
Revamp onboarding process to include capability map of service offered. |
| Summary of success |
TBD |
Re-conduct surveys with the ACE Satisfaction Survey to review the effectiveness of your service offerings
3.3.3 Re-conduct satisfaction surveys and compare against your baseline
Purpose
This satisfaction survey will give you a template to follow to monitor the effectiveness of your ACEs defined service offerings. The goal is to understand what worked, and what did not, so you can add, retract, or modify service offerings where necessary.
Steps
- Re-use the satisfaction survey to measure the effectiveness of the service offerings. Add questions regarding specific service offerings where necessary.
- Cross-analyze your satisfaction survey with metrics tied to your service offerings to help understand the root cause of the issues.
- Use the root-cause analysis exercises from step 3.2 to find the root causes of issues.
- Create a set of recommendations to add, amend, or improve any existing service offerings.
INFO-TECH DELIVERABLE
Download the ACE Satisfaction Survey.
Use Info-Tech’s CoE Maturity Diagnostic Tool to baseline current practices
3.3.4 ACE Maturity Assessment
Purpose
Assess your ACEs maturity by using Info-Tech’s CoE Maturity Diagnostic Tool. Assessing your ACEs maturity lets you know where you currently are, and where to look for improvements. Note that your optimal Maturity Level will depend on organizational specifics (e.g. a small organization with a handful of Agile Teams can be less mature than a large organization with hundreds of Agile Teams).
Steps
- Download the CoE Maturity Diagnostic Tool to assess the maturity of your ACE.
- Complete the assessment tool with all members of your ACE team to determine your current Maturity score.
- Document the results in the ACE Communications Deck.
Document results in the ACE Communications Deck.
INFO-TECH DELIVERABLE
Download the CoE Maturity Diagnostic Tool.
Use Info-Tech’s ACE Communications Deck to deliver your outcomes to the key stakeholders
3.3.5 Structure communications to each of your key stakeholders
Purpose
The ACE Communications Deck will give you a template to follow to effectively communicate with your stakeholders and ensure the long-term viability of your Agile Center of Excellence. Fill in the slides as instructed and provide each stakeholder with a targeted view of the successes of the ACE.
Steps
- Determine who your target audience is for the Communications Deck – you may desire to create one for each of your key stakeholders as they may have different sets of interests.
- Fill out the ACE Communications Deck with the suggested inputs from the exercises you have completed during this research set.
- Review communications with members of the ACE to ensure that there are no communicable benefits that have been missed or omitted in the deck.
INFO-TECH DELIVERABLE
Download the ACE Communications Deck.
Summary of accomplishment
Knowledge Gained
- An understanding of social capital as the key driver for organizational Agile success, and how it optimizes the value delivery of your Agile teams.
- Importance of flexible governance to balance the benefits of localized adaptation and centralized control.
- Alignment of service offerings with both business objectives and functional expectations as critical to ensuring long-term engagement with service offerings.
Processes Optimized
- Knowledge management and transfer of Agile best practices to new or existing Agile teams.
- Optimization of service offerings for Agile teams based on organizational culture and objectives.
- Change request optimization via interfacing ACE functions with existing change management processes.
- Communication planning to ensure transparency during cross-functional collaboration.
Deliverables Completed
- A set of service offerings offered by the Center of Excellence that are aligned with the business, Agile teams, and related stakeholders.
- Engagement plans for Agile team members based on a standardized adoption model to access the ACEs service offerings.
- A suite of Agile metrics to measure effectiveness of Agile teams, the ACE itself, and its ability to deliver positive outcomes.
- A communications plan to help create cross-functional transparency over pending changes as Agile spreads.
- A communications deck to communicate Agile goals, actions, and outcomes to key stakeholders to ensure long-term viability of the CoE.
Research contributors and experts
Paul Blaney, Technology Delivery Executive, Thought Leader and passionate Agile Advocate
Paul has been an Agile practitioner since the manifesto emerged some 20 years ago, applying and refining his views through real life experience at several organizations from startups to large enterprises. He has recently completed the successful build out of the inaugural Agile Delivery Centre of Excellence at TD bank in Toronto.
John Munro, President Scrum Masters Inc.
John Munro is the President of Scrum Masters Inc., a software optimization professional services firm using Agile, Scrum, and Lean to help North American firms “up skill” their software delivery people and processes. Scrum Masters’ unique, highly collaborative “Master Mind” consulting model leverages Agile/Lean experts on a biweekly basis to solve clients’ technical and process challenges.
Doug Birgfeld, Senior Partner Agile Wave
Doug has been a leader in building great teams, Agile project management, and business process innovation for over 20 years. As Senior Partner and Chief Evangelist at Agile Wave, his mission is to educate and to learn from all those who care about effective government delivery, nationally.
Bibliography
Ambler, Scott. “Agile Requirements Change Management.” Agile Modeling. Scott Amber + Associates, 2014. Web. 12 Apr. 2016.
Ambler, Scott. “Center of Excellence (CoEs).” Disciplined Agile 2.0: A Process Decision Framework for Enterprise I.T. Scott Amber + Associates. Web. 01 Apr. 2016.
Ambler, Scott. “Transforming From Traditional to Disciplined Agile Delivery.” Case Study: Disciplined Agile Delivery Adoption. Scott Amber + Associates, 2013. Web.
Beers, Rick. “IT – Business Alignment Why We Stumble and the Path Forward.” Oracle Corporation, July 2013. Web.
Cornelius & Associates. “The Qualities of Leadership: Leading Change.” Cornelius & Associates, n.d. Web.
Craig, William et al. “Generalized Criteria and Evaluation Method for Center of Excellence: A Preliminary Report.” Carnegie Mellon University Research Showcase @ CMU – Software Engineering Institute. Dec. 2009. Web. 20 Apr. 2016.
Forsgren, Dr. Nicole et al (2019), Accelerate: State of DevOps 2019, Google, https://services.google.com/fh/files/misc/state-of-devops-2019.pdf
Gerardi, Bart (2017), Agile Centers of Excellence, PMI Projectmanagement.com, https://www.projectmanagement.com/articles/405819/Agile-Centers-of-Excellence
Gerardi, Bart (2017), Champions of Agile Adoption, PMI Projectmanagement.com, https://www.projectmanagement.com/articles/418151/Champions-of-Agile-Adoption
Gerardi, Bart (2017), The Roles of an Agile COE, PMI Projectmanagement.com, https://www.projectmanagement.com/articles/413346/The-Roles-of-an-Agile-COE
Hohl, P. et al. “Back to the future: origins and directions of the ‘Agile Manifesto’ – views of the originators.” Journal of Software Engineering Research and Development, vol. 6, no. 15, 2018. https://link.springer.com/article/10.1186/s40411-0...
Kaltenecker, Sigi and Hundermark, Peter. “What Are Self-Organising Teams?” InfoQ. 18 July 2014. Web. 14 Apr. 2016.
Kniberg, Henrik and Anderson Ivarsson. “Scaling Agile @ Spotify with Tribes, Squads, Chapters & Guilds.” Oct. 2012. Web. 30 Apr. 2016.
Kumar, Alok et al. “Enterprise Agile Adoption: Challenges and Considerations.” Scrum Alliance. 30 Oct. 2014. Web. 30 May 2016.
Levison, Mark. “Questioning Servant Leadership.” InfoQ, 4 Sept. 2008. Web. https://www.infoq.com/news/2008/09/servant_leadership/
Linders, Ben. “Don't Copy the Spotify Model.” InfoQ.com. 6 Oct. 2016.
Loxton, Matthew (June 1, 2011), CoP vs CoE – What’s the difference, and Why Should You Care?, Wordpress.com
McDowell, Robert, and Bill Simon. In Search of Business Value: Ensuring a Return on Your Technology Investment. SelectBooks, 2010
Novak, Cathy. “Case Study: Agile Government and the State of Maine.” Agile Government Leadership, n.d. Web.
Pal, Nirmal and Daniel Pantaleo. “Services are the Language and Building Blocks of an Agile Enterprise.” The Agile Enterprise: Reinventing your Organization for Success in an On-Demand World. 6 Dec. 2015. Springer Science & Business Media.
Rigby, Darrell K. et al (2018), Agile at Scale, Harvard Business Review, https://hbr.org/2018/05/agile-at-scale
Scaledagileframework.com, Create a Lean-Agile Center of Excellence, Scaled Agile, Inc, https://www.scaledagileframework.com/lace/
Shepley, Joe. “8 reasons COEs fail (Part 2).” Agile Ramblings, 22 Feb. 2010. https://joeshepley.com/2010/02/22/8-reasons-coes-fail-part-2/
Stafford, Jan. “How upper management misconceptions foster Agile failures.” TechTarget. Web. 07 Mar. 2016.
Taulli, Tom (2020), RPA Center Of Excellence (CoE): What You Need To Know For Success, Forbes.com, https://www.forbes.com/sites/tomtaulli/2020/01/25/rpa-center-of-excellence-coe-what-you-need-to-know-for-success/#24364620287a
Telang, Mukta. “The CMMI Agile Adoption Model.” ScrumAlliance. 29 May 2015. Web. 15 Apr. 2016.
VersionOne. “13th Annual State of Agile Report.” VersionOne. 2019. Web.
Vembar, Navin. “Case Study: Agile Government and the General Services Administration (Integrated Award Environment).” Agile Government Leadership, n.d. Web.
Wenger, E., R. A. McDermott, et al. (2002), Cultivating communities of practice: A guide to managing knowledge, Harvard Business Press.
Wenger, E., White, N., Smith, J.D. Digital Habitats; Stewarding Technology for Communities. Cpsquare (2009).

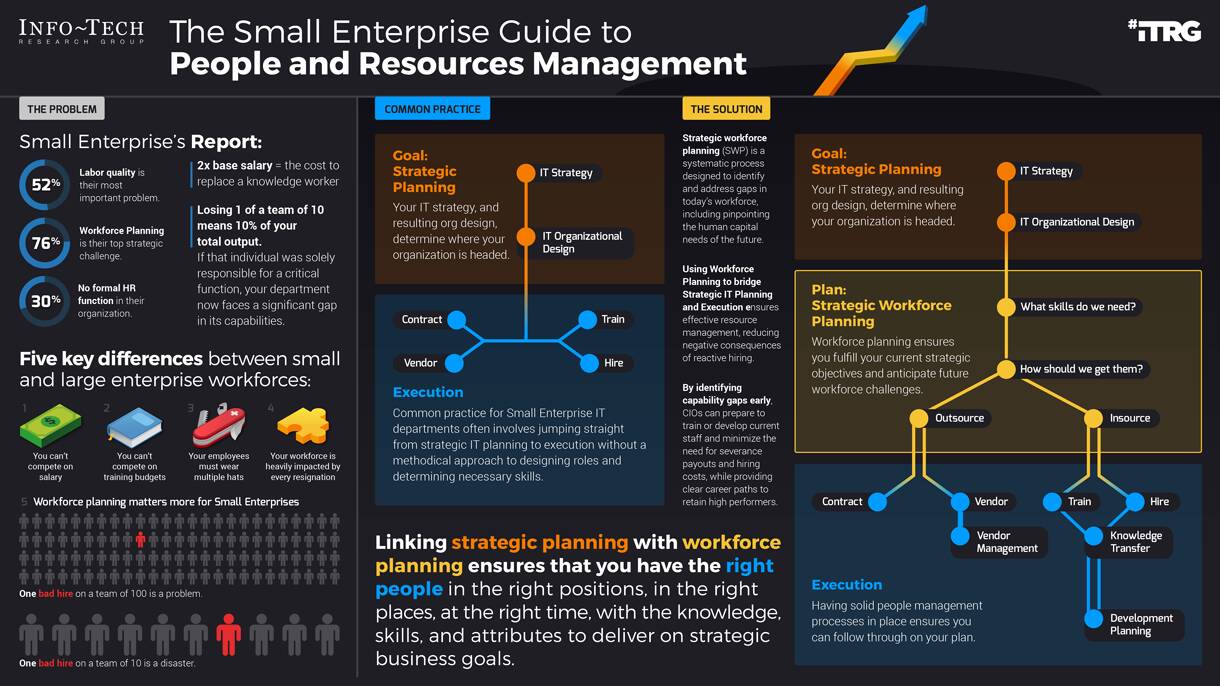


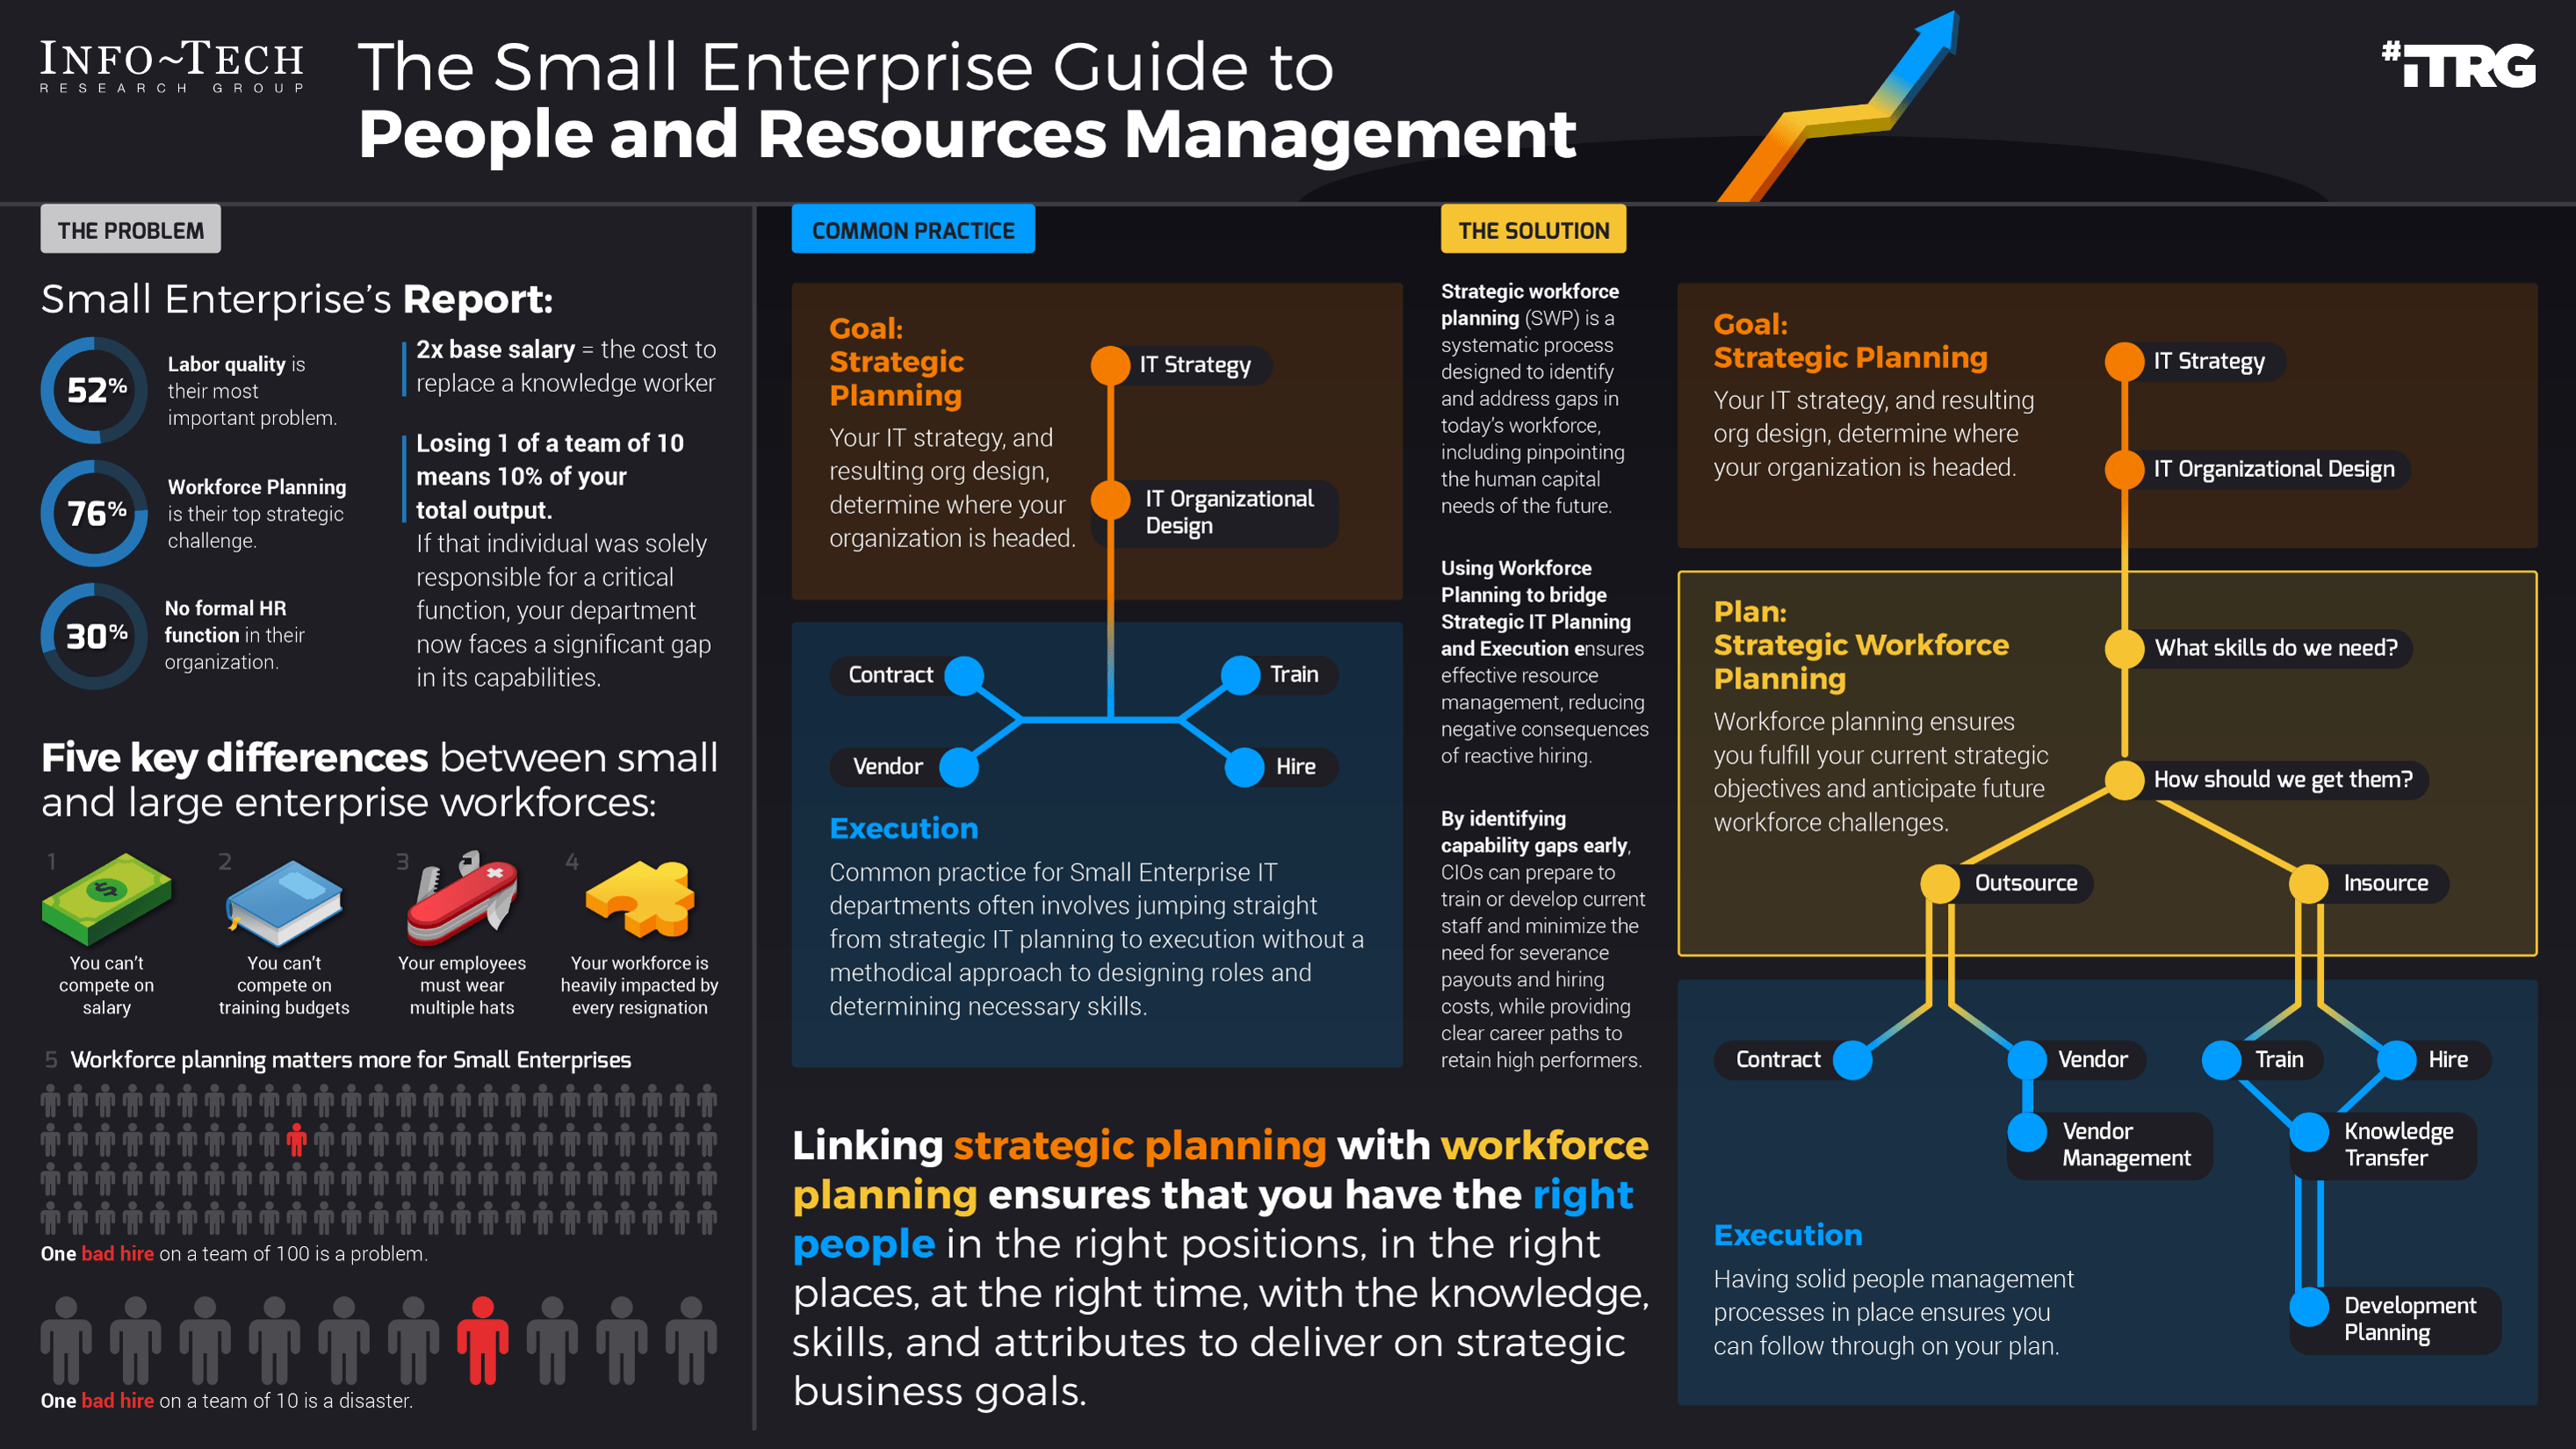
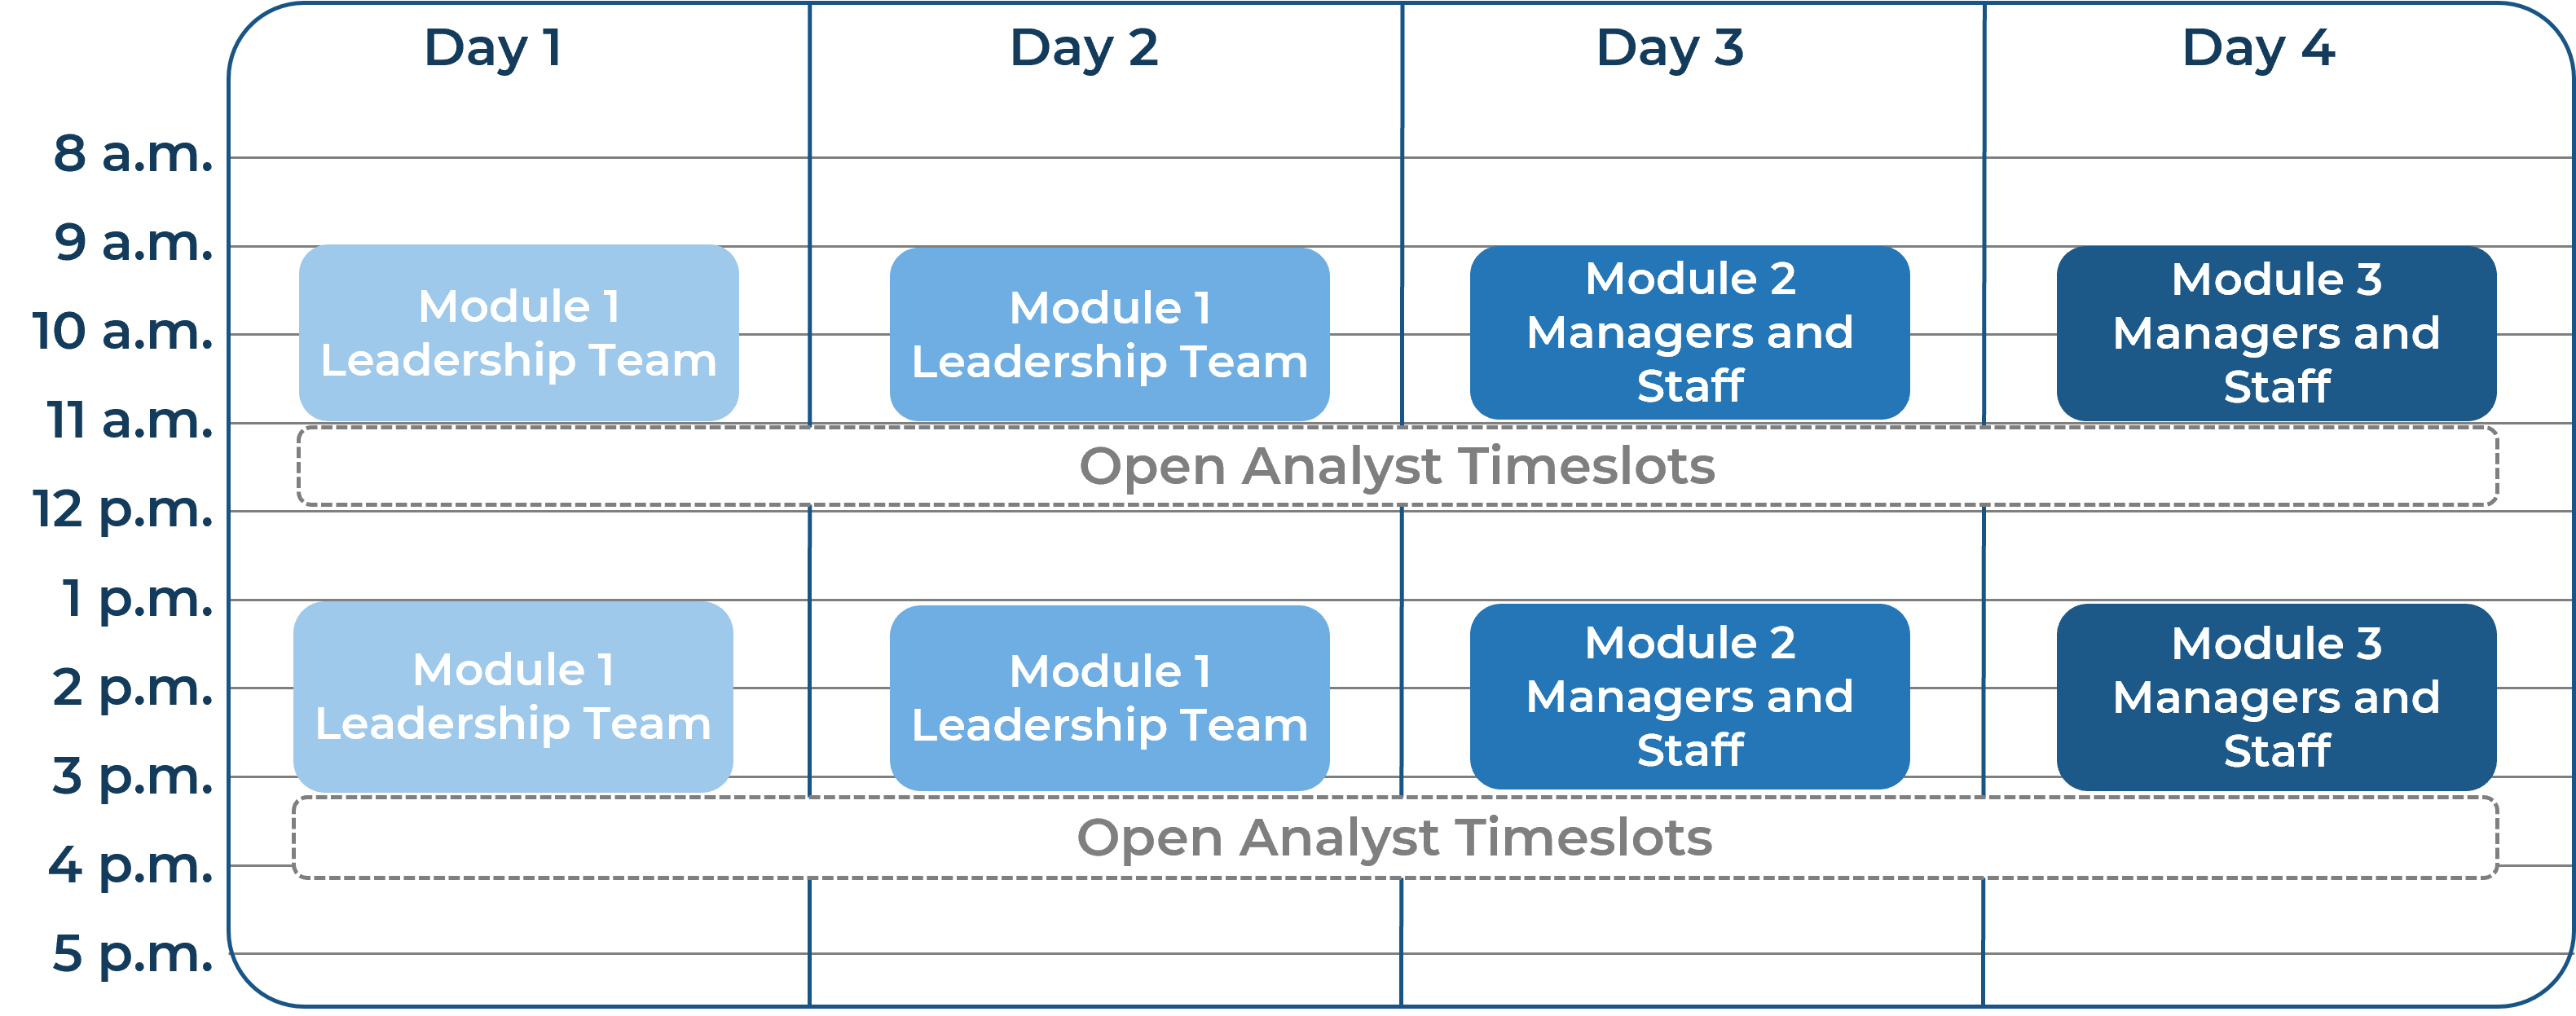
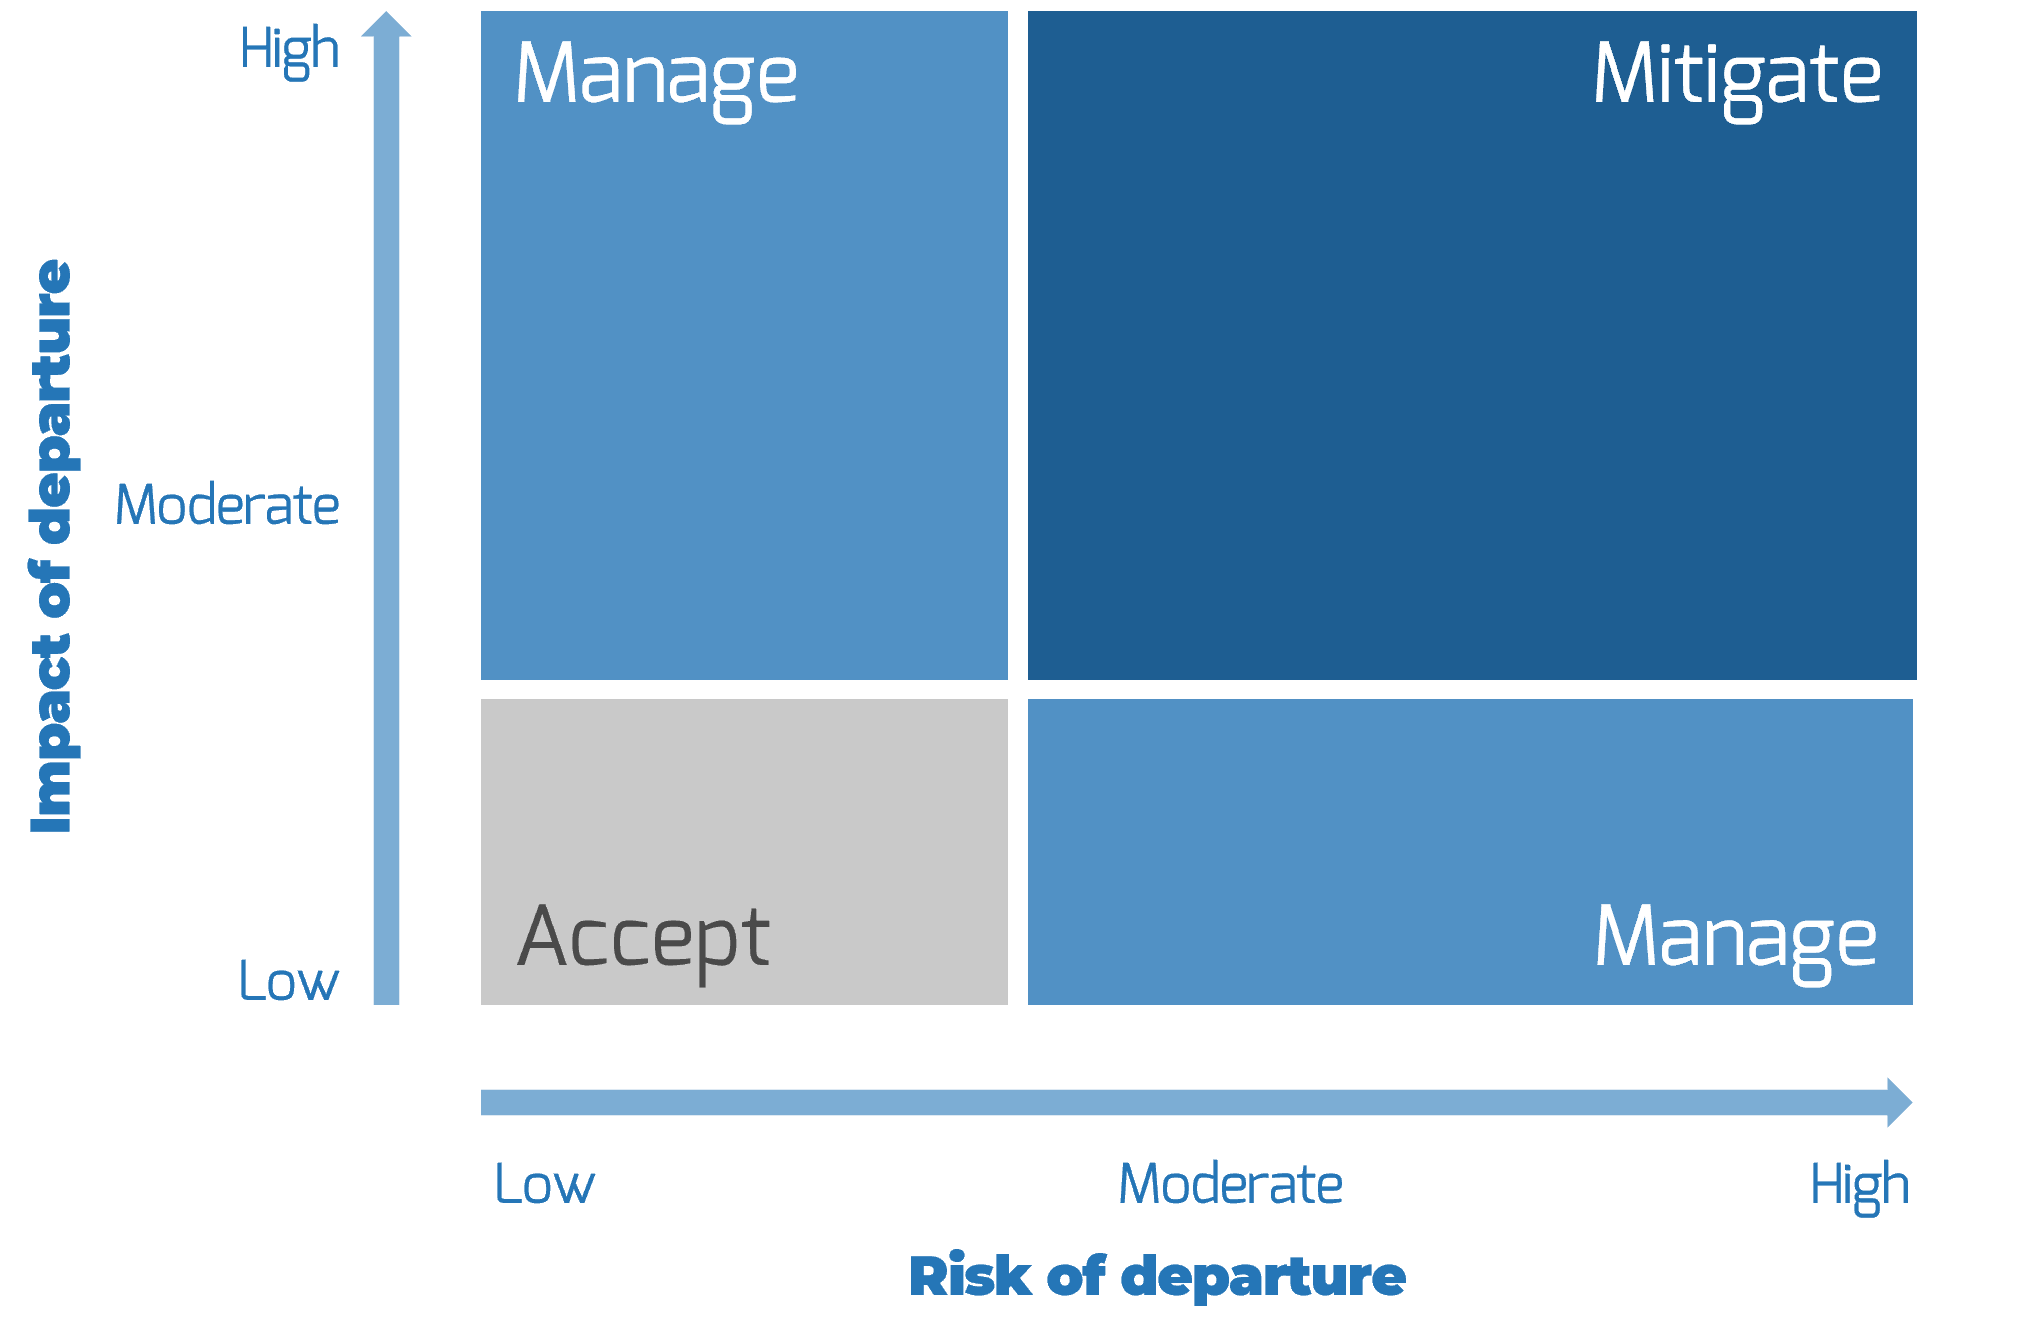


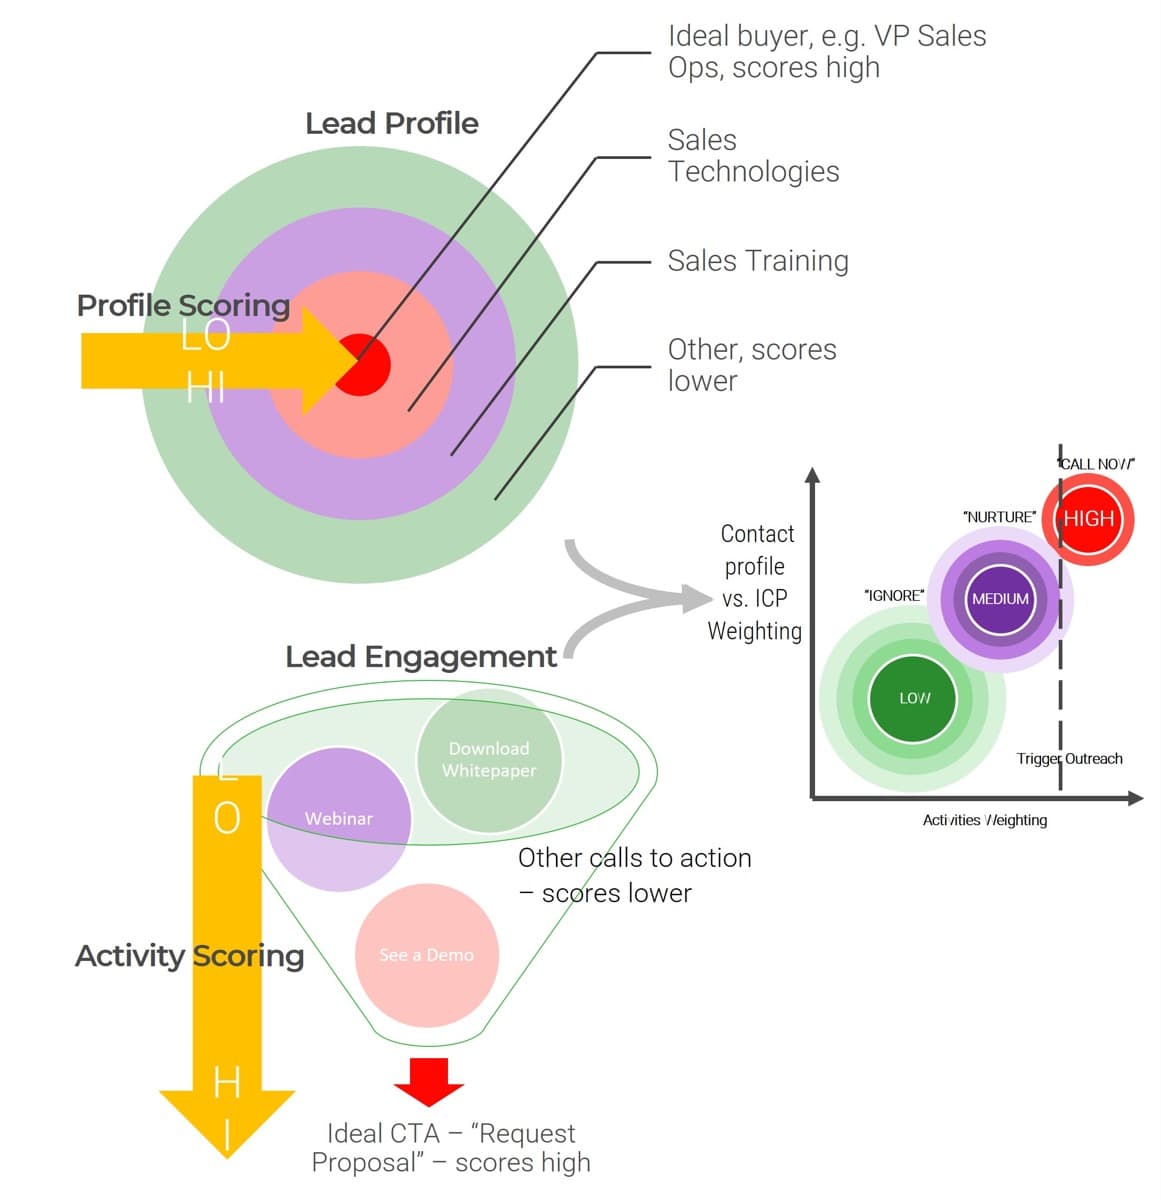
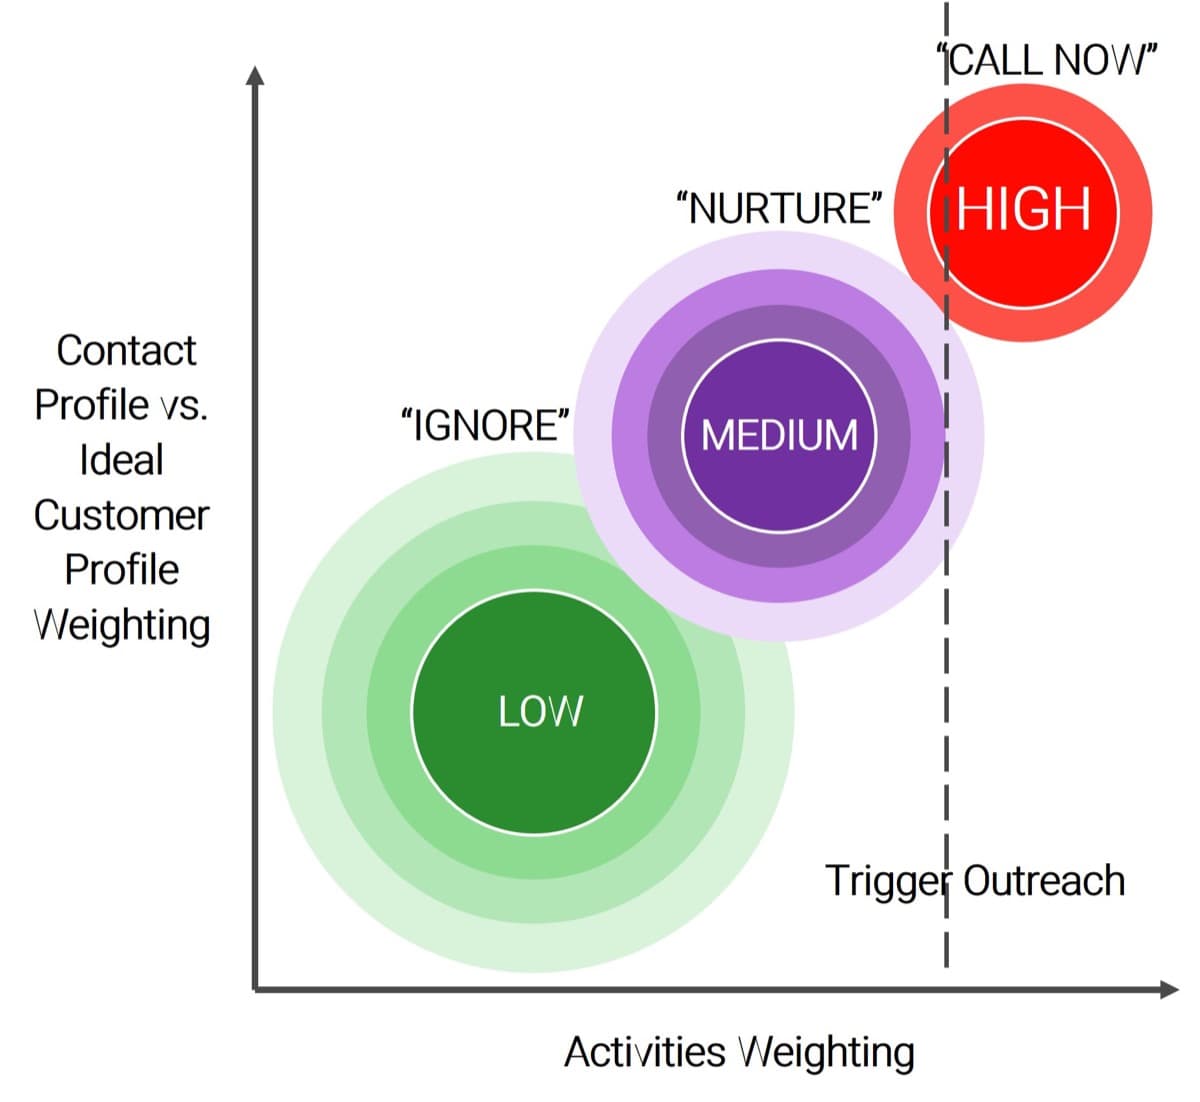
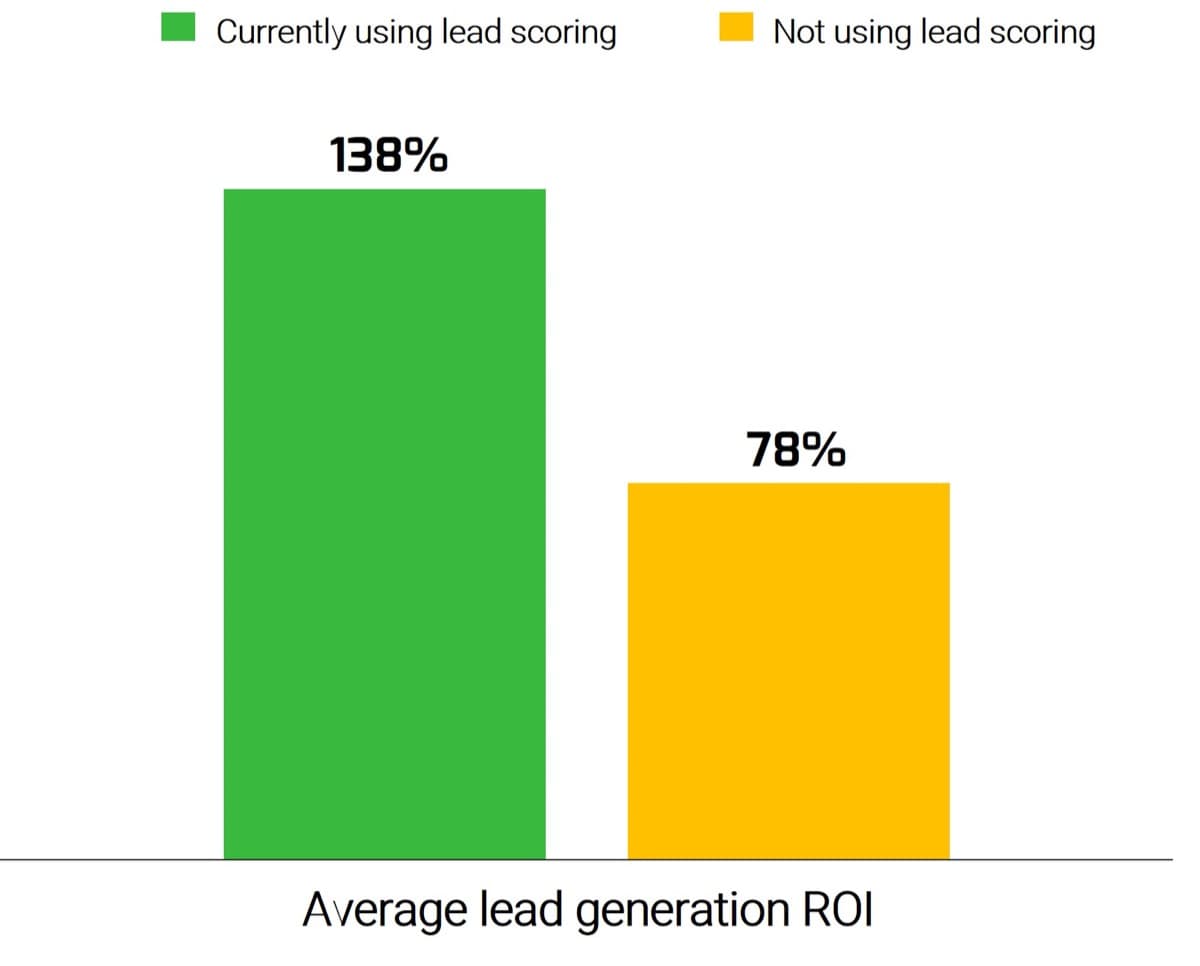
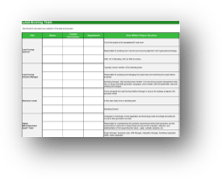
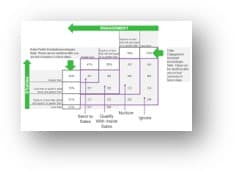
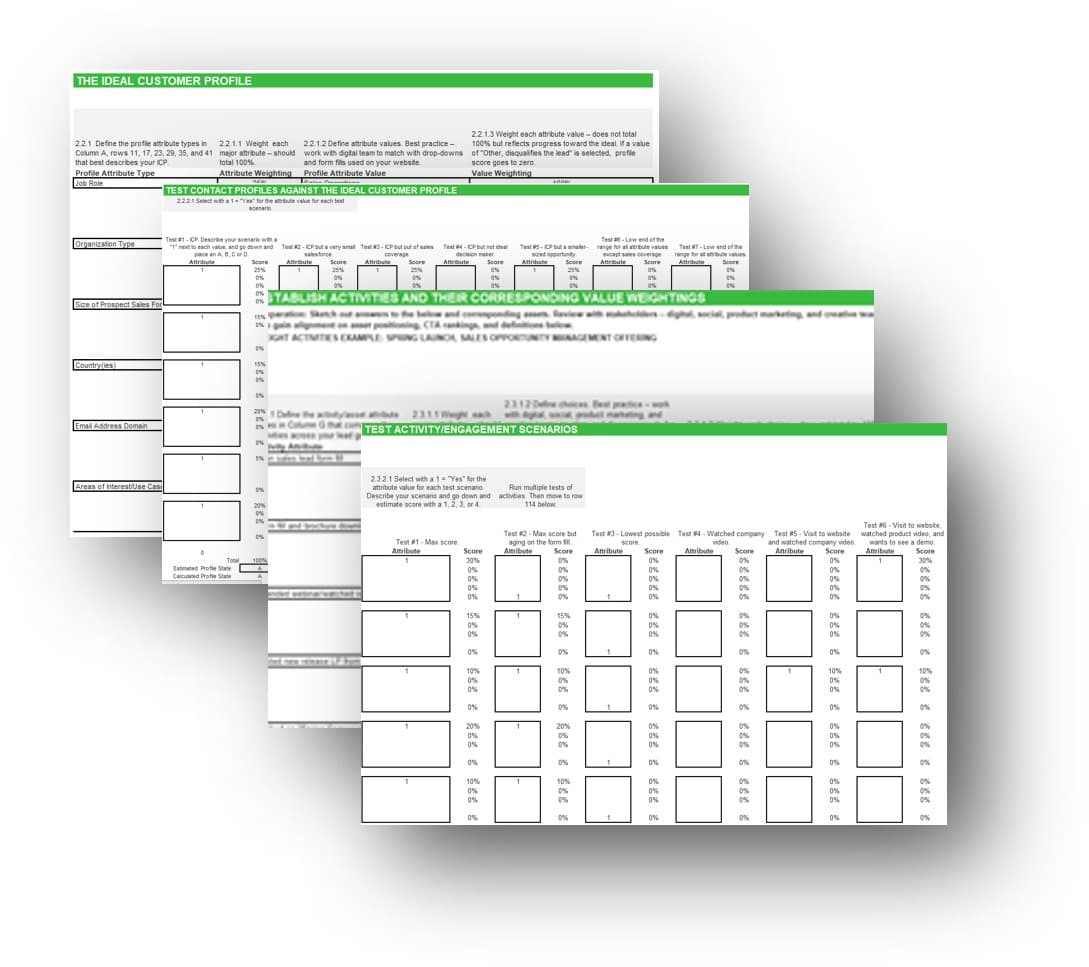
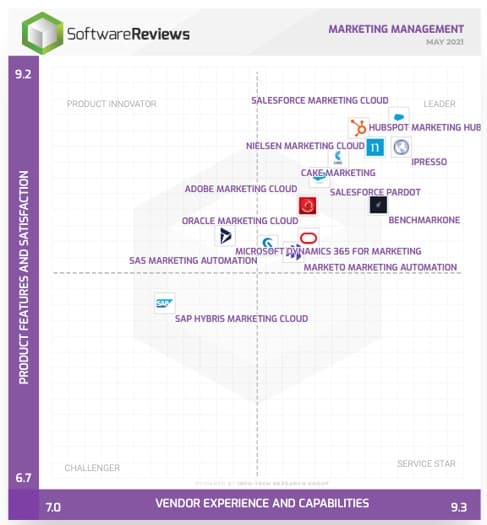
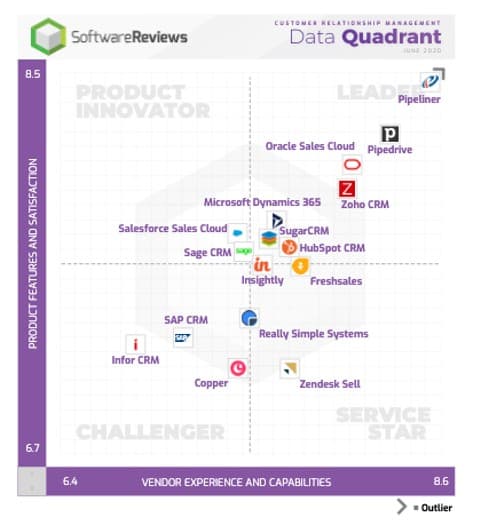
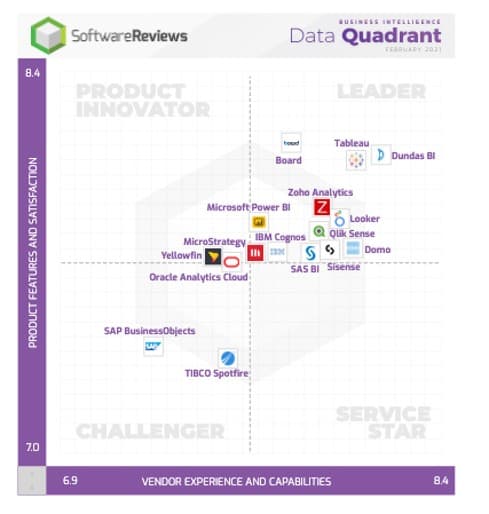
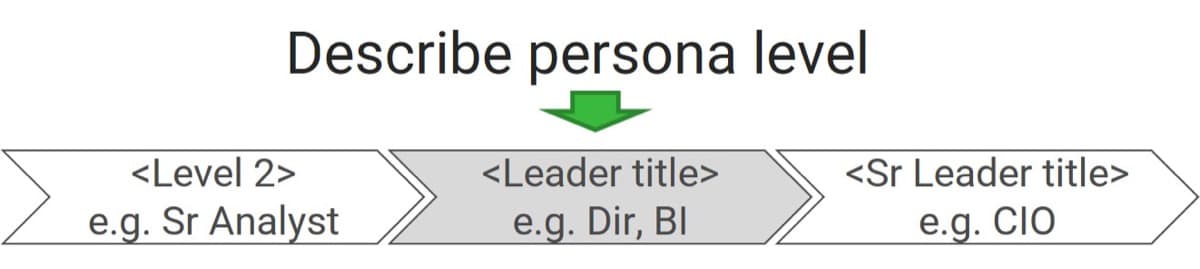
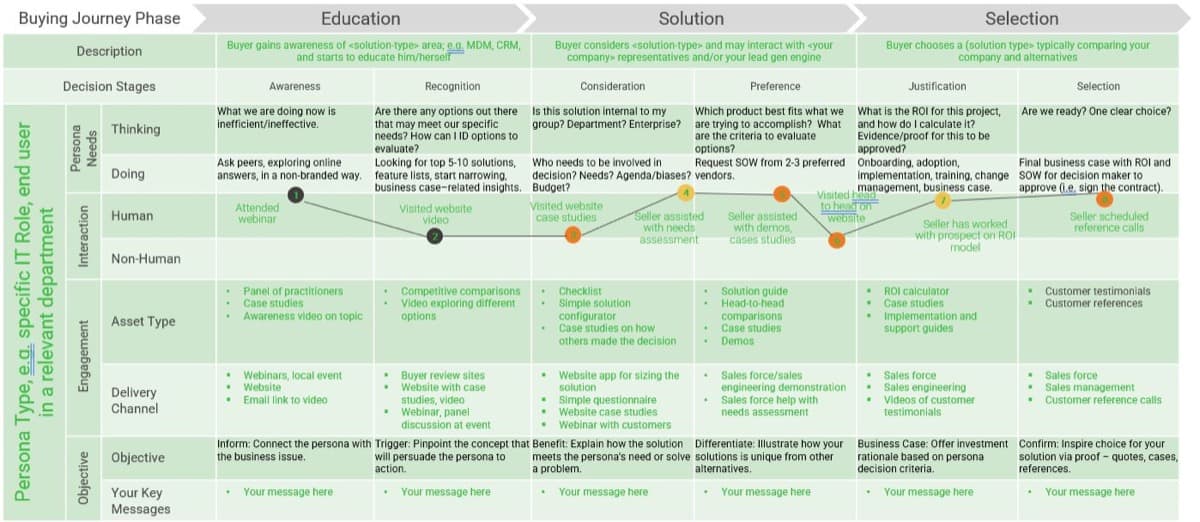
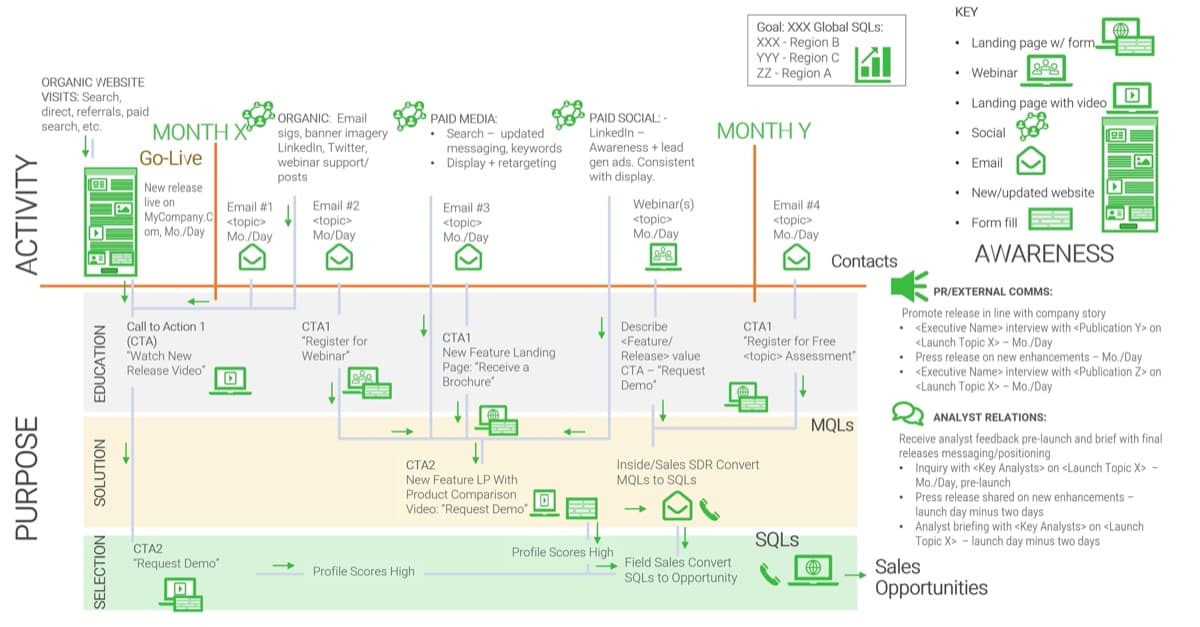
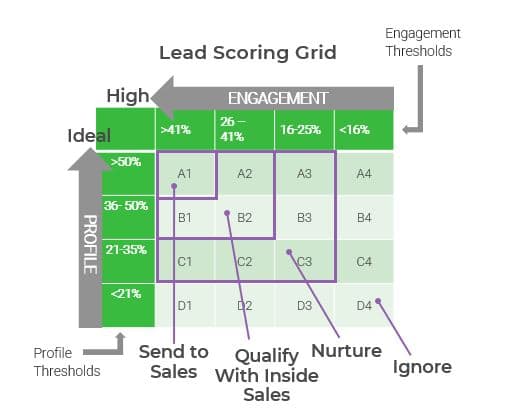
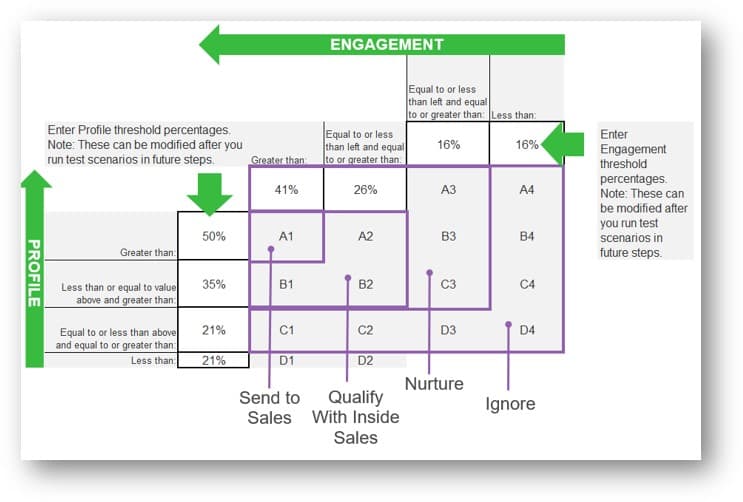
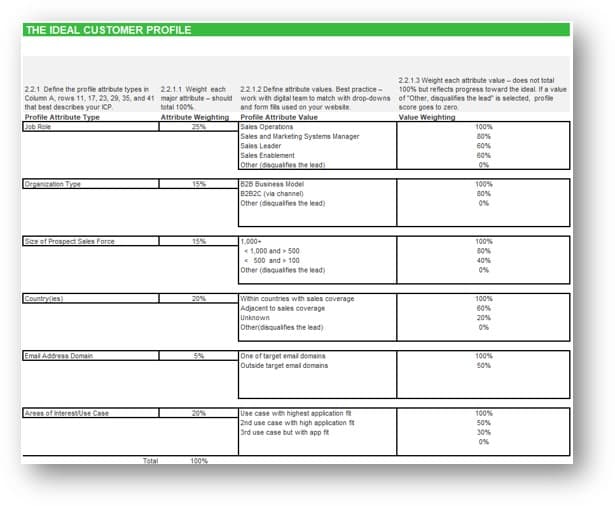
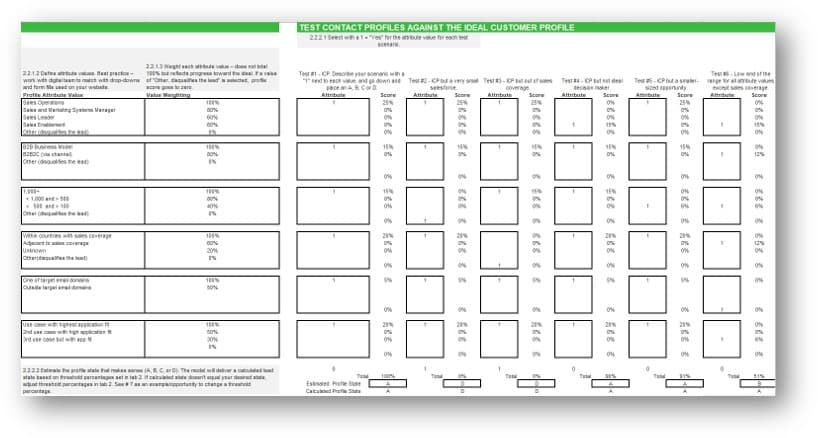
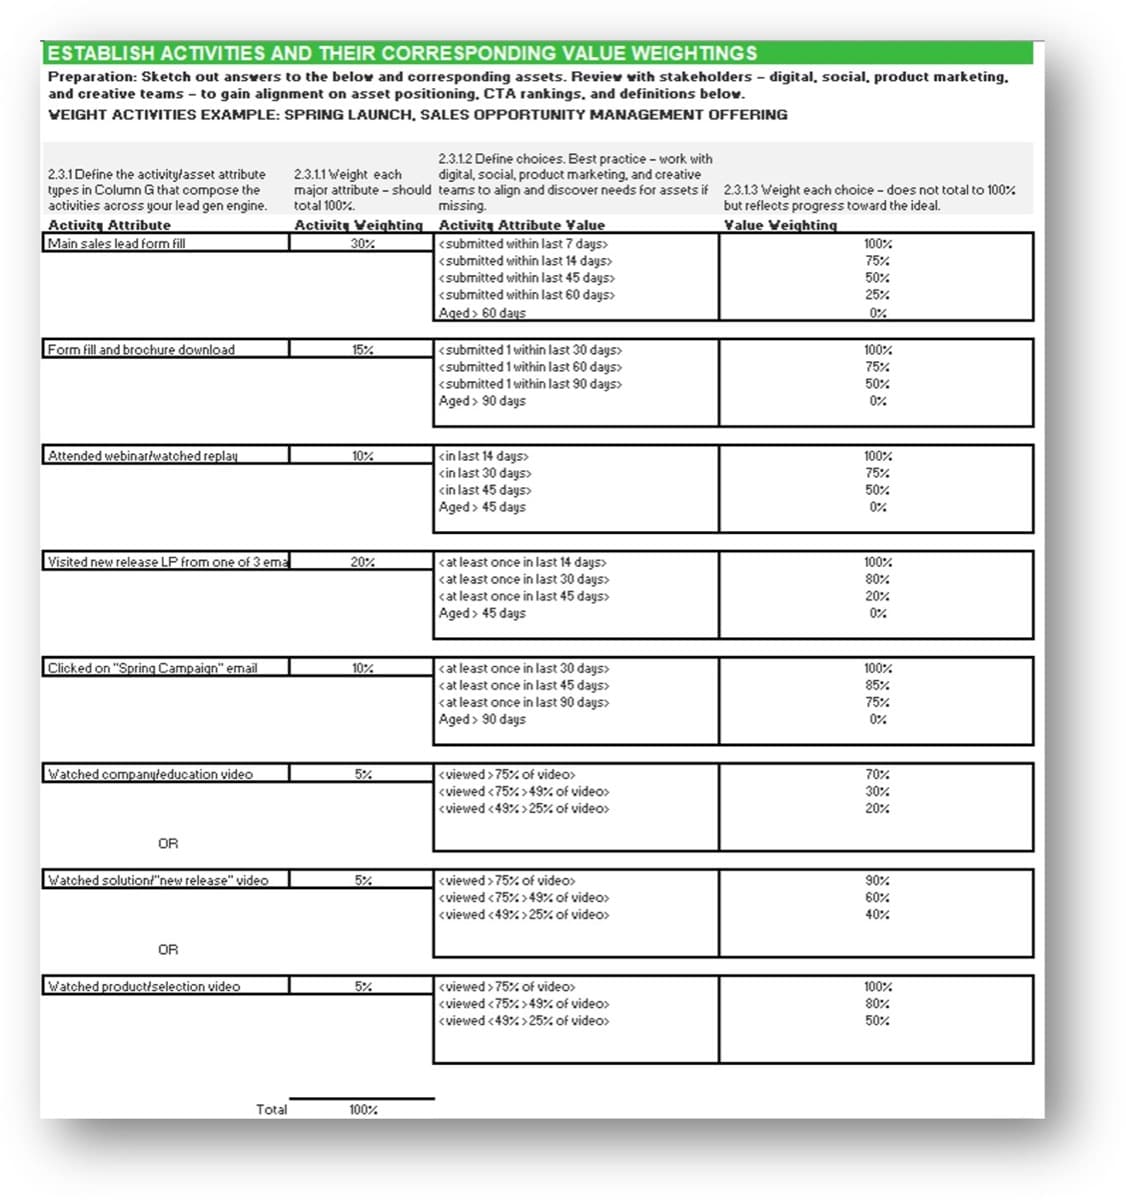
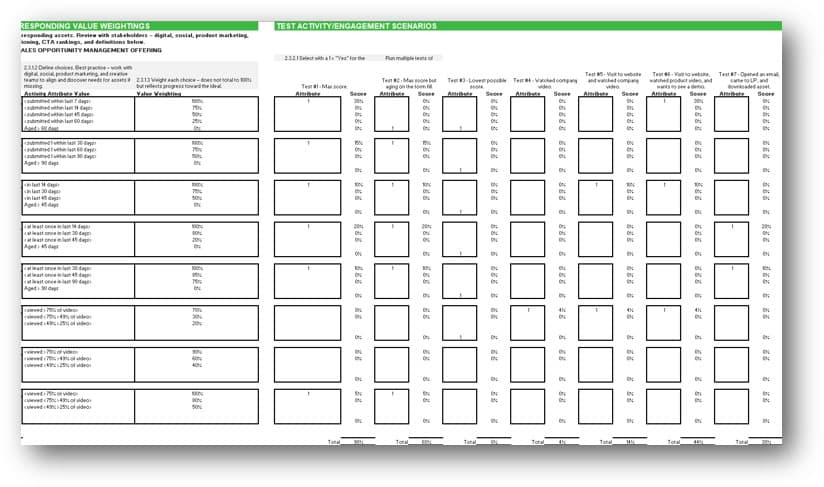
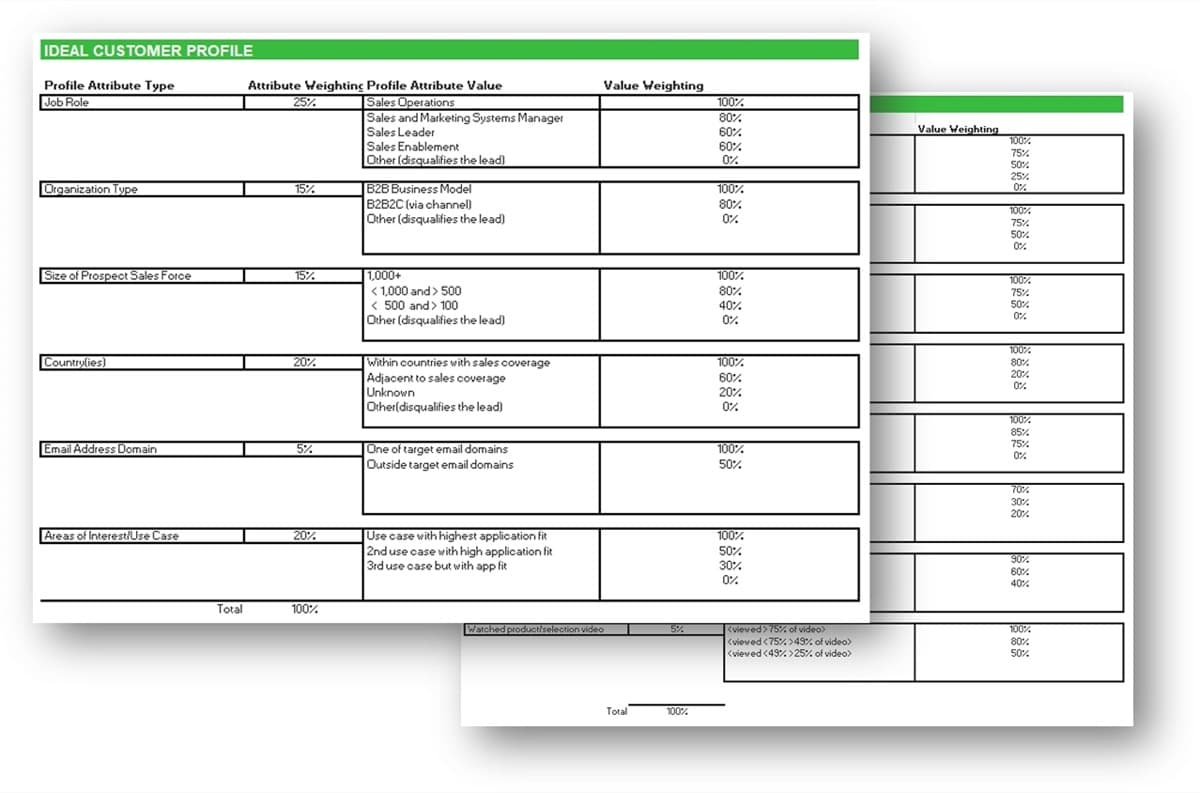
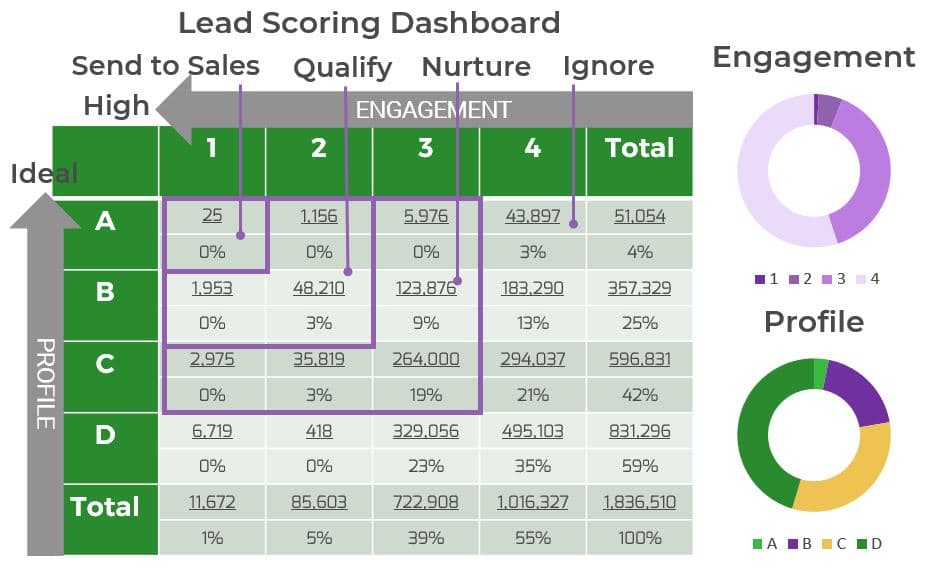
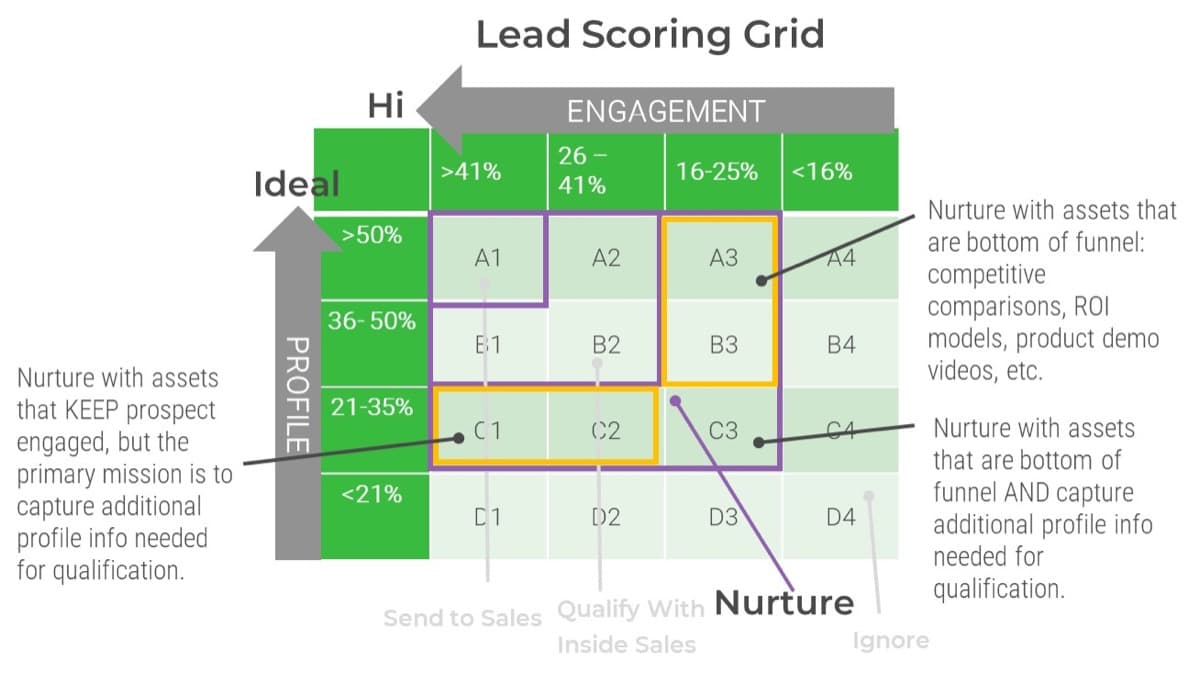
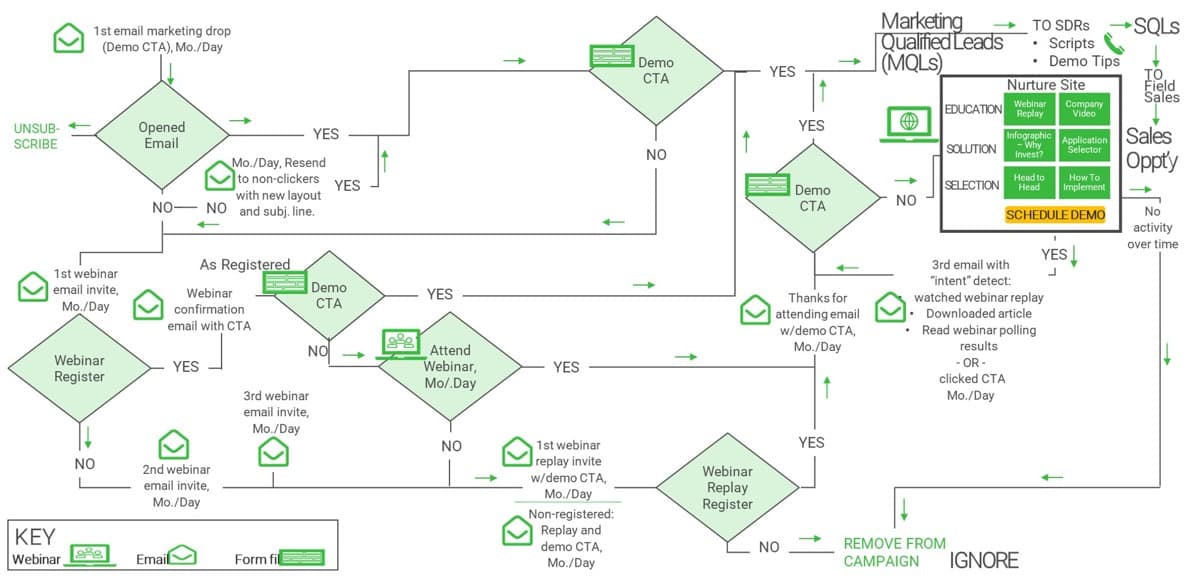

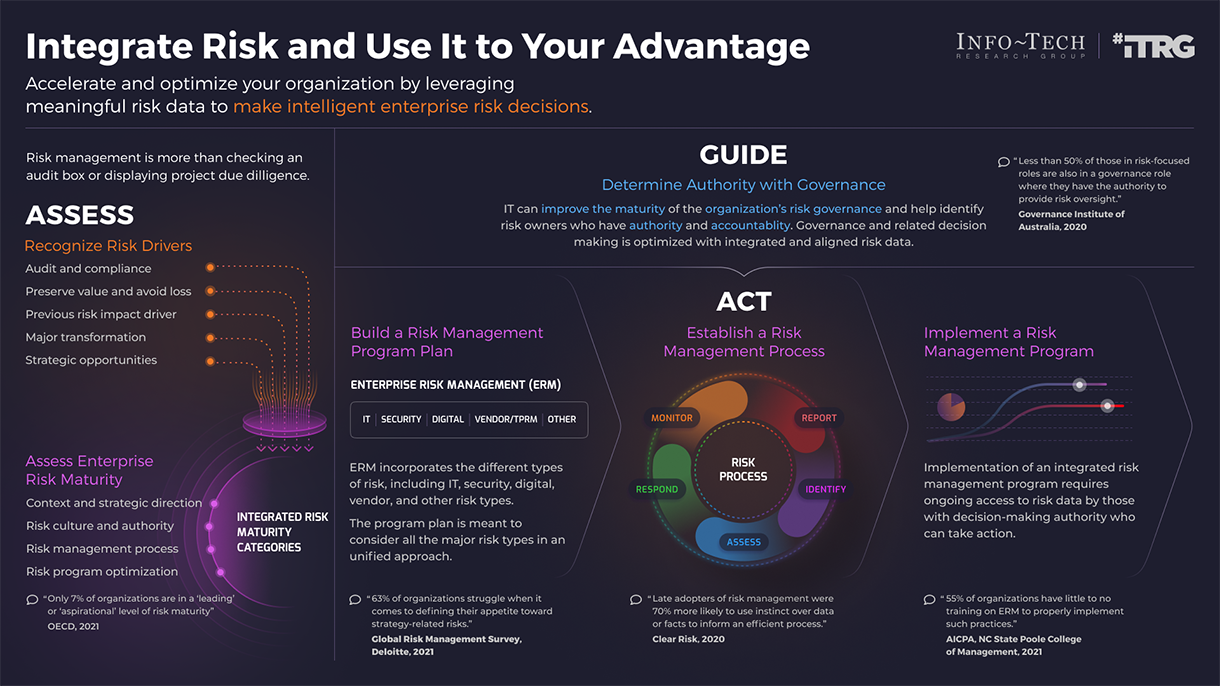


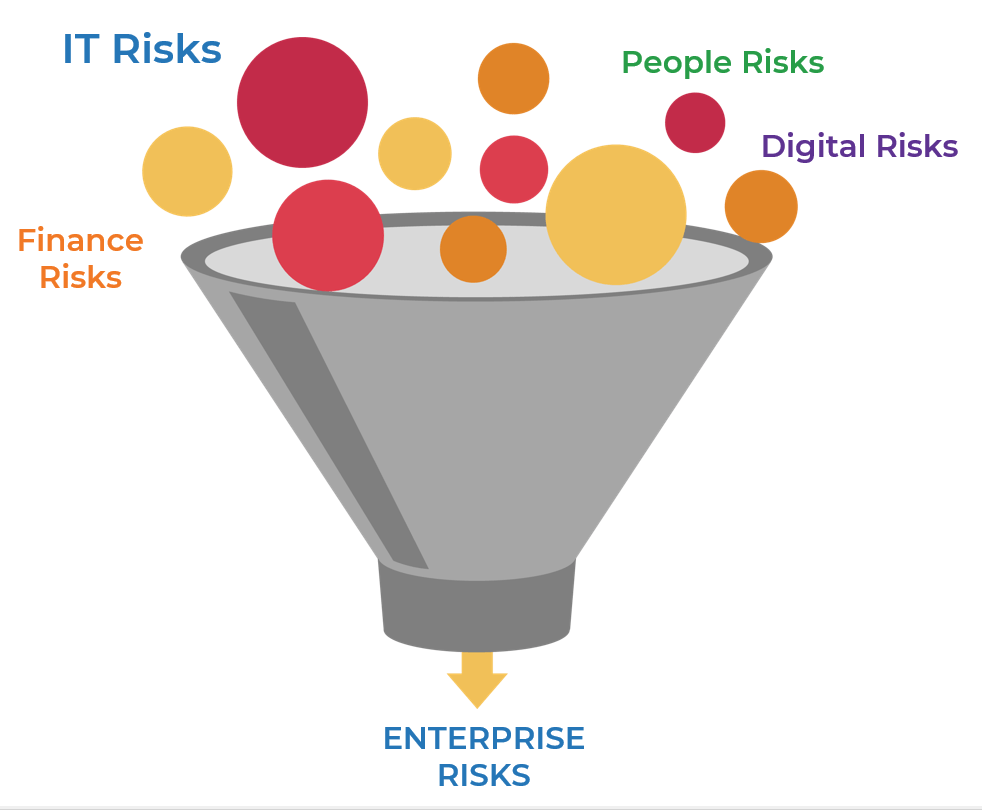
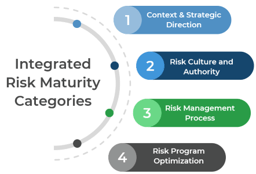
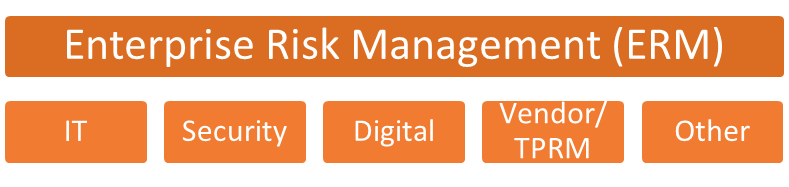
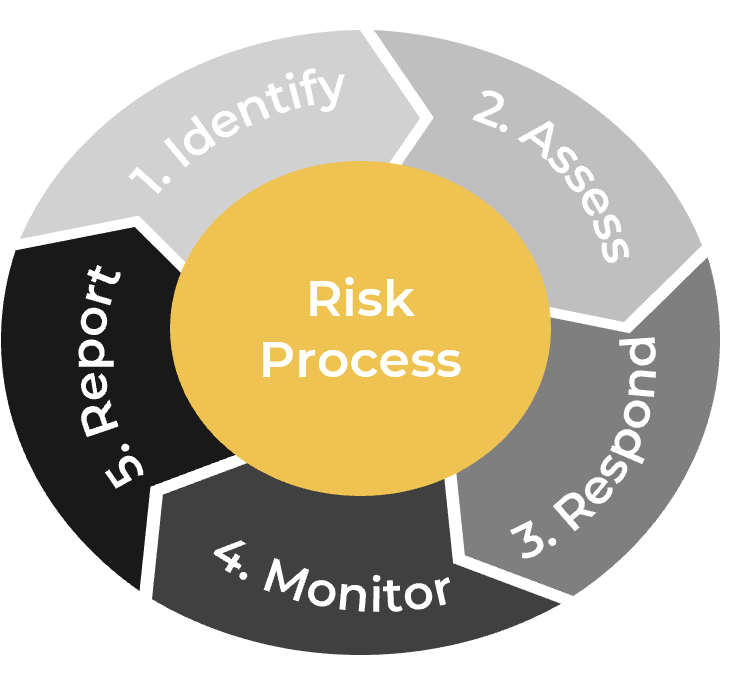
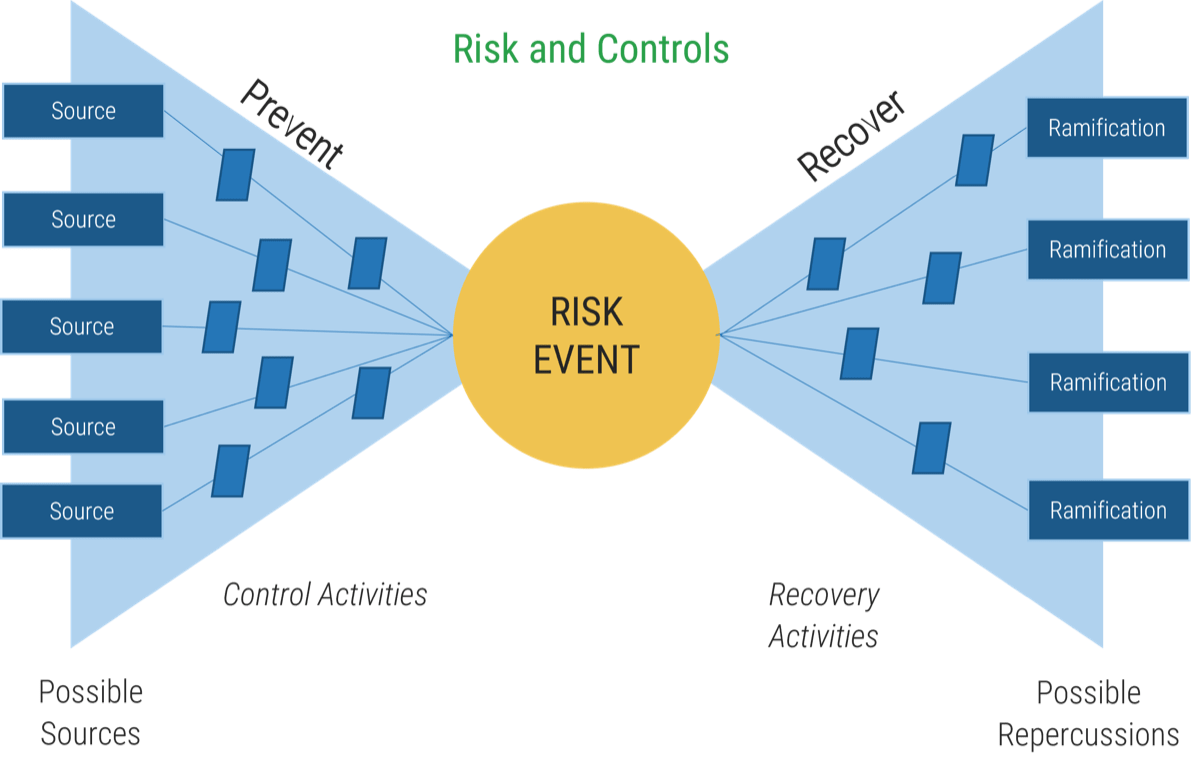
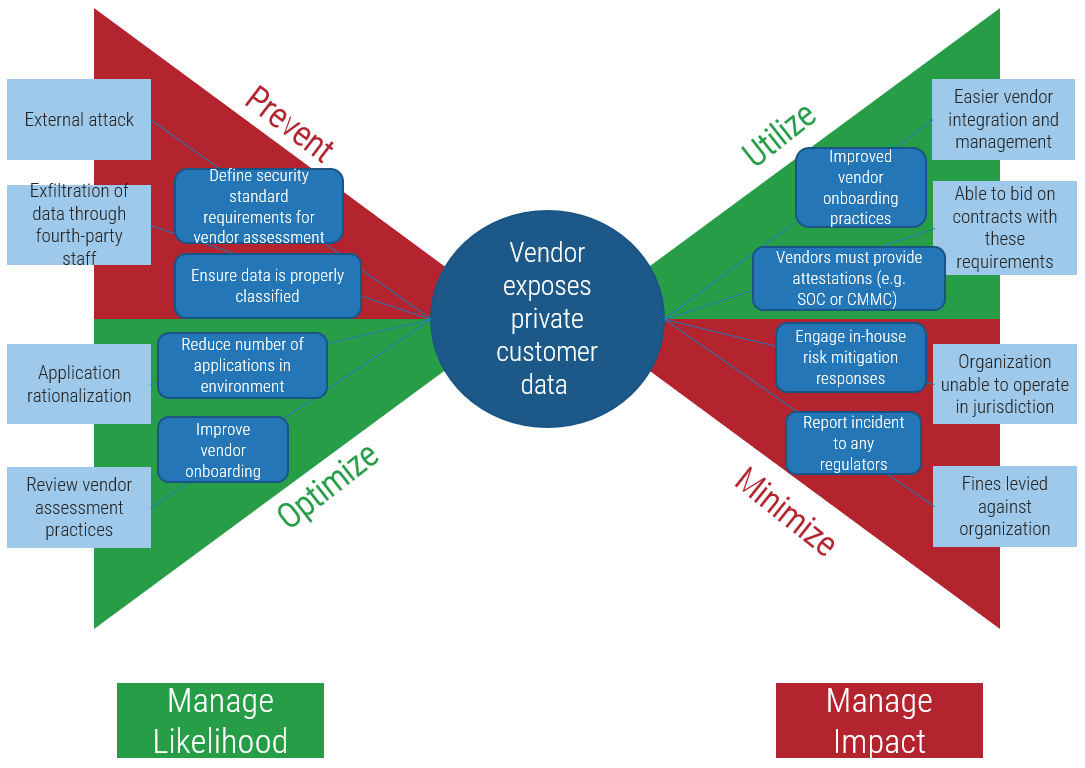
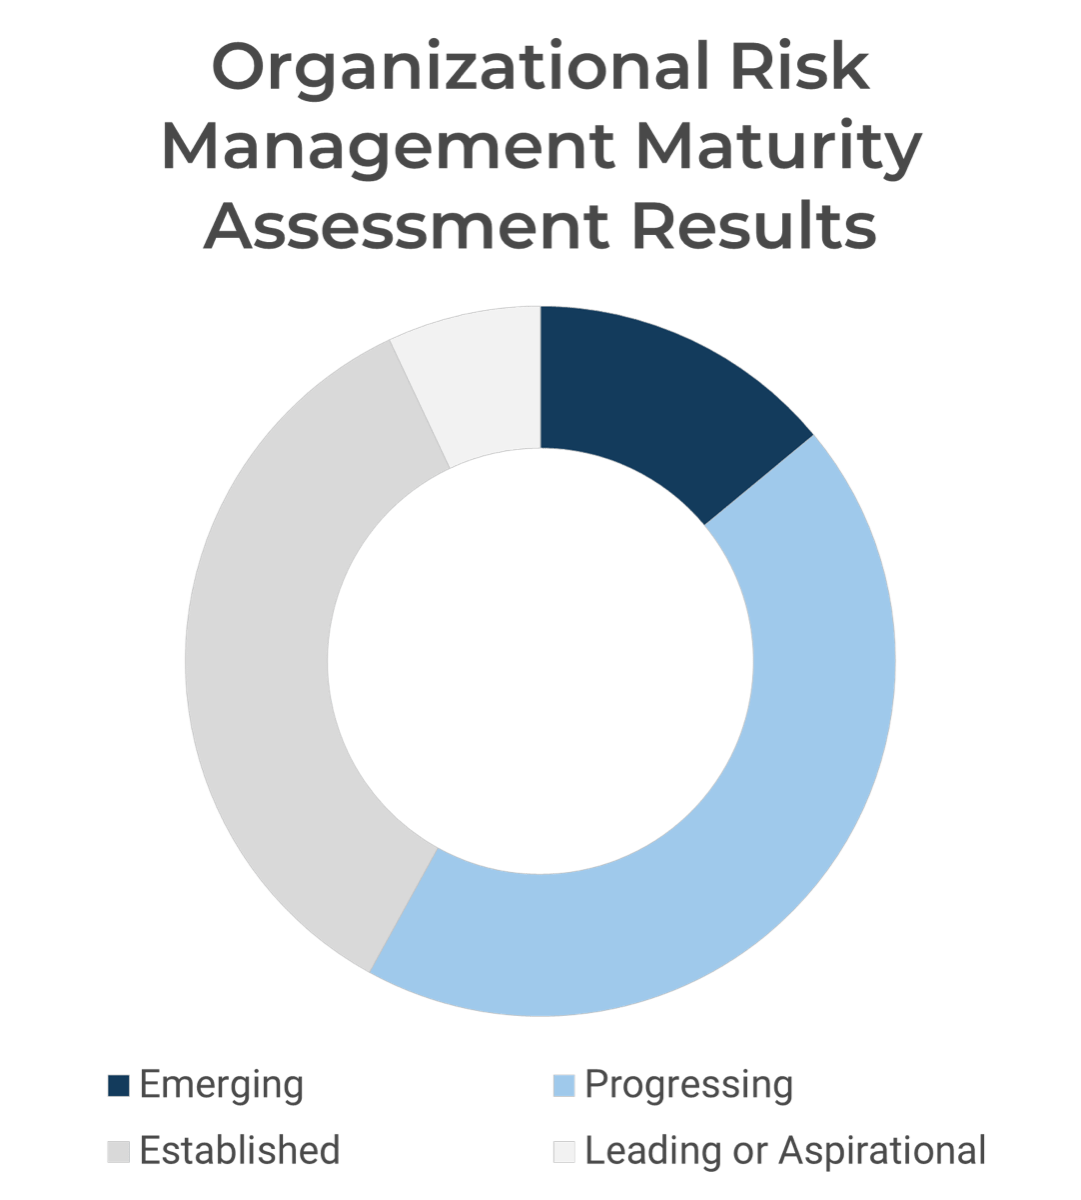

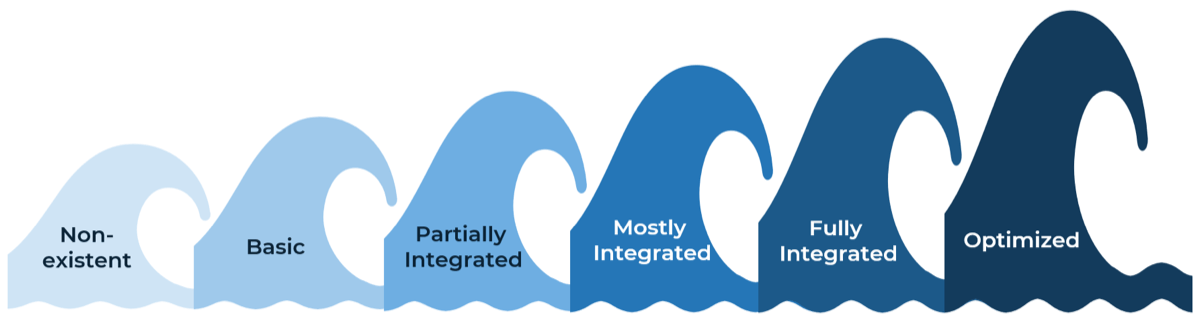
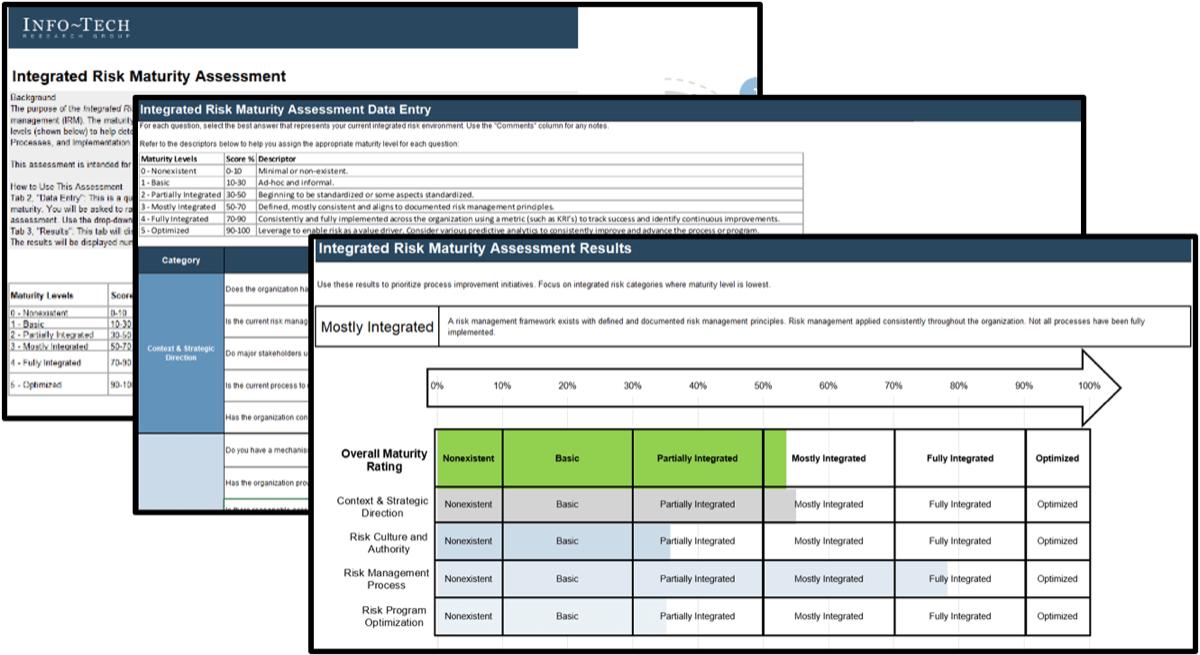


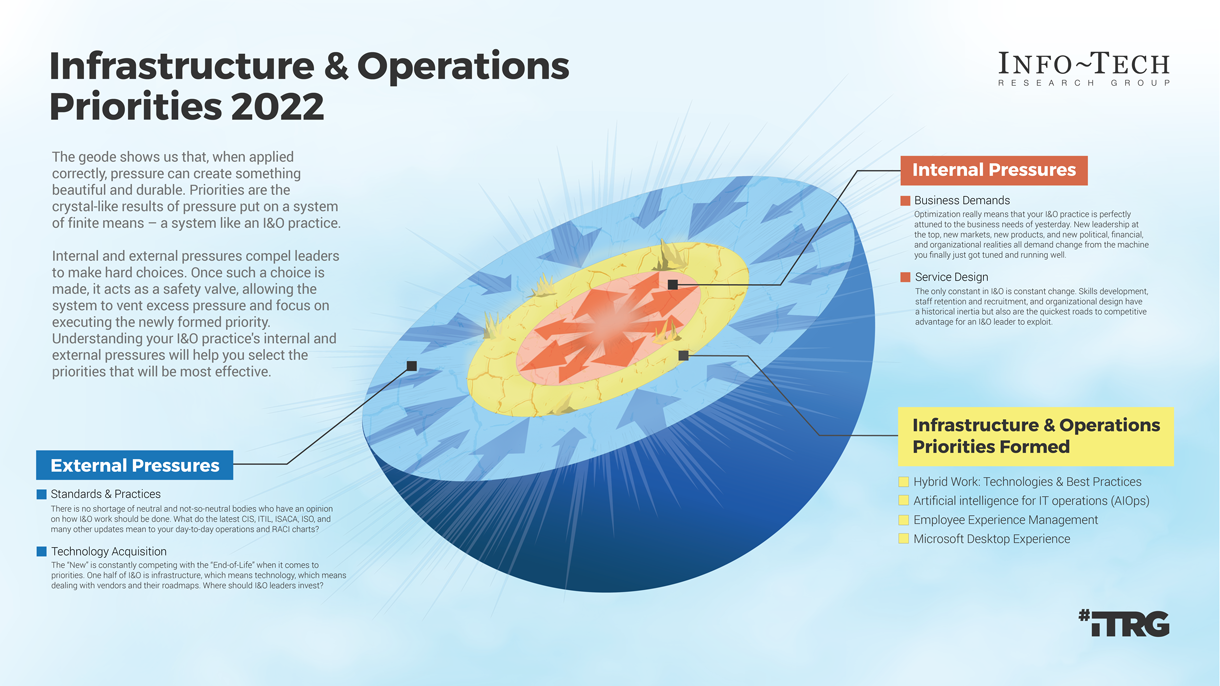


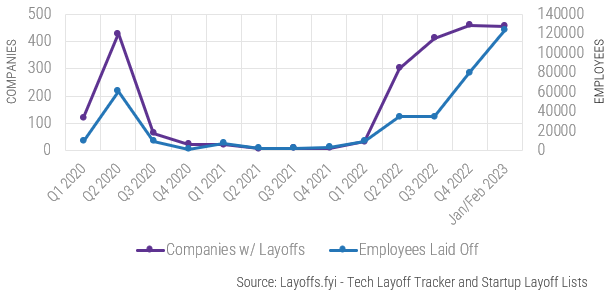
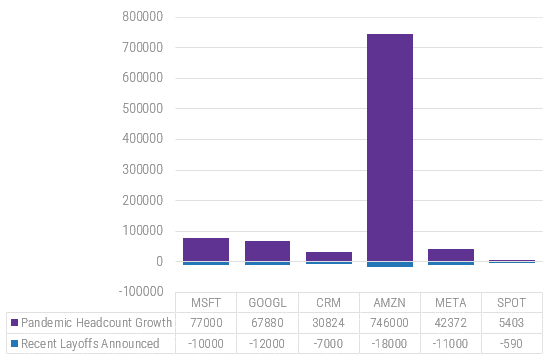
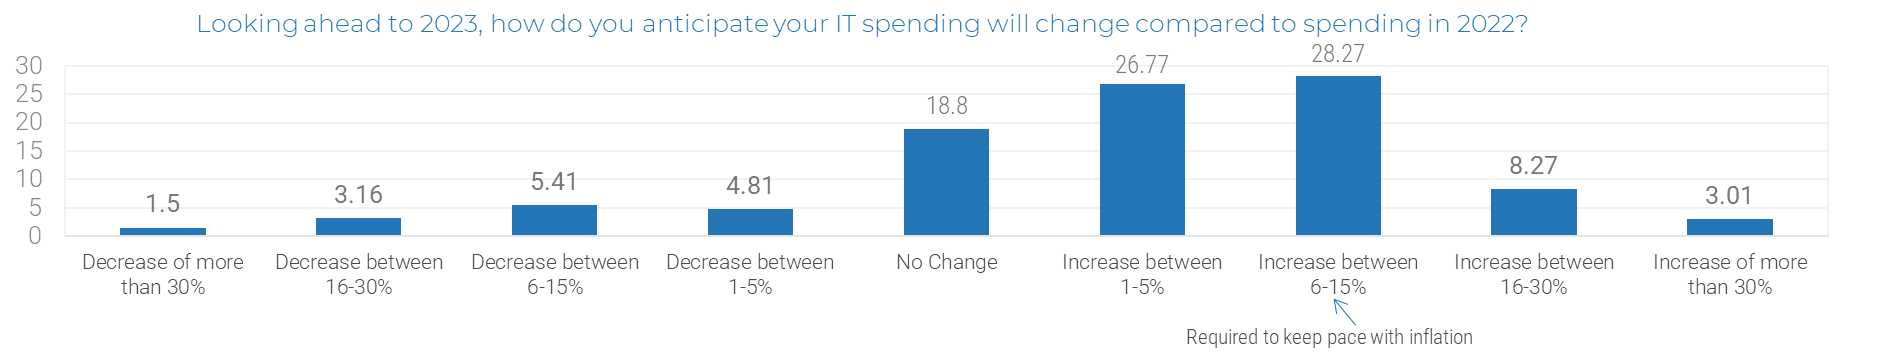

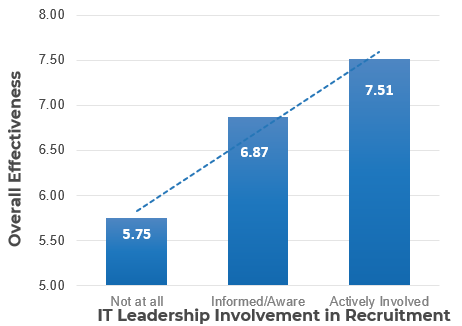
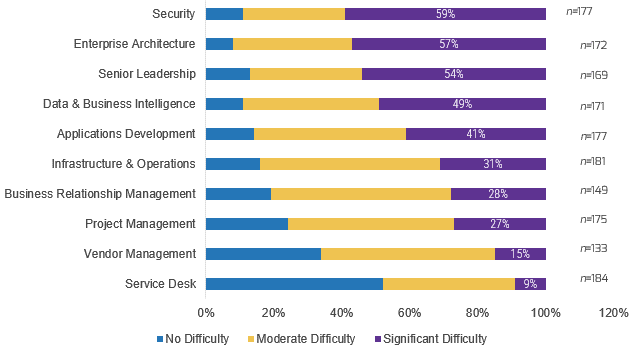
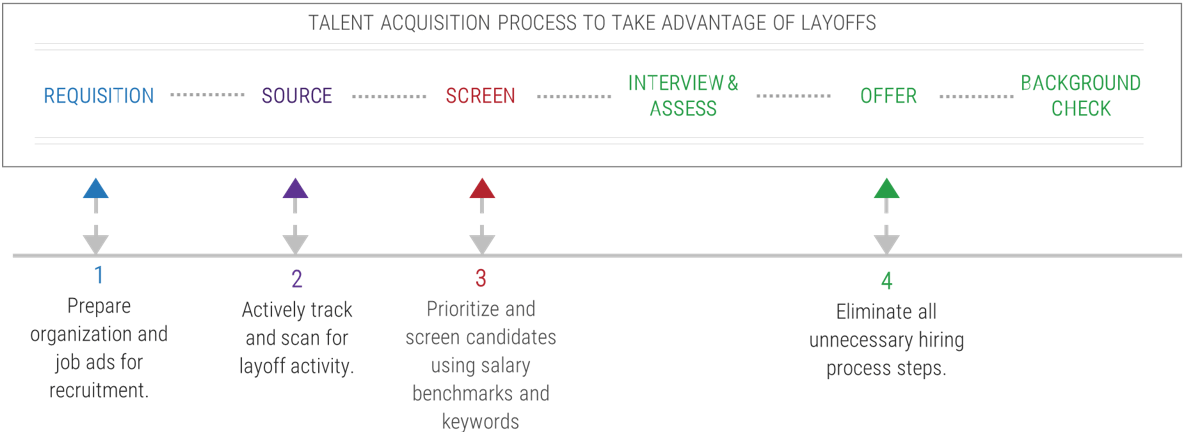
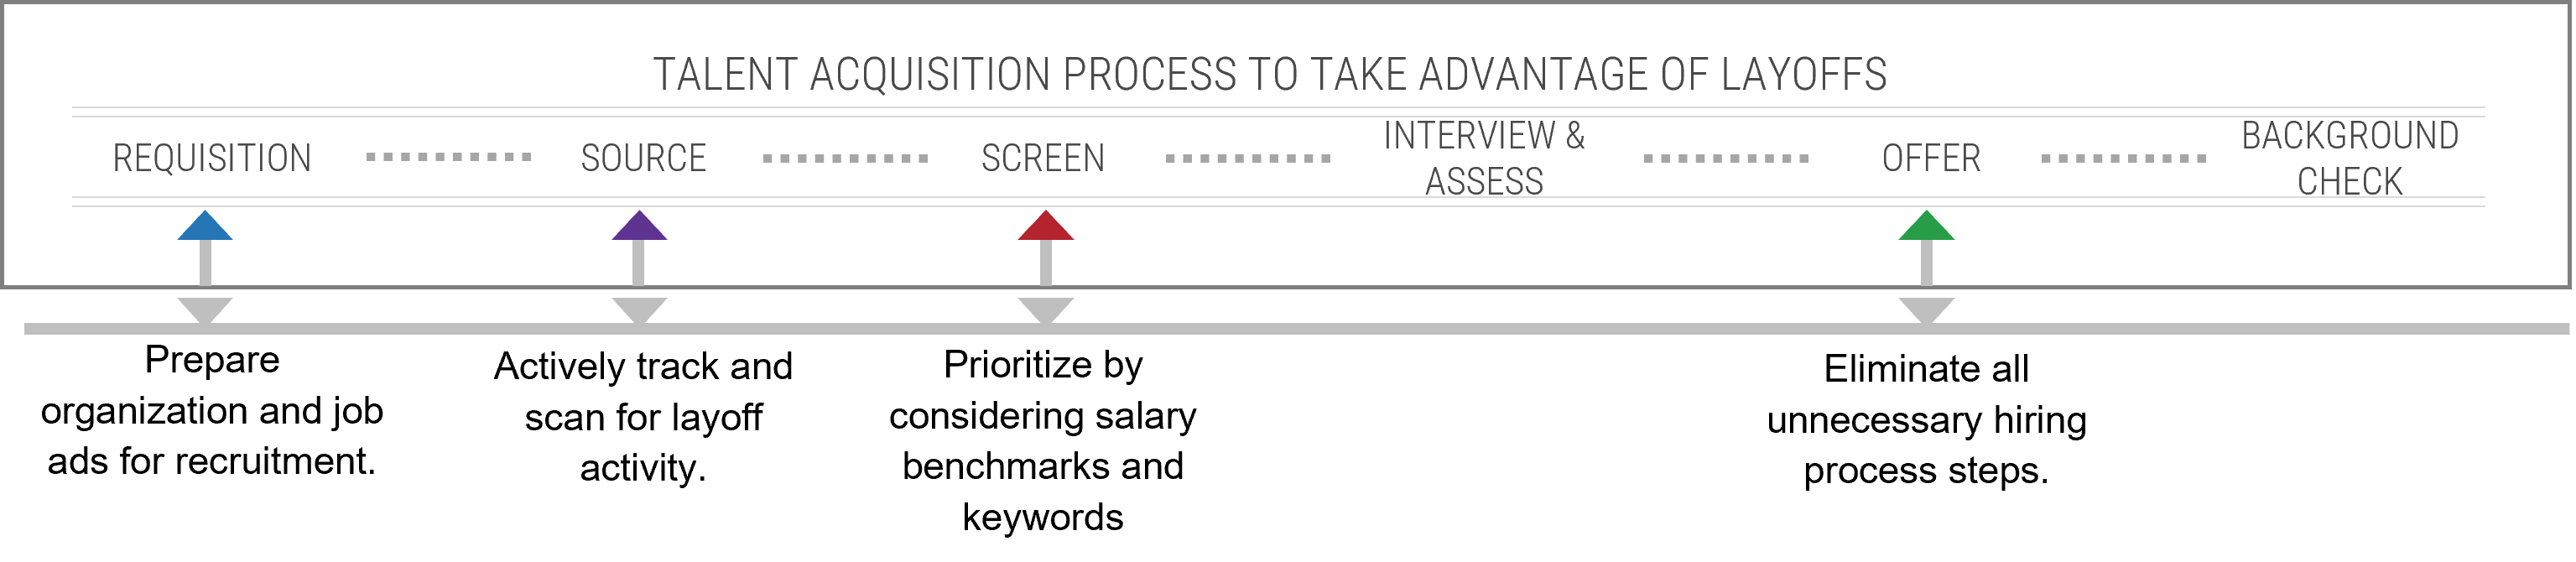

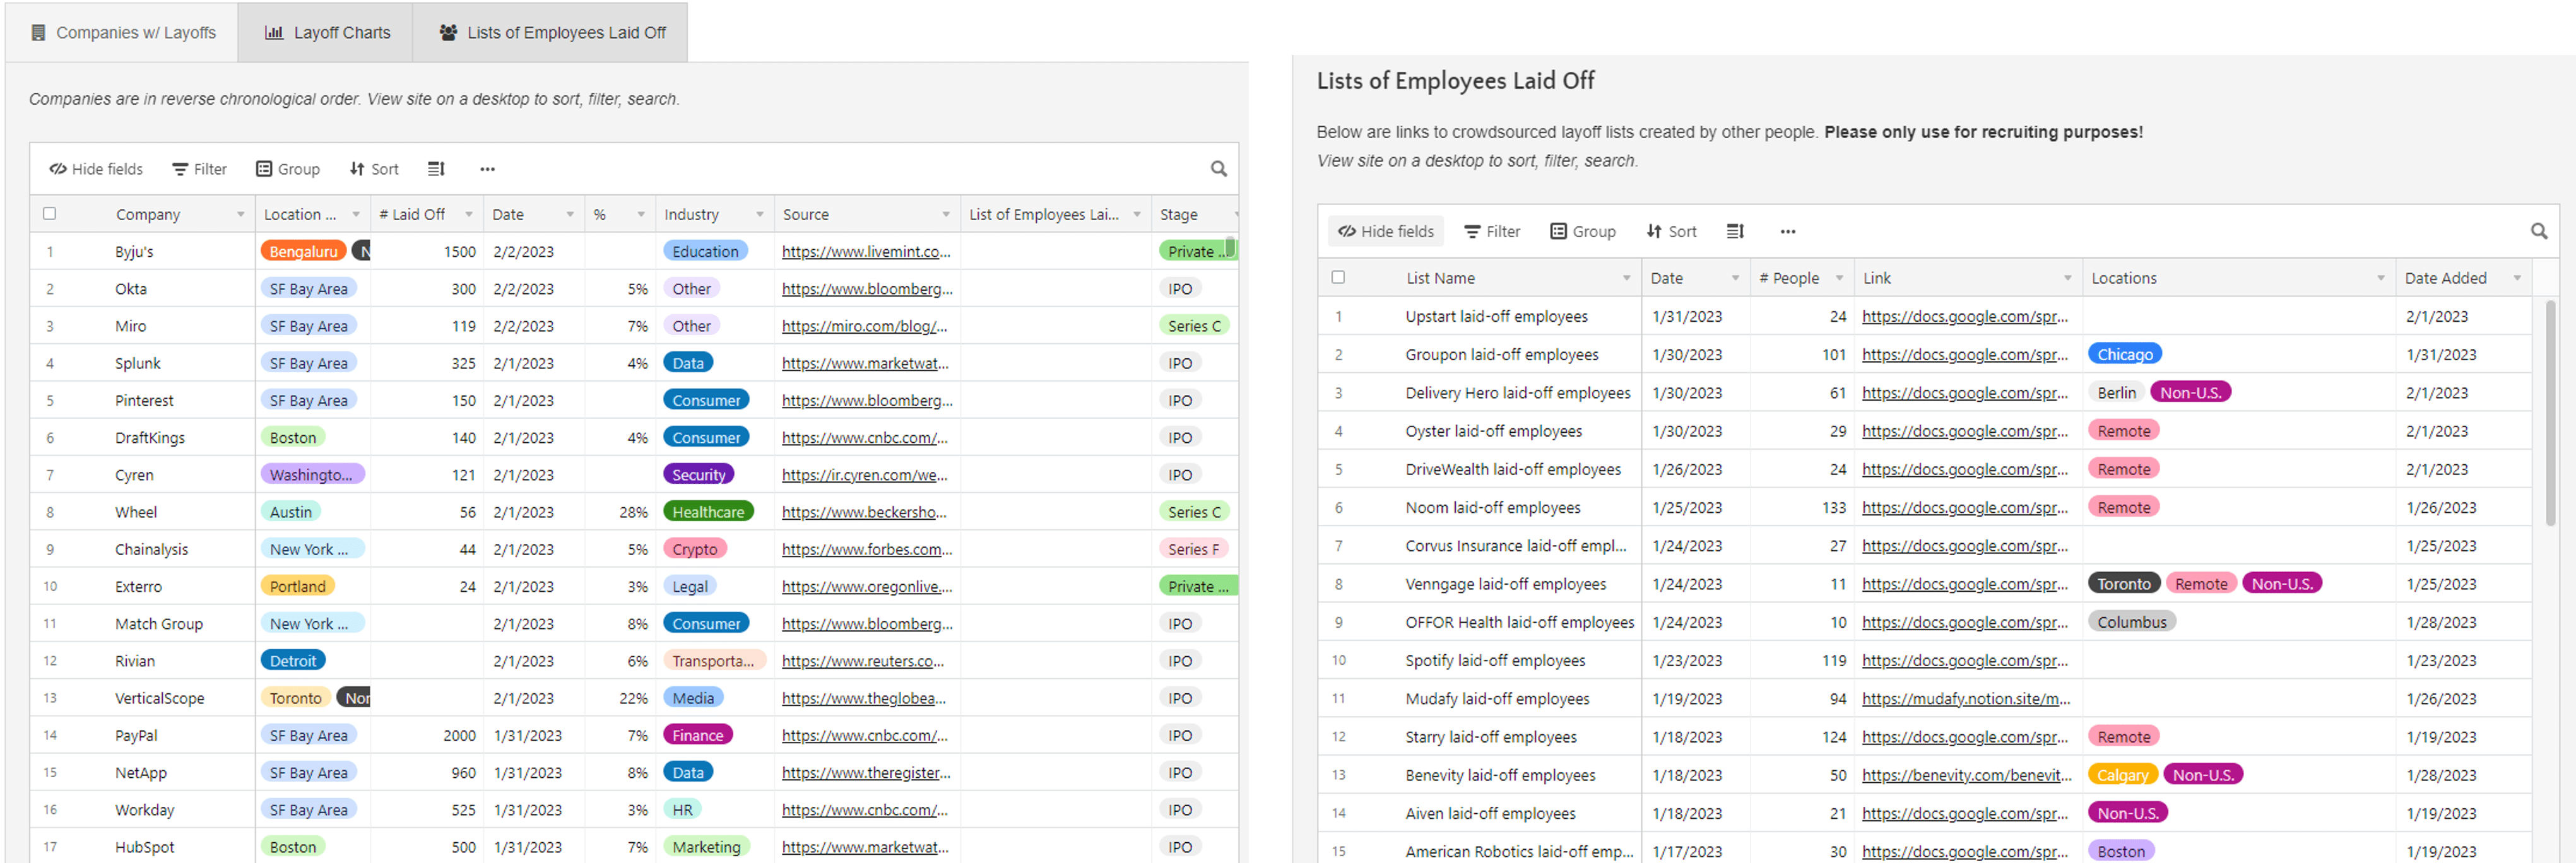
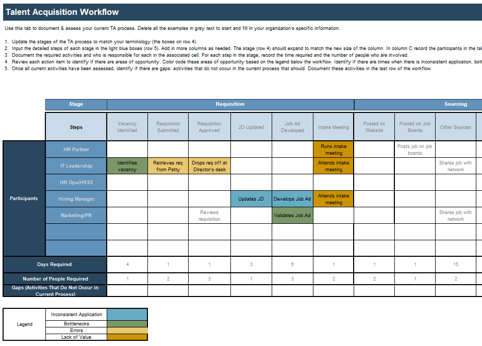
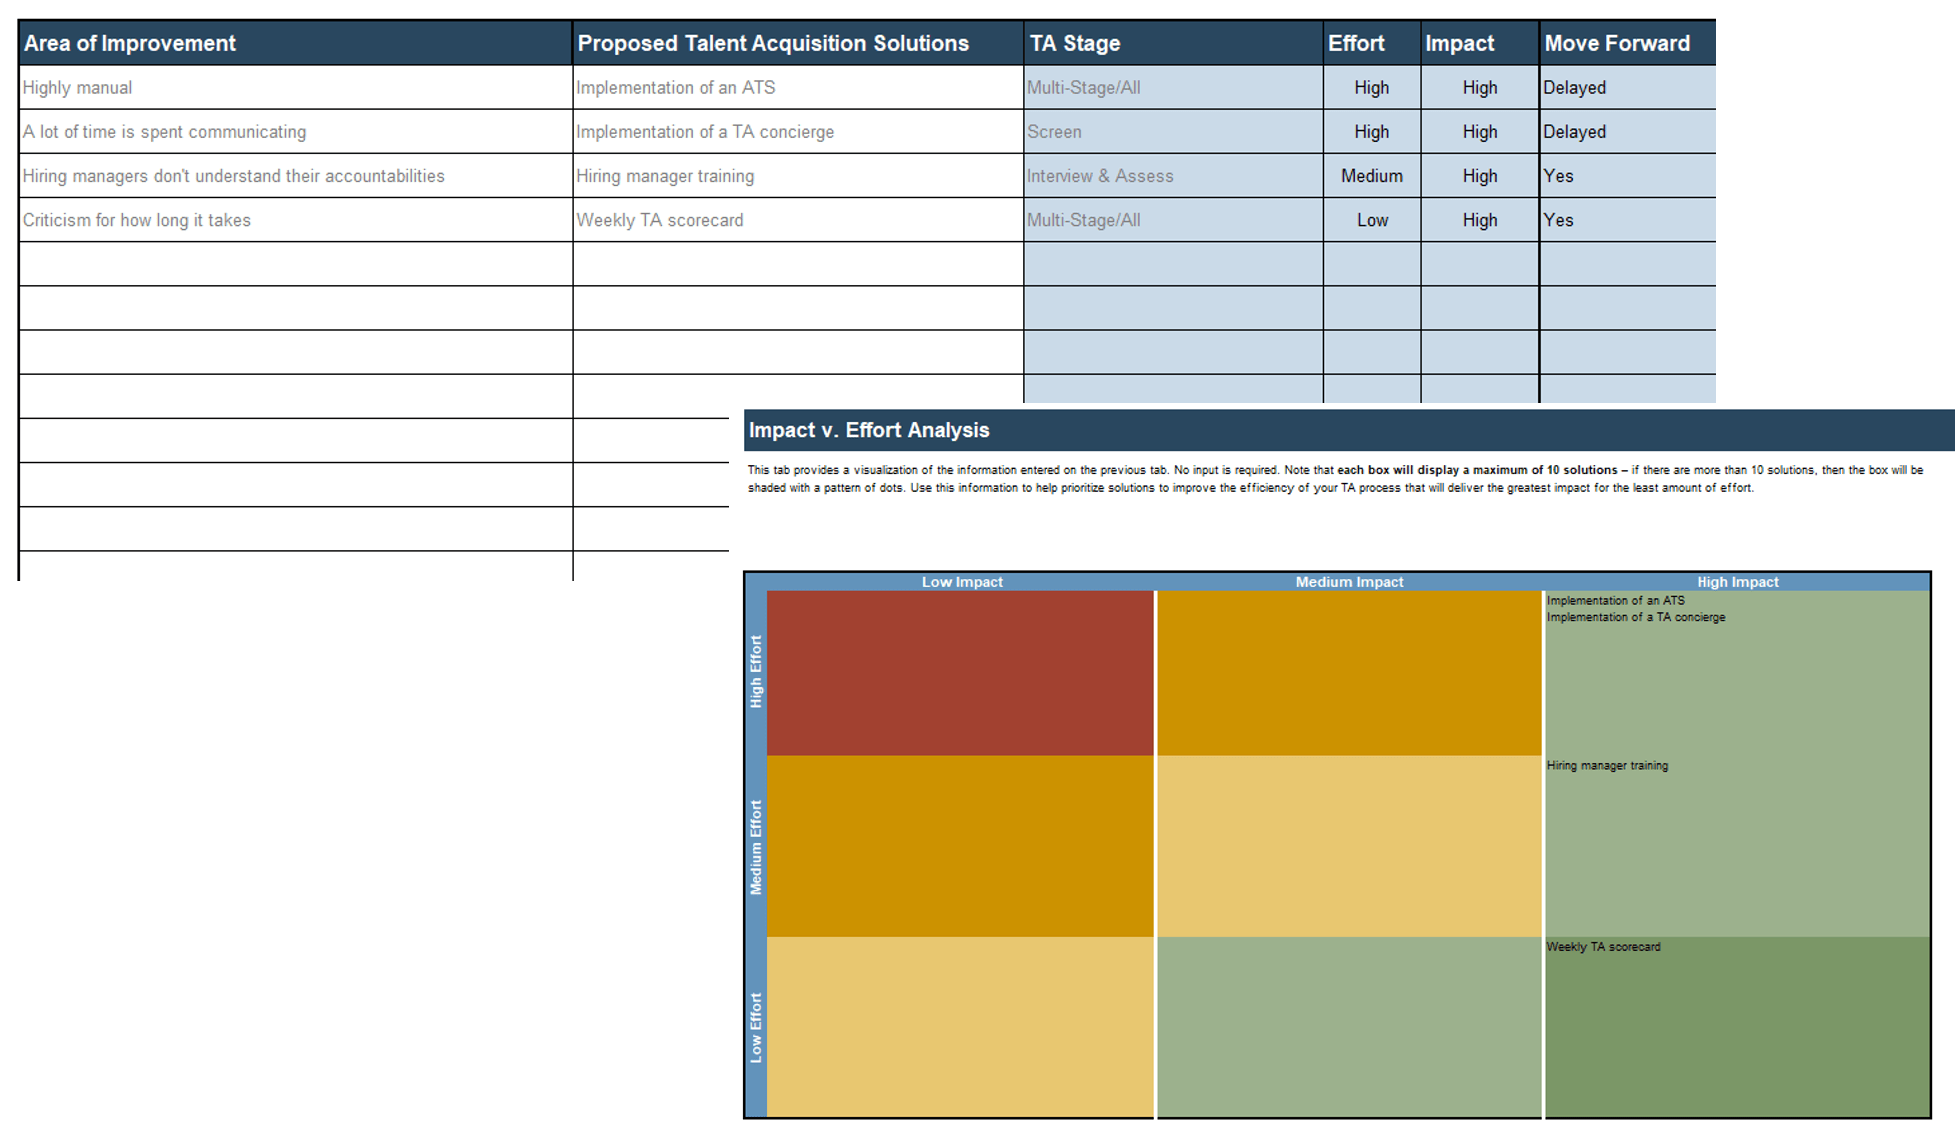

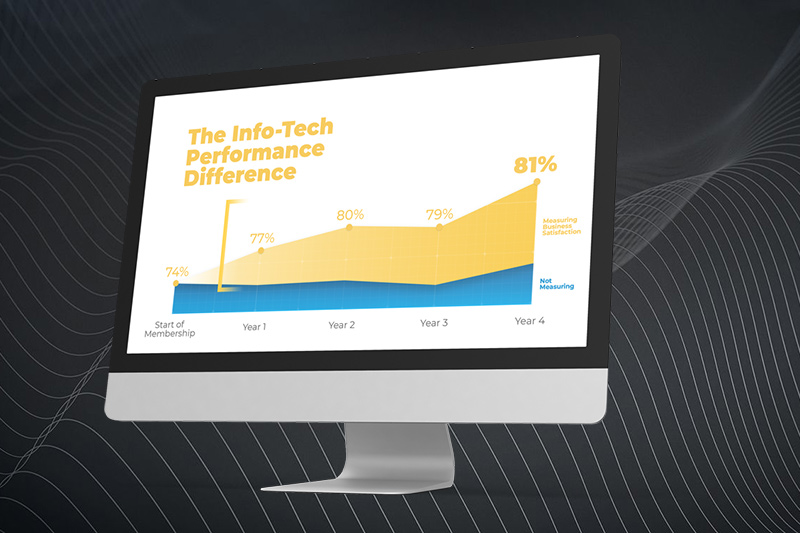


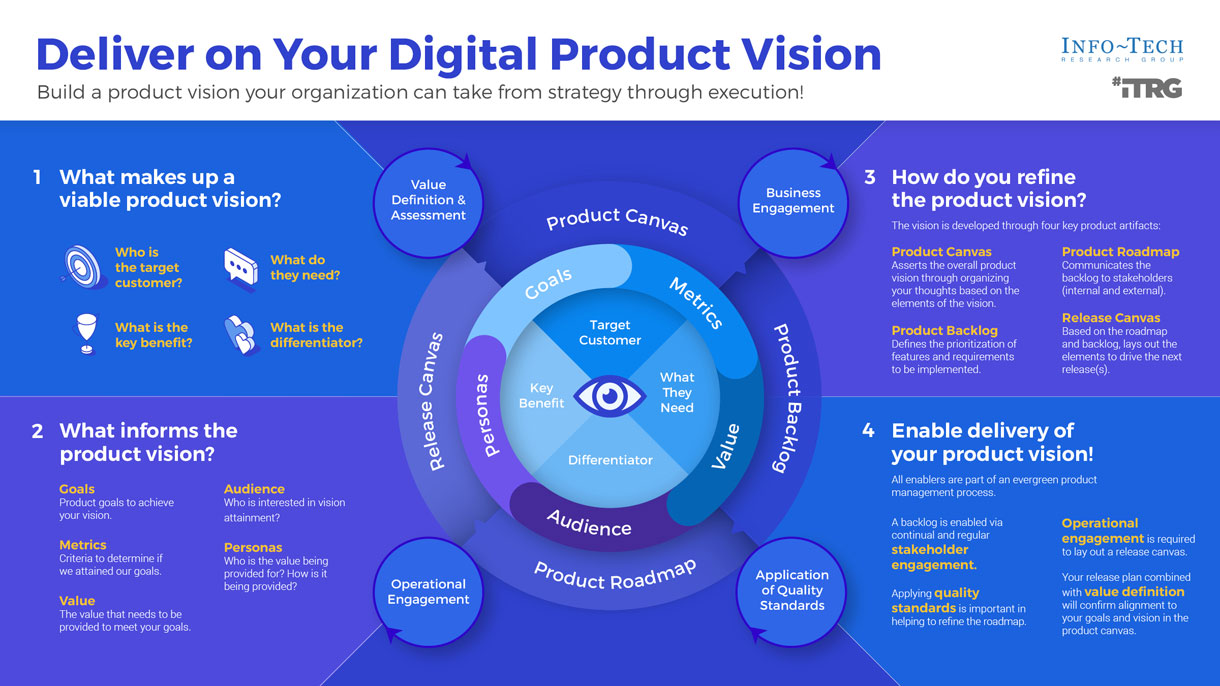


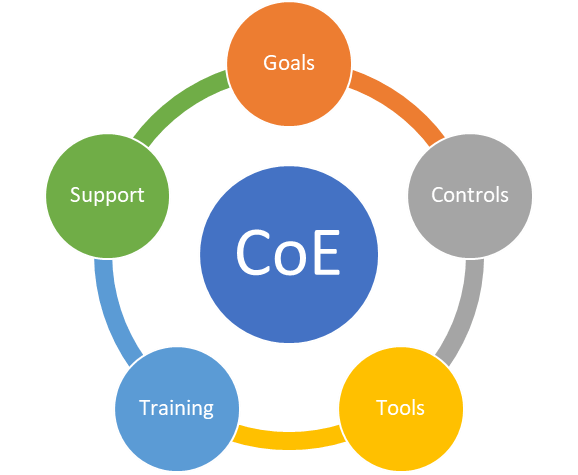
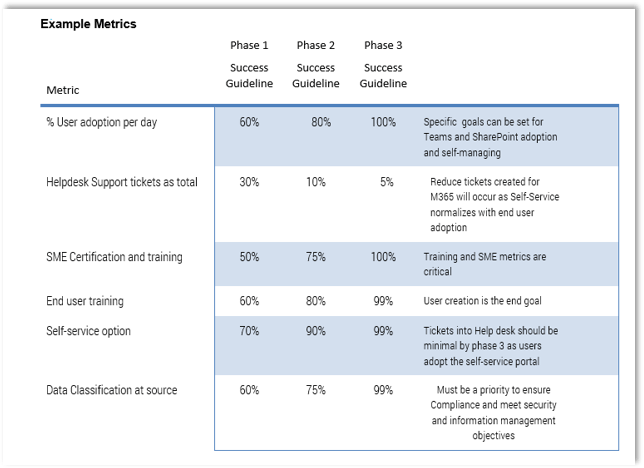
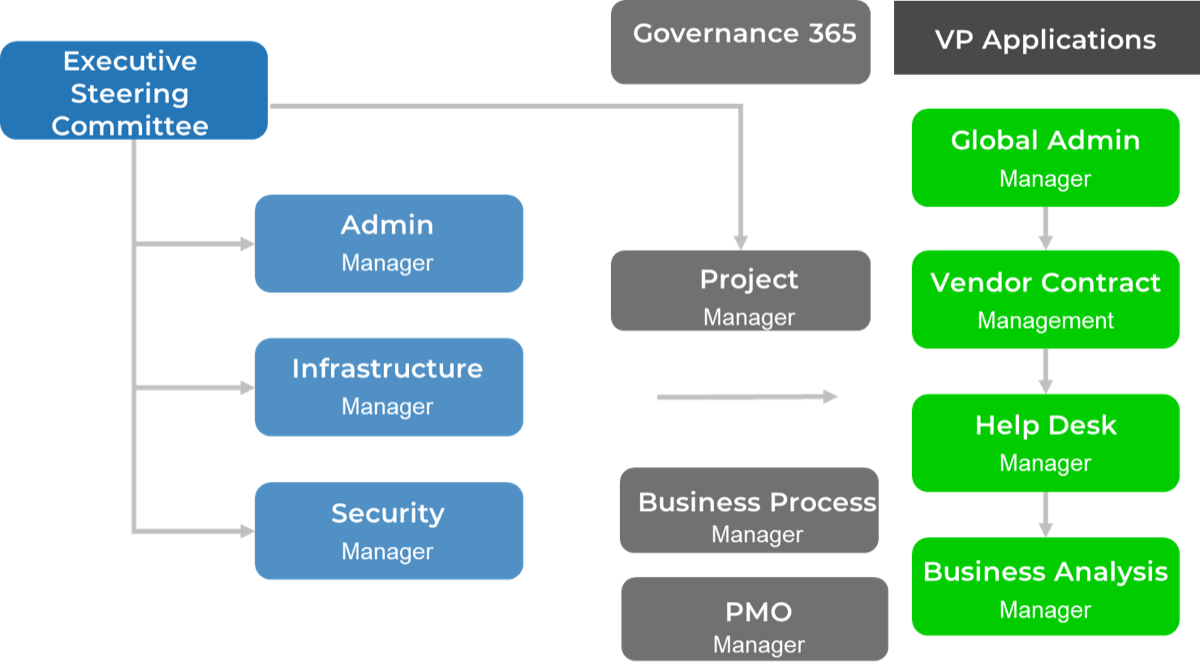
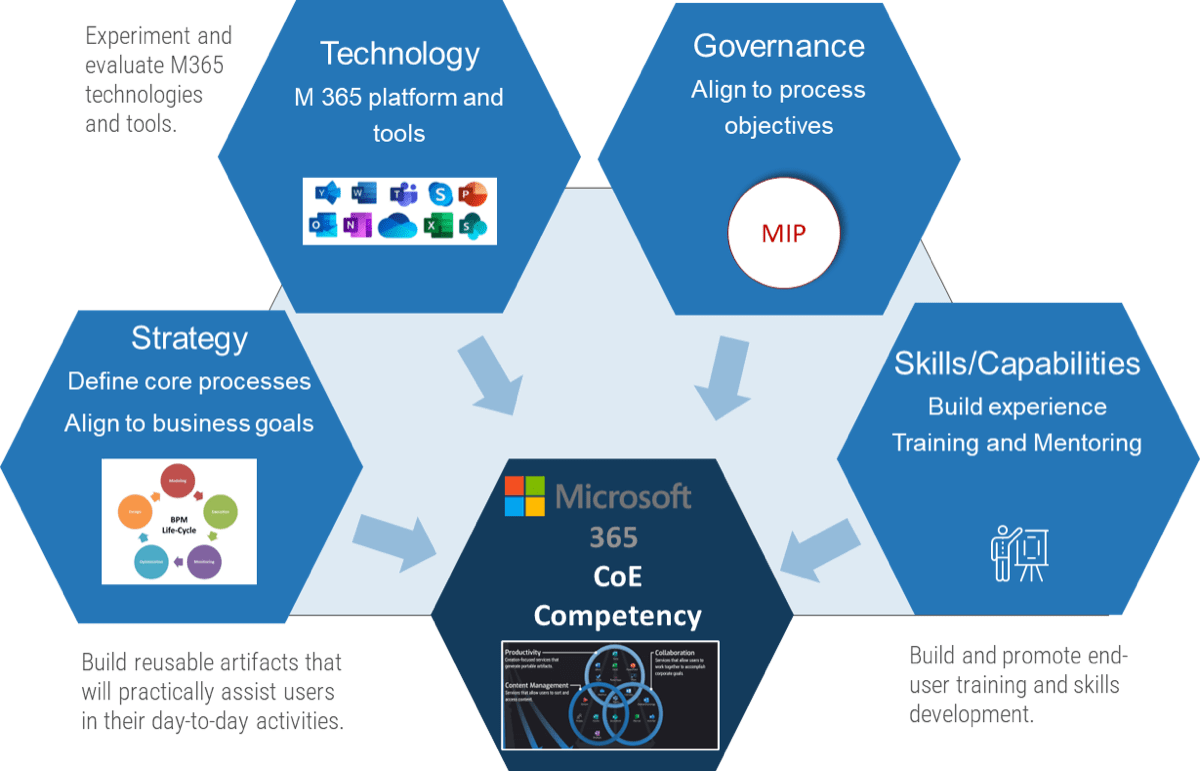
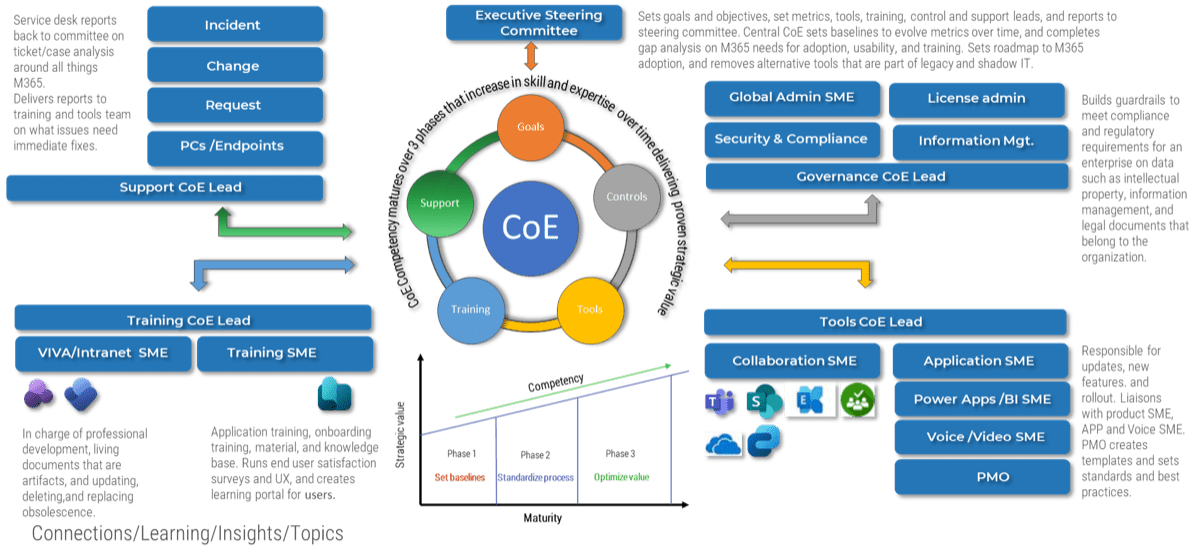
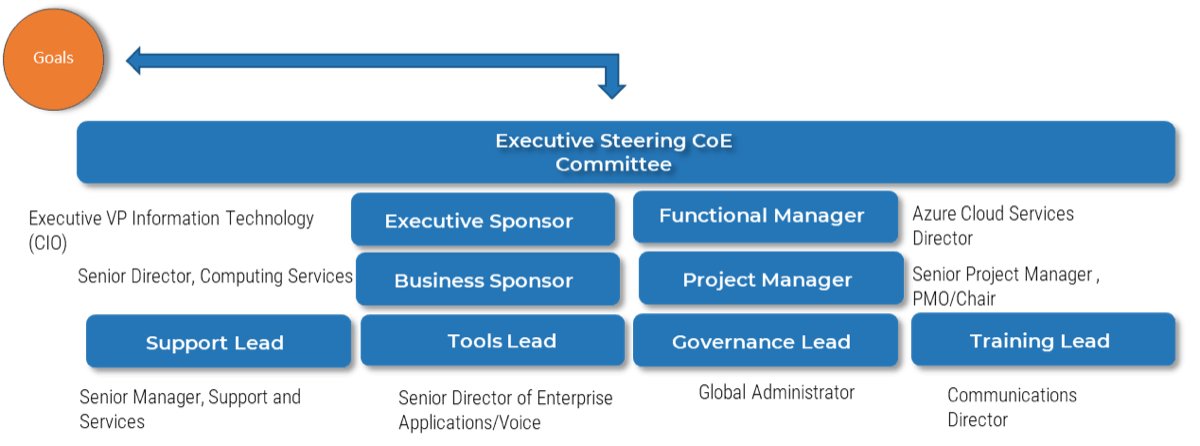
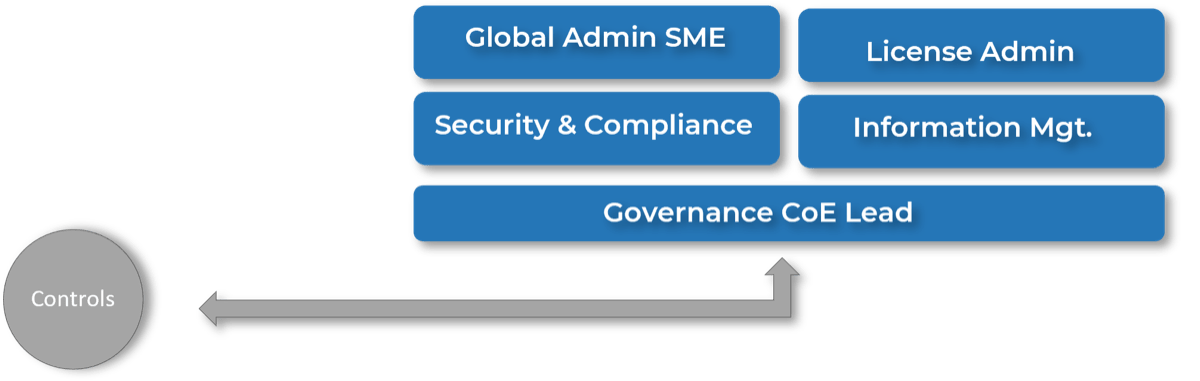
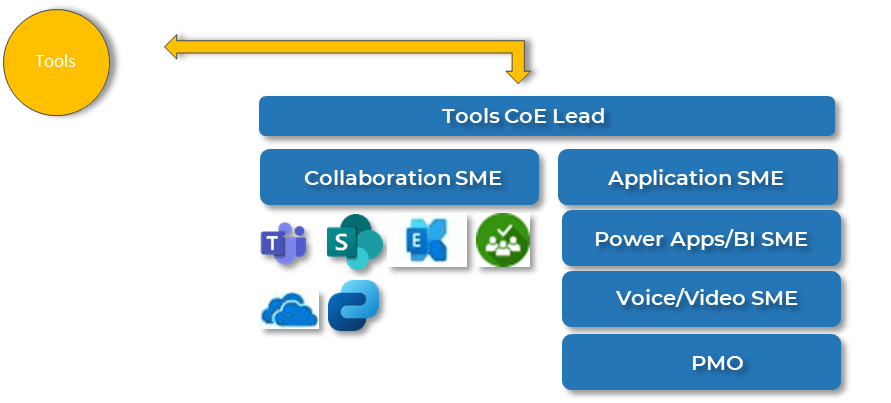
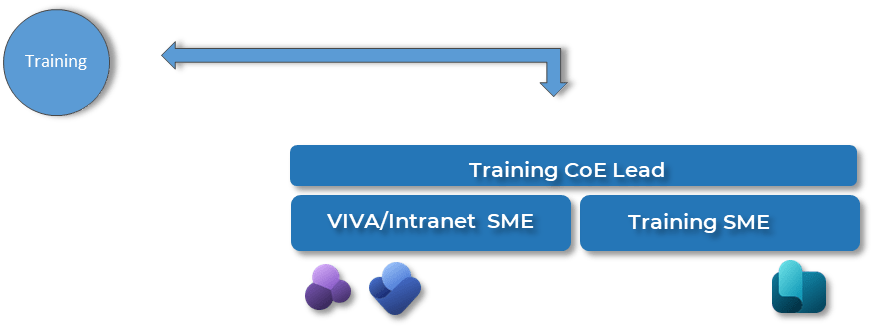
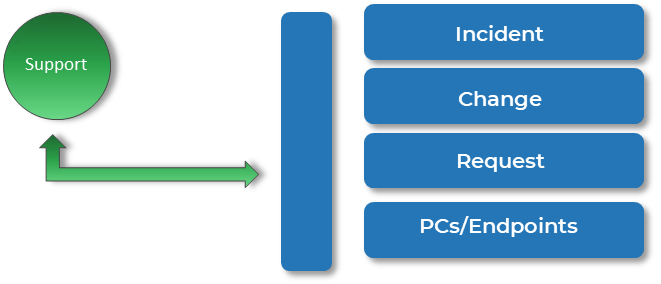
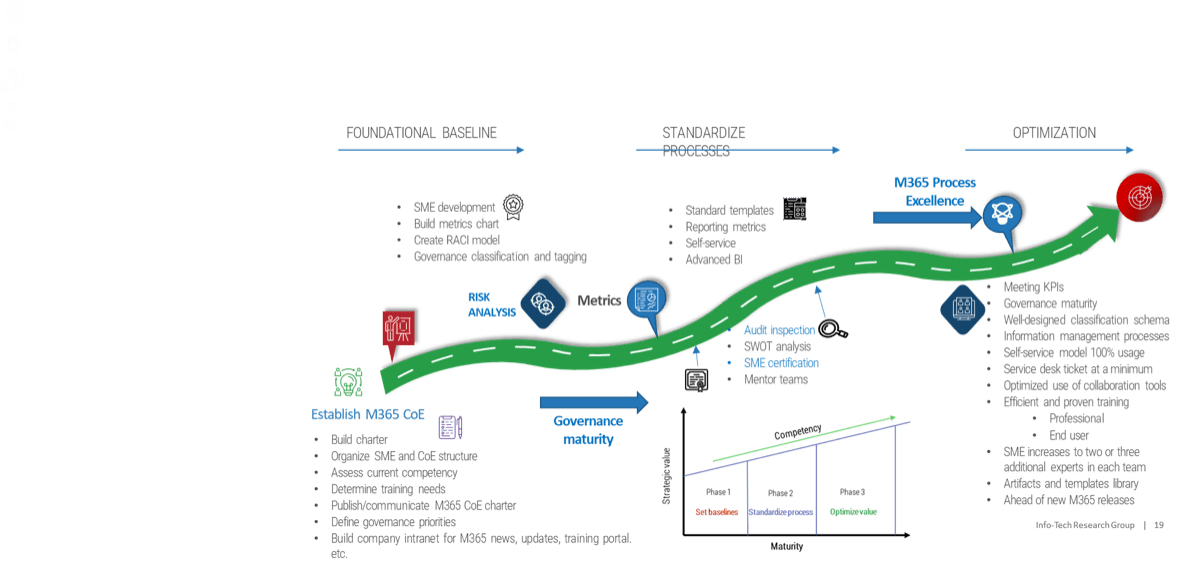
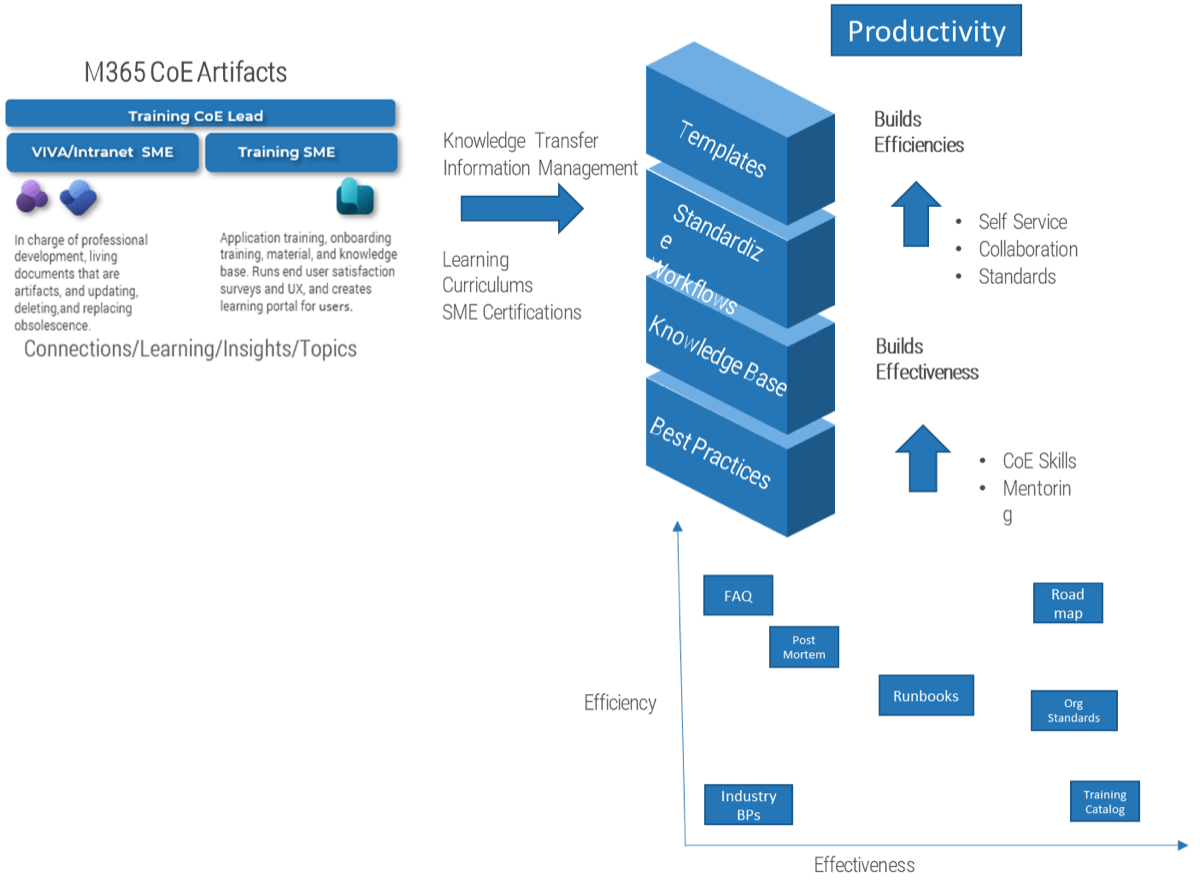
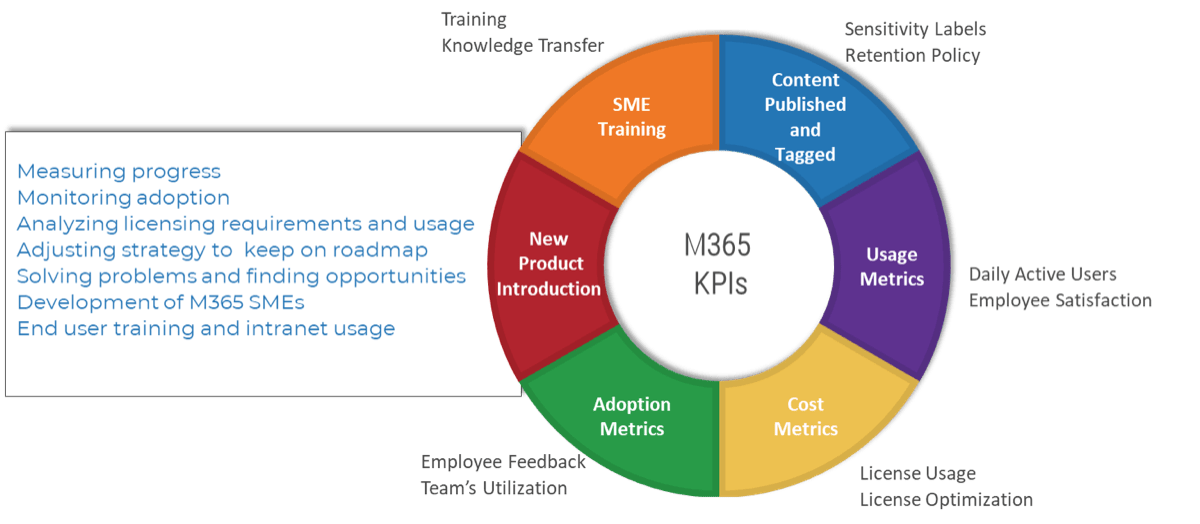


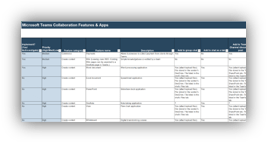
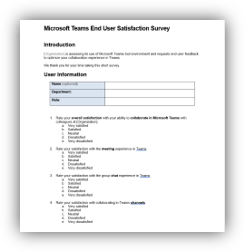
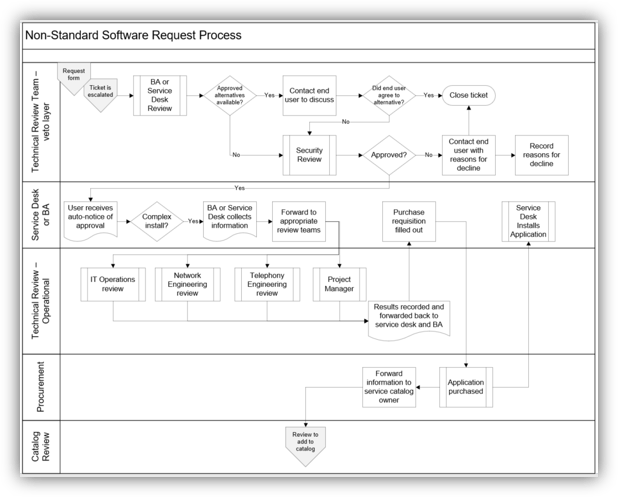
 (Venn diagram recreated from


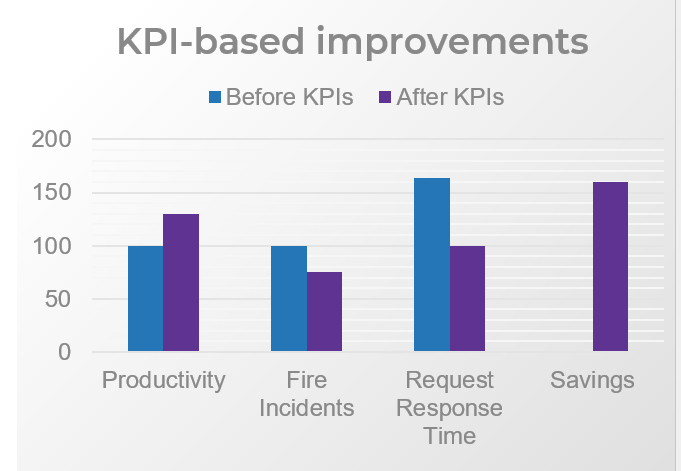
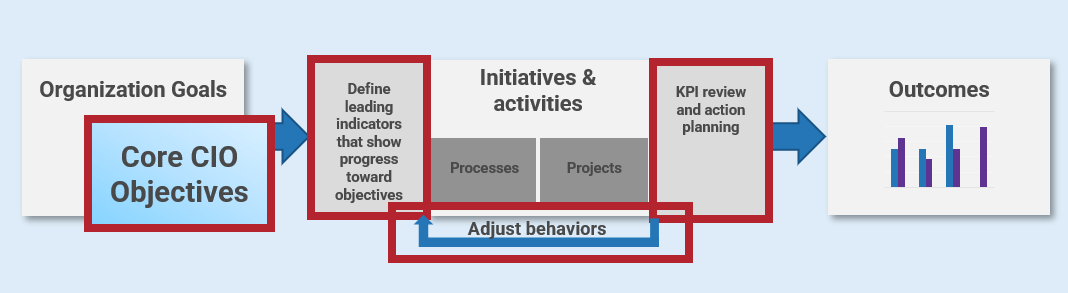
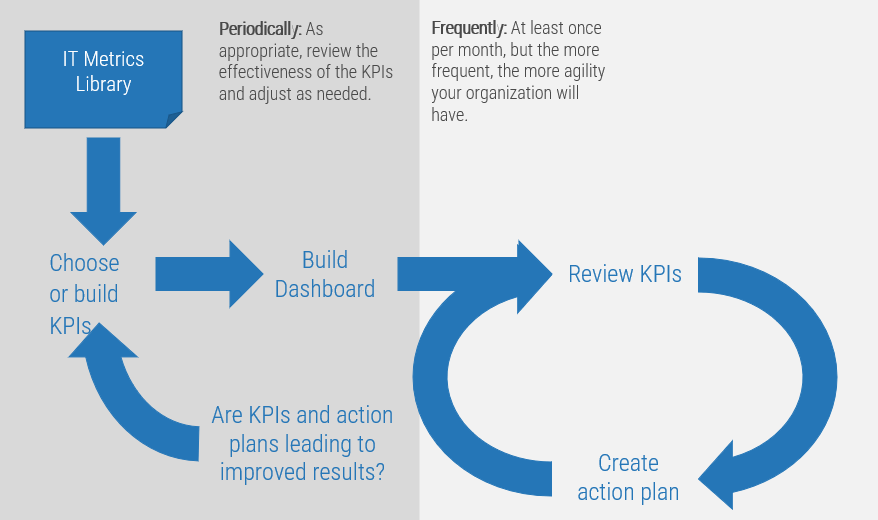
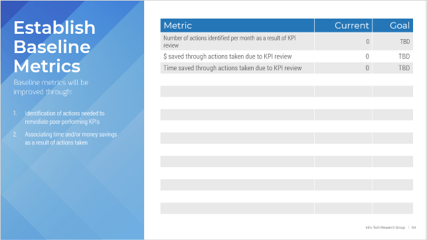
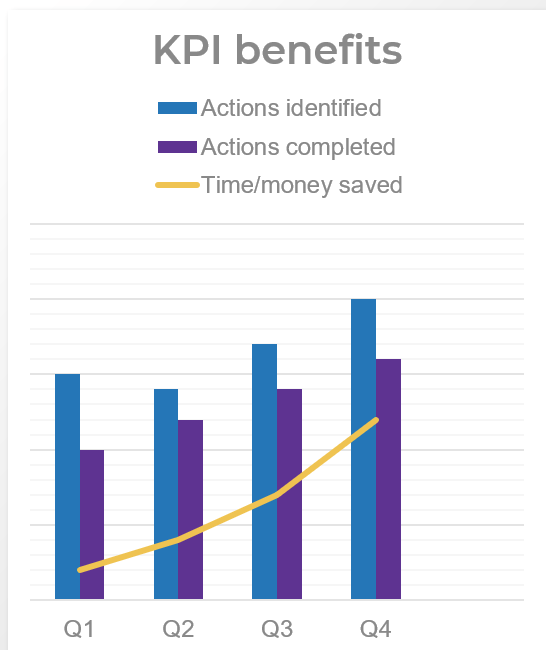
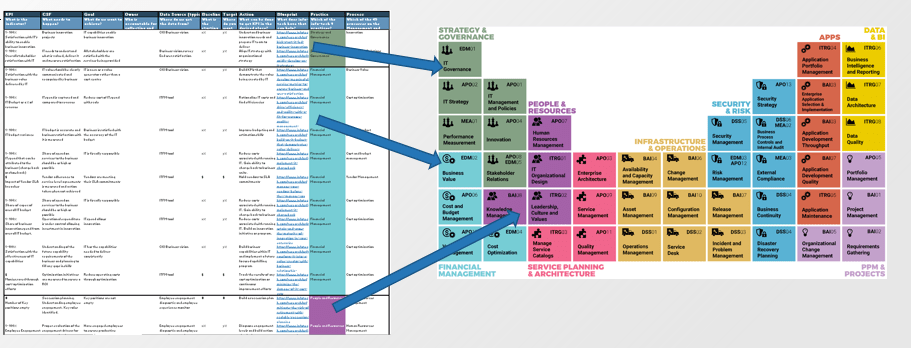
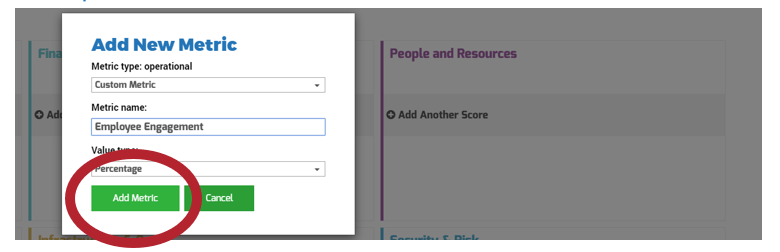
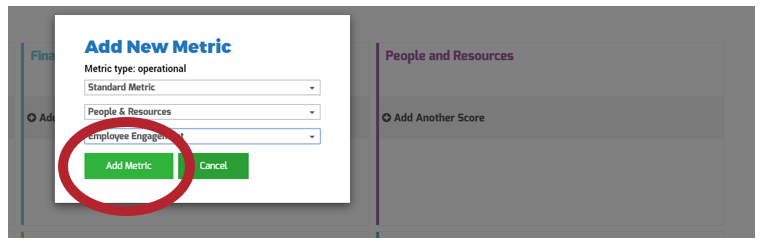


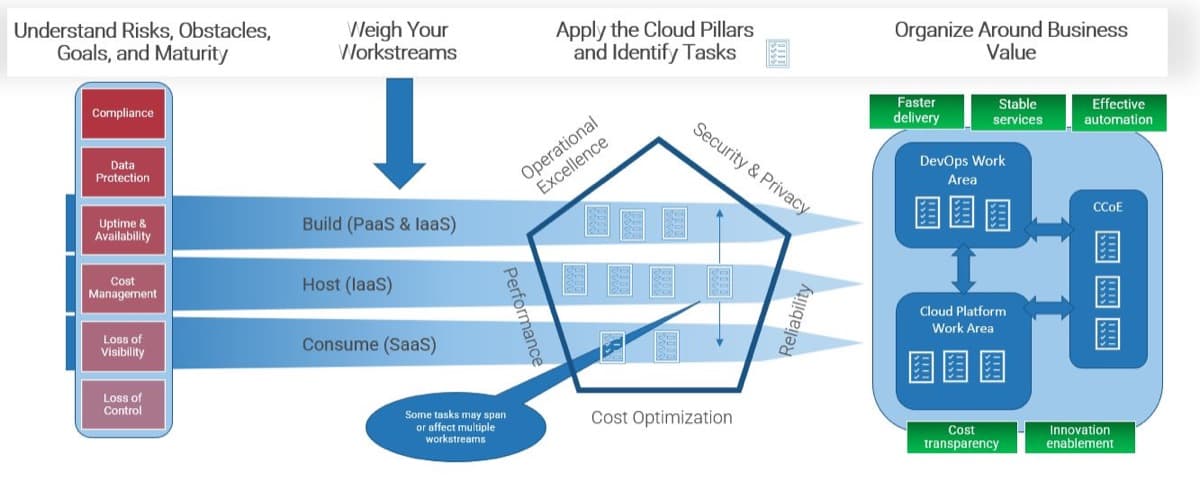
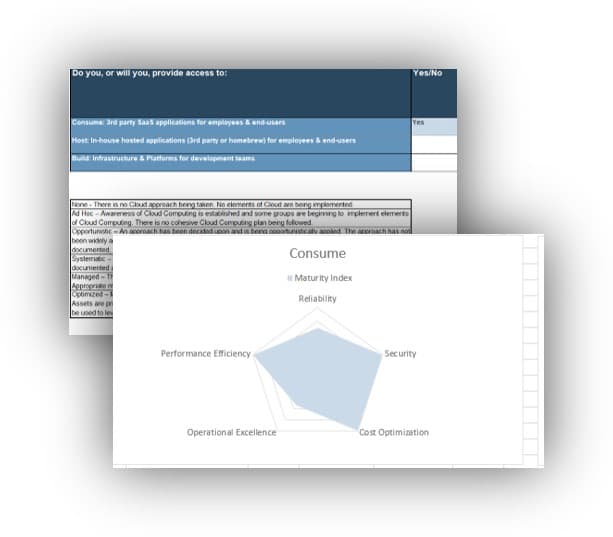
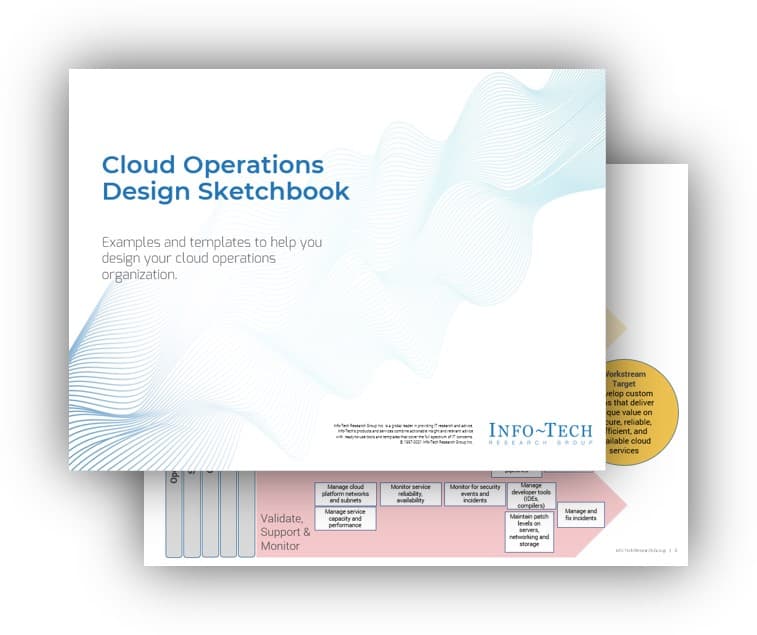
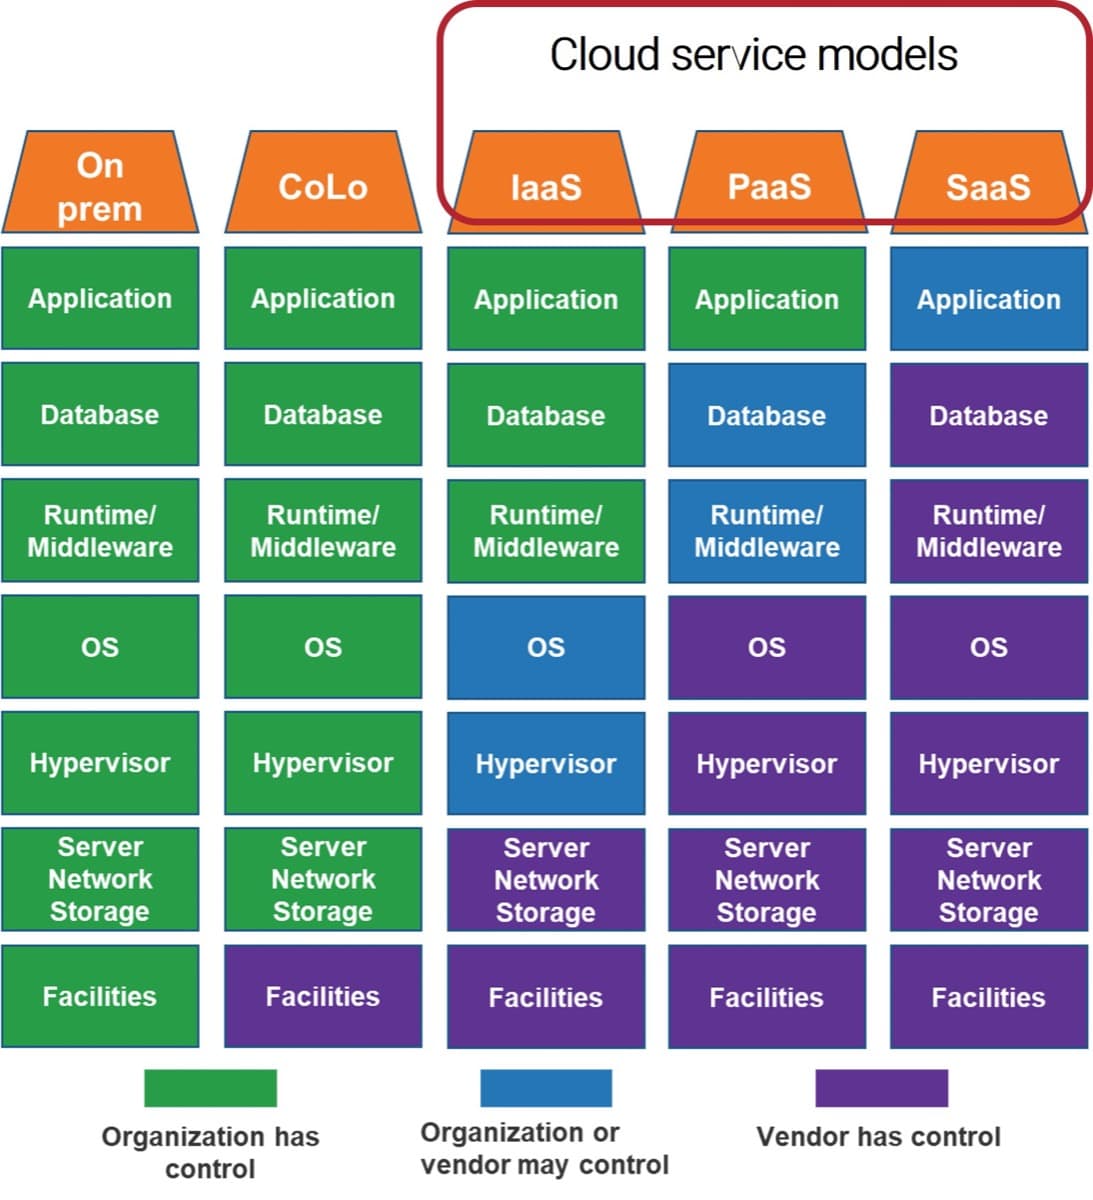
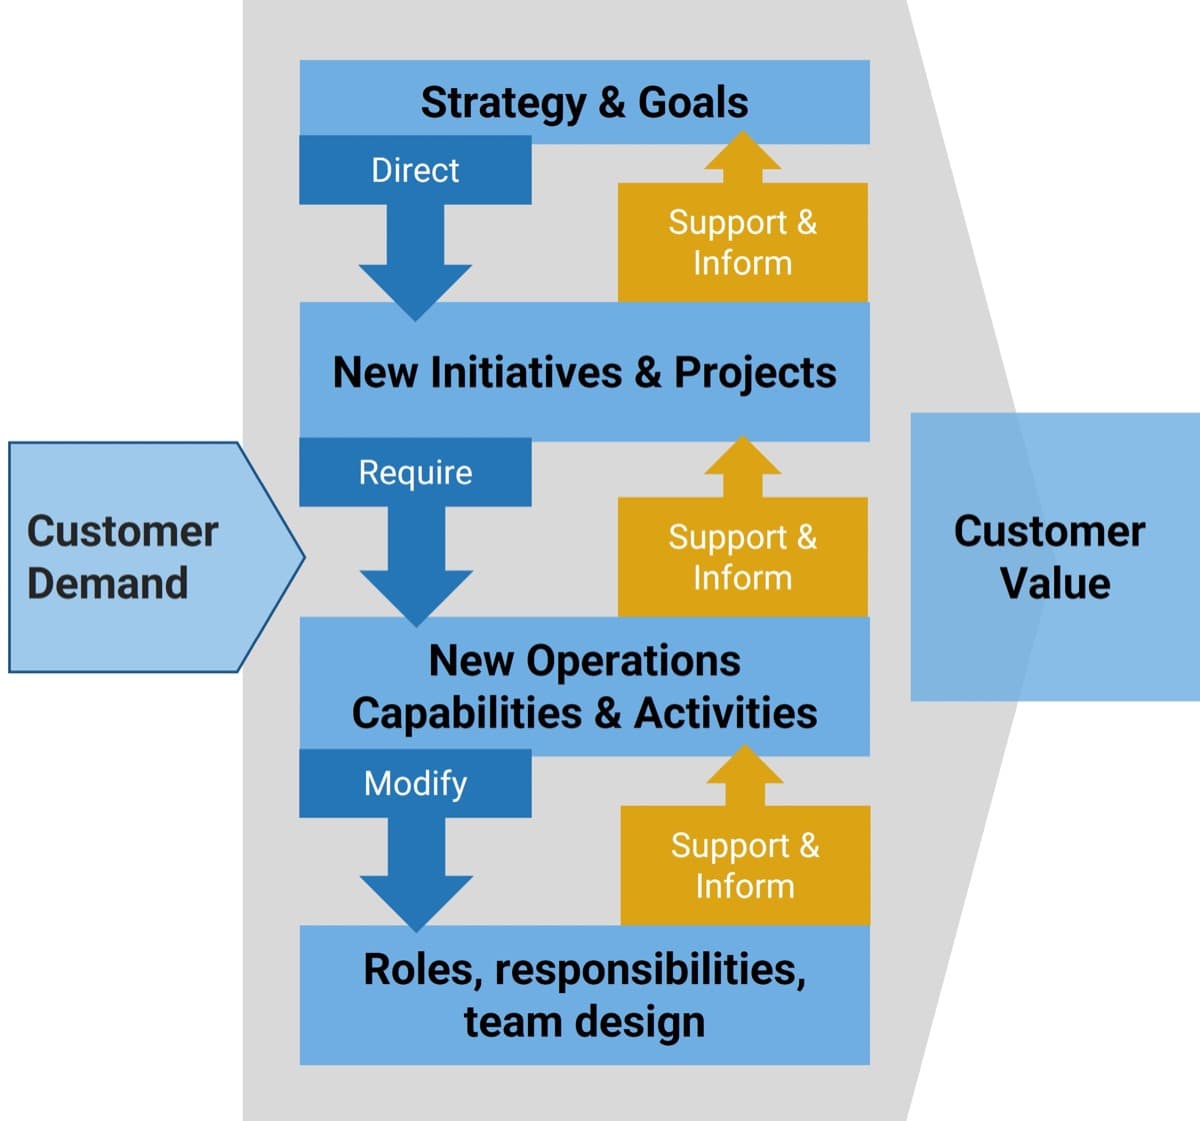
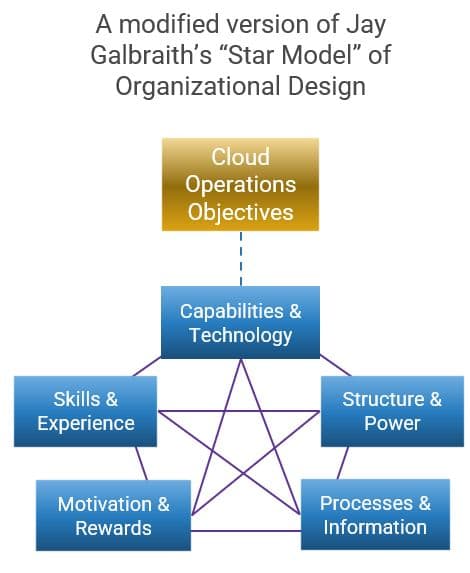
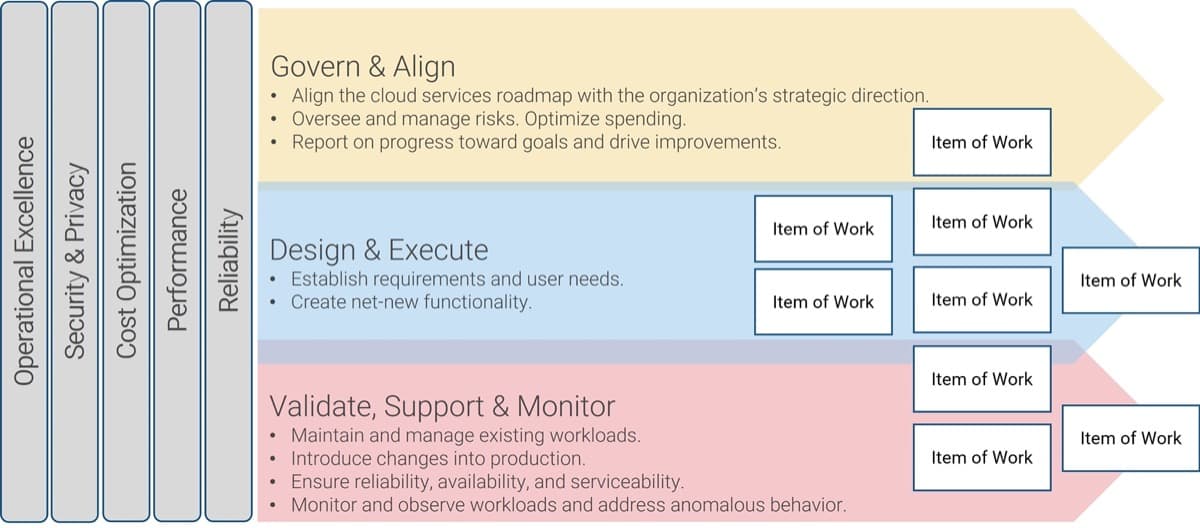
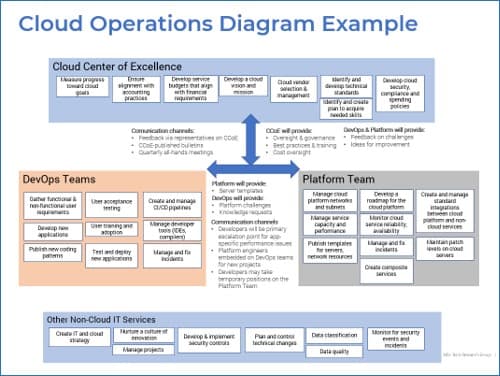
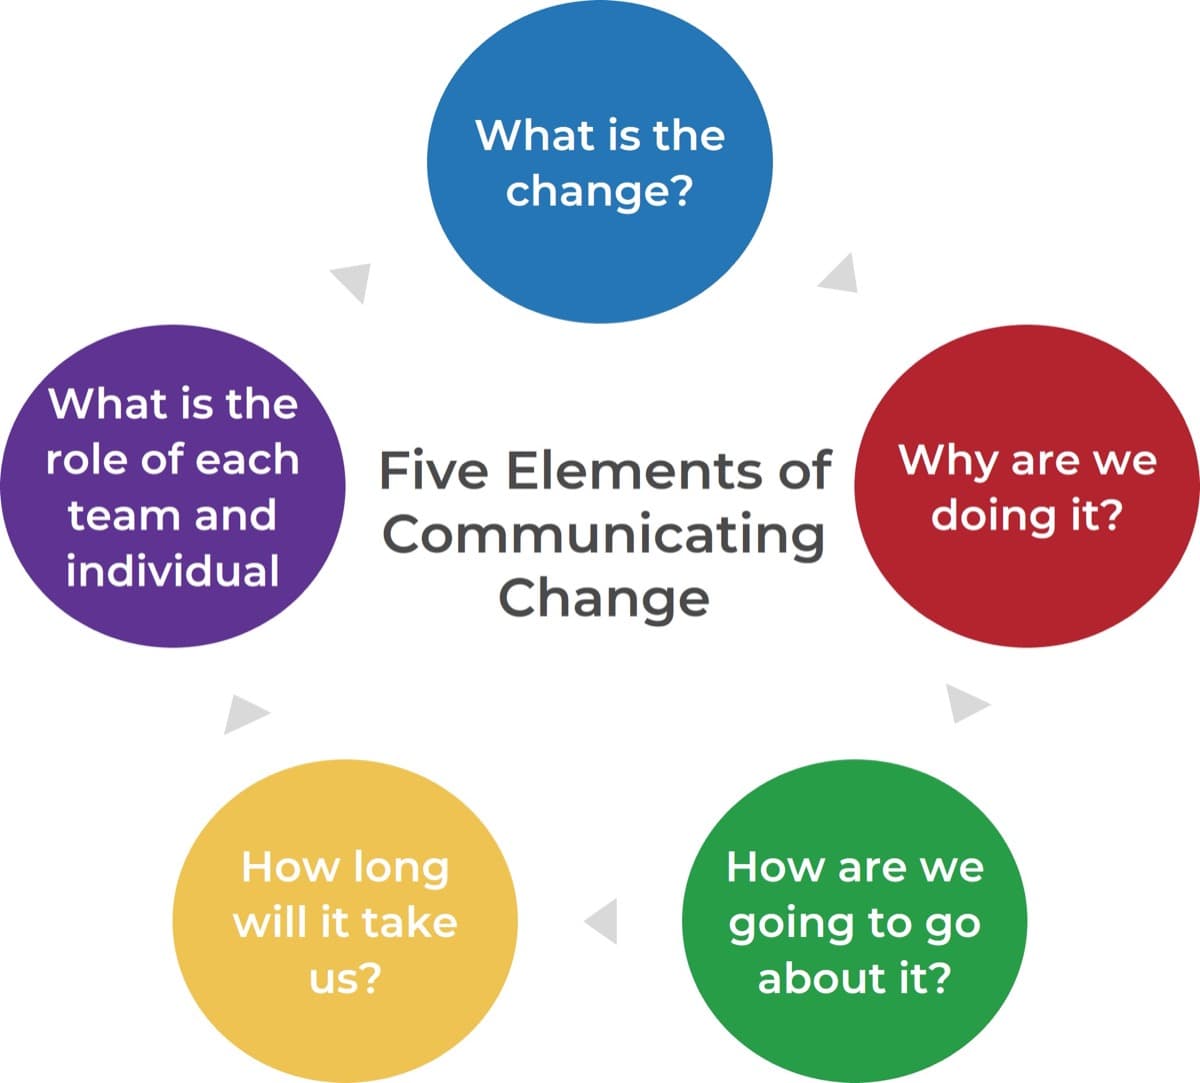


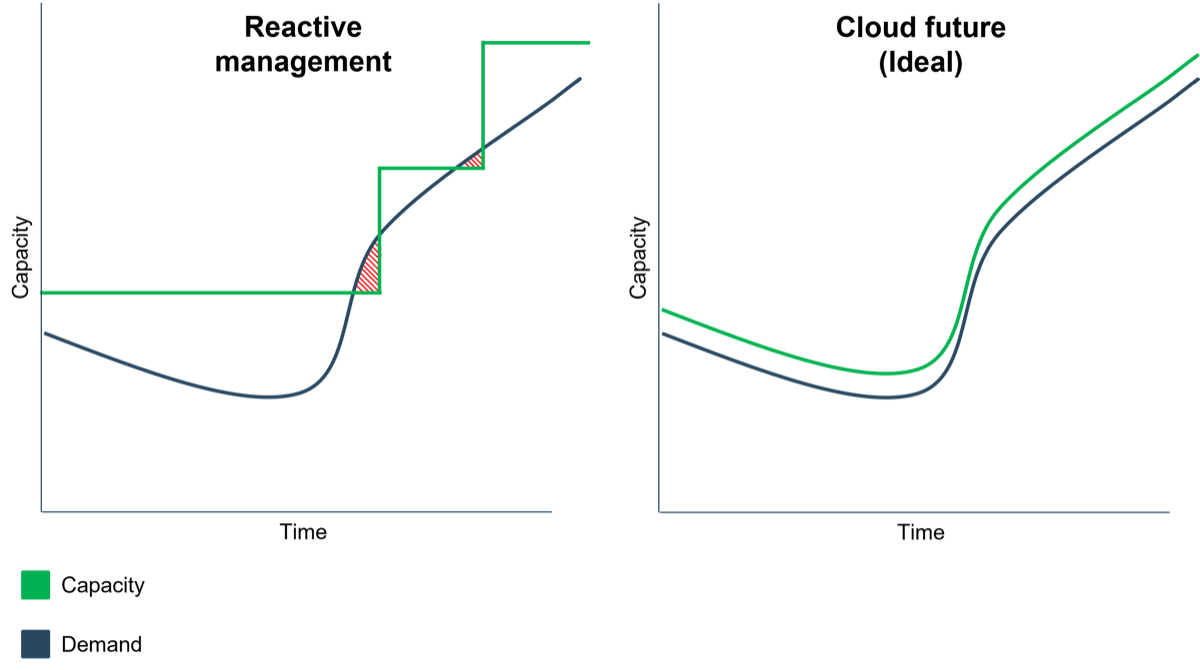
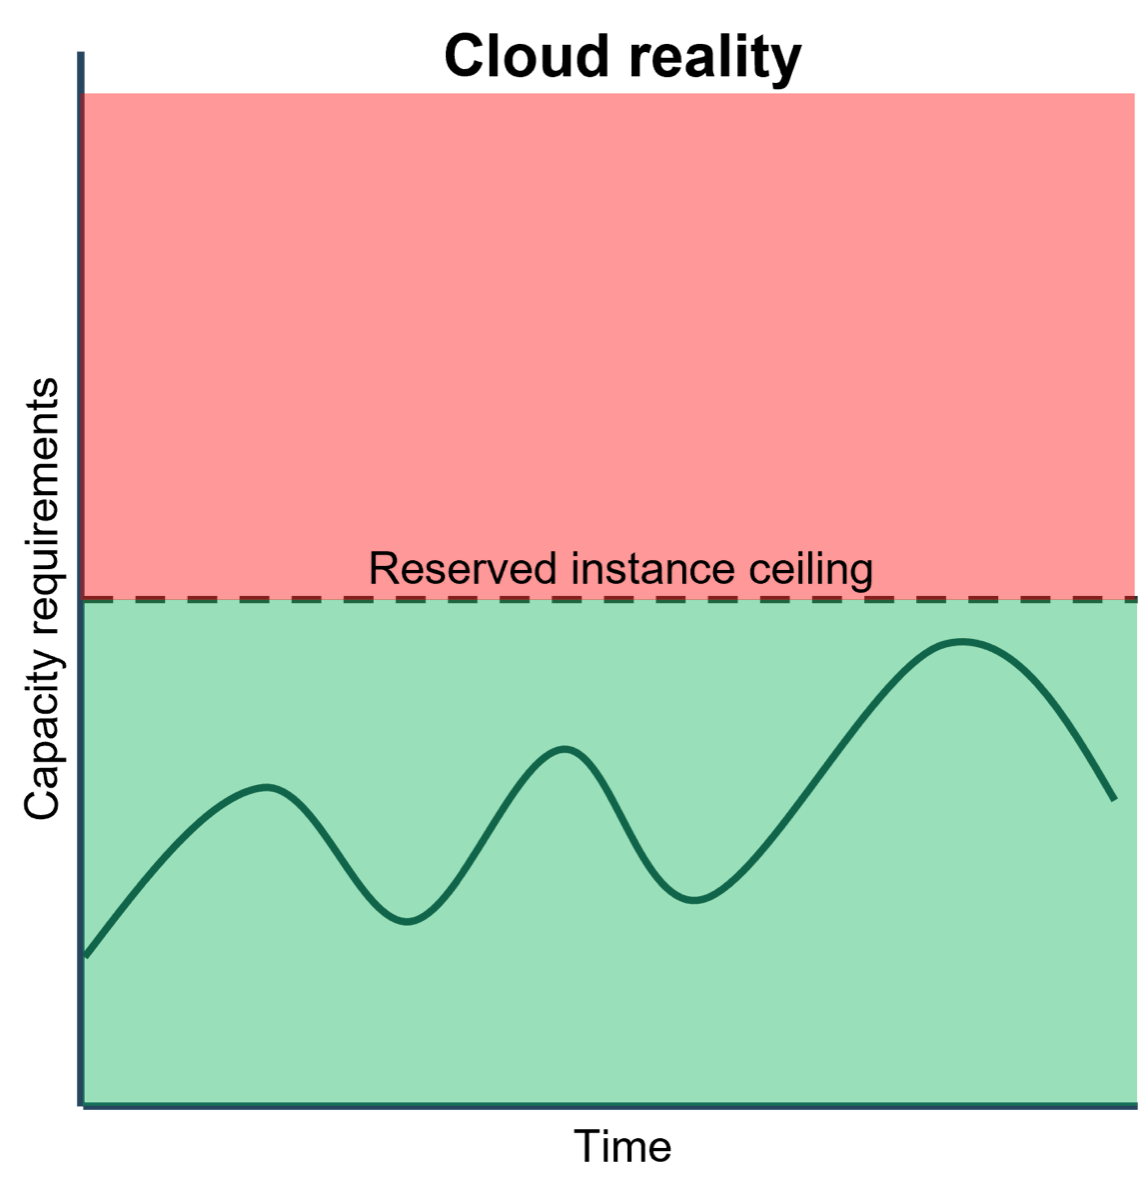
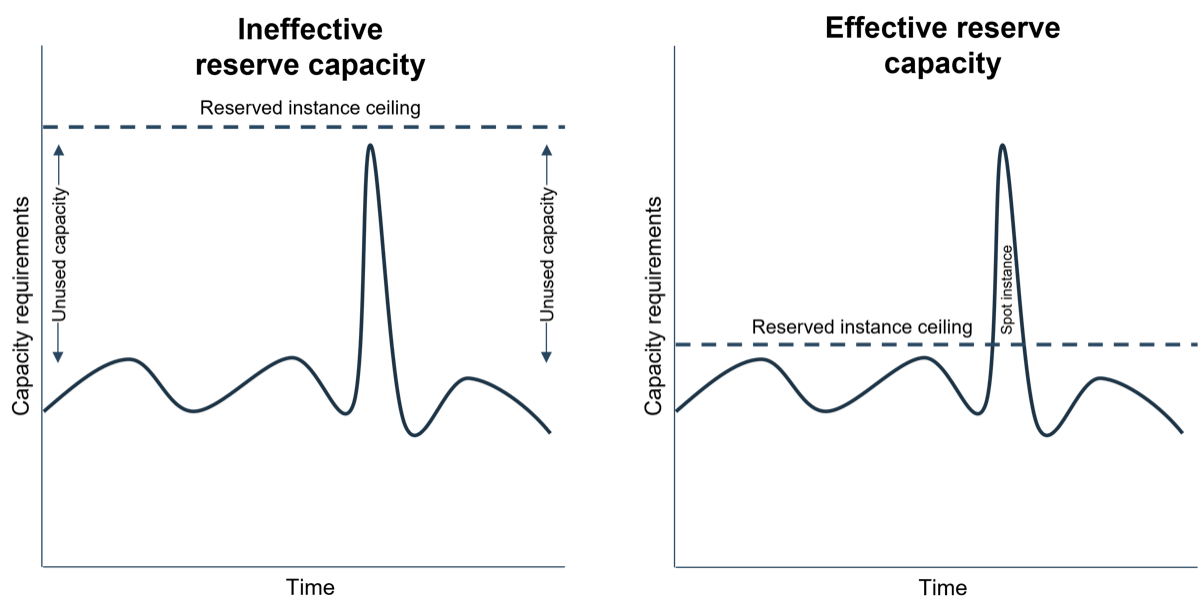
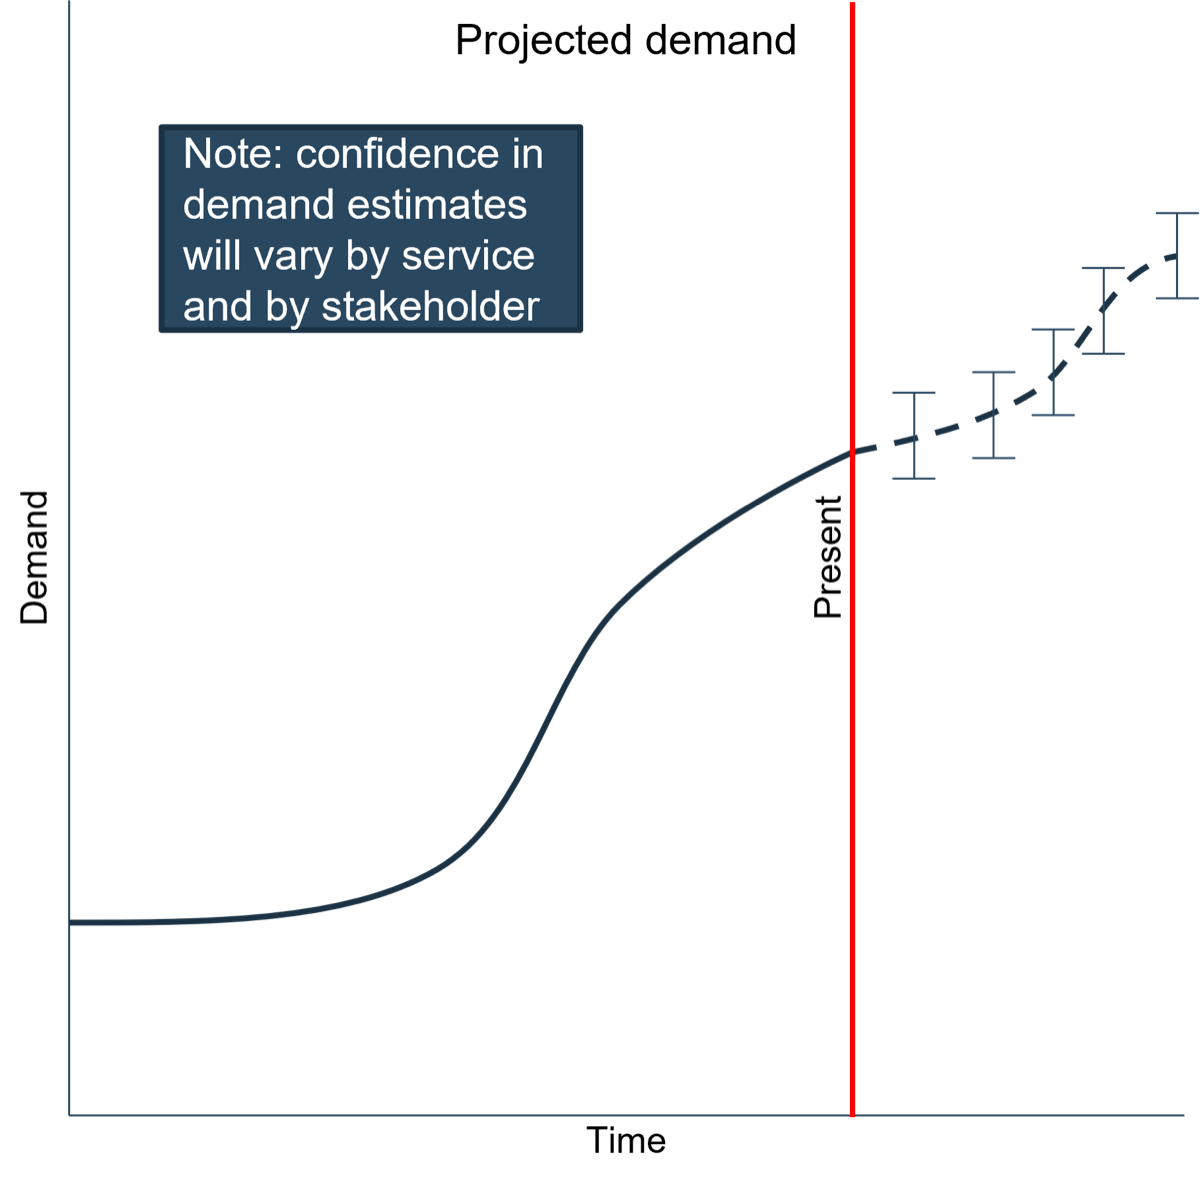


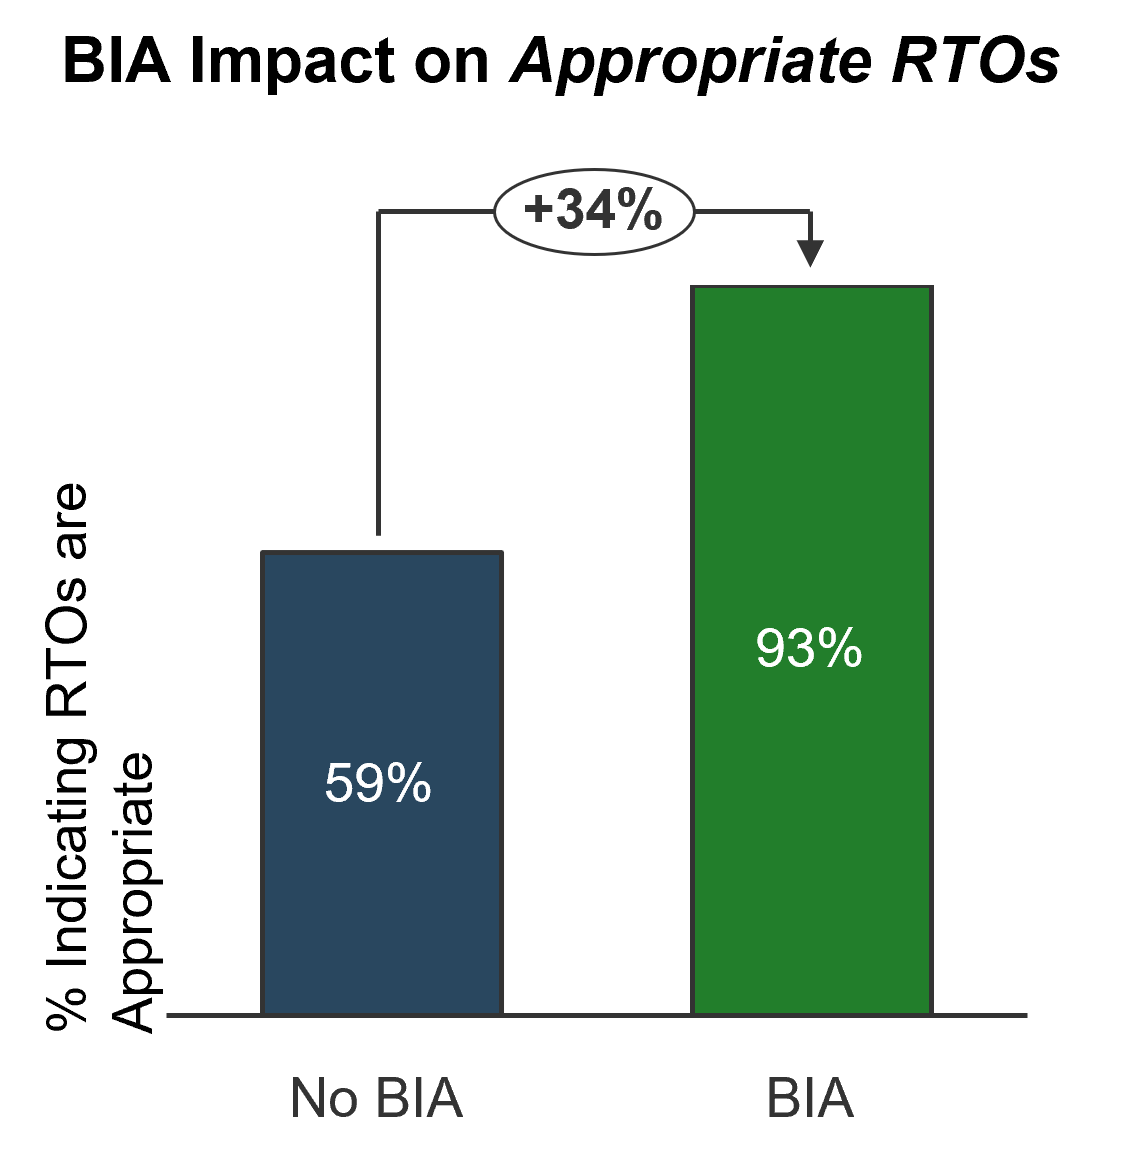
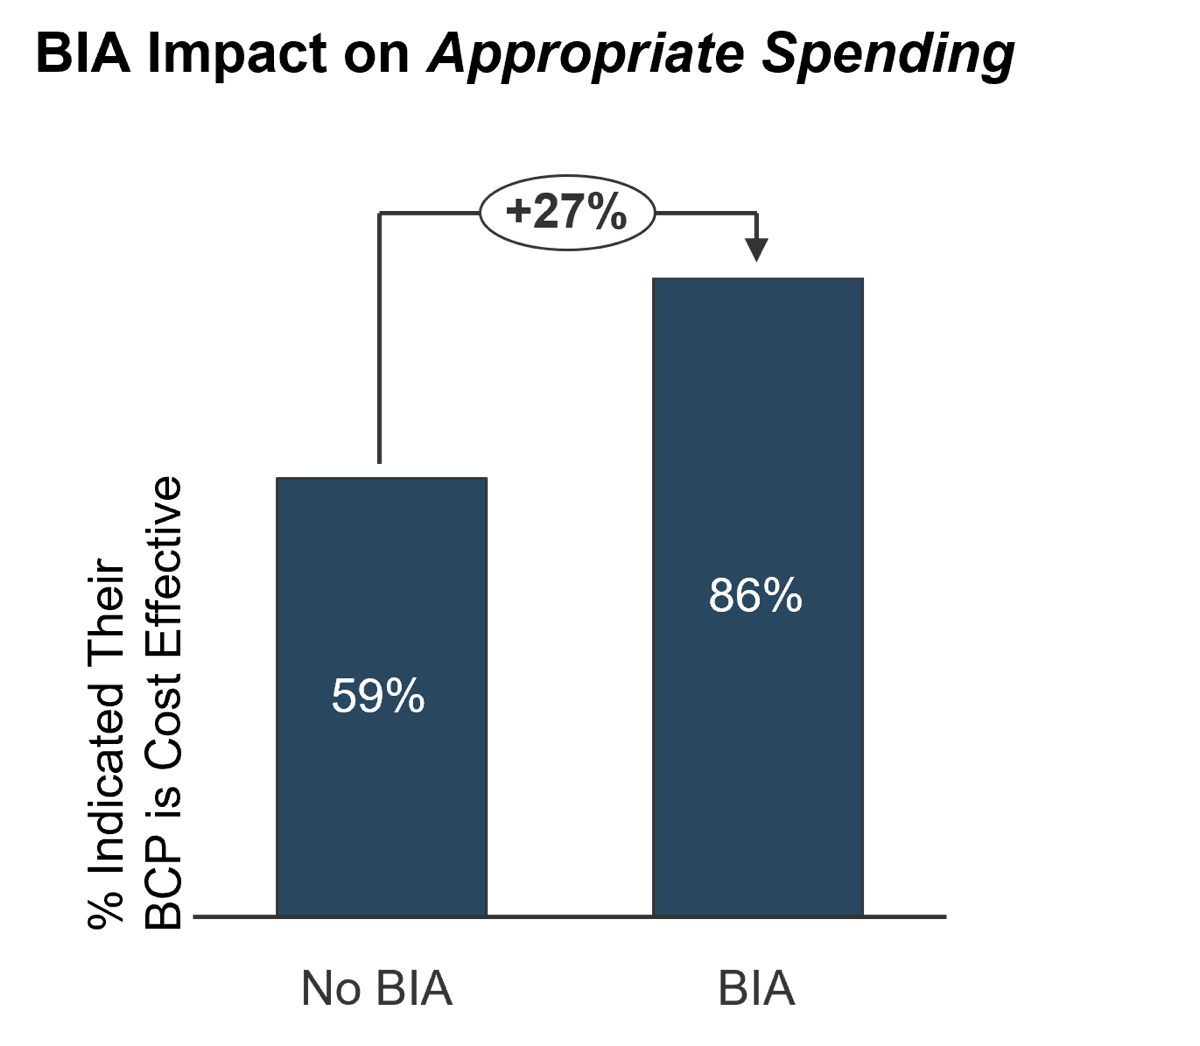

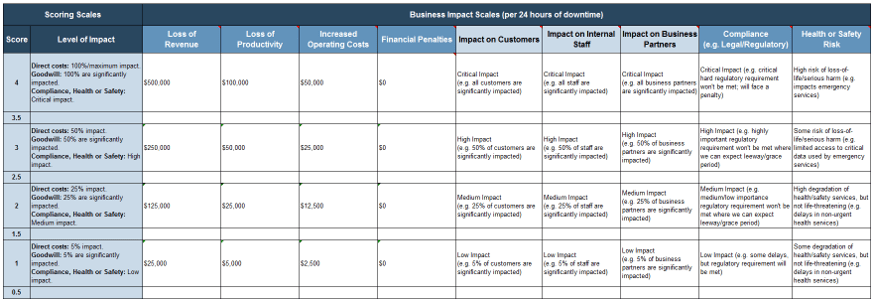
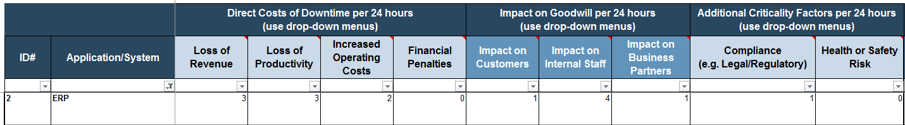
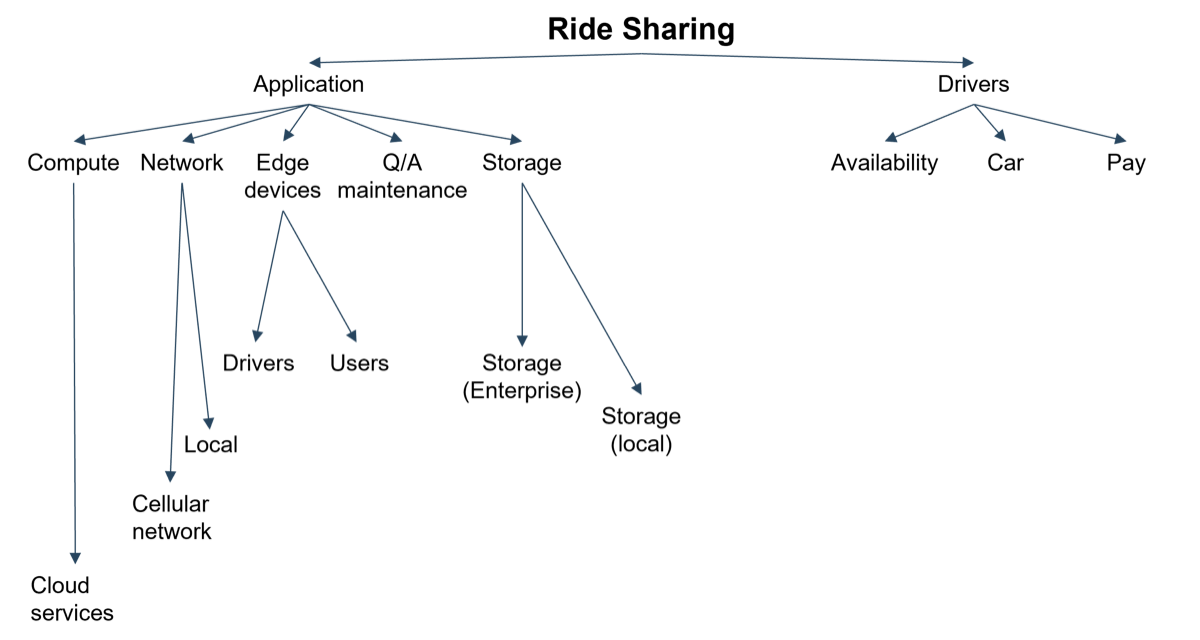
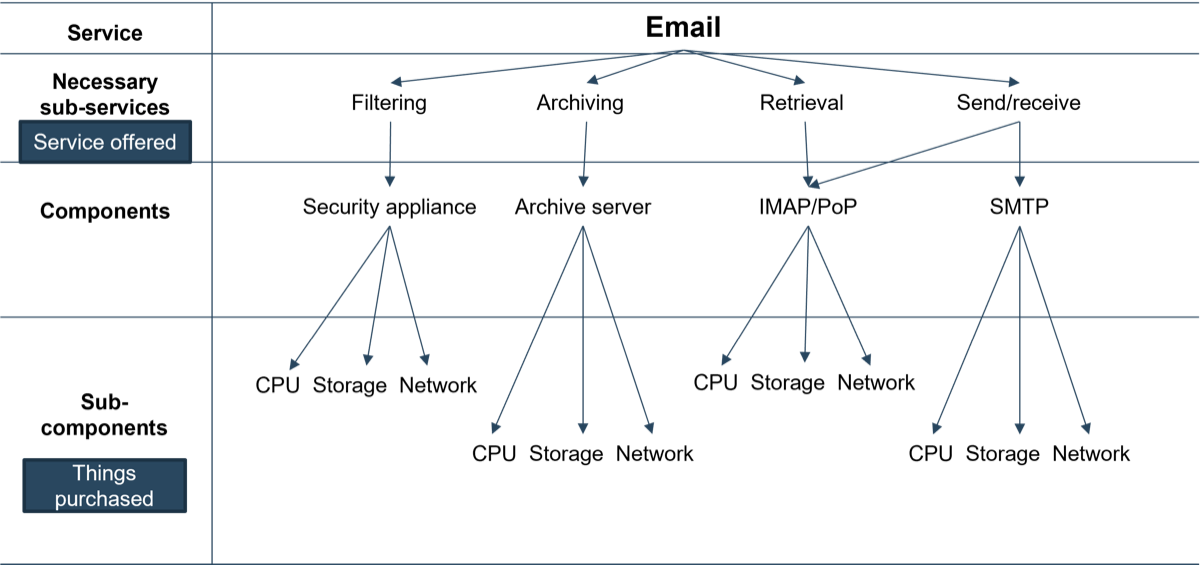
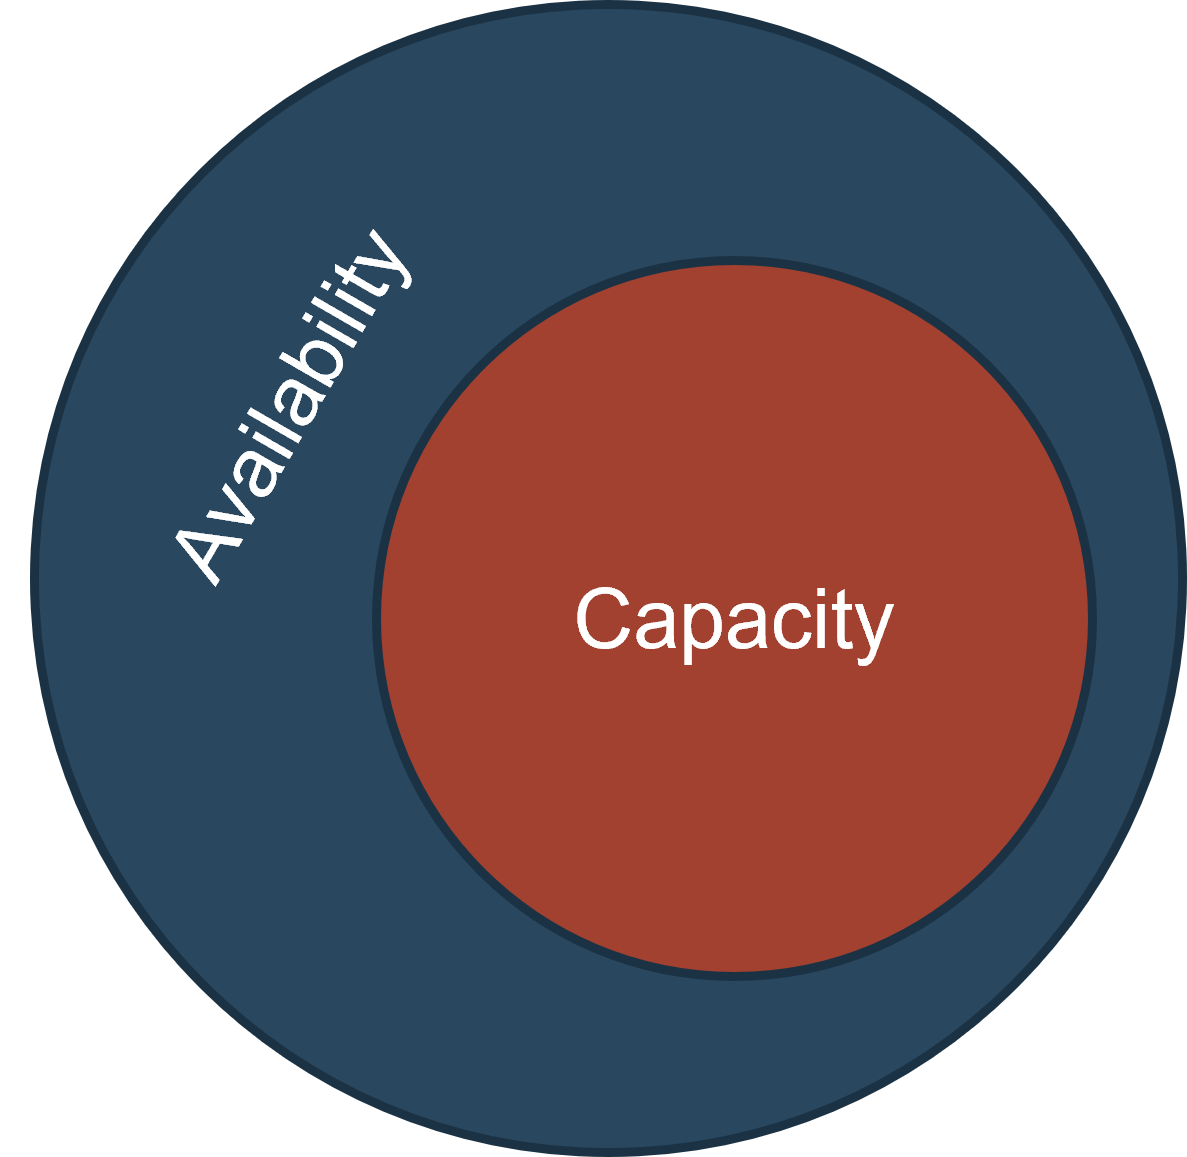

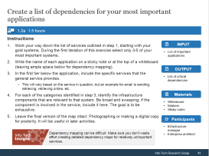
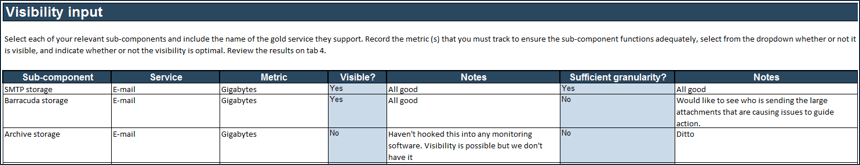
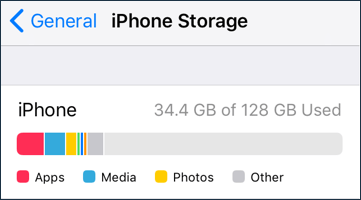
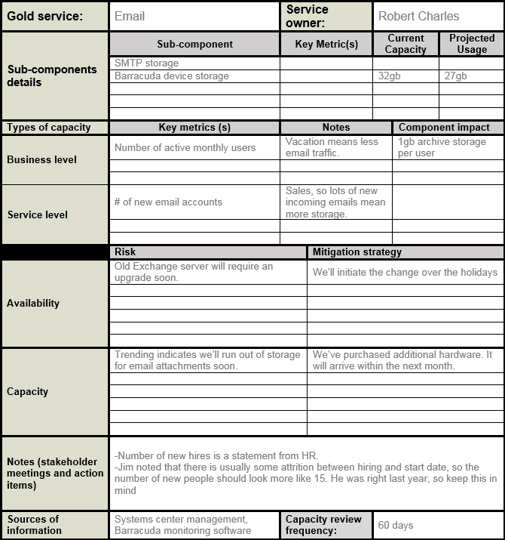
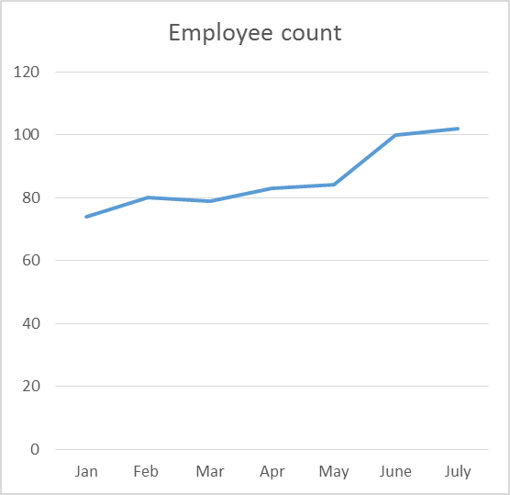


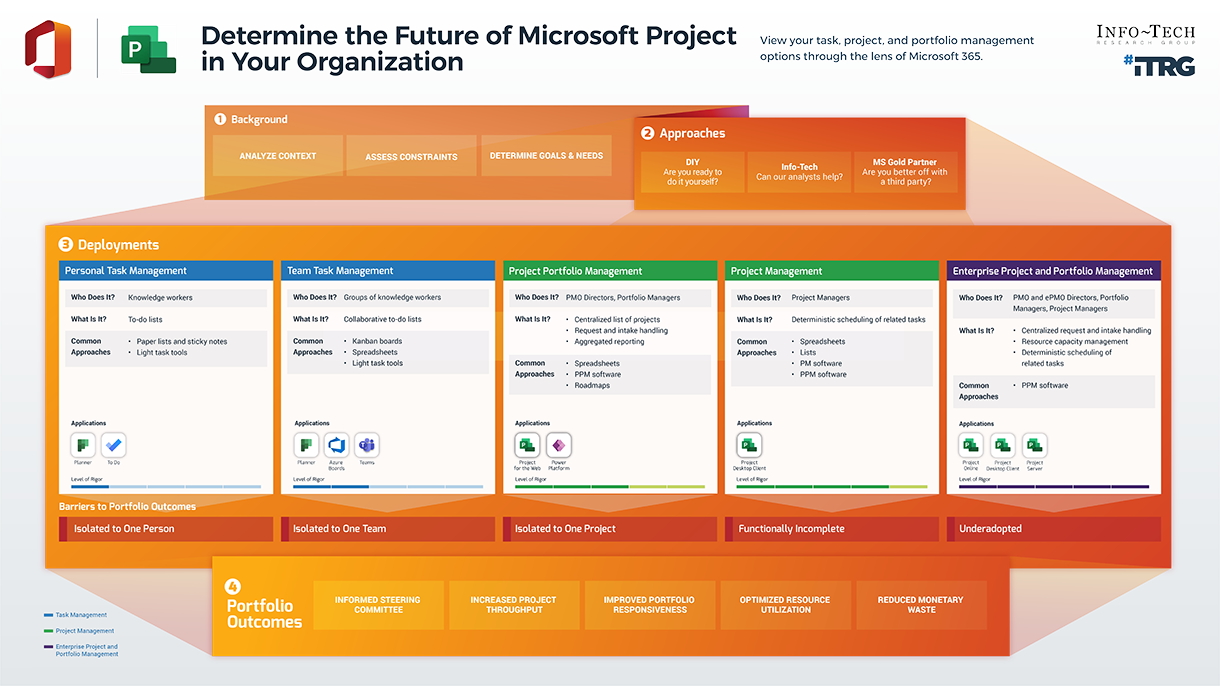
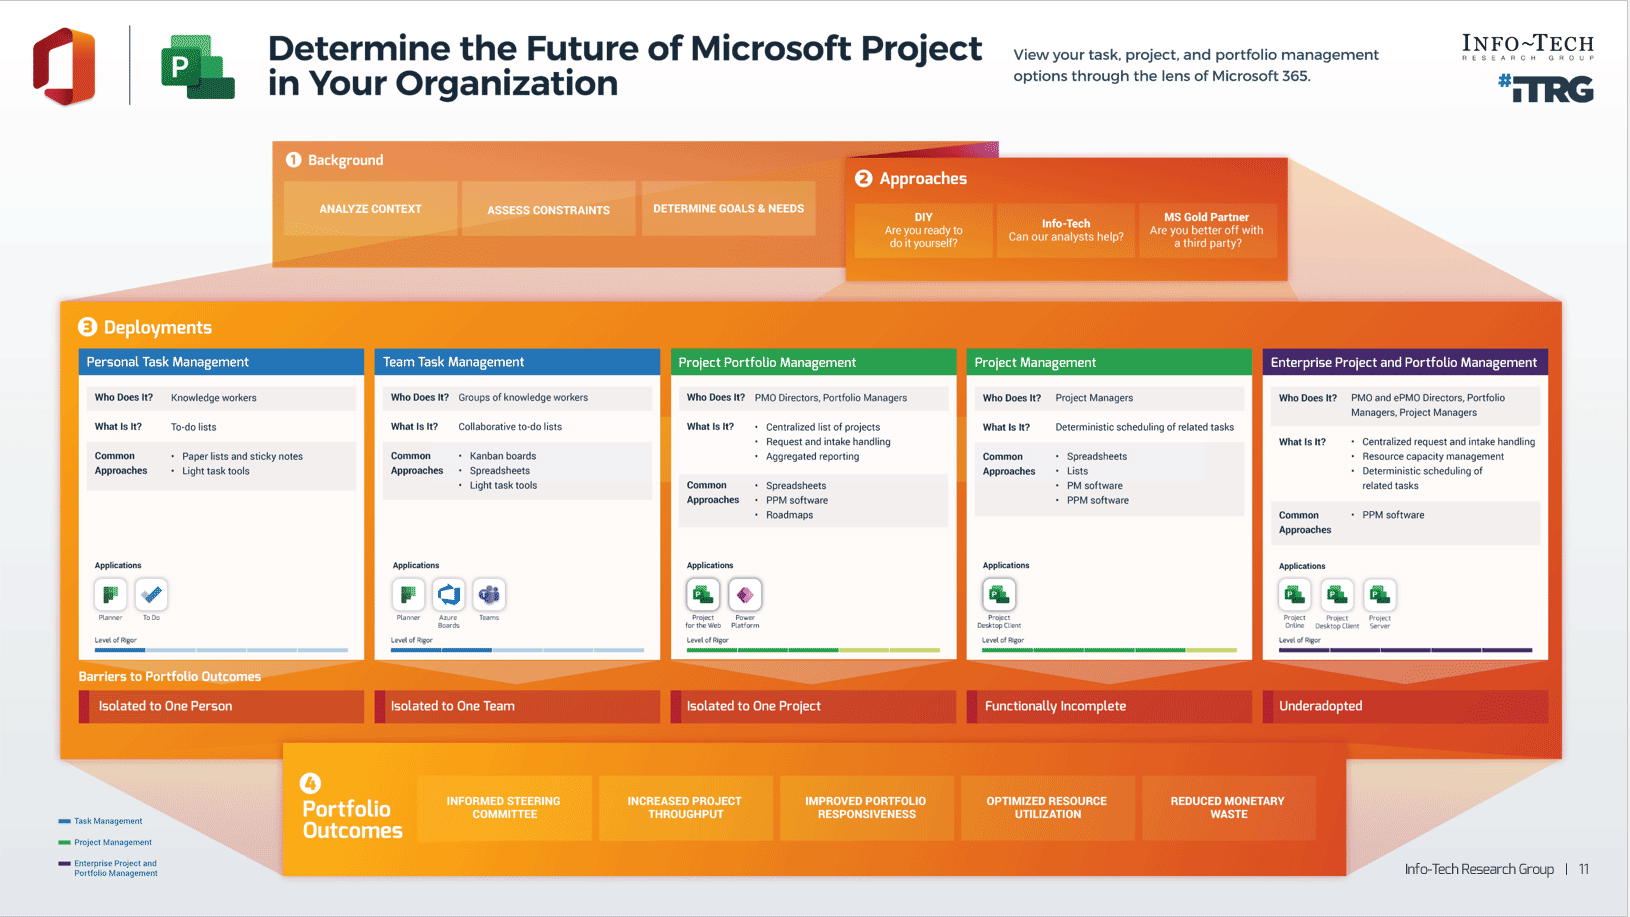
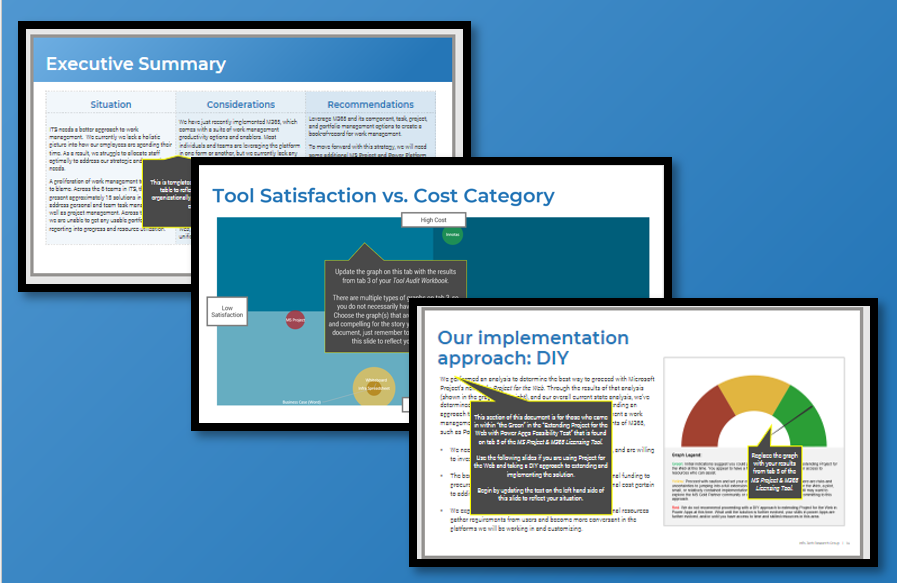
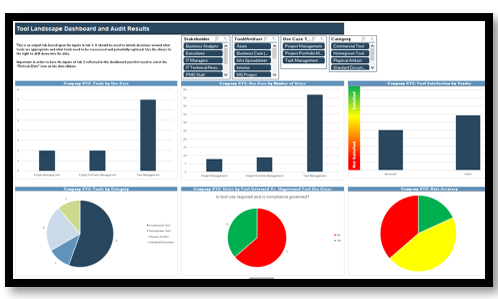
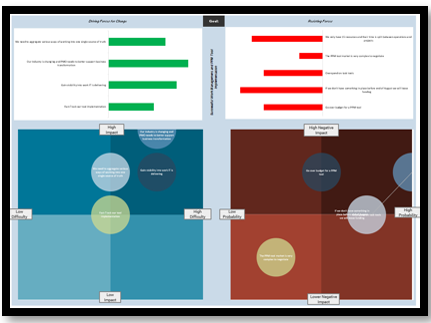
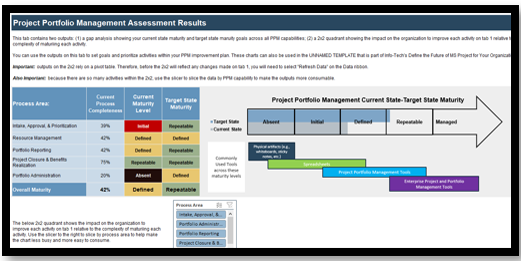
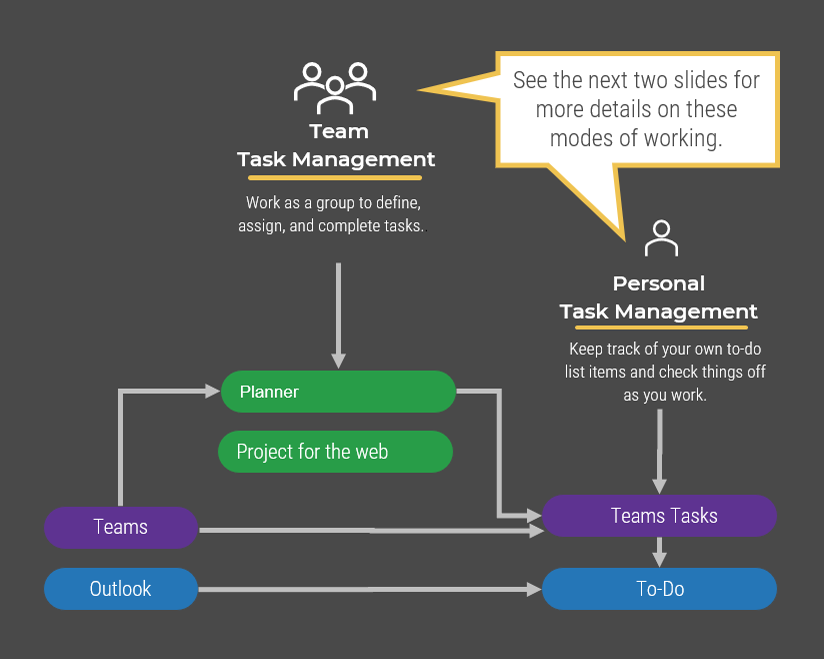
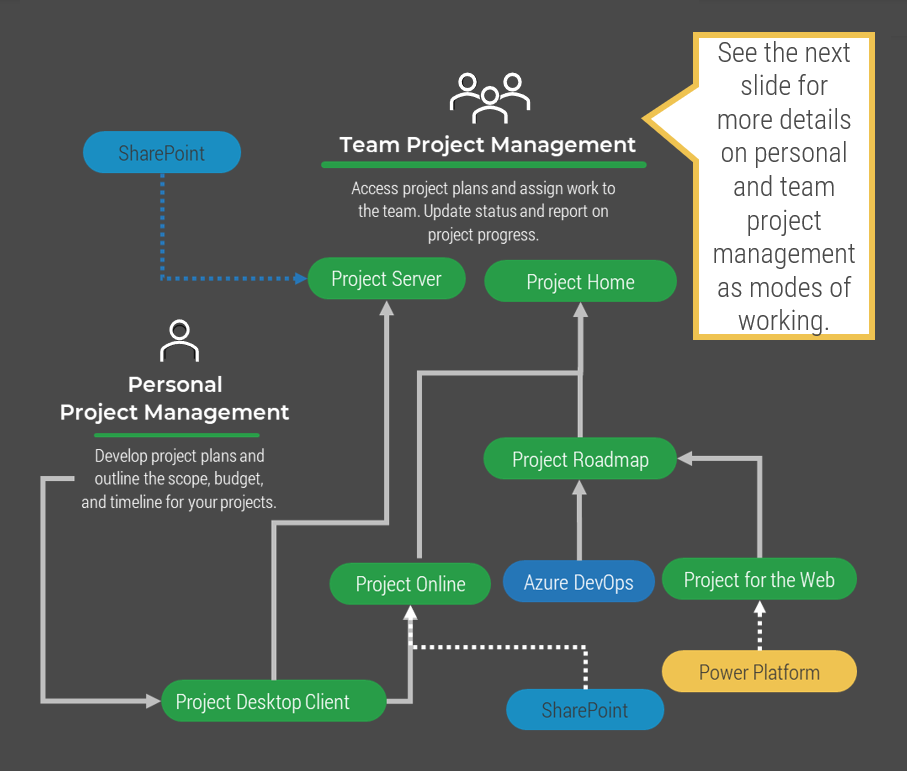
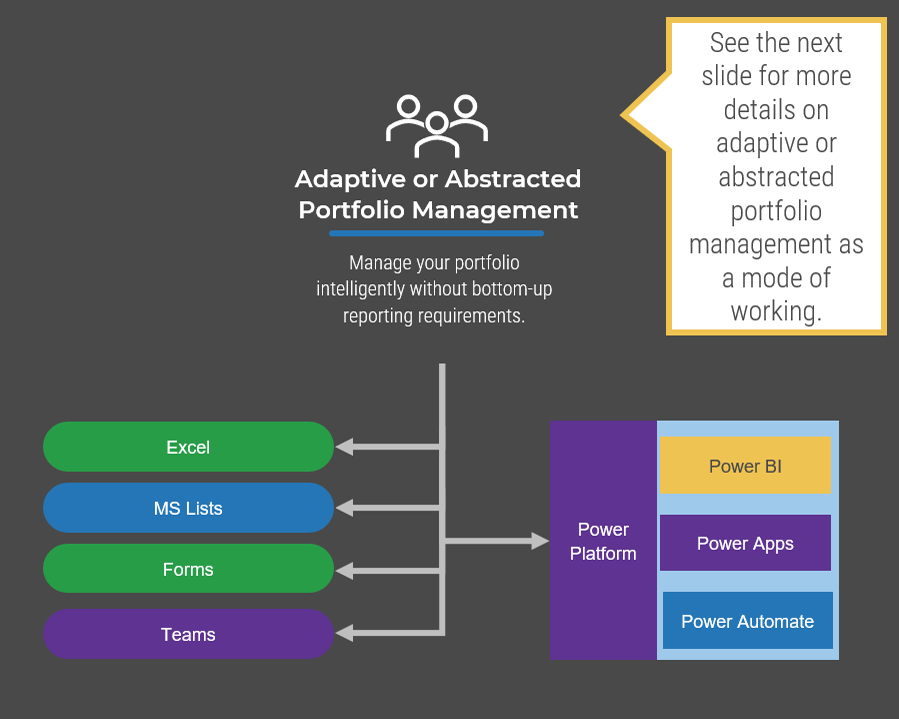
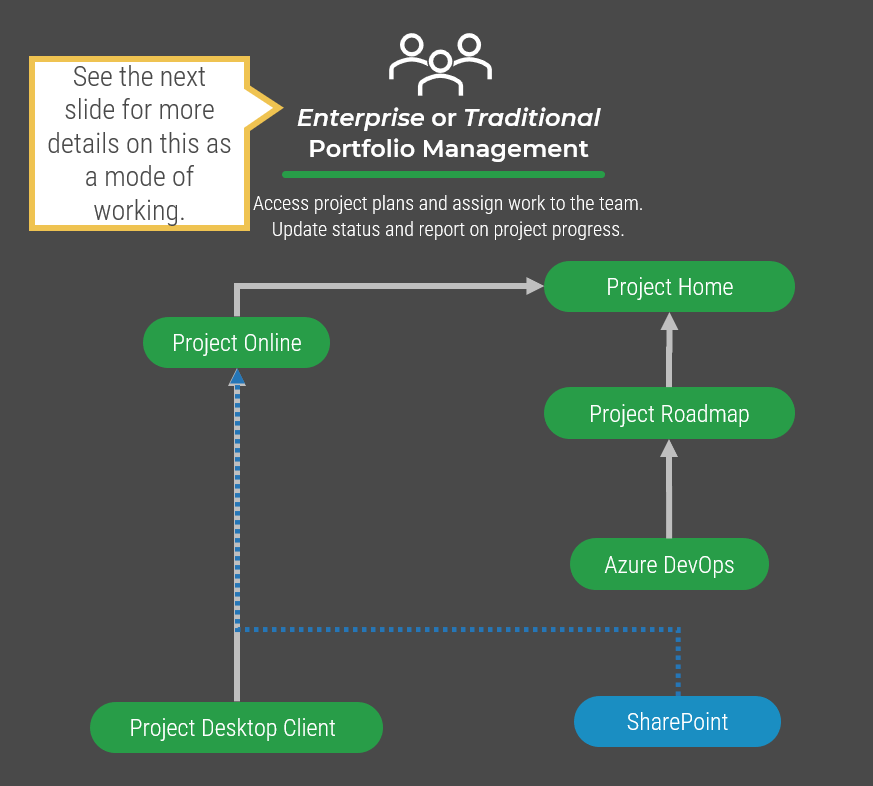
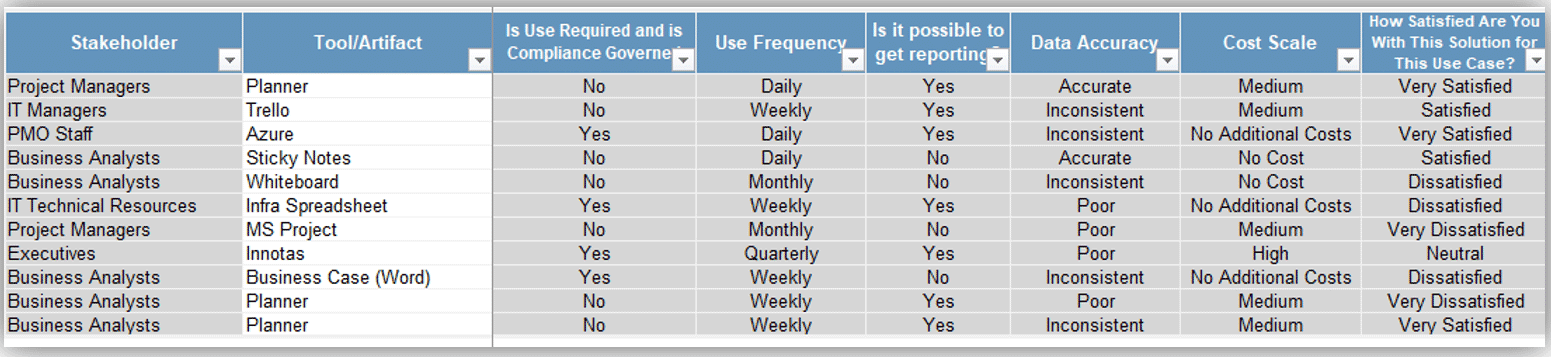
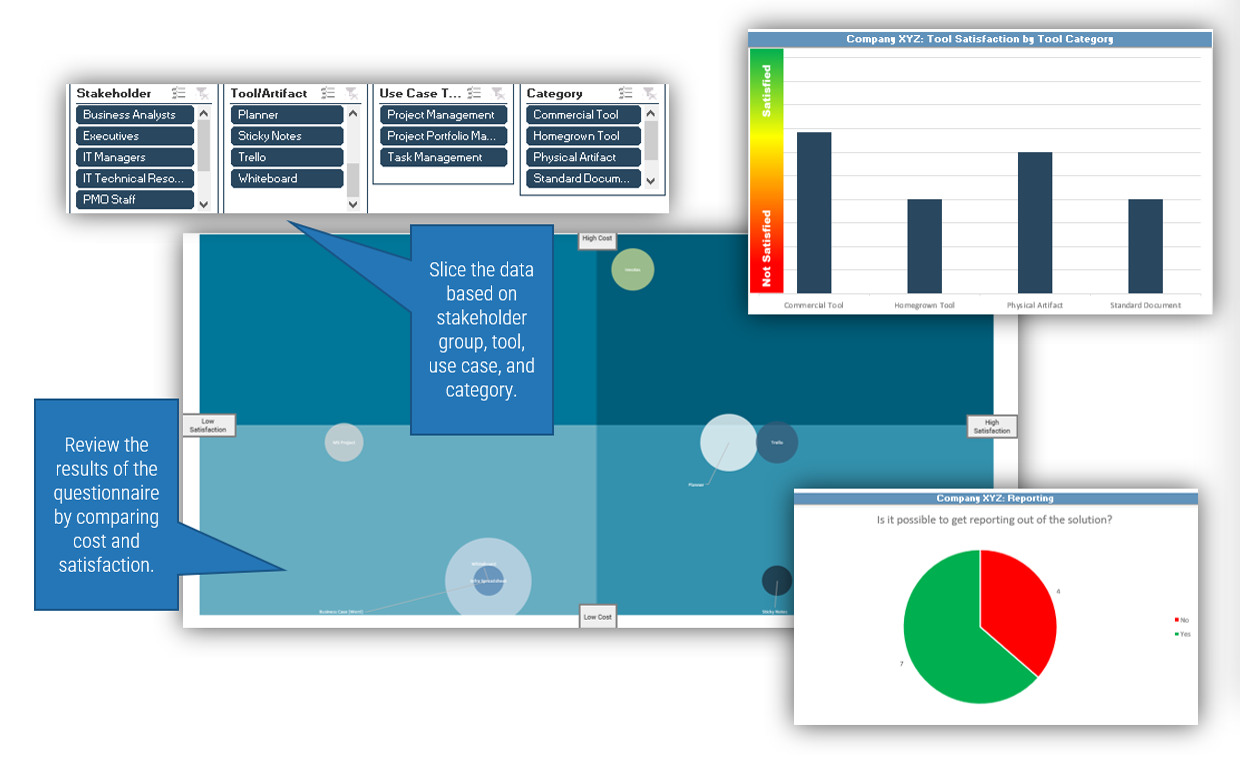
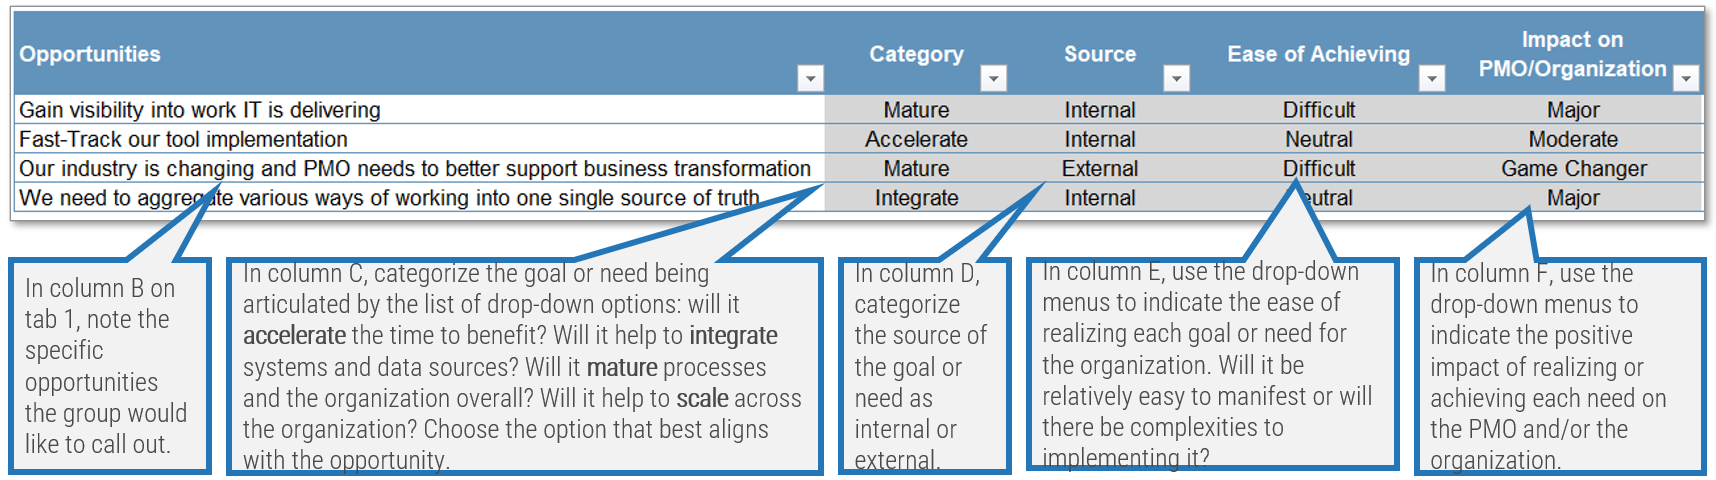
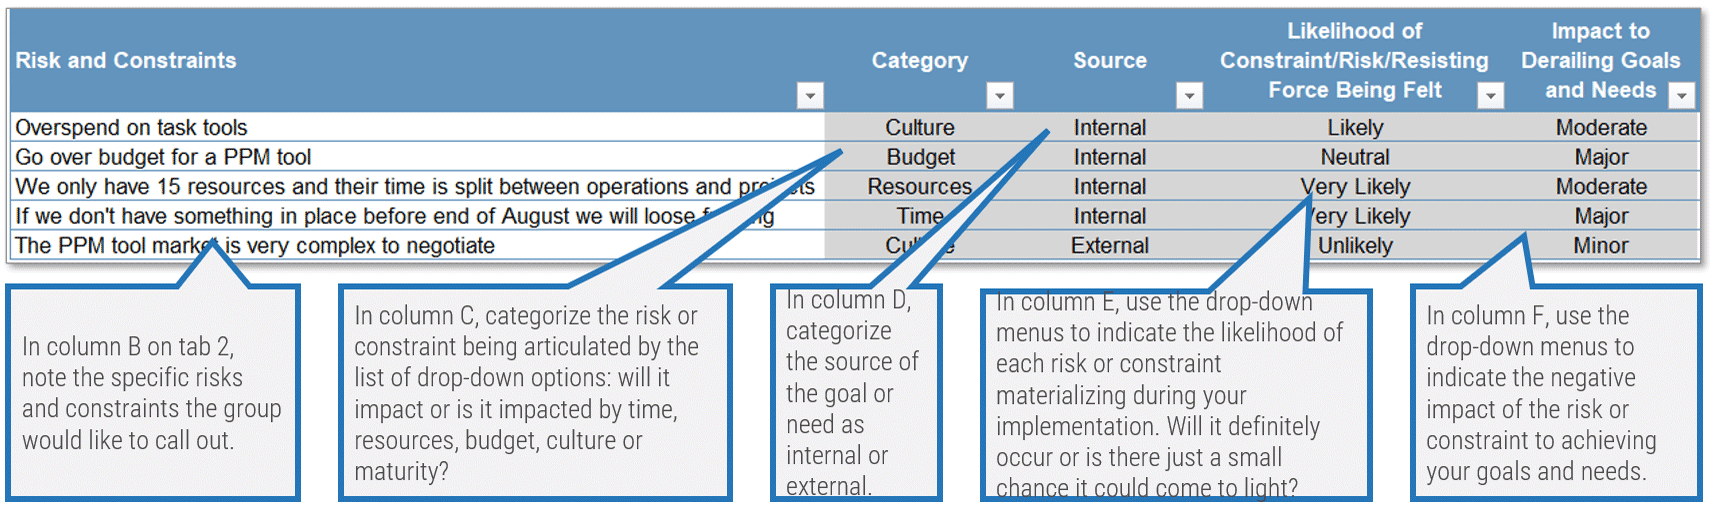
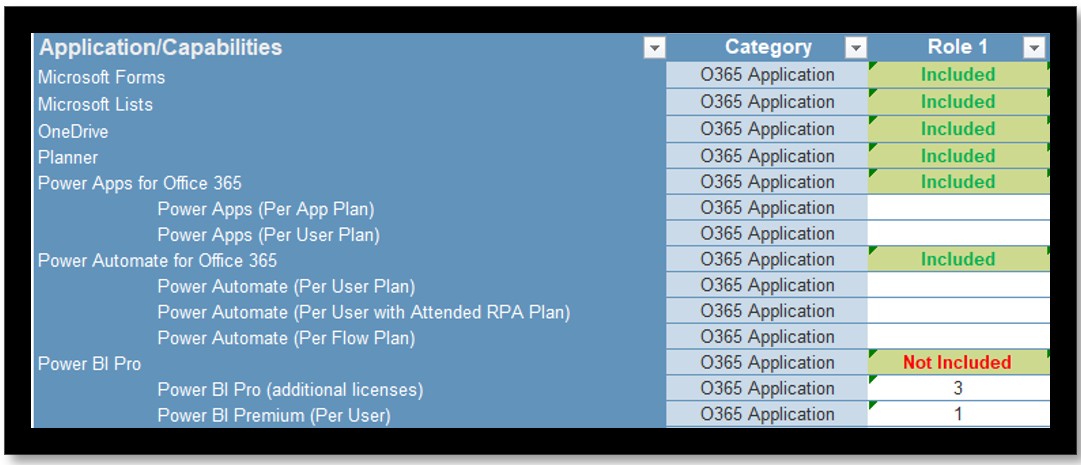
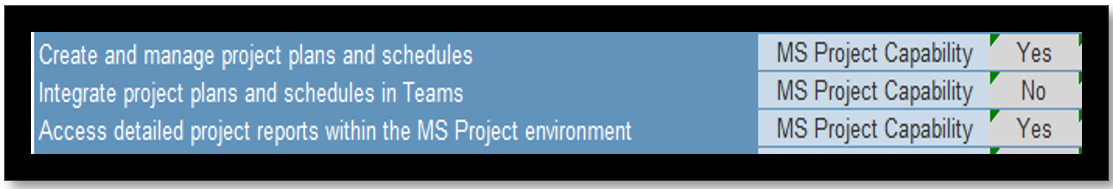
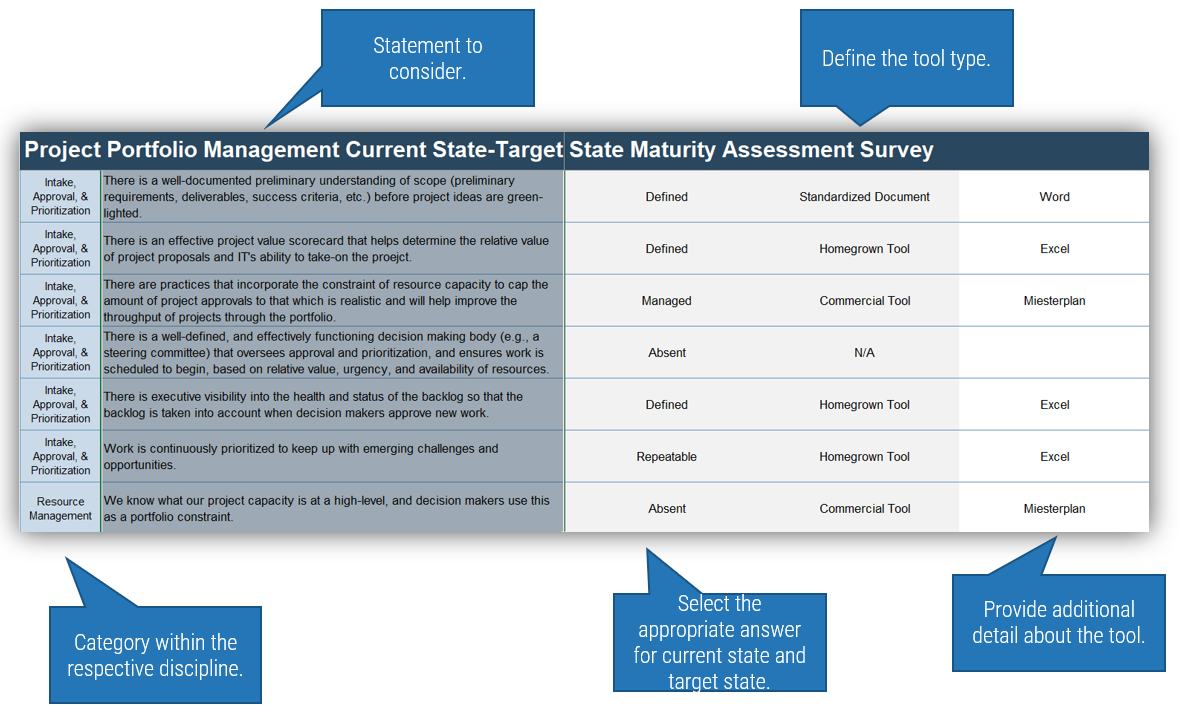
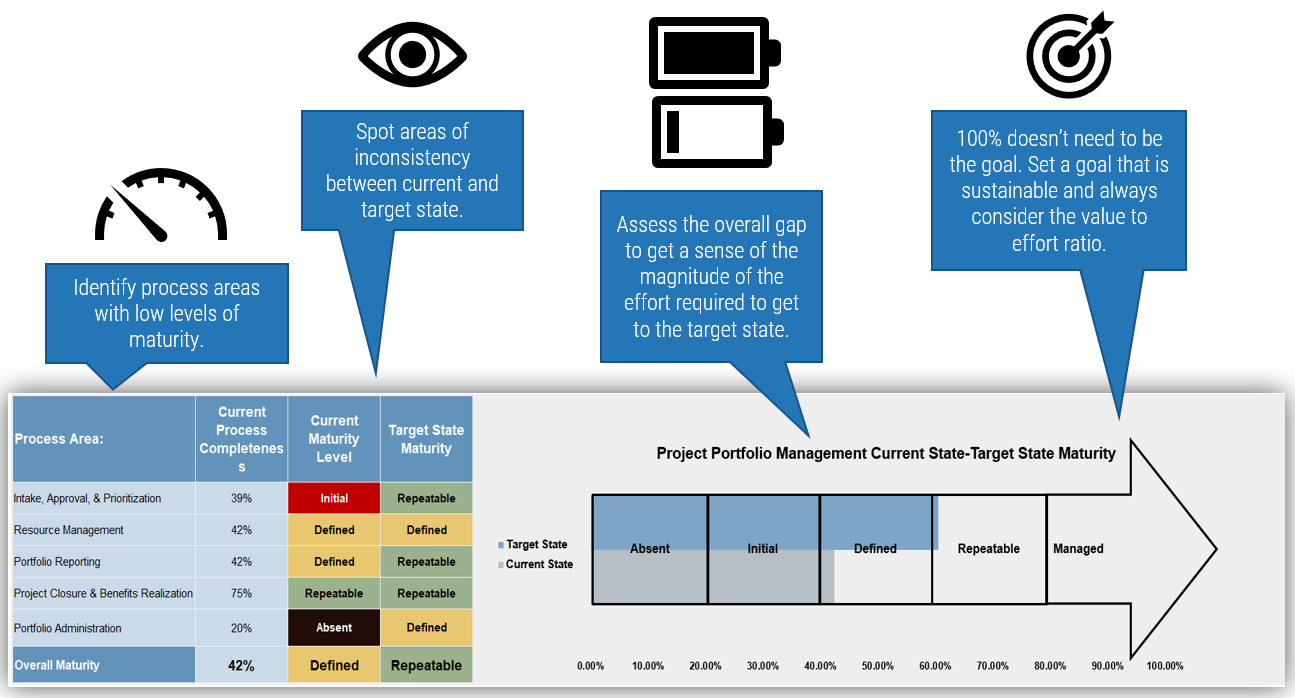
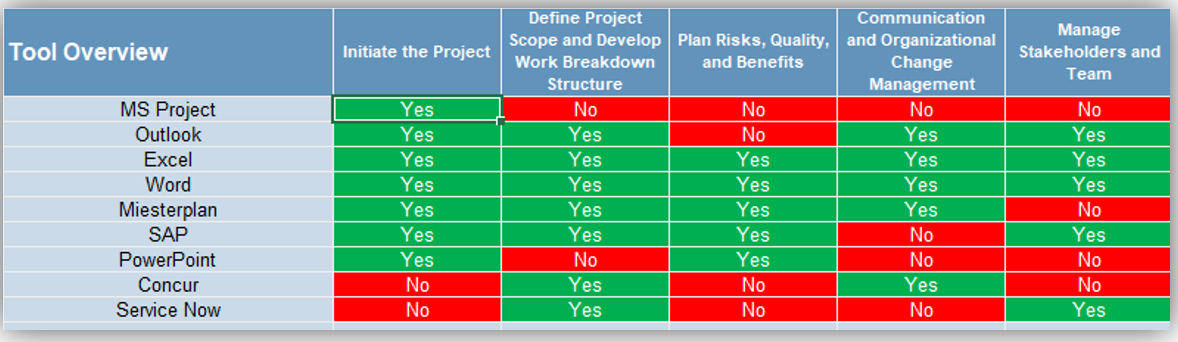
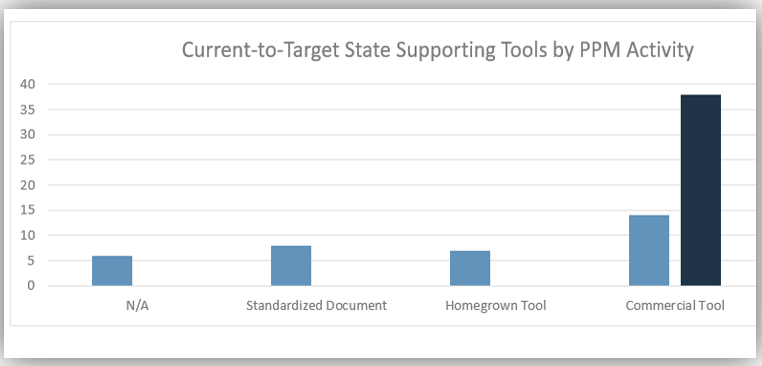
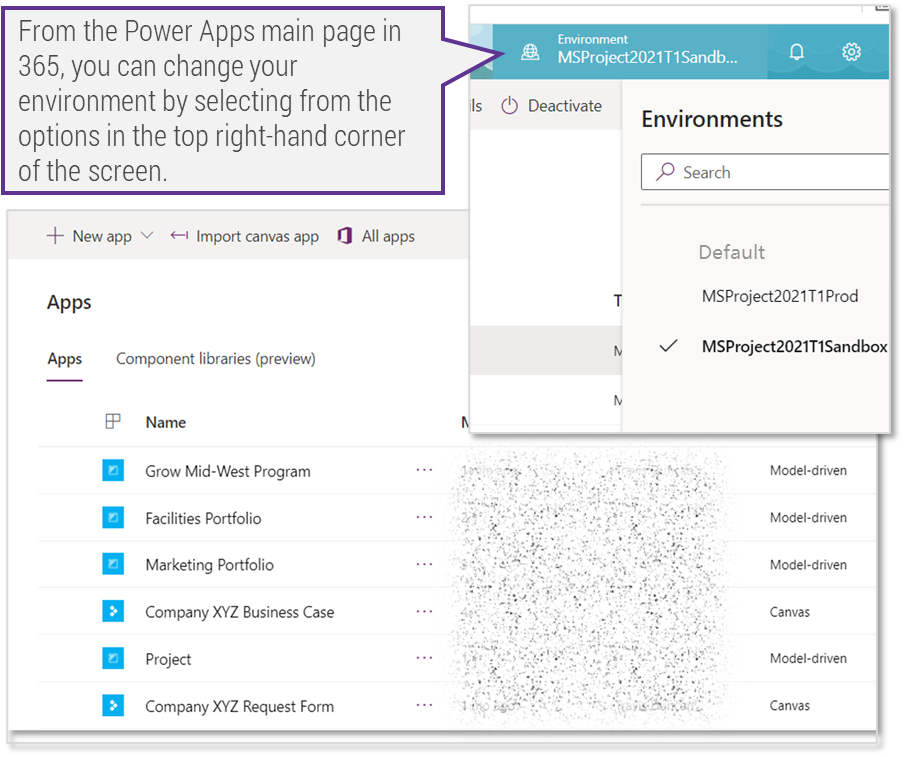
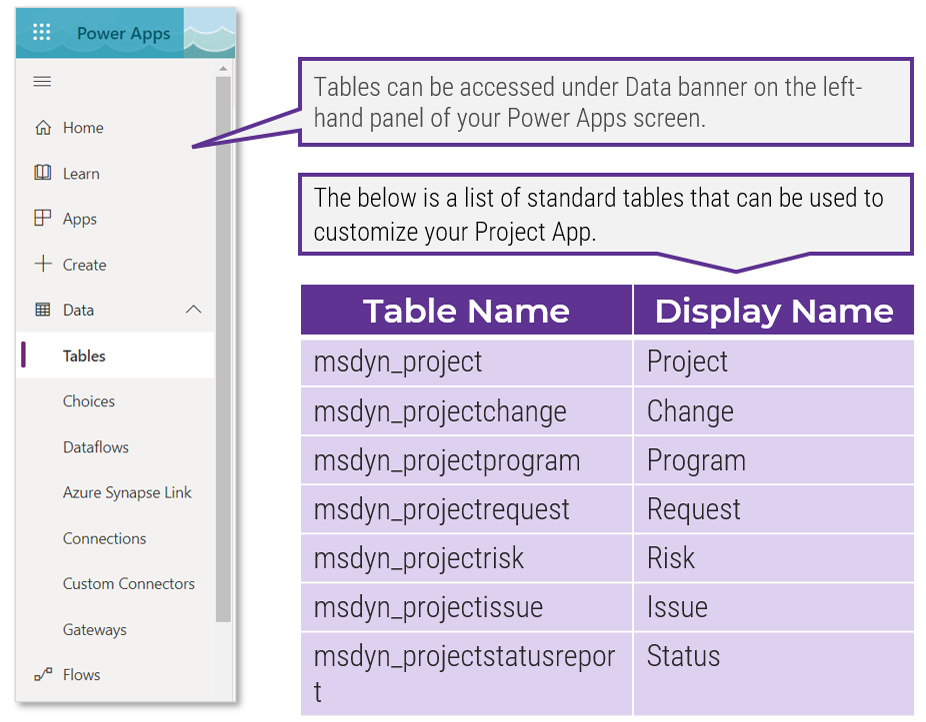
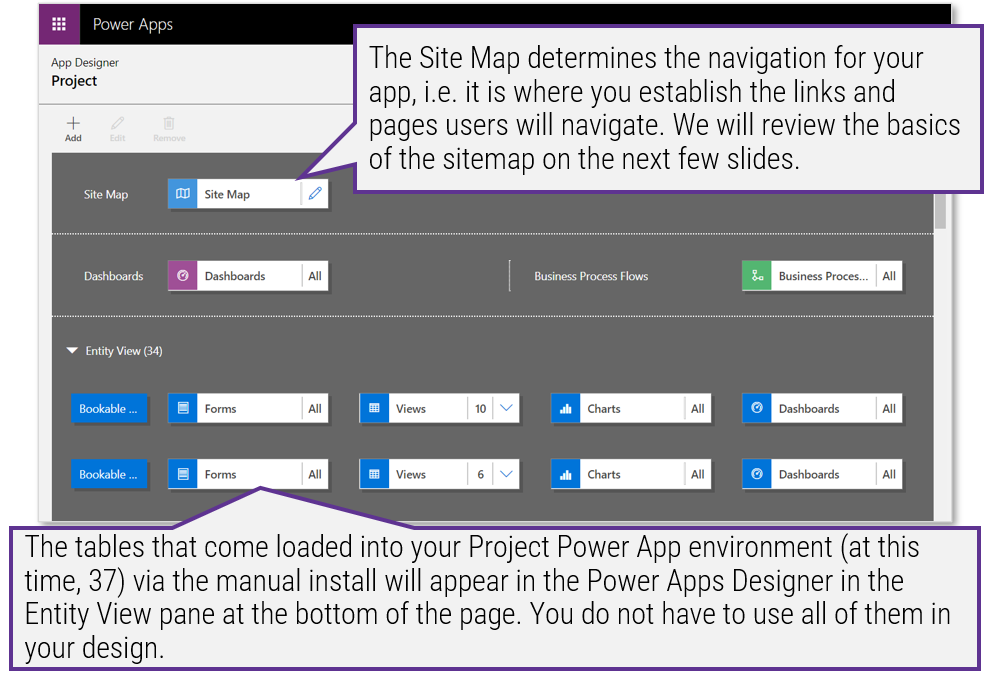
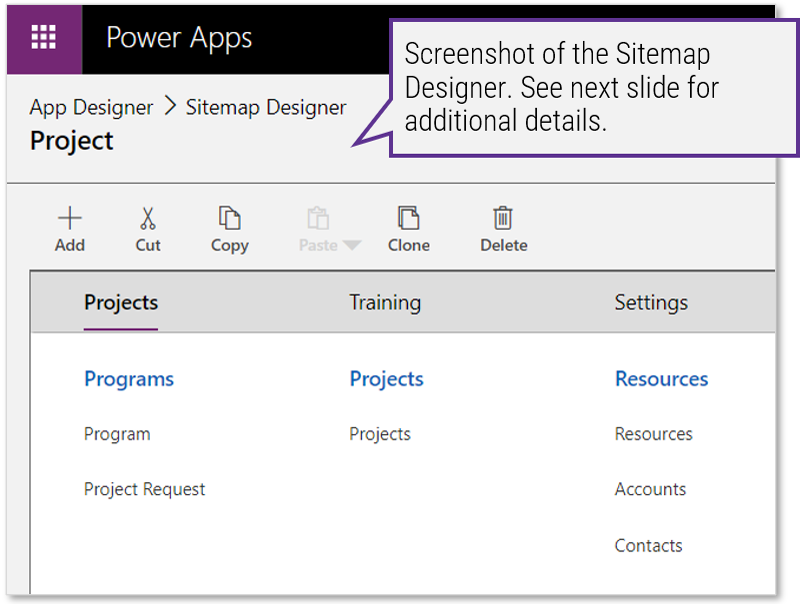
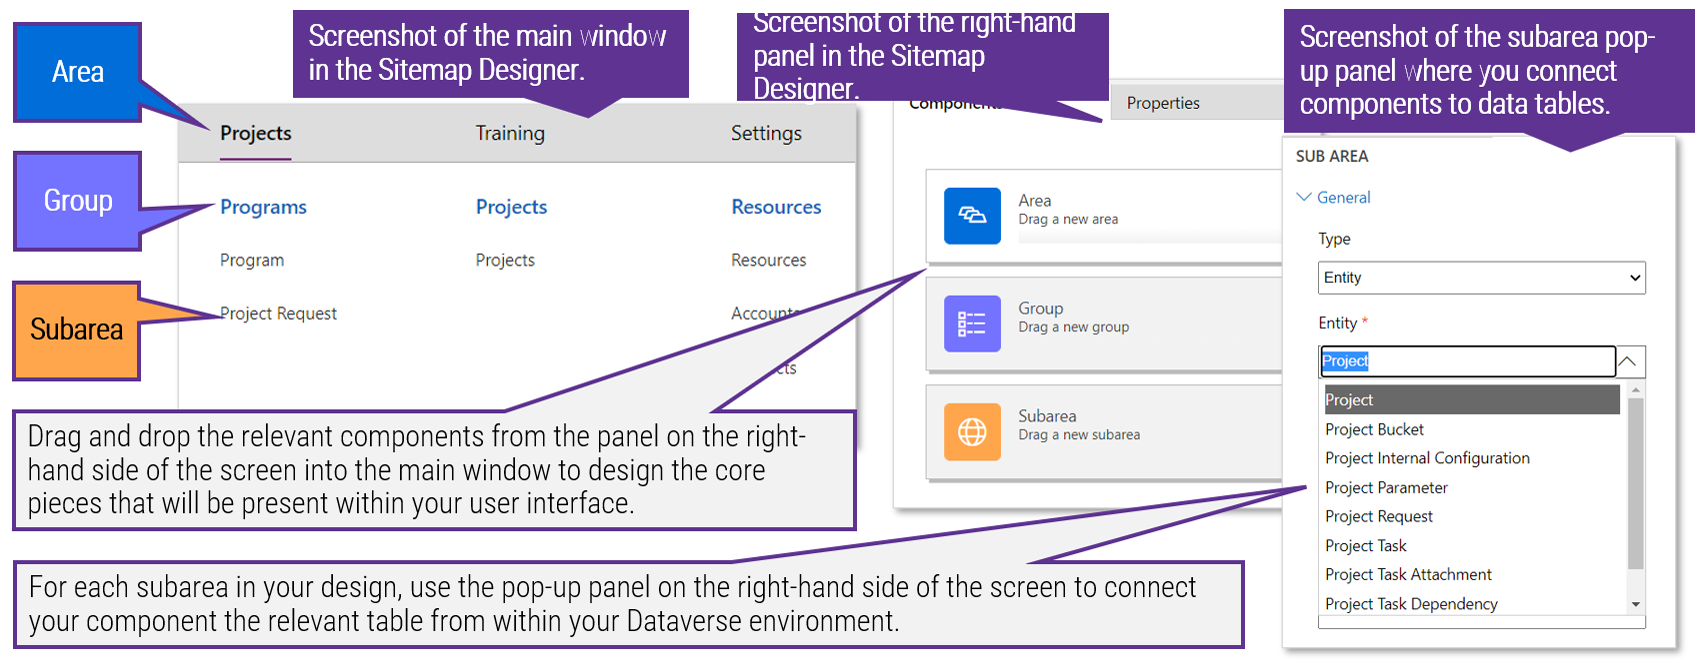
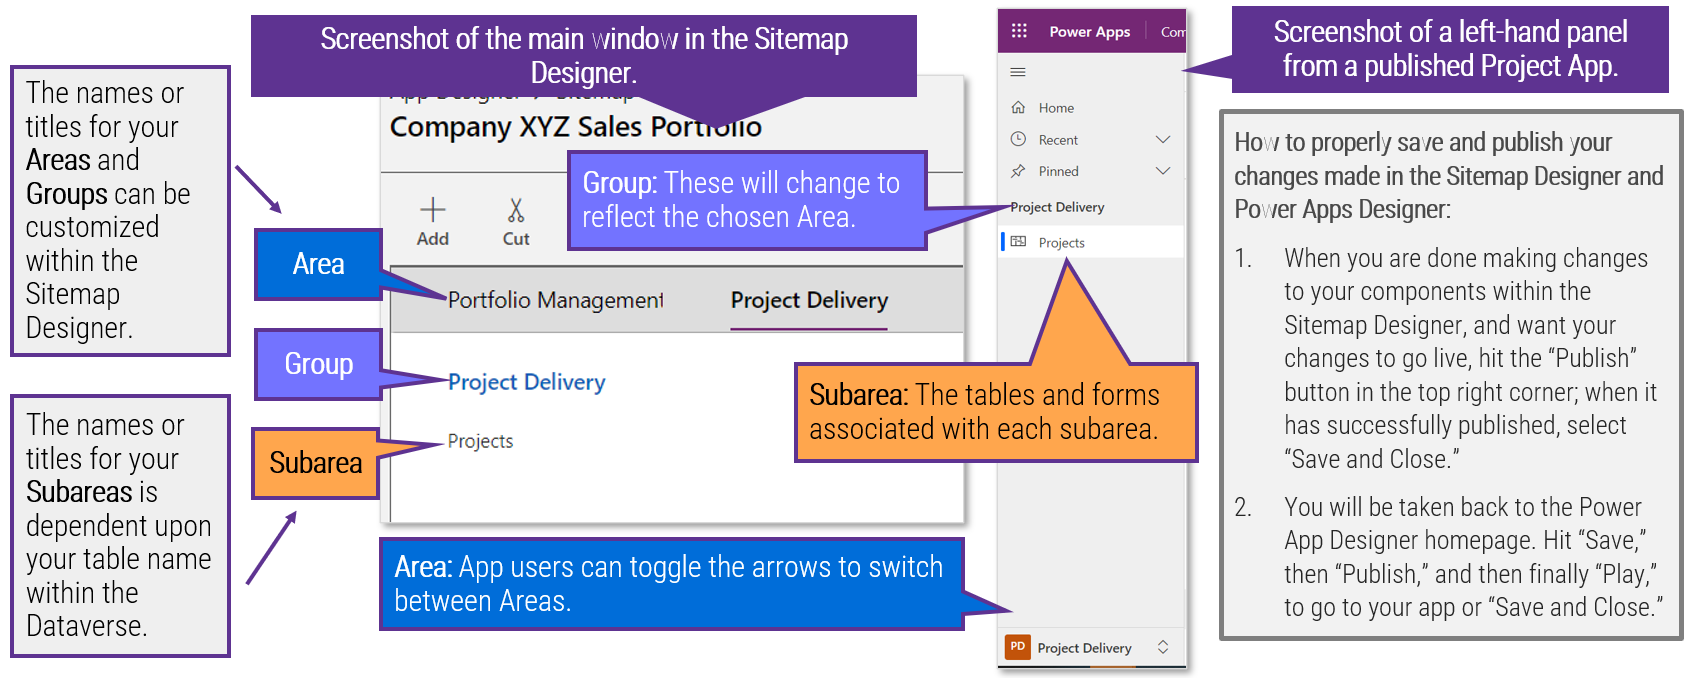
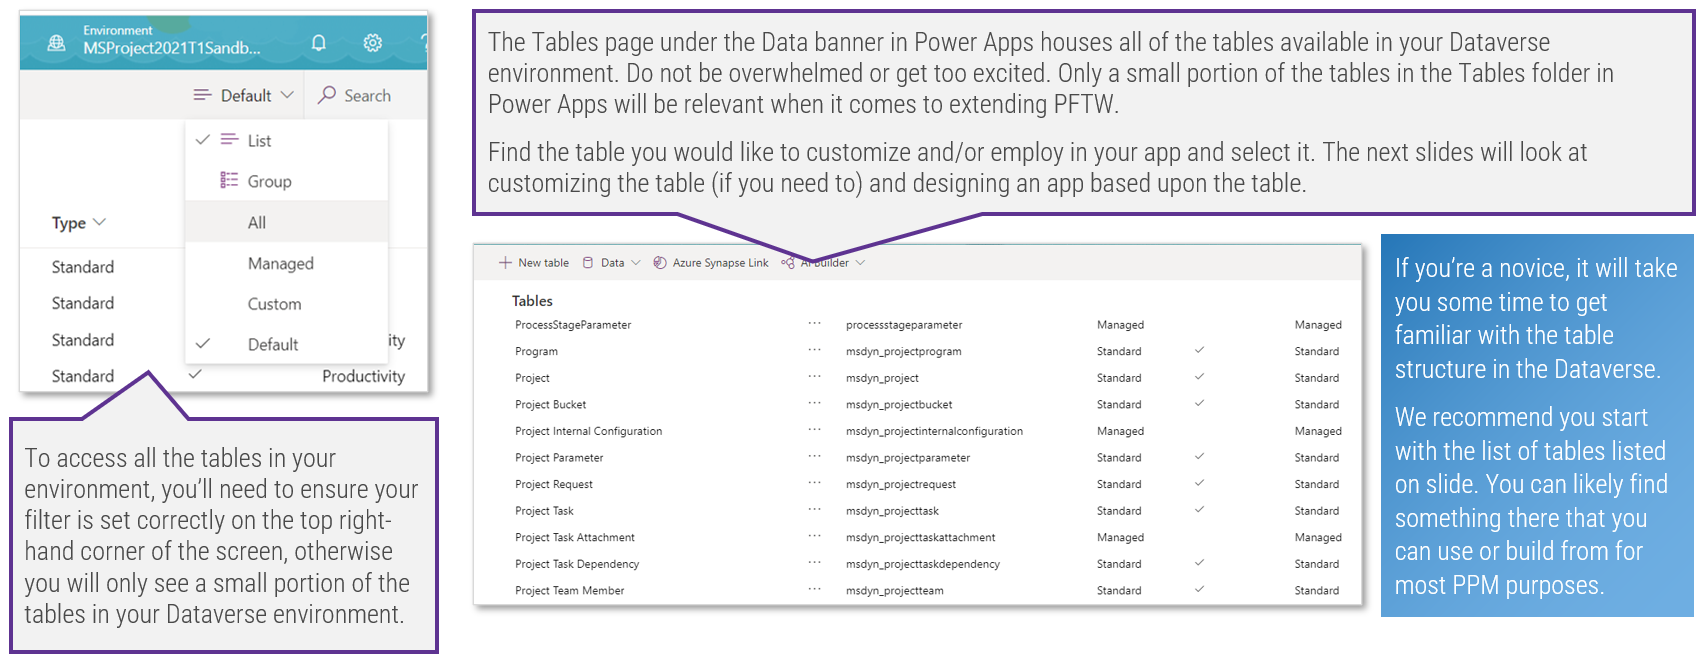
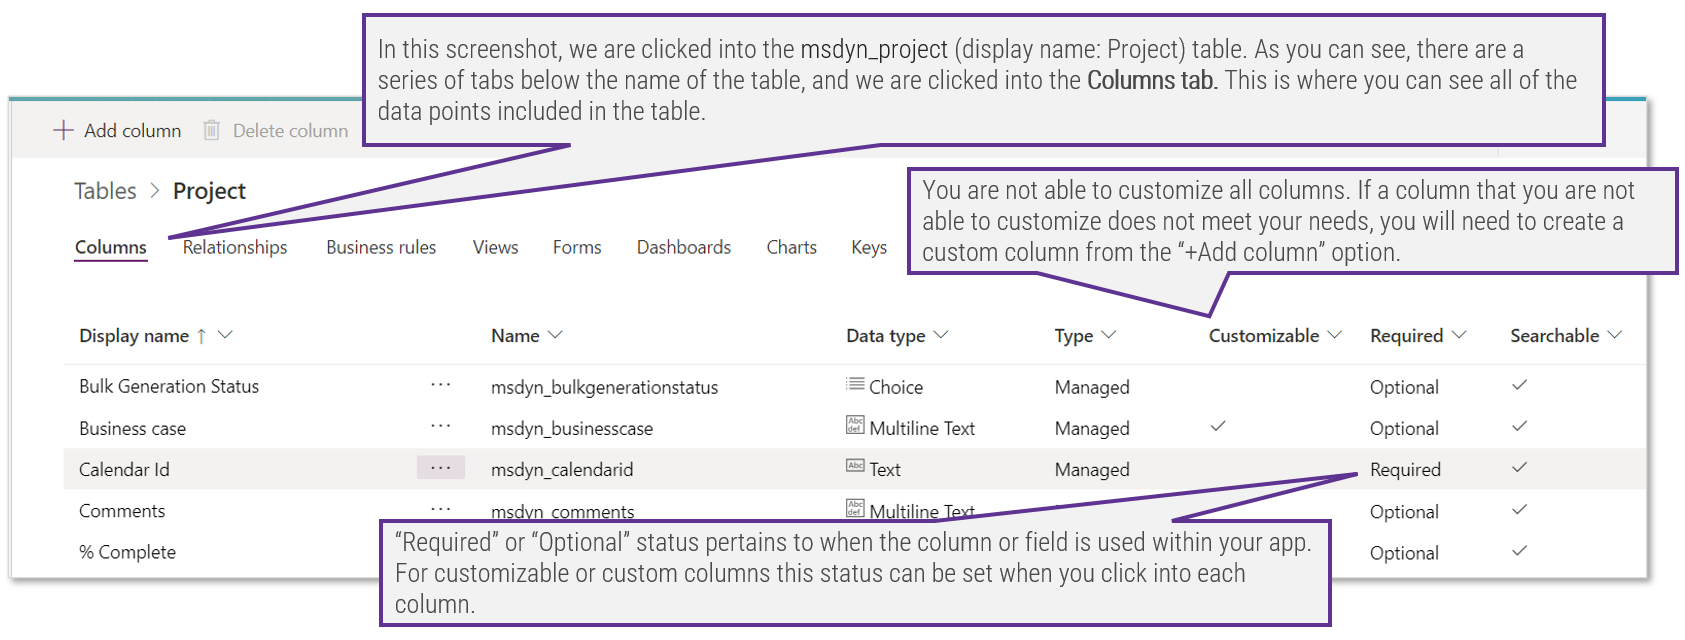
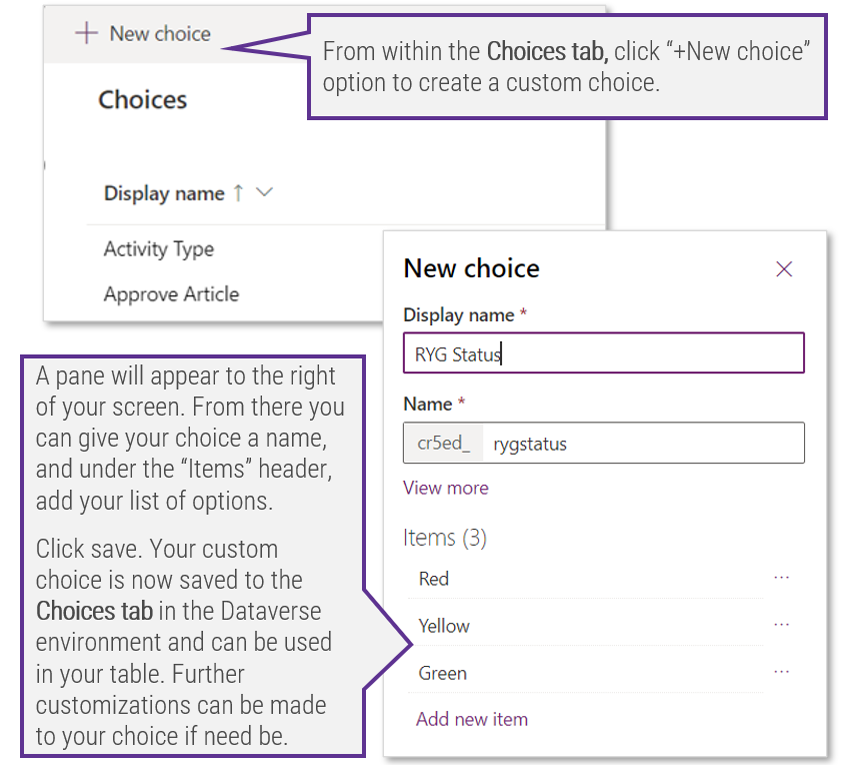
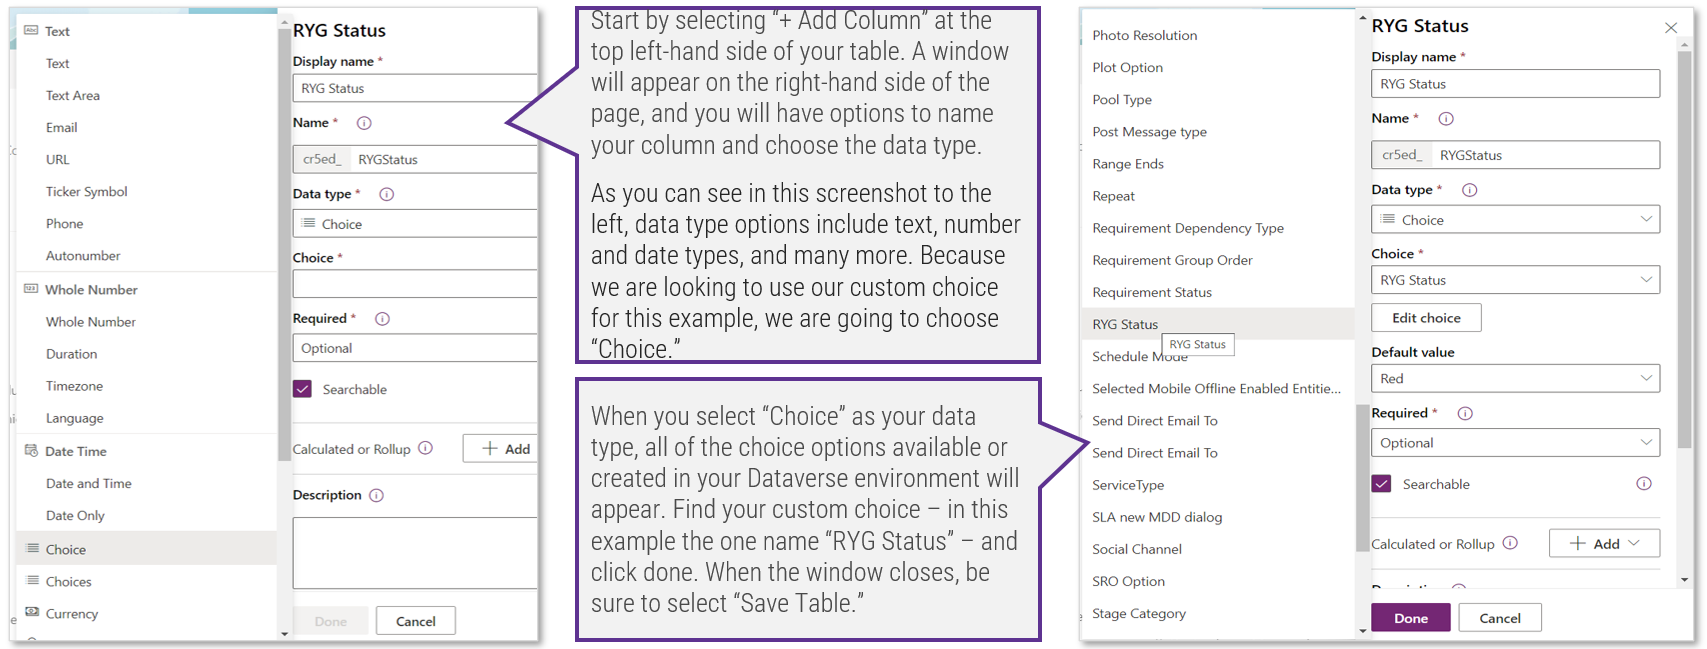
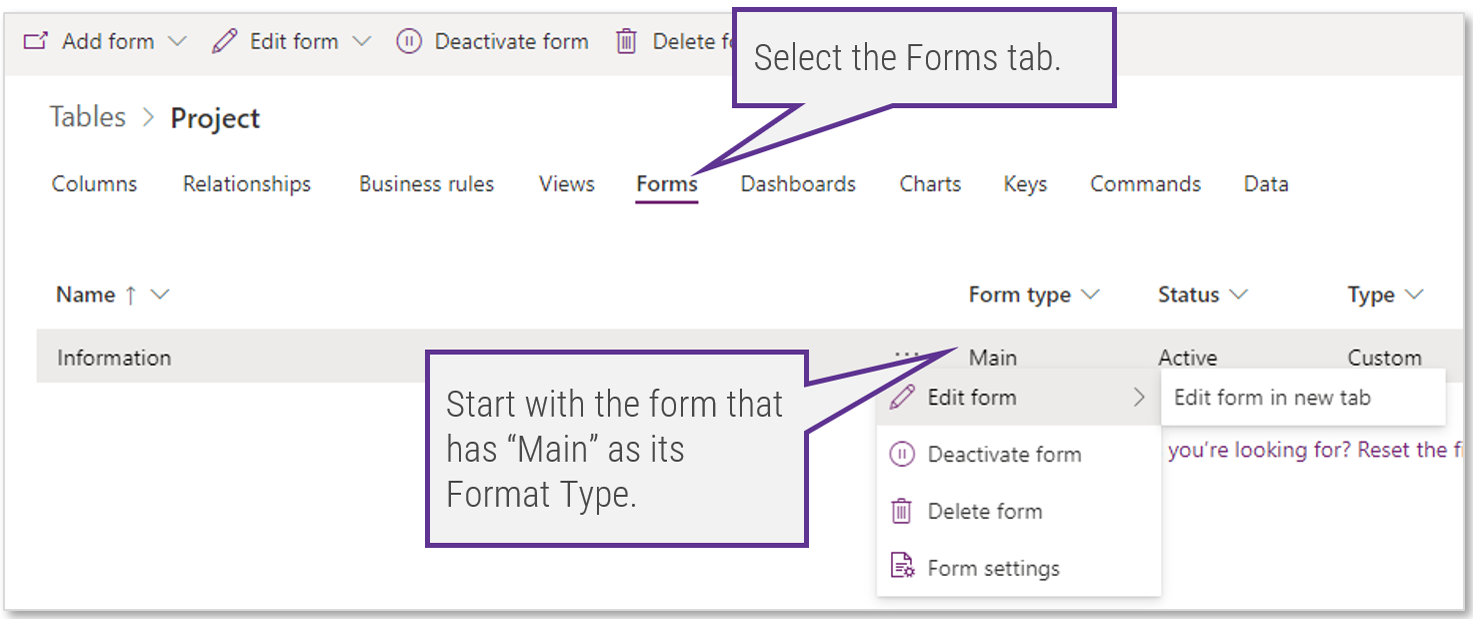
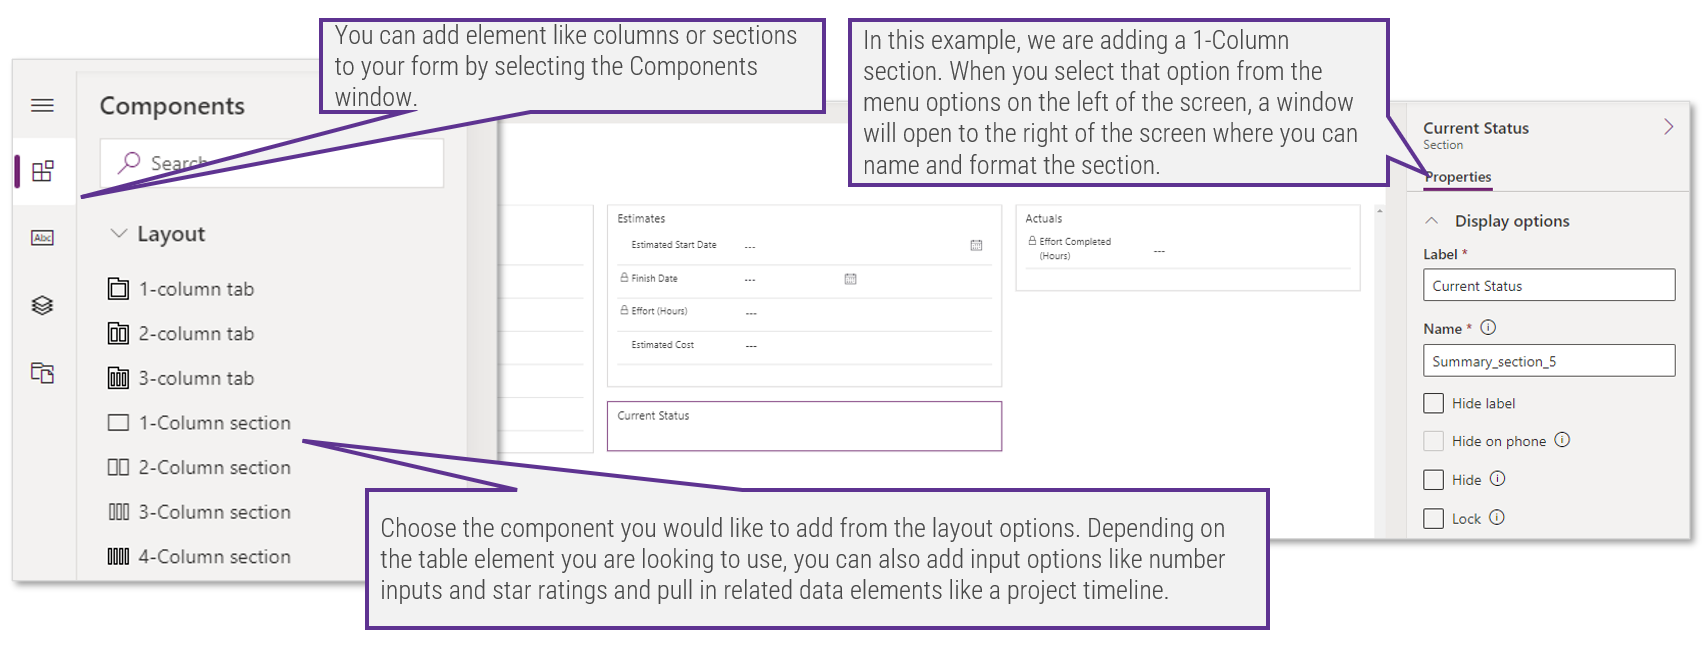
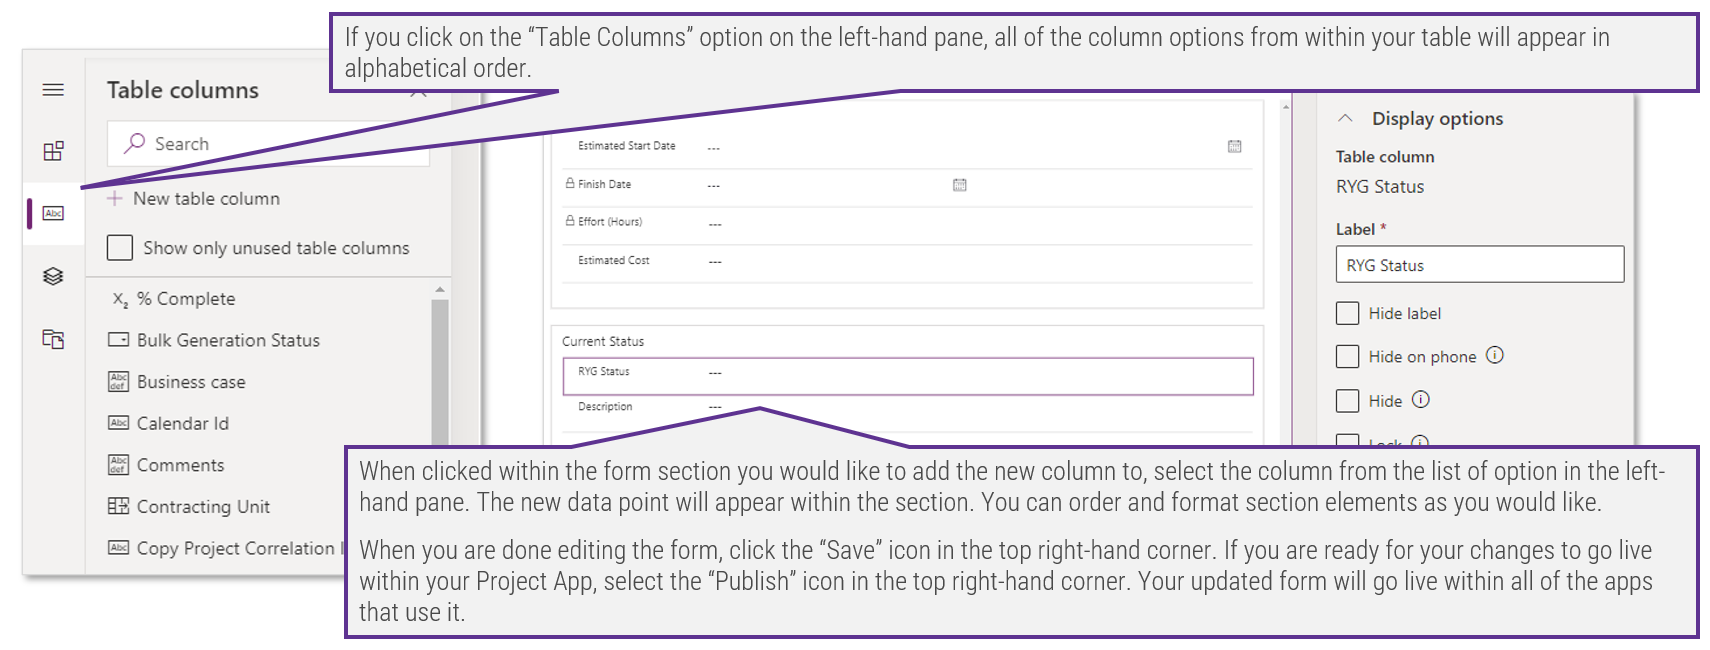
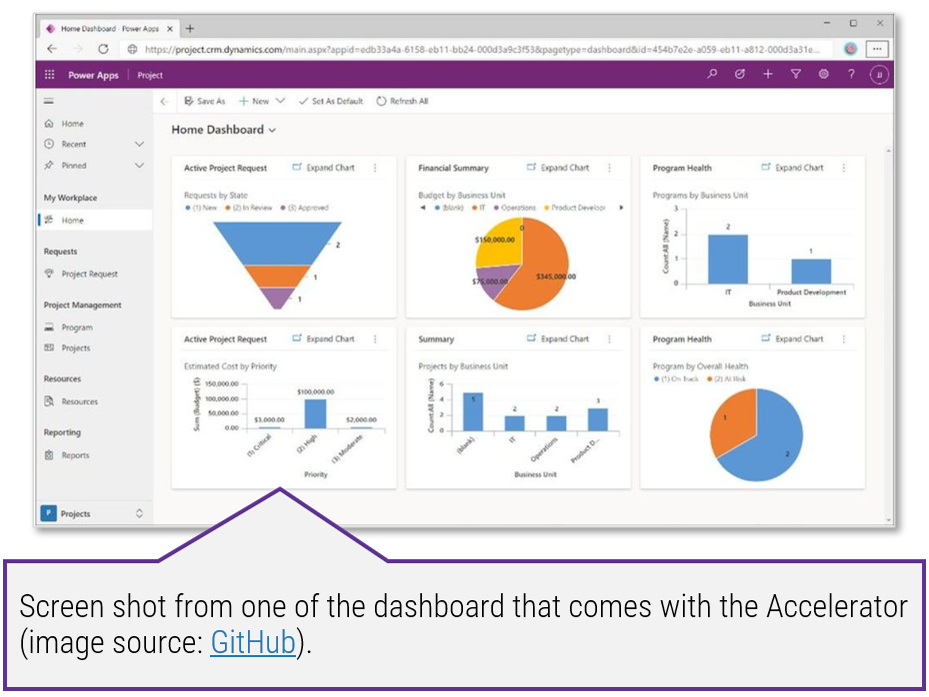
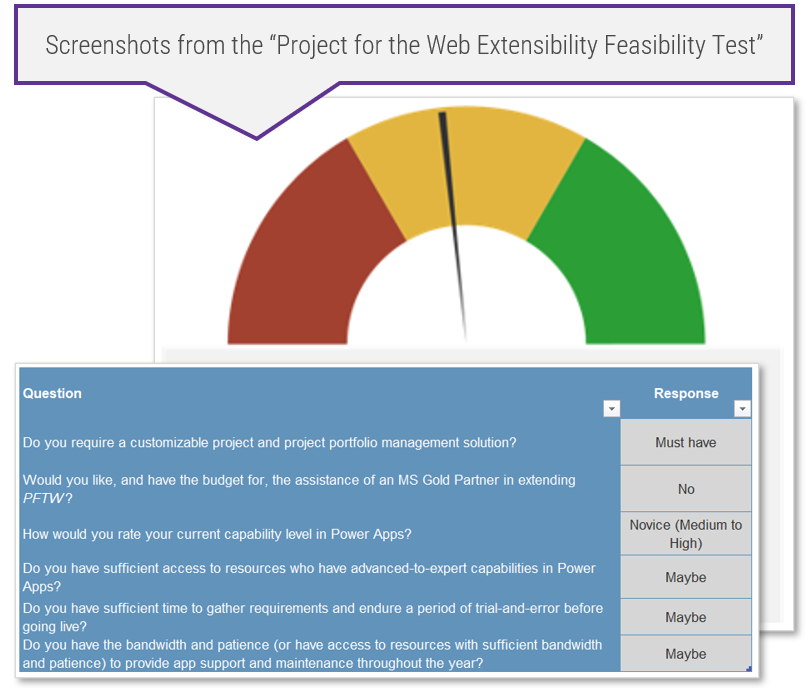

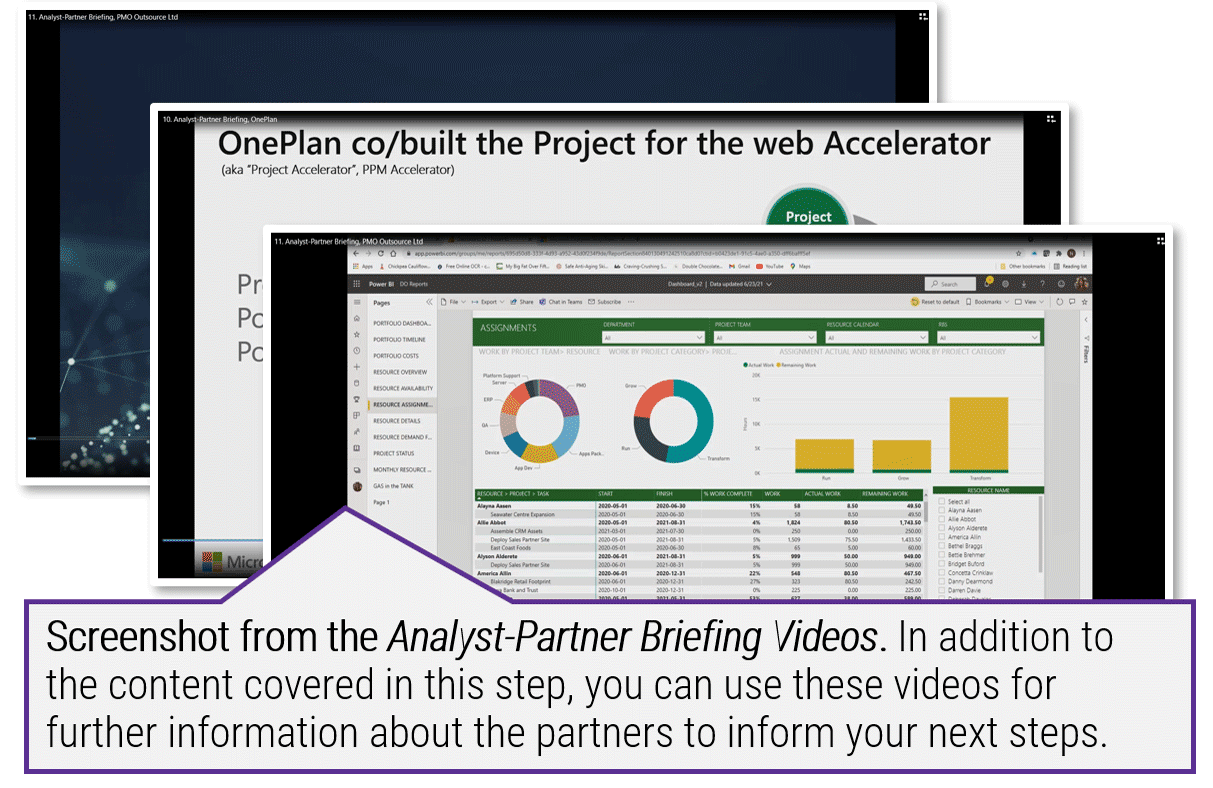
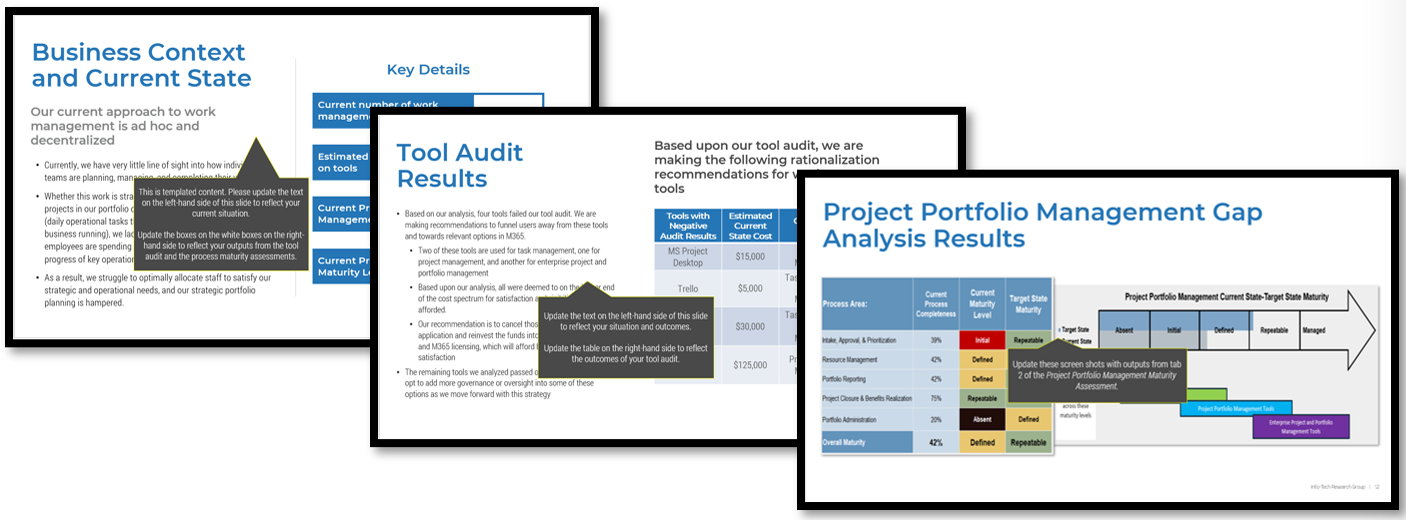
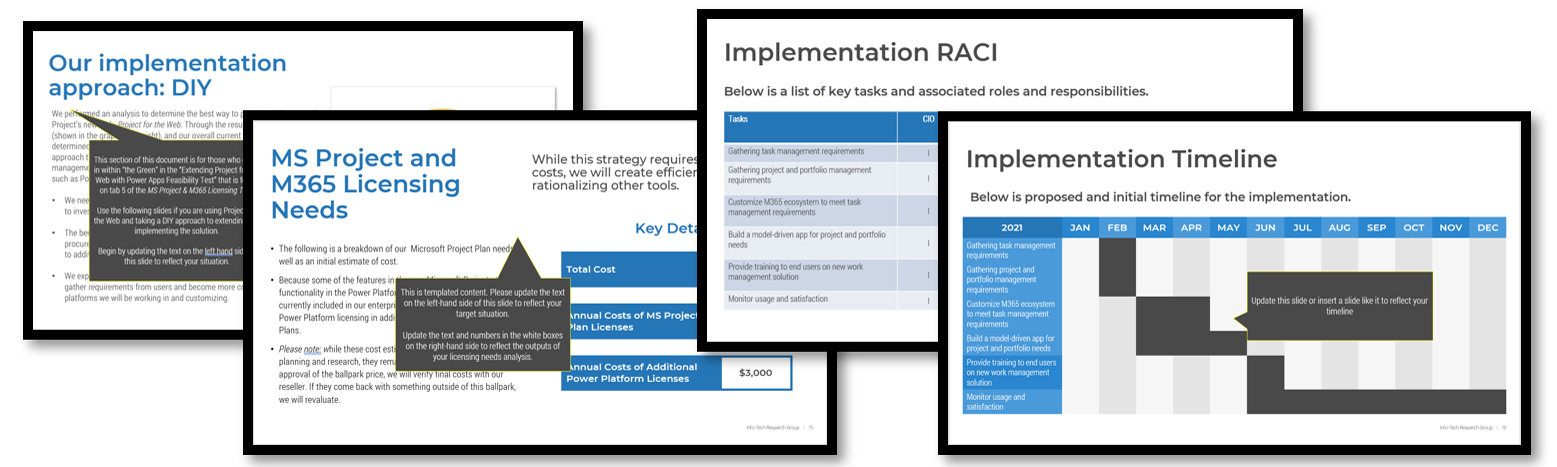
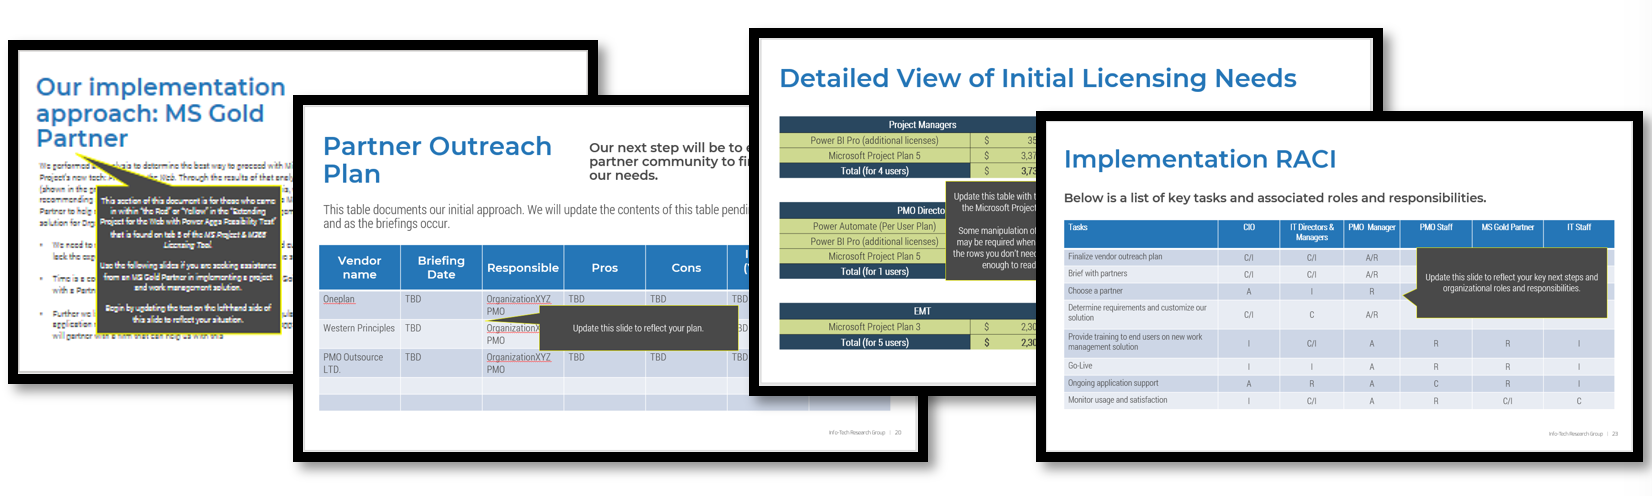
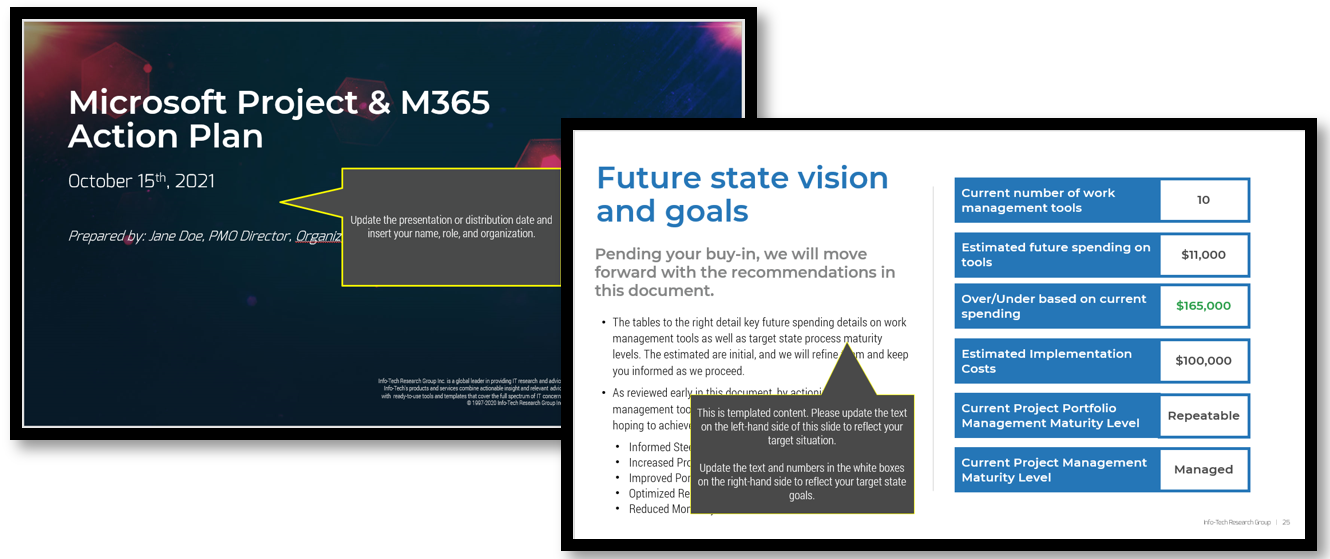


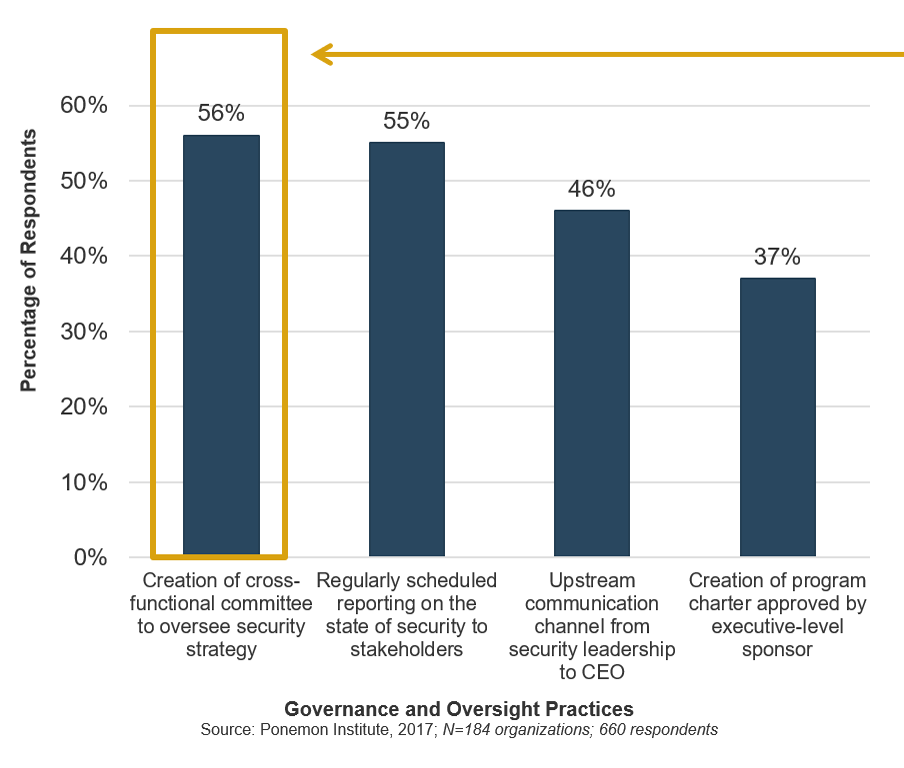


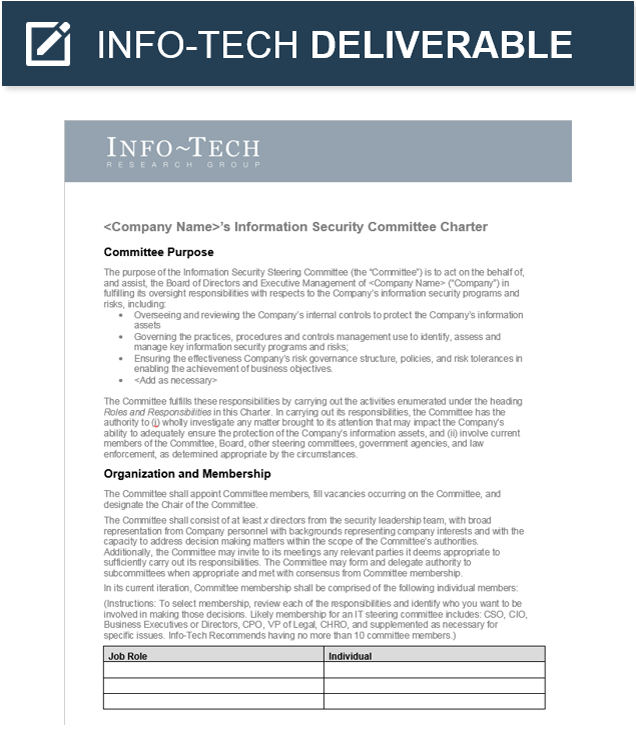

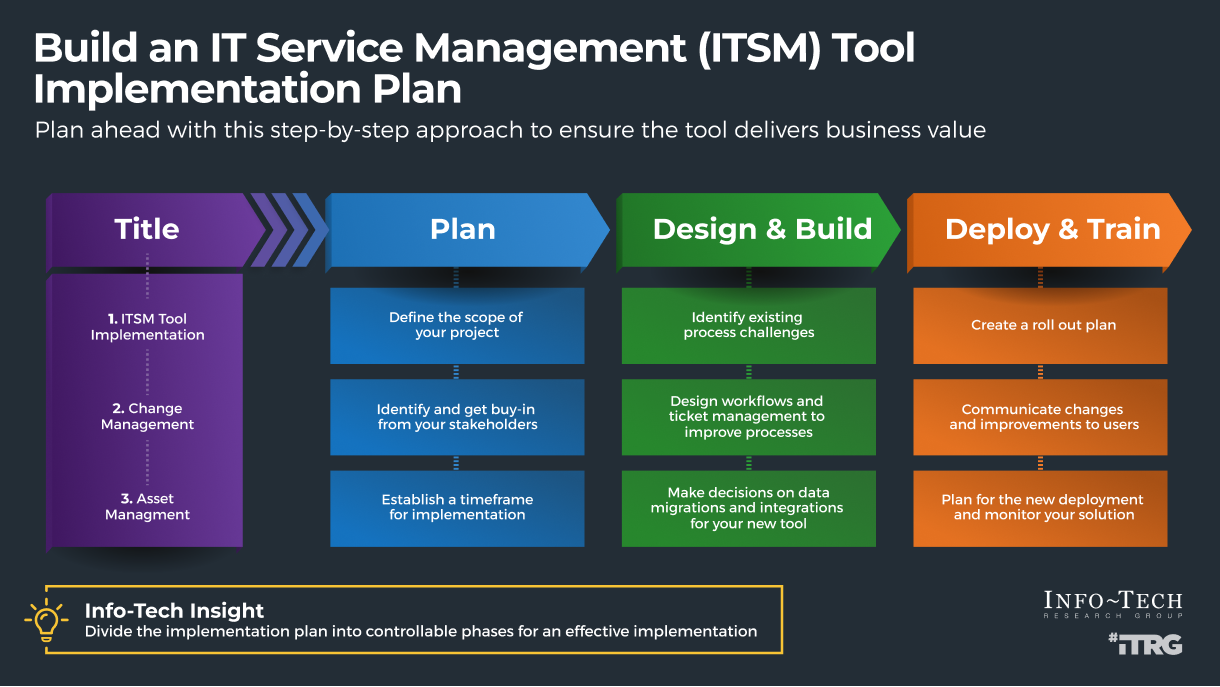

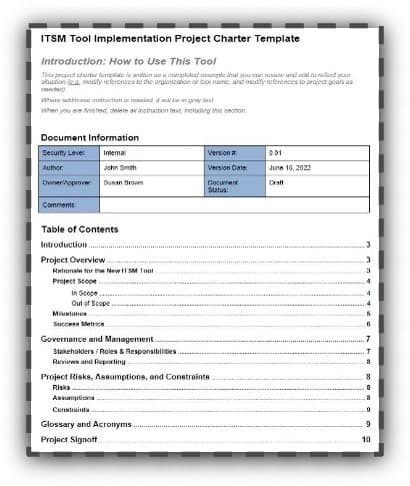
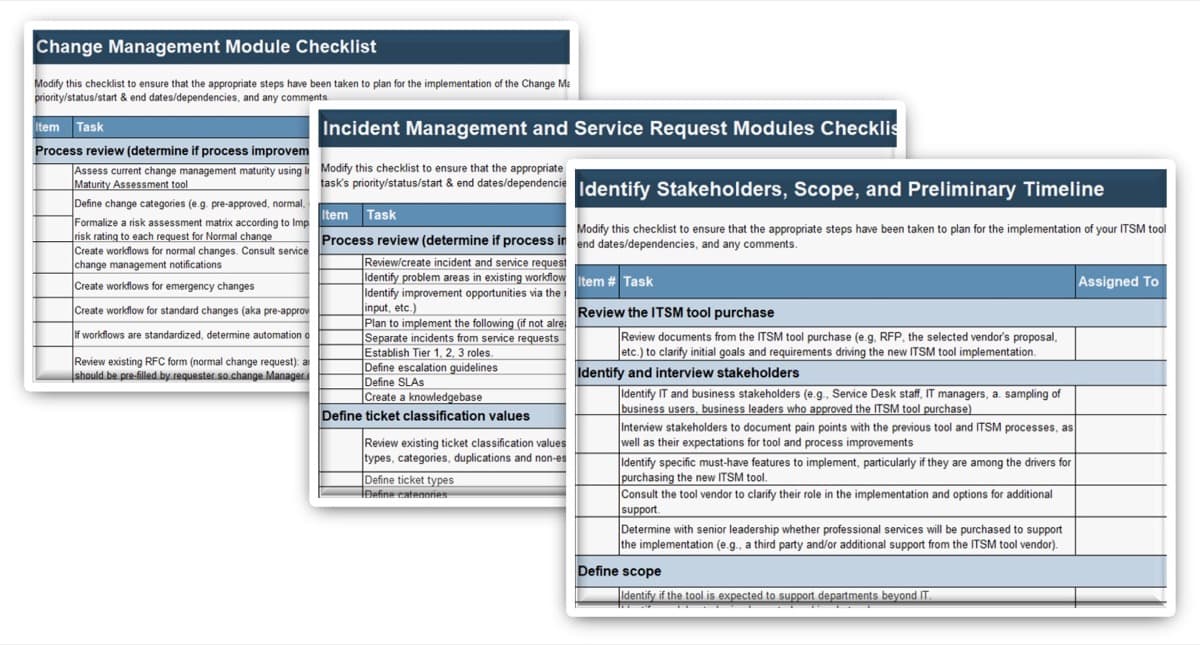
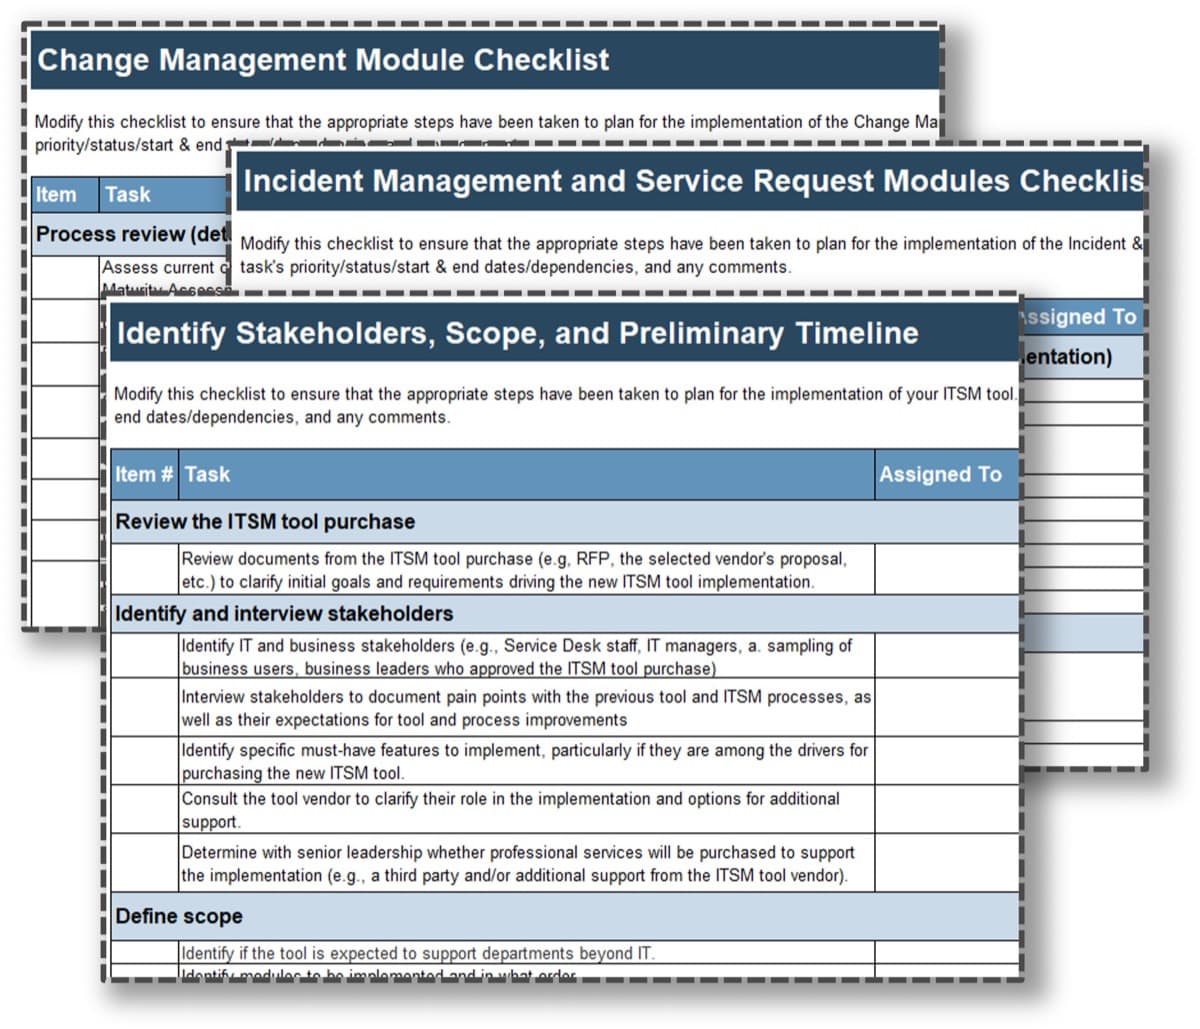
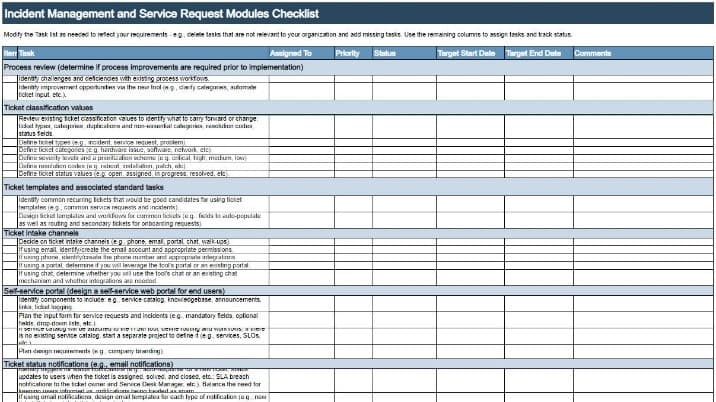
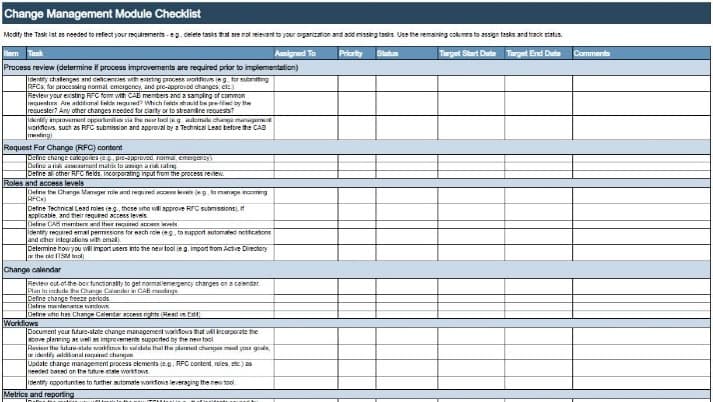
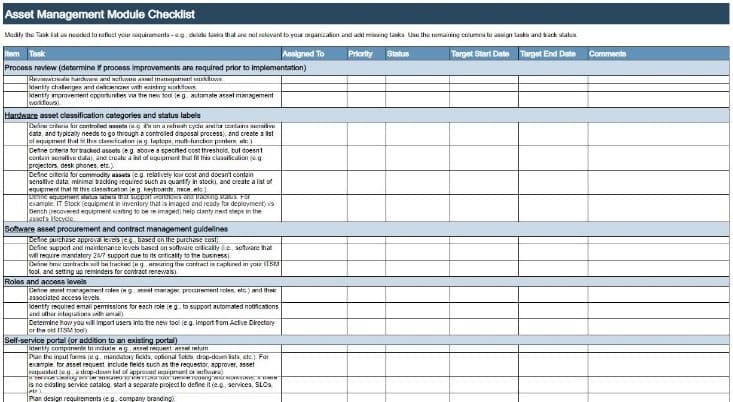
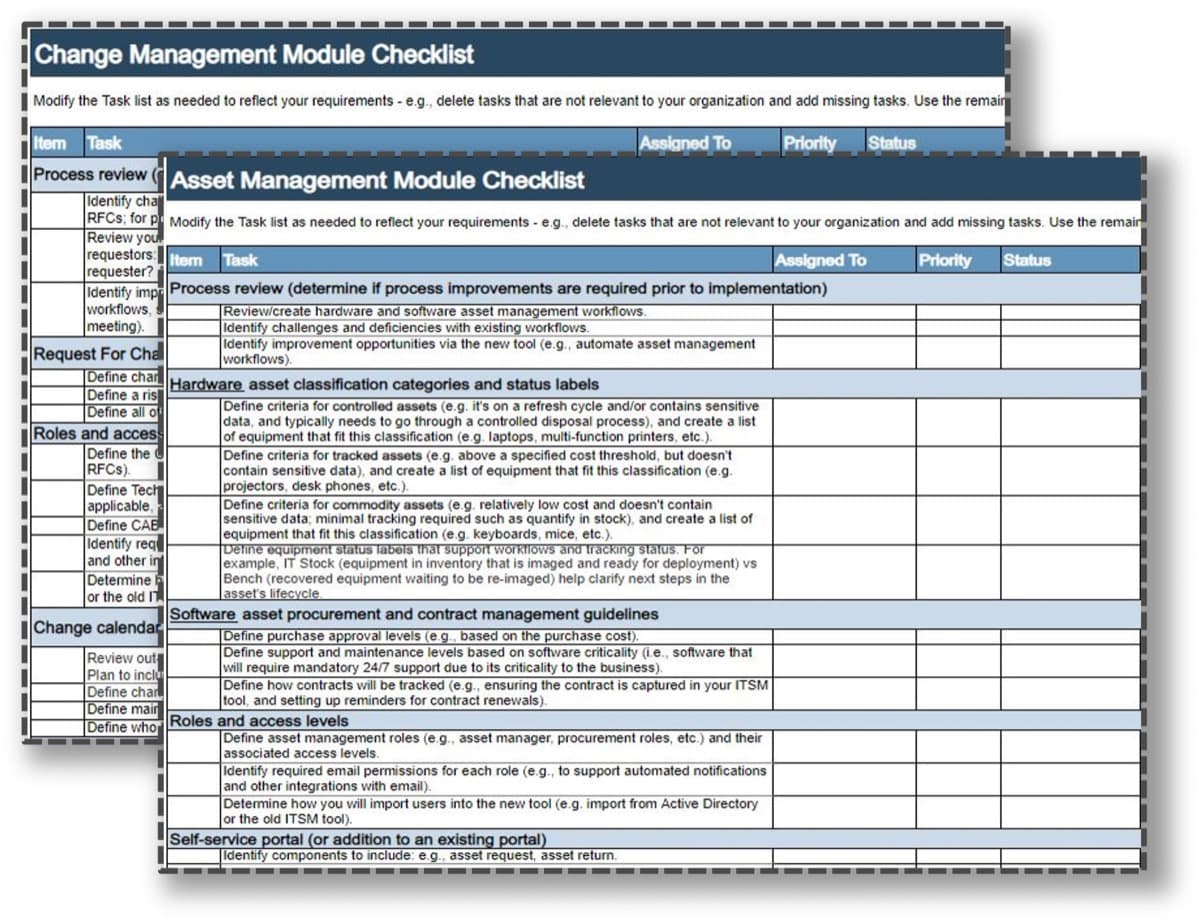
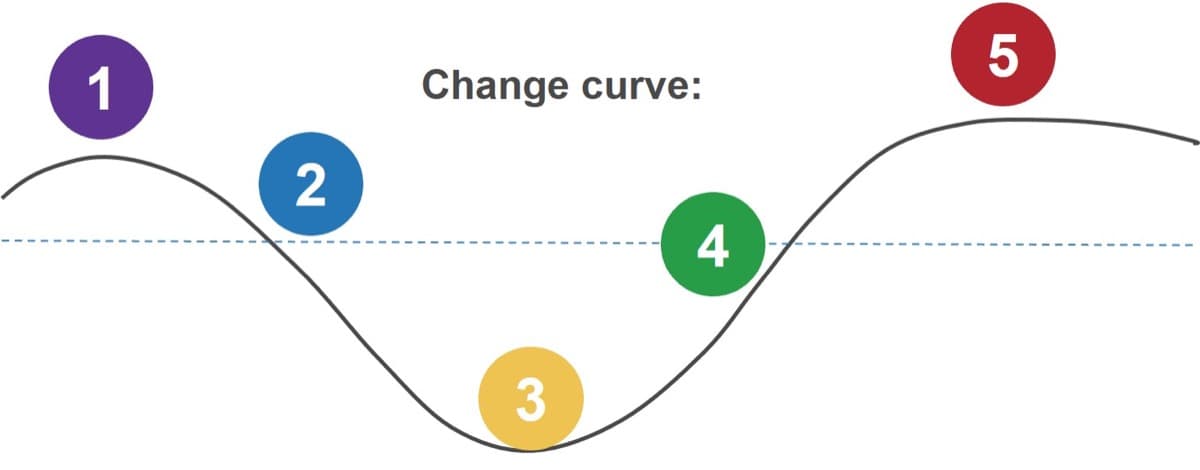
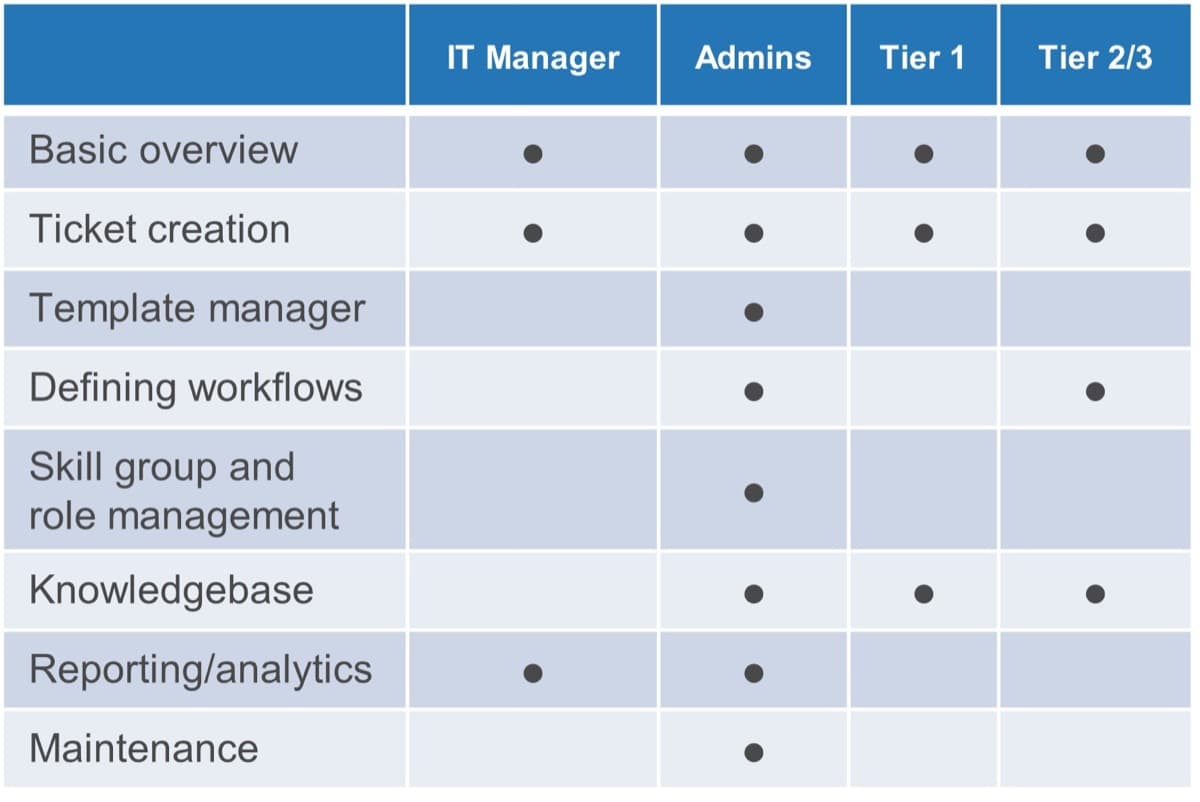
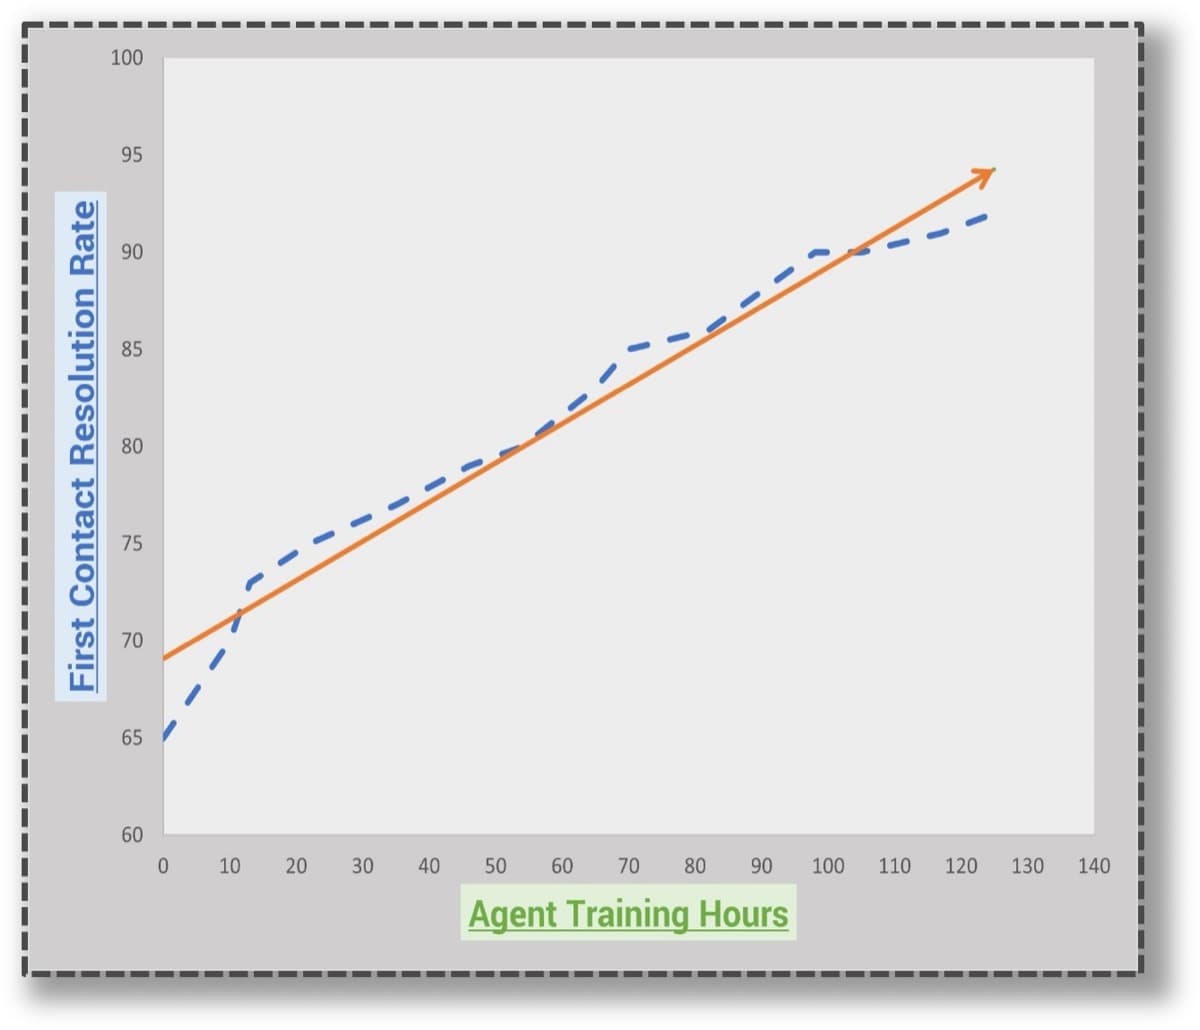

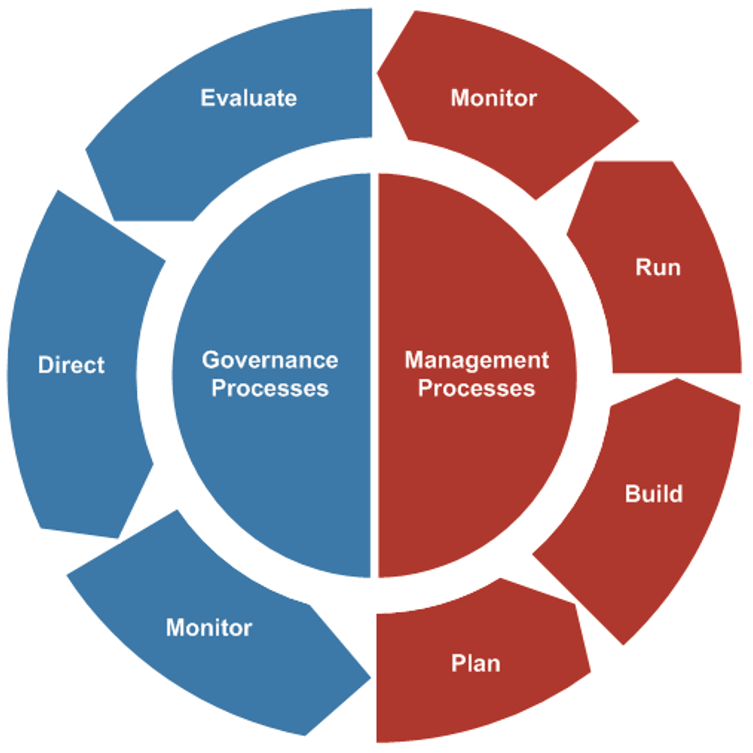
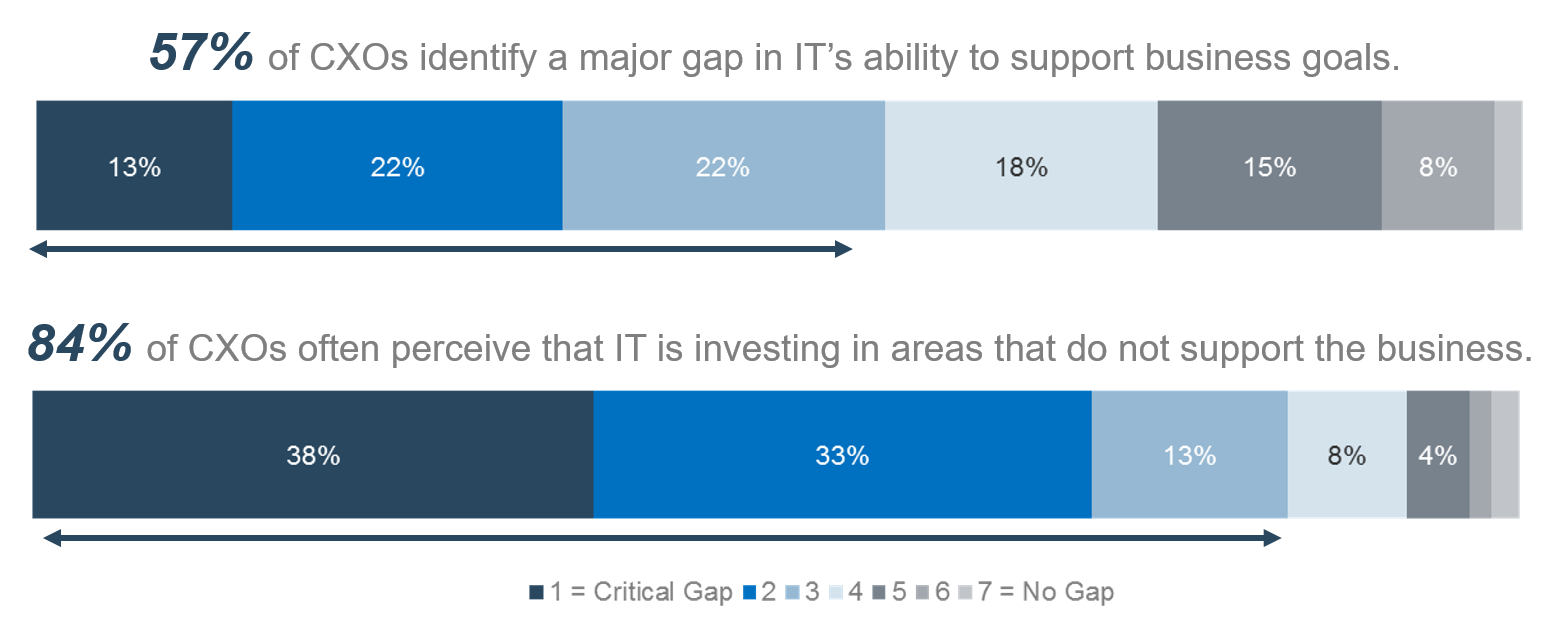

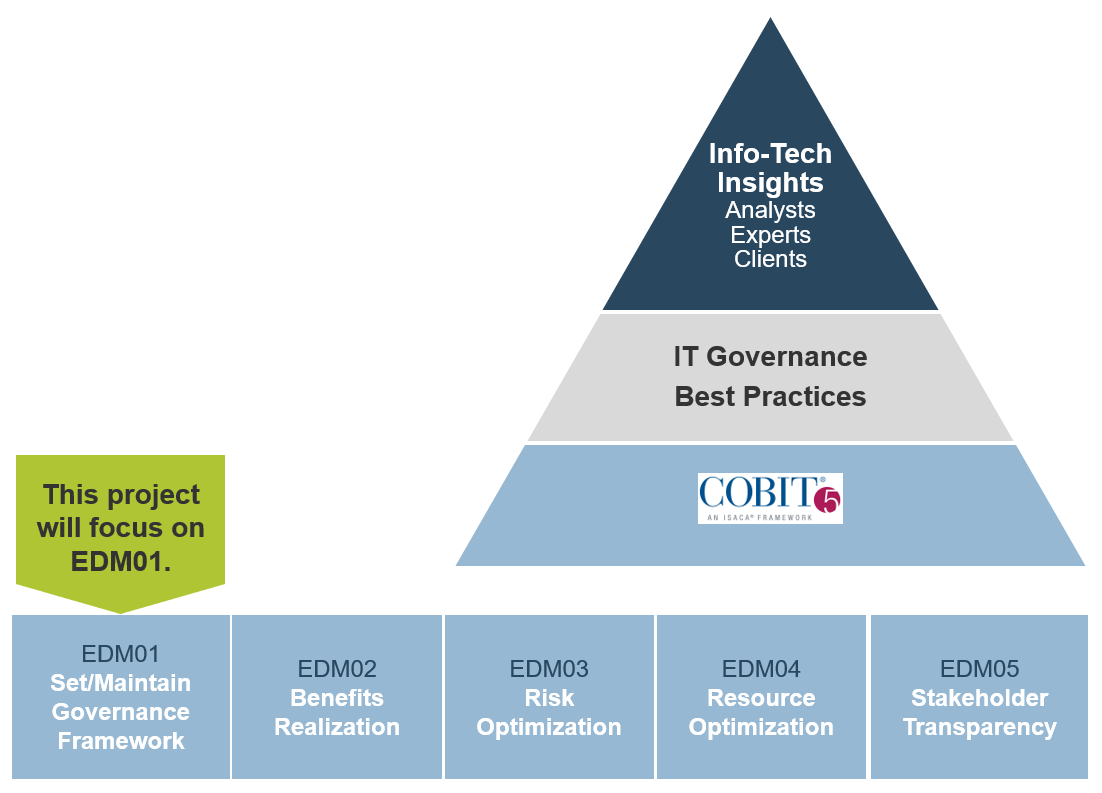


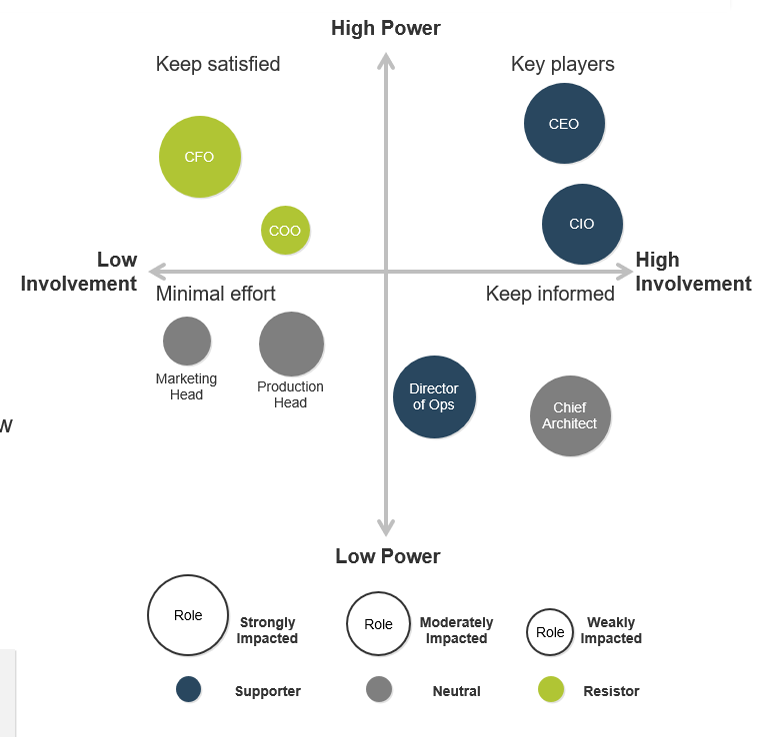
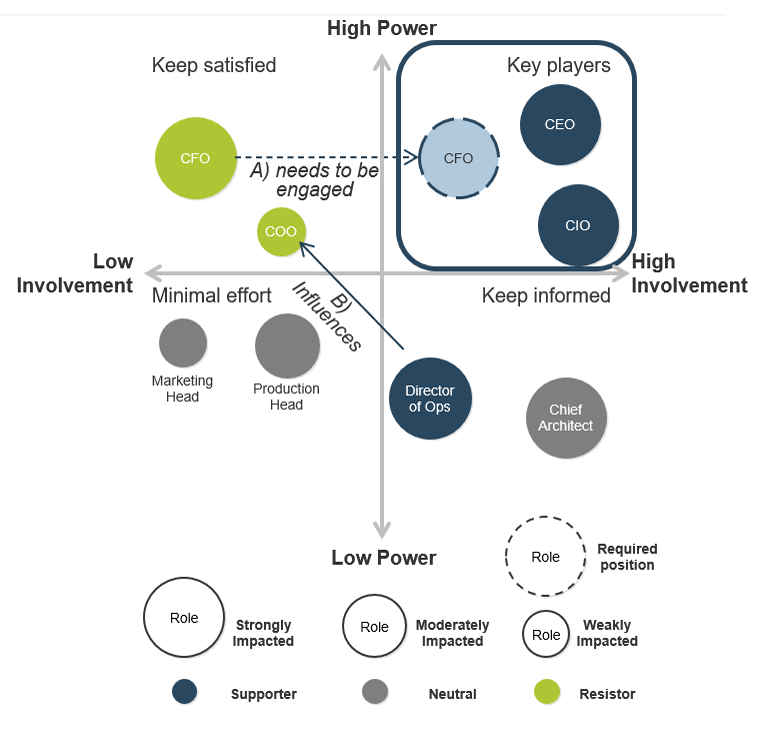
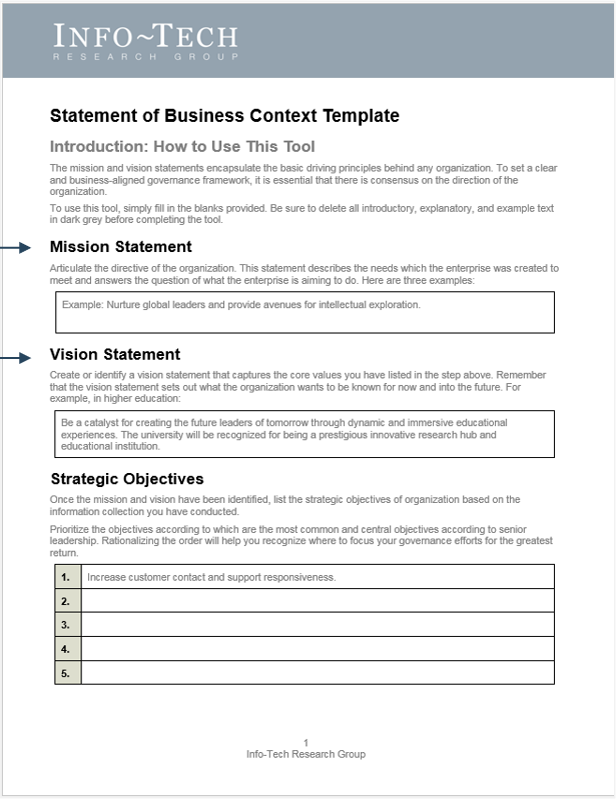
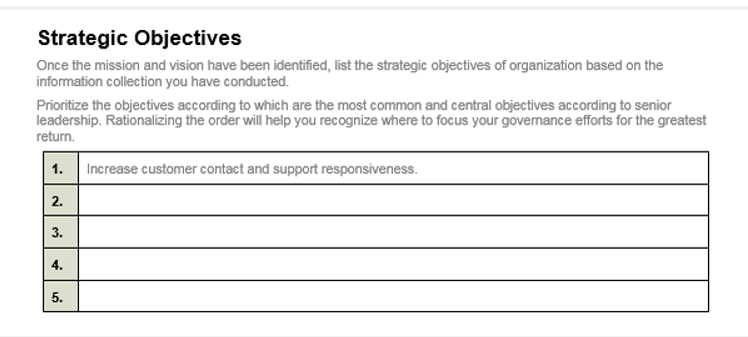
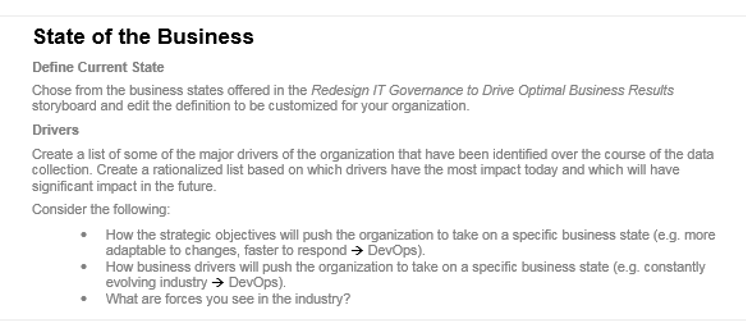

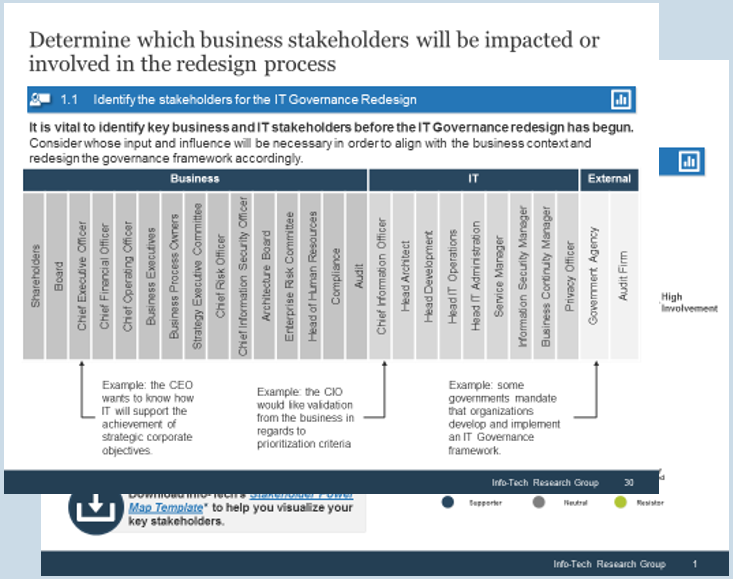
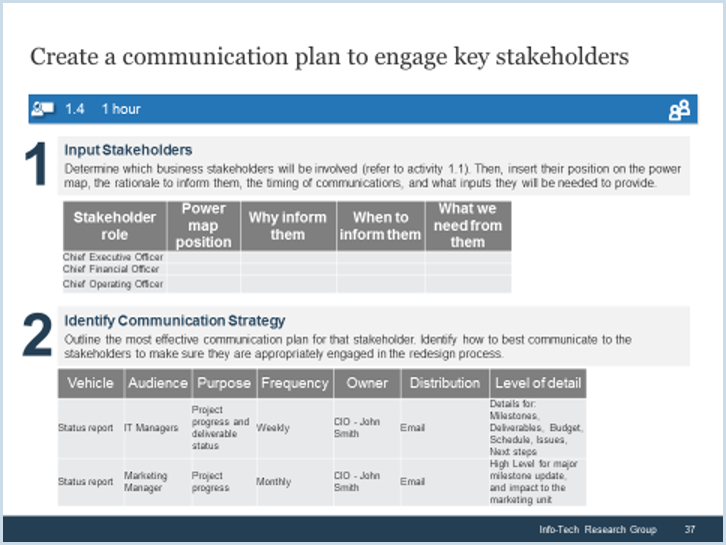
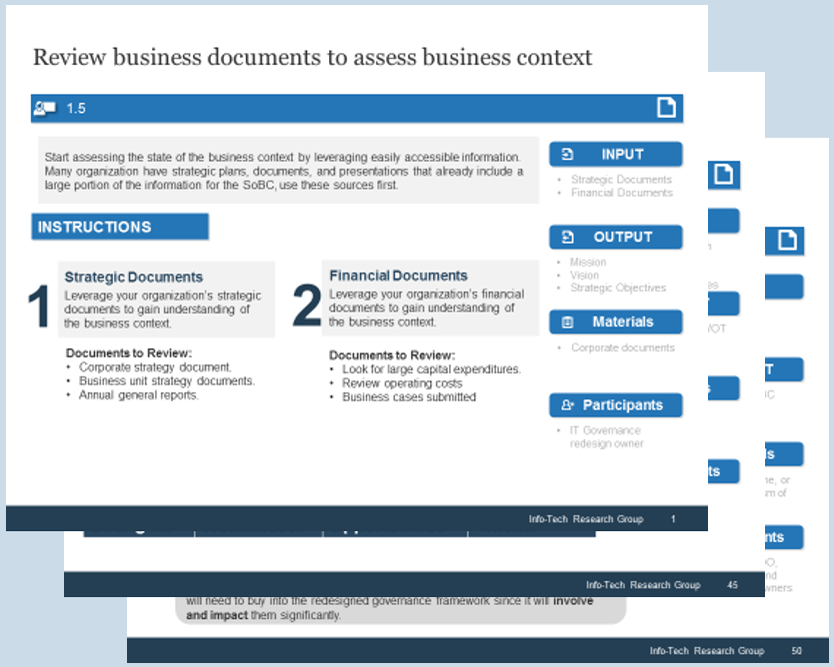
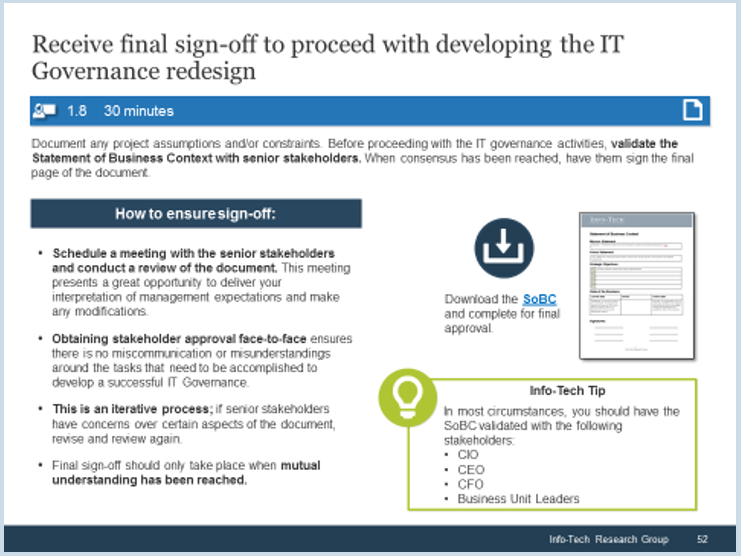
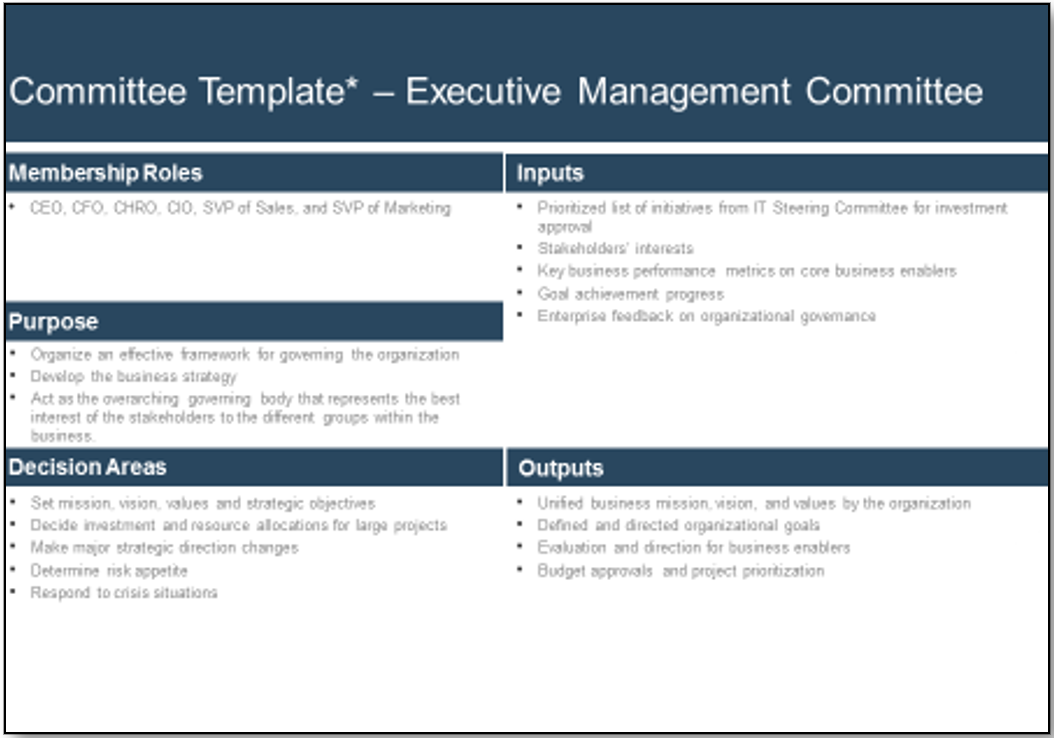
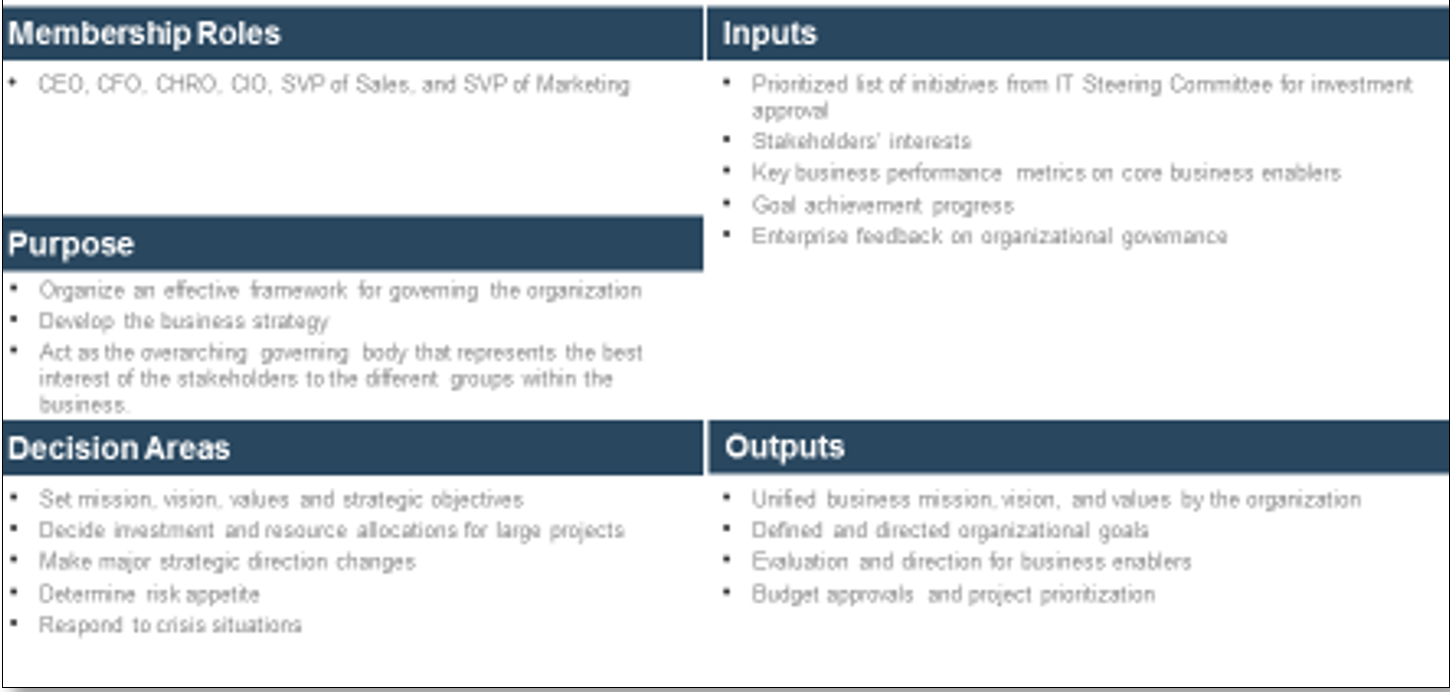
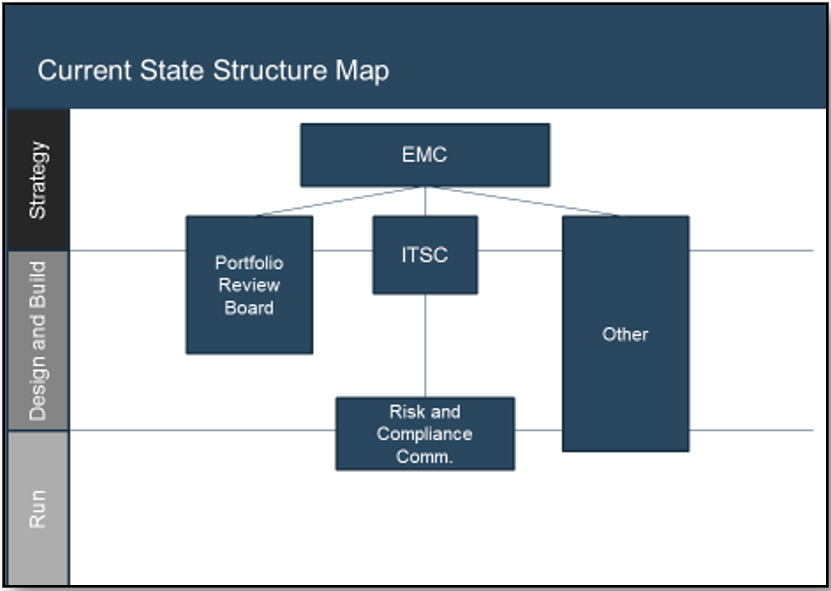 Using the outline provided, create your own governance structure map to represent the way the governing bodies interact and feed into each other.
This is crucial to ensure that the governing structure is streamlined. It will ensure that communication occurs efficiently and that there are no barriers to making decisions swiftly.
Using the outline provided, create your own governance structure map to represent the way the governing bodies interact and feed into each other.
This is crucial to ensure that the governing structure is streamlined. It will ensure that communication occurs efficiently and that there are no barriers to making decisions swiftly.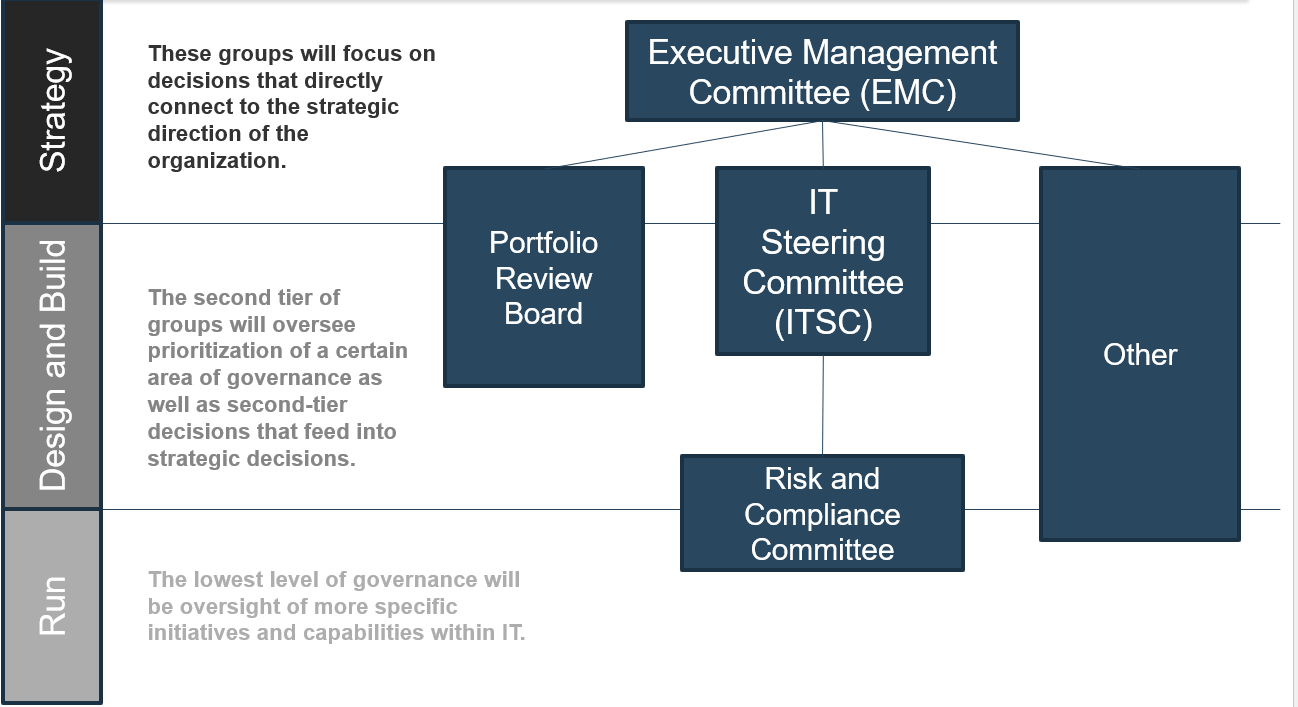
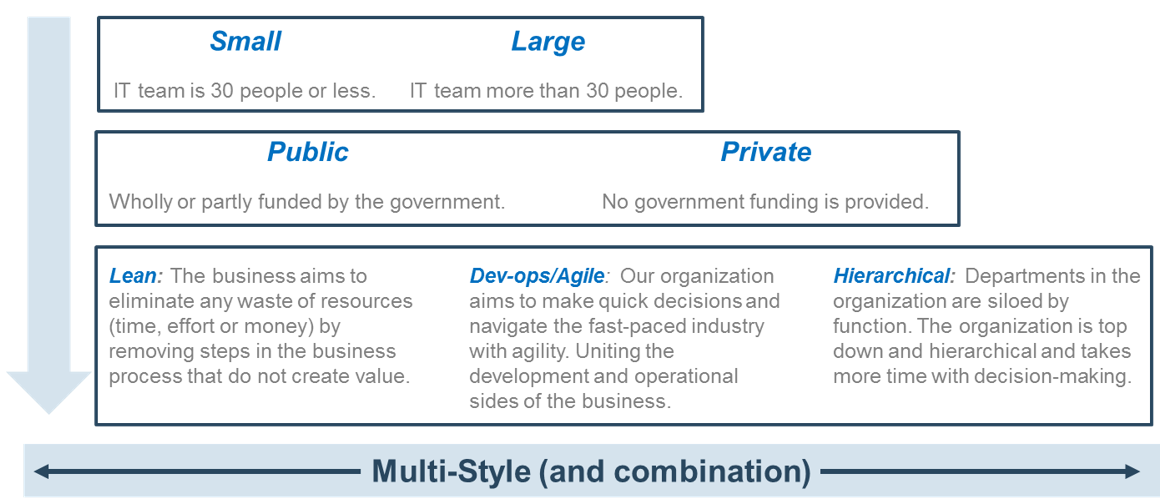
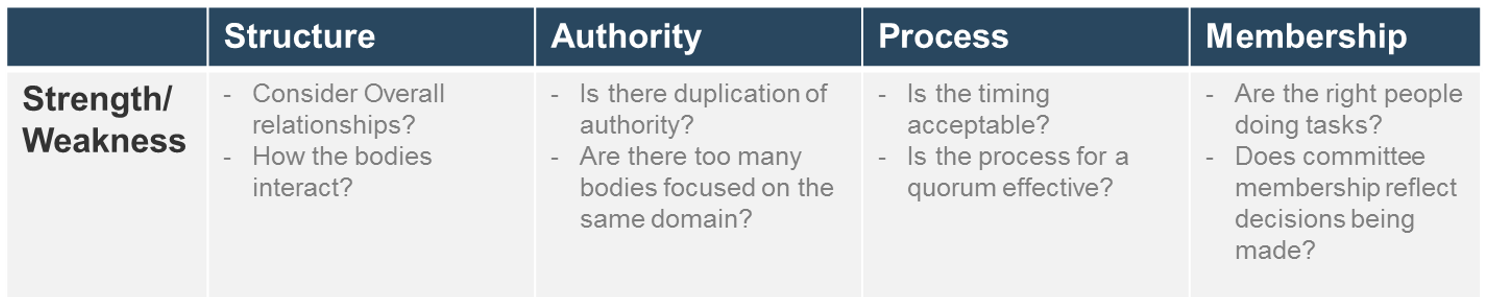
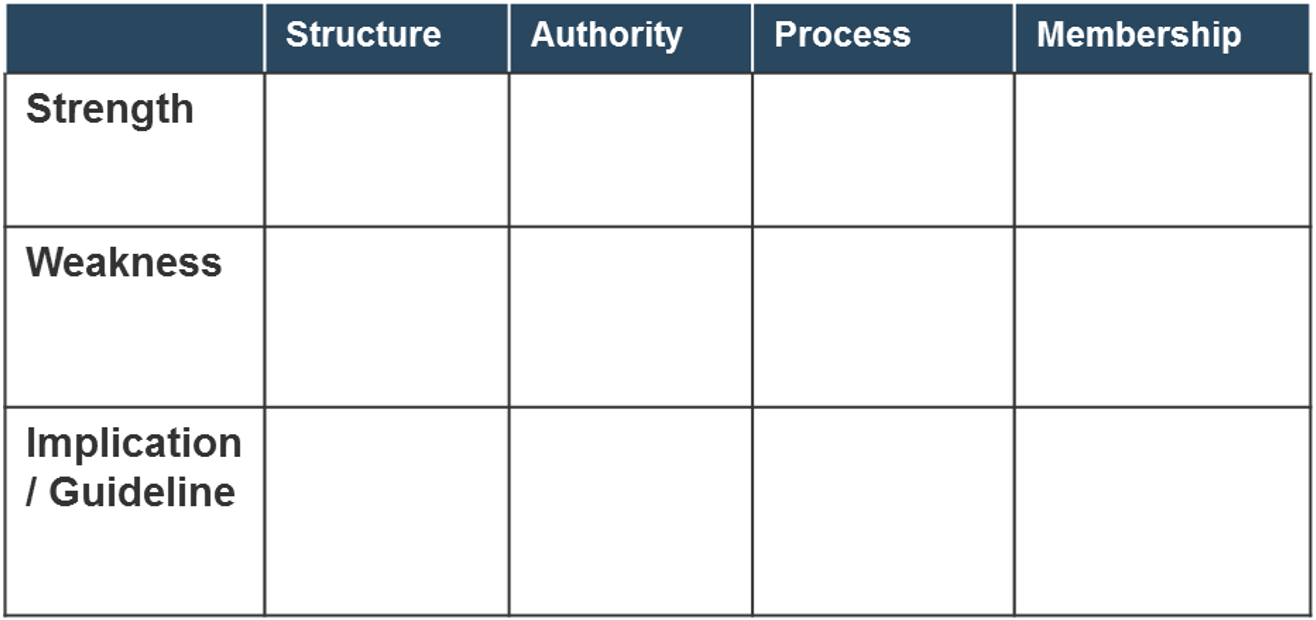 Note: Refer to the example guidelines in the