Further reading
Determine the Future of Microsoft Project in Your Organization
View your task management, project management, and project portfolio management options through the lens of M365.
EXECUTIVE BRIEF
Analyst Perspective
Microsoft Project is an enigma
Microsoft Project has dominated its market since being introduced in the 1980s, yet the level of adoption and usage per license is incredibly low.
The software is ubiquitous, mostly considered to represent its category for “Project Management.” Yet, the software is conflated with its “Portfolio Management” offerings as organizations make platform decisions with Microsoft Project as the incorrectly identified incumbent.
And incredibly, Microsoft has dominated the next era of productivity software with the “365” offerings. Yet, it froze the “Project” family of offerings and introduced the not-yet-functional “Project for the web.”
Having a difficult time understanding what to do with, and about, Microsoft Project? You’re hardly alone. It’s not simply a question of tolerating, embracing, or rejecting the product: many who choose a competitor find they’re still paying for Microsoft Project-related licensing for years to come.
If you’re in the Microsoft 365 ecosystem, use this research to understand your rapidly shifting landscape of options.
(Barry Cousins, Project Portfolio Management Practice Lead, Info-Tech Research Group)
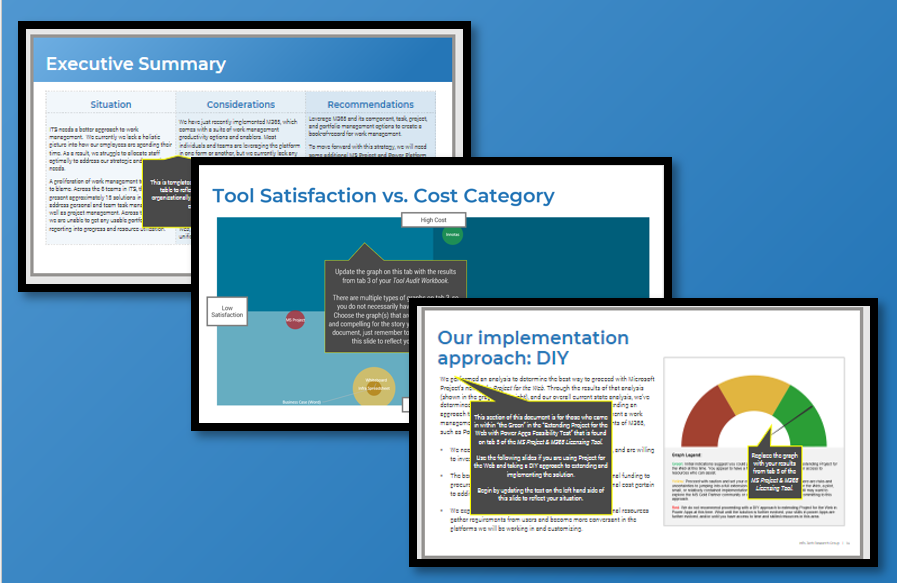
Executive Summary
Your Challenge
You use Microsoft (MS) tools to manage your work, projects, and/or project portfolio.
Their latest offering, Project for the web, is new and you’re not sure what to make of it. Microsoft says it will soon replace Microsoft Project and Project Online, but the new software doesn’t seem to do what the old software did.
The organization has adopted M365 for collaboration and work management. Meetings happen on Teams, projects are scoped a bit with Planner, and the operations group uses Azure Boards to keep track of what they need to get done.
Despite your reservations about the new project management software, Microsoft software has become even more ubiquitous.
Common Obstacles
M365 provides the basic components for managing tasks, projects, and project portfolios, but there is no instruction manual for making those parts work together.
M365 isn’t the only set of tools at play. Business units and teams across the organization have procured other non-Microsoft tools for work management without involving IT.
Microsoft’s latest project offering, Project for the web, is still evolving and you’re never sure if it is stable or ready for prime time. The missing function seems to involve the more sophisticated project planning disciplines, which are still important to larger, longer, and costlier projects.
Common Obstacles
Follow Info-Tech’s path in this blueprint to:
- Perform a tool audit to trim your work management tool landscape.
- Navigate the MS Project and M365 licensing landscape.
- Make sense of what to do with Project for the web and take the right approach to rolling it out (i.e. DIY or MS Gold Partner driven) for your needs.
- Create an action plan to inform next steps.
After following the program in this blueprint, you will be prepared to advise the organization on how to best leverage the rapidly shifting work management options within M365 and the place of MS Project within it.
M365 and, within it, O365 are taking over
Accelerated partly by the pandemic and the move to remote work, Microsoft’s market share in the work productivity space has grown exponentially in the last two years.
70% of Fortune 500 companies purchased 365 from Sept. 2019 to Sept. 2020. (Thexyz blog, 2020)
In its FY21 Q2 report, Microsoft reported 47.5 million M365 consumer subscribers – an 11.2% increase from its FY20 Q4 reporting. (Office 365 for IT Pros, 2021)
As of September 2020, there were 258,000,000 licensed O365 users. (Thexyz blog, 2020)
In this blueprint, we’ll look at what the what the phenomenal growth of M365 means for PMOs and project portfolio practitioners who identify as Microsoft shops
The market share of M365 warrants a fresh look at Microsoft’s suite of project offerings
For many PMO and project portfolio practitioners, the footprint of M365 in their organizations’ work management cultures is forcing a renewed look at Microsoft’s suite of project offerings.
The complicating factor is this renewed look comes at a transitional time in Microsoft’s suite of project and portfolio offerings.
- The market dominance of MS Project Server and Project Online are wanning, with Microsoft promising the end-of-life for Online sometime in the coming years.
- Project Online’s replacement, Project for the web, is a viable task management and lightweight project management tool, but its viability as a replacement for the rigor of Project Online is at present largely a question mark.
- Related to the uncertainty and promise around Project for the web, the Dataverse and the Power Platform offer a glimpse into a democratized future of work management tools but anything specific about that future has yet to solidify.
Microsoft Project has 66% market share in the project management tool space. (Celoxis, 2018)
A copy of MS project is sold or licensed every 20 seconds. (Integent, 2013)
MS Project is evolving to meet new work management realities
It also evolved to not meet the old project management realities.
- The lines between traditional project management and operational task management solutions are blurring as organizations struggle to keep up with demands.
- To make the software easier to use, modern work management doesn’t involve the complexities from days past. You won’t find anywhere to introduce complex predecessor-successor relationships, unbalanced assignments with front-loading or back-loading, early-start/late-finish, critical path, etc.
- “Work management” is among the latest buzzwords in IT consulting. With Project for the web (PFTW), Azure Boards, and Planner, Microsoft is attempting to compete with lighter and better-adopted tools like Trello, Basecamp, Asana, Wrike, and Monday.com.
- Buyers of project and work management software have struggled to understand how PFTW will still be usable if it gets the missing project management function from MS Project.
Info-Tech Insight
Beware of the Software Granularity Paradox.
Common opinion 1: “Plans and estimates that are granular enough to be believable are too detailed to manage and maintain.”
Common opinion 2: “Plans simple enough to publish aren’t detailed enough to produce believable estimates.”
In other words, software simple enough to get widely adopted doesn’t produce believable plans. Software that can produce believable plans is too complex to use at scale.
A viable task and project management option must walk the line between these dichotomies.
M365 gives you the pieces, but it’s on PMO users to piece them together in a viable way
With the new MS Project and M365, it’s on PMOs to avoid the granularity paradox and produce a functioning solution that fits with the organization’s ways of working.
Common perception still sees Microsoft Project as a rich software tool. Thus, when we consider the next generation of Microsoft Project, it’s easy to expect a newer and friendlier version of what we knew before.
In truth, the new solution is a collection of partially integrated but largely disparate tools that each satisfy a portion of the market’s needs. While it looks like a rich collection of function when viewed through high-level requirements, users will find:
- Overlaps, where multiple tools satisfy the same functional requirement (e.g. “assign a task”)
- Gaps, where a tool doesn’t quite do enough and you’re forced to incorporate another tool (e.g. reverting back to Microsoft Project for advanced resource planning)
- Islands, where tools don’t fluently talk to each other (e.g. Planner data integrated in real-time with portfolio data, which requires clunky, unstable, decentralized end-user integrations with Microsoft Power Automate)
Info-Tech's approach
Use our framework to best leverage the right MS Project offerings and M365 components for your organization’s work management needs.
The Info-Tech difference:
- A simple to follow framework to help you make sense of a chaotic landscape.
- Practical and tactical tools that will help you save time.
- Leverage industry best practices and practitioner-based insights.
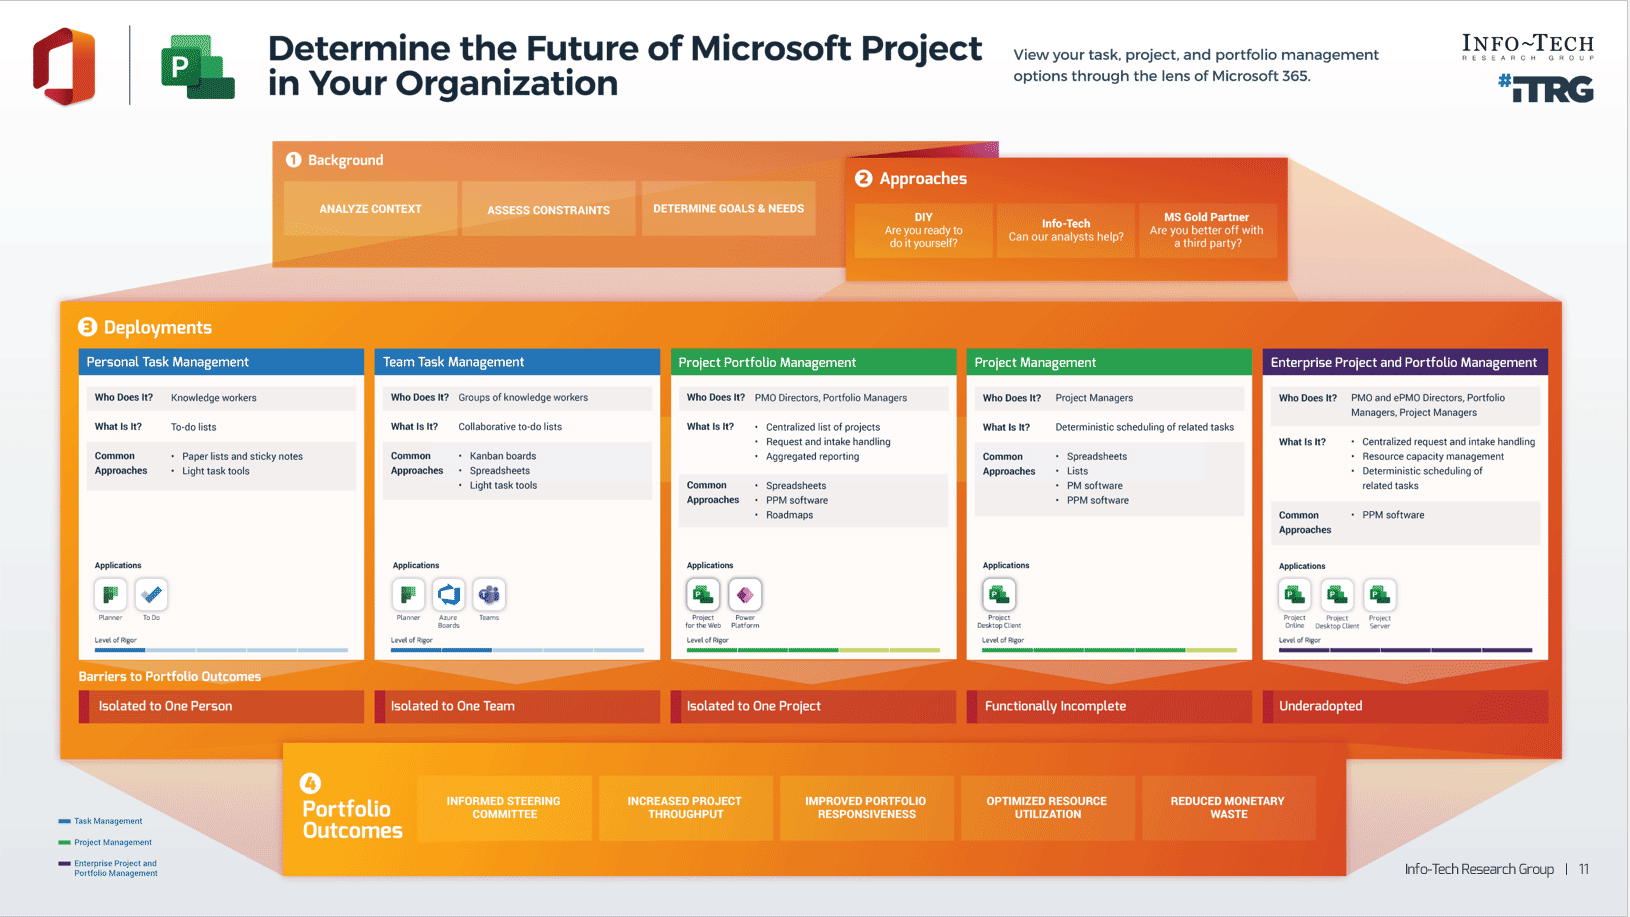
Determine the Future of Microsoft Project in Your Organization
View your task, project, and portfolio management options through the lens of Microsoft 365.
1. Background
- Analyze Content
- Assess Constraints
- Determine Goals and Needs
2. Approaches
- DIY – Are you ready to do it yourself?
- Info-Tech – Can our analysts help?
- MS Gold Partner – Are you better off with a third party?
3. Deployments
Task Management
- Personal Task Management
- Who does it? Knowledge workers
- What is it? To-do lists
- Common Approaches
- Paper list and sticky notes
- Light task tools
- Applications
- Level of Rigor 1/5
- Barriers to Portfolio Outcomes: Isolated to One Person
- Team Task Management
- Who does it? Groups of knowledge workers
- What is it? Collaborative to-do lists
- Common Approaches
- Kanban boards
- Spreadsheets
- Light task tools
- Applications
- Planner
- Azure Boards
- Teams
- Level of Rigor 2/5
- Barriers to Portfolio Outcomes: Isolated to One Team
Project Management
- Project Portfolio Management
- Who does it? PMO Directors, Portfolio Managers
- What is it?
- Centralized list of projects
- Request and intake handling
- Aggregating reporting
- Common Approaches
- Spreadsheets
- PPM software
- Roadmaps
- Applications
- Project for the Web
- Power Platform
- Level of Rigor 3/5
- Barriers to Portfolio Outcomes: Isolated to One Project
- Project Management
- Who does it? Project Managers
- What is it? Deterministic scheduling of related tasks
- Common Approaches
- Spreadsheets
- Lists
- PM software
- PPM software
- Applications
- Level of Rigor 4/5
- Barriers to Portfolio Outcomes: Functionally Incomplete
Enterprise Project and Portfolio Management
- Enterprise Project and Portfolio Management
- Who does it? PMO and ePMO Directors, Portfolio Managers, Project Managers
- What is it?
- Centralized request and intake handling
- Resource capacity management
- Deterministic scheduling of related tasks
- Common Approaches
- Applications
- Project Online
- Project Desktop Client
- Project Server
- Level of Rigor 5/5
- Barriers to Portfolio Outcomes: Underadopted
4. Portfolio Outcomes
- Informed Steering Committee
- Increased Project Throughput
- Improved Portfolio Responsiveness
- Optimized Resource Utilization
- Reduced Monetary Waste
Info-Tech's methodology for Determine the Future of MS Project for Your Organization
|
|
1. Determine Your Tool Needs
|
2. Weigh Your MS Project Implementation Options
|
3. Finalize Your Implementation Approach
|
Phase Steps
|
- Survey the M365 Work Management Tools
- Perform a Process Maturity Assessment to Help Inform Your M365 Starting Point
- Consider the Right MS Project Licenses for Your Stakeholders
|
- Get Familiar With Extending Project for the Web Using Power Apps
- Assess the MS Gold Partner Community
|
- Prepare an Action Plan
|
Phase Outcomes
|
- Work Management Tool Audit
- MS Project and Power Platform Licensing Needs
- Project Management and Project Portfolio Management Maturity Assessment
|
- Project for the Web Readiness Assessment
- MS Gold Partner Outreach Plan
|
- MS Project and M365 Action Plan Presentation
|
Insight Summary
Overarching blueprint insight: Microsoft Parts Sold Separately. Assembly required.
The various MS Project offerings (but most notably the latest, Project for the web) hold the promise of integrating with the rest of M365 into a unified work management solution. However, out of the box, Project for the web and the various platforms within M365 are all disparate utilities that need to be pieced together in a purpose-built manner to make use of them for holistic work management purposes.
If you’re looking for a cohesive product out of the box, look elsewhere. If you’re looking to assemble a wide array of work, project, and portfolio management functions across different functions and departments, you may have found what you seek
Phase 1 insight: Align your tool choice to your process maturity level.
Rather than choosing tools based on your gaps, make sure to assess your current maturity level so that you optimize your investment in the Microsoft landscape.
Phase 2 insight: Weigh your options before jumping into Microsoft’s new tech.
Microsoft’s new Project plans (P1, P3, and P5) suggest there is a meaningful connection out of the box between its old tech (Project desktop, Project Server, and Project Online) and its new tech (Project for the web).
However, the offerings are not always interoperable.
Phase 3 insight: Keep the iterations small as you move ahead with trials and implementations.
Organizations are changing as fast as the software we use to run them.
If you’re implementing parts of this platform, keep the changes small as you monitor the vendors for new software versions and integrations.
Blueprint deliverables
Each step of this blueprint is accompanied by supporting deliverables to help you accomplish your goals:
Key deliverable: Microsoft Project & M365 Action Plan Template
The Action Plan will help culminate and present:
- Context and Constraints
- DIY Implementation Approach
Or
- MS Partner Implementation Approach
- Future-State Vision and Goals
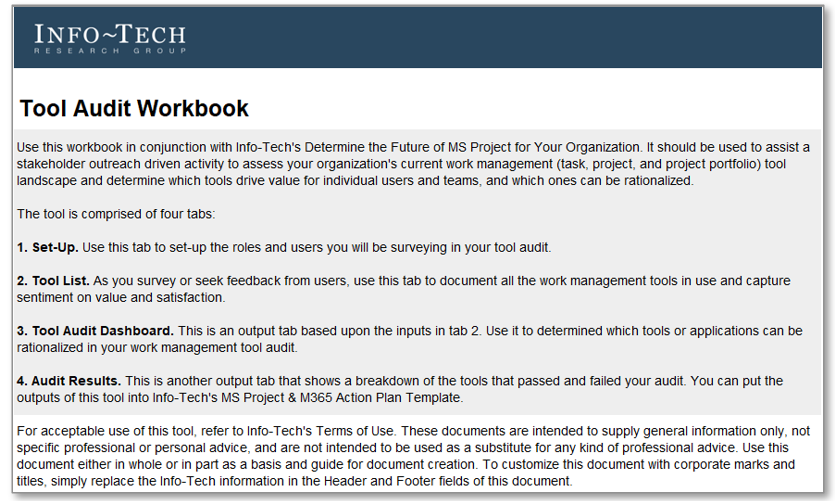
Tool Audit Workbook
Assess your organization's current work management tool landscape and determine what tools drive value for individual users and teams and which ones can be rationalized.
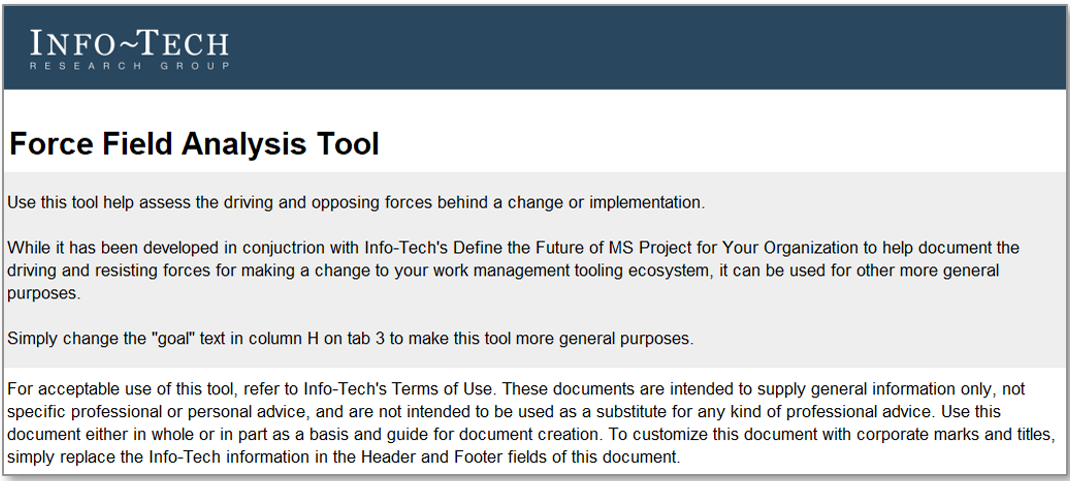
Force Field Analysis
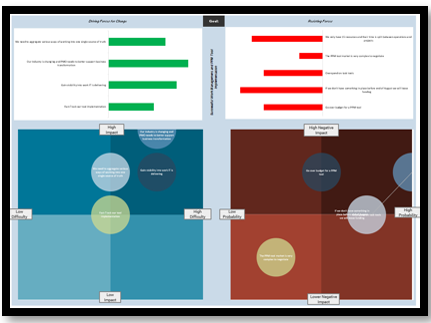
Document the driving and resisting forces for making a change to your work management tools.
Maturity Assessments
Use these assessments to identify gaps in project management and project portfolio management processes. The results will help guide process improvement efforts and measure success and progress.
Microsoft Project & M365 Licensing Tool
Determine the best licensing options and approaches for your implementation of Microsoft Project.
Curate your work management tools to harness valuable portfolio outcomes
-
Increase Project Throughput
Do more projects by ensuring the right projects and the right amount of projects are approved and executed.
-
Support an Informed Steering Committee
Easily compare progress of projects across the portfolio and enable the leadership team to make decisions.
-
Improve portfolio responsiveness
Make the portfolio responsive to executive steering when new projects and changing priorities need rapid action.
-
Optimize Resource Utilization
Assign the right resources to approved projects and minimize the chronic over-allocation of resources that leads to burnout.
-
Reduce Monetary Waste
Terminate low-value projects early and avoid sinking additional funds into unsuccessful ventures.
Info-Tech offers various levels of support to best suit your needs
DIY Toolkit
|
Guided Implementation
|
Workshop
|
Consulting
|
| "Our team has already made this critical project a priority, and we have the time and capability, but some guidance along the way would be helpful."
|
"Our team knows that we need to fix a process, but we need assistance to determine where to focus. Some check-ins along the way would help keep us on track."
|
"We need to hit the ground running and get this project kicked off immediately. Our team has the ability to take this over once we get a framework and strategy in place."
|
"Our team does not have the time or the knowledge to take this project on. We need assistance through the entirety of this project."
|
Diagnostics and consistent frameworks used throughout all four options
Guided Implementation
What does a typical GI on this topic look like?
A Guided Implementation (GI) is a series of calls with an Info-Tech analyst to help implement our best practices in your organization.
A typical GI is between 6 to 8 calls over the course of 3 to 4 months.
Introduction
- Call #1: Scope requirements, objectives, and your specific challenges.
Phase 1
- Call #2: Explore the M365 work management landscape.
- Call #3: Discuss Microsoft Project Plans and their capabilities.
- Call #4: Assess current-state maturity.
Phase 2
- Call #5: Get familiar with extending Project for the web using Power Apps.
- Call #6: Assess the MS Gold Partner Community.
Phase 3
- Call #7: Determine approach and deployment.
- Call #8: Discuss action plan.
Workshop Overview
Contact your account representative for more information.
workshops@infotech.com 1-888-670-8889
|
|
Day 1
Assess Driving Forces and Risks
|
Day 2
Determine Tool Needs and Process Maturity
|
Day 3
Weigh Your Implementation Options
|
Day 4
Finalize Implementation Approach
|
Day 5
Next Steps and Wrap-Up (offsite)
|
Activities
|
- 1.1 Review the business context.
- 1.2 Explore the M365 work management landscape.
- 1.3 Identify driving forces for change.
- 1.4 Analyze potential risks.
- 1.5 Perform current-state analysis on work management tools.
|
- 2.1 Review tool audit dashboard and conduct the final audit.
- 2.2 Identify current Microsoft licensing.
- 2.3 Assess current-state maturity for project management.
- 2.4 Define target state for project management.
- 2.5 Assess current-state maturity for project portfolio management.
- 2.6 Define target state for project portfolio management.
|
- 3.1 Prepare a needs assessment for Microsoft 365 and Project Plan licenses.
- 3.2 Review the business case for Microsoft licensing.
- 3.3 Get familiar with Project for the web.
- 3.4 Assess the MS Gold Partner Community.
- 3.5 Conduct a feasibility test for PFTW.
|
- 4.1 Decide on the implementation approach.
- 4.2 Identify the audience for your proposal.
- 4.3 Determine timeline and assign accountabilities.
- 4.4 Develop executive summary presentation.
|
- 5.1 Complete in-progress deliverables from previous four days.
- 5.2 Set up review time for workshop deliverables and to discuss next steps.
|
Deliverables
|
- Force Field Analysis
- Tool Audit Workbook
|
- Tool Audit Workbook
- Project Management Maturity Assessment
- Portfolio Management Maturity Assessment
|
- Microsoft Project and M365 Licensing Tool
|
- Microsoft Project & M365 Action Plan
|
- Microsoft Project & M365 Action Plan
|
Determine the Future of Microsoft Project for Your Organization
Phase 1: Determine Your Tool Needs
Phase 1: Determine Your Tool Needs
|
Phase 2: Weigh Your Implementation Options
|
Phase 3: Finalize Your Implementation Approach
|
- Step 1.1: Survey the M365 work management landscape
- Step 1.2: Explore the Microsoft Project Plans and their capabilities
- Step 1.3: Assess the maturity of your current PM & PPM capabilities
|
- Step 2.1: Get familiar with extending Project for the web using Power Apps
- Step 2.2: Assess the MS Gold Partner Community
|
- Step 3.1: Prepare an action plan
|
Phase Outcomes
- Tool Audit
- Microsoft Project Licensing Analysis
- Project Management Maturity Assessment
- Project Portfolio Management Maturity Assessments
Step 1.1
Survey the M365 Work Management Landscape
Activities
- 1.1.1 Distinguish between task, project, and portfolio capabilities
- 1.1.2 Review Microsoft’s offering for task, project, and portfolio management needs
- 1.1.4 Assess your organizational context and constraints
- 1.1.3 Explore typical deployment options
This step will walk you through the following activities:
- Assessing your organization’s context for project and project portfolio management
- Documenting the organization’s constraints
- Establishing the organization’s goals and needs
This step involves the following participants:
- PMO Director
- Resource Managers
- Project Managers
- Knowledge Workers
Outcomes of Step
- Knowledge of the Microsoft ecosystem as it relates to task, project, and portfolio management
- Current organizational context and constraints
Don’t underestimate the value of interoperability
The whole Microsoft suite is worth more than the sum of its parts … if you know how to put it together.
38% of the worldwide office suite market belongs to Microsoft. (Source: Statistica, 2021)
1 in 3 small to mid-sized organizations moving to Microsoft Project say they are doing so because it integrates well with Office 365. (Source: CBT Nuggets, 2018)
There’s a gravity to the Microsoft ecosystem.
And while there is no argument that there are standalone task management tools, project management tools, or portfolio management tools that are likely more robust, feature-rich, and easier to adopt, it’s rare that you find an ecosystem that can do it all, to an acceptable level.
That is the value proposition of Microsoft: the ubiquity, familiarity, and versatility. It’s the Swiss army knife of software products.
The work management landscape is evolving
With M365, Microsoft is angling to become the industry leader, and your organization’s hub, for work management.
Workers lose up to 40% of their time multi-tasking and switching between applications. (Bluescape, 2018)
25 Context switches – On average, workers switch between 10 apps, 25 times a day. (Asana, 2021)
“Work management” is among the latest buzzwords in IT consulting.
What is work management? It was born of a blurring of the traditional lines between operational or day-to-day tasks and project management tasks, as organizations struggle to keep up with both operational and project demands.
To make the software easier to use, modern work management doesn’t involve the complexities from days past. You won’t find anywhere to introduce complex predecessor-successor relationships, unbalanced assignments with front-loading or back-loading, early-start/late-finish, critical path, etc.
Indeed, with Project for the web, Azure Boards, Planner, and other M365 utilities, Microsoft is attempting to compete with lighter and better-adopted tools (e.g. Trello, Wike, Monday.com).
The Microsoft world of work management can be understood across three broad categories
Task Management
Task management is essentially the same as keeping track of a to-do list. While you can have a project-related task, you can also have a non-project-related task. The sum of project and non-project tasks make up the work that you need to complete.Project Management
Project management (PM) is a methodical approach to planning and guiding project processes from start to finish. Implementing PM processes helps establish repeatable steps and controls that enable project success. Documentation of PM processes leads to consistent results and dependable delivery on expectations. Portfolio Management
Project portfolio management (PPM) is a strategic approach to approving, prioritizing, resourcing, and reporting on project. In addition, effective PPM should nurture the completion of projects in the portfolio in the most efficient way and track the extent to which the organization is realizing the intended benefits from completed projects.
The slides ahead explain each of these modes of working in the Microsoft ecosystem in turn. Further, Info-Tech’s Task, Project, and Project Portfolio Management Tool Guides explain these areas in more detail.
Use Info-Tech’s Tool Guides assess your MS Project and M365 work management options
Lean on Info-Tech’s Tool Guides as you navigate Microsoft’s tasks management, project management, and project portfolio management options.
- The slides ahead take you through a bird’s-eye view of what your MS Project and M365 work management options look like across Info-Tech’s three broad categories
- In addition to these slides, Info-Tech has three in-depth tool guides that take you through your operational task management, project management, and project portfolio management options in MS Project and M365.
- These tool guides can be leveraged as you determine whether Microsoft has the required toolset for your organization’s task, project, and project portfolio management needs.
Download Info-Tech’s Task Management, Project Management, and Project Portfolio Management Tool Guides
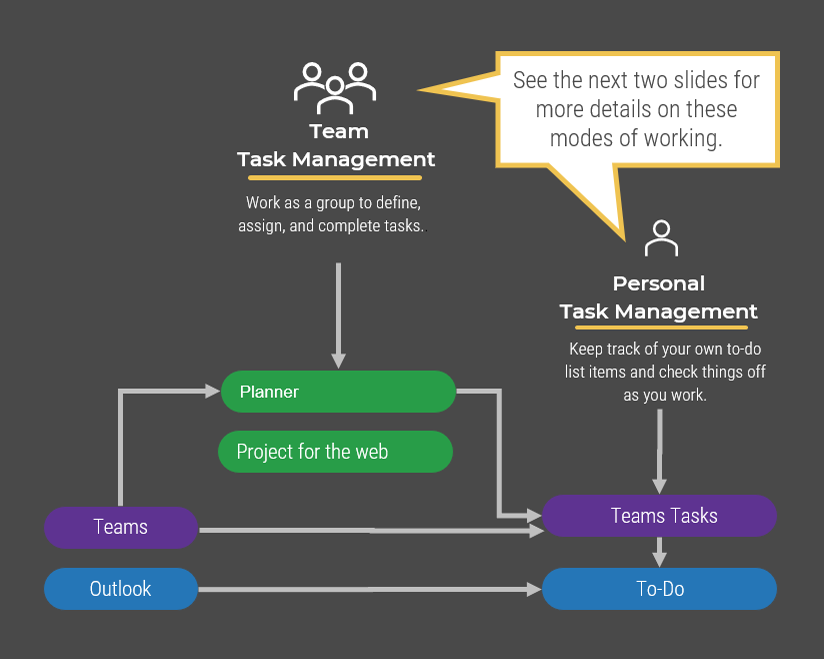
Task Management Overview
What is task management?
- It is essentially the same as keeping track of a to-do list. While you can have a project-related task, you can also have a non-project-related task. The sum of project and non-project tasks make up the work that you need to complete.
What are the benefits of task management using applications within the MS suite?
- Many organizations already own the tools and don't have to go out and buy something separately.
- There is easy integration with other MS applications.
What is personal task management?
- Tools that allow you to structure work that is visible only to you. This can include work from tasks you are going to be completing for yourself and tasks you are completing as part of a larger work effort.
What is team task management?
- Tools that allow users to structure work that is visible to a group. When something is moved or changed, it affects what the group is seeing because it is a shared platform.
Get familiar with the Microsoft product offerings for task management
Download the M365 Task Management Tool Guide
Personal Task Management
The To-Do list
- Who does it?
- What is it?
- How each knowledge worker organizes their individual work tasks in M365
- When is it done?
- As needed throughout the day
- Where is it done?
- How is it done?
- DIY and self-developed
- Usually not repeatable and evolves depending on work location and tools available
- Not governed
Microsoft differentiator:
Utilities like Planner and To-Do make it easier to turn what are often ad hoc approaches into a more repeatable process.
Team Task Management
The SharedTo-Do list
- Who does it?
- Groups of knowledge workers
- What is it?
- Temporary and permanent collections of knowledge workers
- When is it done?
- As needed or on a pre-determined cadence
- Where is it done?
- How is it done?
- User norms are established organically and adapted based upon the needs of the team.
- To whatever extent processes are repeatable in the first place, they remain repeatable only if the team is a collective.
- Usually governed within the team and not subject to wider visibility.
Microsoft differentiator:
Teams has opened personal task management tactics up to more collaborative approaches.
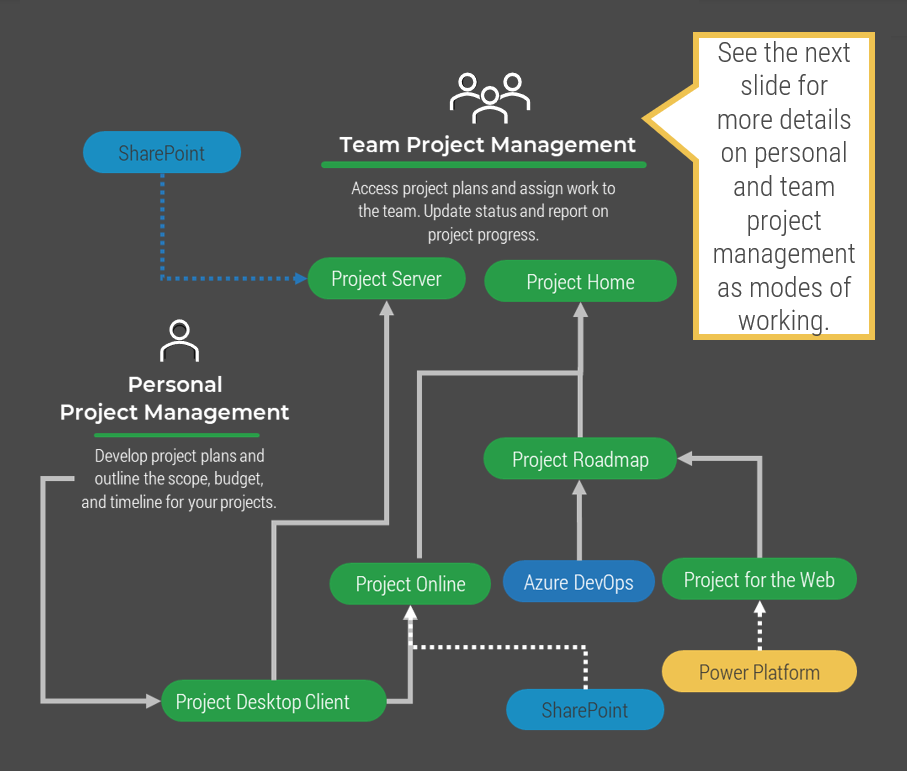
Project Management Overview
2003
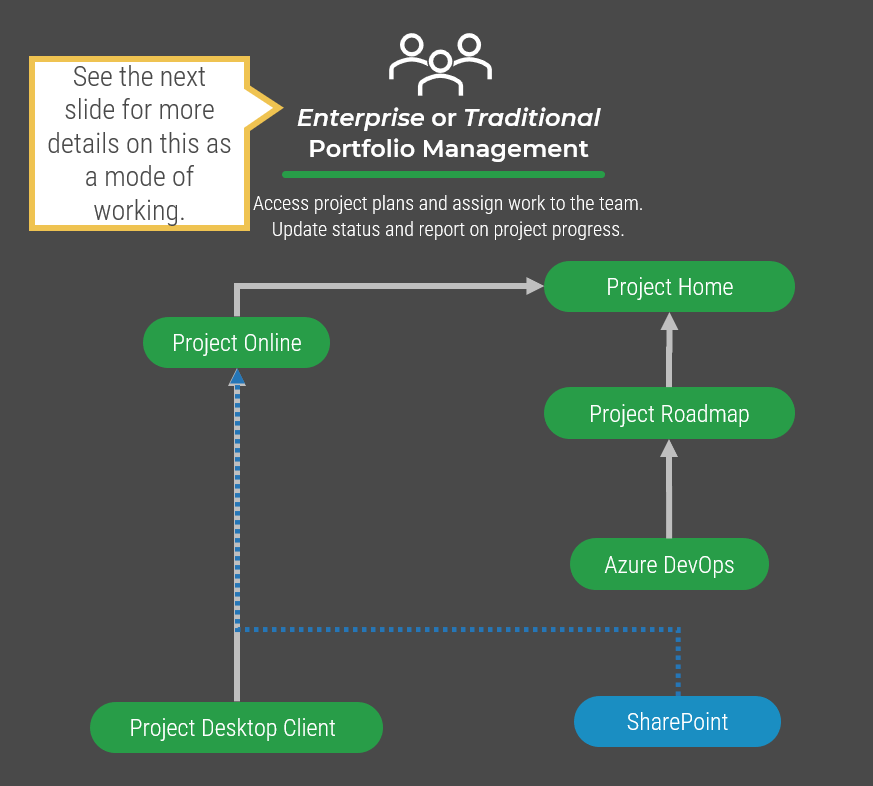
Project Server: This product serves many large enterprise clients, but Microsoft has stated that it is at end of life. It is appealing to industries and organizations where privacy is paramount. This is an on-premises system that combines servers like SharePoint, SQL, and BI to report on information from Project Desktop Client. To realize the value of this product, there must be adoption across the organization and engagement at the project-task level for all projects within the portfolio.
2013
Project Online: This product serves many medium enterprise clients. It is appealing for IT departments who want to get a rich set of features that can be used to intake projects, assign resources, and report on project portfolio health. It is a cloud solution built on the SharePoint platform, which provides many users a sense of familiarity. However, due to the bottom-up reporting nature of this product, again, adoption across the organization and engagement at the project task level for all projects within the portfolio is critical.
2020
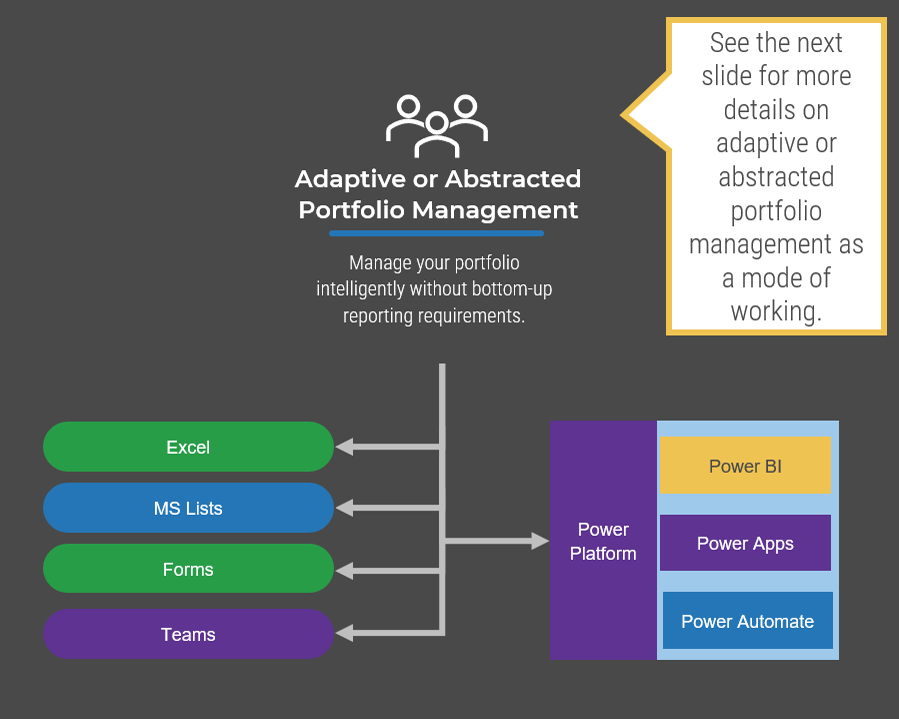
Project for the web: This product is the newest on the market and is quickly being evolved. Many O365 enthusiasts have been early adopters of Project for the web despite its limited features when compared to Project Online. It is also a cloud solution that encourages citizen developers by being built on the MS Power Platform. This positions the product well to integrate with Power BI, Power Automate, and Power Apps. It is, so far, the only MS product that lends itself to abstracted portfolio management, which means it doesn’t rely on project task level engagement to produce portfolio reports. The portfolio can also run with a mixed methodology by funneling Project, Azure Boards, and Planner boards into its roadmap function.
Get familiar with the Microsoft product offerings for project management
Download the M365 Project Management Tool Guide
Project Management
Orchestrating the delivery of project work
- Who does it?
- What is it?
- Individual project managers developing project plans and schedules in the MS Project Desktop Client
- When is it done?
- Throughout the lifecycle of the project
- Where is it done?
- How is it done?
- Used by individual project managers to develop and manage project plans.
- Common approaches may or may not involve reconciliation of resource capacity through integration with Active Directory.
- Sometimes usage norms are established by organizational project management governance standards, though individual use of the desktop client is largely ungoverned.
Microsoft differentiator:
For better or worse, Microsoft’s core solution is veritably synonymous with project management itself and has formally contributed to the definition of the project management space.
Project Portfolio Management Overview
Optimize what you’re already using and get familiar with the Power Platform.
What does PPM look like within M365?
- The Office suite in the Microsoft 365 suite boasts the world’s most widely used application for the purposes of abstracted and strategic PPM: Excel. For the purposes of PPM, Excel is largely implemented in a suboptimal fashion, and as a result, organizations fail to gain PPM adoption and maturation through its use.
- Until very recently, Microsoft toolset did not explicitly address abstracted PPM needs.
- However, with the latest version of M365 and Project for the web, Microsoft is boasting of renewed PPM capabilities from its toolset. These capabilities are largely facilitated through what Microsoft is calling its Power Platform (i.e. a suite of products that includes Power, Power Apps, and Power Automate).
Explore the Microsoft product offering for abstracted project portfolio management
Download the M365 Project Portfolio Management Tool Guide
Project Portfolio Management
Doing the right projects, at the right time, with the right resources
- Who does it?
- PMO directors; portfolio managers
- What is it?
A strategic approach to approving, prioritizing, resourcing, and reporting on projects using applications in M365 and Project for the web. In distinction to enterprise PPM, a top-down or abstracted approach is applied, meaning PPM data is not tied to project task details.
- Where is it done?
- Digital tool, either homegrown or commercial
- How is it done?
- Currently in M365, PPM approaches are largely self-developed, though Microsoft Gold Partners are commonly involved.
- User norms are still evolving, along with the software’s (Project for the web) function.
Microsoft differentiator:
Integration between Project for the web and Power Apps allows for custom approaches.
Project Portfolio Management Overview
Microsoft’s legacy project management toolset has contributed to the definition of traditional or enterprise PPM space.
A robust and intensive bottom-up approach that requires task level roll-ups from projects to inform portfolio level data. For this model to work, reconciliation of individual resource capacity must be universal and perpetually current.
If your organization has low or no maturity with PPM, this approach will be tough to make successful.
In fact, most organizations under adopt the tools required to effectively operate with the traditional project portfolio management. Once adopted and operationalized, this combination of tools gives the executives the most precise view of the current state of projects within the portfolio.
Explore the Microsoft product offering for enterprise project portfolio management
Download the M365 Project Portfolio Management Tool Guide
Enterprise Project and Portfolio Management
Bottom-up approach to managing the project portfolio
- Who does it?
- PMO and ePMO directors; portfolio managers
- Project managers
- What is it?
- A strategic approach to approving, prioritizing, resourcing, and reporting on projects using applications in M365 and Project for the web. In distinction to enterprise PPM, a top-down or abstracted approach is applied, meaning PPM data is not tied to project task details.
- Where is it done?
- Digital tool that is usually commercial.
- How is it done?
- Microsoft Gold Partner involvement is highly likely in successful implementations.
- Usage norms are long established and customized solutions are prevalent.
- To be successful, use must be highly governed.
- Reconciliation of individual resource capacity must be universal and perpetually current.
Microsoft differentiator:
Microsoft’s established network of Gold Partners helps to make this deployment a viable option.
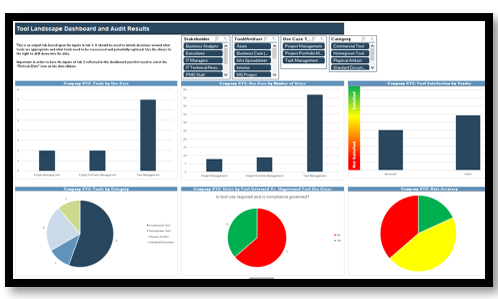
Assess your current tool ecosystem across work management categories
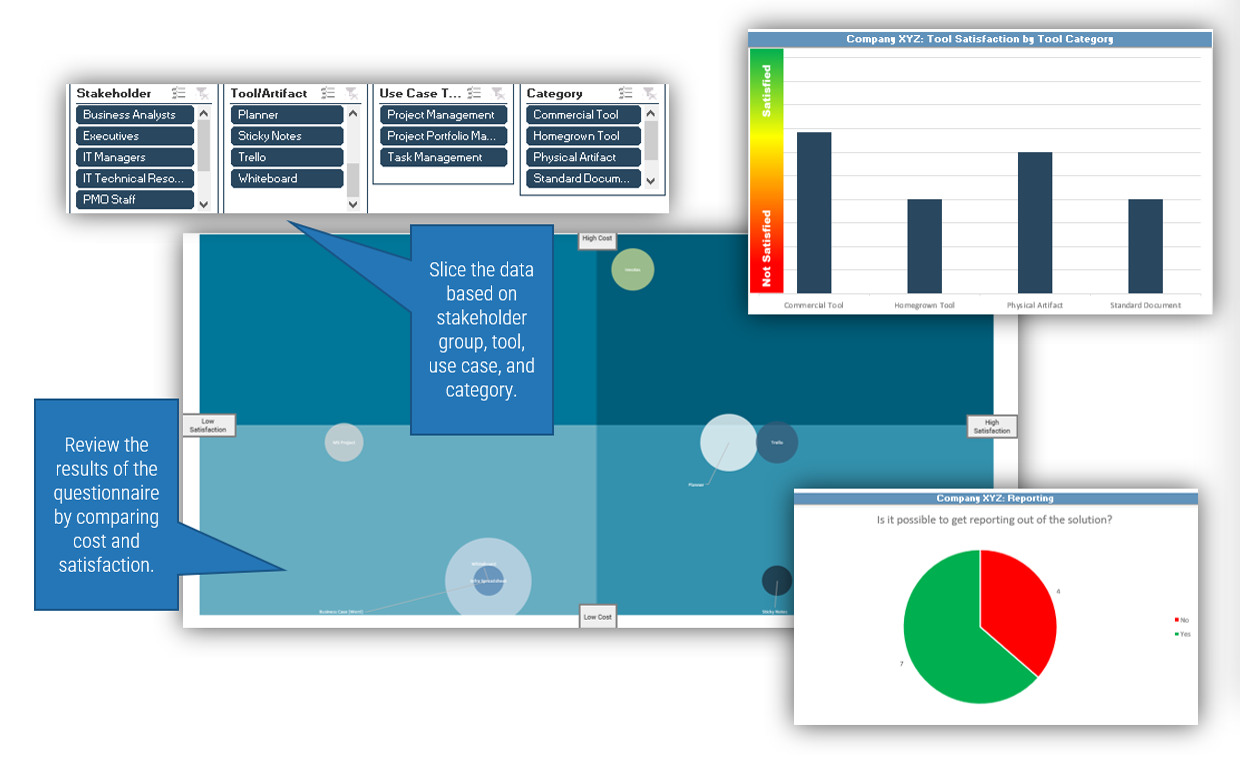
Use Info-Tech’s Tool Audit Workbook to assess the value and satisfaction for the work management tools currently in use.
- With the modes of working in mind that have been addressed in the previous slides and in Info-Tech’s Tool Guides, the activity slides ahead encourage you to engage your wider organization to determine all of the ways of working across individuals and teams.
- Depending on the scope of your work management optimization, these engagements may be limited to IT or may extend to the business.
- Use Info-Tech’s Tool Audit Workbook to help you gather and make sense of the tool data you collect. The result of this activity is to gain insight into the tools that drive value and fail to drive value across your work management categories with a view to streamline the organization’s tool ecosystem.
Download Info-Tech’s Tool Audit Workbook
1.2.1 Compile list of tools
1-3 hours
Input: Information on tools used to complete task, project, and portfolio tasks
Output: Analyzed list of tools
Materials: Whiteboard/Flip Charts, Tool Audit Workbook
Participants: Portfolio Manager (PMO Director), PMO Admin Team, Project Managers, Business Stakeholders
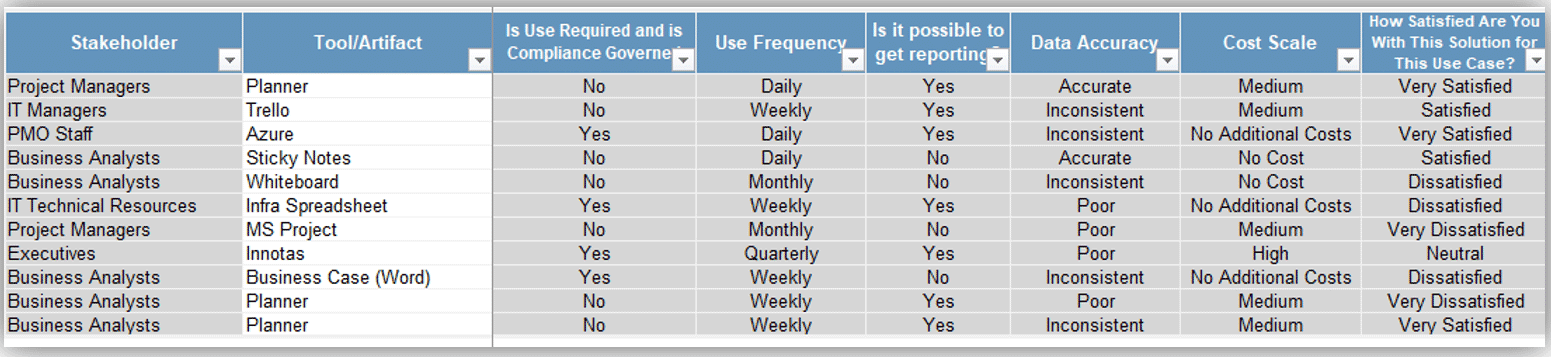
- Identify the stakeholder groups that are in scope. For each group that you’ve identified, brainstorm the different tools and artifacts that are necessary to get the task, project, and project portfolio management functions done.
- Make sure to record the tool name and specify its category (standard document, artifact, homegrown solution, or commercial solution).
- Think about and discuss how often the tool is being used for each use case across the organization. Document whether its use is required. Then assess reporting functionality, data accuracy, and cost.
- Lastly, give a satisfaction rating for each use case.
Excerpt from the Tool Audit Workbook
1.2.1 Review dashboard
1-3 hours
Input: List of key PPM decision points, List of who is accountable for PPM decisions, List of who has PPM decision-making authority
Output: Prioritized list of PPM decision-making support needs
Materials: Whiteboard/Flip Charts, Tool Audit Workbook
Participants: Portfolio Manager (PMO Director), PMO Admin Team, CIO
Discuss the outputs of the Dashboards tab to inform your decision maker on whether to pass or fail the tool for each use case.
1.2.1 Execute final audit
1 hour
Input: List of key PPM decision points, List of who is accountable for PPM decisions, List of who has PPM decision-making authority
Output: Prioritized list of PPM decision-making support needs
Materials: Whiteboard/Flip Charts, Tool Audit Workbook
Participants: Portfolio Manager (PMO Director), PMO Admin Team, CIO
- Using the information available, schedule time with the leadership team to present the results.
- Identify the accountable party to make the final decision on what current tools pass or fail the final audit.
- Mind the gap presented by the failed tools and look to possibilities within the M365 and Microsoft Project suite. For each tool that is deemed unsatisfactory for the future state, mark it as “Fail” in column O on tab 2 of the Tool Audit Workbook. This will ensure the item shows in the “Fail” column on tab 4 of the tool when you refresh the data.
- For each of the tools that “fail” your audit and that you’re going to make recommendations to rationalize in a future state, try to capture the annual total current-state spending on licenses, and the work modes the tool currently supports (i.e. task, project, and/or portfolio management).
- Additionally, start to think about future-state replacements for each tool within or outside of the M365/MS Project platforms. As we move forward to finalize your action plan in the last phase of this blueprint, we will capture and present this information to key stakeholders.
Document your goals, needs, and constraints before proceeding
Use Info-Tech’s Force Field Analysis Tool to help weigh goals and needs against risks and constraints associated with a work management change.
- Now that you have discussed the organization’s ways of working and assessed its tool landscape – and made some initial decisions on some tool options that might need to change across that landscape – gather key stakeholders to define (a) why a change is needed at this time and (b) to document some of the risks and constraints associated with changing.
- Info-Tech’s Force Field Analysis Tool can be used to capture these data points. It takes an organizational change management approach and asks you to consider the positive and negative forces associated with a work management tool change at this time.
- The slides ahead walk you through a force field analysis activity and help you to navigate the relevant tabs in the Tool.
Download Info-Tech's Force Field Analysis Tool
1.2.1 Identify goals and needs (1 of 2)
Use tab 1 of the Force Field Analysis Workbook to assess goals and needs.
30 minutes
Input: Opportunities associated with determining the use case for Microsoft Project and M365 in your organization
Output: Plotted opportunities based on probability and impact
Materials: Whiteboard/Flip Charts, Force Field Analysis Tool
Participants: Portfolio Manager (PMO Director), PMO Admin Team, Project Managers
- Brainstorm opportunities associated with exploring and/or implementing Microsoft Project and the Microsoft 365 suite of products for task, project, and project portfolio management.
- Document relevant opportunities in tab 1 of the Force Field Analysis Tool. For each driving force for the change (note: a driving force can include goals and needs) that is identified, provide a category that explains why the driving force is a concern (i.e. with this force is the organization looking to mature, integrate, scape, or accelerate?).
- In addition, assess the ease of achieving or realizing each goal or need and the impact of realizing them on the PMO and/or the organization.
- See the next slide for a screenshot that helps you navigate tab 1 of the Tool.
Download the Force Field Analysis Tool
1.2.1 Identify goals and needs (2 of 2)
Screenshot of tab 1 of the Force Field Analysis Workbook.
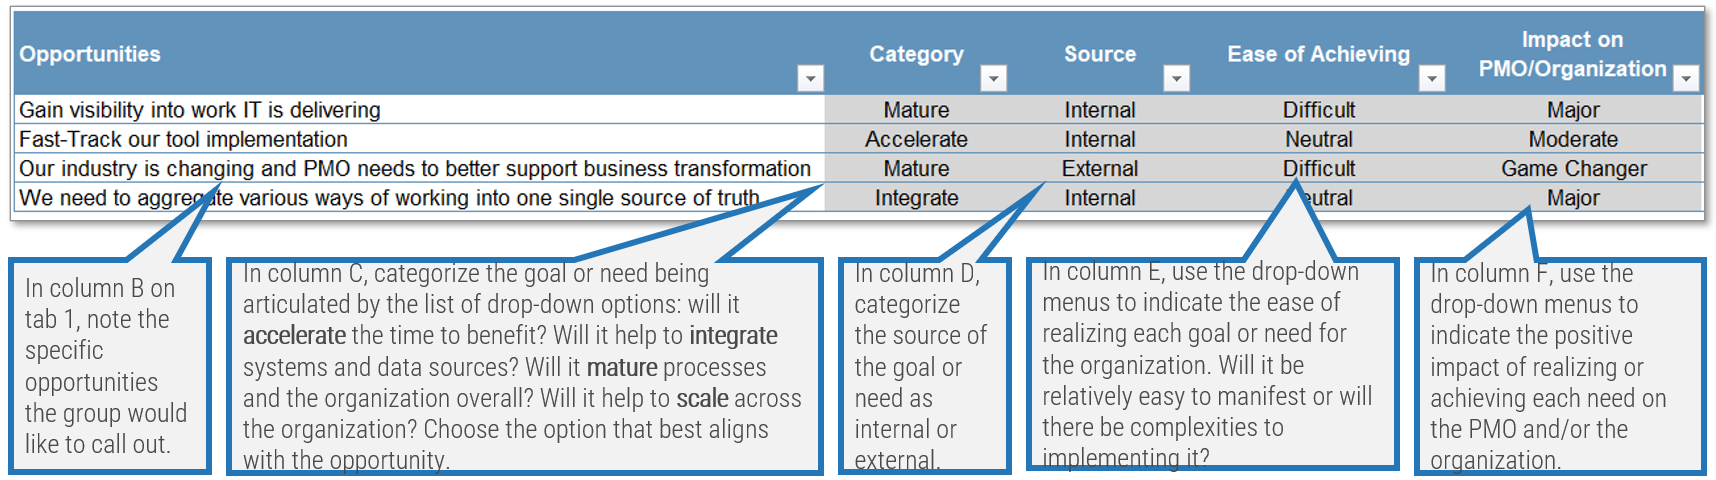
In column B on tab 1, note the specific opportunities the group would like to call out.
In column C, categorize the goal or need being articulated by the list of drop-down options: will it accelerate the time to benefit? Will it help to integrate systems and data sources? Will it mature processes and the organization overall? Will it help to scale across the organization? Choose the option that best aligns with the opportunity.
In column D, categorize the source of the goal or need as internal or external.
In column E, use the drop-down menus to indicate the ease of realizing each goal or need for the organization. Will it be relatively easy to manifest or will there be complexities to implementing it?
In column F, use the drop-down menus to indicate the positive impact of realizing or achieving each need on the PMO and/or the organization.
On tab 3 of the Force Field Analysis Workbook, your inputs on tab 1 are summarized in graphical form from columns B to G. On tab 3, these goals and needs results are contrasted with your inputs on tab 2 (see next slide).
1.2.2 Identify risk and constraints (1 of 2)
Use tab 2 of the Force Field Analysis Workbook to assess opposing forces to change.
30 minutes
Input: Risks associated with determining the use case for Microsoft Project and M365 in your organization
Output: Plotted risks based on probability and impact
Materials: Whiteboard/Flip Charts, Force Field Analysis Tool
Participants: Portfolio Manager (PMO Director), PMO Admin Team, Project Managers
- With the same working group from 1.2.1, brainstorm risks, constraints, and other opposing forces pertaining to your potential future state.
- Document relevant opposing forces in tab 2 of the Force Field Analysis Tool. For each opposing force for the change (note: a driving force can include goals and needs) that is identified, provide a category that explains why the opposing force is a concern (i.e. will it impact or is it impacted by time, resources, maturity, budget, or culture?).
- In addition, assess the likelihood of the risk or constraint coming to light and the negative impact of it coming to light for your proposed change.
- See the next slide for a screenshot that helps you navigate tab 2 of the Force Field Analysis Tool.
Download the Force Field Analysis Tool
1.2.2 Identify risk and constraints (2 of 2)
Screenshot of tab 2 of the Force Field Analysis Workbook.
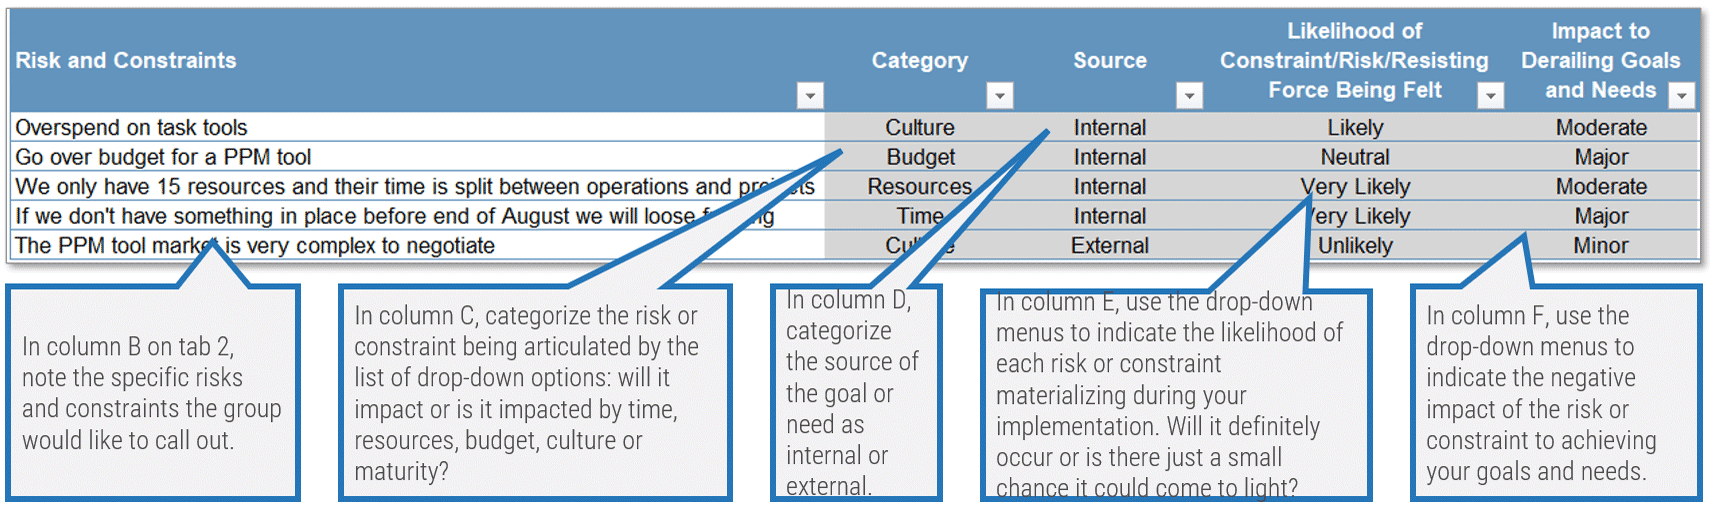
In column B on tab 2, note the specific risks and constraints the group would like to call out.
In column C, categorize the risk or constraint being articulated by the list of drop-down options: will it impact or is it impacted by time, resources, budget, culture or maturity?
In column D, categorize the source of the goal or need as internal or external.
In column E, use the drop-down menus to indicate the likelihood of each risk or constraint materializing during your implementation. Will it definitely occur or is there just a small chance it could come to light?
In column F, use the drop-down menus to indicate the negative impact of the risk or constraint to achieving your goals and needs.
On tab 3 of the Force Field Analysis Workbook, your inputs on tab 2 are summarized in graphical form from columns I to N. On tab 3, your risk and constraint results are contrasted with your inputs on tab 1 to help you gauge the relative weight of driving vs. opposing forces.
Step 1.2
Explore the Microsoft Project Plans and their capabilities
Activities
- 1.1.1 Review the Microsoft 365 licensing features
- 1.1.2 Explore the Microsoft Project Plan licenses
- 1.1.3 Prepare a needs assessment for Microsoft 365 and Project Plan licenses
This step will walk you through the following activities:
- Review the suite of task management, project management, and project portfolio management options available in Microsoft 365.
- Prepare a preliminary checklist of required M365 apps for your stakeholders.
This step usually involves the following participants:
- PMO/Portfolio Manager
- Project Managers
- CIO and other executive stakeholders
- Other project portfolio stakeholders (project and IT workers)
Outcomes of Step
- Preliminary requirements for an M365 project management and project portfolio management tool implementation
Microsoft recently revamped its project plans to balance its old and new tech
Access to the new tech, Project for the web, comes with all license types, while Project Online Professional and Premium licenses have been revamped as P3 and P5.
Navigating Microsoft licensing is never easy, and Project for the web has further complicated licensing needs for project professionals.
As we’ll cover in step 2.1 of this blueprint, Project for the web can be extended beyond its base lightweight work management functionality using the Power Platform (Power Apps, Power Automate, and Power BI). Depending on the scope of your implementation, this can require additional Power Platform licensing.
- In this step, we will help you understand the basics of what’s already included in your enterprise M365 licensing as well as what’s new in Microsoft’s recent Project licensing plans (P1, P3, and P5).
- As we cover toward the end of this step, you can use Info-Tech’s MS Project and M365 Licensing Tool to help you understand your plan and licensing needs. Further assistance on licensing can be found in the Task, Project, and Portfolio Management Tool Guides that accompany this blueprint and Info-Tech’s Modernize Your Microsoft Licensing for the Cloud Era.
Download Info-Tech’s Modernize Your Microsoft Licensing for the Cloud Era
Licensing features for knowledge workers
Please note that licensing packages are frequently subject to change. This is up to date as of August 2021. For the most up-to-date information on licensing, visit the Microsoft website.
Bundles are extremely common and can be more cost effective than à la carte options for the Microsoft products.
The biggest differentiator between M365 and O365 is that the M365 product also includes Windows 10 and Enterprise Mobility and Security.
The color coding in the diagram indicates that the same platform/application suite is available.
| Platform or Application
|
M365 E3
|
M365 E5
|
O365 E1
|
O365 E3
|
O365 E5
|
| Microsoft Forms
|
X
|
X
|
X
|
X
|
X
|
| Microsoft Lists
|
X
|
X
|
X
|
X
|
X
|
| OneDrive
|
X
|
X
|
X
|
X
|
X
|
| Planner
|
X
|
X
|
X
|
X
|
X
|
| Power Apps for Office 365
|
X
|
X
|
X
|
X
|
X
|
| Power Automate for Office
|
X
|
X
|
X
|
X
|
X
|
| Power BI Pro
|
|
X
|
|
|
X
|
| Power Virtual Agents for Teams
|
X
|
X
|
X
|
X
|
X
|
| SharePoint
|
X
|
X
|
X
|
X
|
X
|
| Stream
|
X
|
X
|
X
|
X
|
X
|
| Sway
|
X
|
X
|
X
|
X
|
X
|
| Teams
|
X
|
X
|
X
|
X
|
X
|
| To Do
|
X
|
X
|
X
|
X
|
X
|
Get familiar with Microsoft Project Plan 1
Please note that licensing packages are frequently subject to change. This is up to date as of August 2021. For the most up to date information on licensing, visit the Microsoft website.
Who is a good fit?
- New project managers
- Zero-allocation project managers
- Individuals and organizations who want to move out of Excel into something less fragile (easily breaking formulas)
What does it include?
- Access to Project Home, a landing page to access all project plans you’ve created or have been assigned to.
- Access to Grid View, Board View, and Timeline (Gantt) View to plan and manage your projects with Project for the web
- Sharing Project for the web plans across Microsoft Teams channels
- Co-authoring on project plans
When does it make sense?
- Lightweight project management
- No process to use bottom-up approach for resourcing data
- Critical-path analysis is not required
- Organization does not have an appetite for project management rigor
Get familiar with Microsoft Project Plan 3
Please note that licensing packages are frequently subject to change. This is up to date as of August 2021. For the most up to date information on licensing, visit the Microsoft website.
Who is a good fit?
- Experienced and dedicated project managers
- Organizations with complex projects
- Large project teams are required to complete project work
- Organizations have experience using project management software
What does it include?
Everything in Project Plan 1 plus the following:
- Reporting through Power BI Report template apps (note that there are no pre-built reports for Project for the web)
- Access to build a Roadmap of projects from Project for the web and Azure DevOps with key milestones, statuses, and deadlines
- Project Online to submit and track timesheets for project teams
- MS Project Desktop Client to support resource management
When does it make sense?
- Project management is an established discipline at the organization
- Critical-path analysis is commonly used
- Organization has some appetite for project management rigor
- Resources are expected to submit timesheets to allow for more precise resource management data
Get familiar with Microsoft Project Plan 5
Please note that licensing packages are frequently subject to change. This is up to date as of August 2021. For the most up to date information on licensing, visit the Microsoft website.
Who is a good fit?
- Experienced and dedicated project managers
- Experienced and dedicated PMO directors
- Dedicated portfolio managers
- Organizations proficient at sustaining data in a standard tool
What does it include?
Everything in Project Plan 3 plus the following:
- Portfolio selection and optimization
- Demand management
- Enterprise resource planning and management through deterministic task and resource scheduling
- MS Project Desktop Client to support resource management
When does it make sense?
- Project management is a key success factor at the organization
- Organization employs a bottom-up approach for resourcing data
- Critical-path analysis is required
- Formal project portfolio management processes are well established
- The organization is willing to either put in the time, energy, and resources to learn to configure the system through DIY or is willing to leverage a Microsoft Partner to help them do so
What’s included in each plan (1 of 2)
Plan details are up to date as of September 2021. Plans and pricing can change often. Visit the Microsoft website to validate plan options and get pricing details.
| MS Project Capabilities
|
Info-Tech's Editorial Description
|
P1
|
P3
|
P5
|
| Project Home
|
Essentially a landing page that allows you to access all the project plans you've created or that you're assigned to. It amalgamates plans created in Project for the web, the Project for the web app in Power Apps, and Project Online.
|
X
|
X
|
X
|
| Grid view
|
One of three options in which to create your project plans in Project for the web (board view and timeline view are the other options). You can switch back and forth between the options.
|
X
|
X
|
X
|
| Board view
|
One of three options in which to create your project plans in Project for the web (grid view and timeline view are the other options). You can switch back and forth between the options.
|
X
|
X
|
X
|
| Timeline (Gantt) view
|
One of three options in which to create your project plans in Project for the web (board view and grid view are the other options). You can switch back and forth between the options.
|
X
|
X
|
X
|
| Collaboration and communication
|
This references the ability to add Project for the web project plans to Teams channels.
|
X
|
X
|
X
|
| Coauthoring
|
Many people can have access to the same project plan and can update tasks.
|
X
|
X
|
X
|
| Project planning and scheduling
|
For this the marketing lingo says "includes familiar scheduling tools to assign project tasks to team members and use different views like Grid, Board, and Timeline (Gantt chart) to oversee the schedule." Unclear how this is different than the project plans in the three view options above.
|
X
|
X
|
X
|
X - Functionality Included in Plan
O - Functionality Not Included in Plan
What’s included in each plan (2 of 2)
Plan details are up to date as of September 2021. Plans and pricing can change often. Visit the Microsoft website to validate plan options and get pricing details.
| MS Project Capabilities
|
Info-Tech's Editorial Description
|
P1
|
P3
|
P5
|
| Reporting
|
This seems to reference Excel reports and the Power BI Report Template App, which can be used if you're using Project Online. There are no pre-built reports for Project for the web, but third-party Power Apps are available.
|
O
|
X
|
X
|
| Roadmap
|
Roadmap is a platform that allows you to take one or more projects from Project for the web and Azure DevOps and create an organizational roadmap. Once your projects are loaded into Roadmap you can perform additional customizations like color status reporting and adding key days and milestones.
|
O
|
X
|
X
|
| Timesheet submission
|
Project Online and Server 2013 and 2016 allow team members to submit timesheets if the functionality is required.
|
O
|
X
|
X
|
| Resource management
|
The rich MS Project client supports old school, deterministic project scheduling at the project level.
|
O
|
X
|
X
|
| Desktop client
|
The full desktop client comes with P3 and P5, where it acts as the rich editor for project plans. The software enjoys a multi-decade market dominance as a project management tool but was never paired with an enterprise collaboration server engine that enjoyed the same level of success.
|
O
|
X
|
X
|
| Portfolio selection and optimization
|
Portfolio selection and optimization has been offered as part of the enterprise project and portfolio suite for many years. Most people taking advantage of this capability have used a Microsoft Partner to formalize and operationalize the feature.
|
O
|
O
|
X
|
| Demand Management
|
Enterprise demand management is targeted at the most rigorous of project portfolio management practices. Most people taking advantage of this capability have used a Microsoft Partner to formalize and operationalize the feature.
|
O
|
O
|
X
|
| Enterprise resource planning and management
|
The legacy MS Project Online/Server platform supports enterprise-wide resource capacity management through an old-school, deterministic task and resource scheduling engine, assuming scaled-out deployment of Active Directory. Most people succeeding with this capability have used a Microsoft Partner to formalize and operationalize the feature.
|
O
|
O
|
X
|
X - Functionality Included in Plan
O - Functionality Not Included in Plan
Use Info-Tech’s MS Project and M365 Licensing Tool
Leverage the analysis in Info-Tech’s MS Project & M365 Licensing Tool to help inform your initial assumptions about what you need and how much to budget for it.
- The Licensing Tool can help you determine what Project Plan licensing different user groups might need as well as additional Power Platform licensing that may be required.
- It consists of four main tabs: two set-up tabs where you can validate the plan and pricing information for M365 and MS Project; an analysis tab where you set up your user groups and follow a survey to assess their Project Plan needs; and another analysis tab where you can document your Power Platform licensing needs across your user groups.
- There is also a business case tab that breaks down your total licensing needs. The outputs of this tab can be used in your MS Project & M365 Action Plan Template, which we will help you develop in phase three of this blueprint.
Download Info-Tech's Microsoft Project & M365 Licensing Tool
1.2.1 Conduct a needs assessment
1-2 hours
Input: List of key user groups/profiles, Number of users and current licenses
Output: List of Microsoft applications/capabilities included with each license, Analysis of user group needs for Microsoft Project Plan licenses
Materials: Microsoft Project & 365 Licensing Tool
Participants: Portfolio Manager (PMO Director), PMO Admin Team, Project Managers
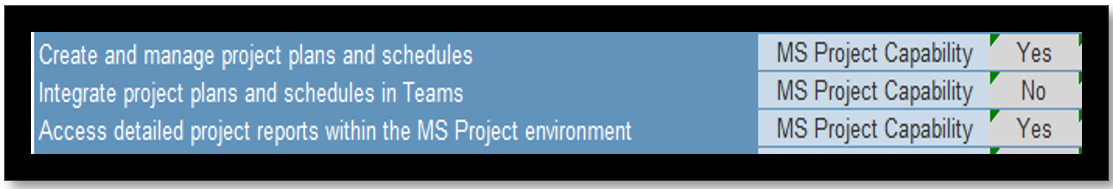
- As a group, analyze the applications included in your current or desired 365 license and calculate any additional Power Platform licensing needs.
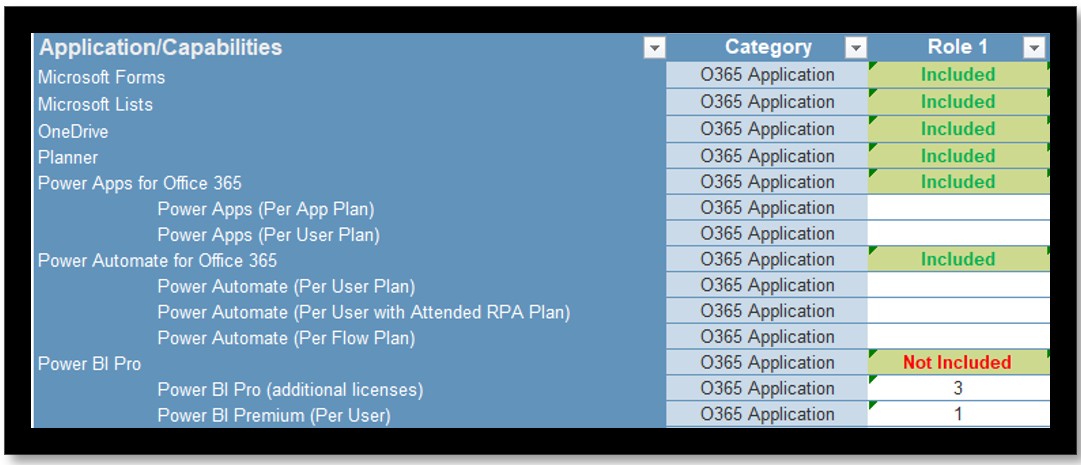
- Within the same group, use the drop-down menus to analyze your high-level MS Project requirements by selecting whether each capability is necessary or not.
- Your inputs to the needs assessment will determine the figures in the Business Case tab. Consider exporting this information to PDF or other format to distribute to stakeholders.
Download Info-Tech's Microsoft Project & M365 Licensing Tool
Step 1.3
Assess the maturity of your current PM & PPM capabilities
Activities
- Assess current state project and project portfolio management processes and tools
- Determine target state project and project portfolio management processes and tools
This step will walk you through the following activities:
- Assess current state project and project portfolio management processes and tools
- Determine target state project and project portfolio management processes and tools
This step usually involves the following participants:
- PMO/Portfolio Manager
- Project Managers
- CIO and other executive stakeholders
- Other project portfolio stakeholders (project and IT workers)
Outcomes of Step
- Current and target state maturity for project management and project portfolio management processes
Project portfolio management and project management are more than tools
Implementing commercial tools without a matching level of process discipline is a futile exercise, leaving organizations frustrated at the wasted time and money.
- The tool is only as good as the data that is input. There is often a misunderstanding that a tool will be “automatic.” While it is true that a tool can help make certain processes easier and more convenient by aggregating information, enhancing reporting, and coauthoring, it will not make up the data. If data becomes stale, the tool is no longer valid for accurate decision making.
- Getting people onboard and establishing a clear process is often the hardest part. As IT folk, it can be easy to get wrapped up in the technology. All too often excitement around tools can drown out the important requisites around people and process. The reality is people and process are a necessary condition for a tool to be successful. Having a tool will not be sufficient to overcome obstacles like poor stakeholder buy-in, inadequate governance, and the absence of a standard operating procedure.
- Slow is the way to go. When deciding what tools to purchase, start small and scale up rather than going all in and all too often ending up with many unused features and fees.
"There's been a chicken-egg debate raging in the PPM world for decades: What comes first, the tool or the process? It seems reasonable to say, ‘We don't have a process now, so we'll just adopt the one in the tool.’ But you'll soon find out that the tool doesn't have a process, and you needed to do more planning and analysis before buying the tool." (Barry Cousins, Practice Lead, Project Portfolio Management)
Assess your process maturity to determine the right tool approach
Take the time to consider and reflect on the current and target state of the processes for project portfolio management and project management.
Project Portfolio Management
- Status and Progress Reporting
Intake, Approval, and Prioritization
PPM is the practice of selecting the right projects and ensuring the organization has the necessary resources to complete them. PPM should enable executive decision makers to make sense of the excess of demand and give IT the ability to prioritize those projects that are most valuable to the business.Resource Management
Project Management
- Initiation
- Planning
- Execution
- Monitoring and Controlling
- Closing
Tailor a project management framework to fit your organization. Formal methodologies aren’t always the best fit. Take what you can use from formal frameworks and define a right-sized approach to your project management processes.Project Closure
Benefits Tracking
Info-Tech’s maturity assessment tools can help you match your tools to your maturity level
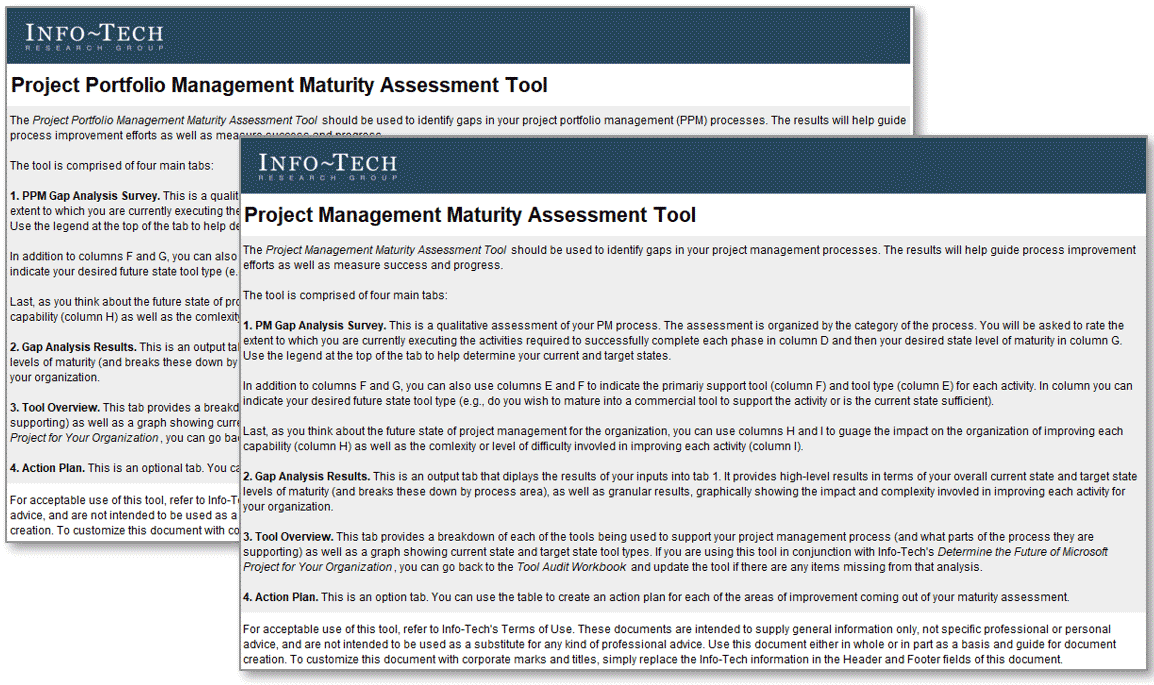
Use Info-Tech’s Project Portfolio Management Maturity Assessment Tool and Project Management Maturity Assessment Tool.
- The next few slides in this step take you through using our maturity assessment tools to help gauge your current-state and target-state maturity levels for project management (PM) and project portfolio management (PPM).
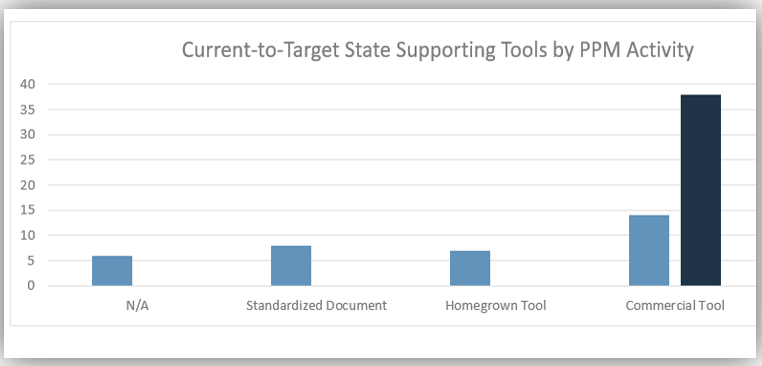
- In addition to the process maturity assessments, these workbooks also help you document current-state support tools and desired target-state tools.
- The outputs of these workbooks can be used in your MS Project & M365 Action Plan Template, which we will help you develop in phase three of this blueprint.
Download Info-Tech’s Project Portfolio Management Maturity Assessment Tool and Project Management Maturity Assessment Tool
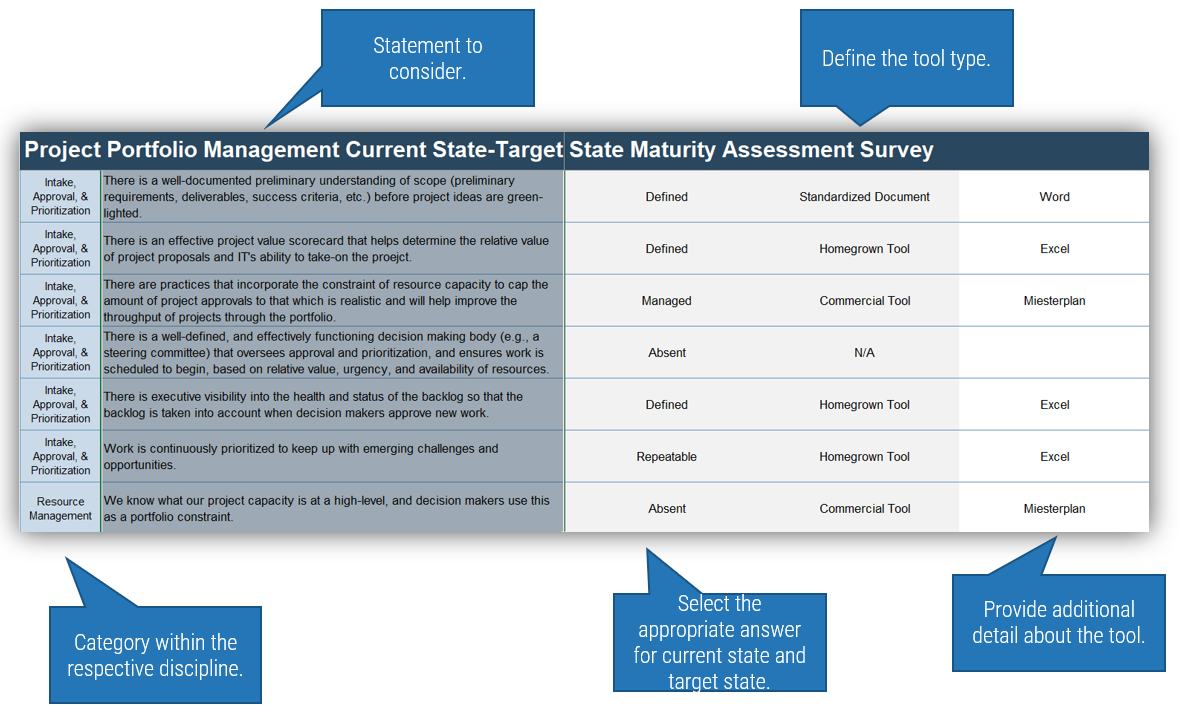
Conduct a gap analysis survey for both project and project portfolio management.
- Review the category and activity statements: For each gap analysis tab in the maturity assessments, use the comprehensive activity statements to identify gaps for the organization.
- Assess the current state: To assess the current state, evaluate whether the statement should be labeled as:
- Absent: There is no evidence of any activities supporting this process.
- Initial: Activity is ad hoc and not well defined.
- Defined: Activity is established and there is moderate adherence to its execution.
- Repeatable: Activity is established, documented, repeatable, and integrated with other phases of the process.
- Managed: Activity execution is tracked by gathering qualitative and quantitative feedback
Once this is documented, take some time to describe the type of tool being used to do this (commercial, home-grown, standardized document) and provide additional details, where applicable.
Define the target state: Repeat the assessment of activity statements for the target state. Then gauge the organizational impact and complexity of improving each capability on a scale of very low to very high.
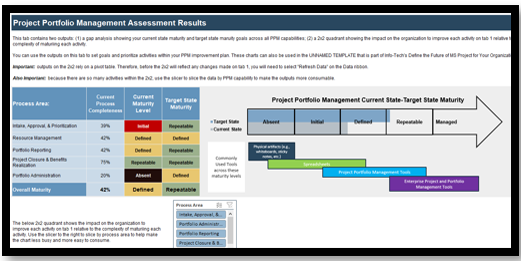
Analyze survey results for project and project portfolio management maturity
Take stock of the gap between current state and target state.
- What process areas have the biggest gap between current and target state?
- What areas are aligned across current and target state?
Identify what areas are currently the least and most mature.
- What process area causes the most pain in the organization?
- What process area is the organization’s lowest priority?
Note the overall current process maturity.
- After having done this exercise, does the overall maturity come as a surprise?
- If so, what are some of the areas that were previously overlooked?
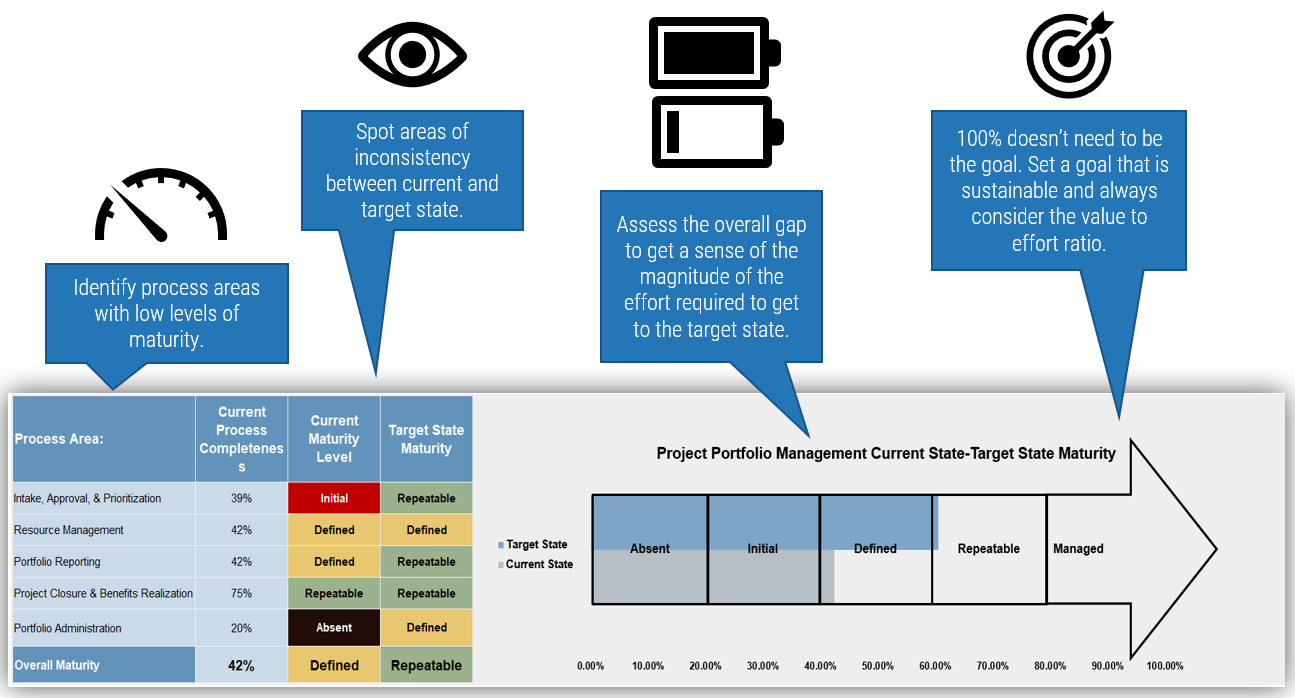
- Identify process areas with low levels of maturity
- Spot areas of inconsistency between current and target state.
- Assess the overall gap to get a sense of the magnitude of the effort required to get to the target state.
- 100% doesn’t need to be the goal. Set a goal that is sustainable and always consider the value to effort ratio.
Screenshot your results and put them into the MS Project and M365 Action Plan Template.
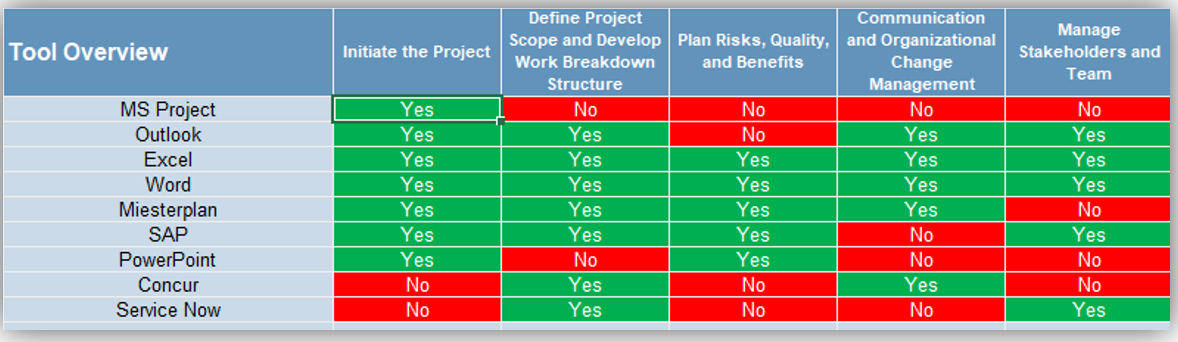
Review the tool overview and plan to address gaps (tabs 3 & 4)
Tool Overview:
Analyze the applications used to support your project management and project portfolio management processes.
Look for:
- Tools that help with processes across the entire PM or PPM lifecycle.
- Tools that are only used for one specific process.
Reflect on the overlap between process areas with pain points and the current tools being used to complete this process.
Consider the sustainability of the target-state tool choice
You have the option to create an action plan for each of the areas of improvement coming out of your maturity assessment.
This can include:
- Tactical Optimization Action: What is the main action needed to improve capability?
- Related Actions: Is there a cross-over with any actions for other capabilities?
- Timeframe: Is this near-term, mid-term, or long-term?
- Proposed Start Date
- Proposed Go-Live Date
- RACI: Who will be responsible, accountable, consulted, and informed?
- Status: What is the status of this action item over time?
Determine the Future of Microsoft Project for Your Organization
Phase 2: Weigh Your Implementation Options
| Phase 1: Determine Your Tool Needs | Phase 2: Weigh Your Implementation Options | Phase 3: Finalize Your Implementation Approach |
- Step 1.1: Survey the M365 work management landscape
- Step 1.2: Perform a process maturity assessment to help inform your M365 starting point
- Step 1.3: Consider the right MS Project licenses for your stakeholders
|
- Step 2.1: Get familiar with extending Project for the web using Power Apps
- Step 2.2: Assess the MS Gold Partner Community
|
- Step 3.1: Prepare an action plan
|
Phase Outcomes
- A decision on how best to proceed (or not proceed) with Project for the web
- A Partner outreach plan
Step 2.1
Get familiar with extending Project for the web using Power Apps
Activities
- Get familiar with Project for the web: how it differs from Microsoft’s traditional project offerings and where it is going
- Understand the basics of how to extend Project for the web in Power Apps
- Perform a feasibility test
This step will walk you through the following activities:
- Get familiar with Project for the web
- Understand the basics of how to extend Project for the web in Power Apps
- Perform a feasibility test to determine if taking a DIY approach to extending Project for the web is right for your organization currently
This step usually involves the following participants:
- Portfolio Manager (PMO Director)
- Project Managers
- Other relevant PMO stakeholders
Outcomes of Step
- A decision on how best to proceed (or not proceed) with Project for the web
Project for the web is the latest of Microsoft’s project management offerings
What is Project for the web?
- First introduced in 2019 as Project Service, Project for the web (PFTW) is Microsoft’s entry into the world of cloud-based work management and lightweight project management options.
- Built on the Power Platform and leveraging the Dataverse for data storage, PFTW integrates with the many applications that M365 users are already employing in their day-to-day work management and collaboration activities.
- It is available as a part of your M365 subscription with the minimum activation of P1 license – it comes with P3 and P5 licenses as well.
- From a functionality and user experience perspective, PFTW is closer to applications like Planner or Azure Boards than it is to traditional MS Project options.
What does it do?
- PFTW allows for task and dependency tracking and basic timeline creation and scheduling and offers board and grid view options. It also allows real-time coauthoring of tasks among team members scheduled to the same project.
- PFTW also comes with a product/functionality Microsoft calls Roadmap, which allows users to aggregate multiple project timelines into a single view for reporting purposes.
What doesn't it do?
- With PFTW, Microsoft is offering noticeably less traditional project management functionality than its existing solutions. Absent are table stakes project management capabilities like critical path, baselining, resource load balancing, etc.
Who is it for?
- Currently, in its base lightweight project management option, PFTW is targeted toward occasional or part-time project managers (not the PMP-certified set) tasked with overseeing and/or collaborating on small to mid-sized initiatives and projects.
Put Project for the web in perspective
Out of the box, PFTW occupies a liminal space when it comes to work management options
- More than a task management tool, but not quite a full project management tool
- Not exactly a portfolio management tool, yet some PPM reporting functionality is inherent in the PFTW through Roadmap
The table to the right shows some of the functionality in PFTW in relation to the task management functionality of Planner and the enterprise project and portfolio management functionality of Project Online.
| Table 2.1a
|
Planner
|
Project for the web
|
Project Online
|
| Coauthoring on Tasks
|
X
|
X
|
|
| Task Planning
|
X
|
X
|
X
|
| Resource Assignments
|
X
|
X
|
X
|
| Board Views
|
X
|
X
|
X
|
| MS Teams Integration
|
X
|
X
|
X
|
| Roadmap
|
|
X
|
X
|
| Table and Gantt Views
|
|
X
|
X
|
| Task Dependency Tracking
|
|
X
|
X
|
| Timesheets
|
|
|
X
|
| Financial Planning
|
|
|
X
|
| Risks and Issues Tracking
|
|
|
X
|
| Program Management
|
|
|
X
|
| Advanced Portfolio Management
|
|
|
X
|
Project for the web will eventually replace Project Online
- As early as 2018 Microsoft has been foreshadowing a transition away from the SharePoint-backed Project environments of Server and Online toward something based in Common Data Service (CDS) – now rebranded as the Dataverse.
- Indeed, as recently as the spring of 2021, at its Reimagine Project Management online event, Microsoft reiterated its plans to sunset Project Online and transition existing Online users to the new environment of Project for the web – though it provided no firm dates when this might occur.
- The reason for this move away from Online appears to be an acknowledgment that the rigidity of the tool is awkward in our current dynamic, collaborative, and overhead-adverse work management paradigm.
- To paraphrase a point made by George Bullock, Sr. Product Marketing Manager, for Microsoft at the Reimagine Project Management event, teams want to manage work as they see fit, but the rigidity of legacy solutions doesn’t allow for this, leading to a proliferation of tools and data sprawl. (This comment was made during the “Overview of Microsoft Project” session during the Reimagine event.)
PFTW is Microsoft’s proposed future-state antidote to this challenge. Its success will depend on how well users are able to integrate the solution into a wider M365 work management setting.
"We are committed to supporting our customers on Project Online and helping them transition to Project for the Web. No end-of-support has been set for Project Online, but when the time comes, we will communicate our plans on the transition path and give you plenty of advance notice." (Heather Heide, Program Manager, Microsoft Planner and Project. This comment was made during the “Overview of Microsoft Project” session during the Reimagine event.)
Project for the web can be extended beyond its base lightweight functionality
Project for the web can be extended to add more traditional and robust project and project portfolio management functionality using the Power Platform.
Microsoft plans to sunset Project Online in favor of PFTW will at first be a head-scratcher for those familiar with the extensive PPM functionality in Project Online and underwhelmed by the project and portfolio management in PFTW.
However, having built the solution upon the Power Platform, Microsoft has made it possible to take the base functionality in PFTW and extend it to create a more custom, organizationally specific user experience.
- With a little taste of what can be done with PFTW by leveraging the Power Platform – and, in particular, Power Apps – it becomes more obvious how we, as users, can begin to evolve the base tool toward a more traditional PPM solution and how, in time, Microsoft’s developers may develop the next iteration of PFTW into something more closely resembling Project Online.
Before users get too excited about using these tools to build a custom PPM approach, we should consider the time, effort, and skills required. The slides ahead will take you through a series of considerations to help you gauge whether your PMO is ready to go it alone in extending the solution.
Extending the tool enhances functionality
Table 2.1a in this step displayed the functionality in PFTW in relation to the task management tool Planner and the robust PPM functionality in Online.
The table to the right shows how the functionality in PFTW can differ from the base solution and Project Online when it is extended using the model-driven app option in Power Apps.
Caveat: The list of functionality and processes in this table is sample data.
This functionality is not inherent in the solution as soon as you integrate with Power Apps. Rather it must be built – and your success in developing these functions will depend upon the time and skills you have available.
| Table 2.1b
|
Project for the web
|
PFTW extended with PowerApps
|
Project Online
|
| Critical Path
|
|
|
X
|
| Timesheets
|
|
|
X
|
| Financial Planning
|
|
X
|
X
|
| Risks and Issues Tracking
|
|
X
|
X
|
| Program Management
|
|
X
|
|
| Status Updates
|
|
X
|
|
| Project Requests
|
|
X
|
|
| Business Cases
|
|
X
|
|
| Project Charters
|
|
X
|
|
| Resource Planning and Capacity Management
|
|
X
|
X
|
| Project Change Requests
|
|
X
|
|
Get familiar with the basics of Power Apps before you decide to go it alone
While the concept of being able to customize and grow a commercial PPM tool is enticing, the reality of low-code development and application maintenance may be too much for resource-constrained PMOs.
Long story short: Extending PFTW in Power Apps is time consuming and can be frustrating for the novice to intermediate user.
It can take days, even weeks, just to find your feet in Power Apps, let alone to determine requirements to start building out a custom model-driven app. The latter activity can entail creating custom columns and tables, determining relationships between tables to get required outputs, in addition to basic design activities.
Time-strapped and resource-constrained practitioners should pause before committing to this deployment approach. To help better understand the commitment, the slides ahead cover the basics of extending PFTW in Power Apps:
- Dataverse environments.
- Navigating Power App Designer and Sitemap Designer
- Customizing tables and forms in the Dataverse
See Info-Tech’s M365 Project Portfolio Management Tool Guide for more information on Power Apps in general.
Get familiar with Power Apps licensing
Power Apps for 365 comes with E1 through E5 M365 licenses (and F3 and F5 licenses), though additional functionality can be purchased if required.
While extending Project for the web with Power Apps does not at this time, in normal deployments, require additional licensing from what is included in a E3 or E5 license, it is not out of the realm of possibility that a more complex deployment could incur costs not included in the Power Apps for 365 that comes with your enterprise agreement.
The table to the right shows current additional licensing options.
Power Apps, Per User, Per App Plan
|
Per User Plan
|
| Cost: US$10 per user per app per month, with a daily Dataverse database capacity of 40 MB and a daily Power Platform request capacity of 1,000.
|
Cost: US$40 per user per month, with a daily Dataverse database capacity of 250 MB and a daily Power Platform request capacity of 5,000.
|
| What's included? This option is marketed as the option that allows organizations to “get started with the platform at a lower entry point … [or those] that run only a few apps.” Users can run an application for a specific business case scenario with “the full capabilities of Power Apps” (meaning, we believe, that unlicensed users can still submit data via an app created by a licensed user).
|
What's included? A per-user plan allows licensed users to run unlimited canvas apps and model-driven apps – portal apps, the licensing guide says, can be “provisioned by customers on demand.” Dataverse database limits (the 250 MB and 5,000 request capacity mentioned above) are pooled at the per tenant, not the per user plan license, capacity.
|
For more on Power Apps licensing, refer to Info-Tech’s Modernize Your Microsoft Licensing for the Cloud Era for more information.
What needs to be configured?
Extending Project for the web requires working with your IT peers to get the right environments configured based upon your needs.
- PFTW data is stored in the Microsoft Dataverse (formerly Common Data Service or CDS).
- The organization’s Dataverse can be made up of one to many environments based upon its needs. Environments are individual databases with unique proprieties in terms of who can access them and what applications can store data in them.
- Project for the web supports three different types of environments: default, production, and sandbox.
- You can have multiple instances of a custom PFTW app deployed across these environments and across different users – and the environment you choose depends upon the use case of each instance.
Types of Environments
-
Default Environment
- It is the easiest to deploy and get started with the PFTW Power App in the default environment. However, it is also the most restricted environment with the least room for configuration.
- Microsoft recommends this environment for simple deployments or for projects that span the organization. This is because everyone in the organization is by default a member of this environment – and, with the least room for configuration, the app is relatively straightforward.
- At minimum, you need one project license to deploy PFTW in the default environment.
-
Production Environment
- This environment affords more flexibility for how a custom app can be configured and deployed. Unlike the default environment, deploying a production environment is a manual process (through the Power Platform Admin Center) and security roles need to be set to limit users who can access the environment.
- Because users can be limited, production environments can be used to support more advanced deployments and can support diverse processes for different teams.
- At present, you need at least five Project licenses to deploy to production environments.
-
Sandbox Environment
- This environment is for users who are responsible for the creation of custom apps. It offers the same functionality as a production environment but allows users to make changes without jeopardizing a production environment.
Resources to provide your IT colleagues with to help in your PFTW deployment:
- Project for the web admin help (Product Documentation, Microsoft)
- Advanced deployment for Project for the web (Video, Microsoft)
- Get Started with Project Power App (Product Support Documentation, Microsoft)
- Project for the Web Security Roles (Product Support Documentation, Microsoft)
Get started creating or customizing a model-driven app
With the proper environments procured, you can now start extending Project for the web.
- Navigate to the environment you would like to extend PFTW within. For the purposes of the slides ahead, we’ll be using a sandbox environment for an example. Ensure you have the right access set up for production and sandbox environments of your own (see links on previous slide for more assistance).
- To begin extending PFTW, the two core features you need to be familiar with before you start in Power Apps are (1) Tables/Entities and (2) the Power Apps Designer – and in particular the Site Map.
From the Power Apps main page in 365, you can change your environment by selecting from the options in the top right-hand corner of the screen.
Screenshot of the Power Apps “Apps” page in a sandbox environment. The Project App will appear as “Project” when the application is installed, though it is also easy to create an app from scratch.
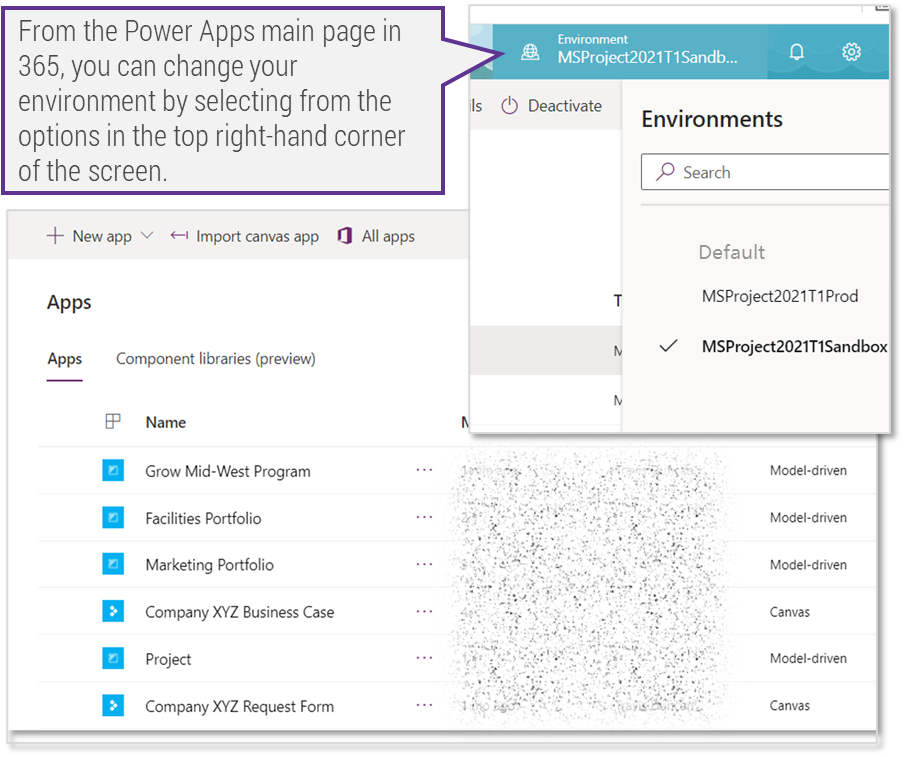
Model-driven apps are built around tables
In Power Apps, tables (formerly called entities and still referred to as entities in the Power Apps Designer) function much like tables in Excel: they are containers of columns of data for tracking purposes. Tables define the data for your app, and you build your app around them.
In general, there are three types of tables:
- Standard: These are out-of-the box tables included with a Dataverse environment. Most standard tables can be customized.
- Managed: These are tables that get imported into an environment as part of a managed solution. Managed tables cannot be customized.
- Custom: These types of tables can either be imported from another solution or created directly in the Dataverse environment. To create custom tables, users need to have System Administrator or System Customizer security roles within the Dataverse.
Tables can be accessed under Data banner on the left-hand panel of your Power Apps screen.
The below is a list of standard tables that can be used to customize your Project App.
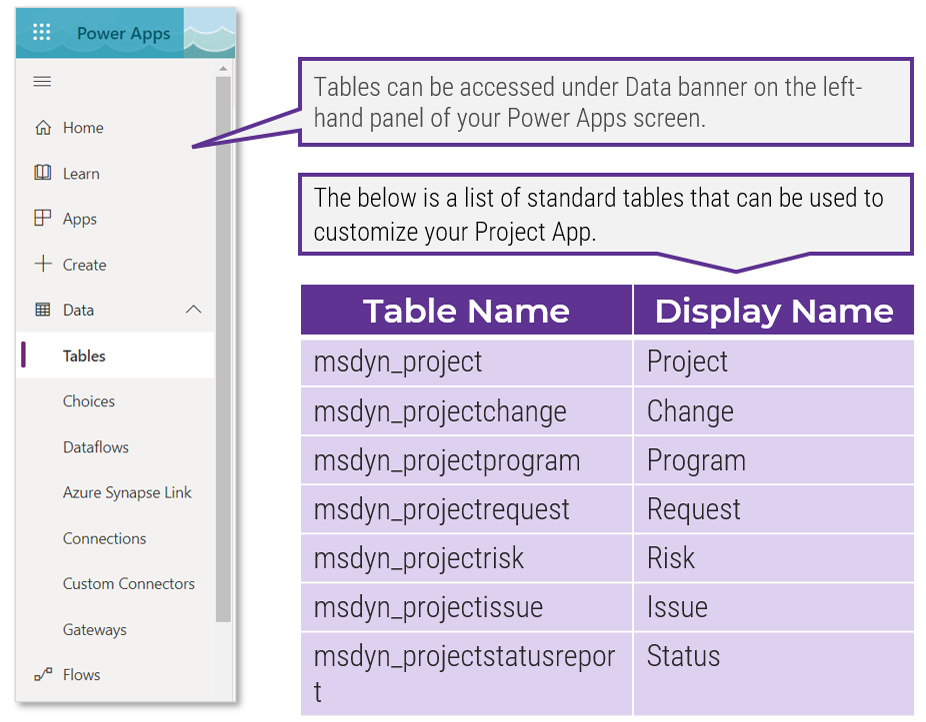
Table Name
|
Display Name
|
| msdyn_project
|
Project
|
| msdyn_projectchange
|
Change
|
| msdyn_projectprogram
|
Program
|
| msdyn_projectrequest
|
Request
|
| msdyn_projectrisk
|
Risk
|
| msdyn_projectissue
|
Issue
|
| msdyn_projectstatusreport
|
Status
|
App layouts are designed in the Power App Designer
You configure tables with a view to using them in the design of your app in the Power Apps Designer.
- If you’re customizing a Project for the web app manually installed into your production or sandbox environment, you can access Designer by highlighting the app from your list of apps on the Apps page and clicking “Edit” in the ribbon above.
- If you’re creating a model-driven app from scratch, Designer will open past the “Create a New App” intro screen.
- If you need to create separate apps in your environment for different PMOs or business units, it is as easy to create an app from scratch as it is to customize the manual install.
- The App Designer is where you can design the layout of your model-driven app and employ the right data tables.
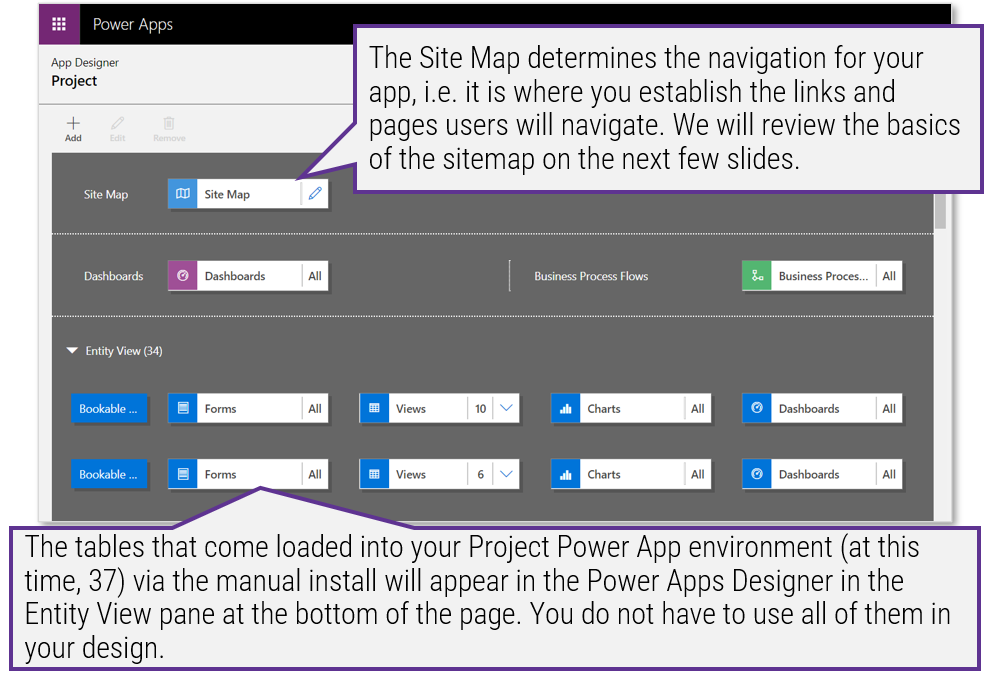
The Site Map determines the navigation for your app, i.e. it is where you establish the links and pages users will navigate. We will review the basics of the sitemap on the next few slides.
The tables that come loaded into your Project Power App environment (at this time, 37) via the manual install will appear in the Power Apps Designer in the Entity View pane at the bottom of the page. You do not have to use all of them in your design.
Navigate the Sitemap Designer
With the components of the previous two slides in mind, let’s walk through how to use them together in the development of a Project app.
As addressed in the previous slide, the sitemap determines the navigation for your app, i.e. it is where you establish the links and the pages that users will navigate.
To get to the Sitemap Designer, highlight the Project App from your list of apps on the Apps page and click “Edit” in the ribbon above. If you’re creating a model-driven app from scratch, Designer will open past the “Create a New App” intro screen.
- To start designing your app layout, click the pencil icon beside the Site Map logo on the App Designer screen.
- This will take you into the Sitemap Designer (see screenshot to the right). This is where you determine the layout of your app and the relevant data points (and related tables from within the Dataverse) that will factor into your Project App.
- In the Sitemap Designer, you simply drag and drop the areas, groups, and subareas you want to see in your app’s user interface (see next slide for more details).
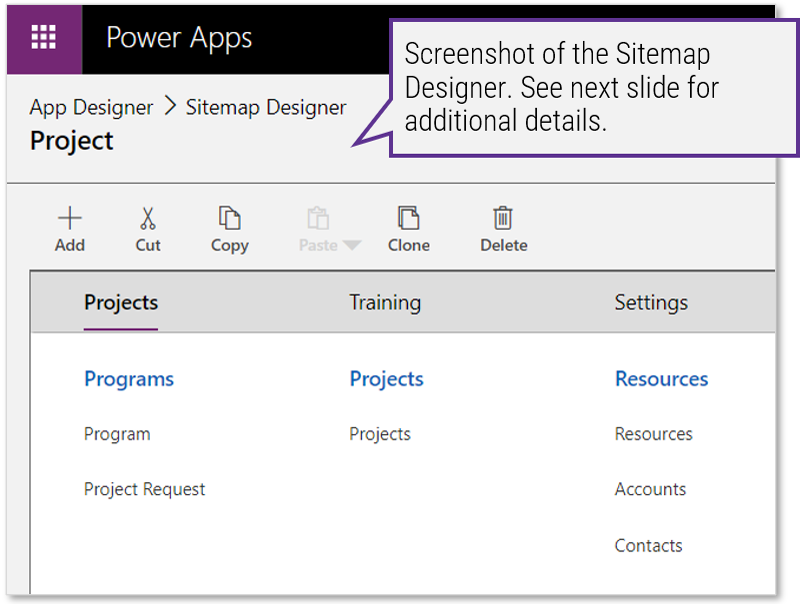
Use Areas, Groups, and Subareas as building blocks for your App
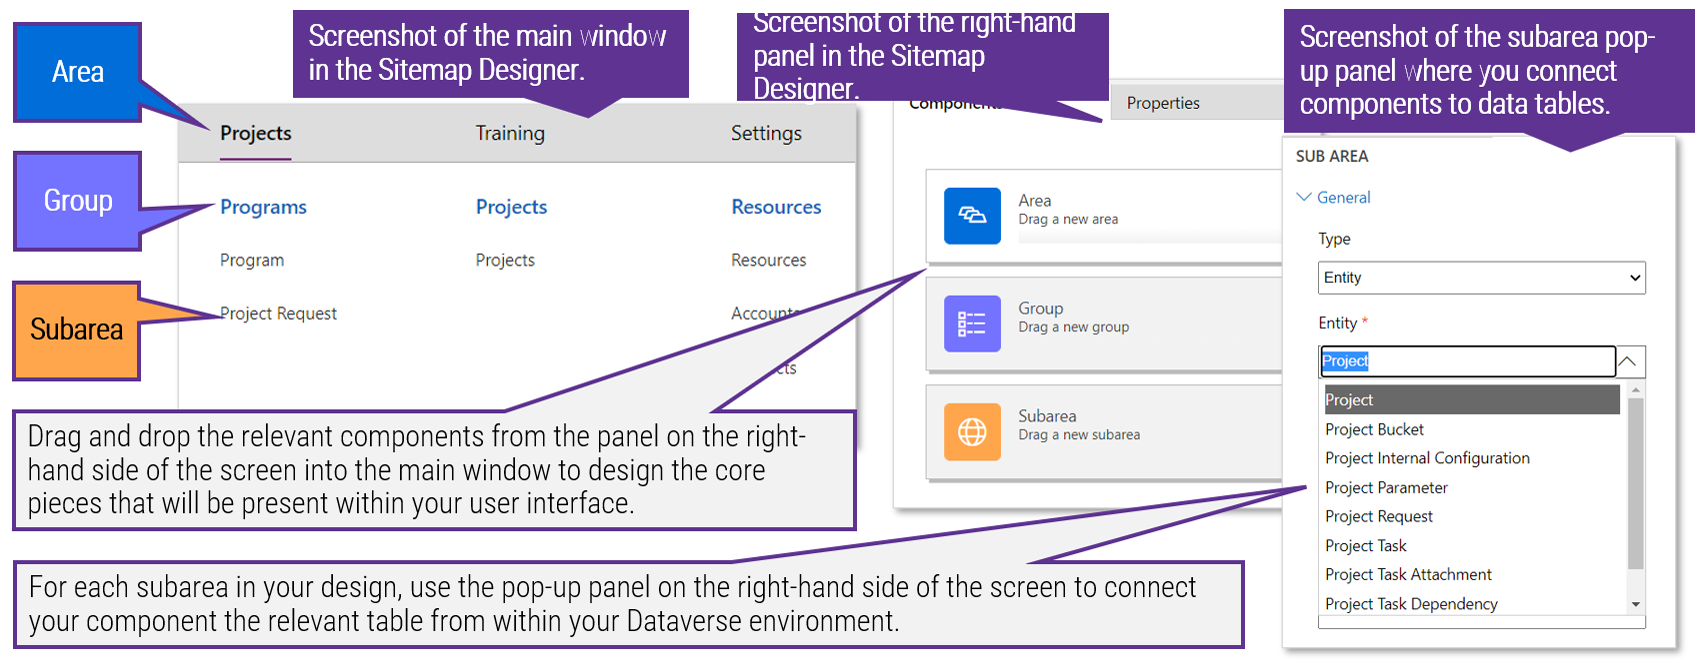
Drag and drop the relevant components from the panel on the right-hand side of the screen into the main window to design the core pieces that will be present within your user interface.
For each subarea in your design, use the pop-up panel on the right-hand side of the screen to connect your component the relevant table from within your Dataverse environment.
How do Areas, Groups, and Subareas translate into an app?
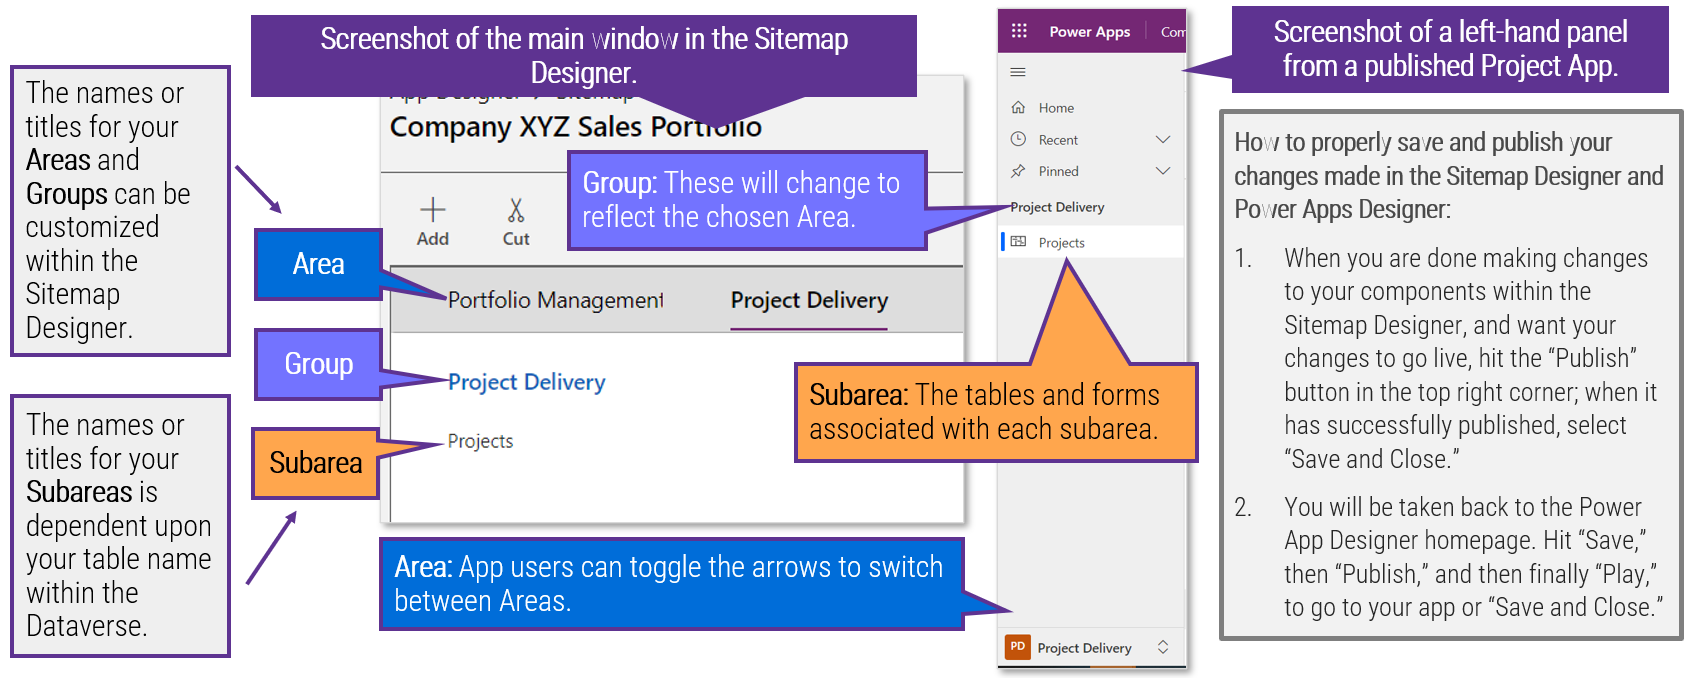
The names or titles for your Areas and Groups can be customized within the Sitemap Designer.
The names or titles for your Subareas is dependent upon your table name within the Dataverse.
Area: App users can toggle the arrows to switch between Areas.
Group: These will change to reflect the chosen Area.
Subarea: The tables and forms associated with each subarea.
How to properly save and publish your changes made in the Sitemap Designer and Power Apps Designer:
- When you are done making changes to your components within the Sitemap Designer, and want your changes to go live, hit the “Publish” button in the top right corner; when it has successfully published, select “Save and Close.”
- You will be taken back to the Power App Designer homepage. Hit “Save,” then “Publish,” and then finally “Play,” to go to your app or “Save and Close.”
How to find the right tables in the Dataverse
While you determine which tables will play into your app in the Sitemap Designer, you use the Tables link to customize tables and forms.
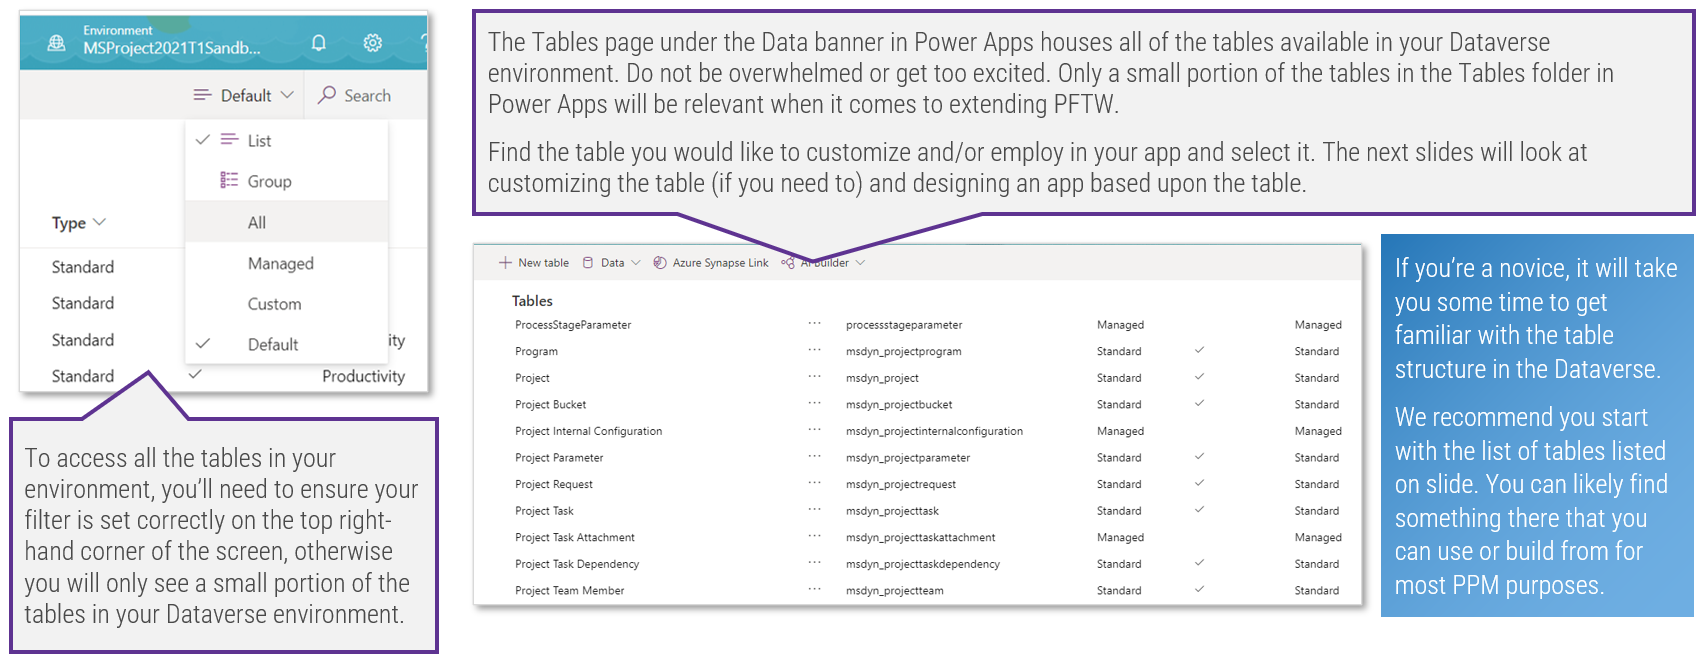
The Tables page under the Data banner in Power Apps houses all of the tables available in your Dataverse environment. Do not be overwhelmed or get too excited. Only a small portion of the tables in the Tables folder in Power Apps will be relevant when it comes to extending PFTW.
Find the table you would like to customize and/or employ in your app and select it. The next slides will look at customizing the table (if you need to) and designing an app based upon the table.
To access all the tables in your environment, you’ll need to ensure your filter is set correctly on the top right-hand corner of the screen, otherwise you will only see a small portion of the tables in your Dataverse environment.
If you’re a novice, it will take you some time to get familiar with the table structure in the Dataverse.
We recommend you start with the list of tables listed on slide. You can likely find something there that you can use or build from for most PPM purposes.
How to customize a table (1 of 3)
You won’t necessarily need to customize a table, but if you do here are some steps to help you get familiar with the basics.
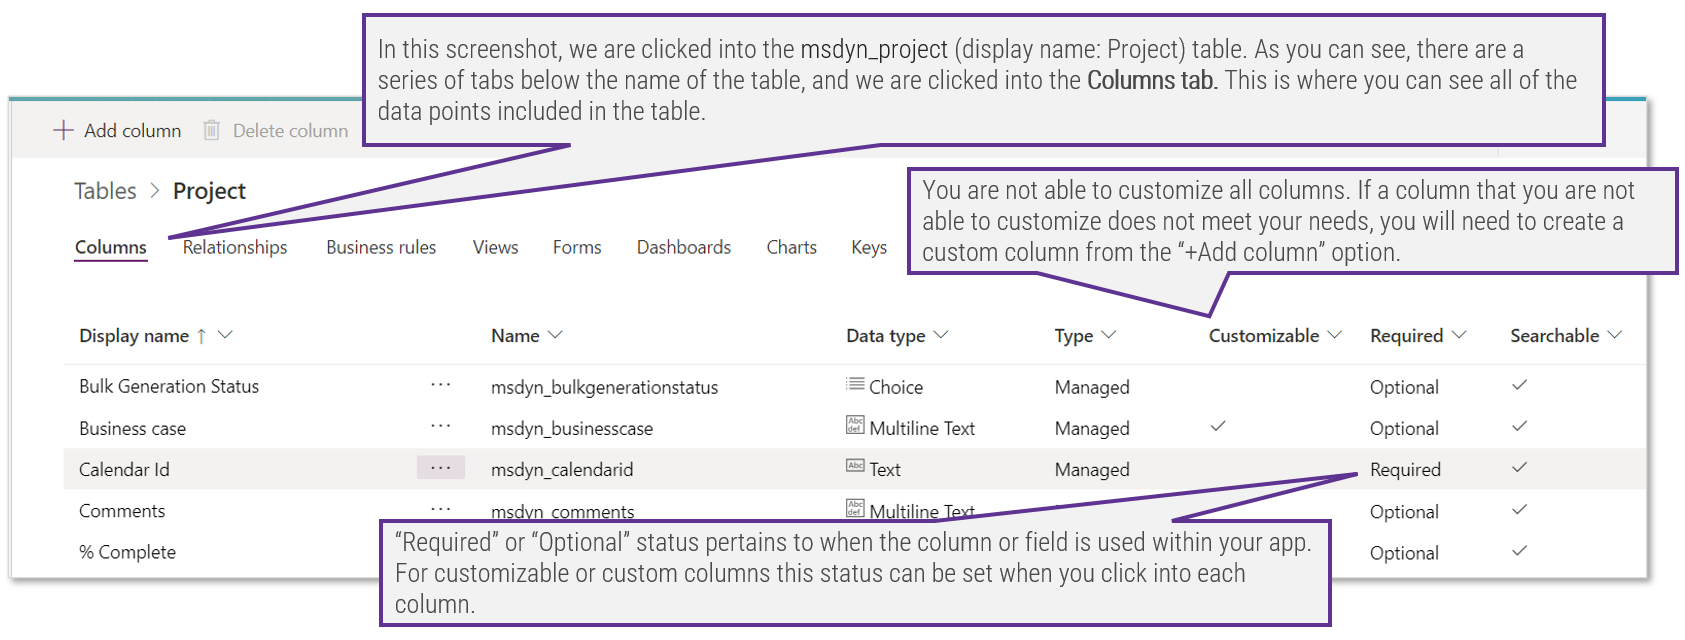
In this screenshot, we are clicked into the msdyn_project (display name: Project) table. As you can see, there are a series of tabs below the name of the table, and we are clicked into the Columns tab. This is where you can see all of the data points included in the table.
You are not able to customize all columns. If a column that you are not able to customize does not meet your needs, you will need to create a custom column from the “+Add column” option.
“Required” or “Optional” status pertains to when the column or field is used within your app. For customizable or custom columns this status can be set when you click into each column.
How to customize a table (2 of 3)
Create a custom “Status” column.
By way of illustrating how you might need to customize a table, we’ll highlight the “msdyn_project_statecode” (display name: Project Status) column that comes preloaded in the Project (msdyn_project) table.
- The Project Status column only gives you a binary choice. While you are able to customize what that binary choice is (it comes preloaded with “Active” and “Inactive” as the options) you cannot add additional choices – so you cannot set it to red/yellow/green, the most universally adopted options for status in the project portfolio management world.
- Because of this, let’s look at the effort involved in creating a choice and adding a custom column to your table based upon that choice.
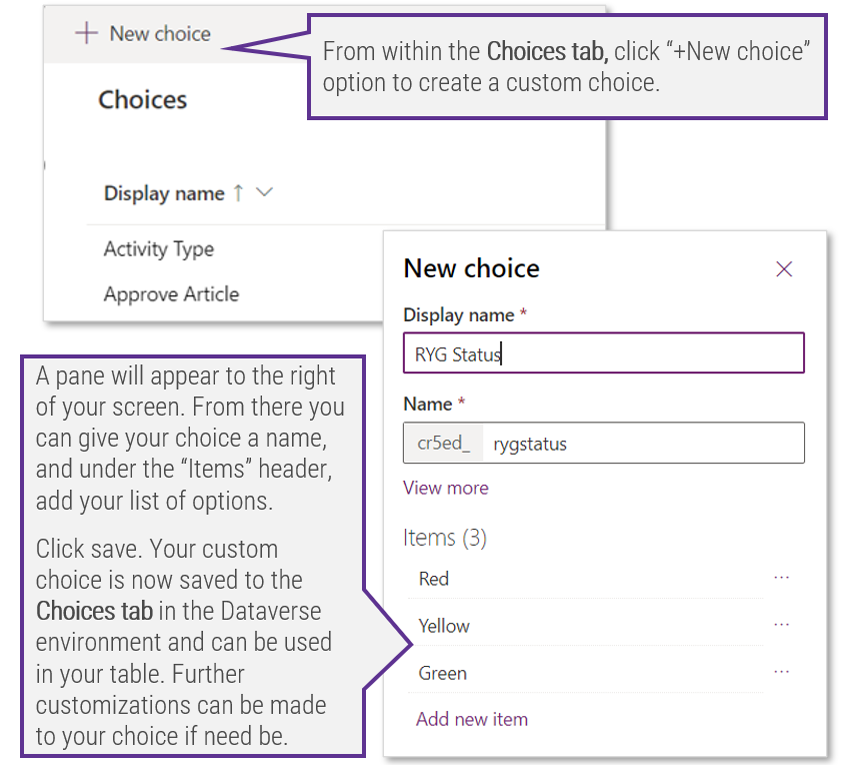
From within the Choices tab, click “+New choice” option to create a custom choice.
A pane will appear to the right of your screen. From there you can give your choice a name, and under the “Items” header, add your list of options.
Click save. Your custom choice is now saved to the Choices tab in the Dataverse environment and can be used in your table. Further customizations can be made to your choice if need be.
How to customize a table (3 of 3)
Back in the Tables tab, you can put your new choice to work by adding a column to a table and selecting your custom choice.
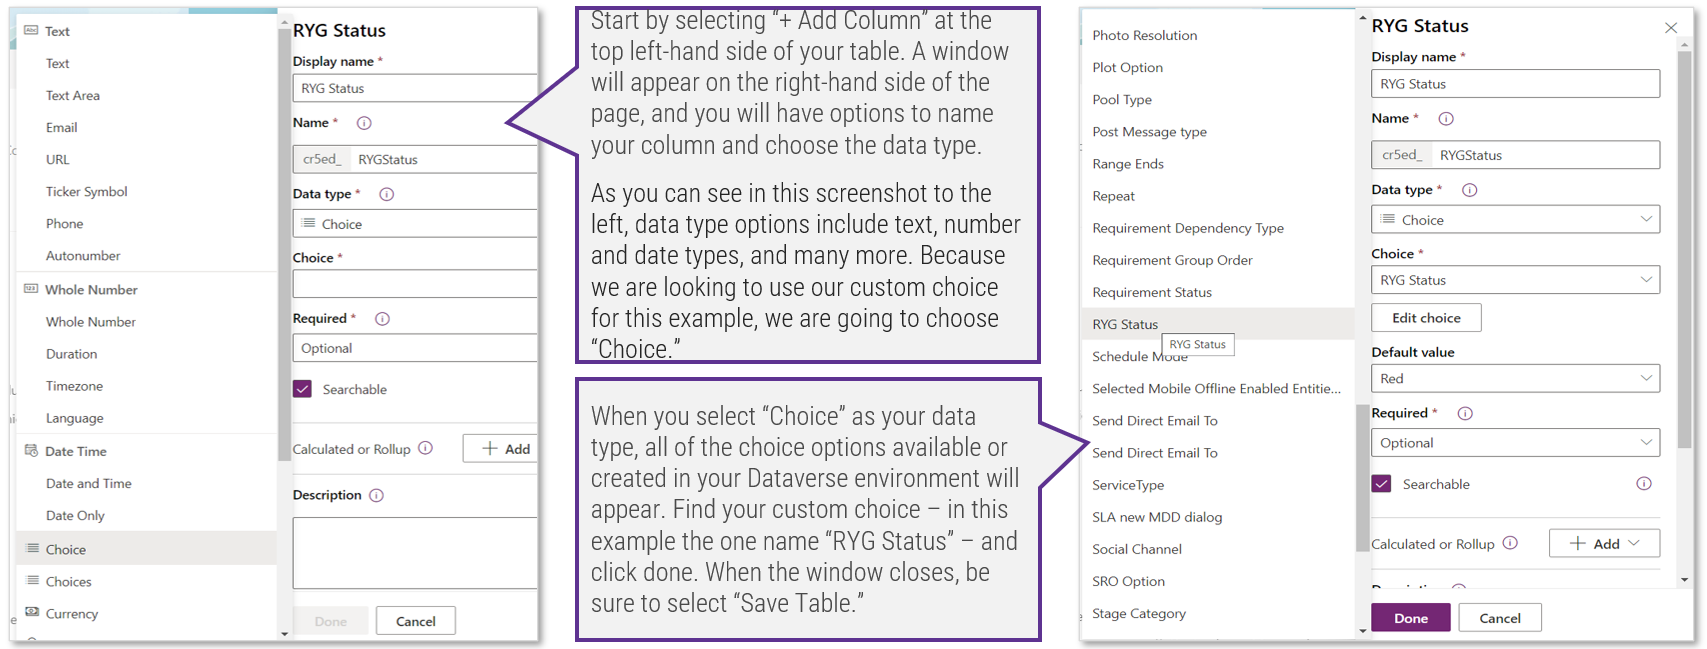
Start by selecting “+ Add Column” at the top left-hand side of your table. A window will appear on the right-hand side of the page, and you will have options to name your column and choose the data type.
As you can see in this screenshot to the left, data type options include text, number and date types, and many more. Because we are looking to use our custom choice for this example, we are going to choose “Choice.”
When you select “Choice” as your data type, all of the choice options available or created in your Dataverse environment will appear. Find your custom choice – in this example the one name “RYG Status” – and click done. When the window closes, be sure to select “Save Table.”
How to develop a Form based upon your table (1 of 3 – open the form editor)
A form is the interface users will engage with when using your Project app.
When the Project app is first installed in your environment, the main user form will be lacking, with only a few basic data options.
This form can be customized and additional tabs can be added to your user interface.
- To do this, go to the table you want to customize.
- In the horizontal series of tabs at the top of the screen, below the table title select the “Forms” option.
- Click on the main information option or select Edit Form for the form with “Main” under its form type. A new window will open where you can customize your form.
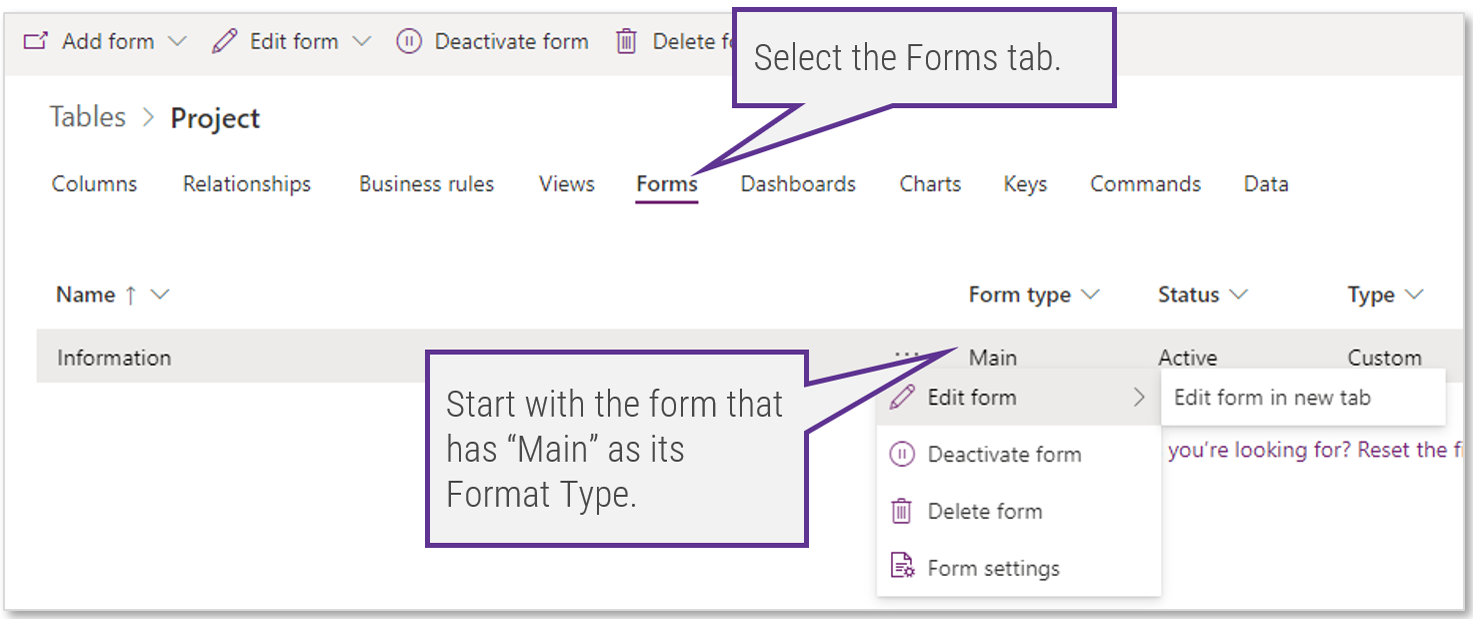
Select the Forms tab.
Start with the form that has “Main” as its Format Type.
How to develop a Form based upon your table (2 of 3 – add a component)
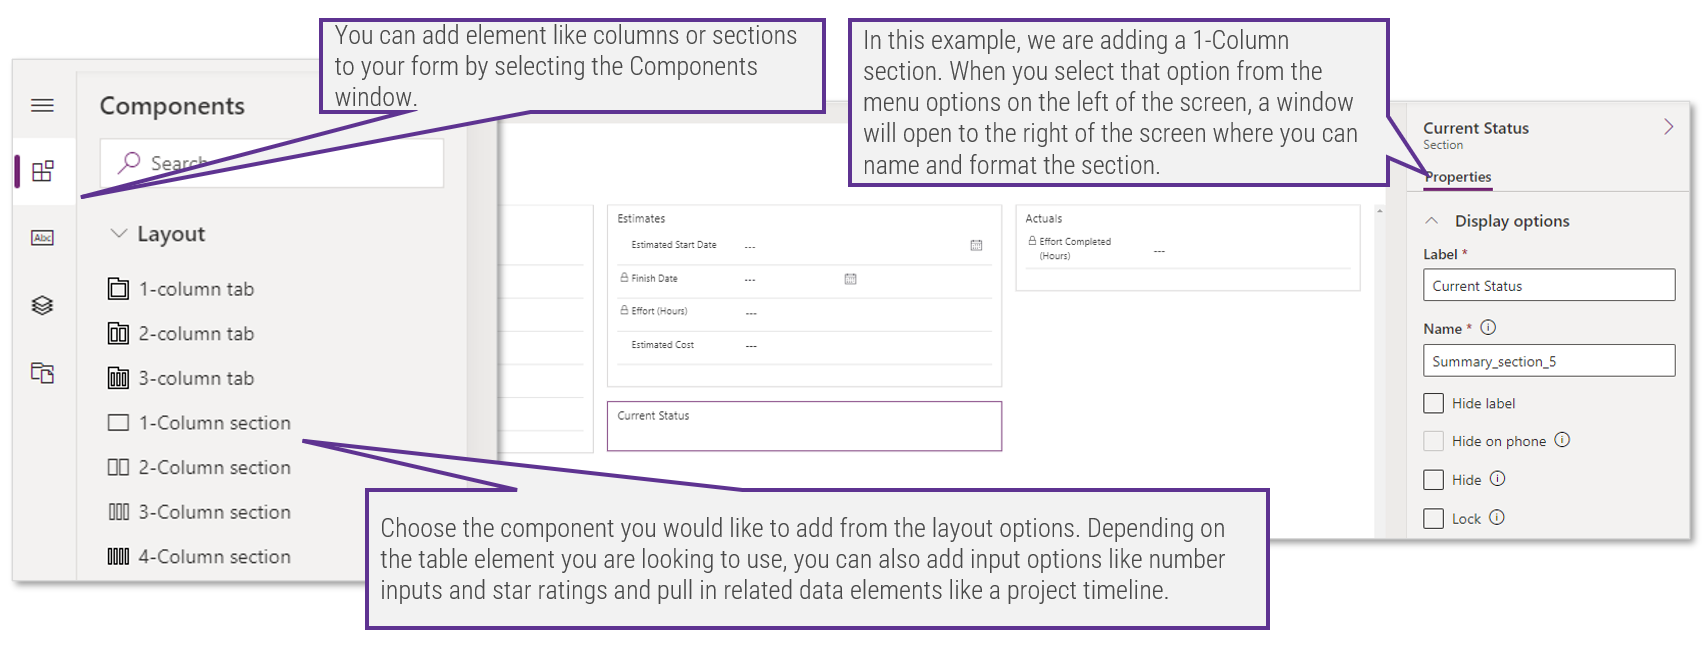
You can add element like columns or sections to your form by selecting the Components window.
In this example, we are adding a 1-Column section. When you select that option from the menu options on the left of the screen, a window will open to the right of the screen where you can name and format the section.
Choose the component you would like to add from the layout options. Depending on the table element you are looking to use, you can also add input options like number inputs and star ratings and pull in related data elements like a project timeline.
How to develop a Form based upon your table (3 of 3 – add table columns)
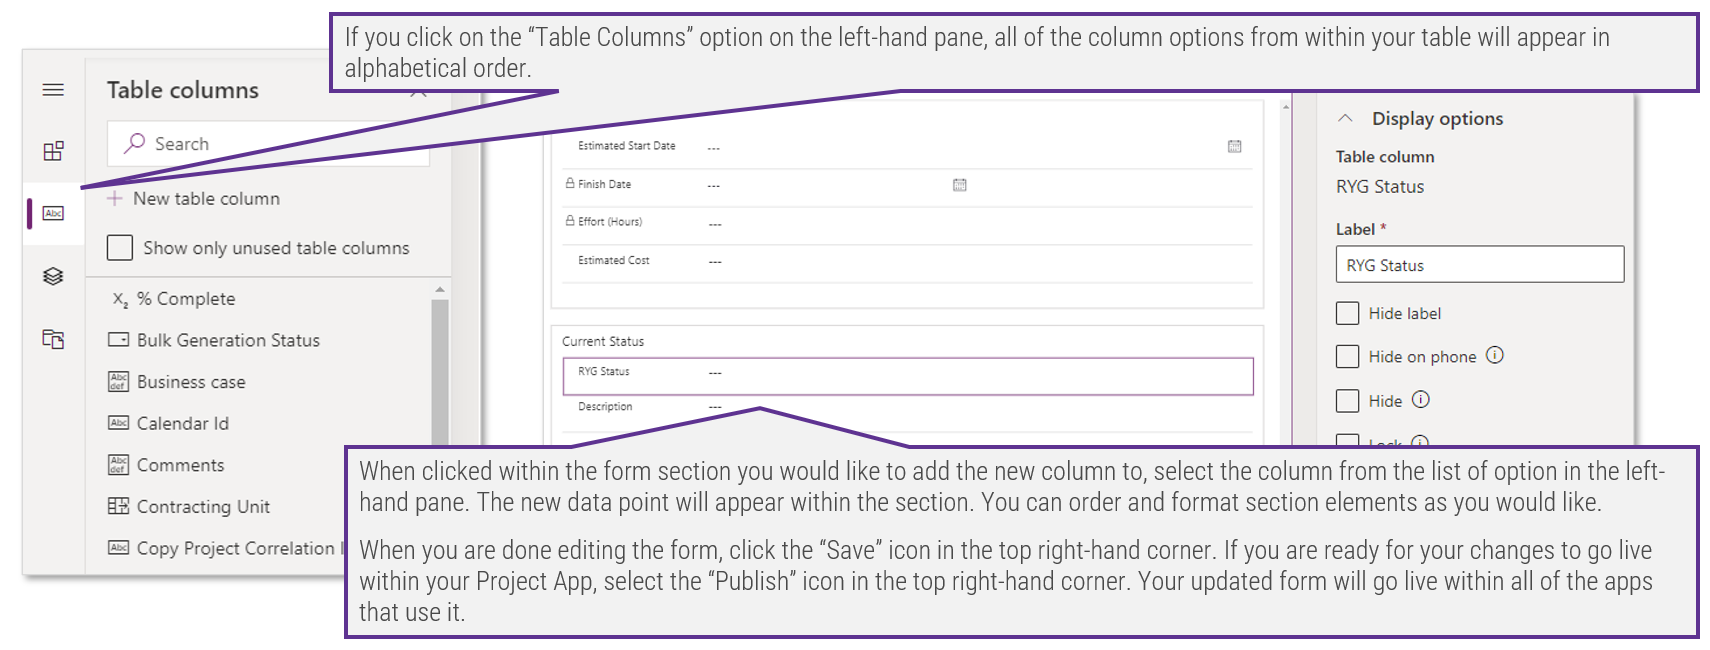
If you click on the “Table Columns” option on the left-hand pane, all of the column options from within your table will appear in alphabetical order.
When clicked within the form section you would like to add the new column to, select the column from the list of option in the left-hand pane. The new data point will appear within the section. You can order and format section elements as you would like.
When you are done editing the form, click the “Save” icon in the top right-hand corner. If you are ready for your changes to go live within your Project App, select the “Publish” icon in the top right-hand corner. Your updated form will go live within all of the apps that use it.
The good and the bad of extending Project for the web
The content in this step has not instructed users how to extend PFTW; rather, it has covered three basic core pieces of Power Apps that those interesting in PFTW need to be aware of: Dataverse environments, the Power Apps and Sitemaps Designers, and Tables and associated Forms.
Because we have only covered the very tip of the iceberg, those interested in going further and taking a DIY approach to extending PFTW will need to build upon these basics to unlock further functionality. Indeed, it takes work to develop the product into something that begins to resemble a viable enterprise project and portfolio management solution. Here are some of the good and the bad elements associated with that work:
The Good:
- You can right-size and purpose build: add as much or as little project management rigor as your process requires. Related, you can customize the solution in multiple ways to suit the needs of specific business units or portfolios.
- Speed to market: it is possible to get up and running quickly with a minimum-viable product.
The Bad:
- Work required: to build anything beyond MVP requires independent research and trial and error.
- Time required: to build anything beyond MVP requires time and skills that many PMOs don’t have.
- Shadow support costs: ungoverned app creation could have negative support and maintenance impacts across IT.
"The move to Power Platform and low code development will […increase] maintenance overhead. Will low code solution hit problems at scale? [H]ow easy will it be to support hundreds or thousands of small applications?
I can hear the IT support desks already complaining at the thought of this. This part of the puzzle is yet to hit real world realities of support because non developers are busy creating lots of low code applications." (Ben Hosking, Software Developer and Blogger, "Why low code software development is eating the world")
Quick start your extension with the Accelerator
For those starting out, there is a pre-built app you can import into your environment to extend the Project for the web app without any custom development.
- If the DIY approach in the previous slides was overwhelming, and you don’t have the budget for a MS Partner route in the near-term, this doesn’t mean that evolving your Project for the web app is unattainable.
- Thanks to a partnership between OnePlan (one of the MS Gold Partners we detail in the next step) and Microsoft, Project for the web users have access to a free resource to help them evolve the base Project app. It’s called the “Project for the web Accelerator” (commonly referred to as “the Accelerator” for short).
- Users interested in learning more about, and accessing, this free resource should refer to the links below:
- The Future of Microsoft Project Online (source: OnePlan).
- Introducing the Project Accelerator (source: Microsoft).
- Project for the web Accelerator (source: GitHub)
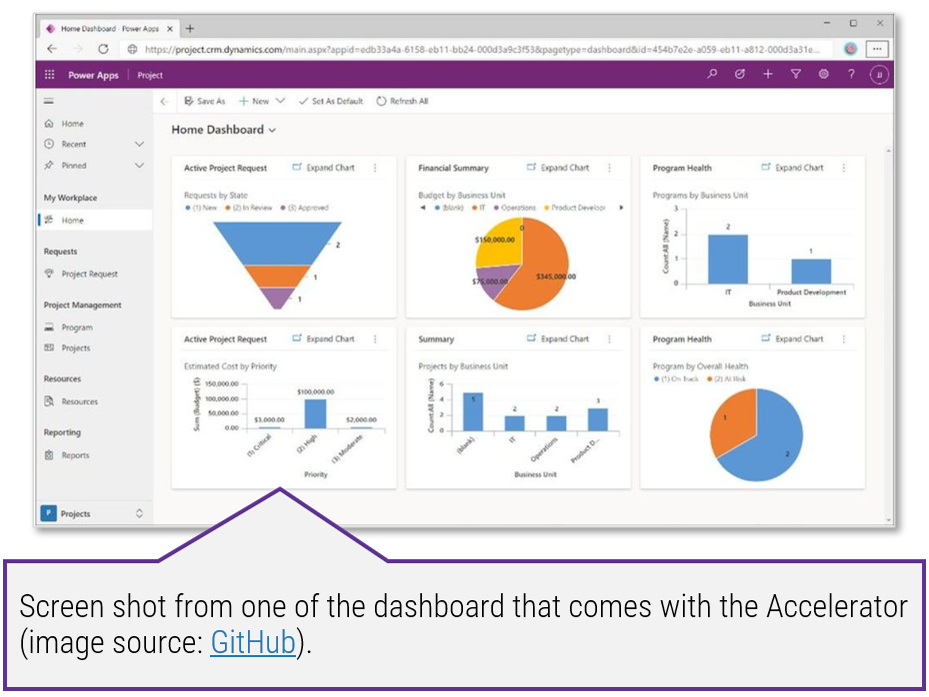
2.1.1 Perform a feasibility test (1 of 2)
15 mins
As we’ve suggested, and as the material in this step indicates, extending PFTW in a DIY fashion is not small task. You need a knowledge of the Dataverse and Power Apps, and access to the requisite skills, time, and resources to develop the solution.
To determine whether your PMO and organization are ready to go it alone in extending PFTW, perform the following activity:
- Convene a collection of portfolio, project, and PMO staff.
- Using the six-question survey on tab 5 of the Microsoft Project & M365 Licensing Tool (see screenshot to the right) as a jumping off point for a discussion, consider the readiness of your PMO or project organization to undertake a DIY approach to extending and implementing PFTW at this time.
- You can use the recommendations on tab 5 of the Microsoft Project & 365 Licensing Tool to inform your next steps, and input the gauge graphic in section 4 of the Microsoft Project & M365 Action Plan Template.
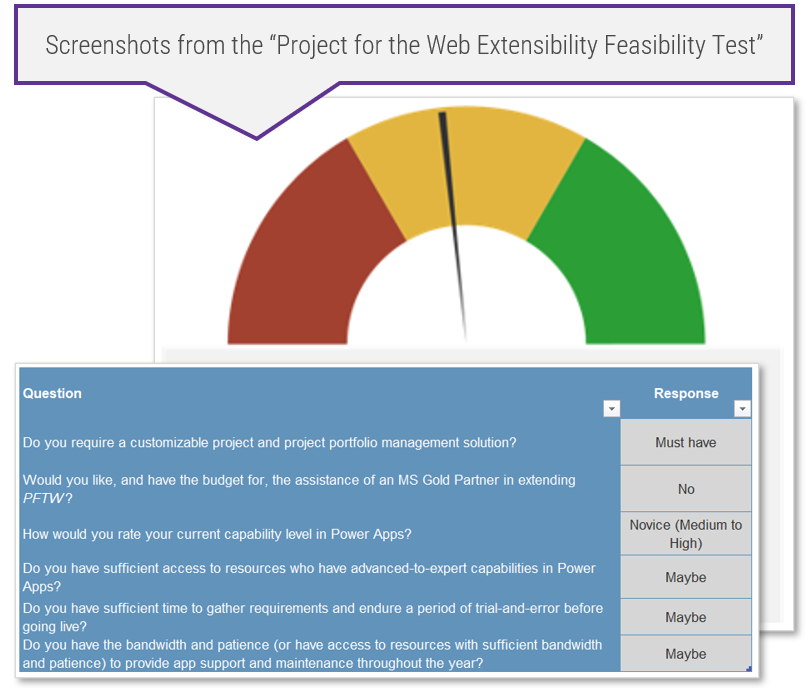
Go to tab 5 of the Microsoft Project & M365 Licensing Tool
See next slide for additional activity details
2.1.1 Perform a feasibility test (2 of 2)
Input: The contents of this step, The Project for the Web Extensibility Feasibility Test (tab 5 in the Microsoft Project & 365 Licensing Tool)
Output: Initial recommendations on whether to proceed and how to proceed with a DIY approach to extending Project for the web
Materials: The Project for the Web Extensibility Feasibility Test (tab 5 in the Microsoft Project & 365 Licensing Tool)
Participants: Portfolio Manager (PMO Director), Project Managers, Other relevant PMO stakeholders
Step 2.2
Assess the Microsoft Gold Partner Community
Activities
- Review what to look for in a Microsoft Partner
- Determine whether your needs would benefit from reaching out to a Microsoft Partner
- Review three key Partners from the North American market
- Create a Partner outreach plan
This step will walk you through the following activities:
- Review what to look for in a Microsoft Partner.
- Determine whether your needs would benefit from reaching out to a Microsoft Partner.
- Review three key Partners from the North American market.
This step usually involves the following participants:
- Portfolio Manager (PMO Director)
- Project Managers
- Other relevant PMO stakeholders
Outcomes of Step
- A better understanding of MS Partners
- A Partner outreach plan
You don’t have to go it alone
Microsoft has an established community of Partners who can help in your customizations and implementations of Project for the web and other MS Project offerings.
If the content in the previous step seemed too technical or overly complex in a way that scared you away from a DIY approach to extending Microsoft’s latest project offering (and at some point in the near future, soon to be its only project offering), Project for the web, fear not.
You do not have to wade into the waters of extending Project for the web alone, or for that matter, in implementing any other MS Project solution.
Instead, Microsoft nurtures a community of Silver and Gold partners who offer hands-on technical assistance and tool implementation services. While the specific services provided vary from partner to partner, all can assist in the customization and implementation of any of Microsoft’s Project offerings.
In this step we will cover what to look for in a Partner and how to assess whether you are a good candidate for the services of a Partner. We will also highlight three Partners from within the North American market.
The basics of the Partner community
What is a Microsoft Partner?
Simply put, an MS Gold Partner is a software or professional services organization that provides sales and services related to Microsoft products.
They’re resellers, implementors, integrators, software manufacturers, trainers, and virtually any other technology-related business service.
- Microsoft has for decades opted out of being a professional services organization, outside of its very “leading edge” offerings from MCS (Microsoft Consulting Services) for only those technologies that are so new that they aren’t yet supported by MS Partners.
- As you can see in the chart on the next slide, to become a silver or gold certified partner, firms must demonstrate expertise in specific areas of business and technology in 18 competency areas that are divided into four categories: applications and infrastructure, business applications, data and AI, and modern workplace and security.
More information on what it takes to become a Microsoft Partner:
- Partner Center (Document Center, Microsoft)
- Differentiate your business by attaining Microsoft competencies (Document Center, Microsoft)
- Partner Network Homepage (Webpage, Microsoft)
- See which partner offer is right for you (Webpage, Microsoft)
Types of partnerships and qualifications
|
|
Microsoft Partner Network
|
Microsoft Action Pack
|
Silver Competency
|
Gold Competency
|
What is it?
|
The Microsoft Partner Network (MPN) is a community that offers members tools, information, and training. Joining the MPN is an entry-level step for all partners.
|
The Action Pack is an annual subscription offered to entry-level partners. It provides training and marketing materials and access to expensive products and licenses at a vastly reduced price.
|
Approximately 5% of firms in the Microsoft Partner Network (MPN) are silver partners. These partners are subject to audits and annual competency exams to maintain silver status.
|
Approximately 1% of firms in the Microsoft Partner Network (MPN) are gold partners. These partners are subject to audits and annual competency exams to maintain Gold status.
|
Requirements
|
Sign up for a membership
|
Annual subscription fee
|
While requirements can vary across competency area, broadly speaking, to become a silver partner firms must:
- Pass regular exams and skills assessments, with at least two individuals on staff with Microsoft Certified Professional Status.
- Hit annual customer, revenue, and licensing metrics.
- Pay the annual subscription fee.
|
While requirements can vary across competency area, broadly speaking, to become a gold partner firms must:
- Pass regular exams and skills assessments, with at least two individuals on staff with Microsoft Certified Professional Status.
- Hit annual customer, revenue, and licensing metrics.
- Pay the annual subscription fee.
|
Annual Fee
|
No Cost
|
$530
|
$1800
|
$5300
|
When would a MS Partner be helpful?
- Project management and portfolio management practitioners might look into procuring the services of a Microsoft Partner for a variety of reasons.
- Because services vary from partner to partner (help to extend Project for the web, implement Project Server or Project Online, augment PMO staffing, etc.) we won’t comment on specific needs here.
- Instead, the three most common conditions that trigger the need are listed to the right.
Speed
When you need to get results faster than your staff can grow the needed capabilities.
Cost
When the complexity of the purchase decision, implementation, communication, training, configuration, and/or customization cannot be cost-justified for internal staff, often because you’ll only do it once.
Expertise & Skills
When your needs cannot be met by the core Microsoft technology without significant extension or customization.
Canadian Microsoft Partners Spotlight
As part of our research process for this blueprint, Info-Tech asked Microsoft Canada for referrals and introductions to leading Microsoft Partners. We spent six months collaborating with them on fresh research into the underlying platform.
These vendors are listed below and are highlighted in subsequent slides.
Spotlighted Partners:


Please Note: While these vendors were referred to us by Microsoft Canada and have a footprint in the Canadian market, their footprints extend beyond this to the North American and global markets.
A word about our approach

Barry Cousins
Project Portfolio Management Practice Lead
Info-Tech Research Group
Our researchers have been working with Microsoft Project Online and Microsoft Project Server clients for years, and it’s fair to say that most of these clients (at some point) used a Microsoft Partner in their deployment. They’re not really software products, per se; they’re platforms. As a Microsoft Partner in 2003 when Project Server got its first big push, I heard it loud and clear: “Some assembly required. You might only make 7% on the licensing, but the world’s your oyster for services.”
In the past few years, Microsoft froze the market for major Microsoft Project decisions by making it clear that the existing offering is not getting updates while the new offering (Project for the web) doesn’t do what the old one did. And in a fascinating timing coincidence, the market substantially adopted Microsoft 365 during that period, which enables access to Project for the web.
Many of Info-Tech’s clients are justifiably curious, confused, and concerned, while the Microsoft Partners have persisted in their knowledge and capability. So, we asked Microsoft Canada for referrals and introductions to leading Microsoft Partners and spent six months collaborating with them on fresh research into the underlying platform.
Disclosure: Info-Tech conducted collaborative research with the partners listed on the previous slide to produce this publication. Market trends and reactions were studied, but the only clients identified were in case studies provided by the Microsoft Partners. Info-Tech’s customers have been, and remain, anonymous. (Barry Cousins, Project Portfolio Management Practice Lead, Info-Tech Research Group)
MS Gold Partner Spotlight:
OnePlan
Headquarters: San Marcos, California, and Toronto, Ontario
Number of Employees: ~80
Active Since: 2007 (as EPMLive)
Website: www.oneplan.ai
Who are they?
- While the OnePlan brand has only been the marketplace for a few years, the company has been a major player in MS Gold Partner space for well over a decade.
- Born out of EPMLive in the mid-aughts, OnePlan Solutions has evolved through a series of acquisitions, including Upland, Tivitie, and most recently Wicresoft.
What do they do?
- Software: Its recent rebranding is largely because OnePlan Solutions is as much a software company as it is a professional services firm. The OnePlan software product is an impressive solution that can be used on its own to facilitate the portfolio approaches outlined on the next slide and that can also integrate with the tools your organization is already using to manage tasks (see here for a full rundown of the solutions within the Microsoft stack and beyond OnePlan can integrate with).
Beyond its ability to integrate with existing solutions, as a software product, OnePlan has modules for resource planning, strategic portfolio planning, financial planning, time tracking, and more.
- PPM Consulting Services: The OnePlan team also offers portfolio management consulting services. See the next slide for a list of its approaches to project portfolio management.
Markets served
- US, Canada, Europe, and Australia
Channel Differentiation
- OnePlan scales to all the PPM needs of all industry types.
- Additionally, OnePlan offers insights and functionality specific to the needs of BioTech-Pharma.
What differentiates OnePlan?
- OnePlan co-developed the Project Accelerator for Project for the web with Microsoft. The OnePlan team’s involvement in developing the Accelerator and making it free for users to access suggests it is aligned to and has expertise in the purpose-built and collaborative vision behind Microsoft’s move away from Project Online and toward the Power Platform and Teams collaboration.
- 2021 MS Gold Partner of the Year. At Microsoft’s recent Microsoft Inspire event, OnePlan was recognized as the Gold Partner of the Year for Project and Portfolio Management as well as a finalist for Power Apps and Power Automate.
- OnePlan Approaches: Below is a list of the services or approaches to project portfolio management that OnePlan provides. See its website for more details.
- Strategic Portfolio Management: Align work to objectives and business outcomes. Track performance against the proposed objectives outcomes.
- Agile Portfolio Management: Implement Agile practices across the organization, both at the team and executive level.
- Adaptive Portfolio Management: Allow teams to use the project methodology and tools that best suit the work/team. Maintain visibility and decision making across the entire portfolio.
- Professional Services Automation: Use automation to operate with greater efficiency.
"OnePlan offers a strategic portfolio, financial and resource management solution that fits the needs of every PMO. Optimize your portfolio, financials and resources enterprise wide." (Paul Estabrooks, Vice President at OnePlan)
OnePlan Case Study
This case study was provided to Info-Tech by OnePlan.
Brambles
INDUSTRY: Supply Chain & Logistics
SOURCE: OnePlan
Overview: Brambles plays a key role in the delivery or return of products amongst global trading partners such as manufacturers, distributors and retailers.
Challenge
Brambles had a variety of Project Management tools with no easy way of consolidating project management data. The proliferation of project management solutions was hindering the execution of a long-term business transformation strategy. Brambles needed certain common and strategic project management processes and enterprise project reporting while still allowing individual project management solutions to be used as part of the PPM platform.
Solution
As part of the PMO-driven business transformation strategy, Brambles implemented a project management “operating system” acting as a foundation for core processes such as project intake, portfolio management, resource, and financial planning and reporting while providing integration capability for a variety of tools used for project execution.
OnePlan’s new Adaptive PPM platform, combining the use of PowerApps and OnePlan, gives Brambles the desired PPM operating system while allowing for tool flexibility at the execution level.
Results
- Comprehensive picture of progress across the portfolio.
- Greater adoption by allowing flexibility of work management tools.
- Modern portfolio management solution that enables leadership to make confident decision.
Solution Details
- OnePlan
- Project
- Power Apps
- Power Automate
- Power BI
- Teams
Contacting OnePlan Solutions
Joe Larscheid: jlarscheid@oneplan.ai
Paul Estabrooks: pestabrooks@oneplan.ai
Contact Us: contact@oneplan.ai
Partners: partner@oneplan.ai
Partner Resources. OnePlan facilitates regular ongoing live webinars on PPM topics that anyone can sign up for on the OnePlan website.
For more information on upcoming webinars, or to access recordings of past webinars, see here.
Additional OnePlan Resources
- How to Extend Microsoft Teams into a Collaborative Project, Portfolio and Work Management Solution (on-demand webinar, OnePlan’s YouTube channel)
- What Does Agile PPM Mean To The Modern PMO (on-demand webinar, OnePlan’s YouTube channel)
- OnePlan is fused with the Microsoft User Experience (blog article, OnePlan)
- Adaptive Portfolio Management Demo – Bringing Order to the Tool Chaos with OnePlan (product demo, OnePlan’s YouTube channel)
- How OnePlan is aligning with Microsoft’s Project and Portfolio Management Vision (blog article, OnePlan)
- Accelerating Office 365 Value with a Hybrid Project Portfolio Management Solution (product demo, OnePlan’s YouTube channel)
MS Gold Partner Spotlight:
PMO Outsource Ltd.
Headquarters: Calgary, Alberta, and Mississauga, Ontario
Website: www.pmooutsource.com
Who are they?
- PMO Outsource Ltd. is a Microsoft Gold Partner and PMI certified professional services firm based in Alberta and Ontario, Canada.
- It offers comprehensive project and portfolio management offerings with a specific focus on project lifecycle management, including demand management, resource management, and governance and communication practices.
What do they do?
- Project Online and Power Platform Expertise. The PMO Outsource Ltd. team has extensive knowledge in both Microsoft’s old tech (Project Server and Desktop) and in its newer, cloud-based technologies (Project Online, Project for the web, the Power Platform, and Dynamics 365).
As the case study in two slides demonstrates, PMO Outsource Ltd. Uses its in-depth knowledge of the Microsoft suite to help organizations automate project and portfolio data collection process, create efficiencies, and encourage cloud adoption.
- PPM Consulting Services: In addition to its Microsoft platform expertise, the PMO Outsource Ltd. team also offers project and portfolio management consulting services, helping organizations evolve their process and governance structures as well as their approaches to PPM tooling.
Markets served
Channel Differentiation
- PMO Outsource Ltd. scales to all the PPM needs of all industry types.
What differentiates PMO Outsource Ltd.?
- PMO Staff Augmentation. In addition to its technology and consulting services, PMO Outsource Ltd. offers PMO staff augmentation services. As advertised on its website, it offers “scalable PMO staffing solutions. Whether you require Project Managers, Business Analysts, Admins or Coordinators, [PMO Outsource Ltd.] can fulfill your talent search requirements from a skilled pool of resources.”
- Multiple and easy-to-understand service contract packages. PMO Outsource Ltd. offers many prepackaged service offerings to suit PMOs’ needs. Those packages include “PMO Management, Admin, and Support,” “PPM Solution, Site and Workflow Configuration,” and “Add-Ons.” For full details of what’s included in these services packages, see the PMO Outsource Ltd. website.
- PMO Outsource Ltd. Services: Below is a list of the services or approaches to project portfolio management that PMO Outsource Ltd. Provides. See its website for more details.
- Process Automation, Workflows, and Tools. Facilitate line of sight by tailoring Microsoft’s technology to your organization’s needs and creating custom workflows.
- PMO Management Framework. Receive a professionally managed PPM methodology as well as governance standardization of processes, tools, and templates.
- Custom BI Reports. Leverage its expertise in reporting and dashboarding to create the visibility your organization needs.
"While selecting an appropriate PPM tool, the PMO should not only evaluate the standard industry tools but also analyze which tool will best fit the organization’s strategy, budget, and culture in the long run." (Neeta Manghnani, PMO Strategist, PMO Outsource Ltd.)
PMO Outsource Ltd. Case Study
This case study was provided to Info-Tech by PMO Outsource Ltd.
SAMUEL
INDUSTRY: Manufacturing
SOURCE: PMO Outsource Ltd.
Challenge
- MS Project 2013 Server (Legacy/OnPrem)
- Out-of-support application and compliance with Office 365
- Out-of-support third-party application for workflows
- No capability for resource management
- Too many manual processes for data maintenance and server administration
Solution
- Migrate project data to MS Project Online
- Recreate workflows using Power Automate solution
- Configure Power BI content packs for Portfolio reporting and resource management dashboards
- Recreate OLAP reports from legacy environment using Power BI
- Cut down nearly 50% of administrative time by automating PMO/PPM processes
- Save costs on Server hardware/application maintenance by nearly 75%
Full Case Study Link
- For full details about how PMO Outsource Ltd. assisted Samuel in modernizing its solution and creating efficiencies, visit the Microsoft website where this case study is highlighted.
Contacting PMO Outsource Ltd.
700 8th Ave SW, #108
Calgary, AB T2P 1H2
Telephone : +1 (587) 355-3745
6045 Creditview Road, #169
Mississauga, ON L5V 0B1
Telephone : +1 (289) 334-1228
Partner Resources. PMO Outsource Ltd.’s approach is rooted within a robust and comprehensive PPM framework that is focused on driving strategic outcomes and business success.
For a full overview of its PPM framework, see here.
Additional PMO Outsource Ltd. Resources
- 5 Benefits of PPM tools and PMO process automation (blog article, PMO Outsource Ltd.)
- Importance of PMO (blog article, PMO Outsource Ltd.)
- Meet the Powerful and Reimagined PPM tool for Everyone! (video, PMO Outsource Ltd. LinkedIn page)
- MS Project Tips: How to add #Sprints to an existing Project? (video, PMO Outsource Ltd. LinkedIn page)
- MS Project Tips: How to add a milestone to your project? (video, PMO Outsource Ltd. LinkedIn page)
- 5 Benefits of implementing Project Online Tools (video, PMO Outsource Ltd. LinkedIn page)
MS Gold Partner Spotlight:
Western Principles
Headquarters: Vancouver, British Columbia
Years Active: 16 Years
Website: www.westernprinciples.com
Who are they?
- Western Principles is a Microsoft Gold Partner and UMT 360 PPM software provider based in British Columbia with a network of consultants across Canada.
- In the last sixteen years, it has successfully conducted over 150 PPM implementations, helping in the implementation, training, and support of Microsoft Project offerings as well as UMT360 – a software solution provider that, much like OnePlan, enhances the PPM capabilities of the Microsoft platform.
What do they do?
- Technology expertise. The Western Principles team helps organizations maximize the value they are getting form the Microsoft Platform. Not only does it offer expertise in all the solutions in the MS Project ecosystem, it also helps organizations optimize their use and understanding of Teams, SharePoint, the Power Platform, and more.
In addition to the Microsoft platform, Western Principles is partnered with many other technology providers, including UMT360 for strategic portfolio management, the Simplex Group for project document controls, HMS for time sheets, and FluentPro for integration, back-ups, and migrations.
- PPM Consulting Services: In addition to its technical services and solutions, Western Principles offers PPM consulting and staff augmentation services.
Markets served
Channel Differentiation
- Western Principles scales to all the PPM needs of all industry types, public and private sector.
- In addition, its website offers persona-specific information based on the PPM needs of engineering and construction, new product development, marketing, and more.
What differentiates Western Principles?
- Gold-certified UMT 360 partner. In addition to being a Microsoft Gold Partner, Western Principles is a gold-certified UMT 360 partner. UMT 360 is a strategic portfolio management tool that integrates with many other work management solutions to offer holistic line of sight into the organization’s supply-demand pain points and strategic portfolio management needs. Some of the solutions UMT 360 integrates with include Project Online and Project for the web, Azure DevOps, Jira, and many more. See here for more information on the impressive functionality in UMT360.
- Sustainment Services. Adoption can be the bane of most PPM tool implementations. Among the many services Western Principles offers, its “sustainment services” stand out. According to Western Principles’ website, these services are addressed to those who require “continual maintenance, change, and repair activities” to keep PPM systems in “good working order” to help maximize ROI.
- Western Principles Services: In addition to the above, below is a list of some of the services that Western Principles offers. See its website for a full list of services.
- Process Optimization: Determine your requirements and process needs.
- Integration: Create a single source of truth.
- Training: Ensure your team knows how to use the systems you implement.
- Staff Augmentation: Provide experienced project team members based upon your needs.
"One of our principles is to begin with the end in mind. This means that we will work with you to define a roadmap to help you advance your strategic portfolio … and project management capabilities. The roadmap for each customer is different and based on where you are today, and where you need to get to." (Western Principles, “Your Strategic Portfolio Management roadmap,” Whitepaper)
Contacting Western Principles
610 – 700 West Pender St.
Vancouver, BC V6C 1G8
+1 (800) 578-4155
Partner Resources. Western Principles provides a multitude of current case studies on its home page. These case studies let you know what the firm is working on this year and the type of support it provides to its clientele.
To access these case studies, see here.
Additional Western Principles Resources
- Program and Portfolio Roll ups with Microsoft Project and Power BI (video, Western Principles YouTube Channel)
- Dump the Spreadsheets for Microsoft Project Online (video, Western Principles YouTube Channel)
- Power BI for Project for the web (video, Western Principles YouTube Channel)
- How to do Capacity Planning and Resource Management in Microsoft Project Online [Part 1 & Part 2] (video, Western Principles YouTube Channel)
- Extend & Integrate Microsoft Project (whitepaper, Western Principles)
- Your COVID-19 Return-to-Work Plan (whitepaper, Western Principles)
Watch Info-Tech’s Analyst-Partner Briefing Videos to lean more
Info-Tech was able to sit down with the partners spotlighted in this step to discuss the current state of the PPM market and Microsoft’s place within it.
- All three partners spotlighted in this step contributed to Info-Tech’s research process for this publication.
- For two of the partners, OnePlan and PMO Outsource Ltd., Info-Tech was able to record a conversation where our analysts and the partners discuss Microsoft’s current MS Project offerings, the current state of the PPM tool market, and the services and the approaches of each respective partner.
- A third video briefing with Western Principles has not happened yet due to logistical reasons. We are hoping we can include a video chat with our peers at Western Principles in the near future.
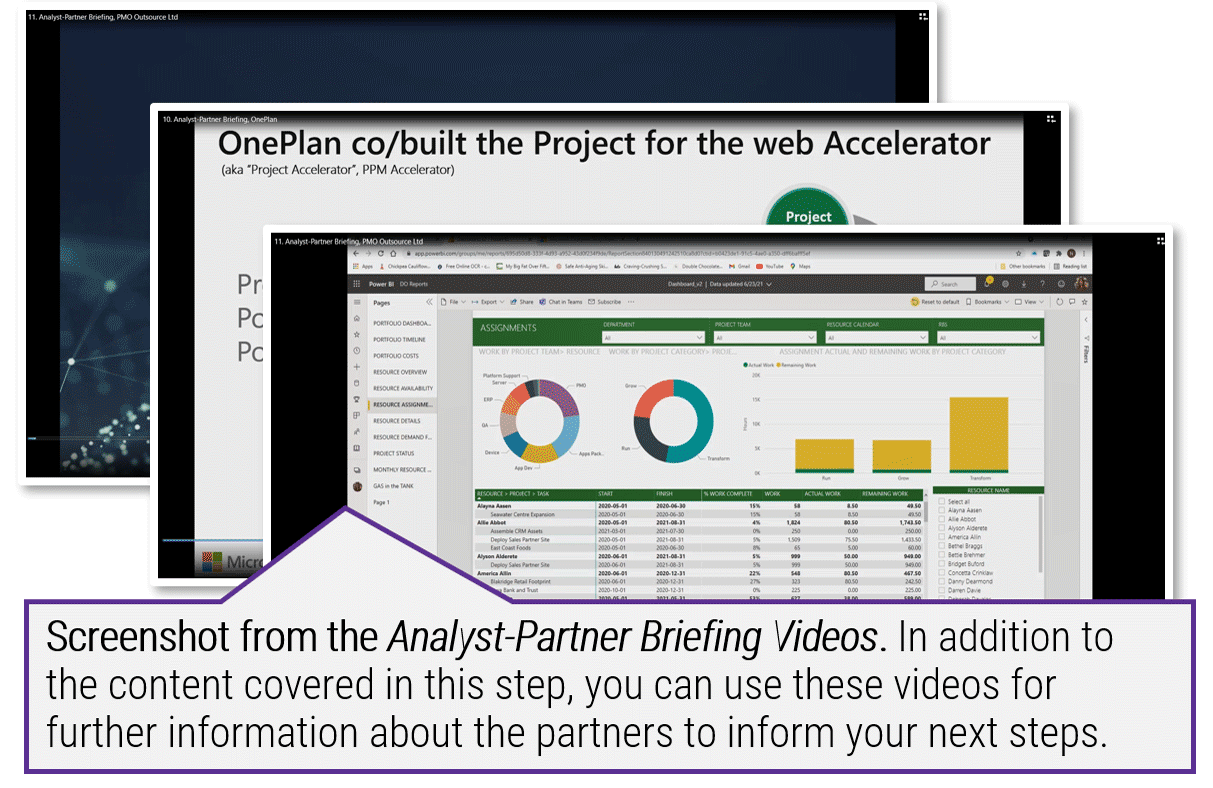
Download Info-Tech’s Analyst-Partner Briefing Videos (OnePlan & PMO Outsource Ltd.)
2.2.1 Create a partner outreach plan
1-3 hours
Input: Contents of this step, List of additional MS Gold Partners
Output: A completed partner outreach program
Materials: MS Project & M365 Action Plan Template
Participants: Portfolio Manager (PMO Director), PMO Admin Team, Project Managers, CIO
- With an understanding of the partner ecosystem, compile a working group of PMO peers and stakeholders to produce a gameplan for engaging the MS Gold Partner ecosystem.
- For additional partner options see Microsoft’s Partner Page.
- Using slide 20 in Info-Tech’s MS Project and M365 Action Plan Template, document the Partners you would want or have scheduled briefings with.
- As you go through the briefings and research process, document the pros and cons and areas of specialized associated with each vendor for your particular work management implementation.
Download the Microsoft Project & M365 Action Plan Template
2.2.2 Document your PM and PPM requirements
1-3 hours
Input: Project Portfolio Management Maturity Assessment, Project Management Maturity Assessment
Output: MS Project & M365 Action Plan Template
Materials: Project Portfolio Management Maturity Assessment, Project Management Maturity Assessment, MS Project & M365 Action Plan Template
Participants: Portfolio Manager (PMO Director), PMO Admin Team, Project Managers, CIO
- As you prepare to engage the Partner Community, you should have a sense of where your project management and project portfolio management gaps are to better communicate your tooling needs.
- Leverage tab 4 from both your Project Portfolio Management Assessment and Project Management Assessment from step 1.3 of this blueprint to help document and communicate your requirements. Those tabs prioritize your project and portfolio management needs by highest impact for the organization.
- You can use the outputs of the tab to inform your inputs on slide 23 of the MS Project & M365 Action Plan Template to present to organizational stakeholders and share with the Partners you are briefing with.
Download the Microsoft Project & M365 Action Plan Template
Determine the Future of Microsoft Project for Your Organization
Phase 3: Finalize Your Implementation Approach
| Phase 1: Determine Your Tool Needs | Phase 2: Weigh Your Implementation Options | Phase 3: Finalize Your Implementation Approach |
- Step 1.1: Survey the M365 work management landscape
- Step 1.2: Perform a process maturity assessment to help inform your M365 starting point
- Step 1.3: Consider the right MS Project licenses for your stakeholders
|
- Step 2.1: Get familiar with extending Project for the web using Power Apps
- Step 2.2: Assess the MS Gold Partner Community
|
- Step 3.1: Prepare an action plan
|
Phase Outcomes
An action plan concerning what to do with MS Project and M365 for your PMO or project organization.
Step 3.1
Prepare an action plan
Activities
- Compile the current state results
- Prepare an Implementation Roadmap
- Complete your presentation deck
This step will walk you through the following activities:
- Assess the impact of organizational change for the project
- Develop your vision for stakeholders
- Compile the current state results and document the implementation approach
- Create clarity through a RACI and proposed implementation timeline
This step usually involves the following participants:
- Portfolio Manager (PMO Director)
- PMO Admin Team
- Business Analysts
- Project Managers
Outcomes of Step
- Microsoft Project and M365 Action Plan
Assess the impact of organizational change
Be prepared to answer: “What’s in it for me?”
Before jumping into licensing and third-party negotiations, ensure you’ve clearly assessed the impact of change.
Tailor the work effort involved in each step, as necessary:
- Assess the impact
- Use the impact assessment questions to identify change impacts.
- Plan for change
- Document the impact on each stakeholder group.
- Anticipate their response.
- Curate a compelling message for each stakeholder group.
- Develop a communication plan.
- Act according to plan
- Identify your executive sponsor.
- Enable the sponsor to drive change communication.
- Coach managers on how they can drive change at the individual level.
Impact Assessment Questions
- Will the change impact how our clients/customers receive, consume, or engage with our products/services?
- Will there be a price increase?
- Will there be a change to compensation and/or rewards?
- Will the vision or mission of the job change?
- Will the change span multiple locations/time zones?
- Are multiple products/services impacted by this change?
- Will staffing levels change?
- Will this change increase the workload?
- Will the tools of the job be substantially different?
- Will a new or different set of skills be needed?
- Will there be a change in reporting relationships?
- Will the workflow and approvals be changed?
- Will there be a substantial change to scheduling and logistics?
Master Organizational Change Management Practices blueprint
Develop your vision for stakeholders
After careful analysis and planning, it’s time to synthesize your findings to those most impacted by the change.
Executive Brief
- Prepare a compelling message about the current situation.
- Outline the considerations the working group took into account when developing the action plan.
- Succinctly describe the recommendations proposed by the working group.
Goals
- Identify the goals for the project.
- Explain the details for each goal to develop the organizational rationale for the project.
- These goals are the building blocks for the change communication that the executive sponsor will use to build a coalition of sponsors.
Future State Vision
- Quantify the high-level costs and benefits of moving forward with this project.
- Articulate the future- state maturity level for both the project and project portfolio management process.
- Reiterate the organizational rationale and drivers for change.
"In failed transformations, you often find plenty of plans, directives, and programs, but no vision…A useful rule of thumb: If you can’t communicate the vision to someone in five minutes or less and get a reaction that signifies both understanding and interest, you are not yet done…" (John P. Kotter, Leading Change)
Get ready to compile the analysis completed throughout this blueprint in the subsequent activities. The outputs will come together in your Microsoft Project and M365 Action Plan.
Use the Microsoft Project & M365 Action Plan Template to help communicate your vision
Our boardroom-ready presentation and communication template can be customized using the outputs of this blueprint.
- Getting stakeholders to understand why you are recommending specific work management changes and then communicating exactly what those changes are and what they will cost is key to the success of your work management implementation.
- To that end, the slides ahead walk you through how to customize the Microsoft Project & M365 Action Plan Template.
- Many of the current-state analysis activities you completed during phase 1 of this blueprint can be directly made use of within the template as can the decisions you made and requirements you documented during phase 2.
- By the end of this step, you will have a boardroom-ready presentation that will help you communicate your future-state vision.
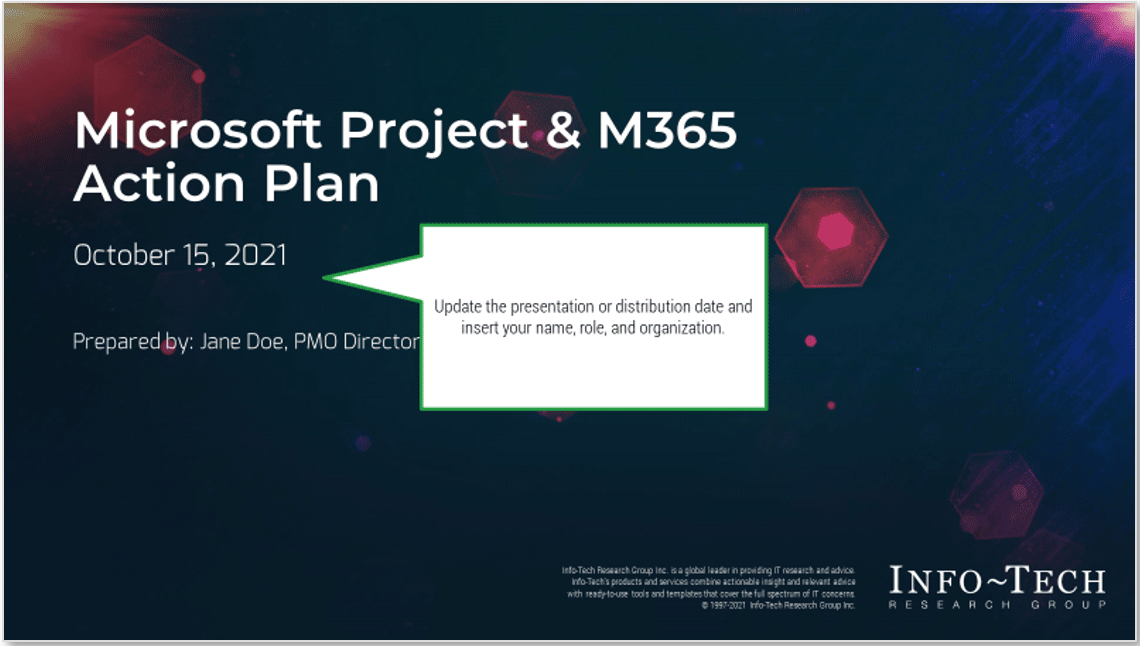
Download Info-Tech’s Microsoft Project & M365 Action Plan Template
3.1.1 Compile current state results
1-3 hours
Input: Force Field Analysis Tool, Tool Audit Workbook, Project Management Maturity Assessment Tool, Project Portfolio Management Maturity Assessment Tool
Output: Section 1: Executive Brief, Section 2: Context and Constraints
Materials: Microsoft Project and M365 Action Plan Template
Participants: PMO Director, PMO Admin Team, Business Analysts, Project Managers
- As a group, review the results of the tools introduced throughout this blueprint. Use this information along with organizational knowledge to document the business context and current state.
- Update the driving forces for change and risks and constraints slides using your outputs from the Force Field Analysis Tool.
- Update the current tool landscape, tool satisfaction, and tool audit results slides using your outputs from the Tool Audit Workbook.
- Update the gap analysis results slides using your outputs from the Project Management and Project Portfolio Management Maturity Assessment Tools.
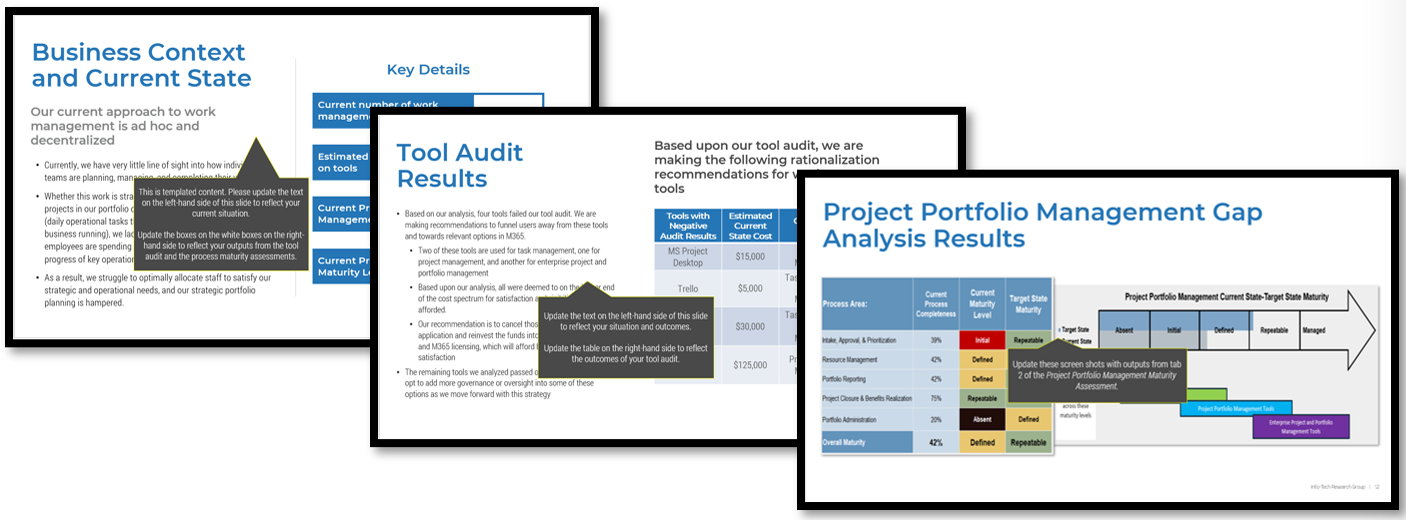
Download the Microsoft Project & M365 Action Plan Template
3.2.1 Option A: Prepare a DIY roadmap
1-3 hours; Note: This is only applicable if you have chosen the DIY route
Input: List of key PPM decision points, List of who is accountable for PPM decisions, List of who has PPM decision-making authority
Output: Section 3: DIY Implementation Approach
Materials: Microsoft Project and M365 Action Plan Template
Participants: PMO Director, PMO Admin Team, Business Analysts, Project Managers
- As a group, review the results of the Microsoft Project and M365 Licensing Tool. Use this information along with organizational knowledge and discussion with the working group to complete Section 3: DIY Implementation Approach.
- Copy and paste your results from tab 5 of the Microsoft Project and M365 Licensing Tool. Update the Implementation Approach slide to detail the rationale for selecting this option.
- Update the Action Plan to articulate the details for total and annual costs of the proposed licensing solution.
- Facilitate a discussion to determine roles and responsibilities for the implementation. Based on the size, risk, and complexity of the implementation, create a reasonable timeline.
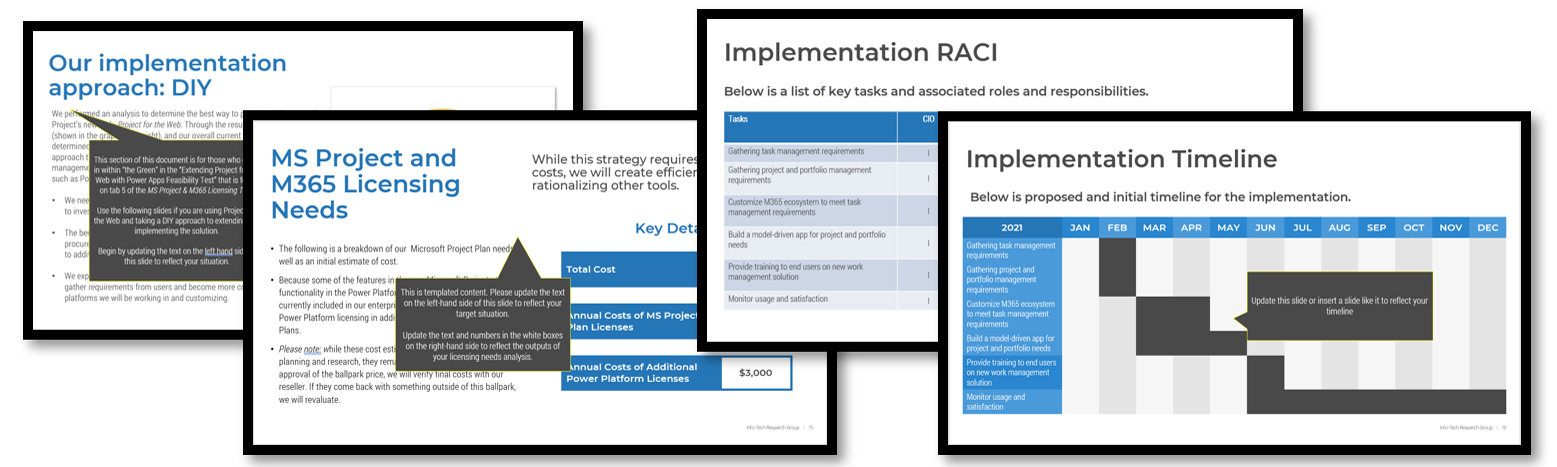
Download the Microsoft Project and M365 Action Plan Template
3.2.1 Option b: Prepare a Partner roadmap
1-3 hours; Note: This is only applicable if you have chosen the Partner route
Input: Microsoft Project and M365 Licensing Tool, Information on Microsoft Partners
Output: Section 4: Microsoft Partner Implementation Route
Materials: Microsoft Project and M365 Action Plan Template
Participants: PMO Director, PMO Admin Team, Business Analysts, Project Managers
- As a group, review the results of the Microsoft Project and M365 Licensing Tool. Use this information along with organizational knowledge and discussion with the working group to complete Section 4: Microsoft Partner Implementation Route.
- Copy and paste your results from tab 5 of the Microsoft Project and M365 Licensing Tool. Update the Implementation Approach slide to detail the rationale for selecting this option.
- Develop an outreach plan for the Microsoft Partners you are planning to survey. Set targets for briefing dates and assign an individual to own any back-and-forth communication. Document the pros and cons of each Partner and gauge interest in continuing to analyze the vendor as a possible solution.
- Facilitate a discussion to determine roles and responsibilities for the implementation. Based on the size, risk, and complexity of the implementation, create a reasonable timeline.
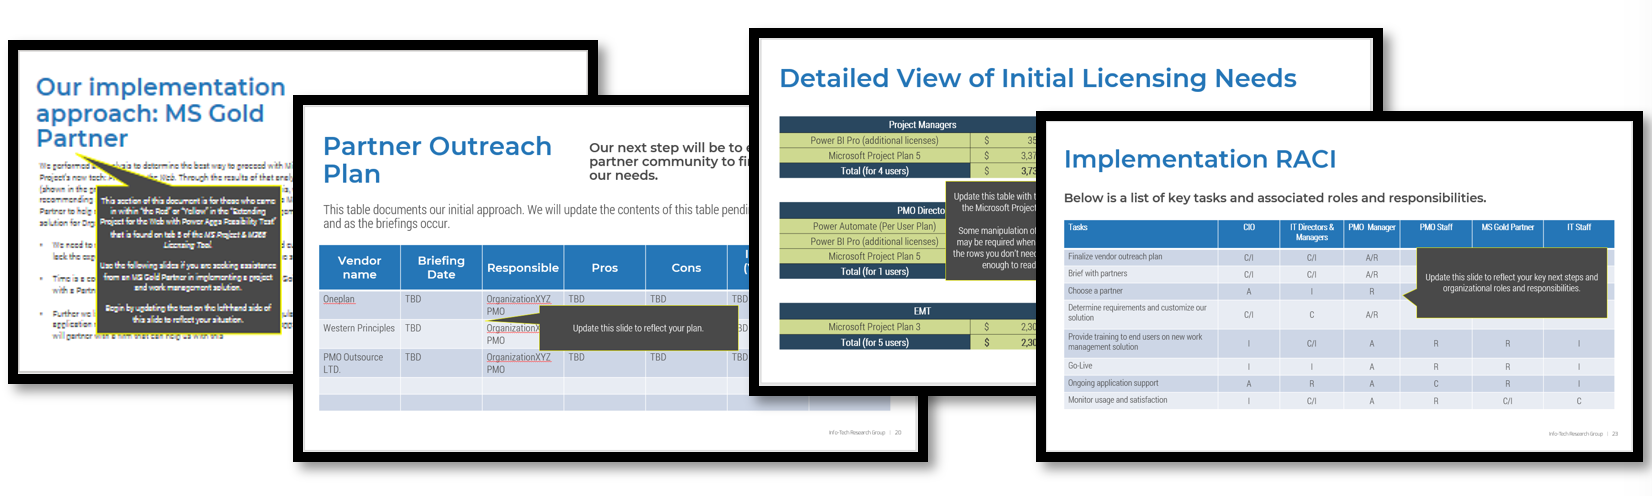
Microsoft Project and M365 Action Plan Template
3.1.2 Complete your presentation deck
1-2 hours
Input: Outputs from the exercises in this blueprint
Output: Section 5: Future-State Vision and Goals
Materials: Microsoft Project and M365 Action Plan Template
Participants: PMO Director, PMO Admin Team, Business Analysts, Project Managers
- Put the finishing touches on your presentation deck by documenting your future- state vision and goals.
- Prepare to present to your stakeholders.
- Understand your audience, their needs and priorities, and their degree of knowledge and experiences with technology. This informs what to include in your presentation and how to position the message and goal.
- Review the deck beginning to end and check for spelling, grammar, and vertical logic.
- Practice delivering the vision for the project through several practice sessions.
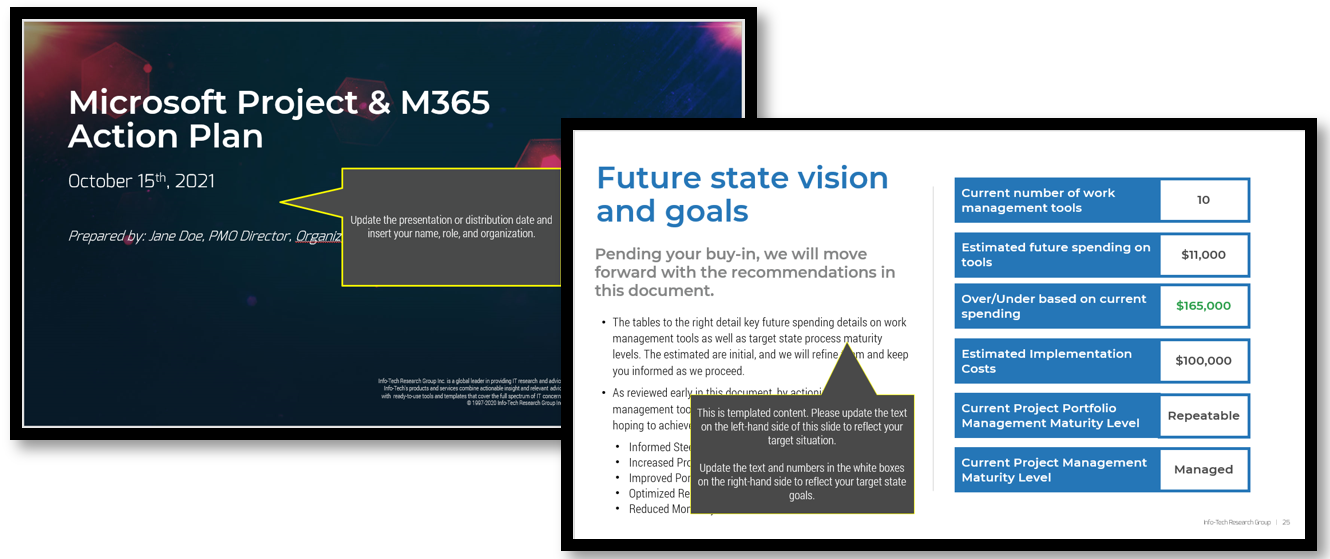
Microsoft Project and M365 Action Plan Template
Pitch your vision to key stakeholders
There are multiple audiences for your pitch, and each audience requires a different level of detail when addressed. Depending on the outcomes expected from each audience, a suitable approach must be chosen. The format and information presented will vary significantly from group to group.
Audience
|
Key Contents
|
Outcome
|
Business Executives
|
- Section 1: Executive Brief
- Section 2: Context and Constraints
- Section 5: Future-State Vision and Goals
|
- Identify executive sponsor
|
IT Leadership
|
- Sections 1-5 with a focus on Section 3 or 4 depending on implementation approach
|
- Get buy-in on proposed project
- Identify skills or resourcing constraints
|
Business Managers
|
- Section 1: Executive Brief
- Section 2: Context and Constraints
- Section 5: Future-State Vision and Goals
|
- Get feedback on proposed plan
- Identify any unassessed risks and organizational impacts
|
Business Users
|
- Section 1: Executive Brief
|
- Support the organizational change management process
|
Summary of Accomplishment
Problem Solved
Knowledge Gained
- How you work: Work management and the various ways of working (personal and team task management, strategic project portfolio management, formal project management, and enterprise project and portfolio management).
- Where you need to go: Project portfolio management and project management current- and target-state maturity levels.
- What you need: Microsoft Project Plans and requisite M365 licensing.
- The skills you need: Extending Project for the web.
- Who you need to work with: Get to know the Microsoft Gold Partner community.
Deliverables Completed
- M365 Tool Guides
- Tool Audit Workbook
- Force Field Analysis Tool
- Project Portfolio Management Maturity Assessment Tool
- Project Management Maturity Assessment Tool
- Microsoft Project & M365 Action Plan Template
If you would like additional support, have our analysts guide you through other phases as part of an Info-Tech workshop
Contact your account representative for more information
workshops@infotech.com
1-888-670-8889
Additional Support
If you would like additional support, have our analysts guide you through other phases as part of an Info-Tech Workshop.
Contact your account representative for more information
workshops@infotech.com 1-888-670-8889
To accelerate this project, engage your IT team in an Info-Tech workshop with an Info-Tech analyst team.
Info-Tech analysts will join you and your team at your location or welcome you to Info-Tech’s historic Toronto office to participate in an innovative onsite workshop.
The following are sample activities that will be conducted by Info-Tech analysts with your team:
Perform a work management tool audit
Gain insight into the tools that drive value or fail to drive value across your work management landscape with a view to streamline the organization’s tool ecosystem.
Prepare an action plan for your tool needs
Prepare the right work management tool recommendations for your IT teams and/or business units and develop a boardroom-ready presentation to communicate needs and next steps.
Research Contributors and Experts
Neeta Manghnani
PMO Strategist
PMO Outsource Ltd.

- Innovative, performance-driven executive with significant experience managing Portfolios, Programs & Projects, and technical systems for international corporations with complex requirements. A hands-on, dynamic leader with over 20 years of experience guiding and motivating cross-functional teams. Highly creative and brings a blend of business acumen and expertise in multiple IT disciplines, to maximize the corporate benefit from capital investments.
- Successfully deploys inventive solutions to automate processes and improve the functionality, scalability and security of critical business systems and applications. Leverages PMO/PPM management and leadership skills to meet the strategic goals and business initiatives.
Robert Strickland
Principal Consultant & Owner
PMO Outsource Ltd.

- Successful entrepreneur, leader, and technologist for over 15 years, is passionate about helping organizations leverage the value of SharePoint, O365, Project Online, Teams and the Power Platform. Expertise in implementing portals, workflows and collaboration experiences that create business value. Strategic manager with years of successful experience building businesses, developing custom solutions, delivering projects, and managing budgets. Strong transformational leader on large implementations with a technical pedigree.
- A digital transformation leader helping clients move to the cloud, collaborate, automate their business processes and eliminate paper forms, spreadsheets and other manual practices.
Related Info-Tech Research
- Develop a Project Portfolio Management Strategy
Time is money; spend it wisely.
- Establish Realistic IT Resource Management Practices
Holistically balance IT supply and demand to avoid overallocation.
- Tailor Project Management Processes to Fit Your Projects
Spend less time managing processes and more time delivering results
Bibliography
“13 Reasons not to use Microsoft Project.” Celoxis, 14 Sept. 2018. Accessed 17 Sept. 2021.
Advisicon. “Project Online vs Project for the Web.” YouTube, 13 Nov. 2013. Accessed 17 Sept. 2021.
Branscombe, Mary. “Is Project Online ready to replace Microsoft Project?” TechRepublic, 23 Jan. 2020. Accessed 17 Sept. 2021.
Chemistruck, Dan. “The Complete Office 365 and Microsoft 365 Licensing Comparison.” Infused Innovations, 4 April 2019. Accessed 17 Sept. 2021.
“Compare Project management solutions and costs.” Microsoft. Accessed 17 Sept. 2021.
Day to Day Dynamics 365. “Microsoft Project for the web - Model-driven app.” YouTube, 29 Oct. 2019. Accessed 17 Sept. 2021.
“Deploying Project for the web.” Microsoft, 24 Aug. 2021. Accessed 17 Sept. 2021.
“Differentiate your business by attaining Microsoft competencies.” Microsoft, 26 Jan. 2021. Accessed 17 Sept. 2021.
“Extend & Integrate Microsoft Project.” Western Principles. Accessed 17 Sept. 2021.
“Get Started with Project Power App.” Microsoft. Accessed 17 Sept. 2021.
Hosking, Ben. “Why low code software development is eating the world.” DevGenius, May 2021. Accessed 17 Sept. 2021.
“How in the World is MS Project Still a Leading PM Software?” CBT Nuggets, 12 Nov. 2018. Accessed 17 Sept. 2021.
Integent. “Project for the Web - Create a Program Entity and a model-driven app then expose in Microsoft Teams.” YouTube, 25 Mar. 2020. Accessed 17 Sept. 2021.
“Introducing the Project Accelerator.” Microsoft, 10 Mar. 2021. Accessed 17 Sept. 2021.
“Join the Microsoft Partner Network.” Microsoft. Accessed 17 Sept. 2021.
Kaneko, Judy. “How Productivity Tools Can Lead to a Loss of Productivity.” Bluescape, 2 Mar. 2018 Accessed 17 Sept. 2021.
Kotter, John. Leading Change. Harvard Business School Press, 1996.
Leis, Merily. “What is Work Management.” Scoro. Accessed 17 Sept. 2021.
Liu, Shanhong. “Number of Office 365 company users worldwide as of June 2021, by leading country.” Statistica, 2021. Web.
Manghnani, Neeta. “5 Benefits of PPM tools and PMO process automation.” PMO Outsource Ltd., 11 Apr. 2021. Accessed 17 Sept. 2021.
“Microsoft 365 and Office 365 plan options.” Microsoft, 31 Aug. 2021. Accessed 17 Sept. 2021.
“Microsoft 365 for enterprise.” Microsoft. Accessed 17 Sept. 2021
“Microsoft Office 365 Usage Statistics.” Thexyz blog, 18 Sept. 2020. Accessed 17 Sept. 2021.
“Microsoft Power Apps, Microsoft Power Automate and Microsoft Power Virtual Agents Licensing Guide.” Microsoft, June 2021. Web.
“Microsoft Project service description.” Microsoft, 31 Aug. 2021. Accessed 17 Sept. 2021.
“Microsoft Project Statistics.” Integent Blog, 12 Dec. 2013. Accessed 17 Sept. 2021.
Nanji, Aadil . Modernize Your Microsoft Licensing for the Cloud Era. Info-Tech Research Group, 12 Mar. 2020. Accessed 17 Sept. 2021.
“Number of Office 365 company users worldwide as of June 2021, by leading country.” Statista, 8 June 2021. Accessed 17 Sept. 2021.
“Overcoming disruption in a digital world.” Asana. Accessed 17 Sept. 2021.
Pajunen, Antti. “Customizing and extending Project for the web.” Day to Day Dynamics 365, 20 Jan. 2020. Accessed 17 Sept. 2021.
“Partner Center Documentation.” Microsoft. Accessed 17 Sept. 2021.
Pragmatic Works. “Building First Power Apps Model Driven Application.” YouTube, 21 June 2019. Accessed 17 Sept. 2021.
“Project architecture overview.” Microsoft, 27 Mar. 2020. Accessed 17 Sept. 2021.
“Project for the web Accelerator.” GitHub. Accessed 17 Sept. 2021.
“Project for the web admin help.” Microsoft, 28 Oct. 2019. Accessed 17 Sept. 2021.
“Project for the Web – The New Microsoft Project.” TPG. Accessed 17 Sept. 2021.
“Project for the Web Security Roles.” Microsoft, 1 July 2021. Accessed 17 Sept. 2021.
“Project Online: Project For The Web vs Microsoft Project vs Planner vs Project Online.” PM Connection, 30 Nov. 2020. Accessed 17 Sept. 2021.
Redmond, Tony. “Office 365 Insights from Microsoft’s FY21 Q2 Results.” Office 365 for IT Pros, 28 Jan. 2021. Accessed 17 Sept. 2021.
Reimagine Project Management with Microsoft. “Advanced deployment for Project for the web.” YouTube, 4 Aug. 2021. Accessed 17 Sept. 2021.
Reimagine Project Management with Microsoft. “Overview of Microsoft Project.” YouTube, 29 July 2021. Accessed 17 Sept. 2021.
“See which partner offer is right for you.” Microsoft. Accessed 17 Sept. 2021.
Shalomova, Anna. “Microsoft Project for Web 2019 vs. Project Online: What’s Best for Enterprise Project Management?” FluentPro, 23 July 2020. Accessed 17 Sept. 2021.
Speed, Richard. “One Project to rule them all: Microsoft plots end to Project Online while nervous Server looks on.” The Register, 28 Sept. 2018. Accessed 17 Sept. 2021.
Spataro, Jared. “A new vision for modern work management with Microsoft Project.” Microsoft, 25 Sept. 2018. Accessed 17 Sept. 2021.
Stickel, Robert. “OnePlan Recognized as Winner of 2021 Microsoft Project & Portfolio Management Partner of the Year.” OnePlan, 8 July 2021. Accessed 17 Sept. 2021.
Stickel, Robert. “The Future of Project Online.” OnePlan, 2 Mar. 2021. Accessed 17 Sept. 2021.
Stickel, Robert. “What It Means to be Adaptive.” OnePlan, 24 May 2021. Accessed 17 Sept. 2021.
“The Future of Microsoft Project Online.” OnePlan. Accessed 17 Sept. 2021.
Weller, Joe. “Demystifying Microsoft Project Licensing.” Smartsheet, 10 Mar. 2016. Accessed 17 Sept. 2021.
Western Principles Inc. “Dump the Spreadsheets for Microsoft Project Online.” YouTube, 2 July 2020. Accessed 17 Sept. 2021.
Western Principles Inc. “Project Online or Project for the web? Which project management system should you use?” YouTube, 11 Aug. 2020. Accessed 17 Sept. 2021.
“What is Power Query?” Microsoft, 22 July 2021. Web.
Wicresoft. “The Power of the New Microsoft Project and Microsoft 365.” YouTube, 29 May 2020. Accessed 17 Sept. 2021.
Wicresoft. “Why the Microsoft Power Platform is the Future of PPM.” YouTube, 11 June 2020. Accessed 17 Sept. 2021.


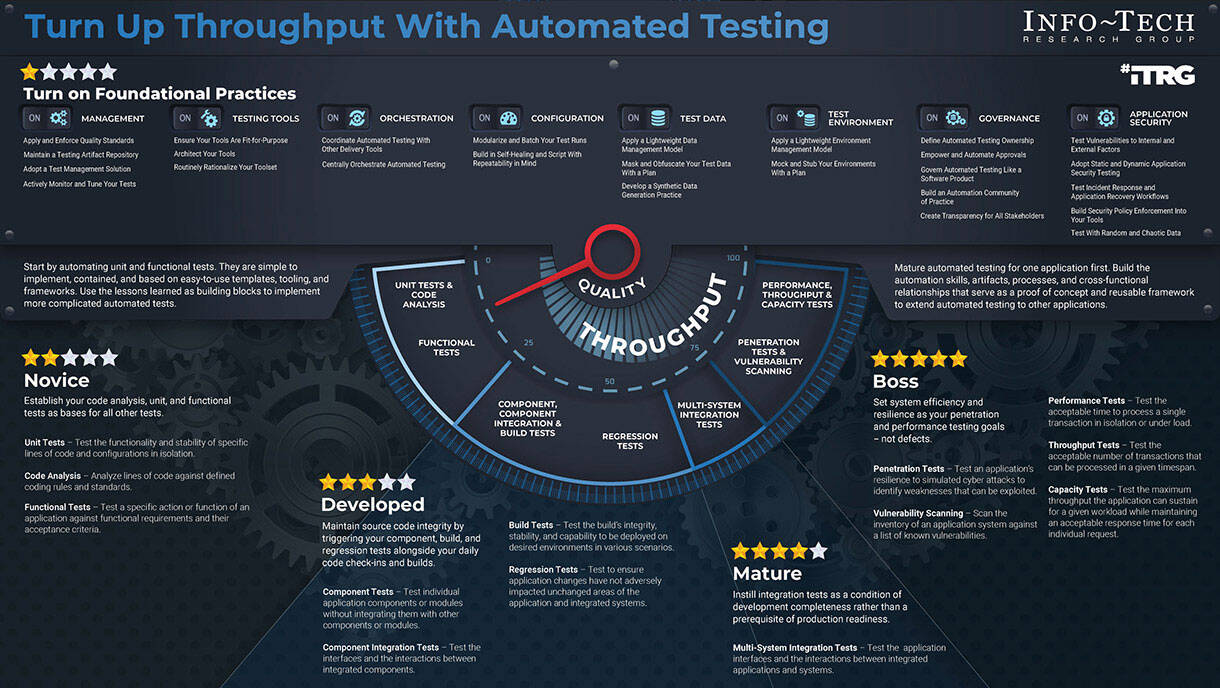

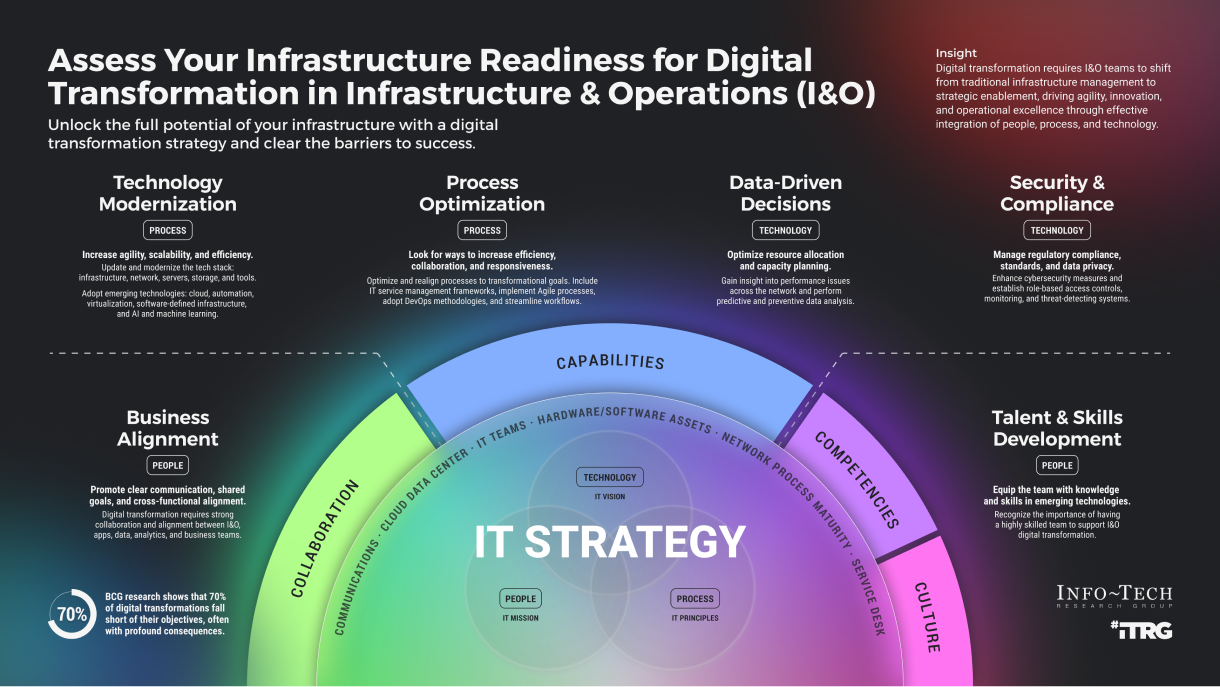


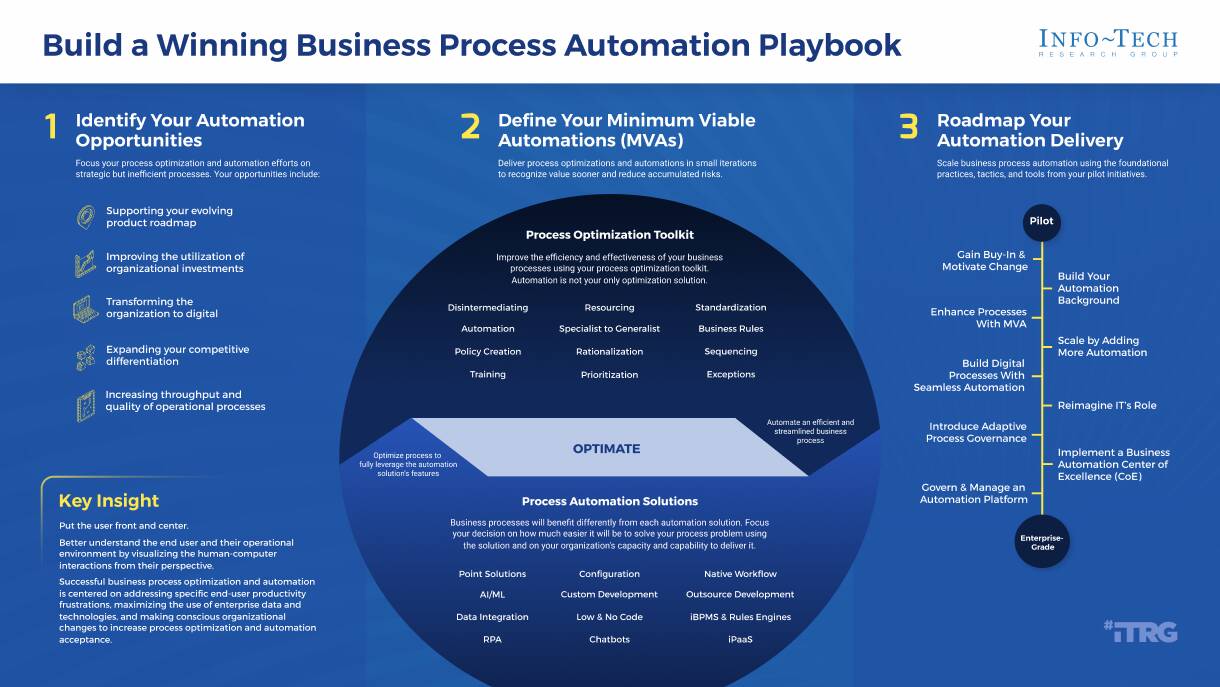

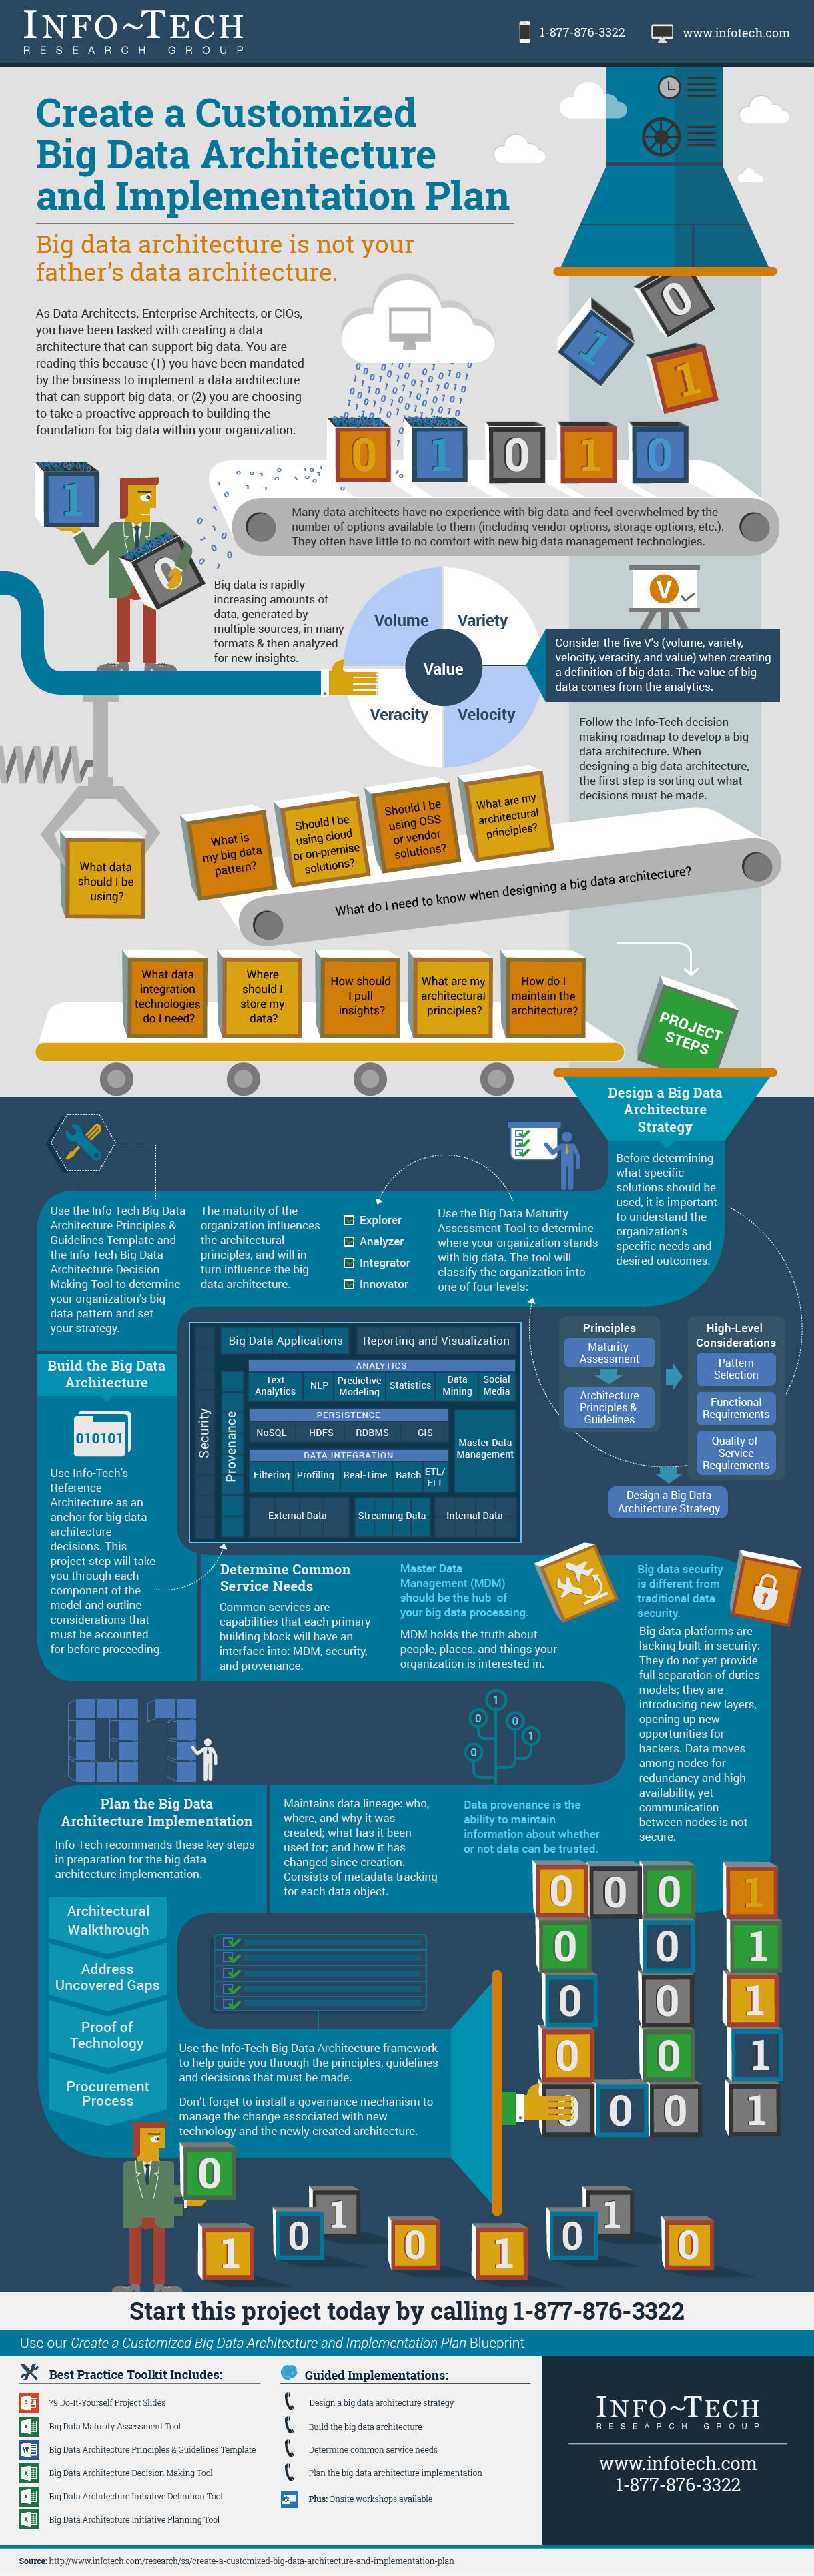


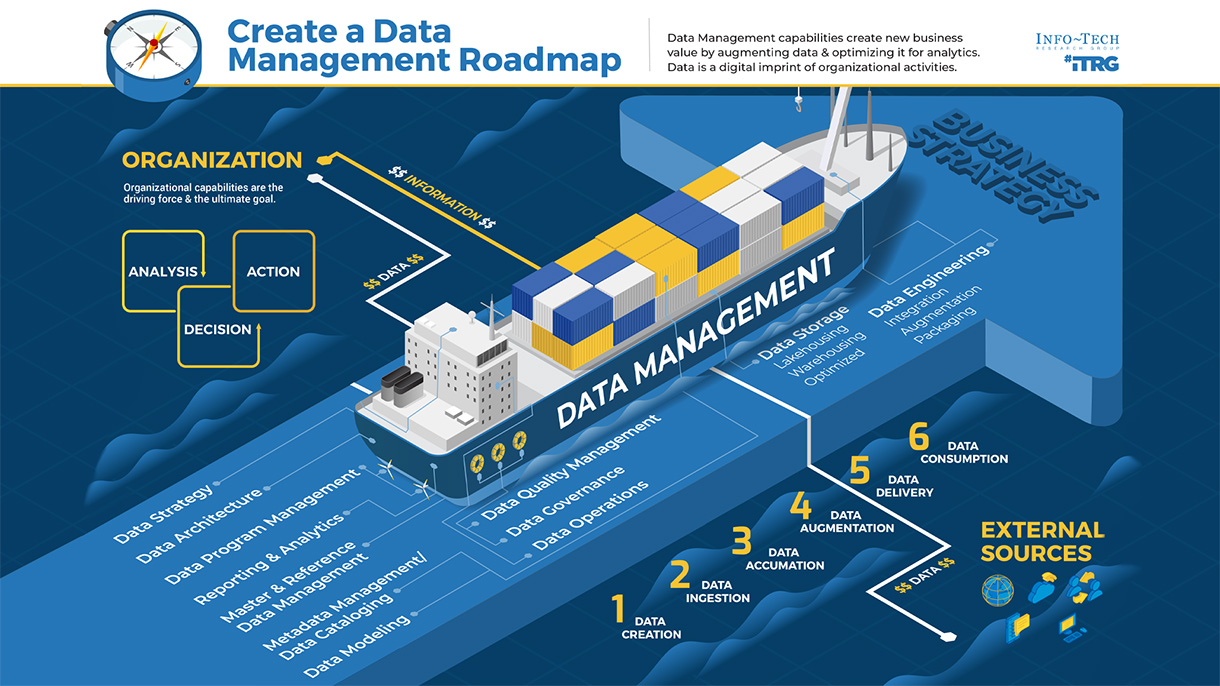
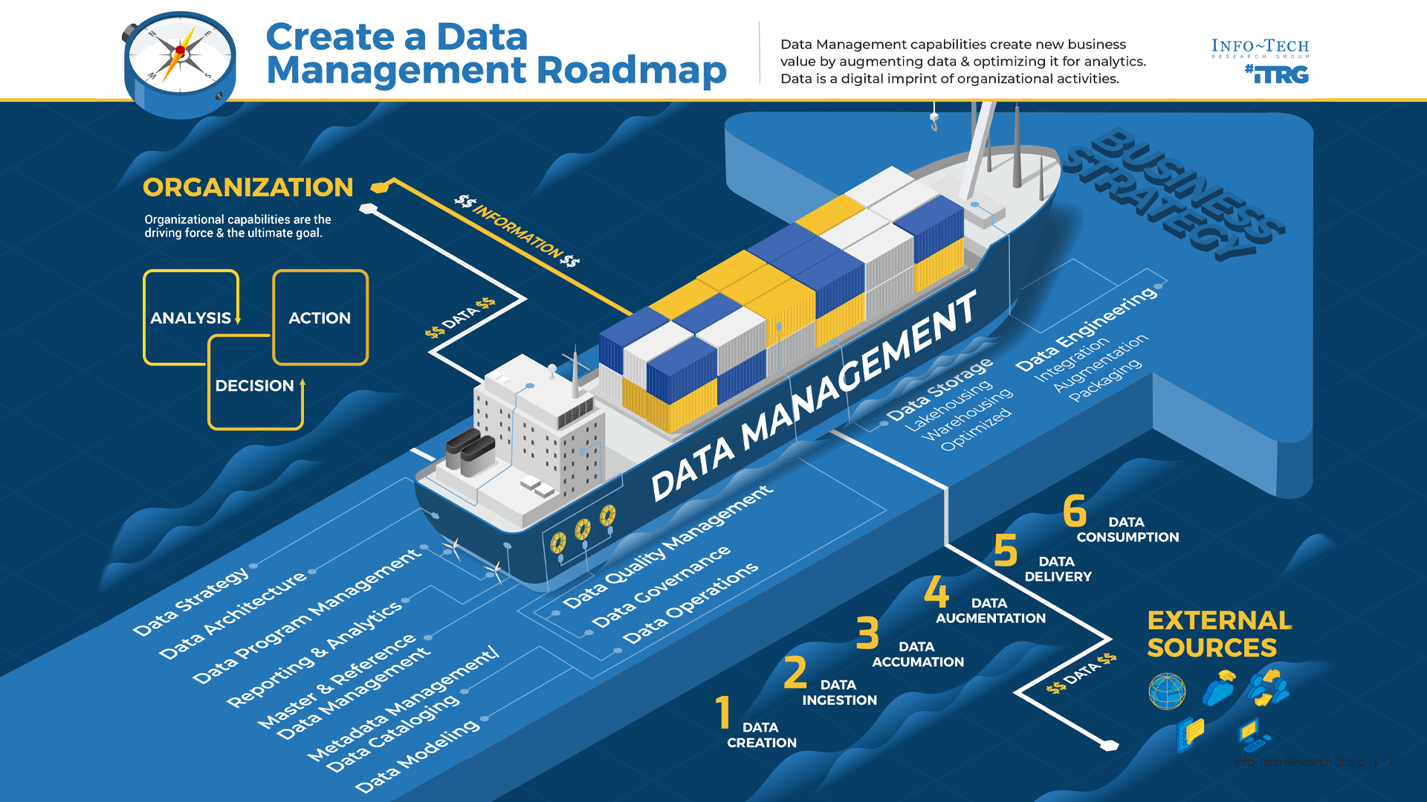
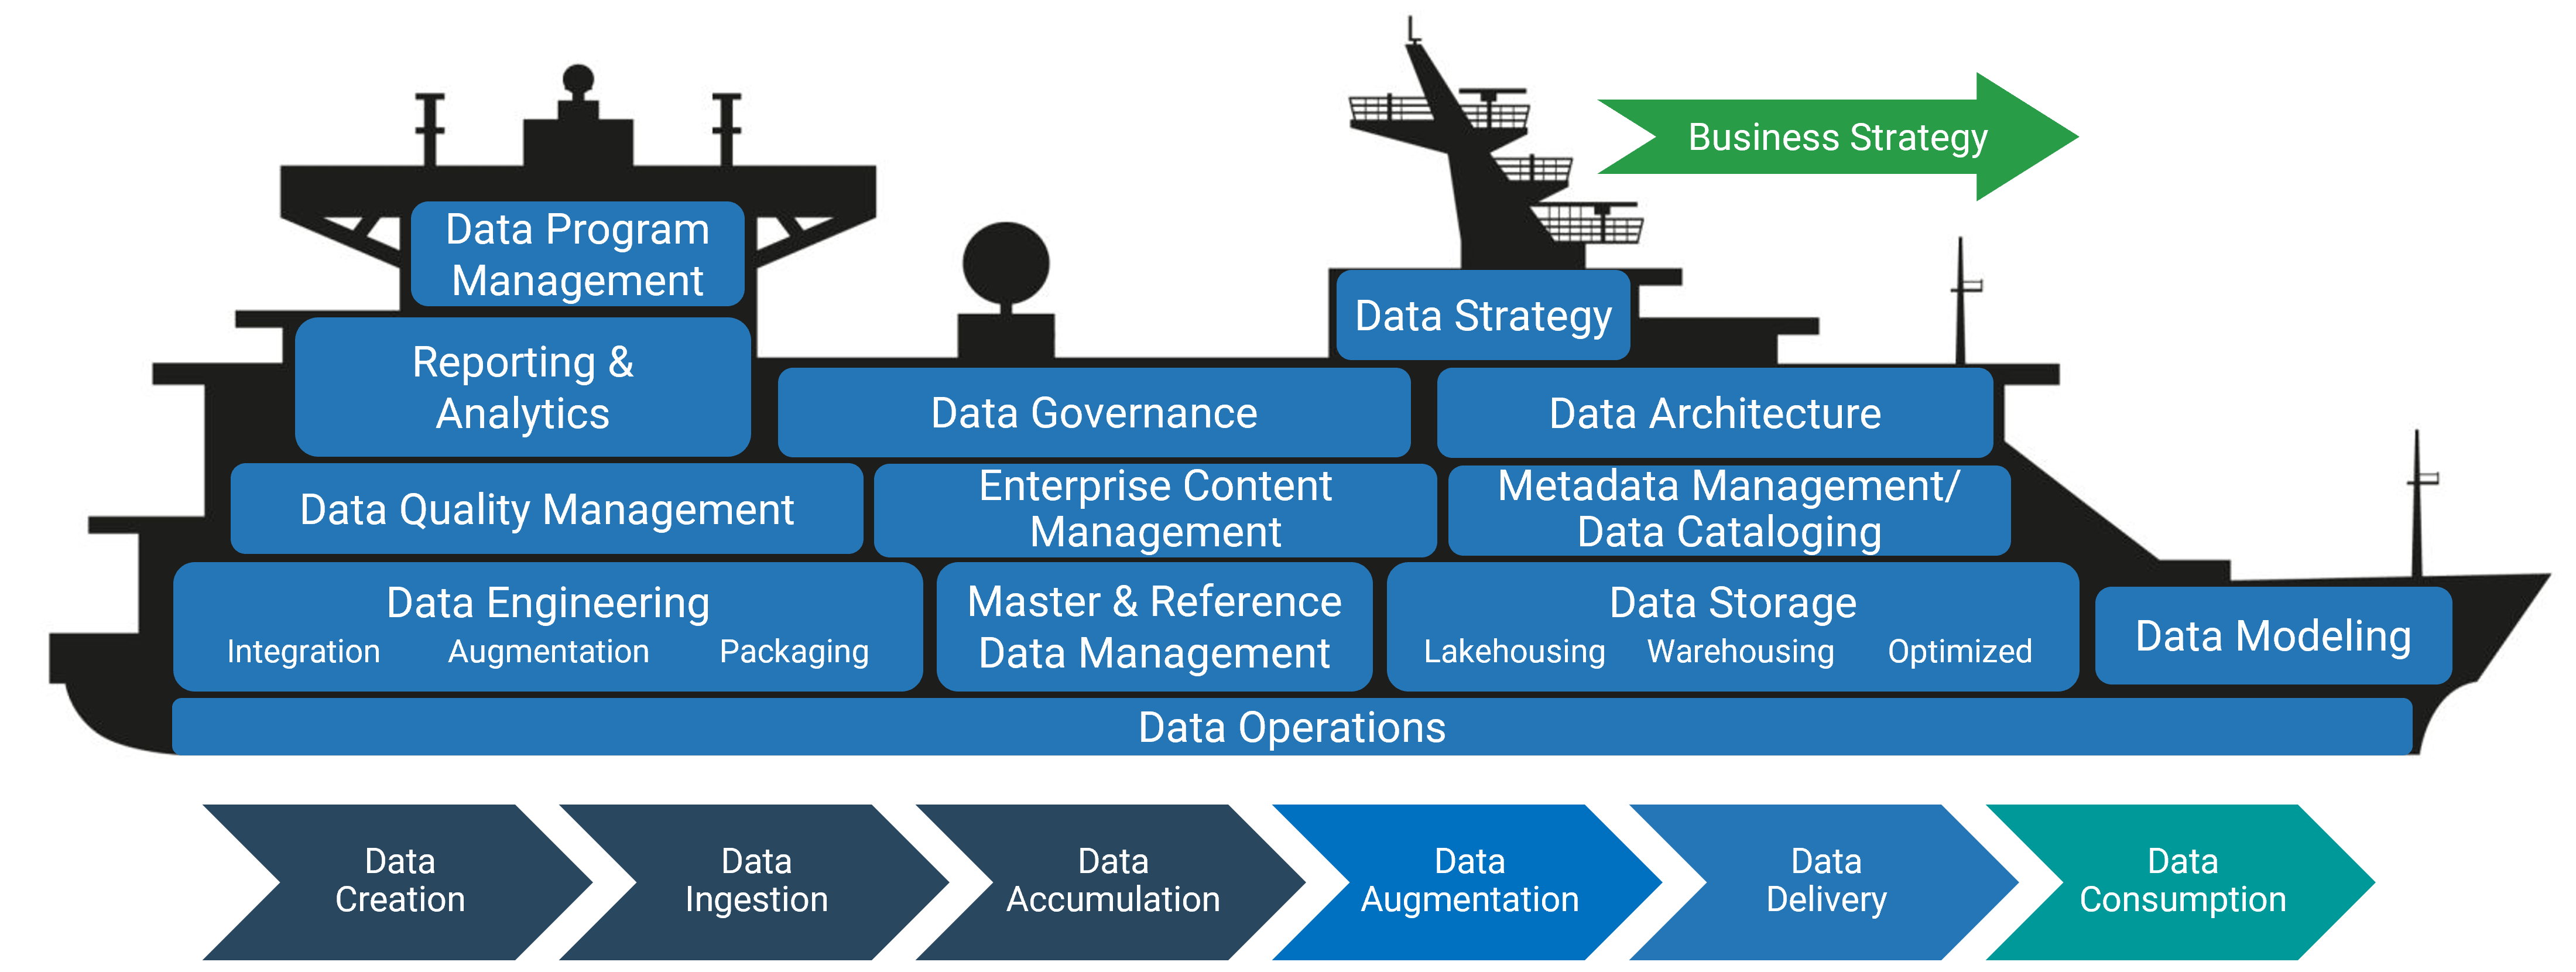
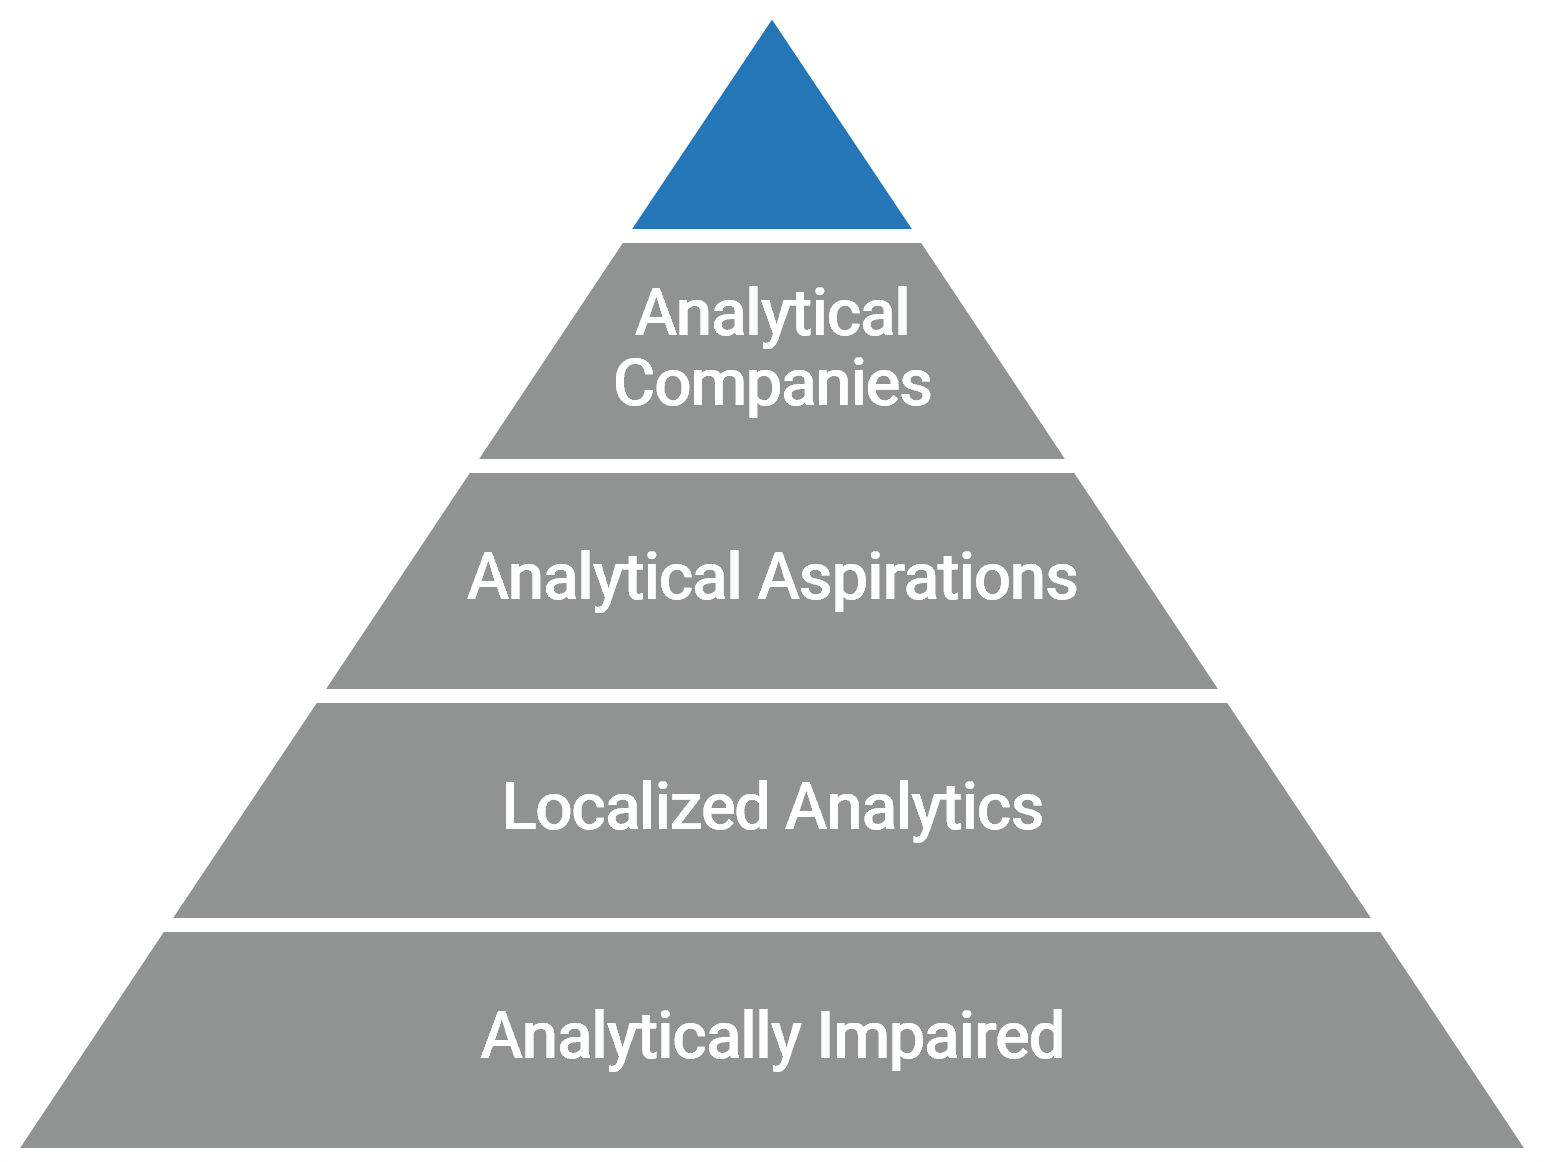
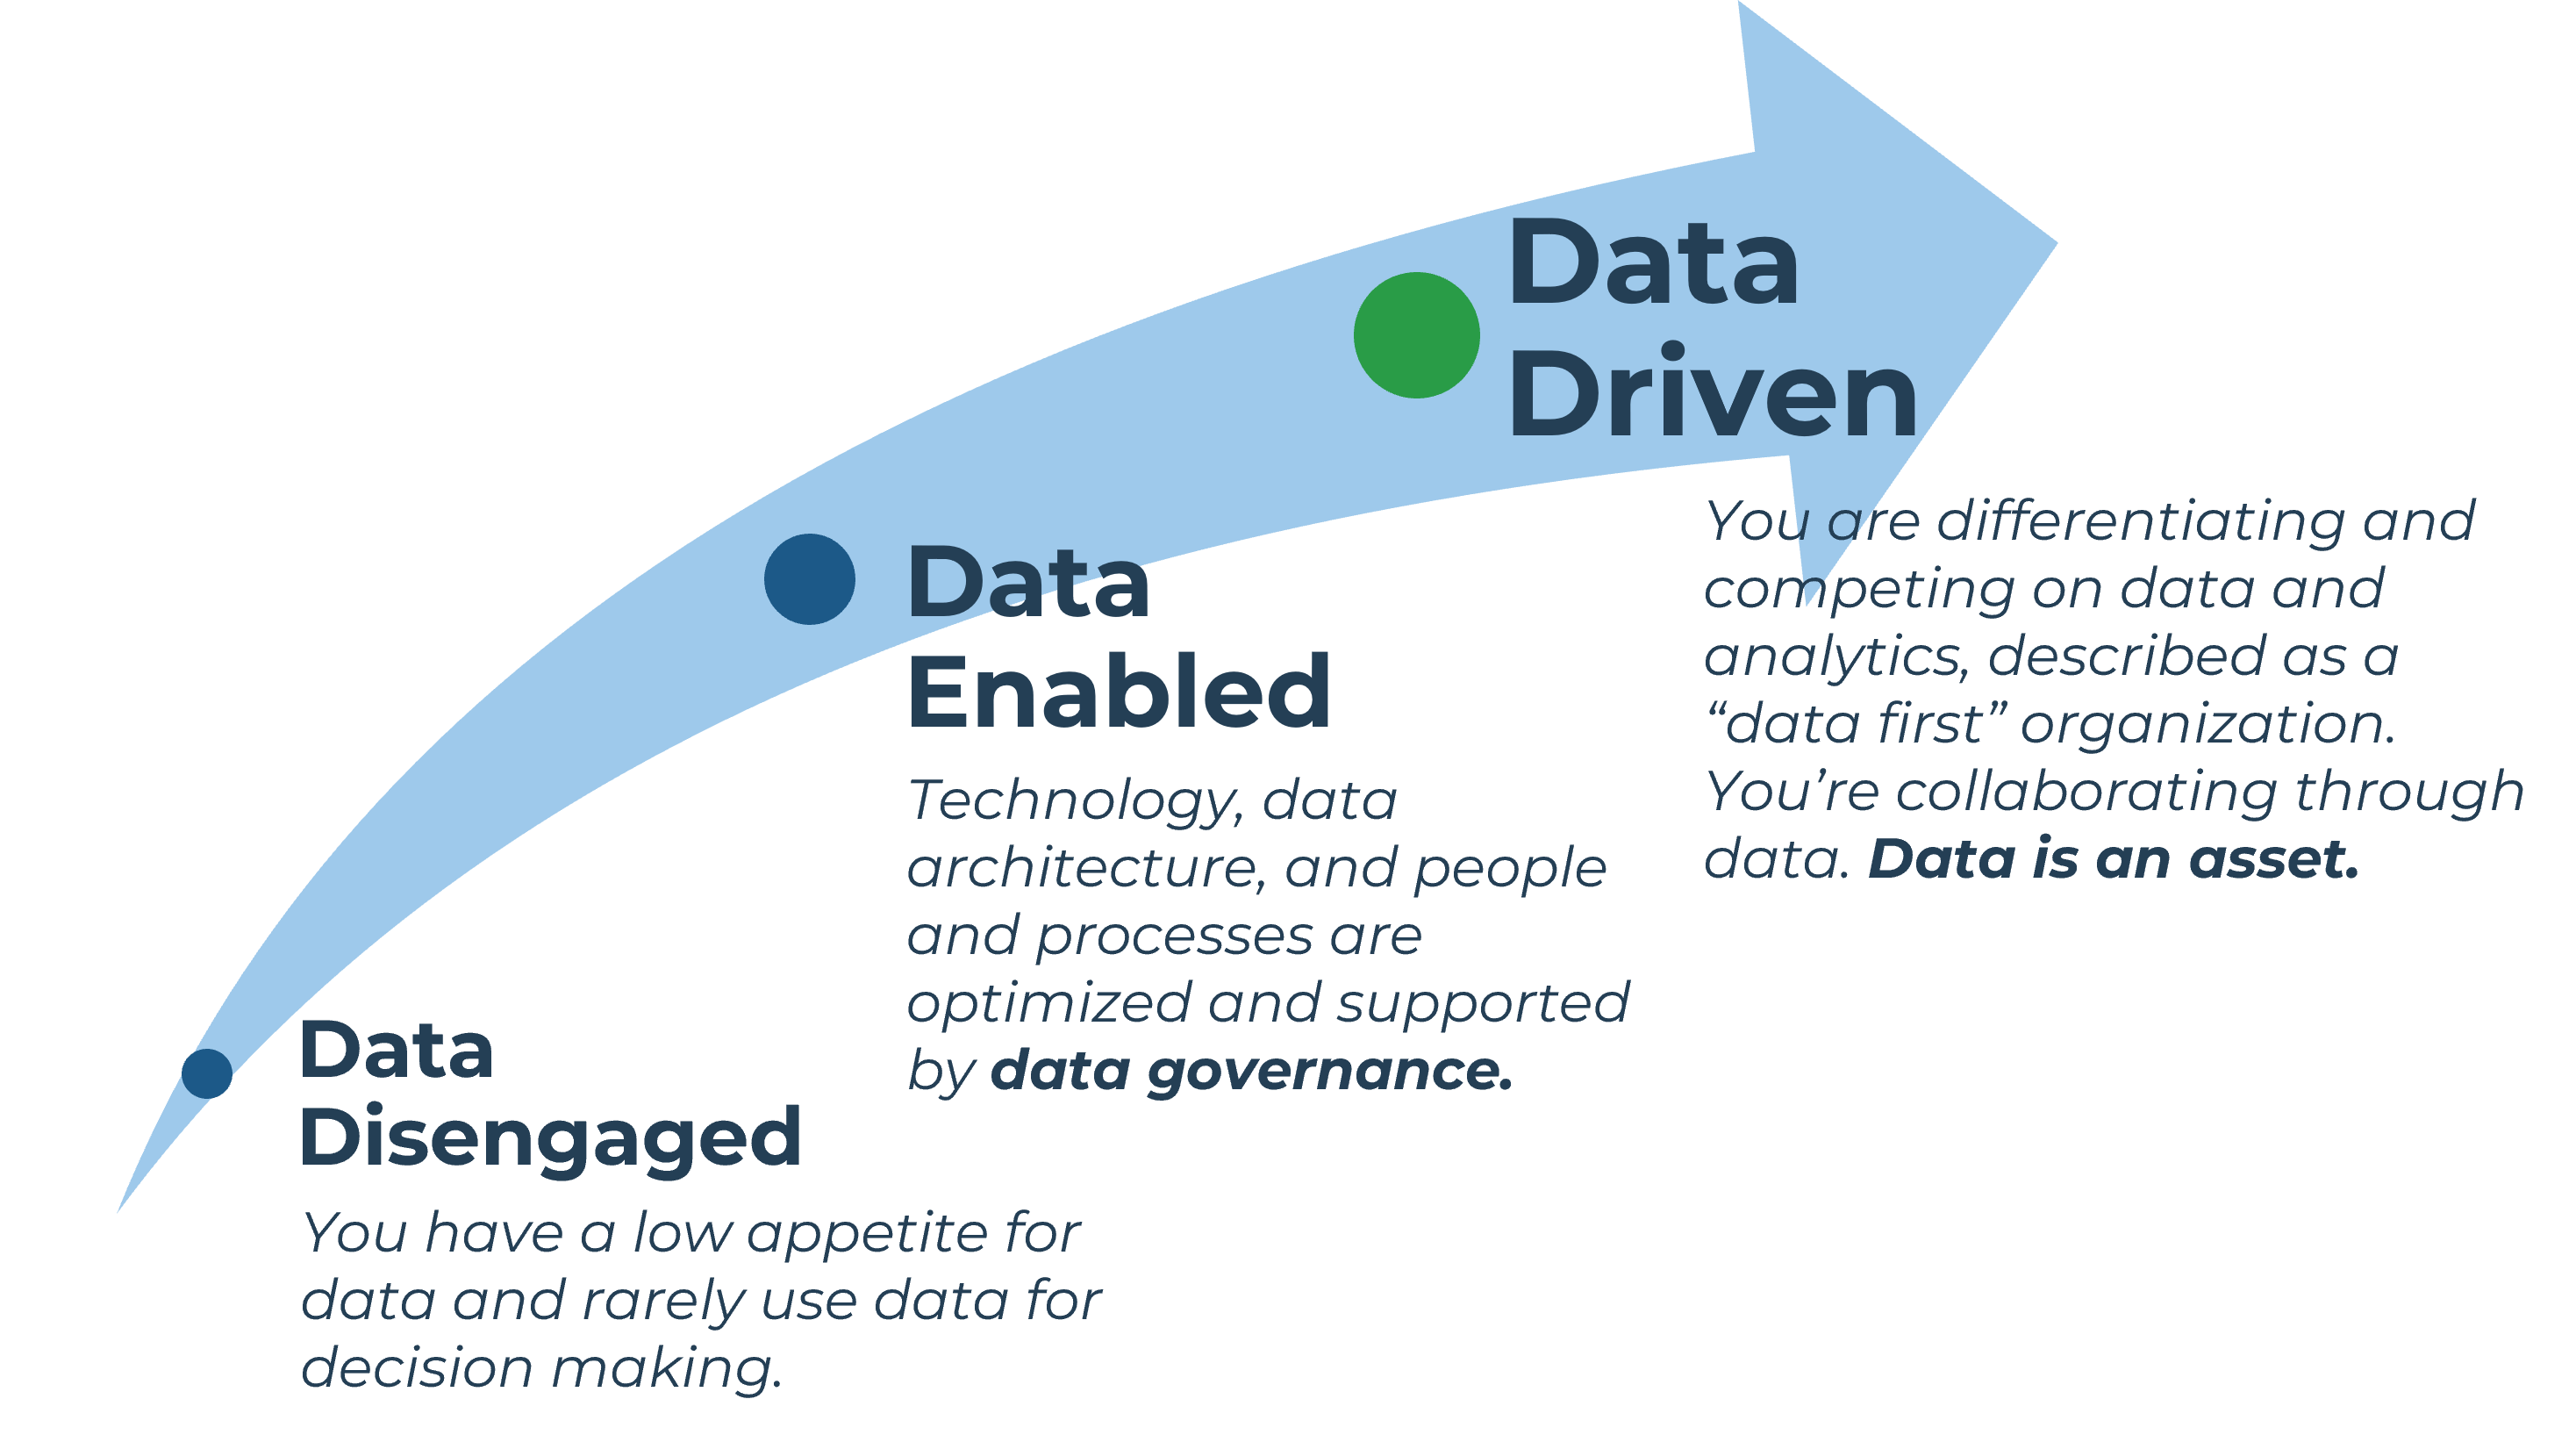
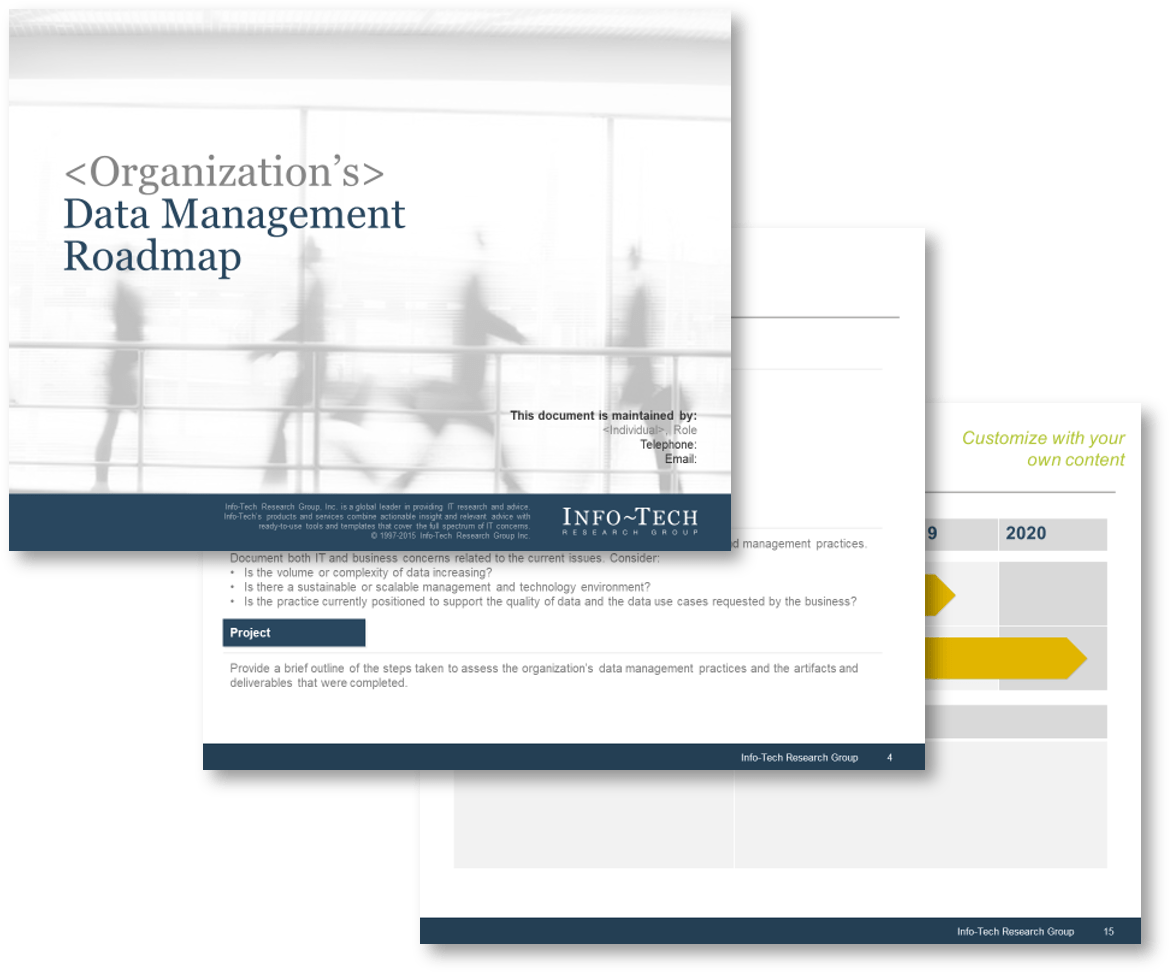
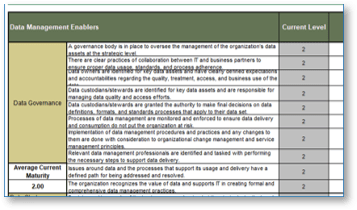

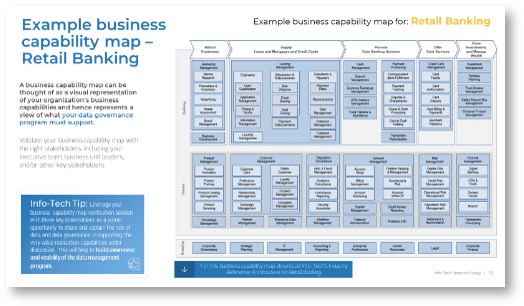
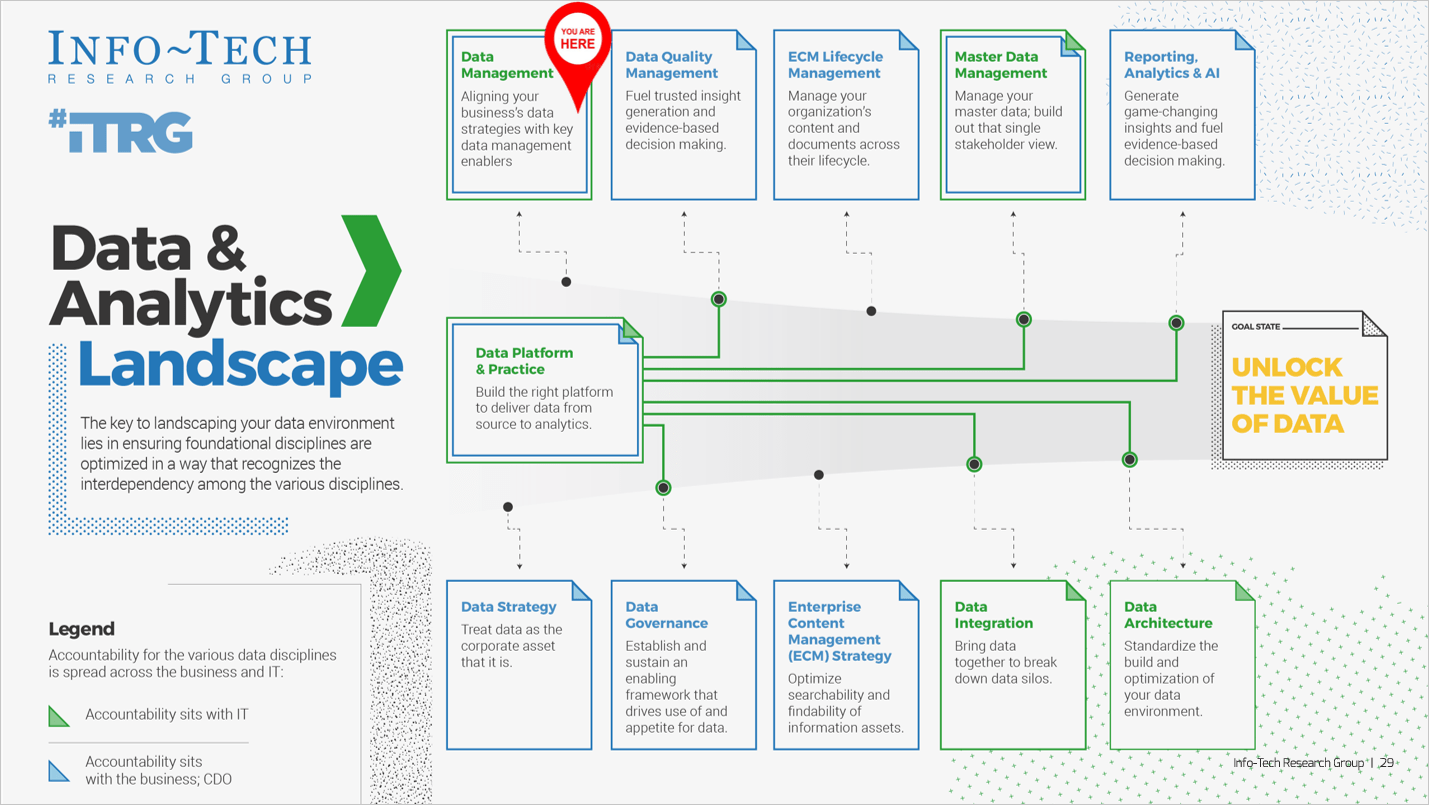
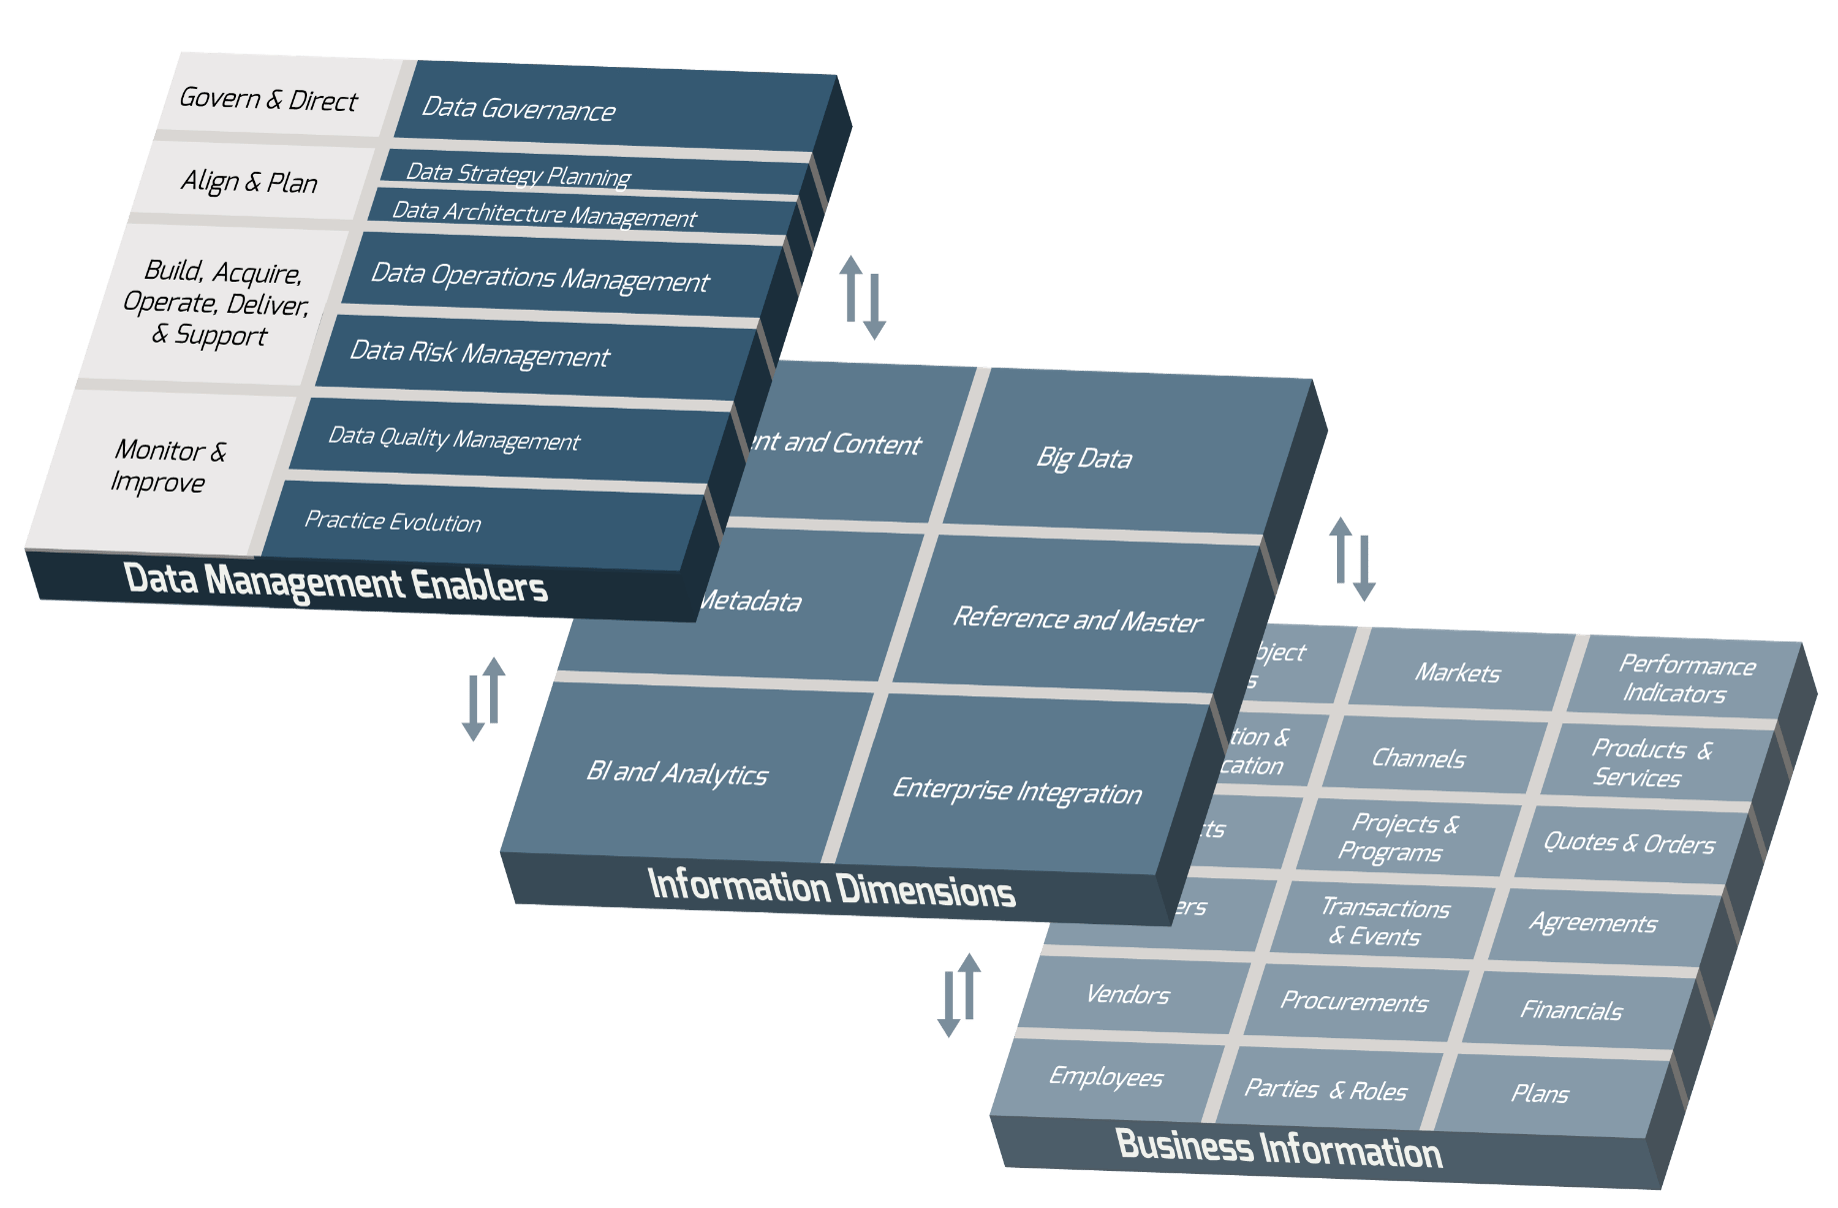
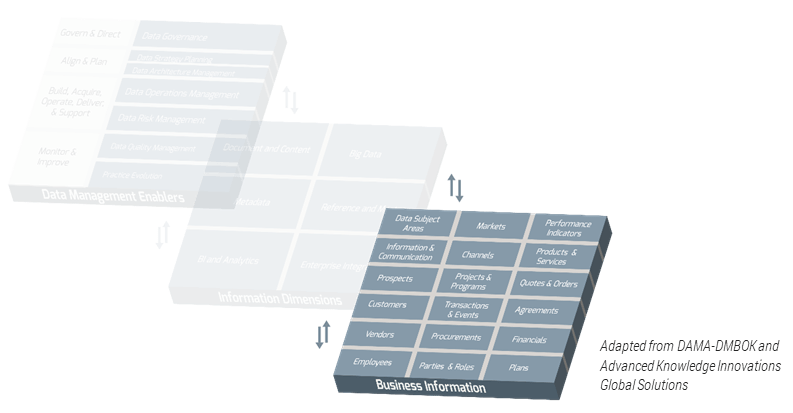
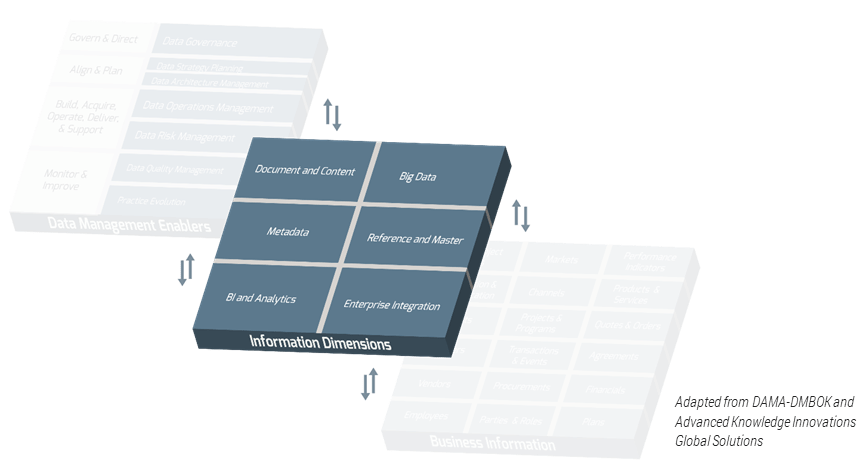
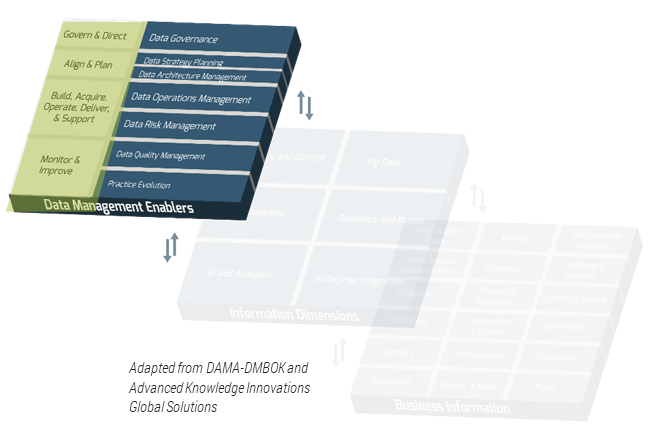
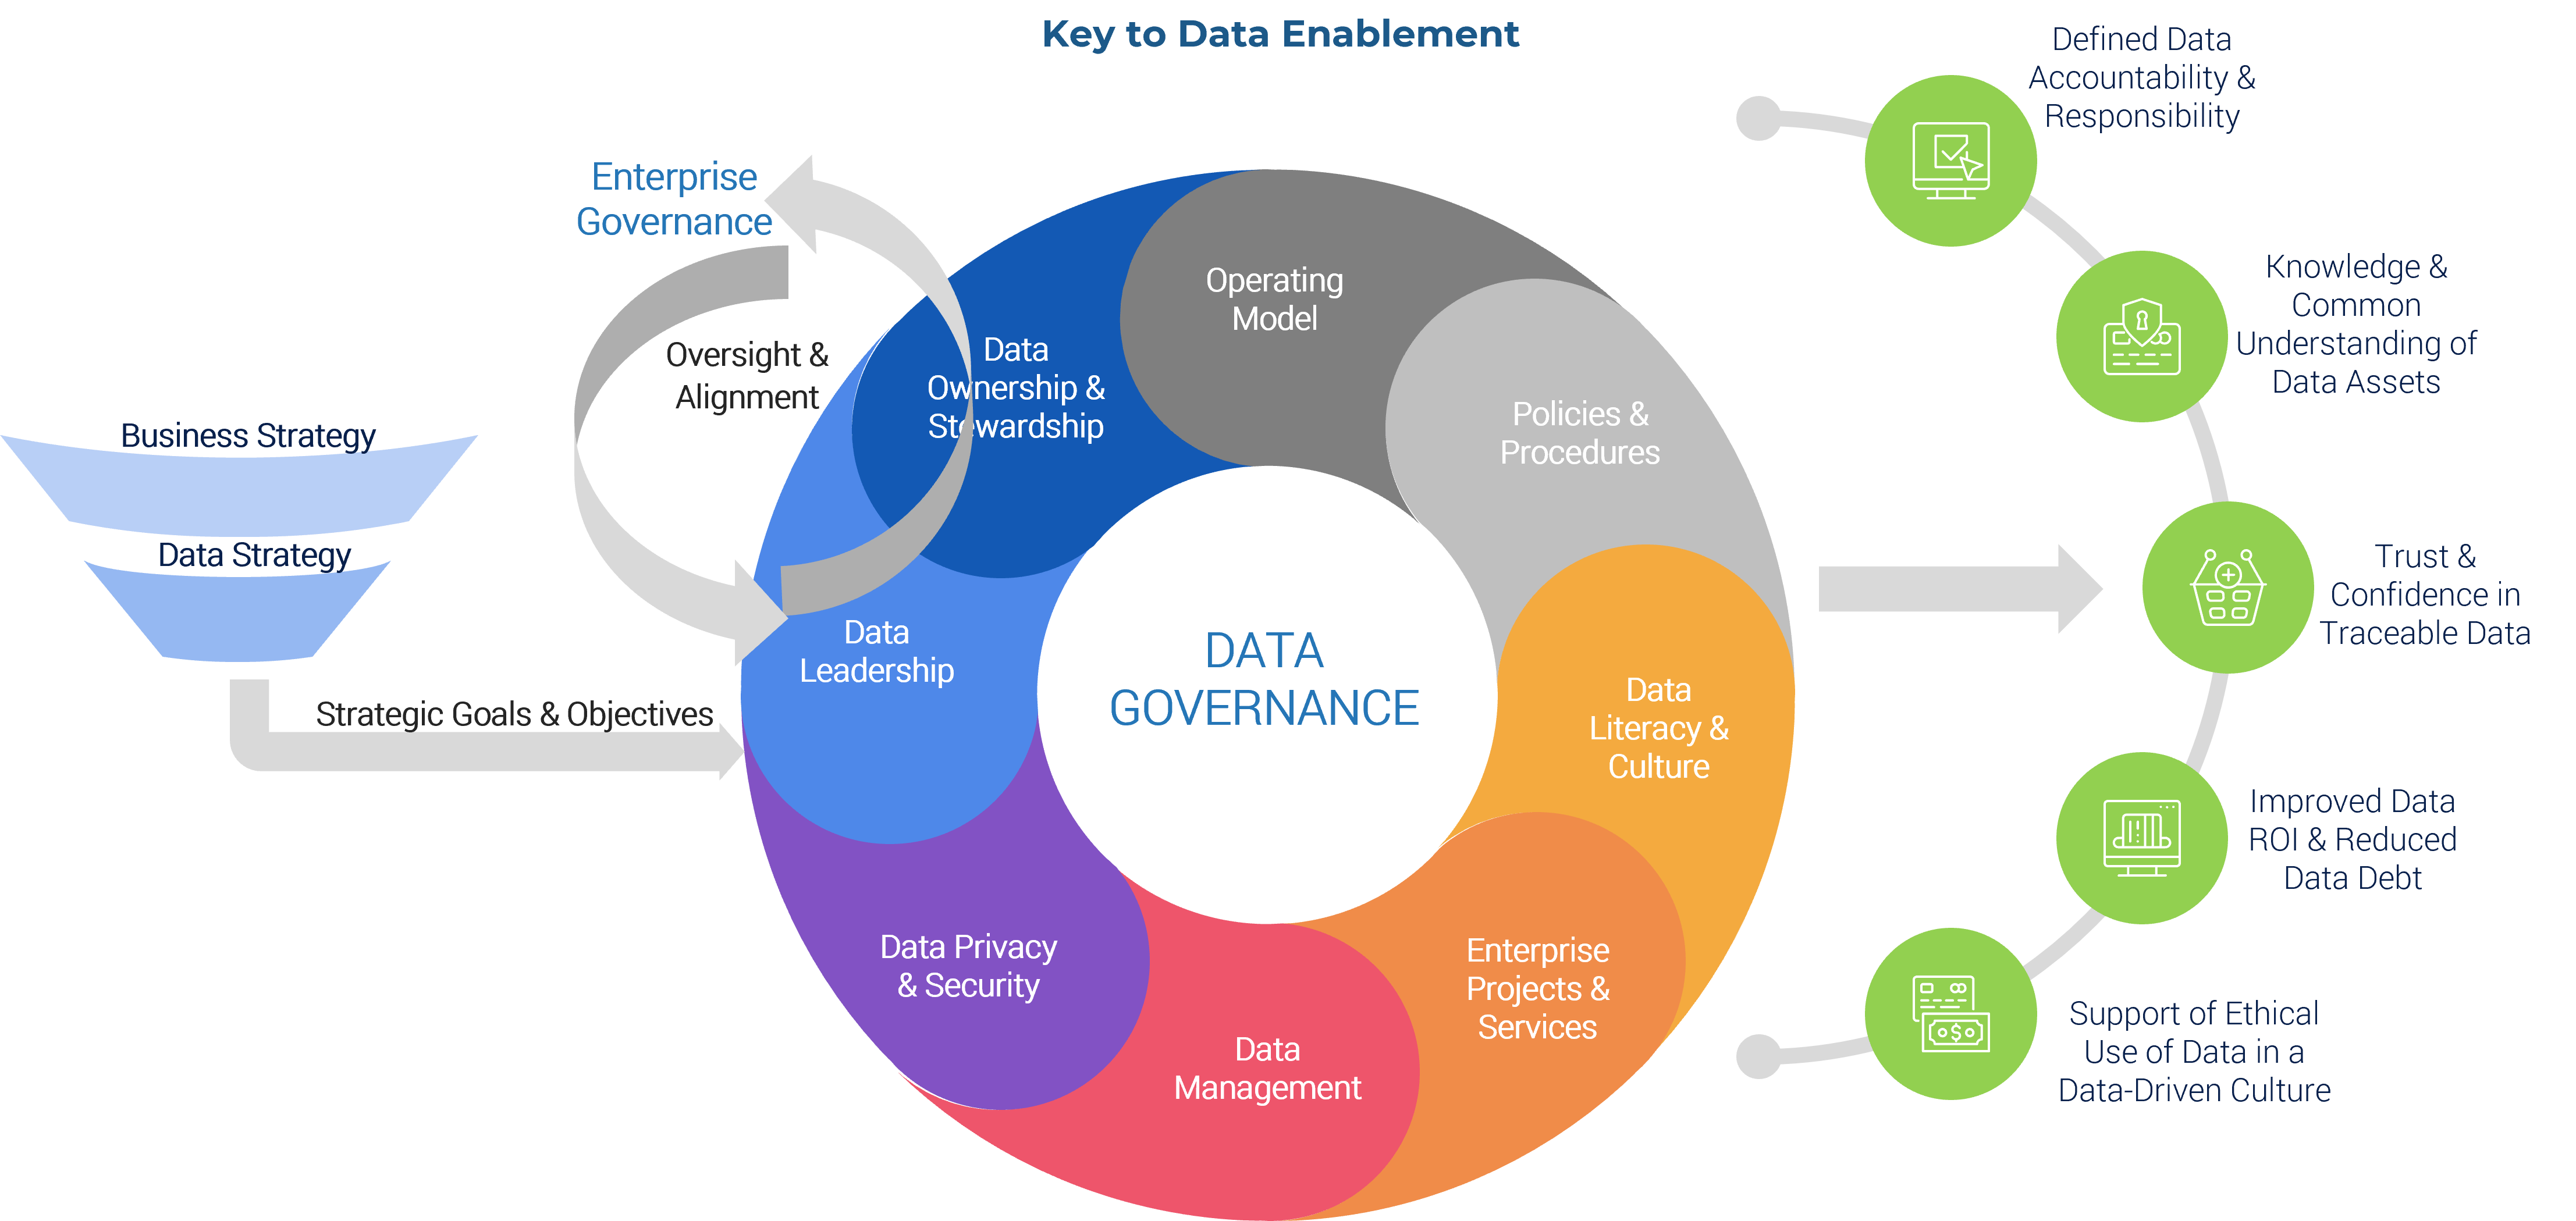
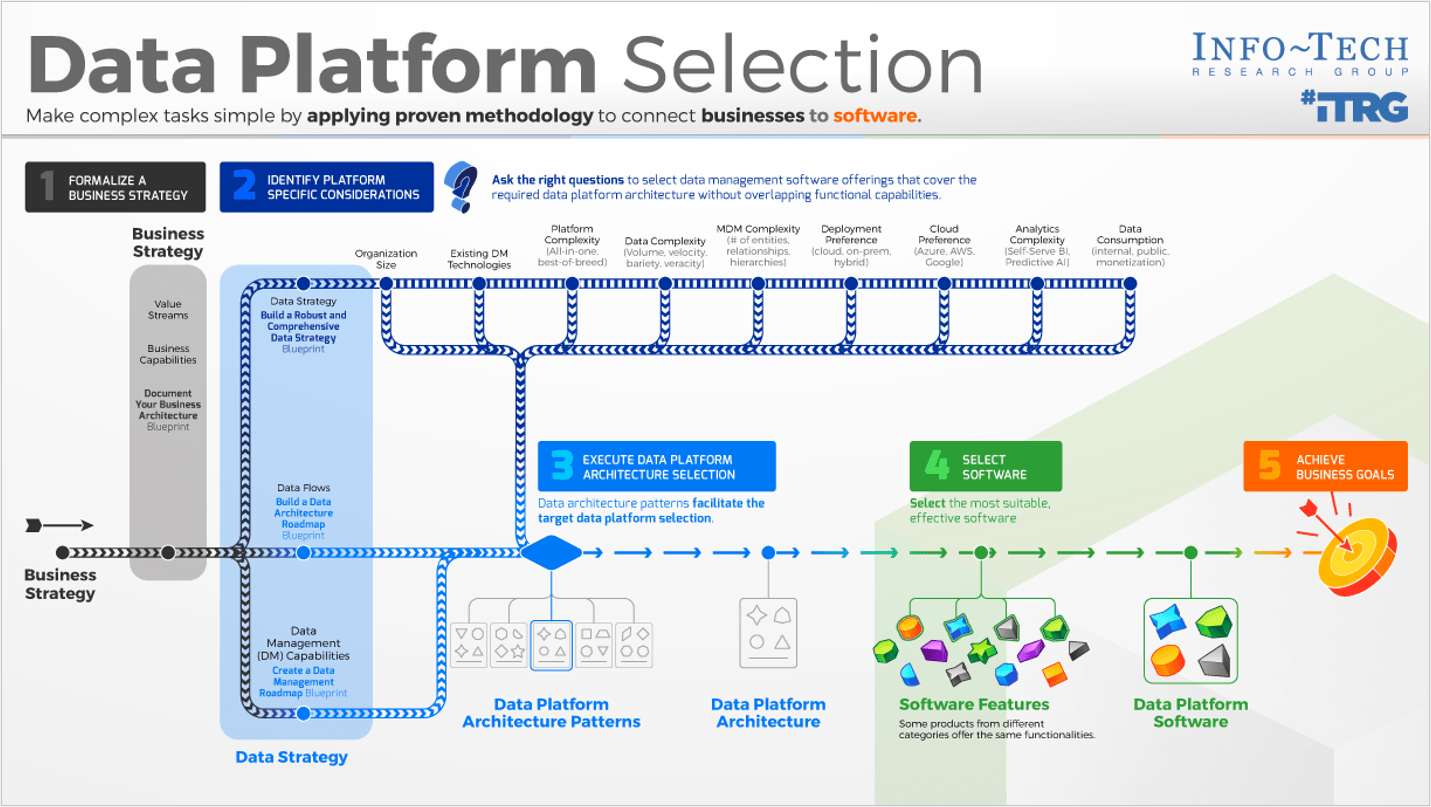
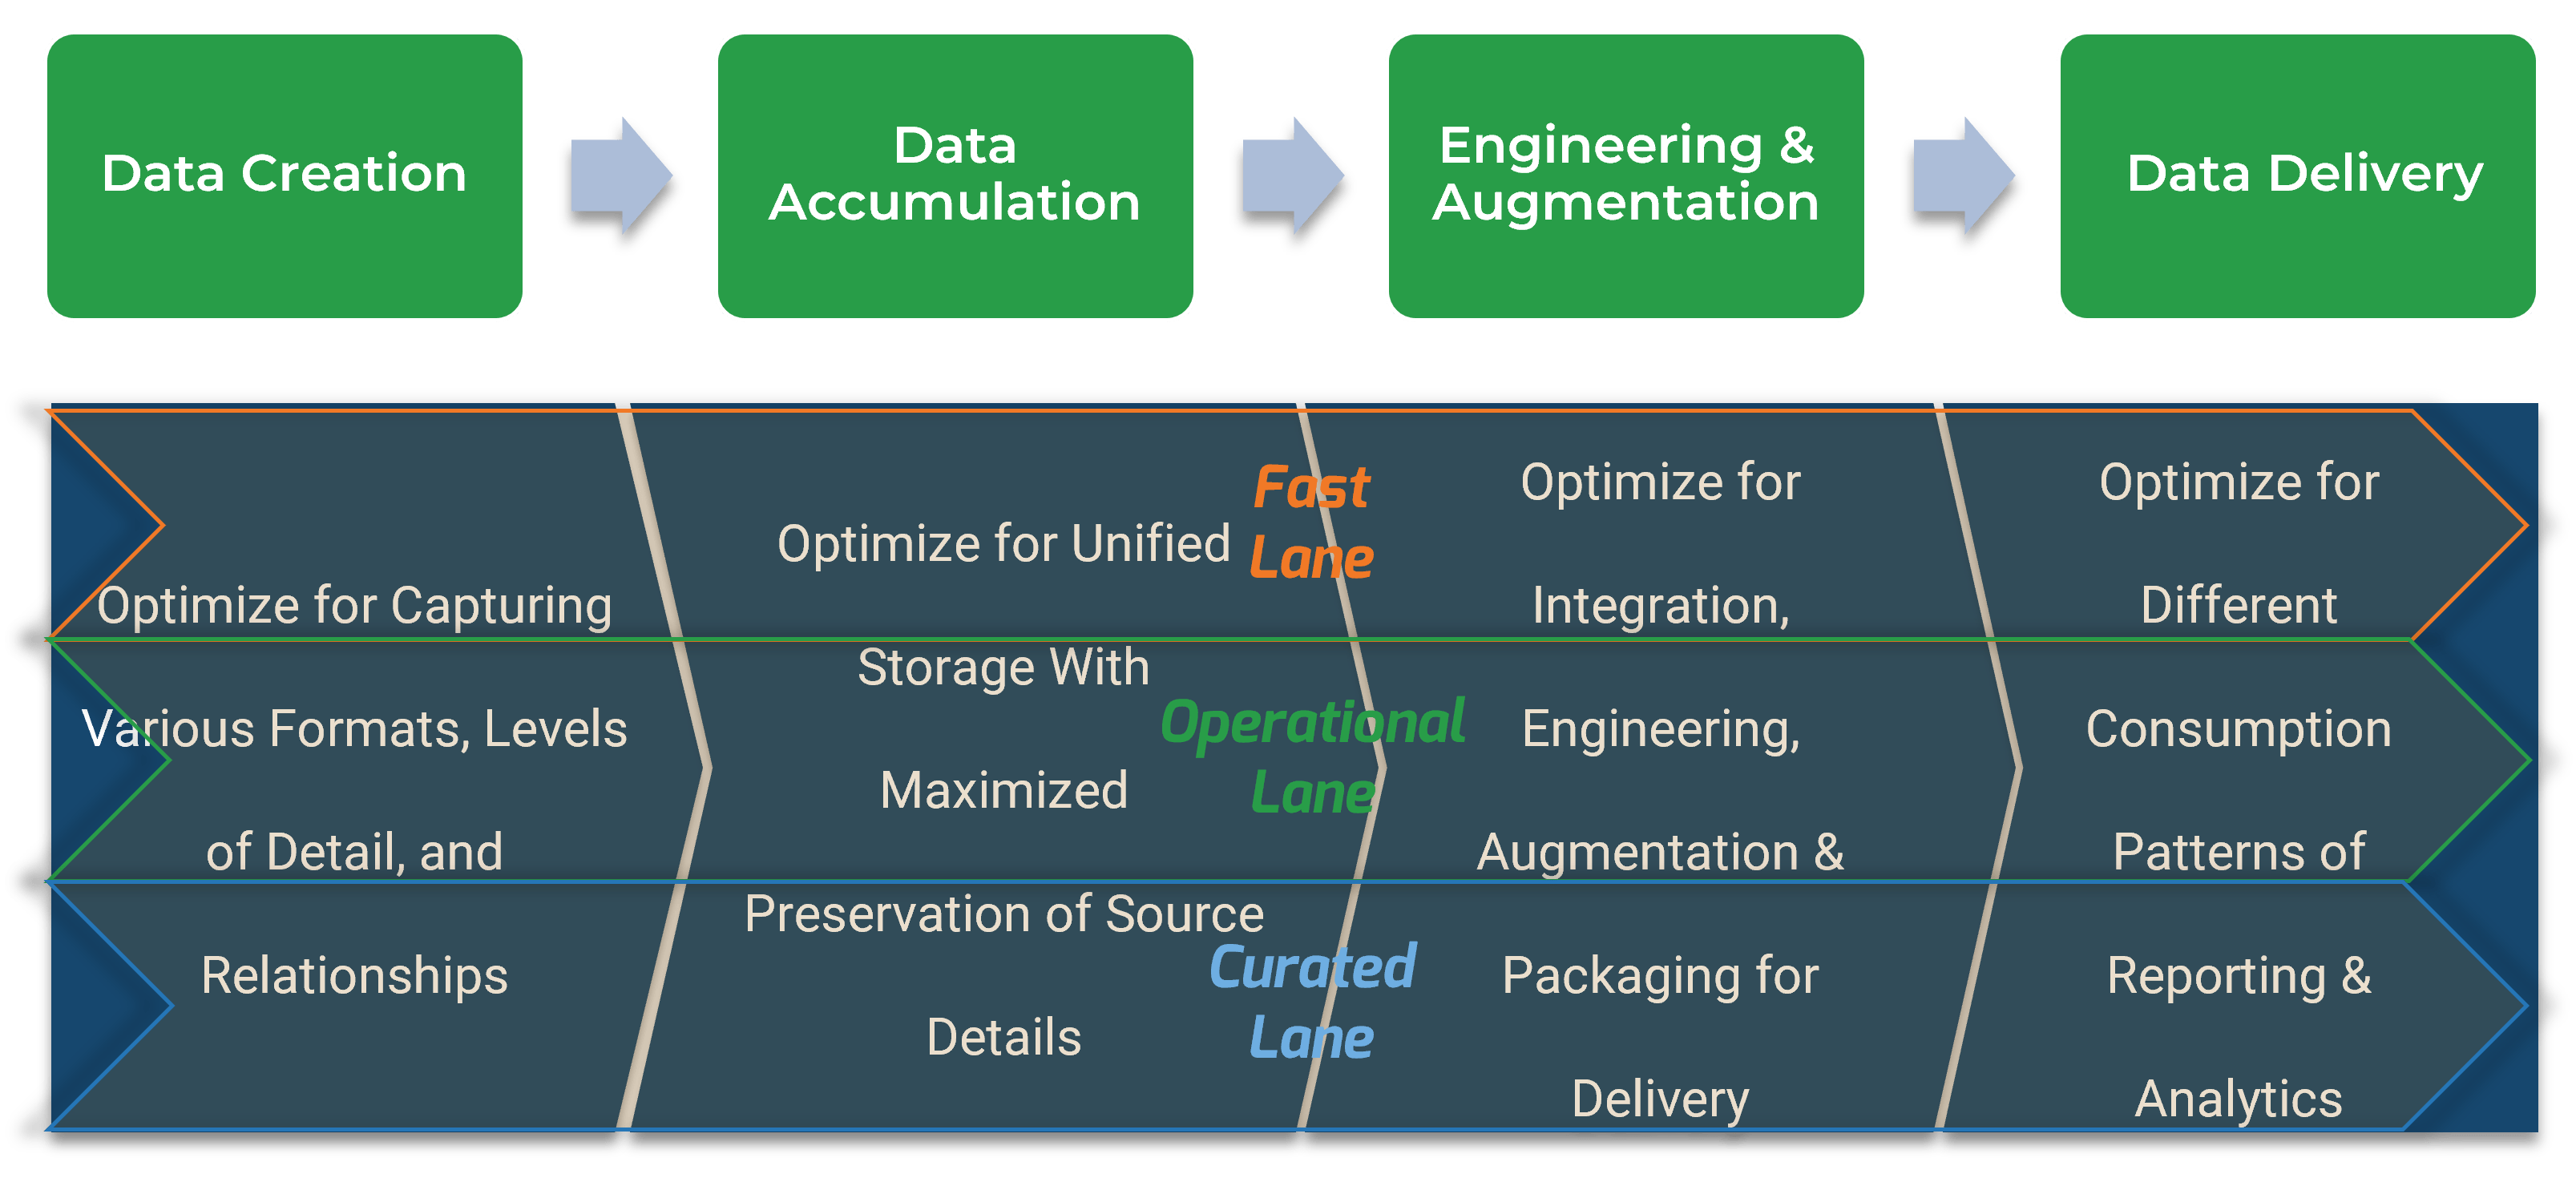
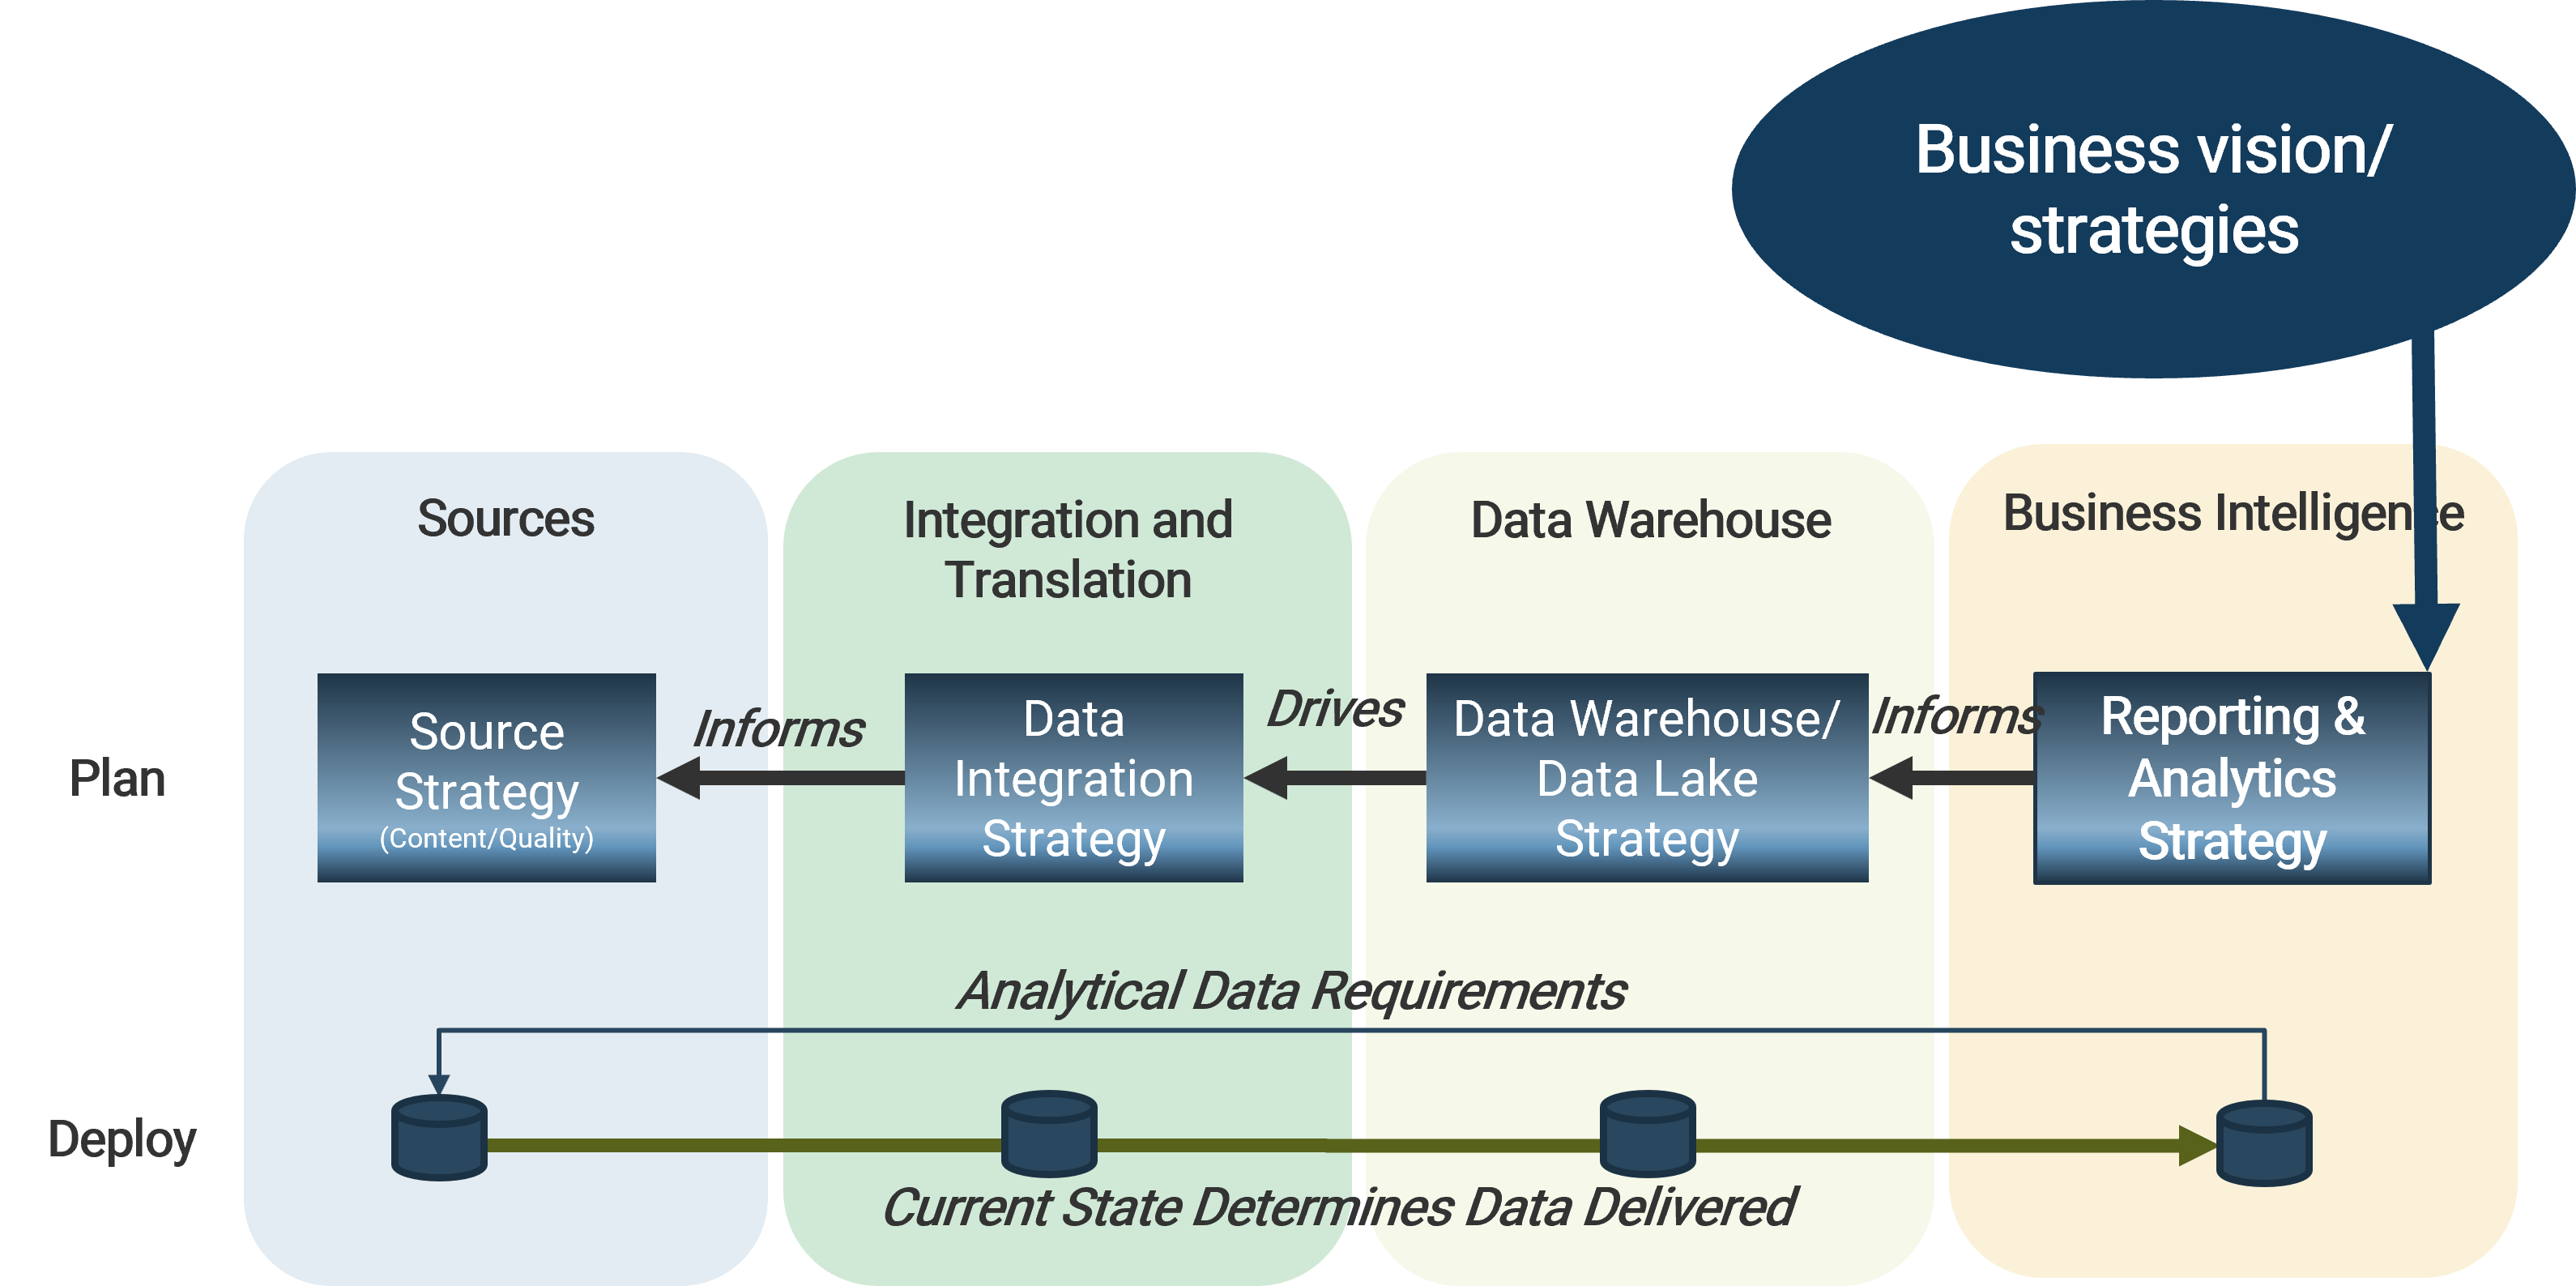
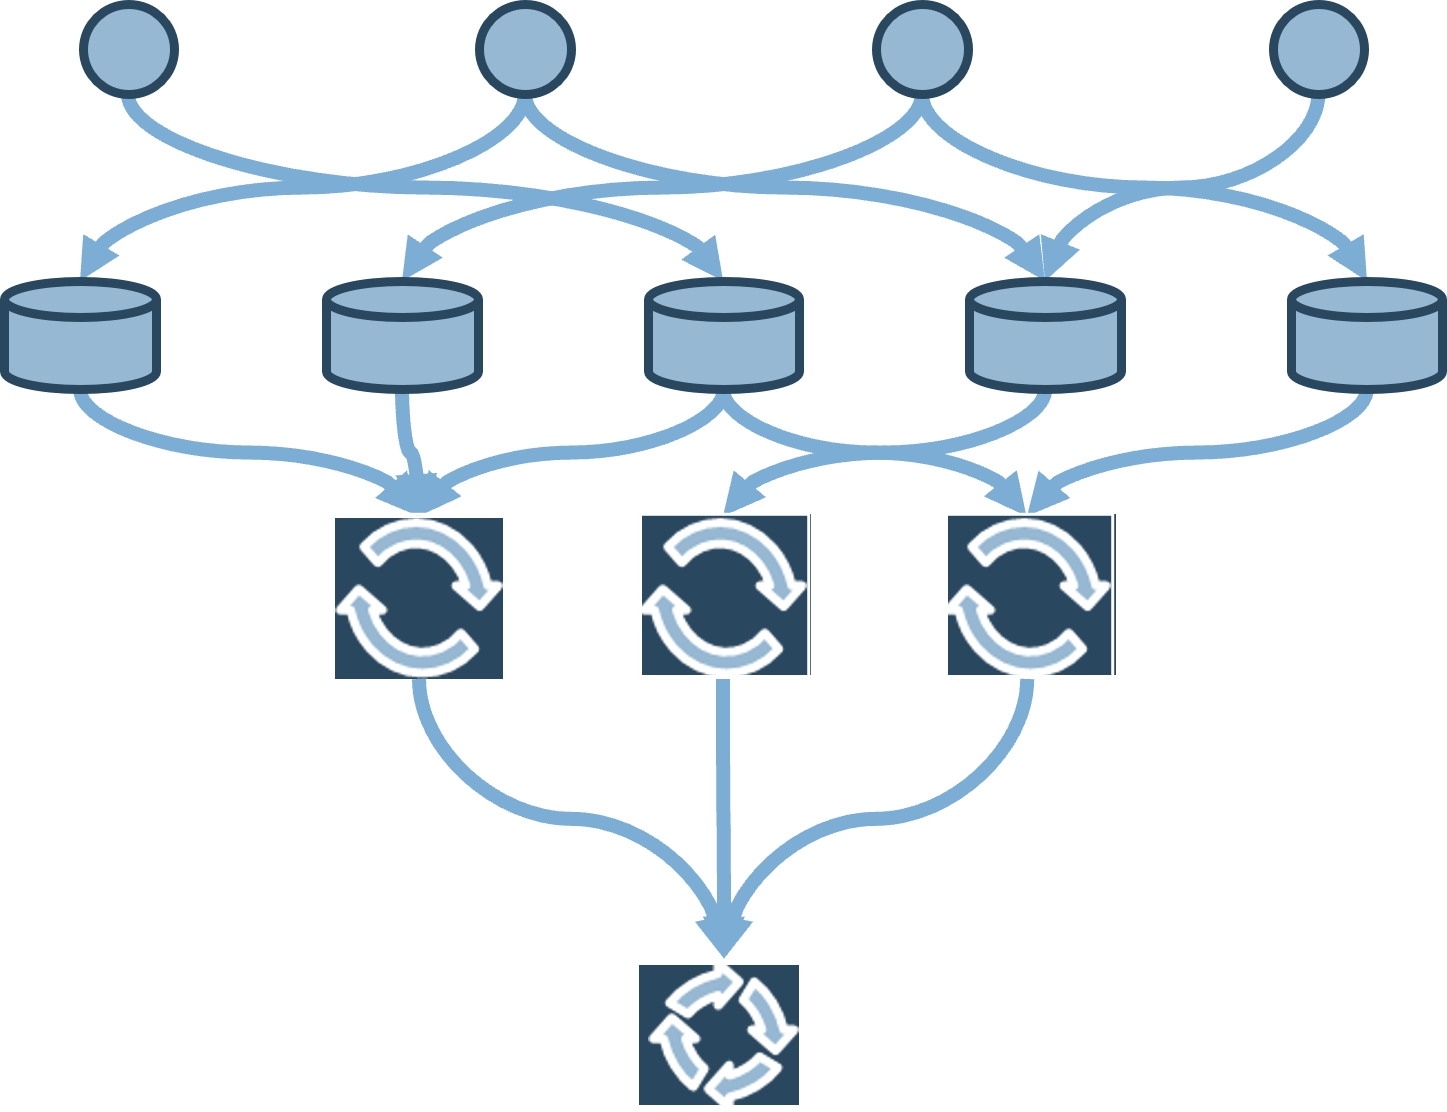

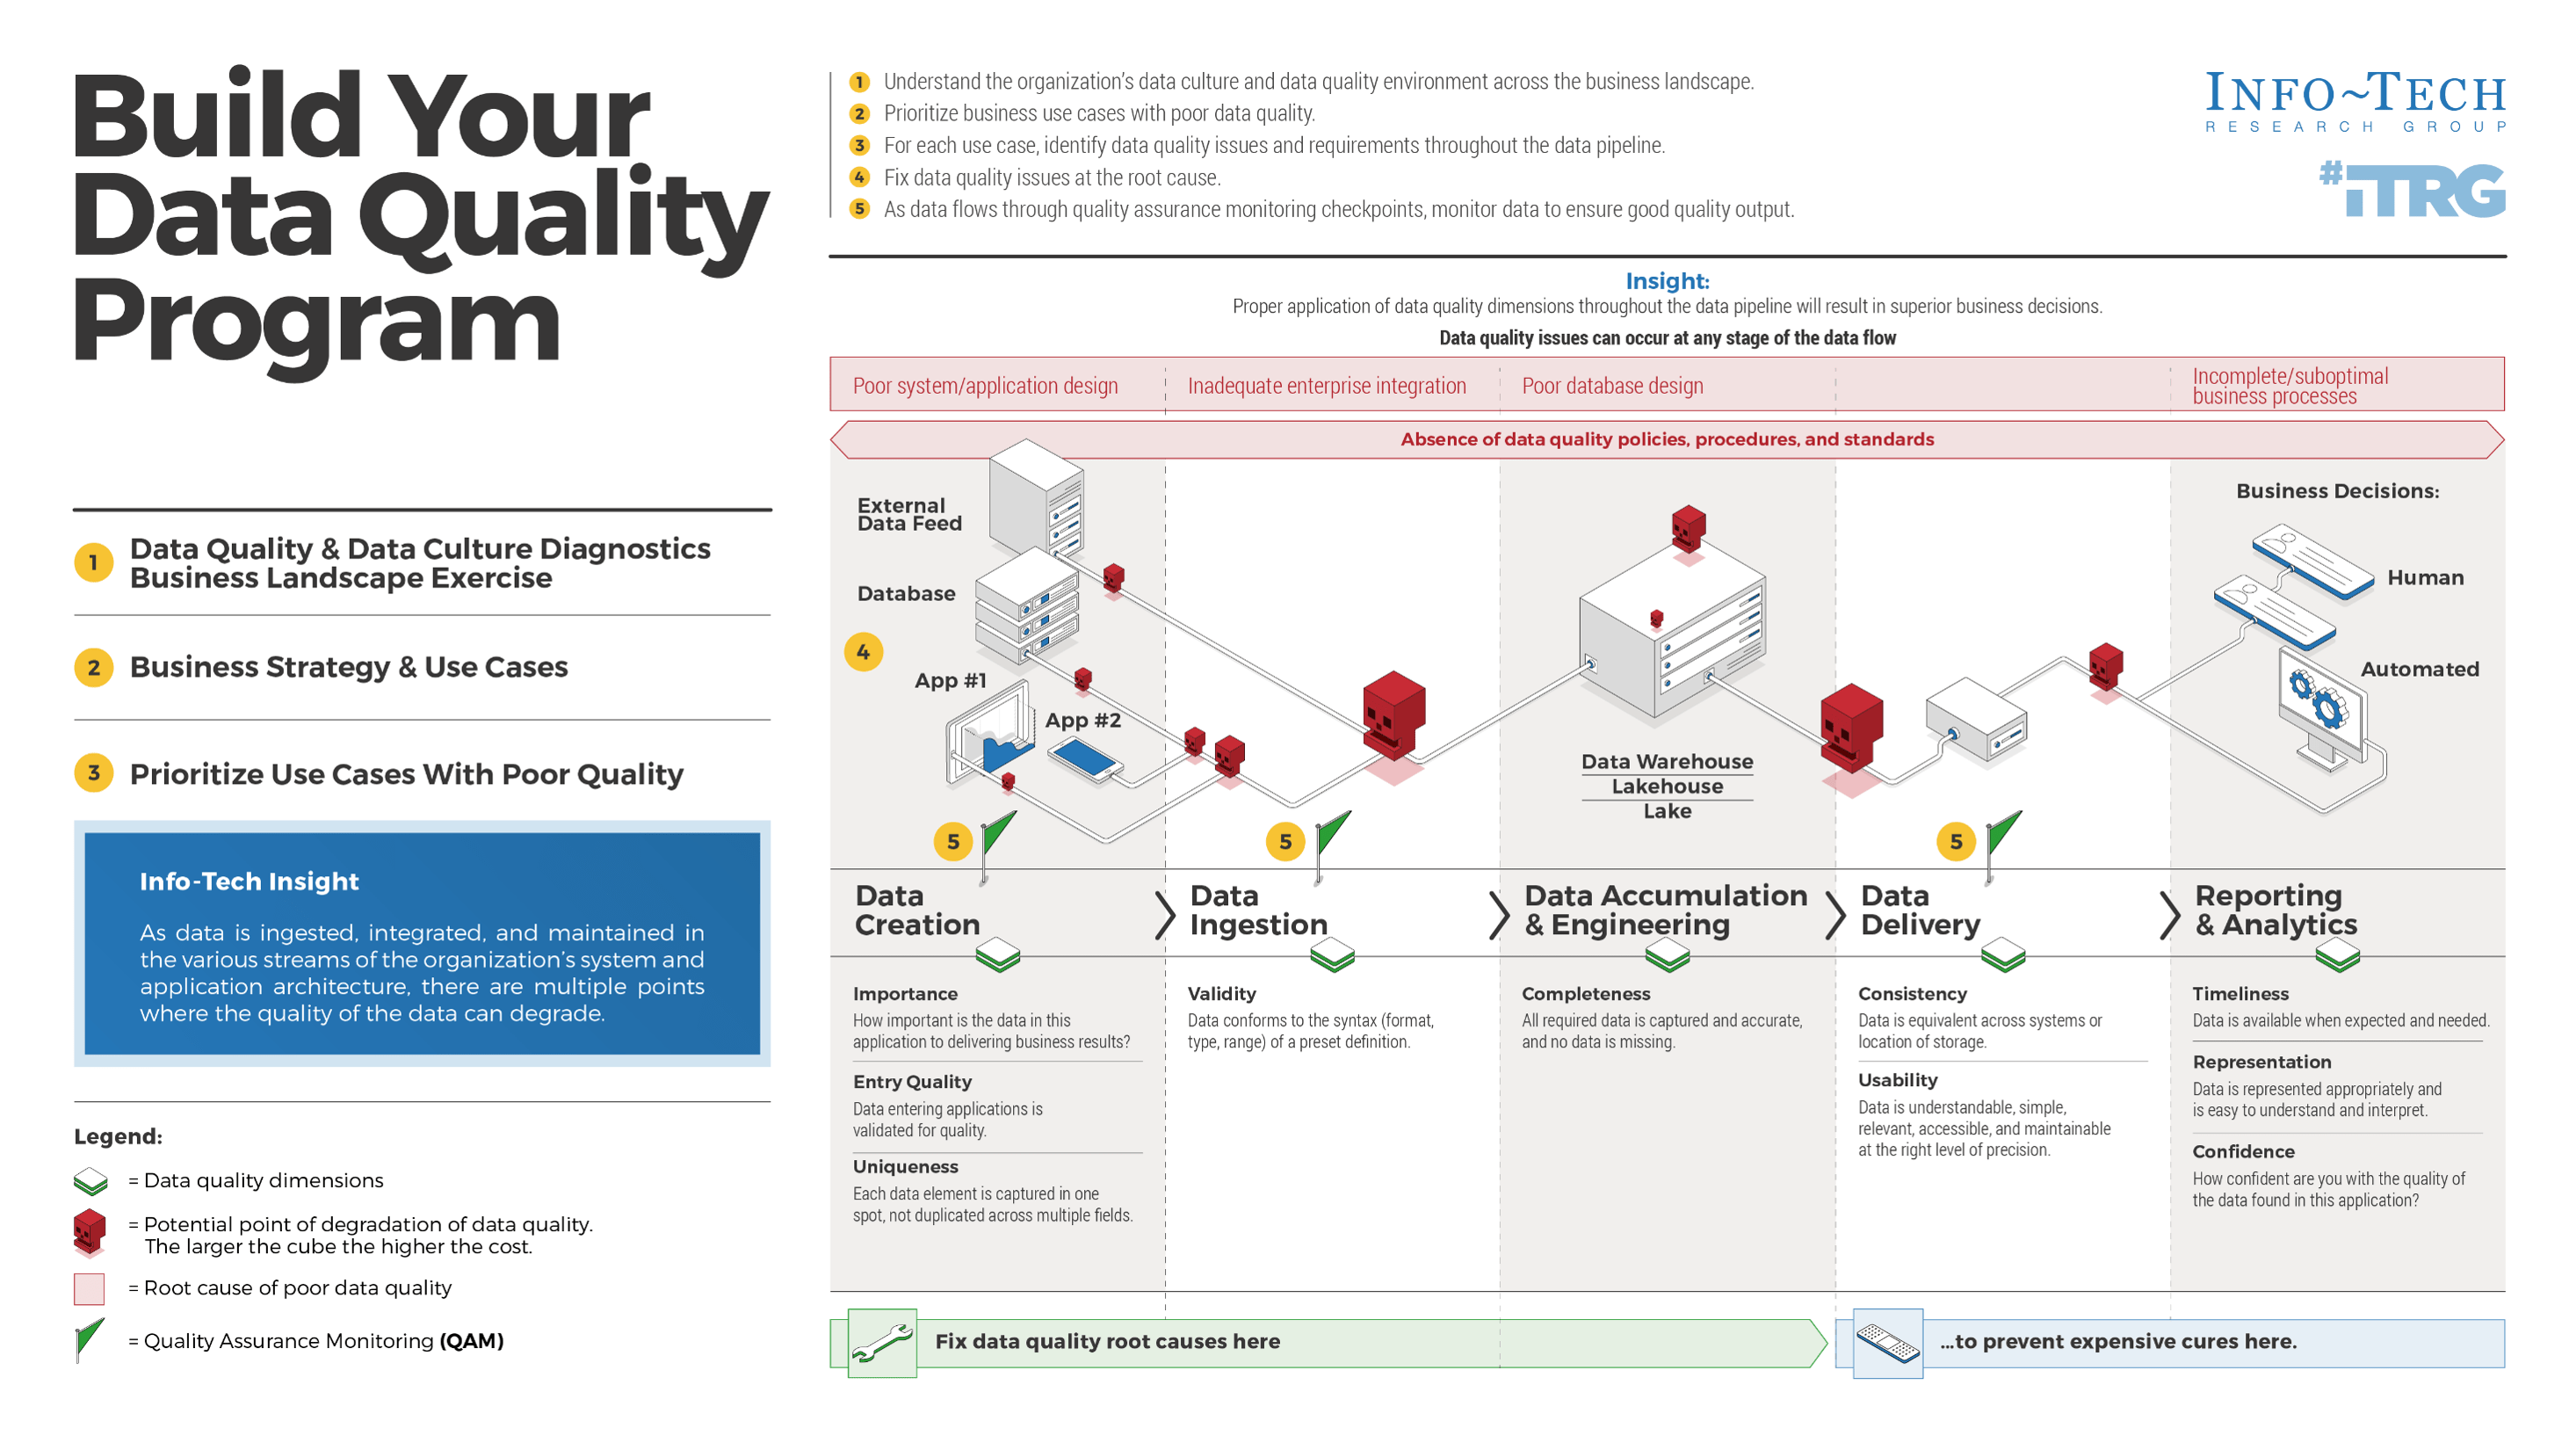
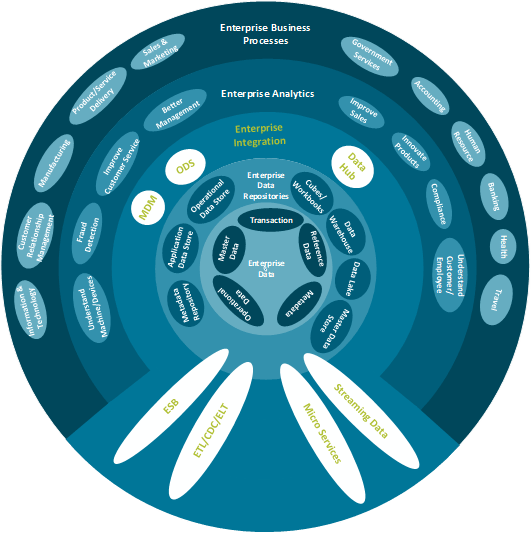
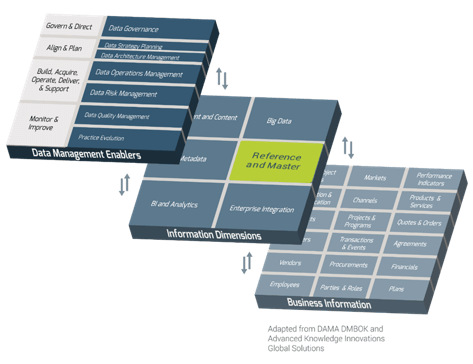
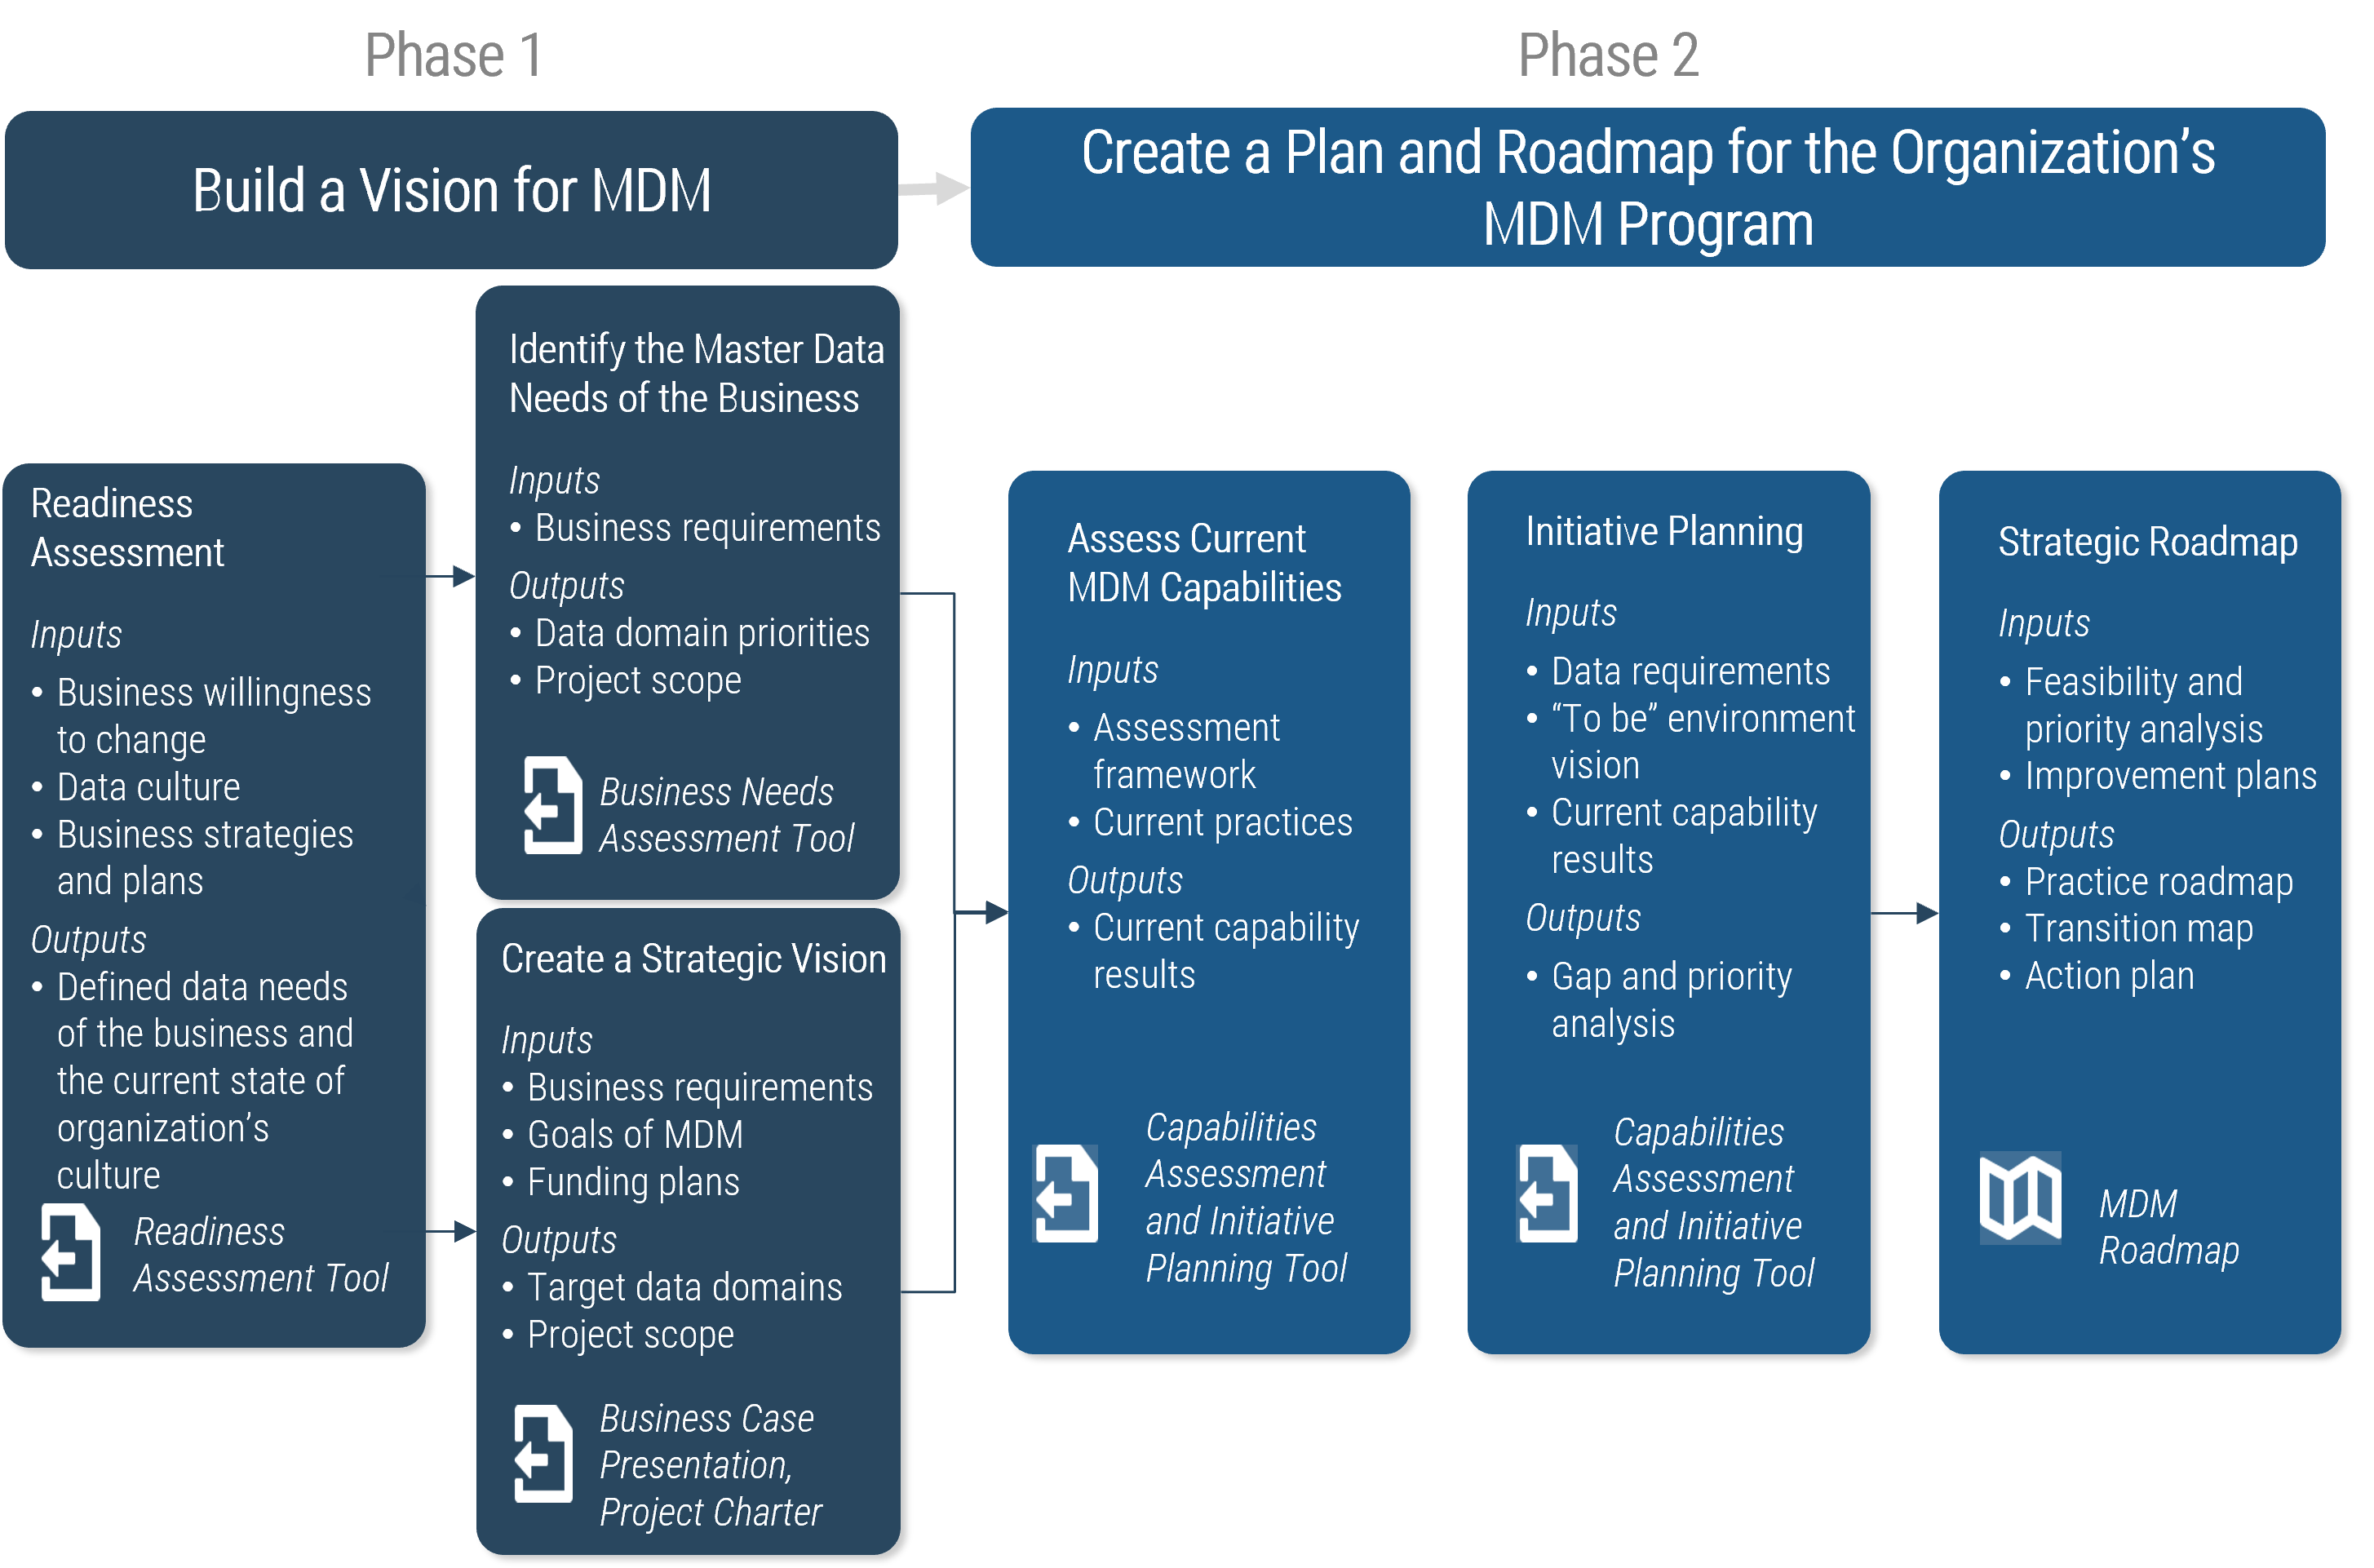
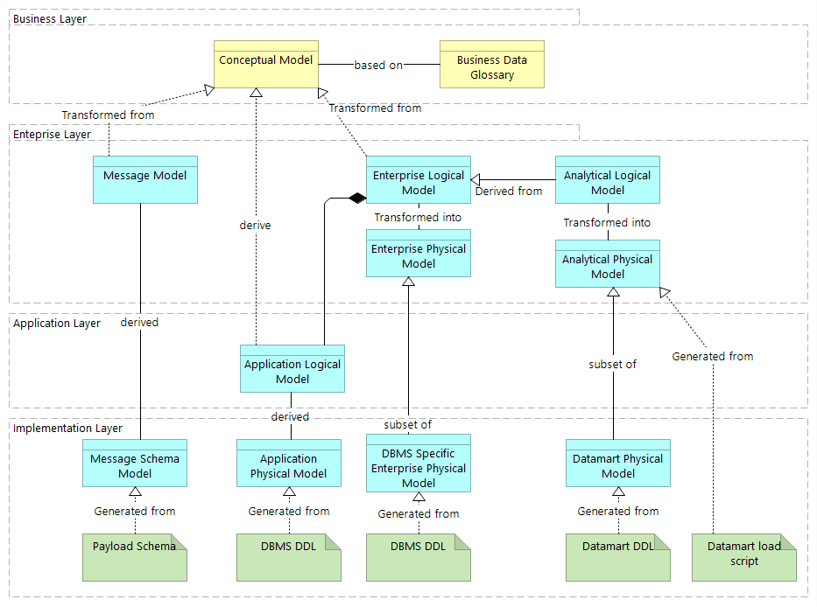
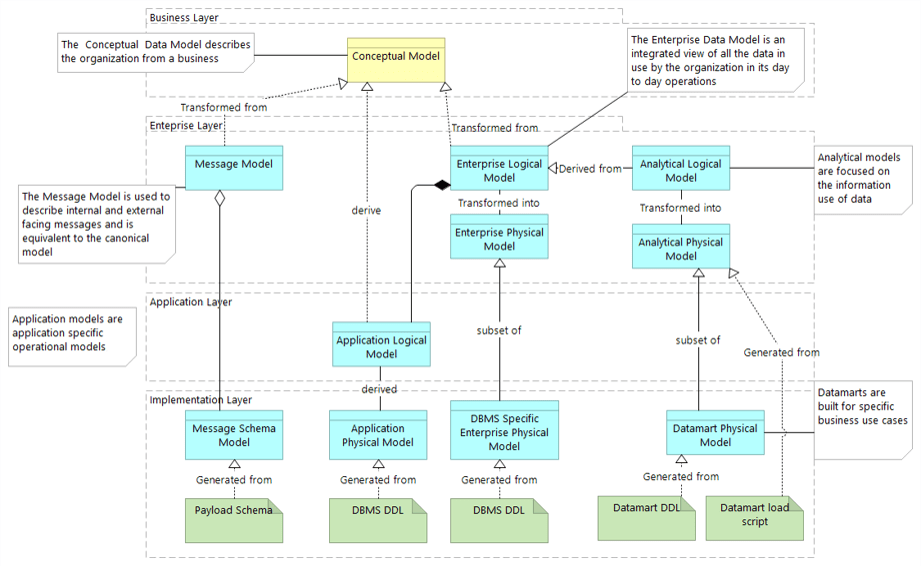
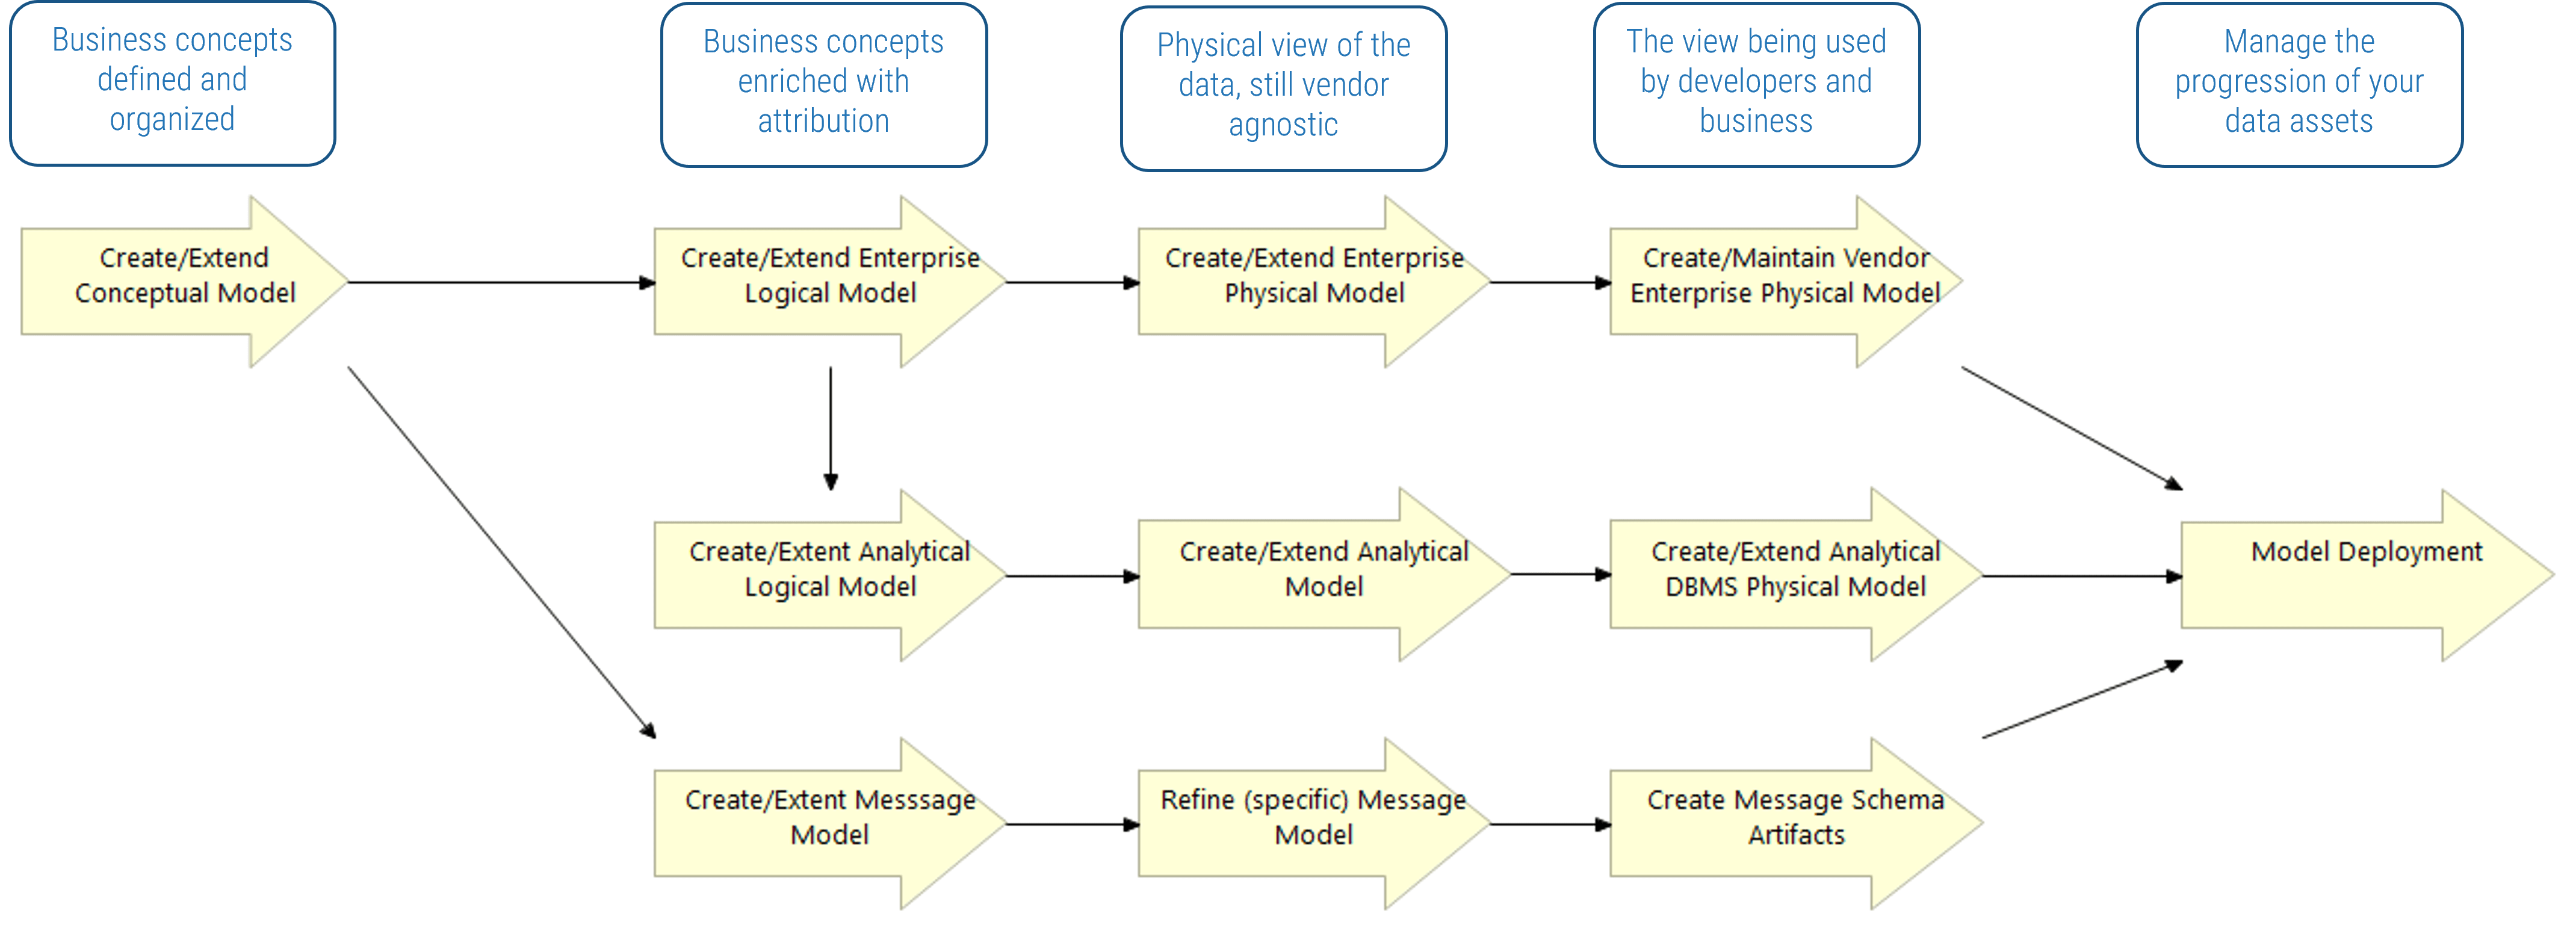
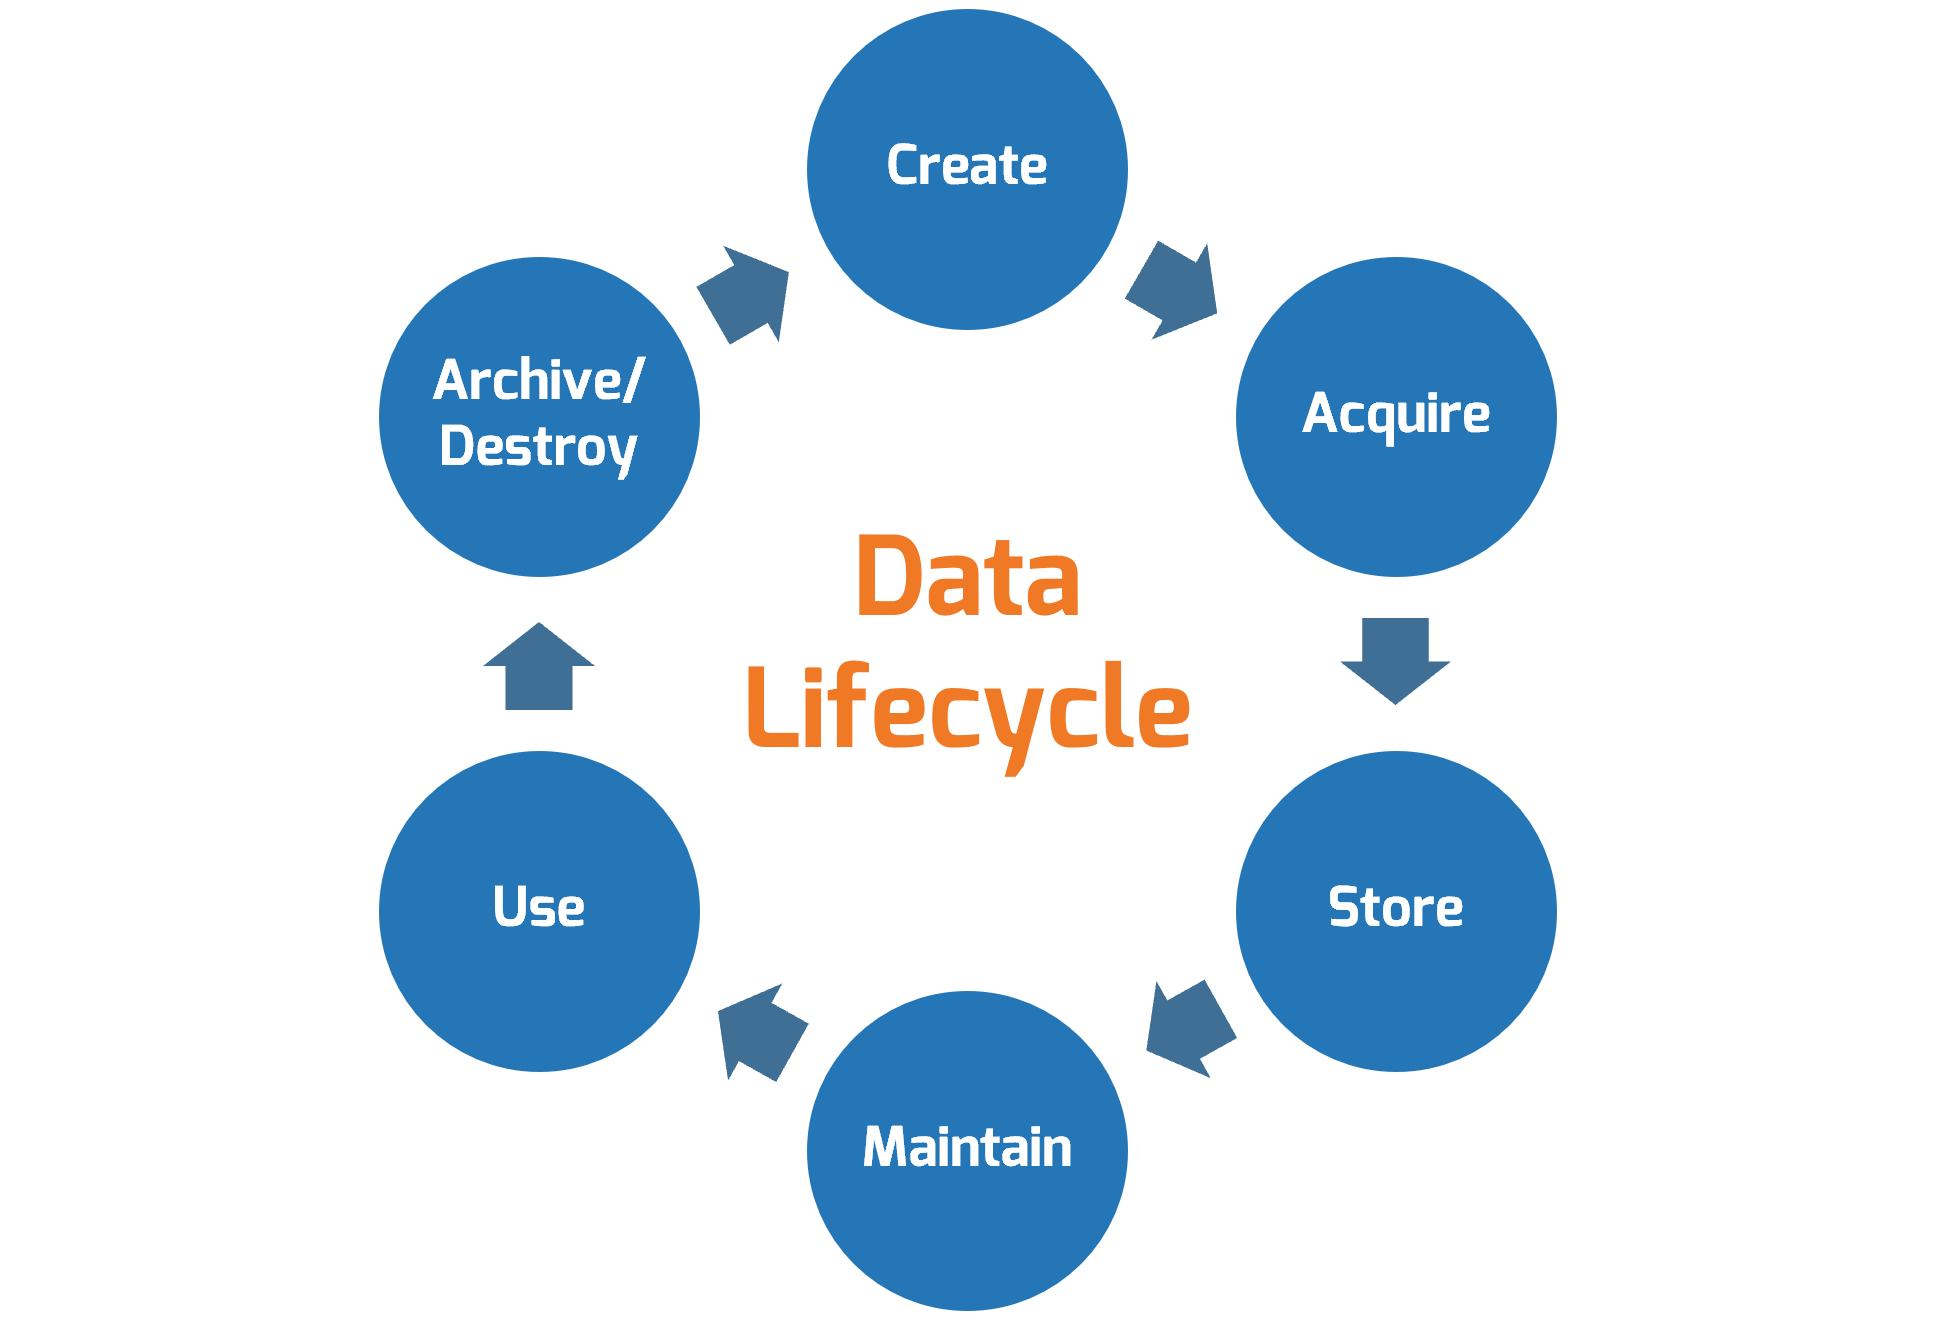
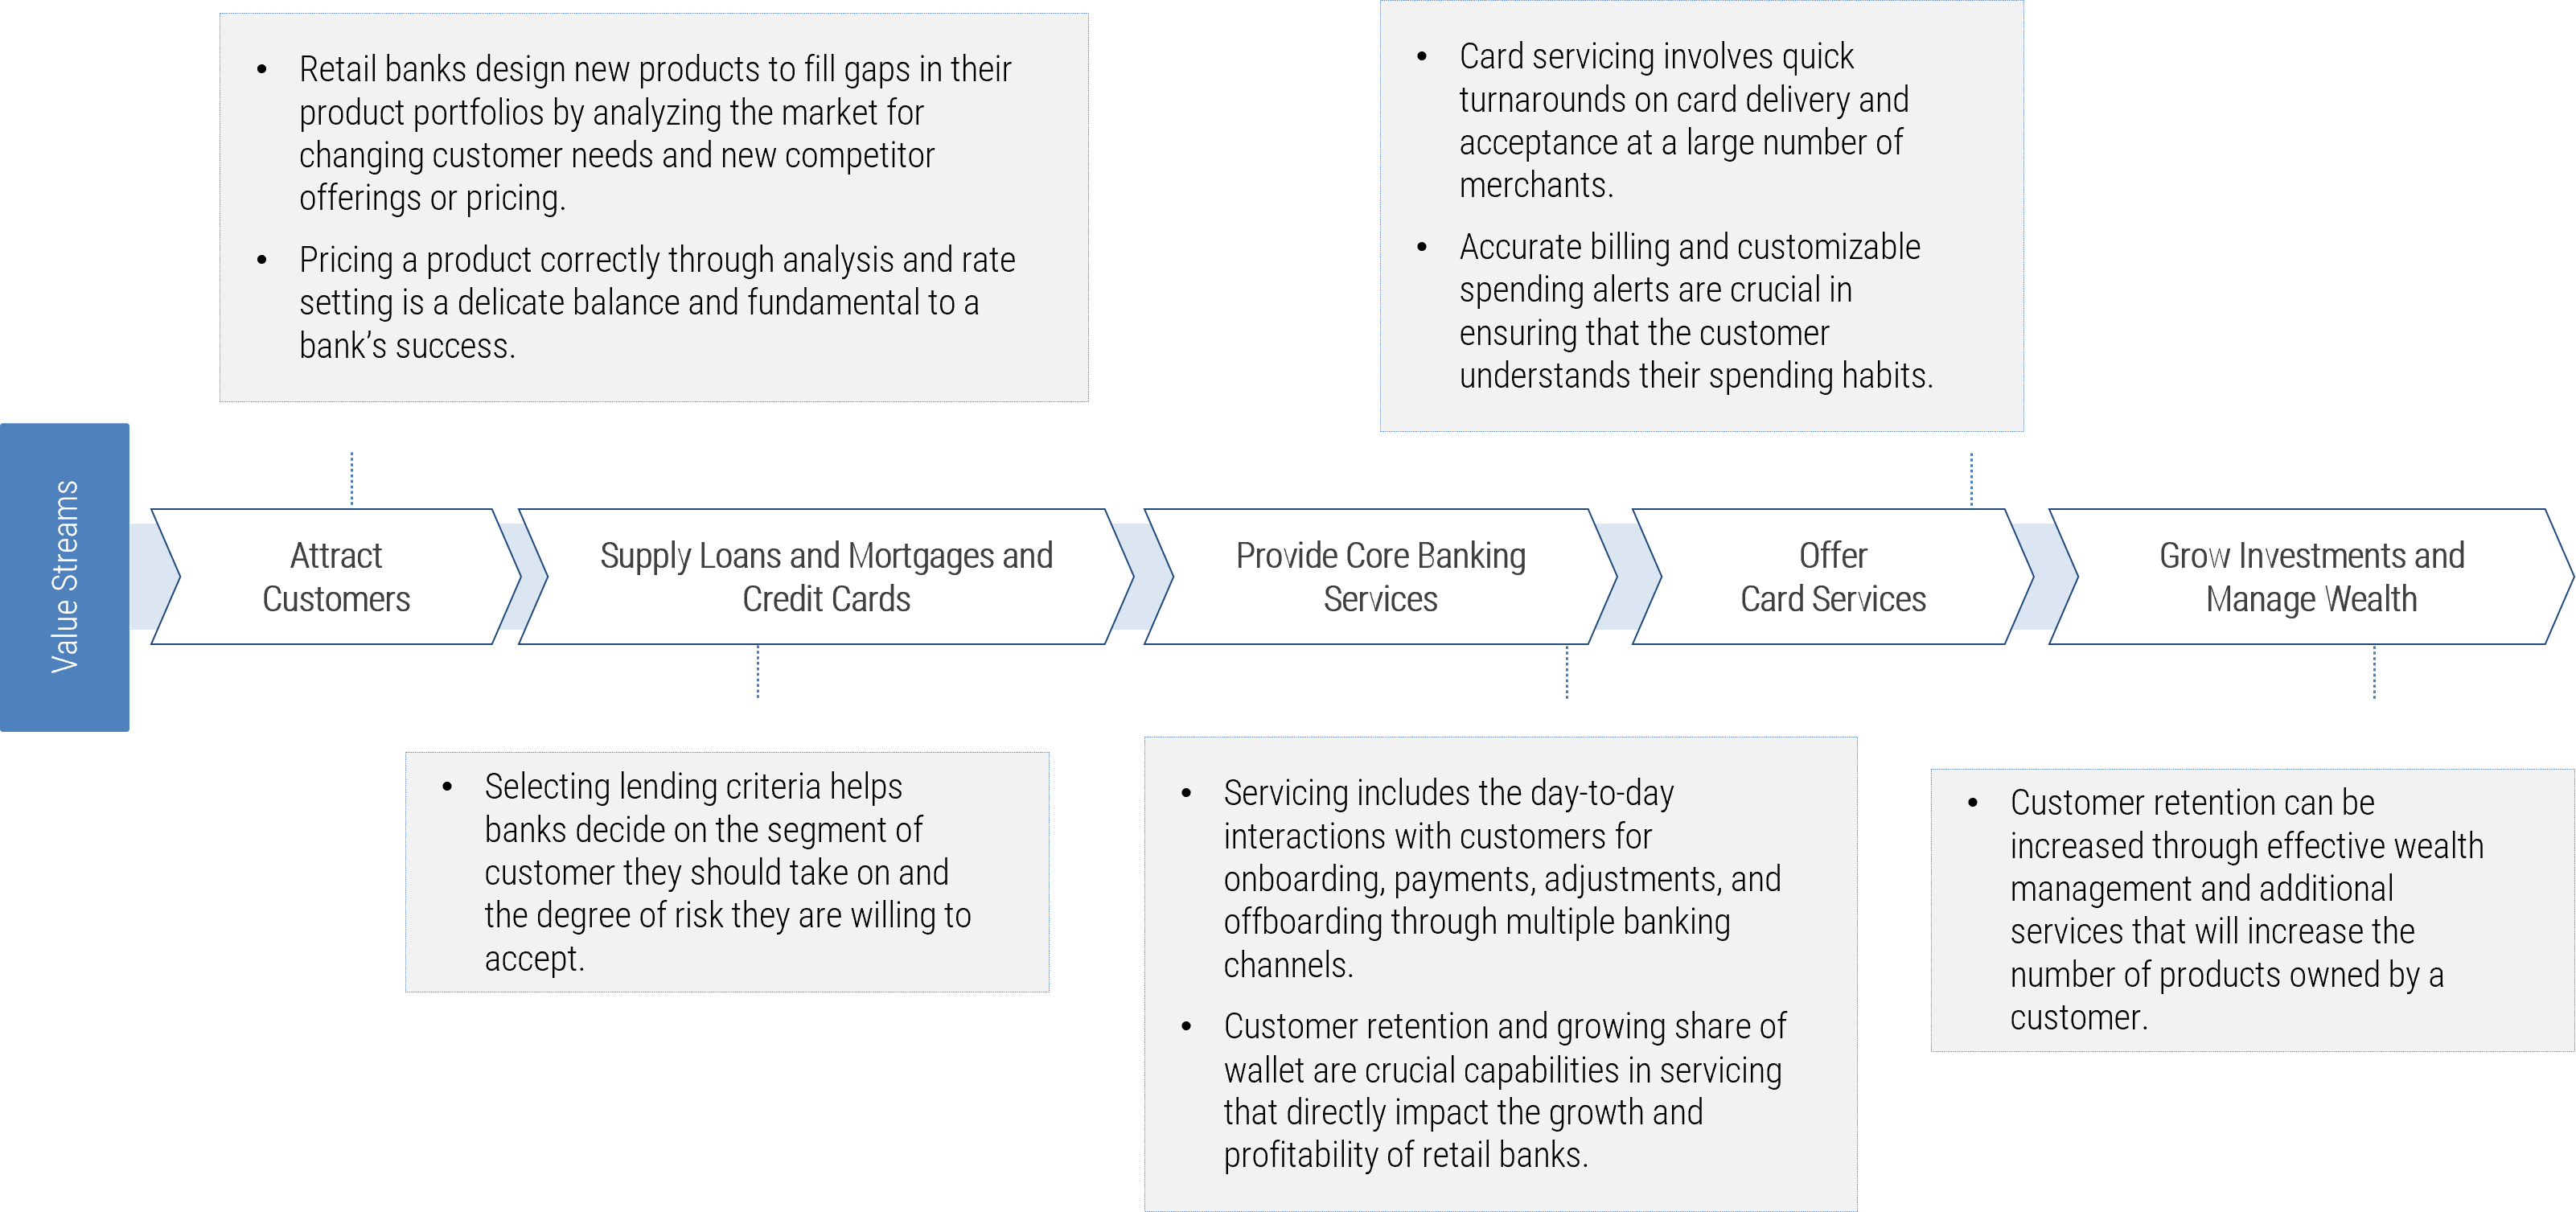
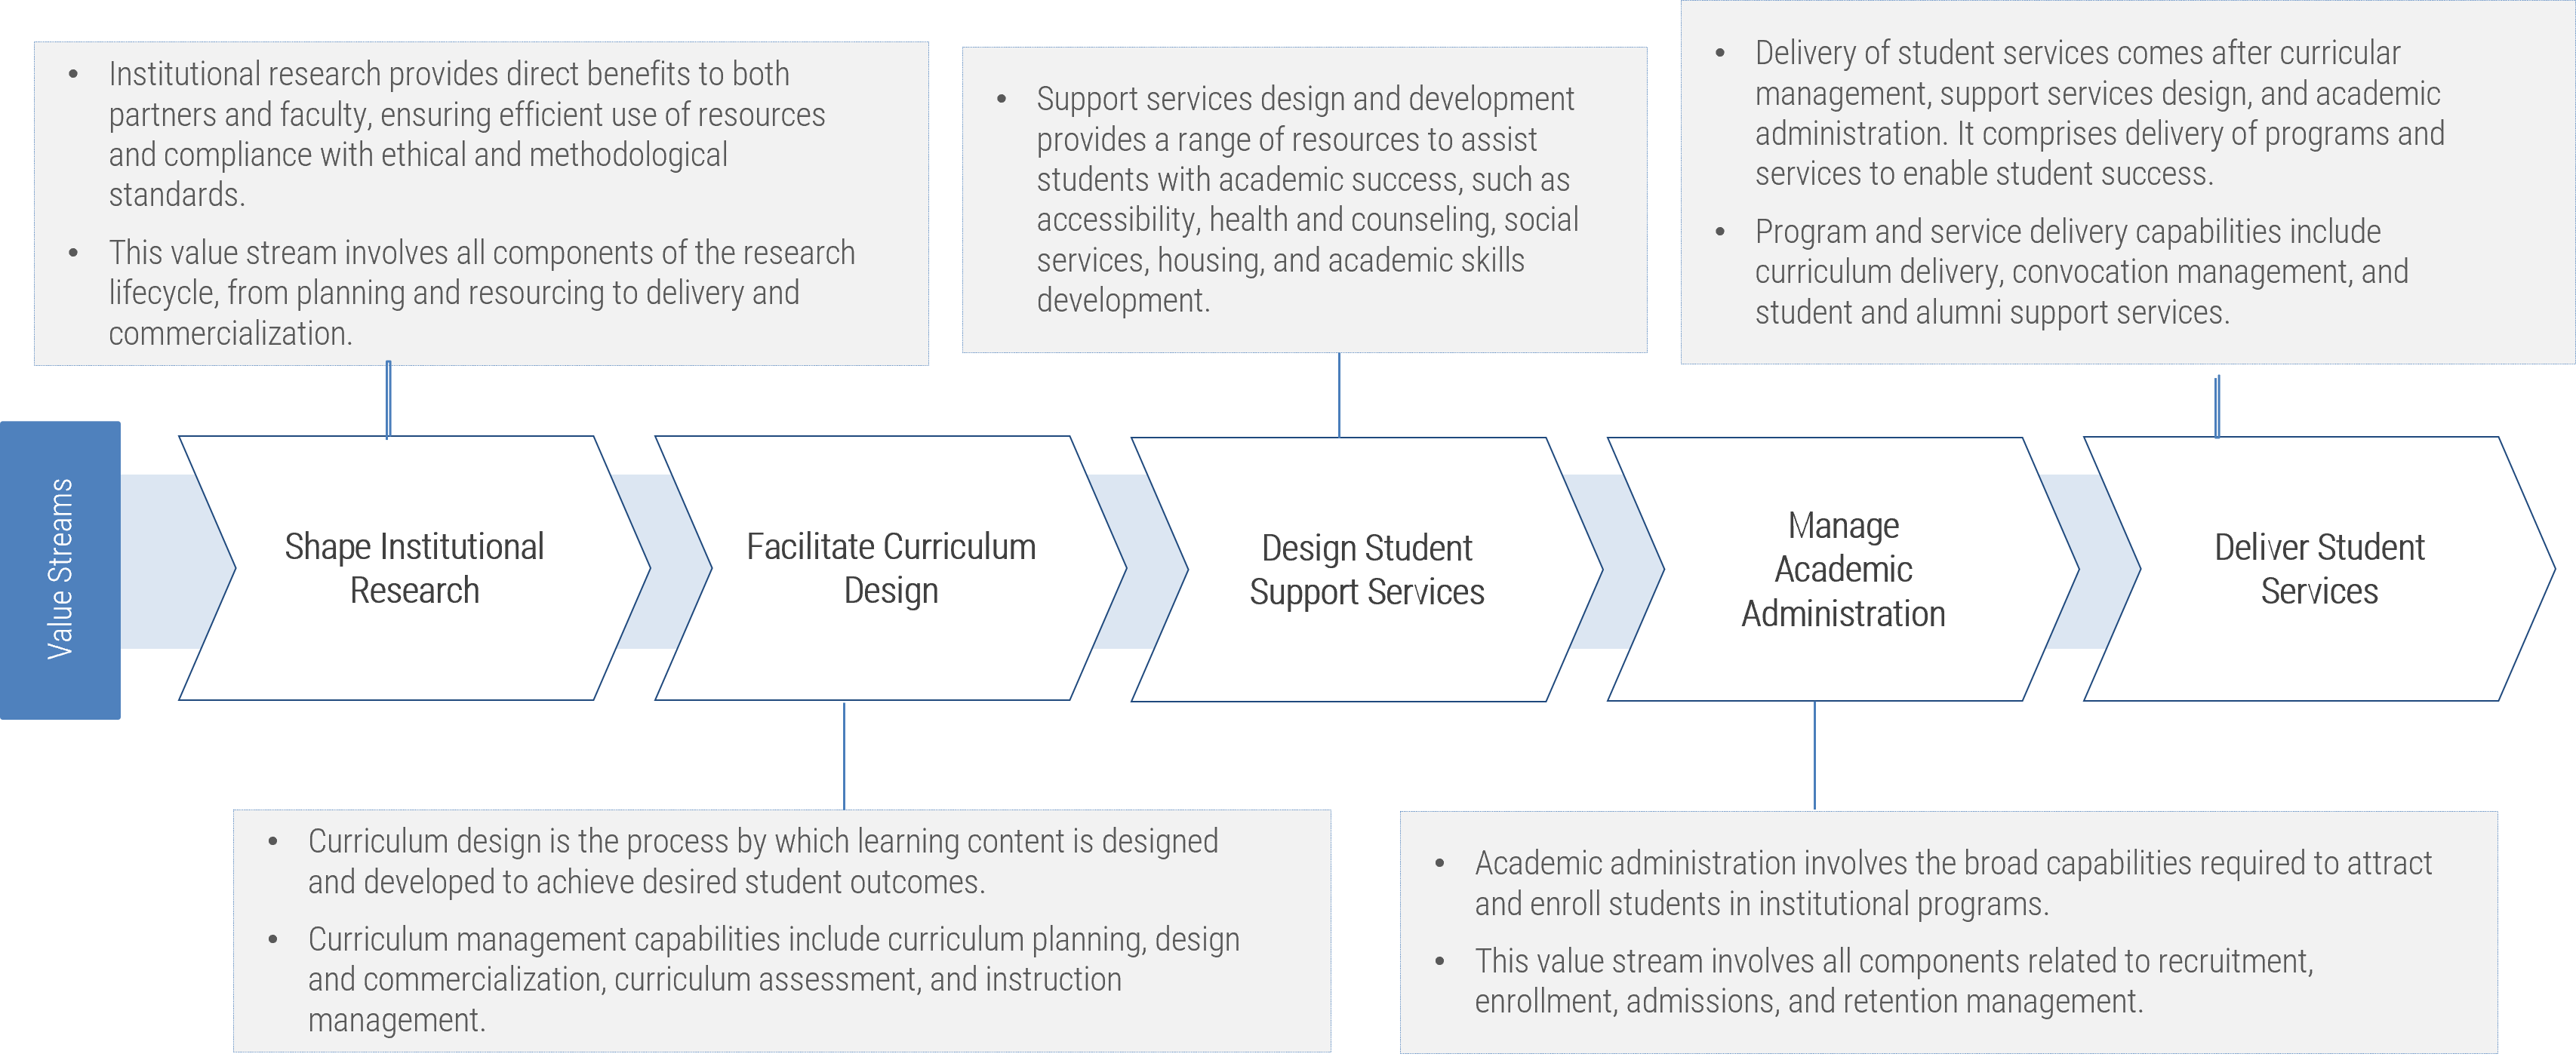
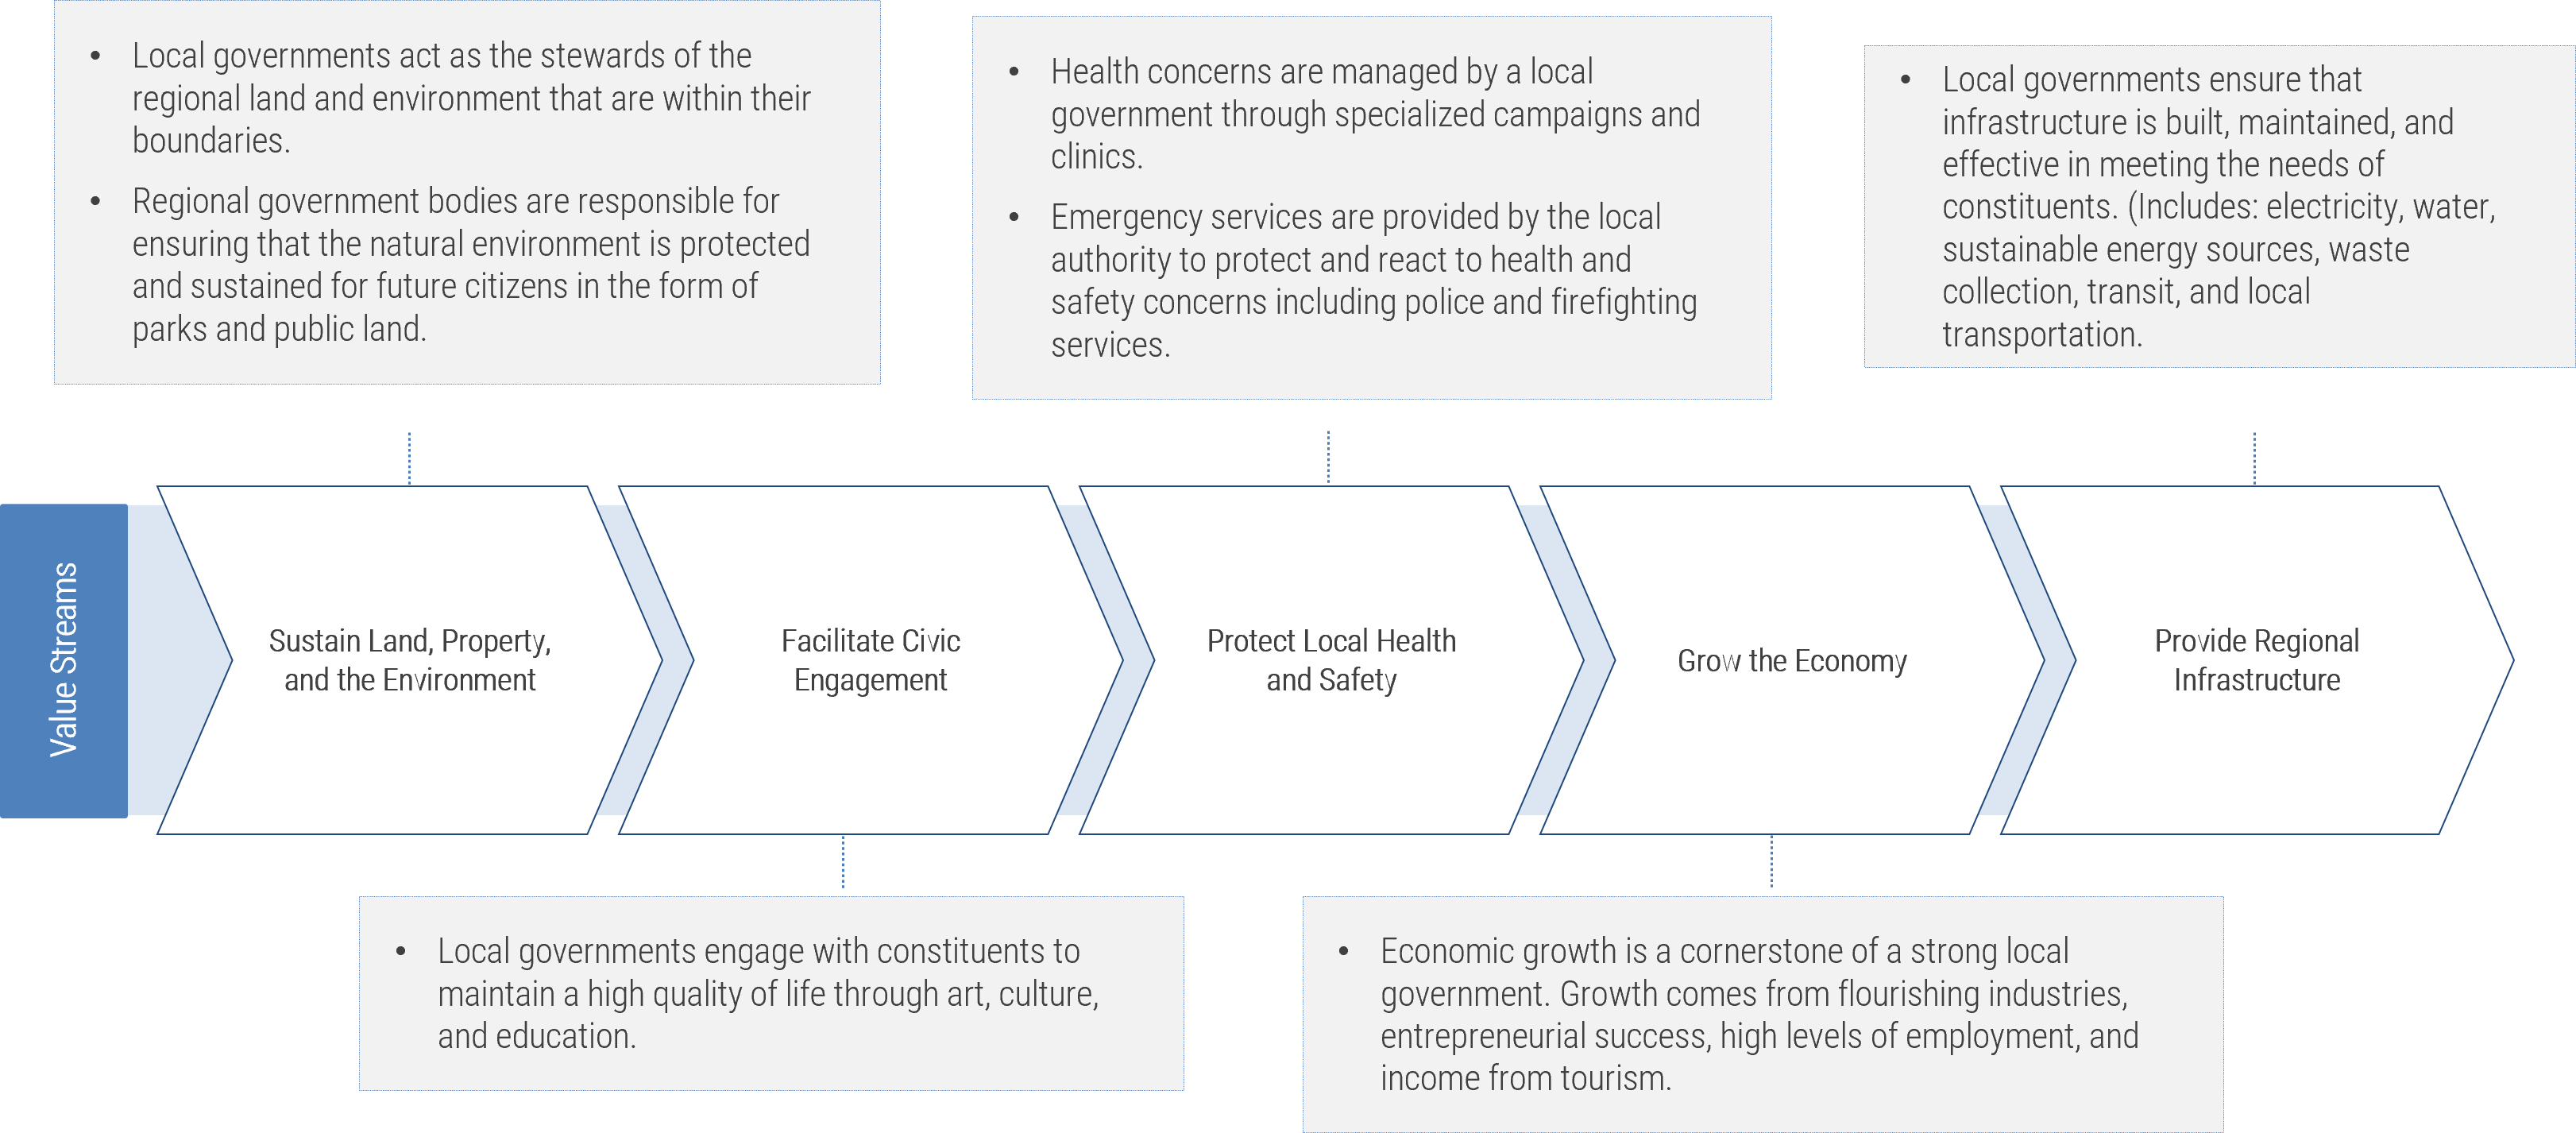
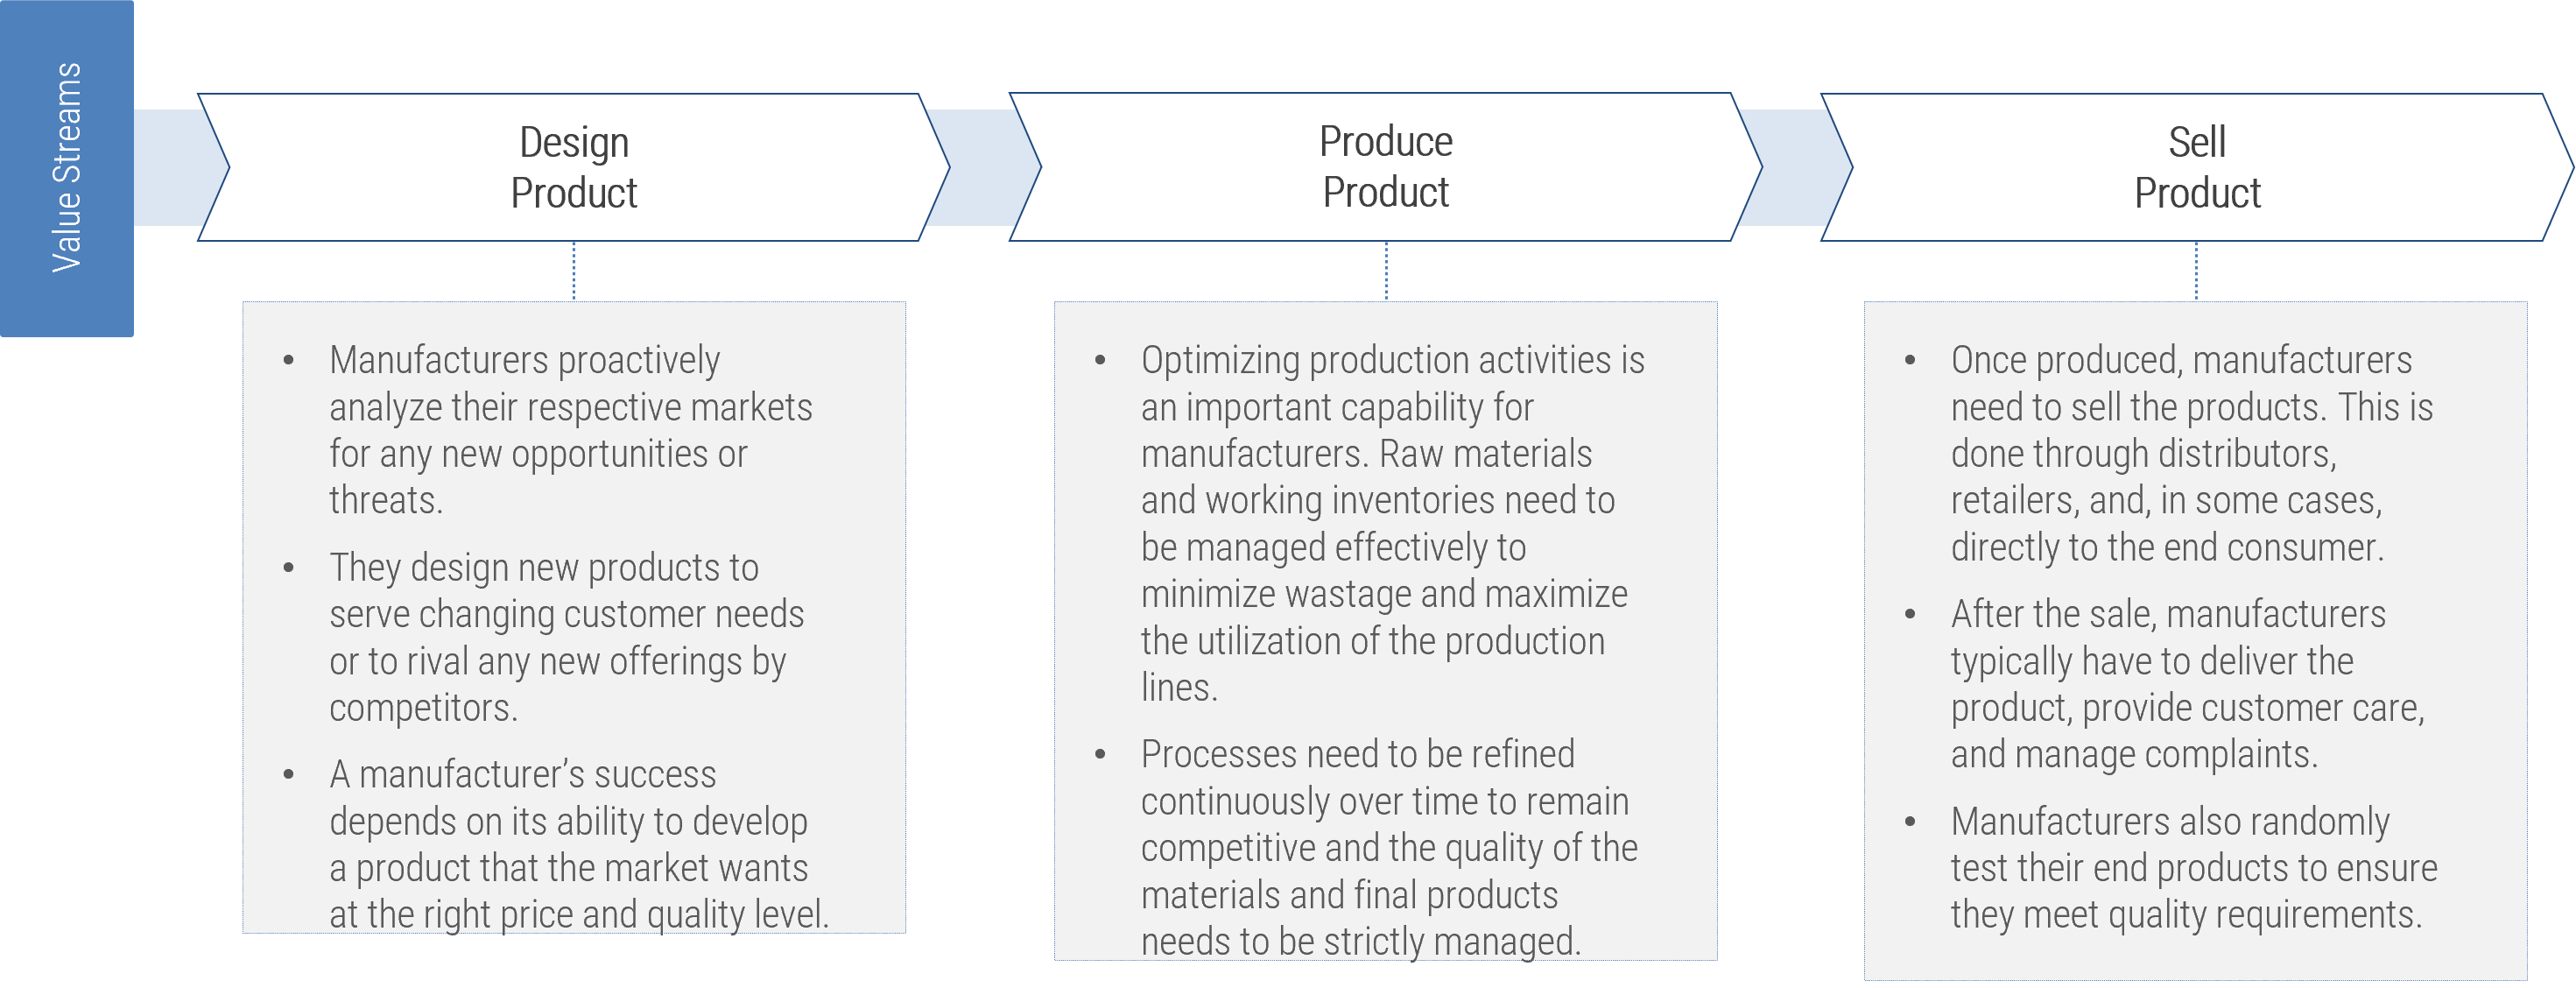
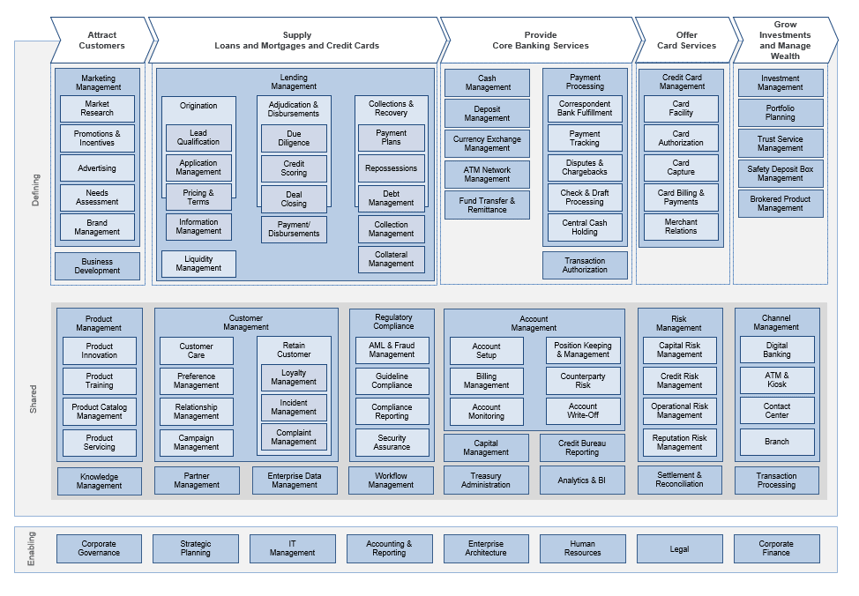
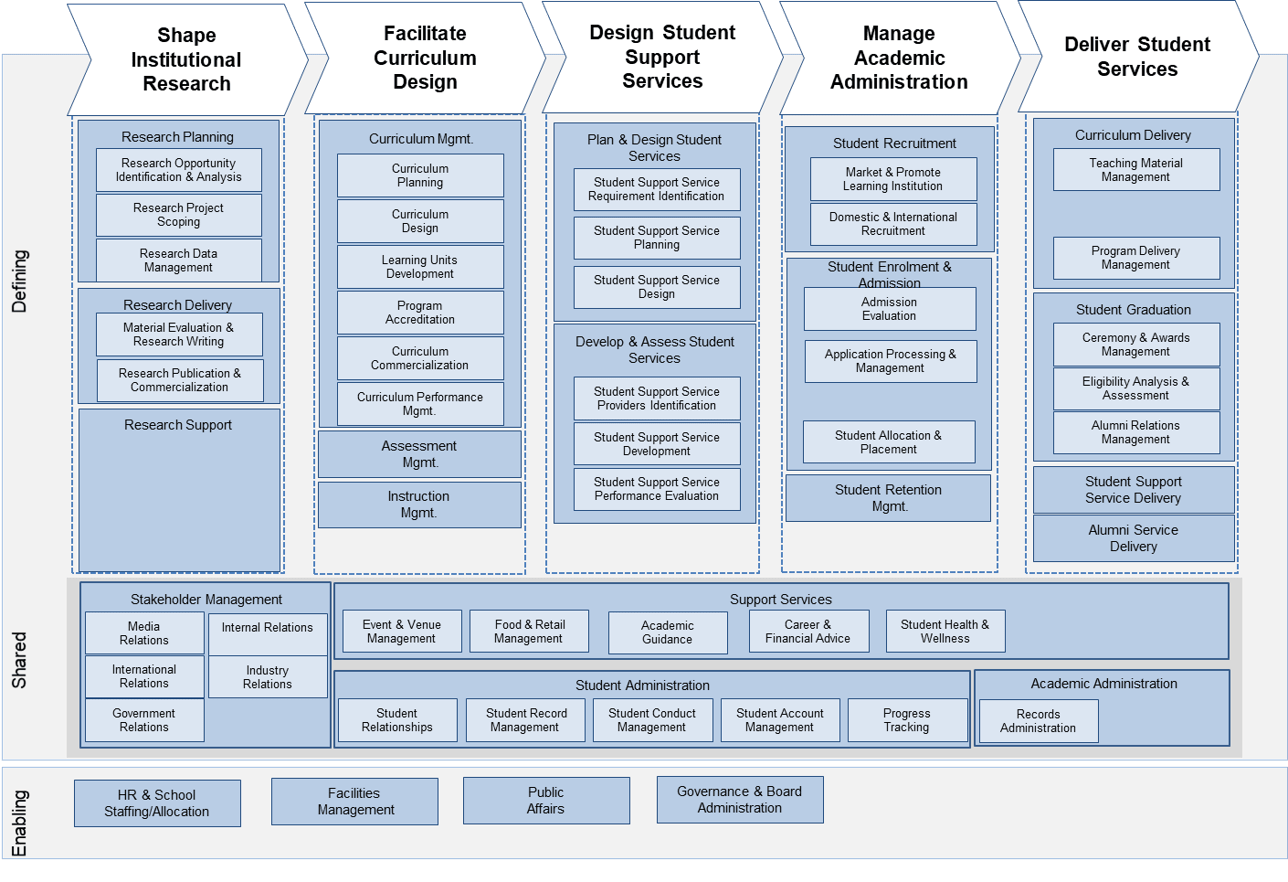

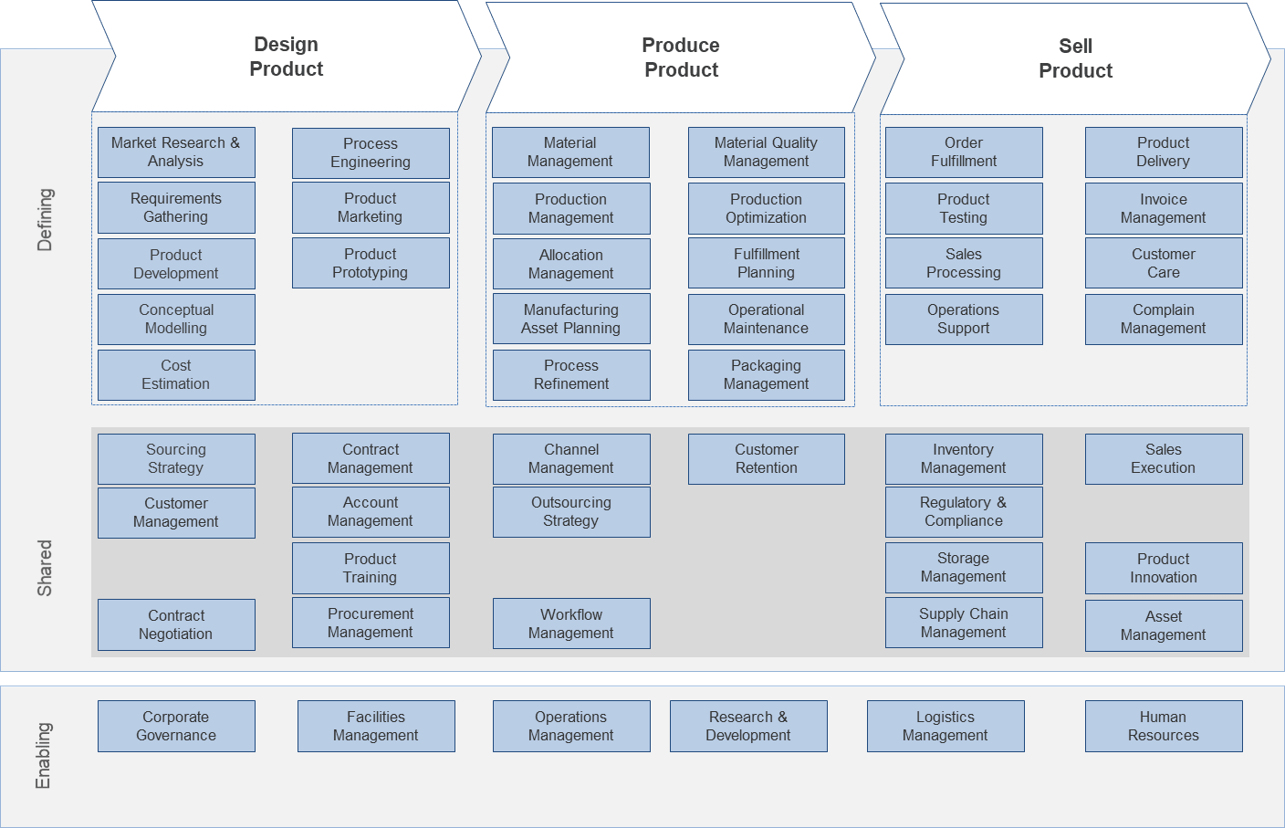
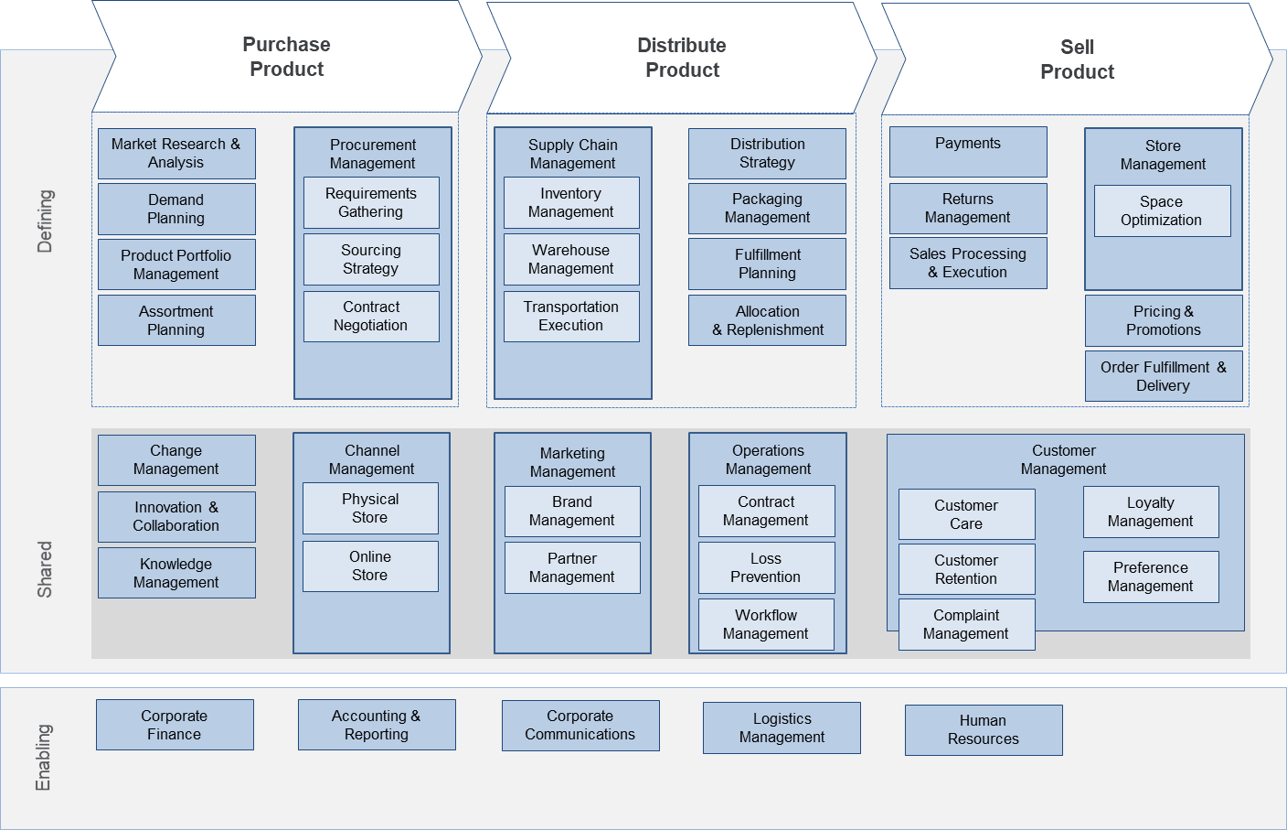
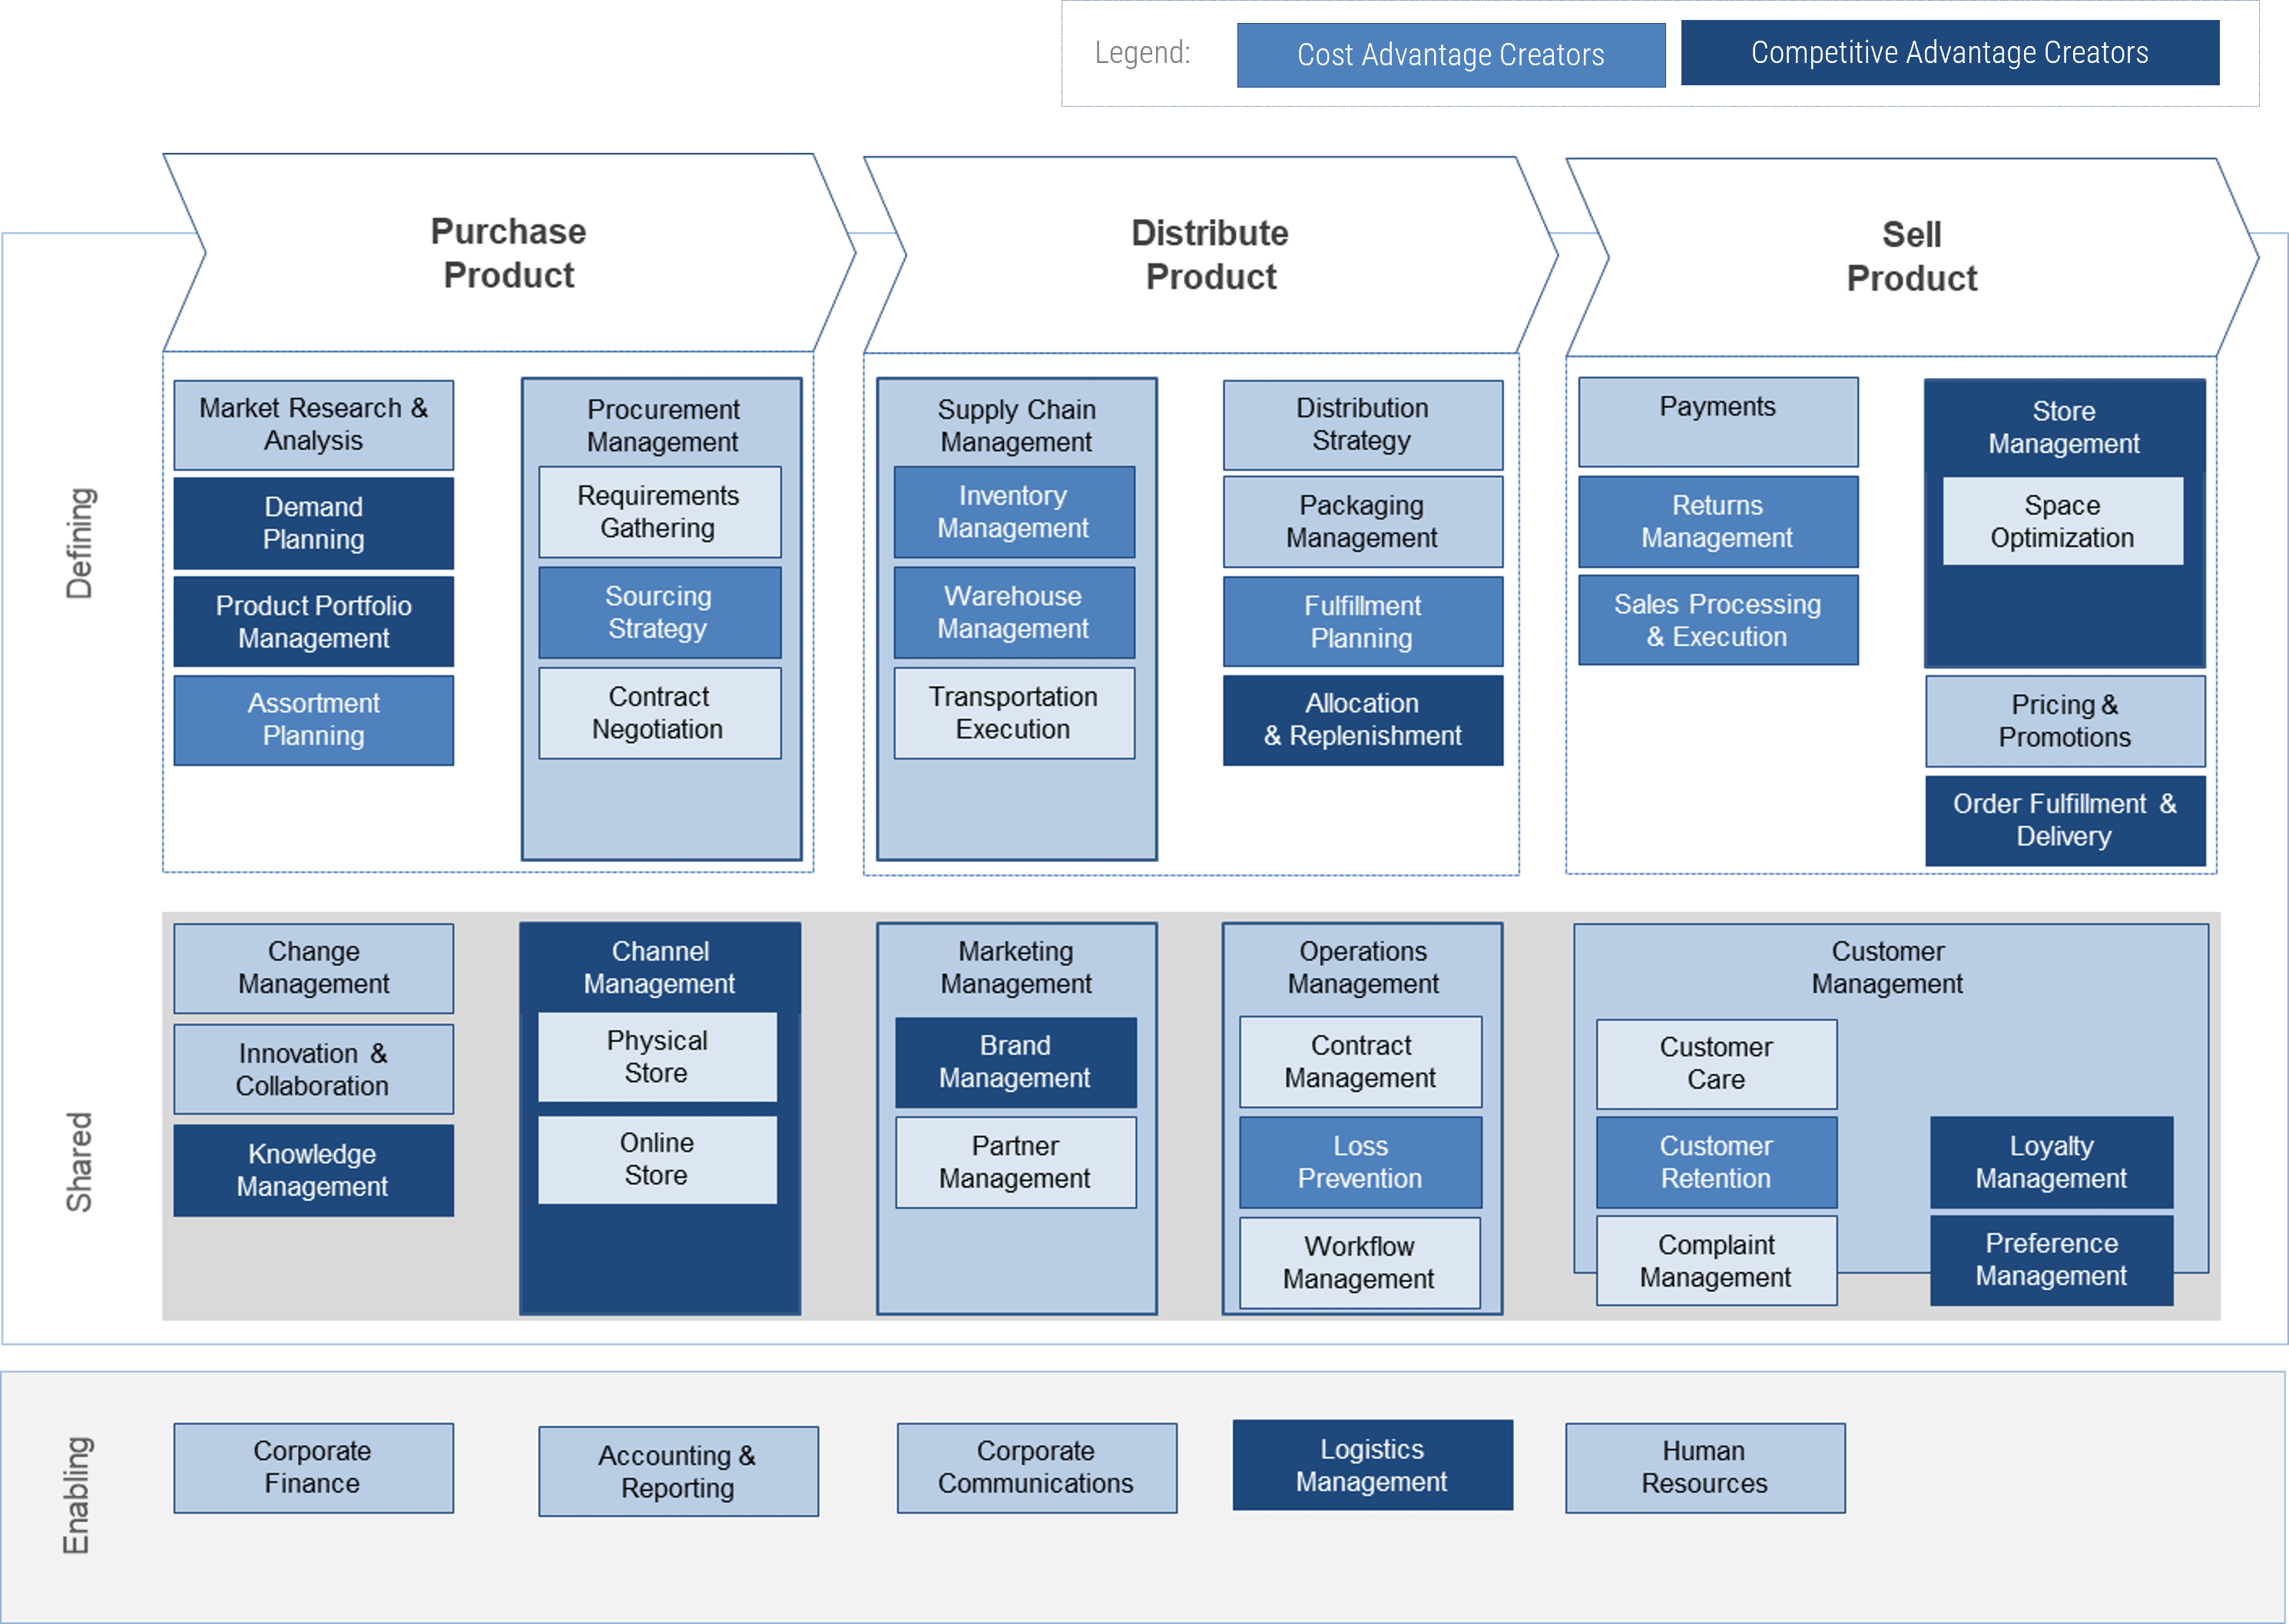
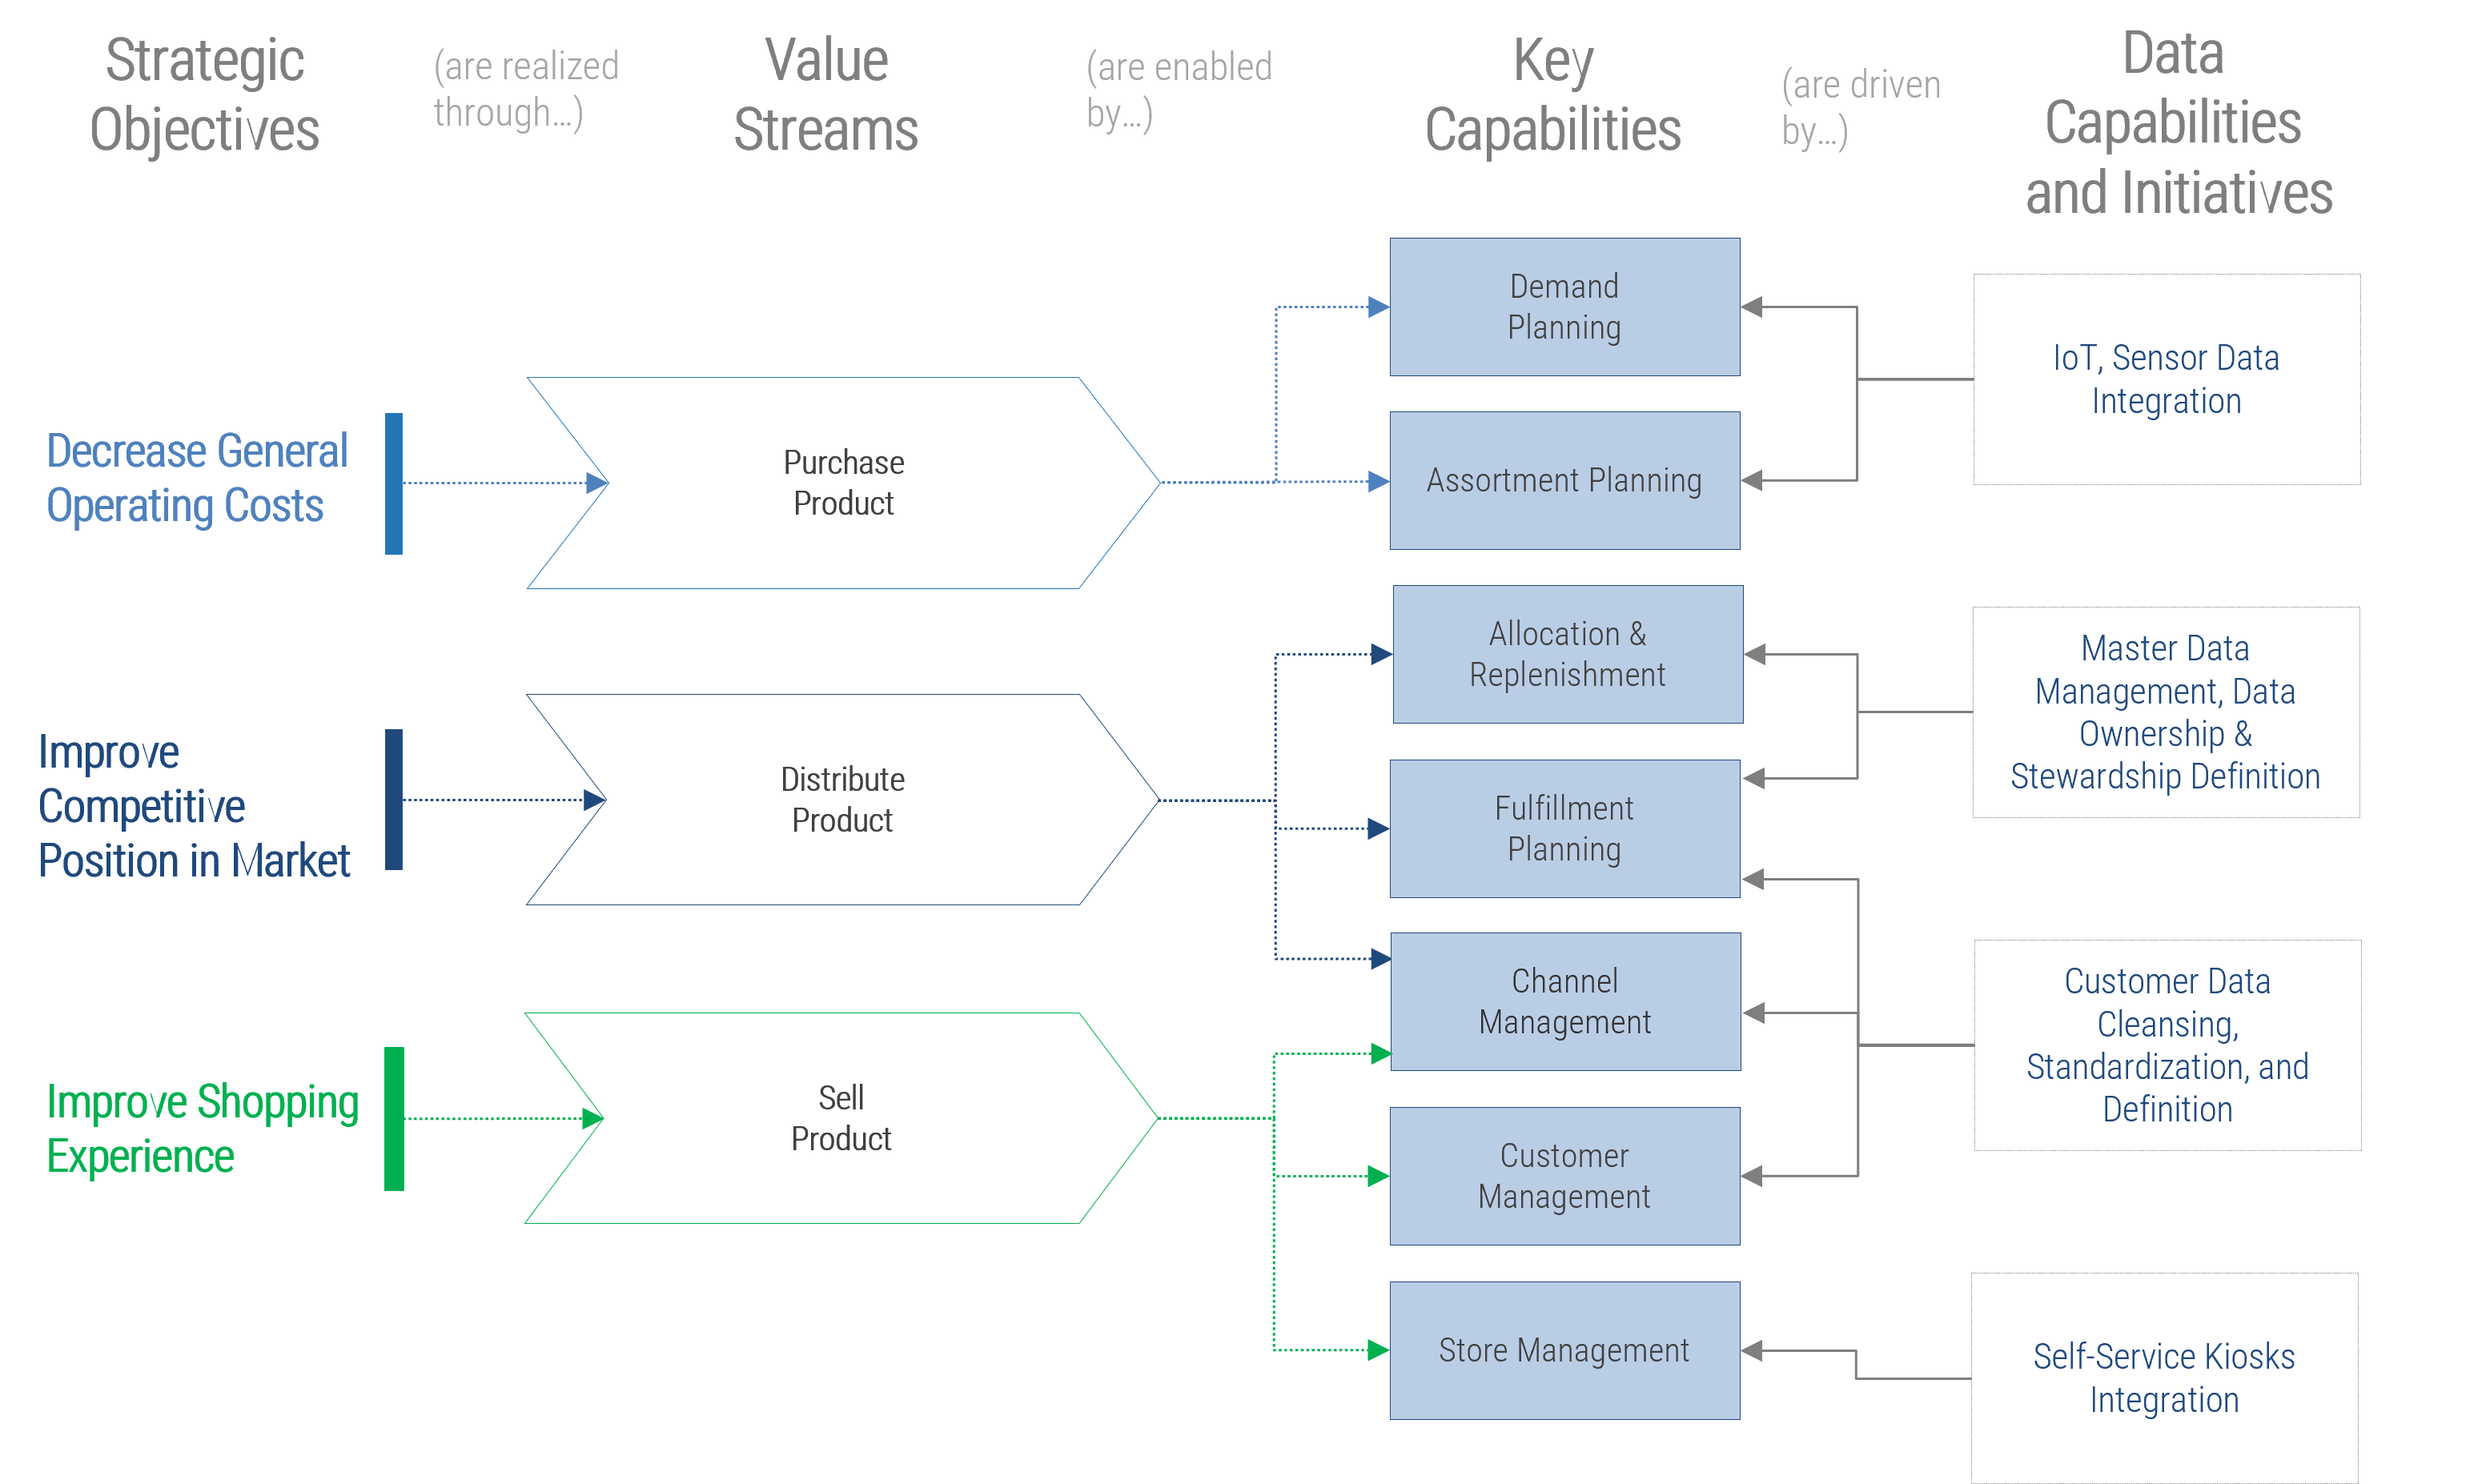
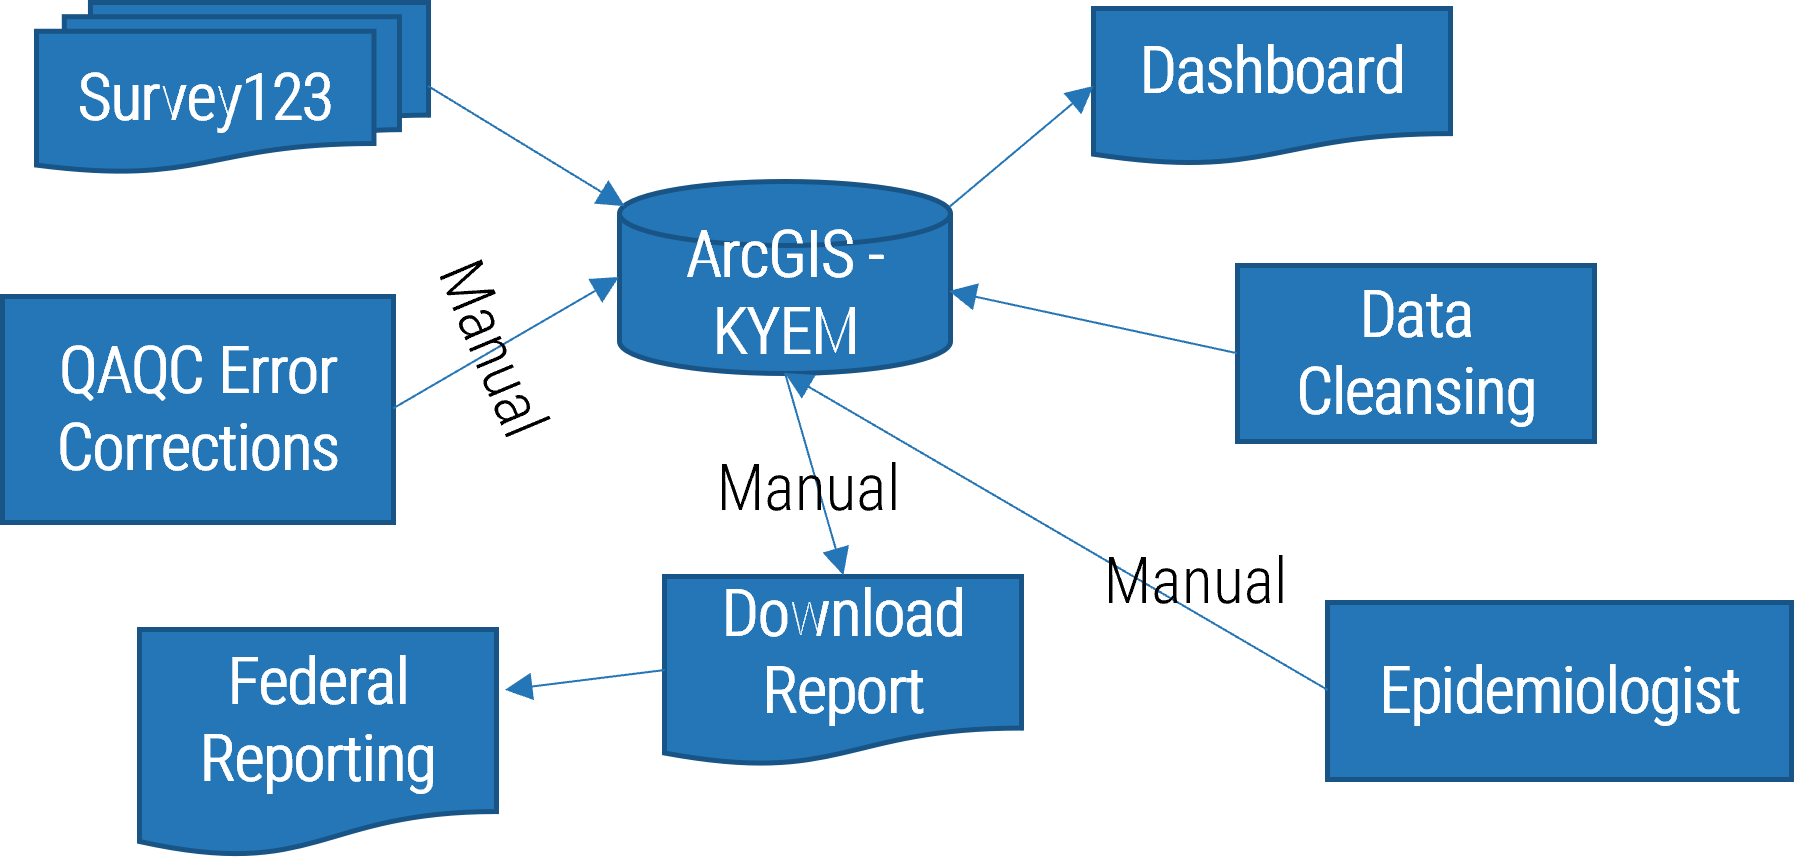
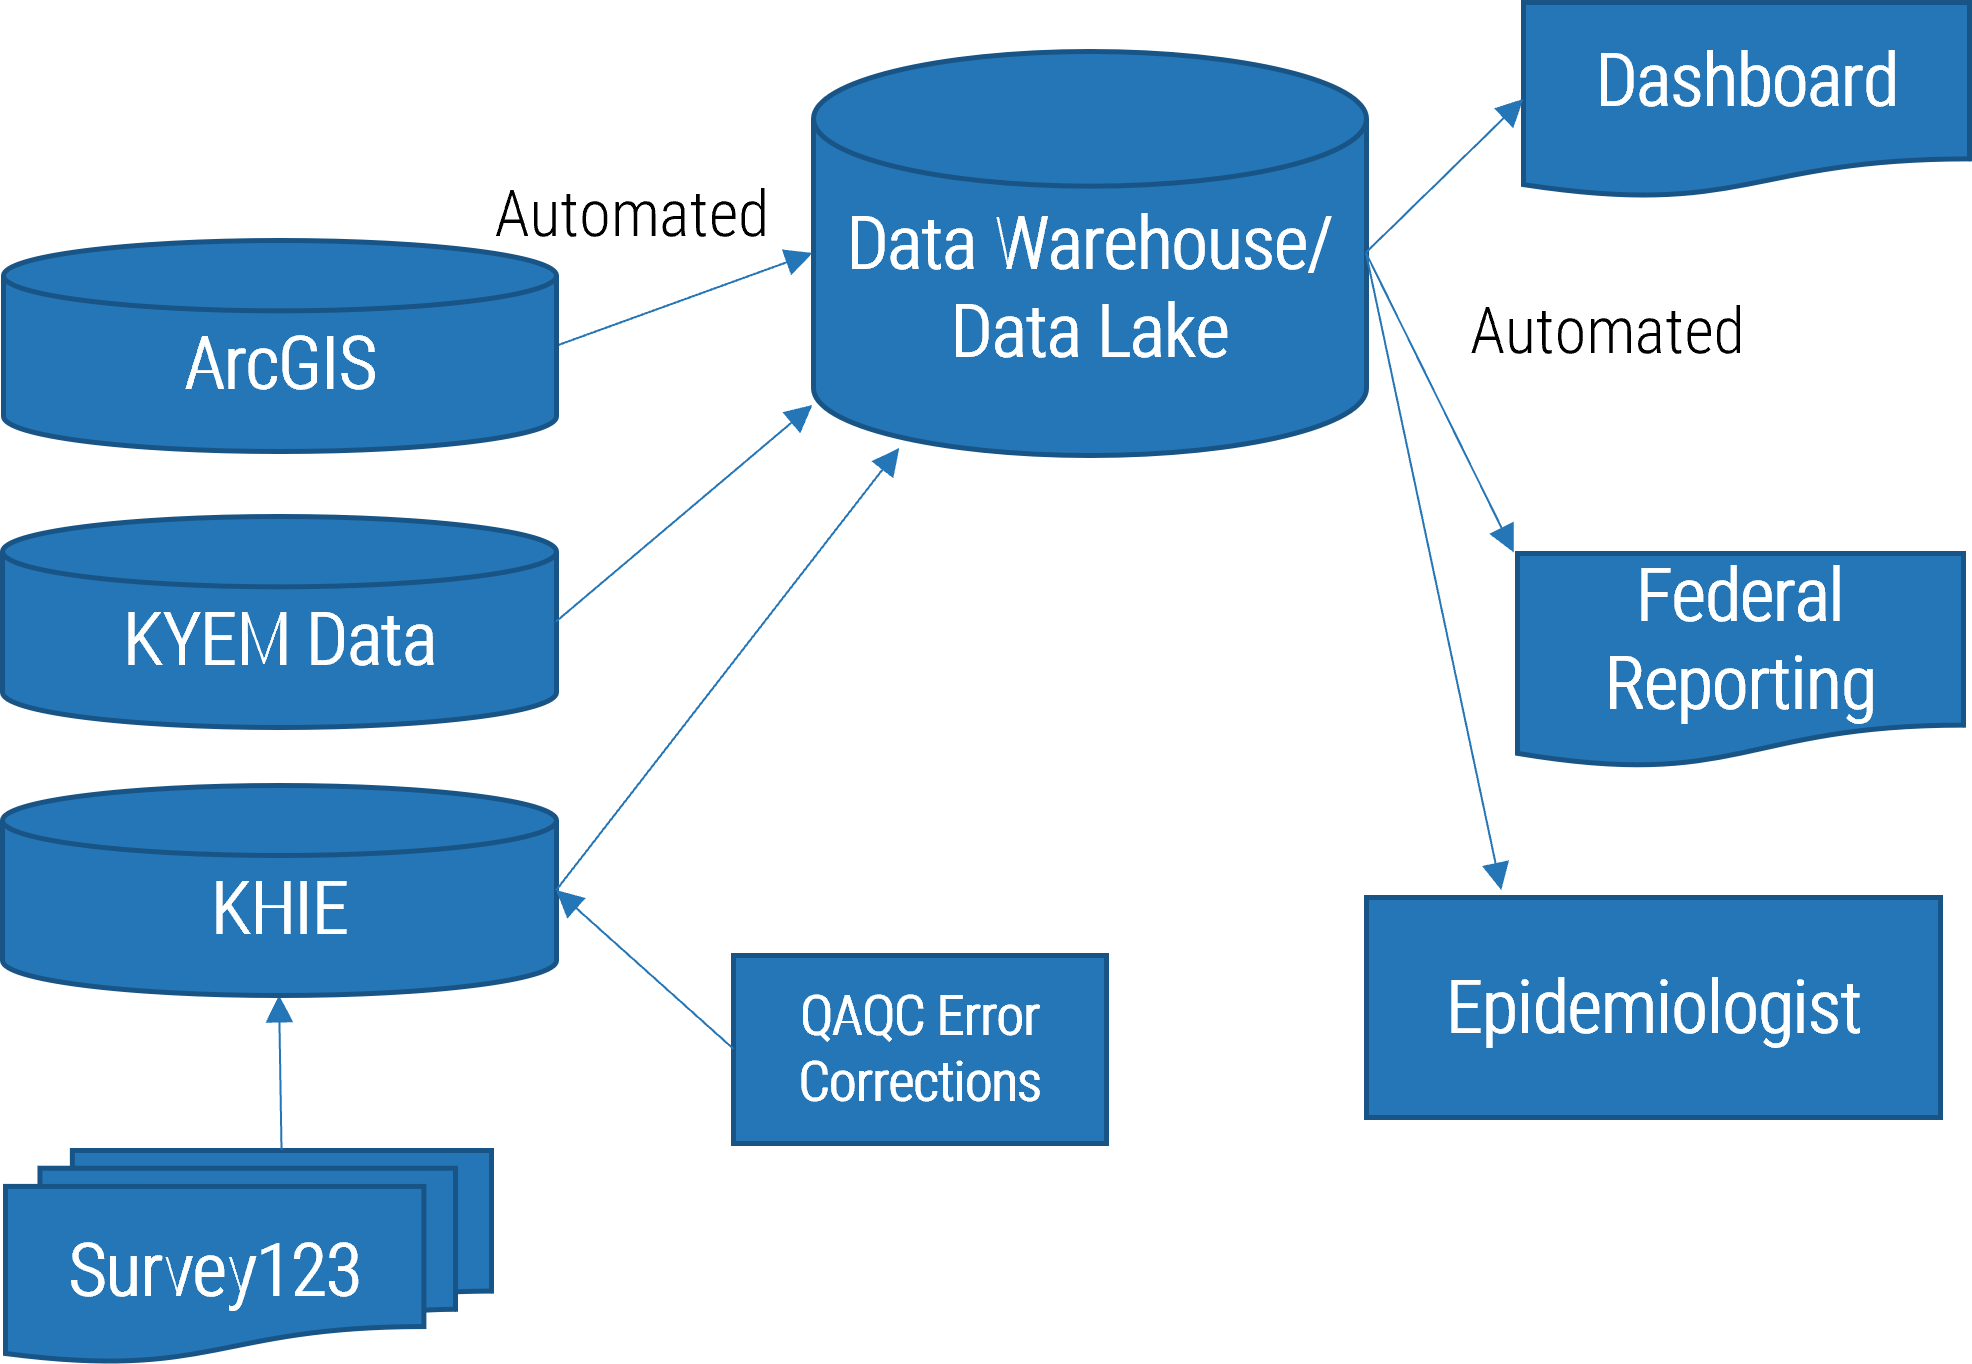

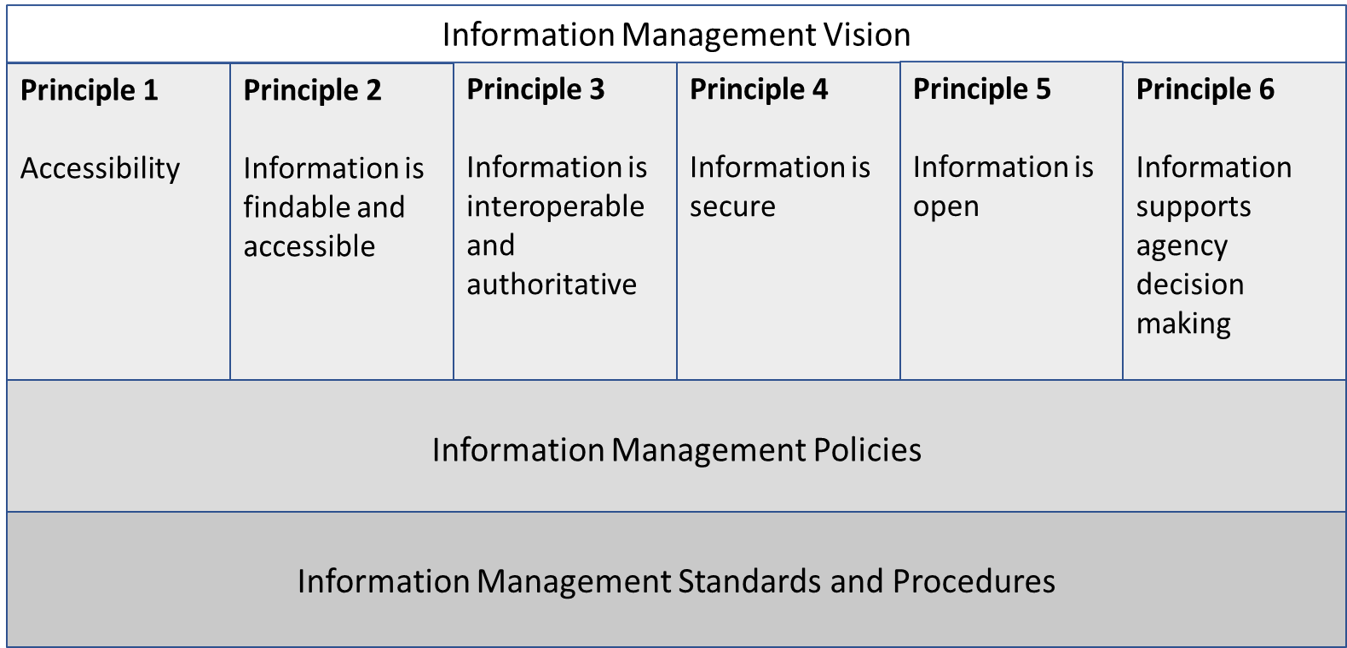
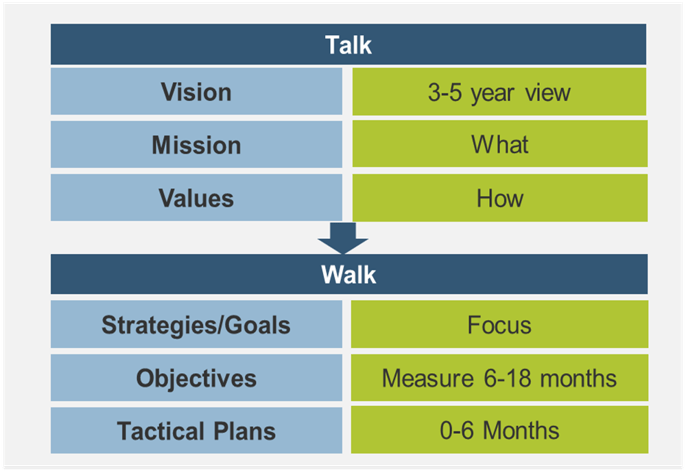
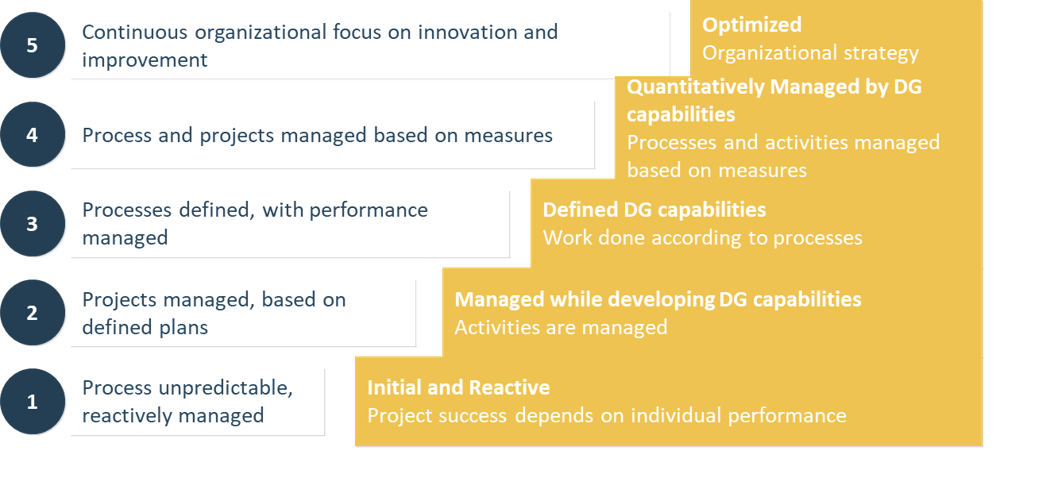
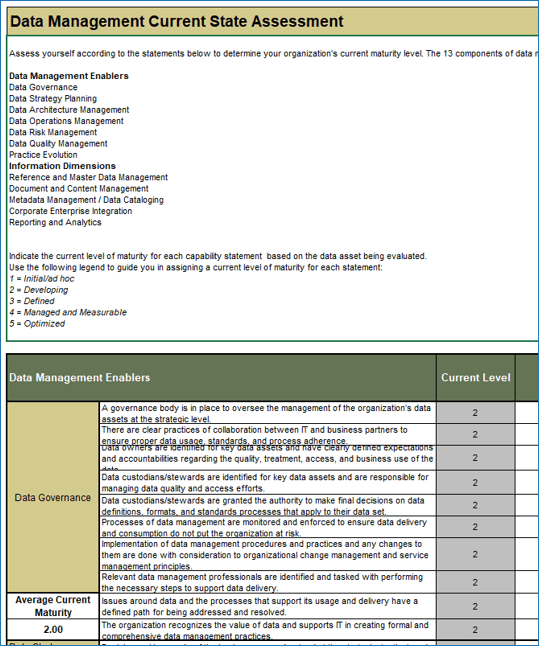
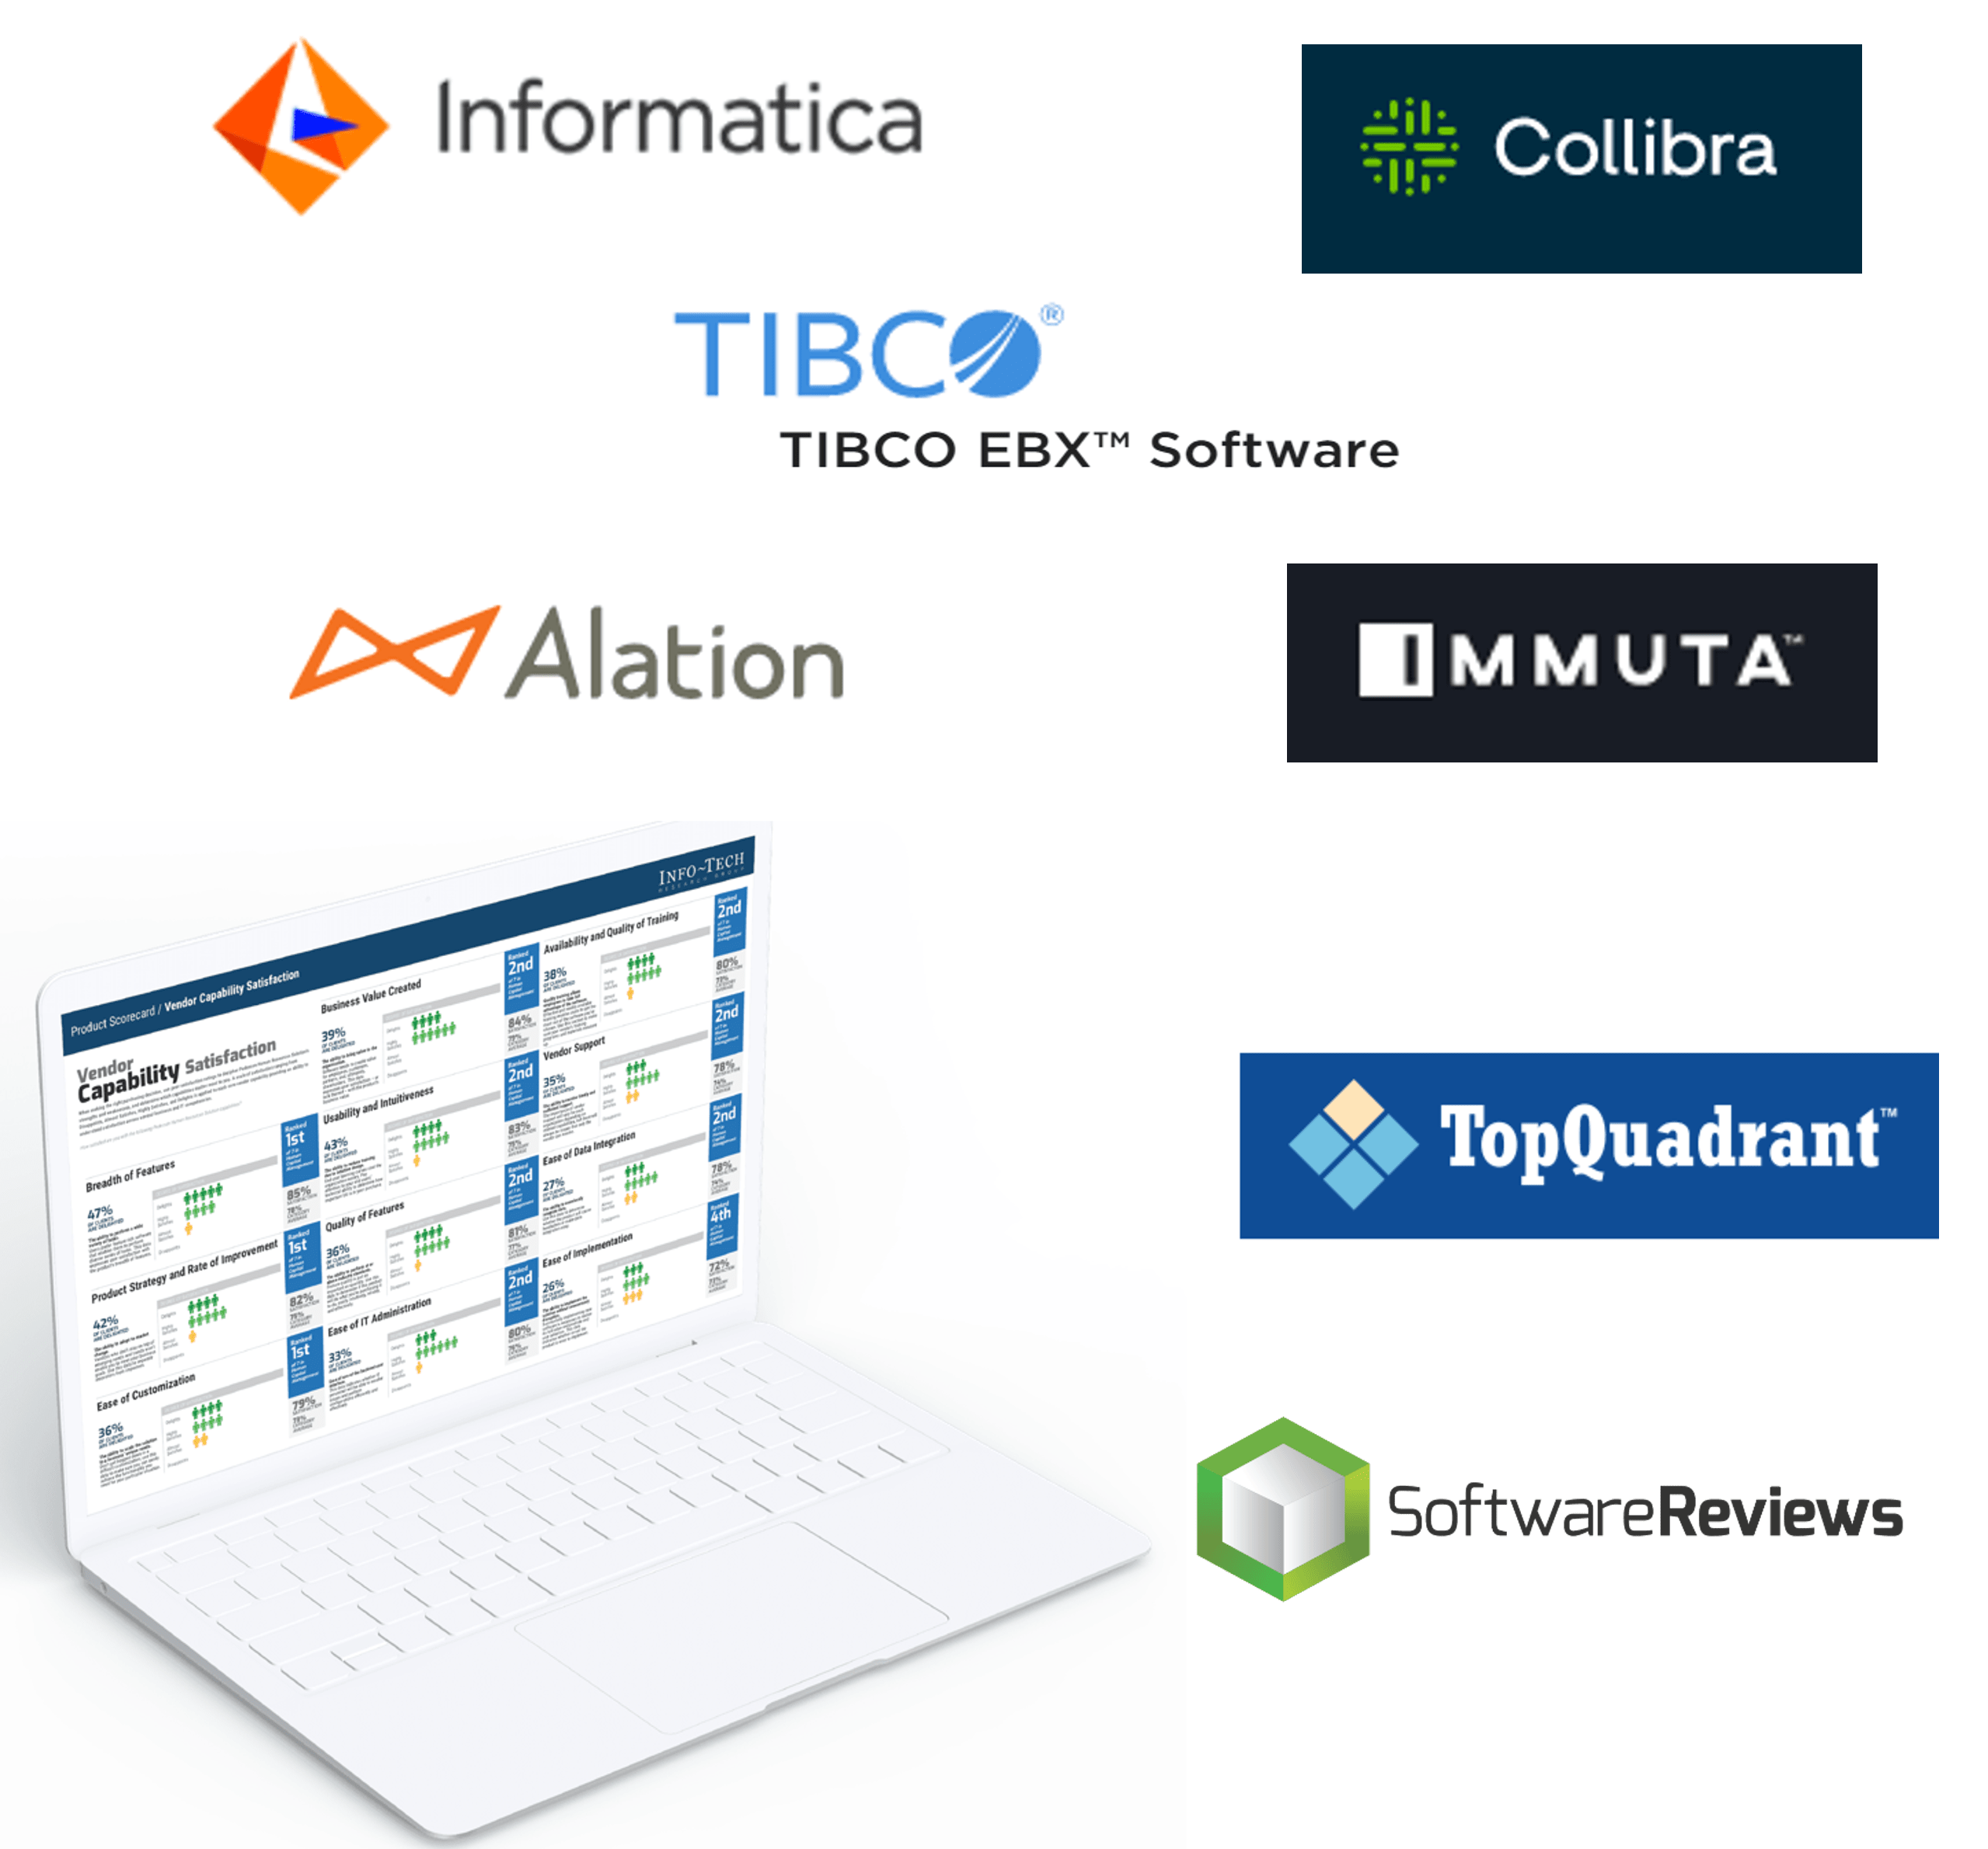

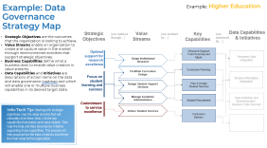
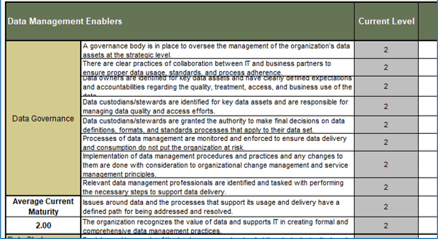

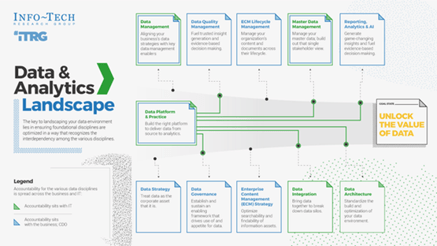


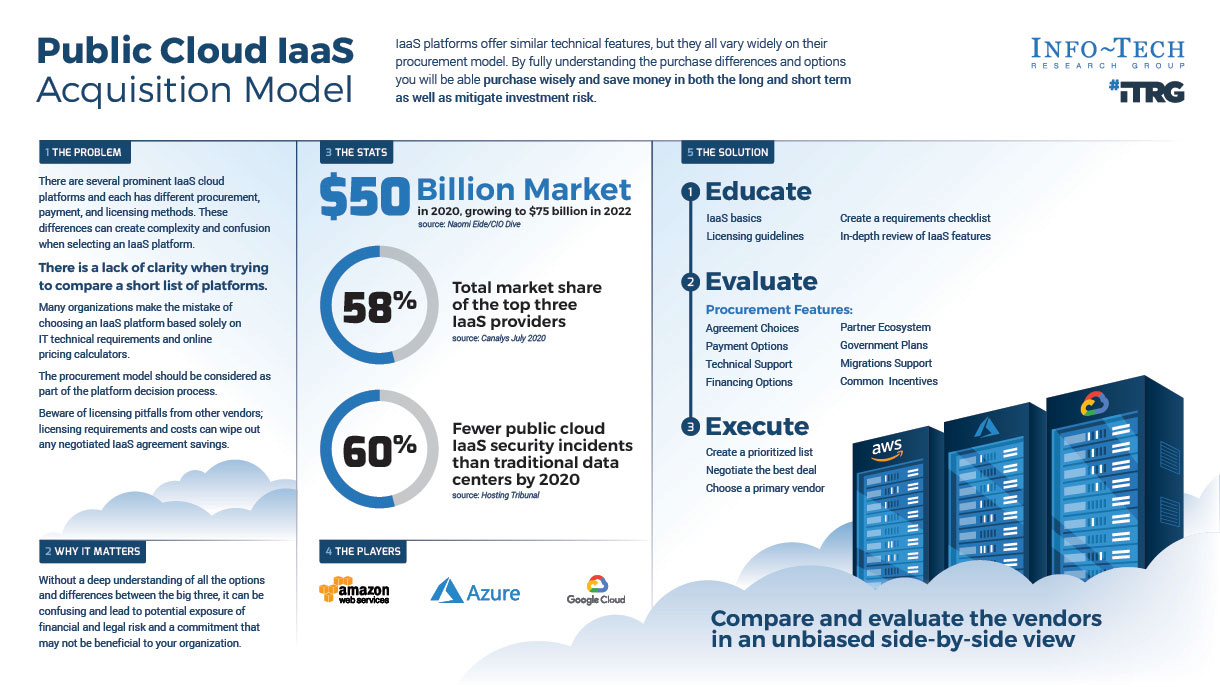


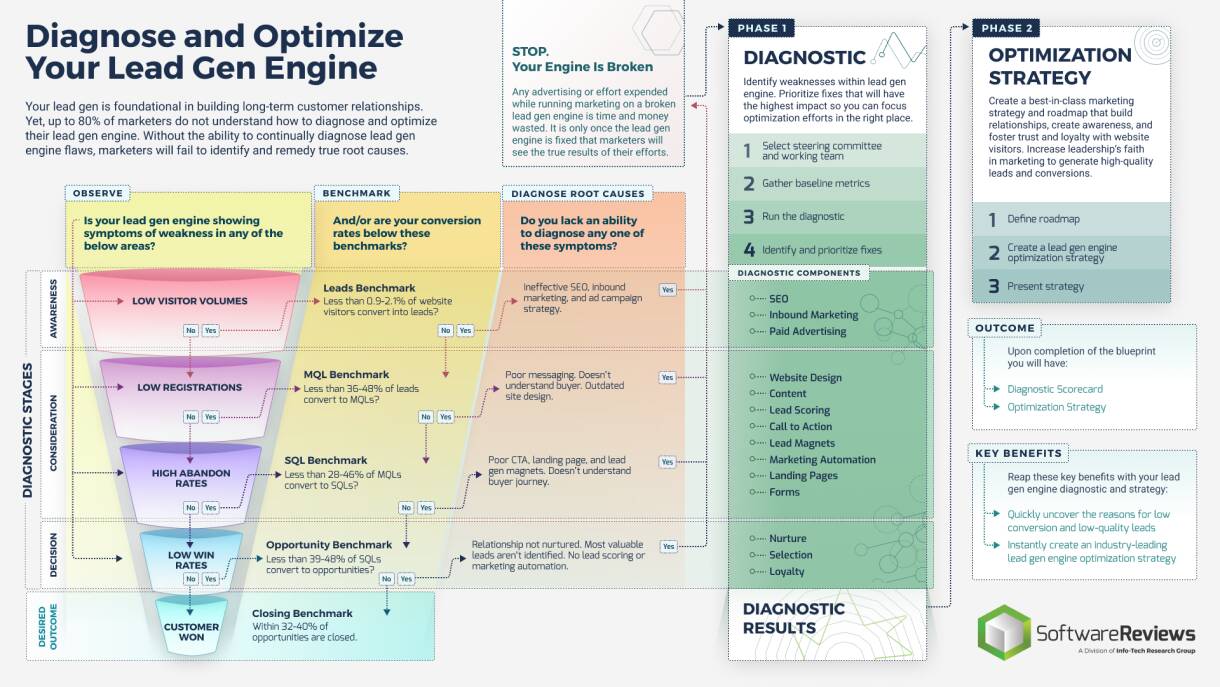

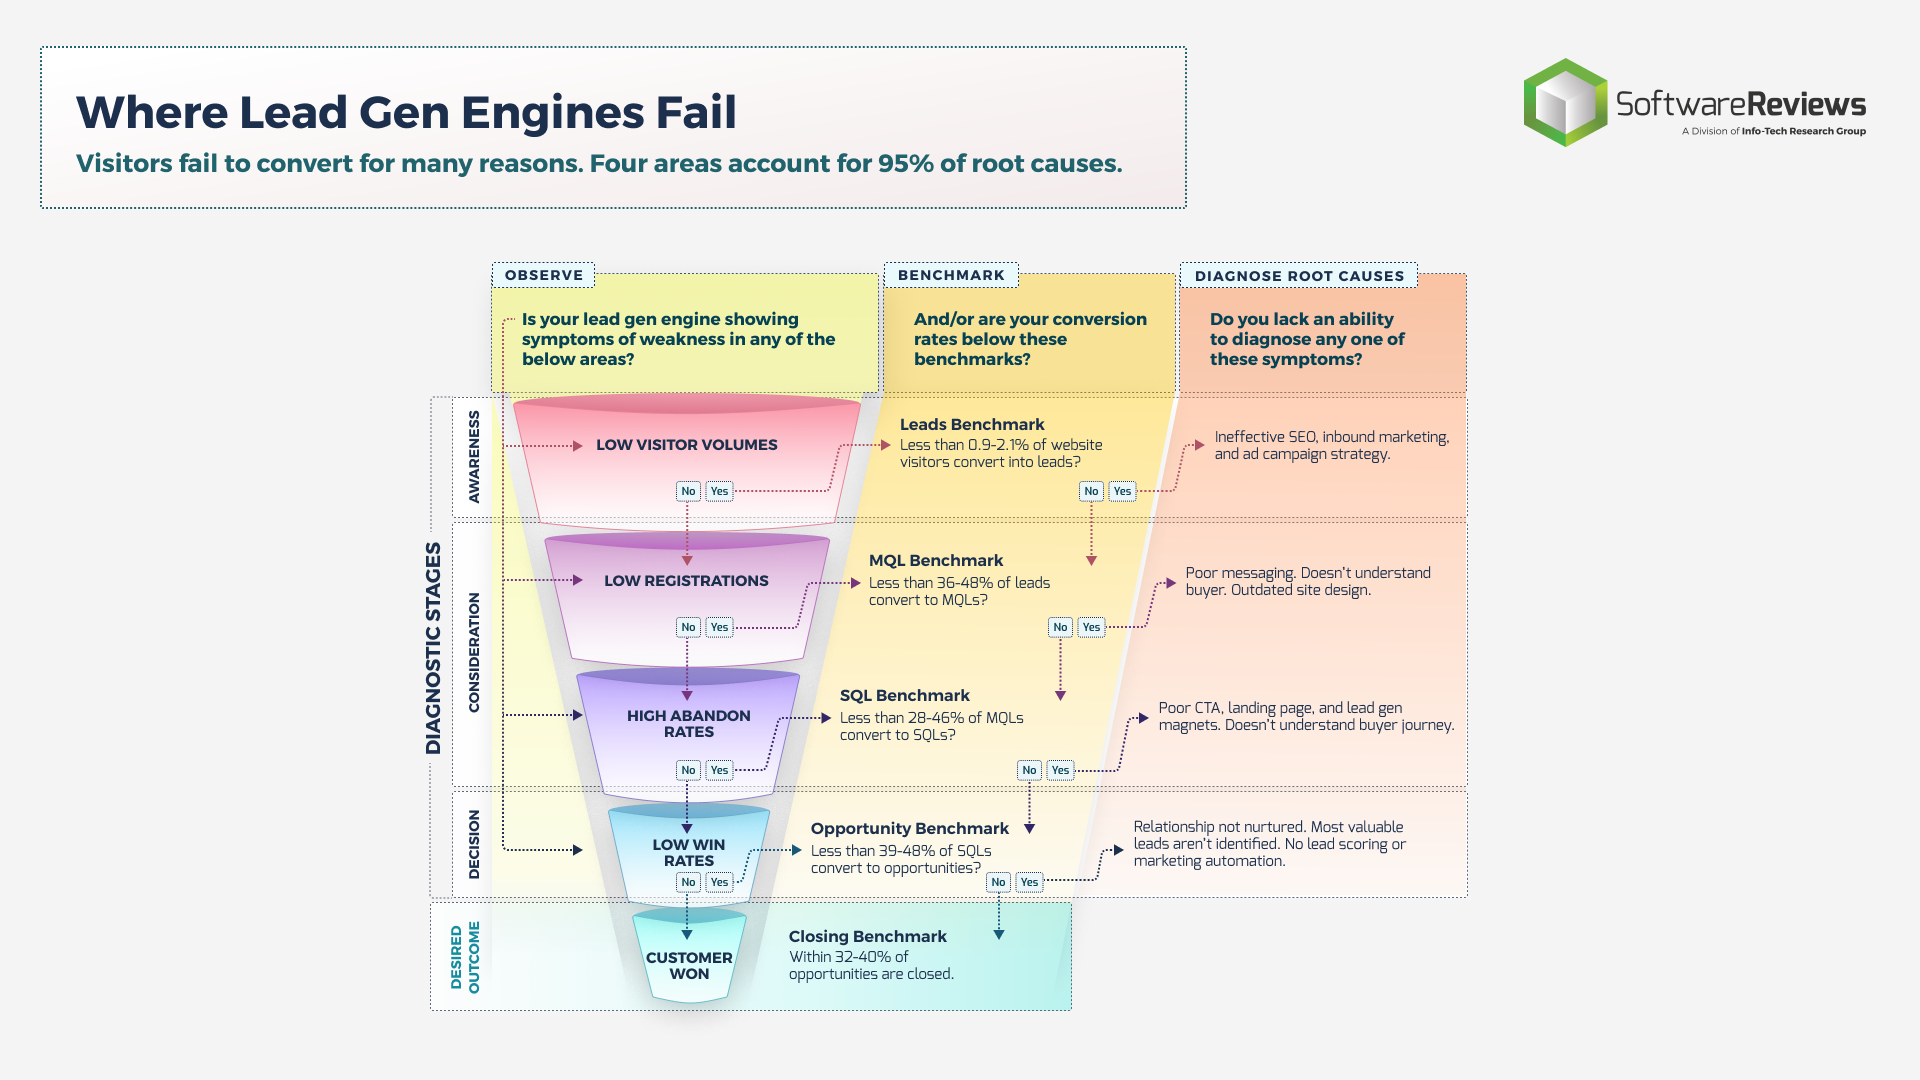
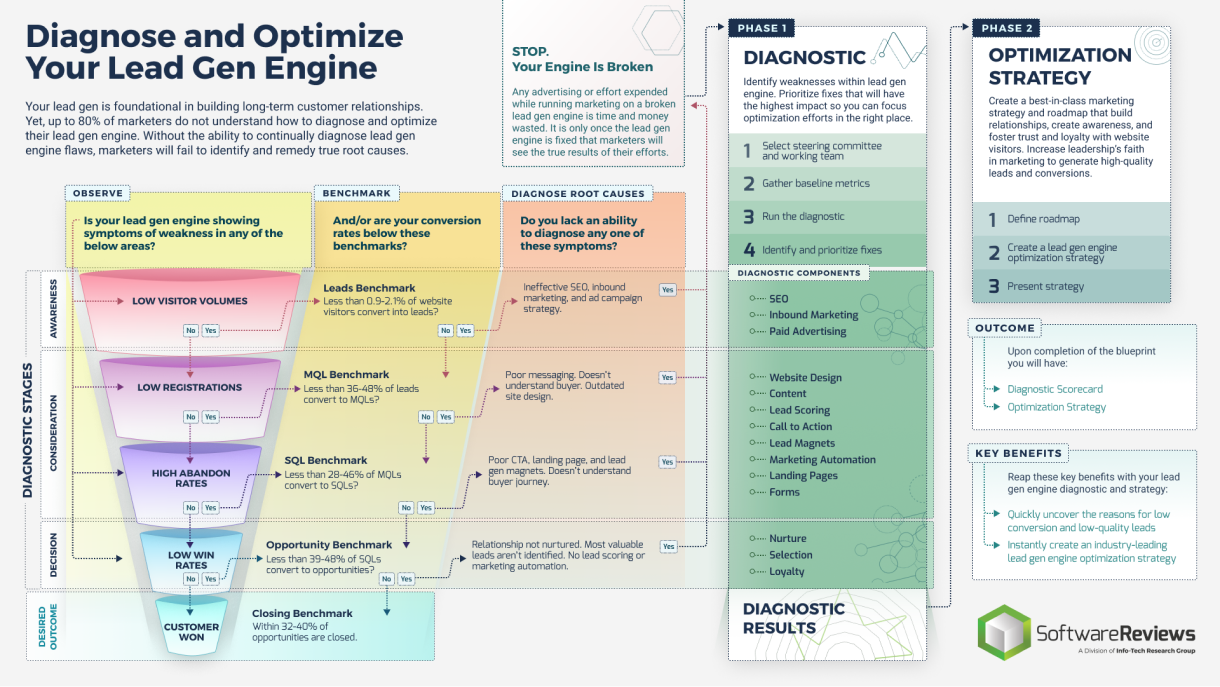
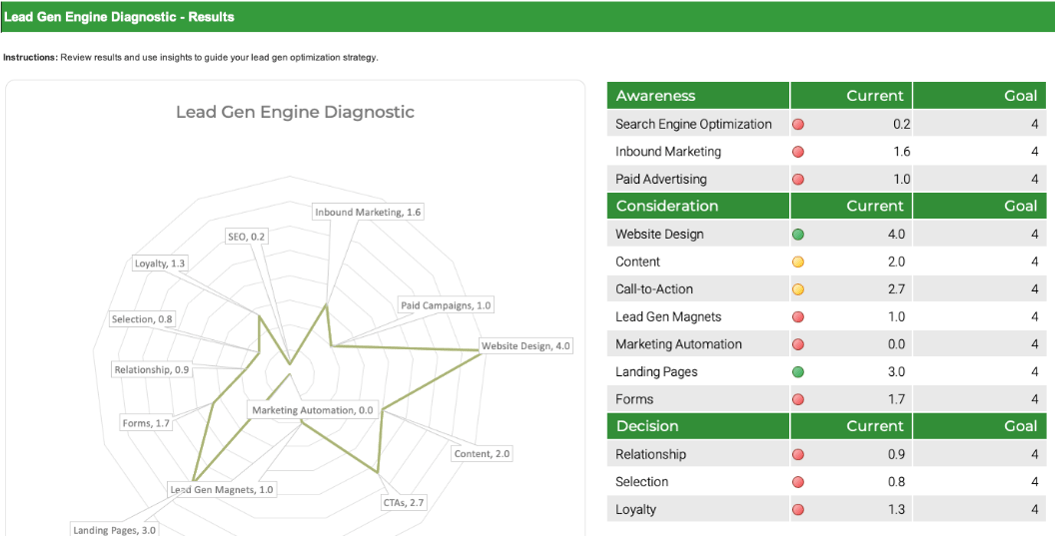
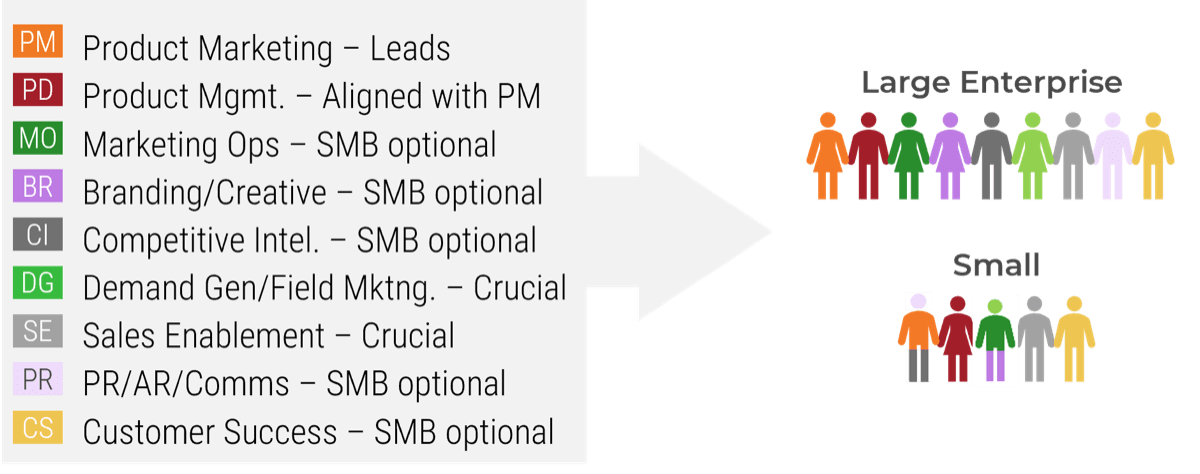


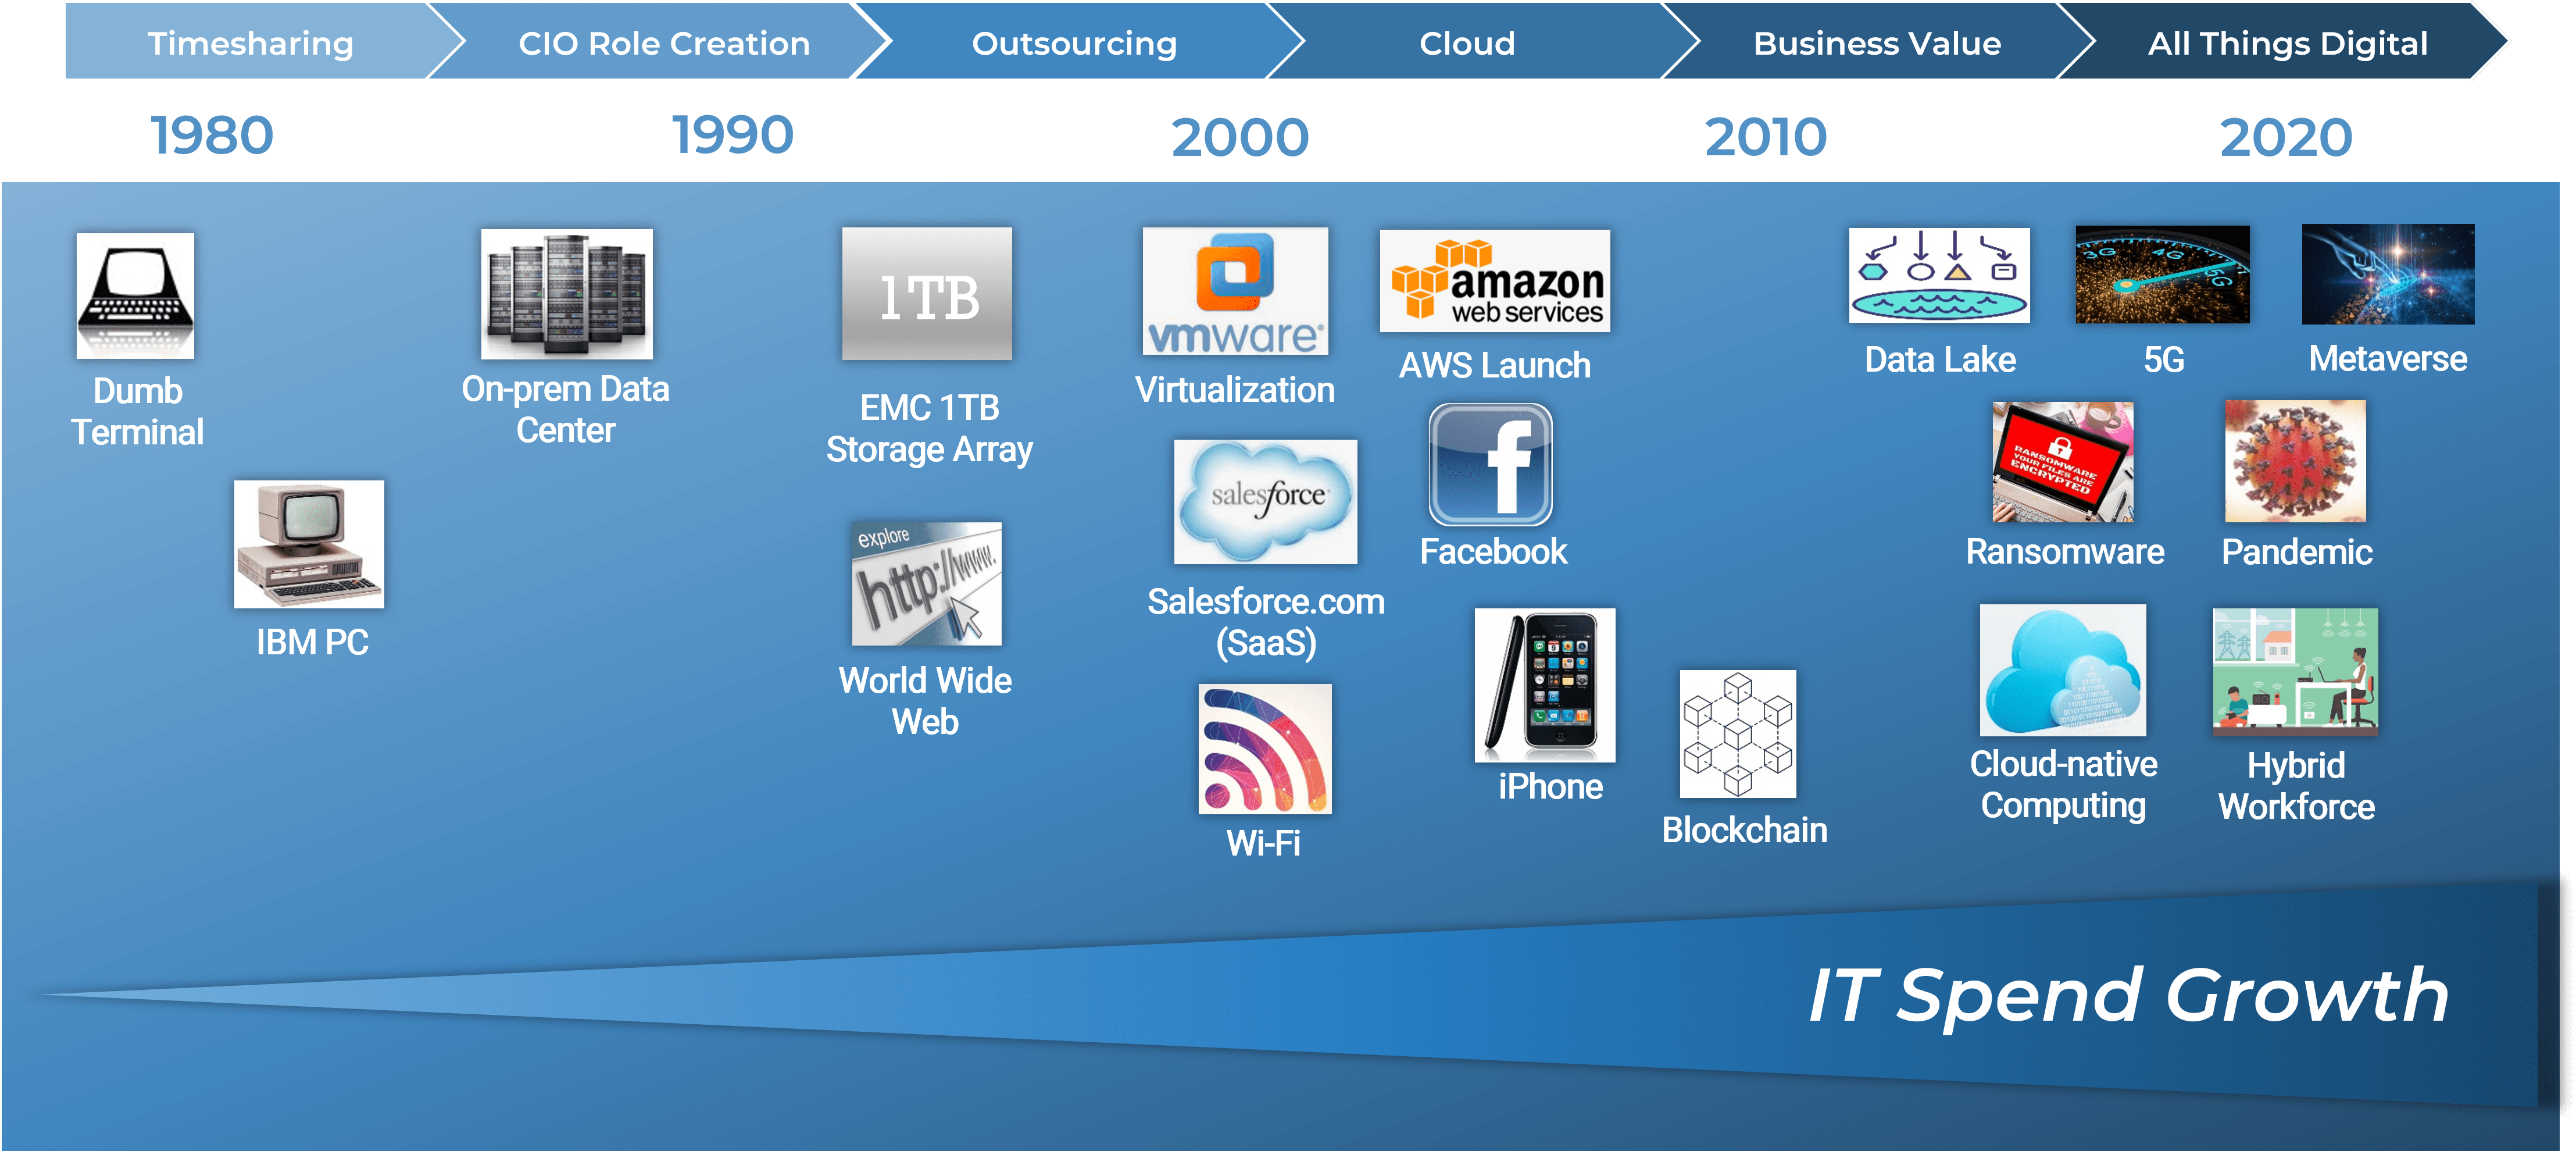
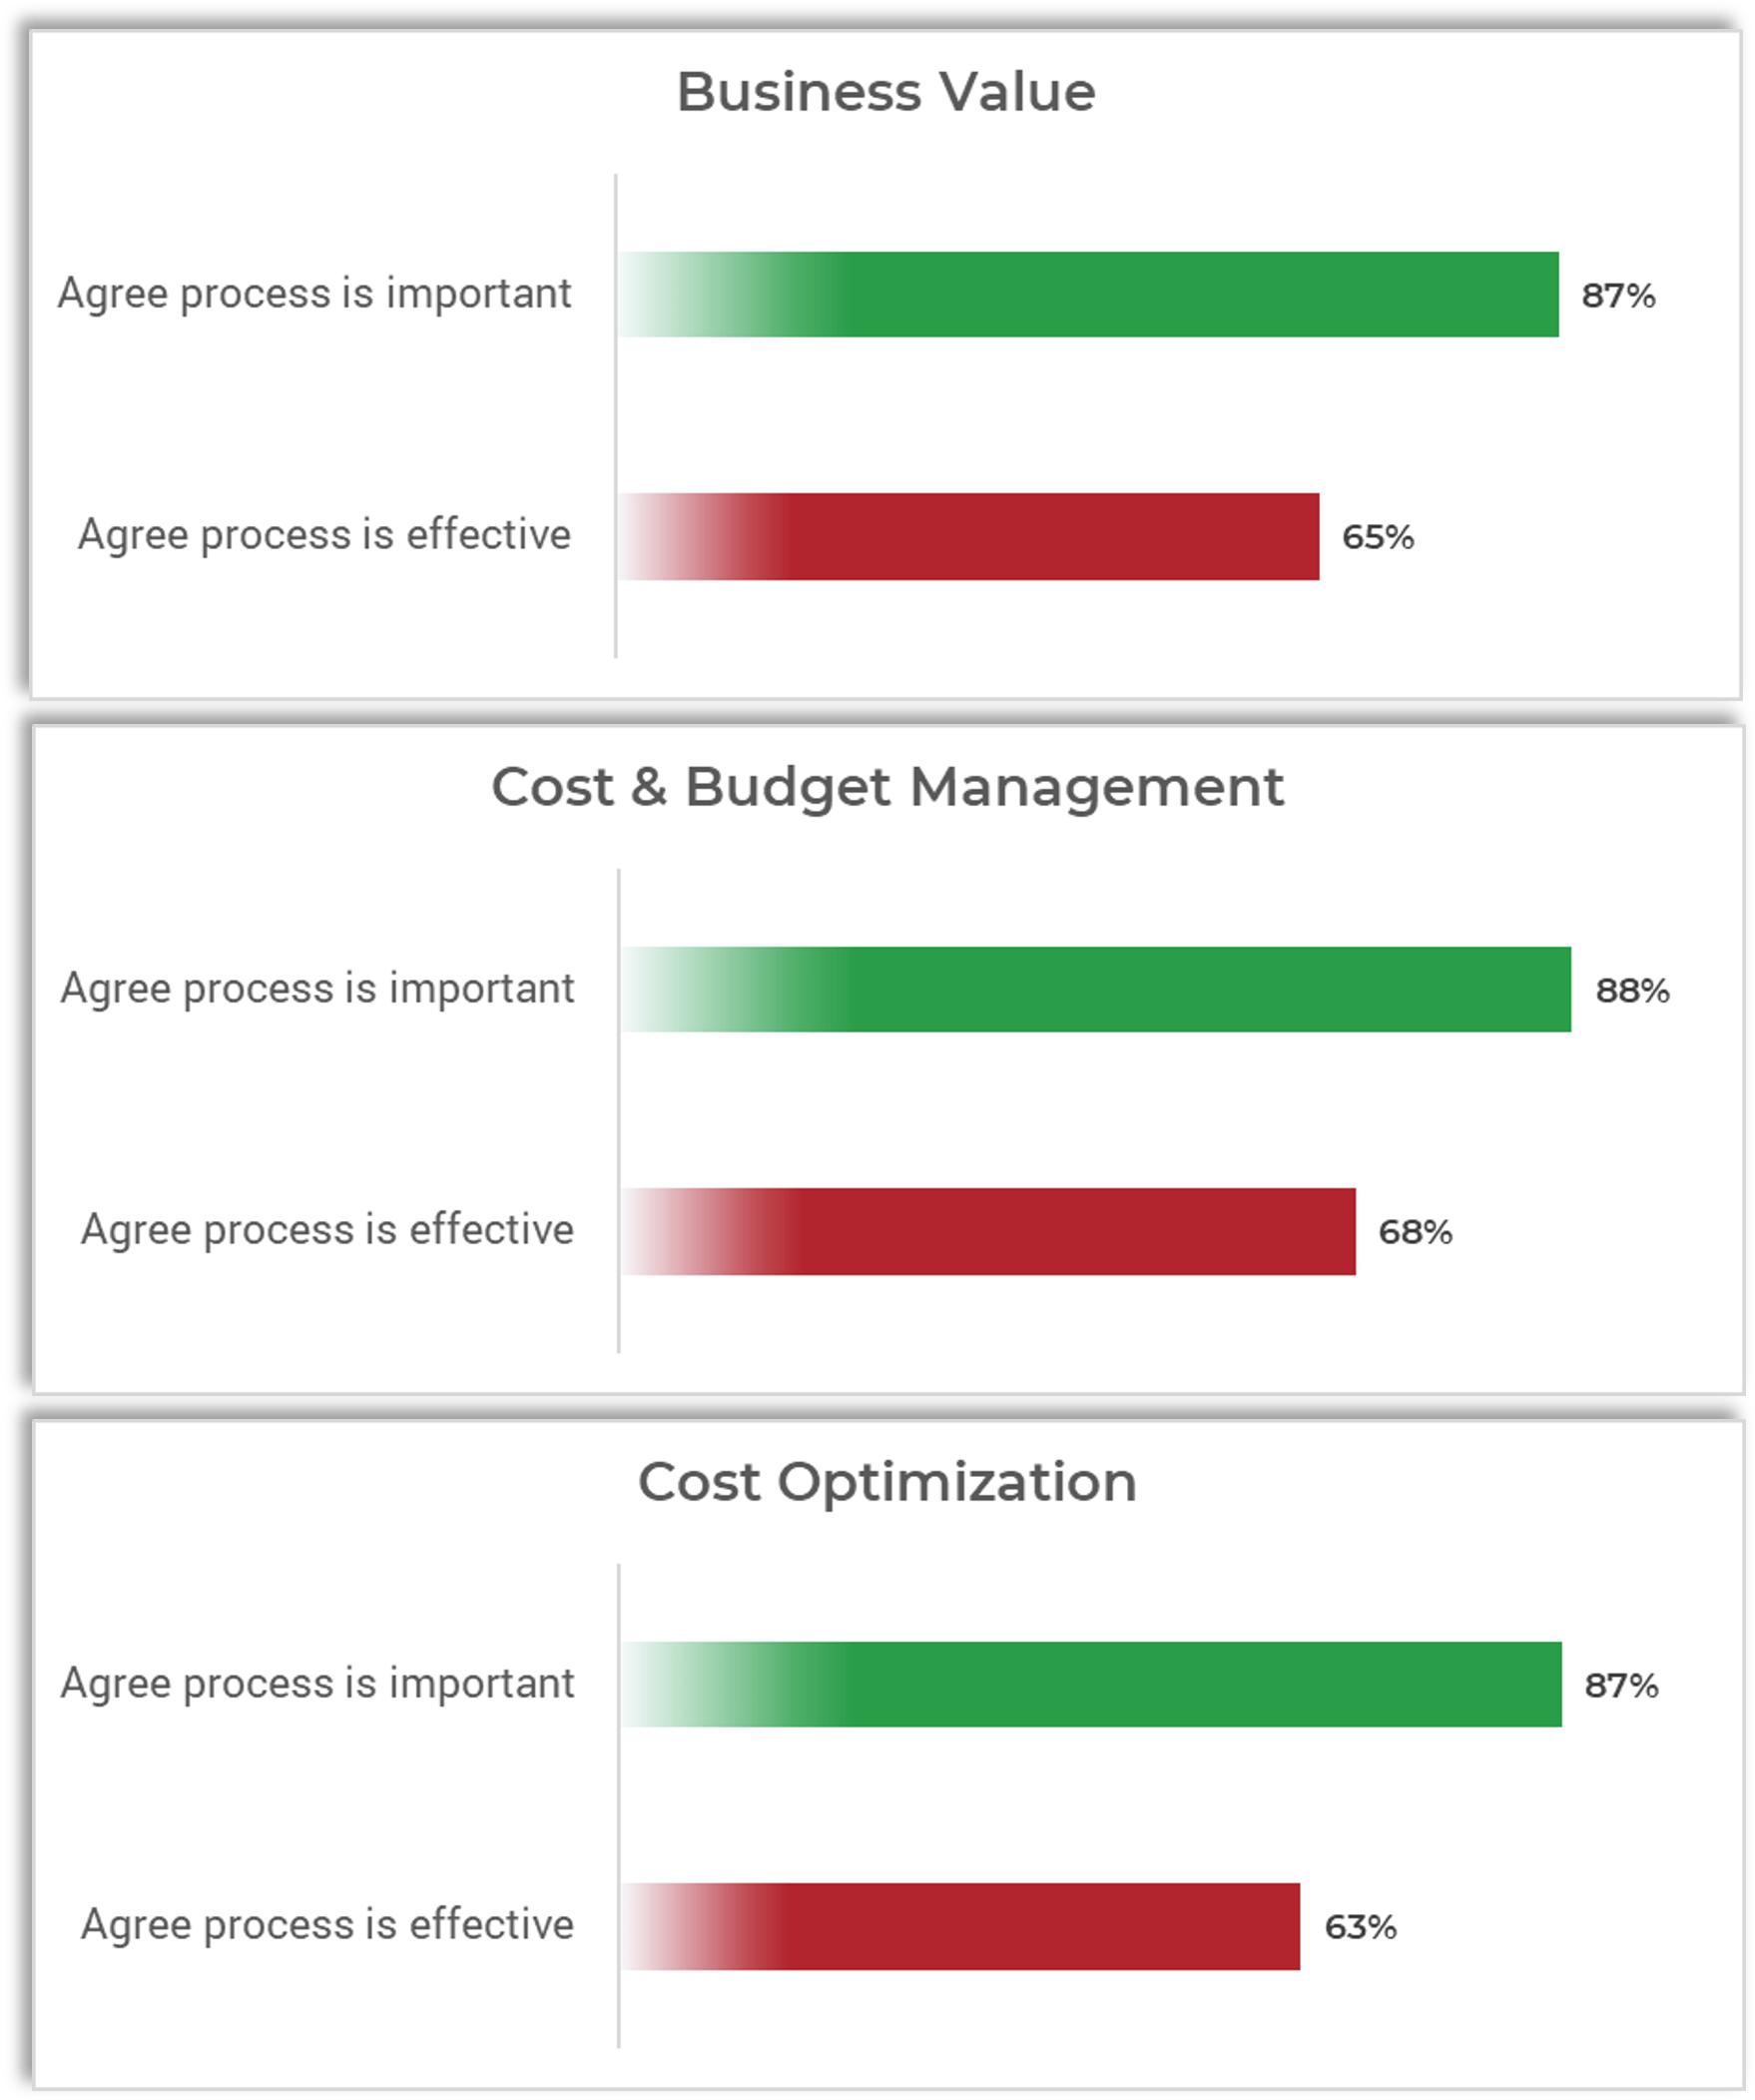
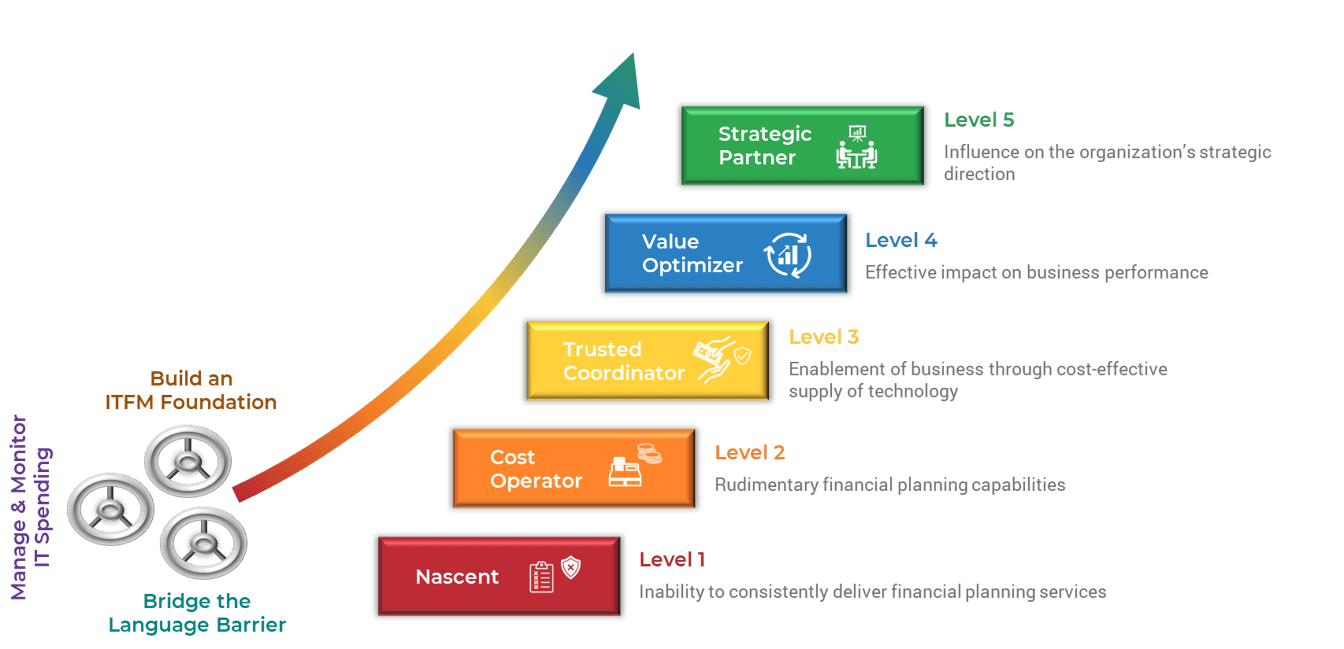
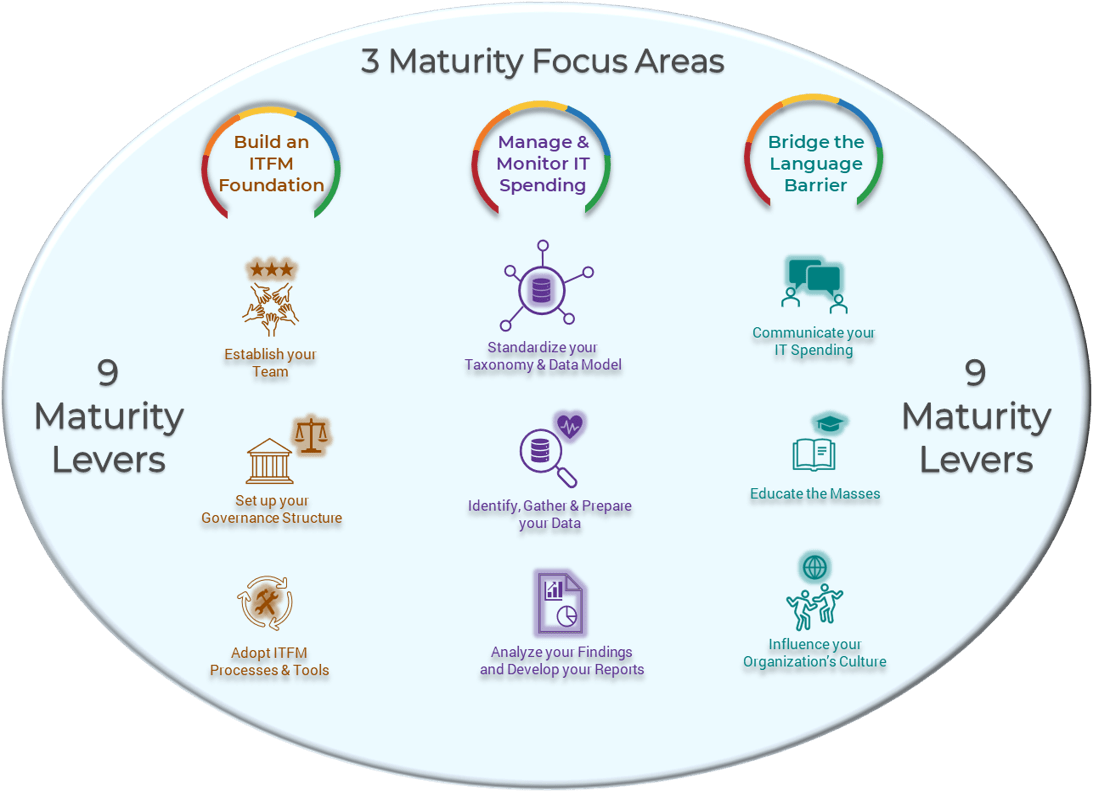
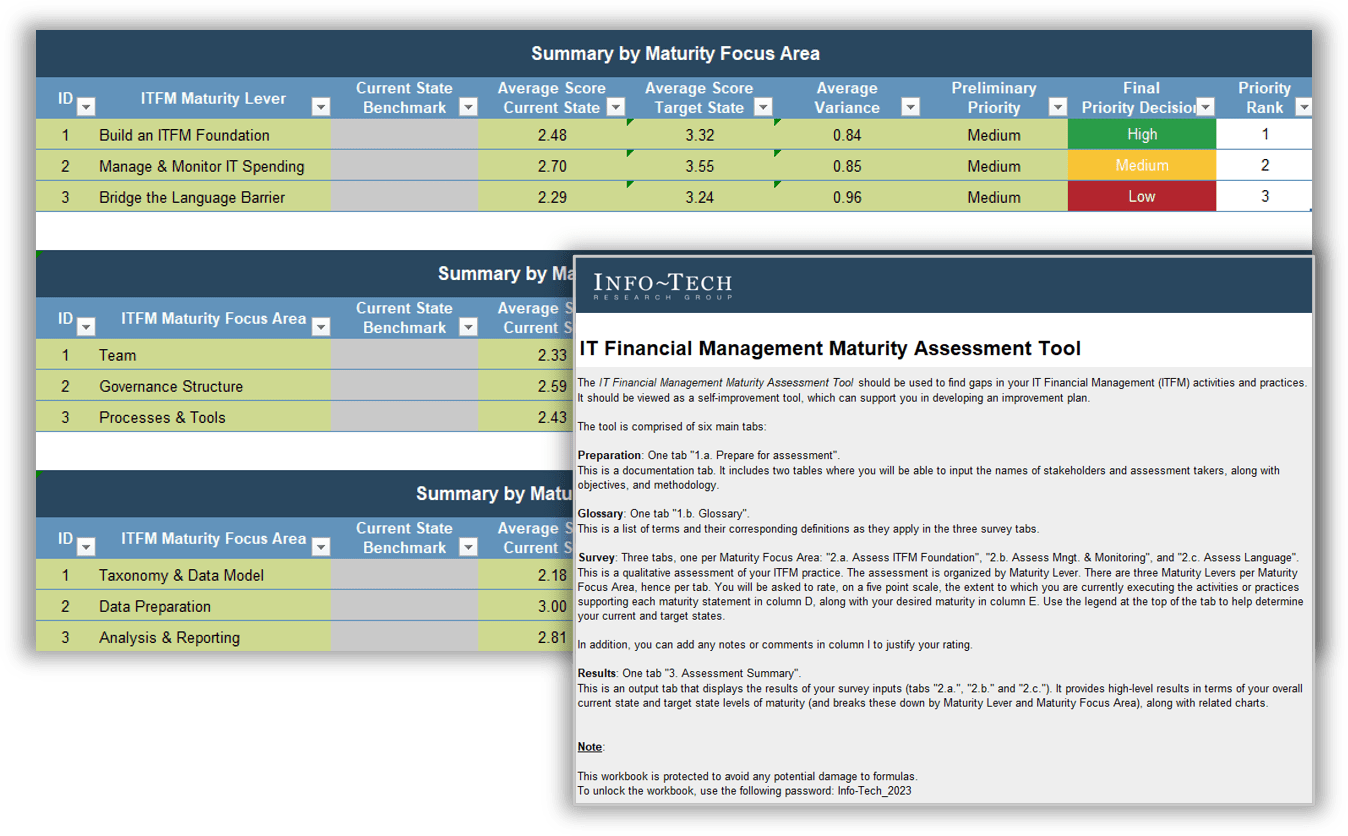
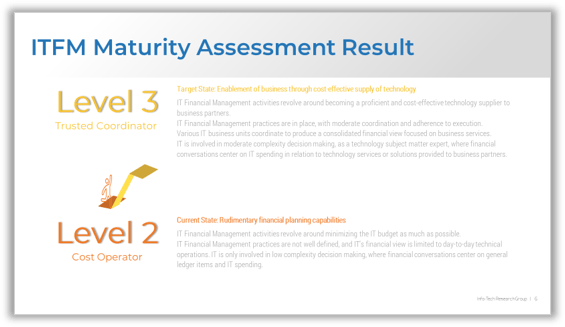
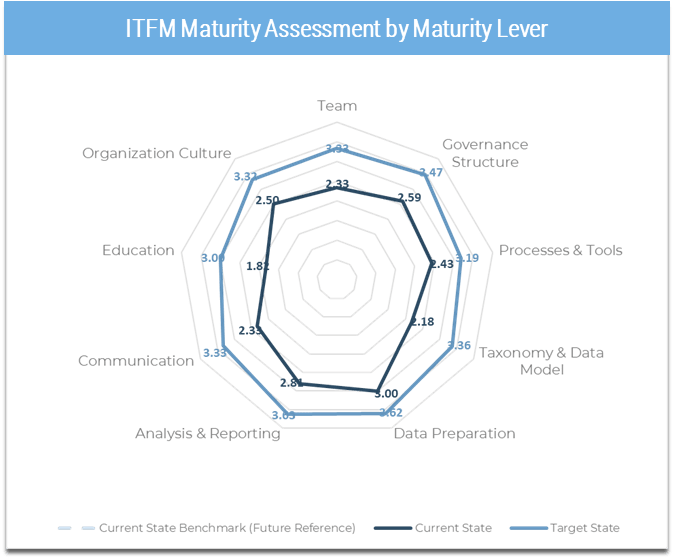
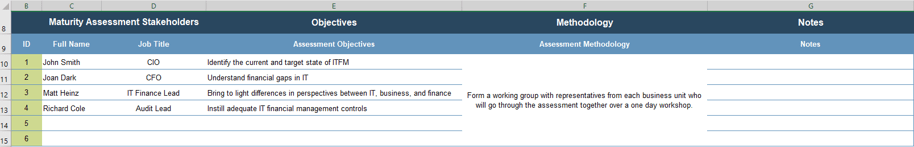
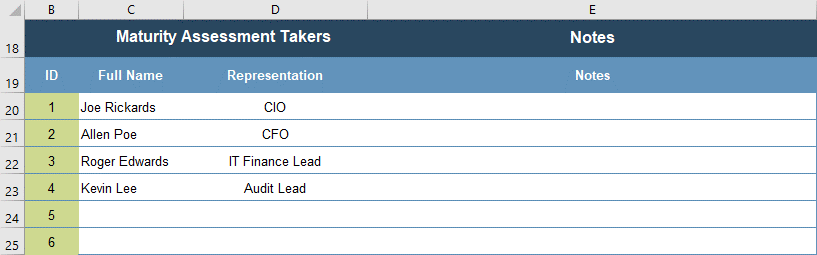
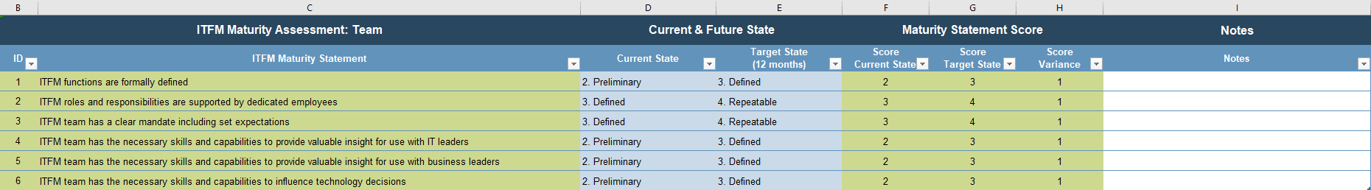
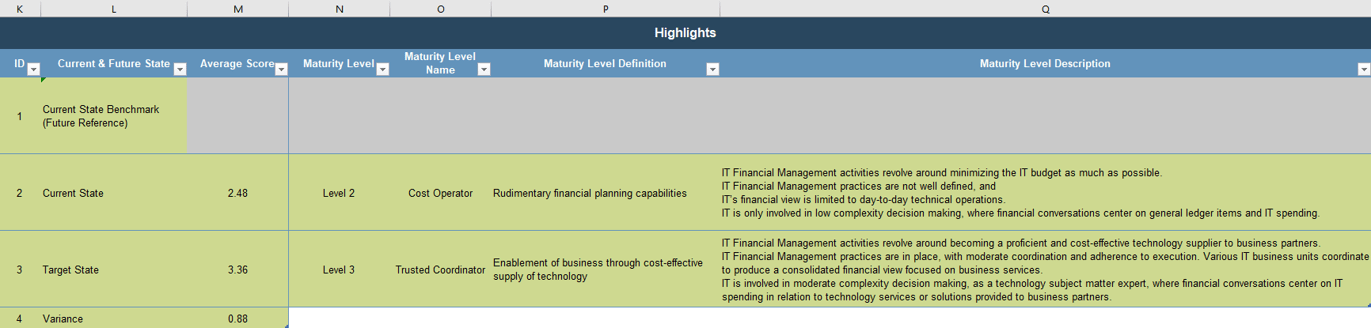
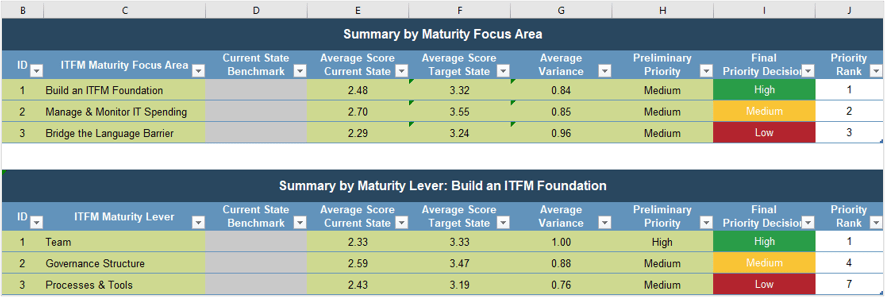
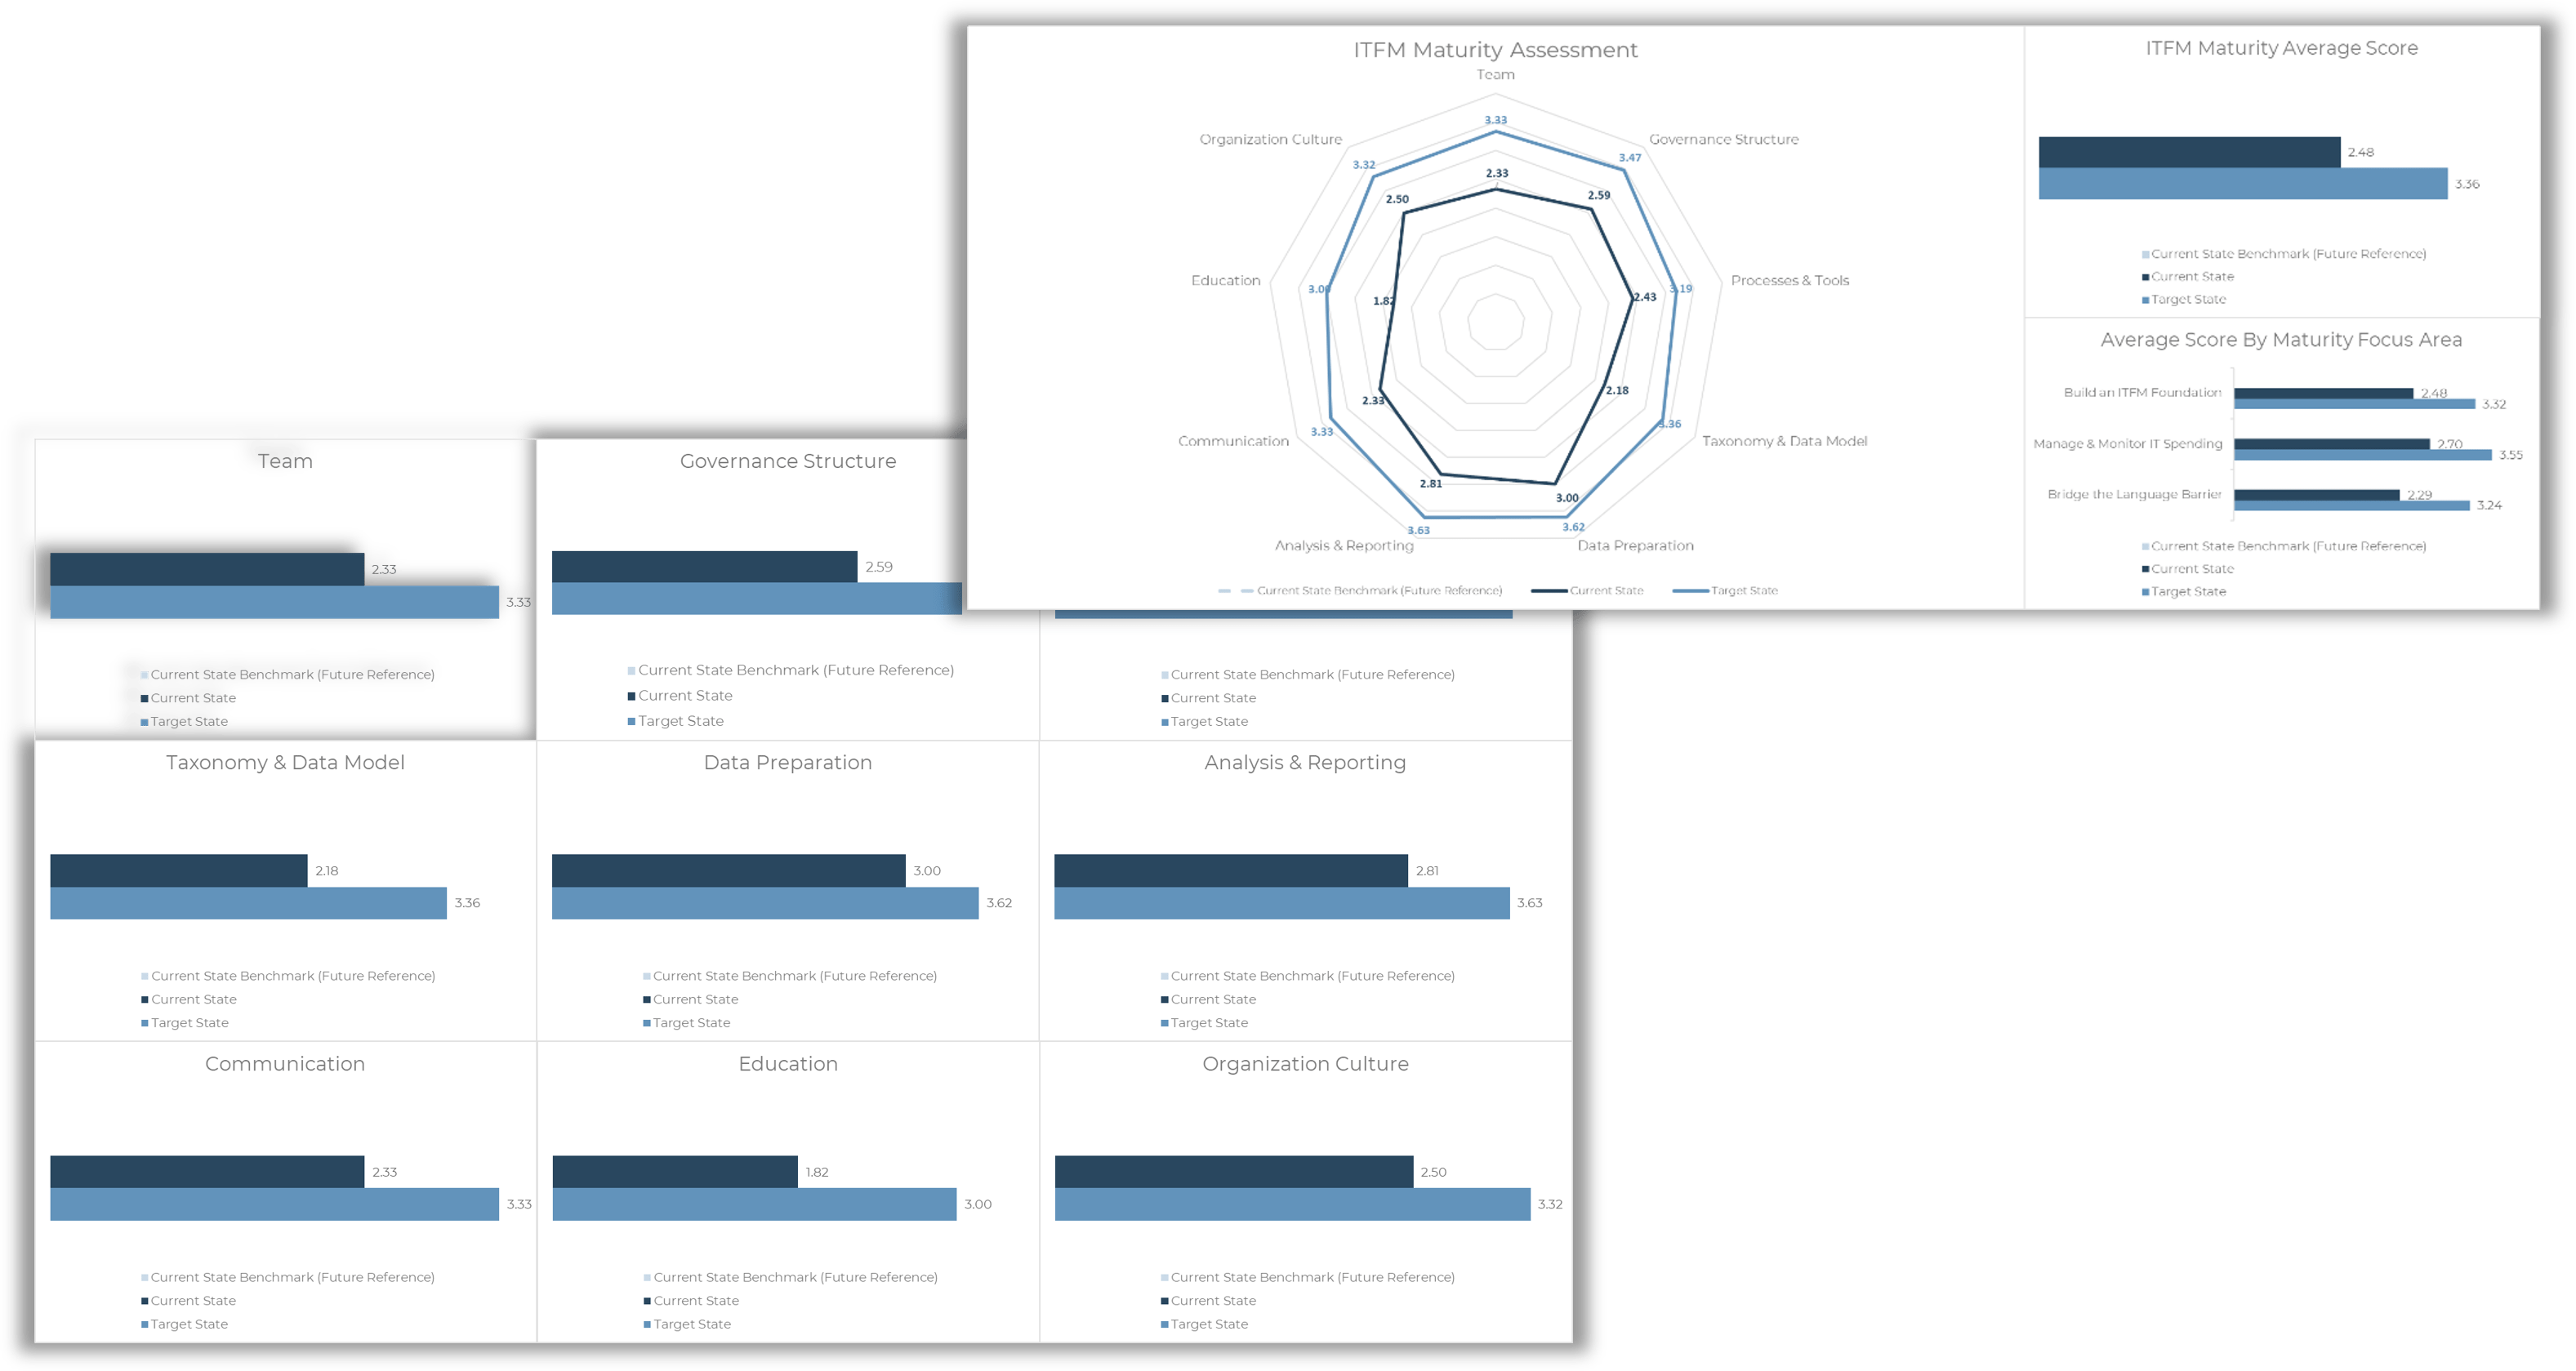
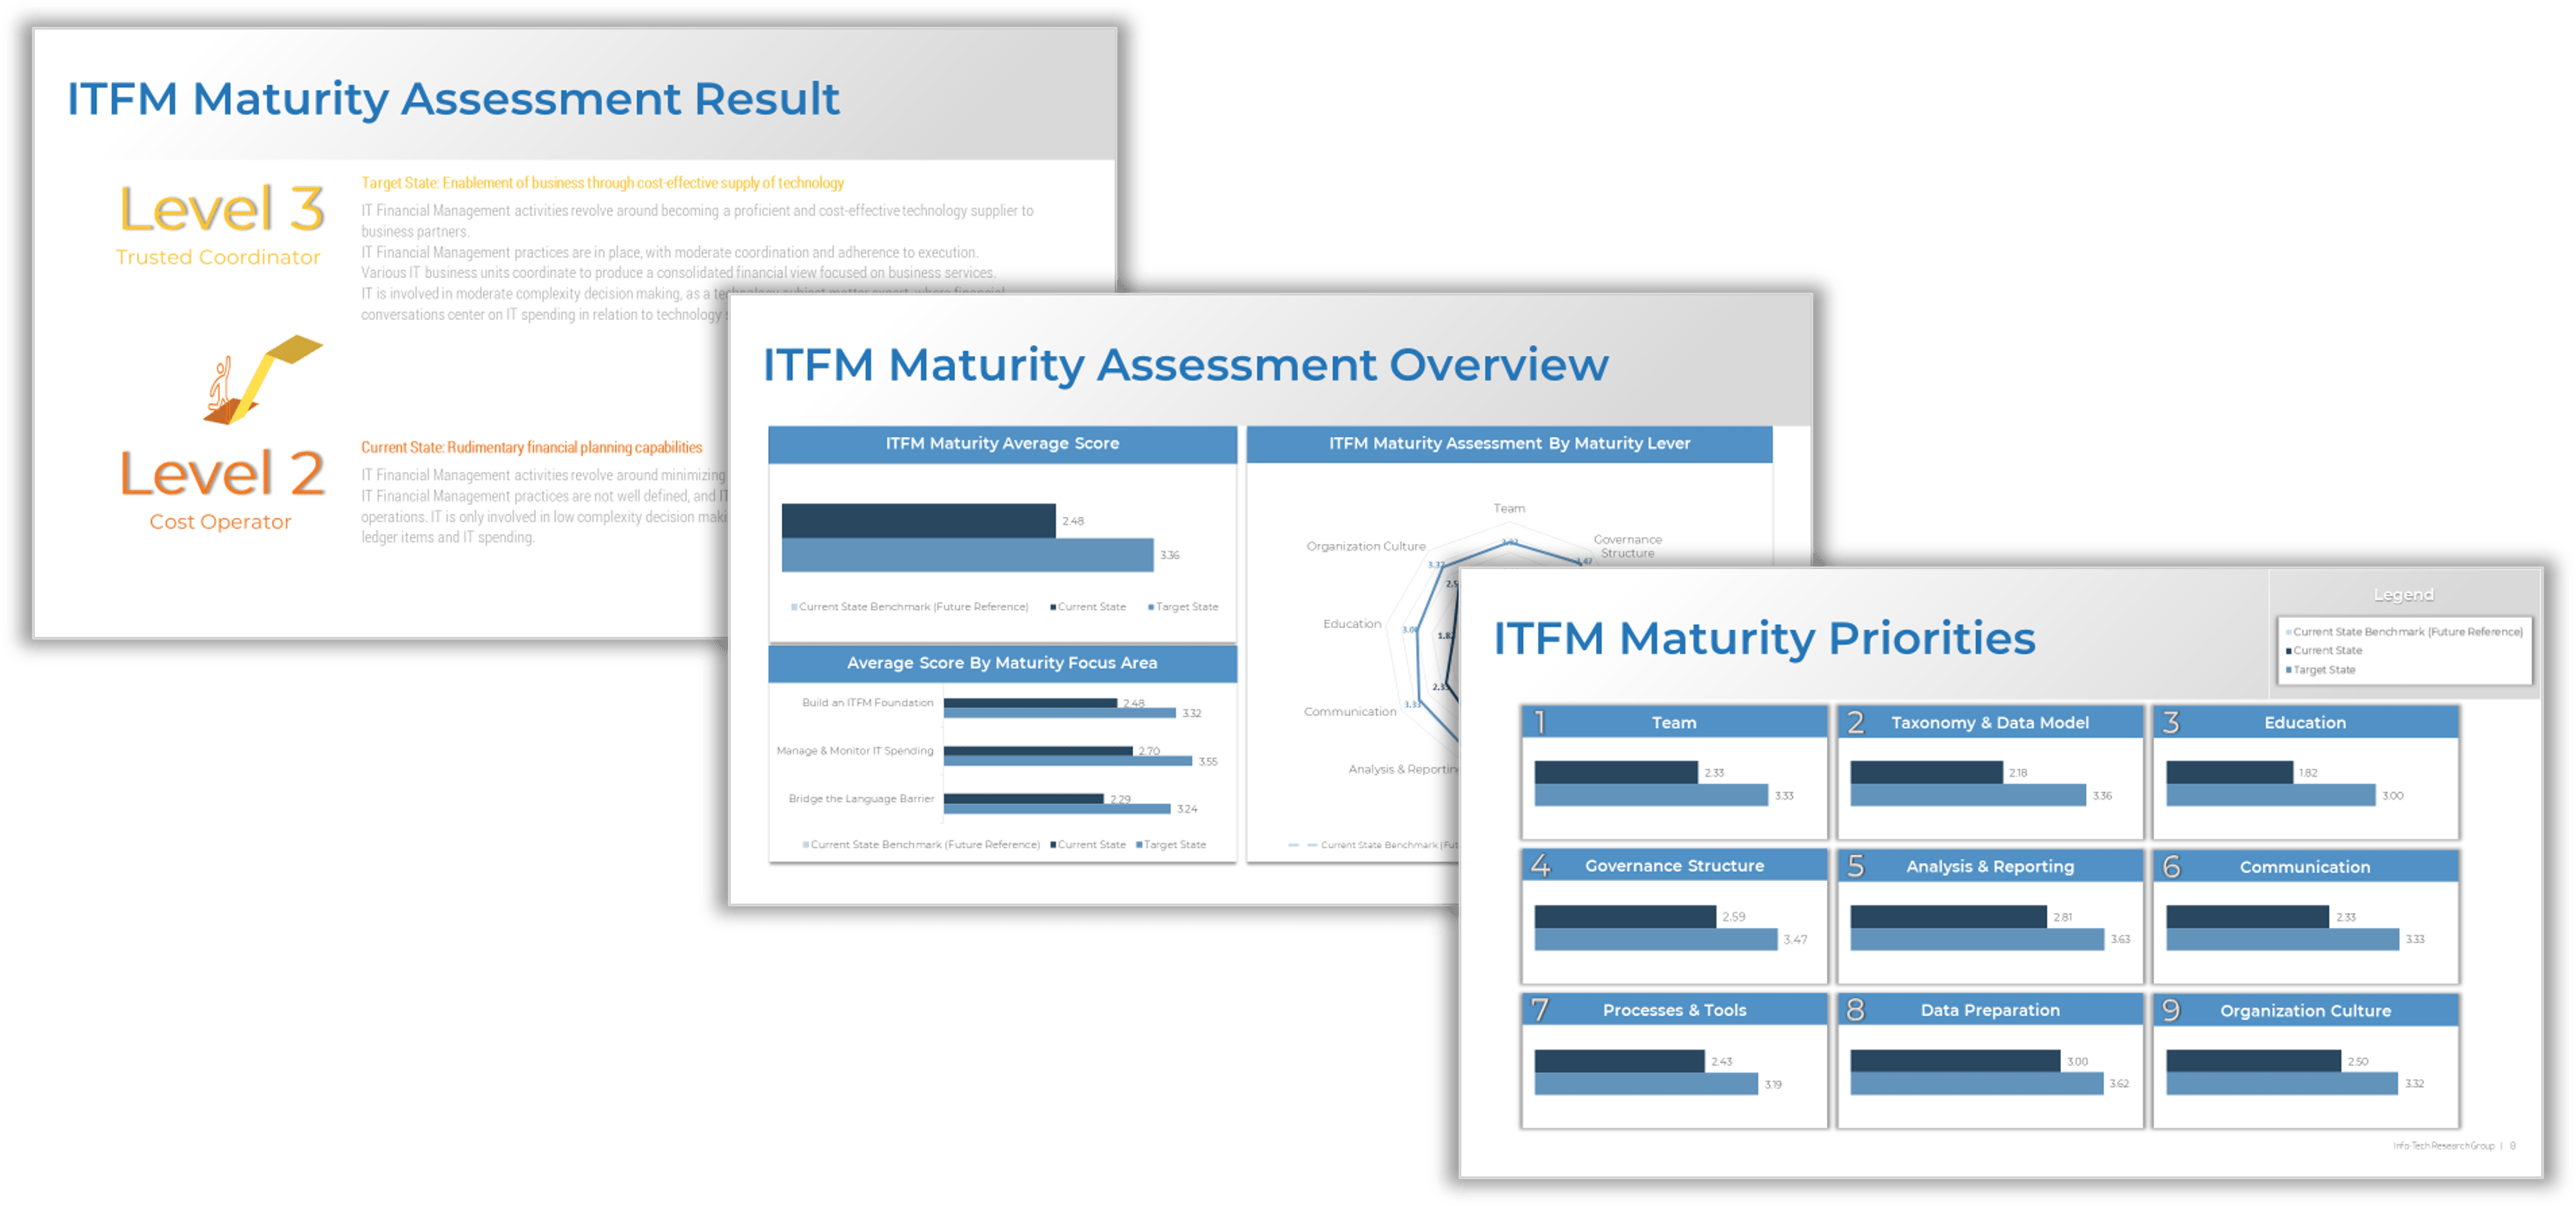


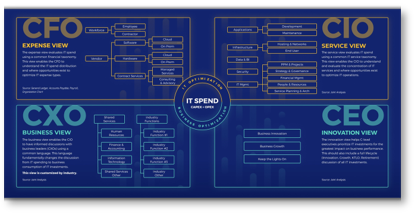
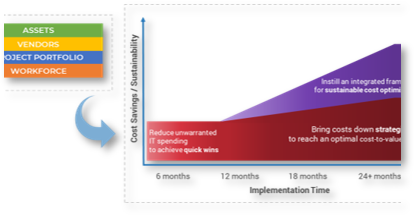


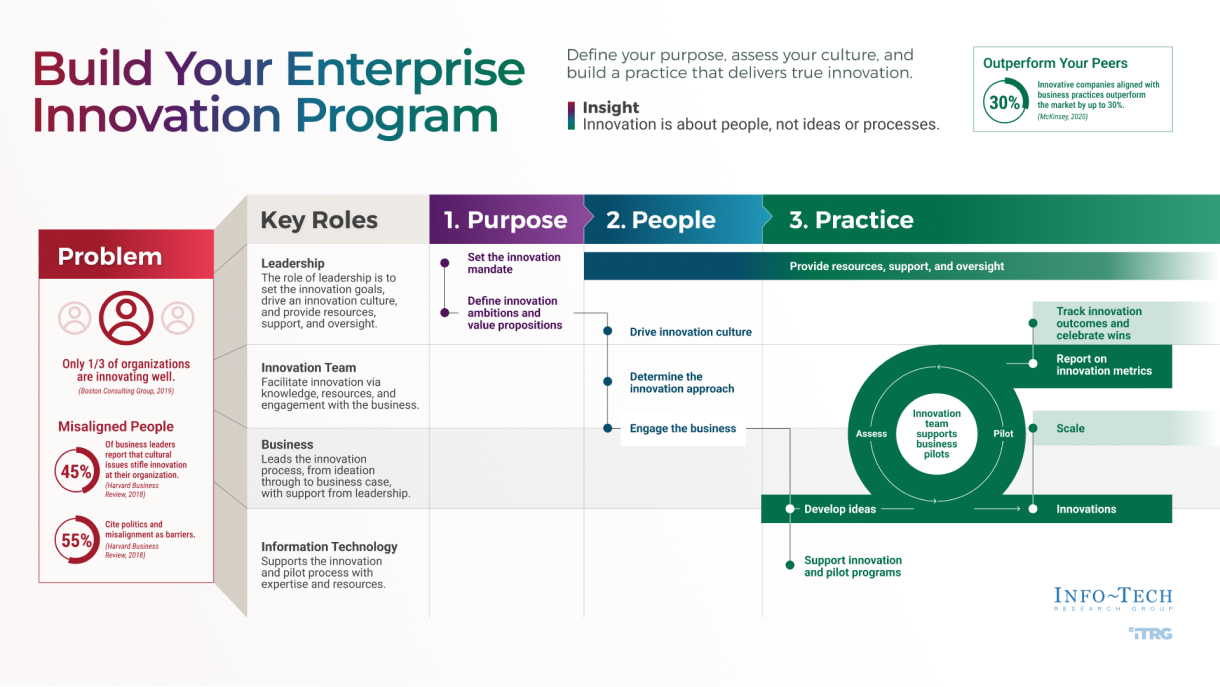

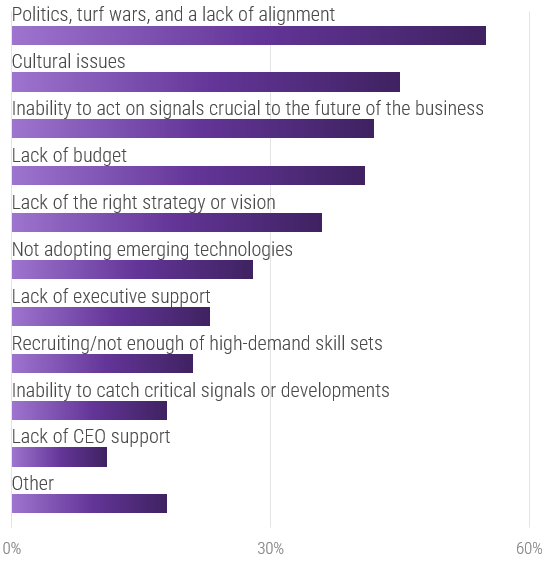
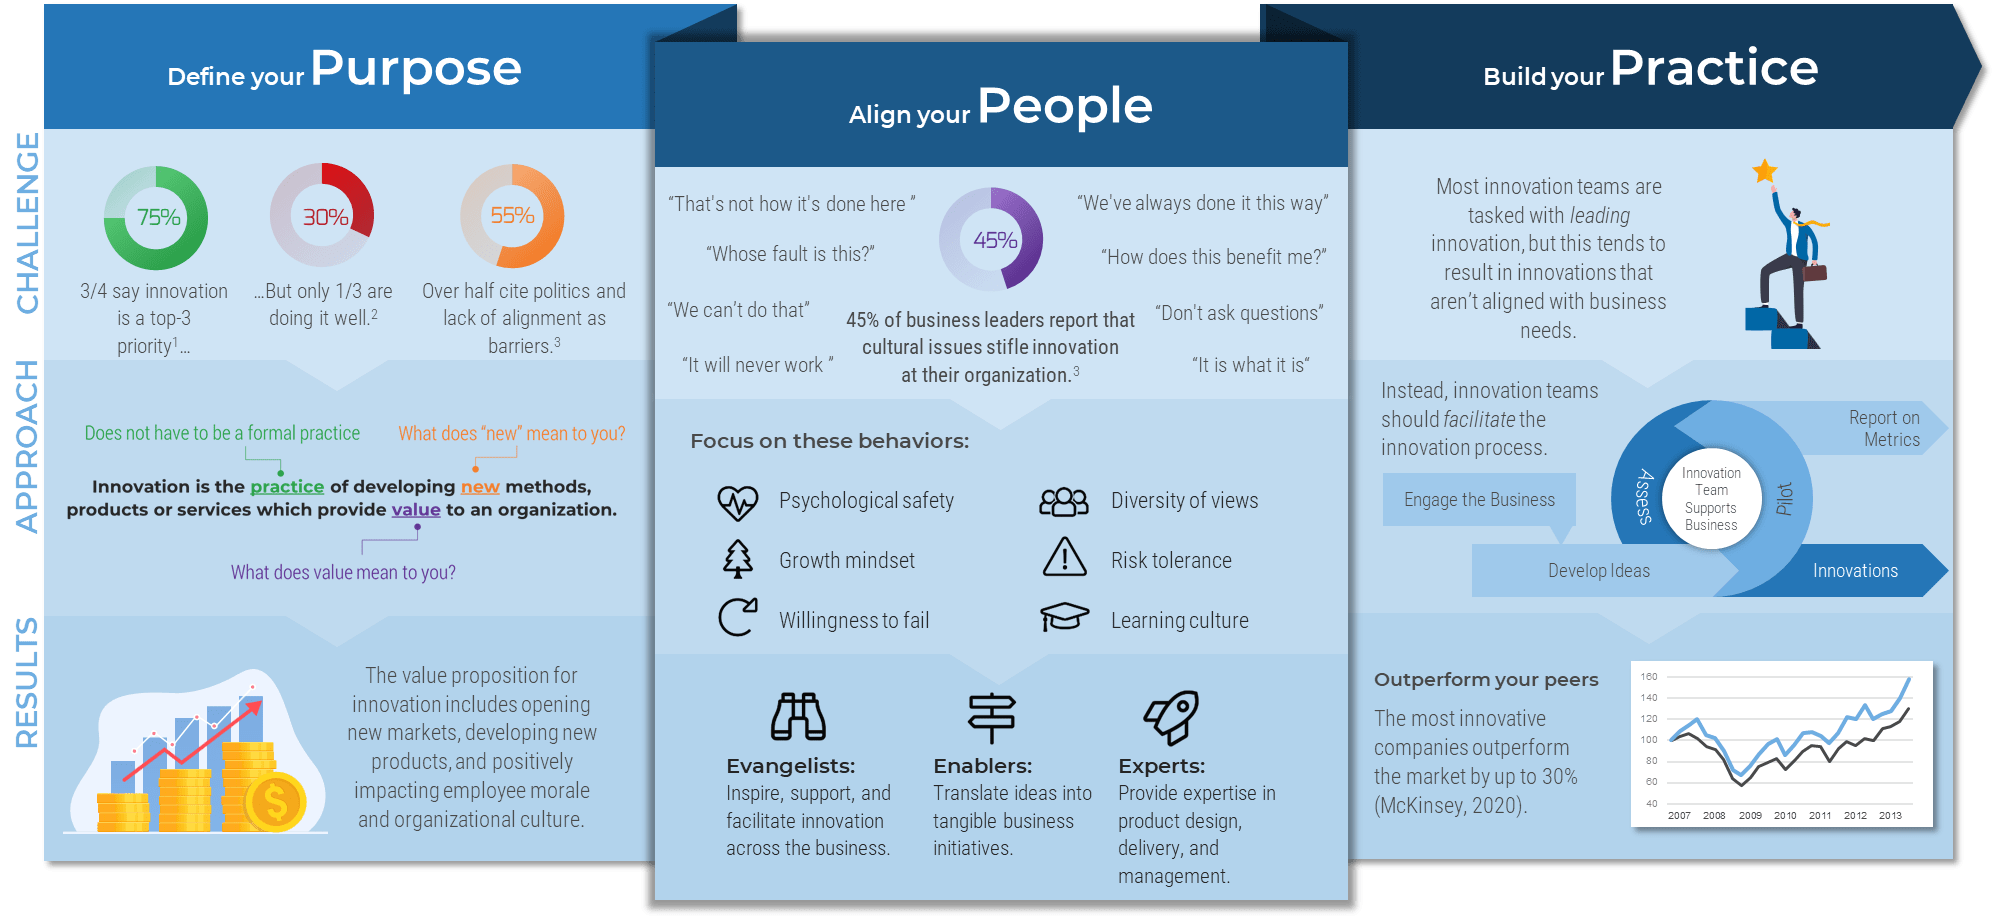


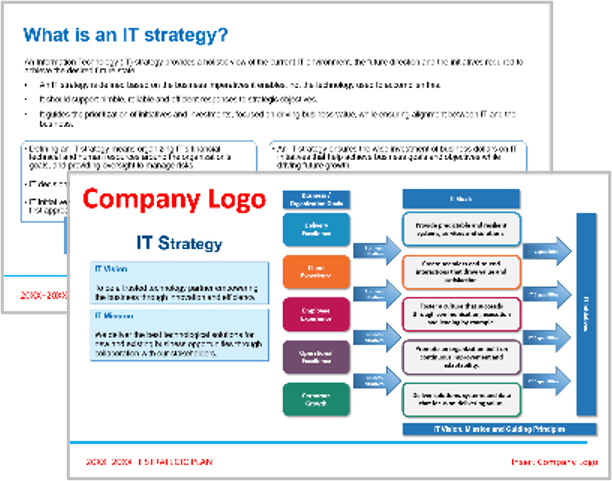


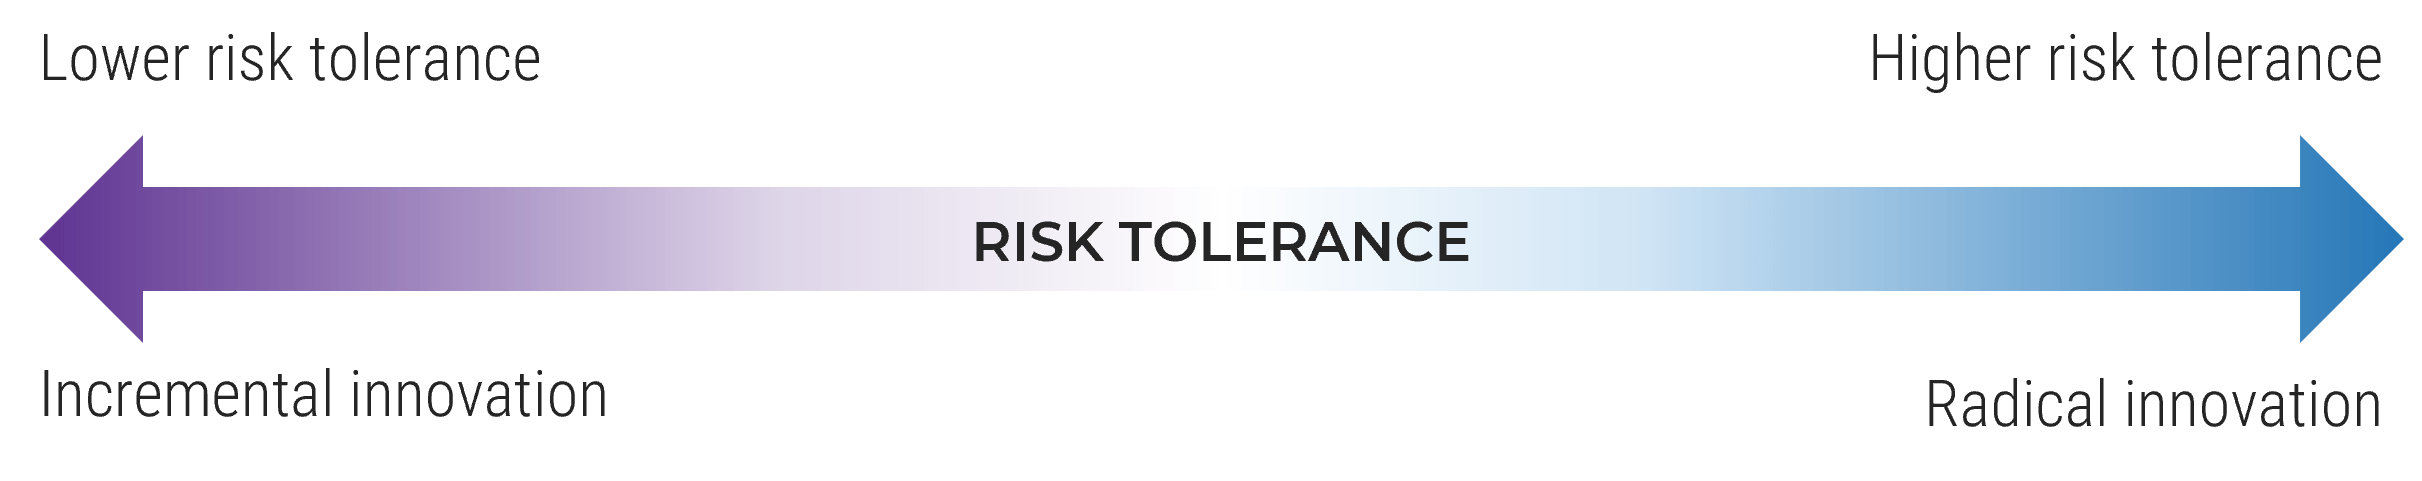
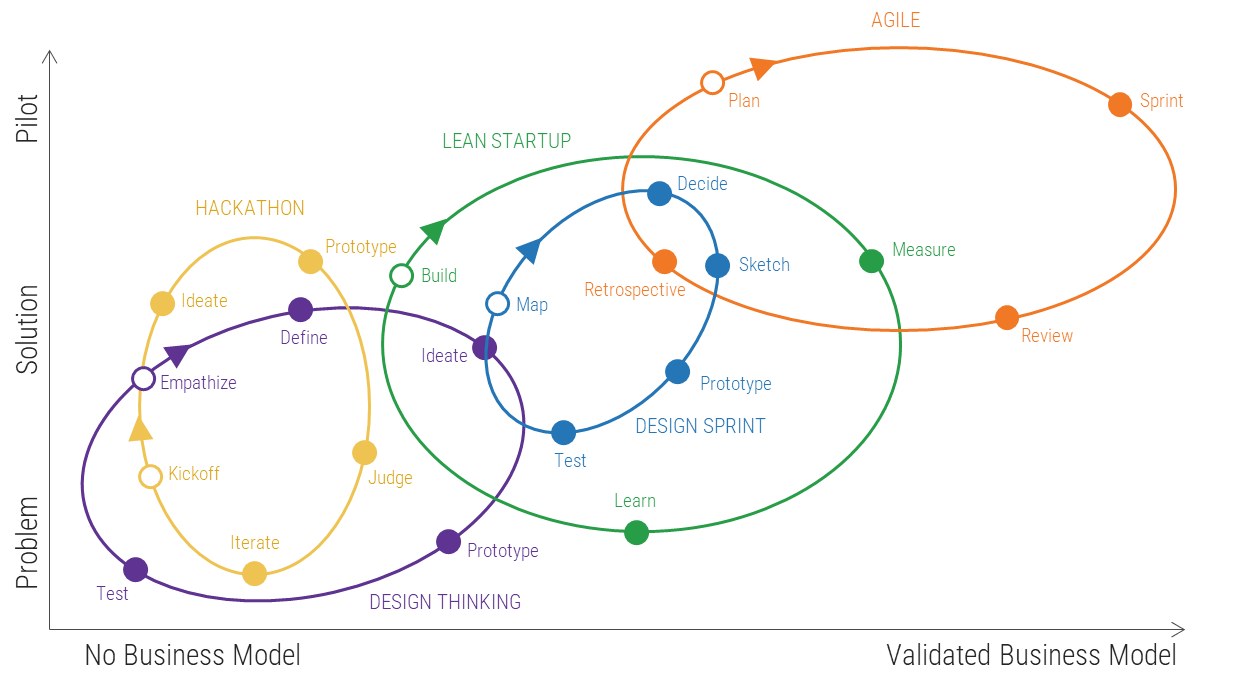
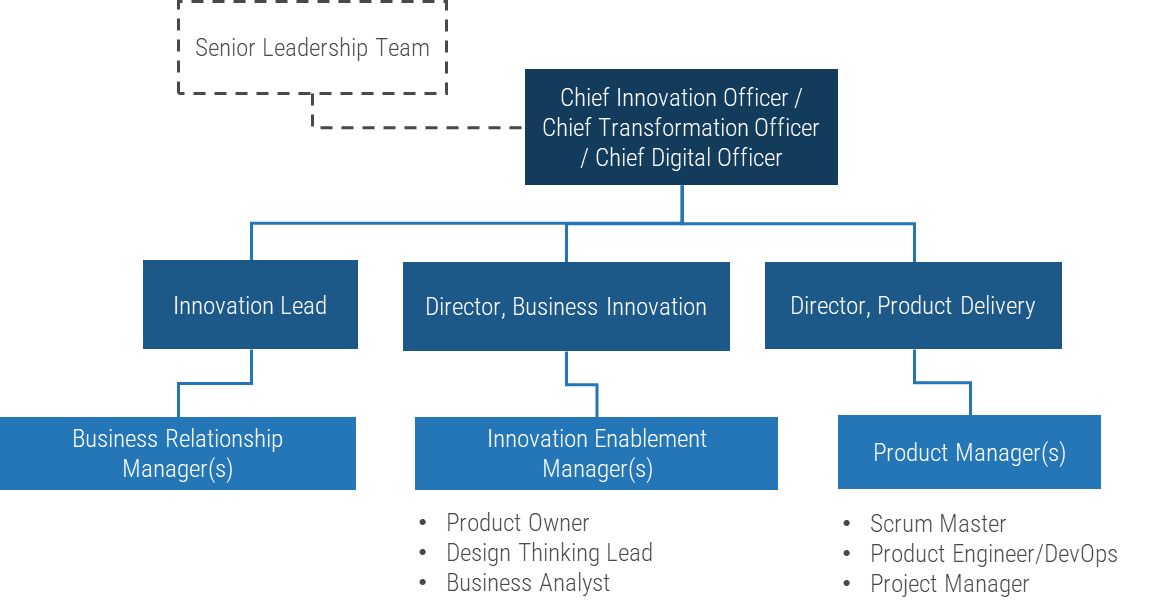
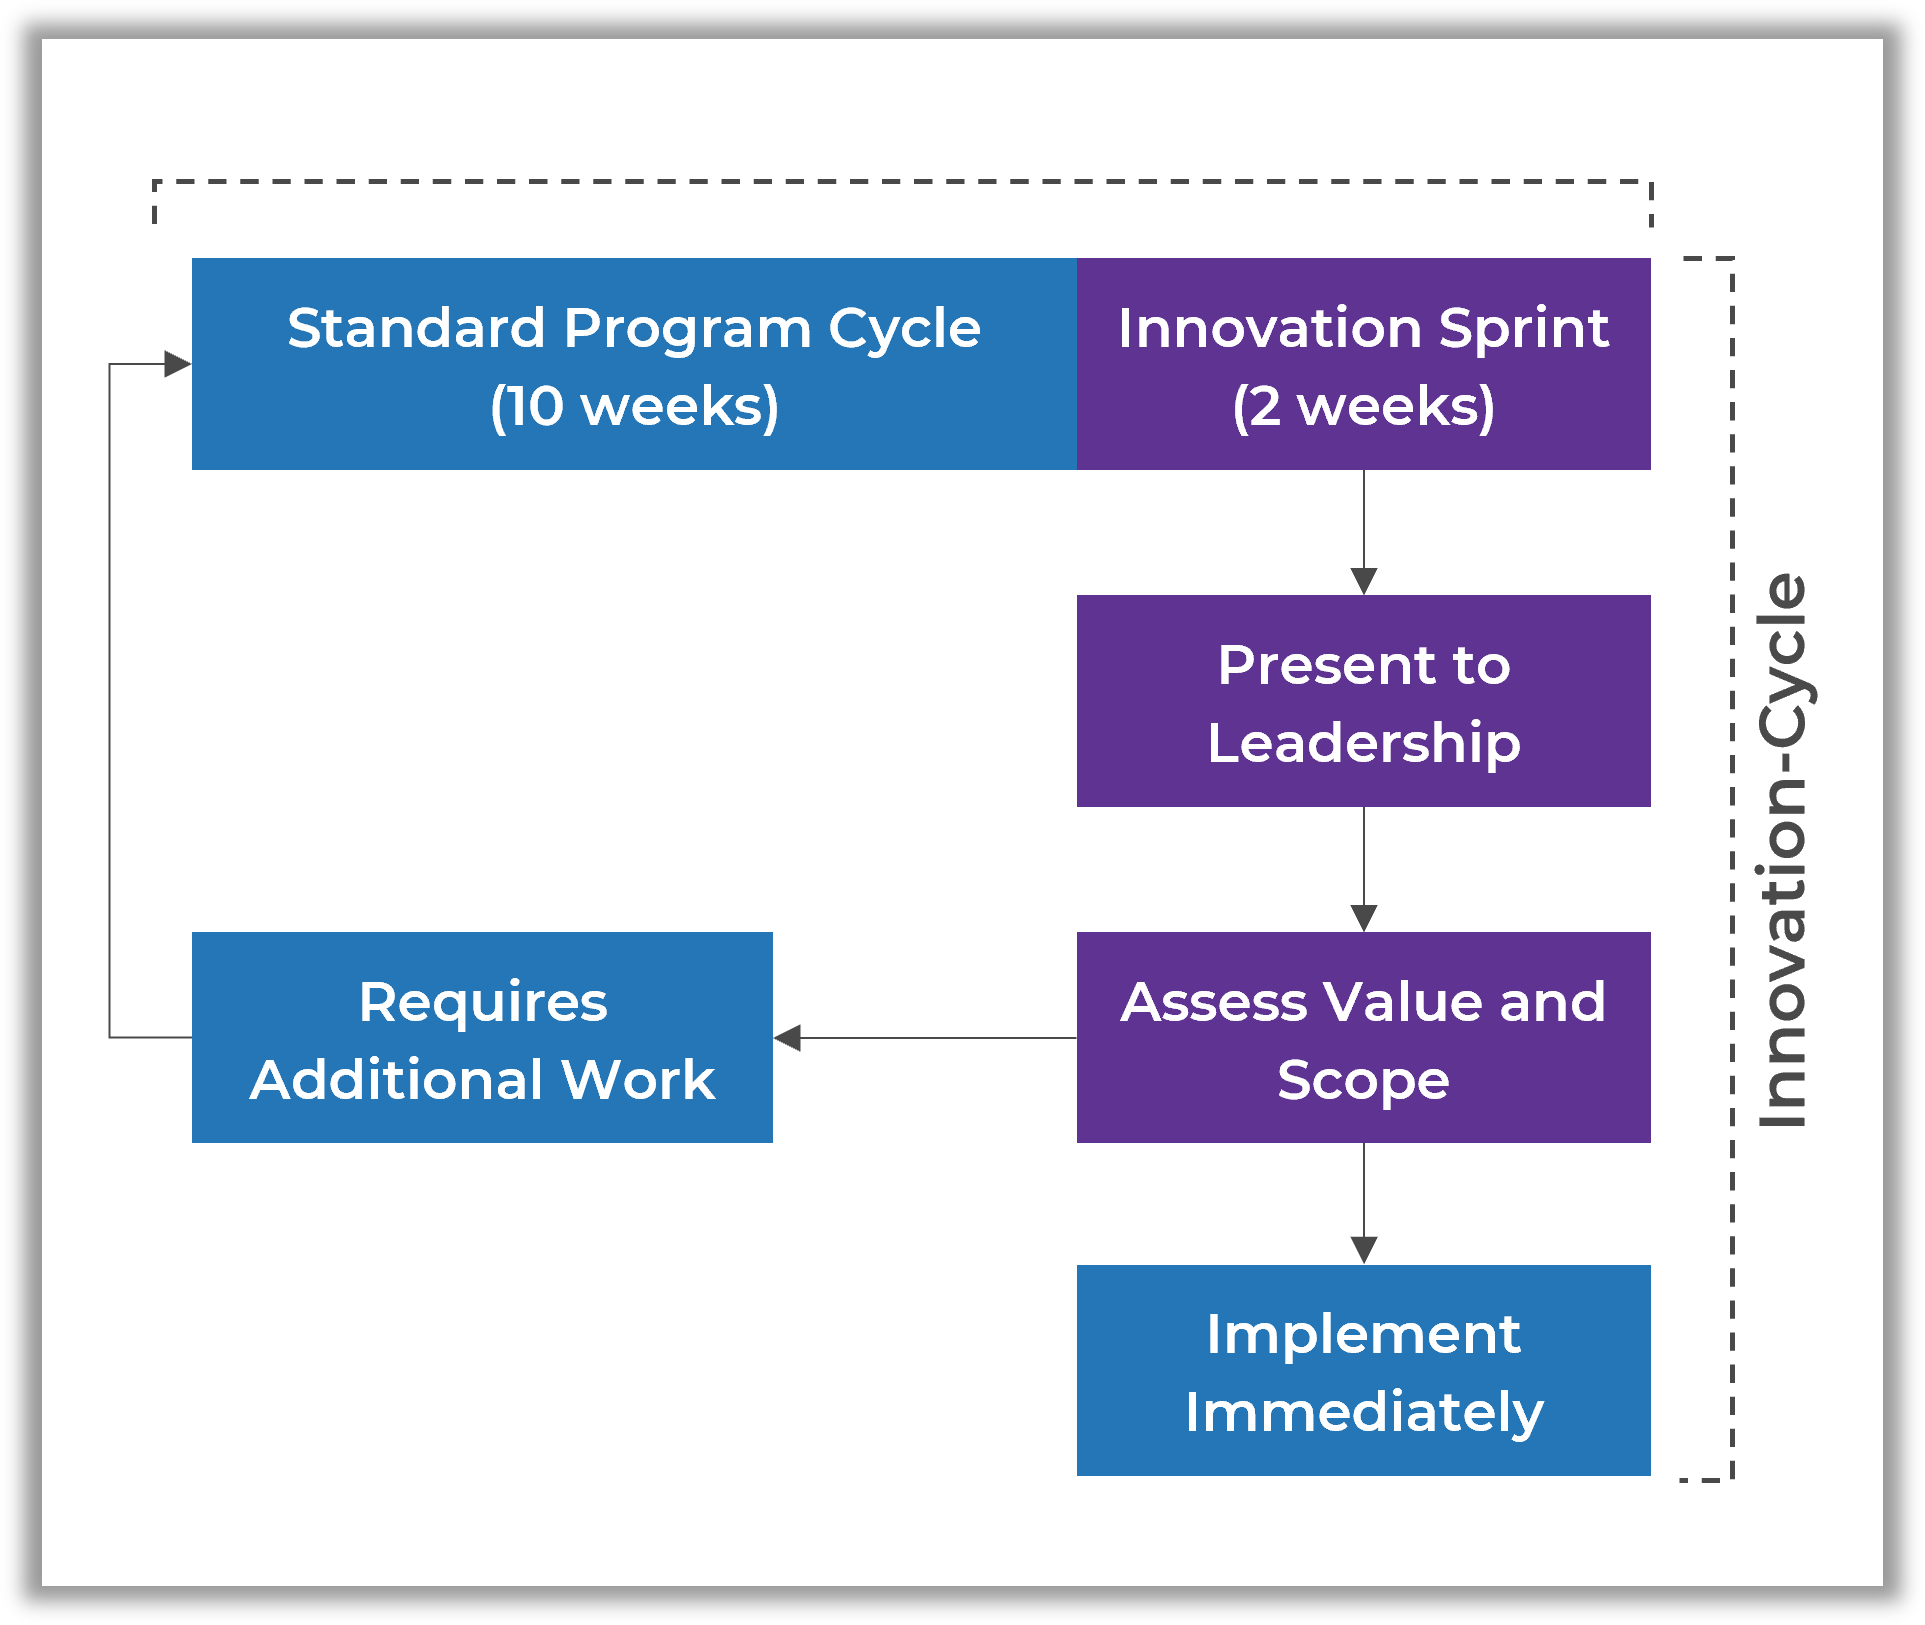
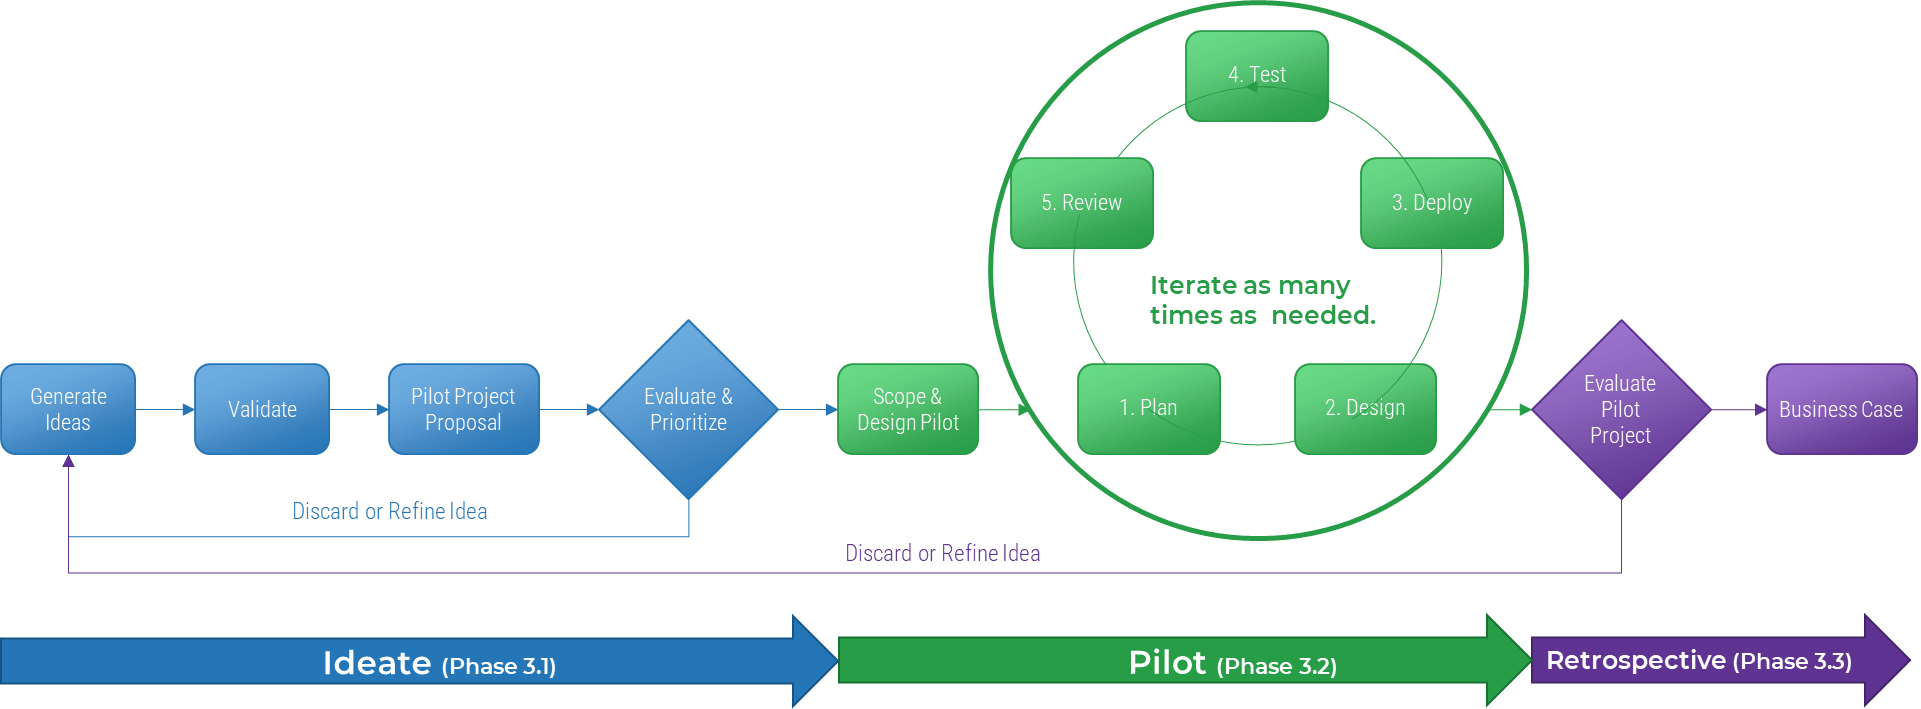

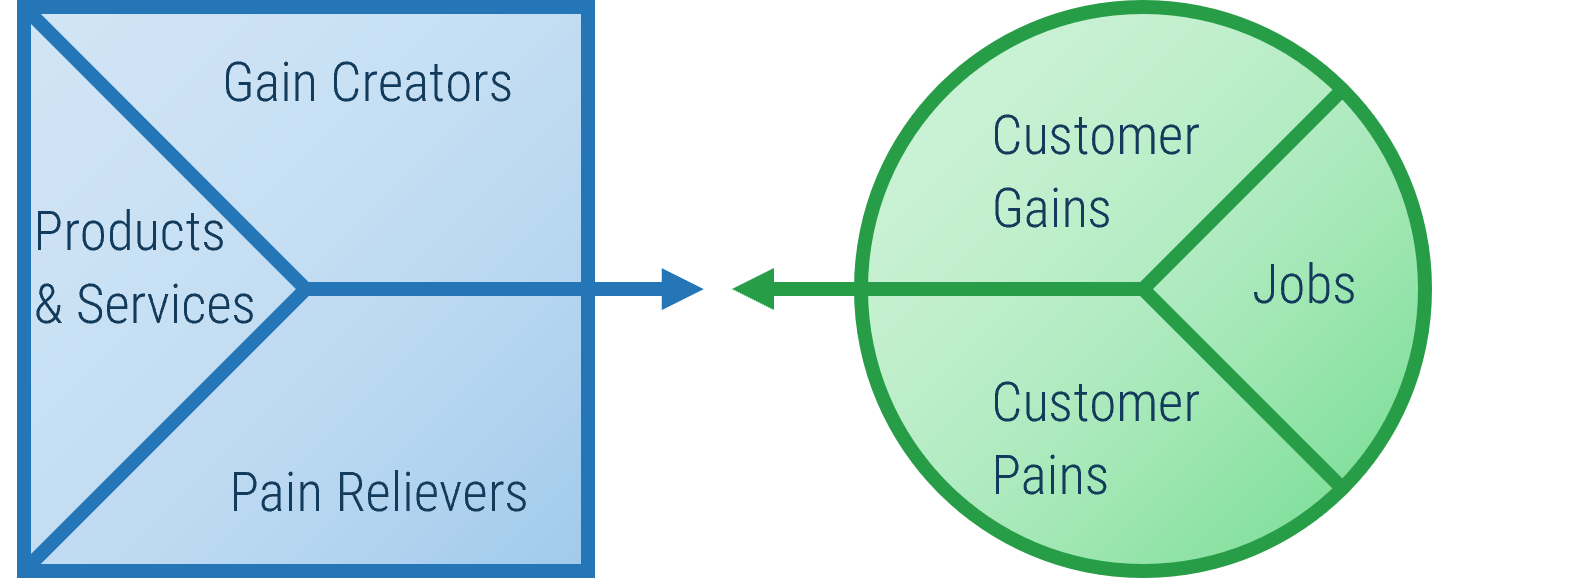


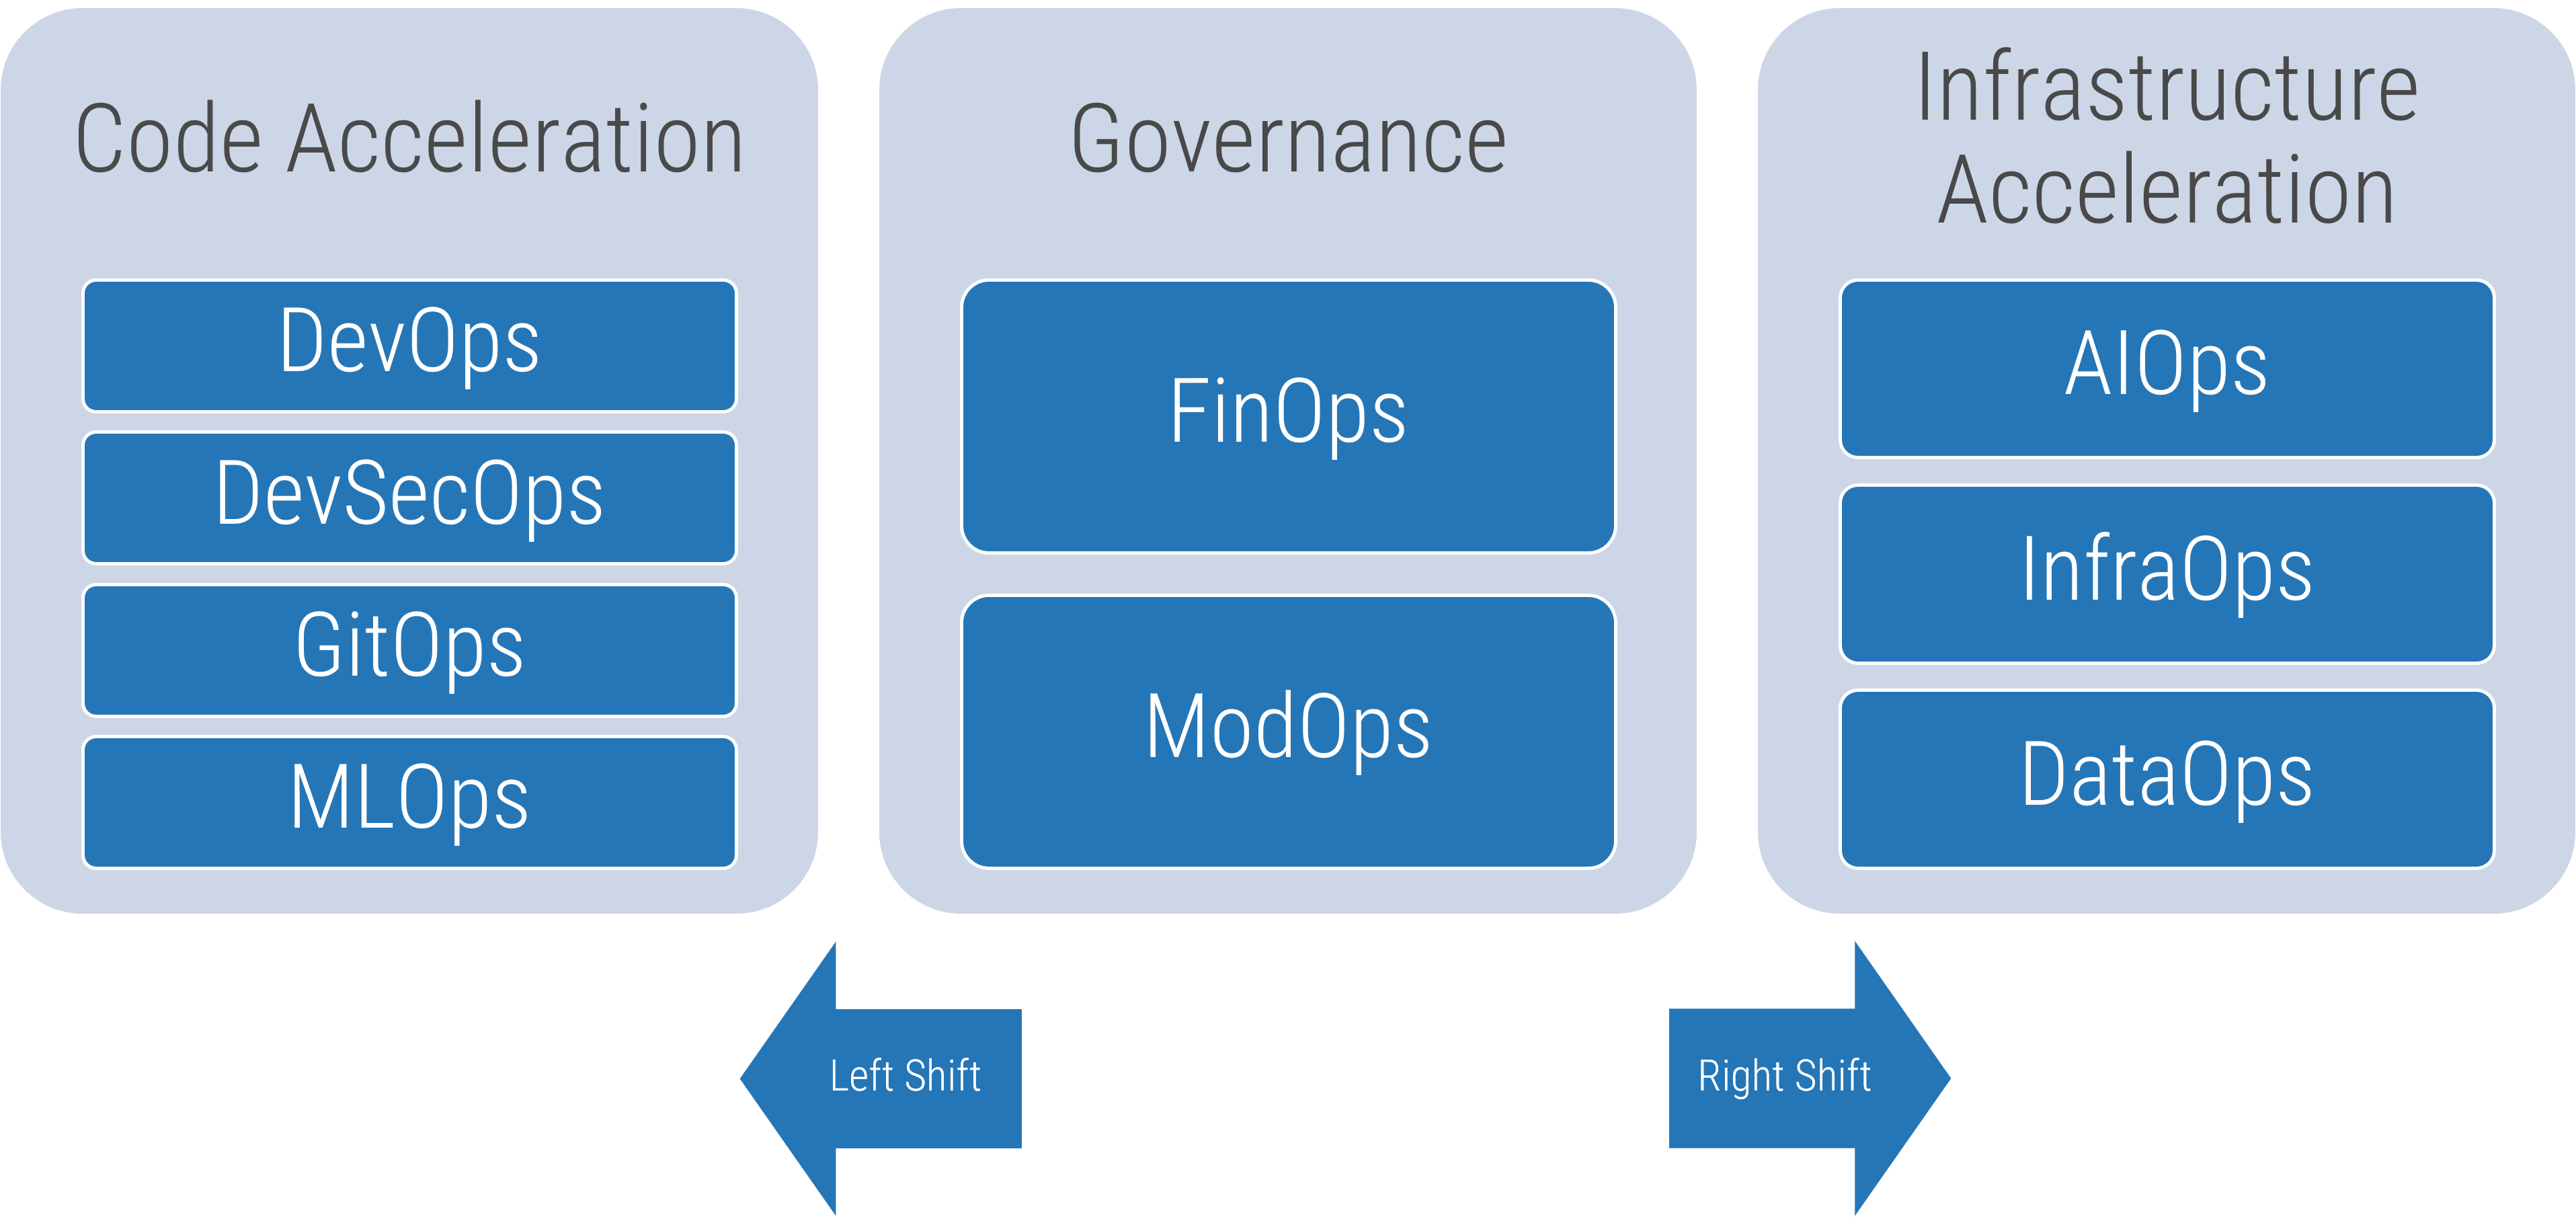
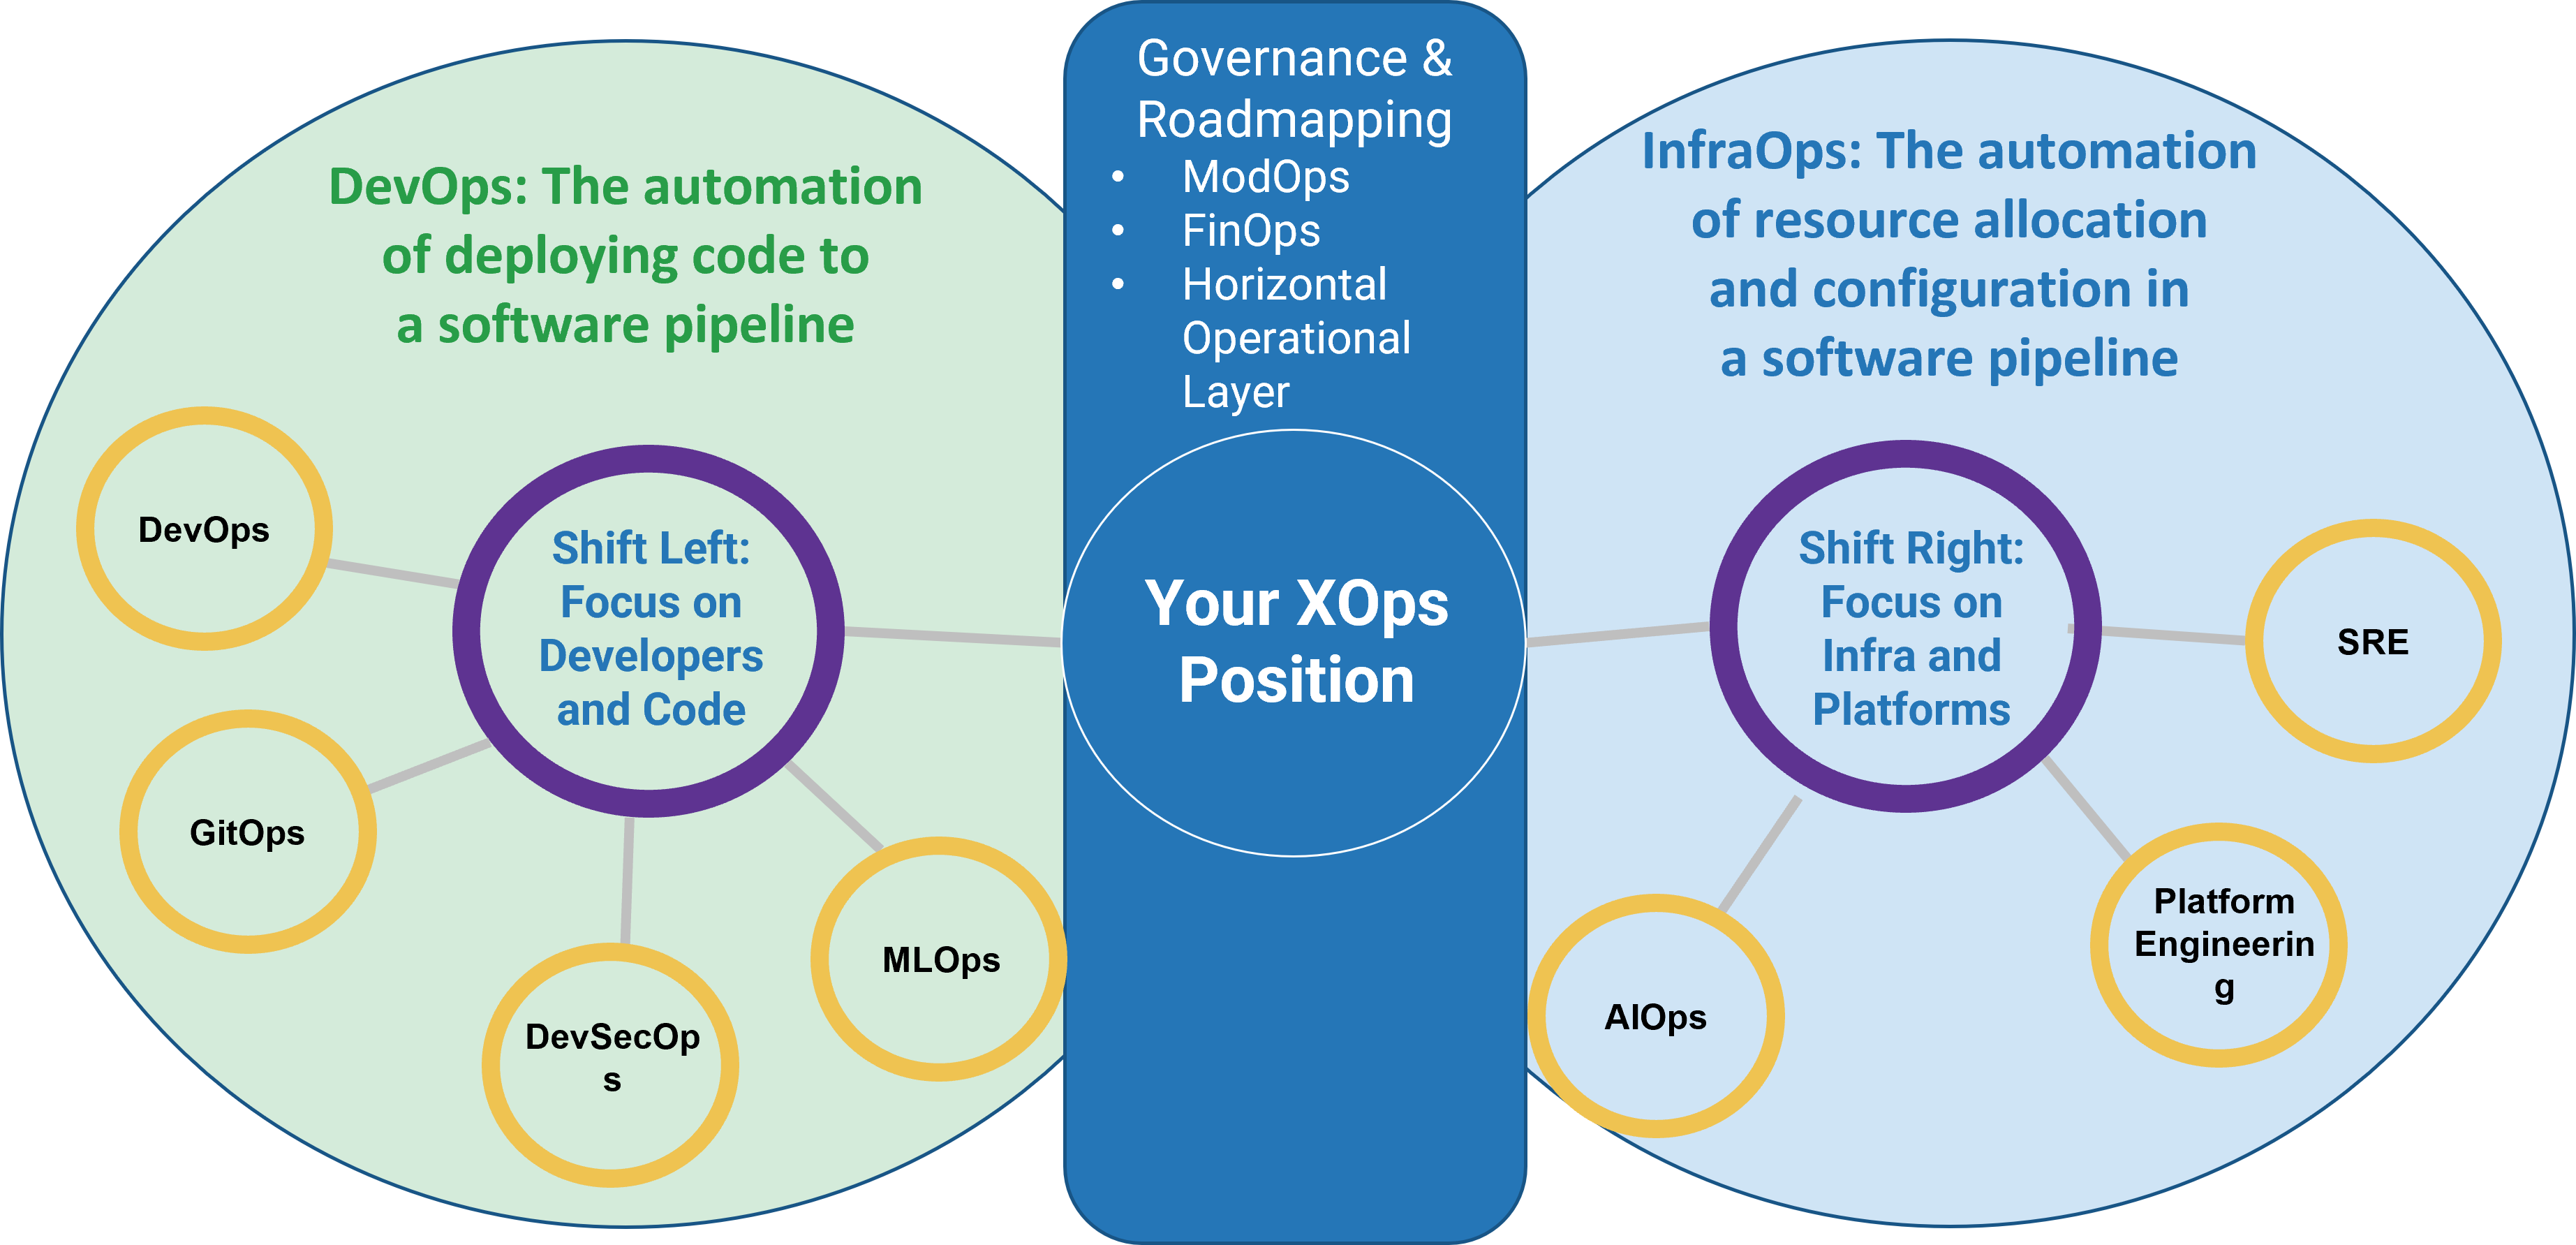
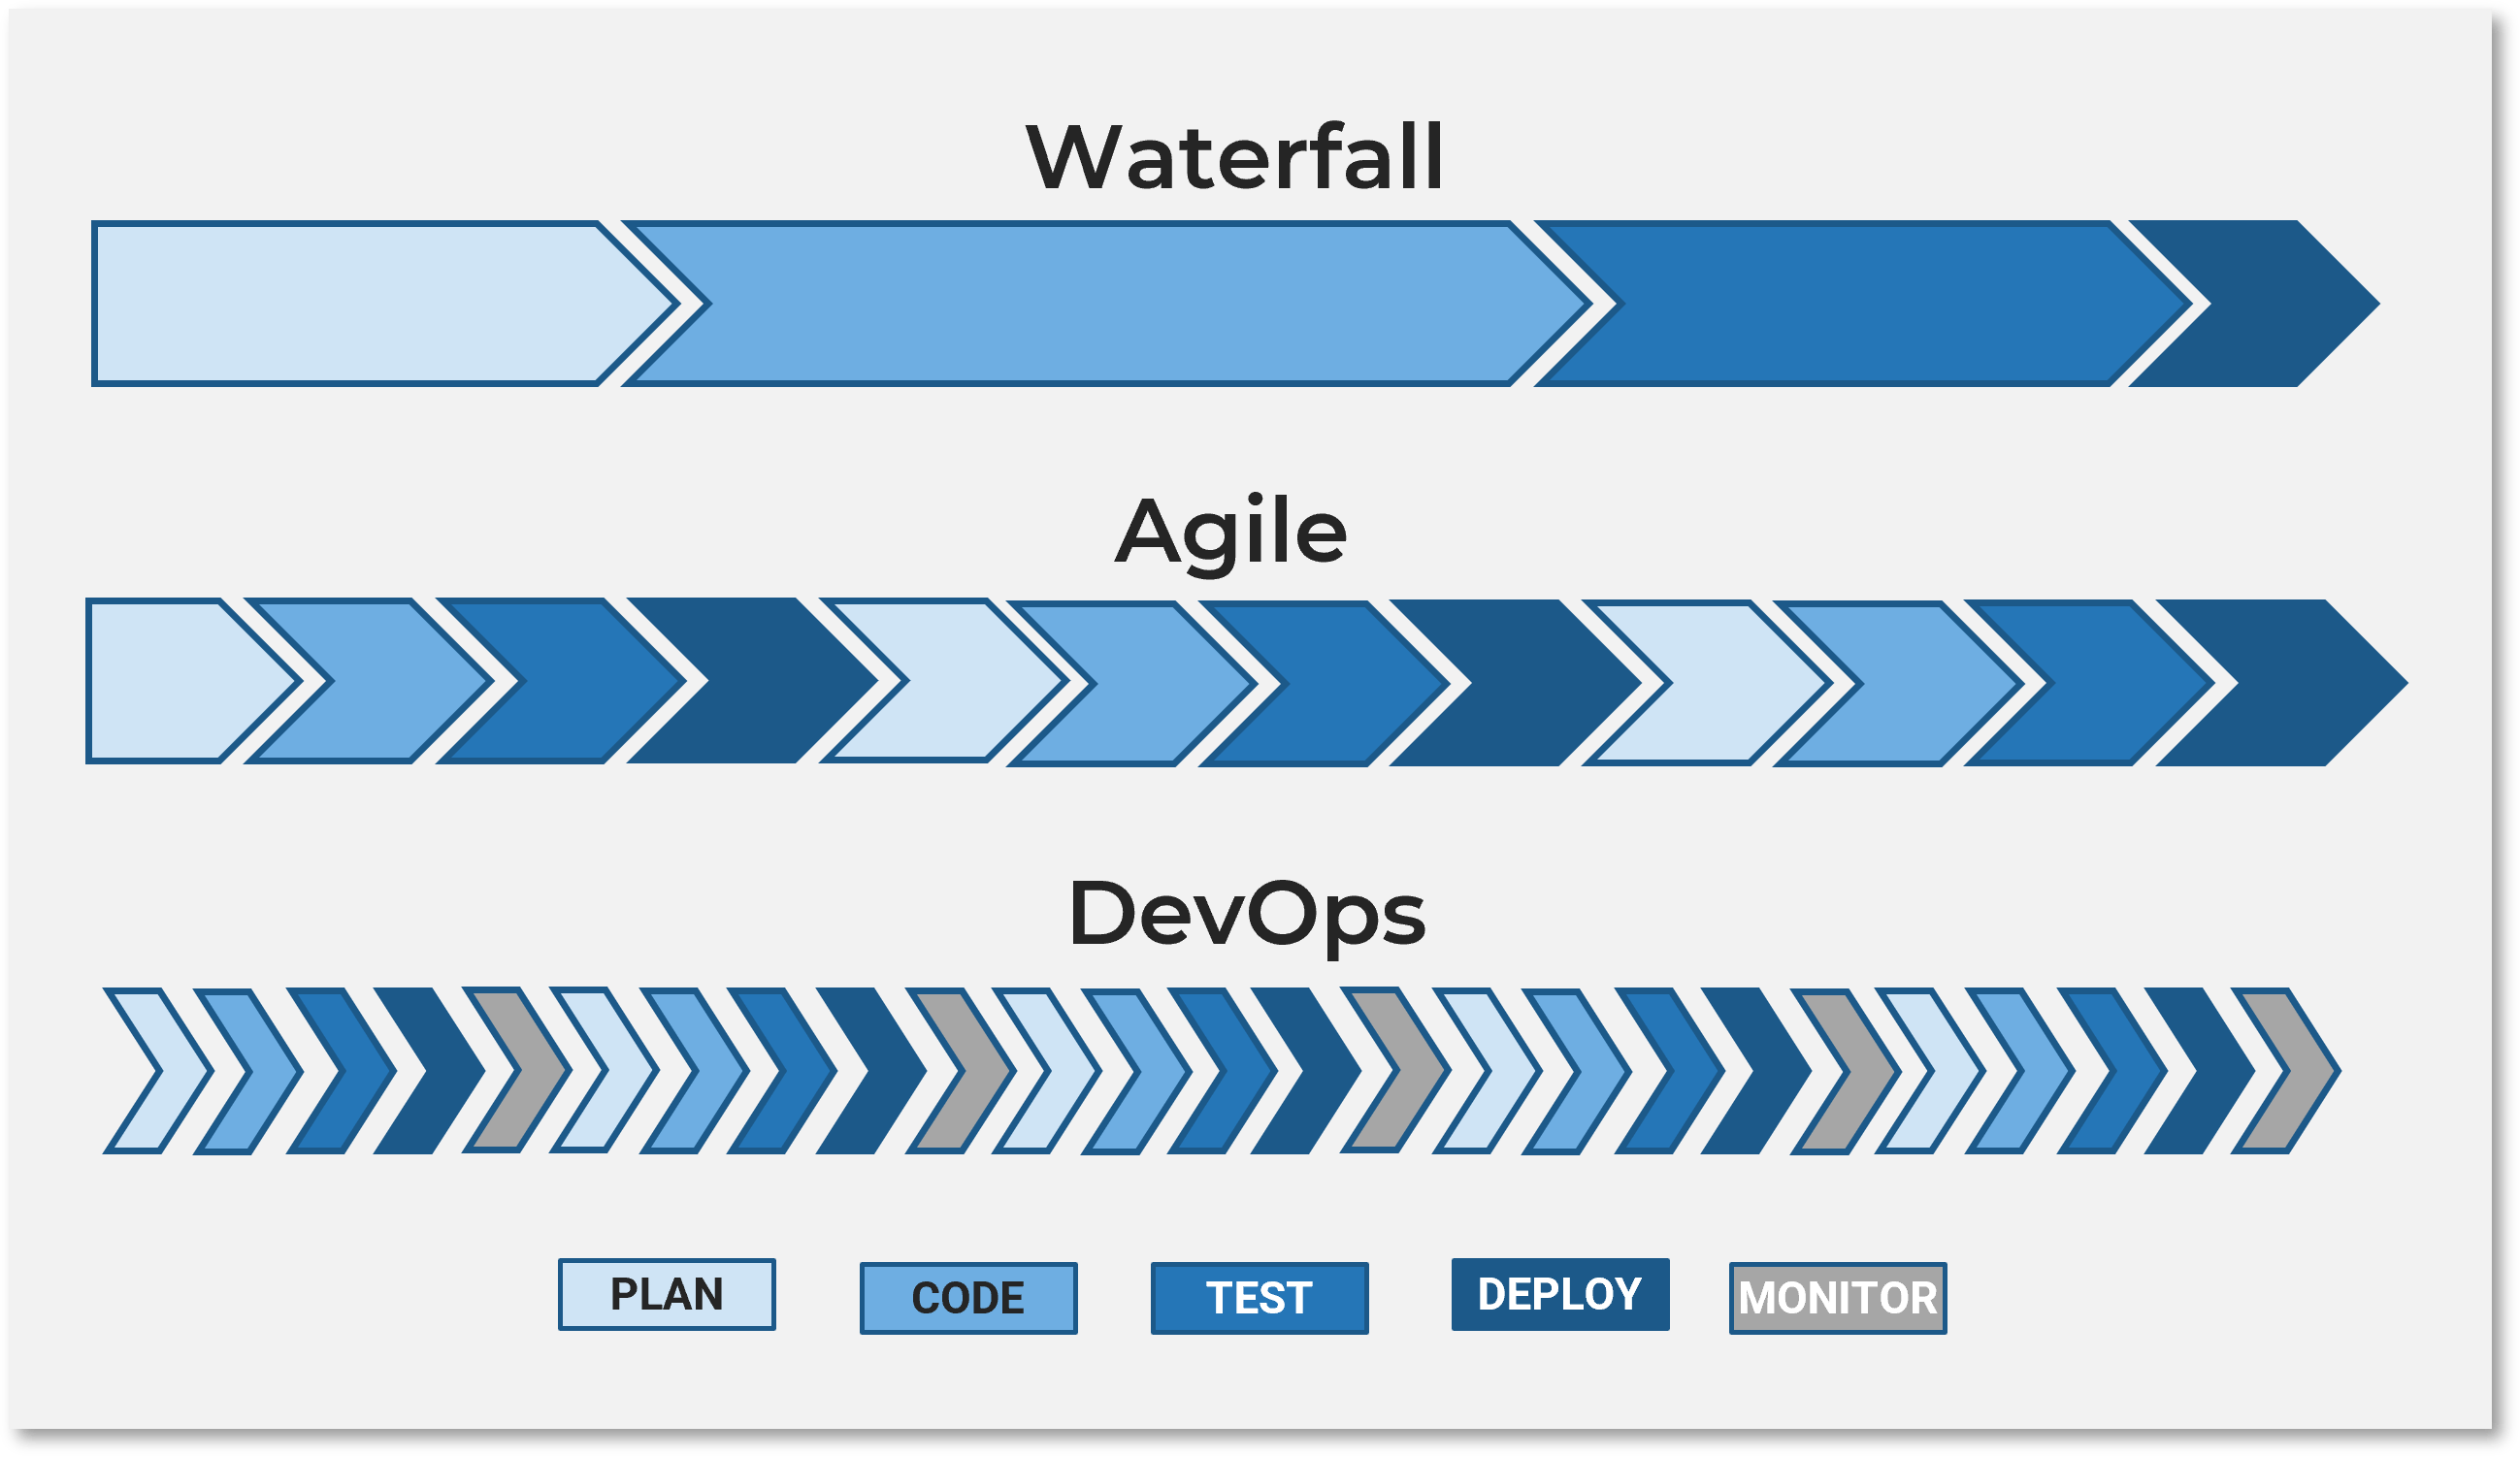
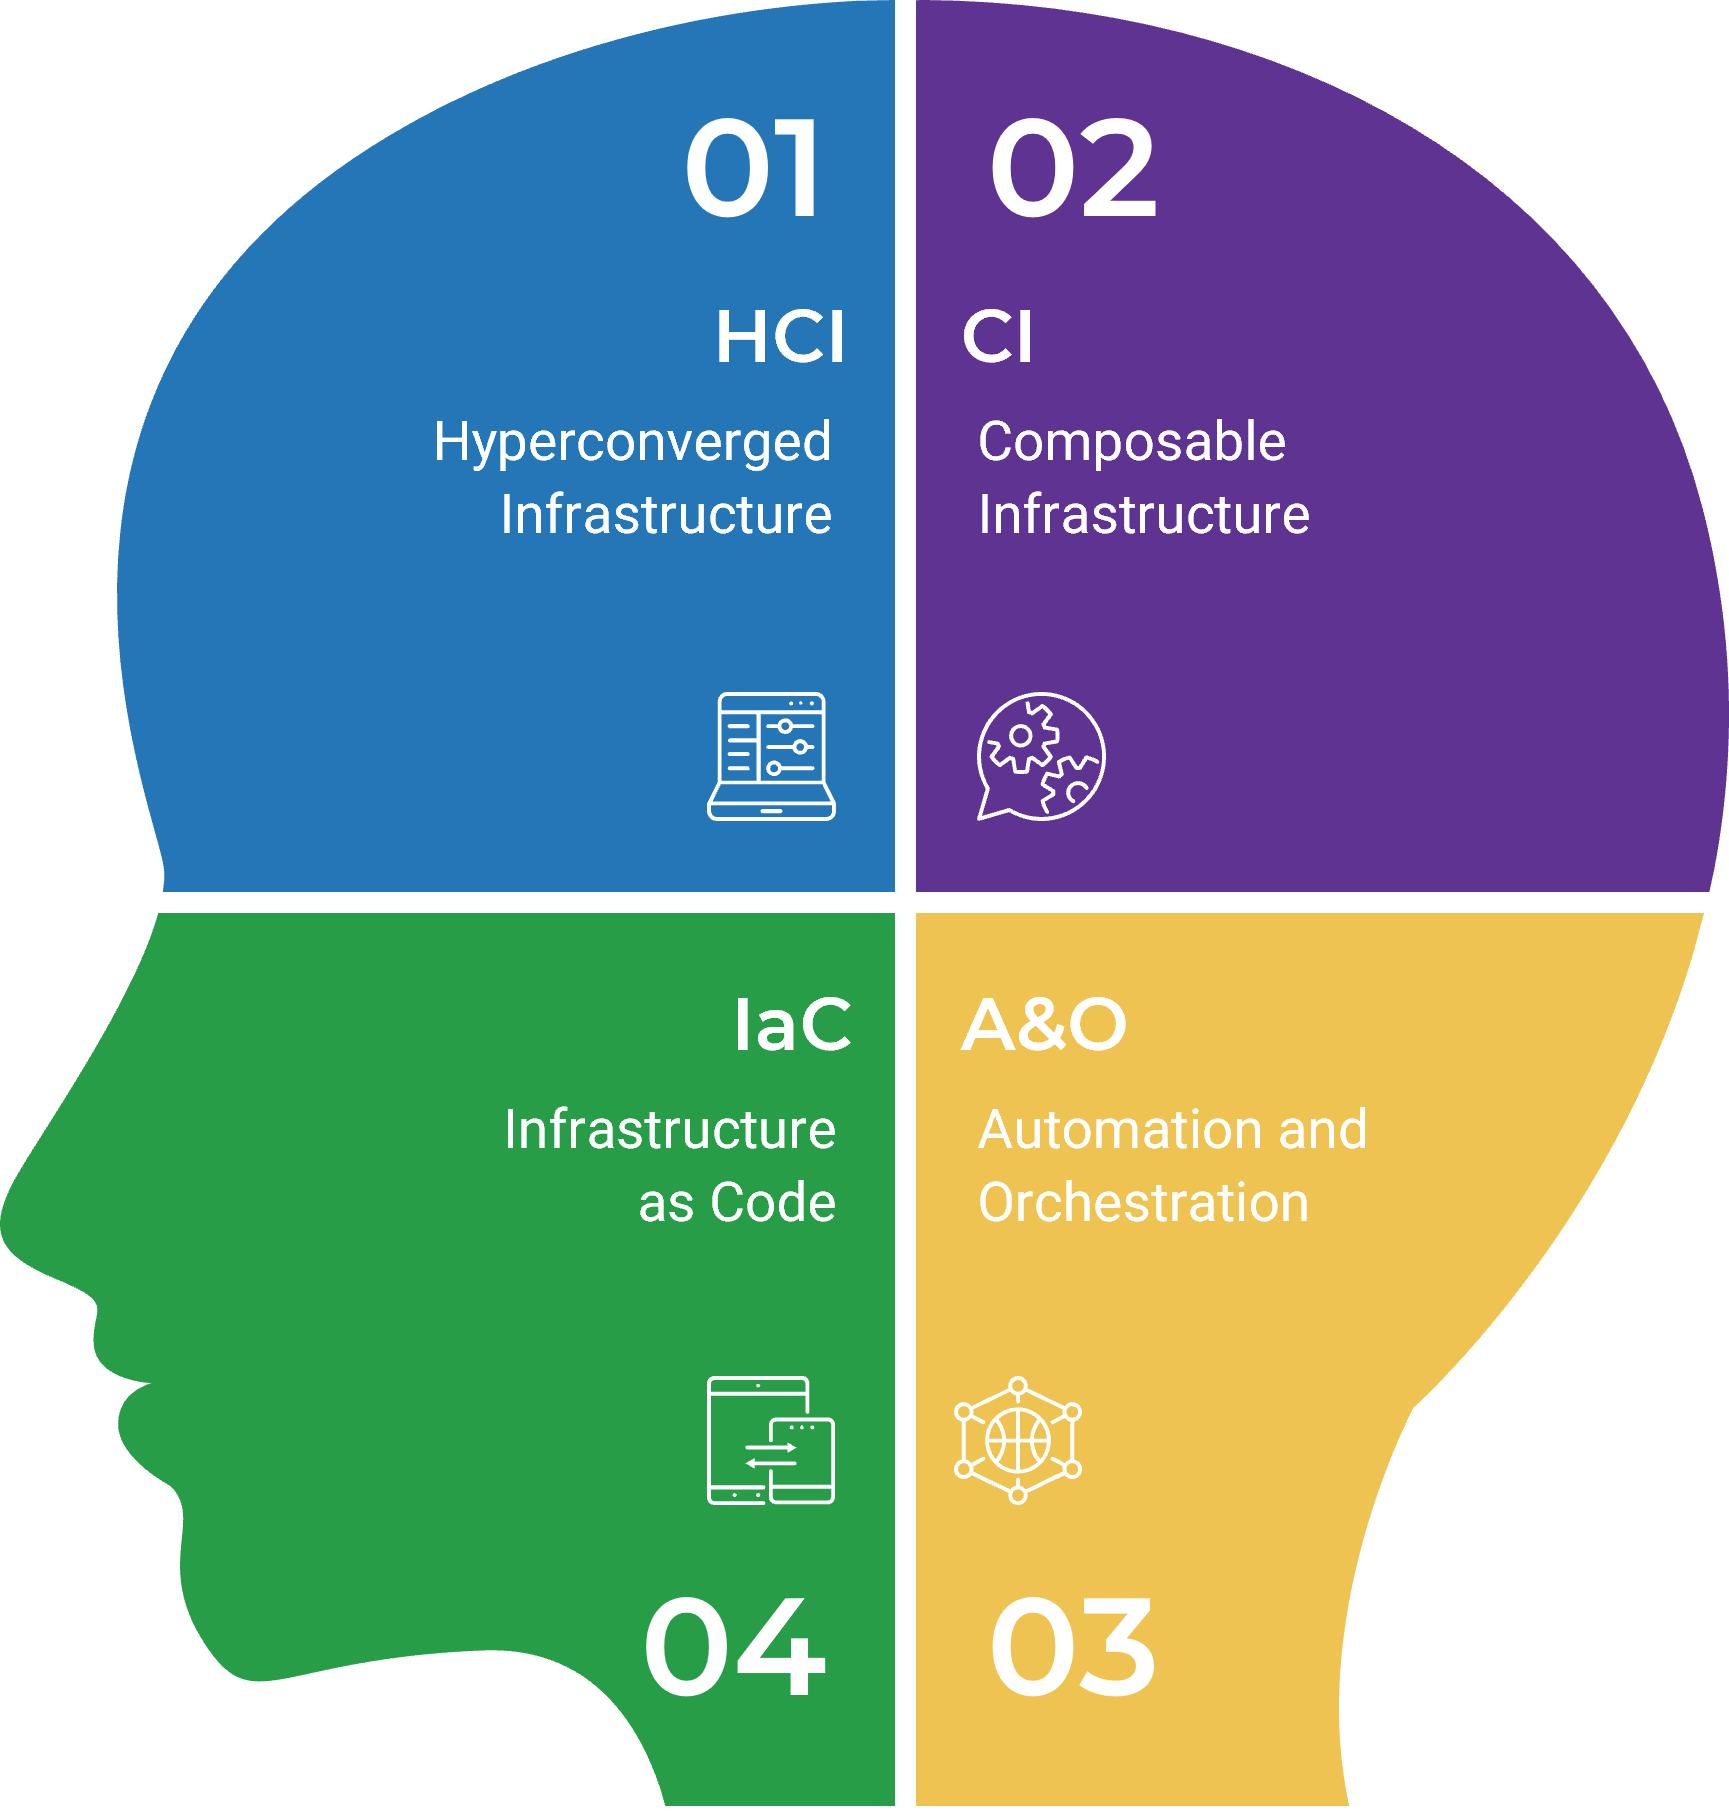
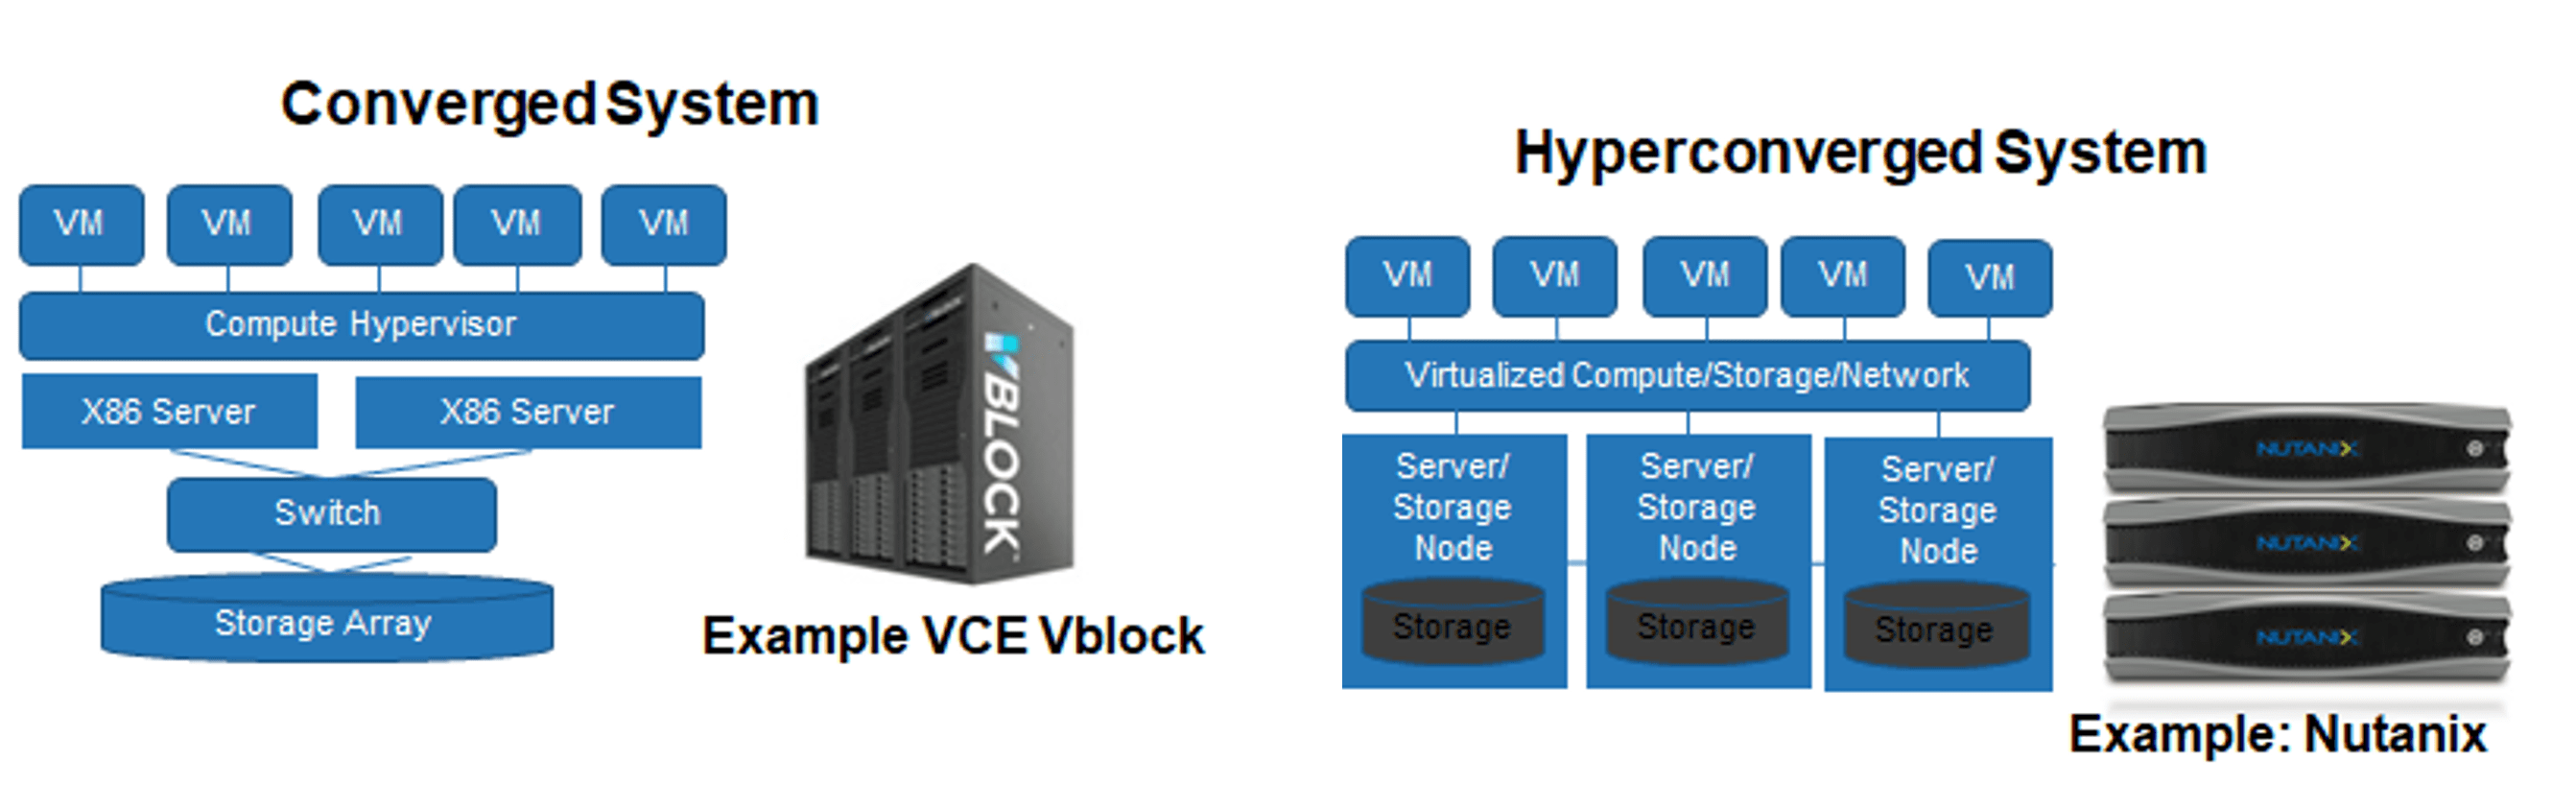

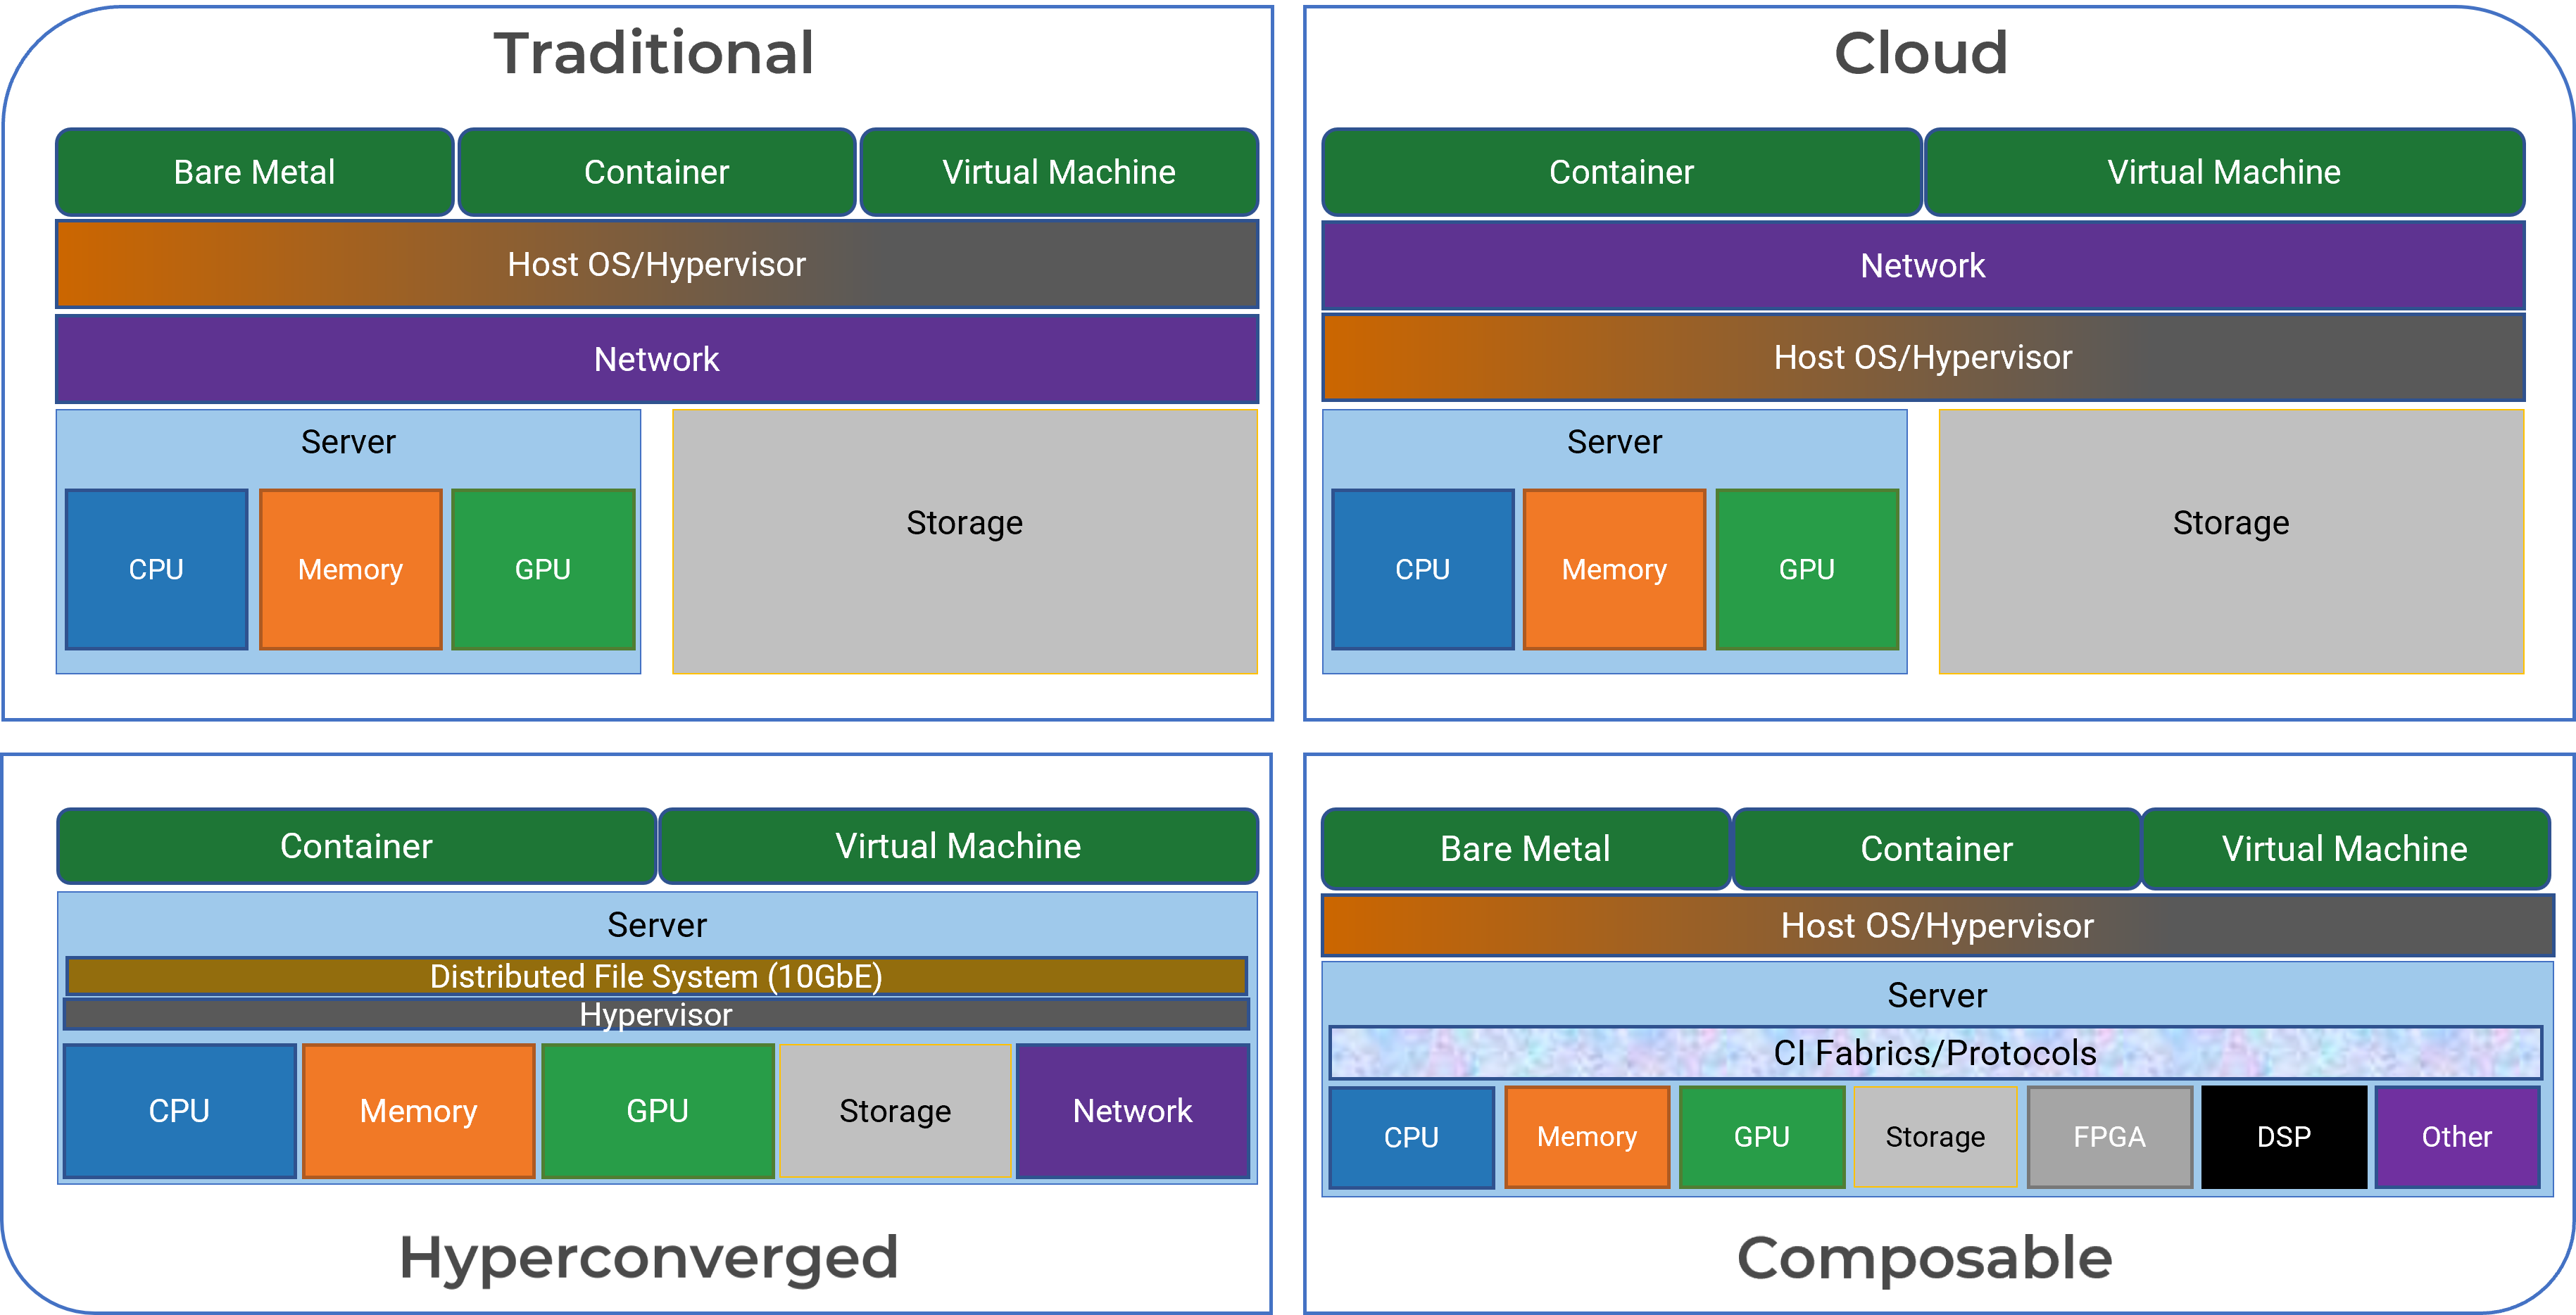
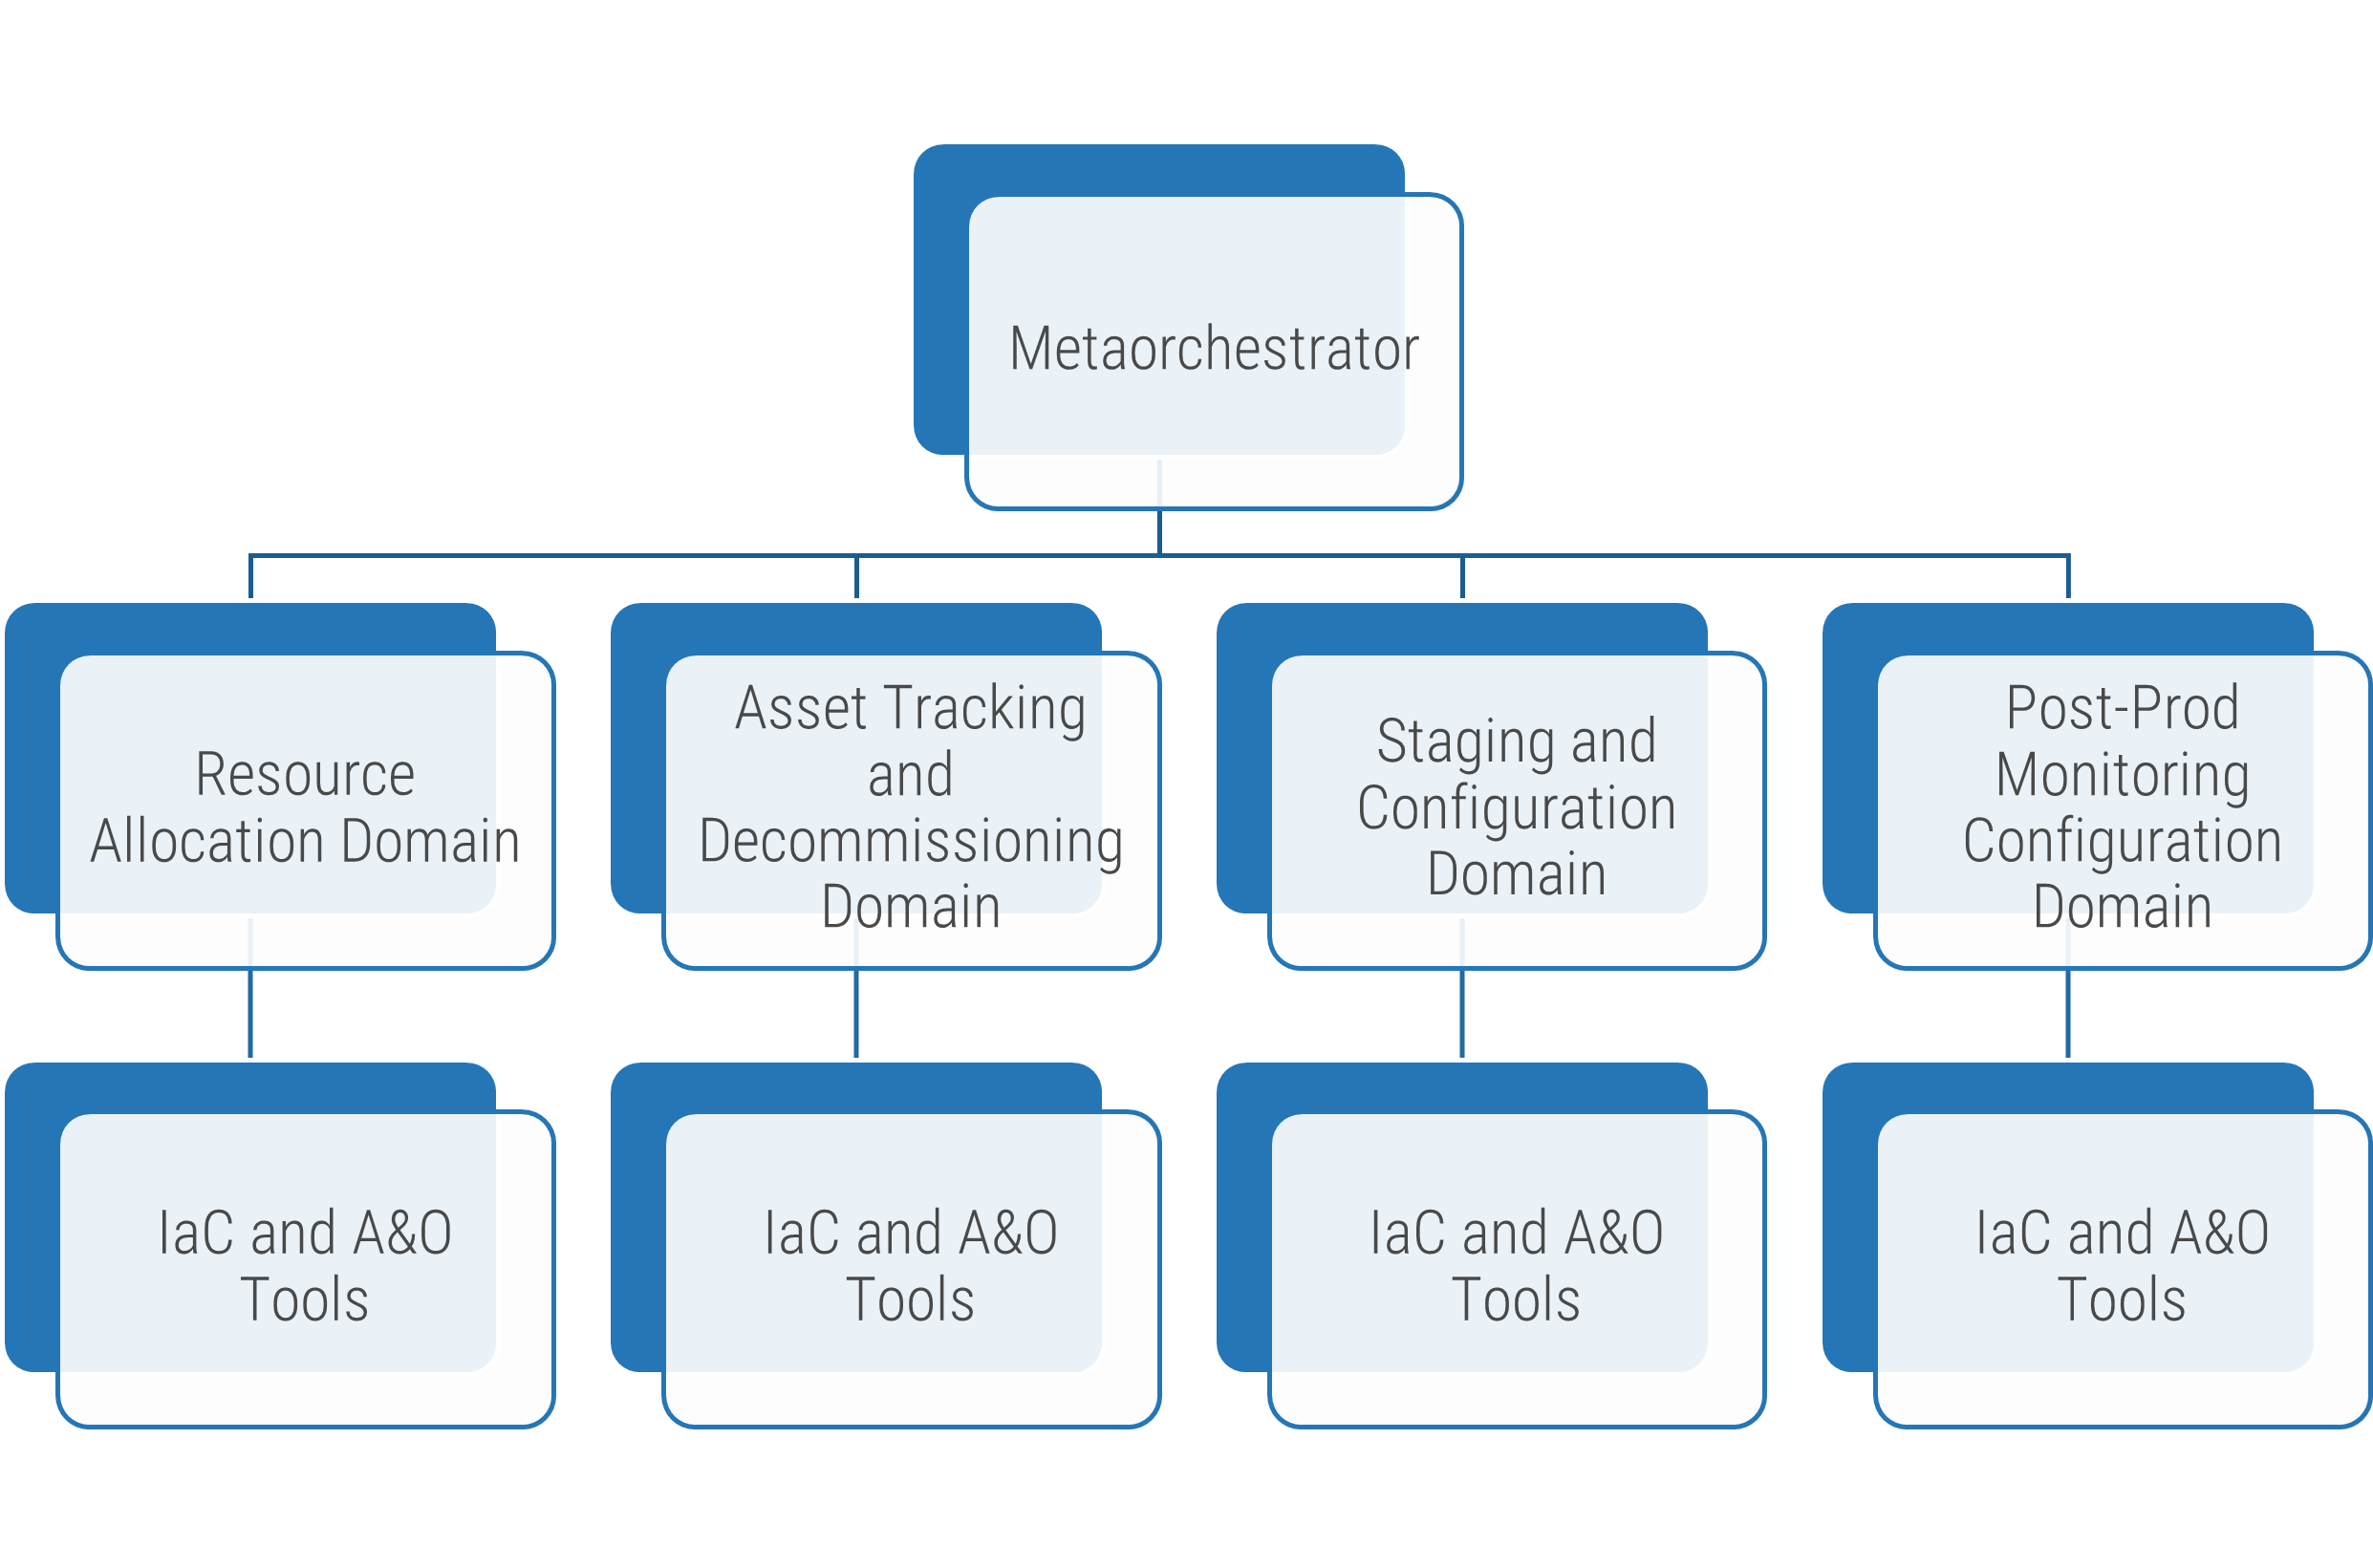


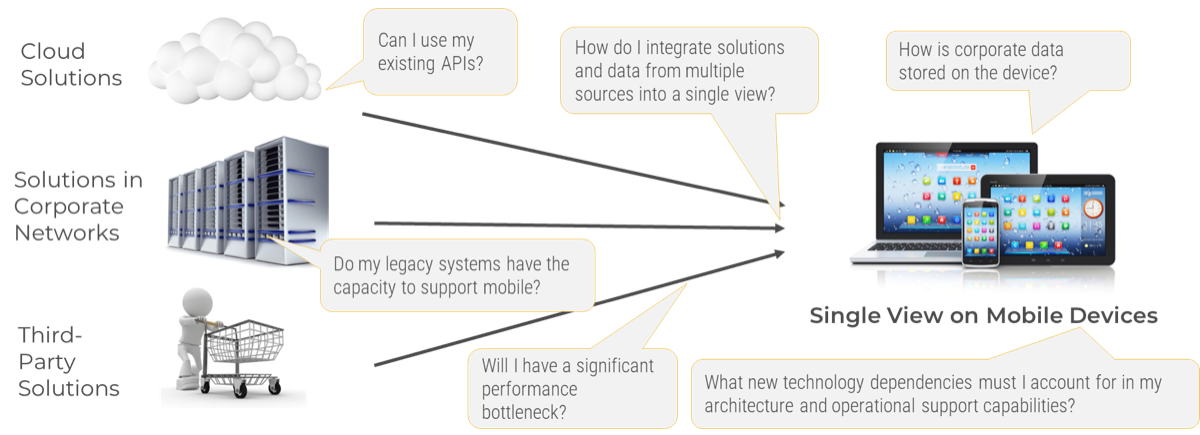
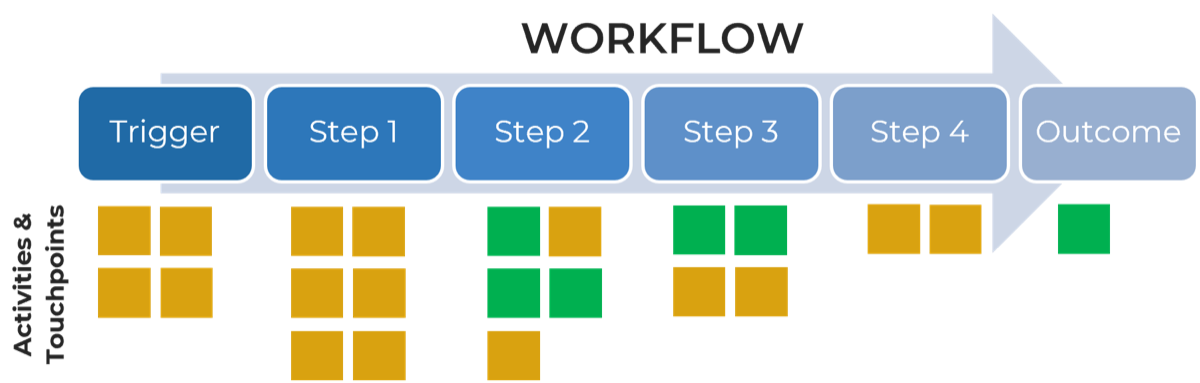
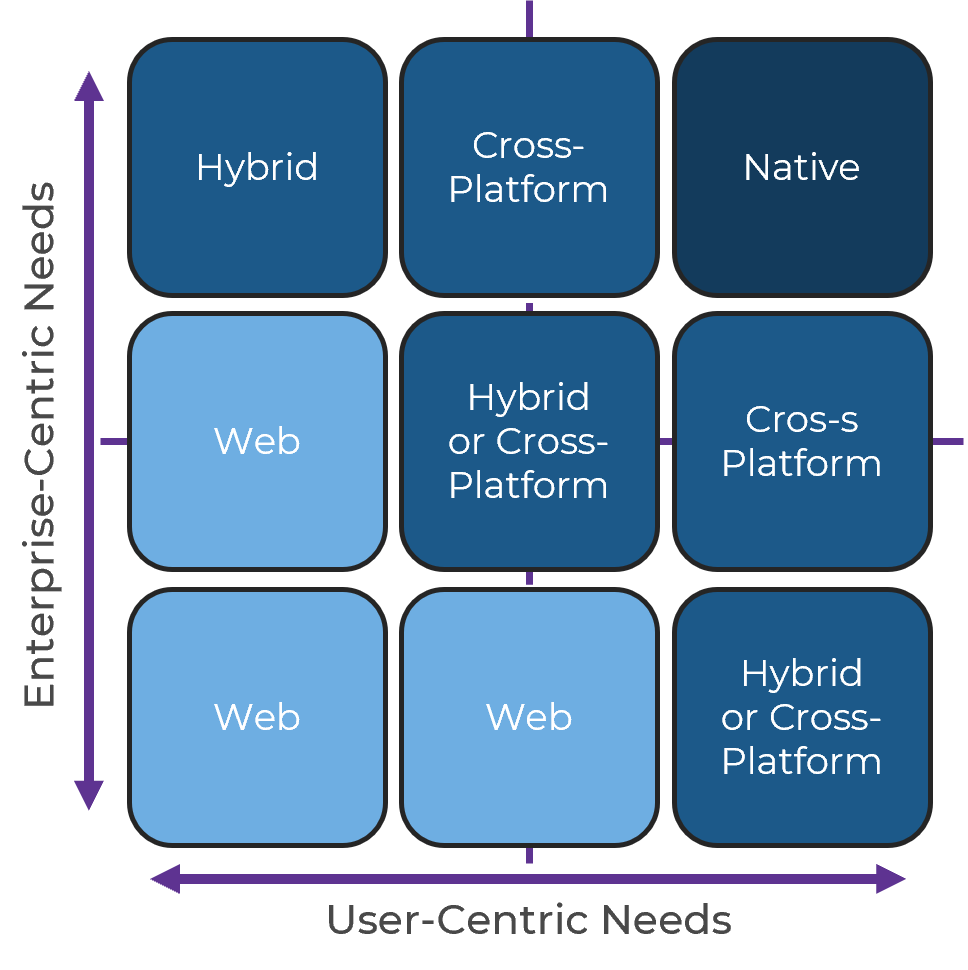
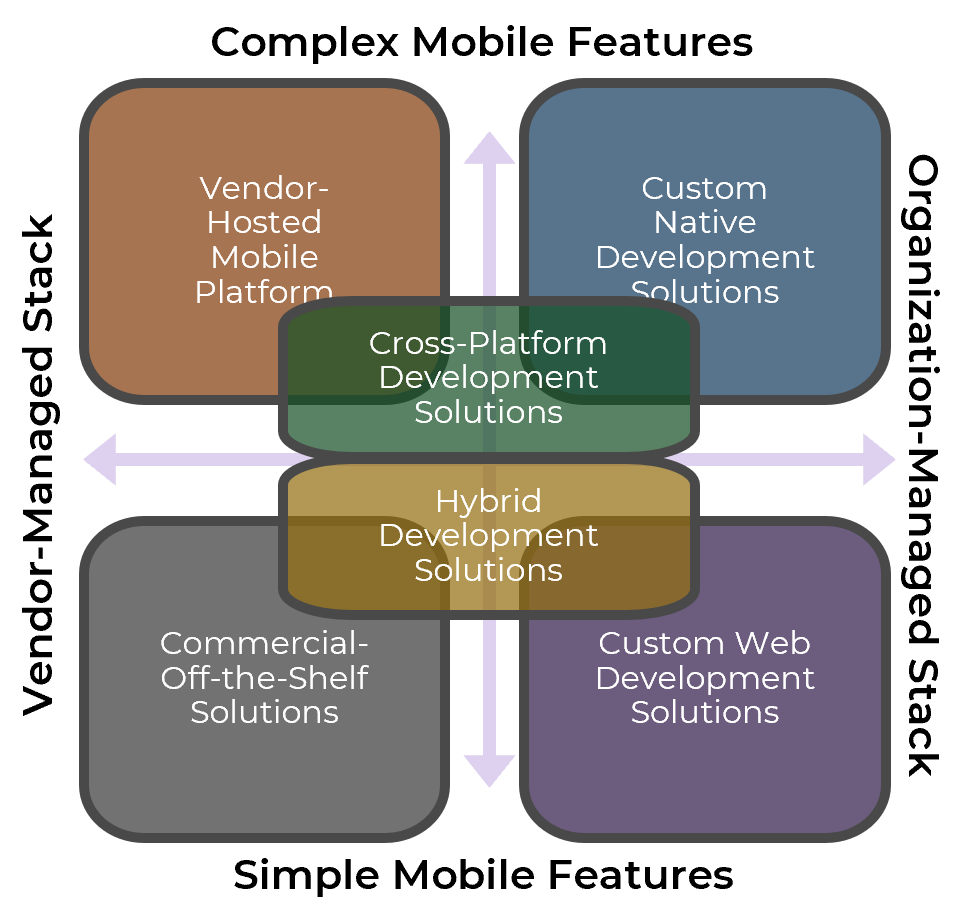
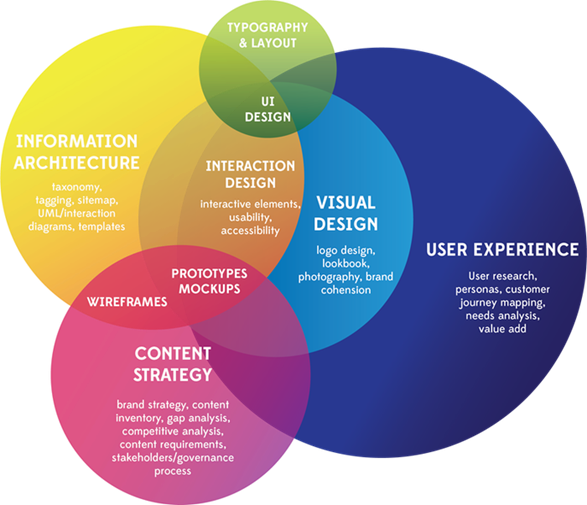
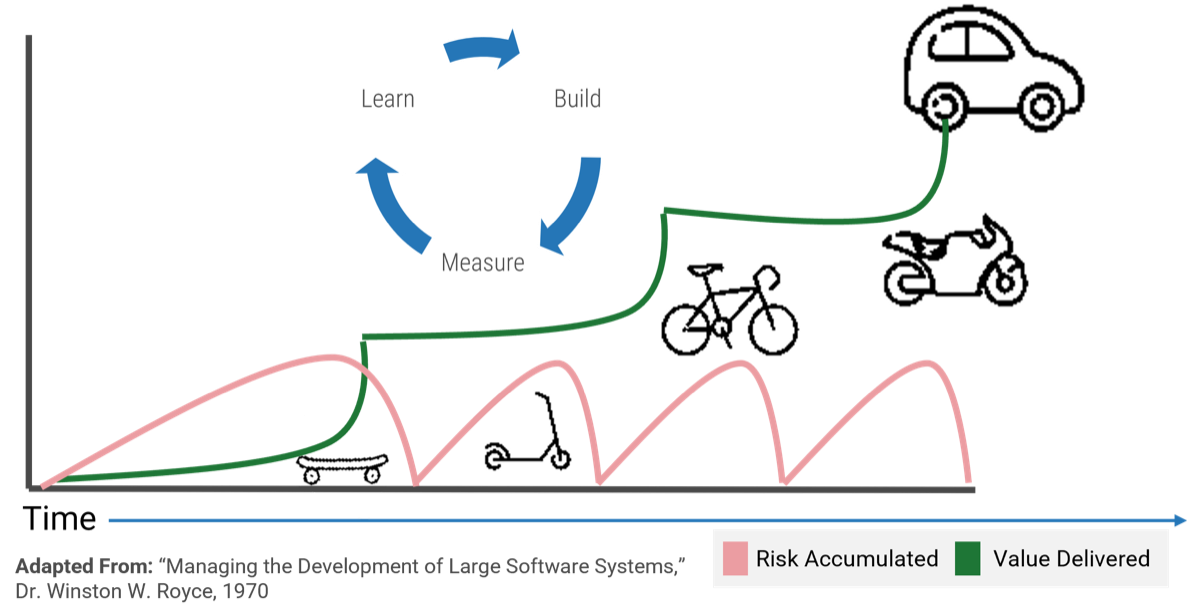
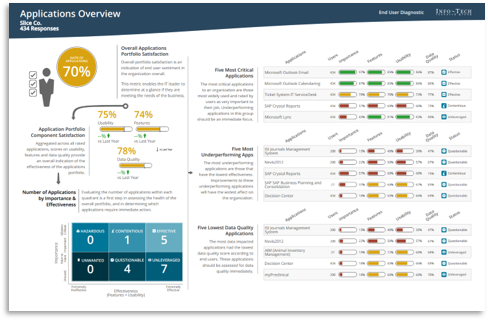
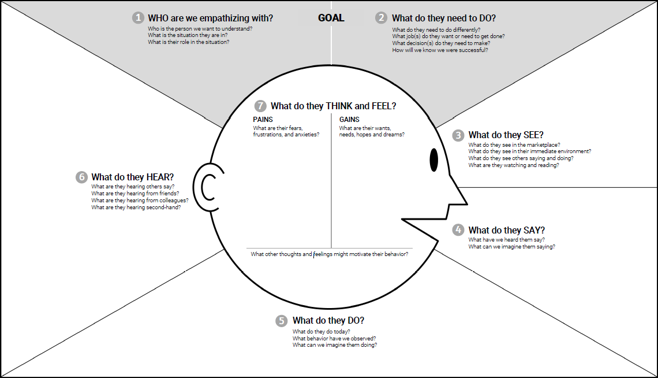
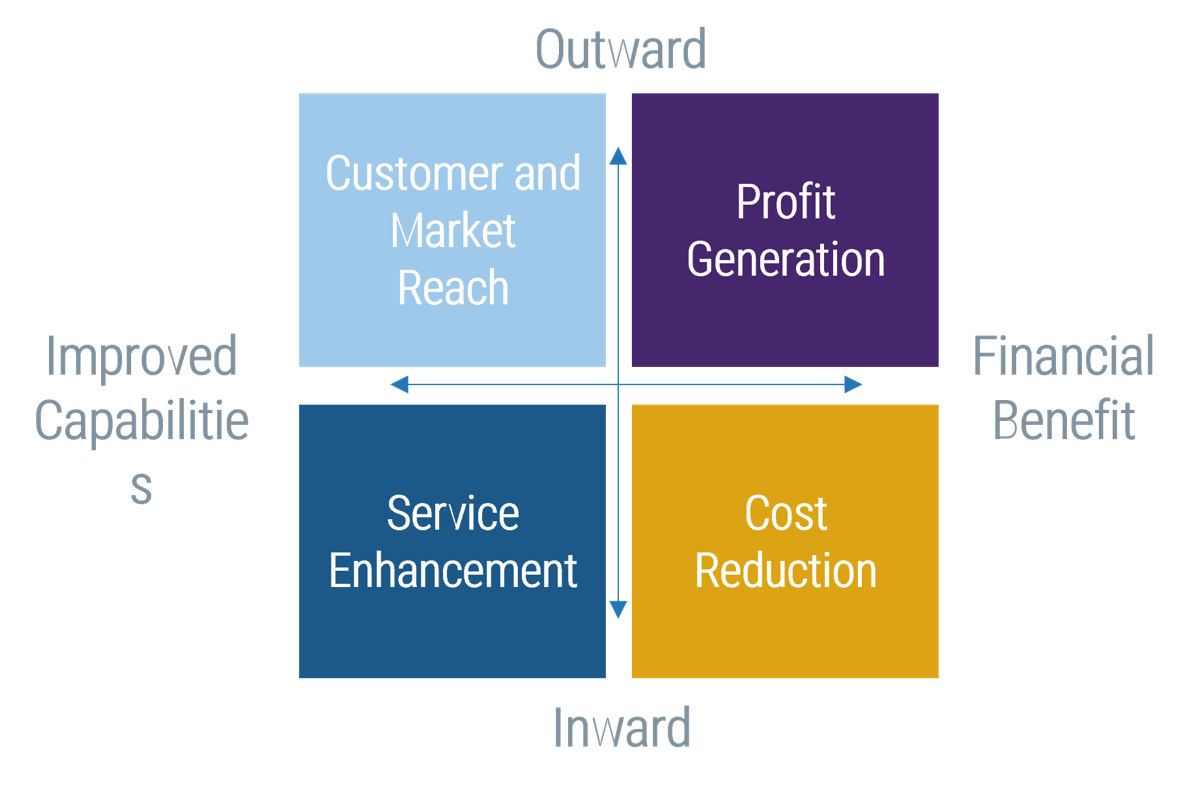
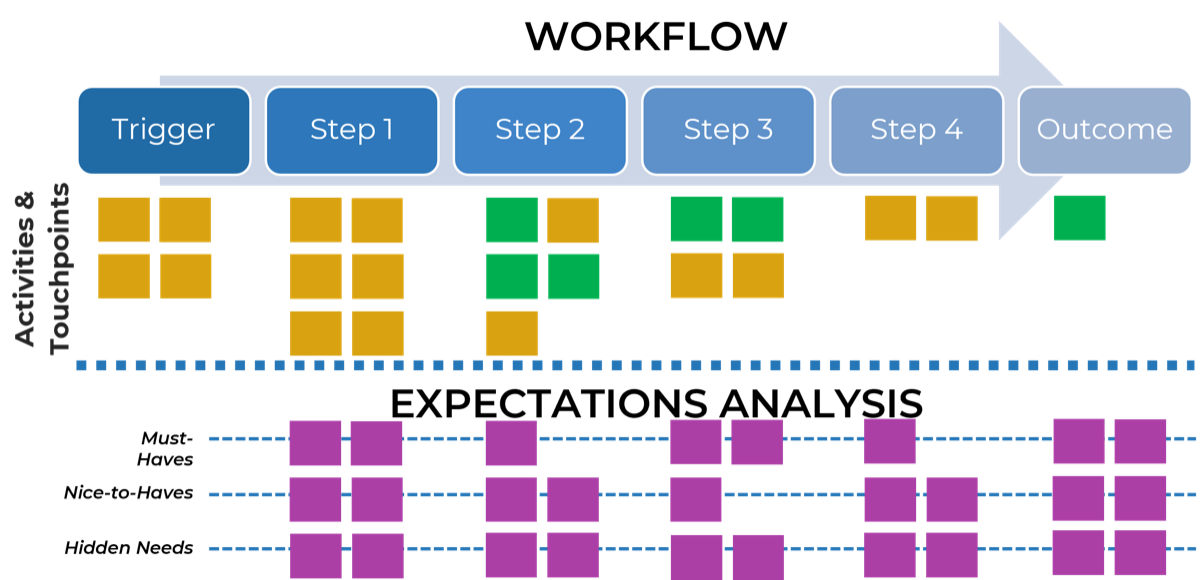
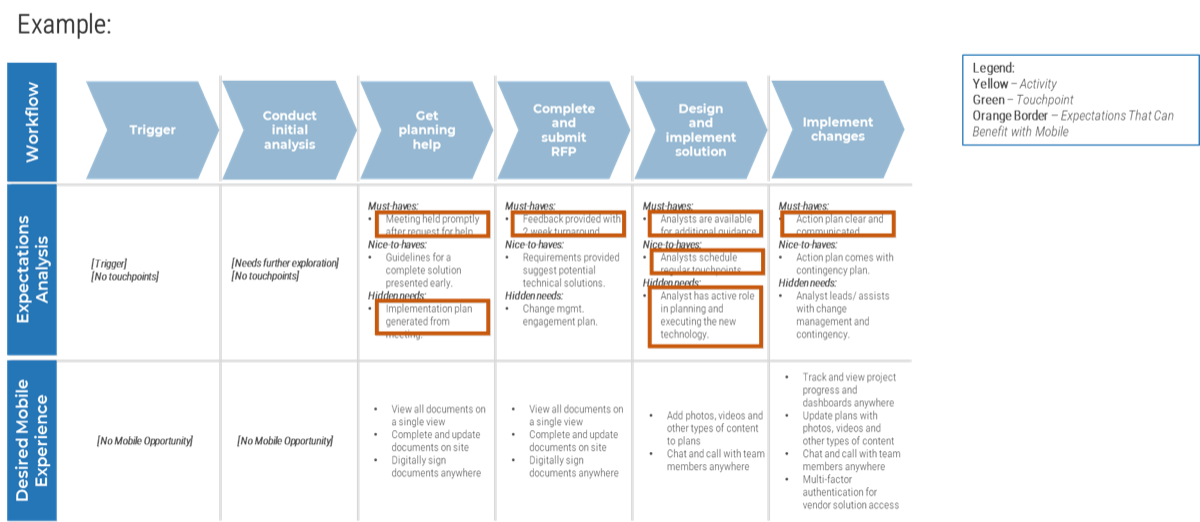
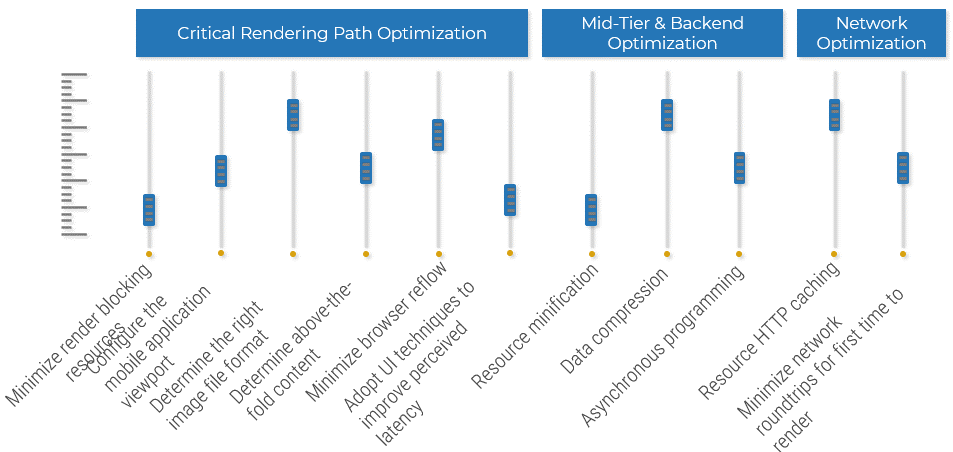
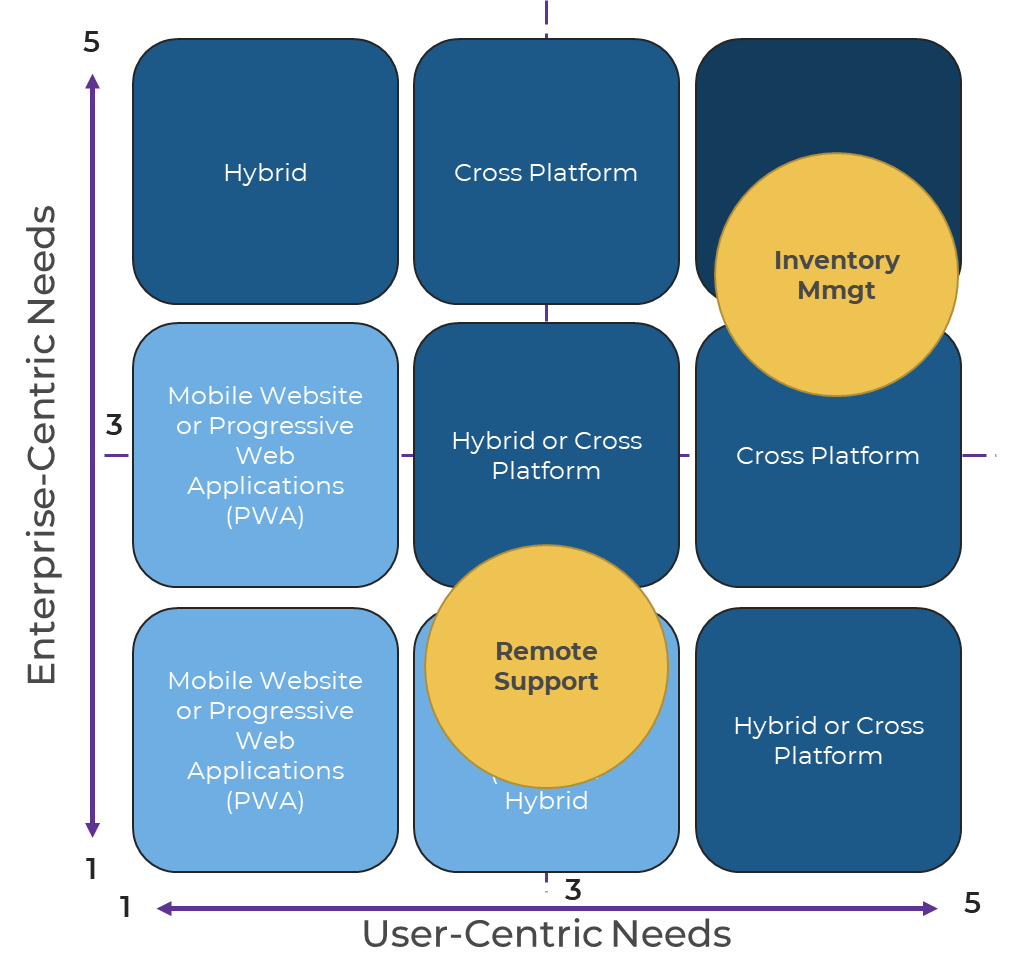
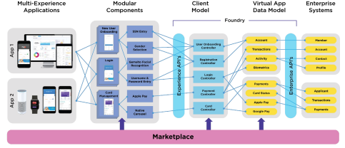
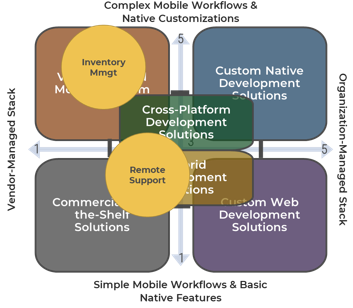
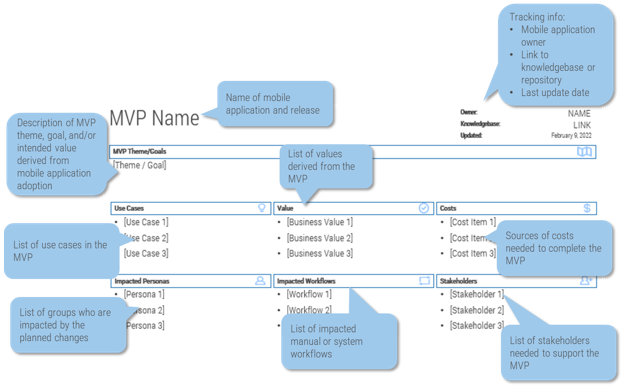
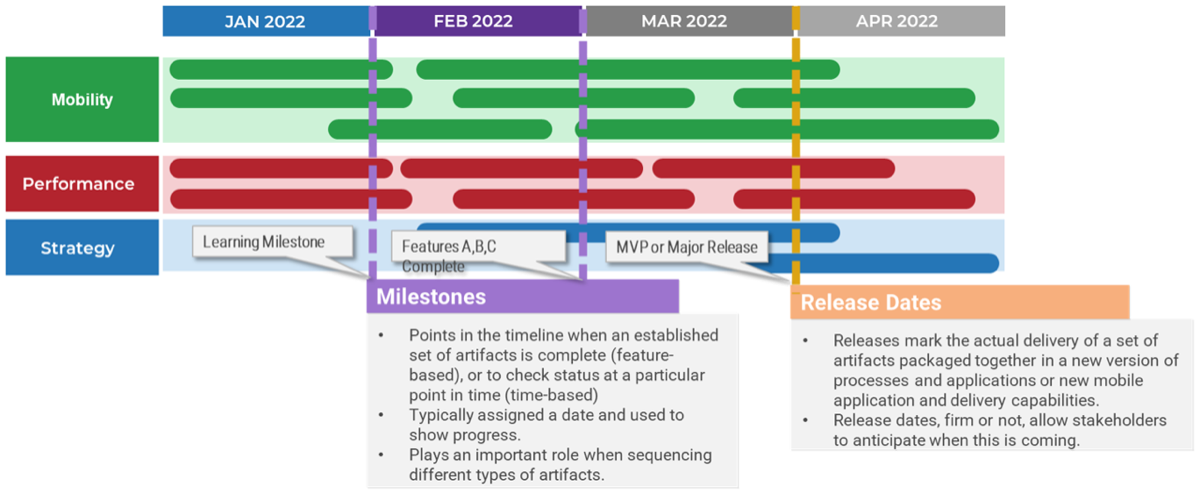
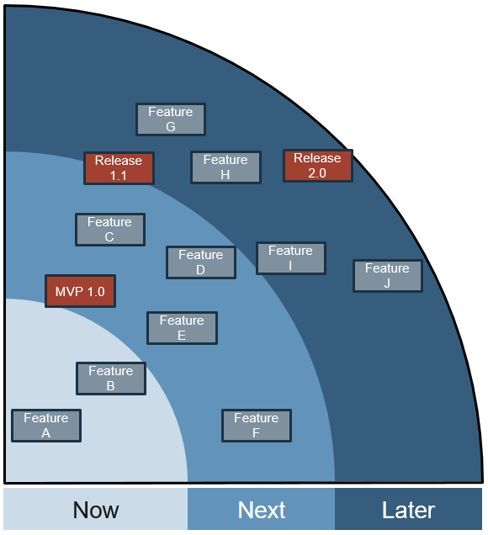

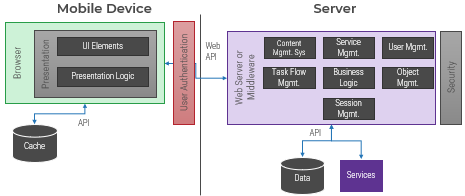
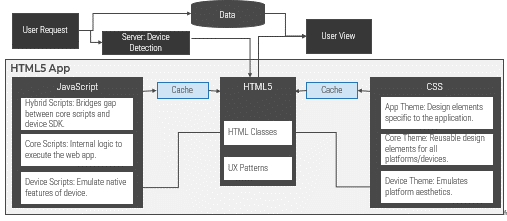
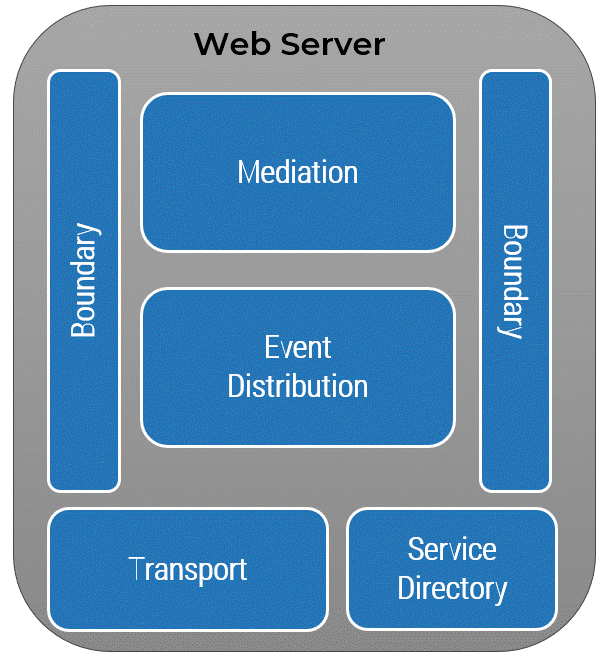
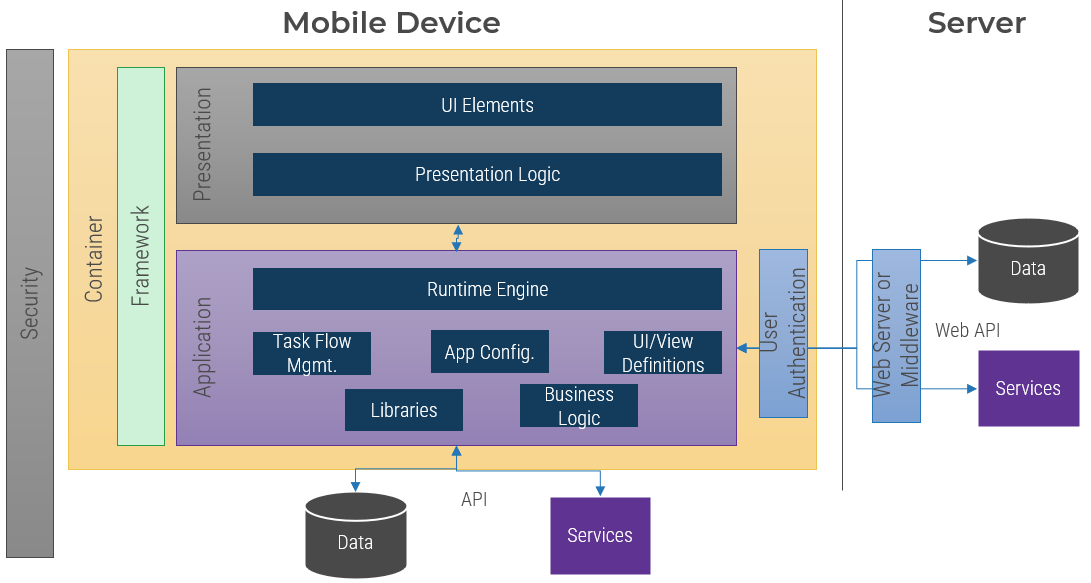
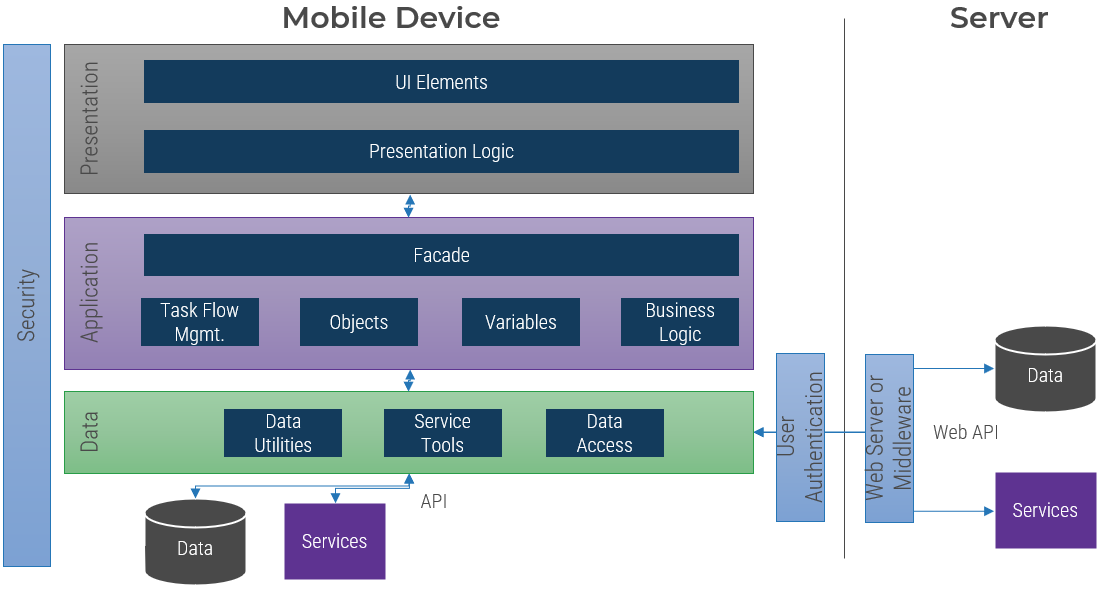


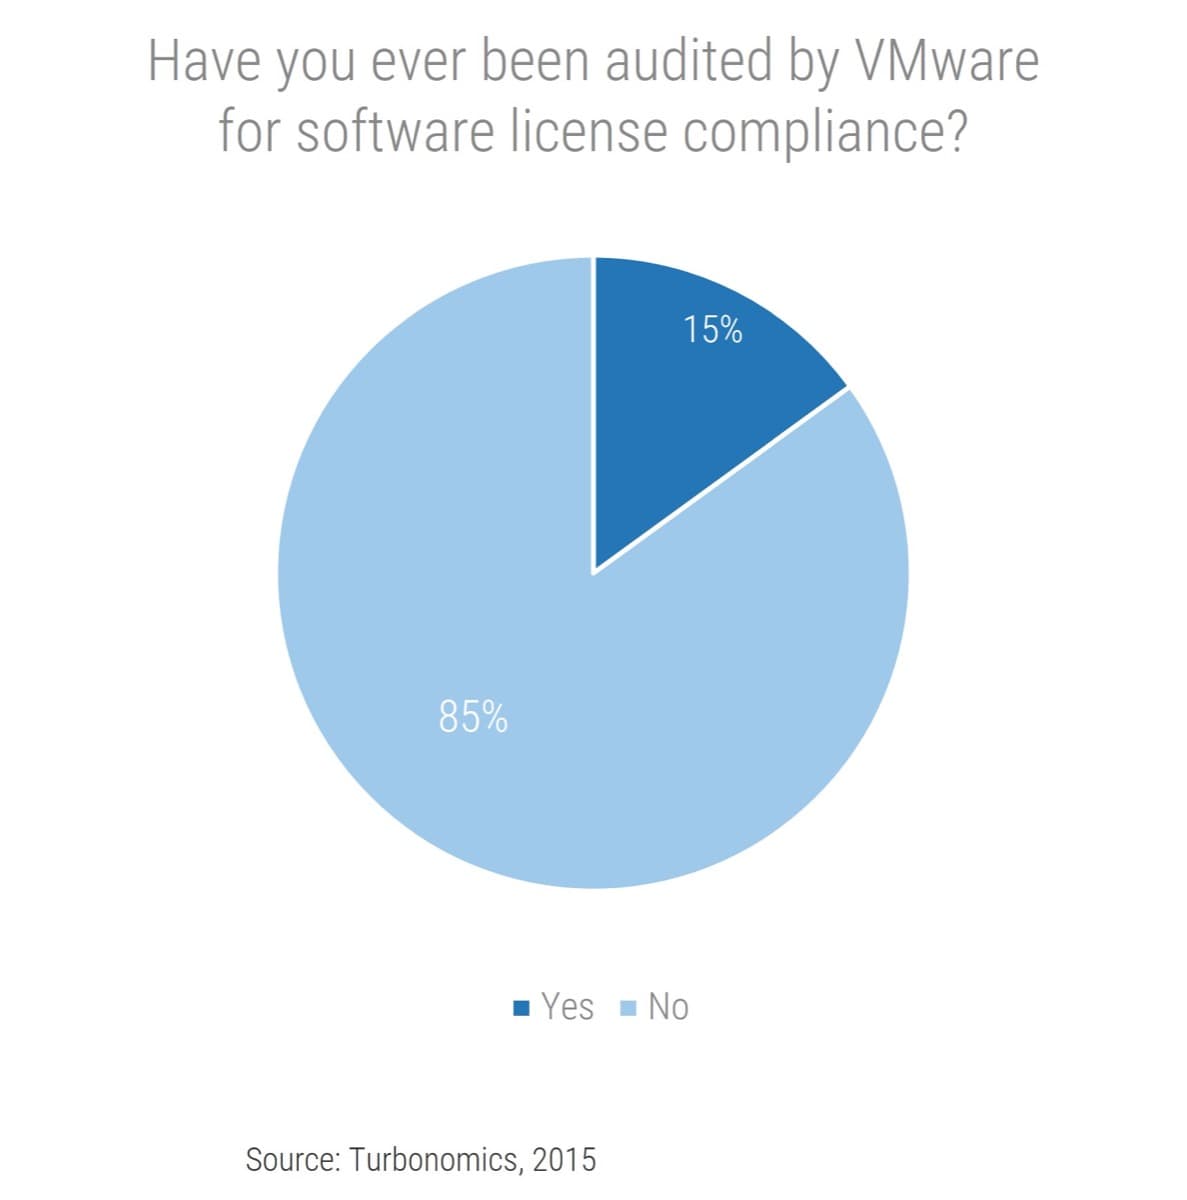
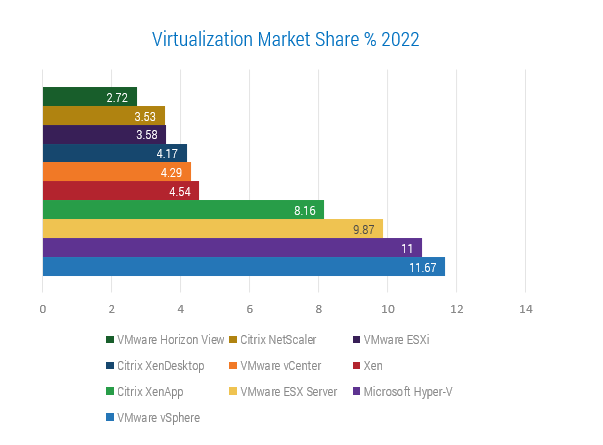
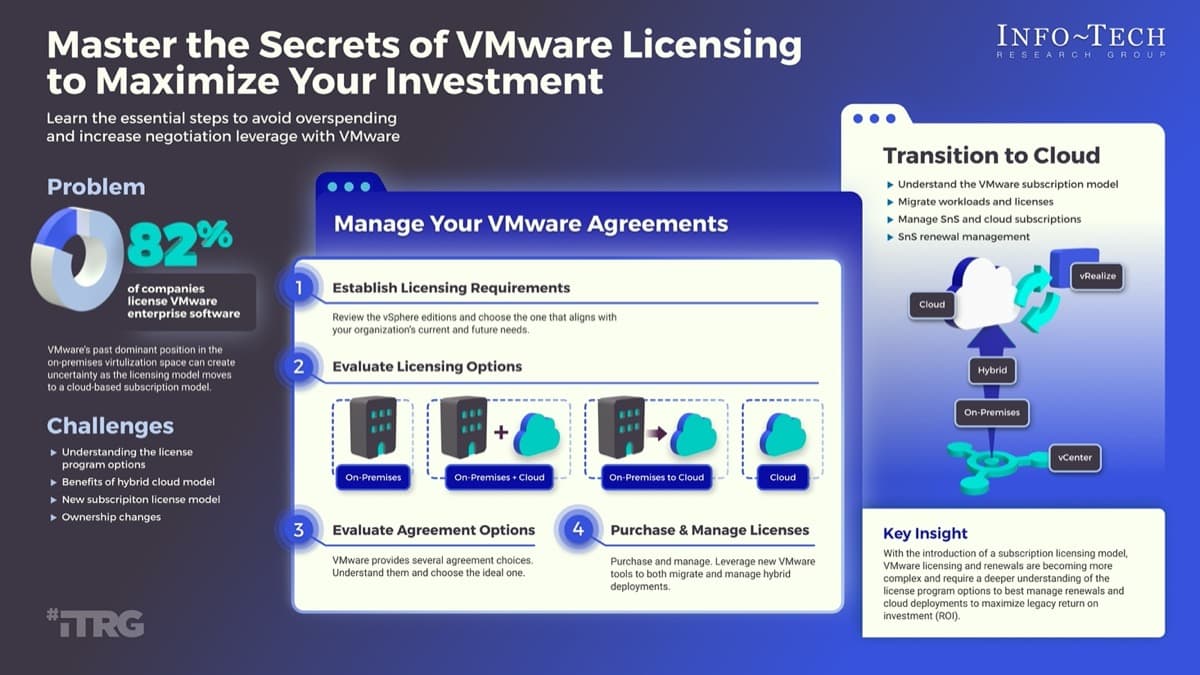
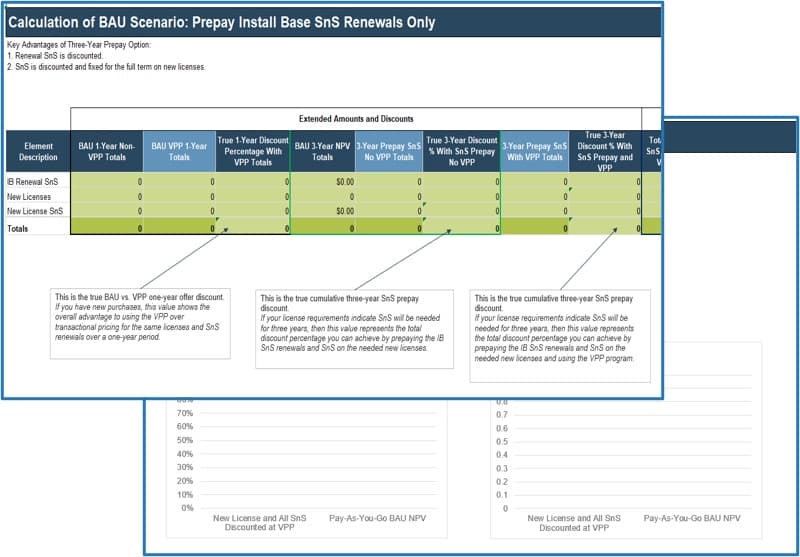
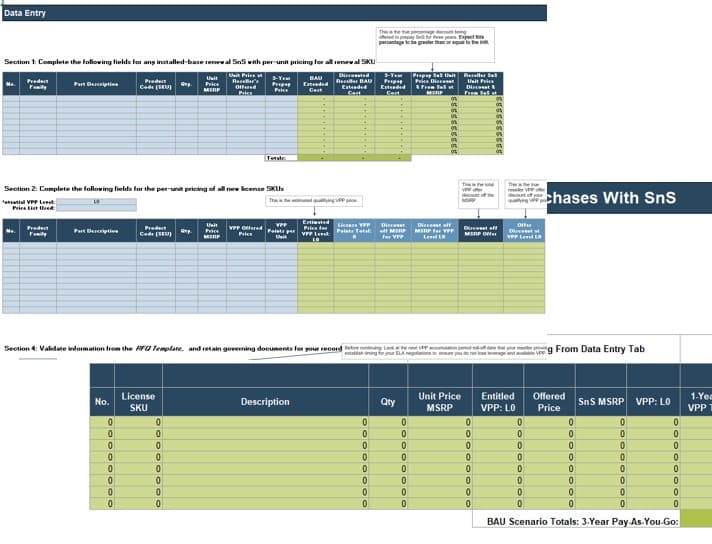
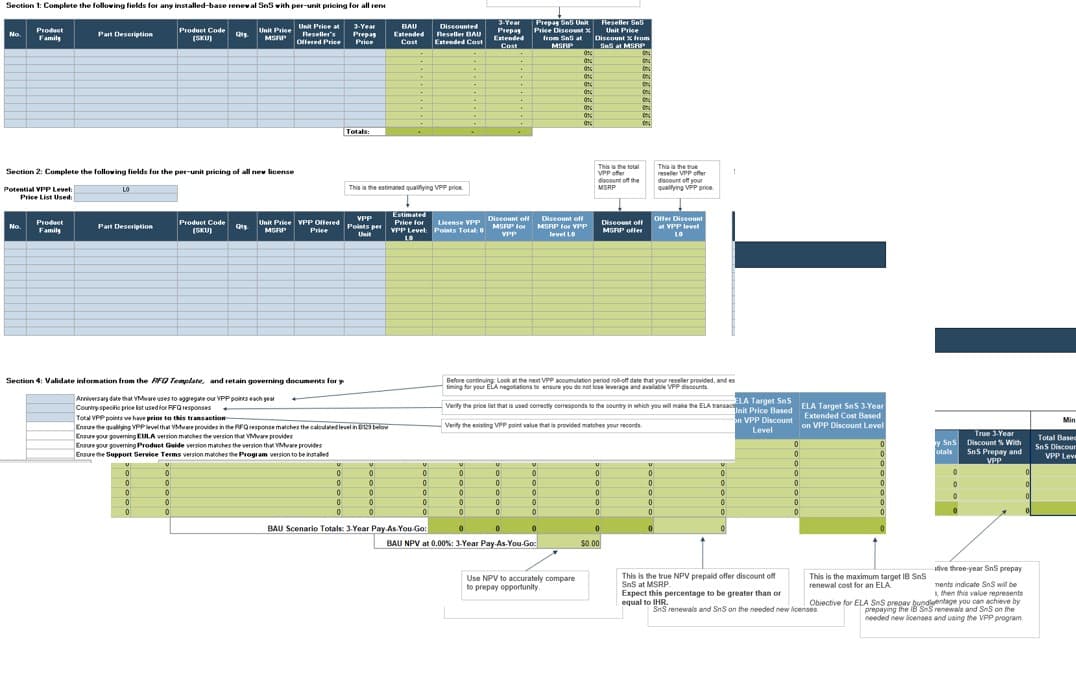
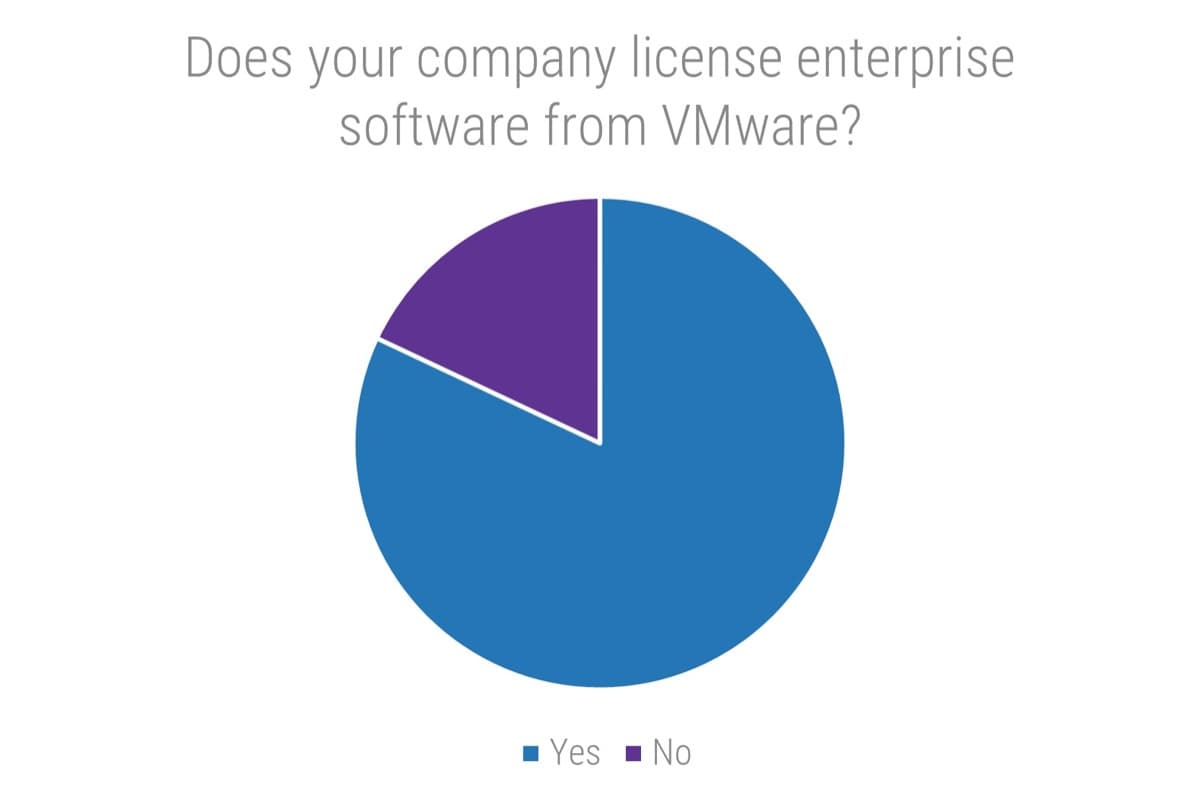
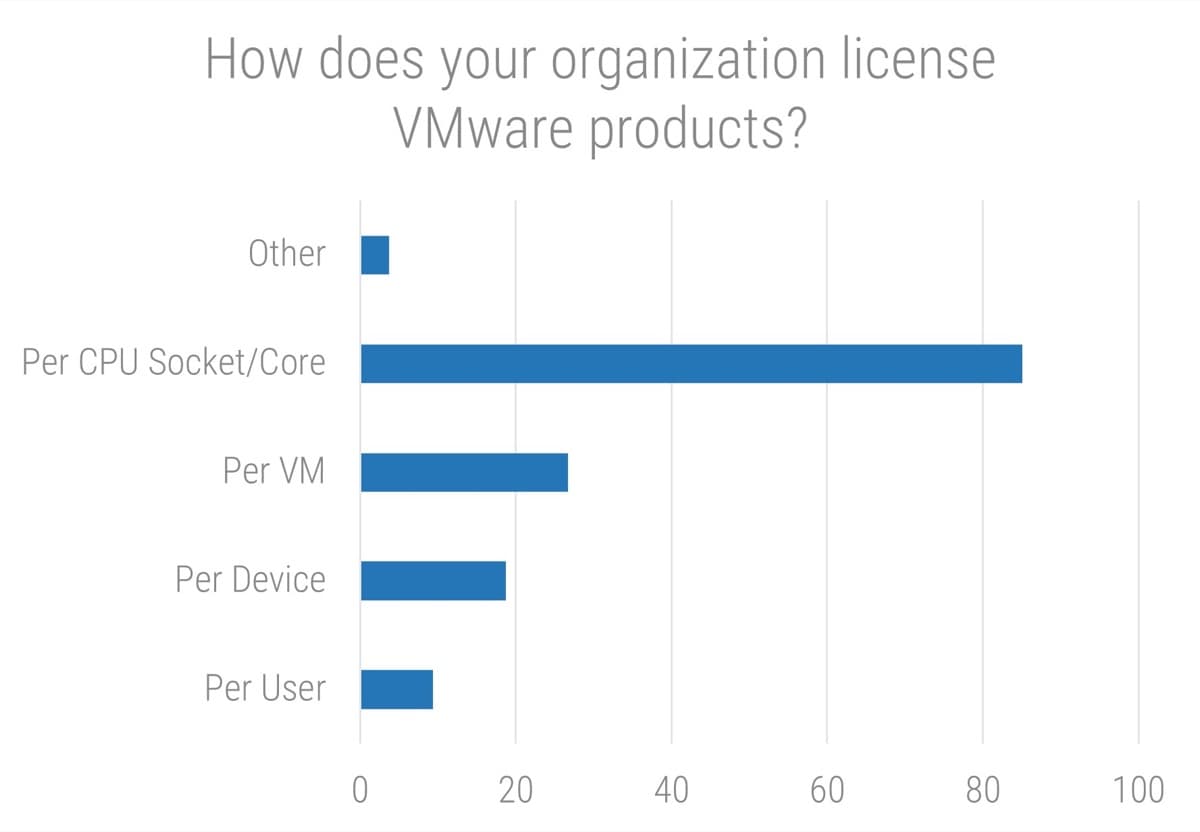
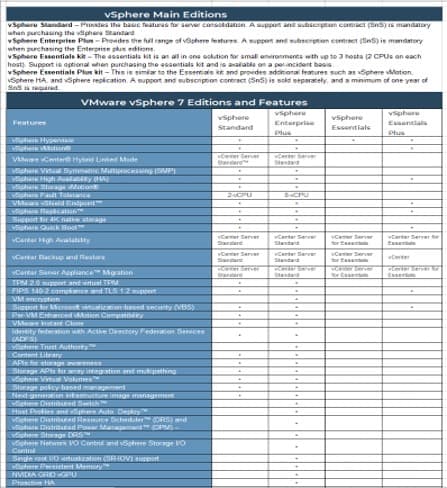
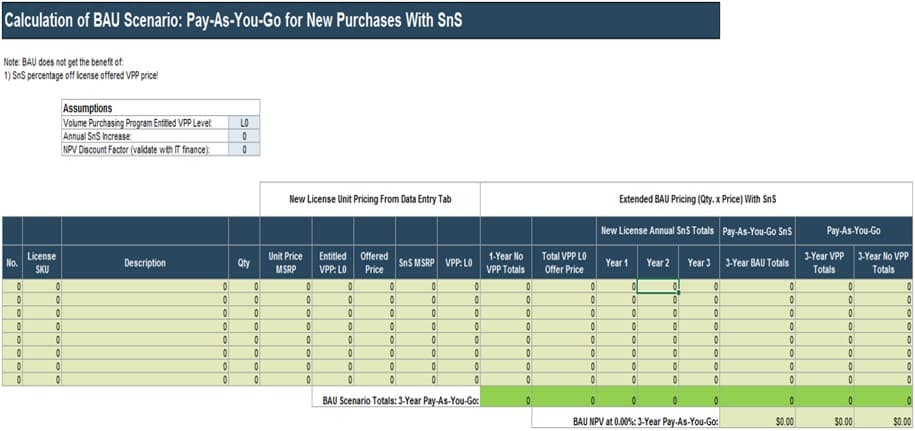
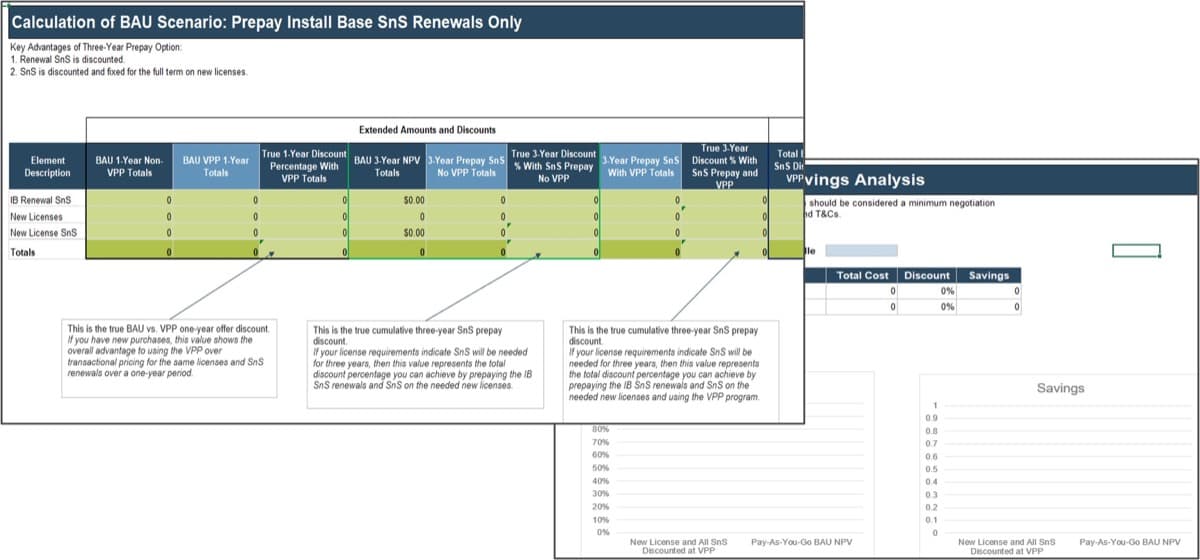
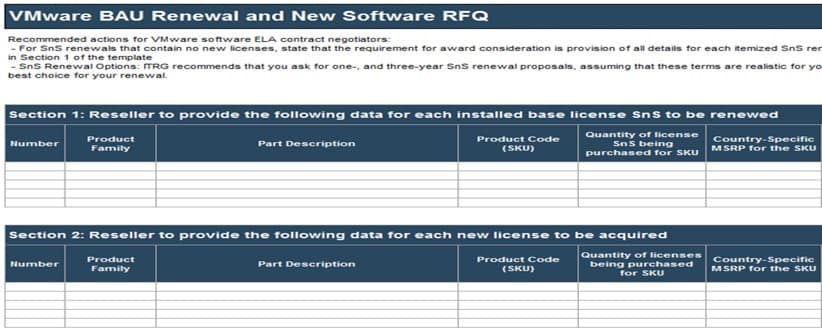
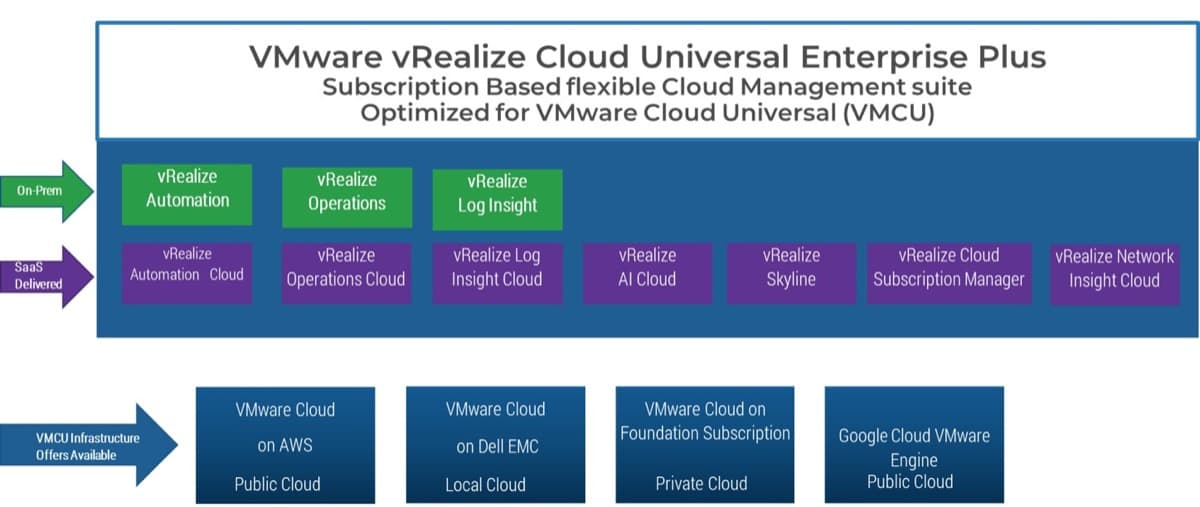
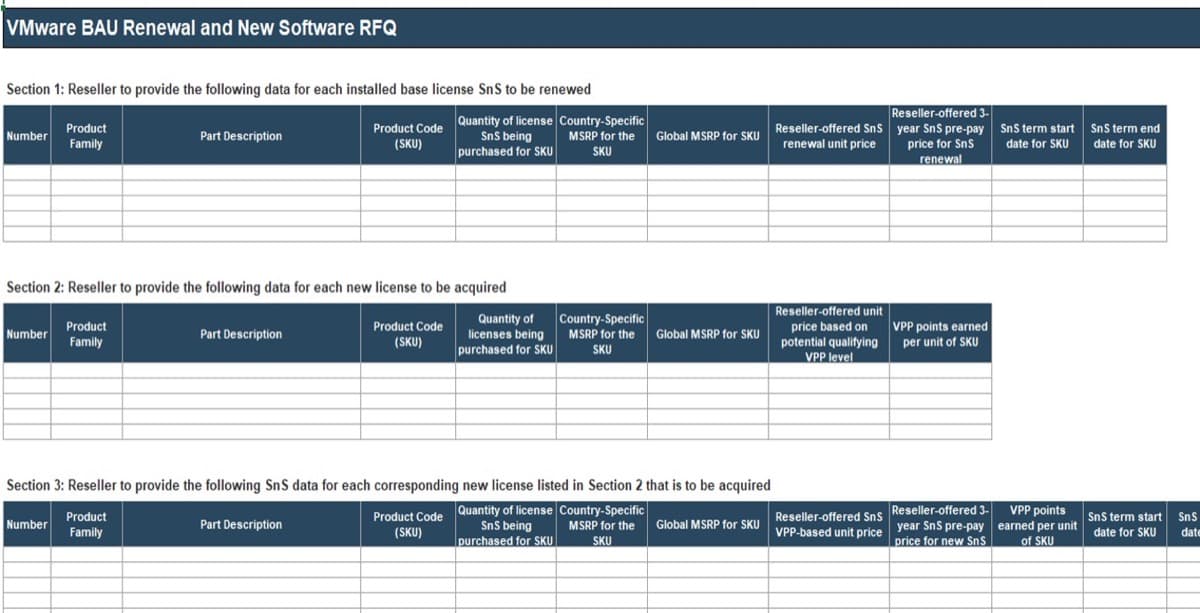


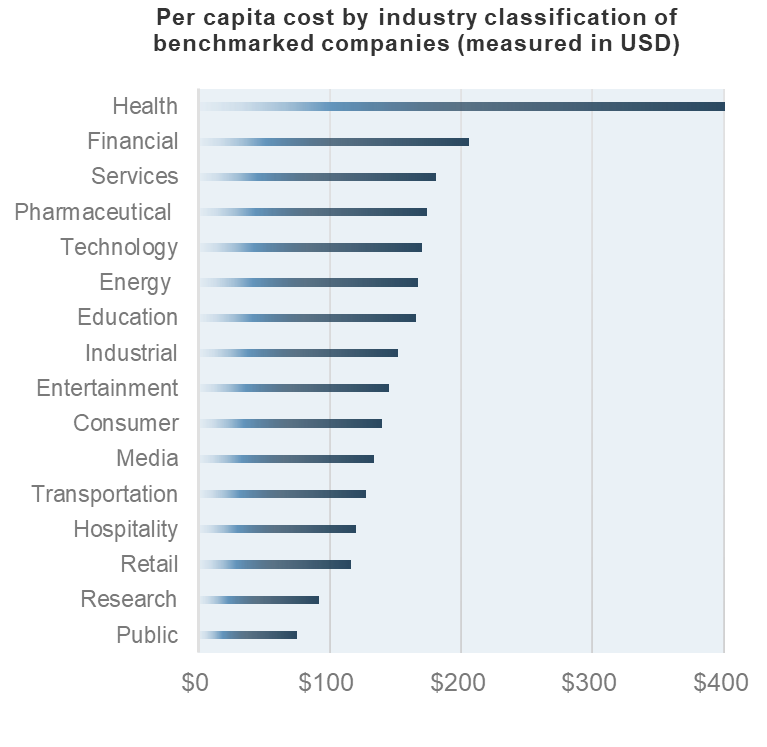


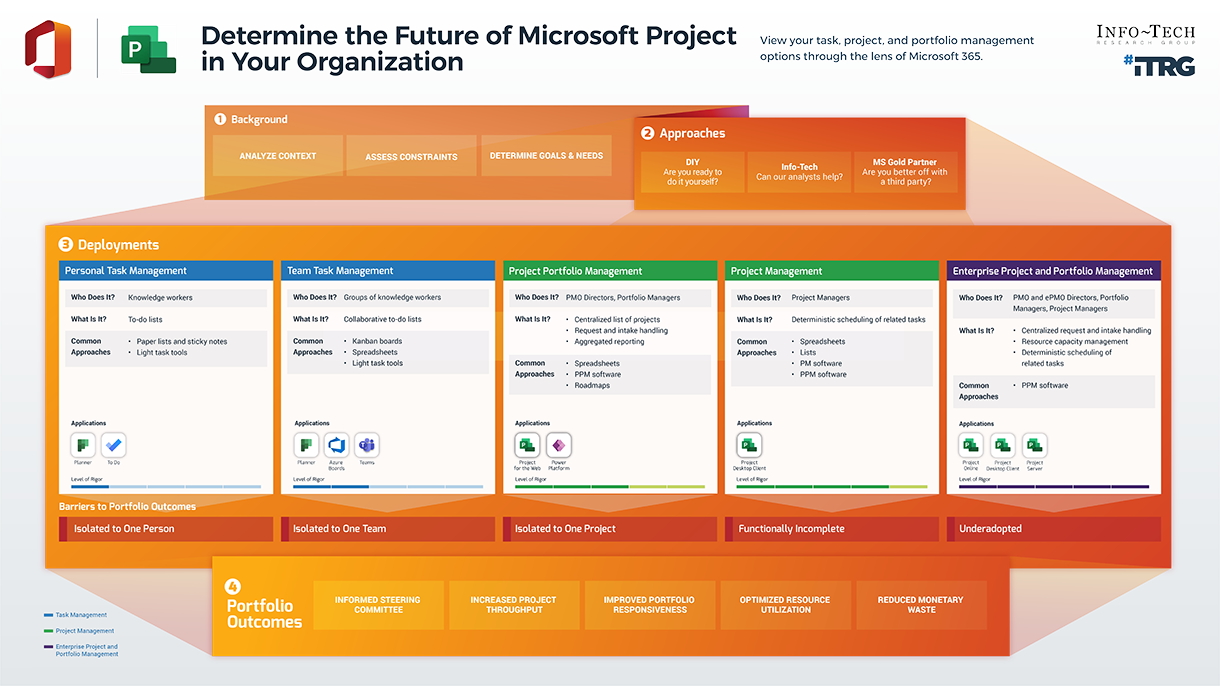


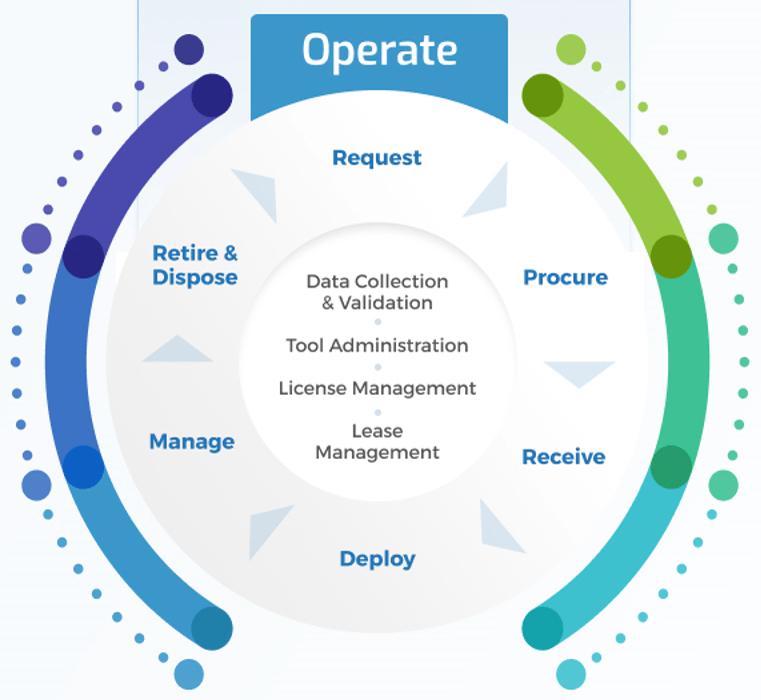


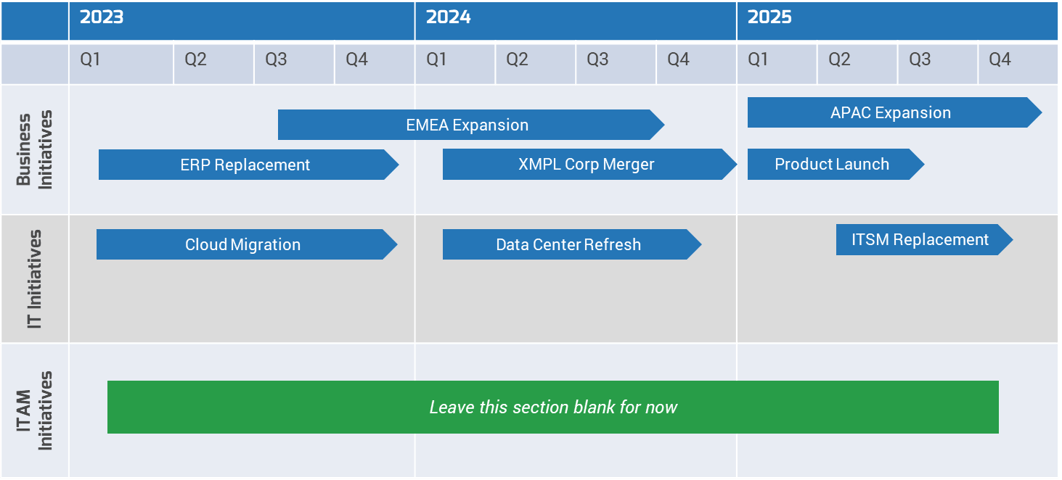
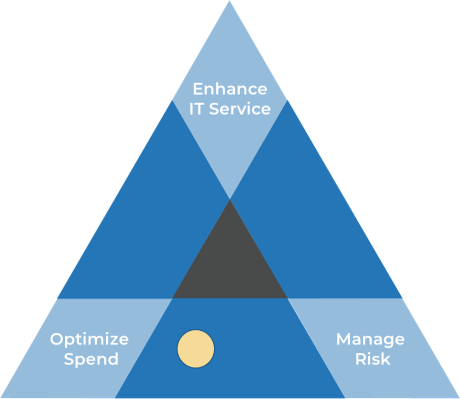
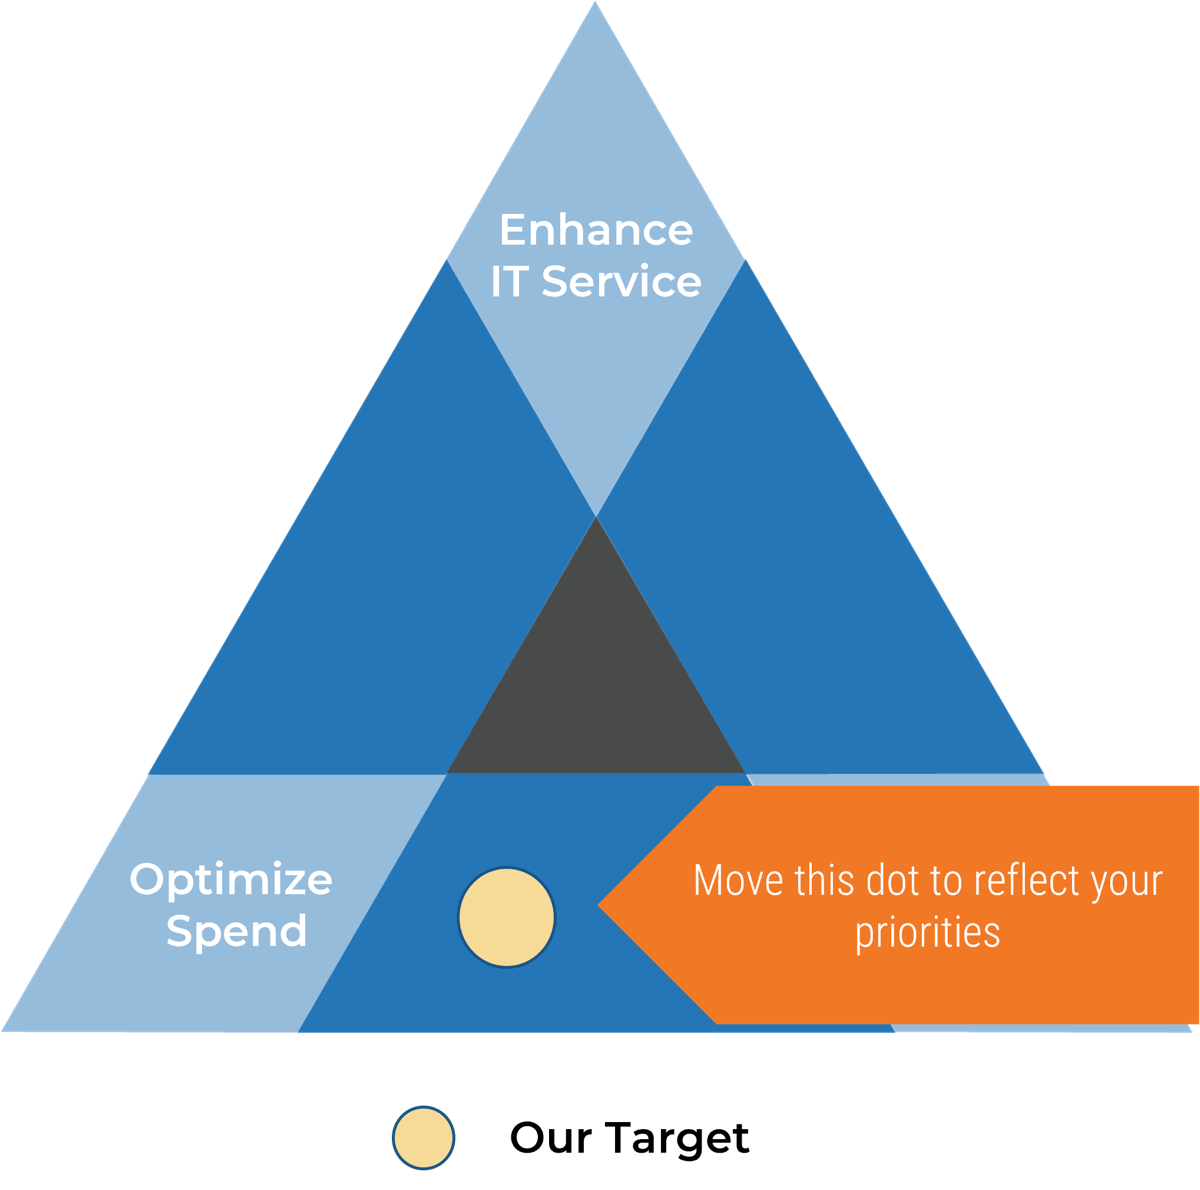


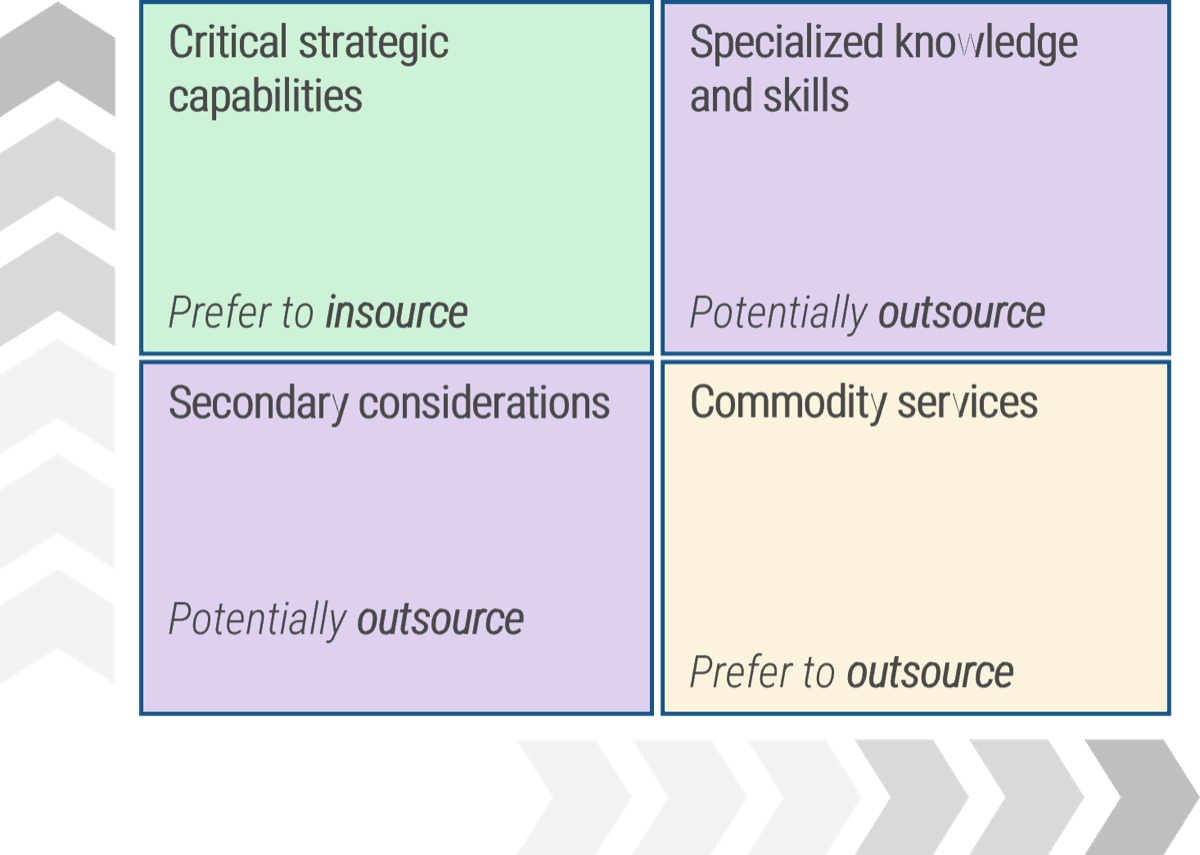
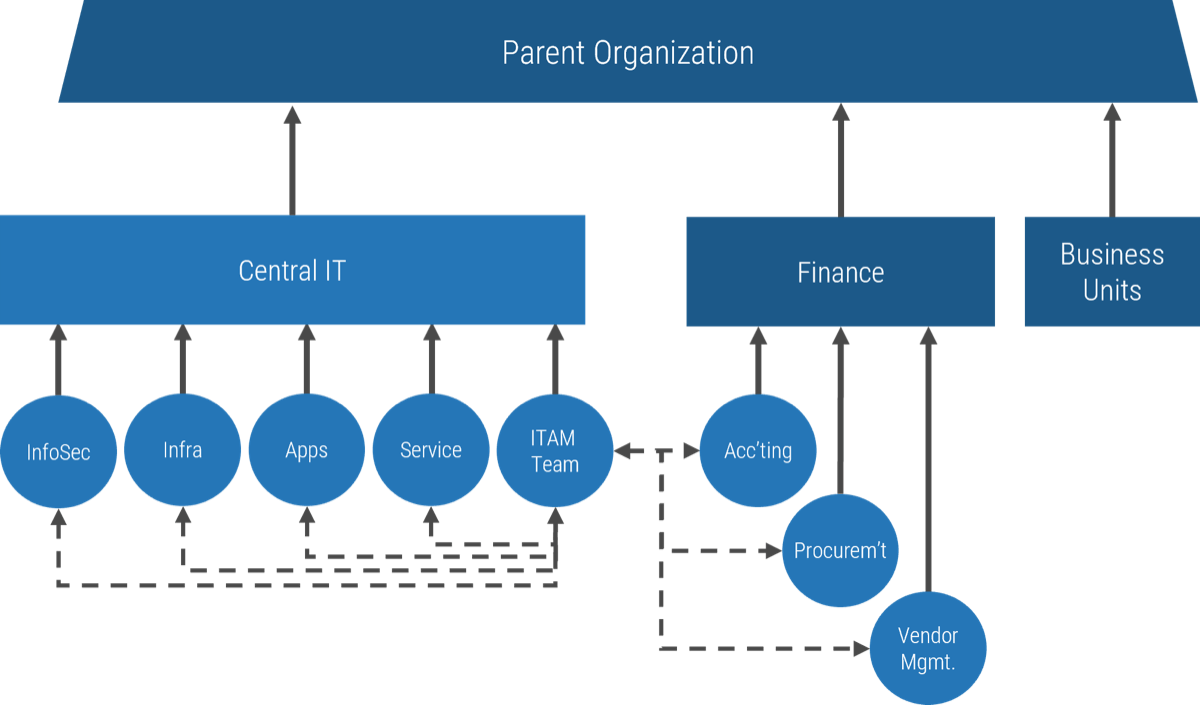
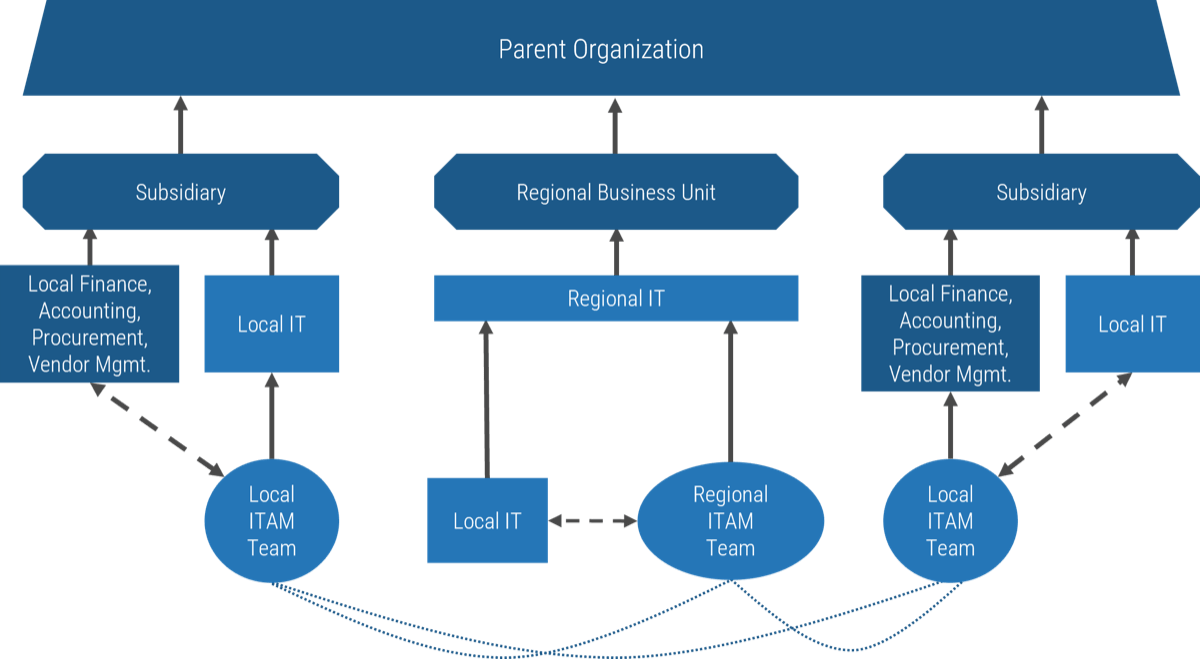
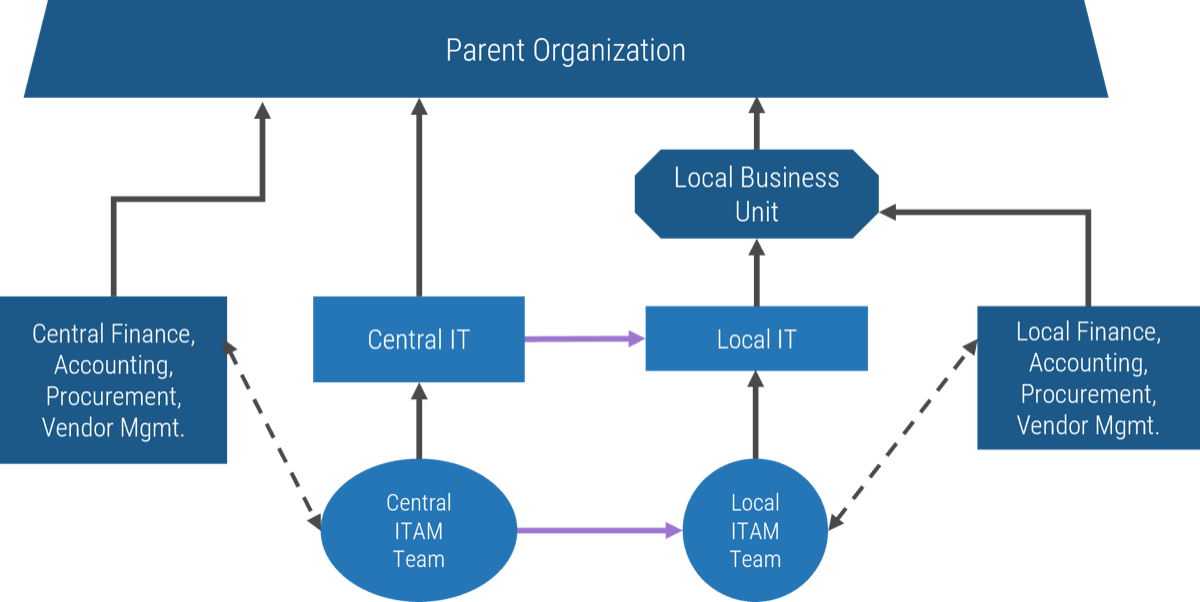
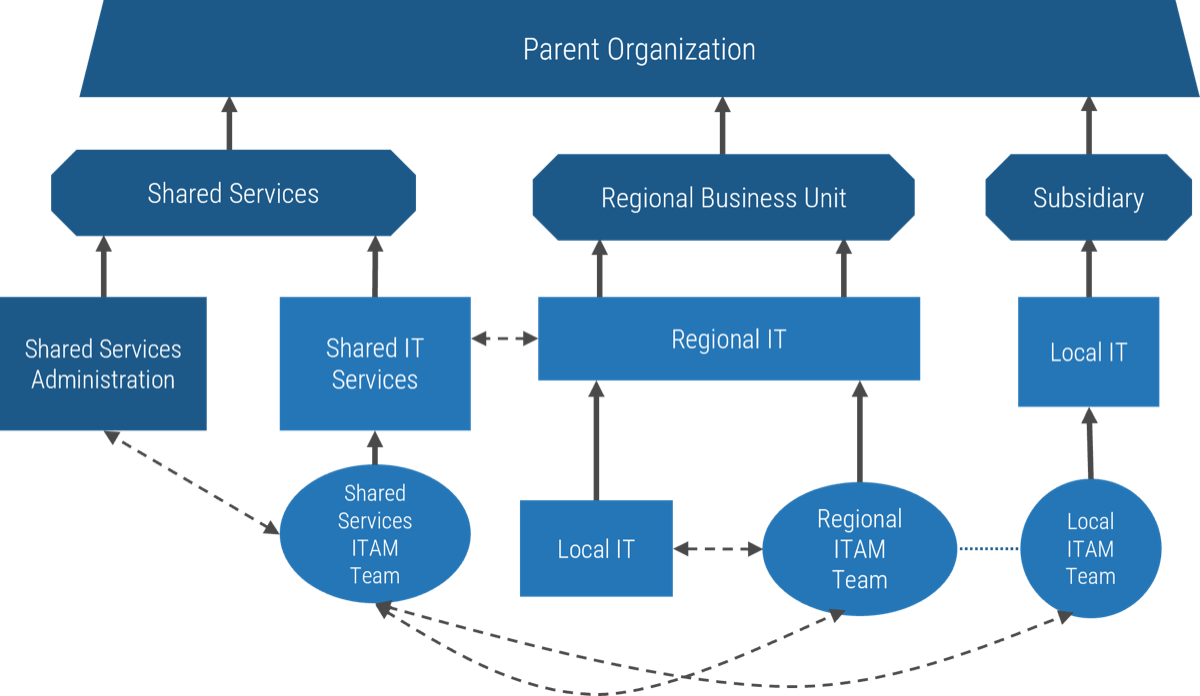

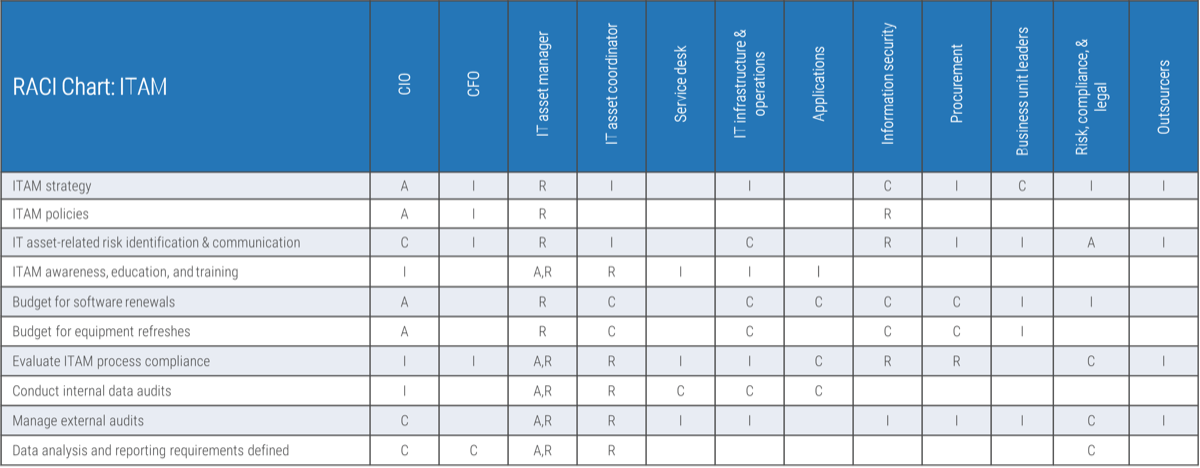

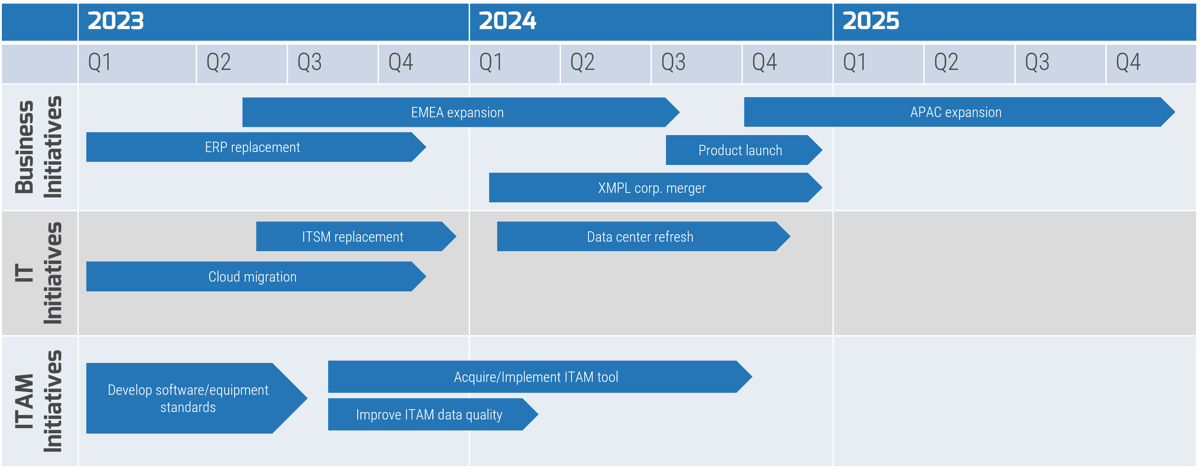


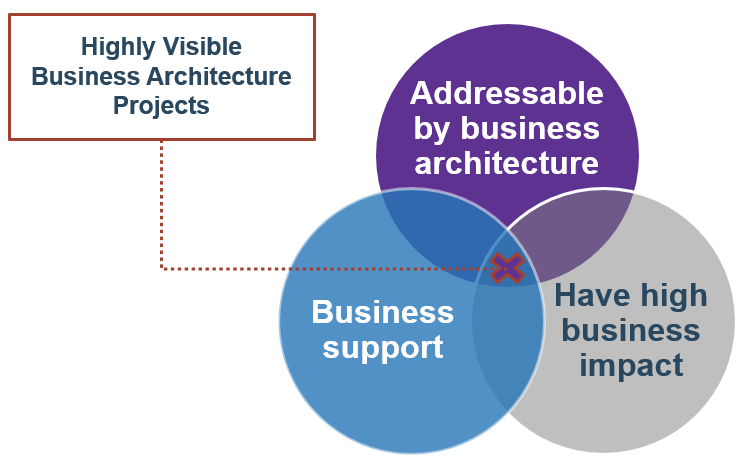
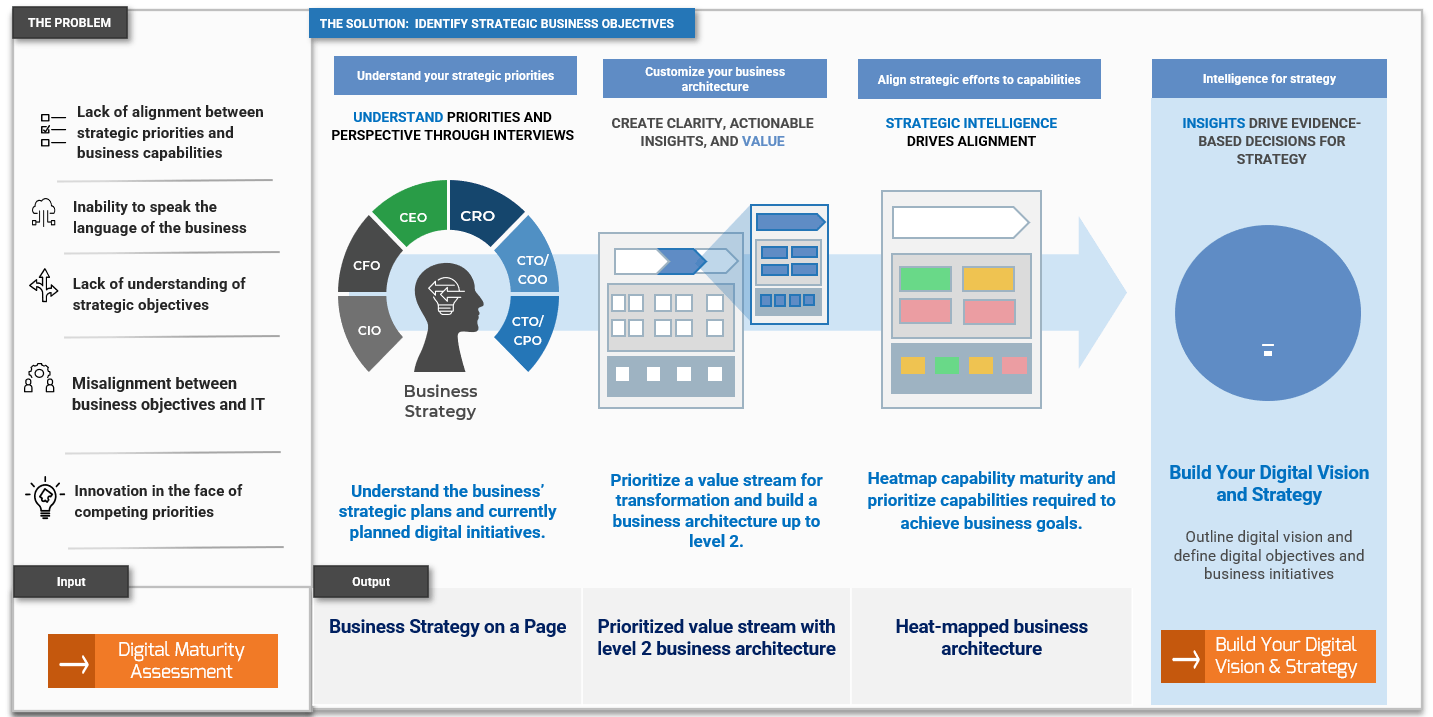
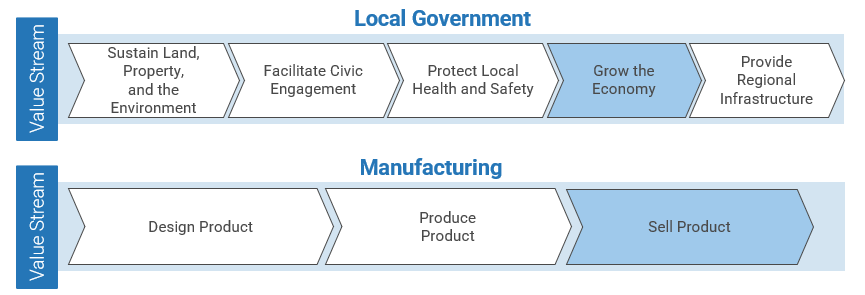
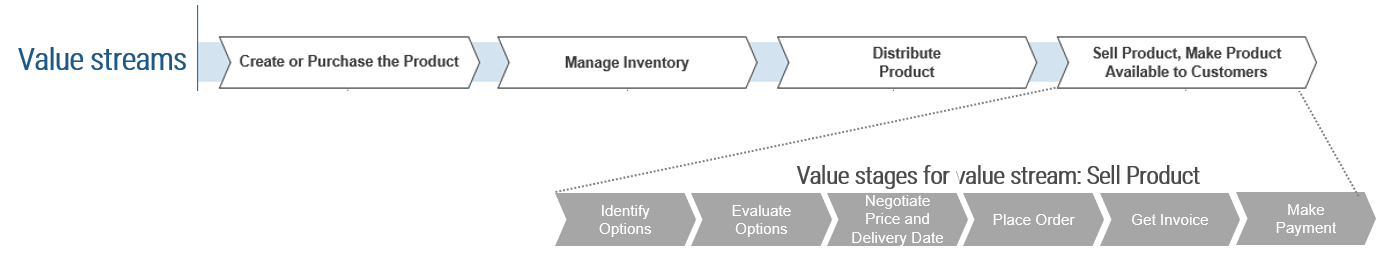
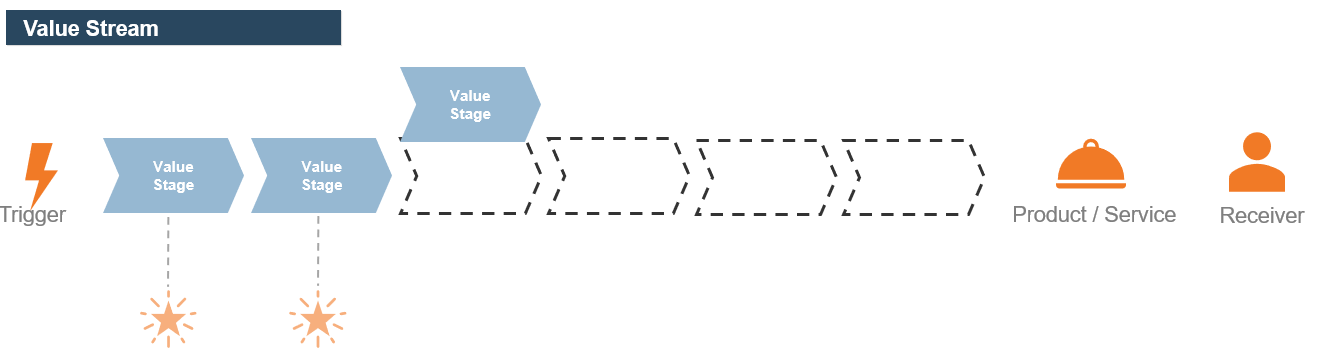
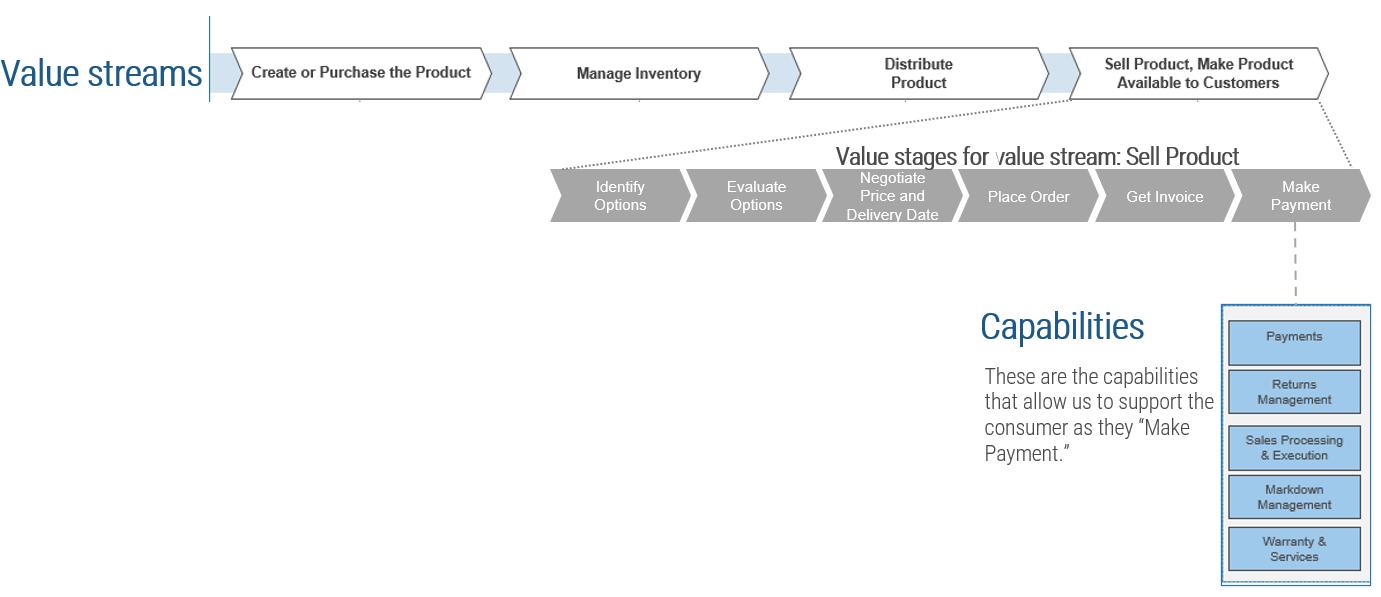

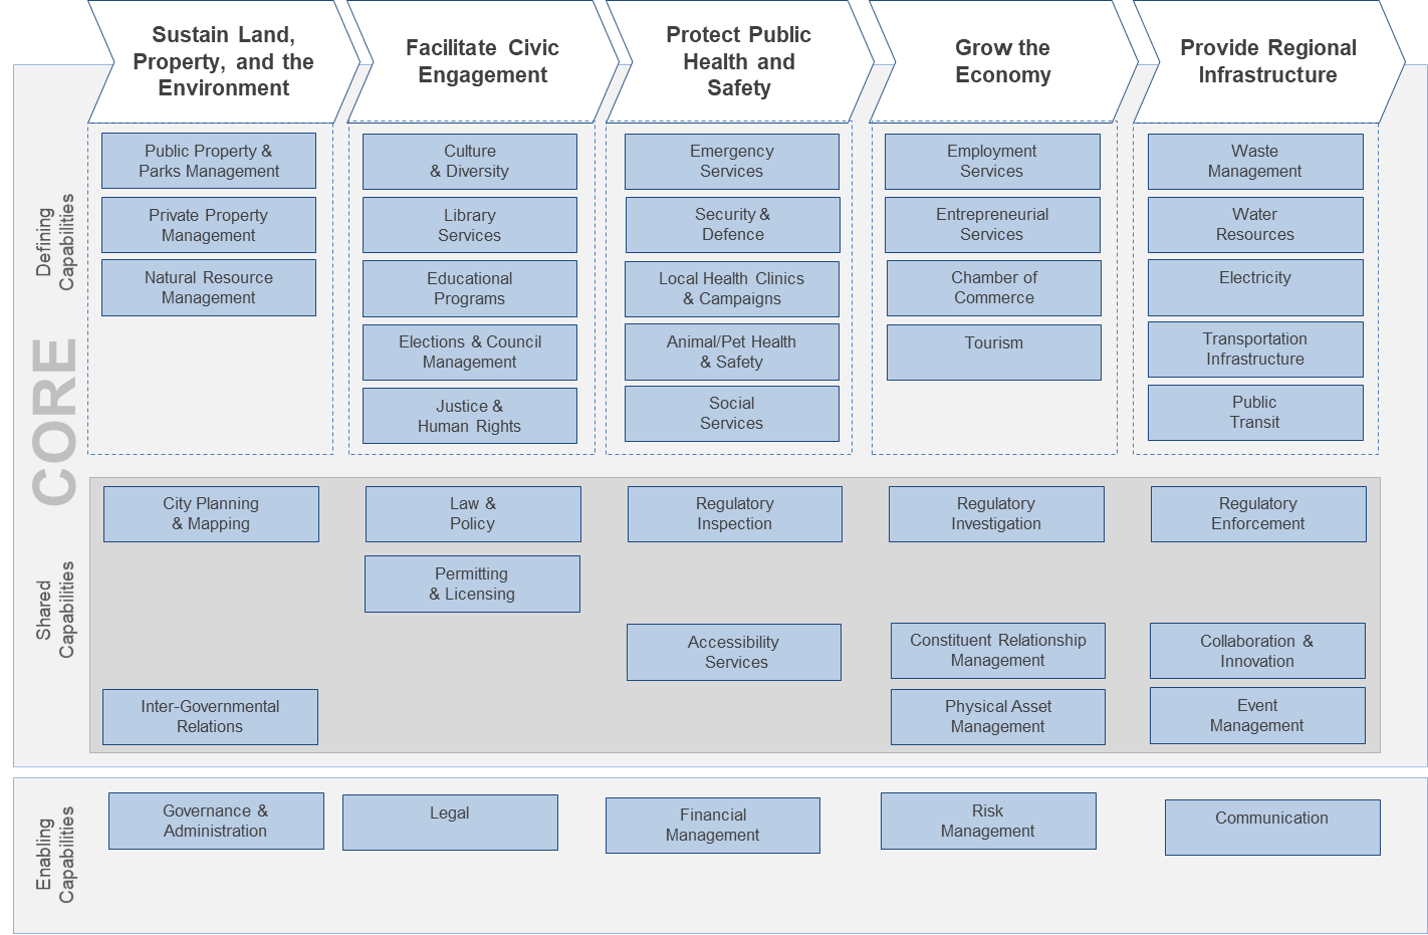
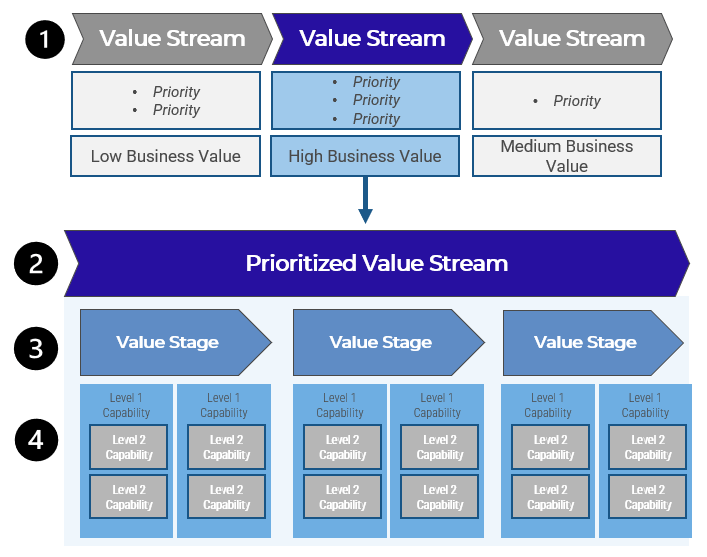
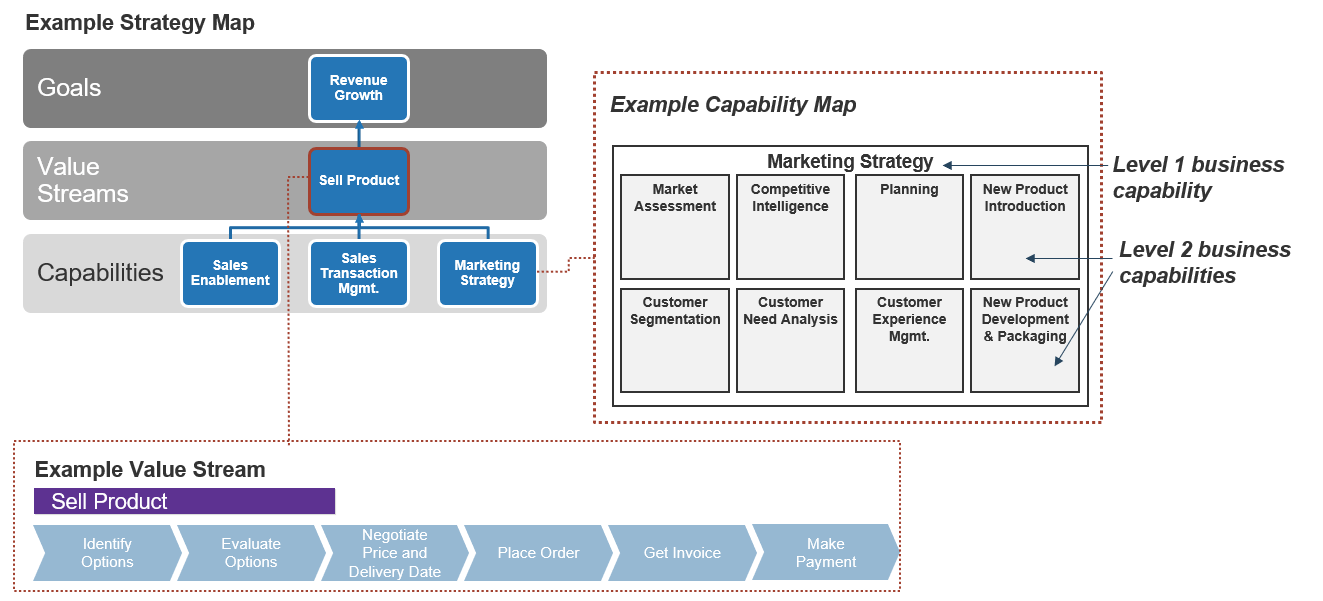
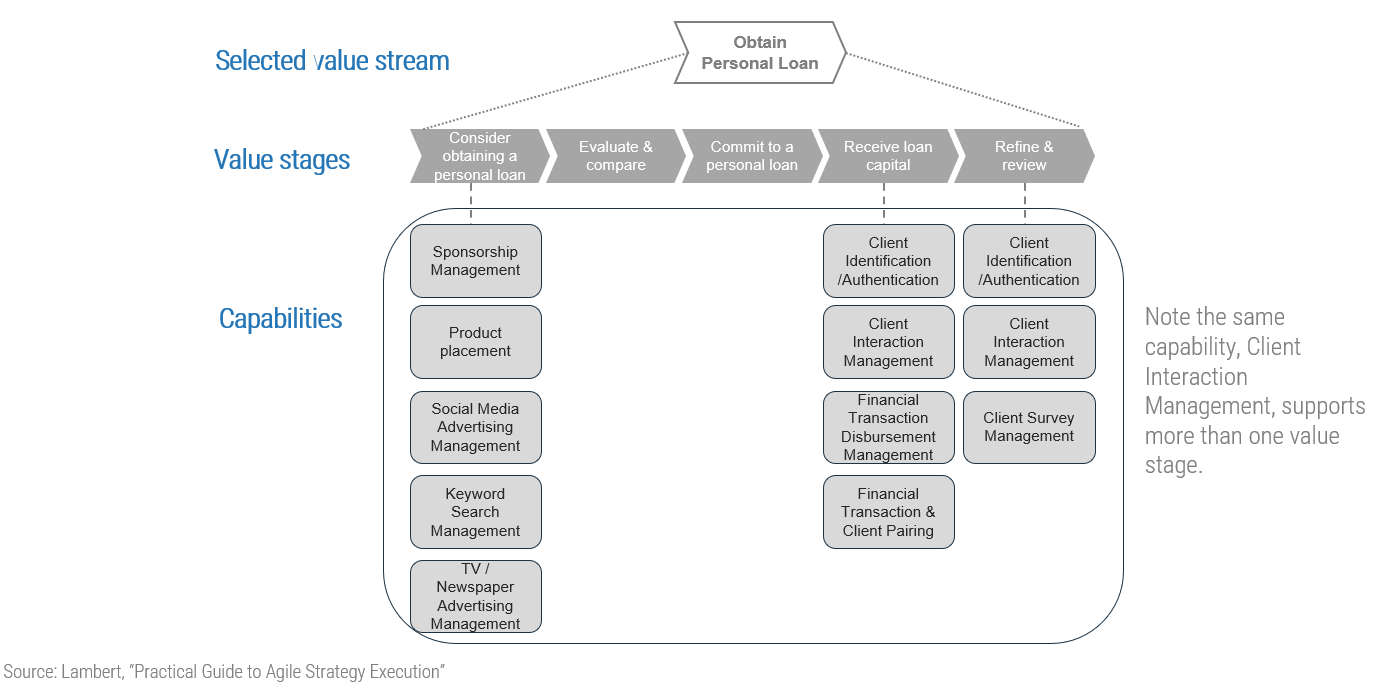
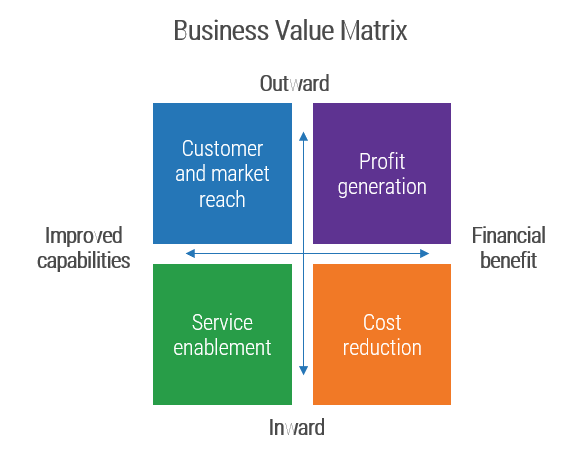
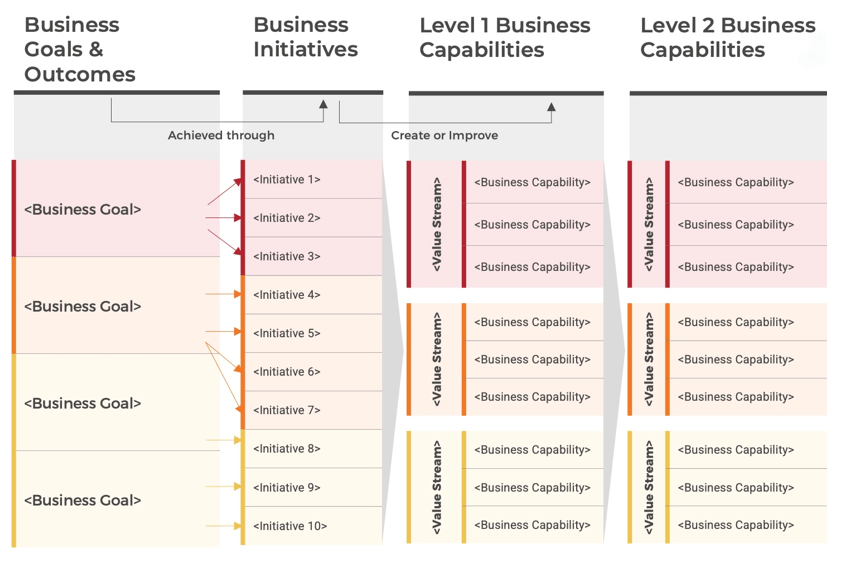
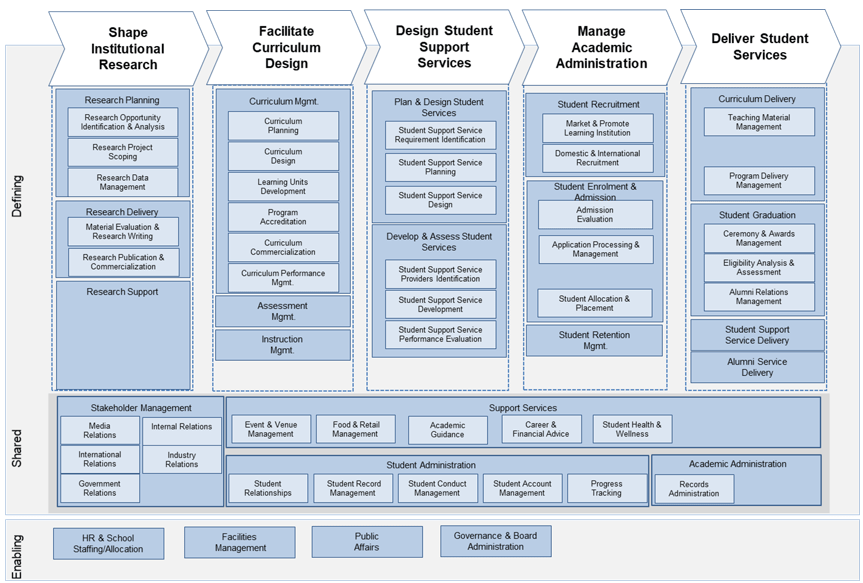
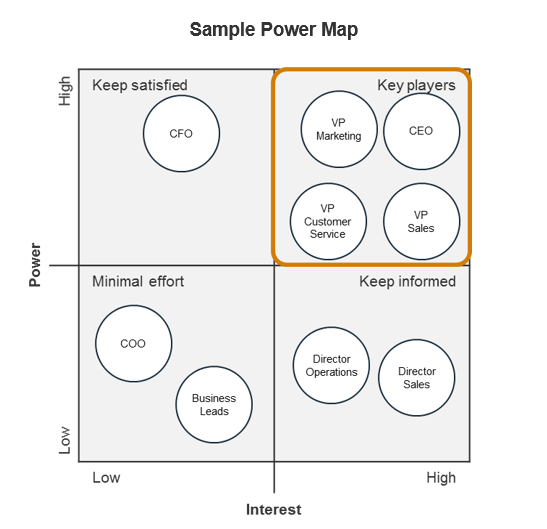
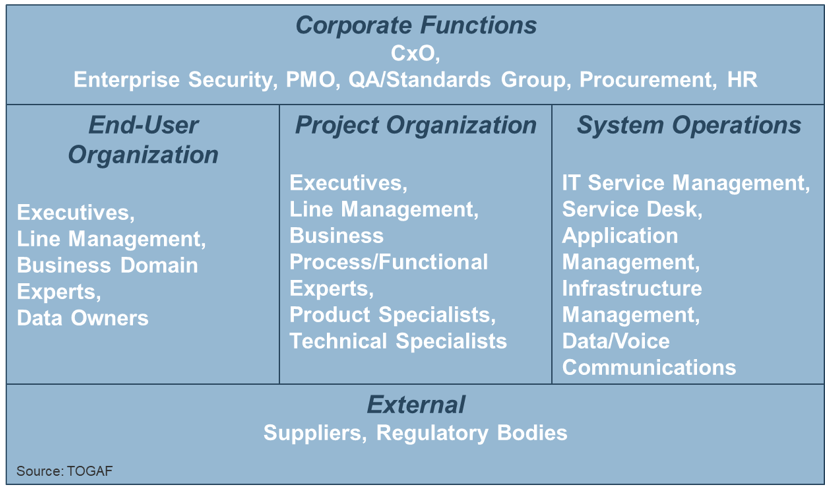
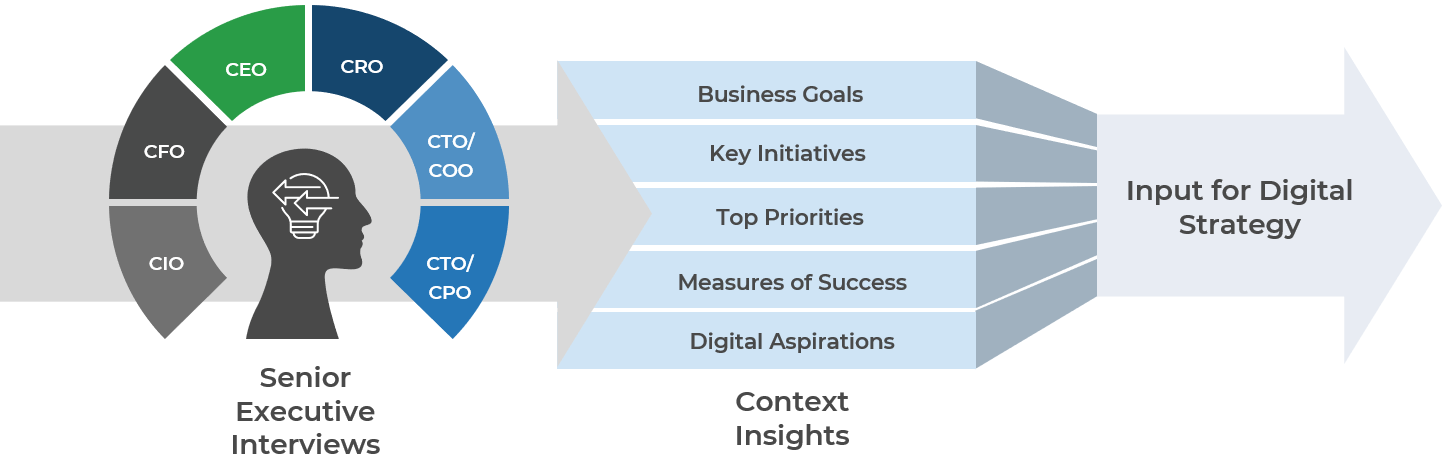
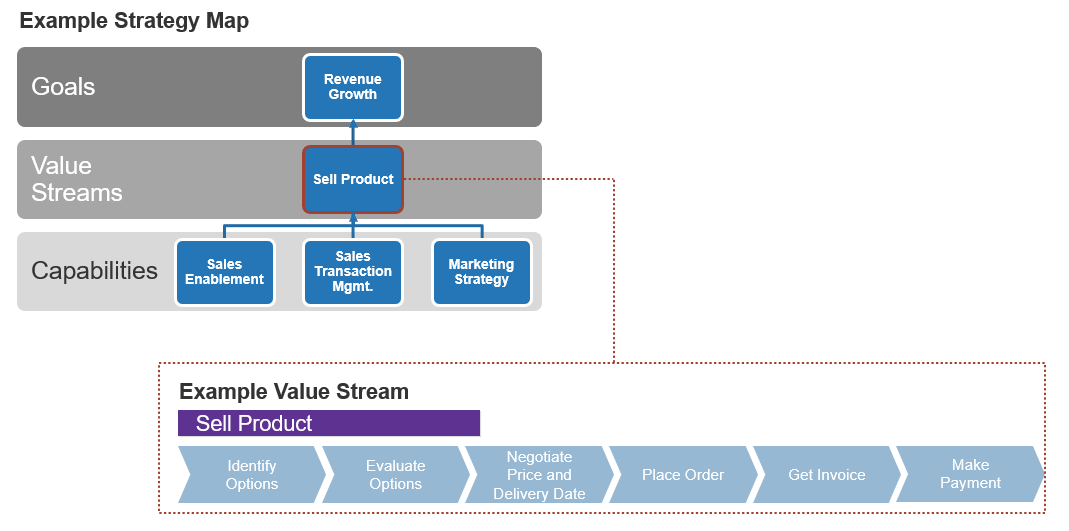
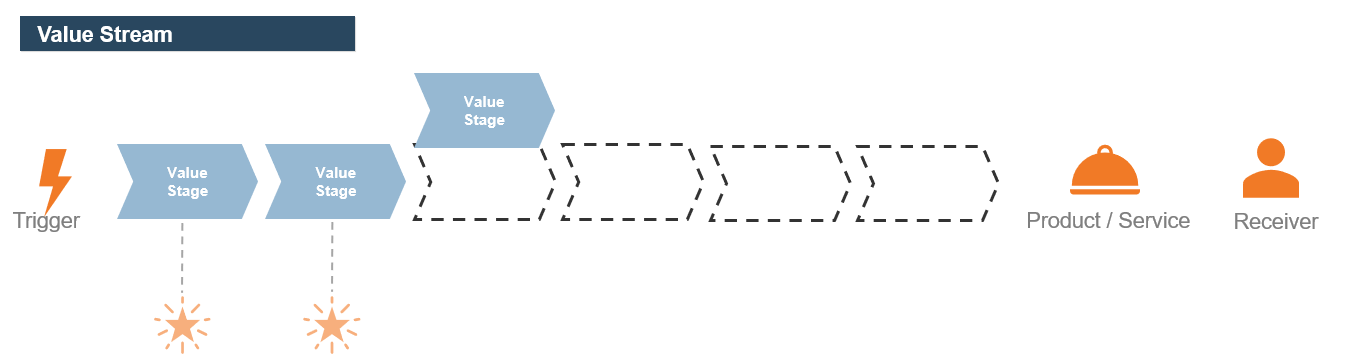
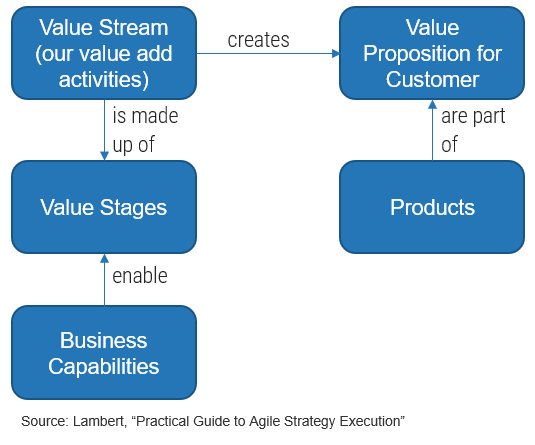
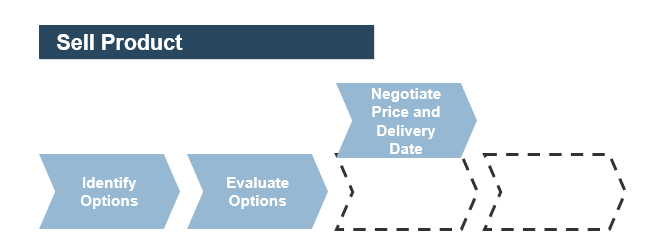
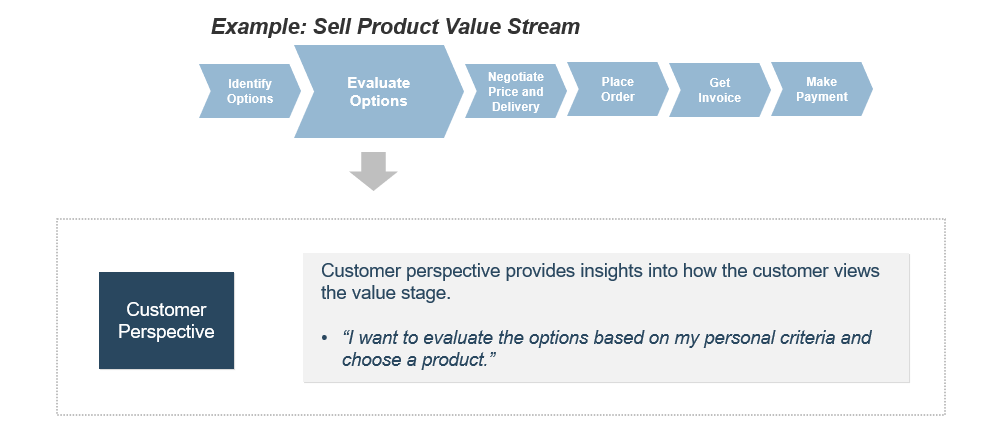
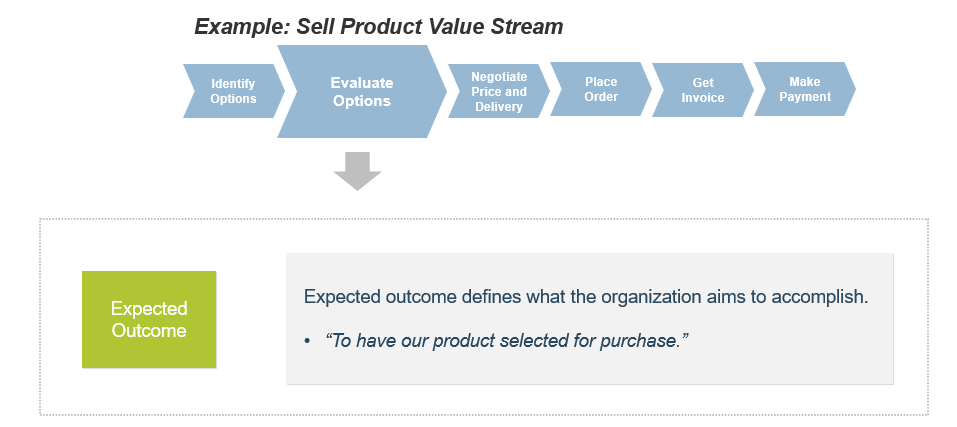
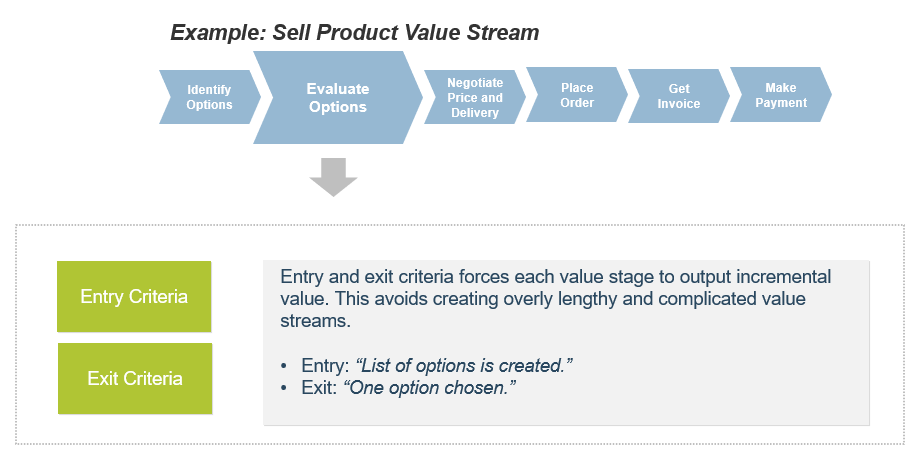
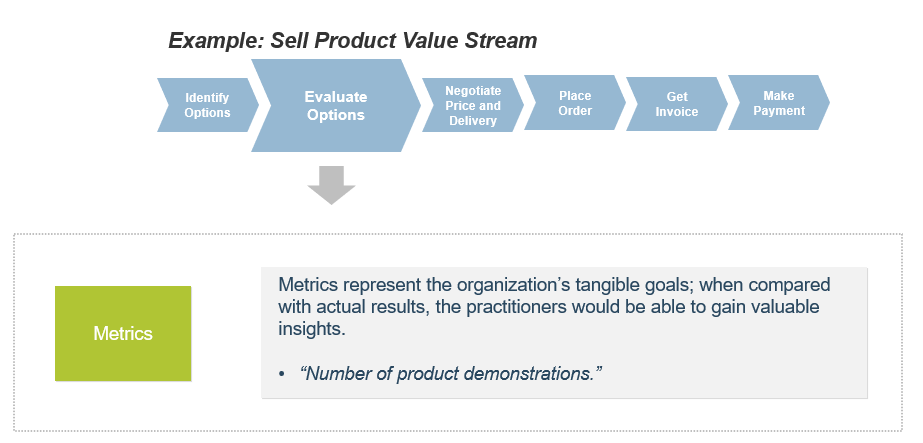
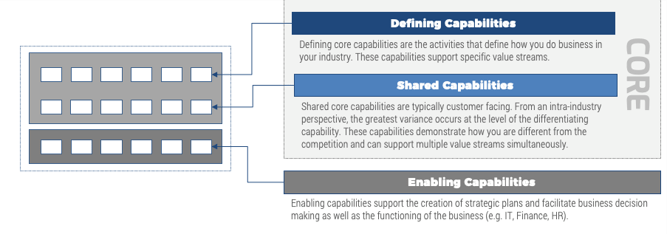
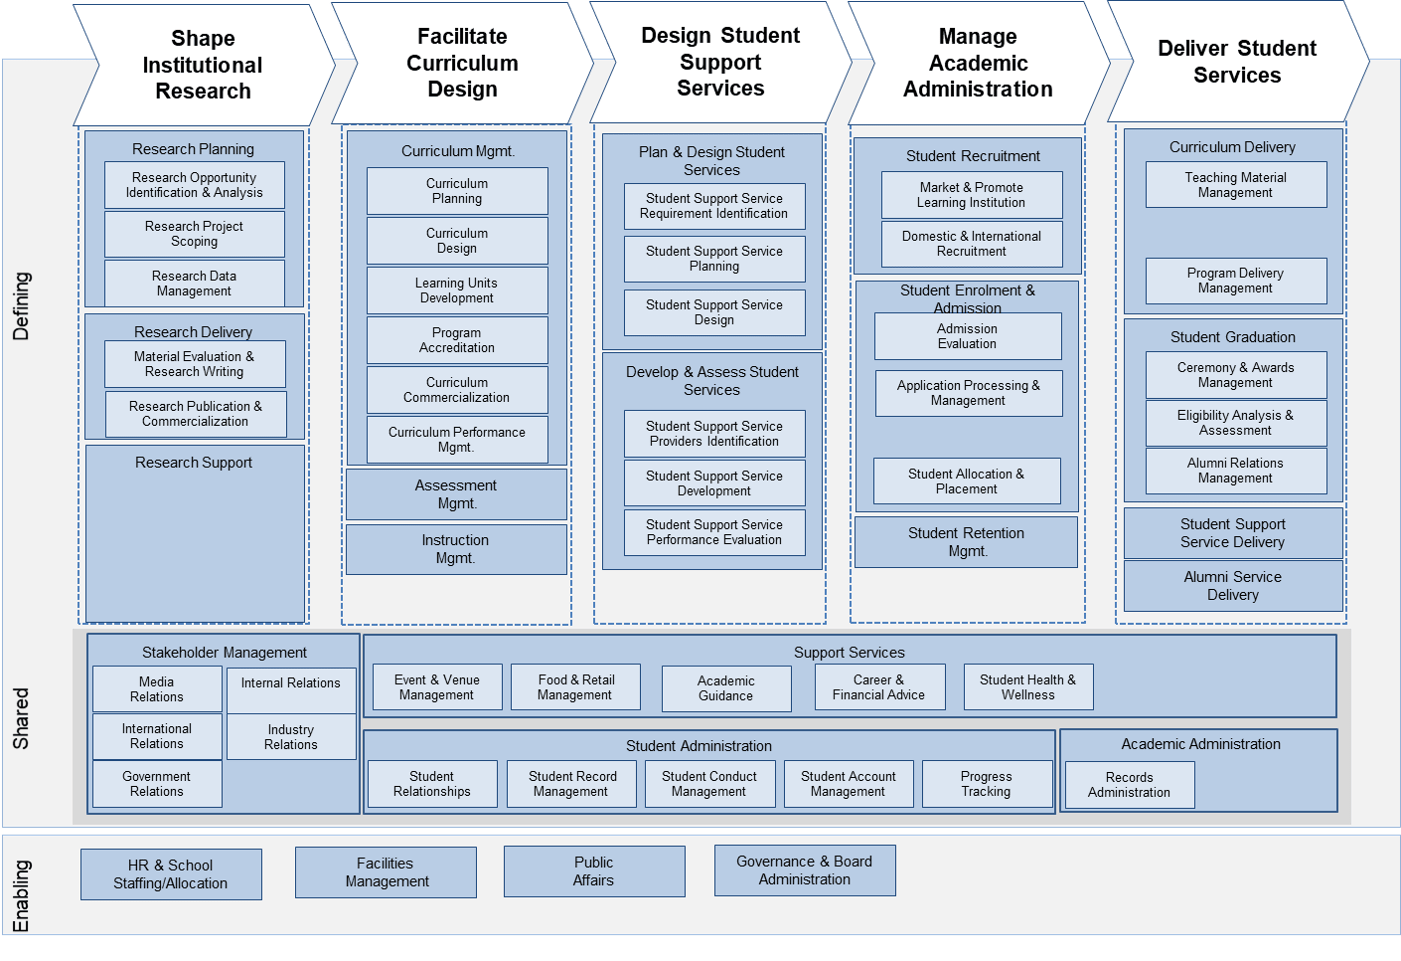

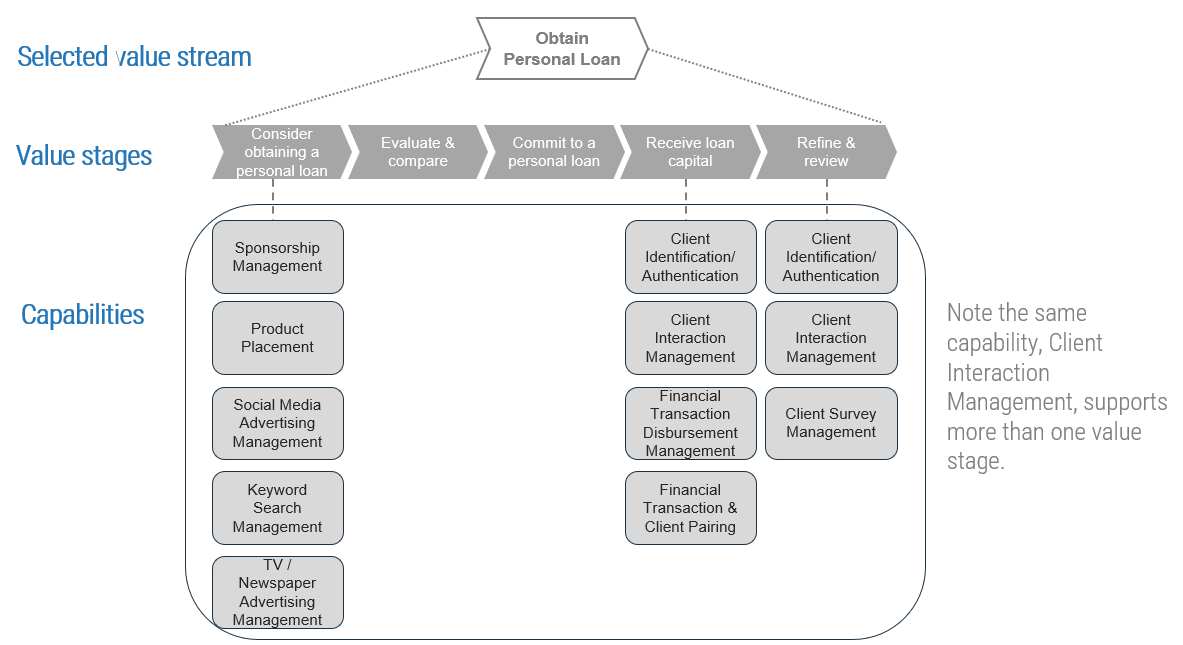
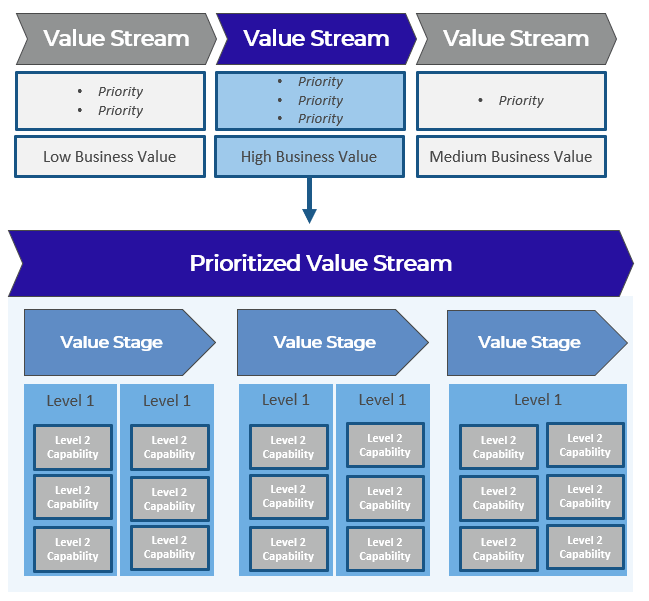
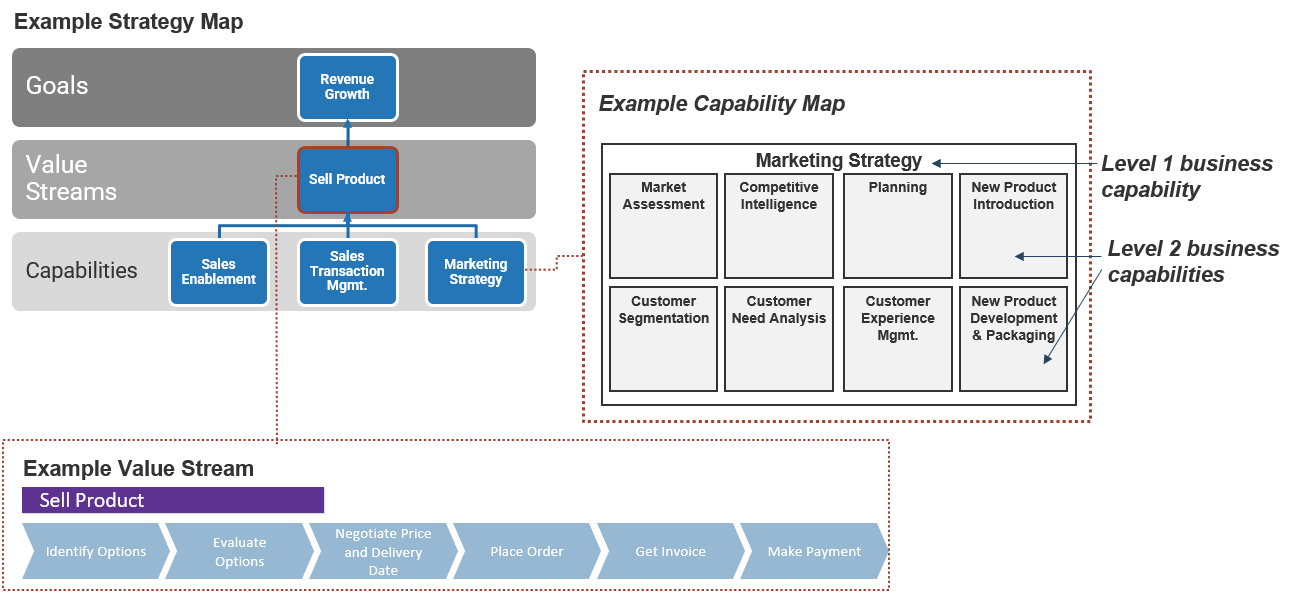
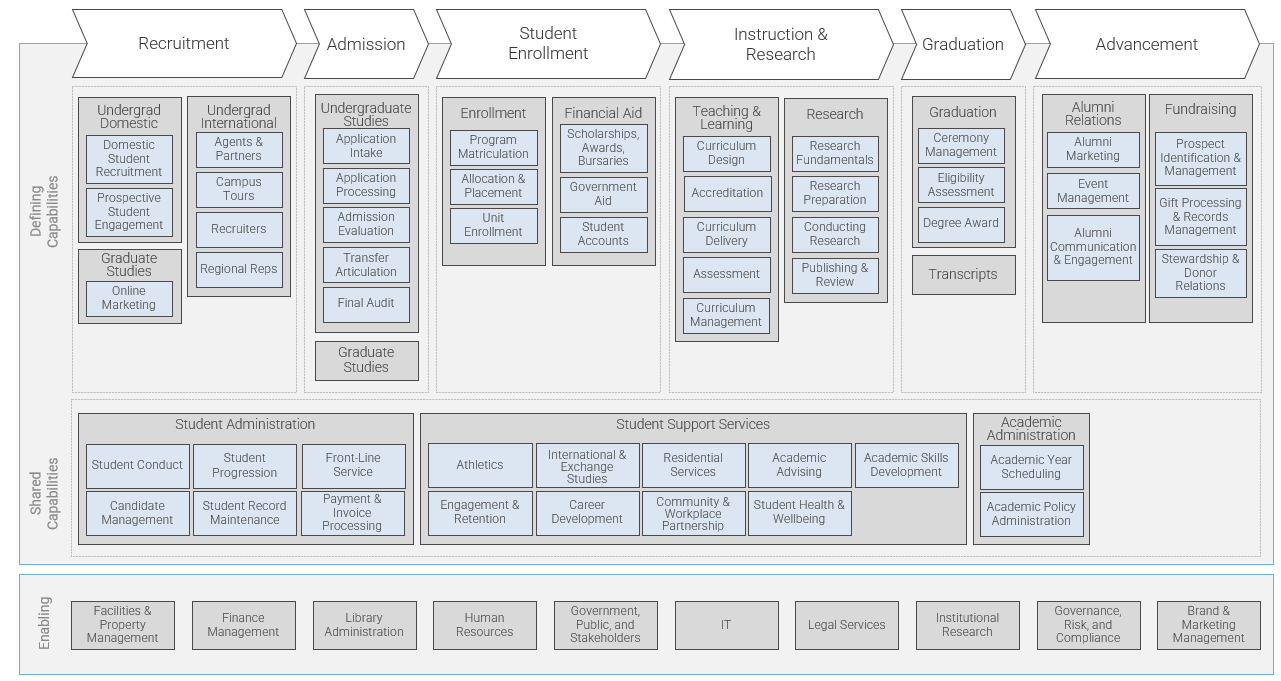
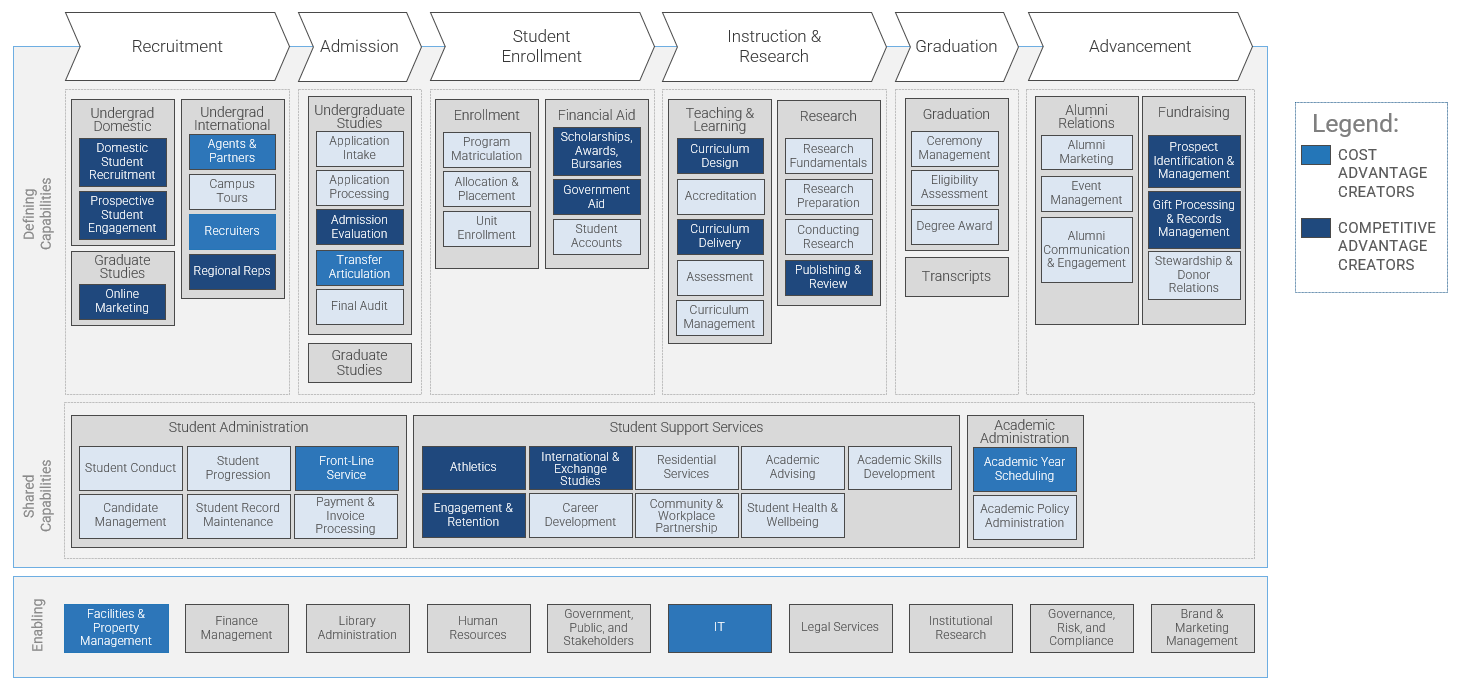
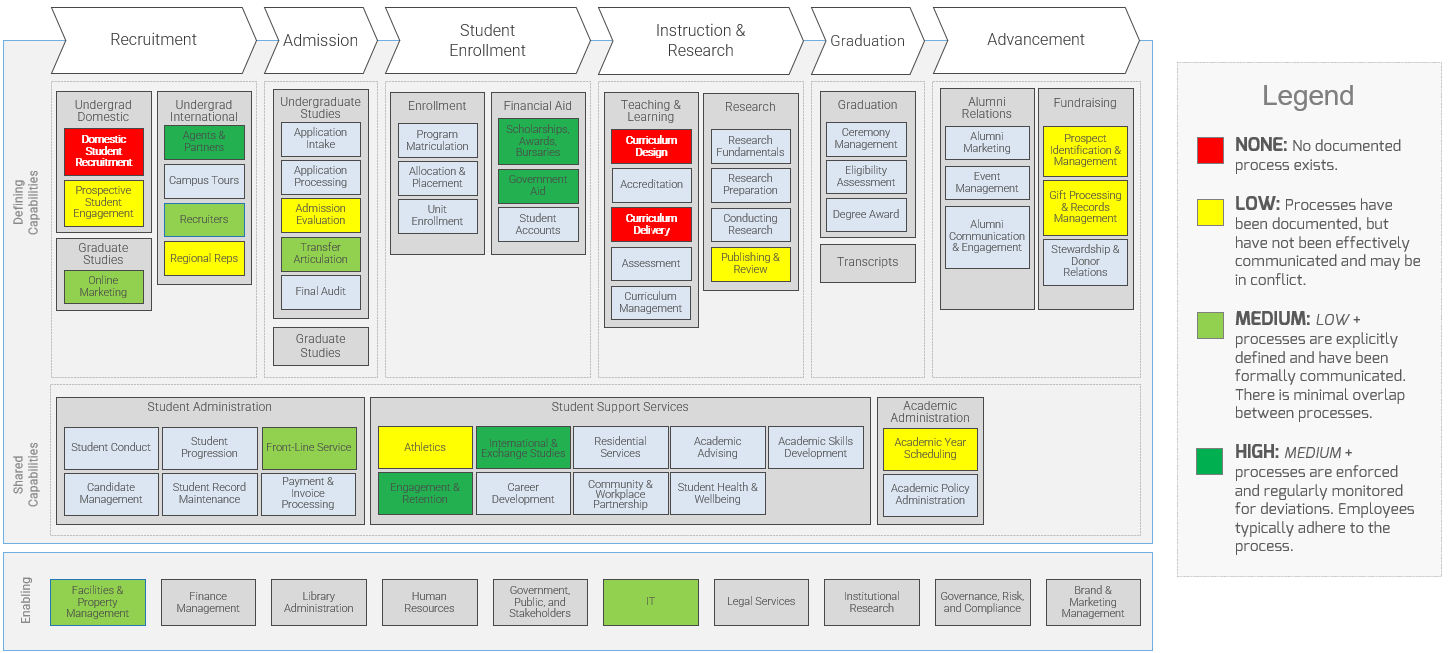
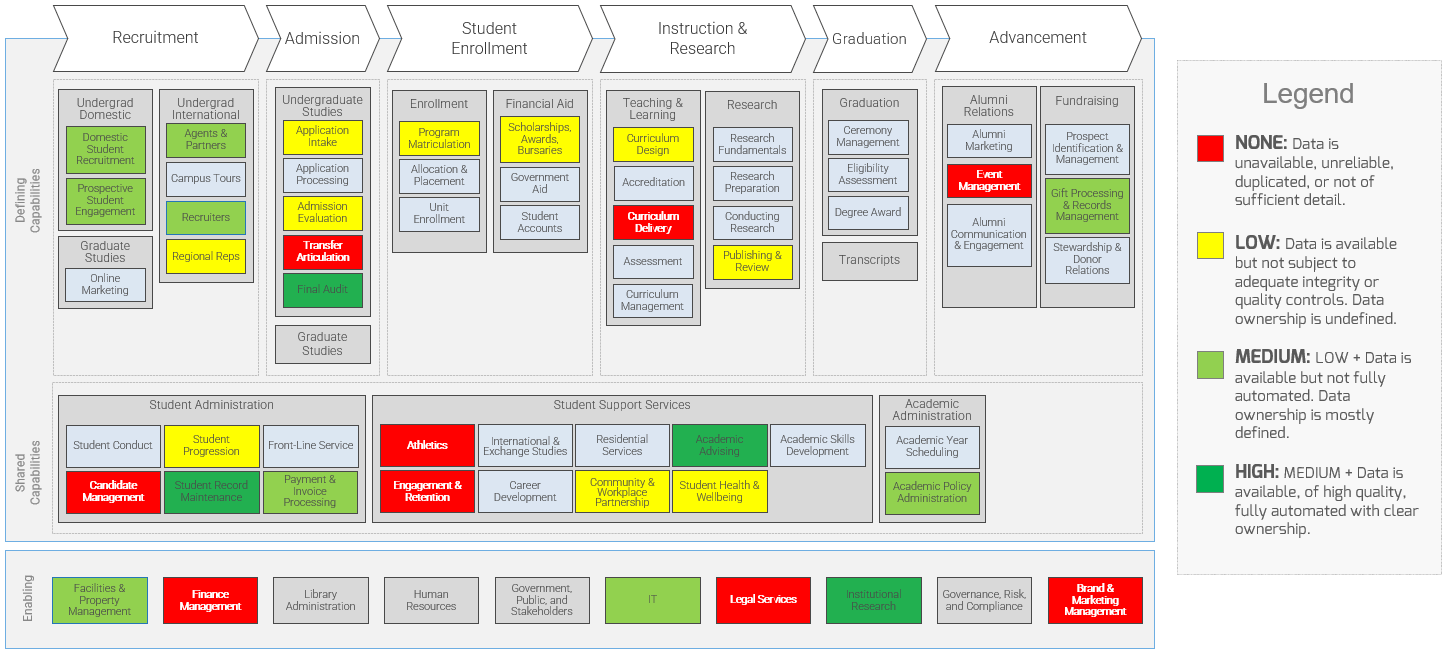
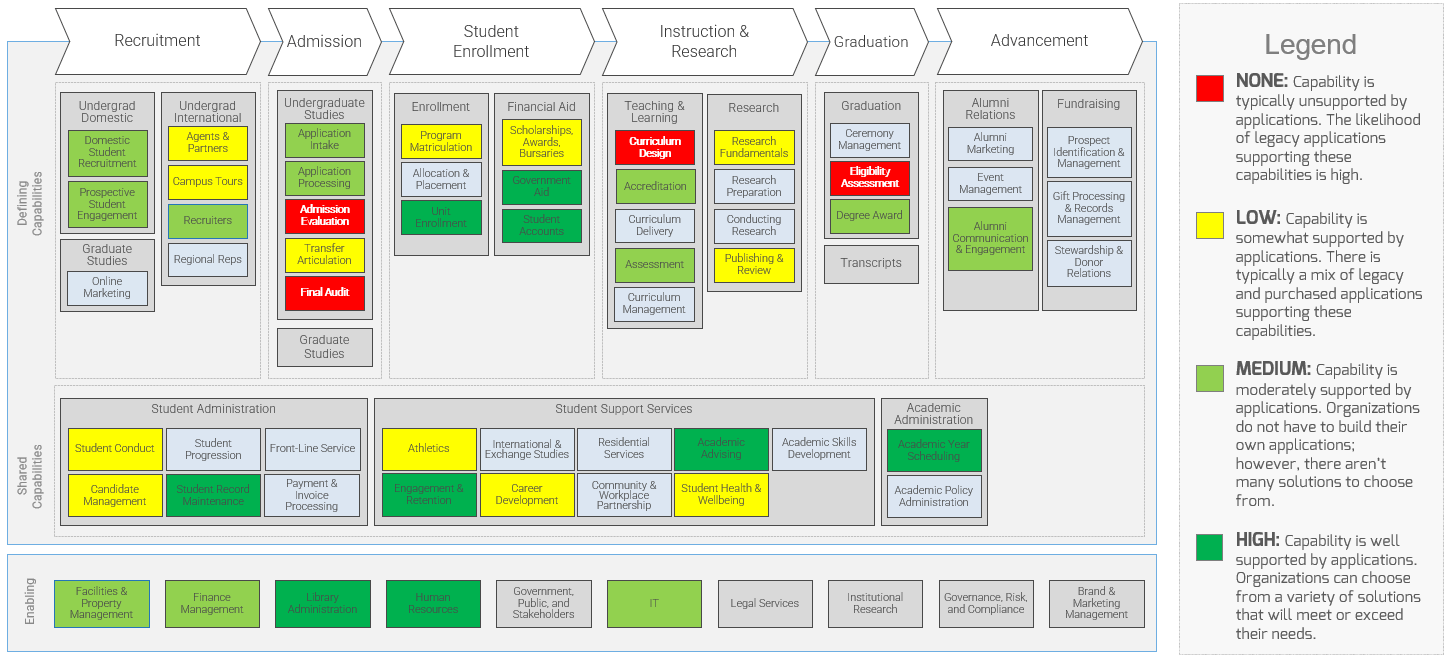
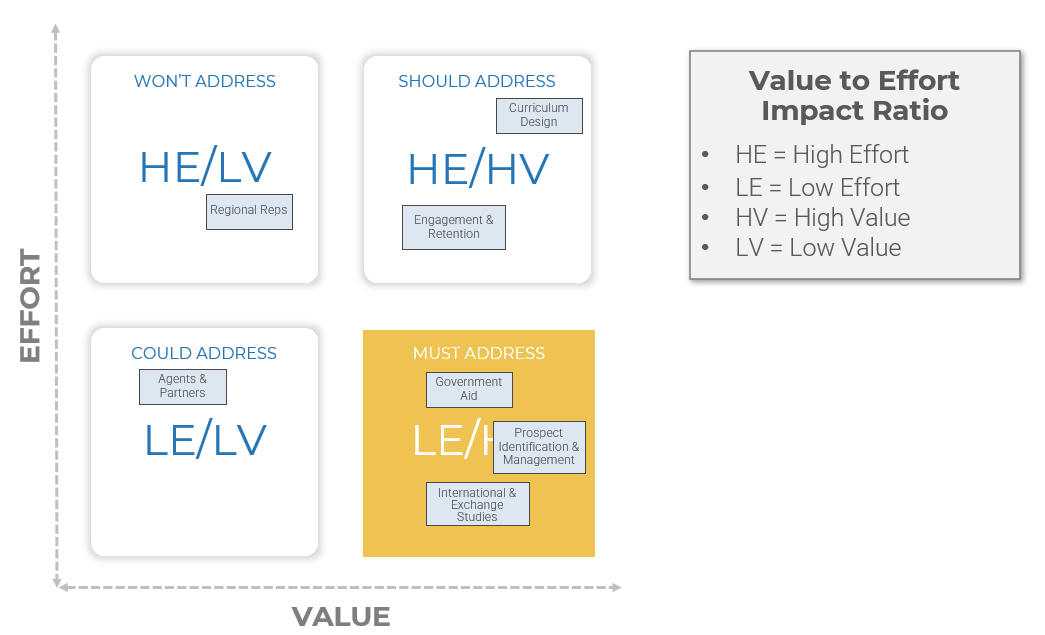


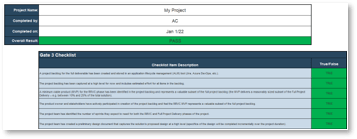
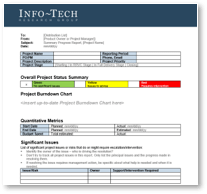
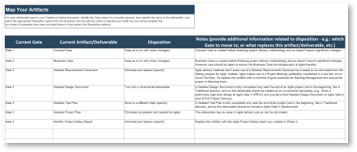


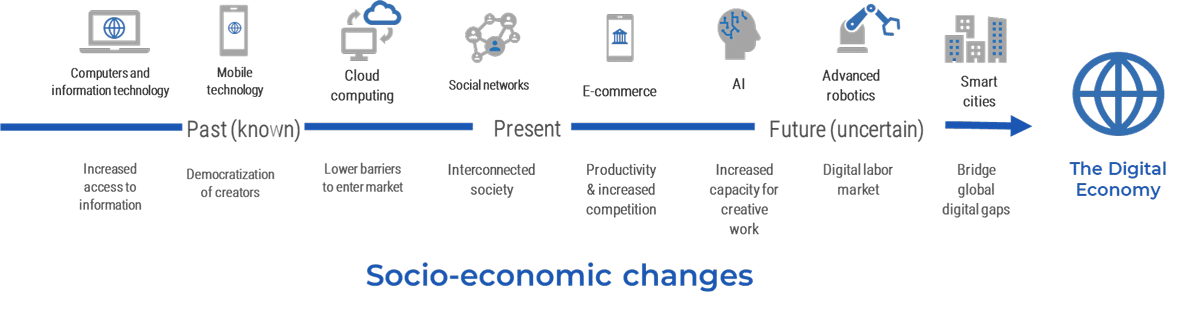
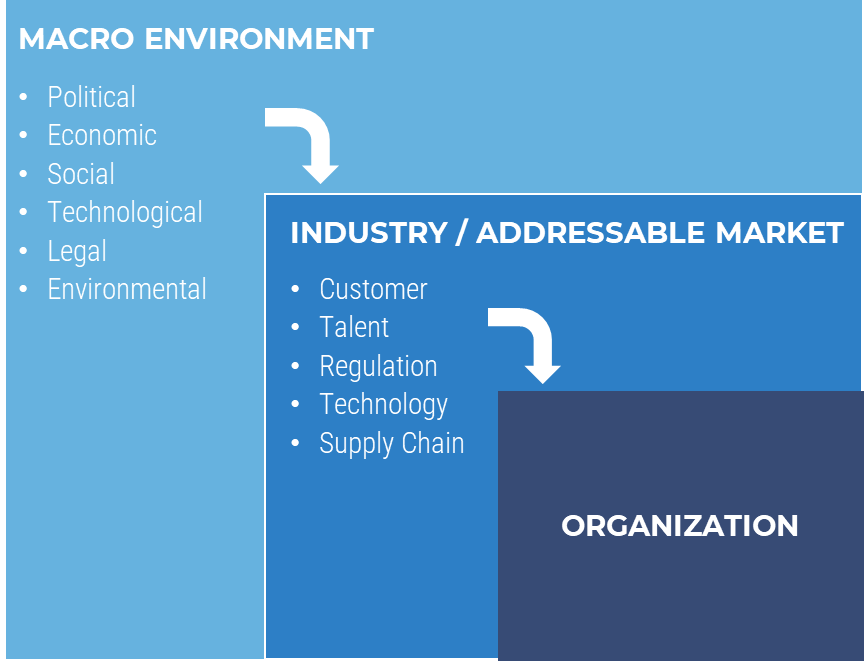
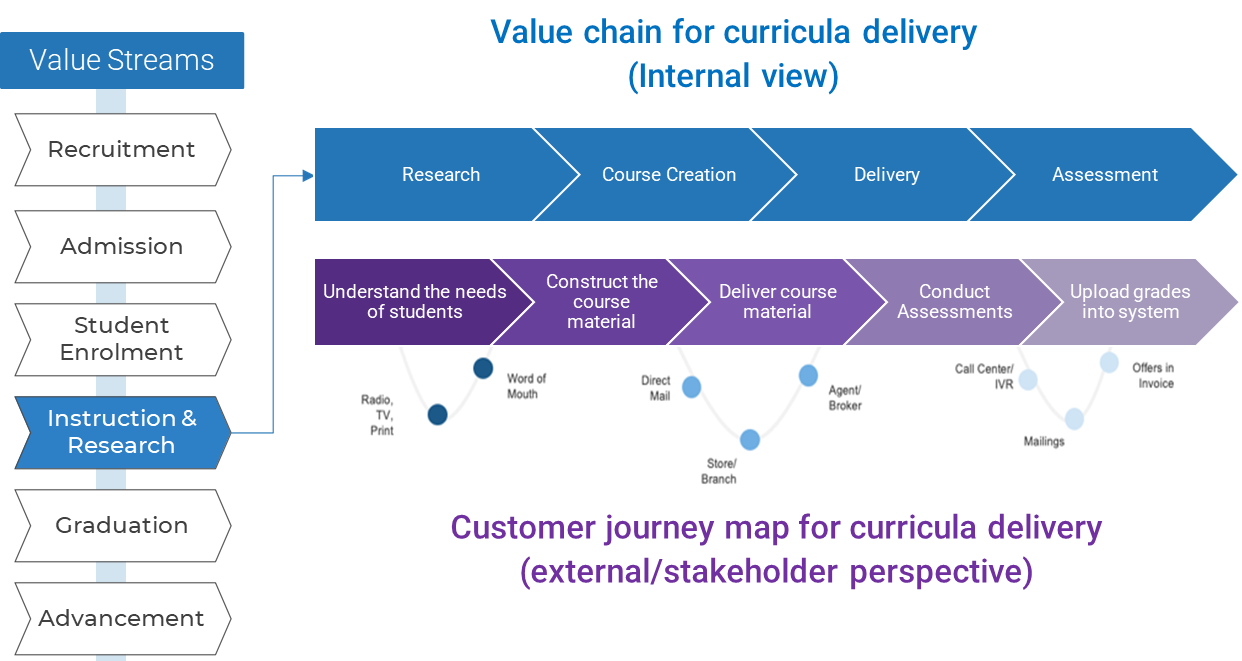
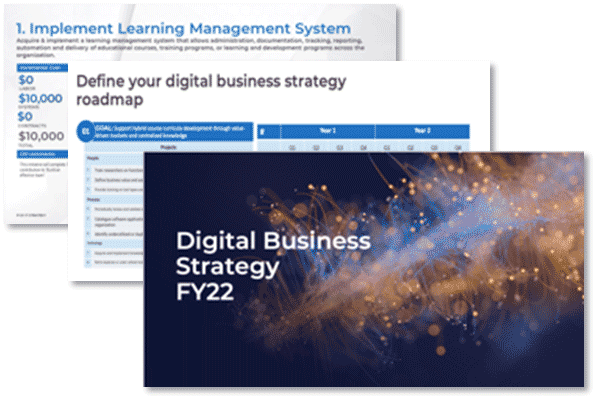
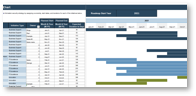
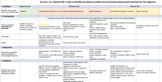
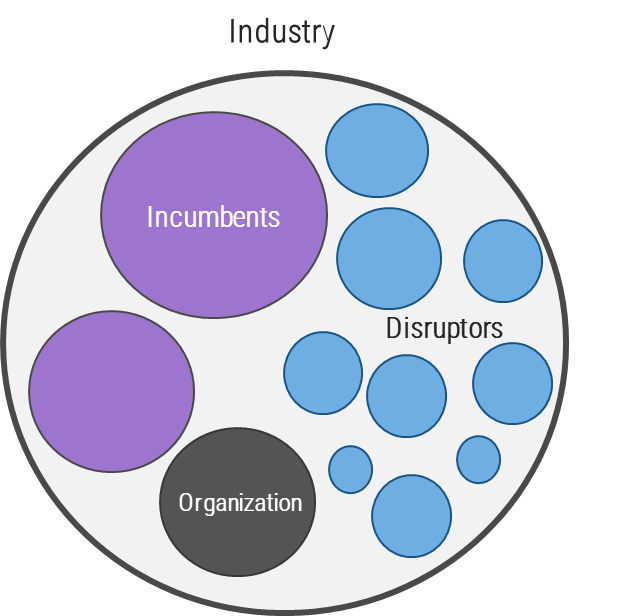
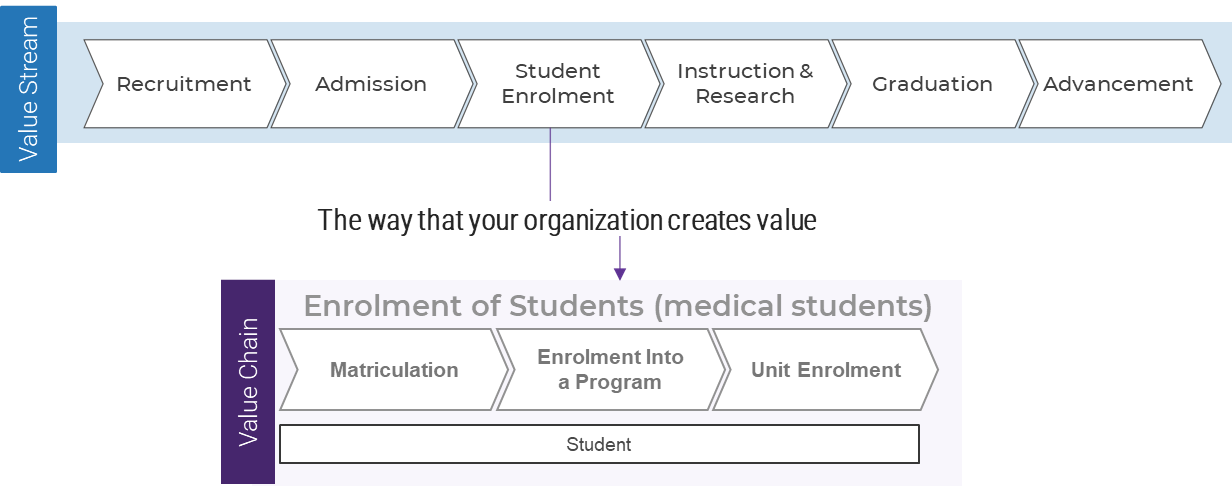
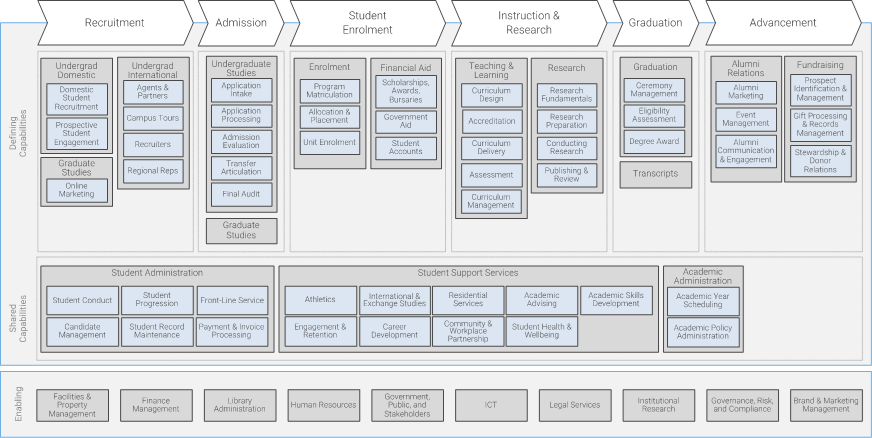
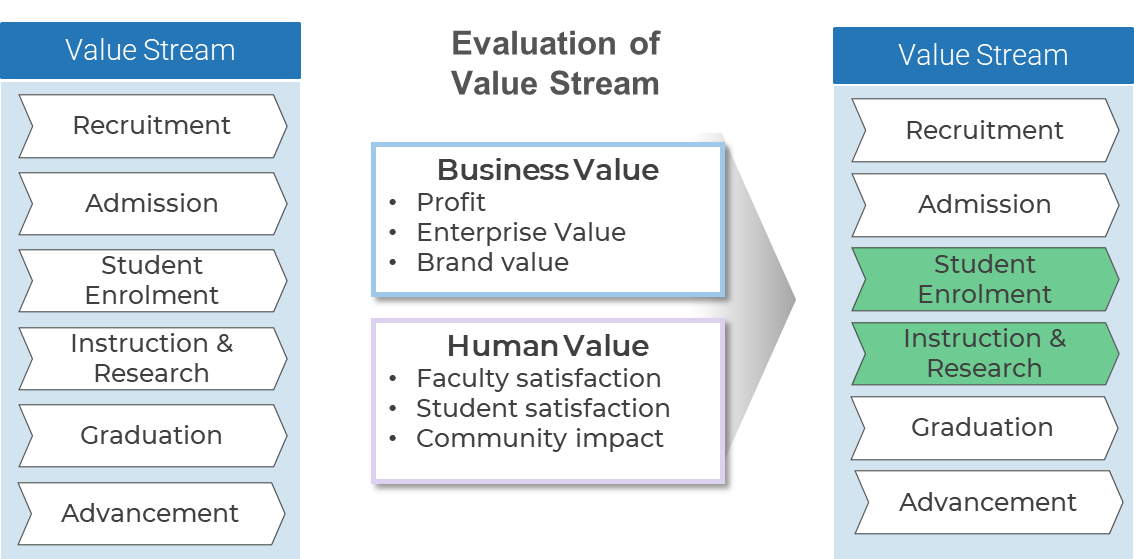
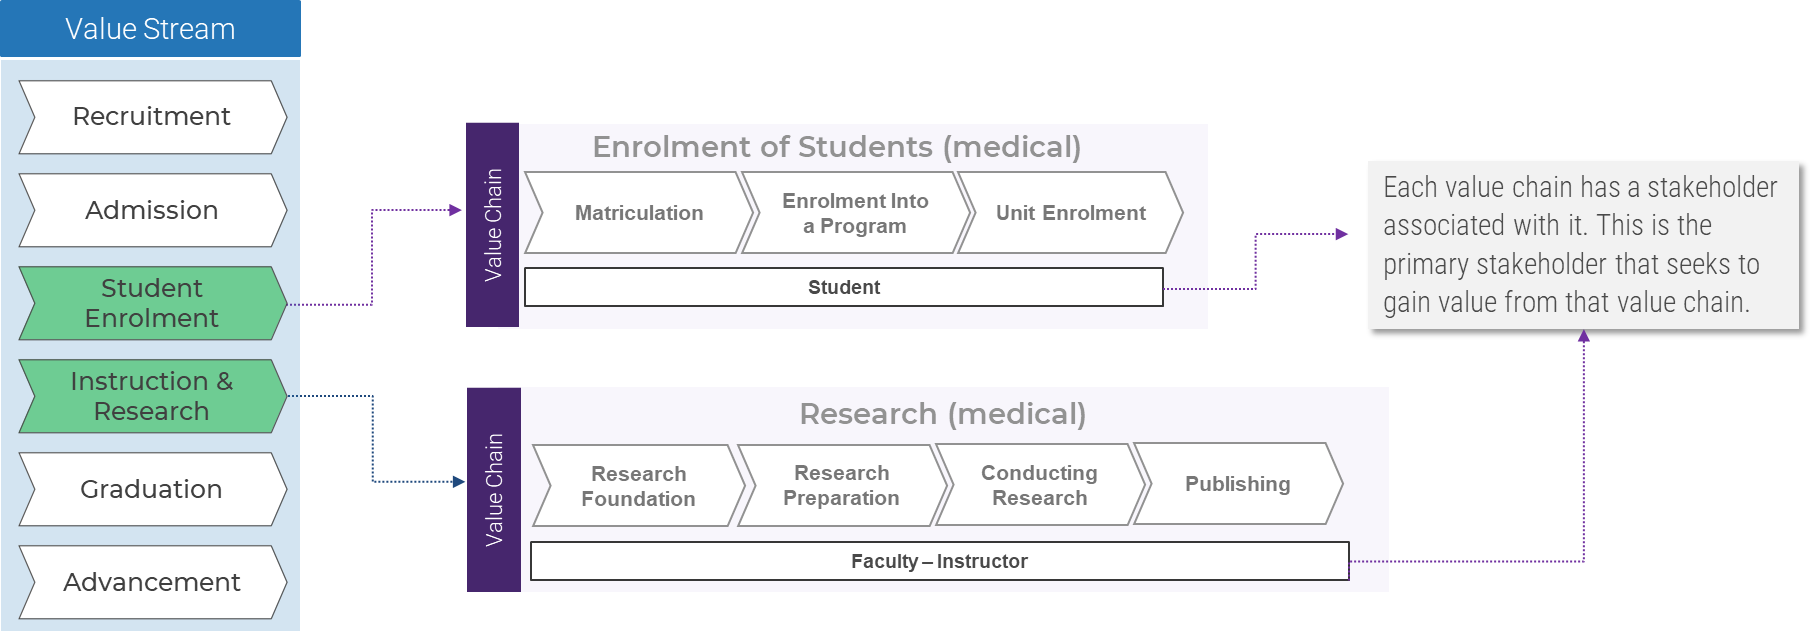
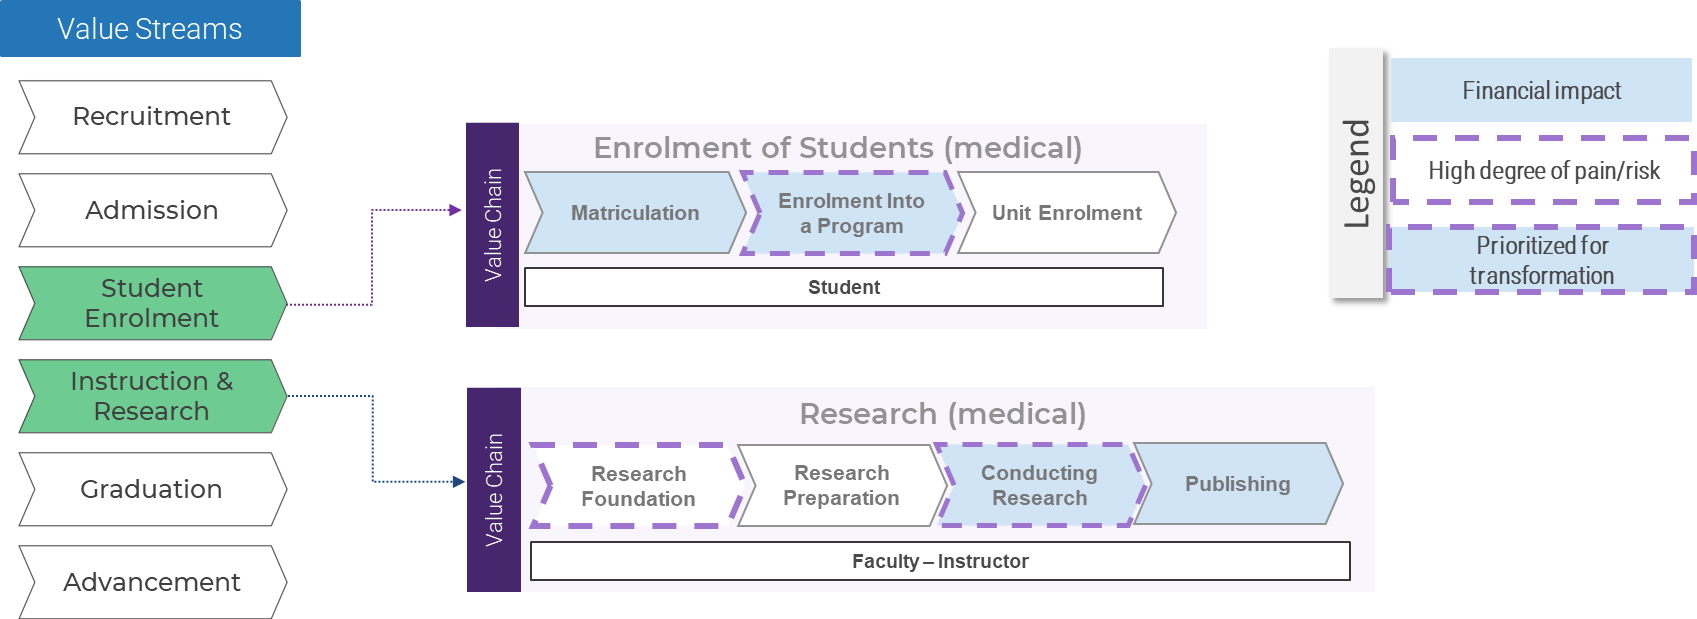
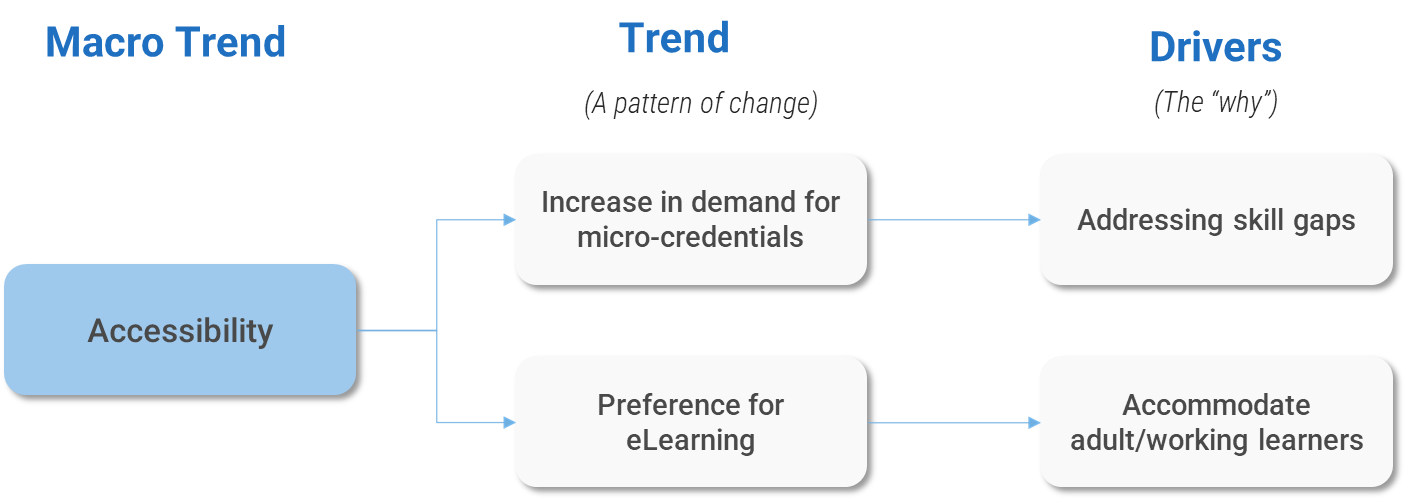

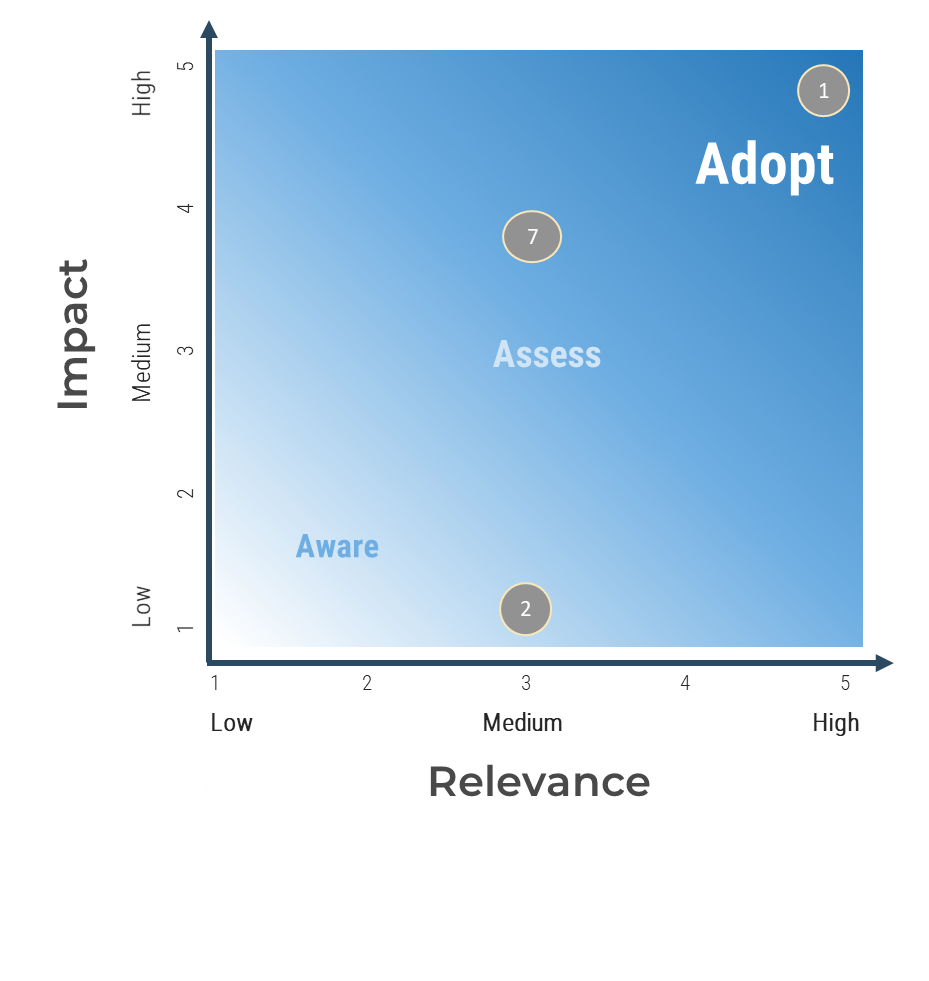

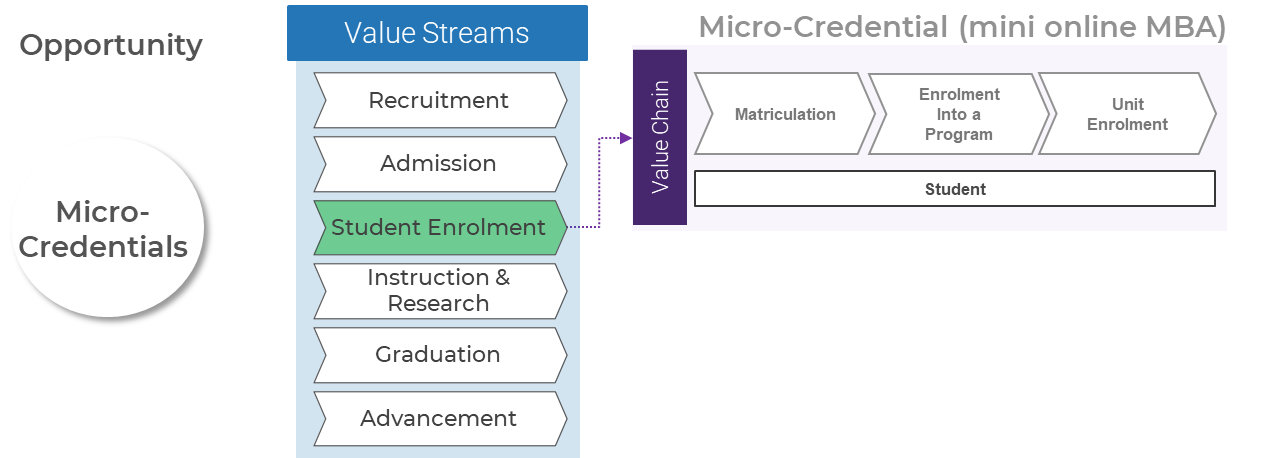
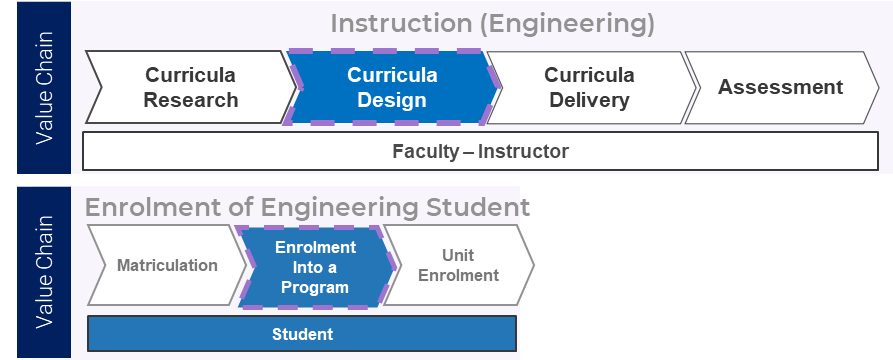
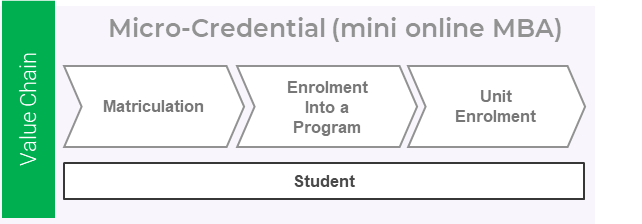
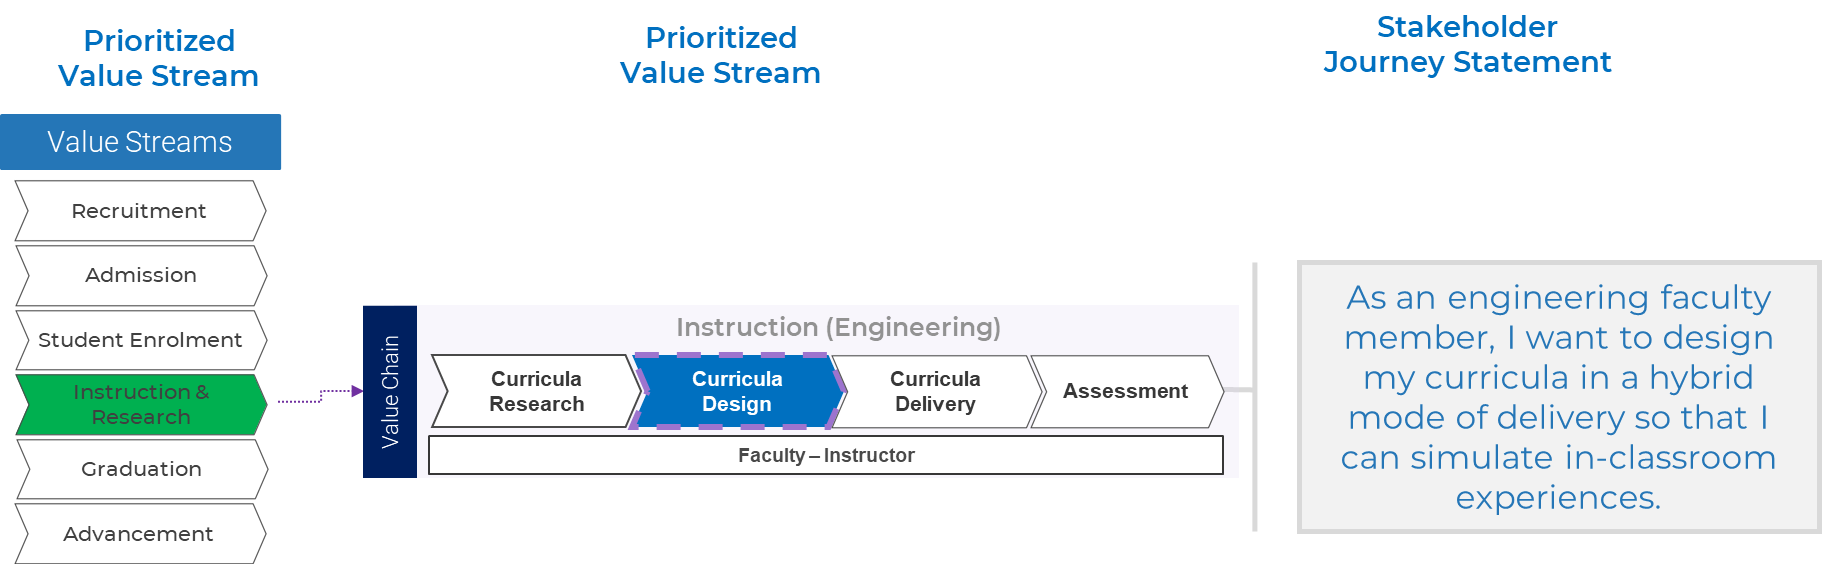
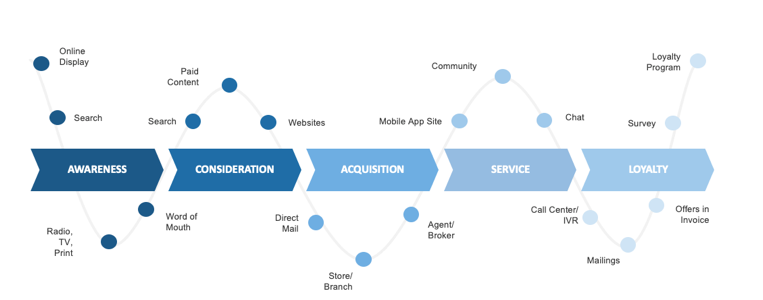
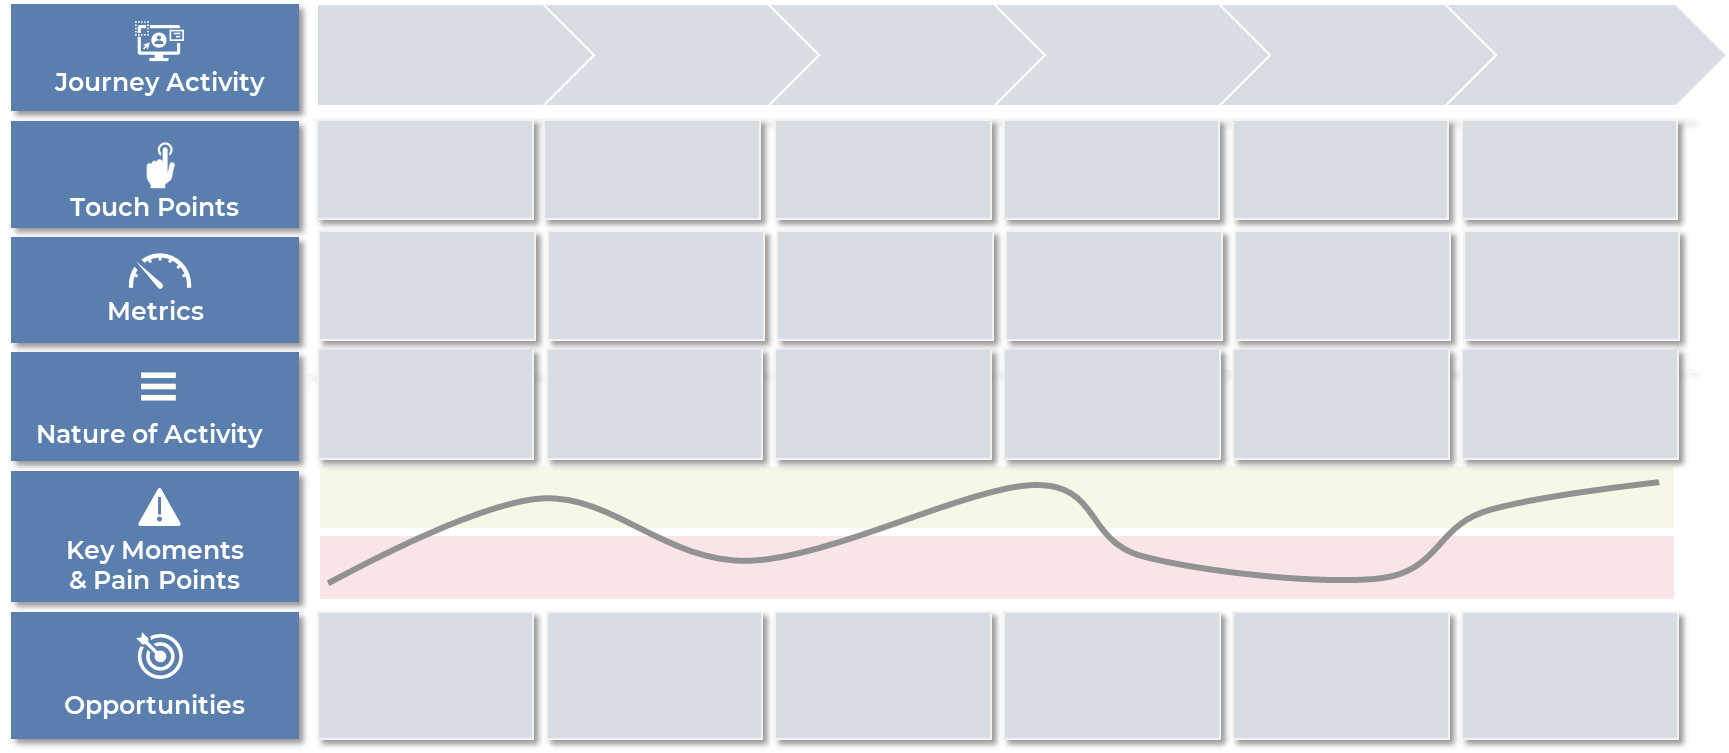
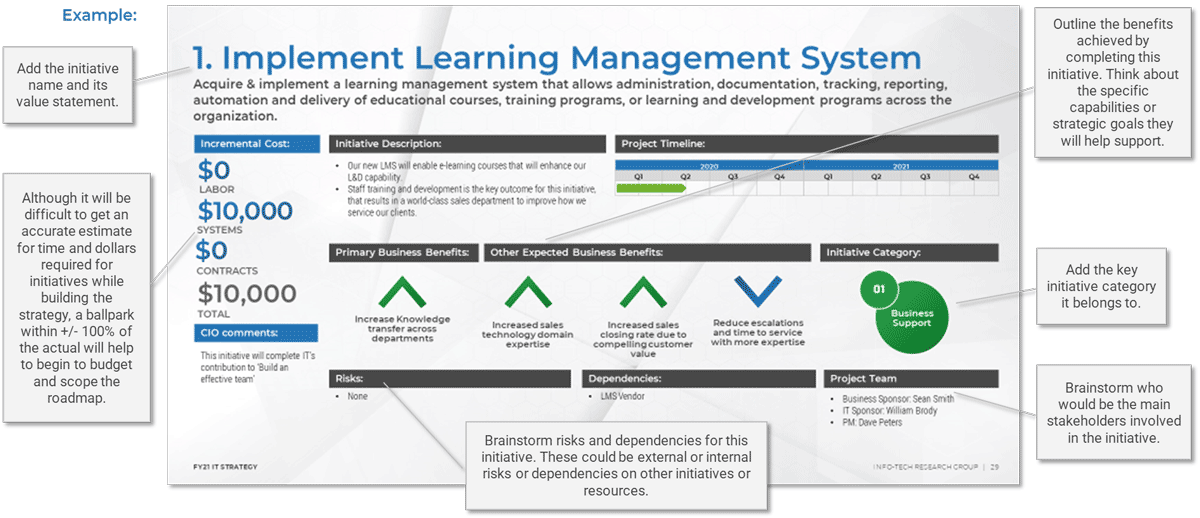
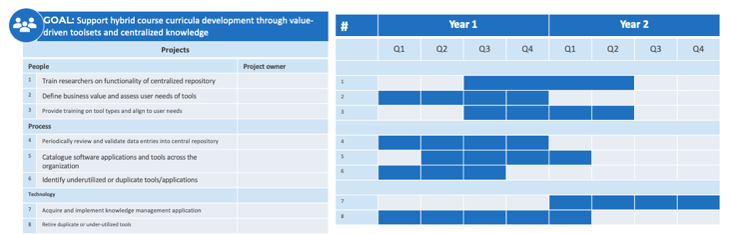
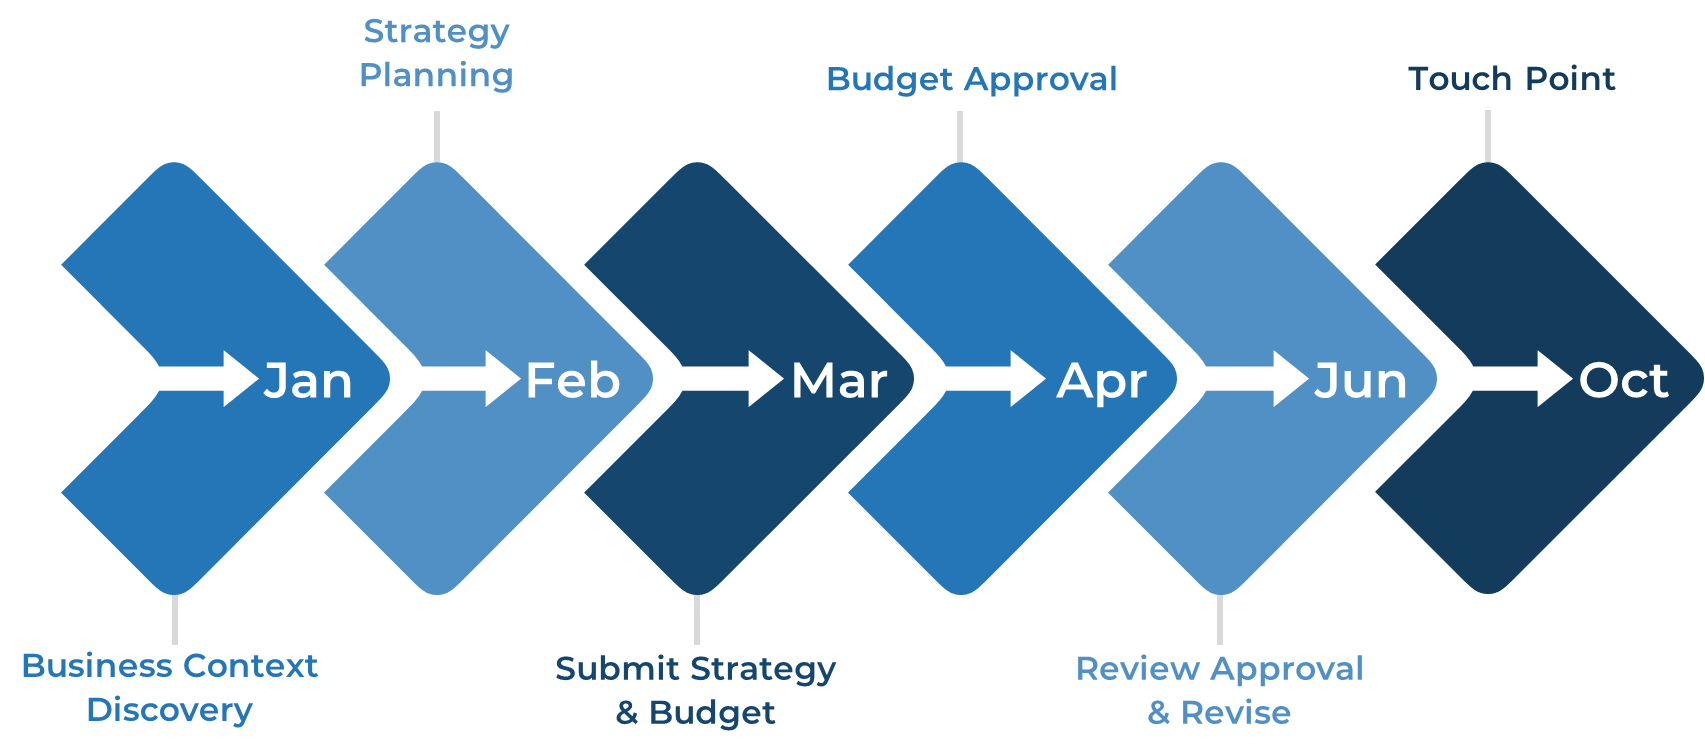


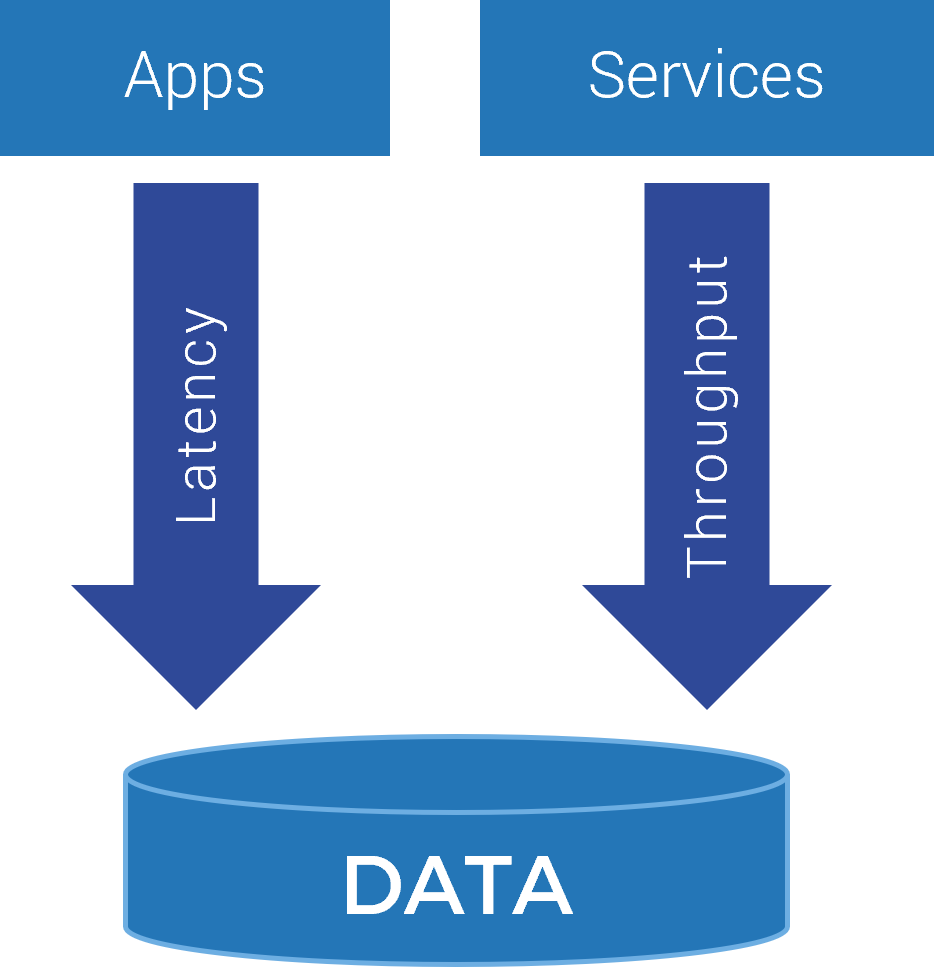

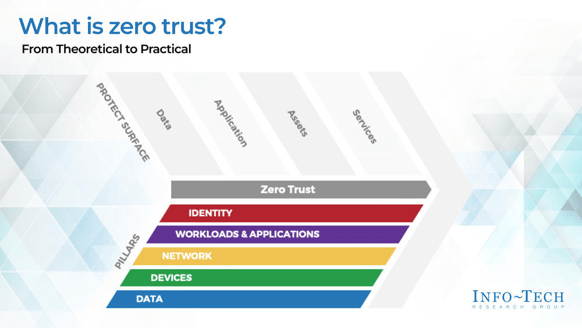


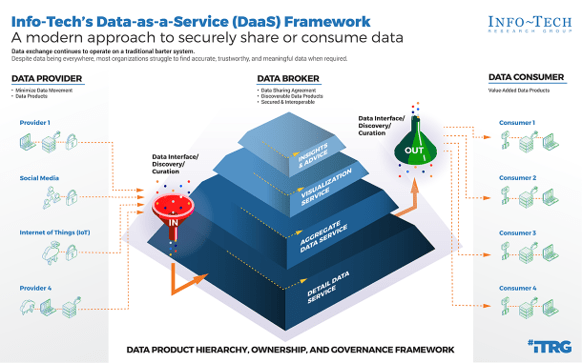
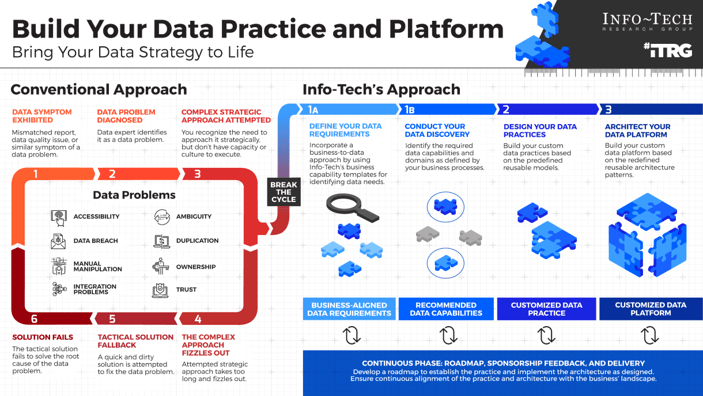


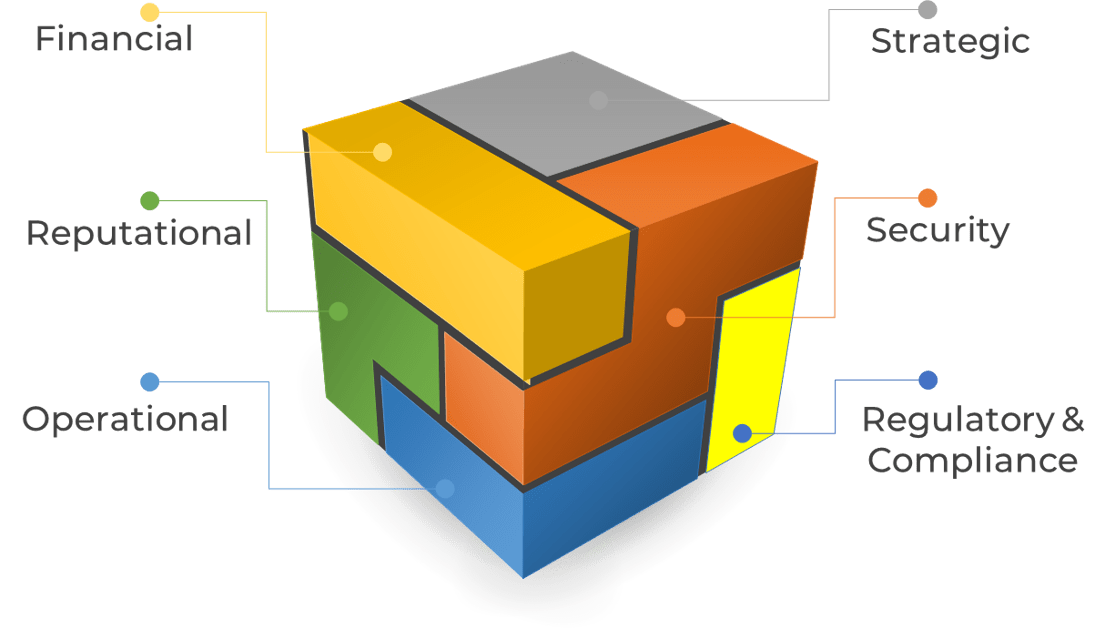
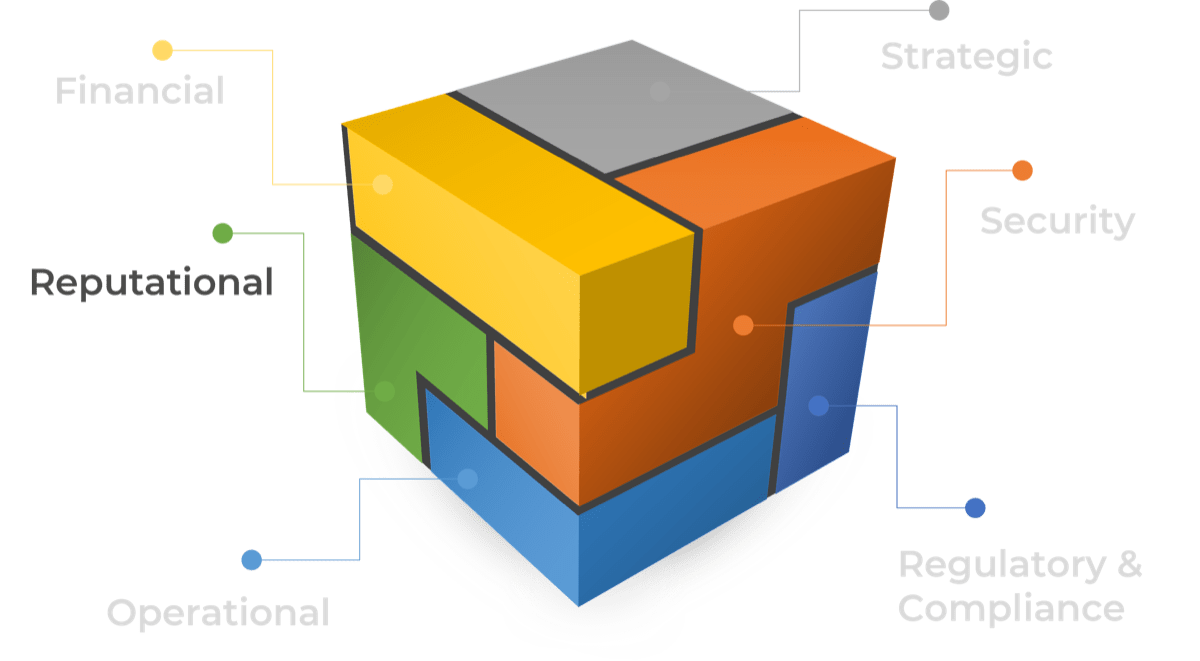


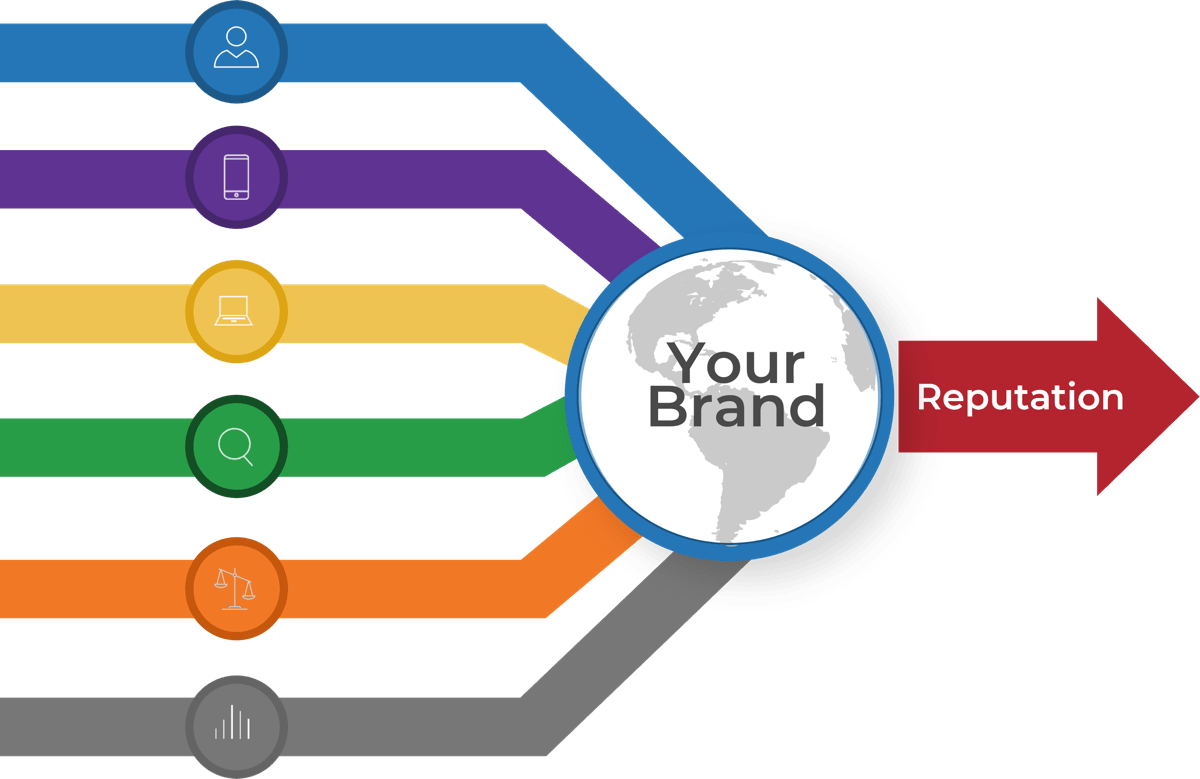


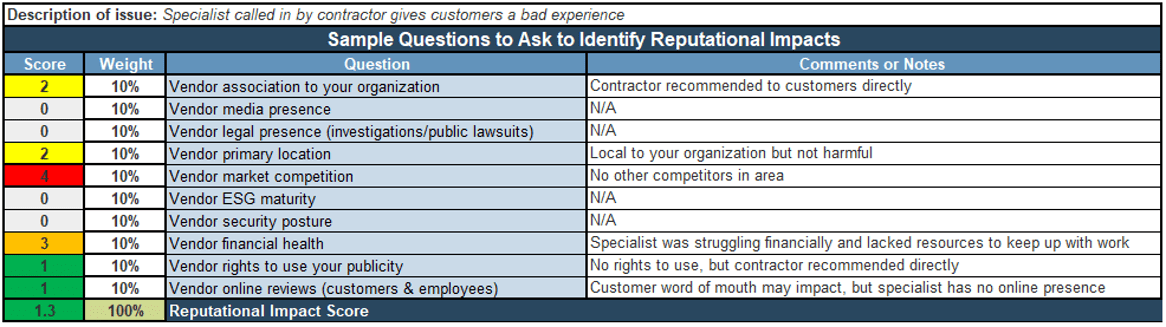

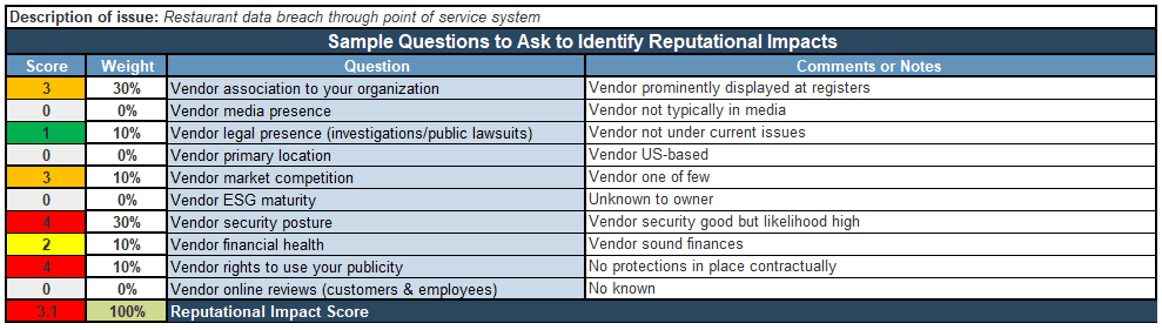

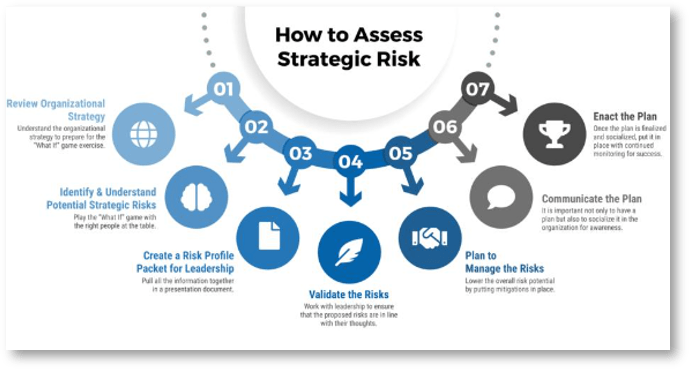


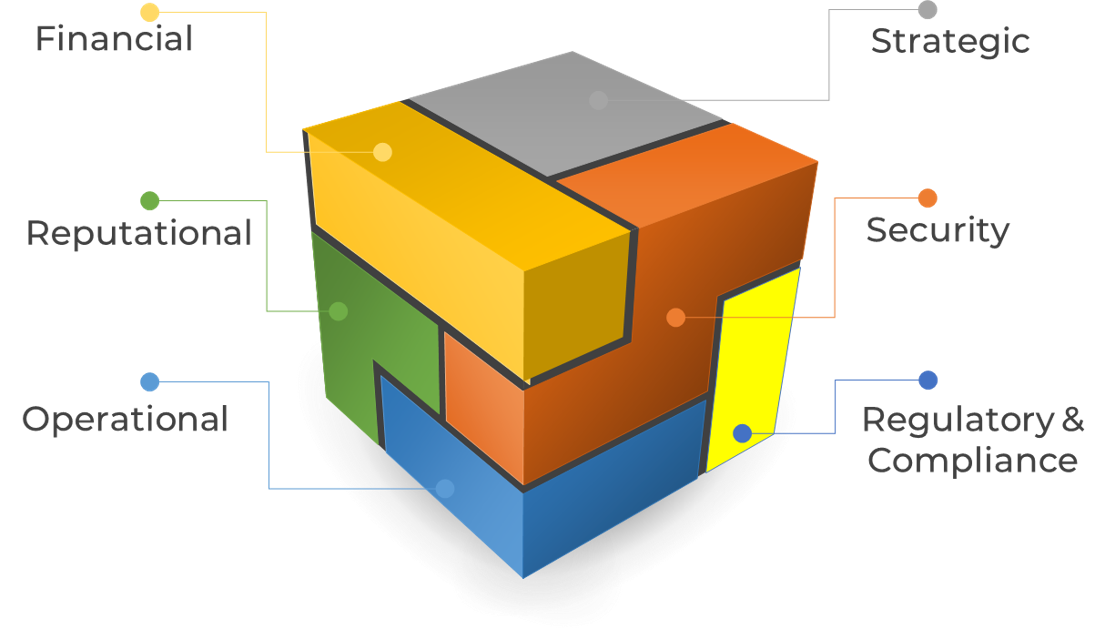
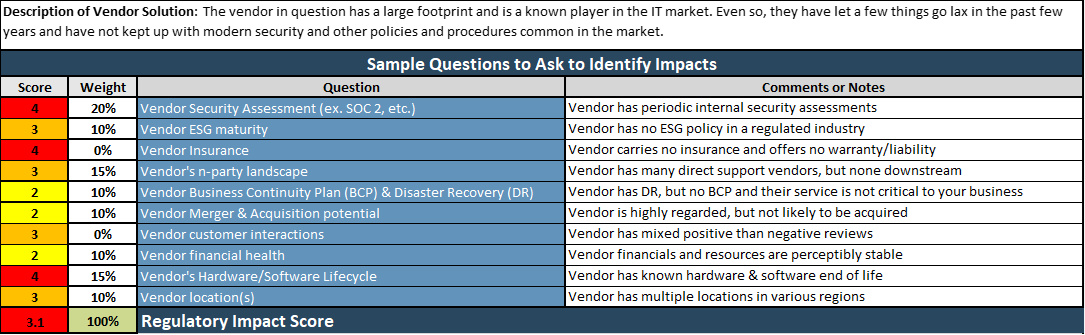
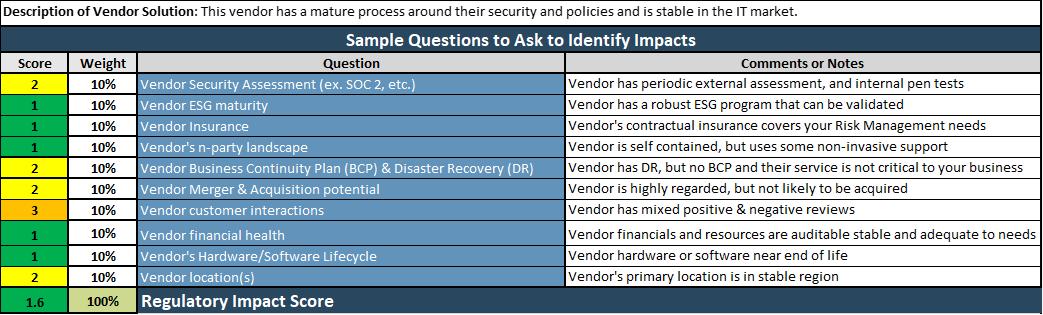


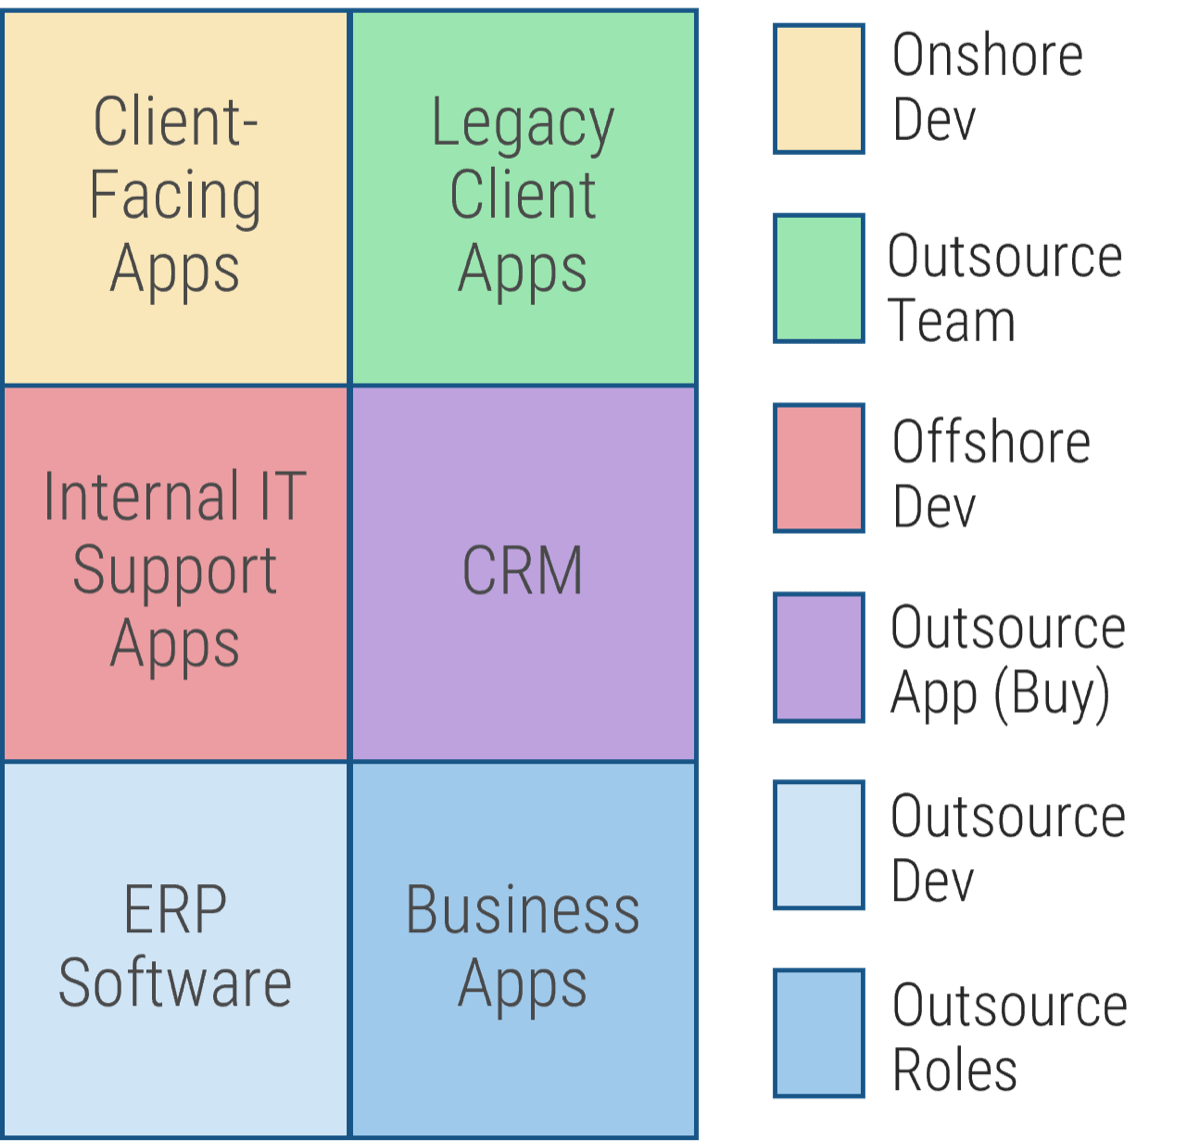
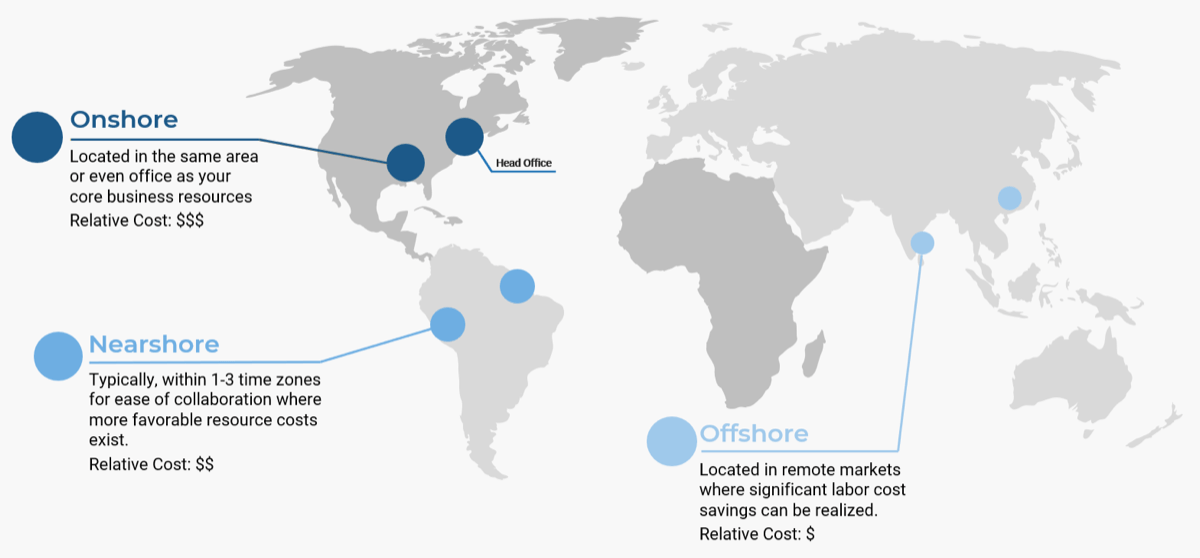

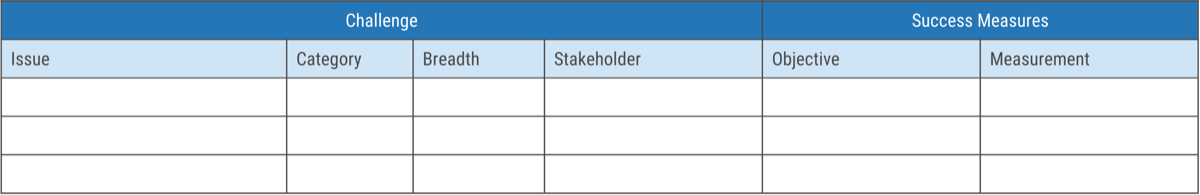
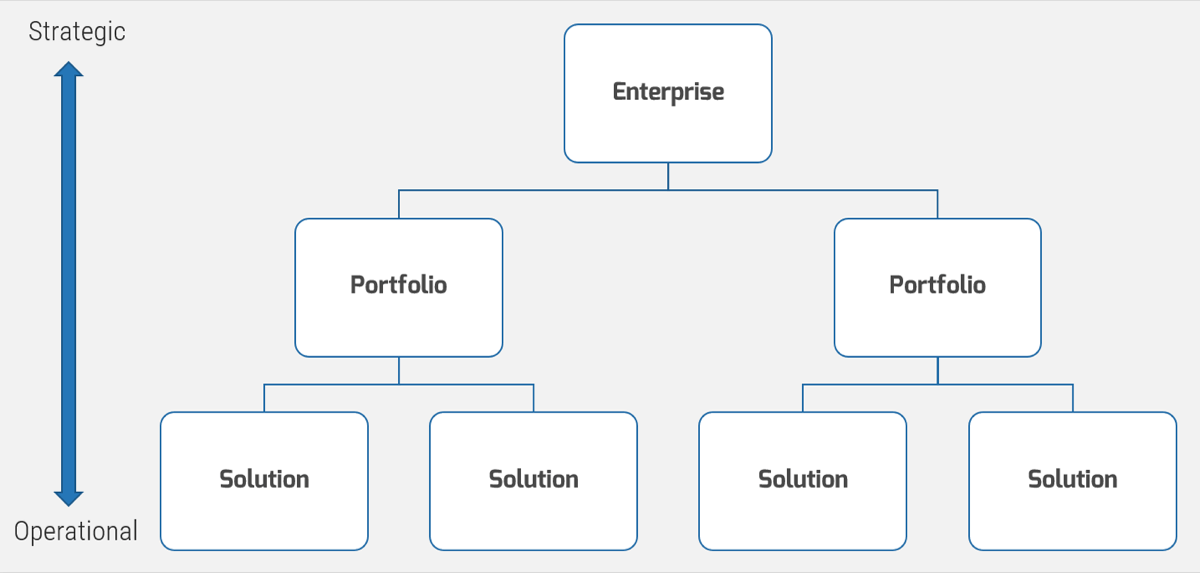


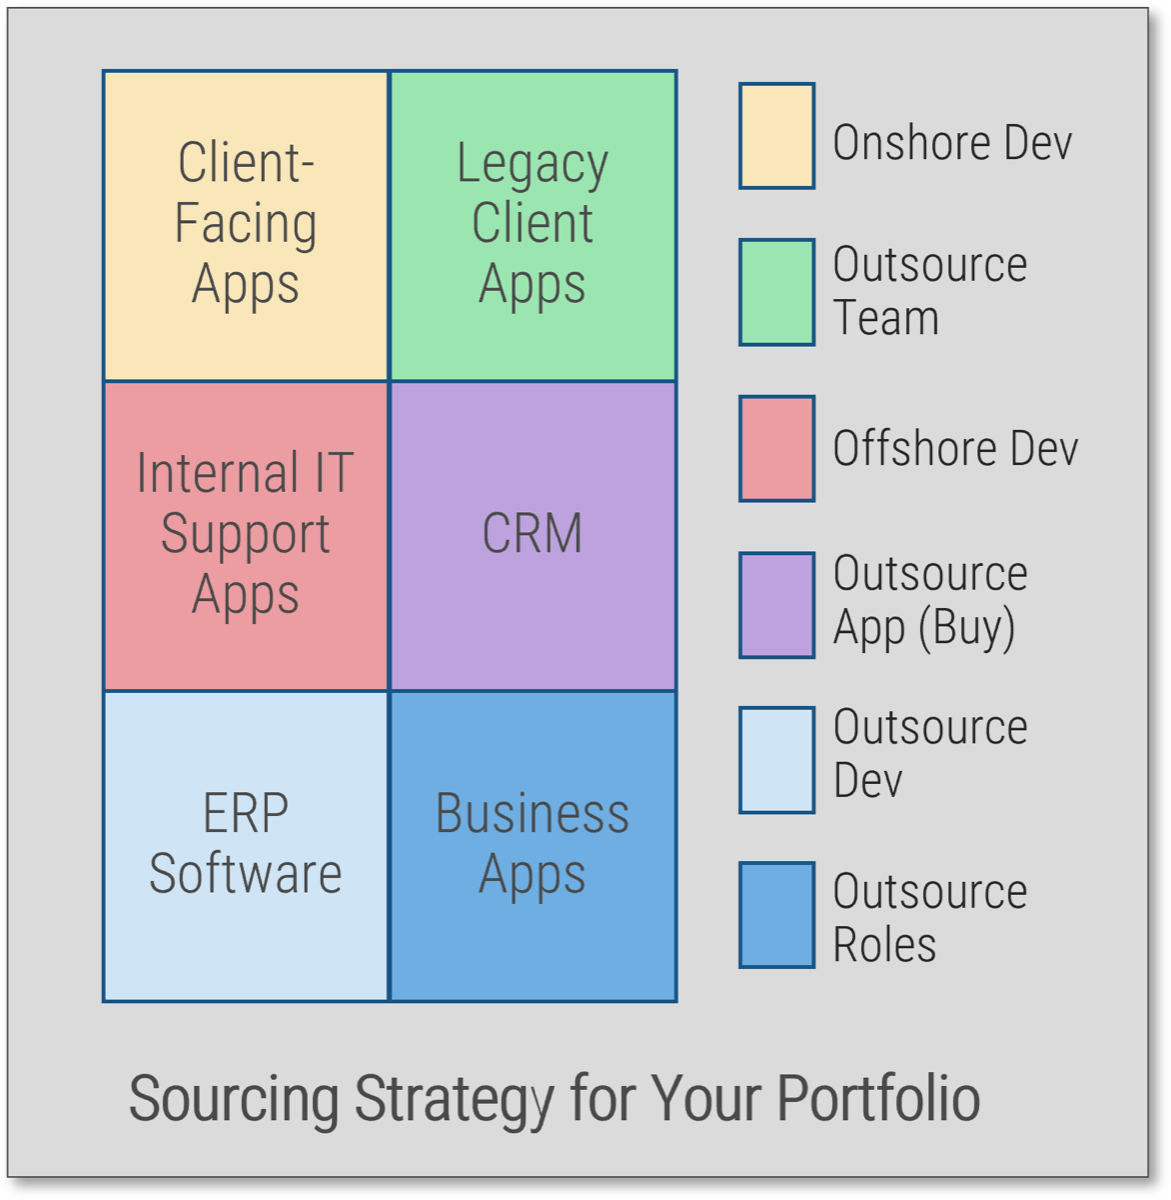


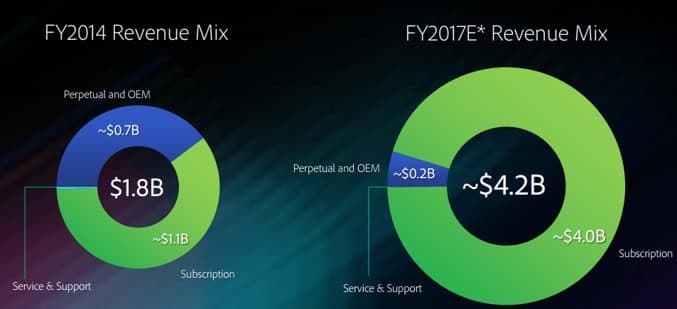
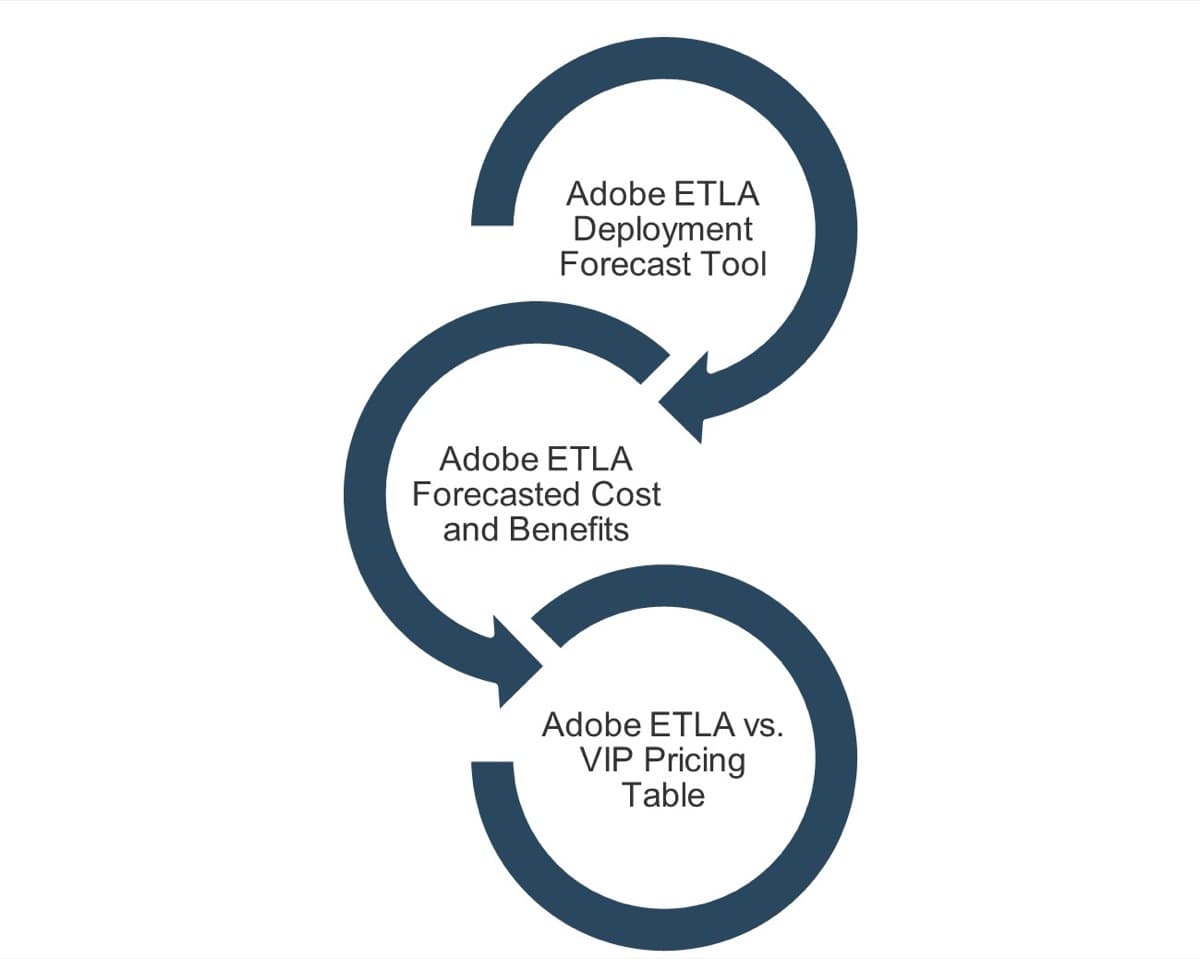
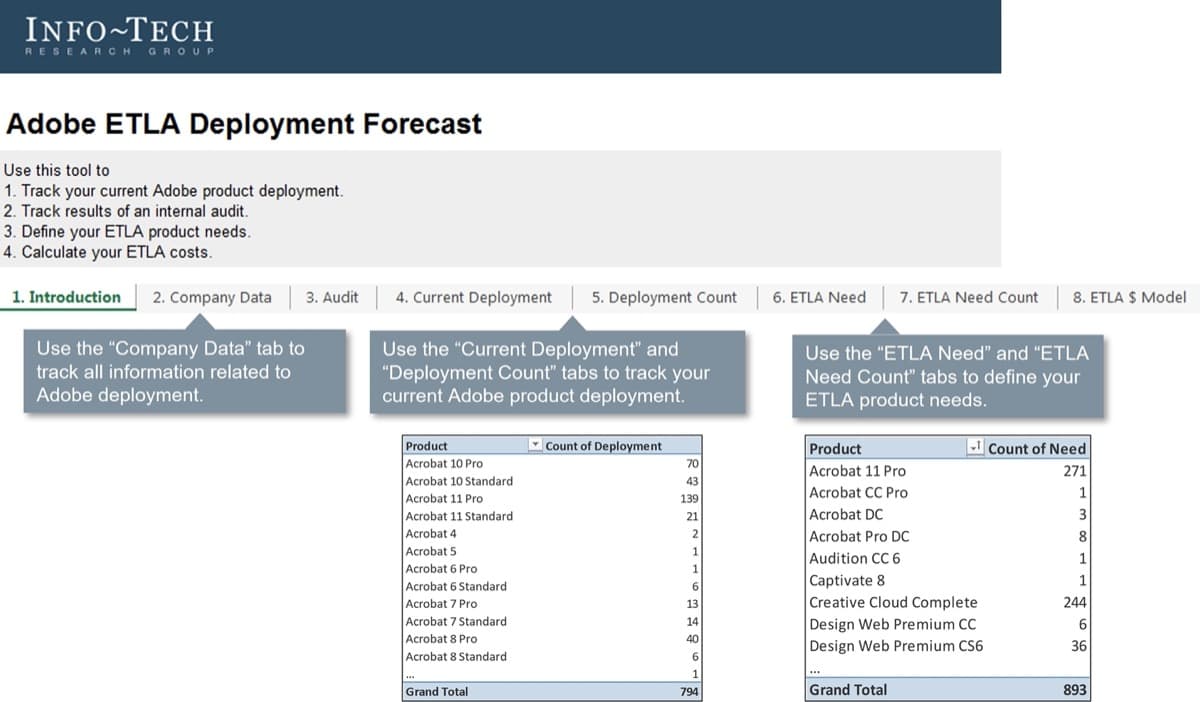

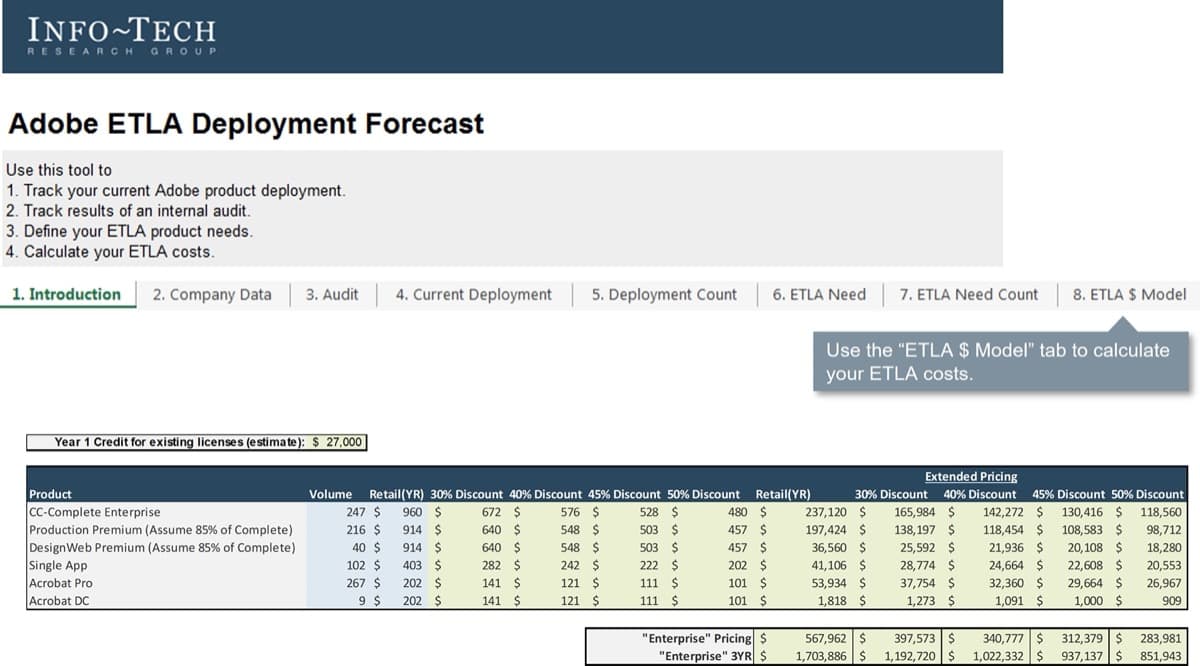
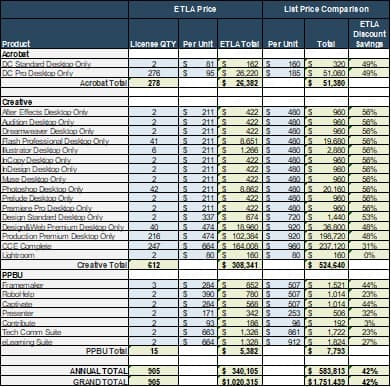
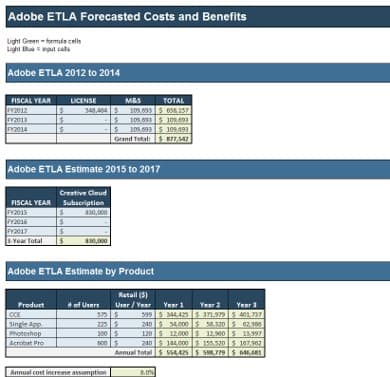
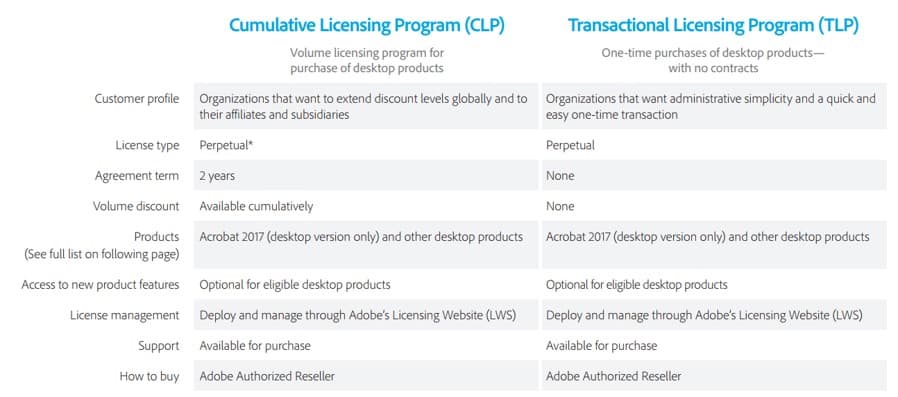
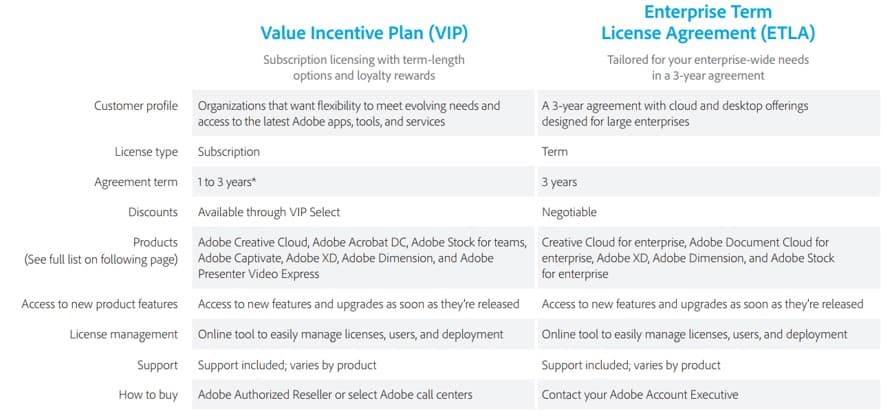


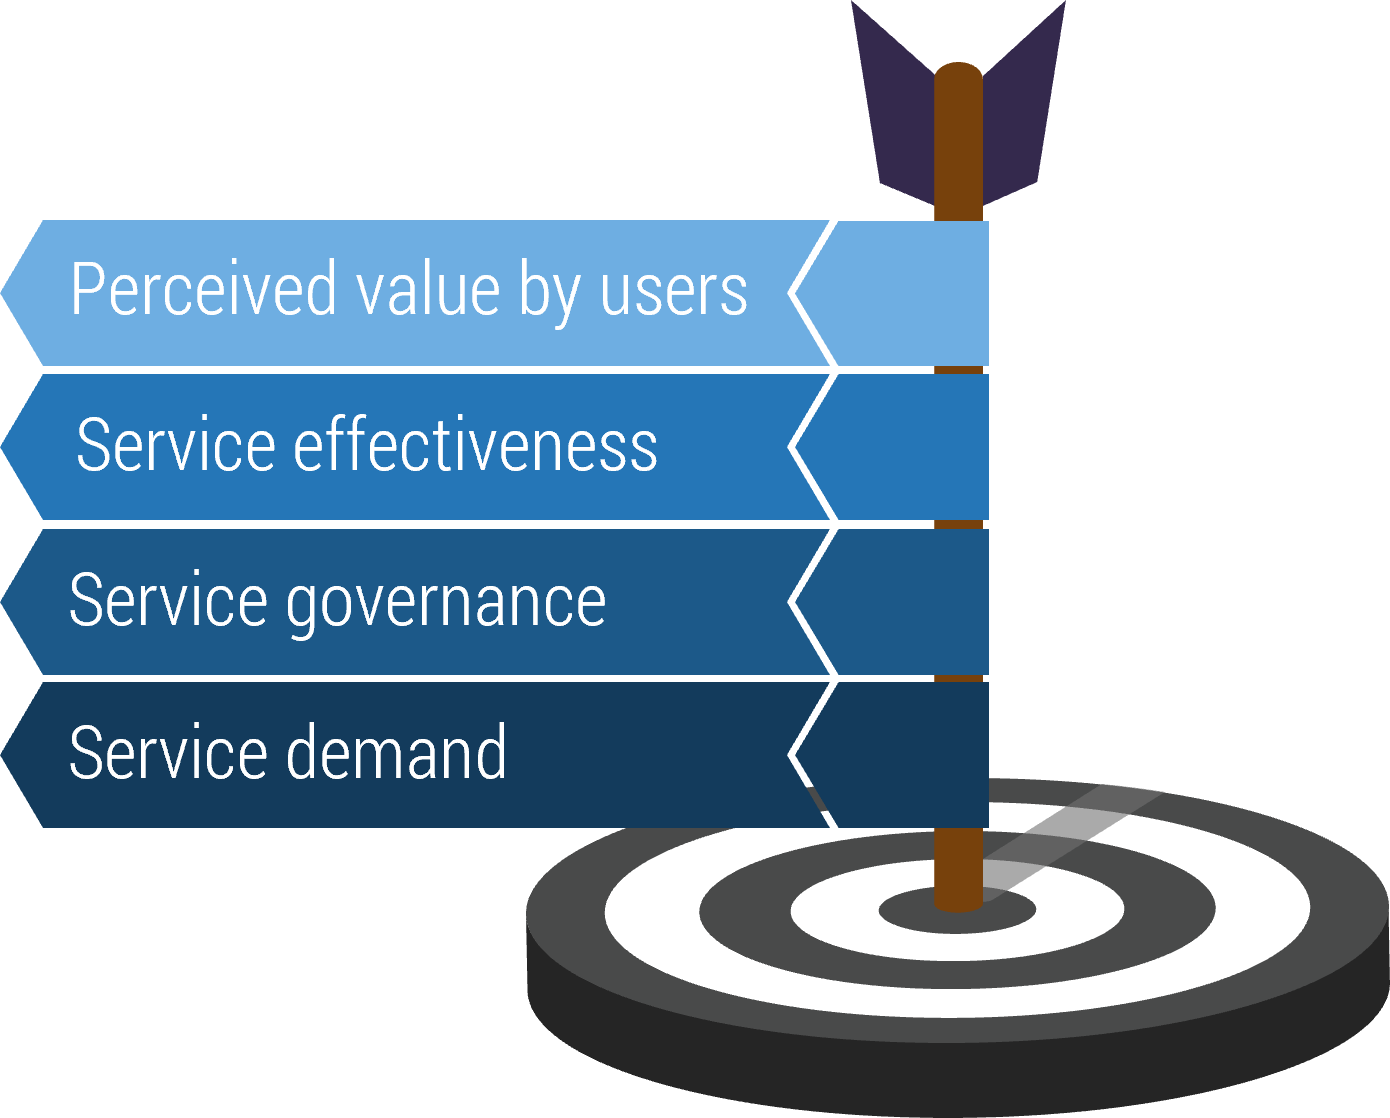
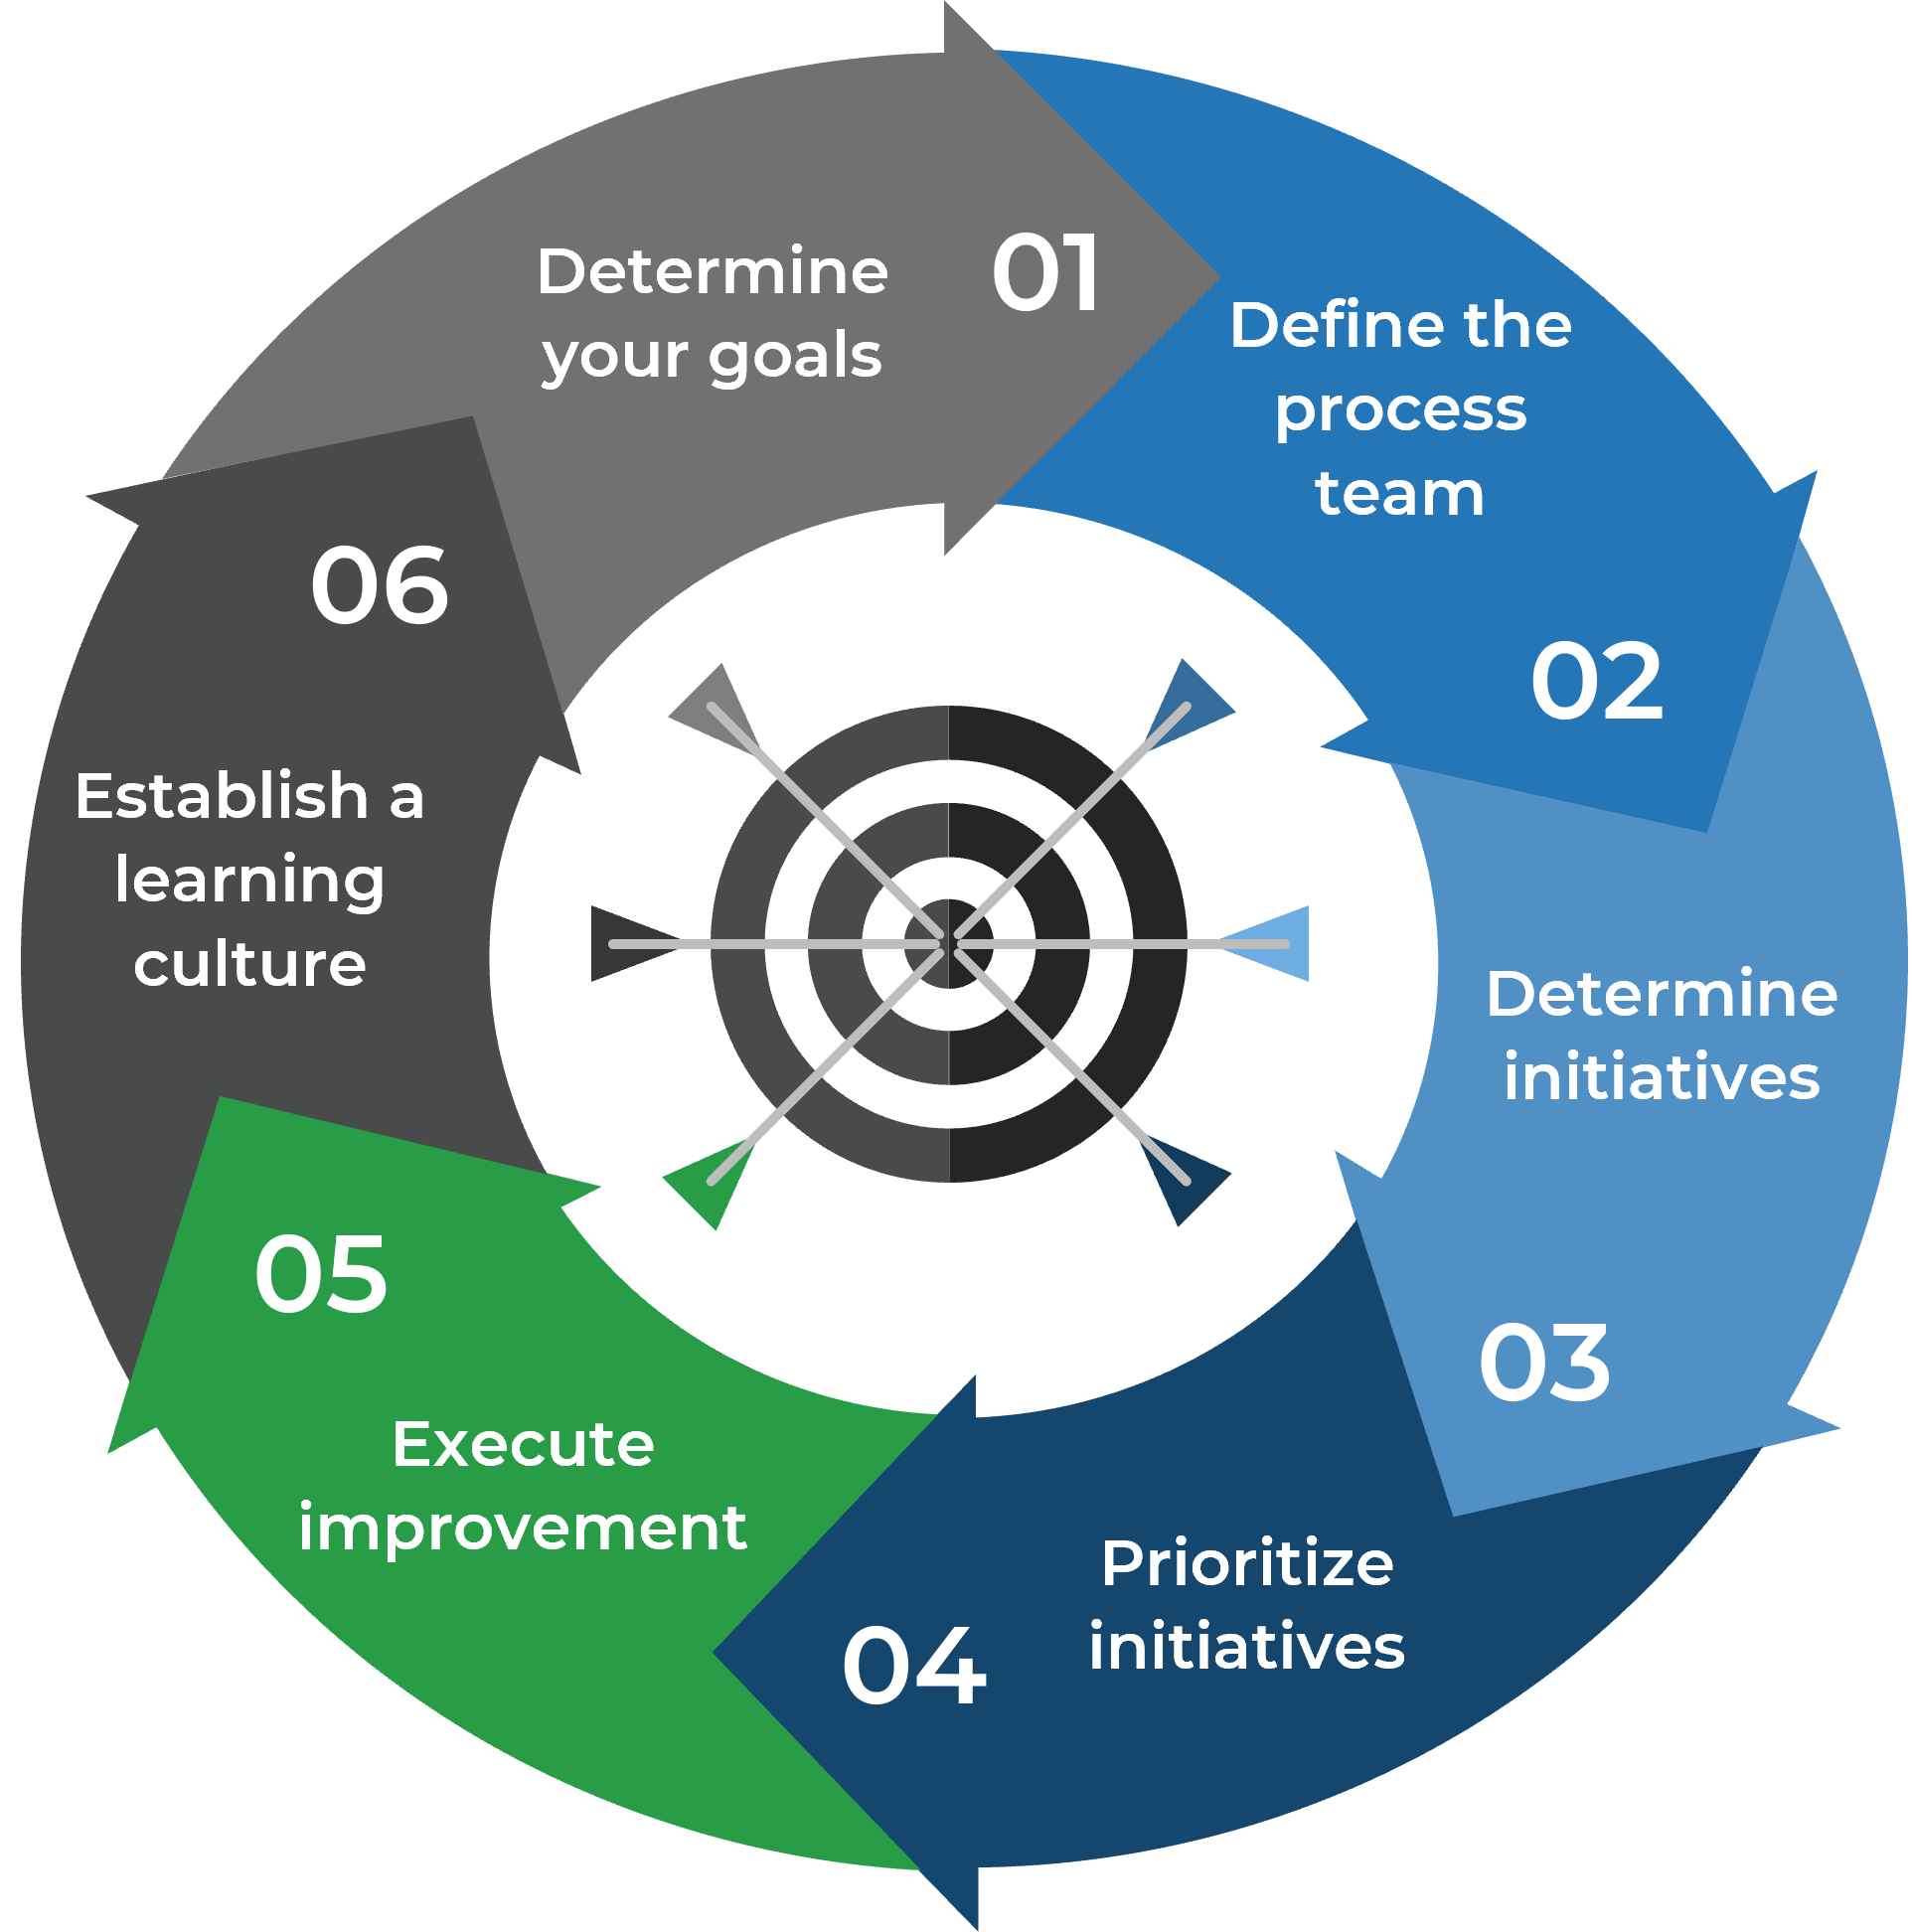
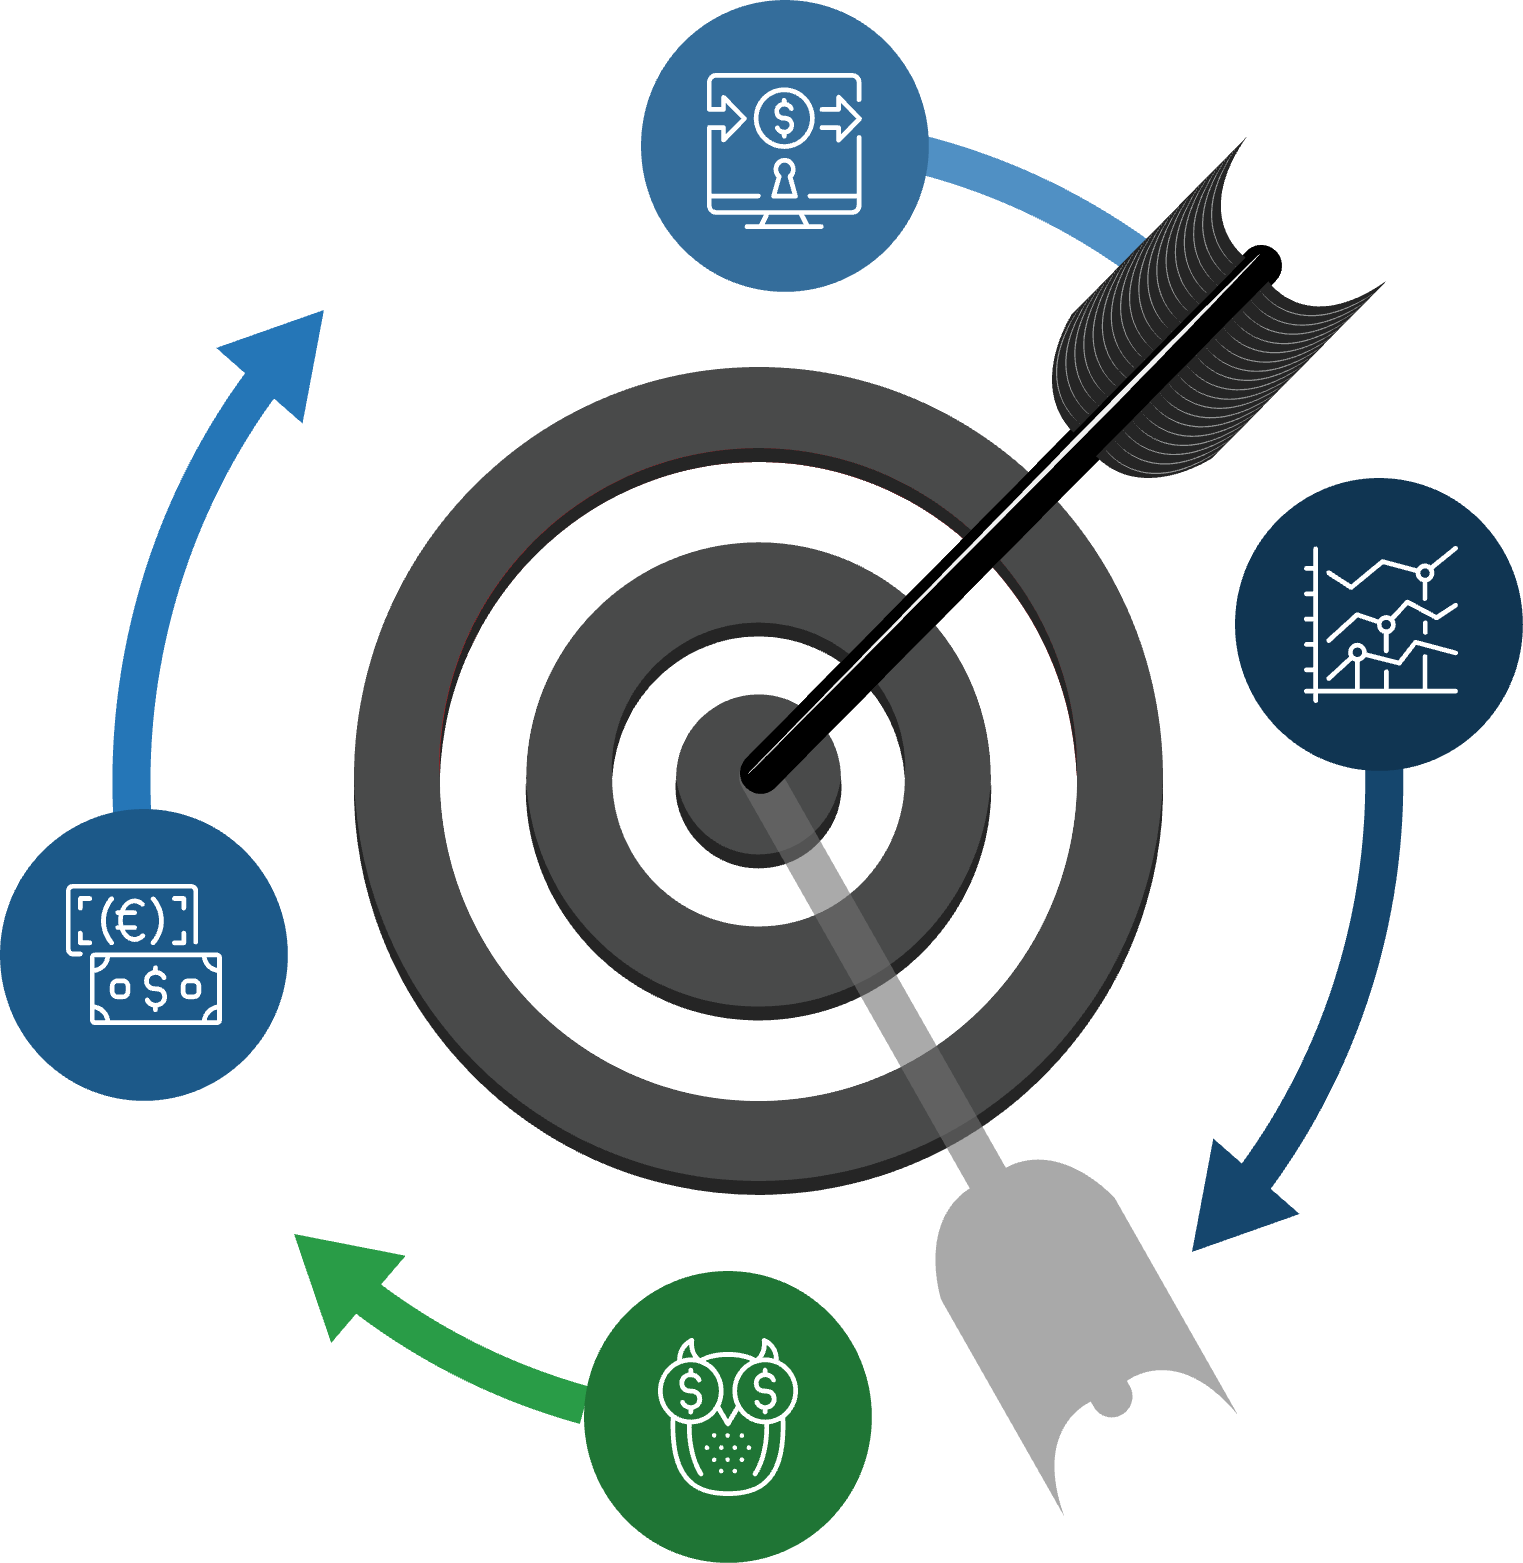

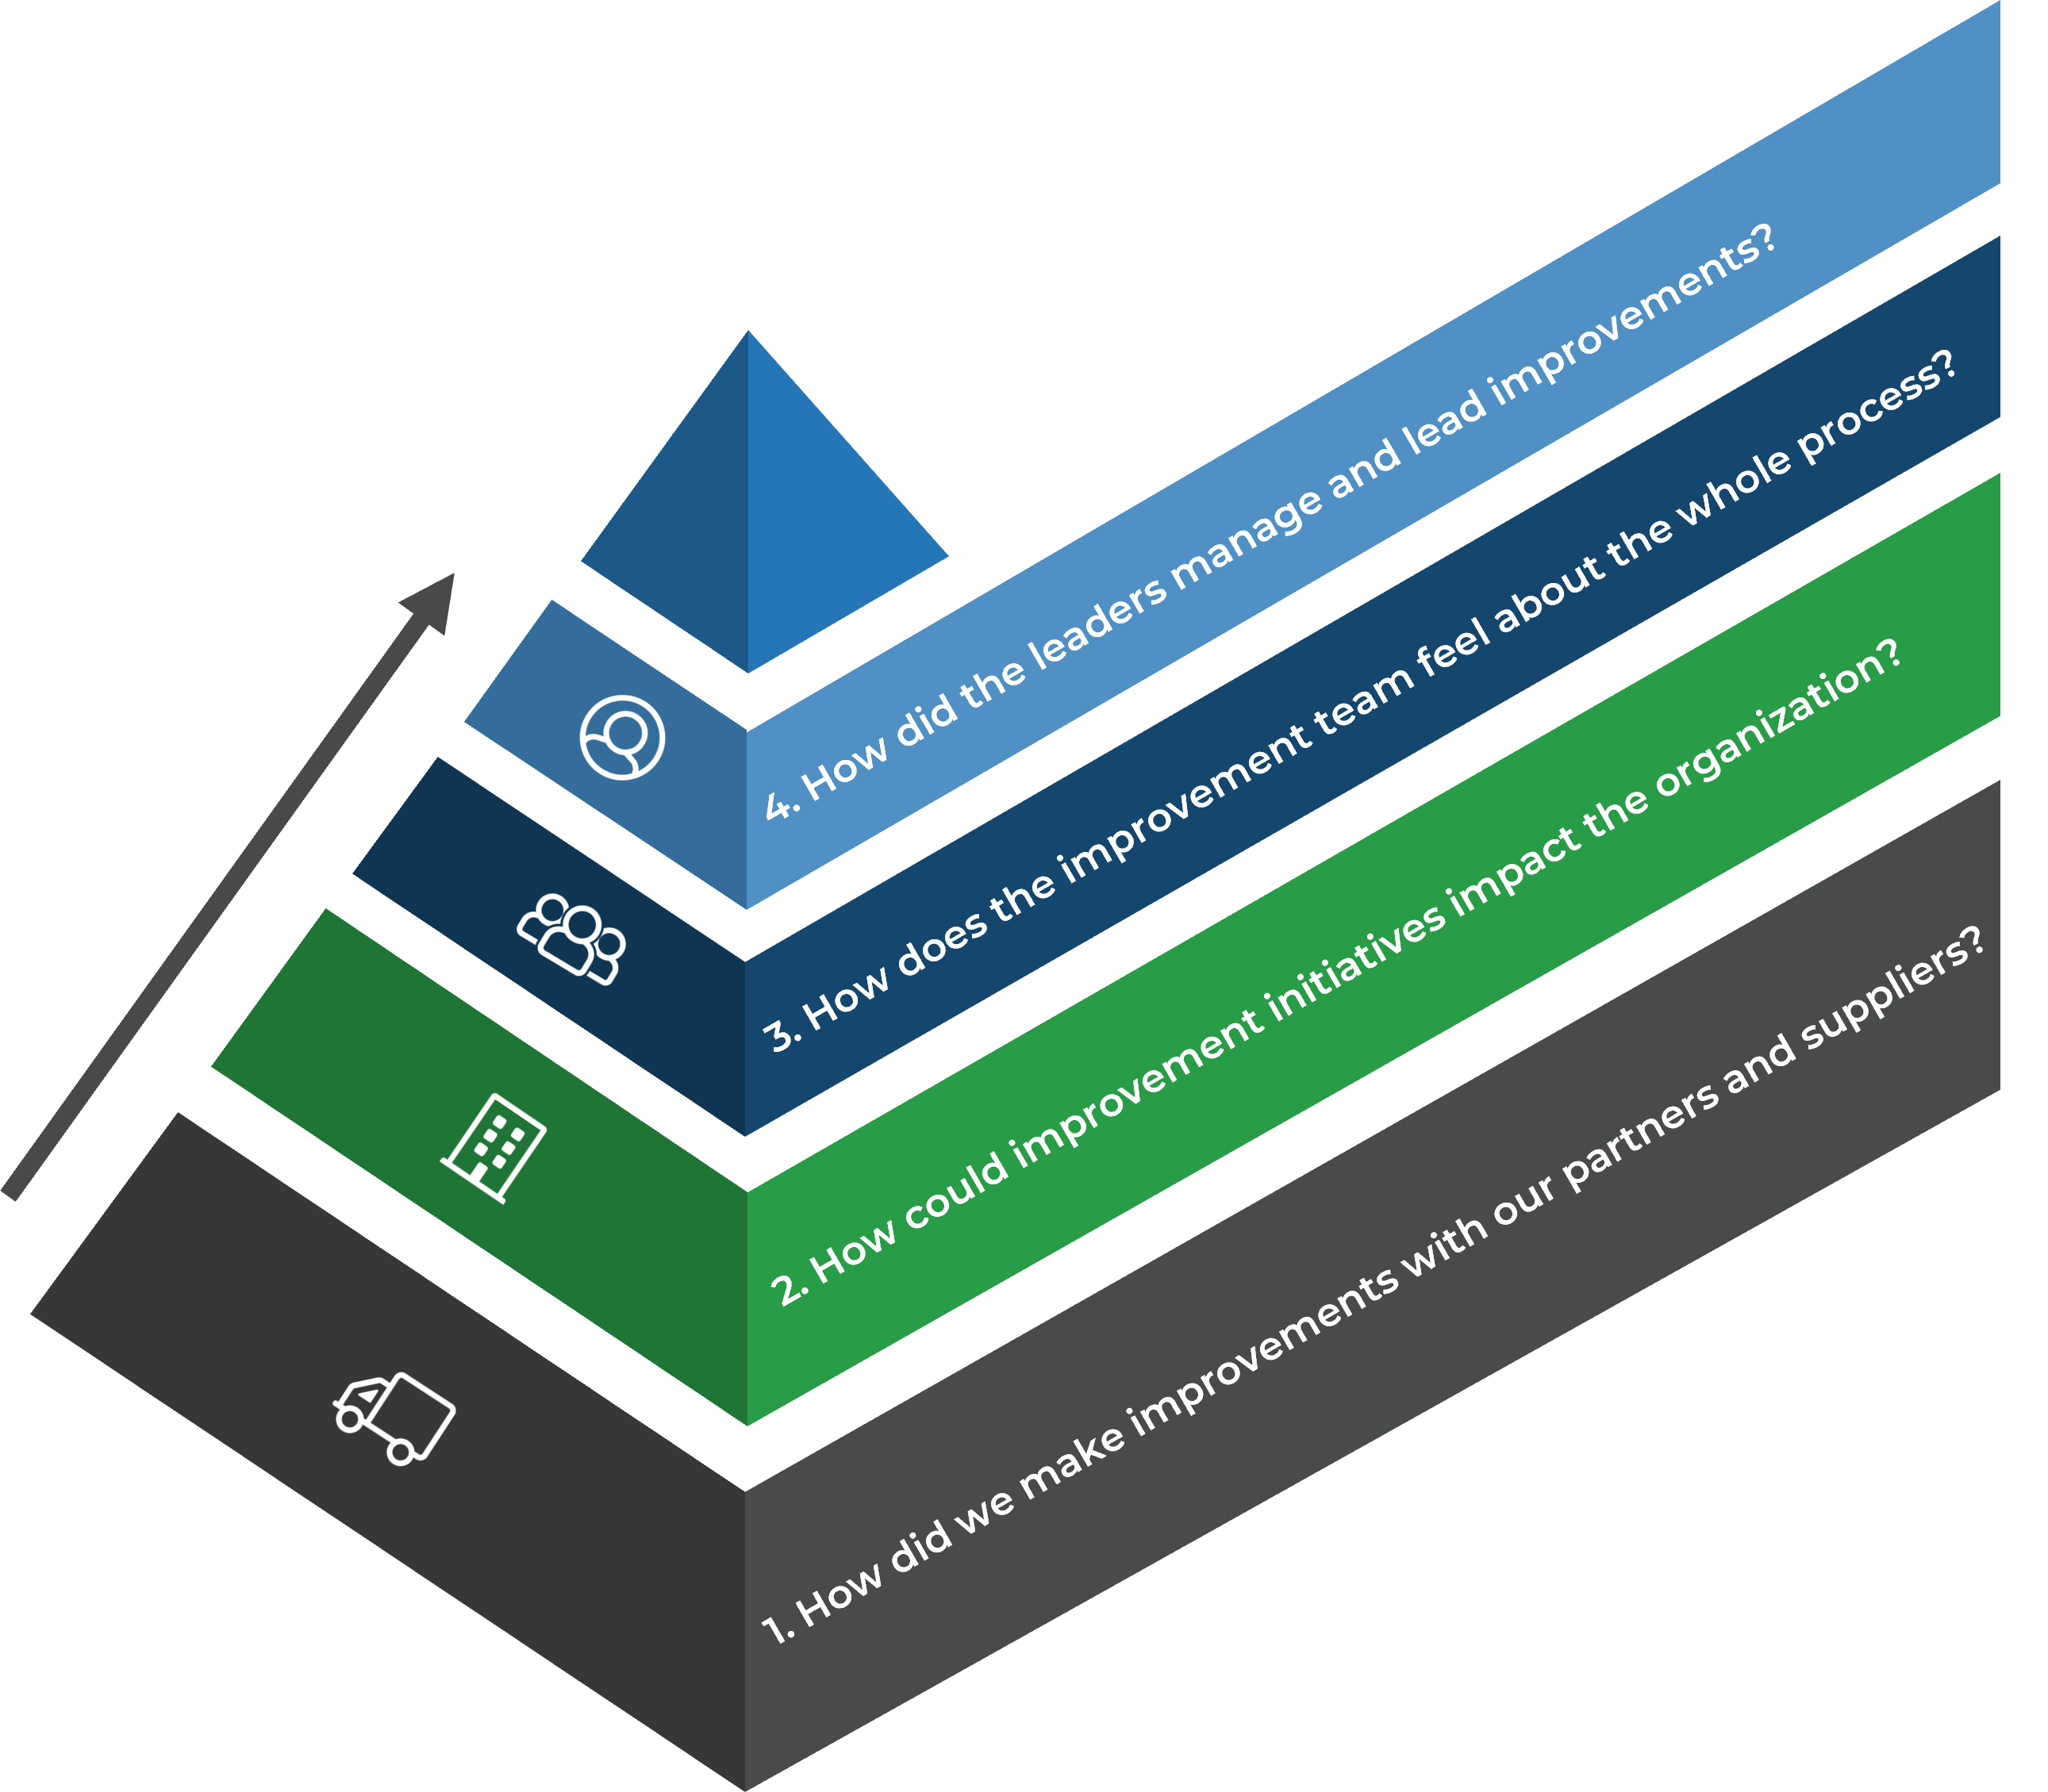
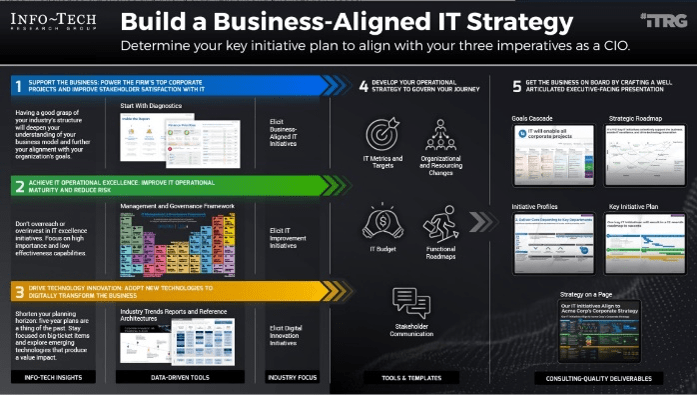
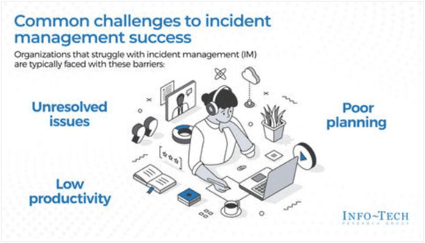


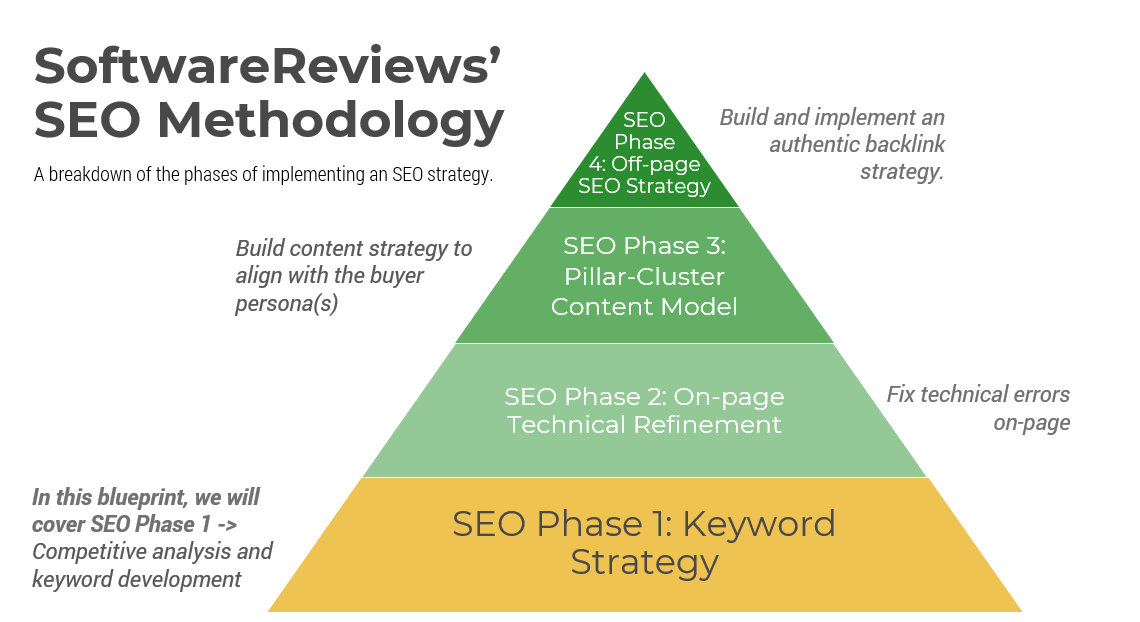
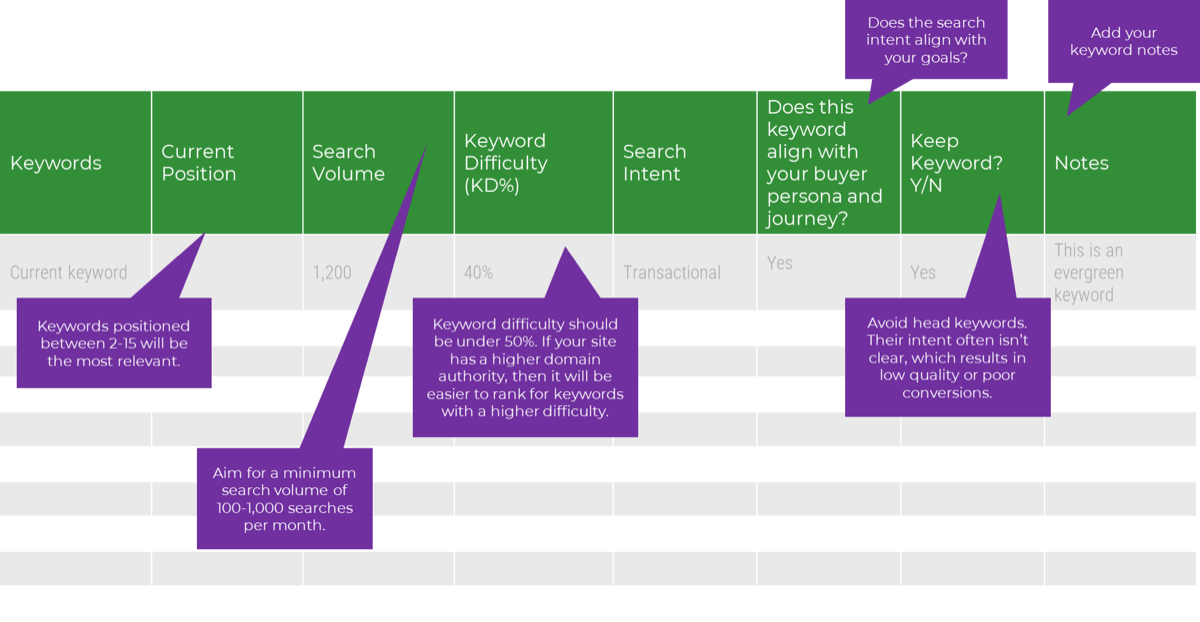
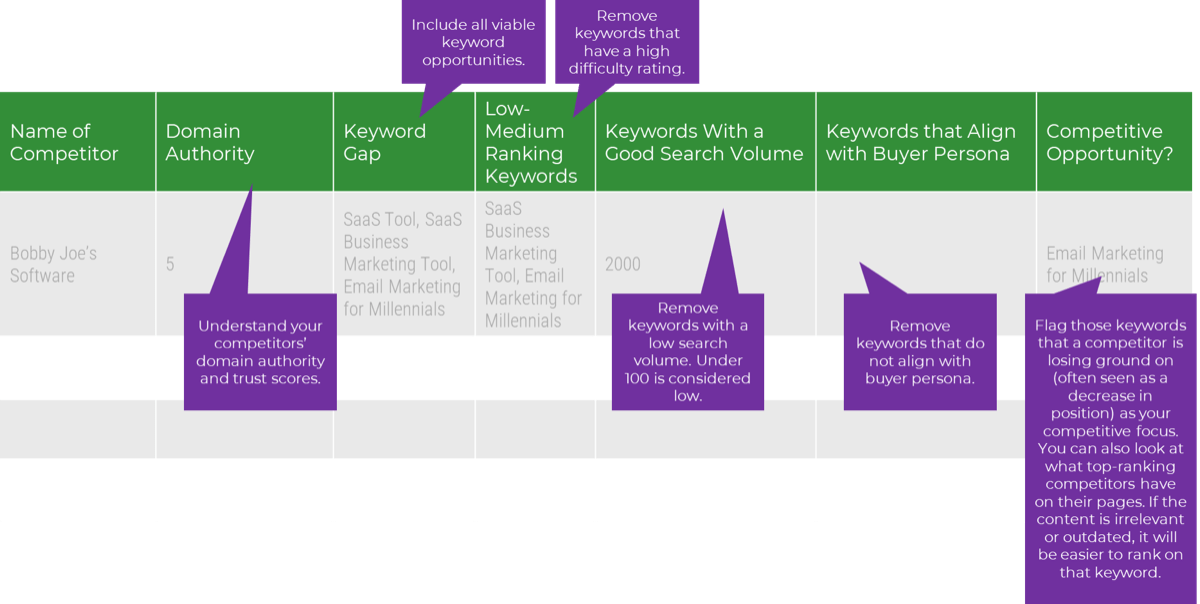
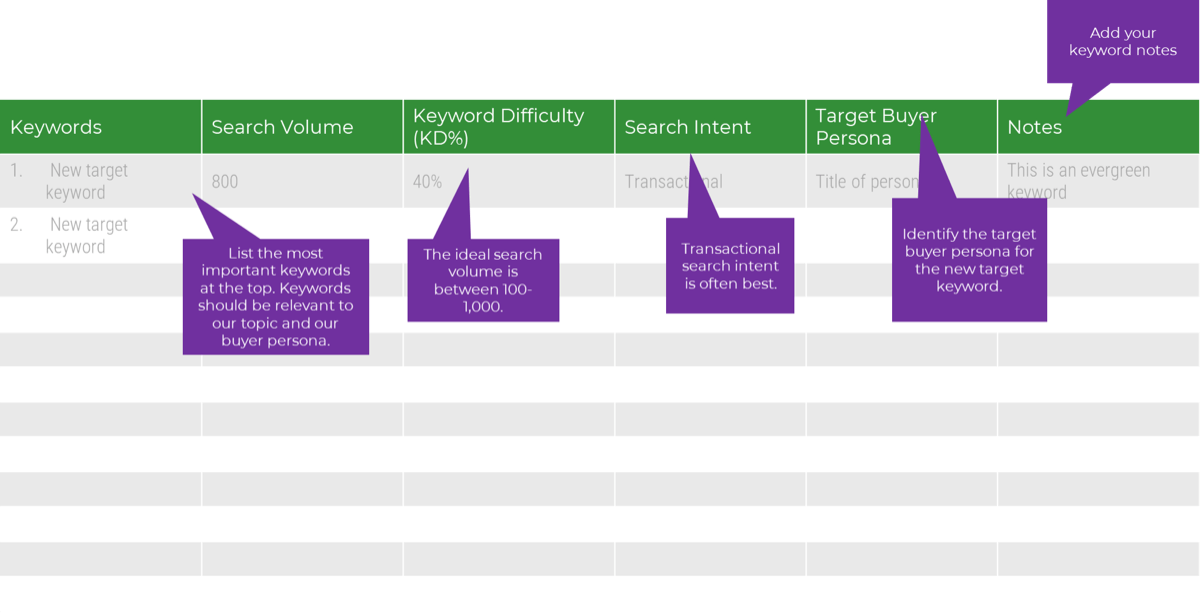

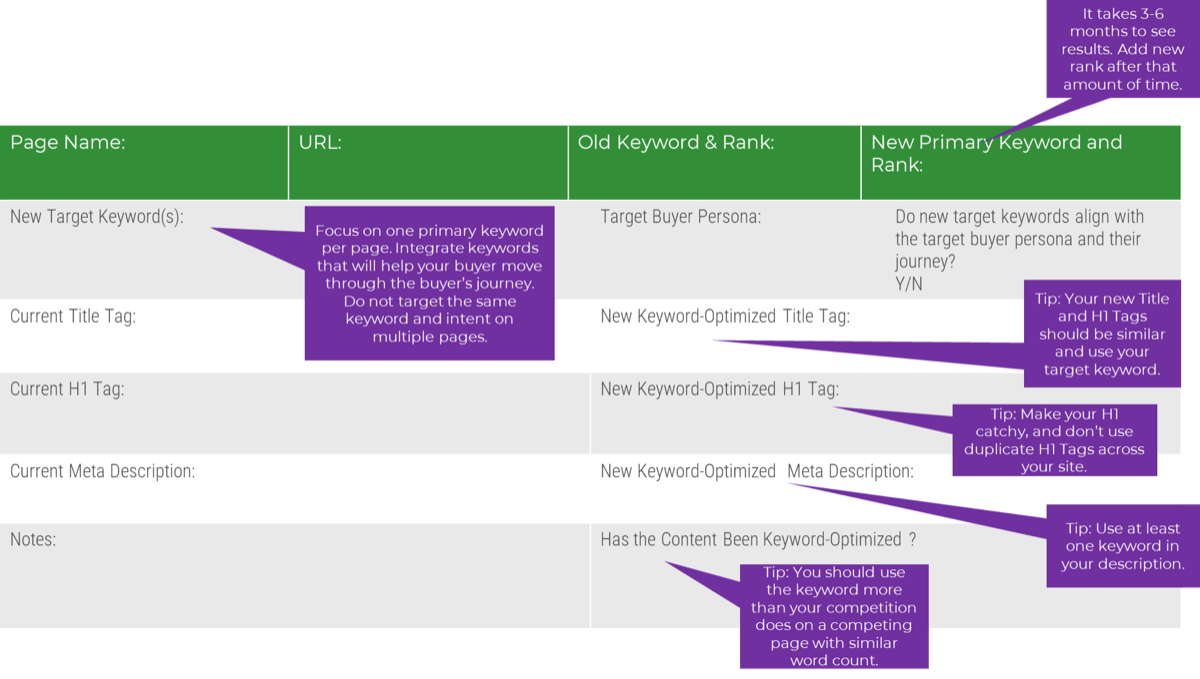


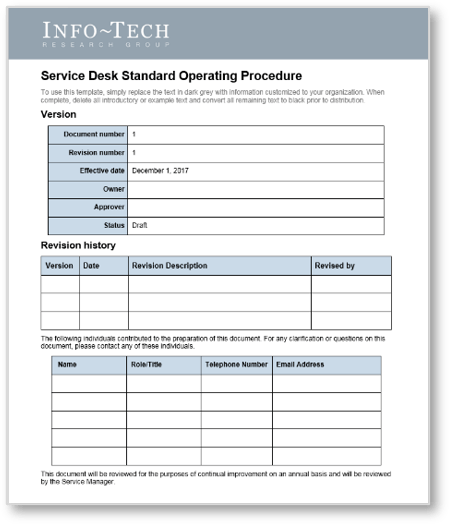
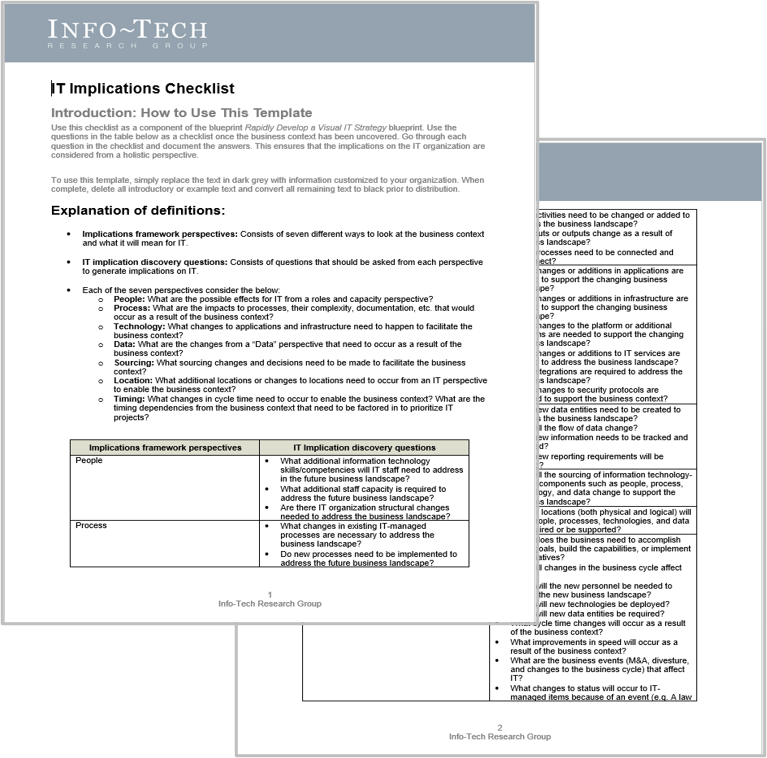
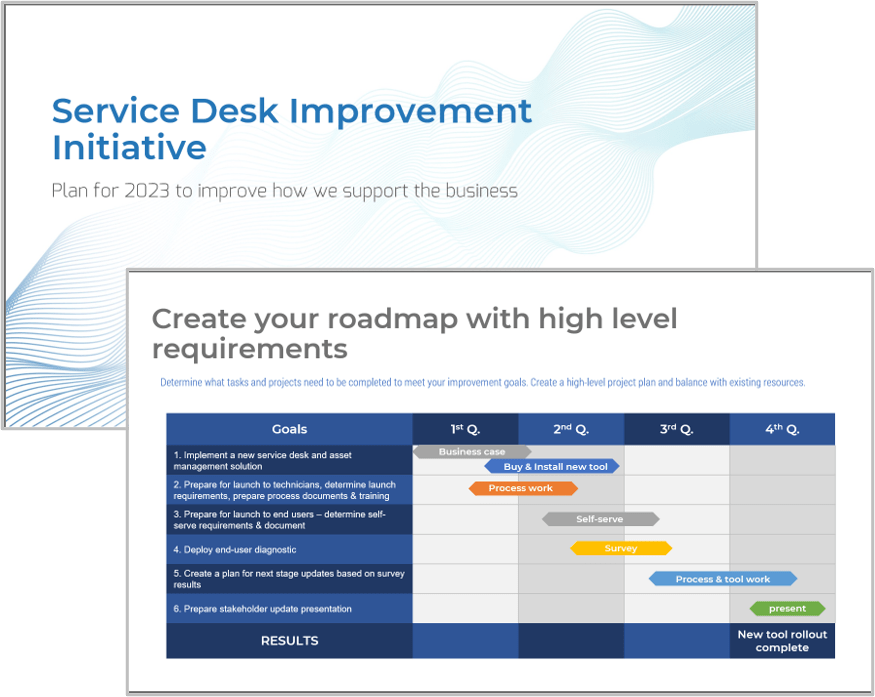
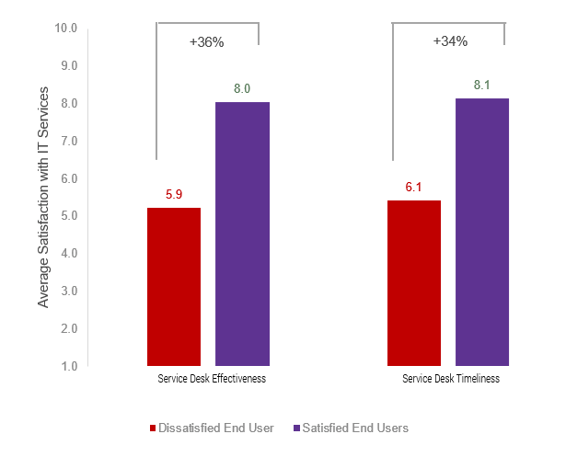
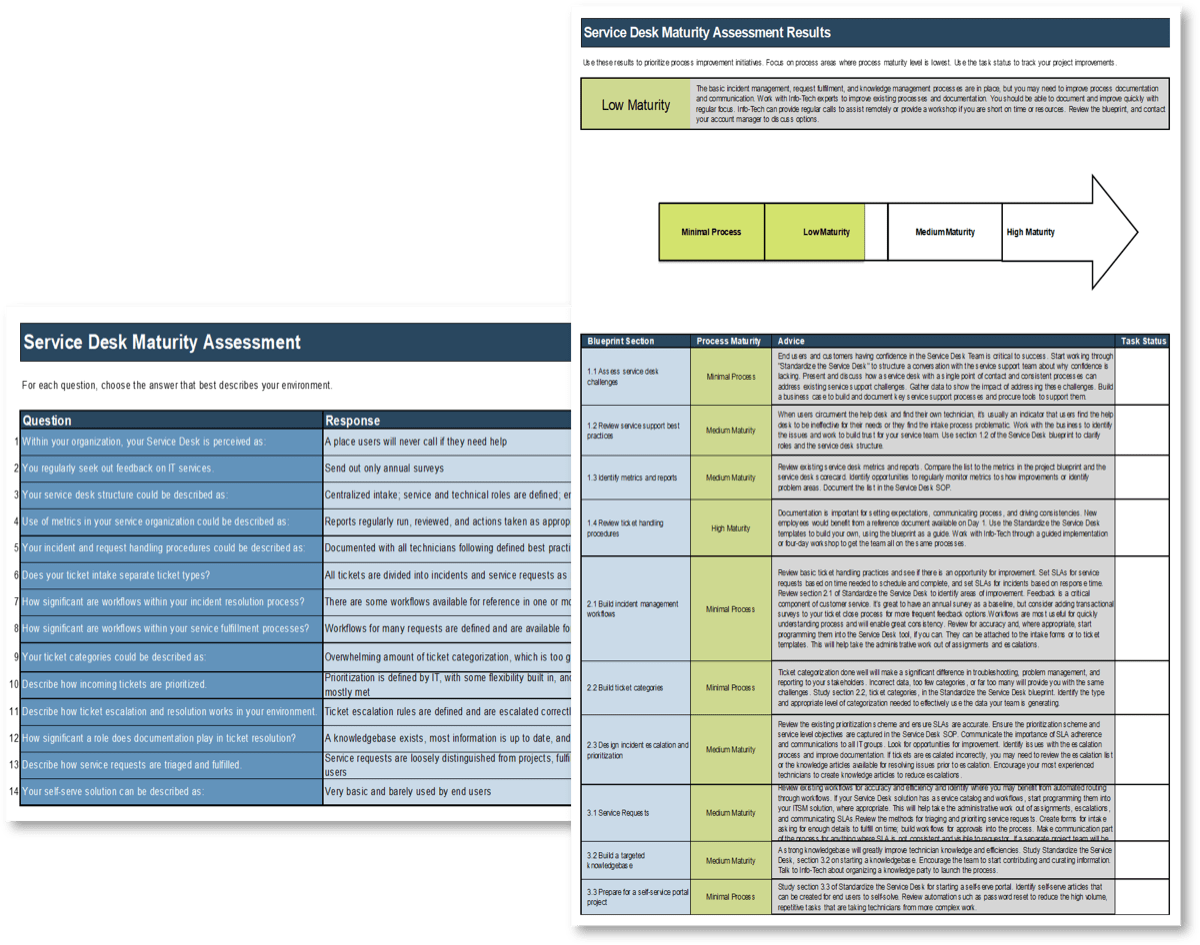

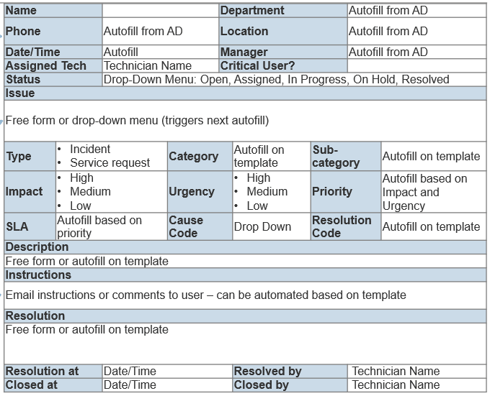
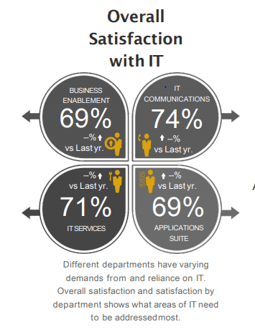
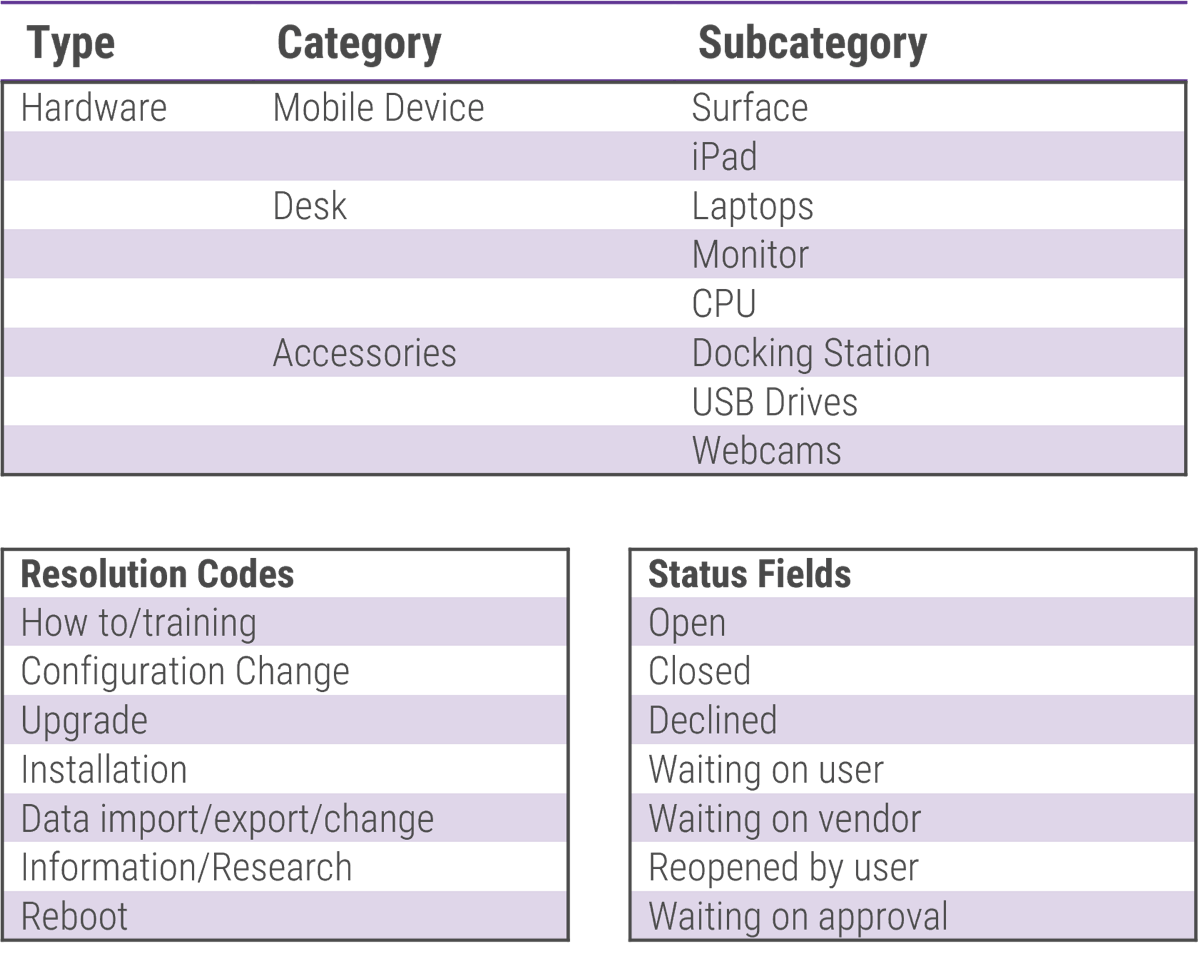


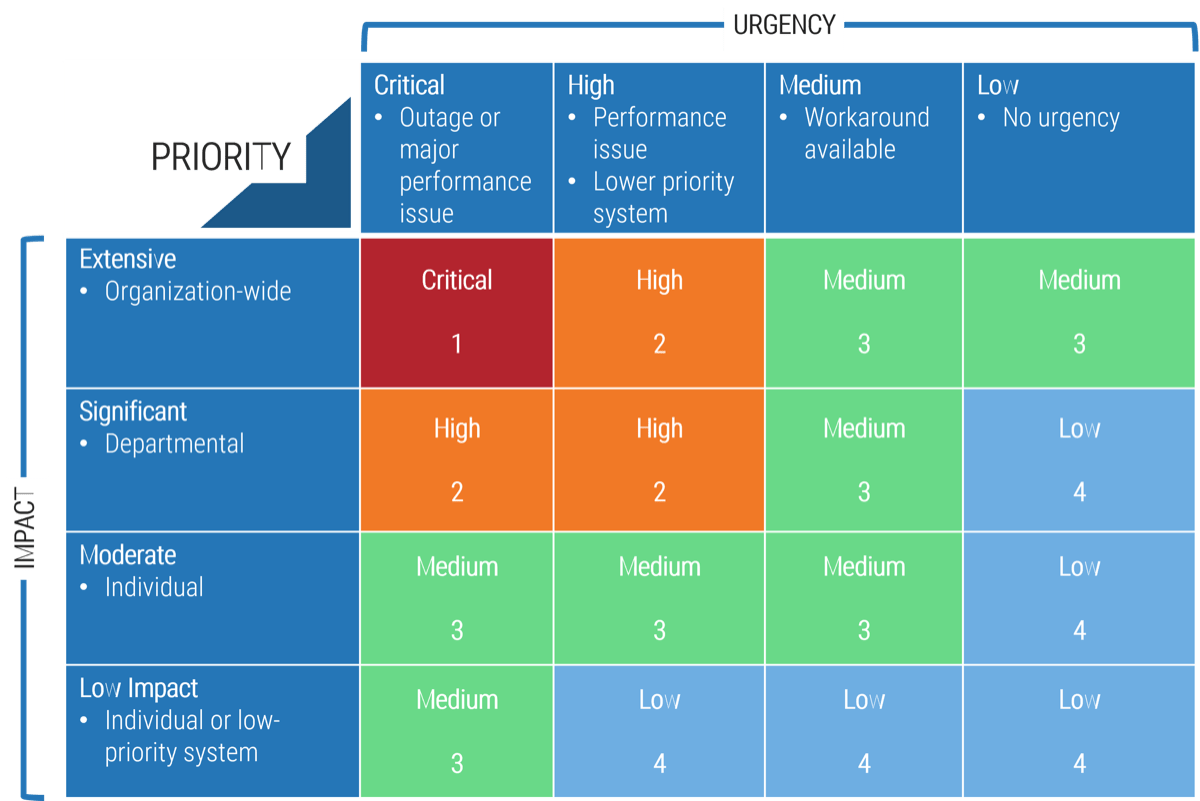
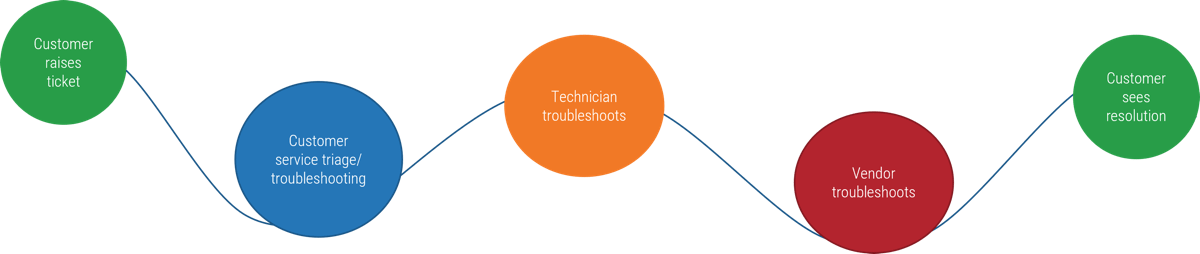


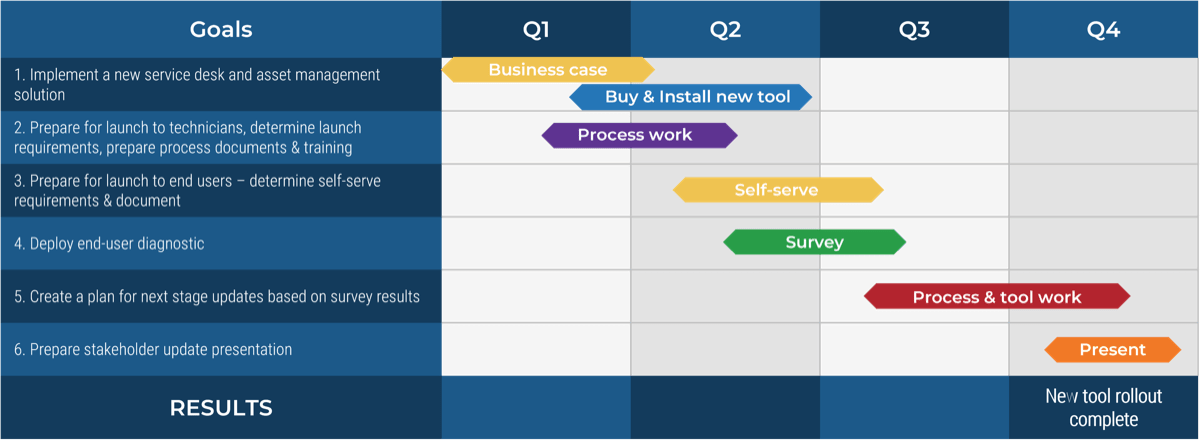

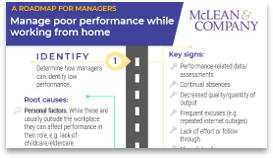
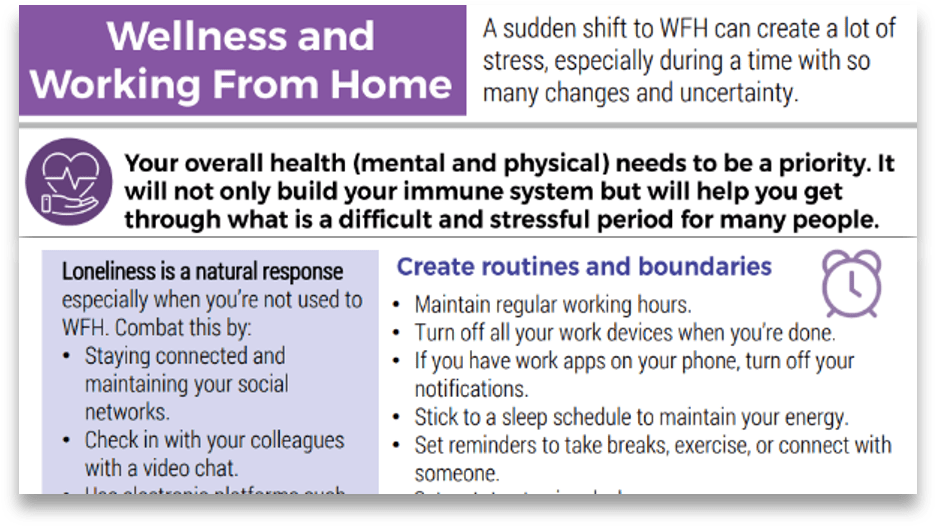


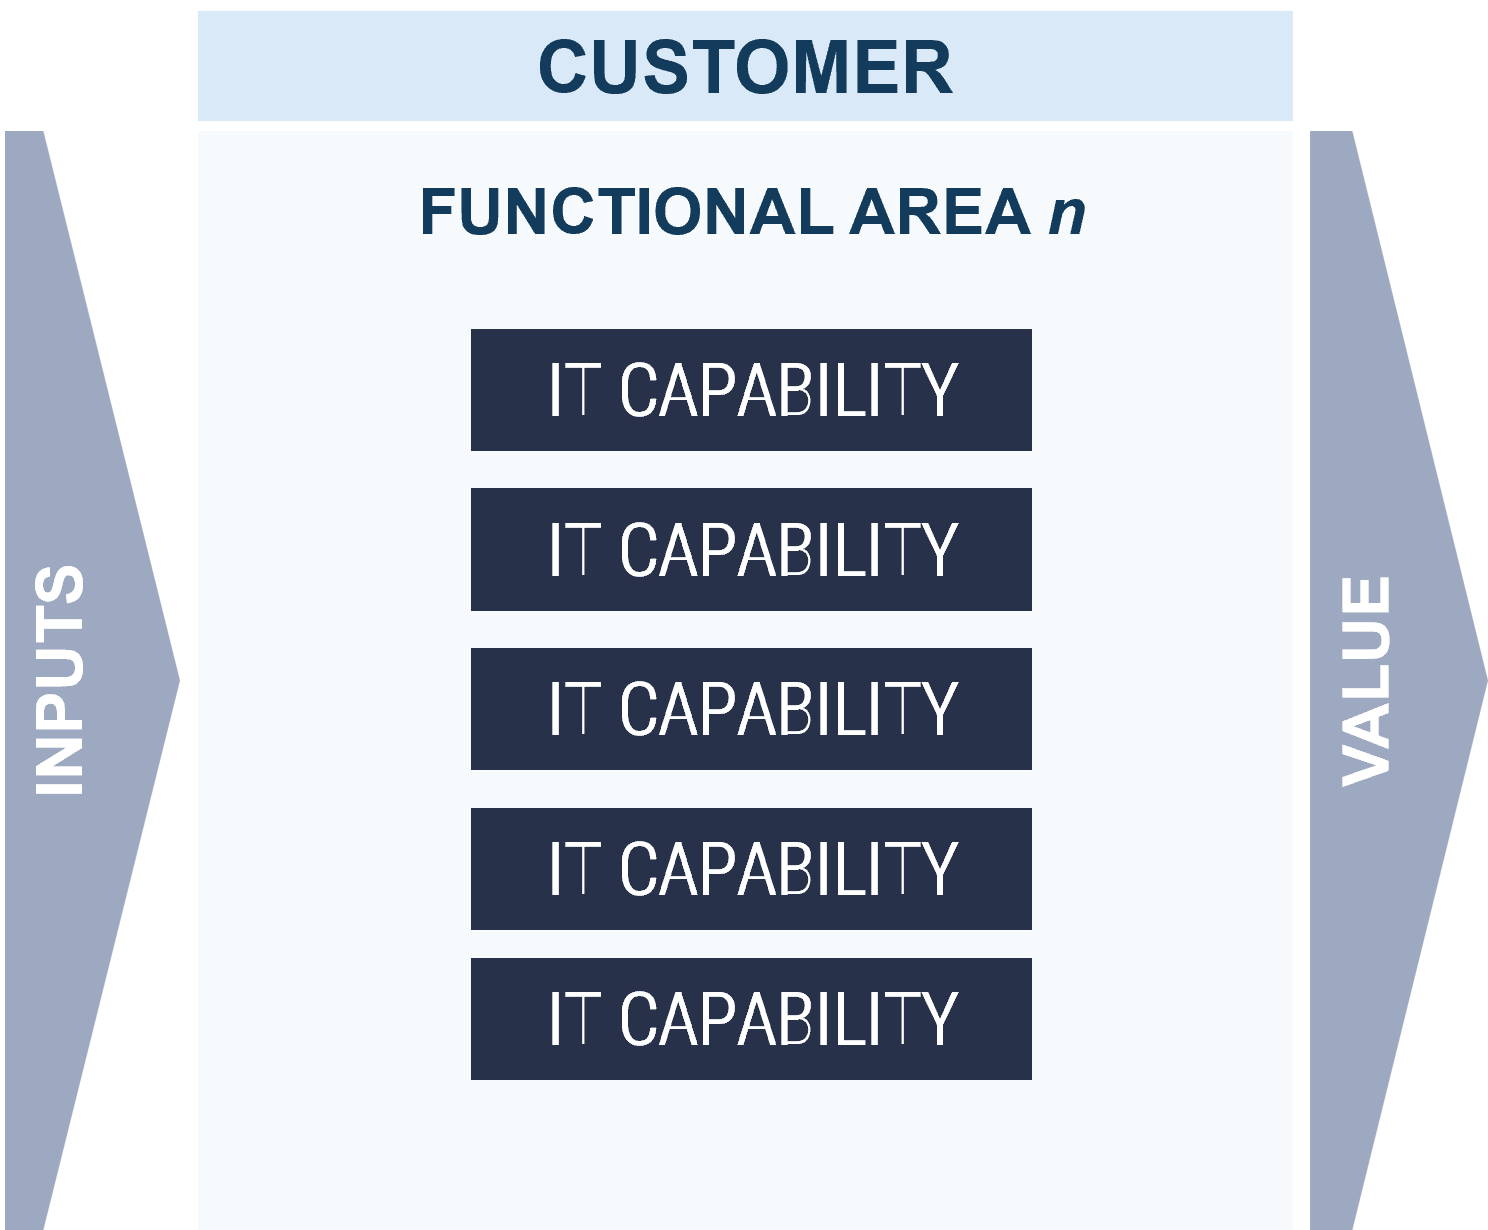
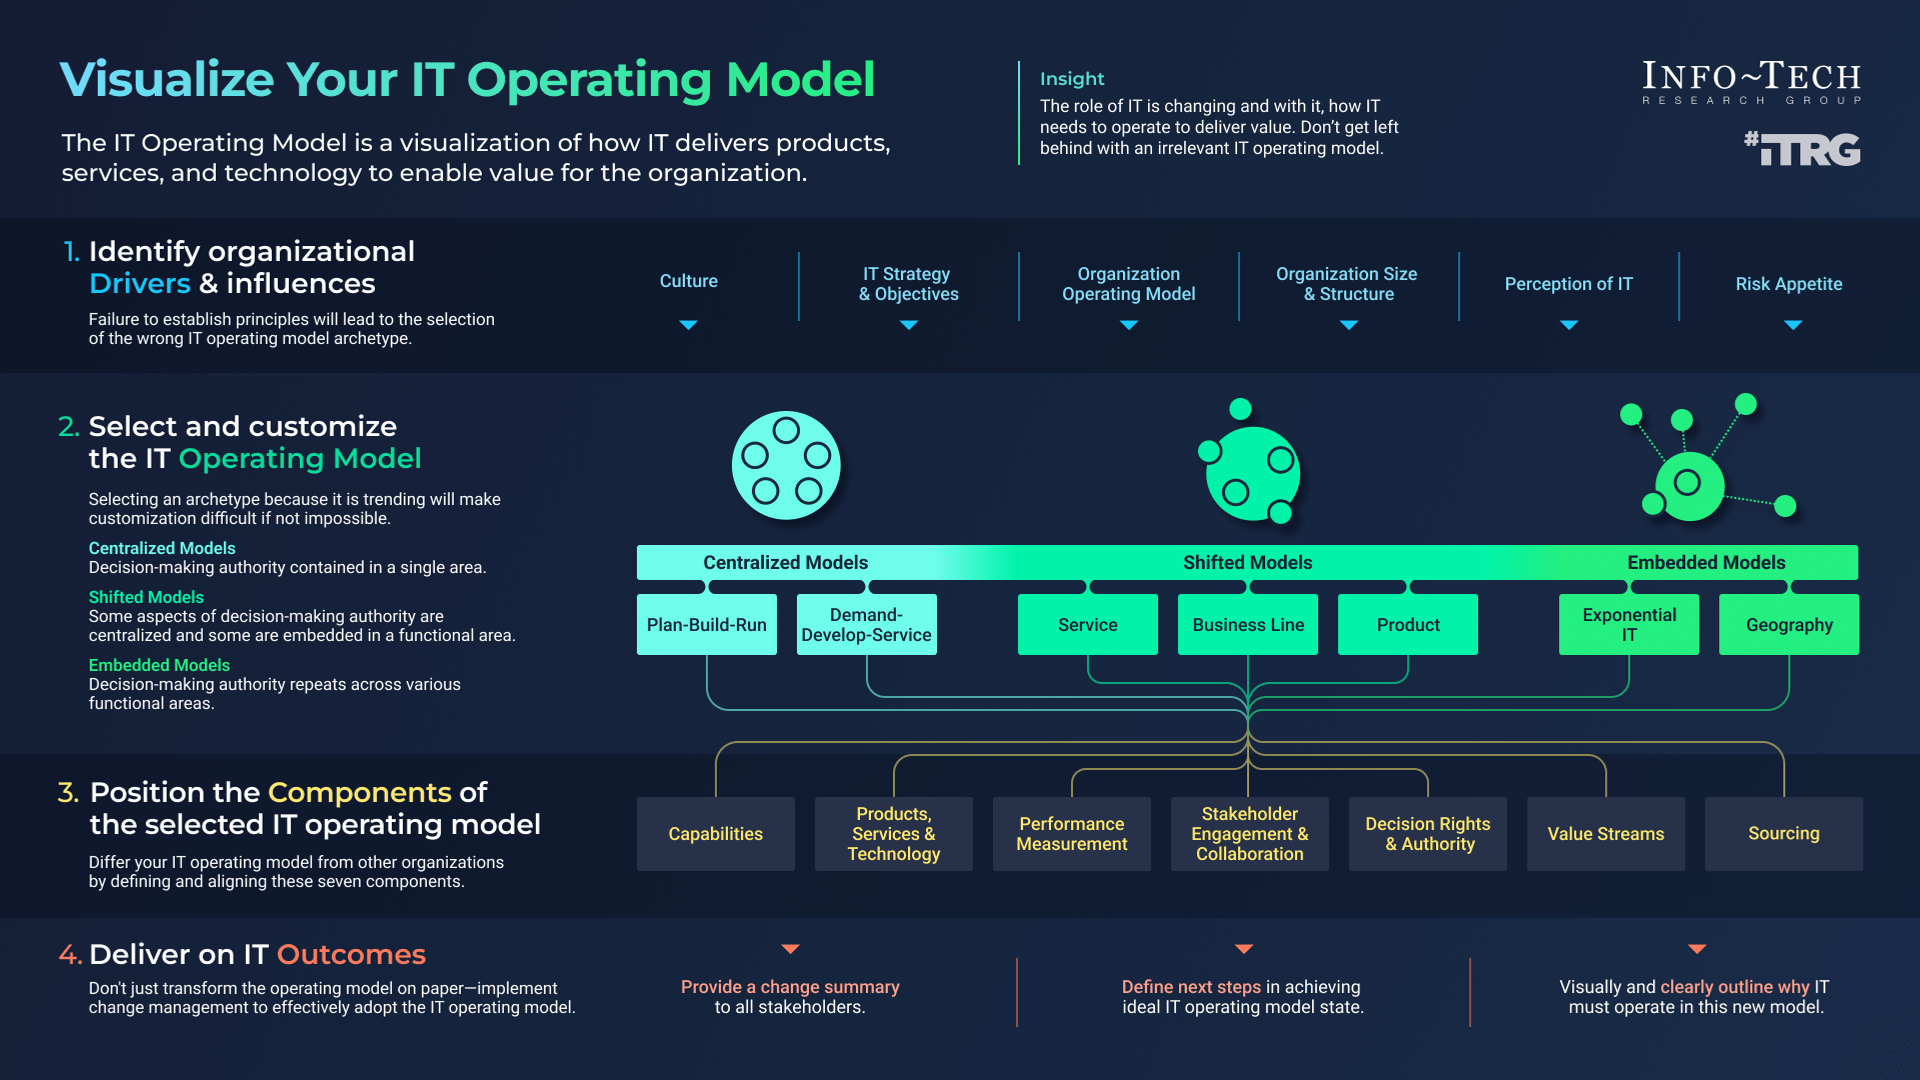
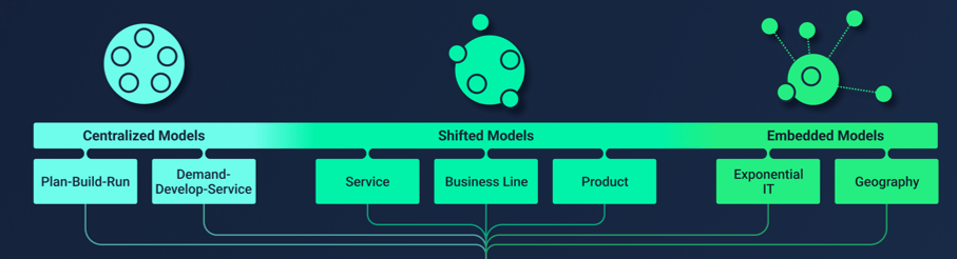
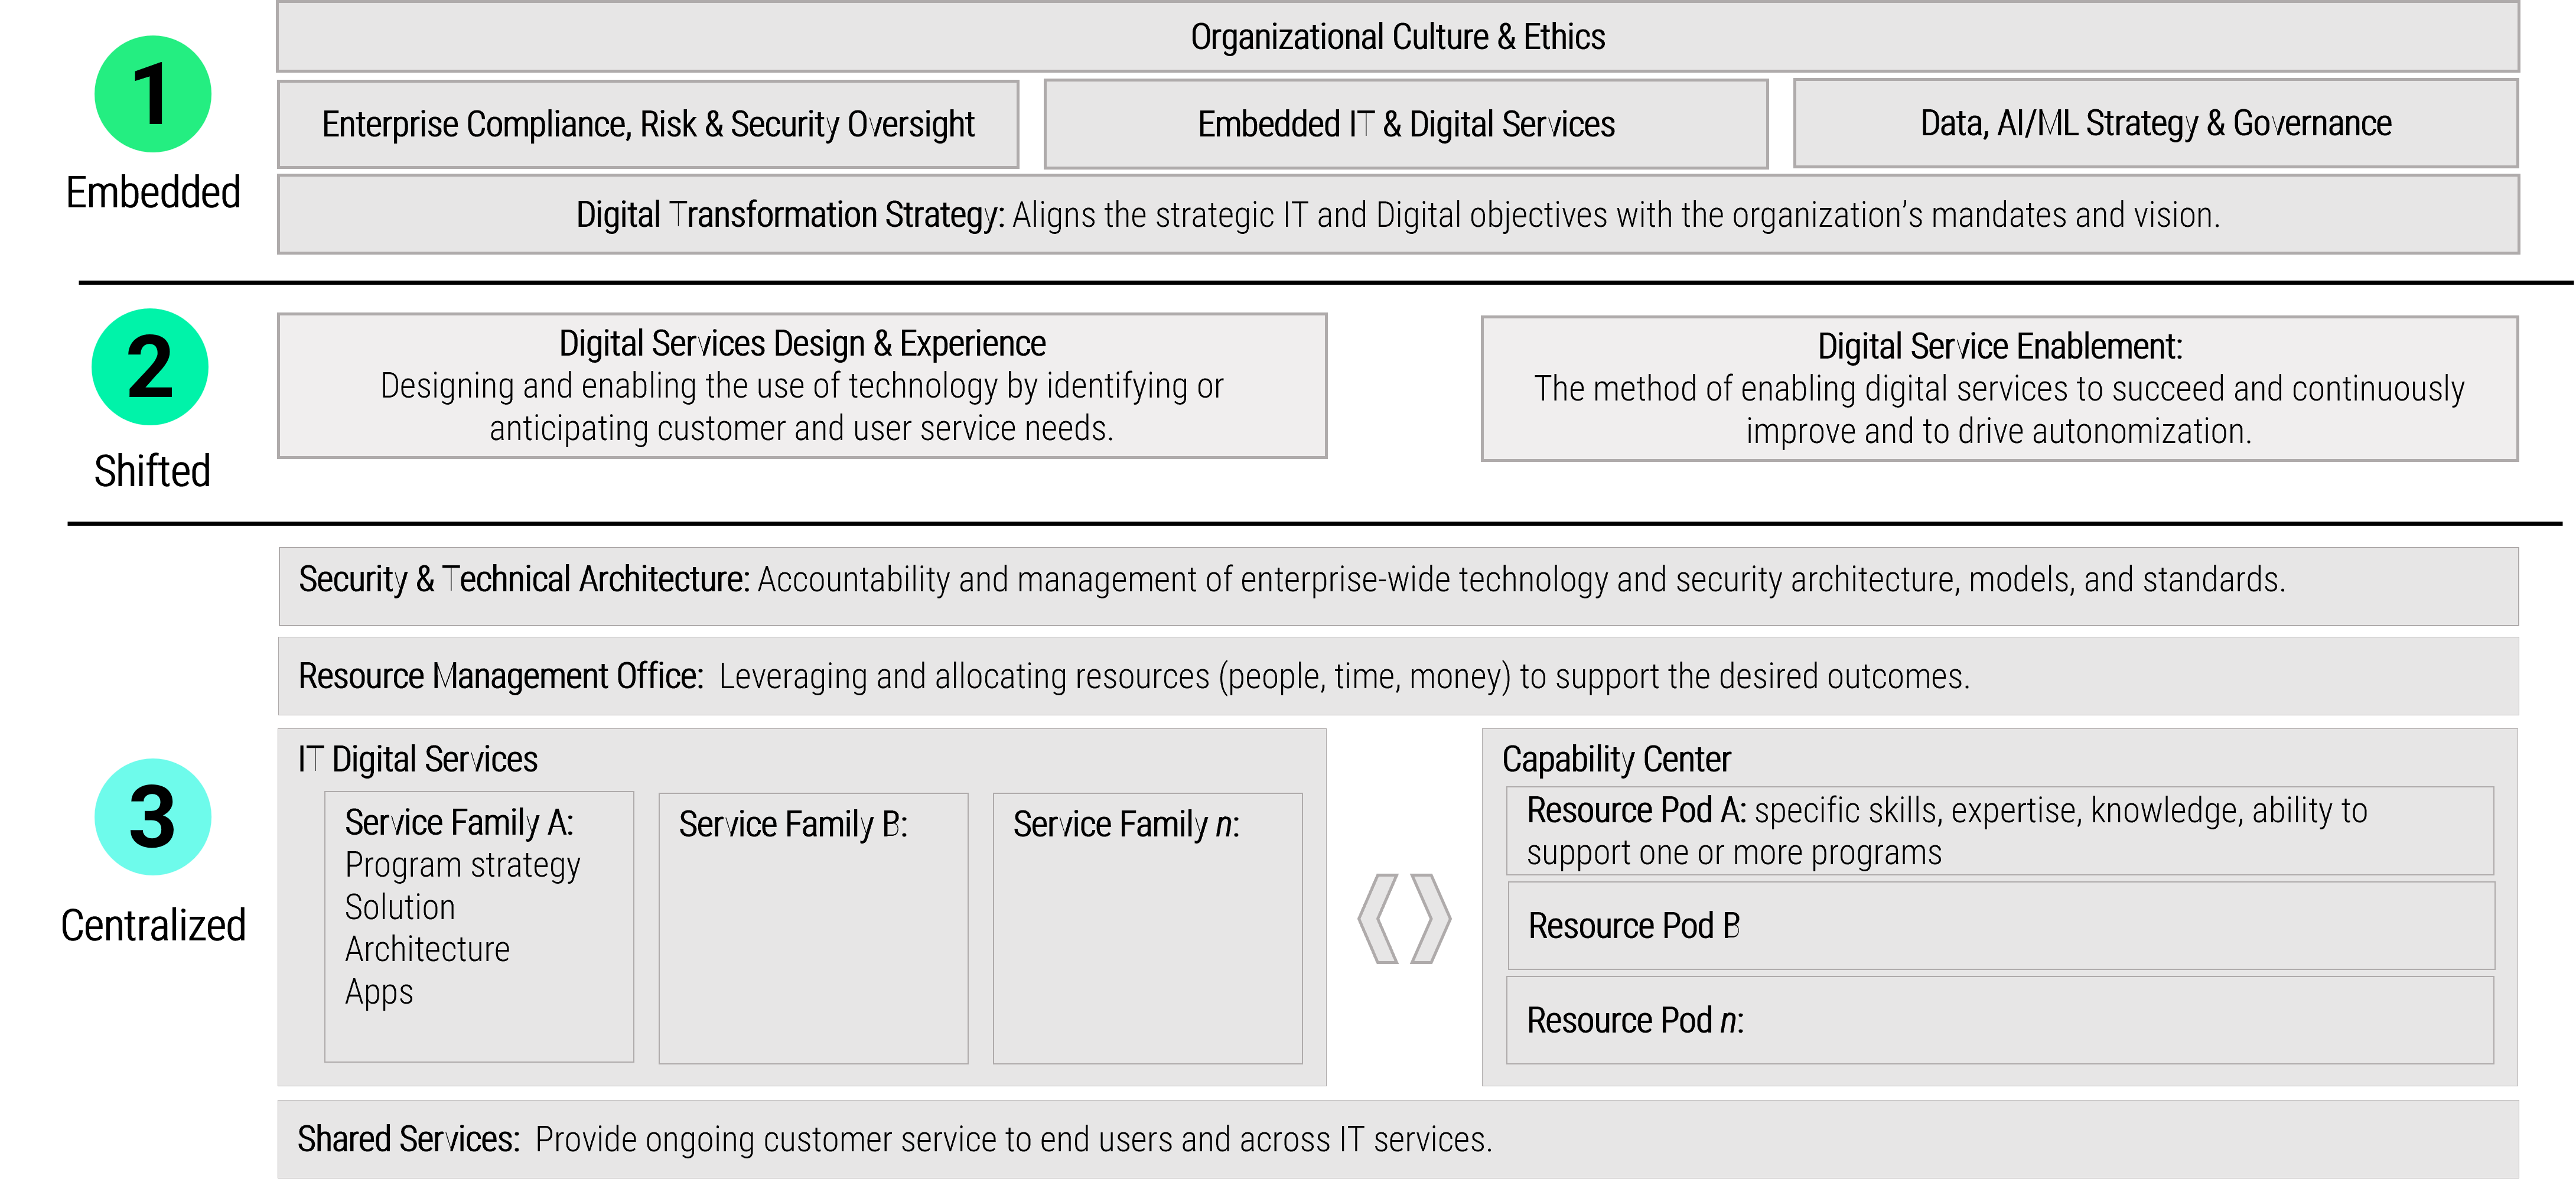

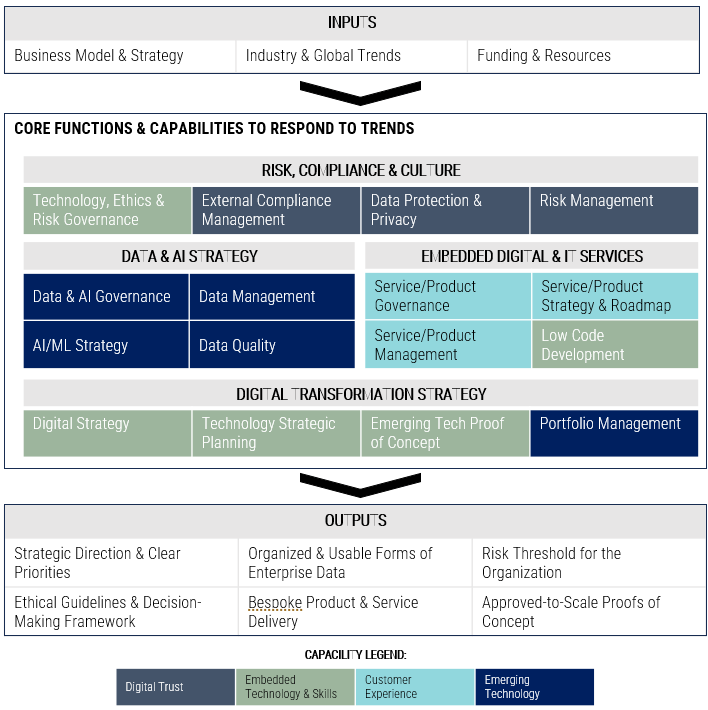
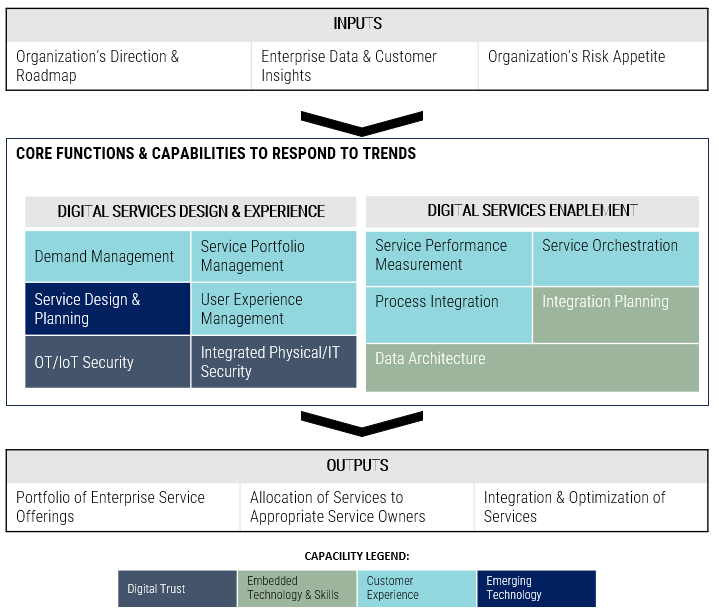

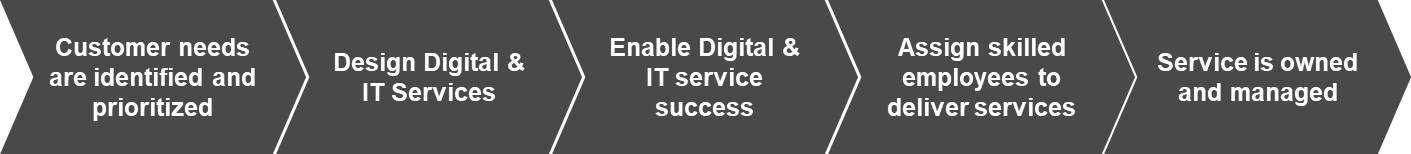

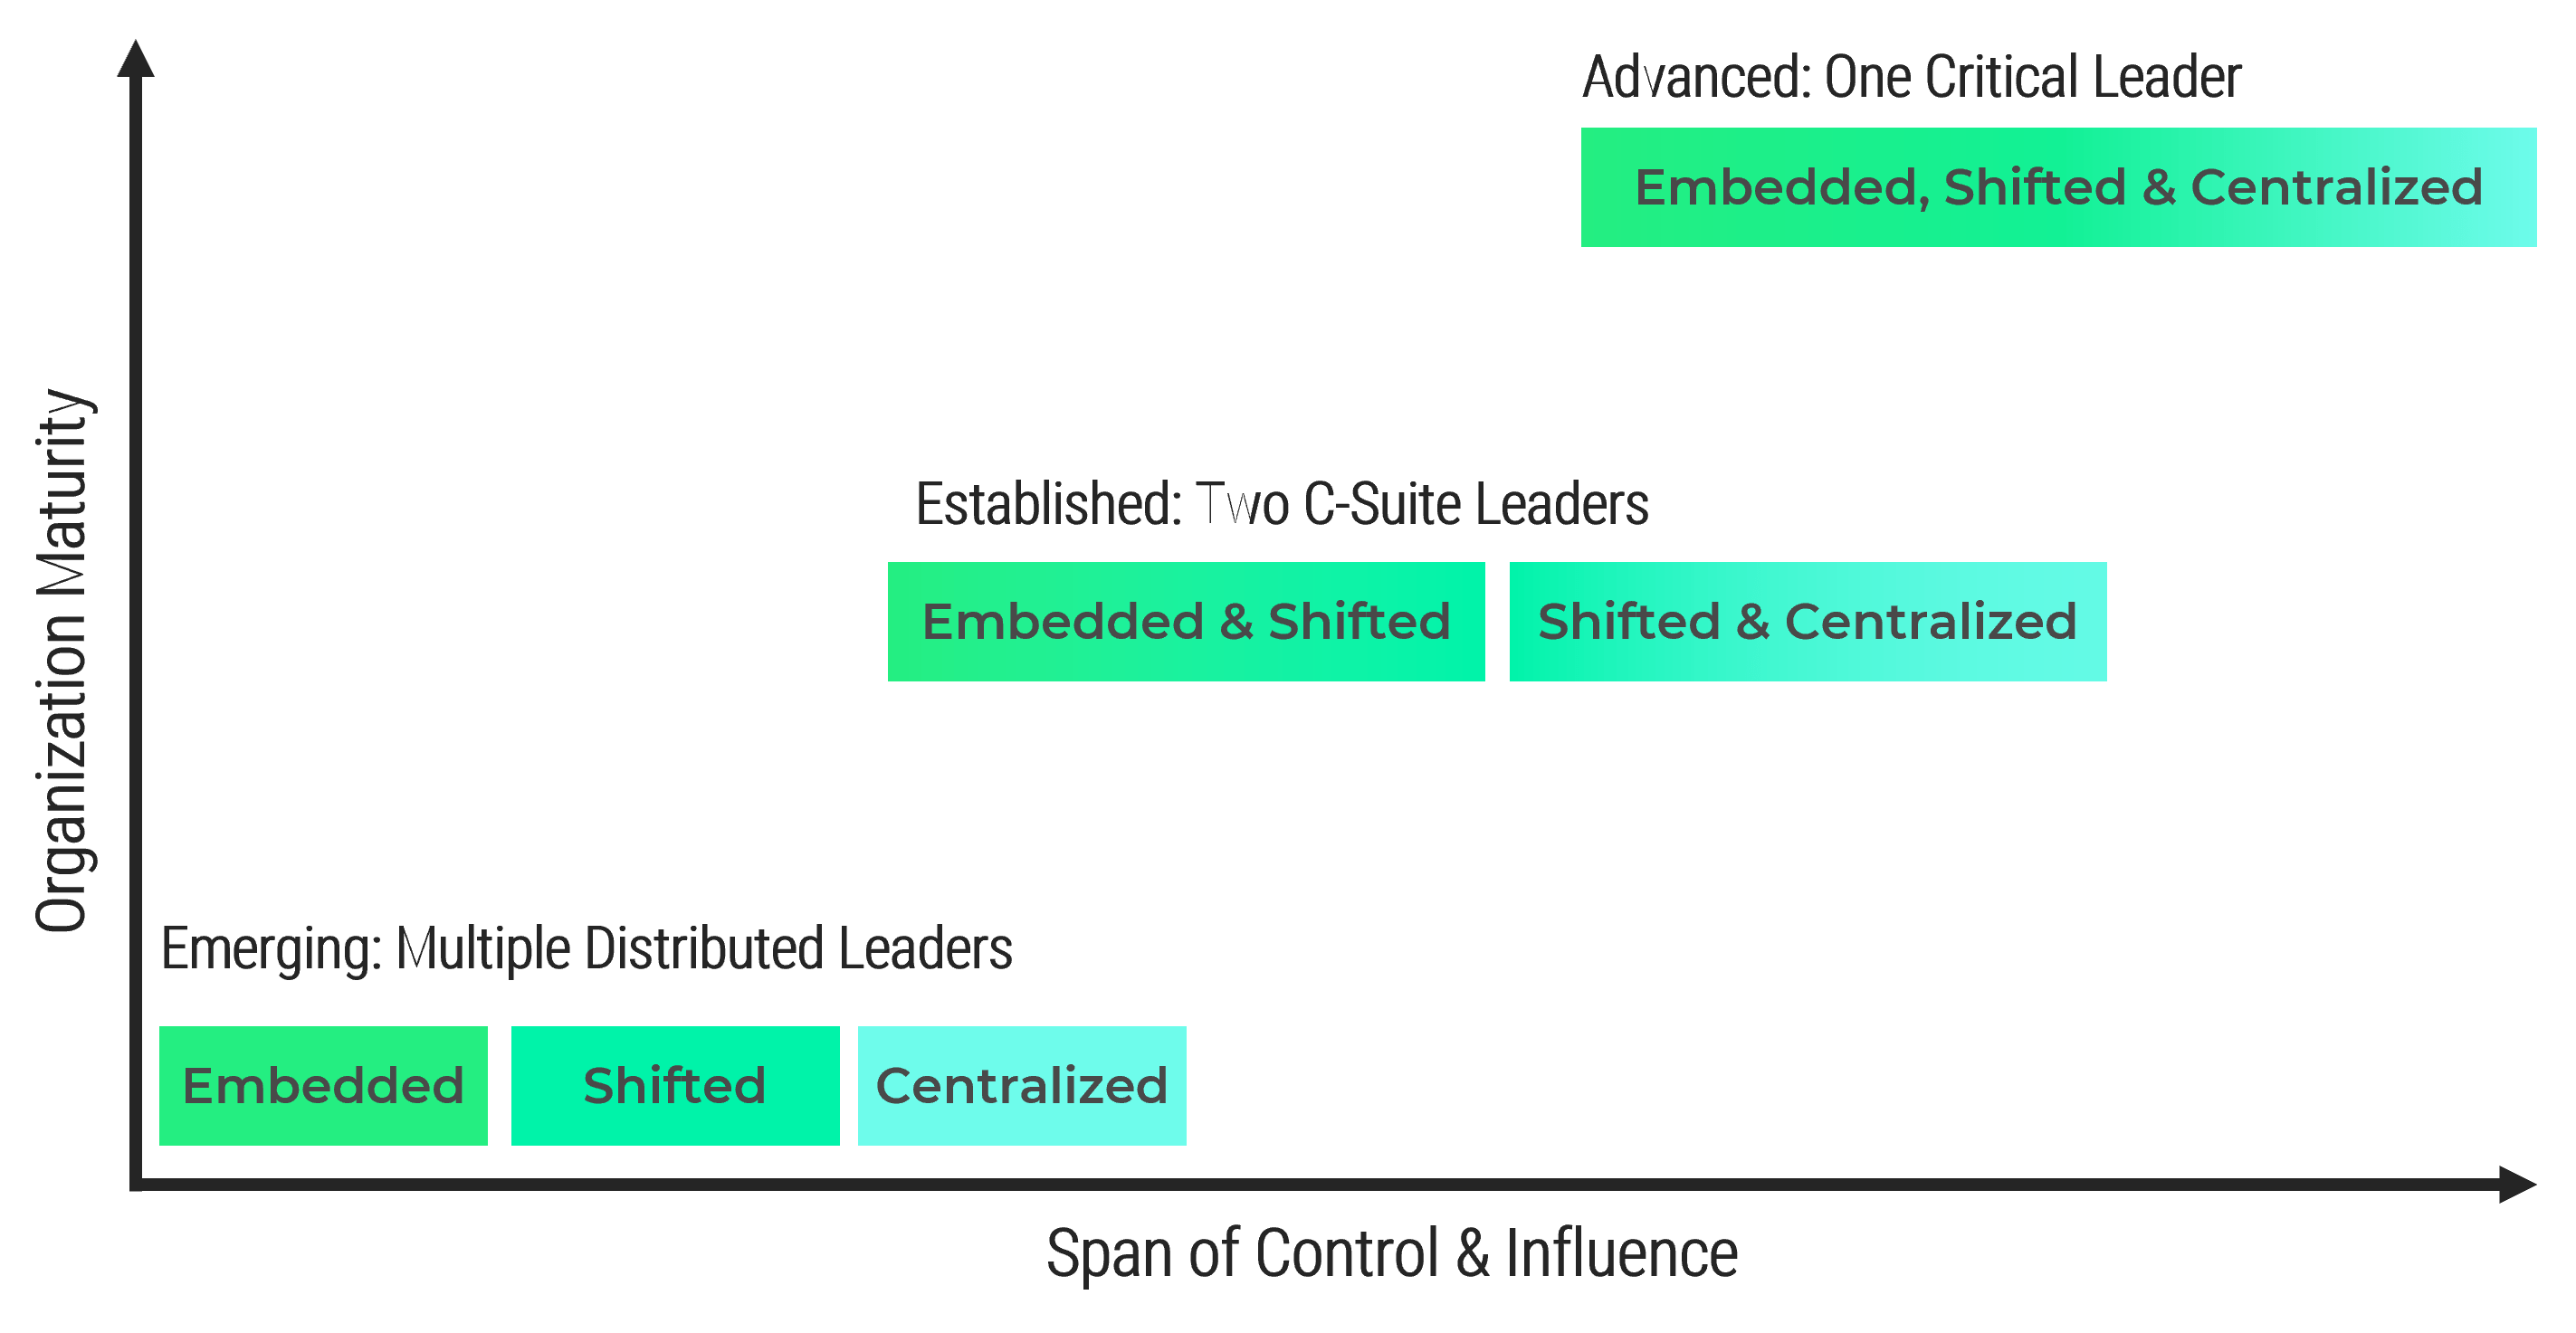
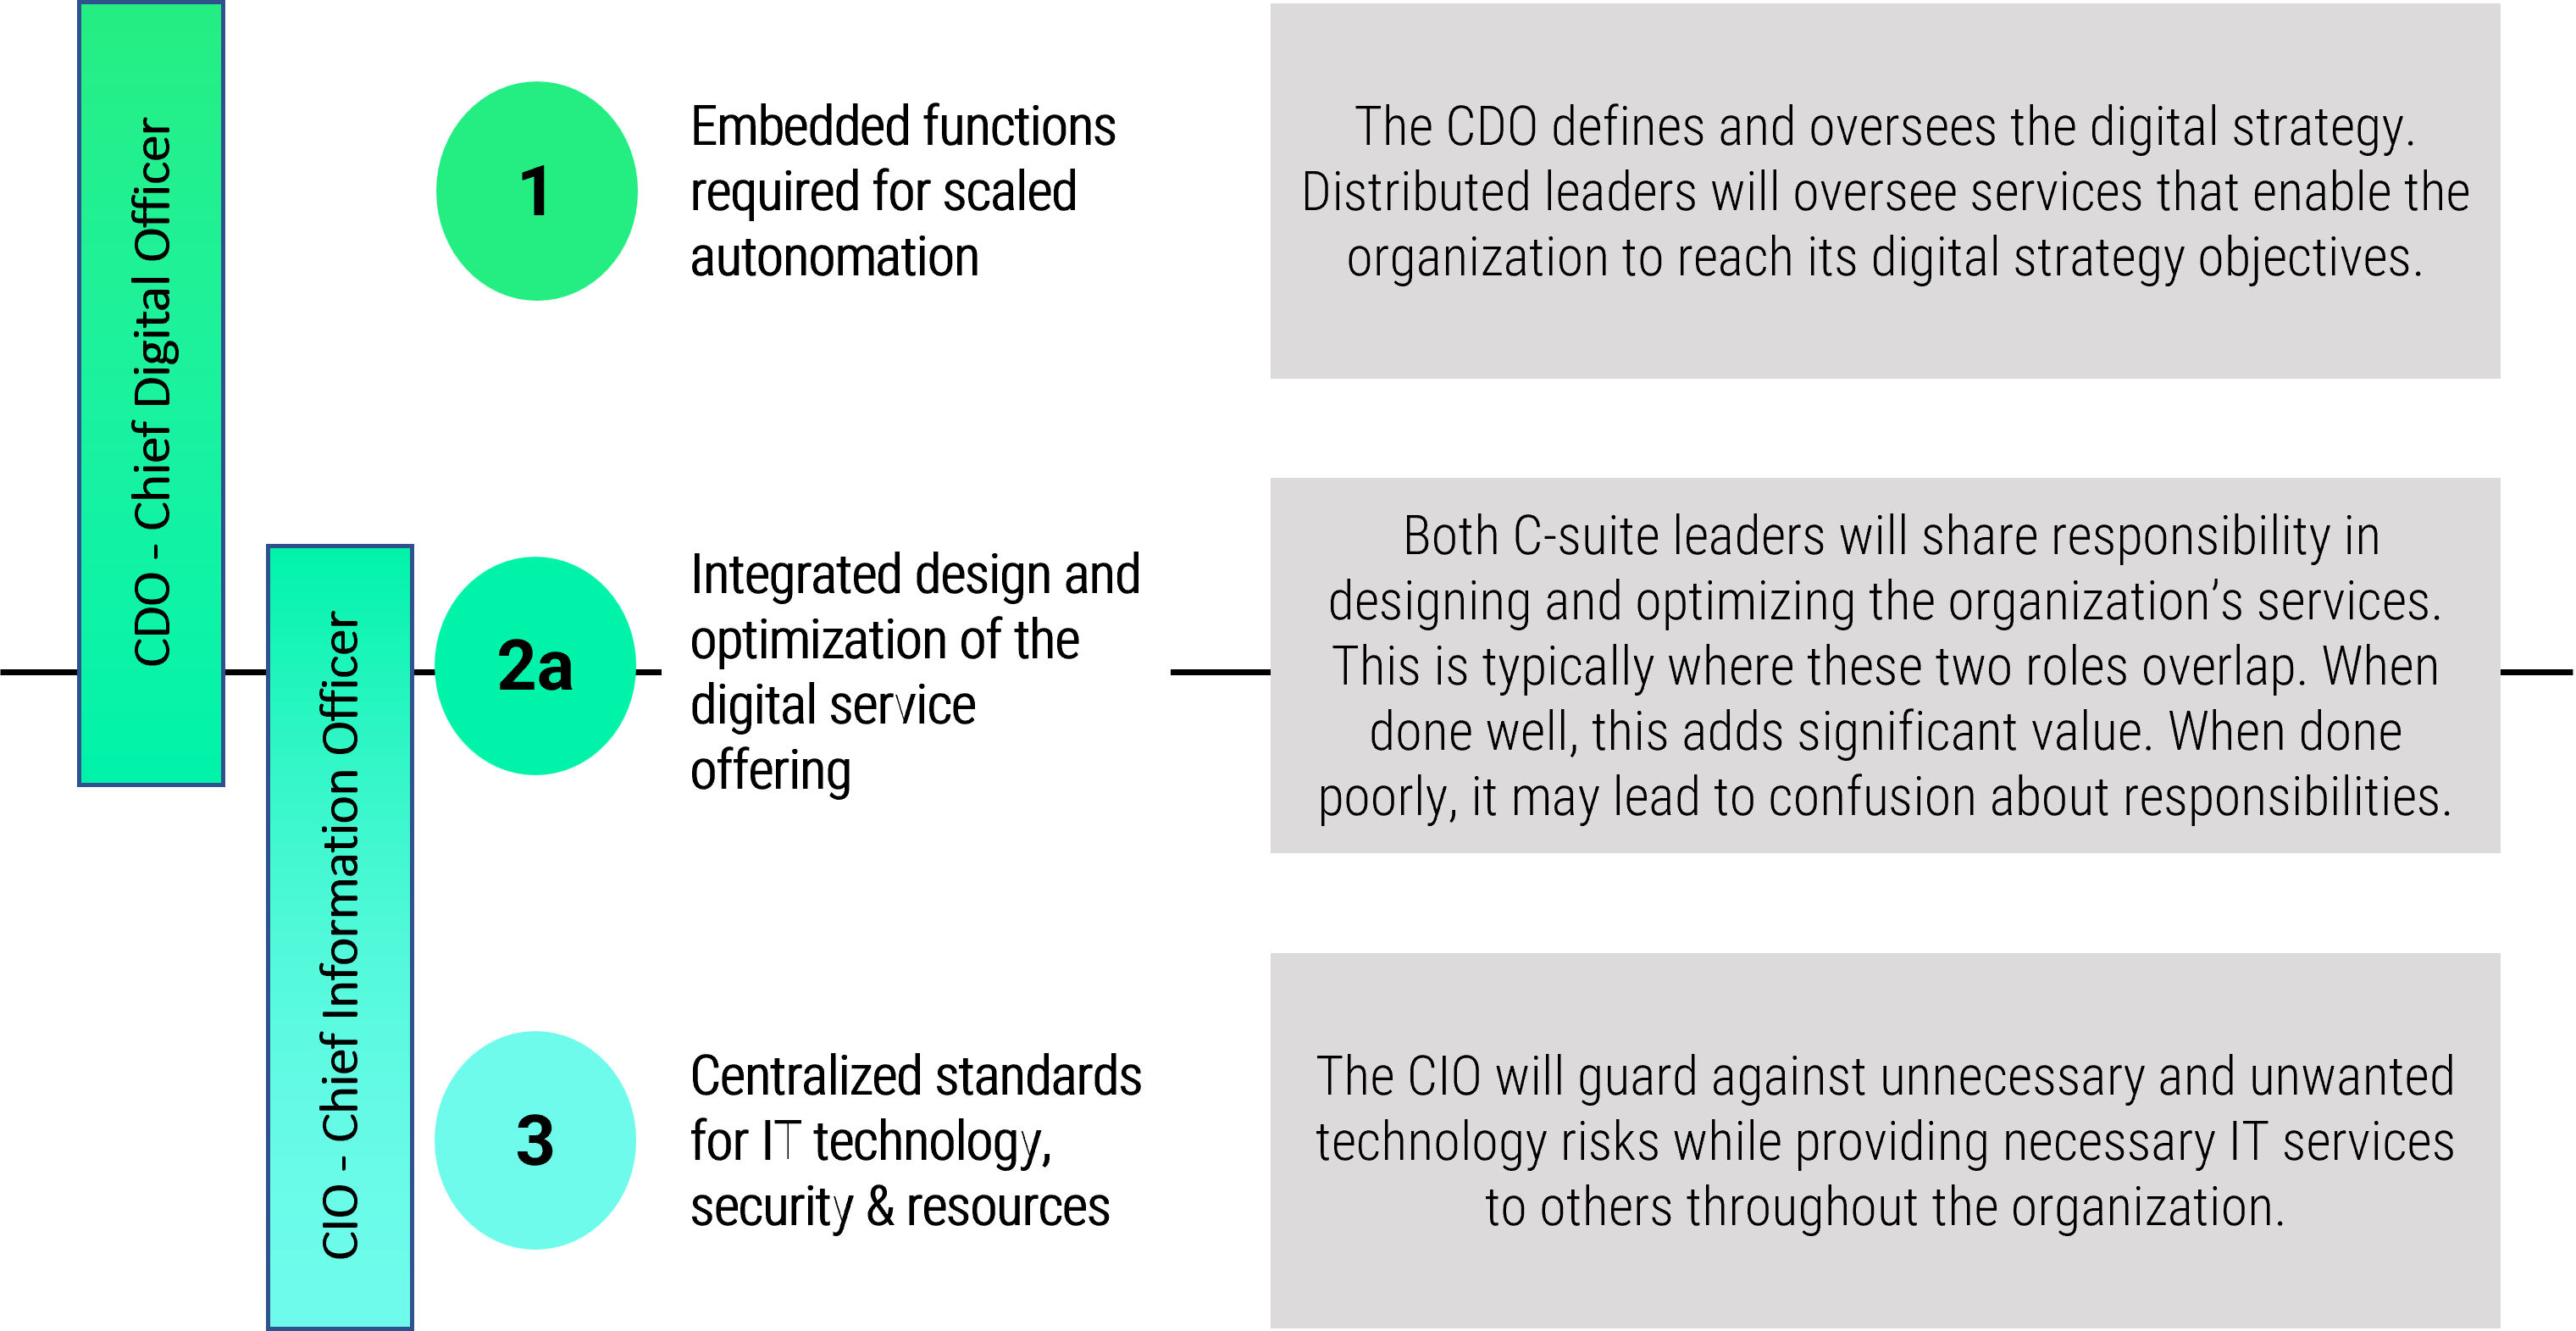
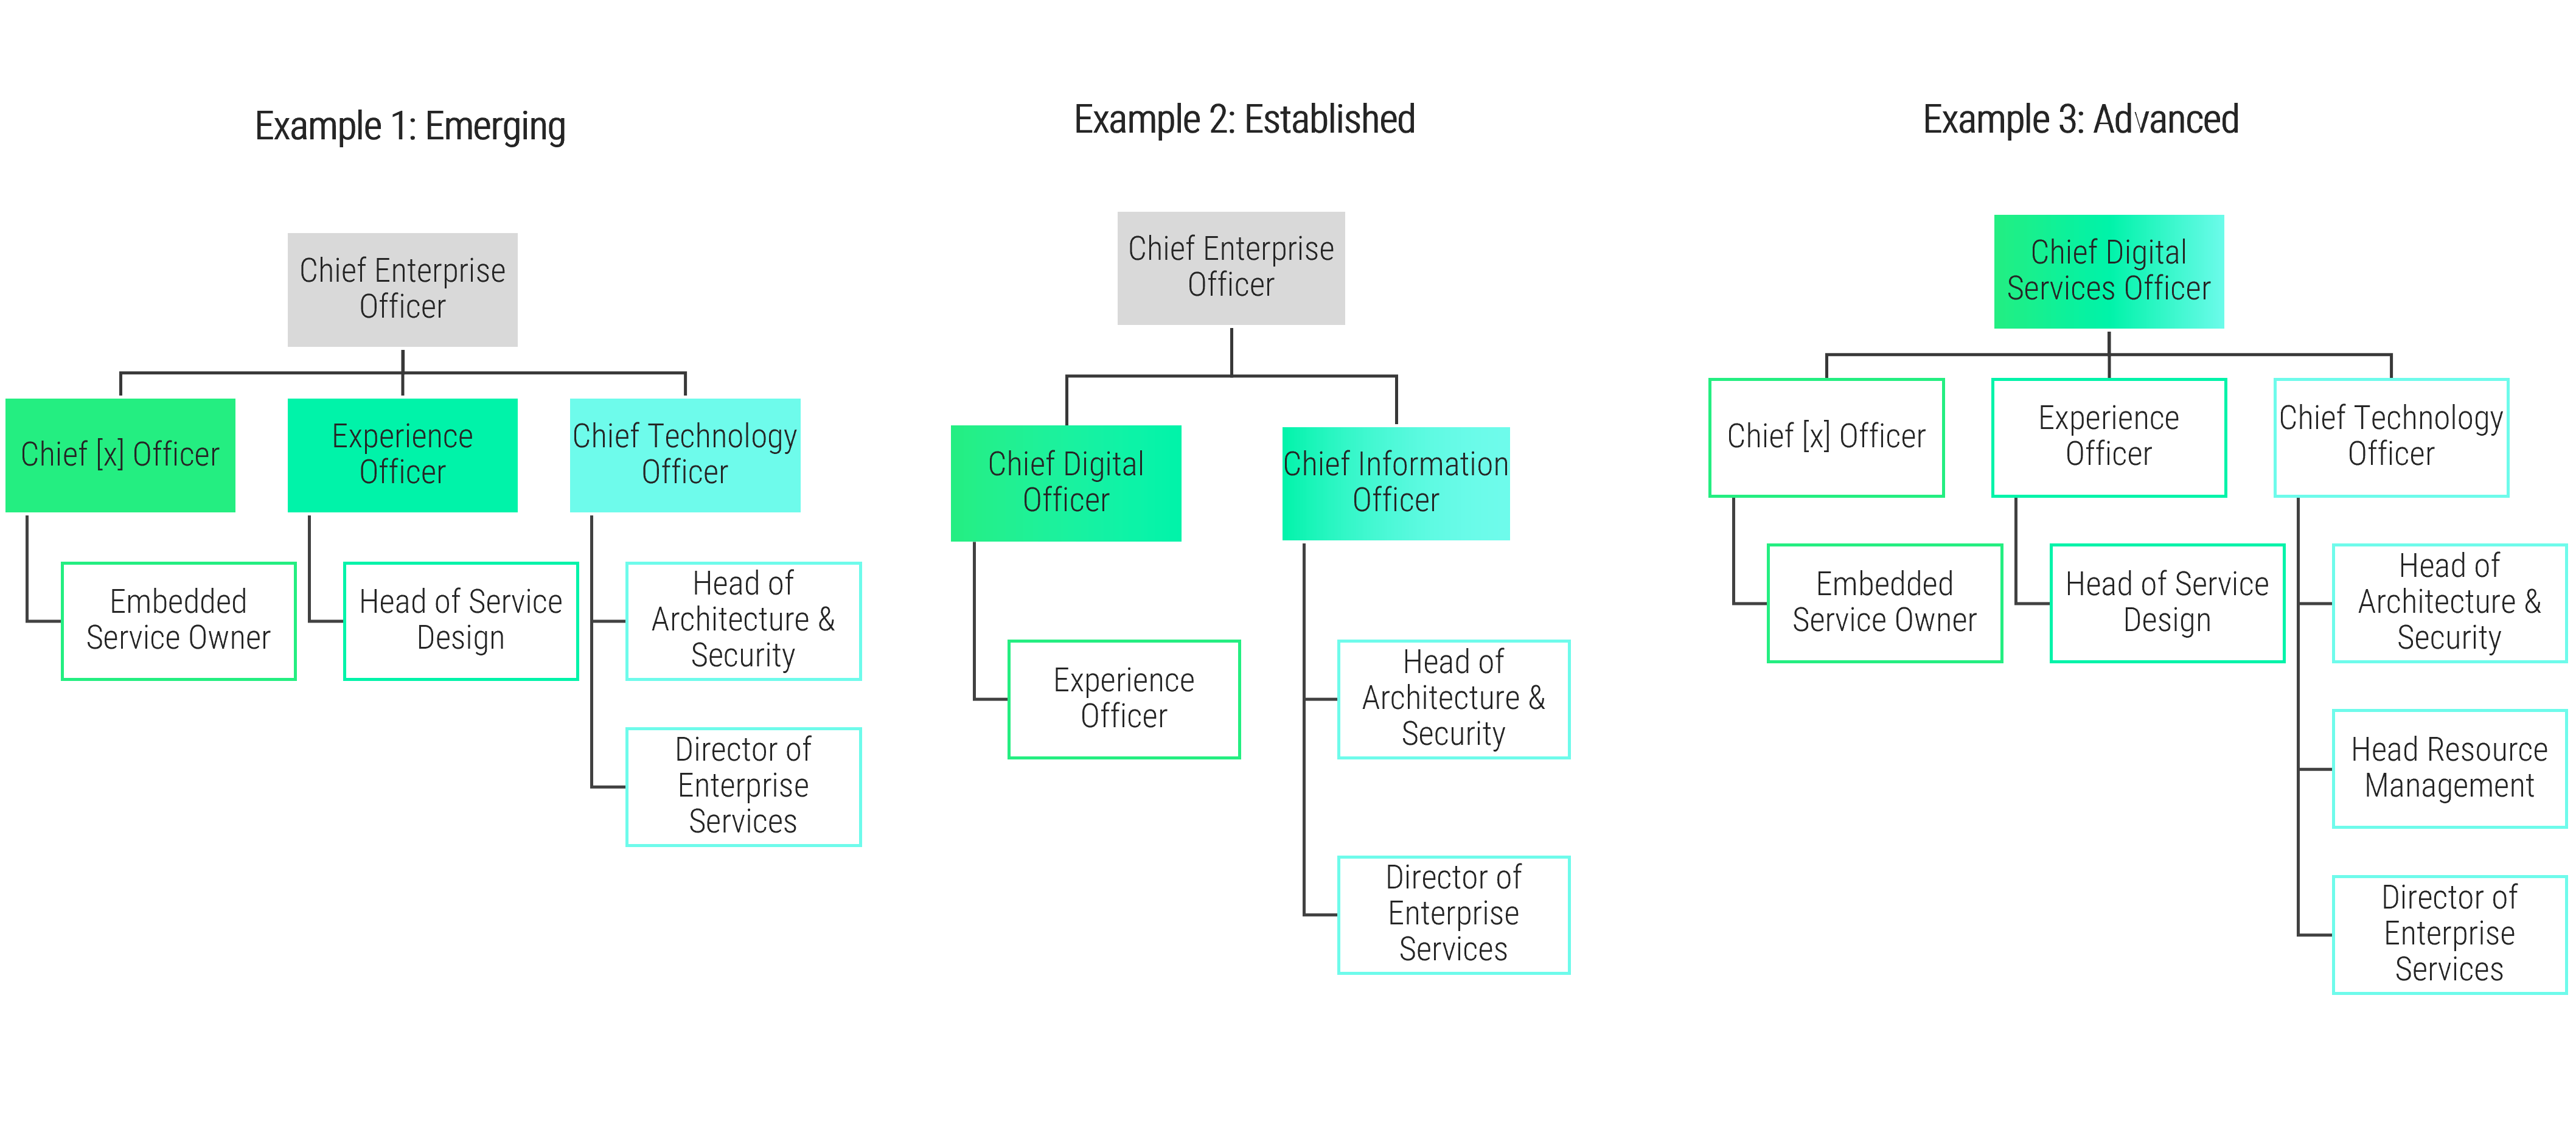
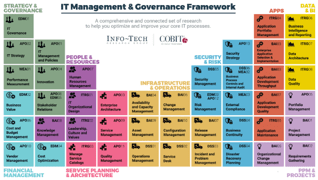
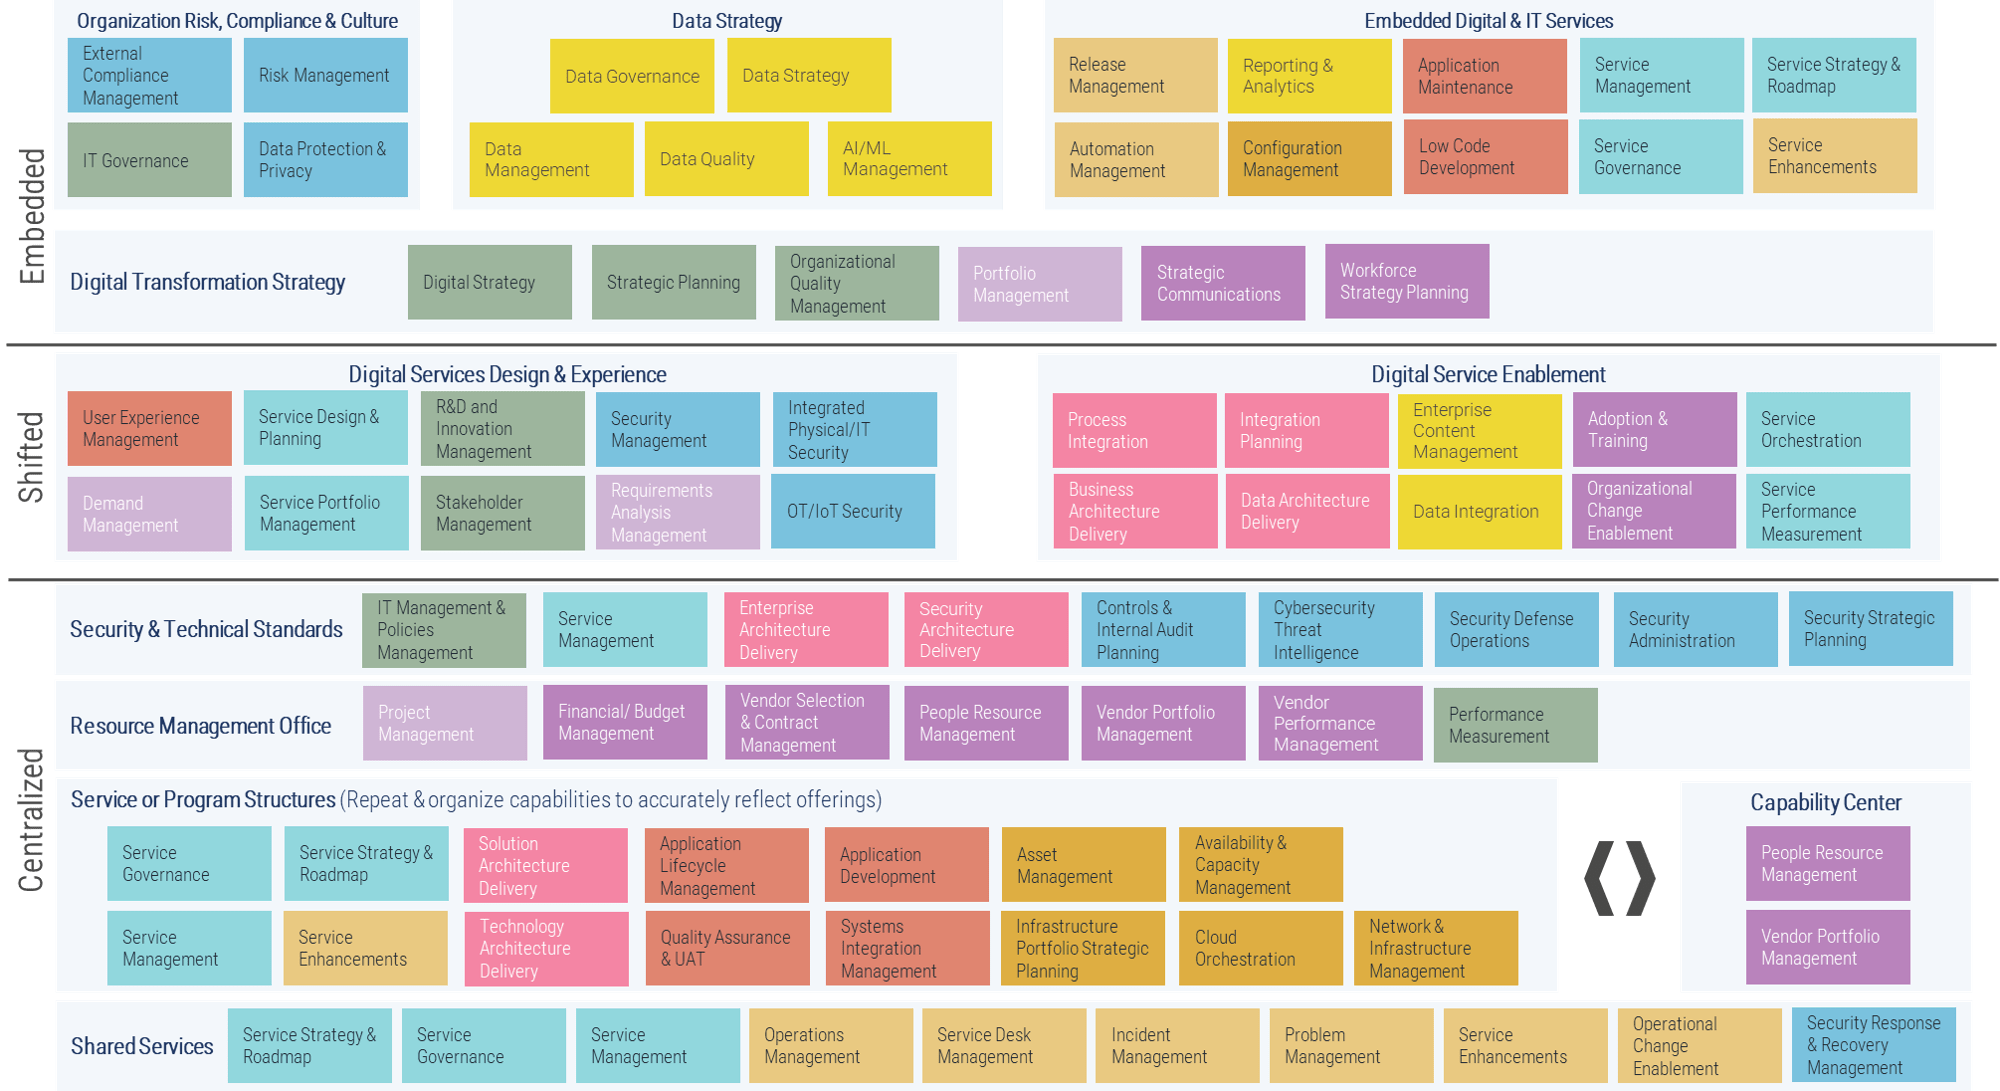


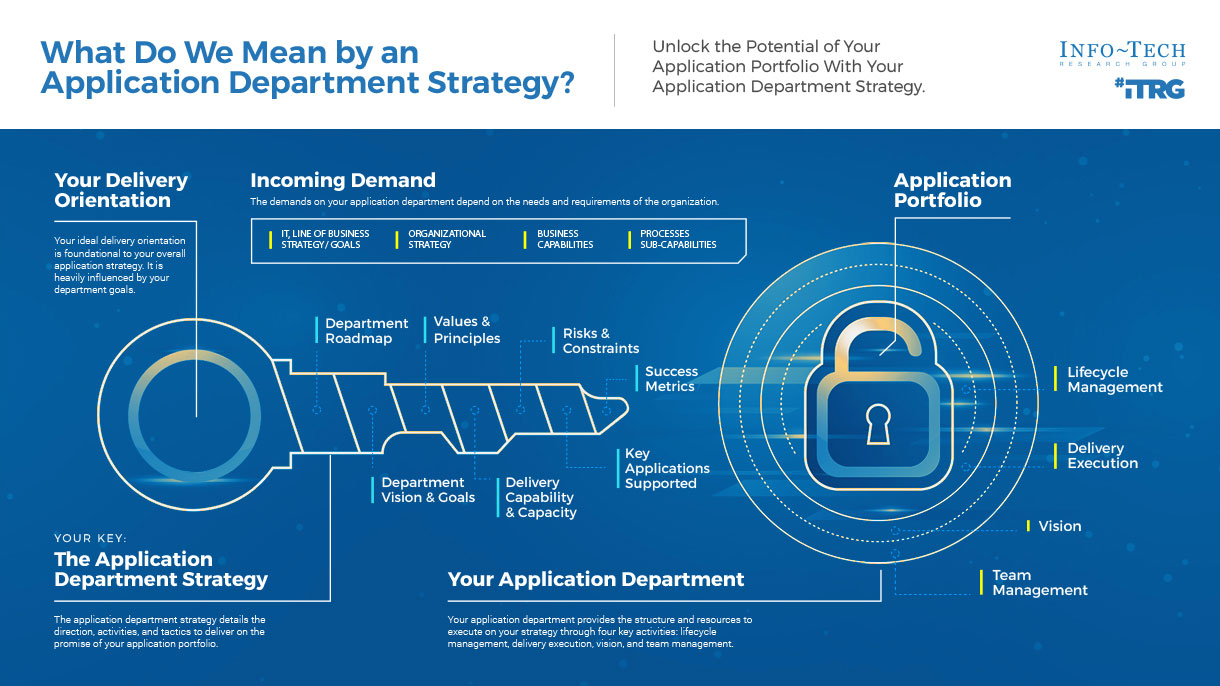


![Map different 'IBM i' scenarios with axes 'Importance to Business Outcomes - Low to High' and 'Vendor’s Performance Advantage - Low to High'. Quadrant labels are '[LI/LA] Potentially Outsource: Service management, Help desk, desk-side support, Asset management', '[LI/HA] Outsource: Application & Infra Support, Web Hosting, SAP Support, Email Services, Infrastructure', '[HI/LA] Insource (For Now): Application development tech support', and '[HI/HA] Potentially Outsource: Onshore or offshore application maintenance'.](/images/ITMGF/infra-and-operations/i-and-o-process-management/strategy-and-organizational-design/ibm-i-migration-considerations/04-ibmi-map-importance-advantage.png)
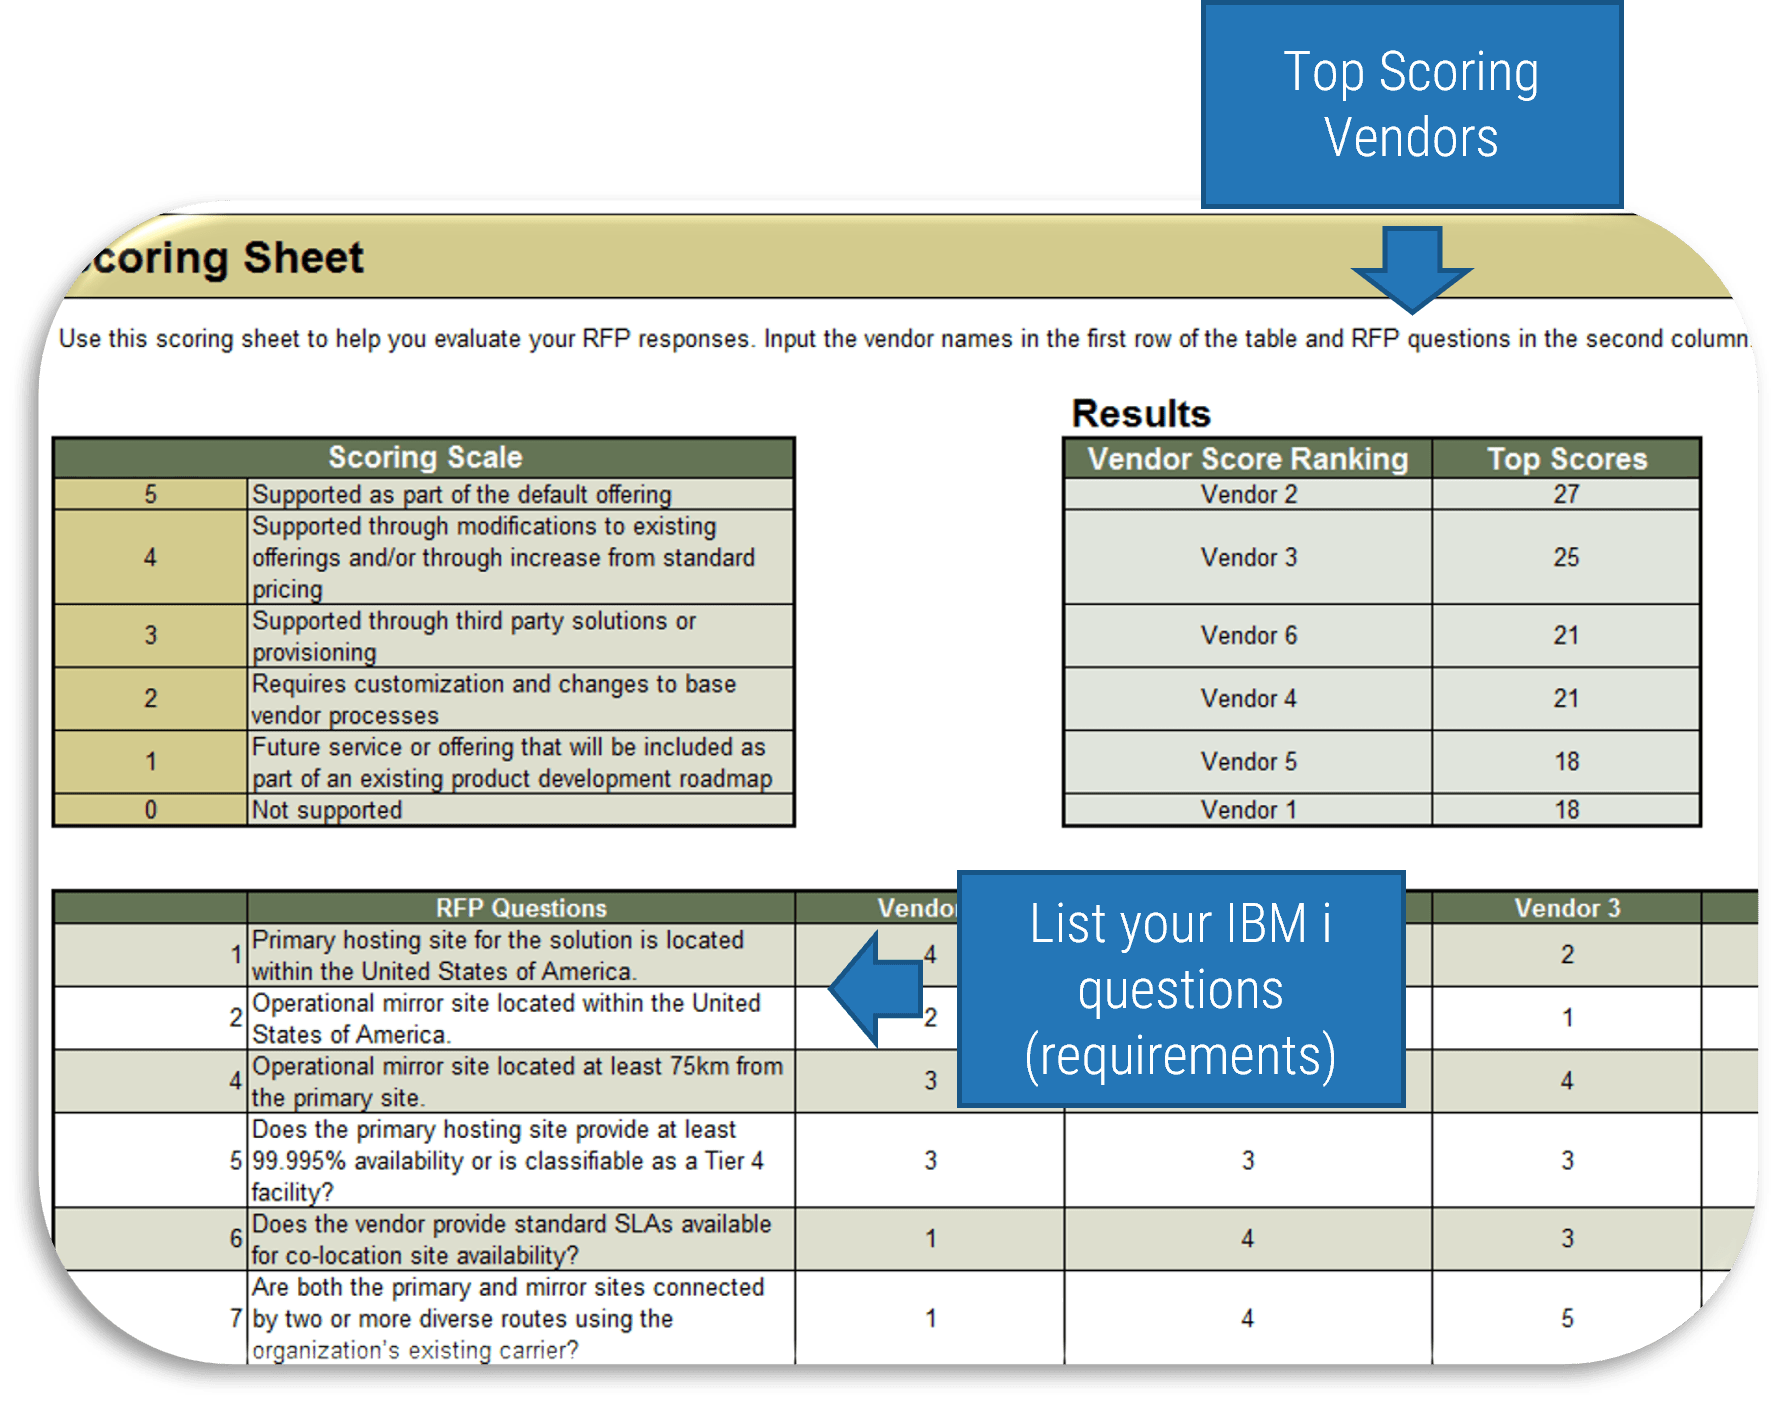


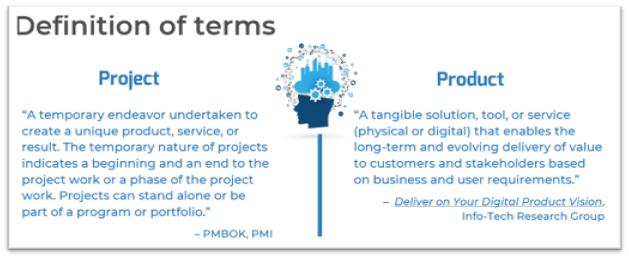
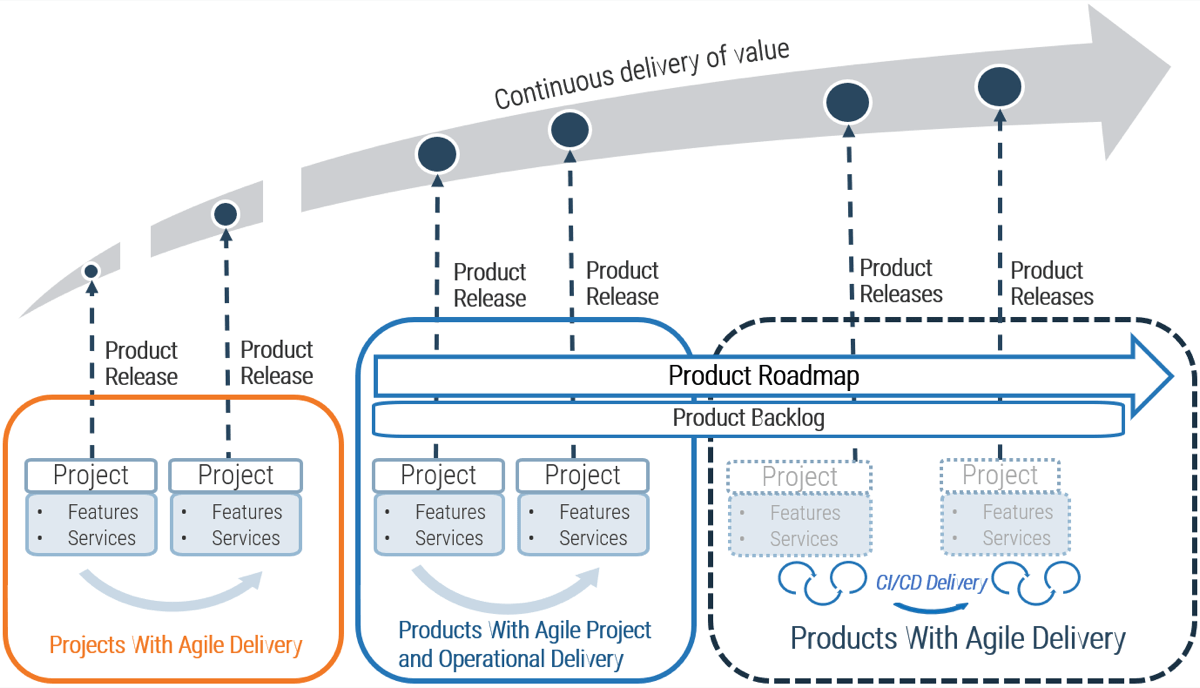

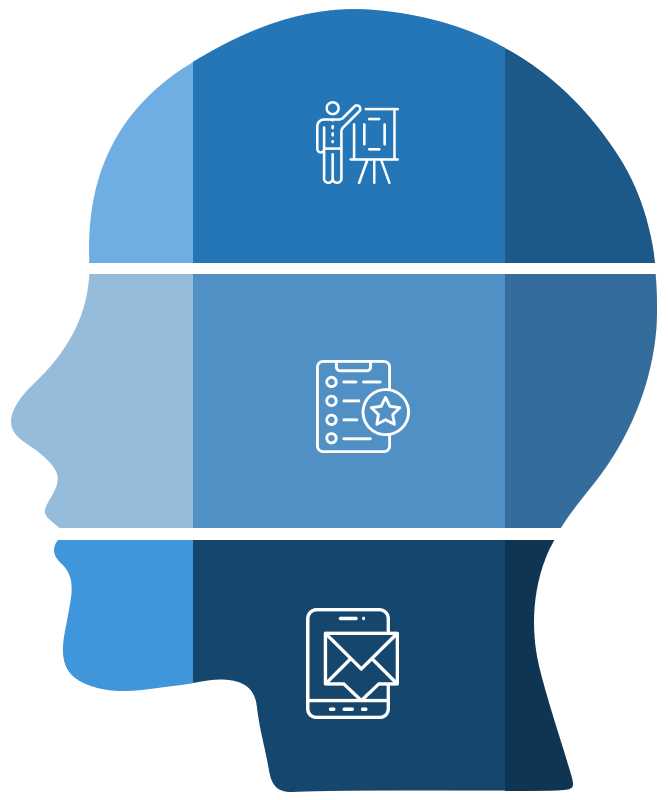

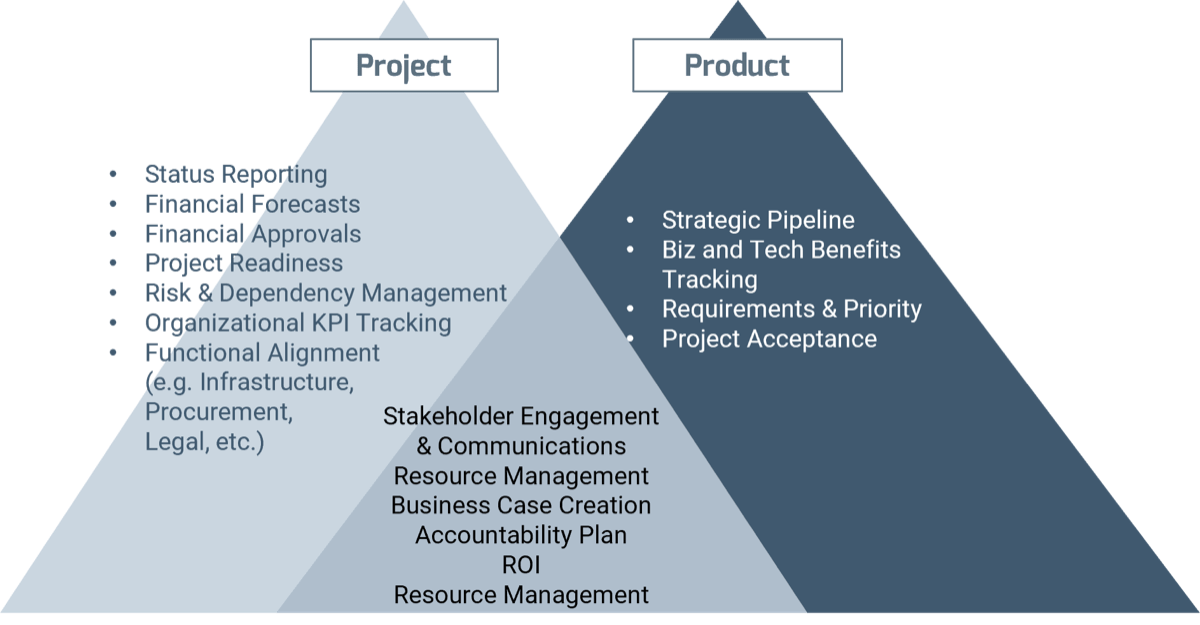
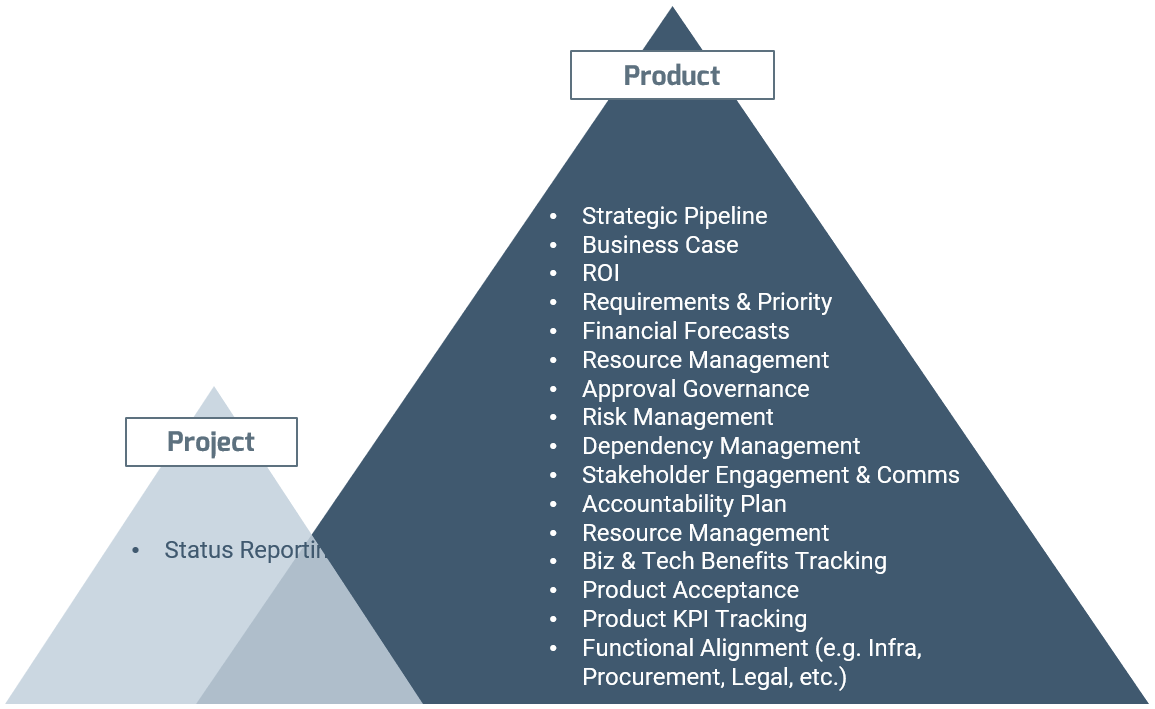


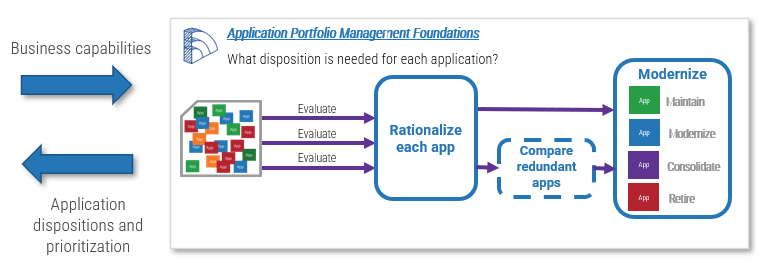
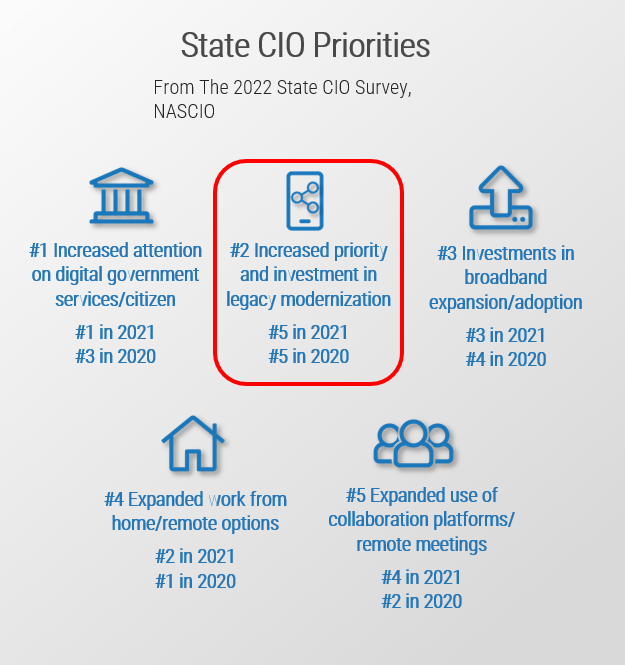


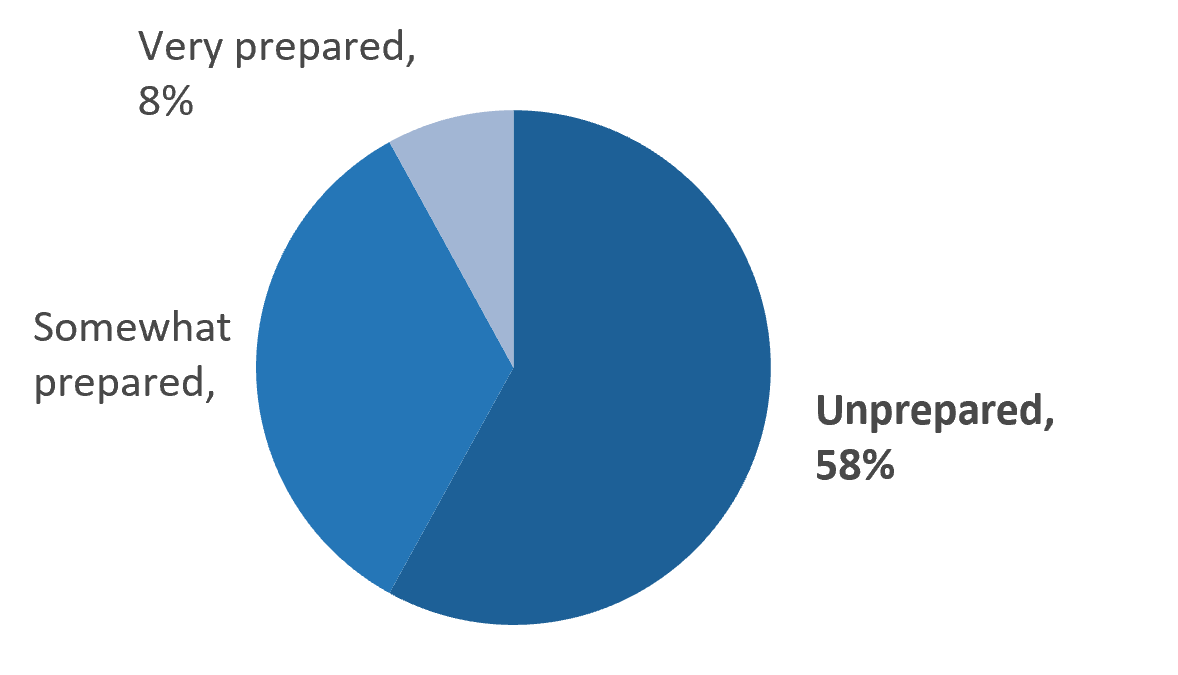
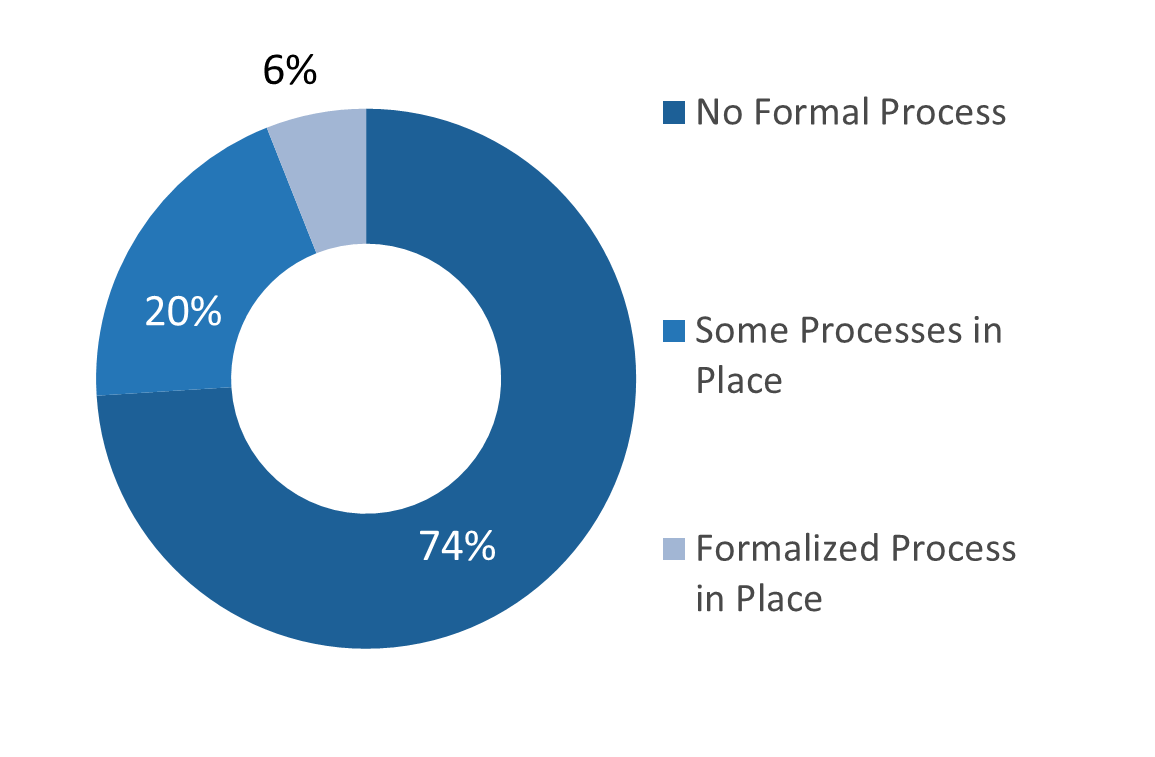


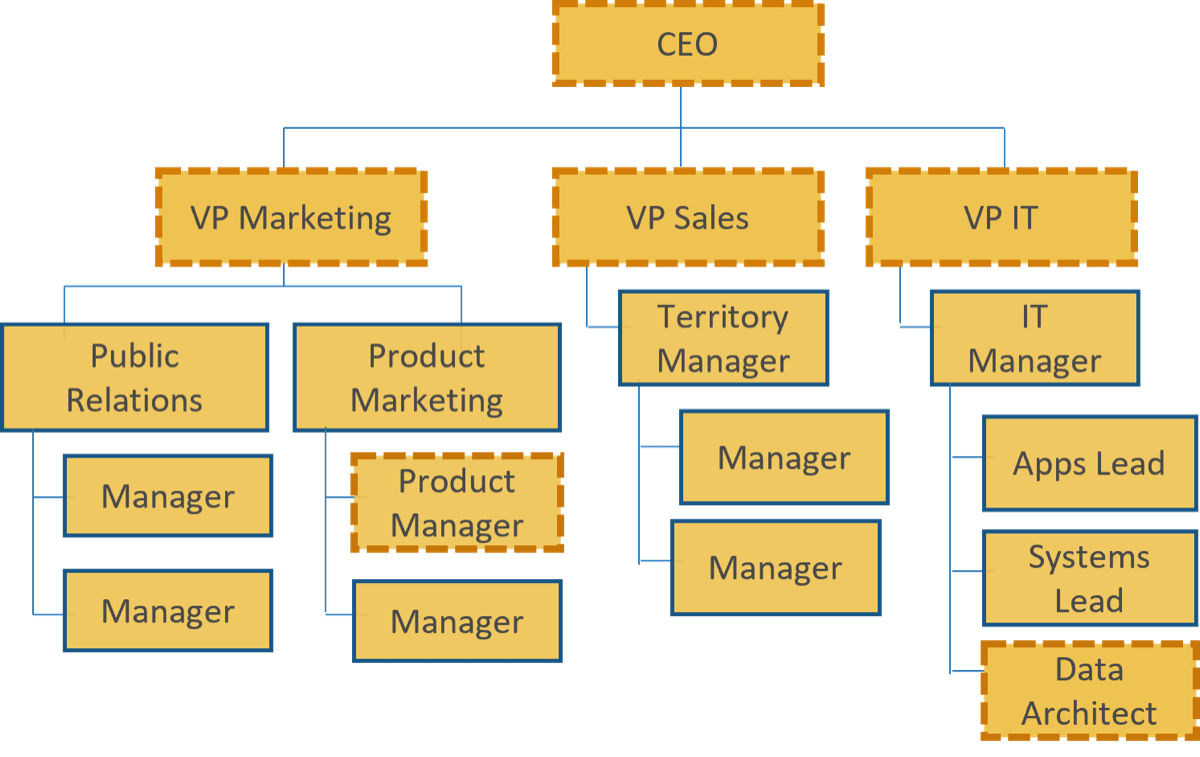

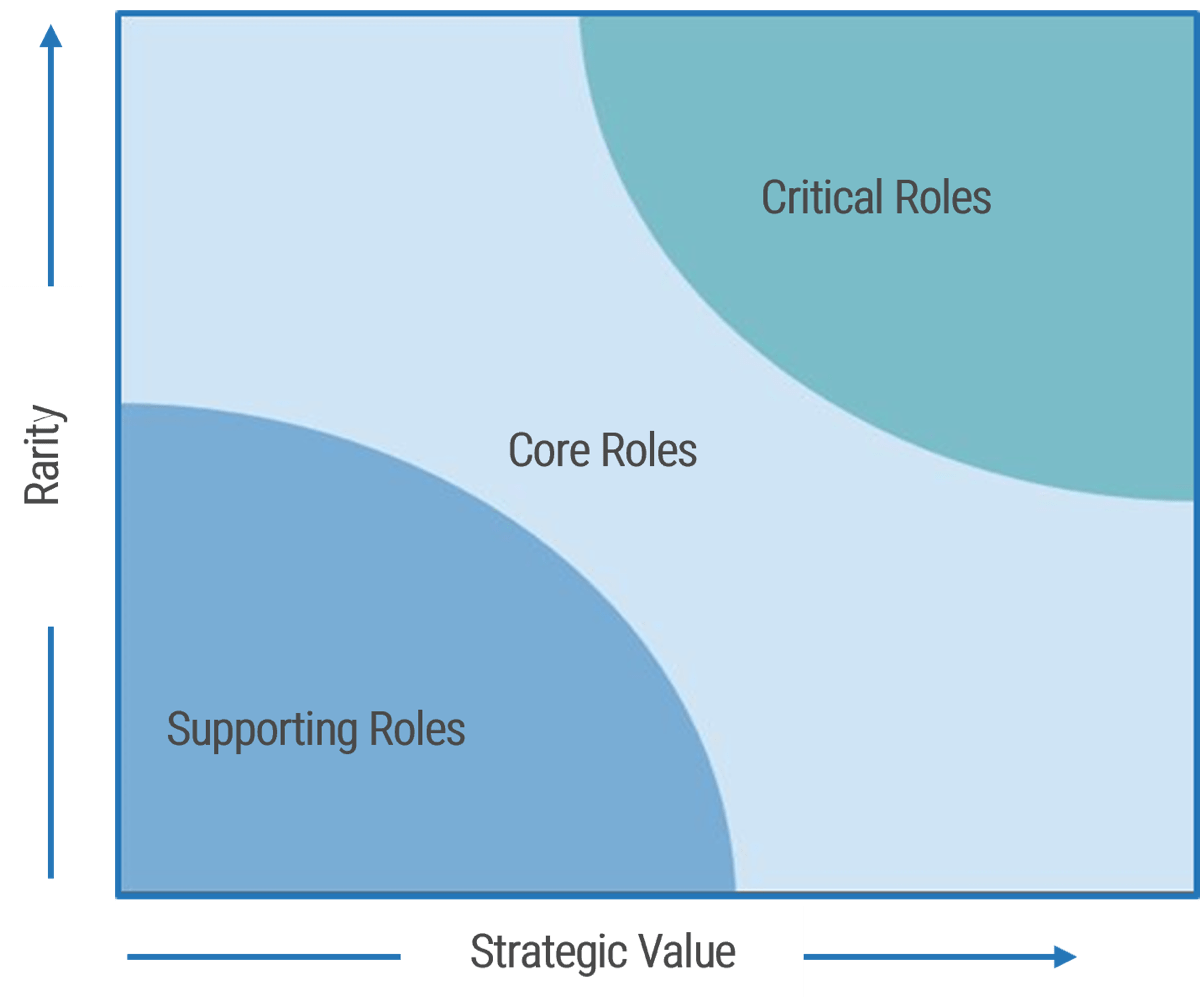


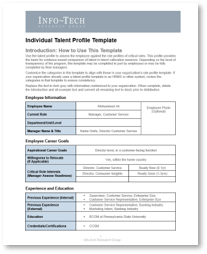
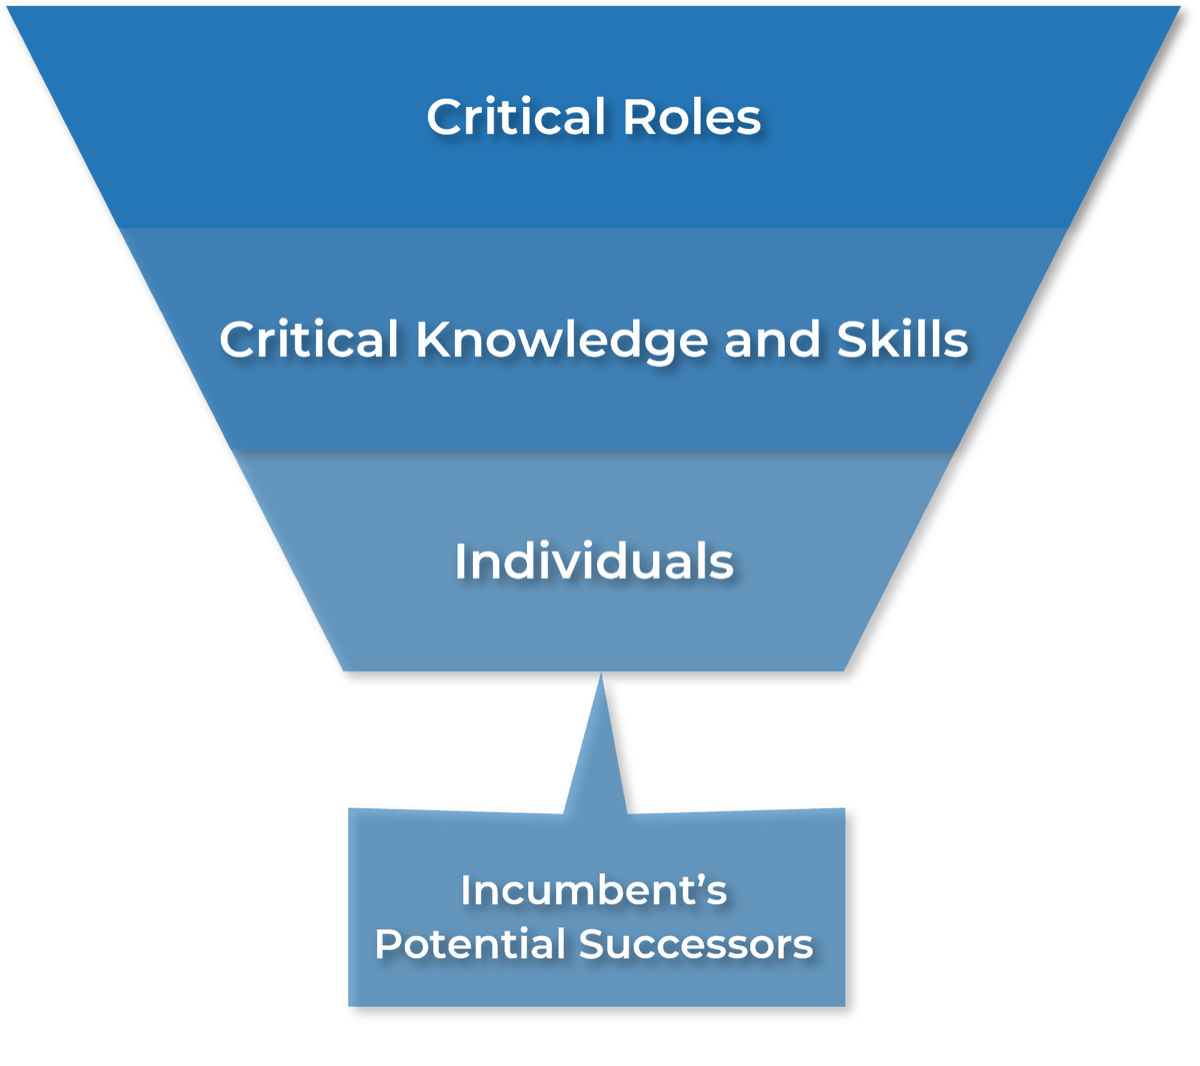
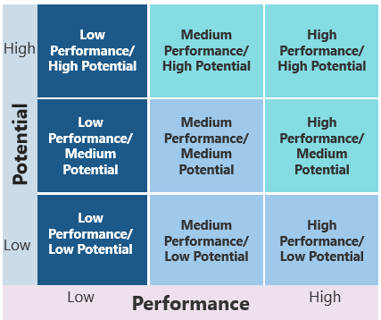

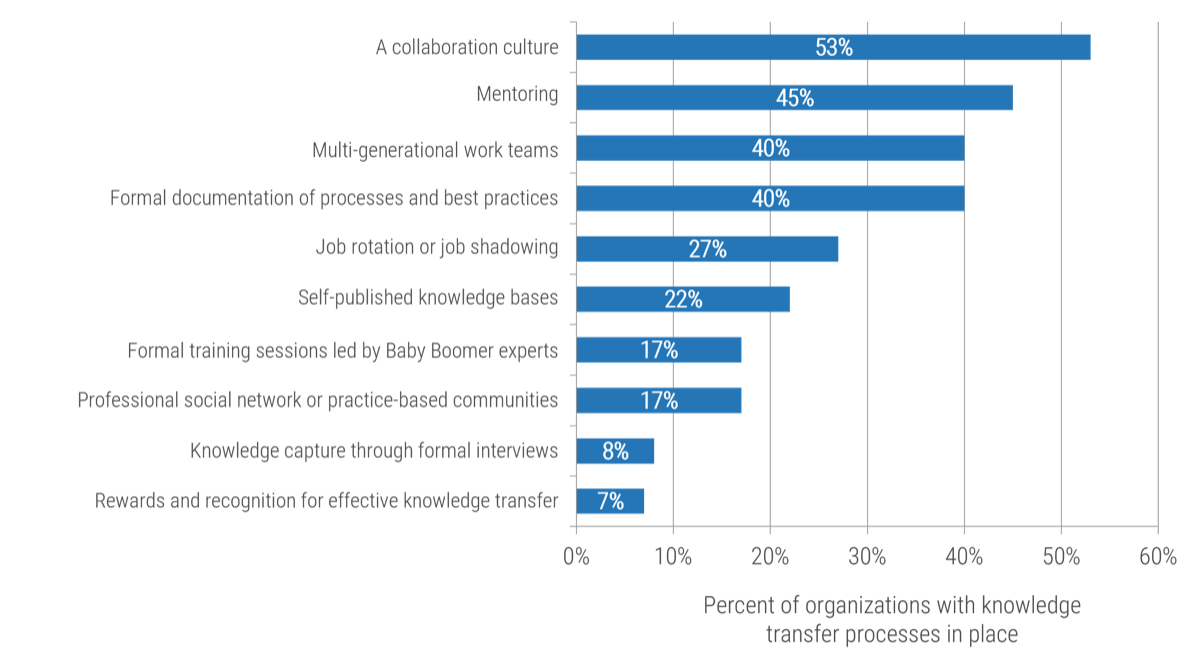
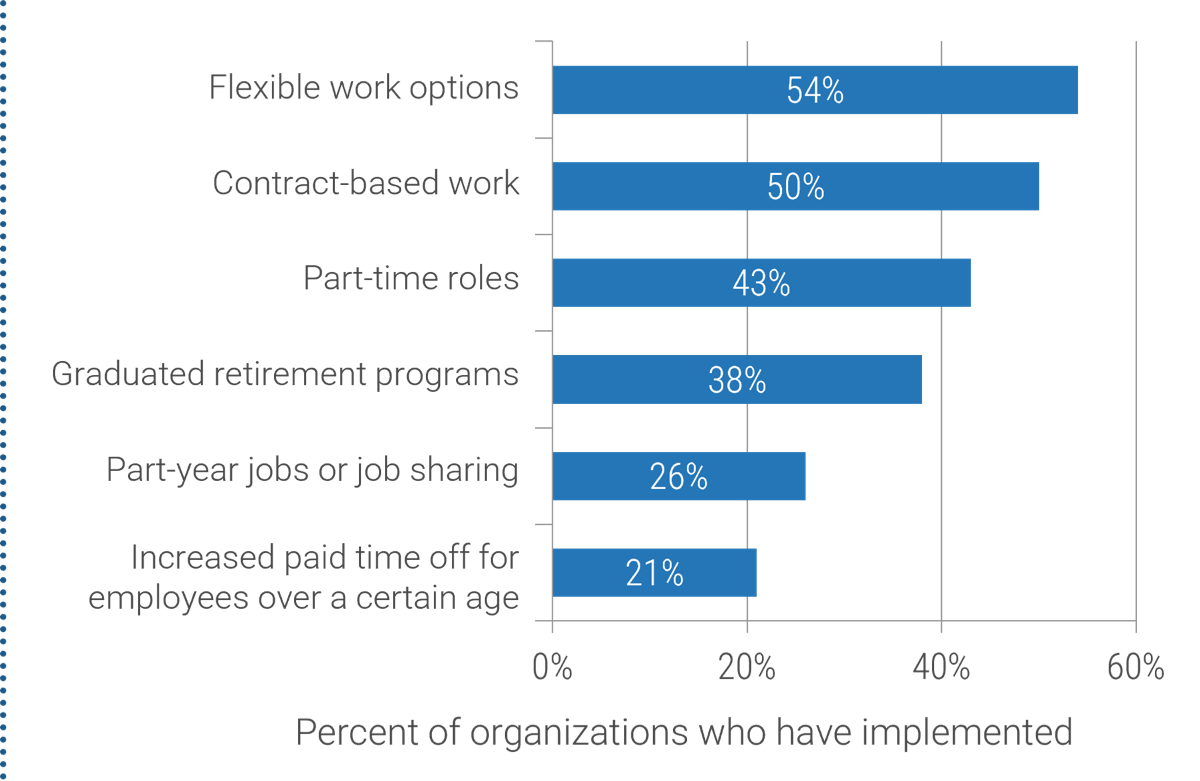


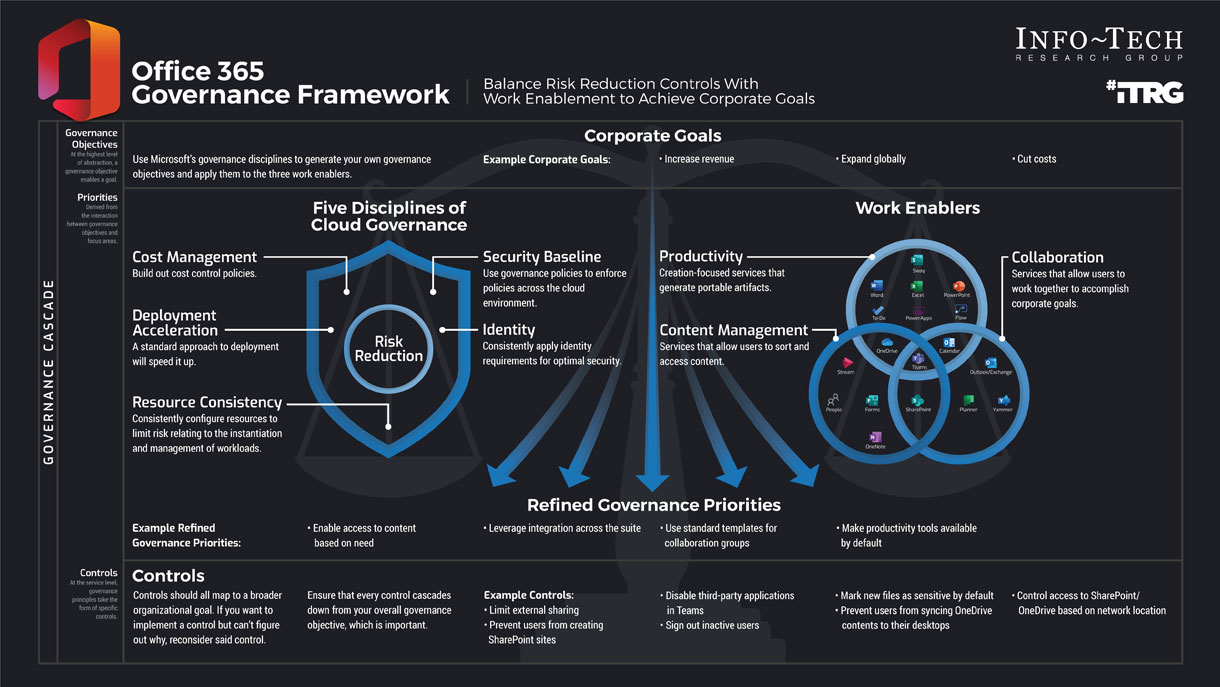


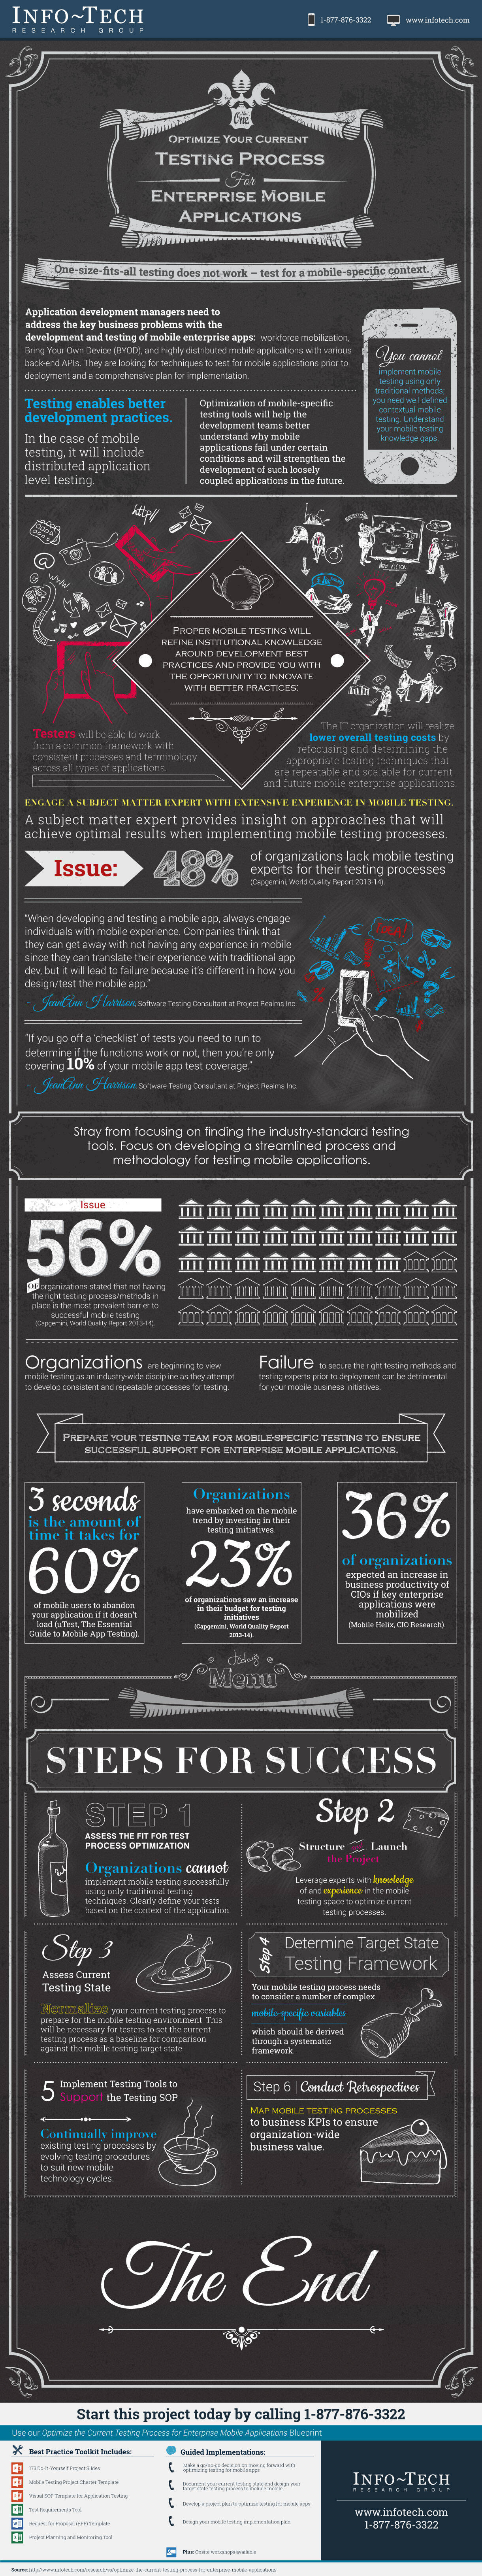

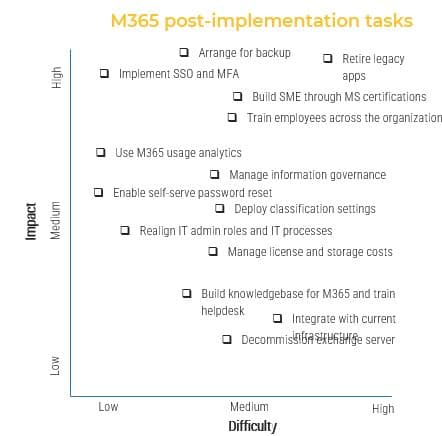
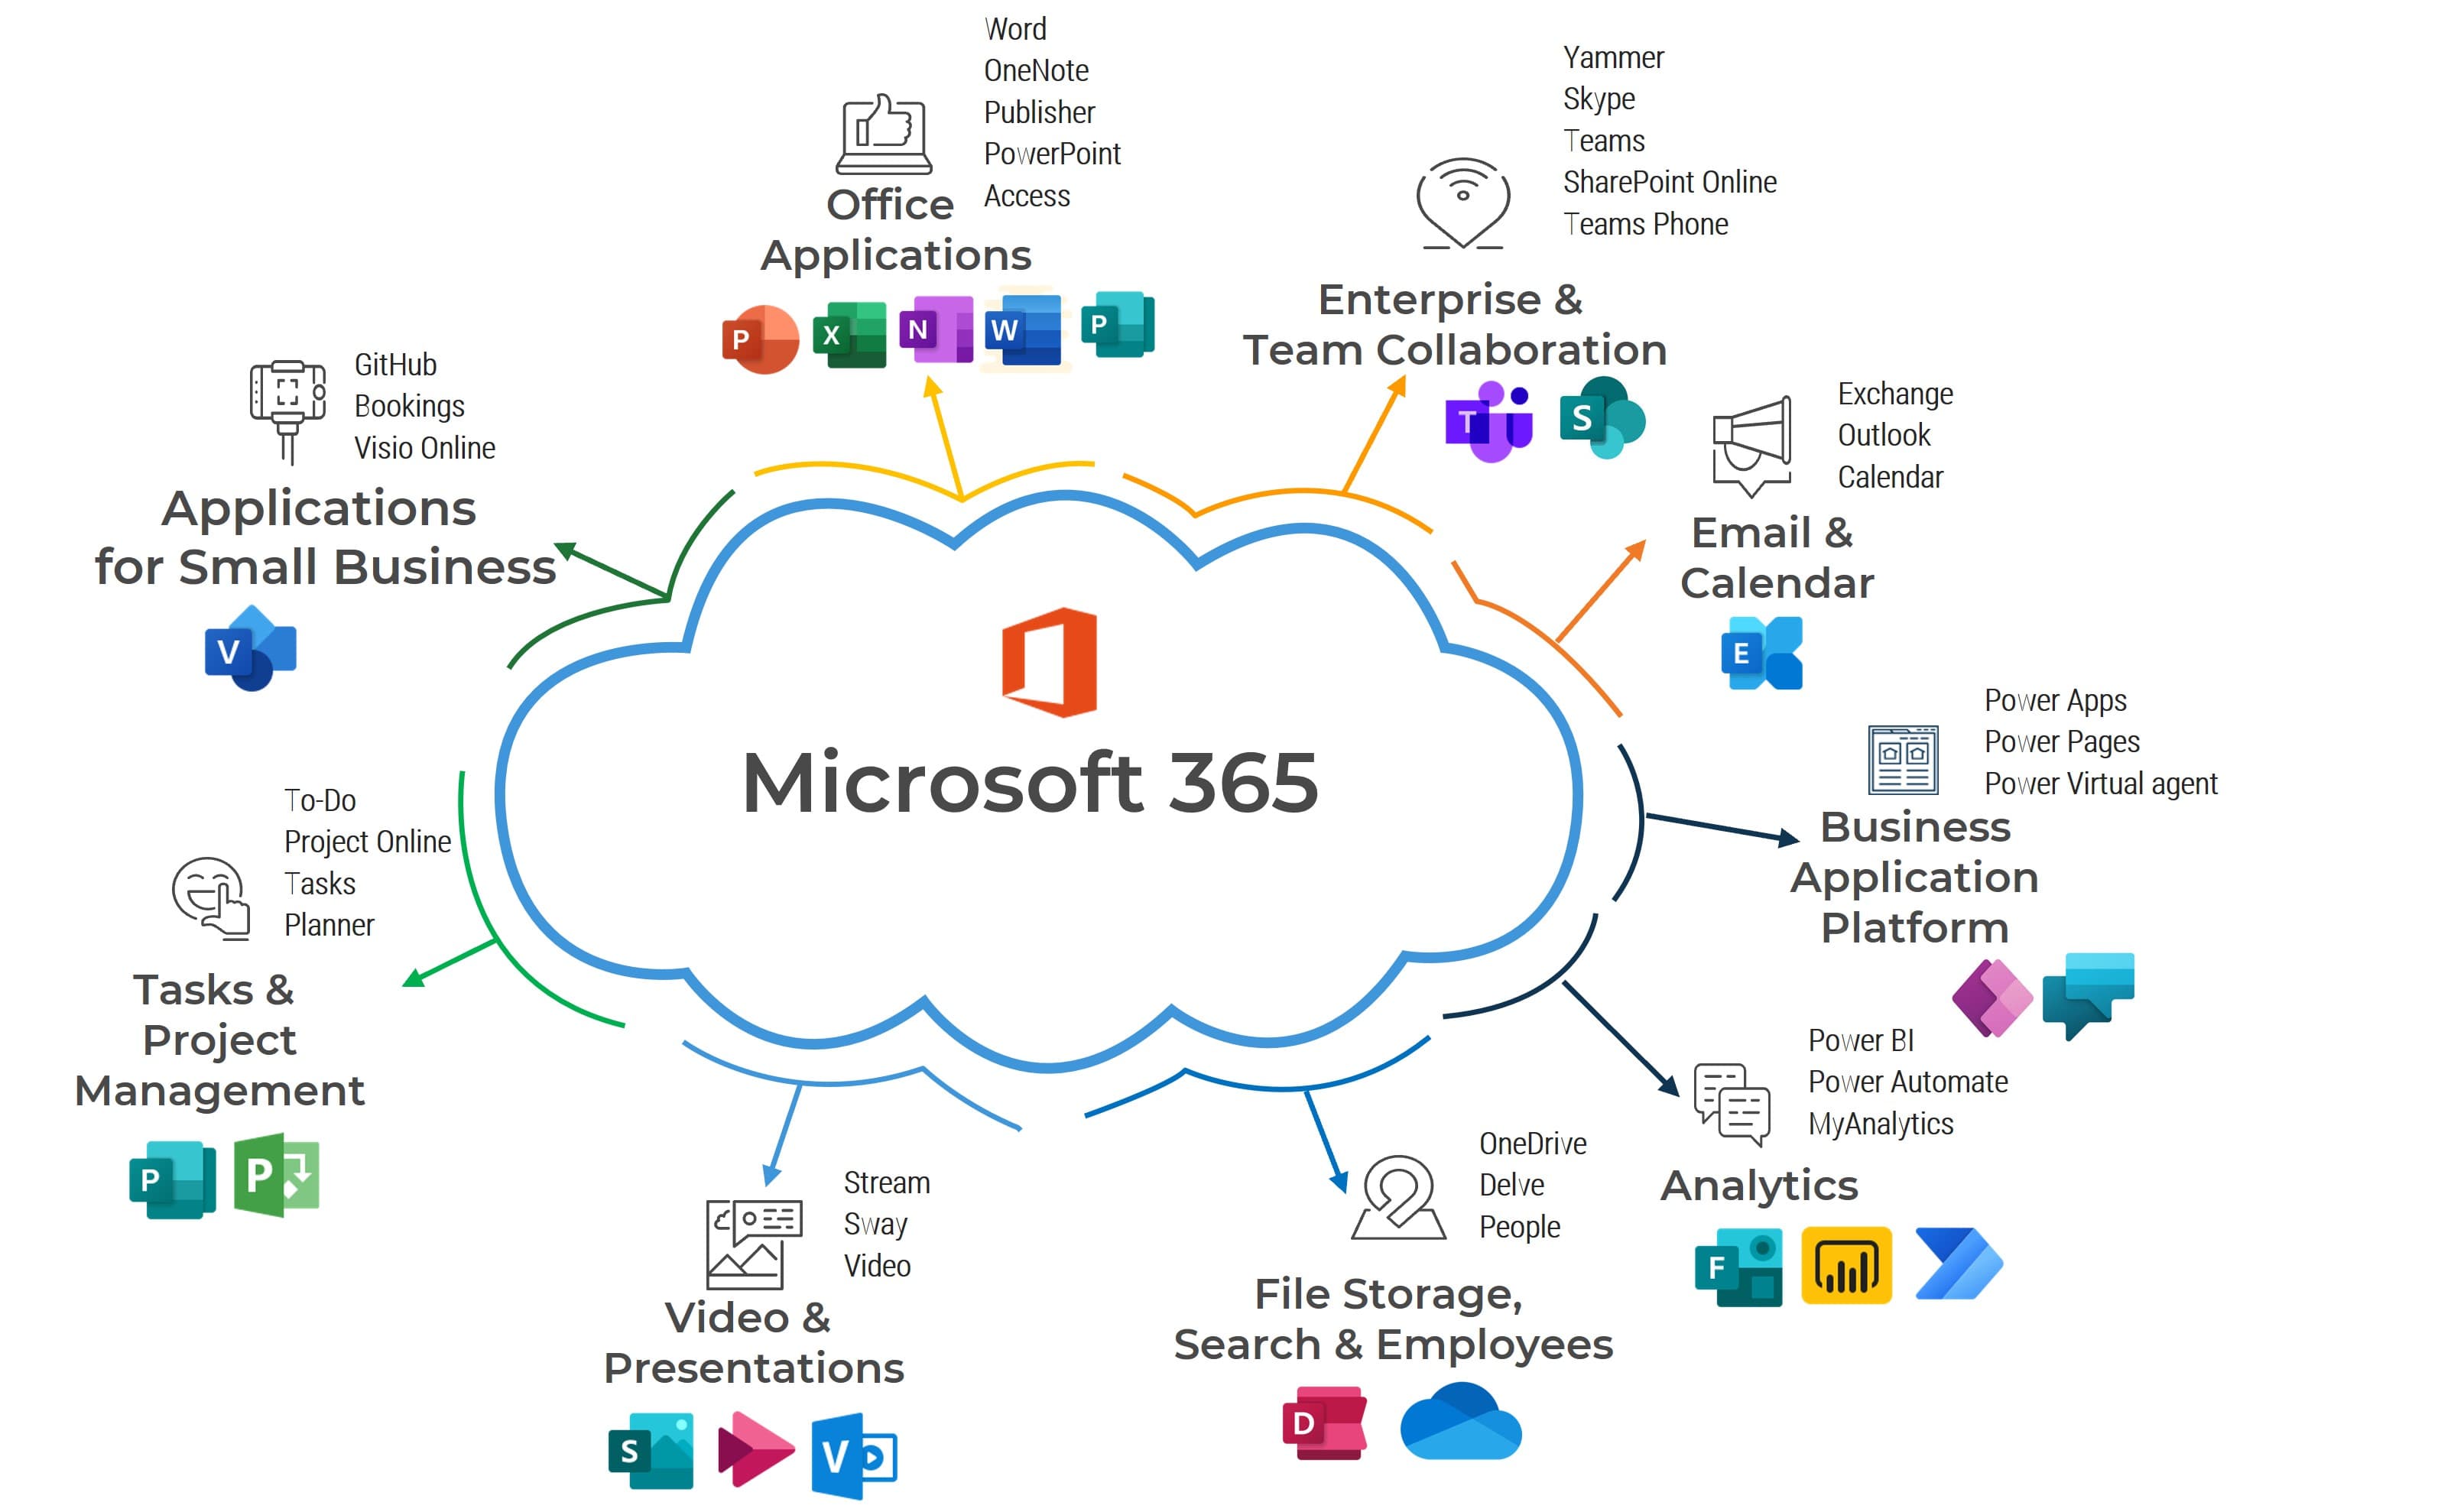
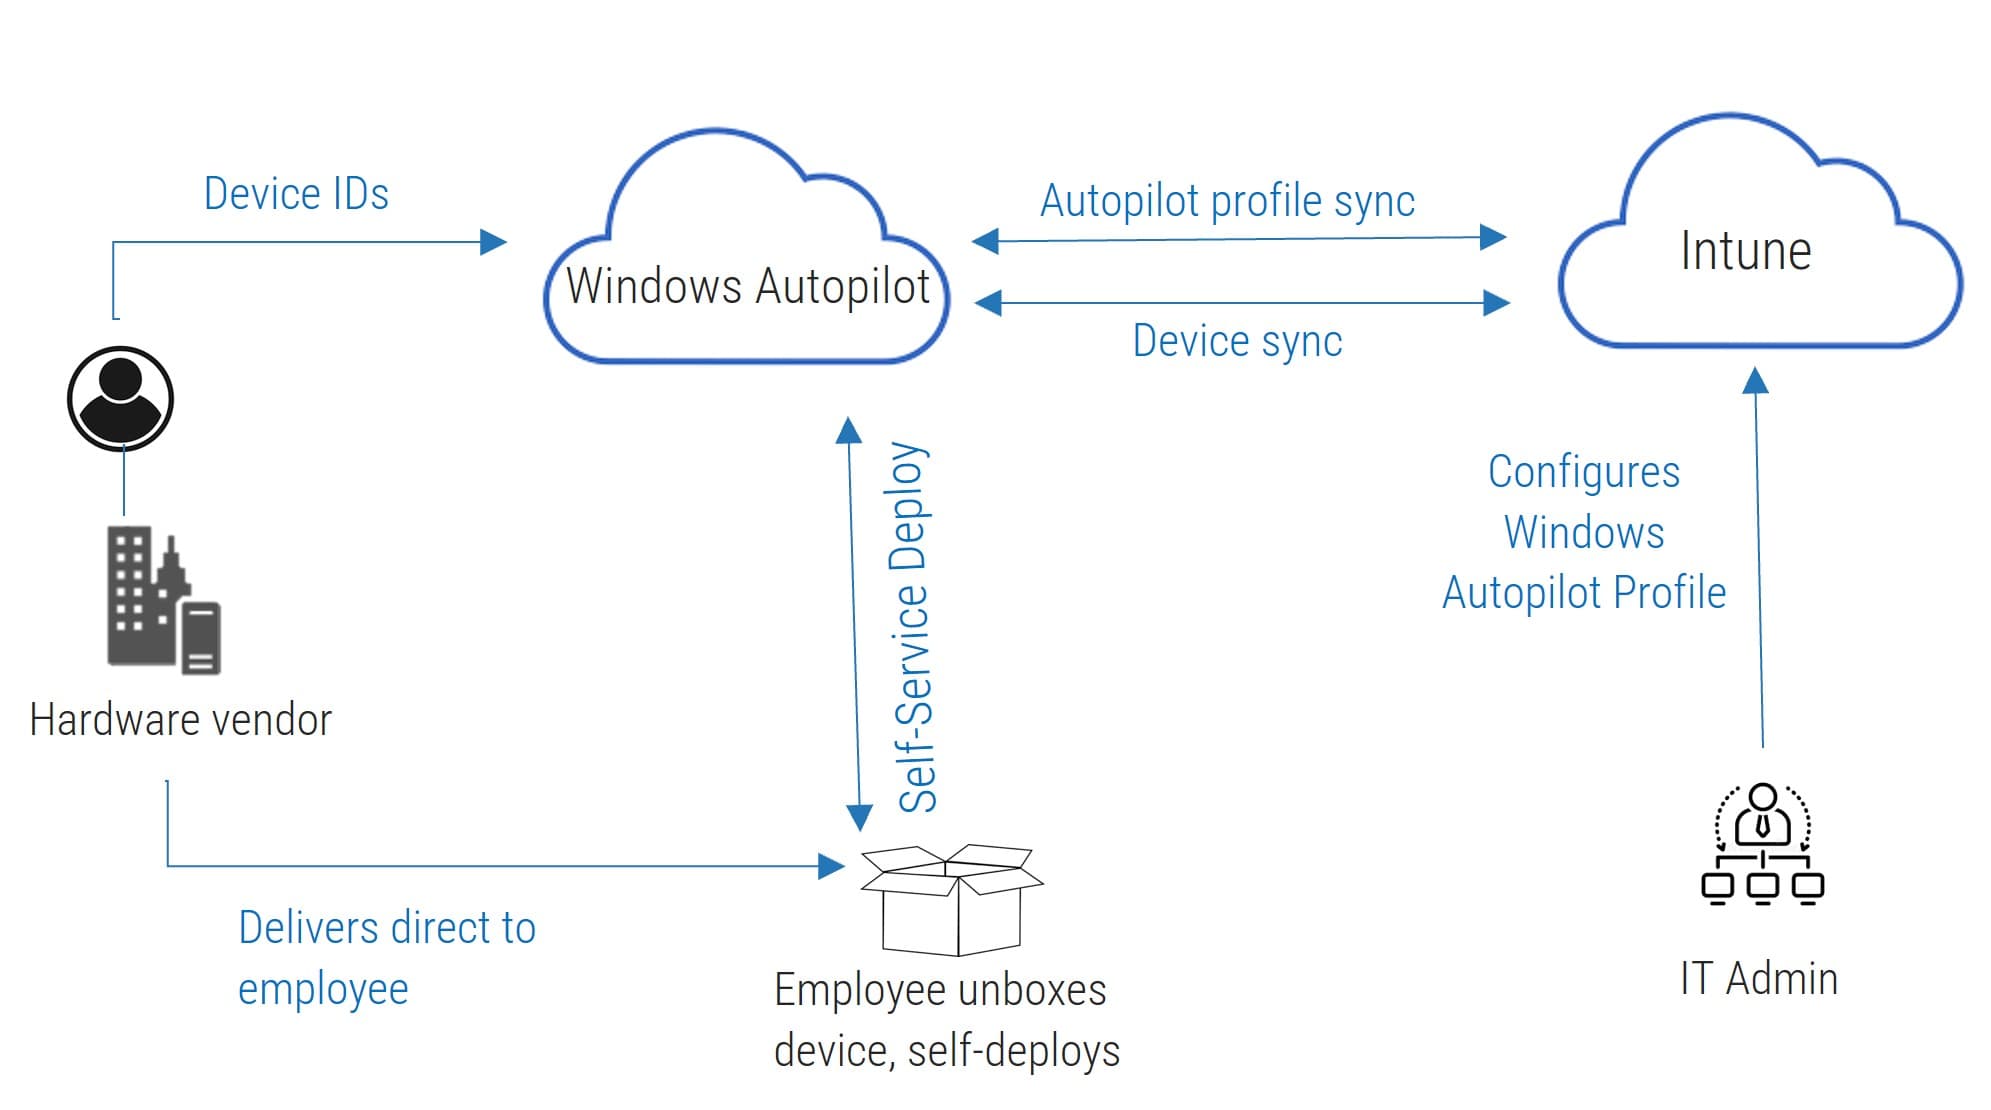
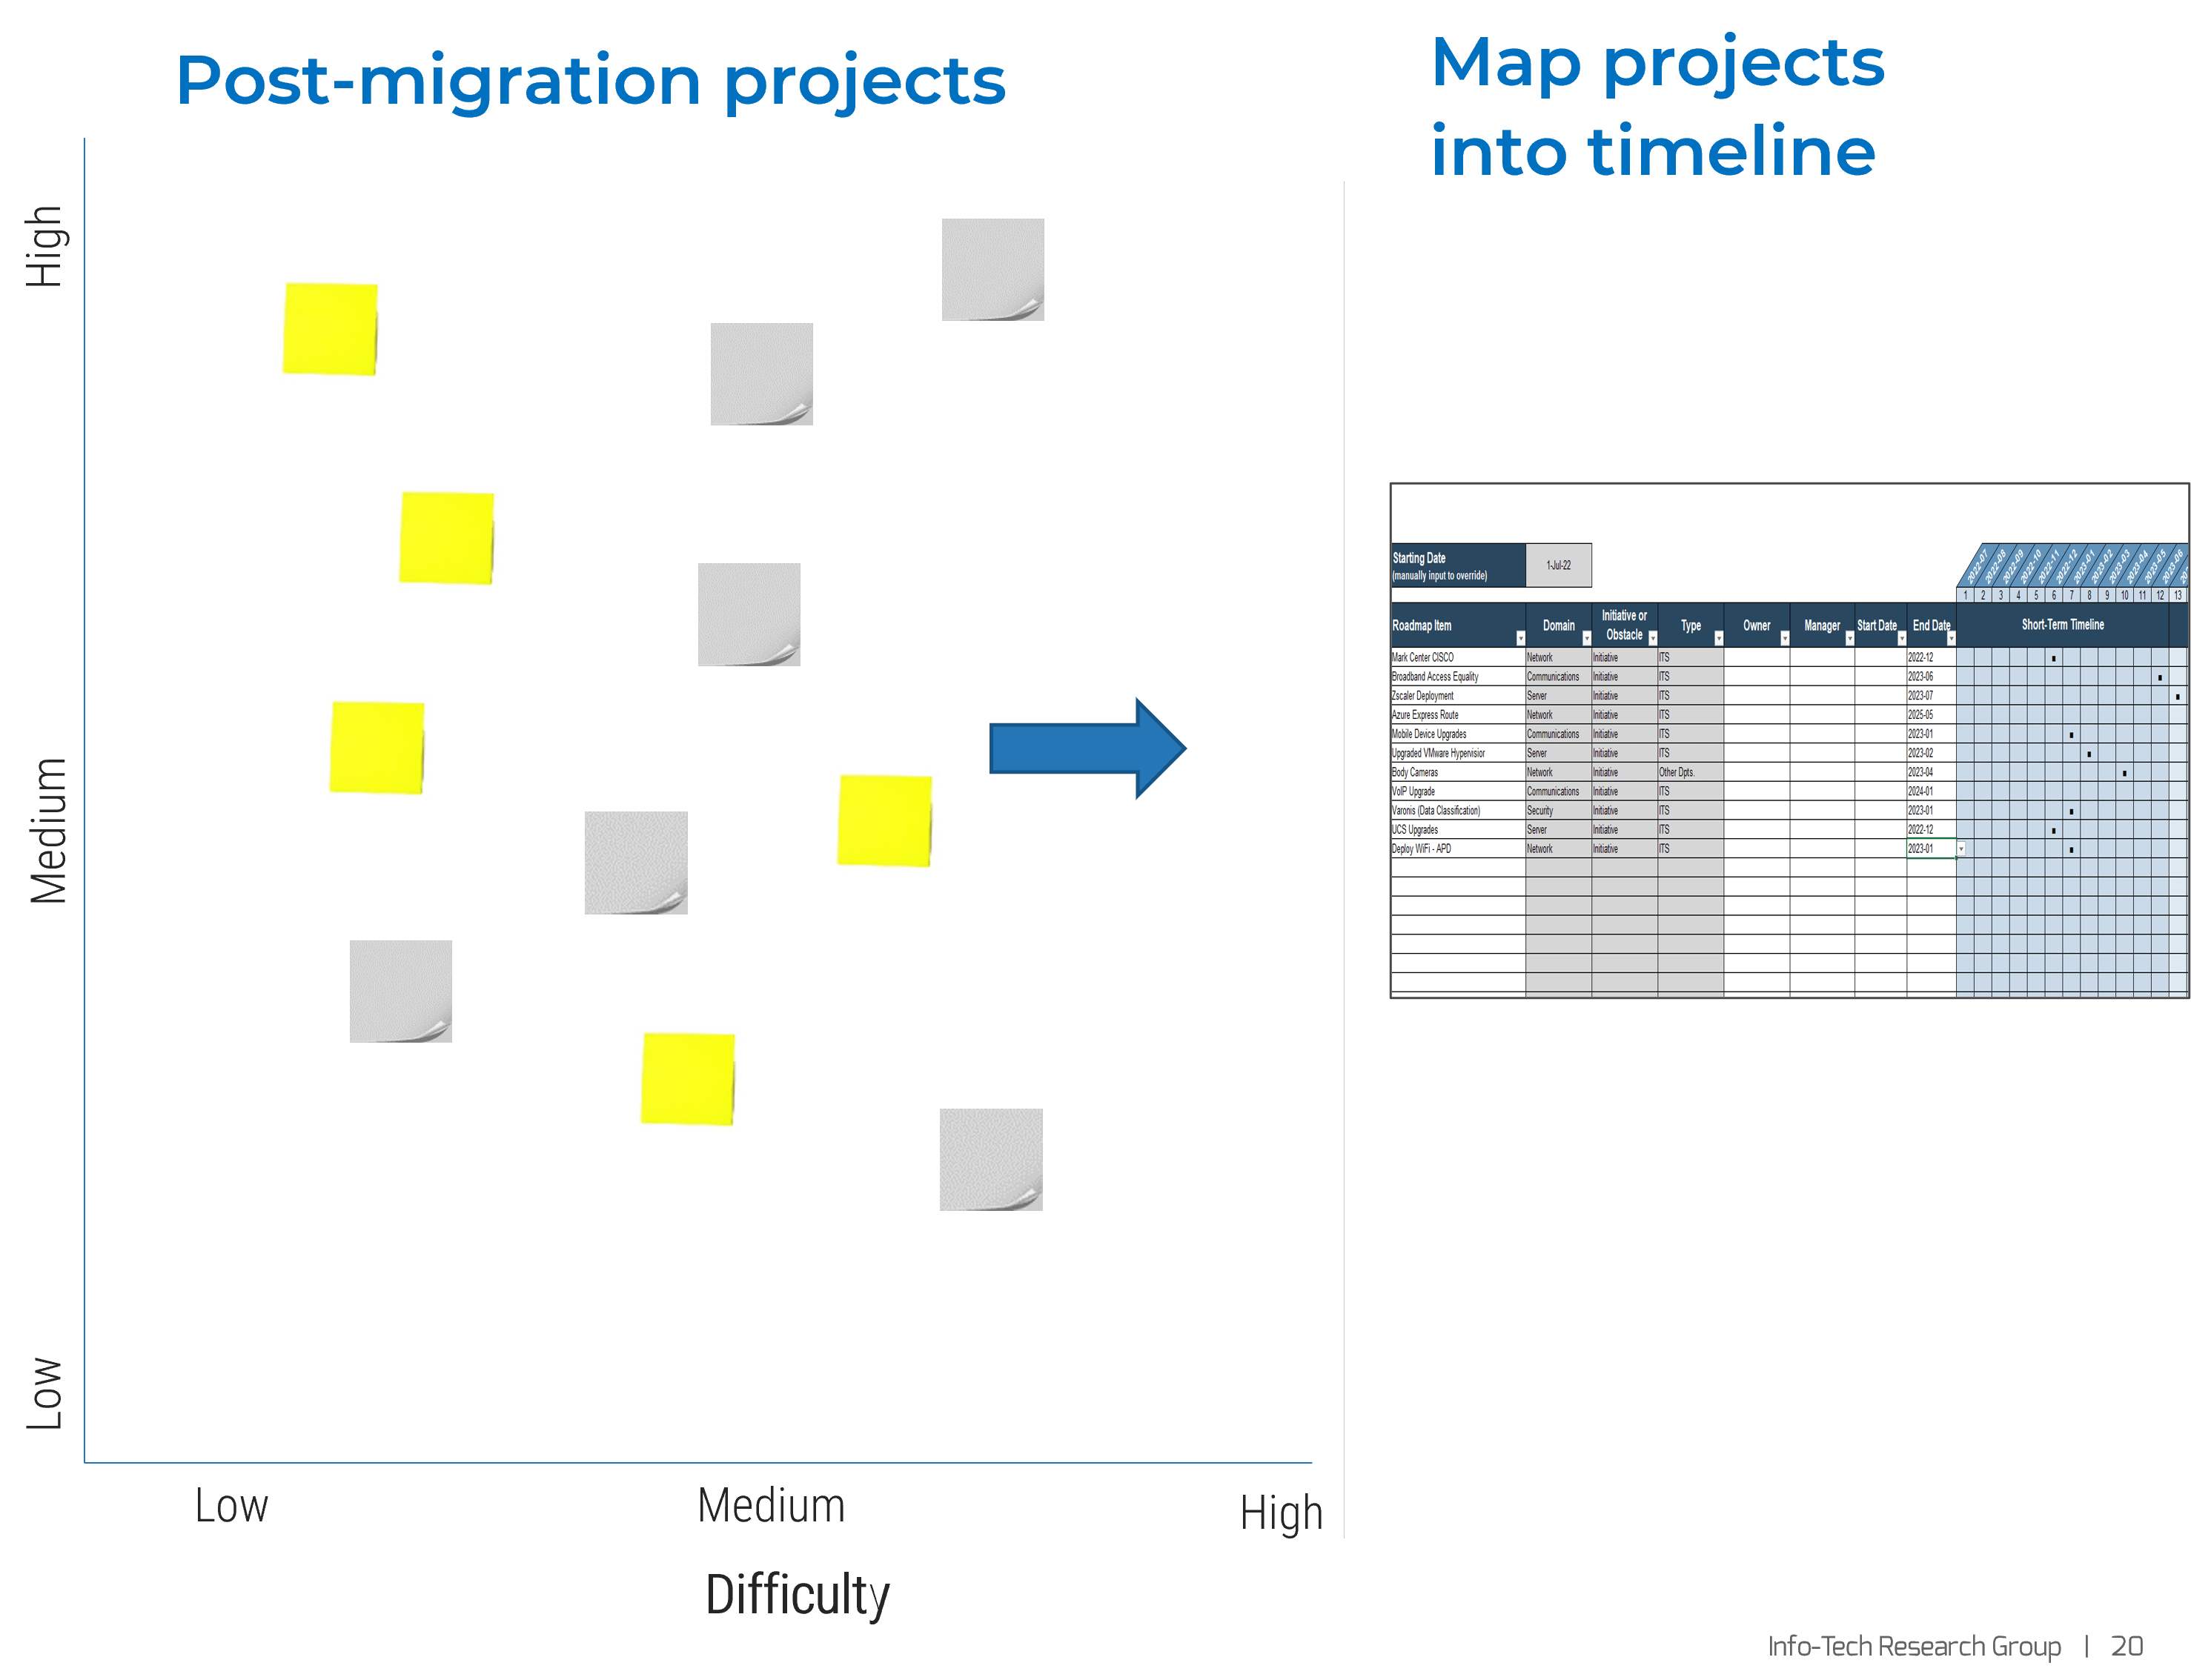


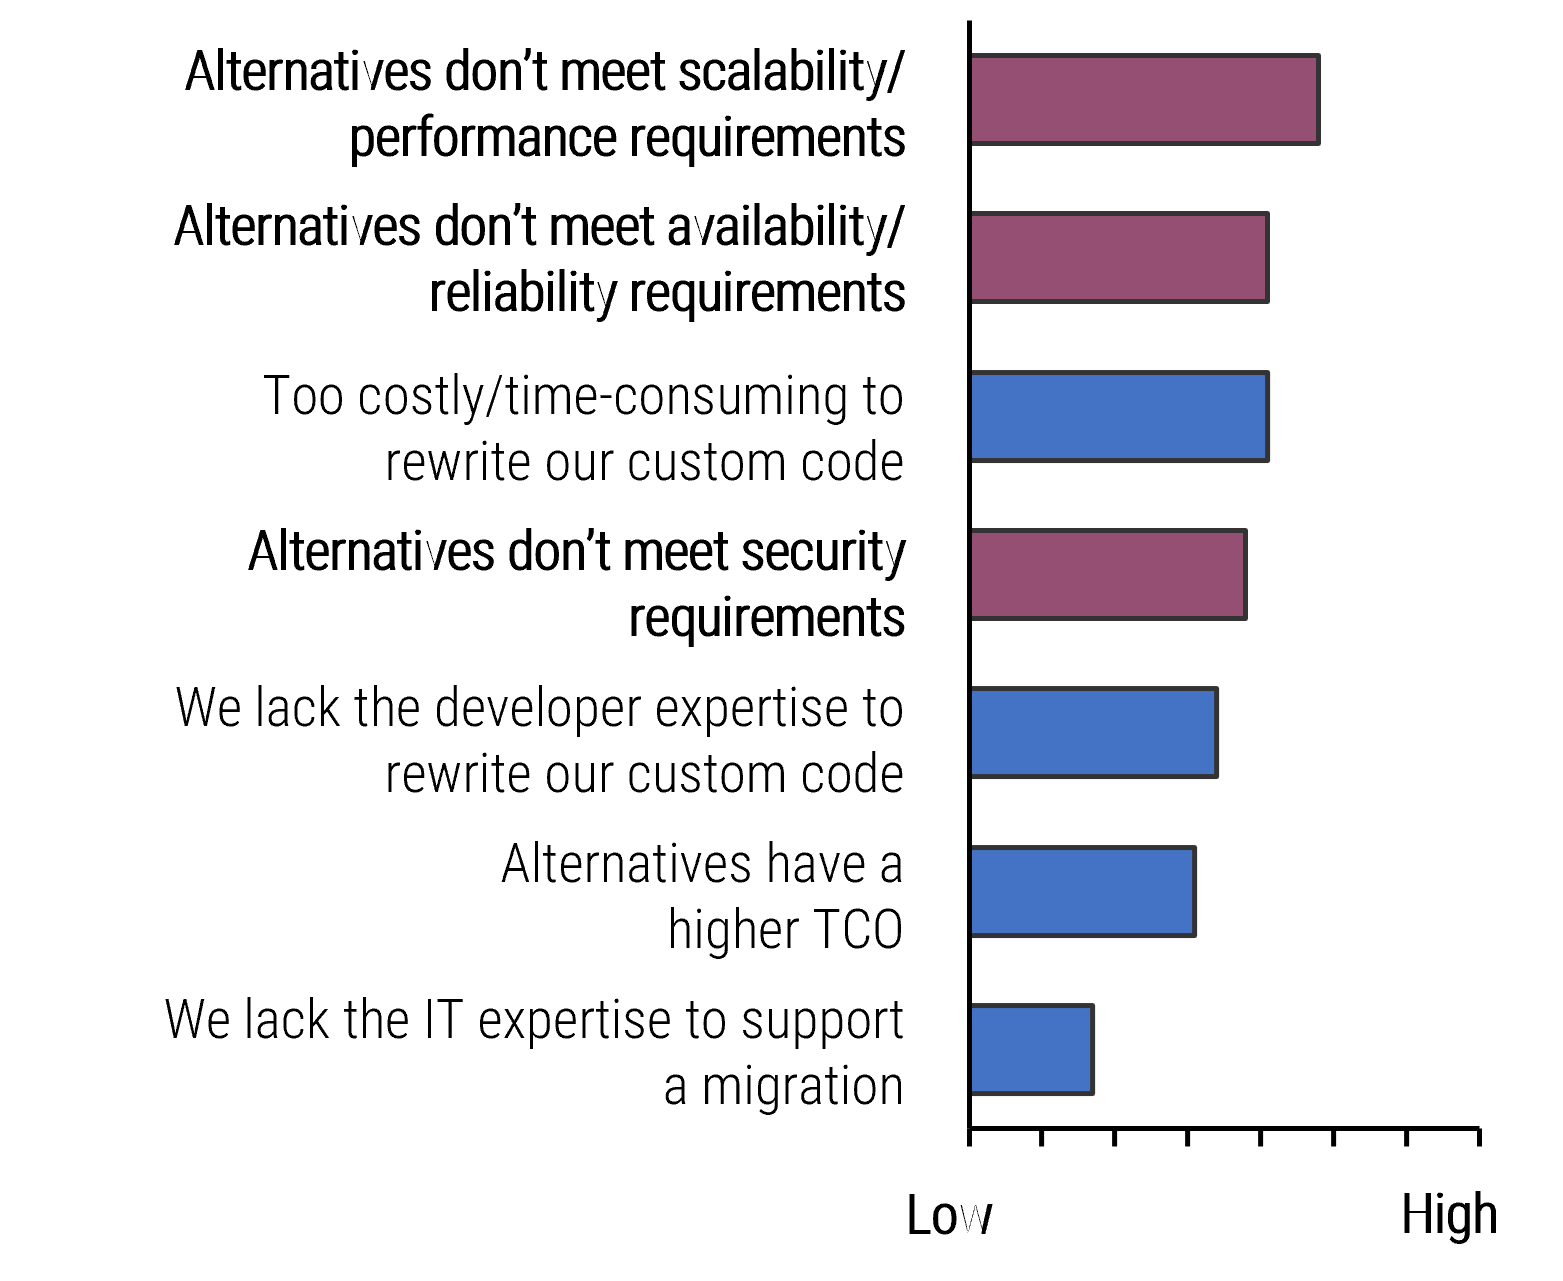
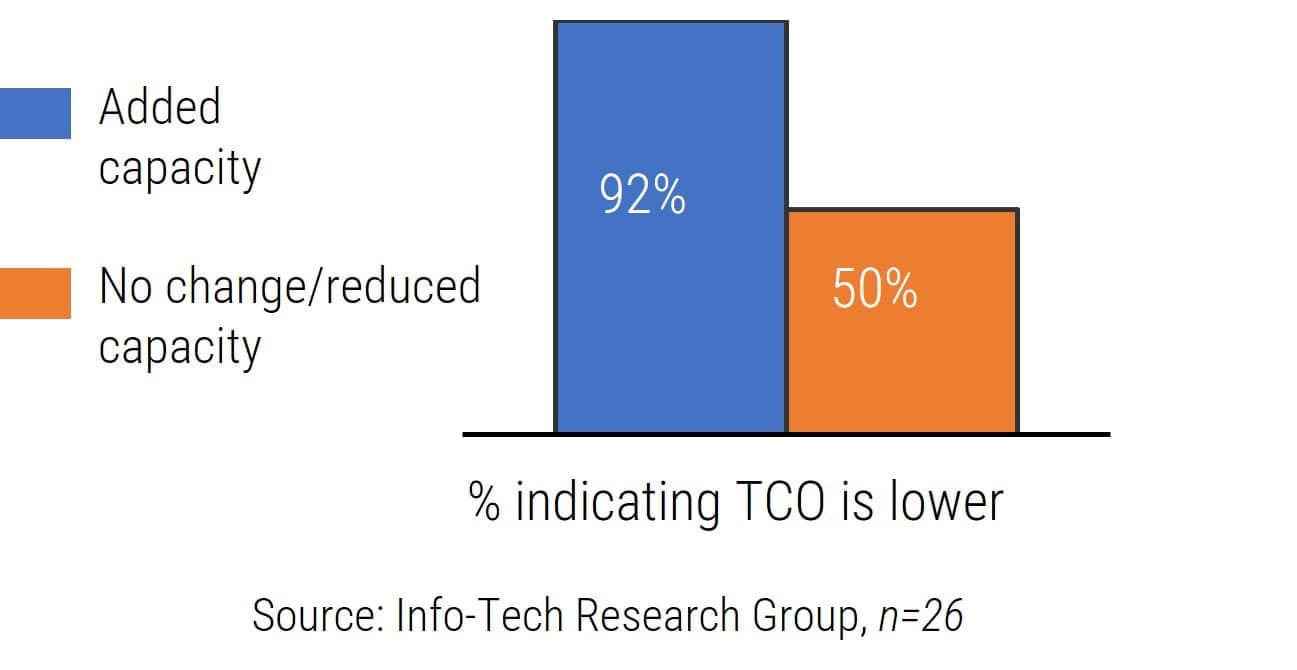
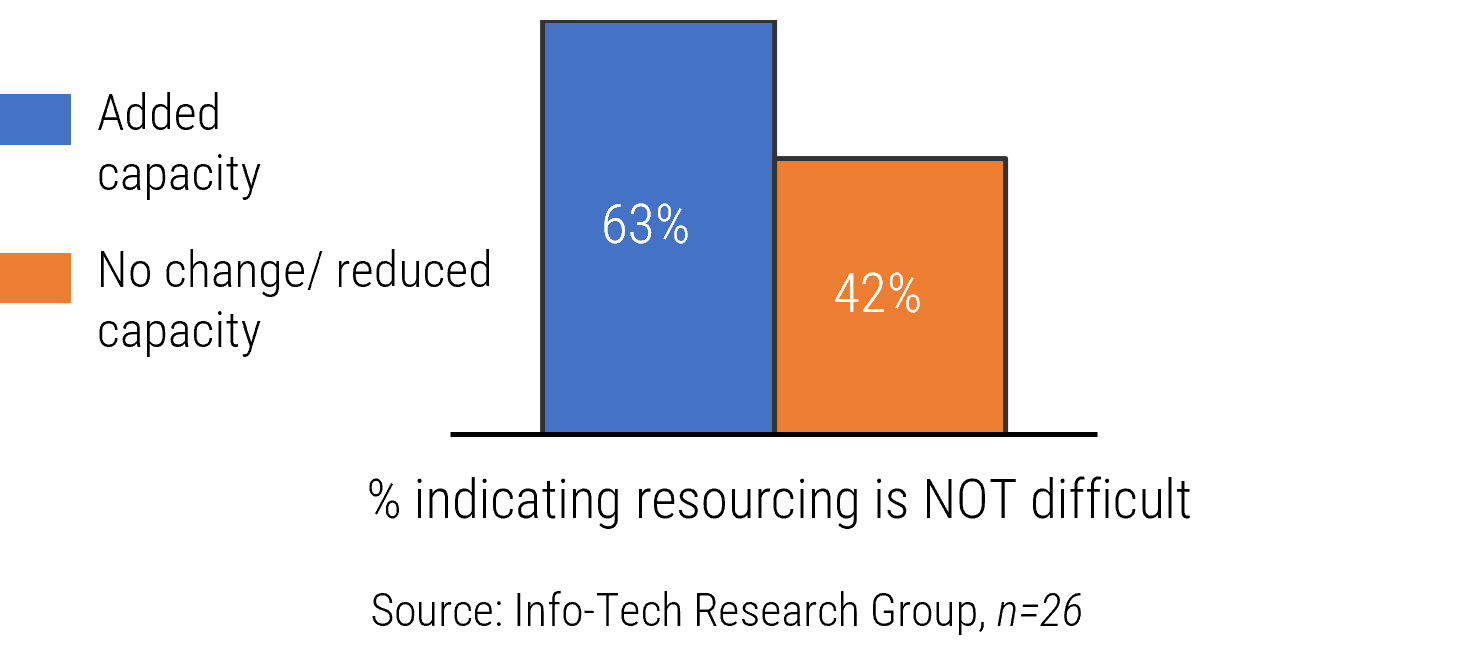
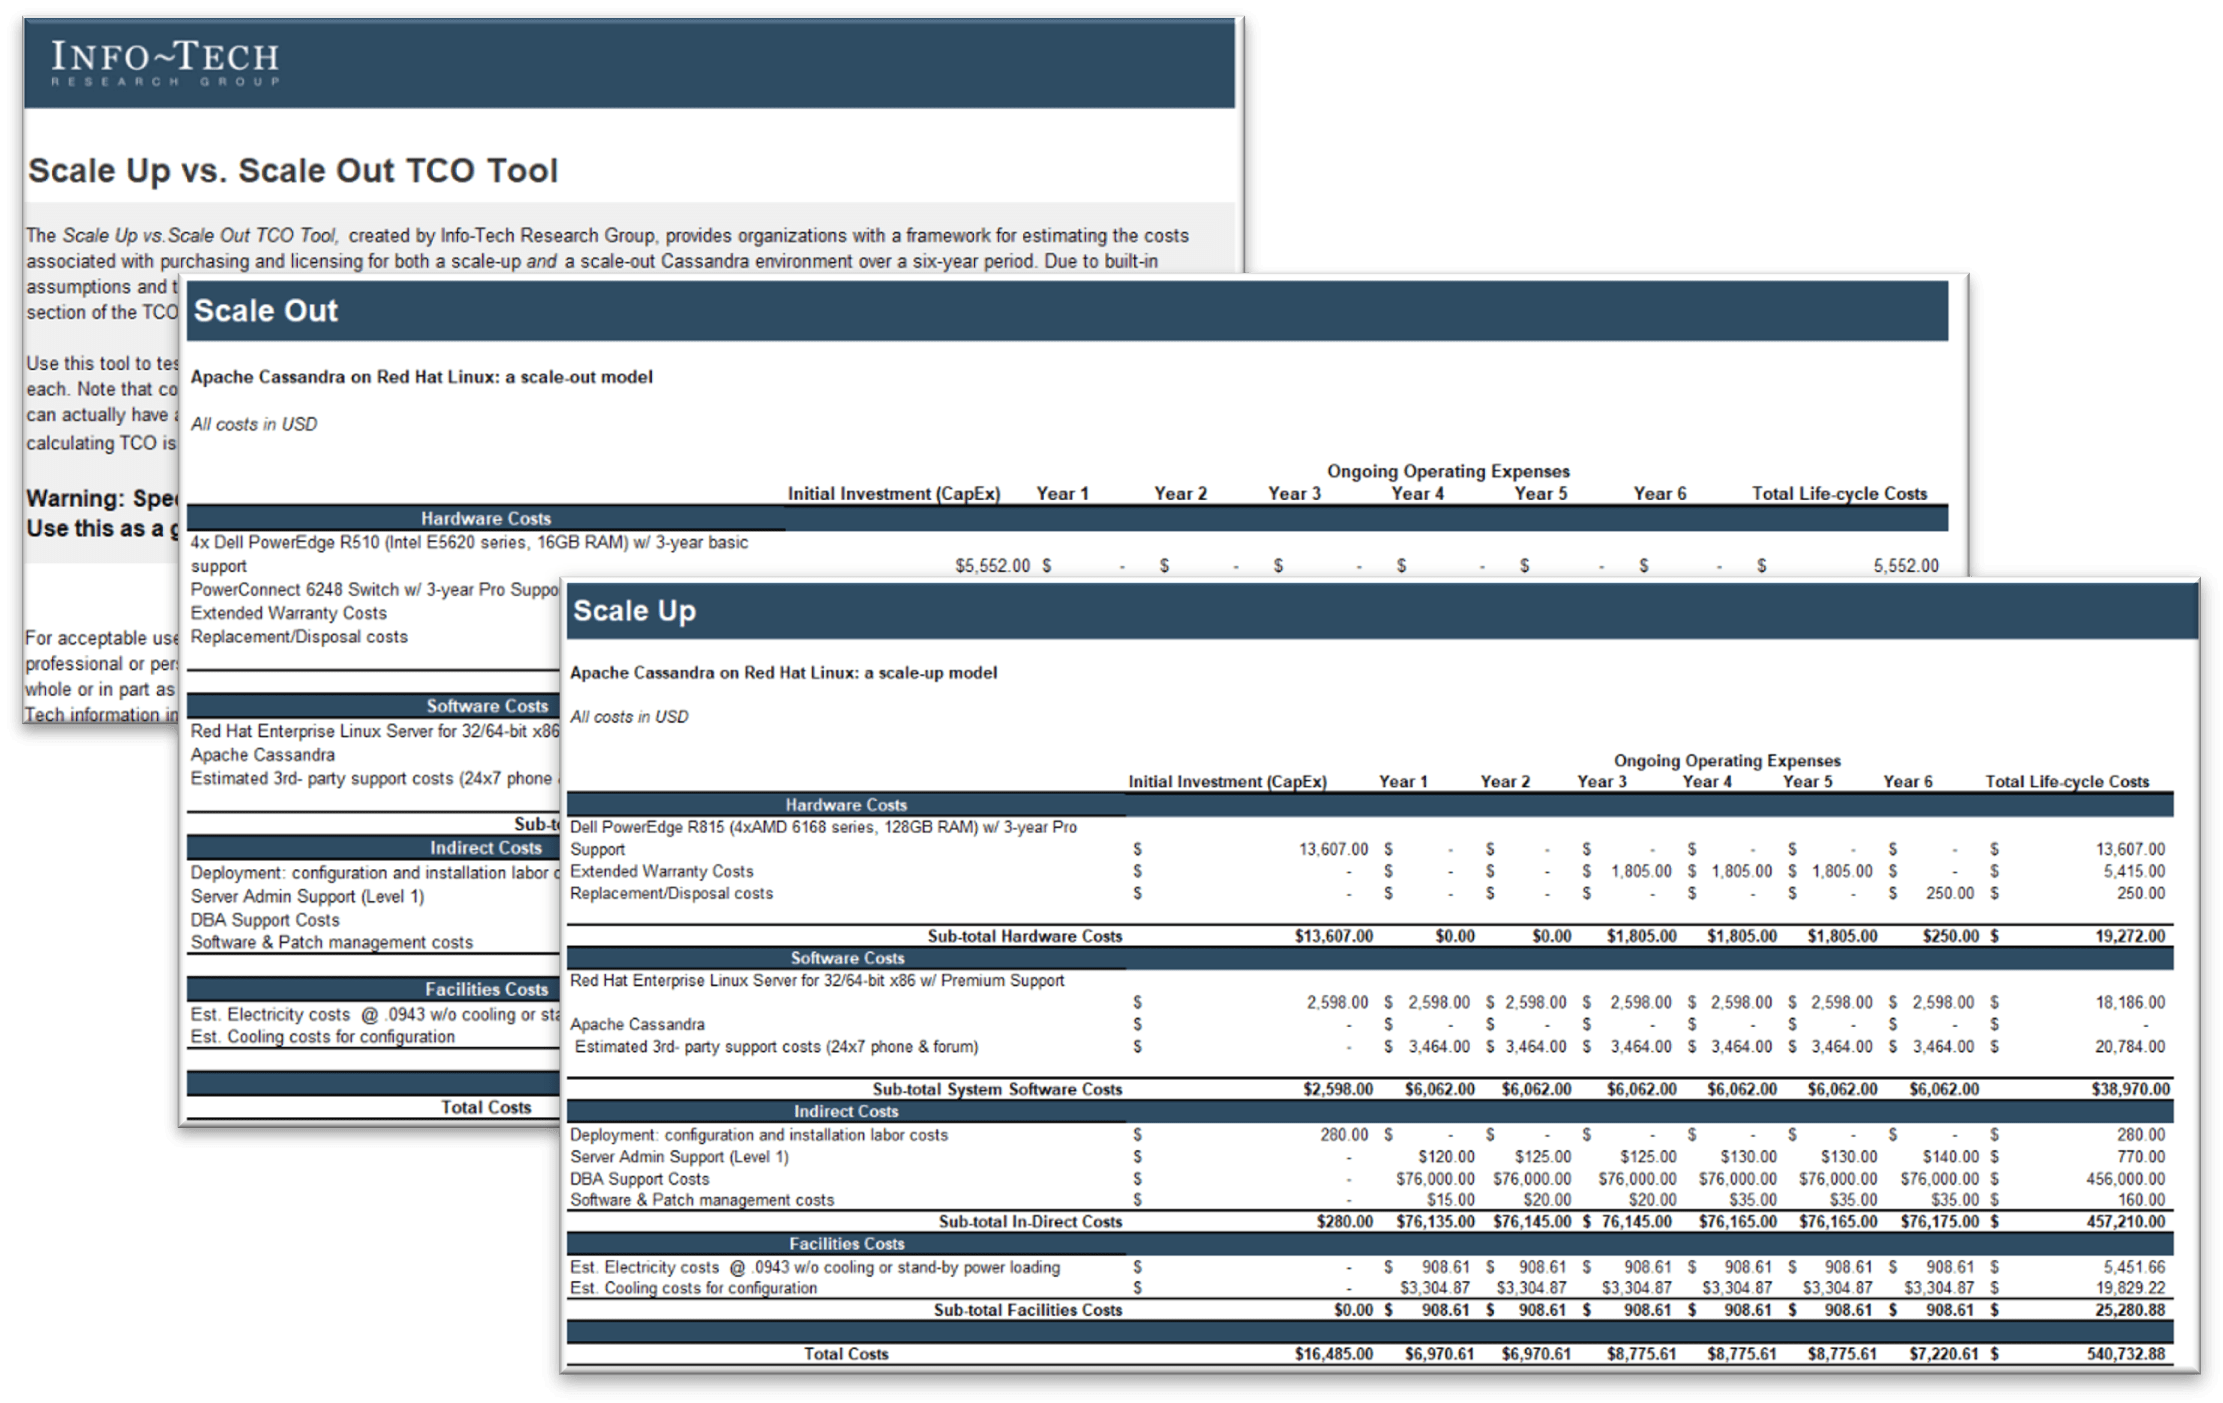


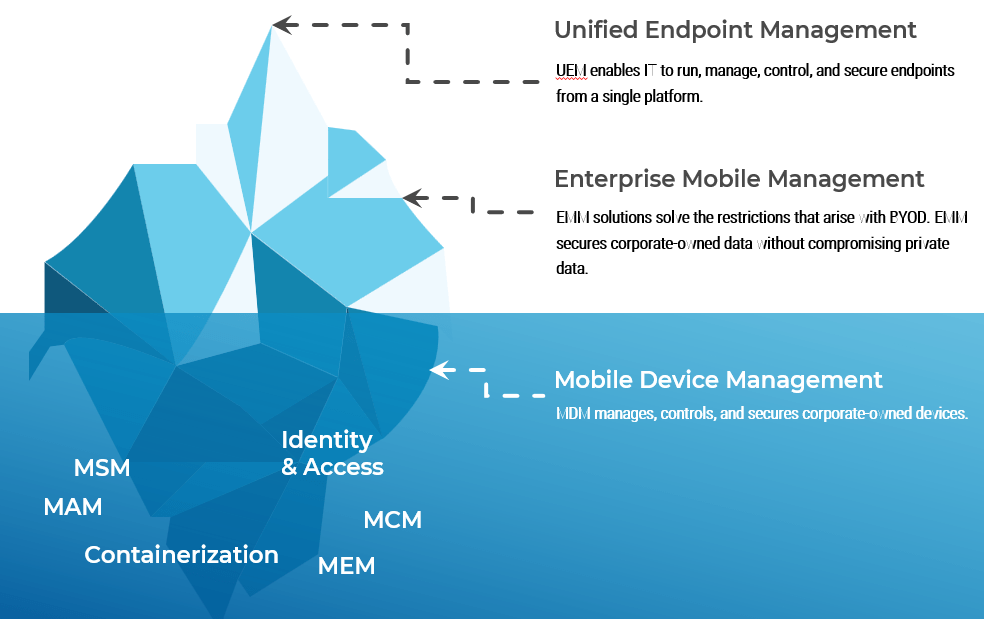
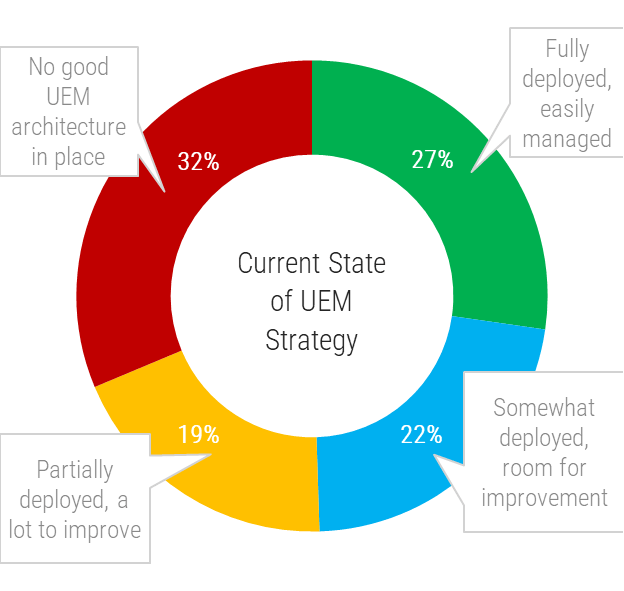
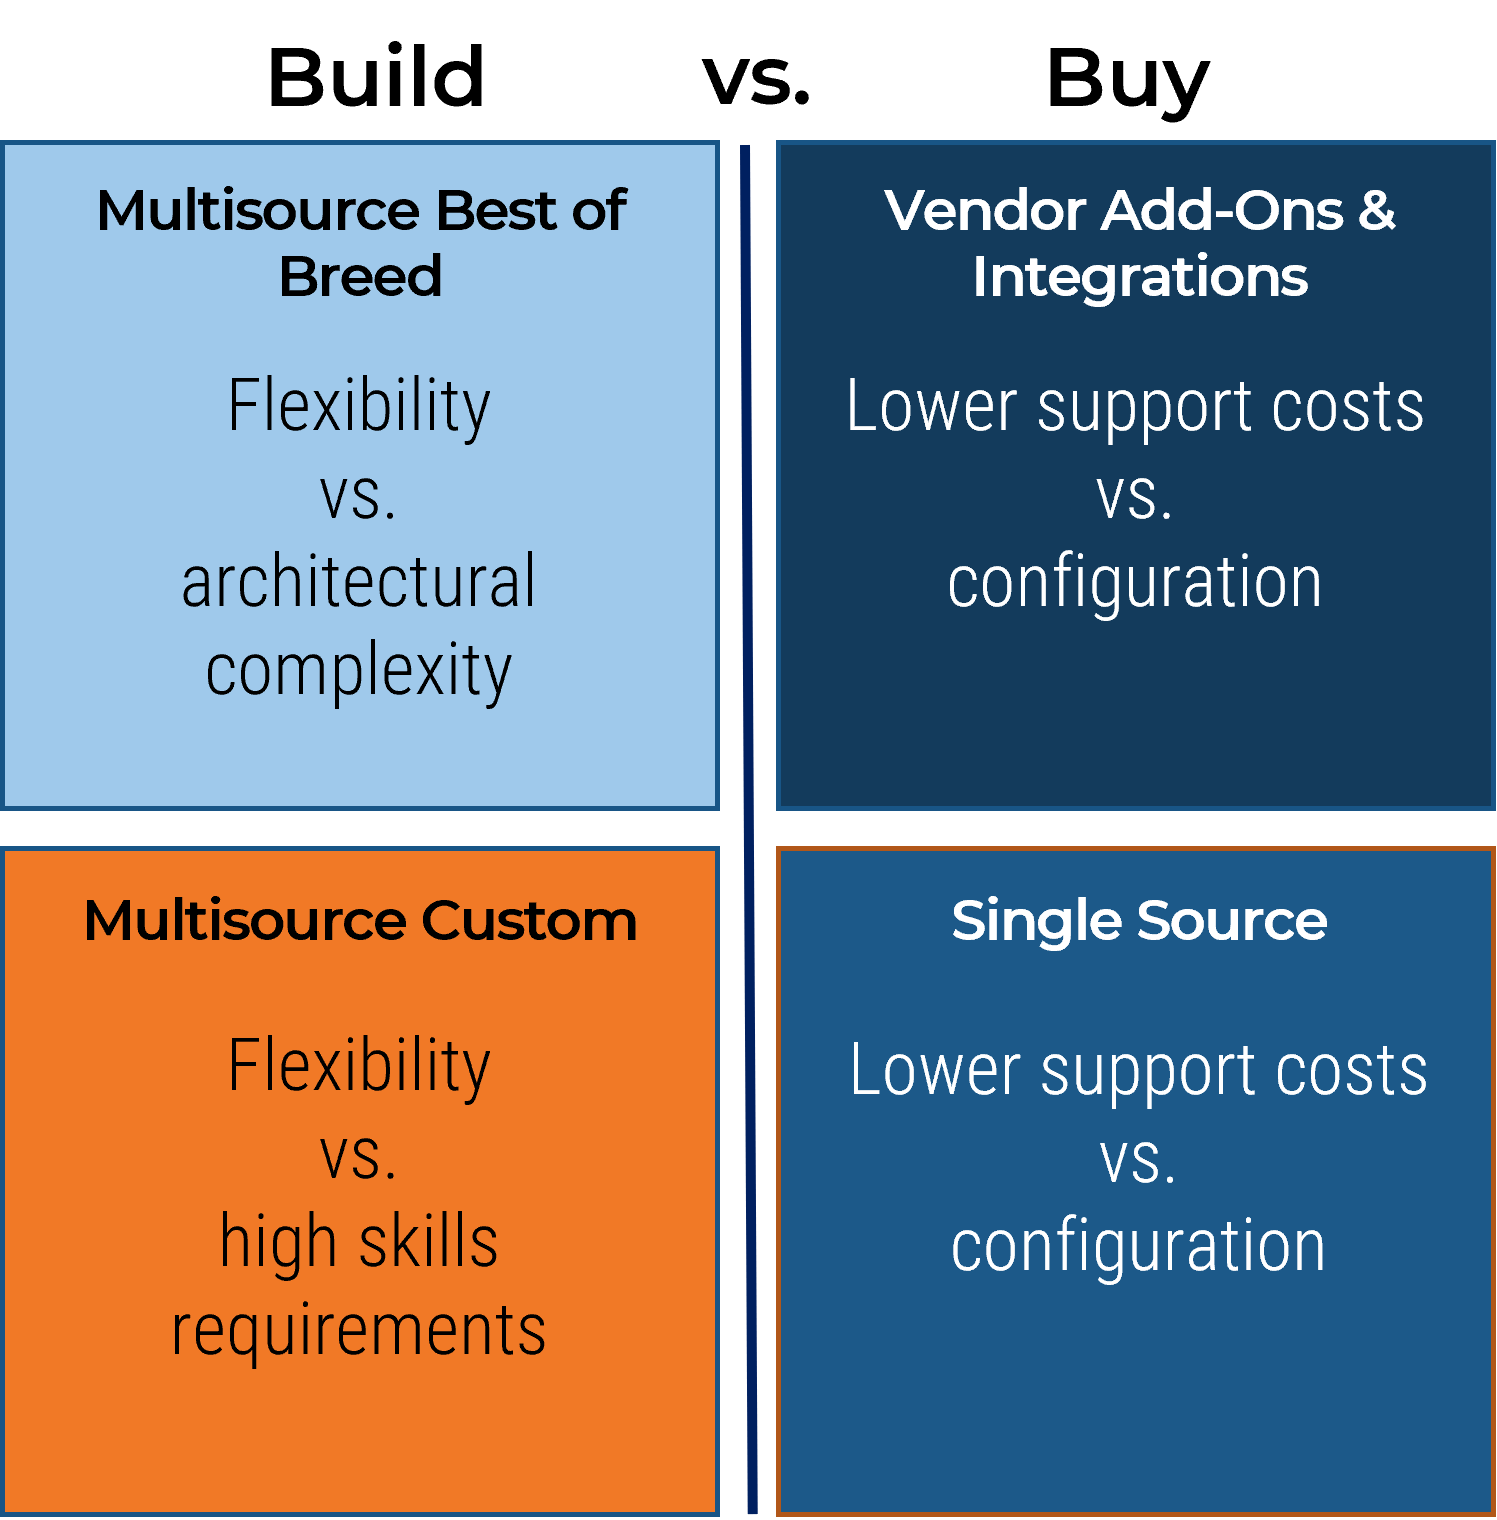
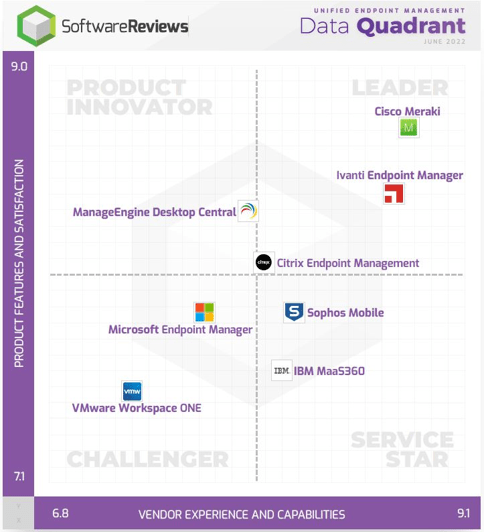
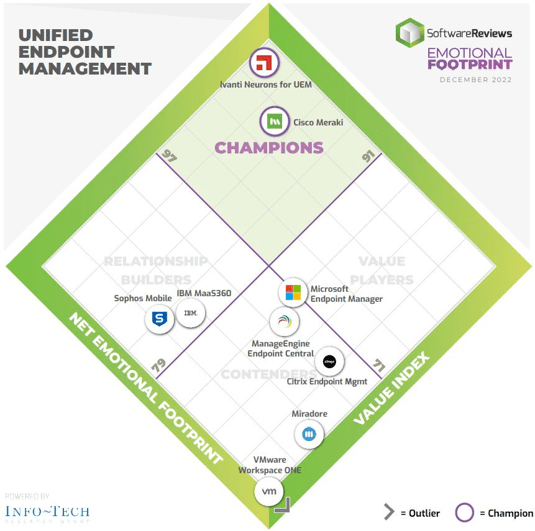
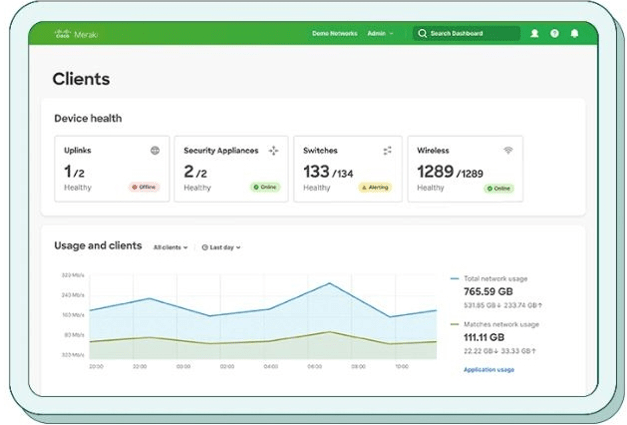
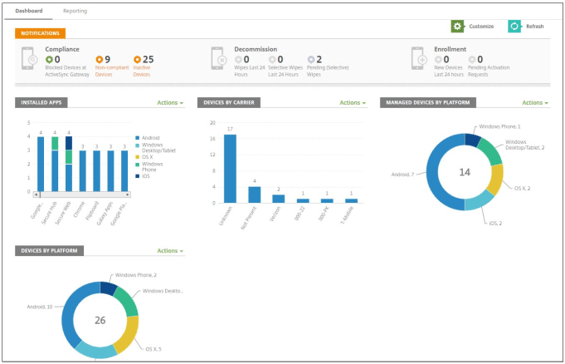
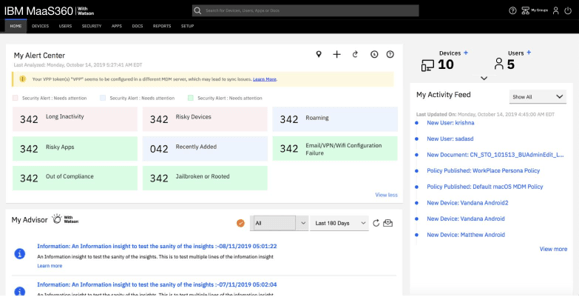
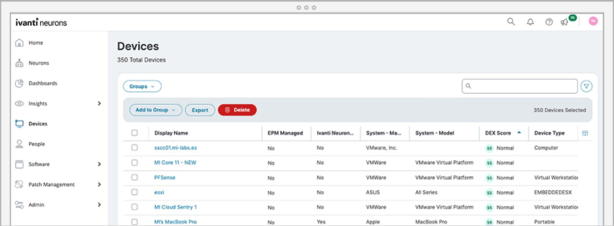
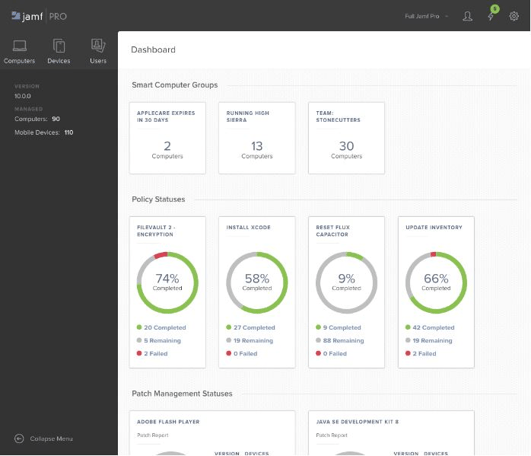
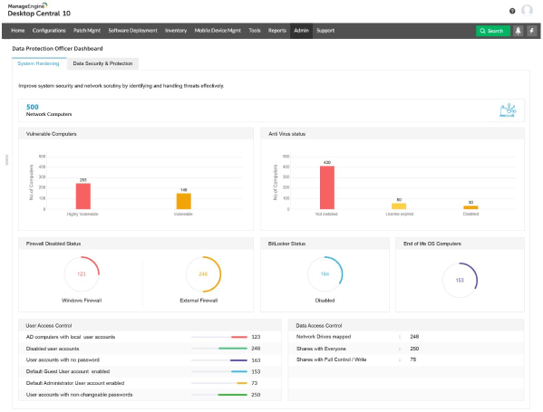
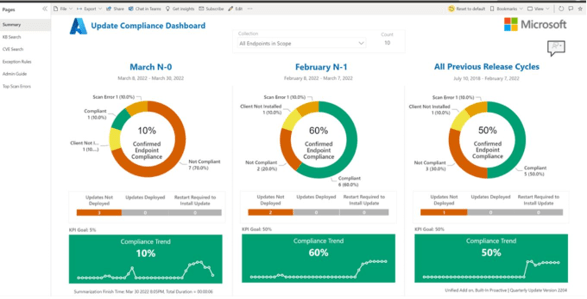
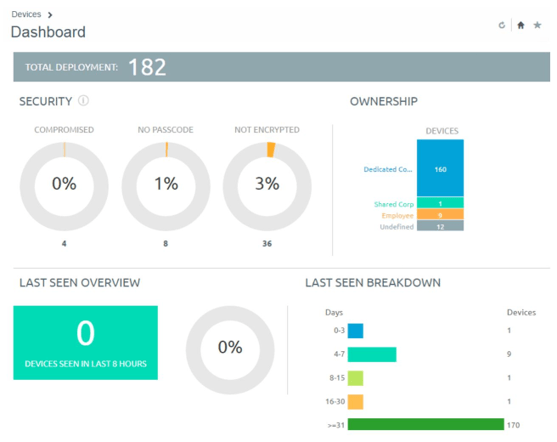
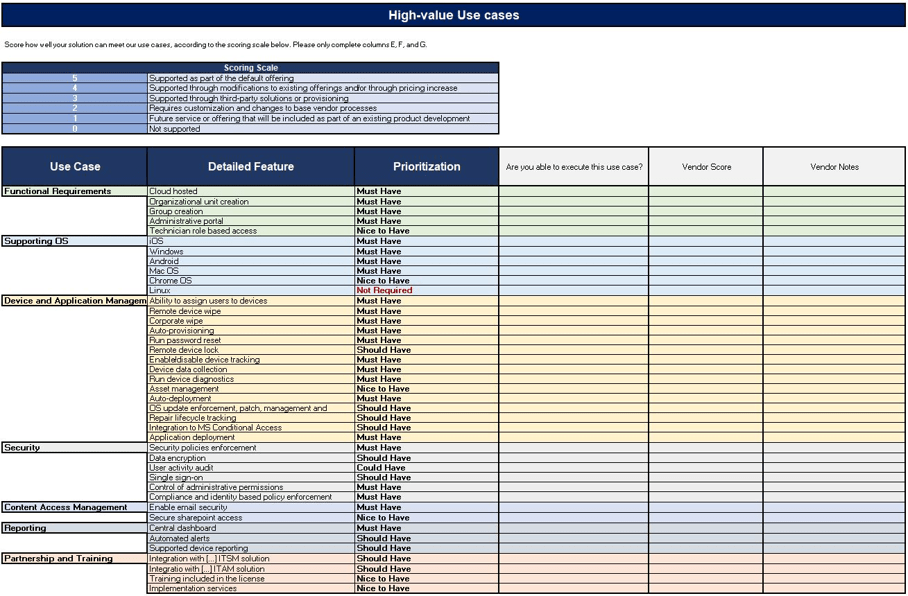
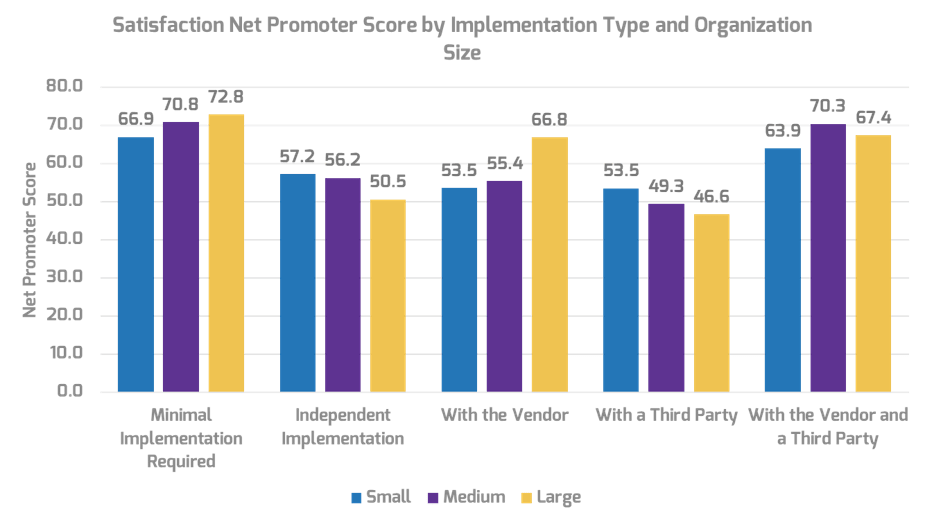
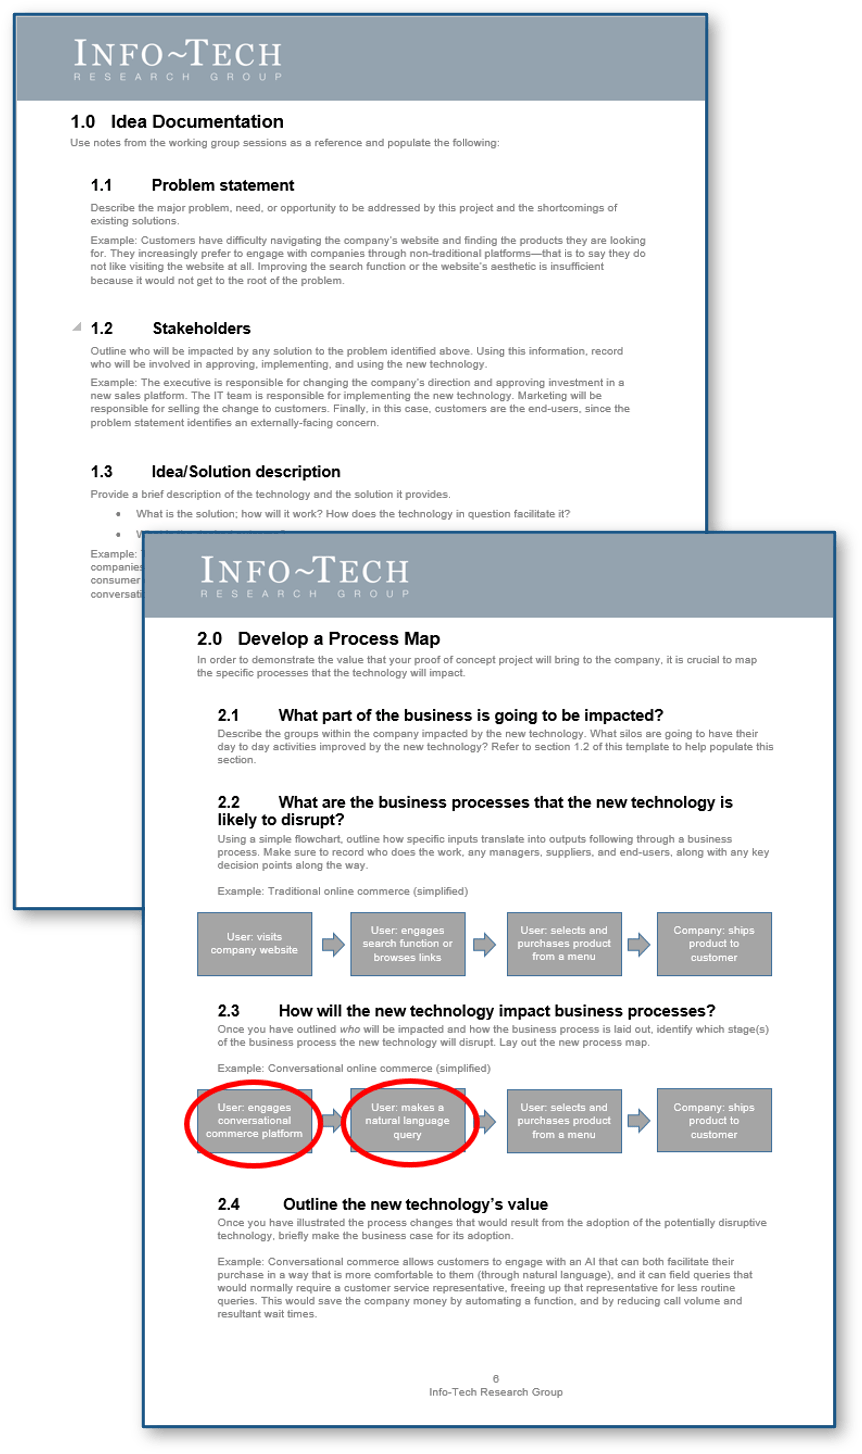