Further reading
Improve Requirements Gathering
Back to basics: great products are built on great requirements.
Analyst Perspective
A strong process for business requirements gathering is essential for application project success. However, most organizations do not take a strategic approach to optimizing how they conduct business analysis and requirements definition.
"Robust business requirements are the basis of a successful project. Without requirements that correctly articulate the underlying needs of your business stakeholders, projects will fail to deliver value and involve significant rework. In fact, an Info-Tech study found that of projects that fail over two-thirds fail due to poorly defined business requirements.
Despite the importance of good business requirements to project success, many organizations struggle to define a consistent and repeatable process for requirements gathering. This results in wasted time and effort from both IT and the business, and generates requirements that are incomplete and of dubious value. Additionally, many business analysts lack the competencies and analytical techniques needed to properly execute the requirements gathering process.
This research will help you get requirements gathering right by developing a set of standard operating procedures across requirements elicitation, analysis, and validation. It will also help you identify and fine-tune the business analyst competencies necessary to make requirements gathering a success."
– Ben Dickie, Director, Enterprise Applications, Info-Tech Research Group
Our understanding of the problem
This Research is Designed For:
- The IT applications director who has accountability for ensuring that requirements gathering procedures are both effective and efficient.
- The designated business analyst or requirements gathering professional who needs a concrete understanding of how to execute upon requirements gathering SOPs.
This Research Will Help You:
- Diagnose your current state and identify (and prioritize) gaps that exist between your target requirements gathering needs and your current capabilities and processes.
- Build a requirements gathering SOP that prescribes a framework for requirements governance and technology usage, as well as techniques for elicitation, analysis, and validation.
This Research Will Also Assist:
- The business partner/stakeholder who is interested in ways to work with IT to improve upon existing procedures for requirements gathering.
- Systems analysts and developers who need to understand how business requirements are effectively gathered upstream.
This Research Will Help Them:
- Understand the significance and importance of business requirements gathering on overall project success and value alignment.
- Create rules of engagement for assisting IT with the collection of requirements from the right stakeholders in a timely fashion.
Executive summary
Situation
- Strong business requirements are essential to project success – inadequate requirements are the number one reason that projects fail.
- Organizations need a consistent, repeatable, and prescriptive set of standard operating procedures (SOPs) that dictate how business requirements gathering should be conducted.
Complication
- If proper due diligence for requirements gathering is not conducted, then the applications that IT is deploying won’t meet business objectives, and they will fail to deliver adequate business value.
- Inaccurate requirements definition can lead to significant amounts of project rework and hurt the organization’s financial performance. It will also damage the relationship between IT and the business.
Resolution
- To avoid delivering makeshift solutions (paving the cow path), organizations need to gather requirements with the desired future state in mind. Organizations need to keep an open mind when gathering requirements.
- Creating a unified set of SOPs is essential for effectively gathering requirements; these procedures should cover not just elicitation, analysis, and validation, but also include process governance and documentation.
- BAs who conduct requirements gathering must demonstrate proven competencies for stakeholder management, analytical techniques, and the ability to speak the language of both the business and IT.
- An improvement in requirements analysis will strengthen the relationship between business and IT, as more and more applications satisfy stakeholder needs. More importantly, the applications delivered by IT will meet all of the must-have and at least some of the nice-to-have requirements, allowing end users to execute their day-to-day responsibilities.
Info-Tech Insight
- Requirements gathering SOPs should be prescriptive based on project complexity. Complex projects will require more analytical rigor. Simpler projects can be served by more straightforward techniques like user story development.
- Business analysts (BA) can make or break the execution of the requirements gathering process.
A strong process still needs to be executed well by BAs with the right blend of skills and knowledge.
Understand what constitutes a strong business requirement
A business requirement is a statement that clearly outlines the functional capability that the business needs from a system or application. There are several attributes to look at in requirements:
Verifiable
Stated in a way that can be easily tested
Unambiguous
Free of subjective terms and can only be interpreted in one way
Complete
Contains all relevant information
Consistent
Does not conflict with other requirements
Achievable
Possible to accomplish with budgetary and technological constraints
Traceable
Trackable from inception through to testing
Unitary
Addresses only one thing and cannot be decomposed into multiple requirements
Agnostic
Doesn’t pre-suppose a specific vendor or product
Not all requirements will meet all of the attributes.
In some situations, an insight will reveal new requirements. This requirement will not follow all of the attributes listed above and that’s okay. If a new insight changes the direction of the project, re-evaluate the scope of the project.
Attributes are context specific.
Depending on the scope of the project, certain attributes will carry more weight than others. Weigh the value of each attribute before elicitation and adjust as required. For example, verifiable will be a less-valued attribute when developing a client-facing website with no established measuring method/software.
Build a firm foundation: requirements gathering is an essential step in any project, but many organizations struggle
Proper requirements gathering is critical for delivering business value from IT projects, but it remains an elusive and perplexing task for most organizations. You need to have a strategy for end-to-end requirements gathering, or your projects will consistently fail to meet business expectations.
50% of project rework is attributable to problems with requirements. (Info-Tech Research Group)
45% of delivered features are utilized by end users. (The Standish Group)
78% of IT professionals believe the business is “usually” or “always” out of sync with project requirements. (Blueprint Software Systems)
45% of IT professionals admit to being “fuzzy” about the details of a project’s business objectives. (Blueprint Software Systems)
Requirements gathering is truly an organization-spanning issue, and it falls directly on the IT directors who oversee projects to put prudent SOPs in place for managing the requirements gathering process. Despite its importance, the majority of organizations have challenges with requirements gathering.
What happens when requirements are no longer effective?
- Poor requirements can have a very visible and negative impact on deployed apps.
- IT receives the blame for any project shortcomings or failures.
- IT loses its credibility and ability to champion future projects.
- Late projects use IT resources longer than planned.
Requirements gathering is a core component of the overall project lifecycle that must be given its due diligence
PMBOK’s Five Phase Project Lifecycle
Initiate – Plan: Requirements Gathering Lives Here – Execute – Control – Close
Inaccurate requirements is the 2nd most common cause of project failure (Project Management Institute ‒ Smartsheet).
Requirements gathering is a critical stage of project planning.
Depending on whether you take an Agile or Waterfall project management approach, it can be extended into the initiate and execute phases of the project lifecycle.
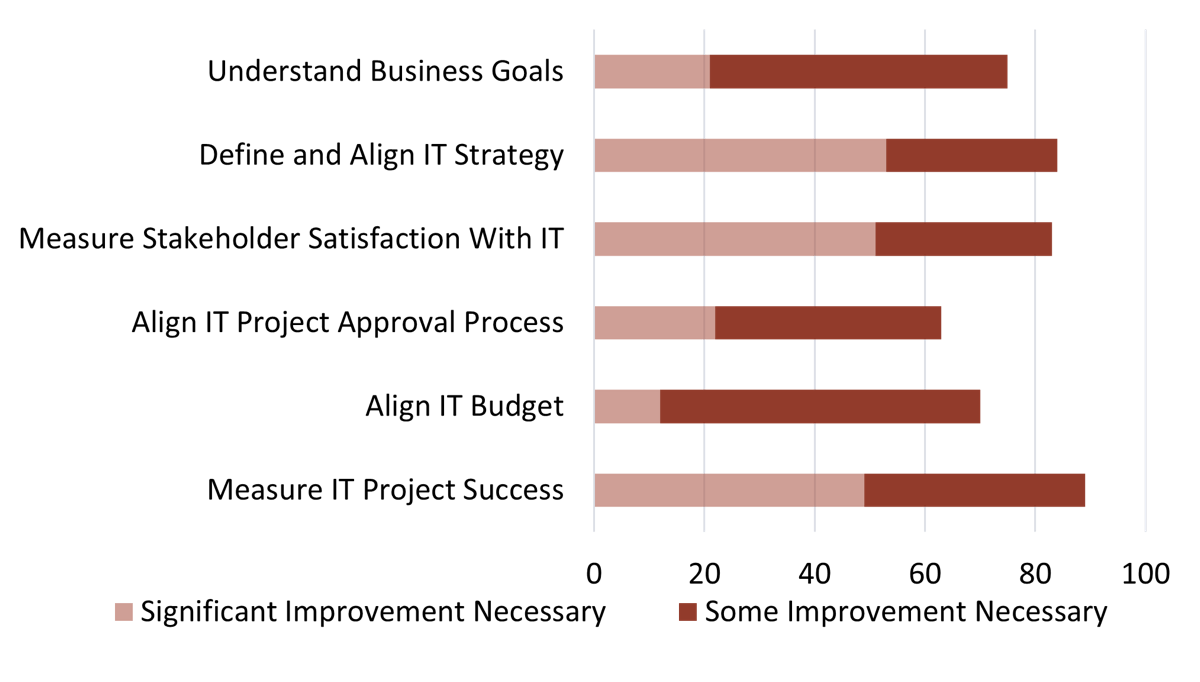
Strong stakeholder satisfaction with requirements gathering results in higher satisfaction in other areas
Organizations that had high satisfaction with requirements gathering were more likely to be highly satisfied with the other areas of IT. In fact, 72% of organizations that had high satisfaction with requirements gathering were also highly satisfied with the availability of IT capacity to complete projects.
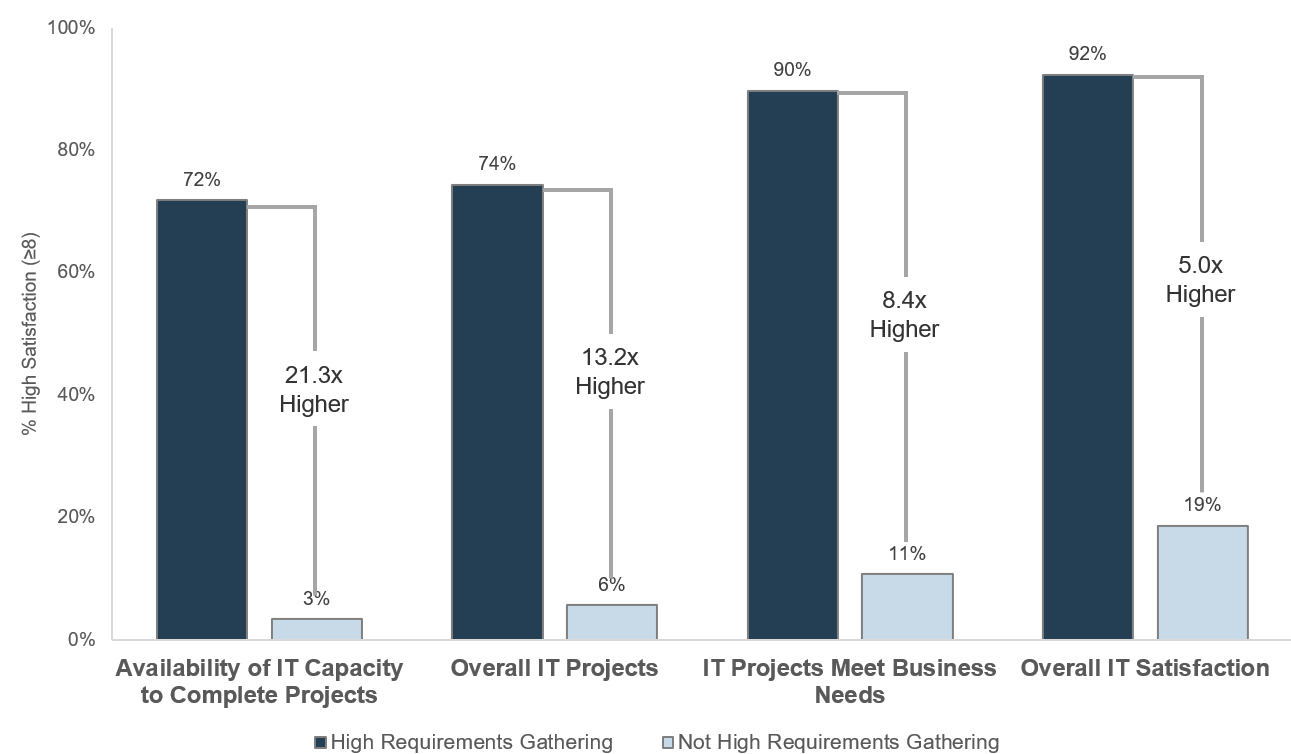
Note: High satisfaction was classified as organizations with a score greater or equal to 8.
Not high satisfaction was every other organization that scored below 8 on the area questions.
N=395 organizations from Info-Tech’s CIO Business Vision diagnostic
Requirements gathering efforts are filled with challenges; review these pitfalls to avoid in your optimization efforts
The challenges that afflict requirements gathering are multifaceted and often systemic in nature. There isn’t a single cure that will fix all of your requirements gathering problems, but an awareness of frequently encountered challenges will give you a basis for where to consider establishing better SOPs. Commonly encountered challenges include:
Process Challenges
- Requirements may be poorly documented, or not documented at all.
- Elicitation methods may be inappropriate (e.g. using a survey when collaborative whiteboarding is needed).
- Elicitation methods may be poorly executed.
- IT and business units may not be communicating requirements in the same terms/language.
- Requirements that conflict with one another may not be identified during analysis.
- Requirements cannot be traced from origin to testing.
Stakeholder Challenges
- Stakeholders may be unaware of the requirements needed for the ideal solution.
- Stakeholders may have difficulty properly articulating their desired requirements.
- Stakeholders may have difficulty gaining consensus on the ideal solution.
- Relevant stakeholders may not be consulted on requirements.
- Sign-off may not be received from the proper stakeholders.
70% of projects fail due to poor requirements. (Info-Tech Research Group)
Address the root cause of poor requirements to increase project success
Root Causes of Poor Requirements Gathering:
- Requirements gathering procedures don’t exist.
- Requirements gathering procedures exist but aren’t followed.
- There isn't enough time allocated to the requirements gathering phase.
- There isn't enough involvement or investment secured from business partners.
- There is no senior leadership involvement or mandate to fix requirements gathering.
- There are inadequate efforts put towards obtaining and enforcing sign-off.
Outcomes of Poor Requirements Gathering:
- Rework due to poor requirements leads to costly overruns.
- Final deliverables are of poor quality.
- Final deliverables are implemented late.
- Predicted gains from deployed applications are not realized.
- There are low feature utilization rates by end users.
- There are high levels of end-user dissatisfaction.
- There are high levels of project sponsor dissatisfaction.
Info-Tech Insight
Requirements gathering is the number one failure point for most development or procurement projects that don’t deliver value. This has been and continues to be the case as most organizations still don't get requirements gathering right. Overcoming organizational cynicism can be a major obstacle when it is time to optimize the requirements gathering process.
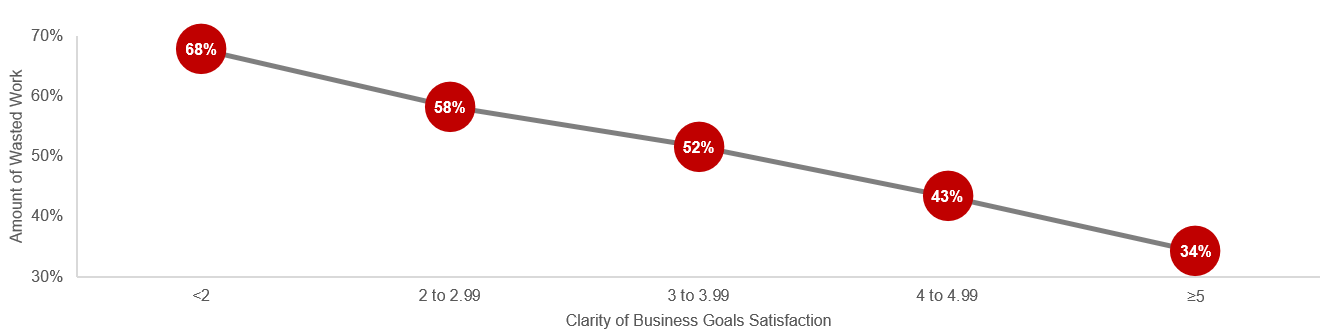
Reduce wasted project work with clarity of business goals and analysis of requirements
You can reduce the amount of wasted work by making sure you have clear business goals. In fact, you could see an improvement of as much as 50% by going from a low level of satisfaction with clarity of business goals (<2) to a high level of satisfaction (≥5).
Likewise, you could see an improvement of as much as 43% by going from a low level of satisfaction with analysis of requirements (less than 2) to a high level of satisfaction (greater than or equal to 5).
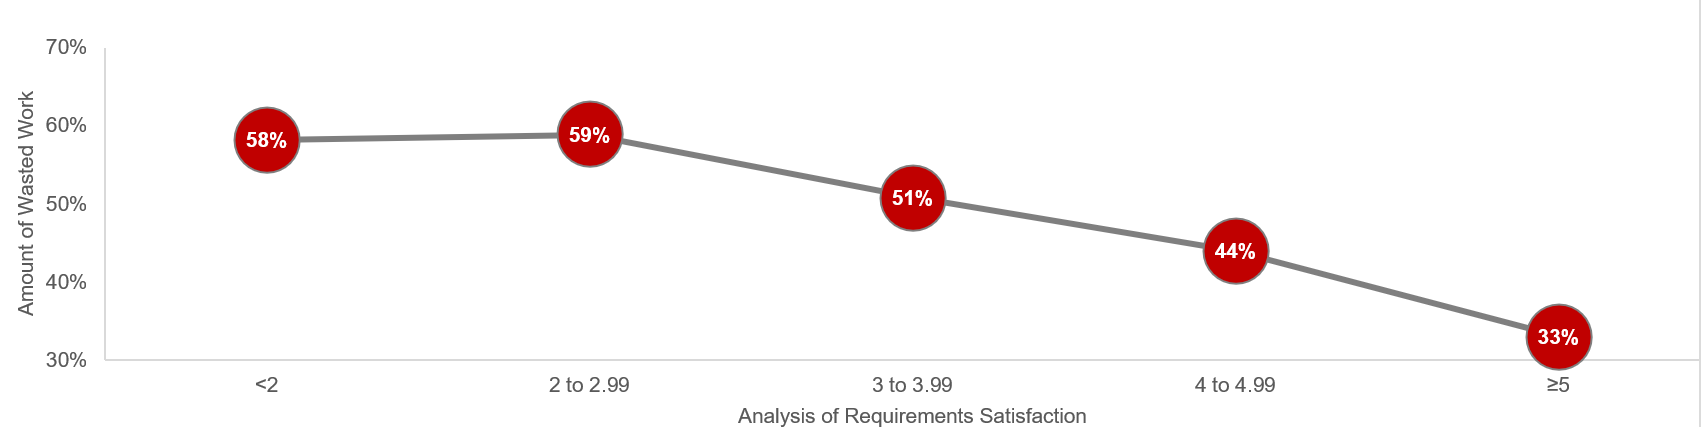
Note: Waste is measured by the amount of cancelled projects; suboptimal assignment of resources; analyzing, fixing, and re-deploying; inefficiency, and unassigned resources.
N=200 teams from the Project Portfolio Management diagnostic
Effective requirements gathering supports other critical elements of project management success
Good intentions and hard work aren’t enough to make a project successful. As you proceed with a project, step back and assess the critical success factors. Make sure that the important inputs and critical activities of requirements gathering are supporting, not inhibiting, project success.
- Streamlined Project Intake
- Strong Stakeholder Management
- Defined Project Scope
- Effective Project Management
- Environmental Analysis
Don’t improvise: have a structured, end-to-end approach for successfully gathering useful requirements
Creating a unified SOP guide for requirements elicitation, analysis, and validation is a critical step for requirements optimization; it gives your BAs a common frame of reference for conducting requirements gathering.
- The key to requirements optimization is to establish a strong set of SOPs that provide direction on how your organization should be executing requirements gathering processes. This SOP guide should be a holistic document that walks your BAs through a requirements gathering project from beginning to end.
- An SOP that is put aside is useless; it must be well communicated to BAs. It should be treated as the veritable manifesto of requirements management in your organization.
Info-Tech Insight
Having a standardized approach to requirements management is critical, and SOPs should be the responsibility of a group. The SOP guide should cover all of the major bases of requirements management. In addition to providing a walk-through of the process, an SOP also clarifies requirements governance.
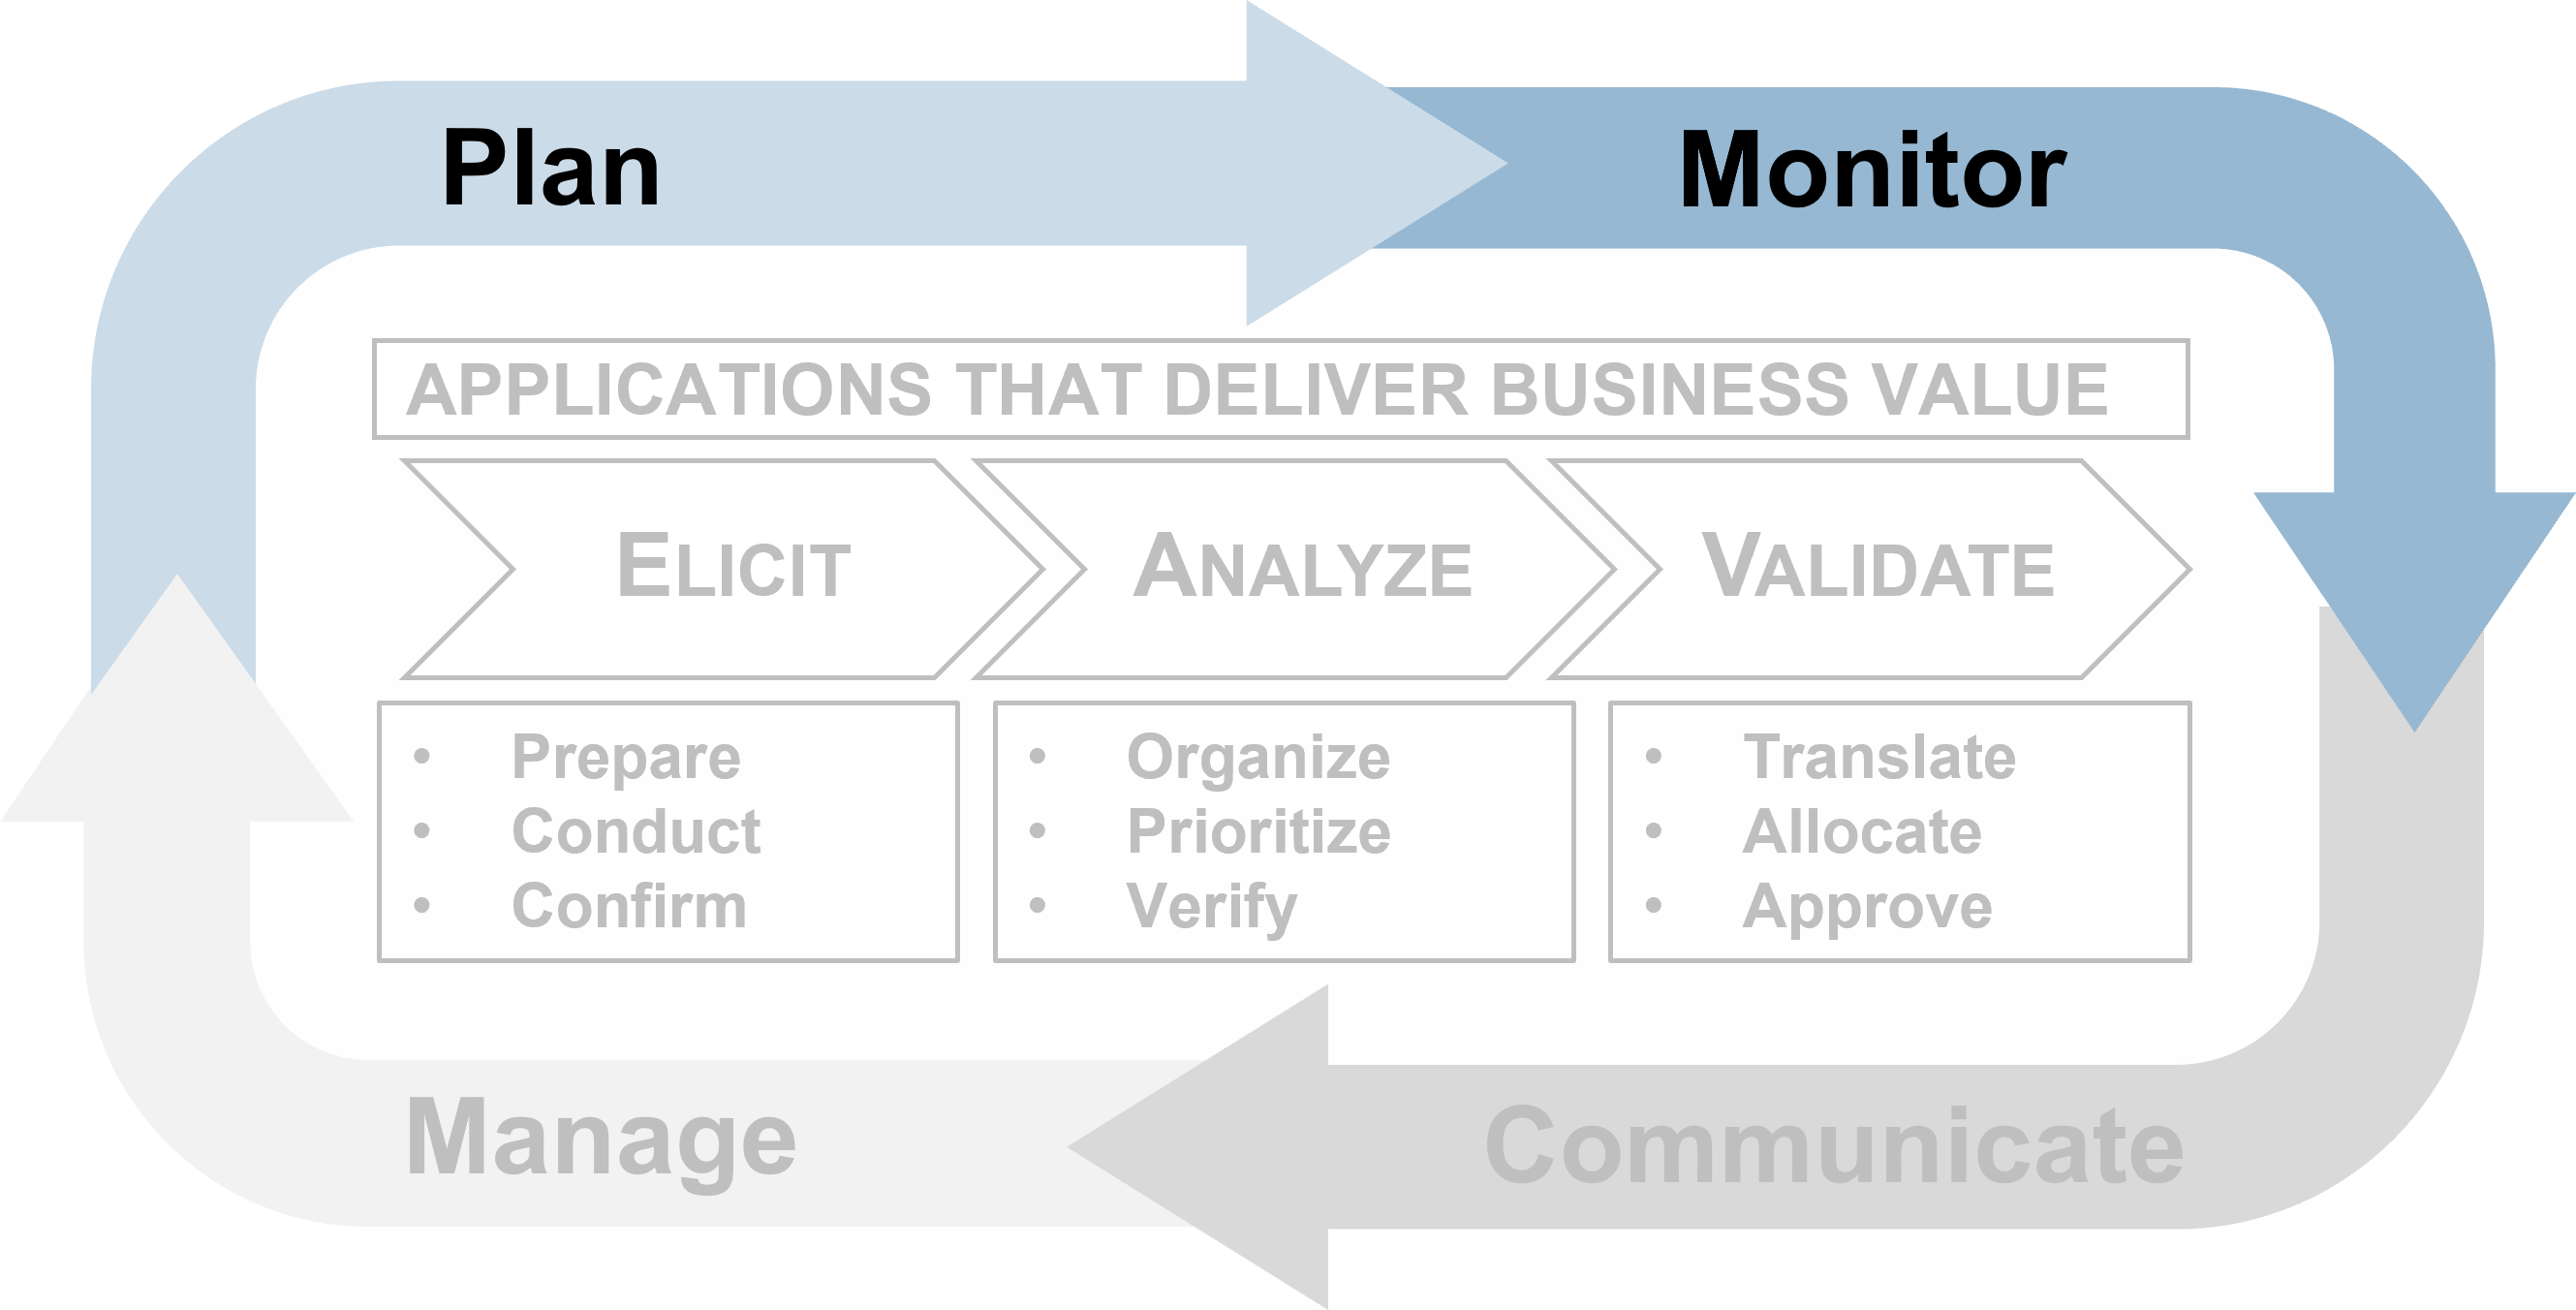
Leverage Info-Tech’s proven Requirements Gathering Framework as the basis for building requirements processes
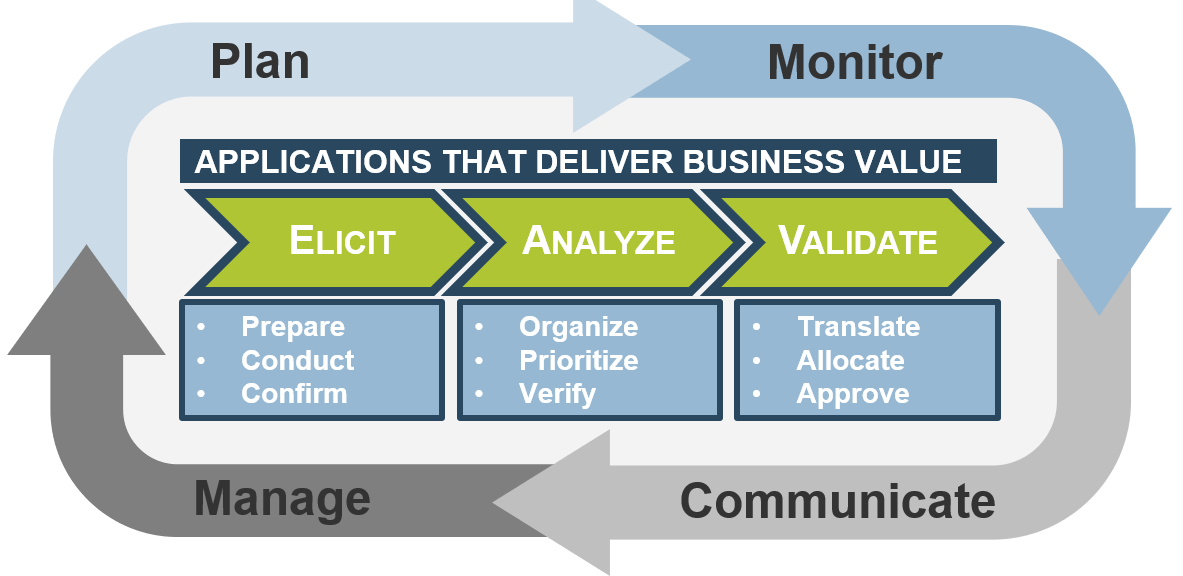
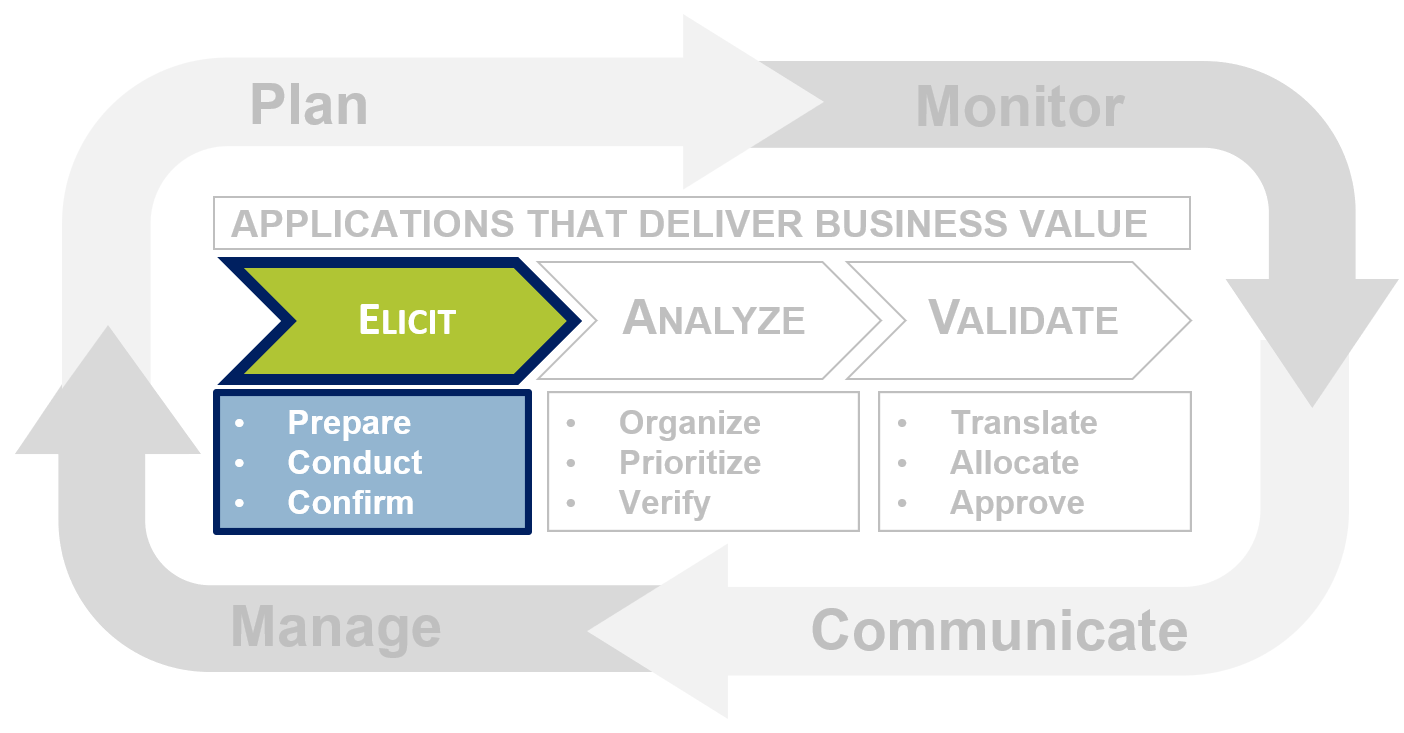
Info-Tech’s Requirements Gathering Framework is a comprehensive approach to requirements management that can be scaled to any size of project or organization. This framework has been extensively road-tested with our clients to ensure that it balances the needs of IT and business stakeholders to give a holistic, end-to-end approach for requirements gathering. It covers the foundational issues (elicitation, analysis, and validation) and prescribes techniques for planning, monitoring, communicating, and managing the requirements gathering process.
Don’t forget resourcing: the best requirements gathering process will still fail if you don’t develop BA competencies
When creating the process for requirements gathering, think about how it will be executed by your BAs, and what the composition of your BA team should look like. A strong BA needs to serve as an effective translator, being able to speak the language of both the business and IT.
- To ensure alignment of your BAs to the requirements gathering process, undertake a formal skills assessment to identify areas where analysts are strong, and areas that should be targeted for training and skills development.
- Training of BAs on the requirements gathering process and development of intimate familiarity with SOPs is essential; you need to get BAs on the same page to ensure consistency and repeatability of the requirements process.
- Consider implementing a formal mentorship and/or job shadowing program between senior and junior BAs. Many of our members report that leveraging senior BAs to bootstrap the competencies of more junior team members is a proven approach to building skillsets for requirements gathering.
What are some core competencies of a good BA?
- Strong stakeholder management.
- Proven track record in facilitating elicitation sessions.
- Ability to bridge the gulf between IT and the business by speaking both languages.
- Ability to ask relevant probing questions to uncover latent needs.
- Experience with creating project operating models and business process diagrams.
- Ability to set and manage expectations throughout the process.
Throughout this blueprint, look for the “BA Insight” box to learn how steps in the requirements gathering process relate to the skills needed by BAs to facilitate the process effectively.
A mid-sized local government overhauls its requirements gathering approach and sees strong results
CASE STUDY
Industry
Government
Source
Info-Tech Research Group Workshop
The Client
The organization was a local government responsible for providing services to approximately 600,000 citizens in the southern US. Its IT department is tasked with deploying applications and systems (such as HRIS) that support the various initiatives and mandate of the local government.
The Requirements Gathering Challenge
The IT department recognized that a strong requirements gathering process was essential to delivering value to its stakeholders. However, there was no codified process in place – each BA unilaterally decided how they would conduct requirements gathering at the start of each project. IT recognized that to enhance both the effectiveness and efficiency of requirements gathering, it needed to put in place a strong, prescriptive set of SOPs.
The Improvement
Working with a team from Info-Tech, the IT leadership and BA team conducted a workshop to develop a new set of SOPs that provided clear guidance for each stage of the requirements process: elicitation, analysis, and validation. As a result, business satisfaction and value alignment increased.
The Requirements Gathering SOP and BA Playbook offers a codified set of SOPs for requirements gathering gave BAs a clear playbook.
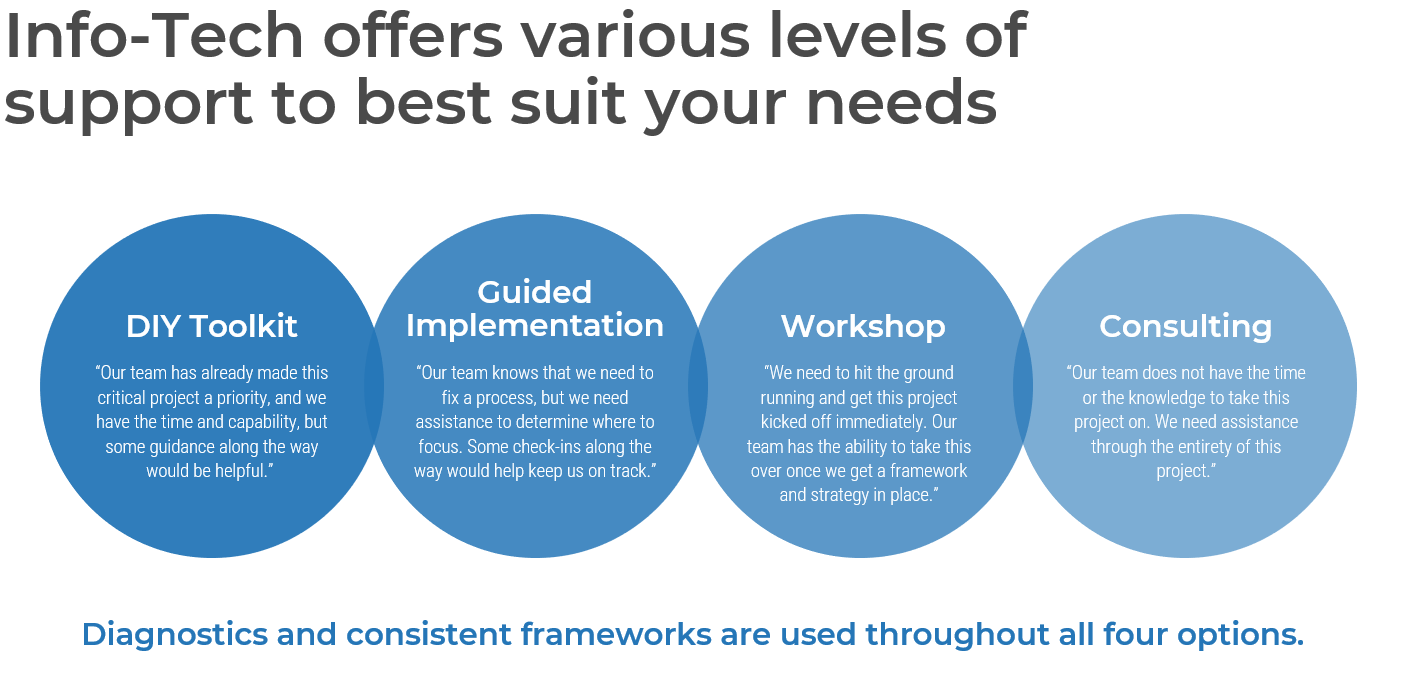
Info-Tech offers various levels of support to best suit your needs
DIY Toolkit
“Our team has already made this critical project a priority, and we have the time and capability, but some guidance along the way would be helpful.”
Guided Implementation
“Our team knows that we need to fix a process, but we need assistance to determine where to focus. Some check-ins along the way would help keep us on track.”
Workshop
“We need to hit the ground running and get this project kicked off immediately. Our team has the ability to take this over once we get a framework and strategy in place.”
Consulting
“Our team does not have the time or the knowledge to take this project on. We need assistance through the entirety of this project.”
Diagnostics and consistent frameworks used throughout all four options
Build a Strong Approach to Business Requirements Gathering – project overview
|
|
1. Build the Target State for Requirements Gathering
|
2. Define the Elicitation Process
|
3. Analyze and Validate Requirements
|
4. Create a Requirements Governance Action Plan
|
| Best-Practice Toolkit
|
1.1 Understand the Benefits of Requirements Optimization
1.2 Determine Your Target State for Requirements Gathering
|
2.1 Determine Elicitation Techniques
2.2 Structure Elicitation Output
|
3.1 Create Analysis Framework
3.2 Validate Business Requirements
|
4.1 Create Control Processes for Requirements Changes
4.2 Build Requirements Governance and Communication Plan
|
| Guided Implementations
|
- Review Info-Tech’s requirements gathering methodology.
- Assess current state for requirements gathering – pains and challenges.
- Determine target state for business requirements gathering – areas of opportunity.
|
- Assess elicitation techniques and determine best fit to projects and business environment.
- Review options for structuring the output of requirements elicitation (i.e. SIPOC).
|
- Create policies for requirements categorization and prioritization.
- Establish best practices for validating the BRD with project stakeholders.
|
- Discuss how to handle changes to requirements, and establish a formal change control process.
- Review options for ongoing governance of the requirements gathering process.
|
| Onsite Workshop
|
Module 1: Define the Current and Target State
|
Module 2: Define the Elicitation Process
|
Module 3: Analyze and Validate Requirements
|
Module 4: Governance and Continuous Improvement Process
|
|
|
Phase 1 Results: Clear understanding of target needs for the requirements process.
|
Phase 2 Results: Best practices for conducting and structuring elicitation.
|
Phase 3 Results: Standardized frameworks for analysis and validation of business requirements.
|
Phase 4 Results: Formalized change control and governance processes for requirements.
|
Workshop overview
Contact your account representative or email Workshops@InfoTech.com for more information.
|
|
Workshop Day 1
|
Workshop Day 2
|
Workshop Day 3
|
Workshop Day 4
|
Workshop Day 5
|
| Activities
|
Define Current State and Target State for Requirements Gathering
- Understand current state and document existing requirement process steps.
- Identify stakeholder, process, outcome, and reigning challenges.
- Conduct target state analysis.
- Establish requirements gathering metrics.
- Identify project levels 1/2/3/4.
- Match control points to project levels 1/2/3/4.
- Conduct project scoping and identify stakeholders.
|
Define the Elicitation Process
- Understand elicitation techniques and which ones to use.
- Document and confirm elicitation techniques.
- Create a requirements gathering elicitation plan for your project.
- Practice using interviews with business stakeholders to build use case models.
- Practice using table-top testing with business stakeholders to build use case models.
- Build the operating model for your project
|
Analyze and Validate Requirements
- Categorize gathered requirements for use.
- Consolidate similar requirements and eliminate redundancies.
- Practice prioritizing requirements.
- Rightsize the requirements documentation template.
- Present the business requirements document (BRD) to business stakeholders.
- Identify testing opportunities.
|
Establish Change Control Processes
- Review existing CR process.
- Review change control process best practices & optimization opportunities.
- Build guidelines for escalating changes.
- Confirm your requirements gathering process for project levels 1/2/3/4.
|
Establish Ongoing Governance for Requirements Gathering
- Define RACI for the requirements gathering process.
- Define the requirements gathering governance process.
- Define RACI for requirements gathering governance.
- Define the agenda and cadence for requirements gathering governance.
- Identify and analyze stakeholders for communication plan.
- Create communication management plan.
- Build the action plan.
|
| Deliverables
|
- Requirements gathering maturity assessment
- Project level selection tool
- Requirements gathering documentation tool
|
- Project elicitation schedule
- Project operating model
- Project use cases
|
- Requirements gathering documentation tool
- Requirements gathering testing checklist
|
- Requirements traceability matrix
- Requirements gathering communication tracking template
|
- Requirements gathering action plan
|
Phase 1: Build the Target State for the Requirements Gathering Process
Phase 1 outline
Call 1-888-670-8889 or email GuidedImplementations@InfoTech.com for more information.
Complete these steps on your own, or call us to complete a guided implementation. A guided implementation is a series of
2-3 advisory calls that help you execute each phase of a project. They are included in most advisory memberships.
Guided Implementation 1: Build the Target State
Proposed Time to Completion: 2 weeks
Step 1.1: Understand the Benefits of Requirements Optimization
Start with an analyst kick off call:
- Review Info-Tech’s requirements gathering methodology.
Then complete these activities…
With these tools & templates:
Requirements Gathering SOP and BA Playbook
Step 1.2: Determine Your Target State for Requirements Gathering
Review findings with analyst:
- Assess current state for requirements gathering – pains and challenges.
- Determine target state for business requirements gathering – areas of opportunity.
Then complete these activities…
- Identify your business process model.
- Define project levels.
- Match control points to project level.
- Identify and analyze stakeholders.
With these tools & templates:
- Requirements Gathering Maturity Assessment
- Project Level Selection Tool
- Business Requirements Analyst job description
- Requirements Gathering Communication Tracking Template
Phase 1 Results & Insights:
Clear understanding of target needs for the requirements process.
Step 1.1: Understand the Benefits of Requirements Optimization
Phase 1
1.1 Understand the Benefits of Requirements Optimization
1.2 Determine Your Target State for Requirements Gathering
Phase 2
2.1 Determine Elicitation Techniques
2.2 Structure Elicitation Output
Phase 3
3.1 Create Analysis Framework
3.2 Validate Business Requirements
Phase 4
4.1 Create Control Processes for Requirements Changes
4.2 Build Requirements Governance and Communication Plan
This step will walk you through the following activities:
- Identifying challenges with requirements gathering and identifying objectives for the workshop.
This step involves the following participants:
- Business stakeholders
- BAs
Outcomes of this step
- Stakeholder objectives identified.
Requirements optimization is powerful, but it’s not free; gauge the organizational capital you’ll need to make it a success
Optimizing requirements management is not something that can be done in isolation, and it’s not necessarily going to be easy. Improving your requirements will translate into better value delivery, but it takes real commitment from IT and its business partners.
There are four “pillars of commitment” that will be necessary to succeed with requirements optimization:
- Senior Management Organizational Capital
- Before organizations can establish revised SOPs for requirements gathering, they’ll need a strong champion in senior management to ensure that updated elicitation and sign-off techniques do not offend people. A powerful sponsor can lead to success, especially if they are in the business.
- End-User Organizational Capital
- To overcome cynicism, you need to focus on convincing end users that there is something to be gained from participating in requirements gathering (and the broader process of requirements optimization). Frame the value by focusing on how good requirements mean better apps (e.g. faster, cheaper, fewer errors, less frustration).
- Staff Resourcing
- You can have a great SOP, but if you don’t have the right resources to execute on it you’re going to have difficulty. Requirements gathering needs dedicated BAs (or equivalent staff) who are trained in best practices and can handle elicitation, analysis, and validation successfully.
- Dedicated Cycle Time
- IT and the business both need to be willing to demonstrate the value of requirements optimization by giving requirements gathering the time it needs to succeed. If these parties are convinced by the concept in theory, but still try to rush moving to the development phase, they’re destined for failure.
Rethink your approach to requirements gathering: start by examining the business process, then tackle technology
When gathering business requirements, it’s critical not to assume that layering on technology to a process will automatically solve your problems.
Proper requirements gathering views projects holistically (i.e. not just as an attempt to deploy an application or technology, but as an endeavor to enable new or re-engineered business processes). Neglecting to see requirements gathering in the context of business process enablement leads to failure.
- Far too often, organizations automate an existing process without putting much thought into finding a better way to do things.
- Most organizations focus on identifying a series of small improvements to make to a process and realize limited gains.
- The best way to generate transformational gains is to reinvent how the process should be performed and work backwards from there.
- You should take a top-down approach and begin by speaking with senior management about the business case for the project and their vision for the target state.
- You should elicit requirements from the rank-and-file employees while centering the discussion and requirements around senior management’s target state. Don’t turn requirements gathering into a griping session about deficiencies with a current application.
Leverage Info-Tech’s proven Requirements Gathering Framework as the basis for building requirements processes
Info-Tech’s Requirements Gathering Framework is a comprehensive approach to requirements management that can be scaled to any size of project or organization. This framework has been extensively road-tested with our clients to ensure that it balances the needs of IT and business stakeholders to give a holistic, end-to-end approach for requirements gathering. It covers both the foundational issues (elicitation, analysis, and validation) as well as prescribing techniques for planning, monitoring, communicating, and managing the requirements gathering process.
Requirements gathering fireside chat
1.1.1 – 45 minutes
Output
Materials
- Whiteboard, markers, sticky notes
Participants
Identify the challenges you’re experiencing with requirements gathering, and identify objectives.
- Hand out sticky notes to participants, and ask the group to work independently to think of challenges that exist with regards to requirements gathering. (Hint: consider stakeholder challenges, process challenges, outcome challenges, and training challenges.) Ask participants to write their current challenges on sticky notes, and place them on the whiteboard.
- As a group, review all sticky notes and group challenges into themes.
- For each theme you uncover, work as a group to determine the objective that will overcome these challenges throughout the workshop and write this on the whiteboard.
- Discuss how these challenges will be addressed in the workshop.
Don’t improvise: have a structured, prescriptive end-to-end approach for successfully gathering useful requirements
Creating a unified SOP guide for requirements elicitation, analysis, and validation is a critical step for requirements optimization; it gives your BAs a common frame of reference for conducting requirements gathering.
- The key to requirements optimization is to establish a strong set of SOPs that provide direction on how your organization should be executing requirements gathering processes. This SOP guide should be a holistic document that walks your BAs through a requirements gathering project from beginning to end.
- An SOP that is put aside is useless; it must be well communicated to BAs. It should be treated as the veritable manifesto of requirements management in your organization.
Info-Tech Insight
Having a standardized approach to requirements management is critical, and SOPs should be the responsibility of a group. The SOP guide should cover all of the major bases of requirements management. In addition to providing a walk-through of the process, an SOP also clarifies requirements governance.
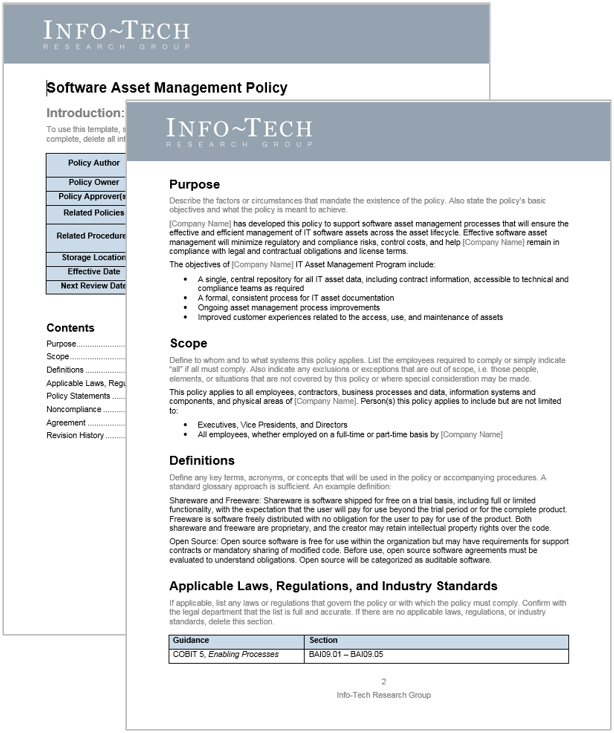
Use Info-Tech’s Requirements Gathering SOP and BA Playbook to assist with requirements gathering optimization
Info-Tech’s Requirements Gathering SOP and BA Playbook template forms the basis of this blueprint. It’s a structured document that you can fill out with defined procedures for how requirements should be gathered at your organization.
Info-Tech’s Requirements Gathering SOP and BA Playbook template provides a number of sections that you can populate to provide direction for requirements gathering practitioners. Sections provided include: Organizational Context Governance Procedures Resourcing Model Technology Strategy Knowledge Management Elicitation SOPs Analysis SOPs Validation SOPs.
The template has been pre-populated with an example of requirements management procedures. Feel free to customize it to fit your specific needs.
Download the Requirements Gathering SOP and BA Playbook template.
Step 1.2: Determine Your Target State for Requirements Gathering
Phase 1
1.1 Understand the Benefits of Requirements Optimization
1.2 Determine Your Target State for Requirements Gathering
Phase 2
2.1 Determine Elicitation Techniques
2.2 Structure Elicitation Output
Phase 3
3.1 Create Analysis Framework
3.2 Validate Business Requirements
Phase 4
4.1 Create Control Processes for Requirements Changes
4.2 Build Requirements Governance and Communication Plan
This step will walk you through the following activities:
- Conduct a current and target state analysis.
- Identify requirements gathering business process model.
- Establish requirements gathering performance metrics.
- Define project levels – level 1/2/3/4.
- Match control points to project level.
- Conduct initial brainstorming on the project.
This step involves the following participants:
Outcomes of this step:
- Requirements gathering maturity summary.
- Requirements gathering business process model.
- Identification of project levels.
- Identification of control points.
Plan for requirements gathering
Establishing an overarching plan for requirements governance is the first step in building an SOP. You must also decide who will actually execute the requirements gathering processes, and what technology they will use to accomplish this. Planning for governance, resourcing, and technology is something that should be done repeatedly and at a higher strategic level than the more sequential steps of elicitation, analysis, and validation.
Establish your target state for requirements gathering processes to have a cogent roadmap of what needs to be done
Visualize how you want requirements to be gathered in your organization. Do not let elements of the current process restrict your thinking.
- First, articulate the impetus for optimizing requirements management and establish clear goals.
- Use these goals to drive the target state.
For example:
- If the goal is to improve the accuracy of requirements, then restructure the validation process.
- If the goal is to improve the consistency of requirements gathering, then create SOPs or use electronic templates and tools.
Refrain from only making small changes to improve the existing process. Think about the optimal way to structure the requirements gathering process.
Define the attributes of a good requirement to help benchmark the type of outputs that you’re looking for
Attributes of Good Requirements
Verifiable – It is stated in a way that can be
tested.
Unambiguous – It is free of
subjective terms and can only be interpreted in one way.
Complete – It contains all
relevant information.
Consistent – It does not
conflict with other requirements.
Achievable – It is possible
to accomplish given the budgetary and technological constraints.
Traceable – It can tracked
from inception to testing.
Unitary – It addresses
only one thing and cannot be decomposed into multiple requirements.
Accurate – It is based on proven facts and correct information.
Other Considerations:
Organizations can also track a requirement owner, rationale, priority level (must have vs. nice to have), and current status (approved, tested, etc.).
Info-Tech Insight
Requirements must be solution agnostic – they should focus on the underlying need rather than the technology required to satisfy the need as it can be really easy to fall into the technology solution trap.
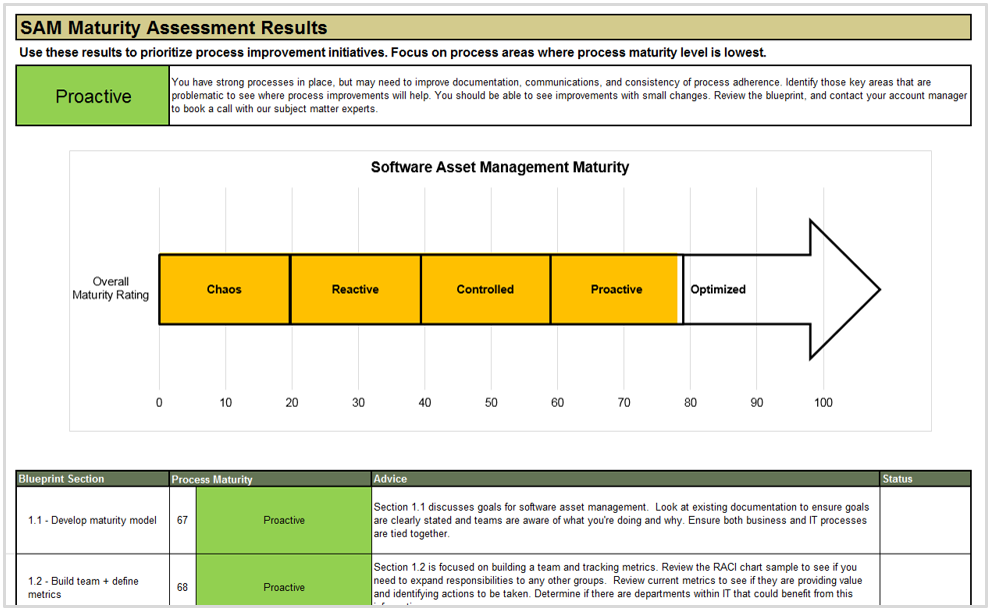
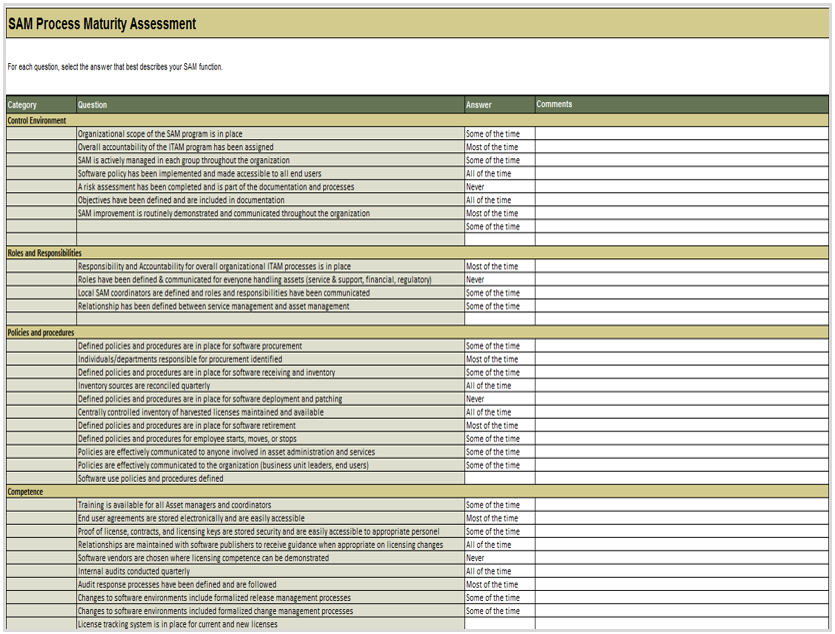
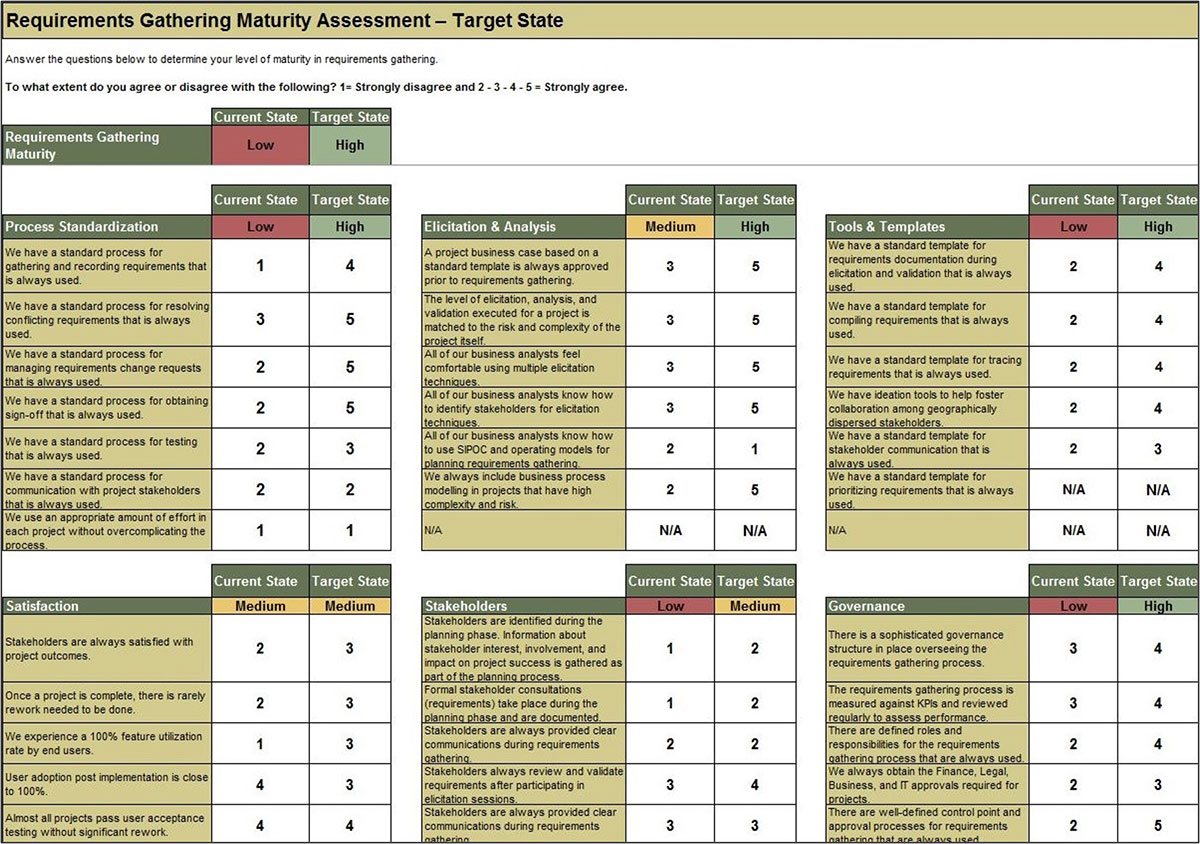
Use Info-Tech’s Requirements Gathering Maturity Assessment tool to help conduct current and target state analysis
Use the Requirements Gathering Maturity Assessment tool to help assess the maturity of your requirements gathering function in your organization, and identify the gaps between the current state and the target state. This will help focus your organization's efforts in closing the gaps that represent high-value opportunities.
- On tab 2. Current State, use the drop-down responses to provide the answer that best matches your organization, where 1= Strongly disagree and 5 = Strongly agree. On tab 3. Target State, answer the same questions in relation to where your organization would like to be.
- Based on your responses, tab 4. Maturity Summary will display a visual of the gap between the current and target state.
Conduct a current and target state analysis
1.2.1 – 1 hour
Complete the Requirements Gathering Maturity Assessment tool to define your target state, and identify the gaps in your current state.
Input
- Current and target state maturity rating
Output
- Requirements gathering maturity summary
Materials
Participants
- For each component of requirements gathering, write out a series of questions to evaluate your current requirements gathering practices. Use the Requirements Gathering Maturity Assessment tool to assist you in drafting questions.
- Review the questions in each category, and agree on a rating from 1-5 on their current maturity: 1= Strongly disagree and 5 = Strongly agree. (Note: it will likely be very rare that they would score a 5 in any category, even for the target state.)
- Once the assigned categories have been completed, have groups present their assessment to all, and ensure that there is consensus. Once consensus has been reached, input the information into the Current State tab of the tool to reveal the overall current state of maturity score for each category.
- Now that the current state is complete, go through each category and define the target state goals.
- Document any gaps or action items that need to be addressed.
Example: Conduct a current and target state analysis
Select the project-specific KPIs that will be used to track the value of requirements gathering optimization
You need to ensure your requirements gathering procedures are having the desired effect and adjust course when necessary. Establishing an upfront list of key performance indicators that will be benchmarked and tracked is a crucial step.
- Without following up on requirements gathering by tracking project metrics and KPIs, organizations will not be able to accurately gauge if the requirements process re-engineering is having a tangible, measurable effect. They will also not be able to determine what changes (if any) need to be made to SOPs based on project performance.
- This is a crucial step that many organizations overlook. Creating a retroactive list of KPIs is inadequate, since you must benchmark pre-optimization project metrics in order to assess and isolate the value generated by reducing errors and cycle time and increasing value of deployed applications.
Establish requirements gathering performance metrics
1.2.2 – 30 minutes
Input
Output
- Target performance metrics
Materials
Participants
-
Identify the following information for the last six months to one year:
- Average number of reworks to requirements.
- Number of change requests.
- Percent of feature utilization by end users.
- User adoption rate.
- Number of breaches in regulatory requirements.
- Percent of final deliverables implemented on time.
- End-user satisfaction score (if possible).
- As a group, look at each metric in turn and set your target metrics for six months to one year for each of these categories.
Document the output from this exercise in section 2.2 of the Requirements Gathering SOP and BA Playbook.
Visualize your current and target state process for requirements gathering with a business process model
A business process model (BPM) is a simplified depiction of a complex process. These visual representations allow all types of stakeholders to quickly understand a process, how it affects them, and enables more effective decision making. Consider these areas for your model:
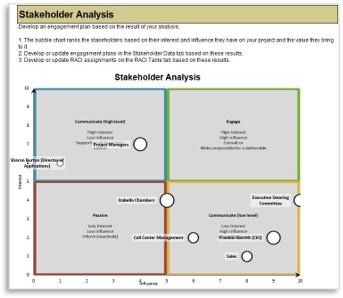
Stakeholder Analysis
- Identify who the right stakeholders are
- Plan communication
- Document stakeholder responsibilities in a RACI
Elicitation Techniques
- Get the right information from stakeholders
- Document it in the appropriate format
- Define business need
- Enterprise analysis
Documentation
- How are outputs built?
- Process flows
- Use cases
- Business rules
- Traceability matrix
- System requirements
Validation & Traceability
- Make sure requirements are accurate and complete
- Trace business needs to requirements
Managing Requirements
- Organizing and prioritizing
- Gap analysis
- Managing scope
- Communicating
- Managing changes
Supporting Tools
- Templates to standardize
- Checklists
- Software to automate the process
Your requirements gathering process will vary based on the project level
It’s important to determine the project levels up front, as each project level will have a specific degree of elicitation, analysis, and validation that will need to be completed. That being said, not all organizations will have four levels.
Level 4
- Very high risk and complexity.
- Projects that result in a transformative change in the way you do business. Level 4 projects affect all lines of business, multiple technology areas, and have significant costs and/or risks.
- Example: Implement ERP
Level 3
- High risk and complexity.
- Projects that affect multiple lines of business and have significant costs and/or risks.
- Example: Implement CRM
Level 2
- Medium risk and complexity.
- Projects with broader exposure to the business that present a moderate level of risk to business operations.
- Example: Deploy Office 365
Level 1
- Low risk and complexity.
- Routine/straightforward projects with limited exposure to the business and low risk of negative business impact.
- Example: SharePoint Update
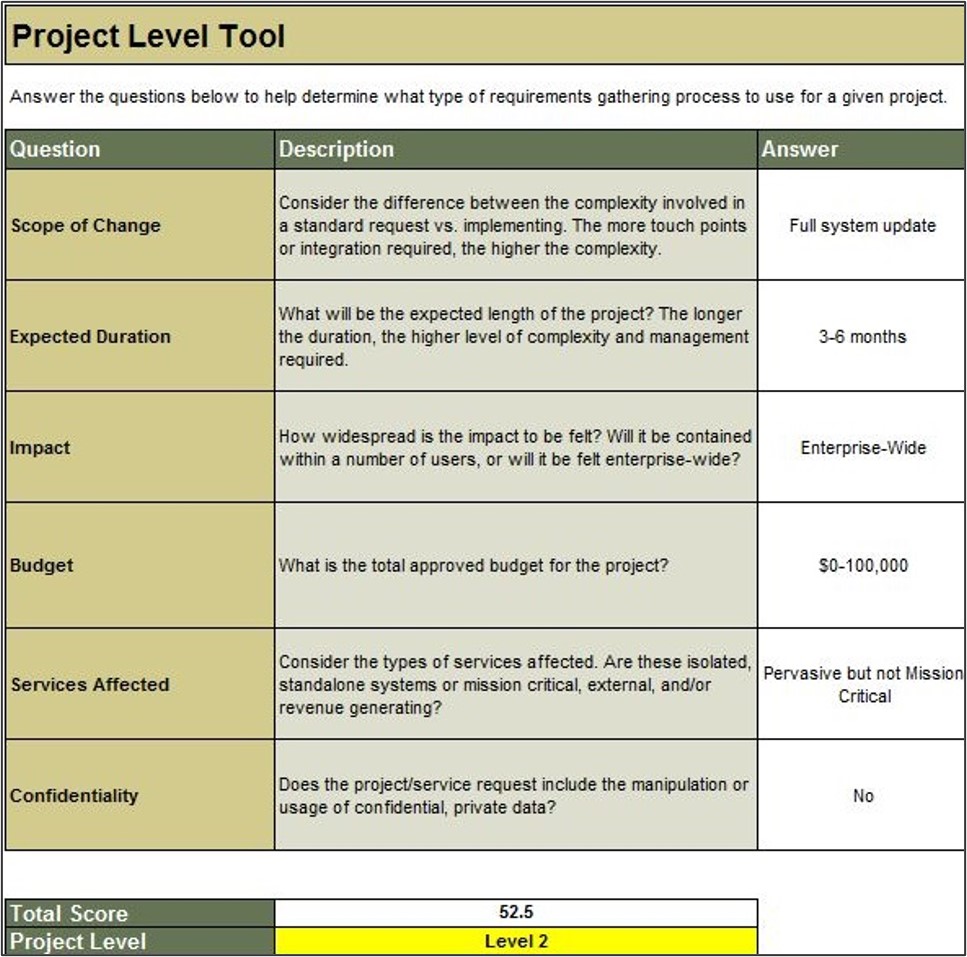
Use Info-Tech’s Project Level Selection Tool to classify your project level and complexity
1.3 Project Level Selection Tool
The Project Level Selection Tool will classify your projects into four levels, enabling you to evaluate the risk and complexity of a particular project and match it with an appropriate requirements gathering process.
Project Level Input
- Consider the weighting criteria for each question and make any needed adjustments to better reflect how your organization values each of the criterion.
- Review the option levels 1-4 for each of the six questions, and make any modifications necessary to better suit your organization.
- Review the points assigned to each of the four buckets for each of the six questions, and make any modifications needed.
Project Level Selection
- Use this tab to evaluate the project level of each new project.
- To do so, answer each of the questions in the tool.
Define project levels – Level 1/2/3/4
1.2.3 – 1 hour
Input
- Project level assessment criteria
Output
- Identification of project levels
Materials
Participants
Define the project levels to determine the appropriate requirements gathering process for each.
- Begin by asking participants to review the six criteria for assessing project levels as identified in the Project Level Selection Tool. Have participants review the list and ensure agreement around the factors. Create a chart on the board using Level 1, Level 2, Level 3, and Level 4 as column headings.
- Create a row for each of the chosen factors. Begin by filling in the chart with criteria for a level 4 project: What constitutes a level 4 project according to these six factors?
- Repeat the exercise for Level 3, Level 2, and Level 1. When complete, you should have a chart that defines the four project levels at your organization.
- Input this information into the tool, and ask participants to review the weighting factors and point allocations and make modifications where necessary.
- Input the details from one of the projects participants had selected prior to the workshop beginning and determine its project level. Discuss whether this level is accurate,
and make any changes needed.
Document the output from this exercise in section 2.3 of the Requirements Gathering SOP and BA Playbook.
Define project levels
1.2.3 – 1 hour
| Category
|
Level 4
|
Level 3
|
Level 2
|
Level 1
|
| Scope of Change
|
Full system update
|
Full system update
|
Multiple modules
|
Minor change
|
| Expected Duration
|
12 months +
|
6 months +
|
3-6 months
|
0-3 months
|
| Impact
|
Enterprise-wide, globally dispersed
|
Enterprise-wide
|
Department-wide
|
Low users/single division
|
| Budget
|
$1,000,000+
|
$500,000-1,000,000
|
$100,000-500,000
|
$0-100,000
|
| Services Affected
|
Mission critical, revenue impacting
|
Mission critical, revenue impacting
|
Pervasive but not mission critical
|
Isolated, non-essential
|
| Confidentiality
|
Yes
|
Yes
|
No
|
No
|
Define project levels
1.2.3 – 1 hour
The tool is comprised of six questions, each of which is linked to at least one type of project risk.
Using the answers provided, the tool will calculate a level for each risk category. Overall project level is a weighted average of the individual risk levels, based on the importance weighting of each type of risk set by the project manager.
This tool is an excerpt from Info-Tech’s exhaustive Project Level Assessment Tool.
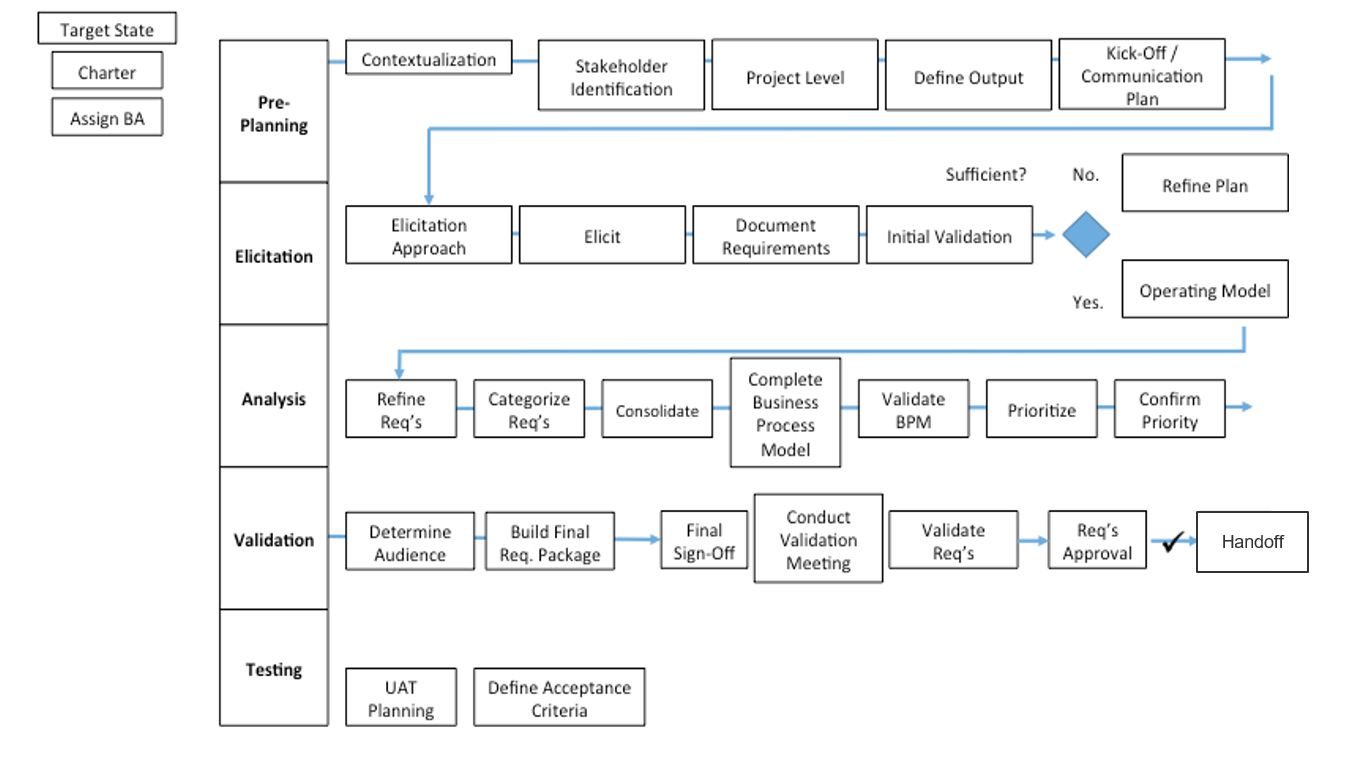
Build your initial requirements gathering business process models: create different models based on project complexity
1.2.4 – 30 minutes
Input
- Current requirements gathering process flow
Output
- Requirements gathering business process model
Materials
Participants
Brainstorm the ideal target business process flows for your requirements gathering process (by project level).
- As a group, create a process flow on the whiteboard that covers the entire requirements gathering lifecycle, incorporating the feedback from exercise 1.2.1. Draw the process with input from the entire group.
- After the process flow is complete, compare it to the best practice process flow on the following slide. You may want to create different process flows based on project level (i.e. a process model for Level 1 and 2 requirements gathering, and a process model for how to collect requirements for Level 3 and 4). As you work through the blueprint, revisit and refine these models – this is the initial brainstorming!
Document the output from this exercise in section 2.4 of the Requirements Gathering SOP and BA Playbook.
Example: requirements gathering business process model
Develop your BA team to accelerate collecting, analyzing, and translating requirements
Having an SOP is important, but it should be the basis for training the people who will actually execute the requirements gathering process. Your BA team is critical for requirements gathering – they need to know the SOPs in detail, and you need to have a plan for recruiting those with an excellent skill set.
- The designated BA(s) for the project have responsibility for end-to-end requirements management – they are responsible for executing the SOPs outlined in this blueprint, including elicitation, analysis, and validation of requirements during the project.
- Designated BAs must work collaboratively with their counterparts in the business and IT (e.g. developer teams or procurement professionals) to ensure that the approved requirements are met in a timely and cost-effective manner.
The ideal candidates for requirements gathering are technically savvy analysts (but not necessarily computer science majors) from the business who are already fluent with the business’ language and cognizant of the day-to-day challenges that take place. Organizationally, these BAs should be in a group that bridges IT and the business (such as an RGCOE or PMO) and be specialists rather than generalists in the requirements management space.
A BA resourcing strategy is included in the SOP. Customize it to suit your needs.
"Make sure your people understand the business they are trying to provide the solution for as well if not better than the business folks themselves." – Ken Piddington, CIO, MRE Consulting
Use Info-Tech’s Business Requirements Analyst job description template for sourcing the right talent
1.4 Business Requirements Analyst
If you don’t have a trained group of in-house BAs who can execute your requirements gathering process, consider sourcing the talent from internal candidates or calling for qualified applicants. Our Business Requirements Analyst job description template can help you quickly get the word out.
- Sometimes, you will have a dedicated set of BAs, and sometimes you won’t. In the latter case, the template covers:
- Job Title
- Description of Role
- Responsibilities
- Target Job Skills
- Target Job Qualifications
- The template is primarily designed for external hiring, but can also be used to find qualified internal candidates.
Info-Tech Deliverable
Download the Business Requirements Analyst job description template.
Standardizing process begins with establishing expectations
CASE STUDY
Industry Government
Source Info-Tech Workshop
Challenge
A mid-sized US municipality was challenged with managing stakeholder expectations for projects, including the collection and analysis of business requirements.
The lack of a consistent approach to requirements gathering was causing the IT department to lose credibility with department level executives, impacting the ability of the team to engage project stakeholders in defining project needs.
Solution
The City contracted Info-Tech to help build an SOP to govern and train all BAs on a consistent requirements gathering process.
The teams first set about establishing a consistent approach to defining project levels, defining six questions to be asked for each project. This framework would be used to assess the complexity, risk, and scope of each project, thereby defining the appropriate level of rigor and documentation required for each initiative.
Results
Once the project levels were defined, the team established a formalized set of steps, tools, and artifacts to be created for each phase of the project. These tools helped the team present a consistent approach to each project to the stakeholders, helping improve credibility and engagement for eliciting requirements.
The project level should set the level of control
Choose a level of control that facilitates success without slowing progress.
| No control
|
Right-sized control
|
Over-engineered control
|
| Final deliverable may not satisfy business or user requirements.
|
Control points and communication are set at appropriate stage-gates to allow for deliverables to be evaluated and assessed before proceeding to the next phase.
|
Excessive controls can result in too much time spent on stage-gates and approvals, which creates delays in the schedule and causes milestones to be missed.
|
Info-Tech Insight
Throughout the requirements gathering process, you need checks and balances to ensure that the projects are going according to plan. Now that we know our stakeholder, elicitation, and prioritization processes, we will set up the control points for each project level.
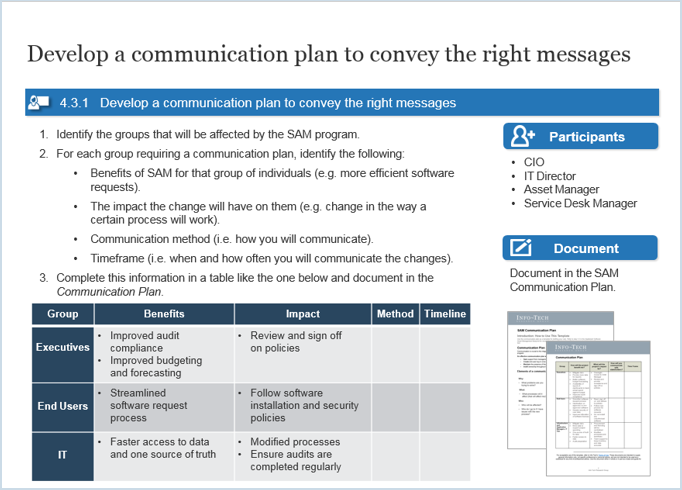
Plan your communication with stakeholders
Determine how you want to receive and distribute messages to stakeholders.
| Communication Milestones
|
Audience
|
Artifact
|
Final Goal
|
| Project Initiation
|
Project Sponsor
|
Project Charter
|
Communicate Goals and Scope of Project
|
| Elicitation Scheduling
|
Selected Stakeholders (SMEs, Power Users)
|
Proposed Solution
|
Schedule Elicitation Sessions
|
| Elicitation Follow-Up
|
Selected Stakeholders
|
Elicitation Notes
|
Confirm Accuracy of Notes
|
| First Pass Validation
|
Selected Stakeholders
|
Consolidated Requirements
|
Validate Aggregated Requirements
|
| Second Pass Validation
|
Selected Stakeholders
|
Prioritized Requirements
|
Validate Requirements Priority
|
| Eliminated Requirements
|
Affected Stakeholders
|
Out of Scope Requirements
|
Affected Stakeholders Understand Impact of Eliminated Requirements
|
| Solution Selection
|
High Authority/Expertise Stakeholders
|
Modeled Solutions
|
Select Solution
|
| Selected Solution
|
High Authority/Expertise Stakeholders and Project Sponsor
|
Requirements Package
|
Communicate Solution
|
| Requirements Sign-Off
|
Project Sponsor
|
Requirements Package
|
Obtain Sign-Off
|
Setting control points – approvals and sign-offs
# – Control Point: A decision requiring specific approval or sign-off from defined stakeholders involved with the project. Control points result in accepted or rejected deliverables/documents.
A – Plan Approval: This control point requires a review of the requirements gathering plan, stakeholders, and elicitation techniques.
B – Requirements Validation: This control point requires a review of the requirements documentation that indicates project and product requirements.
C – Prioritization Sign-Off: This requires sign-off from the business and/or user groups. This might be sign-off to approve a document, prioritization, or confirm that testing is complete.
D – IT or Peer Sign-Off: This requires sign-off from IT to approve technical requirements or confirm that IT is ready to accept a change.
Match control points to project level and identify these in your requirements business process models
1.2.5 – 45 minutes
Input
- Activity 1.2.4 business process diagram
Output
Materials
- Whiteboard
- Markers
- Sticky notes
Participants
- Business stakeholders
- BAs
Define all of the key control points, required documentation, and involved stakeholders.
- On the board, post the initial business process diagram built in exercise 1.2.4. Have participants suggest appropriate control points. Write the control point number on a sticky note and place it where the control point should be.
- Now that we have identified the control points, consider each control point and define who will be involved in each one, who provides the approval to move forward, the documentation required, and the overall goal.
Document the output from this exercise in section 6.1 of the Requirements Gathering SOP and BA Playbook.
A savvy BA should clarify and confirm project scope prior to embarking on requirements elicitation
Before commencing requirements gathering, it’s critical that your practitioners have a clear understanding of the initial business case and rationale for the project that they’re supporting. This is vital for providing the business context that elicitation activities must be geared towards.
- Prior to commencing the requirements gathering phase, the designated BA should obtain a clear statement of scope or initial project charter from the project sponsor. It’s also advisable for the BA to have an in-person meeting with the project sponsor(s) to understand the overarching strategic or tactical impetus for the project. This initial meeting should be less about eliciting requirements and more about understanding why the project is moving forward, and the business processes it seeks to enable or re-engineer (the target state).
- During this meeting, the BA should seek to develop a clear understanding of the strategic rationale for why the project is being undertaken (the anticipated business benefits) and why it is being undertaken at this time. If the sponsor has any business process models they can share, this would be a good time to review them.
During requirements gathering, BAs should steer clear of solutions and focus on capturing requirements. Focus on traceable, hierarchical, and testable requirements. Focusing on solution design means you are out of requirements mode.
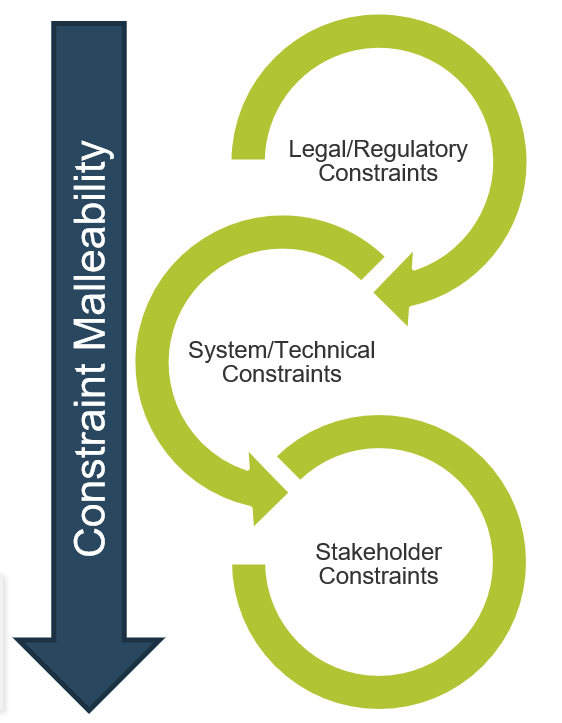
Identify constraints early and often, and ensure that they are adequately communicated to project sponsors and end users
Constraints come in many forms (i.e. financial, regulatory, and technological). Identifying these constraints prior to entering requirements gathering enables you to remain alert; you can separate what is possible from what is impossible, and set stakeholder expectations accordingly.
- Most organizations don’t inventory their constraints until after they’ve gathered requirements. This is dangerous, as clients may inadvertently signal to end users or stakeholders that an infeasible requirement is something they will pursue. As a result, stakeholders are disappointed when they don’t see it materialize.
- Organizations need to put advanced effort into constraint identification and management. Too much time is wasted pursuing requirements that aren't feasible given existing internal (e.g. budgets and system) and external (e.g. legislative or regulatory) constraints.
- Organizations need to manage diverse stakeholders for requirements analysis. Communication will not always be solely with internal teams, but also with suppliers, customers, vendors, and system integrators.
Stakeholder management is a critical aspect of the BA’s role. Part of the BA’s responsibility is prioritizing solutions and demonstrating to stakeholders the level of effort required and the value attained.
Conduct initial brainstorming on the scope of a selected enterprise application project (real or a sample of your choice)
1.2.6 – 30 minutes
Input
Output
Materials
Participants
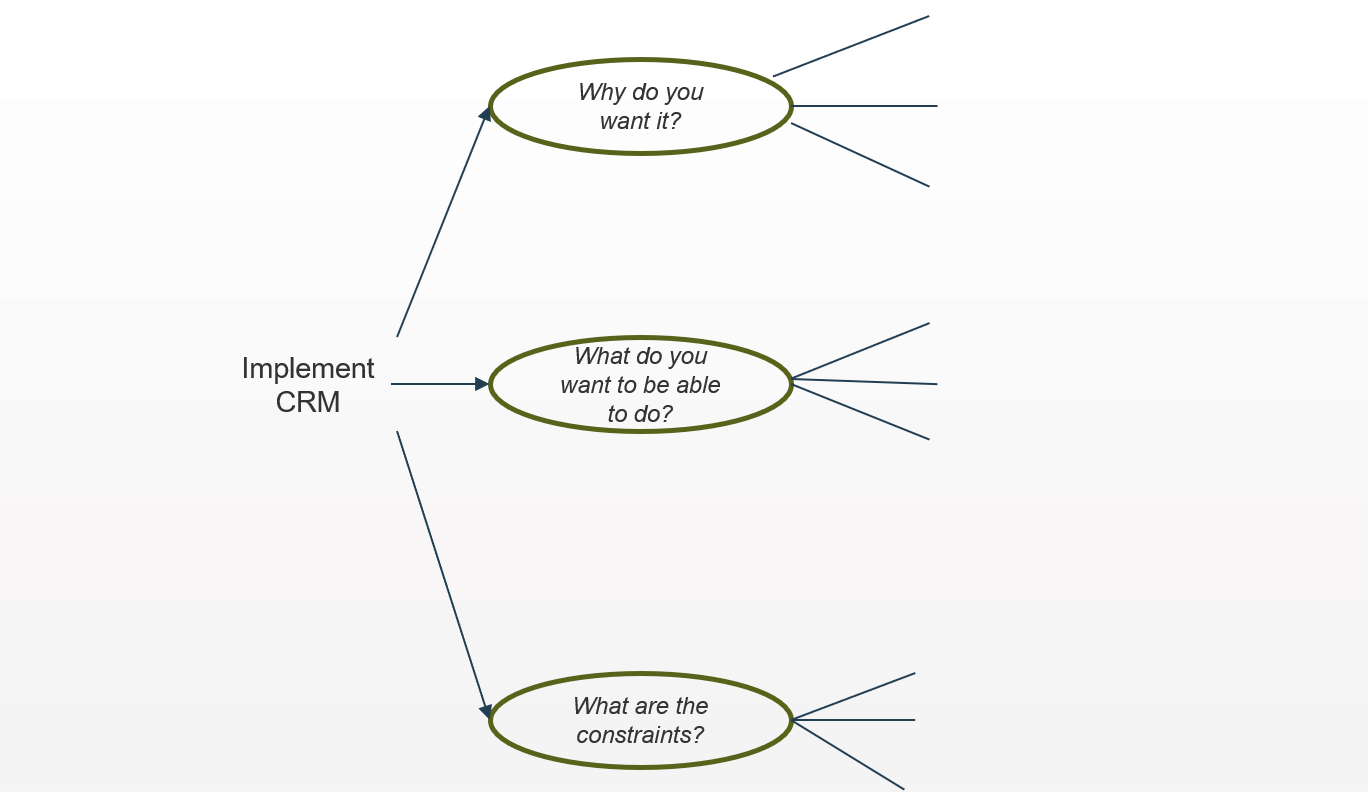
Begin the requirements gathering process by conducting some initial scoping on why we are doing the project, the goals, and the constraints.
- Share the project intake form/charter with each member of the group, and give them a few minutes to read over the project details.
- On the board write the project topic and three sub-topics:
- Why does the business want this?
- What do you want customers (end users) to be able to do?
- What are the constraints?
- As a group, brainstorm answers to each of these questions and write them on the board.
Example: Conduct initial brainstorming on the project
Identify stakeholders that must be consulted during the elicitation part of the process; get a good spectrum of subject matter experts (SMEs)
Before you can dive into most elicitation techniques, you need to know who you’re going to speak with – not all stakeholders hold the same value.
There are two broad categories of stakeholders:
Customers: Those who ask for a system/project/change but do not necessarily use it. These are typically executive sponsors, project managers, or interested stakeholders. They are customers in the sense that they may provide the funding or budget for a project, and may have requests for features and functionality, but they won’t have to use it in their own workflows.
Users: Those who may not ask for a system but must use it in their routine workflows. These are your end users, those who will actually interact with the system. Users don’t necessarily have to be people – they can also be other systems that will require inputs or outputs from the proposed solution. Understand their needs to best drive more granular functional requirements.
"The people you need to make happy at the end of the day are the people who are going to help you identify and prioritize requirements." – Director of IT, Municipal Utilities Provider
Need a hand with stakeholder identification? Leverage Info-Tech’s Stakeholder Planning Tool to catalog and prioritize the stakeholders your BAs will need to contact during the elicitation phase.
Exercise: Identify and analyze stakeholders for the application project prior to beginning formal elicitation
1.2.7 – 45 minutes
Input
Output
Materials
- Whiteboard
- Markers
- Sticky notes
Participants
Practice the process for identifying and analyzing key stakeholders for requirements gathering.
- As a group, generate a complete list of the project stakeholders. Consider who is involved in the problem and who will be impacted by the solution, and record the names of these stakeholders/stakeholder groups on a sticky note. Categories include:
- Who is the project sponsor?
- Who are the user groups?
- Who are the project architects?
- Who are the specialty stakeholders (SMEs)?
- Who is your project team?
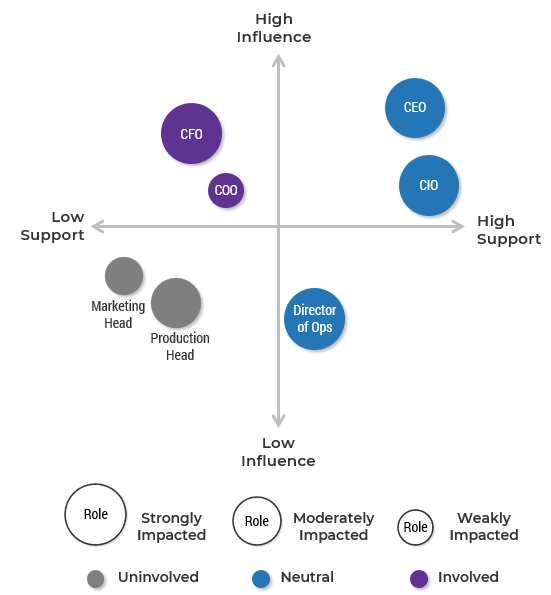
- Now that you’ve compiled a complete list, review each user group and indicate their level of influence against their level of involvement in the project to create a stakeholder power map by placing their sticky on a 2X2 grid.
- At the end of the day, record this list in the Requirements Gathering Communication Tracking Template.
Use Info-Tech’s Requirements Gathering Communication Tracking Template
1.5 Requirements Gathering Communication Tracking Template
Use the Requirements Gathering Communication Tracking Template for structuring and managing ongoing communications among key requirements gathering implementation stakeholders.
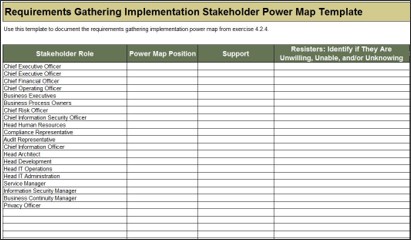
Use the Stakeholder Power Map tab to:
- Identify the stakeholder's name and role.
- Identify their position on the power map using the drop-down menu.
- Identify their level of support.
- Identify resisters' reasons for resisting as: unwilling, unable, and/or unknowing.
- Identify which committees they currently sit on, and which they will sit on in the future state.
- Identify any key objections the stakeholder may have.

Use the Communication Management Plan tab to:
- Identify the vehicle/communication medium (status update, meeting, training, etc.).
- Identify the audience for the communication.
- Identify the purpose for communication.
- Identify the frequency.
- Identify who is responsible for the communication.
- Identify how the communication will be distributed, and the level of detail.
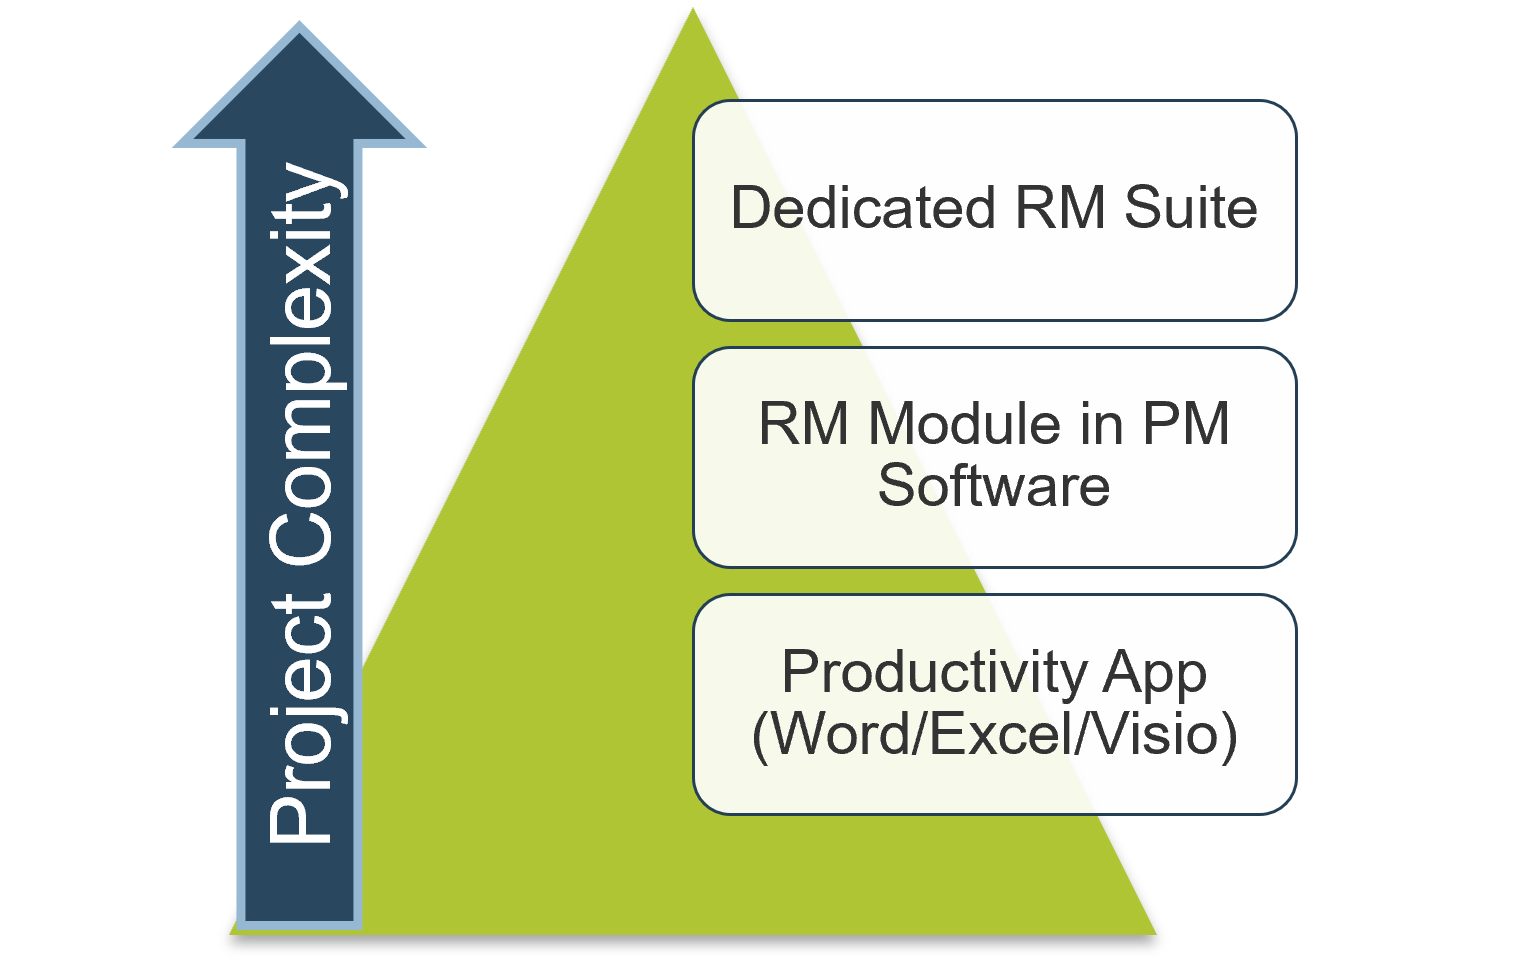
Right-size your investments in requirements management technology; sometimes the “suite spot” isn’t necessary
Recording and analyzing requirements needs some kind of tool, but don’t overinvest in a dedicated suite if you can manage with a more inexpensive solution (such as Word, Excel, and/or Visio). Top-tier solutions may be necessary for an enterprise ERP deployment, but you can use a low-cost solution for low-level productivity application.
- Many companies do things in the wrong order. Organizations need to right-size the approach that they take to recording and analyzing requirements. Taking the suite approach isn’t always better – often, inputting the requirements into Word or Excel will suffice. An RM suite won’t solve your problems by itself.
- If you’re dealing with strategic approach or calculated approach projects, their complexity likely warrants a dedicated RM suite that can trace system dependencies. If you’re dealing with primarily elementary or fundamental approach projects, use a more basic tool.
Your SOP guide should specify the technology platform that your analysts are expected to use for initial elicitation as well as analysis and validation. You don’t want them to use Word if you’ve invested in a full-out IBM RM solution.
If you need to opt for a dedicated suite, these vendors should be strong contenders in your consideration set
Dedicated requirements management suites are a great (although pricey) way to have full control over recording, analysis, and hierarchical categorization of requirements. Consider some of the major vendors in the space if Word, Excel, and Visio aren’t suitable for you.
- Before you purchase a full-scale suite or module for requirements management, ensure that the following contenders have been evaluated for your requirements gathering technology strategy:
- Micro Focus Requirements Management
- IBM Requisite Pro
- IBM Rational DOORS
- Blueprint Requirements Management
- Jama Software
- Polarion Software (a Siemens Company)
A mid-sized consulting company overhauls its requirement gathering software to better understand stakeholder needs
CASE STUDY
Industry Consulting
Source Jama Software
Challenge
ArcherPoint is a leading Microsoft Partner responsible for providing business solutions to its clients. Its varied customer base now requires a more sophisticated requirements gathering software.
Its process was centered around emailing Word documents, creating versions, and merging issues. ArcherPoint recognized the need to enhance effectiveness, efficiency, and accuracy of requirements gathering through a prescriptive set of elicitation procedures.
Solution
The IT department at ArcherPoint recognized that a strong requirements gathering process was essential to delivering value to stakeholders. It needed more scalable and flexible requirements gathering software to enhance requirements traceability. The company implemented SaaS solutions that included traceability and seamless integration features.
These features reduced the incidences of repetition, allowed for tracing of requirements relationships, and ultimately led to an exhaustive understanding of stakeholders’ needs.
Results
Projects are now vetted upon an understanding of the business client’s needs with a thorough requirements gathering collection and analysis.
A deeper understanding of the business needs also allows ArcherPoint to better understand the roles and responsibilities of stakeholders. This allows for the implementation of structures and policies which makes the requirements gathering process rigorous.
There are different types of requirements that need to be gathered throughout the elicitation phase
Business Requirements
- Higher-level statements of the goals, objectives, or needs of the enterprise.
- Describe the reasons why a project has been initiated, the objectives that the project will achieve, and the metrics that will be used to measure its success.
- Business requirements focus on the needs of the organization as a whole, not stakeholders within it.
- Business requirements provide the foundation on which all further requirements analysis is based:
- Ultimately, any detailed requirements must map to business requirements. If not, what business need does the detailed requirement fulfill?
Stakeholder Requirements
- Statements of the needs of a particular stakeholder or class of stakeholders, and how that stakeholder will interact with a solution.
- Stakeholder requirements serve as a bridge between business requirements and the various classes of solution requirements.
- When eliciting stakeholder requirements, other types of detailed requirements may be identified. Record these for future use, but keep the focus on capturing the stakeholders’ needs over detailing solution requirements.
Solution options or preferences are not requirements. Be sure to identify these quickly to avoid being forced into untimely discussions and sub-optimal solution decisions.
Requirement types – a quick overview (continued)
Solution Requirements: Describe the characteristics of a solution that meet business requirements and stakeholder requirements. They are frequently divided into sub-categories, particularly when the requirements describe a software solution:
Functional Requirements
- Describe the behavior and information that the solution will manage. They describe capabilities the system will be able to perform in terms of behaviors or operations, i.e. specific information technology application actions or responses.
- Functional requirements are not detailed solution specifications; rather, they are the basis from which specifications will be developed.
Non-Functional Requirements
- Capture conditions that do not directly relate to the behavior or functionality of the solution, but rather describe environmental conditions under which the solution must remain effective or qualities that the systems must have. These can include requirements related to capacity, speed, security, availability, and the information architecture and presentation of the user interface.
- Non-functional requirements often represent constraints on the ultimate solution. They tend to be less negotiable than functional requirements.
- For IT solutions, technical requirements would fit in this category.
Info-Tech Insight
Remember that solution requirements are distinct from solution specifications; in time, specifications will be developed from the requirements. Don’t get ahead of the process.
If you want additional support, have our analysts guide you through this phase as part of an Info-Tech workshop
Book a workshop with our Info-Tech analysts:
- To accelerate this project, engage your IT team in an Info-Tech workshop with an Info-Tech analyst team.
- Info-Tech analysts will join you and your team onsite at your location or welcome you to Info-Tech’s historic Toronto office to participate in an innovative onsite workshop.
- Contact your account manager (www.infotech.com/account), or email Workshops@InfoTech.com for more information.
The following are sample activities that will be conducted by Info-Tech analysts with your team:
1.2.1 Conduct current and target state analysis
An analyst will facilitate a discussion to assess the maturity of your requirements gathering process and identify any gaps in the current state.
1.2.2 Establish requirements gathering performance metrics
Speak to an analyst to discuss and determine key metrics for measuring the effectiveness of your requirements gathering processes.
1.2.4 Identify your requirements gathering business process model
An analyst will facilitate a discussion to determine the ideal target business process flow for your requirements gathering.
1.2.3; 1.2.5 Define control levels and match control points
An analyst will assist you with determining the appropriate requirements gathering approach for different project levels. The discussion will highlight key control points and define stakeholders who will be involved in each one.
1.2.6; 1.2.7 Conduct initial scoping and identify key stakeholders
An analyst will facilitate a discussion to highlight the scope of the requirements gathering optimization project as well as identify and analyze key stakeholders in the process.
Phase 2: Define the Elicitation Process
Phase 2 outline
Call 1-888-670-8889 or email GuidedImplementations@InfoTech.com for more information.
Complete these steps on your own, or call us to complete a guided implementation. A guided implementation is a series of
2-3 advisory calls that help you execute each phase of a project. They are included in most advisory memberships.
Guided Implementation 2: Define the Elicitation Process
Proposed Time to Completion: 2 weeks
Step 2.1: Determine Elicitation Techniques
Start with an analyst kick off call:
- Understand and assess elicitation techniques.
- Determine best fit to projects and business environment.
Then complete these activities…
- Understand different elicitation techniques.
- Record the approved elicitation techniques.
Step 2.2: Structure Elicitation Output
Review findings with analyst:
- Review options for structuring the output of requirements elicitation.
- Build the requirements gathering operating model.
Then complete these activities…
- Build use case model.
- Use table-top testing to build use case models.
- Build the operating model.
With these tools & templates:
- Business Requirements Document Template
- Scrum Documentation Template
Phase 2 Results & Insights:
- Best practices for conducting and structuring elicitation.
Step 2.1: Determine Elicitation Techniques
Phase 1
1.1 Understand the Benefits of Requirements Optimization
1.2 Determine Your Target State for Requirements Gathering
Phase 2
2.1 Determine Elicitation Techniques
2.2 Structure Elicitation Output
Phase 3
3.1 Create Analysis Framework
3.2 Validate Business Requirements
Phase 4
4.1 Create Control Processes for Requirements Changes
4.2 Build Requirements Governance and Communication Plan
This step will walk you through the following activities:
- Understand requirements elicitation techniques.
This step involves the following participants:
- BAs
- Business stakeholders
Outcomes of this step
- Select and record best-fit elicitation techniques.
Eliciting requirements is all about effectively creating the initial shortlist of needs the business has for an application
The elicitation phase is where the BAs actually meet with project stakeholders and uncover the requirements for the application. Major tasks within this phase include stakeholder identification, selecting elicitation techniques, and conducting the elicitation sessions. This phase involves the most information gathering and therefore requires a significant amount of time to be done properly.
Good requirements elicitation leverages a strong elicitation framework and executes the right elicitation techniques
A mediocre requirements practitioner takes an order taker approach to elicitation: they elicit requirements by showing up to a meeting with the stakeholder and asking, “What do you want?” This approach frequently results in gaps in requirements, as most stakeholders cannot free-form spit out an accurate inventory of their needs.
A strong requirements practitioner first decides on an elicitation framework – a mechanism to anchor the discussion about the business requirements. Info-Tech recommends using business process modelling (BPM) as the most effective framework. The BA can now work through several key questions:
- What processes will this application need to support?
- What does the current process look like?
- How could we improve the process?
- In a target state process map, what are the key functional requirements necessary to support this?
The second key element to elicitation is using the right blend of elicitation techniques: the tactical approach used to actually collect the requirements. Interviews are the most popular means, but focus groups, JAD sessions, and observational techniques can often yield better results – faster. This section will touch on BPM/BPI as an elicitation framework, then do deep dive on different elicitation techniques.
The elicitation phase of most enterprise application projects follows a similar four-step approach
Prepare
Stakeholders must be identified, and elicitation frameworks and techniques selected. Each technique requires different preparation. For example, brainstorming requires ground rules; focus groups require invitations, specific focus areas, and meeting rooms (perhaps even cameras). Look at each of these techniques and discuss how you would prepare.
Conduct
A good elicitor has the following underlying competencies: analytical thinking, problem solving, behavioral characteristics, business knowledge, communication skills, interaction skills, and proficiency in BA tools. In both group and individual elicitation techniques, interpersonal proficiency and strong facilitation is a must. A good BA has an intuitive sense of how to manage the flow of conversations, keep them results-oriented, and prevent stakeholder tangents or gripe sessions.
Document
How you document will depend on the technique you use. For example, recording and transcribing a focus group is probably a good idea, but you still need to analyze the results and determine the actual requirements. Use cases demand a software tool – without one, they become cumbersome and unwieldy. Consider how you would document the results before you choose the technique. Some analysts prefer to use solutions like OneNote or Evernote for capturing the raw initial notes, others prefer pen and paper: it’s what works best for the BA at hand.
Confirm
Review the documentation with your stakeholder and confirm the understanding of each requirement via active listening skills. Revise requirements as necessary. Circulating the initial notes of a requirements interview or focus group is a great practice to get into – it ensures jargon and acronyms are correctly captured, and that nothing has been lost in the initial translation.
BPM is an extremely useful framework for framing your requirements elicitation discussions
What is BPM? (Source: BPMInstitute.org)
BPMs can take multiple forms, but they are created as visual process flows that depict a series of events. They can be customized at the discretion of the requirements gathering team (swim lanes, legends, etc.) based on the level of detail needed from the input.
When to use them?
BPMs can be used as the basis for further process improvement or re-engineering efforts for IT and applications projects. When the requirements gathering process owner needs to validate whether or not a specific step involved in the process is necessary, BPM provides the necessary breakdown.
What’s the benefit?
Different individuals absorb information in a variety of ways. Visual representations of a process or set of steps tend to be well received by a large sub-set of individuals, making BPMs an effective analysis technique.
This related Info-Tech blueprint provides an extremely thorough overview of how to leverage BPM and process improvement approaches.
Use a SIPOC table to assist with zooming into a step in a BPM to help define requirements
| Build a Sales Report
|
|
|
- Daily sales results
- Sales by product
- Sales by account rep
|
- Receive customer orders
- Process invoices
- GL roll-up
|
- Sales by region
- Sales by rep
|
|
- Report is accurate
- Report is timely
|
- Balance to GL
- Automated email notification
|
Source: iSixSigma
Example: Extract requirements from a BPM for a customer service solution
Look at an example for a claims process, and focus on the Record Claim task (event).
| Task
|
Input
|
Output
|
Risks
|
Opportunities
|
Condition
|
Sample Requirements
|
| Record Claim
|
Customer Email
|
Case Record
|
- An agent accidentally misses the email and the case is not submitted.
- The contents of the email are not properly ported over into the case for the claim.
- The claim is routed to the wrong recipient within the claims department.
- There is translation risk when the claim is entered in another language from which it is received.
|
- Reduce the time to populate a customer’s claim information into the case.
- Automate the data capture and routing.
|
- Pre-population of the case with the email contents.
- Suggested routing based on the nature of the case.
- Multi-language support.
|
Business:
- The system requires email-to-case functionality.
Non-Functional:
- The cases must be supported in multiple languages.
- Case management requires Outlook integration.
Functional:
- The case must support the following information:
- Title; Customer; Subject; Case Origin; Case Type; Owner; Status; Priority
- The system must pre-populate the claims agent based on the nature of the case.
|
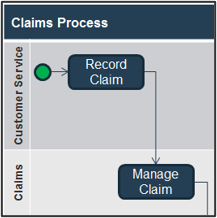
Identify the preferred elicitation techniques in your requirements gathering SOP: outline order of operations
Conducting elicitation typically takes the greatest part of the requirements management process. During elicitation, the designated BA(s) should be reviewing documentation, and conducting individual and group sessions with key stakeholders.
- When eliciting requirements, it’s critical that your designated BAs use multiple techniques; relying only on stakeholder interviews while neglecting to conduct focus groups and joint whiteboarding sessions will lead to trouble.
- Avoid makeshift solutions by focusing on target state requirements, but don’t forget about the basic user needs. These can often be neglected because one party assumes that the other already knows about them.
- The SOP guide should provide your BAs with a shortlist of recommended/mandated elicitation techniques based on business scenarios (examples in this section). Your SOP should also suggest the order in which BAs use the techniques for initial elicitation. Generally, document review comes first, followed by group, individual, and observational techniques.
Elicitation is an iterative process – requirements should be refined in successive steps. If you need more information in the analysis phases, don’t be afraid to go back and conduct more elicitation.
Understand different elicitation techniques
2.1.1 – 1 hour
Input
Output
- Elicitation technique assessment
Materials
Participants
- For this exercise, review the following elicitation techniques: observation, document review, surveys, focus groups, and interviews. Use the material in the next slides to brainstorm around the following questions:
- What types of information can the technique be used to collect?
- Why would you use this technique over others?
- How will you prepare to use the technique?
- How will you document the technique?
- Is this technique suitable for all projects?
- When wouldn’t you use it?
- Have each group present their findings from the brainstorming to the group.
Document any changes to the elicitation techniques in section 4.0 of the Requirements Gathering SOP and BA Playbook.
Understand different elicitation techniques – Interviews
| Technique
|
Description
|
Assessment and Best Practices
|
Stakeholder Effort
|
BA Effort
|
| Structured One-on-One Interview
|
In a structured one-on-one interview, the BA has a fixed list of questions to ask the stakeholder and follows up where necessary.
|
Structured interviews provide the opportunity to quickly home in on areas of concern that were identified during process mapping or group elicitation techniques. They should be employed with purpose, i.e. to receive specific stakeholder feedback on proposed requirements or to help identify systemic constraints. Generally speaking, they should be 30 minutes or less.
|
Low
|
Medium
|
| Unstructured One-on-One Interview
|
In an unstructured one-on-one interview, the BA allows the conversation to flow free form. The BA may have broad themes to touch on but does not run down a specific question list.
|
Unstructured interviews are most useful for initial elicitation, when brainstorming a draft list of potential requirements is paramount. Unstructured interviews work best with senior stakeholders (sponsors or power users), since they can be time consuming if they’re applied to a large sample size. It’s important for BAs not to stifle open dialogue and allow the participants to speak openly. They should be 60 minutes or less.
|
Medium
|
Low
|
Info-Tech Insight
Interviews should be used with high-value targets. Those who receive one-on-one face time can help generate good requirements, as well as allow effective communication around requirements at a later point (i.e. during the analysis and validation phases).
Understand the diverse approaches for interviews
Use a clear interview approach to guide the preparation, facilitation styles, participants, and interview schedules you manage for a specific project.
Depending on your stakeholder audience and interview objectives, apply one or more of the following approaches to interviews.
Interview Approaches
- Unstructured
- Semi-structured
- Structured
The Benefits of Interviews
Fosters direct engagement
IT is able to hear directly from stakeholders about what they are looking to do with a solution and the level of functionality that they expect from it.
Offers greater detail
With interviews, a greater degree of insight can be gained by leveraging information that wouldn’t be collected through traditional surveys. Face-to-face interactions provide thorough answers and context that helps inform requirements.
Removes ambiguity
Face-to-face interactions allow opportunities for follow-up around ambiguous answers. Clarify what stakeholders are looking for and expect in a project.
Enables stakeholder management
Interviews are a direct line of communication with a project stakeholder. They provide input and insight, and help to maintain alignment, plan next steps, and increase awareness within the IT organization.
Select an interview structure based on project objectives and staff types
Consider stakeholder types and characteristics, in conjunction with the best way to maximize time, when selecting which of the three interview structures to leverage during the elicitation phase of requirements gathering.
Structured Interviews
- Interviews conducted using this structure are modelled after the typical Q&A session.
- The interviewer asks the participant a variety of closed-ended questions.
- The participant’s response is limited to the scope of the question.
Semi-Structured Interviews
- The interviewer may prepare a guide, but it acts as more of an outline.
- The goal of the interview is to foster and develop conversation.
- Participants have the ability to answer questions on broad topics without compromising the initial guide.
Unstructured Interviews
- The interviewer may have a general interview guide filled with open-ended questions.
- The objective of the questions is to promote discussion.
- Participants may discuss broader themes and topics.
Select the best interview approach
Review the following questions to determine what interview structure you should utilize. If you answer the question with “Yes,” then follow the corresponding recommendations for the interview elements.
| Question
|
Structure Type
|
Facilitation Technique
|
# of Participants
|
| Do you have to interview multiple participants at once because of time constraints?
|
Semi-structured
|
Discussion
|
1+
|
| Does the business or stakeholders want you to ask specific questions?
|
Structured
|
Q&A
|
1
|
| Have you already tried an unsuccessful survey to gather information?
|
Semi-structured
|
Discussion
|
1+
|
| Are you utilizing interviews to understand the area?
|
Unstructured
|
Discussion
|
1+
|
| Do you need to gather requirements for an immediate project?
|
Structured
|
Q&A
|
1+
|
Decisions to make for interviews
Interviews should be used with high-value targets. Those who receive one-on-one face time can help generate good requirements and allow for effective communication around requirements during the analysis and validation stages.
Who to engage?
- Individuals with an understanding of the project scope, constraints and considerations, and high-level objectives.
- Project stakeholders from across different functional units to solicit a varied set of requirement inputs.
How to engage?
- Approach selected interview candidate(s) with a verbal invitation to participate in the requirements gathering process for [Project X].
- Take the initiative to book time in the candidate’s calendar. Include in your calendar invitation a description of the preparation required for the interview, the anticipated outputs, and a brief timeline agenda for the interview itself.
How to drive participant engagement?
- Use introductory interview questions to better familiarize yourself with the interviewee and to create an environment in which the individual feels welcome and at ease.
- Once acclimatized, ensure that you hold the attention of the interviewee by providing further probing, yet applicable, interview questions.
Manage each point of the interaction in the interview process
Interviews generally follow the same workflow regardless of which structure you select. You must manage the process to ensure that the interview runs smoothly and results in an effective gathering requirements process.
- Prep Schedule
- Recommended Actions
- Send an email with a proposed date and time for the meeting.
- Include an overview of what you will be discussing.
- Mention if other people will be joining (if group interview).
- Meeting Opening
- Recommended Actions
- Provide context around the meeting’s purpose and primary focal points.
- Let interviewee(s) know how long the interview will last.
- Ask if they have any blockers that may cause the meeting to end early.
- Meeting Discussion
- Recommended Actions
- Ask questions and facilitate discussion in accordance with the structure you have selected.
- Ensure that the meeting’s dialogue is being either recorded using written notes (if possible) or a voice recorder.
- Meeting Wrap-Up
- Recommended Actions
- Provide a summary of the big findings and what was agreed upon.
- Outline next steps or anything else you will require from the participant.
- Let the interviewee(s) know that you will follow up with interview notes, and will require feedback from them.
- Meeting Follow-Up
- Recommended Actions
- Send an overview of what was covered and agreed upon during the interview.
- Show the mock-ups of your work based on the interview, and solicit feedback.
- Give the interviewee(s) the opportunity to review your notes or recording and add value where needed.
Solve the problem before it occurs with interview troubleshooting techniques
The interview process may grind to a halt due to challenging situations. Below are common scenarios and corresponding troubleshooting techniques to get your interview back on track.
| Scenario
|
Technique
|
| Quiet interviewee
|
Begin all interviews by asking courteous and welcoming questions. This technique will warm the interviewee up and make them feel more comfortable. Ask prompting questions during periods of silence in the interview. Take note of the answers provided by the interviewee in your interview guide, along with observations and impact statements that occur throughout the duration of the interview process.
|
| Disgruntled interviewee
|
Avoid creating a hostile environment by eliminating the interviewee’s perception that you are choosing to focus on issues that the interviewee feels will not be resolved. Ask questions to contextualize the issue. For example, ask why they feel a particular way about the issue, and determine whether they have valid concerns that you can resolve.
|
| Interviewee has issues articulating their answer
|
Encourage the interviewee to use a whiteboard or pen and paper to kick start their thought process. Make sure you book a room with these resources readily available.
|
Understand different elicitation techniques – Observation
| Technique
|
Description
|
Assessment and Best Practices
|
Stakeholder Effort
|
BA Effort
|
| Casual Observation
|
The process of observing stakeholders performing tasks where the stakeholders are unaware they are being observed.
|
Capture true behavior through observation of stakeholders performing tasks without informing them they are being observed. This information can be valuable for mapping business process; however, it is difficult to isolate the core business activities from unnecessary actions.
|
Low
|
Medium
|
| Formal Observation
|
The process of observing stakeholders performing tasks where the stakeholders are aware they are being observed.
|
Formal observation allows BAs to isolate and study the core activities in a business process because the stakeholder is aware they are being observed. Stakeholders may become distrusting of the BA and modify their behavior if they feel their job responsibilities or job security are at risk
|
Low
|
Medium
|
Info-Tech Insight
Observing stakeholders does not uncover any information about the target state. Be sure to use contextual observation in conjunction with other techniques to discover the target state.
Understand different elicitation techniques – Surveys
| Technique
|
Description
|
Assessment and Best Practices
|
Stakeholder Effort
|
BA Effort
|
| Closed-Response Survey
|
A survey that has fixed responses for each answer. A Likert-scale (or similar measures) can be used to have respondents evaluate and prioritize possible requirements.
|
Closed response surveys can be sent to large groups and used to quickly gauge user interest in different functional areas. They are easy for users to fill out and don’t require a high investment of time. However, their main deficit is that they are likely to miss novel requirements not listed. As such, closed response surveys are best used after initial elicitation or brainstorming to validate feature groups.
|
Low
|
Medium
|
| Open-Response Survey
|
A survey that has open-ended response fields. Questions are fixed, but respondents are free to populate the field in their own words. Open-response surveys take longer to fill out than closed, but can garner deeper insights.
|
Open-response surveys are a useful supplement (and occasionally replacement) for group elicitation techniques, like focus groups, when you need to receive an initial list of requirements from a broad cross-section of stakeholders. Their primary shortcoming is the analyst can’t immediately follow up on interesting points. However, they are particularly useful for reaching stakeholders who are unavailable for individual one-on-ones or group meetings.
|
Low
|
Medium
|
Info-Tech Insight
Surveys can be useful mechanisms for initial drafting of raw requirements (open-response) and gauging user interest in proposed requirements or feature sets (closed-response). However, they should not be the sole focus of your elicitation program due to lack of interactivity and two-way dialogue with the BA.
Be aware: Know the implications of leveraging surveys
What are surveys?
Surveys take a sample population’s written responses for data collection. Survey respondents can identify themselves or choose to remain anonymous. Anonymity removes the fear of repercussions for giving critical responses to sensitive topics.
Who needs to be involved?
Participants of a survey include the survey writer, respondent(s), and results compiler. There is a moderate amount of work that comes from both the writer and compiler, with little work involved on the end of the respondent.
What are the benefits?
The main benefit of surveys is their ability to reach large population groups and segments without requiring personal interaction, thus saving money. Surveys are also very responsive and can be created and modified rapidly to address needs as they arise on an on-going basis.
When is it best to employ a survey method?
Surveys are most valuable when completed early in the requirements gathering stage.
Intake and Scoping → Requirements Gathering → Solution Design → Development/ Procurement → Implementation/ Deployment
When a project is announced, develop surveys to gauge what users consider must-have, should-have, and could-have requirements.
Use surveys to profile the demand for specific requirements.
It is often difficult to determine if requirements are must haves or should haves. Surveys are a strong method to assist in narrowing down a wide range of requirements.
- If all survey respondents list the same requirement, then that requirement is a must have.
- If no participants mention a requirement, then that requirement is not likely to be important to project success.
- If the results are scattered, it could be that the organization is unsure of what is needed.
Are surveys worth the time and effort? Most of the time.
Surveys can generate insights. However, there are potential barriers:
- Well-constructed surveys are difficult to make – asking the right questions without being too long.
- Participants may not take surveys seriously, giving non-truthful or half-hearted answers.
Surveys should only be done if the above barriers can easily be overcome.
Scenario: Survey used to gather potential requirements
Scenario
There is an unclear picture of the business needs and functional requirements for a solution.
Survey Approach
Use open-ended questions to allow respondents to propose requirements they see as necessary.
Sample questions
- What do you believe _______ (project) should include to be successful?
- How can _______ (project) be best made for you?
- What do you like/dislike about ________ (process that the project will address)?
What to do with your results
Take a step back
If you are using surveys to elicit a large number of requirements, there is probably a lack of clear scope and vision. Focus on scope clarification. Joint development sessions are a great technique for defining your scope with SMEs.
Moving ahead
- Create additional surveys. Additional surveys can help narrow down the large list of requirements. This process can be reiterated until there is a manageable number of requirements.
- Move onto interviews. Speak directly with the users to get a grasp of the importance of the requirements taken from surveys.
Employ survey design best practices
Proper survey design determines how valuable the responses will be. Review survey principles released by the University of Wisconsin-Madison.
Provide context
Include enough detail to contextualize questions to the employee’s job duties.
Where necessary:
- Include conditions
- Timeline considerations
- Additional pertinent details
Give clear instructions
When introducing a question identify if it should be answered by giving one answer, multiple answers, or a ranking of answers.
Avoid IT jargon
Ensure the survey’s language is easily understood.
When surveying colleagues from the business use their own terms, not IT’s.
E.g. laptops vs. hardware
Saying “laptops” is more detailed and is a universal term.
Use ranges
Recommended:
In a month your Outlook fails:
- 1-3 times
- 4-7 times
- 7+ times
Not Recommended:
Your Outlook fails:
- Almost never
- Infrequently
- Frequently
- Almost always
Keep surveys short
Improve responses and maintain stakeholder interest by only including relevant questions that have corresponding actions.
Recommended: Keep surveys to ten or less prompts.
Scenario: Survey used to narrow down requirements
Scenario
There is a large list of requirements and the business is unsure of which ones to further pursue.
Survey Approach
Use closed-ended questions to give degrees of importance and rank requirements.
Sample questions
- How often do you need _____ (requirement)?
- 1-3 times a week; 4-6 times a week; 7+ times a week
- Given the five listed requirements below, rank each requirement in order of importance, with 1 being the most important and 5 being the least important.
- On a scale from 1-5, how important is ________ (requirement)?
- 1 – Not important at all; 2 – Would provide minimal benefit; 3 – Would be nice to have; 4 – Would provide substantial benefit; 5 – Crucial to success
What to do with your results
Determine which requirements to further explore
Avoid simply aggregating average importance and using the highest average as the number-one priority. Group the highest average importance requirements to be further explored with other elicitation techniques.
Moving ahead
The group of highly important requirements needs to be further explored during interviews, joint development sessions, and rapid development sessions.
Scenario: Survey used to discover crucial hidden requirements
Scenario
The business wanted a closer look into a specific process to determine if the project could be improved to better address process issues.
Survey Approach
Use open-ended questions to allow employees to articulate very specific details of a process.
Sample questions
- While doing ________ (process/activity), what part is the most frustrating to accomplish? Why?
- Is there any part of ________ (process/activity) that you feel does not add value? Why?
- How would you improve _________ (process/activity)?
What to do with your results
Set up prototyping
Prototype a portion with the new requirement to see if it meets the user’s needs. Joint application development and rapid development sessions pair developers and users together to collaboratively build a solution.
Next steps
- Use interviews to begin solution mapping. Speak to SMEs and the users that the requirement would affect. Understand how to properly incorporate the discovered requirement(s) into the solution.
- Create user stories. User stories allow developers to step into the shoes of the users. Document the user’s requirement desires and their reason for wanting it. Give those user stories to the developers.
Explore mediums for survey delivery
Online
Free online surveys offer quick survey templates but may lack customization. Paid options include customizable features. Studies show that most participants find web-based surveys more appealing, as web surveys tend to have a higher rate of completion.
Potential Services (Not a comprehensive list)
SurveyMonkey – free and paid options
Good Forms – free options
Ideal for:
- Low complexity surveys
- High complexity surveys
- Quick responses
- Low cost (free survey options)
Paper
Paper surveys offer complete customizability. However, paper surveys take longer to distribute and record, and are also more expensive to administer.
Ideal for:
- Low complexity surveys
- High complexity surveys
- Quick responses
- Low cost
Internally-developed
Internally-developed surveys can be distributed via the intranet or email. Internal surveys offer the most customization. Cost is the creator’s time, but cost can be saved on distribution versus paper and paid online surveys.
Ideal for:
- Low complexity surveys
- High complexity surveys
- Quick responses
- Low cost (if created quickly)
Understand different elicitation techniques – Focus Groups
| Technique
|
Description
|
Assessment and Best Practices
|
Stakeholder Effort
|
BA Effort
|
| Focus Group
|
Focus groups are sessions held between a small group (typically ten individuals or less) and an experienced facilitator who leads the conversation in a productive direction.
|
Focus groups are highly effective for initial requirements brainstorming. The best practice is to structure them in a cross-functional manner to ensure multiple viewpoints are represented, and the conversation doesn’t become dominated by one particular individual. Facilitators must be wary of groupthink in these meetings (i.e. the tendency to converge on a single POV).
|
Medium
|
Medium
|
| Workshop
|
Workshops are larger sessions (typically ten people or more) that are led by a facilitator, and are dependent on targeted exercises. Workshops may be occasionally decomposed into smaller group sessions.
|
Workshops are highly versatile: they can be used for initial brainstorming, requirement prioritization, constraint identification, and business process mapping. Typically, the facilitator will use exercises or activities (such as whiteboarding, sticky note prioritization, role-playing, etc.) to get participants to share and evaluate sets of requirements. The main downside to workshops is a high time commitment from both stakeholders and the BA.
|
Medium
|
High
|
Info-Tech Insight
Group elicitation techniques are most useful for gathering a wide spectrum of requirements from a broad group of stakeholders. Individual or observational techniques are typically needed for further follow-up and in-depth analysis with critical power users or sponsors.
Conduct focus groups and workshops
There are two specific types of group interviews that can be utilized to elicit requirements: focus groups and workshops. Understand each type’s strengths and weaknesses to determine which is better to use in certain situations.
|
|
Focus Groups
|
Workshops
|
| Description
|
- Small groups are encouraged to speak openly about topics with guidance from a facilitator.
|
- Larger groups are led by a facilitator to complete target exercises that promote hands-on learning.
|
| Strengths
|
- Highly effective for initial requirements brainstorming.
- Insights can be explored in depth.
|
- Any part of the requirements gathering process can be done in a workshop.
- Use of activities can increase the learning beyond simple discussions.
|
| Weaknesses
|
- Loudest voice in the room can induce groupthink.
- Discussion can easily veer off topic.
|
- Extremely difficult to bring together such a large group for extended periods of time.
|
| Facilitation Guidance
|
- Make sure the group is structured in a cross-functional manner to ensure multiple viewpoints are represented.
|
- If the group is too large, break the members into smaller groups. Try putting together members who would not usually interact.
|
Solution mapping and joint review sessions should be used for high-touch, high-rigor BPM-centric projects
| Technique
|
Description
|
Assessment and Best Practices
|
Stakeholder Effort
|
BA Effort
|
| Solution Mapping Session
|
A one-on-one session to outline business processes. BPM methods are used to write possible target states for the solution on a whiteboard and to engineer requirements based on steps in the model.
|
Solution mapping should be done with technically savvy stakeholders with a firm understanding of BPM methodologies and nomenclature. Generally, this type of elicitation method should be done with stakeholders who participated in tier one elicitation techniques who can assist with reverse-engineering business models into requirement lists.
|
Medium
|
Medium
|
| Joint Requirements Review Session
|
This elicitation method is sometimes used as a last step prior to moving to formal requirements analysis. During the review session, the rough list of requirements is vetted and confirmed with stakeholders.
|
A one-on-one (or small group) requirements review session gives your BAs the opportunity to ensure that what was recorded/transcribed during previous one-on-ones (or group elicitation sessions) is materially accurate and representative of the intent of the stakeholder. This elicitation step allows you to do a preliminary clean up of the requirements list before entering the formal analysis phase.
|
Low
|
Low
|
Info-Tech Insight
Solution mapping and joint requirements review sessions are more advanced elicitation techniques that should be employed after preliminary techniques have been utilized. They should be reserved for technically sophisticated, high-value stakeholders.
Interactive whiteboarding and joint development sessions should be leveraged for high-rigor BPM-based projects
| Technique
|
Description
|
Assessment and Best Practices
|
Stakeholder Effort
|
BA Effort
|
| Interactive White- boarding
|
A group session where either a) requirements are converted to BPM diagrams and process flows, or b) these flows are reverse engineered to distil requirement sets.
|
While the focus of workshops and focus groups is more on direct requirements elicitation, interactive whiteboarding sessions are used to assist with creating initial solution maps (or reverse engineering proposed solutions into requirements). By bringing stakeholders into the process, the BA benefits from a greater depth of experience and access to SMEs.
|
Medium
|
Medium
|
| Joint Application Development (JAD)
|
JAD sessions pair end-user teams together with developers (and BA facilitators) to collect requirements and begin mapping and developing prototypes directly on the spot.
|
JAD sessions fit well with organizations that use Agile processes. They are particularly useful when the overall project scope is ambiguous; they can be used for project scoping, requirements definition, and initial prototyping. JAD techniques are heavily dependent on having SMEs in the room – they should preference knowledge power users over the “rank and file.”
|
High
|
High
|
Info-Tech Insight
Interactive whiteboarding should be heavily BPM-centric, creating models that link requirements to specific workflow activities. Joint development sessions are time-consuming but create greater cohesion and understanding between BAs, developers, and SMEs.
Rapid application development sessions add some Agile aspects to requirements elicitation
| Technique
|
Description
|
Assessment and Best Practices
|
Stakeholder Effort
|
BA Effort
|
| Rapid Application Development
|
A form of prototyping, RAD sessions are akin to joint development sessions but with greater emphasis on back-and-forth mock-ups of the proposed solution.
|
RAD sessions are highly iterative – requirements are gathered in sessions, developers create prototypes offline, and the results are validated by stakeholders in the next meeting. This approach should only be employed in highly Agile-centric environments.
|
High
|
High
|
For more information specific to using the Agile development methodology, refer to the project blueprint Implement Agile Practices That Work.
The role of the BA differs with an Agile approach to requirements gathering. A traditional BA is a subset of the Agile BA, who typically serves as product owner. Agile BAs have elevated responsibilities that include bridging communication between stakeholders and developers, prioritizing and detailing the requirements, and testing solutions.
Overview of JAD and RDS techniques (Part 1)
Use the following slides to gain a thorough understanding of both JAD and rapid development sessions (RDS) to decide which fits your project best.
|
|
Joint Application Development
|
Rapid Development Sessions
|
| Description
|
JAD pairs end users and developers with a facilitator to collect requirements and begin solution mapping to create an initial prototype.
|
RDS is an advanced approach to JAD. After an initial meeting, prototypes are developed and validated by stakeholders. Improvements are suggested by stakeholders and another prototype is created. This process is iterated until a complete solution is created.
|
| Who is involved?
|
End users, SMEs, developers, and a facilitator (you).
|
| Who should use this technique?
|
JAD is best employed in an Agile organization. Agile organizations can take advantage of the high amount of collaboration involved. RDS requires a more Agile organization that can effectively and efficiently handle impromptu meetings to improve iterations.
|
| Time/effort versus value
|
JAD is a time/effort-intensive activity, requiring different parties at the same time. However, the value is well worth it. JAD provides clarity for the project’s scope, justifies the requirements gathered, and could result in an initial prototype.
|
RDS is even more time/effort intensive than JAD. While it is more resource intensive, the reward is a more quickly developed full solution that is more customized with fewer bugs.
|
Overview of JAD and RDS techniques (Part 2)
Joint Application Development
Timeline
Projects that use JAD should not expect dramatically quicker solution development. JAD is a thorough look at the elicitation process to make sure that the right requirements are found for the final solution’s needs. If done well, JAD eliminates rework.
Engagement
Employees vary in their project engagement. Certain employees leverage JAD because they care about the solution. Others are asked for their expertise (SMEs) or because they perform the process often and understand it well.
Implications
JAD’s thorough process guarantees that requirements gathering is done well.
- All requirements map back to the scope.
- SMEs are consulted throughout the duration of the process.
- Prototyping is only done after final solution mapping is complete.
Rapid Development Sessions
Timeline
Projects that use RDS can either expect quicker or slower requirements gathering depending on the quality of iteration. If each iteration solves a requirement issue, then one can expect that the solution will be developed fairly rapidly. If the iterations fail to meet requirements the process will be quite lengthy.
Engagement
Employees doing RDS are typically very engaged in the project and play a large role in helping to create the solution.
Implications
RDS success is tied to the organization’s ability to collaborate. Strong collaboration will lead to:
- Fewer bugs as they are eliminated in each iteration.
- A solution that is highly customized to meet the user’s needs.
Poor collaboration will lead to RDS losing its full value.
When is it best to use JAD?
JAD is best employed in an Agile organization for application development and selection. This technique best serves relatively complicated, large-scale projects that require rapid or sequential iterations on a prototype or solution as a part of requirements gathering elicitation. JAD effectuates each step in the elicitation process well, from initial elicitation to narrowing down requirements.
When tackling a project type you’ve never attempted
Most requirement gathering professionals will use their experience with project type standards to establish key requirements. Avoid only relying on standards when tackling a new project type. Apply JAD’s structured approach to a new project type to be thorough during the elicitation phase.
In tandem with other elicitation techniques
While JAD is an overarching requirements elicitation technique, it should not be the only one used. Combine the strengths of other elicitation techniques for the best results.
When is it best to use RDS?
RDS is best utilized when one, but preferably both, of the below criteria is met.
When the scope of the project is small to medium sized
RDS’ strengths lie in being able to tailor-make certain aspects of the solution. If the solution is too large, tailor-made sections are impossible as multiple user groups have different needs or there is insufficient resources. When a project is small to medium sized, developers can take the time to custom make sections for a specific user group.
When most development resources are readily available
RDS requires developers spending a large amount of time with users, leaving less time for development. Having developers at the ready to take on users’ improvement maintains the effectiveness of RDS. If the same developer who speaks to users develops the entire iteration, the process would be slowed down dramatically, losing effectiveness.
Techniques to compliment JAD/RDS
1. Unstructured conversations
JAD relies on unstructured conversations to clarify scope, gain insights, and discuss prototyping. However, a structure must exist to guarantee that all topics are discussed and meetings are not wasted.
2. Solution mapping and interactive white-boarding
JAD often involves visually illustrating how high-level concepts connect as well as prototypes. Use solution mapping and interactive whiteboarding to help users and participants better understand the solution.
3. Focus groups
Having a group development session provides all the benefits of focus groups while reducing time spent in the typically time-intensive JAD process.
Plan how you will execute JAD
Before the meeting
1. Prepare for the meeting
Email all parties a meeting overview of topics that will be discussed.
During the meeting
2. Discussion
- Facilitate the conversation according to what is needed (e.g. skip scope clarification if it is already well defined).
- Leverage solution mapping and other visual aids to appeal to all users.
- Confirm with SMEs that requirements will meet the users’ needs.
- Discuss initial prototyping.
After the meeting
3. Wrap-up
- Provide a key findings summary and set of agreements.
- Outline next steps for all parties.
4. Follow-up
- Send the mock-up of any agreed upon prototype(s).
- Schedule future meetings to continue prototyping.
JAD provides a detail-oriented view into the elicitation process. As a facilitator, take detailed notes to maximize the outputs of JAD.
Plan how you will execute RDS
Before the meeting
1. Prepare for the meeting
- Email all parties a meeting overview.
- Ask employees and developers to bring their vision of the solution, regardless of its level of detail.
During the meeting
2. Hold the discussion
- Facilitate the conversation according to what is needed (e.g. skip scope clarification if already well defined).
- Have both parties explain their visions for the solution.
- Talk about initial prototype and current iteration.
After the meeting
3. Wrap-up
- Provide a key findings summary and agreements.
- Outline next steps for all parties.
4. Follow-up
- Send the mock-up of any agreed upon prototype(s).
- Schedule future meeting to continue prototyping.
RDS is best done in quick succession. Keep in constant contact with both employees and developers to maintain positive momentum from a successful iteration improvement.
Develop a tailored facilitation guide for JAD and RDS
JAD/RDS are both collaborative activities, and as with all group activities, issues are bound to arise. Be proactive and resolve issues using the following guidelines.
| Scenario
|
Technique
|
| Employee and developer visions for the solution don’t match up
|
Focus on what both solutions have in common first to dissolve any tension. Next, understand the reason why both parties have differences. Was it a difference in assumptions? Difference in what is a requirement? Once the answer has been determined, work on bridging the gaps. If there is no resolution, appoint a credible authority (or yourself) to become the final decision maker.
|
| Employee has difficulty understanding the technical aspect of the developer’s solution
|
Translate the developer’s technical terms into a language that the employee understands. Encourage the employee to ask questions to further their understanding.
|
| Employee was told that their requirement or proposed solution is not feasible
|
Have a high-level member of the development team explain how the requirement/solution is not feasible. If it’s possible, tell the employee that the requirement can be done in a future release and keep them updated.
|
Harvest documentation from past projects to uncover reusable requirements
| Technique
|
Description
|
Assessment and Best Practices
|
Stakeholder Effort
|
BA Effort
|
| Legacy System Manuals
|
The process of reviewing documentation and manuals associated with legacy systems to identify constraints and exact requirements for reuse.
|
Reviewing legacy systems and accompanying documentation is an excellent way to gain a preliminary understanding of the requirements for the upcoming application. Be careful not to overly rely on requirements from legacy systems; if legacy systems have a feature set up one way, this does not mean it should be set up the same way on the upcoming application. If an upcoming application must interact with other systems, it is ideal to understand the integration points early.
|
None
|
High
|
| Historical Projects
|
The process of reviewing documentation from historical projects to extract reusable requirements.
|
Previous project documentation can be a great source of information and historical lessons learned. Unfortunately, historical projects may not be well documented. Historical mining can save a great deal of time; however, the fact that it was done historically does not mean that it was done properly.
|
None
|
High
|
Info-Tech Insight
Document mining is a laborious process, and as the term “mining” suggests the yield will vary. Regardless of the outcome, document mining must be performed and should be viewed as an investment in the requirements gathering process.
Extract internal and external constraints from business rules, policies, and glossaries
| Technique
|
Description
|
Assessment and Best Practices
|
Stakeholder Effort
|
BA Effort
|
| Rules
|
The process of extracting business logic from pre-existing business rules (e.g. explicit or implied workflows).
|
Stakeholders may not be fully aware of all of the business rules or the underlying rationale for the rules. Unfortunately, business rule documents can be lengthy and the number of rules relevant to the project will vary.
|
None
|
High
|
| Glossary
|
The process of extracting terminology and definitions from glossaries.
|
Terminology and definitions do not directly lead to the generation of requirements. However, reviewing glossaries will allow BAs to better understand domain SMEs and interpret their requirements.
|
None
|
High
|
| Policy
|
The process of extracting business logic from business policy documents (e.g. security policy and acceptable use).
|
Stakeholders may not be fully aware of the different policies or the underlying rationale for why they were created. Going directly to the source is an excellent way to identify constraints and requirements. Unfortunately, policies can be lengthy and the number of items relevant to the project will vary.
|
None
|
High
|
Info-Tech Insight
Document mining should be the first type of elicitation activity that is conducted because it allows the BA to become familiar with organizational terminology and processes. As a result, the stakeholder facing elicitation sessions will be more productive.
Review the different types of formal documentation (Part 1)
1. Glossary
Extract terminology and definitions from glossaries. A glossary is an excellent source to understand the terminology that SMEs will use.
2. Policy
Pull business logic from policy documents (e.g. security policy and acceptable use). Policies generally have mandatory requirements for projects, such as standard compliance requirements.
3. Rules
Review and reuse business logic that comes from pre-existing rules (e.g. explicit or implied workflows). Like policies, rules often have mandatory requirements or at least will require significant change for something to no longer be a requirement.
Review the different types of formal documentation (Part 2)
4. Legacy System
Review documents and manuals of legacy systems, and identify reusable constraints and requirements. Benefits include:
- Gain a preliminary understanding of general organizational requirements.
- Ease of solution integration with the legacy system if needed.
Remember to not use all of the basic requirements of a legacy system. Always strive to find a better, more productive solution.
5. Historical Projects
Review documents from historical projects to extract reusable requirements. Lessons learned from the company’s previous projects are more applicable than case studies. While historical projects can be of great use, consider that previous projects may not be well documented.
Drive business alignment as an output from documentation review
Project managers frequently state that aligning projects to the business goals is a key objective of effective project management; however, it is rarely carried out throughout the project itself. This gap is often due to a lack of understanding around how to create true alignment between individual projects and the business needs.
Use company-released statements and reports
Extract business wants and needs from official statements and reports (e.g. press releases, yearly reports). Statements and reports outline where the organization wants to go which helps to unearth relevant project requirements.
Ask yourself, does the project align to the business?
Documented requirements should always align with the scope of the project and the business objectives. Refer back frequently to your set of gathered requirements to check if they are properly aligned and ensure the project is not veering away from the original scope and business objectives.
Don’t just read for the sake of reading
The largest problem with documentation review is that requirements gathering professionals do it for the sake of saying they did it. As a result, projects often go off course due to not aligning to business objectives following the review sessions.
- When reading a document, take notes to avoid projects going over time and budget and business dissatisfaction. Document your notes and schedule time to review the set of complete notes with your team following the individual documentation review.
Select elicitation techniques that match the elicitation scenario
There is a time and place for each technique. Don’t become too reliant on the same ones. Diversify your approach based on the elicitation goal.
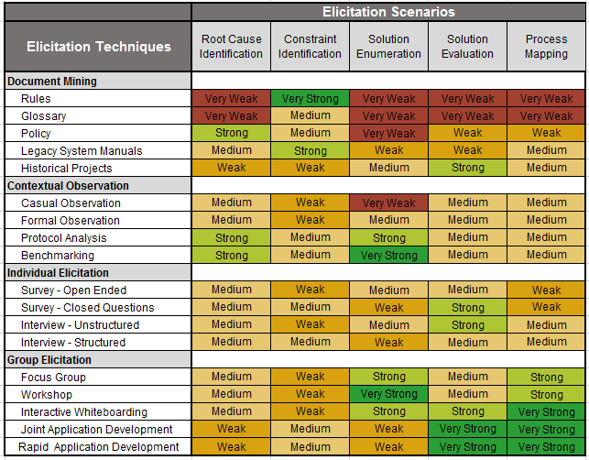
This table shows the relative strengths and weaknesses of each elicitation technique compared against the five basic elicitation scenarios.
A typical project will encounter most of the elicitation scenarios. Therefore, it is important to utilize a healthy mix of techniques to optimize effectiveness.
Very Strong = Very Effective
Strong = Effective
Medium = Somewhat Effective
Weak = Minimally Effective
Very Weak = Not Effective
Record the approved elicitation techniques that your BAs should use
2.1.2 – 30 minutes
Input
- Approved elicitation techniques
Output
Materials
Participants
- Business stakeholders
- BAs
Record the approved elicitation methods and best practices for each technique in the SOP.
Identify which techniques should be utilized with the different stakeholder classes.
Segment the different techniques based by project complexity level.
Use the following chart to record the approved techniques.
| Stakeholder
|
L1 Projects
|
L2 Projects
|
L3 Projects
|
L4 Projects
|
| Senior Management
|
Structured Interviews
|
| Project Sponsor
|
Unstructured Interviews
|
| SME (Business)
|
Focus Groups
|
Unstructured Interviews
|
| Functional Manager
|
Focus Groups
|
Structured Interviews
|
| End Users
|
Surveys; Focus Groups; Follow-Up Interviews; Observational Techniques
|
Document the output from this exercise in section 4.0 of the Requirements Gathering SOP and BA Playbook.
Confirm initial elicitation notes with stakeholders
Open lines of communication with stakeholders and keep them involved in the requirements gathering process; confirm the initial elicitation before proceeding.
Confirming the notes from the elicitation session with stakeholders will result in three benefits:
- Simple miscommunications can compound and result in costly rework if they aren’t caught early. Providing stakeholders with a copy of notes from the elicitation session will eliminate issues before they manifest themselves in the project.
- Stakeholders often require an absorption period after elicitation sessions to reflect on the meeting. Following up with stakeholders gives them an opportunity to clarify, enhance, or change their responses.
- Stakeholders will become disinterested in the project (and potentially the finished application) if their involvement in the project ends after elicitation. Confirming the notes from elicitation keeps them involved in the process and transitions stakeholders into the analysis phase.
This is the Confirm stage of the Confirm, Verify, Approve process.
“Are these notes accurate and complete?”
If you want additional support, have our analysts guide you through this phase as part of an Info-Tech workshop
Book a workshop with our Info-Tech analysts:
- To accelerate this project, engage your IT team in an Info-Tech workshop with an Info-Tech analyst team.
- Info-Tech analysts will join you and your team onsite at your location or welcome you to Info-Tech’s historic Toronto office to participate in an innovative onsite workshop.
- Contact your account manager (www.infotech.com/account), or email Workshops@InfoTech.com for more information.
The following are sample activities that will be conducted by Info-Tech analysts with your team:
2.1.1 Understand the different elicitation techniques
An analyst will walk you through the different elicitation techniques including observations, document reviews, surveys, focus groups, and interviews, and highlight the level of effort required for each.
2.1.2 Select and record the approved elicitation techniques
An analyst will facilitate the discussion to determine which techniques should be utilized with the different stakeholder classes.
Step 2.2: Structure Elicitation Output
Phase 1
1.1 Understand the Benefits of Requirements Optimization
1.2 Determine Your Target State for Requirements Gathering
Phase 2
2.1 Determine Elicitation Techniques
2.2 Structure Elicitation Output
Phase 3
3.1 Create Analysis Framework
3.2 Validate Business Requirements
Phase 4
4.1 Create Control Processes for Requirements Changes
4.2 Build Requirements Governance and Communication Plan
This step will walk you through the following activities:
- Build use-case models.
- Practice using elicitation techniques with business stakeholders to build use-case models.
- Practice leveraging user stories to convey requirements.
This step involves the following participants:
- BAs
- Business stakeholders
Outcomes of this step
- Understand the value of use-case models for requirements gathering.
- Practice different techniques for building use-case models with stakeholders.
Record and capture requirements in solution-oriented formats
Unstructured notes for each requirement are difficult to manage and create ambiguity. Using solution-oriented formats during elicitation sessions ensures that the content can be digested by IT and business users.
This table shows common solution-oriented formats for recording requirements. Determine which formats the development team and BAs are comfortable using and create a list of acceptable formats to use in projects.
| Format
|
Description
|
Examples
|
| Behavior Diagrams
|
These diagrams describe what must happen in the system.
|
Business Process Models, Swim Lane Diagram, Use Case Diagram
|
| Interaction Diagrams
|
These diagrams describe the flow and control of data within a system.
|
Sequence Diagrams, Entity Diagrams
|
| Stories
|
These text-based representations take the perspective of a user and describe the activities and benefits of a process.
|
Scenarios, User Stories
|
Info-Tech Insight
Business process modeling is an excellent way to visually represent intricate processes for both IT and business users. For complex projects with high business significance, business process modeling is the best way to capture requirements and create transformational gains.
Use cases give projects direction and guidance from the business perspective
Use Case Creation Process
Define Use Cases for Each Stakeholder
- Each stakeholder may have different uses for the same solution. Identify all possible use cases attributed to the stakeholders.
- All use cases are possible test case scenarios.
Define Applications for Each Use Case
- Applications are the engines behind the use cases. Defining the applications to satisfy use cases will pinpoint the areas where development or procurement is necessary.
Consider the following guidelines:
- Don’t involve systems in the use cases. Use cases just identify the key end-user interaction points that the proposed solution is supposed to cover.
- Some use cases are dependent on other use cases or multiple stakeholders may be involved in a single use case. Depending on the availability of these use cases, they can either be all identified up front (Waterfall) or created at various iterations (Agile).
- Consider the enterprise architecture perspective. Existing enterprise architecture designs can provide a foundation of current requirement mappings and system structure. Reuse these resources to reduce efforts.
- Avoid developing use cases in isolation. Reusability is key in reducing designing efforts. By involving multiple departments, requirement clashes can be avoided and the likelihood of reusability increases.
Develop practical use cases to help drive the development effort in the right direction
Evaluating the practicality and likelihood of use cases is just as important as developing them.
Use cases can conflict with each other. In certain situations, specific requirements of these use cases may clash with one another even though they are functionally sound. Evaluate use-case requirements and determine how they satisfy the overall business need.
Use cases are not necessarily isolated; they can be nested. Certain functionalities are dependent on the results of another action, often in a hierarchical fashion. By mapping out the expected workflows, BAs can determine the most appropriate way to implement.
Use cases can be functionally implemented in many ways. There could be multiple ways to accomplish the same use case. Each of these needs to be documented so that functional testing and user documentation can be based on them.
Nested Use Case Examples:
| Log Into Account
|
← Depends on (Nested)
|
Ordering Products Online
|
| Enter username and password
|
|
Complete order form
|
| Verify user is a real person
|
Process order
|
| Send user forgotten password message
|
Check user’s account
|
| Send order confirmation to user
|
Build a use-case model
2.2.1 – 45 minutes
Input
Output
Materials
Participants
- Business stakeholders
- BAs
Demonstrate how to use elicitation techniques to build use cases for the project.
- Identify a sub-process to build the use-case model. Begin the exercise by giving a brief description of the purpose of the meeting.
- For each stakeholder, draw a stick figure on the board. Pose the question “If you need to do X, what is your first step?” Go through the process until the end goal and draw each step. Ensure that you capture triggers, causes, decision points, outcomes, tools, and interactions.
- Starting at the beginning of the diagram, go through each step again and check with stakeholders if the step can be broken down into more granular steps.
- Ask the stakeholder if there are any alternative flows that people use, or any exceptions to process steps. If there are, map these out on the board.
- Go back through each step and ask the stakeholder where the current process is causing them grief, and where modification should be made.
- Record this information in the Business Requirements Document Template.
Build a use-case model
2.2.1
Example: Generate Letters
Inspector: Log into system → Search for case → Identify recipient → Determine letter type → Print letter
Admin: Receive letter from inspector → Package and mail letter
Citizen: Receive letter from inspector
Understand user stories and profiles
What are they?
User stories describe what requirement a user wants in the solution and why they want it. The end goal of a user story is to create a simple description of a requirement for developers.
When to use them
User stories should always be used in requirements gathering. User stories should be collected throughout the elicitation process. Try to recapture user stories as new project information is released to capture any changes in end-customer needs.
What’s the benefit?
User stories help capture target users, customers, and stakeholders. They also create a “face” for individual user requirements by providing user context. This detail enables IT leaders to associate goals and end objectives with each persona.
Takeaway
To better understand the characteristics driving user requirements, begin to map objectives to separate user personas that represent each of the project stakeholders.
Are user stories worth the time and effort?
Absolutely.
A user’s wants and needs serve as a constant reminder to developers. Developers can use this information to focus on how a solution needs to accomplish a goal instead of only focusing on what goals need to be completed.
Create customized user stories to guide or structure your elicitation output
Instructions
- During surveys, interviews, and development sessions, ask participants the following questions:
- What do you want from the solution?
- Why do you want that?
- Separate the answer into an “I want to” and “So that” format.
- For users who give multiple “I want to” and “So that” statements, separate them into their respective pairs.
- Place each story on a small card that can easily be given to developers.
| As a
|
I want to
|
So that
|
Size
|
Priority
|
| Developer
|
Learn network and system constraints
|
The churn between Operations and I will be reduced.
|
1 point
|
Low
|
|
Team member
|
Increase the number of demonstrations
|
I can achieve greater alignment with business stakeholders.
|
3 points
|
High
|
| Product owner
|
Implement a user story prioritization technique
|
I can delegate stories in my product backlog to multiple Agile teams.
|
3 points
|
Medium
|
How to make an effective and compelling user story
Keep your user stories short and impactful to ensure that they retain their impact.
Follow a simple formula:
As a [stakeholder title], I want to [one requirement] so that [reason for wanting that requirement].
Use this template for all user stories. Other formats will undermine the point of a user story. Multiple requirements from a single user must be made into multiple stories and given to the appropriate developer. User stories should fit onto a sticky note or small card.
Example
|
|
As an:
|
I want to:
|
So that:
|
| ✓
|
Administrator
|
Integrate with Excel
|
File transfer won’t possibly lose information
|
| X
|
Administrator
|
Integrate with Excel and Word
|
File transfer won’t possibly lose information
|
While the difference between the two may be small, it would still undermine the effectiveness
of a user story. Different developers may work on the integration of Excel or Word and may
not receive this user story.
Assign user stories a size and priority level
Designate a size to user stories
Size is an estimate of how many resources must be dedicated to accomplish the want. Assign a size to each user story to help determine resource allocation.
Assign business priority to user stories
Based on how important the requirement is to project success, assign each user story a rating of high, medium, or low. The priority given will dictate which requirements are completed first.
Example:
Scope: Design software to simplify financial reporting
| User Story
|
Estimated Size
|
Priority
|
| As an administrator, I want to integrate with Excel so that file transfer won’t possibly lose information.
|
Low
|
High
|
| As an administrator, I want to simplify graph construction so that I can more easily display information for stakeholders.
|
High
|
Medium
|
Combine both size and priority to decide resource allocation. Low-size, high-priority tasks should always be done first.
Group similar user stories together to create greater impact
Group user stories that have the same requirement
When collecting user stories, many will be centered around the same requirement. Group similar user stories together to show the need for that requirement’s inclusion in the solution.
Even if it isn’t a must-have requirement, if the number of similar user stories is high enough, it would become the most important should-have requirement.
Group together user stories such as these:
| As an
|
I want
|
So that
|
| Administrator
|
To be able to create bar graphs
|
Information can be more easily illustrated
|
| Accountant
|
To be able to make pie charts
|
Budget information can be visually represented
|
Both user stories are about creating charts and would be developed similarly.
Leave these user stories separate
| As an
|
I want
|
So that
|
| Administrator
|
The program to auto-save
|
Information won’t be lost during power outages
|
| Accountant
|
To be able to save to SharePoint
|
My colleagues can easily view and edit my work
|
While both stories are about saving documents, the development of each feature is vastly different.
Create customized user profiles
User profiles are a way of grouping users based on a significant shared details (e.g. in the finance department, website user).
Go beyond the user profile
When creating the profile, consider more than the group’s name. Ask yourself the following questions:
- What level of knowledge and expertise does this user profile have with this type of software?
- How much will this user profile interact with the solution?
- What degree of dependency will this user profile have on the solution?
For example, if a user profile has low expertise but interacts and depends heavily on the program, a more thorough tutorial of the FAQ section is needed.
Profiles put developers in user’s shoes
Grouping users together helps developers put a face to the name. Developers can then more easily empathize with users and develop an end solution that is directly catered to their needs.
Leverage group activities to break down user-story sizing techniques
Work in groups to run through the following story-sizing activities.
Planning Poker: This approach uses the Delphi method where members estimate the size of each user story by revealing numbered cards. These estimates are then discussed and agreed upon as a group.
- Planning poker generates discussion about variances in estimates but dominant personalities may lead to biased results or groupthink.
Team Sort: This approach can assist in expediting estimation when you are handling numerous user stories.
- Bucket your user stories into sizes (e.g. extra-small, small, medium, large, and extra-large) based on an acceptable benchmark that may change from project to project.
- Collaborate as a team to conclude the final size.
- Next, translate these sizes into points.
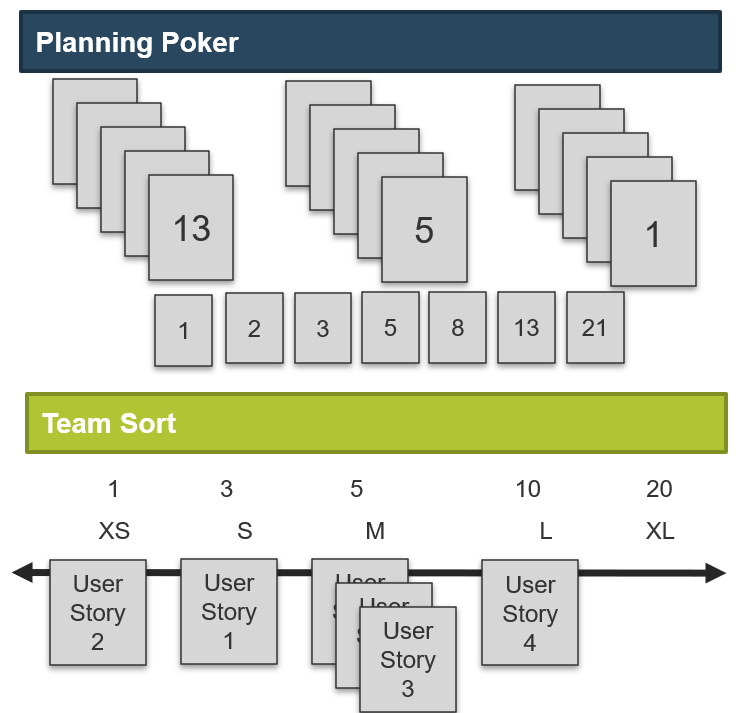
Create a product backlog to communicate business needs to development teams
Use the product backlog to capture expected work and create a roadmap for the project by showing what requirements need to be delivered.
How is the product owner involved?
- The product owner is responsible for keeping in close contact with the end customer and making the appropriate changes to the product backlog as new ideas, insights, and impediments arise.
- The product owner should have good communication with the team to make accurate changes to the product backlog depending on technical difficulties and needs for clarification.
How do I create a product backlog?
- Write requirements in user stories. Use the format: “As a (user role), I want (function) so that (benefit).” Identify end users and understand their needs.
- Assign each requirement a priority. Decide which requirements are the most important to deliver. Ask yourself, “Which user story will create the most value?”
What are the approaches to generate my backlog?
- Team Brainstorming – The product owner, team, and scrum master work together to write and prioritize user stories in a single or a series of meetings.
- Business Case – The product owner translates business cases into user stories as per the definition of “development ready.”
Epics and Themes
As you begin to take on larger projects, it may be advantageous to organize and group your user stories to simplify your release plan:
- Epics are collections of similar user stories and are used to describe significant and large development initiatives.
- Themes are collections of similar epics and are normally used to define high-level business objectives.
To avoid confusion, the pilot product backlog will be solely composed of user stories.
Example:
| Theme: Increase user exposure to corporate services through mobile devices
|
| Epic: Access corporate services through a mobile application
|
Epic: Access corporate services through mobile website
|
| User Story: As a user, I want to find the closest office so that I can minimize travel time As a user, I want to find the closest office so that I can minimize travel time
|
User Story: As a user, I want to submit a complaint so that I can improve company processes
|
Simulate product backlog creation
Overview
Leverage Info-Tech’s Scrum Documentation Template, using the Backlog and Planning tab, to help walk you through this activity.
Instructions
- Have your product owner describe the business objectives of the pilot project.
- Write the key business requirements as user stories.
- Based on your business value drivers, identify the business value of your user stories (high, medium, low).
- Have your team review the user stories and question the story’s value, priority, goal, and meaning.
- Break down the user stories if the feature or business goal is unclear or too large.
- Document the perceived business value of each user story, as well as the priority, goal, and meaning.
Examples:
As a citizen, I want to know about road construction so that I can save time when driving. Business Value: High
As a customer, I want to find the nearest government office so that I can register for benefits. Business Value: Medium
As a voter, I want to know what each candidate believes in so that I can make an informed decision. Business Value: High
If you want additional support, have our analysts guide you through this phase as part of an Info-Tech workshop
Book a workshop with our Info-Tech analysts:
- To accelerate this project, engage your IT team in an Info-Tech workshop with an Info-Tech analyst team.
- Info-Tech analysts will join you and your team onsite at your location or welcome you to Info-Tech’s historic Toronto office to participate in an innovative onsite workshop.
- Contact your account manager (www.infotech.com/account), or email Workshops@InfoTech.com for more information.
The following are sample activities that will be conducted by Info-Tech analysts with your team:
2.2.1 Build use-case models
An analyst will assist in demonstrating how to use elicitation techniques to build use-case models. The analyst will walk you through the table testing to visually map out and design process flows for each use case.
Phase 3: Analyze and Validate Requirements
Phase 3 outline
Call 1-888-670-8889 or email GuidedImplementations@InfoTech.com for more information.
Complete these steps on your own, or call us to complete a guided implementation. A guided implementation is a series of
2-3 advisory calls that help you execute each phase of a project. They are included in most advisory memberships.
Guided Implementation 3: Analyze and Validate Requirements
Proposed Time to Completion: 1 week
Step 3.1: Create Analysis Framework
Start with an analyst kick off call:
- Create policies for requirements categorization and prioritization.
Then complete these activities…
- Create functional requirements categories.
- Consolidate similar requirements and eliminate redundancies.
- Prioritize requirements.
With these tools & templates:
- Requirements Gathering Documentation Tool
Step 3.2: Validate Business Requirements
Review findings with analyst:
- Establish best practices for validating the BRD with project stakeholders.
Then complete these activities…
- Right-size the BRD.
- Present the BRD to business stakeholders.
- Translate business requirements into technical requirements.
- Identify testing opportunities.
With these tools & templates:
- Business Requirements Document Template
- Requirements Gathering Testing Checklist
Phase 3 Results & Insights:
- Standardized frameworks for analysis and validation of business requirements
Step 3.1: Create Analysis Framework
Phase 1
1.1 Understand the Benefits of Requirements Optimization
1.2 Determine Your Target State for Requirements Gathering
Phase 2
2.1 Determine Elicitation Techniques
2.2 Structure Elicitation Output
Phase 3
3.1 Create Analysis Framework
3.2 Validate Business Requirements
Phase 4
4.1 Create Control Processes for Requirements Changes
4.2 Build Requirements Governance and Communication Plan
This step will walk you through the following activities:
- Categorize requirements.
- Eliminate redundant requirements.
This step involves the following participants:
Outcomes of this step
- Prioritized requirements list.
Analyze requirements to de-duplicate them, consolidate them – and most importantly – prioritize them!
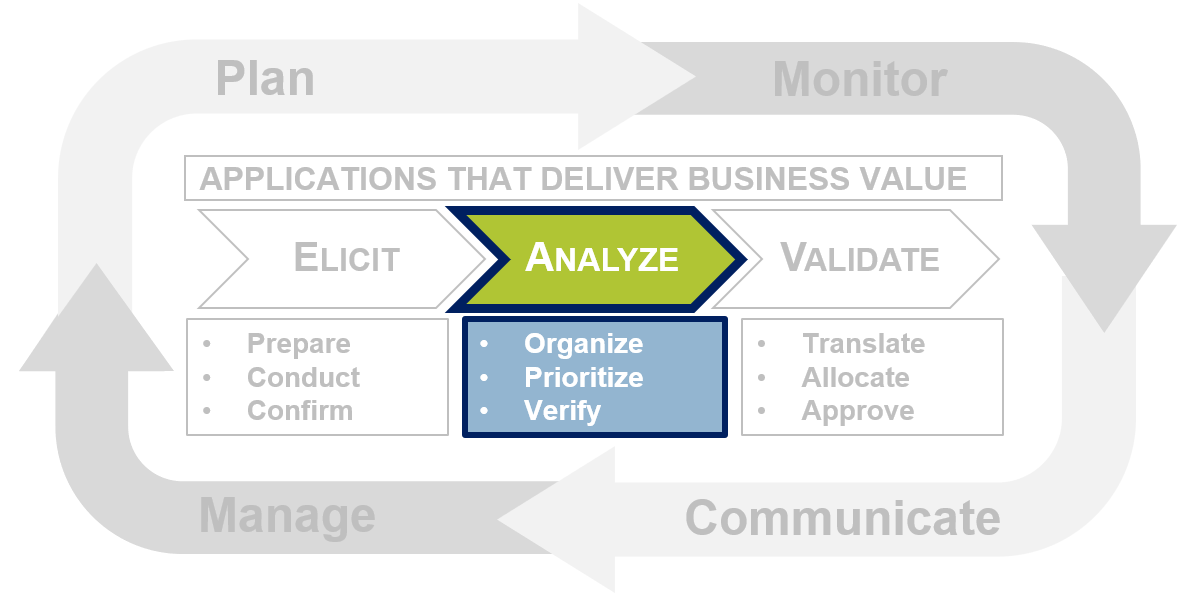
The analysis phase is where requirements are compiled, categorized, and prioritized to make managing large volumes easier. Many organizations prematurely celebrate being finished the elicitation phase and do not perform adequate diligence in this phase; however, the analysis phase is crucial for a smooth transition into validation and application development or procurement.
Categorize requirements to identify and highlight requirement relationships and dependencies
Eliciting requirements is an important step in the process, but turning endless pages of notes into something meaningful to all stakeholders is the major challenge.
Begin the analysis phase by categorizing requirements to make locating, reconciling, and managing them much easier. There are often complex relationships and dependencies among requirements that do not get noted or emphasized to the development team and as a result get overlooked.
Typically, requirements are classified as functional and non-functional at the high level. Functional requirements specify WHAT the system or component needs to do and non-functional requirements explain HOW the system must behave.
Examples
Functional Requirement: The application must produce a sales report at the end of the month.
Non-Functional Requirement: The report must be available within one minute after midnight (EST) of the last day of the month. The report will be available for five years after the report is produced. All numbers in the report will be displayed to two decimal places.
Categorize requirements to identify and highlight requirement relationships and dependencies
Further sub-categorization of requirements is necessary to realize the full benefit of categorization. Proficient BAs will even work backwards from the categories to drive the elicitation sessions. The categories used will depend on the type of project, but for categorizing non-functional requirements, the Volere Requirements Resources has created an exhaustive list of sub-categories.
| Requirements Category
|
Elements
|
Example
|
| Look & Feel
|
Appearance, Style
|
User Experience
|
| Usability & Humanity
|
Ease of Use, Personalization, Internationalization, Learning, Understandability, Accessibility
|
Language Support
|
| Performance
|
Speed, Latency, Safety, Precision, Reliability, Availability, Robustness, Capacity, Scalability, Longevity
|
Bandwidth
|
| Operational & Environmental
|
Expected Physical Environment, Interfacing With Adjacent Systems, Productization, Release
|
Heating and Cooling
|
| Maintainability & Support
|
Maintenance, Supportability, Adaptability
|
Warranty SLAs
|
|
Security
|
Access, Integrity, Privacy, Audit, Immunity
|
Intrusion Prevention
|
| Cultural & Political
|
Global Differentiation
|
Different Statutory Holidays
|
| Legal
|
Compliance, Standards
|
Hosting Regulations
|
What constitutes good requirements
Complete – Expressed a whole idea or statement.
Correct – Technically and legally possible.
Clear – Unambiguous and not confusing.
Verifiable – It can be determined that the system meets the requirement.
Necessary – Should support one of the project goals.
Feasible – Can be accomplished within cost and schedule.
Prioritized – Tracked according to business need levels.
Consistent – Not in conflict with other requirements.
Traceable – Uniquely identified and tracked.
Modular – Can be changed without excessive impact.
Design-independent – Does not pose specific solutions on design.
Create functional requirement categories
3.1.1 – 1 hour
Input
Output
Materials
- Whiteboard
- Markers
- Sticky notes
Participants
Practice the techniques for categorizing requirements.
- Divide the list of requirements that were elicited for the identified sub-process in exercise 2.2.1 among smaller groups.
- Have groups write the requirements on red, yellow, or green sticky notes, depending on the stakeholder’s level of influence.
- Along the top of the whiteboard, write the eight requirements categories, and have each group place the sticky notes under the category where they believe they should fit.
- Once each group has posted the requirements, review the board and discuss any requirements that should be placed in another category.
Document any changes to the requirements categories in section 5.1 of the Requirements Gathering SOP and BA Playbook.
Create functional requirement categories
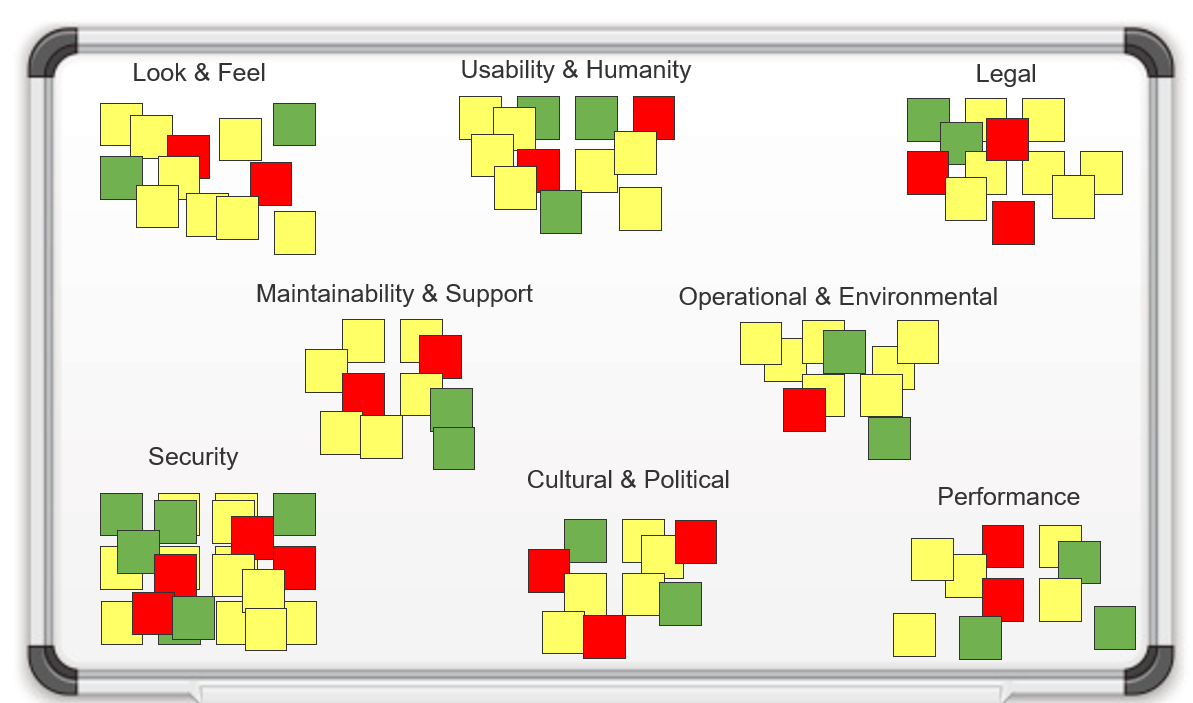
Consolidate similar requirements and eliminate redundancies
Clean up requirements and make everyone’s life simpler!
After elicitation, it is very common for an organization to end up with redundant, complementary, and conflicting requirements. Consolidation will make managing a large volume of requirements much easier.
|
|
Redundant Requirements
|
Owner
|
Priority
|
| 1.
|
The application shall feed employee information into the payroll system.
|
Payroll
|
High
|
| 2.
|
The application shall feed employee information into the payroll system.
|
HR
|
Low
|
| Result
|
The application shall feed employee information into the payroll system.
|
Payroll & HR
|
High
|
|
|
Complementary Requirements
|
Owner
|
Priority
|
| 1.
|
The application shall export reports in XLS and PDF format.
|
Marketing
|
High
|
| 2.
|
The application shall export reports in CSV and PDF format.
|
Finance
|
High
|
| Result
|
The application shall export reports in XLS, CSV, and PDF format.
|
Marketing & Finance
|
High
|
Info-Tech Insight
When collapsing redundant or complementary requirements, it is imperative that the ownership and priority metadata be preserved for future reference. Avoid consolidating complementary requirements with drastically different priority levels.
Identify and eliminate conflict between requirements
Conflicting requirements are unavoidable; identify and resolve them as early as possible to minimize rework and grief.
Conflicting requirements occur when stakeholders have requirements that either partially or fully contradict one another, and as a result, it is not possible or practical to implement all of the requirements.
Steps to Resolving Conflict:
- Notify the relevant stakeholders of the conflict and search for a basic solution or compromise.
- If the stakeholders remain in a deadlock, appoint a final decision maker.
- Schedule a meeting to resolve the conflict with the relevant stakeholders and the decision maker. If multiple conflicts exist between the same stakeholder groups, try to resolve as many as possible at once to save time and encourage reciprocation.
- Give all parties the opportunity to voice their rationale and objectively rate the priority of the requirement. Attempt to reach an agreement, consensus, or compromise.
- If the parties remain in a deadlock, encourage the final decision maker to weigh in. Their decision should be based on which party has the greater need for the requirement, the difficulty to implement the requirement, and which requirement better aligns with the project goals.
Info-Tech Insight
Resolve conflicts whenever possible during the elicitation phase by using cross-functional workshops to facilitate discussions that address and settle conflicts in the room.
Consolidate similar requirements and eliminate redundancies
3.1.2 – 30 minutes
Input
Output
Materials
- Whiteboard
- Markers
- Sticky notes
Participants
Review the outputs from the last exercise and ensure that the list is mutually exclusive by consolidating similar requirements and eliminating redundancies.
- Looking at each category in turn, review the sticky notes and group similar, complementary, and conflicting notes together. Put a red dot on any conflicting requirements to be used in a later exercise.
- Have the group start by eliminating the redundant requirements.
- Have the group look at the complementary requirements, and consolidate each into a single requirement. Discard originals.
- Record this information in the Requirements Gathering Documentation Tool.
Prioritize requirements to assist with solution modeling
Prioritization is the process of ranking each requirement based on its importance to project success. Hold a separate meeting for the domain SMEs, implementation SMEs, project managers, and project sponsors to prioritize the requirements list. At the conclusion of the meeting, each requirement should be assigned a priority level. The implementation SMEs will use these priority levels to ensure efforts are targeted towards the proper requirements as well as to plan features available on each release. Use the MoSCoW Model of Prioritization to effectively order requirements.
The MoSCoW Model of Prioritization
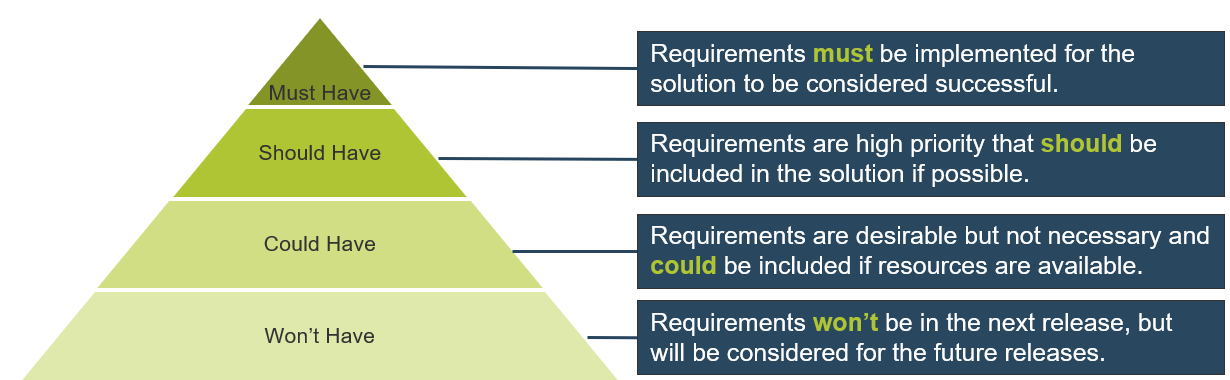
The MoSCoW model was introduced by Dai Clegg of Oracle UK in 1994
(Source: ProductPlan).
Base your prioritization on the right set of criteria
Effective Prioritization Criteria
| Criteria
|
Description
|
| Regulatory & Legal Compliance
|
These requirements will be considered mandatory.
|
| Policy Compliance
|
Unless an internal policy can be altered or an exception can be made, these requirements will be considered mandatory.
|
| Business Value Significance
|
Give a higher priority to high-value requirements.
|
| Business Risk
|
Any requirement with the potential to jeopardize the entire project should be given a high priority and implemented early.
|
| Likelihood of Success
|
Especially in proof-of-concept projects, it is recommended that requirements have good odds.
|
| Implementation Complexity
|
Give a higher priority to low implementation difficulty requirements.
|
| Alignment With Strategy
|
Give a higher priority to requirements that enable the corporate strategy.
|
| Urgency
|
Prioritize requirements based on time sensitivity.
|
| Dependencies
|
A requirement on its own may be low priority, but if it supports a high-priority requirement, then its priority must match it.
|
Info-Tech Insight
It is easier to prioritize requirements if they have already been collapsed, resolved, and rewritten. There is no point in prioritizing every requirement that is elicited up front when some of them will eventually be eliminated.
Use the Requirements Gathering Documentation Tool to steer your requirements gathering approach during a project
3.1 Requirements Gathering Documentation Tool
Use the Requirements Gathering Documentation Tool to identify and track stakeholder involvement, elicitation techniques, and scheduling, as well as to track categorization and prioritization of requirements.
- Use the Identify Stakeholders tab to:
- Identify the stakeholder's name and role.
- Identify their influence and involvement.
- Identify the elicitation techniques that you will be using.
- Identify who will be conducting the elicitation sessions.
- Identify if requirements were validated post elicitation session.
- Identify when the elicitation will take place.
- Use the Categorize & Prioritize tab to:
- Identify the stakeholder.
- Identify the core function.
- Identify the business requirement.
- Describe the requirement.
- Identify the categorization of the requirement.
- Identify the level of priority of the requirement.
Prioritize requirements
3.1.3 – 30 minutes
Input
- Requirements list
- Prioritization criteria
Output
Materials
- Whiteboard
- Markers
- Sticky notes
Participants
- BAs
- Business stakeholders
Using the output from the MoSCoW model, prioritize the requirements according to those you must have, should have, could have, and won’t have.
- As a group, review each requirement and decide if the requirement is:
- Must have
- Should have
- Could have
- Won’t have
- Beginning with the must-have requirements, determine if each has any dependencies. Ensure that each of the dependencies are moved to the must-have category. Group and circle the dependent requirements.
- Continue the same exercise with the should-have and could-have options.
- Record the results in the Requirements Gathering Documentation Tool.
Step 1 – Prioritize requirements
3.1.3
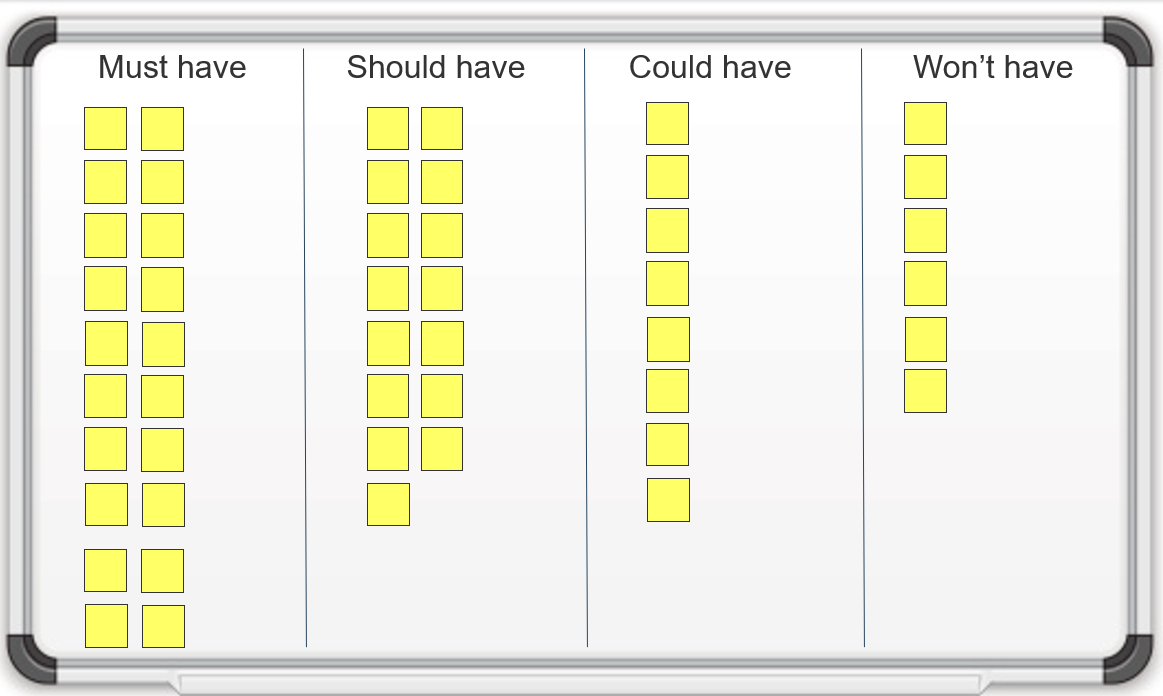
Step 2-3 – Prioritize requirements
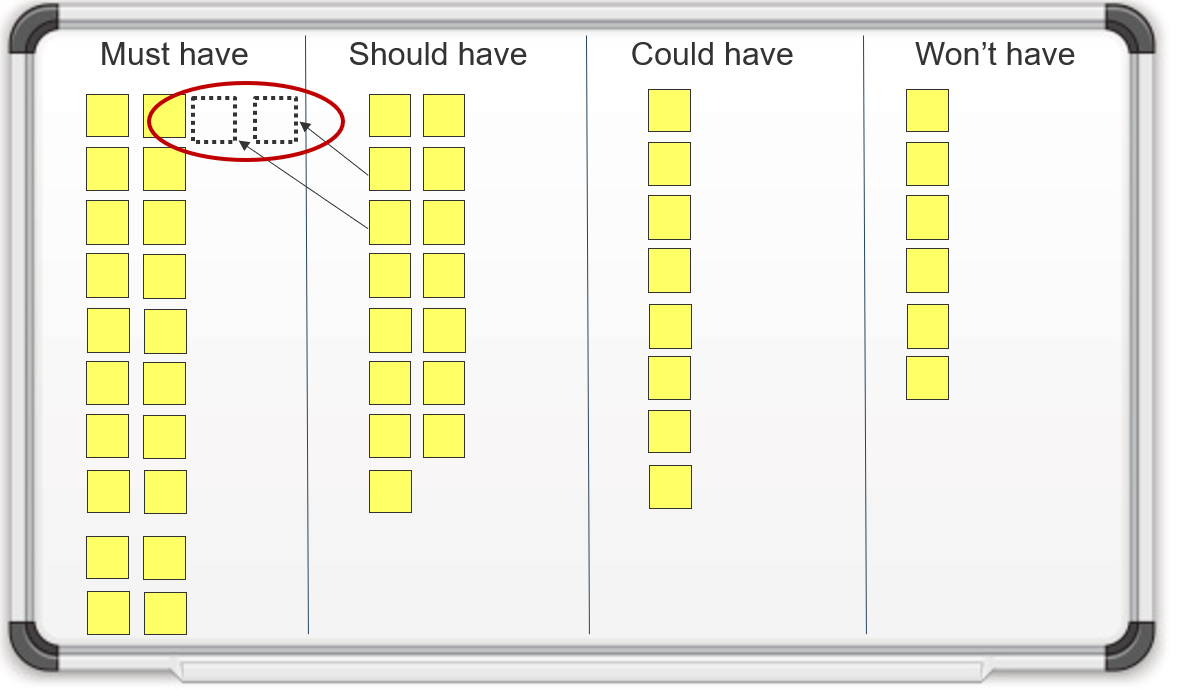
If you want additional support, have our analysts guide you through this phase as part of an Info-Tech workshop
3.1.1 Create functional requirements categories
An analyst will facilitate the discussion to brainstorm and determine criteria for requirements categories.
3.1.2 Consolidate similar requirements and eliminate redundancies
An analyst will facilitate a session to review the requirements categories to ensure the list is mutually exclusive by consolidating similar requirements and eliminating redundancies.
3.1.3 Prioritize requirements
An analyst will facilitate the discussion on how to prioritize requirements according to the MoSCoW prioritization framework. The analyst will also walk you through the exercise of determining dependencies for each requirement.
Step 3.2: Validate Business Requirements
Phase 1
1.1 Understand the Benefits of Requirements Optimization
1.2 Determine Your Target State for Requirements Gathering
Phase 2
2.1 Determine Elicitation Techniques
2.2 Structure Elicitation Output
Phase 3
3.1 Create Analysis Framework
3.2 Validate Business Requirements
Phase 4
4.1 Create Control Processes for Requirements Changes
4.2 Build Requirements Governance and Communication Plan
This step will walk you through the following activities:
- Build the BRD.
- Translate functional requirements to technical requirements.
- Identify testing opportunities.
This step involves the following participants:
Outcomes of this step
Validate requirements to ensure that they meet stakeholder needs – getting sign-off is essential
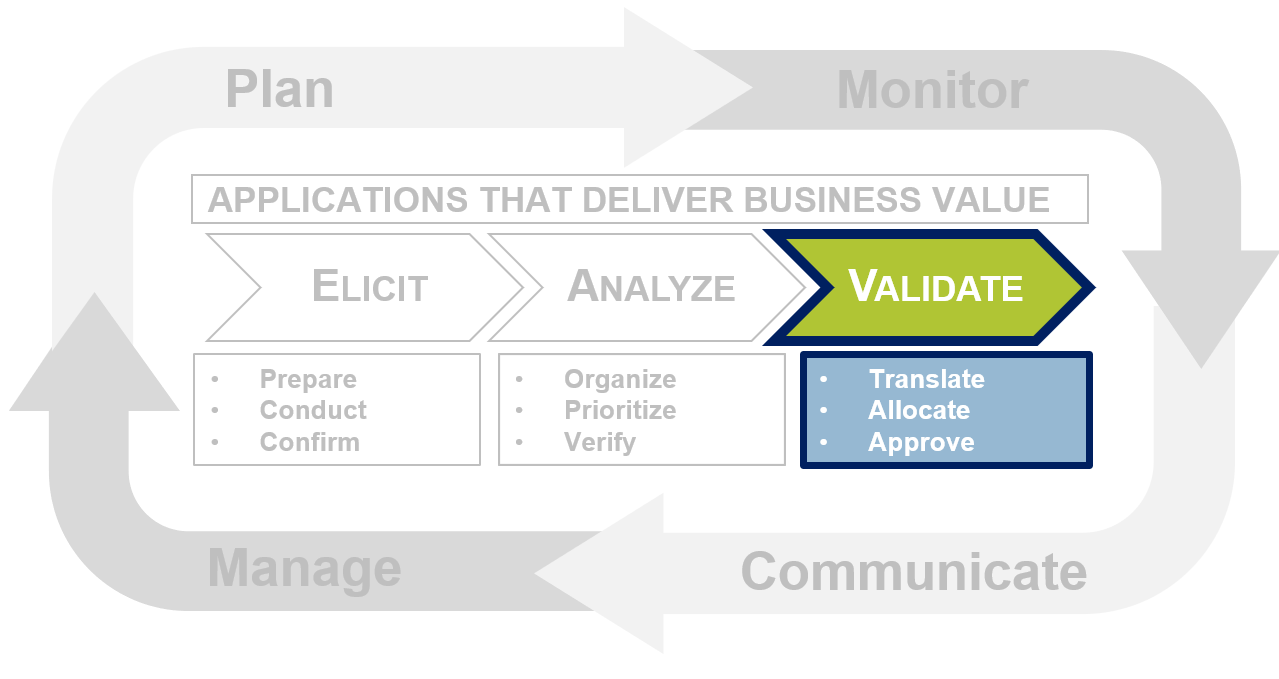
The validation phase involves translating the requirements, modeling the solutions, allocating features across the phased deployment plan, preparing the requirements package, and getting requirement sign-off. This is the last step in the Info-Tech Requirements Gathering Framework.
Prepare a user-friendly requirements package
Before going for final sign-off, ensure that you have pulled together all of the relevant documentation.
The requirements package is a compilation of all of the business analysis and requirements gathering that occurred. The document will be distributed among major stakeholders for review and sign-off.
Some may argue that the biggest challenge in the validation phase is getting the stakeholders to sign off on the requirements package; however, the real challenge is getting them to actually read it. Often, stakeholders sign the requirements document without fully understanding the scope of the application, details of deployment, and how it affects them.
Remember, this document is not for the BAs; it’s for the stakeholders. Make the package with the stakeholders in mind. Create multiple versions of the requirements package where the length and level of technical details is tailored to the audience. Consider creating a supplementary PowerPoint version of the requirements package to present to senior management.
Contents of Requirements Package:
- Project Charter (if available)
- Overarching Project Goals
- Categorized Business Requirements
- Selected Solution Proposal
- Rationale for Solution Selection
- Phased Roll-Out Plan
- Proposed Schedule/Timeline
- Signatures Page
"Sit down with your stakeholders, read them the document line by line, and have them paraphrase it back to you so you’re on the same page." – Anonymous City Manager of IT Project Planning Info-Tech Interview
Capture requirements in a dedicated BRD
The BRD captures the original business objectives and high-level business requirements for the system/process. The system requirements document (SRD) captures the more detailed functional and technical requirements.
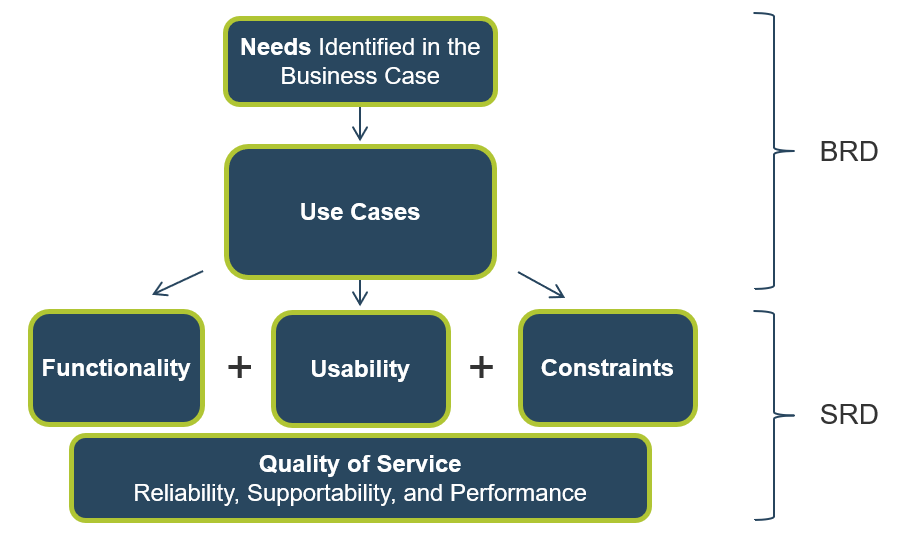
Use Info-Tech’s Business Requirements Document Template to specify the business needs and expectations
3.2 Business Requirements Document Template
The Business Requirements Document Template can be used to record the functional, quality, and usability requirements into formats that are easily consumable for future analysis, architectural and design activities, and most importantly in a format that is understandable by all business partners.
The BRD is designed to take the reader from a high-level understanding of the business processes down to the detailed automation requirements. It should capture the following:
- Project summary and background
- Operating model
- Business process model
- Use cases
- Requirements elicitation techniques
- Prioritized requirements
- Assumptions and constraints
Rightsize the BRD
3.2.1 – 30 minutes
Input
- Project levels
- BRD categories
Output
Materials
Participants
- BAs
- Business stakeholders
Build the required documentation for requirements gathering.
- On the board, write out the components of the BRD. As a group, review the headings and decide if all sections are needed for level 1 & 2 and level 3 & 4 projects. Your level 3-4 project business cases will have the most detailed business cases; consider your level 1-2 projects, and remove any categories you don’t believe are necessary for the project level.
- Now that you have a right-sized template, break the team into two groups and have each group complete one section of the template for your selected project.
- Project overview
- Implementation considerations
- Once complete, have each group present its section, and allow the group to make additions and modifications to each section.
Document the output from this exercise in section 6 of the Requirements Gathering SOP and BA Playbook.
Present the BRD to business stakeholders
3.2.2 – 1 hour
Input
Output
Materials
Participants
Practice presenting the requirements document to business stakeholders.
- Hold a meeting with a group of selected stakeholders, and have a representative present each section of the BRD for your project.
- Instruct participants that they should spend the majority of their time on the requirements section, in particular the operating model and the requirements prioritization.
- At the end of the meeting, have the business stakeholders validate the requirements, and approve moving forward with the project or indicate where further requirements gathering must take place.
Example:
| Typical Requirements Gathering Validation Meeting Agenda
|
| Project overview
|
5 minutes
|
| Project operating model
|
10 minutes
|
| Prioritized requirements list
|
5 minutes
|
| Business process model
|
30 minutes
|
| Implementation considerations
|
5 minutes
|
Translate business requirements into technical requirements
3.2.3 – 30 minutes
Input
Output
Materials
Participants
- Business stakeholders
- BAs
- Developers
Practice translating business requirements into system requirements.
- Bring in representatives from the development team, and have a representative walk them through the business process model.
- Present a detailed account of each business requirement, and work with the IT team to build out the system requirements for each.
- Document the system requirements in the Requirements Gathering Documentation Tool.
For requirements traceability, ensure you’re linking your requirements management back to your test strategy
After a solution has been fully deployed, it’s critical to create a strong link between your software testing strategy and the requirements that were collected. User acceptance testing (UAT) is a good approach for requirement verification.
- Many organizations fail to create an explicit connection between their requirements gathering and software testing strategies. Don’t follow their example!
- When conducting UAT, structure exercises in the context of the requirements; run through the signed-off list and ask users whether or not the deployed functionality was in line with the expectations outlined in the finalized requirements documentation.
- If not – determine whether it was a miscommunication on the requirements management side or a failure of the developers (or procurement team) to meet the agreed-upon requirements.
Download the Requirements Gathering Testing Checklist template.
Identify the testing opportunities
3.2.4 – 30 minutes
Input
Output
- Requirements testing process
Materials
Participants
Identify how to test the effectiveness of different requirements.
- Ask the group to review the list of requirements and identify:
- Which kinds of requirements enable constructive testing efforts?
- Which kinds of requirements enable destructive testing efforts?
- Which kinds of requirements support end-user acceptance testing?
- What do these validation-enabling objectives mean in terms of requirement specificity?
- For each, identify who will do the testing and at what stage.
Verify that the requirements still meet the stakeholders’ needs
Keep the stakeholders involved in the process in between elicitation and sign-off to ensure that nothing gets lost in transition.
After an organization’s requirements have been aggregated, categorized, and consolidated, the business requirements package will begin to take shape. However, there is still a great deal of work to complete. Prior to proceeding with the process, requirements should be verified by domain SMEs to ensure that the analyzed requirements continue to meet their needs. This step is often overlooked because it is laborious and can create additional work; however, the workload associated with verification is much less than the eventual rework stemming from poor requirements.
All errors in the requirements gathering process eventually surface; it is only a matter of time. Control when these errors appear and minimize costs by soliciting feedback from stakeholders early and often.
This is the Verify stage of the Confirm, Verify, Approve process.
“Do these requirements still meet your needs?”
Put it all together: obtain final requirements sign-off
Use the sign-off process as one last opportunity to manage expectations, obtain commitment from the stakeholders, and minimize change requests.
Development or procurement of the application cannot begin until the requirements package has been approved by all of the key stakeholders. This will be the third time that the stakeholders are asked to review the requirements; however, this will be the first time that the stakeholders are asked to sign off on them.
It is important that the stakeholders understand the significance of their signatures. This is their last opportunity to see exactly what the solution will look like and to make change requests. Ensure that the stakeholders also recognize which requirements were omitted from the solution that may affect them.
The sign-off process needs to mean something to the stakeholders. Once a signature is given, that stakeholder must be accountable for it and should not be able to make change requests. Note that there are some requests from senior stakeholders that can’t be refused; use discretion when declining requests.
This is the Approve stage of the Confirm, Verify, Approve process.
"Once requirements are signed off, stay firm on them!" – Anonymous Hospital Business Systems Analyst Info-Tech Interview
If you want additional support, have our analysts guide you through this phase as part of an Info-Tech workshop
Book a workshop with out Info-Tech analysts:
- To accelerate this project, engage your IT team in an Info-Tech workshop with an Info-Tech analyst team.
- Info-Tech analysts will join you and your team onsite at your location or welcome you to Info-Tech’s historic Toronto office to participate in an innovative onsite workshop.
- Contact your account manager (www.infotech.com/account), or email Workshops@InfoTech.com for more information.
The following are sample activities that will be conducted by Info-Tech analysts with your team:
3.2.1; 3.2.2 Rightsize the BRD and present it to business stakeholders
An analyst will facilitate the discussion to gather the required documentation for building the BRD. The analyst will also assist with practicing the presenting of each section of the document to business stakeholders.
3.2.3; 3.2.4 Translate business requirements into technical requirements and identify testing opportunities
An analyst will facilitate the session to practice translating business requirements into testing requirements and assist in determining how to test the effectiveness of different requirements.
Phase 4: Create a Requirements Governance Action Plan
Phase 4 outline
Call 1-888-670-8889 or email GuidedImplementations@InfoTech.com for more information.
Complete these steps on your own, or call us to complete a guided implementation. A guided implementation is a series of
2-3 advisory calls that help you execute each phase of a project. They are included in most advisory memberships.
Guided Implementation 4: Create a Requirements Governance Action Plan
Proposed Time to Completion: 3 weeks
Step 4.1: Create Control Processes for Requirements Changes
Start with an analyst kick off call:
- Discuss how to handle changes to requirements and establish a formal change control process.
Then complete these activities…
- Develop a change control process.
- Build the guidelines for escalating changes.
- Confirm your requirements gathering process.
- Define RACI for the requirements gathering process.
With these tools & templates:
- Requirements Traceability Matrix
Step 4.2: Build Requirements Governance and Communication Plan
Review findings with analyst:
- Review options for ongoing governance of the requirements gathering process.
Then complete these activities…
- Define the requirements gathering steering committee purpose.
- Define the RACI for the RGSC.
- Define procedures, cadence, and agenda for the RGSC.
- Identify and analyze stakeholders.
- Create a communications management plan.
- Build the requirements gathering process implementation timeline.
With these tools & templates:
Requirements Gathering Communication Tracking Template
Phase 4 Results & Insights:
- Formalized change control and governance processes for requirements.
Step 4.1: Create Control Processes for Requirements Changes
Phase 1
1.1 Understand the Benefits of Requirements Optimization
1.2 Determine Your Target State for Requirements Gathering
Phase 2
2.1 Determine Elicitation Techniques
2.2 Structure Elicitation Output
Phase 3
3.1 Create Analysis Framework
3.2 Validate Business Requirements
Phase 4
4.1 Create Control Processes for Requirements Changes
4.2 Build Requirements Governance and Communication Plan
This step will walk you through the following activities:
- Develop change control process.
- Develop change escalation process.
This step involves the following participants:
- BAs
- Business stakeholders
Outcomes of this step
- Requirements gathering process validation.
- RACI completed.
Manage, communicate, and test requirements
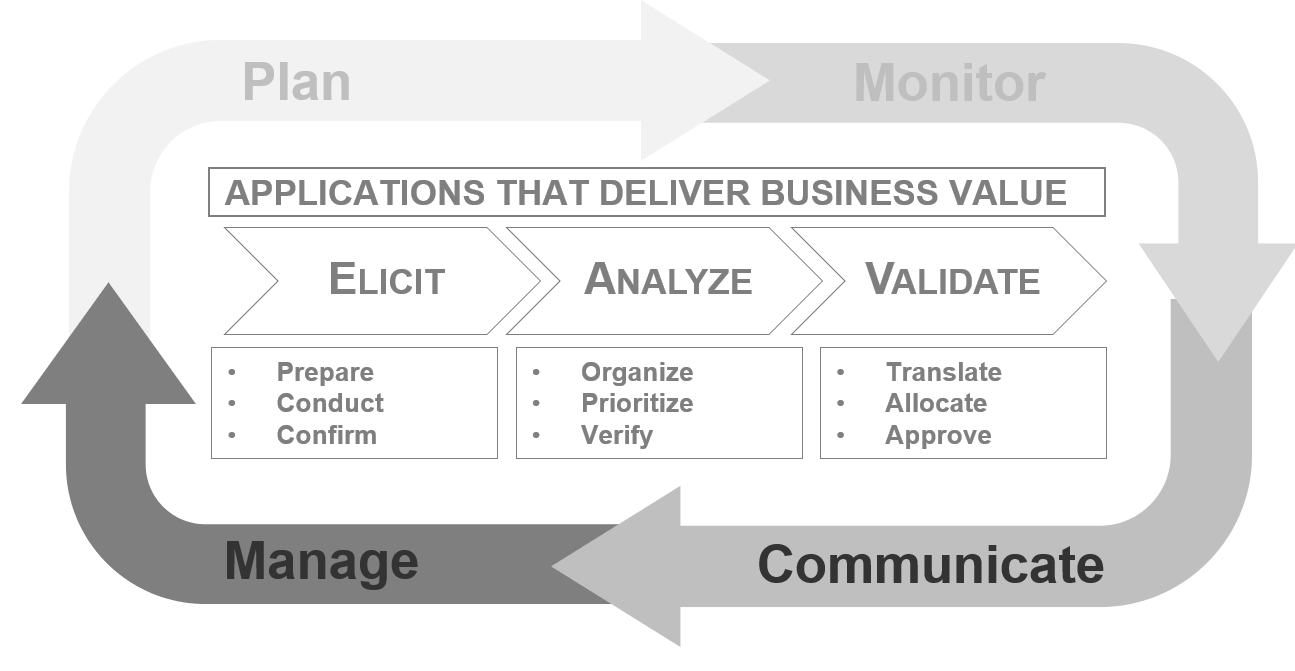
Although the manage, communicate, and test requirements section chronologically falls as the last section of this blueprint, that does not imply that this section is to be performed only at the end. These tasks are meant to be completed iteratively throughout the project to support the core requirements gathering tasks.
Prevent requirements scope creep
Once the stakeholders sign off on the requirements document, any changes need to be tracked and managed. To do that, you need a change control process.
Thoroughly validating requirements should reduce the amount of change requests you receive. However, eliminating all changes is unavoidable.
The BAs, sponsor, and stakeholders should have agreed upon a clearly defined scope for the project during the planning phase, but there will almost always be requests for change as the project progresses. Even a high number of small changes can negatively impact the project schedule and budget.
To avoid scope creep, route all changes, including small ones, through a formal change control process that will be adapted depending on the level of project and impact of the change.
Linking change requests to requirements is essential to understanding relevance and potential impact
- Receive project change request.
- Refer to requirements document to identify requirements associated with the change.
- Matching requirement is found: The change is relevant to the project.
- Multiple requirements are associated with the proposed change: The change has wider implications for the project and will require closer analysis.
- The request involves a change or new business requirements: Even if the change is within scope, time, and budget, return to the stakeholder who submitted the request to identify the potentially new requirements that relate to this change. If the sponsor agrees to the new requirements, you may be able to approve the change.
- Findings influence decision to escalate/approve/reject change request.
Develop a change control process
4.1.1 – 45 minutes
Input
- Current change control process
Output
- Updated change control process
Materials
Participants
- Ask the team to consider their current change control process. It might be helpful to discuss a project that is currently underway, or already completed, to provide context. Draw the process on the whiteboard through discussion with the team.
- If necessary, provide some cues. Below are some change control process activities:
- Submit project change request form.
- PM assesses change.
- Project sponsor assesses change.
- Bring request to project steering committee to assess change.
- Approve/reject change.
- Ask participants to brainstorm a potential separate process for dealing with small changes. Add a new branch for minor changes, which will allow you to make decisions on when to bundle the changes versus implementing directly.
Document any changes from this exercise in section 7.1 of the Requirements Gathering SOP and BA Playbook.
Example change control process
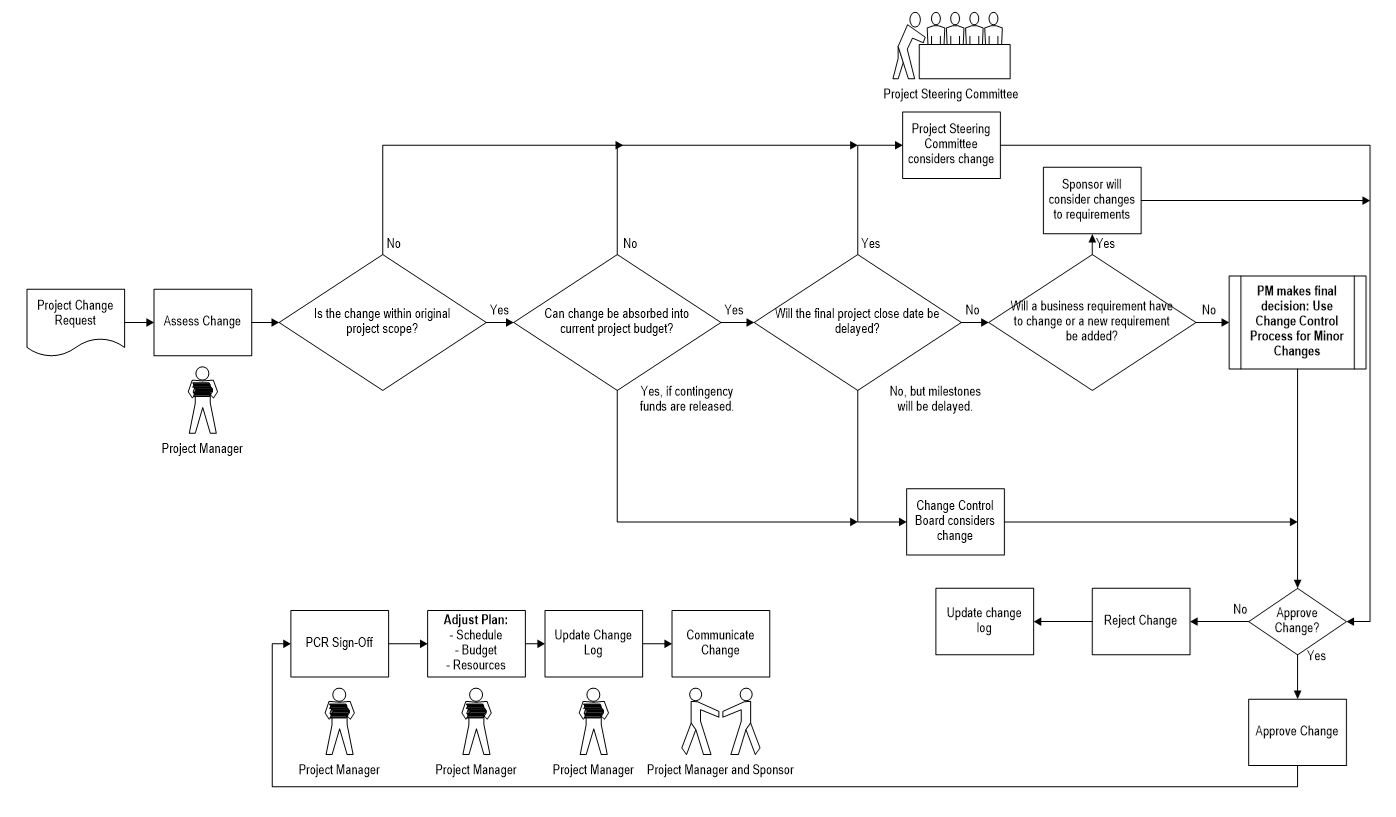
Build guidelines for escalating changes
4.1.2 – 1 hour
Input
- Current change control process
Output
- Updated change control process
Materials
Participants
Determine how changes will be escalated for level 1/2/3/4 projects.
- Write down the escalation options for level 3 & 4 projects on the whiteboard:
- Final decision rests with project manager.
- Escalate to sponsor.
- Escalate to project steering committee.
- Escalate to change control board.
- Brainstorm categories for assessing the impact of a change and begin creating a chart on the whiteboard by listing these categories in the far left column. Across the top, list the escalation options for level 3 & 4 projects.
- Ask the team to agree on escalation conditions for each escalation option. For example, for the final decision to rest with the project manager one condition might be:
- Change is within original project scope.
- Review the output from exercise 4.1.1 and tailor the process model to meet level 3 & 4 escalation models.
- Repeat steps 1-4 for level 1 & 2 projects.
Document any changes from this exercise in section 7.2 of the Requirements Gathering SOP and BA Playbook.
Example: Change control process – Level 3 & 4
| Impact Category
|
Final Decision Rests With Project Manager If:
|
Escalate to Steering Committee If:
|
Escalate to Change Control Board If:
|
Escalate to Sponsor If:
|
| Scope
|
- Change is within original project scope.
|
|
|
|
| Budget
|
- Change can be absorbed into current project budget.
|
- Change will require additional funds exceeding any contingency reserves.
|
- Change will require the release of contingency reserves.
|
|
| Schedule
|
- Change can be absorbed into current project schedule.
|
- Change will require the final project close date to be delayed.
|
- Change will require a delay in key milestone dates.
|
|
| Requirements
|
- Change can be linked to an existing business requirement.
|
|
|
- Change will require a change to business requirements, or a new business requirement.
|
Example: Change control process – Level 1 & 2
| Impact Category | Final Decision Rests With Project Manager If: | Escalate to Steering Committee If: | Escalate to Sponsor If: |
|---|
| Scope |
- Change is within original project scope.
| | |
| Budget |
- Change can be absorbed into current project budget, even if this means releasing contingency funds.
|
- Change will require additional funds exceeding any contingency reserves.
| |
| Schedule |
- Change can be absorbed into current project schedule, even if this means moving milestone dates.
|
- Change will require the final project close date to be delayed.
| |
| Requirements |
- Change can be linked to an existing business requirement.
| |
- Change will require a change to business requirements, or a new business requirement.
|
Leverage Info-Tech’s Requirements Traceability Matrix to help create end-to-end traceability of your requirements
4.1 Requirements Traceability Matrix
Even if you’re not using a dedicated requirements management suite, you still need a way to trace requirements from inception to closure.
- Ensuring traceability of requirements is key. If you don’t have a dedicated suite, Info-Tech’s Requirements Traceability Matrix can be used as a form of documentation.
- The traceability matrix covers:
- Association ID
- Technical Assumptions and Needs
- Functional Requirement
- Status
- Architectural Documentation
- Software Modules
- Test Case Number
Info-Tech Deliverable
Take advantage of Info-Tech’s Requirements Traceability Matrix to track requirements from inception through to testing.
You can’t fully validate what you don’t test; link your requirements management back to your test strategy
Create a repository to store requirements for reuse on future projects.
- Reuse previously documented requirements on future projects to save the organization time, money, and grief. Well-documented requirements discovered early can even be reused in the same project.
- If every module of the application must be able to save or print, then the requirement only needs to be written once. The key is to be able to identify and isolate requirements with a high likelihood of reuse. Typically, requirements pertaining to regulatory and business rule compliance are prime candidates for reuse.
- Build and share a repository to store historical requirement documentation. The repository must be intuitive and easy to navigate, or users will not take advantage of it. Plan the information hierarchy in advance. Requirements management software suites have the ability to create a repository and easily migrate requirements over from past projects.
- Assign one person to manage the repository to create consistency and accountability. This person will maintain the master requirements document and ensure the changes that take place during development are reflected in the requirements.
Confirm your requirements gathering process
4.1.3 – 45 minutes
Input
Output
- Requirements gathering process model
Materials
Participants
Review the requirements gathering process and control levels for project levels 1/2/3/4 and add as much detail as possible to each process.
- Draw out the requirements gathering process for a level 4 project as created in exercise 1.2.4 on a whiteboard.
- Review each process step as a group, and break down each step so that it is at its most granular. Be sure to include each decision point, key documentation, and approvals.
- Once complete, review the process for level 3, 2 & 1. Reduce steps as necessary. Note: there may not be a lot of differentiation between your project level 4 & 3 or level 2 & 1 processes. You should see differentiation in your process between 2 and 3.
Document the output from this exercise in section 2.4 of the Requirements Gathering SOP and BA Playbook.
Example: Confirm your requirements gathering
process
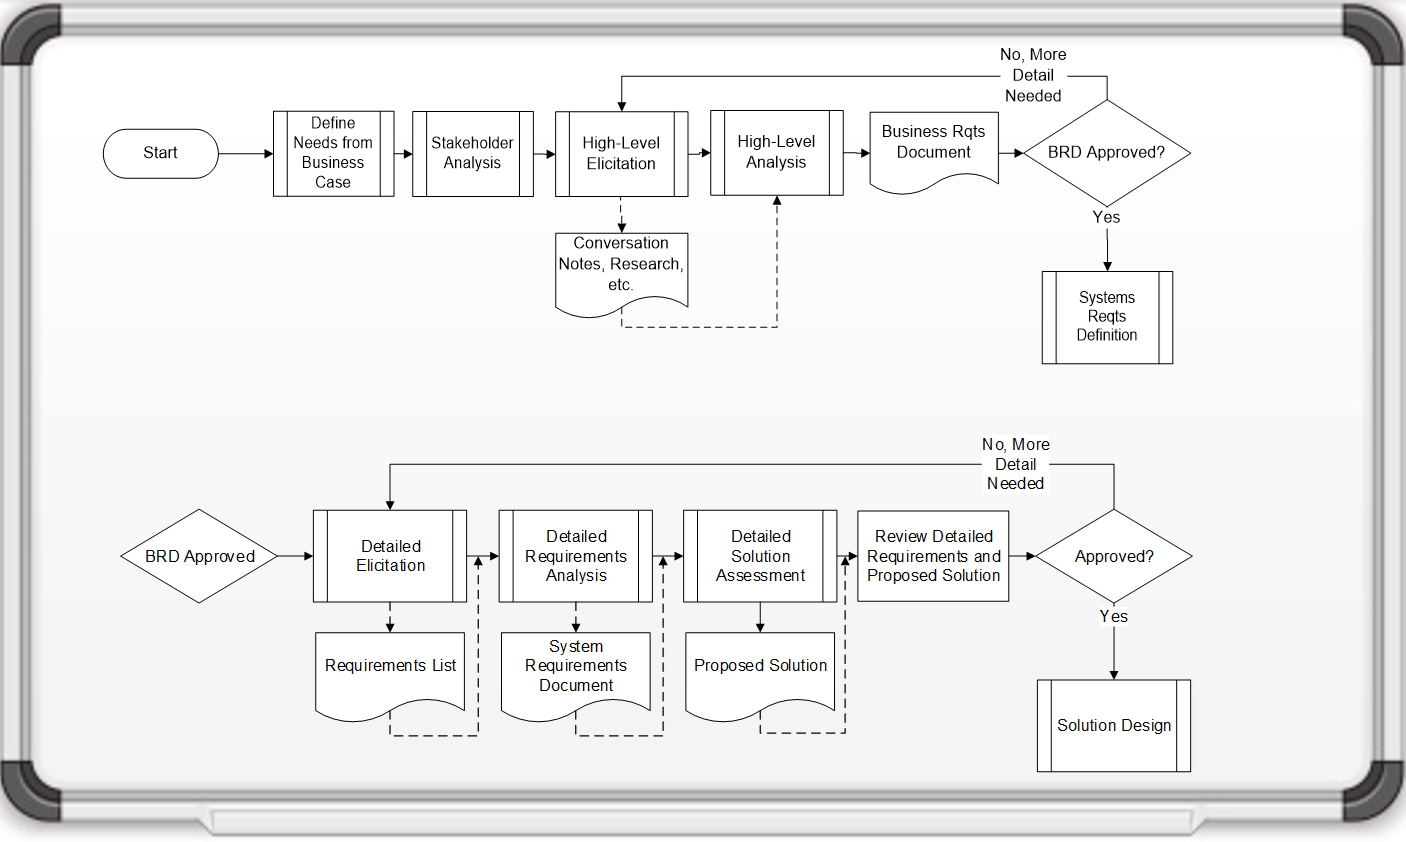
Define RACI for the requirements gathering process
4.1.4 – 45 minutes
Input
Output
Materials
Participants
Understand who is responsible, accountable, consulted, and informed for key elements of the requirements gathering process for project levels 1/2/3/4.
- As a group, identify the key stakeholders for requirements gathering and place those names along the top of the board.
- On the left side of the board, list the process steps and control points for a level 4 project.
- For each process step, identify who is responsible, accountable, informed, and consulted.
- Repeat this process for project levels 3, 2 & 1.
Example: RACI for requirements gathering
|
|
Project Requestor
|
Project Sponsor
|
Customers
|
Suppliers
|
Subject Matter Experts
|
Vendors
|
Executives
|
Project Management
|
IT Management
|
Developer/ Business Analyst
|
Network Services
|
Support
|
| Intake Form
|
A
|
C
|
|
|
C
|
|
|
|
I
|
R
|
|
|
| High-Level Business Case
|
R
|
A
|
C
|
C
|
C
|
C
|
I
|
|
I
|
C
|
|
|
| Project Classification
|
I
|
I
|
|
|
|
C
|
I
|
R
|
A
|
R
|
|
|
| Project Approval
|
R
|
R
|
I
|
I
|
I
|
I
|
I
|
I
|
A
|
I
|
I
|
|
| Project Charter
|
R
|
C
|
R
|
R
|
C
|
R
|
I
|
A
|
I
|
R
|
C
|
C
|
| Develop BRD
|
R
|
I
|
R
|
C
|
C
|
C
|
|
R
|
|
A
|
C
|
C
|
| Sign-Off on BRD/ Project Charter
|
R
|
A
|
R
|
|
|
|
|
R
|
R
|
R
|
|
|
| Develop System Requirements
|
C
|
|
C
|
|
C
|
R
|
|
I
|
C
|
A
|
R
|
R
|
| Sign-Off on SRD
|
R
|
R
|
|
|
|
|
|
R
|
I
|
A
|
R
|
R
|
| Testing/Validation
|
A
|
I
|
R
|
C
|
R
|
C
|
|
R
|
I
|
R
|
R
|
|
| Change Requests
|
R
|
R
|
C
|
|
C
|
|
|
A
|
I
|
R
|
C
|
|
| Sign-Off on Change Request
|
R
|
A
|
R
|
|
|
|
|
R
|
R
|
R
|
|
|
| Final Acceptance
|
R
|
A
|
R
|
I
|
I
|
I
|
I
|
R
|
R
|
R
|
I
|
I
|
If you want additional support, have our analysts guide you through this phase as part of an Info-Tech workshop
Book a workshop with our Info-Tech analysts:
4.1.1; 4.1.2 Develop a change control process and guidelines for escalating changes
An analyst will facilitate the discussion on how to improve upon your organization’s change control processes and how changes will be escalated to ensure effective tracking and management of changes.
4.1.3 Confirm your requirements gathering process
With the group, an analyst will review the requirements gathering process and control levels for the different project levels.
4.1.4 Define the RACI for the requirements gathering process
An analyst will facilitate a whiteboard exercise to understand who is responsible, accountable, informed, and consulted for key elements of the requirements gathering process.
Step 4.2: Build Requirements Governance and Communication Plan
Phase 1
1.1 Understand the Benefits of Requirements Optimization
1.2 Determine Your Target State for Requirements Gathering
Phase 2
2.1 Determine Elicitation Techniques
2.2 Structure Elicitation Output
Phase 3
3.1 Create Analysis Framework
3.2 Validate Business Requirements
Phase 4
4.1 Create Control Processes for Requirements Changes
4.2 Build Requirements Governance and Communication Plan
This step will walk you through the following activities:
- Developing a requirements gathering steering committee.
- Identifying and analyzing stakeholders for requirements governance.
- Creating a communication management plan.
This step involves the following participants:
- Business stakeholders
- BAs
Outcomes of this step
- Requirements governance framework.
- Communication management plan.
Establish proper governance for requirements gathering that effectively creates and communicates guiding principles
If appropriate governance oversight doesn’t exist to create and enforce operating procedures, analysts and developers will run amok with their own processes.
- One of the best ways to properly govern your requirements gathering process is to establish a working committee within the framework of your existing IT steering committee. This working group should be given the responsibility of policy formulation and oversight for requirements gathering operating procedures. The governance group should be comprised of both business and IT sponsors (e.g. a director, BA, and “voice of the business” line manager).
- The governance team will not actually be executing the requirements gathering process, but it will be deciding upon which policies to adopt for elicitation, analysis, and validation. The team will also be responsible for ensuring – either directly or indirectly through designated managers – that BAs or other requirements gathering processionals are following the approved steps.
Requirements Governance Responsibilities
1. Provide oversight and review of SOPs pertaining to requirements elicitation, analysis, and validation.
2. Establish corporate policies with respect to requirements gathering SOP training and education of analysts.
3. Prioritize efforts for requirements optimization.
4. Determine and track metrics that will be used to gauge the success (or failure) of requirements optimization efforts and make process and policy changes as needed.
Right-size your governance structure to your organization’s complexity and breadth of capabilities
Not all organizations will be best served by a formal steering committee for requirements gathering. Assess the complexity of your projects and the number of requirements gathering practitioners to match the right governance structure.
Level 1: Working Committee
- A working committee is convened temporarily as required to do periodic reviews of the requirements process (often annually, or when issues are surfaced by practitioners). This governance mechanism works best in small organizations with an ad hoc culture, low complexity projects, and a small number of practitioners.
Level 2: IT Steering Committee Sub-Group
- For organizations that already have a formal IT steering committee, a sub-group dedicated to managing the requirements gathering process is desirable to a full committee if most projects are complexity level 1 or 2, and/or there are fewer than ten requirements gathering practitioners.
Level 3: Requirements Gathering Steering Committee
- If your requirements gathering process has more than ten practitioners and routinely deals with high-complexity projects (like ERP or CRM), a standing formal committee responsible for oversight of SOPs will provide stronger governance than the first two options.
Level 4: Requirements Gathering Center of Excellence
- For large organizations with multiple business units, matrix organizations for BAs, and a very large number of requirements gathering practitioners, a formal center of excellence can provide both governance as well as onboarding and training for requirements gathering.
Identify and analyze stakeholders
4.2.1A – 1 hour
Input
- Number of practitioners, project complexity levels
Output
- Governance structure selection
Materials
Participants
Use a power map to determine which governance model best fits your organization.
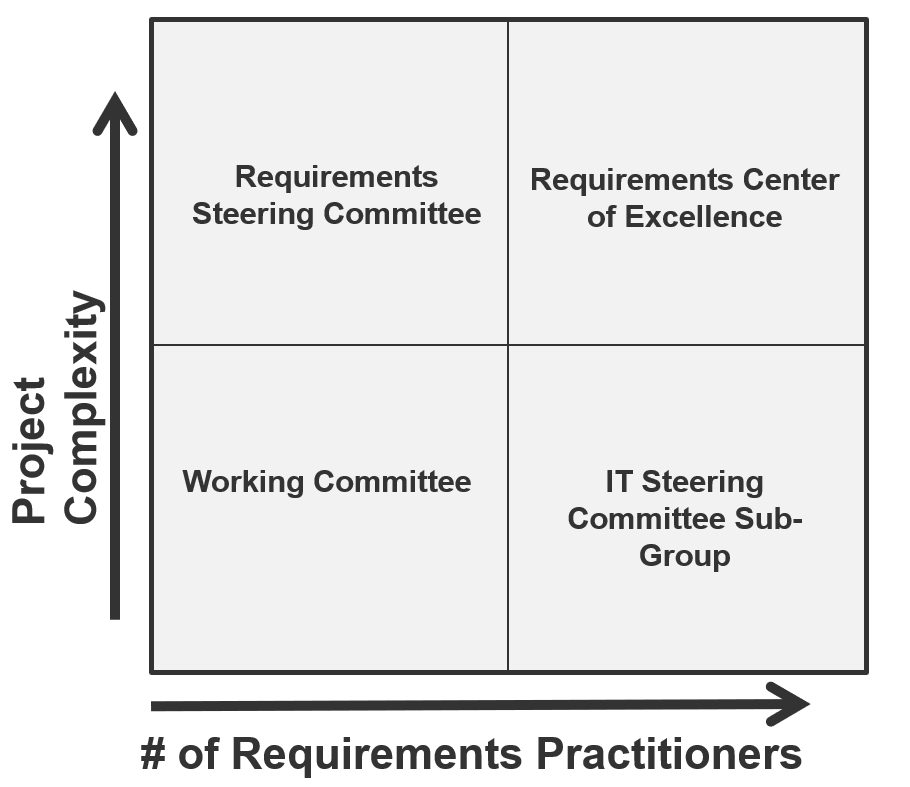
Define your requirements gathering governance structure(s) and purpose
4.2.1B – 30 minutes
Input
- Requirements gathering elicitation, analysis, and validation policies
Output
Materials
Participants
This exercise will help to define the purpose statement for the applicable requirements gathering governance team.
- As a group, brainstorm key words that describe the unique role the governance team will play. Consider value, decisions, and authority.
- Using the themes, come up with a set of statements that describe the overall purpose statement.
- Document the outcome for the final deliverable.
Example:
The requirements gathering governance team oversees the procedures that are employed by BAs and other requirements gathering practitioners for [insert company name]. Members of the team are appointed by [insert role] and are accountable to [typically the chair of the committee].
Day-to-day operations of the requirements gathering team are expected to be at the practitioner (i.e. BA) level. The team is not responsible for conducting elicitation on its own, although members of the team may be involved from a project perspective.
Document the output from this exercise in section 3.1 of the Requirements Gathering SOP and BA Playbook.
A benefits provider established a steering committee to provide consistency and standardization in requirements gathering
CASE STUDY
Industry Not-for-Profit
Source Info-Tech Workshop
Challenge
This organization is a not-for-profit benefits provider that offers dental coverage to more than 1.5 million people across three states.
With a wide ranging application portfolio that includes in-house, custom developed applications as well as commercial off-the-shelf solutions, the company had no consistent method of gathering requirements.
Solution
The organization contracted Info-Tech to help build an SOP to put in place a rigorous and efficient methodology for requirements elicitation, analysis, and validation.
One of the key realizations in the workshop was the need for governance and oversight over the requirements gathering process. As a result, the organization developed a Requirements Management Steering Committee to provide strategic oversight and governance over requirements gathering processes.
Results
The Requirements Management Steering Committee introduced accountability and oversight into the procedures that are employed by BAs. The Committee’s mandate included:
- Provide oversight and review SOPs pertaining to requirements elicitation, analysis, and validation.
- Establish corporate policies with respect to training and education of analysts on requirements gathering SOPs.
- Prioritize efforts for requirements optimization.
- Determine metrics that can be used to gauge the success of requirements optimization efforts.
Authority matrix – RACI
There needs to be a clear understanding of who is accountable, responsible, consulted, and informed about matters brought to the attention of the requirements gathering governance team.
- An authority matrix is often used within organizations to indicate roles and responsibilities in relation to processes and activities.
- Using the RACI model as an example, there is only one person accountable for an activity, although several people may be responsible for executing parts of the activity.
- In this model, accountable means end-to-end accountability for the process. Accountability should remain with the same person for all activities of a process.
R – Responsible
The one responsible for getting the job done.
A – Accountable
Only one person can be accountable for each task.
C – Consulted
Involvement through input of knowledge and information.
I – Informed
Receiving information about process execution and quality.
Define the RACI for effective requirements gathering governance
4.2.2 – 30 minutes
Input
Output
Materials
- Whiteboard
- Markers
- Sticky notes
Participants
Build the participation list and authority matrix for the requirements gathering governance team.
- Have each participant individually consider the responsibilities of the governance team, and write five participant roles they believe should be members of the governance team.
- Have each participant place the roles on the whiteboard, group participants, and agree to five participants who should be members.
- On the whiteboard, write the responsibilities of the governance team in a column on the left, and place the sticky notes of the participant roles along the top of the board.
- Under the appropriate column for each activity, identify who is the “accountable,” “responsible,” “consulted,” and “informed” role for each activity.
- Agree to a governance chair.
Document any changes from this exercise in section 3.1 of the Requirements Gathering SOP and BA Playbook.
Example: Steps 2-5: Build the governance RACI
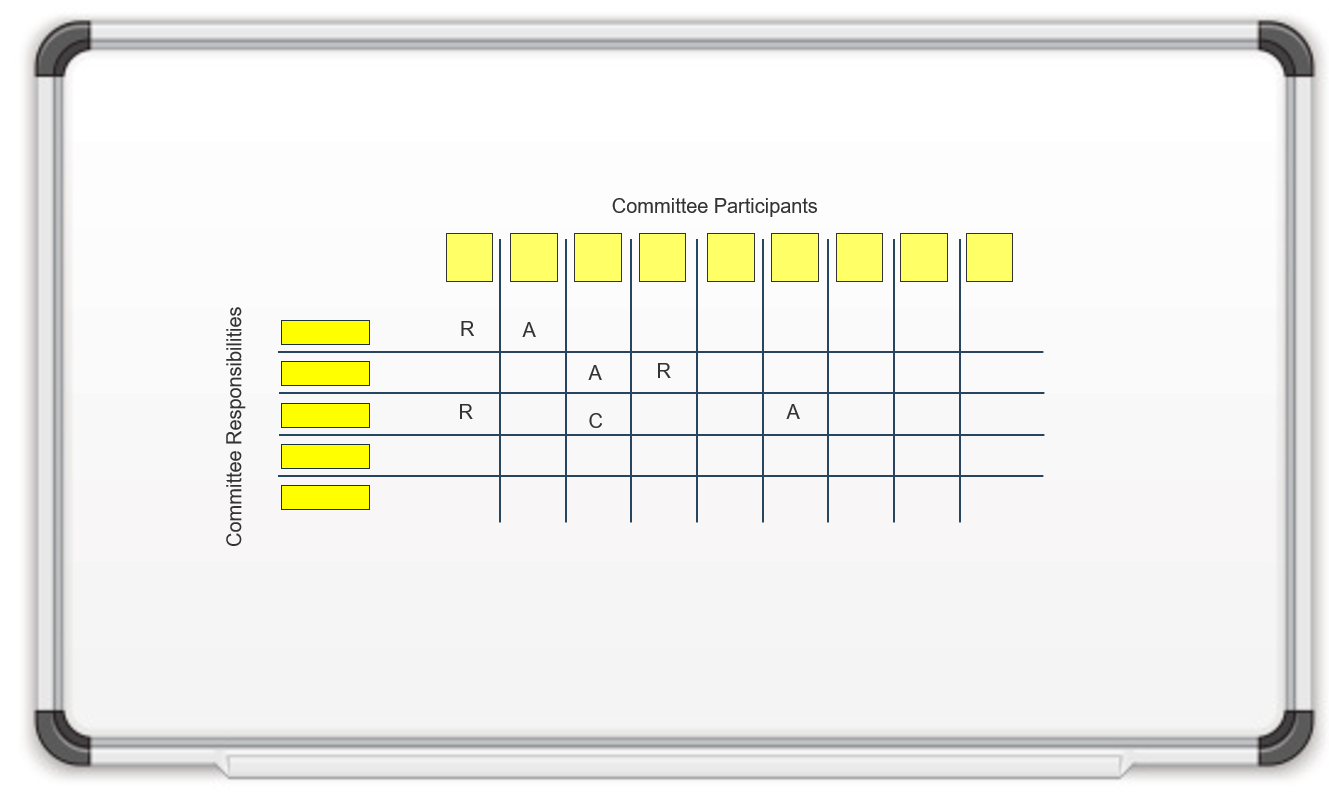
Define your requirements gathering governance team procedures, cadence, and agenda
4.2.3 – 30 minutes
Input
- Governance responsibilities
Output
- Governance procedures and agenda
Materials
Participants
- Steering committee members
Define your governance team procedures, cadence, and agenda.
- Review the format of a typical agenda as well as the list of responsibilities for the governance team.
- Consider how you will address each of these responsibilities in the meeting, who needs to present, and how long each presentation should be.
- Add up the times to define the meeting duration.
- Consider how often you need to meet to discuss the information: monthly, quarterly, or annually? Are there different actions that need to be taken at different points in the year?
- As a group, decide how the governance team will approve changes and document any voting standards that should be included in the charter. Will a vote be taken during or prior to the meeting? Who will have the authority to break a tie?
- As a group, decide how the committee will review information and documentation. Will members commit to reviewing associated documents before the meeting? Can associated documentation be stored in a knowledge repository and/or be distributed to members prior to the meeting? Who will be responsible for this? Can a short meeting/conference call be held with relevant reviewers to discuss documentation before the official committee meeting?
Review the format of a typical agenda
4.2.3 – 30 minutes
| Meeting call to order
|
[Committee Chair]
|
[Time]
|
| Roll call
|
[Committee Chair]
|
[Time]
|
| Review of SOPs
|
|
|
| A. Requirements gathering dashboard review
|
[Presenters, department]
|
[Time]
|
| B. Review targets
|
[Presenters, department]
|
[Time]
|
| C. Policy Review
|
[Presenters, department]
|
[Time]
|
Define the governance procedures and cadence
4.2.3 – 30 minutes
- The governance team or committee will be chaired by [insert role].
- The team shall meet on a [insert time frame (e.g. monthly, semi-annual, annual)] basis. These meetings will be scheduled by the team or committee chair or designated proxy.
- Approval for all SOP changes will be reached through a [insert vote consensus criteria (majority, uncontested, etc.)] vote of the governance team. The vote will be administered by the governance chair. Each member of the committee shall be entitled to one vote, excepting [insert exceptions].
- The governance team has the authority to reject any requirements gathering proposal which it deems not to have made a sufficient case or which does not significantly contribute to the strategic objectives of [insert company name].
- [Name of individual] will record and distribute the meeting minutes and documentation of business to be discussed in the meeting.
Document any changes from this exercise in section 3.1 of the Requirements Gathering SOP and BA Playbook.
Changing the requirements gathering process can be disruptive – be successful by gaining business support
A successful communication plan involves making the initiative visible and creating staff awareness around it. Educate the organization on how the requirements gathering process will differ.
People can be adverse to change and may be unreceptive to being told they must “comply” to new policies and procedures. Demonstrate the value in requirements gathering and show how it will assist people in their day-to-day activities.
By demonstrating how an improved requirements gathering process will impact staff directly, you create a deeper level of understanding across lines-of-business, and ultimately a higher level of acceptance for new processes, rules, and guidelines.
A proactive communication plan will:
- Assist in overcoming issues with prioritization, alignment resourcing, and staff resistance.
- Provide a formalized process for implementing new policies, rules, and guidelines.
- Detail requirements gathering ownership and accountability for the entirety of the process.
- Encourage acceptance and support of the initiative.
Identify and analyze stakeholders to communicate the change process
Who are the requirements gathering stakeholders?
Stakeholder:
- A stakeholder is any person, group, or organization who is the end user, owner, sponsor, or consumer of an IT project, change, or application.
- When assessing an individual or group, ask whether they can impact or be impacted by any decision, change, or activity executed as part of the project. This might include individuals outside of the organization.
Key Stakeholder:
- Someone in a management role or someone with decision-making power who will be able to influence requirements and/or be impacted by project outcomes.
User Group Representatives:
- For impacted user groups, follow best practice and engage an individual to act as a representative. This individual will become the primary point of contact when making decisions that impact the group.
Identify the reasons for resistance to change
Stakeholders may resist change for a variety of reasons, and different strategies are necessary to address each.
Unwilling – Individuals who are unwilling to change may need additional encouragement. For these individuals, you’ll need to reframe the situation and emphasize how the change will benefit them specifically.
Unable – All involved requirements gathering will need some form of training on the process, committee roles, and responsibilities. Be sure to have training and support available for employees who need it and communicate this to staff.
Unaware – Until people understand exactly what is going on, they will not be able to conform to the process. Communicate change regularly at the appropriate detail to encourage stakeholder support.
Info-Tech Insight
Resisters who have influence present a high risk to the implementation as they may encourage others to resist as well. Know where and why each stakeholder is likely to resist to mitigate risk. A detailed plan will ensure you have the needed documentation and communications to successfully manage stakeholder resistance.
Identify and analyze stakeholders
4.2.4 – 1 hour
Input
- Requirements gathering stakeholders list
Output
Materials
- Whiteboard
- Markers
- Sticky notes
Participants
Identify the impact and level of resistance of all stakeholders to come up with the right communication plan.
- Through discussion, generate a complete list of stakeholders for requirements gathering and record the names on the whiteboard or flip chart. Group related stakeholders together.
- Using the template on the next slide, draw the stakeholder power map.
- Evaluate each stakeholder on the list based on:
- Influence: To what degree can this stakeholder impact progress?
- Involvement: How involved is the stakeholder already?
- Support: Label supporters with green sticky notes, resisters with red notes, and the rest with a third color.
- Based on the assessment, write the stakeholder’s name on a green, red, or other colored sticky note, and place the sticky note in the appropriate place on the power map.
- For each of the stakeholders identified as resisters, determine
why you think they would be resistant. Is it because they are
unwilling, unable, and/or unknowing?
- Document changes to the stakeholder analysis in the Requirements Gathering Communication Tracking Template.
Identify and analyze stakeholders
4.2.4 – 1 hour
Use a power map to plot key stakeholders according to influence and involvement.
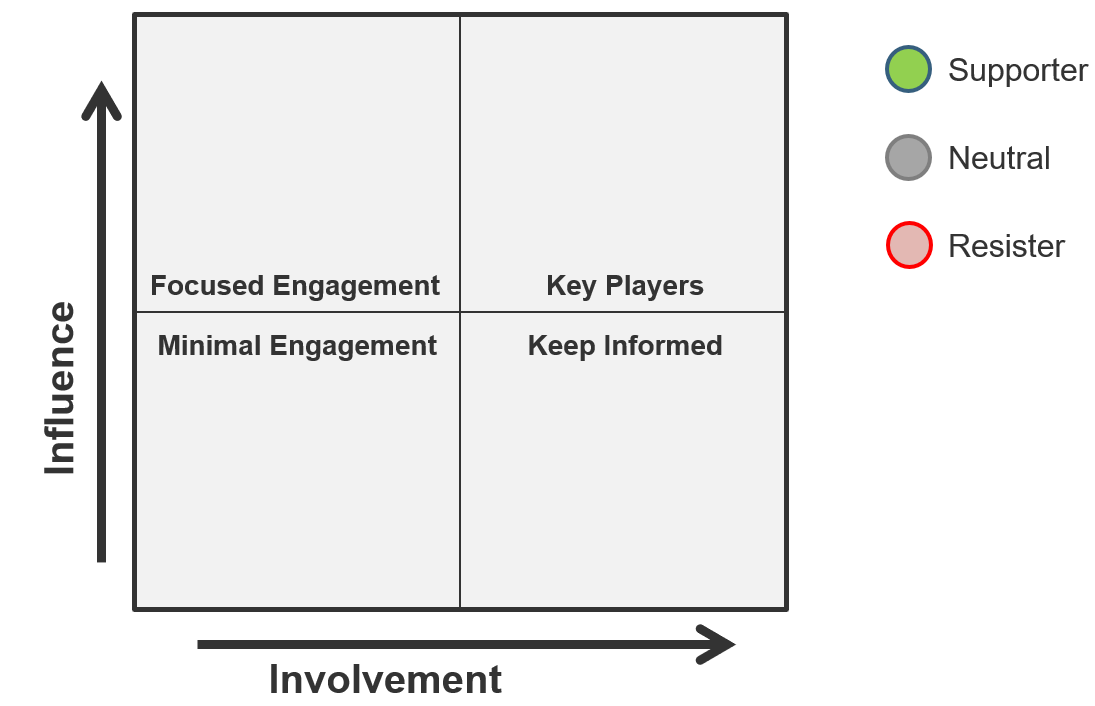
Example: Identify and analyze stakeholders
Use a power map to plot key stakeholders according to influence and involvement.
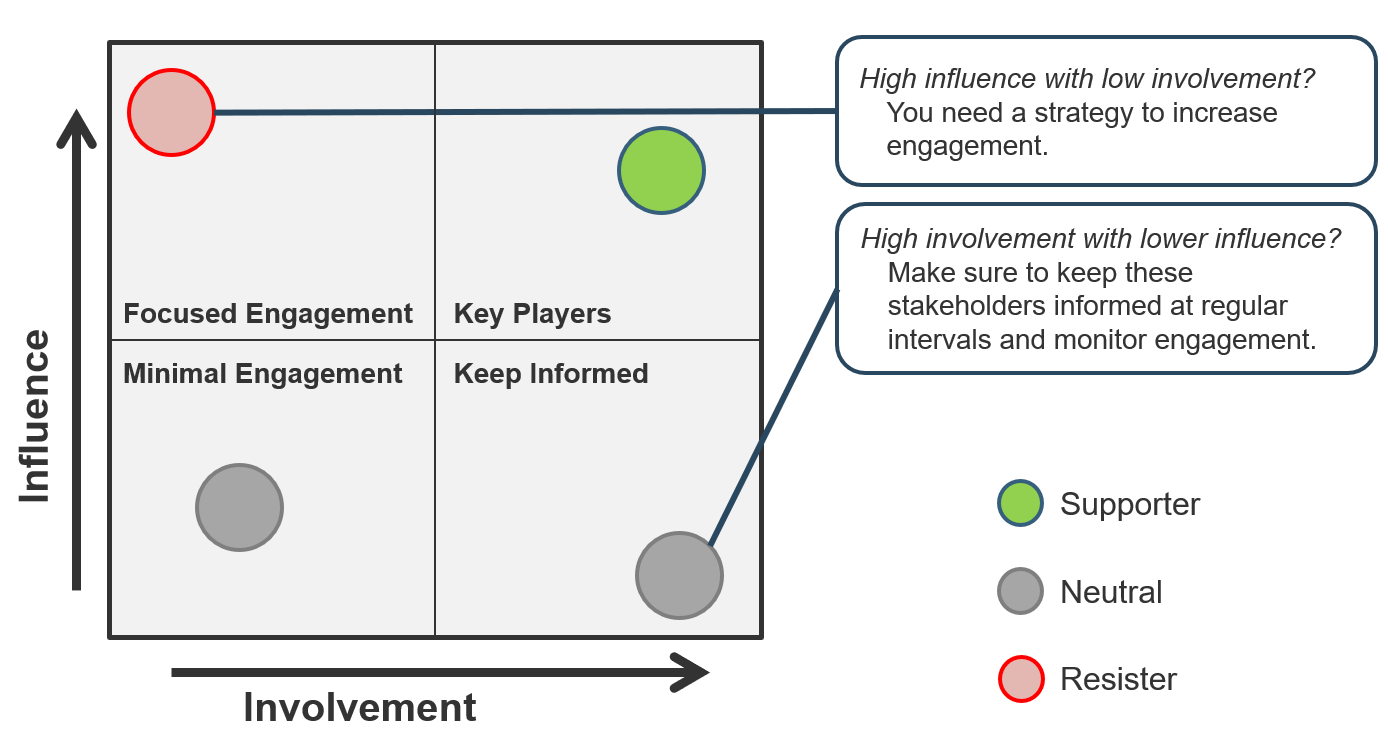
Stakeholder analysis: Reading the power map
High Risk:
Stakeholders with high influence who are not as involved in the project or are heavily impacted by the project are less likely to give feedback throughout the project lifecycle and need to be engaged. They are not as involved but have the ability to impact project success, so stay one step ahead.
Do not limit your engagement to kick-off and close – you need to continue seeking input and support at all stages of the project.
Mid Risk:
Key players have high influence, but they are also more involved with the project or impacted by its outcomes and are thus easier to engage.
Stakeholders who are heavily impacted by project outcomes will be essential to your organizational change management strategy. Do not wait until implementation to engage them in preparing the organization to accept the project – make them change champions.
Low Risk:
Stakeholders with low influence who are not impacted by the project do not pose as great of a risk, but you need to keep them consistently informed of the project and involve them at the appropriate control points to collect feedback and approval.
Inputs to the communications plan
Stakeholder analysis should drive communications planning.
Identify Stakeholders
- Who is impacted by this project?
- Who can affect project outcomes?
Assess Stakeholders
- Influence
- Involvement
- Support
Stakeholder Change Impact Assessment
- Identify change supporters/resistors and craft change messages to foster acceptance.
Stakeholder Register
- Record assessment results and preferred methods of communication.
The Communications Management Plan:
- Who will receive information?
- What information will be distributed?
- How will information be distributed?
- What is the frequency of communication?
- What will the level of detail be?
- Who is responsible for distributing information?
Communicate the reason for the change and stay on message throughout the change
Leaders of successful change spend considerable time developing a powerful change message: a compelling narrative that articulates the desired end state and makes the change concrete and meaningful to staff. They create the change vision with staff to build ownership and commitment.
The change message should:
- Explain why the change is needed.
- Summarize the things that will stay the same.
- Highlight the things that will be left behind.
- Emphasize the things that are being changed.
- Explain how the change will be implemented.
- Address how the change will affect the various roles in the organization.
- Discuss staff’s role in making the change successful.
The five elements of communicating the reason for the change:
COMMUNICATING THE CHANGE
What is the change?
Why are we doing it?
How are we going to go about it?
How long will it take us?
What will the role be for each department and individual?
Create a communications management plan
4.2.5 – 45 minutes
Input
Output
- Communications management plan
Materials
Participants
Build the communications management plan around your stakeholders’ needs.
- Build a chart on the board using the template on the next slide.
- Using the list from exercise 4.1.1, brainstorm a list of communication vehicles that will need to be used as part of the rollout plan (e.g. status updates, training).
- Through group discussion, fill in all these columns for at least three communication vehicles:
- (Target) audience
- Purpose (description)
- Frequency (of the communication)
- The method, frequency, and content of communication vehicles will change depending on the stakeholder involved. This needs to be reflected by your plan. For example, you may have several rows for “Status Report” to cover the different stakeholders who will be receiving it.
- Owner (of the message)
- Distribution (method)
- (Level of) details
- High/medium/low + headings
- Document your stakeholder analysis in the Requirements Gathering Communication Tracking Template.
Communications plan template
4.2.5 – 45 minutes
Sample communications plan: Status reports
| Vehicle
|
Audience
|
Purpose
|
Frequency
|
Owner
|
Distribution
|
Level of Detail
|
|
|
|
|
|
|
|
|
|
|
|
|
|
|
|
|
|
|
|
|
|
|
|
|
Communications Guidelines
- Regardless of complexity, it is important not to overwhelm stakeholders with information that is not relevant to them. Sending more detailed information than is necessary might mean that it does not get read.
- Distributing reports too widely may lead to people assuming that someone else is reading it, causing them to neglect reading it themselves.
- Only distribute reports to the stakeholders who need the information. Think about what information that stakeholder requires to feel comfortable.
Example: Identify and analyze stakeholders
Sample communications plan: Status reports
| Vehicle
|
Audience
|
Purpose
|
Frequency
|
Owner
|
Distribution
|
Level of Detail
|
| Status Report
|
Sponsor
|
Project progress and deliverable status
|
Weekly
|
Project Manager
|
Email
|
Details for
- Milestones
- Deliverables
- Budget
- Schedule
- Issues
|
| Status Report
|
Line of Business VP
|
Project progress
|
Monthly
|
Project Manager
|
Email
|
High Level for
|
Build your requirements gathering process implementation timeline
4.2.6 – 45 minutes
Input
Output
Materials
- Whiteboard
- Markers
- Sticky notes
Participants
Build a high-level timeline for the implementation.
- Collect the action items identified throughout the week in the “parking lot.”
- Individually or in groups, brainstorm any additional action items. Consider communication, additional training required, approvals, etc.
- Write these on sticky notes and add them to the parking lot with the others.
- As a group, start organizing these notes into logical groupings.
- Assign each of the tasks to a person or group.
- Identify any risks or dependencies.
- Assign each of the tasks to a timeline.
- Following the exercise, the facilitator will convert this into a Gantt chart using the roadmap for requirements gathering action plan.
Step 3: Organize the action items into logical groupings
4.2.6 – 45 minutes
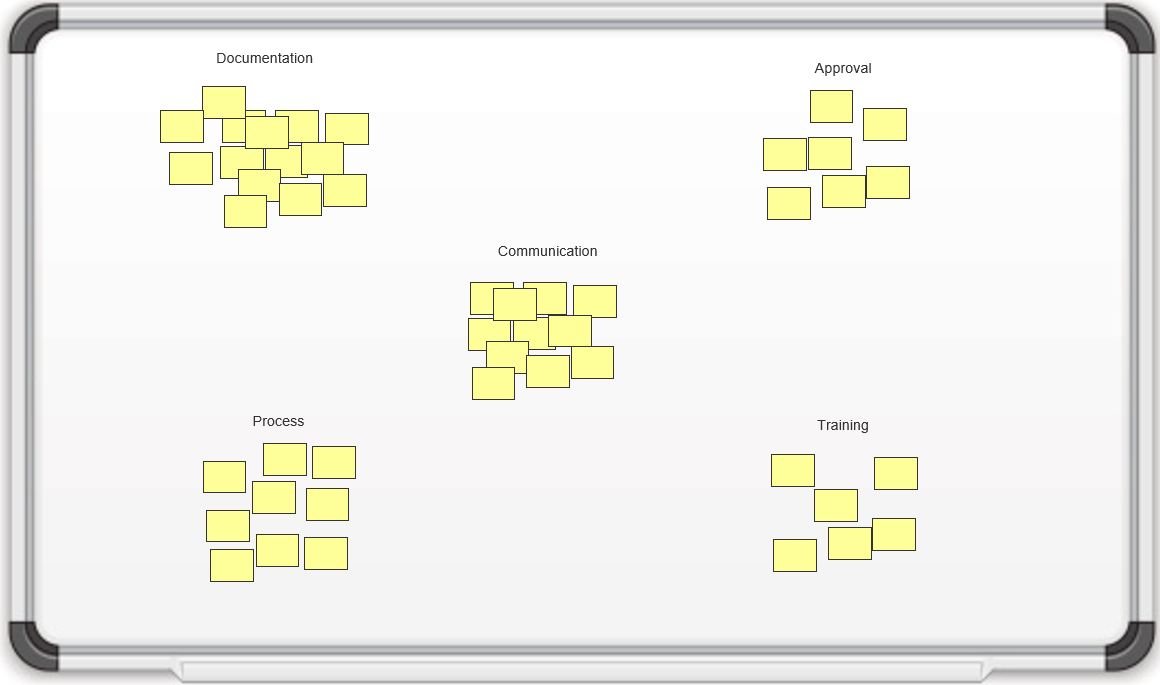
Steps 4-6: Organize the action items into logical groupings
4.2.6 – 45 minutes
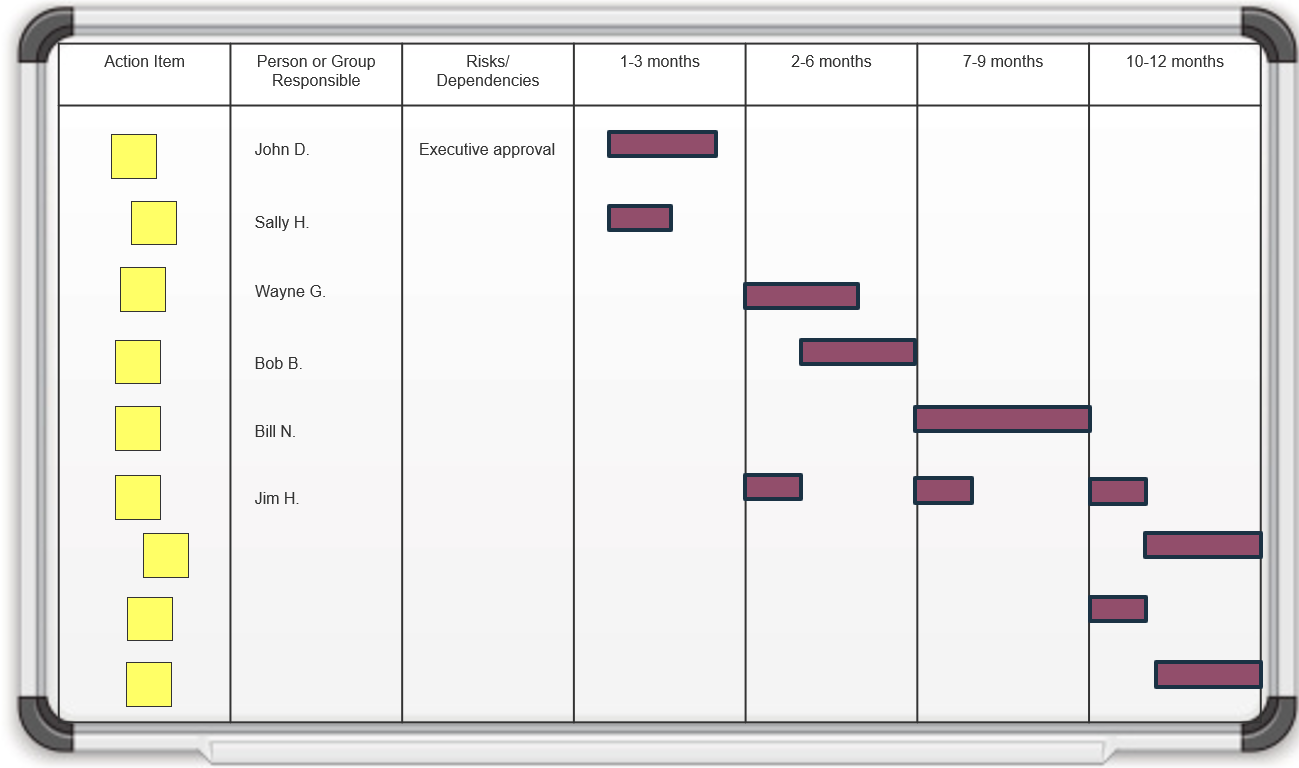
Recalculate the selected requirements gathering metrics
Measure and monitor the benefits of requirements gathering optimization.
- Reassess the list of selected and captured requirements management metrics.
- Recalculate the metrics and analyze any changes. Don’t expect a substantial result after the first attempt. It will take a while for BAs to adjust to the Info-Tech Requirements Gathering Framework. After the third project, results will begin to materialize.
- Understand that the project complexity and business significance will also affect how long it takes to see results. The ideal projects to beta the process on would be of low complexity and high business significance.
- Realize that poor requirements gathering can have negative effects on the morale of BAs, IT, and project managers. Don’t forget to capture the impact of these through surveys.
Major KPIs typically used for benchmarking include:
- Number of application bugs/defects (for internally developed applications).
- Number of support requests or help desk tickets for the application, controlled for user deployment levels.
- Overall project cycle time.
- Overall project cost.
- Requirements gathering as a percentage of project time.
Revisit the requirements gathering metrics selected in the planning phase and recalculate them after requirements gathering optimization has been attempted.
If you want additional support, have our analysts guide you through this phase as part of an Info-Tech workshop
Book a workshop with our Info-Tech analysts:
- To accelerate this project, engage your IT team in an Info-Tech workshop with an Info-Tech analyst team.
- Info-Tech analysts will join you and your team onsite at your location or welcome you to Info-Tech’s historic Toronto office to participate in an innovative onsite workshop.
-
Contact your account manager (www.infotech.com/account), or email Workshops@InfoTech.com for more information.
The following are sample activities that will be conducted by Info-Tech analysts with your team:
4.2.1; 4.2.2; 4.2.3 – Build a requirements gathering steering committee
The analyst will facilitate the discussion to define the purpose statement of the steering committee, build the participation list and authority matrix for its members, and define the procedures and agenda.
If you want additional support, have our analysts guide you through this phase as part of an Info-Tech workshop
Book a workshop with our Info-Tech analysts:
4.2.4 Identify and analyze stakeholders
An analyst will facilitate the discussion on how to identify the impact and level of resistance of all stakeholders to come up with the communication plan.
4.2.5 Create a communications management plan
An analyst will assist the team in building the communications management plan based on the stakeholders’ needs that were outlined in the stakeholder analysis exercise.
4.2.6 Build a requirements gathering implementation timeline
An analyst will facilitate a session to brainstorm and document any action items and build a high-level timeline for implementation.
Insight breakdown
Requirements gathering SOPs should be prescriptive based on project complexity.
- Complex projects will require more analytical rigor. Simpler projects can be served by more straightforward techniques such as user stories.
Requirements gathering management tools can be pricy, but they can also be beneficial.
- Requirements gathering management tools are a great way to have full control over recording, analyzing, and categorizing requirements over complex projects.
BAs can make or break the execution of the requirements gathering process.
- A strong process still needs to be executed well by BAs with the right blend of skills and knowledge.
Summary of accomplishment
Knowledge Gained
- Best practices for each stage of the requirements gathering framework:
- Elicitation
- Analysis
- Validation
- A clear understanding of BA competencies and skill sets necessary to successfully execute the requirements gathering process.
Processes Optimized
- Stakeholder identification and management.
- Requirements elicitation, analysis, and validation.
- Requirements gathering governance.
- Change control processes for new requirements.
- Communication processes for requirements gathering.
Deliverables Completed
- SOPs for requirements gathering.
- Project level selection framework.
- Communications framework for requirements gathering.
- Requirements documentation standards.
Organizations and experts who contributed to this research
Interviews
- Douglas Van Gelder, IT Manager, Community Development Commission of the County of Los Angeles
- Michael Lyons, Transit Management Analyst, Metropolitan Transit Authority
- Ken Piddington, CIO, MRE Consulting
- Thomas Dong, Enterprise Software Manager, City of Waterloo
- Chad Evans, Director of IT, Ontario Northland
- Three anonymous contributors
Note: This research also incorporates extensive insights and feedback from our advisory service and related research projects.
Bibliography
“10 Ways Requirements Can Sabotage Your Projects Right From the Start.” Blueprint Software Systems, 2012. Web.
“BPM Definition.” BPMInstitute.org, n.d. Web.
“Capturing the Value of Project Management.” PMI’s Pulse of the Profession, 2015. Web.
Eby, Kate. “Demystifying the 5 Phases of Project Management.” Smartsheet, 29 May 2019. Web.
“Product Management: MoSCoW Prioritization.” ProductPlan, n.d. Web.
“Projects Delivered on Time & on Budget Result in Larger Market Opportunities.” Jama Software, 2015. Web.
“SIPOC Table.” iSixSigma, n.d. Web.
“Survey Principles.” University of Wisconsin-Madison, n.d. Web.
“The Standish Group 2015 Chaos Report.” The Standish Group, 2015. Web.


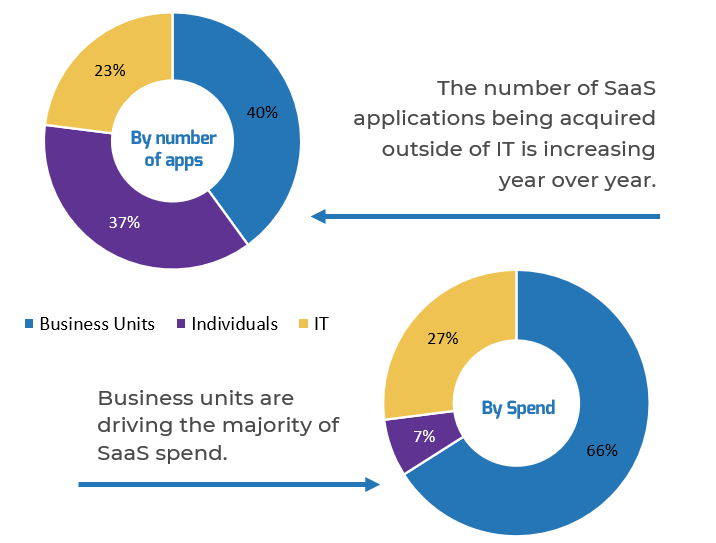
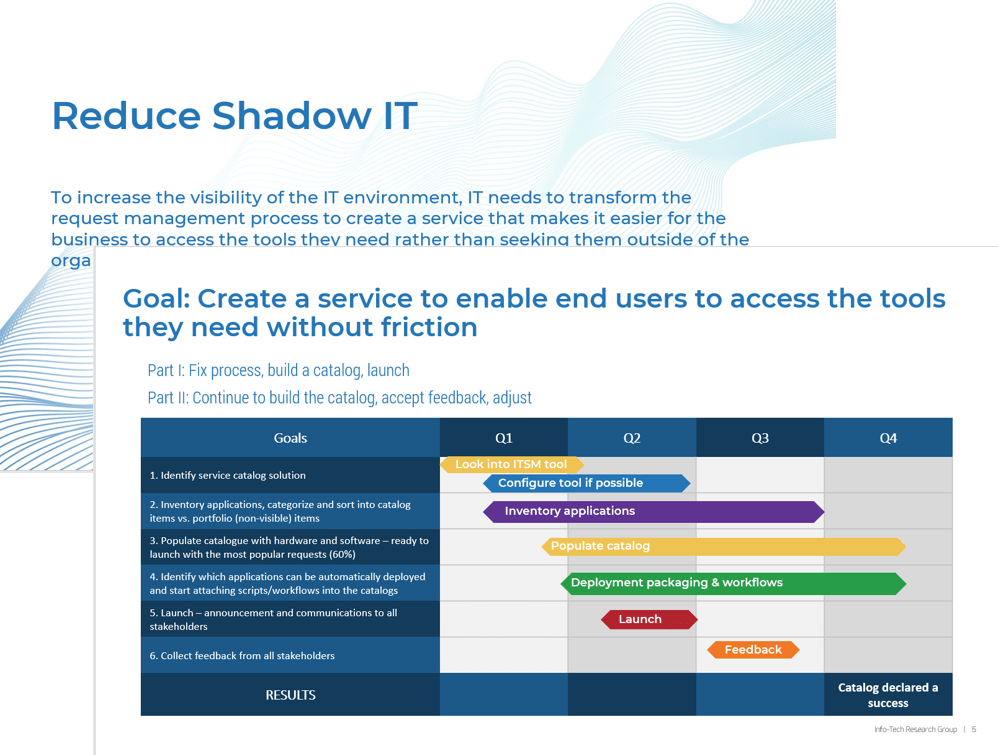
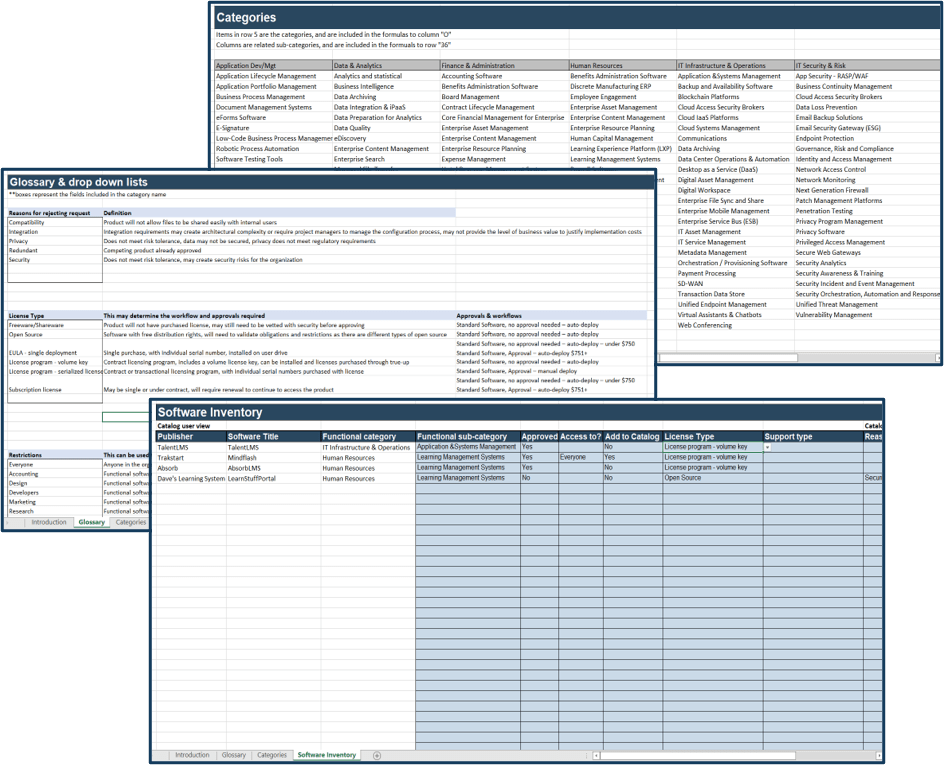
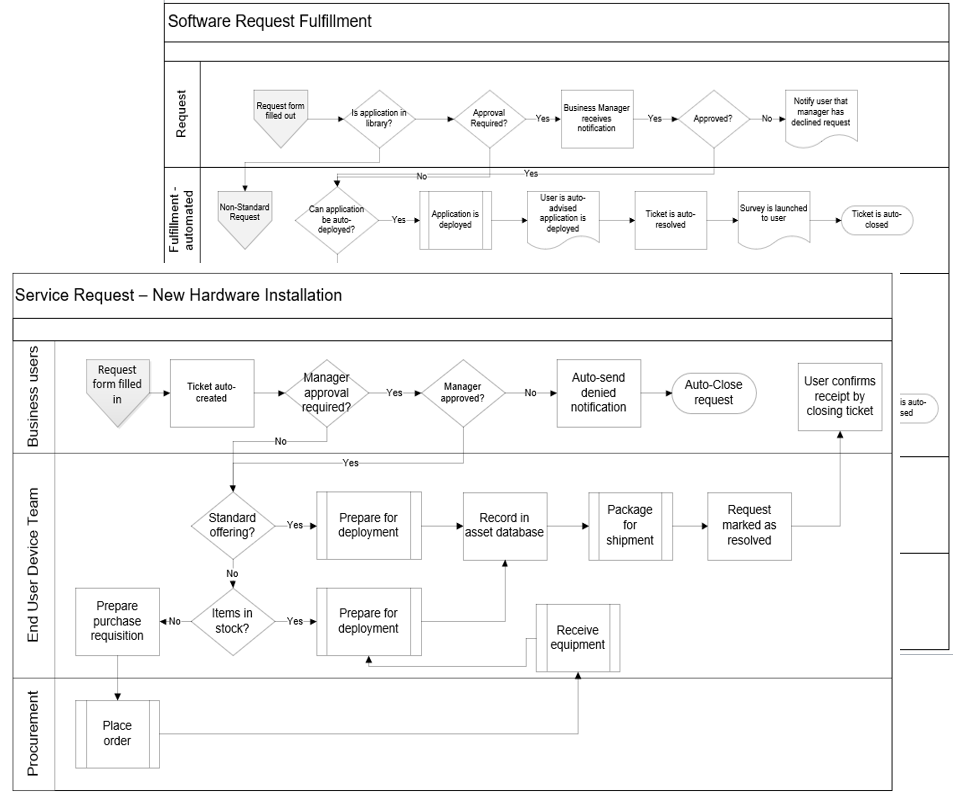
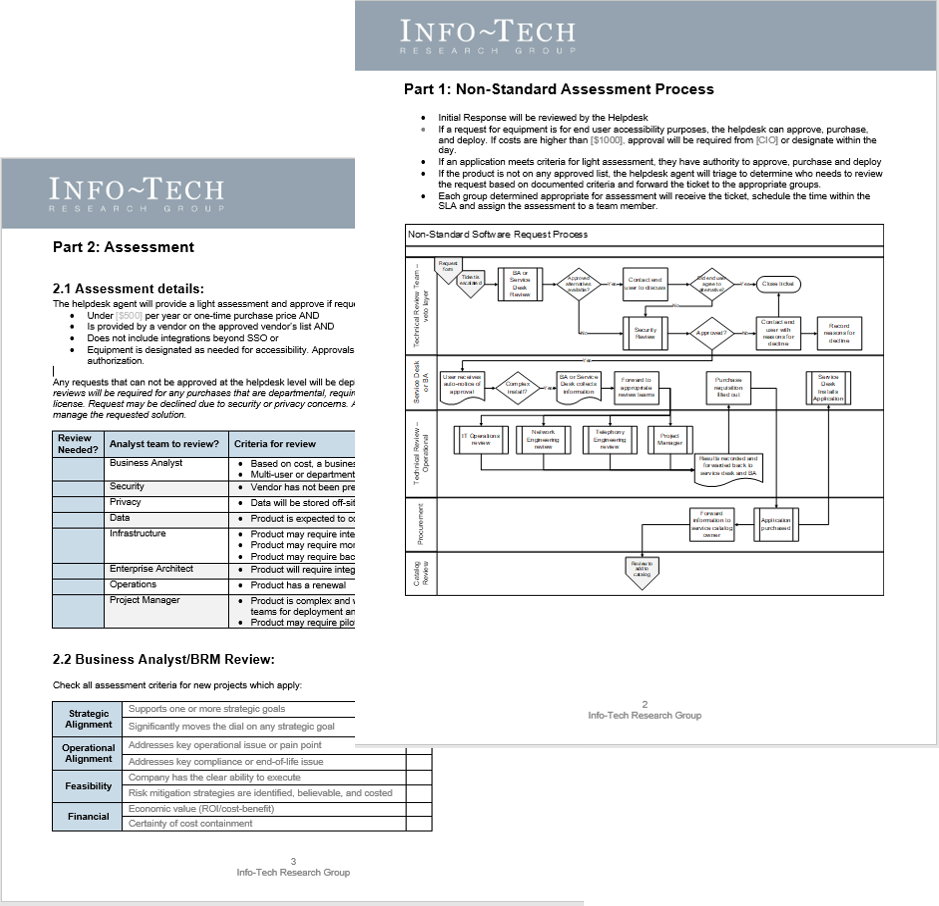

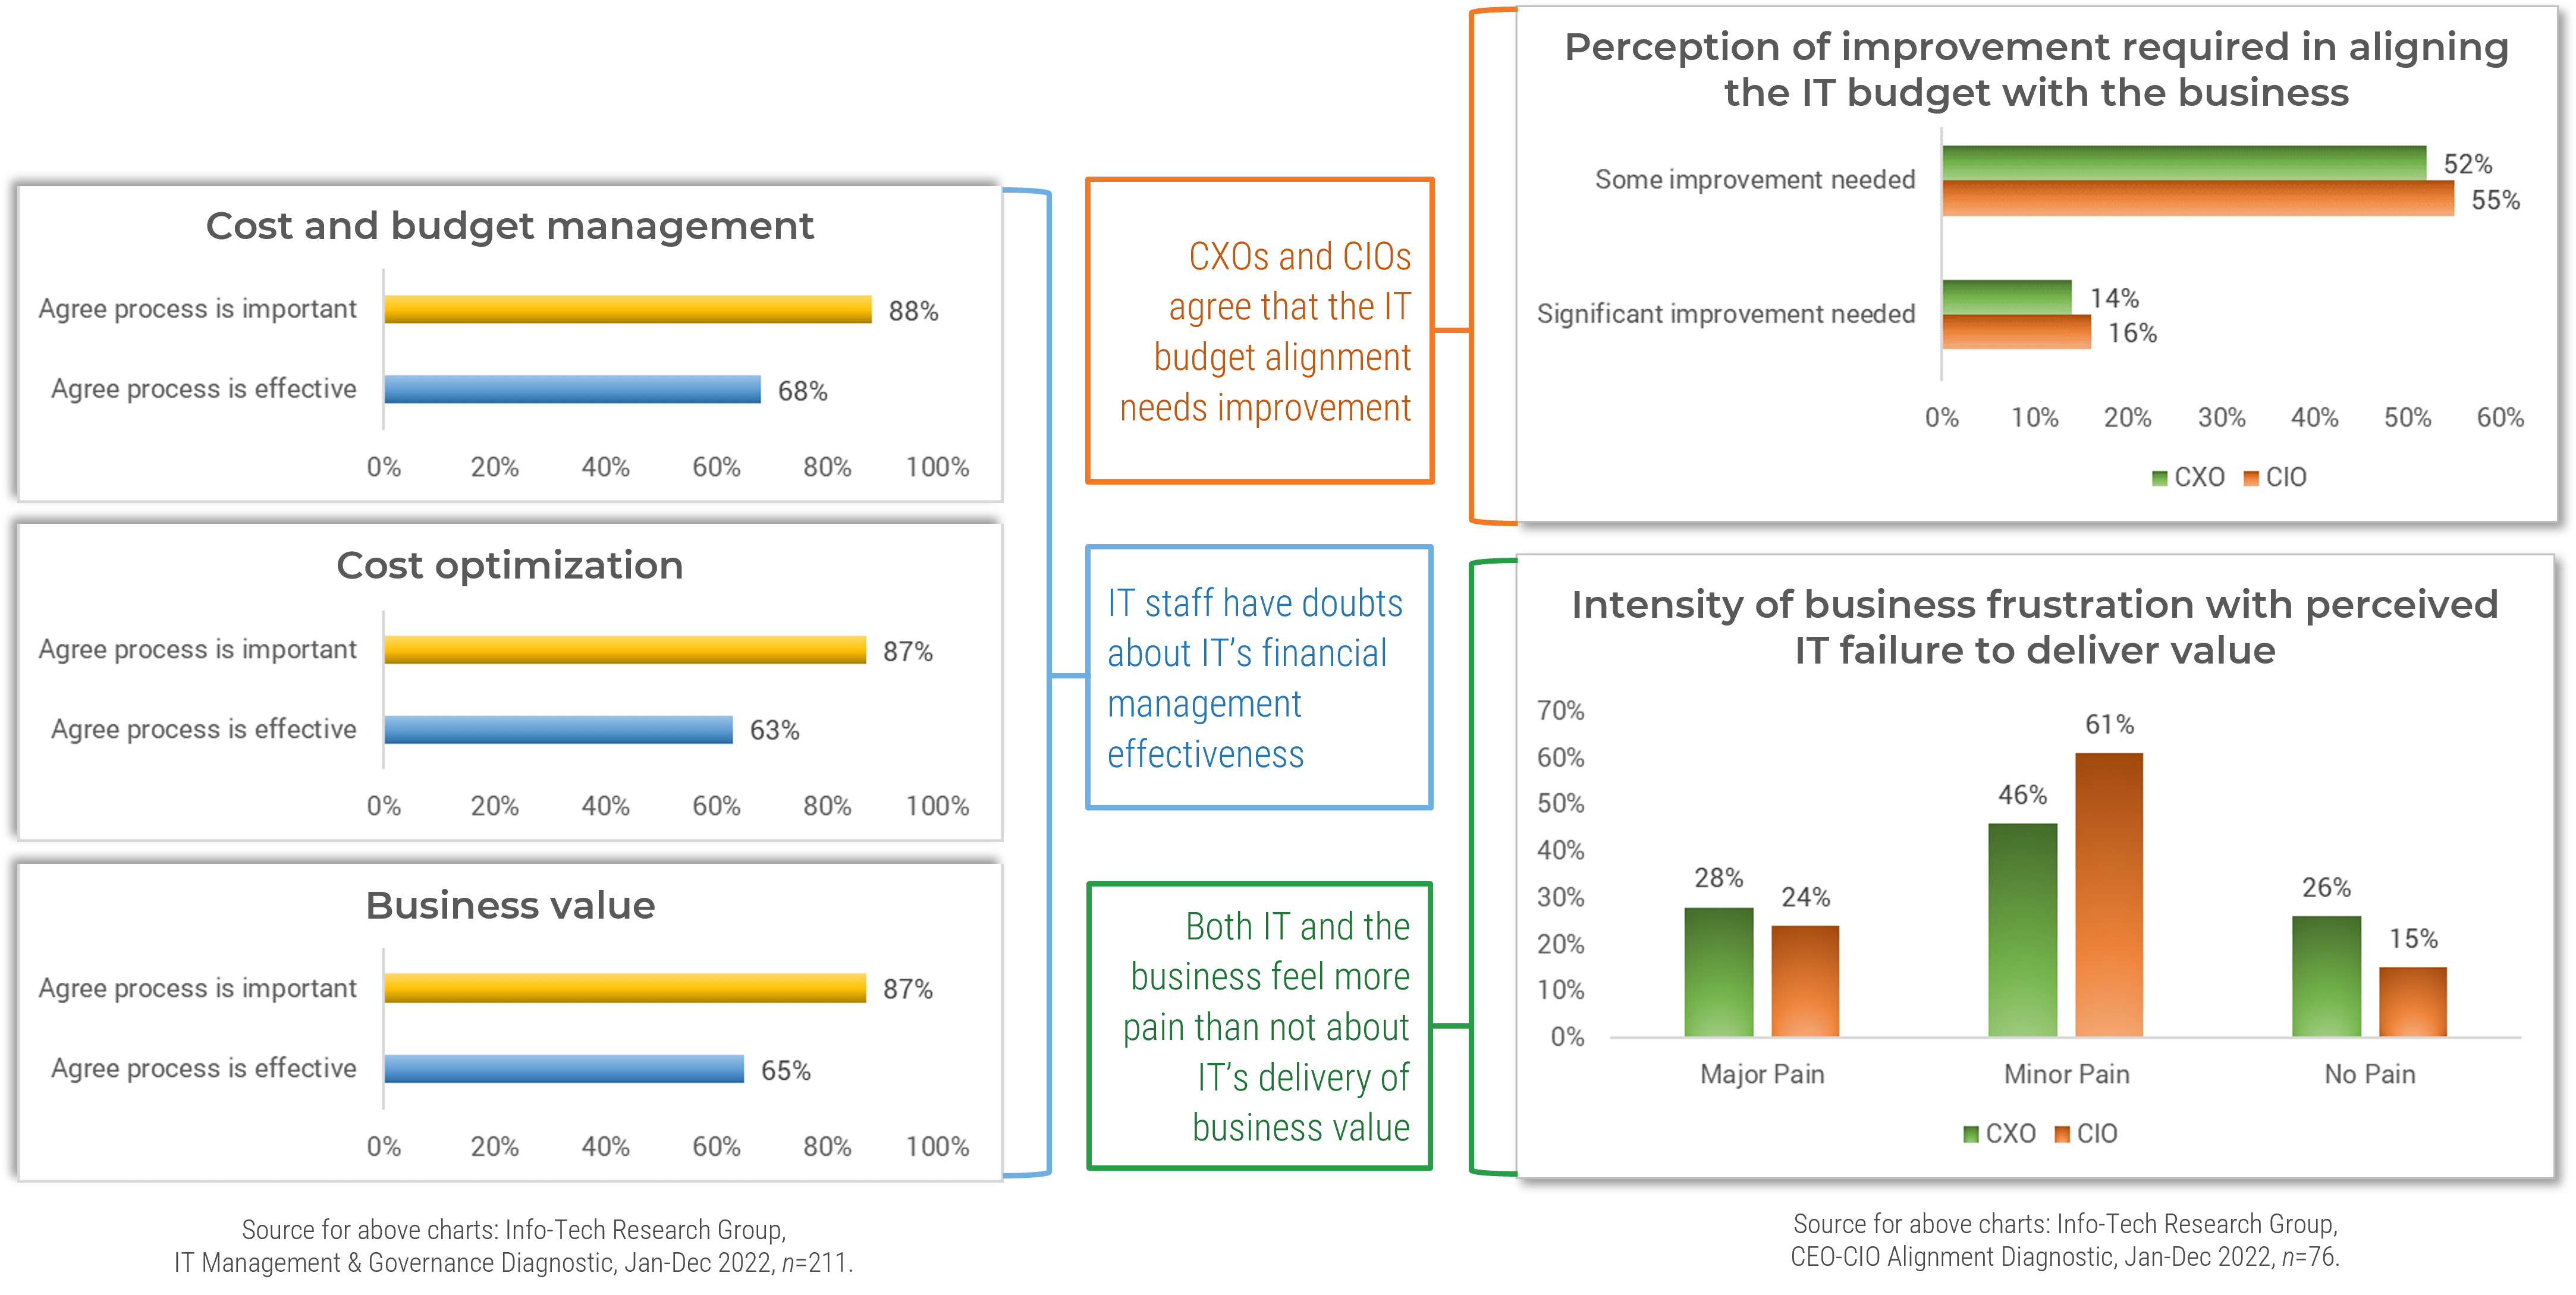
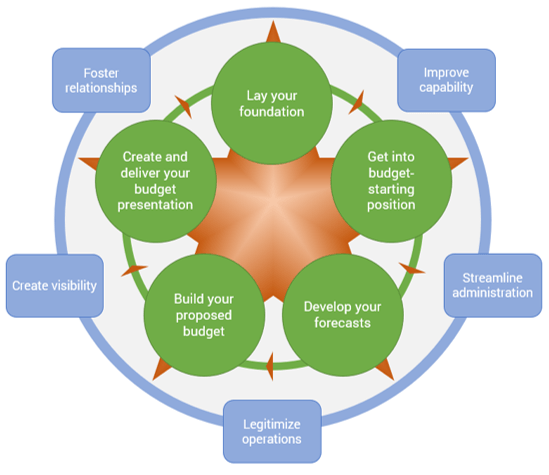
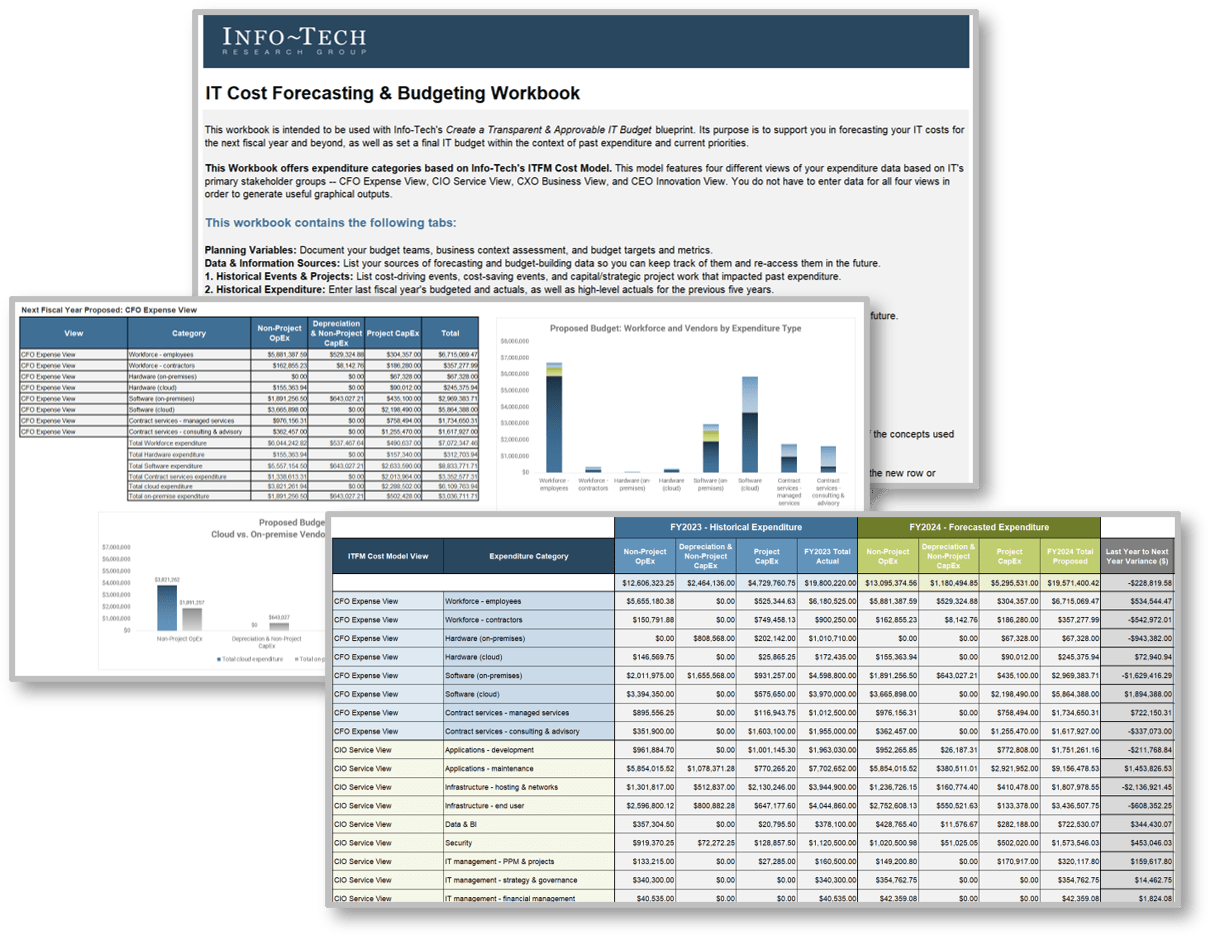
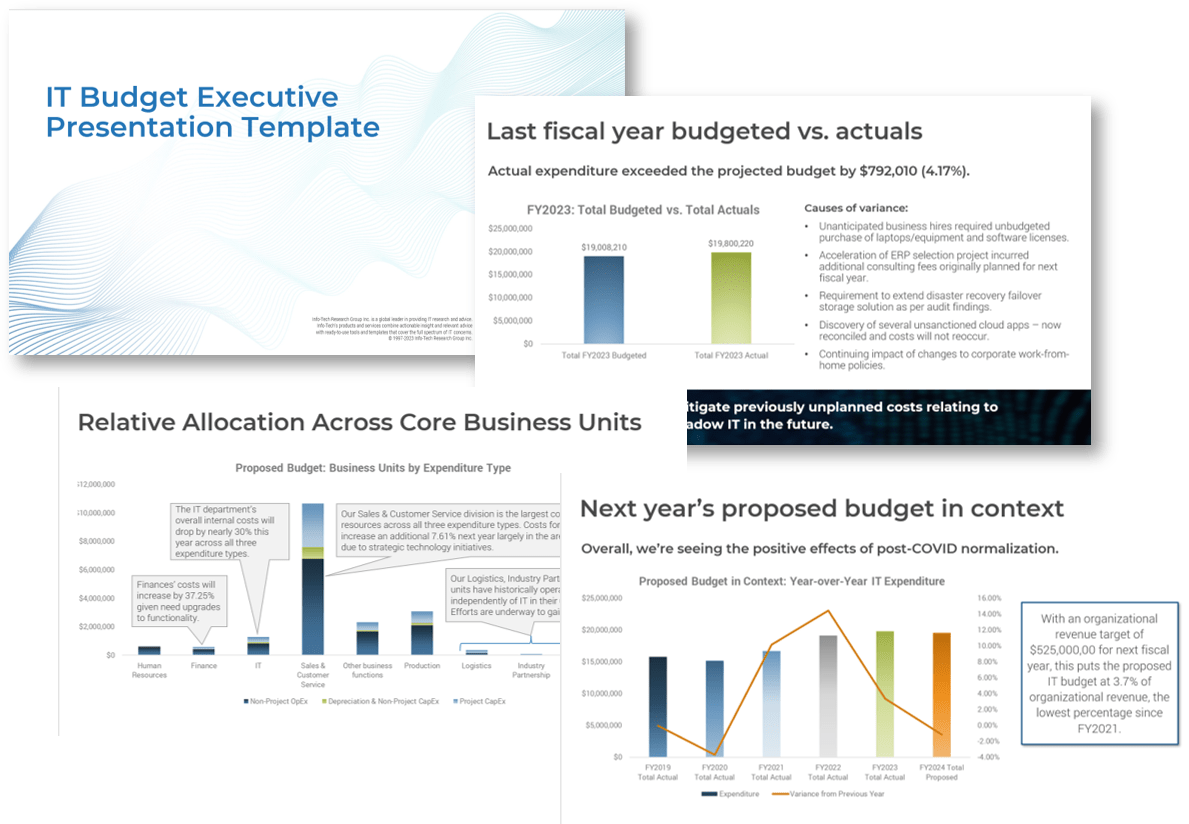
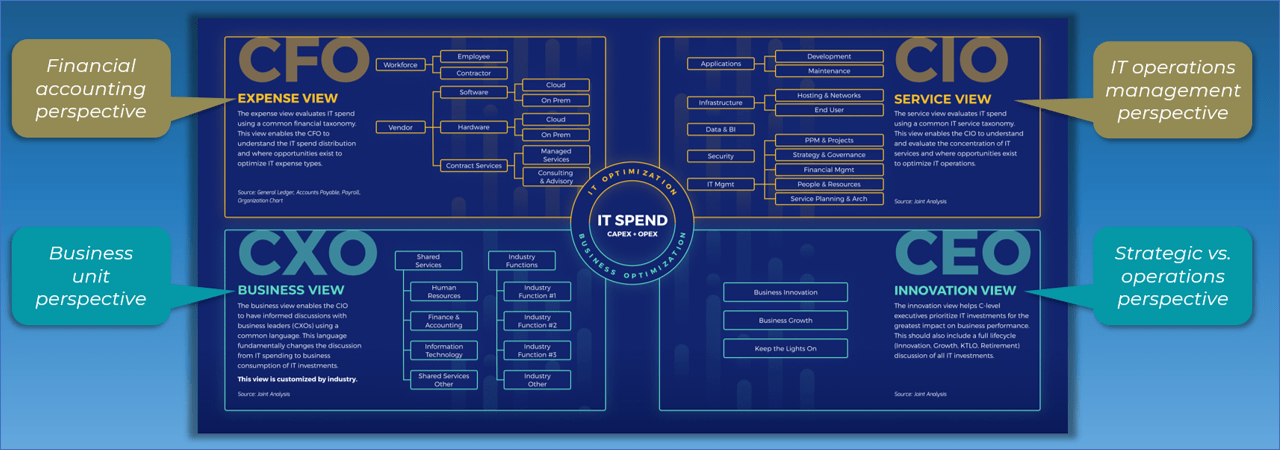
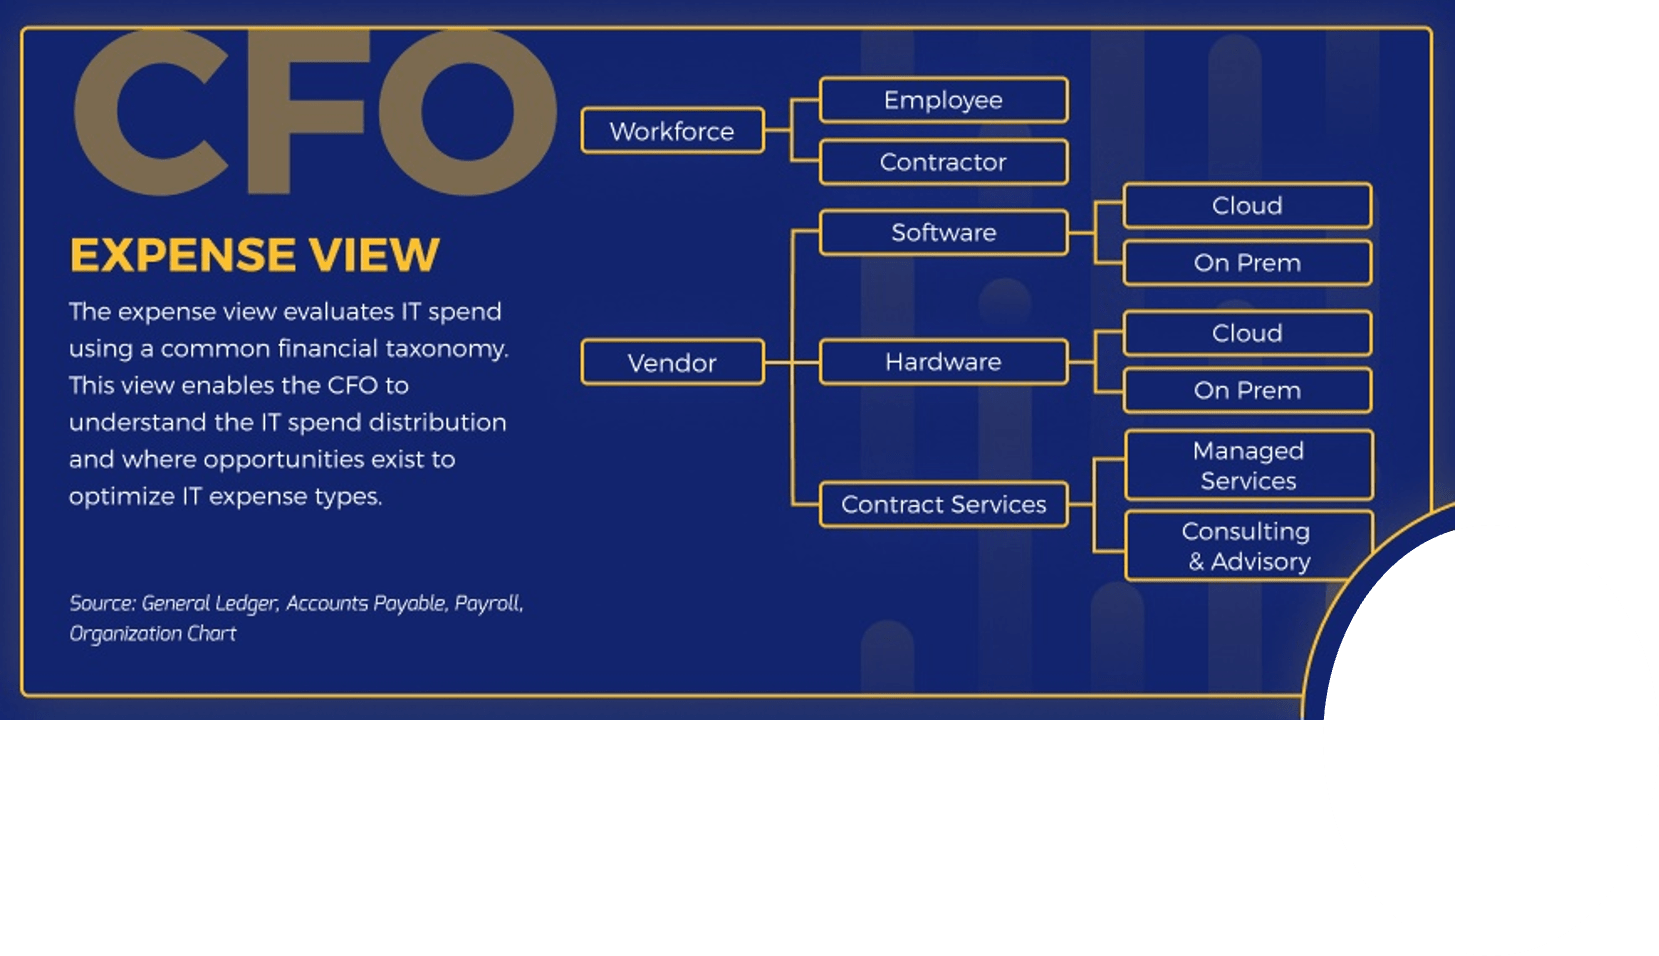
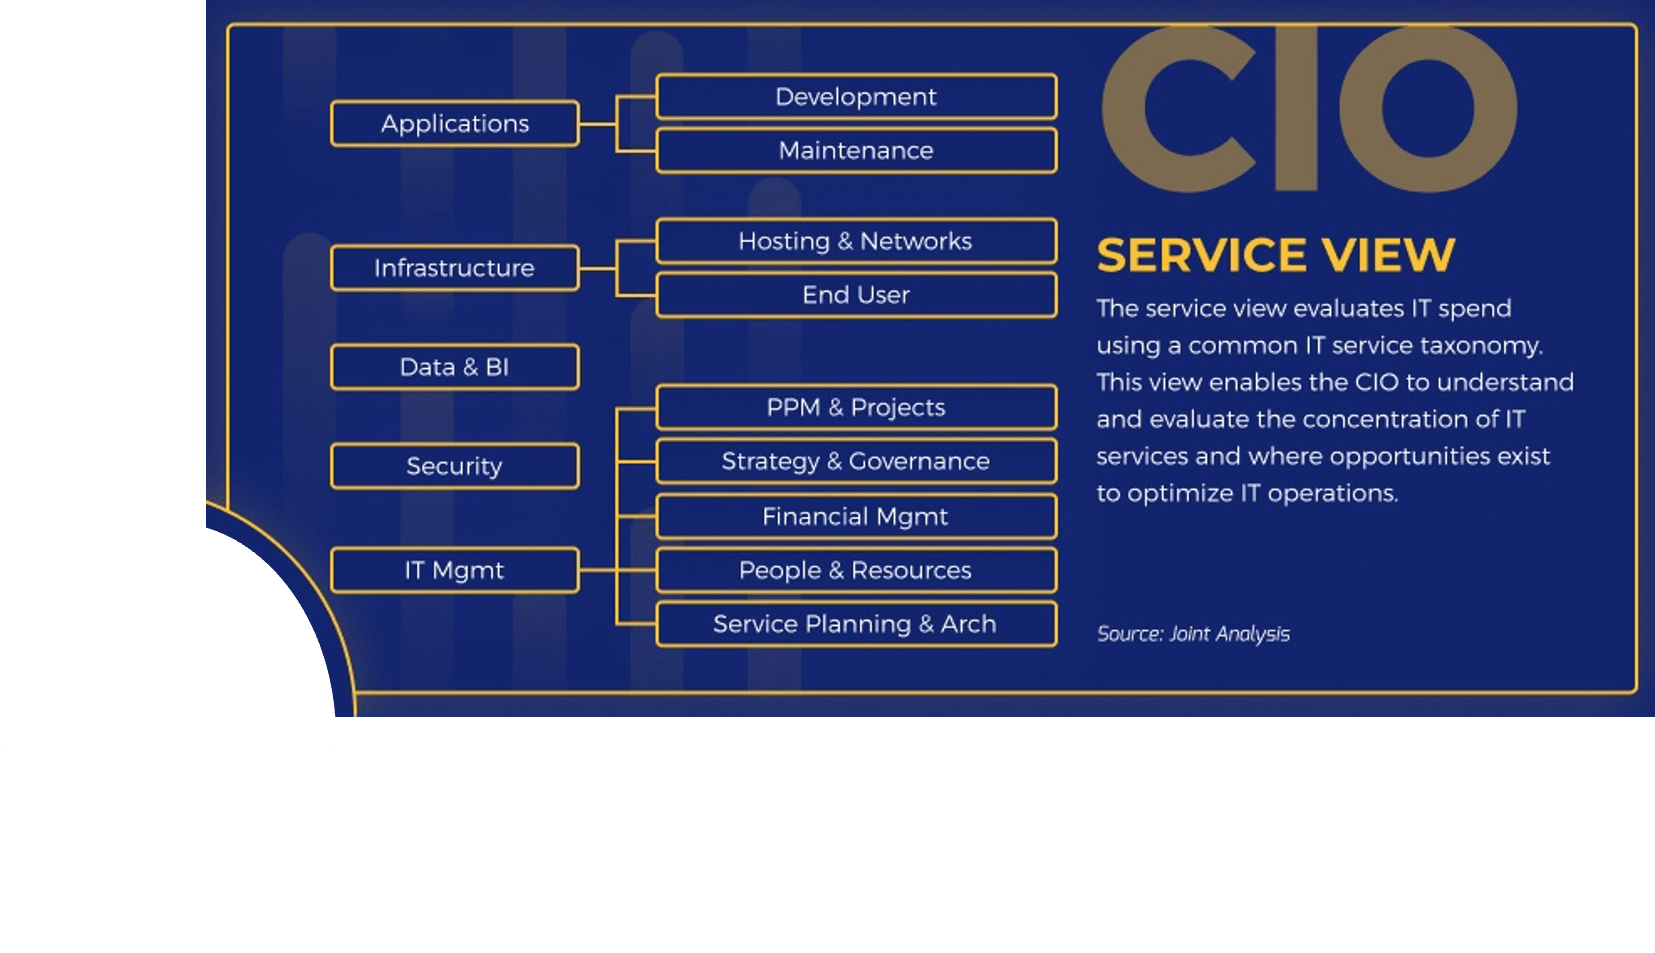
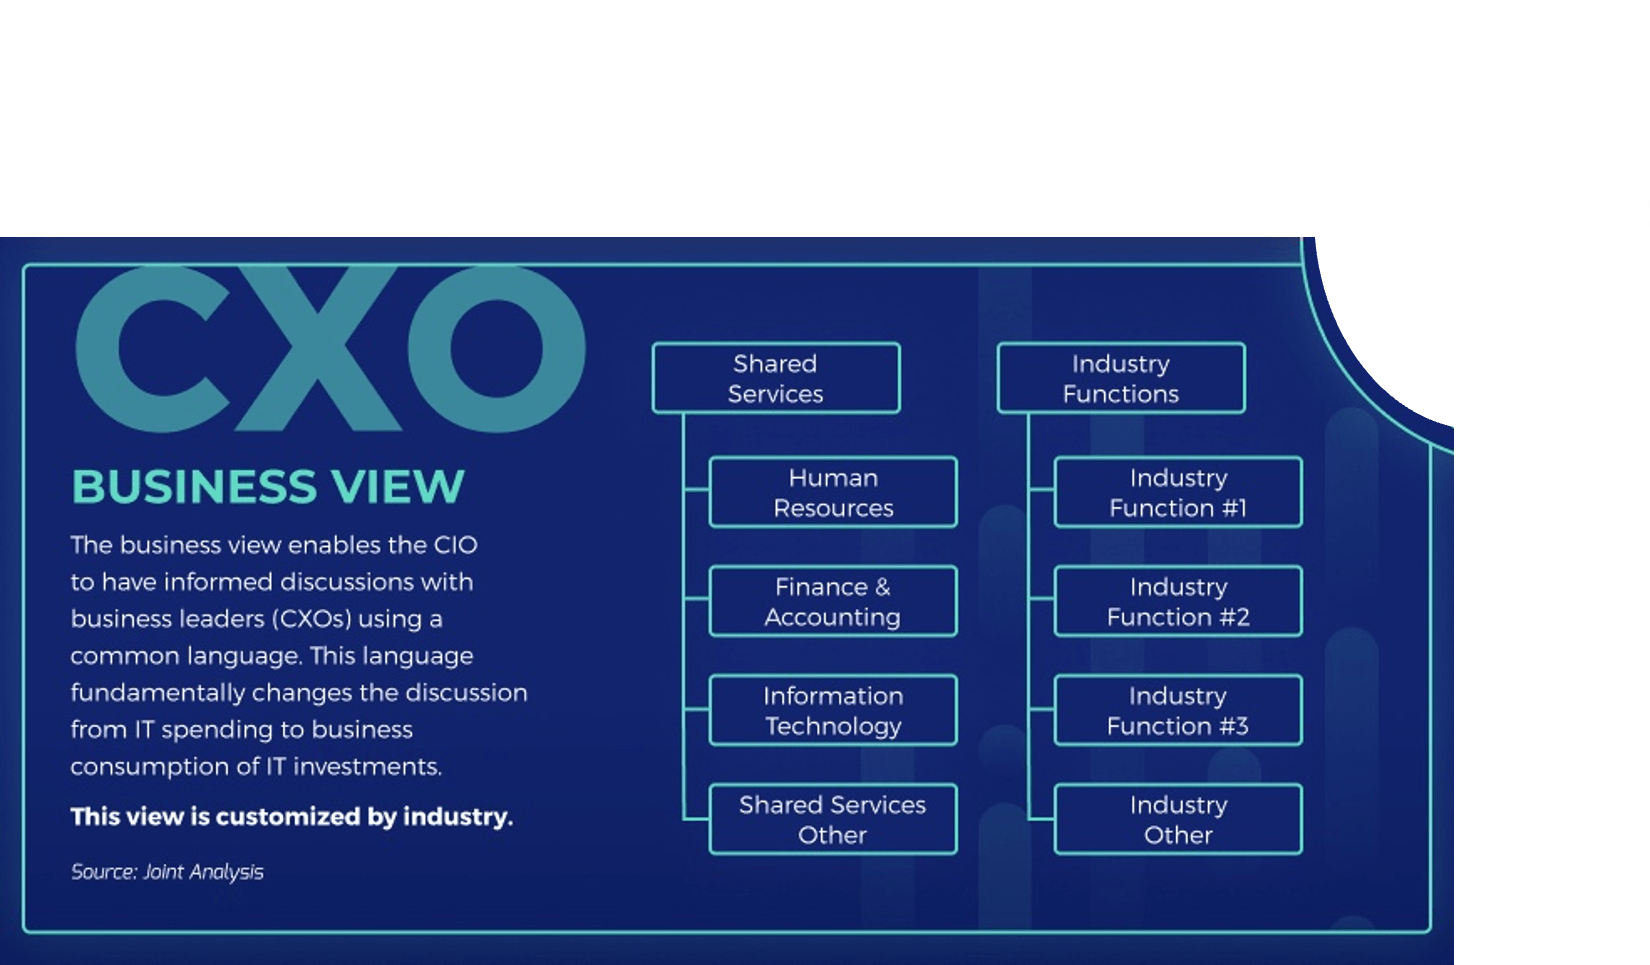
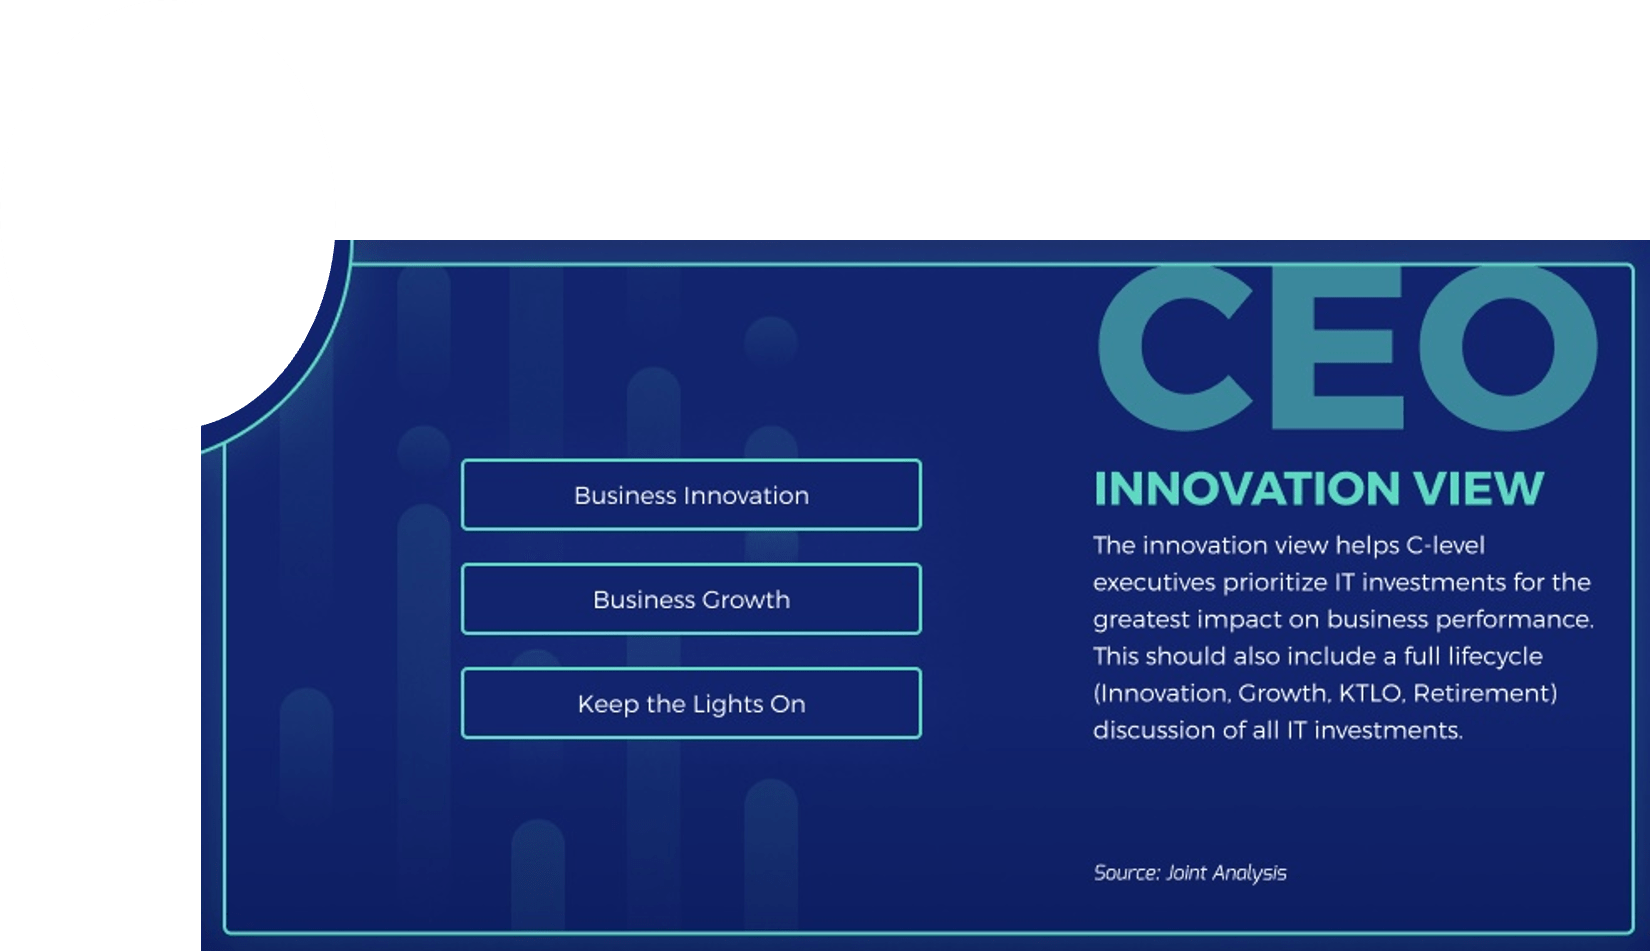
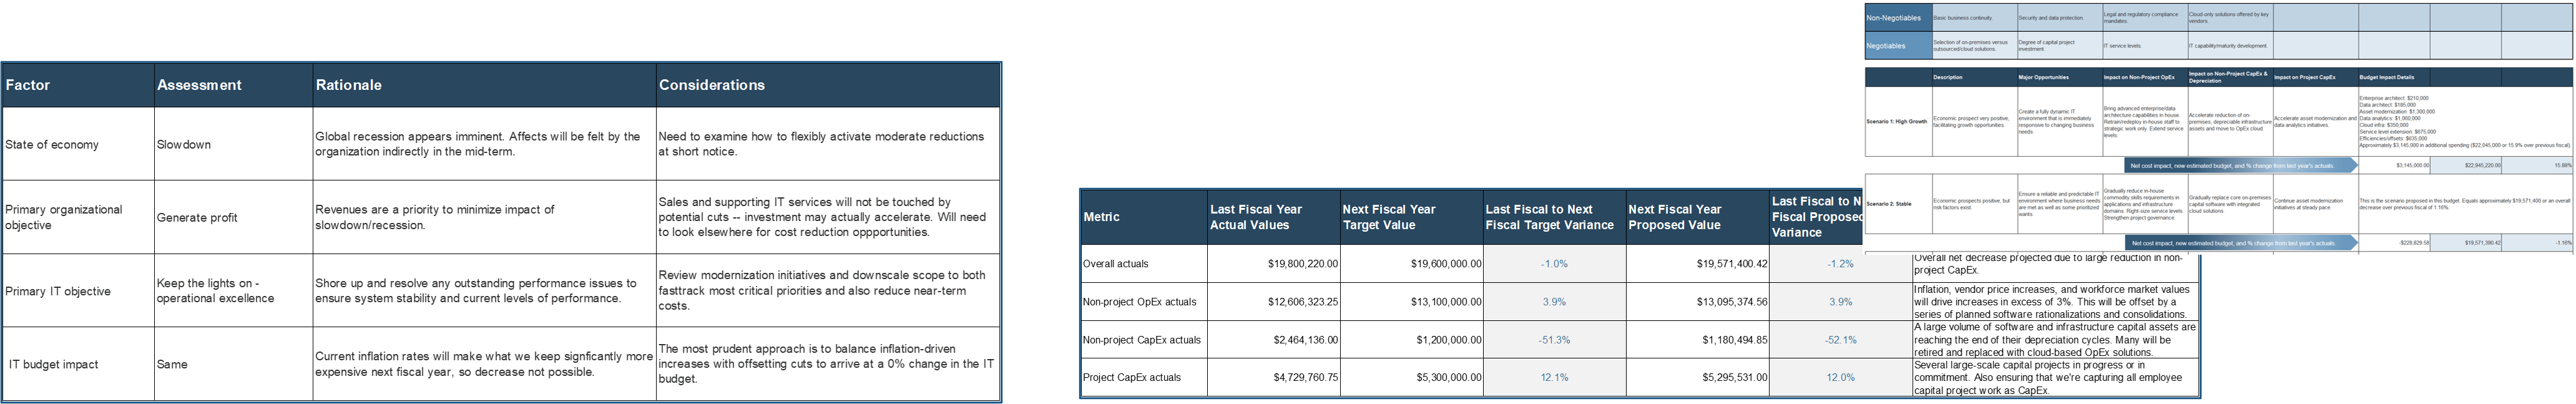
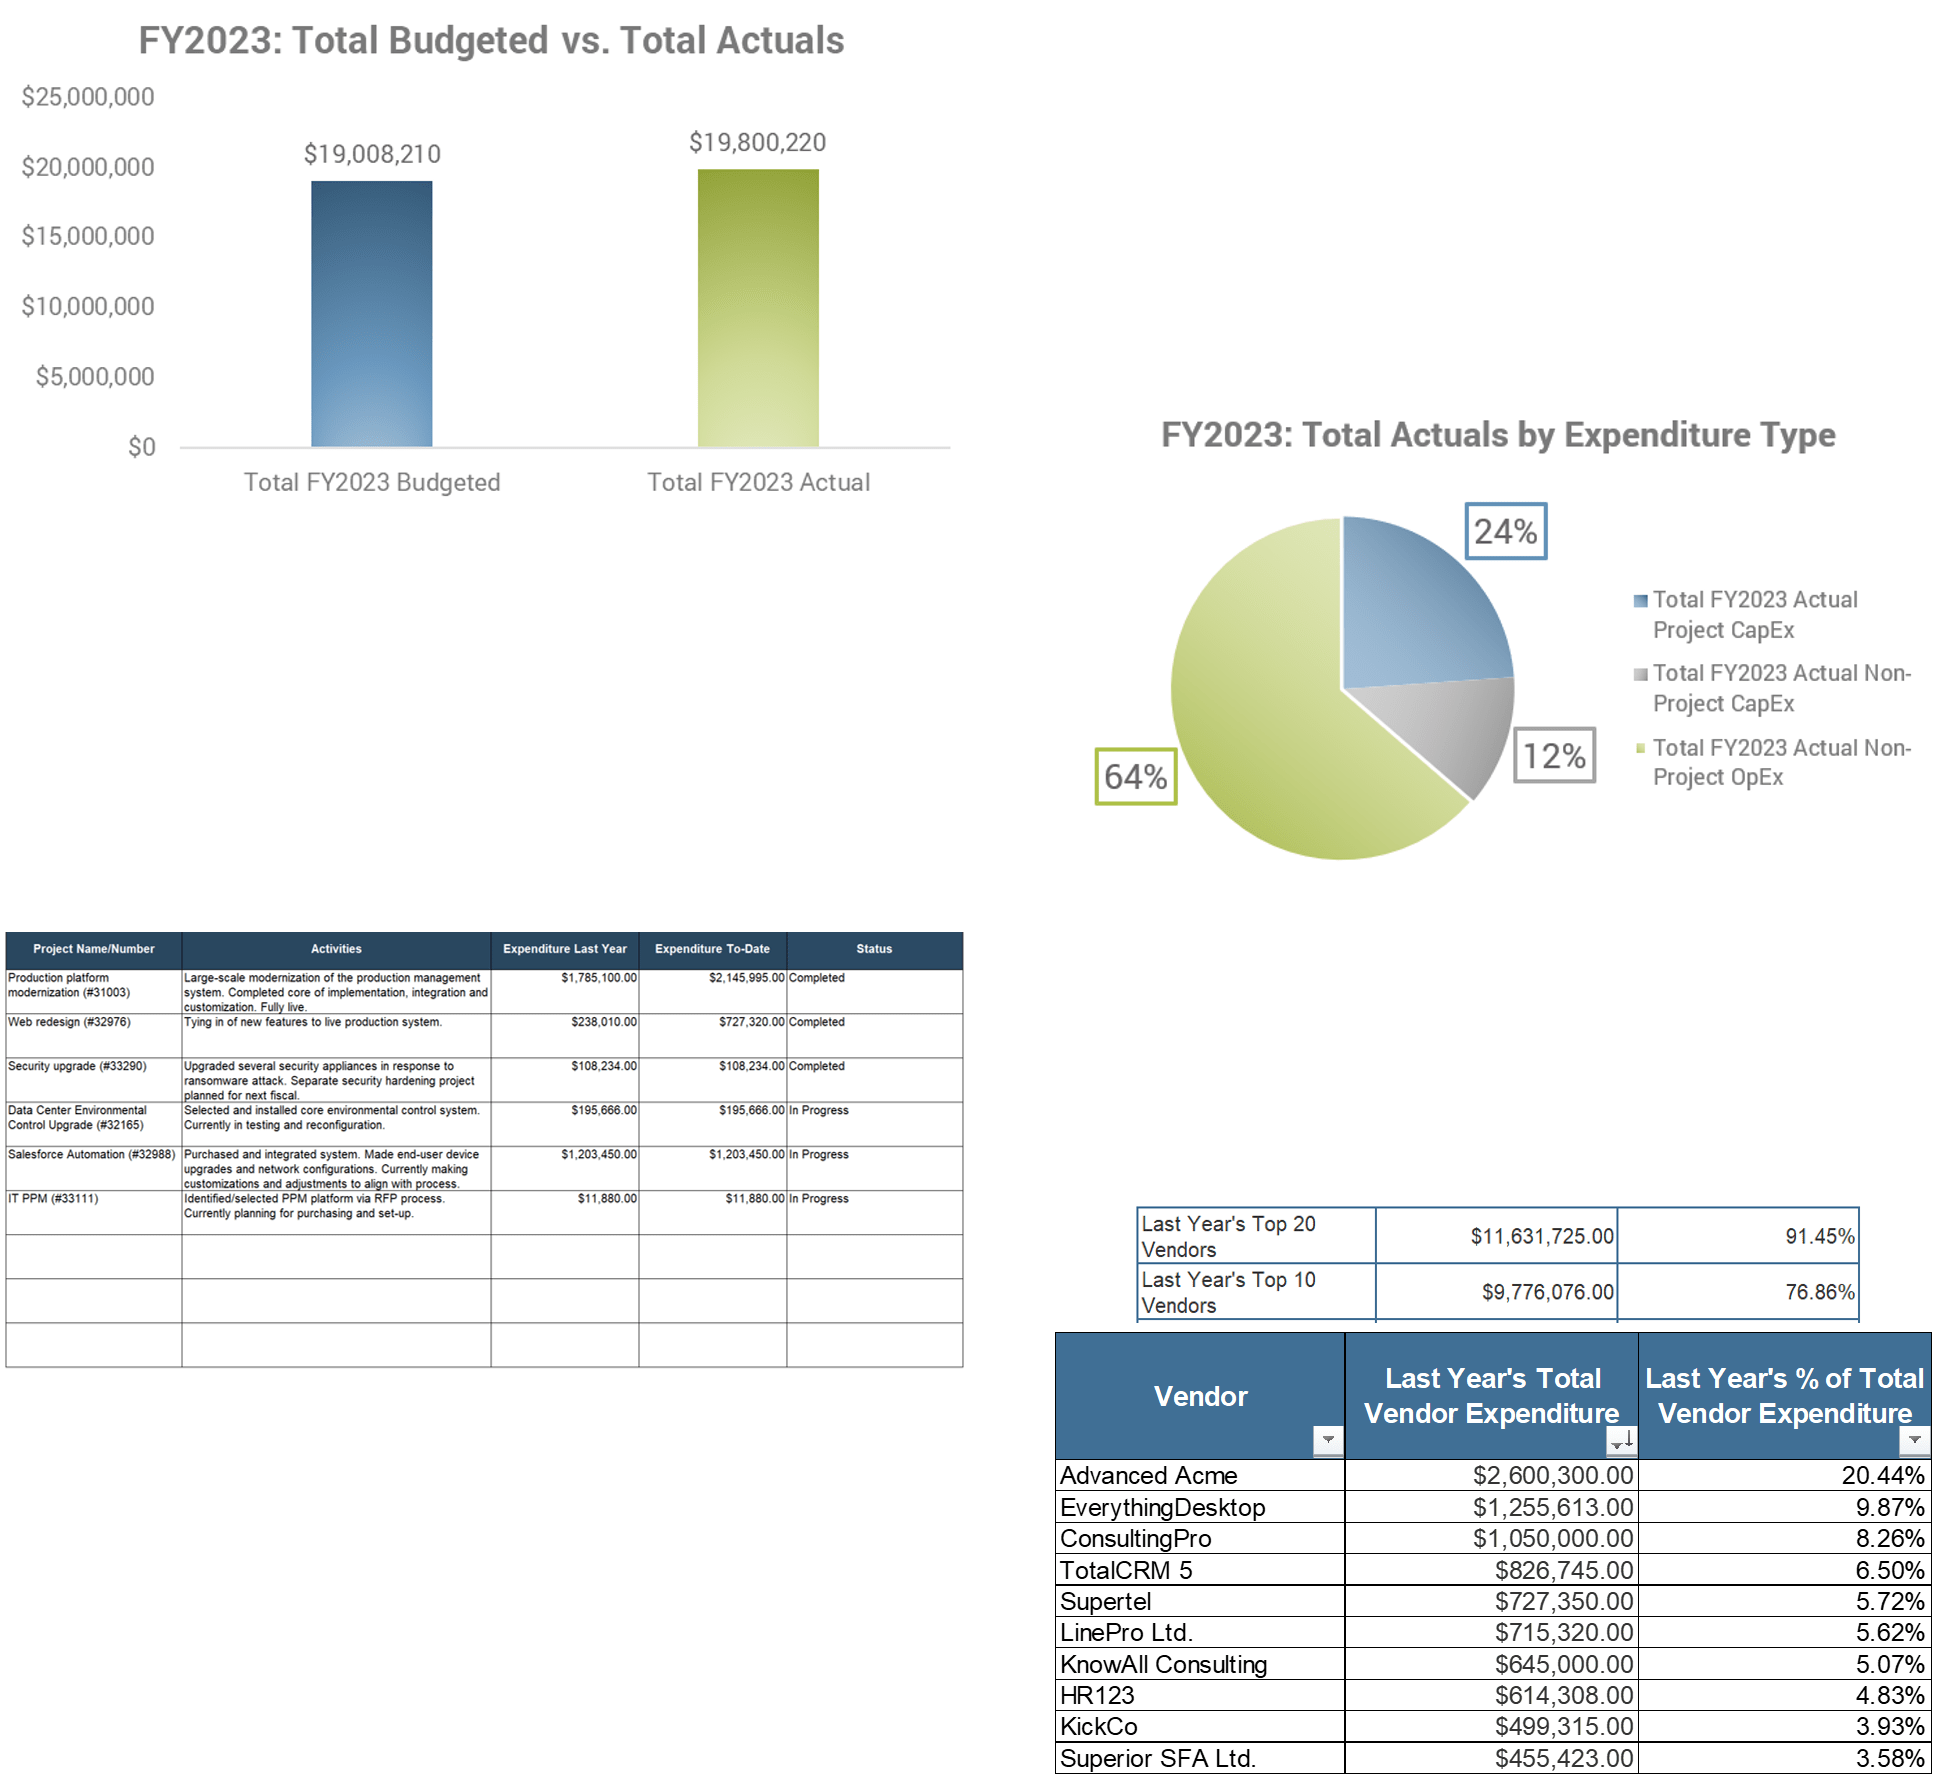
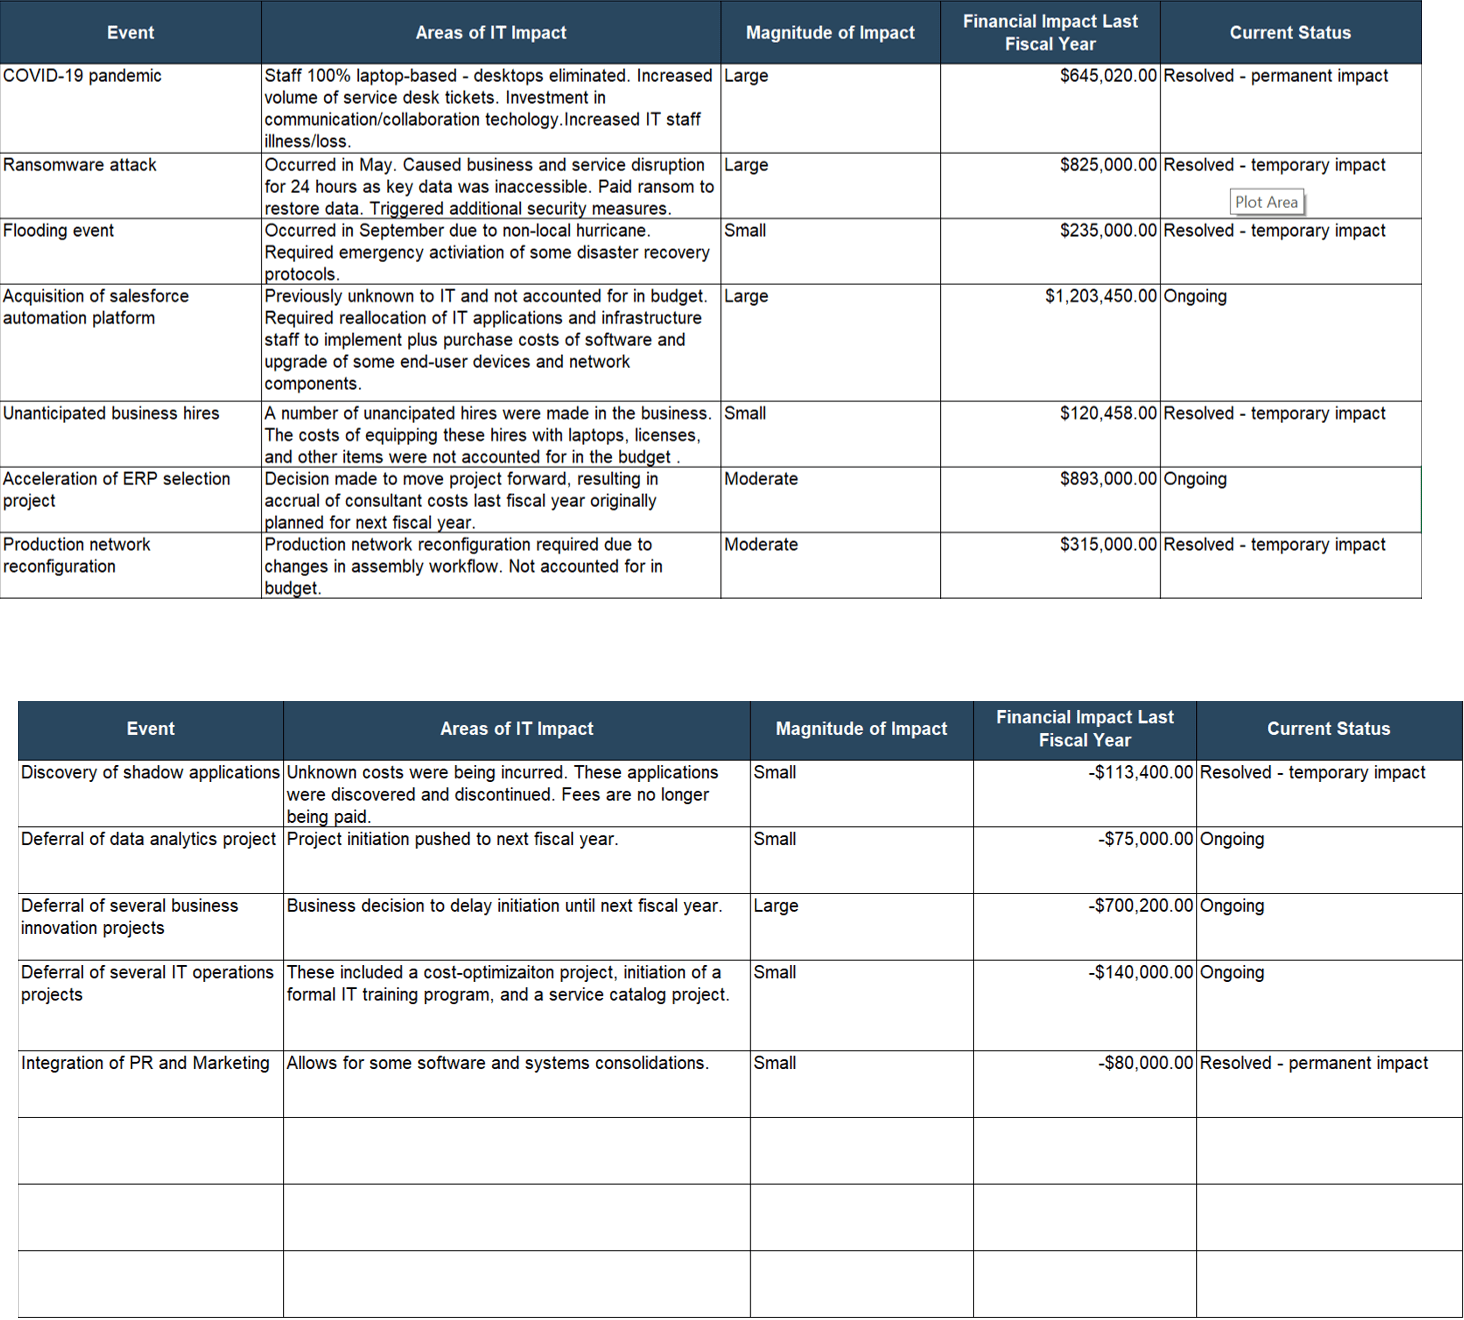
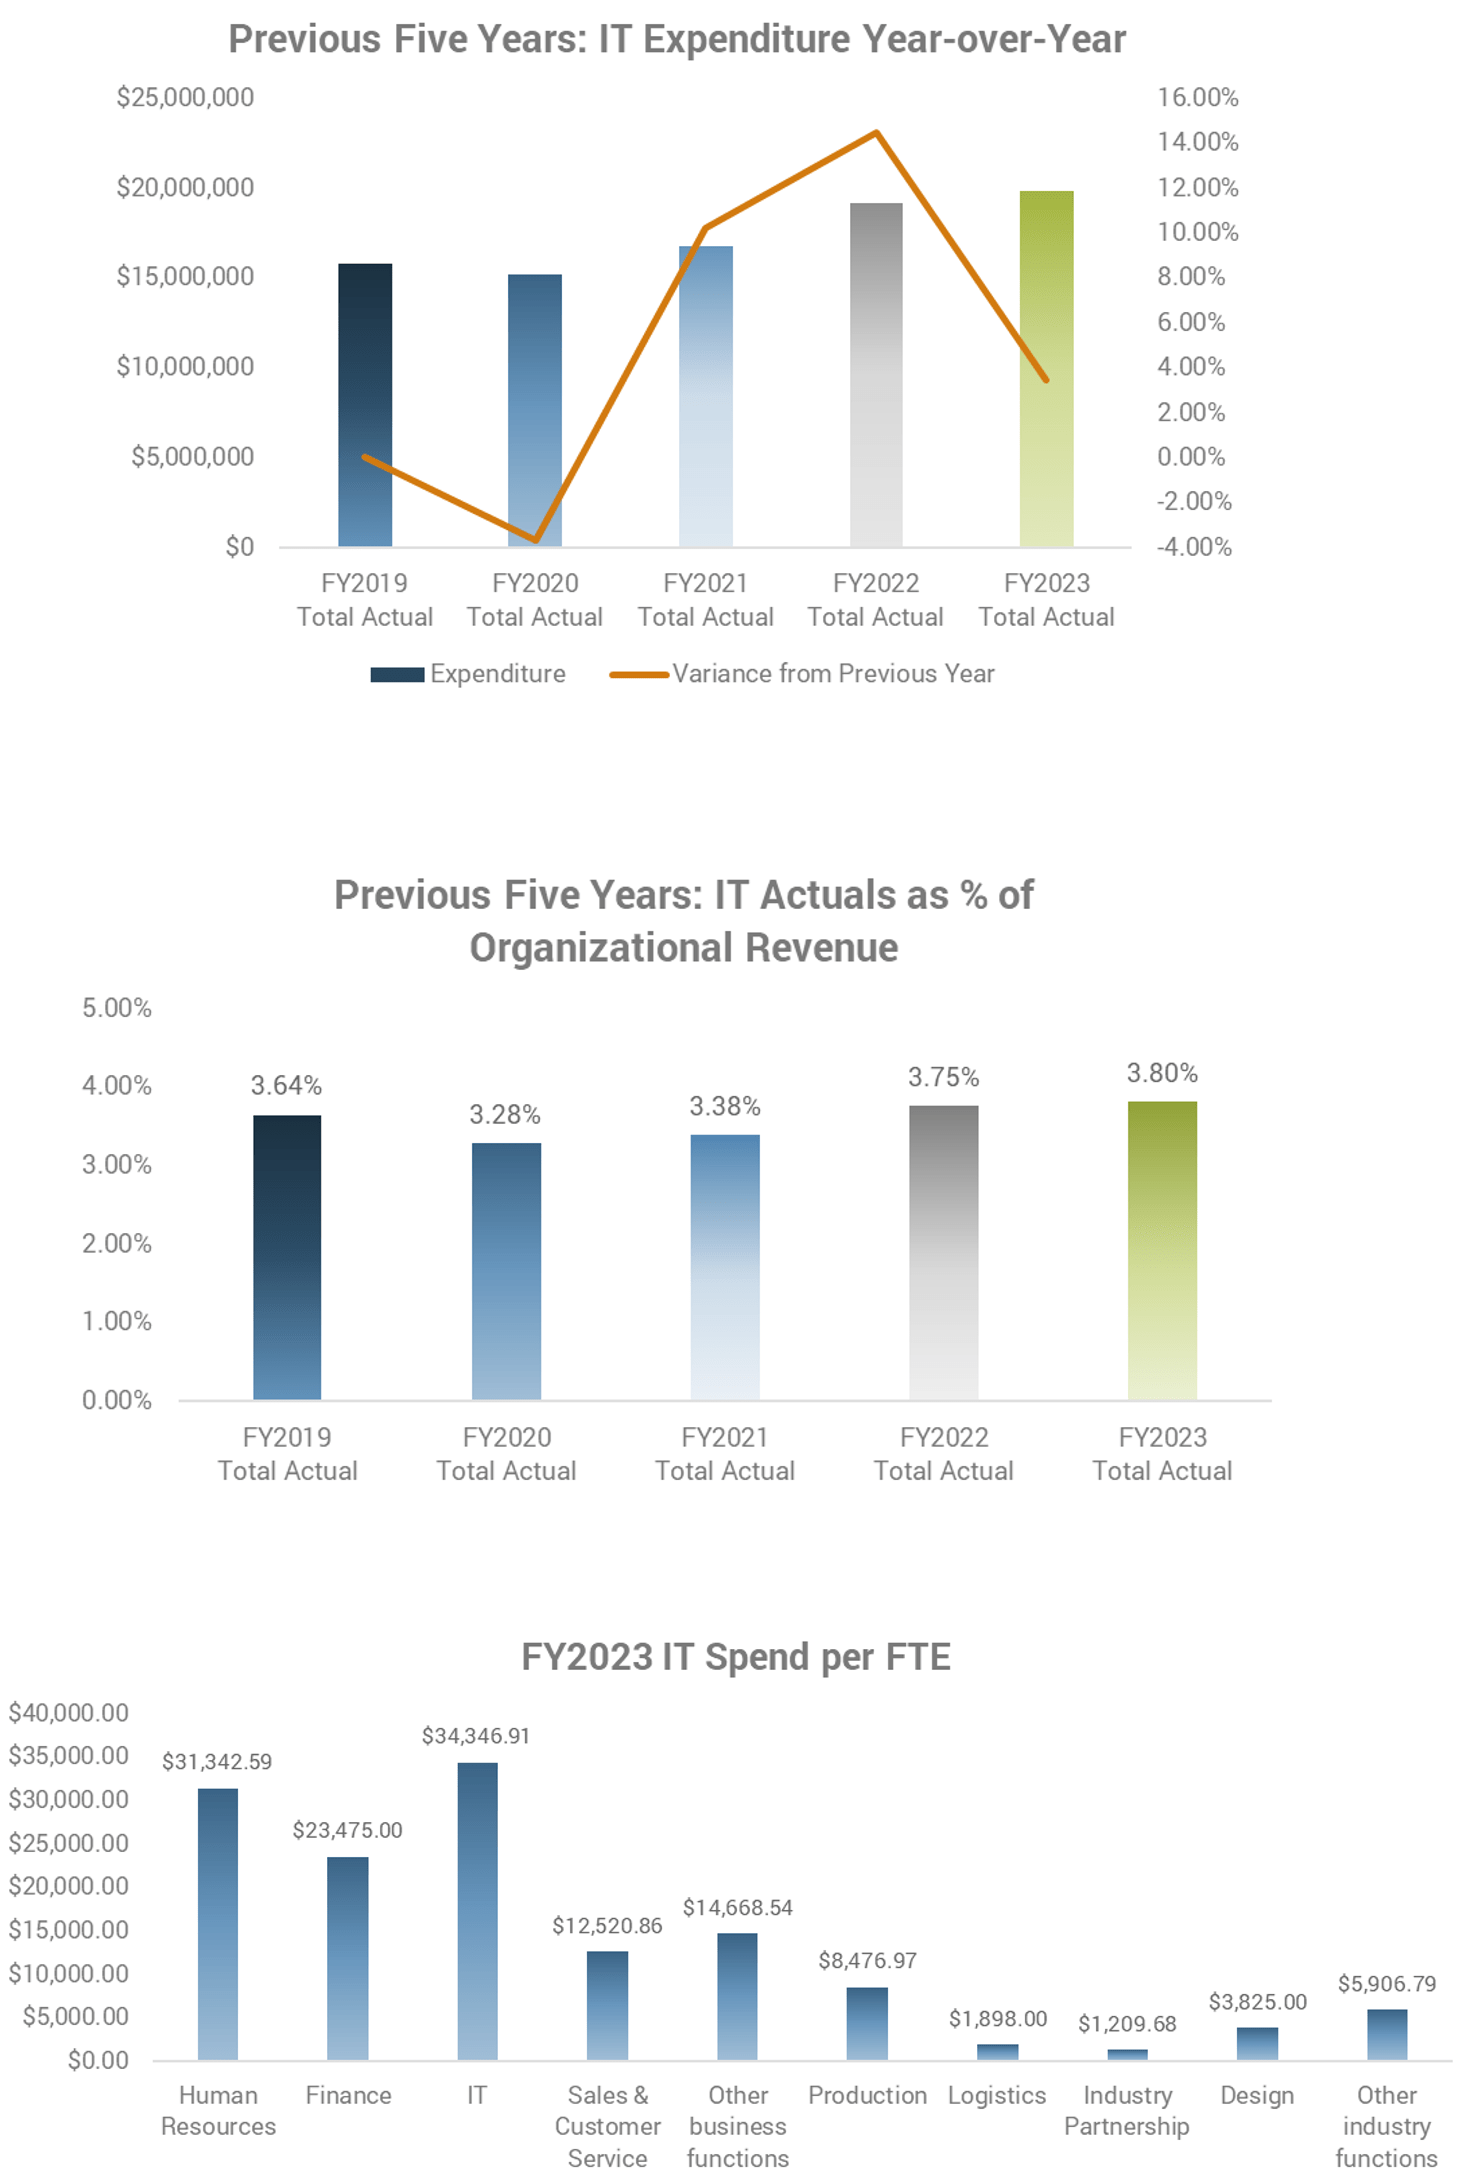
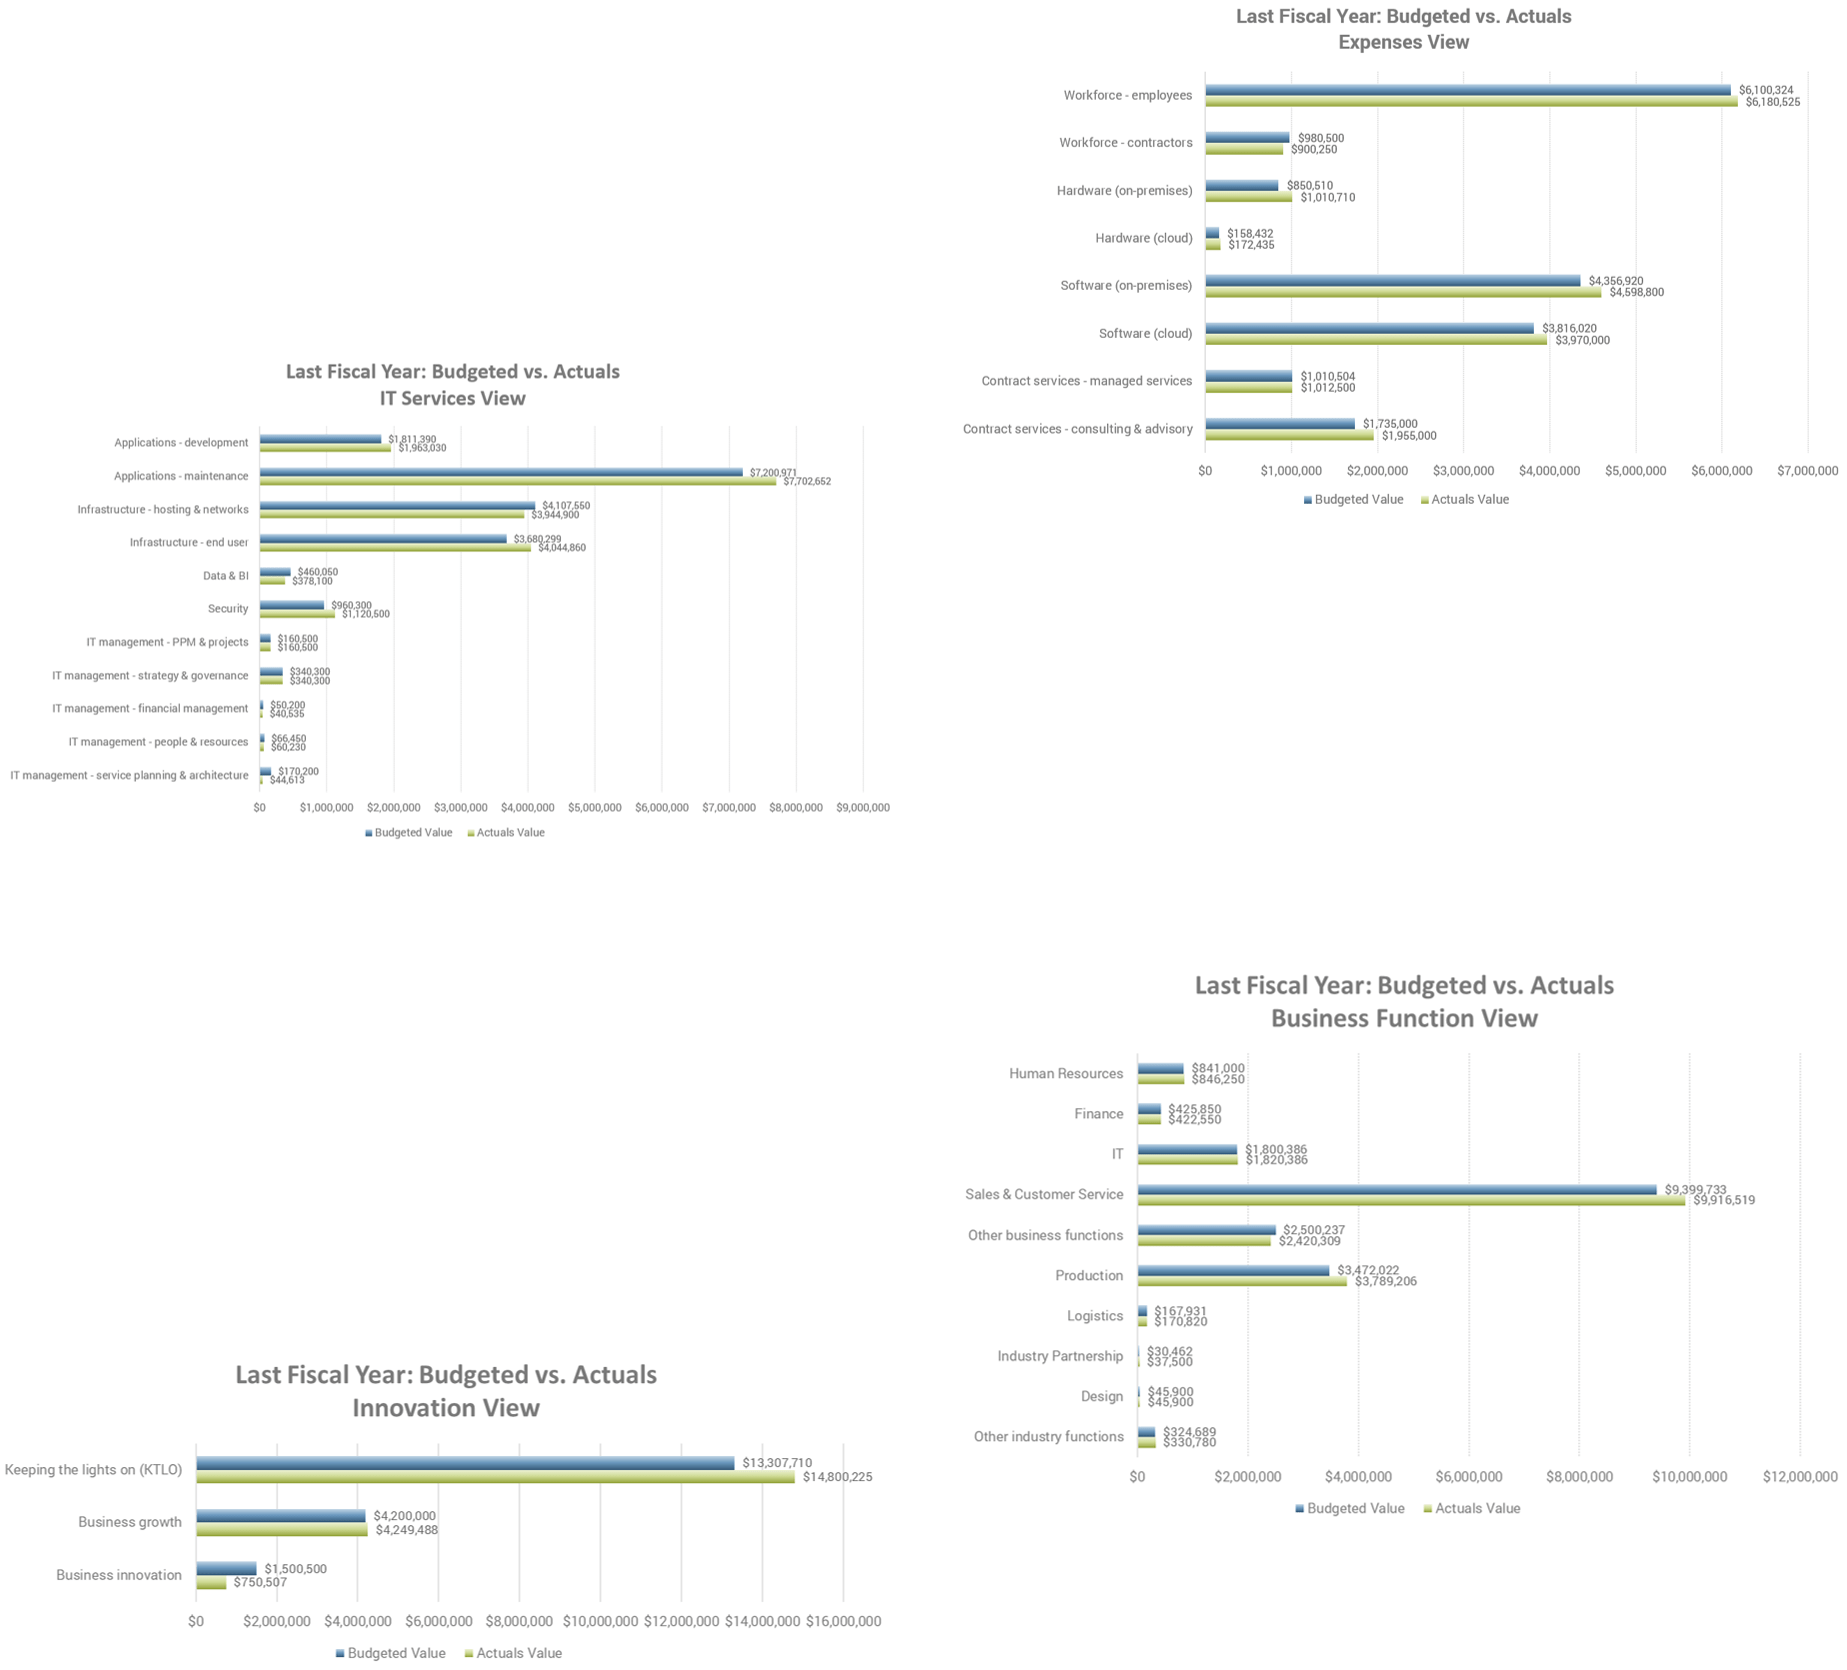
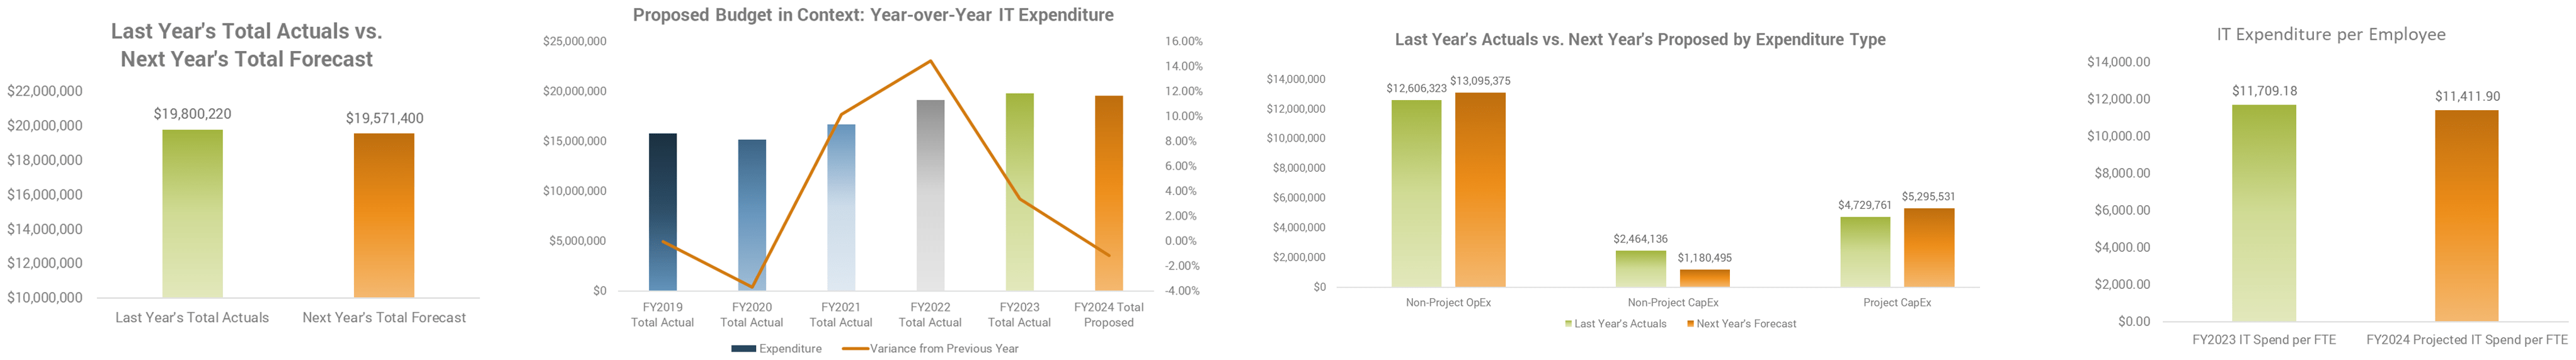
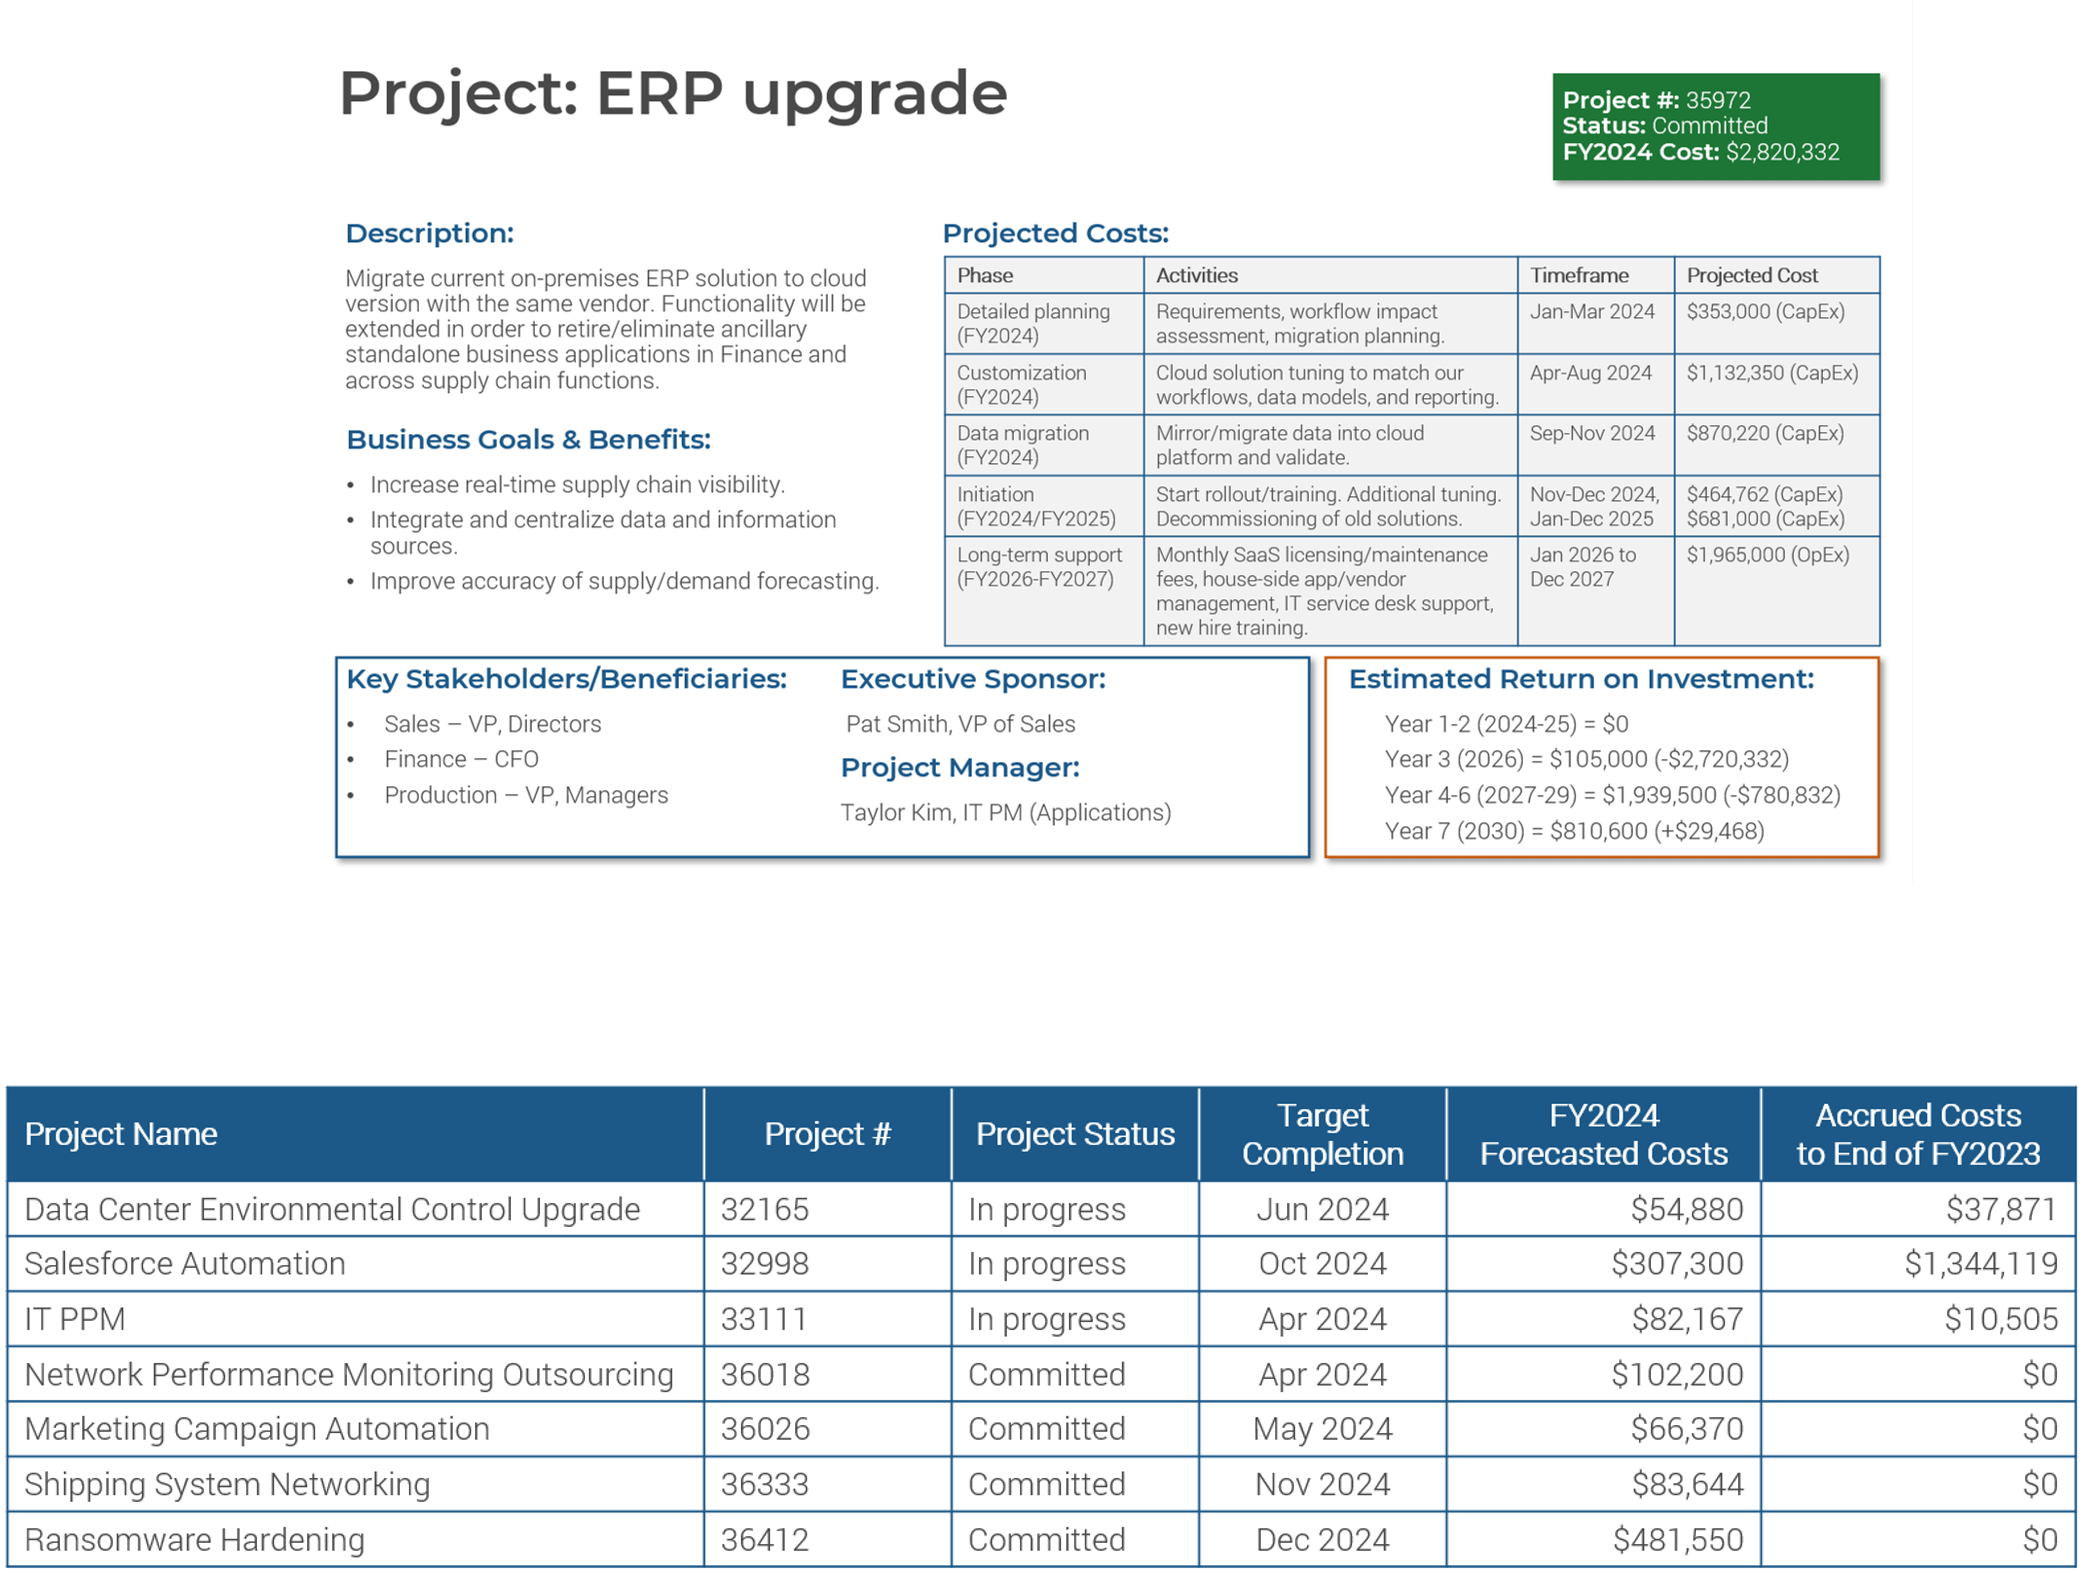
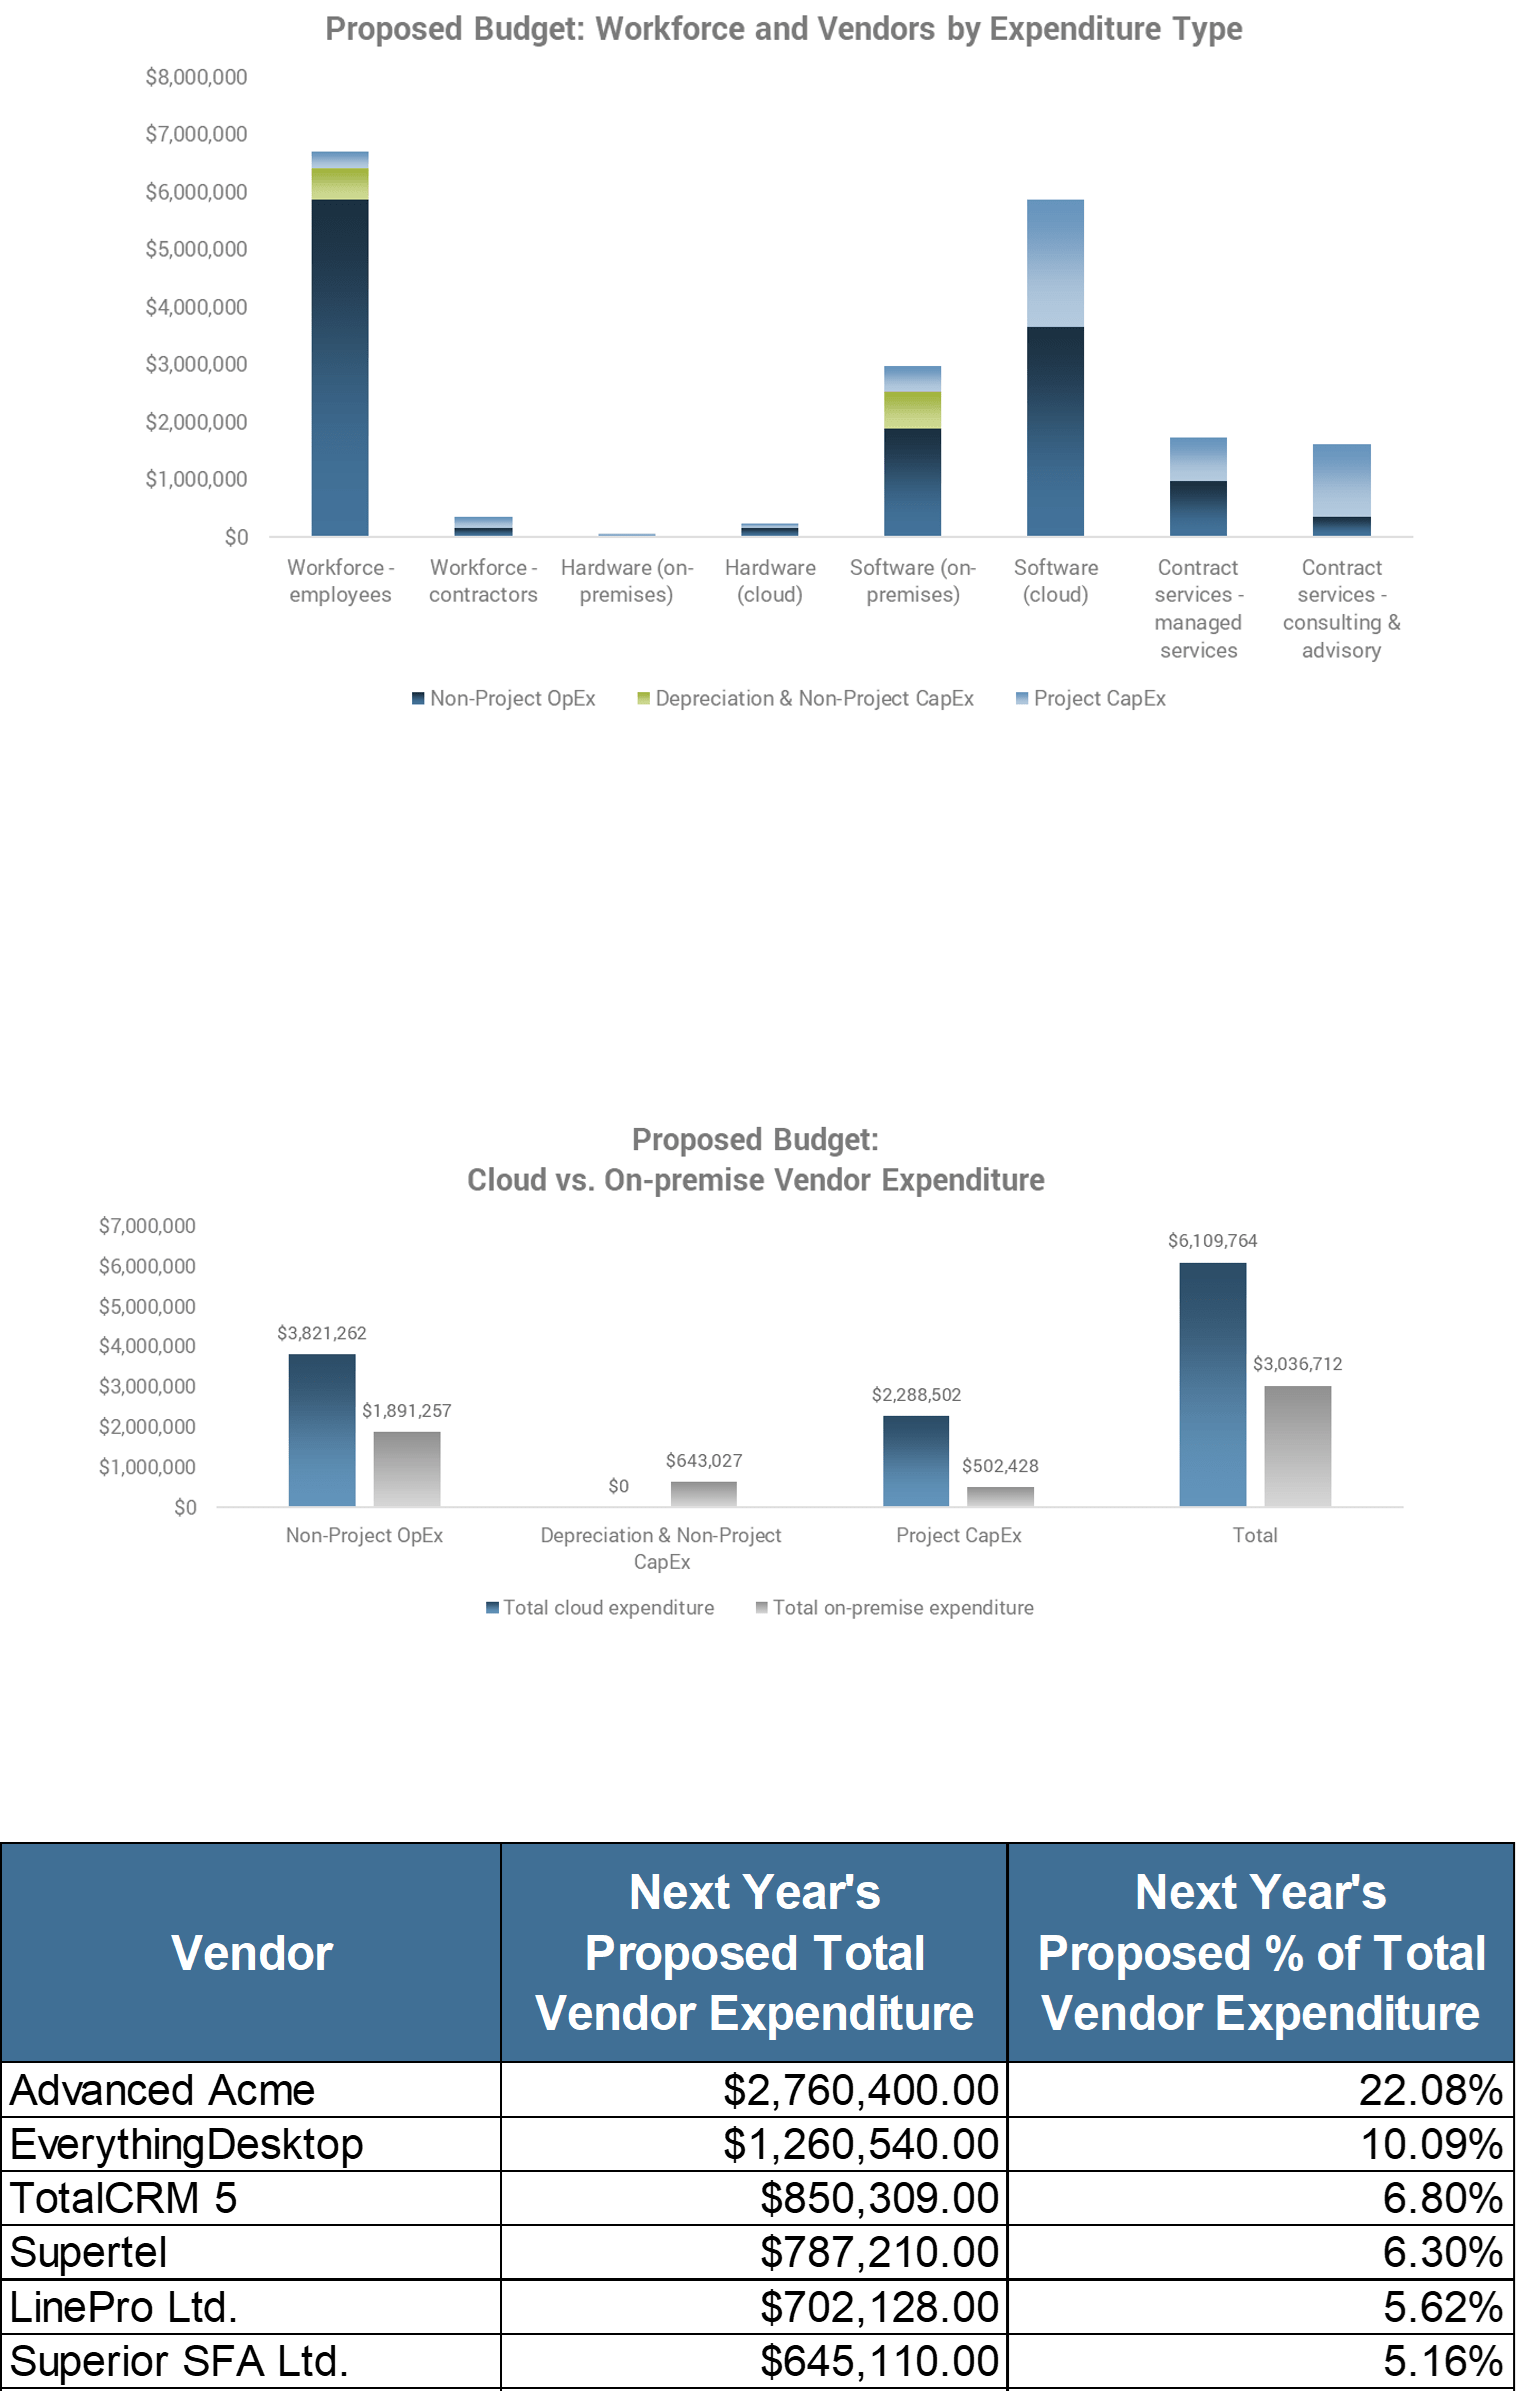
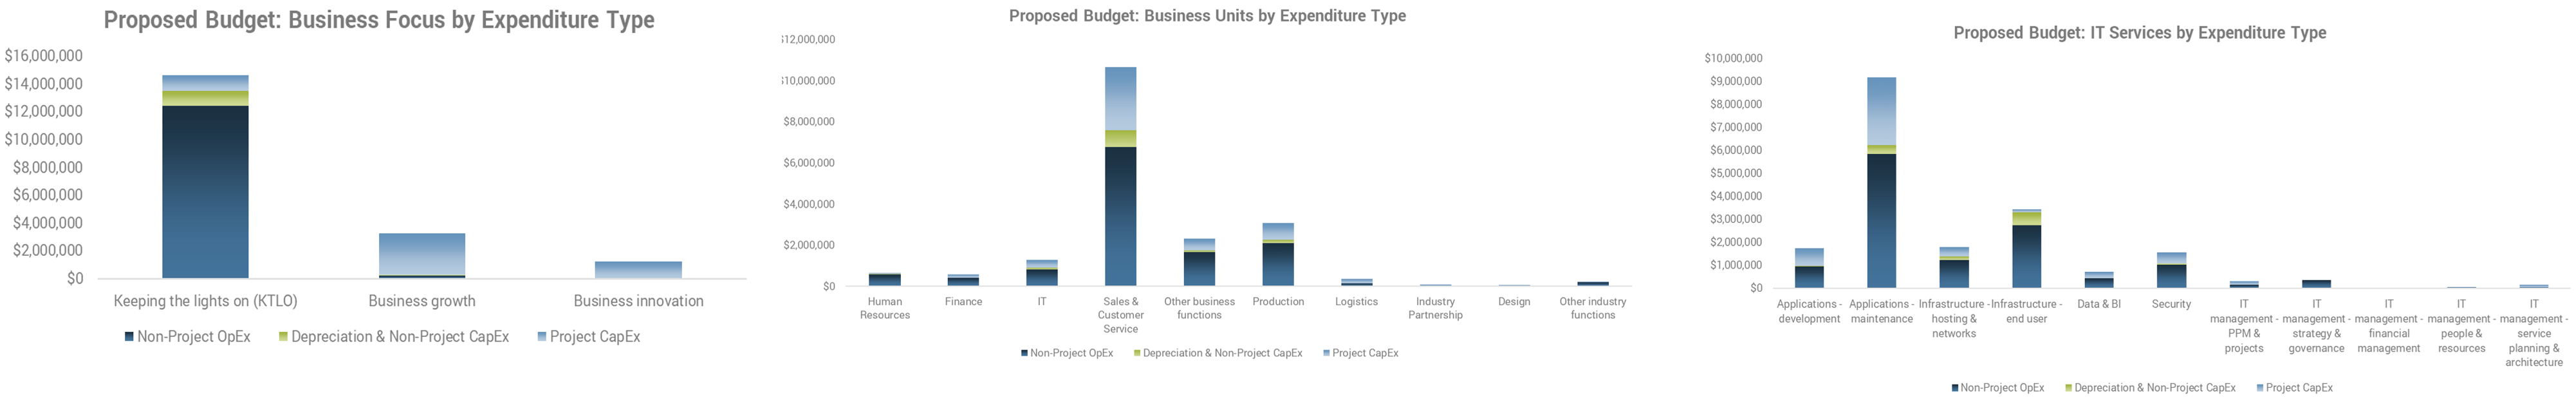


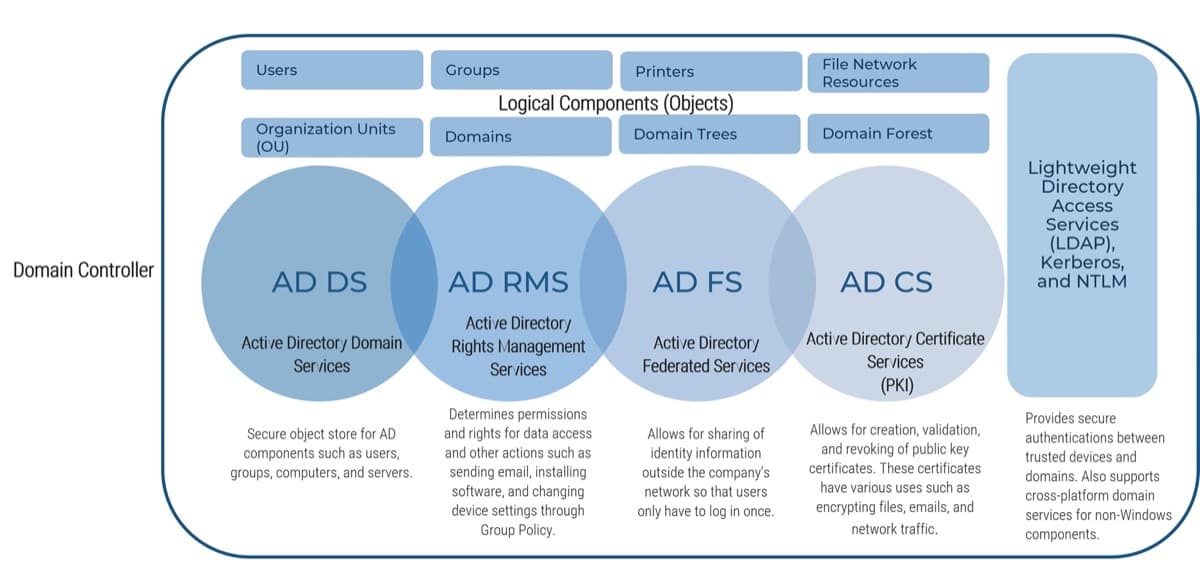
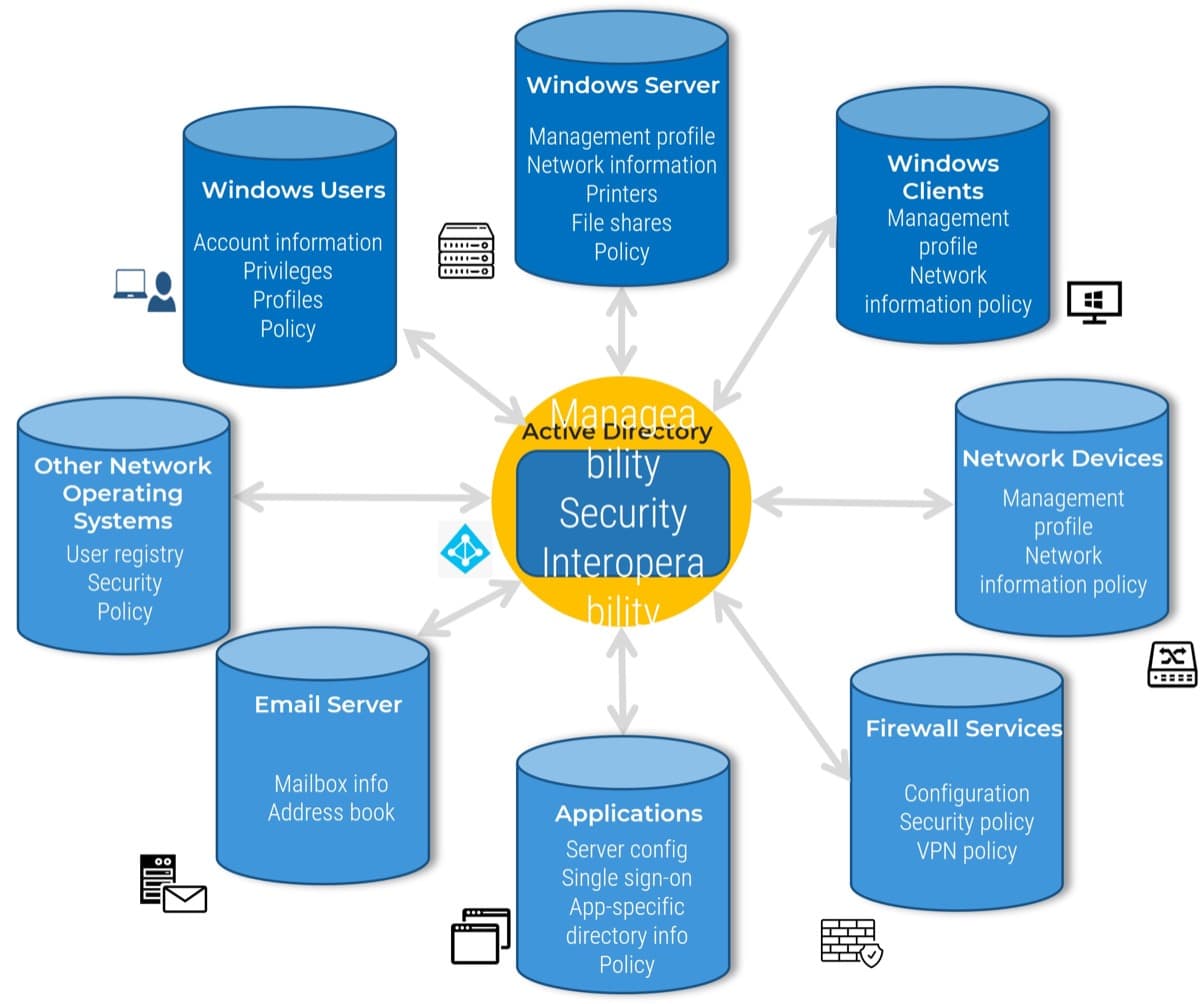
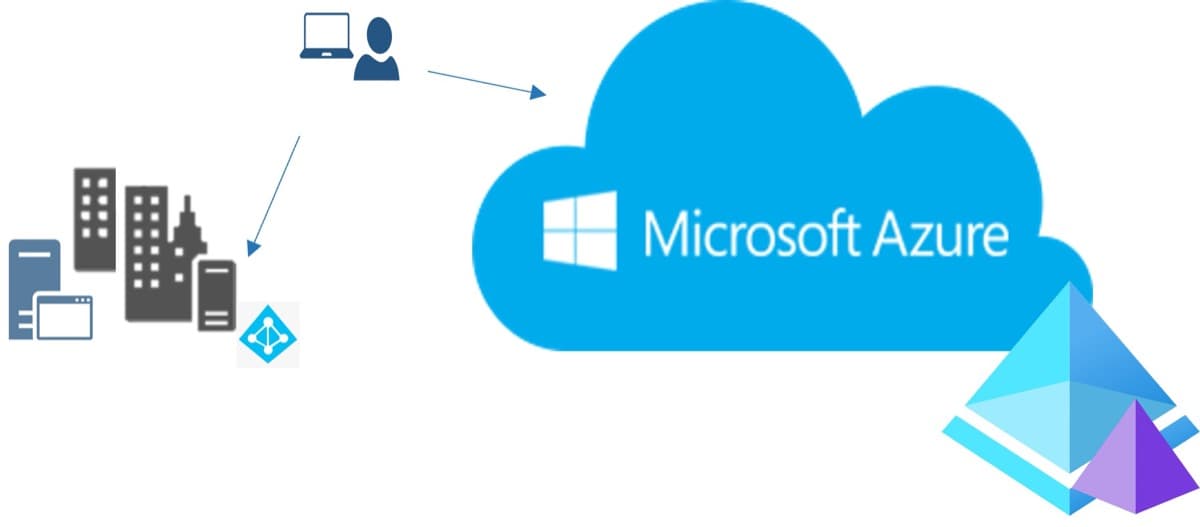
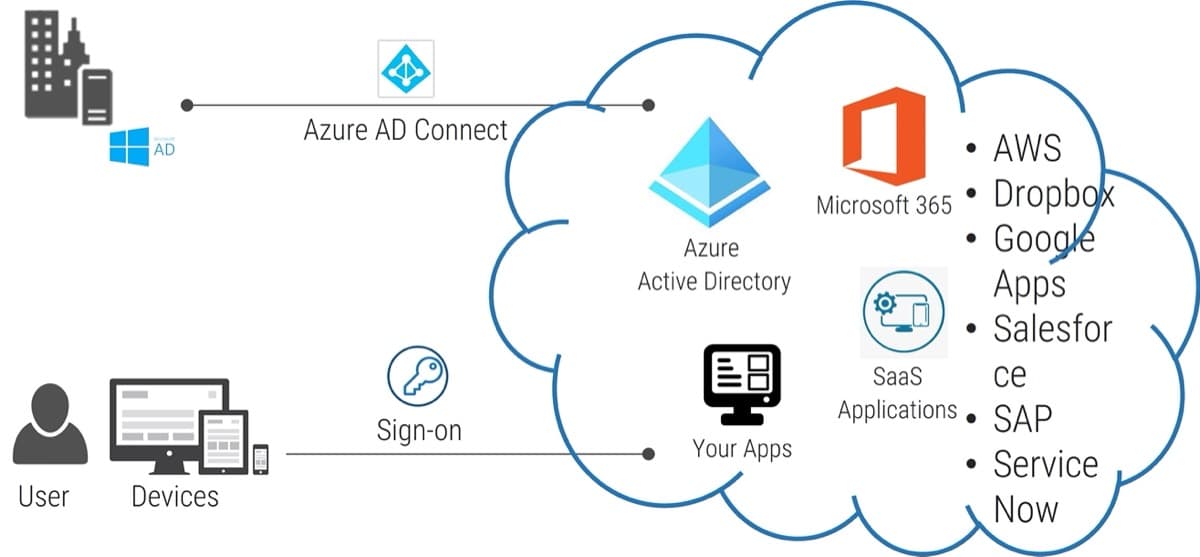


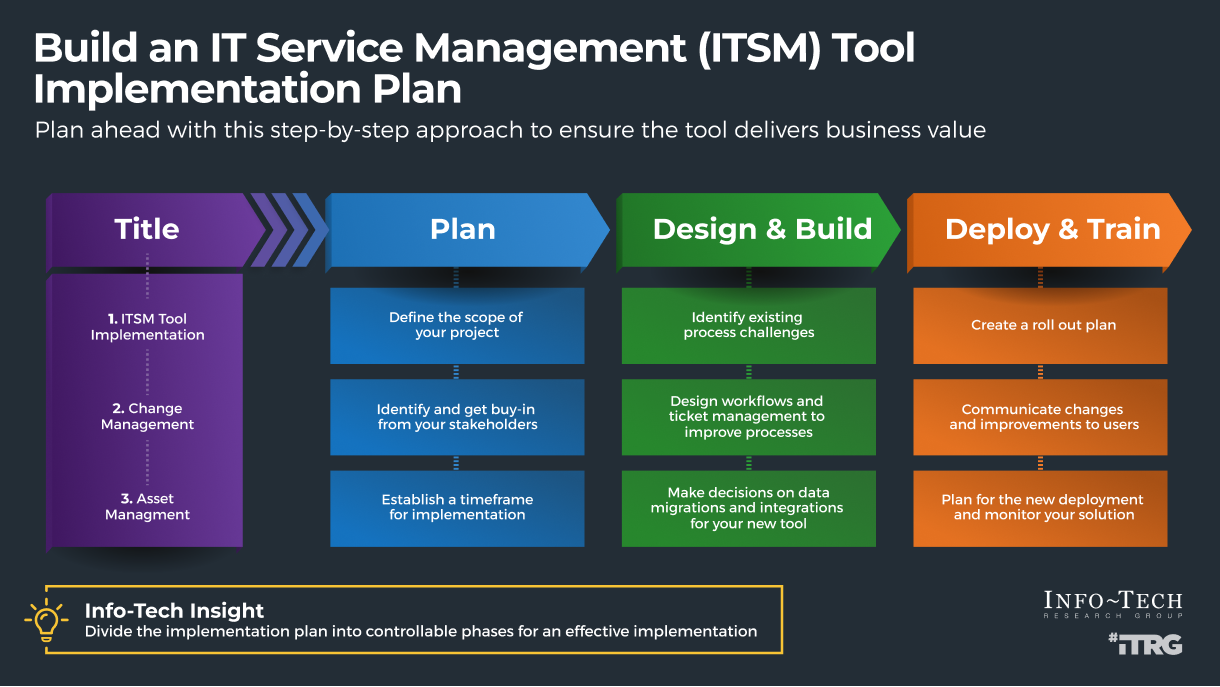

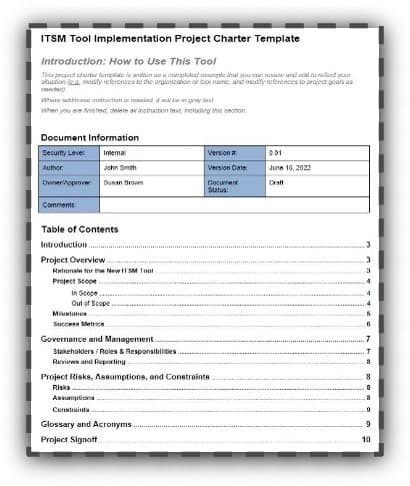
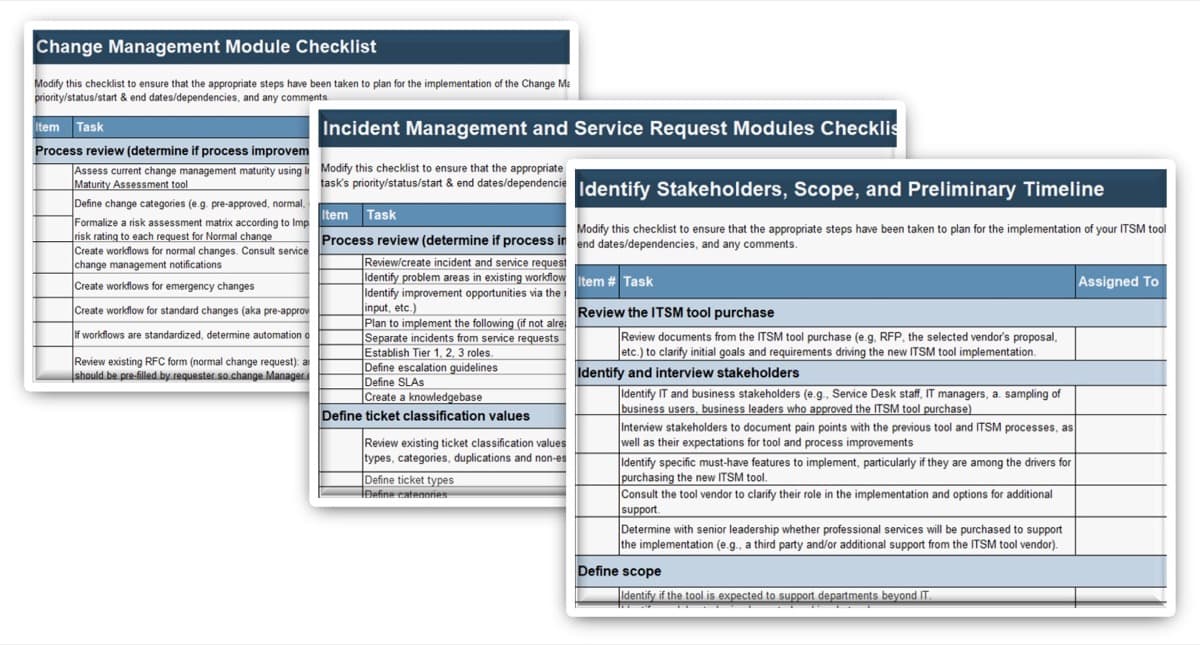
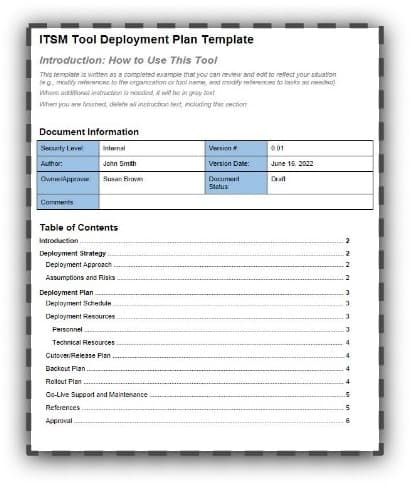
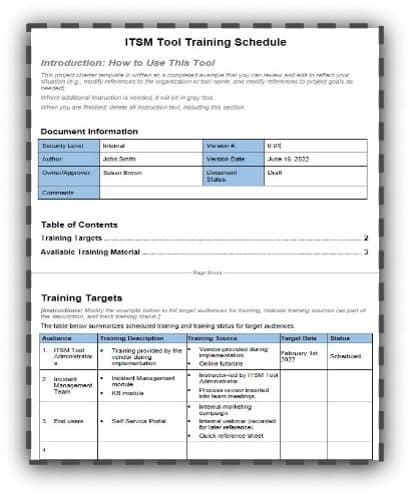
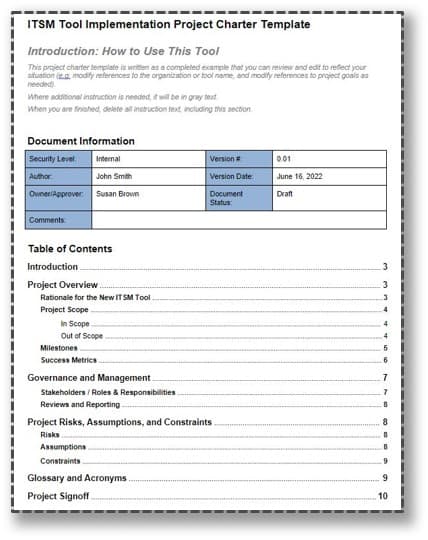
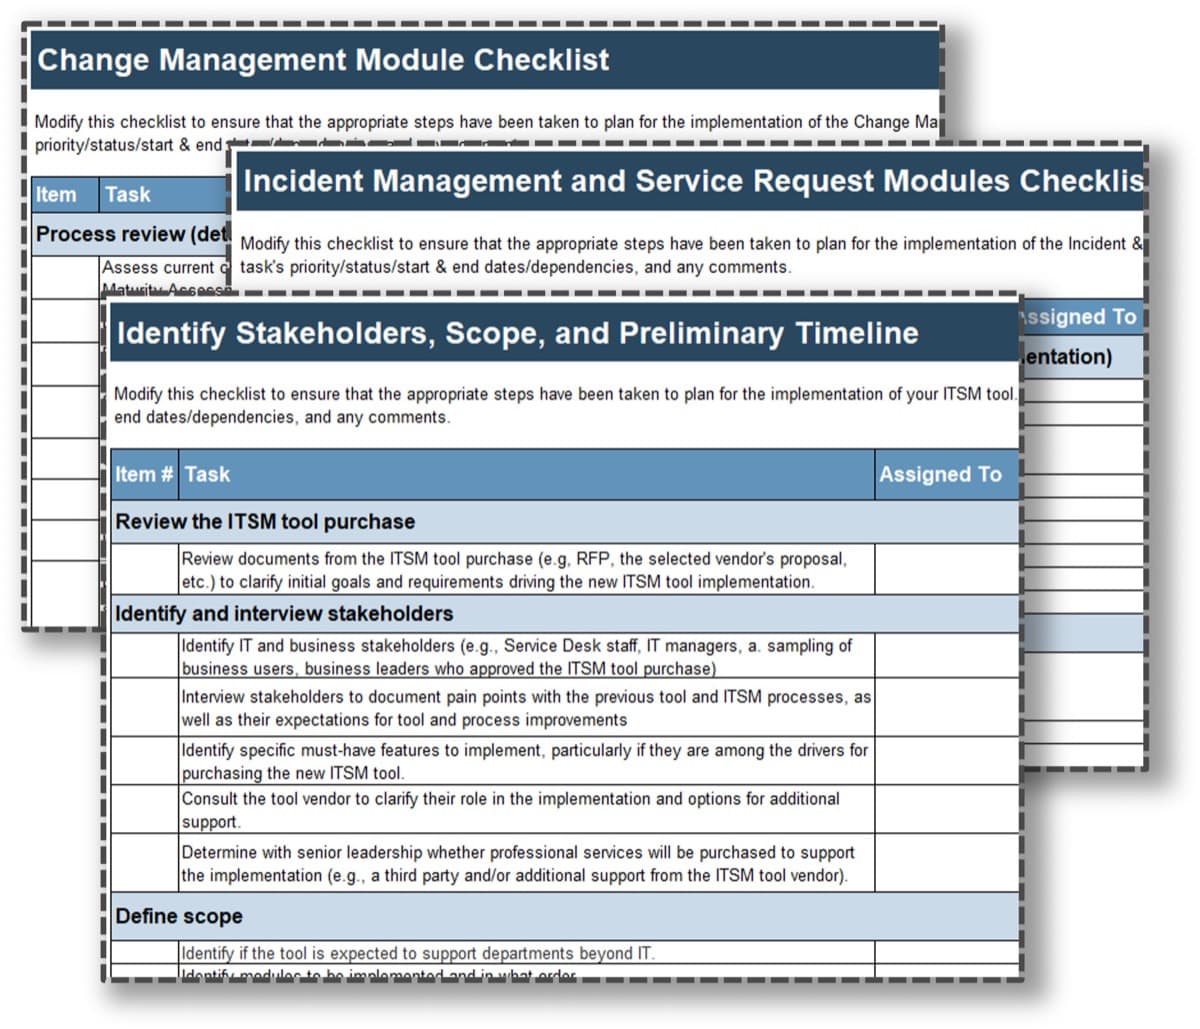
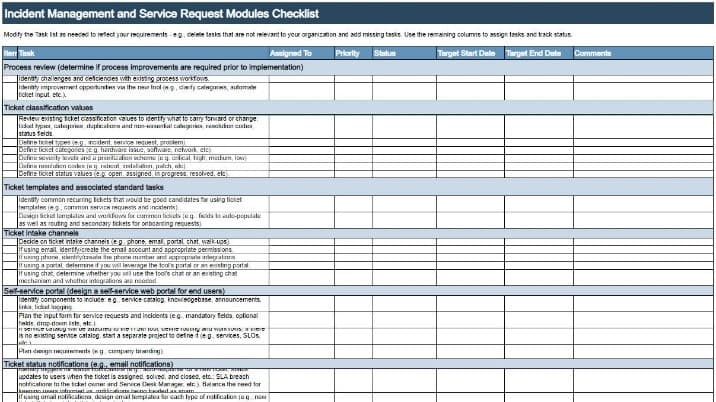
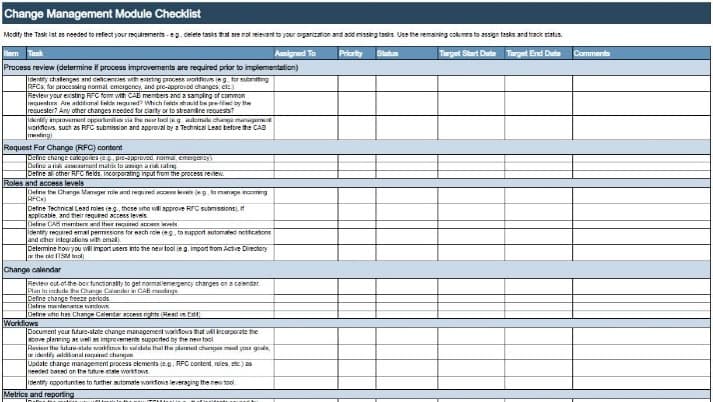
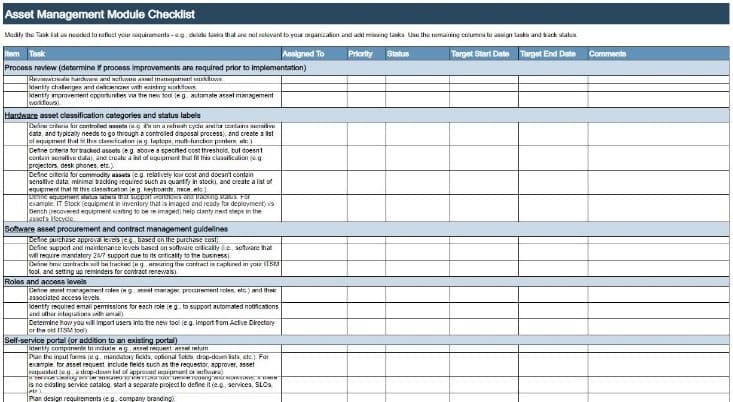
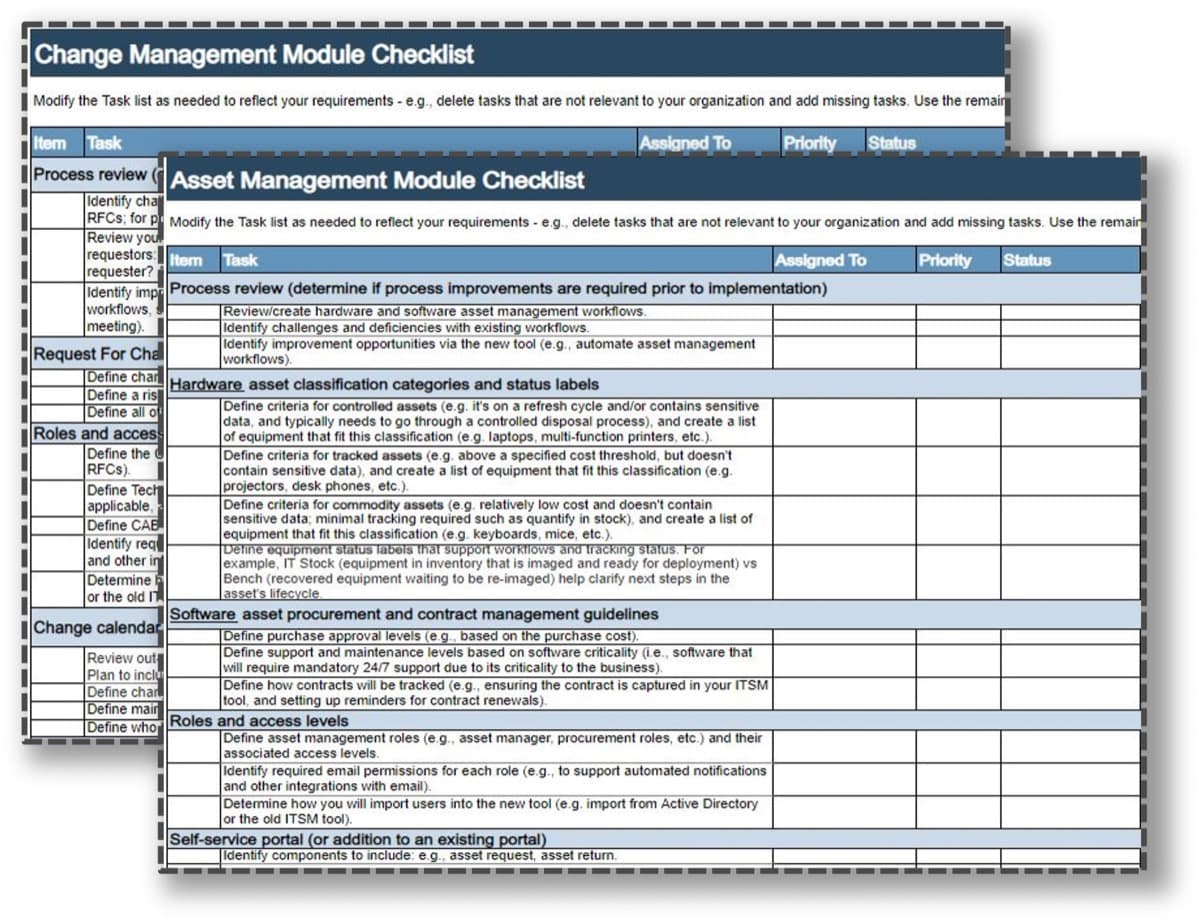
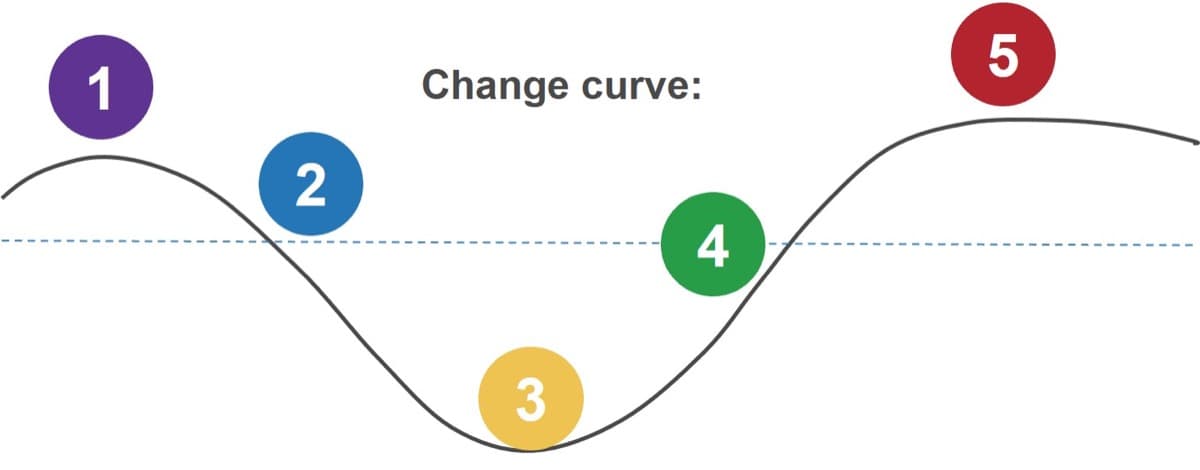
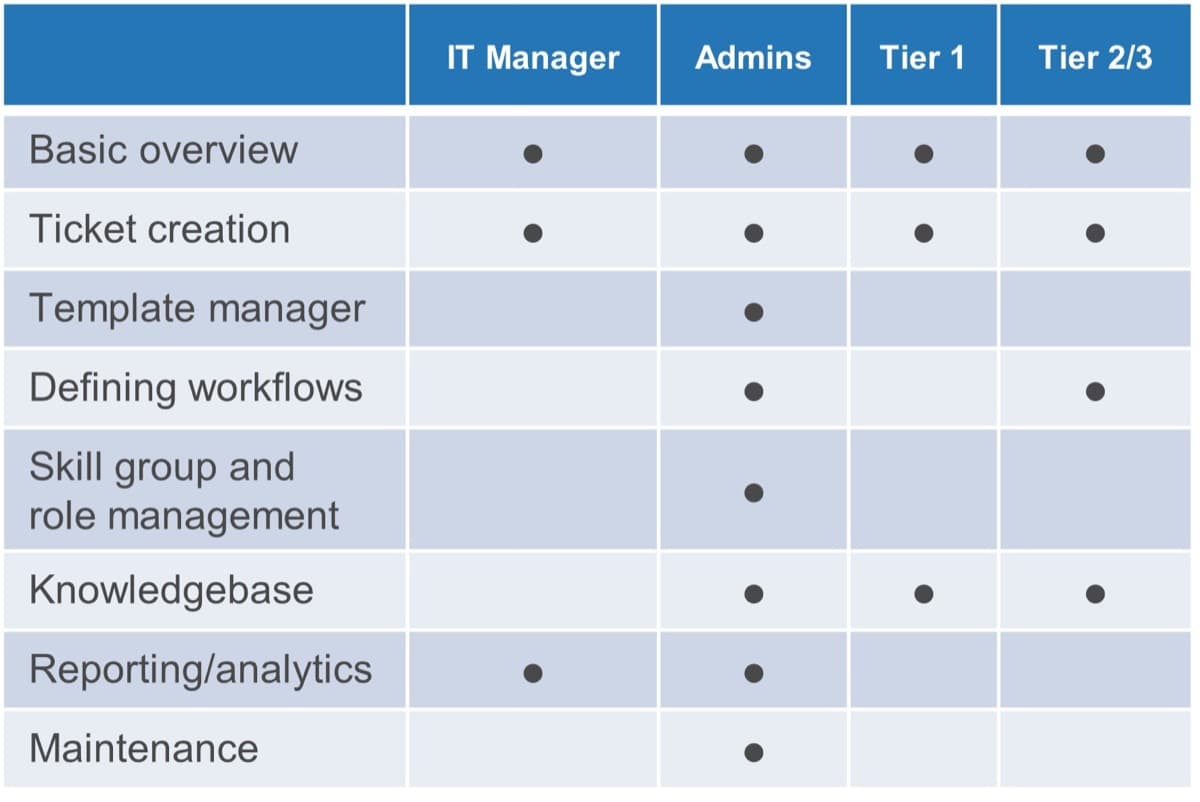
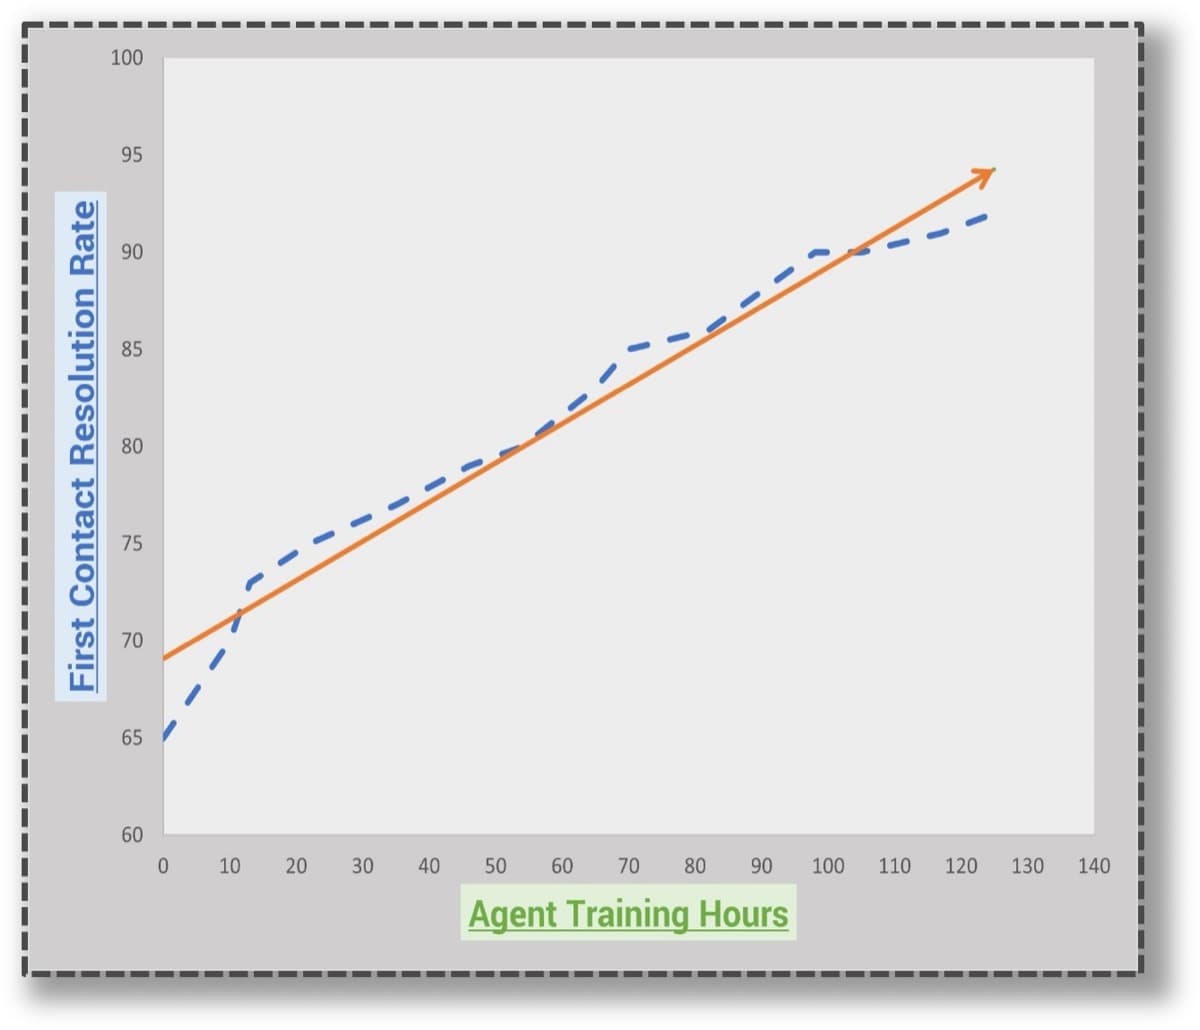

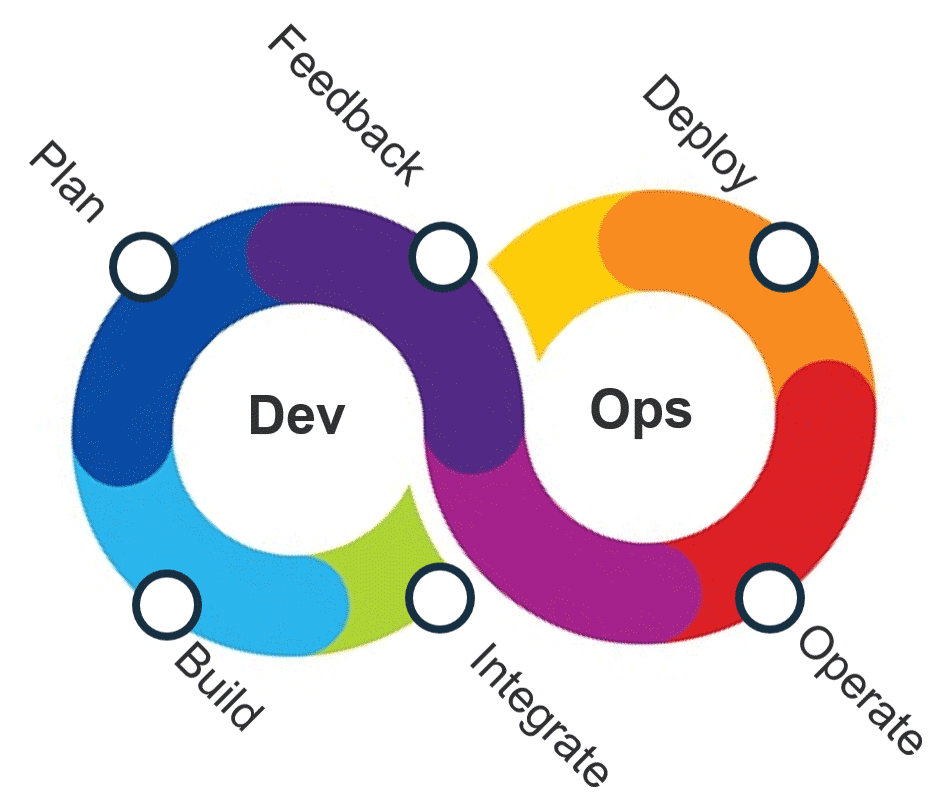


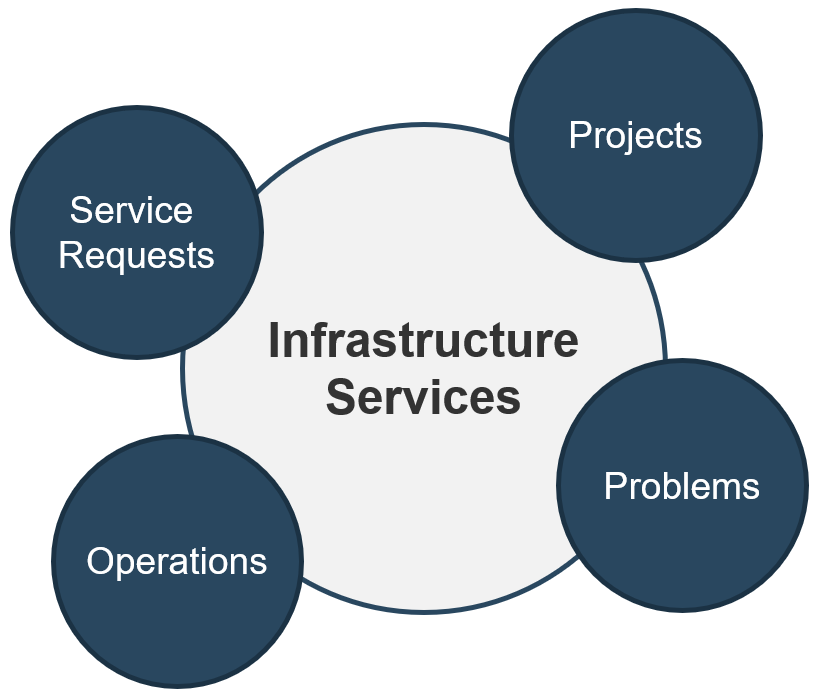


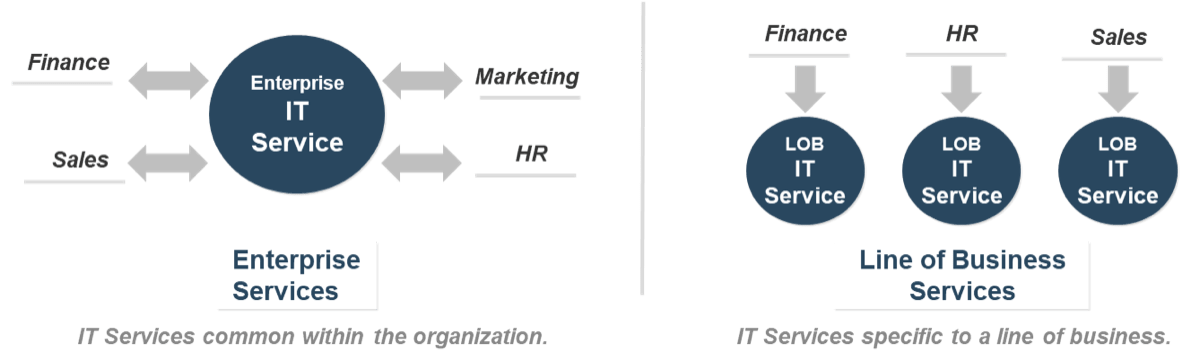
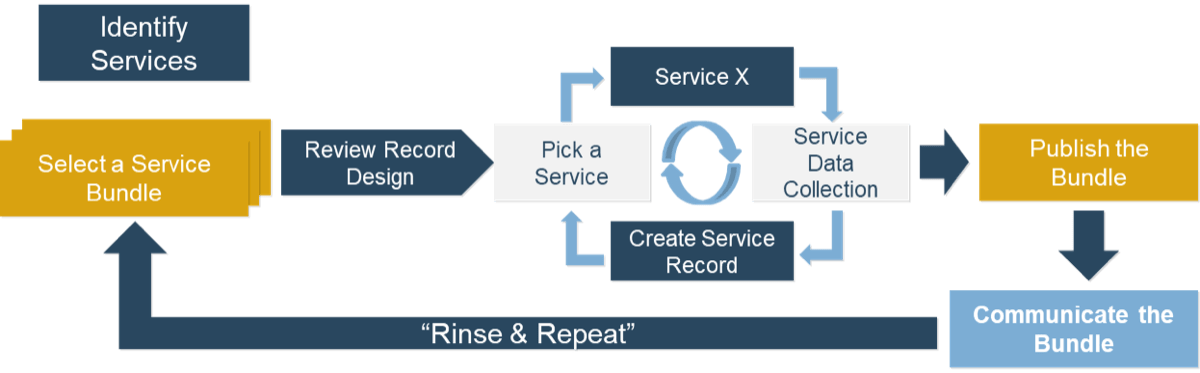
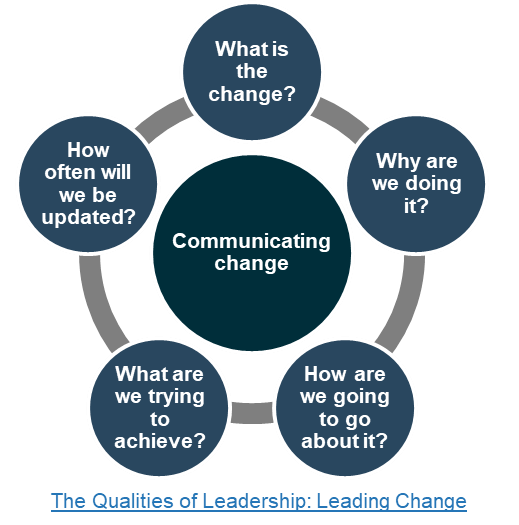
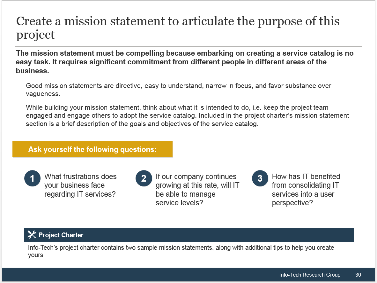
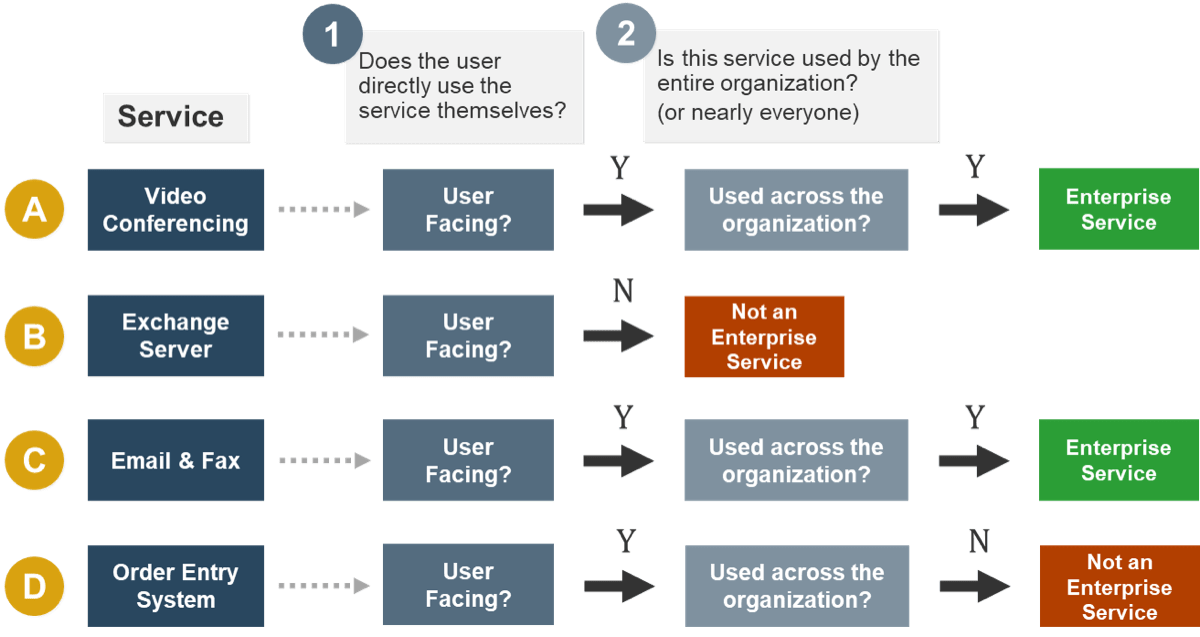
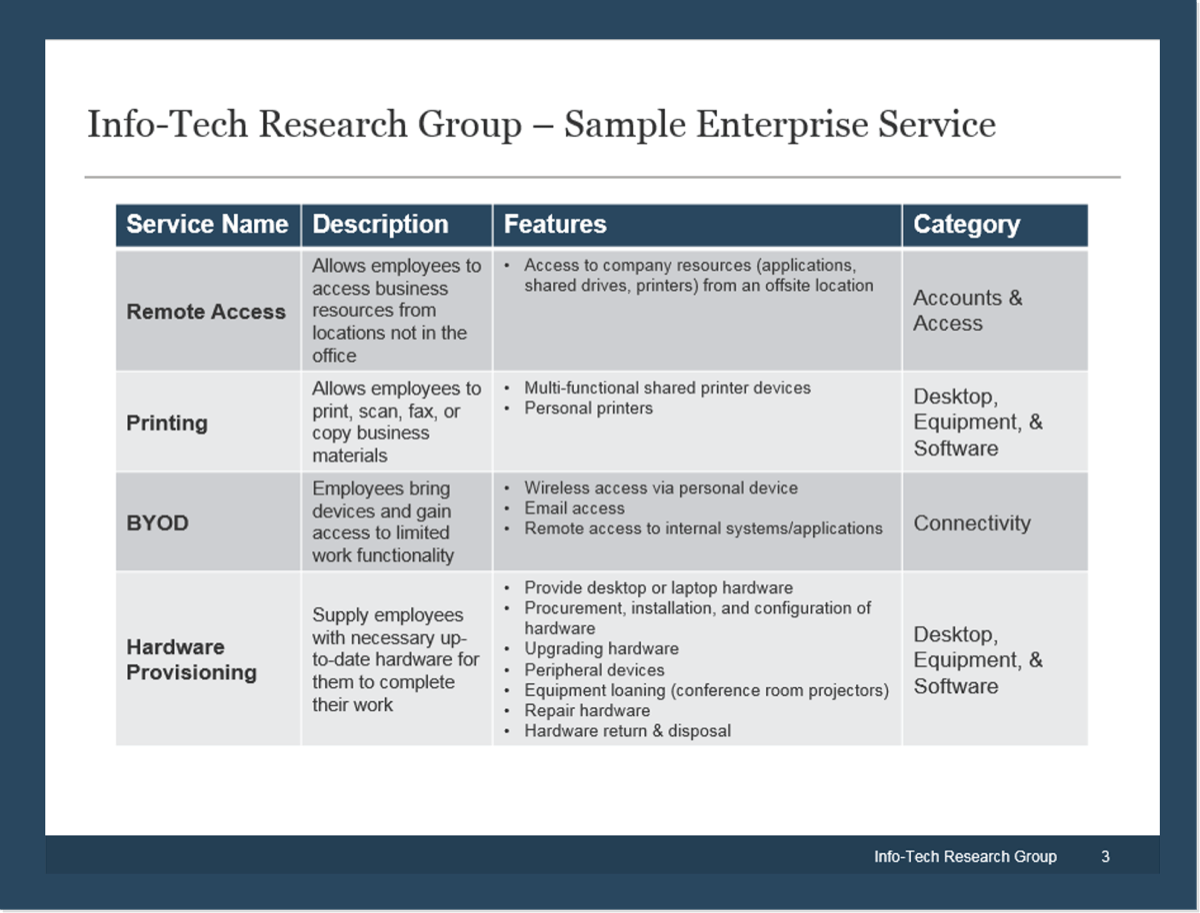

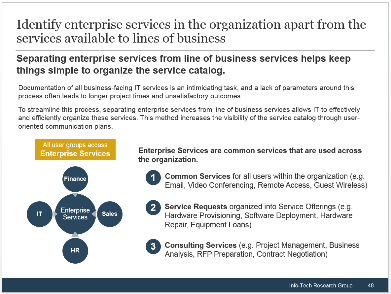
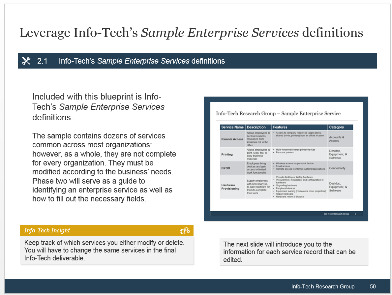
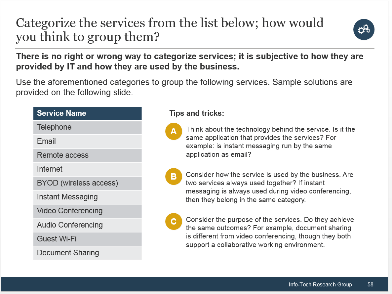
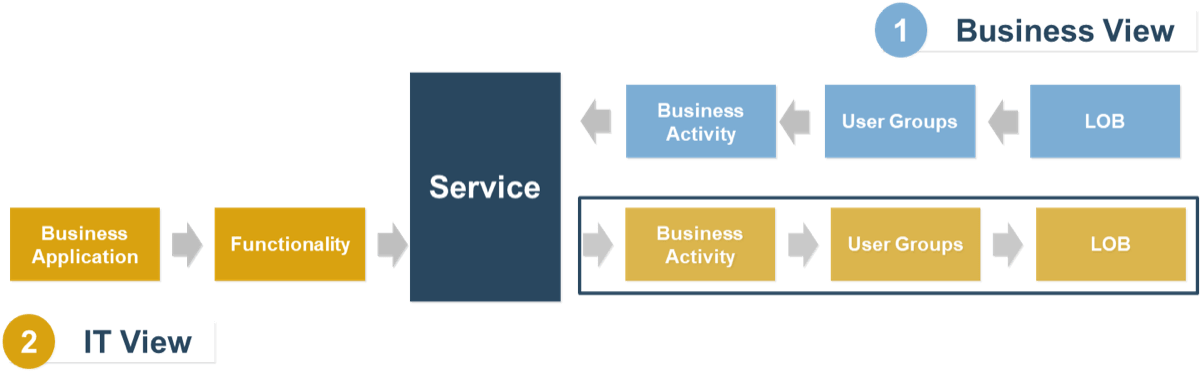
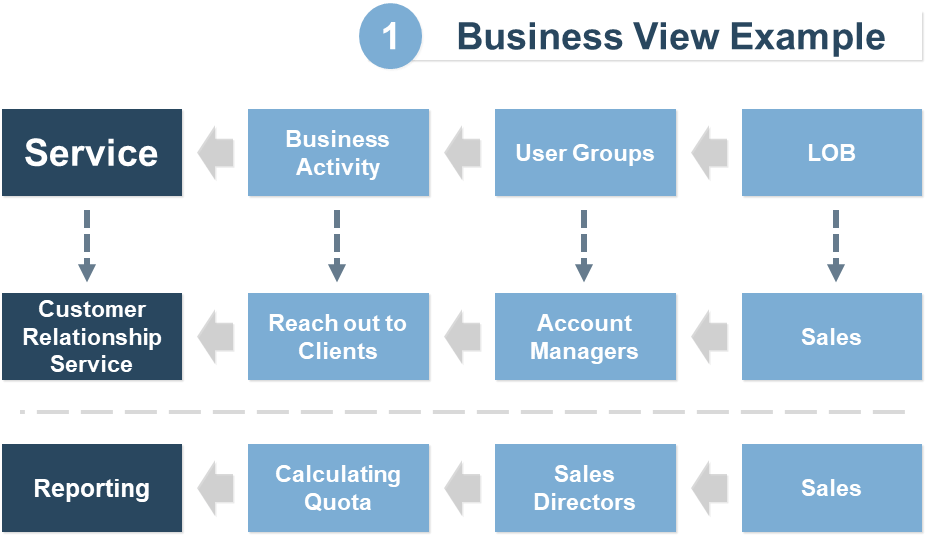
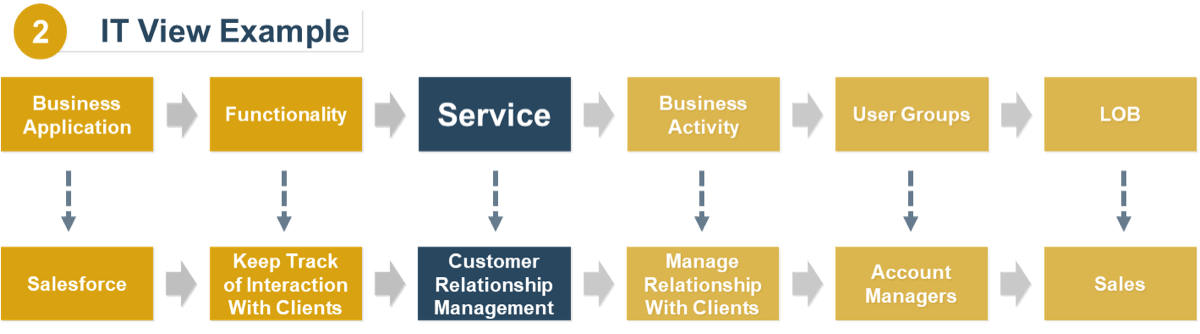
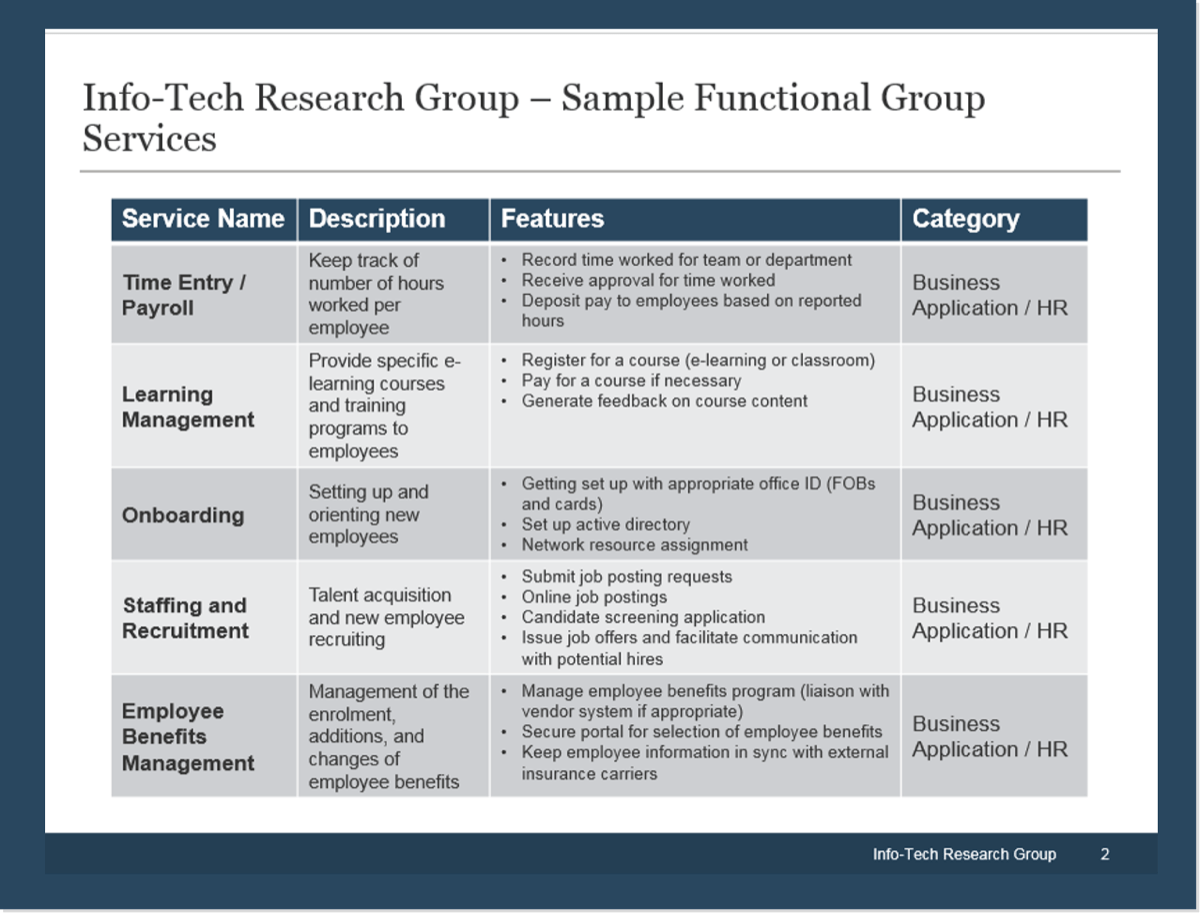
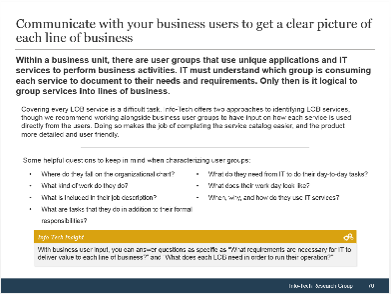
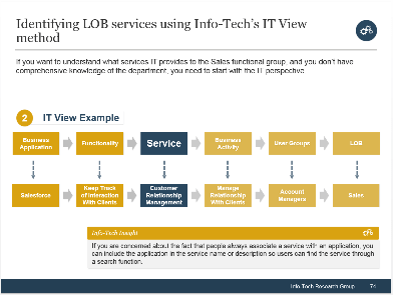
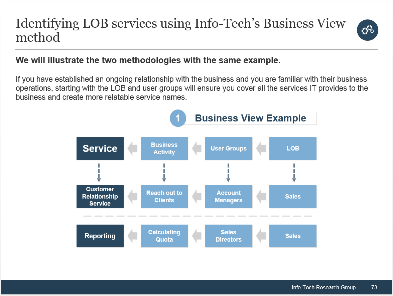
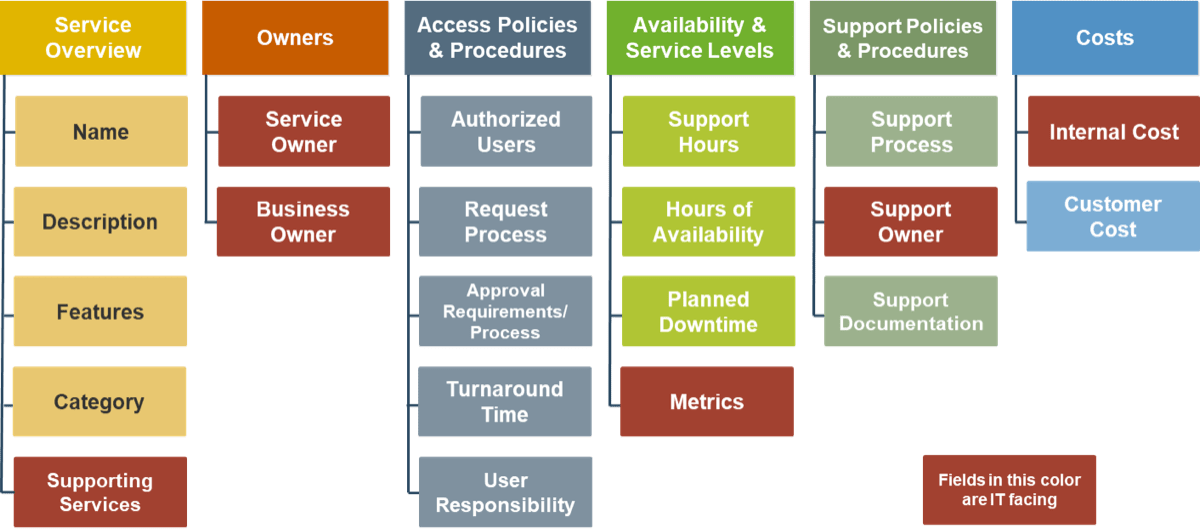
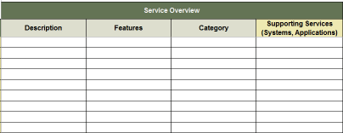
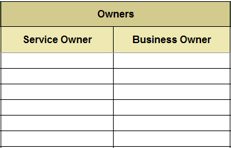


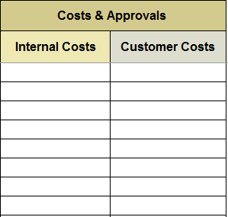
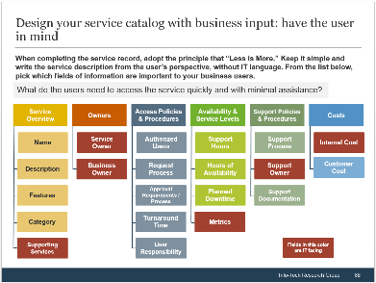
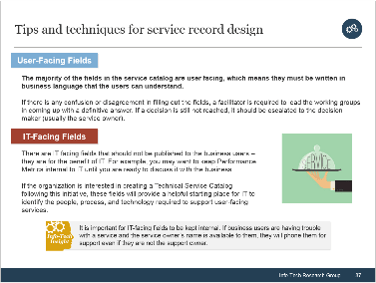
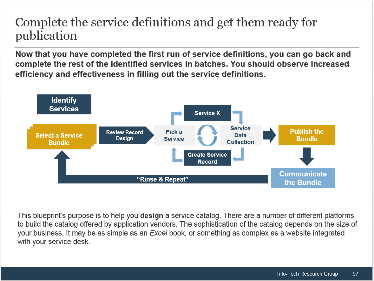

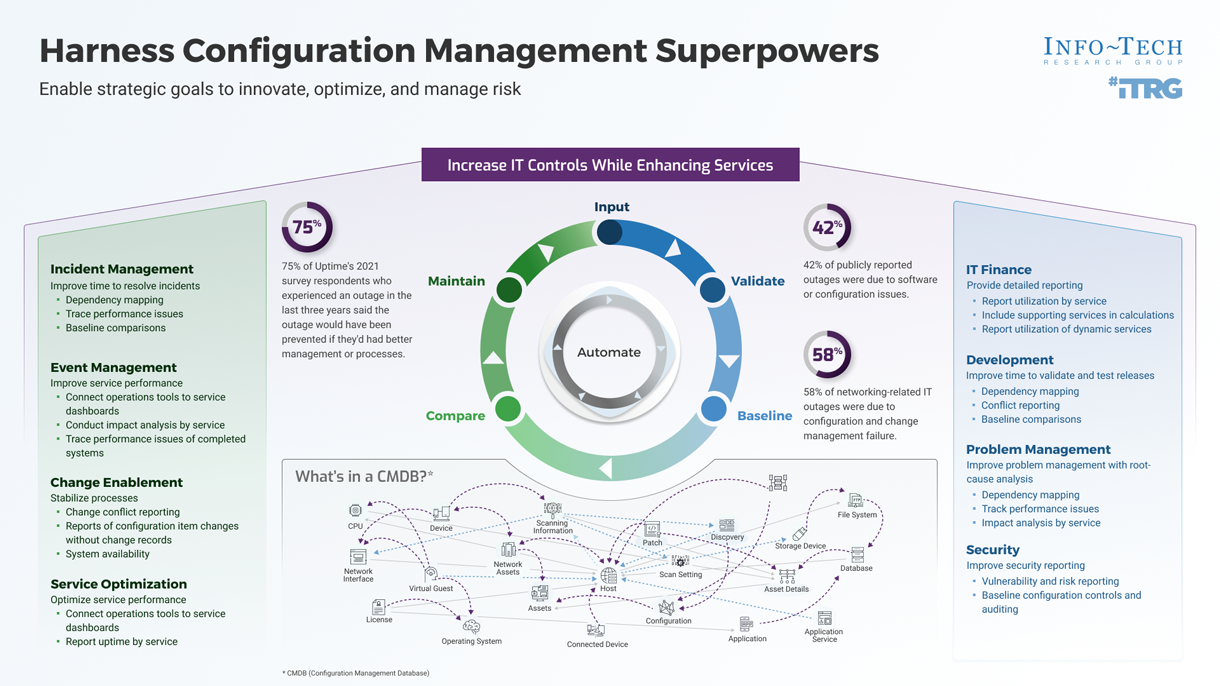

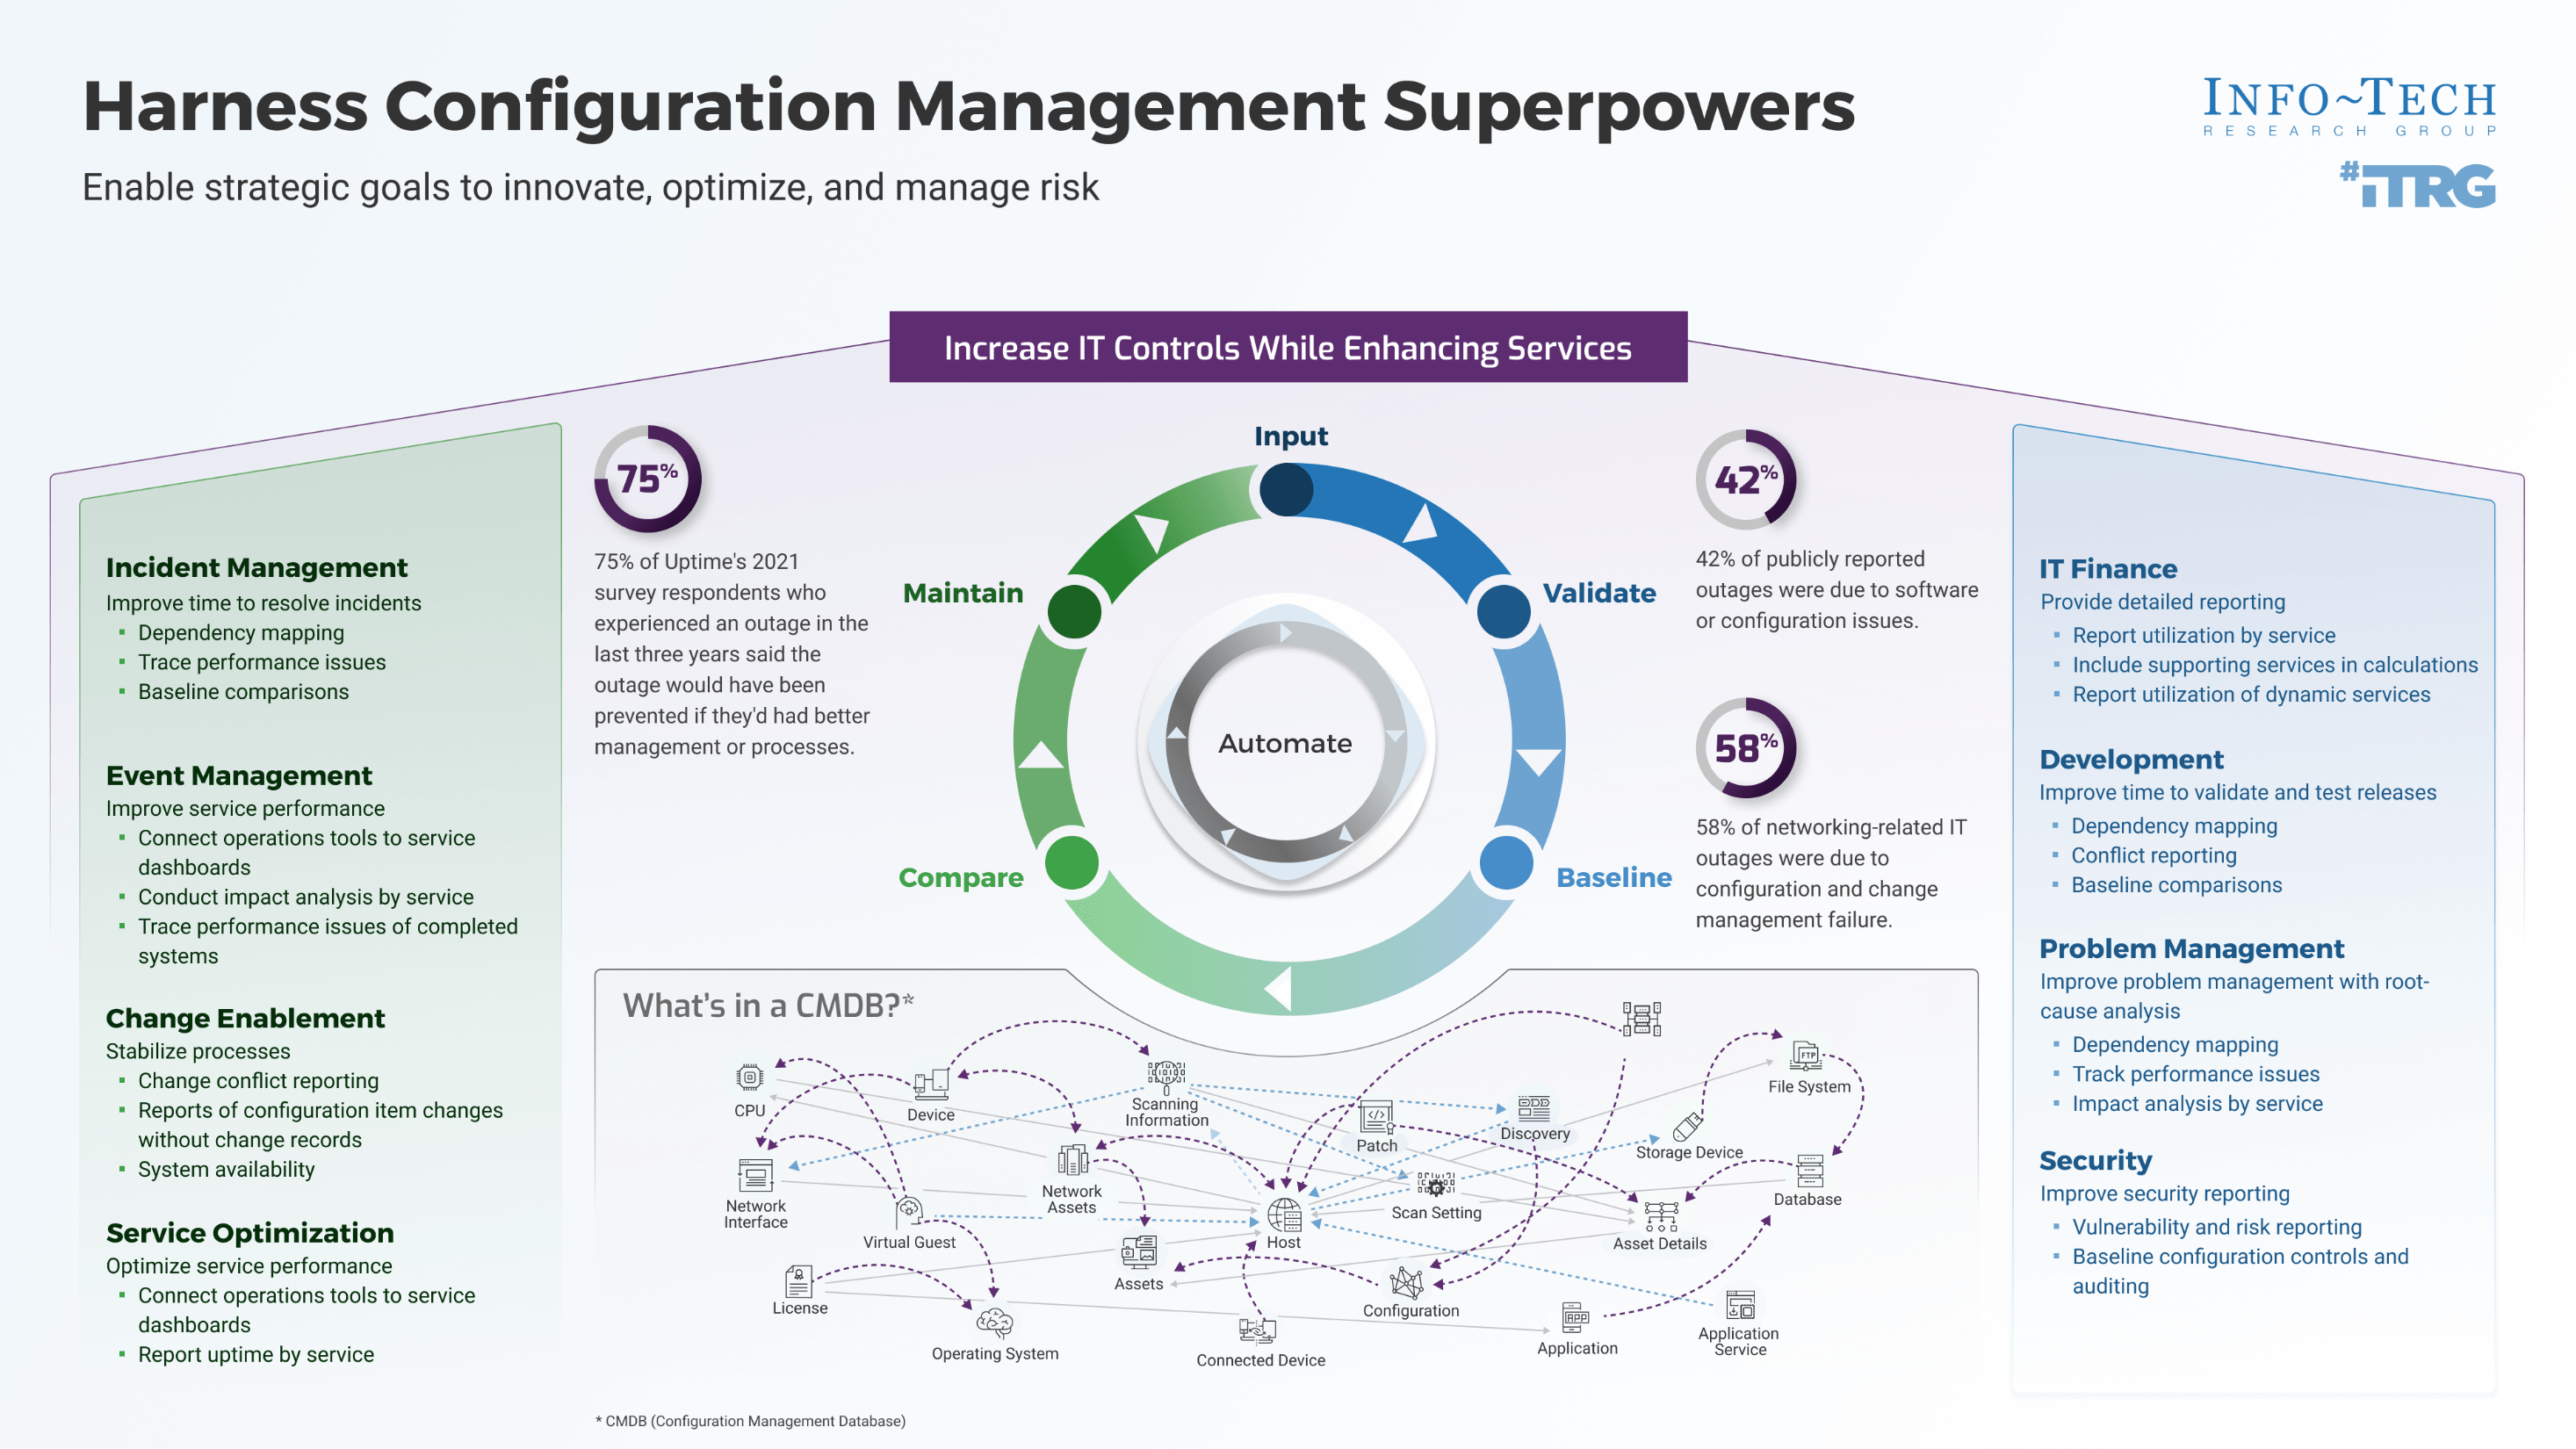
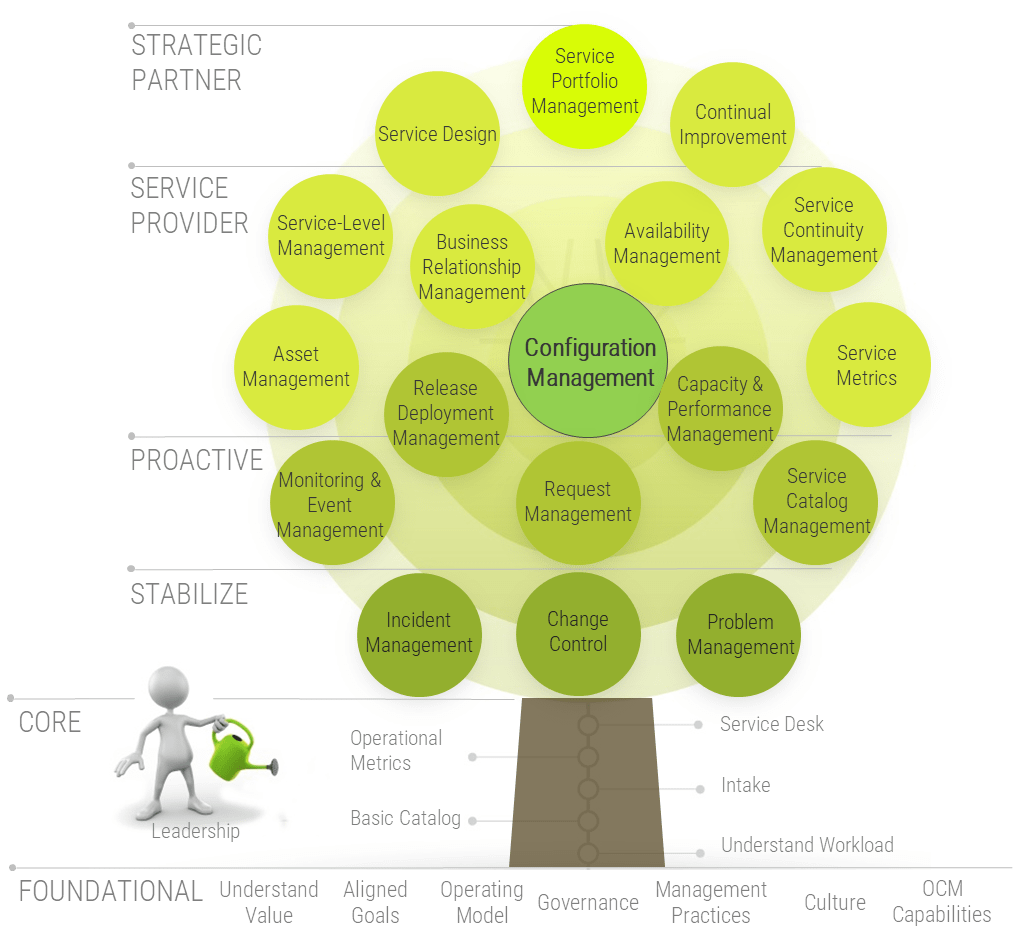
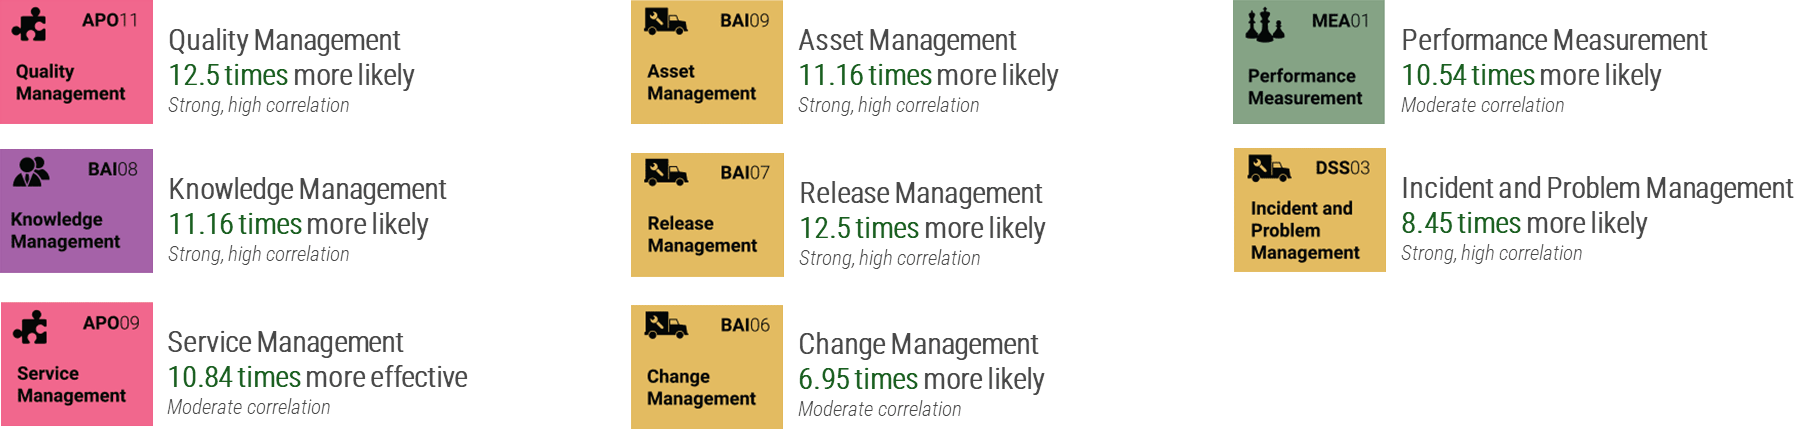
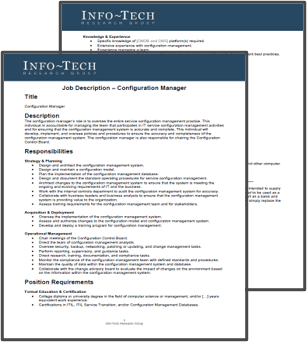
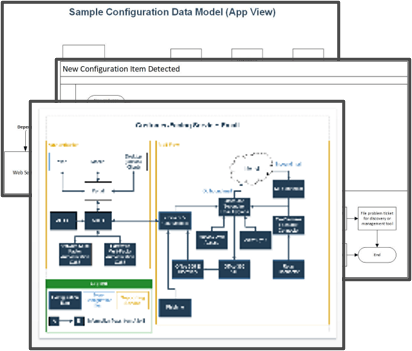
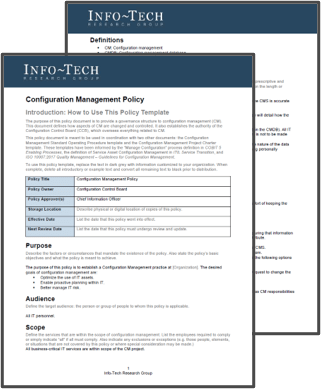
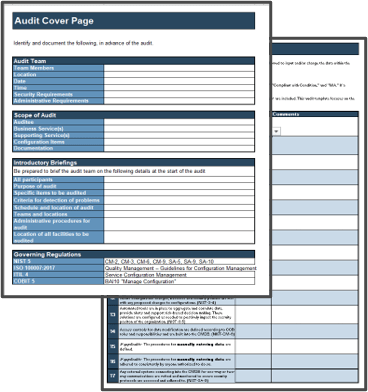
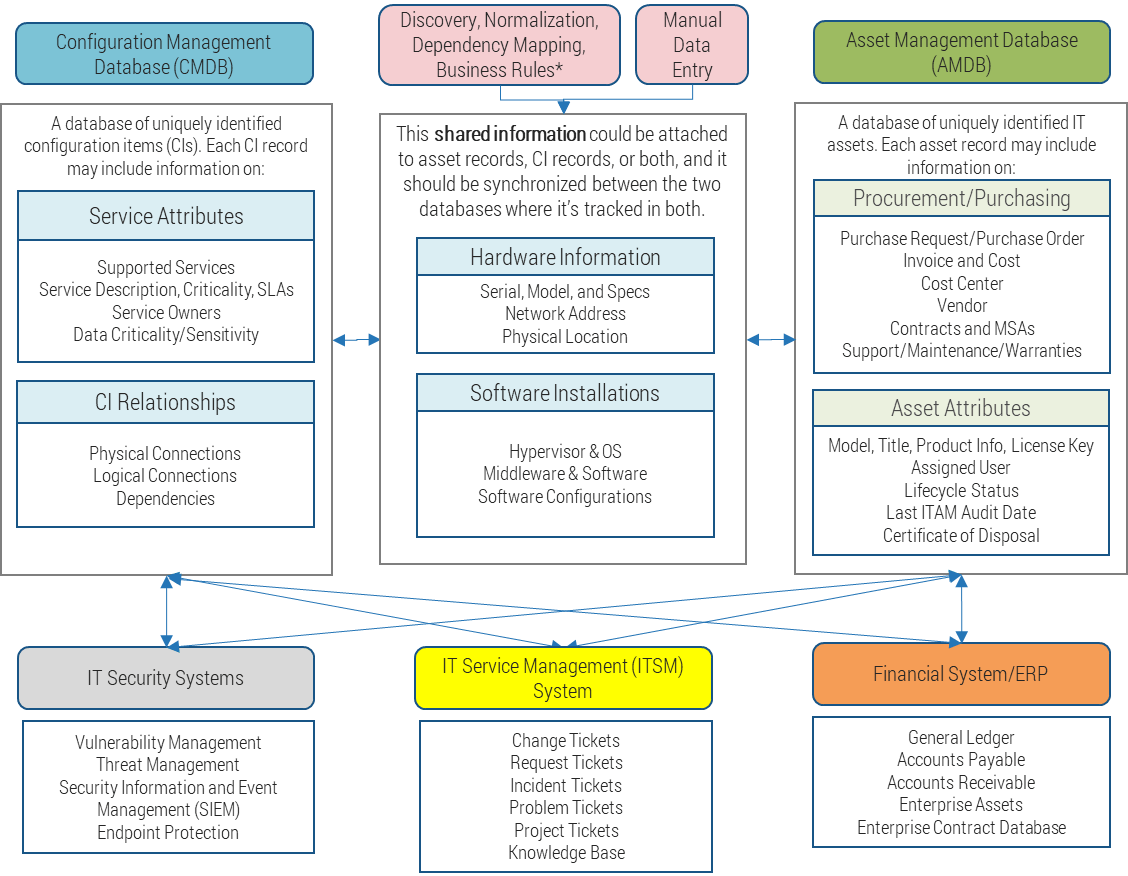
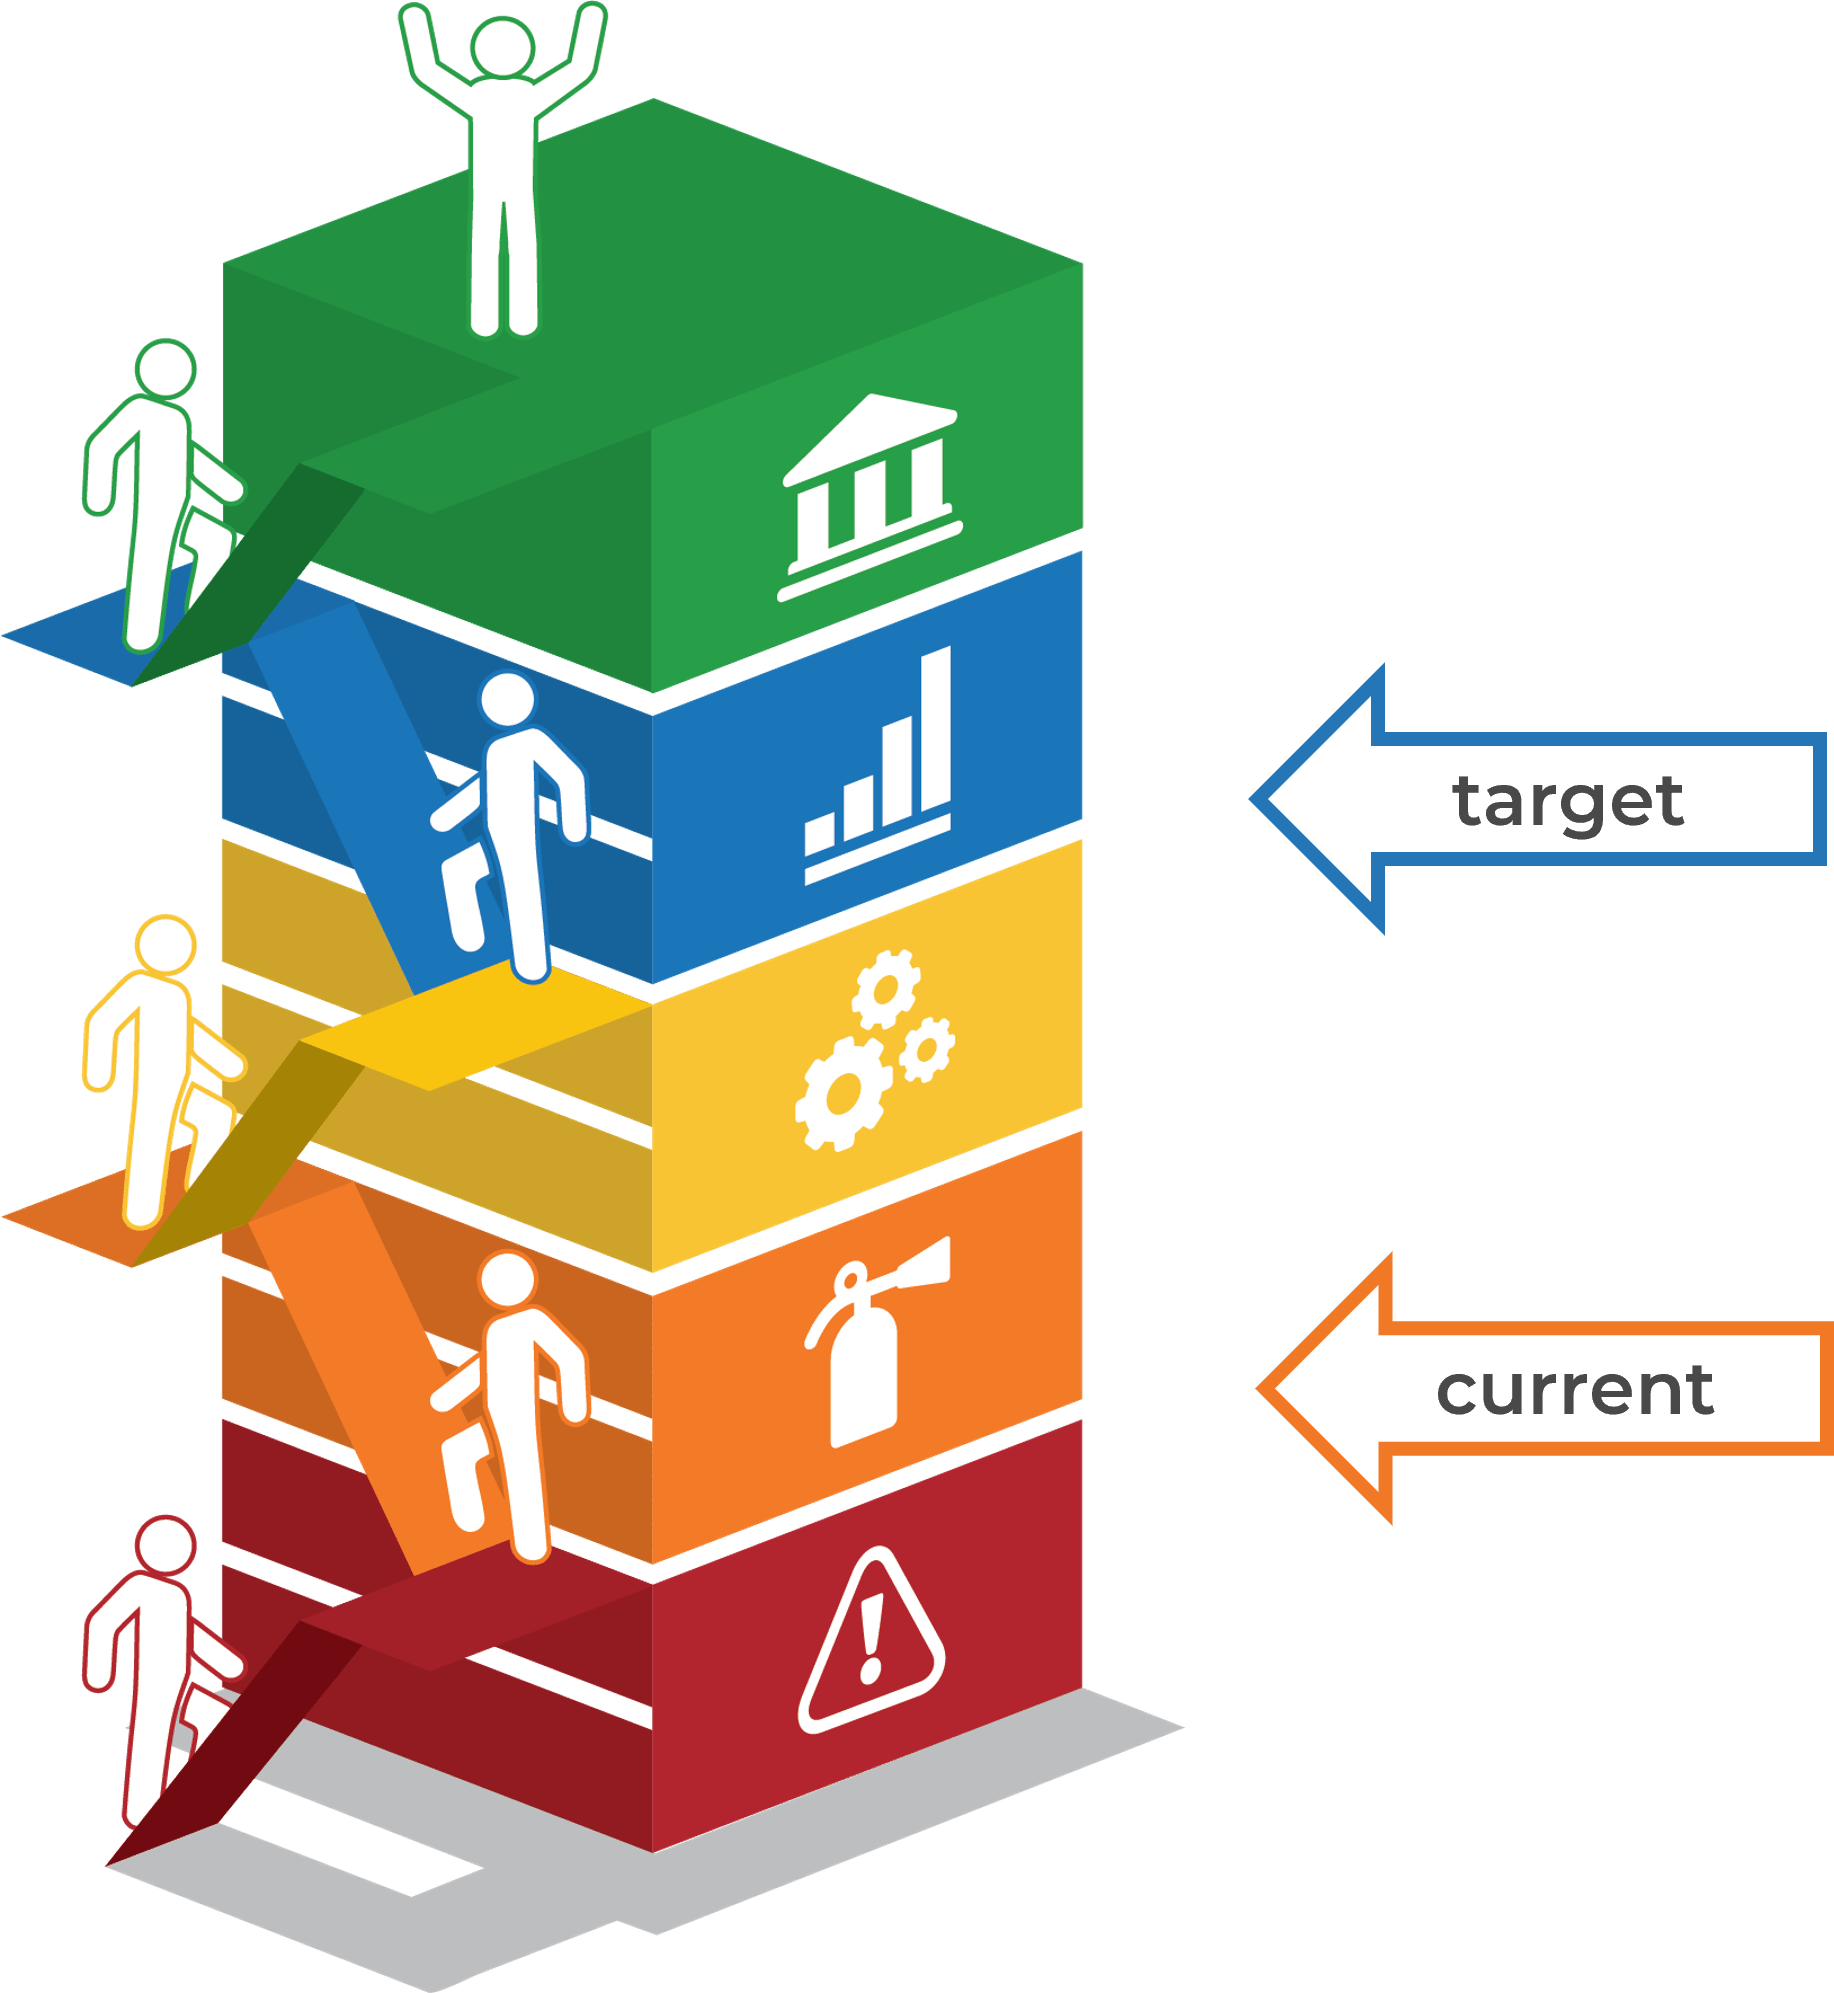
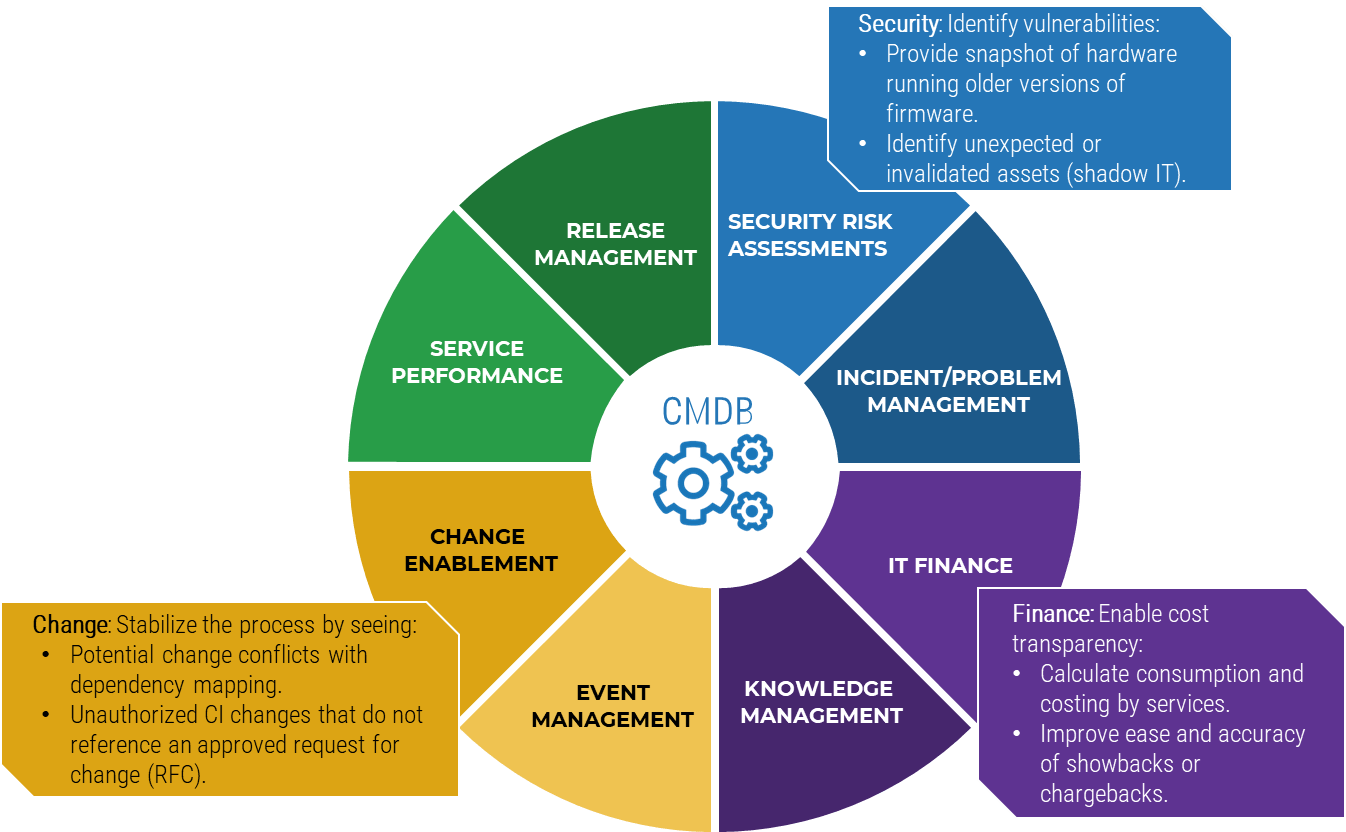


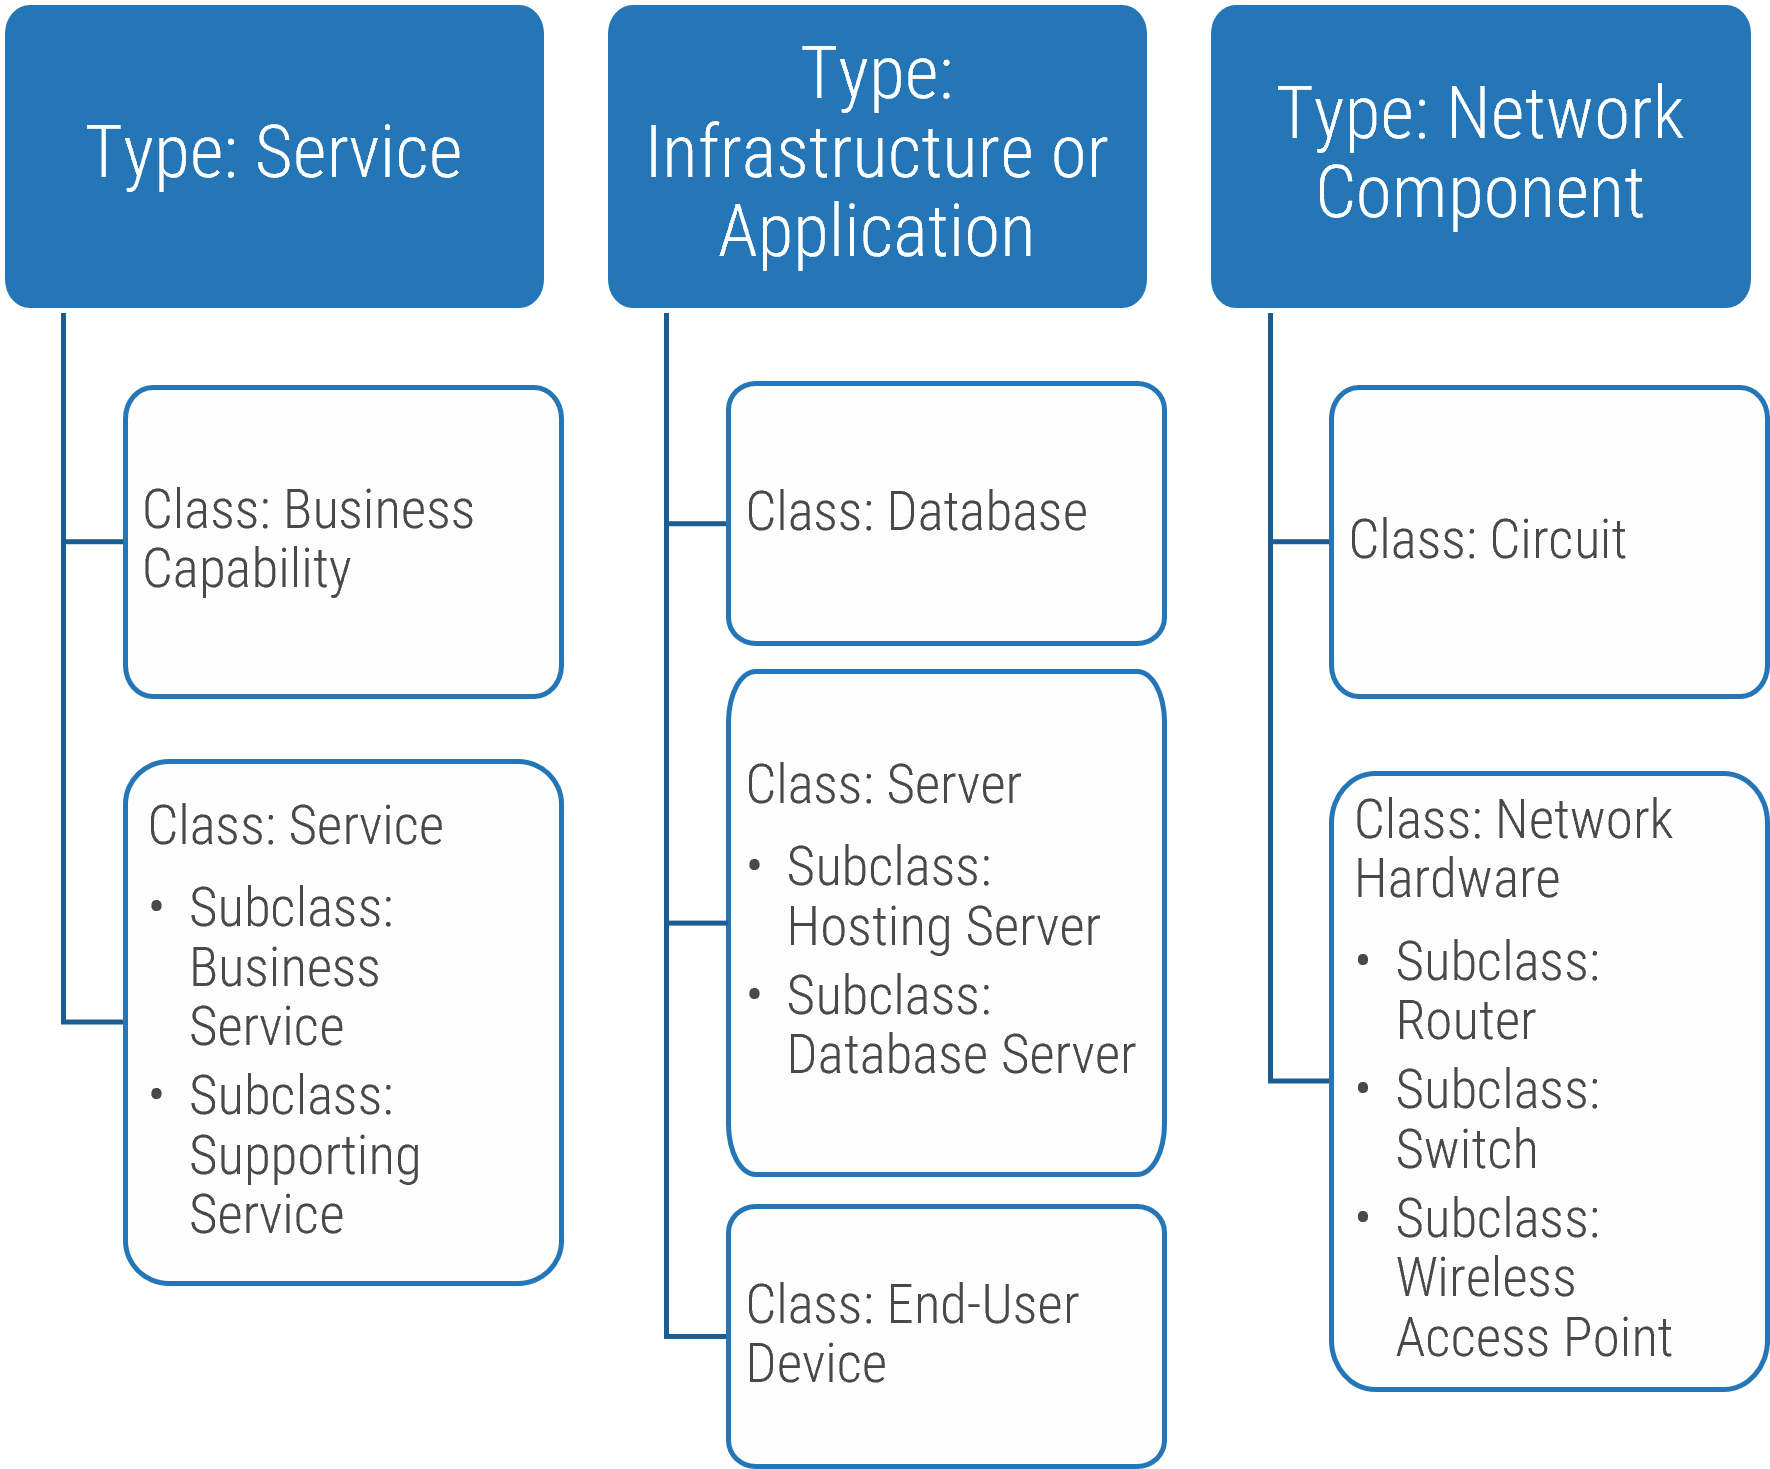
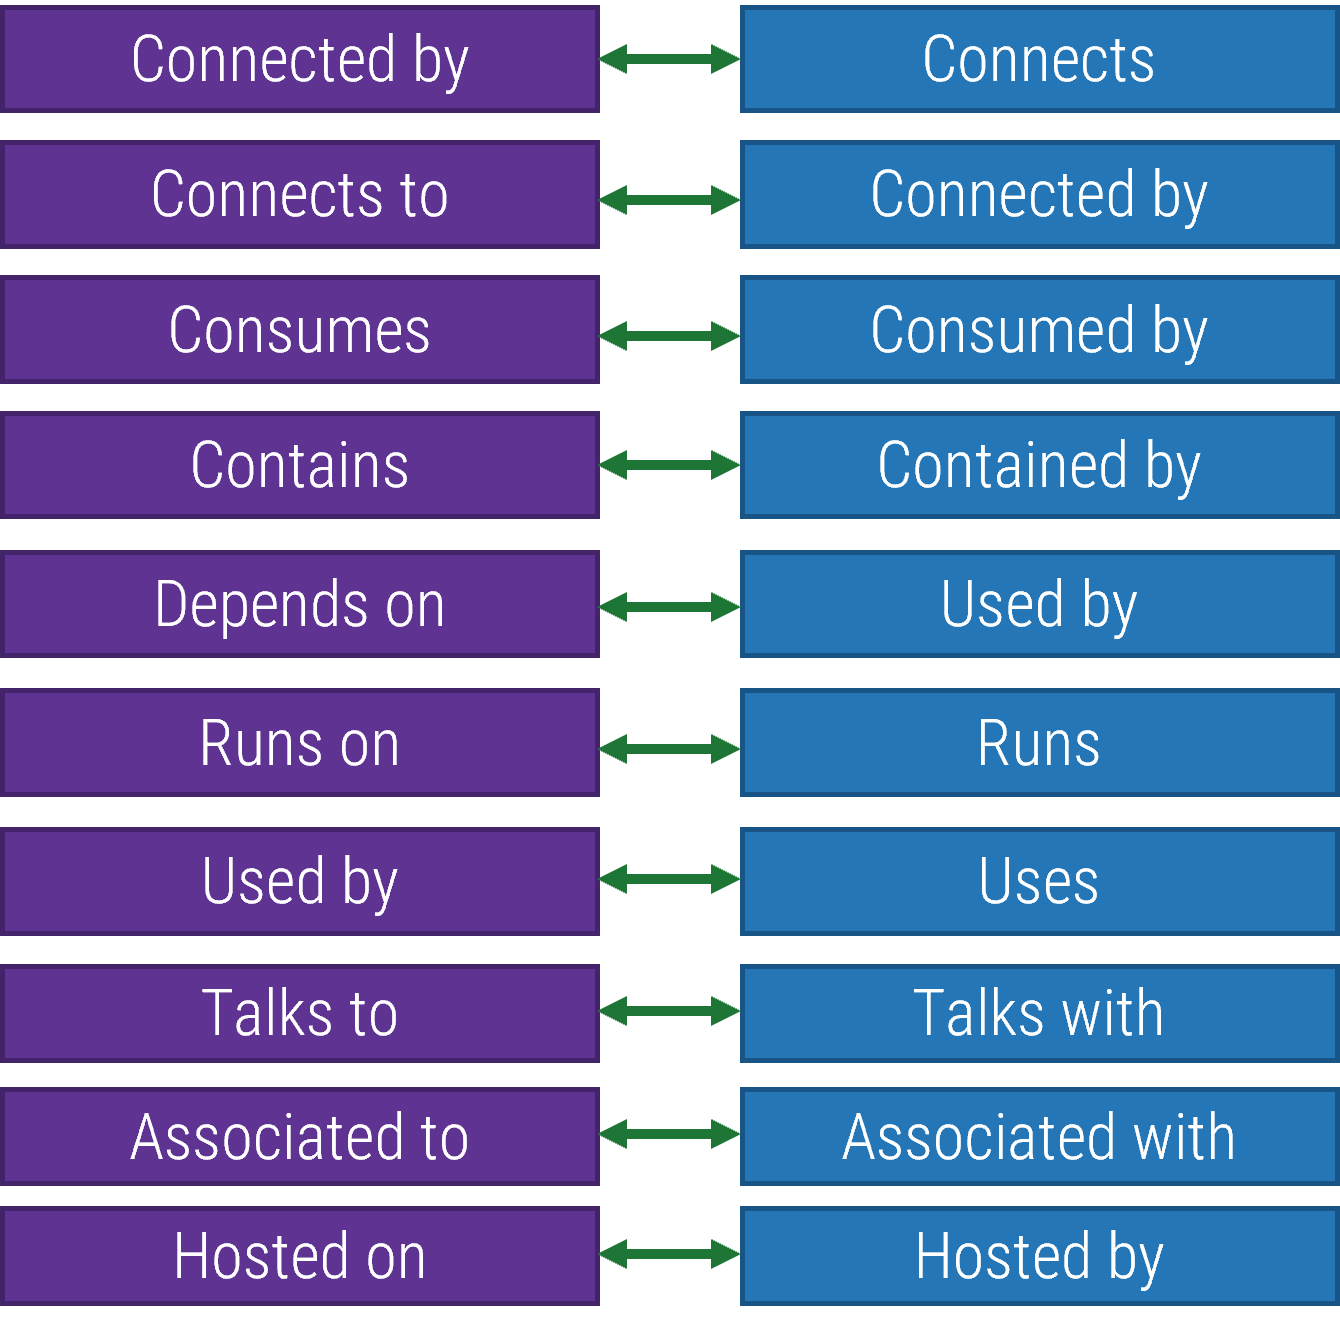
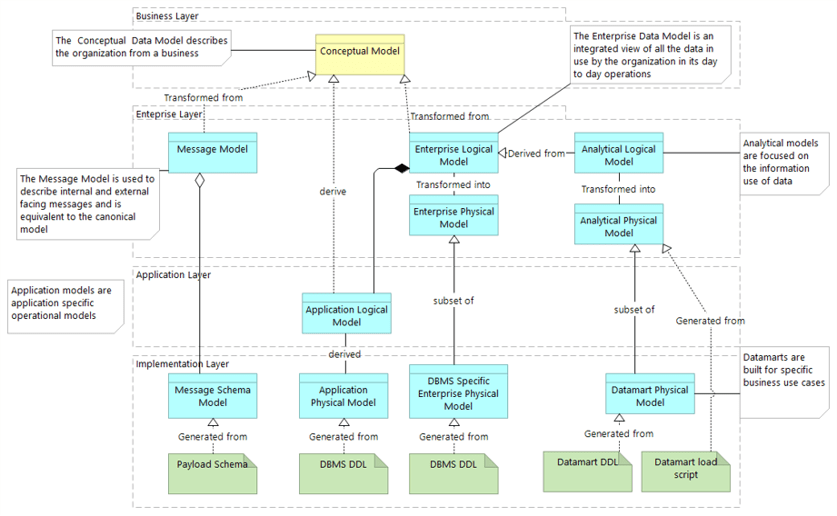
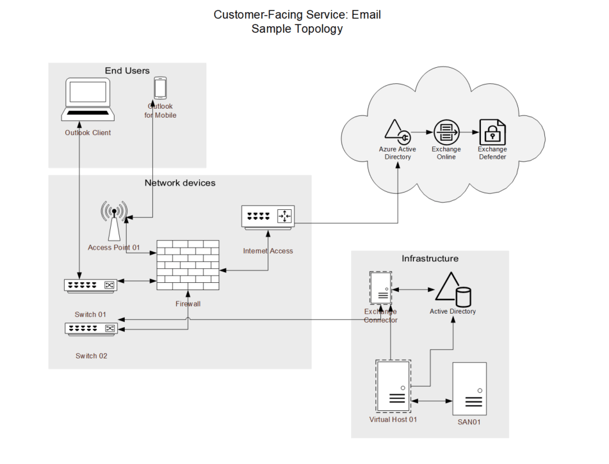
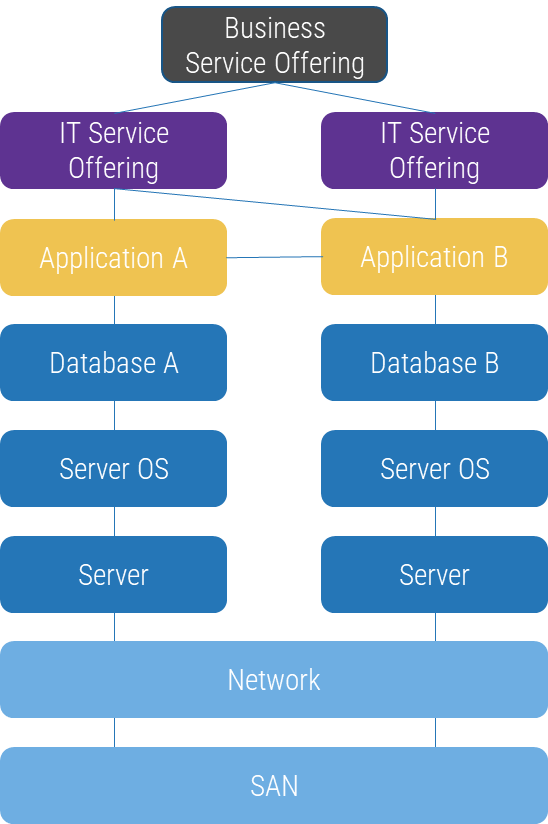
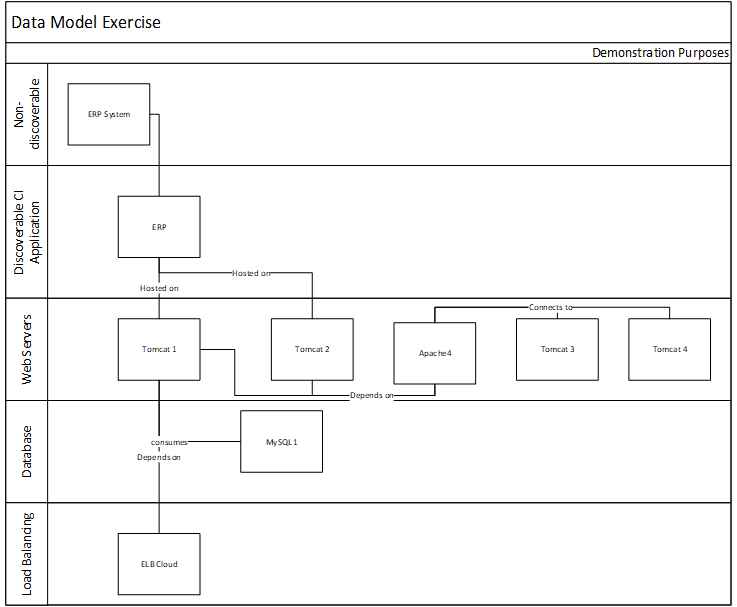
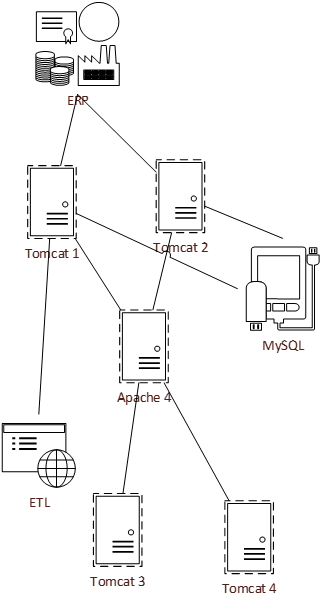
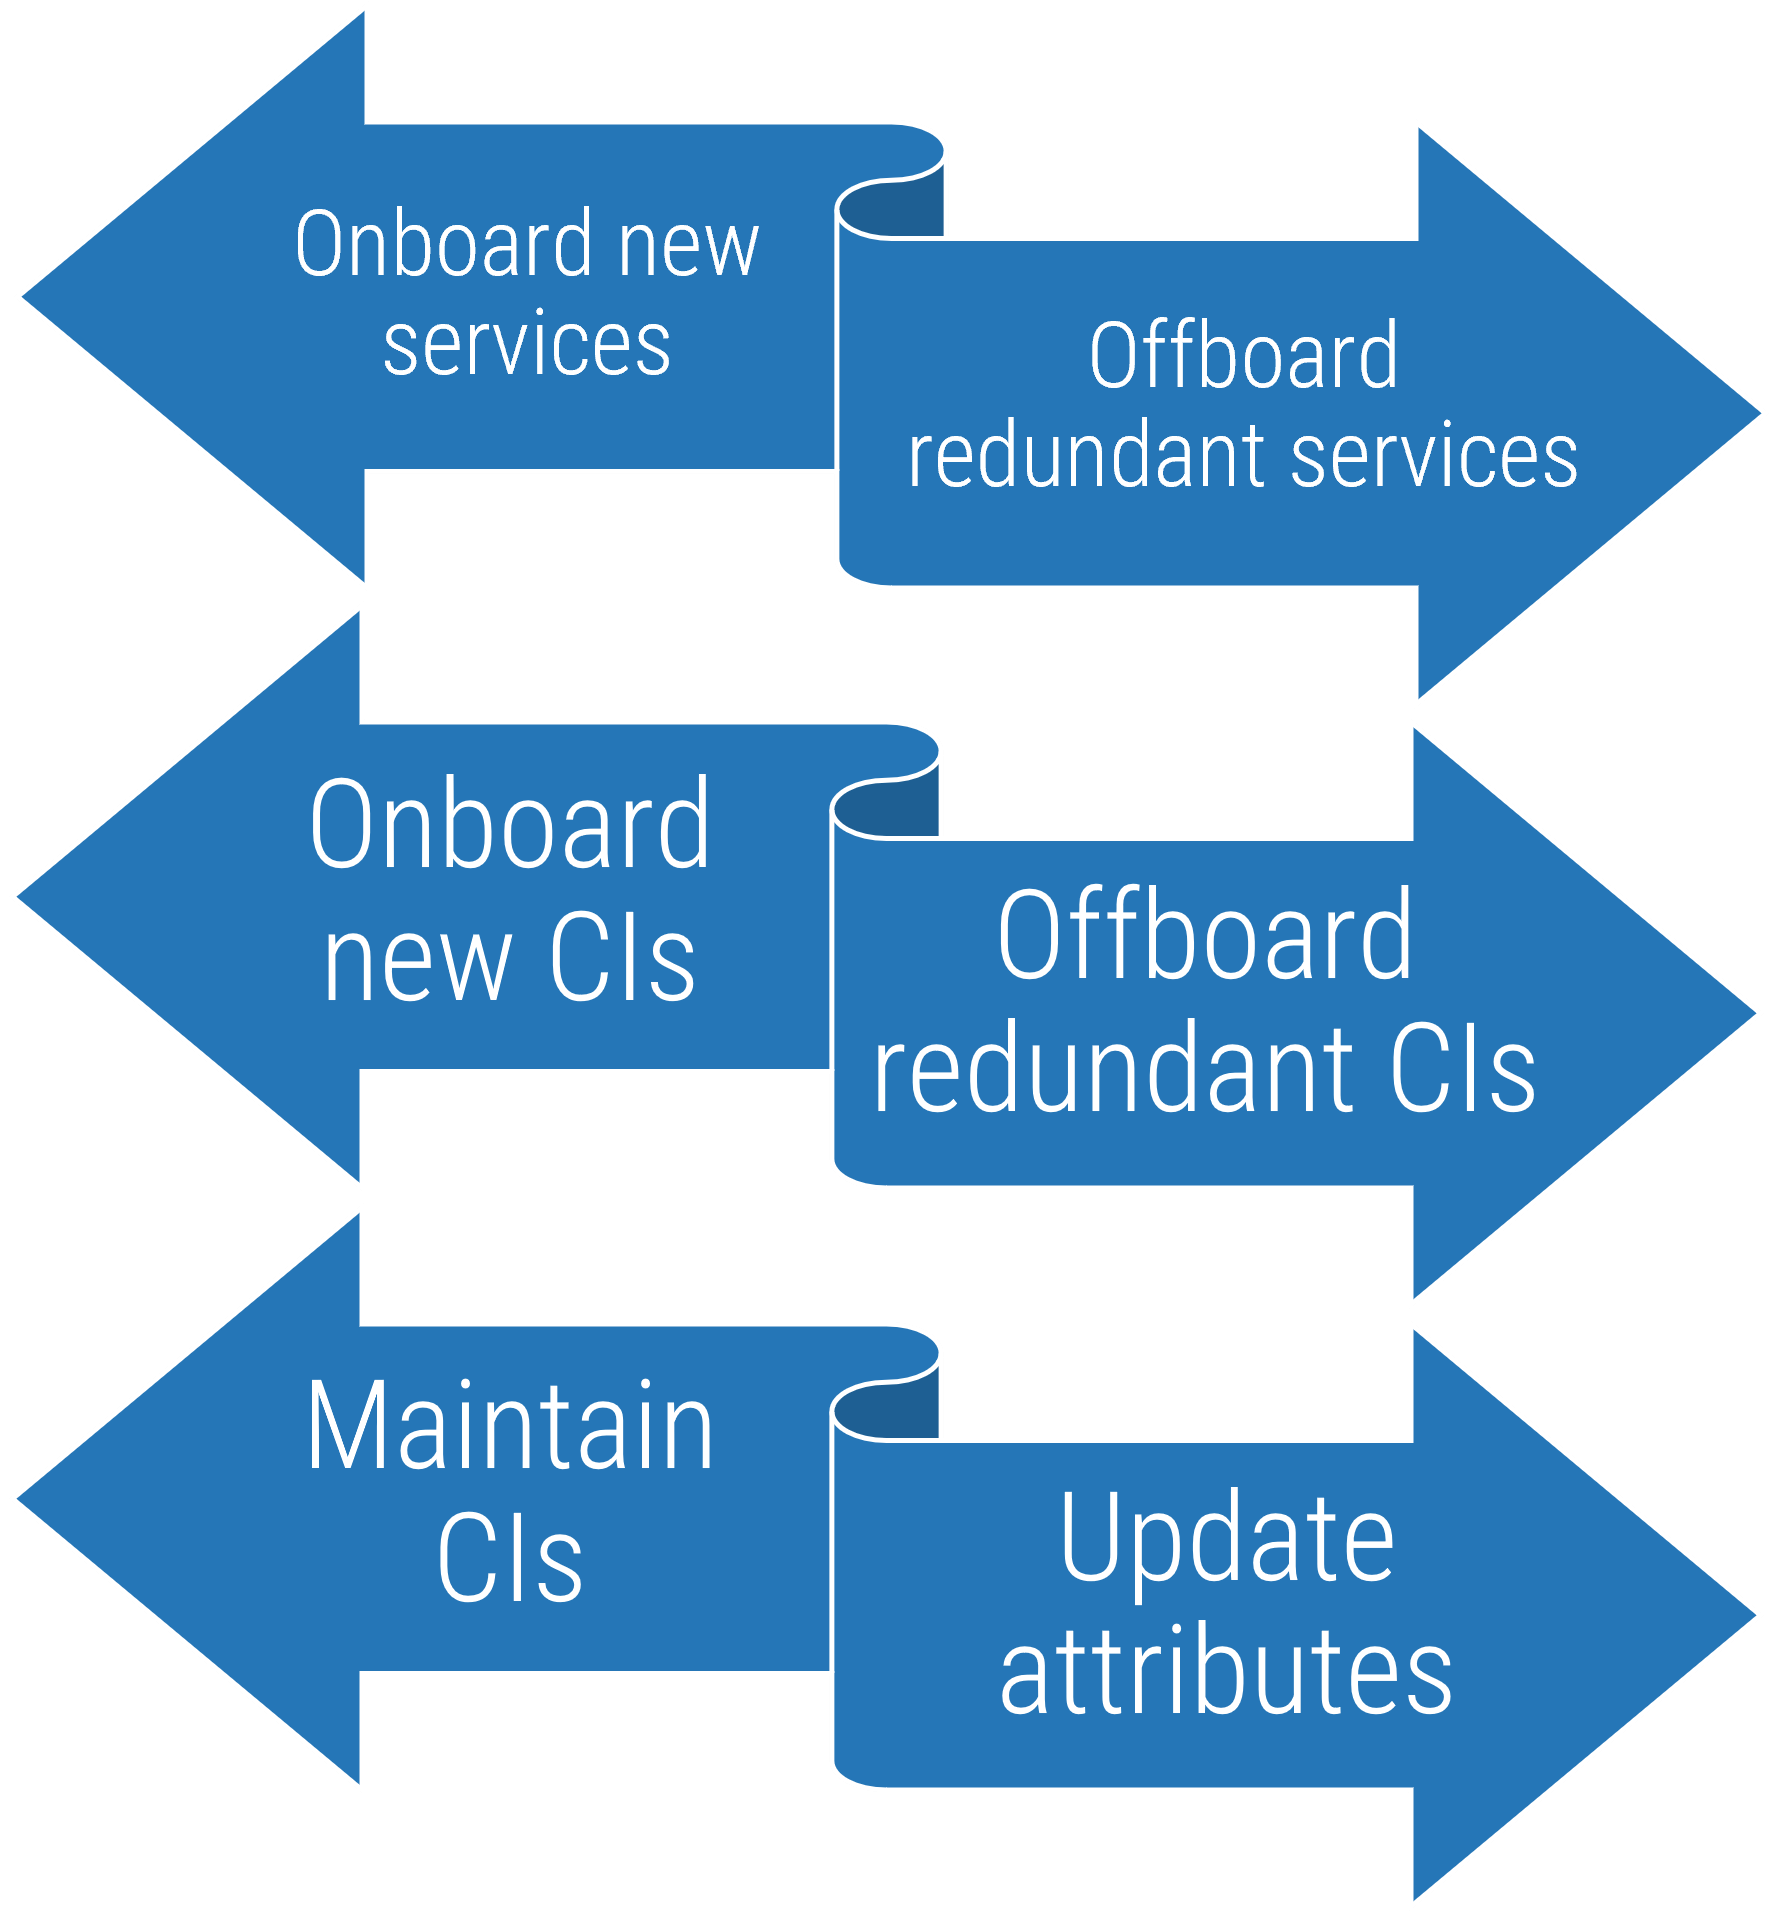
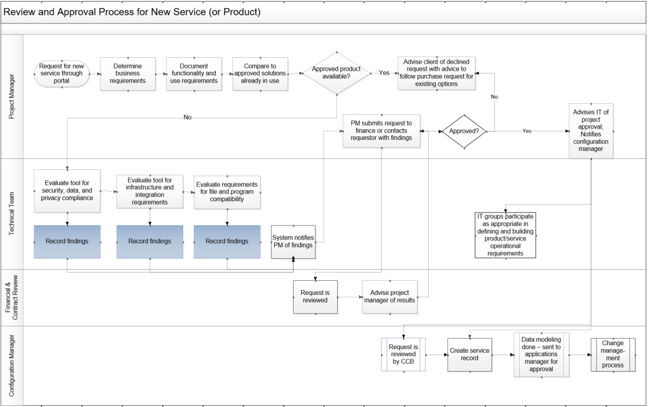
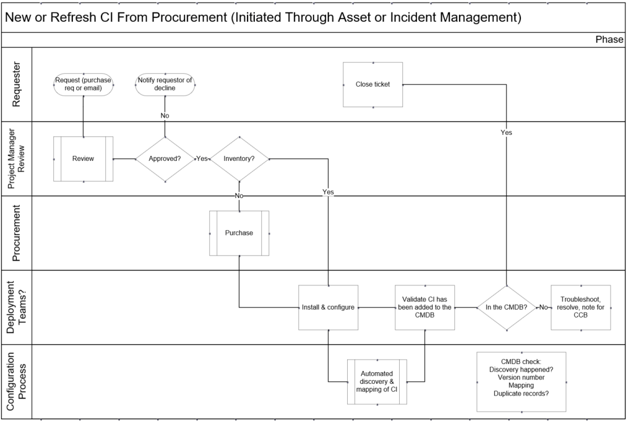
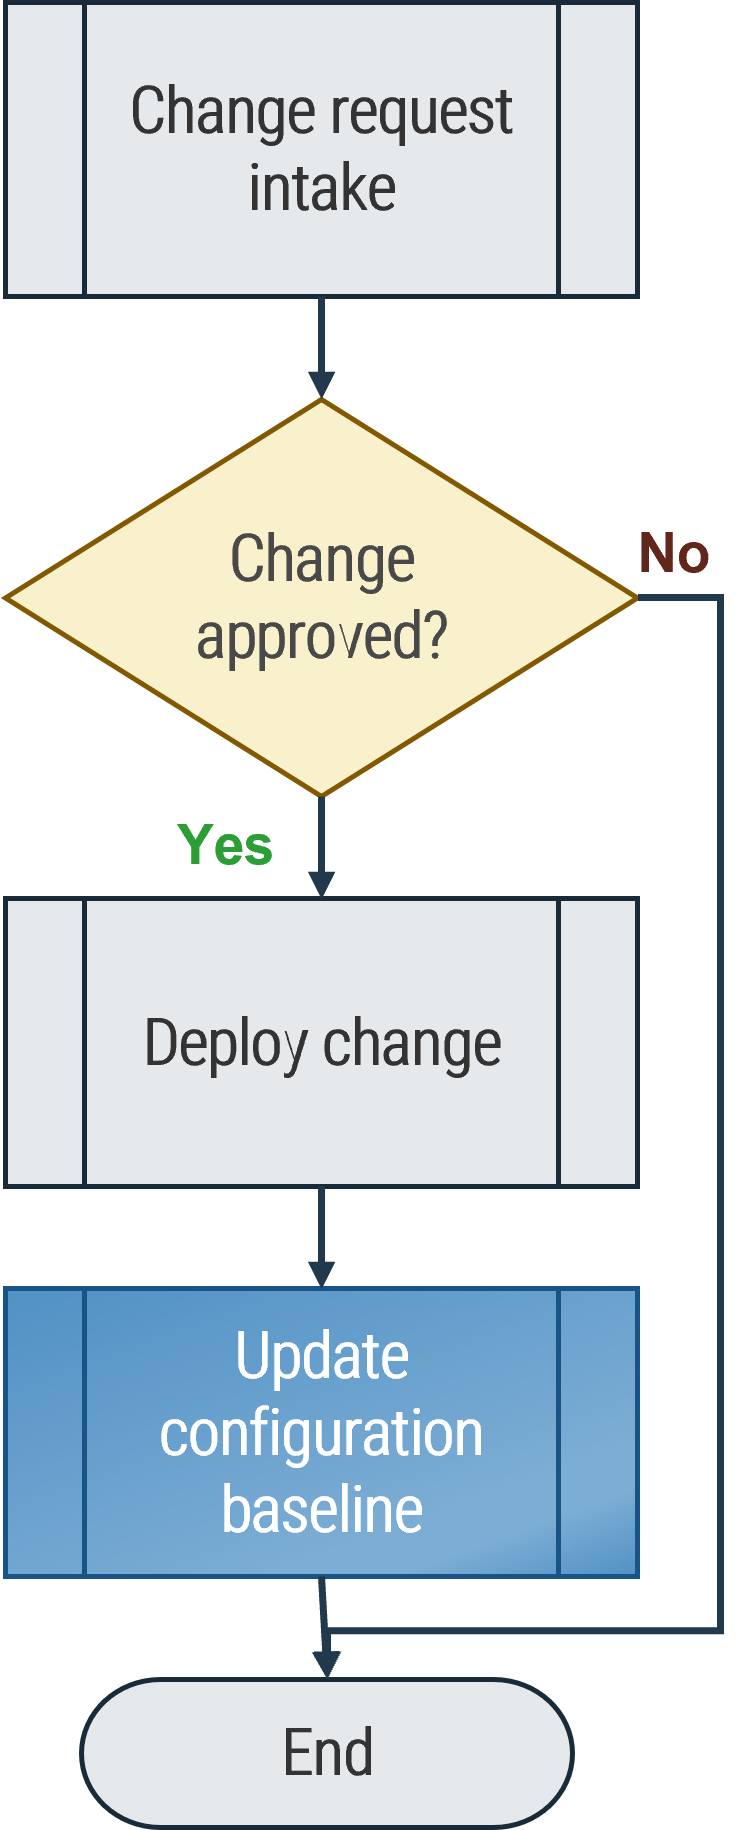
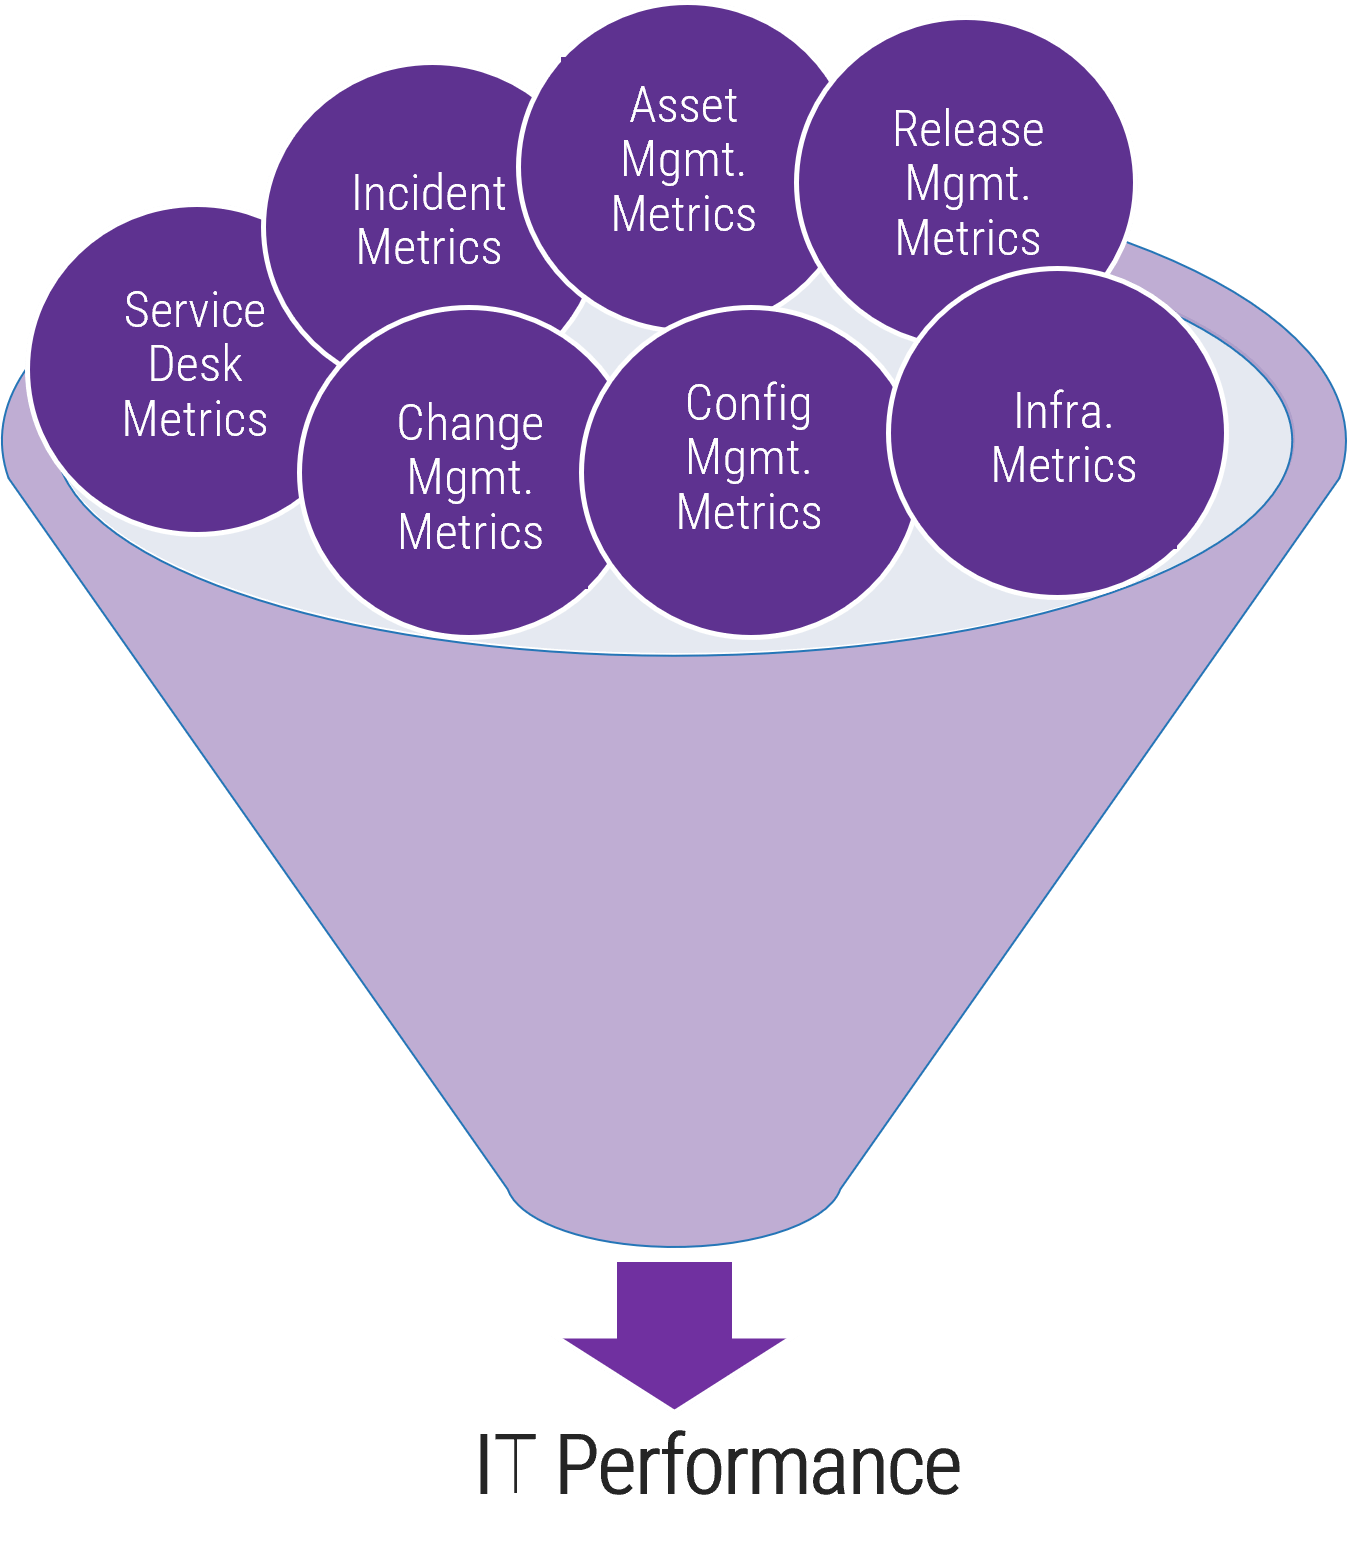
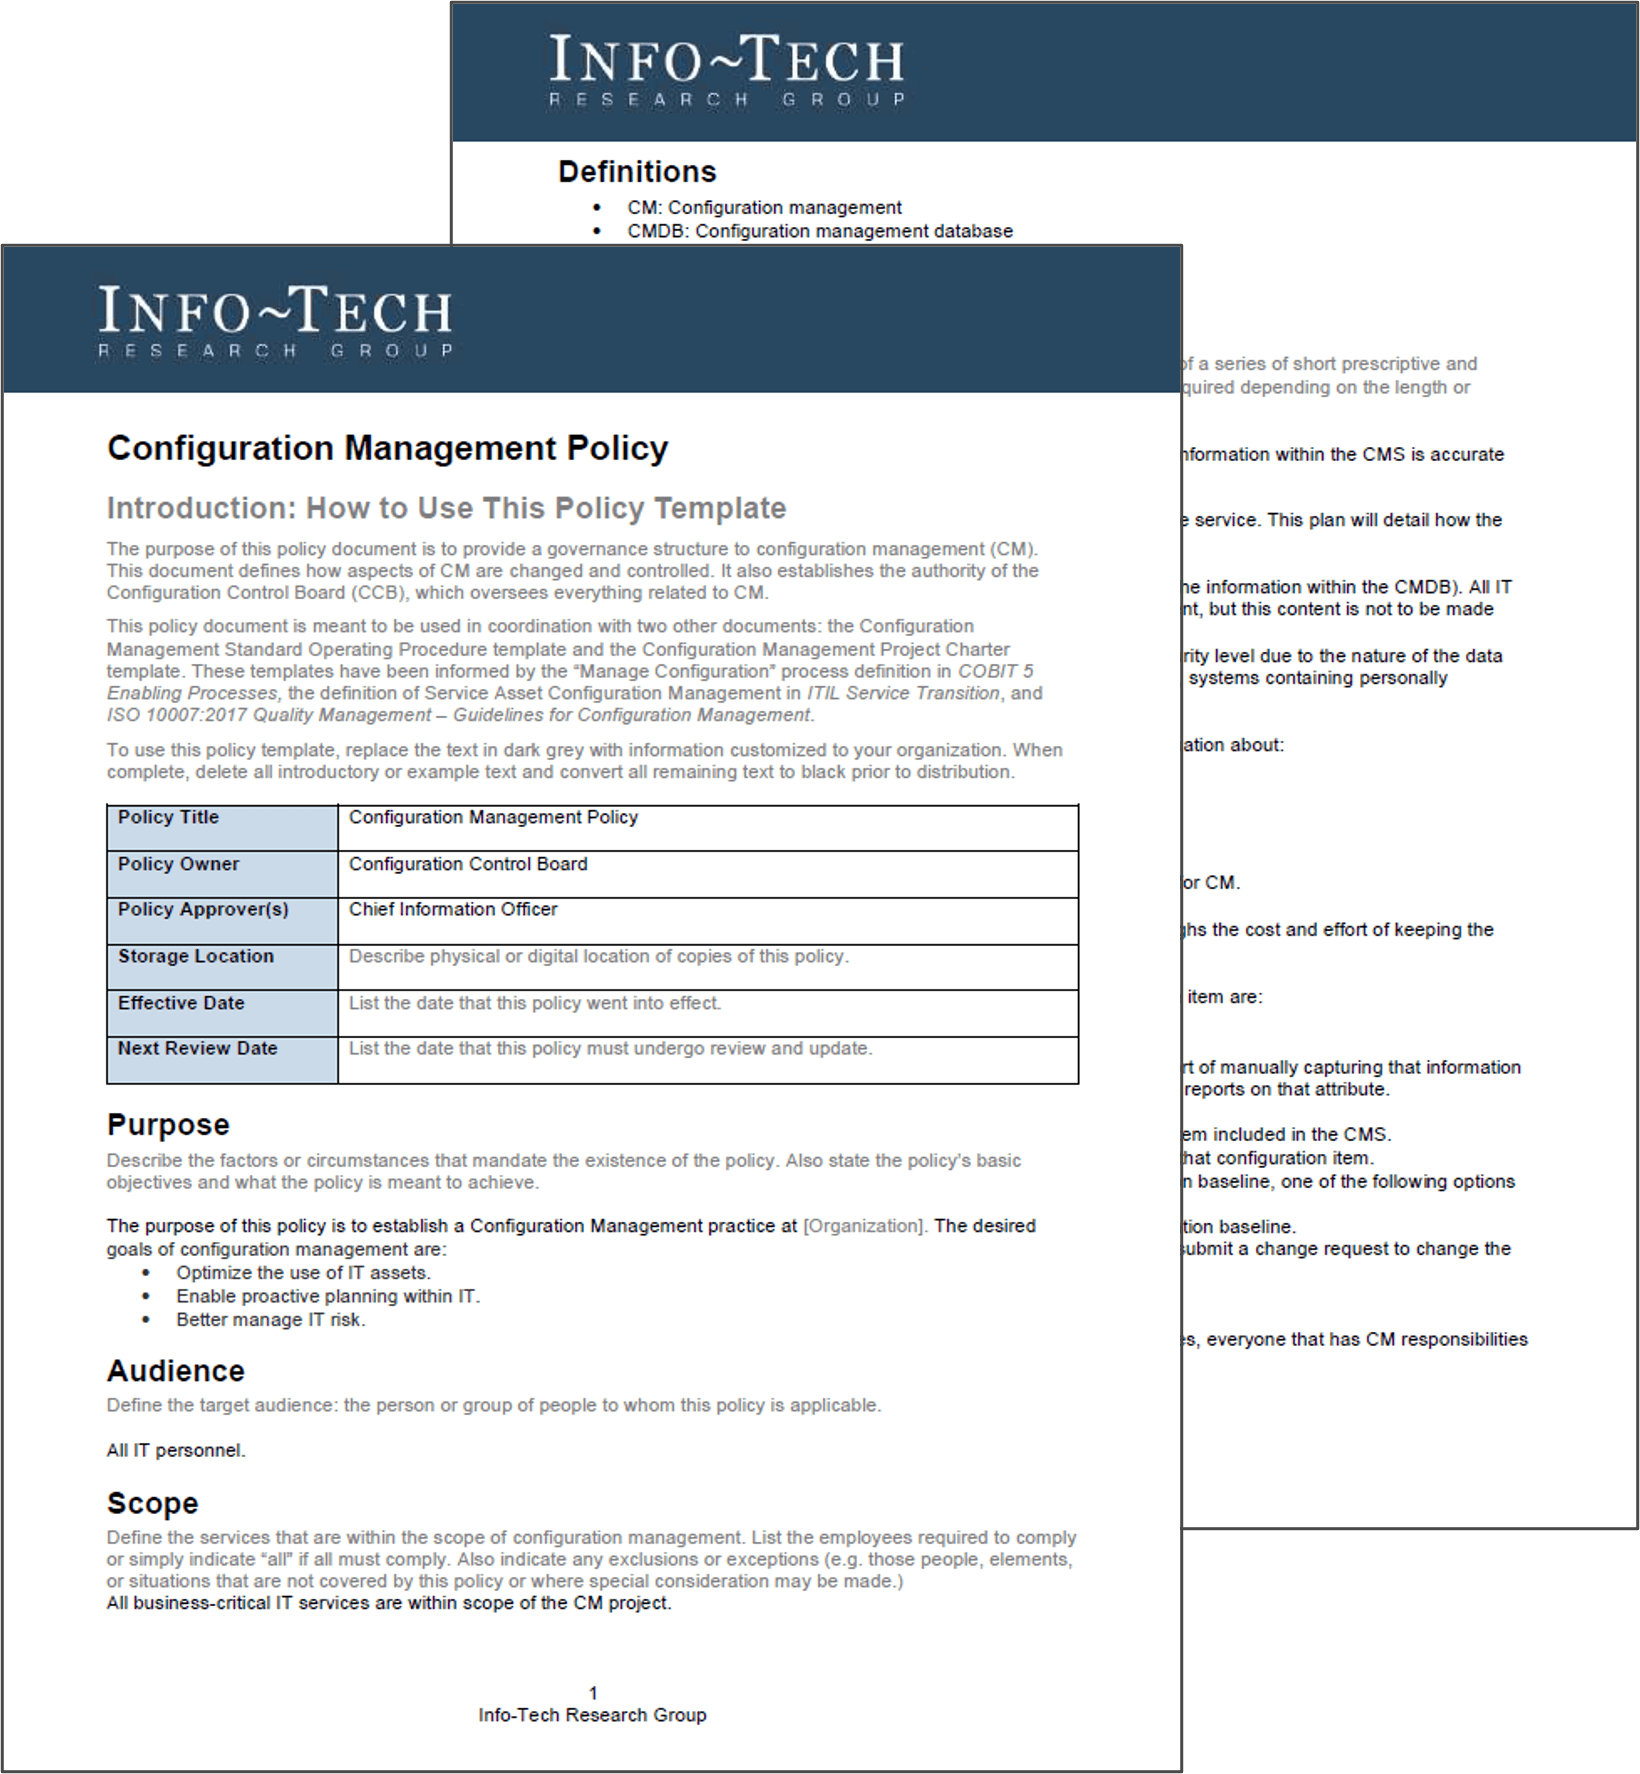
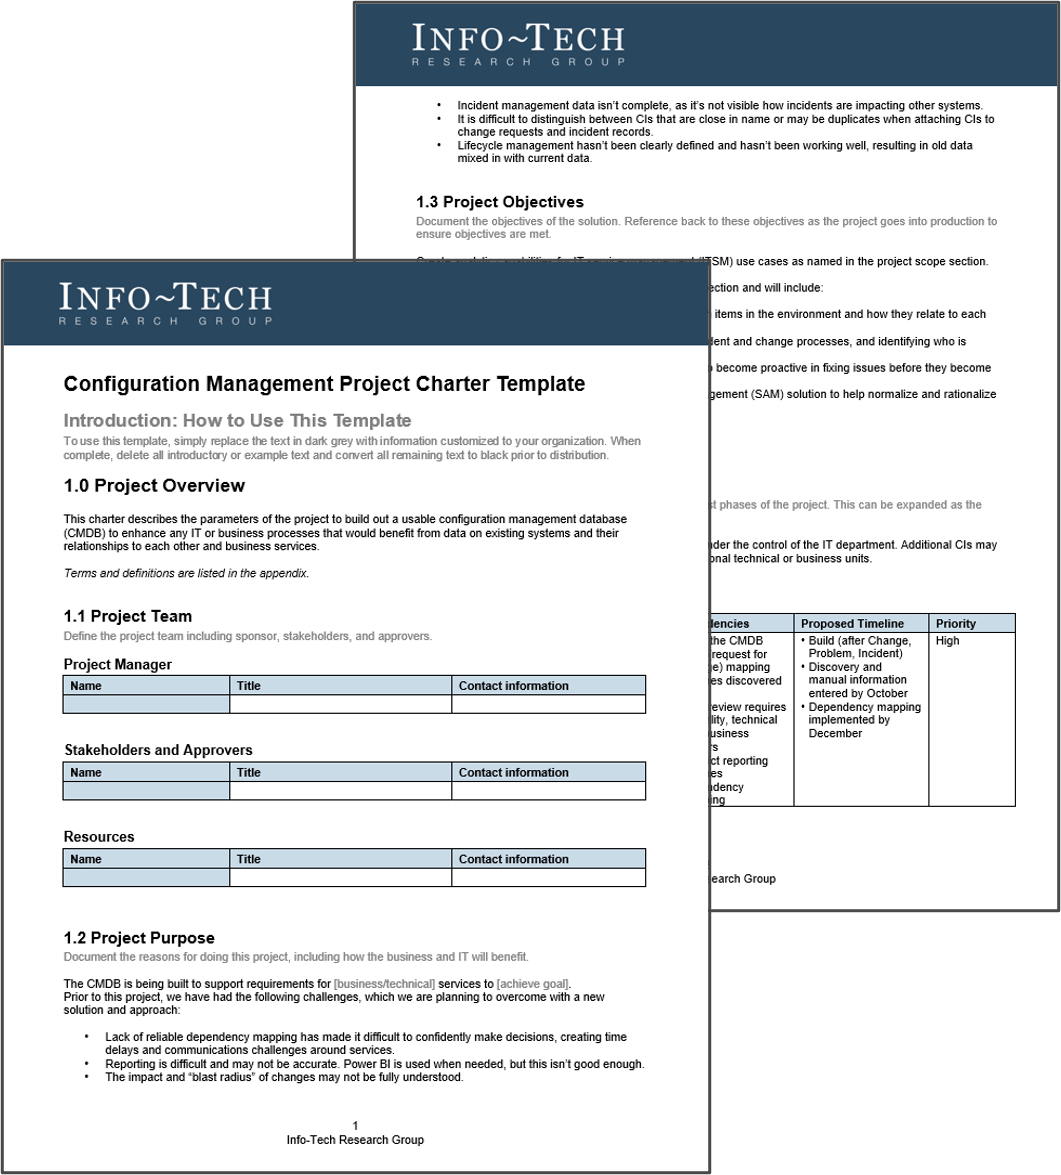


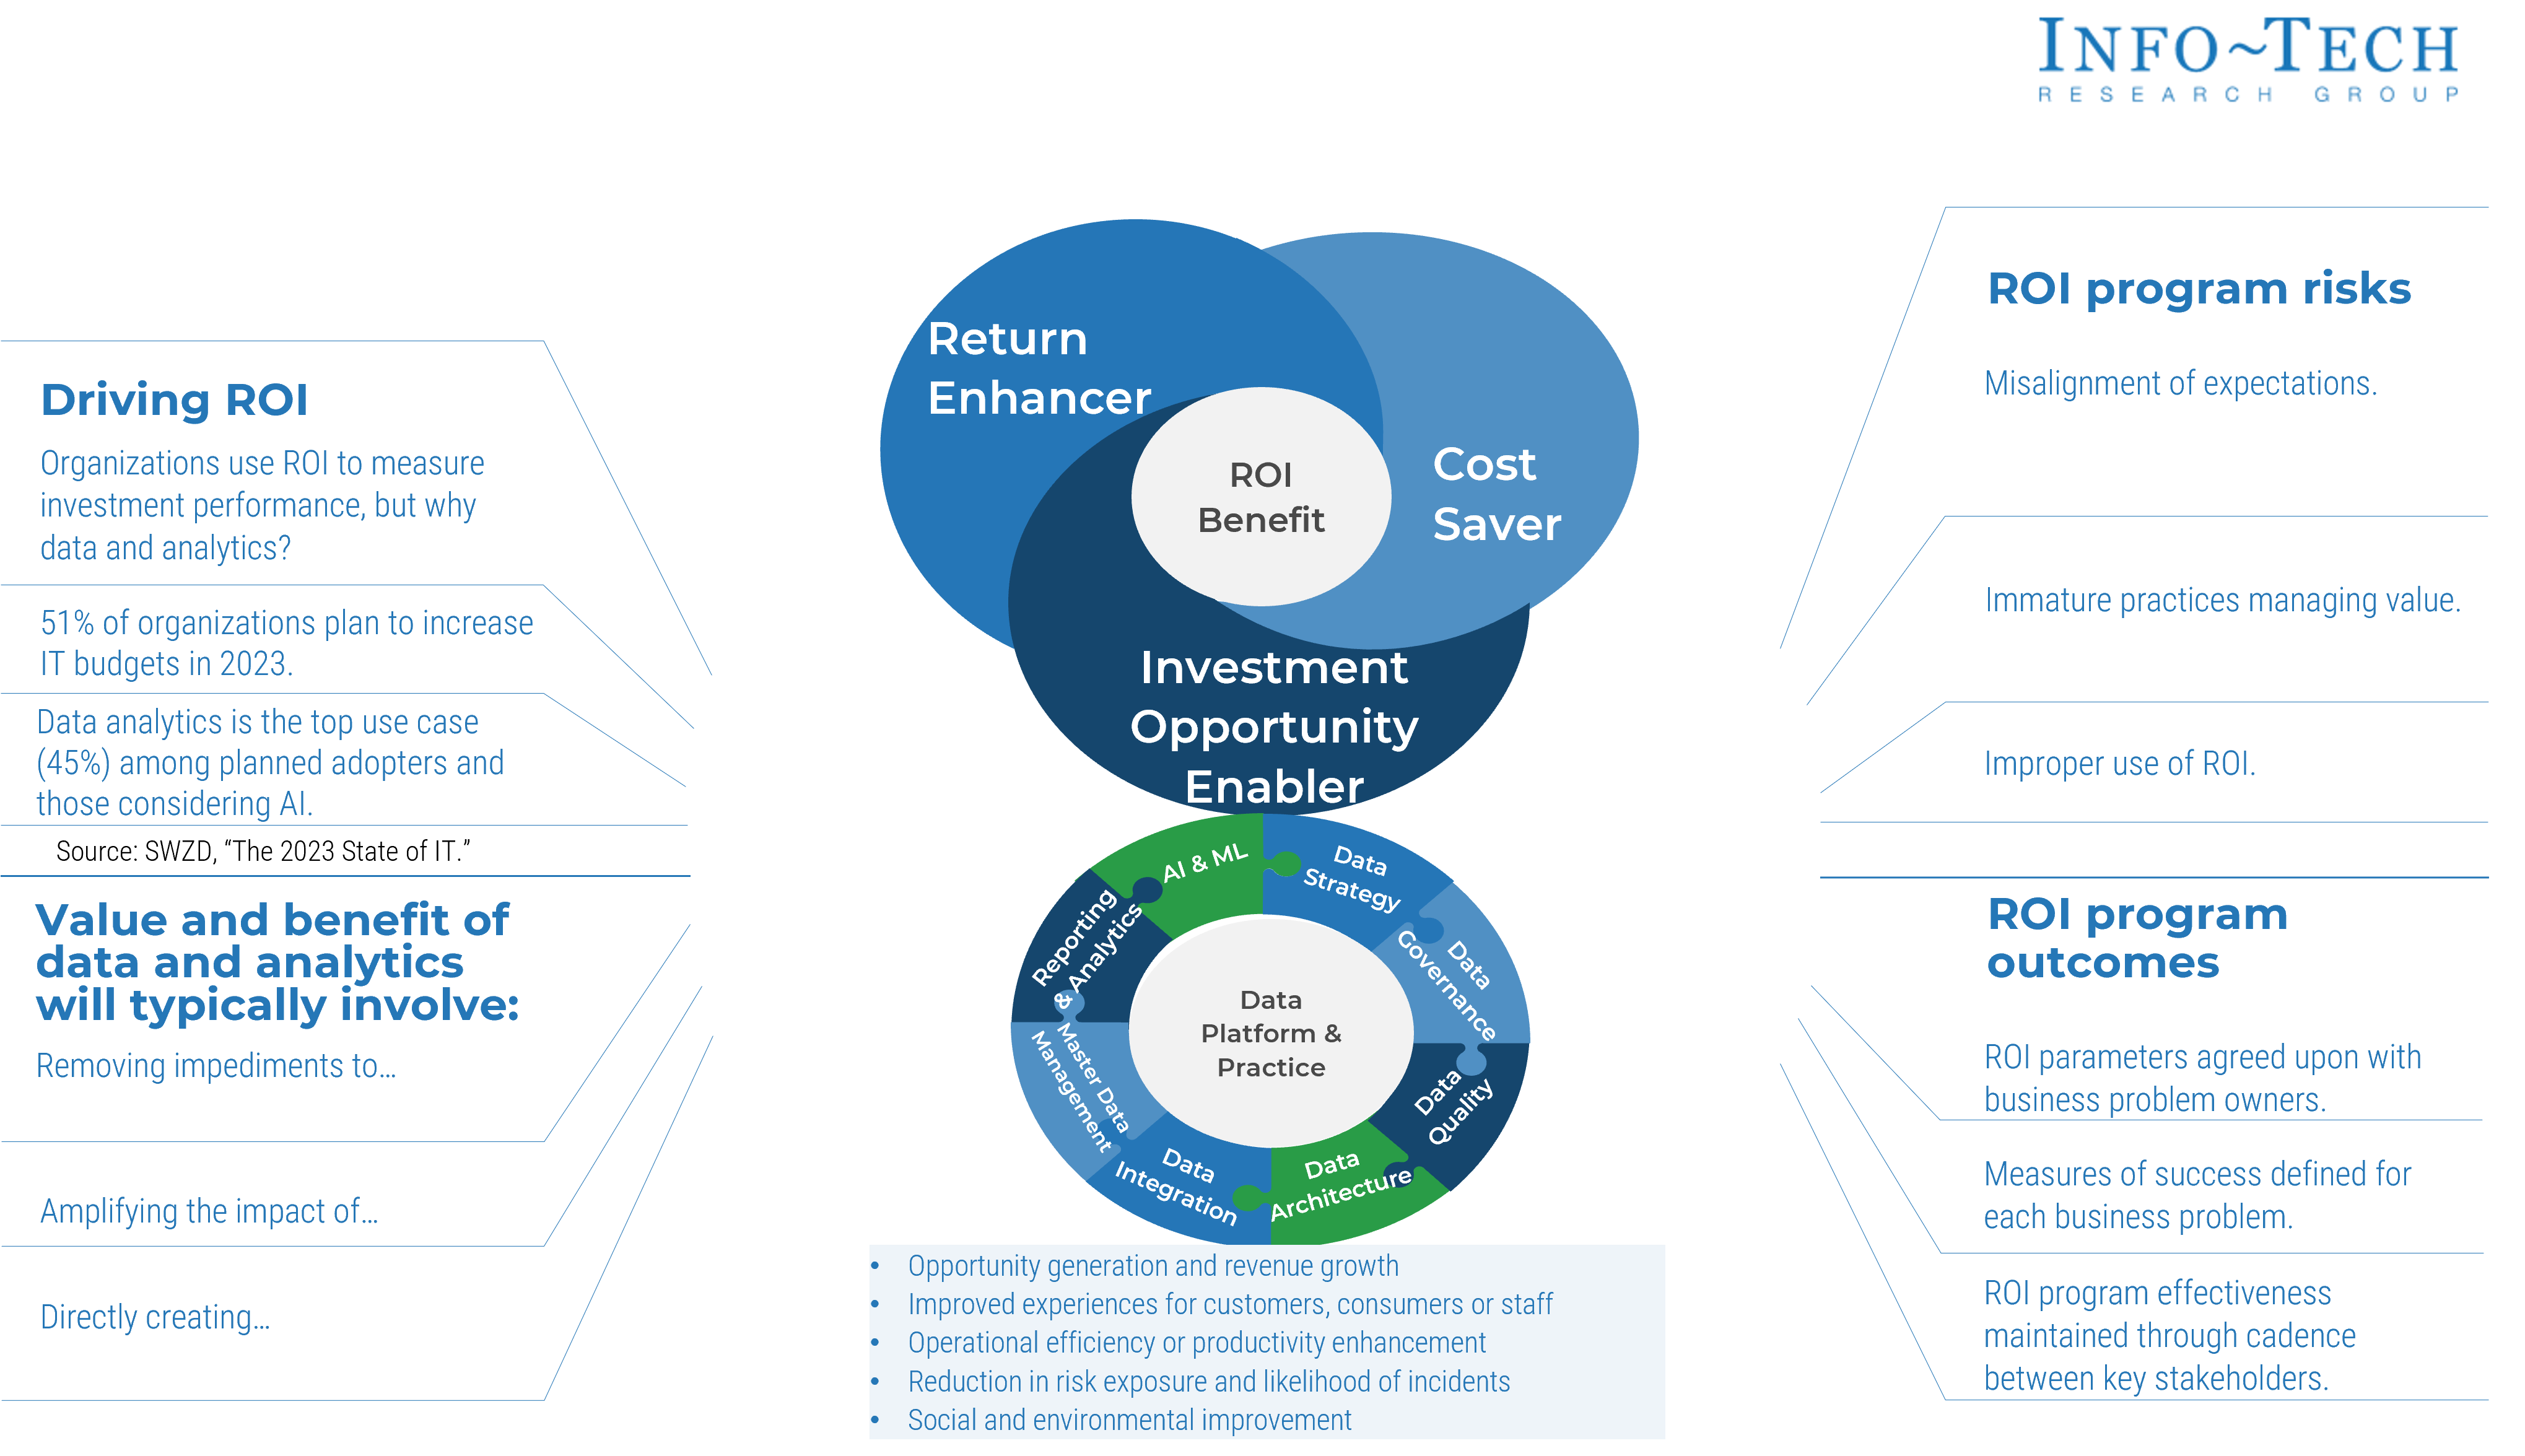


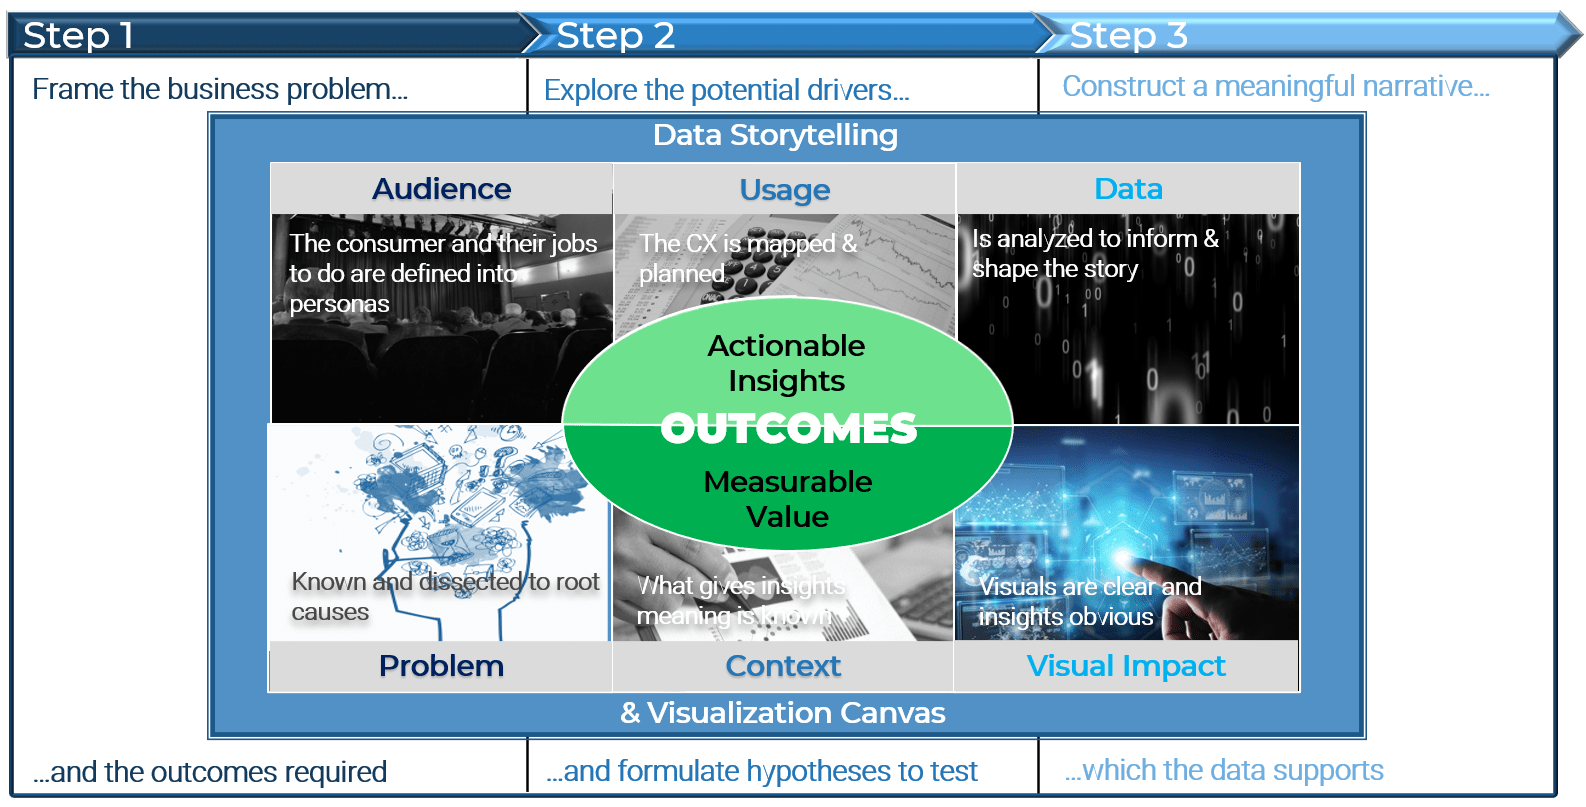


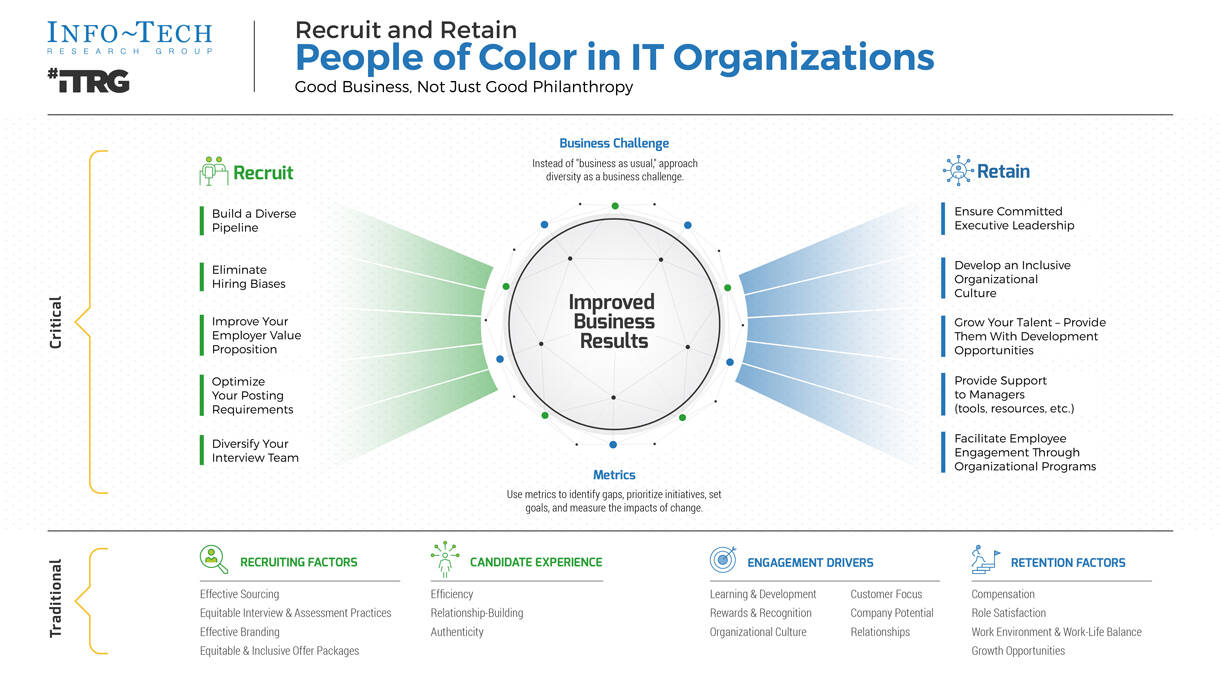


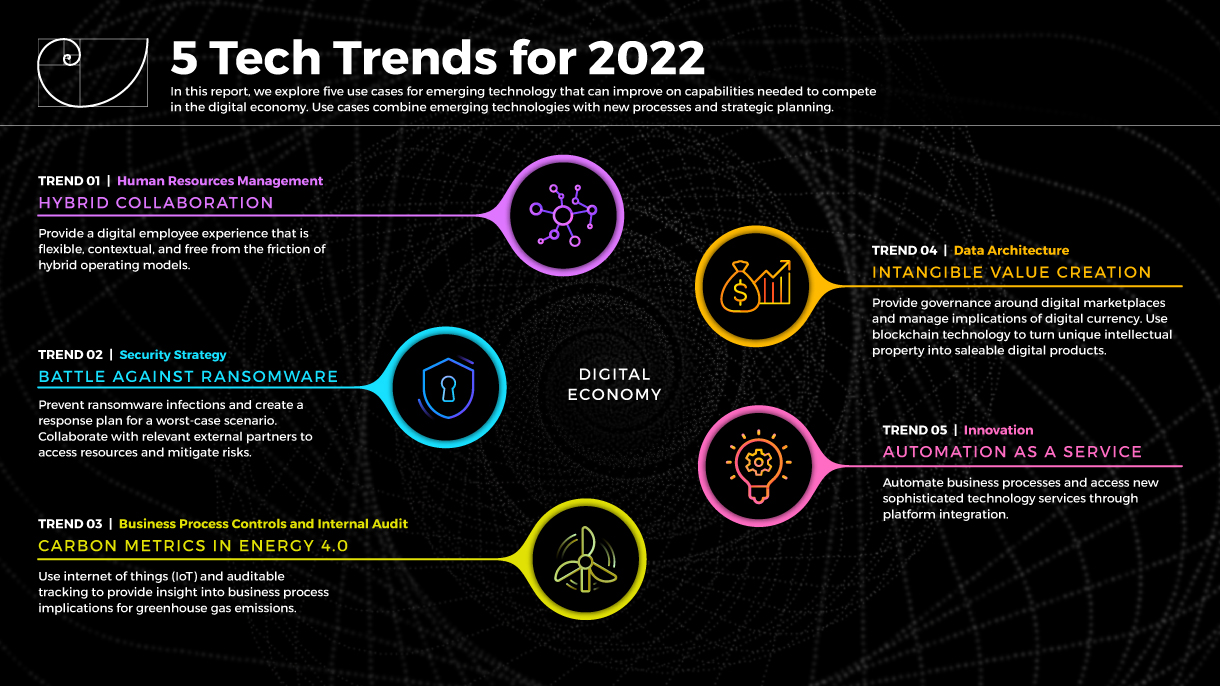
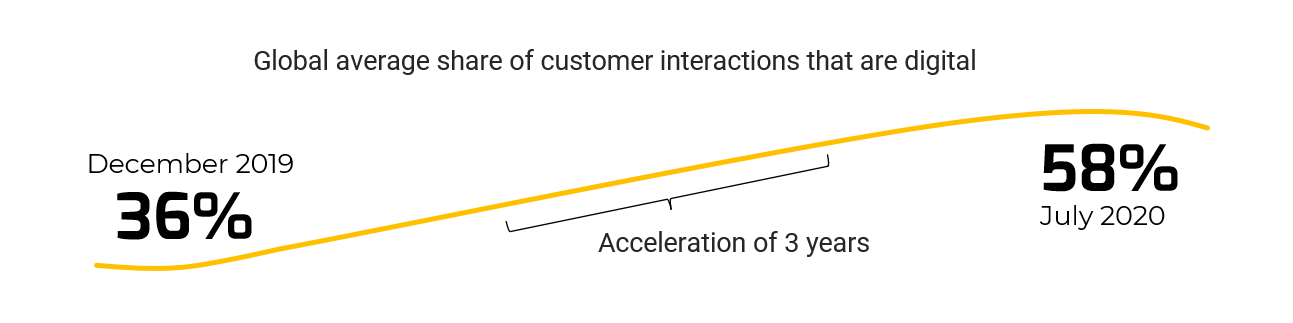
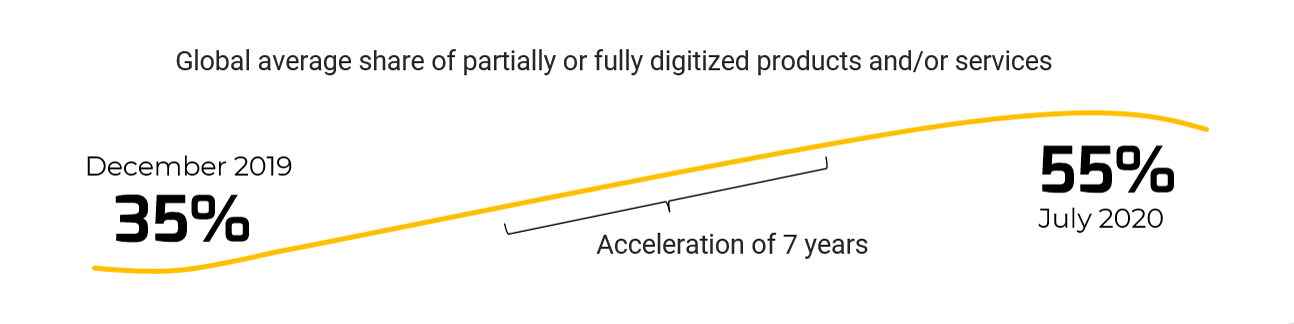 (McKinsey, 2020)
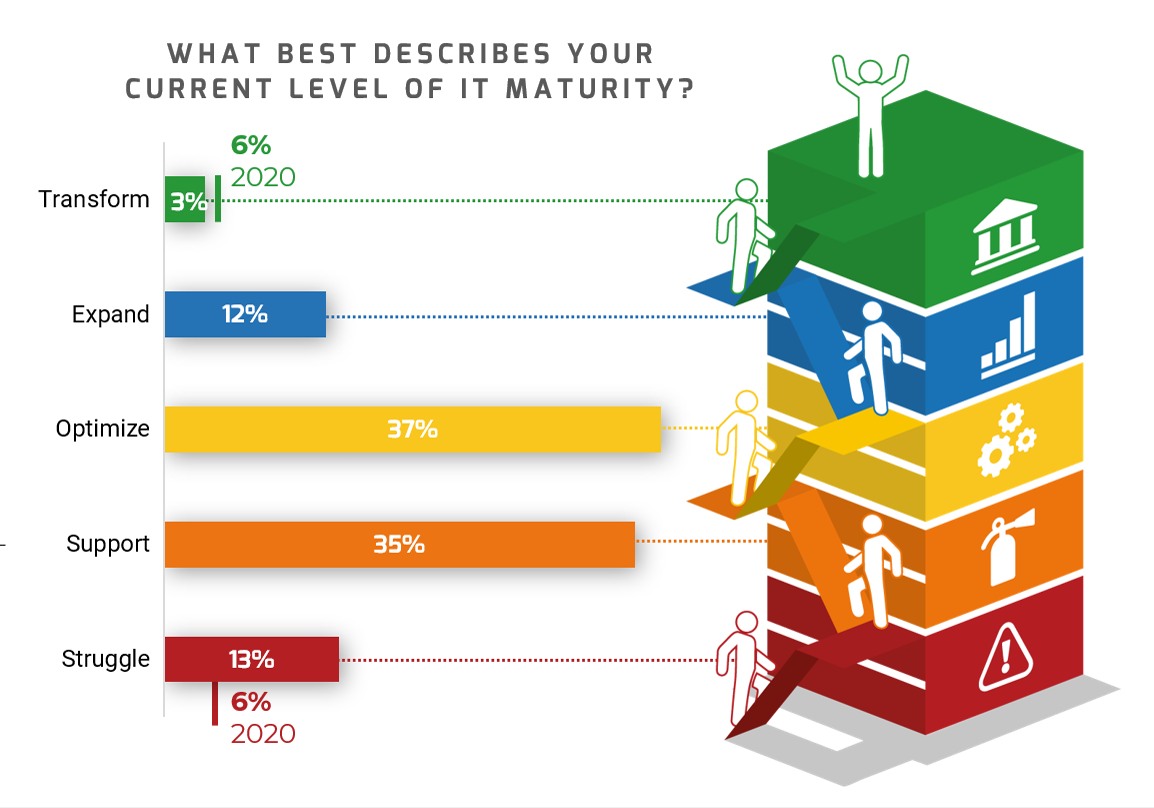
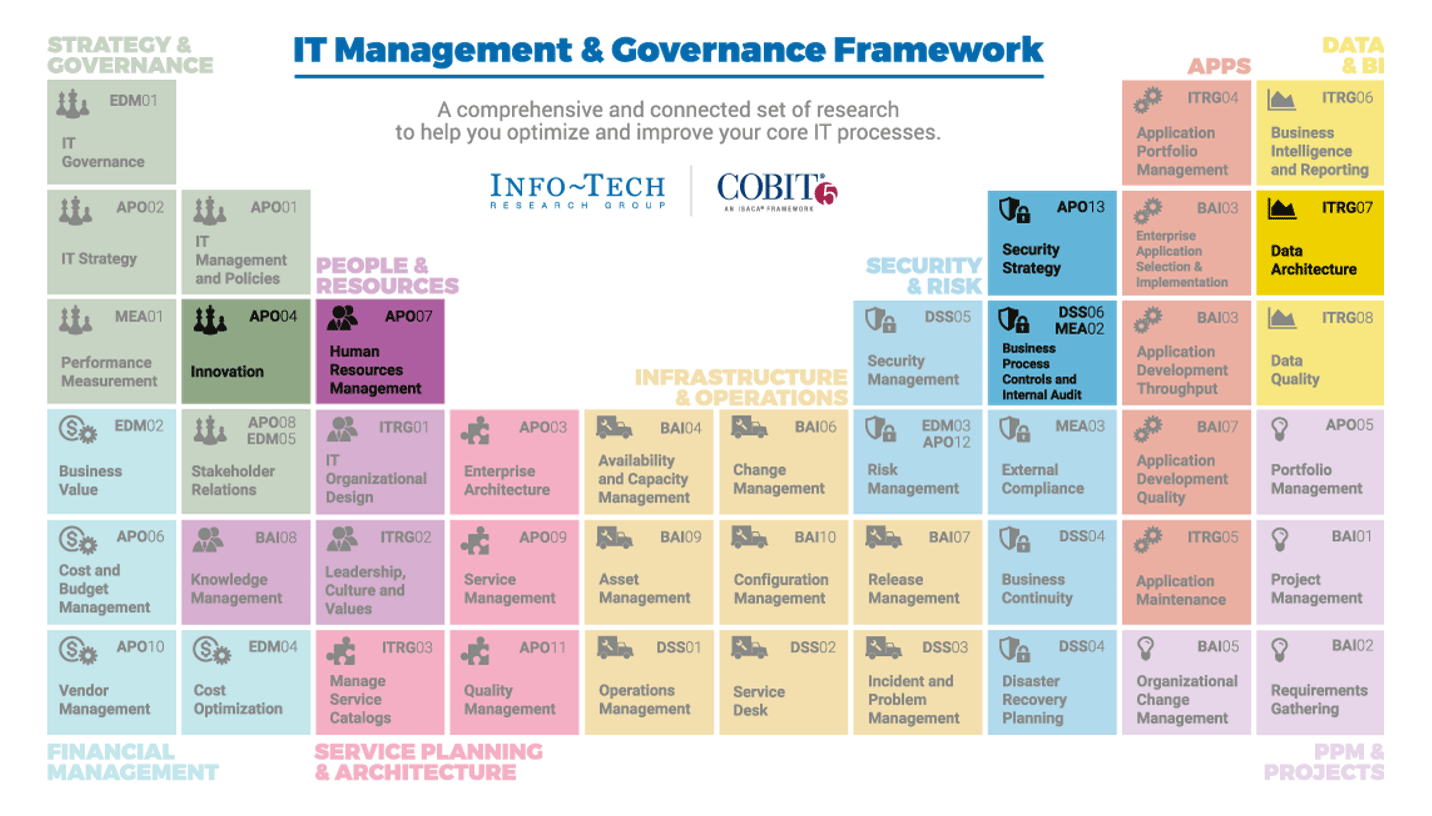


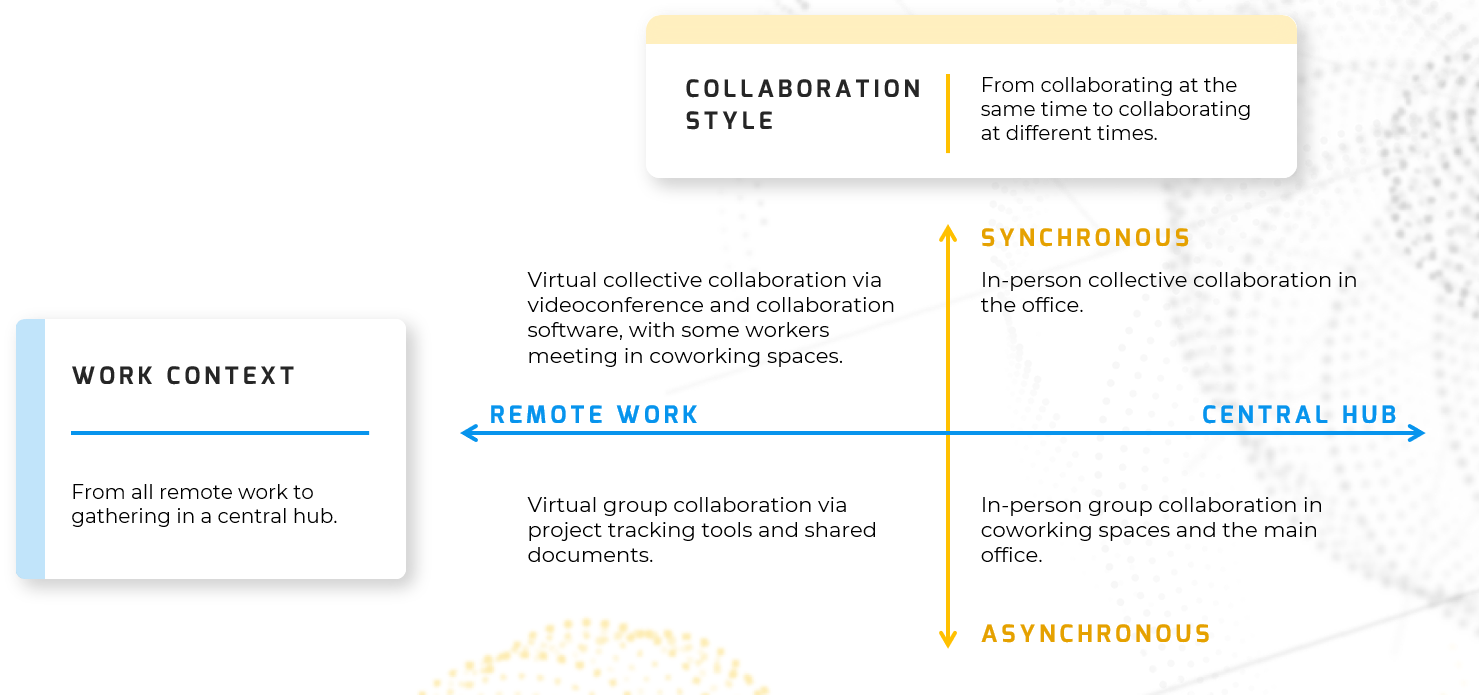

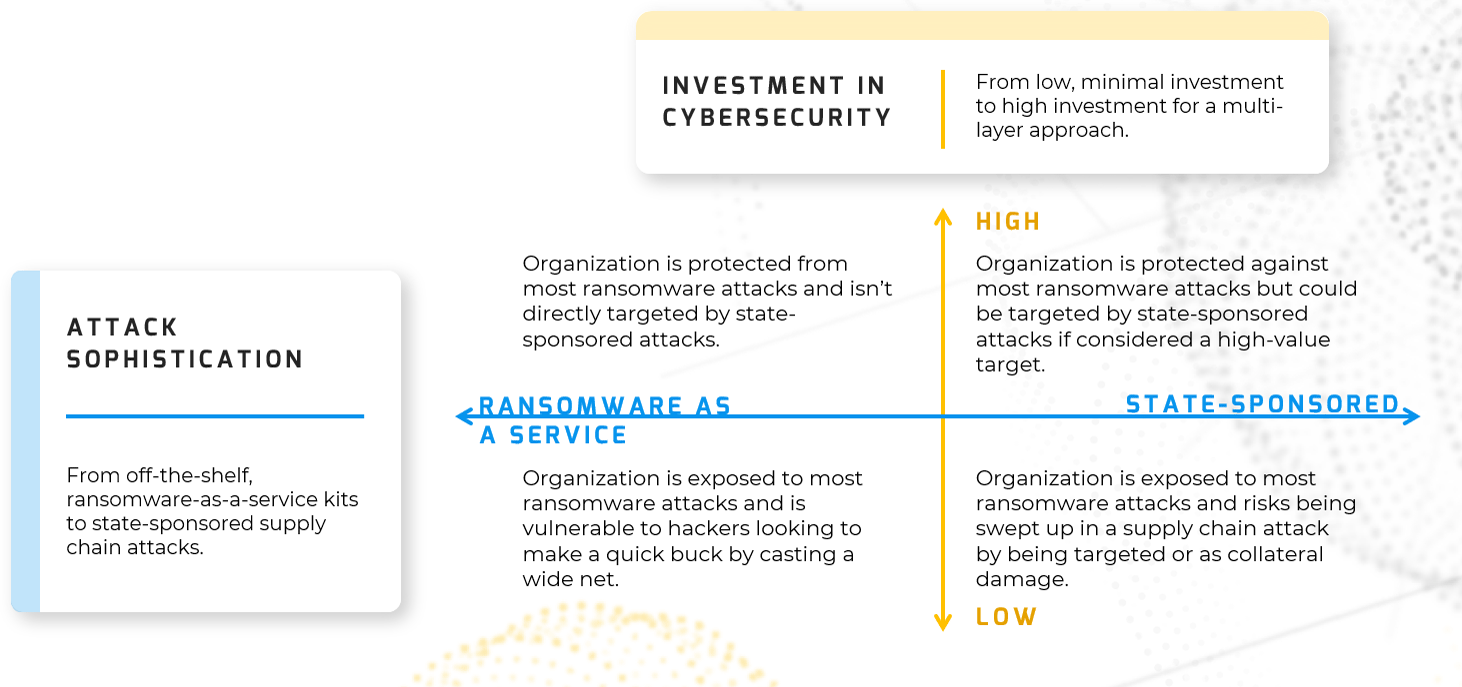

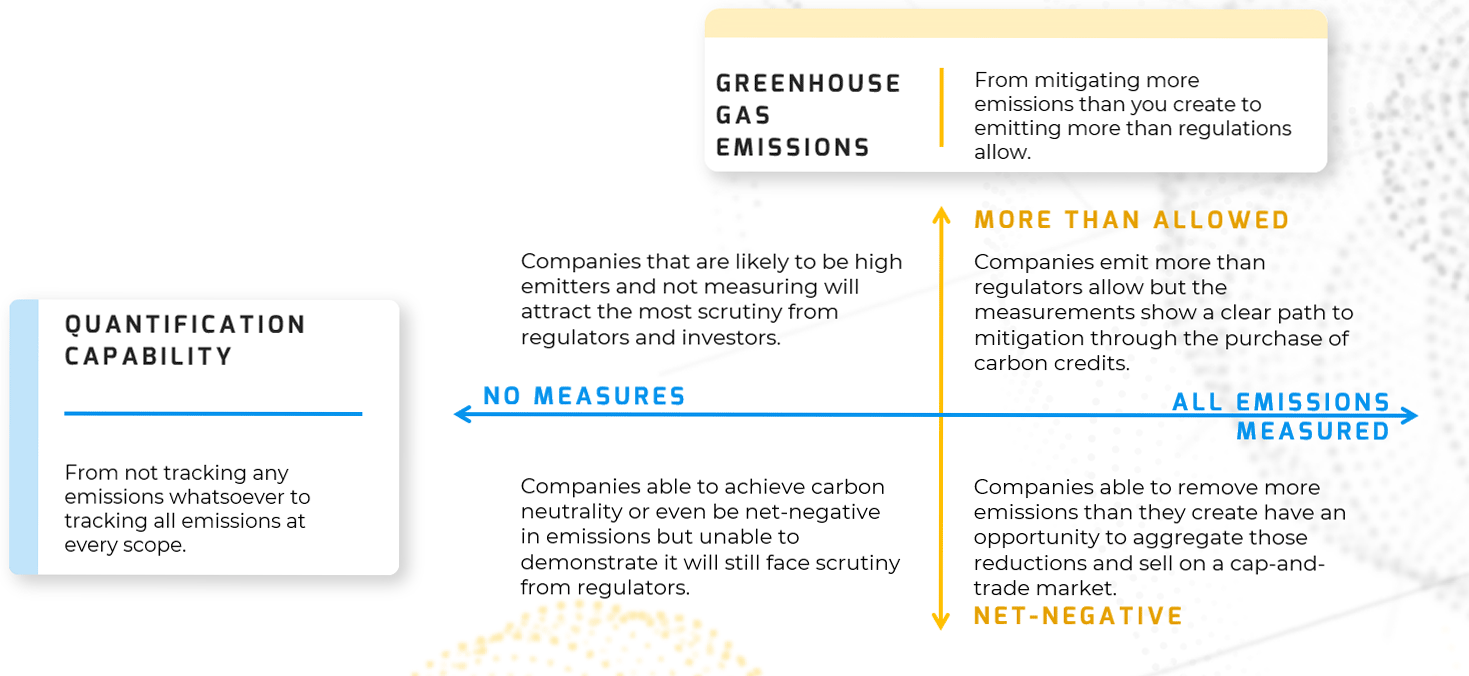

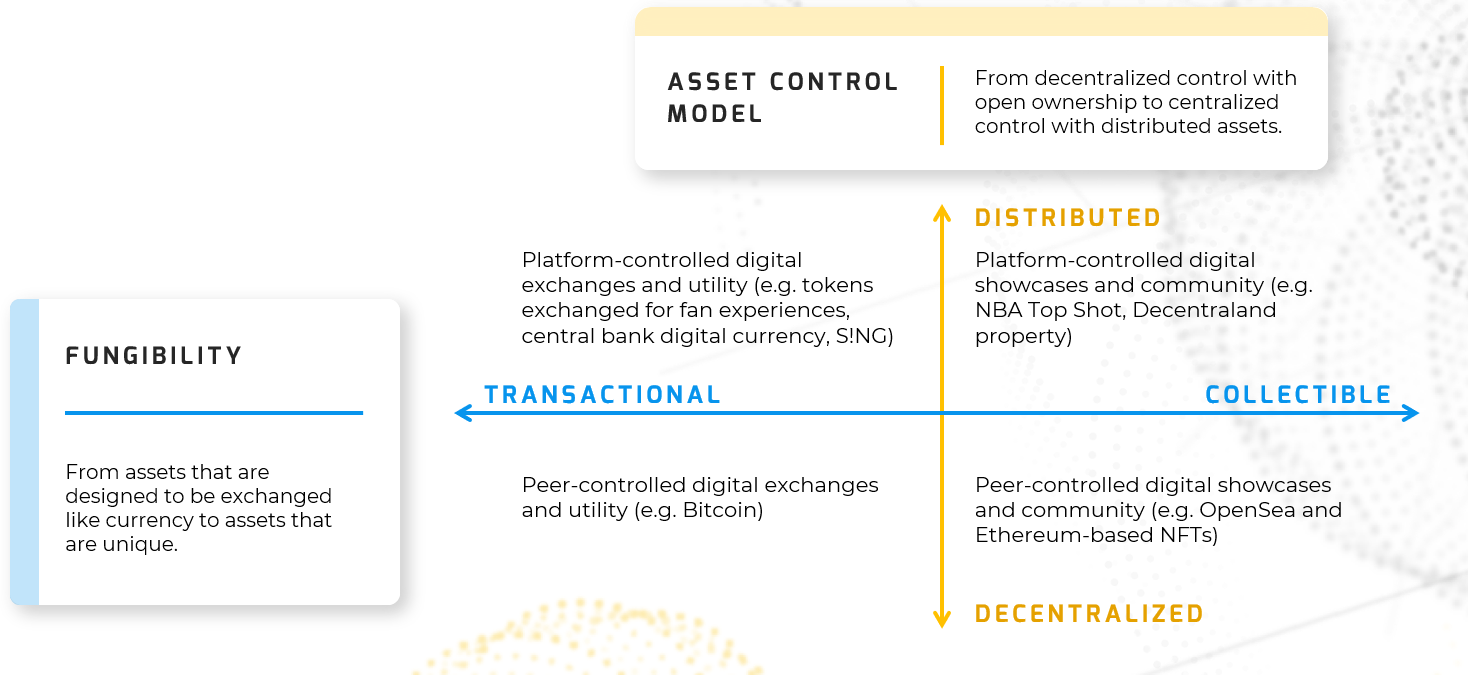
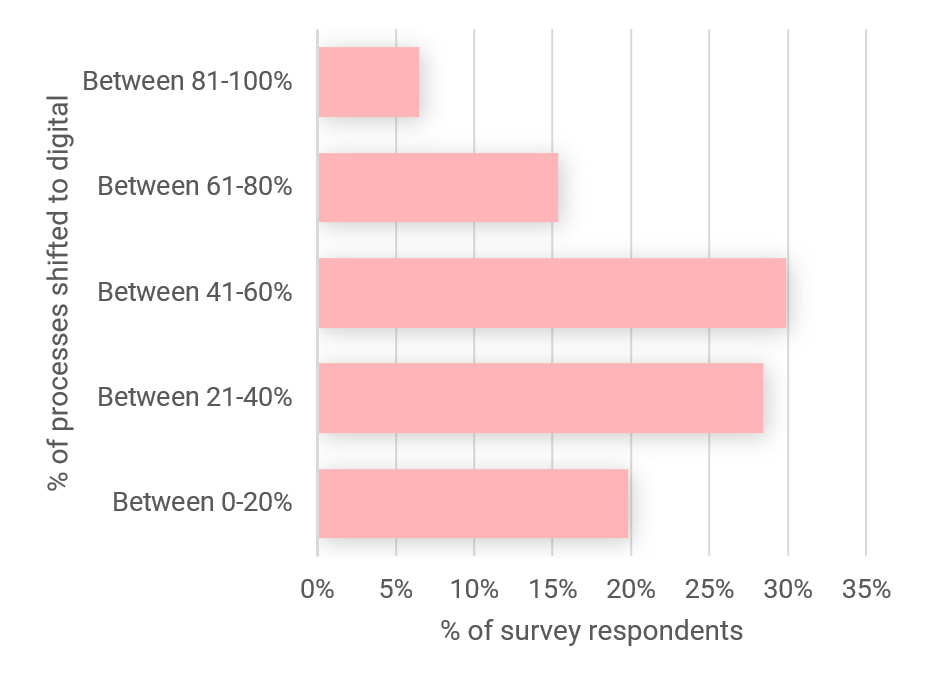

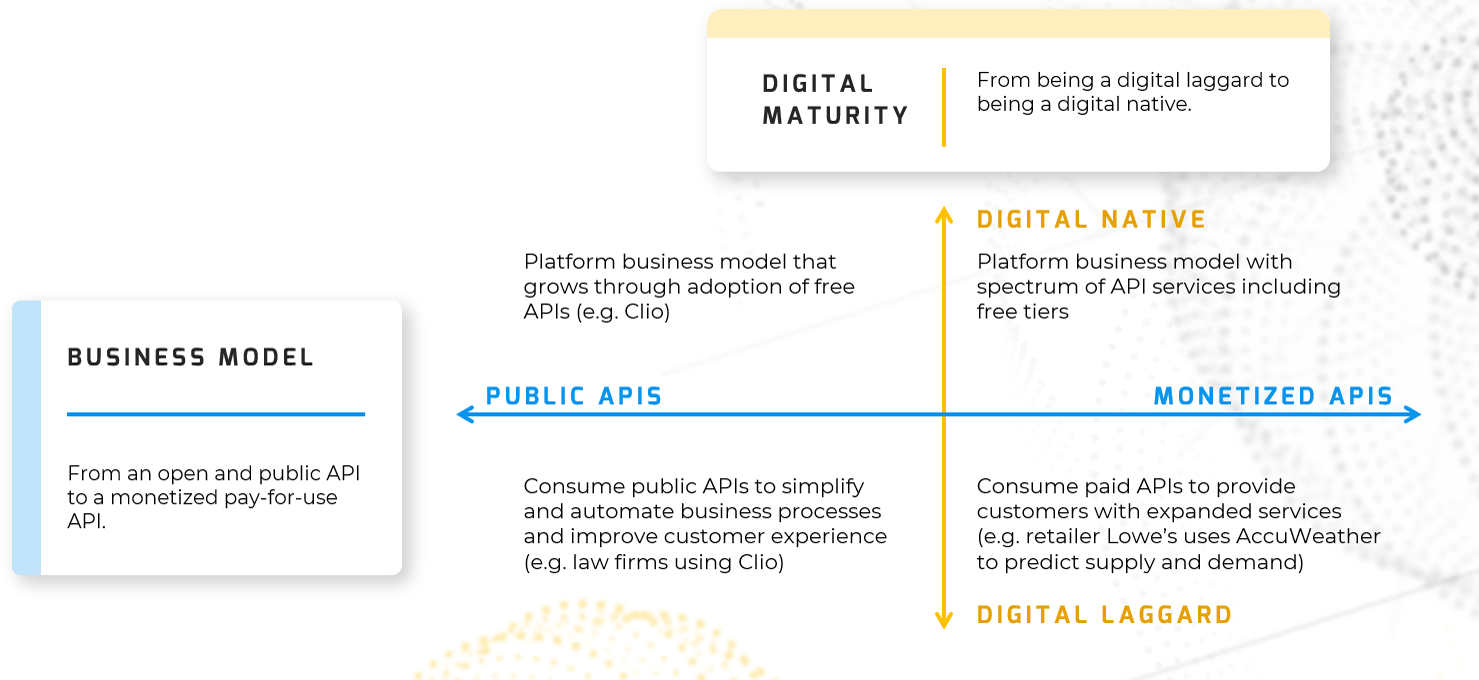


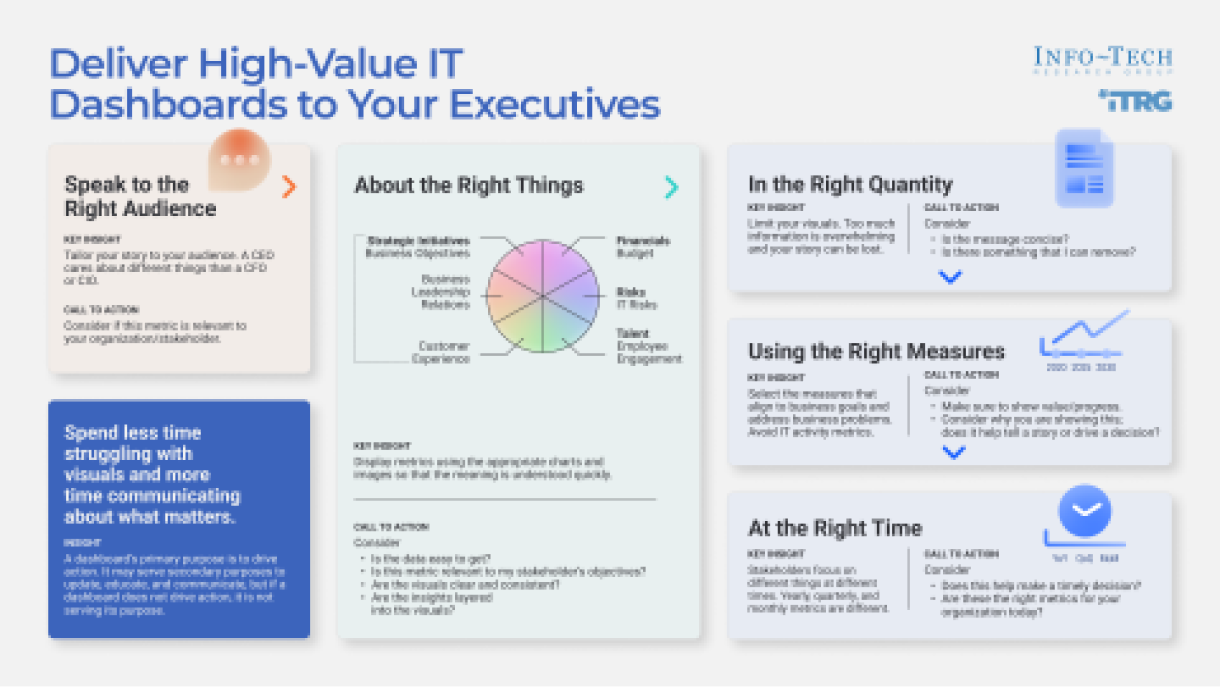

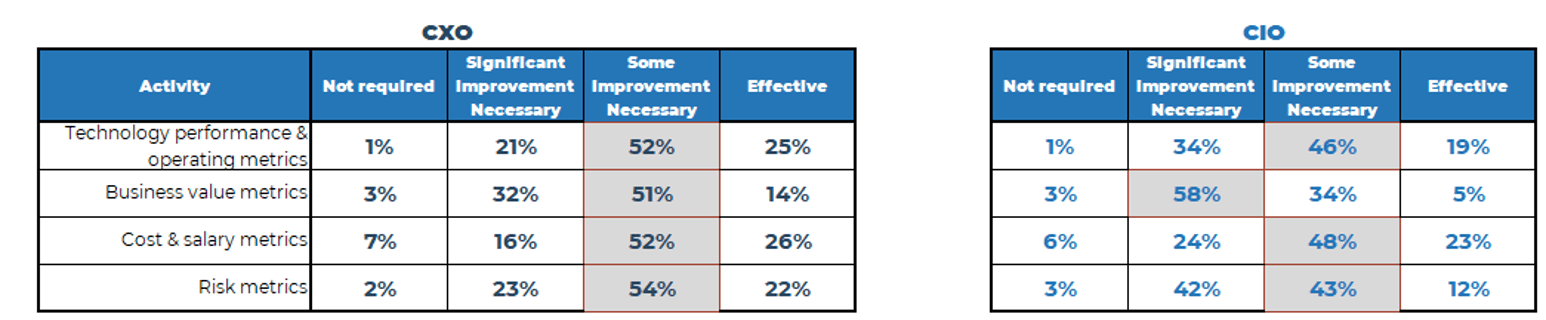


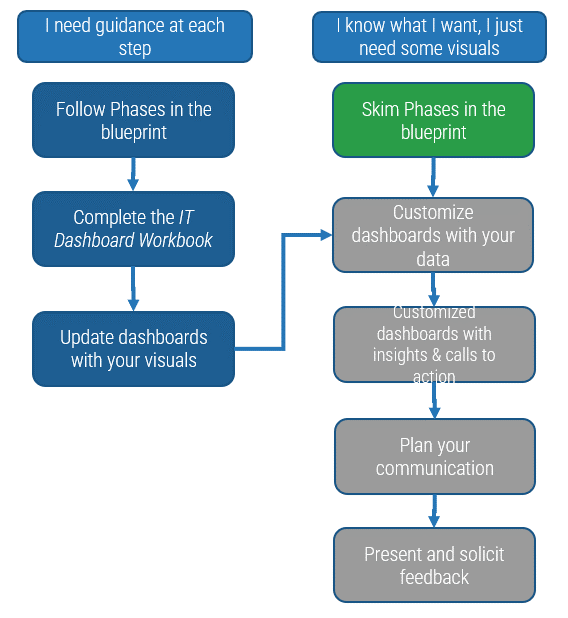
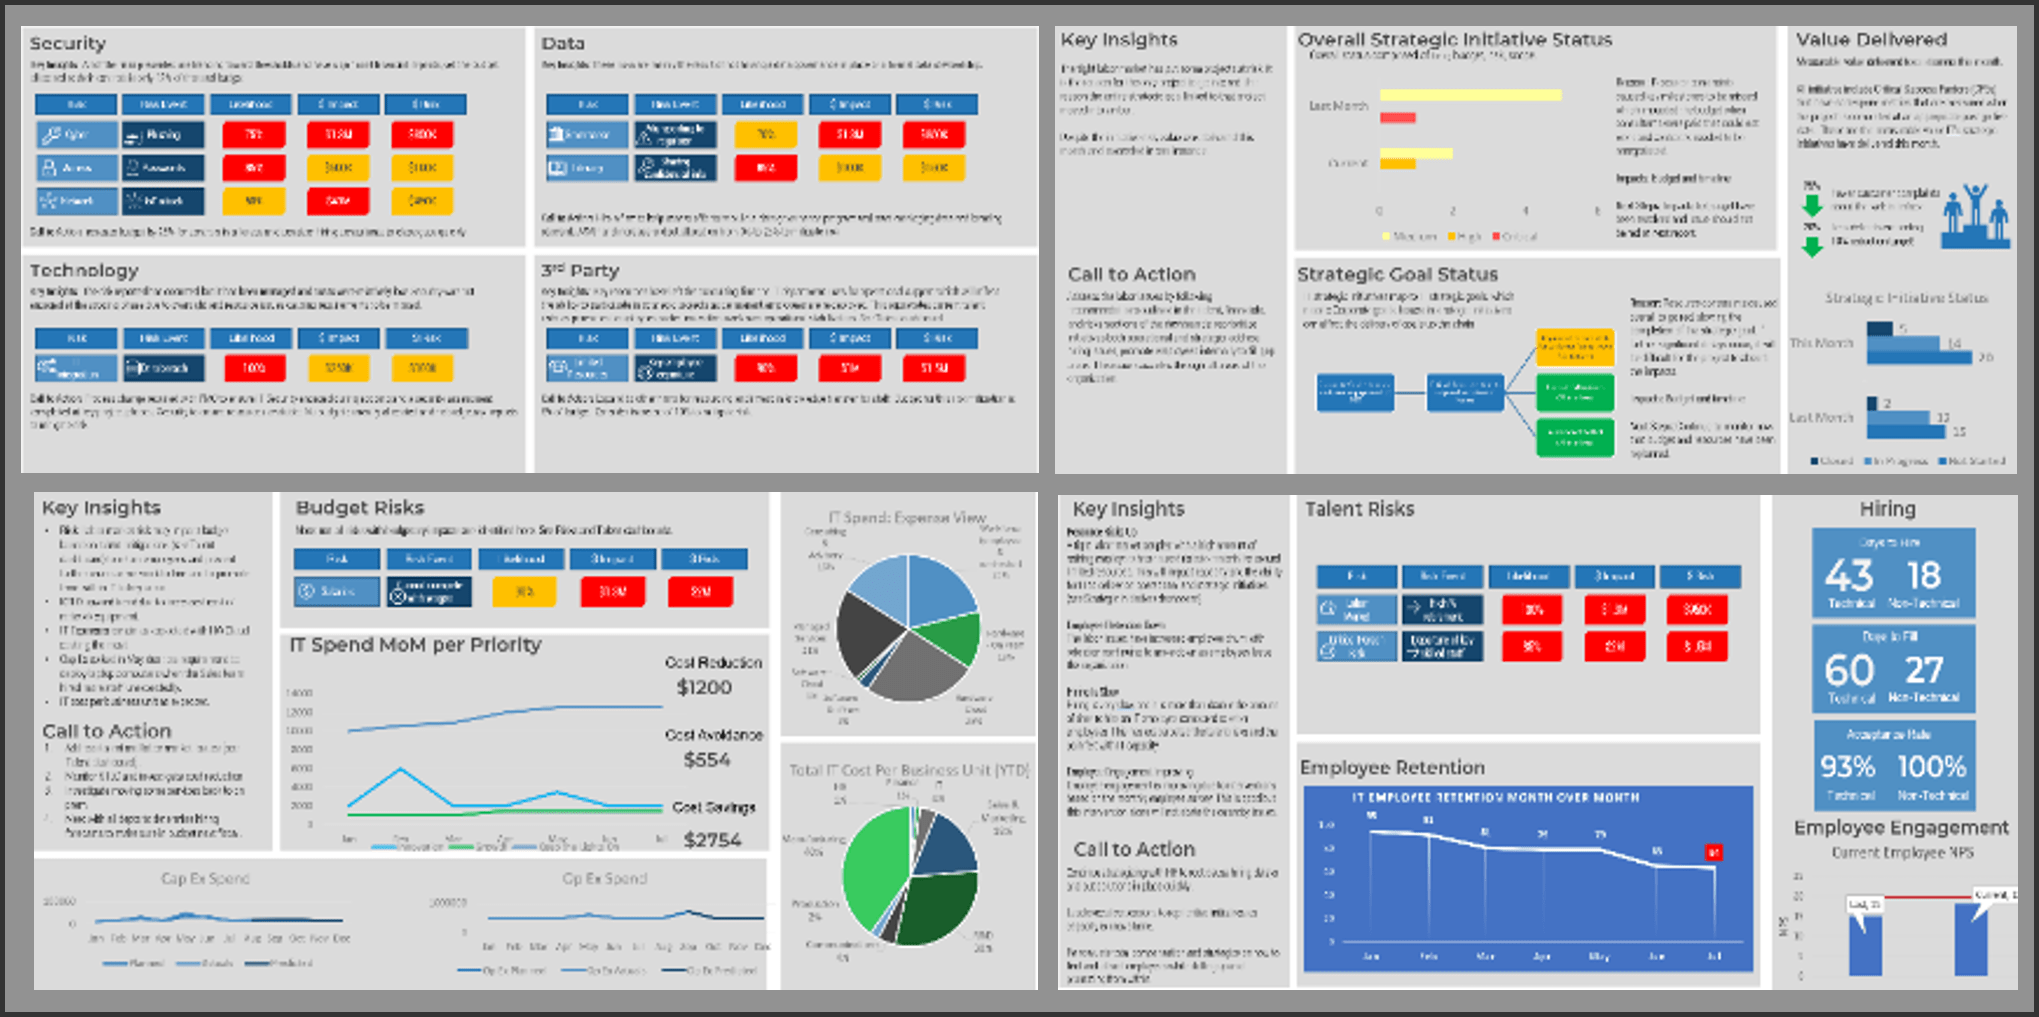
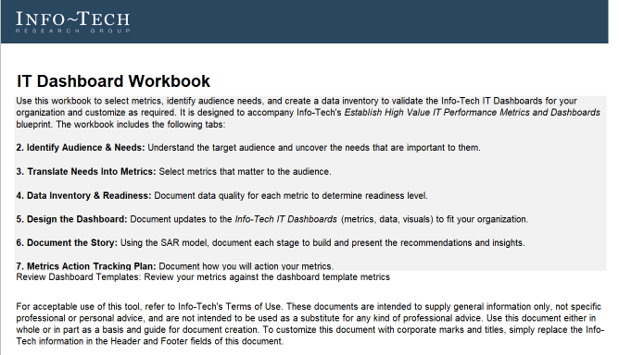
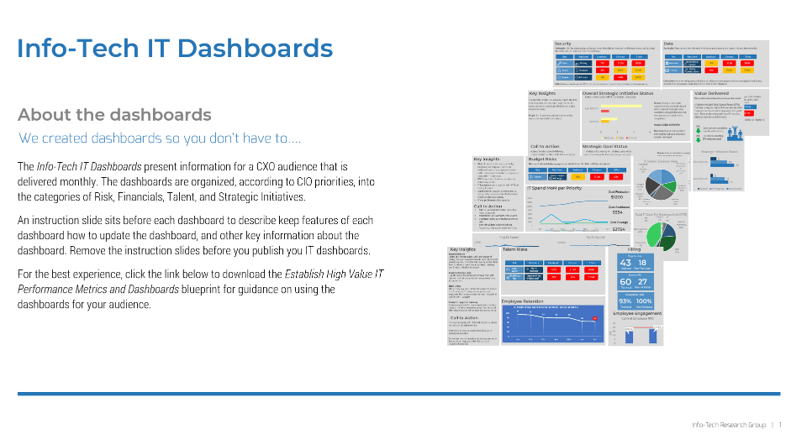
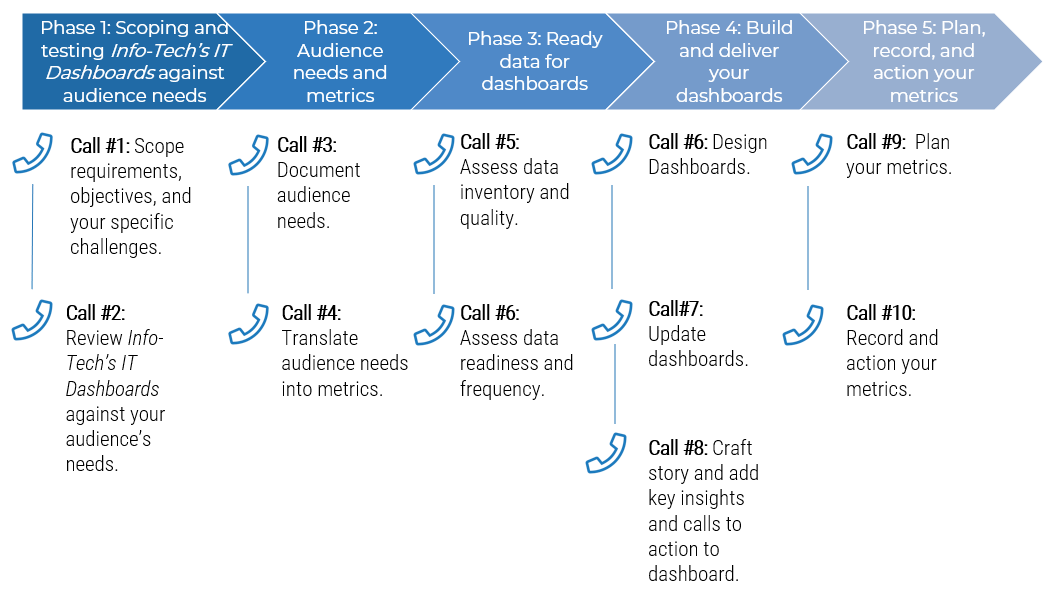
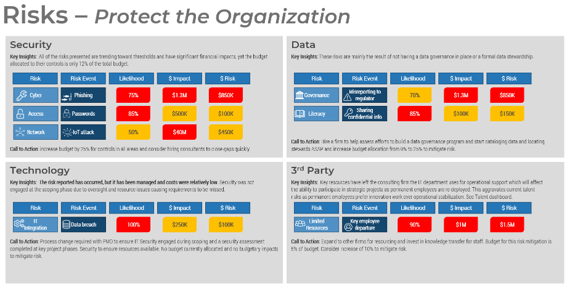
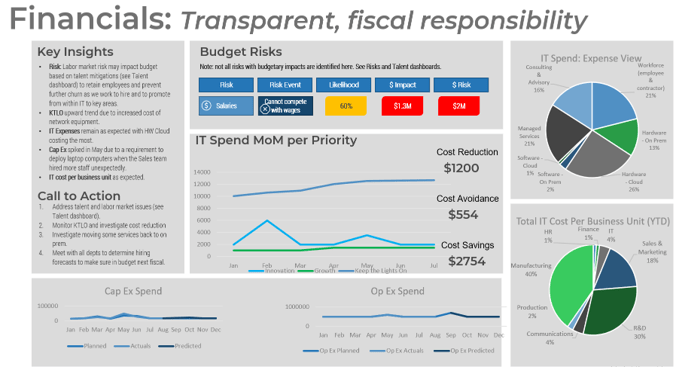
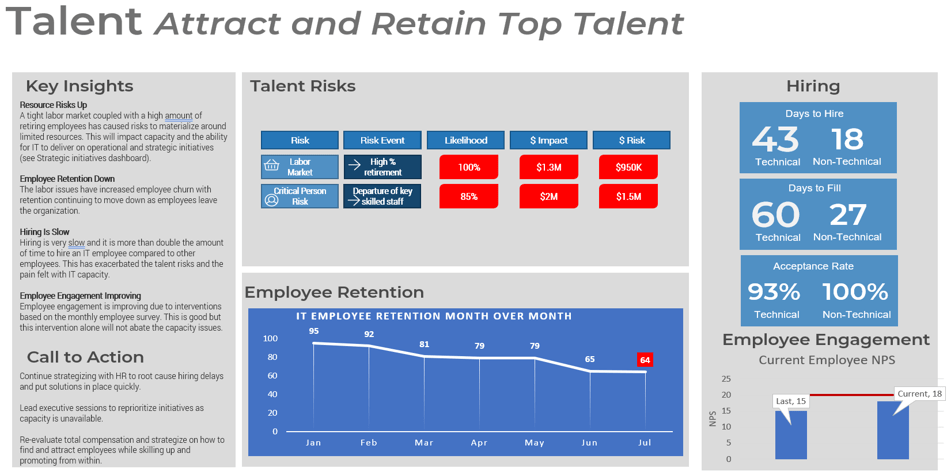
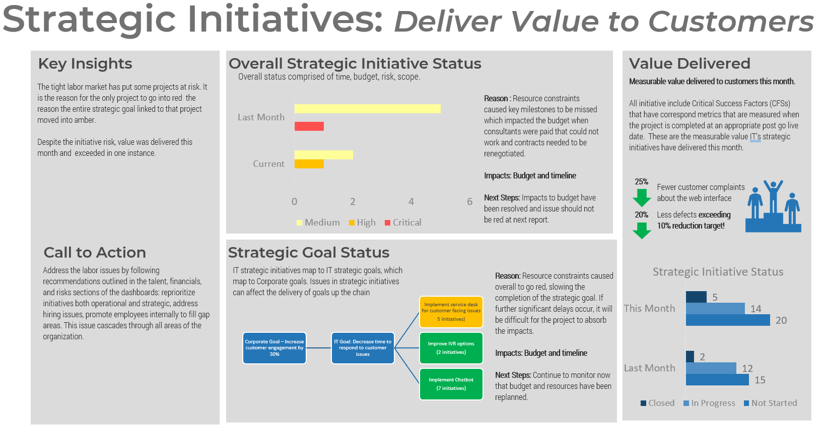
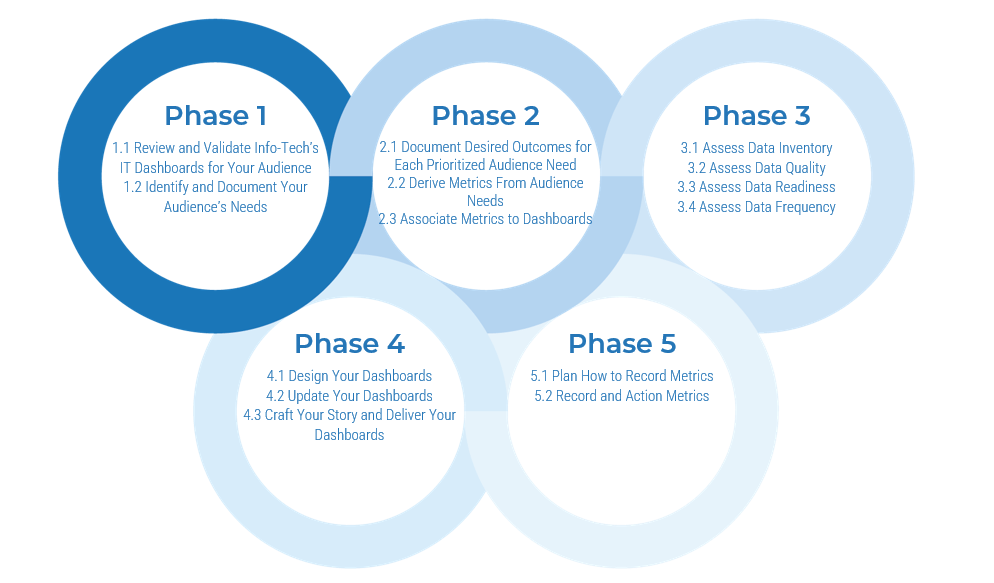
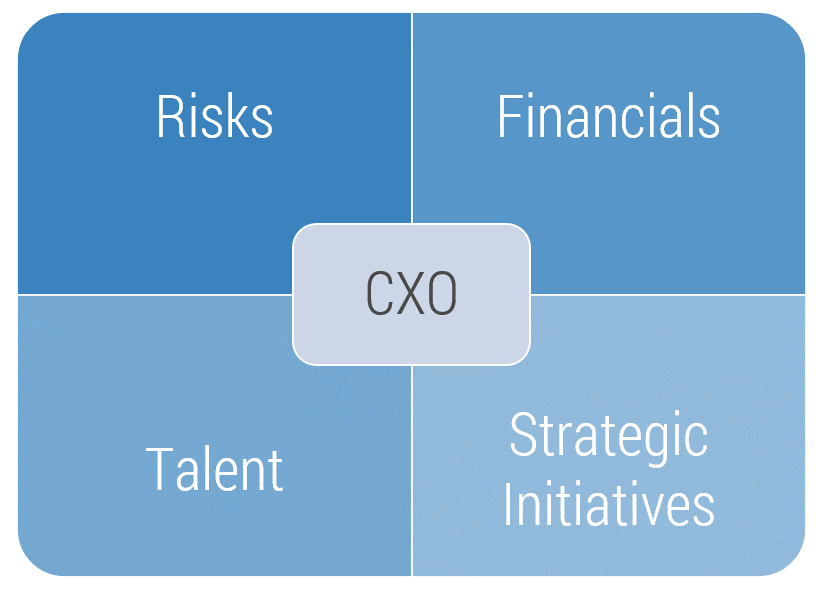
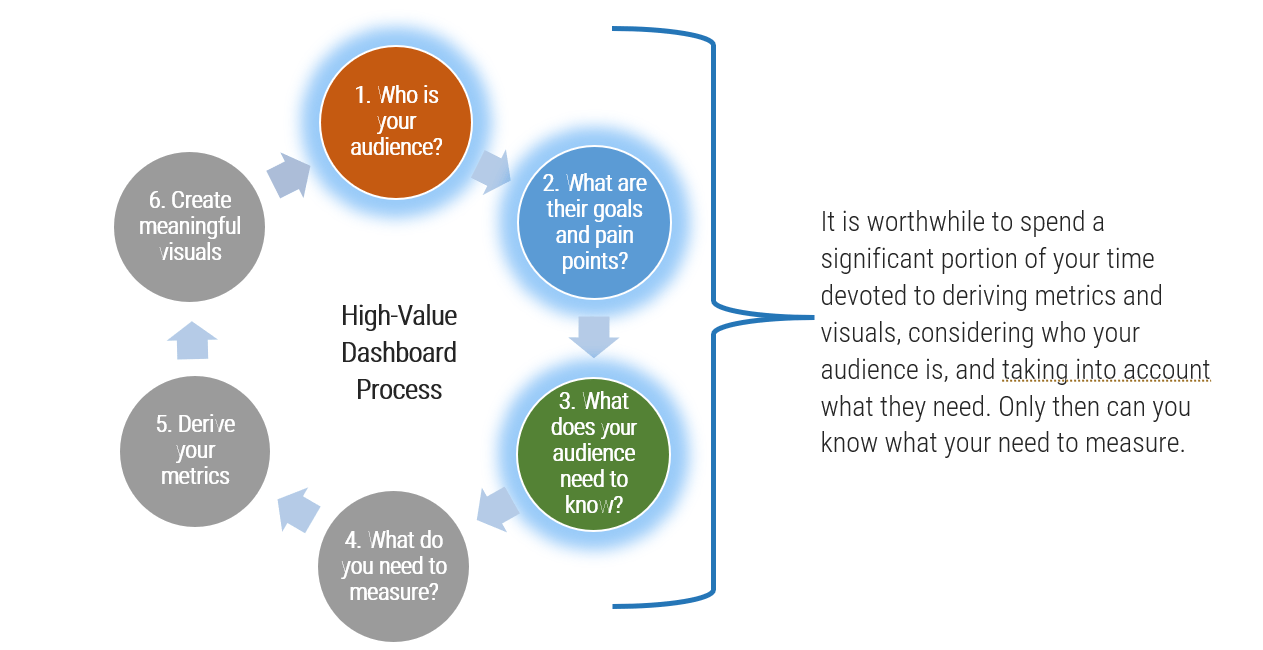
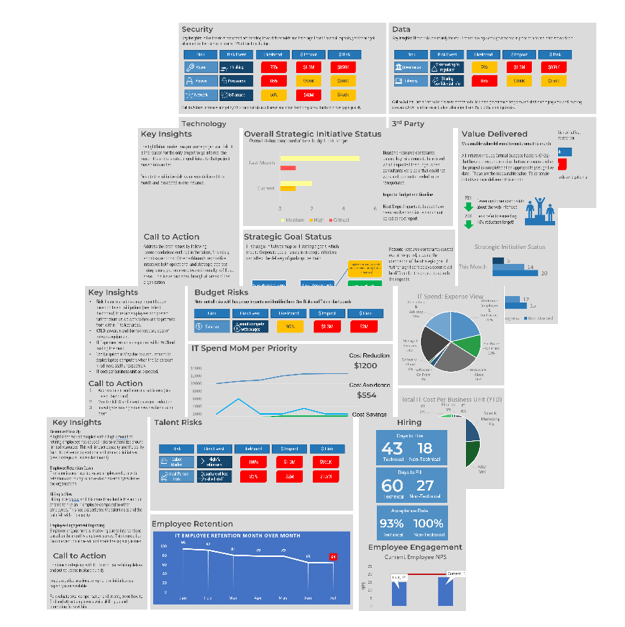
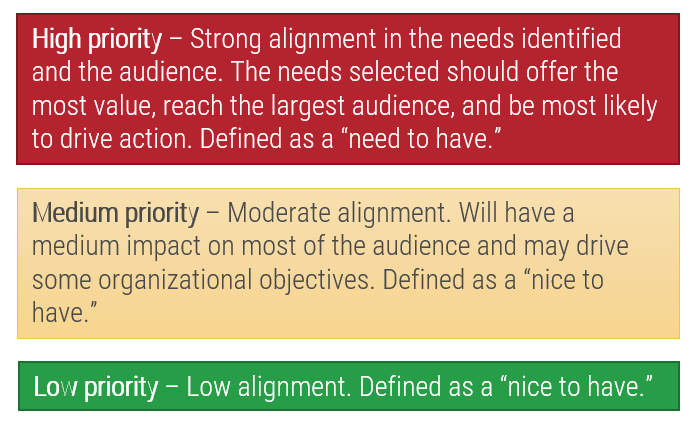
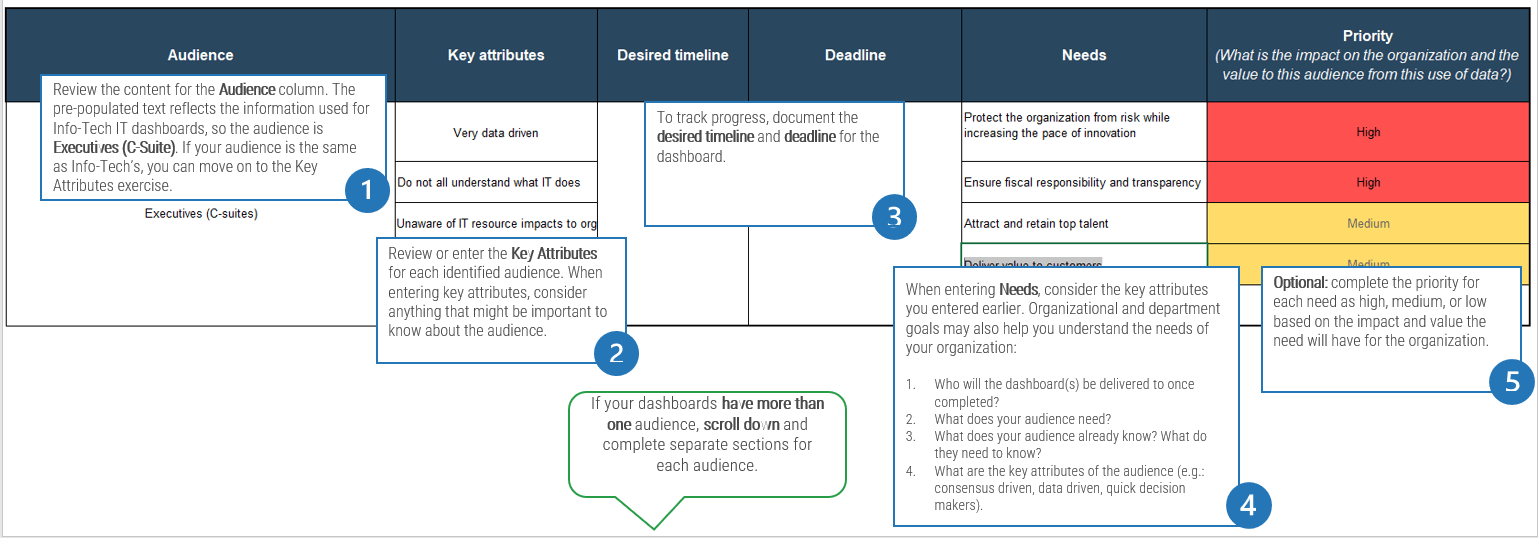
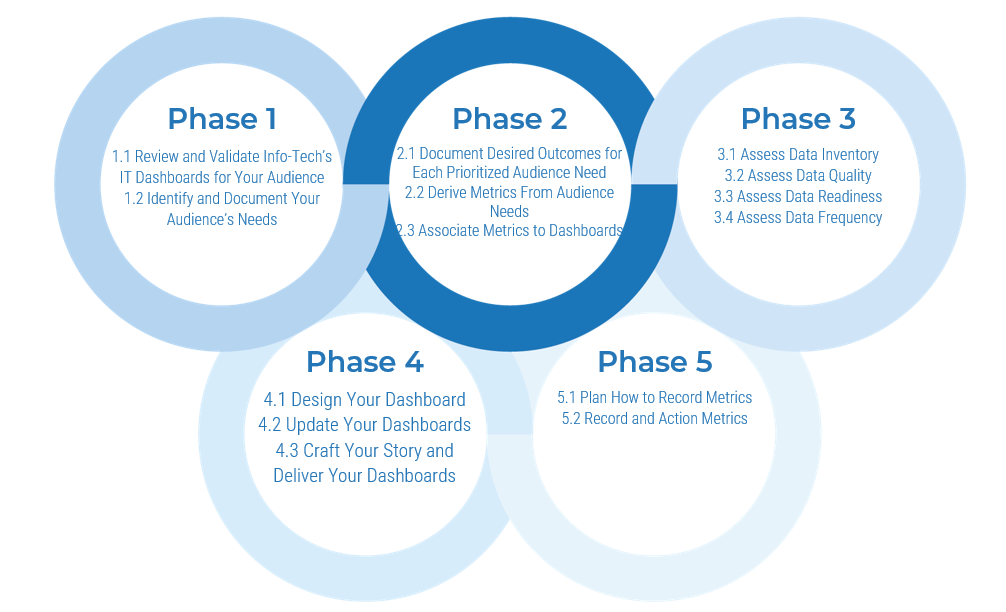
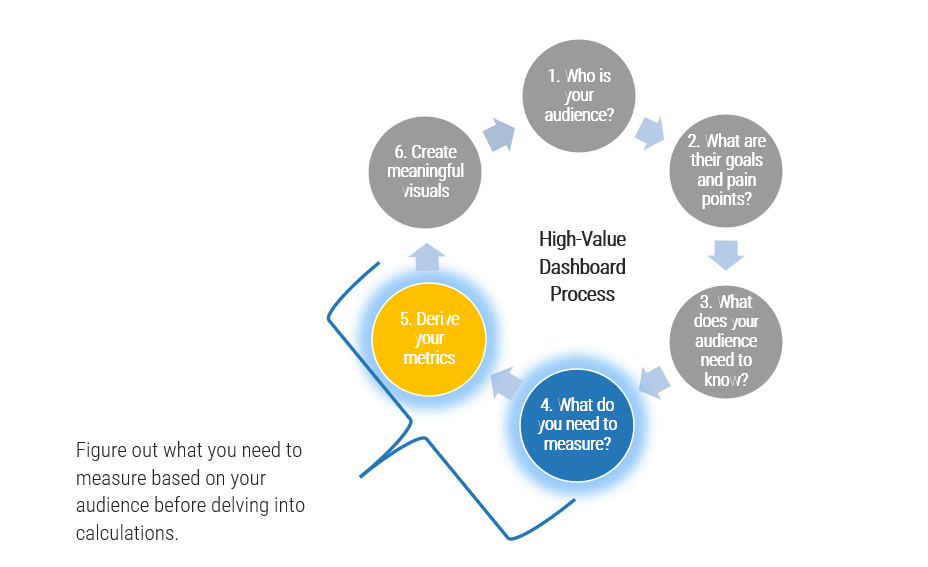
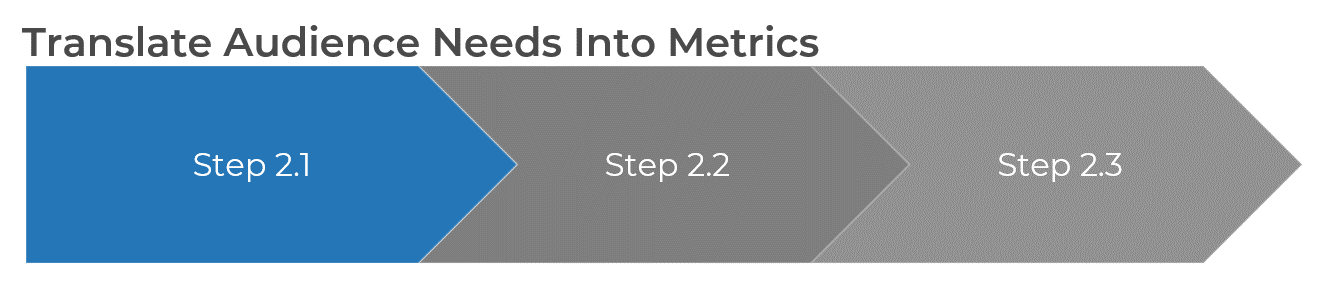
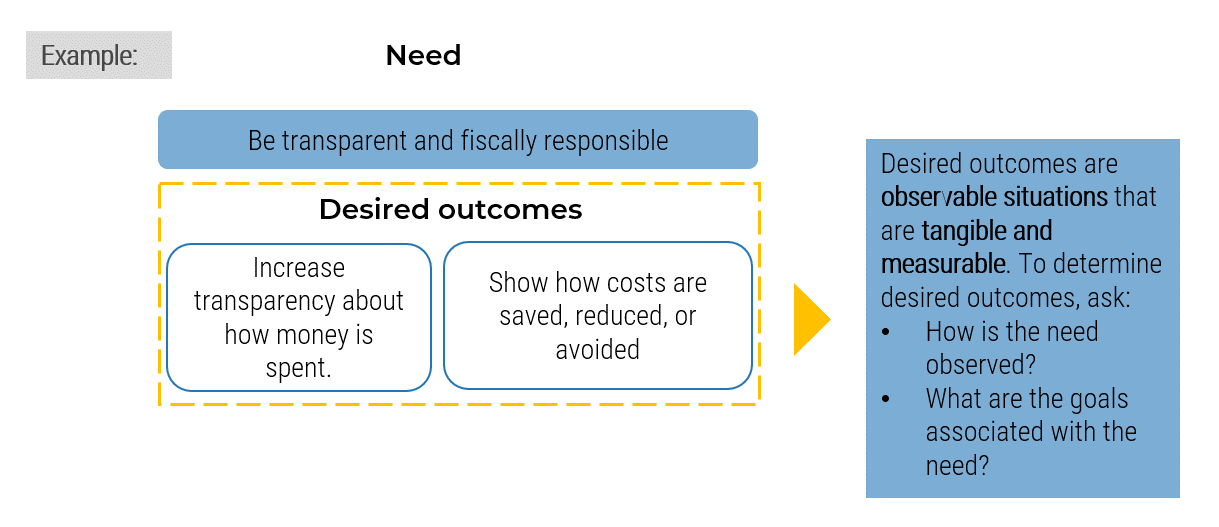
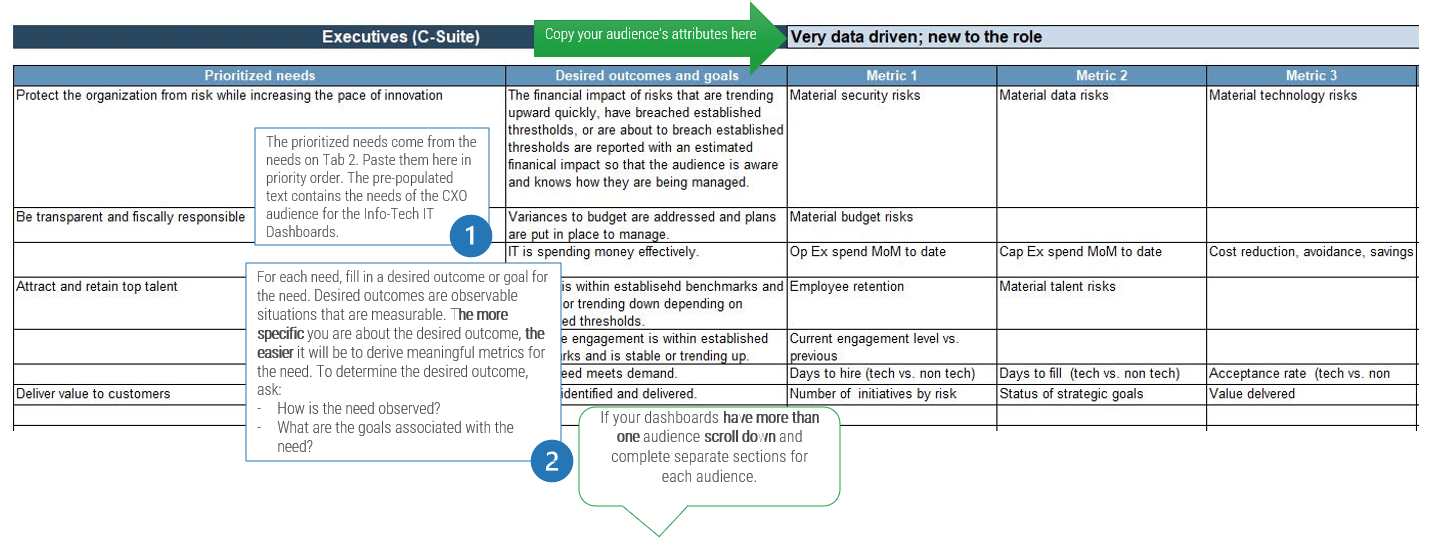
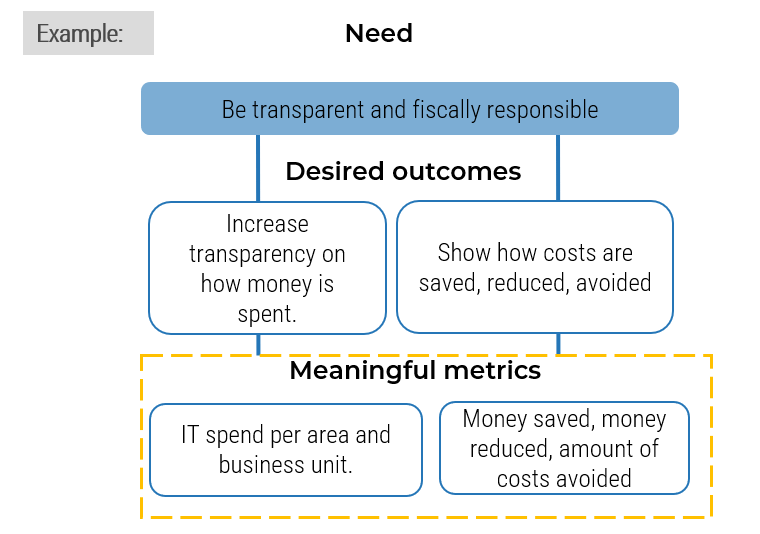
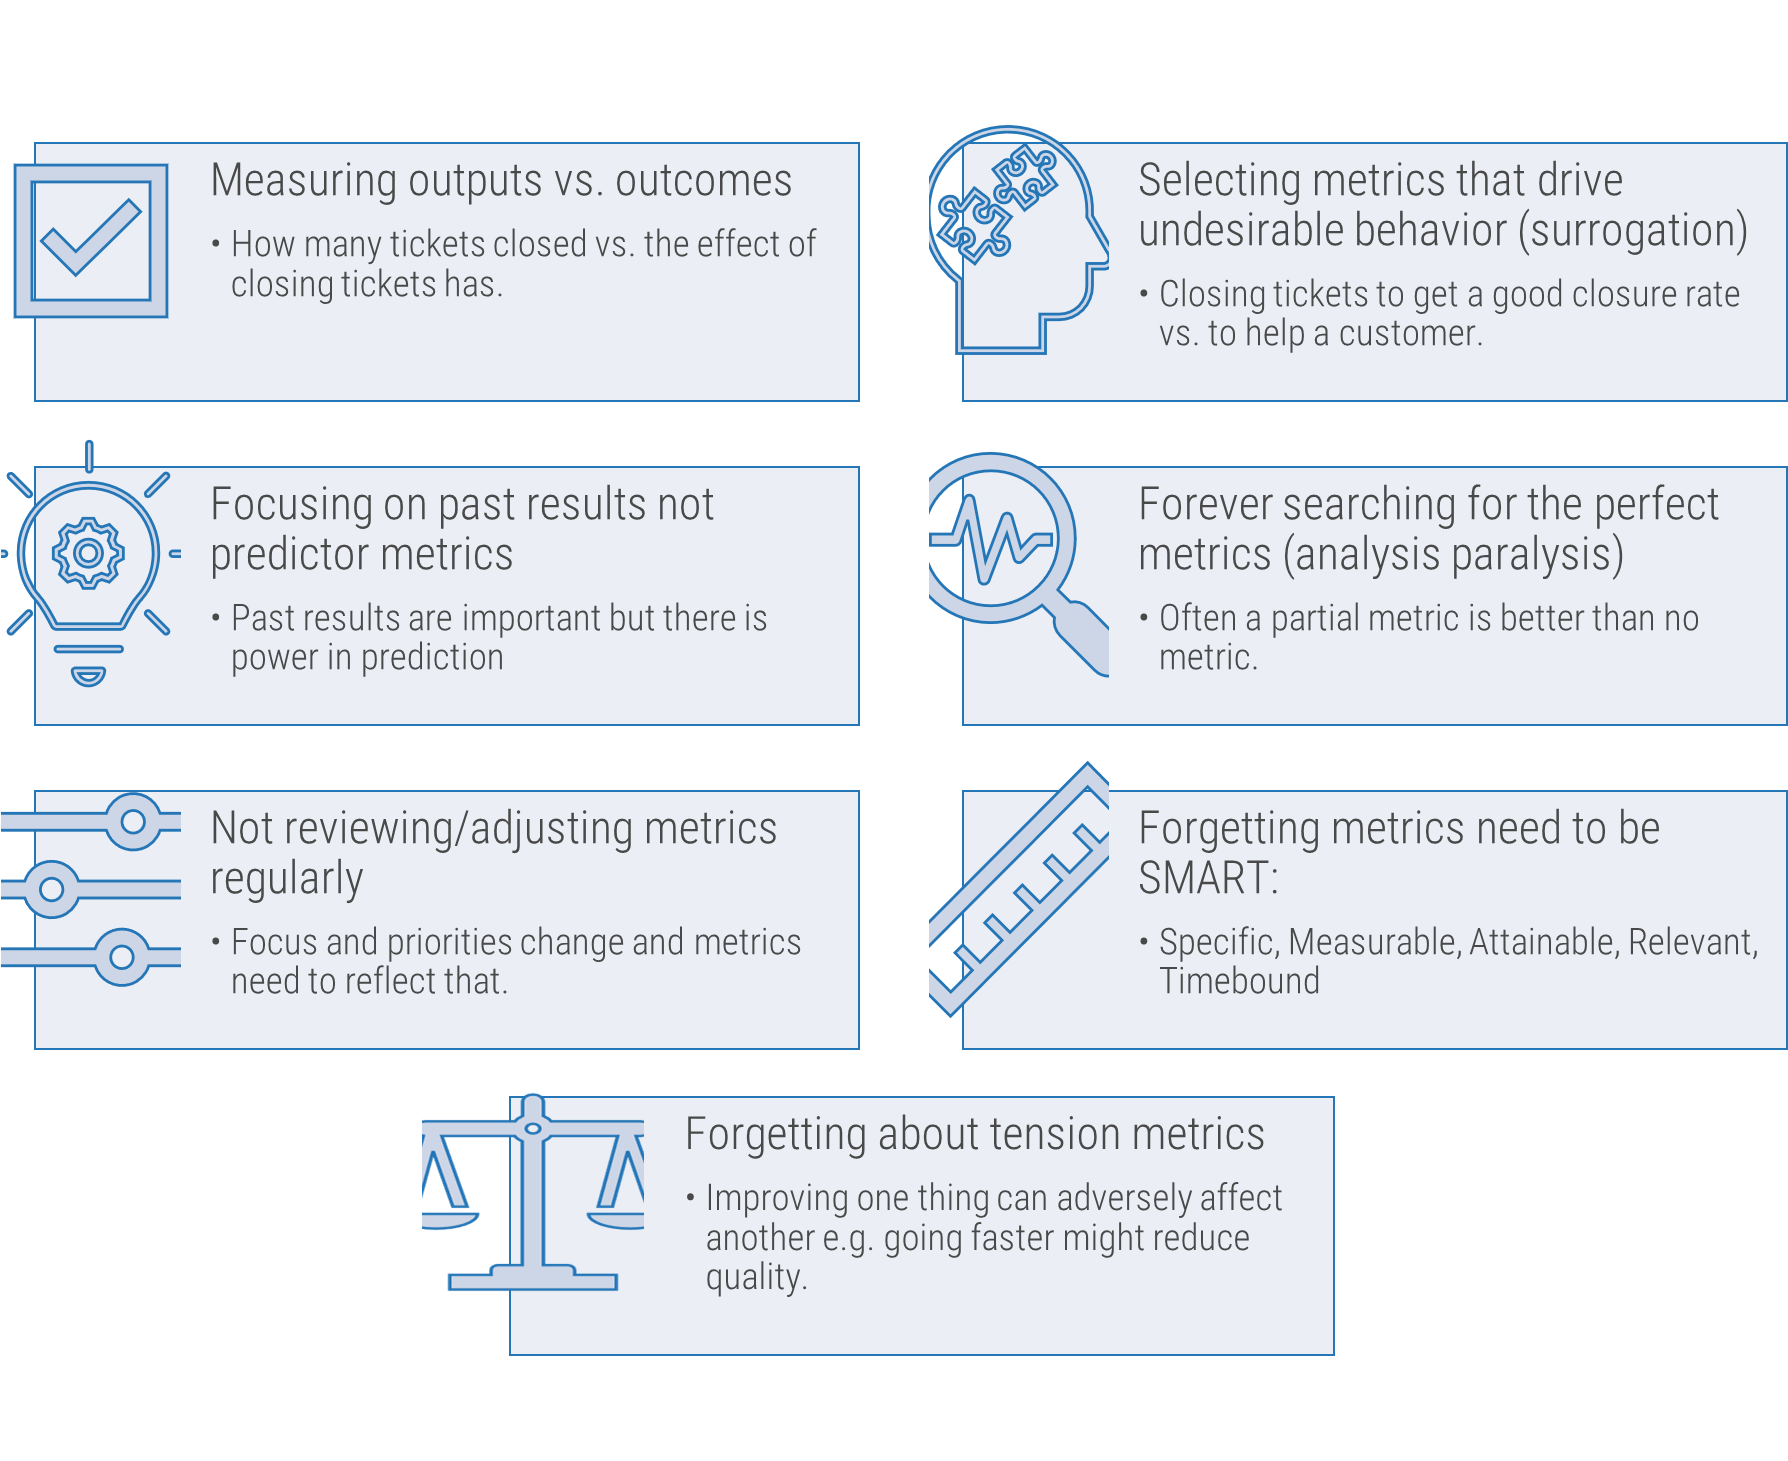
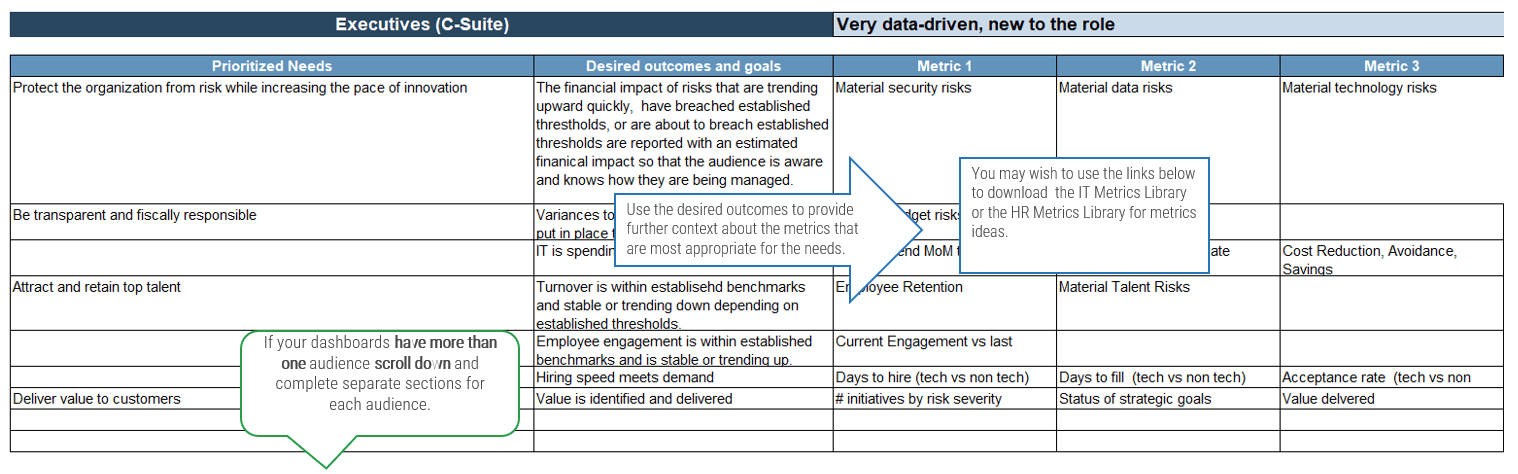
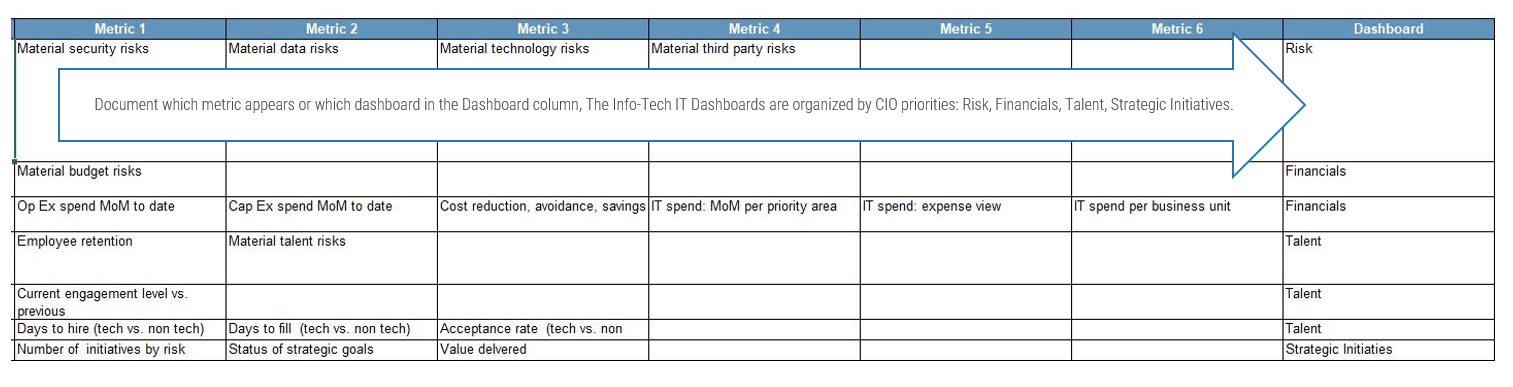
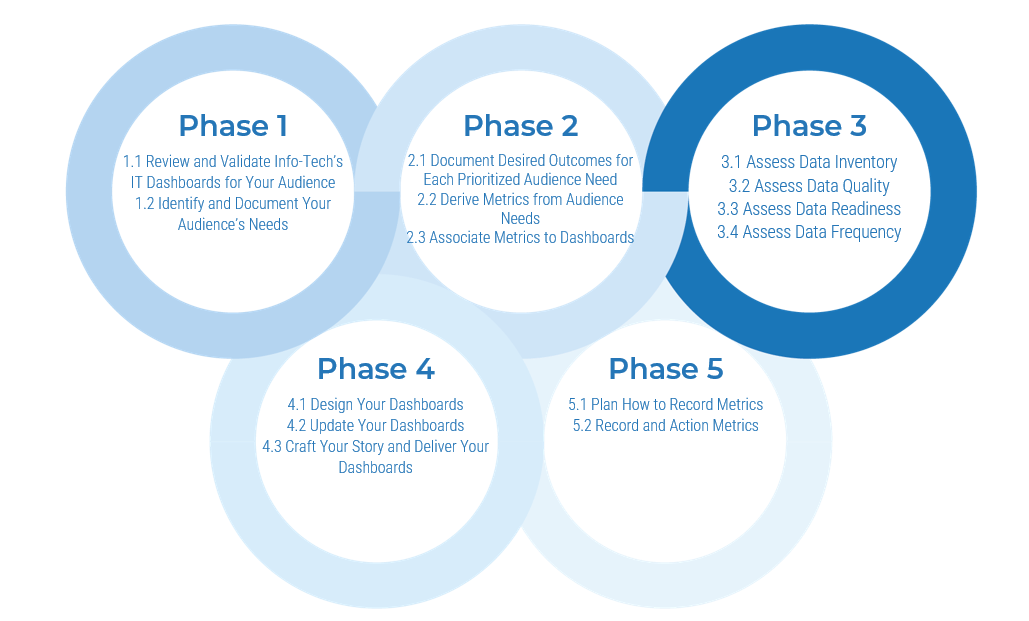
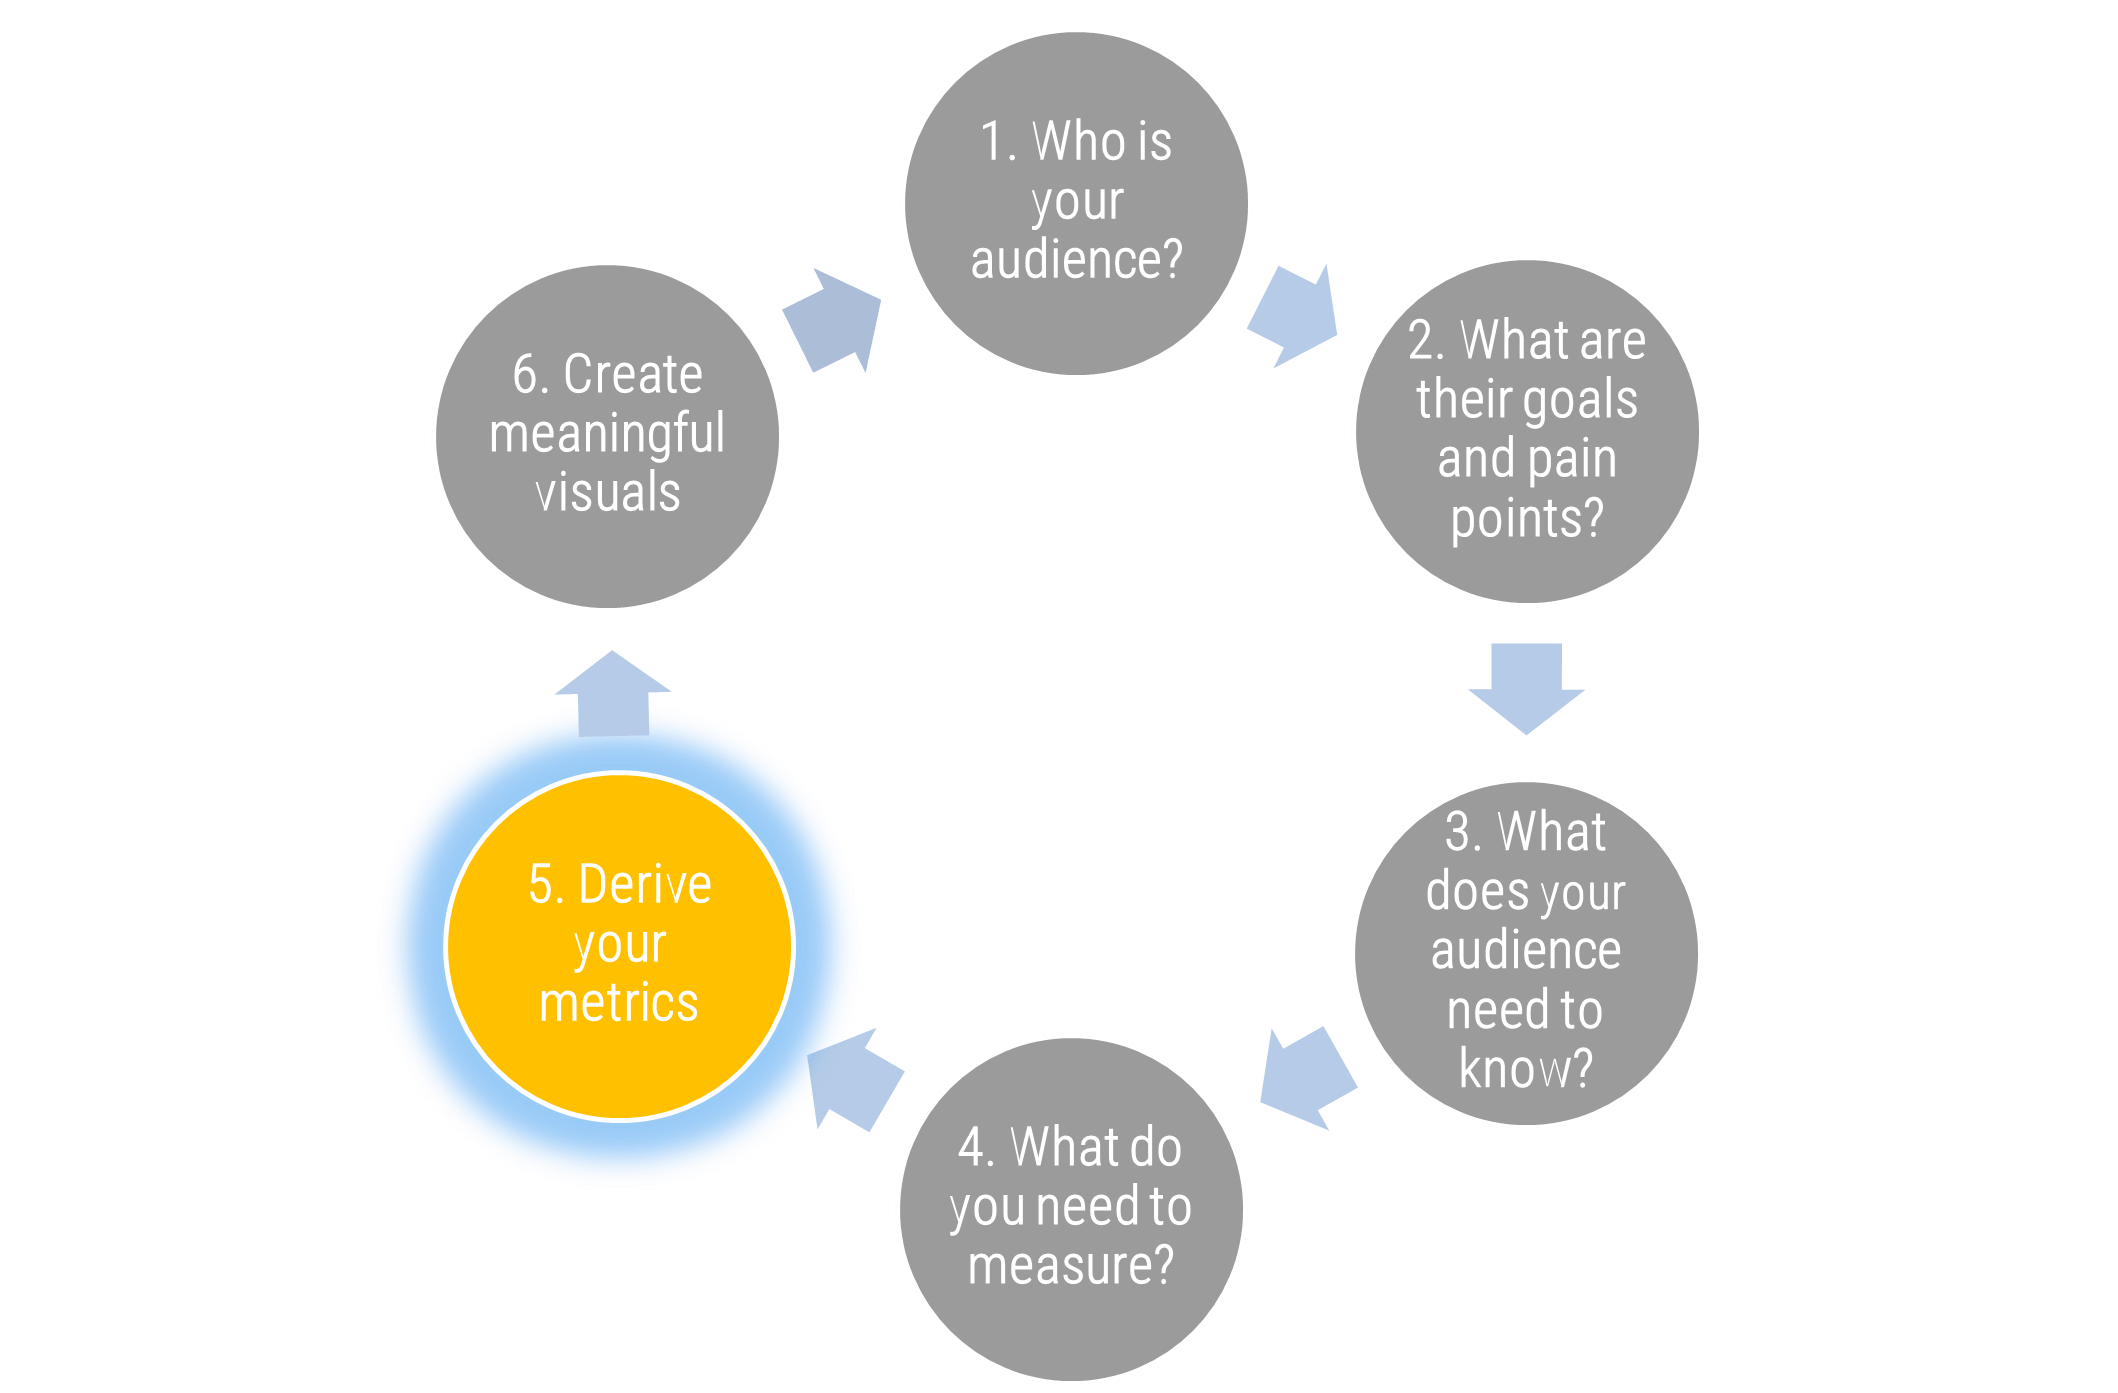
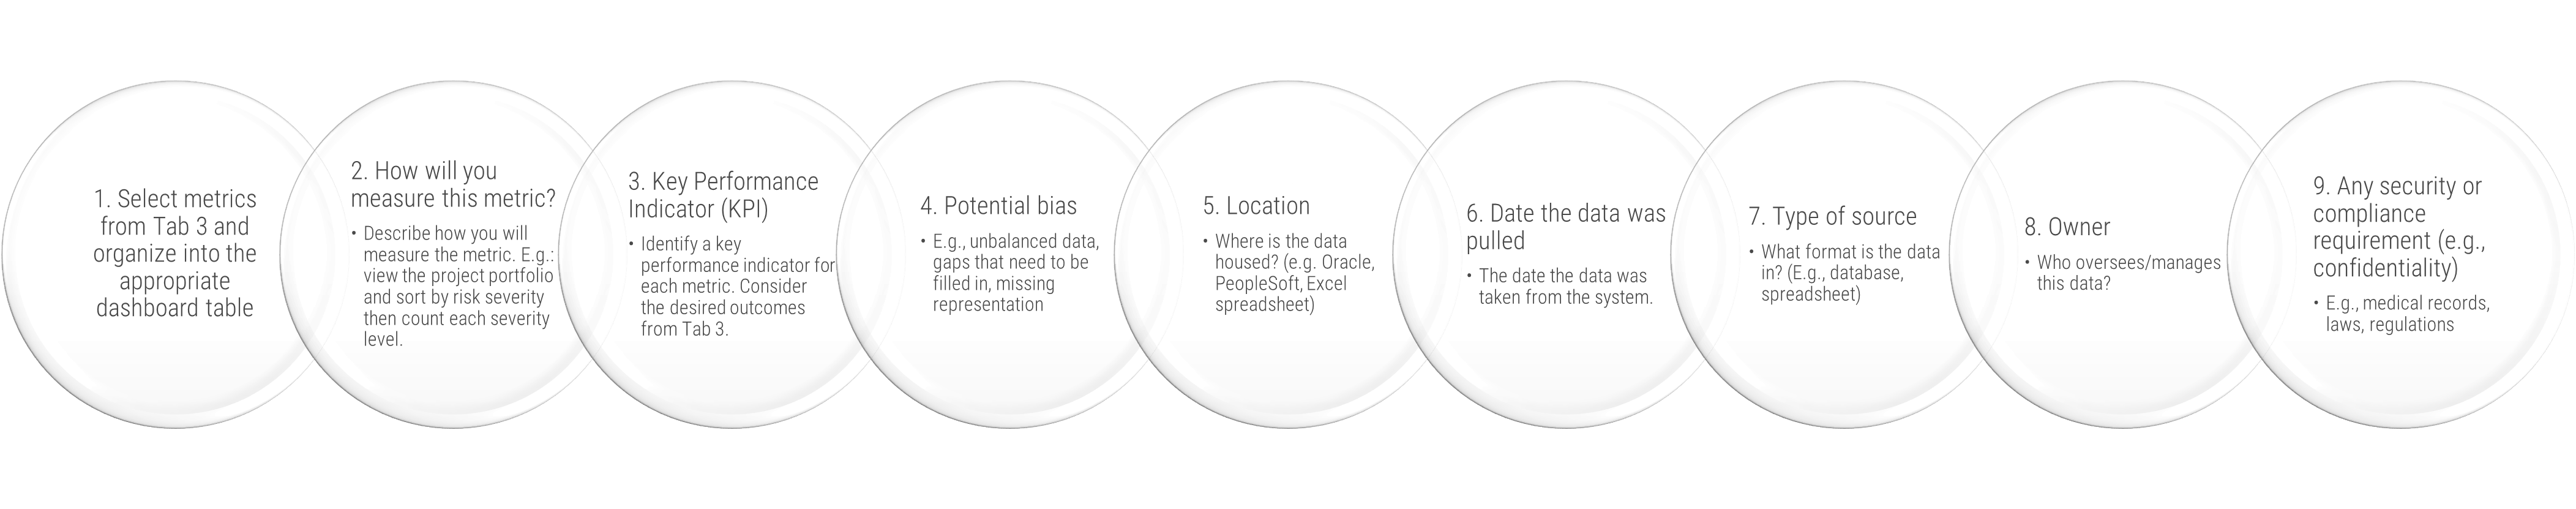
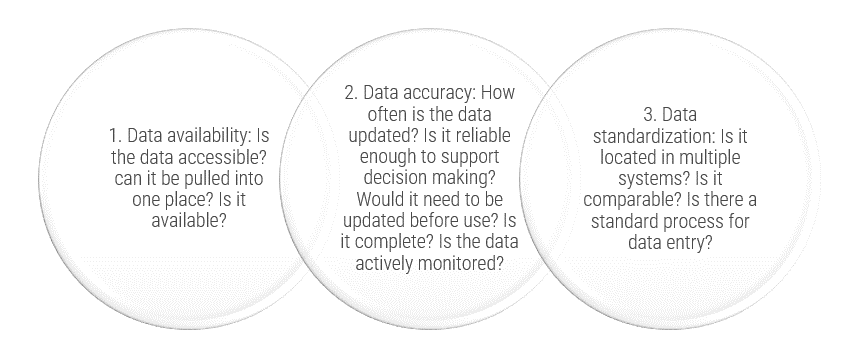
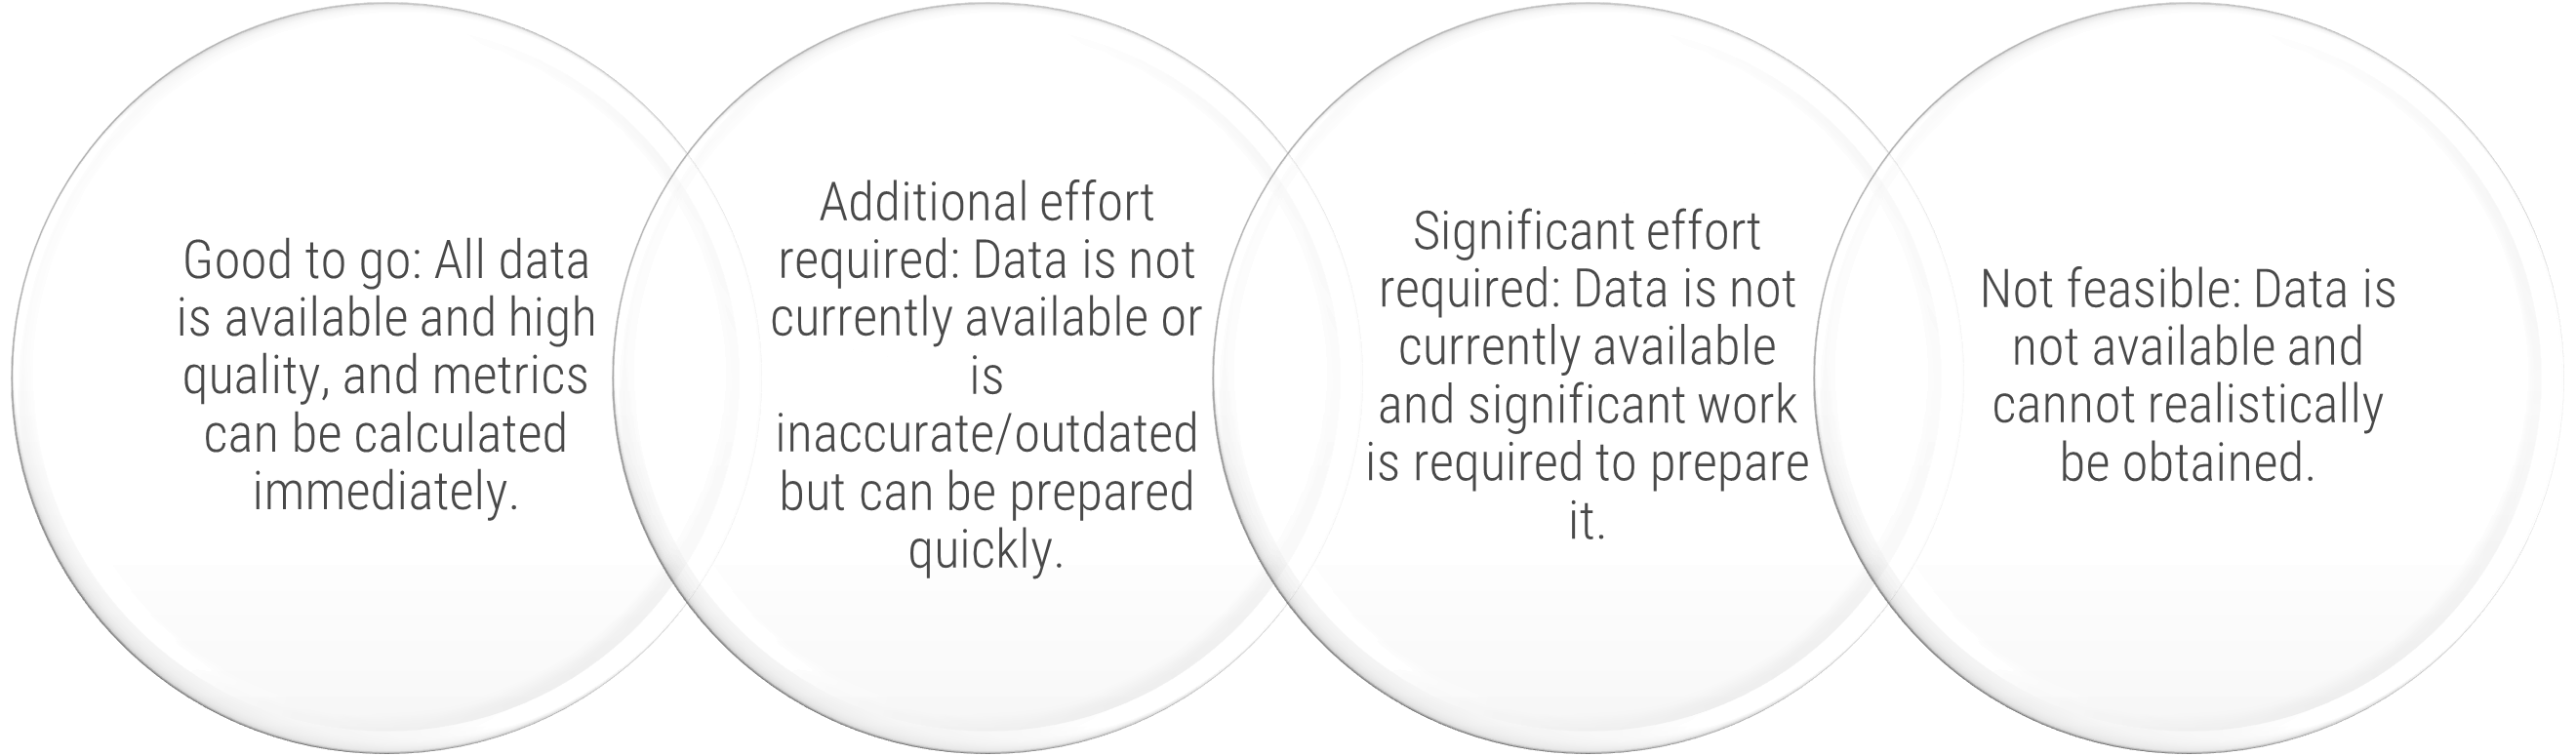
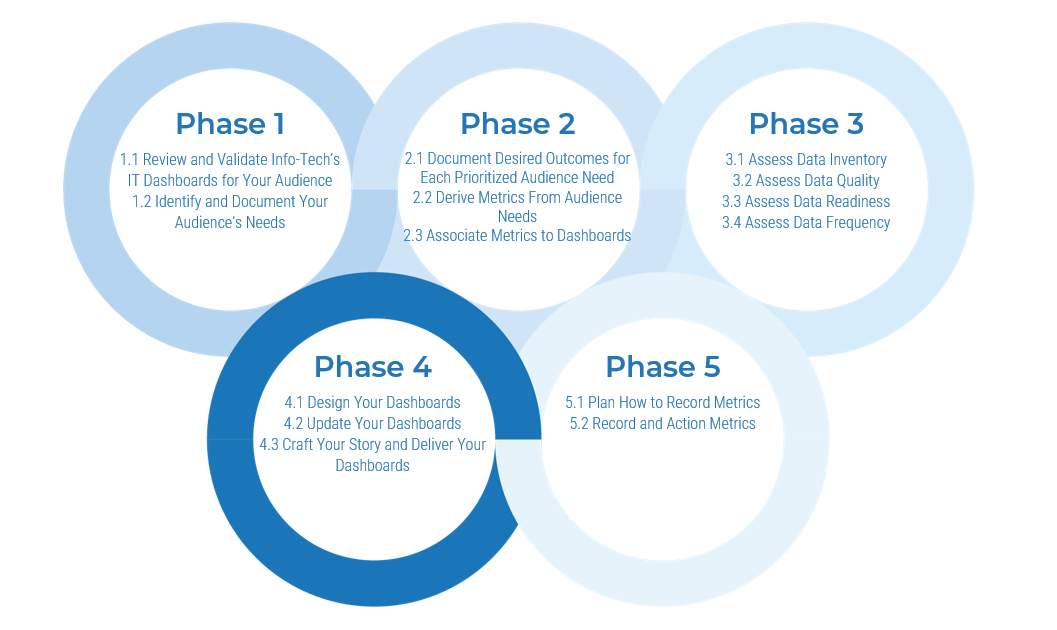
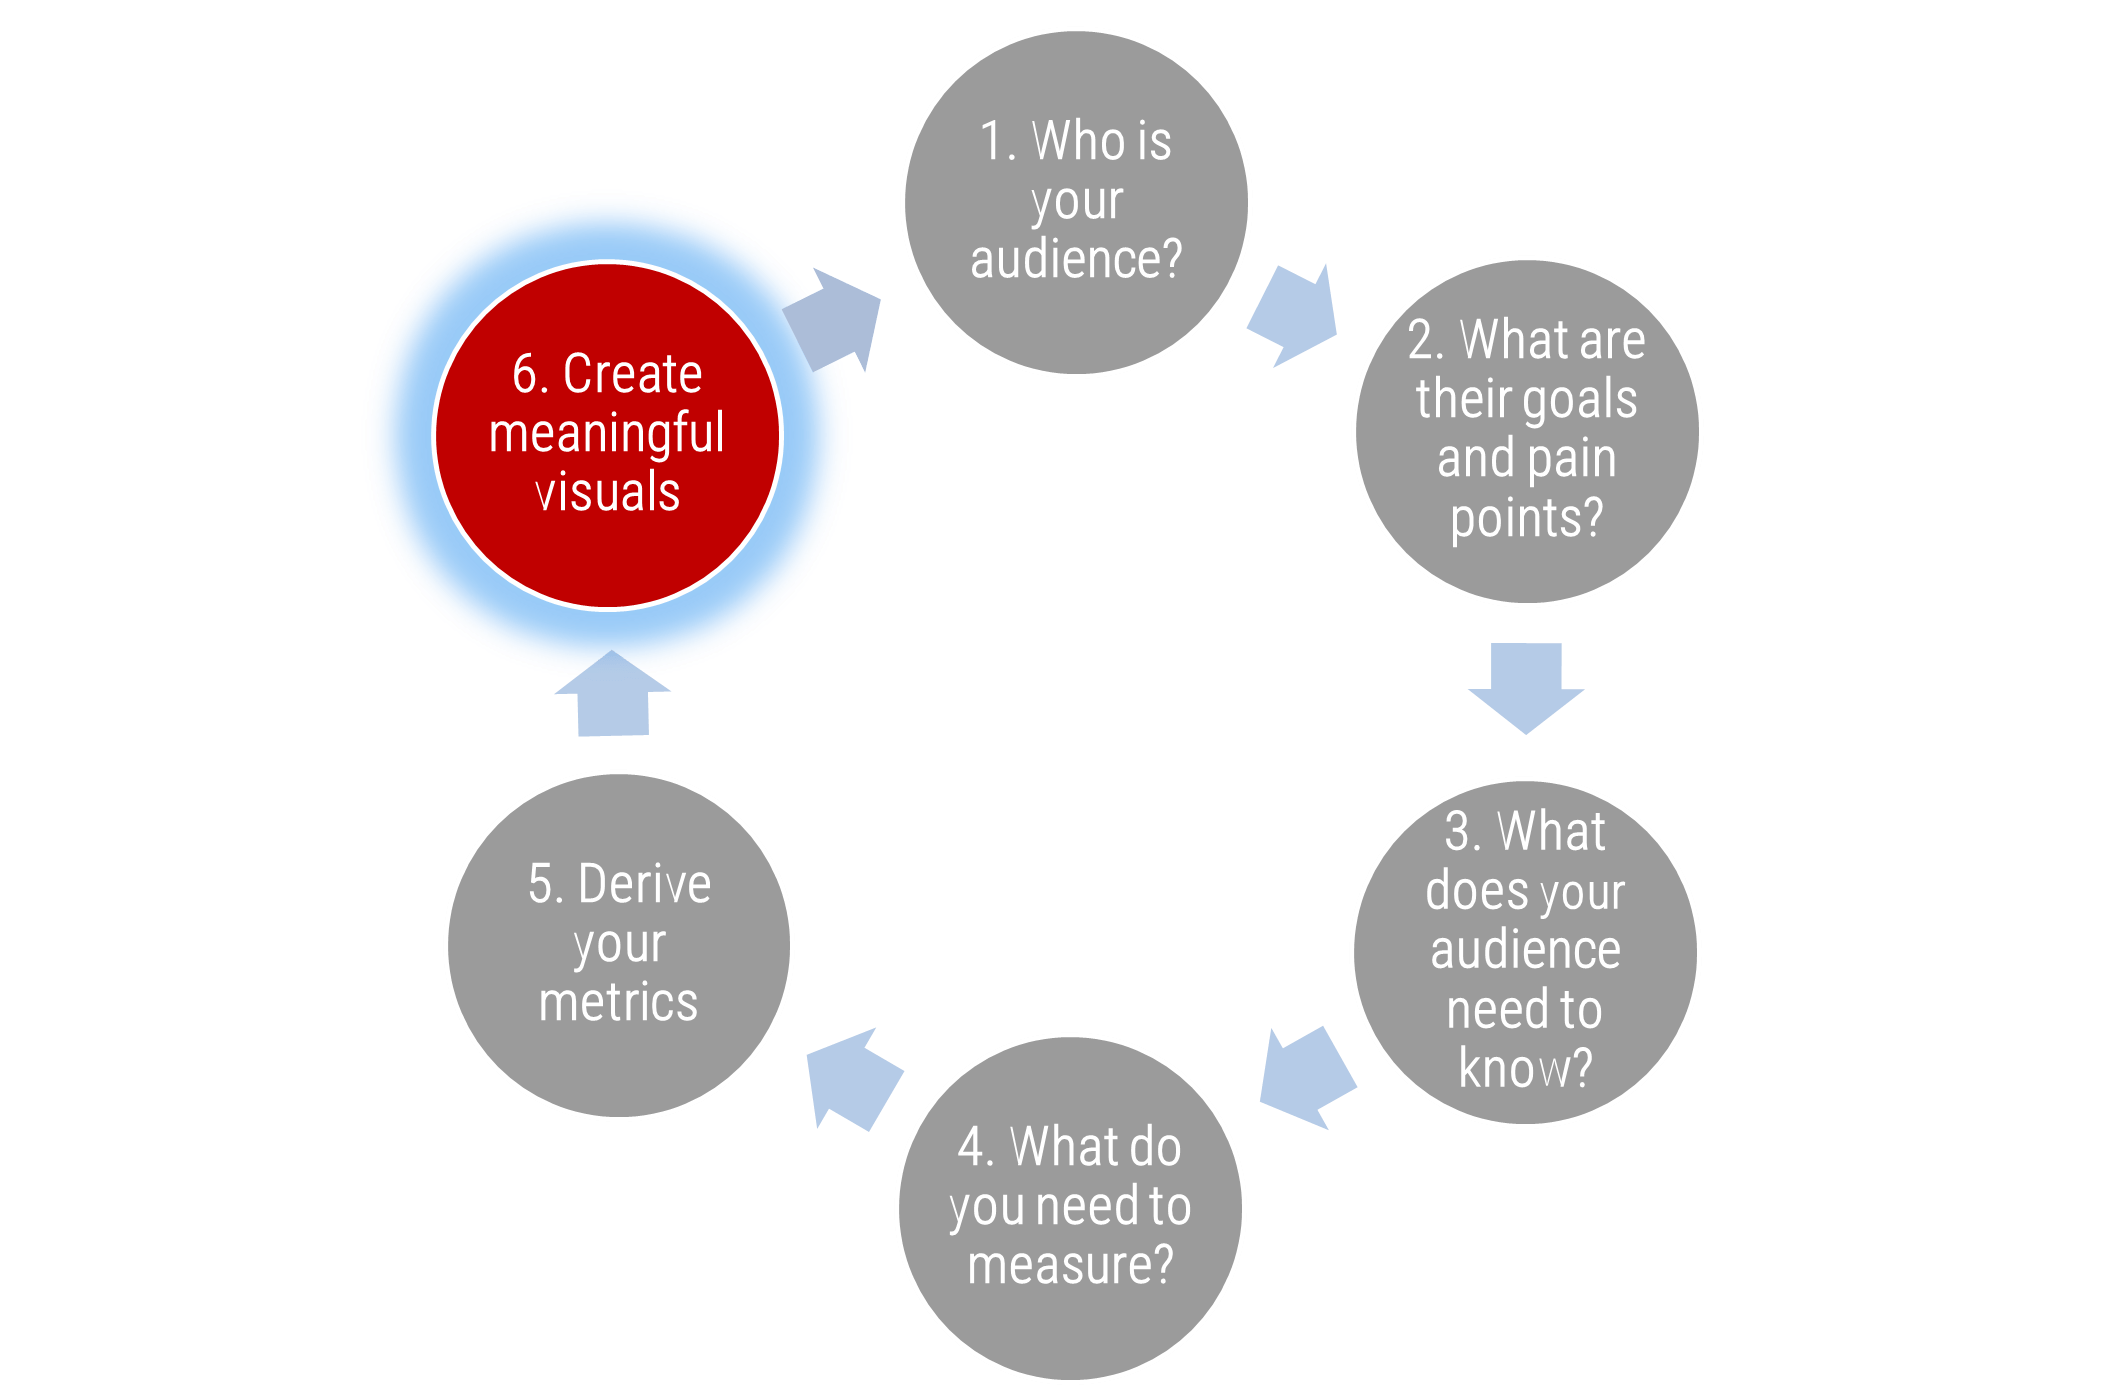
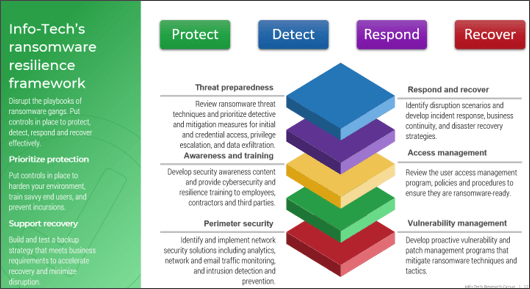


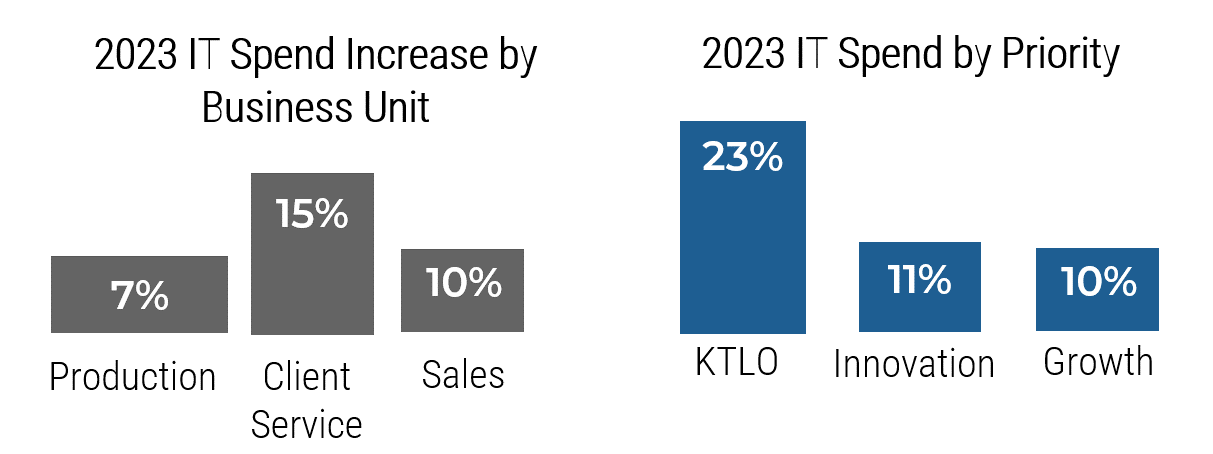
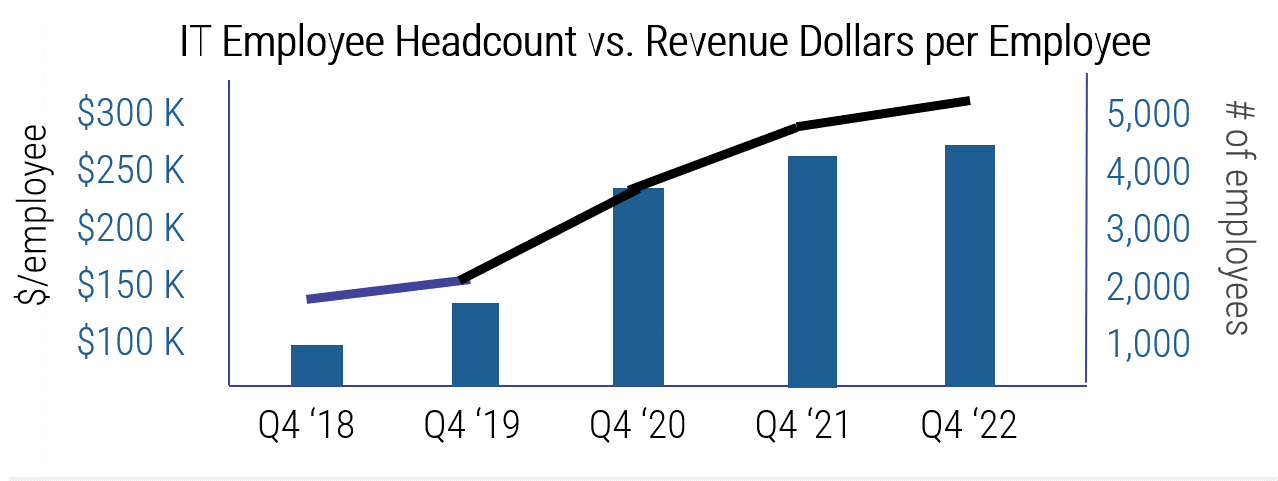
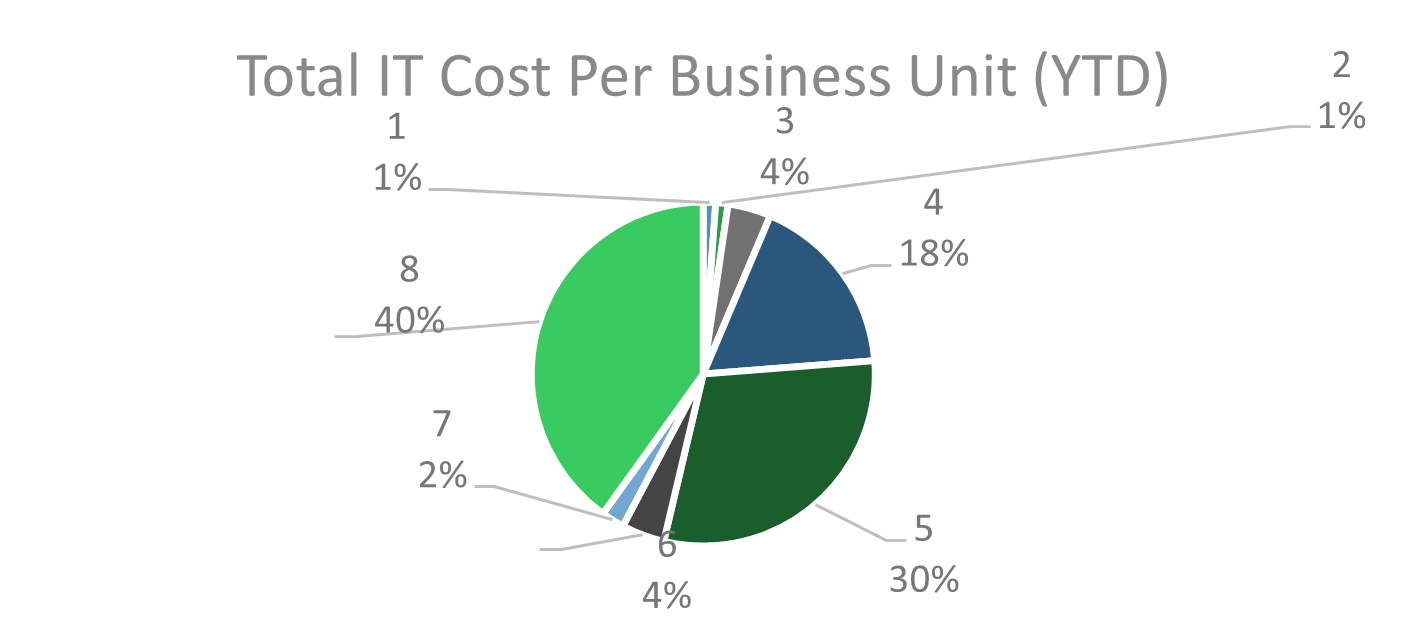
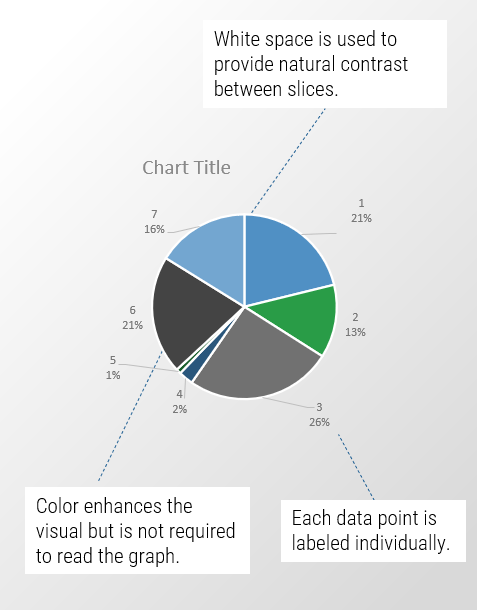
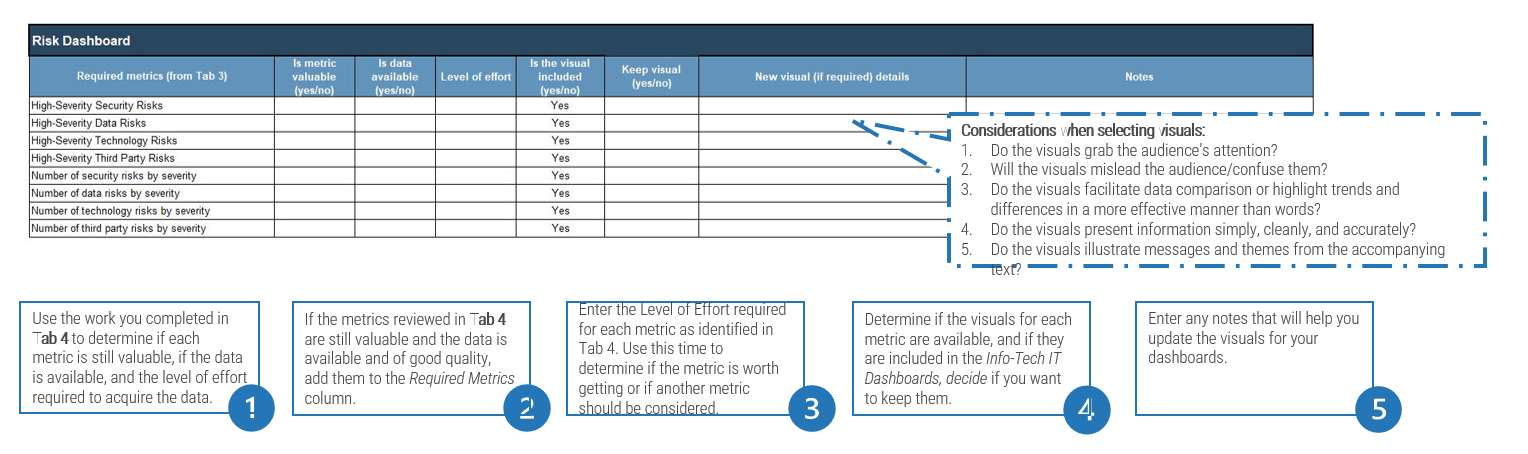
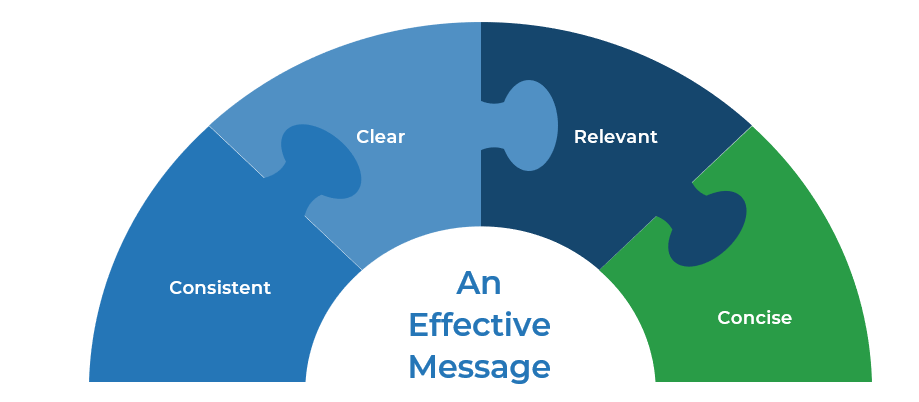
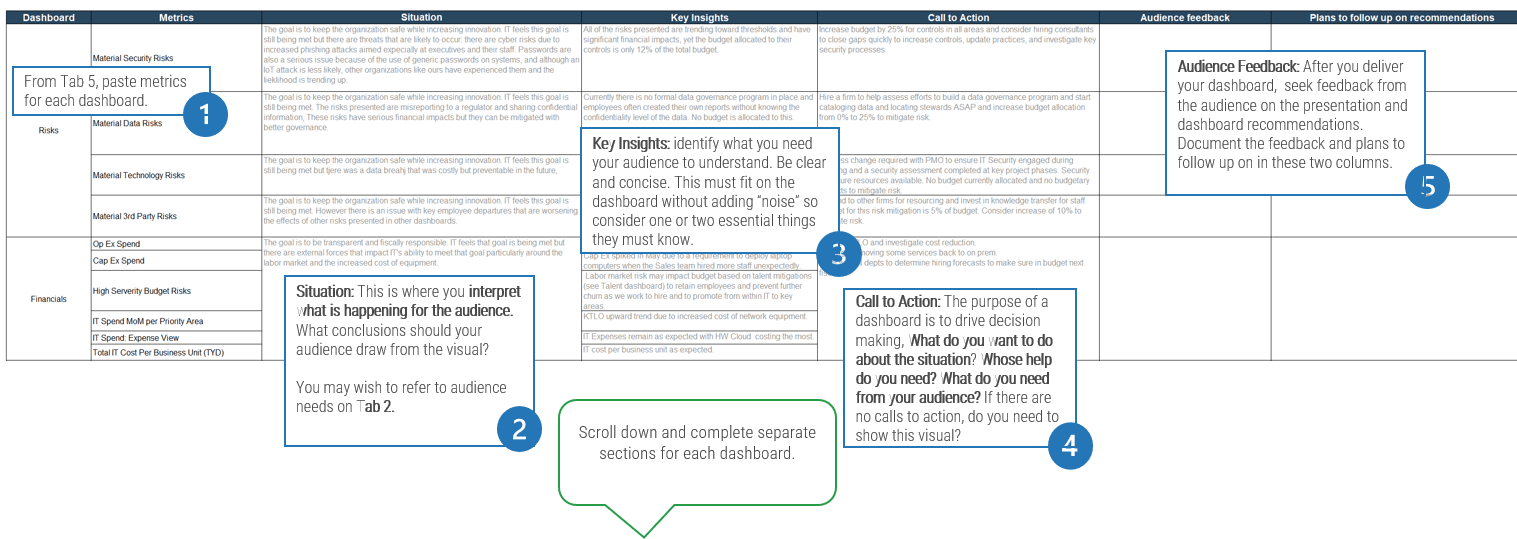
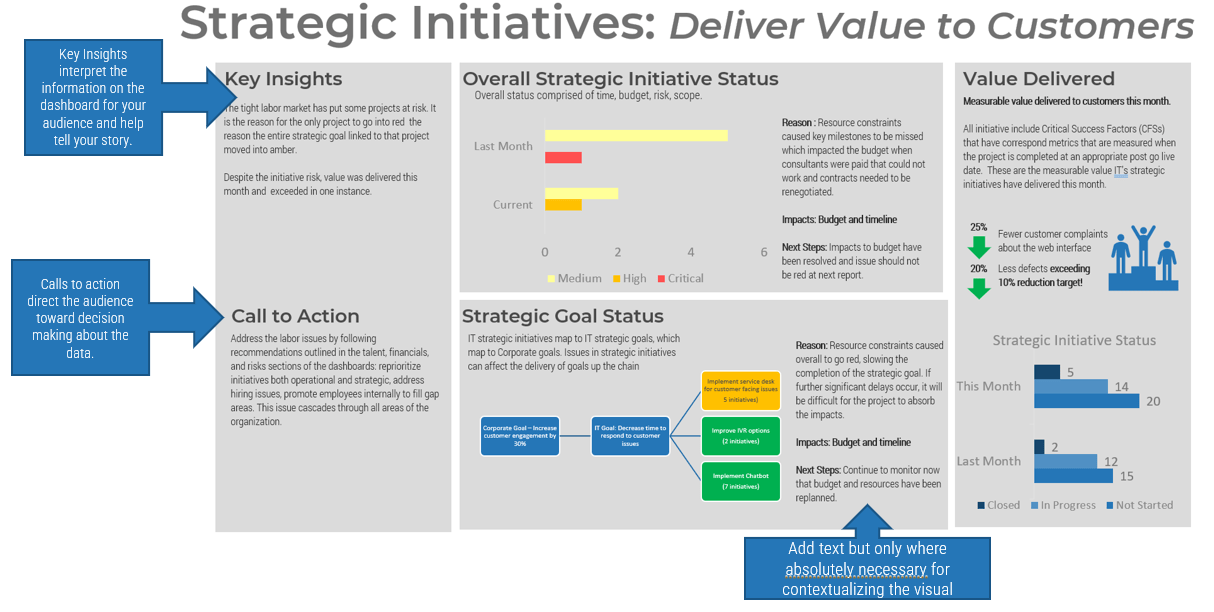
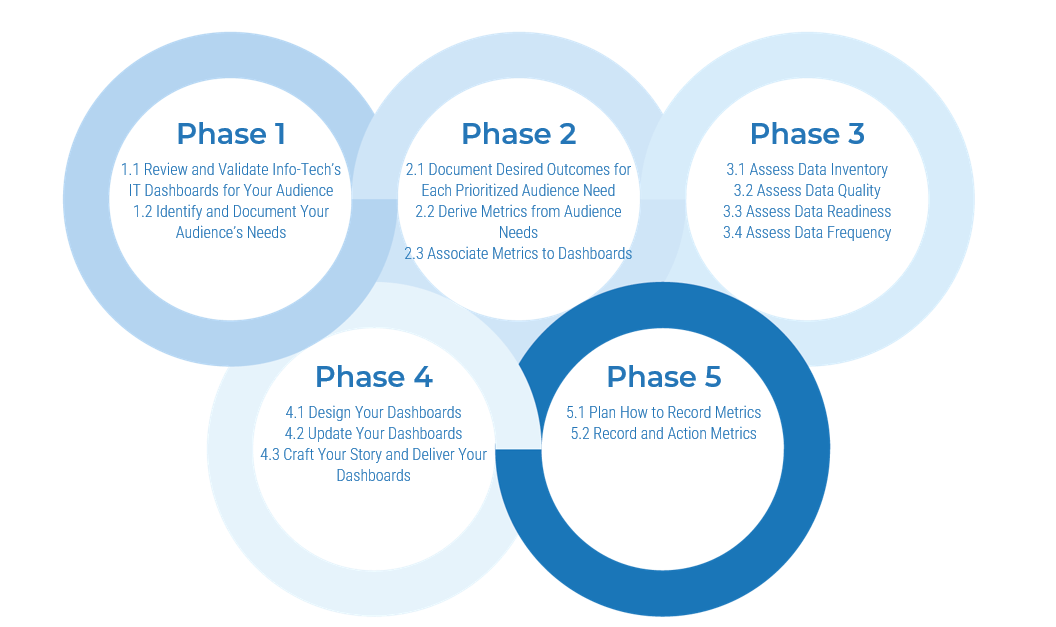
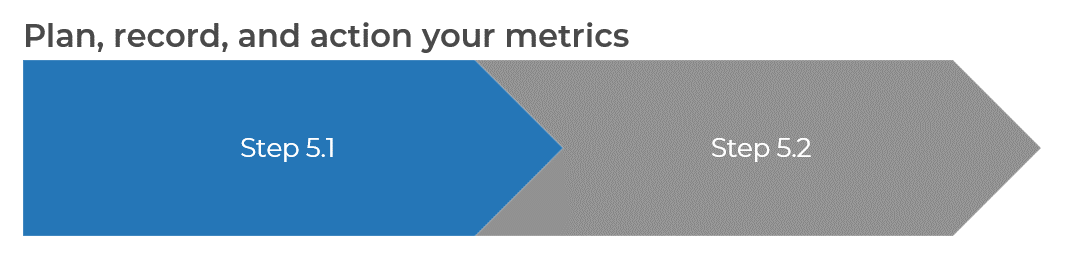
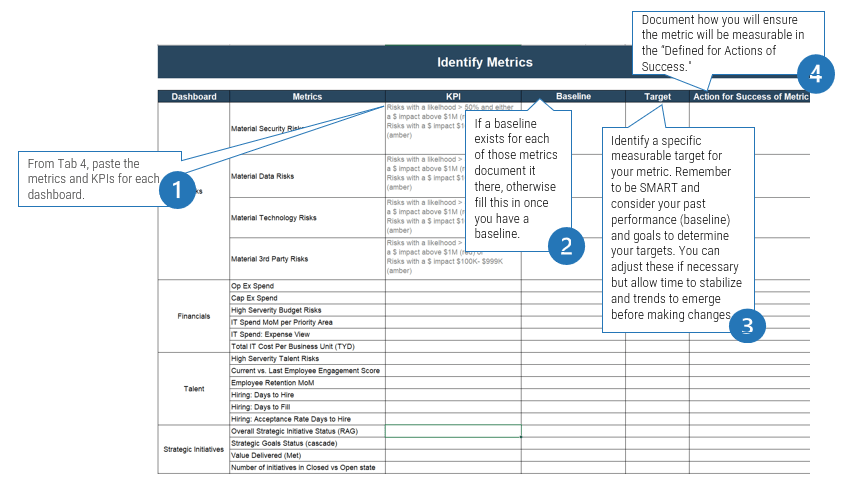
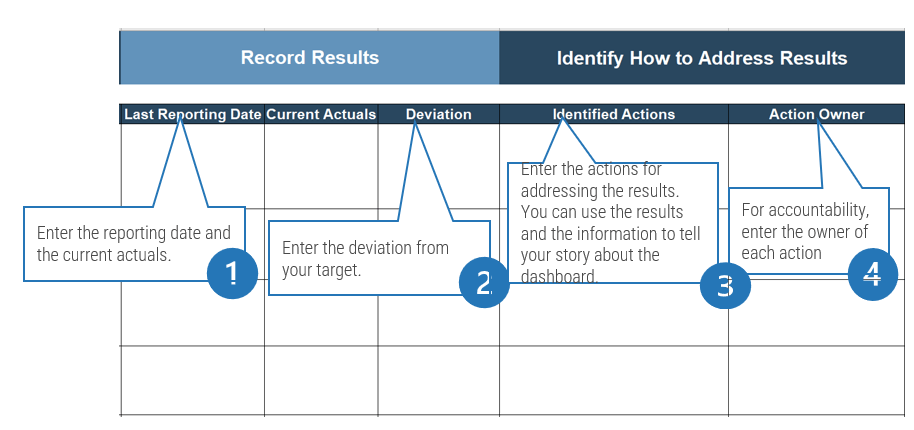
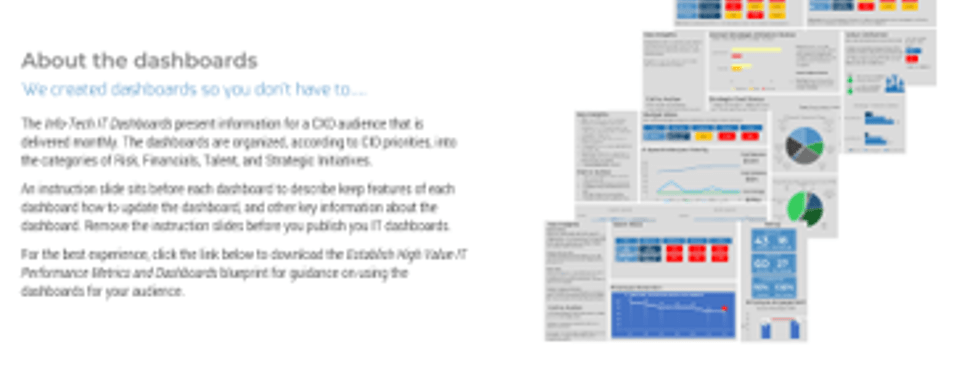
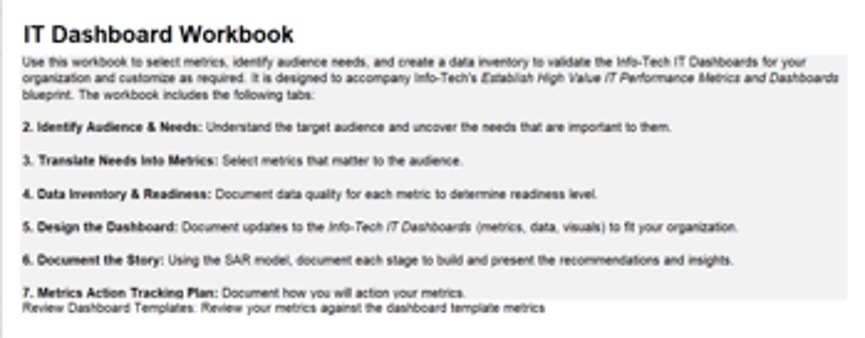


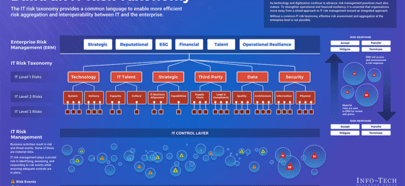
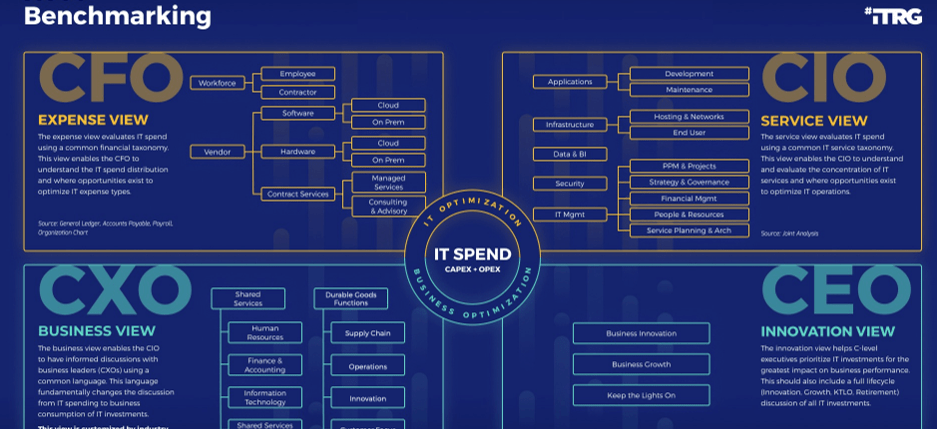


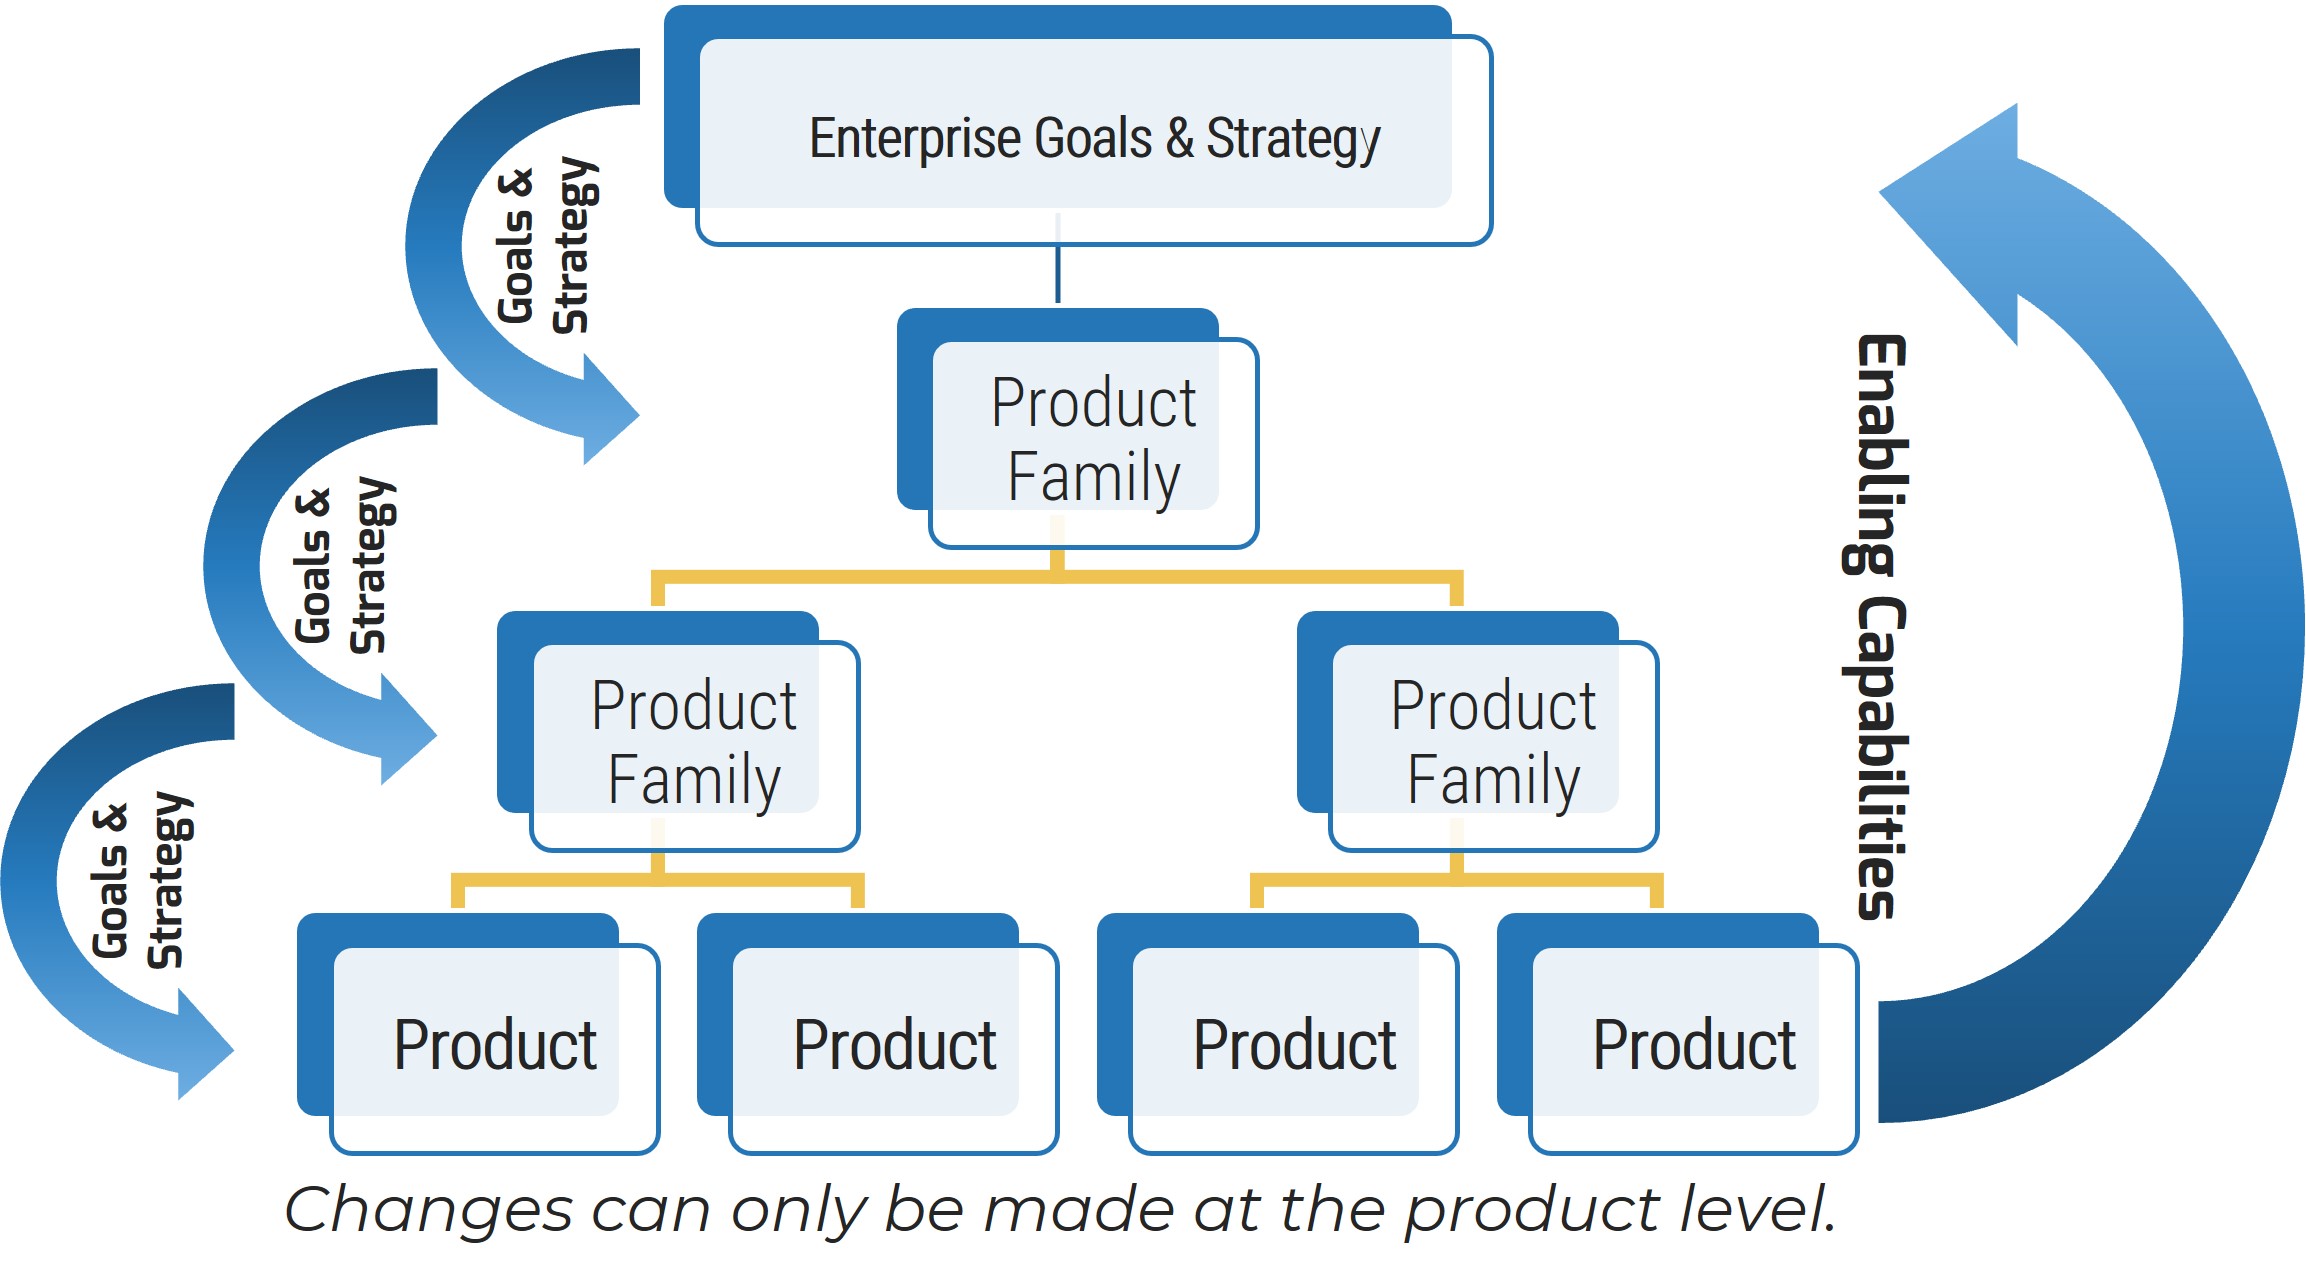
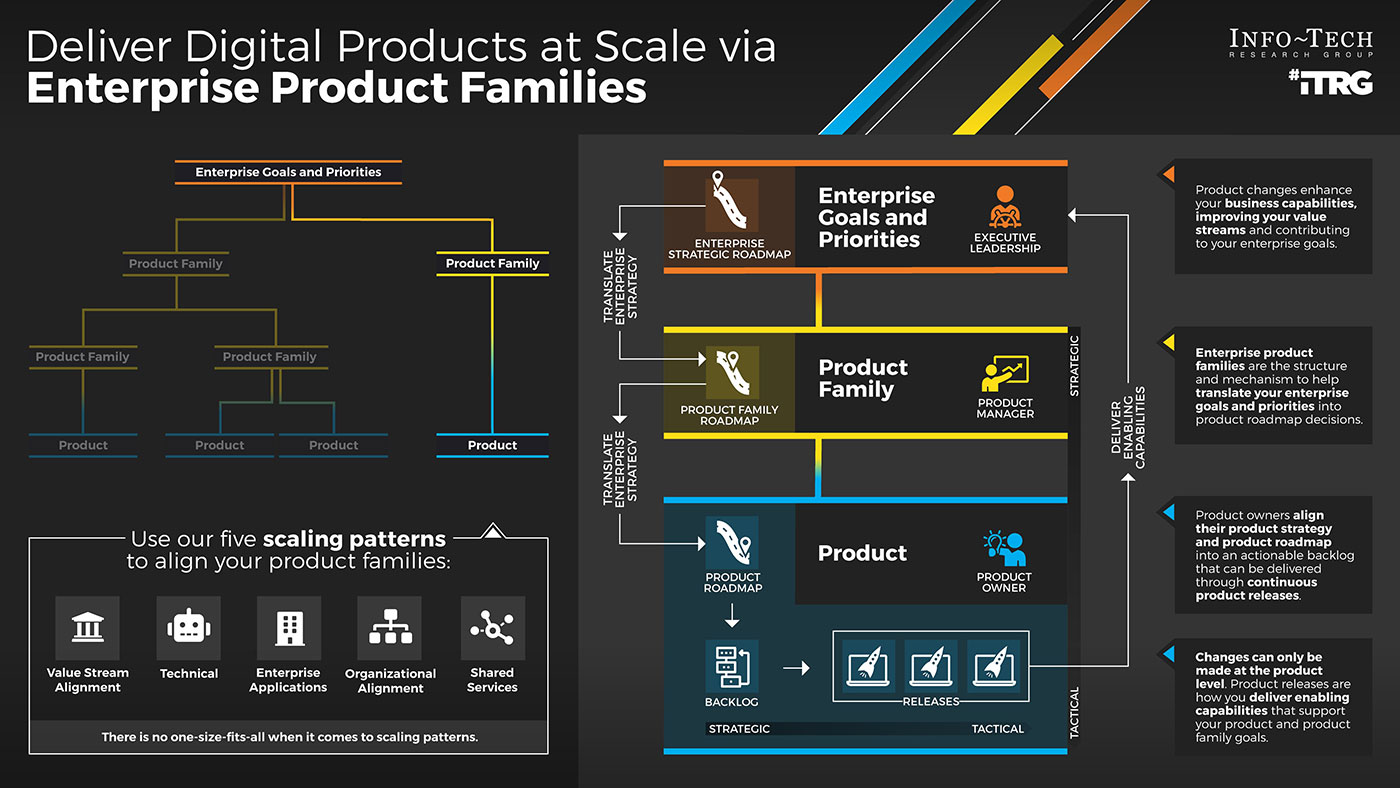
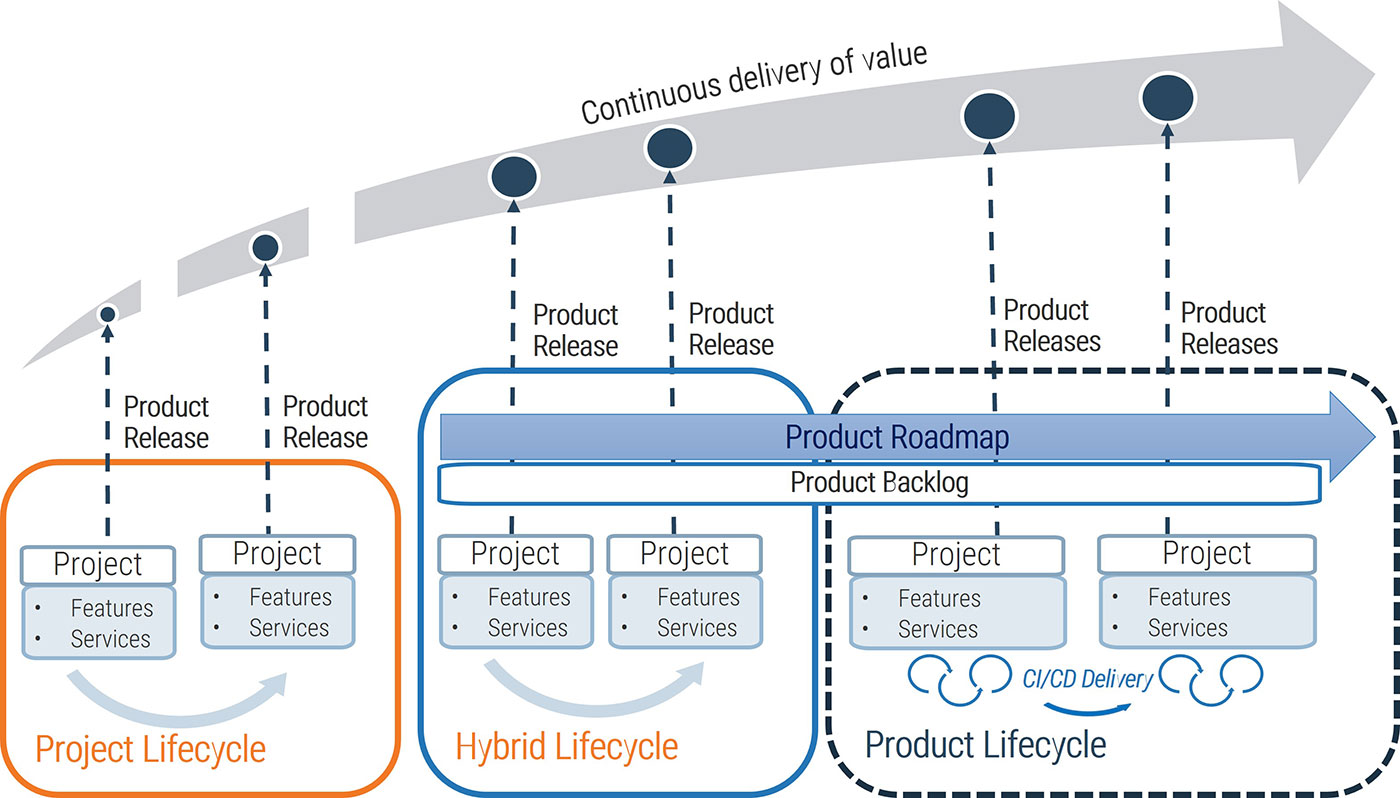
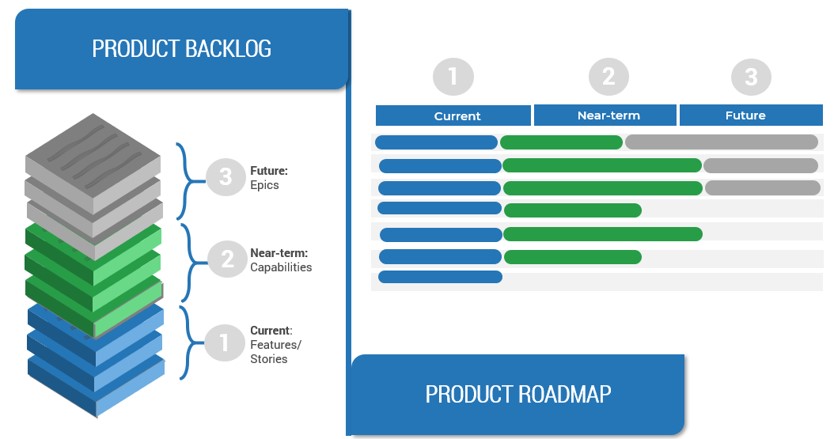
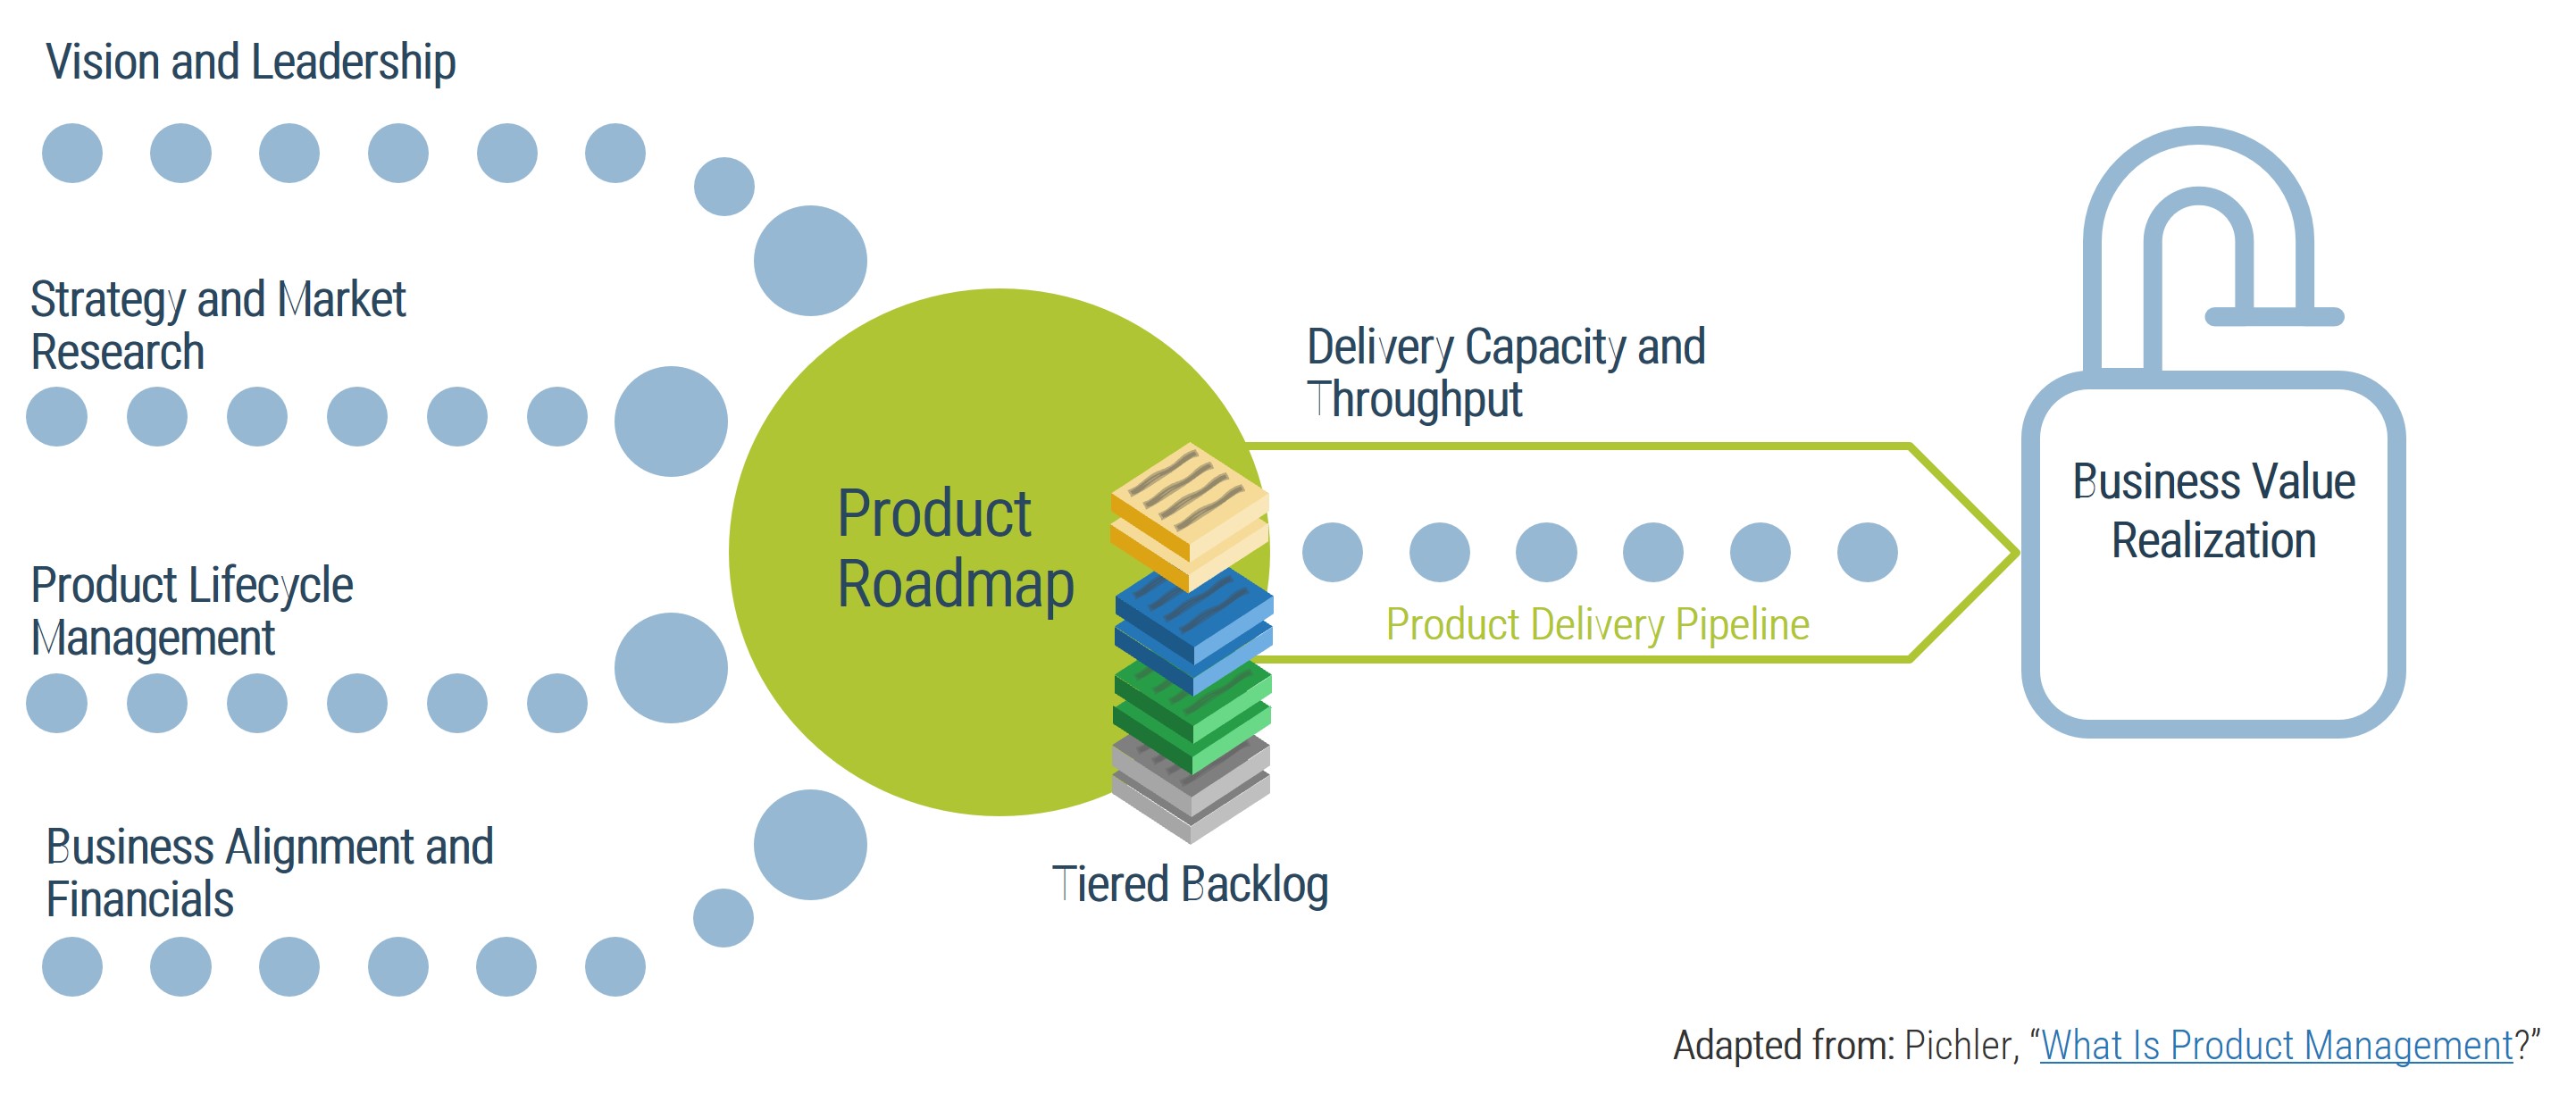
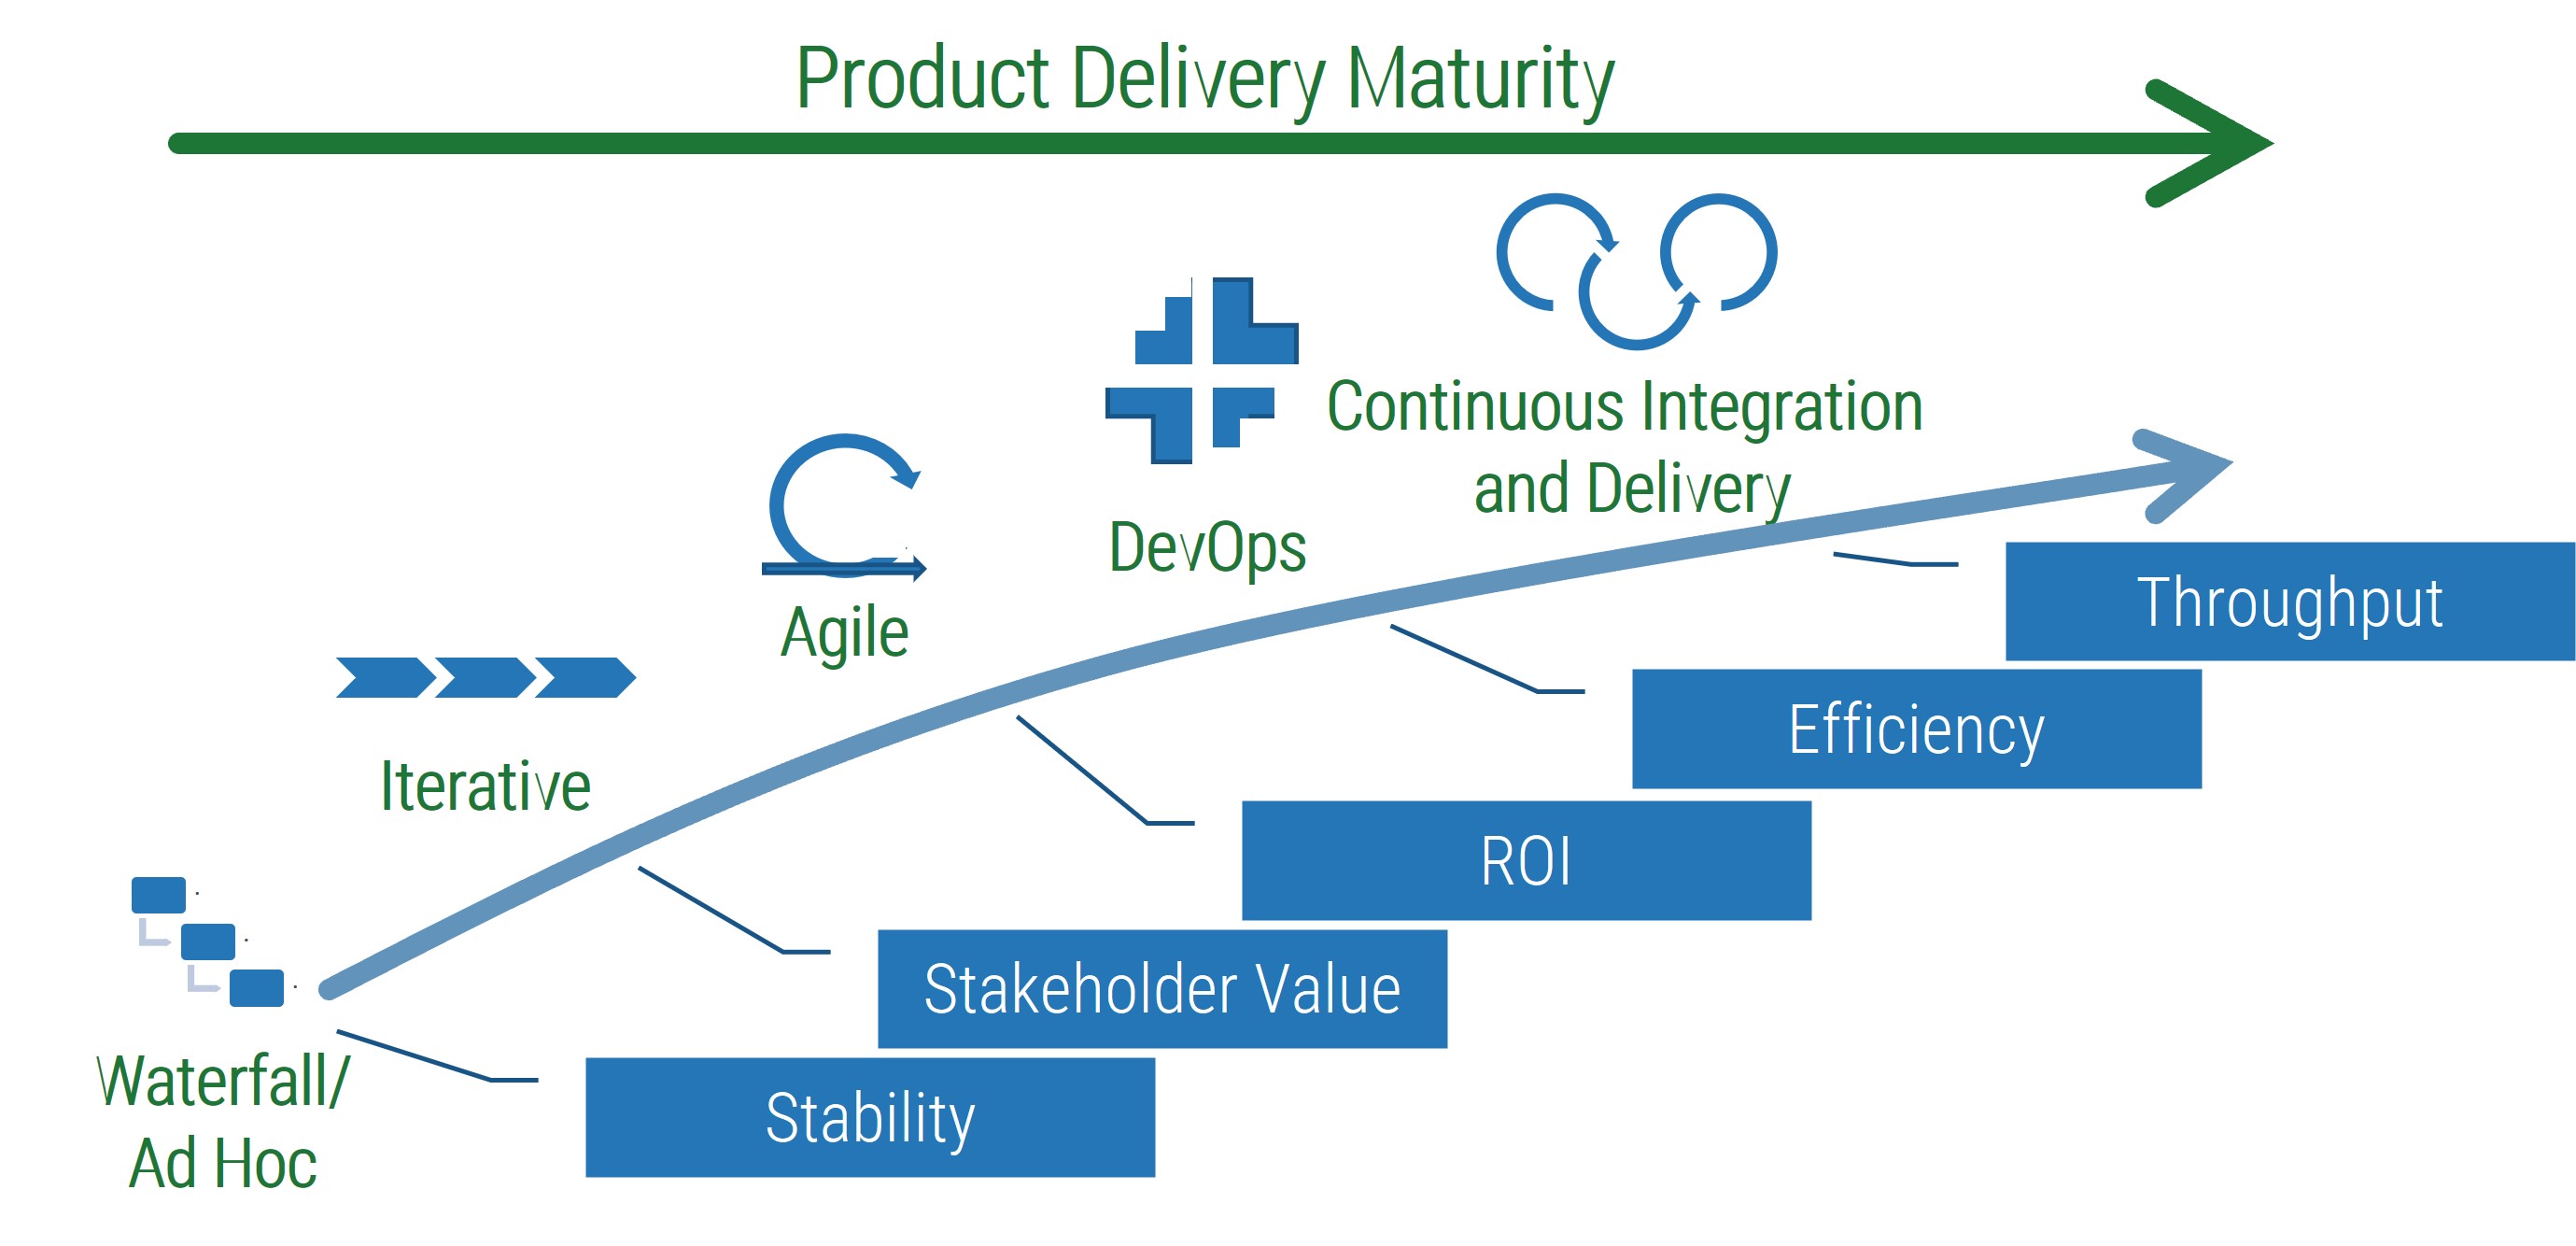
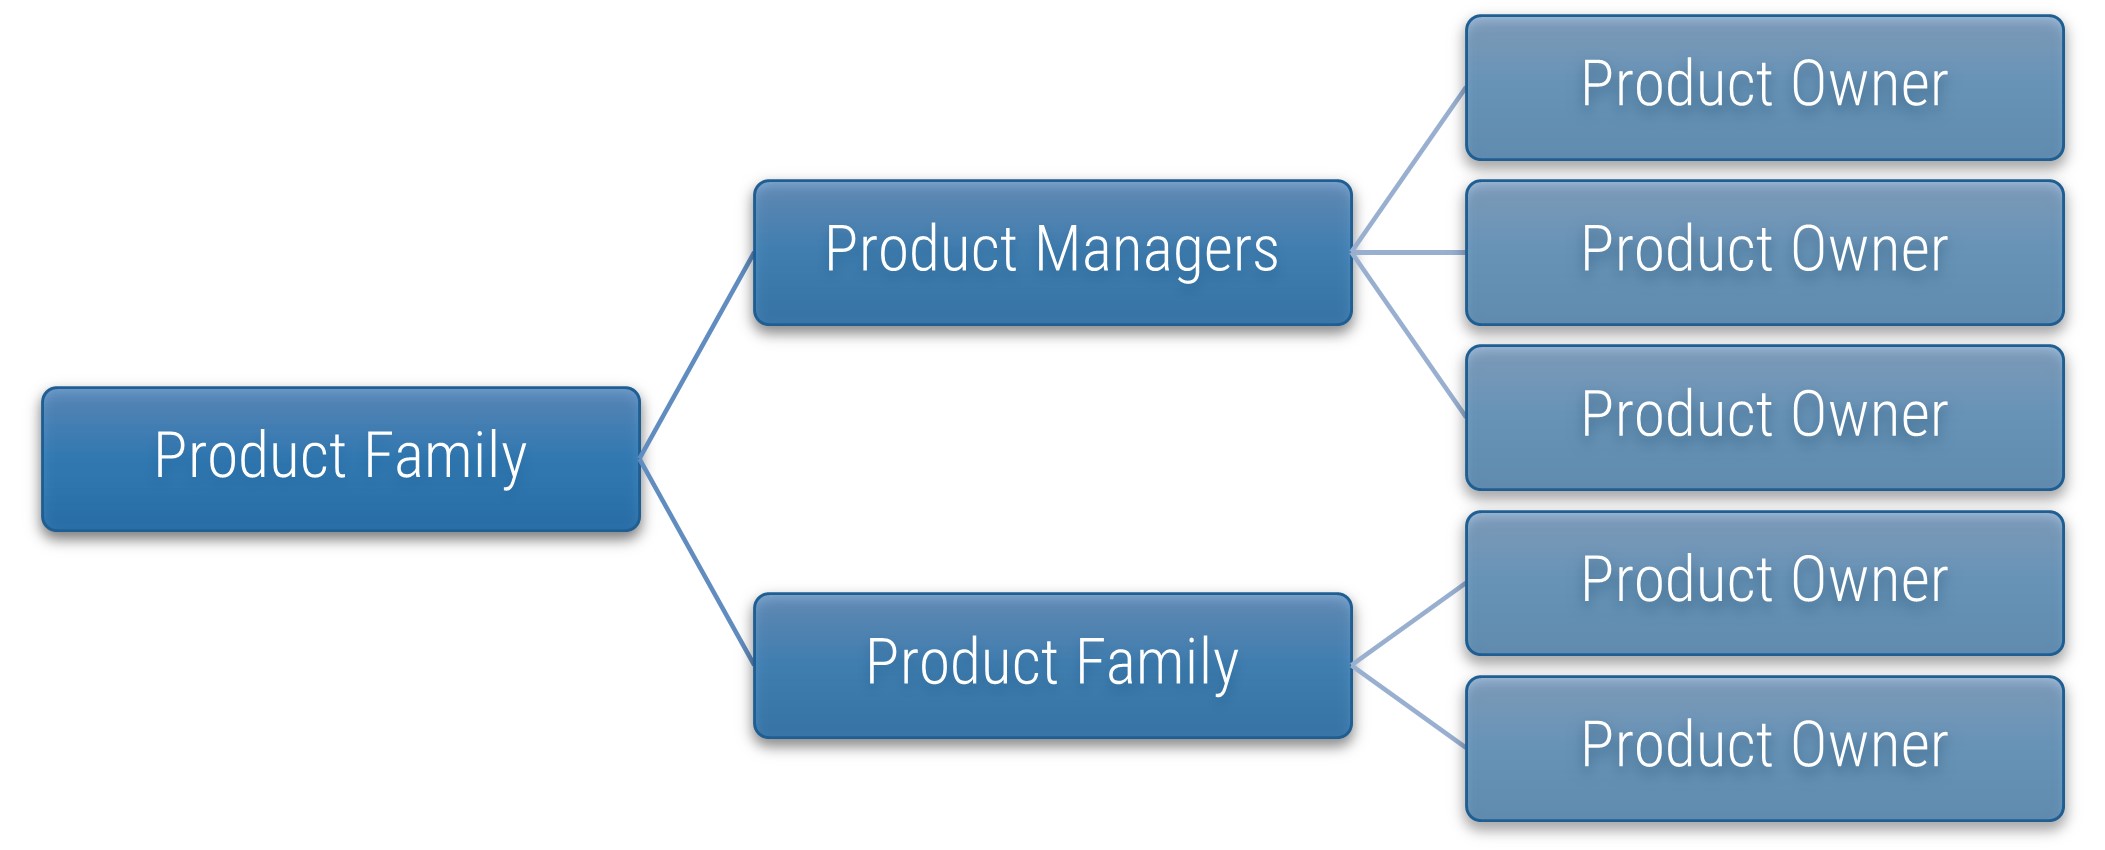
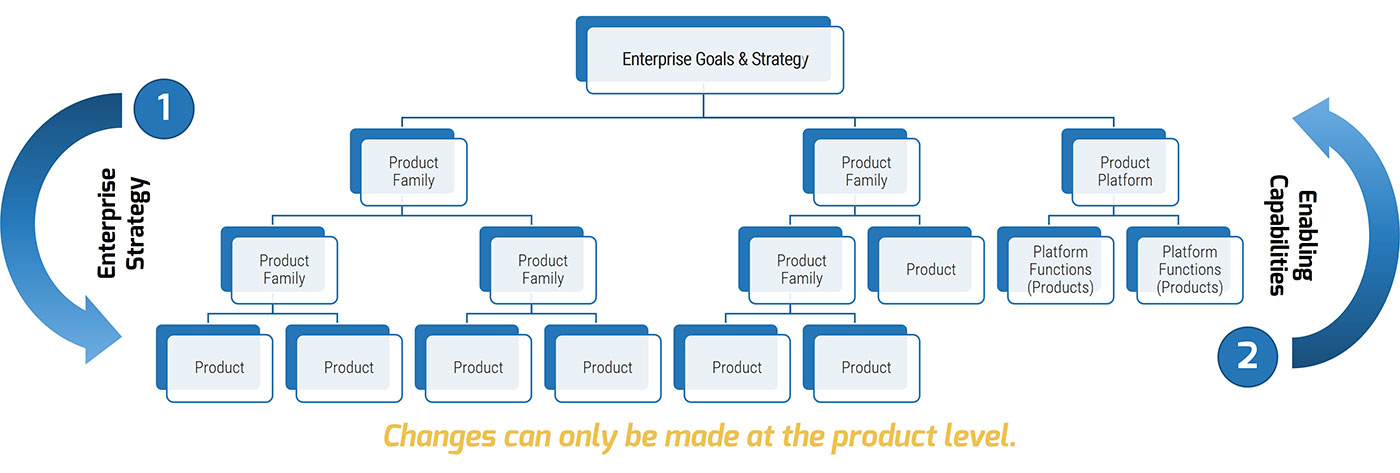
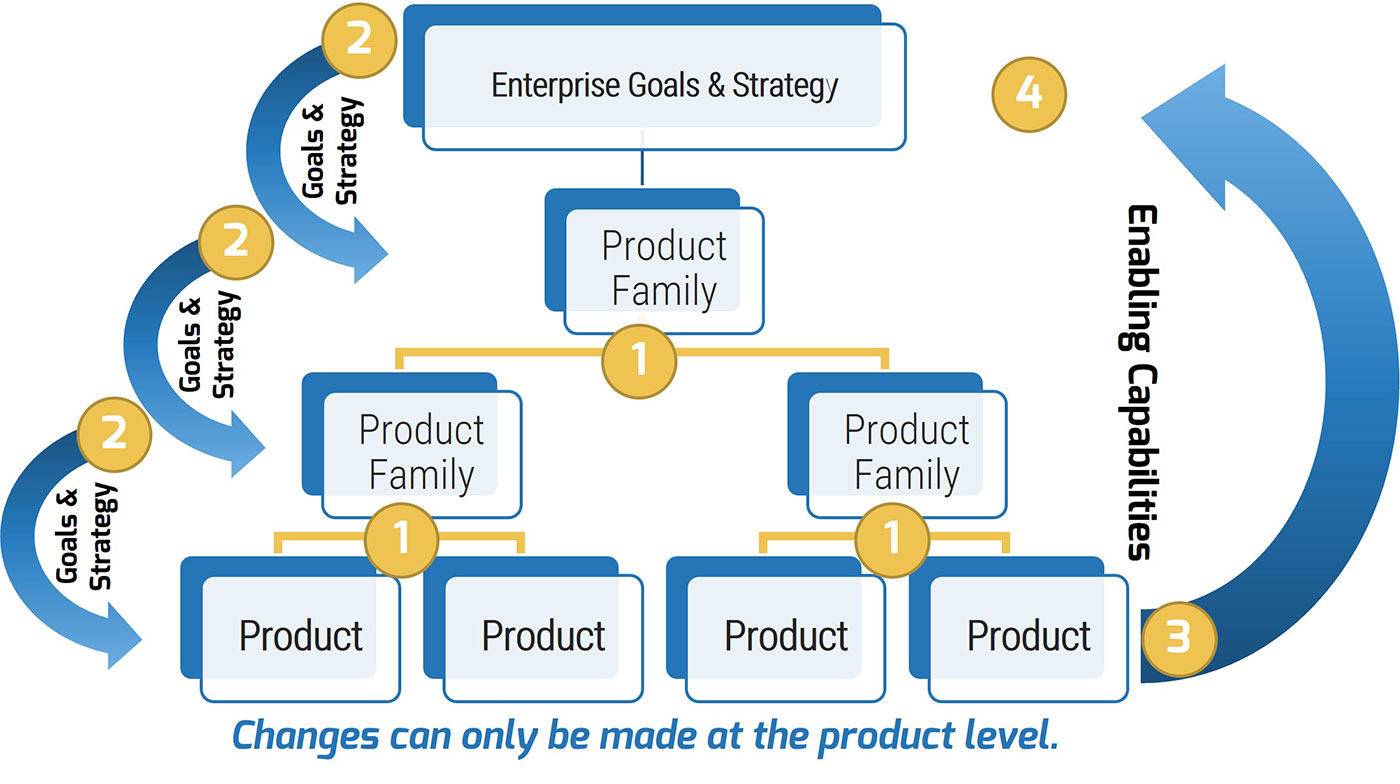
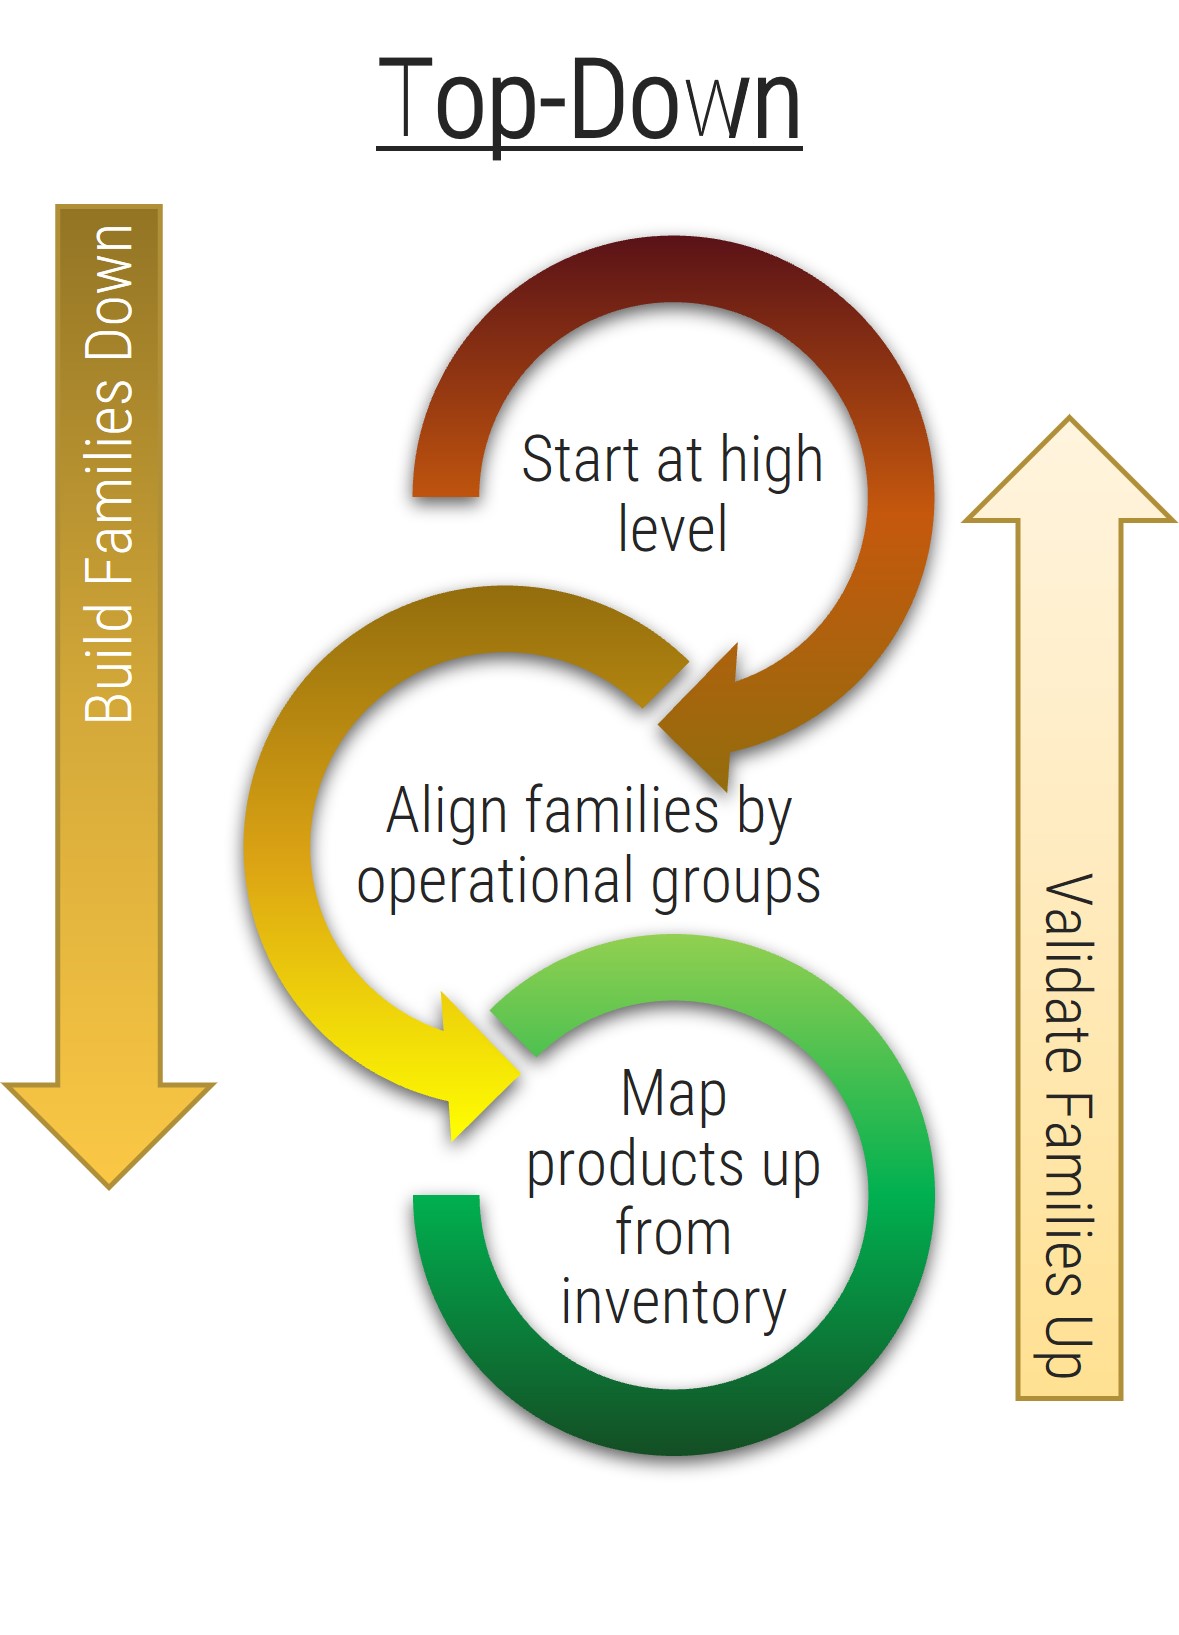
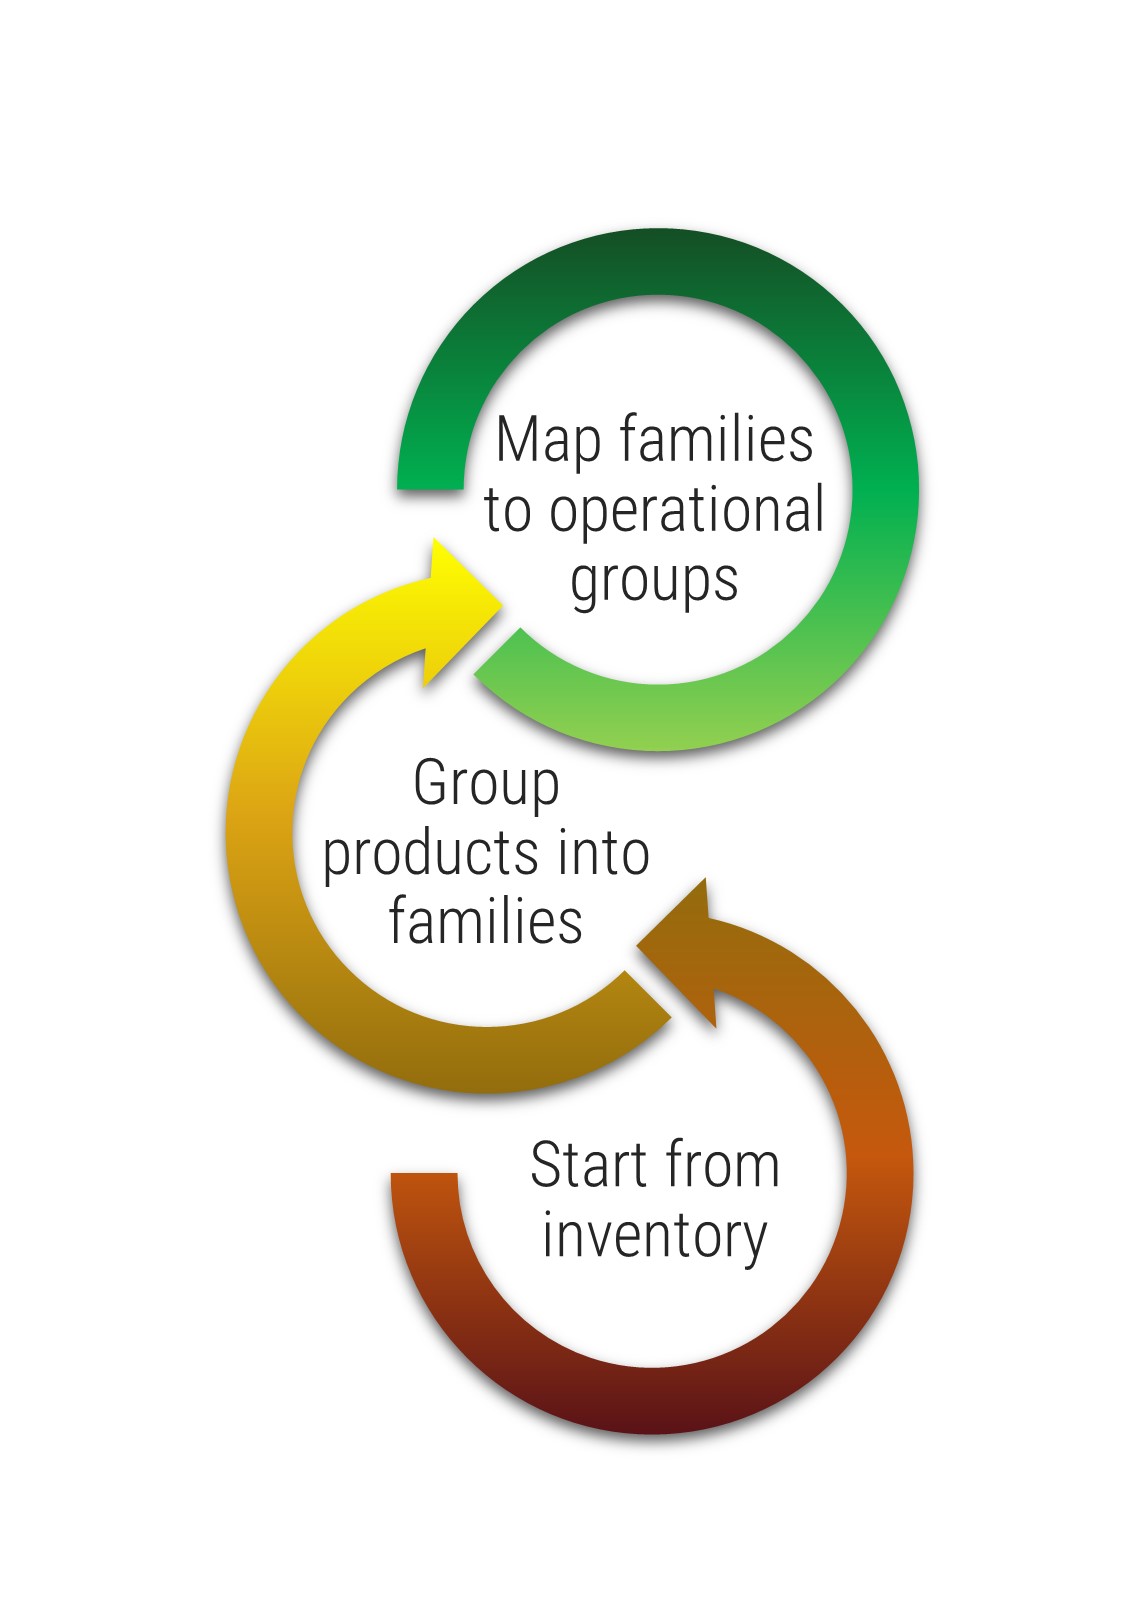
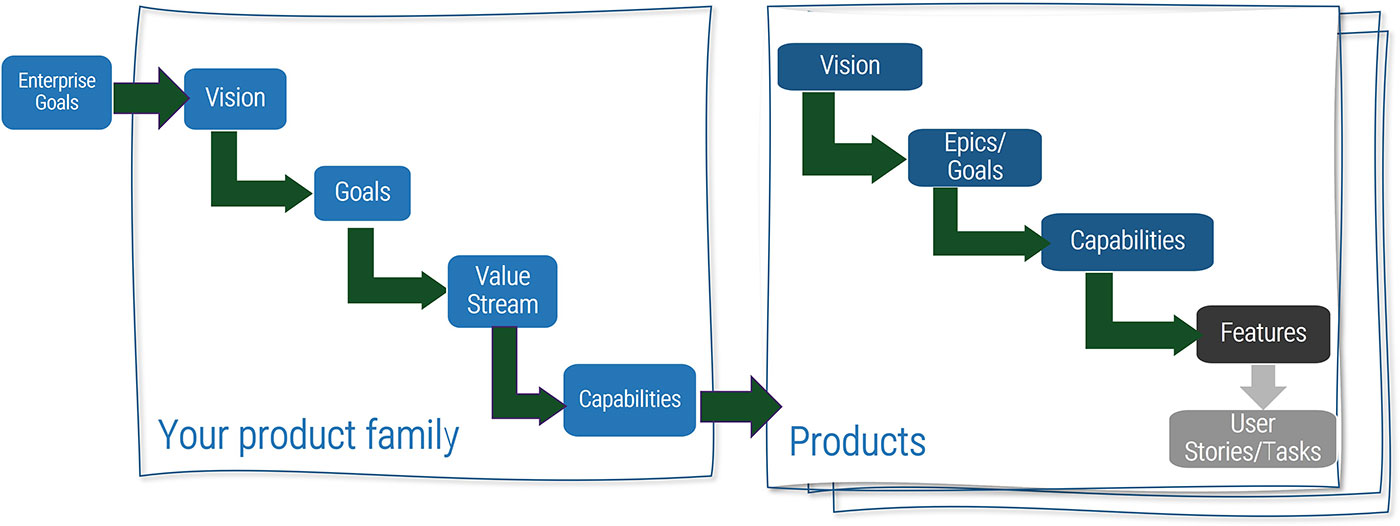
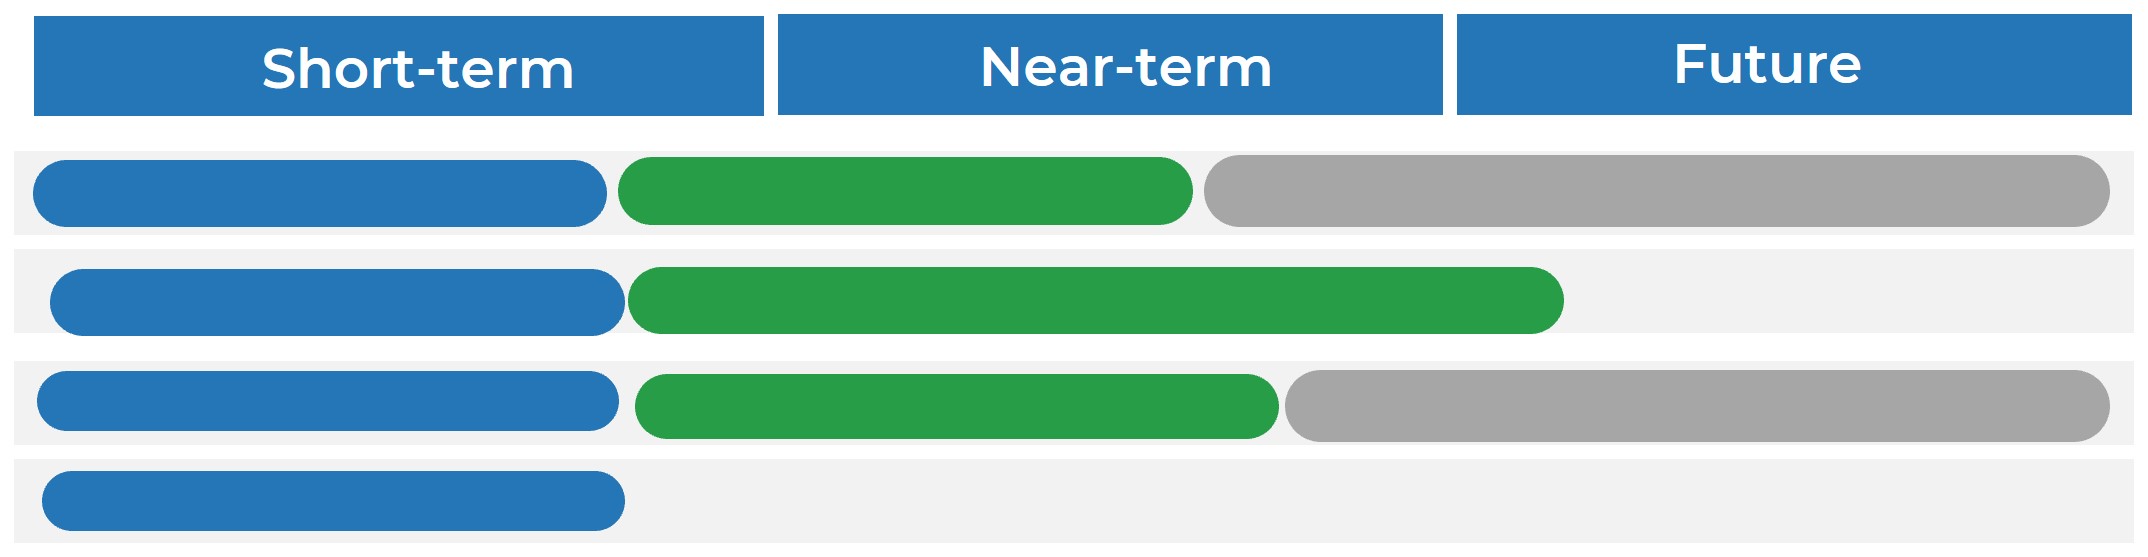
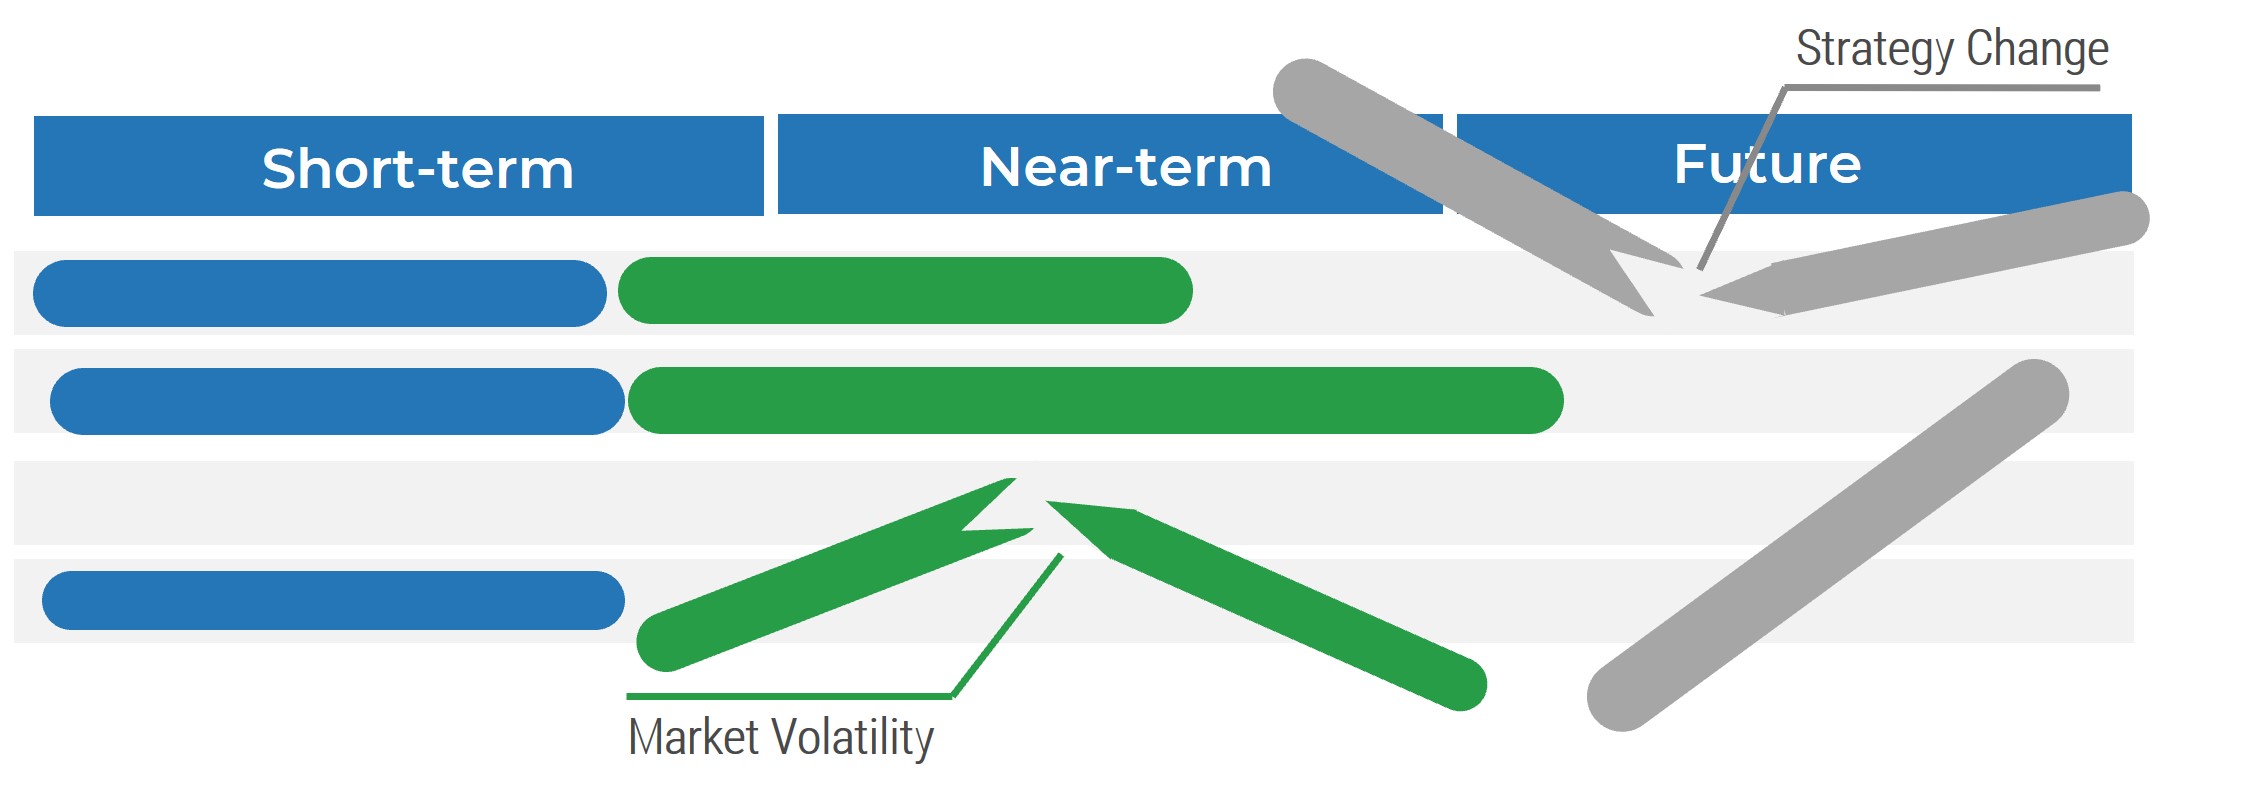
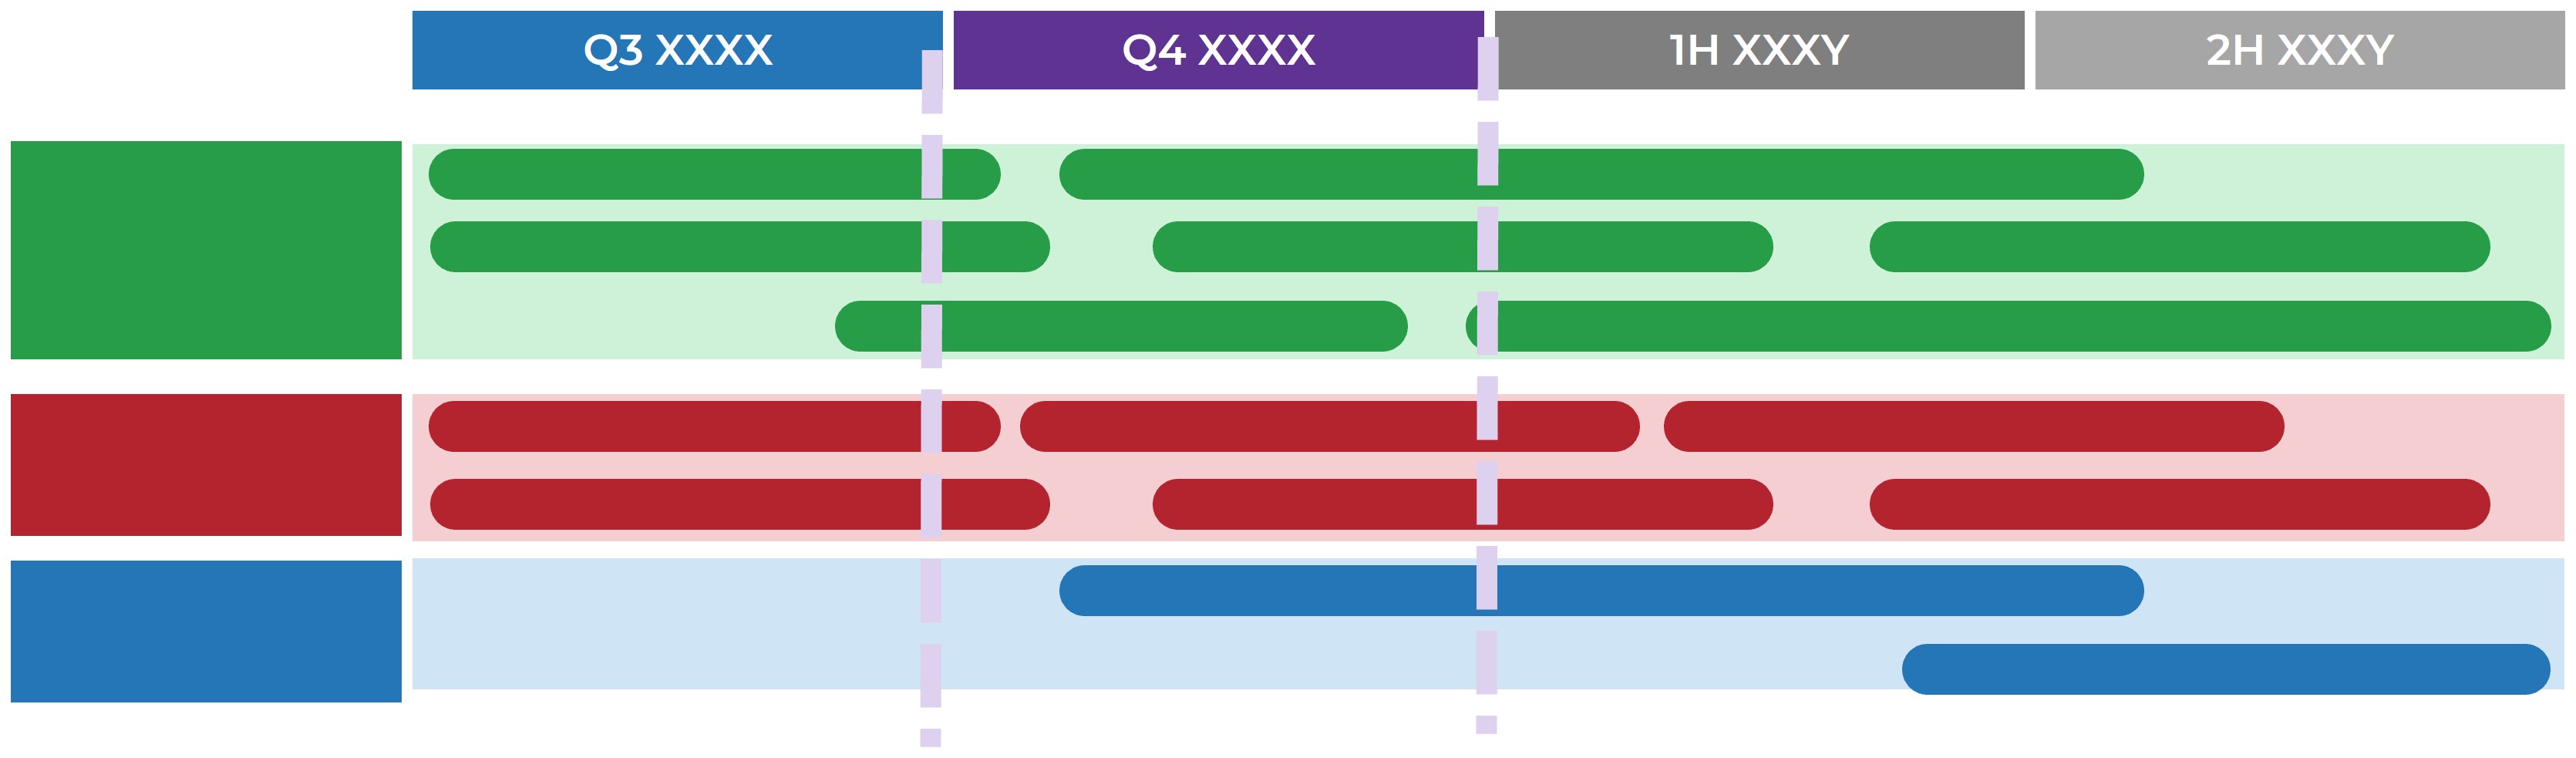
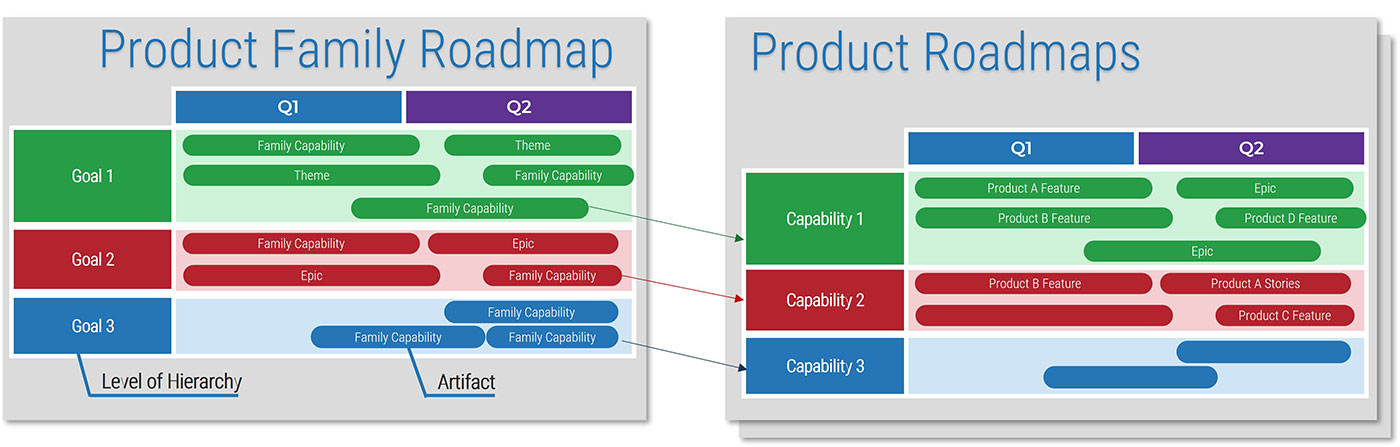
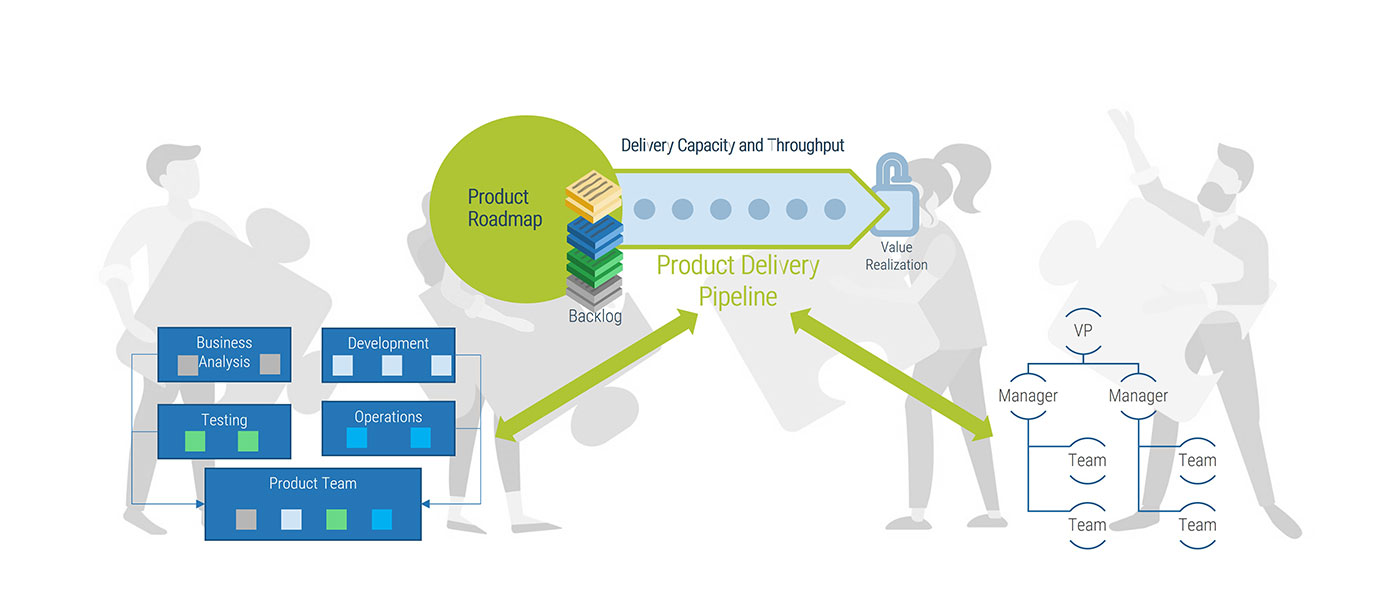
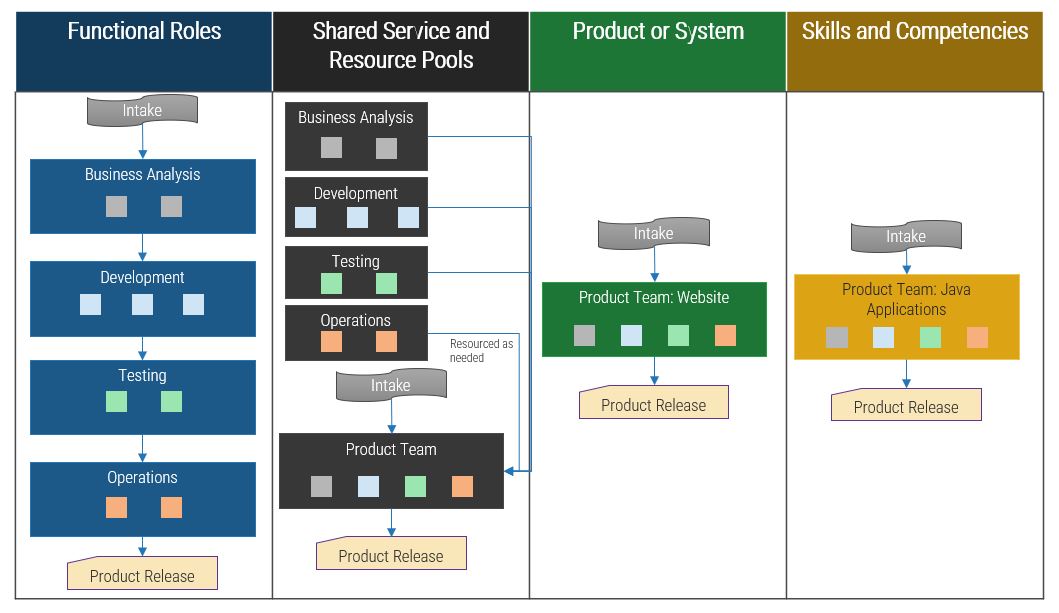
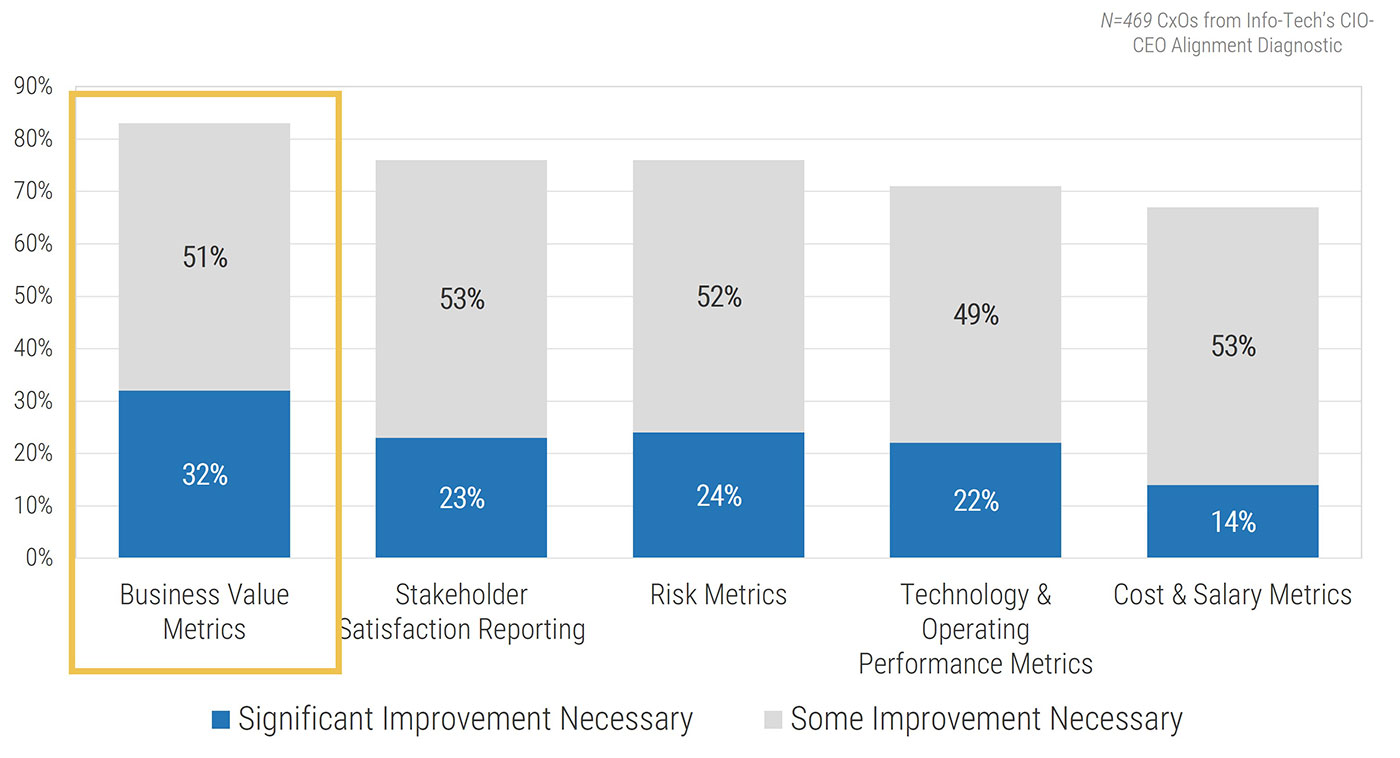

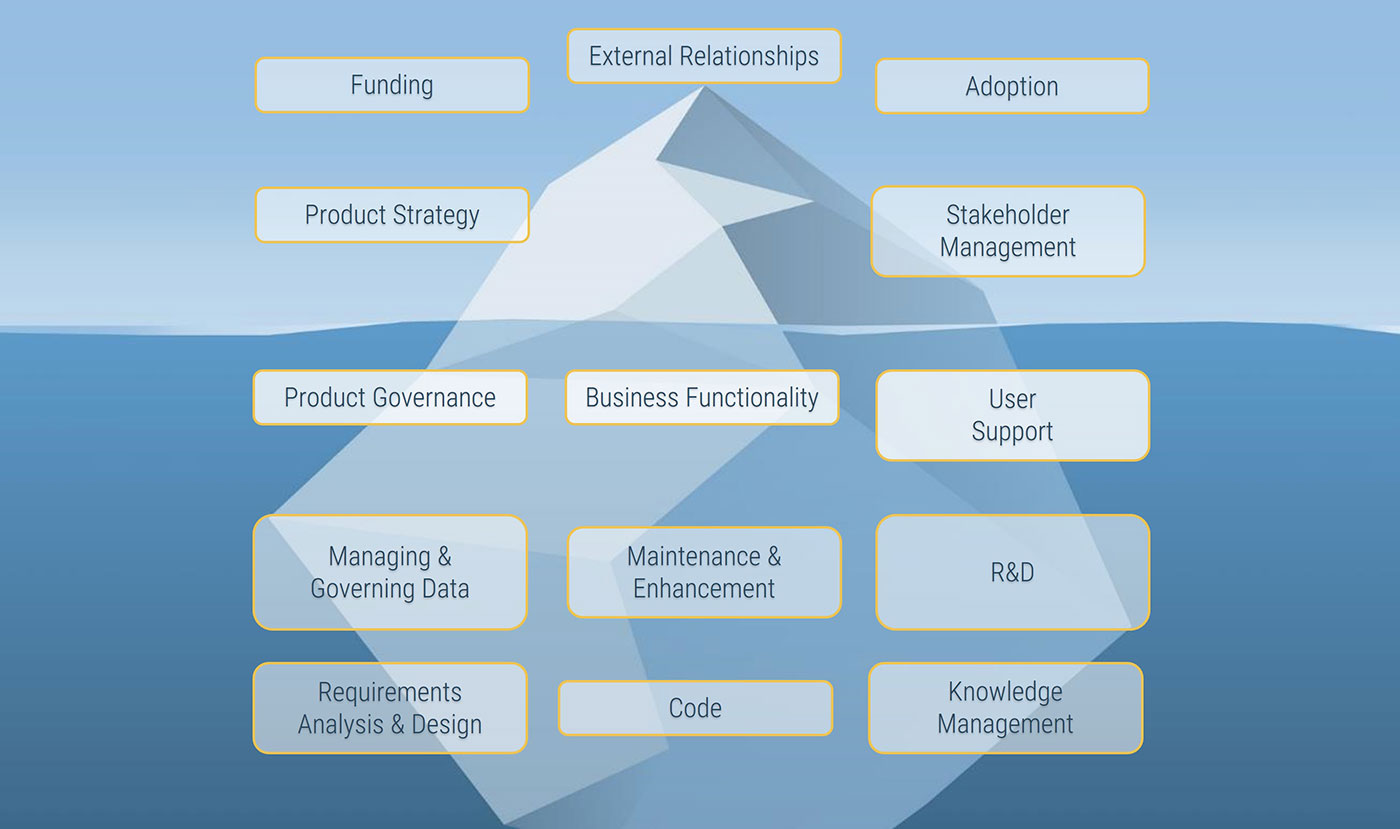
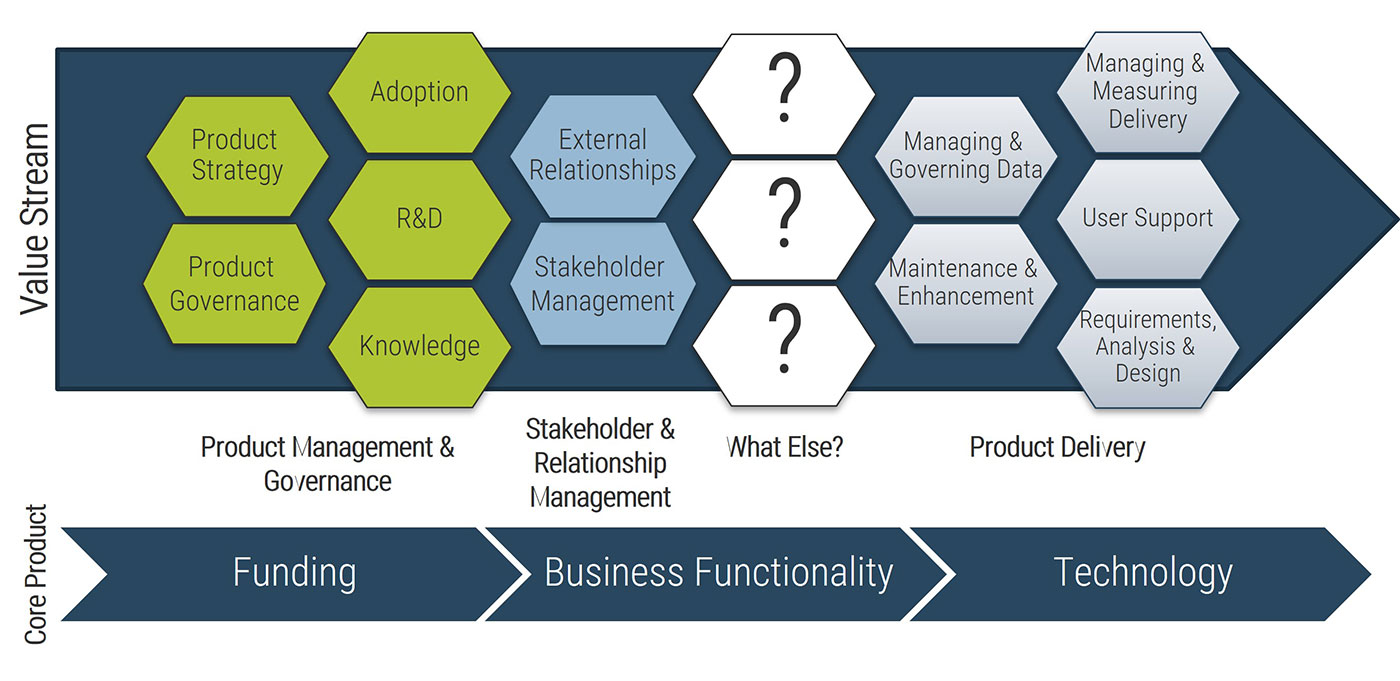
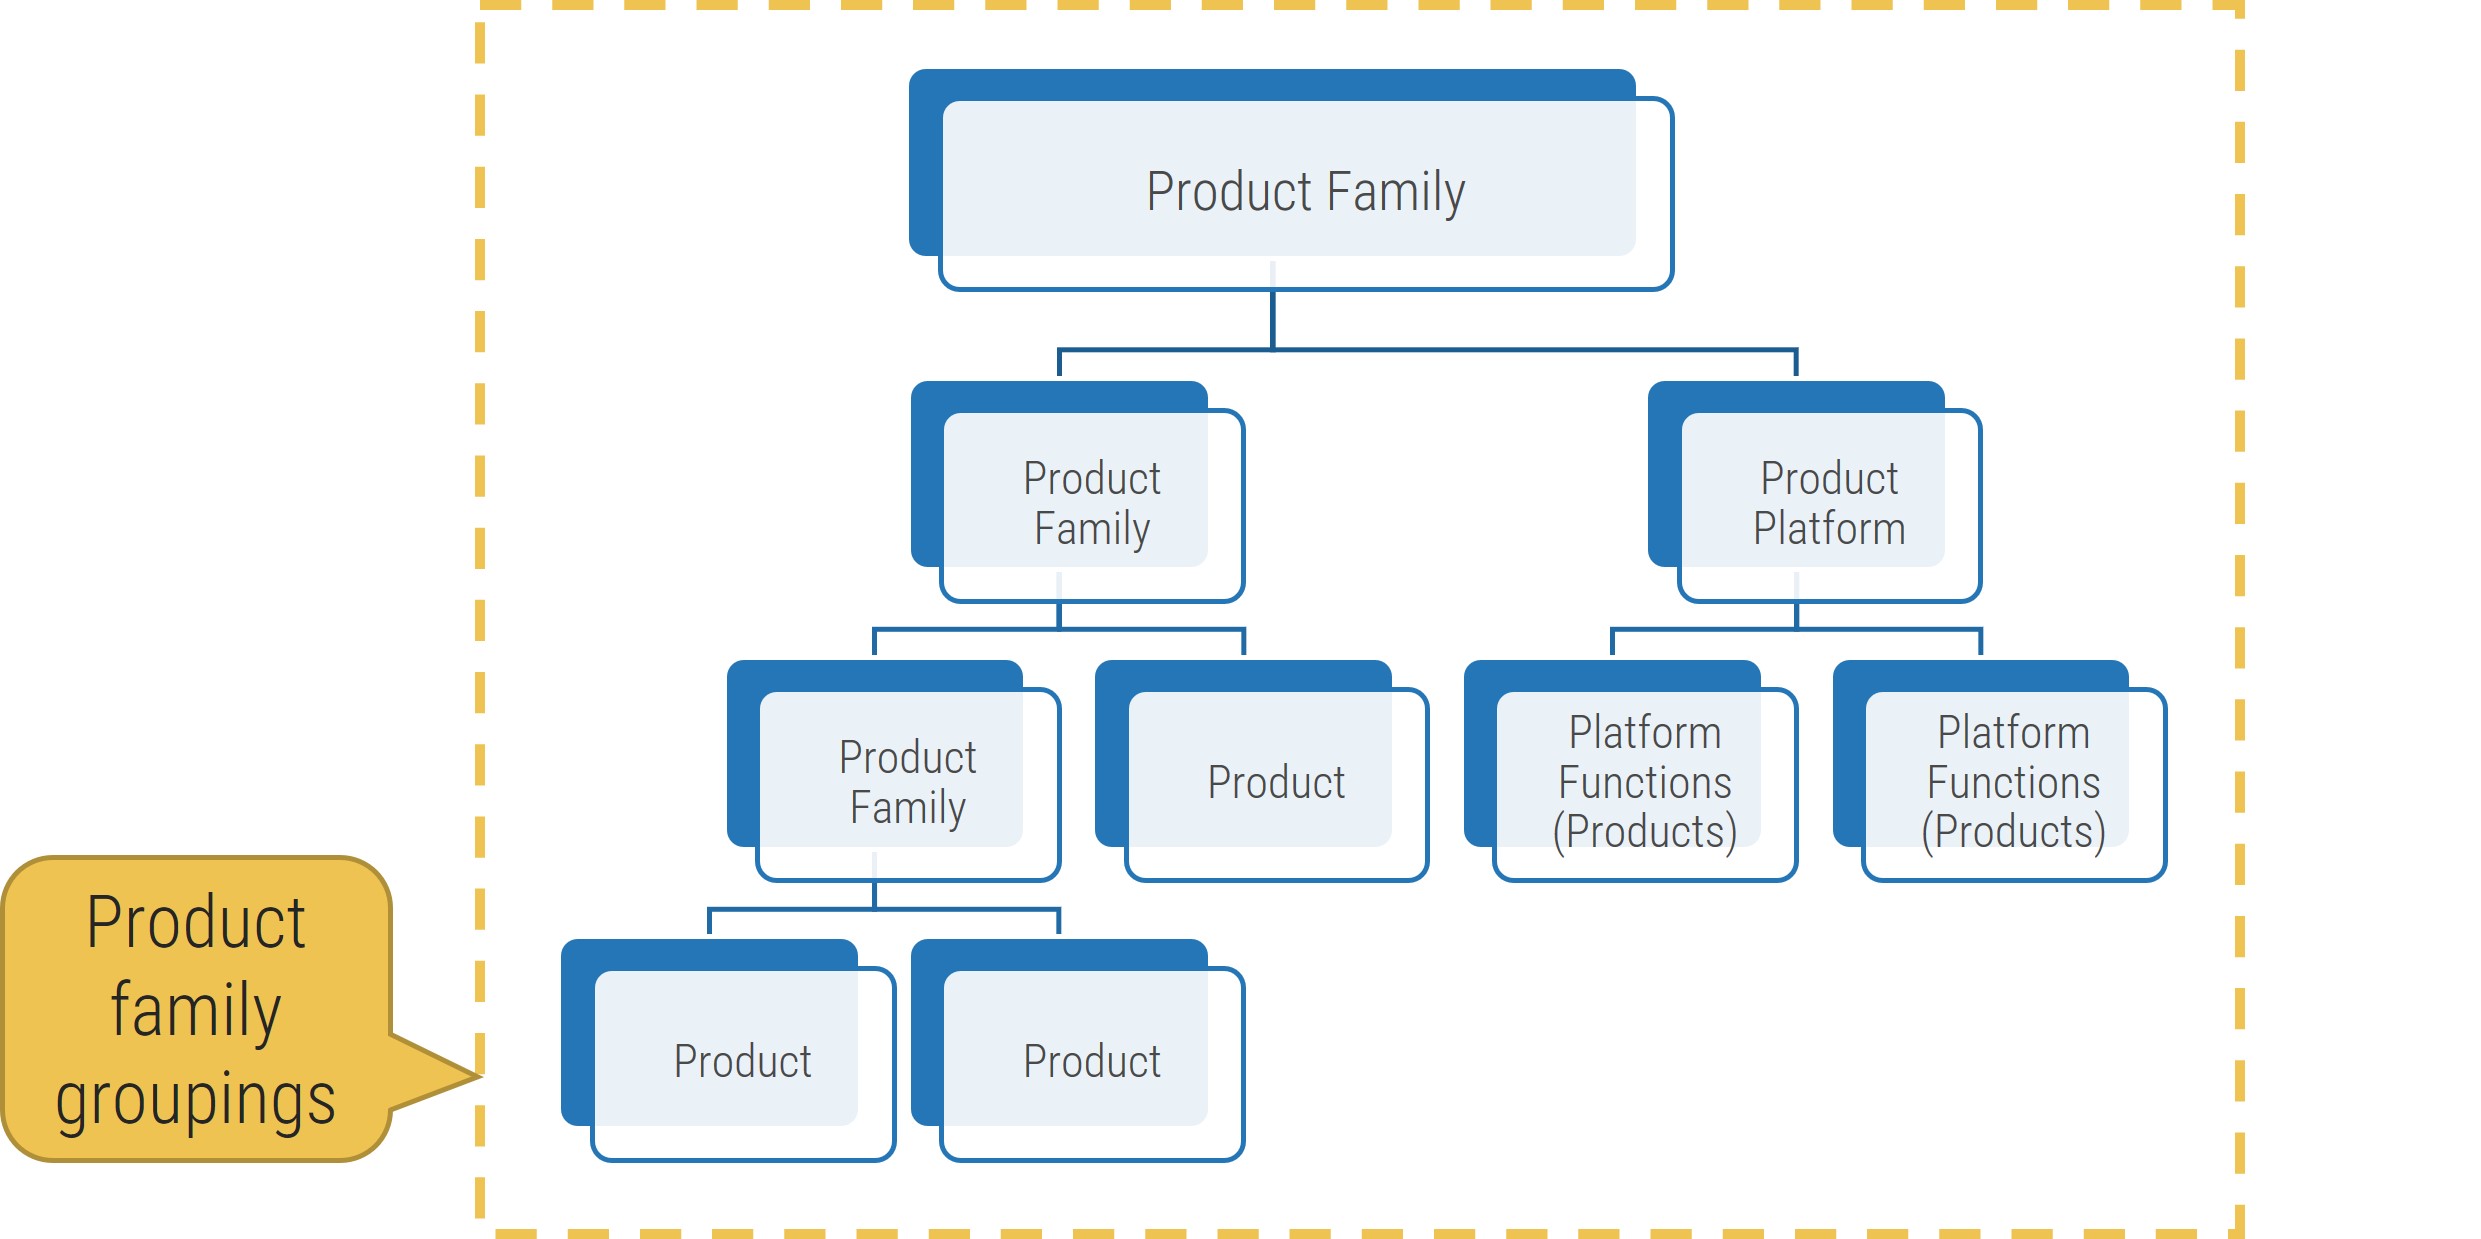
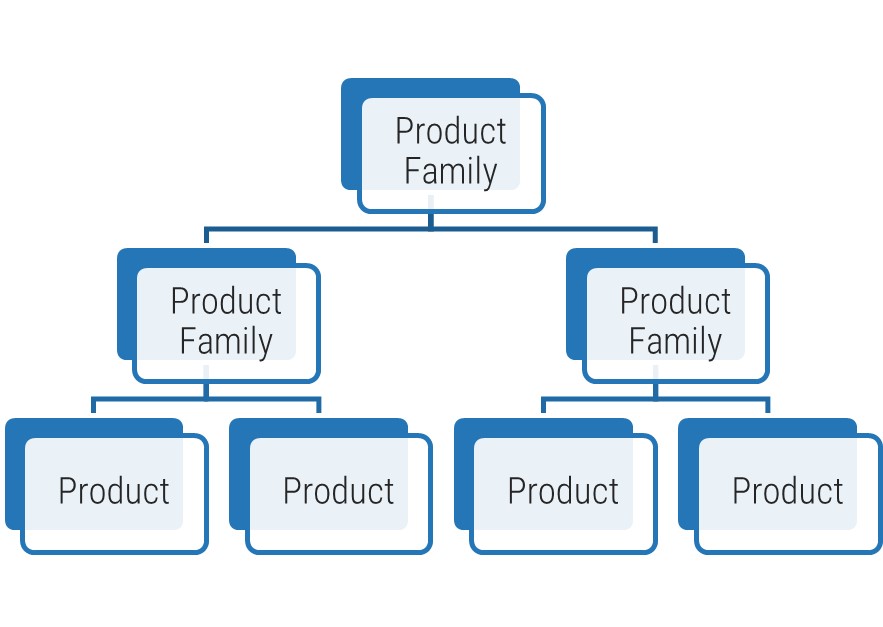
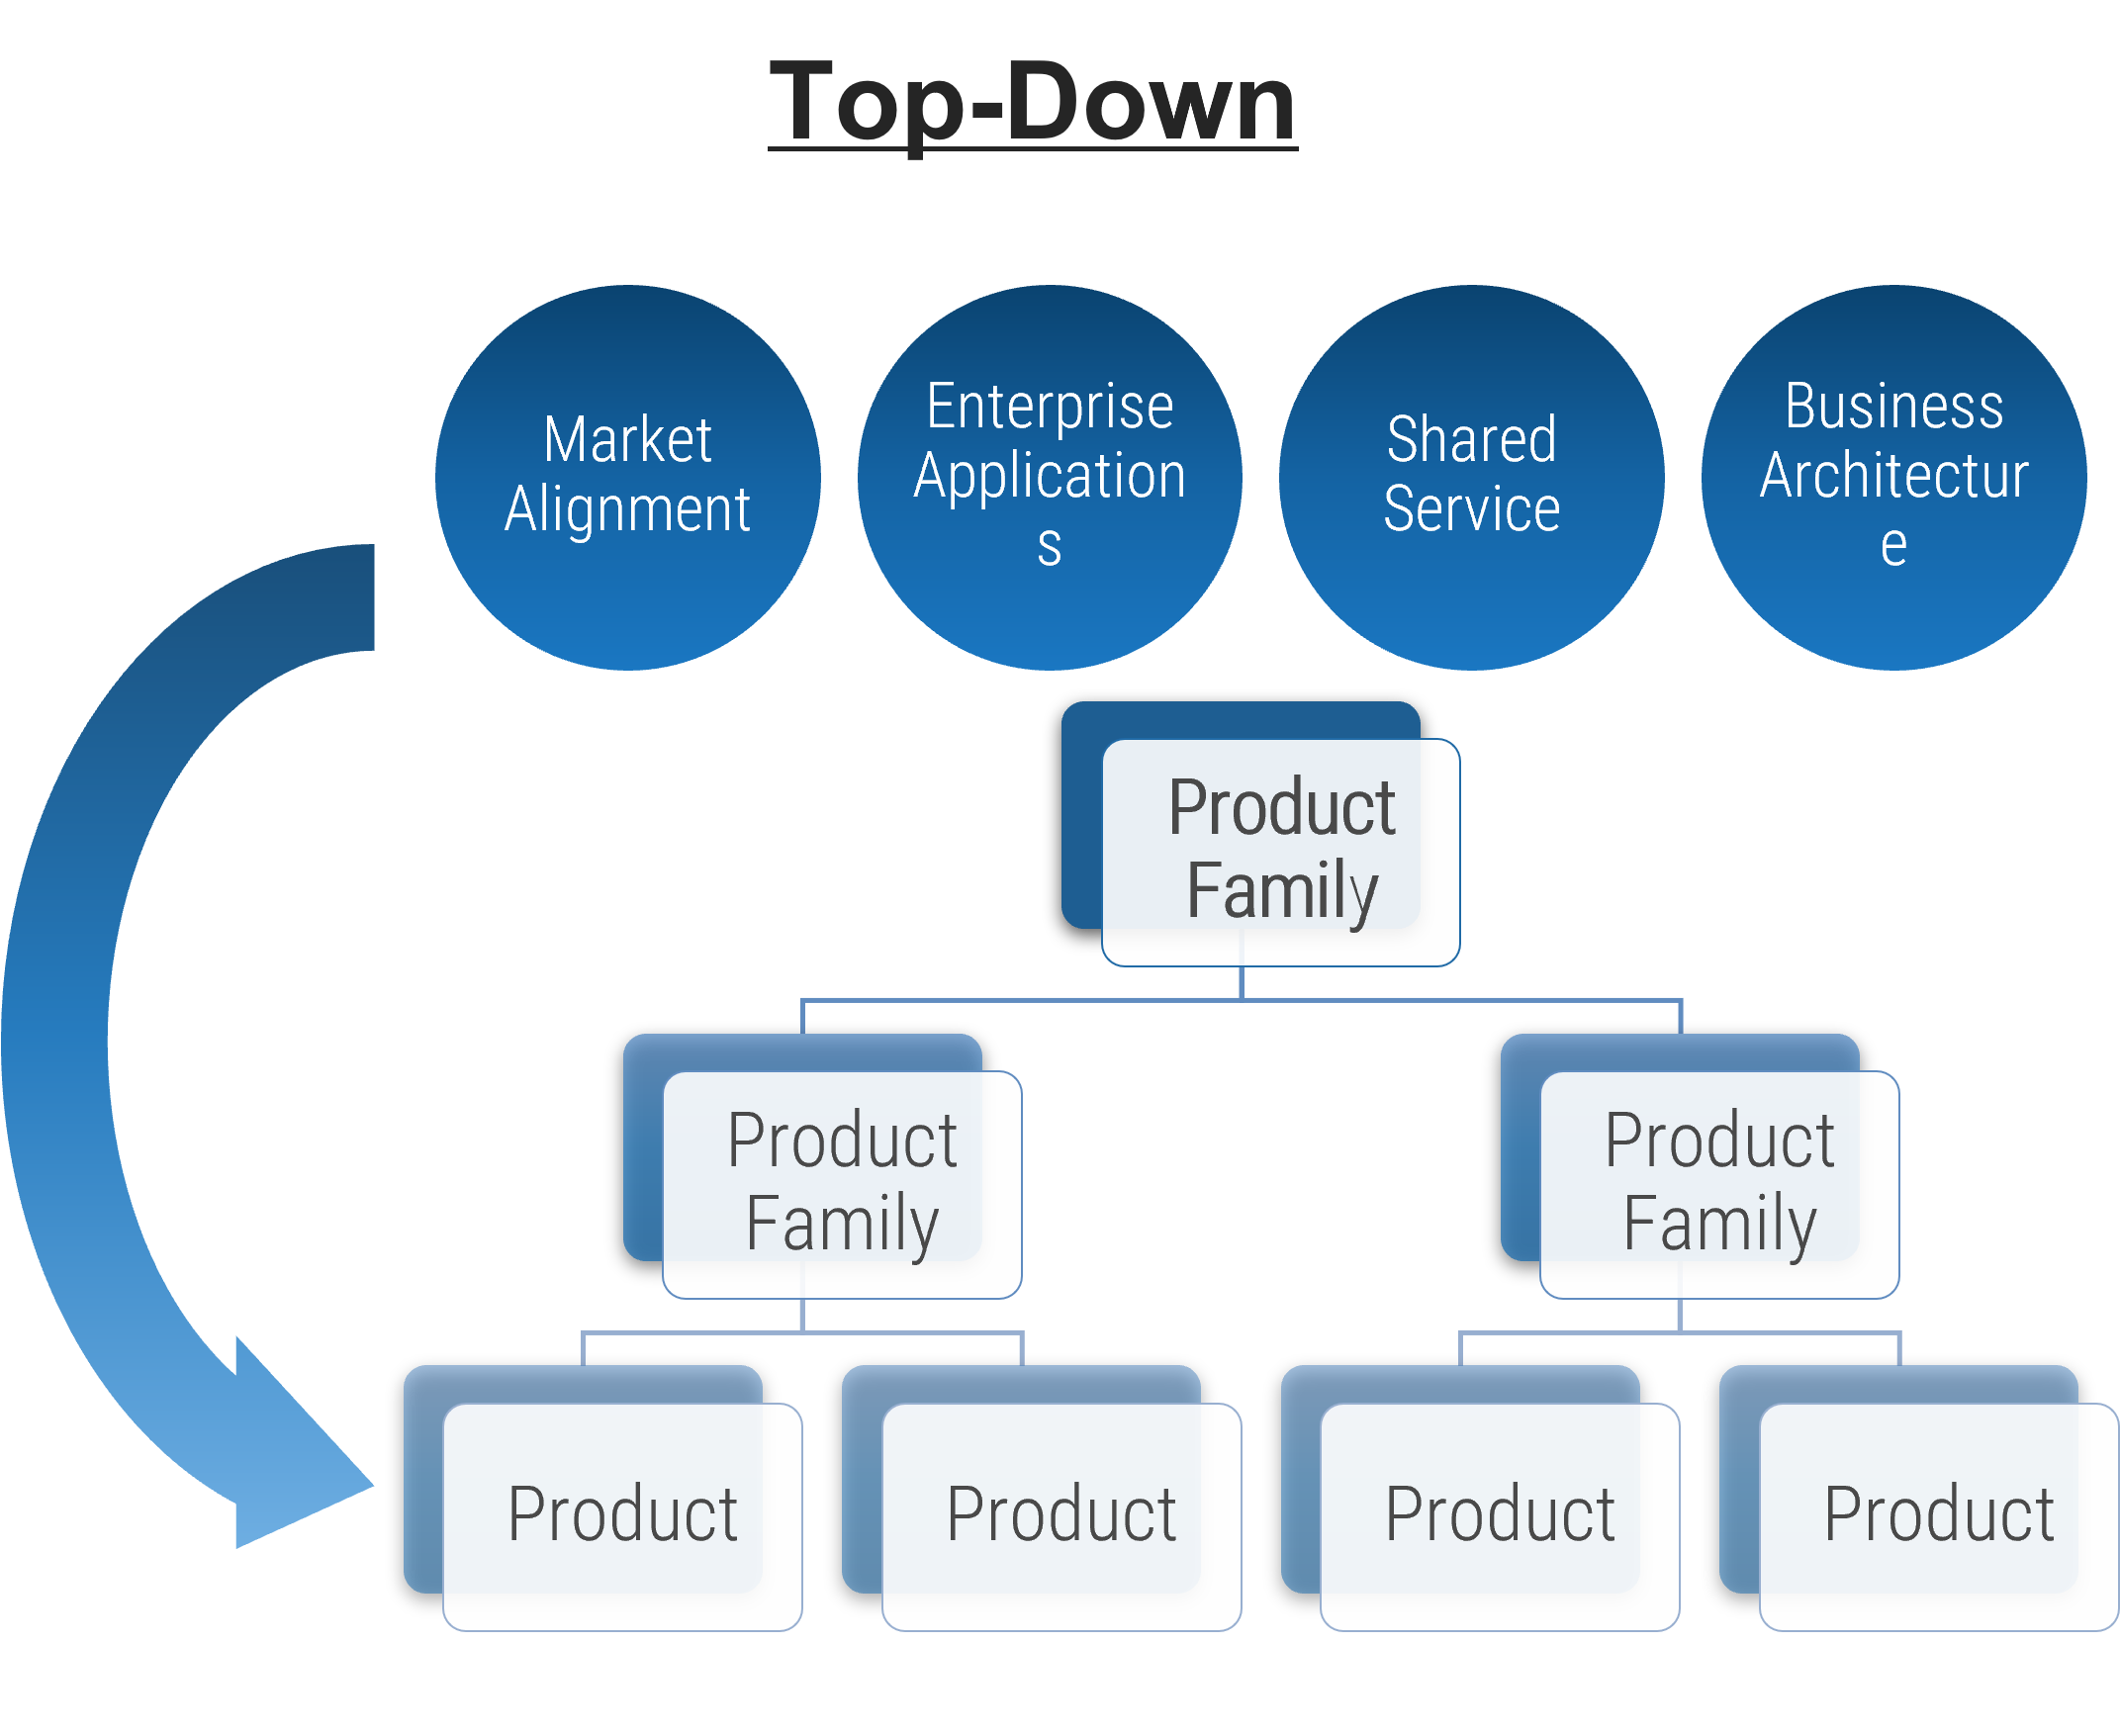
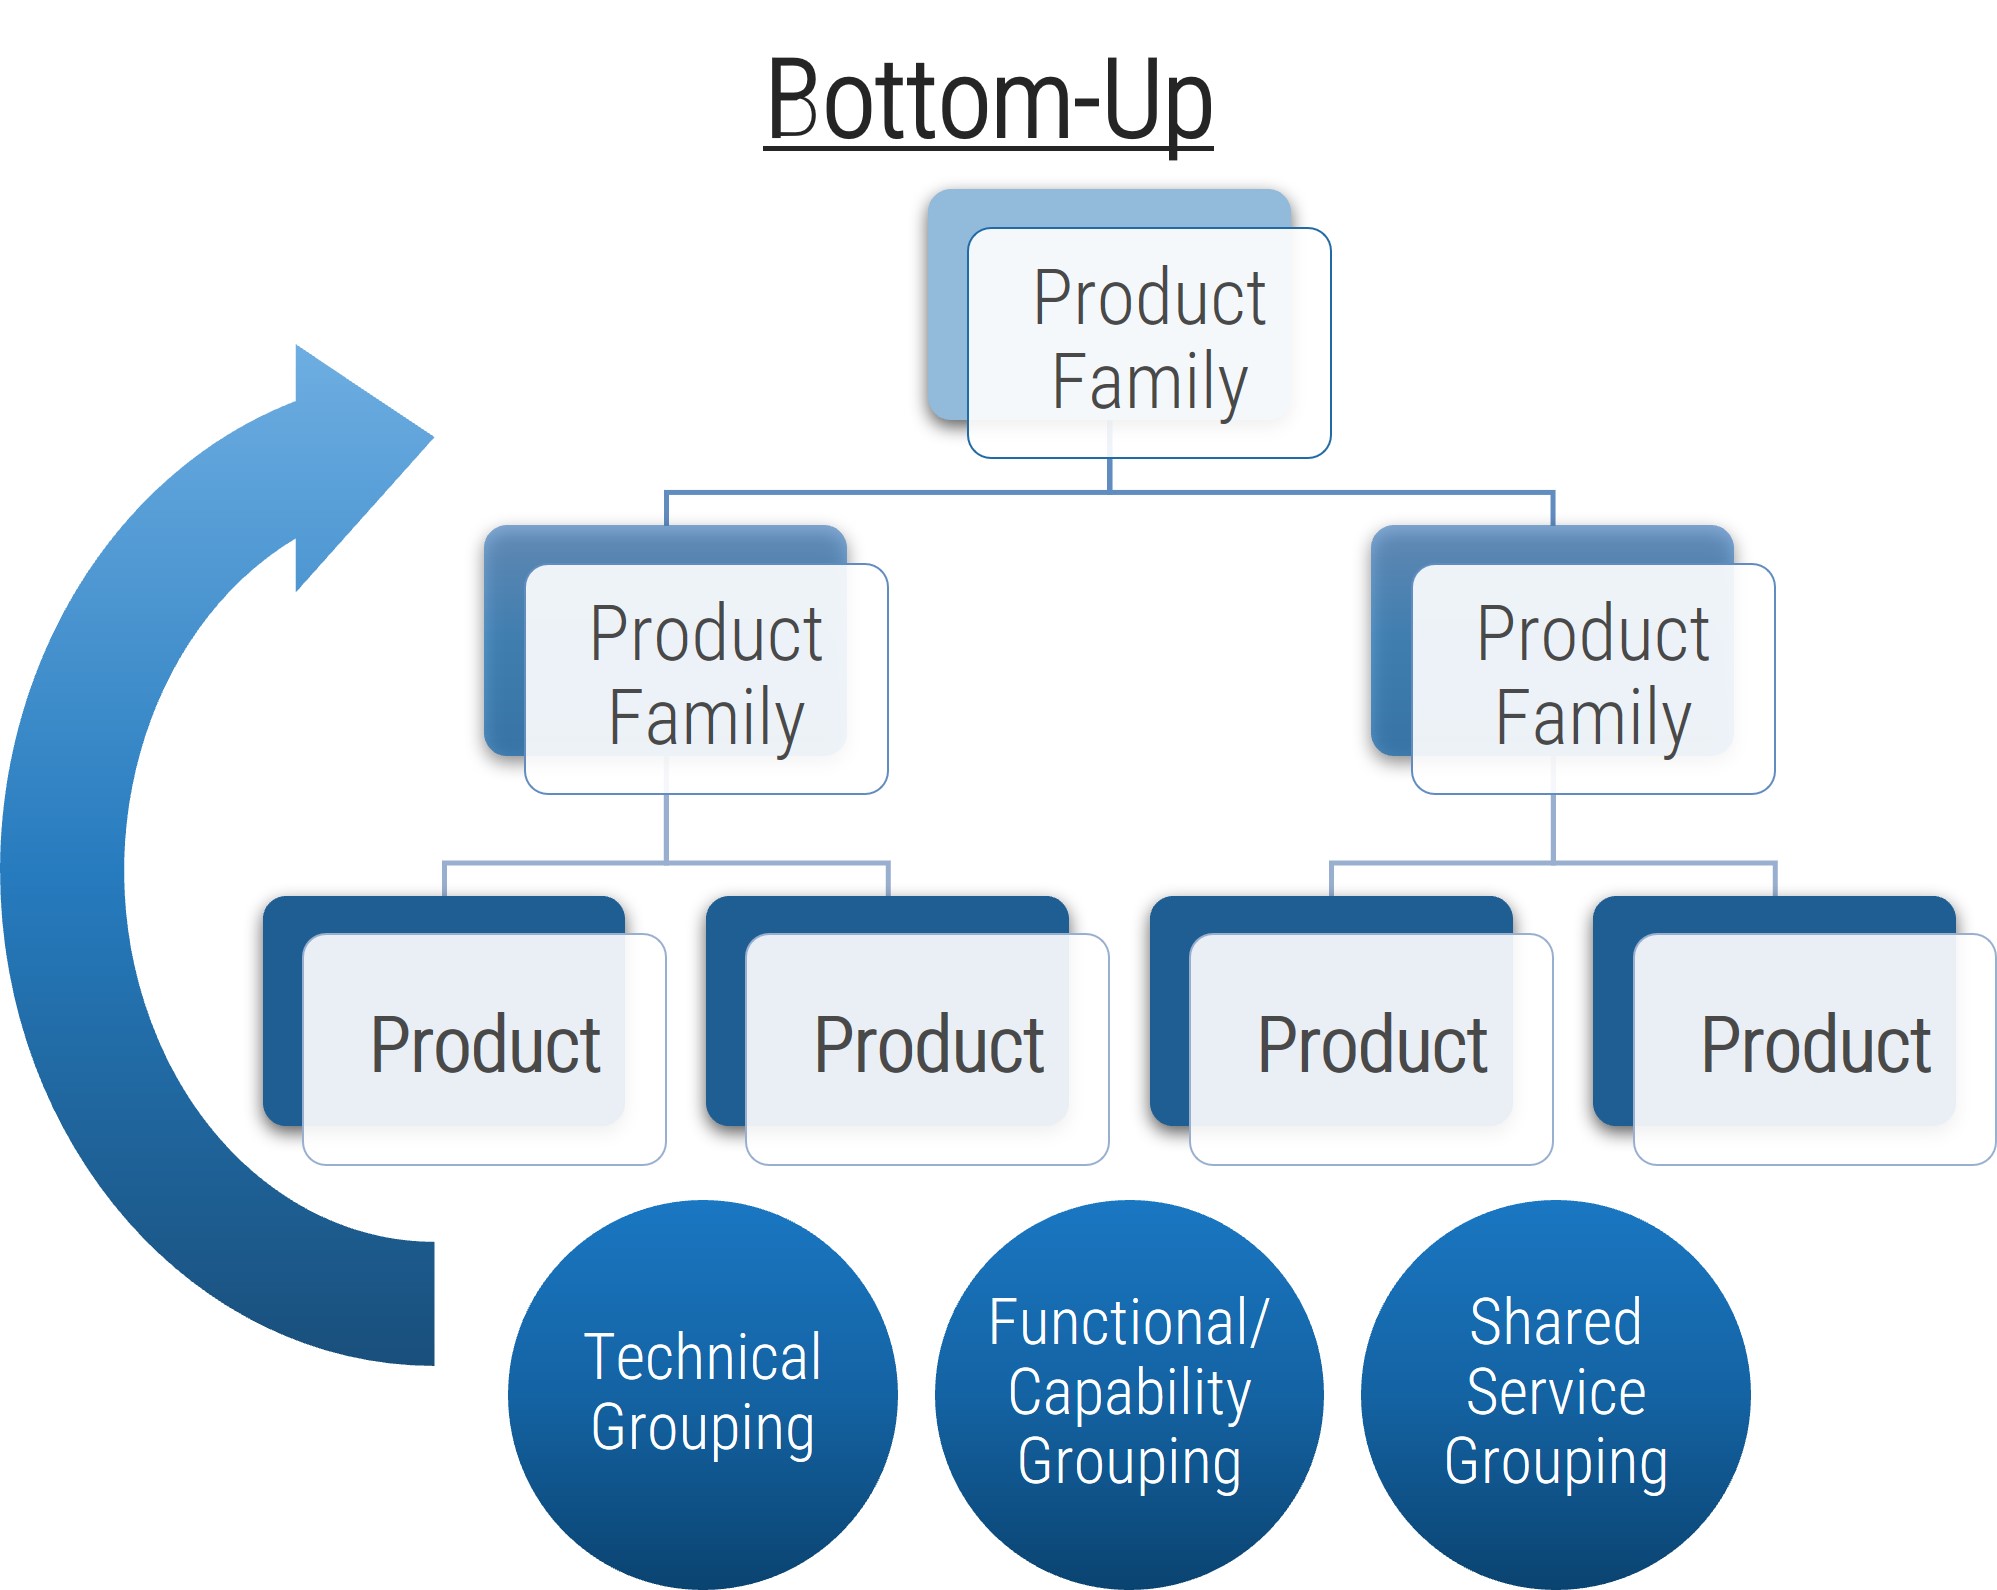
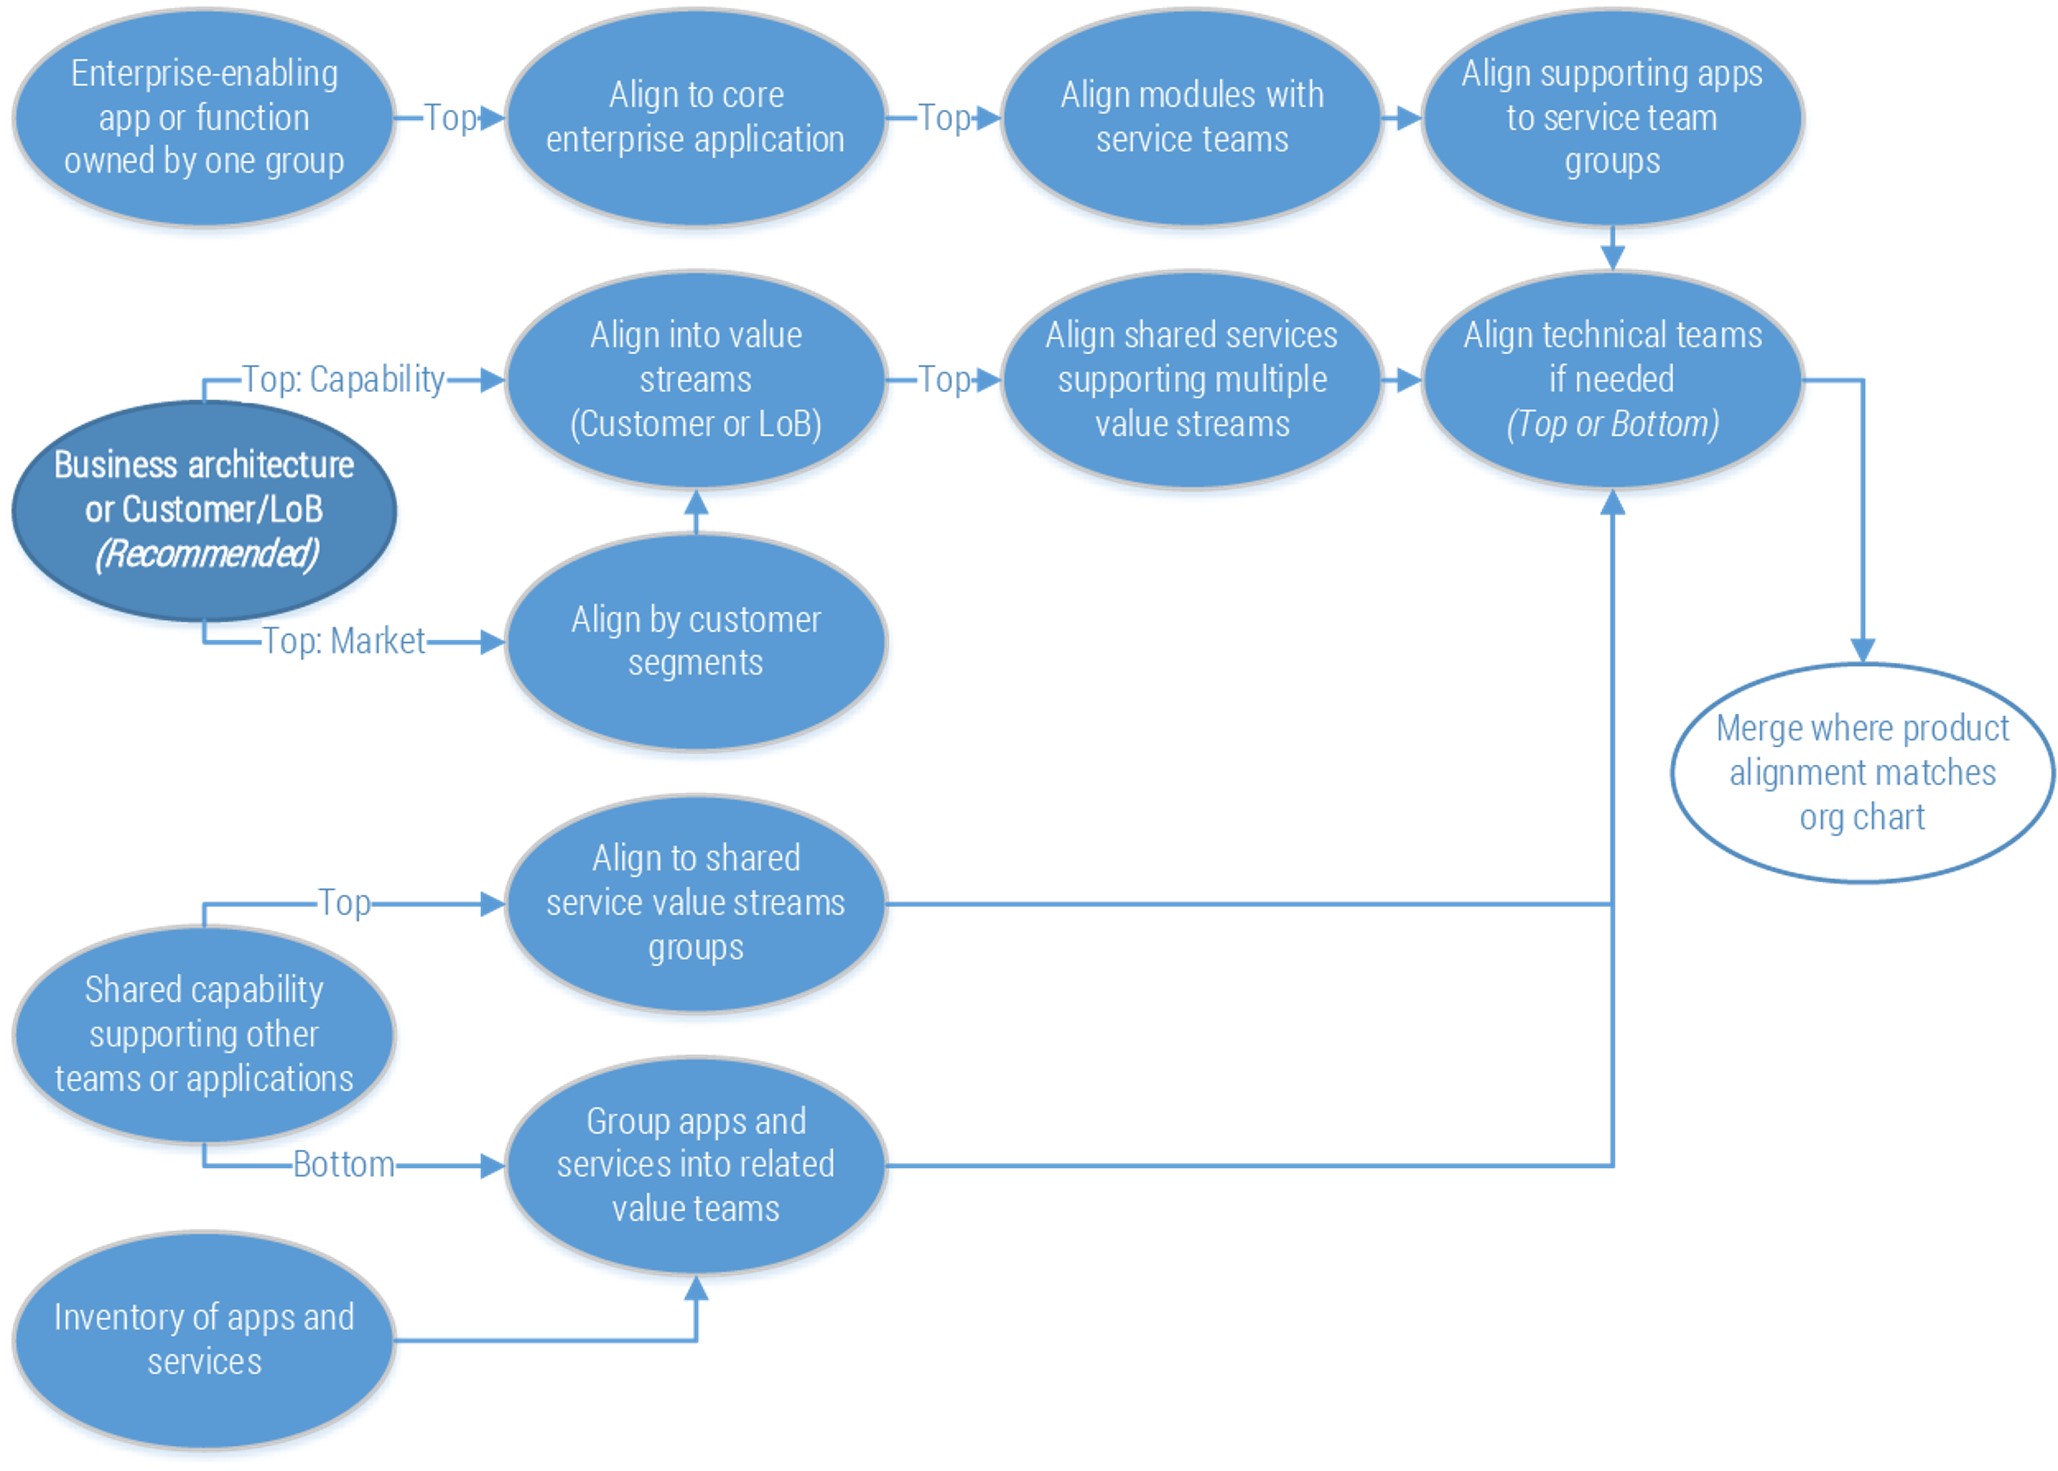
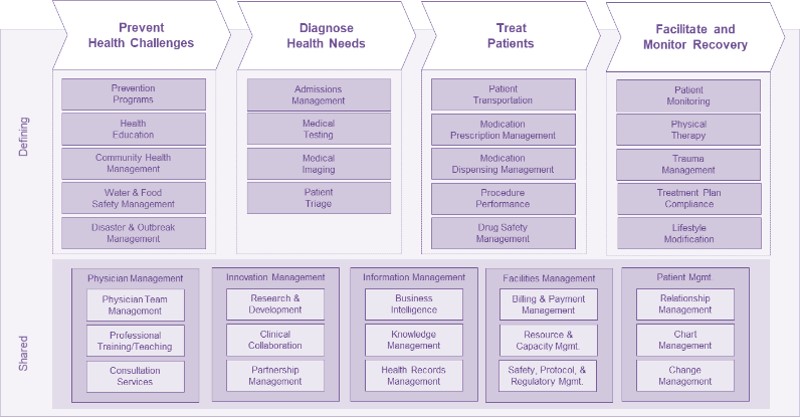
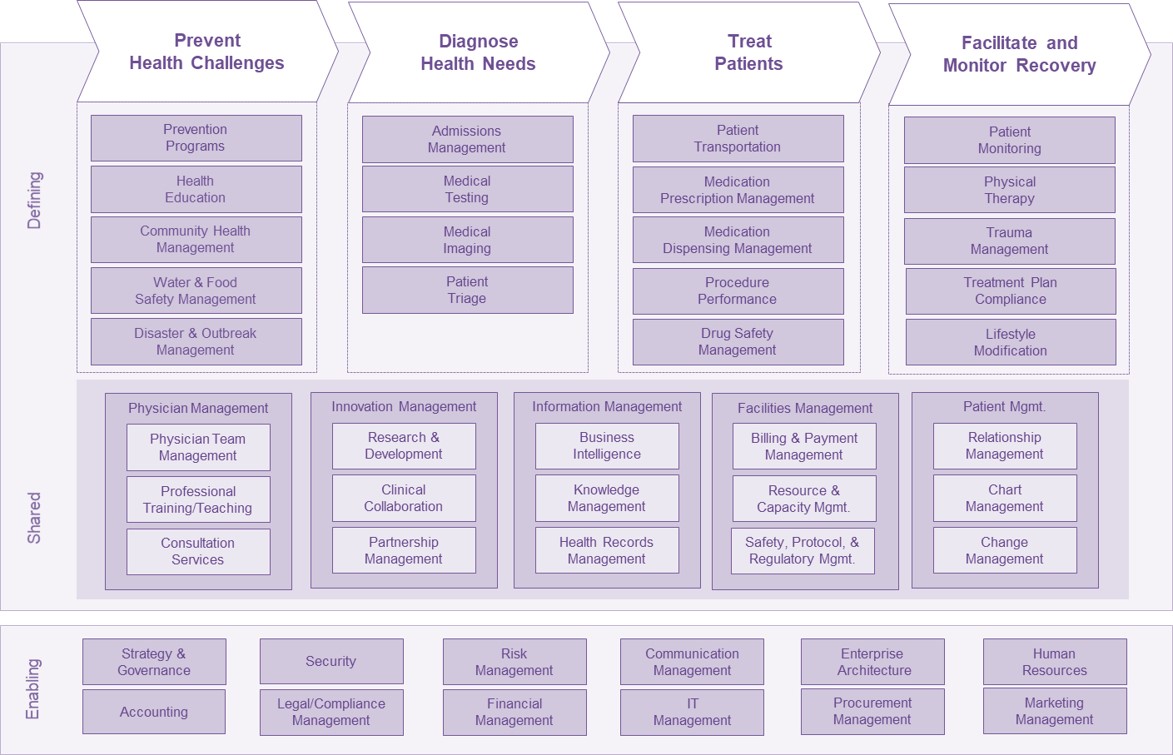
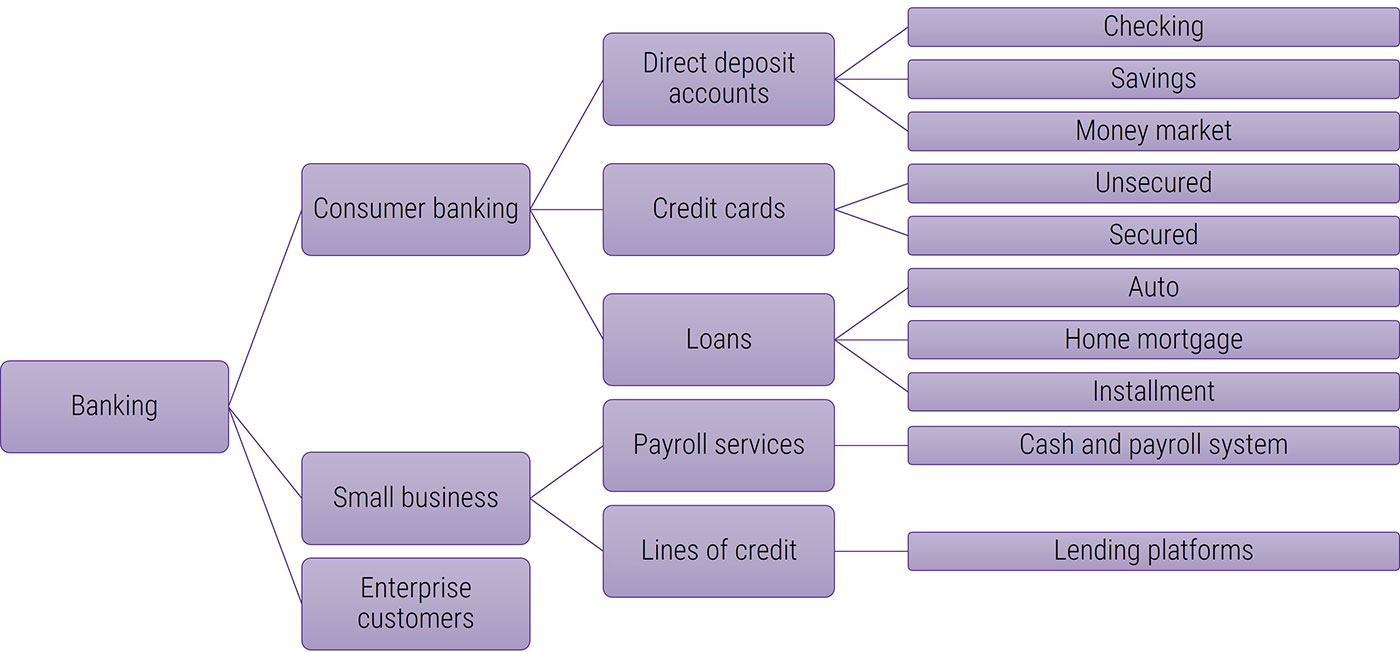
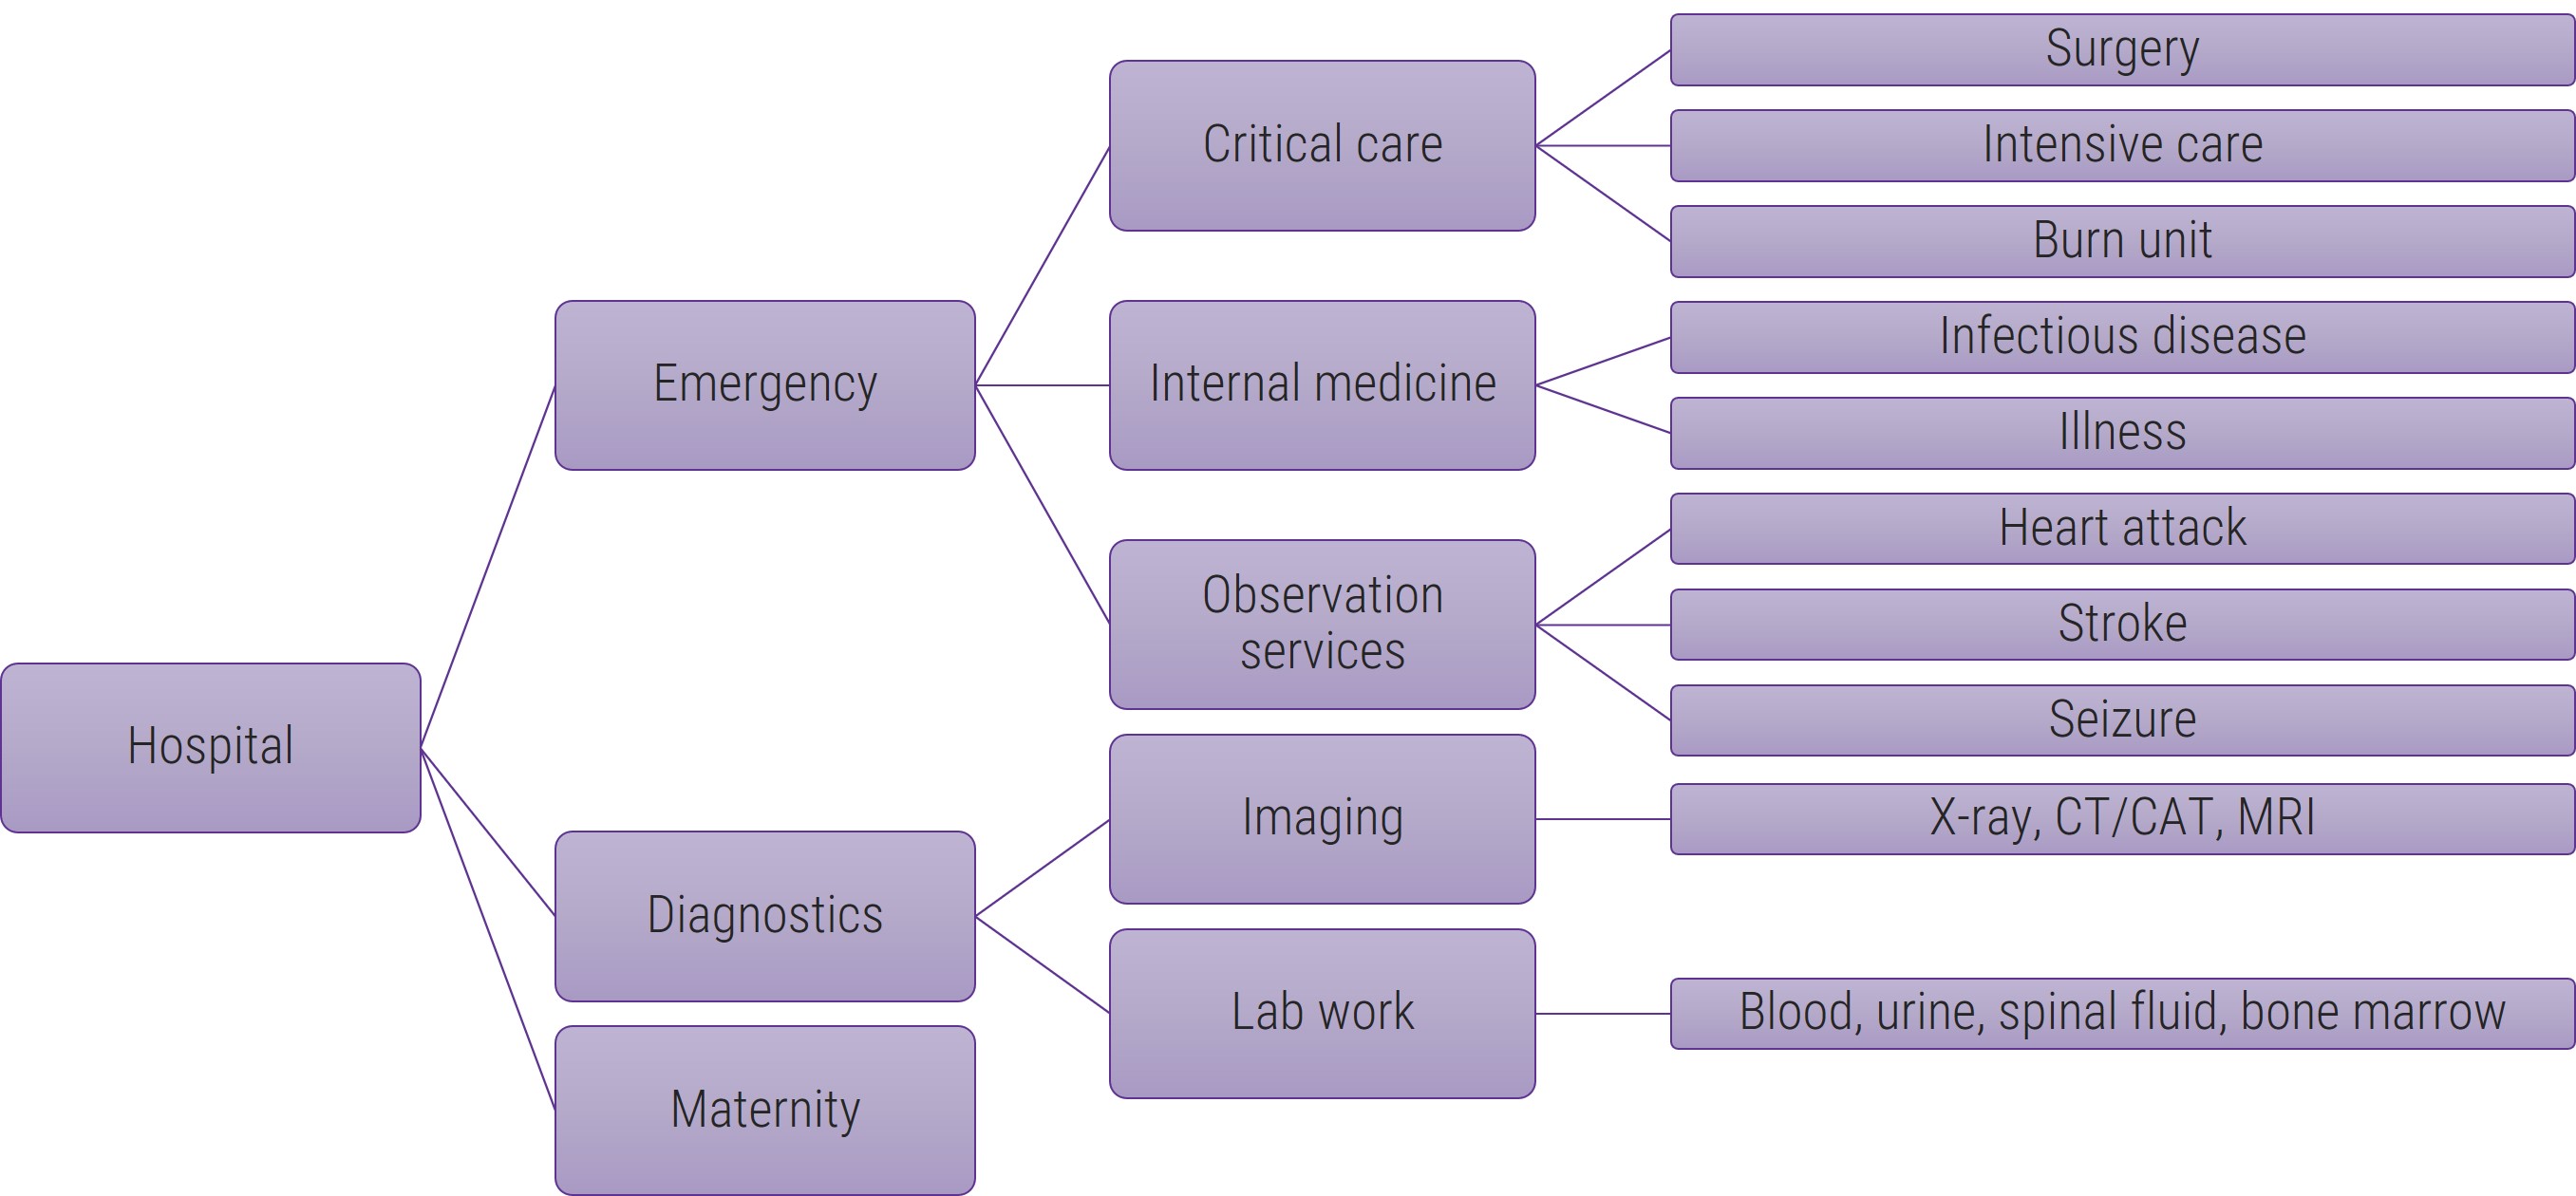
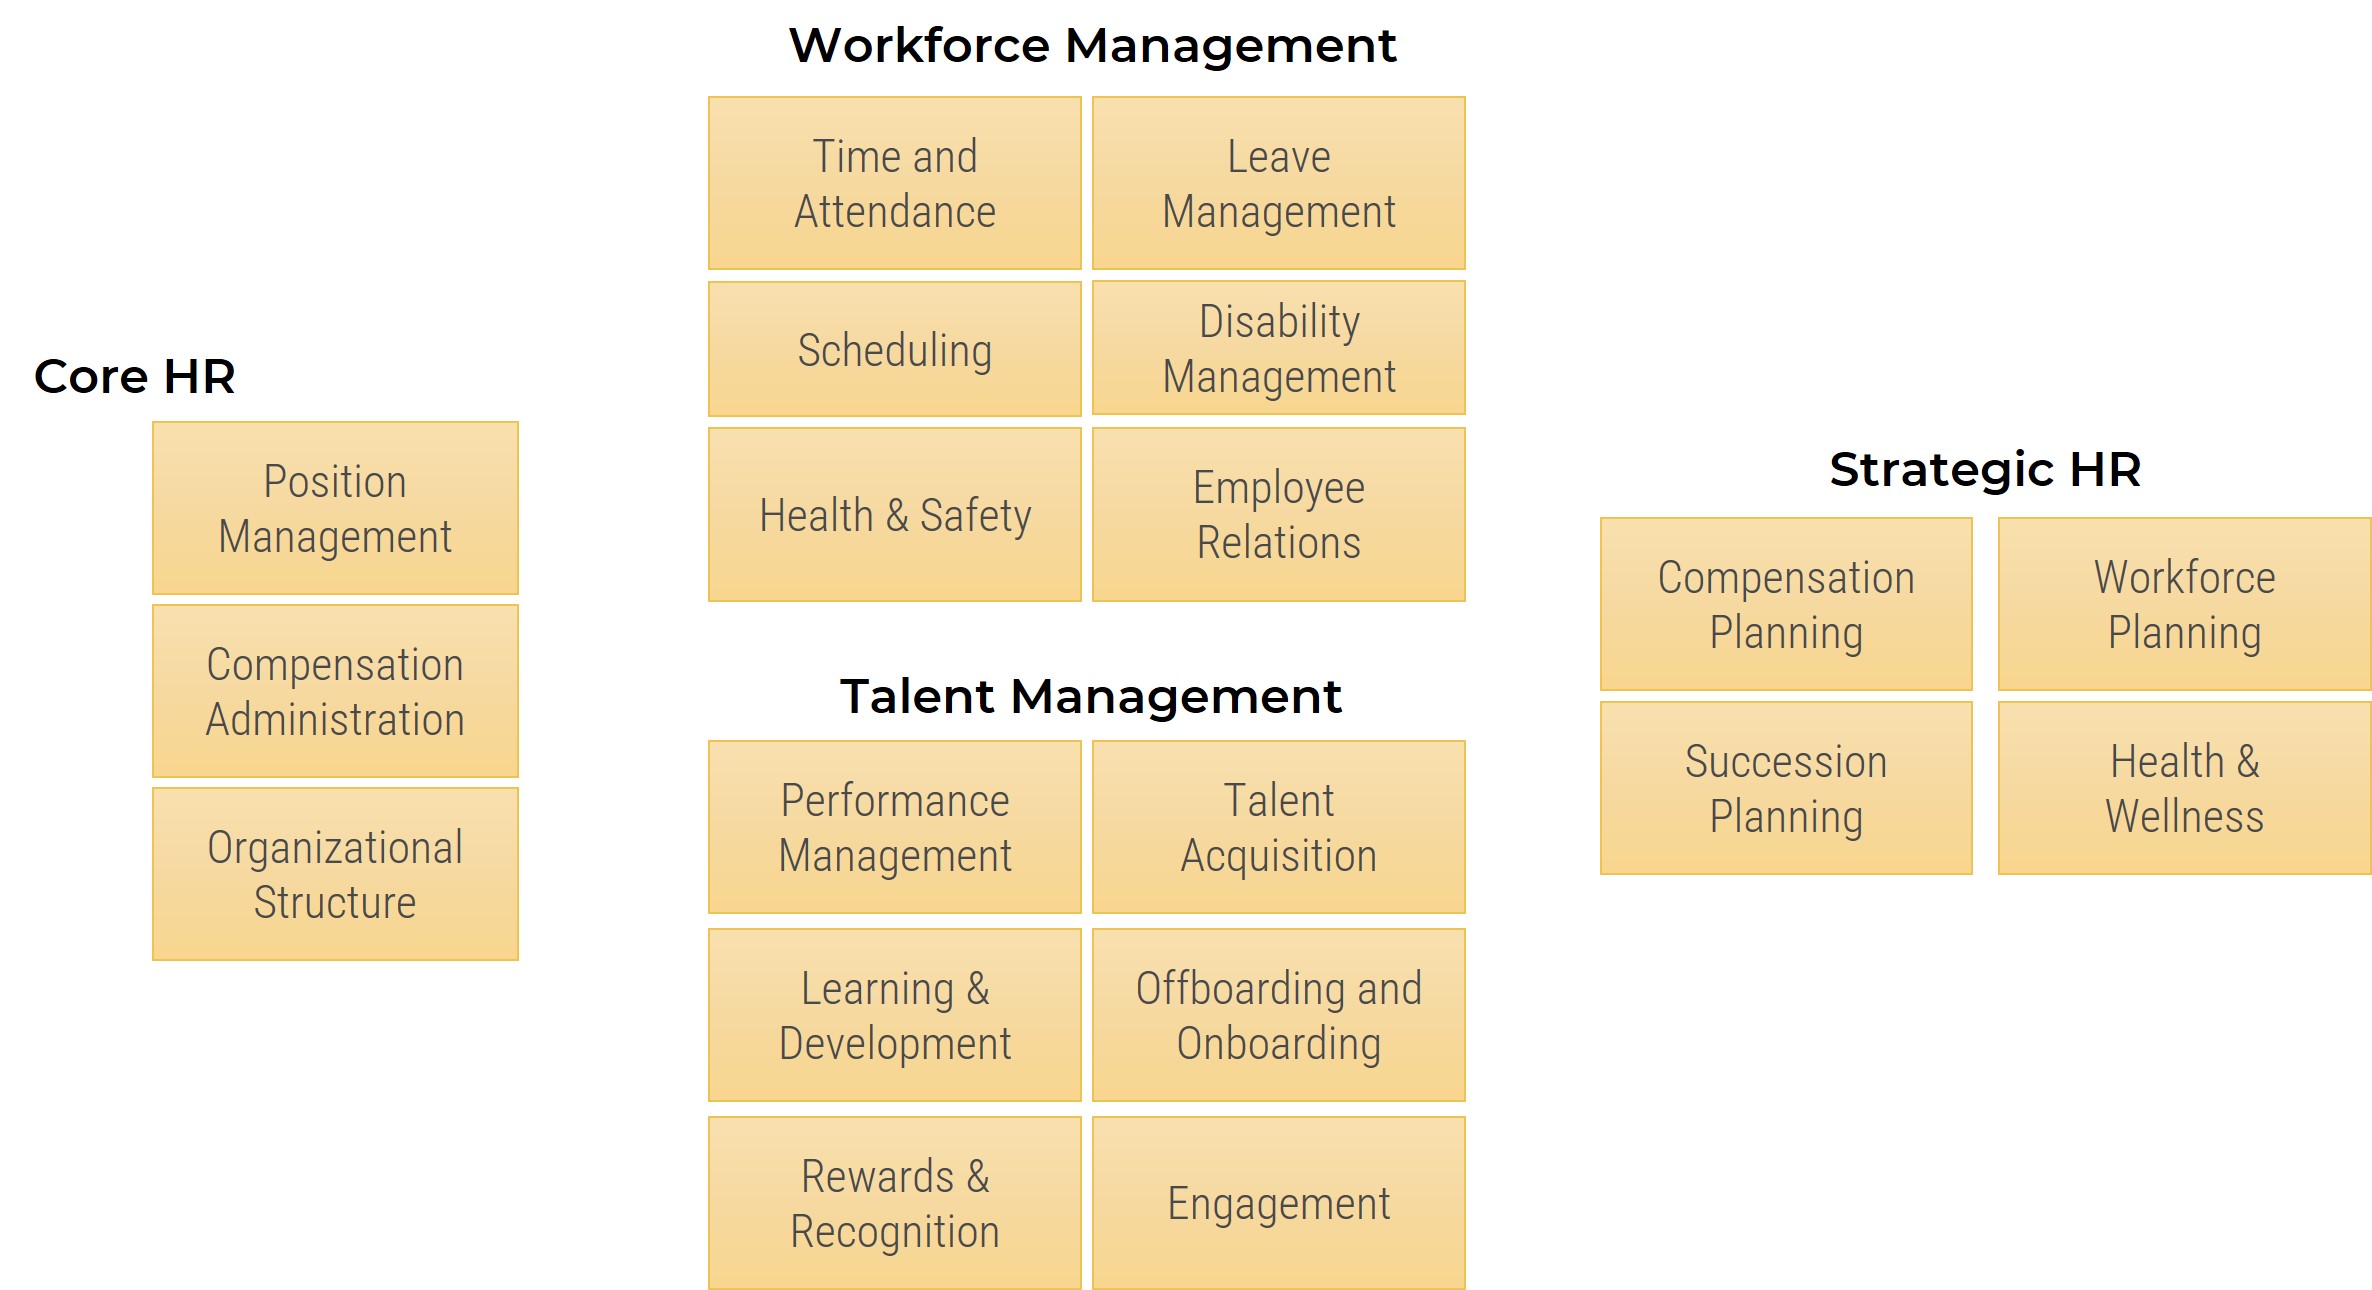
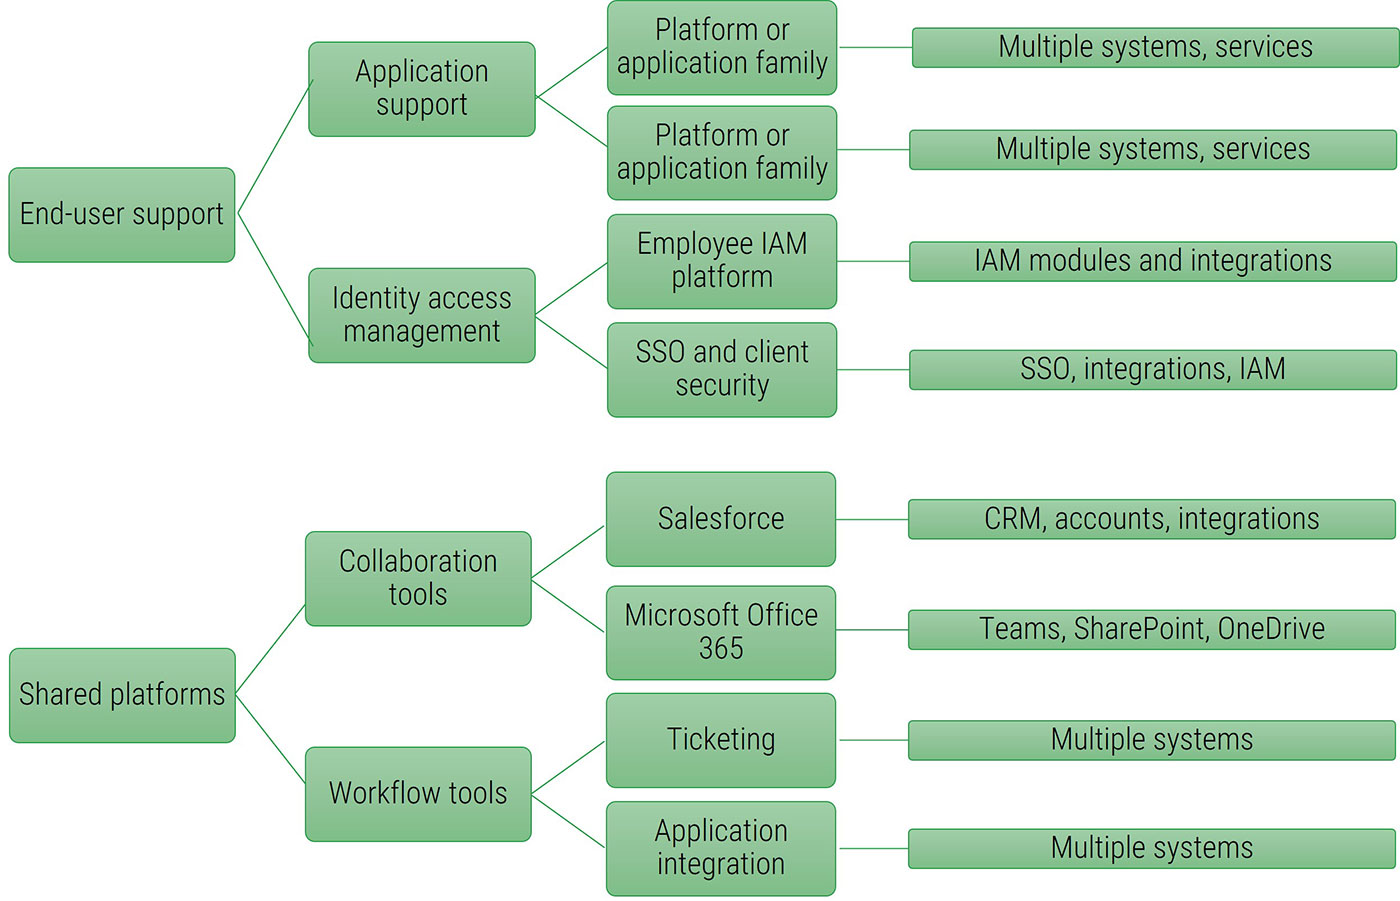
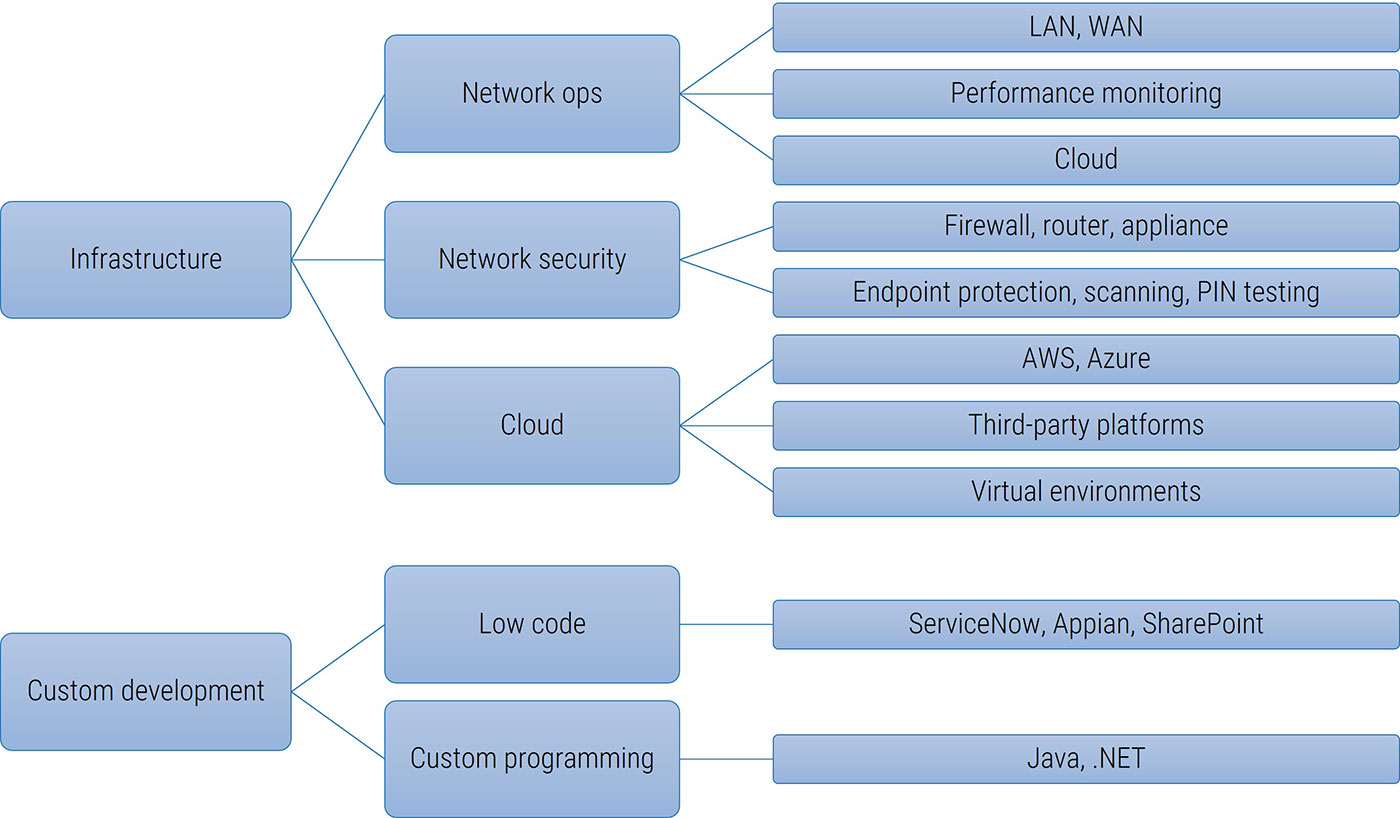
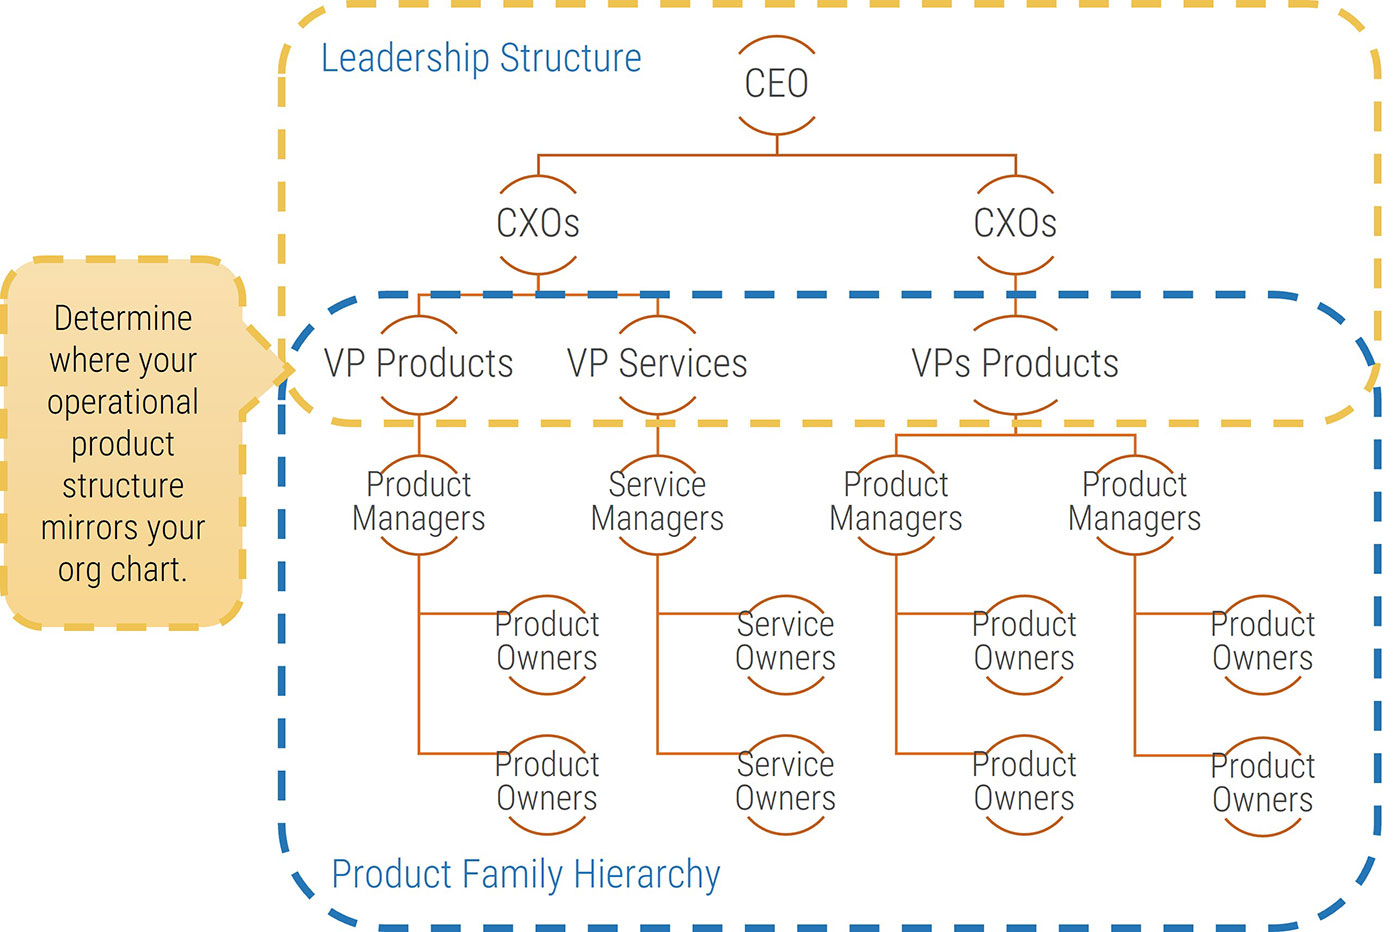
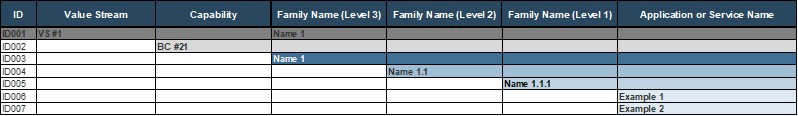

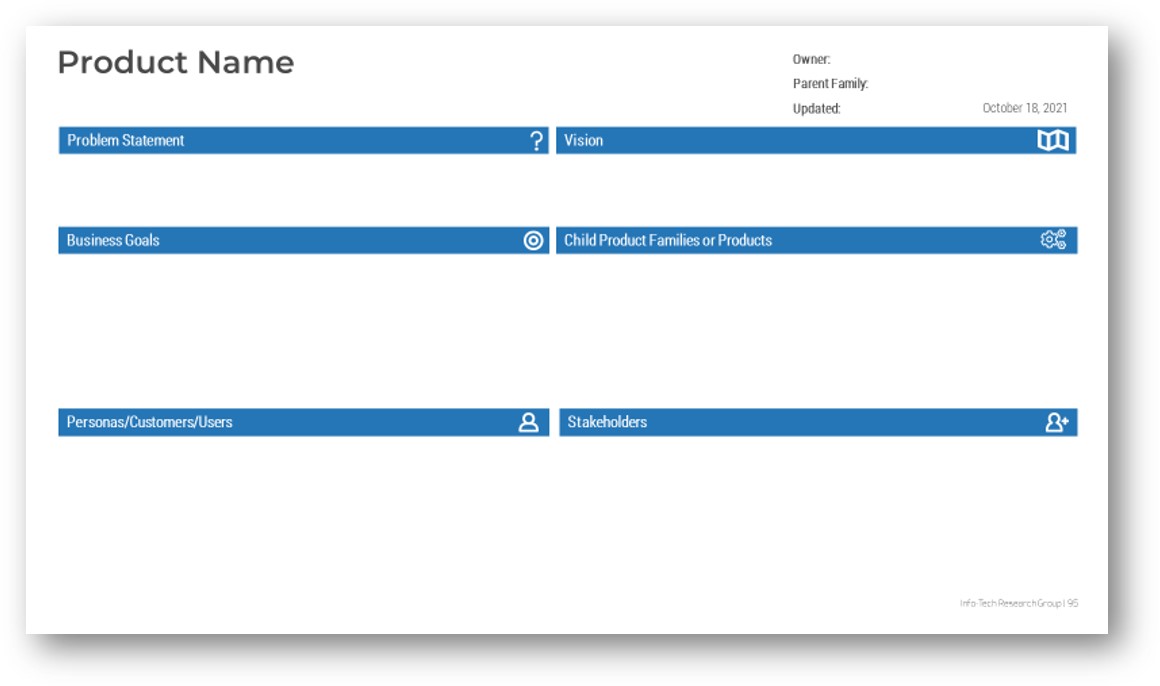
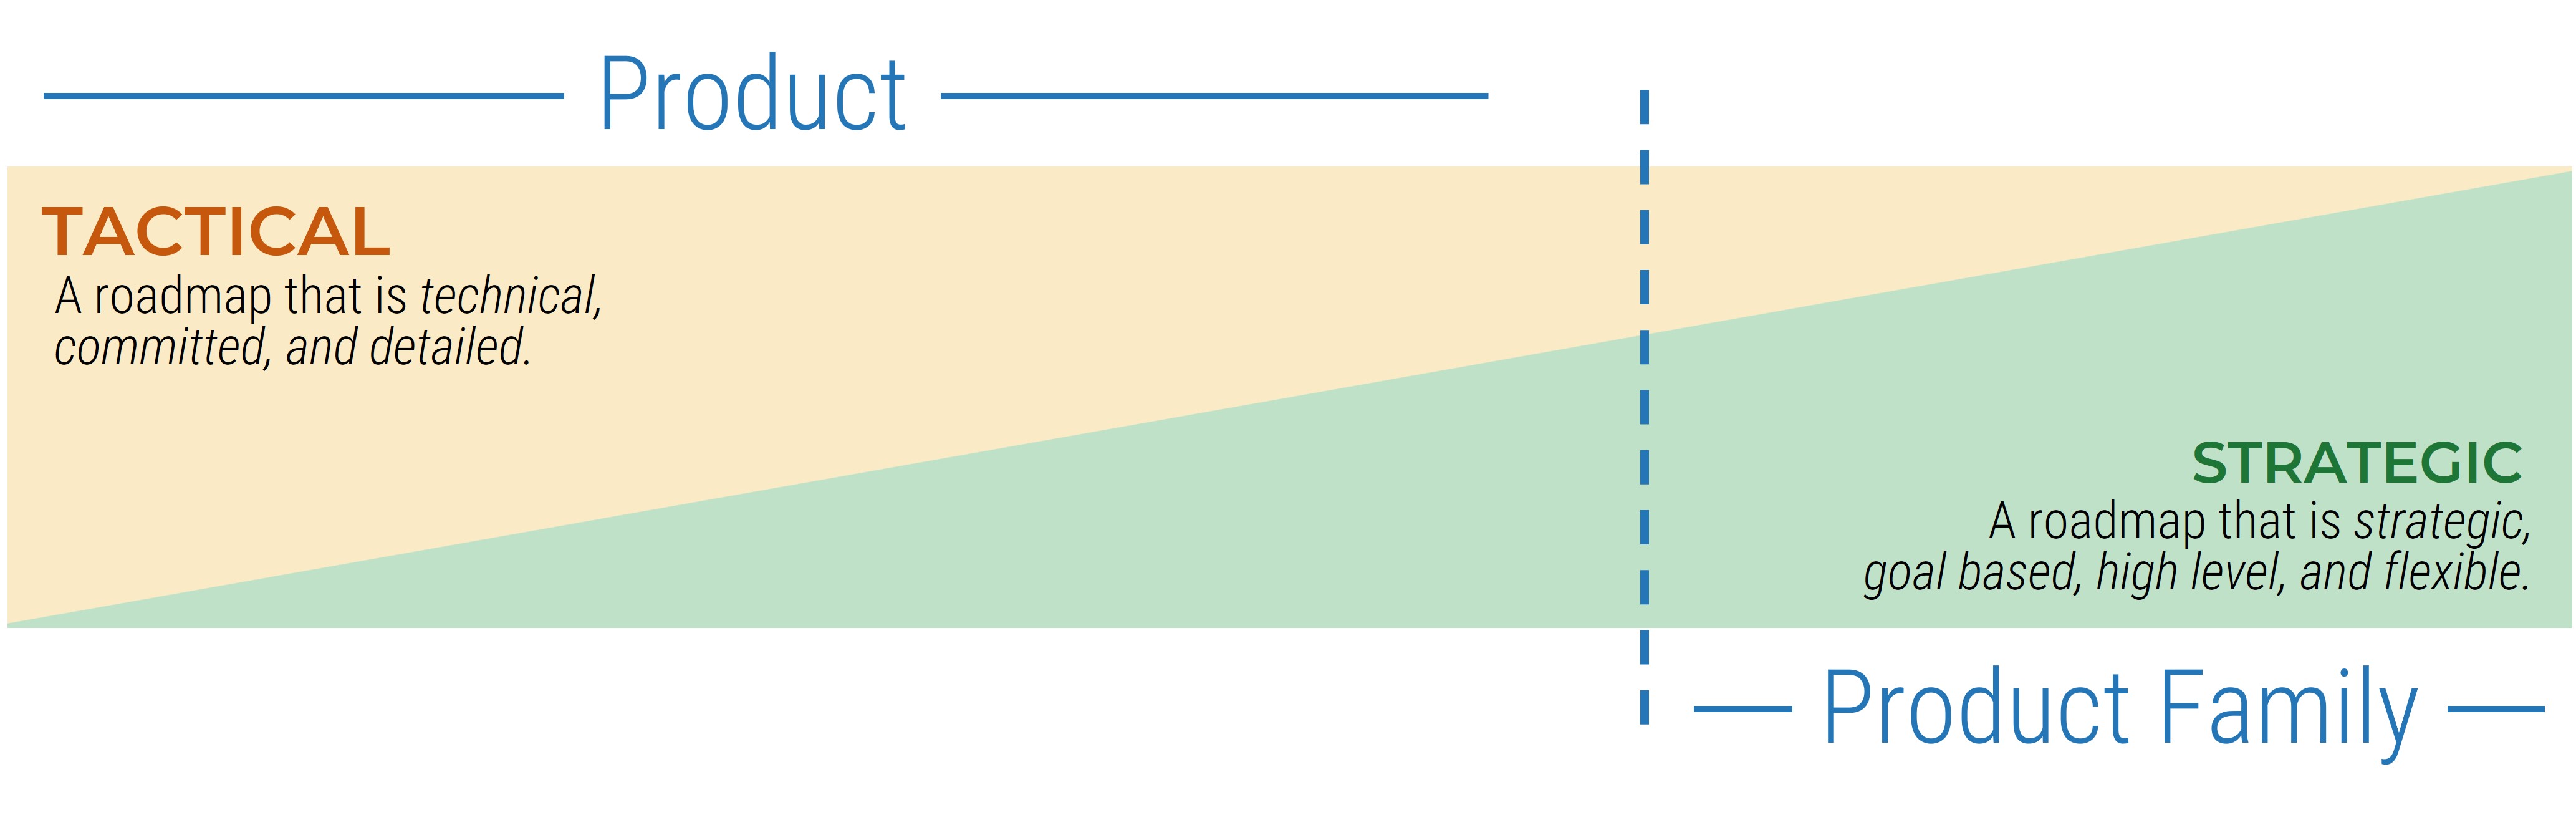
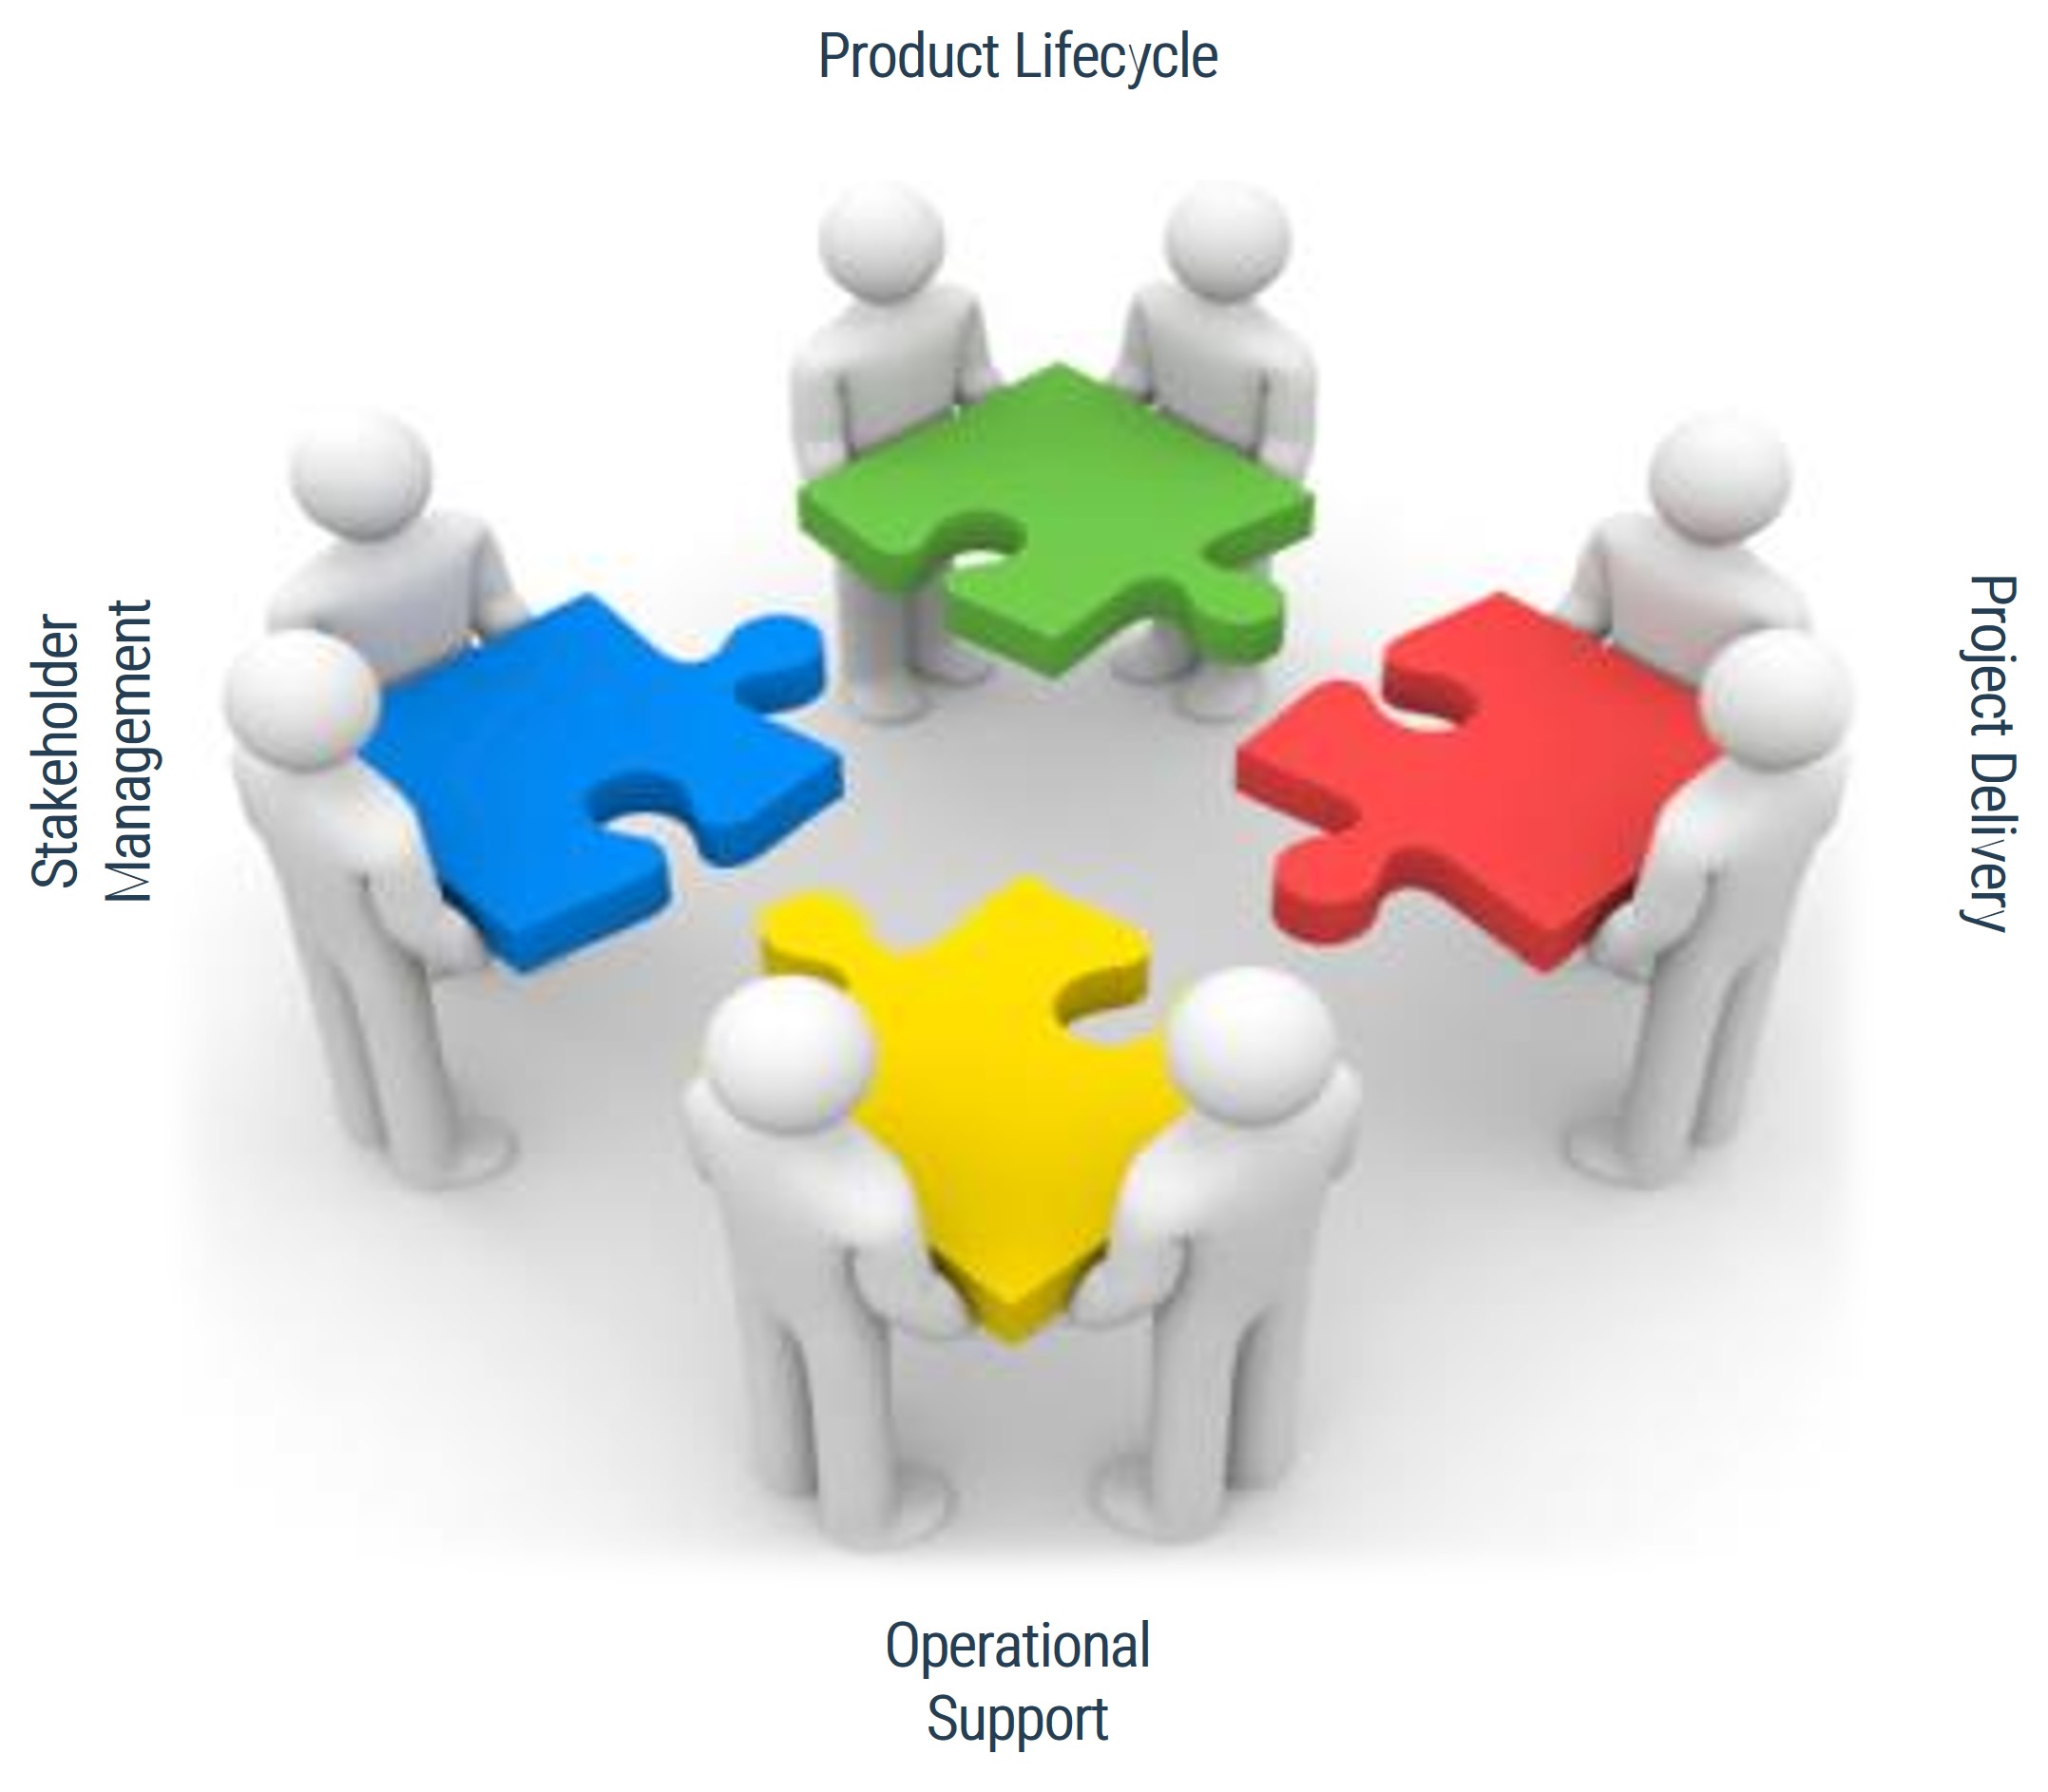
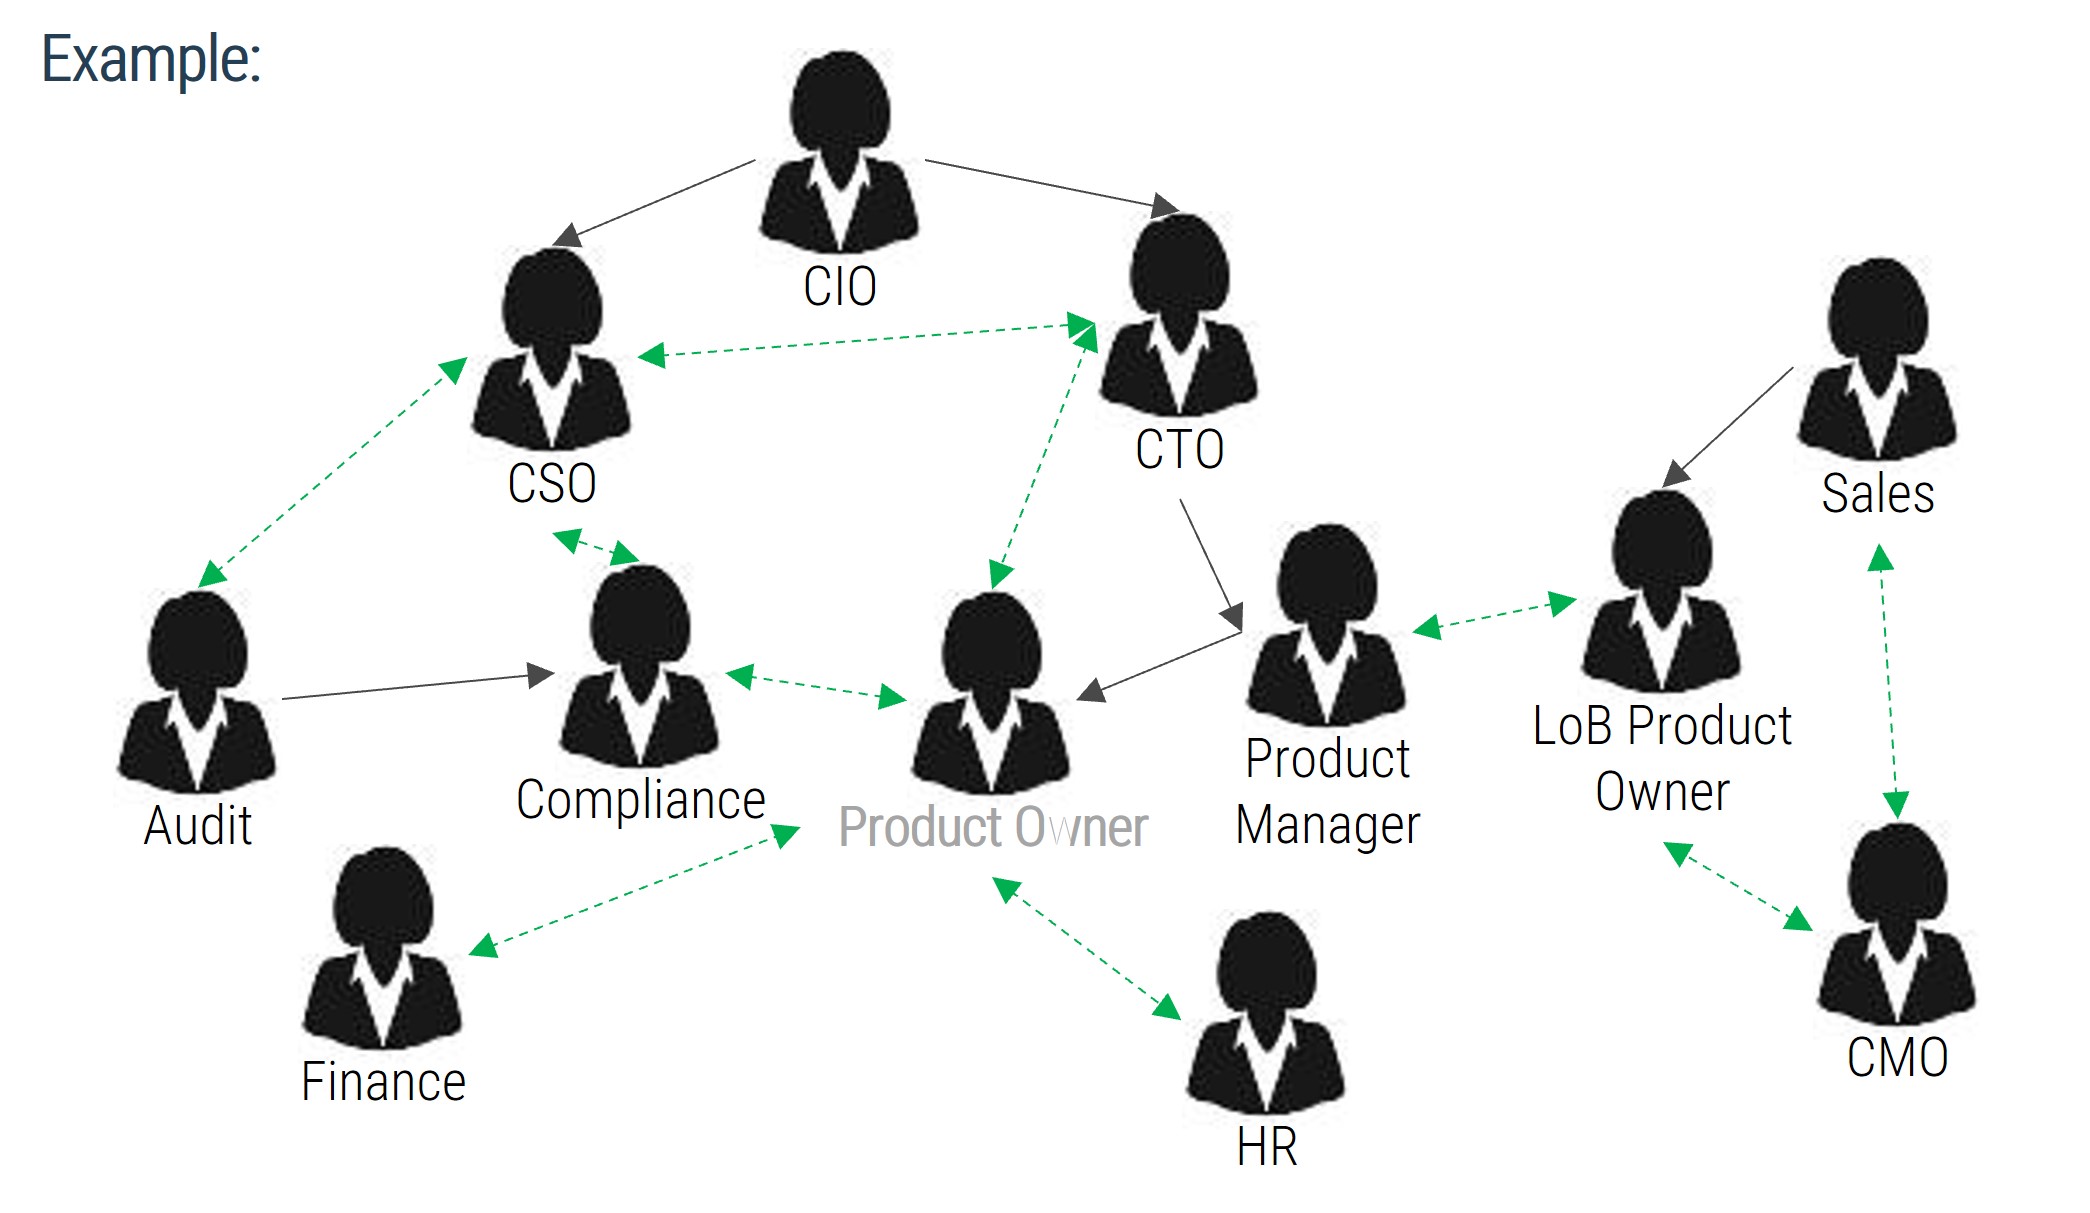
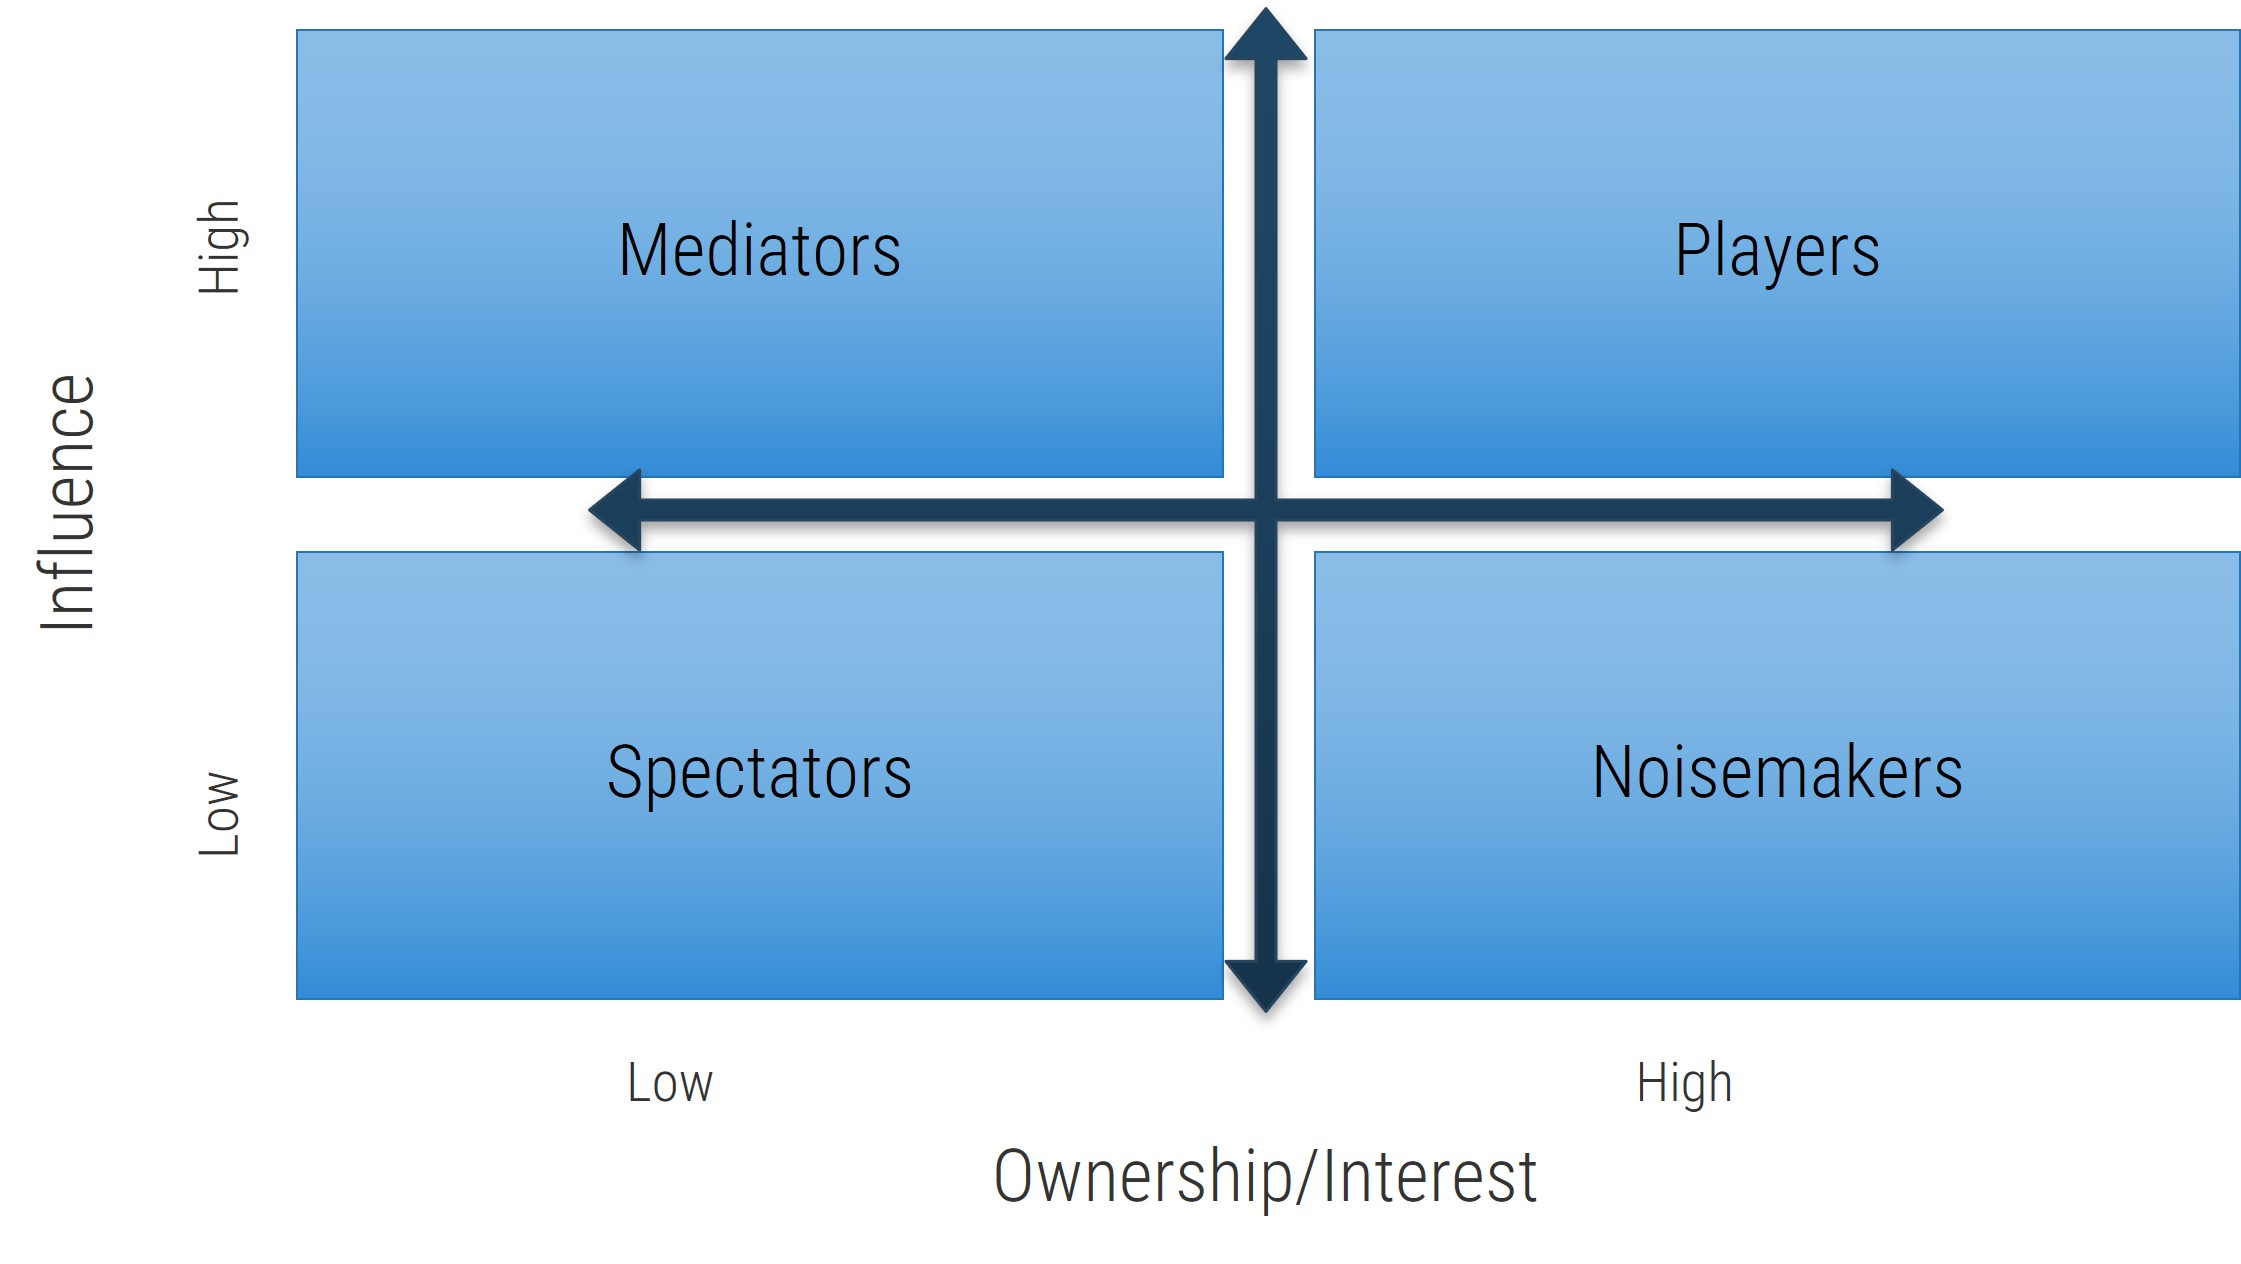
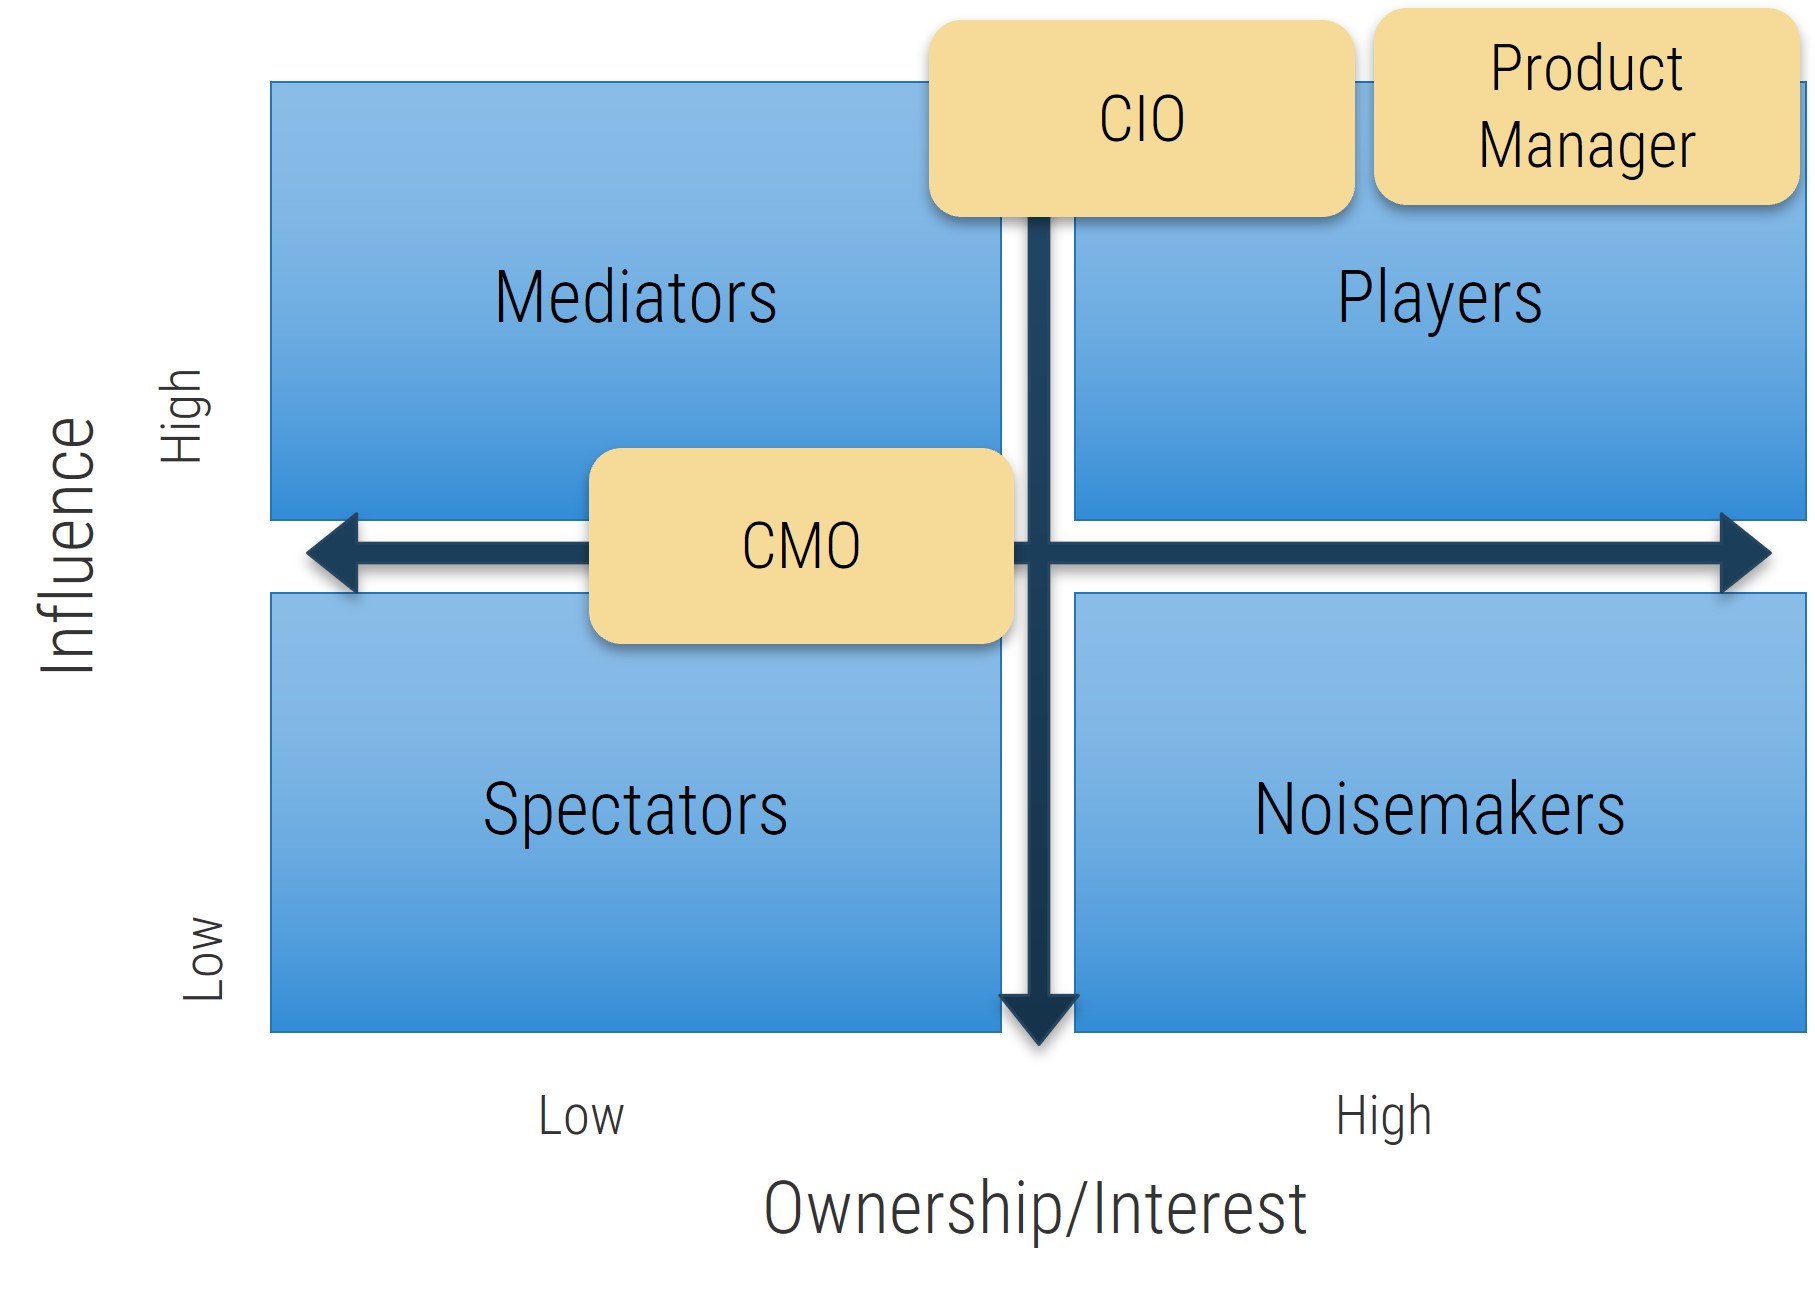
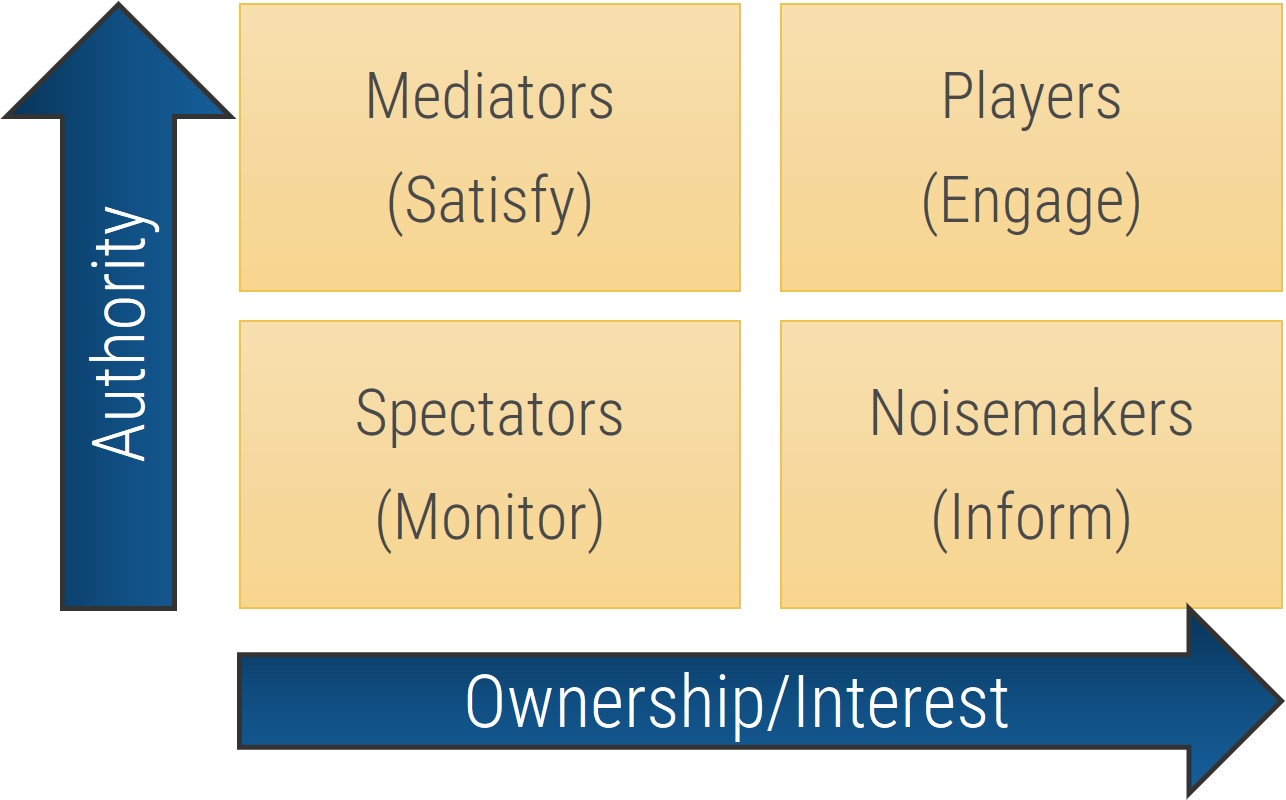
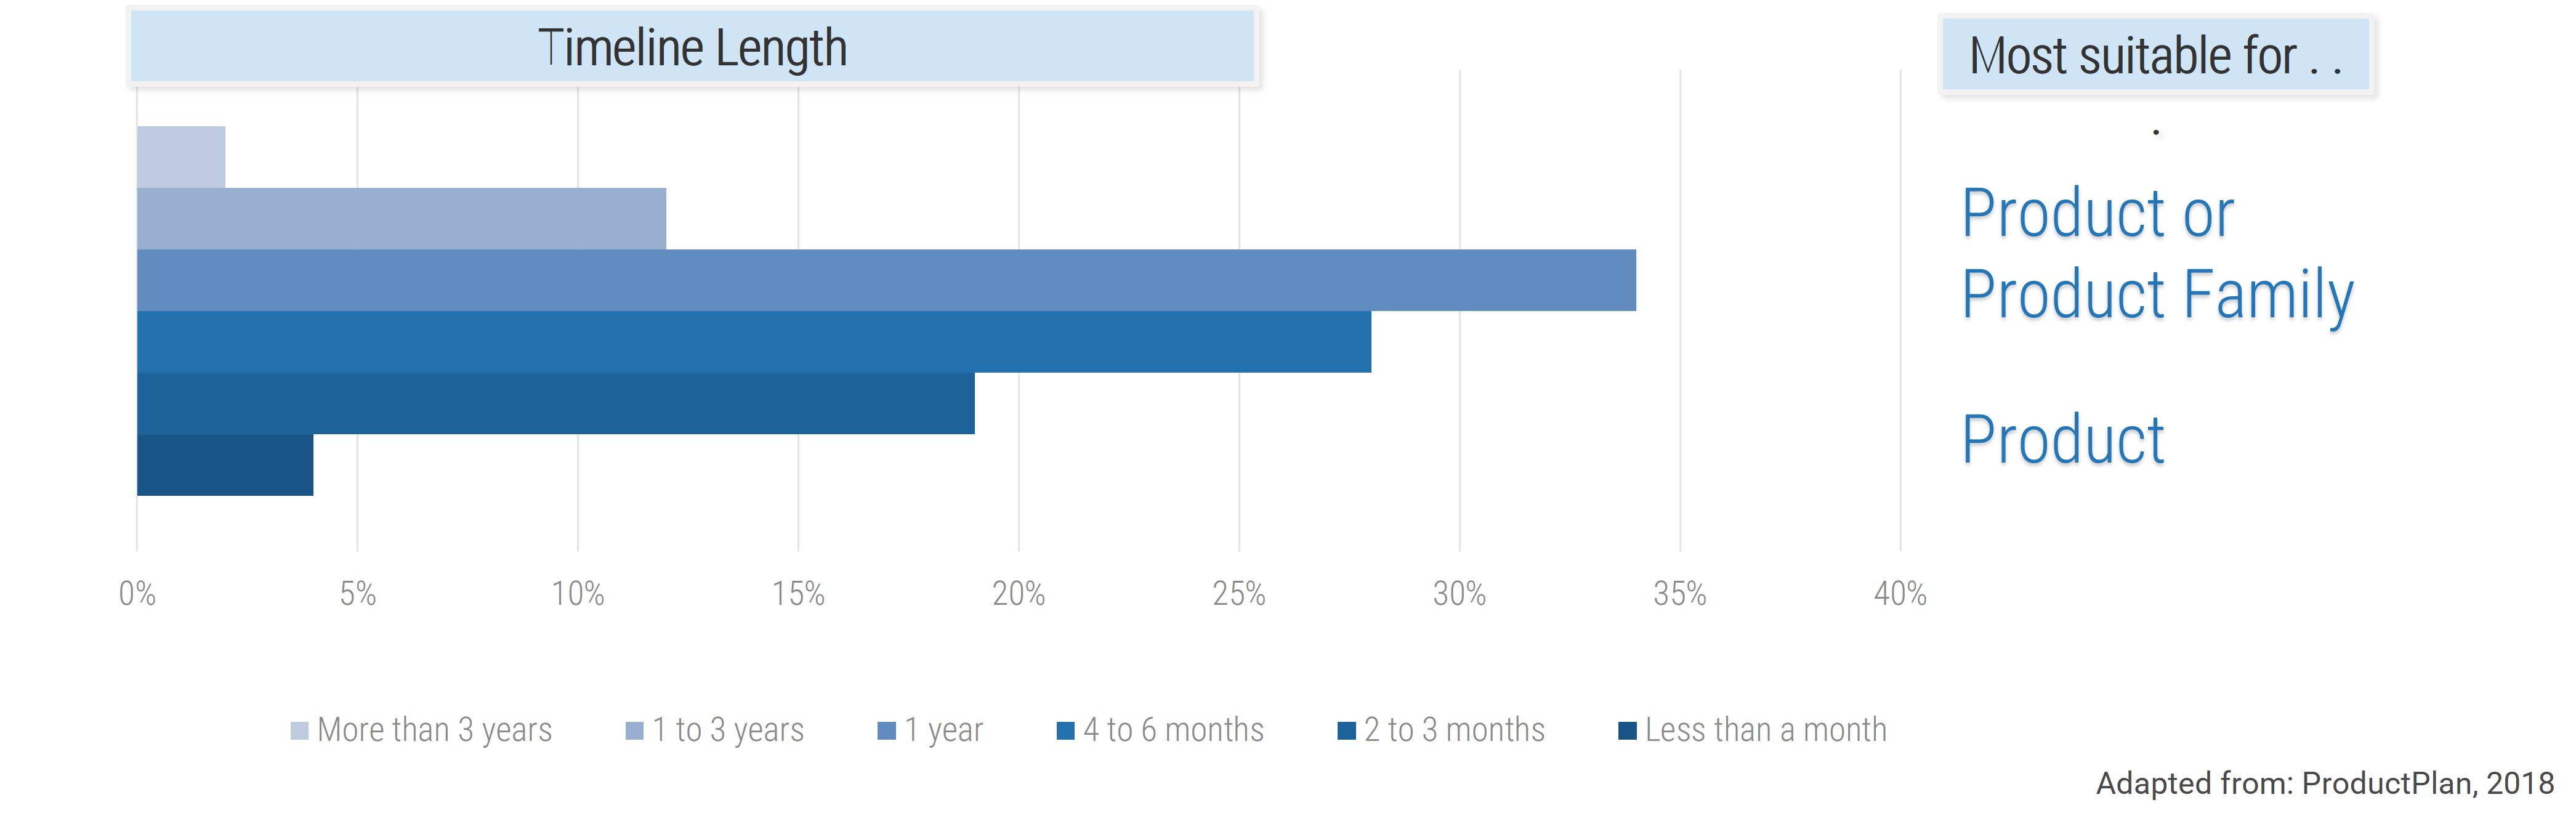
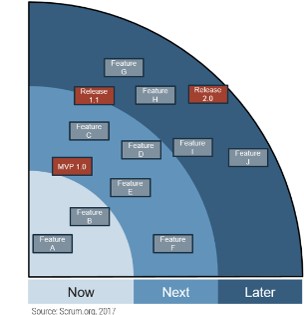
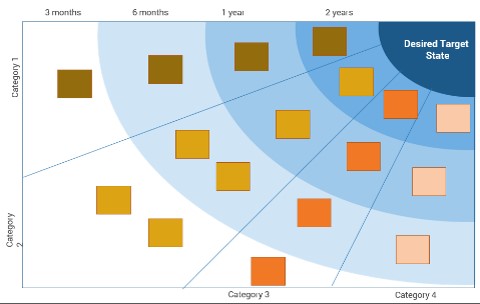
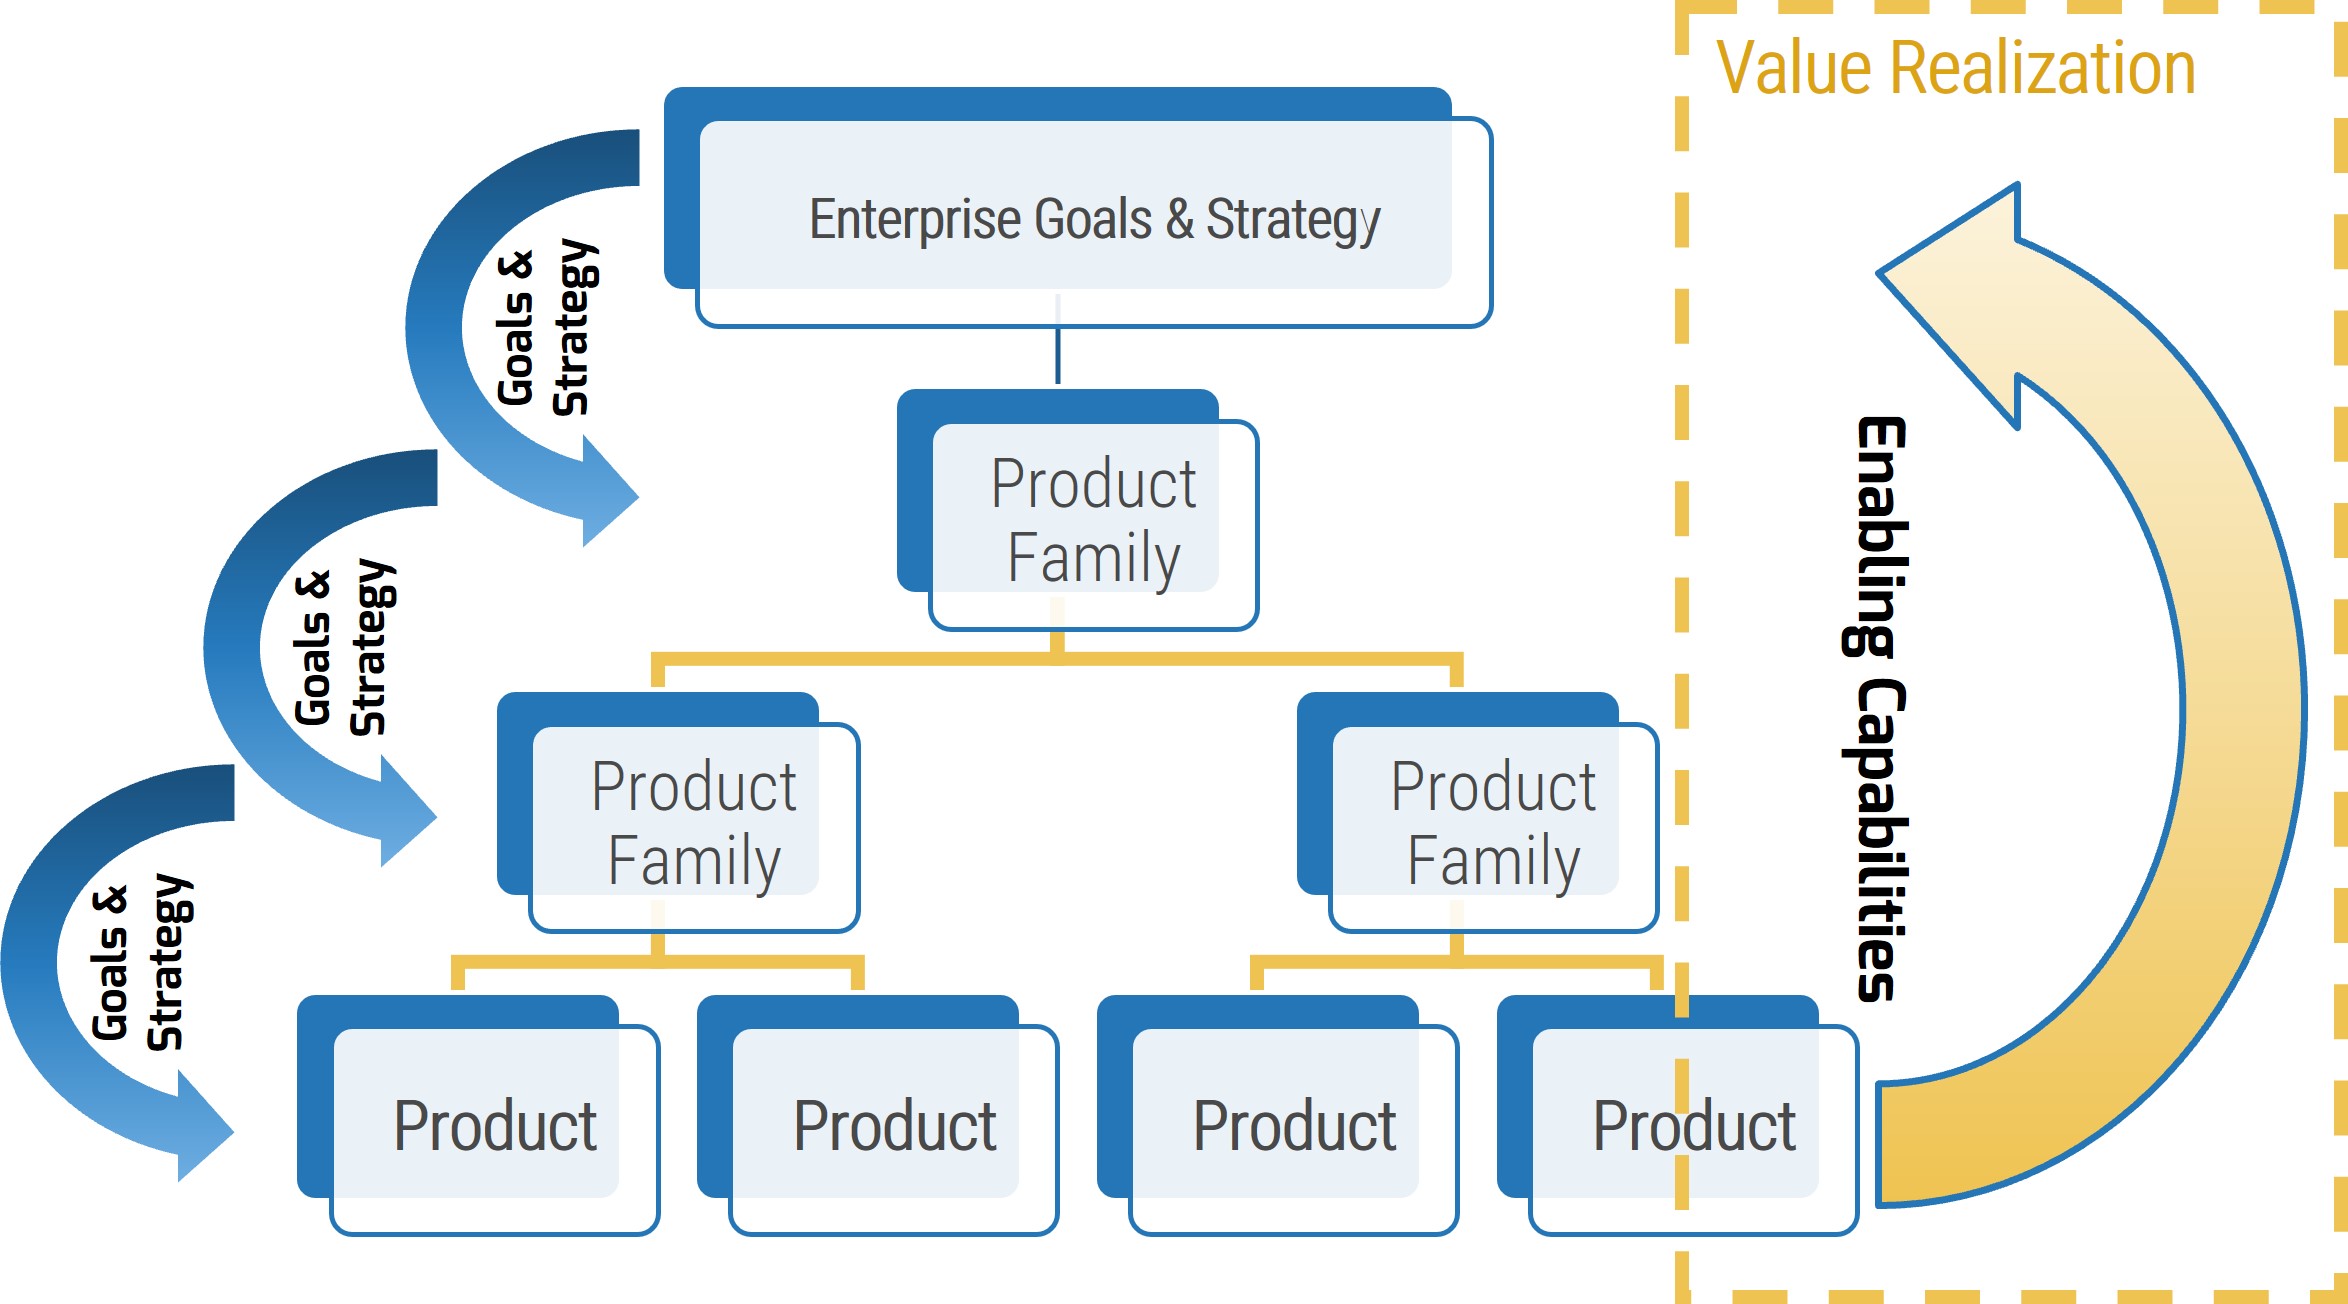
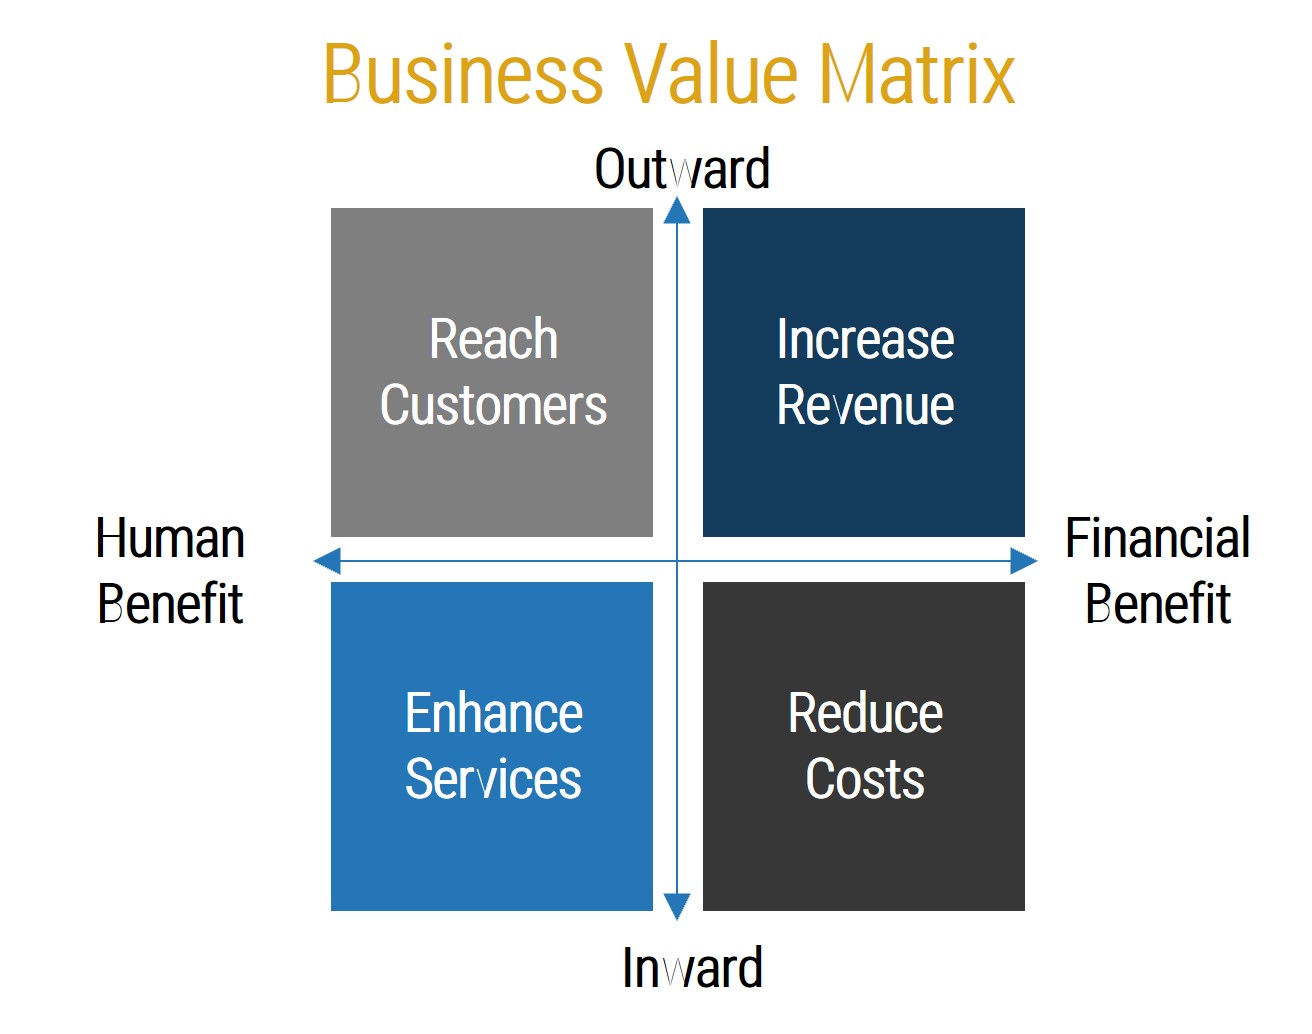
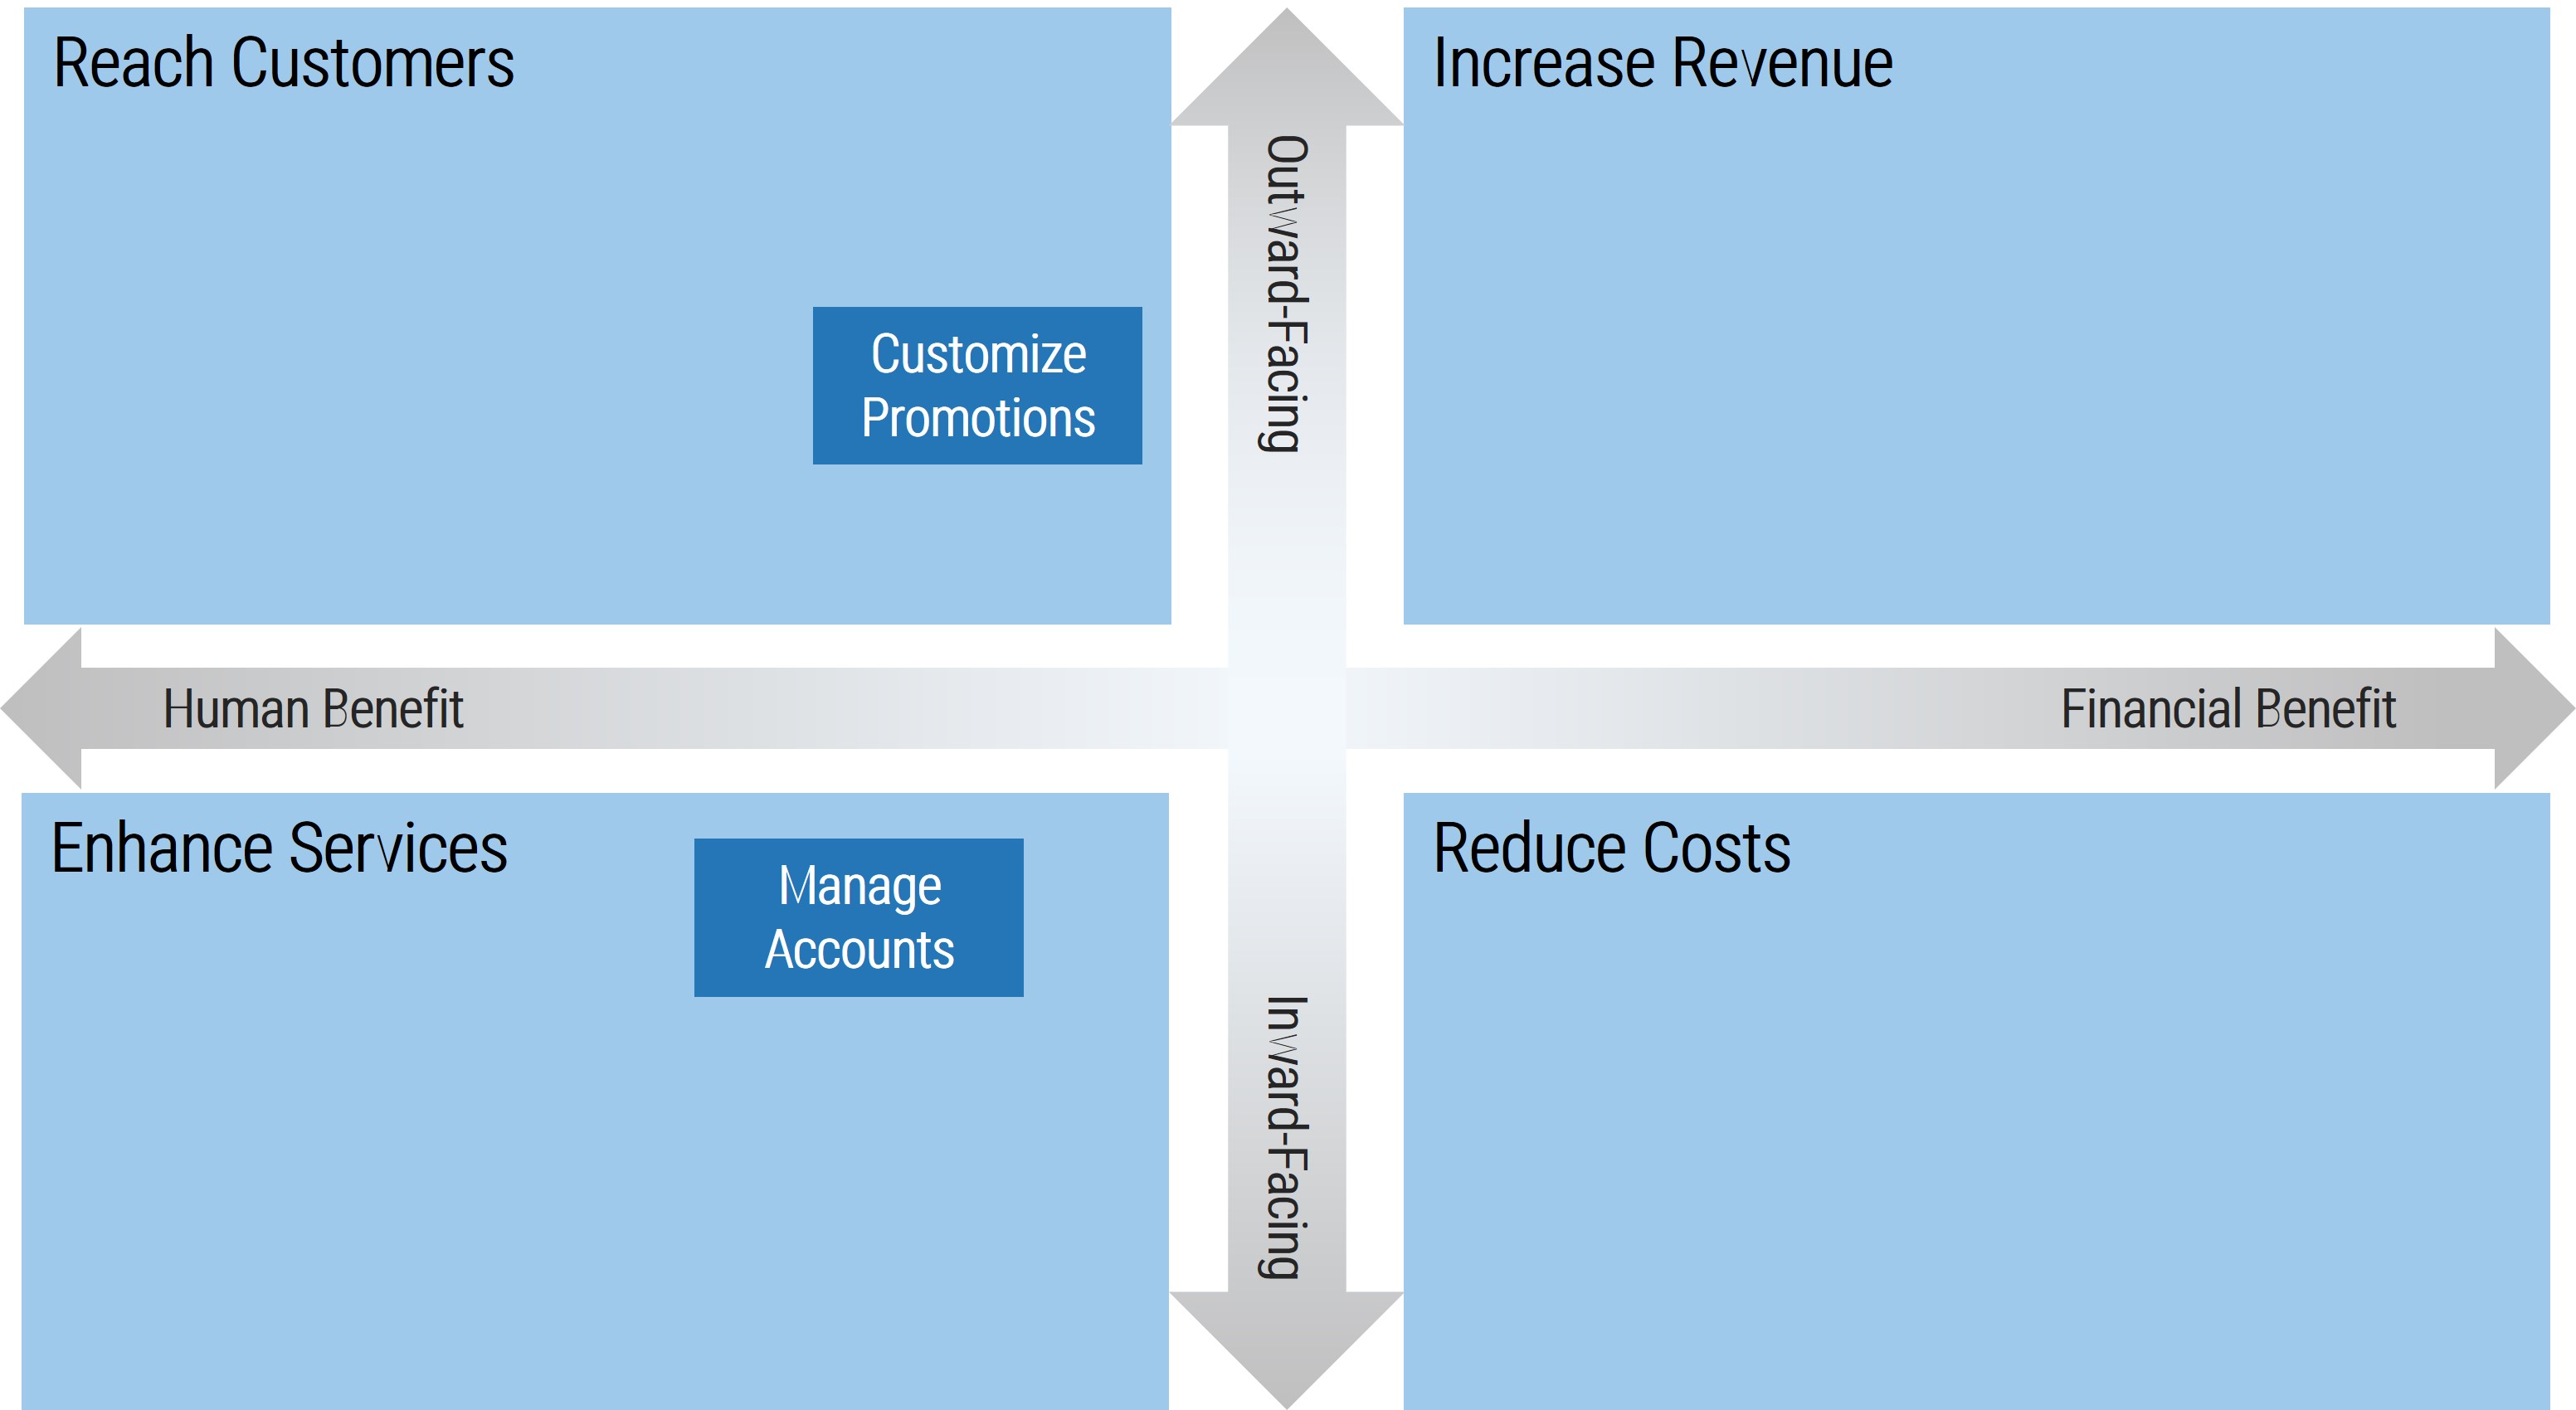
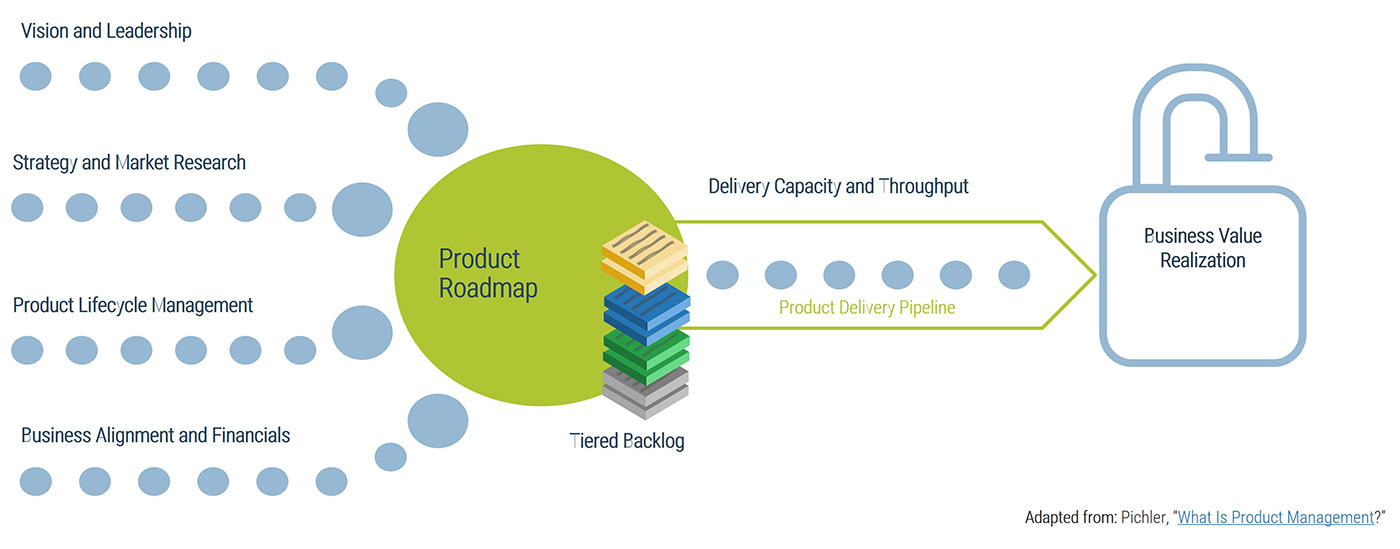
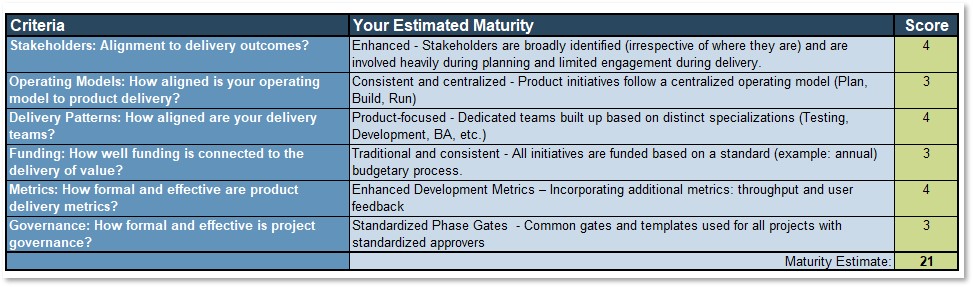
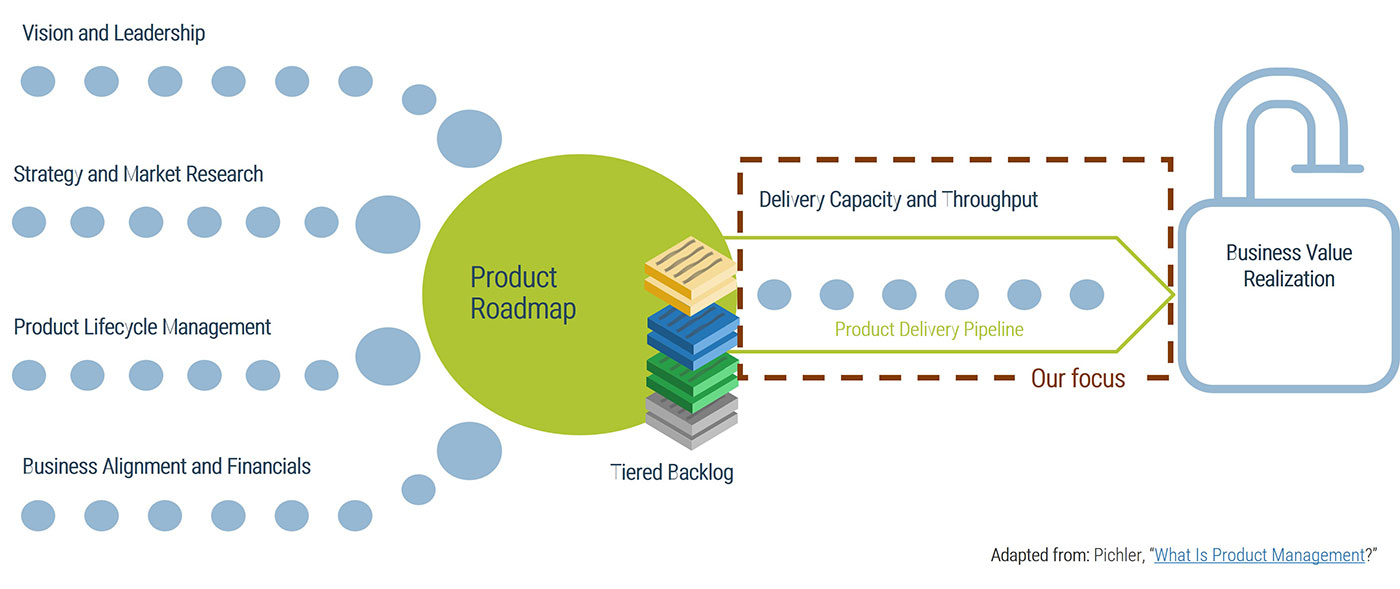
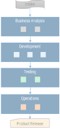
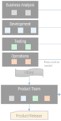
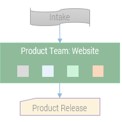
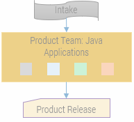
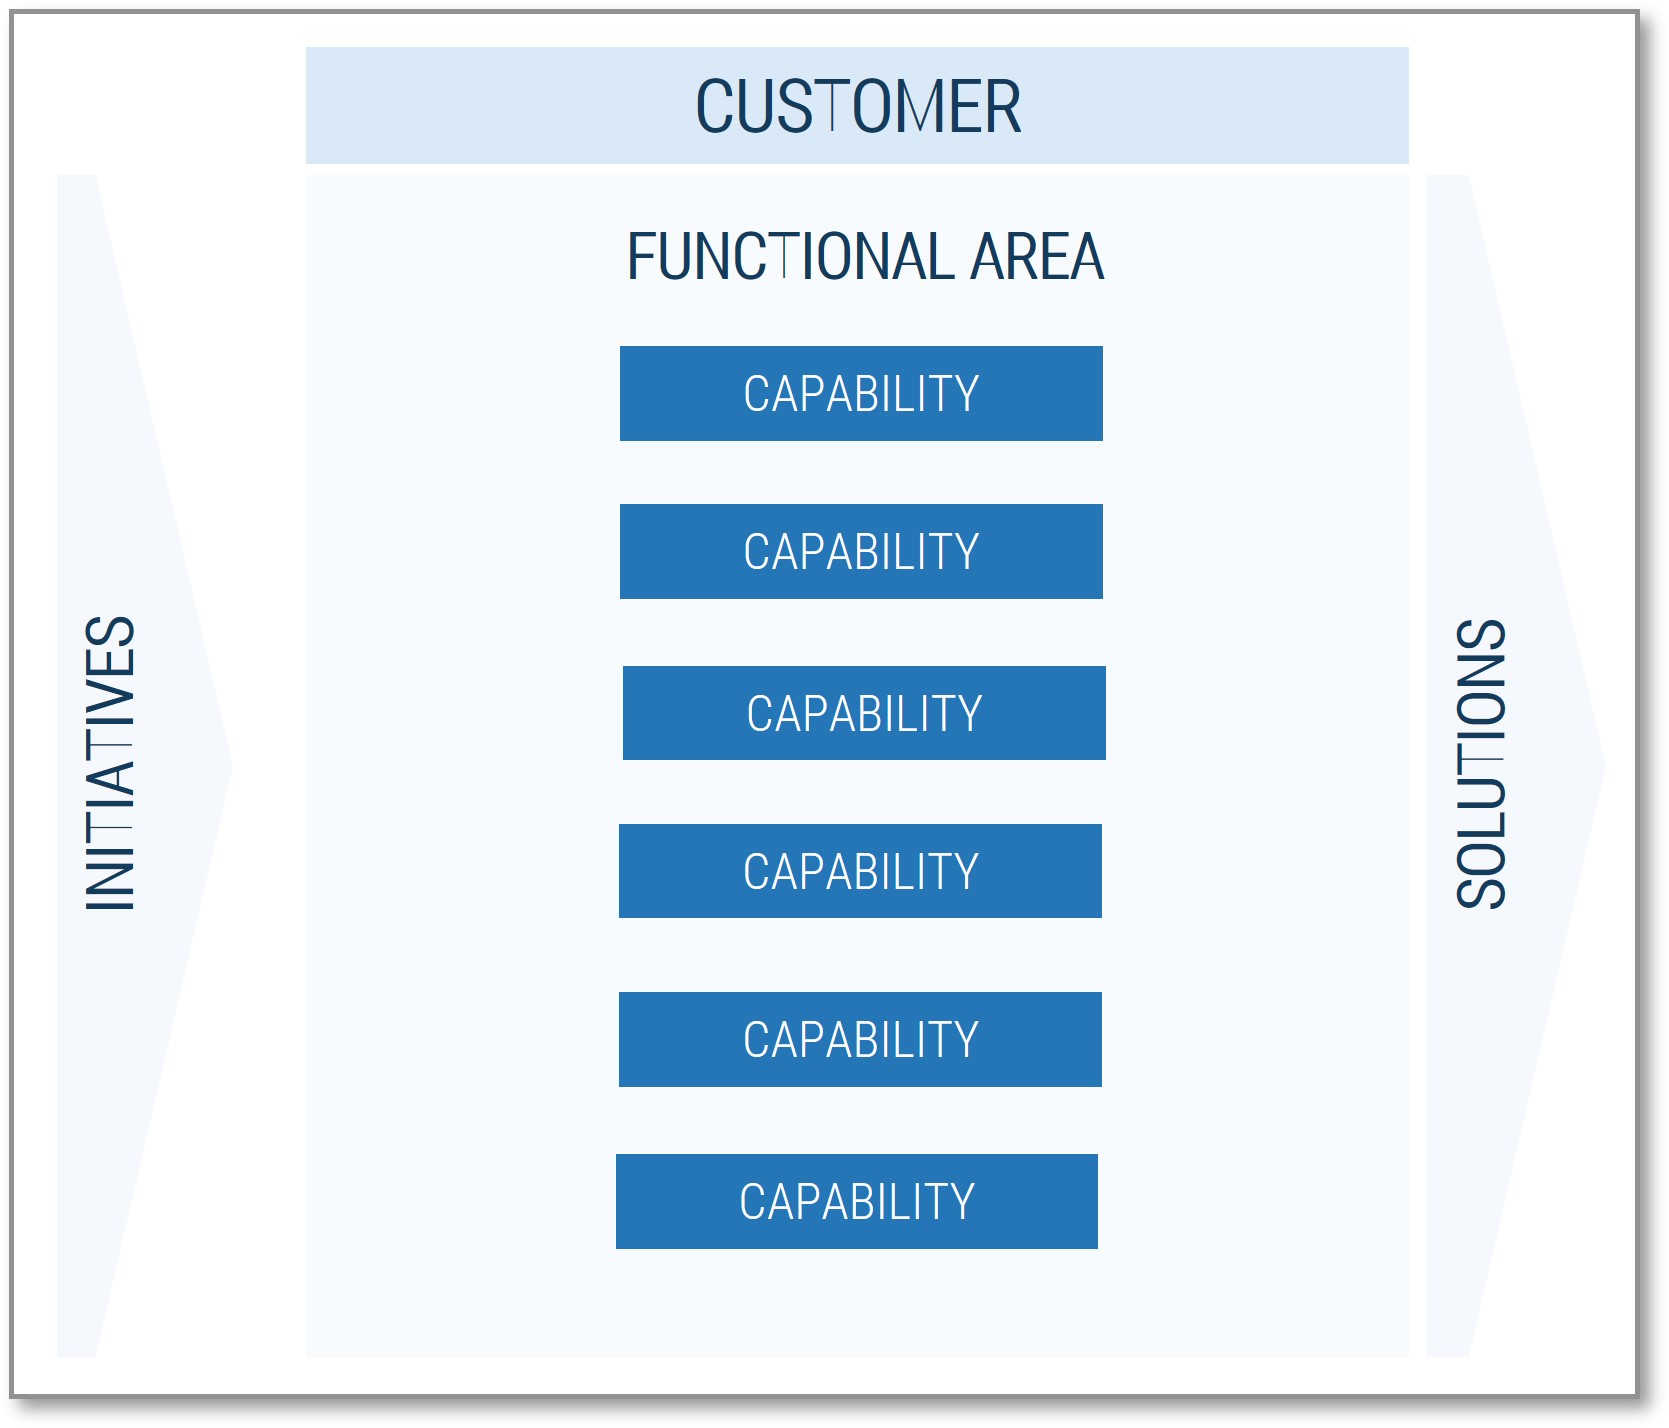
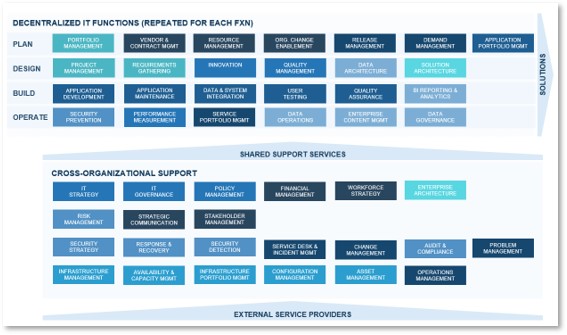
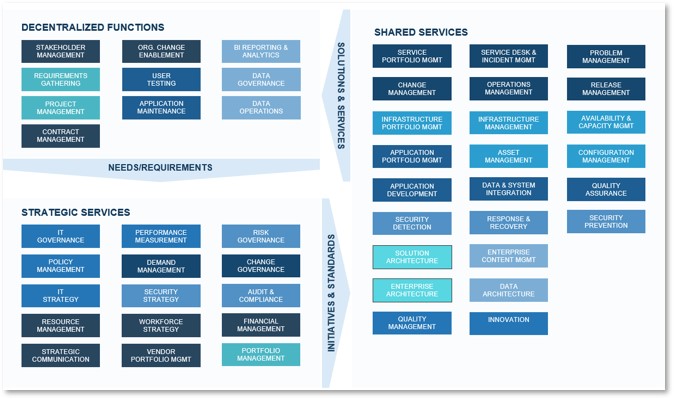
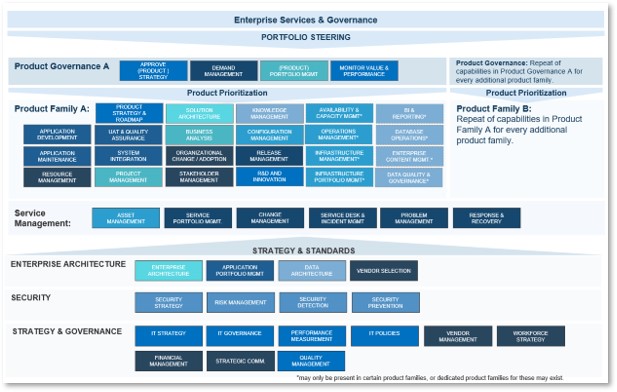
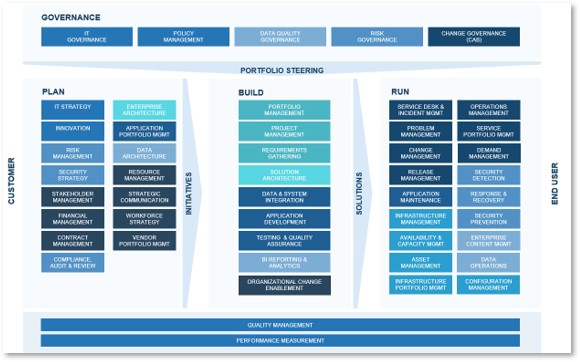
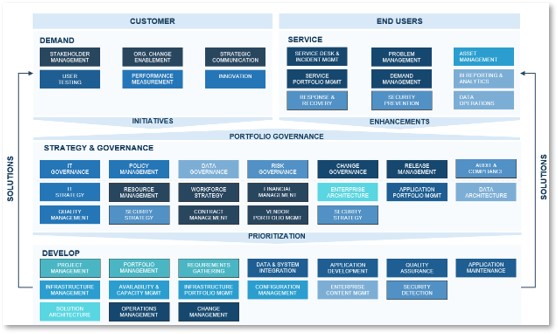
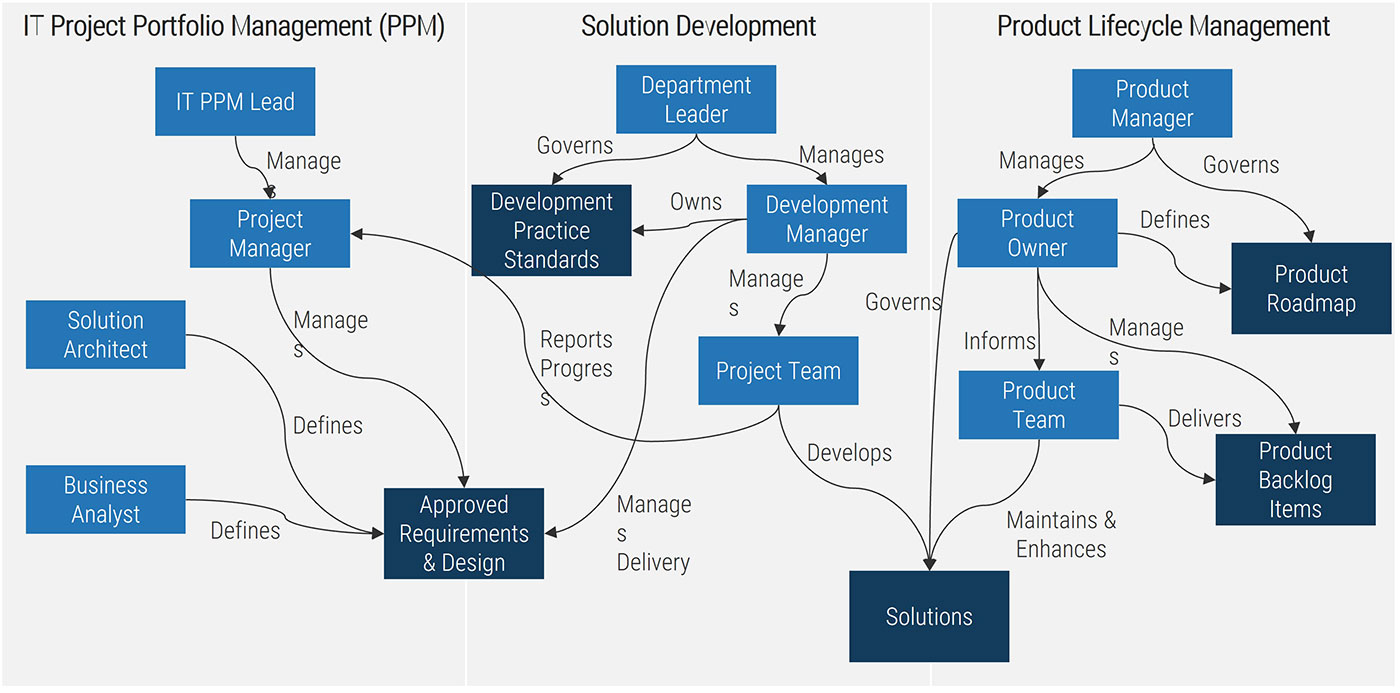
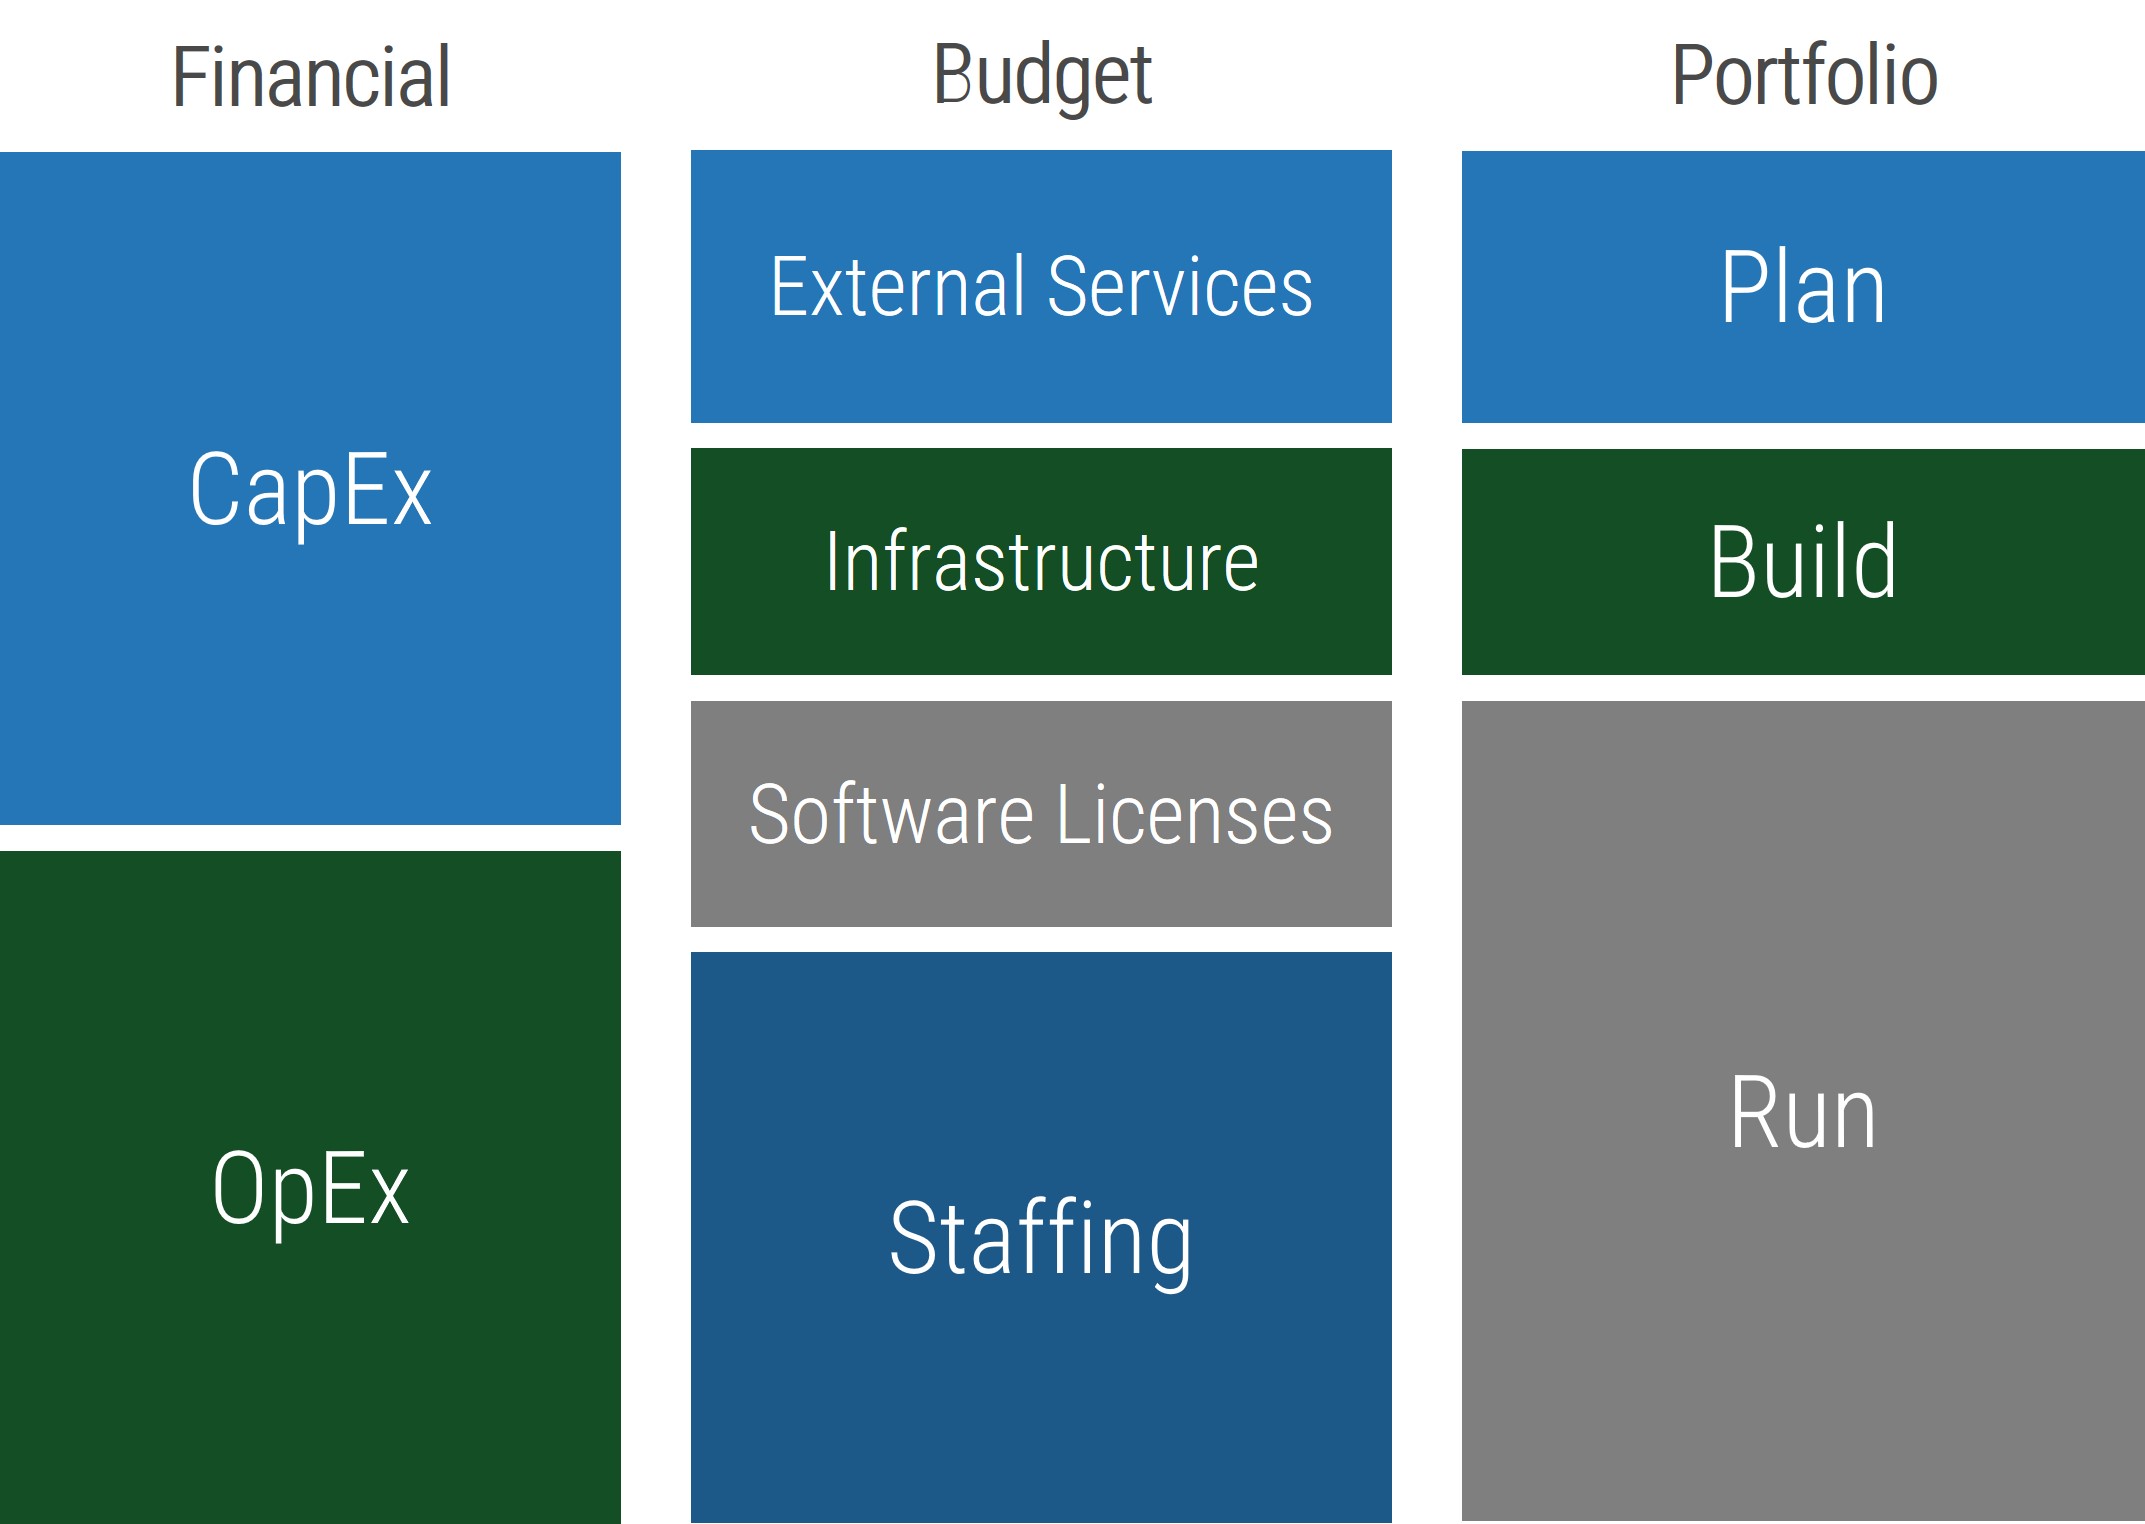
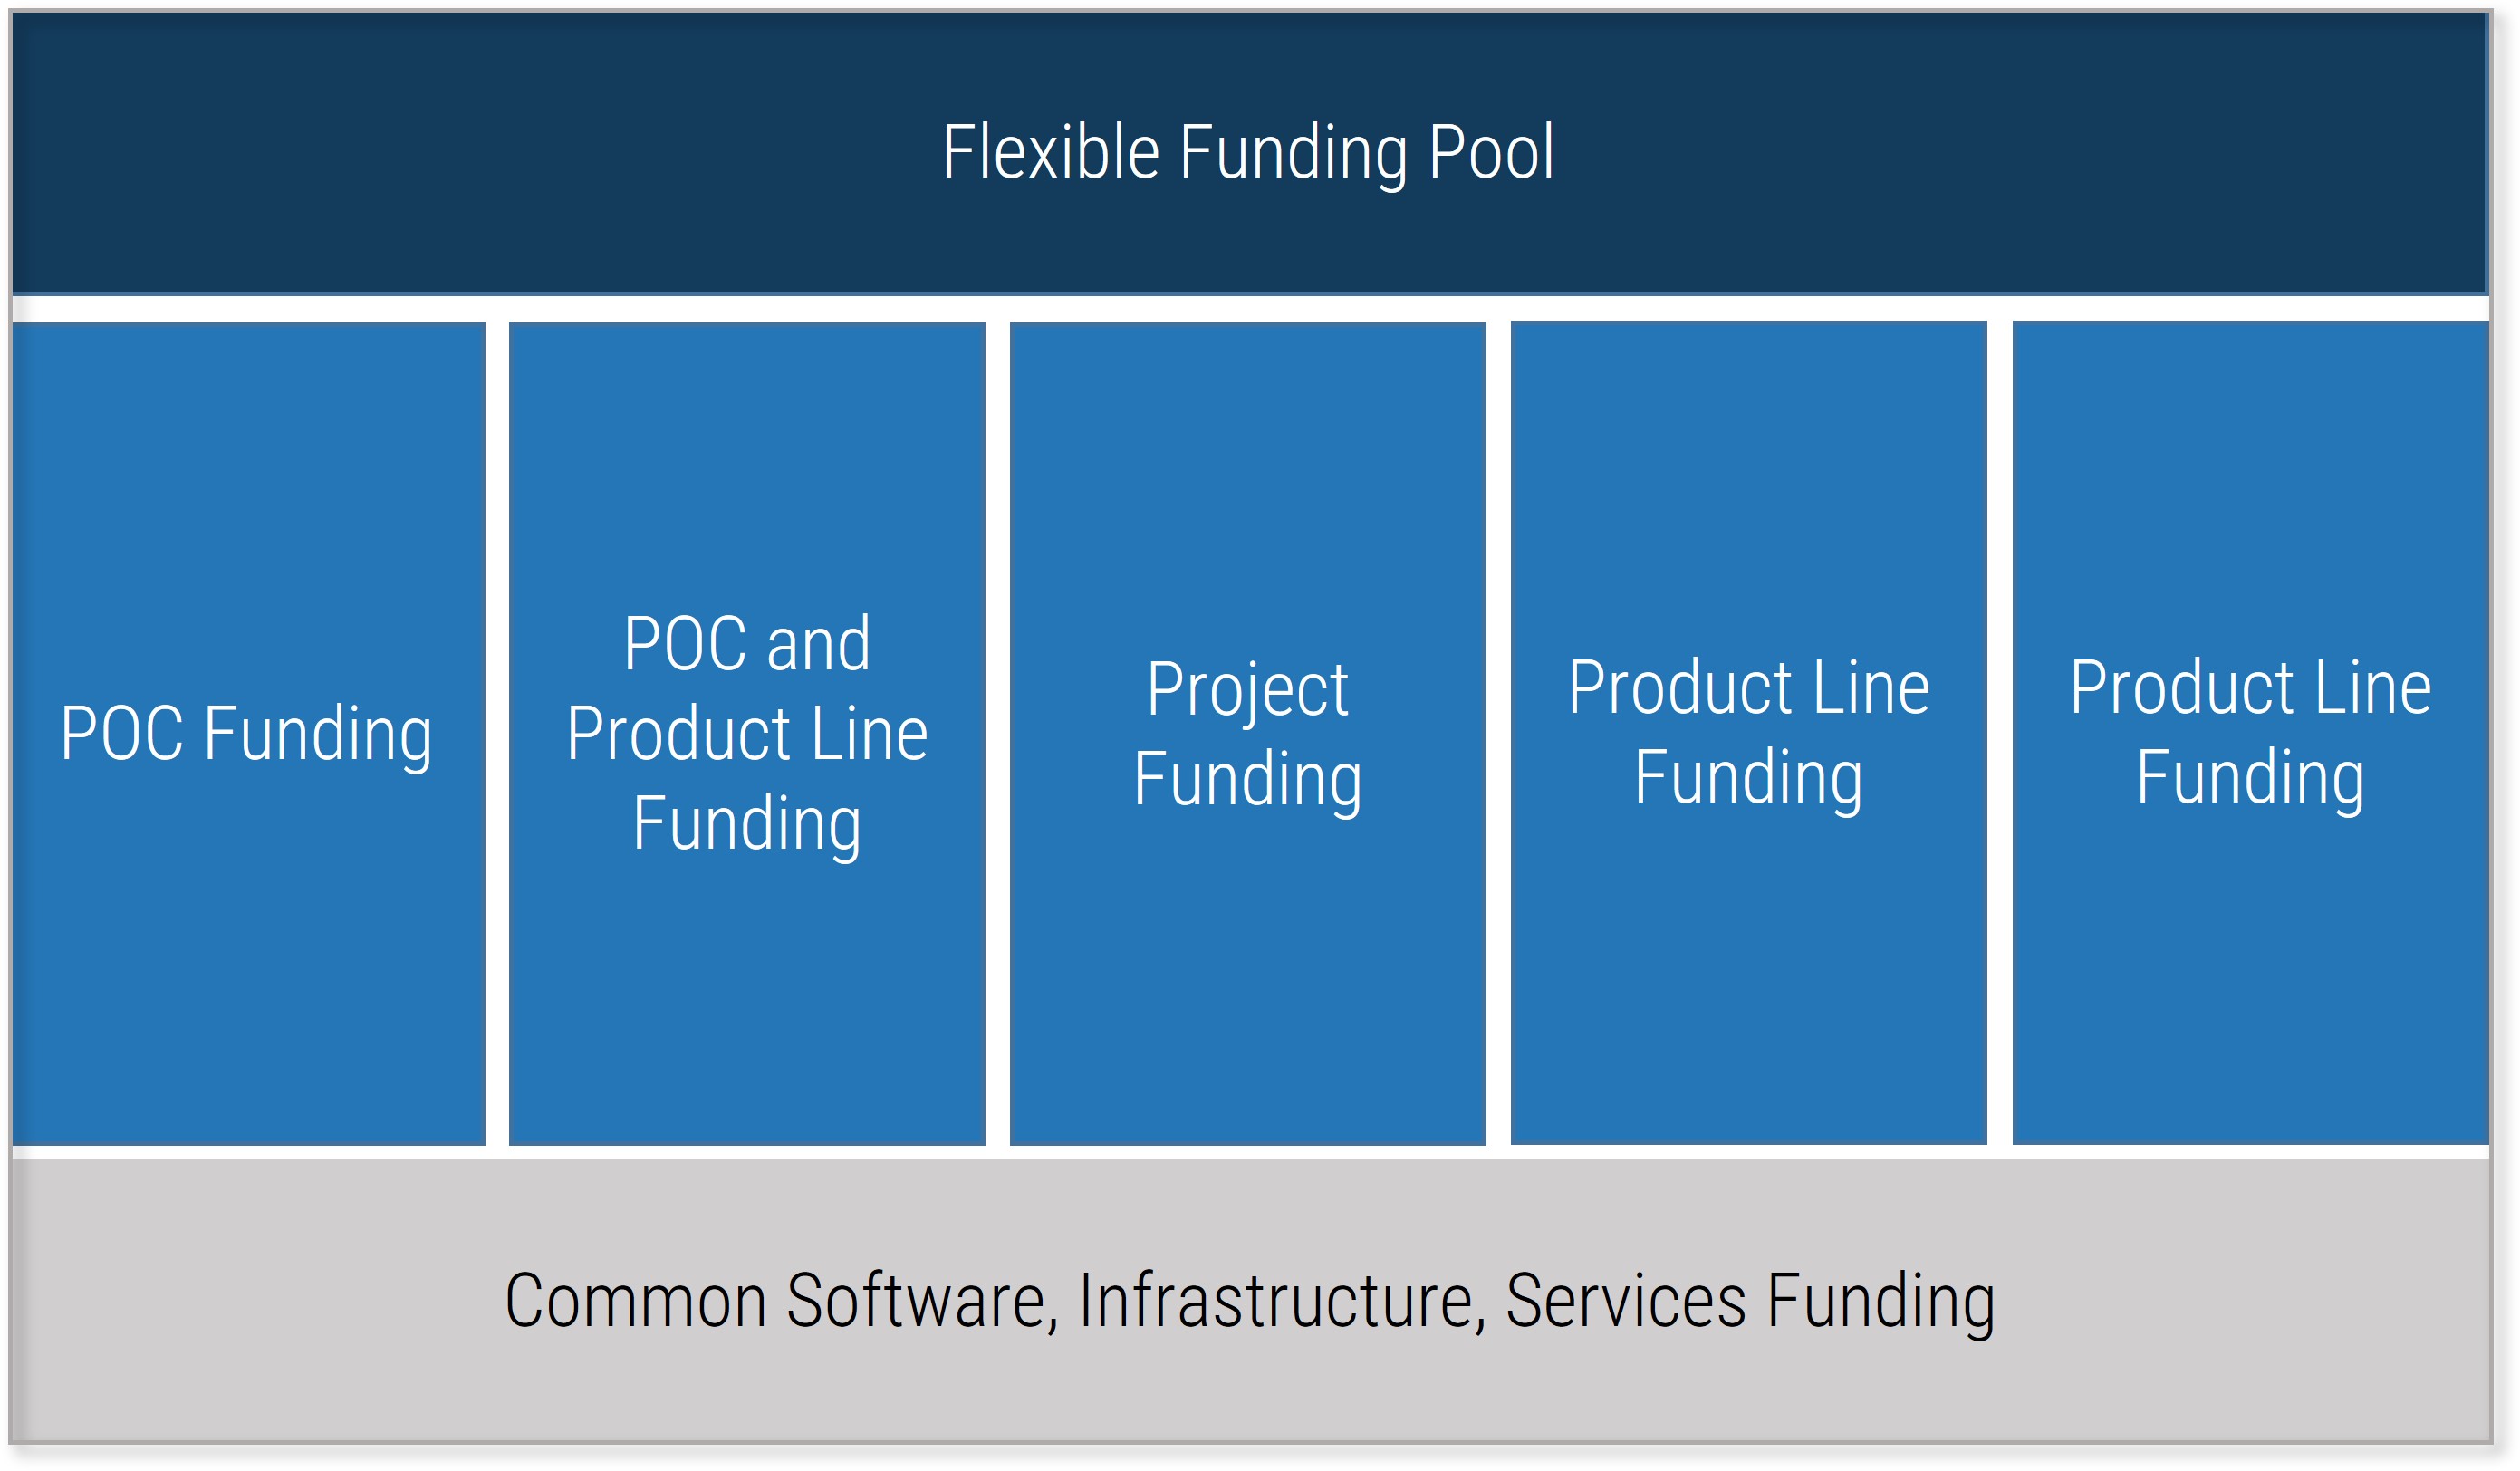
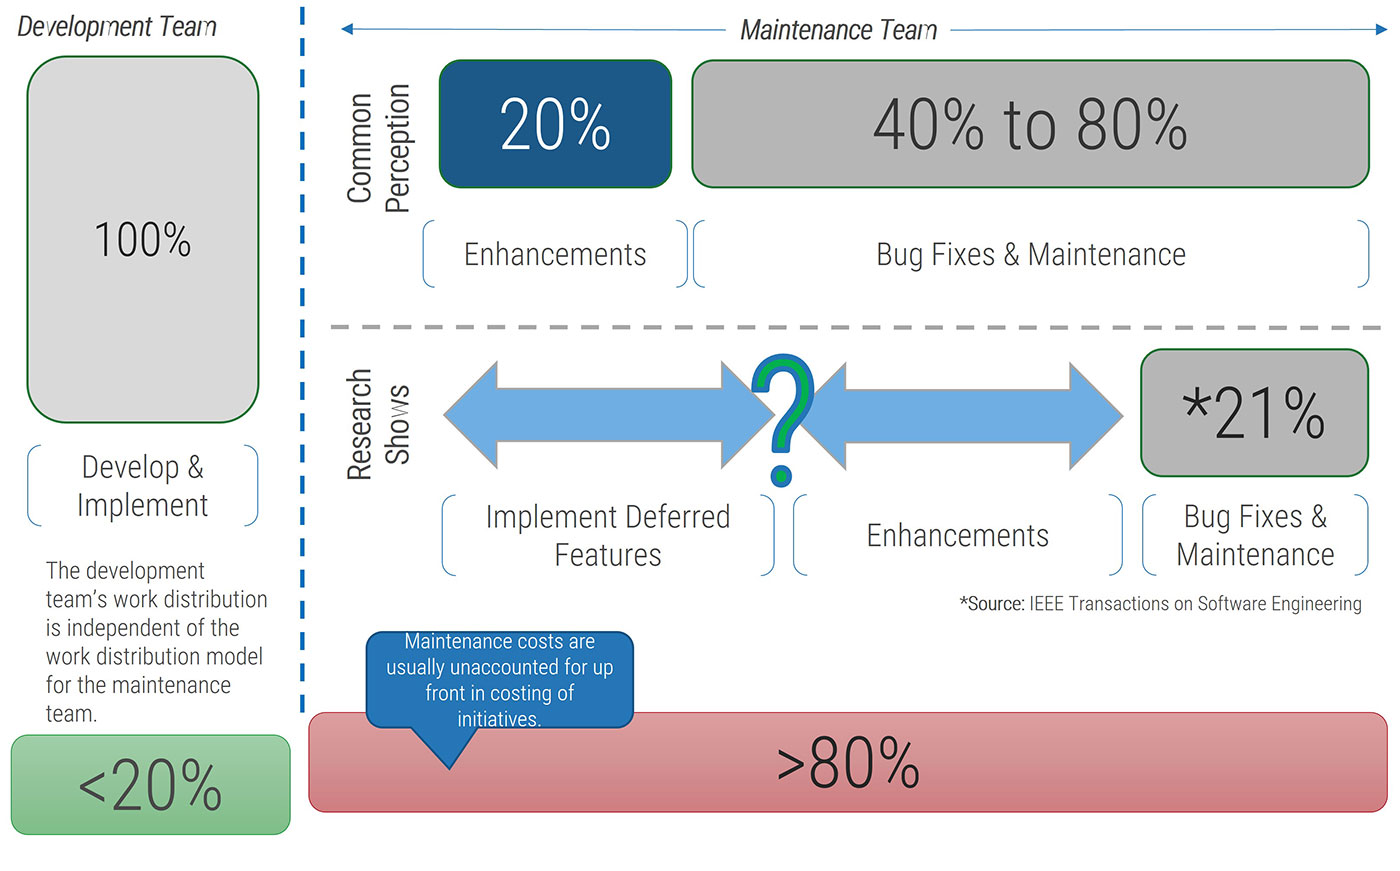
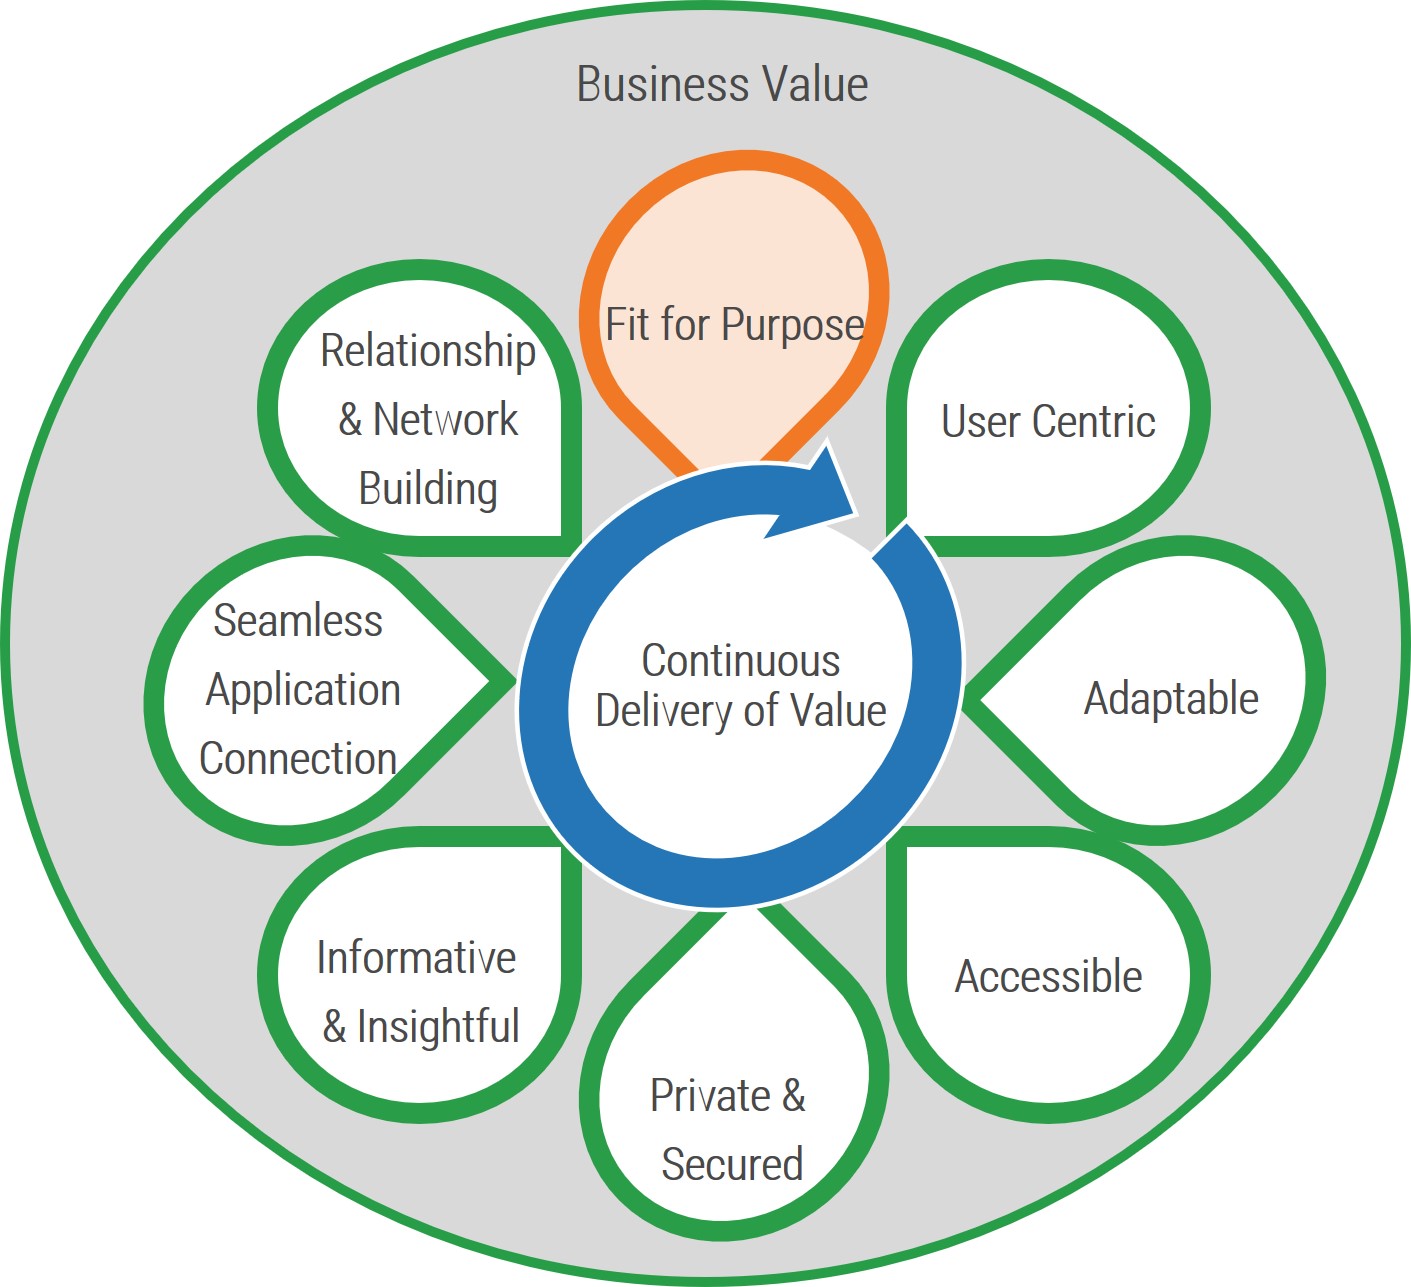
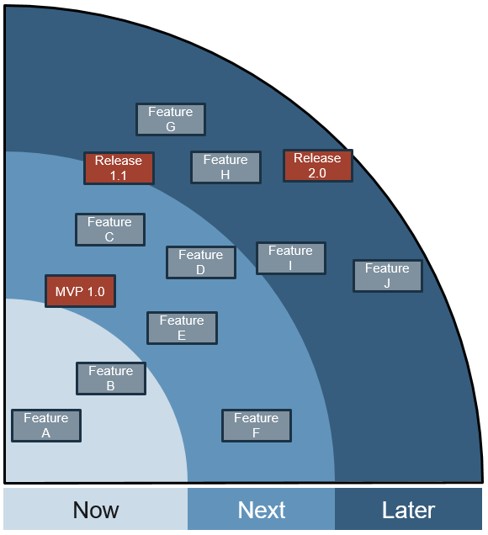


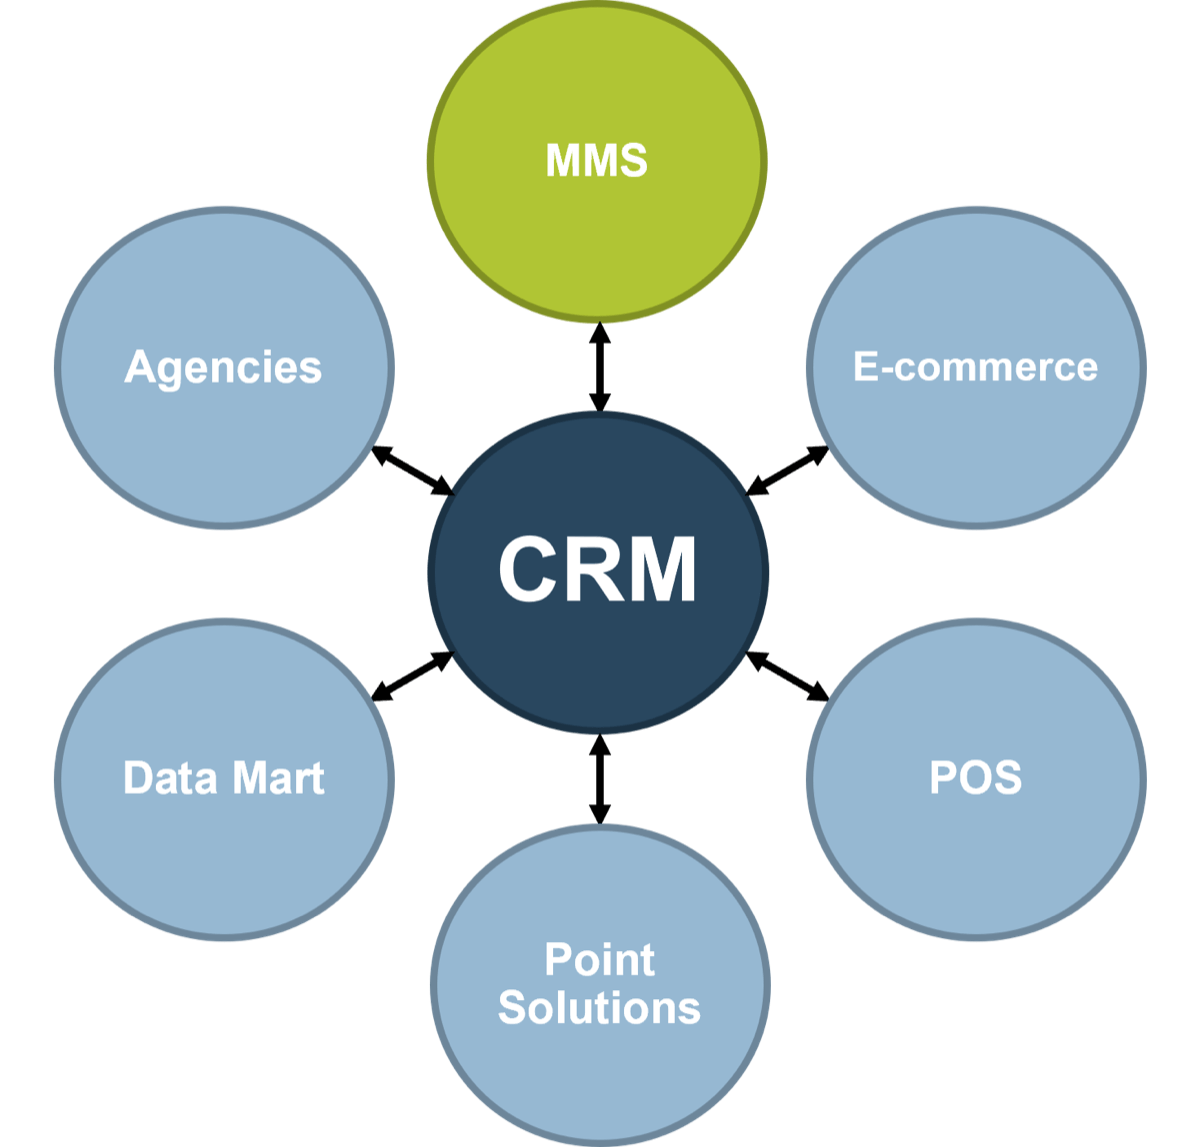


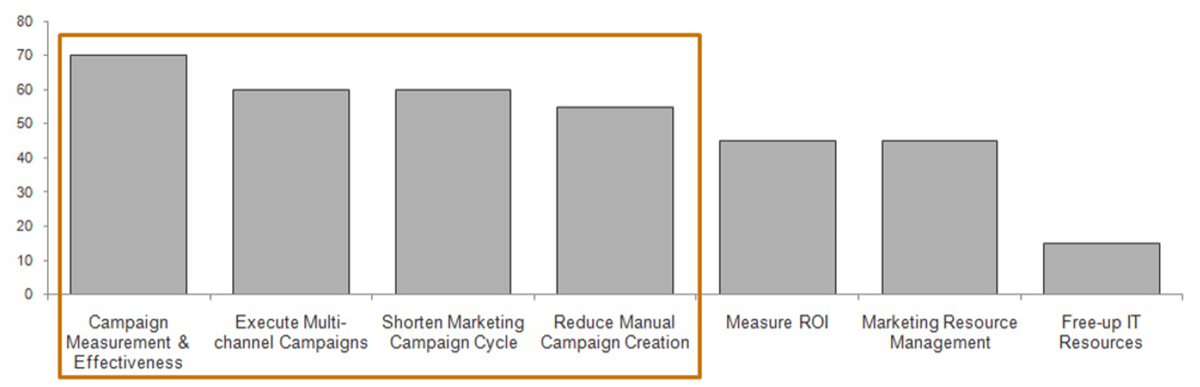
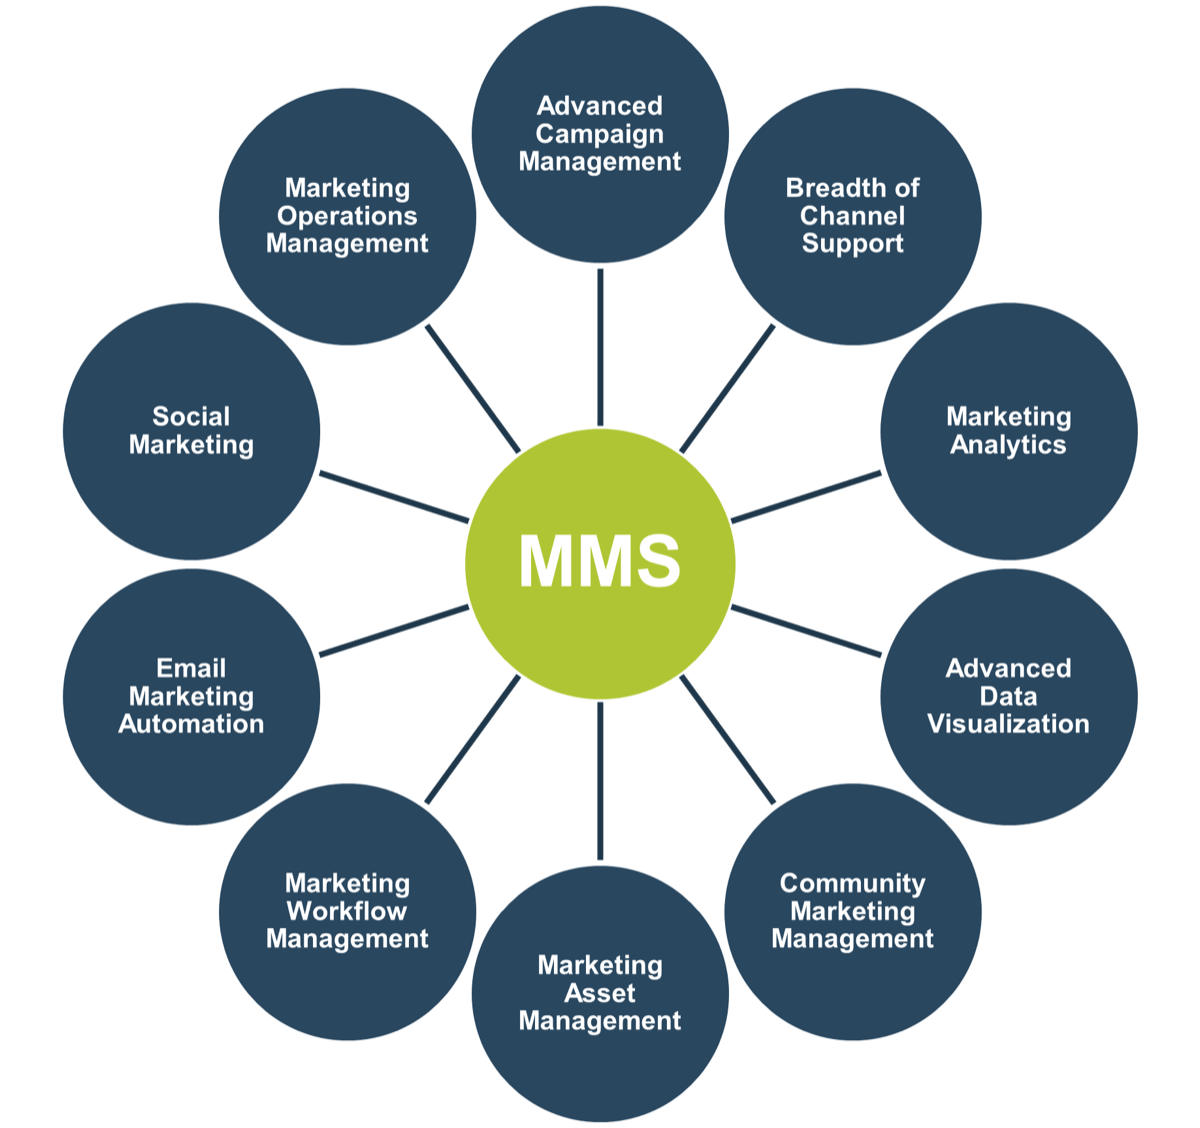

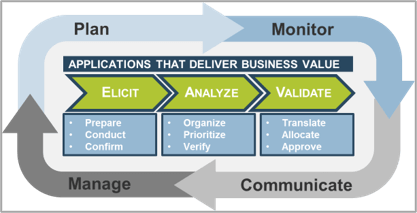
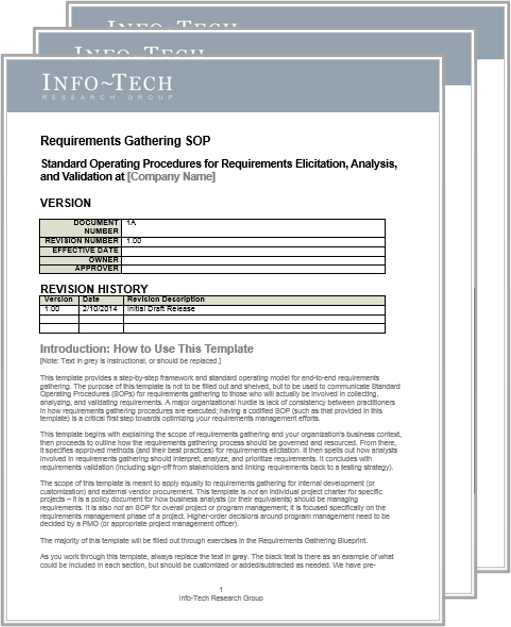
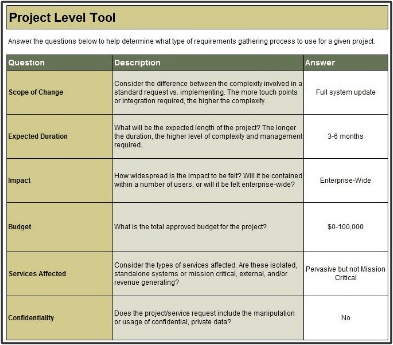


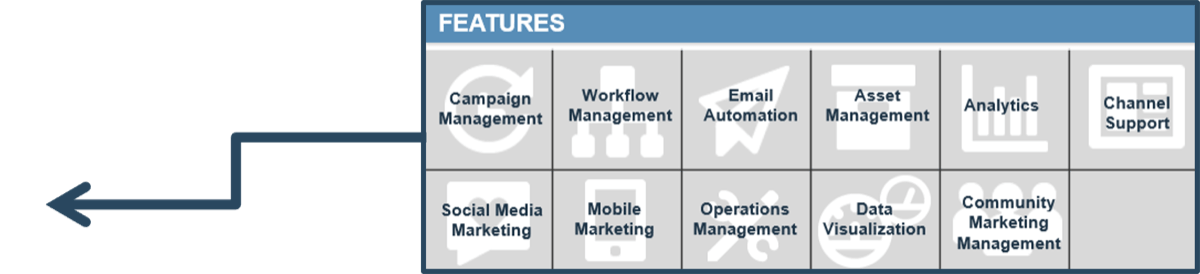

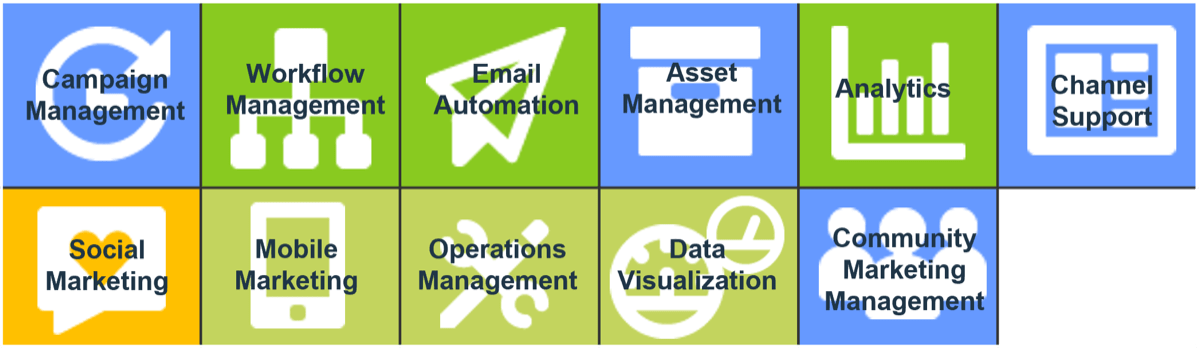
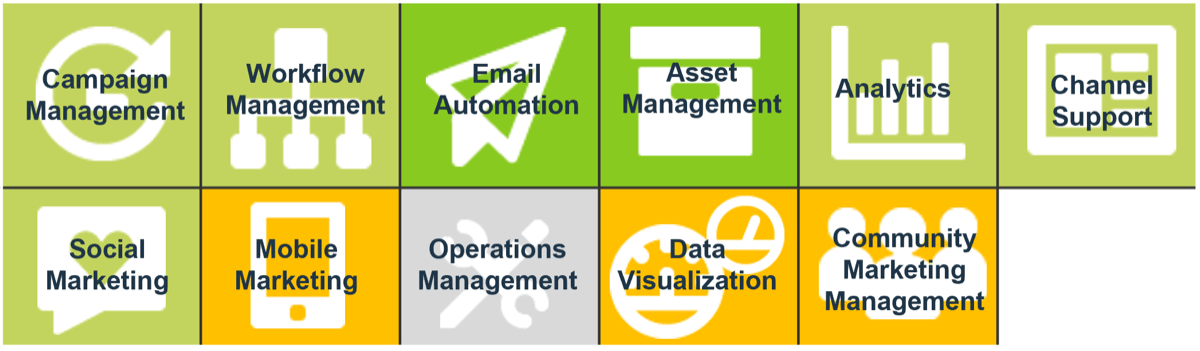
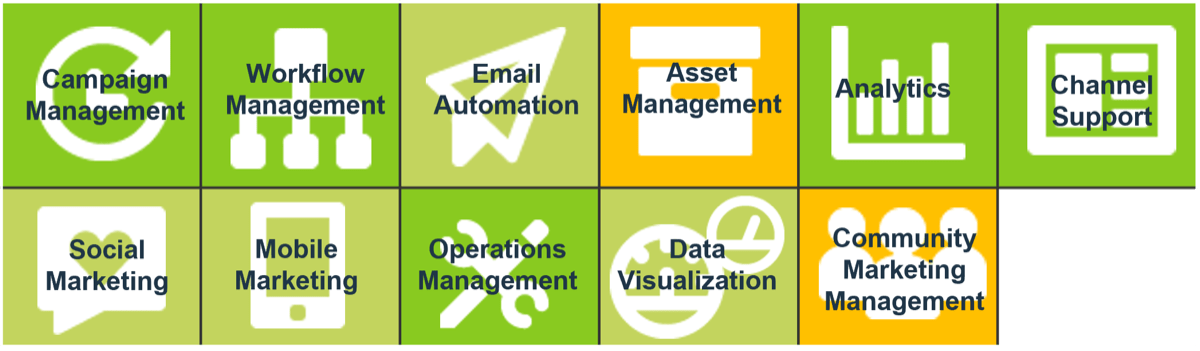


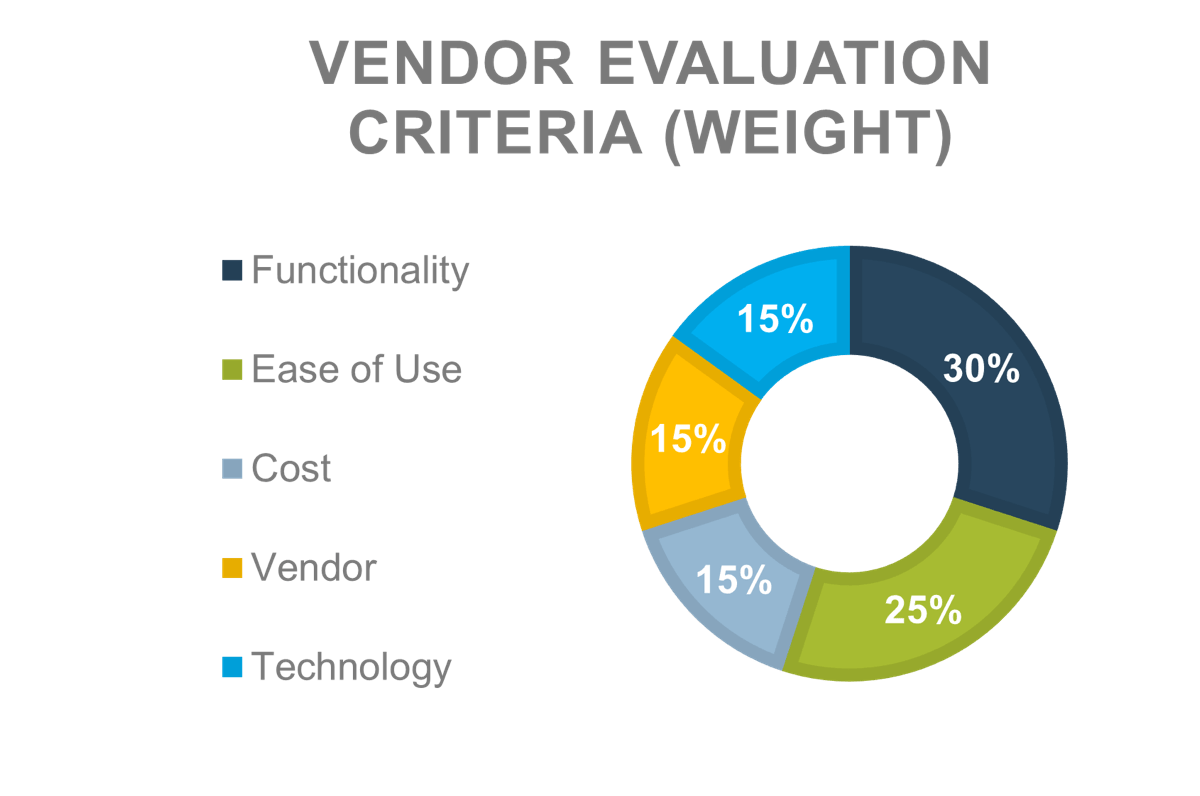

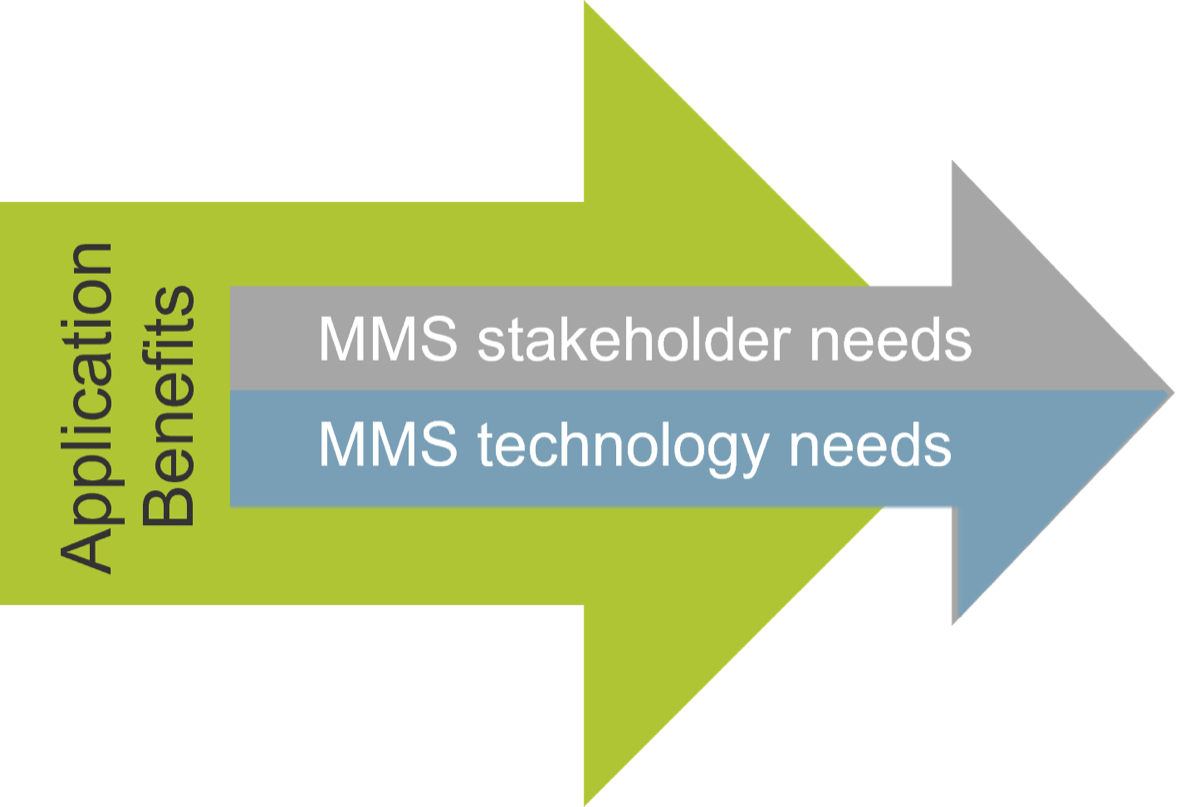


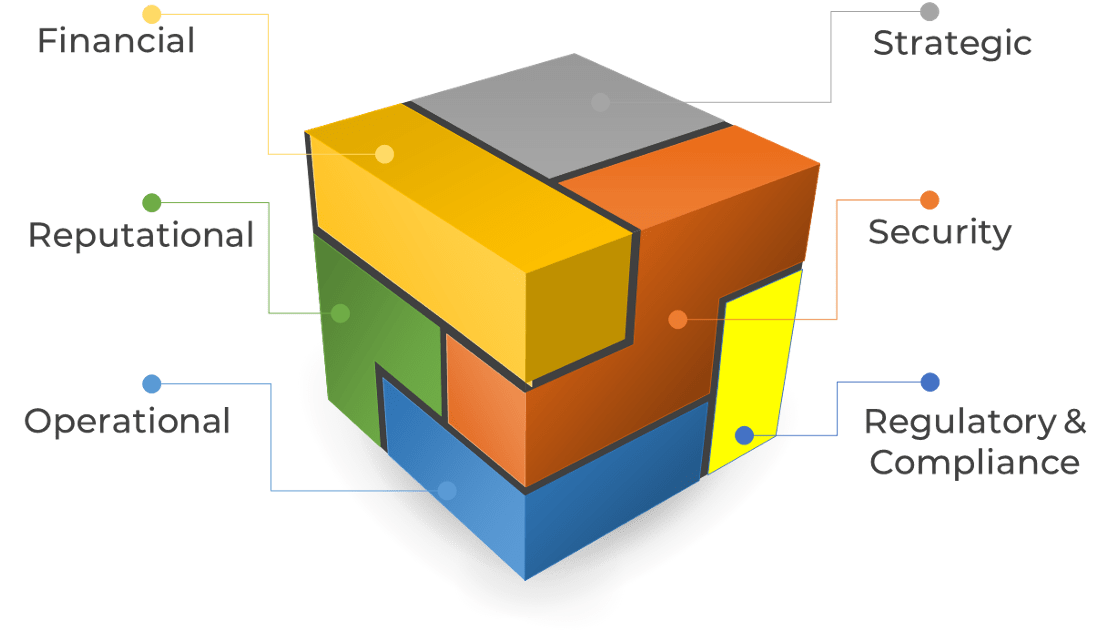
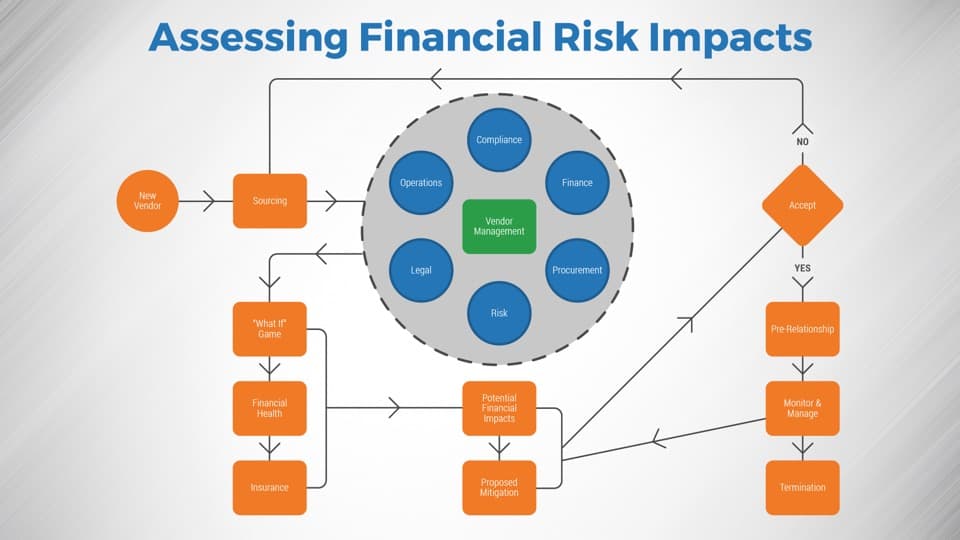
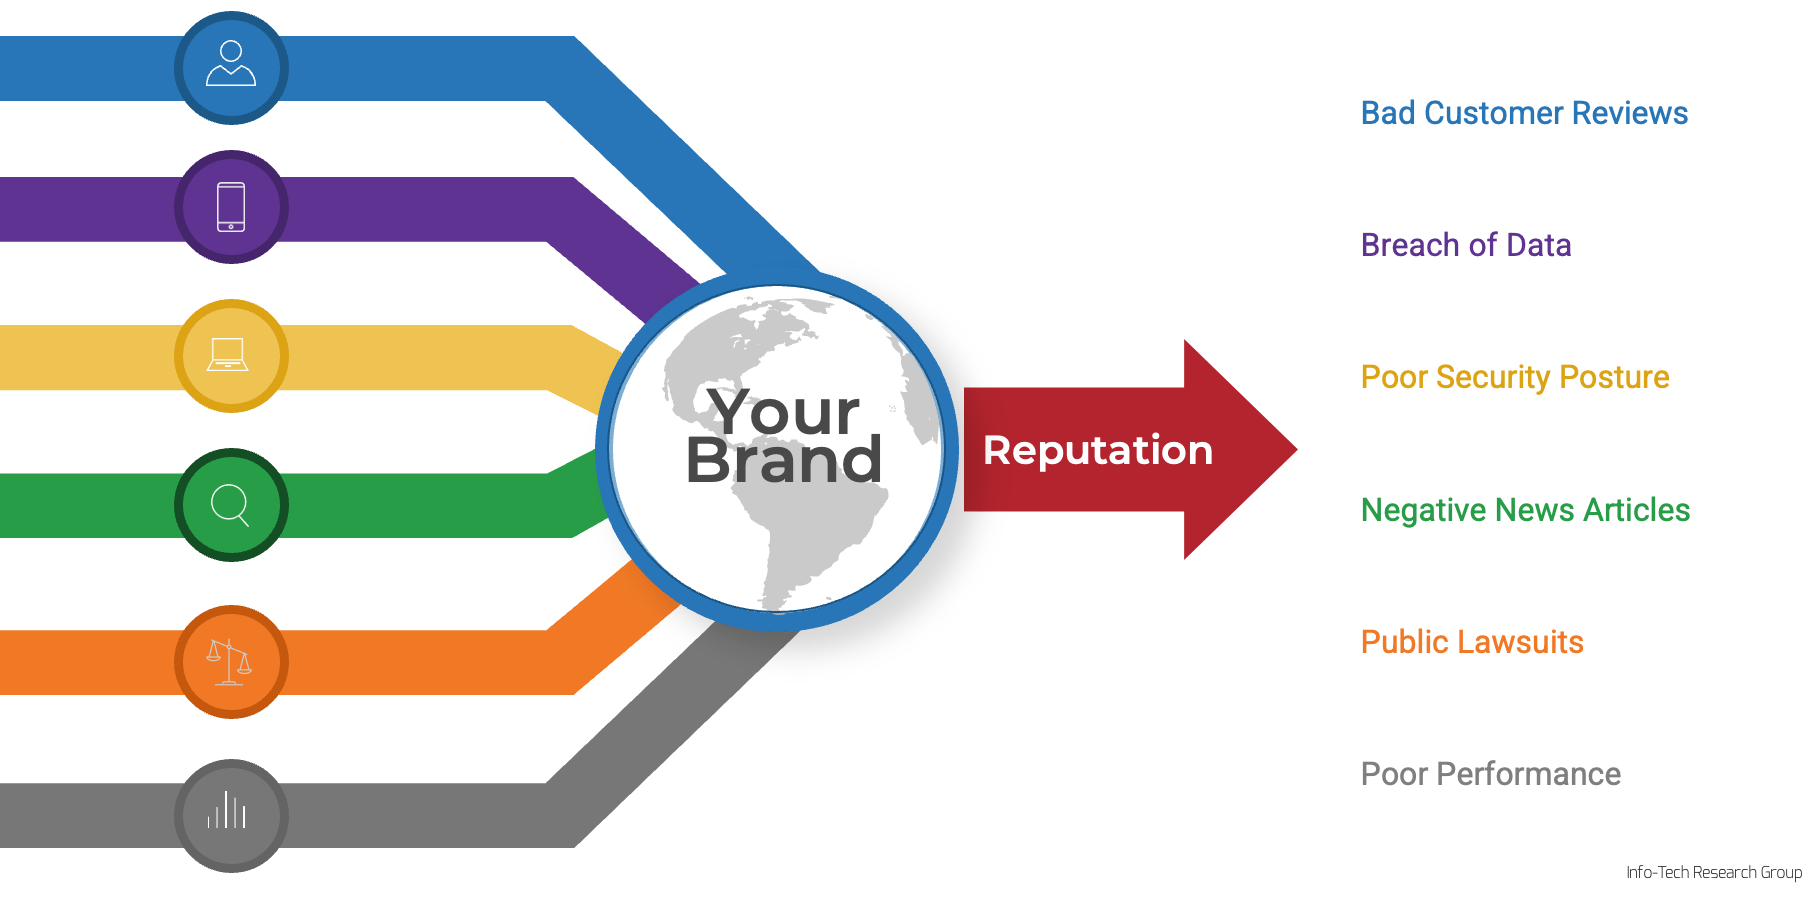
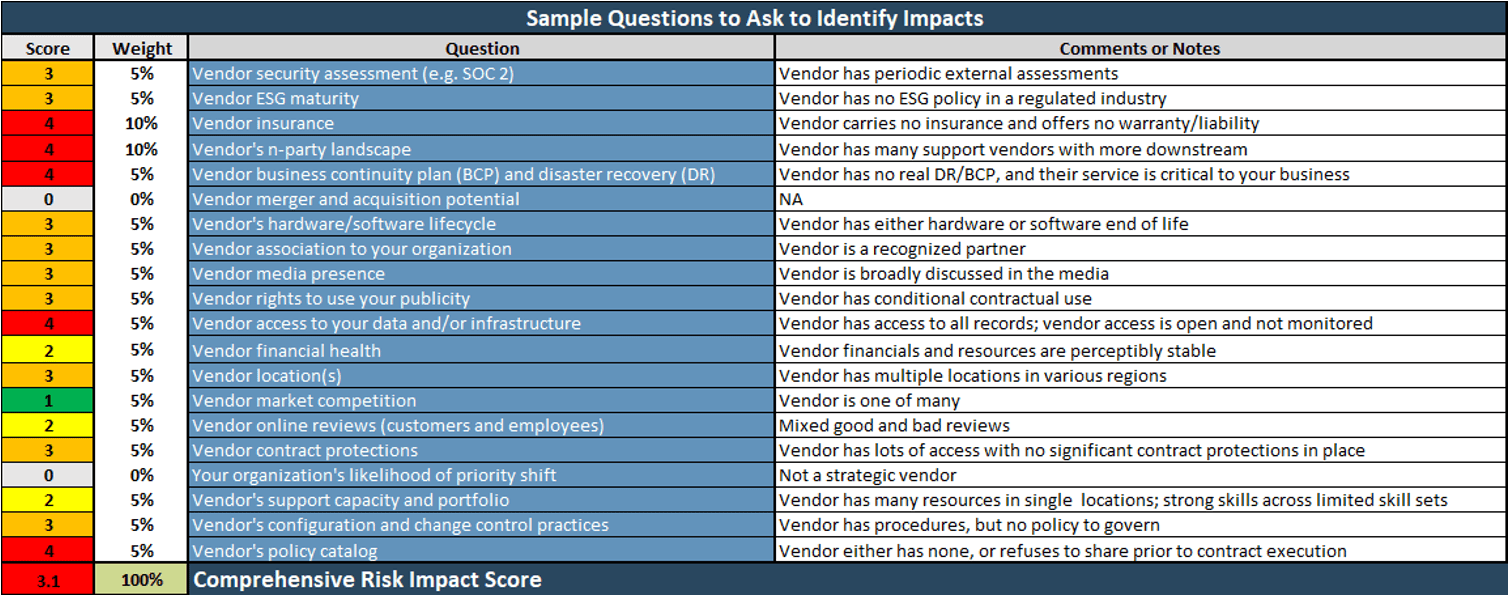
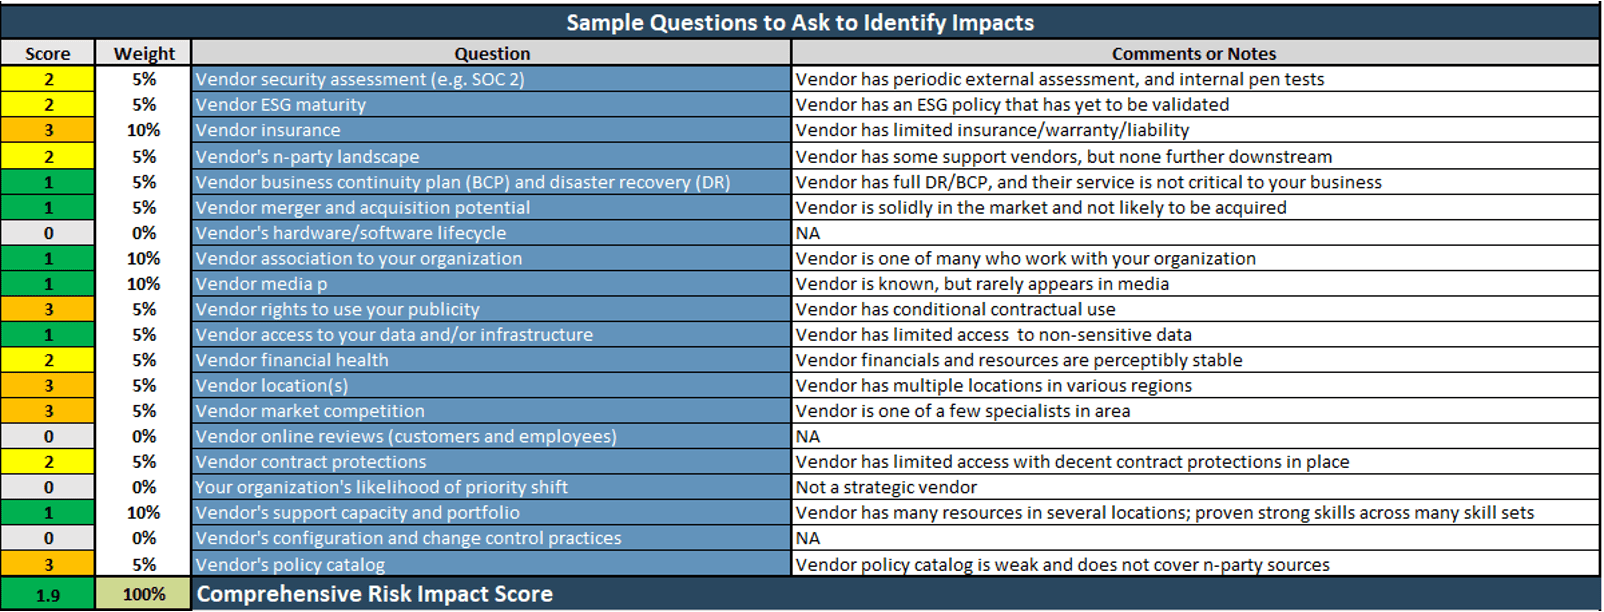

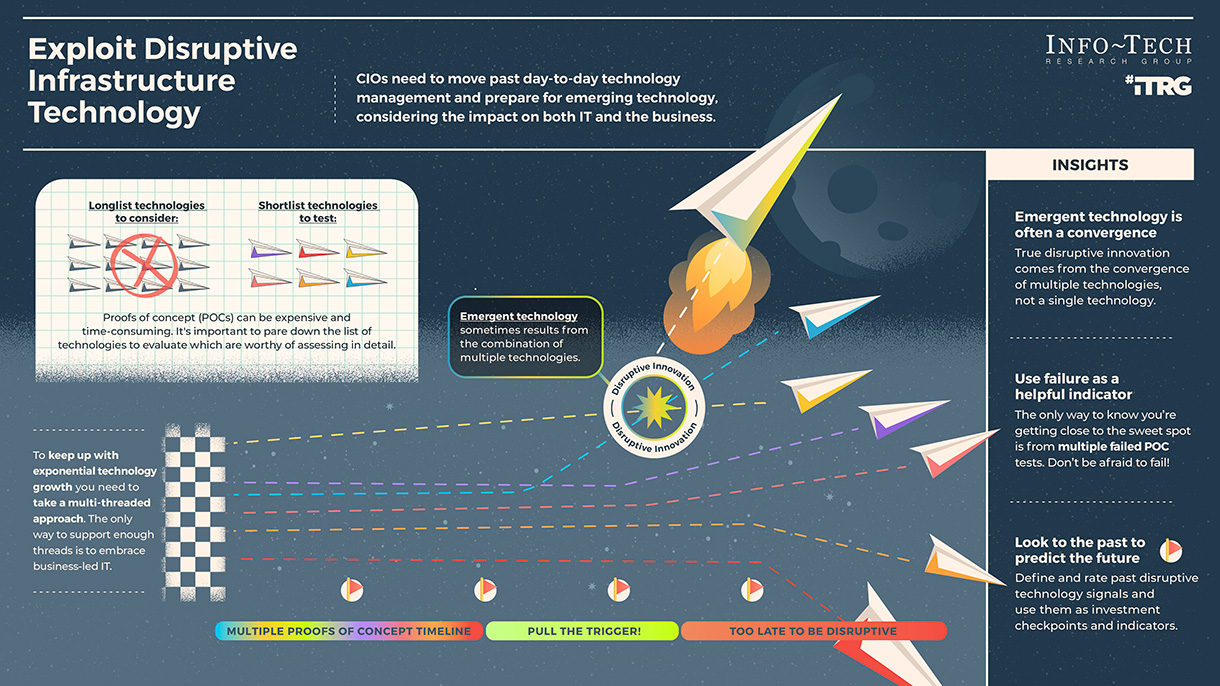

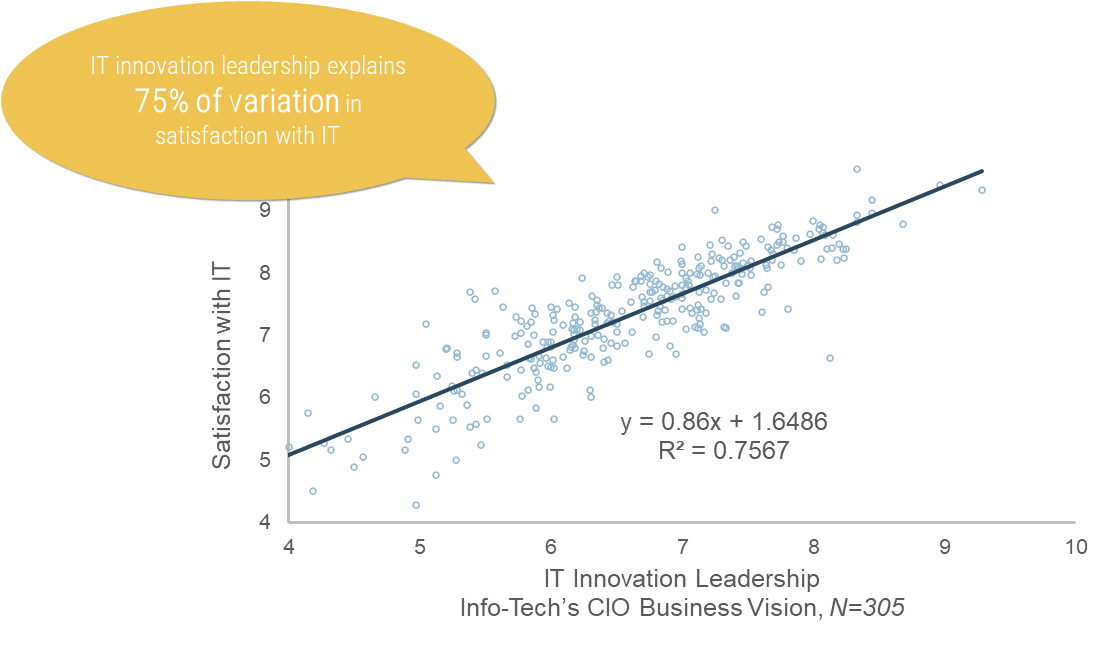

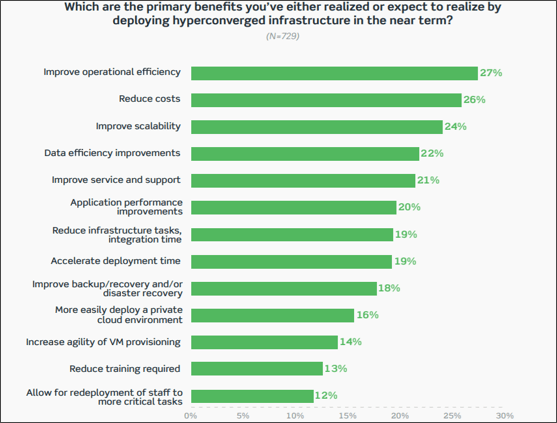

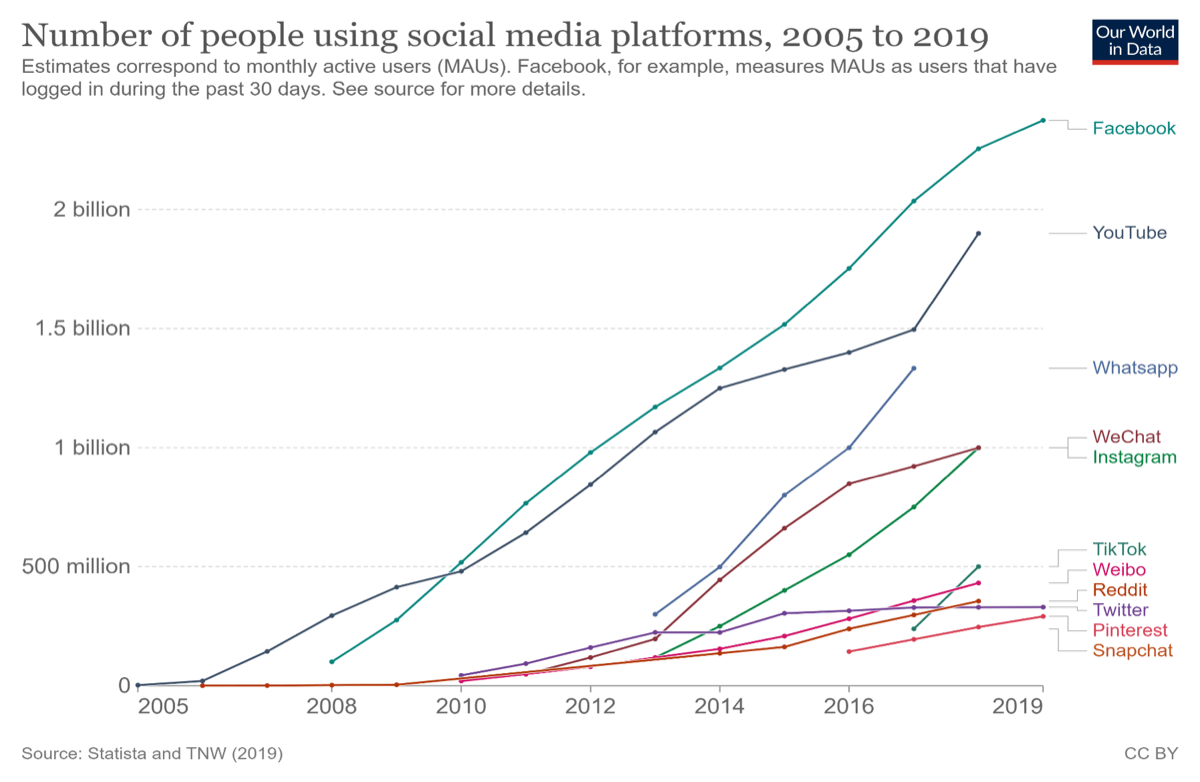
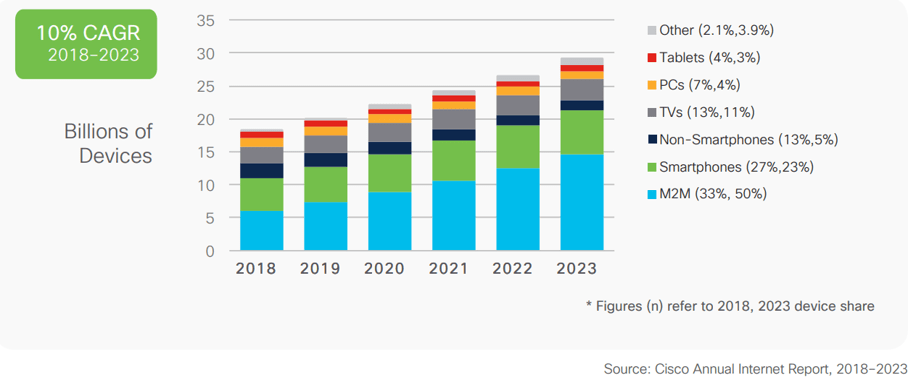
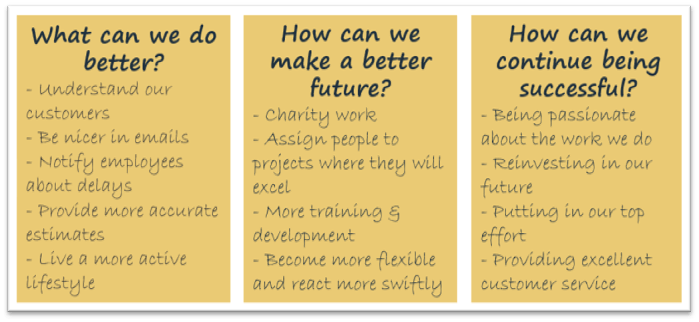
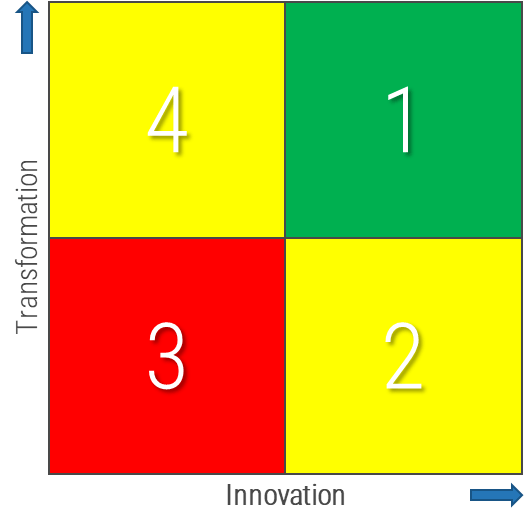
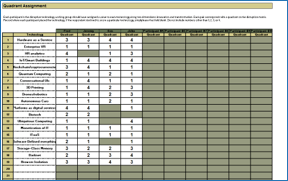
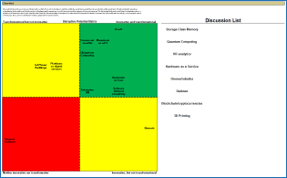
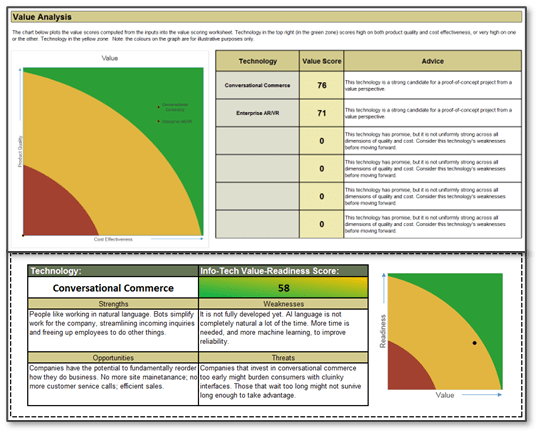
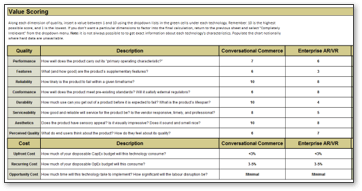
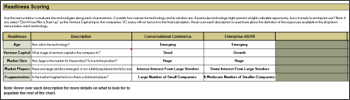
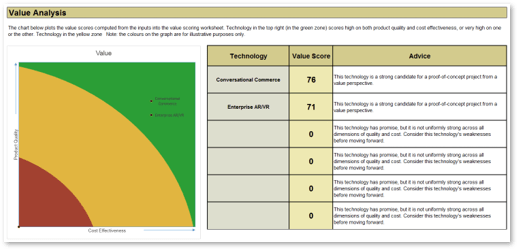
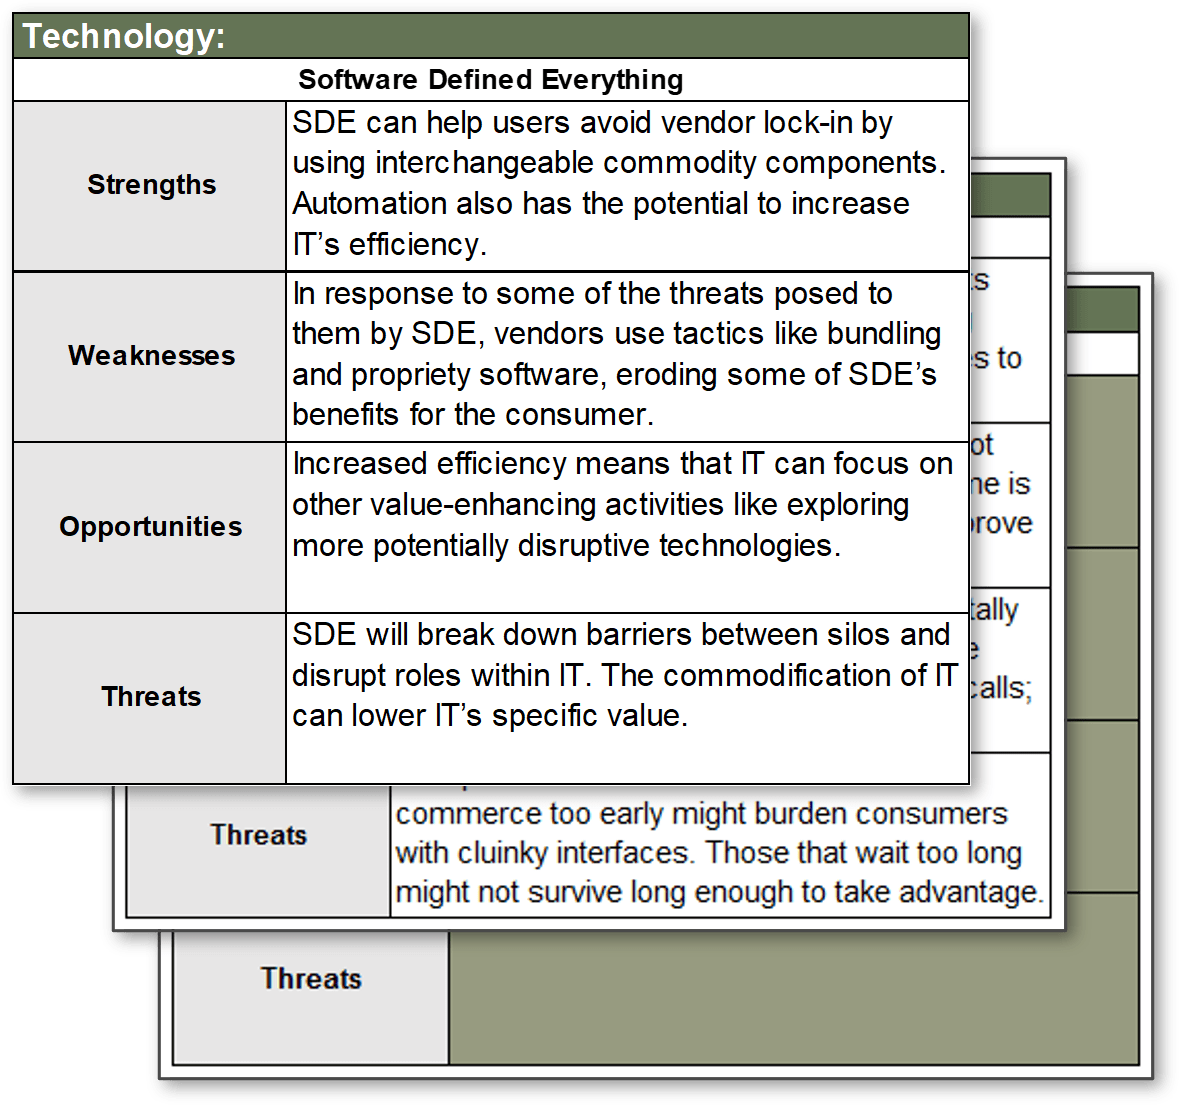
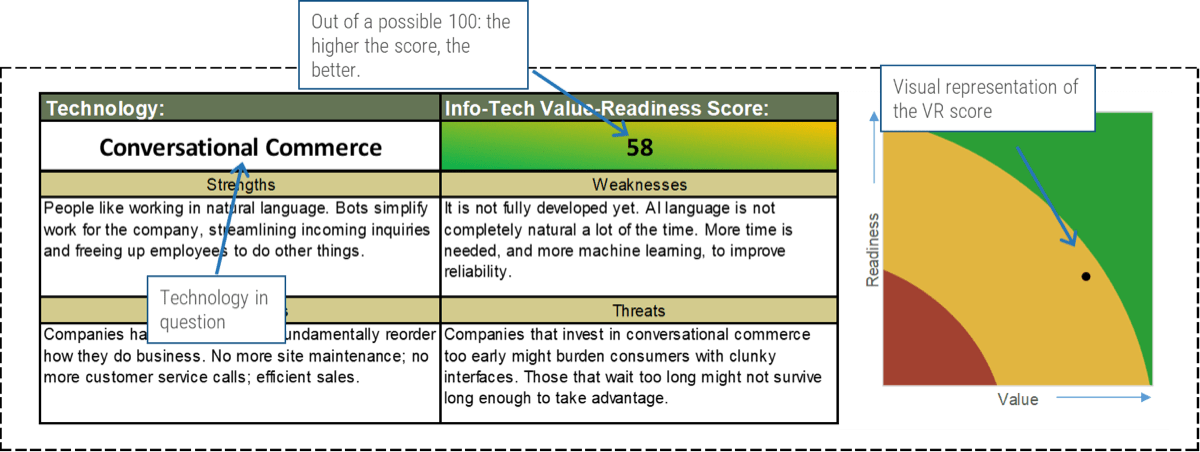
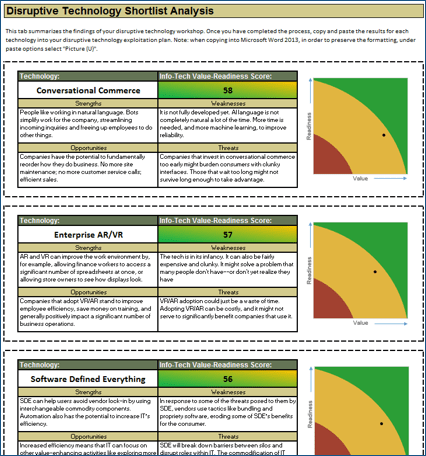
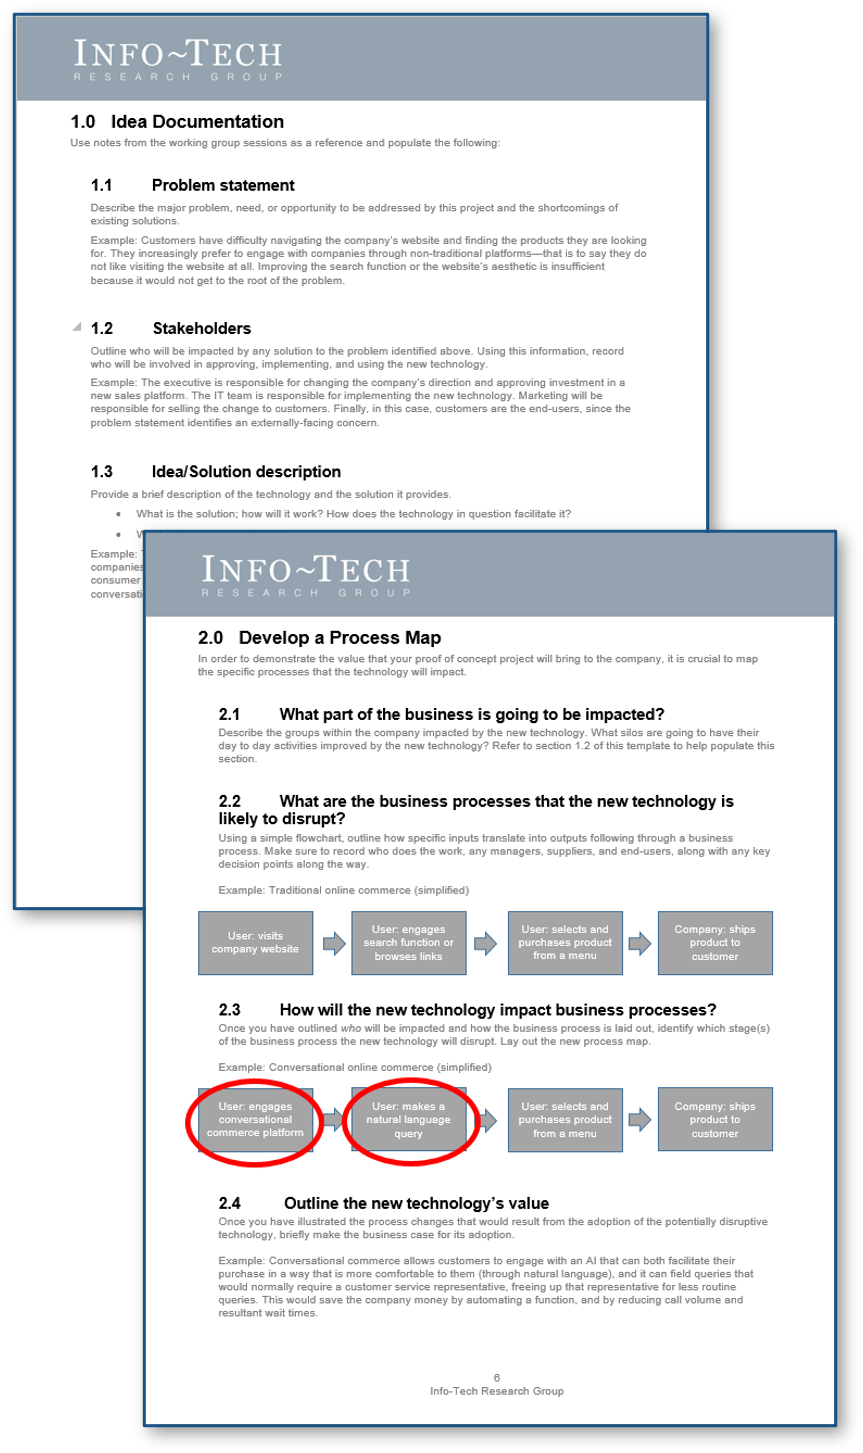
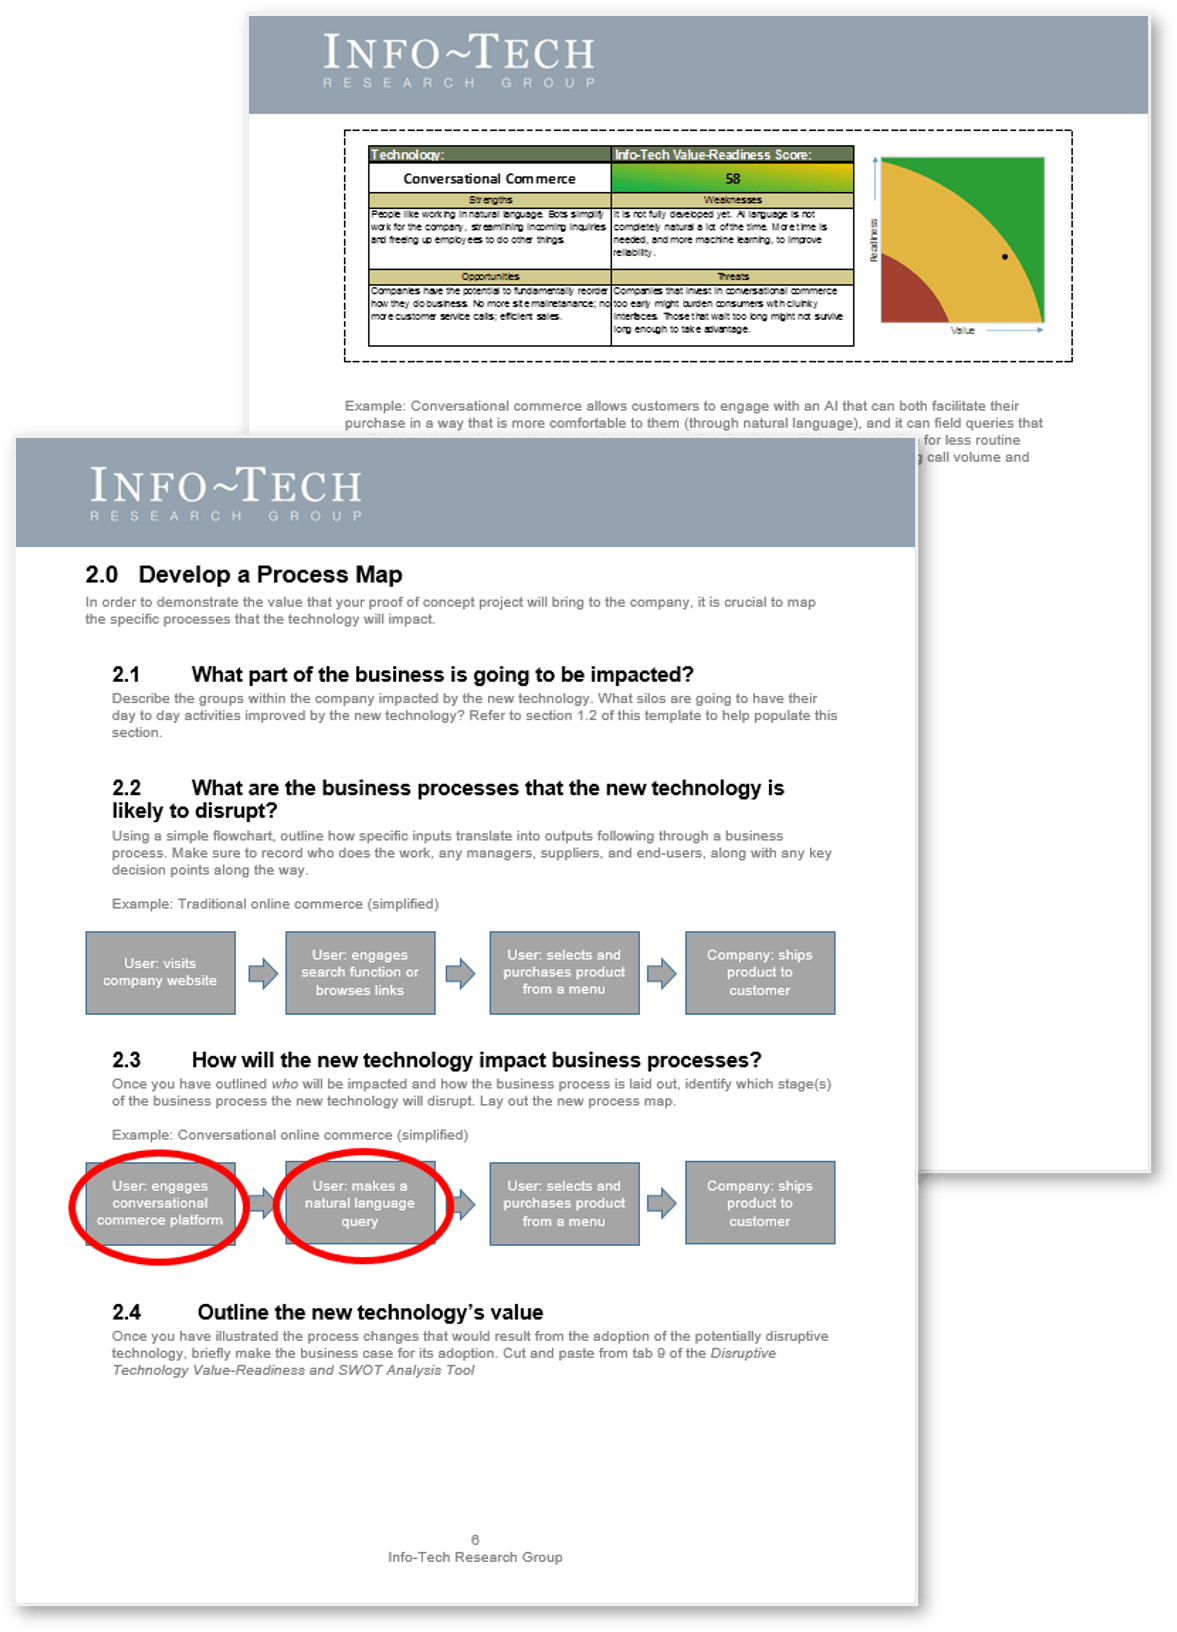
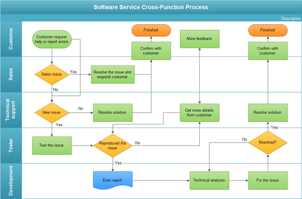
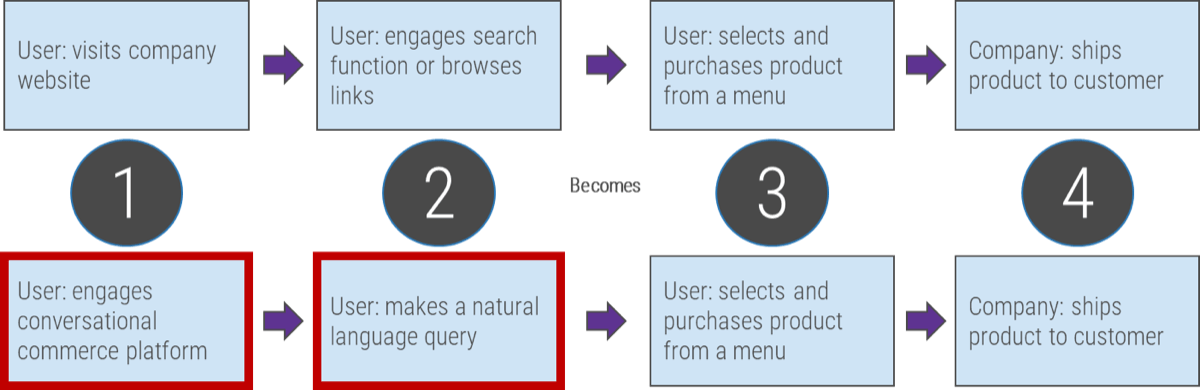
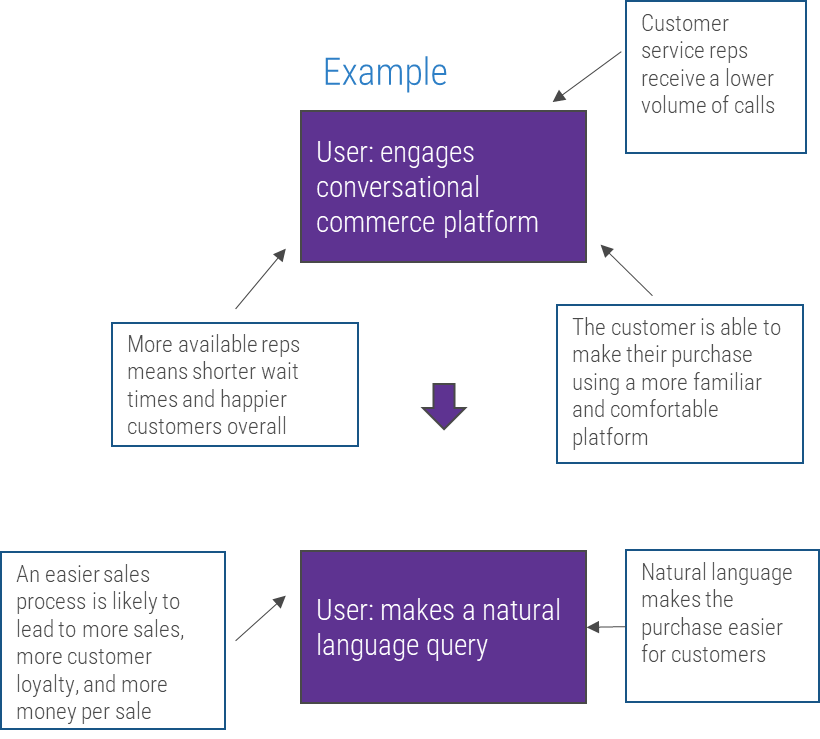
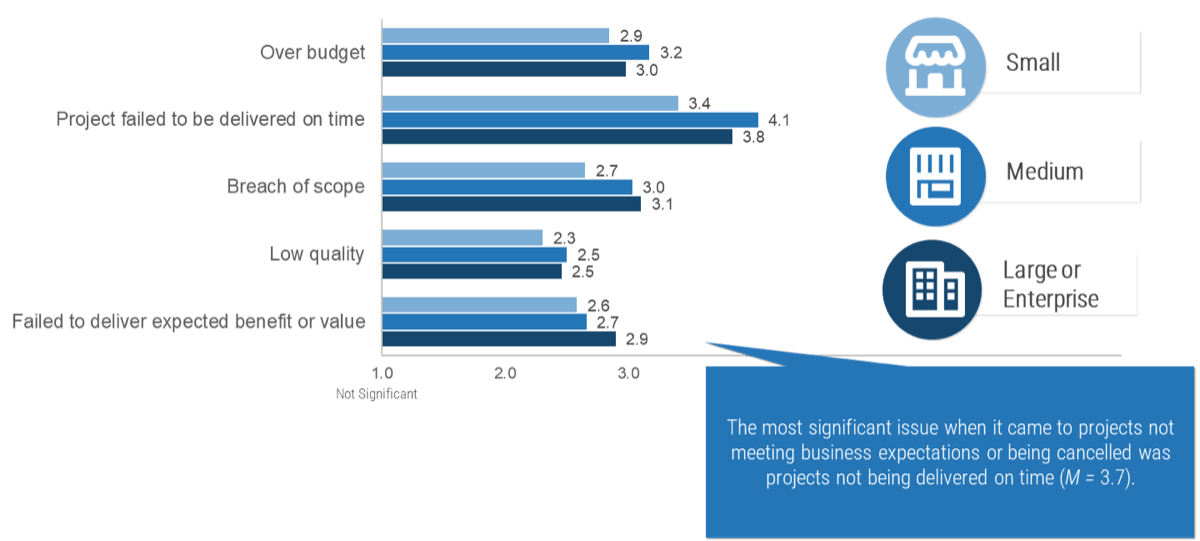


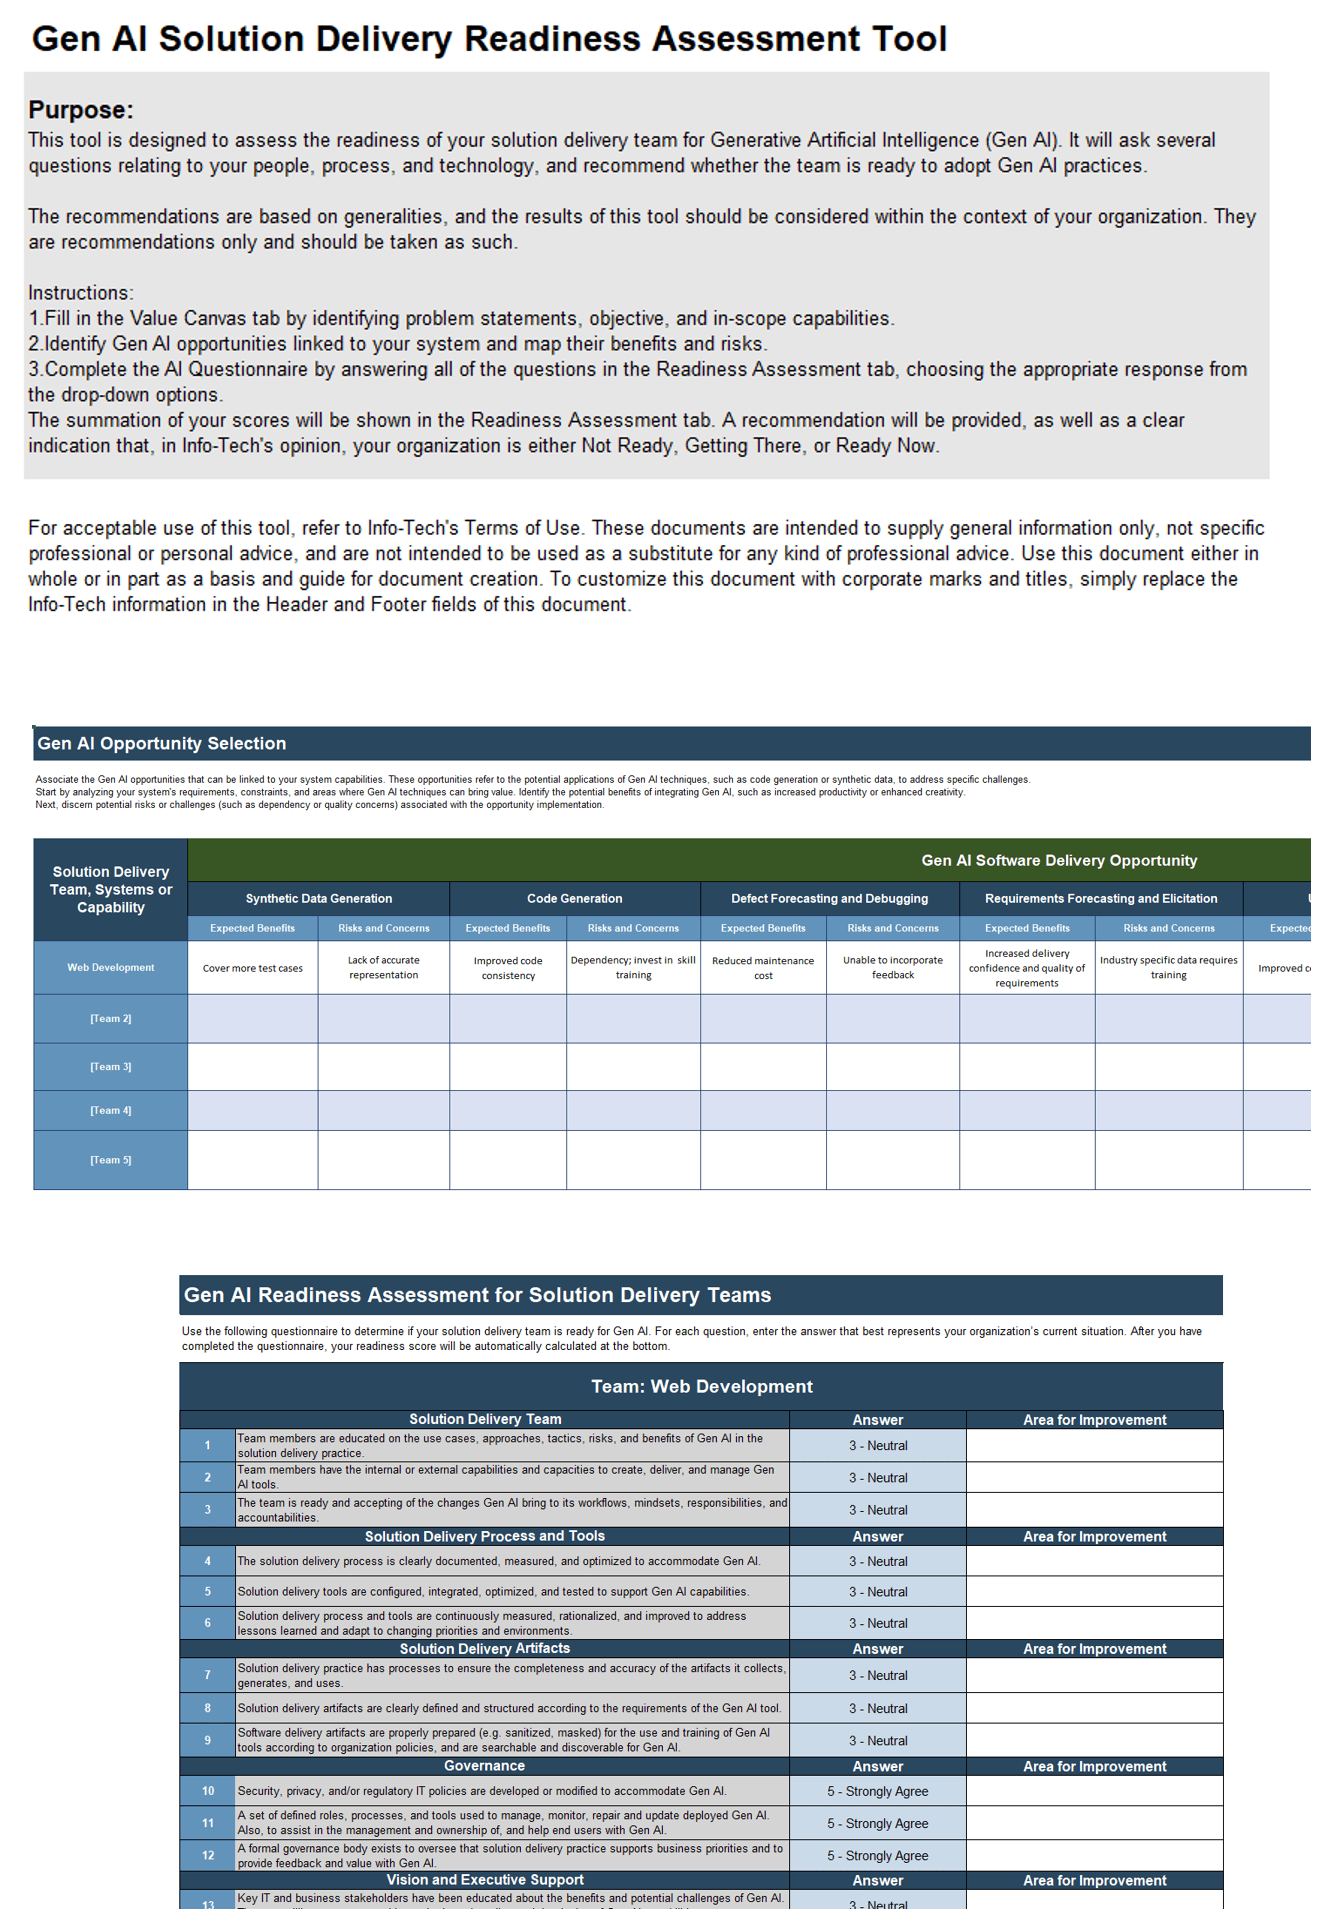
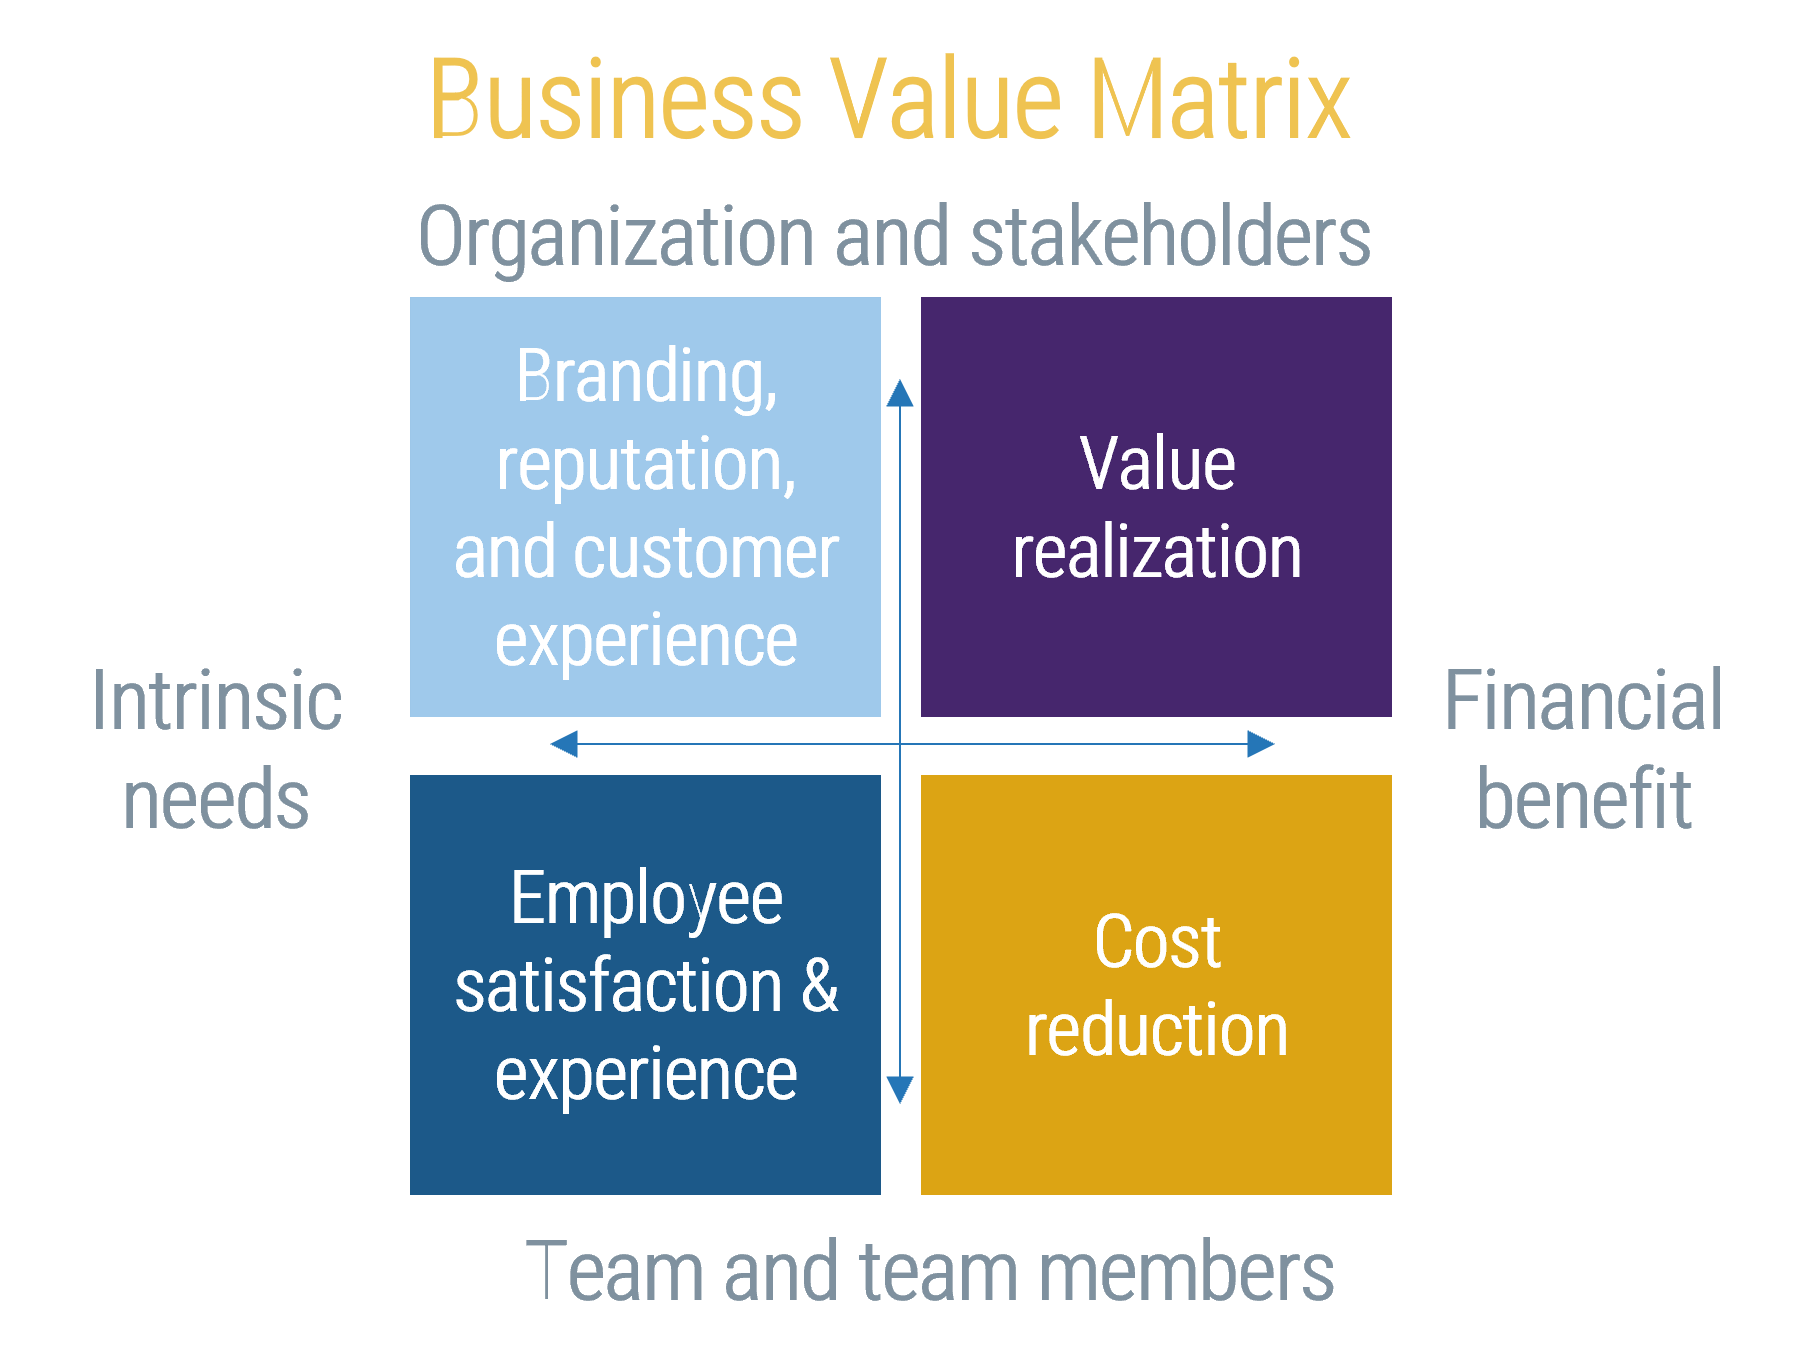
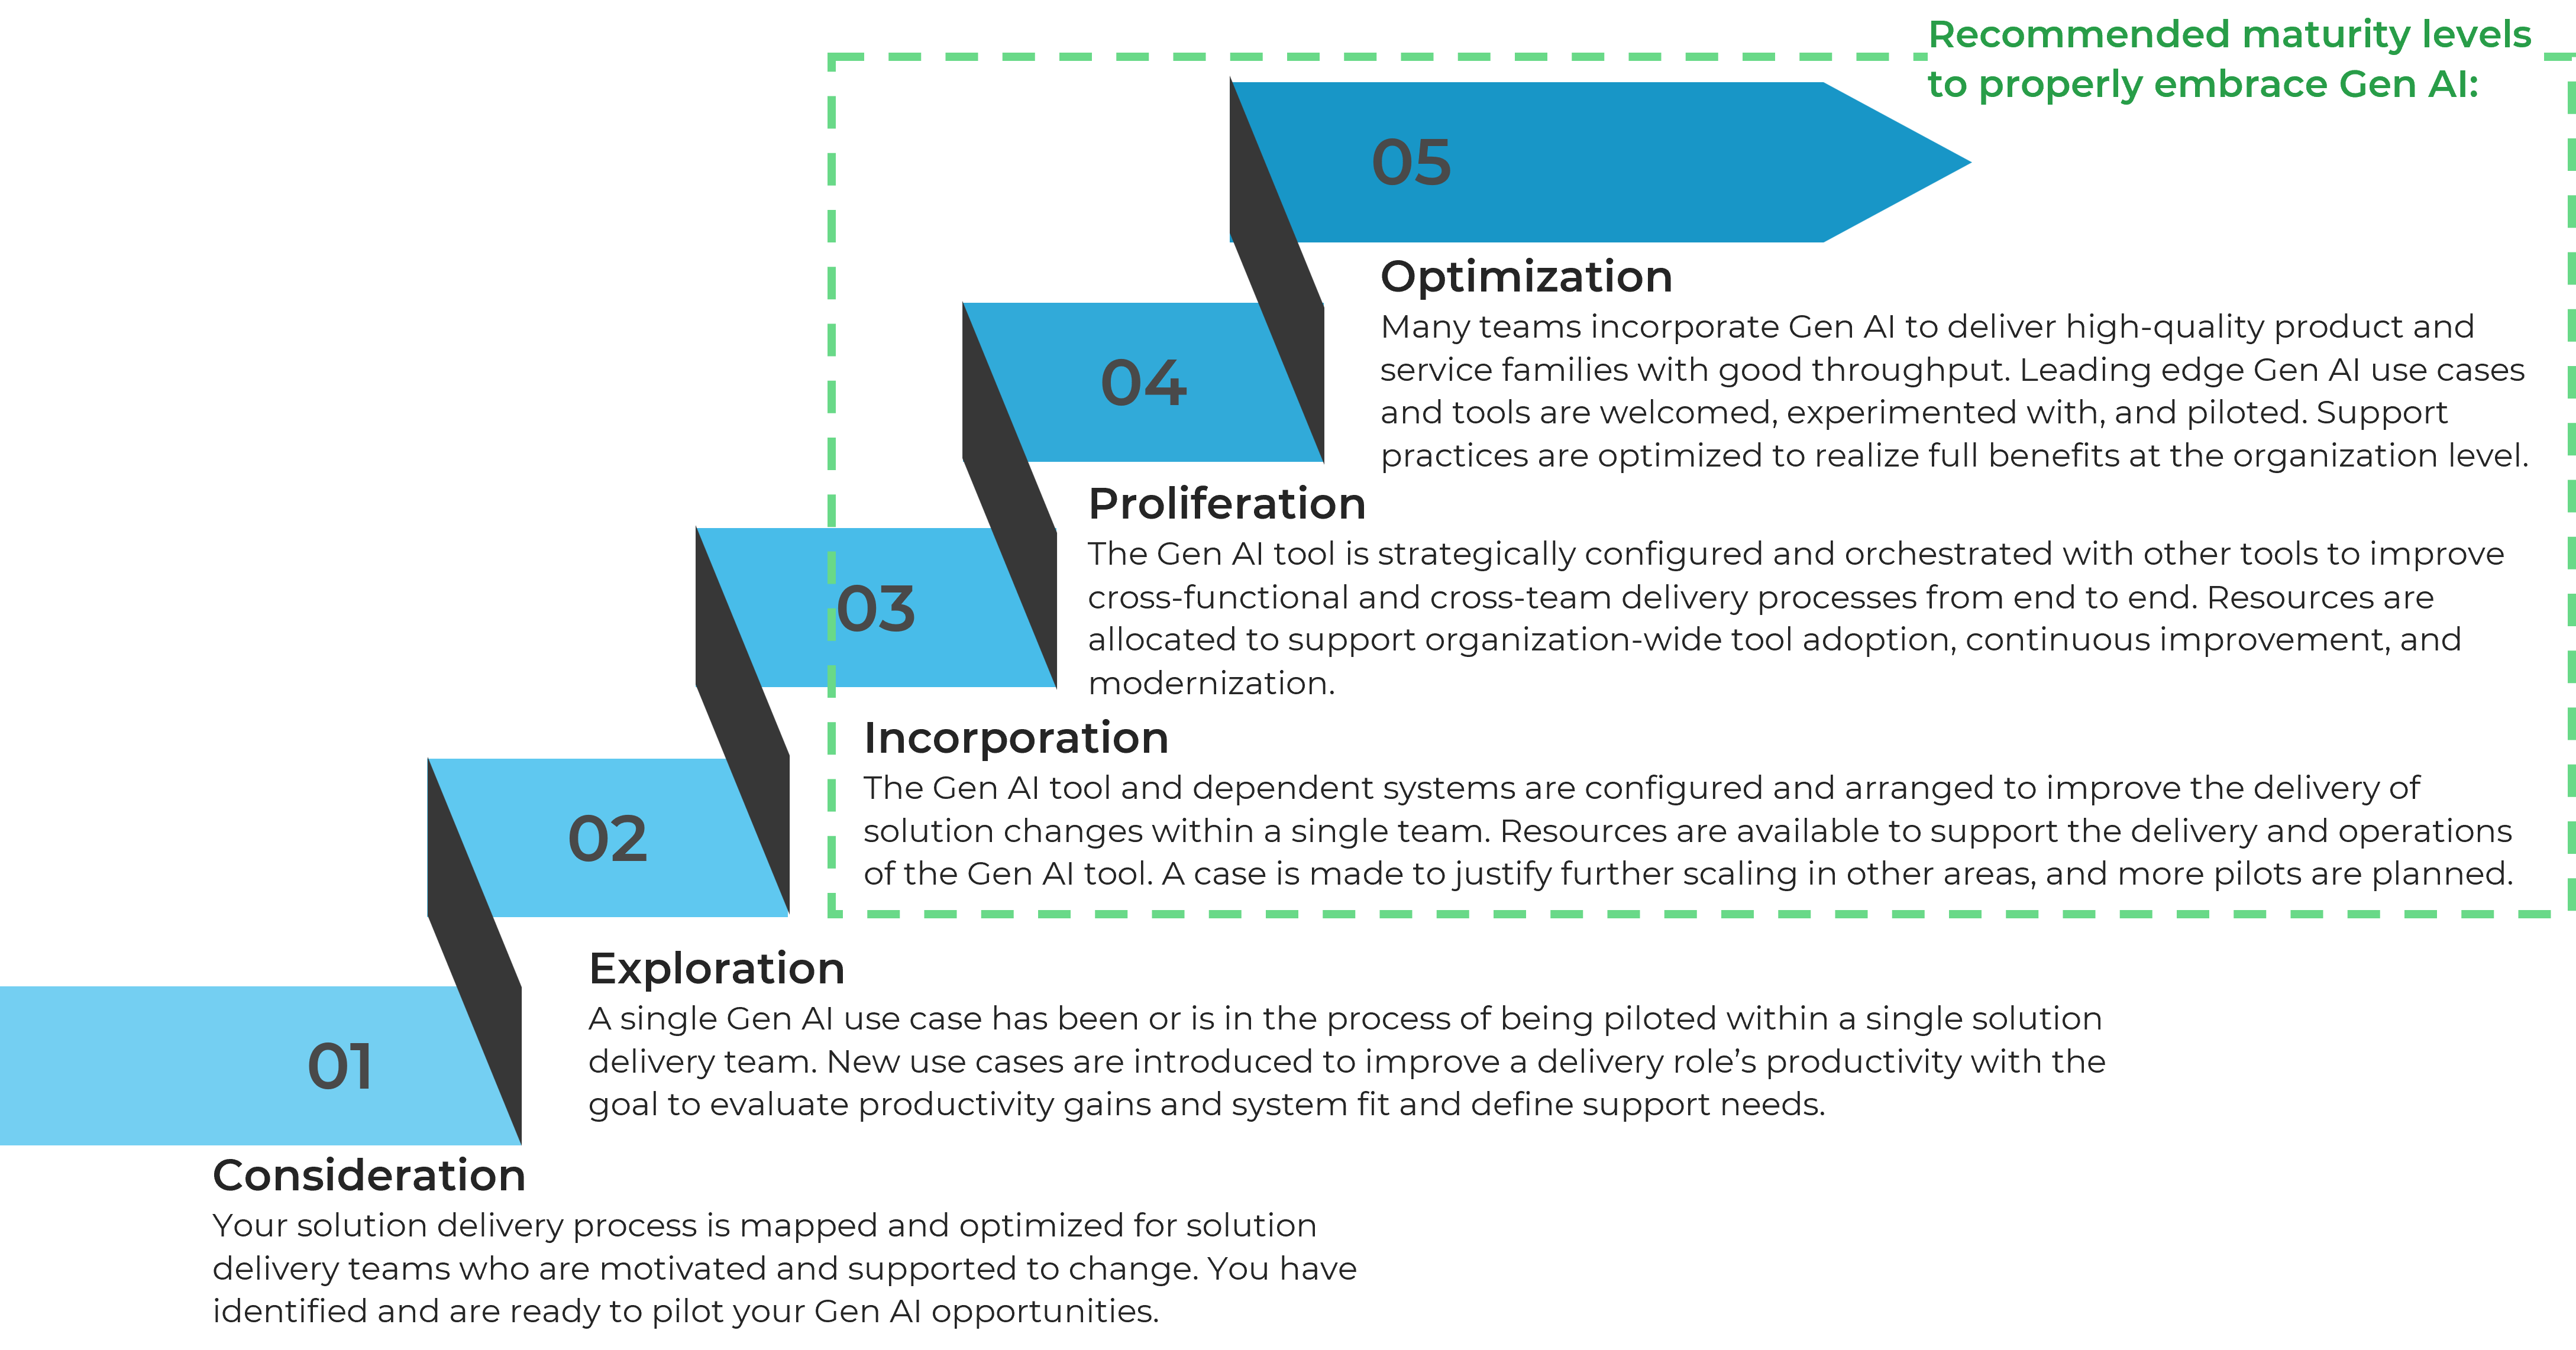


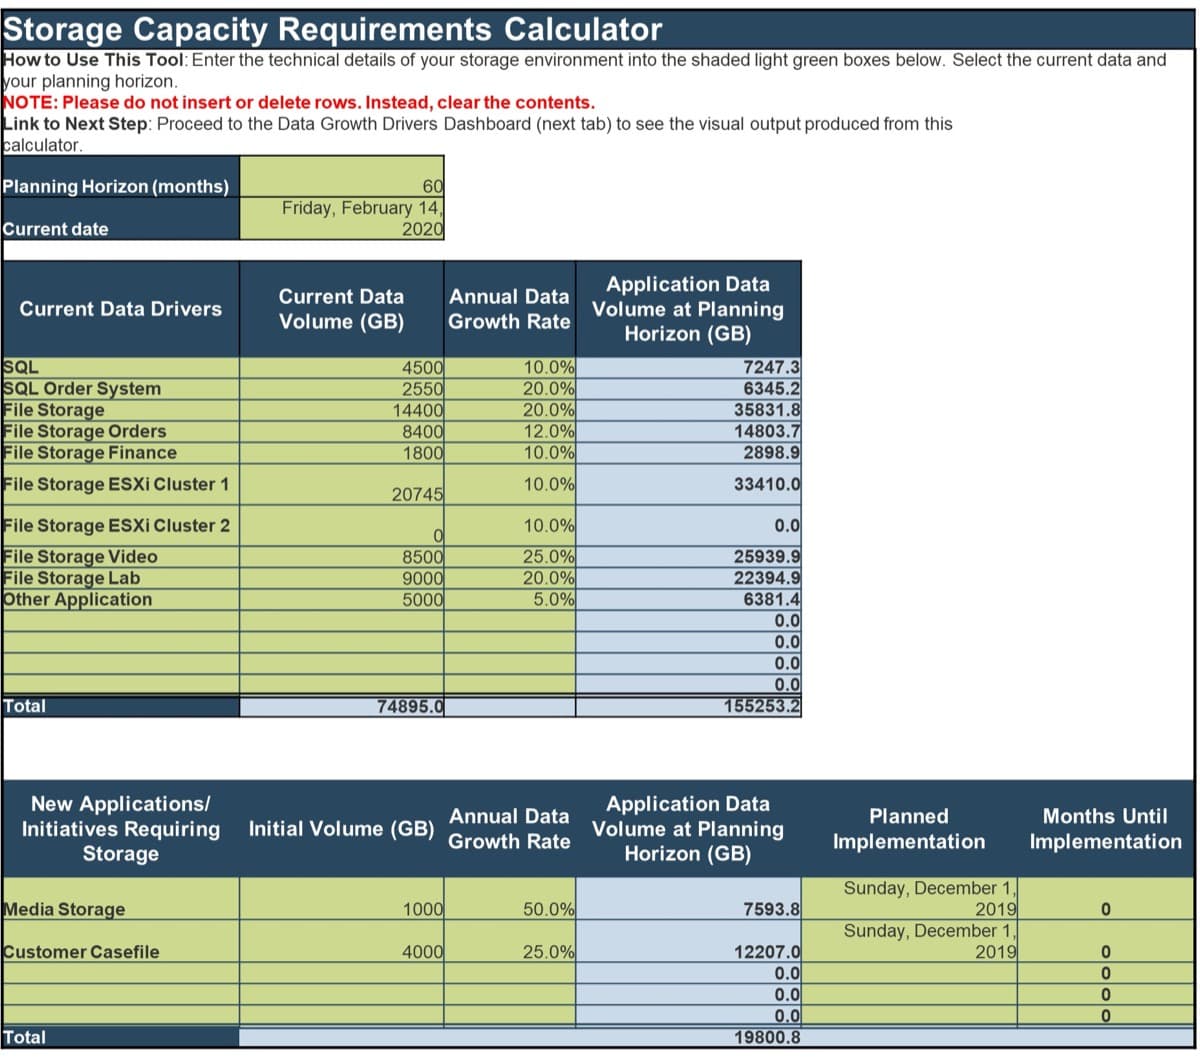

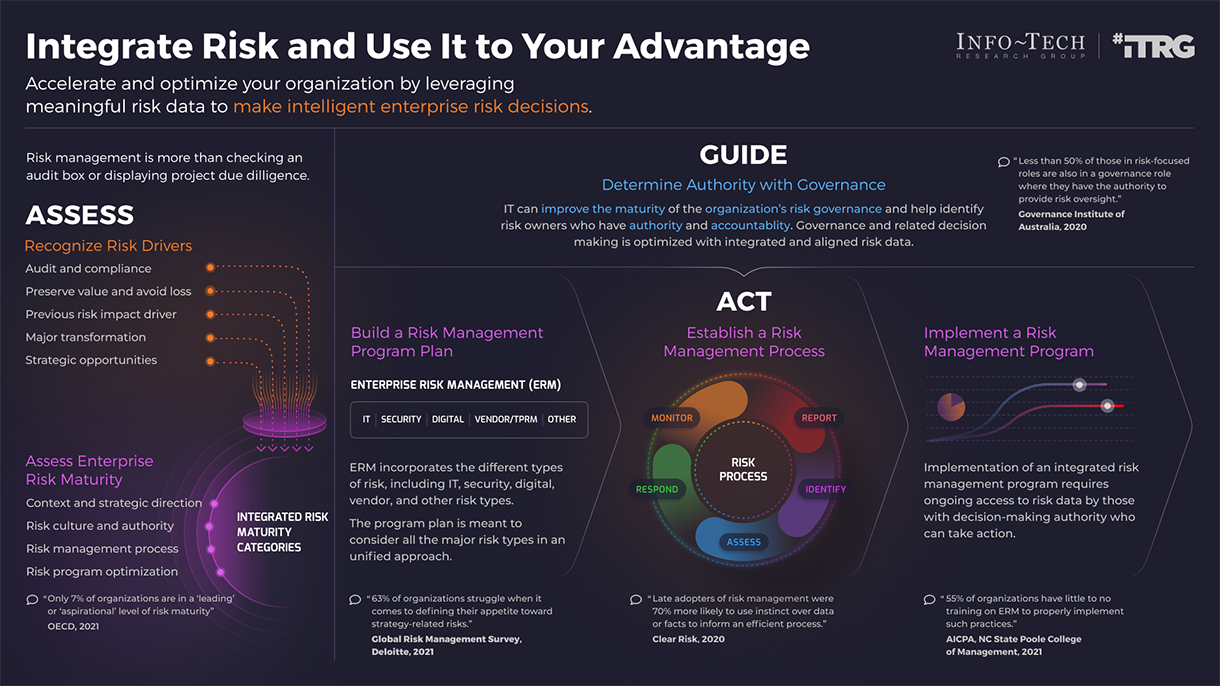


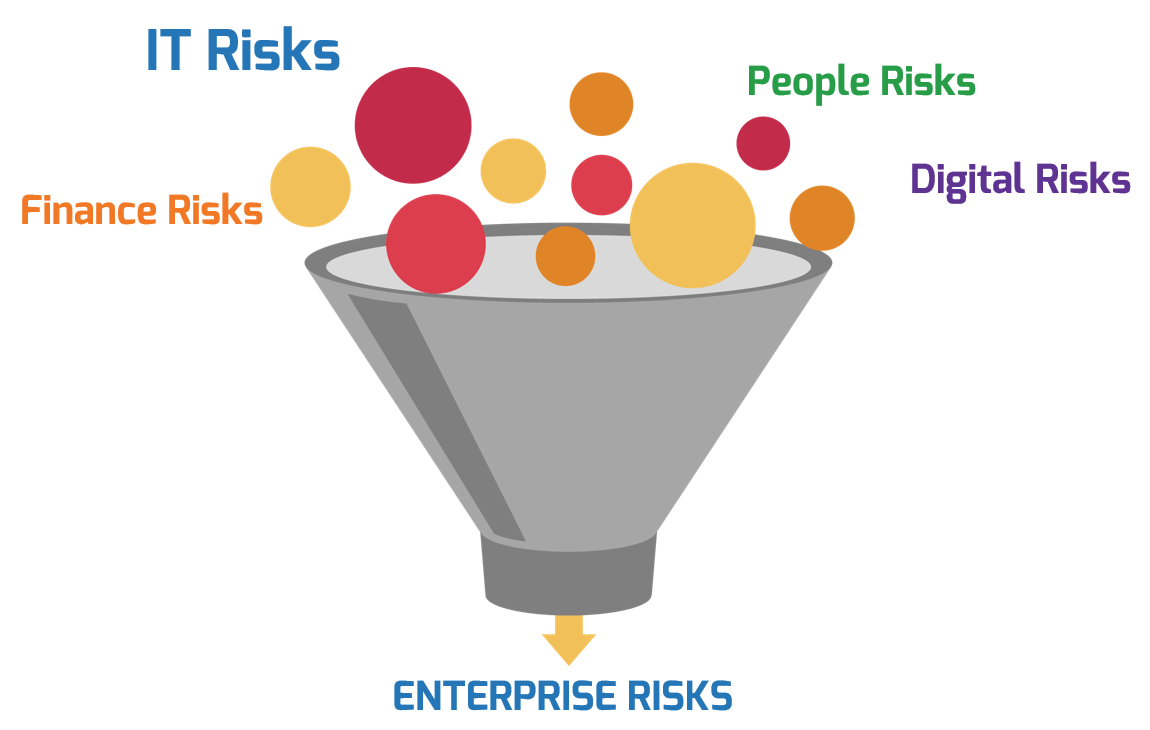
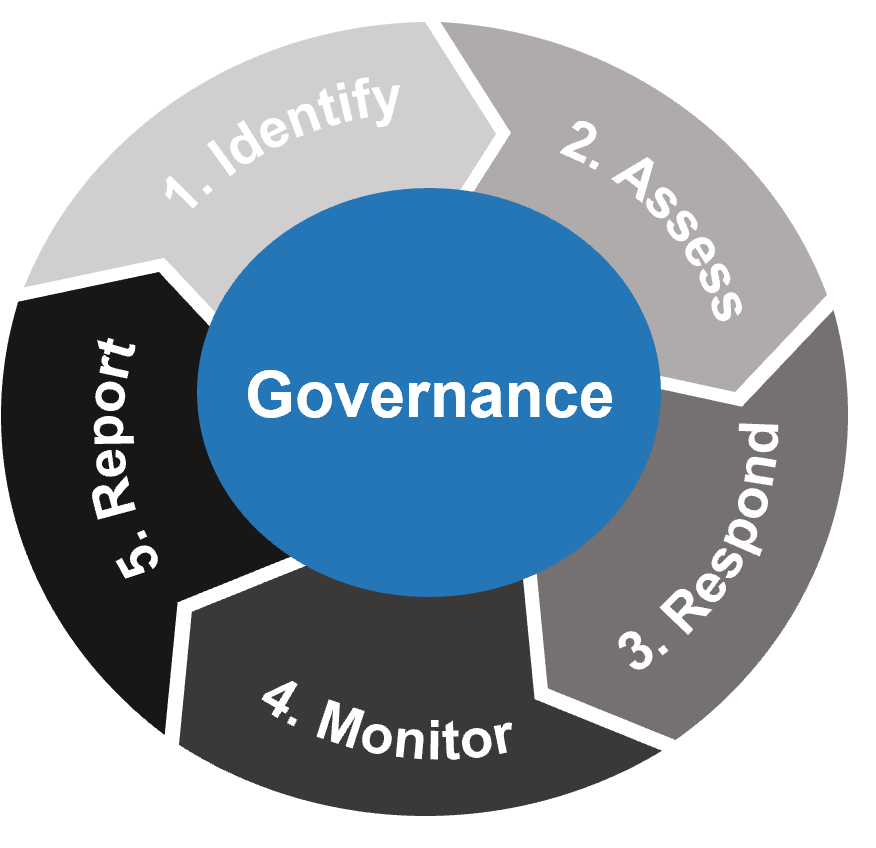
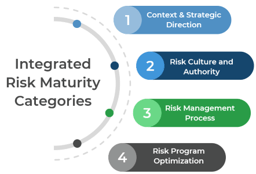
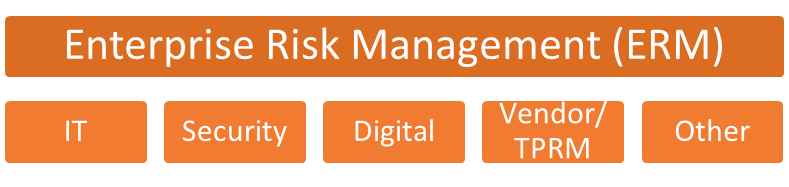
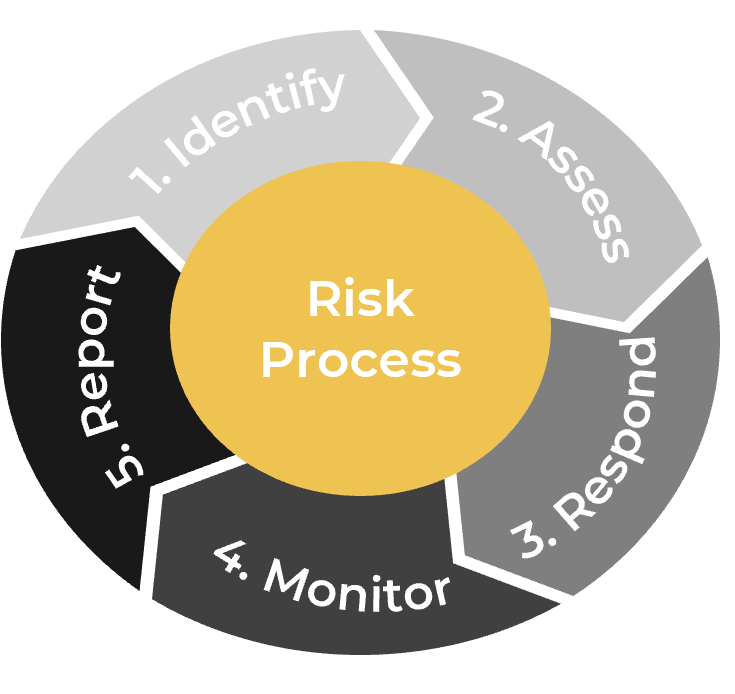
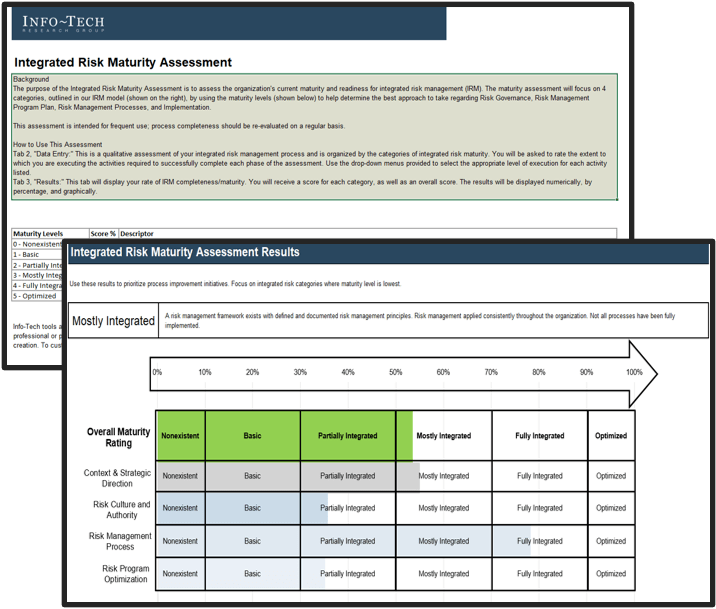
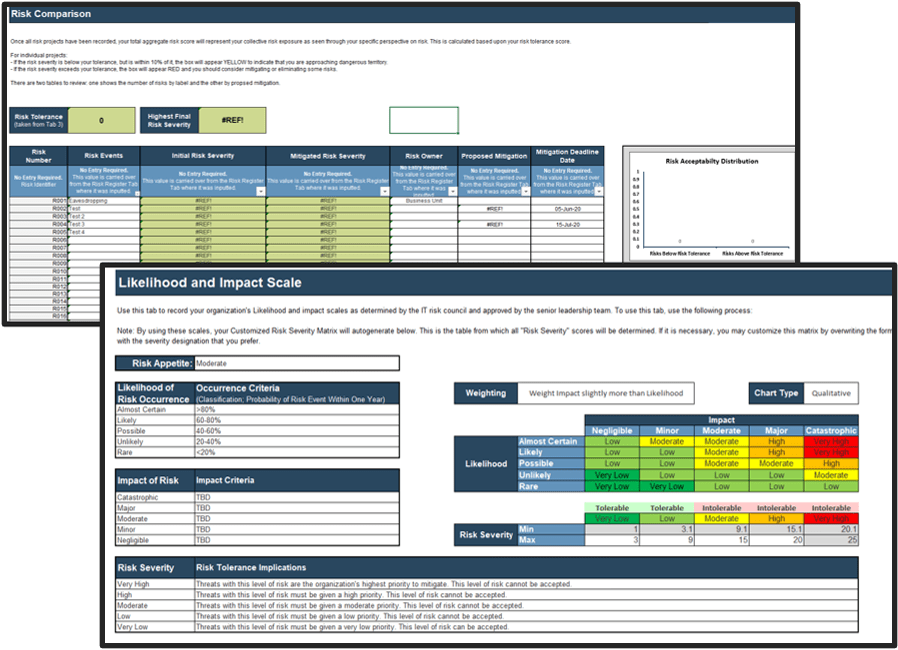
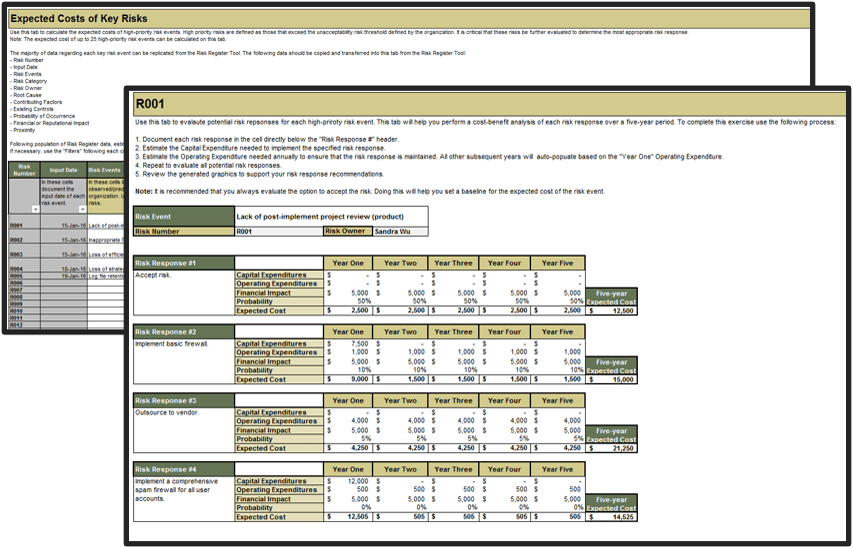
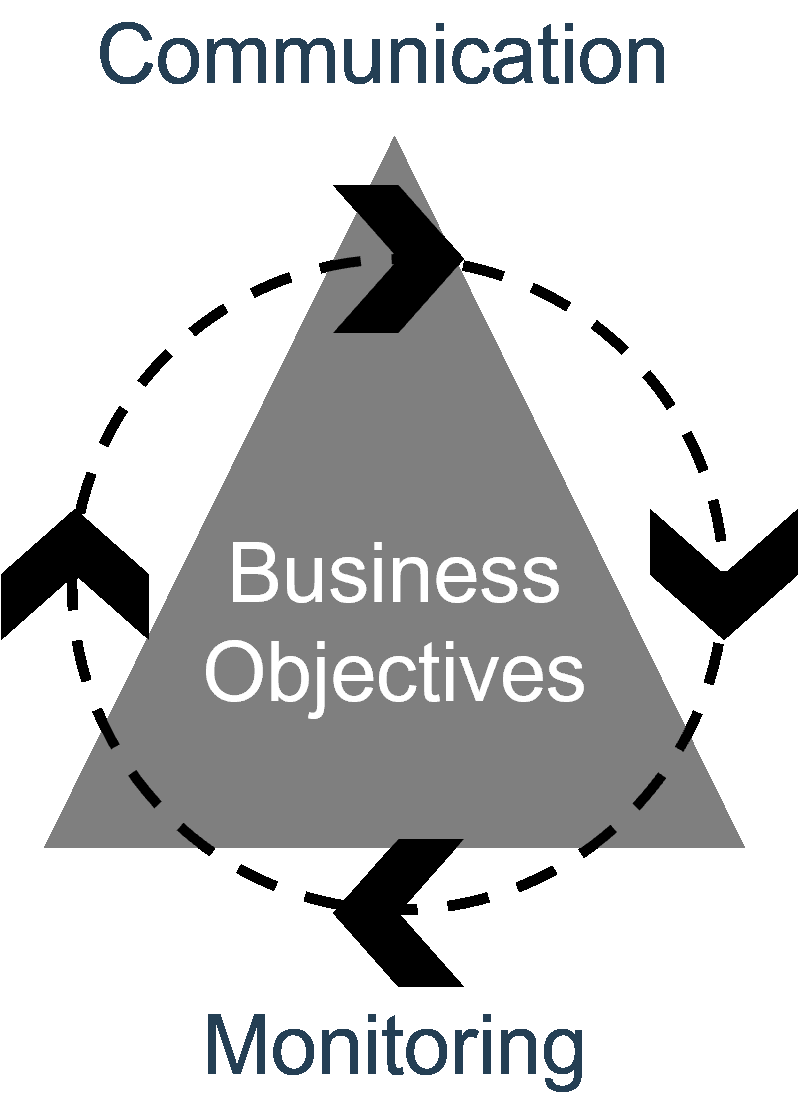
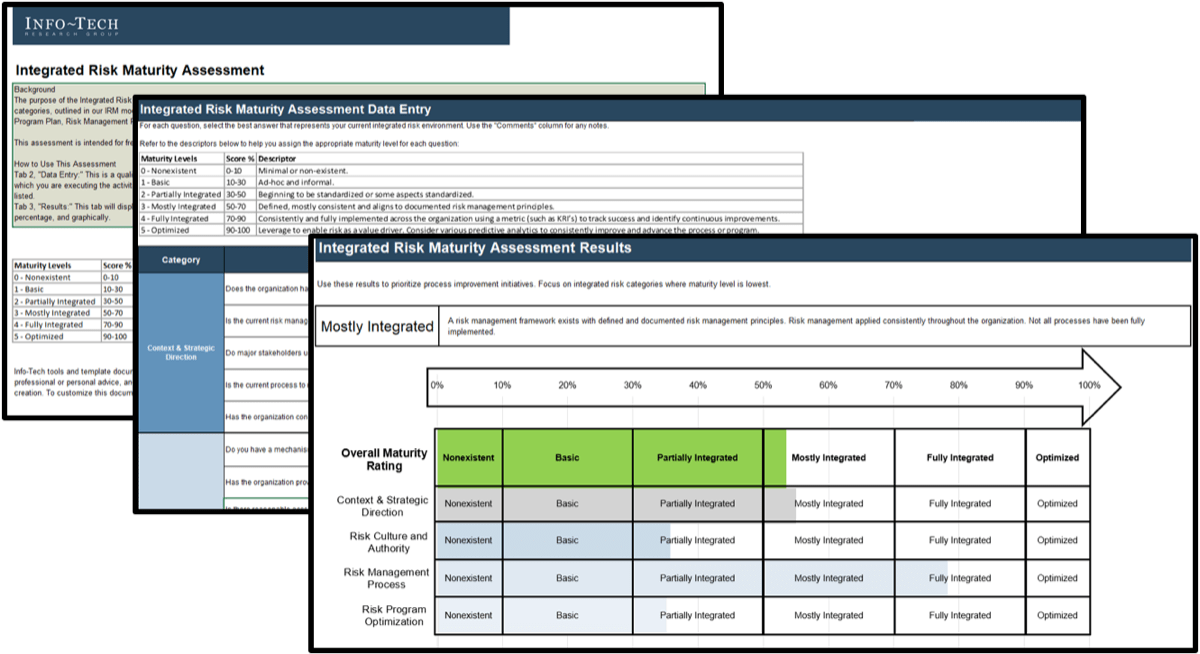

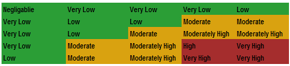
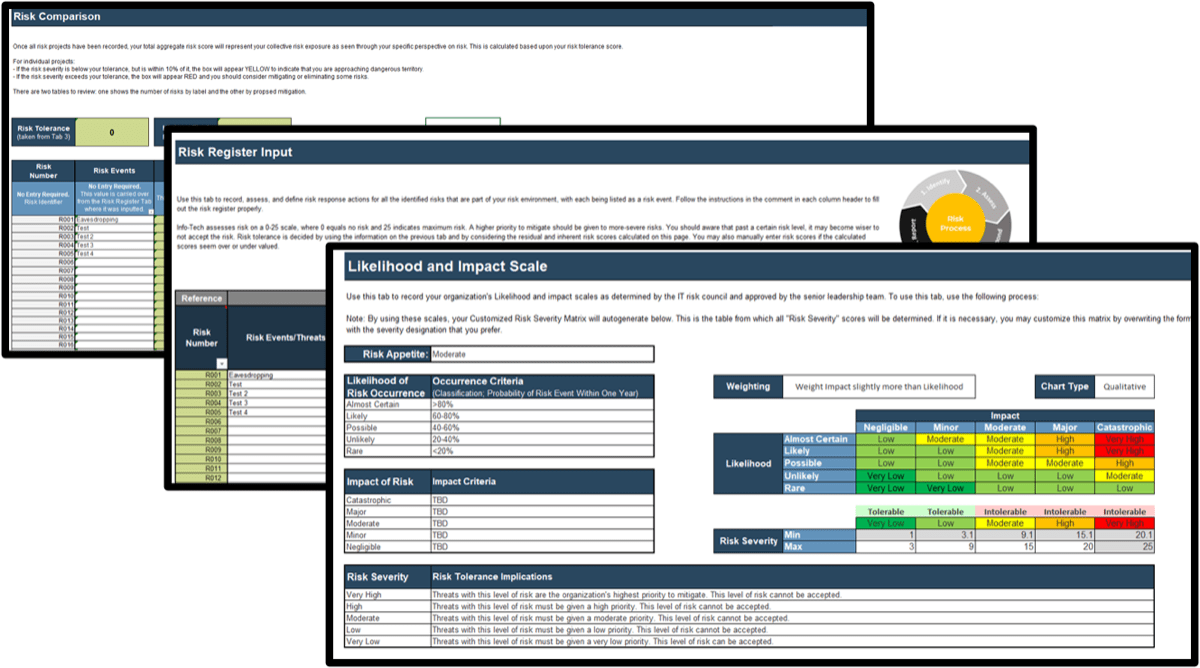
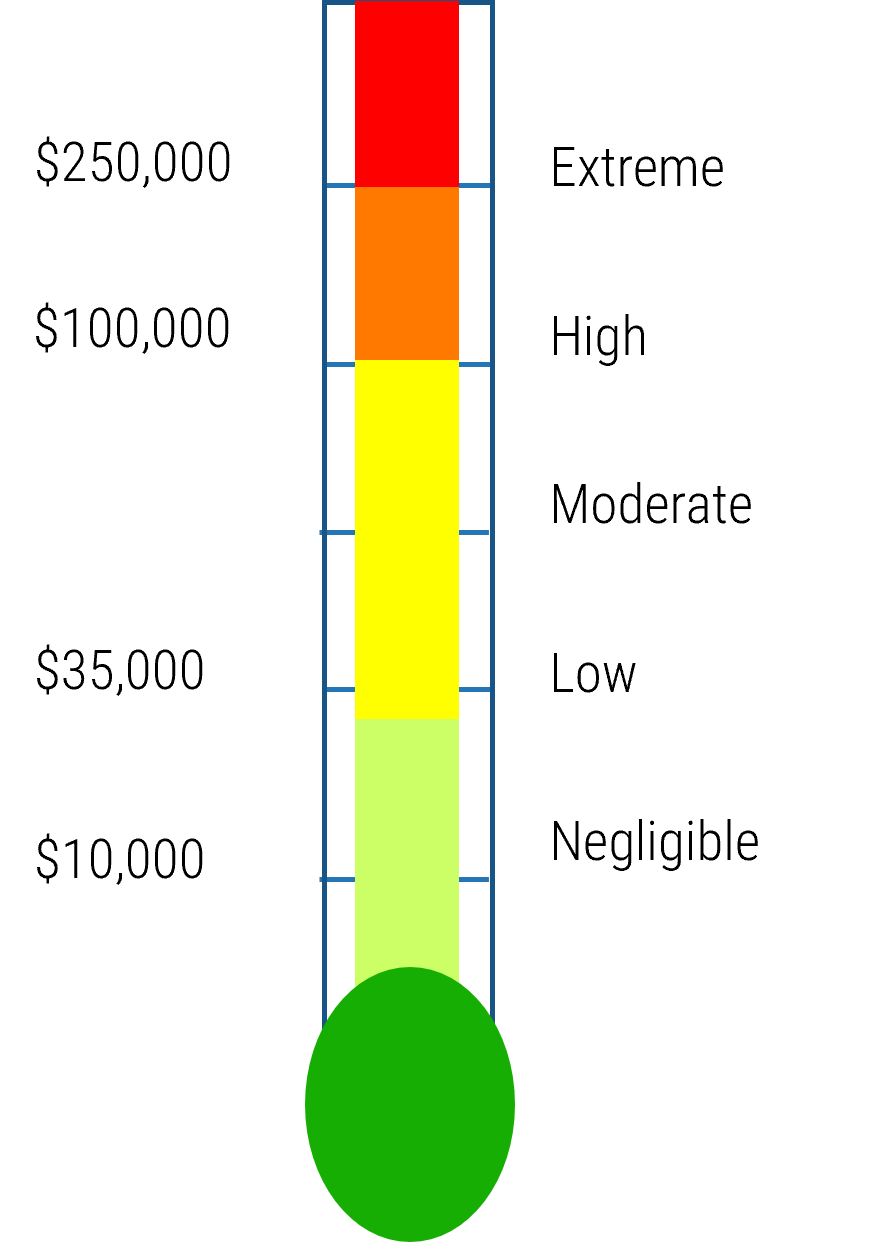
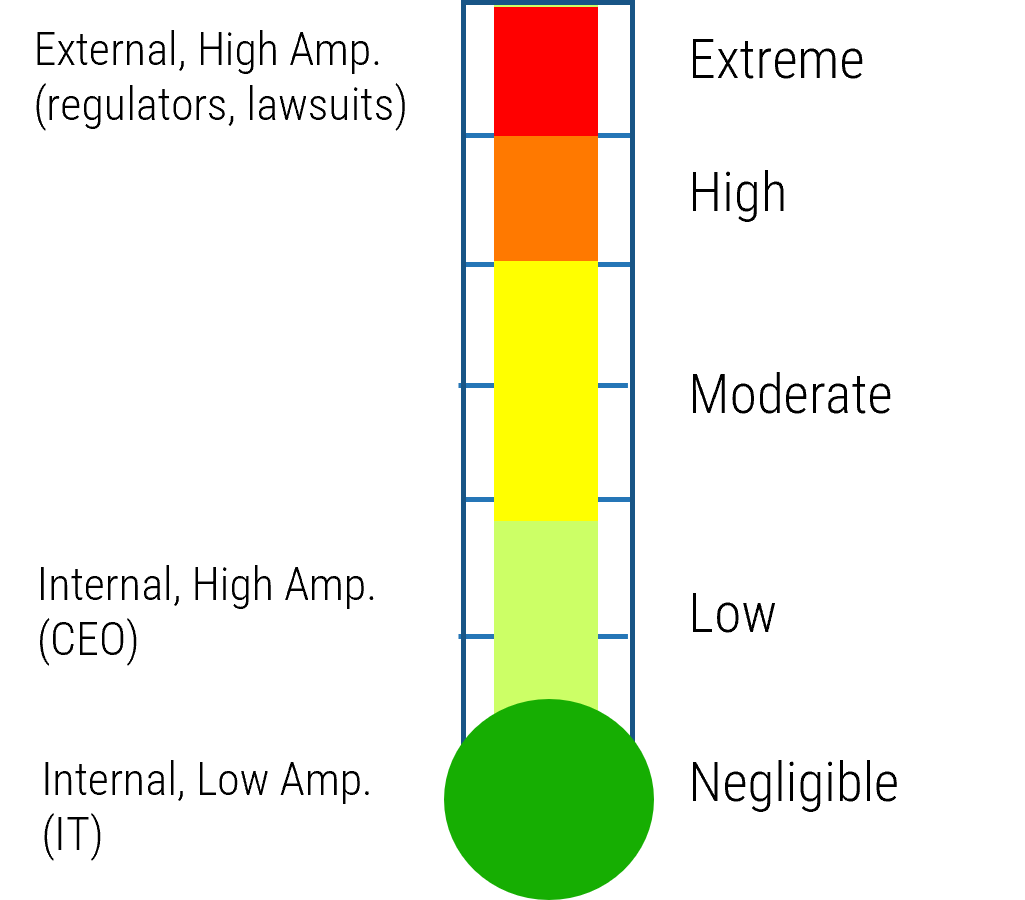
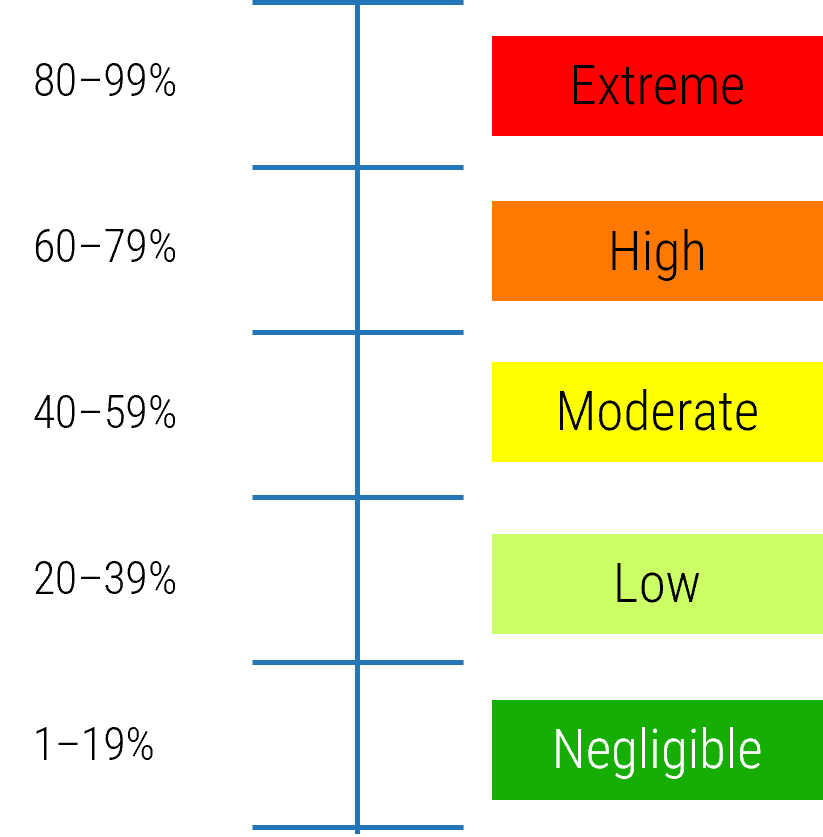
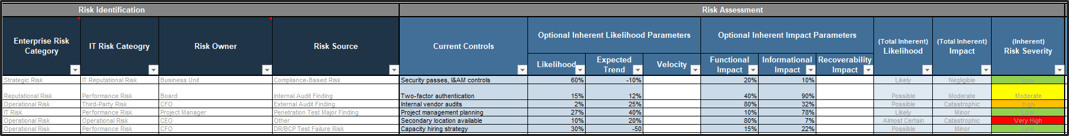
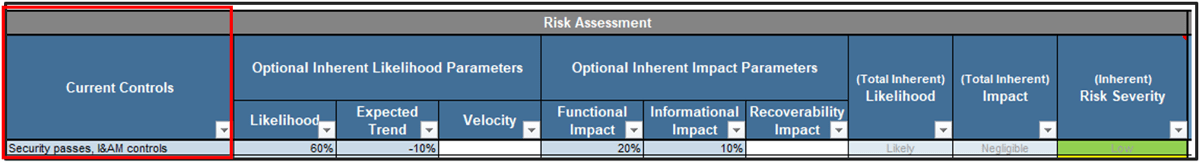
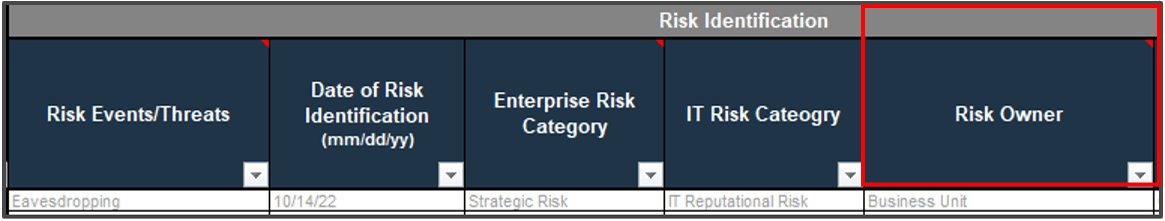
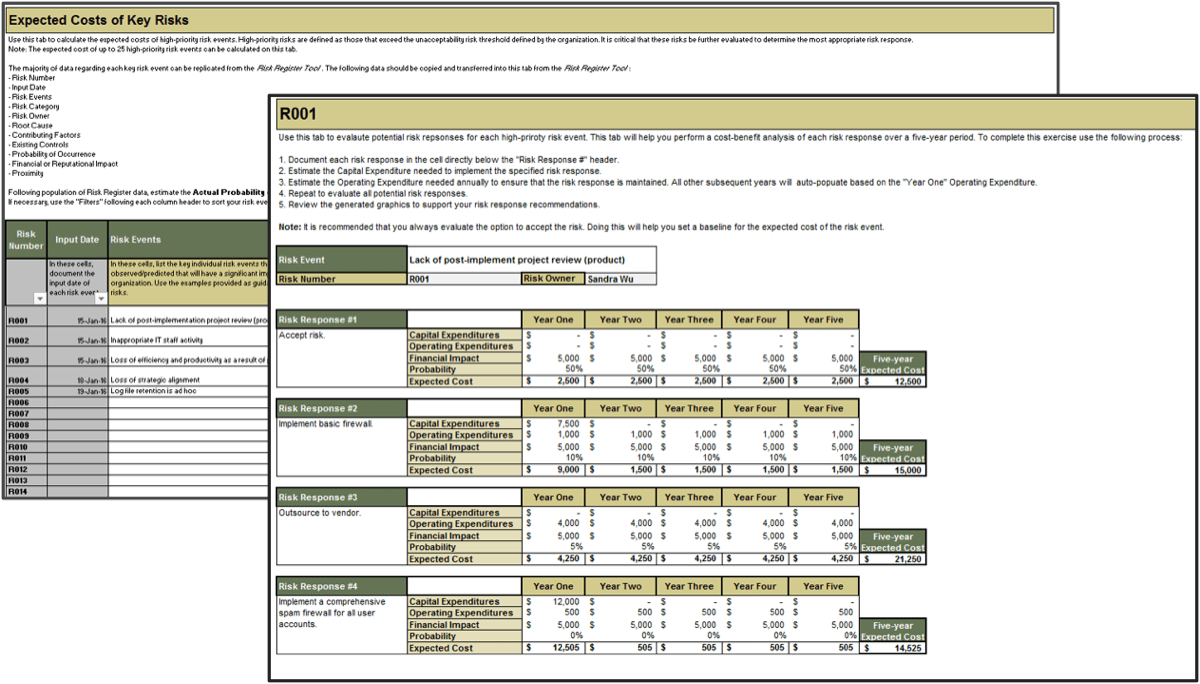
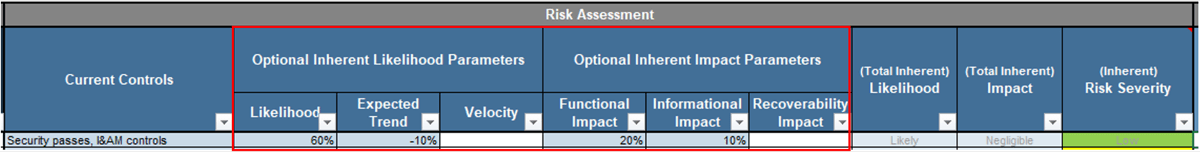
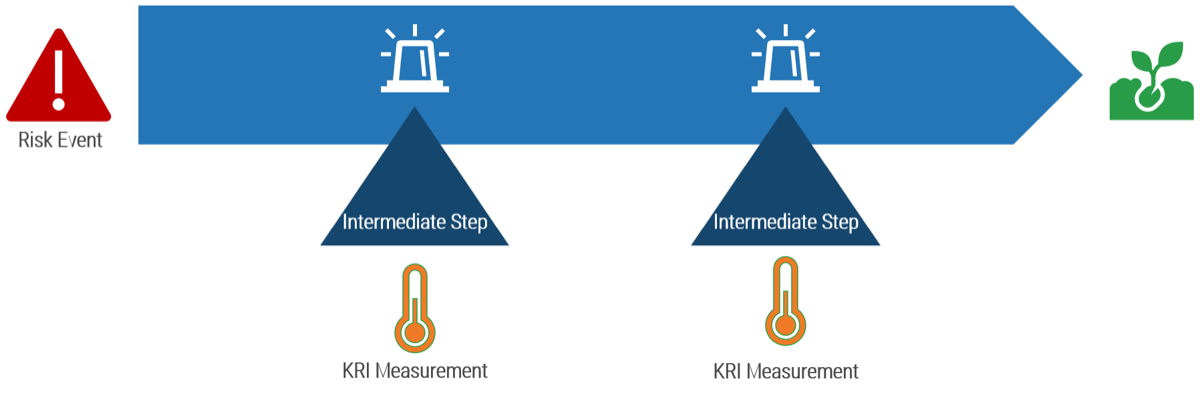
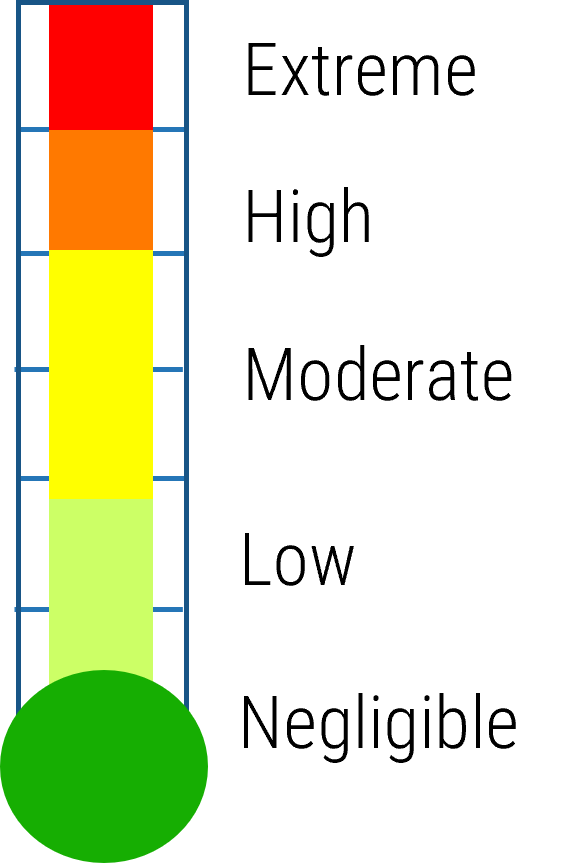
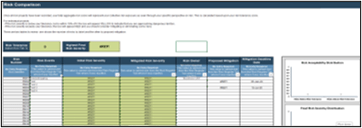
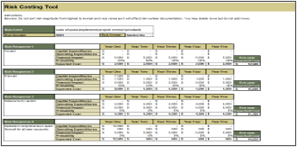
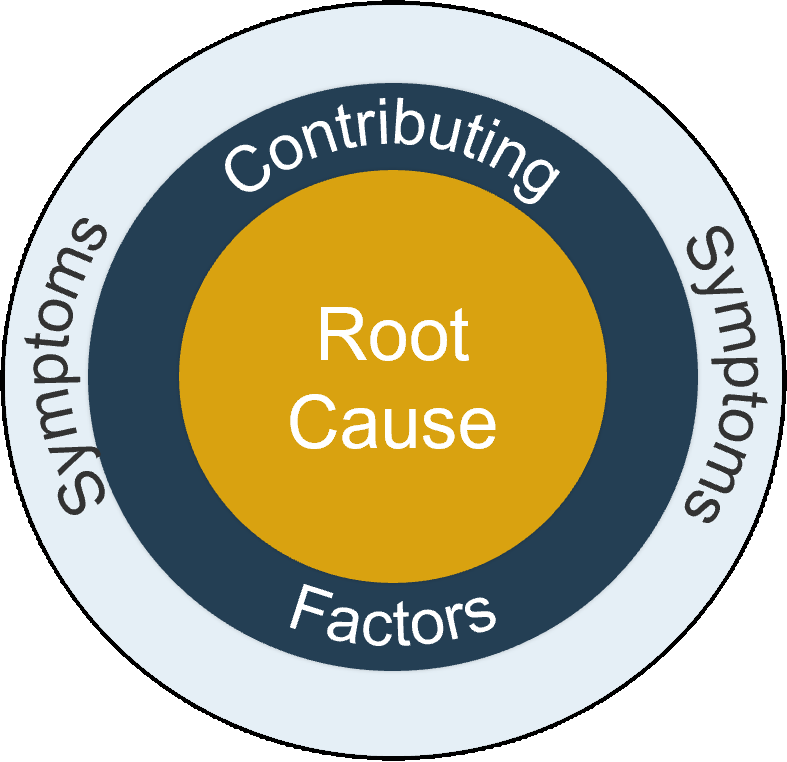
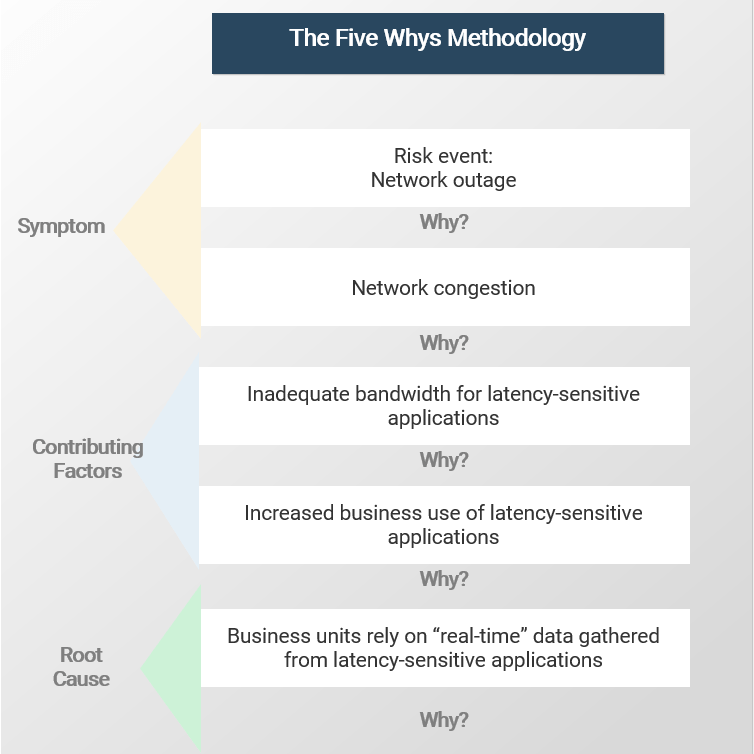

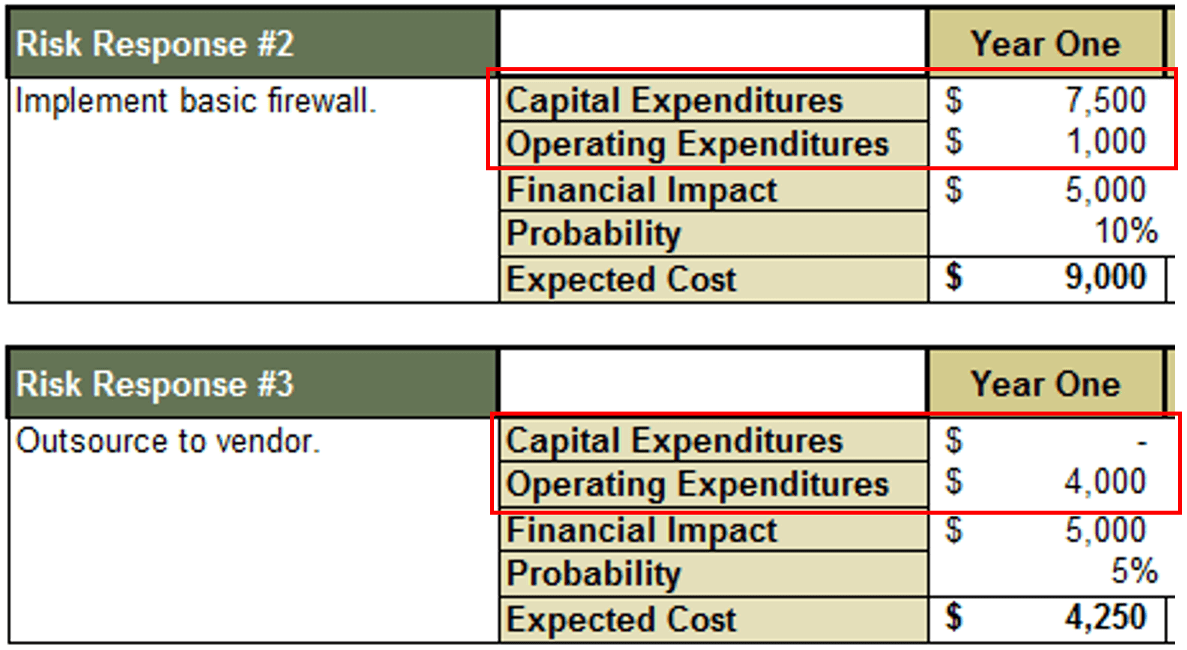
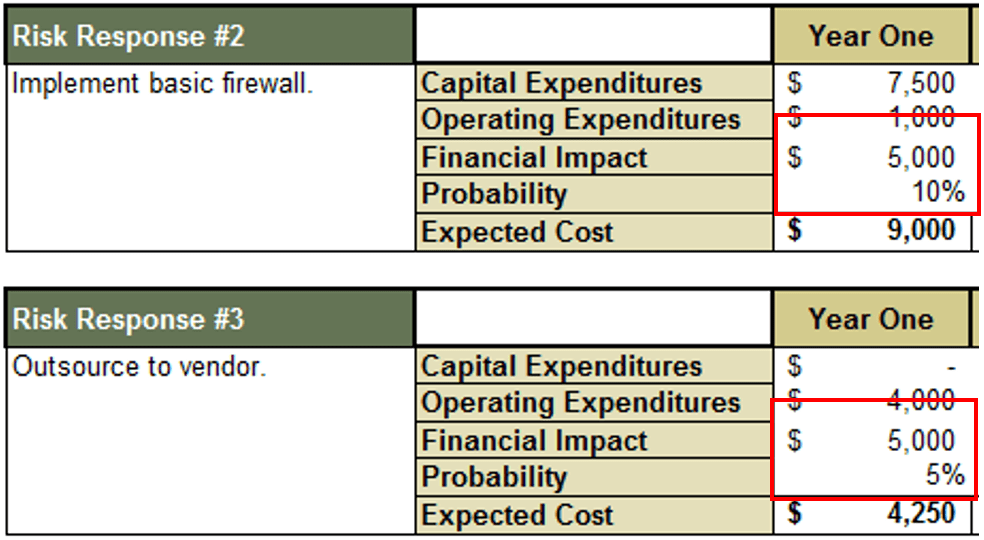
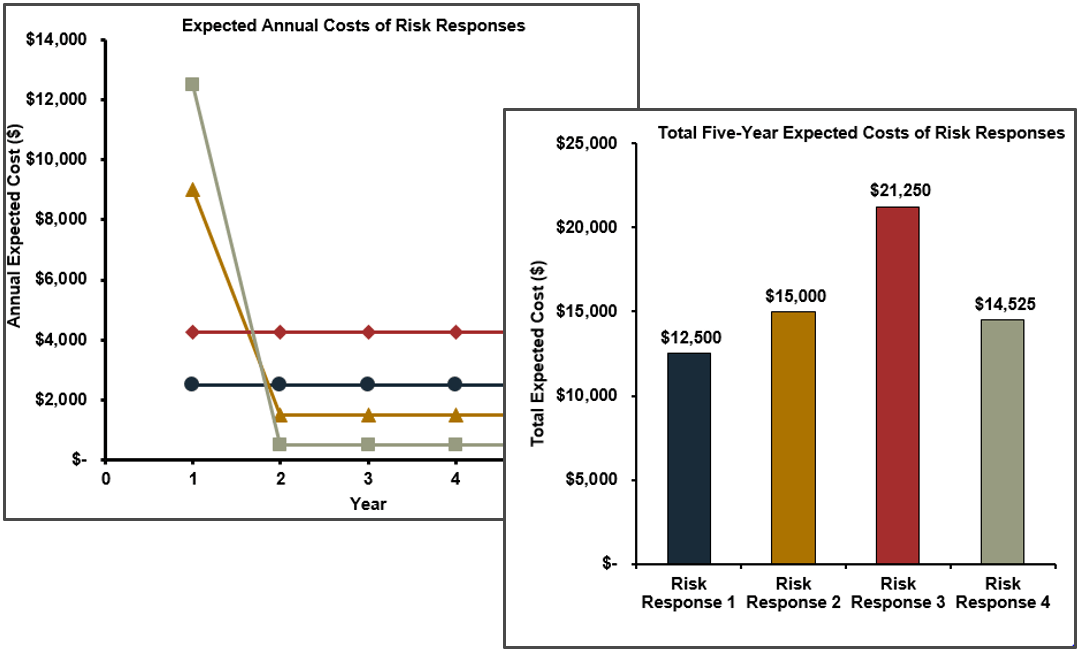
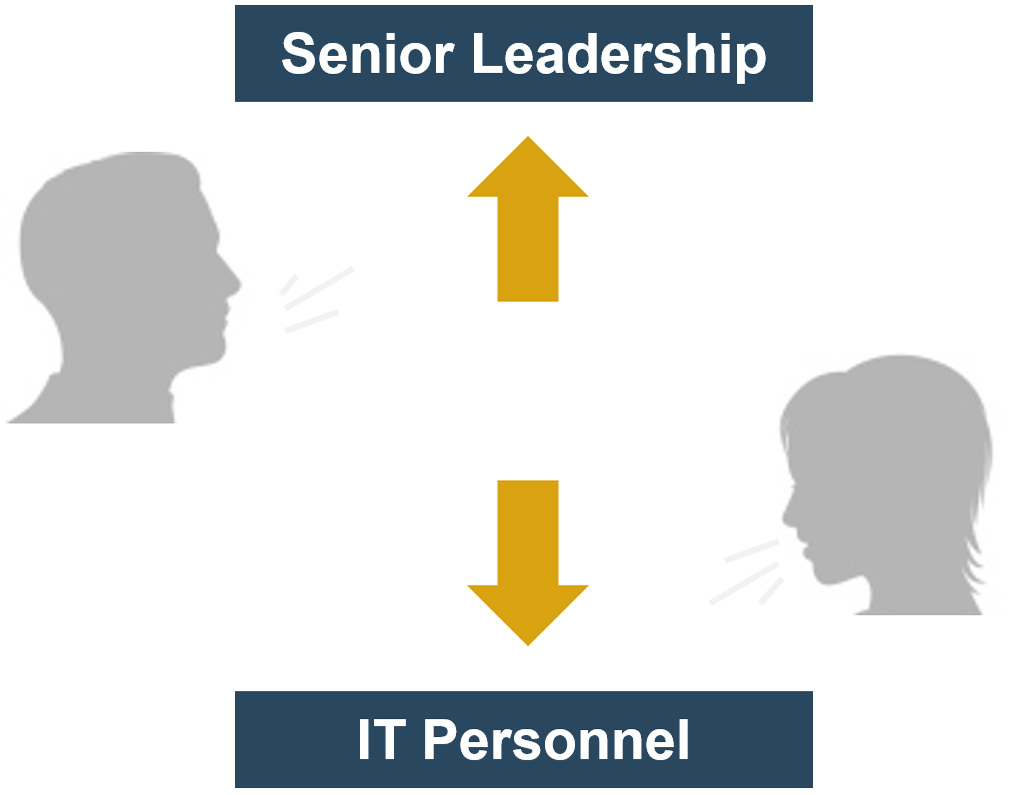
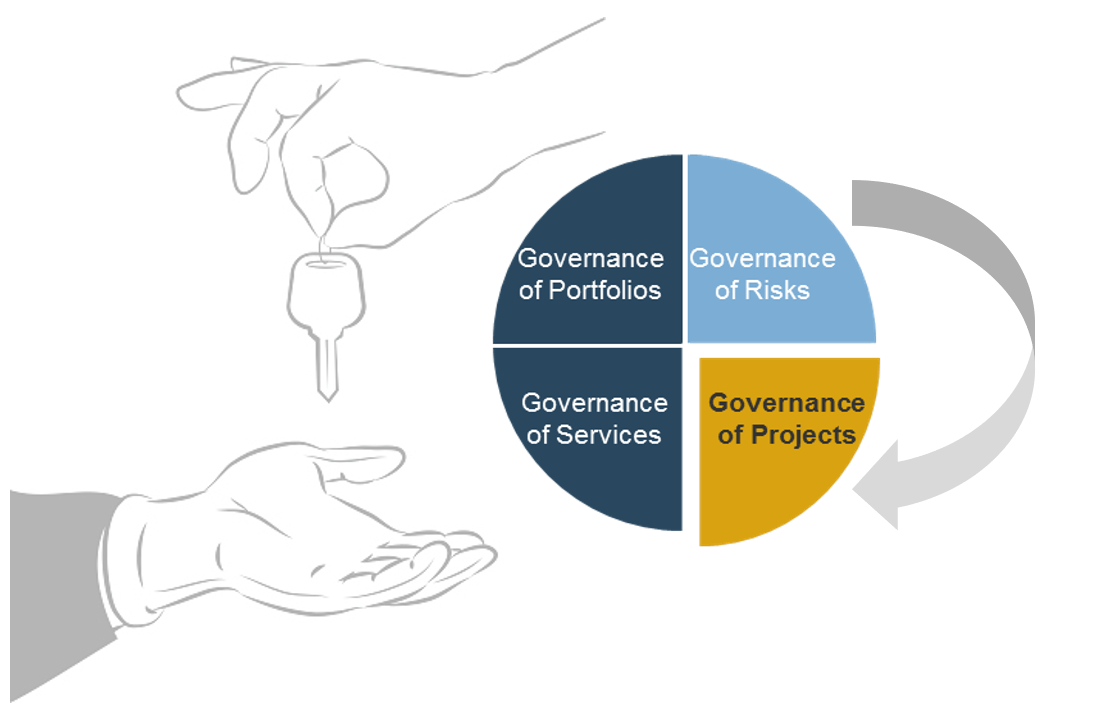
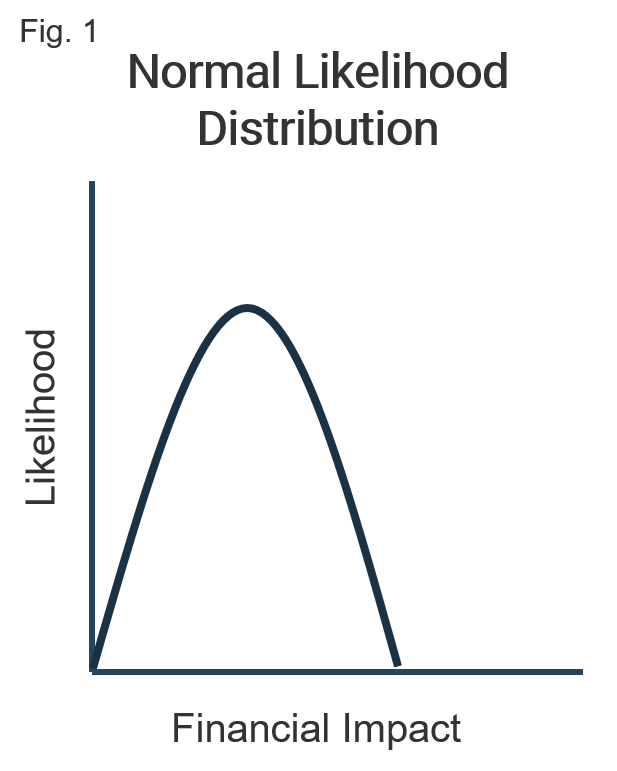
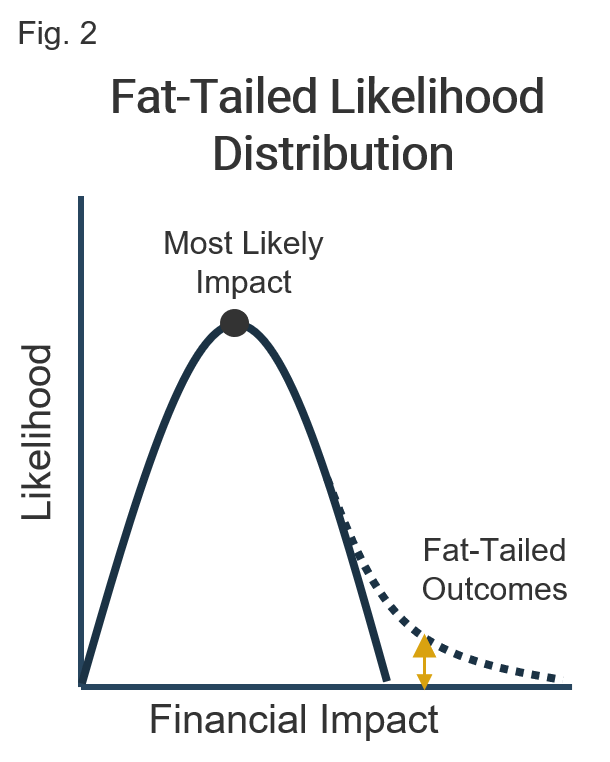


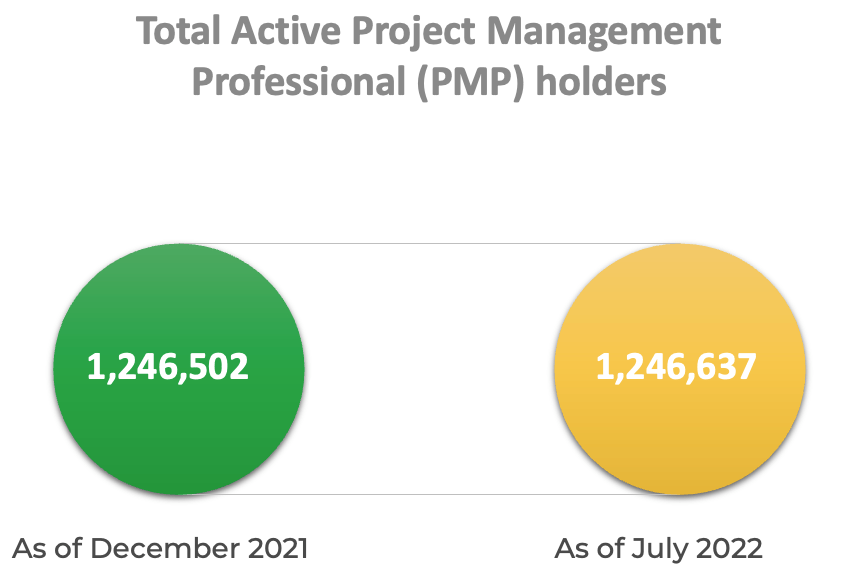
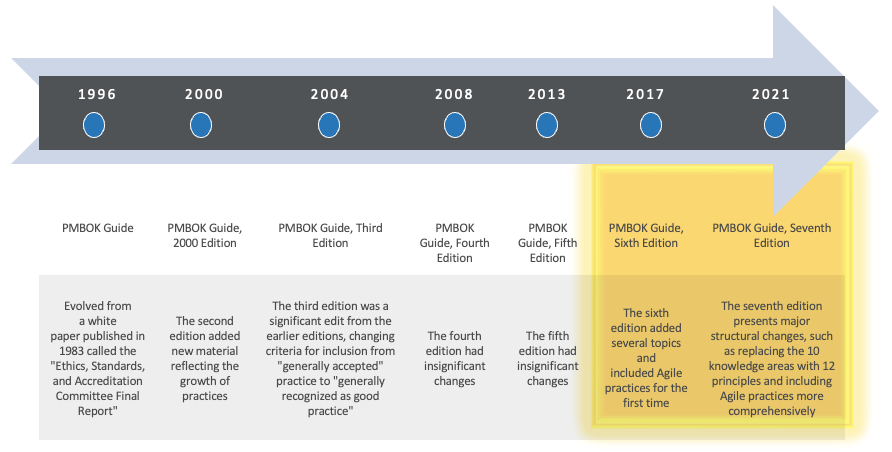
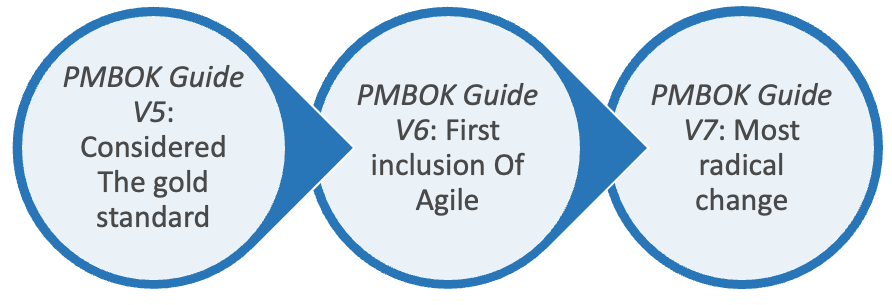
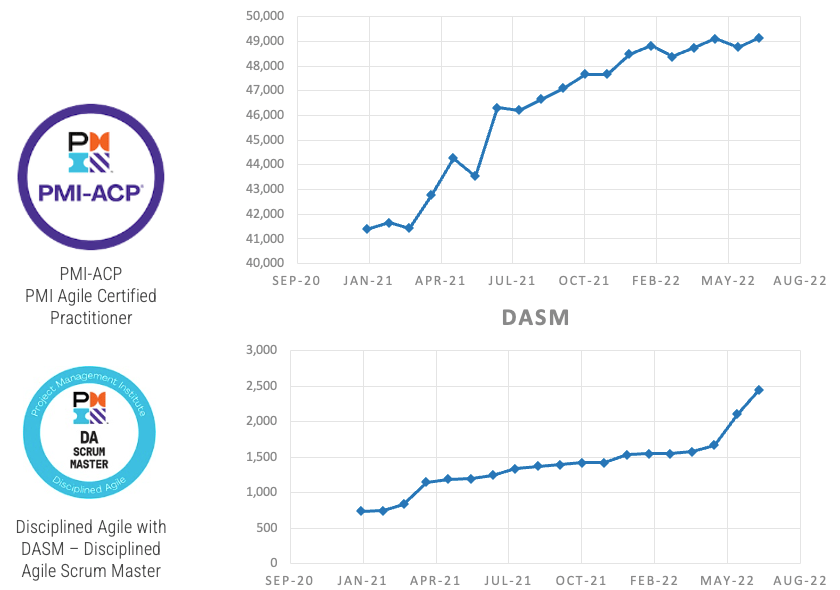


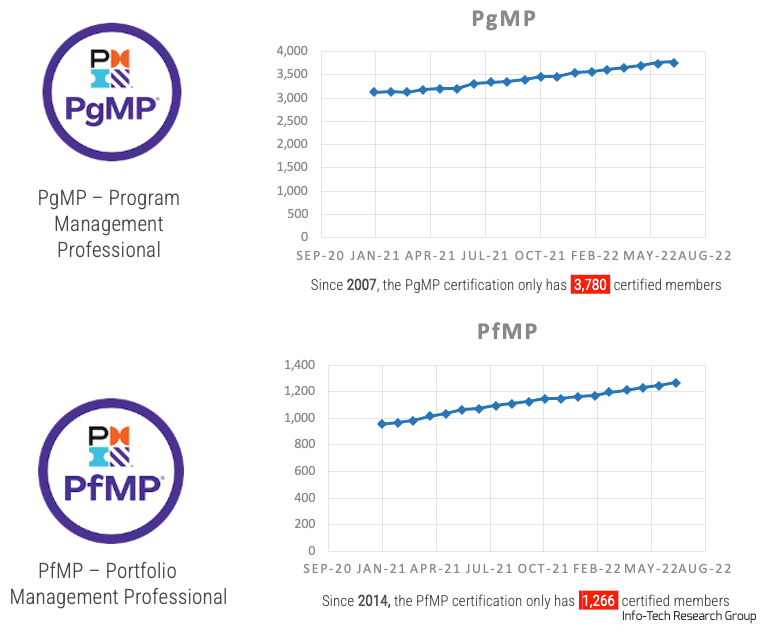
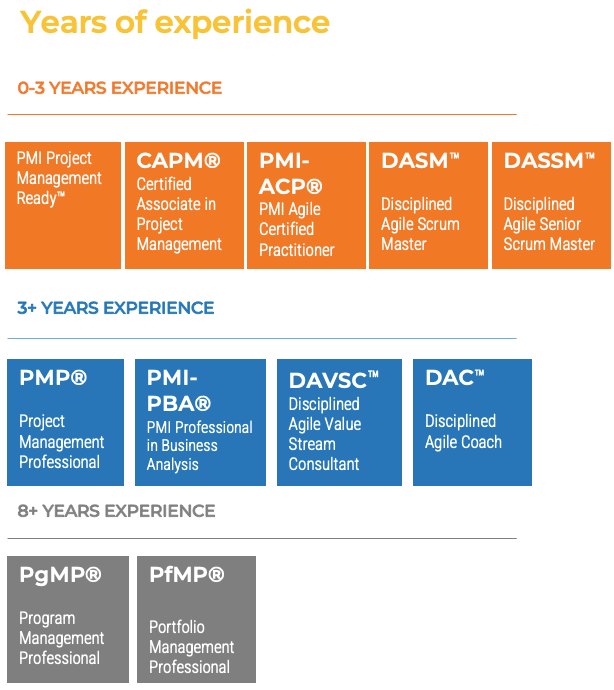
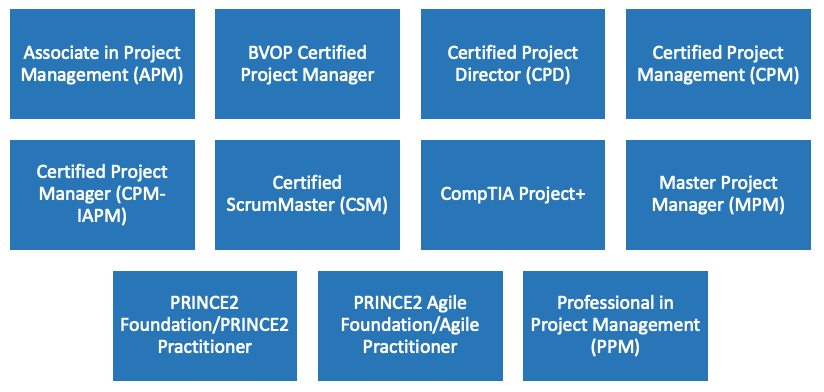
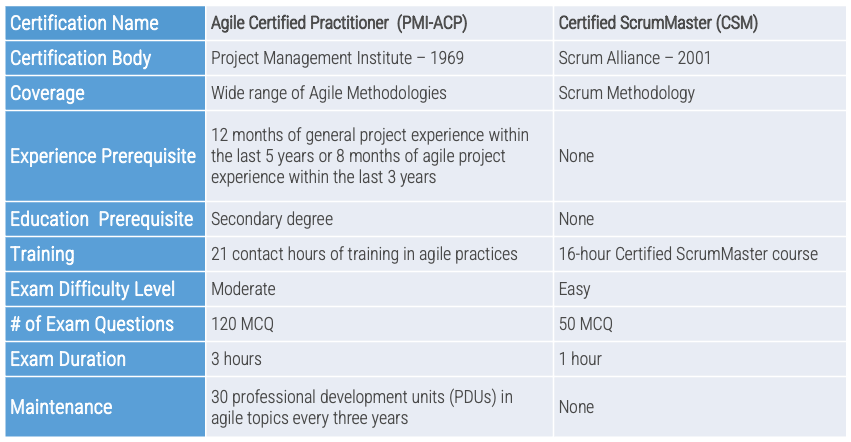


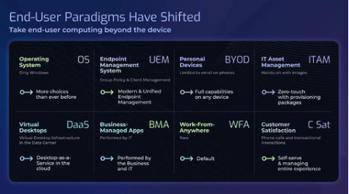


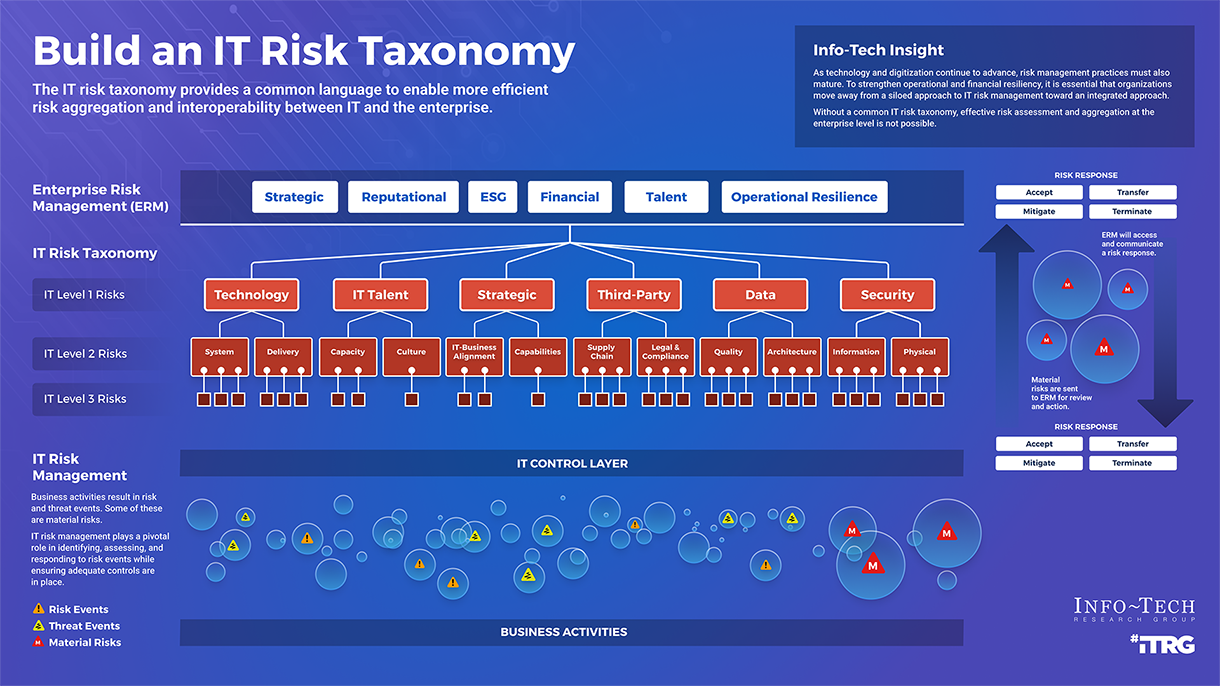


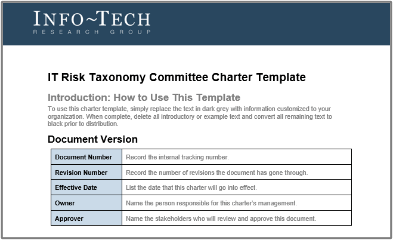
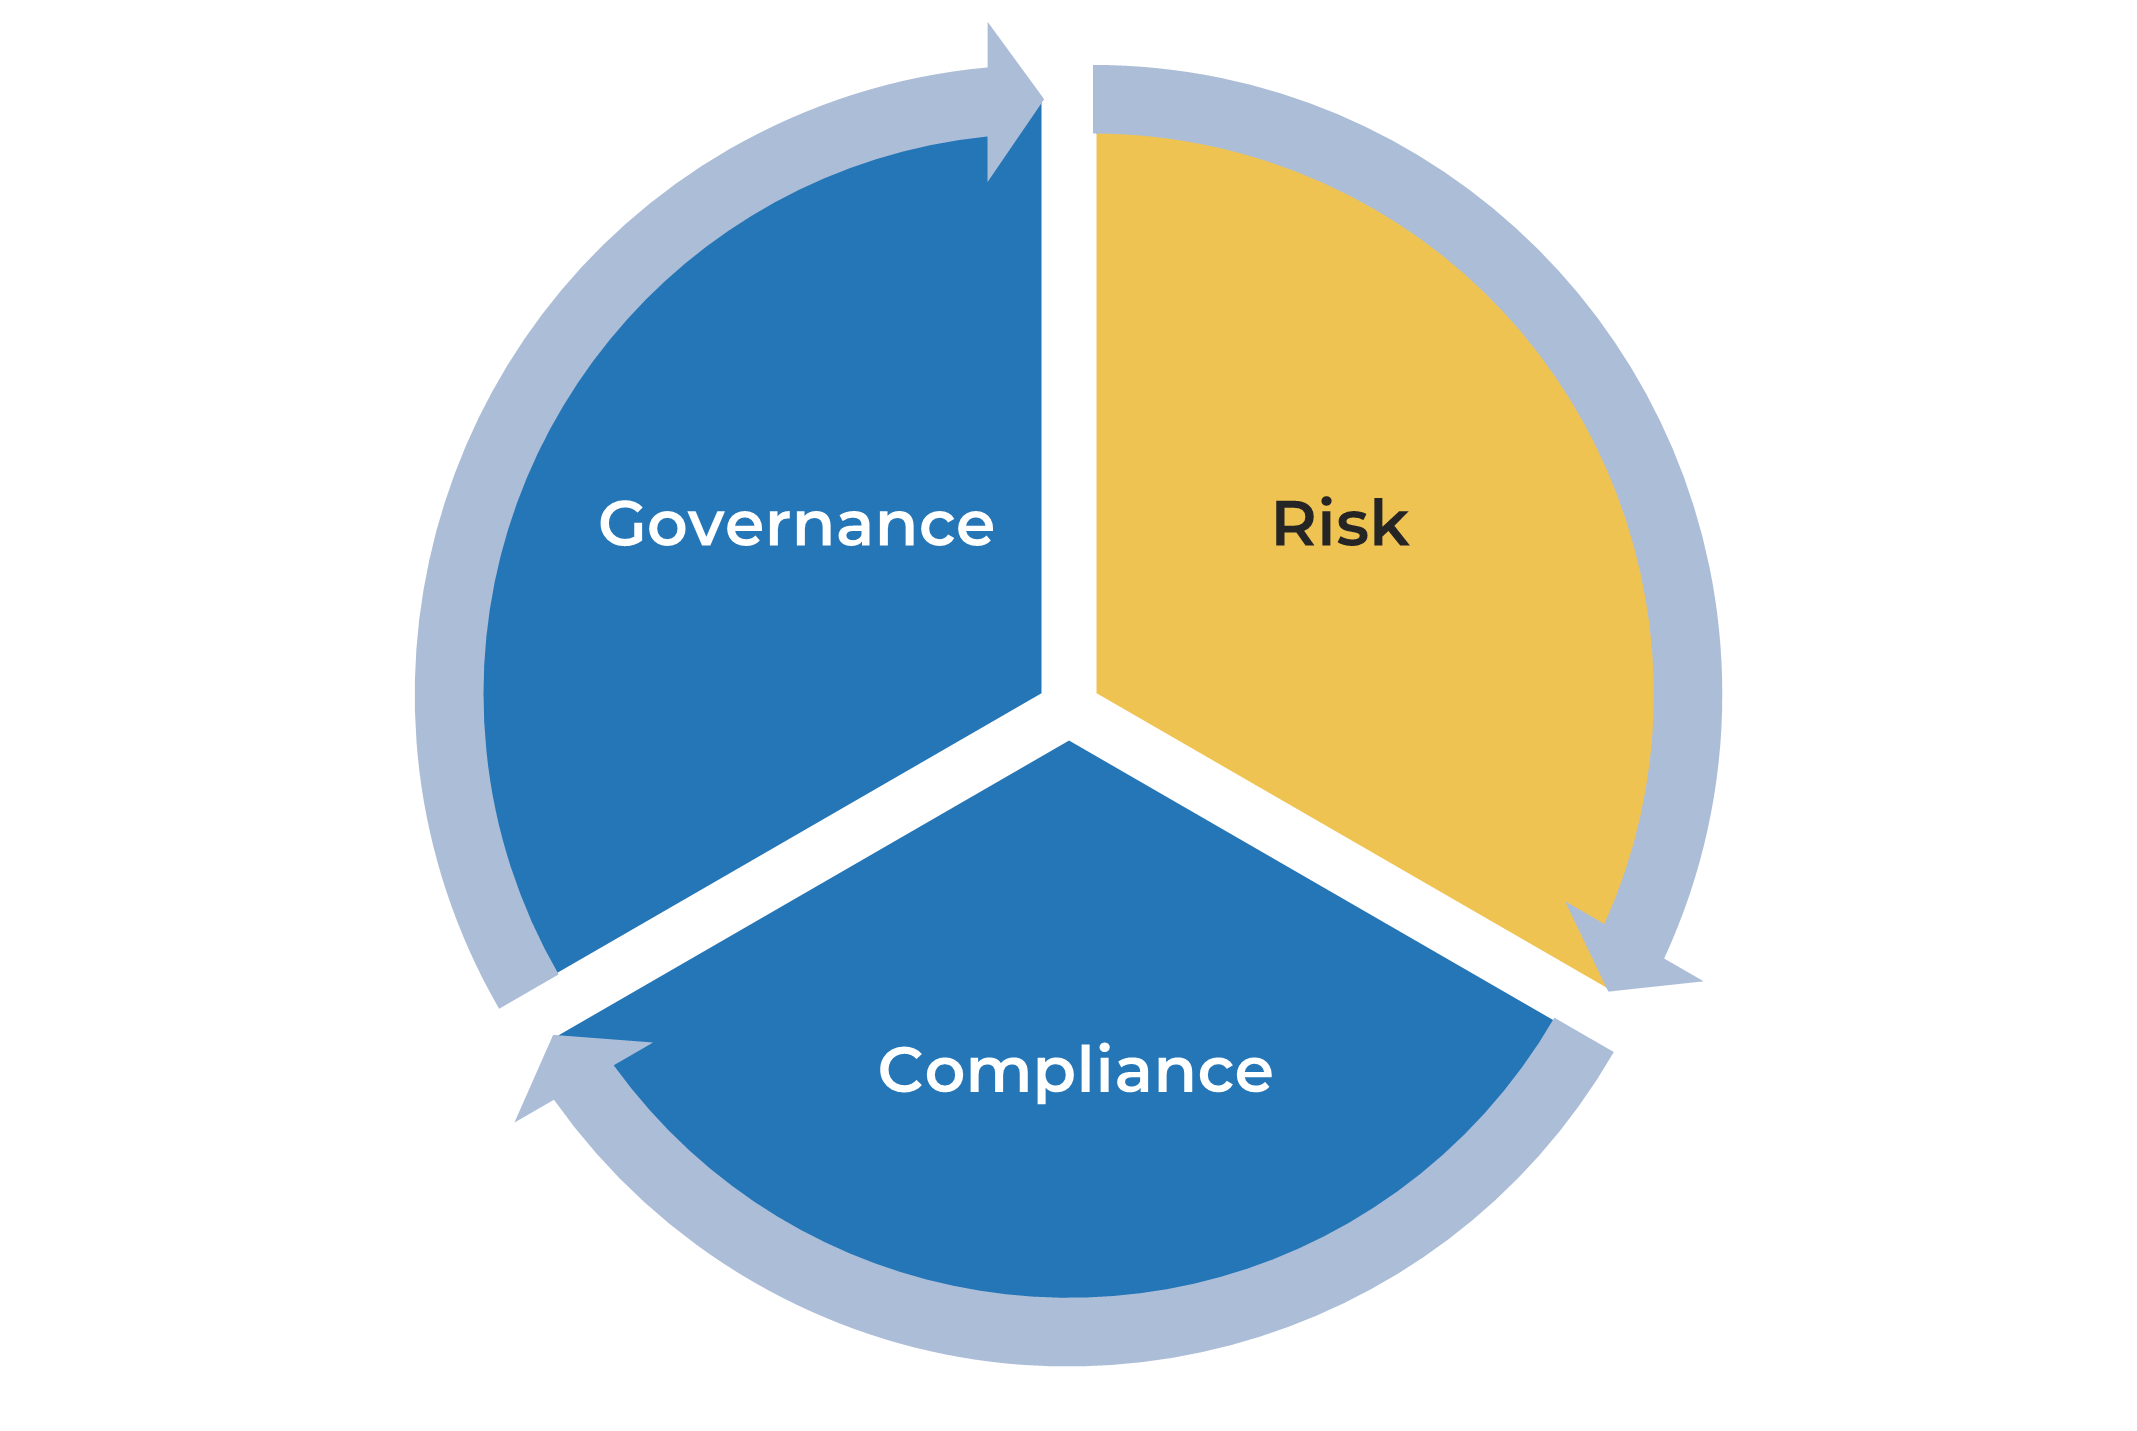
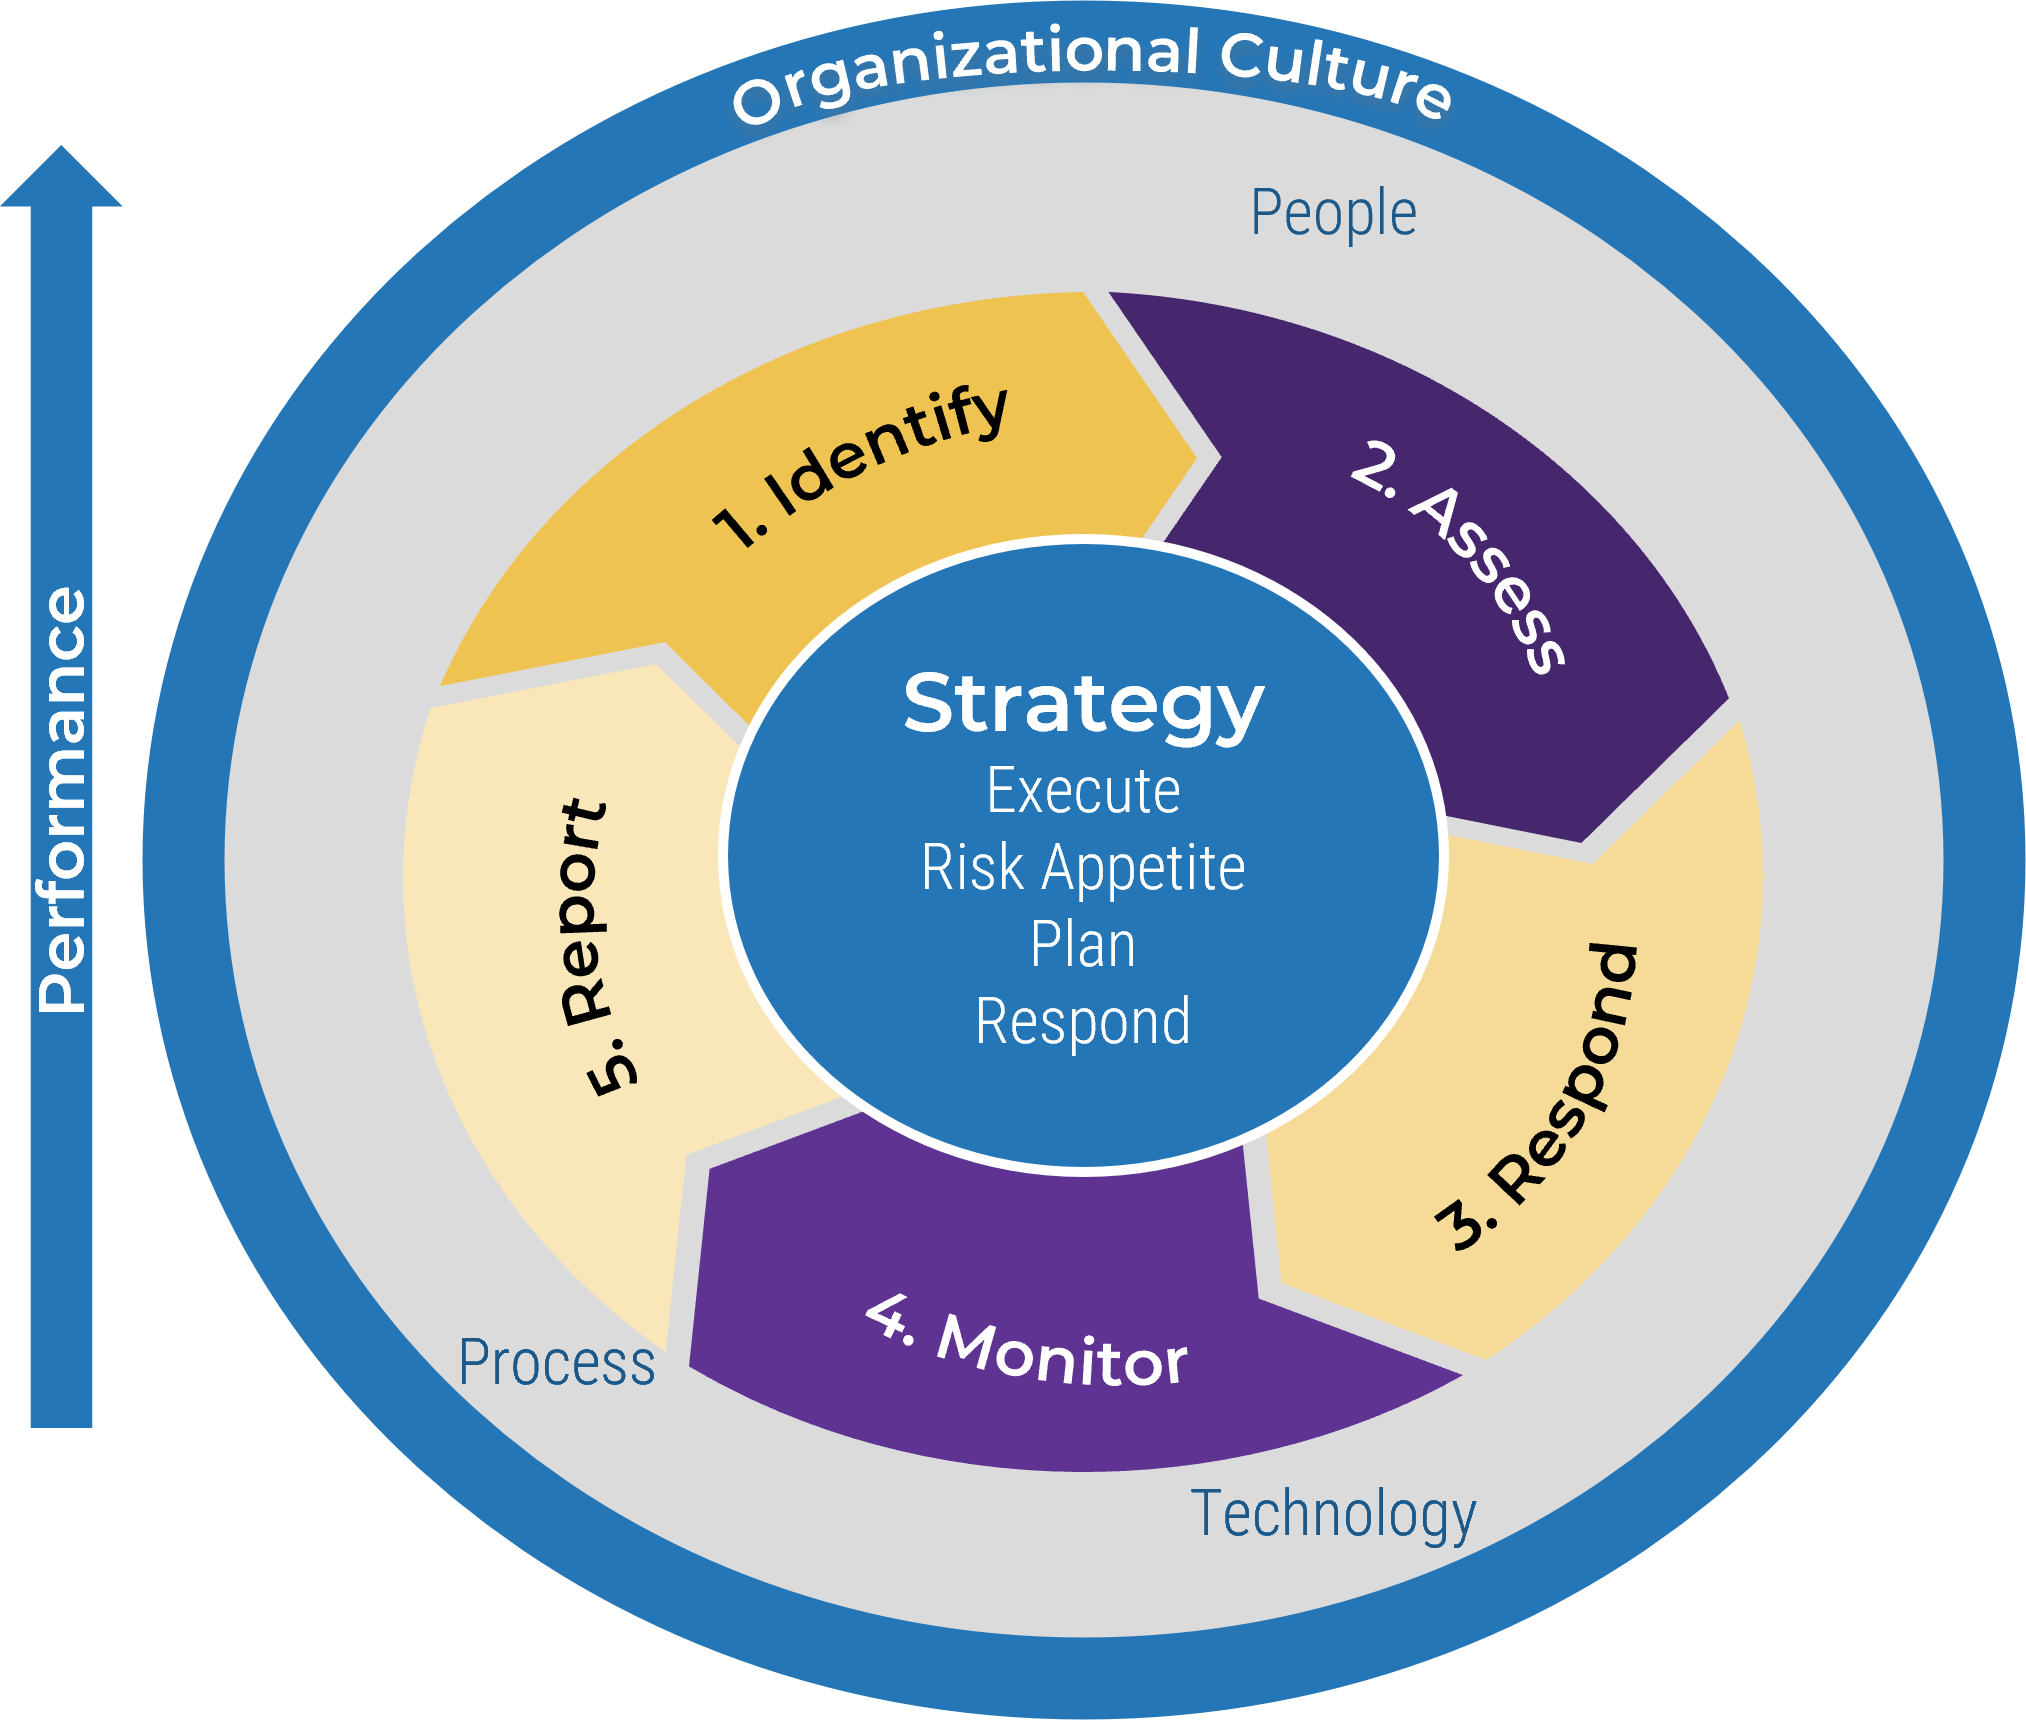
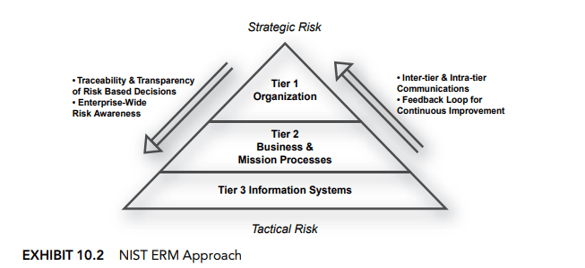
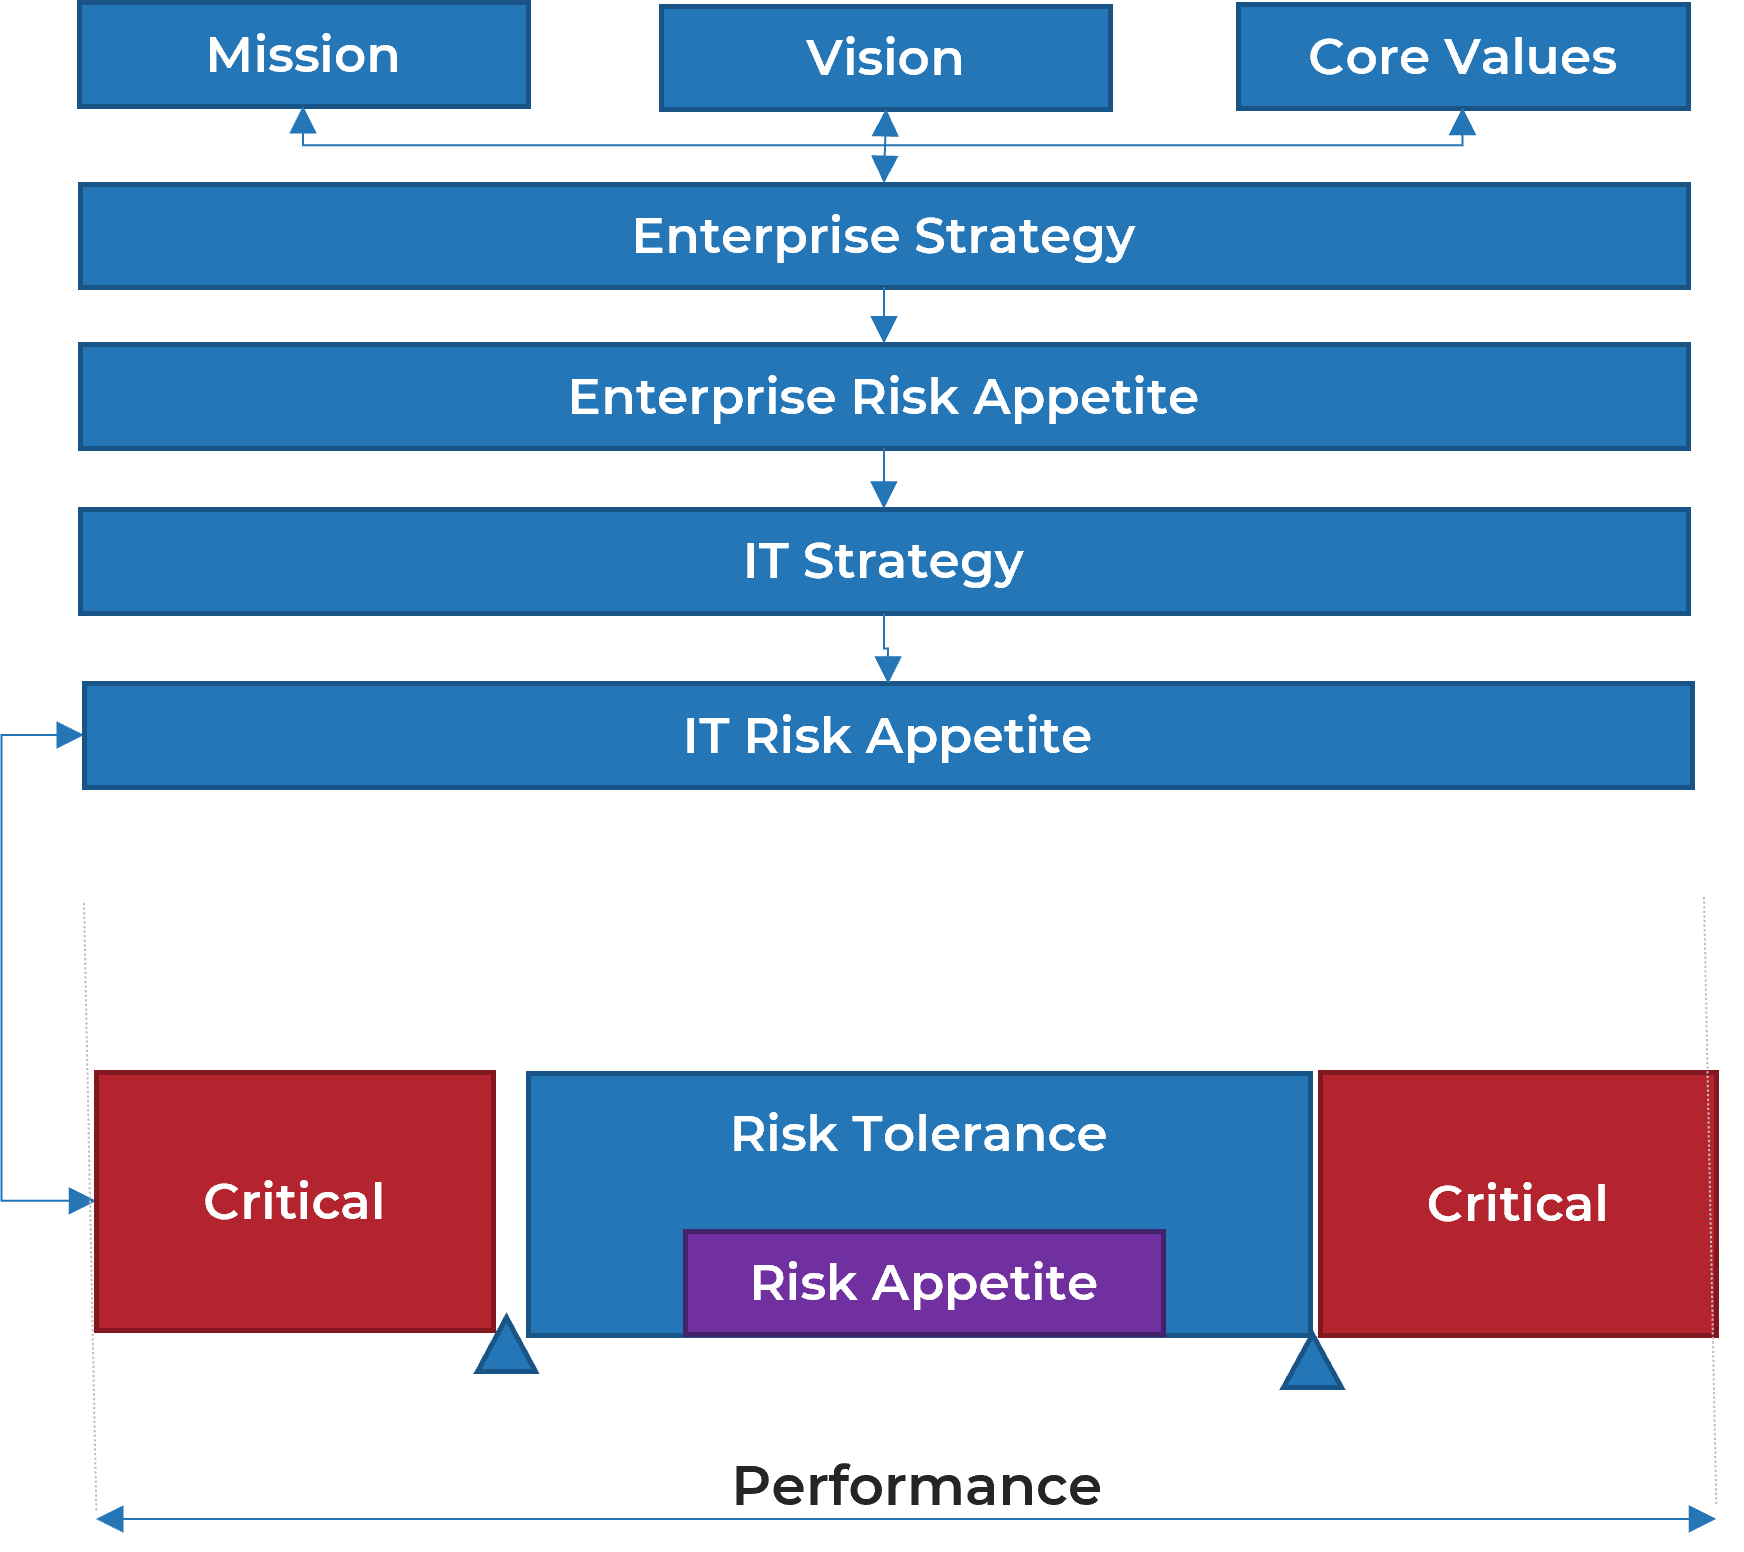
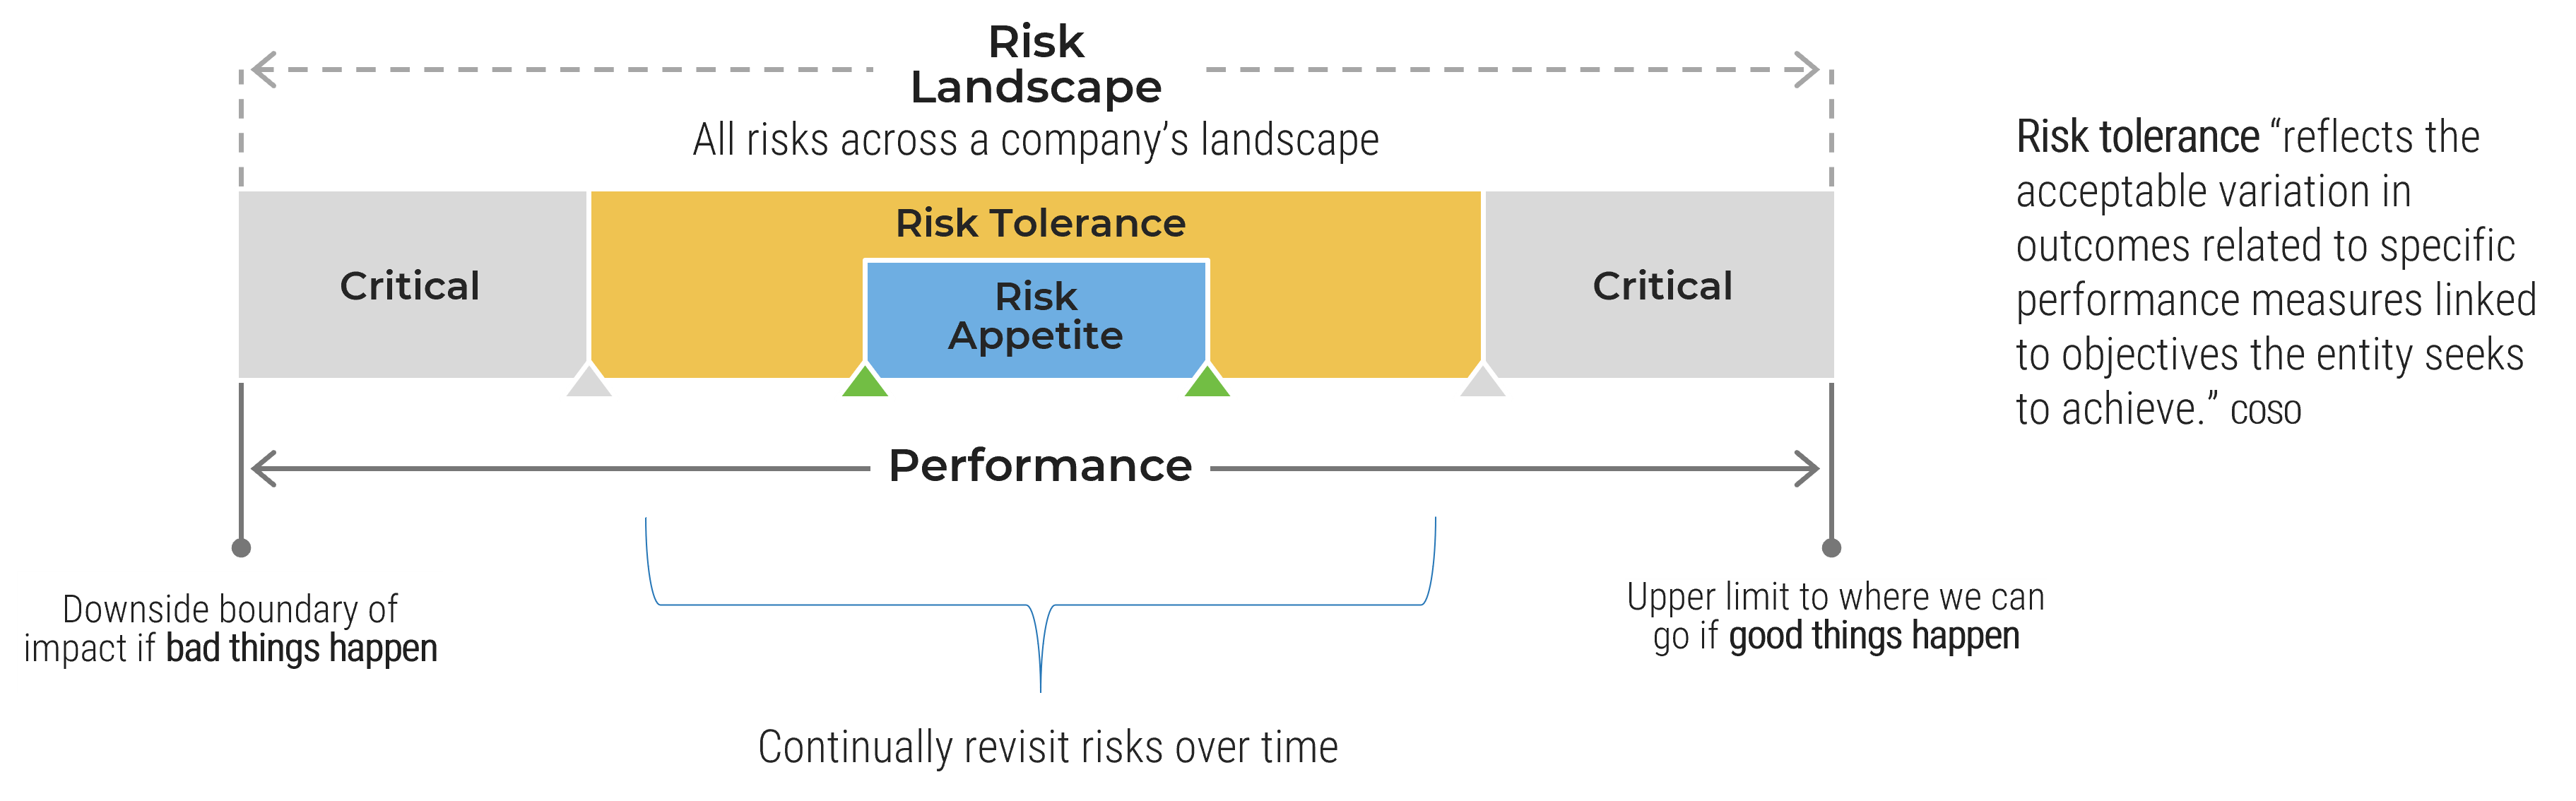
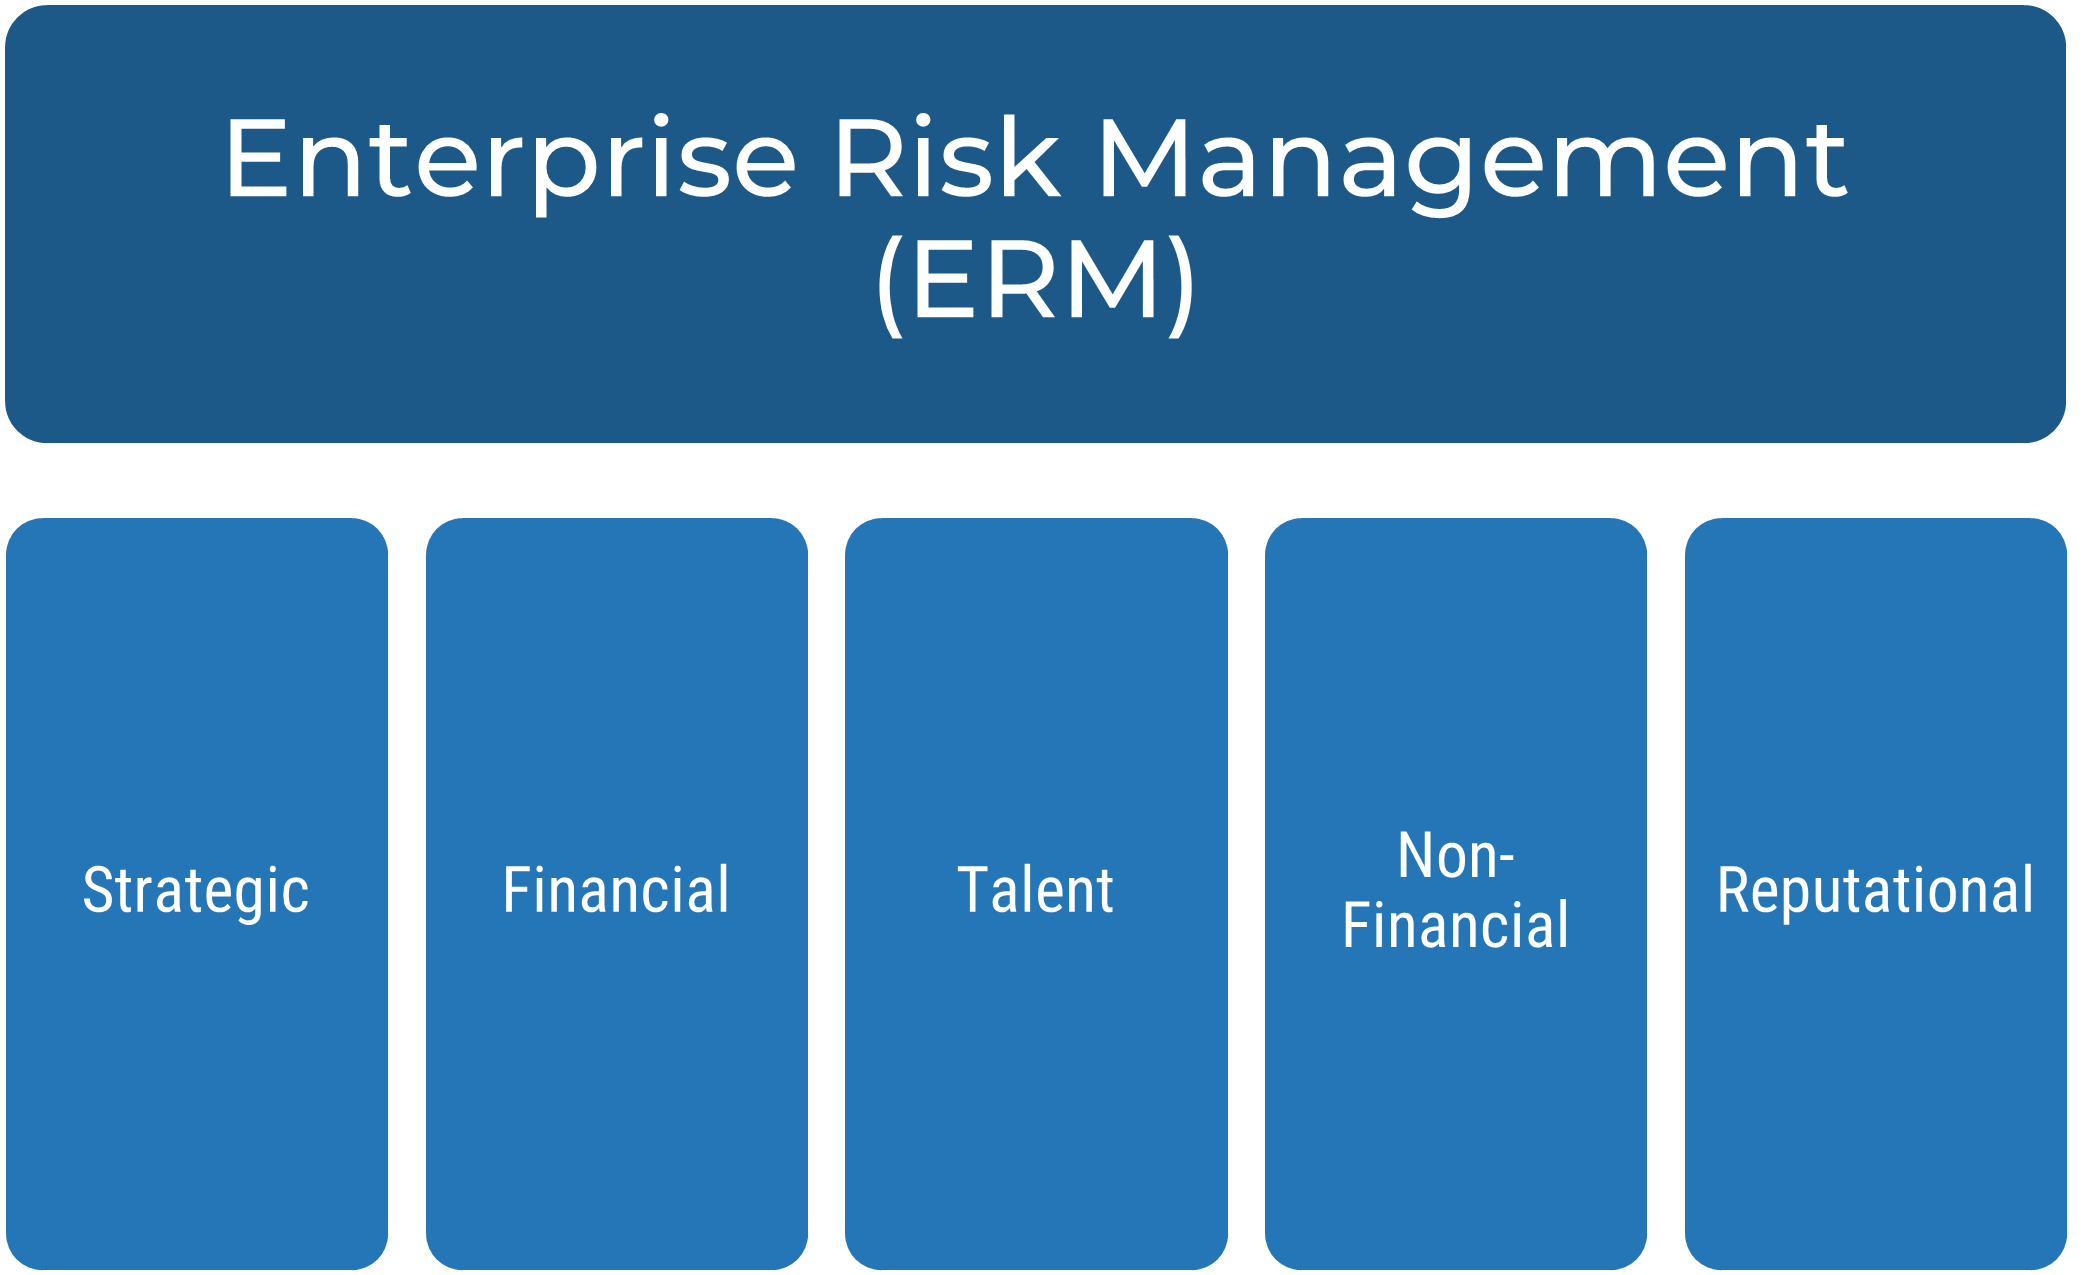
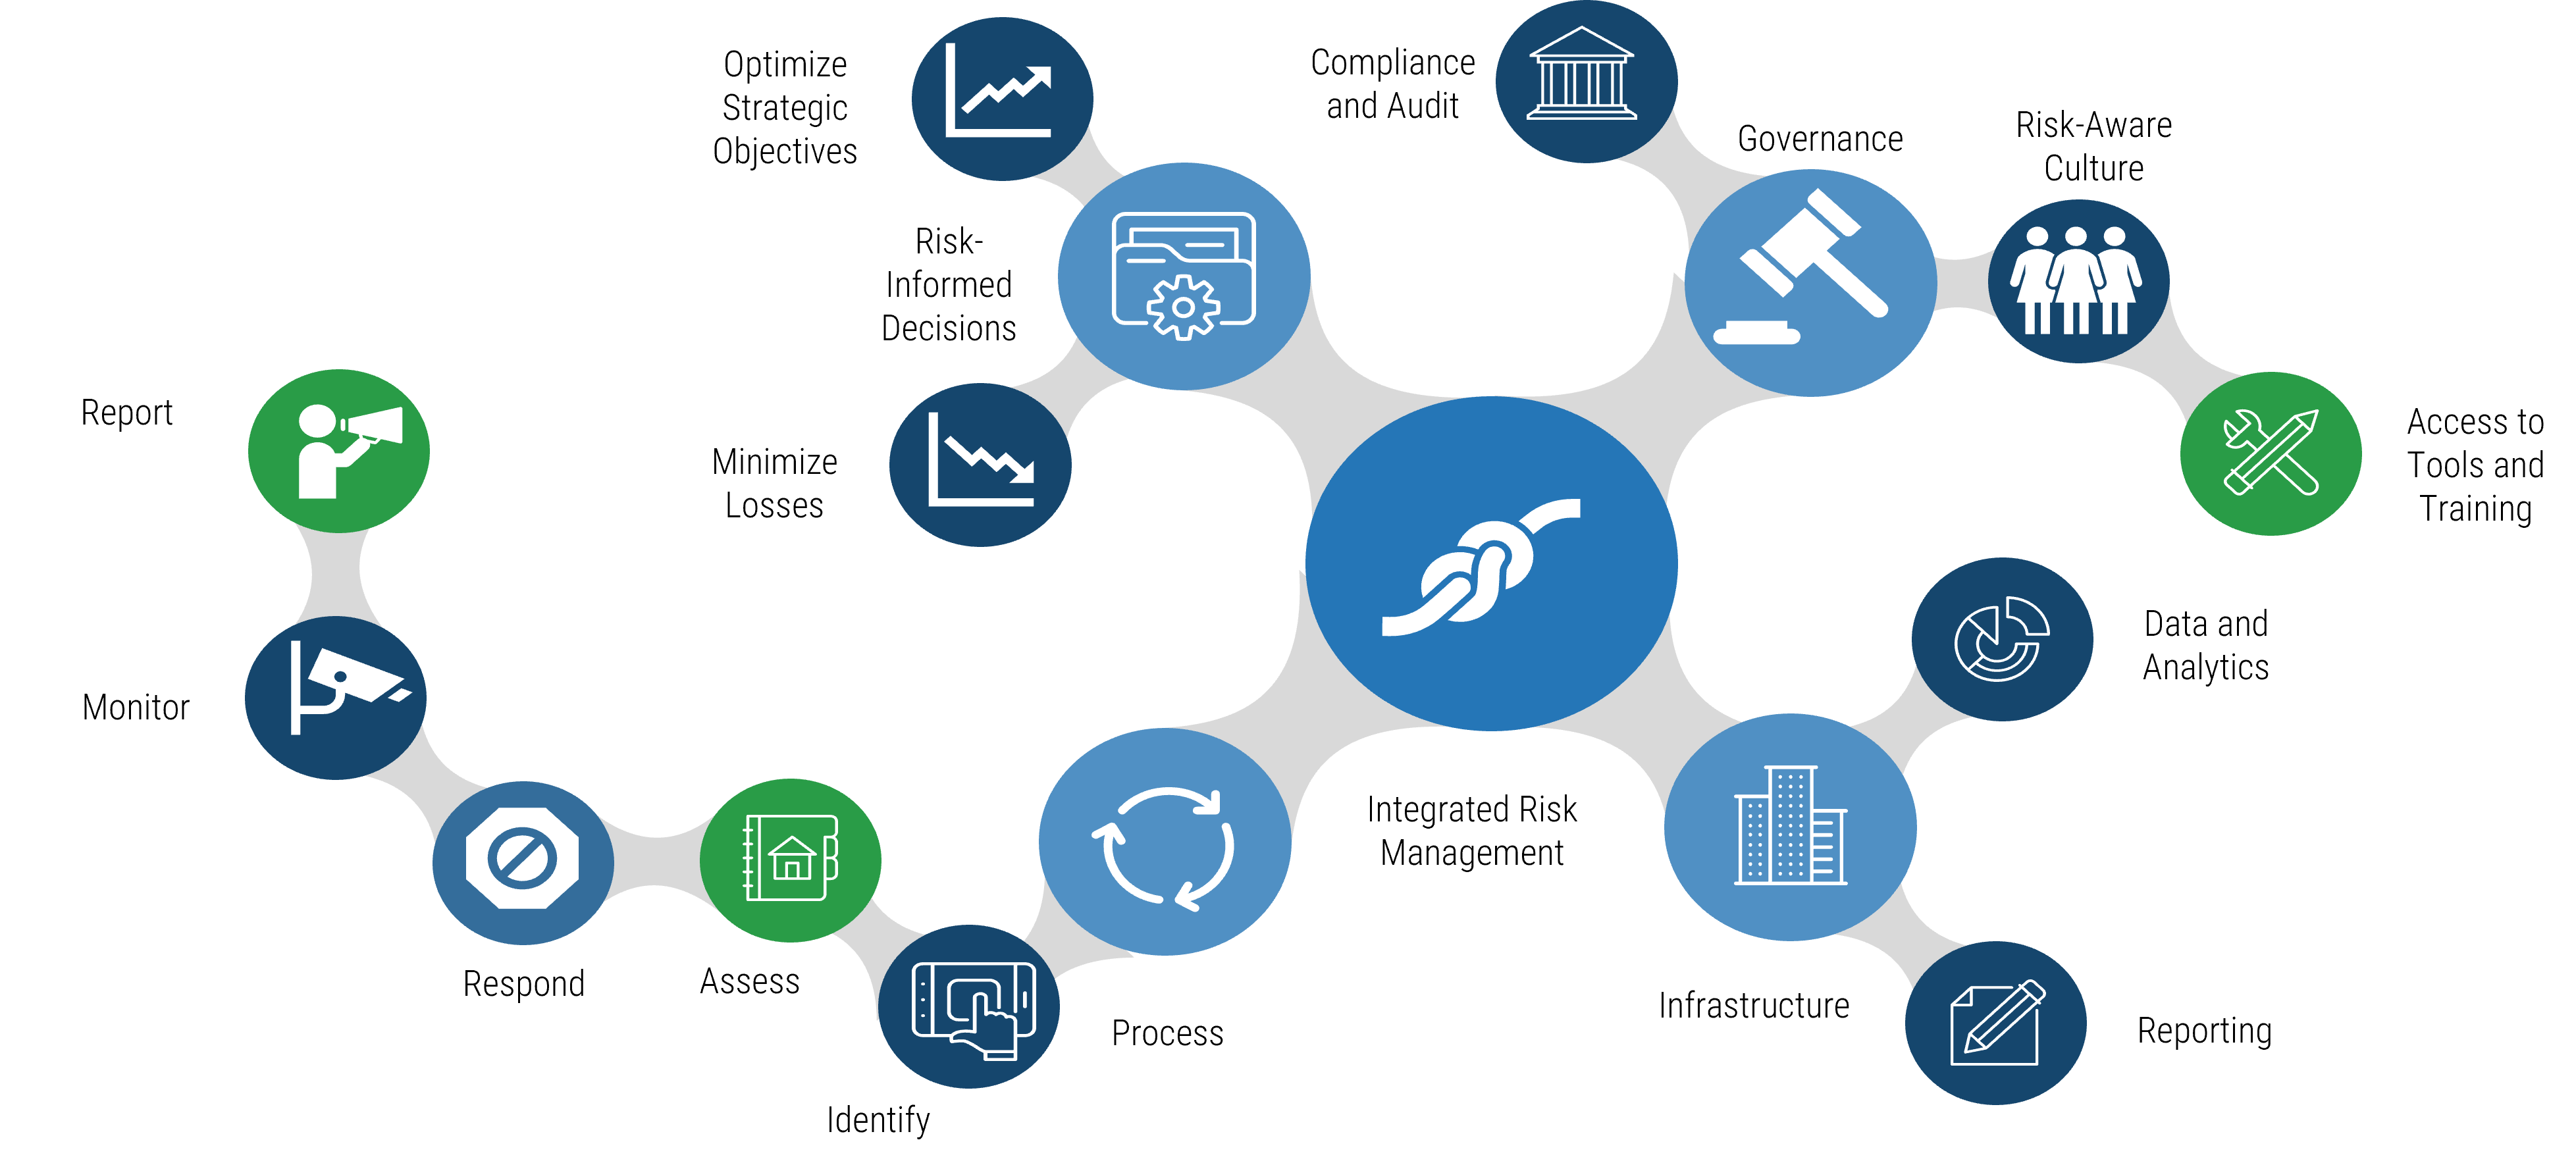
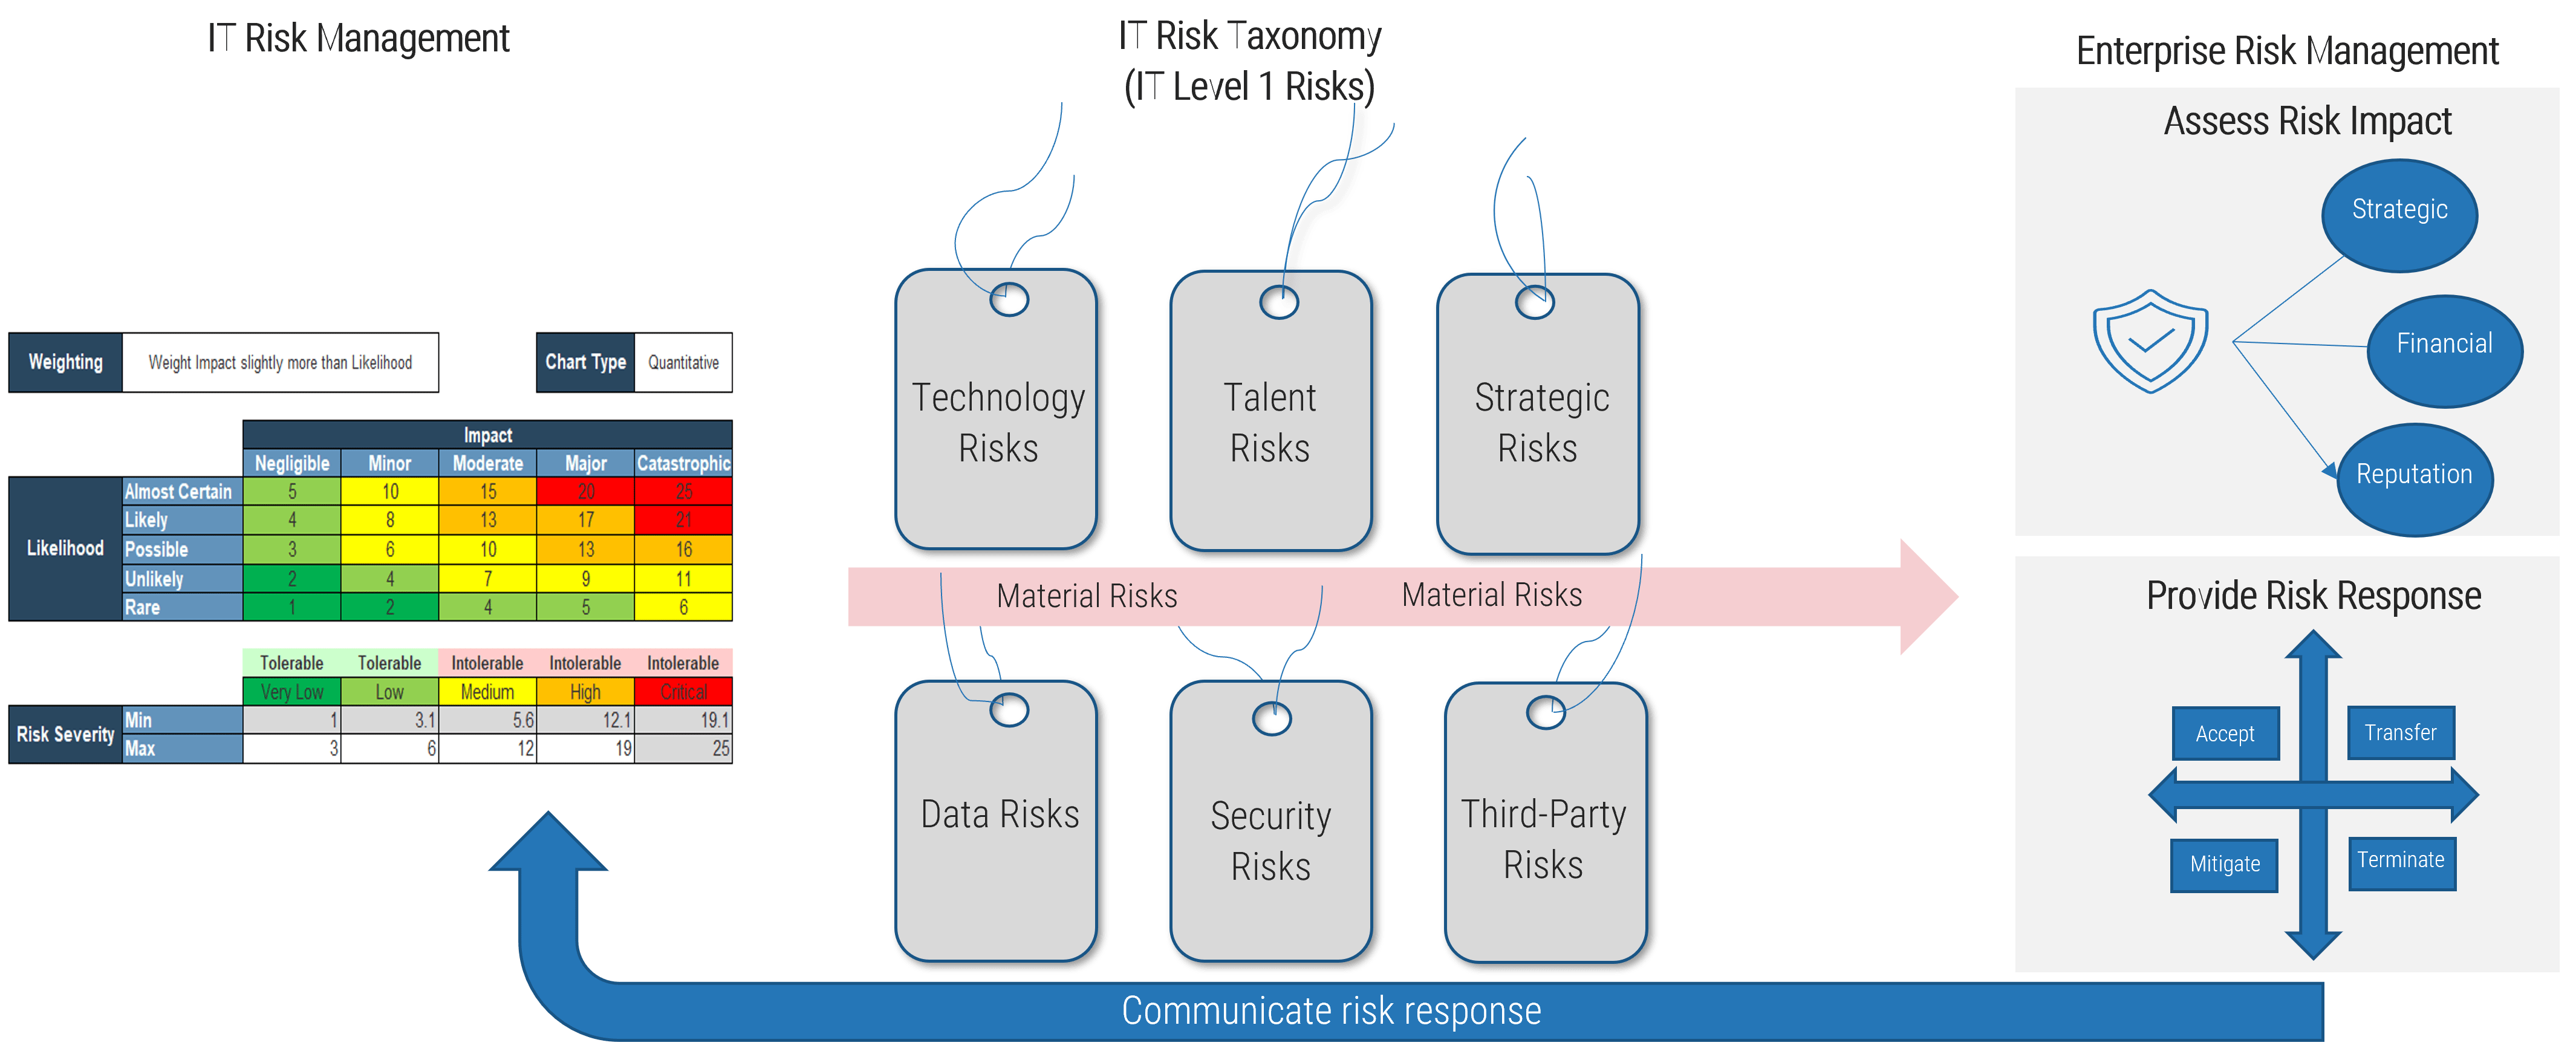
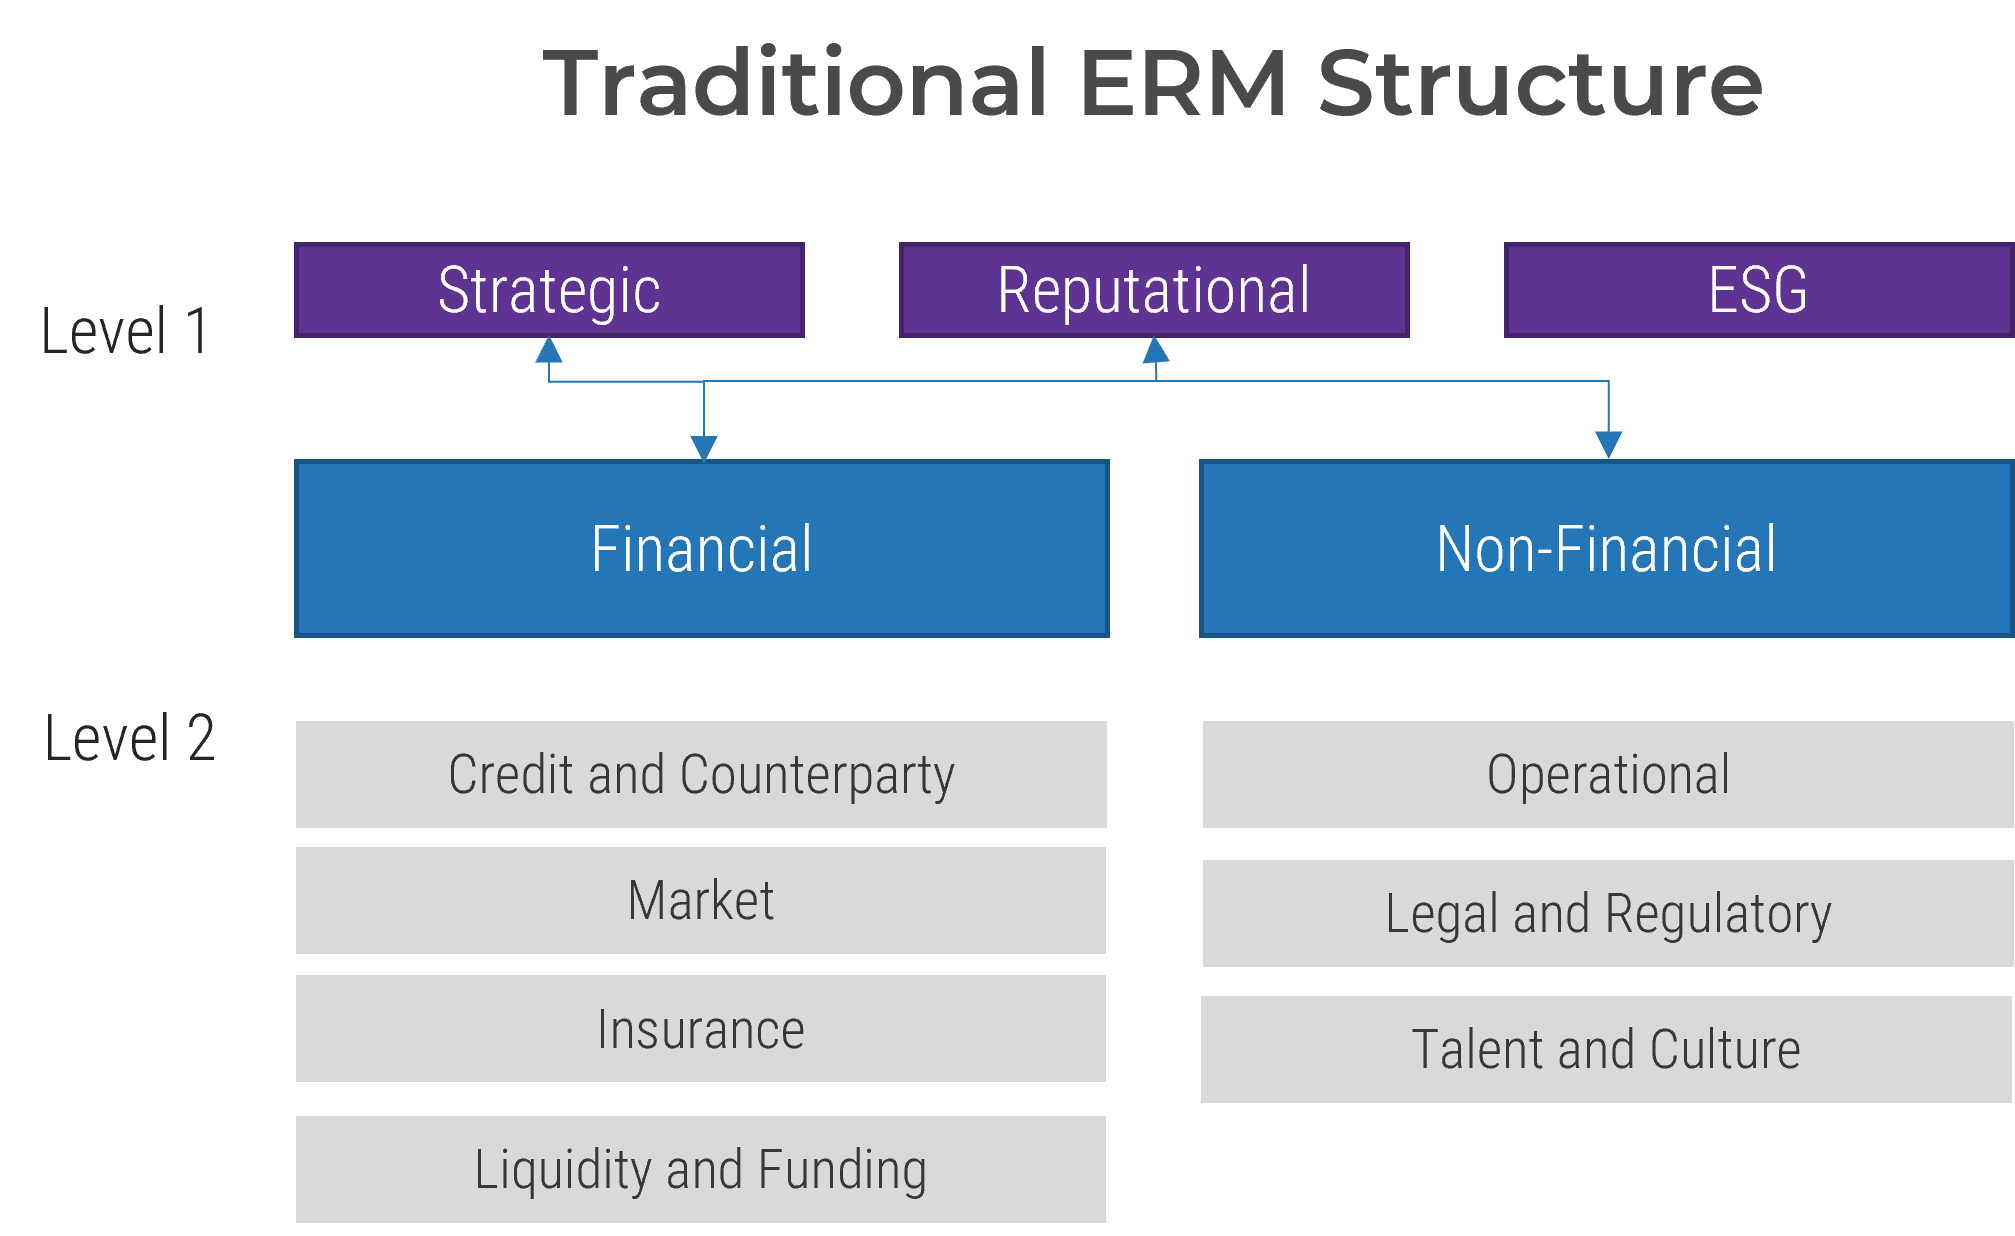
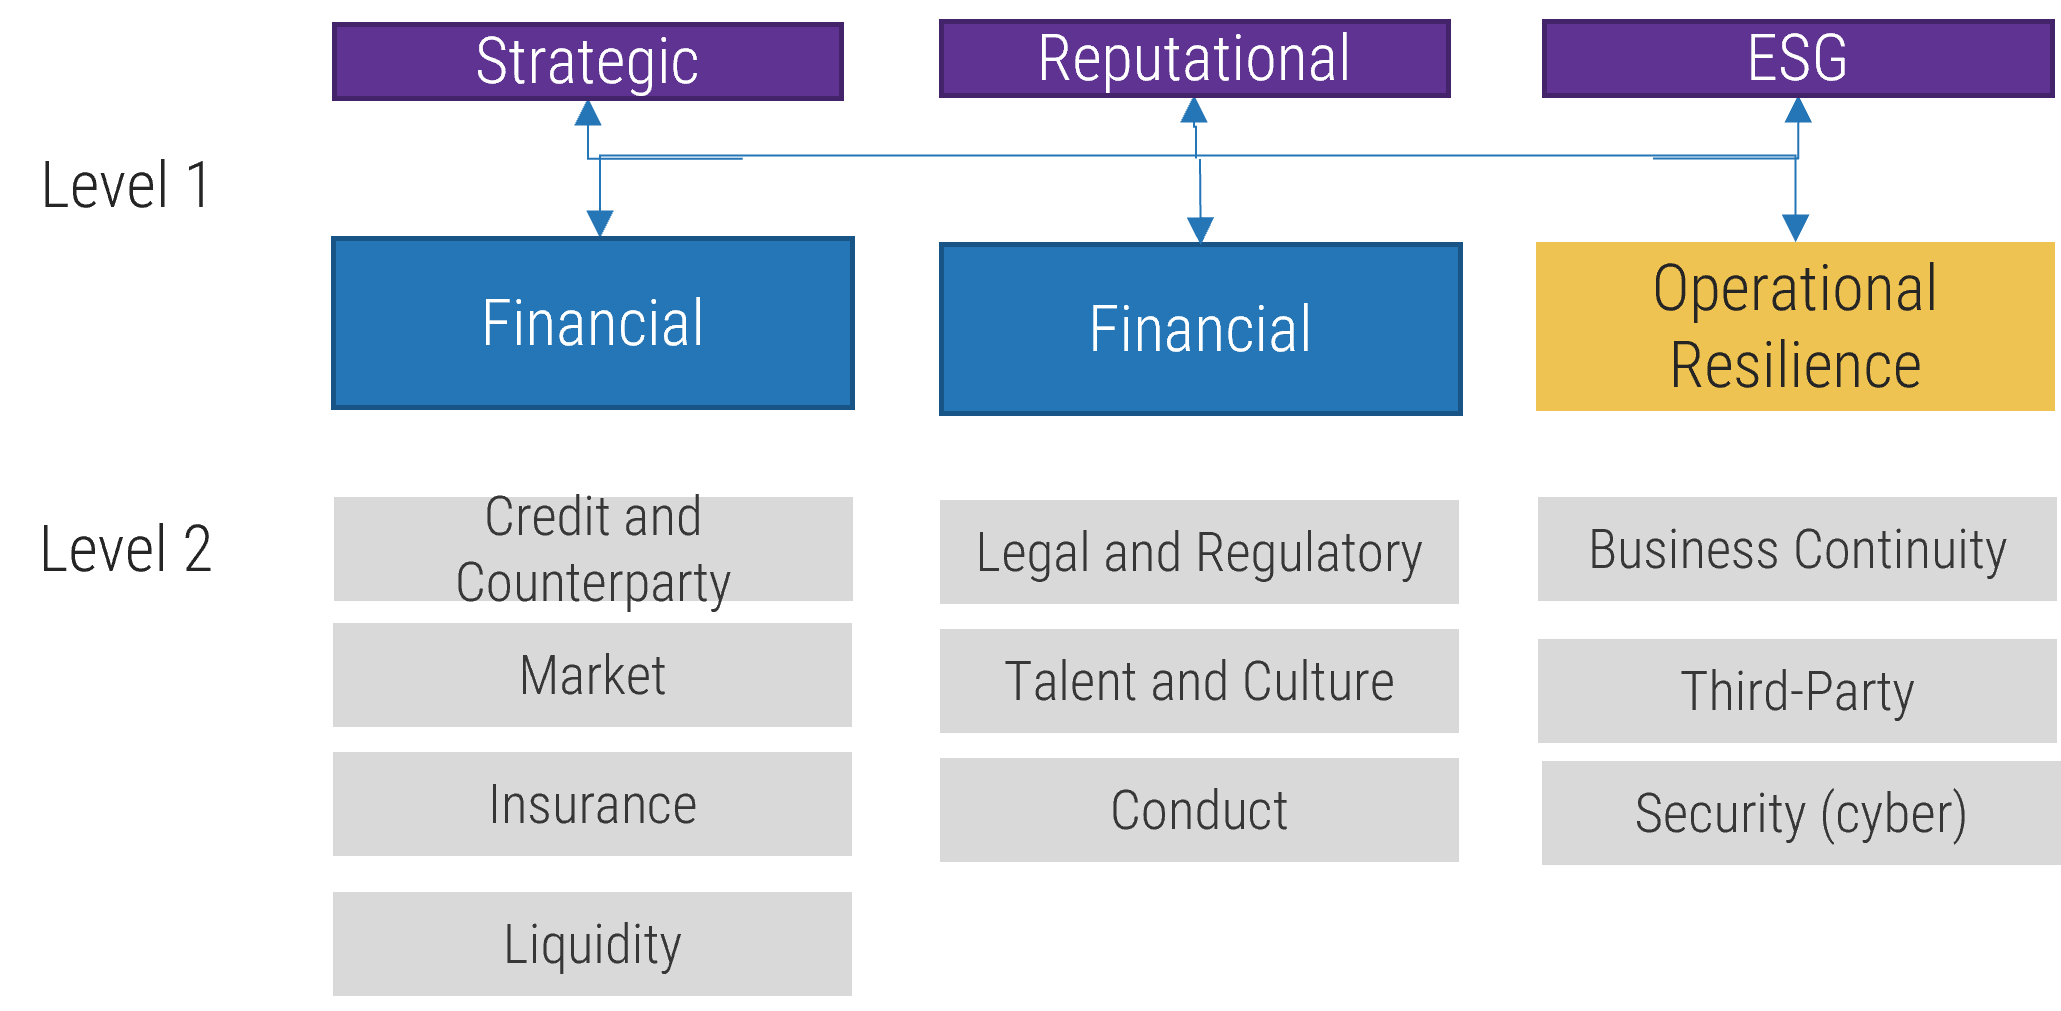
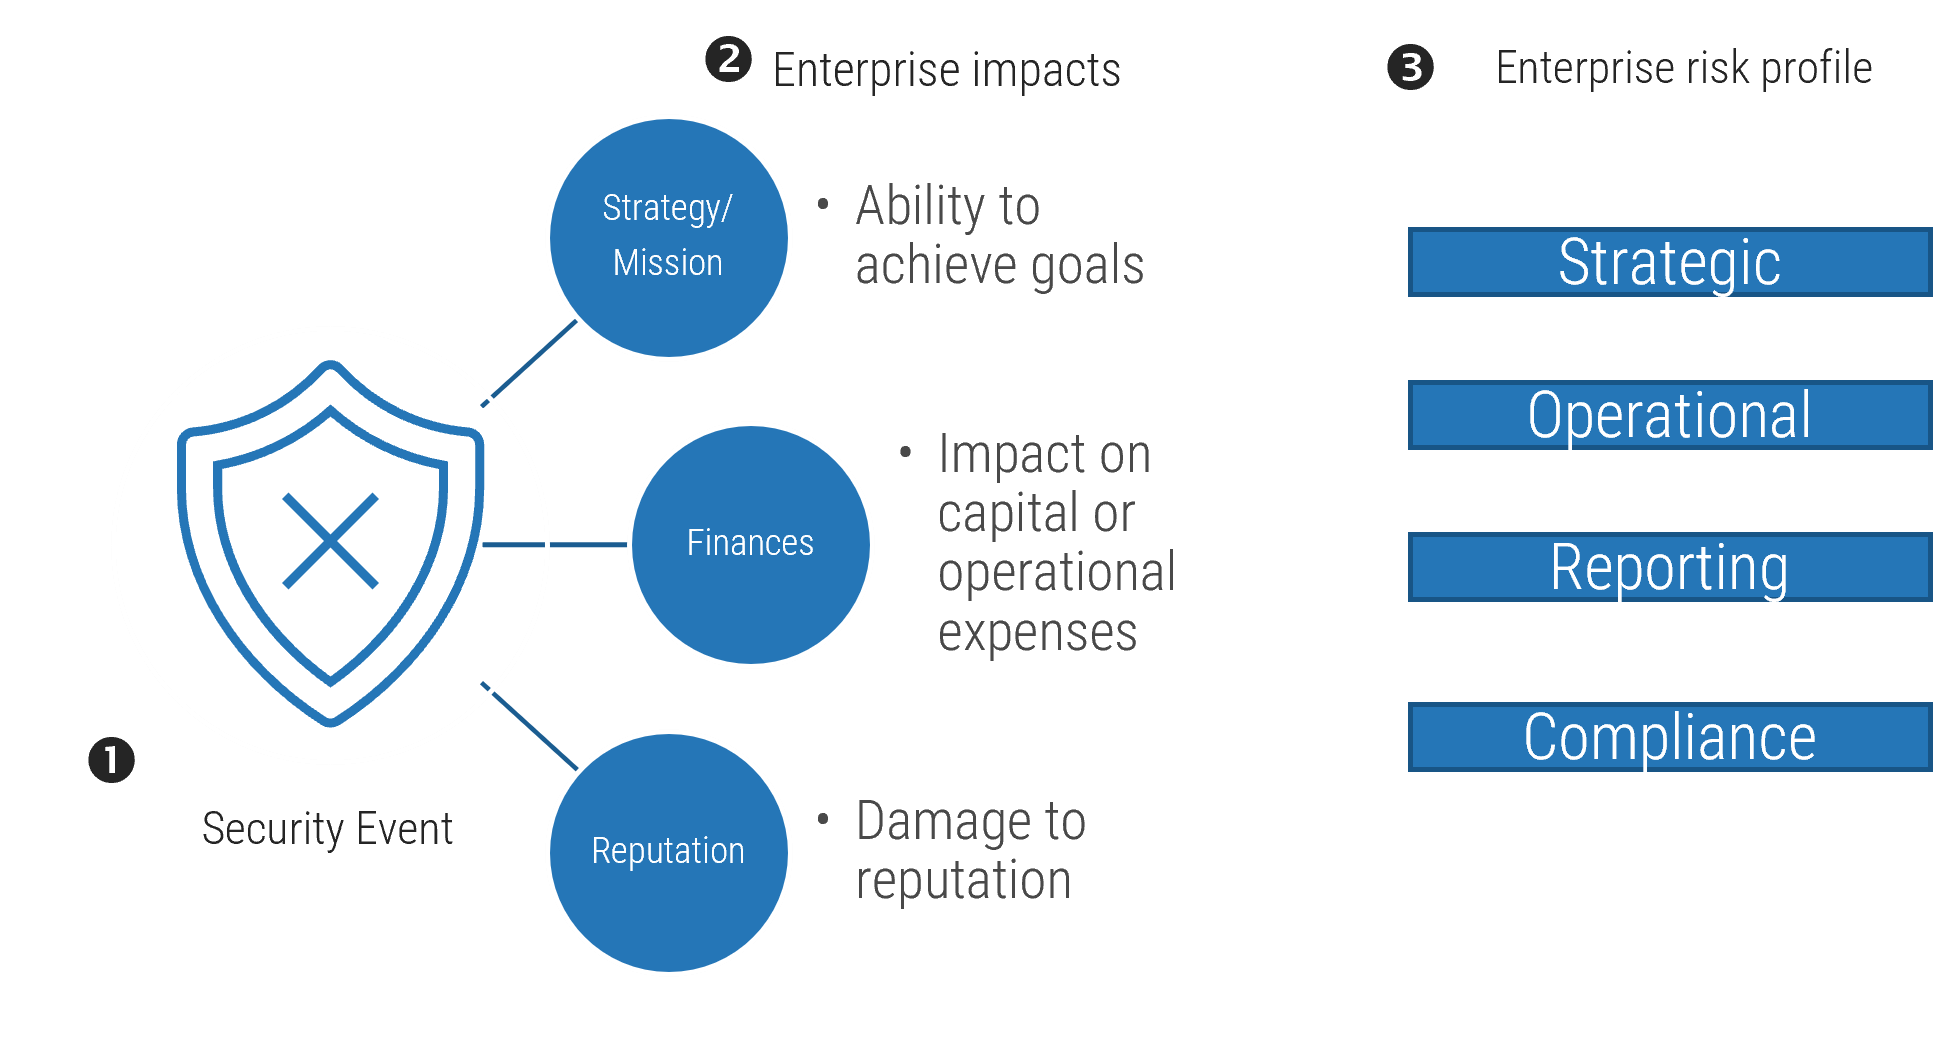
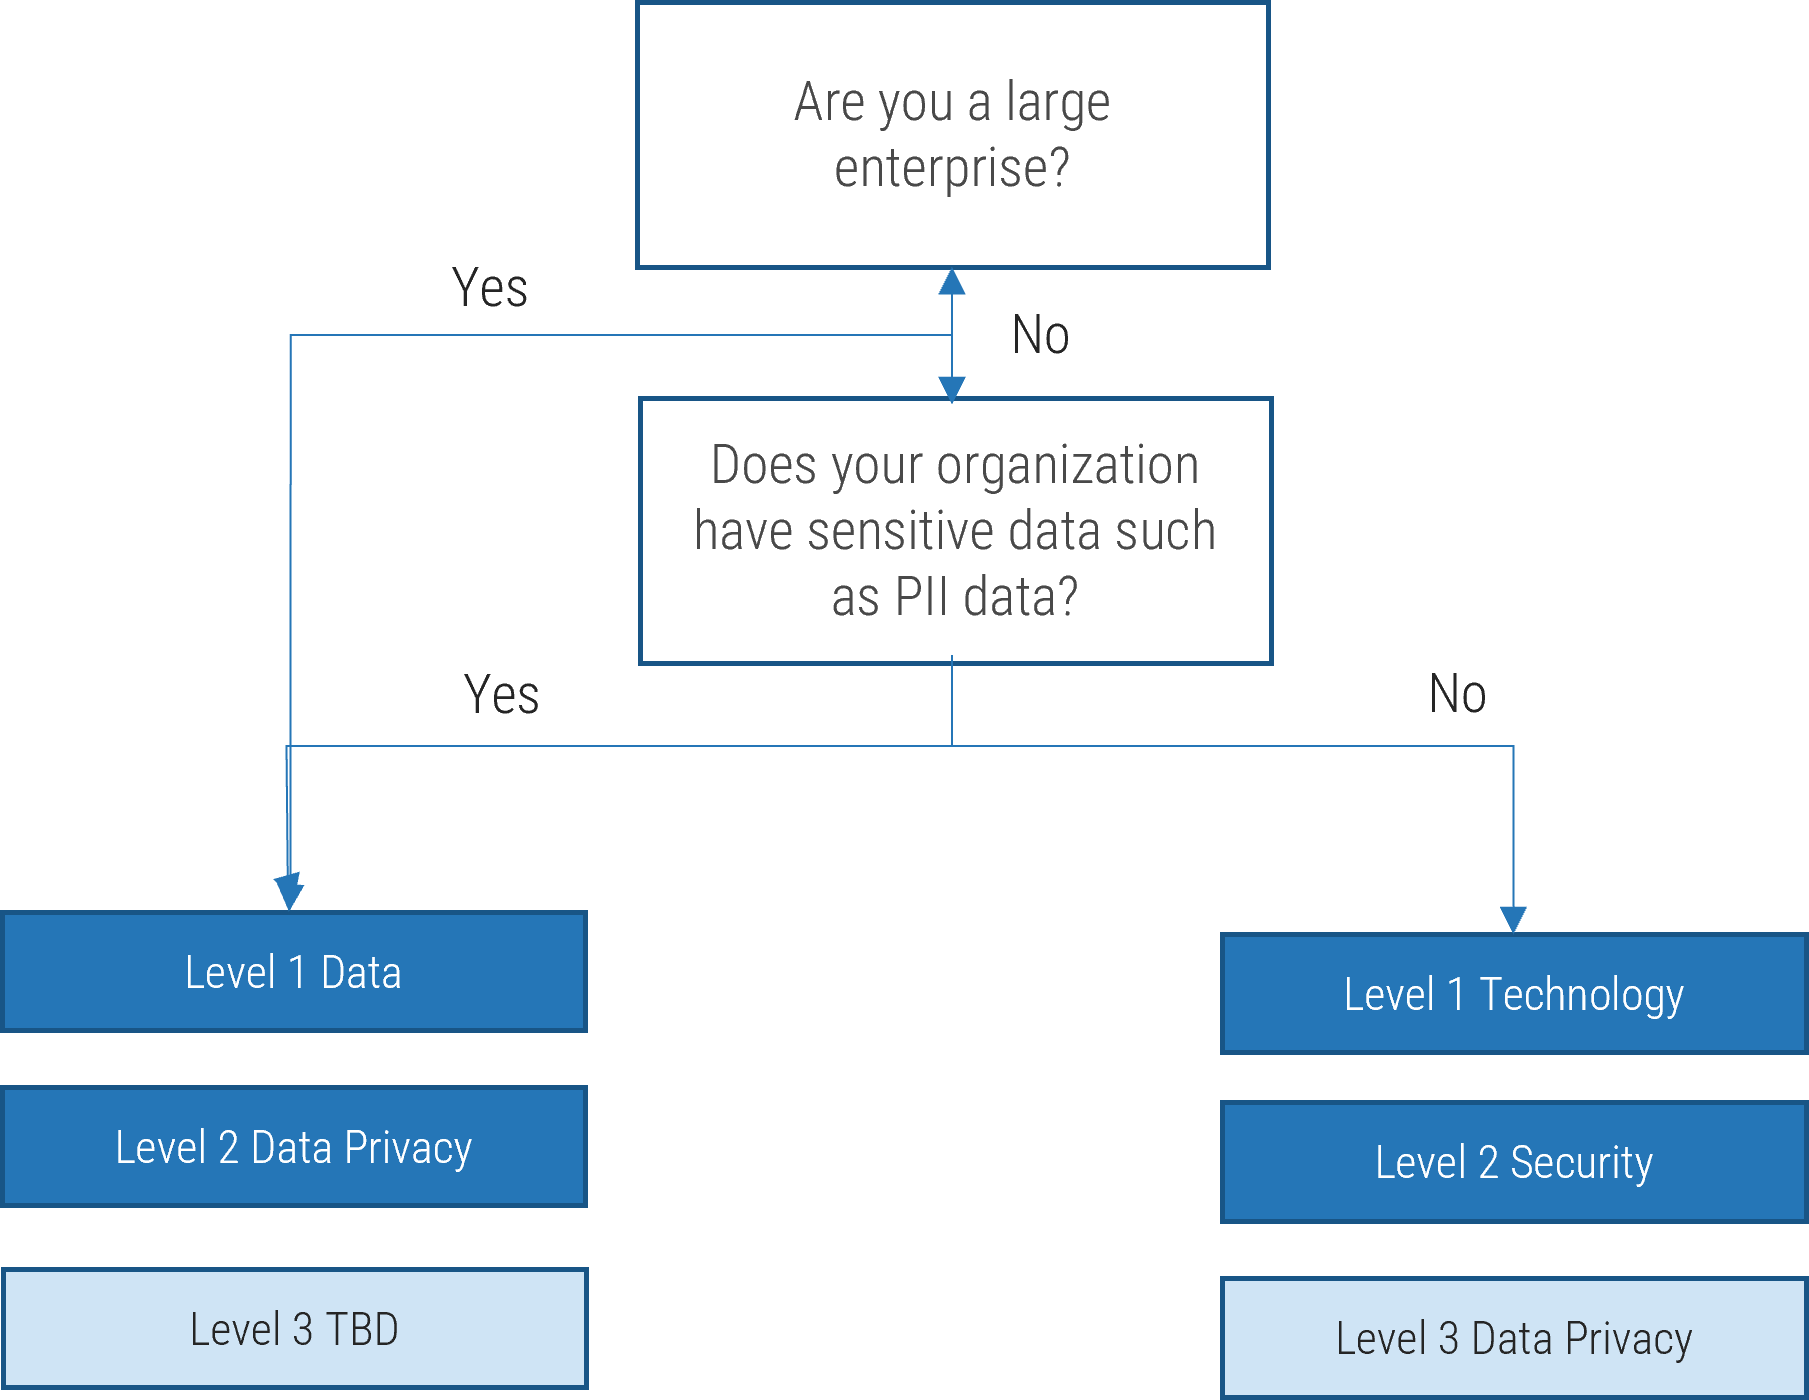
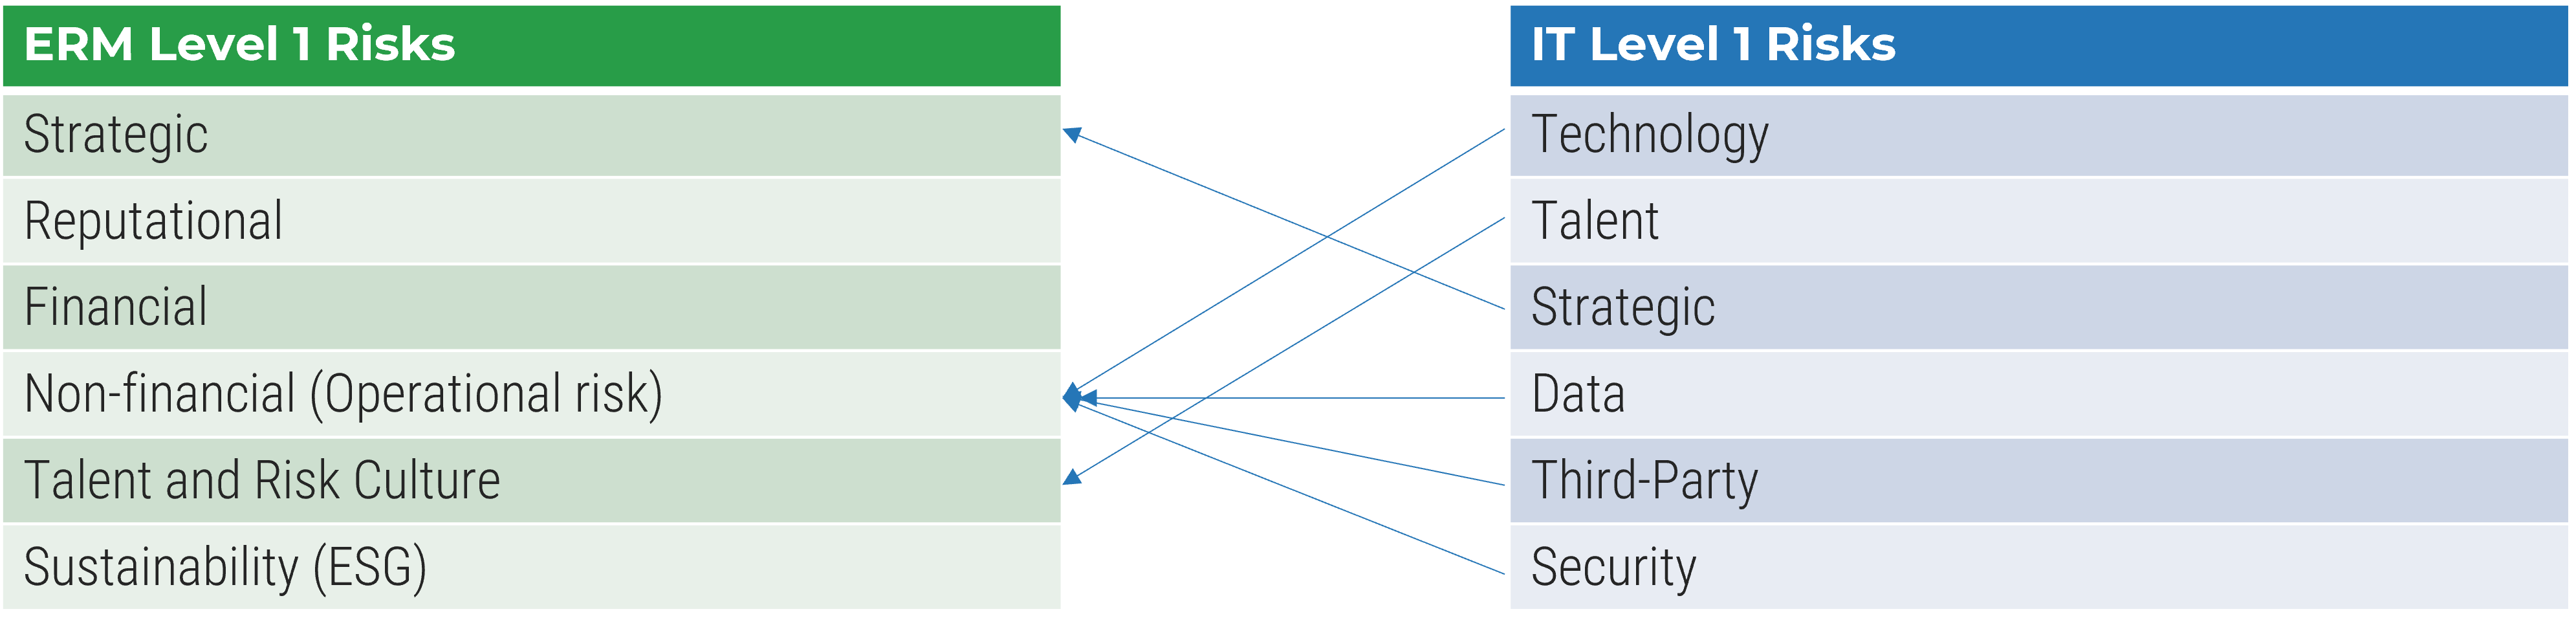


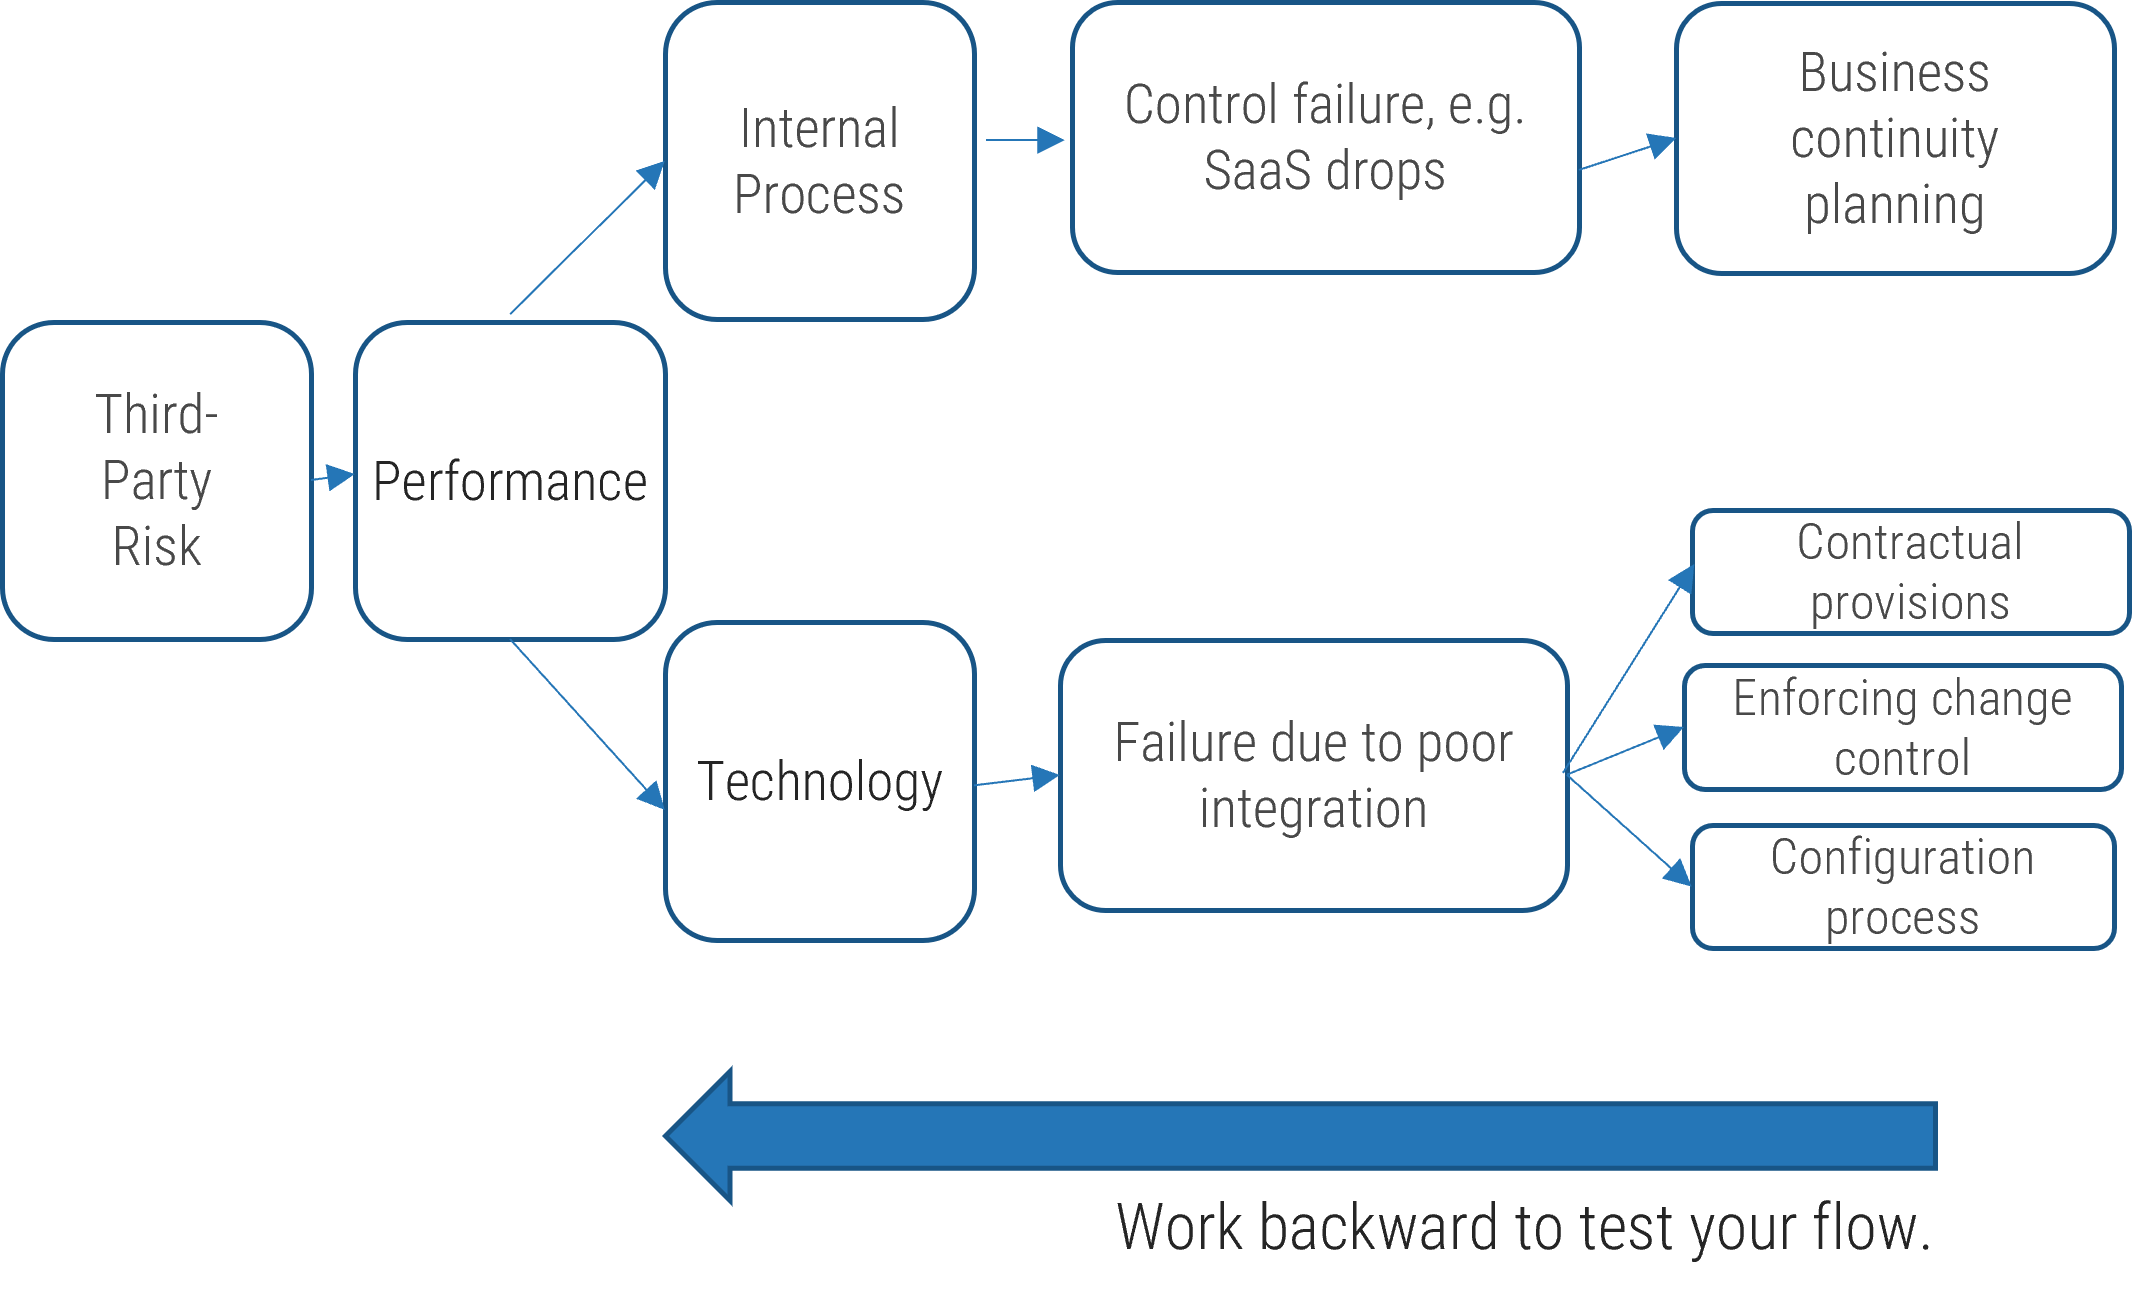
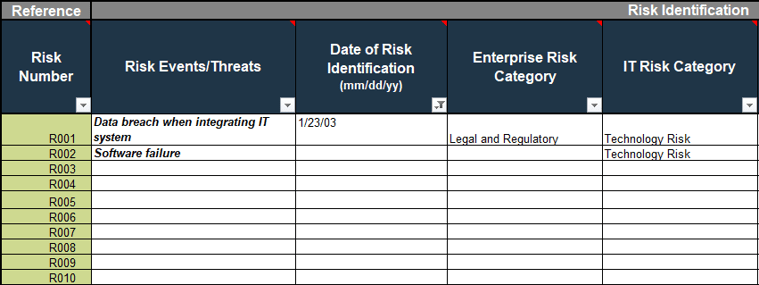


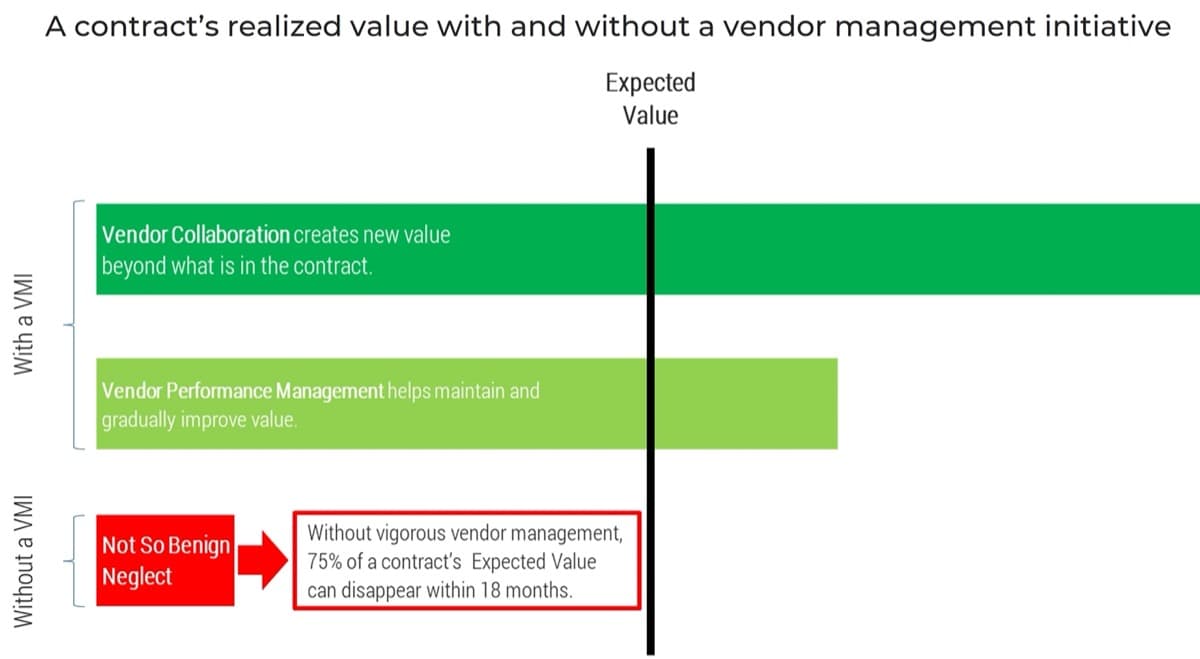
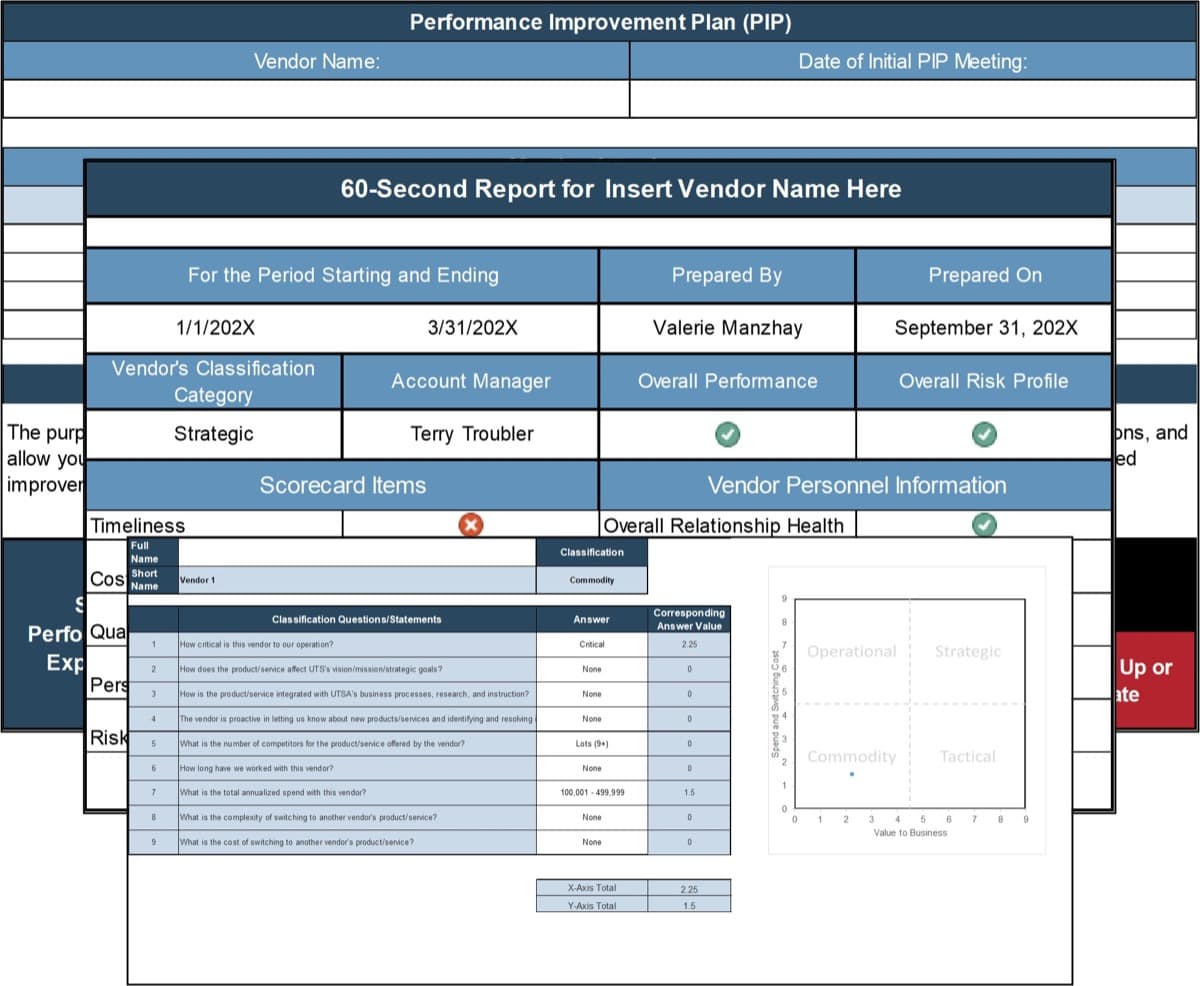
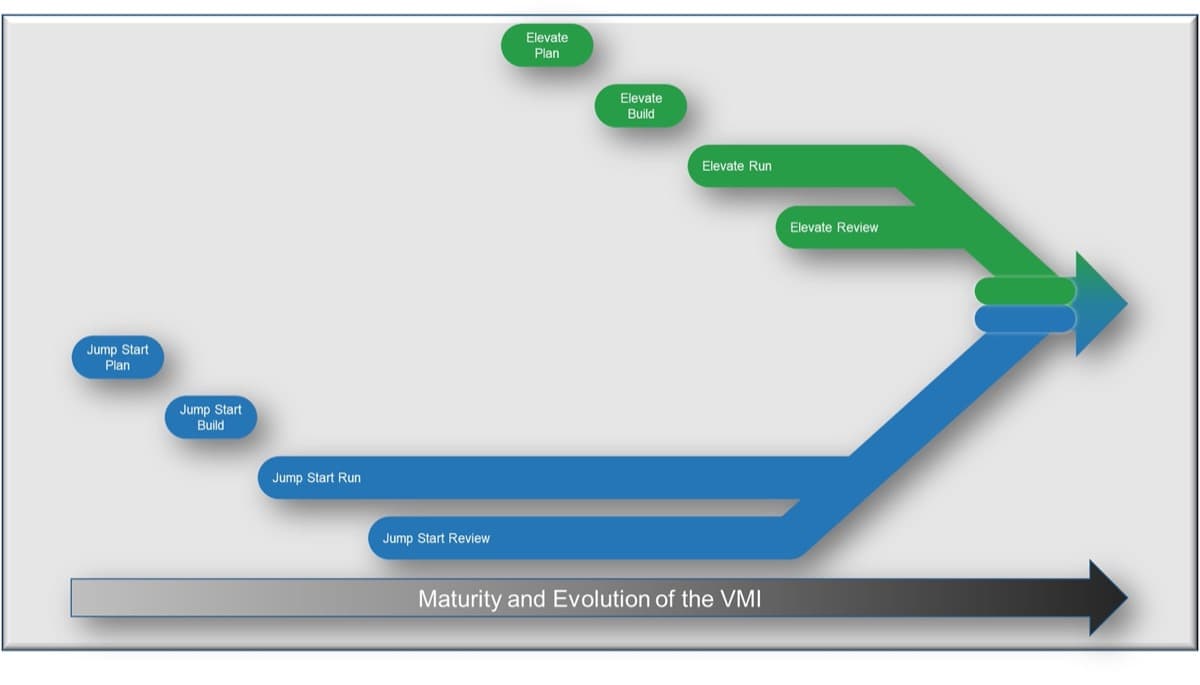
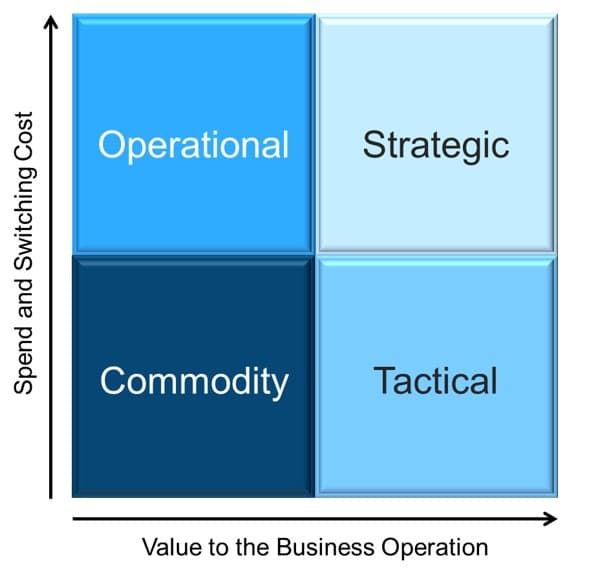
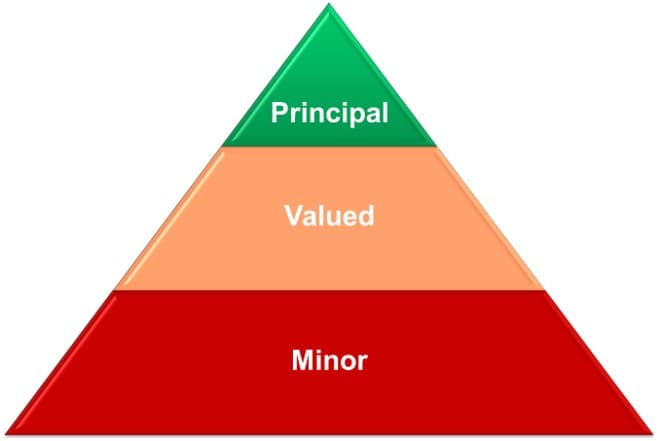
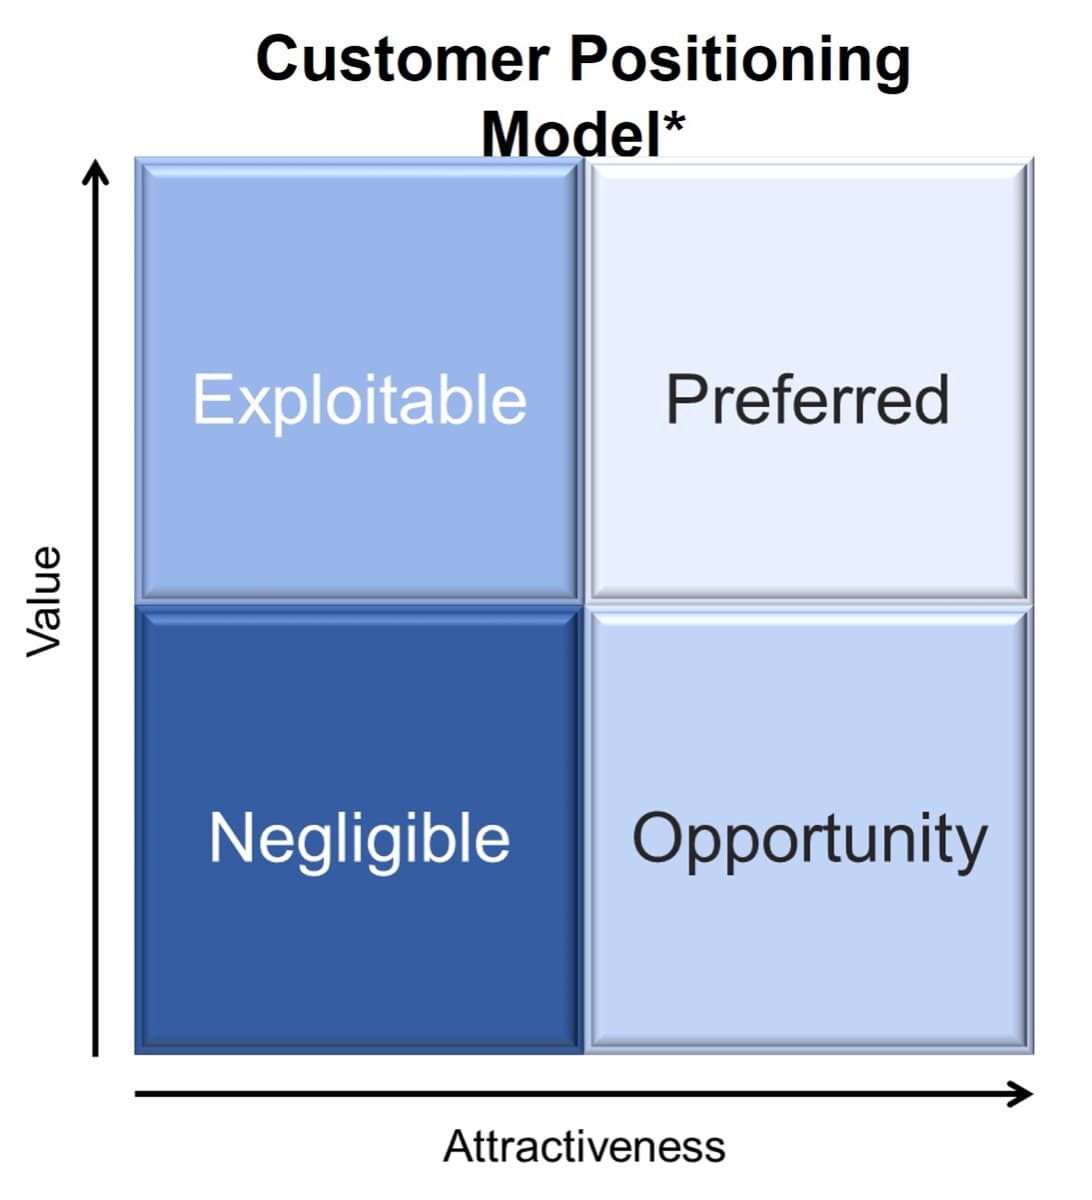
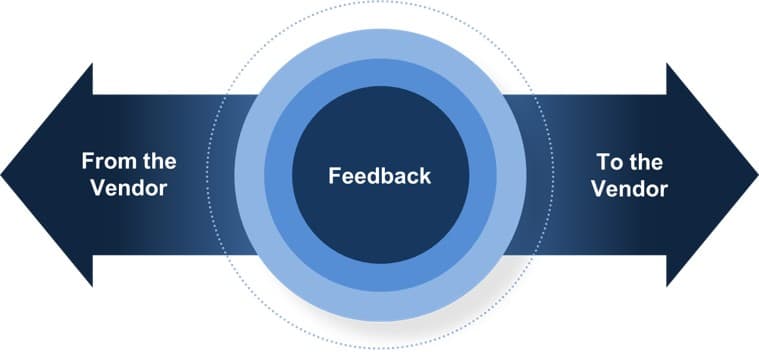
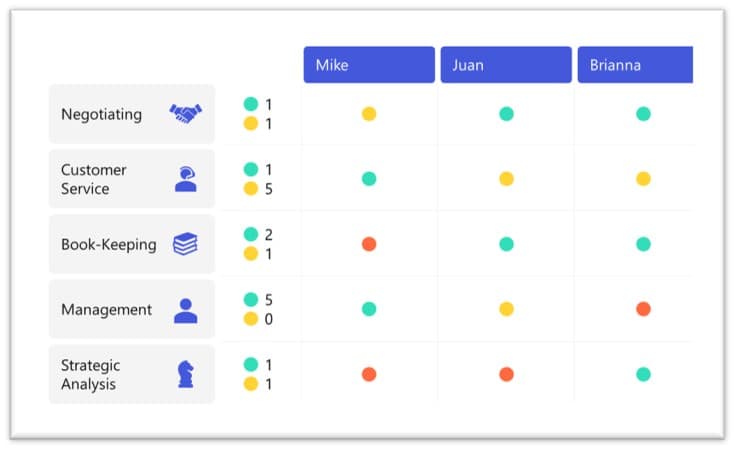
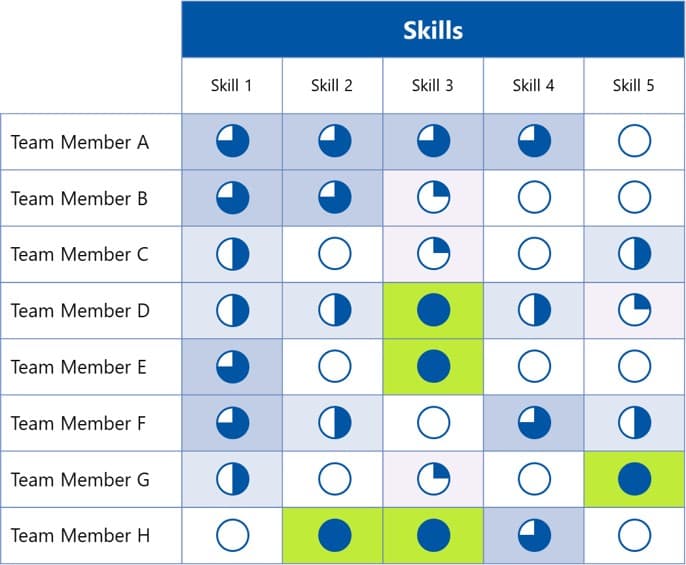
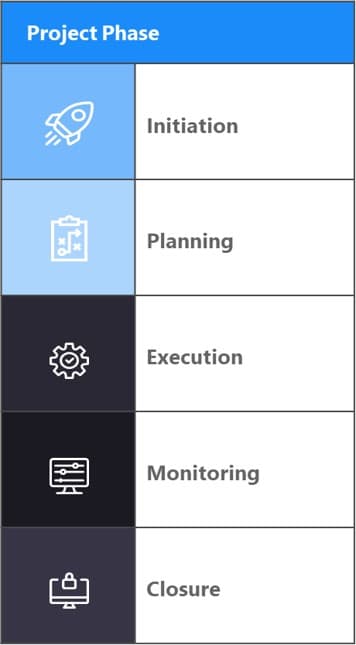
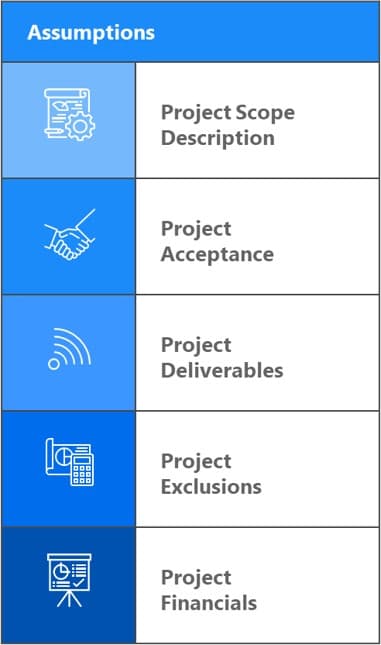
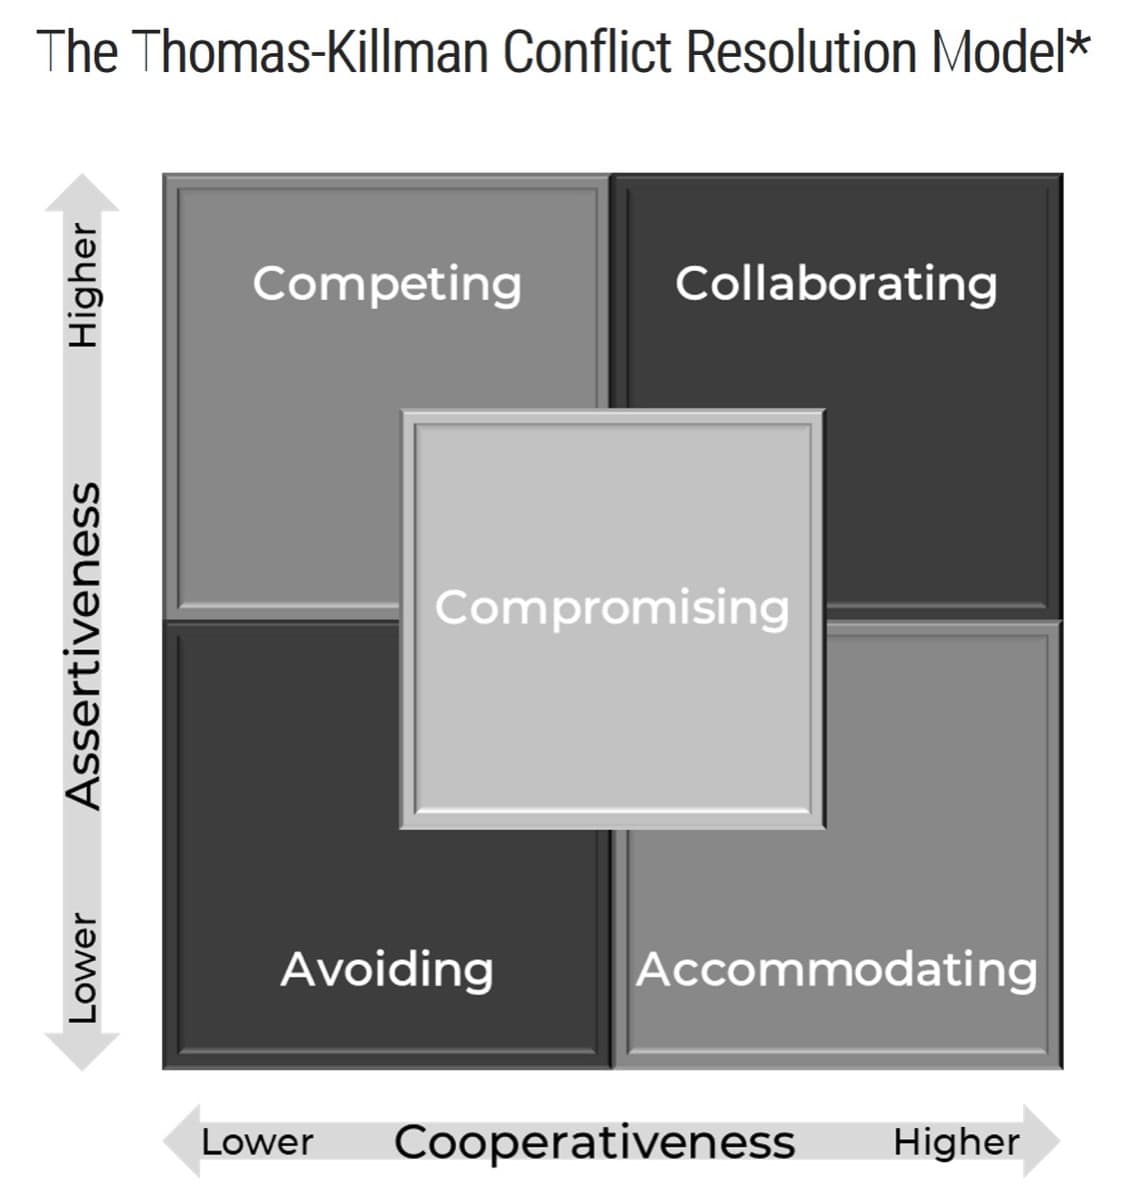
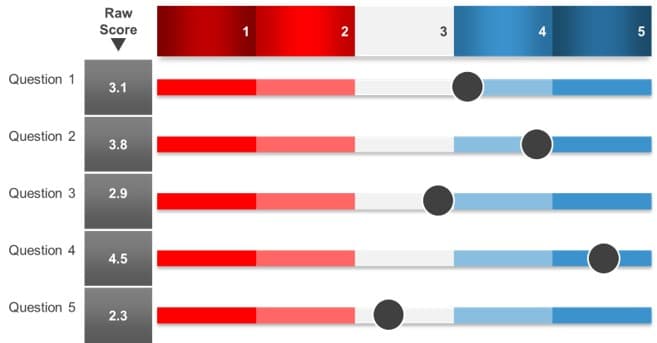

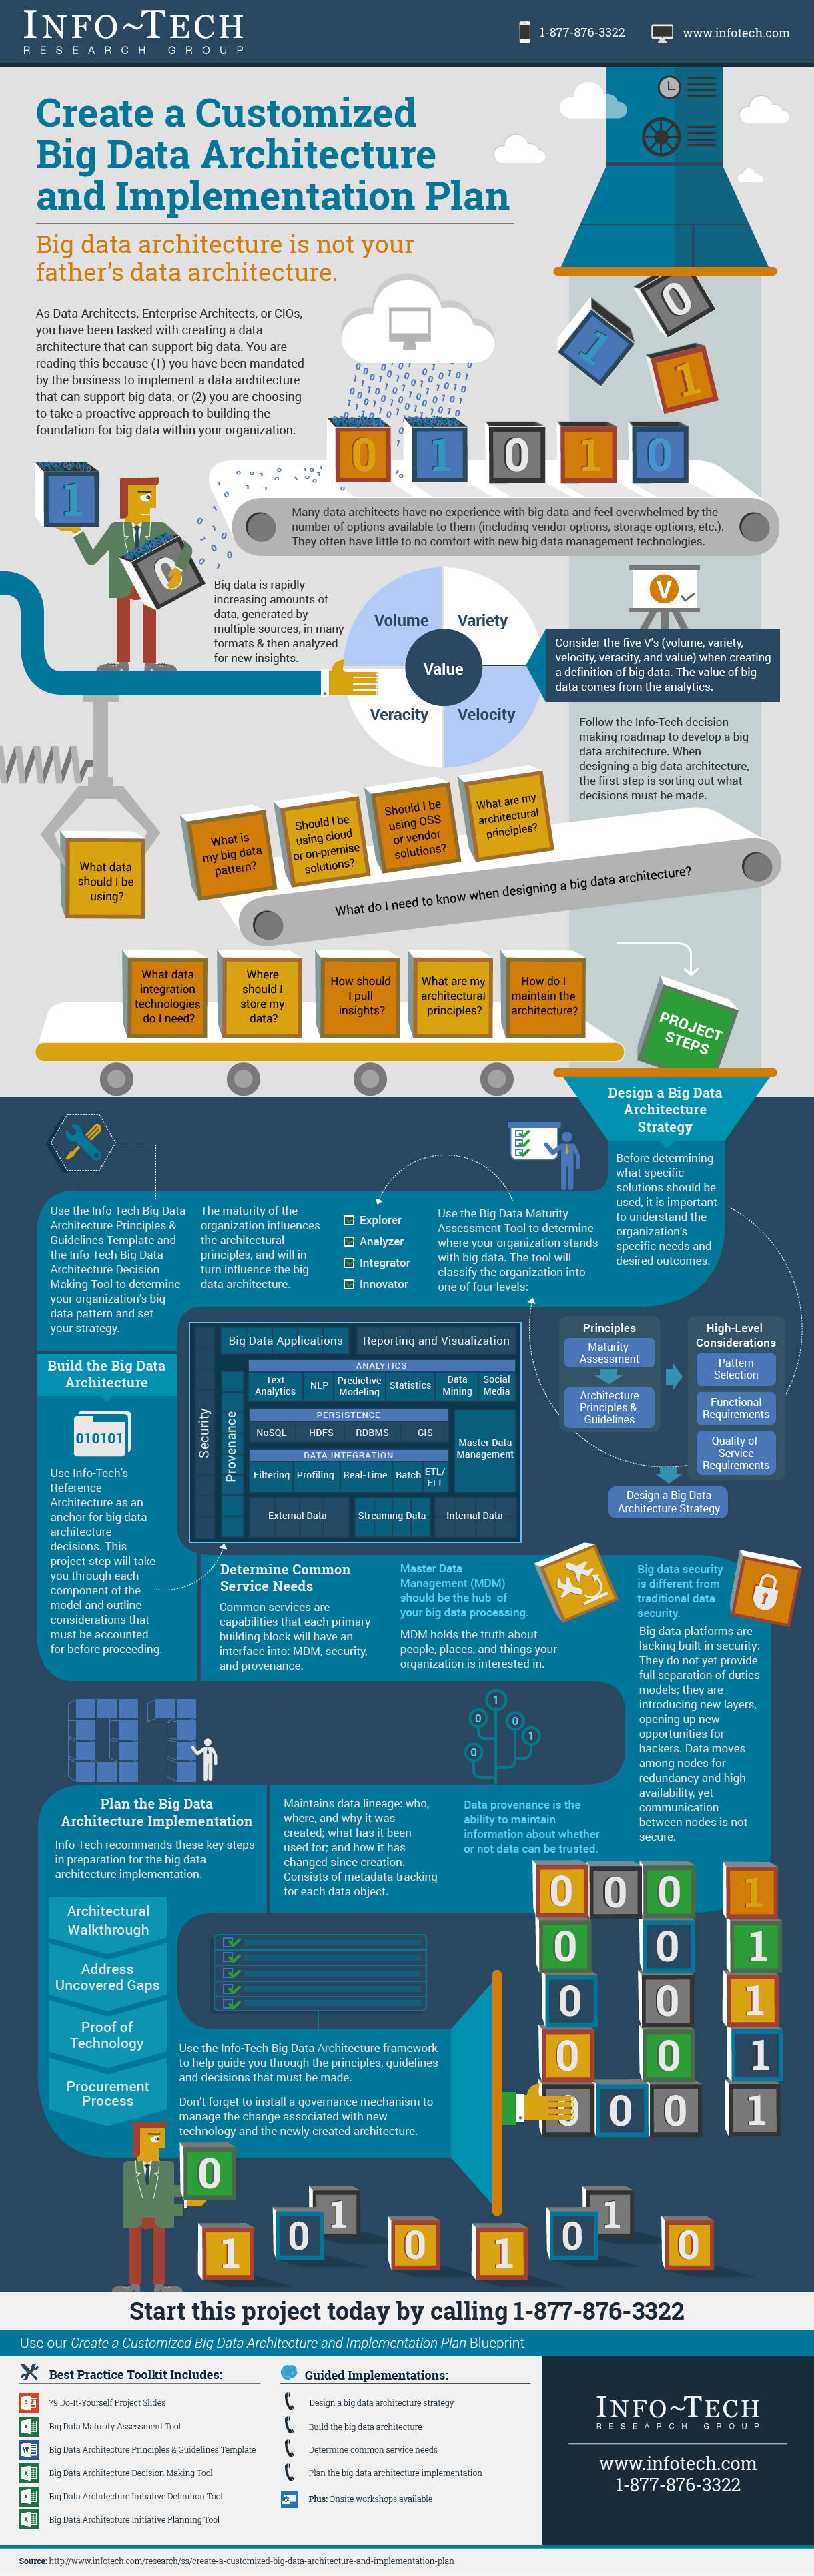

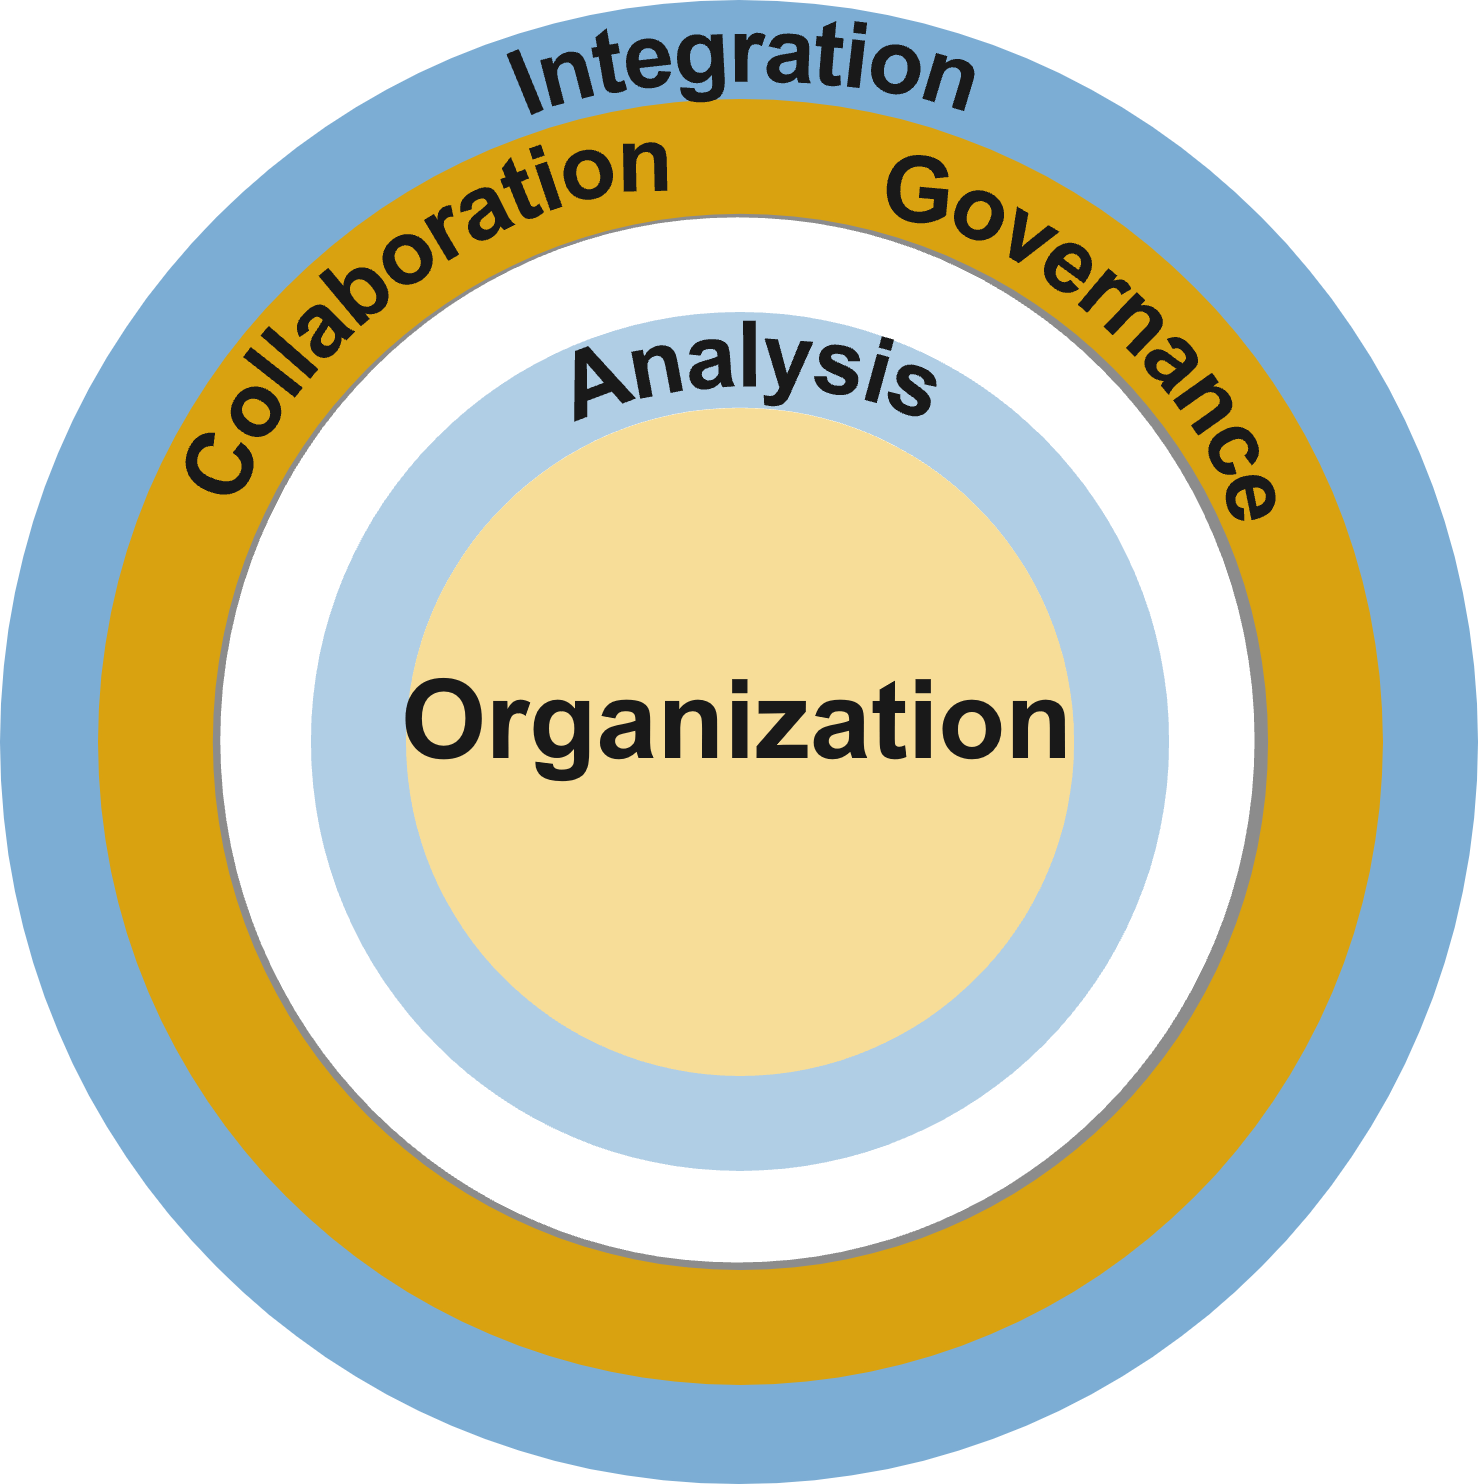
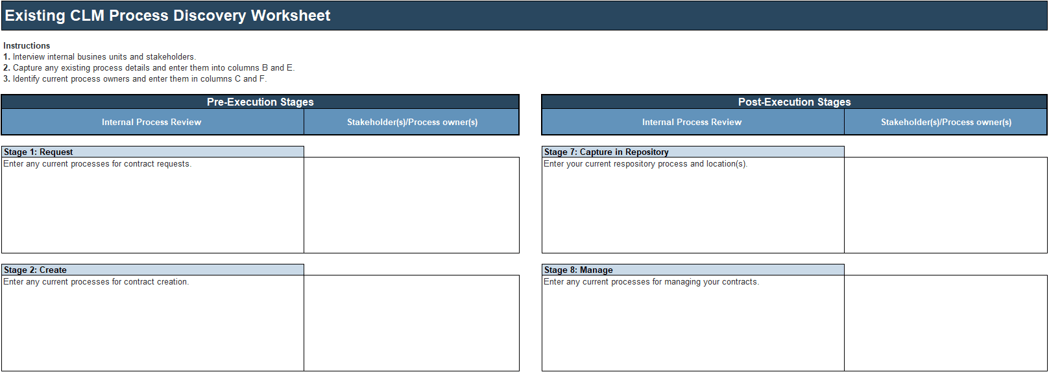
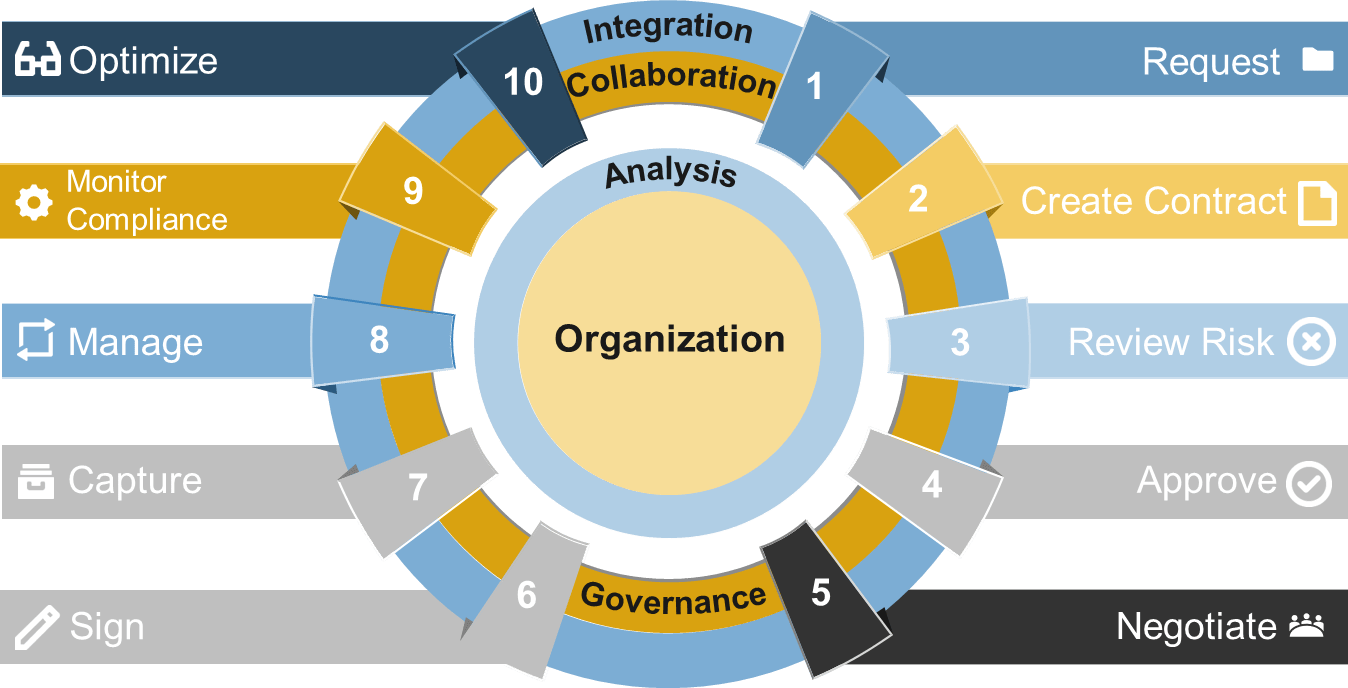
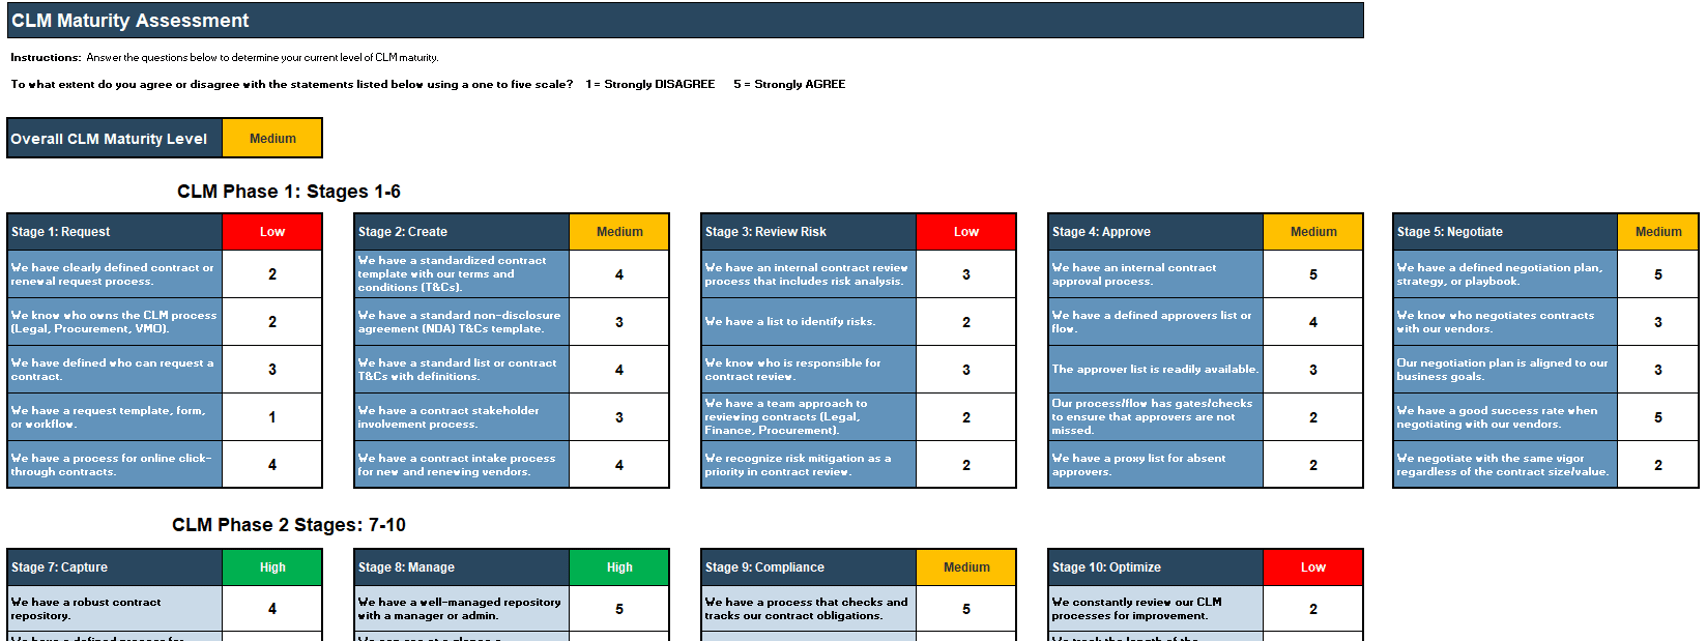
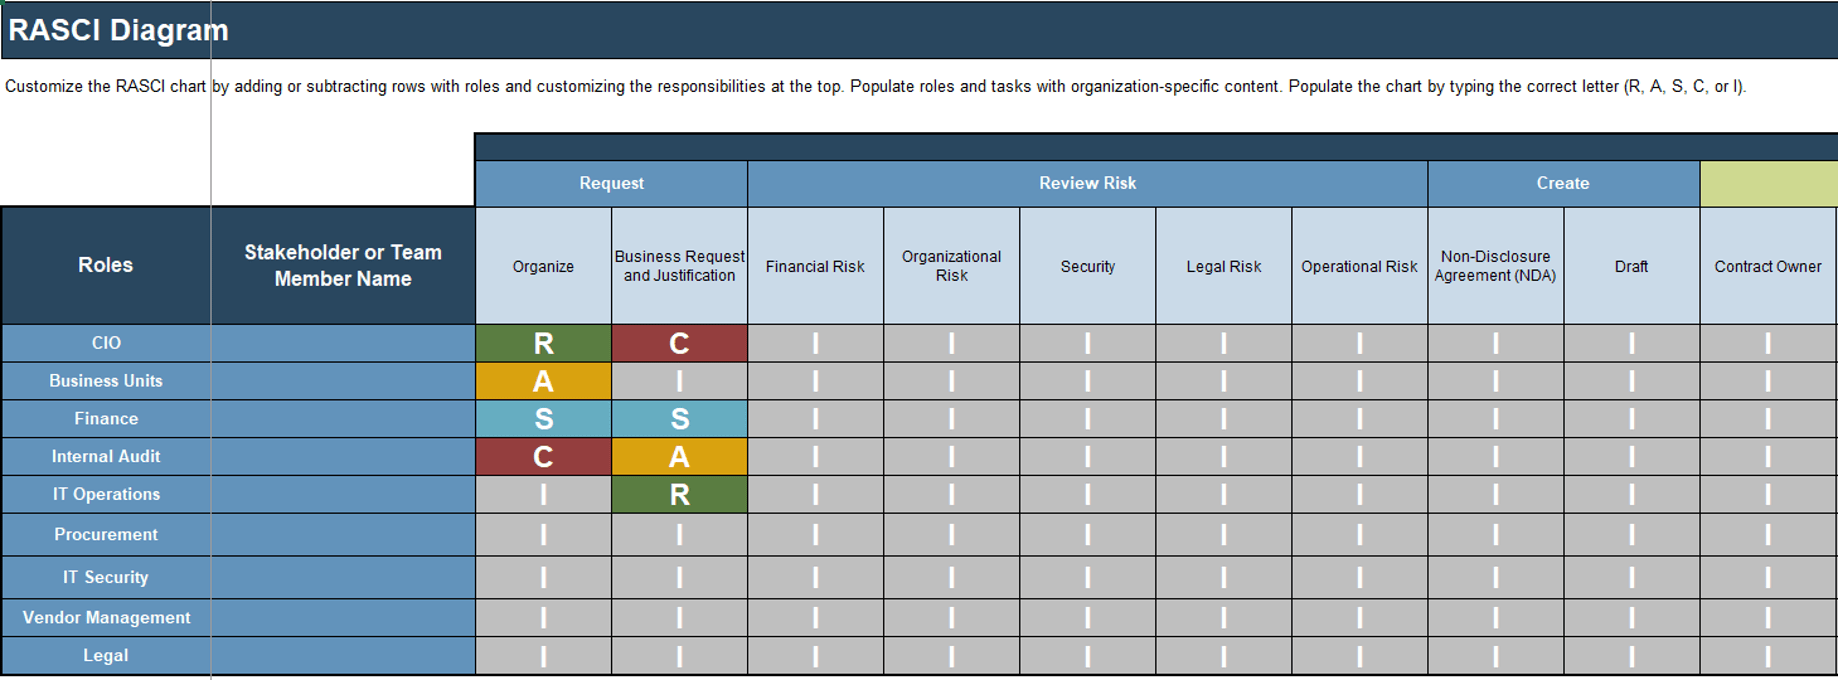


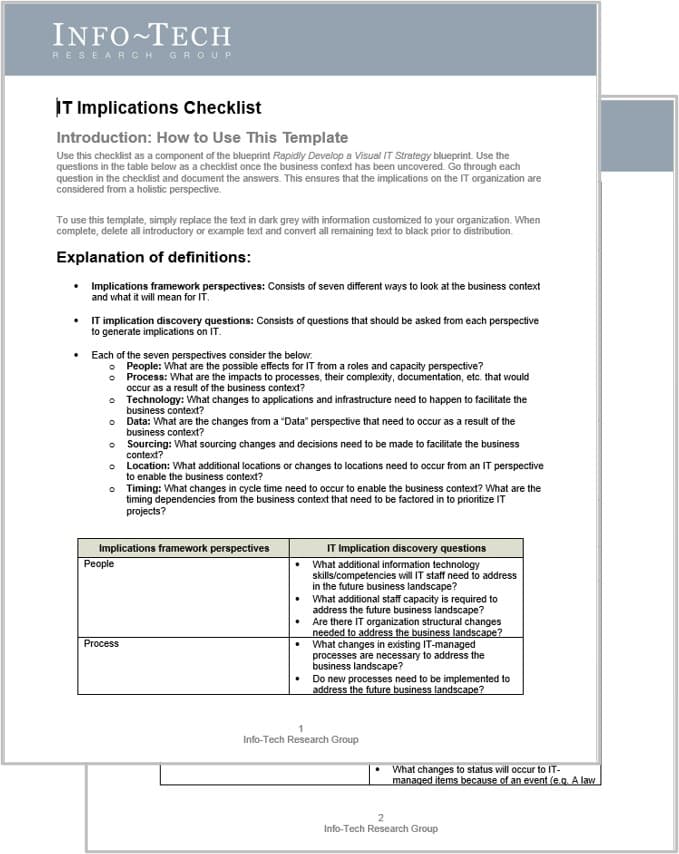
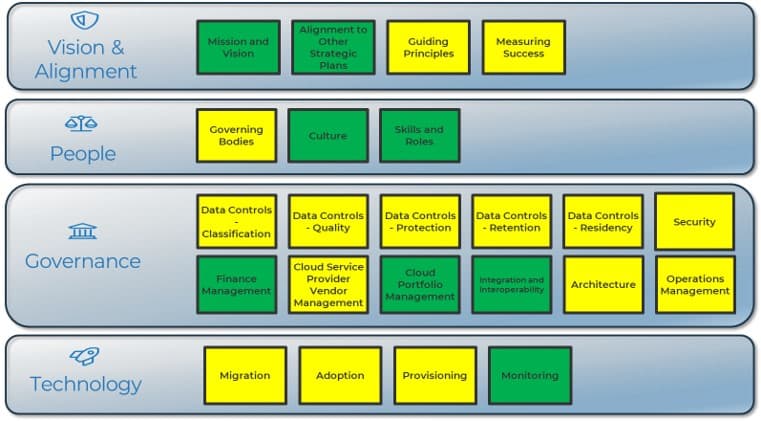


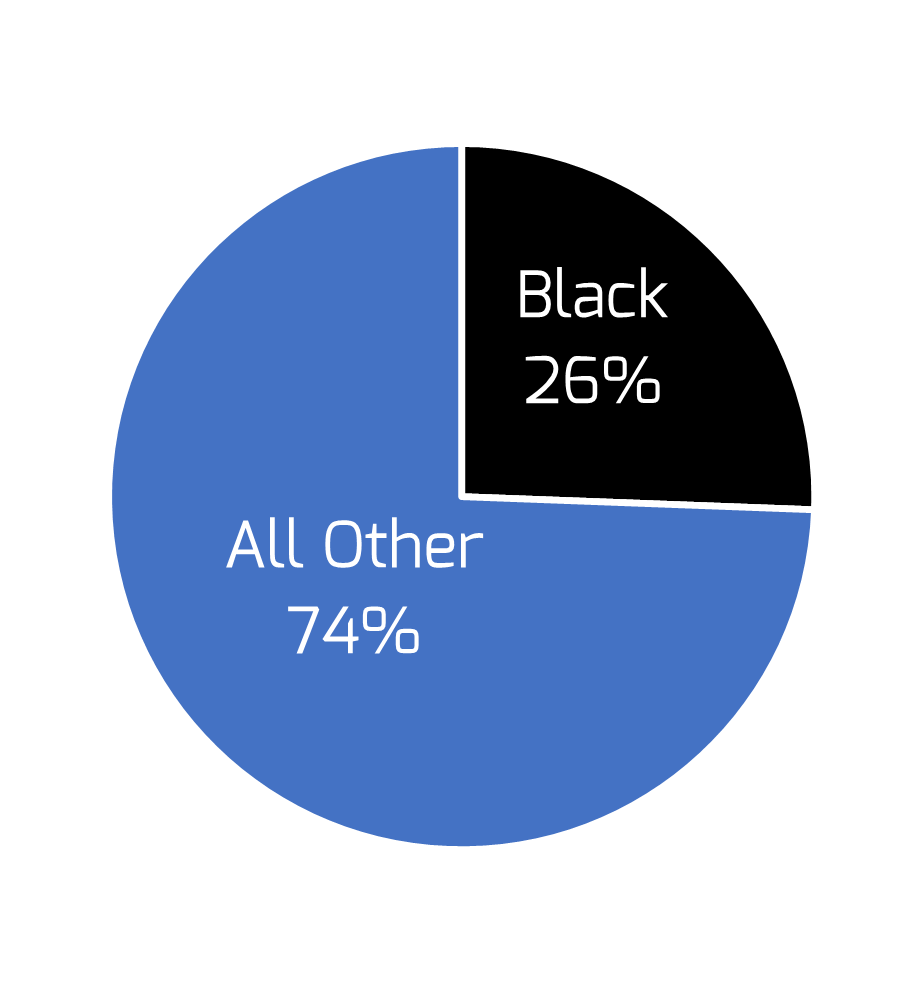

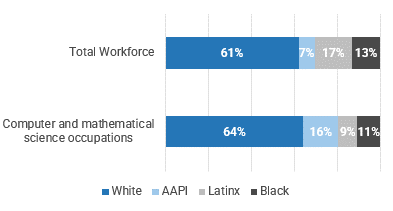
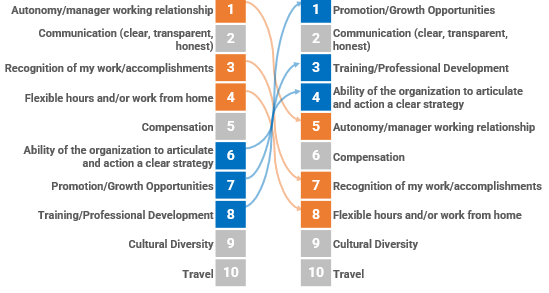
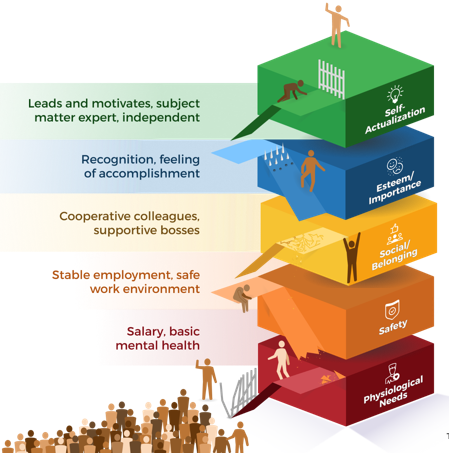
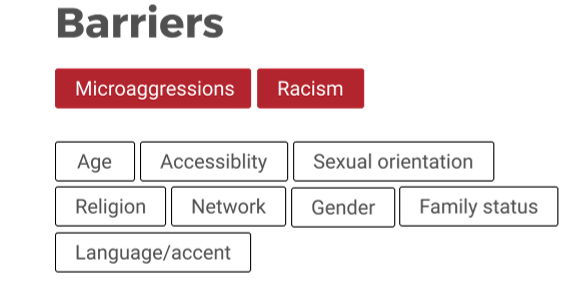
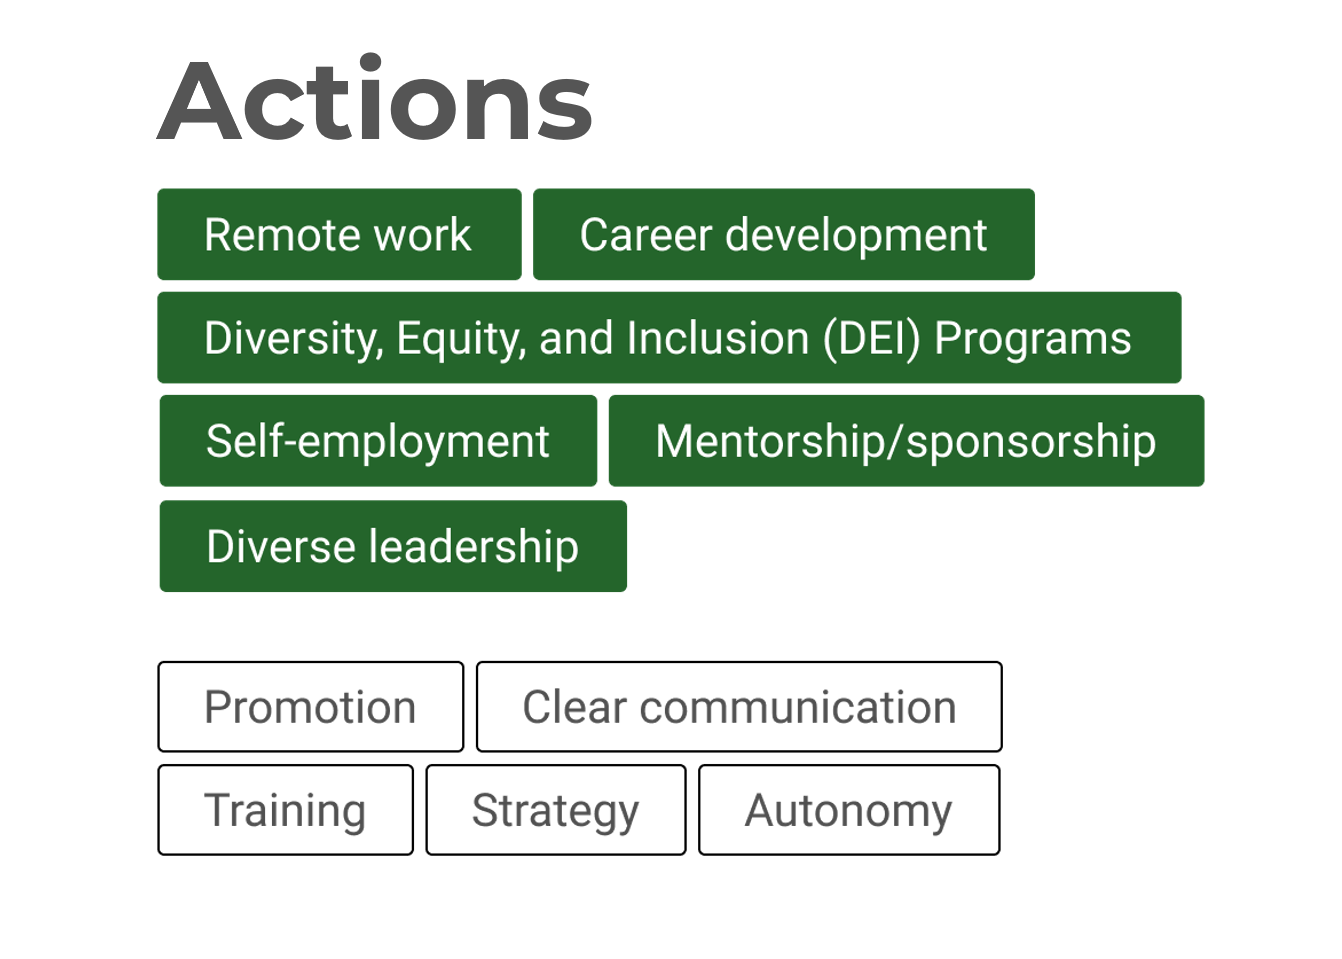
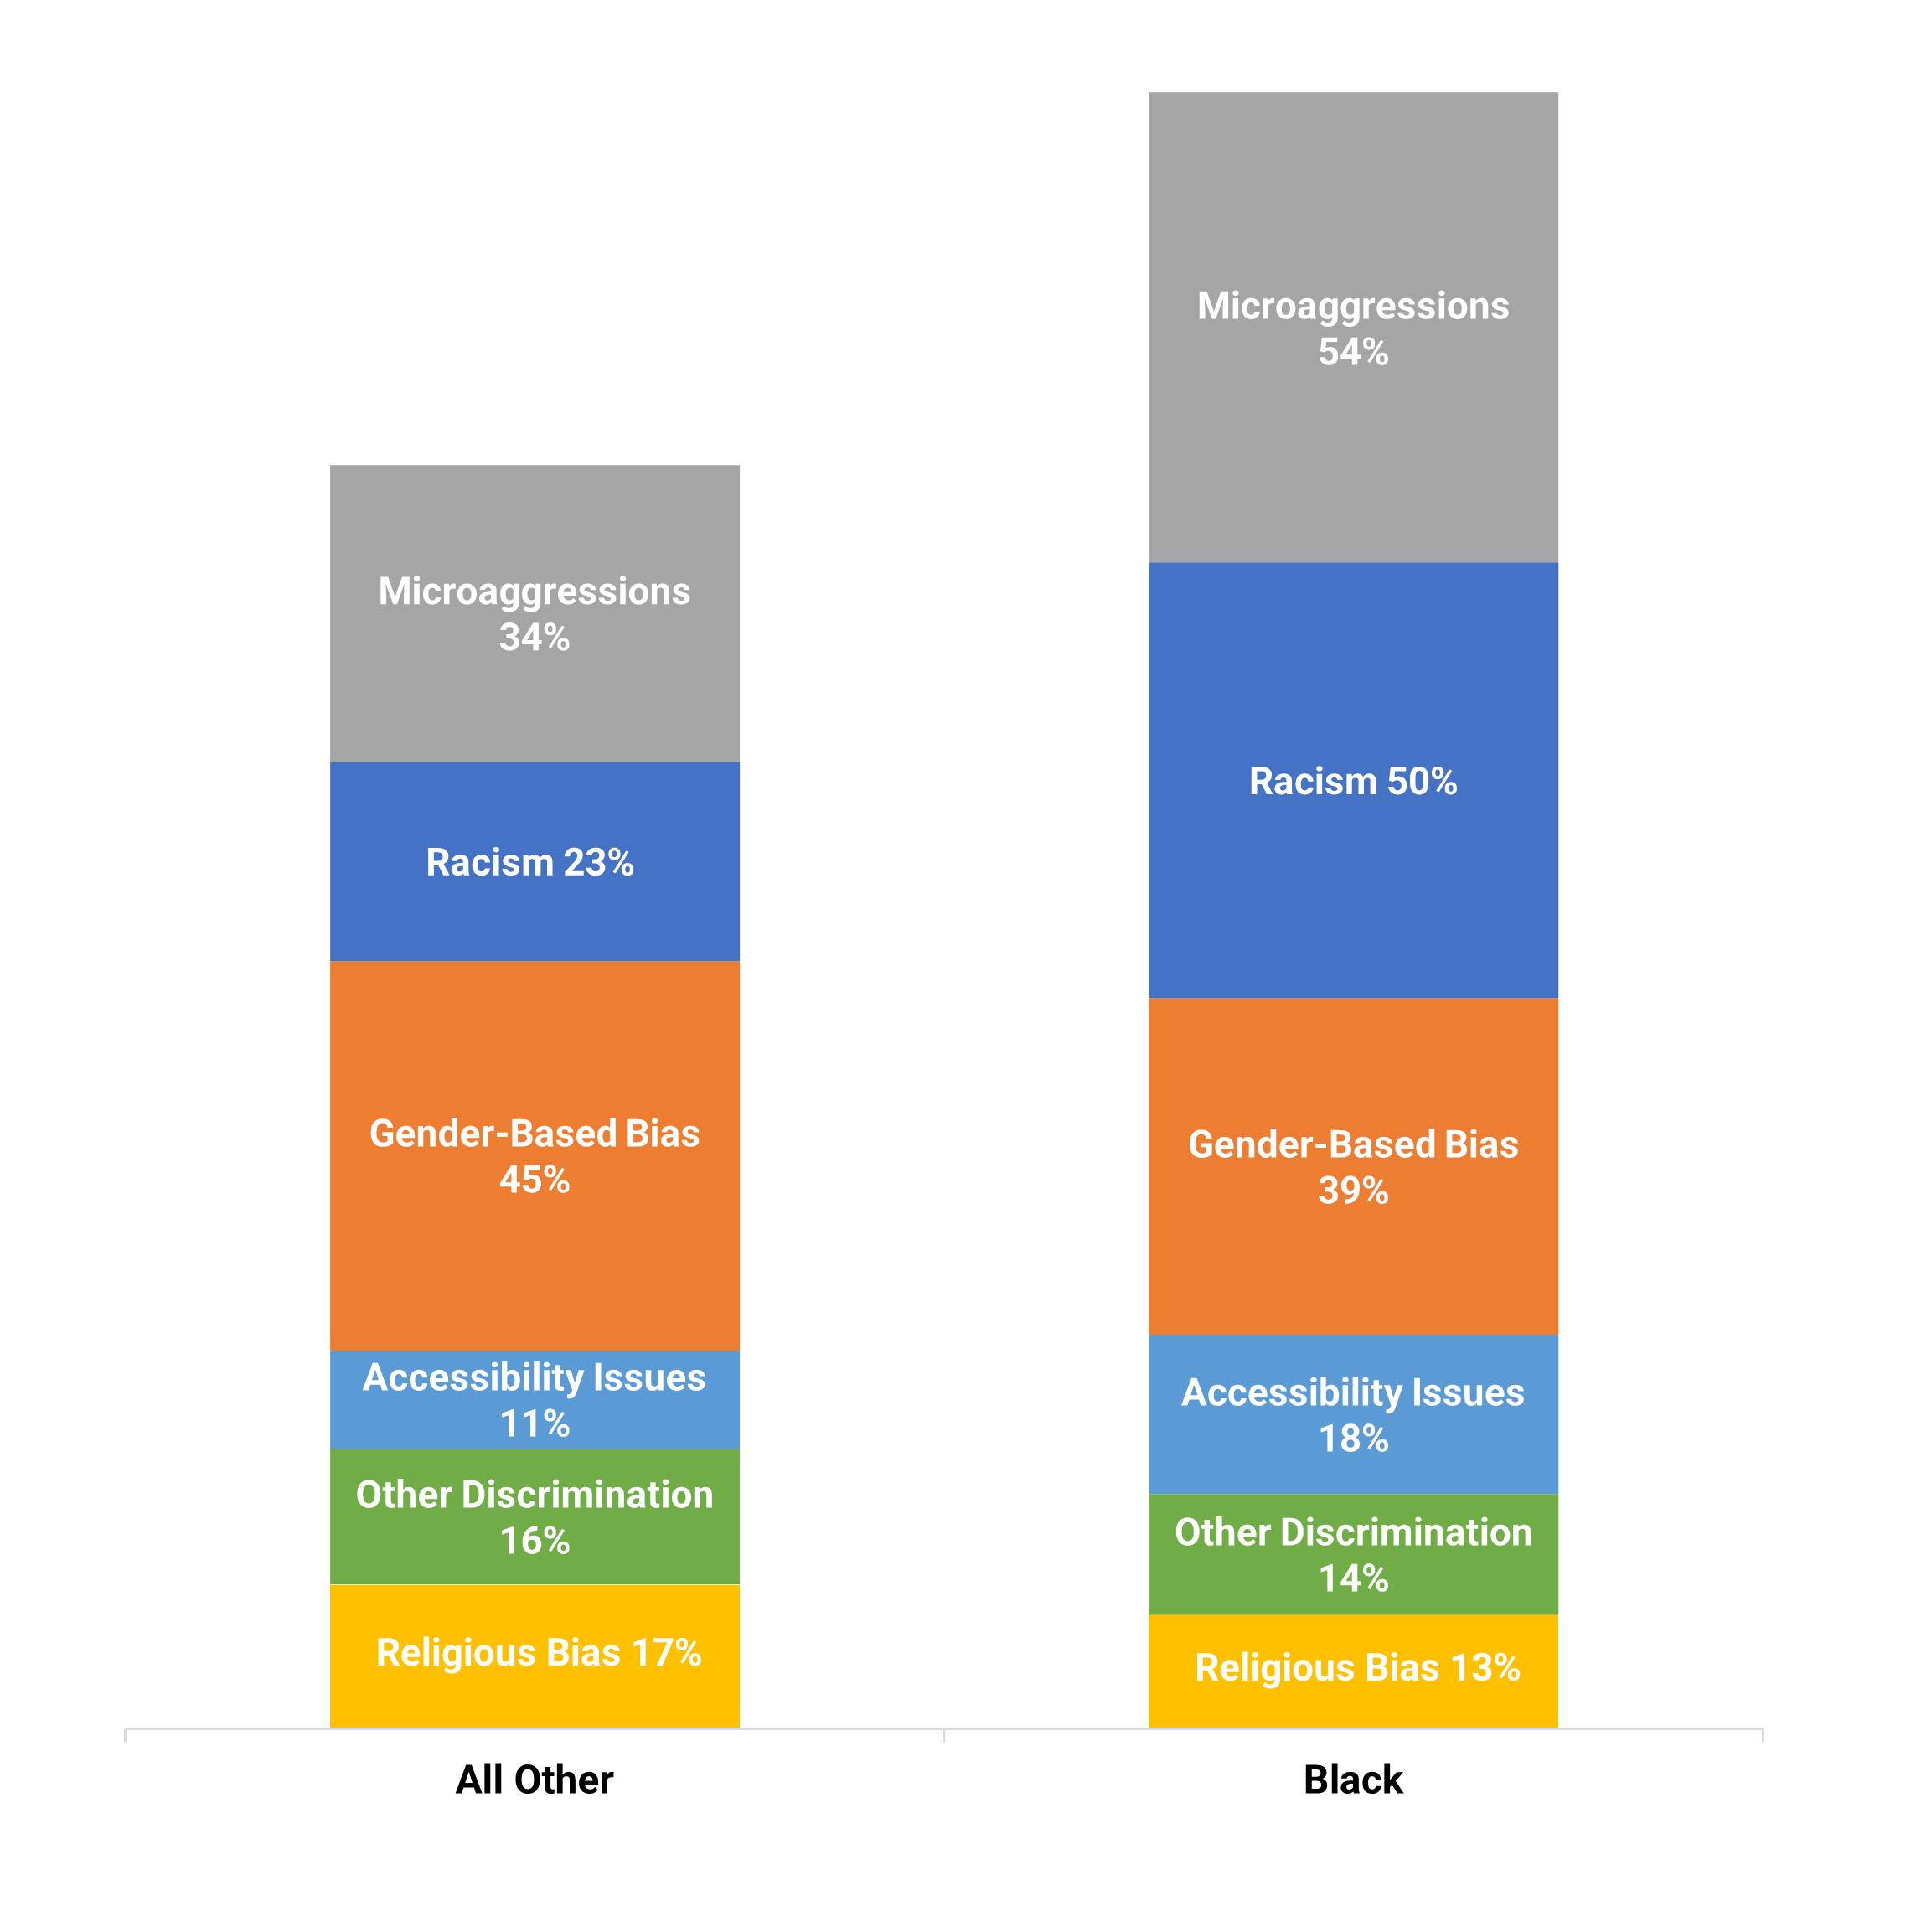
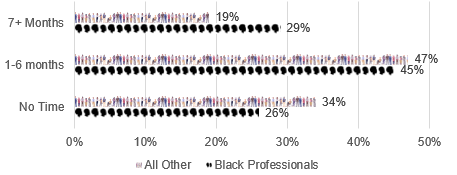
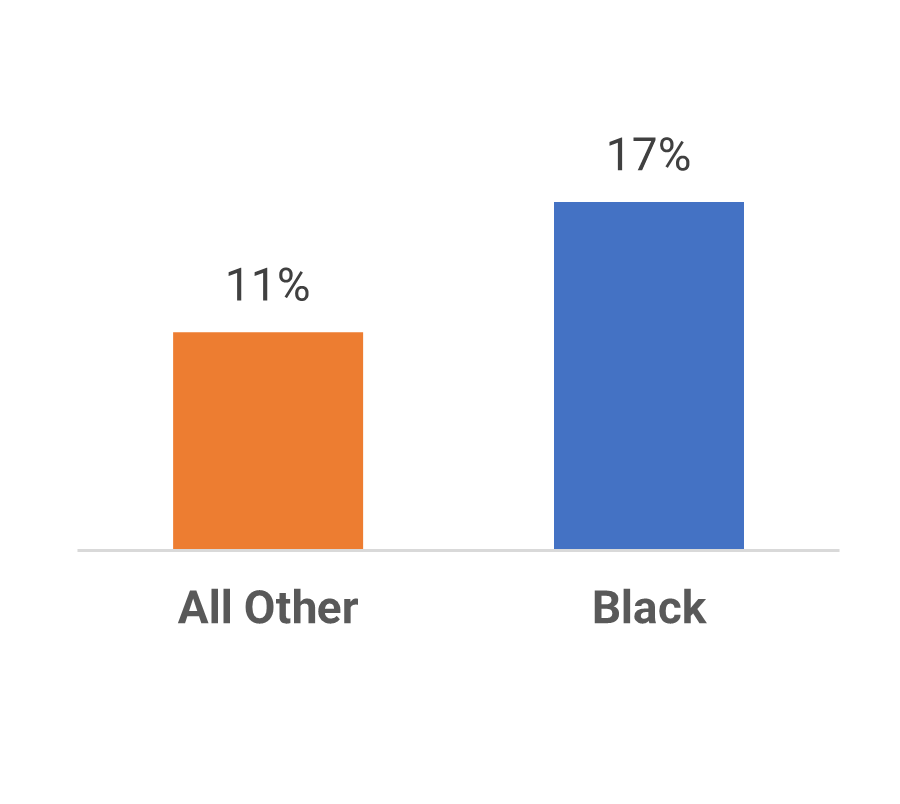
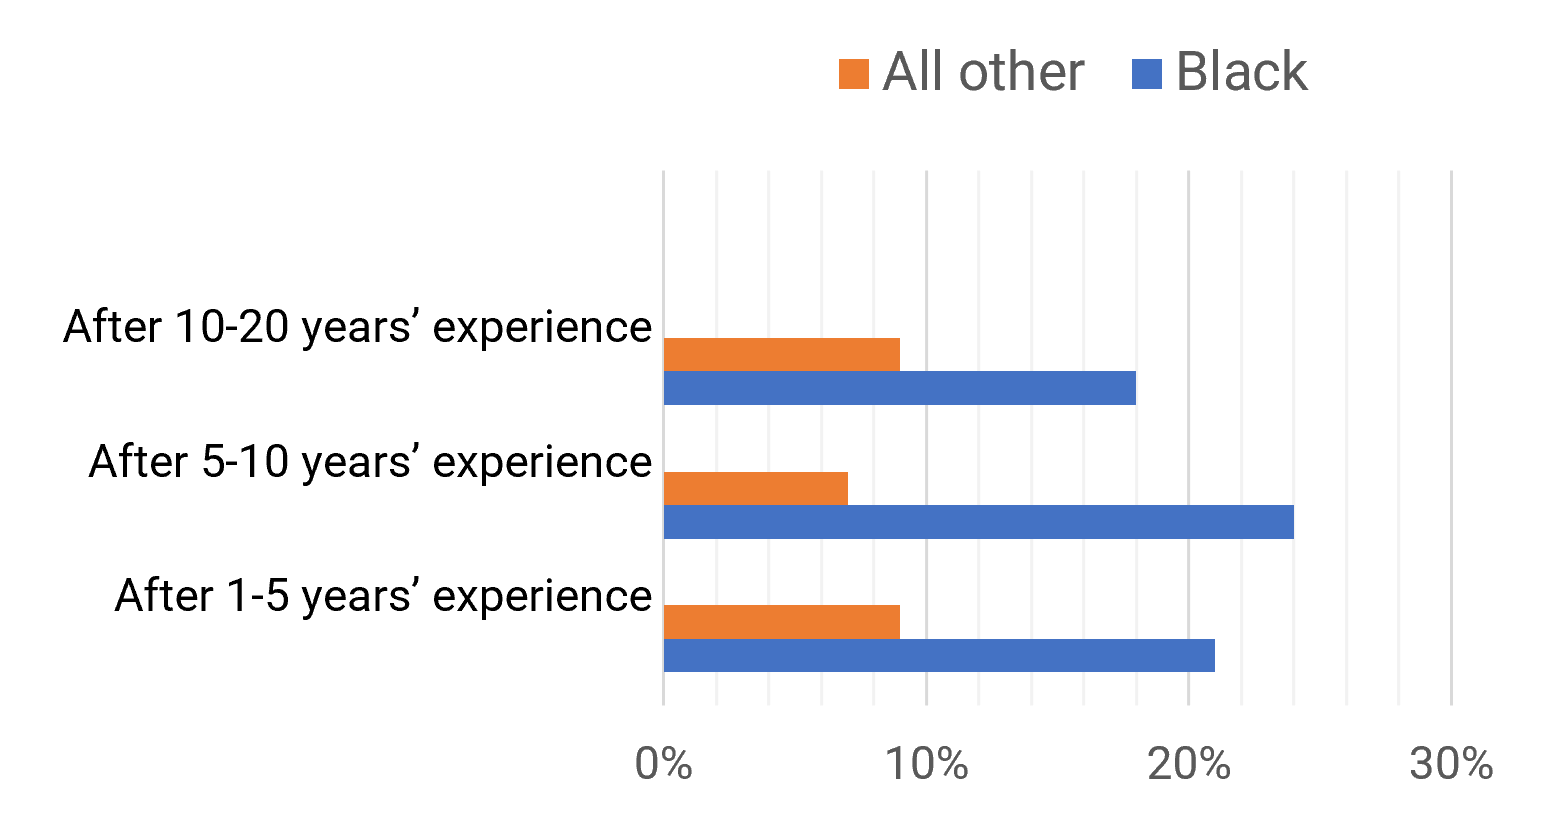

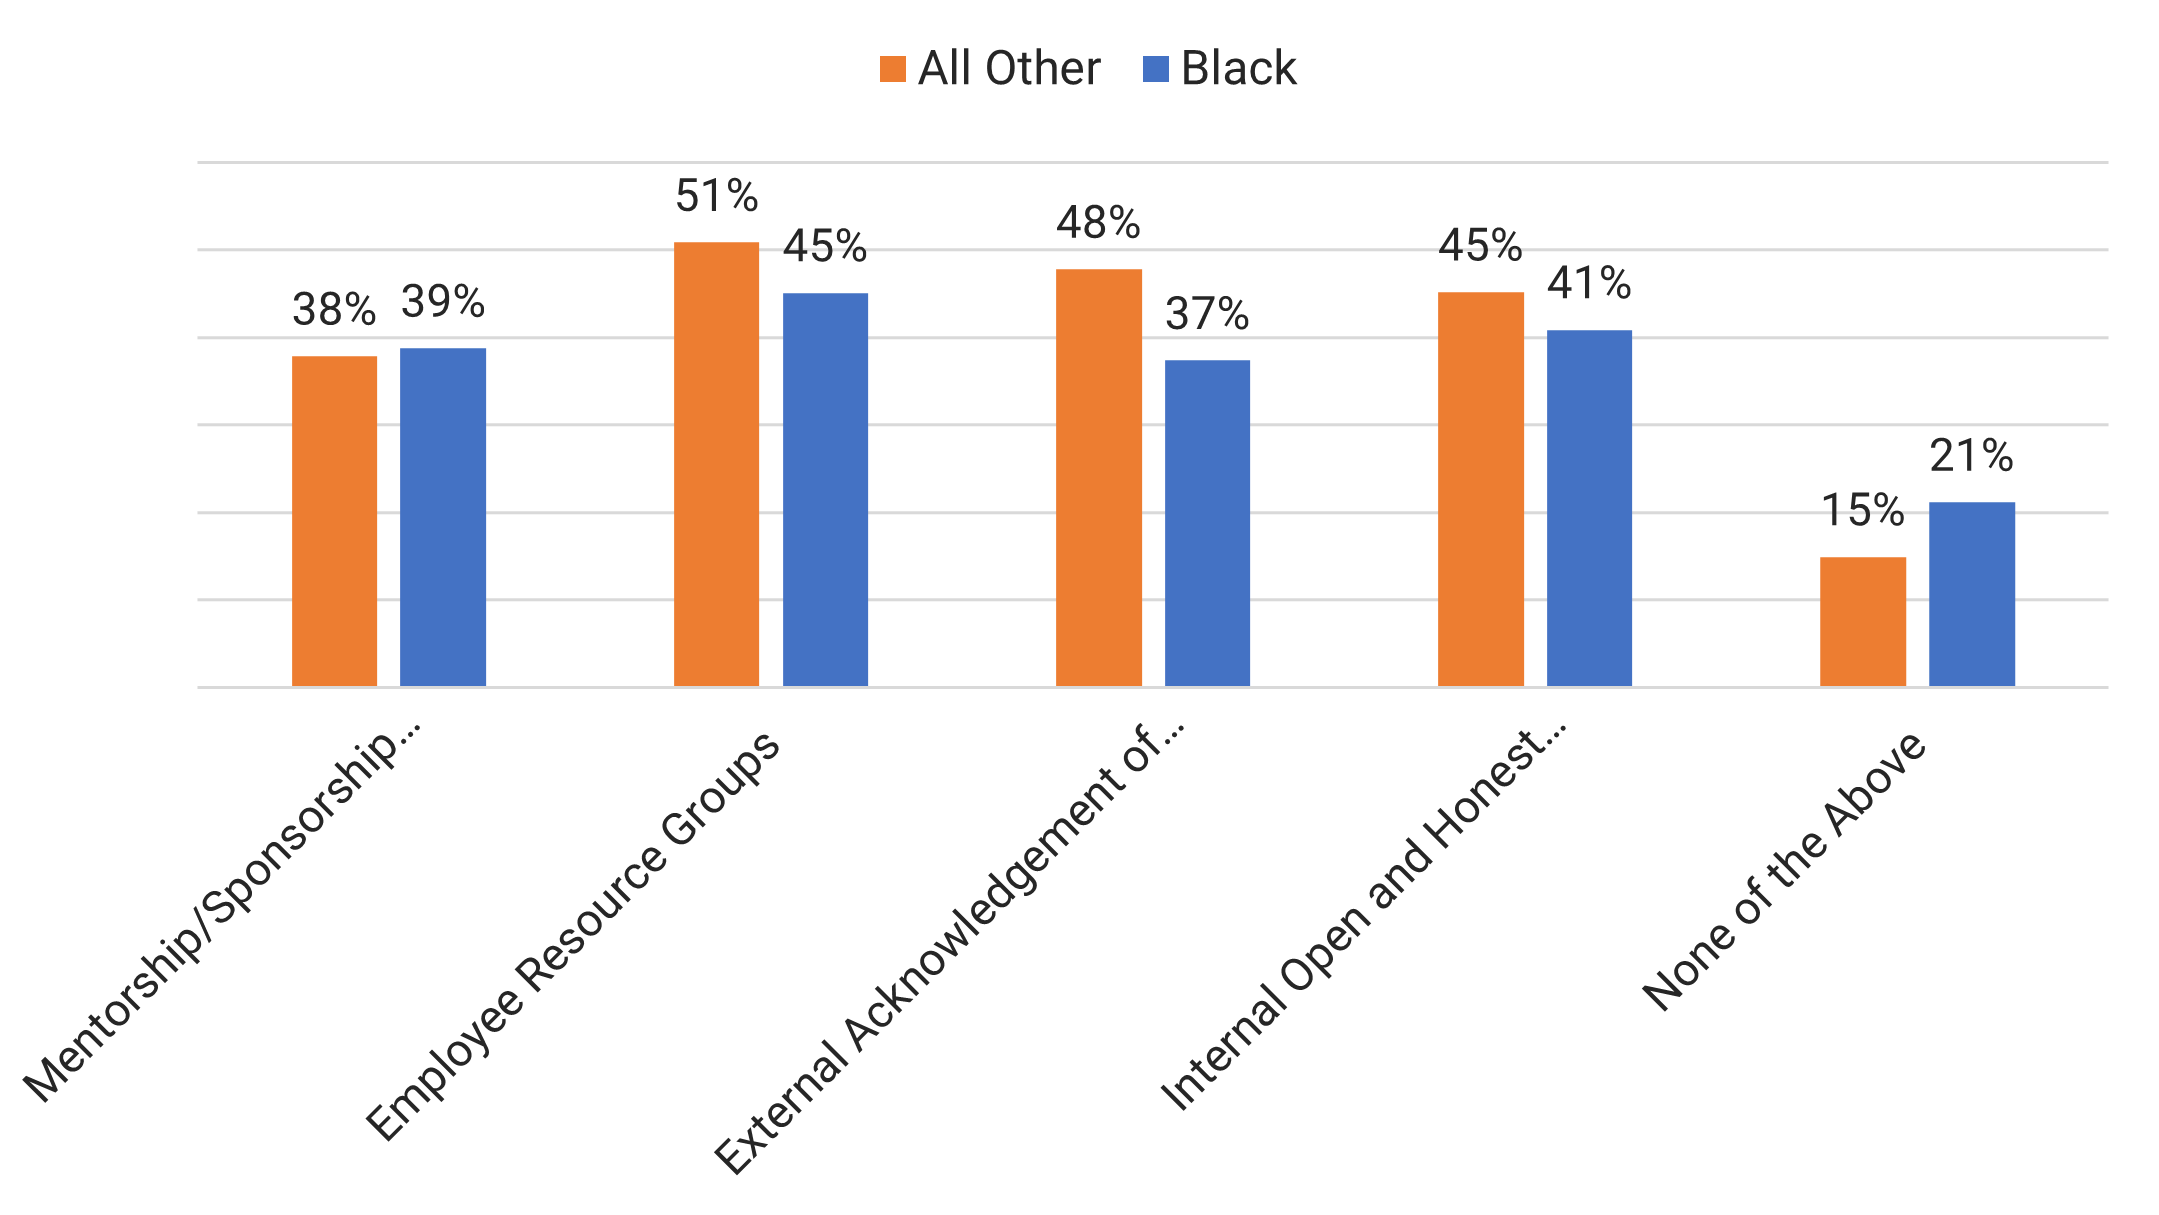
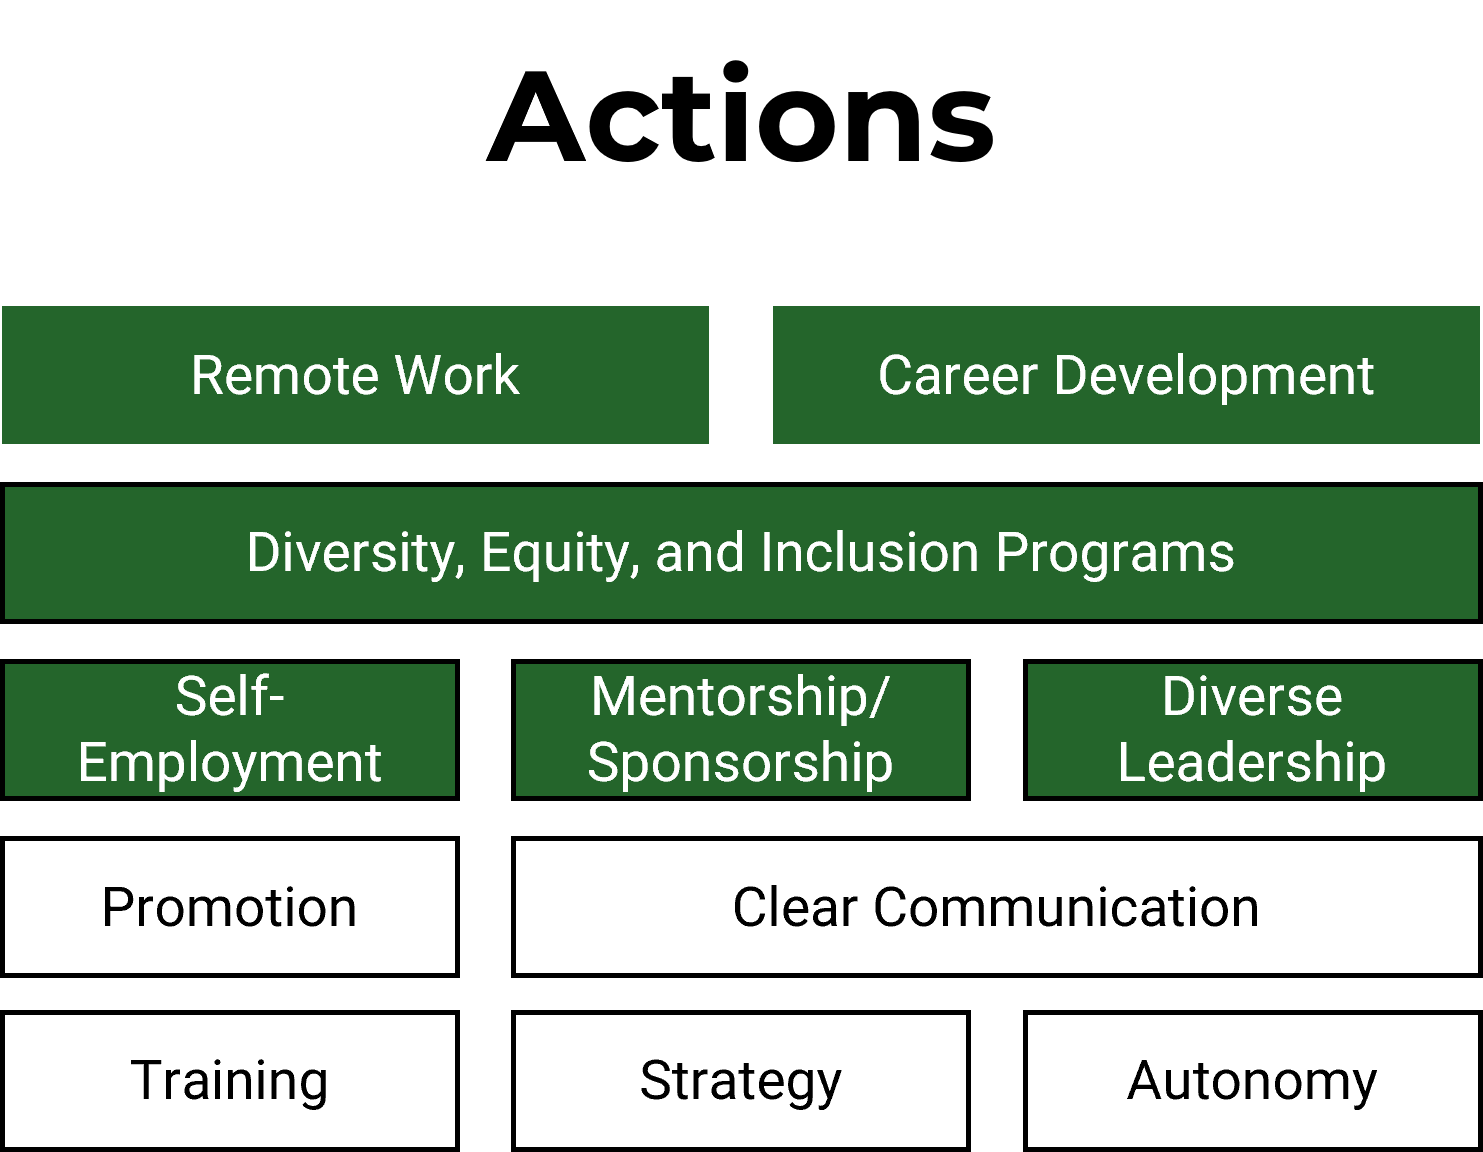
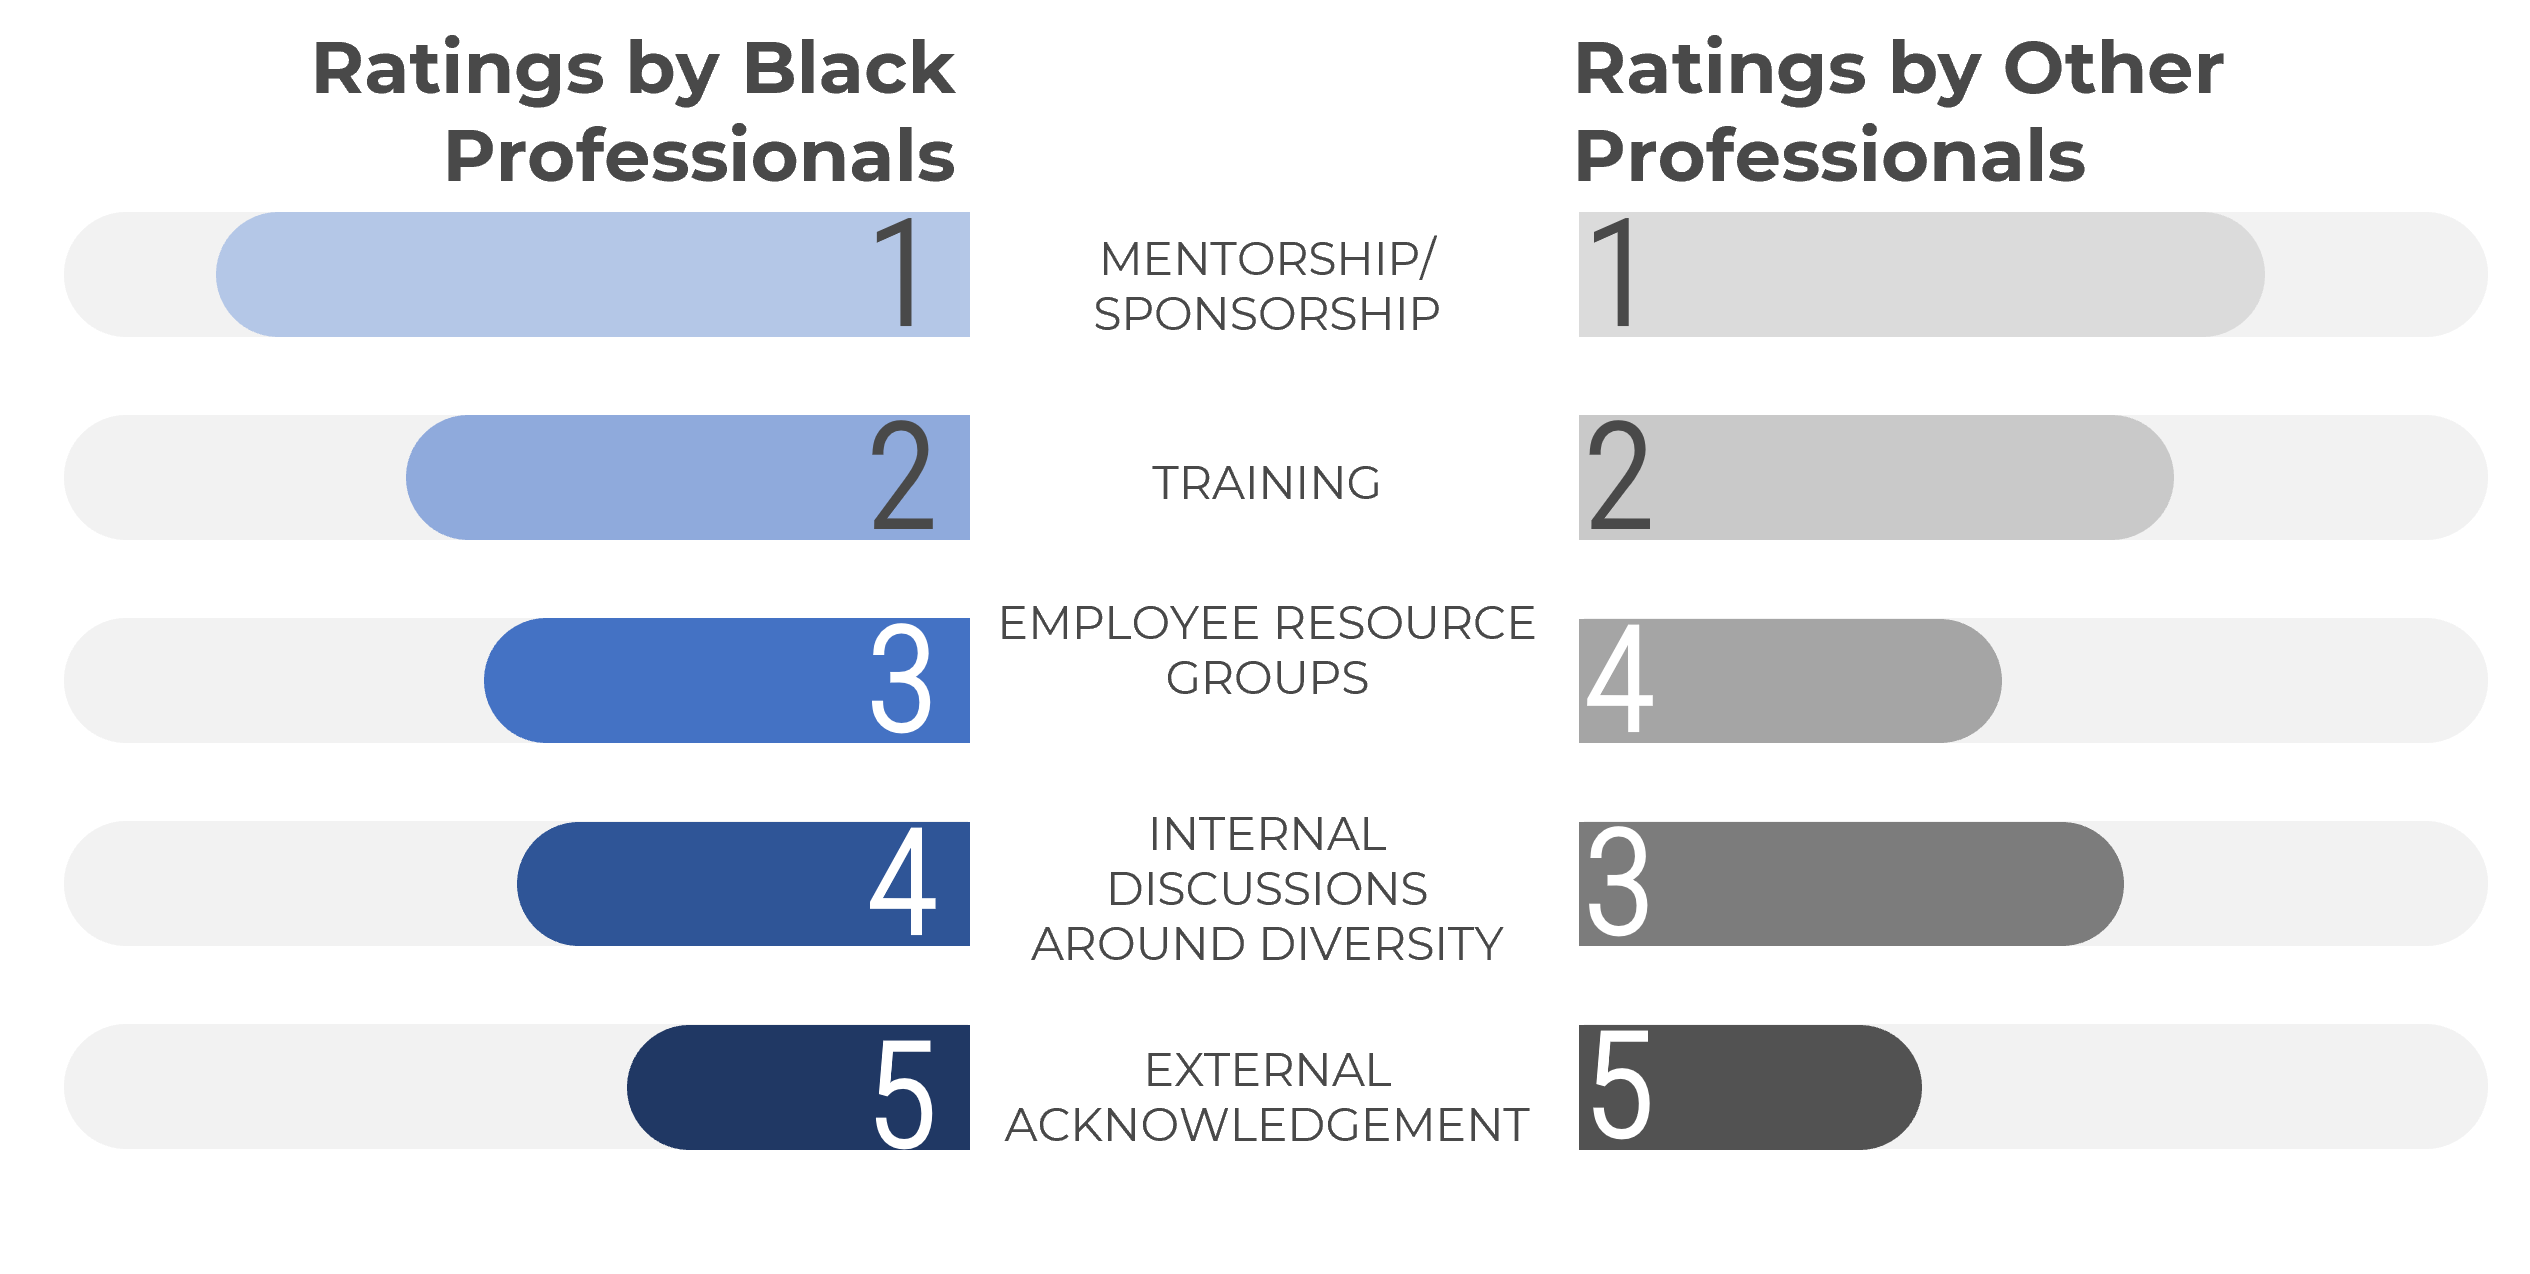


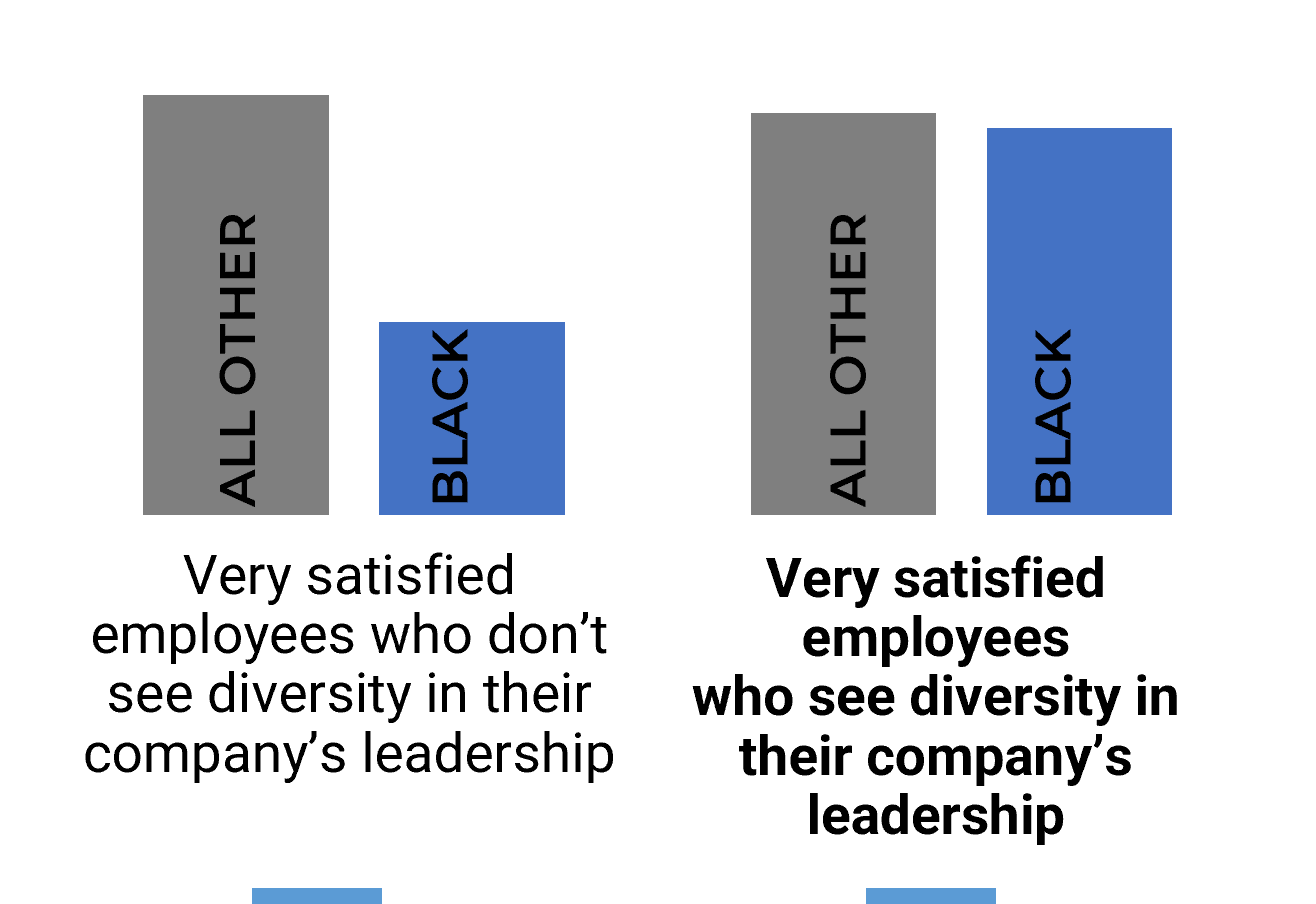


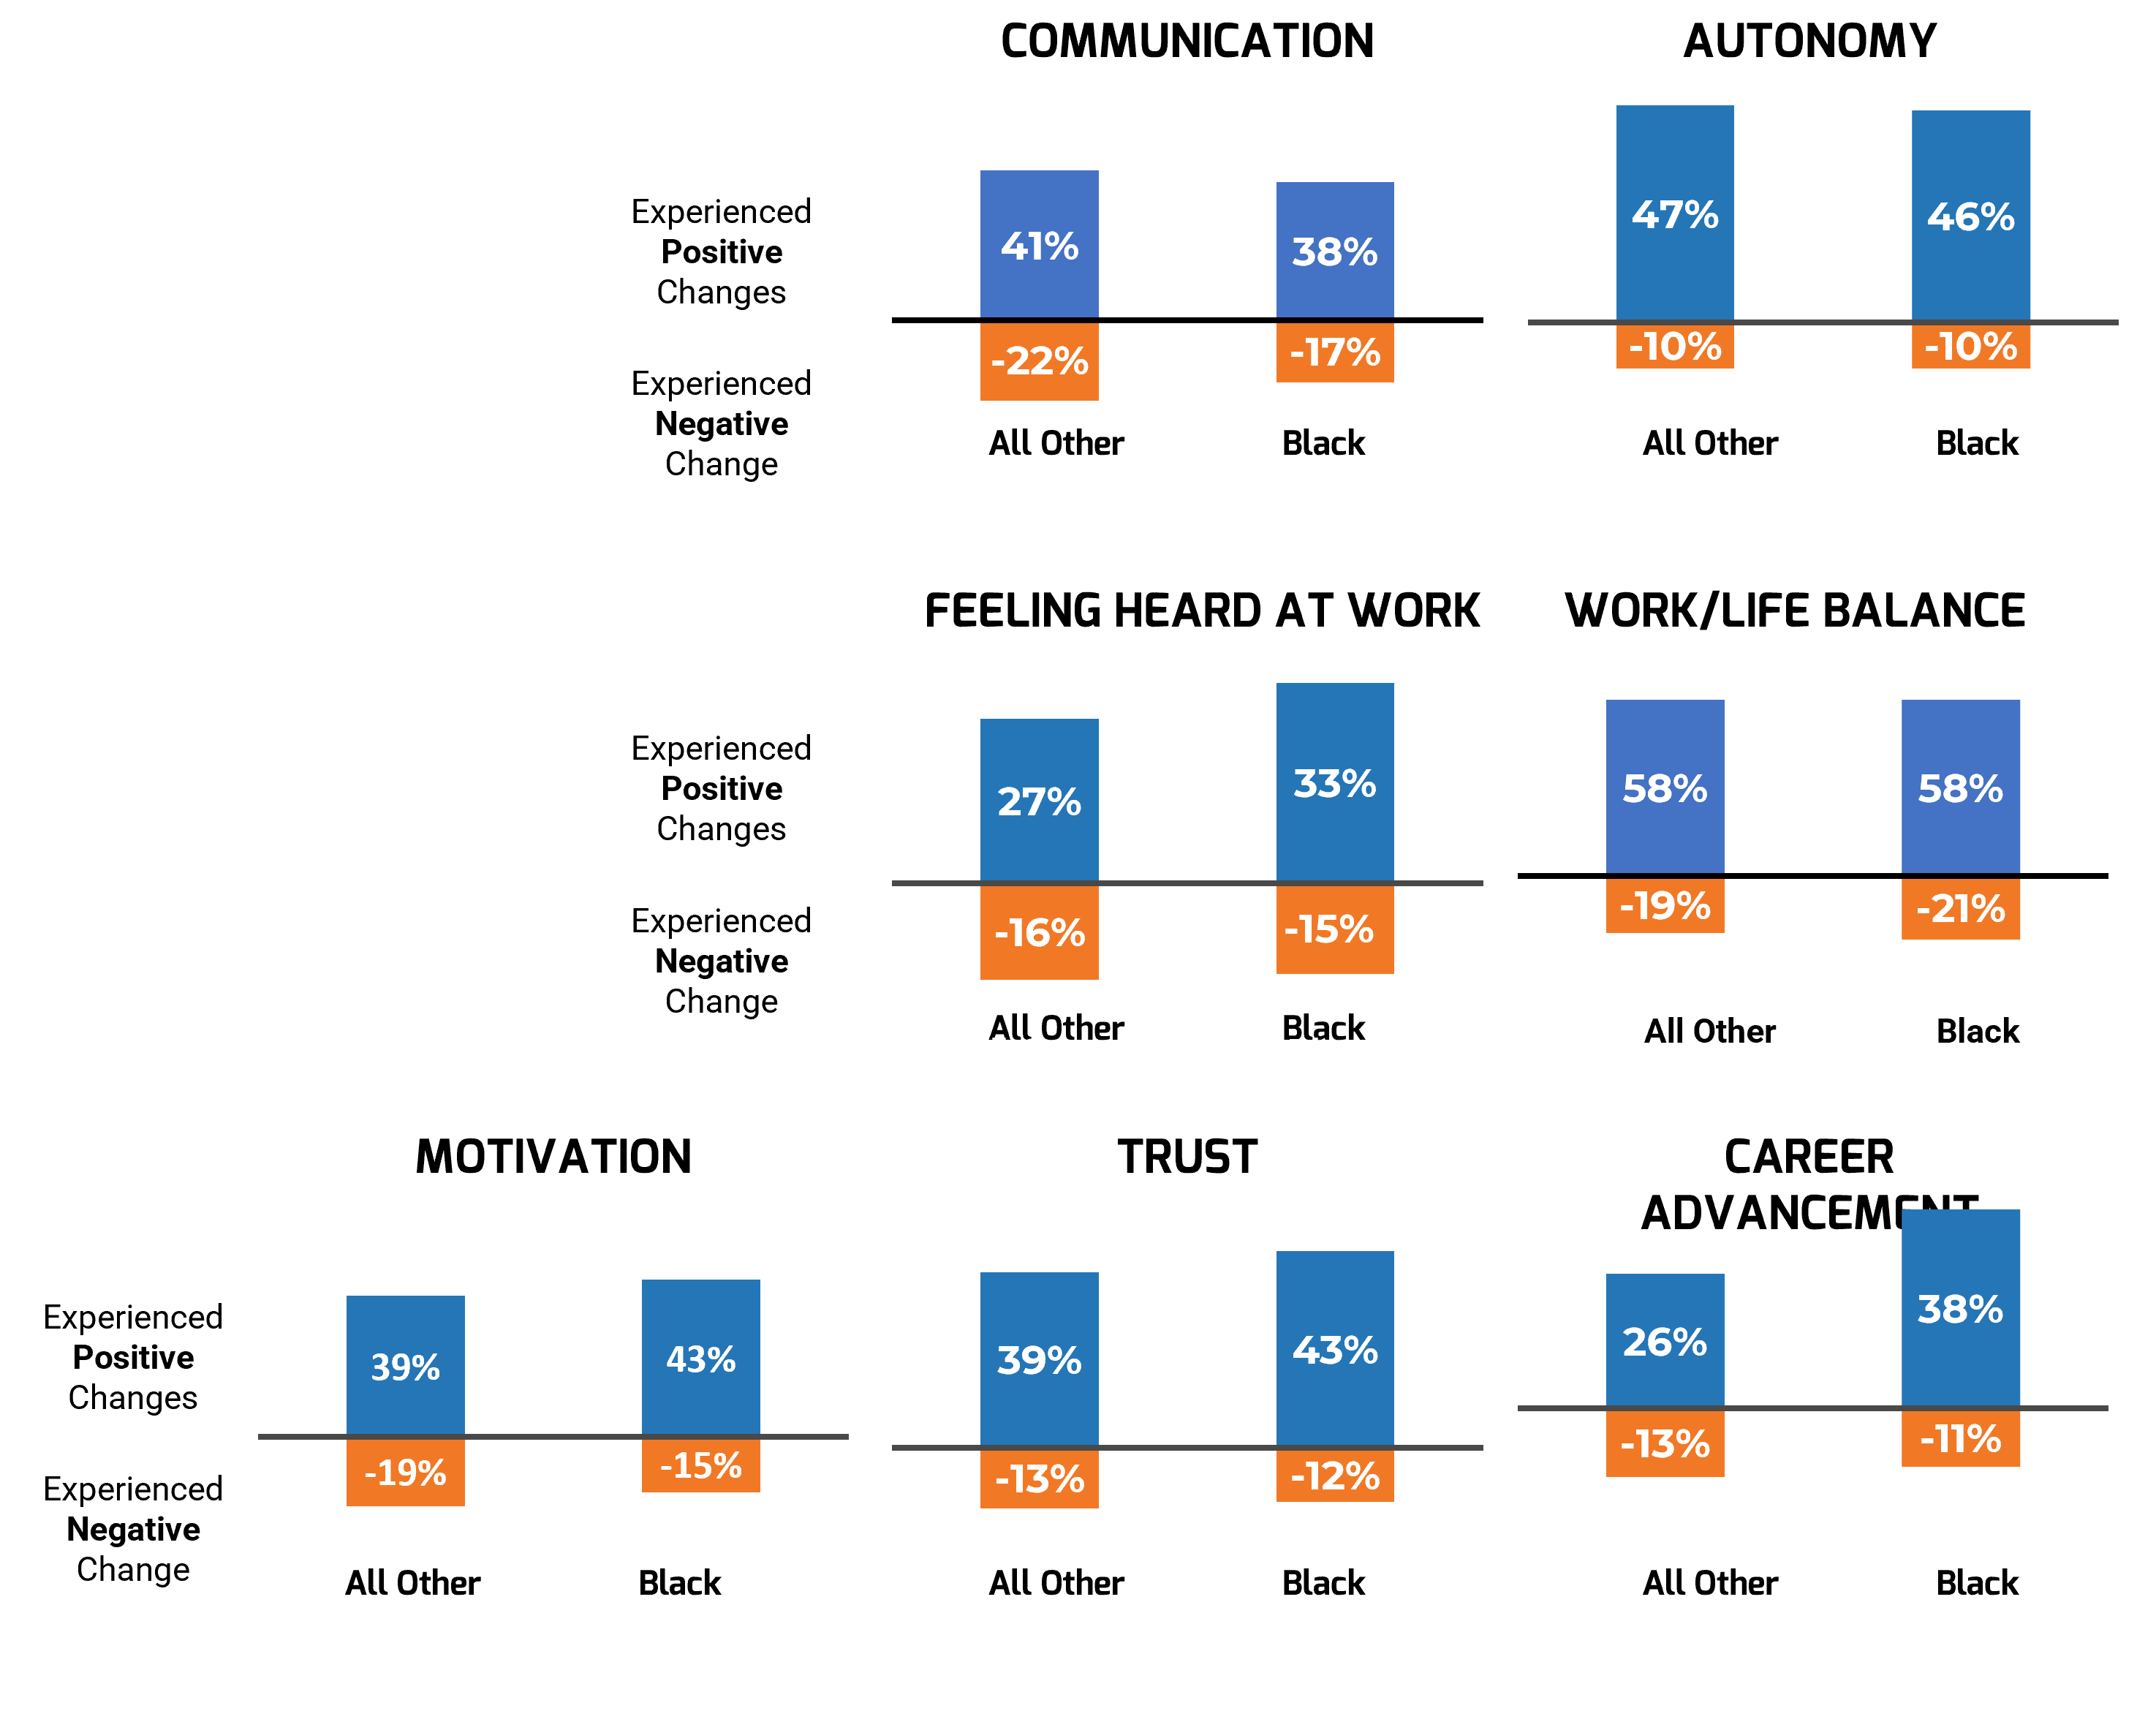
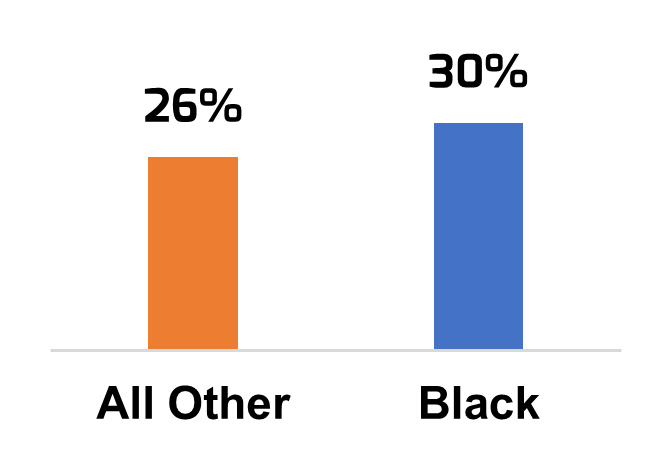
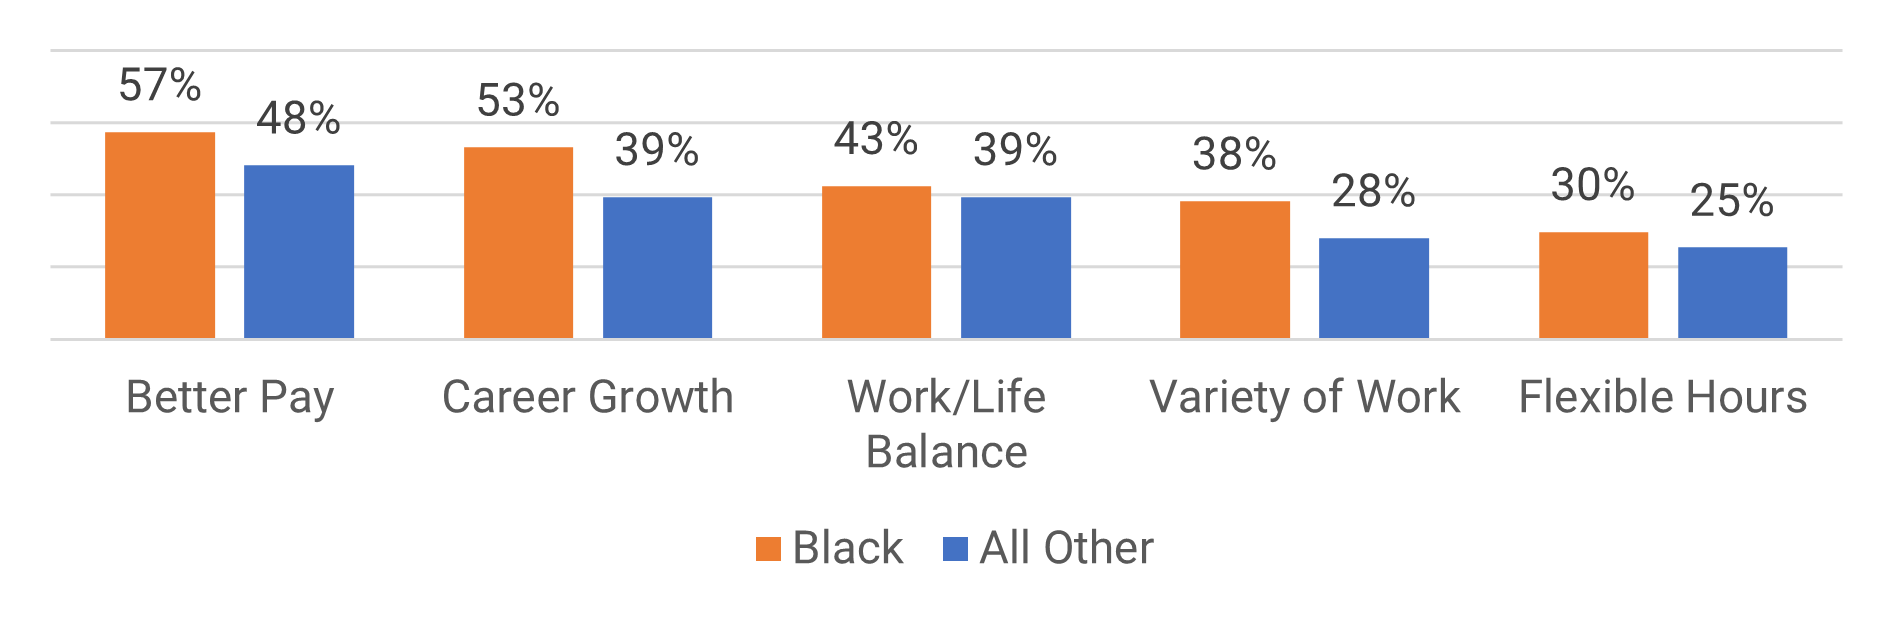
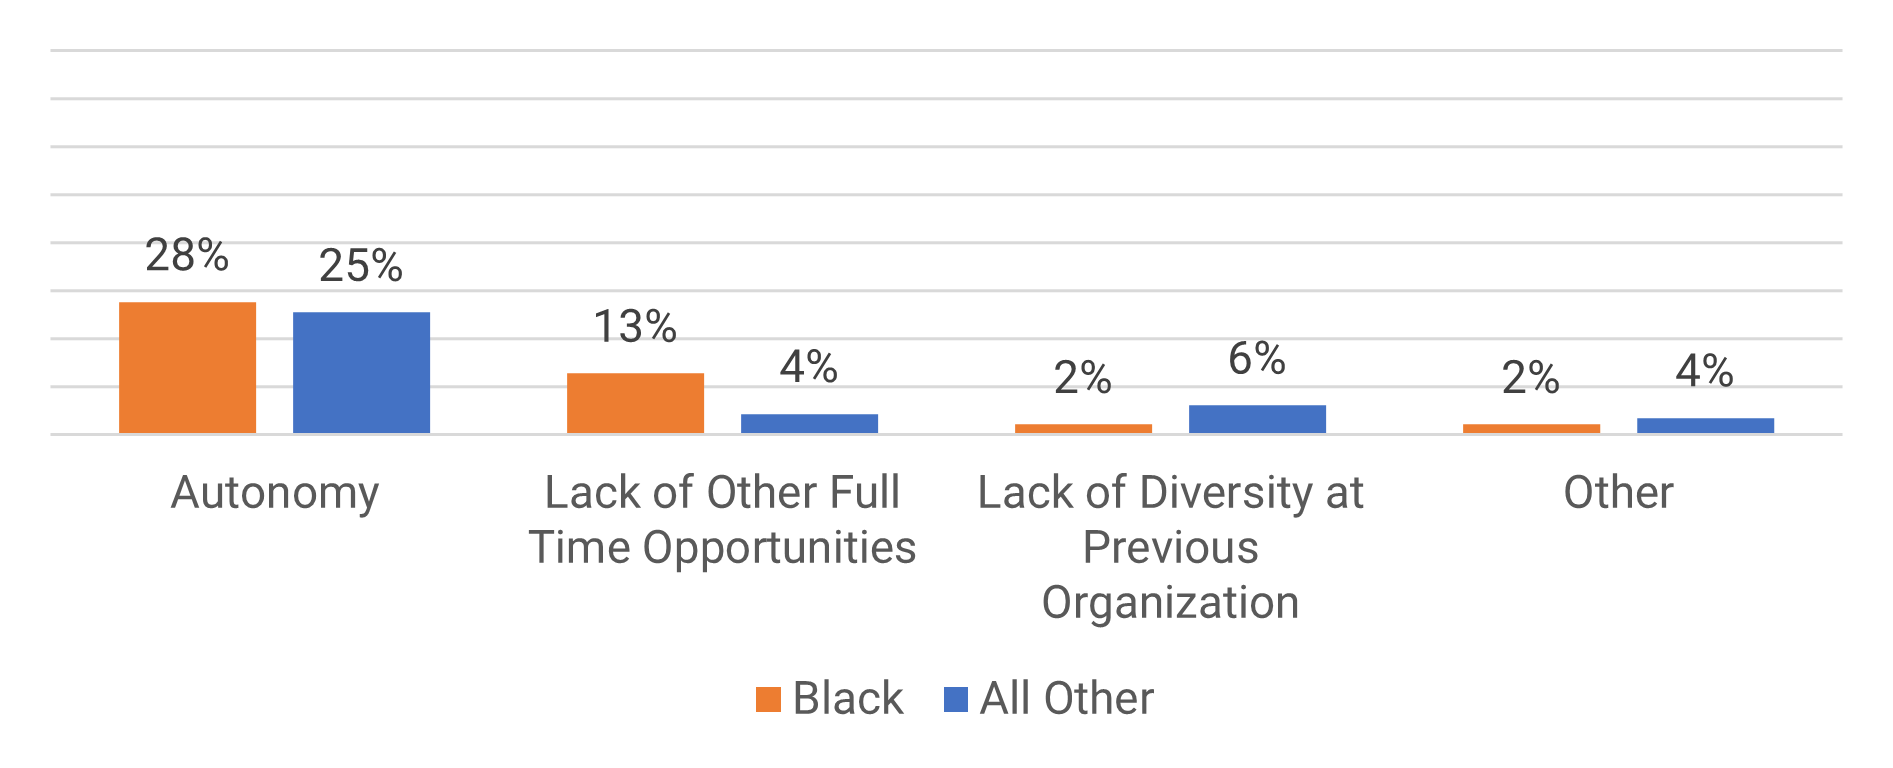
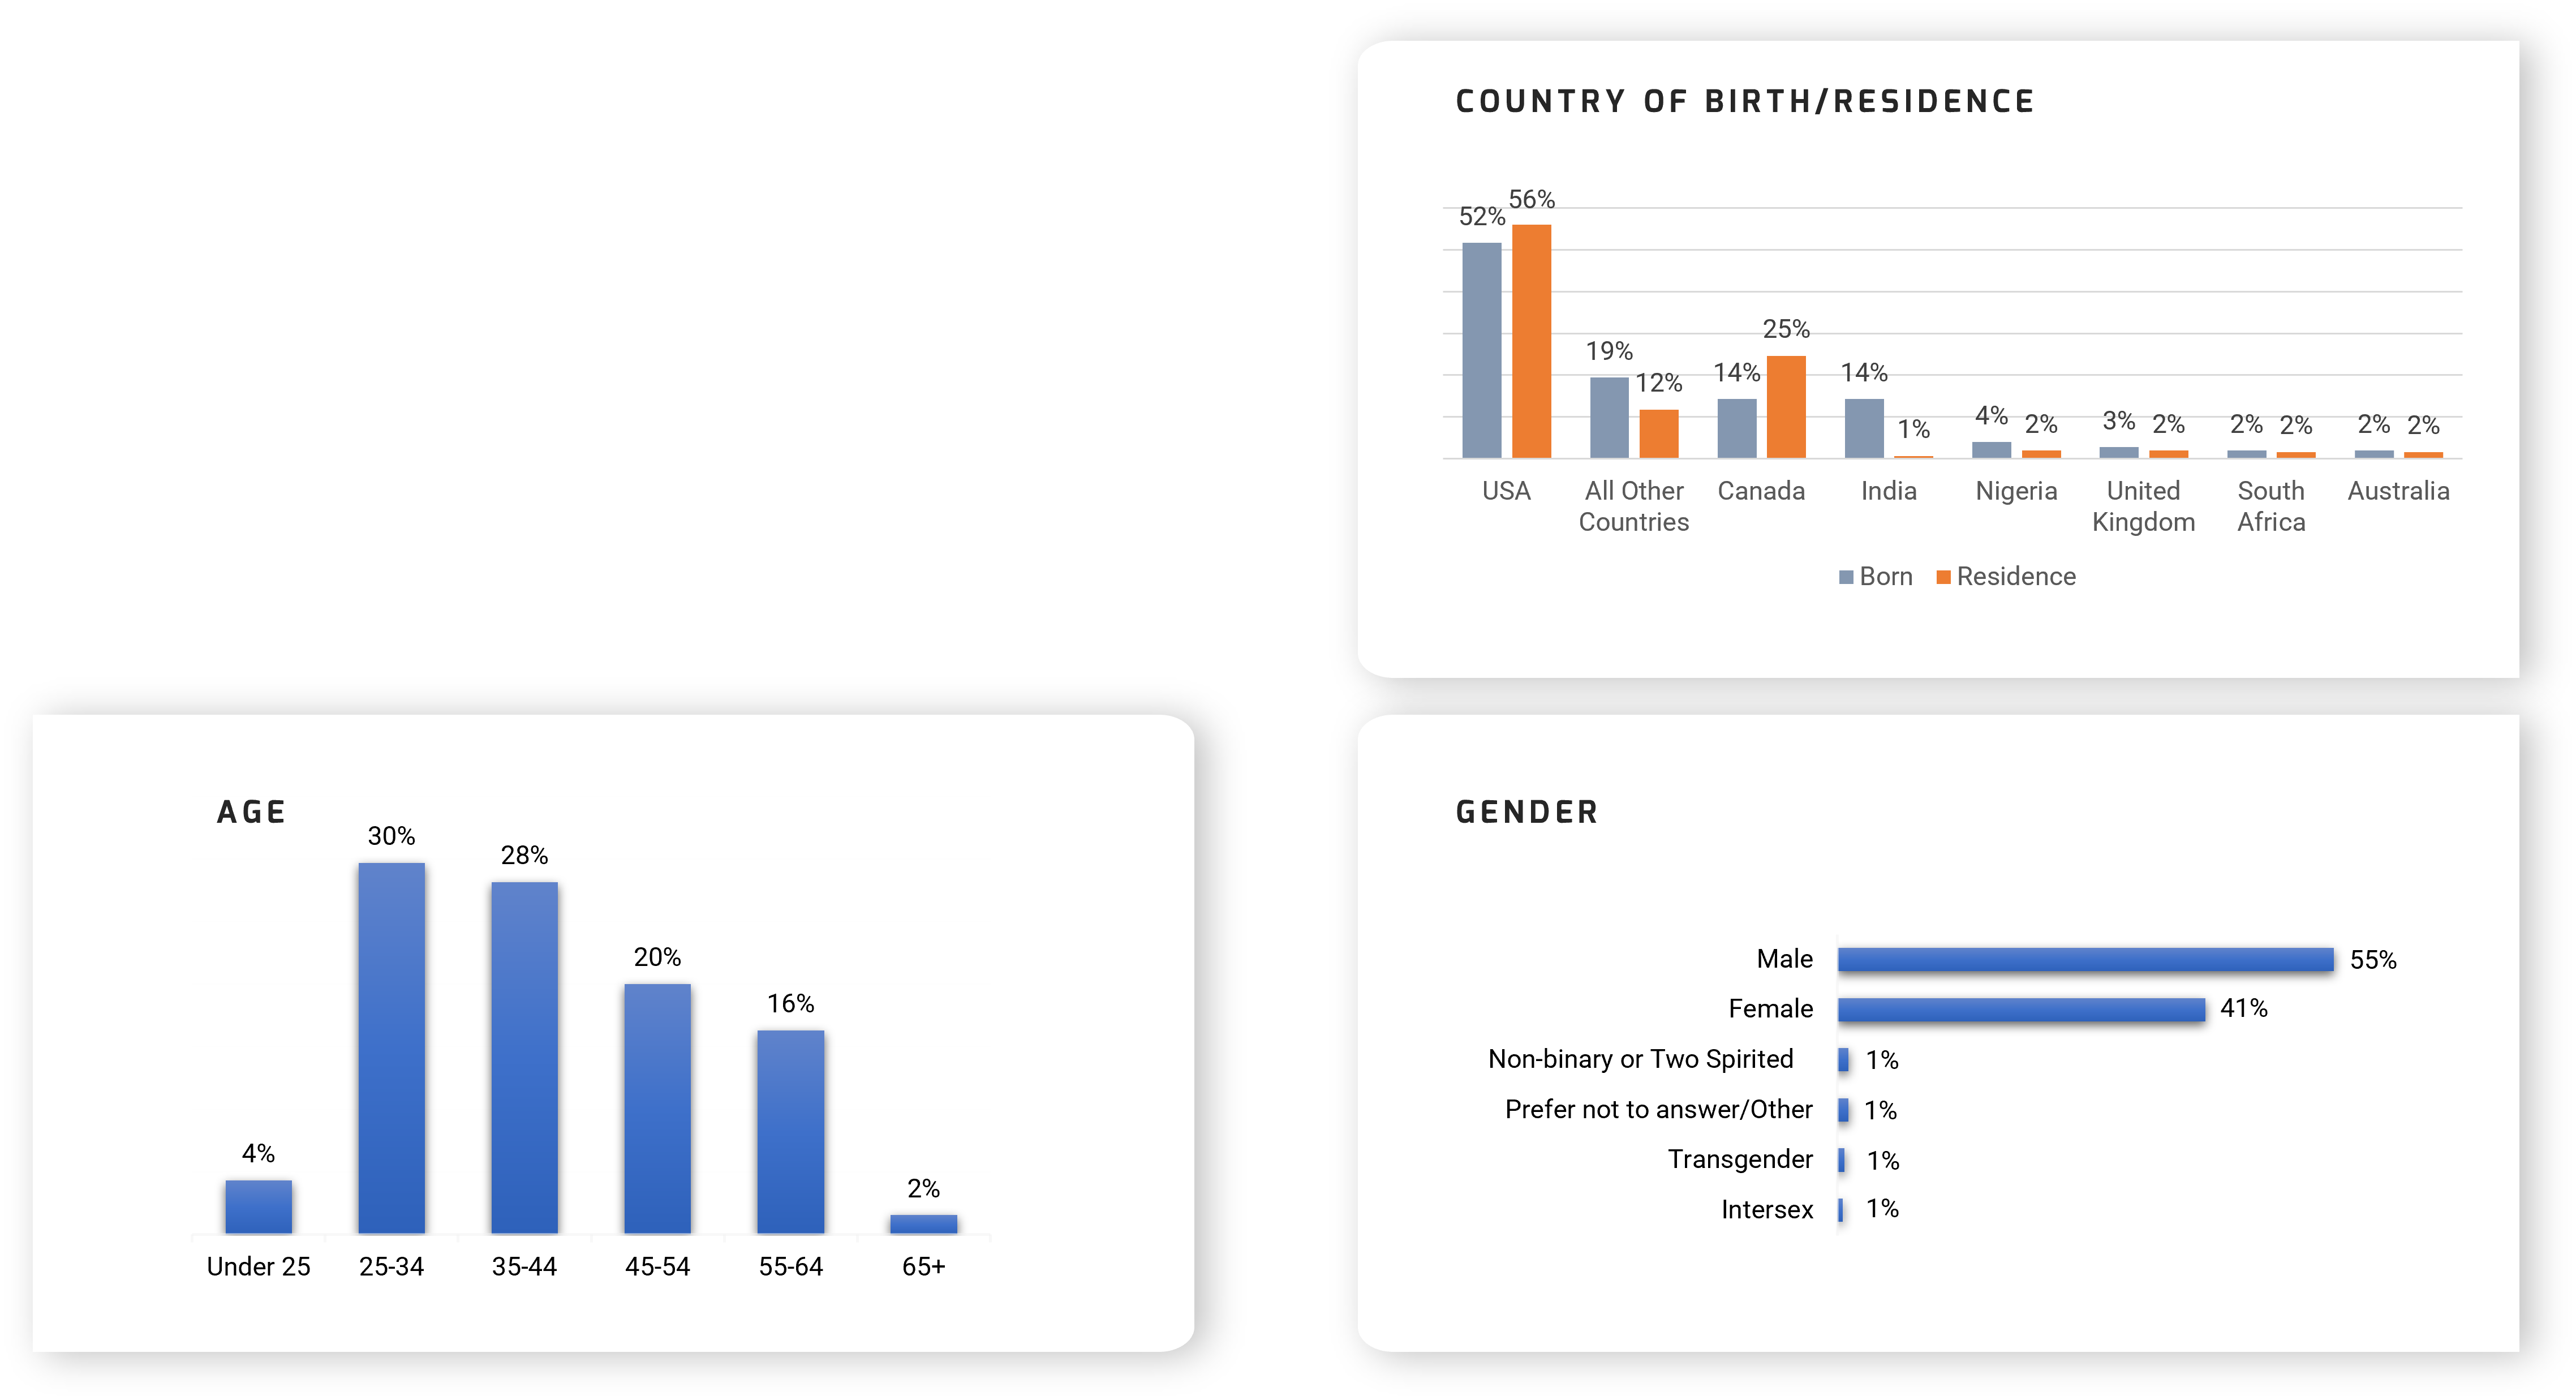
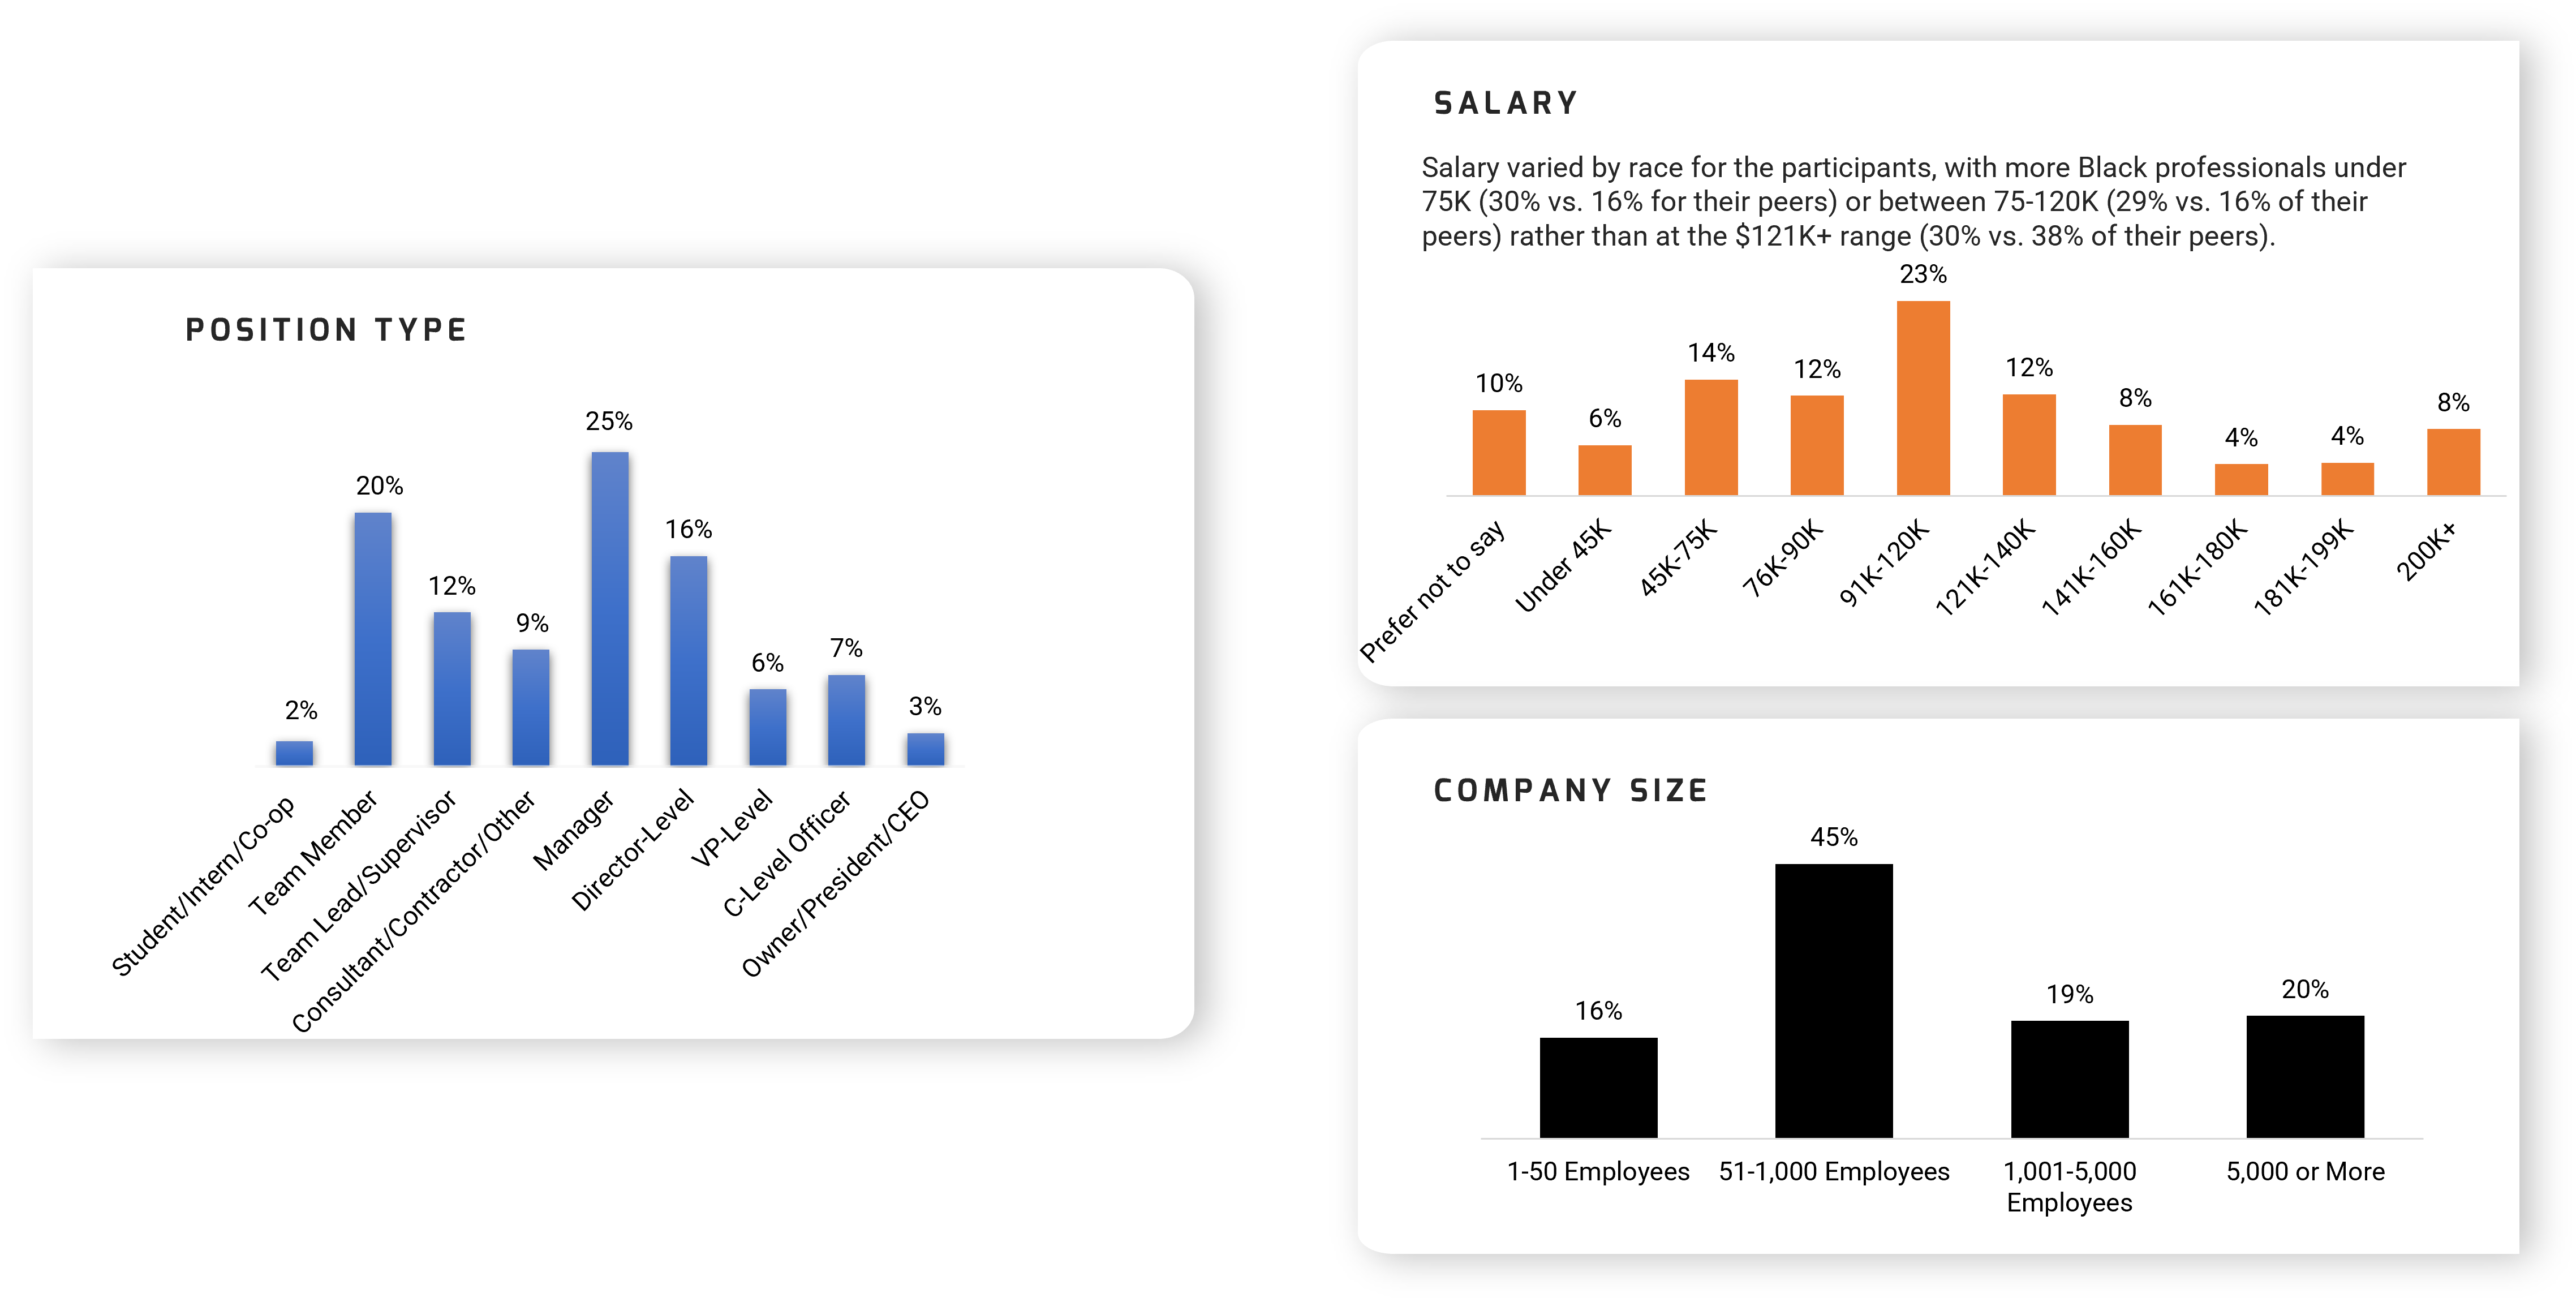
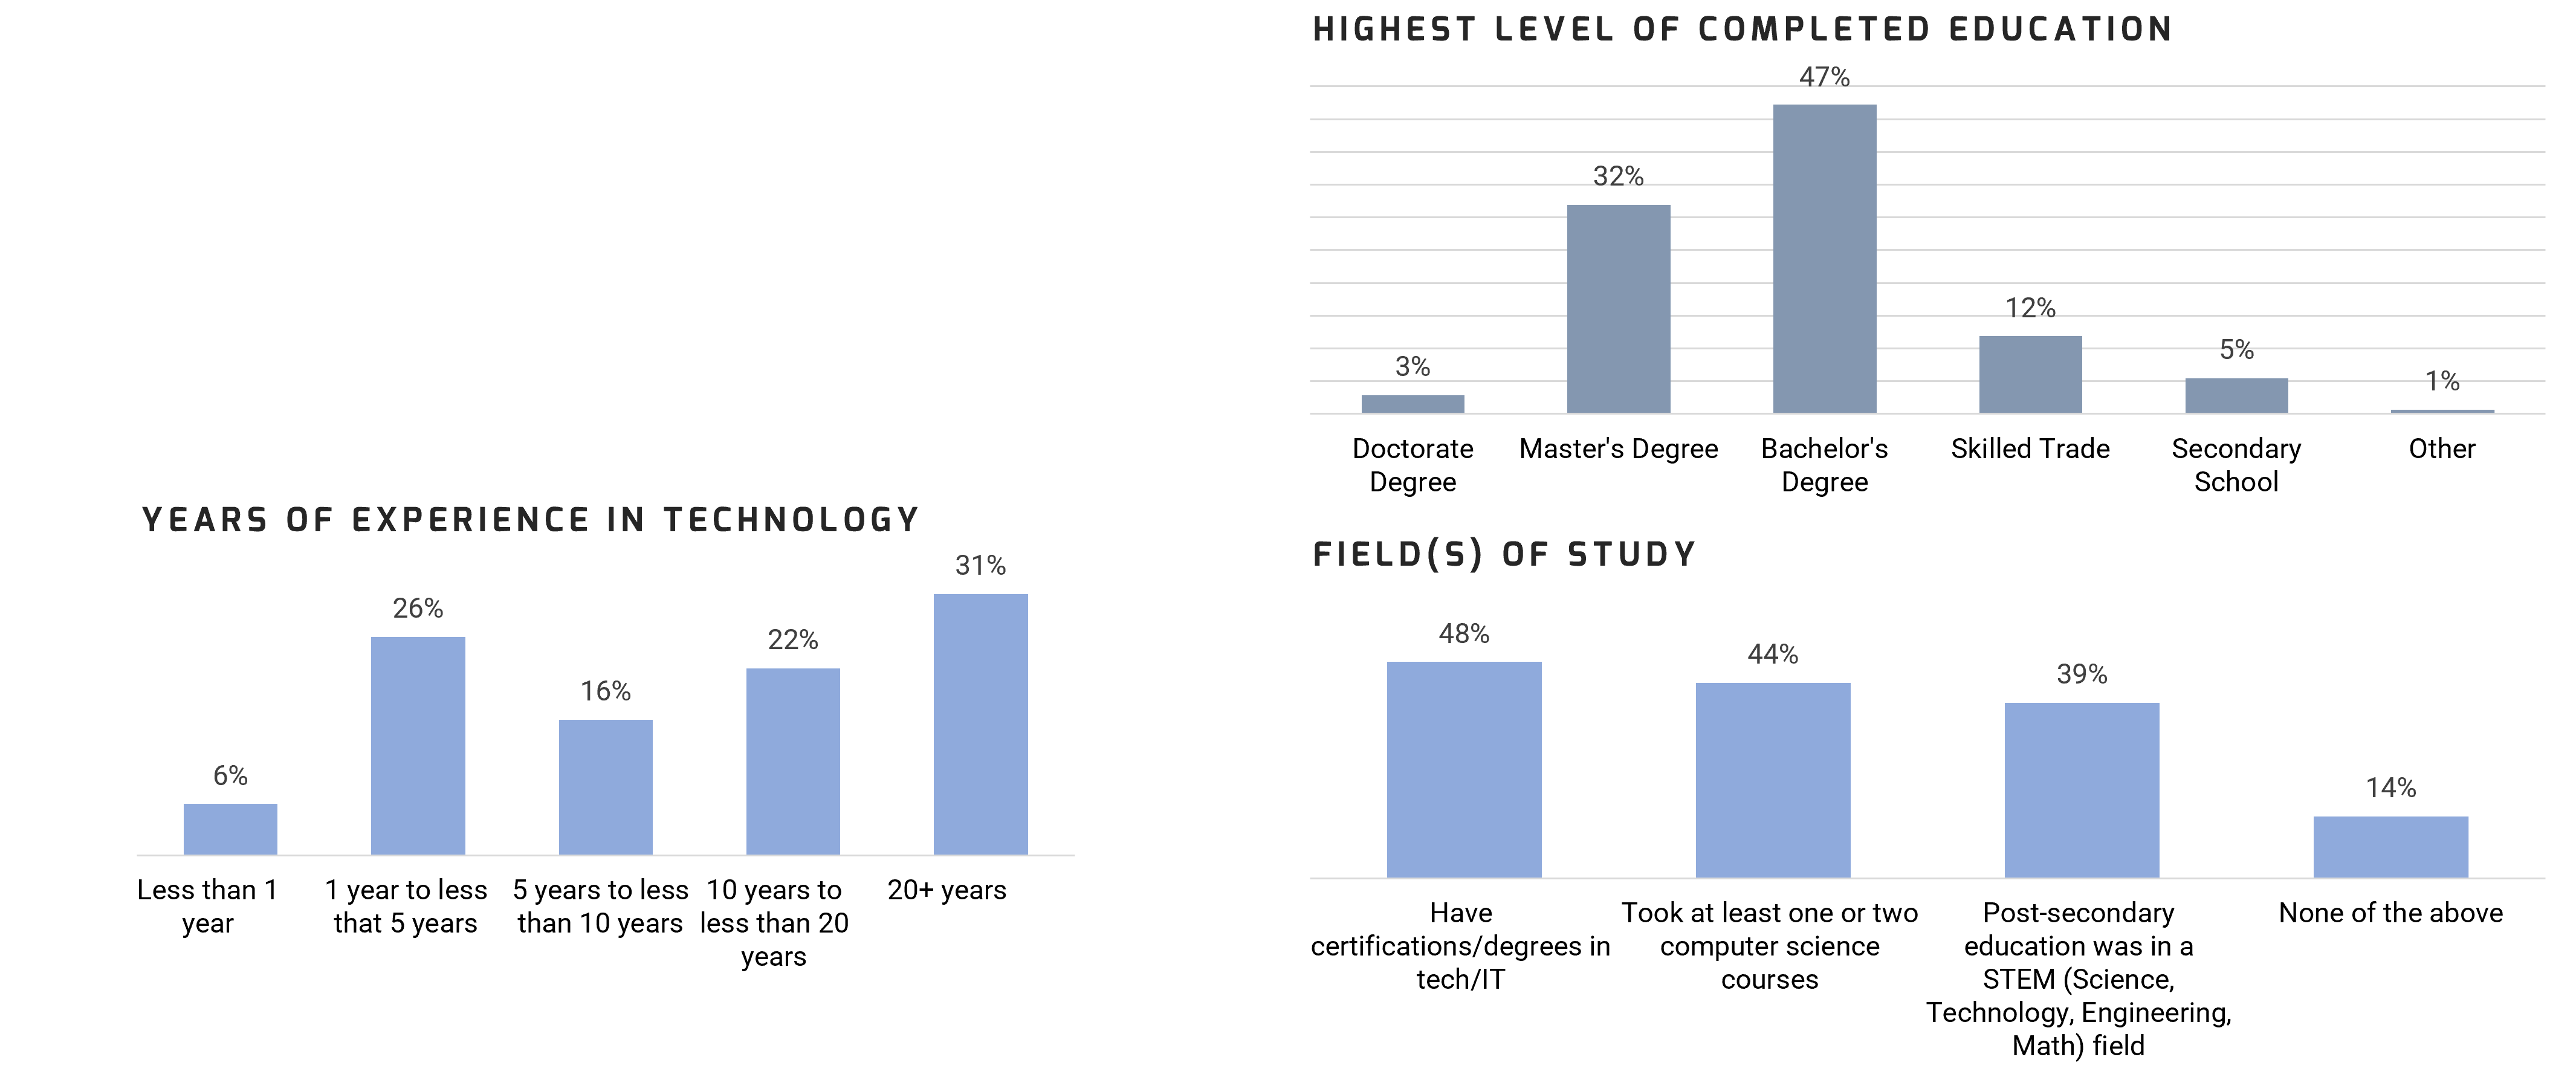
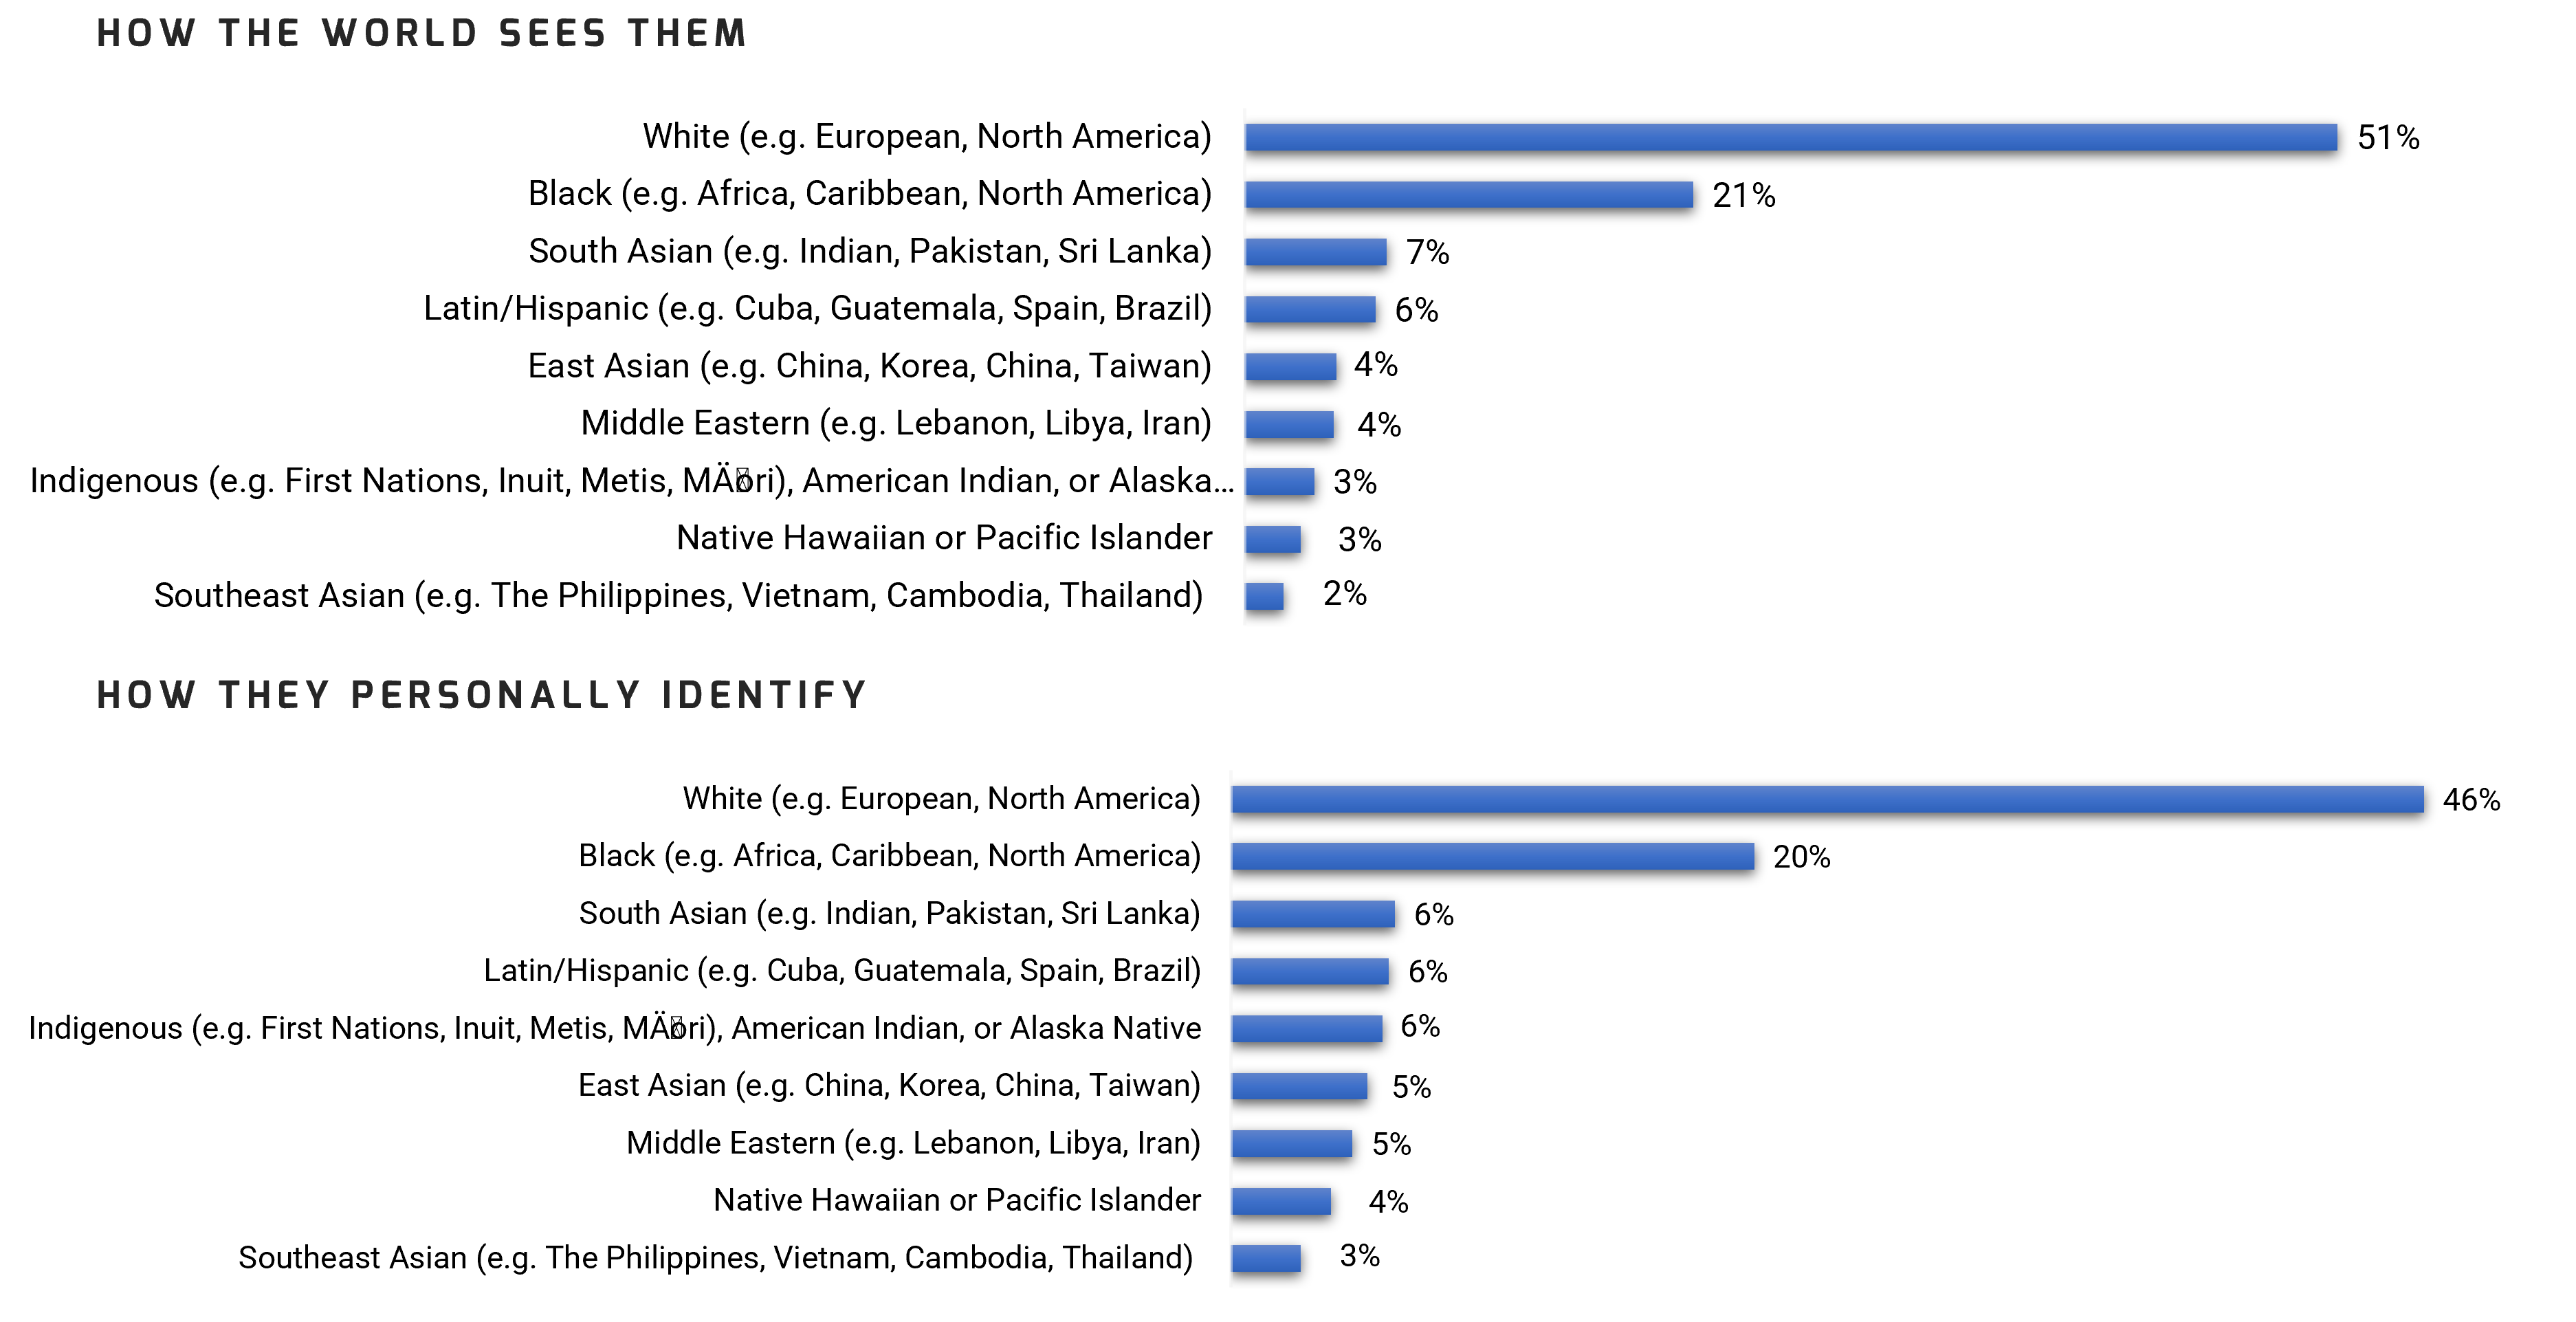


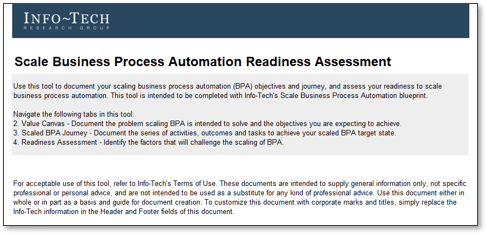
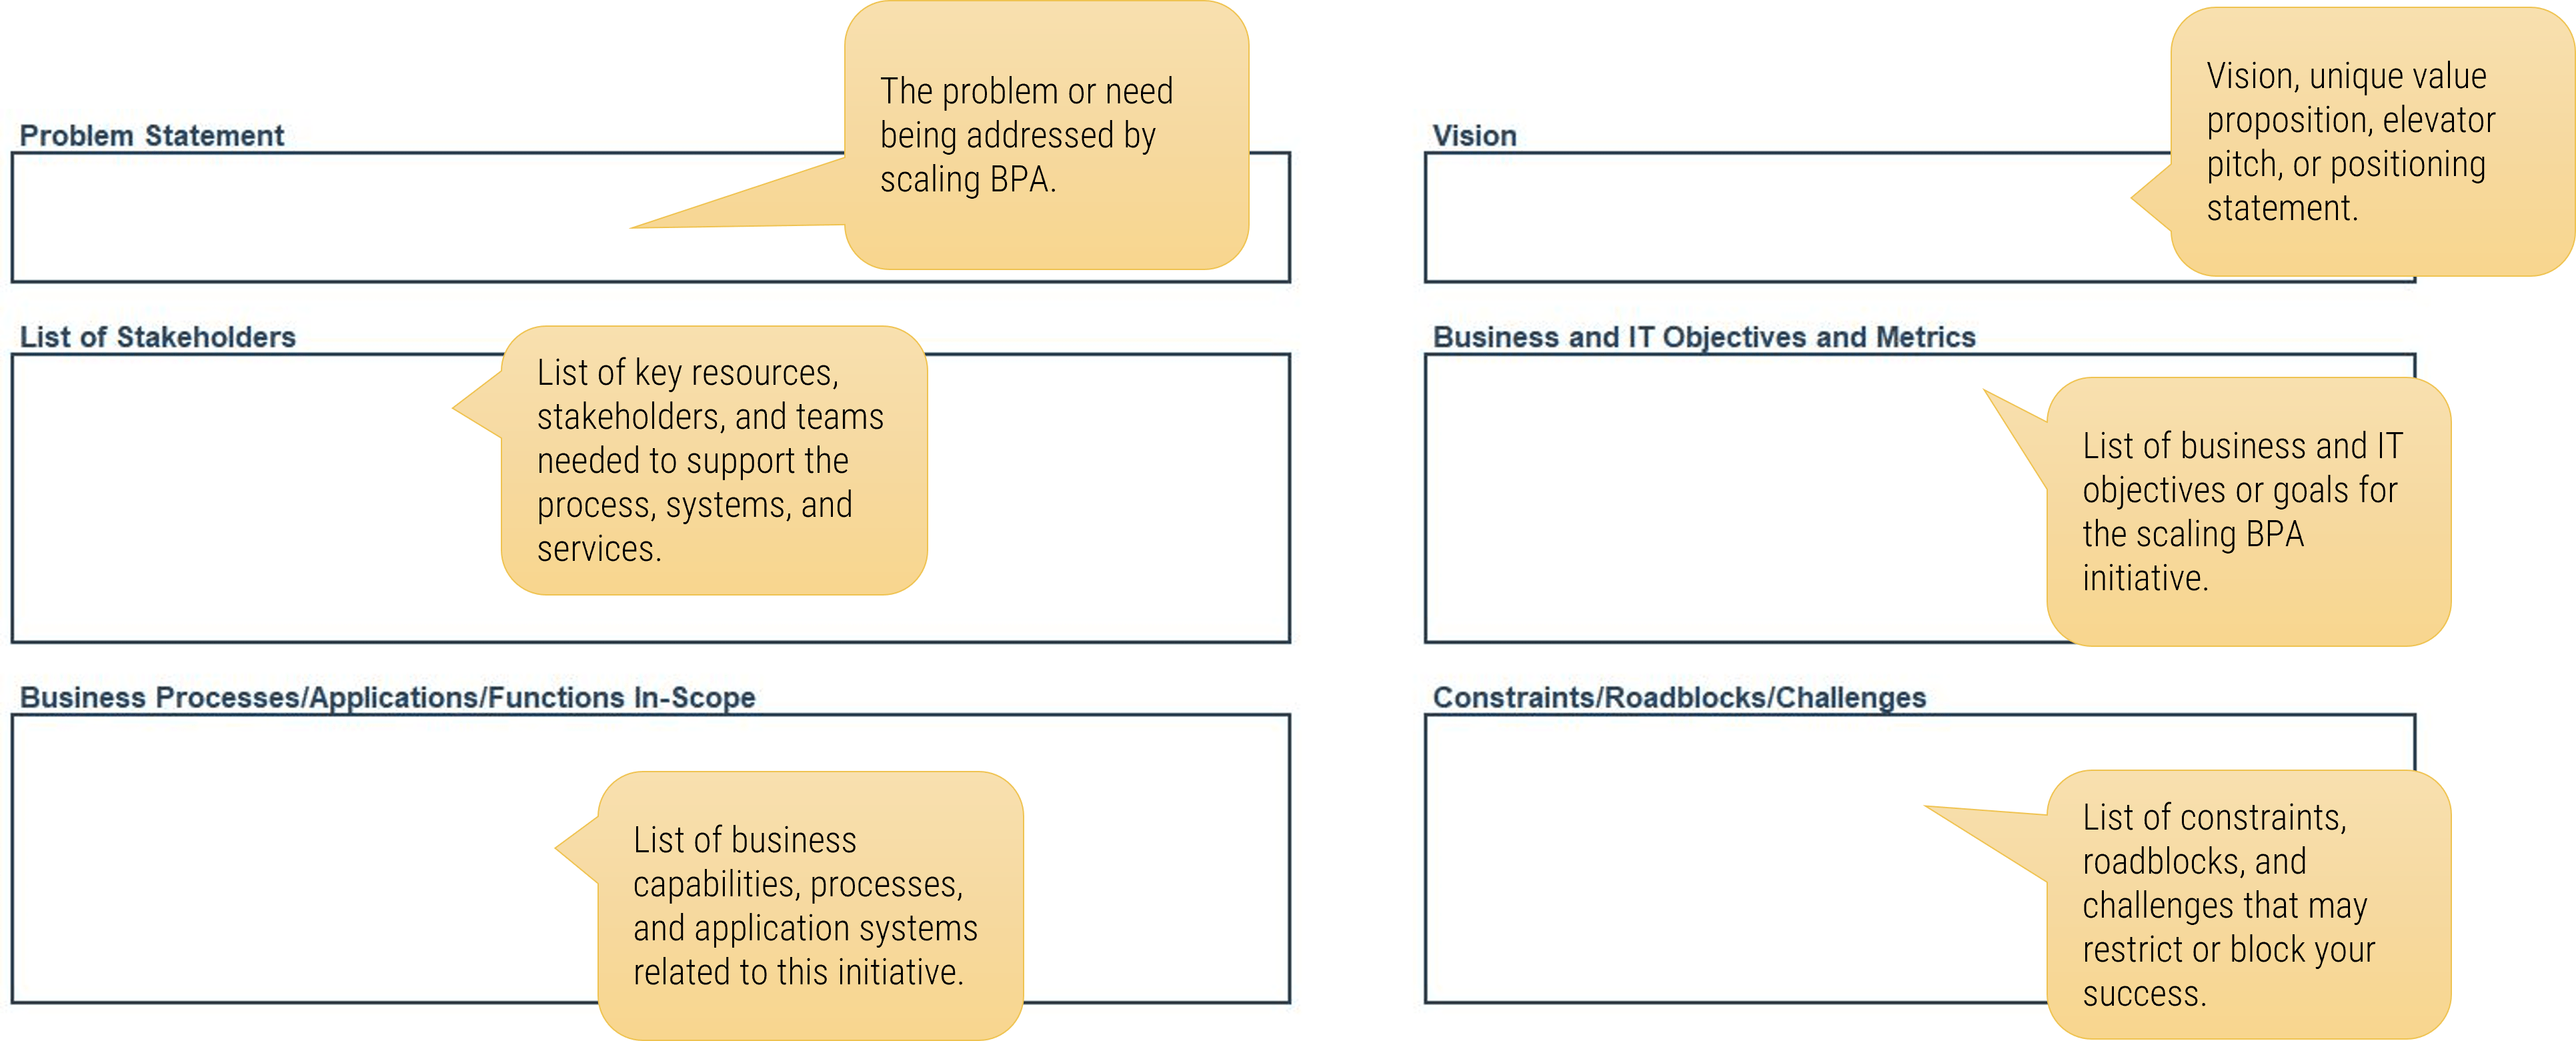
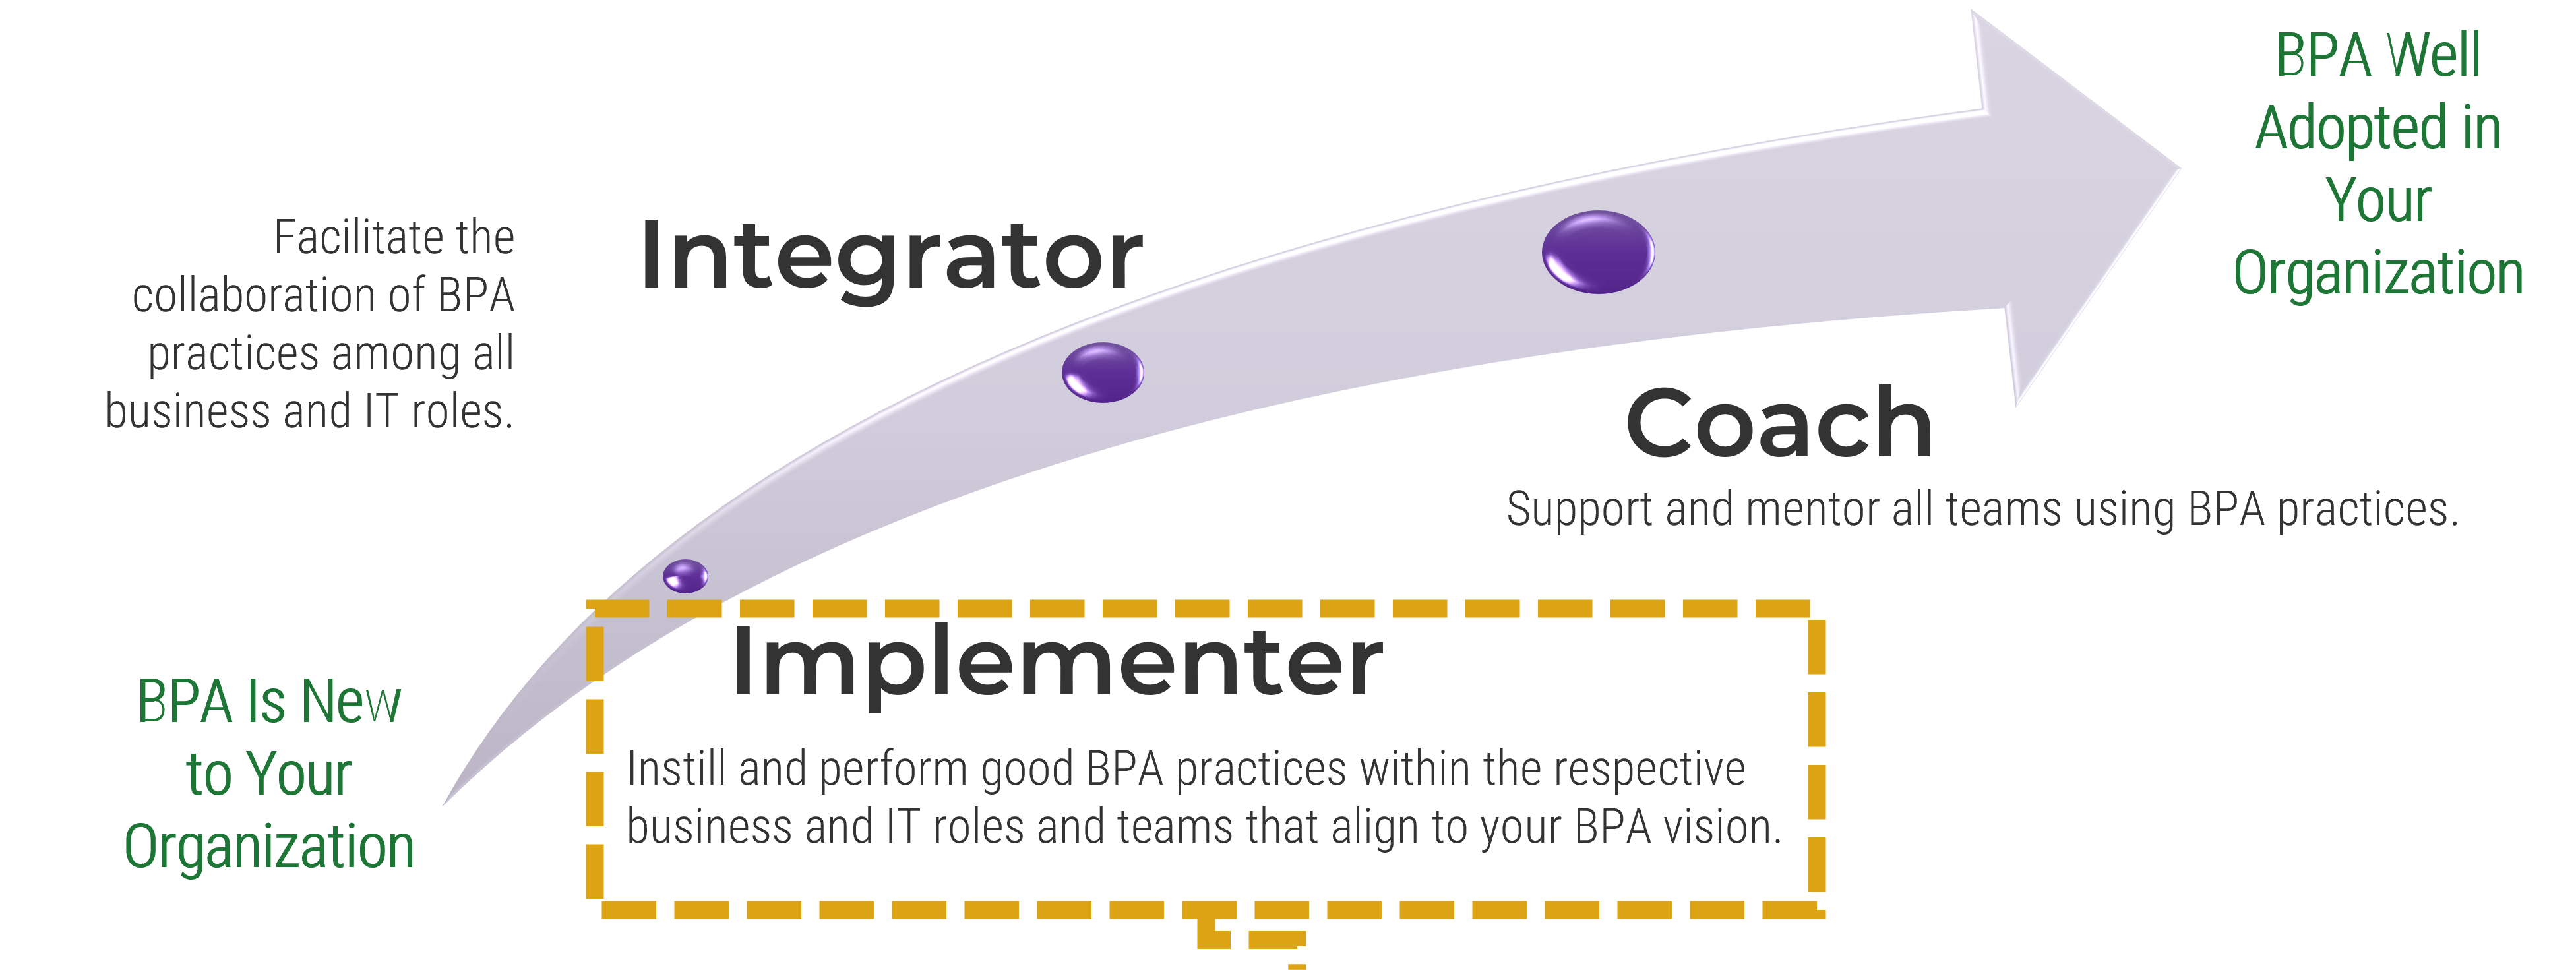
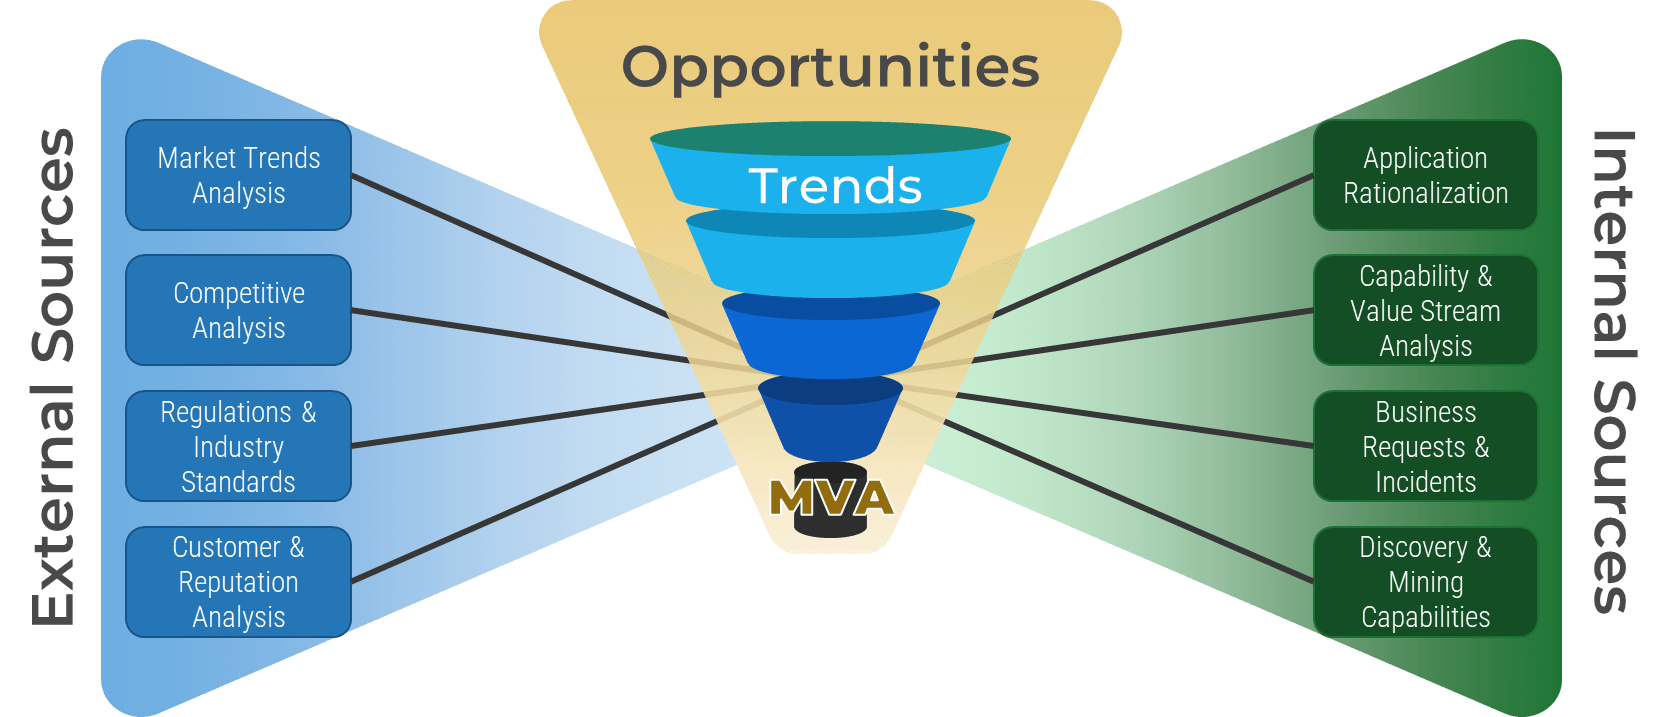


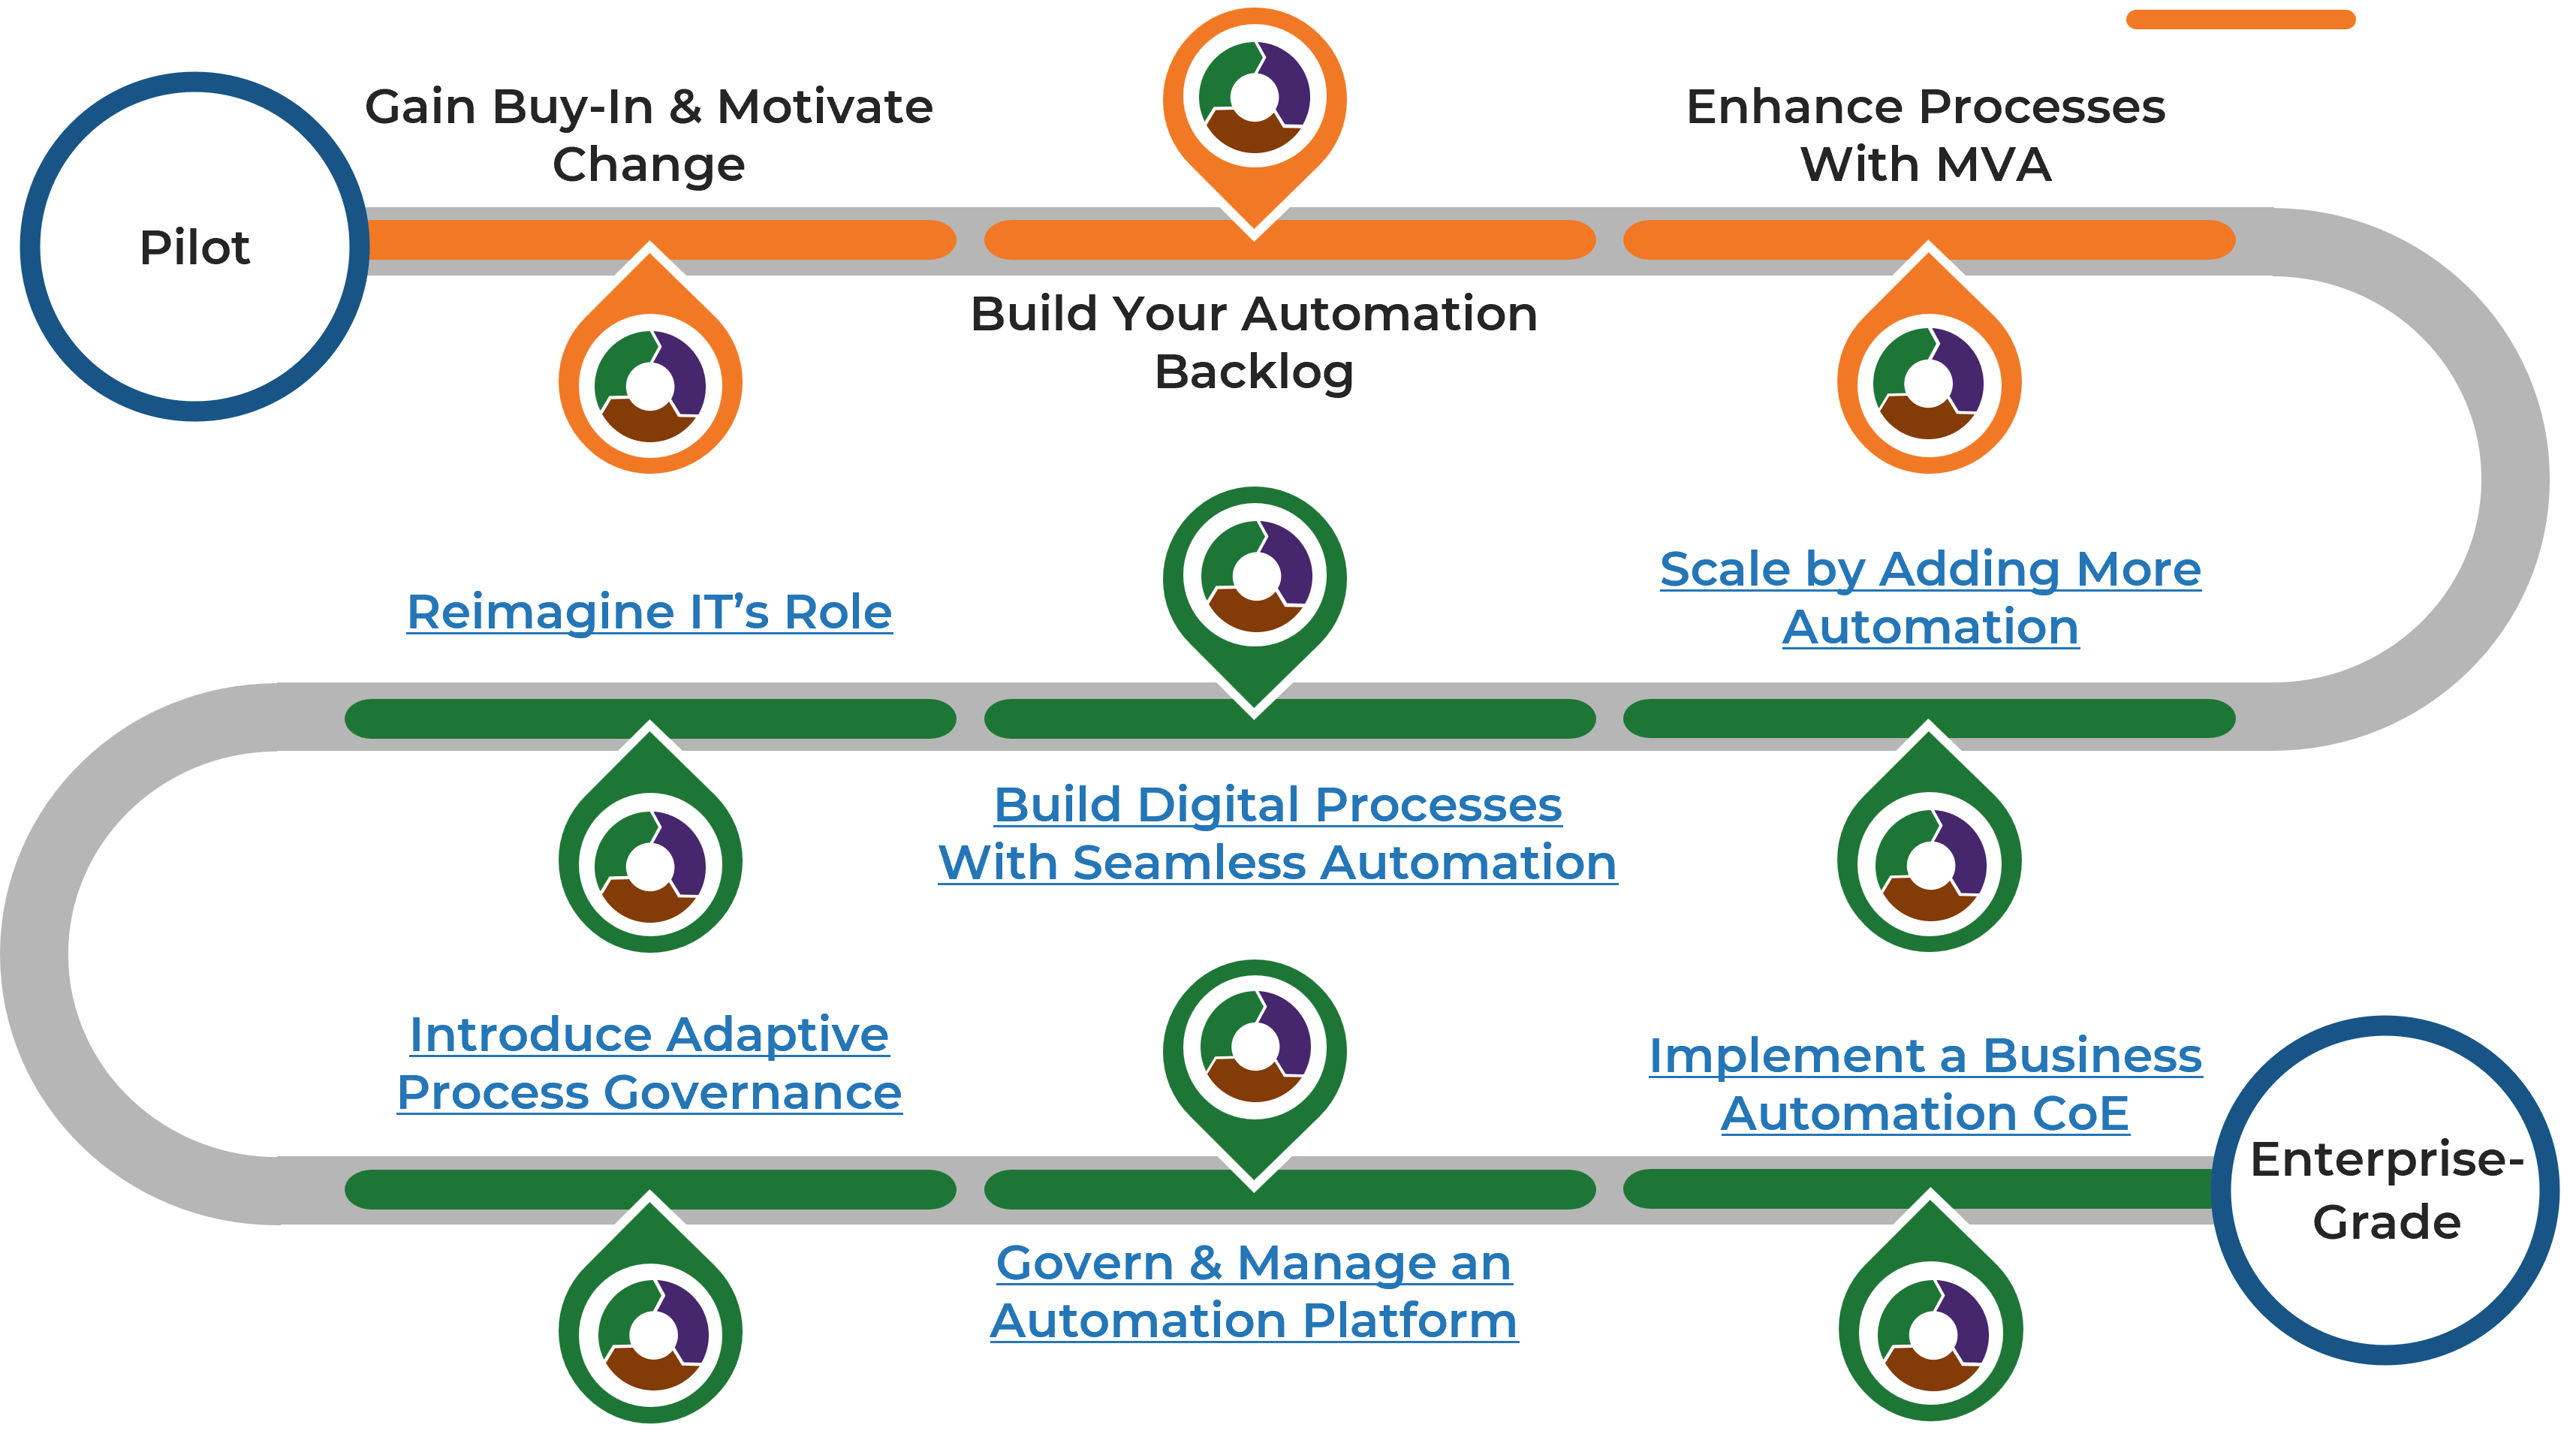
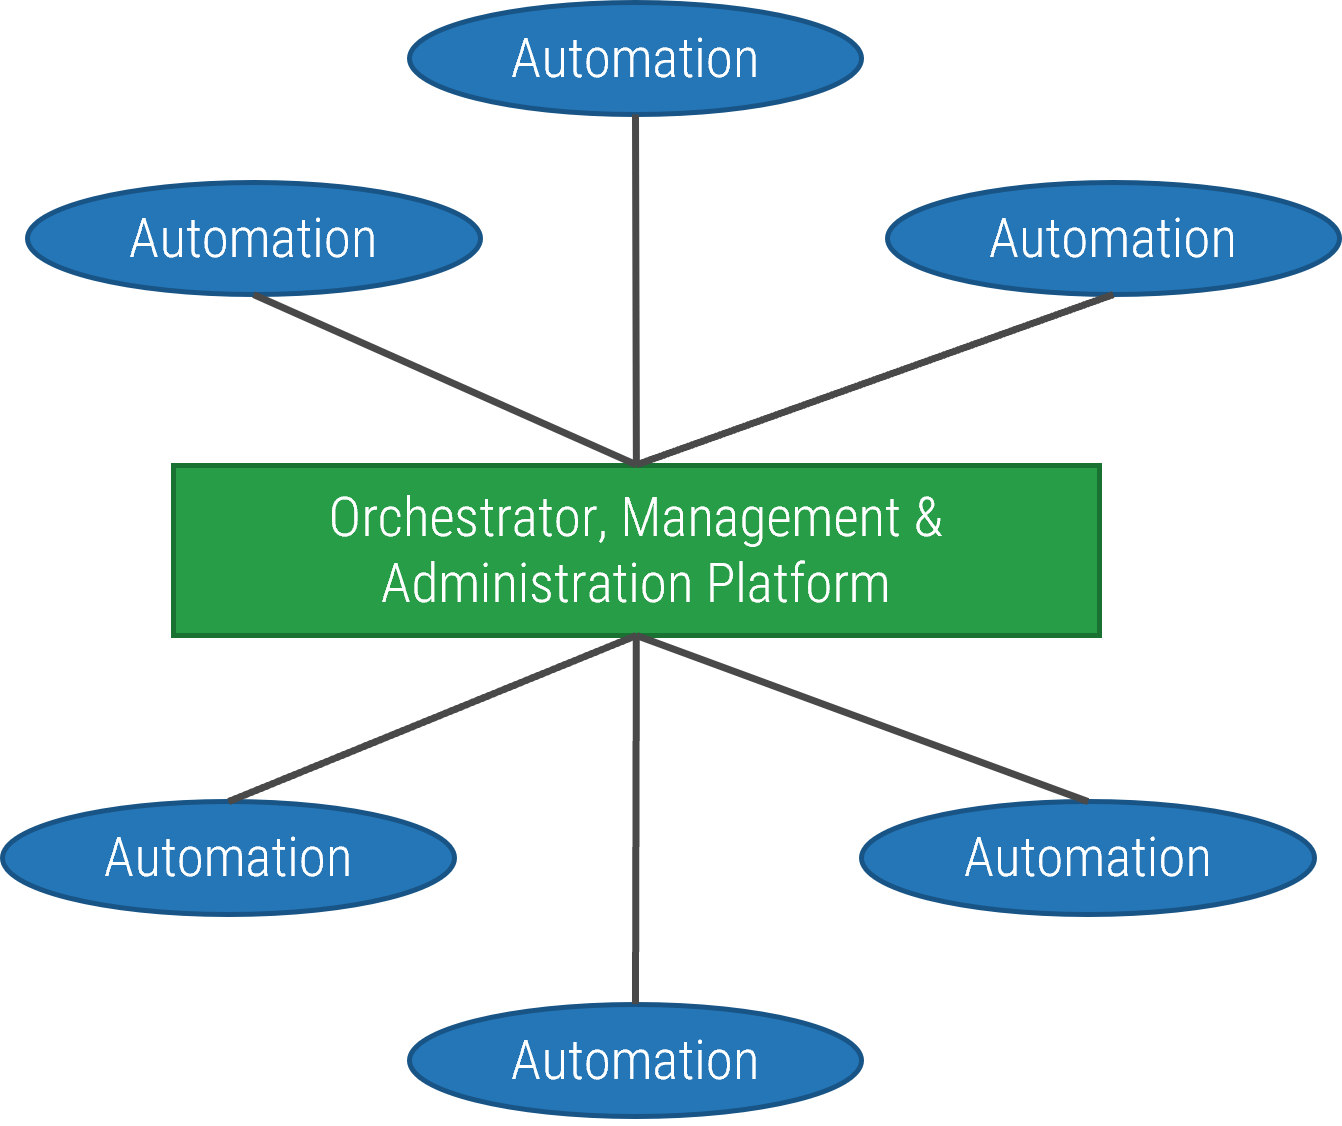
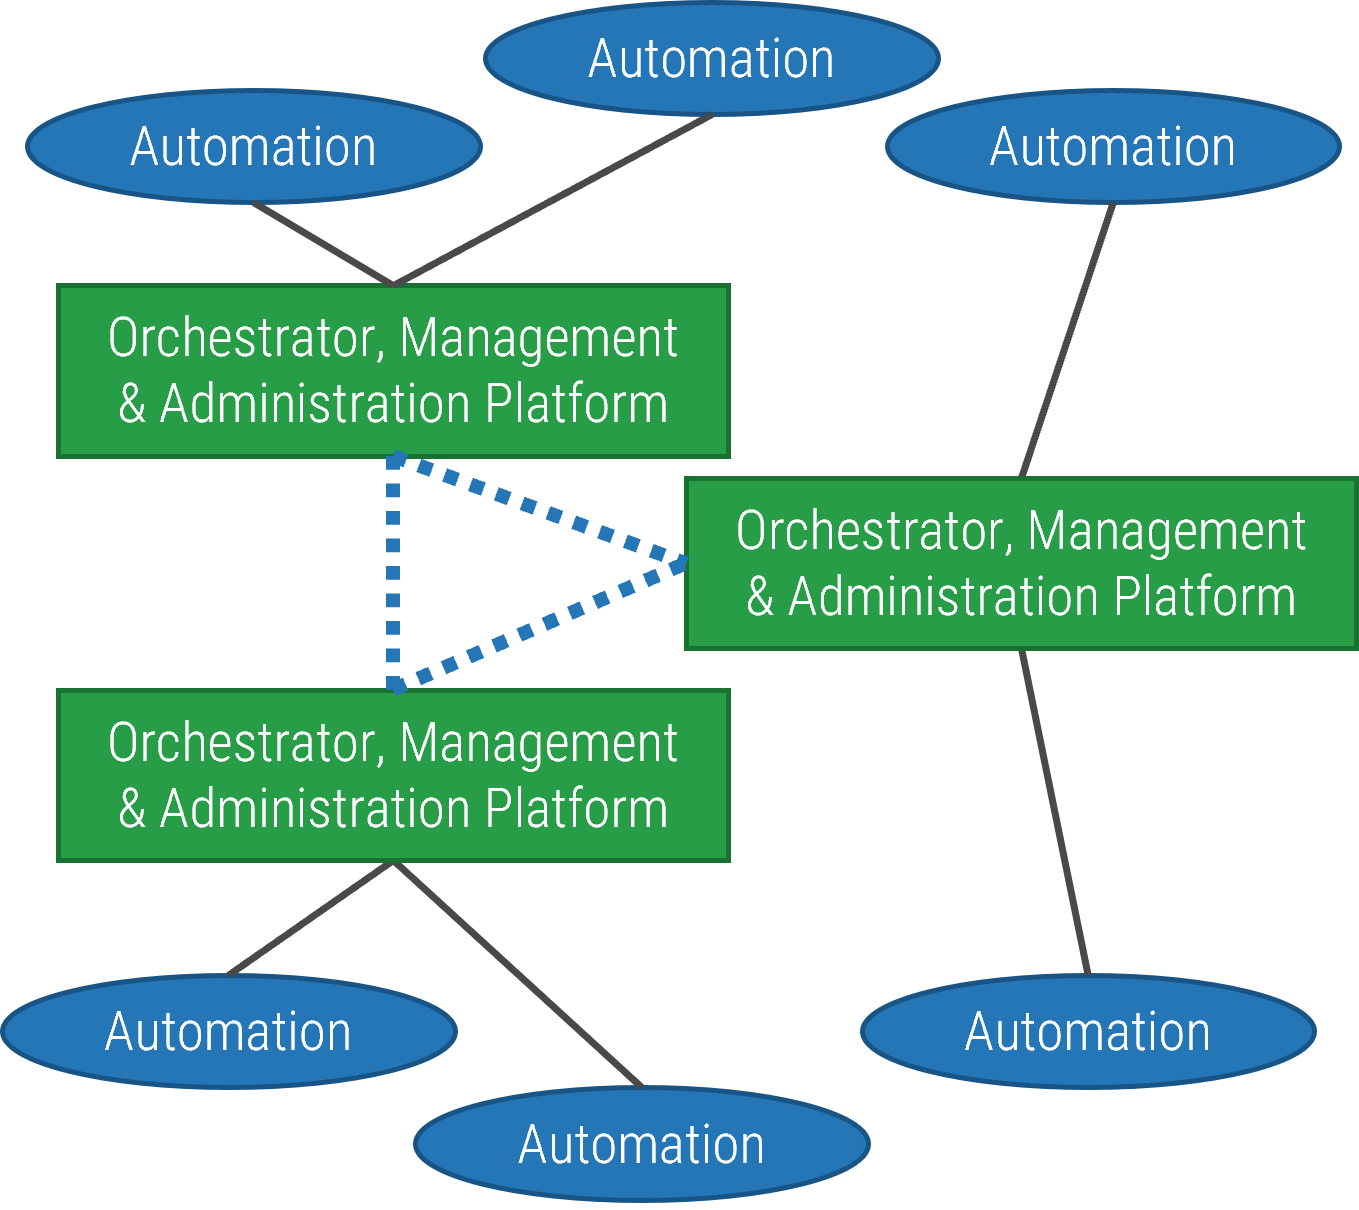
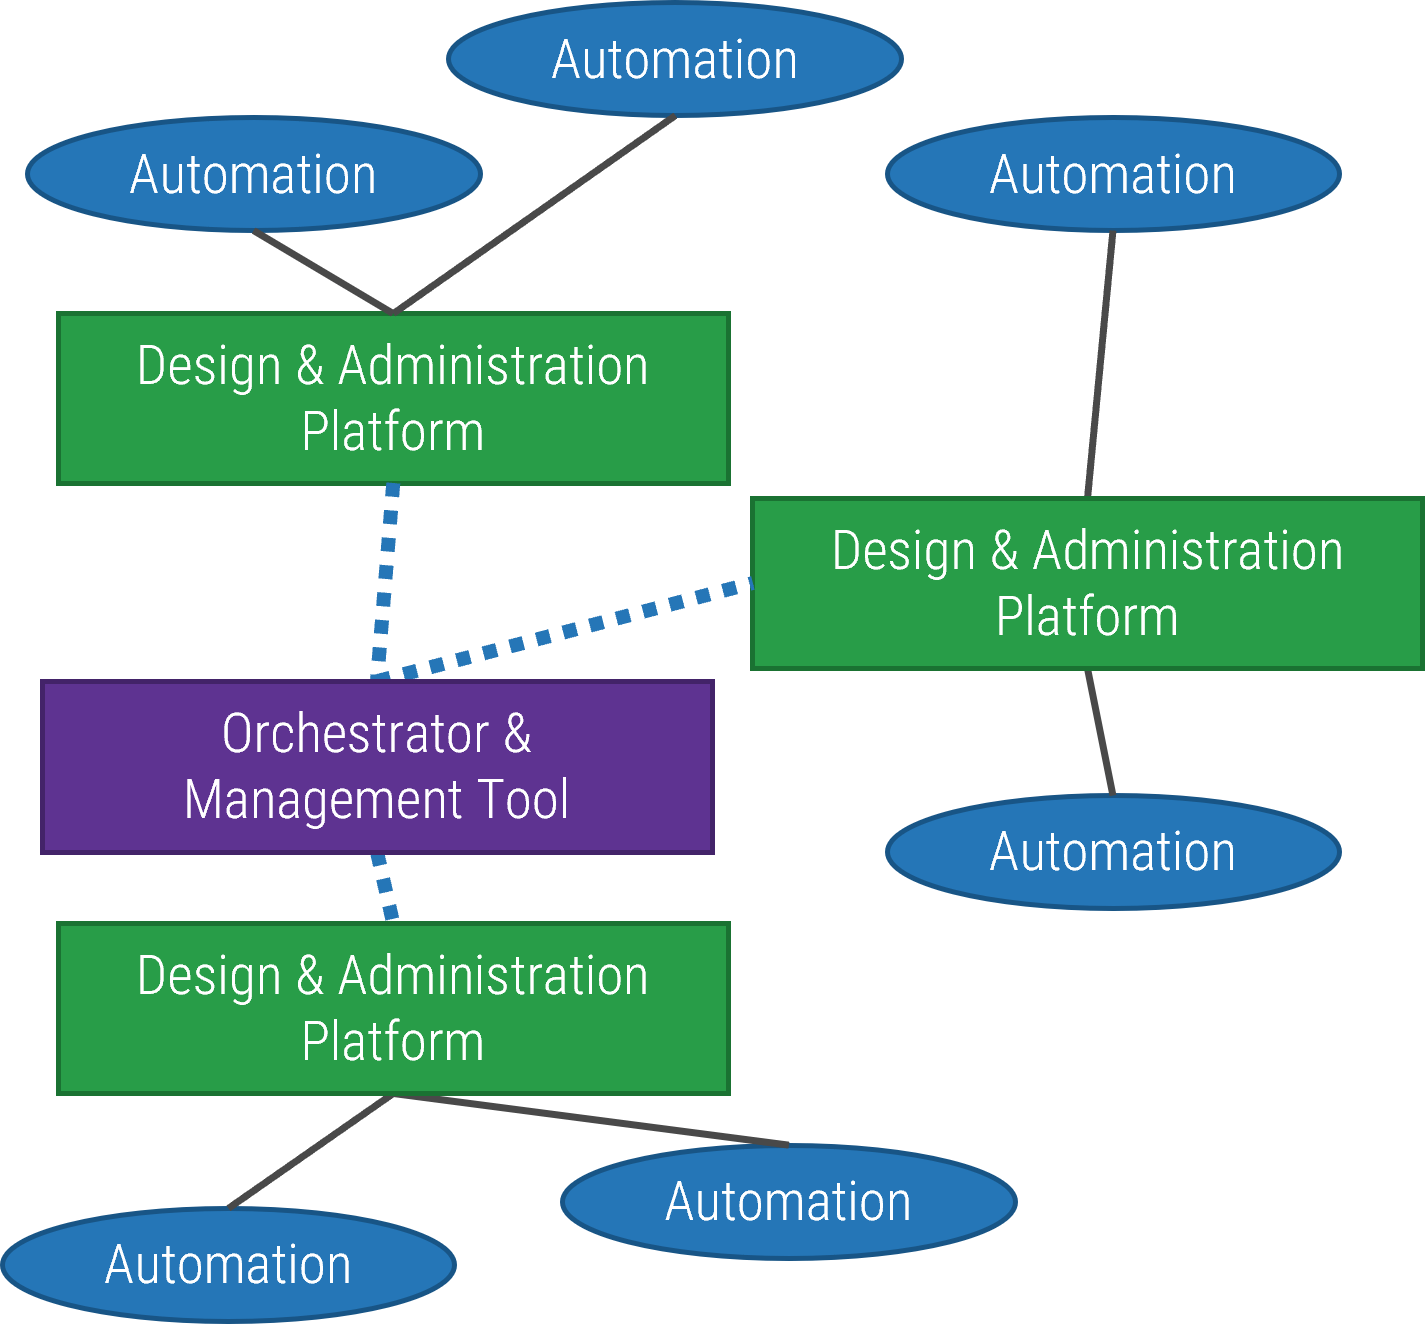
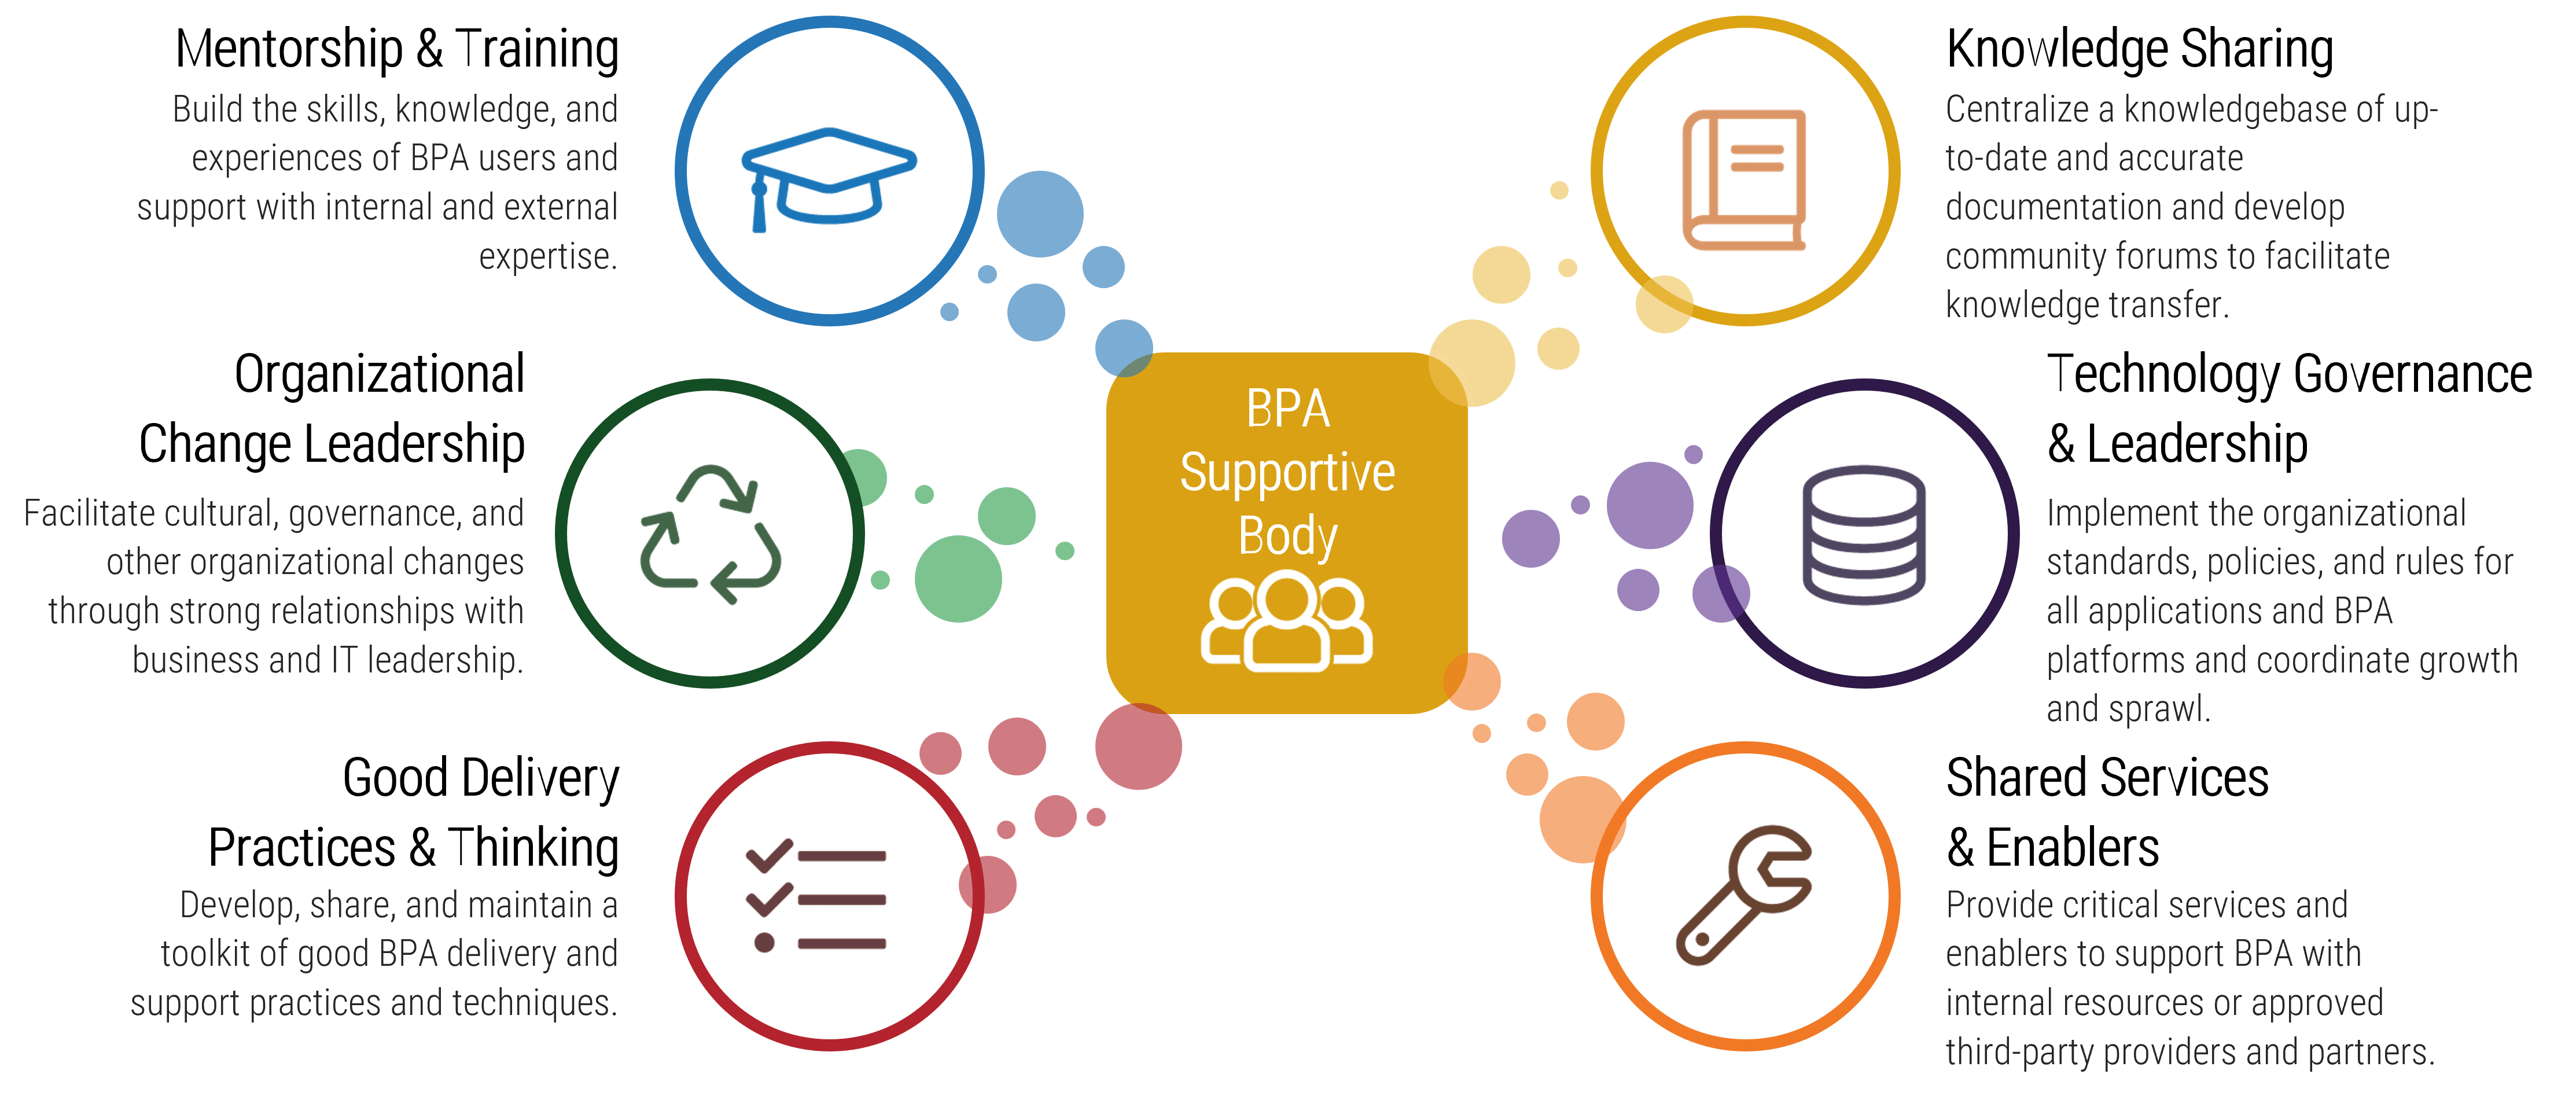
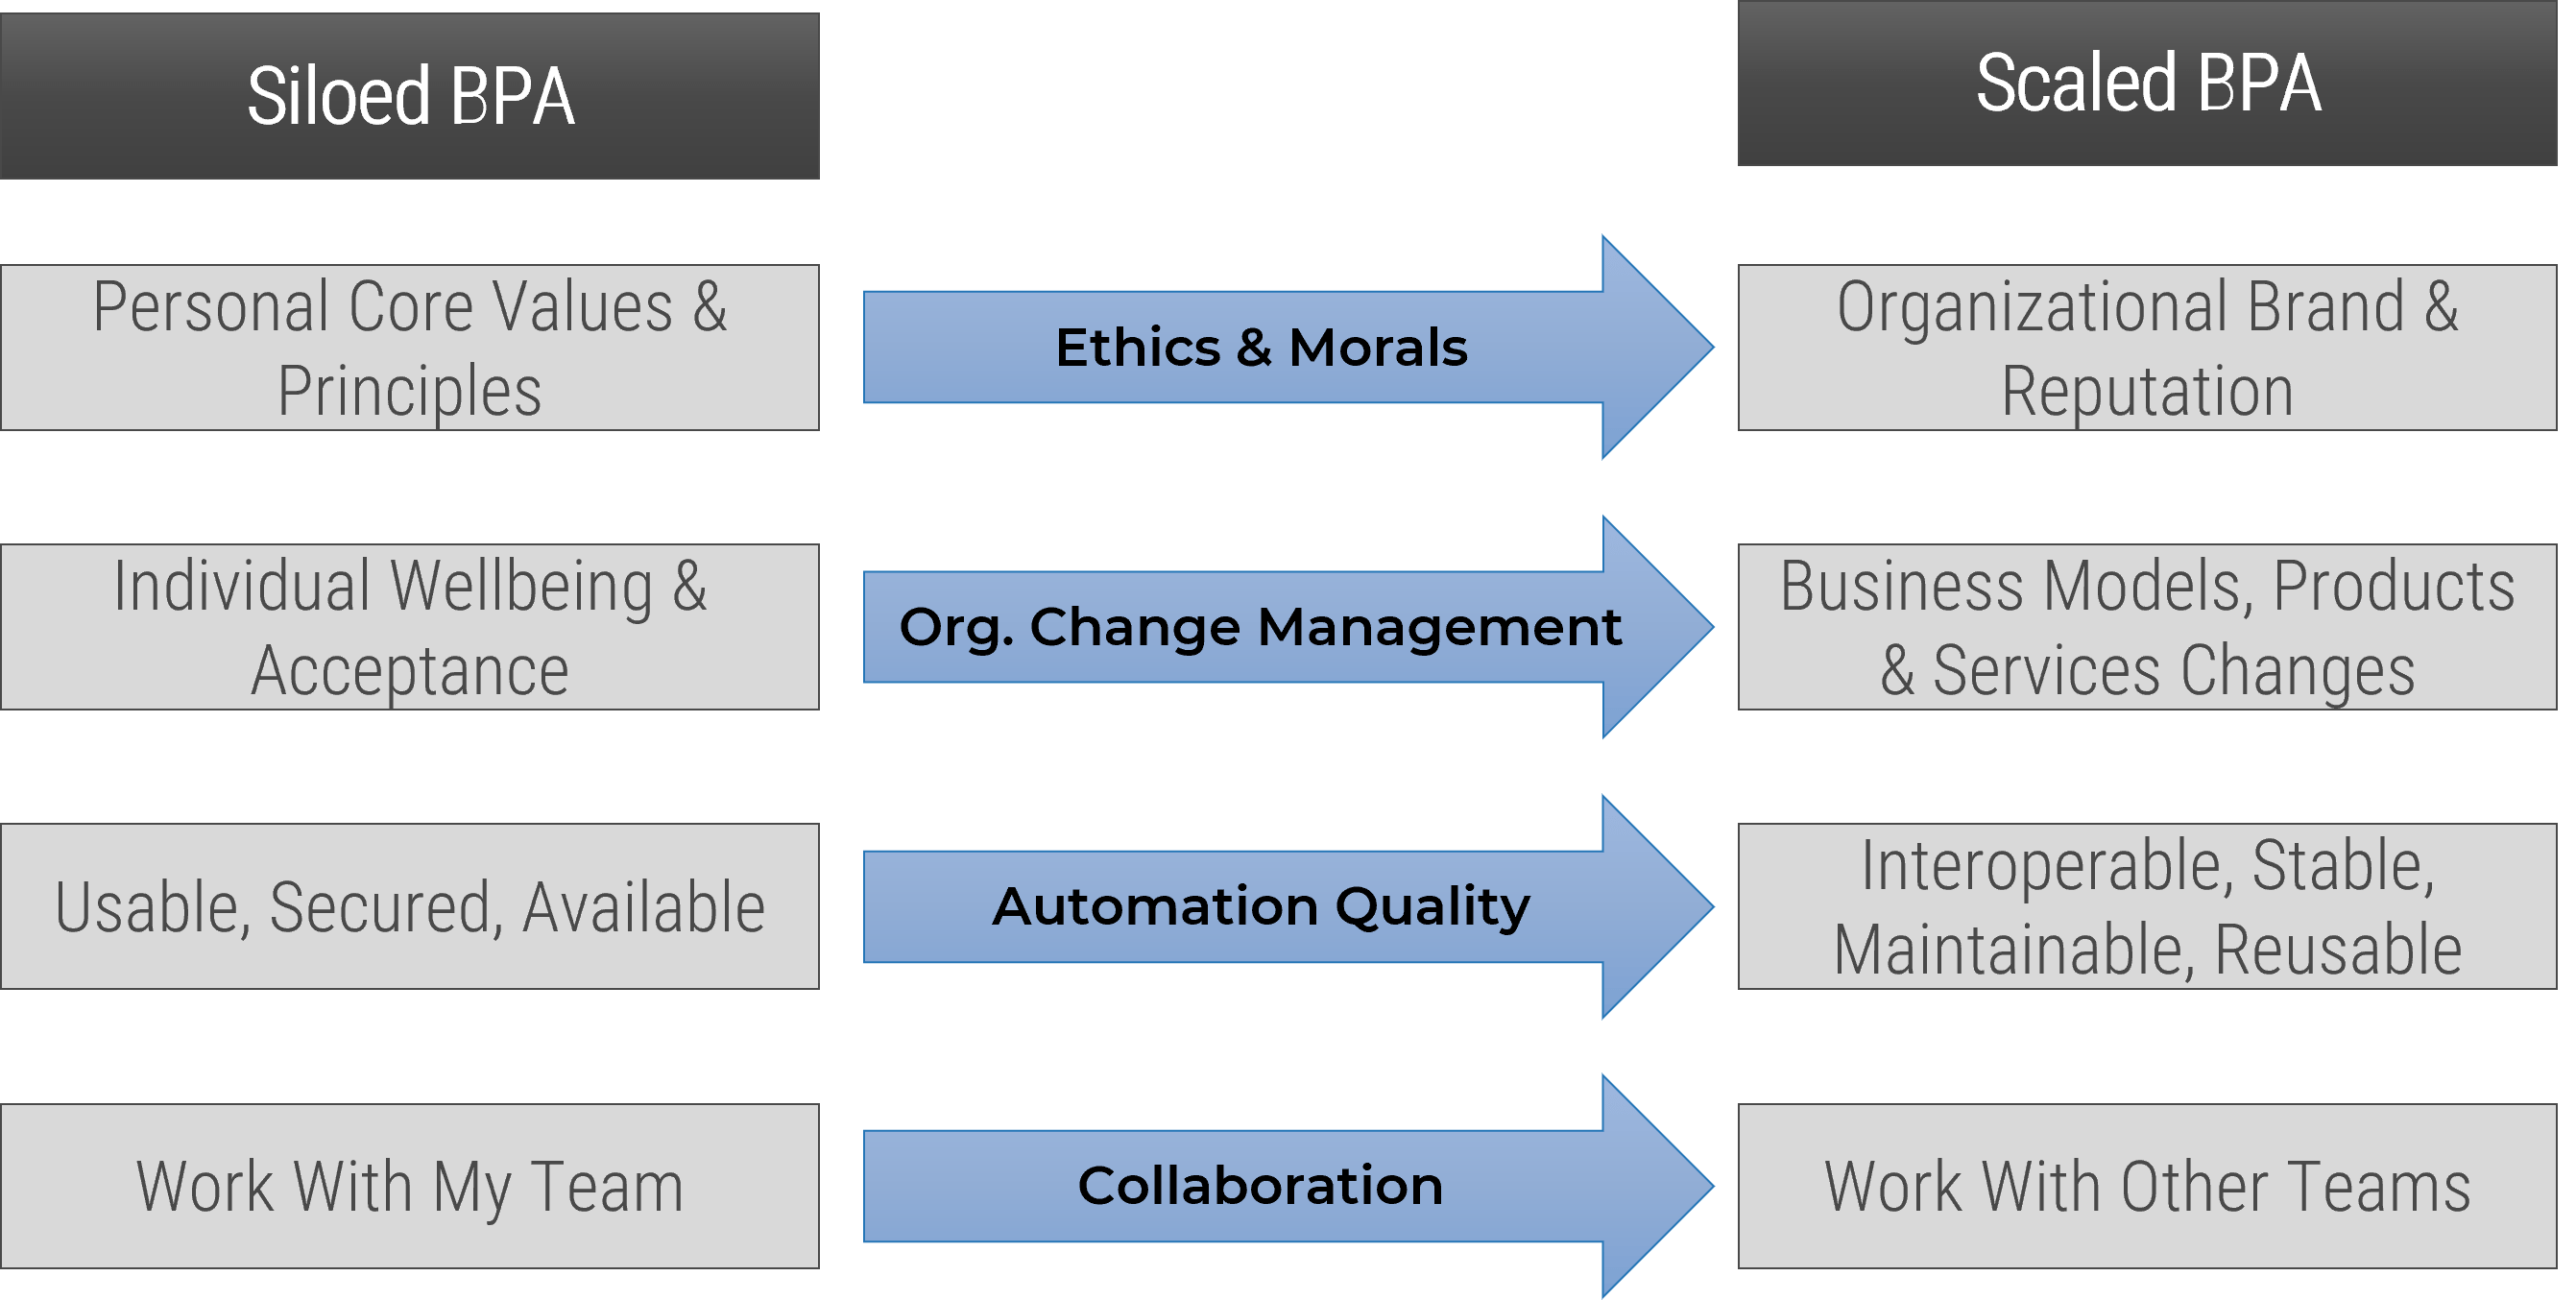

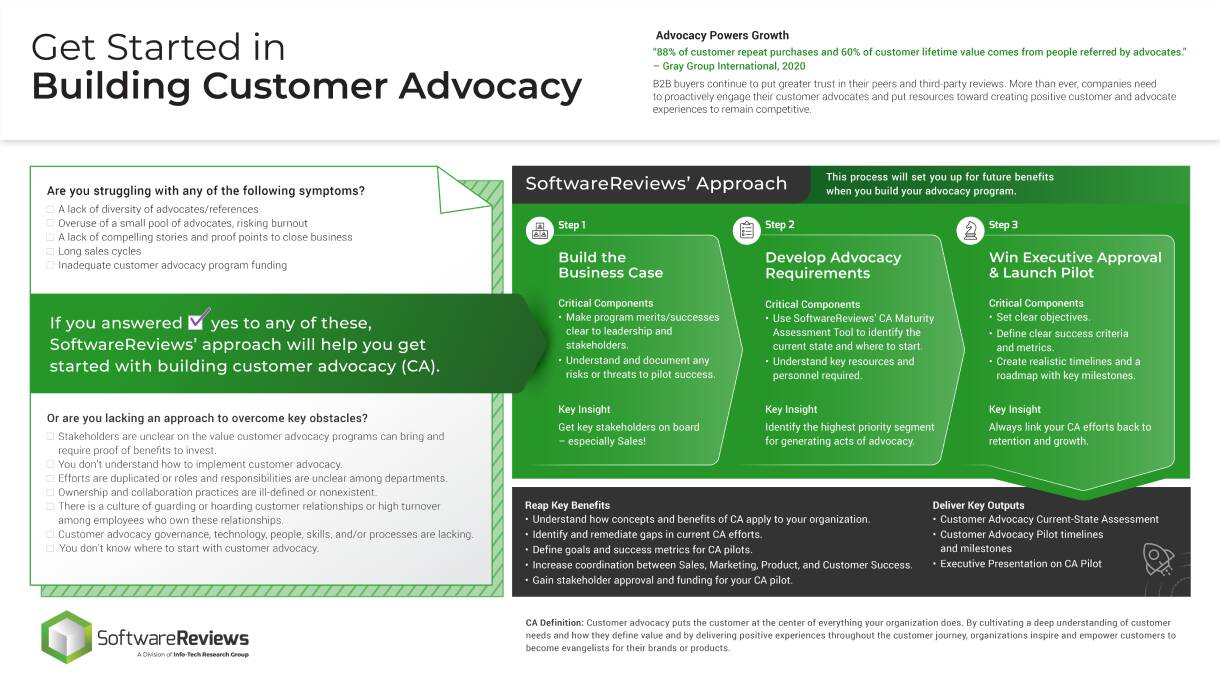

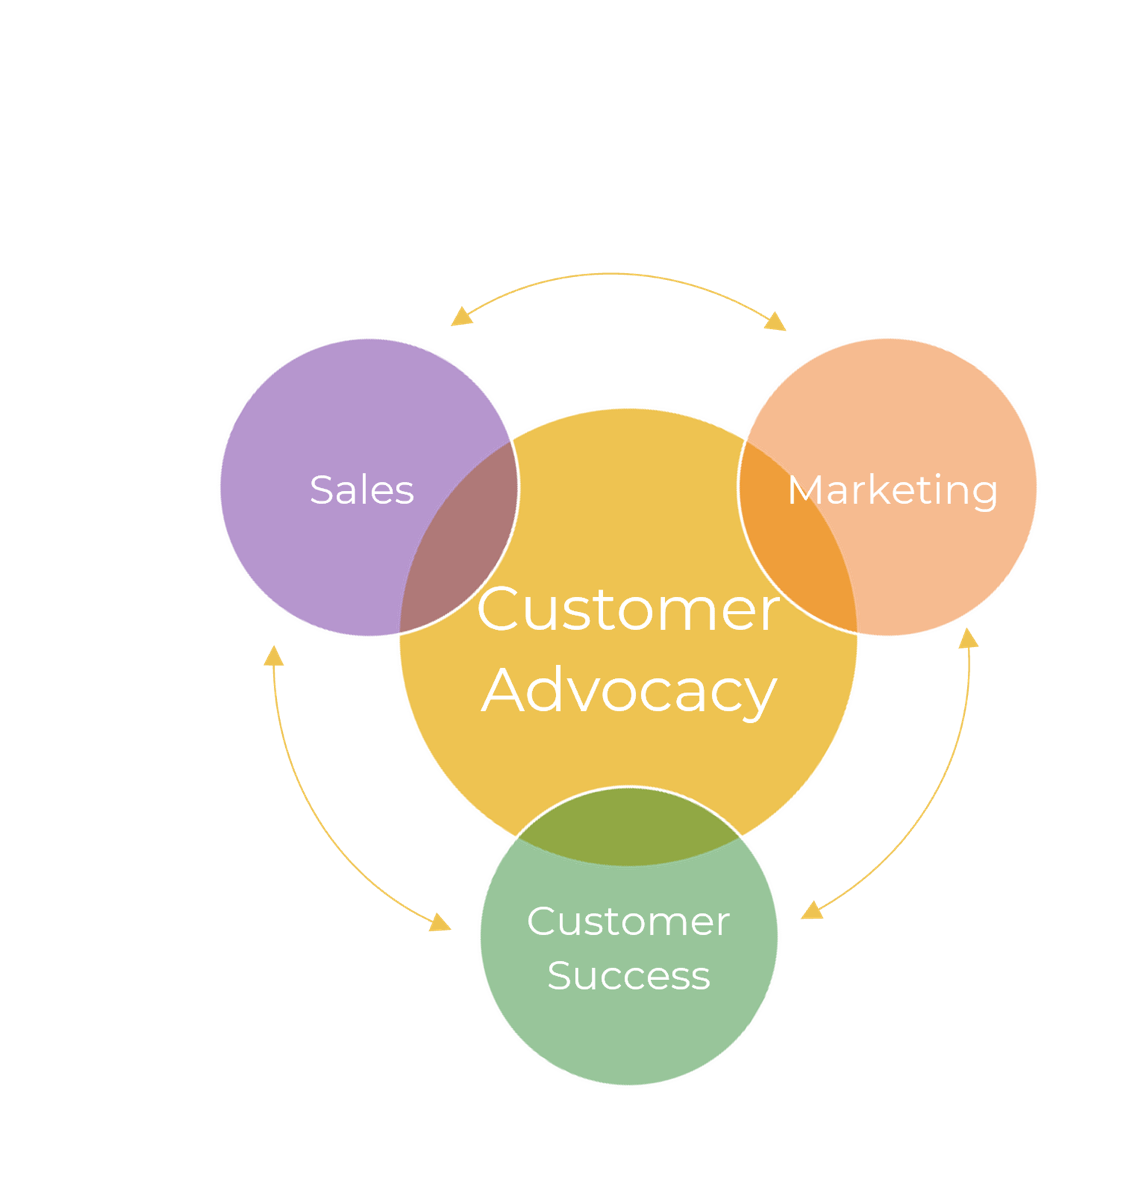
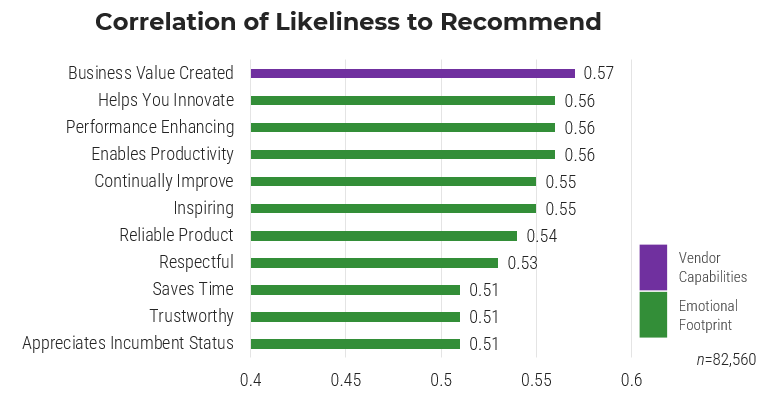


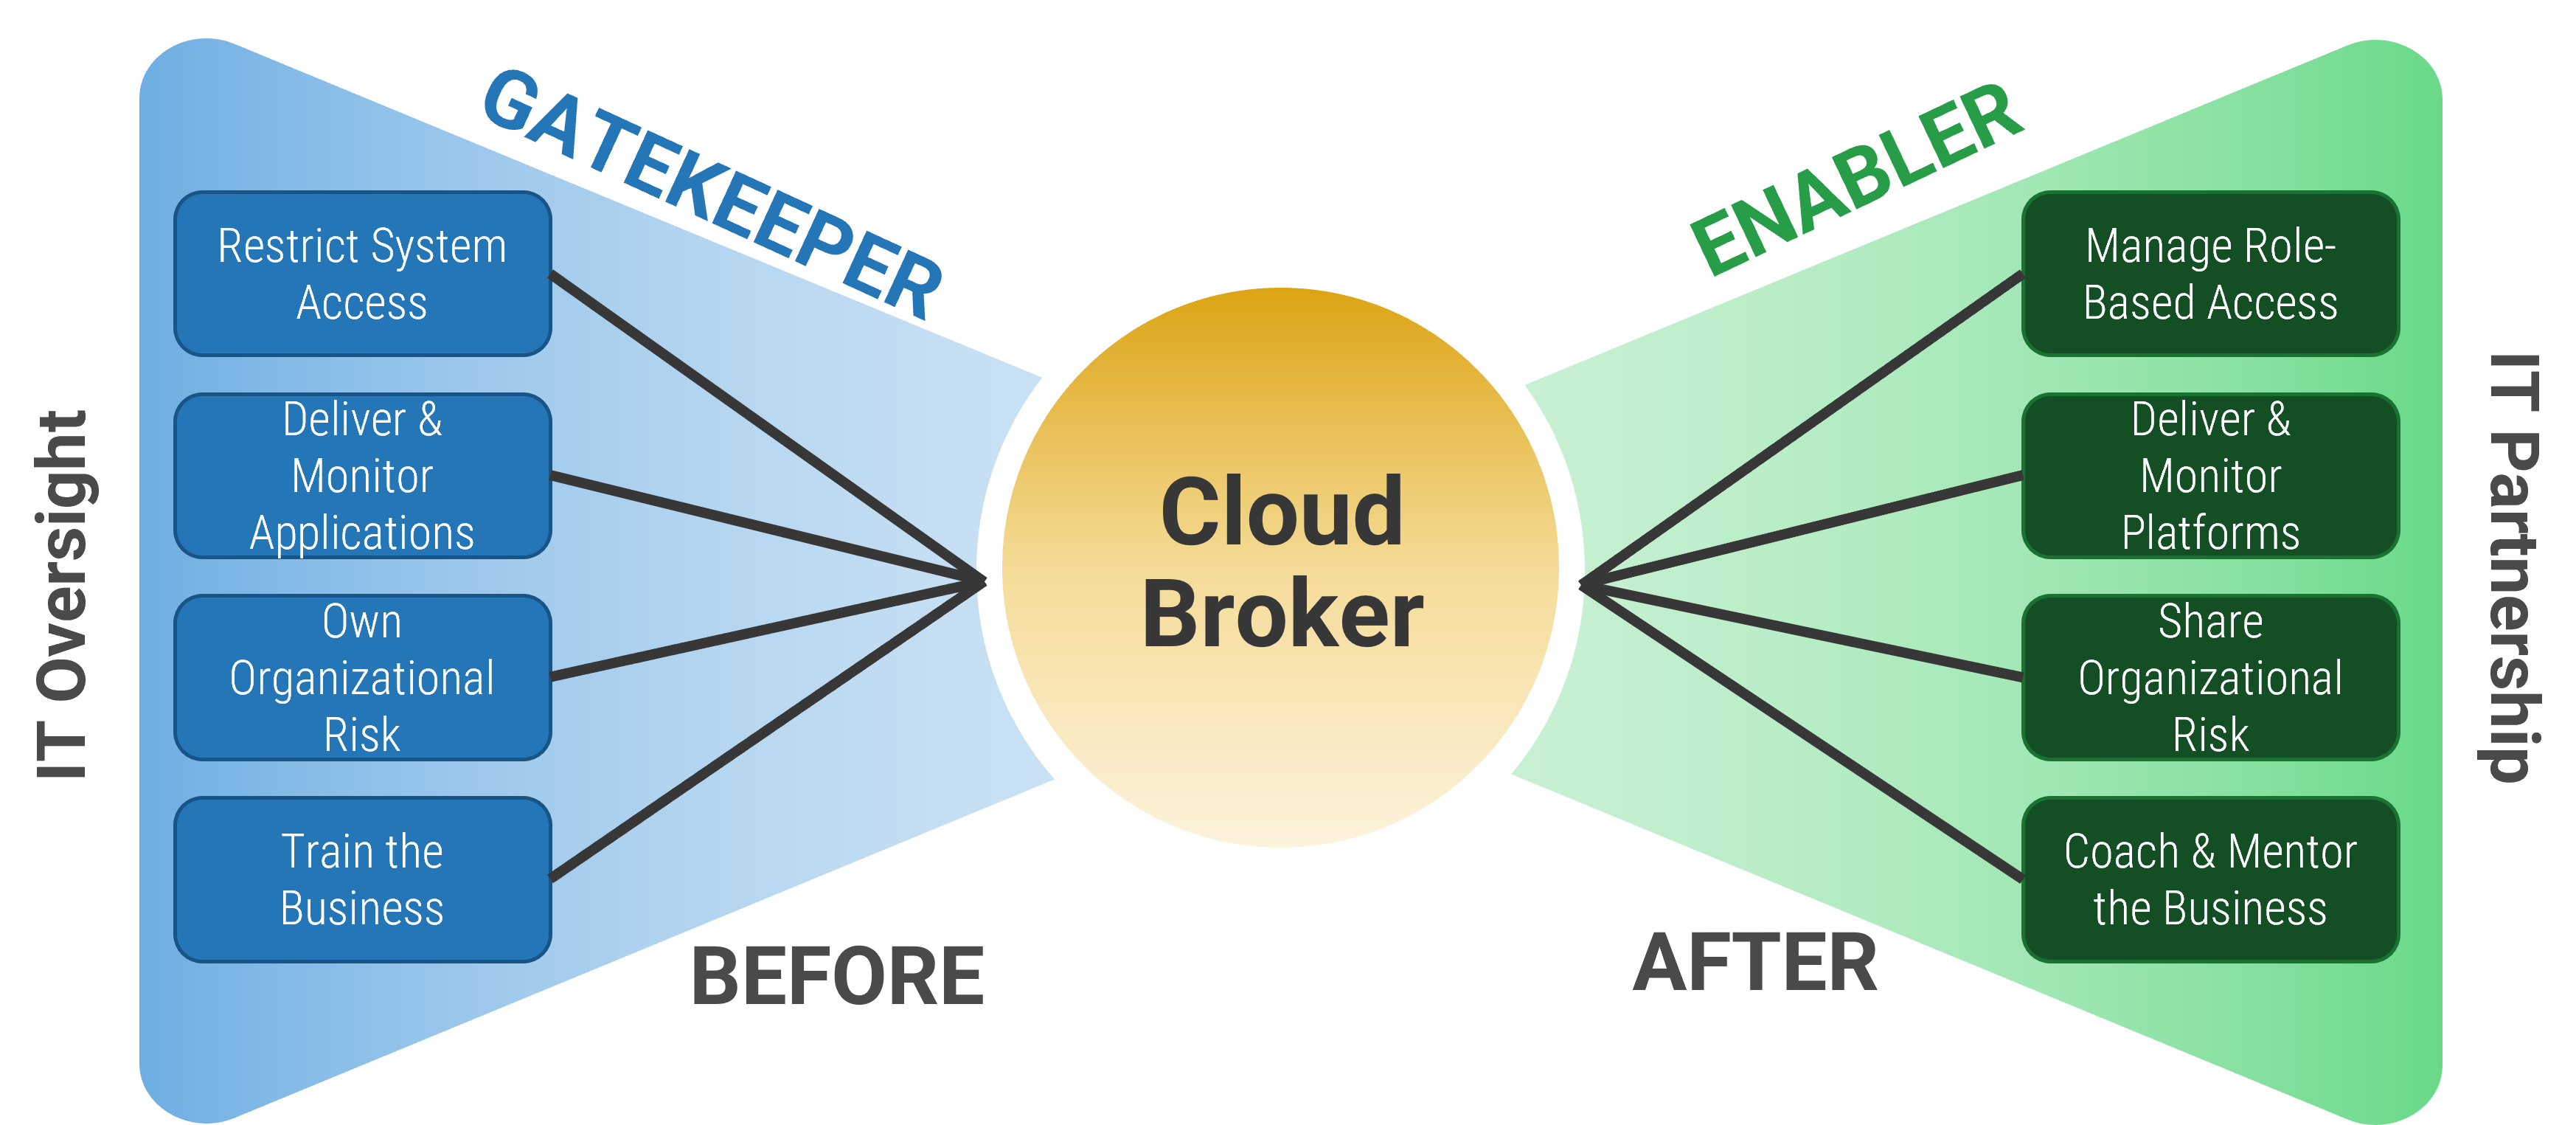
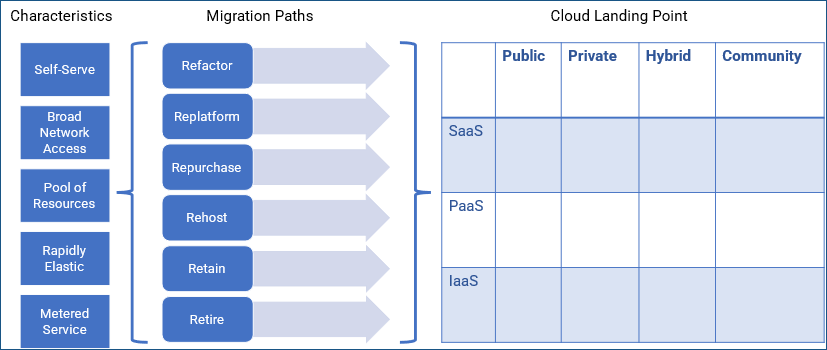
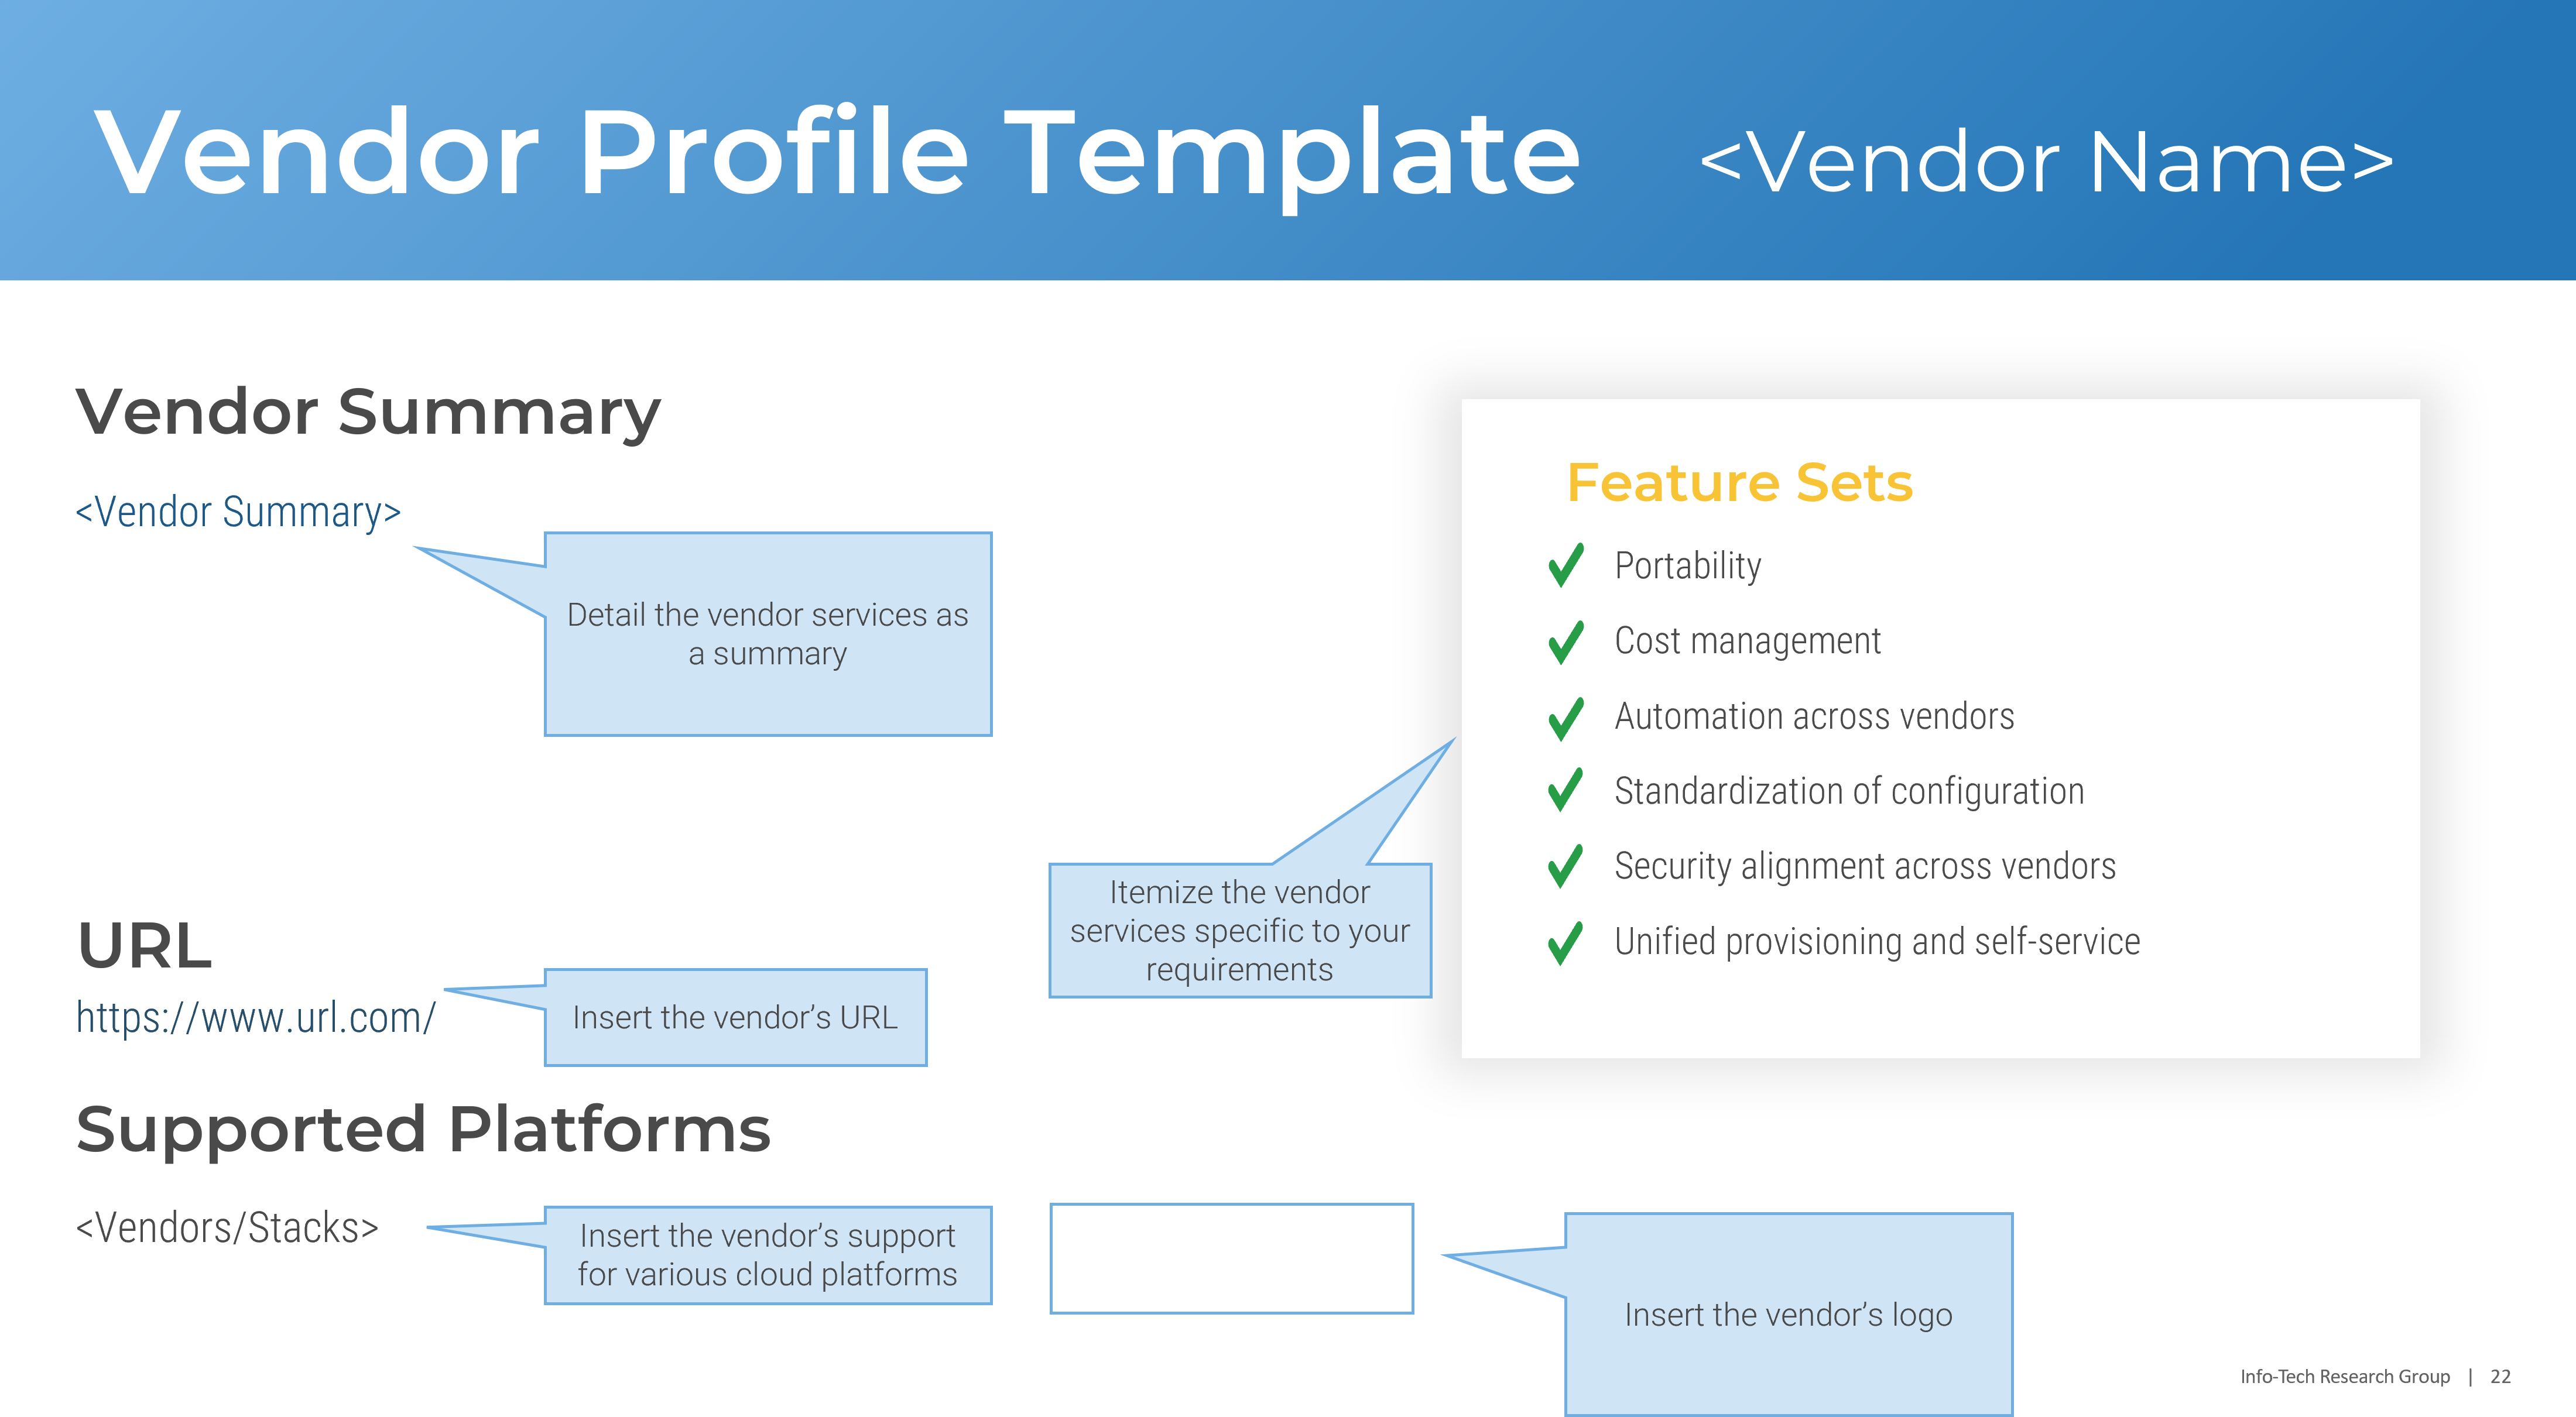
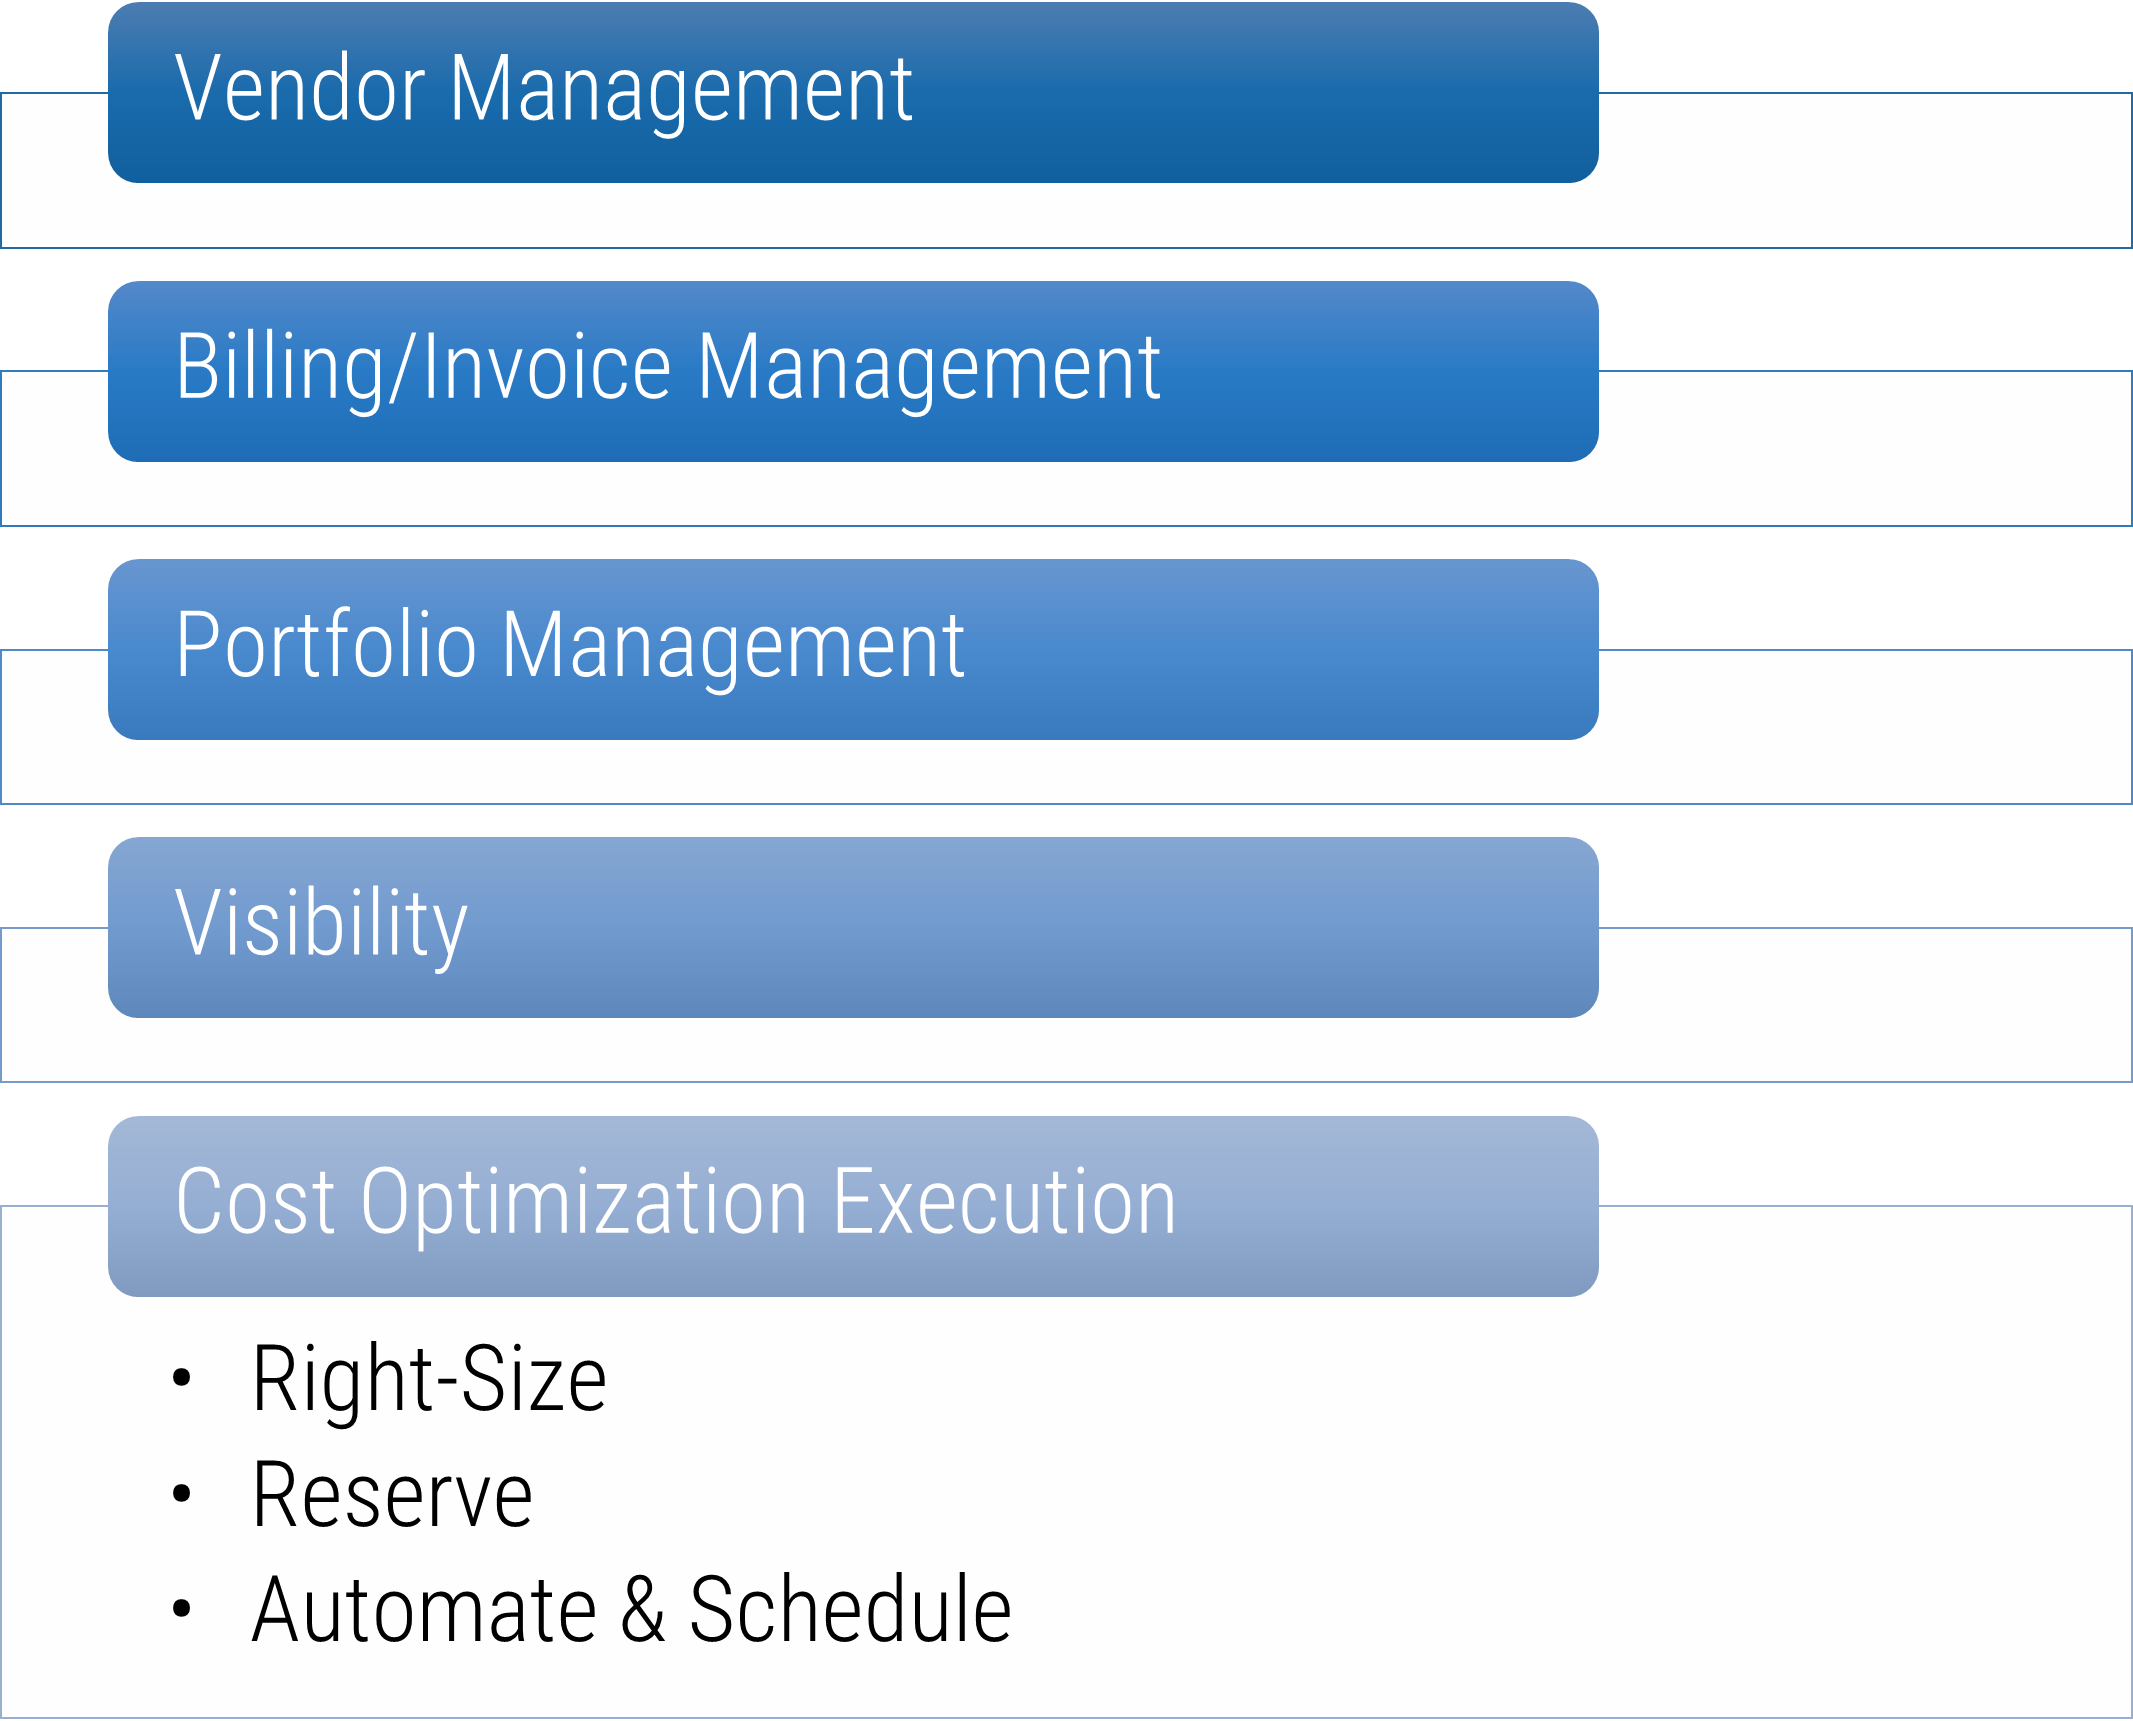

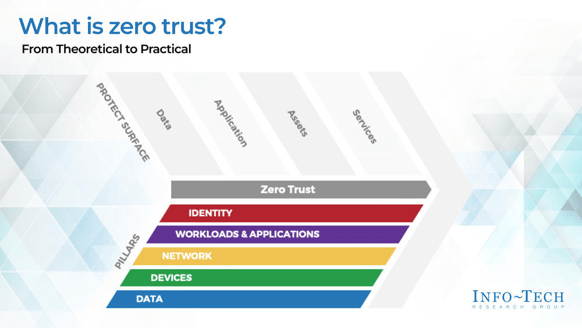


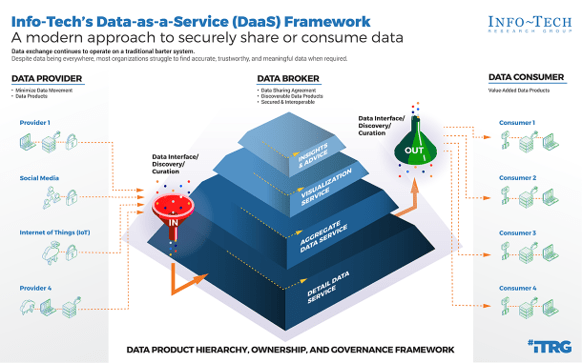
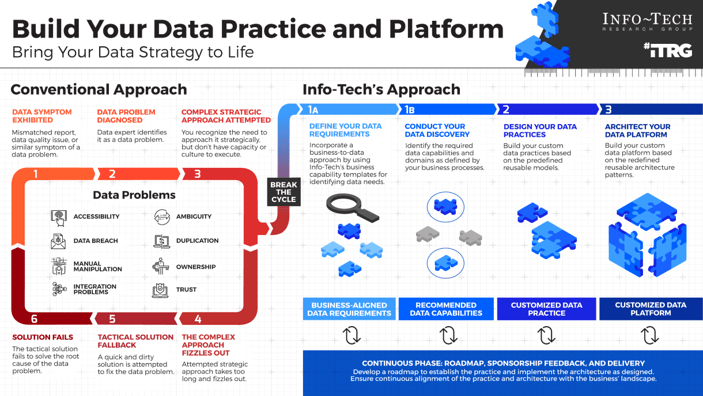


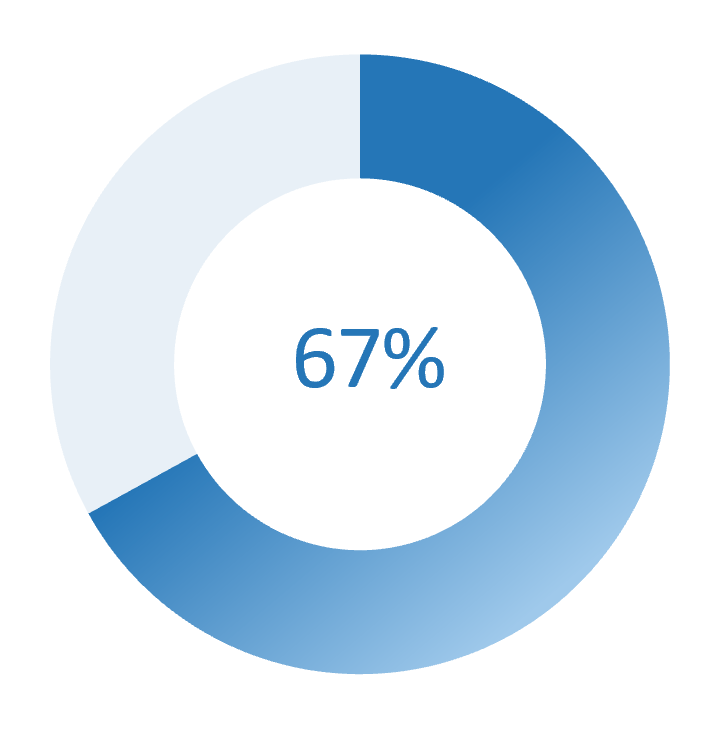
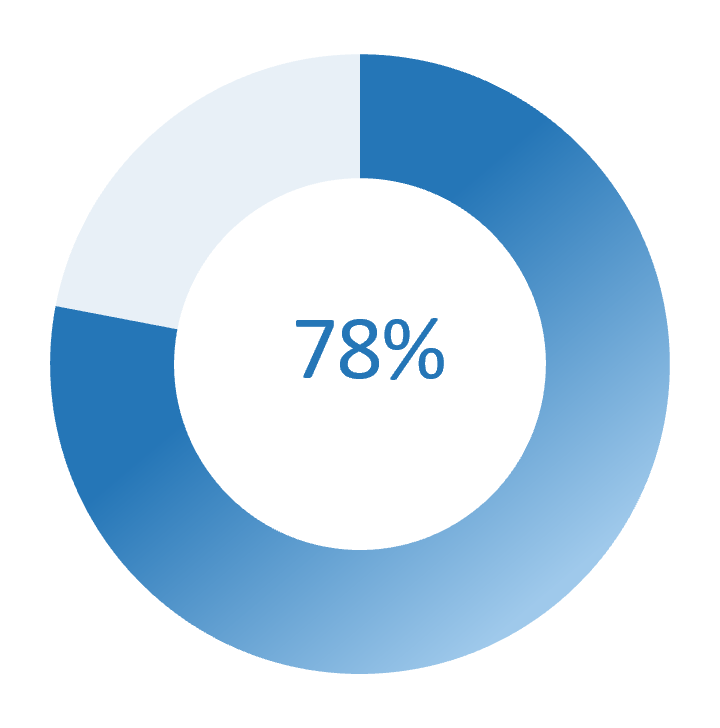
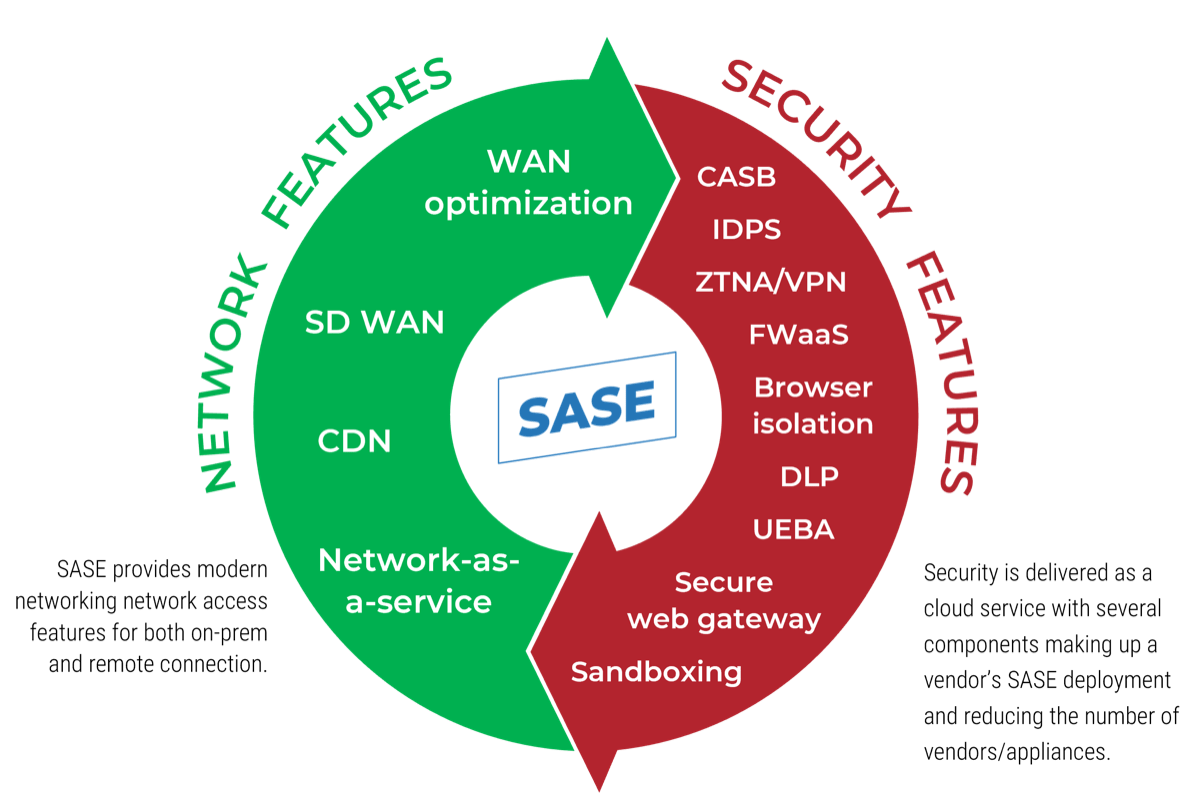
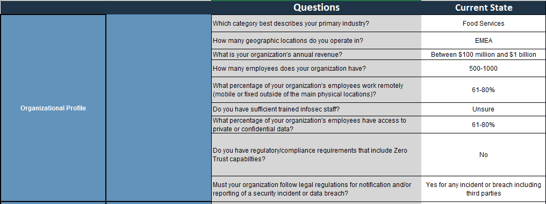
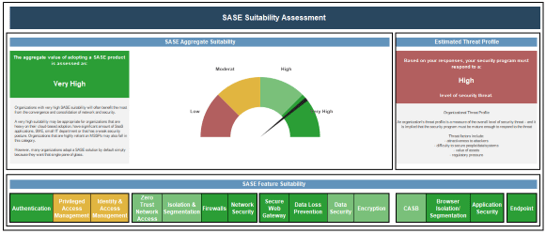
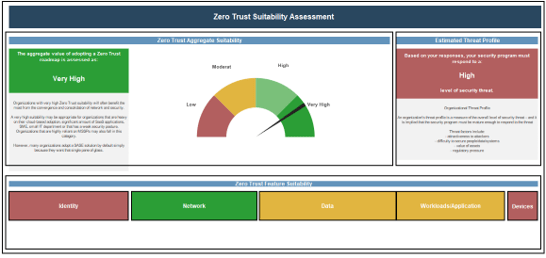
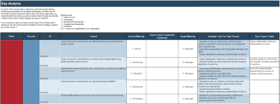
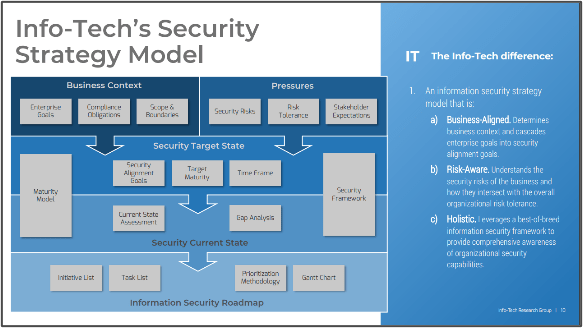
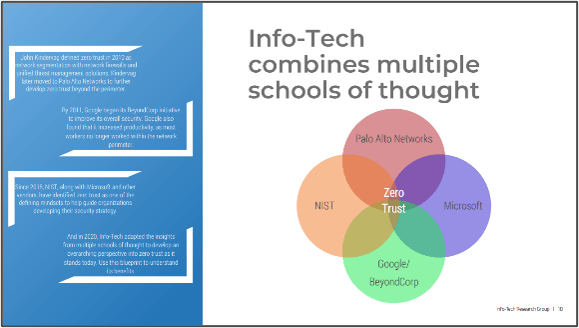
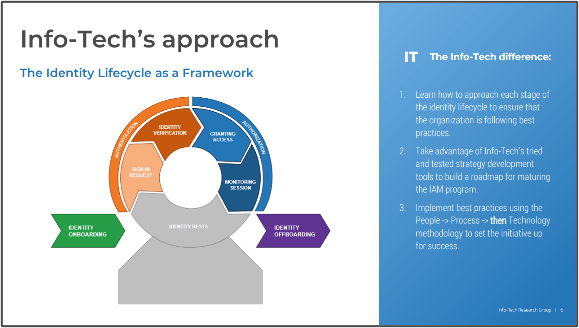

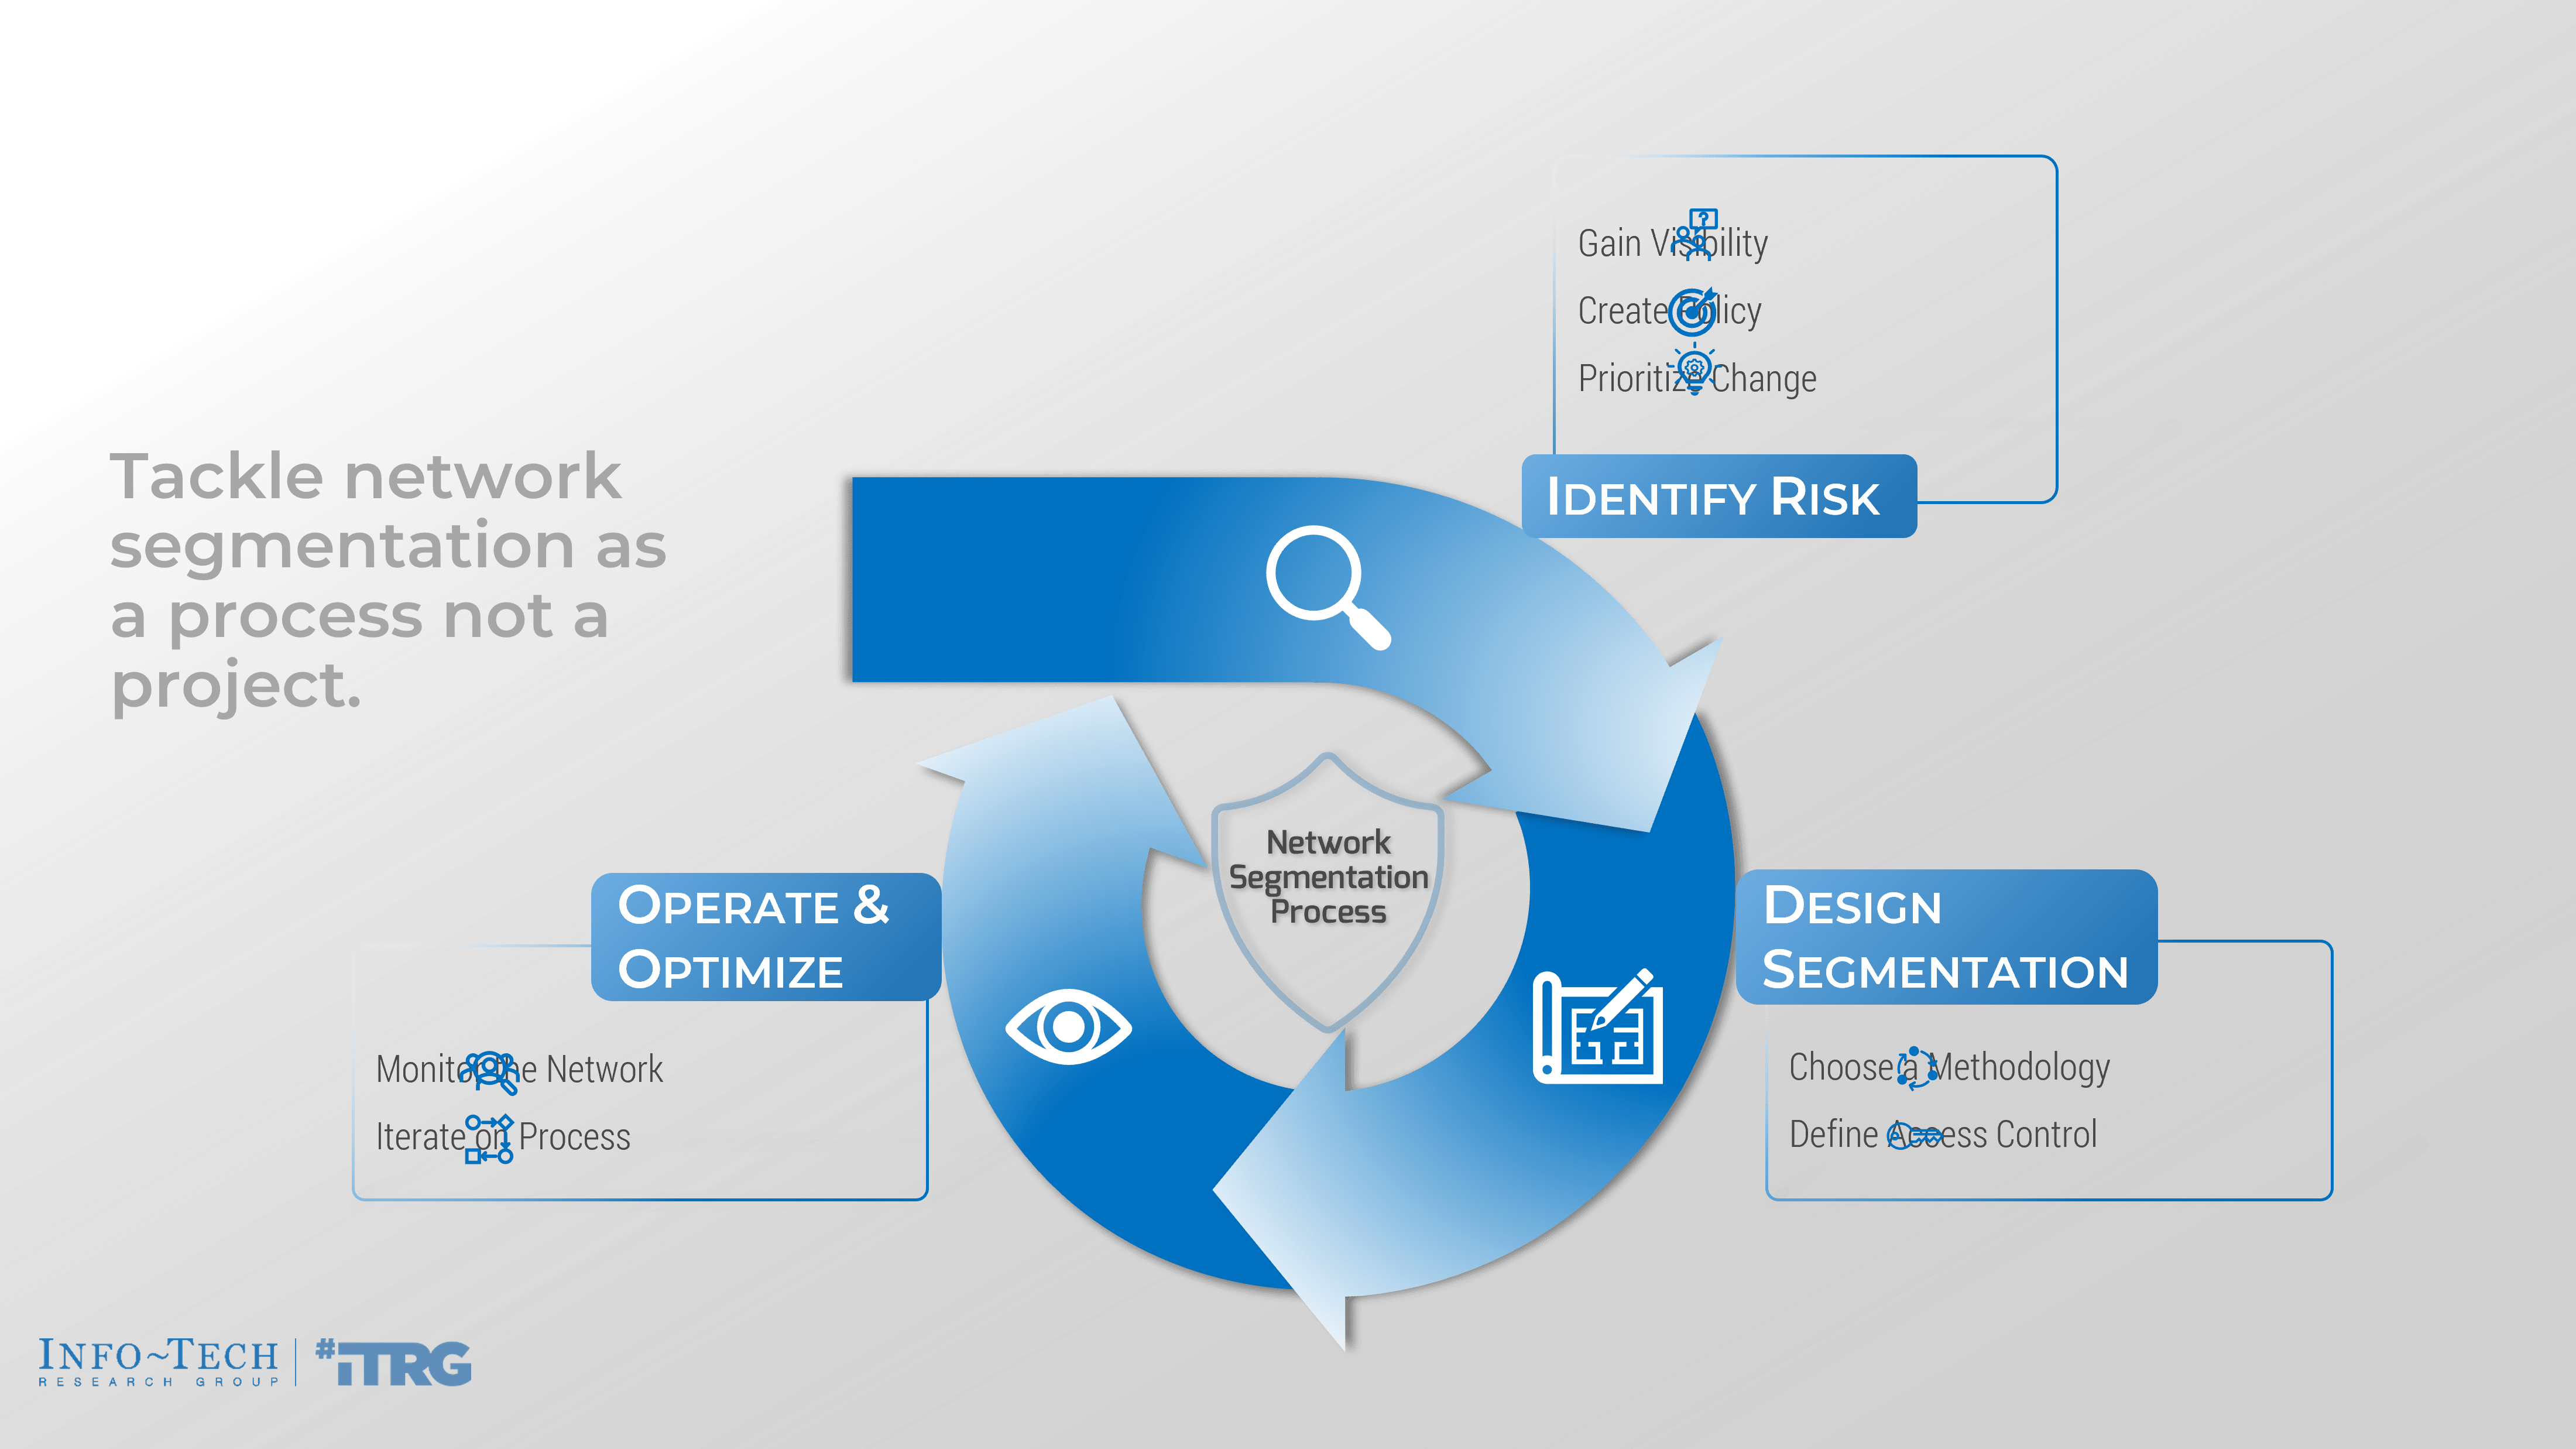
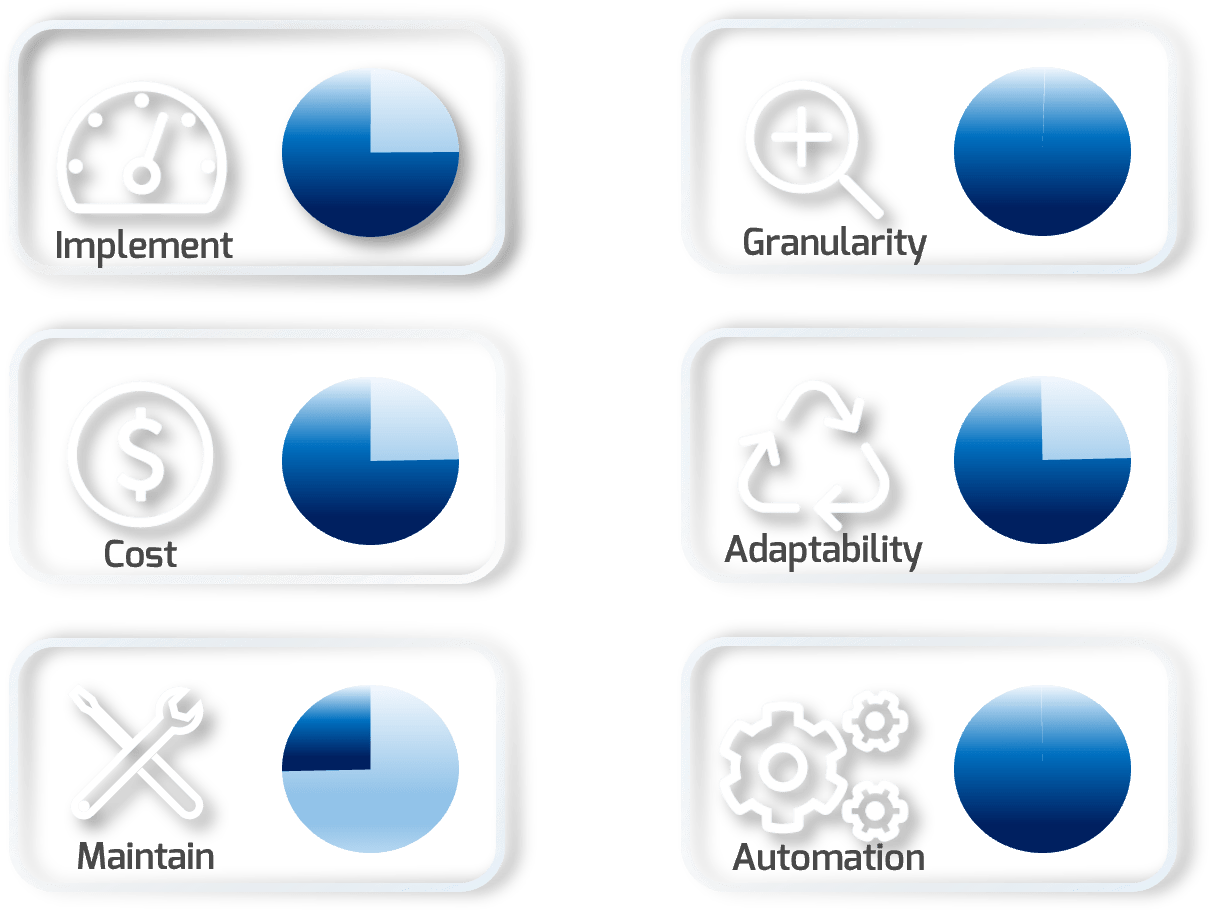


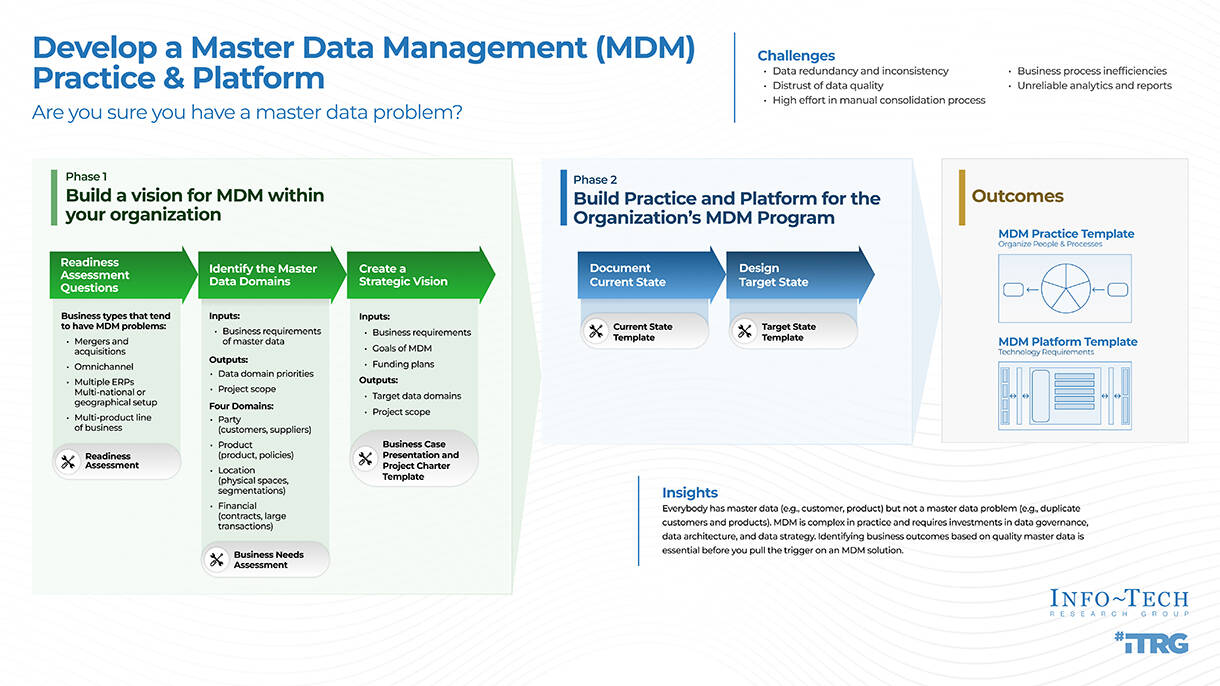


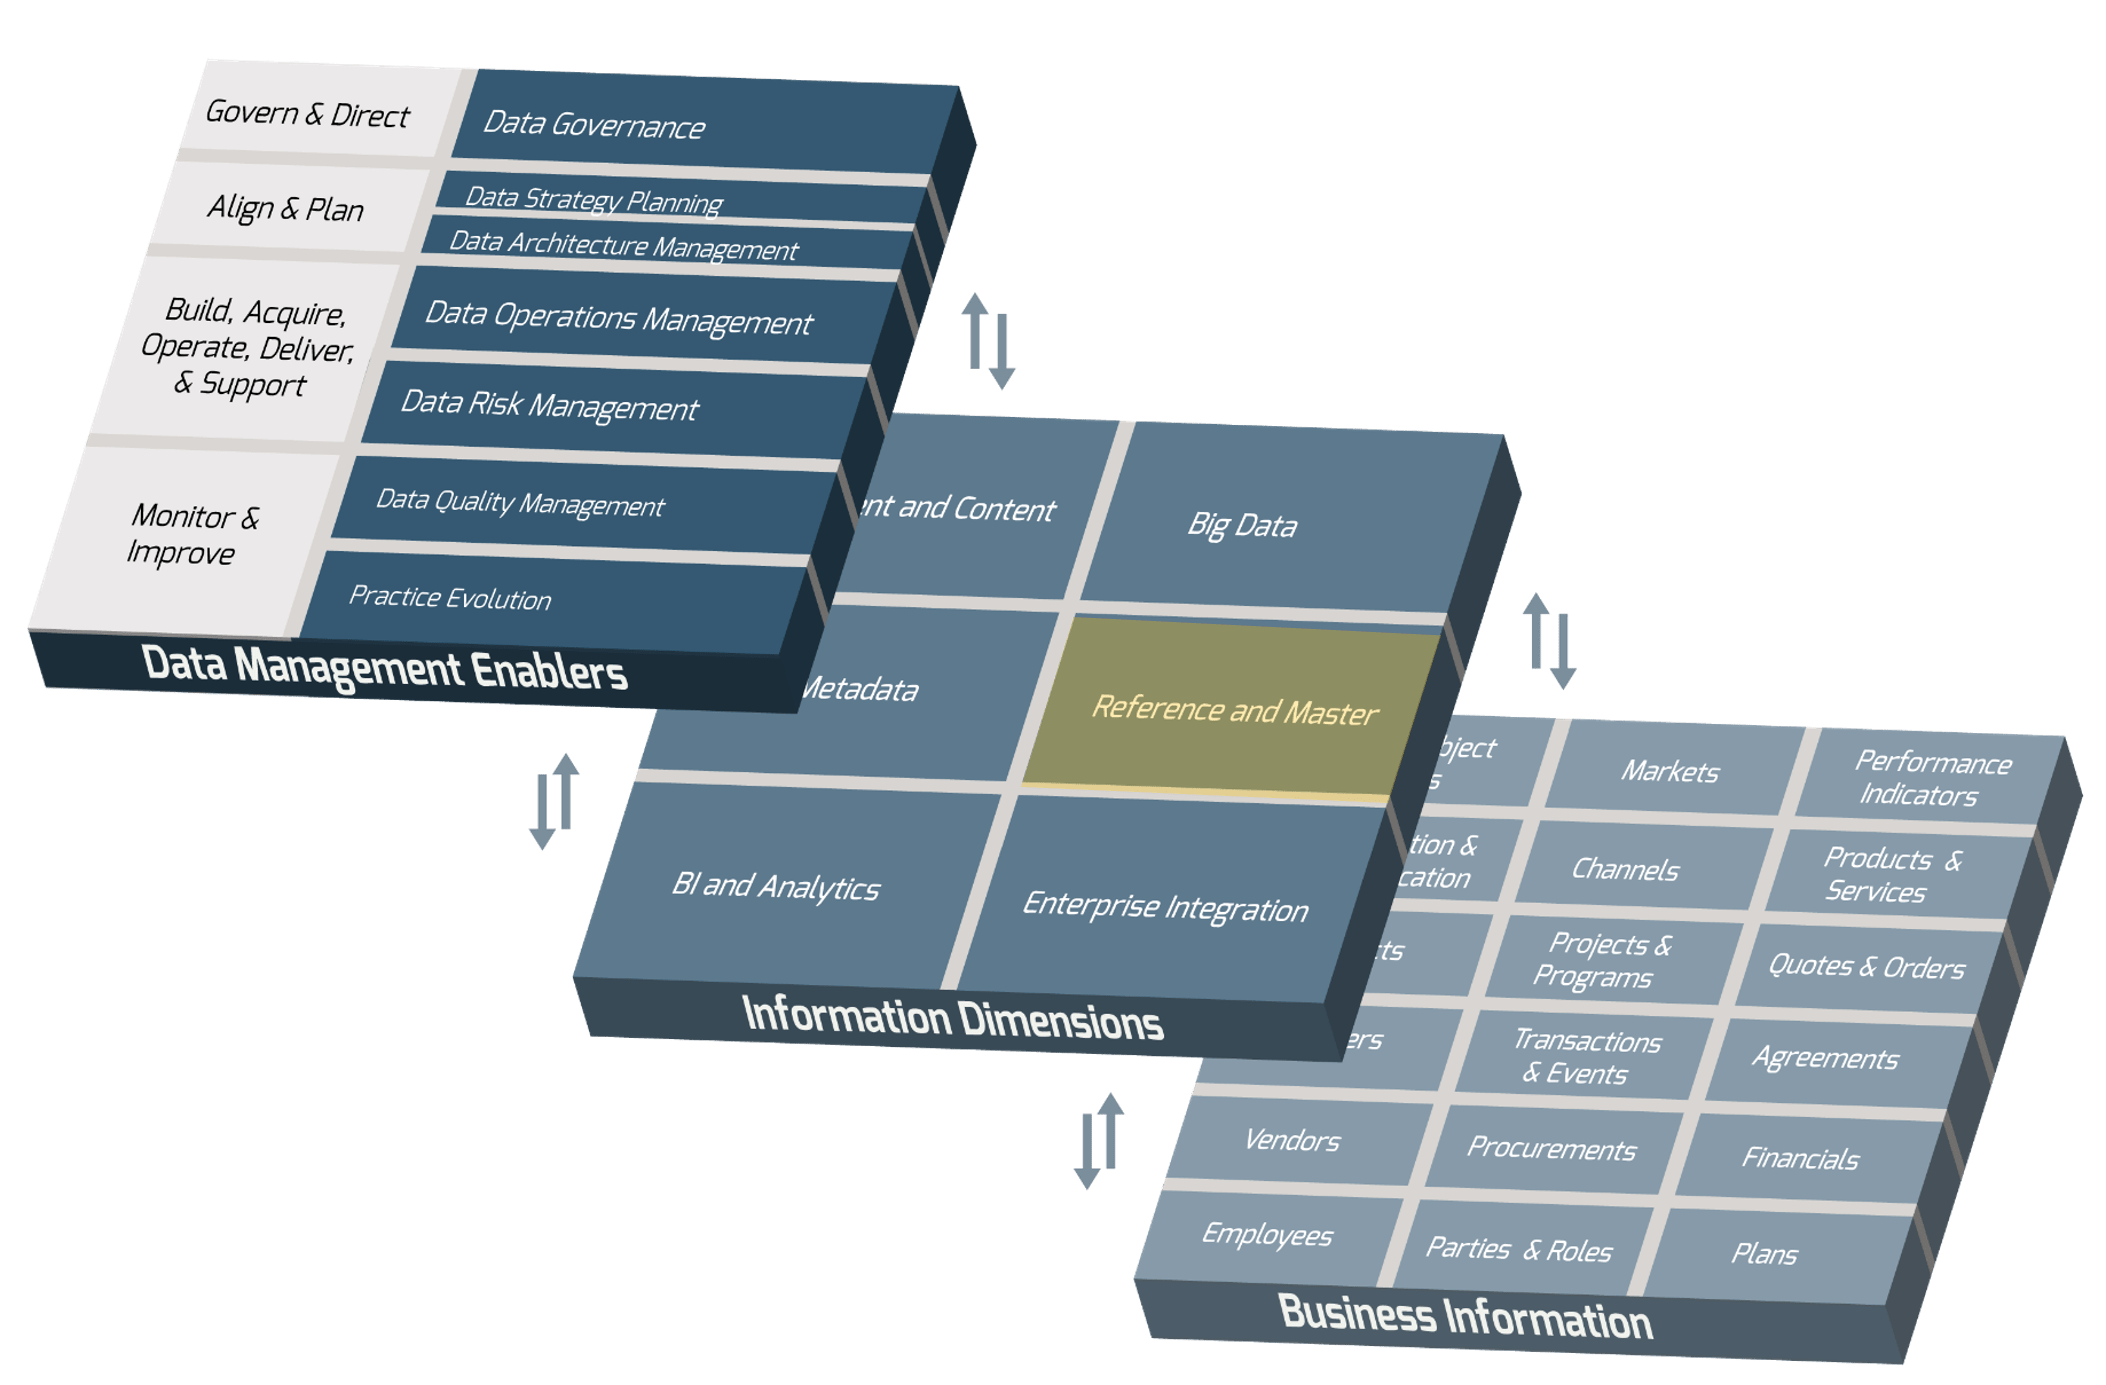
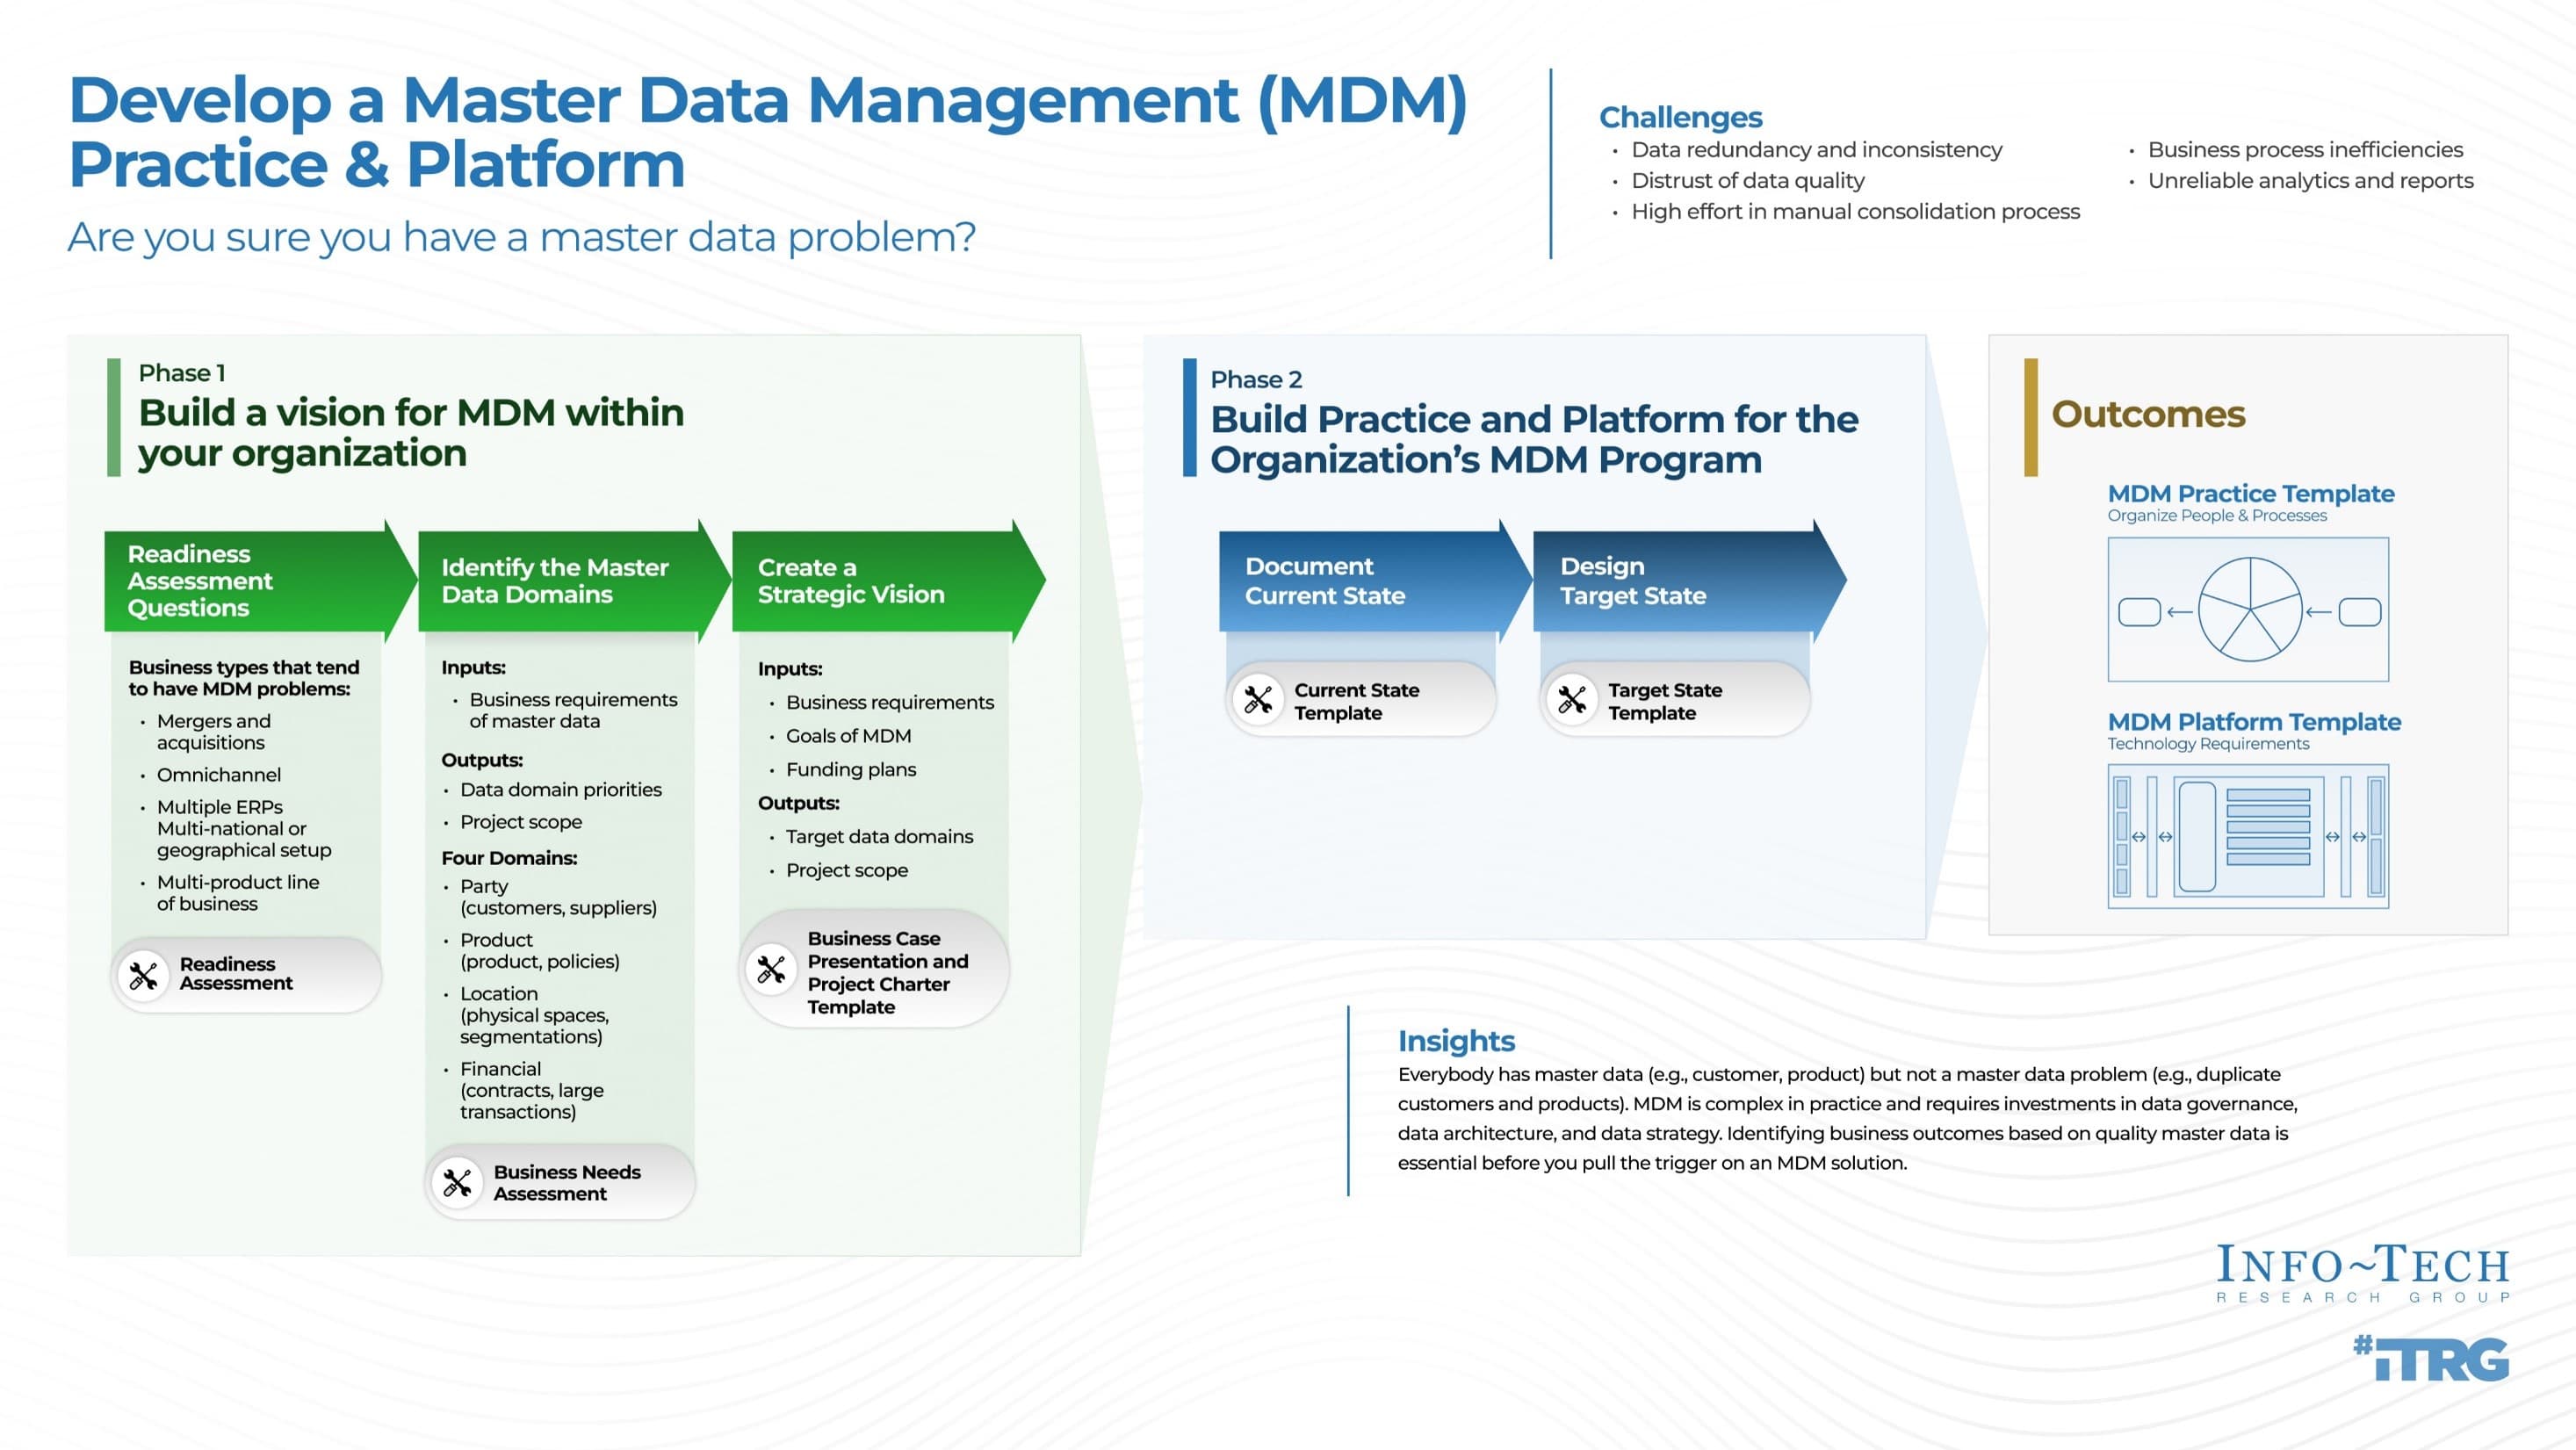
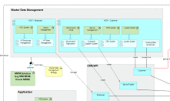
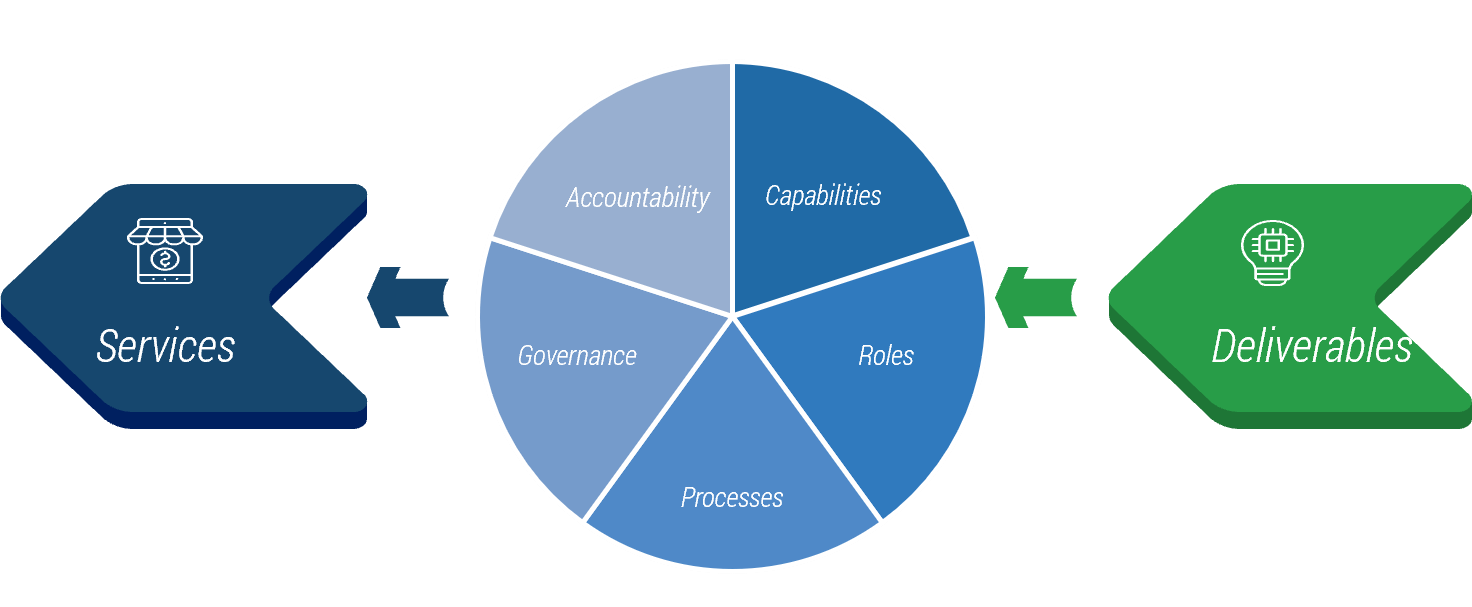
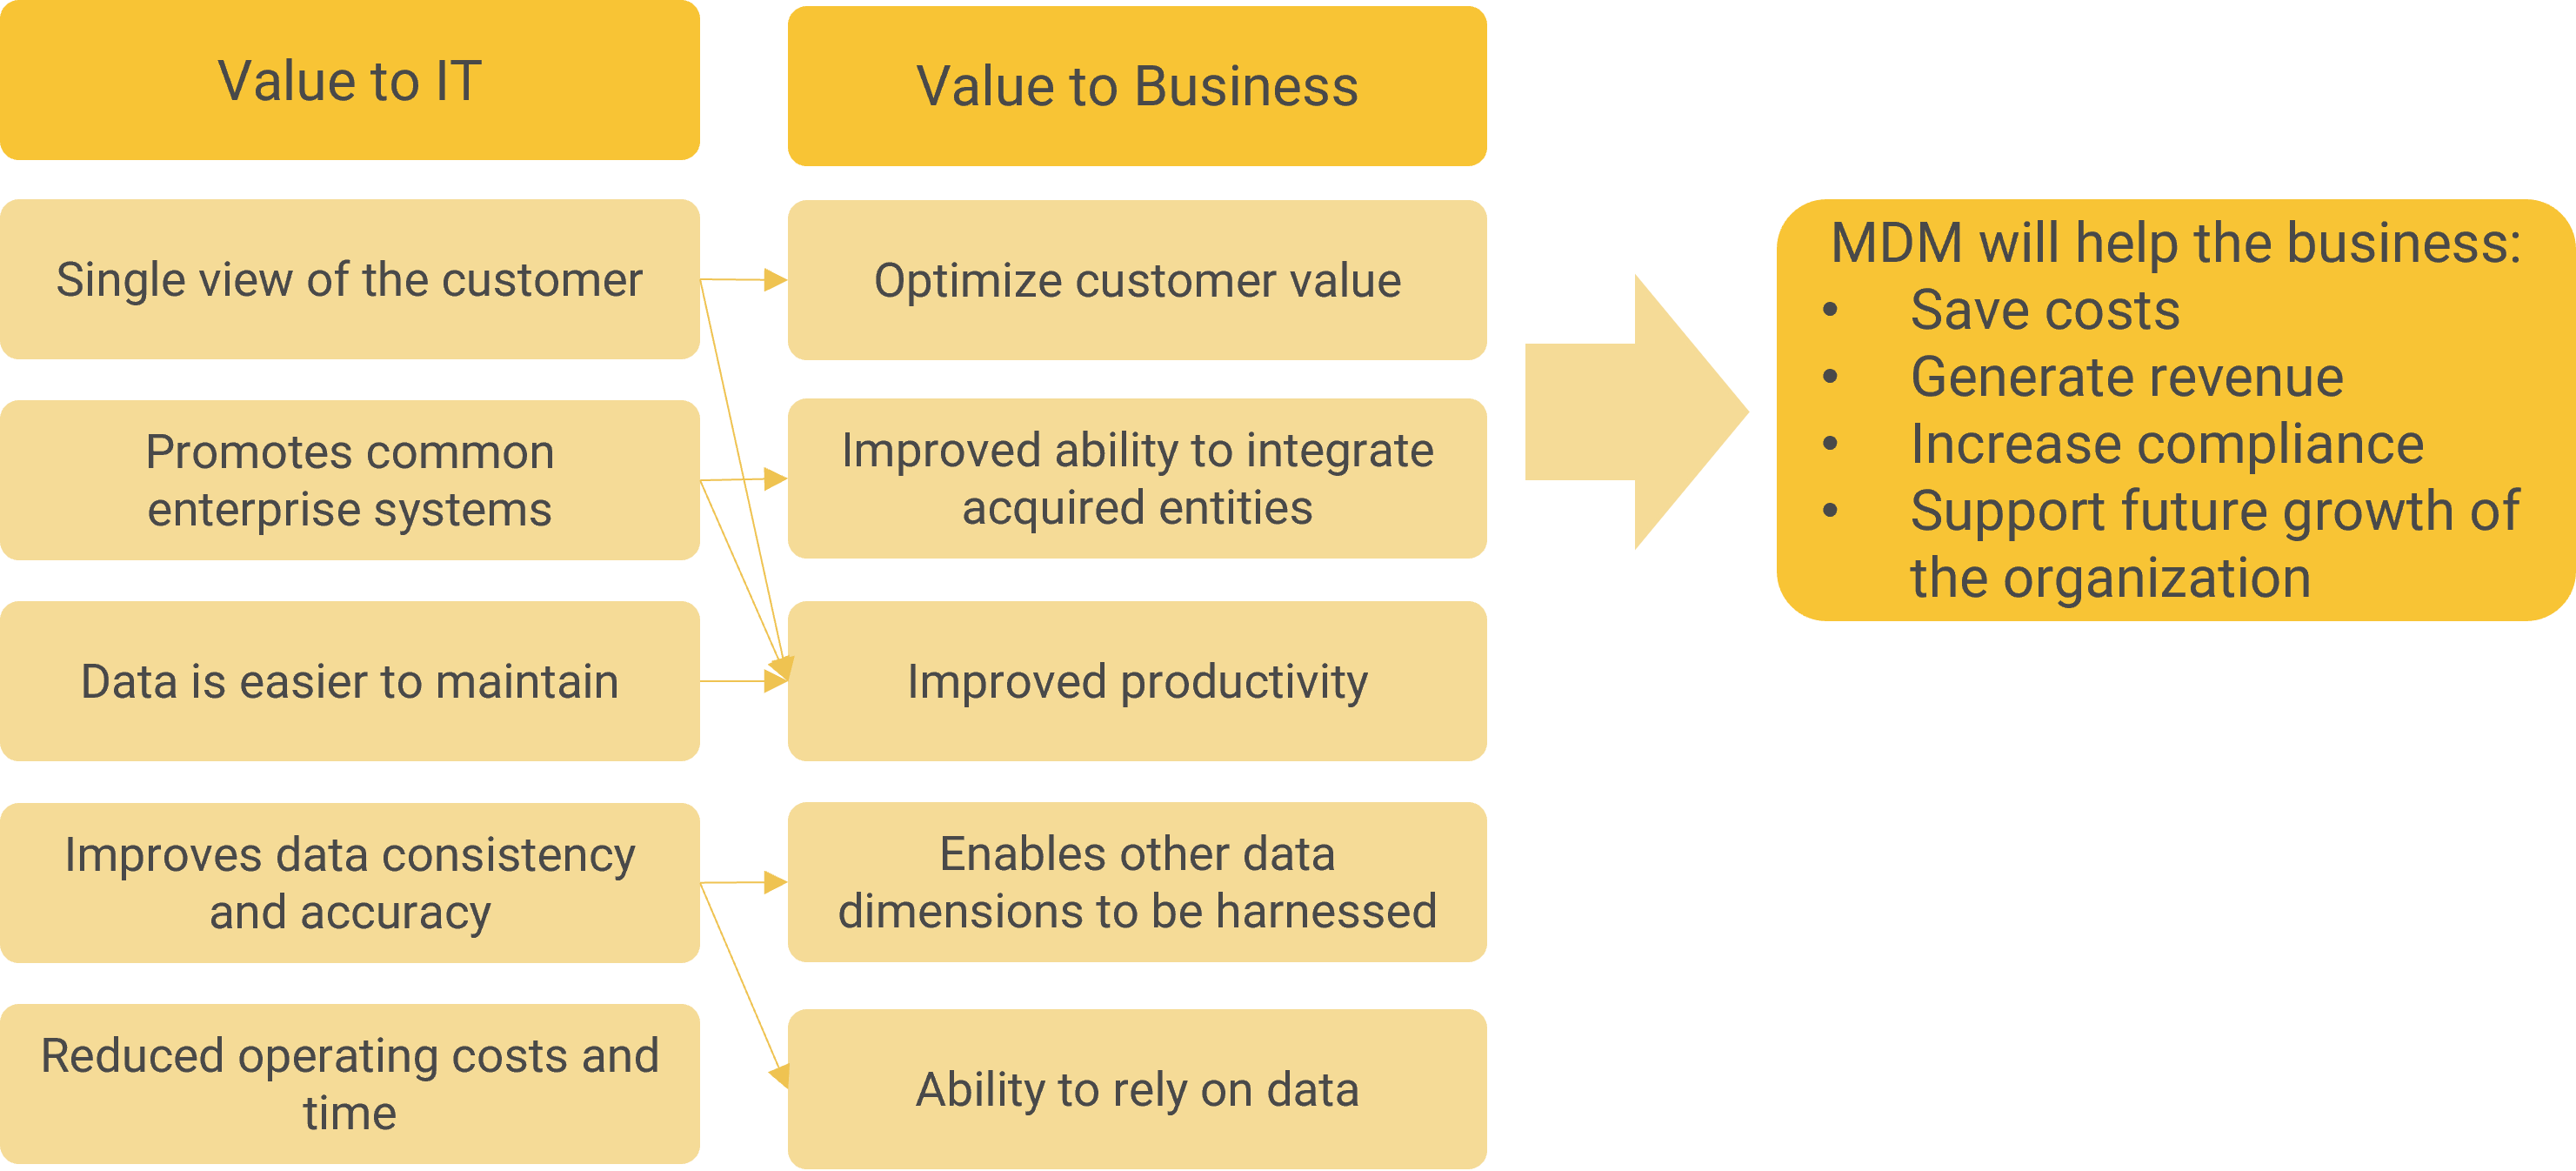
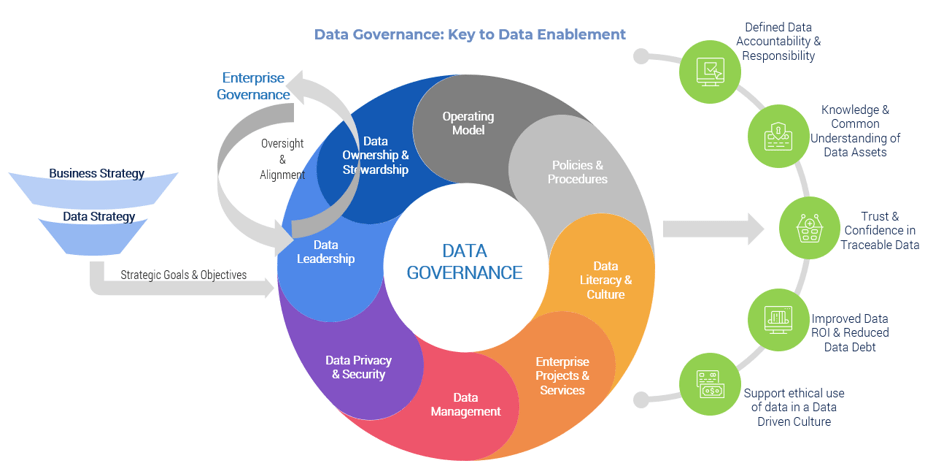
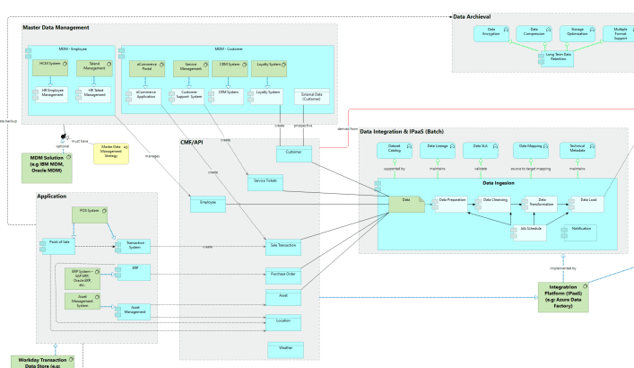
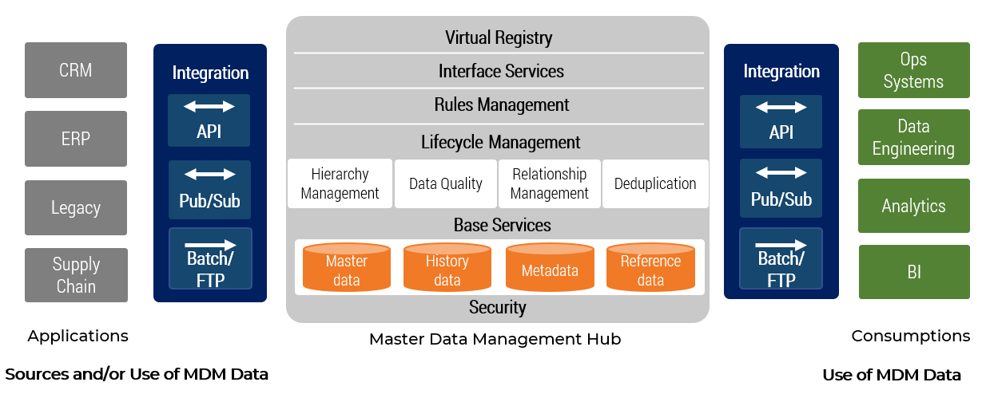
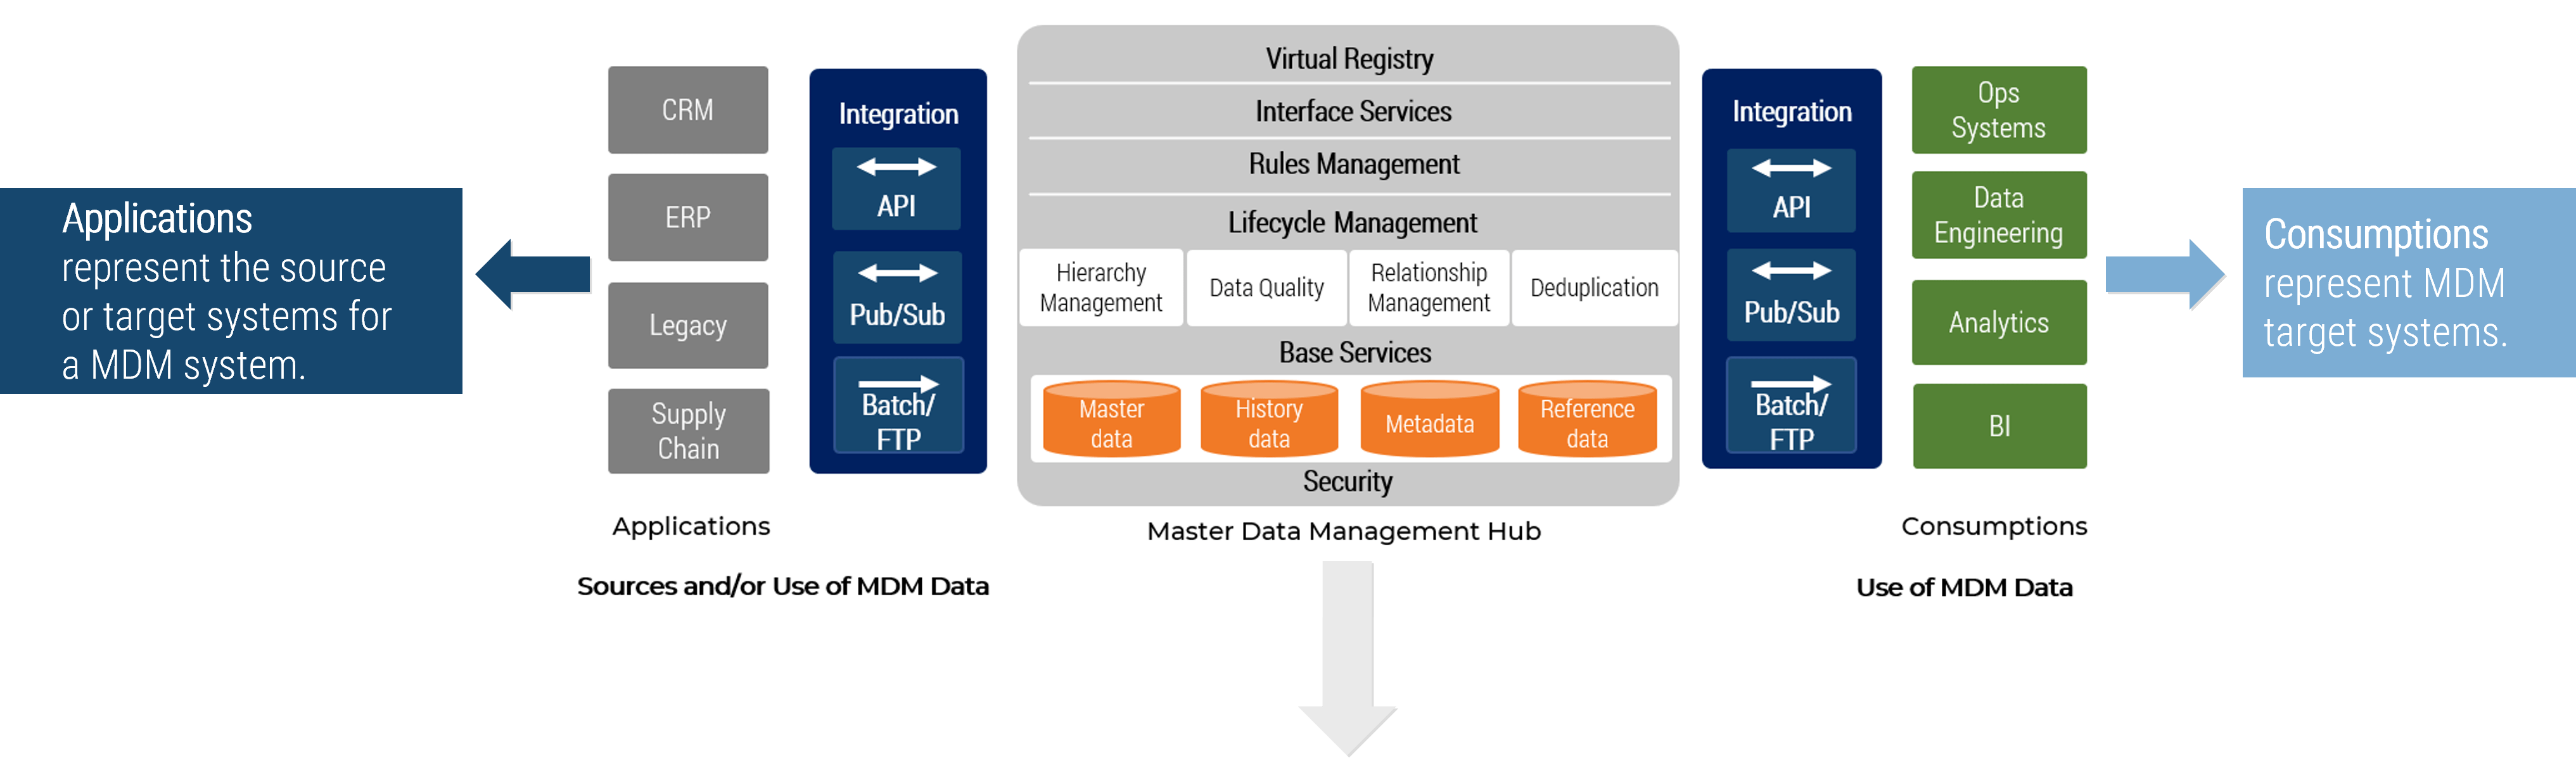
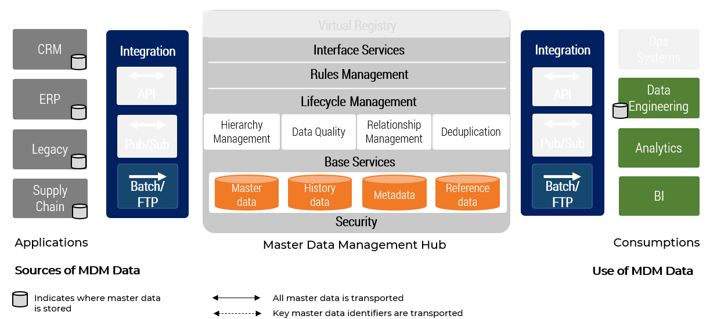
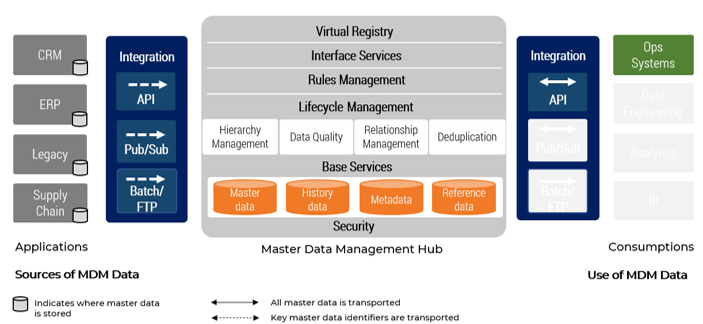
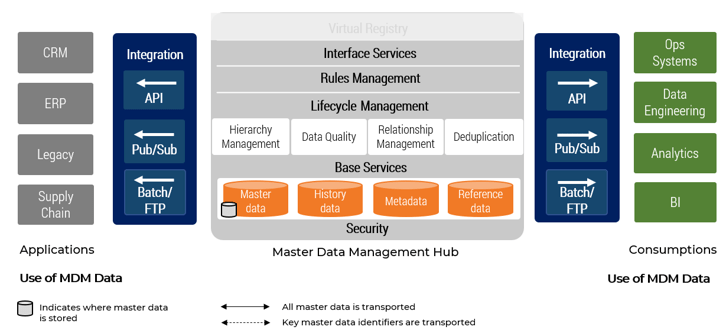
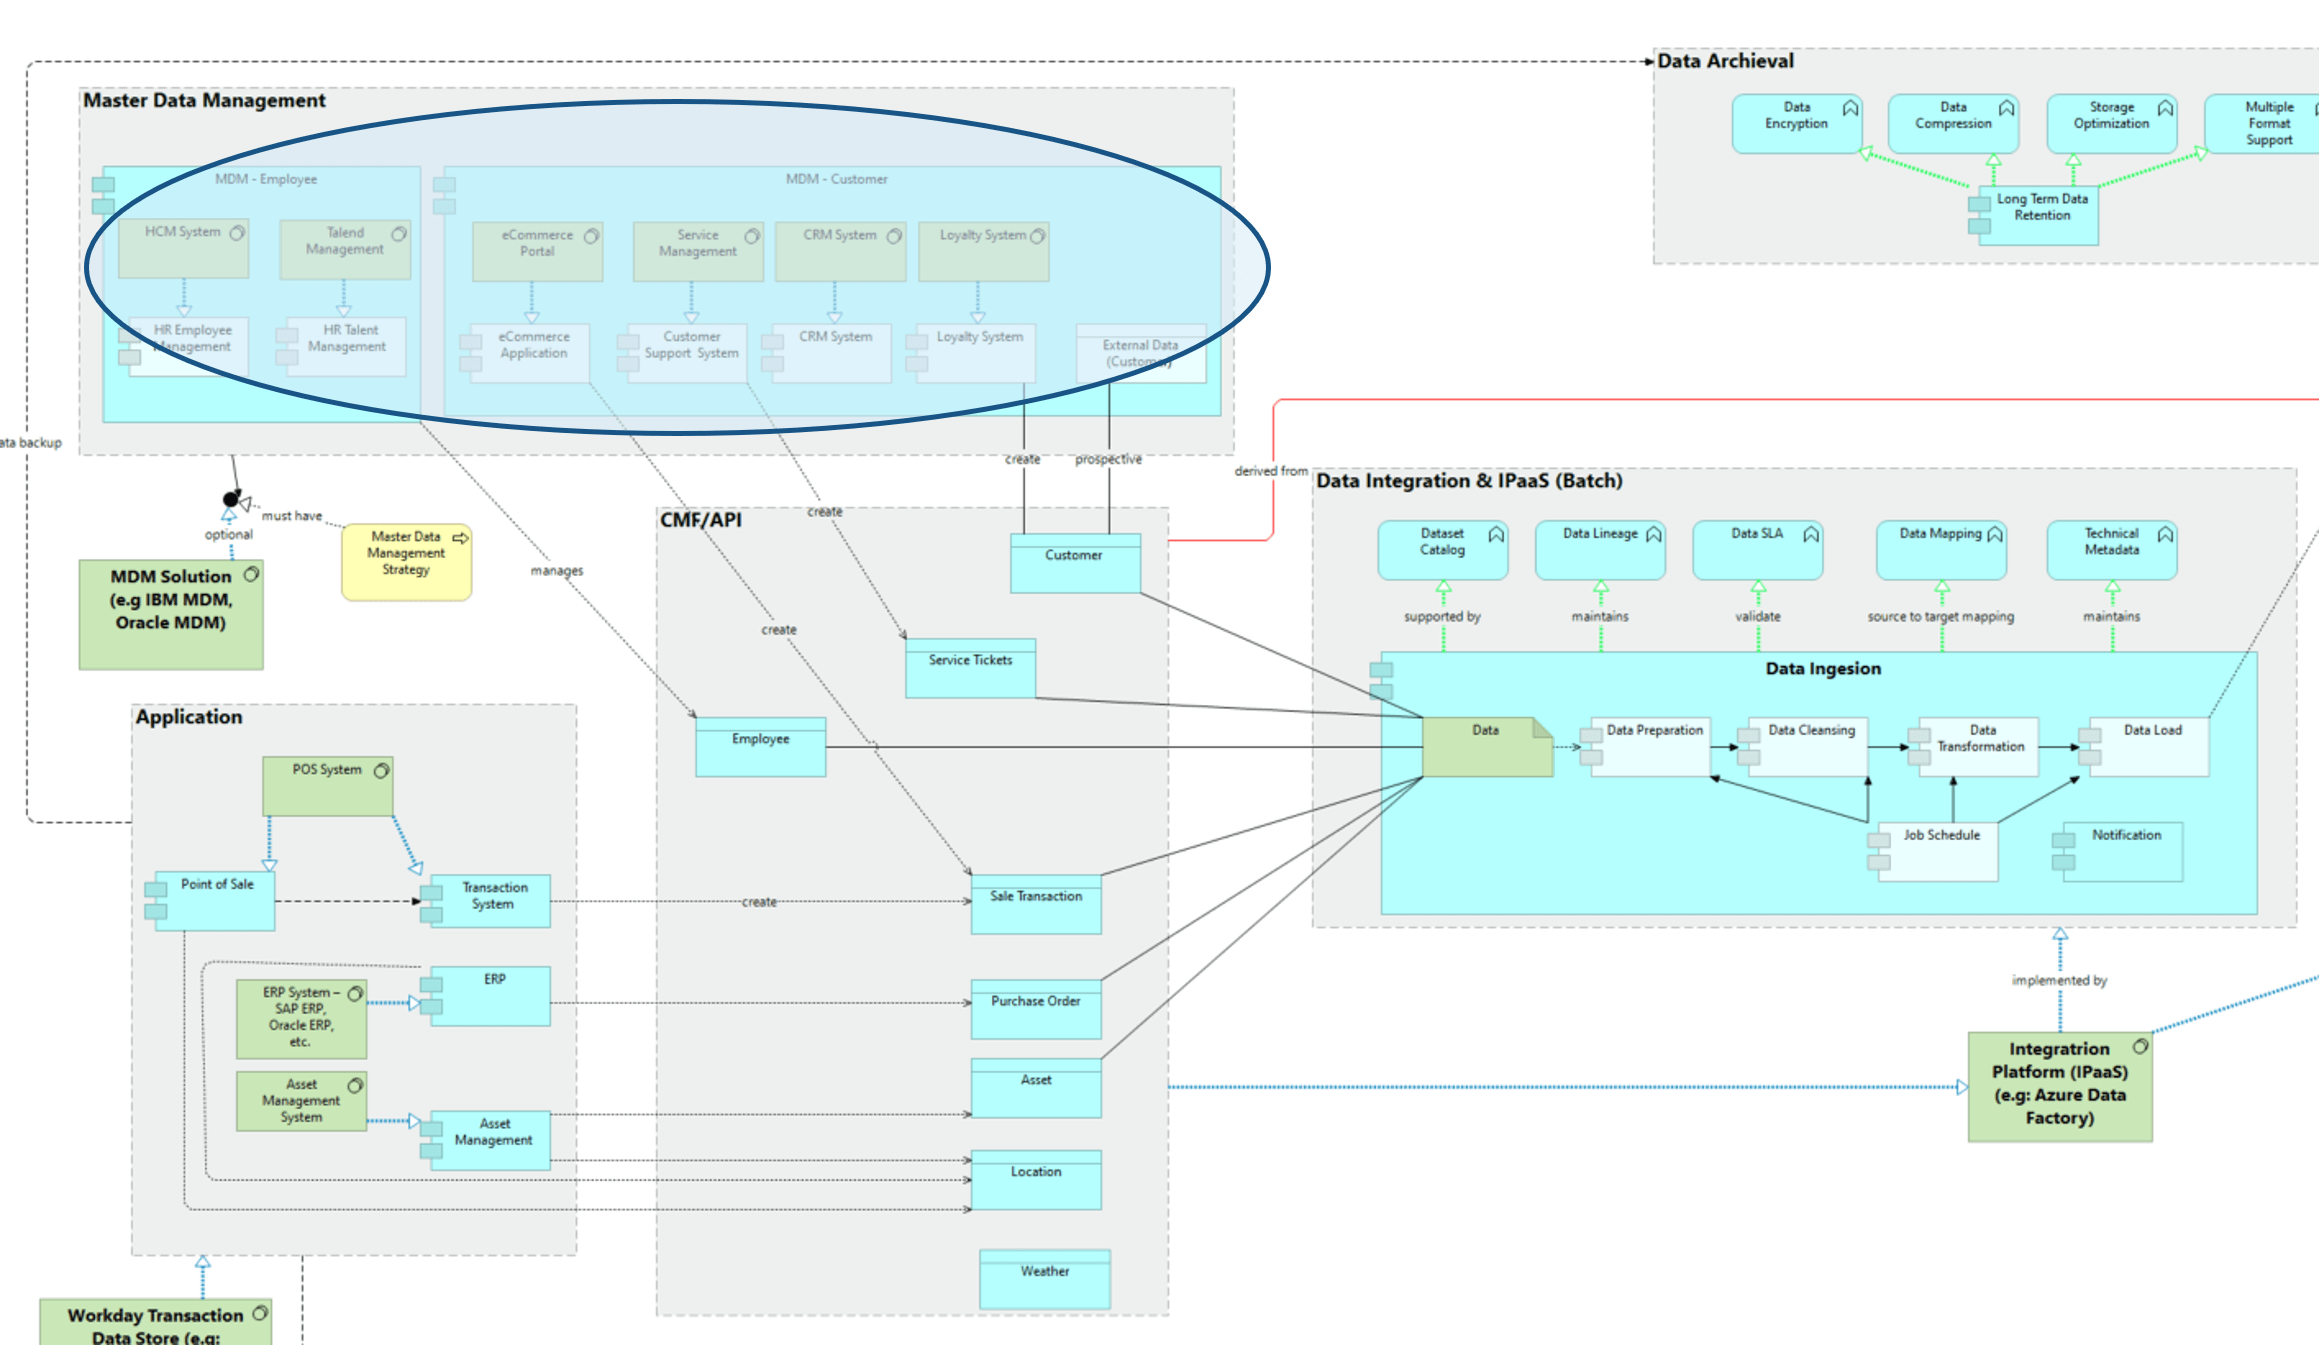
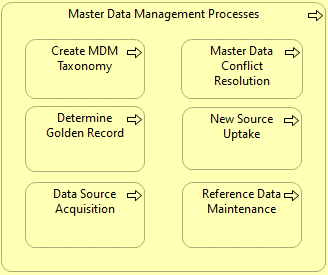
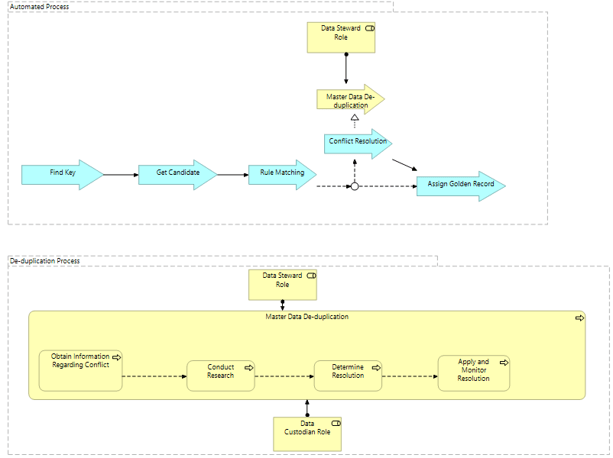
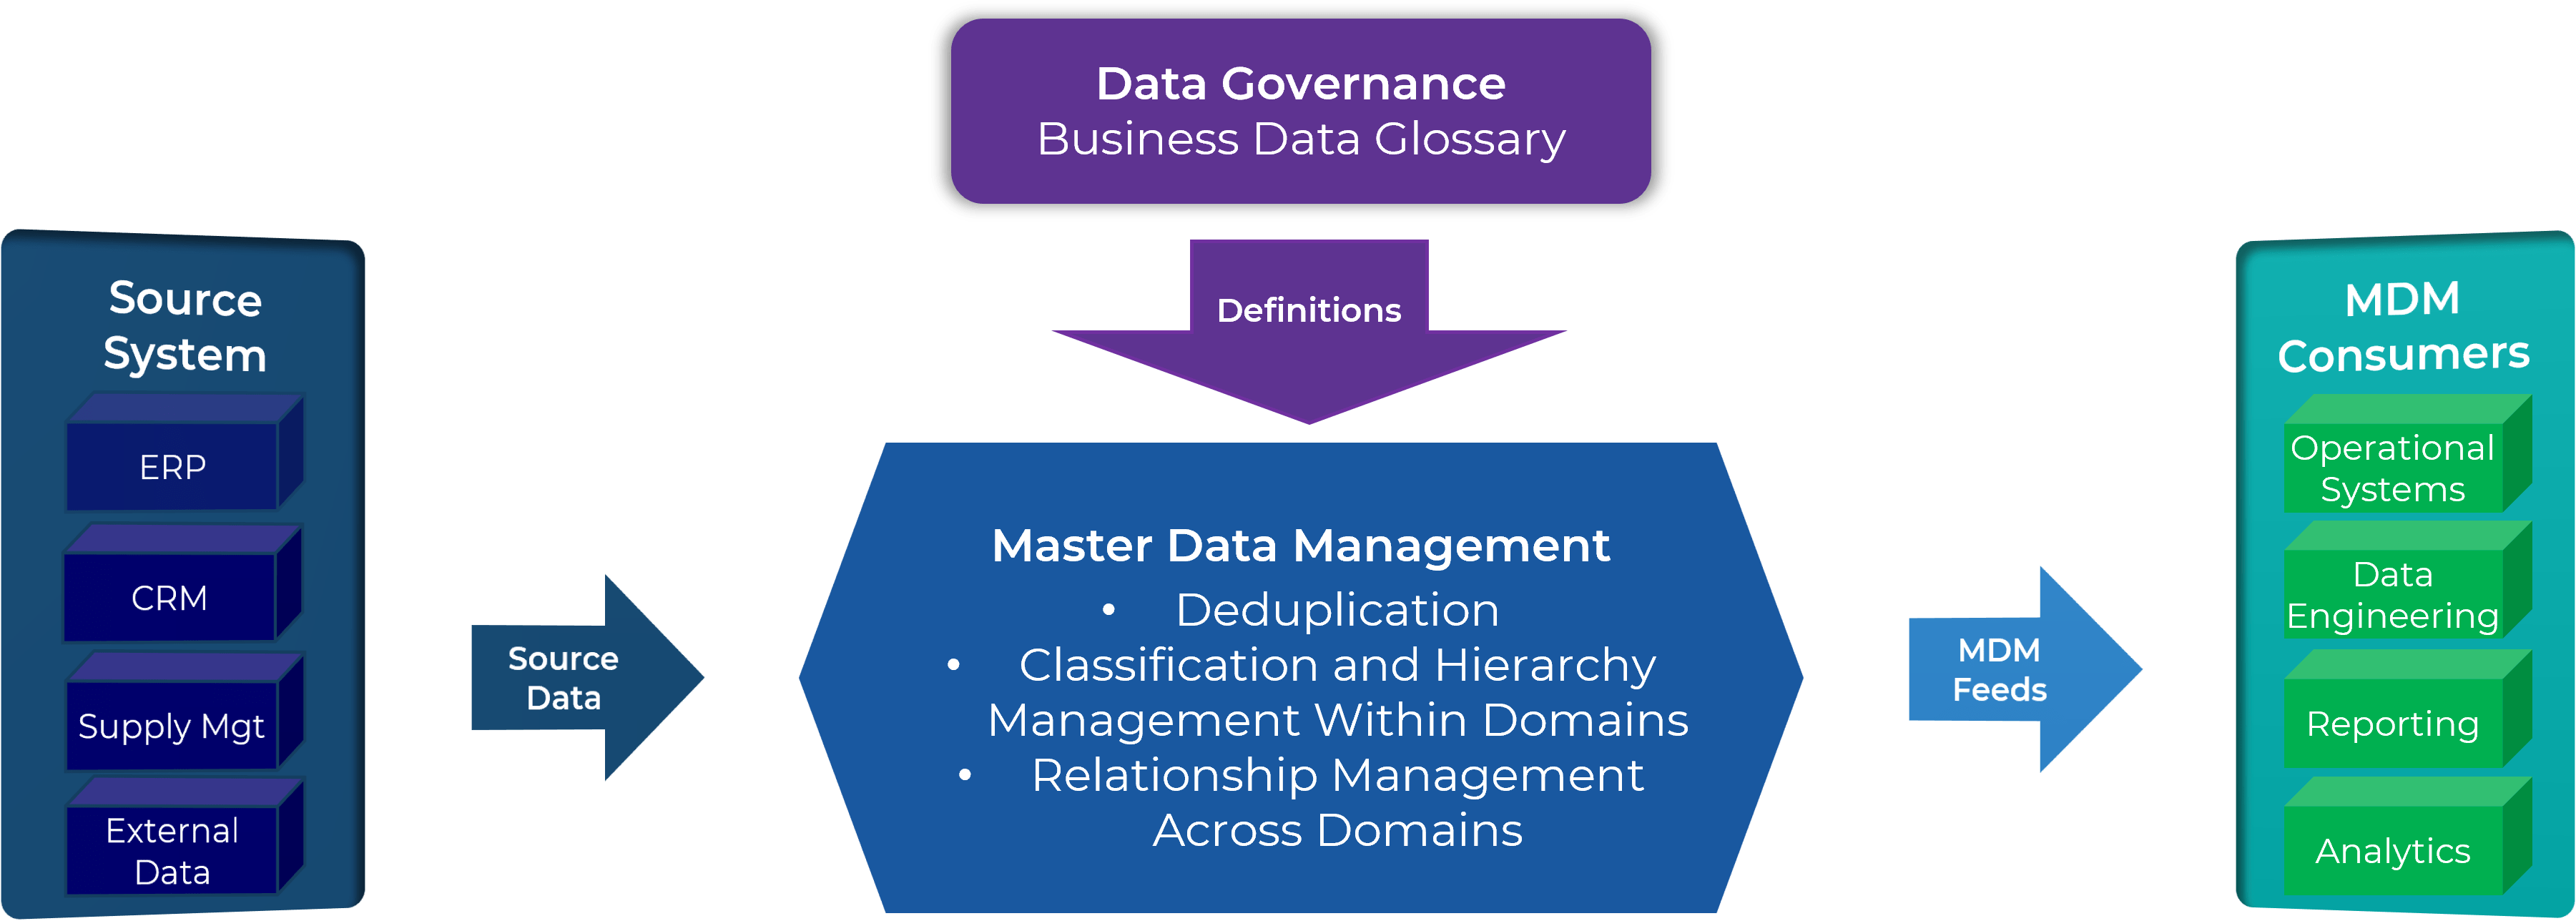
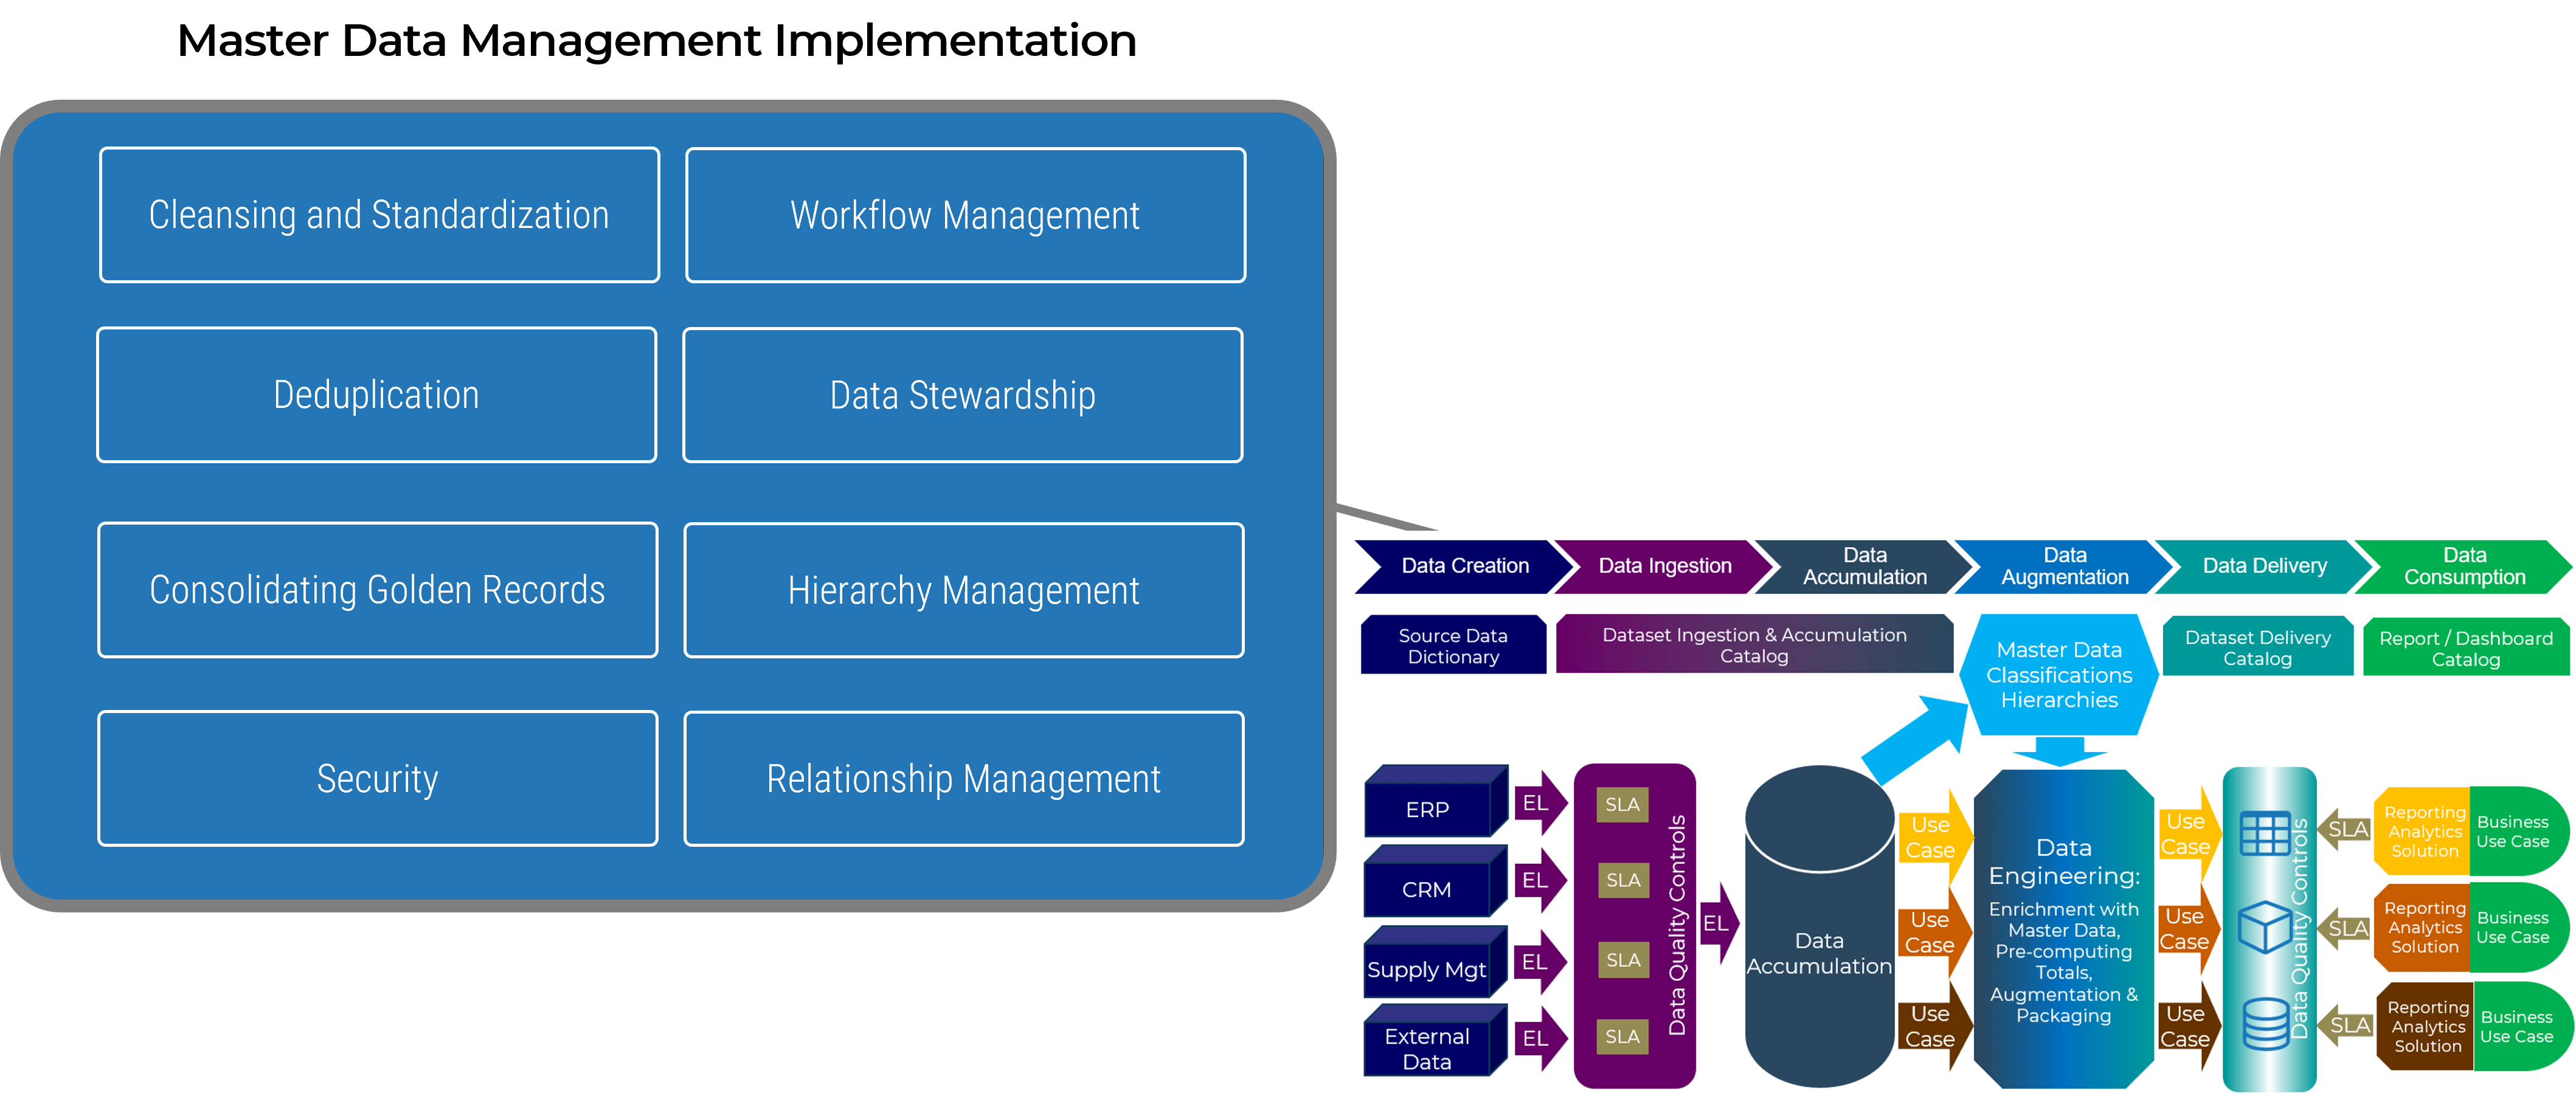
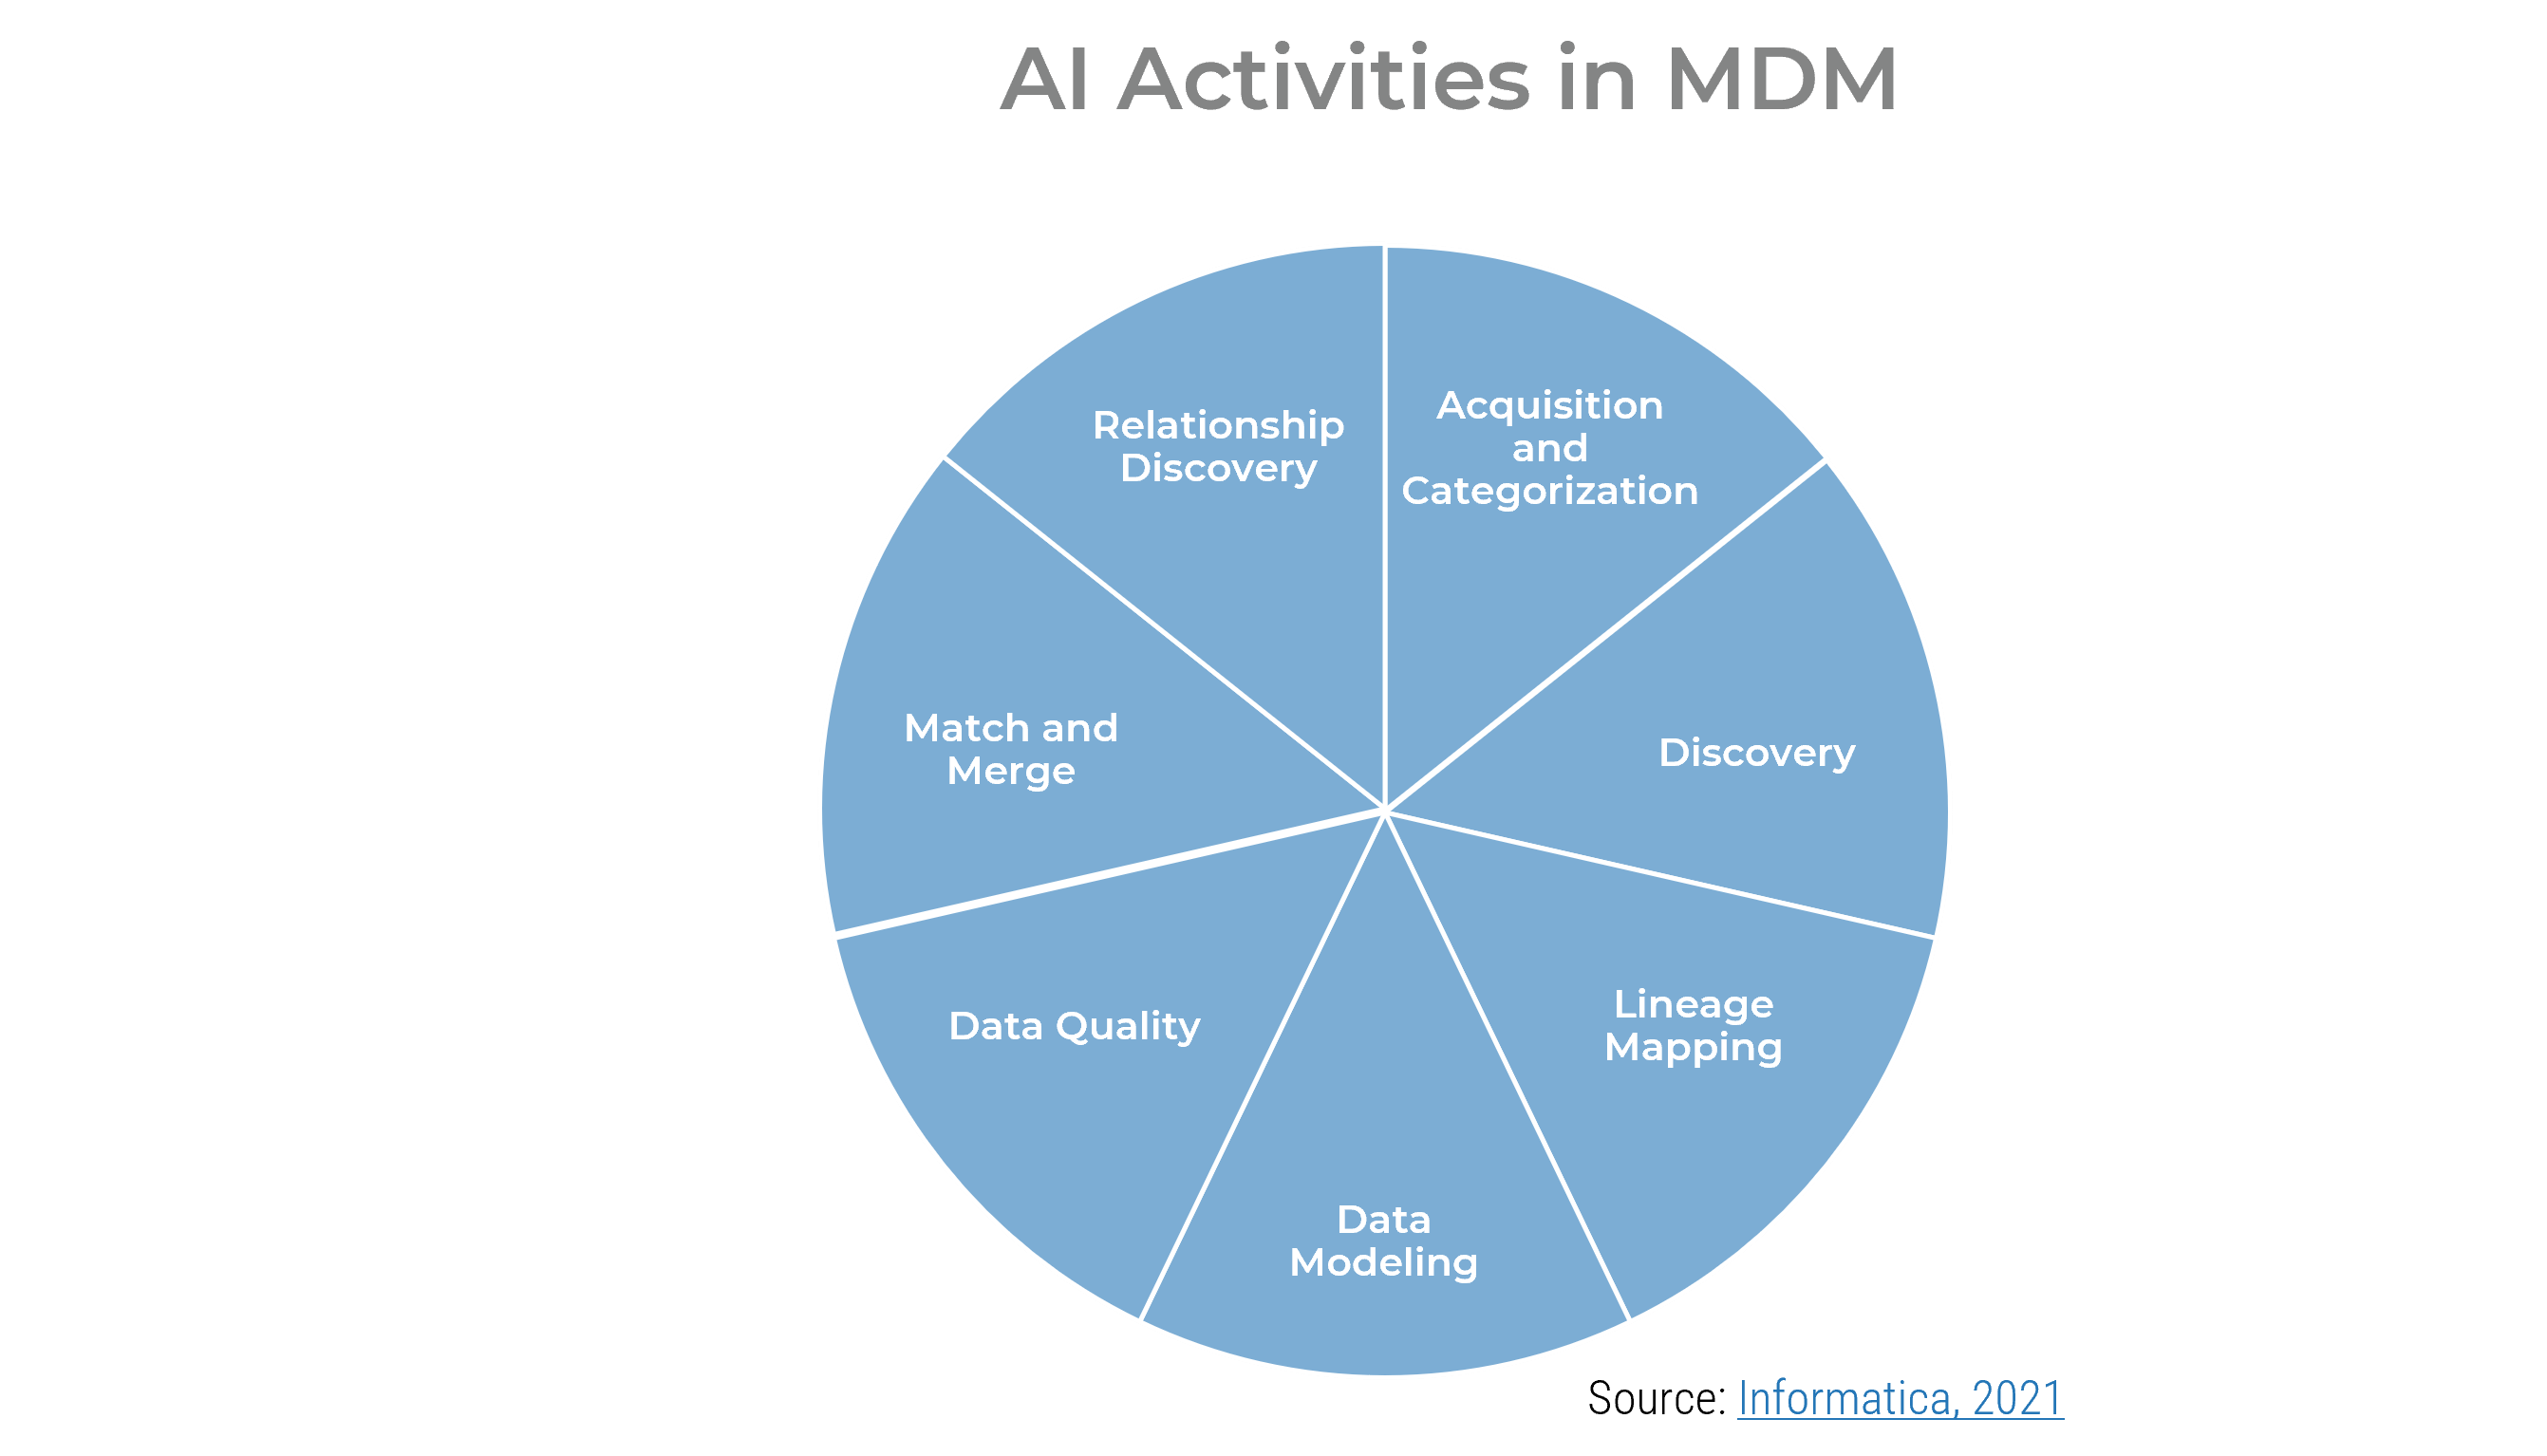


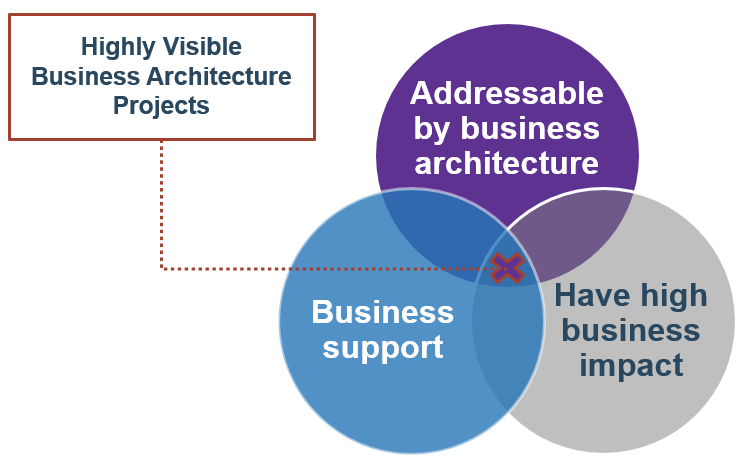
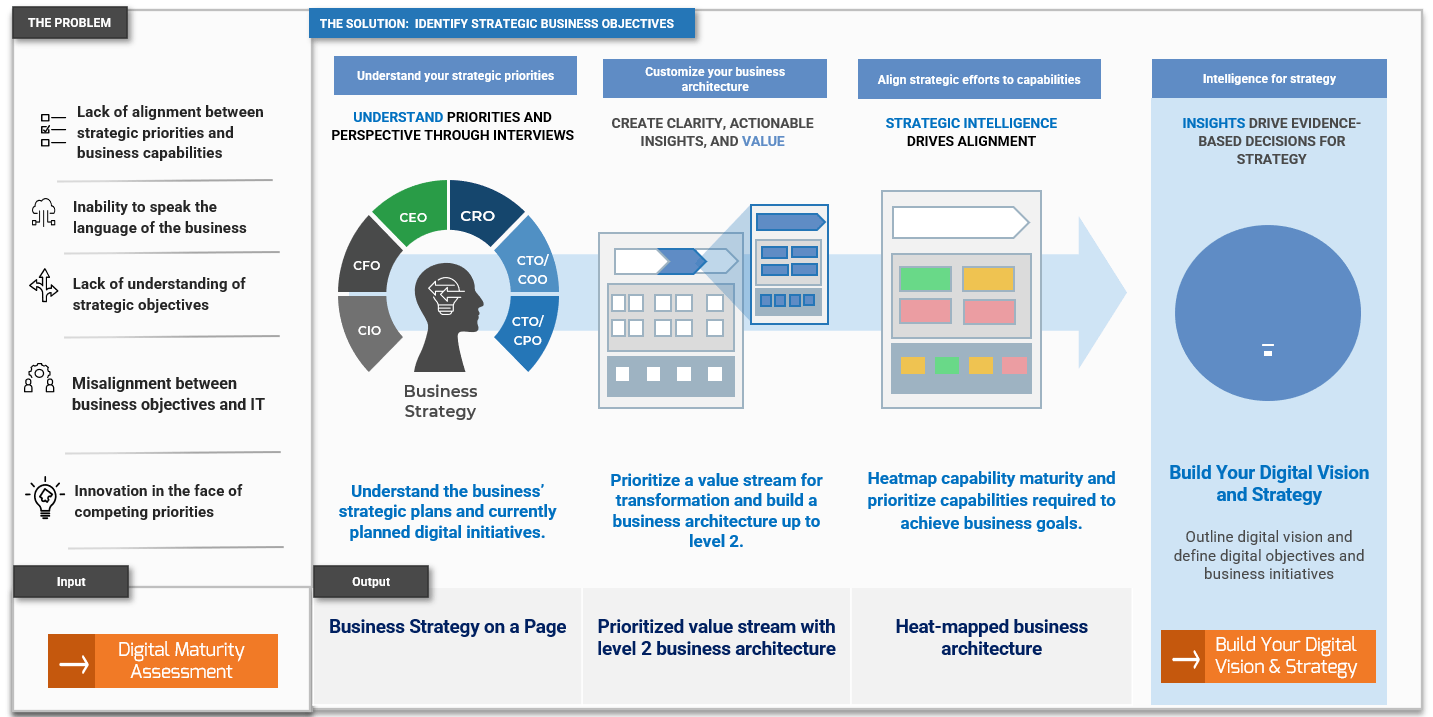
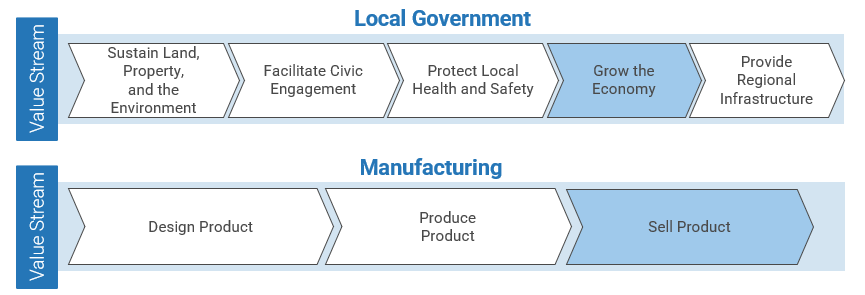
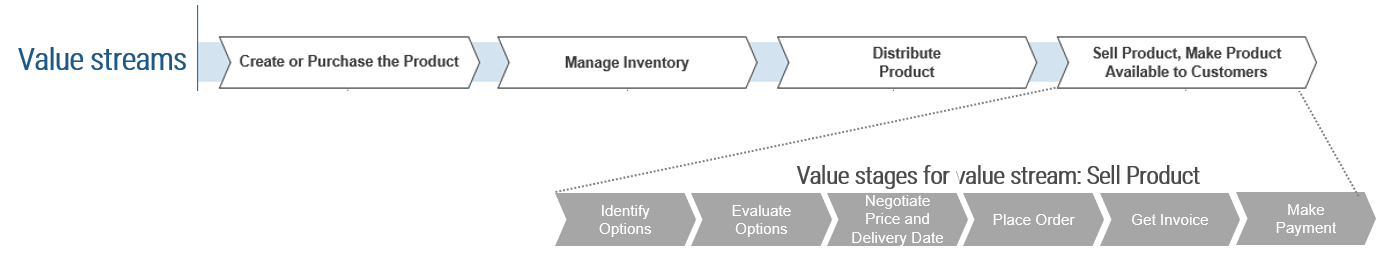
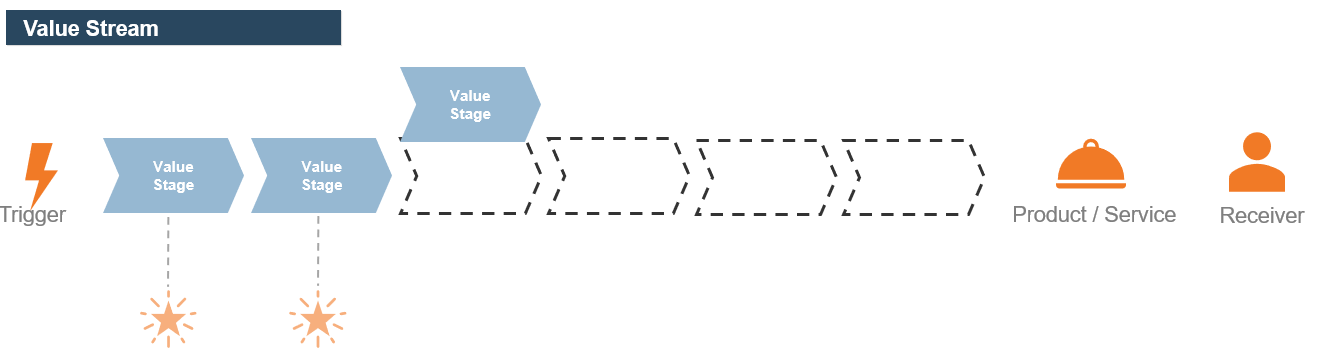
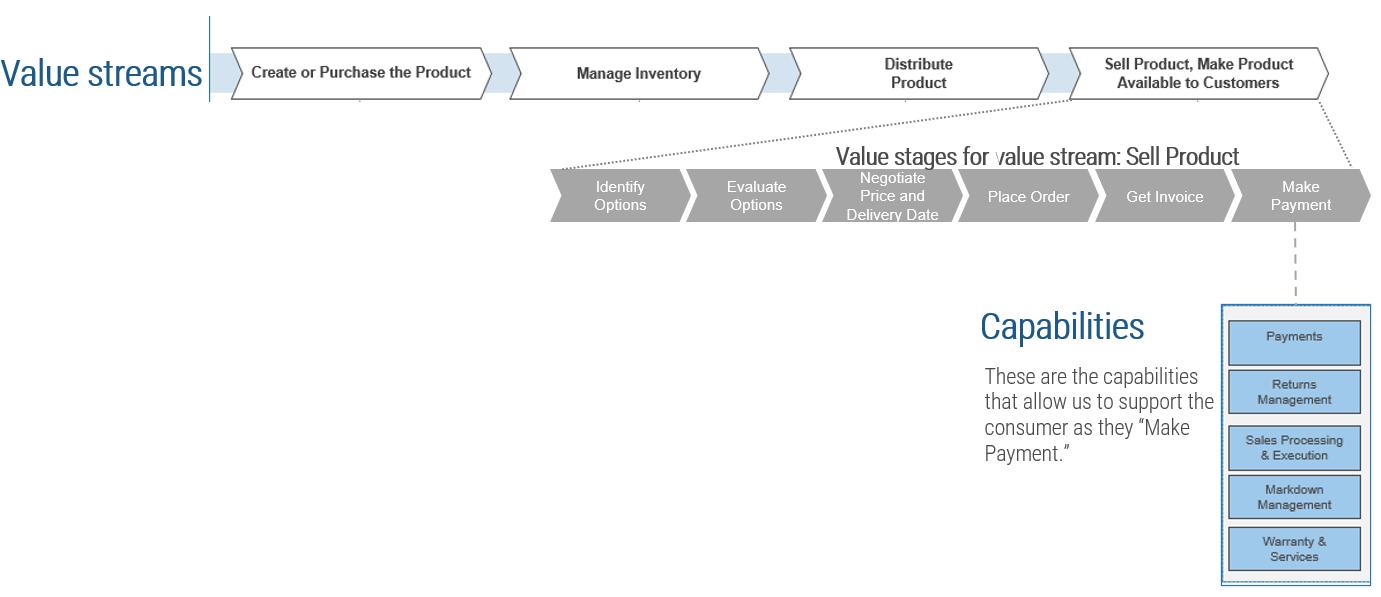

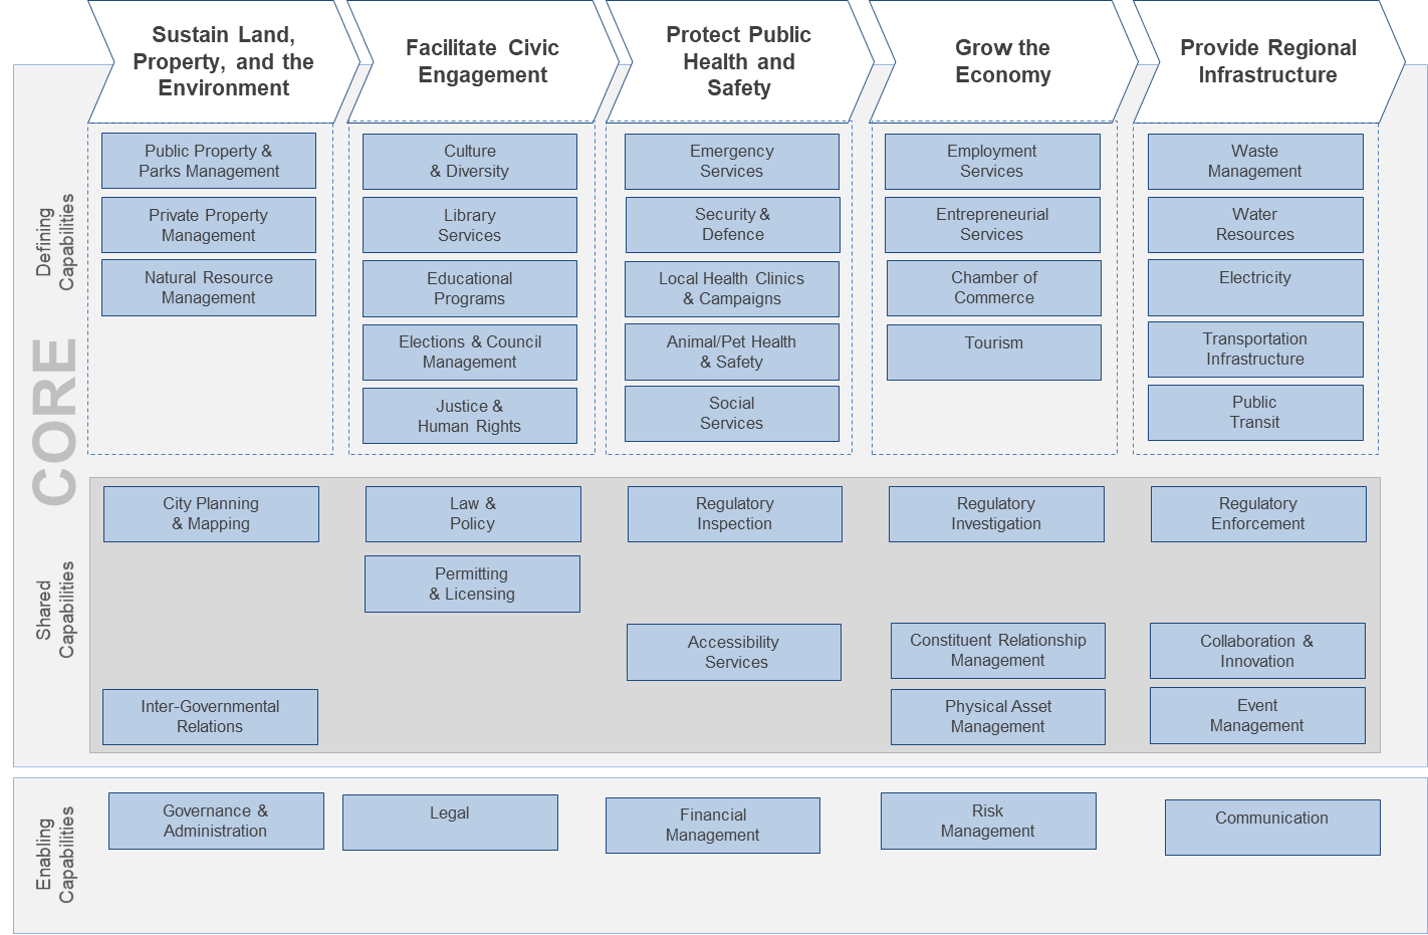
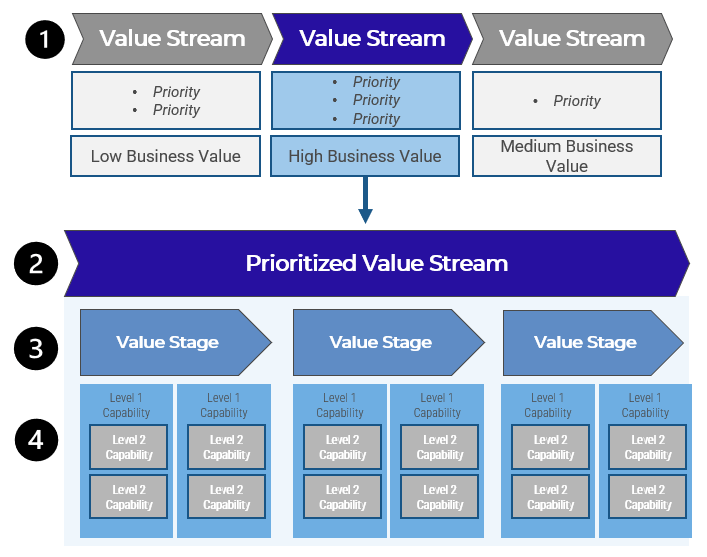
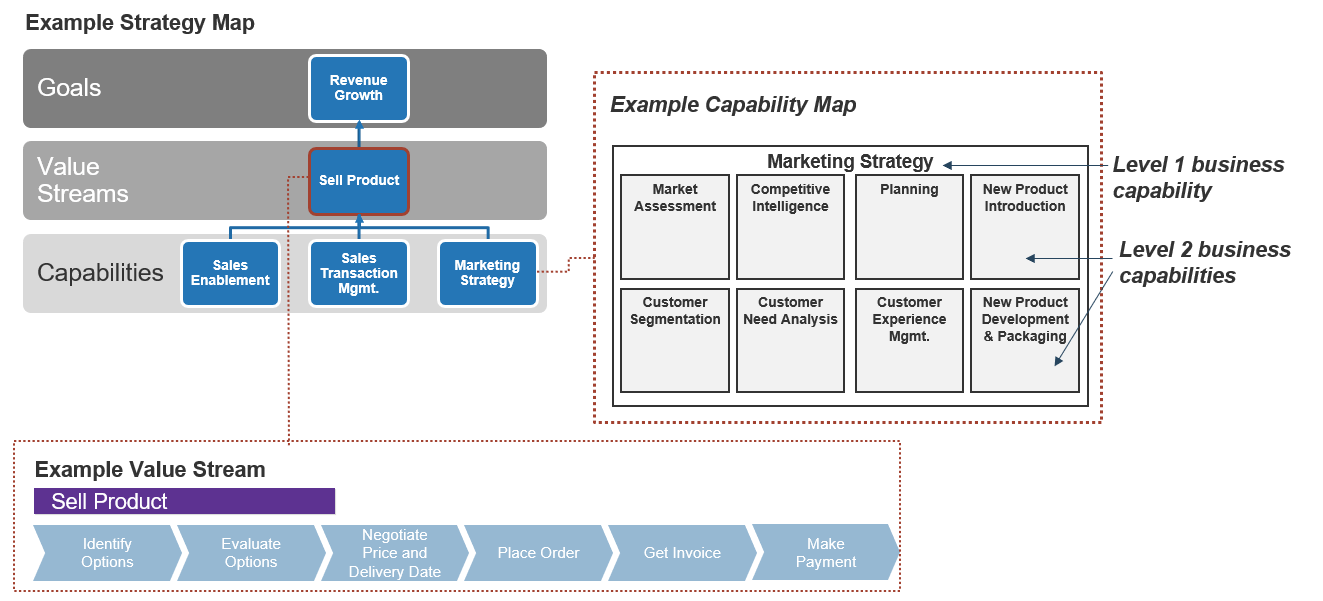
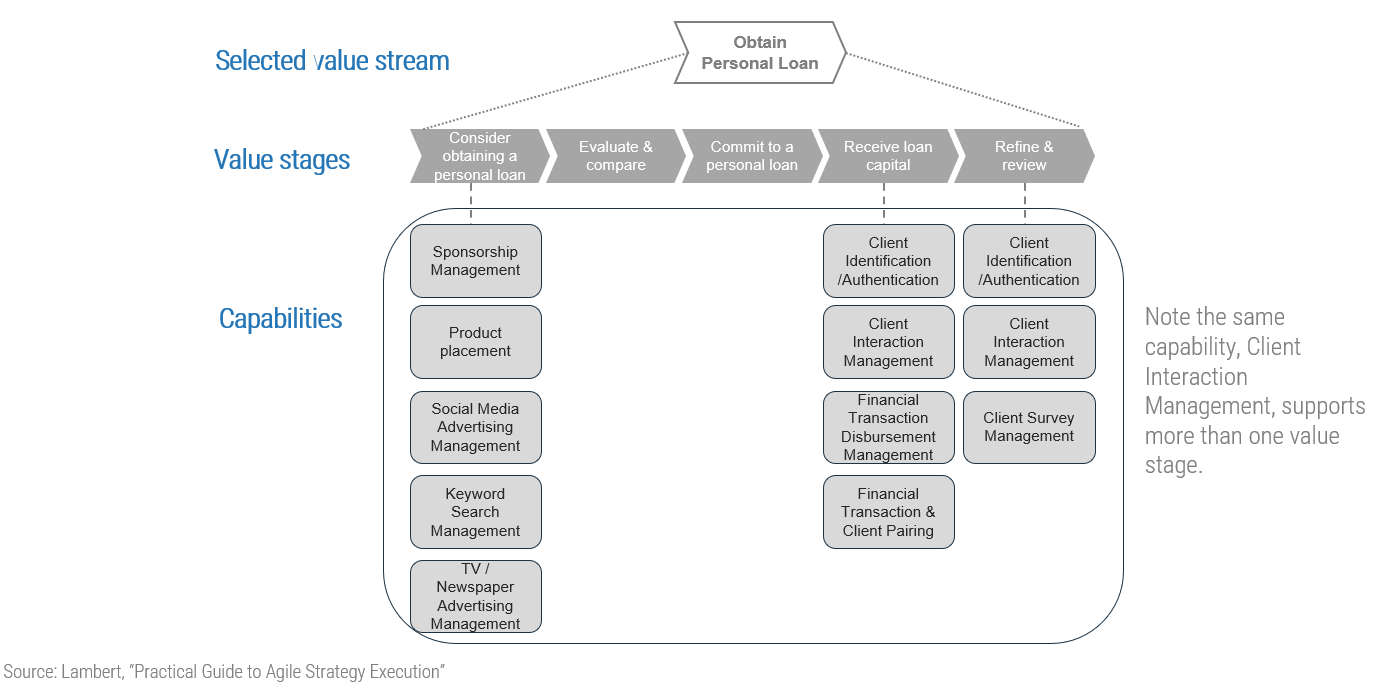
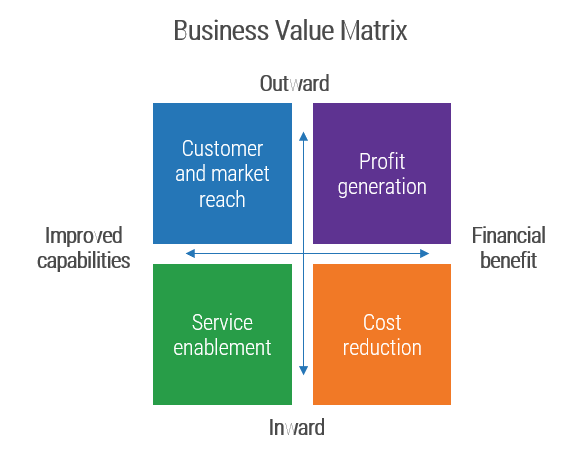
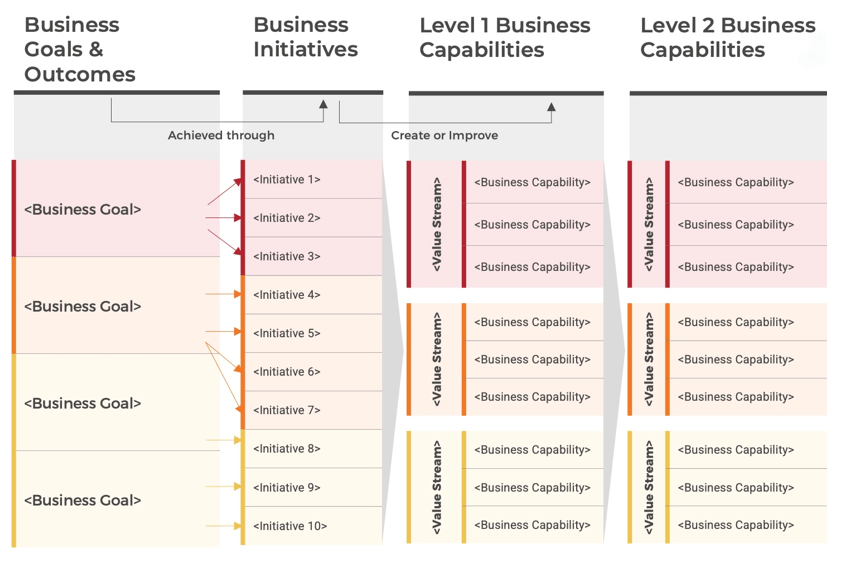
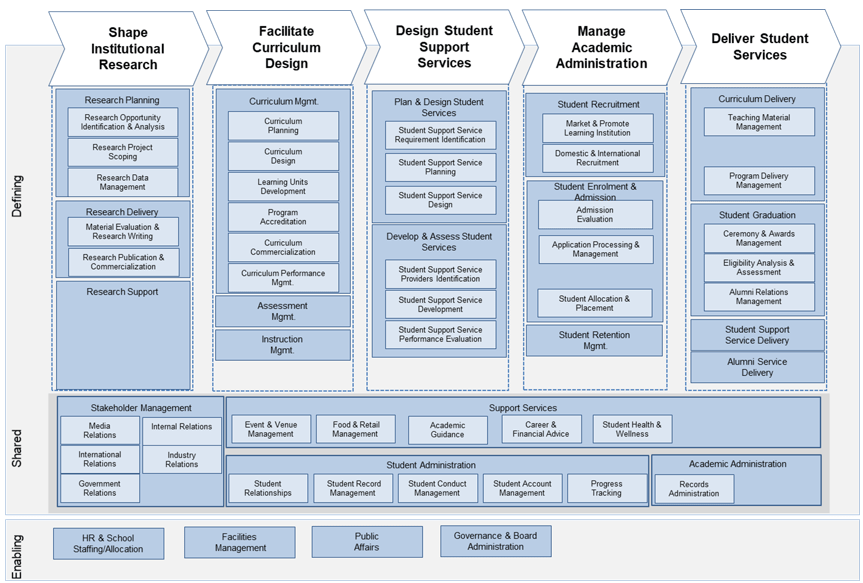
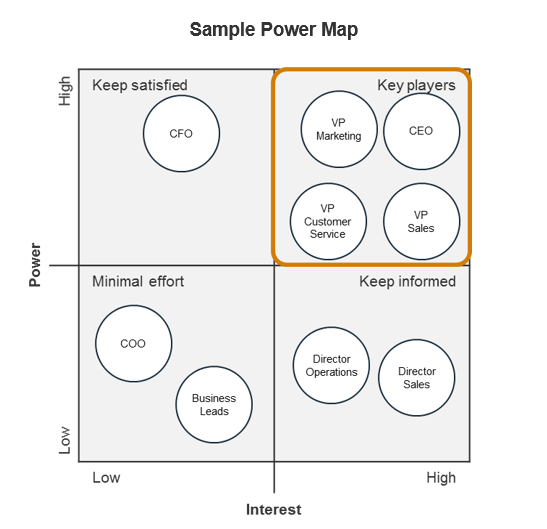
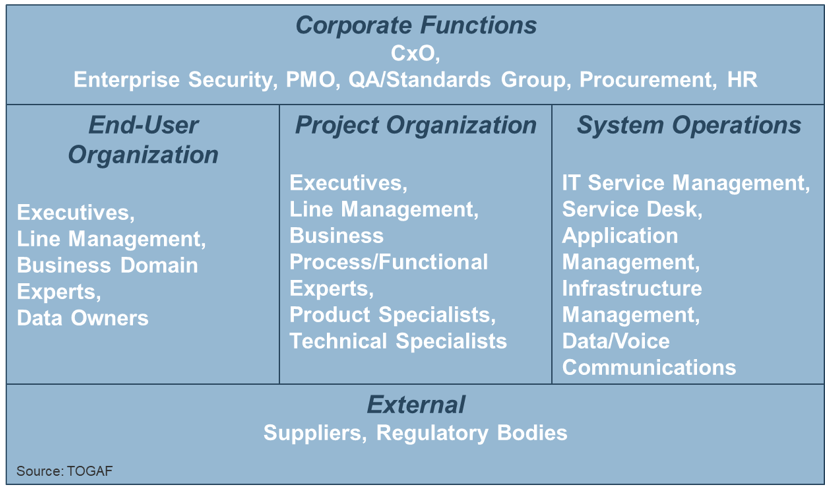
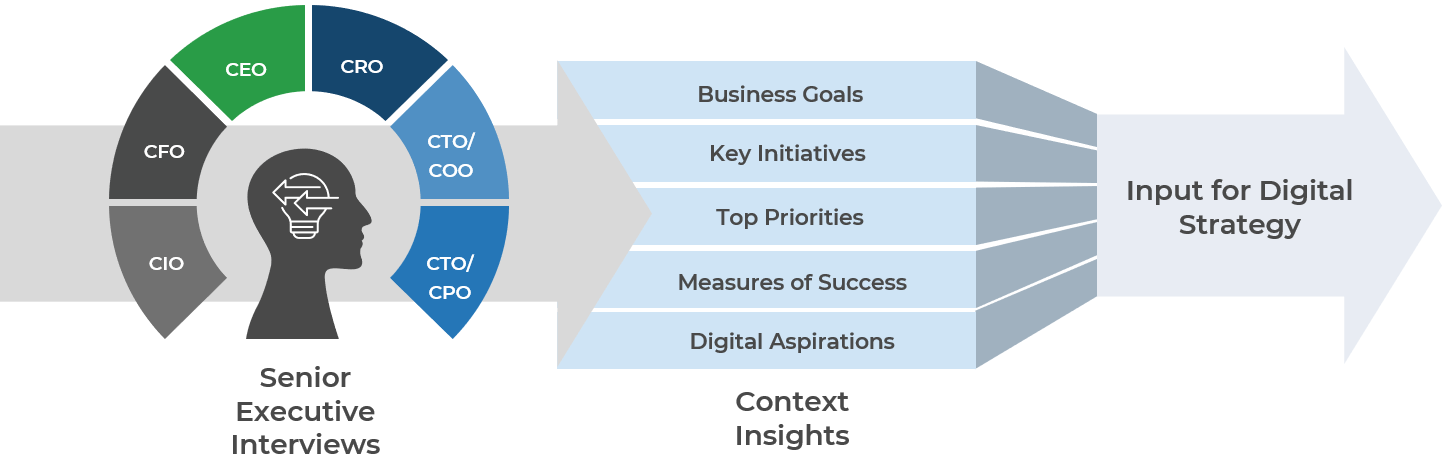
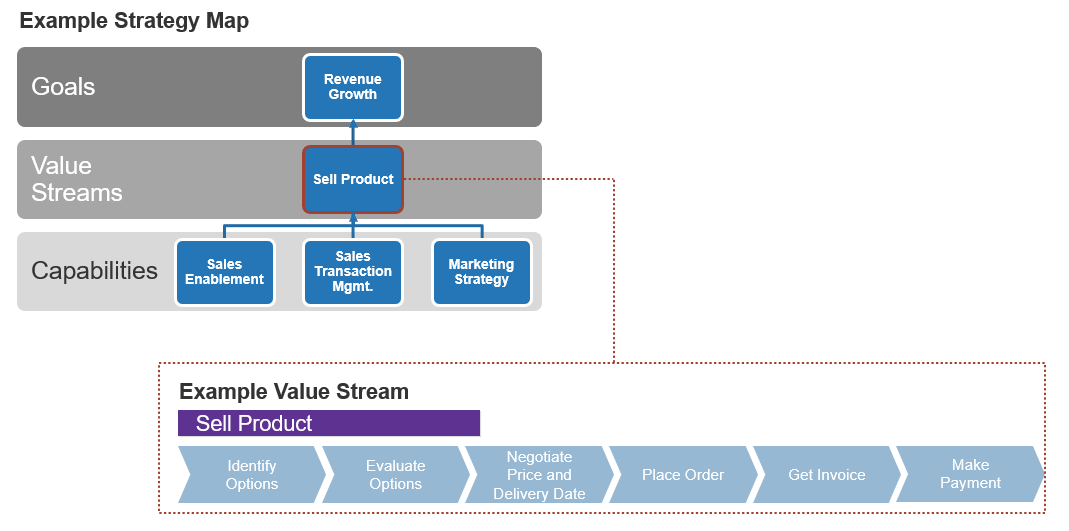
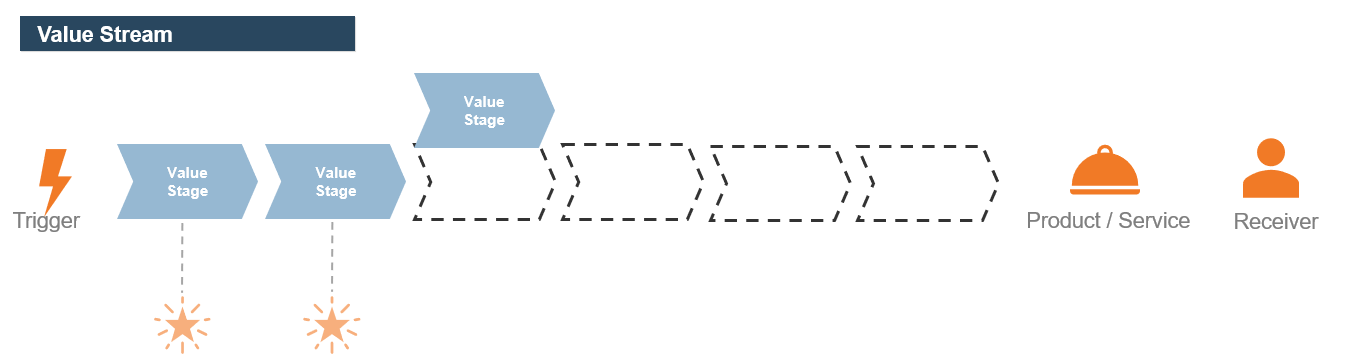
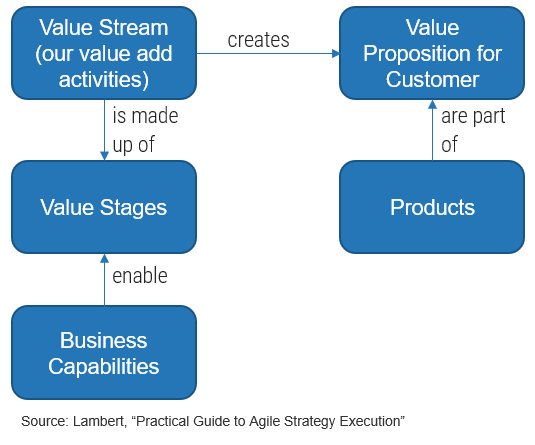
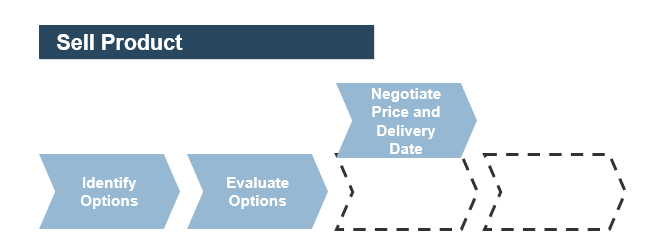
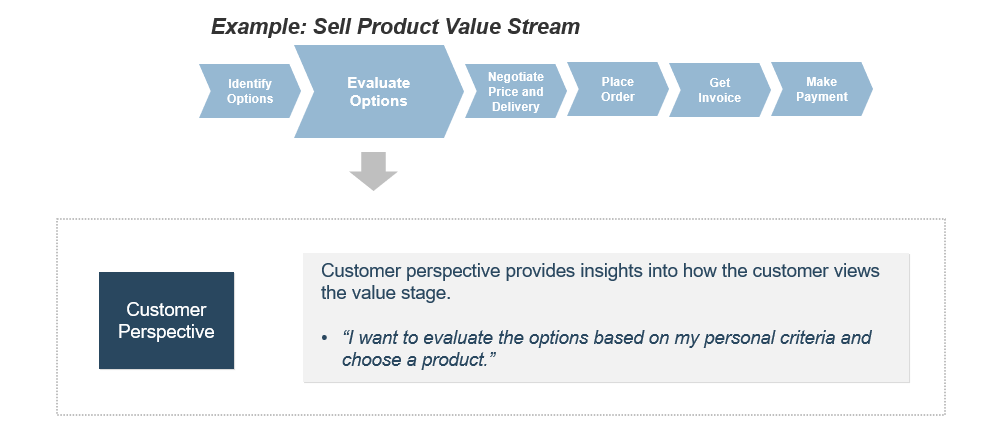
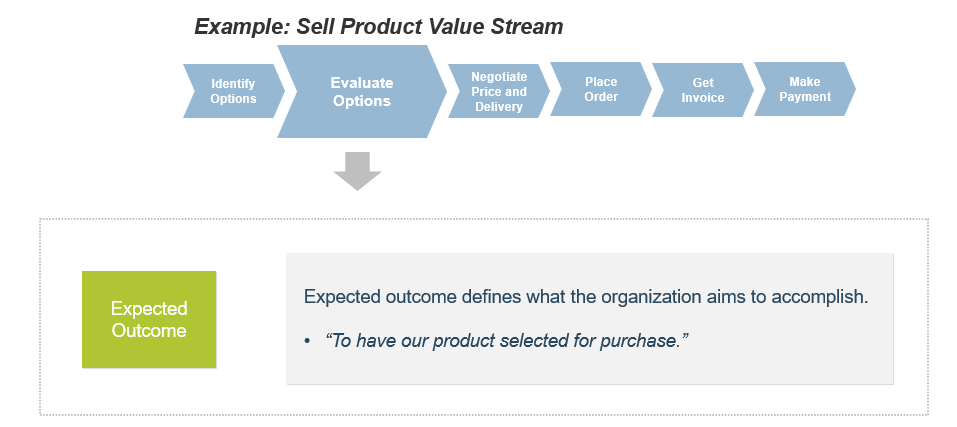
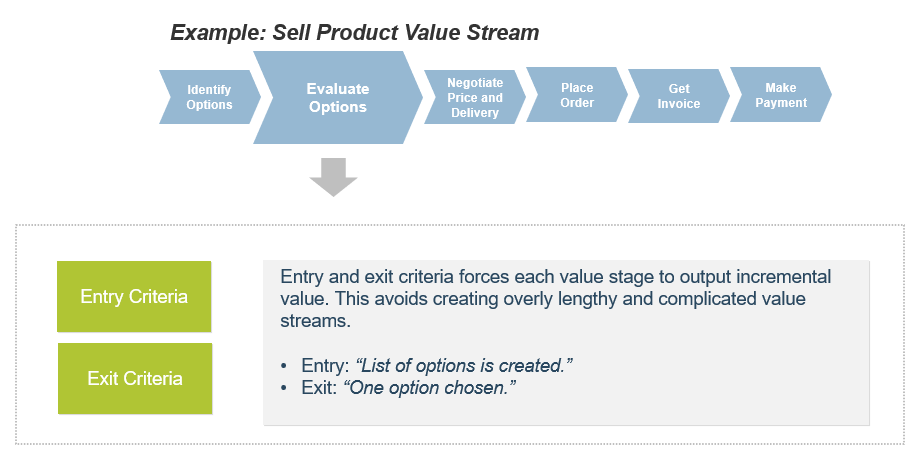
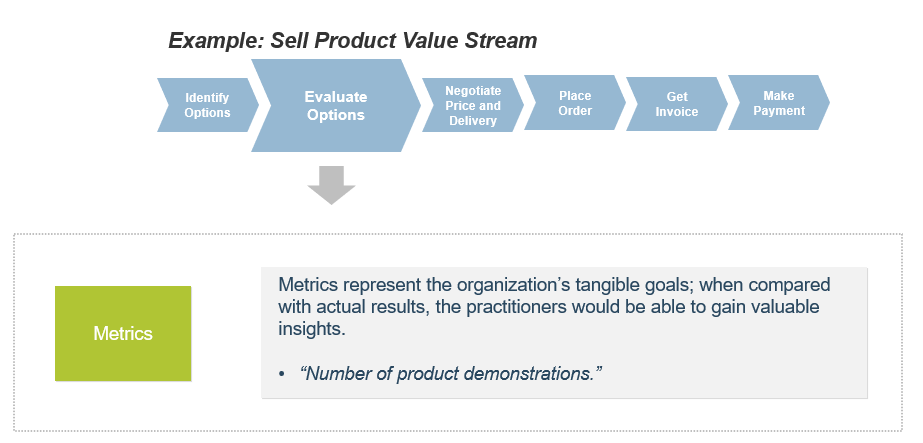
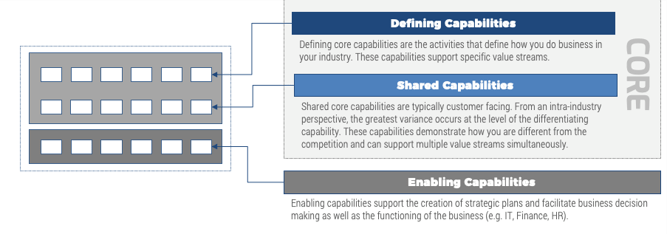
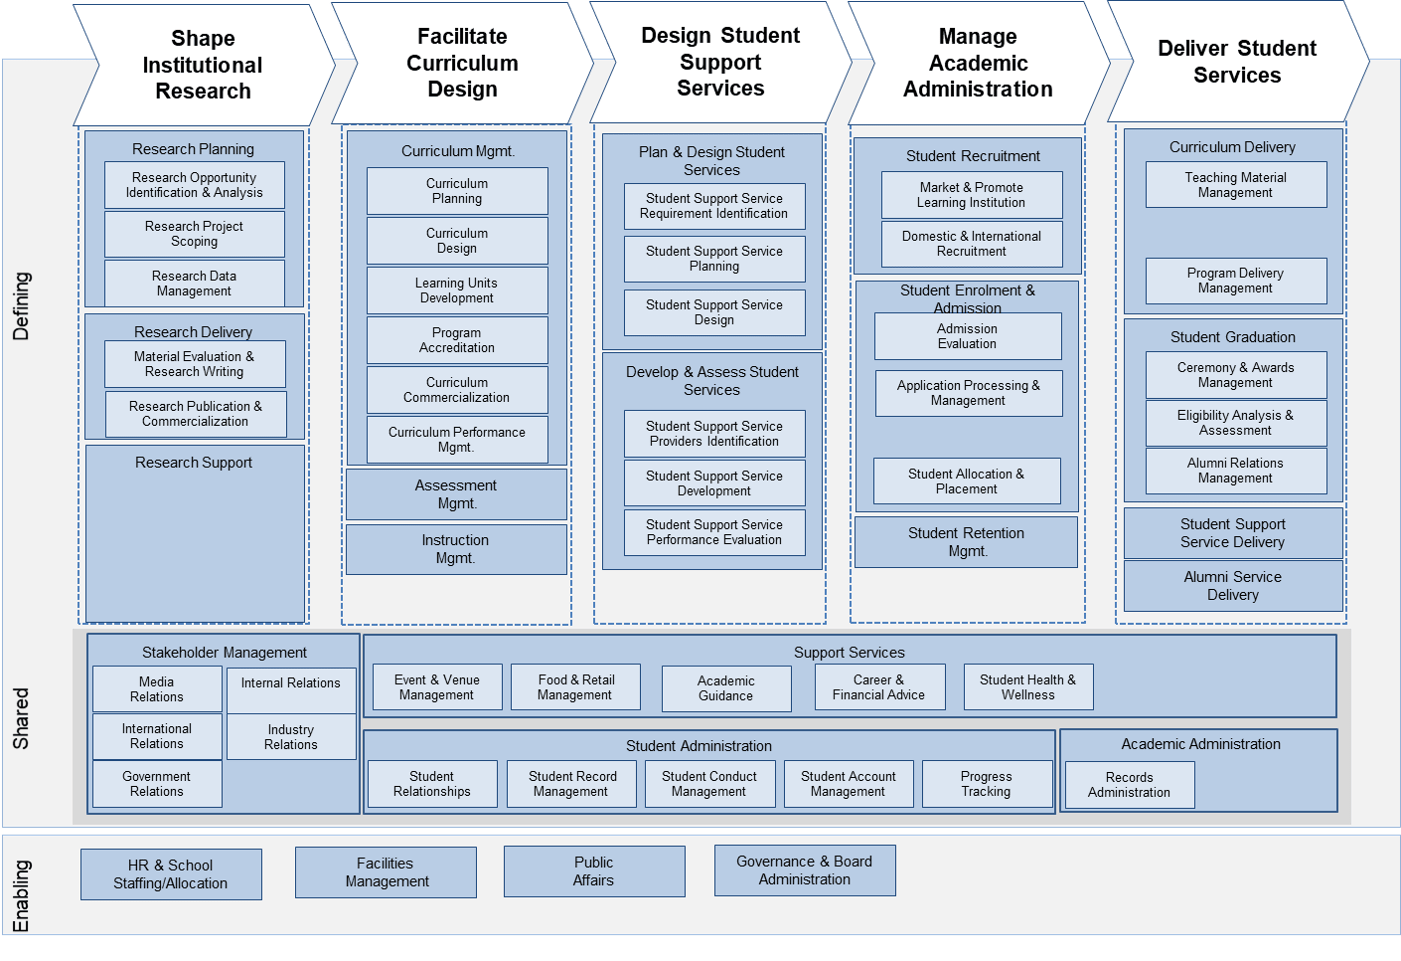

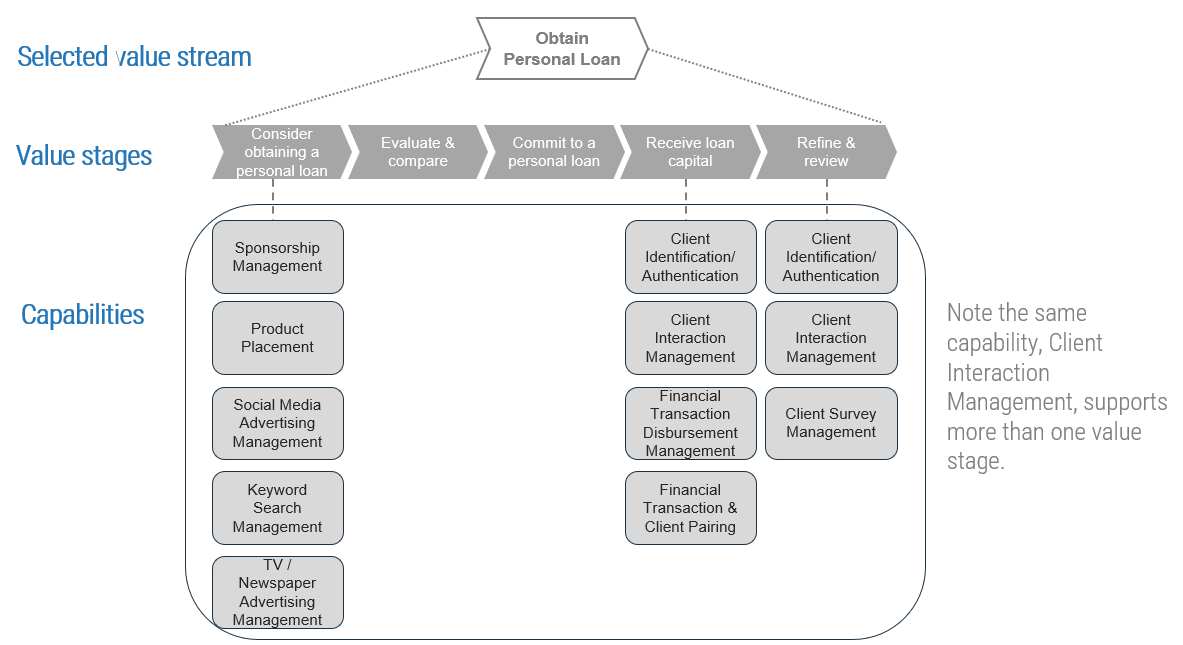
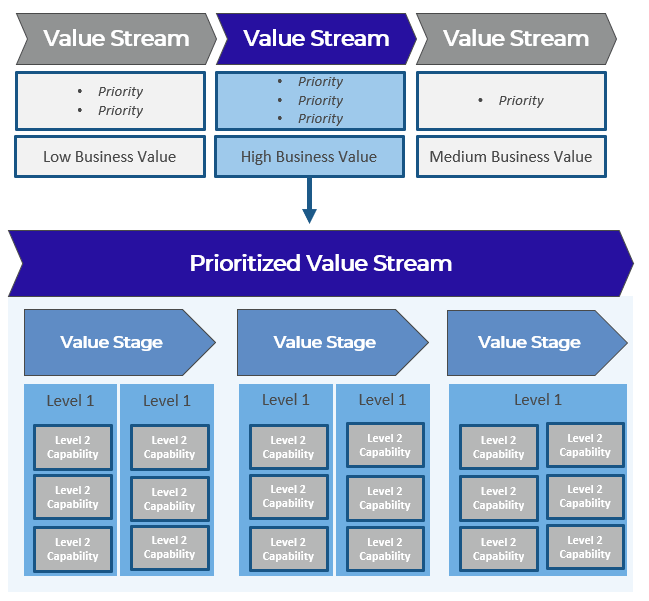
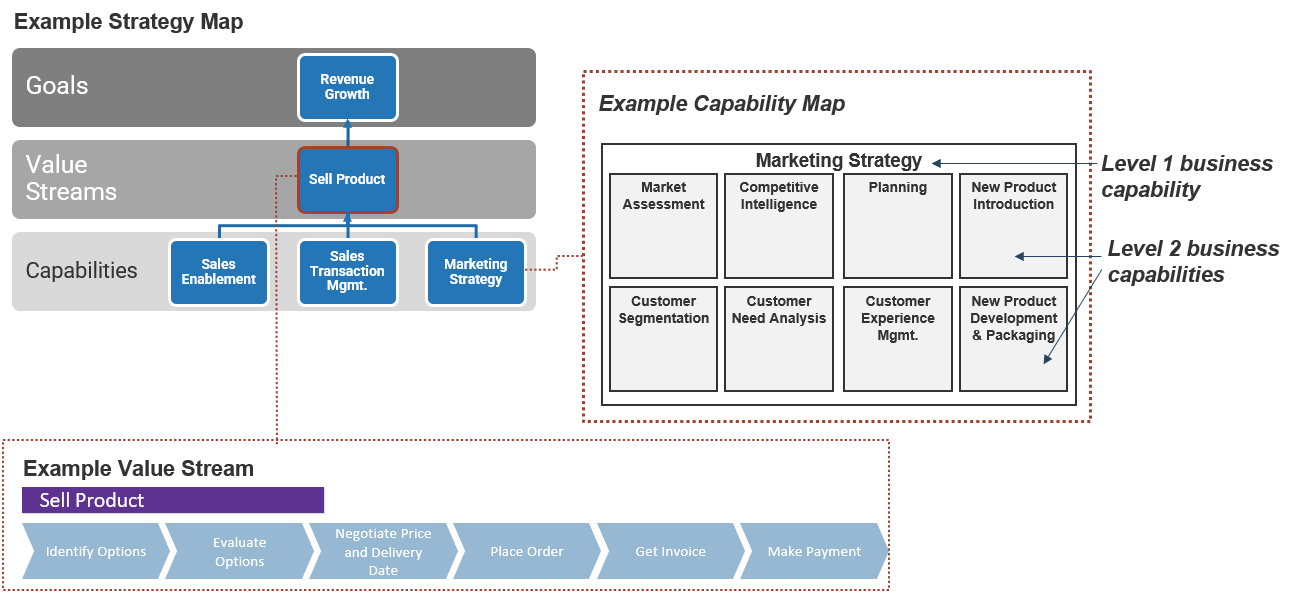
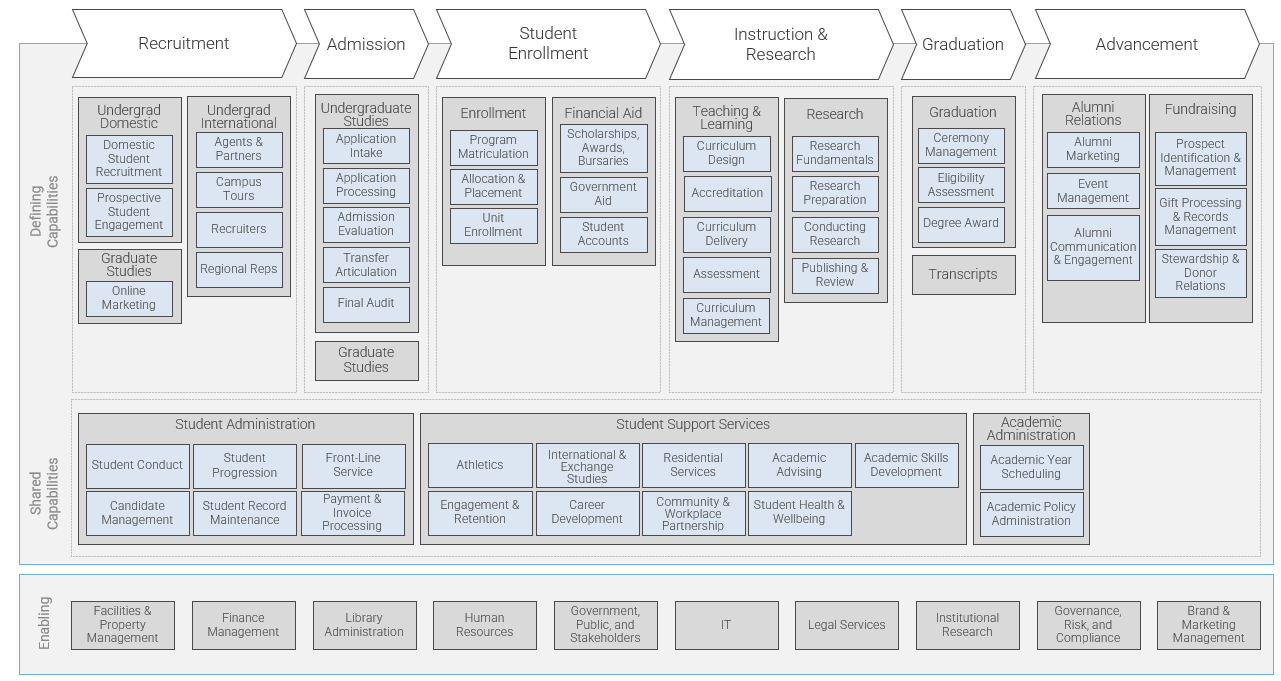
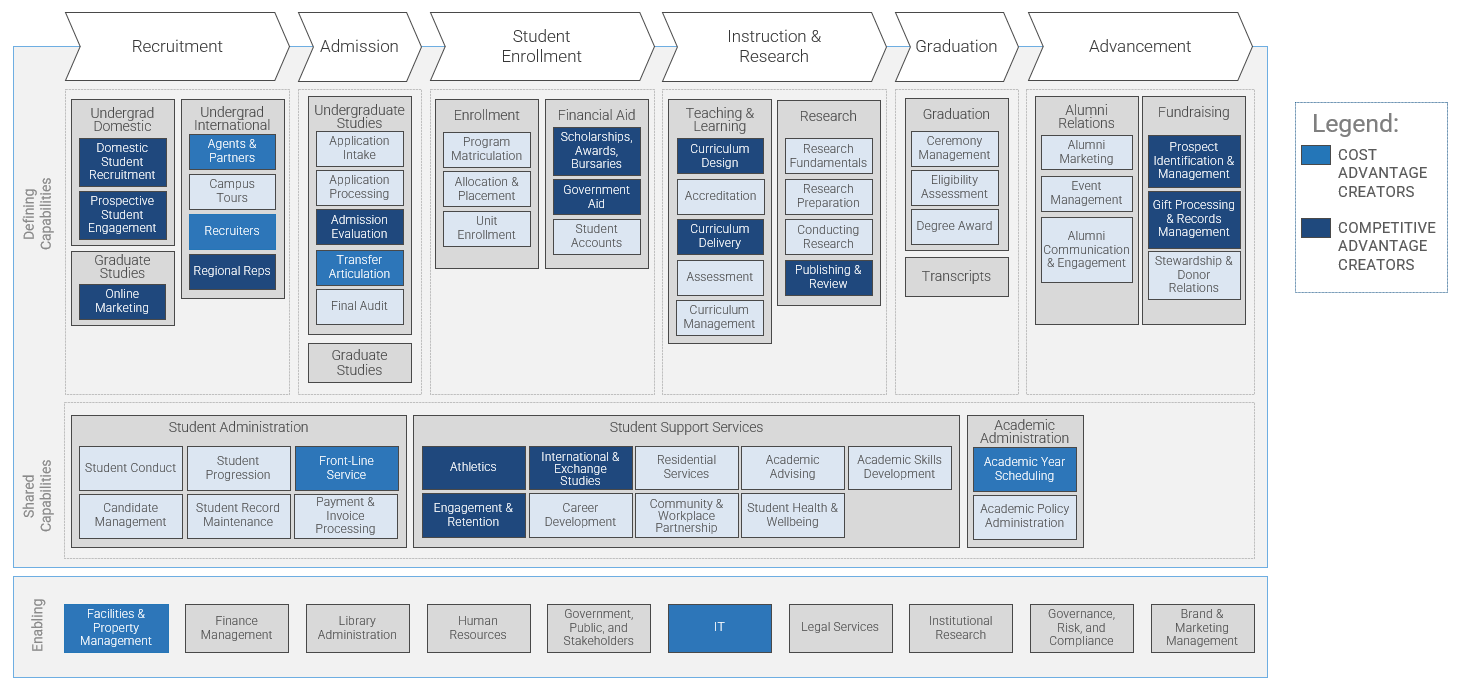
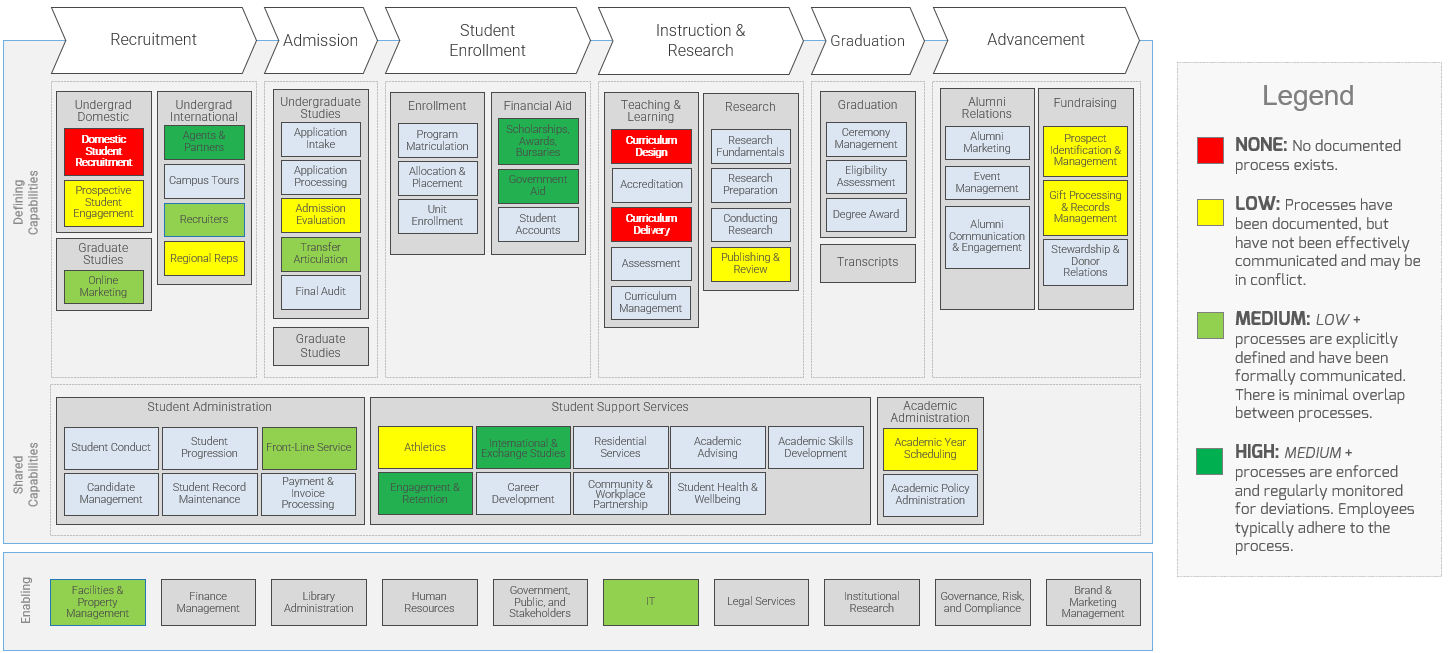
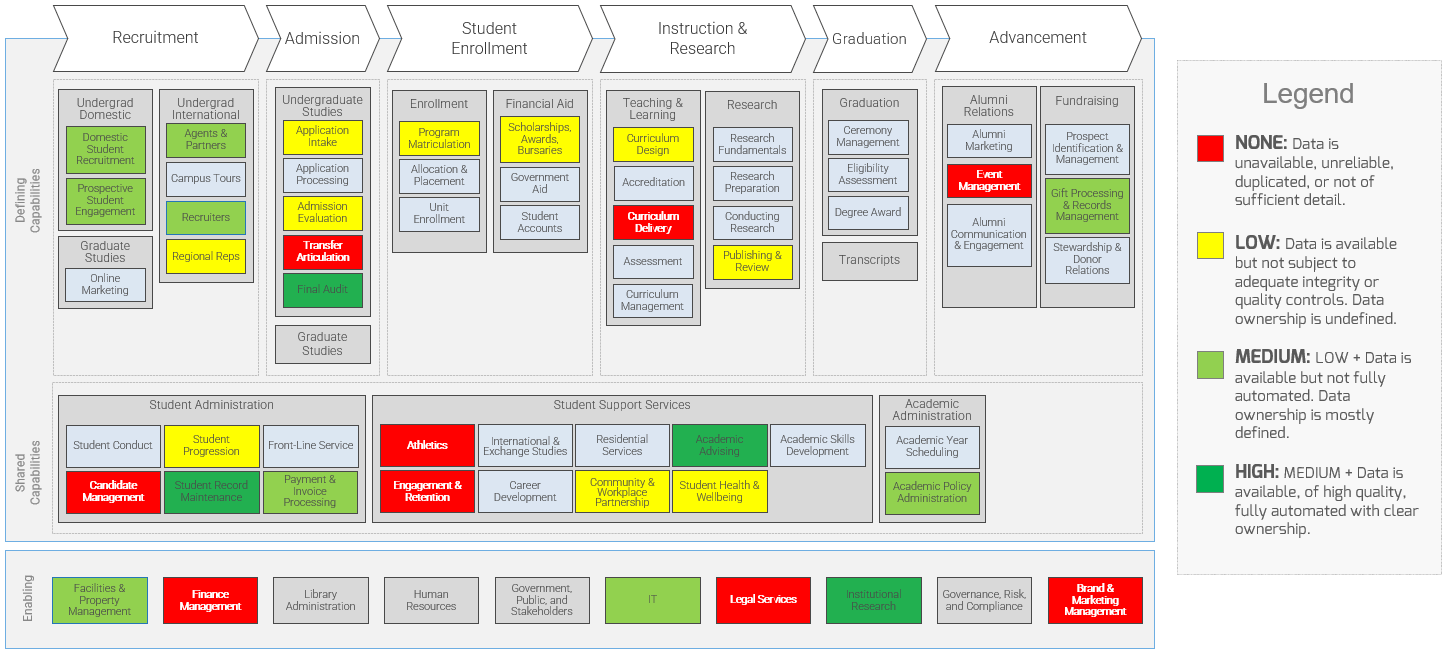
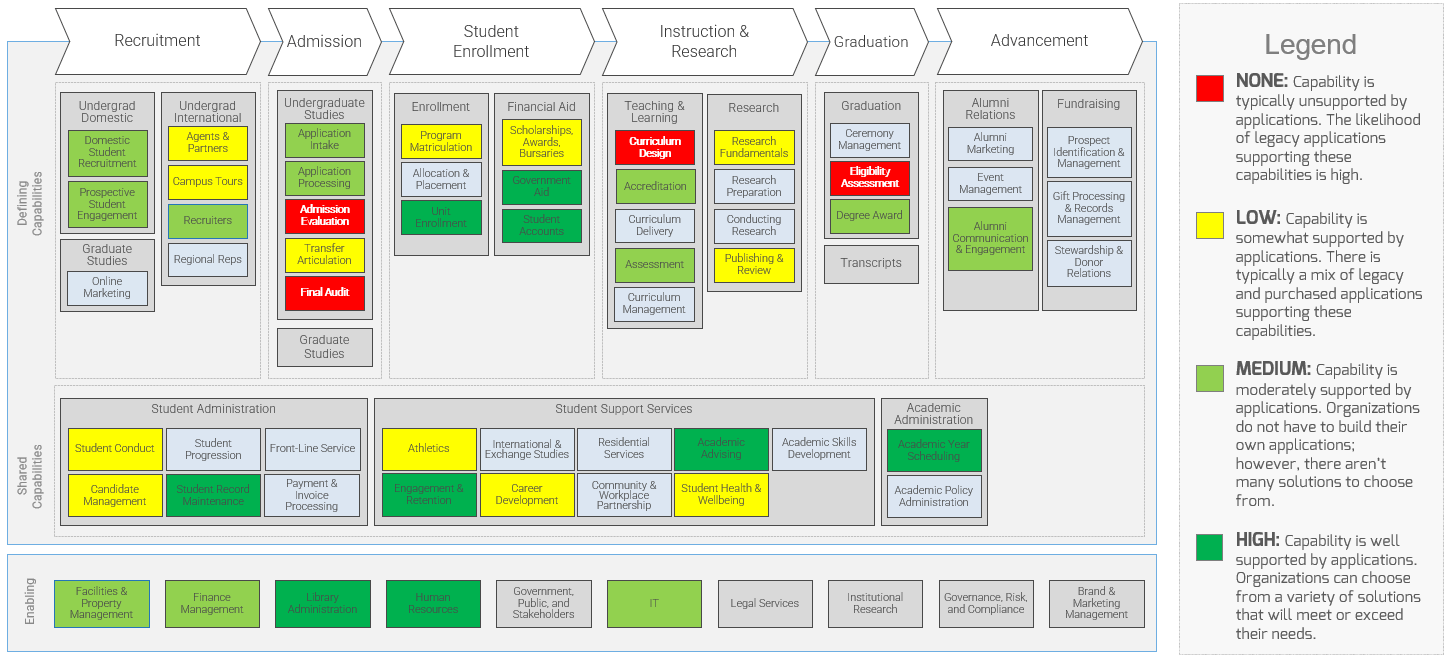
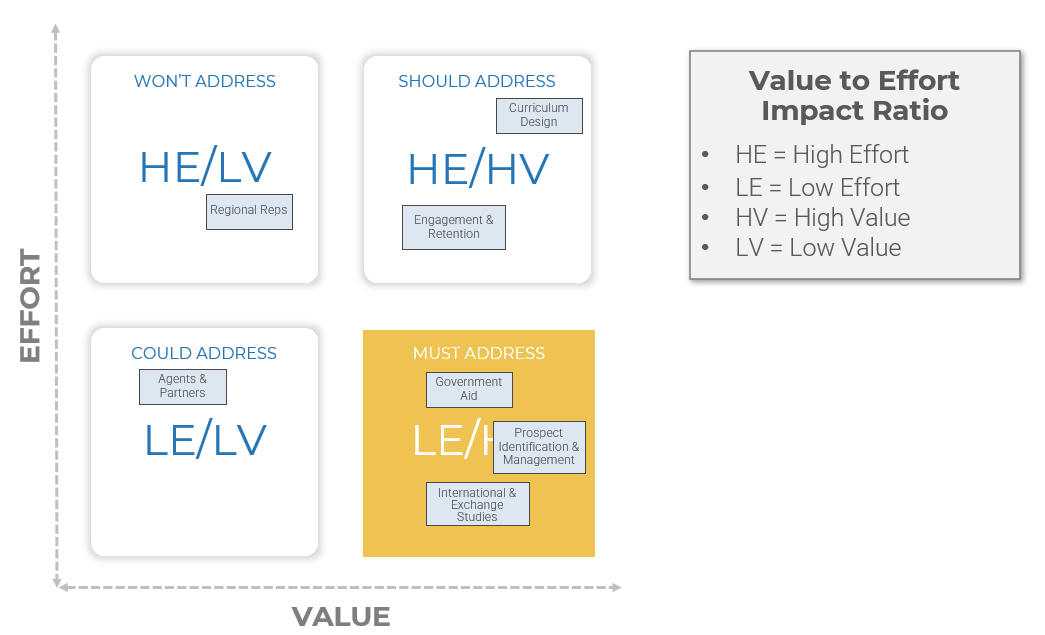


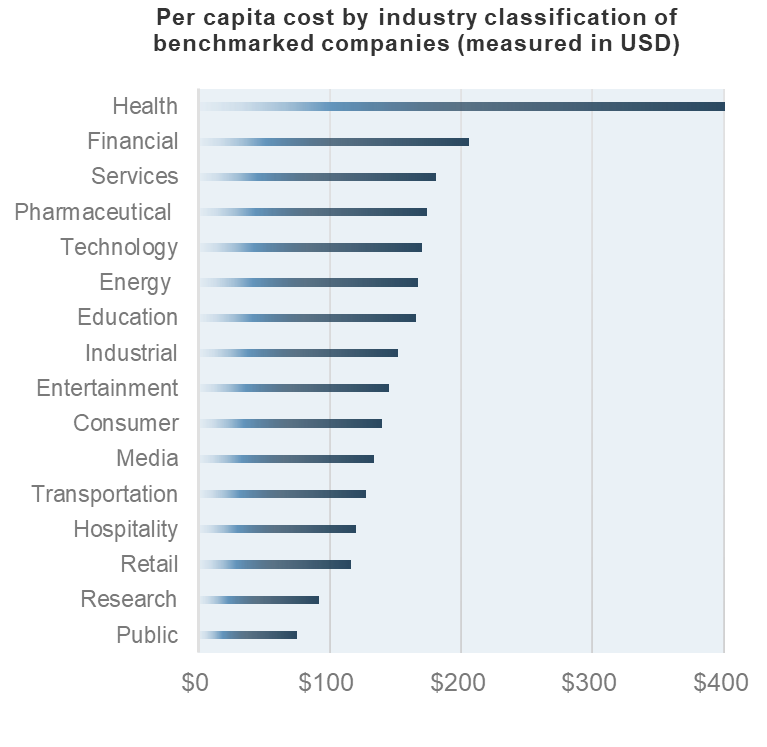
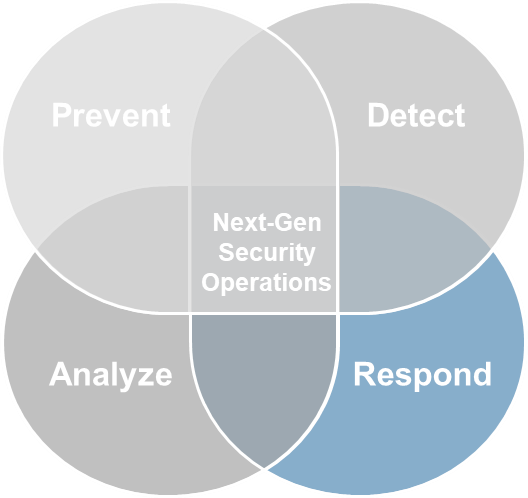


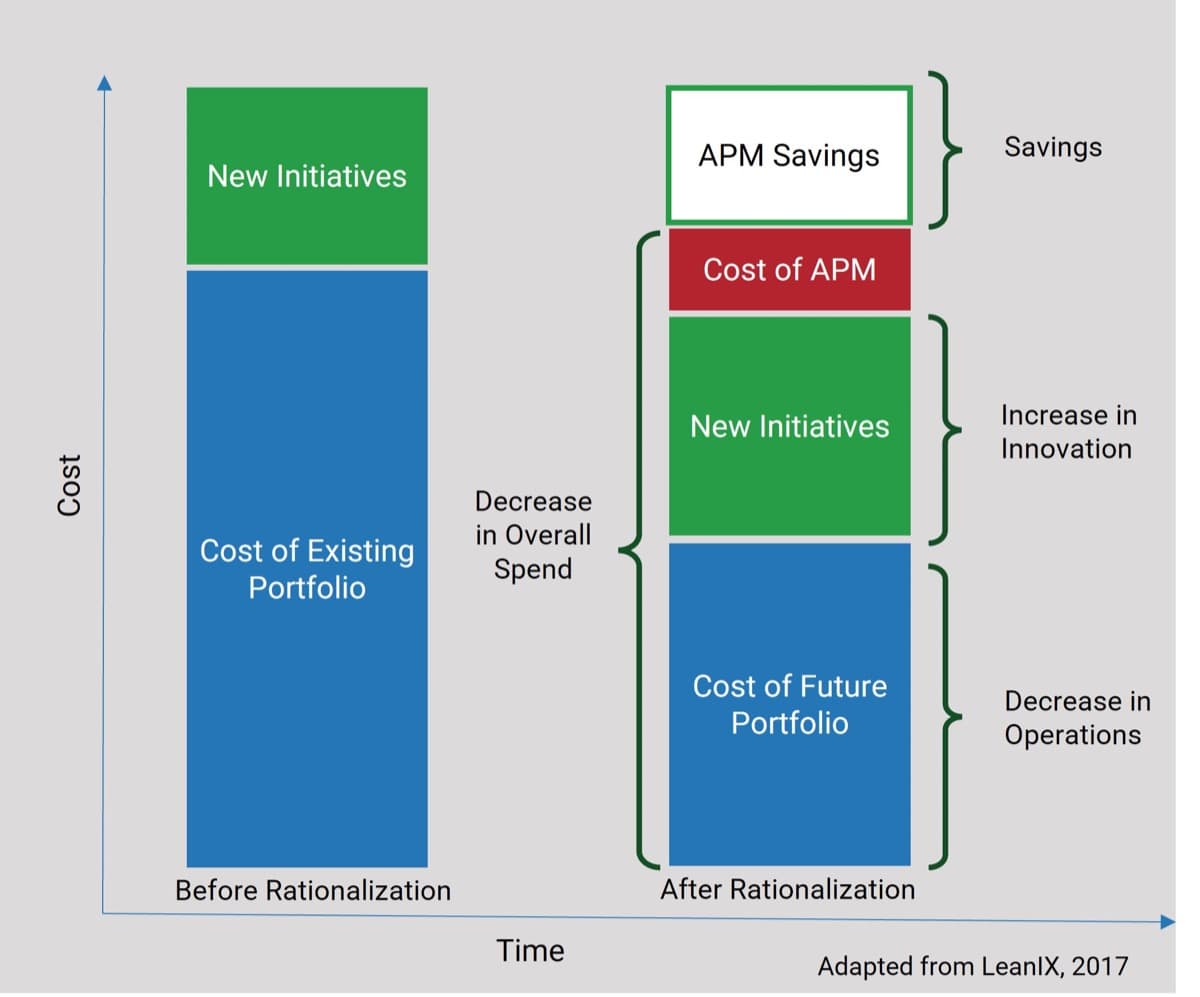
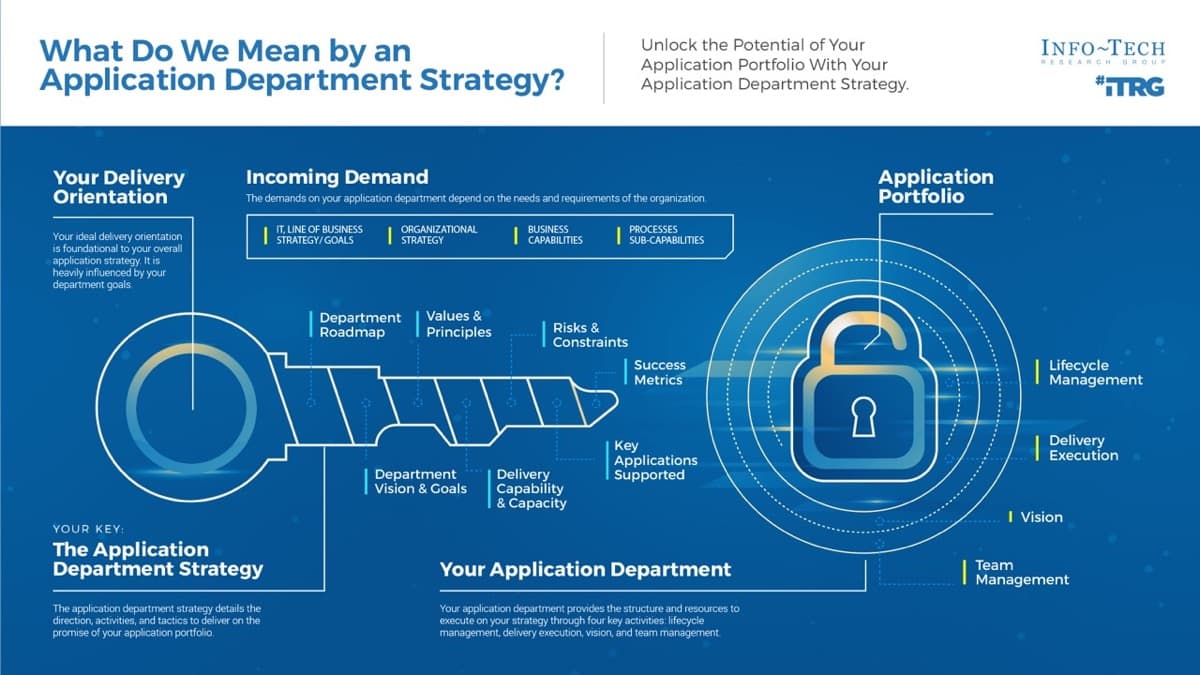
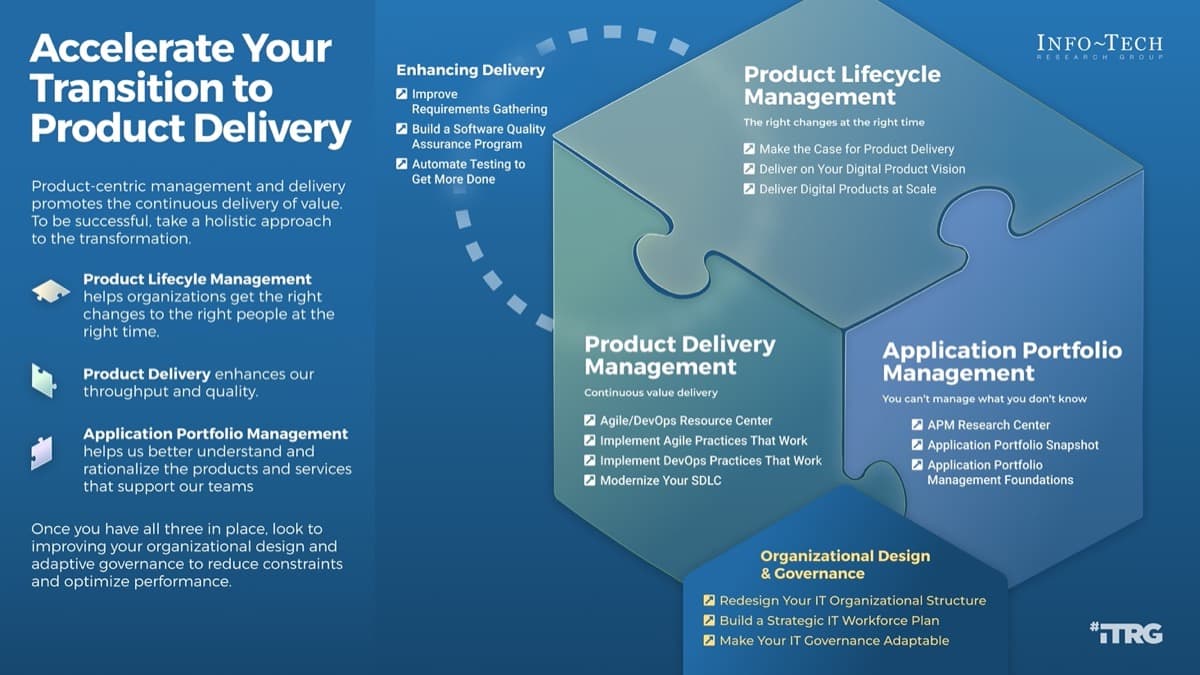
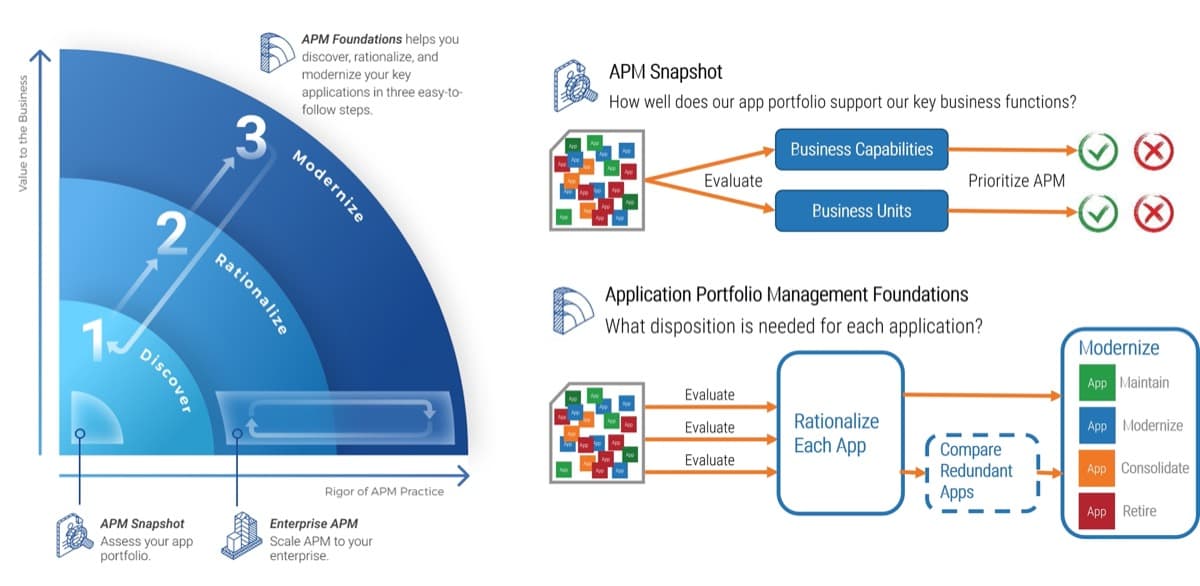
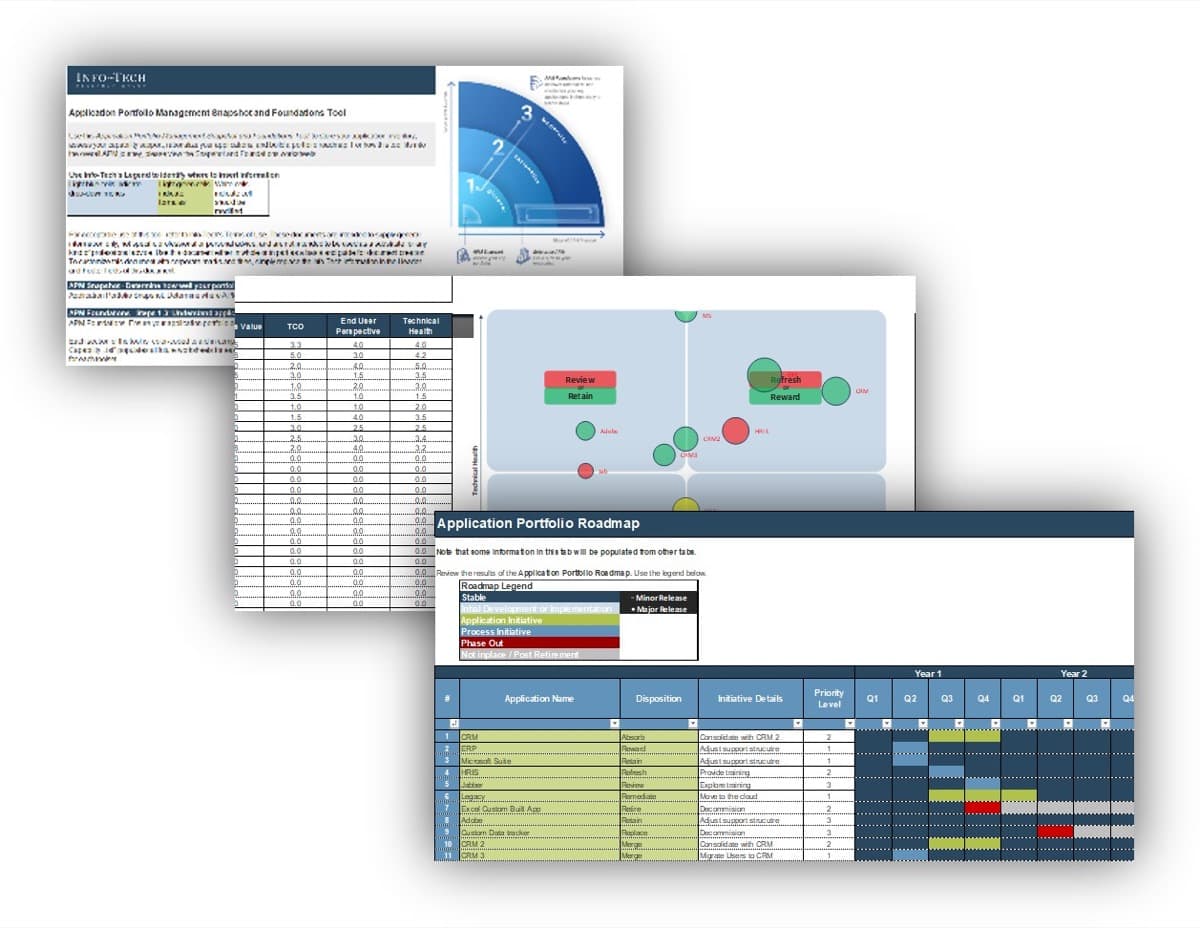
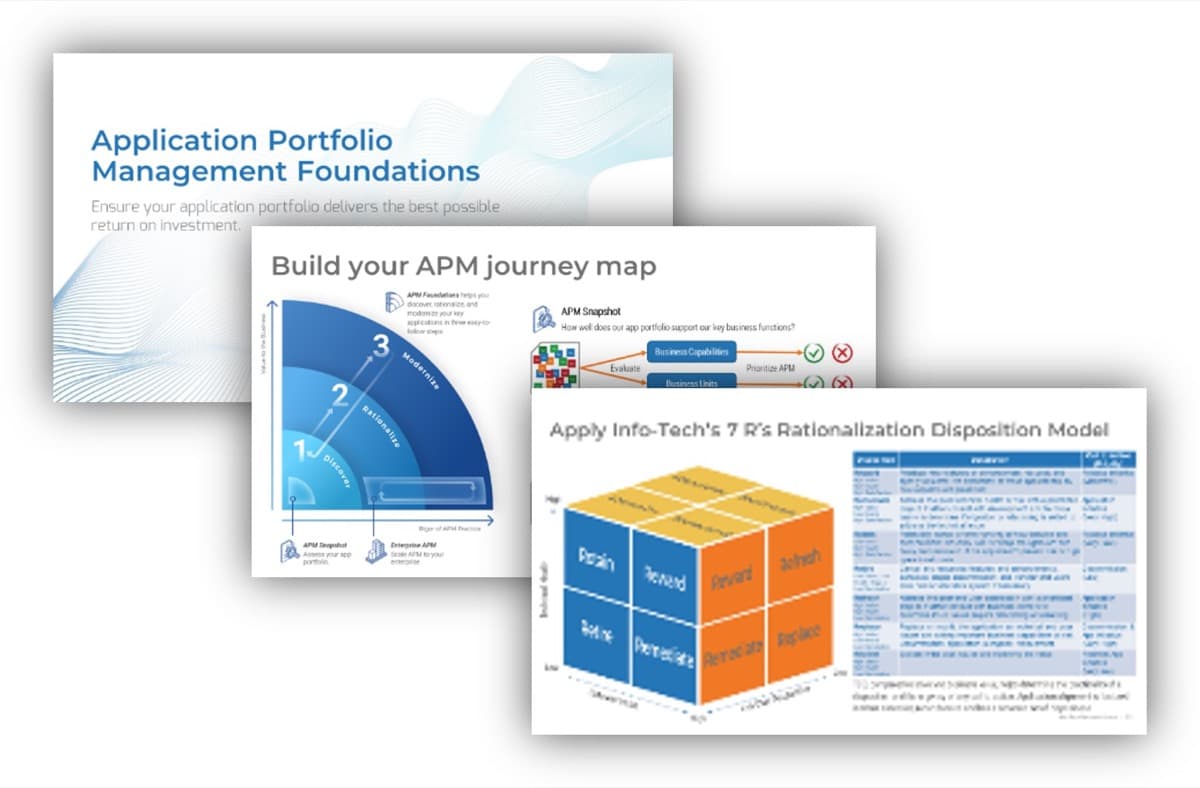
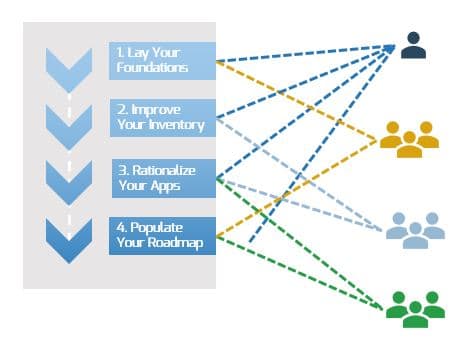


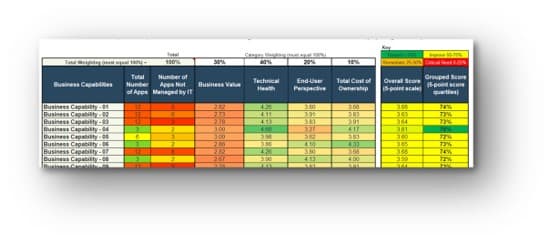
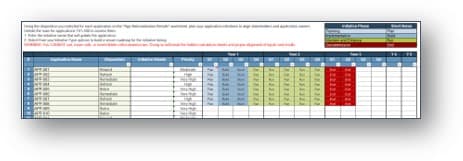
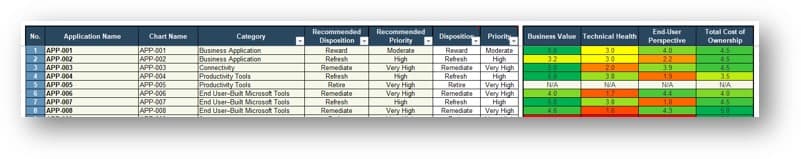
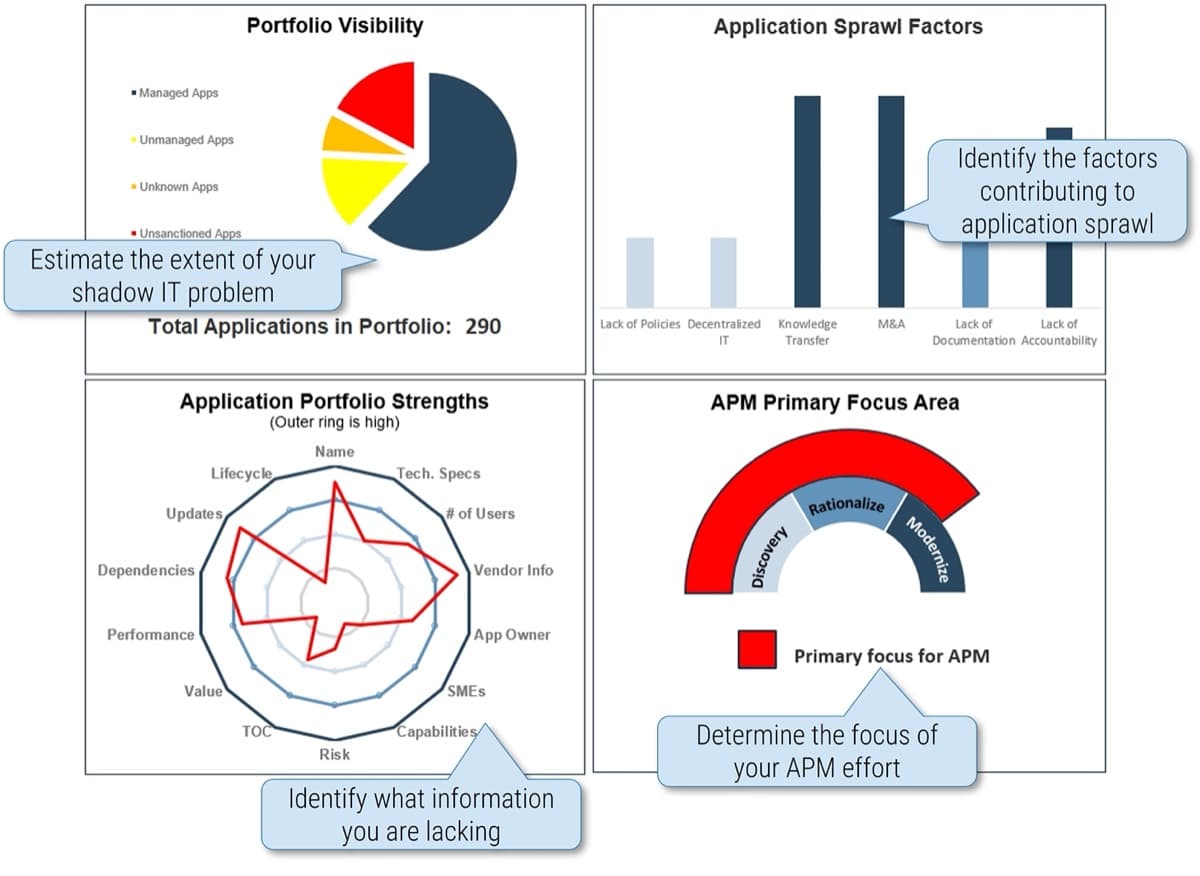
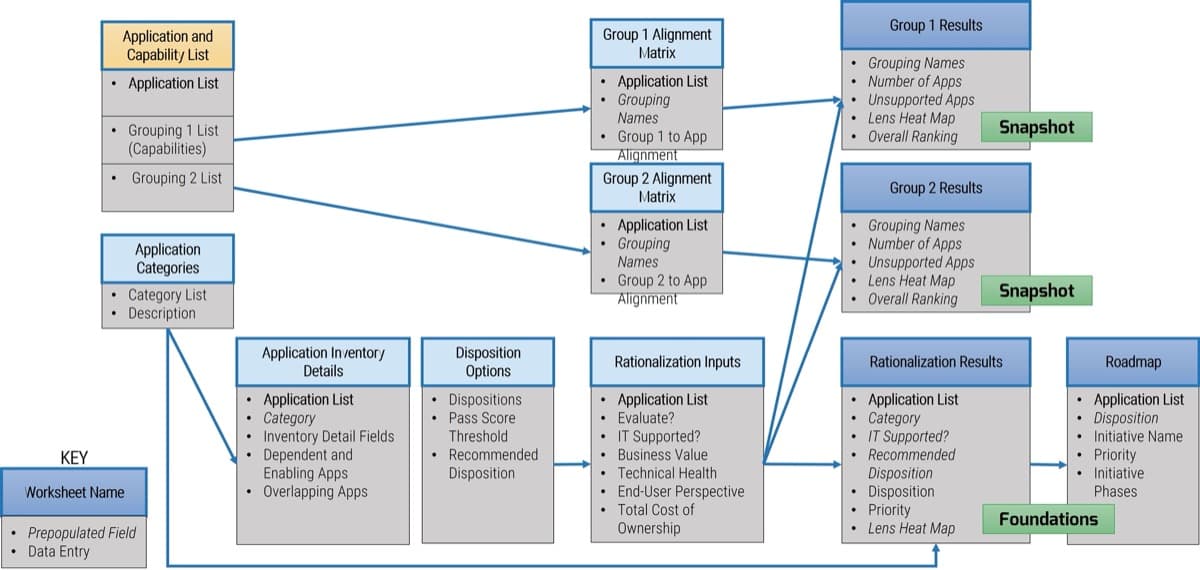
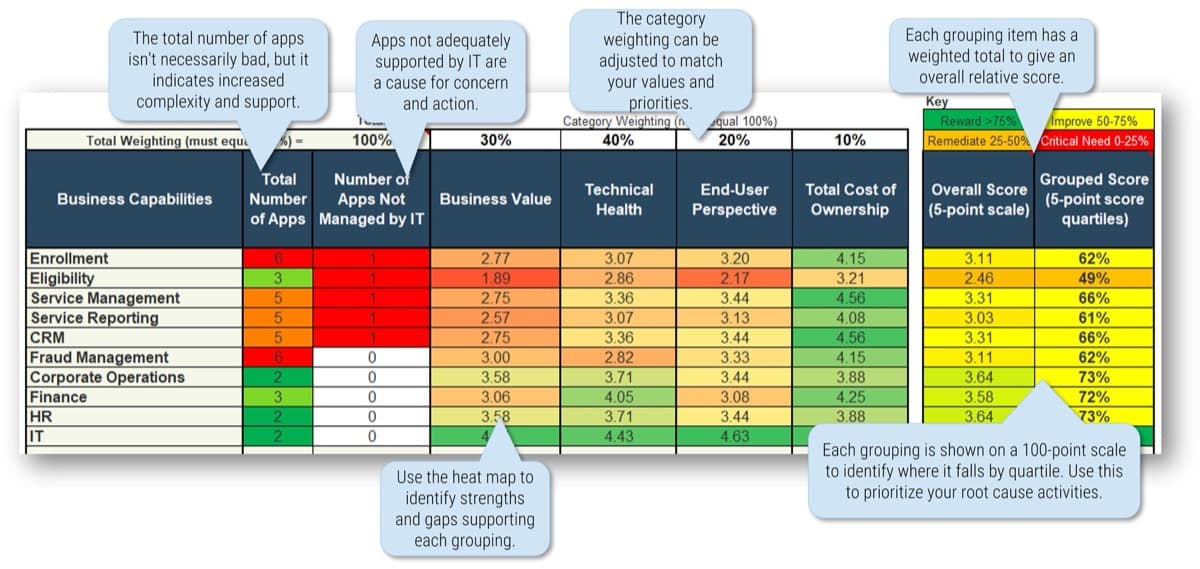
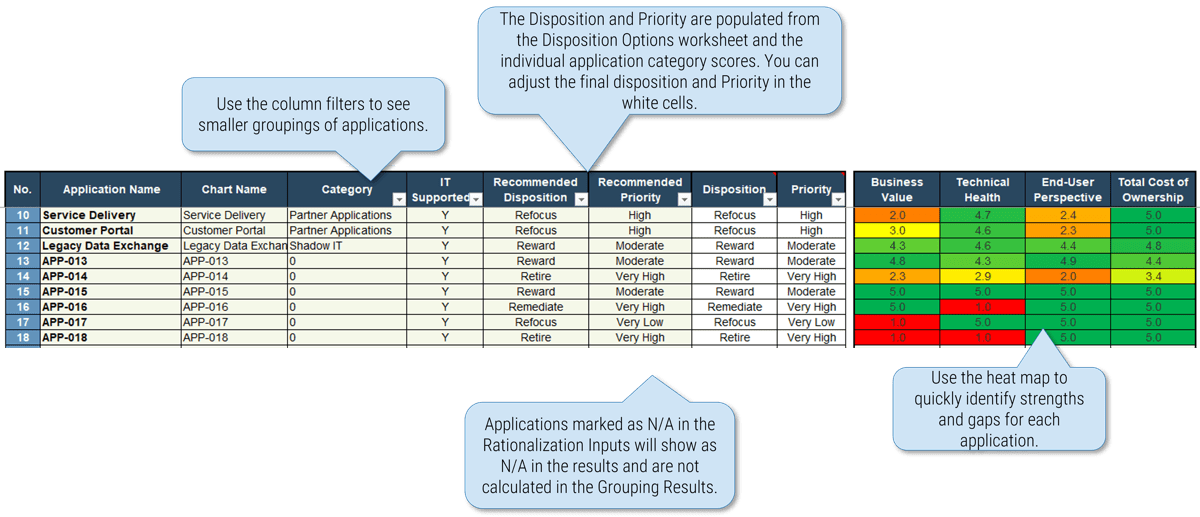
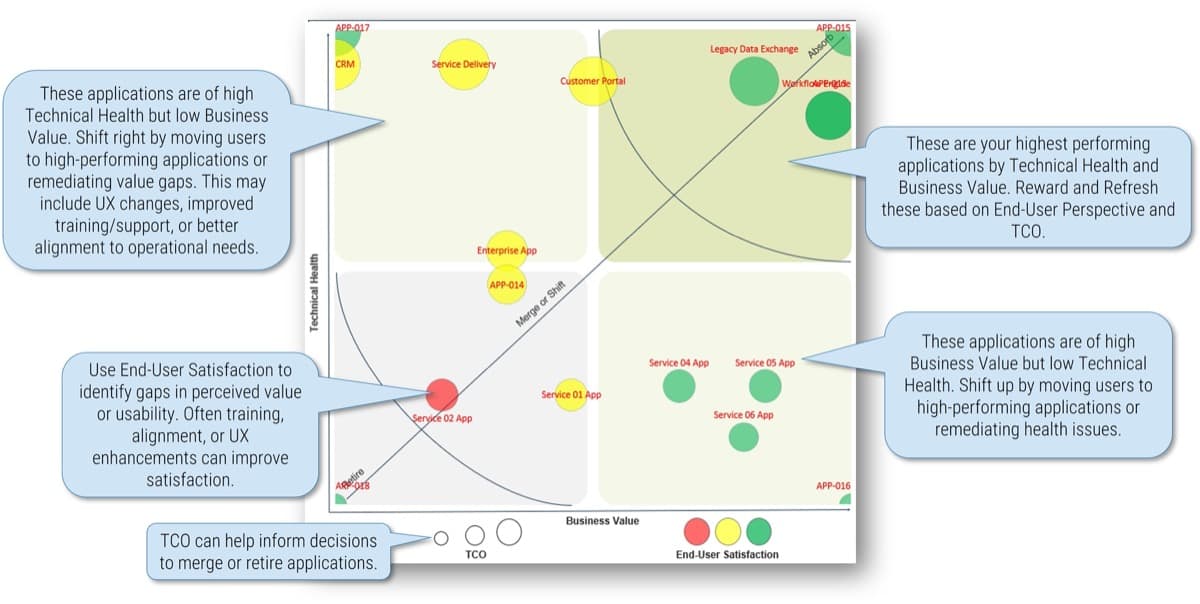
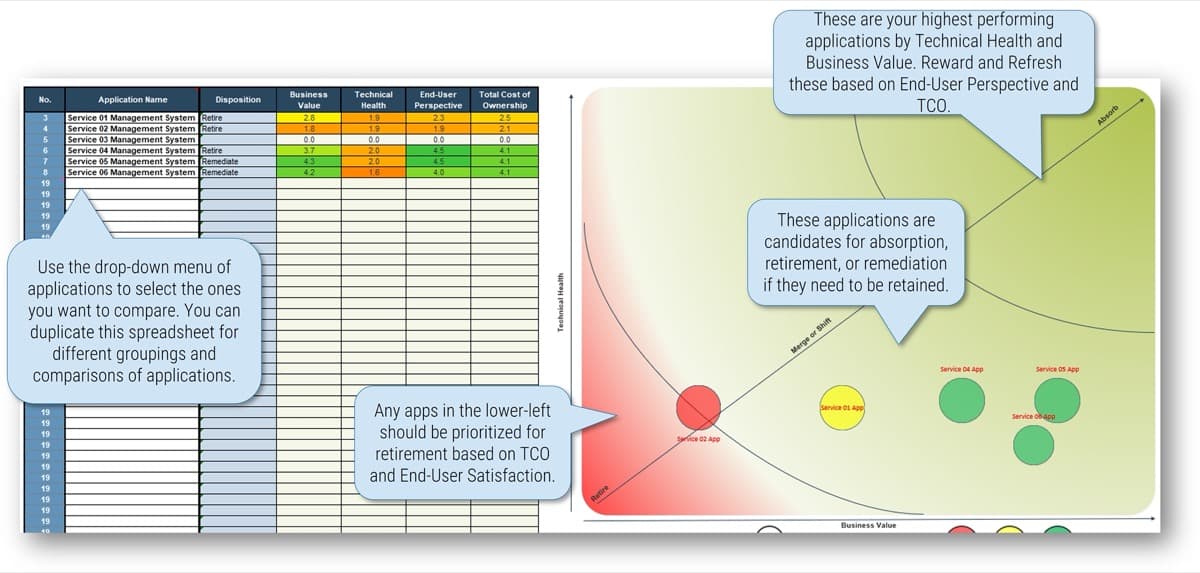
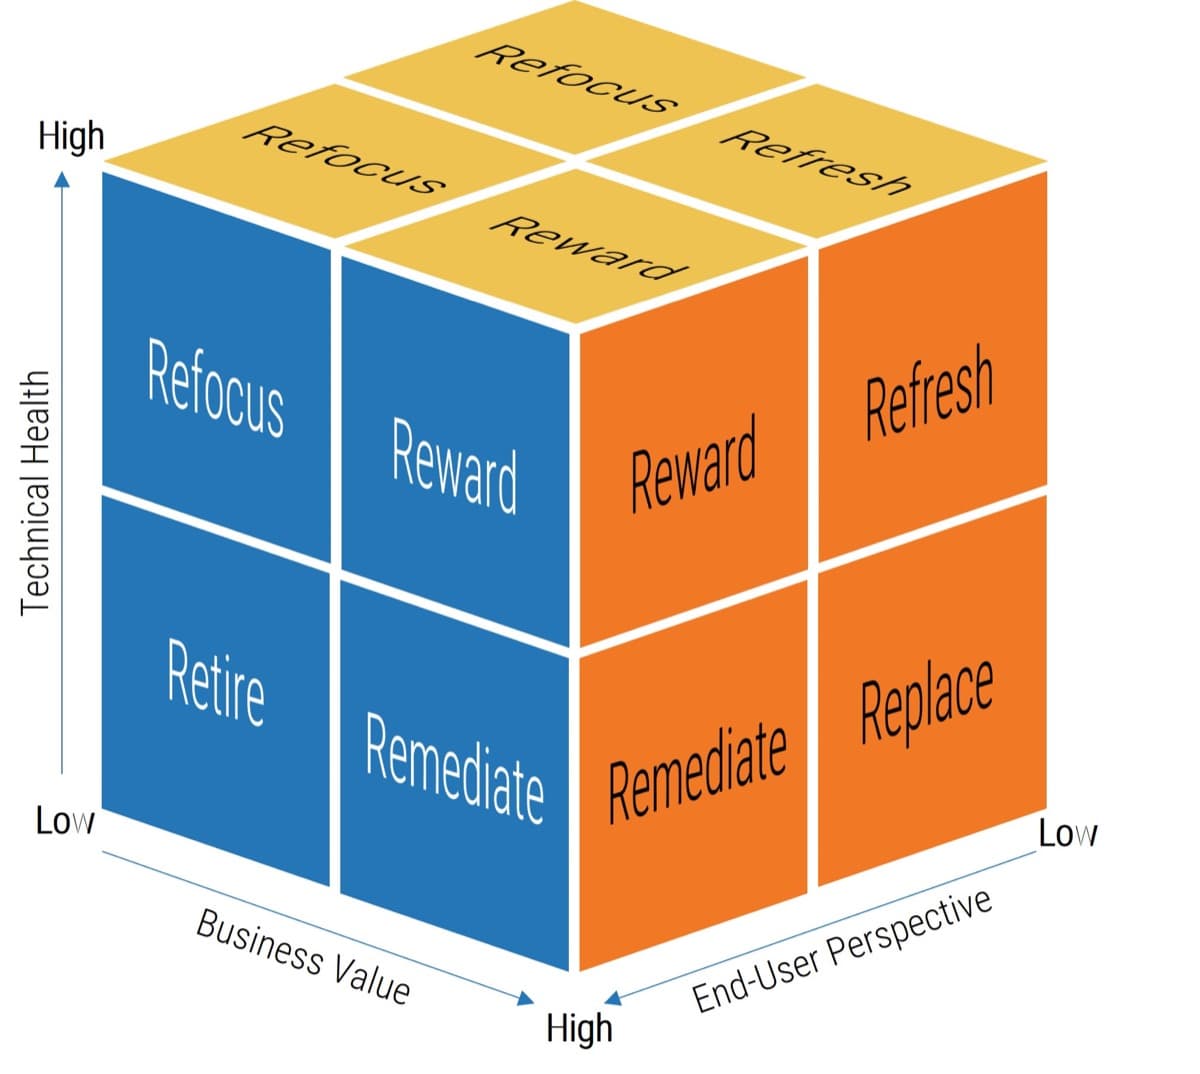
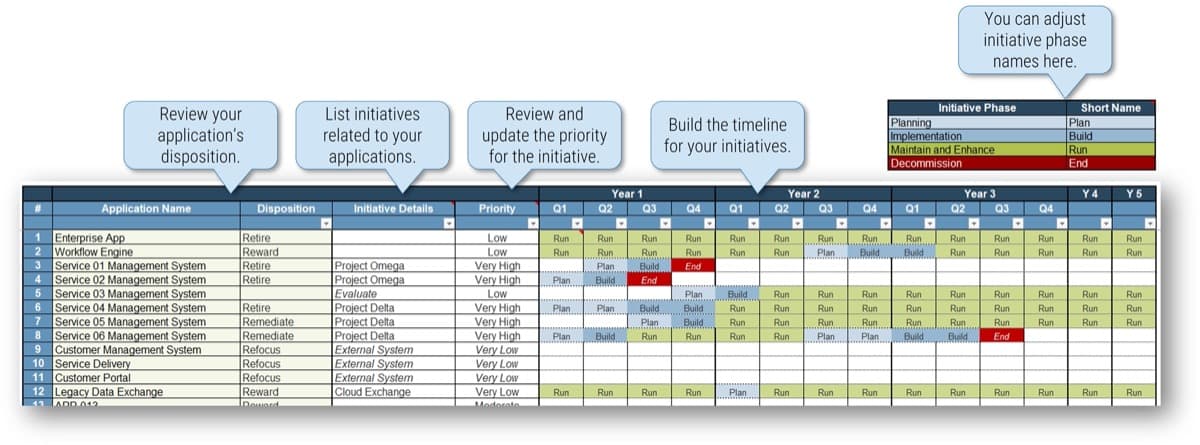
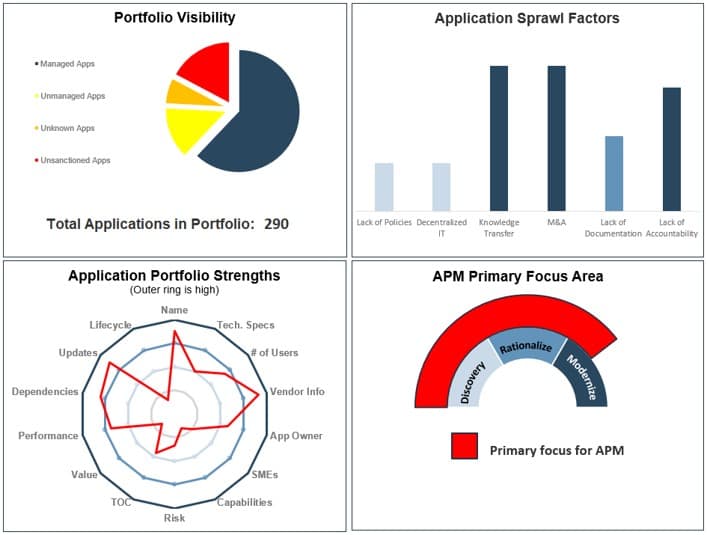

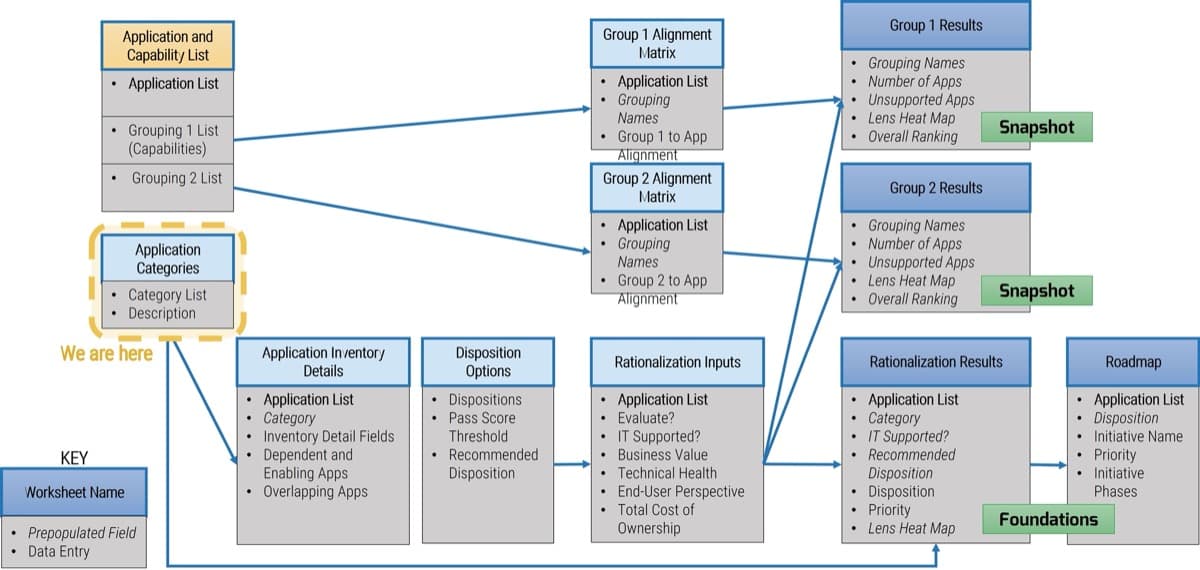
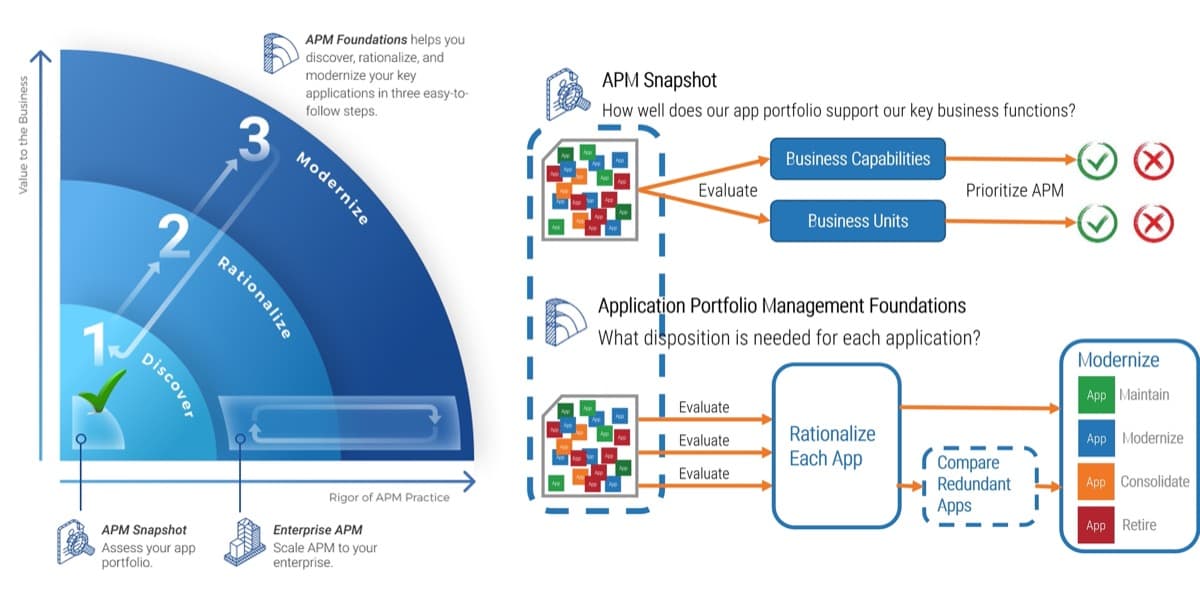
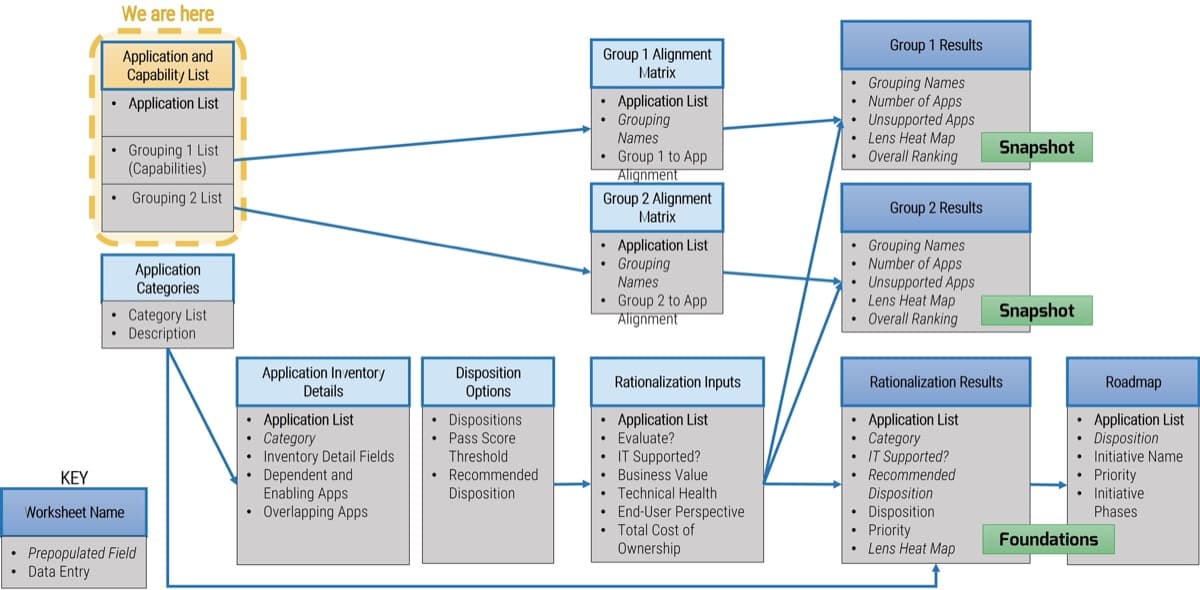
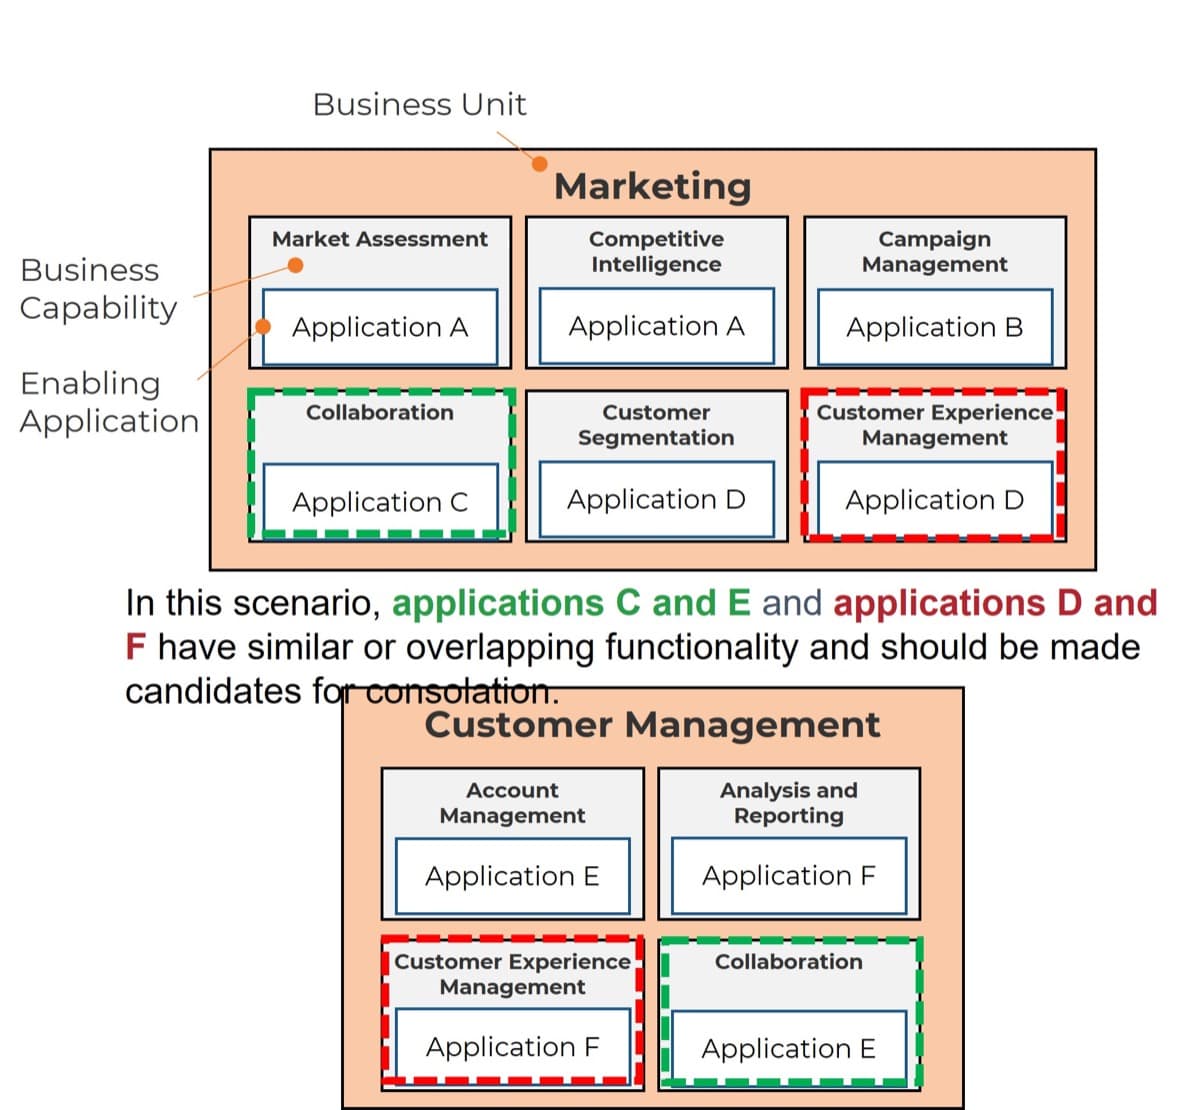
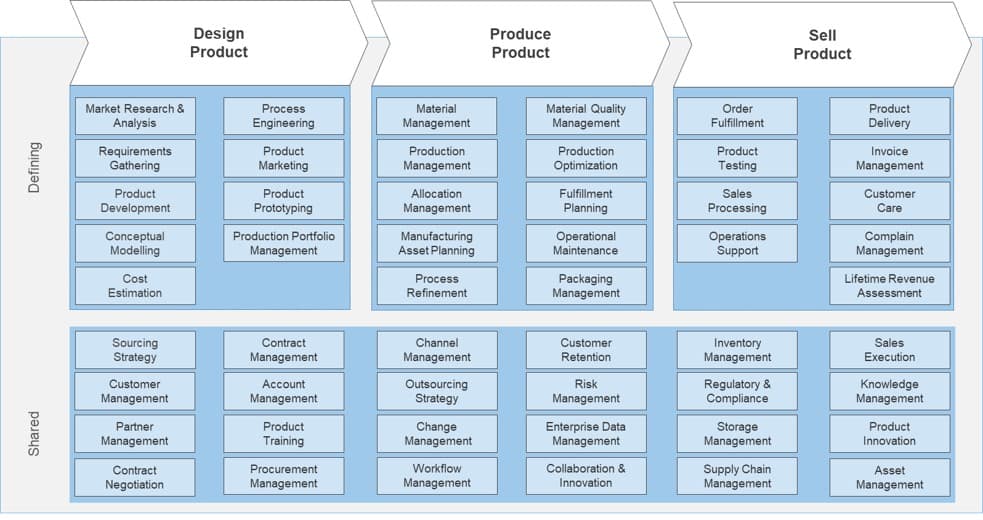
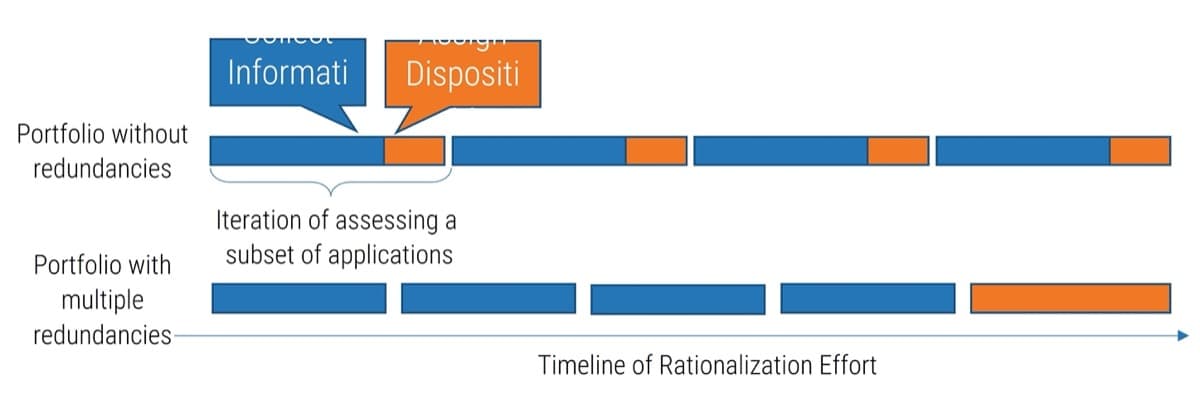
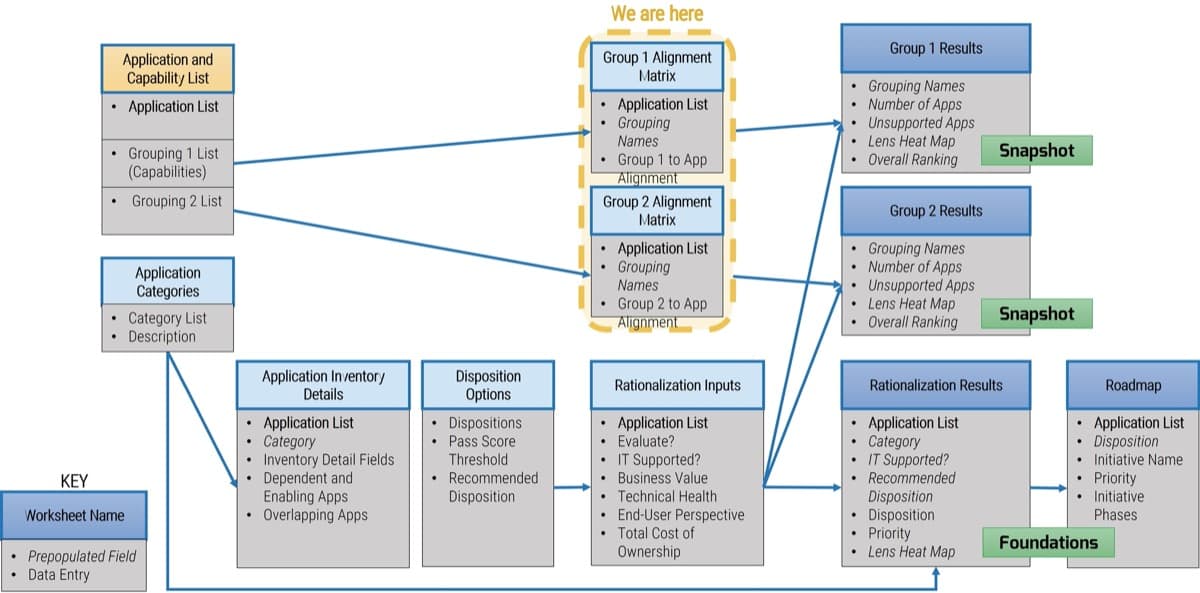
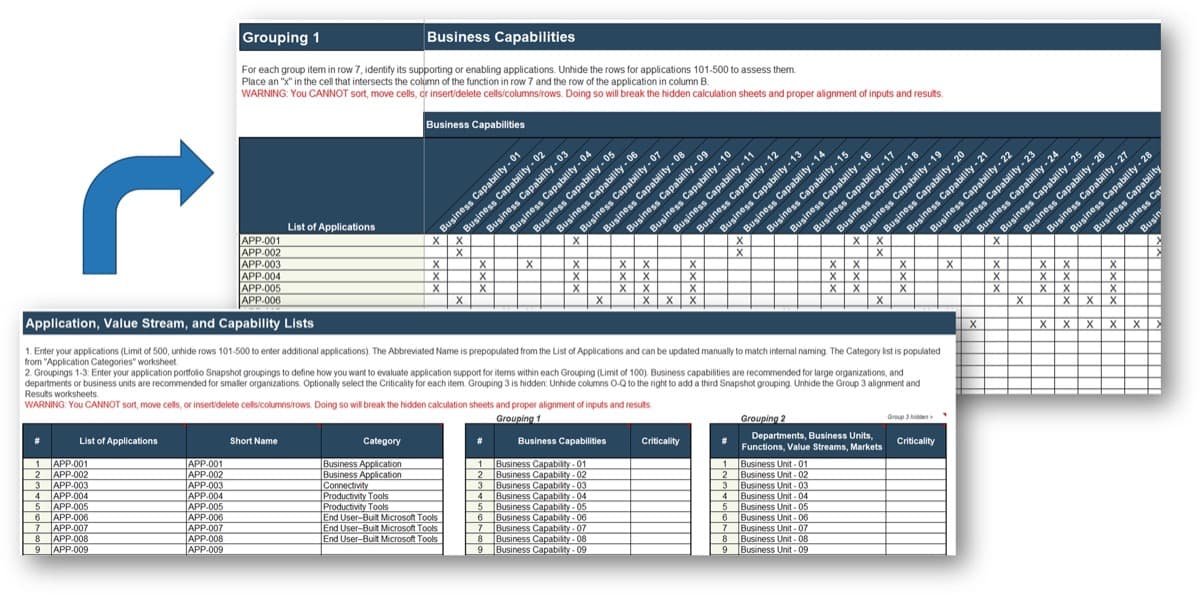
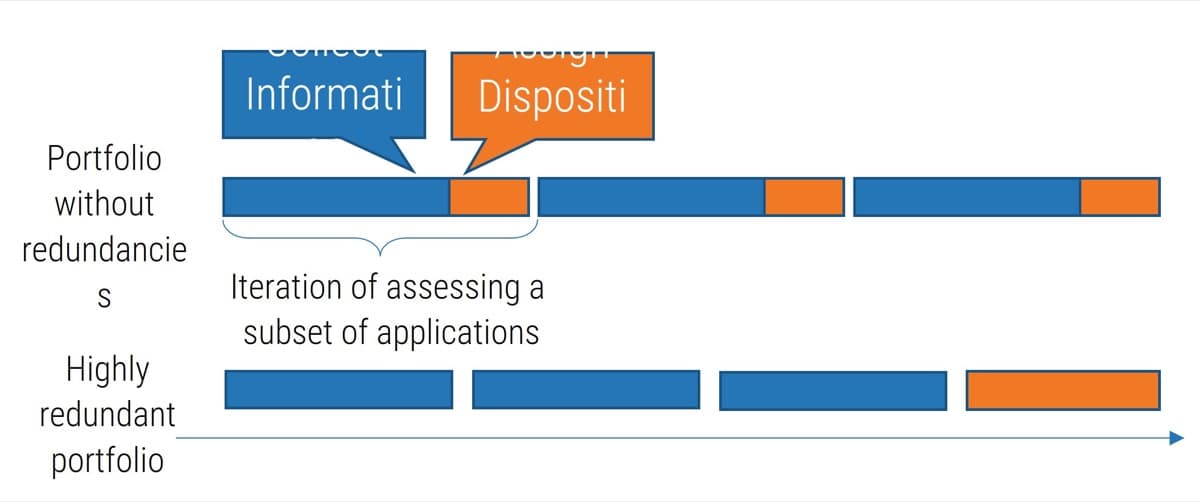
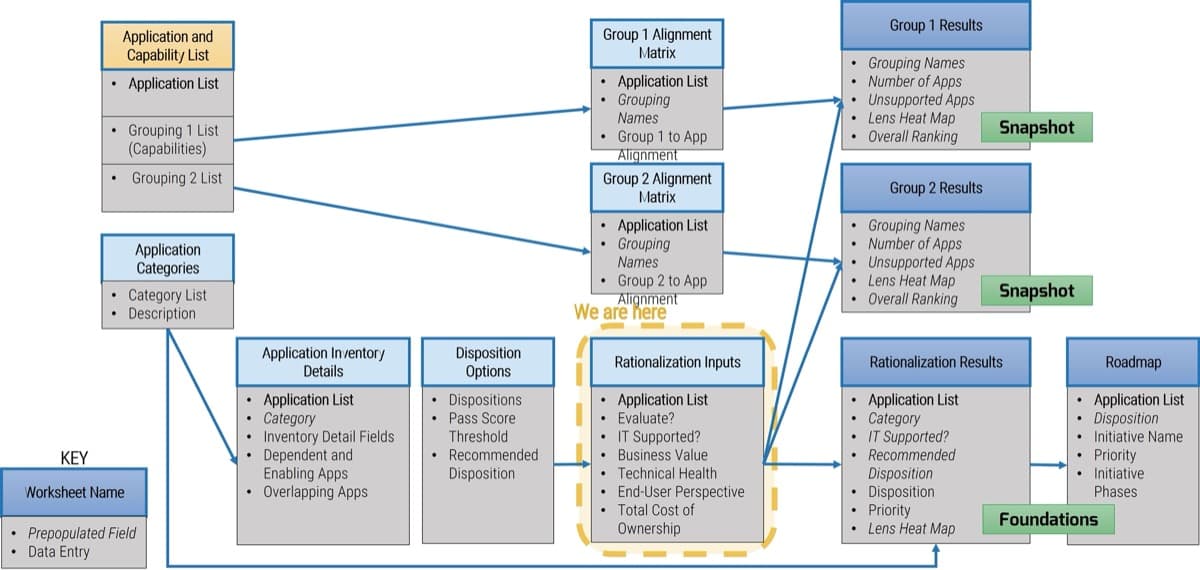
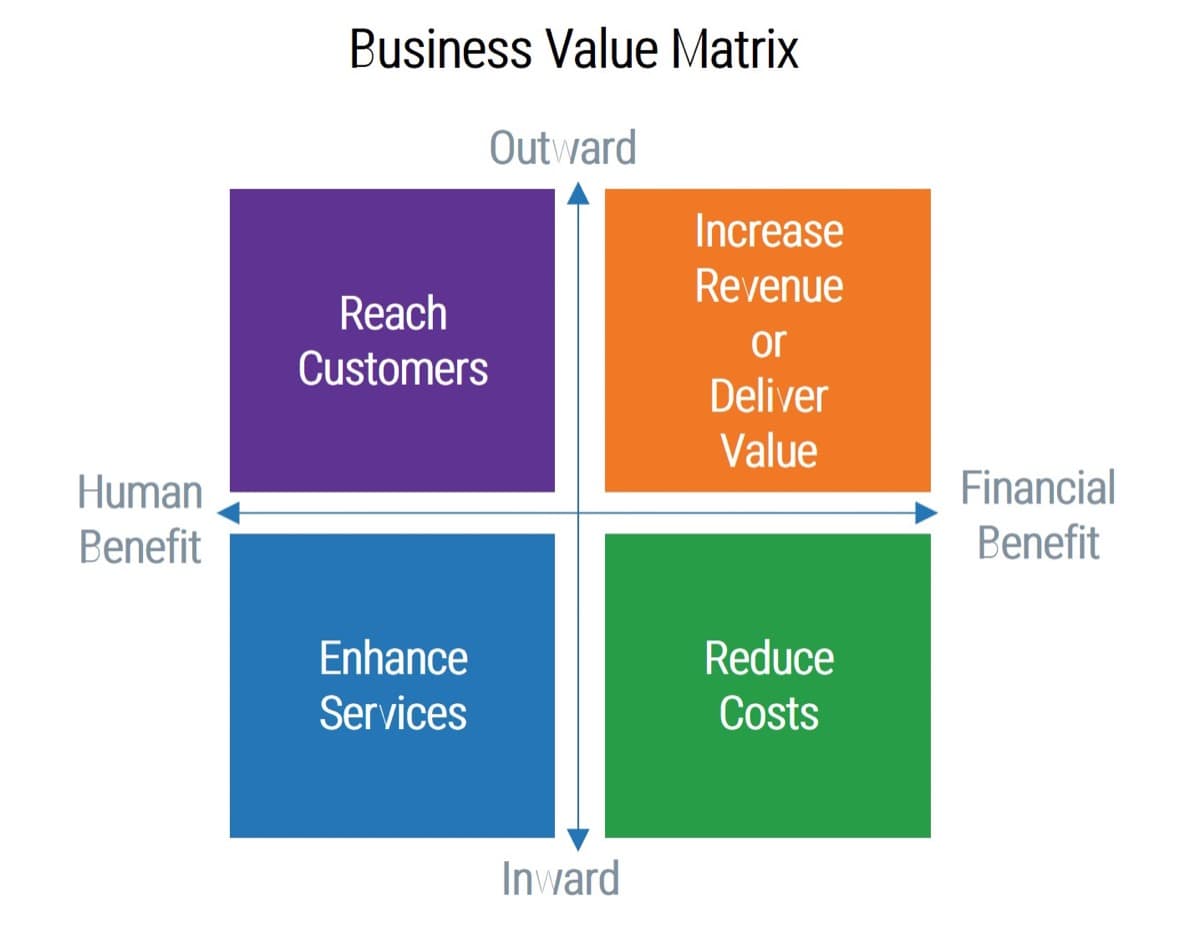
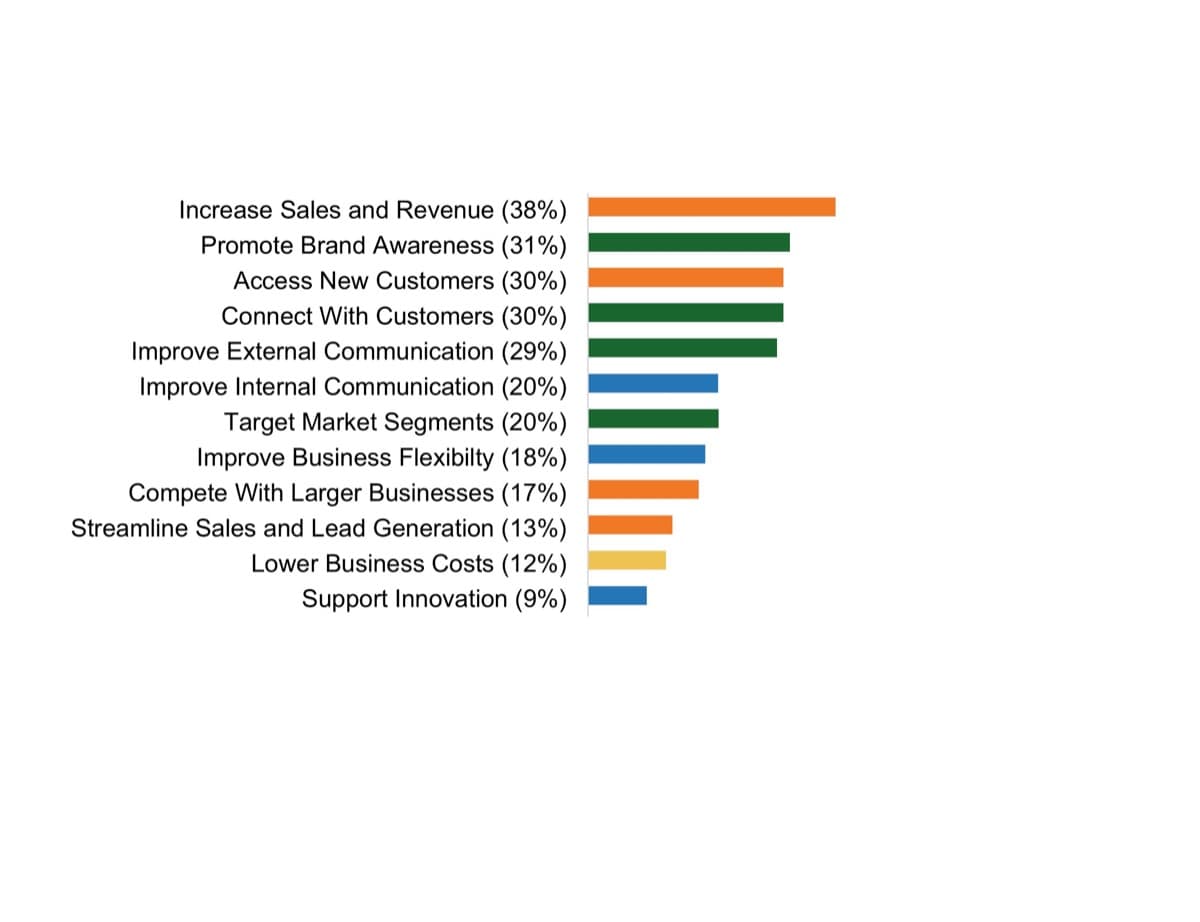
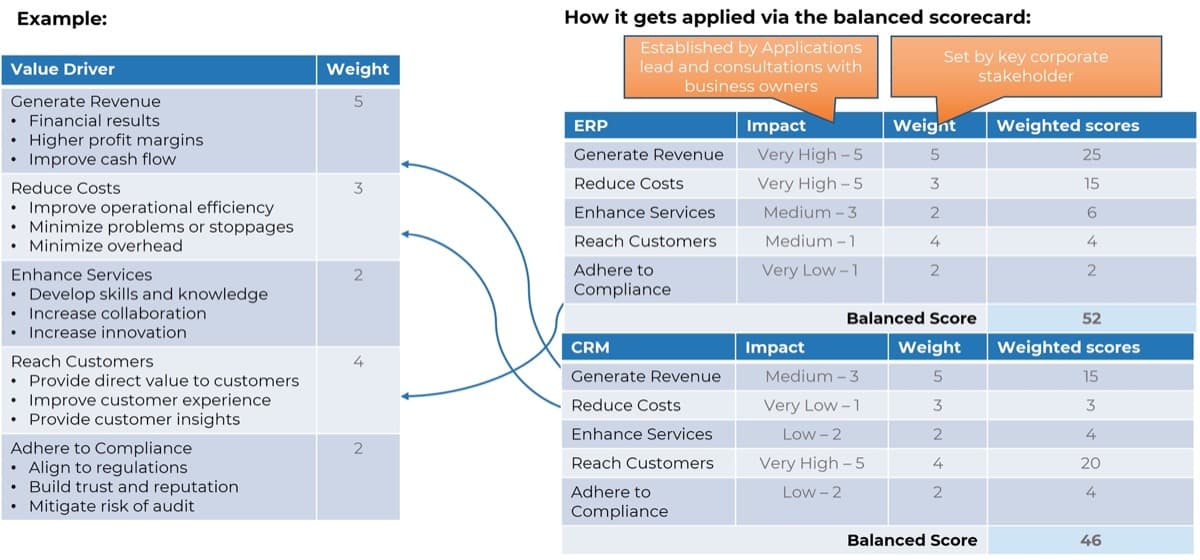
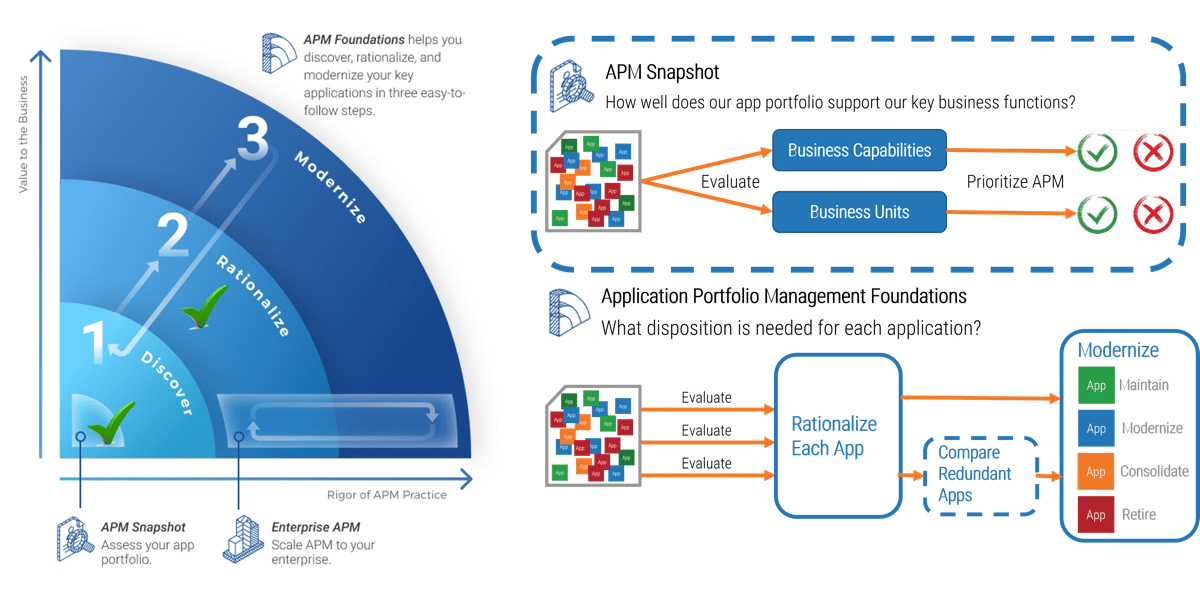
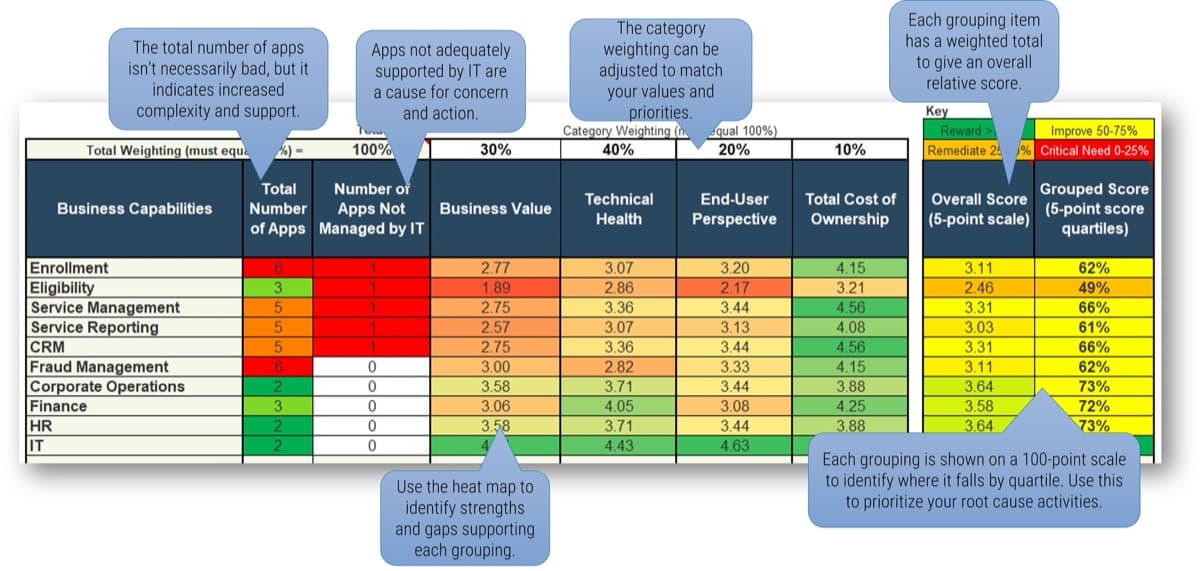
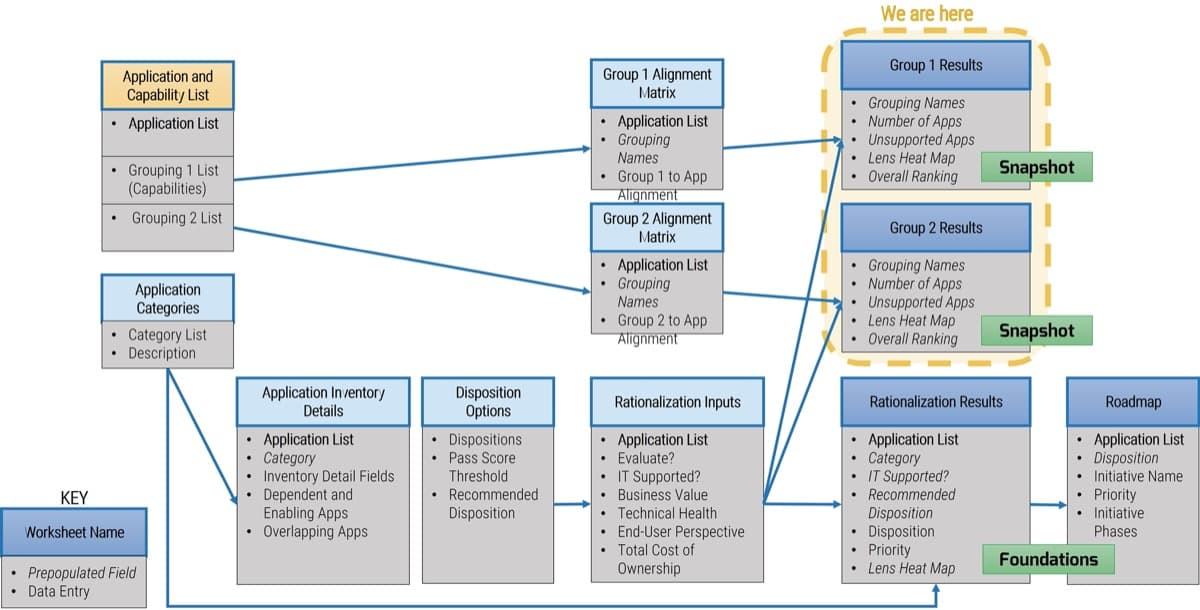
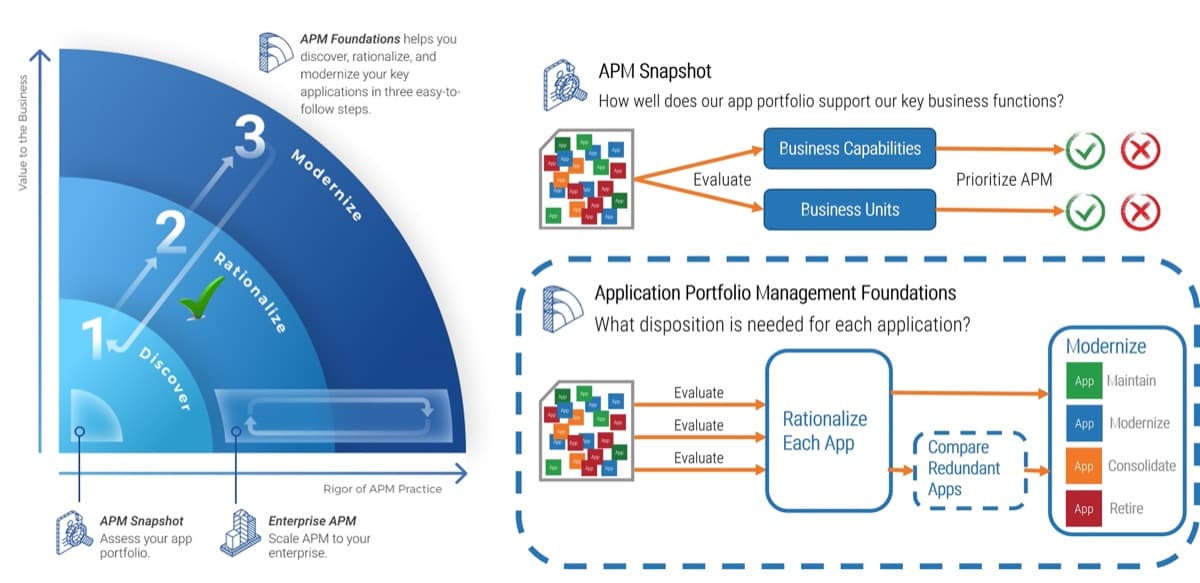
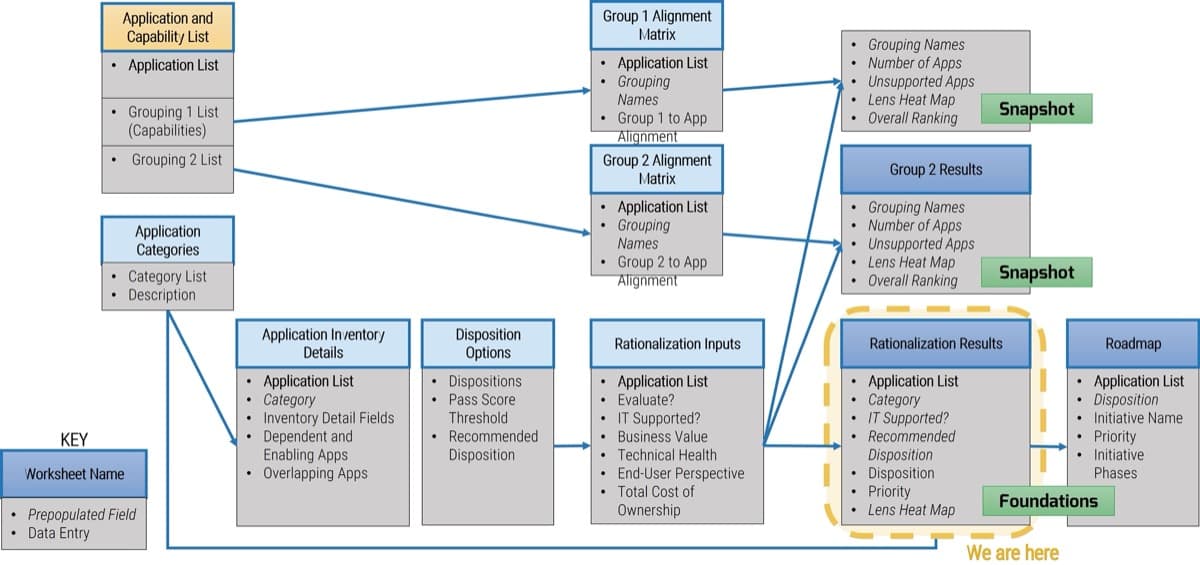
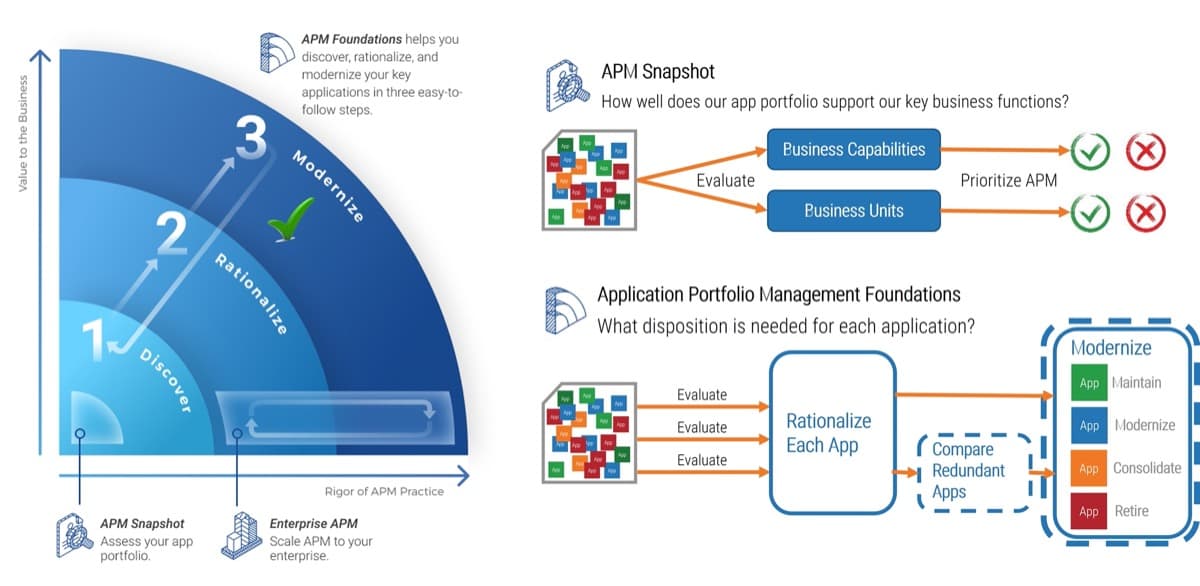
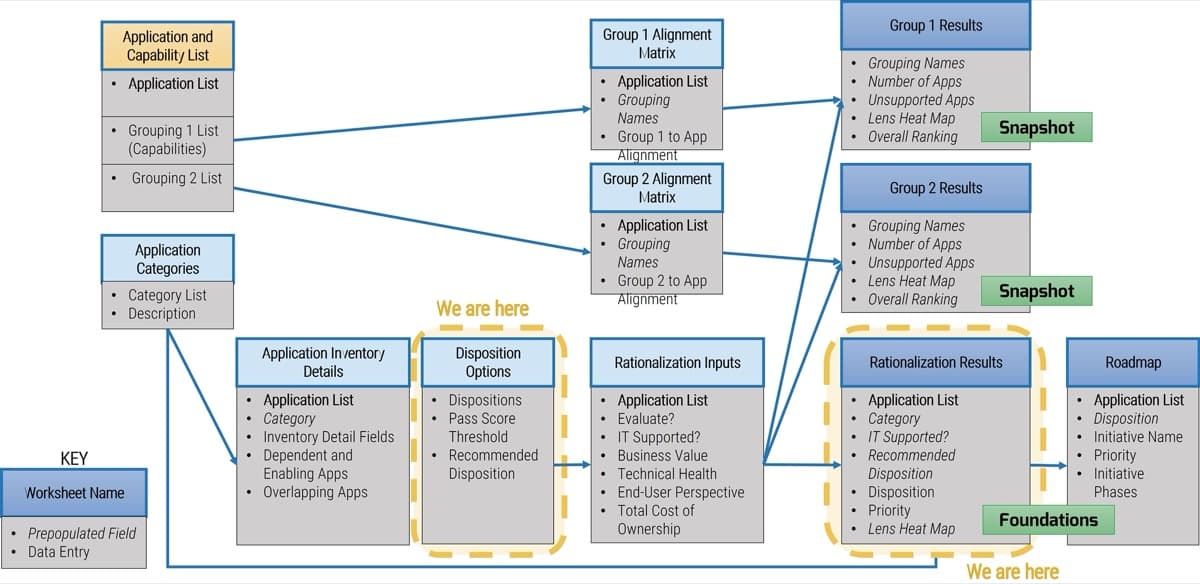

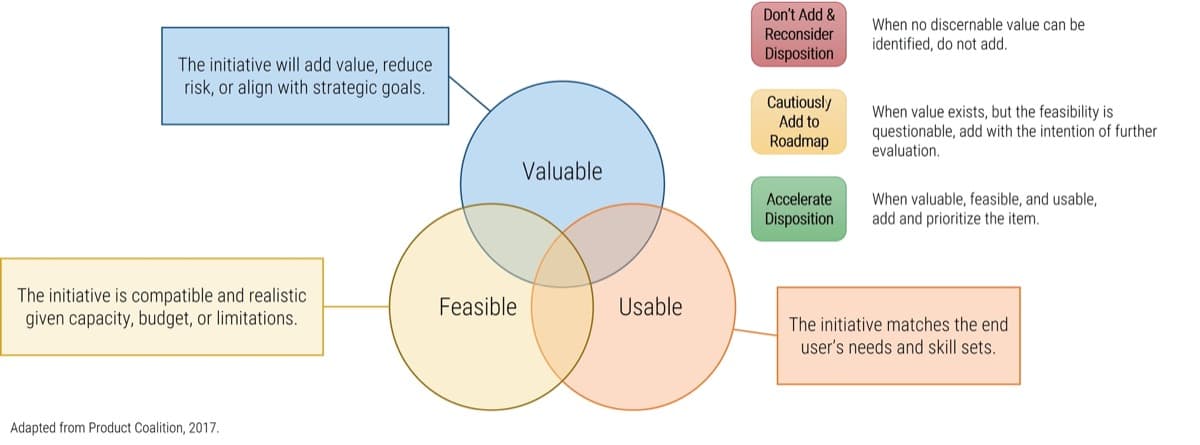
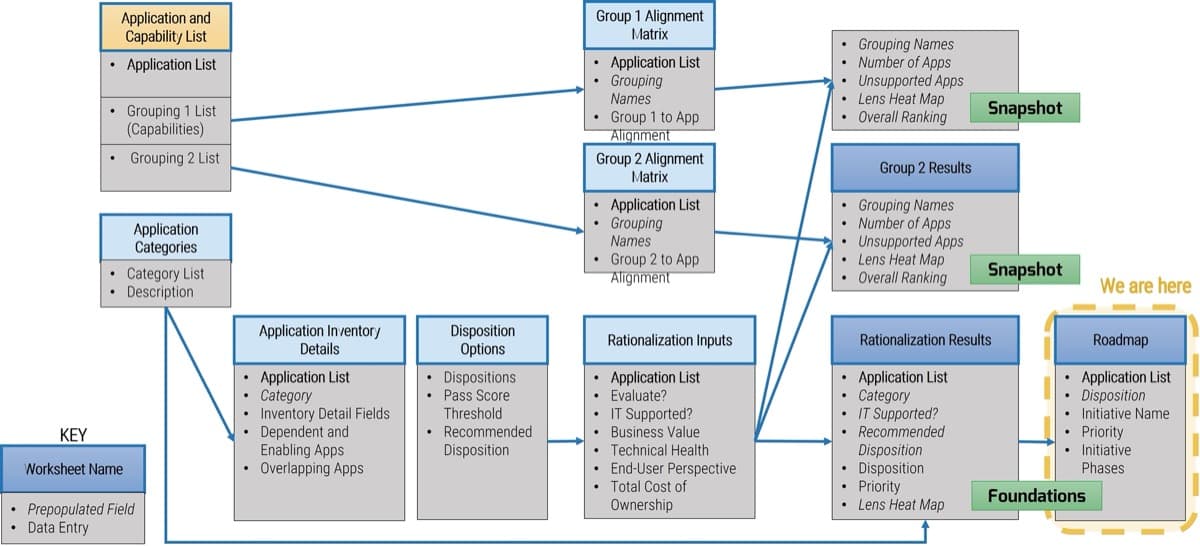
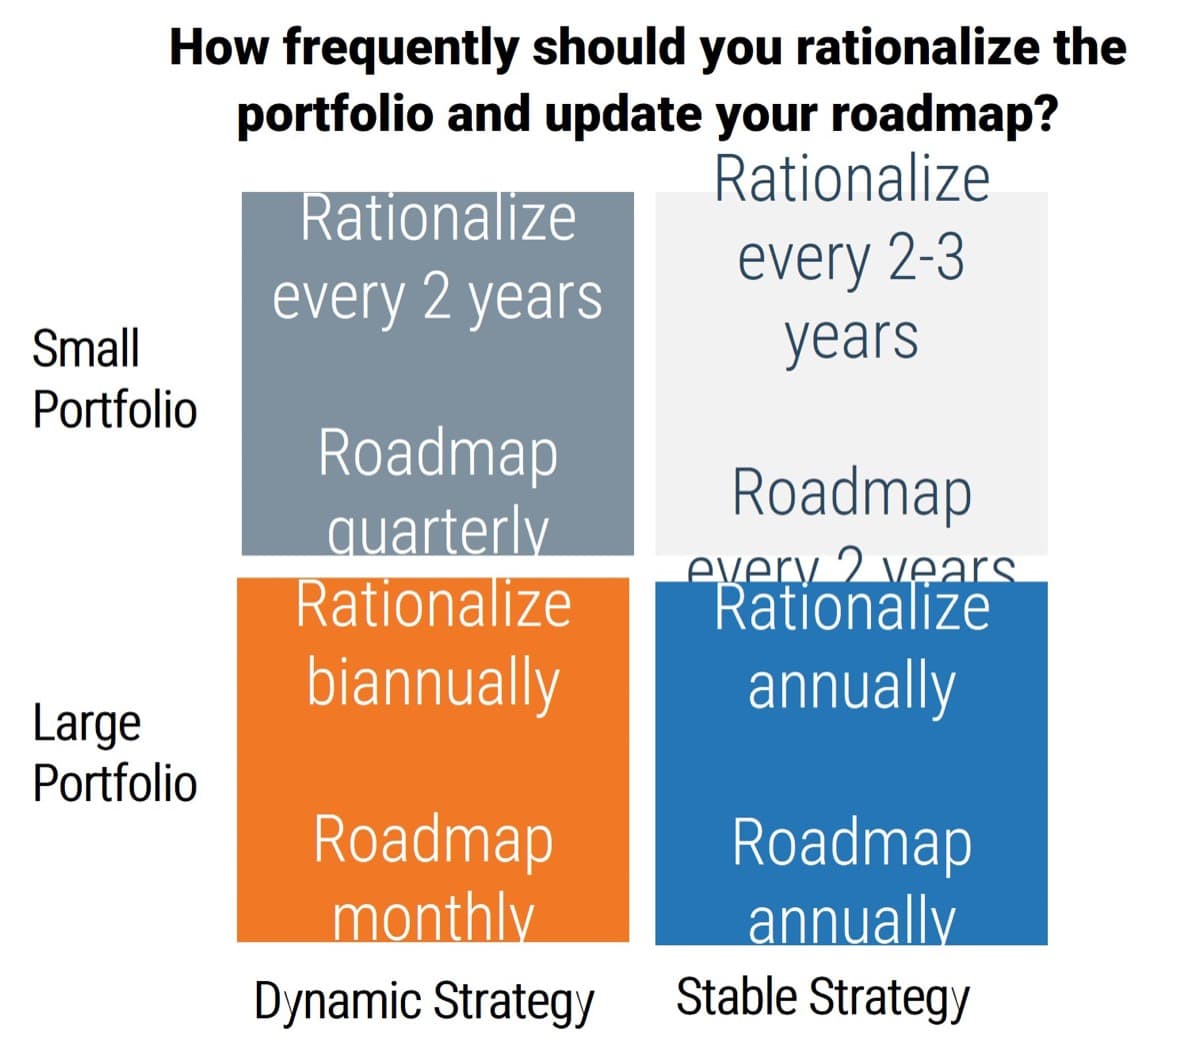
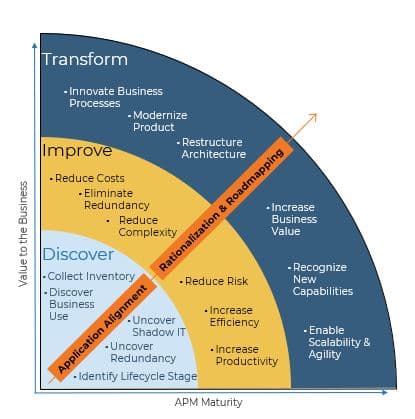


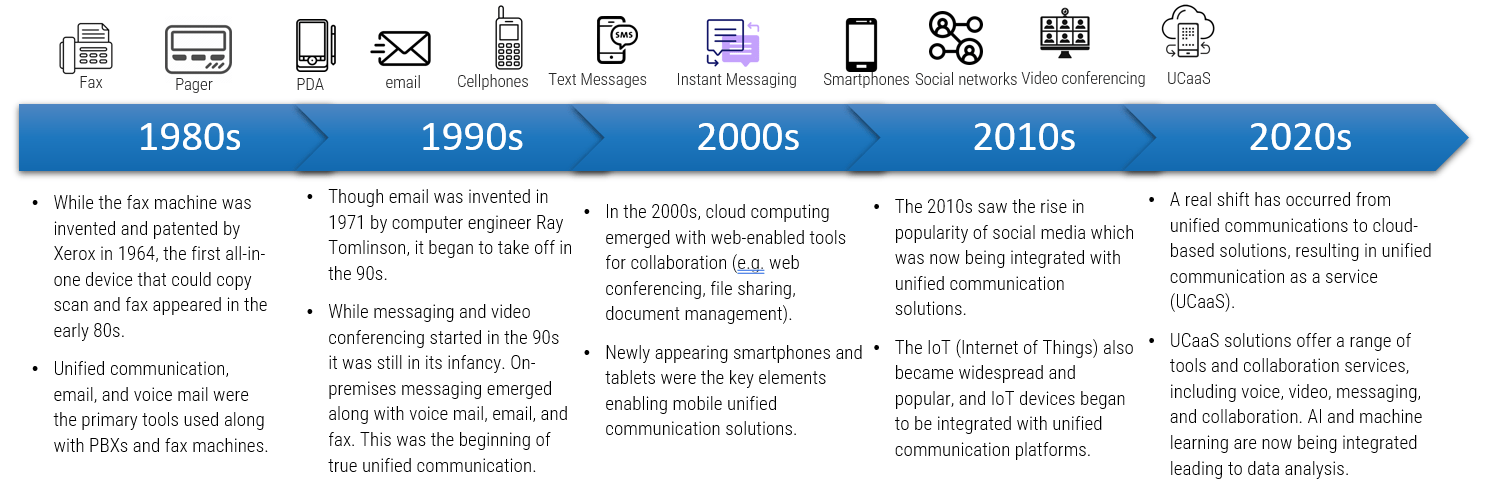
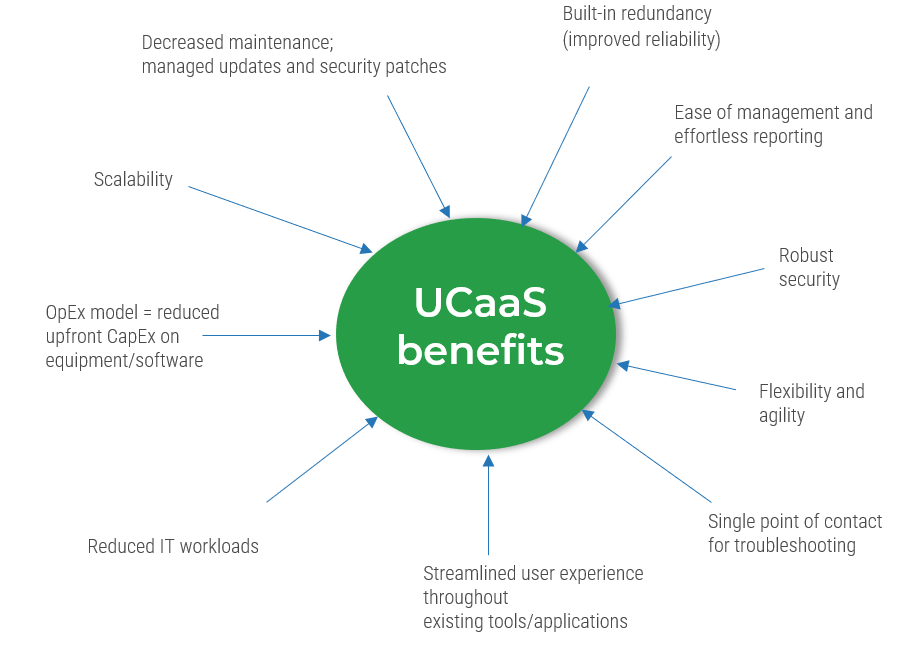
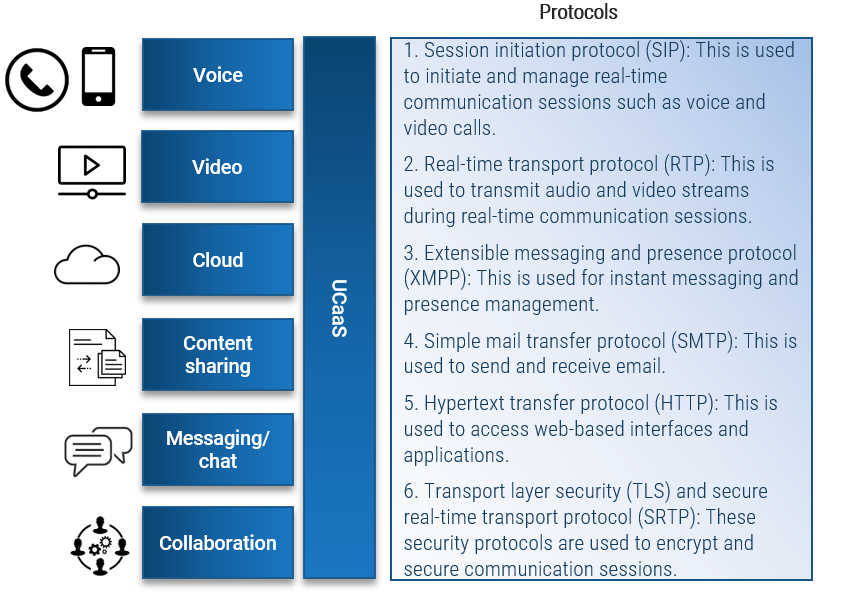
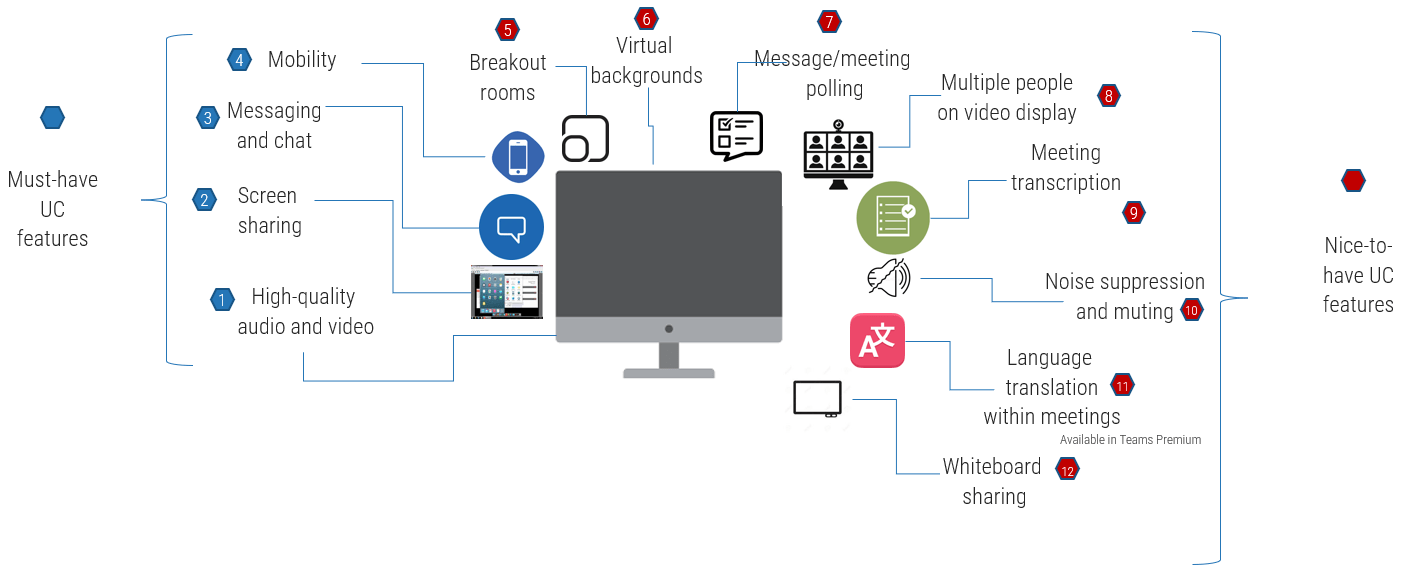


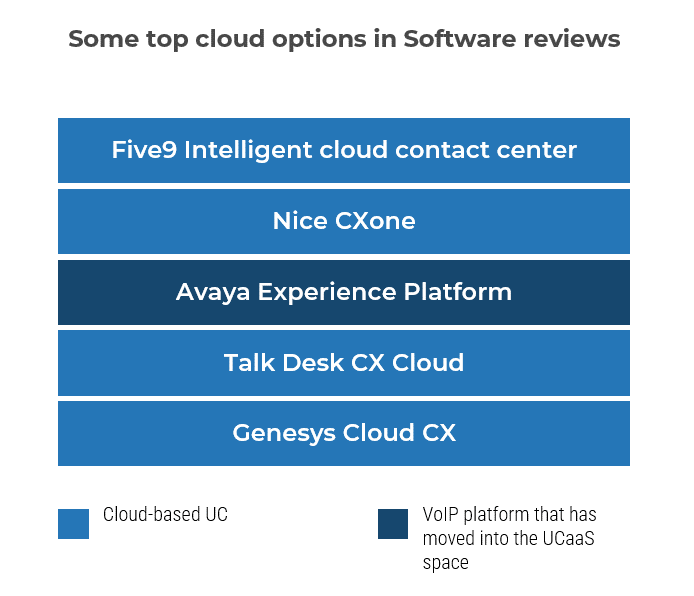
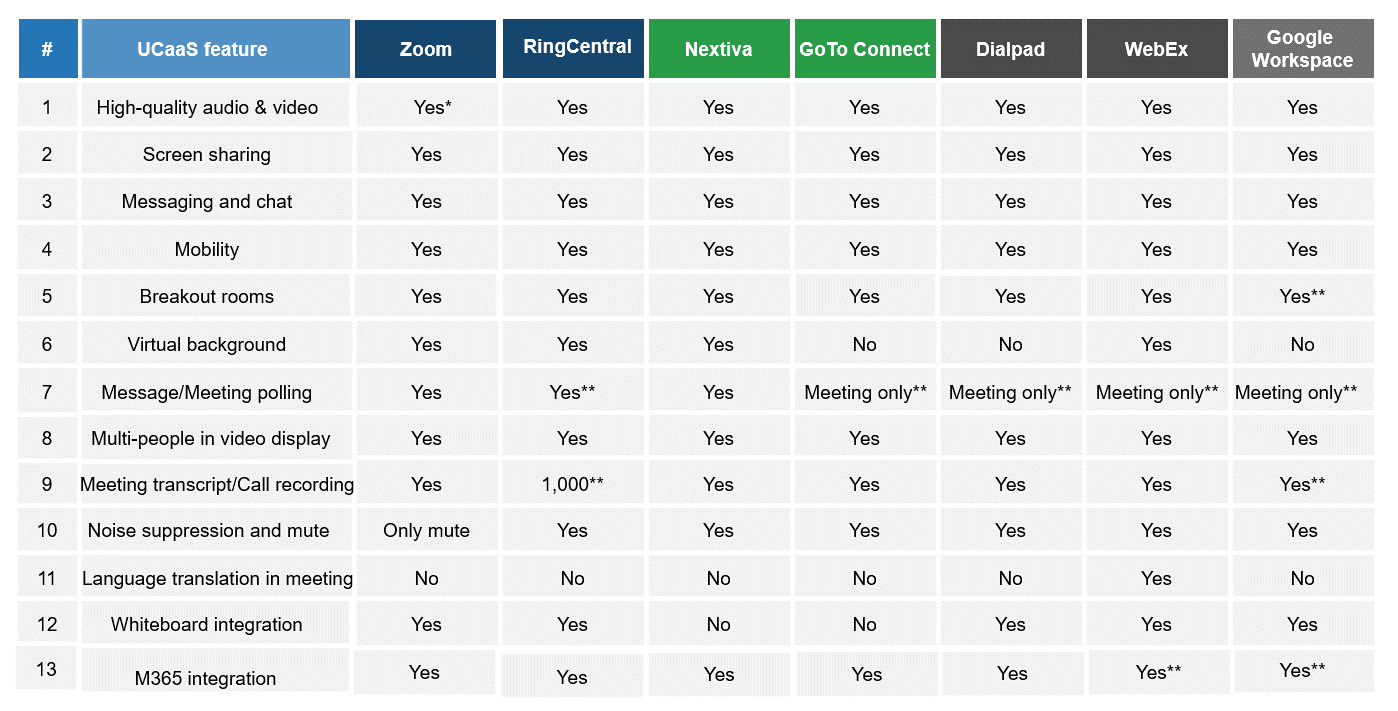
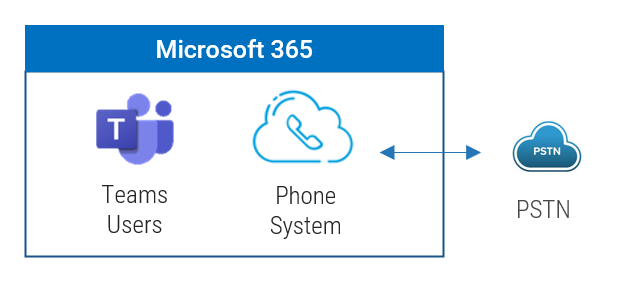
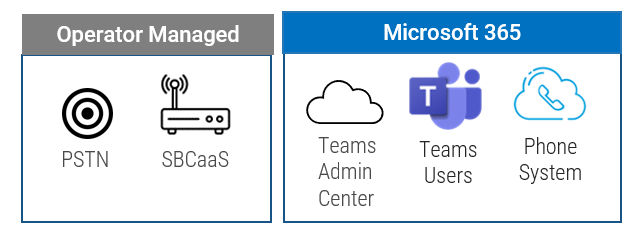
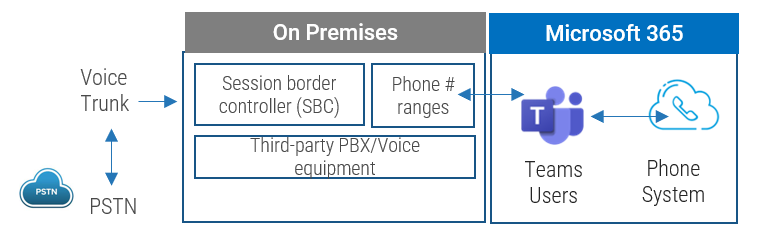
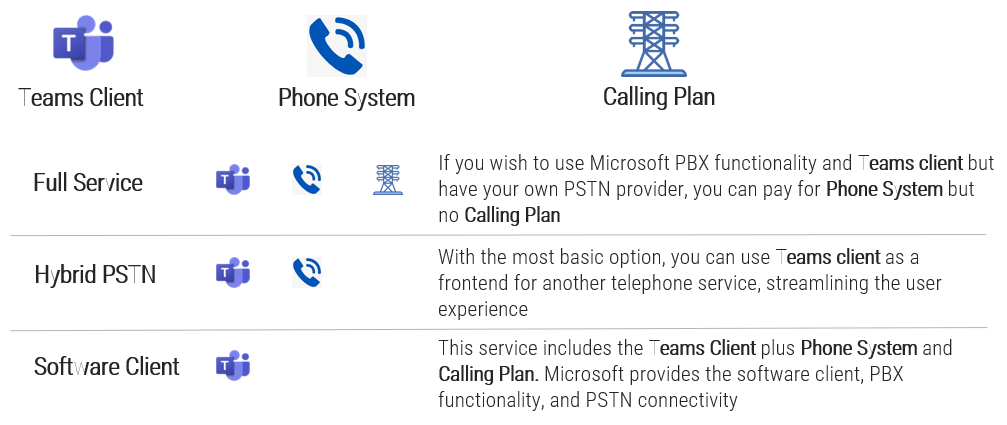
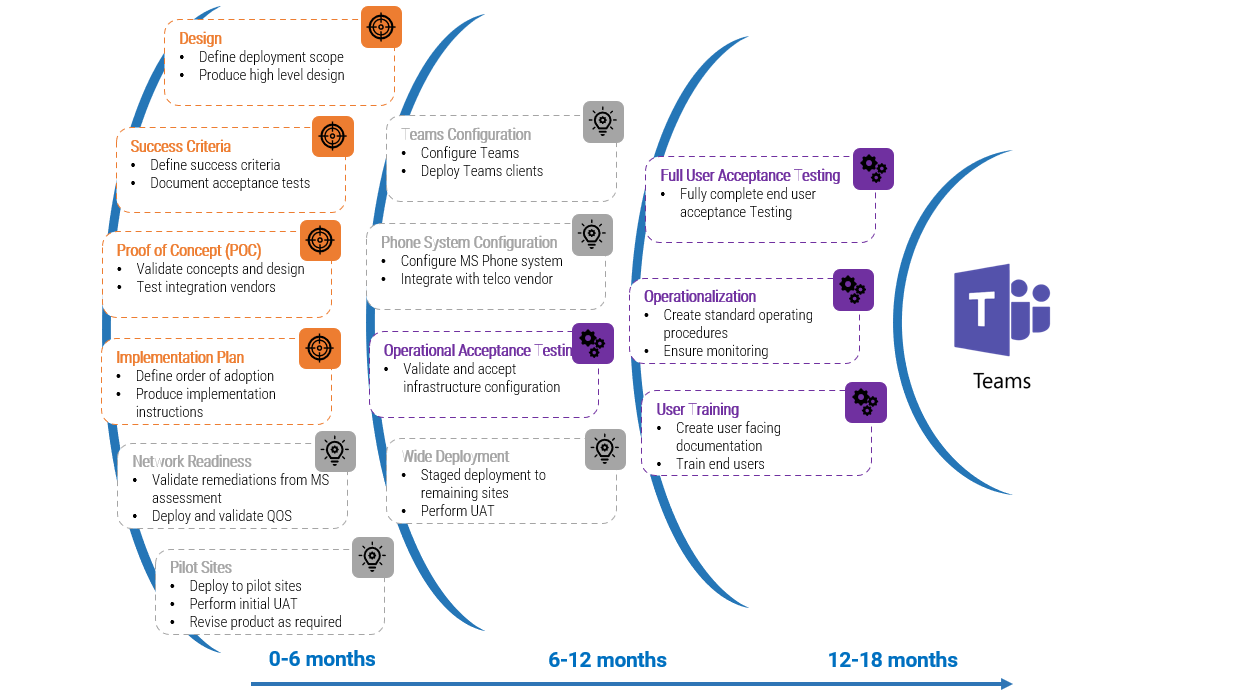
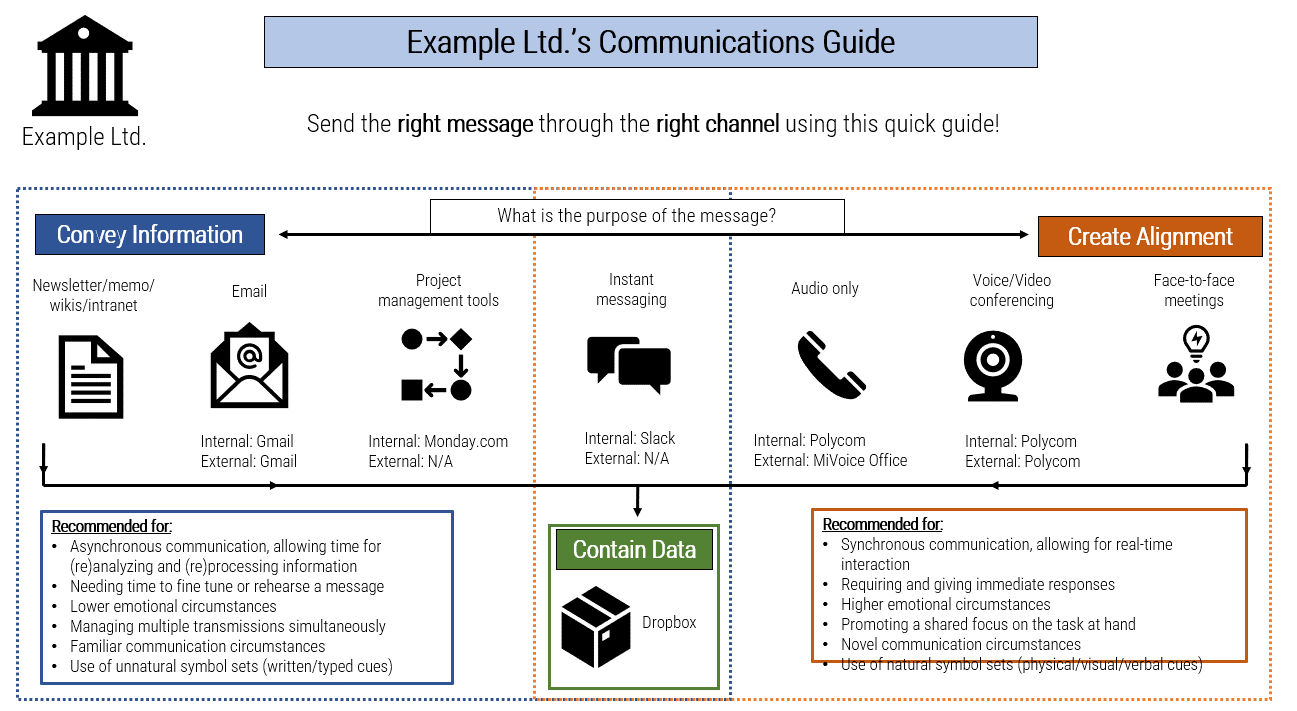
![A diagram that shows [Insert Organization Name]’s Communications Guide](/images/ITMGF/infra-and-operations/end-user-computing/voice-video-management/assess-your-readiness-to-implement-ucaas/030-communications-guide-template.png)


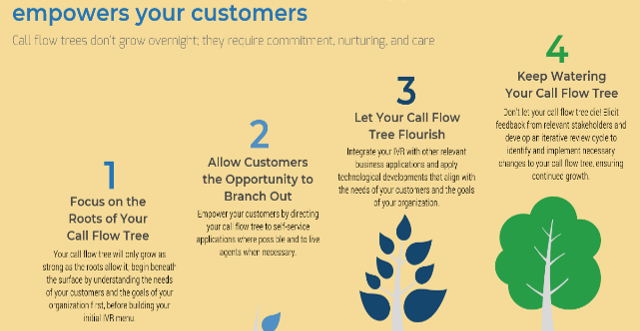

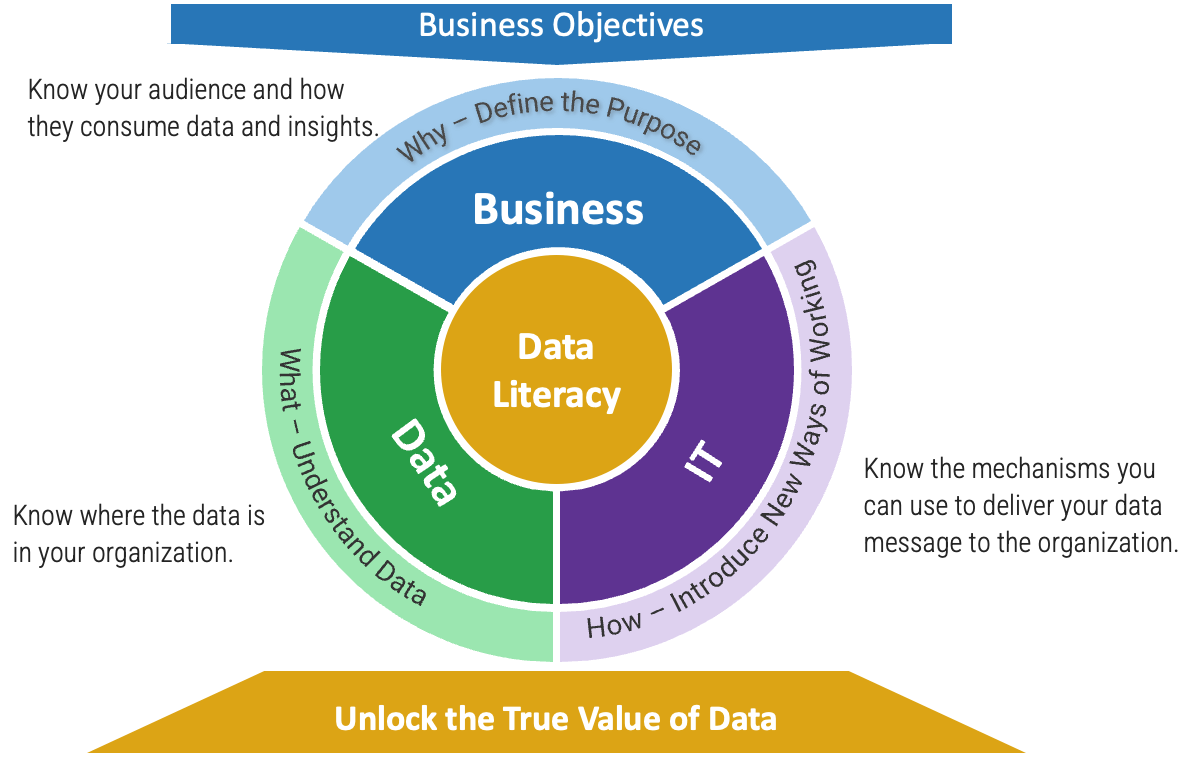
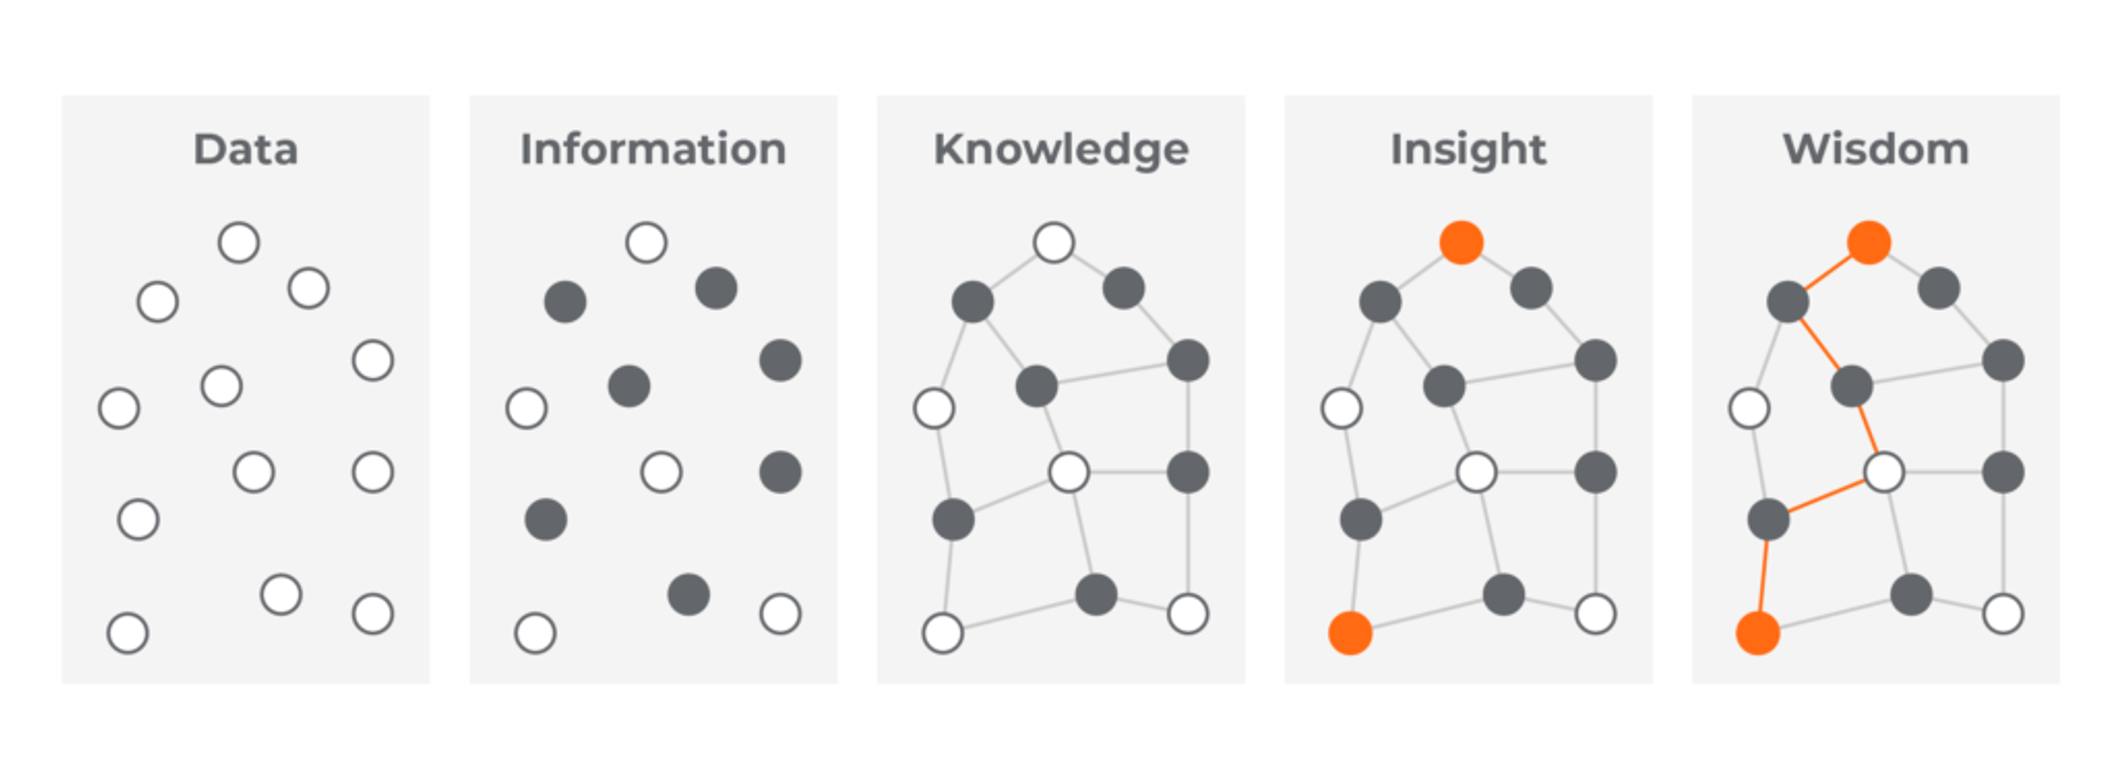
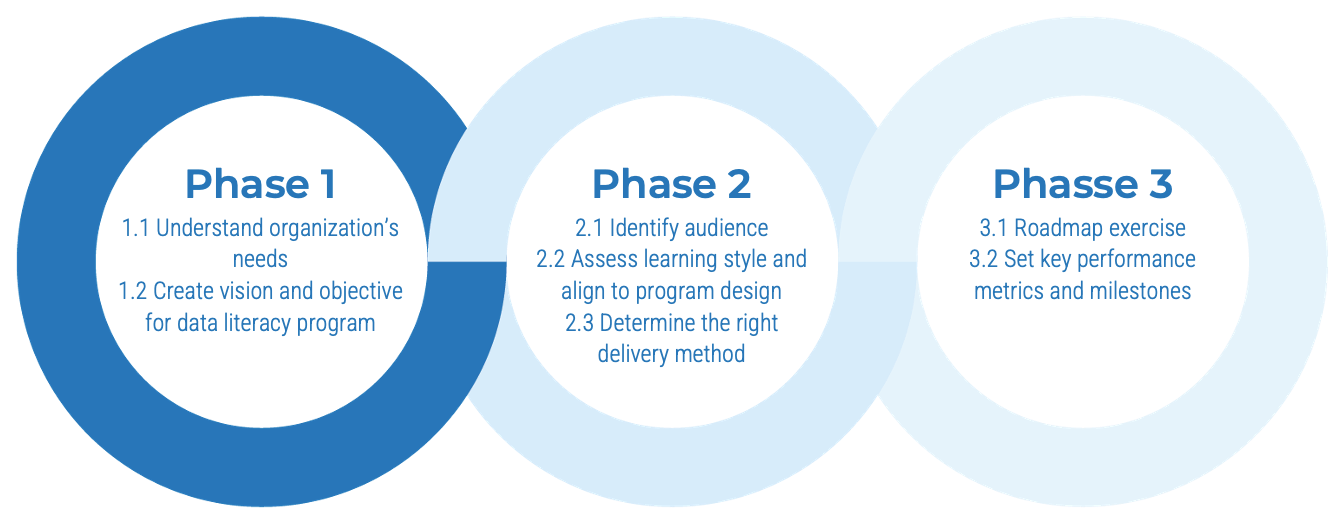
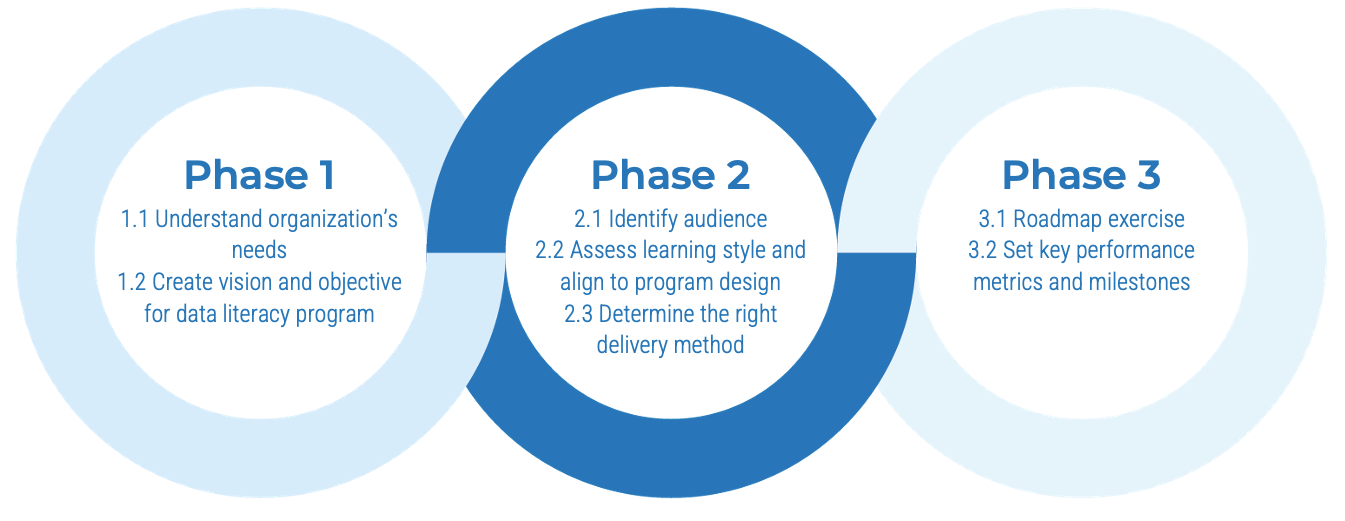
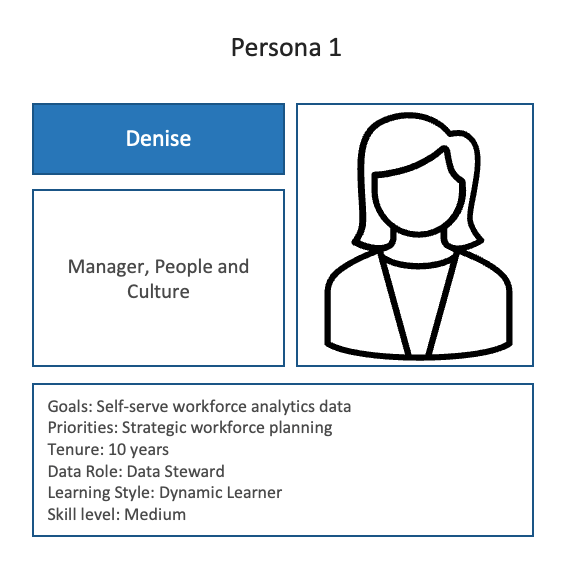
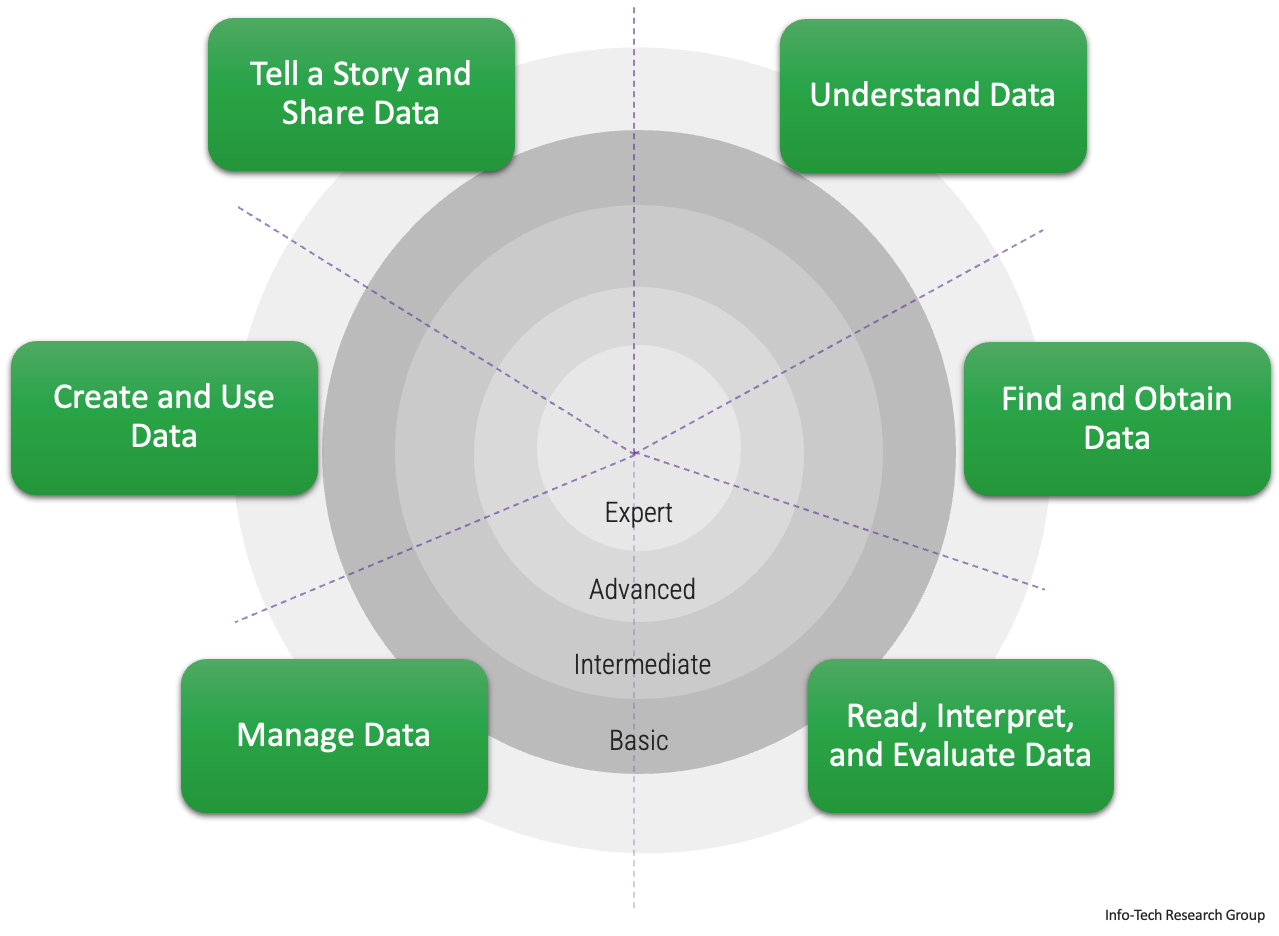
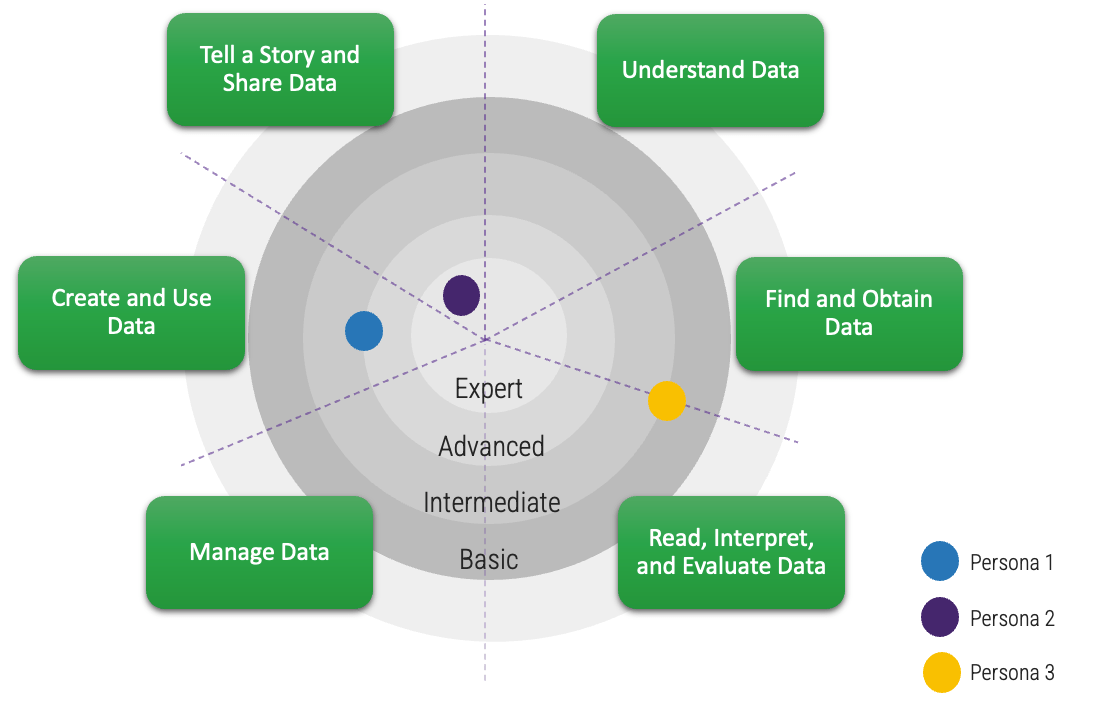
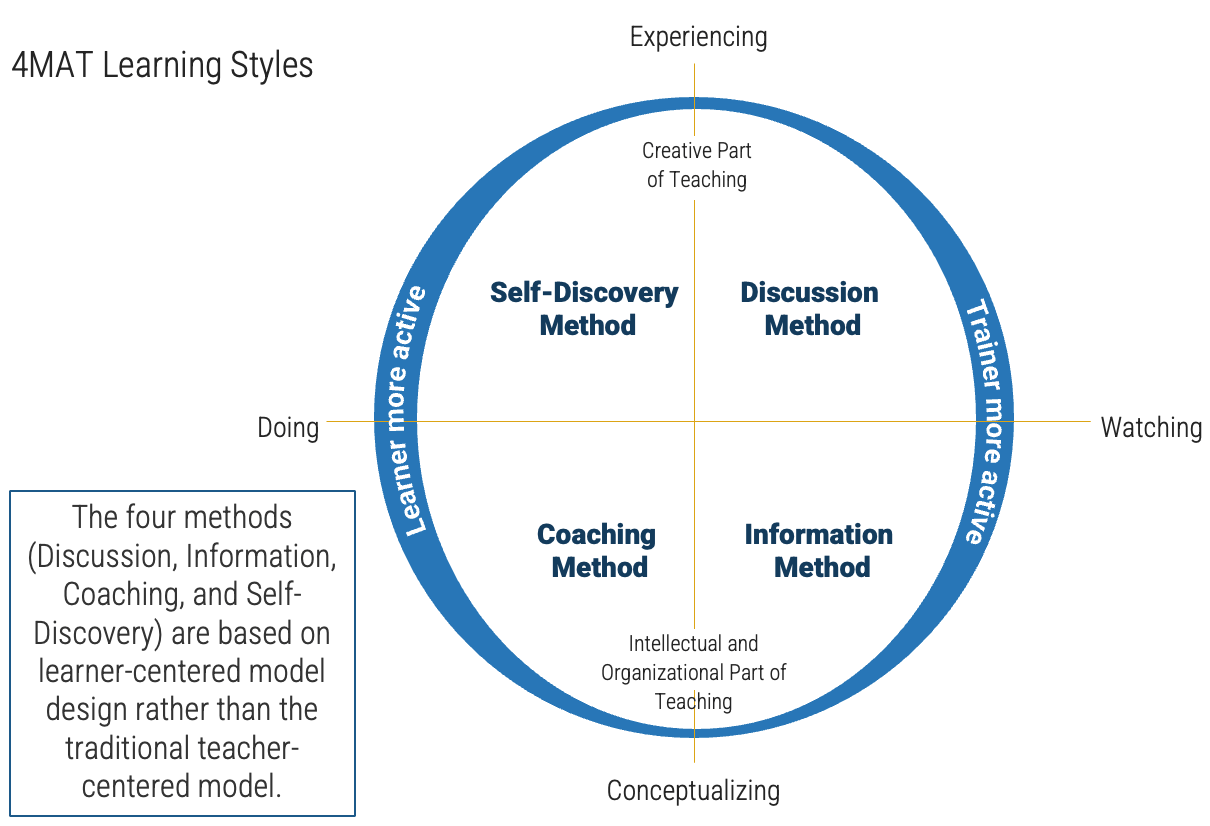
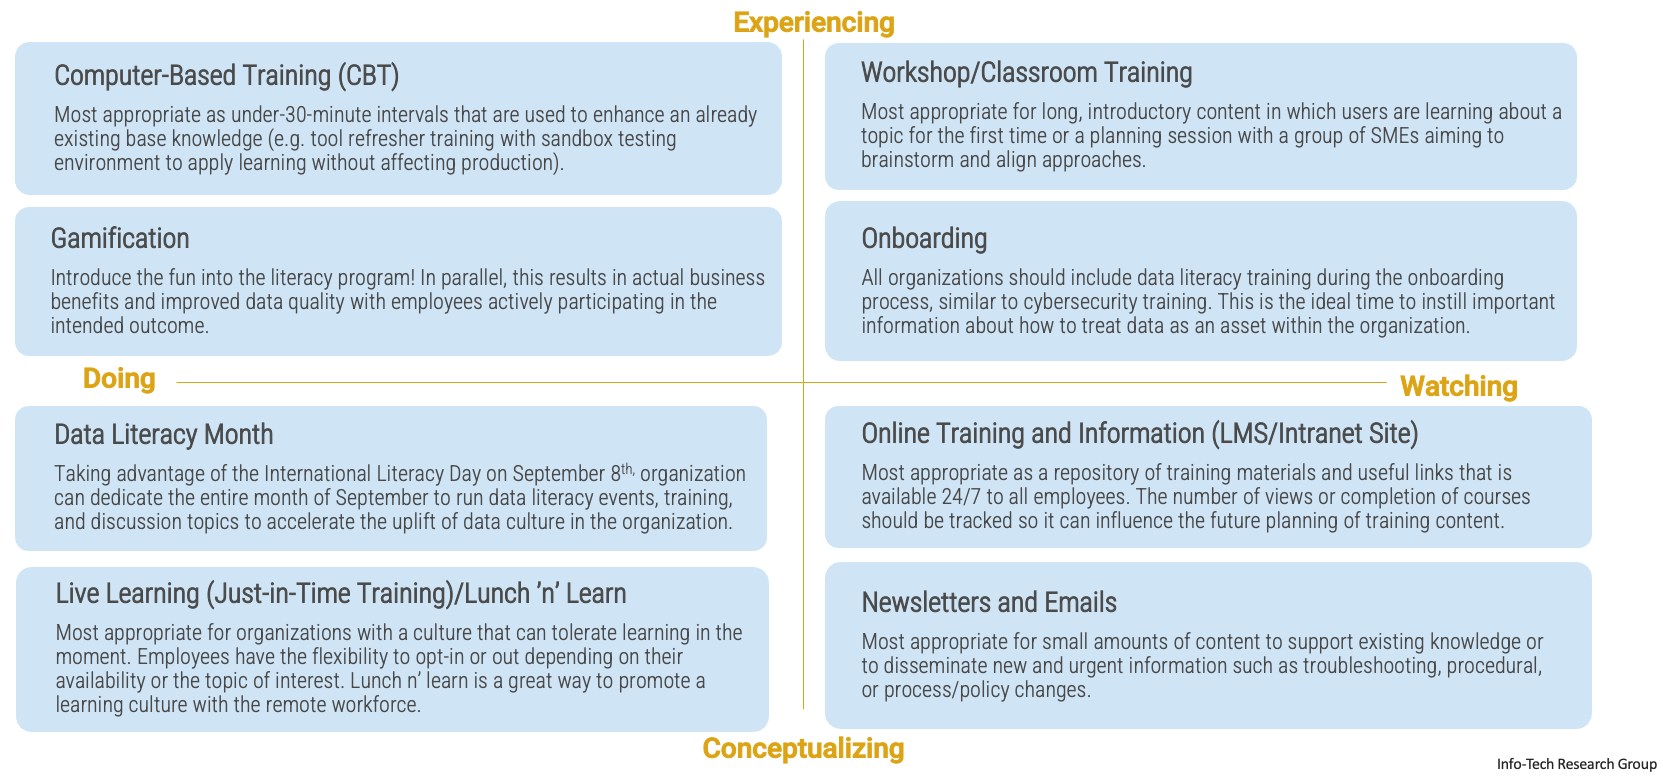
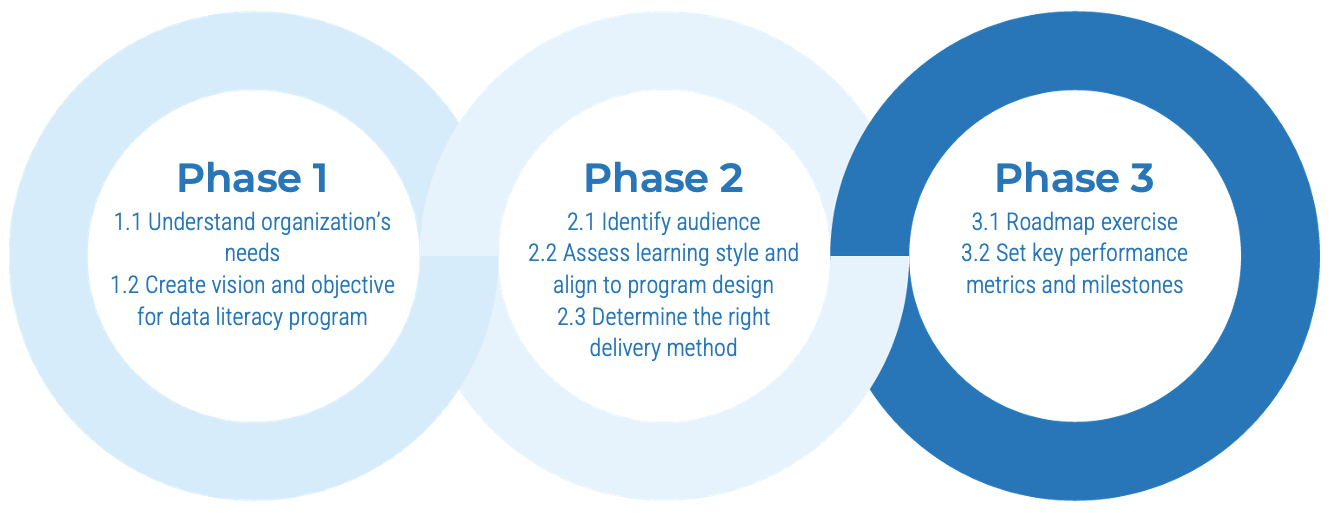
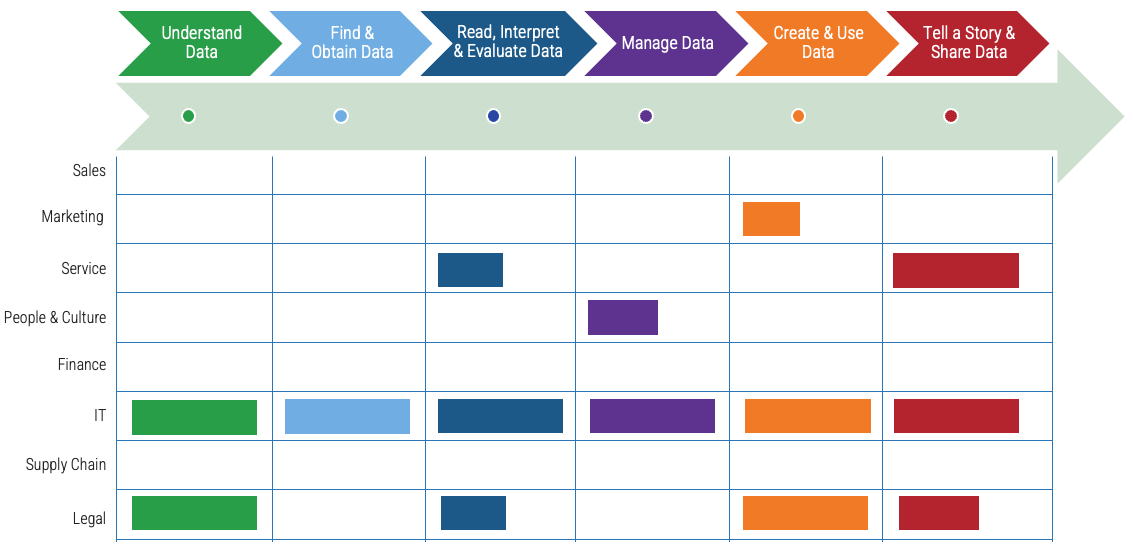


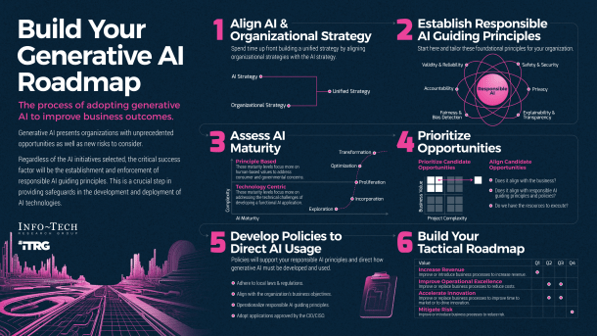
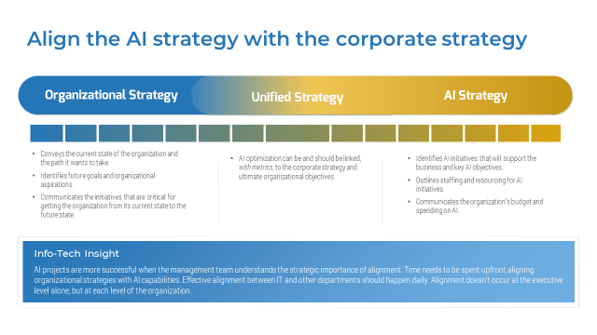

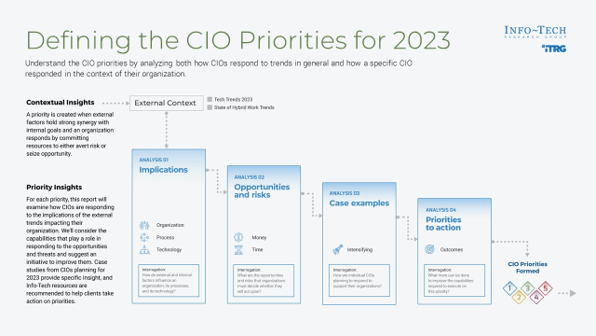
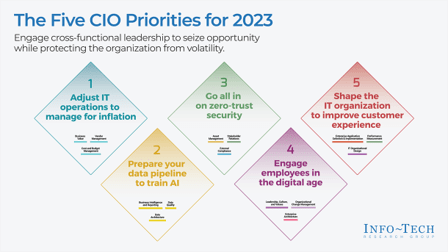

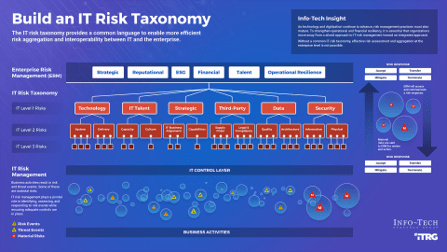


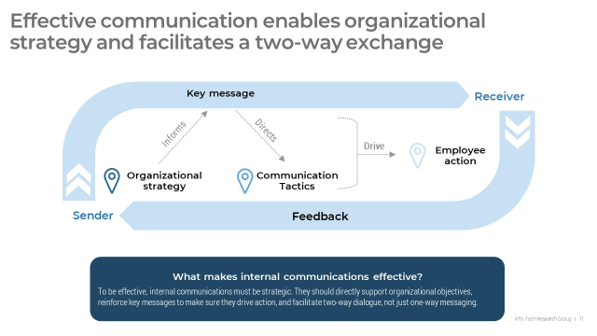

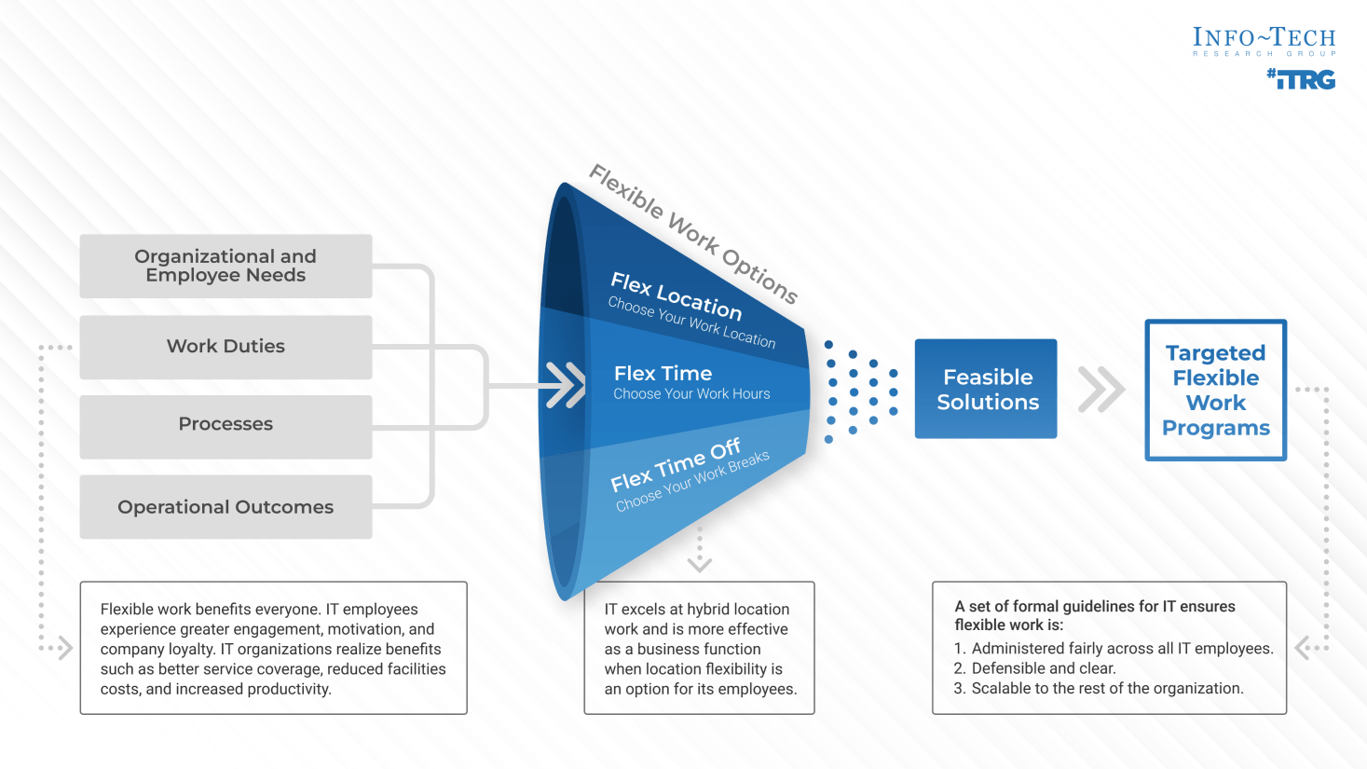
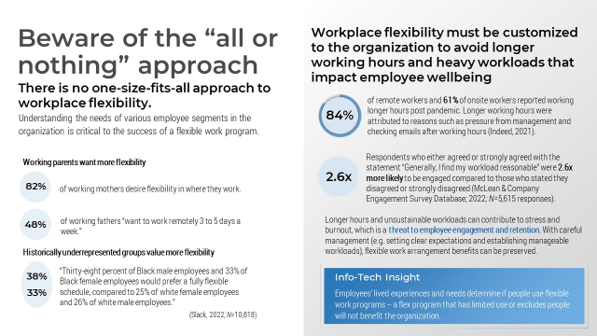

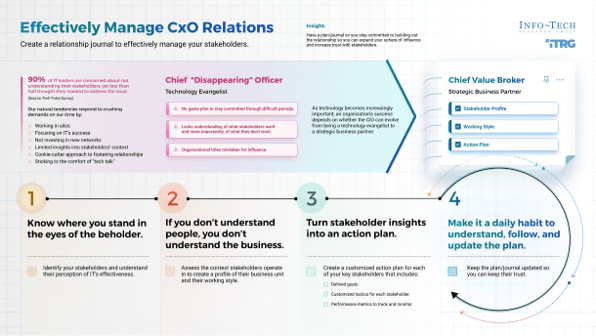
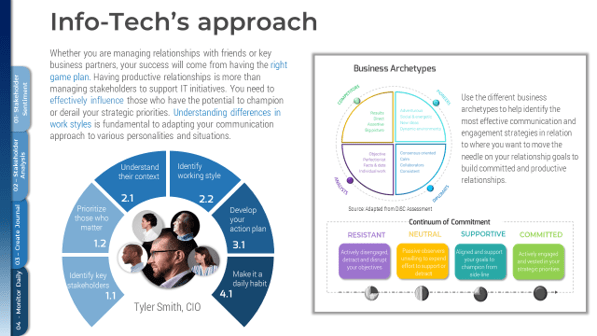
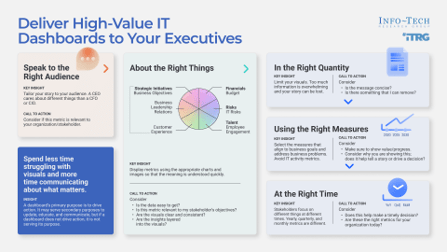
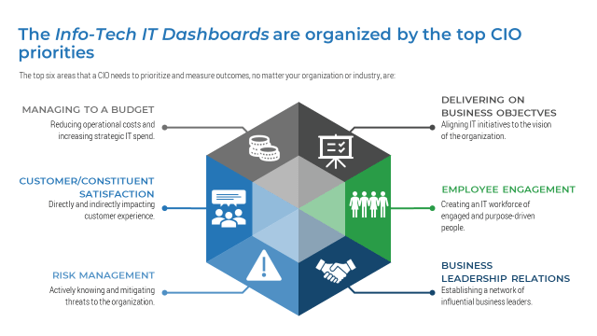

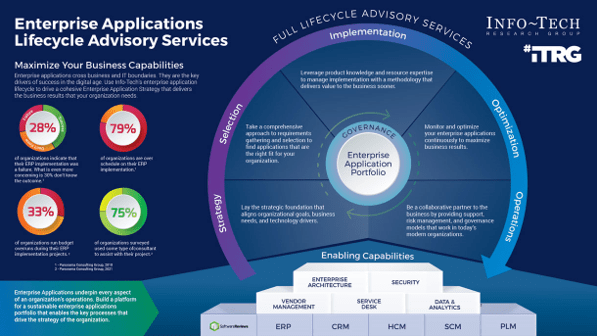
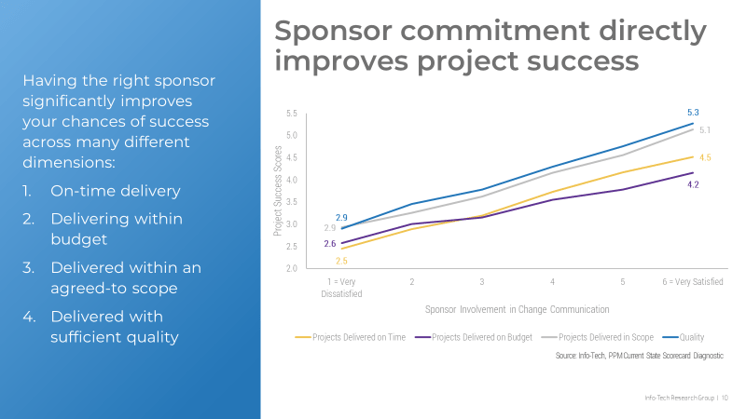

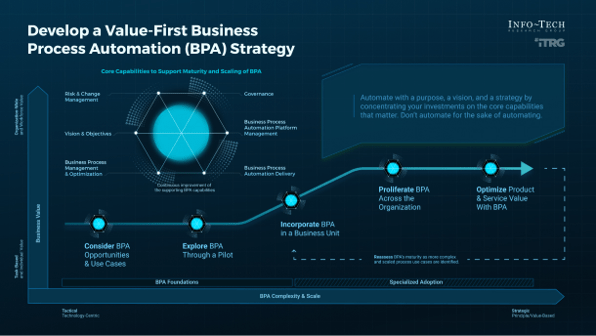
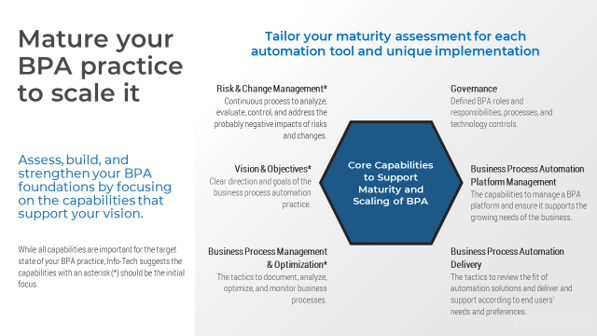

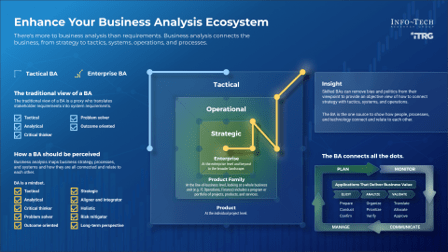
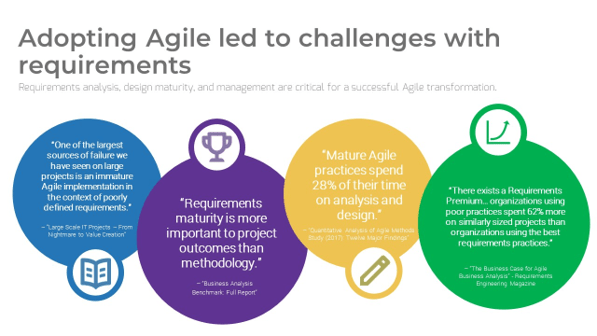

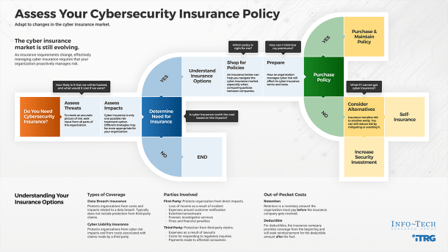
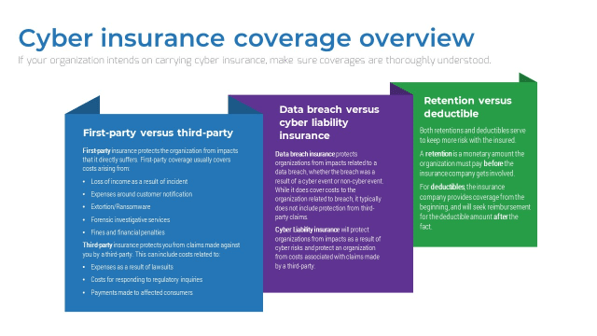

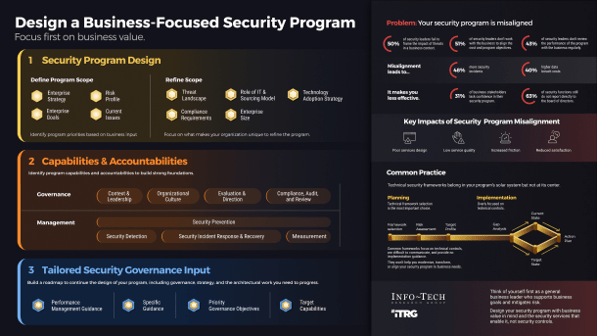
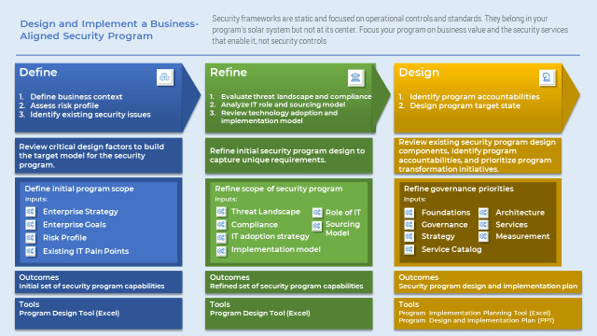

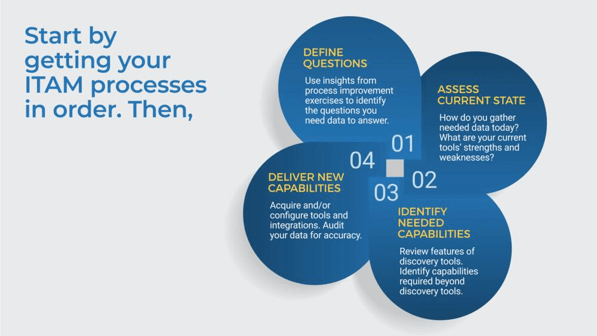
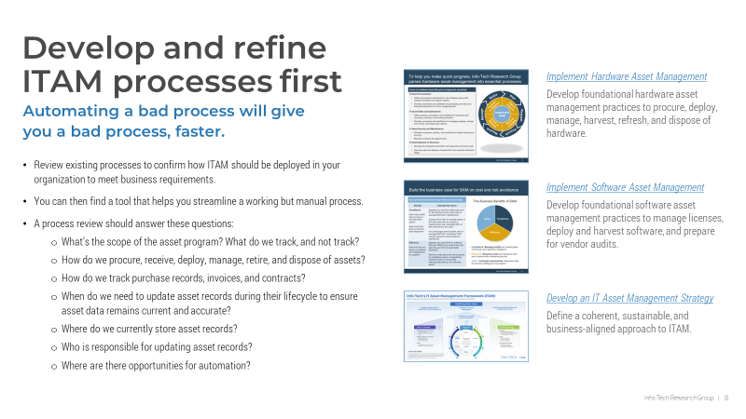

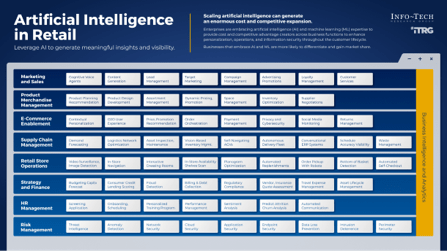
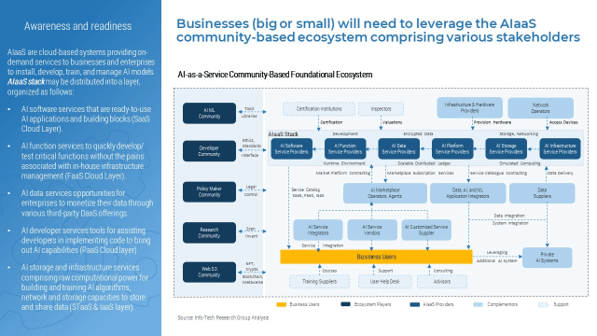

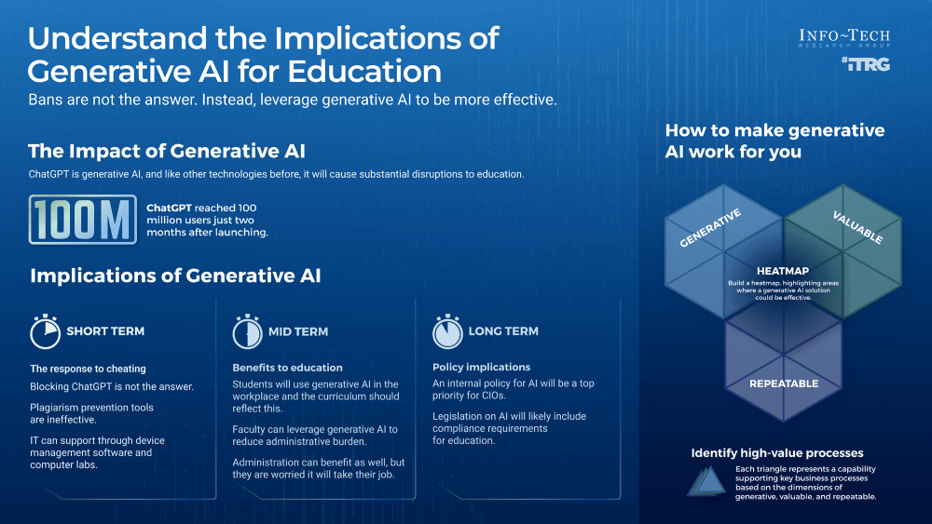
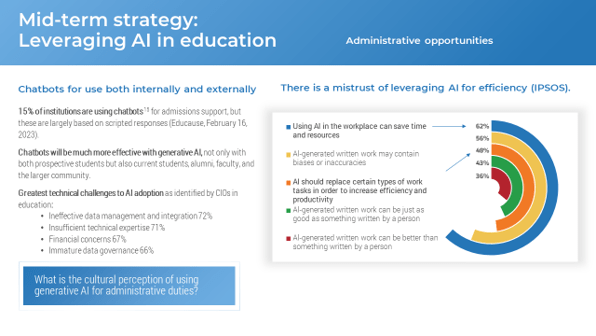
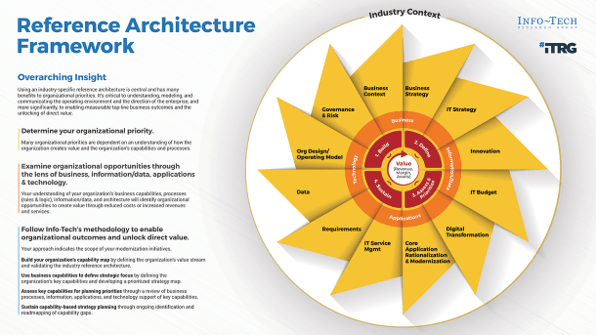

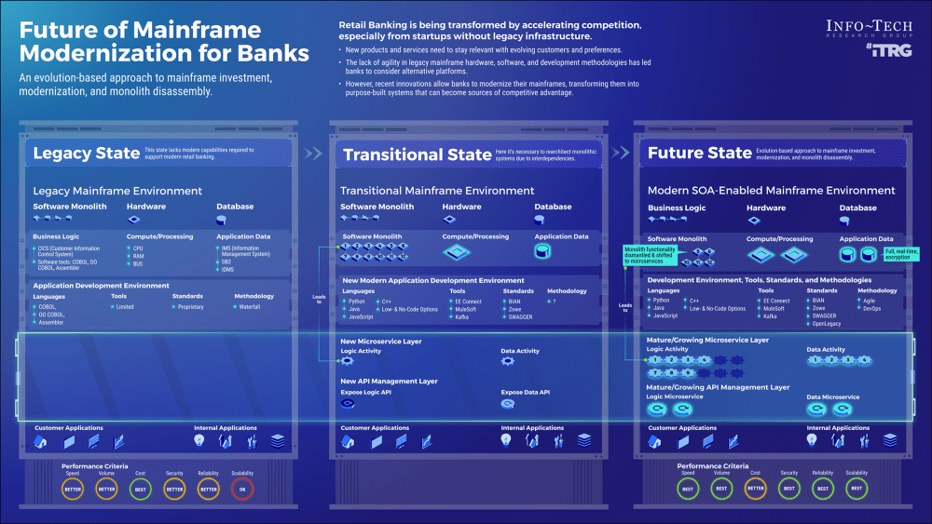
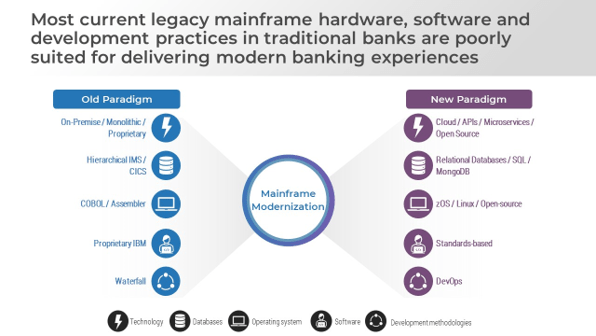

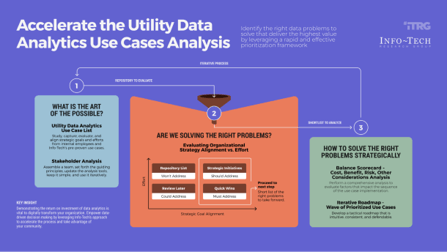


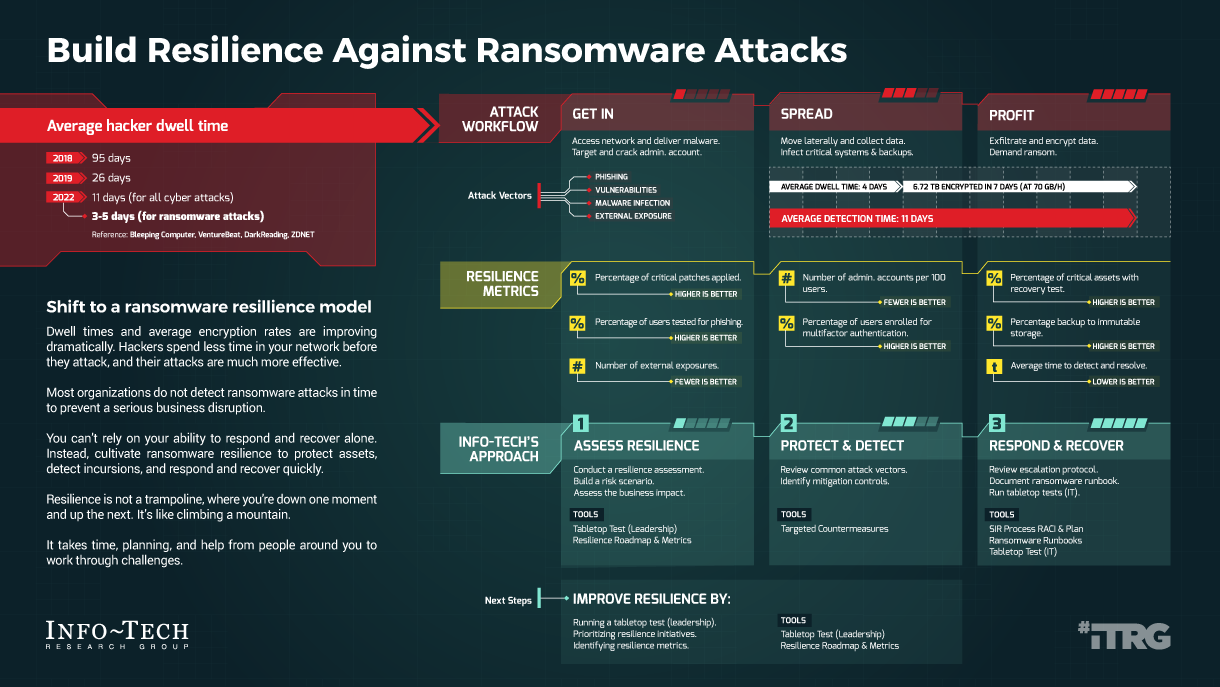

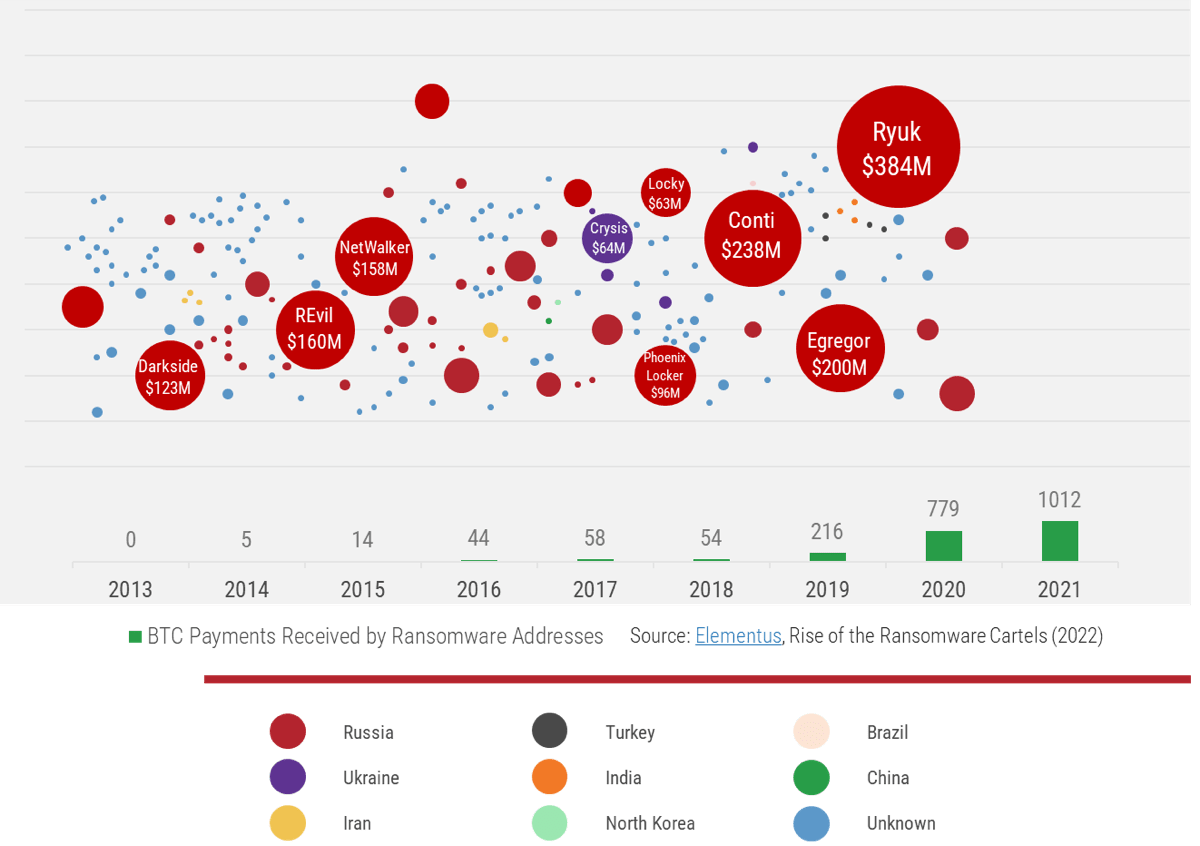
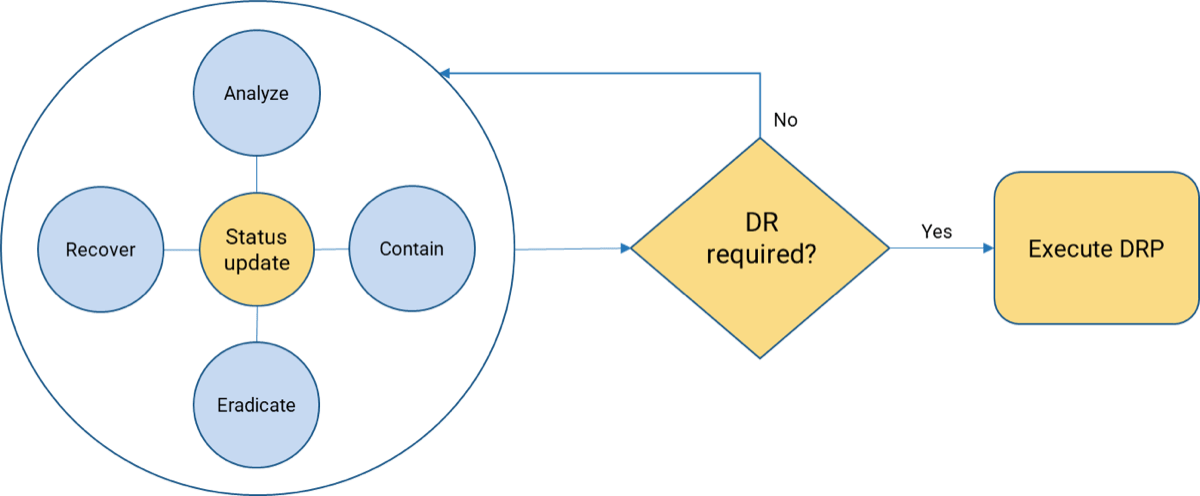
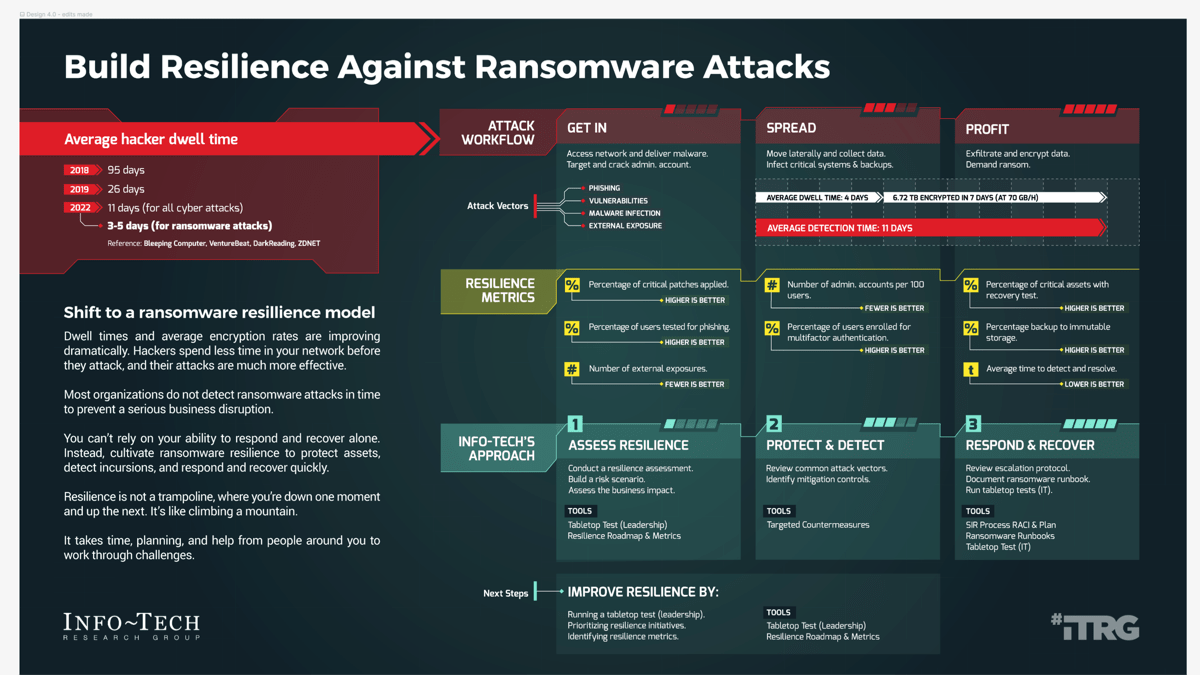
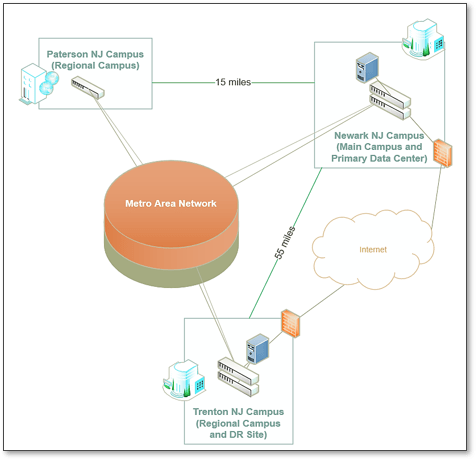
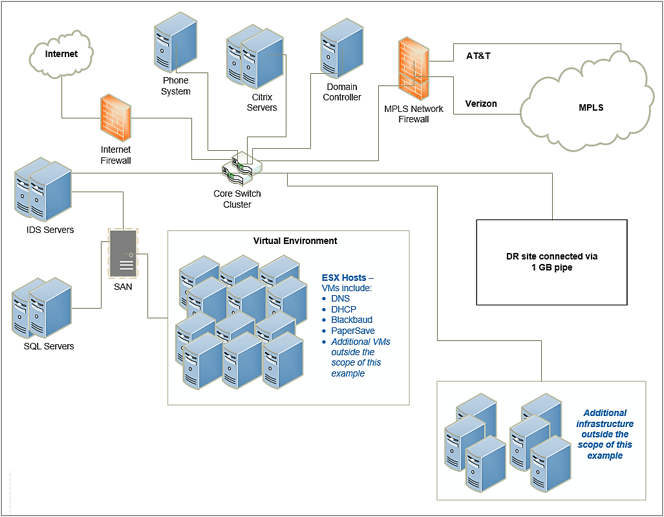
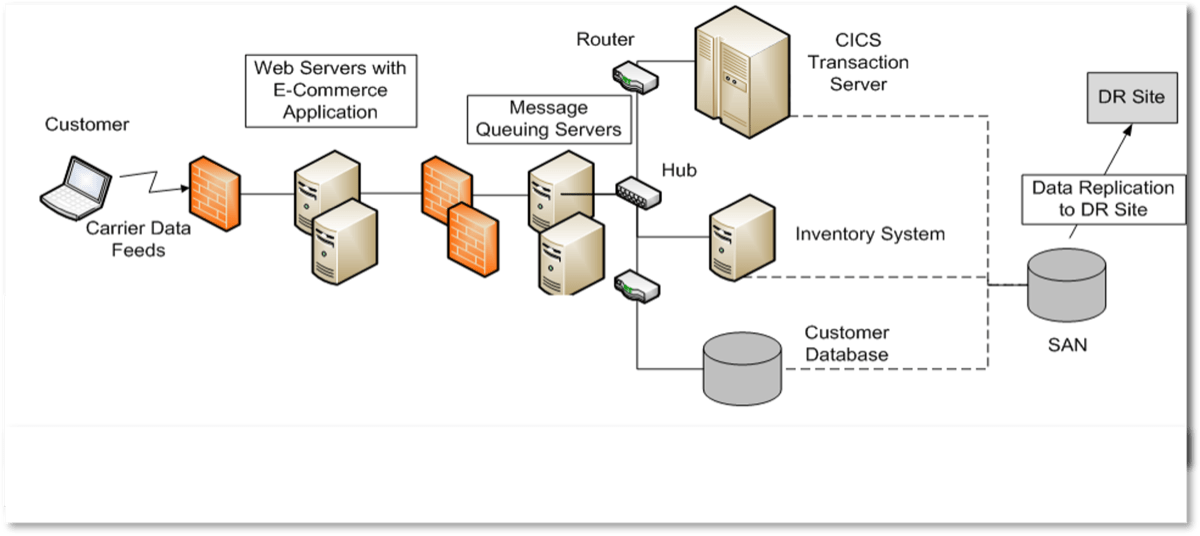
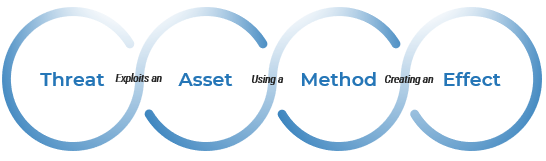
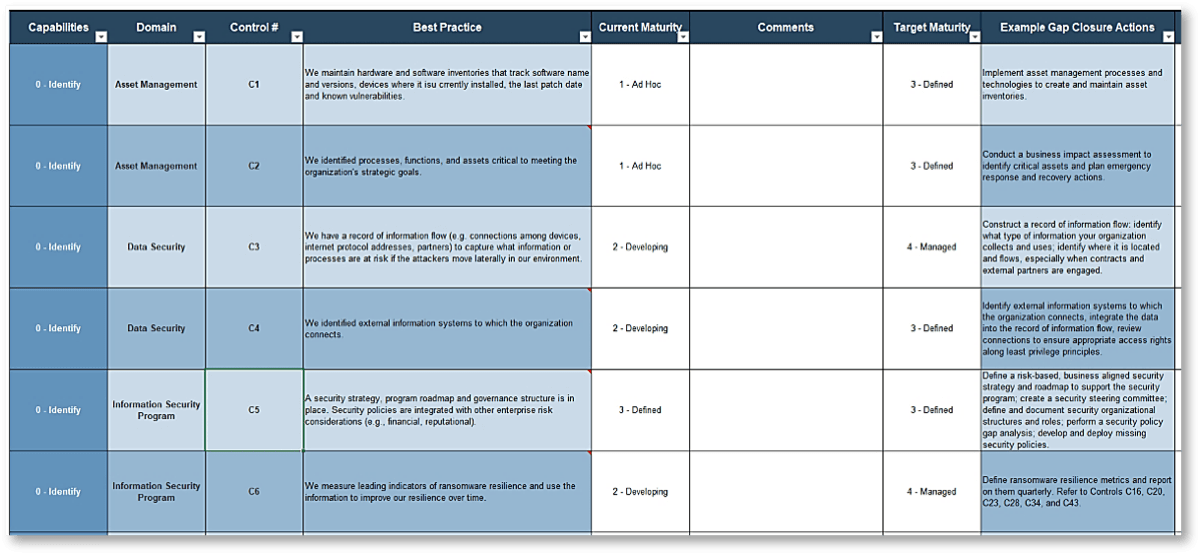
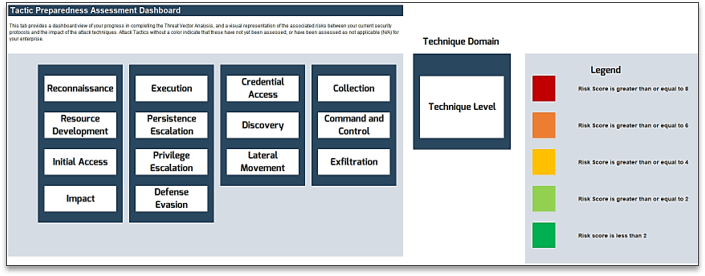
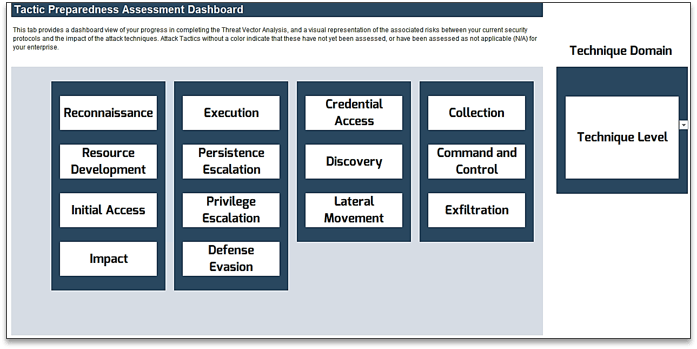
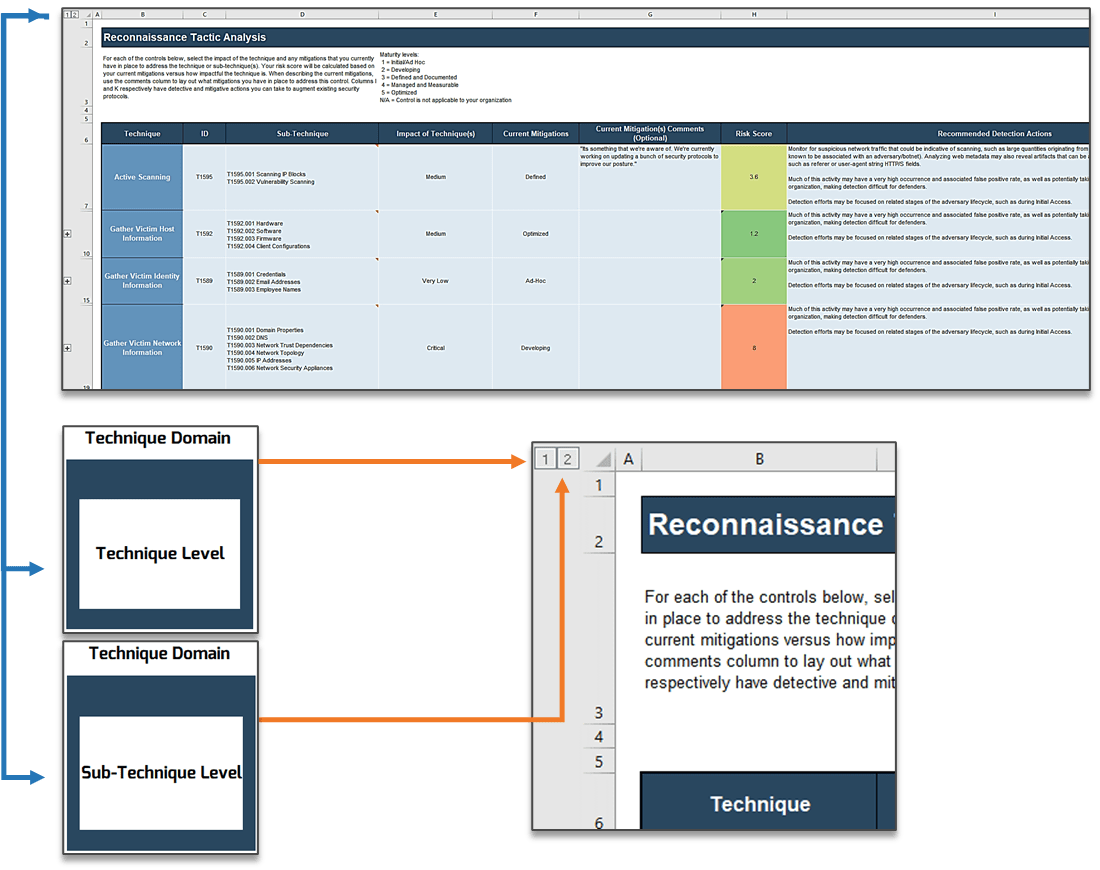
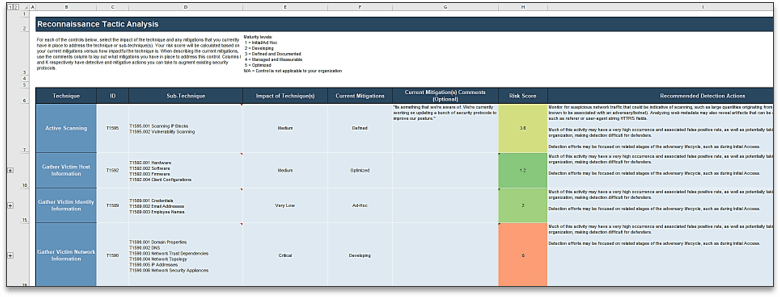
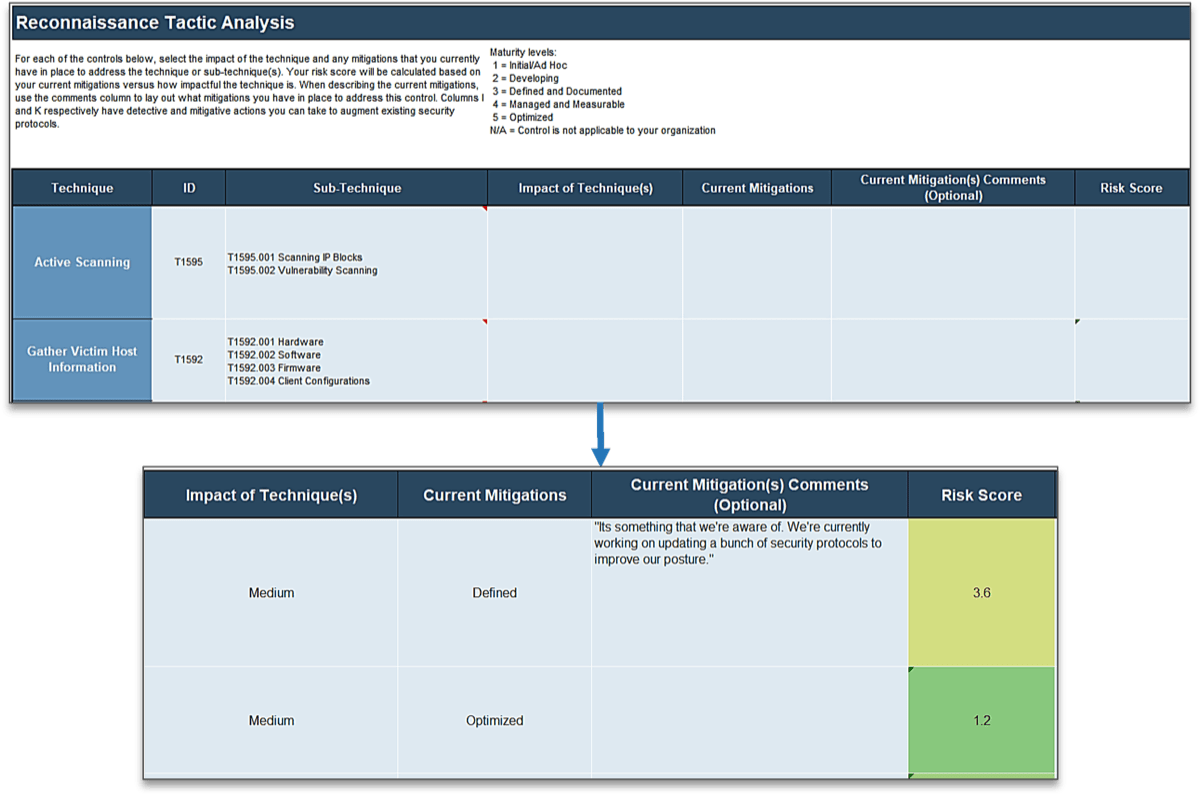
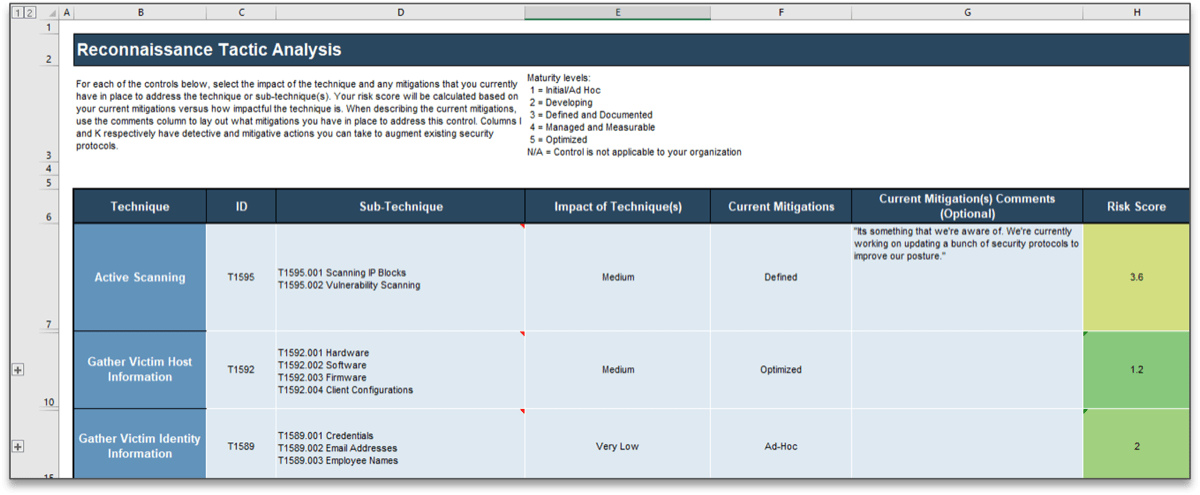
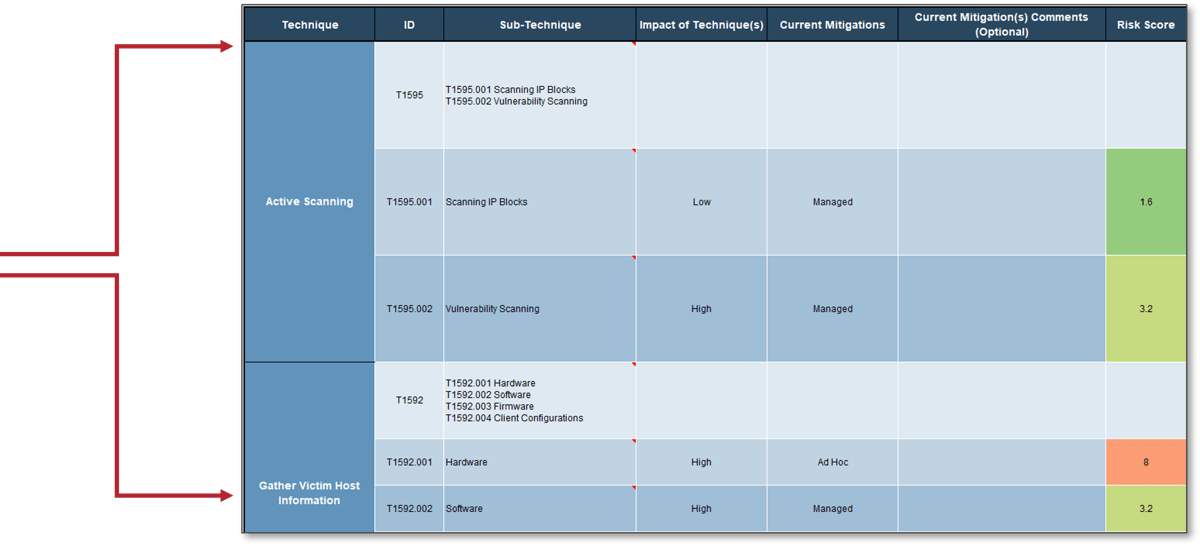
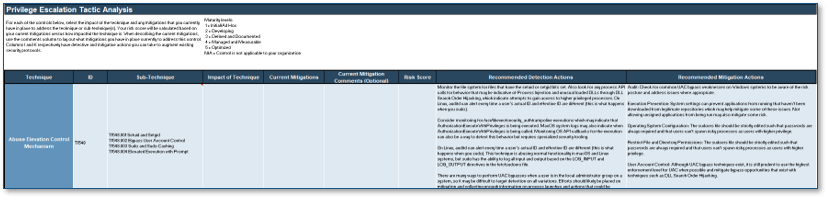
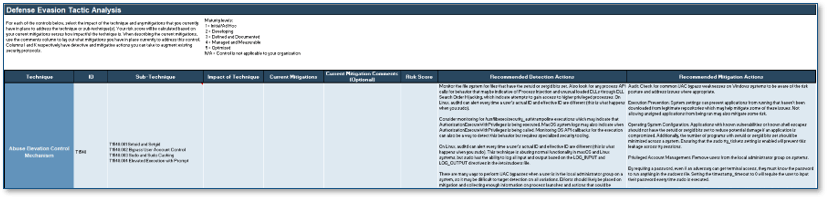
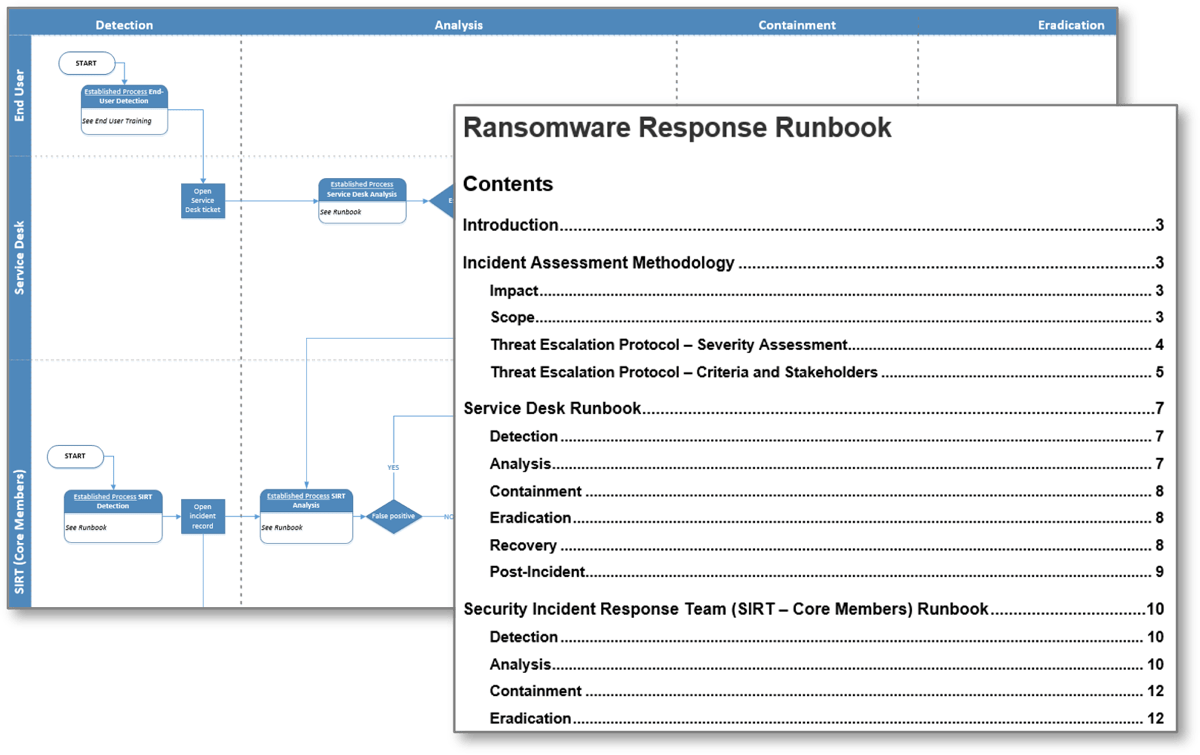
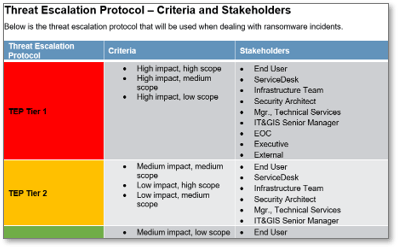
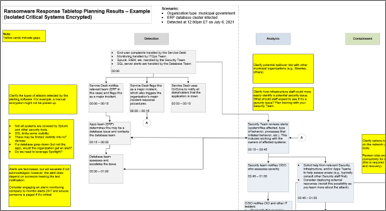
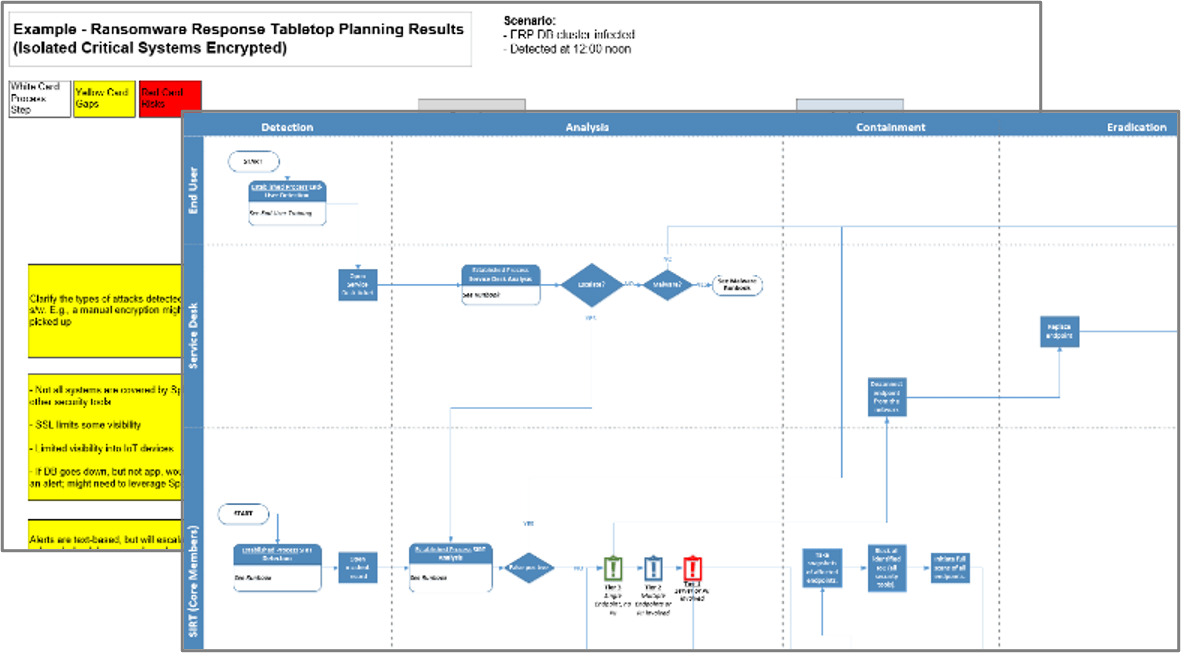
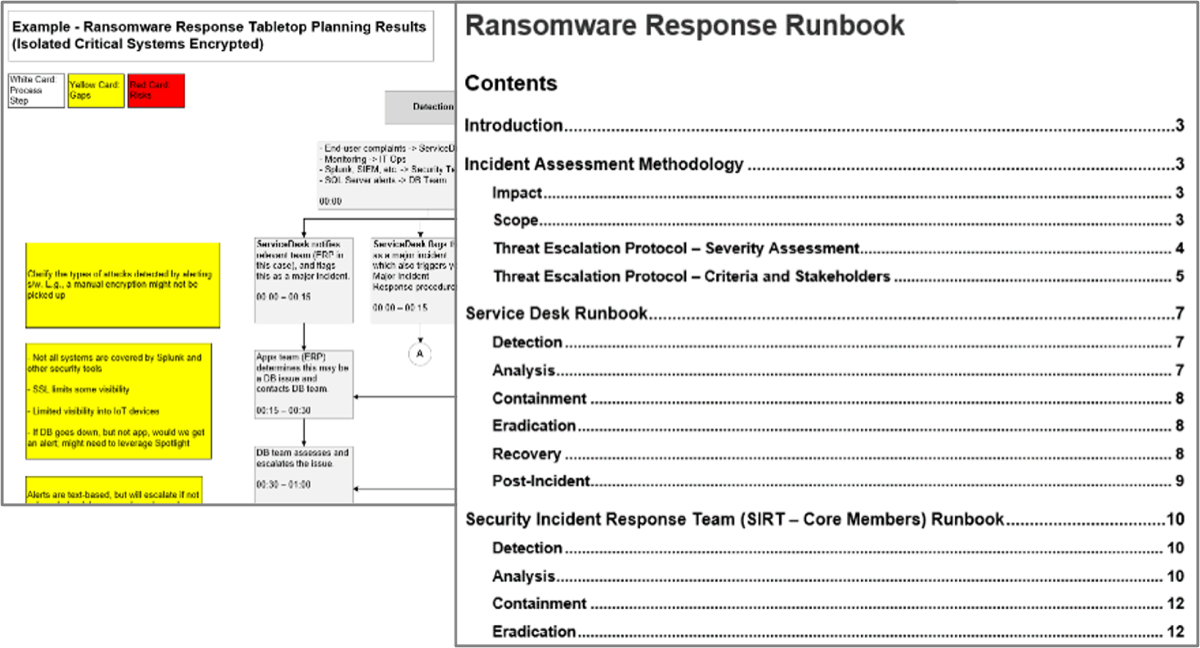
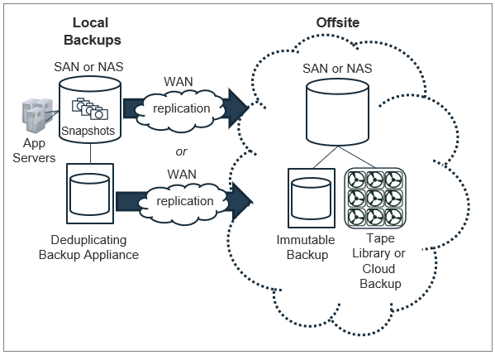
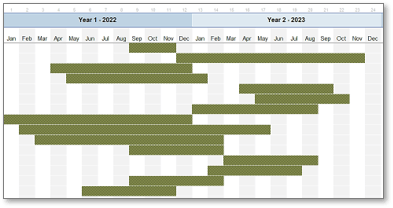
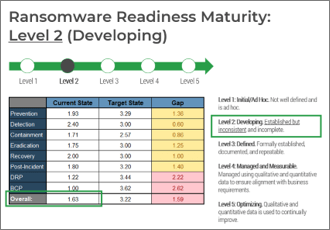


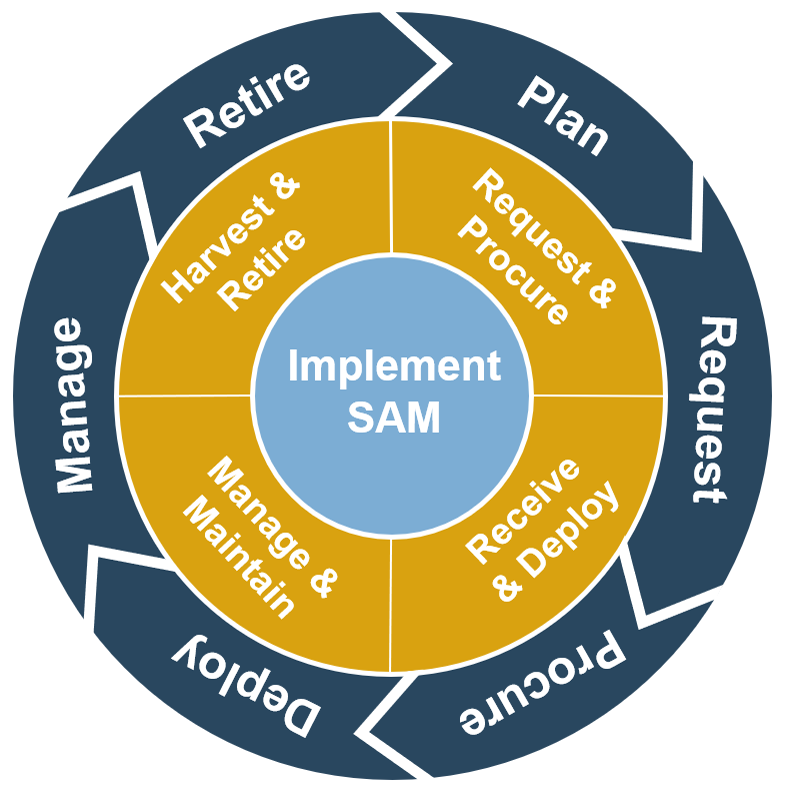
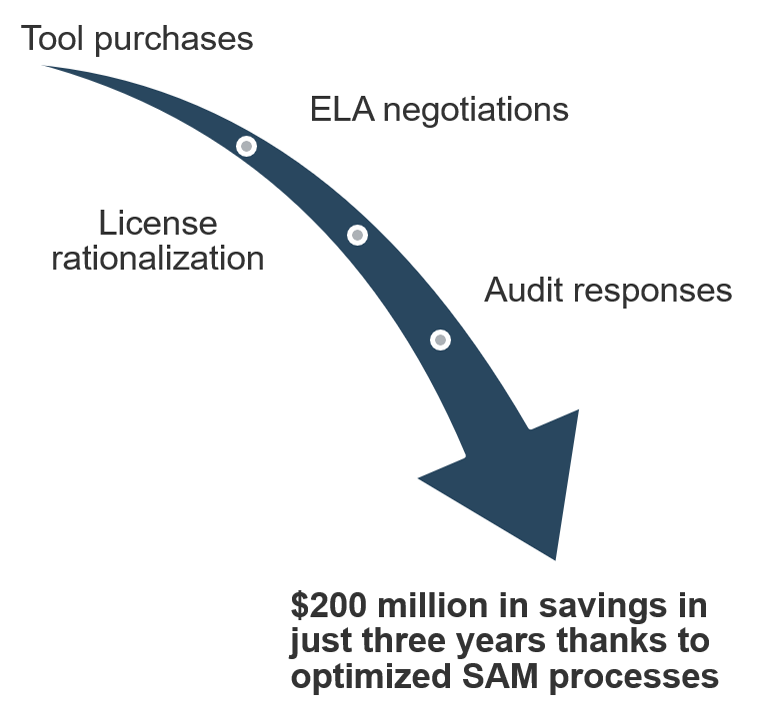
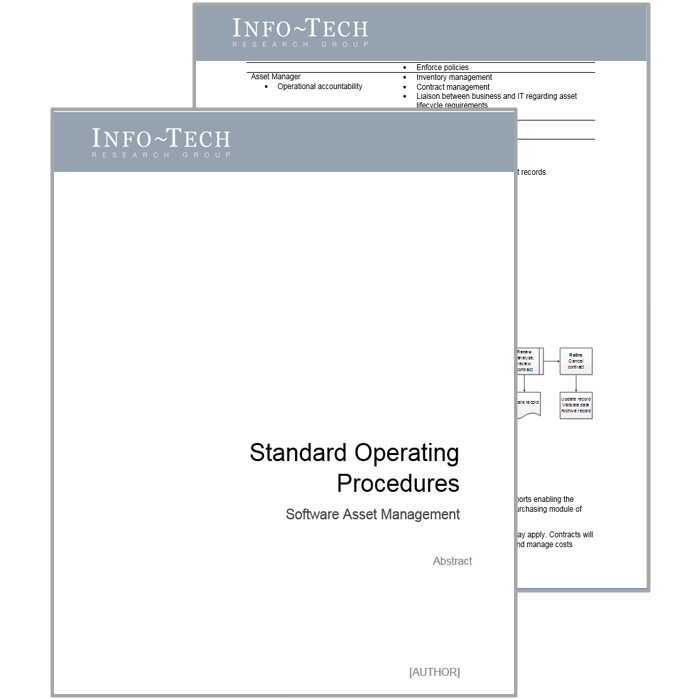
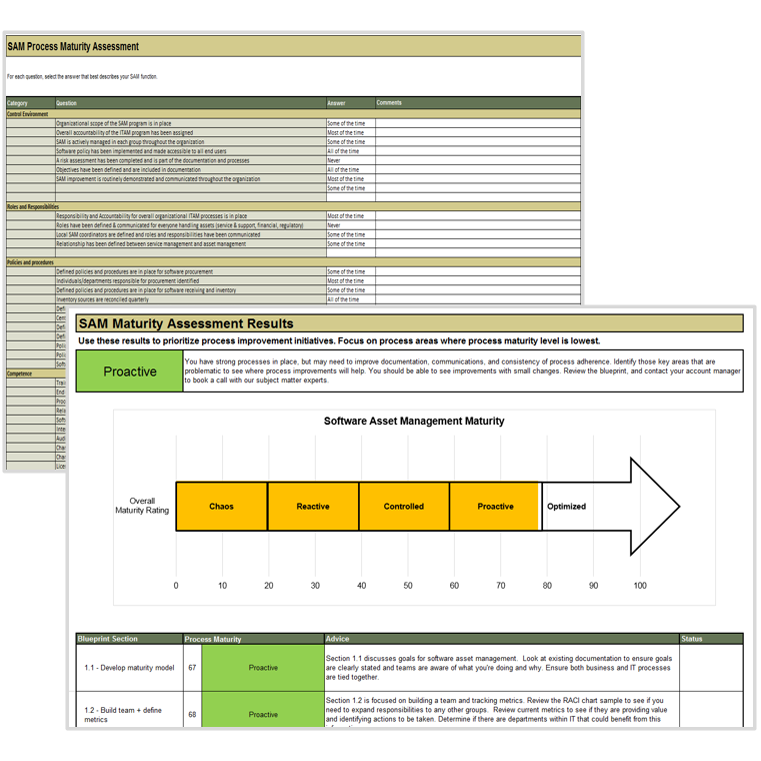
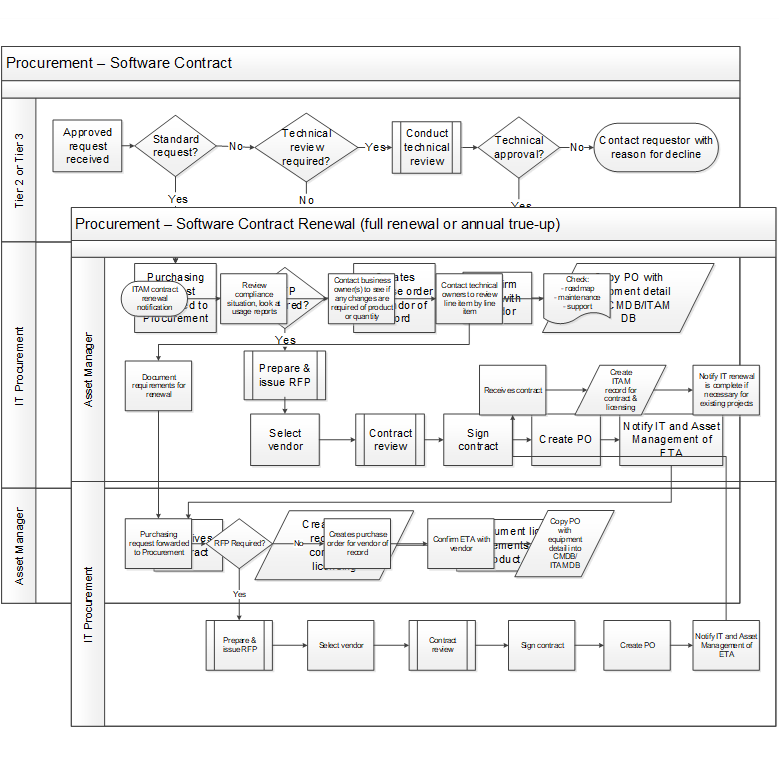
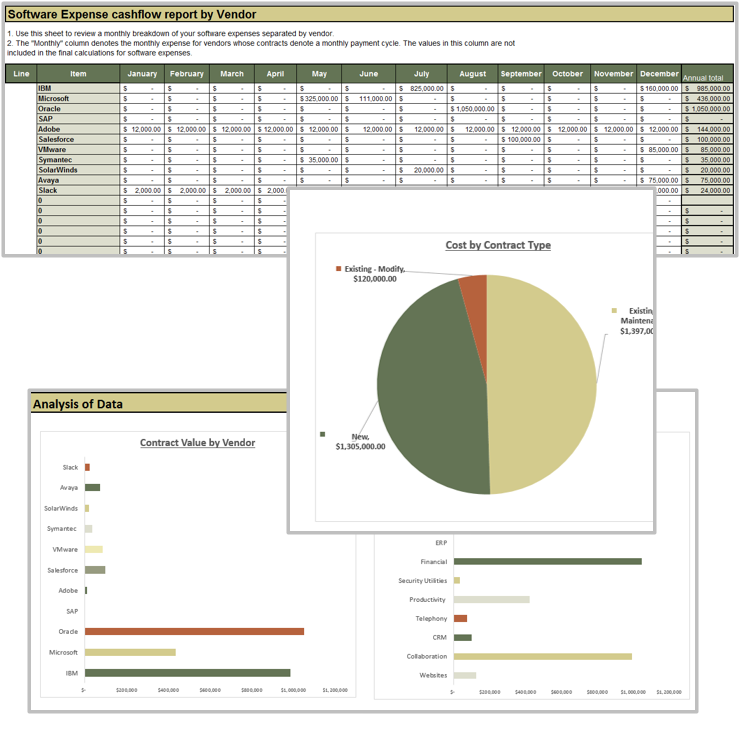
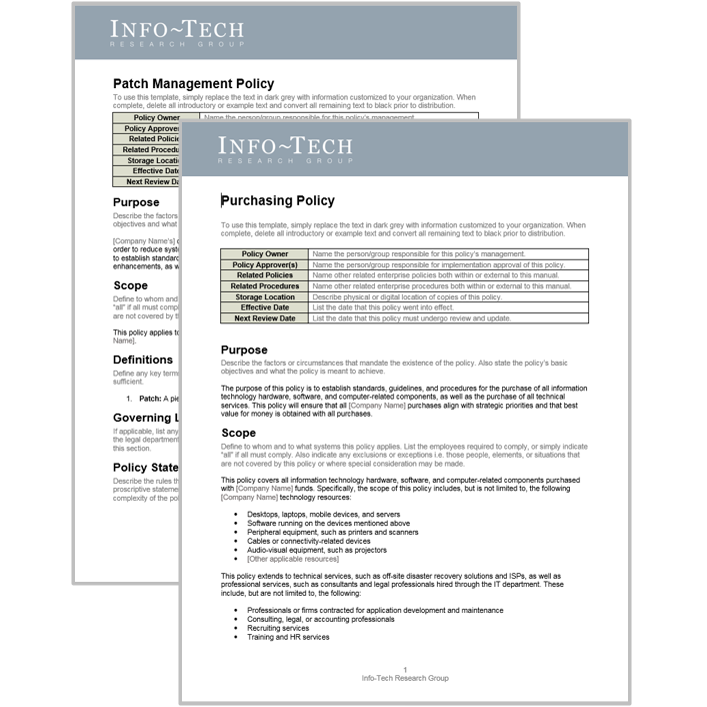
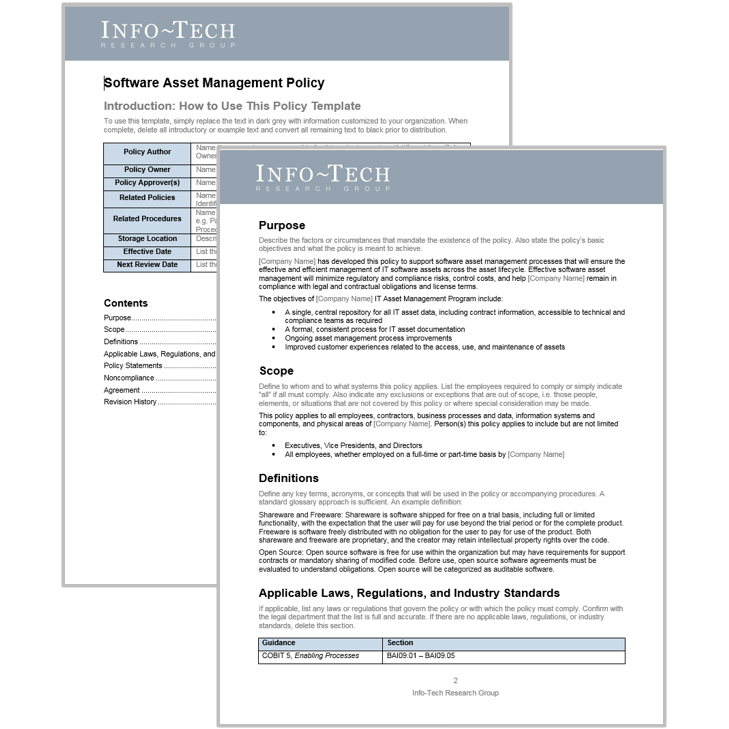
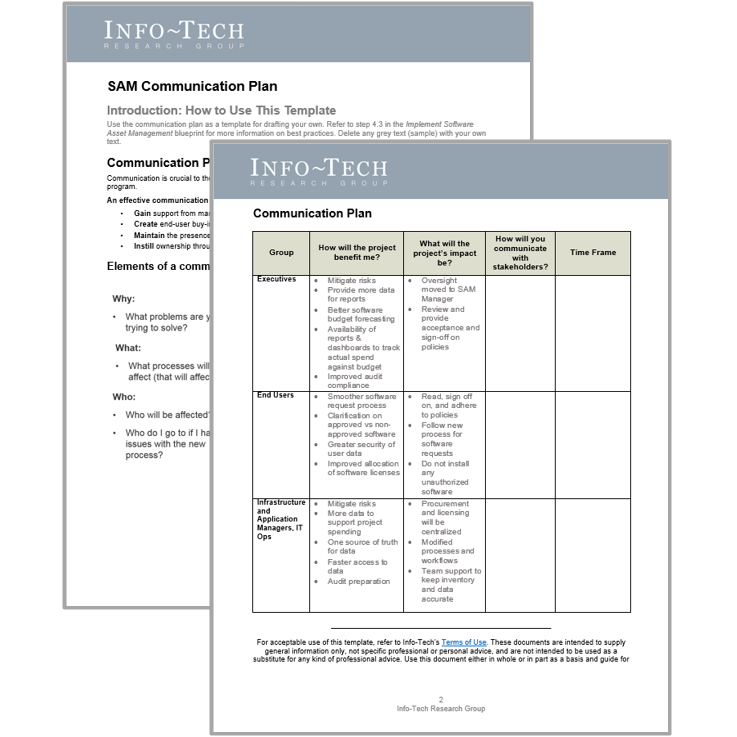
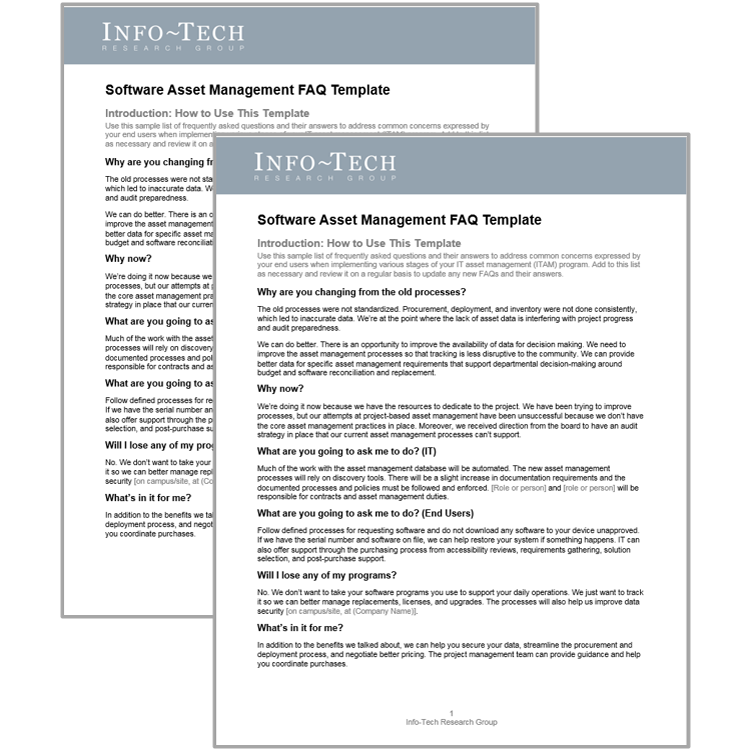
 Best-Practice Toolkit
 Onsite Workshop