Further reading
Establish Realistic IT Resource Management Practices
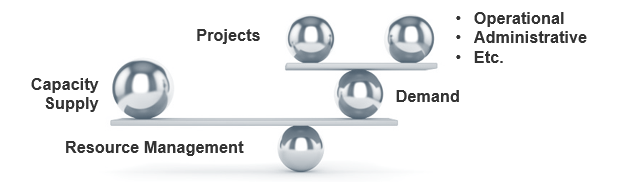
Holistically balance IT supply and demand to avoid overallocation.
Analyst perspective
Restore the right accountabilities for reconciling supply and demand.
"Who gets in trouble at the organization when too many projects are approved?
We’ve just exited a period of about 20-25 years where the answer to the above question was usually “nobody.” The officers of the corporation held nobody to account for the malinvestment of resources that comes from approving too many projects or having systemically unrealistic project due dates. Boards of directors failed to hold the officers accountable for that. And shareholders failed to hold boards of directors accountable for that.
But this is shifting right under our feet. Increasingly, PMOs are being managed with the mentality previously reserved for those in the finance department. In many cases, the PMOs are now reporting to the CFO! This represents a very simple and basic reversion to the concept of fiduciary duty: somebody will be held to account for the consumption of all those hours, and somebody should be the approver of projects who created the excess demand." – Barry Cousins Senior Director of Research, PMO Practice Info-Tech Research Group
Our understanding of the problem
This Research Is Designed For:
- IT leaders who lack actionable evidence of a resource-supply, work-demand imbalance.
- CIOs whose departments struggle to meet service and project delivery expectations with given resources.
- Portfolio managers, PMO directors, and project managers whose portfolio and project plans suffer due to unstable resource availability.
This Research Will Help You:
- Build trustworthy resource capacity data to support service and project portfolio management.
- Develop sustainable resource management practices to help you estimate, and continually validate, your true resource capacity for services and projects.
- Identify the demands that deplete your resource capacity without creating value for IT.
This Research Will Also Assist:
- Steering committee and C-suite management who want to improve IT’s delivery of projects.
- Project sponsors that want to ensure their projects get the promised resource time by their project managers.
This Research Will Help Them:
- Ensure sufficient supply of time for projects to be successfully completed with high quality.
- Communicate the new resource management practice and get stakeholder buy-in.
Executive summary
Situation
- As CIO, you oversee a department that lacks the resource capacity to adequately meet organizational demand for new projects and services. As a result, project quality and timelines suffer, and service delivery lags.
- You need a resource management strategy to help bring balance to supply and demand in order to improve IT’s ability to deliver.
Complication
- The shift to matrix work structures has strained traditional methods of time tracking. Day-to-day demand is chaotic; staff are pulled in multiple directions by numerous people, making usable capacity data elusive.
- The executive team approves too many projects, but is not held to account for the overspend on time. Instead, the IT worker is made liable, expected to simply get things done under excessive demands.
Resolution
- Instill a culture of capacity awareness. For years, the project portfolio management (PPM) industry has helped IT departments report on demand and usage, but it has largely failed to make capacity part of the conversation. This research helps inject capacity awareness into project and service portfolio planning, enabling IT to get proactive about constraints before overallocation spirals, and project and service delivery suffers.
- Build a sustainable process. Efforts to get better at resource management often falter when you try to get too granular too quickly. Info-Tech’s approach starts at a high level, ensuring that capacity data is accurate and usable, and that IT’s process discipline is mature enough to maintain the data, before drilling down into greater levels of precision.
- Establish a capacity hub. You will ultimately need a tool to help provide ongoing resource visibility. Follow the advice in this blueprint to help with your tool selection and ensure the reporting needs of both your team and executives are met.
Info-Tech Insight
- Take a realistic approach to resource management. New organizational realities have made traditional, rigorous resource projections impossible to maintain. Accept reality and get realistic about where IT’s time goes.
- Make IT’s capacity perpetually transparent. The best way to ensure projects are approved and scheduled based upon the availability of the right teams and skills is to shine a light into IT’s capacity and hold decision makers to account with usable capacity reports.
The availability of staff time is rarely factored into IT project and service delivery commitments
As a result, a lot gets promised and worked on, and staff are always busy, but very little actually gets done – at least not within given timelines or to expected levels of quality.
Organizations tend to bite off more than they can chew when it comes to project and service delivery commitments involving IT resources.
While the need for businesses to make an excess of IT commitments is understandable, the impacts of systemically overallocating IT are clearly negative:
- Stakeholder relations suffer. Promises are made to the business that can’t be met by IT.
- IT delivery suffers. Project timelines and quality frequently suffer, and service support regularly lags.
- Employee engagement suffers. Anxiety and stress levels are consistently high among IT staff, while morale and engagement levels are low.
76% of organizations say they have too many projects on the go and an unmanageable and ever-growing backlog of things to get to. (Cooper, 2014)
Almost 70% of workers feel as though they have too much work on their plates and not enough time to do it. (Reynolds, 2016)
Resource management can help to improve workloads and project results, but traditional approaches commonly fall short
Traditional approaches to resource management suffer from a fundamental misconception about the availability of time in 2017.
The concept of resource management comes from a pre-World Wide Web era, when resource and project plans could be based on a relatively stable set of assumptions.
In the old paradigm, the availability of time was fairly predictable, as was the demand for IT services, so there was value to investing time into rigorous demand forecasts and planning.
Resource projections could be based in a secure set of assumptions – i.e. 8 hour days, 40 hour weeks – and staff had the time to support detailed resource management processes that provided accurate usage data.
Old Realities
- Predictability. Change tended to be slow and deliberate, providing more stability for advanced, rigorous demand forecasts and planning.
- Fixed hierarchy. Tasks, priorities, and decisions were communicated through a fixed chain of command.
- Single-task focus. The old reality was more accommodating to sustained focus on one task at a time.
96% of organizations report problems with the accuracy of information on employee timesheets. (Dimensional, 2013)
Old reality resource forecasting inevitably falters under the weight of unpredictable demands and constant distractions
New realities are causing demands on workers’ time to be unpredictable and unrelenting, making a sustained focus on a specific task for any length of time elusive.
Part of the old resource management mythology is the idea that a person can do (for example) eight different one-hour tasks in eight hours of continuous work. This idea has gone from harmlessly mistaken to grossly unrealistic.
The predictability and focus have given way to more chaotic workplace realities. Technology is ubiquitous, and the demand for IT services is constant.
A day in IT is characterized by frequent task-switching, regular interruptions, and an influx of technology-enabled distractions.
Every 3 minutes and 5 seconds: How often the typical office worker switches tasks, either through self-directed or other-directed interruptions. (Schulte, 2015)
12 minutes, 40 seconds: The average amount of time in-between face-to-face interruptions in matrix organizations. (Anderson, 2015)
23 minutes, 15 seconds: The average amount of time it takes to become on task, productive, and focused again after an interruption. (Schulte, 2015)
759 hours: The average number of hours lost per employee annually due to distractions and interruptions. (Huth, 2015)
The validity of traditional, rigorous resource planning has long been an illusion. New realities are making the sustained focus and stable assumptions that old reality projections relied on all but impossible to maintain.
For resource management practices to be effective, they need to evolve to meet new realities
New organizational realities have exacerbated traditional approaches to time tracking, making accurate and usable resource data elusive.
The technology revolution that began in the 1990s ushered in a new paradigm in organizational structures. Matrix reporting structures, diminished supervision of knowledge workers, massive multi-tasking, and a continuous stream of information and communications from the outside world have smashed the predictability and stability of the old paradigm.
The resource management industry has largely failed to evolve. It remains stubbornly rooted in old realities, relying on calculations and rollups that become increasingly unsustainable and irrelevant in our high-autonomy staff cultures and interruption-driven work days.
New Realities
- Unpredictable. Technologies and organizational strategies change before traditional IT demand forecasts and project plans can be realized.
- Matrix management. Staff can be accountable to multiple project managers and functional managers at any given time.
- Multi-task focus. In the new reality, workers’ attentions are scattered across multiple tasks and projects at any given time.
87% of organizations report challenges with traditional methods of time tracking and reporting. (Dimensional, 2013)
40% of working time is not tracked or tracked inaccurately by staff. (actiTIME, 2016)
Poor resource management practices cost organizations dearly
While time is money, the statistics around resource visibility and utilization suggest that the vast majority of organizations don’t spend their available time all that wisely.
Research shows that ineffective resource management directly impacts an organization’s bottom line, contributing to such cost drains as the systemic late delivery of projects and increased project costs.
Despite this, the majority of organizations fail to treat staff time like the precious commodity it is.
As the results of a 2016 survey show, the top three pain points for IT and PMO leaders all revolve around a wider cultural negligence concerning staff time (Alexander, TechRepublic, 2016):
- Overcommitted resources
- Constant change that affects staff assignments
- An inability to prioritize shared resources
Top risks associated with poor resource management
Inability to complete projects on time – 52%
Inability to innovate fast enough – 39%
Increased project costs – 38%
Missed business opportunities – 34%
Dissatisfied customers or clients – 32%
12 times more waste – Organizations with poor resource management practices waste nearly 12 times more resource hours than high-performing organizations. (PMI, 2014)
The concept of fiduciary duty represents the best way to bring balance to supply and demand, and improve project outcomes
Unless someone is accountable for controlling the consumption of staff hours, too much work will get approved and committed to without evidence of sufficient resourcing.
Who is accountable for controlling the consumption of staff hours?
In many ways, no question is more important to the organization’s bottom line – and certainly, to the effectiveness of a resource management strategy.
Historically, the answer would have been the executive layer of the organization. However, in the 1990s management largely abdicated its obligation to control resources and expenditures via “employee empowerment.”
Controls on approvals became less rigid, and accountability for choosing what to do (and not do) shifted onto the shoulders of the individual worker. This creates a current paradigm where no one is accountable for the malinvestment…
…of resources that comes from approving too many projects. Instead, it’s up to individual workers to sink-or-swim, as they attempt to reconcile, day after day, seemingly infinite organizational demand with their finite supply of working hours.
If your organization has higher demand (i.e. approved project work) than supply (i.e. people’s time), your staff will be the final decision makers on what does and does NOT get worked on.
Effective time leadership distinguishes top performing senior executives
"Everything requires time… It is the one truly universal condition. All work takes place in time and uses up time. Yet most people take for granted this unique, irreplaceable and necessary resource. Nothing else, perhaps, distinguishes effective executives as much as their tender loving care of time." – Peter Drucker (quoted in Frank)
67% of employees surveyed believe their CEOs focus too much on decisions based in short-term financial results and not enough time on decisions that create a stable, positive workplace for staff. (2016 Edelman Trust Barometer)
Bring balance to supply and demand with realistic resource management practices
Use Info-Tech’s approach to resource management to capture an accurate view of where your time goes and achieve sustained visibility into your capacity for new projects.
Realistic project resource management starts by aligning demand with capacity, and then developing tactics to sustain alignment, even in the chaos of our fast-paced, rapidly changing, interruption-driven project environments.
This blueprint will help you develop practices to promote and maintain accurate resourcing data, while developing tactics to continually inform decision makers’ assumptions about how much capacity is realistically available for project work.
This research follows a three-phase approach to sustainable practices:
- Take Stock of Organizational Supply and Demand
- Design a Realistic Resource Management Process
- Implement Sustainable Resource Management Practices
Info-Tech’s three-phase framework is structured around a practical, tactical approach to resource management. It’s not about what you put together as a one-time snapshot. It’s about what you can and will maintain every week, even during a crisis. When you stop maintaining resource management data, it’s nearly impossible to catch up and you’re usually forced to start fresh.
Info-Tech’s approach is rooted in our seven dimensions of resource management
Action the decision points across Info-Tech’s seven dimensions to ensure your resource management process is guided by realistic data and process goals.
Default project vs. non-project ratio
How much time is available for projects once non-project demands are factored in?
Reporting frequency
How often is the allocation data verified, reconciled, and reported for use?
Forecast horizon
How far into the future can you realistically predict resource supply?
Scope of allocation
To whom is time allocated?
Allocation cadence
How long is each allocation period?
Granularity of time allocation
What’s the smallest unit of time to allocate?
Granularity of work assignment
What is time allocated to?
This blueprint will help you make the right decisions for your organization across each of these dimensions to ensure your resource management practices match your current process maturity levels.
Once your framework is defined, we’ll equip you with a tactical plan to help keep supply and demand continually balanced
This blueprint will help you customize a playbook to ensure your allocations are perpetually balanced week after week, month after month.
Developing a process is one thing, sustaining it is another.
The goal of this research isn’t just to achieve a one-time balancing of workloads and expect that this will stand the test of time.
The true test of a resource management process is how well it facilitates the flow of accurate and usable data as workloads become chaotic, and fires and crises erupt.
- Info-Tech’s approach will help you develop a playbook and a “rebalancing routine” that will help ensure your allocations remain perpetually current and balanced.
- The sample routine to the right shows you an example of what this rebalancing process will look like (customizing this process is covered in Phase 3 of the blueprint).
Sample “rebalancing” routine
- Maintain a comprehensive list of the sources of demand (i.e. document the matrix).
- Catalog the demand.
- Allocate the supply.
- Forecast the capacity to your forecast horizon.
- Identify and prepare work packages or tasks for unsatisfied demand to ensure that supply can be utilized if it becomes free.
- Reconcile any imbalance by repeating steps 1-5 on update frequency, say, weekly or monthly.
Info-Tech’s method is complemented by a suite of resource management tools and templates
Each phase of this blueprint is accompanied by supporting deliverables to help plan your resource management strategy and sustain your process implementation.
Resource management depends on the flow of information and data from the project level up to functional managers, project managers, and beyond – CIOs, steering committees, and senior executives.
Tools are required to help plan, organize, and facilitate this flow, and each phase of this blueprint is centered around tools and templates to help you successfully support your process implementation.
Take Stock of Organizational Supply and Demand
Tools and Templates:
Design a Realistic Resource Management Process
Tools and Templates:
Implement Sustainable Resource Management Practices
Tools and Templates:
Use Info-Tech’s Portfolio Manager Lite to support your new process without a heavy upfront investment in tools
Spreadsheets can provide a viable alternative for organizations not ready to invest in an expensive tool, or for those not getting what they need from their commercial selections.
While homegrown solutions like spreadsheets and intranet sites lack the robust functionality of commercial offerings, they have dramatically lower complexity and cost-in-use.
Info-Tech’s Portfolio Manager Lite is a sophisticated, scalable, and highly customizable spreadsheet-based solution that will get your new resource management process up and running, without a heavy upfront cost.
Kinds of PPM solutions used by Info-Tech clients
Homemade – 46%
Commercial – 33%
No Solution – 21%
(Info-Tech Research Group (2016), N=433)
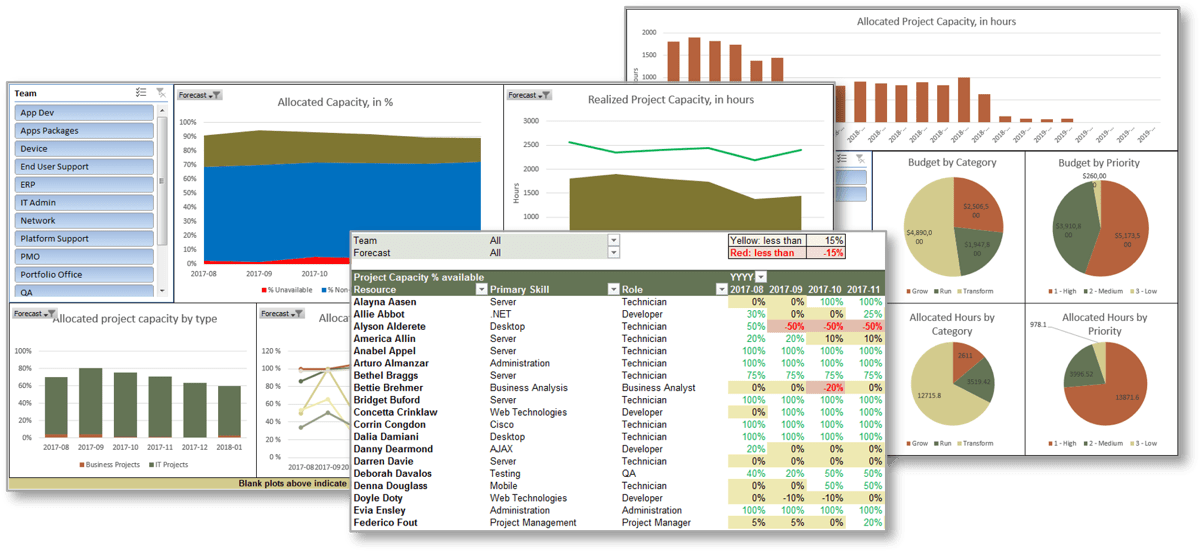
Samples of Portfolio Manager Lite's output and reporting tabs
Info-Tech’s approach to resource management is part of our larger project portfolio management framework
This blueprint will help you master the art of resource management and set you up for greater success in other project portfolio management capabilities.
Resource management is one capability within Info-Tech’s larger project portfolio management (PPM) framework.
Resource visibility and capacity awareness permeates the whole of PPM, helping to ensure the right intake decisions get made, and projects are scheduled according to resource and skill availability.
Whether you have an existing PPM strategy that you are looking to optimize or you are just starting on your PPM journey, this blueprint will help you situate your resource management processes within a larger project and portfolio framework.
Info-Tech’ s PPM framework is based on extensive research and practical application, and complements industry standards such as those offered by PMI and ISACA.
| Project Portfolio Management
|
| Status & Progress Reporting
|
| Intake, Approval, & Prioritization
|
Resource Management
|
Project Management
|
Project Closure
|
Benefits Tracking
|
| Organizational Change Management
|
| Intake →
|
Execution→
|
Closure
|
Realize the value that improved resource management practices could bring to your organization
Spend your company’s HR dollars more efficiently.
Improved resource management and capacity awareness will allow your organization to improve resource utilization and increase project throughput.
CIOs, PMOs, and portfolio managers can use this blueprint to improve the alignment between supply and demand. You should be able to gauge the value through the following metrics:
Near-Term Success Metrics (6 to 12 months)
- Increased frequency of currency (i.e. more accurate and usable resource data and reports).
- Improved job satisfaction from project resources due to more even workloads.
- Better ability to schedule project start dates and estimate end dates due to recourse visibility.
Long-Term Success Metrics (12 to 24 months)
- More projects completed on time.
- Reclaimed capacity for project work.
- A reduction in resource waste and increased resource utilization on productive project work.
- Ability to track estimated vs. actual budget and work effort on projects.
In the past 12 months, Info-Tech clients have reported an average measured value rating of $550,000 from the purchase of workshops based on this research.
Info-Tech client masters resource management by shifting the focus to capacity forecasting
CASE STUDY
Industry Education
Source Info-Tech Client
Situation
- There are more than 200 people in the IT organization.
- IT is essentially a shared services environment with clients spanning multiple institutions across a wide geography.
- The PMO identified dedicated resources for resource management.
Complication
- The definition of “resource management” was constantly shifting between accounting the past (i.e. time records), the present (i.e. work assignments), and the future (i.e. long term project allocations).
- The task data set (i.e. for current work assignments) was not aligned to the historic time records or future capacity.
- It was difficult to predict or account for the spend, which exceeded 30,000 hours per month.
“We’re told we can’t say NO to projects. But this new tool set and approach allows us to give an informed WHEN.” – Senior PMO Director, Education
Resolution
- The leadership decided to forecast and communicate their resource capacity on a 3-4 month forecast horizon using Info-Tech’s Portfolio Manager 2017.
- Unallocated resource capacity was identified within certain skill sets that had previously been assessed as fully allocated. While some of the more high-visibility staff were indeed overallocated, other more junior personnel had been systemically underutilized on projects.
- The high demand for IT project resourcing was immediately placed in the context of a believable, credible expression of supply.
Info-Tech offers various levels of support to best suit your needs
DIY Toolkit
“Our team has already made this critical project a priority, and we have the time and capability, but some guidance along the way would be helpful.”
Guided Implementation
“Our team knows that we need to fix a process, but we need assistance to determine where to focus. Some check-ins along the way would help keep us on track.”
Workshop
“We need to hit the ground running and get this project kicked off immediately. Our team has the ability to take this over once we get a framework and strategy in place.”
Consulting
“Our team does not have the time or the knowledge to take this project on. We need assistance through the entirety of this project.”
Diagnostics and consistent frameworks used throughout all four options
Establish Realistic IT Resource Management Practices – project overview
|
|
1. Take Stock of Organizational Supply and Demand
|
2. Design a Realistic Resource Management Process
|
3. Implement Sustainable Resource Management Practices
|
| Best-Practice Toolkit
|
1.1 Set a resource management course of action
1.2 Create realistic estimates of supply and demand
|
2.1 Customize the seven dimensions of resource management
2.2 Determine the resource management tool that will best support your process
2.3 Build process steps to ensure data accuracy and sustainability
|
3.1 Pilot your resource management process to assess viability
3.2 Plan to engage your stakeholders with your playbook
|
| Guided Implementations
|
- Scoping call
- Assess how accountability for resource management is currently distributed
- Create a realistic estimate of project capacity
- Map all sources of demand on resources at a high level
|
- Set your seven dimensions of resource management
- Jump-start spreadsheet-based resource management with Portfolio Manager Lite
- Build on the workflow to determine how data will be collected and who will support the process
|
- Define the scope of a pilot and determine logistics
- Finalize resource management roles and responsibilities
- Brainstorm and plan for potential resistance to change, objections, and fatigue from stakeholders
|
| Onsite Workshop
|
Module 1:
- Take Stock of Organizational Supply and Demand
|
Module 2:
- Design a Realistic Resource Management Process
|
Module 3:
- Implement Sustainable Resource Management Practices
|
|
|
Phase 1 Outcome:
- Resource Management Supply-Demand Calculator
|
Phase 2 Outcome:
- Resource Management Playbook
|
Phase 3 Outcome:
- Resource Management Communications Template
|
Workshop overview
Contact your account representative or email Workshops@InfoTech.com for more information.
|
|
Workshop Day 1
|
Workshop Day 2
|
Workshop Day 3
|
Workshop Day 4
|
Workshop Day 5
|
| Activities
|
Introduction to PPM and resource management
1.1 Complete and review PPM Current State Scorecard Assessment
1.2 Perform root cause analysis of resource management challenges
1.3 Initiate time audit survey of management and staff
|
Take stock of supply and demand
2.1 Review the outputs of the time audit survey and analyze the data
2.2 Analyze project and non-project demands, including the sources of those demands
2.3 Set the seven dimensions of resource management
|
Design a resource management process
3.1 Review resource management tool options
3.2 Prepare a vendor demo script or review Portfolio Manager Lite
3.3 Build process steps to ensure data accuracy and sustainability
|
Pilot and refine the process
4.1 Define methods for piloting the strategy (after the workshop)
4.2 Complete the Process Pilot Plan Template
4.3 Conduct a mock resource management meeting
4.4 Perform a RACI exercise
|
Communicate and implement the process
5.1 Brainstorm potential implications of the new strategy and develop a plan to manage stakeholder and staff resistance to the strategy
5.2 Customize the Resource Management Communications Template
5.3 Finalize the playbook
|
| Deliverables
|
- PPM Current State Scorecard Assessment
- Root cause analysis
- Time Audit Workbook and survey templates
|
- Resource Management Supply-Demand Calculator
|
- Portfolio Manager Lite
- PPM Solution Vendor Demo Script
- Tentative Resource Management Playbook
|
- Process Pilot Plan Template
- RACI chart
|
- Resource Management Communications Template
- Finalized Resource Management Playbook
|
Phase 1
Take Stock of Organizational Resource Supply and Demand
Phase 1 Outline
Call 1-888-670-8889 or email GuidedImplementations@InfoTech.com for more information.
Complete these steps on your own, or call us to complete a guided implementation. A guided implementation is a series of
2-3 advisory calls that help you execute each phase of a project. They are included in most advisory memberships.
Guided Implementation 1: Take Stock of Organizational Resource Supply and Demand
Proposed Time to Completion (in weeks): 1-2 weeks
Step 1.1: Analyze the current state
Start with an analyst kick-off call:
- Discuss the goals, aims, benefits, and challenges of resource management
- Identify who is currently accountable for balancing resource supply and demand
Then complete these activities…
- Assess the current distribution of accountabilities in resource management
- Delve into your current problems to uncover root causes
- Make a go/no-go decision on developing a new resource management practice
Step 1.2: Estimate your supply and demand
Review findings with analyst:
- Root causes of resource management
- Your current impression about the resource supply-demand imbalance
Then complete these activities…
- Estimate your resource capacity for each role
- Estimate your project/non-project demand on resources
- Validate the findings with a time-tracking survey
With these tools & templates:
- Resource Management Supply-Demand Calculator
- Time-Tracking Survey Email Template
Phase 1 Results & Insights:
A matrix organization creates many small, untraceable demands that are often overlooked in resource management efforts, which leads to underestimating total demand and overcommitting resources. To capture them and enhance the success of your resource management effort, focus on completeness rather than precision. Precision of data will improve over time as your process maturity grows.
Step 1.1: Set a resource management course of action
PHASE 1
1.1 Set a course of action
1.2 Estimate supply and demand
PHASE 2
2.1 Select resource management dimensions
2.2 Select resource management tools
2.3 Build process steps
PHASE 3
3.1 Pilot your process for viability
3.2 Plan stakeholder engagement
This step will walk you through the following activities:
- Determine your resource management process capability level
- Assess how accountability for resource management is currently distributed
This step involves the following participants:
- CIO / IT Director
- PMO Director/ Portfolio Manager
- Functional / Resource Managers
- Project Managers
Outcomes of this step
- Current distribution of accountability for resource management practice
- Root-cause analysis of resourcing challenges facing the organization
- Commitment to implementing a right-sized resource management practice
“Too many projects, not enough resources” is the reality of most IT environments
A profound imbalance between demand (i.e. approved project work and service delivery commitments) and supply (i.e. people’s time) is the top challenge IT departments face today..
In today’s organizations, the desires of business units for new products and enhancements, and the appetites of senior leadership to approve more and more projects for those products and services, far outstrip IT’s ability to realistically deliver on everything.
The vast majority of IT departments lack the resourcing to meet project demand – especially given the fact that day-to-day operational demands frequently trump project work.
As a result, project throughput suffers – and with it, IT’s reputation within the organization.
Info-Tech Insight
Where does the time go? The portfolio manager (or equivalent) should function as the accounting department for time, showing what’s available in IT’s human resources budget for projects and providing ongoing visibility into how that budget of time is being spent.
Resource management can help to even out staff workloads and improve project and service delivery results
As the results of a recent survey* show, the top three pain points for IT and PMO leaders all revolve around a wider cultural negligence concerning staff time:
- Overcommitted resources
- Constant change that affects staff assignments
- An inability to prioritize shared resources
A resource management strategy can help to alleviate these pain points and reconcile the imbalance between supply and demand by achieving the following outcomes:
- Improving resource visibility
- Reducing overallocation, and accordingly, resource stress
- Reducing project delay
- Improving resource efficiency and productivity
Top risks associated with poor resource management
Inability to complete projects on time – 52%
Inability to innovate fast enough – 39%
Increased project costs – 38%
Missed business opportunities – 34%
Dissatisfied customers or clients – 32%
12 times more waste – Organizations with poor resource management practices waste nearly 12 times more resource hours than high-performing organizations. (PMI, 2014)
Resource management is a core process in Info-Tech’s project portfolio management framework
Project portfolio management (PPM) creates a stable and secure infrastructure around projects.
PPM’s goal is to maximize the throughput of projects that provide strategic and operational value to the organization. To do this, a PPM strategy must help to:
| Info-Tech's Project Portfolio Management Process Model
|
| 3. Status & Progress Reporting [make sure the projects are okay]
|
| 1. Intake, Approval, & Prioritization [select the right projects]
|
2. Resource Management [Pick the right time and people to execute the projects
|
Project Management
|
4. Project Closure
[make sure the projects get done]
|
5. Benefits Tracking
[make sure they were worth doing]
|
| Organizational Change Management
|
| Intake →
|
Execution→
|
Closure
|
If you don’t yet have a PPM strategy in place, or would like to revisit your existing PPM strategy before implementing resource management practices, see Info-Tech’s blueprint, Develop a Project Portfolio Management Strategy.
Effective resource management is rooted in a relatively simple set of questions
However, while the questions are rather simple, the answers become complicated by challenges unique to matrix organizations and other workplace realities in 2017.
To support the goals of PPM more generally, resource management must (1) supply quality work-hours to approved and ongoing projects, and (2) supply reliable data with which to steer the project portfolio.
To do this, a resource management strategy must address a relatively straightforward set of questions.
Key Questions
- Who assigns the resources?
- Who feeds the data on resources?
- How do we make sure it’s valid?
- How do we handle contingencies when projects are late or when availability changes?
Challenges
- Matrix organizations require project workers to answer to many masters and balance project work with “keep the lights on” activities and other administrative work.
- Interruptions, distractions, and divided attention create consistent challenges for workplace productivity.
"In matrix organizations, complicated processes and tools get implemented to answer the deceptively simple question “what’s Bob going to work on over the next few months?” Inevitably, the data captured becomes the focus of scrutiny as functional and project managers complain about data inaccuracy while simultaneously remaining reluctant to invest the effort necessary to improve quality." – Kiron Bondale
Determine your organization’s resource management capability level with a maturity assessment
1.1.1
10 minutes
Input
- Organizational strategy and culture
Output
- Resource management capability level
Materials
Participants
- PMO Director/ Portfolio Manager
- Project Managers
- Resource Managers
Kick-off the discussion on the resource management process by deciding which capability level most accurately describes your organization’s current state.
|
|
Capability Level Descriptions
|
| Capability Level 5: Optimized
|
Our organization has an accurate picture of project versus non-project workloads and allocates resources accordingly. We periodically reclaim lost capacity through organizational and behavioral change.
|
| Capability Level 4: Aligned
|
We have an accurate picture of how much time is spent on project versus non-project work. We allocate resources to these projects accordingly. We are checking in on project progress bi-weekly.
|
| Capability Level 3: Pixelated
|
We are allocating resources to projects and tracking progress monthly. We have a rough estimate of how much time is spent on project versus non-project work.
|
| Capability Level 2: Opaque
|
We match resource teams to projects and check in annually, but we do not forecast future resource needs or track project versus non-project work.
|
| Capability Level 1: Unmanaged
|
Our organization expects projects to be finished, but there is no process in place for allocating resources or tracking project progress.
|
If resources are poorly managed, they prioritize work based on consequences rather than on meeting demand
As a result, matrix organizations are collectively steered by each resource and its individual motives, not by managers, executives, or organizational strategy.
In a matrix organization, demands on a resource’s time come from many directions, each demand unaware of the others. Resources are expected to prioritize their work, but they typically lack the authority to formally reject demand, so demand frequently outstrips the supply of work-hours the resource can deliver.
When this happens, the resource has three options:
- Work more hours, typically without compensation.
- Choose tasks not to do in a way that minimizes personal consequences.
- Diminish work quality to meet quantity demands.
The result is an unsustainable system for those involved:
- Resources cannot meet expectations, leading to frustration and disengagement.
- Managers cannot deliver on the projects or services they manage and struggle to retain skilled resources who are looking elsewhere for “greener pastures.”
- Executives cannot execute strategic plans as they lose decision-making power over their resources.
Scope your resource management practices within a matrix organization by asking “who?”
Resource management boils down to a seemingly simple question: how do we balance supply and demand? Balancing requires a decision maker to make choices; however, in a matrix organization, identifying this decision maker is not straightforward:
Balance
- Who decides how much capacity should be dedicated to project work versus administrative or operational work?
- Who decides how to respond to unexpected changes in supply or demand?
Supply
- Who decides how much total capacity we have for each necessary skill set?
- Who manages the contingency, or redundancy, of capacity?
- Who validates the capacity supply as a whole?
- Who decides what to report as unexpected changes in supply (and to whom)?
Demand
- Who generates demand on the resource that can be controlled by their manager?
- Who generates demand on the capacity that cannot be controlled by their manager?
- Who validates the demand on capacity as a whole?
- Who decides what to report as unexpected changes in demand (and to whom)?
The individual who has the authority to make choices, and who is ultimately liable for those decisions, is an accountable person. In a matrix organization, accountability is dispersed, sometimes spilling over to those without the necessary authority.
To effectively balance supply and demand, senior management must be held accountable
Differentiate between responsibility and accountability to manage the organization’s project portfolio effectively.
Responsibility
The responsible party is the individual (or group) who actually completes the task.
Responsibility can be shared.
VS.
Accountability
The accountable person is the individual who has the authority to make choices, and is ultimately answerable for the decision.
Accountability cannot be shared.
Resources often do not have the necessary scope of authority to make resource management choices, so they can never be truly accountable for the project portfolio. Instead, resources are accountable for making available trustworthy data, so the right people can make choices driven by organizational strategy.
The next activity will assess how accountability for resource management is currently distributed in your organization.
Assess the current distribution of accountability for resource management practice
1.1.2
15 minutes
Input
- Organizational strategy and culture
Output
- Current distribution of accountabilities for resource management
Materials
- Whiteboard/flip chart
- Markers
Participants
- CIO
- PMO Director/ Portfolio Manager
Below is a list of tasks in resource management that require choices. Discuss who is currently accountable and whether they have the right authority and ability to deliver on that accountability.
| Resource management tasks that require choices
|
Accountability
|
| Current
|
Effective?
|
| Identify all demands on resources
|
|
|
| Prioritize identified project demands
|
|
|
| Prioritize identified operational demands
|
|
|
| Prioritize identified administrative demands
|
|
|
| Prioritize all of the above demands
|
|
|
| Enumerate resource supply
|
|
|
| Validate resource supply
|
|
|
| Collect and validate supply and demand data
|
|
|
| Defer or reject work beyond available supply
|
|
|
| Adjust resource supply to meet demand
|
|
|
Develop coordination between project and functional managers to optimize resource management
Because resources are invariably responsible for both project and non-project work, efforts to procure capacity for projects cannot exist in isolation.
IT departments need many different technical skill sets at their disposal for their day-to-day operations and services, as well as for projects. A limited hiring budget for IT restricts the number of hires with any given skill, forcing IT to share resources between service and project portfolios.
This resource sharing produces a matrix organization divided along the lines of service and projects. Functional and project managers provide respective oversight for services and projects. Resources split their available work-hours toward service and project tasks according to priority –
in theory.
However, in practice, two major challenges exist:
- Poor coordination between functional and project managers causes commitments beyond resource capacity, disputes about resource oversight, and animosity among management, all while resources struggle to balance unclear priorities.
- Resources have a “third boss,” namely uncontrolled demands from the rest of the business, which lack both visibility and accountability.
Resource management processes must account for the numerous small demands generated in a matrix organization
Avoid going bankrupt $20 at a time: small demands add up to a significant chunk of work-hours.
Because resource managers must cover both projects and services within IT, the typical solution to allocation problems in matrix organizations is to escalate the urgency and severity of demands by involving the executive steering committee. Unfortunately, the steering committee cannot expend time and resources on all demands. Instead, they often set a minimum threshold for cases – 100-1,000 work-hours depending on the organization.
Under this resource management practice, small demands – especially the quick-fixes and little projects from “the third boss” – continue to erode project capacity. Eventually, projects fail to get resources because pesky small demands have no restrictions on the resources they consumed.
Realistic resource management needs to account for demand from all three bosses; however…
Info-Tech Insight
Excess project or service request intake channels lead to the proliferation of “off-the-grid” projects and tasks that lack visibility from the IT leadership. This can indicate that there may be too much red tape: that is, the request process is made too complex or cumbersome. Consider simplifying the request process and bring IT’s visibility into those requests.
Interrogate your resource management problems to uncover root causes
1.1.3
30 minutes to 1 hour
Input
- Organizational strategy and culture
Output
- Root causes of resource management failures
Materials
- Whiteboard/flip chart
- Sticky notes
- Markers
Participants
- CIO
- PMO Director/ Portfolio Manager
- Functional Managers
- Project Managers
- Pick a starting problem statement in resource management.
e.g. projects can’t get resource work-hours.
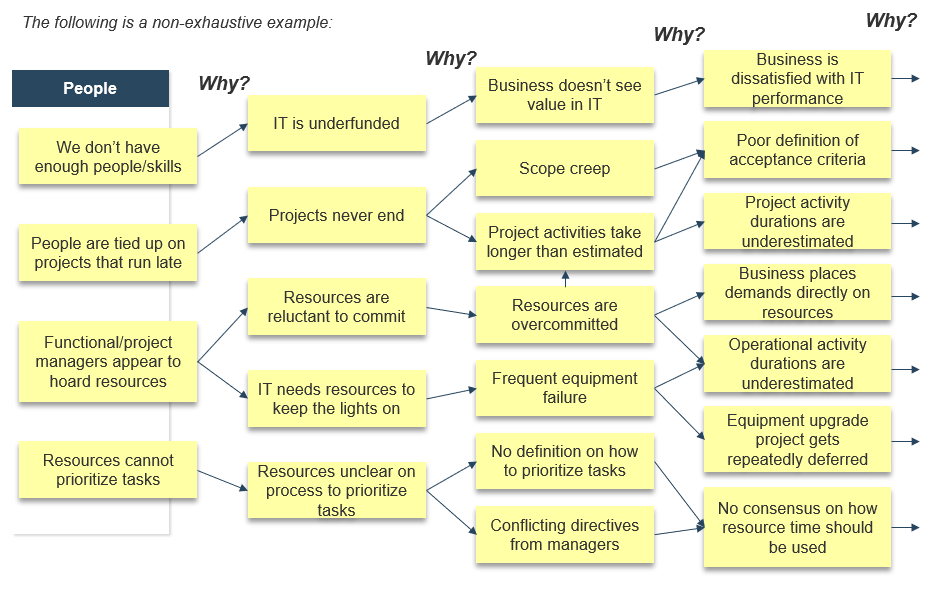
- Ask the participants “why”? Use three generic headings – people, processes, and technology – to keep participants focused. Keep the responses solution-agnostic: do not jump to solutions. If you have a large group, divide into smaller groups and use sticky notes to encourage more participation in this brainstorming step.
| People
|
Processes
|
Technology
|
- We don’t have enough people/skills.
- People are tied up on projects that run late.
- Functional and project managers appear to hoard resources.
- Resources cannot prioritize work.
|
- Resources are too busy responding to 911s from the business.
- Resources cannot prioritize projects vs. operational tasks.
- “Soft-closed” projects do not release resources for other work.
|
- We don’t have tools that show resource availability.
- Tools we have for showing resource availability are not being used.
- Data is inaccurate and unreliable.
|
- Determine the root cause by iteratively asking “why?” up to five times, or until the chain of whys comes full circle. (i.e. Why A? B. Why B? C. Why C? A.)
See below for an example.
1.1.2 Example of a root-cause analysis: people
The following is a non-exhaustive example:
Right-size your resource management strategy with Info-Tech’s realistic resource management practice
If precise, accurate, and complete data on resource supply and demand was consistently available, reporting on project capacity would be easy. Such data would provide managers complete control over a resource’s time, like a foreman at a construction site. However, this theoretical scenario is incompatible with today’s matrixed workplace:
- Sources of demand can lie outside IT’s control.
- Demand is generated chaotically, with little predictability.
- Resources work with minimal supervision.
Collecting and maintaining resource data is therefore nearly impossible:
- Achieving perfect data accuracy creates unnecessary overhead.
- Non-compliance by one project or resource makes your entire data set unusable for resource management.
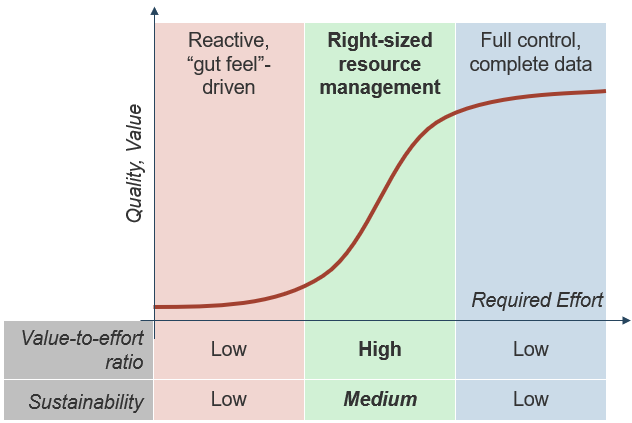
This blueprint will guide you through right-sizing your resource management efforts to achieve maximum value-to-effort ratio and sustainability.
Choose your resource management course of action
Portfolio managers looking for a resource management solution have three mutually exclusive options:
Option A: Do Nothing
- Rely on expert judgment and intuition to make portfolio choices.
- Allow the third boss to dictate the demands of your resources.
Option B: Get Precise
- Aim for granularity and precision of data with a solution that may demand more capacity than is realistically available by hiring, outsourcing, or over-allocating people’s time.
- Require detailed, accurate time sheets for all project tasks.
- For those choosing this option, proceed to Info-Tech’s Select and Implement a PPM Solution.
Option C: Get Realistic
- Balance capacity supply and demand using abstraction.
- Implement right-sized resource management practices that rely on realistic, high-level capacity estimates.
- Reduce instability in data by focusing on resource capacity, rather than granular project demands and task level details.
This blueprint takes you through the steps necessary to accomplish Option C, using Info-Tech’s tools and templates for managing your resources.
Step 1.2: Create realistic estimates of supply and demand
PHASE 1
1.1 Set a course of action
1.2 Estimate supply and demand
PHASE 2
2.1 Select resource management dimensions
2.2 Select resource management tools
2.3 Build process steps
PHASE 3
3.1 Pilot your process for viability
3.2 Plan stakeholder engagement
This step will walk you through the following activities:
- Create a realistic estimate of project capacity
- Map all sources of demand on resources at a high level
- Validate your supply and demand assumptions by directly surveying your resources
This step involves the following participants:
- PMO Director / Portfolio Manager
- Project Managers (optional)
- Functional / Resource Managers (optional)
- Project Resources (optional)
Outcomes of this step
- A realistic estimate of your total and project capacity, as well as project and non-project demand on their time
- Quantitative insight into the resourcing challenges facing the organization
- Results from a time-tracking survey, which are used to validate the assumptions made for estimating resource supply and demand
Create a realistic estimate of your project capacity with Info-Tech’s Resource Management Supply-Demand Calculator
Take an iterative approach to capacity estimates: use your assumptions to create a meaningful estimate, and then validate with your staff to improve its accuracy.
Use Info-Tech’s Resource Management Supply-Demand Calculator to create a realistic estimate of your project capacity.
The calculator tool requires minimal upfront staff participation: you can obtain meaningful results with participation from even a single person, with insight on the distribution of your resources and their average work week or month. As the number of participants increases, the quality of analysis will improve.
The first half of this step guides you through how to use the calculator. The second half provides tactical advice on how to gather additional data and validate your resourcing data with your staff.
Download Info-Tech’s Resource Management Supply-Demand Calculator
Info-Tech Insight
What’s first, process or tools? Remember that process determines the quality of your data while data quality limits the tool’s utility. Without quality data, you cannot evaluate the success of the tool, so nail down your collection process first.
Break down your resource capacity into high-level buckets of time for each role
1.2.1
30 minutes - 1 hour
Input
- Staff resource types
- Average work week
- Estimated allocations
Output
A realistic estimate of project capacity
Materials
Resource Management Supply-Demand Calculator
Participants
- PMO Director
- Resource/Functional Managers (optional)
We define four high-level buckets of resource time:
- Absence: on average, a resource spends 14% of the year on vacation, statutory holidays, business holidays and other forms of absenteeism.
- Administrative: time spent on meetings, recordkeeping, etc.
- Operational: keeping the lights on; reactive work.
- Projects: time to work on projects; typically, this bucket of time is whatever’s left from the above.
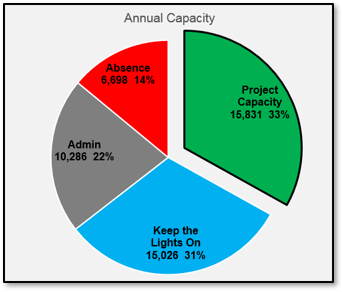
Instructions for working through Tab 2 of the Resource Management Supply-Demand Calculator are provided in the next two sections. Follow along to obtain your breakdown of annual resource capacity in a pie chart.
Break down your resource capacity into high-level buckets of time for each role
1.2.1
Resource Management Supply-Demand Calculator, Tab 2: Capacity Supply
Discover how many work-hours are at your disposal by first accounting for absences.
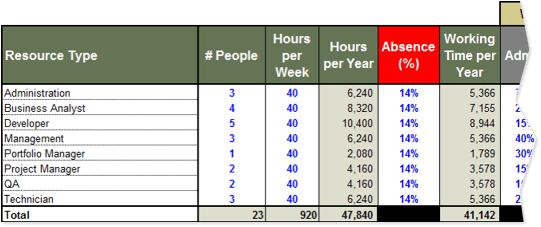
- Compile a list of each of the roles within your department.
- Enter the number of staff currently performing each role.
- Enter the number of hours in a typical work week for each role.
- Enter the foreseeable out-of-office time (vacation, sick time, etc.) Typically, this value is 12-16% depending on the region.
Hours per Year represents your total resource capacity for each role, as well as the entire department. This column is automatically calculated.
Working Time per Year represents your total resource capacity minus time employees are expected to spend out of office. This column is automatically calculated.
Info-Tech Insight
Example for a five-day work week:
- 2 weeks (10 days) of statutory holidays
- 3 weeks of vacation
- 1.4 weeks (7 days) of sick days on average
- 1 week (5 days) for company holidays
Result: 7.4/52 weeks’ absence = 14.2%
Break down your resource capacity into high-level buckets of time for each role (continued)
1.2.1
Resource Management Supply-Demand Calculator, Tab 2: Capacity Supply
Determine the current distribution of your resources’ time and your confidence in whether the resources indeed supply those times.
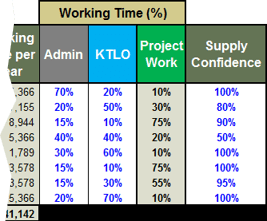
5. Enter the percentage of working time across each role that, on an annual basis, goes toward administrative duties (non-project meetings, training, time spent checking email, etc.) and keep-the-lights-on work (e.g. support and maintenance work).
While these percentages will vary by individual, a high-level estimate across each role will suffice for the purposes of this activity.
6. Express how confident you are in each resource being able to deliver the calculated project work hours in percentages.
Another interpretation for supply confidence is “supply control”: estimate your current ability to control this distribution of working time to meet the changing needs in percentages.
Percentage of your working time that goes toward project work is calculated based upon what’s left after your non-project working time allocations have been subtracted.
Create a realistic estimate of the demand from your project portfolio with the T-shirt sizing technique
1.2.2
15 minutes - 30 minutes
Input
- Average work-hours for a project
- List of projects
- PPM Current State Scorecard
Output
A realistic estimate of resource demand from your project portfolio
Materials
Resource Management Supply-Demand Calculator
Participants
- PMO Director
- Project Managers (optional)
Quickly re-express the size of your project portfolio in resource hours required.
Estimating the resources required for a project in a project backlog can take a lot of effort. Rather than trying to create an accurate estimate for each project, a set of standard project sizes (often referred to as the “T-shirt sizing” technique) will be sufficiently accurate for estimating your project backlog’s overall demand.
Instructions for working through Tab 3 of the tool are provided here and in the next section.
1. For each type of project, enter the average number for work-hours.
| Project Types
|
Average Number of Work Hours for a Project
|
| Small
|
80
|
| Medium
|
200
|
| Large
|
500
|
| Extra-Large
|
1000
|
Improve your estimate of demand from your project portfolio by accounting for unproductive capacity spending
1.2.2
Resource Management Supply-Demand Calculator, Tab 3: Project Demand
2. Using your list of projects, enter the number of projects for each appropriate field.
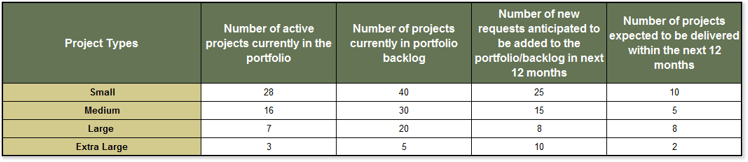
3. Enter your resource waste data from the PPM Current State Scorecard (see next section). Alternatively, enter your best guess on how much project capacity is spent wastefully per category.
Info-Tech Insight
The calculator estimates the project demand by T-shirt-sizing the work-hours required by projects to be delivered within the next 12 months and then adding the corresponding wasted capacity. This may be a pessimistic estimate, but it is more realistic because projects tend to be delivered late more than early.
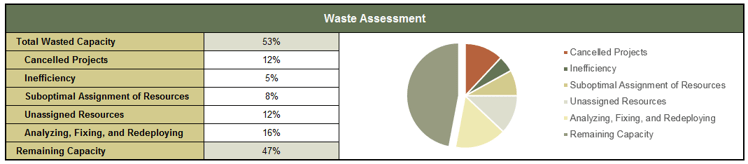
Estimate how much project capacity is wasted with Info-Tech’s PPM Current State Scorecard
Call 1-888-670-8889 or contact your Account Manager for more information.
This step is highly recommended but not required.
Info-Tech’s PPM Current State Scorecard diagnostic provides a comprehensive view of your portfolio management strengths and weaknesses, including project portfolio management, project management, customer management, and resource utilization.
Use the wisdom-of-the-crowd to estimate resource waste in:
- Cancelled projects
- Inefficiency
- Suboptimal assignment of resources
- Unassigned resources
- Analyzing, fixing, and redeploying
50% of PPM resource is wasted on average, effectively halving your available project capacity.
Estimate non-project demand on your resources by role
1.2.3
45 minutes - 1 hour
Input
- Organizational chart
- Knowledge of staff non-project demand
Output
Documented non-project demands and their estimated degree of fluctuation
Materials
Resource Management Supply-Demand Calculator
Participants
- PMO Director
- Functional Managers (optional)
Document non-project demand that could eat into your project capacity.
When discussing project demands, non-project demands (administrative and operational) are often underestimated and downplayed – even though, in reality, they take a de facto higher priority to project work. Use Tab 4 of the tool to document these non-project demands, as well as their sources.
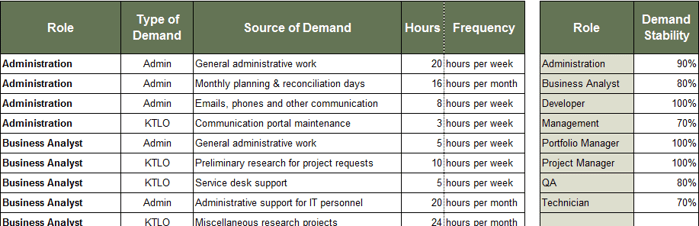
1. Choose a role using a drop-down list.
2. Enter the type and the source of the demand.
3. Enter the size and the frequency of the demand in hours.
4. Estimate how stable the non-project demands are for each role.
Examine and discuss your supply-demand analysis report
1.2.4
30 minutes - 1 hour
Input
Completed Resource Management Supply-Demand Calculator
Output
Supply-Demand Analysis Report
Materials
Resource Management Supply-Demand Calculator
Participants
- PMO Director
- Functional Managers
- Project Managers
Start a data-driven discussion on resource management using the capacity supply-demand analysis report.
Tab 5 of the calculator is a report that contains the following analysis:
- Overall resource capacity supply and demand gap
- Project capacity supply vs. demand gap
- Non-project capacity supply vs. demand balance
- Resource capacity confidence
Each analysis is described and explained in the following four sections. Examine the report and discuss the following among the activity participants:
- How is your perception of the current resource capacity supply-demand balance affected by this analysis? How is it confirmed? Is it changed?
- Perform a root-cause analysis of problems revealed by the report. For each observation, ask “why?” repeatedly – generally, you can arrive at the root cause in four iterations.
- Refer back to Activity 1.1.2: current distribution of accountability for resource management. In your situation, how would you prioritize which resource management tasks to improve? Who are the involved stakeholders?
Examine your supply-demand analysis report: overall resource capacity gap
1.2.4
Resource Management Supply-Demand Calculator, Tab 5: Supply-Demand Analysis
1. Examine your resource capacity supply and demand gap.
The top of the report on Tab 5 shows a breakdown of your annual resource supply and demand, with resource capacity shown in both total hours and percentage of the total. For the purposes of the analysis, absence is averaged. If total demand is less than available resource supply, the surplus capacity will be displayed as “Free Capacity” on the demand side.
The Supply & Demand Analysis table displays the realistic project capacity, which is calculated by subtracting non-project supply deficit from the project capacity. This is based on the assumption that all non-project work must get done. The difference between the project demand and the realistic project capacity is your supply-demand gap, in work-hours.
If your supply-demand gap is zero, recognize that the project demand does not take into account the project backlog: it only takes into account the projects that are expected to be delivered within the next 12 months.
Examine your supply-demand analysis report: project capacity gap
1.2.4
Resource Management Supply-Demand Calculator, Tab 5: Supply-Demand Analysis
2. Examine your project capacity supply vs. demand gap.
The project capacity supply and demand analysis compares your available annual project capacity with the size of your project portfolio, expressed in work-hours.
The supply side is further broken down to productive vs. wasted project capacity. The demand side is broken down to three buckets of projects: those that are active, those that sit in the backlog, and those that are expected to be added within 12 months. Percentage values are expressed in terms of total project capacity.
A key observation here is the limitation to which reducing wasteful spending of resources can get to the project portfolio backlog. In this example, even a theoretical scenario of 100% productive project capacity will not likely result in net shrinkage of the project portfolio backlog. To achieve that, either the total project capacity must be increased, or less projects must be approved.
Note: the work-hours necessary for delivering projects that are expected to be completed within 12 months is not shown in this visualization, as they should be represented within the other three categories of projects.
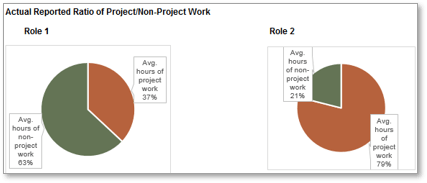
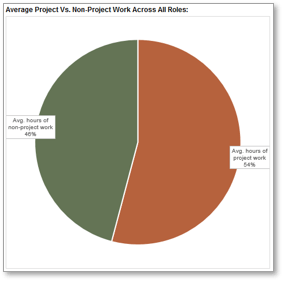
Examine your supply-demand analysis report: non-project capacity gap
1.2.4
Resource Management Supply-Demand Calculator, Tab 5: Supply-Demand Analysis
3. Drill down on the non-project capacity supply-demand balance by each role.
The non-project capacity supply and demand analysis compares your available non-project capacity and their demands in a year, for each role, in work-hours.
With this chart, you can:
- Observe which roles are “running hot,” (i.e. they have more demand than available supply).
- Verify your non-project/project supply ratio assumptions in Tab 2 of the tool / Activity 1.2.1.
Tab 5 also provides similar breakdowns for administrative and keep-the-lights-on capacity supply and demand by each role.
Examine your supply-demand analysis report: resource capacity confidence (RCC)
1.2.4
Resource Management Supply-Demand Calculator, Tab 5: Supply-Demand Analysis
4. Examine your resource capacity confidence.
In our approach, we introduce a metric called Resource Capacity Confidence (RCC). Conceptually, RCC is defined as follows:
Resource Capacity Confidence = SC × DS × SDR
| Term
|
Name
|
Description
|
| SC
|
Supply Control
|
How confident are you that the supply of your resources’ project capacity will be delivered?
|
| DS
|
Demand Stability
|
How wildly does demand fluctuate? If it cannot be controlled, can it be predicted?
|
| SDR
|
Supply-Demand Ratio
|
How severely does demand outstrip supply?
|
In this context, RCC can be defined as follows:
"Given the uncertainty that our resources can supply hours according to the assumed project/non-project ratio, the fluctuations in non-project demand, and the overall deficit in project capacity, there is about 50% chance that we will be able to deliver the projects we are expected to deliver within the next 12 months."
Case study: Non-project work is probably taking far more time than you might like
CASE STUDY
Industry Government
Source Info-Tech Client
"When our customers get a budget for a project, it’s all in capital. It never occurs to them that IT has a limited number of hours. "
Challenge
- A small municipal government was servicing a wide geographic area for information technology and infrastructure services.
- There was no meaningful division of IT resources between support and project work.
- Previous IT leadership tried a commercial PPM tool and stopped paying maintenance fees for it because of lack of adoption.
- Projects were tracked inconsistently in multiple places.
Solution
- New project requests were approved with IT involvement.
- Project approvals were entirely associated with the capital budget required and resourcing was never considered to be a constraint.
- The broad assumption was that IT time was generally available for project work.
- In reality, the IT personnel had almost no time for project work.
Results
- The organization introduced Info-Tech’s Grow Your Own PPM Solution template with minor modifications.
- They established delivery dates for projects based on available time.
- Time was allocated for projects based on person, project, percentage of time, and month.
- They prioritized project allocations above reactive support work.
Validate your resourcing assumptions with your staff by surveying their use of time
Embrace the reality of imperfect IT labor efficiency to improve your understanding of resource time spend.
Use Info-Tech’s time-tracking survey to validate your resourcing assumptions and get additional information to improve your understanding of resource time spent: imperfect labor efficiency and continuous partial attention.
Causes of imperfect IT labor inefficiency
- Most IT tasks are unique to their respective projects and contexts. A component that took 30 minutes to install last year might take two hours to install this year due to system changes that occurred since then.
- Many IT tasks come up unexpectedly due to the need to maintain and support systems implemented on past projects. This work is unpredictable in terms of specifics (what will break where, when, or how).
- Task switching slows people down and consumes time.
- Problem solving and solution design often requires unstructured time to think more openly. Some of the most valuable solutions are conceived or discovered when people aren’t regimented and focused on getting things done.
Info-Tech Insight
Part of the old resource management mythology is the idea that a person can do (for example) eight different one-hour tasks in eight hours of continuous work. This idea has gone from harmlessly mistaken to grossly unrealistic.
Constant interruptions lead to continuous partial attention that threatens real productivity
There’s a difference between being busy and getting things done.
“Working” on multiple tasks at once can often feel extremely gratifying in the short term because it distracts people from thinking about work that isn’t being done.
The bottom line is that continuous partial attention impedes the progress of project work.
Research on continuous partial attention
- A study that analyzed interruptions and their effects on individuals in the workplace found that that “41% of the time an interrupted task was not resumed right away” (Mark, 2015).
- Research has also shown that it can take people an average of 23 minutes to return to a task after being interrupted (Schulte, 2015).
- Delays following interruptions are typically due to switching between multiple other activities before returning to the original task. In many cases, those tasks are much lower priorities – and in some cases not even work-related.
Info-Tech Insight
It may not be possible to minimize interruptions in the workplace, as many of these are considered to be urgent at the time. However, setting guidelines for how and when individuals can be interrupted may help to limit the amount of lost project time.
"Like so many things, in small doses, continuous partial attention can be a very functional behavior. However, in large doses, it contributes to a stressful lifestyle, to operating in crisis management mode, and to a compromised ability to reflect, to make decisions, and to think creatively."
– Linda Stone, Continuous Partial Attention
Define the goals and the scope of the time-tracking survey
1.2.5
30 minutes
Input
Completed Resource Management Supply-Demand Calculator
Output
Survey design for the time-tracking survey
Materials
N/A
Participants
- PMO Director
- Functional Managers
- Project Managers
Discuss the following with the activity participants:
- Define the scope of the survey
- Respondents: Comprehensive survey of individuals vs. a representative sample using roles.
- Granularity: decide how in-depth the questions will be and how often the survey will be delivered.
- Data Collection: what information do you want to collect?
- Proportion of project vs. non-project work.
- Time spent on administrative tasks.
- Prevalence and impact of distractions.
- Worker satisfaction.
- Determine the sample time period covered by the survey
- Info-Tech recommends 2-4 weeks. Less than 2 weeks might not be a representative sample, especially during vacation seasons.
- More than 4 weeks will impose unreasonable time and effort for diminishing returns; data quality will begin to deteriorate as participation declines.
- Determine the survey method
- Use your organization’s preferred survey distributor/online survey tool, or conduct one-on-one interviews to capture data.
1.2.5 continued - Refine the questionnaire to improve the relevance and quality of insights produced by the survey
Start with Info-Tech’s recommended weekly survey questions:
- Estimate your daily average for number of hours spent on:
- Total work
- Project work
- Non-project work
- How many times are you interrupted with “urgent” requests requiring immediate response in a given day?
- How many people or projects did you complete tasks for this week?
- Rate your overall satisfaction with work this week.
- Describe any special tasks, interruptions, or requests that took your time and attention away from project work this week.
Customize these questions to suit your needs.
Info-Tech Insight
Maximize the number of survey responses you get by limiting the number of questions you ask. Info-Tech finds that participation drops off rapidly after five questions.
1.2.5 continued - Communicate the survey goals and steps, and conduct
the survey
- Communicate the purpose and goals of the survey to maximize participation and satisfaction.
- Provide background for why the survey is taking place. Clarify that the intention is to improve working conditions and management capabilities, not to play “gotcha” or hold workers accountable.
- Provide a timeline so expectations are clear about when possible next steps will occur, such as
- Sharing and analyzing results
- Making decisions
- Taking action
- Reiterate what people are required or expected to do and how much effort is required. Provide reasonable and realistic estimates of how much time and effort people should spend on audit participation.
- Distribute the survey; collect and analyze the data.
Info-Tech Insight
Make sure that employees understand the purpose of the survey. It is important that they give honest responses that reflect the struggles they are encountering with balancing project and non-project work, not simply telling management what they want to hear.
Ensuring that employees know this survey is being used to help them, rather than scolding them for not completing work, will give you useful, insightful data on employee time.
Use Info-Tech’s Time-Tracking Survey Email Template for facilitating your communications.
Info-Tech Best Practice
Provide guidance to your resources with examples on how to differentiate project work vs. non-project work, administrative vs. keep-the-lights-on work, what counts as interruptions, etc.
Optimize your project portfolio to maintain continuous visibility into capacity
Now that you have a realistic picture of your realized project capacity and demand amounts, it’s time to use these values to tailor and optimize your resource management practices.
Based on desired outcomes for this phase, we have
- Determined the correct course of action to resolve your supply/demand imbalances.
- Assessed the overall project capacity of your portfolio.
- Cataloged sources of project and non-project demands.
- Performed a time audit to create an accurate and realistic picture of the time spent on different types of work.
In the next phase, we will:
- Wireframe a resource management process.
- Choose a resource management tool.
- Define data collection, analysis, and reporting steps within a sustainable resource management process.
Screenshots from tab 6 of the Time Audit Workbook.
Info-Tech Insight
The validity of traditional, rigorous resource planning has long been an illusion because the resource projections were typically not maintained. New realities such as faster project cycles, matrix organizations, and high-autonomy staff cultures have made the illusion impossible to maintain.
If you want additional support, have our analysts guide you through this phase as part of an Info-Tech workshop
Book a workshop with our Info-Tech analysts:
- To accelerate this project, engage your IT team in an Info-Tech workshop with an Info-Tech analyst team.
- Info-Tech analysts will join you and your team onsite at your location or welcome you to Info-Tech’s historic Toronto office to participate in an innovative onsite workshop.
- Contact your account manager (www.infotech.com/account), or email Workshops@InfoTech.com for more information.
The following are sample activities that will be conducted by Info-Tech analysts with your team:
1.1.2 Assess the current distribution of accountability for resource management practice
Discuss who is currently accountable for various facets of resource management, and whether they have the right authority and ability to deliver on that accountability.
1.2.1 Create realistic estimates of supply and demand using Info-Tech’s Supply-Demand Calculator
Derive actionable, quantitative insight into the resourcing challenges facing the organization by using Info-Tech’s methodology that prioritizes completeness over precision.
Phase 2
Design a Realistic Resource Management Process
Phase 2 Outline
Call 1-888-670-8889 or email GuidedImplementations@InfoTech.com for more information.
Complete these steps on your own, or call us to complete a guided implementation. A guided implementation is a series of 2-3 advisory calls that help you execute each phase of a project. They are included in most advisory memberships.
Guided Implementation 2: Draft a Resource Management Process
Proposed Time to Completion (in weeks): 3-6 weeks
Step 2.1: Determine the dimensions of resource management
Start with an analyst kick-off call:
- Introduce the seven dimensions of resource management
- Trade-off between granularity and utility of data
Then complete these activities…
- Decide on the seven dimensions
- Examine the strategy’s cost-of-use
With these tools & templates:
Resource Management Playbook
Step 2.2: Support your process with a resource management tool
Discuss with the analyst:
- Inventory of available PPM tools
- Overview of Portfolio Manager Lite 2017
Then complete these activities…
- Populate the tool with data
- Explore portfolio data with the workbook’s output tabs
With these tools & templates:
- Portfolio Manager Lite
- PPM Solution Vendor Demo Script
Step 2.3: Build process steps
Discuss with the analyst:
- Common challenges of resource management practice
- Recommendations for a pilot initiative
Then complete these activities…
- Review and customize contents of the Resource Management Playbook
With these tools & templates:
- Resource Management Playbook
Phase 2 Results & Insights:
Draft the resource management practice with sustainability in mind. It is about what you can and will maintain every week, even during a crisis: it is not about what you put together as a one-time snapshot. Once you stop maintaining resource data, it's nearly impossible to catch up.
Step 2.1: Customize the seven dimensions of resource management
PHASE 1
1.1 Set a course of action
1.2 Estimate supply and demand
PHASE 2
2.1 Select resource management dimensions
2.2 Select resource management tools
2.3 Build process steps
PHASE 3
3.1 Pilot your process for viability
3.2 Plan stakeholder engagement
This step will walk you through the following activities:
- Establish a default project vs. non-project work ratio
- Decide the scope of allocation for your strategy
- Set your allocation cadence
- Limit the granularity of time allocation
- Define the granularity of work assignment
- Apply a forecast horizon
- Determine the update frequency
This step involves the following participants:
- CIO / IT Director
- PMO Director / Portfolio Manager
- Functional / Resource Managers
- Project Managers
Outcomes of this step
- Seven dimensions of resource management, chosen to fit the current needs and culture of the organization
- Parameters for creating a resource management process (downstream)
There is no one-size-fits-all resource management strategy
Don’t get boxed into a canned solution that doesn’t make sense for your department’s maturity level and culture.
Resource management strategies are commonly implemented “out-of-the-box,” via a commercial PPM or time-tracking tool, or an external third-party consultant in partnership with those types of tools.
While these solutions and best practices have insights to offer – and provide admirable maturity targets – they often outstrip the near-term abilities of IT teams to successfully implement, adopt, and support them.
Tailor an approach that makes sense for your department and organization. You don’t need complex and granular processes to get usable resourcing data; you just need to make sure that you’ve carved out a process that works in terms of providing data you can use.
- In this step, we will walk you through Info-Tech’s seven dimensions of resource management to help wireframe your resource management process.
- In the subsequent steps in this phase, we will develop these dimensions from a wireframe into a functioning process.
Info-Tech Insight
Put processes before tools. Most commercial PPM tools include a resource management function that was designed for hourly granularity. This is part of the fallacy of an old reality that was never real. Determine which goals are realistic and fit your solution to your problem.
Wireframe a strategy that will work for your department using Info-Tech’s seven dimensions of resource management
Action the decision points across Info-Tech’s seven dimensions to ensure your resource management process is guided by realistic data and process goals.
In this step, we will walk you through the decision points in each dimension to determine the departmental specificities of your resource management strategy
Default project vs. non-project ratio
How much time is available for projects once non-project demands are factored in?
Reporting frequency
How often is the allocation data verified, reconciled, and reported for use?
Forecast horizon
How far into the future can you realistically predict resource supply?
Scope of allocation
To whom is time allocated?
Allocation cadence
How long is each allocation period?
Granularity of time allocation
What’s the smallest unit of time to allocate?
Granularity of work assignment
What is time allocated to?
Info-Tech Best Practice
Ensure that both the functional managers and the project managers participate in the following discussions. Without buy-in from both dimensions of the matrix organization, you will have difficulty making meaningful resource management data and process decisions.
Establish your default project versus non-project work ratio
2.1.1
30 minutes
Input
- Completed Resource Management Supply-Demand Calculator
Output
- Default organizational P-NP ratio and role-specific P-NP ratios
Materials
- Resource Management Supply-Demand Calculator
- Time Audit Workbook
- Resource Management Playbook
Participants
- CIO
- PMO Director
- Project Managers
- Resource Managers
How much time is available for projects once non-project demands are factored in?
The default project vs. non-project work ratio (P-NP Ratio) is a starting point for functional and project managers to budget the work-hours at their disposal as well as for resources to split their time – if not directed otherwise by their managers.
How to set this dimension. The Resource Management Supply-Demand Calculator from step 1.2 shows the current P-NP ratio for the department, and how the percentages translate into work-hours. The Time Audit Workbook from step 1.2 shows the ratio for specific roles.
For the work of setting this dimension, you can choose to keep the current ratio from step 1.2 as your default, or choose a new ratio based on the advice below.
- Discuss and decide how the supply-demand gap should be reconciled from the project side vs. the functional side.
- Use the current organizational priority as a guide, and keep in mind that the default P-NP ratio is to be adjusted over time to respond to changing needs and priorities of the organization.
- Once the organizational default P-NP ratio is chosen, defining role-specific ratios may be helpful. A help desk employee may spend only 10% of their time on project work, while an analyst may spend 80% of their time on project work.
Decide the scope of allocation for your strategy
2.1.2
15-30 minutes
Input
- Current practices for assigning work and allocating time
- Distribution of RM accountability (Activity 1.1.2)
Output
- Resource management scope of allocation
Materials
Participants
- CIO
- PMO Director
- Project Managers
- Resource Managers
To whom is time allocated?
Scope of allocation is the “who” of the equation. At the lowest and most detailed level, allocations are made to individual resources. At the highest and most abstract level, though, allocations can be made to a department. Other “whos” in scope of allocation can include teams, roles, or skills.
How to set this dimension. Consider how much granularity is required for your overall project capacity visibility, and the process overhead you’re willing to commit to support this visibility. The more low-level and detailed the scope of allocation (e.g. skills or individuals) the more data maintenance required to keep it current.
- Discuss and decide to whom time will be allocated for the purposes of resource management.
- Recall your prior discussion from activity 1.1.2 on how accountabilities for resource management are distributed within your organization.
- The benefit of allocating teams to projects is that it is much easier to avoid overallocation. When a team is overallocated, it is visible. Individual overallocations can go unnoticed.
- Once you have mastered the art of keeping resource data current and accurate at a higher level (e.g. team), it can be easier move lower level and assign and track allocations in a per-role or per-person basis.
Set your allocation cadence
2.1.3
15-30 minutes
Input
- Current practices for assigning work and allocating time
- Scope of allocation (Activity 2.1.2)
Output
- Determination of temporal frames over which time will be allotted
Materials
Participants
- CIO
- PMO Director
- Project Managers
- Resource Managers
How long is each allocation period?
How long is each individual allocation period? In what “buckets of time” do you plan to spend time – week by week, month by month, or quarter by quarter? The typical allocation cadence is monthly; however, depending on the scope of allocation and the nature of work assigned, this cadence can differ.
How to set this dimension. Allocation cadence can depend on a number of factors. For instance, if you’re allocating time to agile teams, the cadence would most naturally be bi-weekly; if work is assigned via programs, you might allocate time by quarters.
- Discuss and decide the appropriate allocation cadence for the purposes of resource management. You could even be an environment that currently has different cadences for different teams. If so, it will be helpful to standardize a cadence for the purposes of centralized project portfolio resource management.
- If the cadence is too short (e.g. days or weeks), it will require a dedicated effort to maintain the data.
- If the cadence is too long (e.g. quarters or bi-annual), your resource management strategy could fail to produce actionable insight and lack the appropriate agility in being responsive to changes in direction.
- Ultimately, your allocation cadence may be contingent upon the limitations of your resource management solution (see step 2.2).
Limit the granularity of time allocation
2.1.3
15-30 minutes
Input
- Requirements for granularity of data
- Resource management scope of allocation (Activity 2.1.2)
Output
- Determination of lowest level of granularity for time allocation
Materials
Participants
- CIO
- PMO Director
- Project Managers
- Resource Managers
What’s the smallest unit of time that will be allocated?
Granularity of time allocation refers to the smallest unit of time that can be allocated. You may not need to set firm limits on this, given that it could differ from PM to PM, and resource manager to resource manager. Nevertheless, it can be helpful to articulate an “as-low-as-you’ll-go” limit to help avoid getting too granular too soon in your data aspirations.
How to set this dimension. At a high level, the granularity of allocation could be as high as a week. At its lowest level, it could be an hour. Other options include a full day (e.g. 8 hours), a half day (4 hours), or 2-hour increments.
- Discuss and decide the appropriate granularity for all allocations in the new resource management practice.
- As a guideline, granularity of allocation should be one order of magnitude smaller than the allocation cadence to provide enough precision for meaningfully dividing up each allocation cadence, without imposing an unreasonably rigorous expectation for resources to manage their time.
- The purpose of codifying this dimension is to help provide a guideline for how granular allocations should be. Hourly granularity can be difficult to maintain, so (for instance) by setting a half-day granularity you can help avoid project managers and resource managers getting too granular.
Define the granularity of work assignments
2.1.4
15-30 minutes
Input
- Requirements for granularity of work assignment
- Resource management scope of allocation (Activity 2.1.2)
Output
- Determination of work assignment
Materials
Participants
- CIO
- PMO Director
- Project Managers
- Resource Managers
To what is time allocated?
Determine a realistic granularity for your allocation. This is the “what” of the equation: what your resources are working on or the size of work for which allocations are managed.
How to set this dimension. A high level granularity of work assignment would assign an entire program, a mid-level scope would involve allocating a project or a phase of a project, and a low level, rigorous scope would involve allocating an individual task.
- Discuss and decide the appropriate granularity for all work assignments in the new resource management strategy.
- The higher granularity that is assigned, the more difficult it becomes to maintain the data. However, assigning at program level might not lead to useful, practical data.
- Begin by allocating to projects to help you mature your organization, and once you have mastered data maintenance at this level, you can move on to a more granular work assignment.
- If you are at a maturity level of 1 or 2, Info-Tech recommends beginning by assigning by project. If you are at a maturity level 3-4, it may be time to start allocating by phase or task.
Apply a forecast horizon
2.1.5
15-30 minutes
Input
- Current practices for work planning, capacity forecasting
- Allocation scope, cadence, and granularity
(Activities 2.1.2-4)
Output
- Resource management forecast horizon
Materials
Participants
- CIO
- PMO Director
- Project Managers
- Resource Managers
How far into the future can you realistically predict resource supply?
Determine a realistic forecasting horizon for your allocation. At this point you have decided “what” “who” is working on and how frequently this will be updated. Now it is time to decide how far resource needs will be forecasted, e.g. “what will this person be working on in 3 months?”
How to set this dimension. A high-level forecast horizon would only look forward week-to-week, with little consideration of the long-term future. A mid-level forecast would involve predicting one quarter in advance and a low-level, rigorous scope would involve forecasting one or more years in advance.
- Discuss and decide the appropriate forecast horizon that will apply to all allocations in the new resource management practice. It’s important that your forecast horizon helps to foster accurate data. If you can’t ensure data accuracy for a set period, make your forecast horizon shorter.
- If you are at a maturity level of 1 or 2, Info-Tech recommends forecasting one month in advance.
- If you are already at level 3-4 on the resource management maturity model, Info-Tech recommends forecasting one quarter to one year in advance.
See the diagram below for further explanation
2.1.5 Forecast horizon diagram
Between today and the forecast horizon (“forecast window”), all stakeholders in resource management commit to reasonable accuracy of data. The aim is to create a reliable data set that can be used to determine true resource capacity, as well as the available resource capacity to meet unplanned, urgent demands.
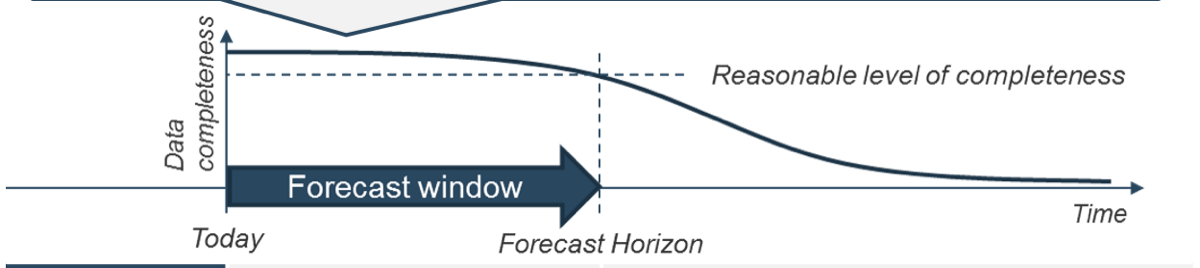
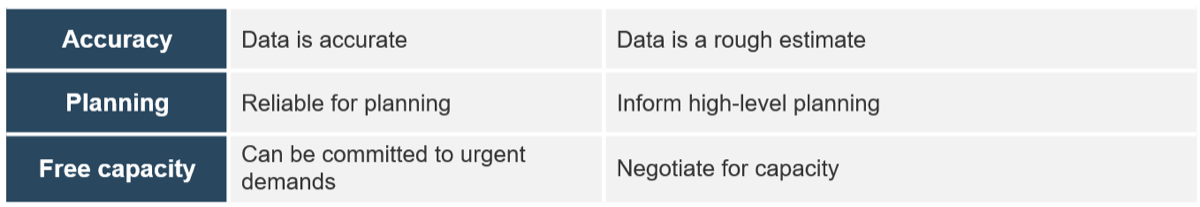
Info-Tech Insight
Ensure data accuracy. It is important to note that forecasting a year in advance does not necessarily make your organization more mature, unless you can actually rely on these estimates and use them. It is important to only forecast as far in advance as you can accurately predict.
Determine the update frequency
2.1.6
30 minutes
Input
- Current practices for work planning, capacity reporting
- Current practices for project intake, prioritization, and approval
- RM core dimensions (Activities 2.1.1)
Output
- Resource management update frequency
Materials
Participants
- CIO
- PMO Director
- Project Managers
- Resource Managers
How often is the allocation data verified, reconciled, and reported for use?
How often will you reconcile and rebalance your allocations? Your update frequency will determine this. It is very much the heartbeat of resource management, dictating how often reports on allocations will be updated and published for stakeholders’ consumption.
How to set this dimension. Determine a realistic frequency with which to update project reports. This will be how you determine who is working on what during each measurement period.
- Discuss and decide how often the supply-demand gap should be reconciled from the project side vs. the functional side.
- Keep in mind that the more frequent the reporting period, the more time must go into data maintenance. A monthly frequency requires maintenance at the end of the month, while weekly requires it at the end of each week.
- Also think about how accurately you can maintain the data. Having a quarterly update frequency may require less maintenance time than monthly, but this information may not stay up to date in between these long stretches.
- Reports generated at each update frequency should both inform resources on what to work on, what not to work on, and how to prioritize tasks if something unexpected comes up, as well as the steering committee, to help inform project approval decisions.
Finalize the dimensions for your provisional resource management process
2.1.7
10 minutes
Input
- 7 core dimensions of resource management (Activities 2.1.1-6)
Output
- Provisional resource management strategy
Materials
- Resource Management Playbook
Participants
- CIO
- PMO Director
- Project Managers
- Resource Managers
Document the outputs from the preceding seven activities. These determinations will form the foundation of your resource management strategy, which we will go on to define in more detail in the subsequent steps of this phase.
- Keep in mind, at this stage your dimensions are provisional and subject to change, pending the outcomes of steps 2.2 and 2.3.
| RM Core Dimensions
|
Decision
|
| Default P-NP ratio
|
40%-60$ + exception by roles
|
| Scope of allocation
|
Individual resource
|
| Allocation cadence
|
Monthly
|
| Granularity of time allocation
|
4 hours
|
| Granularity of work assignment
|
Projects
|
| Forecast horizon
|
3 months
|
| Reporting frequency
|
Twice a month
|
Document these dimensions in Section 1.1 of Info-Tech’s Resource Management Playbook. We will be further customizing this template in steps 2.3 and 3.1.
Step 2.2: Determine the resource management tool that will best support your process
PHASE 1
1.1 Set a course of action
1.2 Estimate supply and demand
PHASE 2
2.1 Select resource management dimensions
2.2 Select resource management tools
2.3 Build process steps
PHASE 3
3.1 Pilot your process for viability
3.2 Plan stakeholder engagement
This step will walk you through the following activities:
- Consider the pros and cons of commercial tools vs. spreadsheets as a resource management tool
- Review the PPM Solution Vendor Demo Script to ensure your investment in a commercial tool meets your resource management needs
- Jump-start spreadsheet-based resource management with Portfolio Manager Lite
This step involves the following participants:
- PMO Director / Portfolio Manager
- Functional / Resource Managers
- Project Managers
Outcomes of this step
- Choice of tool to support the resource management process
- Examination of the commercial tool’s ability to support the resource management process chosen
- Set-up and initial use of Portfolio Manager Lite for a spreadsheet-based resource management solution
Effective resource management practices require an effective resource management tool
The discipline of resource management has largely become inextricable from the tools that help support it. Ensure that you choose the right tool for your environment.
Resource management depends on the flow of information and data from the project level up to functional managers, project managers, and beyond.
Tools are required to help facilitate this flow, and the project portfolio management landscape is littered with endless time-tracking and capacity management options.
These options can each have their merits and their drawbacks. The success of implementing a resource management strategy very much hinges upon weighing these, and then choosing the right solution for your project eco-system.
- This first part of this step will help you assess the tool landscape and make the right choice to help support your resource management practices.
- In the second part of this step, we’ll take a deep-dive into Info-Tech’s Excel-based resource management solution. If you are implementing our solution, these sections will help you understand and set up the tool.
Info-Tech Insight
Establish a book of record. While it is possible to succeed using ad hoc tools and data sources, a centralized repository for capacity data works best. Your tool choice should help establish a capacity book of record to help ensure ongoing reconciliation of supply and demand at the portfolio level.
Get to know your resource management tool options
At a high level, those looking for a resource management solution have two broad options: a commercial project portfolio management (PPM) or time-tracking software on the one hand, and a spreadsheet-based tool, like Google Sheets or Excel, on the other.
Obviously, if your team or department already has access to a PPM or time-tracking software, it makes sense to continue using this, as long as it will accommodate the process that was wireframed in the previous step.
Otherwise, pursue the tool option that makes the most sense given both the strategy that you’ve wireframed and other organizational factors. See the table below and the next section for guidance.
“If you’re planning on doing resource allocation by hand, you’re not going to get very far.”
– Rachel Burger
|
|
Commercial Solutions
|
Spreadsheet-Based Solutions
|
| Description
|
- These highly powerful solutions are purchased from a software/service provider.
|
- These can be as simple as a list of current projects on a spreadsheet or a more advanced solution with resource capacity analysis.
|
| Pros
|
- Extraordinary function
- Potential for automated roll-ups
- Collaboration functionality
|
- Easy to deploy: high process maturity or organization-wide adoption not required.
- Lower cost-in-use – in many cases, they are free.
- Highly customizable.
|
| Cons
|
- High process maturity required
- High cost-in-use
- Generally expensive to customize
- Comprehensive, continual, and organization-wide adoption required
|
- Easy to break.
- Typically, they require a centralized deployment with a single administrator responsible for data entry.
|
Option A: When pursuing commercial options, don’t bite off more functionality than your people can sustain
While commercial options offer the most robust functionality for automation, collaboration, and reporting, they are also costly, difficult to implement, and onerous to sustain over the long run.
It’s not uncommon for organizations to sink vast amounts of money into commercial PPM tools, year after year, and never actually get any usable resource or forecasting data from these tools.
The reasons for this can vary, but in many cases it is because organizations mistake a tool for a PPM or a resource management strategy.
A tool is no substitute for having a clearly defined process that staff can support. Be aware of these two factors before investing in a commercial tool:
- Visibility cannot be automated. It is not uncommon for CIOs to believe that because they’ve invested in a tool, they have an automated portfolio that enables them to sit back and wait for the data to roll in. With many tools, the challenge is that the calculations driving the rollups have become increasingly unsustainable and irrelevant in our high-autonomy staff cultures and interruption-driven work days.
- Information does not equal knowledge. While commercial tools have robust reporting features, the data outputs can lead to information overload – and, subsequently, disinterest – unless they are curated and filtered to suit your executive’s needs and expectations.
47%
Of those companies using automated software to assist in resource management, almost half report that those systems failed to accurately calculate resource forecasts.
– PM Solutions
Info-Tech Insight
Put process sustainability before enhanced tool functionality.
Ensure that you have sustainable processes in place before investing in an expensive commercial tool. Your tool selection should help facilitate capability-matched processes and serve user adoption.
Trying to establish processes around a tool with a functionality that exceeds your process maturity is a recipe for failure.
Before jumping into a commercial tool, consider some basic parameters for your selection
Use the table below as a starting point to help ensure you are pursuing a resource management tool that is right for your organization’s size and process maturity level.
| Tool Category
|
Characteristics
|
# of Users
|
PPM Maturity
|
Sample Vendors
|
| Enterprise tools
|
- Higher professional services requirements for enterprise deployment
- Larger reference customers
|
1,000>
|
High
|
- MS Project Server
- Oracle Primavera
- Planisware
|
| Mid-market tools
|
- Lower expectation of professional services engaged in initial deployment contract
- Fewer globally recognizable reference clients
- Faster deployments
|
100>
|
Intermediate-to-High
|
- Workfront
- Project Insight
- Innotas
|
| Entry-level tools
|
- Lower cost than mid-market and enterprise PPM tools
- Limited configurability, reporting, and resource management functionalities
- Compelling solutions to the organizations that want to get a fast start to a trial deployment
|
<100
|
Low-to-Intermediate
|
- 5PM
- AceProject
- Liquid Planner
|
For a more in-depth treatment of choosing and implementing a commercial PPM tool to assist with your resource management practice, see Info-Tech’s blueprint, Select and Implement a PPM Solution.
Use Info-Tech’s PPM Solution Vendor Demo Script to help ensure you get the functionality you need
PPM Solution Vendor Demo Script (optional)
To ensure your investment in a commercial tool meets your resource management needs, use Info-Tech’s PPM Solution Vendor Demo Script to structure your tool demos and interactions with vendors.
For instance, some important scenarios to consider when looking at potential tools include:
- How are overallocation and underallocation situations identified and reconciled in the solution?
- How are users motivated to maintain their own timesheets (beyond simply being mandated as part of their job); how does the solution and timesheet functionality help team members do their job?
- How will portfolio-level reports remain useful and accurate despite “zero-adoption” scenarios, in which some or all teams do not actively maintain task and timesheet data?
Any deficiencies in answering these types of questions should alert you to the fact that a potential solution may not adequately meet the needs of your resource management strategy.
Download Info-Tech’s PPM Solution Vendor Demo Script
"[H]ow (are PPM solutions) performing in a matrix organization? Well, there are gaps. There will be employees who do not submit timesheets, who share their time between project and operational activities, and whose reporting relationships do not fit neatly into the PPM database structure. This creates exceptions in the PPM application, and you may just have the perfect solution to a small subset of your problems." – Vilmos Rajda
Option B: When managing resourcing via spreadsheets, you don’t have to feel like you’re settling for the lesser option
Spreadsheets can provide a viable alternative for organizations not ready to invest in an expensive tool or for those not getting what they need from their commercial selections.
When it comes to resource management at a portfolio level, spreadsheets can be just as effective as commercial tools for facilitating the flow of accurate and maintainable resourcing data and for communicating resource usage and availability.
Some of the benefits of spreadsheets over commercials tools include:
- They are easy to set up and deploy. High process maturity or organization-wide user adoption are not required.
- They have a low cost-in-use. In the case of Excel, the tool itself comes at no additional cost.
- They are highly customizable. No development time/costs are required to tweak the solution to suit your needs.
To be clear: spreadsheets have their drawbacks (for instance, they are easy to break, require a centralized data administrator, and are yours and yours alone to maintain). If your department has the budget and the process maturity to support a commercial tool, you should pursue the options covered in the previous sections.
However, if you are looking for a viable alternative to an expensive tool, spreadsheets have the ability to support a rigorous resource management practice.
"Because we already have enterprise licensing for an expensive commercial tool, everyone else thinks it’s logical to start there. I think we’re going to start with something quick and dirty like Excel." – EPMO Director, Law Enforcement Services
Info-Tech Insight
Make the choice to ensure adoption.
When making your selection, the most important consideration across all the solution categories is data maintenance. You must be assured that you and your team can maintain the data.
As soon as your portfolio data becomes inconsistent and unreliable, decision makers will lose trust in your resource data, and the authority of your resource management strategy will become very tenuous.
While spreadsheets offer a viable resource management option, not all spreadsheets are created equal
Lean on Info-Tech’s experience and expertise to get up and running quickly with a superior resource management Excel-based tool: Portfolio Manager Lite 2017.
Spreadsheets are the most common PPM tool – and it’s not hard to understand why: they can be created with minimal cost and effort.
But when something is easy to do, it’s important to keep in mind that it’s also easy to do badly. As James Kwak says in his article, “The Importance of Excel,” “The biggest problem is that anyone can create Excel Spreadsheets—badly.”
- Info-Tech’s Portfolio Manager Lite 2017 offers an antidote to the deficiencies that can haunt home-grown resource management tools.
- As an easy-to-deploy, highly evolved spreadsheet-based option, Portfolio Manager Lite enables you to mature your resource management processes, and provide effective resource visibility without the costly upfront investment.
Download Info-Tech’s Portfolio Manager Lite 2017
Info-Tech Insight
Balance functionality and adoption. Clients often find it difficult to gain adoption with commercial tools. Though homegrown solutions may have less functionality, the higher adoption level can make up for this and also potentially save your organization thousands a year in licensing fees.
Determine your resource management solution and revisit your seven dimensions of resource management
2.2.1
Times will vary
Participants
Based on input from the previous slides, determine the resource management solution option you will pursue and implement to help support your resource management strategy. Record this selection in section 1.2 of the Resource Management Playbook.
- You may need to revisit the decisions made in step 2.1 to consider if the default values for your seven core dimensions of resource management are still sound. Keep these current and relevant as you become more familiar with your resource management solution.
| RM Core Dimensions
|
Default Value
|
| Default P-NP ratio
|
Role-specific
|
| Scope of allocation
|
Individual resource
|
| Allocation cadence
|
Monthly
|
| Granularity of allocation
|
(not defined)
|
| Granularity of work assignment
|
Project
|
| Forecast horizon
|
6 months
|
| Reporting frequency
|
(not defined)
|
Portfolio Manager Lite has comprehensive sample data to help you understand its functions.
As you can see in this table, the tool itself assumes five of the seven resource management core dimensions. You will need to determine departmental values for granularity of allocation and reporting frequency. The other dimensions are determined by the tool.
If you’re piloting Info-Tech’s Portfolio Manager Lite, review the subsequent slides in this step before proceeding to step 2.3. If you are not piloting Portfolio Manager Lite, proceed directly to step 2.3.
Overview of Portfolio Manager Lite
Portfolio Manager Lite has two set-up tabs, three data entry tabs, and six output-only tabs. The next 15 slides show how to use them. To use this tool, you need Excel 2013 or 2016. If you’re using Excel 2013, you must download and install Microsoft Power Query version 2.64 or later, available for download from Microsoft.
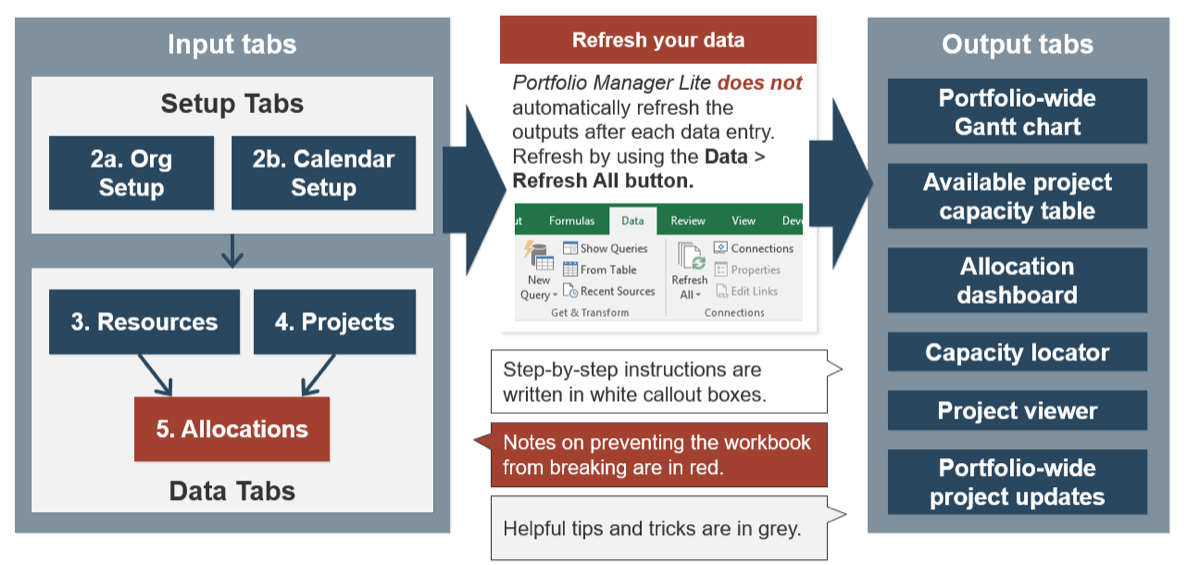
Observe “table manners” to maintain table integrity and prevent Portfolio Manager Lite malfunctions
Excel tables enable you to manage and analyze a group of related data. Since Portfolio Manager Lite uses tables extensively, maintaining the table’s integrity is critical. Here are some things to know for working with Excel tables.
Do not leave empty rows at the end.
Adjust the sizing handle to eliminate empty rows.
Always paste values.
Default pasting behavior can interrupt formula references and introduce unwanted external links. Always right-click and select Paste Values.
Correctly add/remove rows within a table.
Do not use row headings; instead, always right-click inside a table to manipulate table rows.
Set up Portfolio Manager Lite
2.2.1
Portfolio Manager Lite, Tab 2a: Org Setup
The Org Setup tab is divided into two sections, Resources and Projects. Each section contains several categories to group your resources and projects. Items listed under each category will be available via drop-down lists in the data tabs.
These categorizations will be used later to “slice” your resource allocation data. For example, you’ll be able to visualize the resource allocations for each team, for each division, or for each role.
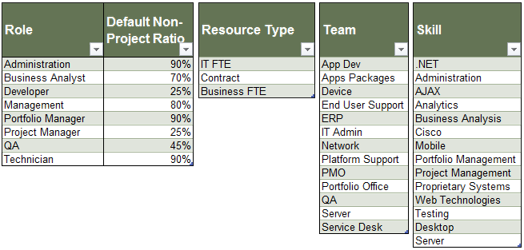
1. Role and Default Non-Project Ratio columns: From the Supply-Demand Calculator, copy the list of roles, and how much of each role’s time is spent on non-projects by default (see below; add the values marked with yellow arrows).
2. Resource Type column: List the type of resource you have available.
3. Team and Skill columns: List the teams, and skills for your resources.
In the Resources tab, items in drop-down lists will appear in the same order as shown here. Sort them to make things easy to find.
Do not delete tables you won’t use. Instead, leave or hide tables.
Set up Portfolio Manager Lite (continued)
2.2.1
Portfolio Manager Lite, Tab 2a: Org Setup
The projects section of the Org Setup tab contains several categories for entering project data. Items listed under each category will be available via drop-down lists in the Projects tab. These categorizations will be used later to analyze how your resources are allocated.
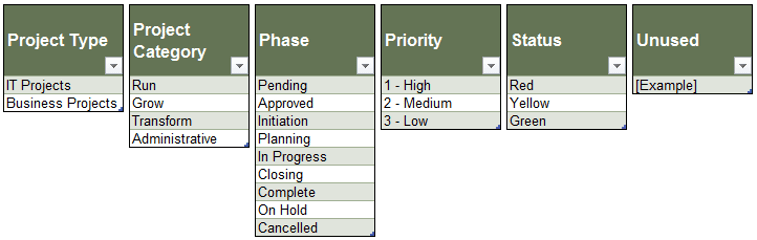
1. Project Type: Enter the names of project types, in which projects will be grouped. All projects must belong to a type. Examples of types may include sub-portfolios or programs.
2. Project Category: Enter the names of project categories, in which projects will be grouped. Unlike types, category is an optional grouping.
3. Phase: Enter the project phases. Ensure that your phases list has “In Progress” and “Complete” options. They are needed for the portfolio-wide Gantt chart (the Gantt tab).
4. Priority and Status: Define the choices for project priorities and statuses if necessary (optional).
5. Unused: An extra column with predefined choices is left for customization (optional).
Set up Portfolio Manager Lite (continued)
2.2.1
Portfolio Manager Lite, Tab 2b: Calendar Setup
Portfolio Manager Lite is set up for a monthly allocation cadence out of the box. Use this tab to set up the start date, the default resource potential capacity, and the months to include in your reports.
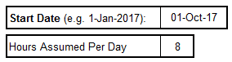
1. Enter a start date for the calendar, e.g. start of your fiscal or calendar year.
2. Enter how many hours are assumed in a working day. It is used to calculate the default maximum available hours in a month.
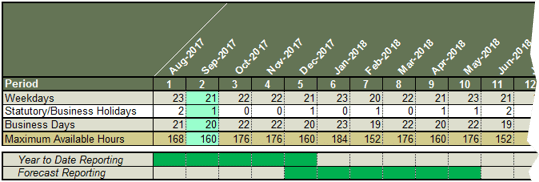
Maximum Available Hours, Weekdays, and Business Days are automatically generated.
The current month is highlighted in green.
3. Enter the number of holidays to correct the number of business days for each month.
Year to Date Reporting and Forecast Reporting ranges are controlled by this table. Use the period above Maximum Available Hours.
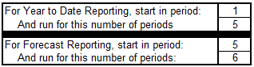
Info-Tech Best Practice
Both Portfolio Manager Lite and Portfolio Manager 2017 can be customized for non-monthly resource allocation. Speak to an Info-Tech analyst to ask for more information.
Enter resource information and their total capacity
2.2.2
Portfolio Manager Lite, Tab 3: Resources
Portfolio Manager Lite is set up for allocating time to individual resources out of the box. Information on these resources is entered in the Resources tab. It has four sections, arranged horizontally.
1. Enter basic information on your resources. Resource type, team, role, and skill will be used to help you analyze your resource data.
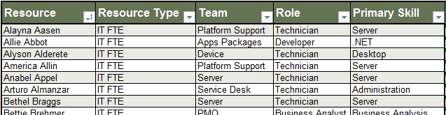
Ensure that the resource names are unique.
Sort or filter the table using the filter button in the header row.
2. Their total capacity in work-hours is automatically calculated for each month, using the default numbers from the Calendar Setup tab. If necessary, overwrite the formula and enter in custom values.
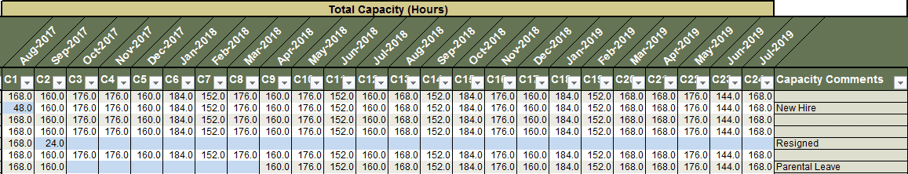
Cells with less than 120 hours are highlighted in blue.
Do not add or delete any columns, or modify this header row.
Enter out-of-office time and non-project time for your resources
2.2.2
Portfolio Manager Lite, Tab 3: Resources
3. Enter the resources’ out-of-office time for each month, as they are reported.
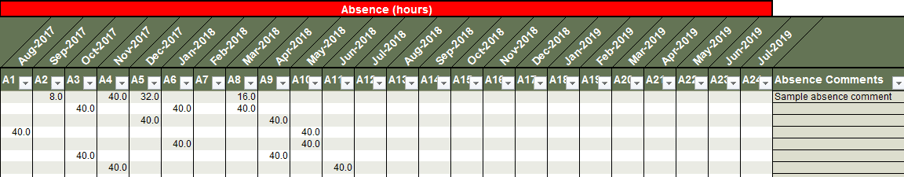
Do not add or delete any columns, or modify the header row, below the dates.
4. Resources’ percentages of time spent on non-projects are automatically calculated, based on their roles’ default P-NP ratios. If necessary, overwrite the formula and enter in custom values.
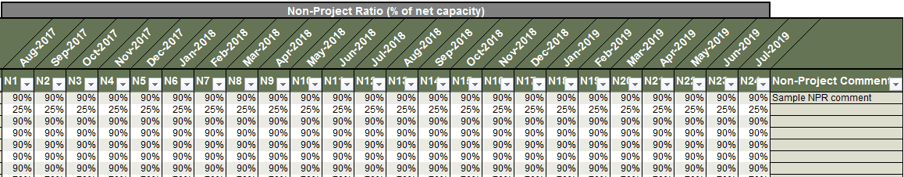
Do not add or delete any columns, or modify the header row, below the dates.
Populate your project records
2.2.3
Portfolio Manager Lite, Tab 4: Projects
Portfolio Manager Lite is set up for allocating time to projects out of the box. Information on these projects is entered in the Projects tab.
1. Enter project names and some basic information. These fields are mandatory.
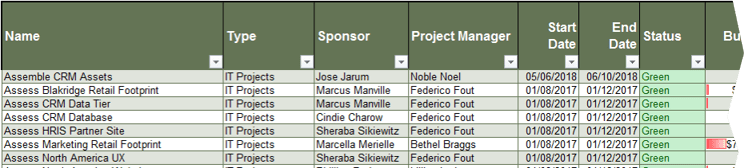
Ensure that the project names are unique.
Do not modify or change the headers of the first seven columns. Do not add to or delete these columns.
2. Continue entering more information about projects. These fields are optional and can be customized.
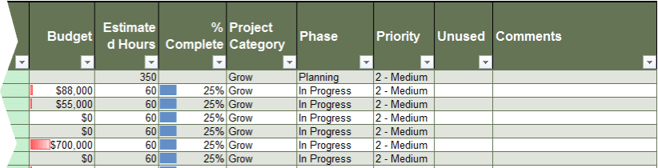
Headers of these columns can be changed. Extra columns can be added to the right of the Status column if desired. However, Info-Tech strongly recommends that you speak to an Info-Tech analyst before customizing.
The Project Category, Phase, and Priority fields are entered using drop-down lists from the Org Setup tab.
Allocate your resource project capacity to projects
2.2.4
Portfolio Manager Lite, Tab 5: Allocations
Project capacity for each resource is calculated as follows, using the data from the Resources tab:
Project capacity = (total project capacity – absence) x (100% – non-project%)
In the Allocations tab, project capacity is allocated in percentages with 100% representing the allocation of all available project time of a resource to a project.
This allocation-by-percentage model has some advantages and drawbacks:
Advantages
- Allocating all available project capacity to project is straightforward
- Easy for project managers to coordinate with each other (e.g. “Jon’s project time will be split 50%-50% between two projects” = enter 50% allocation to each project)
Drawbacks
- How many hours is represented by a percentage of someone’s capacity is unclear
- Must check whether enough work-hours are allocated for what’s needed (e.g. “Deliverable A needs 20 hours of work from Jon in November. Is 50% of his project capacity enough?”)
The Allocations tab has a few features to help you mitigate these disadvantages.
Info-Tech Best Practice
For organizations with lower resource management practice maturity, start with percentages. In Portfolio Manager 2017, allocations are entered in work-hours to avoid the above drawbacks altogether, but this may require a higher practice maturity.
Enter your resource project capacity allocations
2.2.4
Portfolio Manager Lite, Tab 5: Allocations
A line item in the Allocations tab requires three pieces of information: a project, a resource, and the percentage of project capacity for each month.
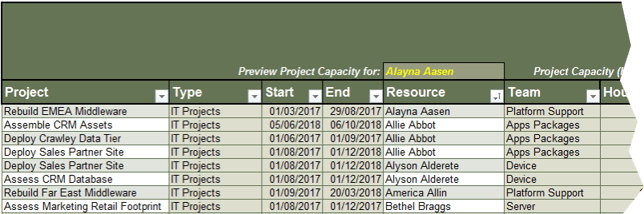
1. Choose a project. Type, Start date, and End date are automatically displayed.
2. Choose a resource. Team is automatically displayed.
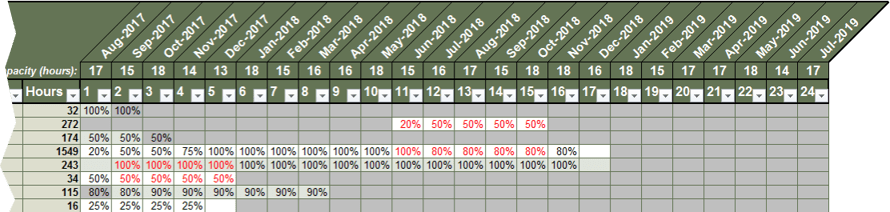
3. Enter the resource’s allocated hours for the project in percentages.
Built-in functions in the Allocations tab display helpful information for balancing project supply and demand
2.2.4
Portfolio Manager Lite, Tab 5: Allocations
The Allocations tab helps you preview the available project capacity of a resource, as well as the work-hours represented by each allocation line item, to mitigate the drawbacks of percentage allocations.
In addition, overallocations (allocations for a given month add up to over 100%) are highlighted in red. These functions help resource managers balance the project supply and demand.
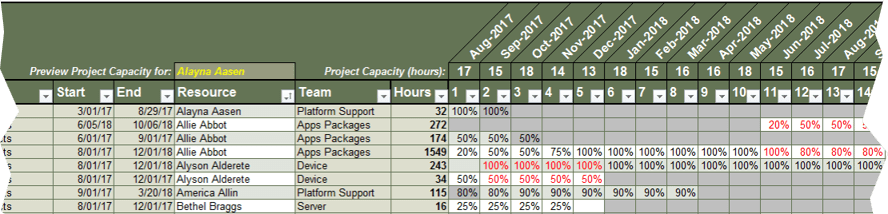
To preview a resource’s project capacity in work-hours, choose a resource using a drop down. The resource’s available project capacity for each month is displayed to the right.
Sort or filter the table using the filter button in the header row. Here, the Time table is sorted by Resource.
The total work-hours for each line item is shown in the Hours column. Here, 25% of Bethel’s project capacity for 4 months adds up to only 16 work-hours for this project.
A resource is overallocated when project capacity allocations add up to more than 100% for a given month. Overallocations are highlighted in red.
Get the timeline of your project portfolio with the Gantt chart tab
2.2.5
Portfolio Manager Lite, Tab 6: Gantt
The Gantt tab is a pivot-table-driven chart that graphically represents the start and end dates of projects and their project statuses.
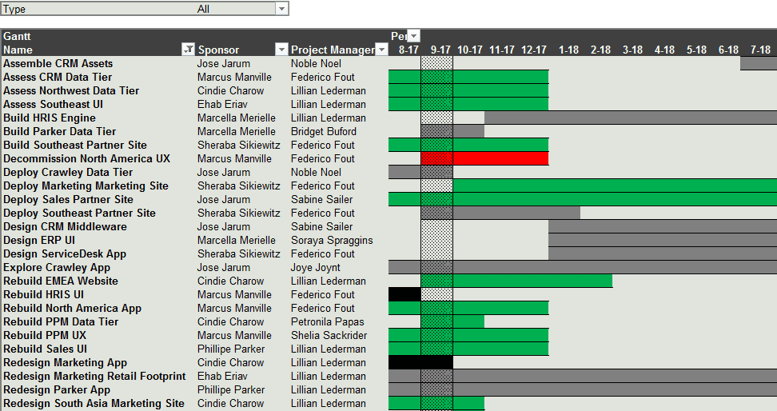
Filter entries by project type above the chart.
The current month (9-17) is highlighted.
You can filter and sort entries by project name, sponsor, or project manager.
In progress (under Phase column) projects show the color of their overall status.
Projects that are neither completed nor in progress are shown in grey.
Completed (under Phase column) projects are displayed as black.
Get a bird’s-eye view of your available project capacity with the Resource Load tab
2.2.6
Portfolio Manager Lite, Tab 7: Resource Load
The Resource Load tab is a PivotTable showing the available project capacity for each resource.
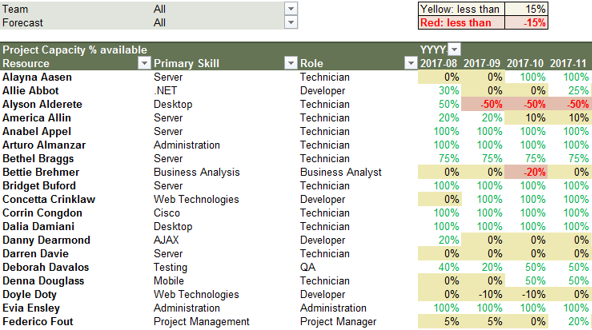
Change the thresholds for indicating project overallocation at the top right.
You can filter and sort entries by resource or role.
Values in yellow and red highlight overallocation.
Values in green indicate resource availability.
This table provides a bird’s-eye view of all available project capacity. Highlights for overallocated resources yield a simple heat map that indicates resourcing conflicts that need attention.
The next two tabs contain graphical dashboards of available capacity.
Tip: Add more resource information by dragging a column name into the Rows box in the PivotTable field view pane.
Example: add the Team column by dragging it into the Rows box
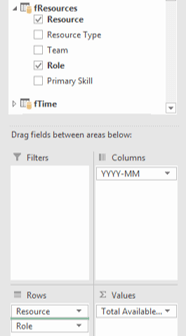
Analyze your resource allocation landscape with the Capacity Slicer tab
2.2.7
Portfolio Manager Lite, Tab 8: Capacity Slicer
The Capacity Slicer tab is a set of pivot charts showing the distribution of resource allocation and how they compare against the potential capacity.
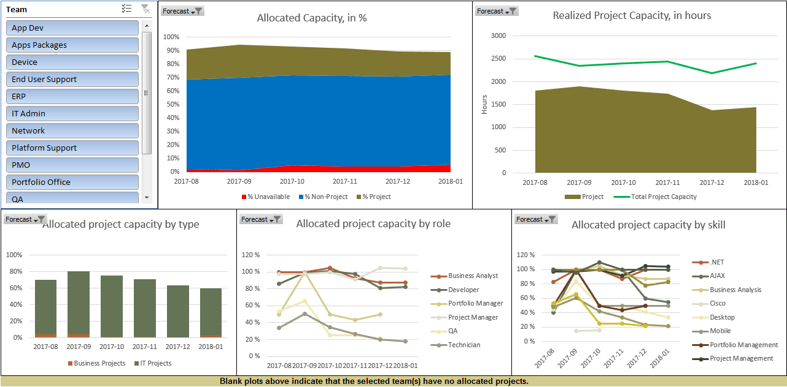
At the top left of each chart, you can turn Forecast Reporting on (true) or off (false). For Year to Date reporting, replace Forecast with YTD in the Field View pane’s Filter field.
In the Allocated Capacity, in % chart, capacity is shown as a % of total available capacity. Exceeding 100% indicates overallocation.
In the Realized Project Capacity, in hours chart, the vertical axis is in work-hours. This gap between allocation and capacity represents available project capacity.
The bottom plots show how allocated project capacity is distributed. If the boxes are empty, no allocation data is available.
Use the Team slicer to drill down on resource capacity and allocation by groups of resources
2.2.7
Portfolio Manager Lite, Tab 8: Capacity Slicer
A slicer filters the data shown in a PivotTable, a PivotChart, or other slicers. In this tab, the team slicer enables you to view resource capacity and allocation by each team or for multiple teams.
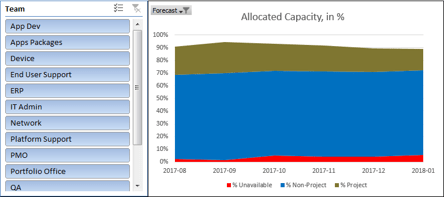
The button next to the Team header enables multiple selection.
The next button to the right clears the filter set by this slicer.
All teams with capacity or allocation data are listed in the slicers.
For example, if you select "App Dev":
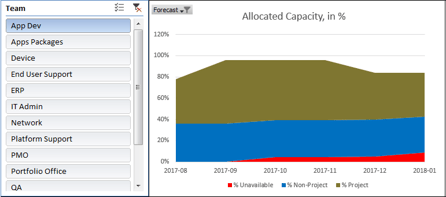
The vertical axis scales automatically for filtered data.
The capacity and allocation data for all application division teams is shown.
Resources not in the App Dev team are filtered out.
Drill down on individual-level resource allocation and demand with the Capacity Locator tab
2.2.8
Portfolio Manager Lite, Tab 9: Capacity Locator
The Capacity Locator tab is a group of PivotCharts with multiple slicers to view available project capacity.
For example: click on “Developer” under Role:
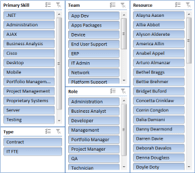
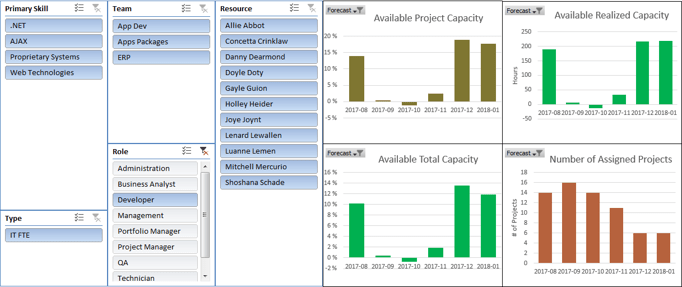
Primary skills of all developers are displayed on the left in the Primary Skill column. You can choose a skill to narrow down the list of resources from all developers to all developers with that skill.
The selected resources are shown in the Resources column. Data on the right pertains to these resources.
- The top left graph shows the average available project capacity for all selected resources.
- The top right graph shows the sum of all available capacity from all selected resources.
- In the lower left graph, pay attention to available total capacity, as selected resources may have significant non-project demands.
- The lower right graph shows the number of assigned projects. Control the number of concurrent projects to reduce the need for multitasking and optimize your resource use.
Where you see the filter button with an x, you can clear the filter imposed by this slicer.
Check how your projects are resourced with the Project Viewer tab
2.2.9
Portfolio Manager Lite, Tab 10: Project Viewer
The Project Viewer tab is a set of PivotCharts with multiple slicers to view how resources are allocated to different projects.
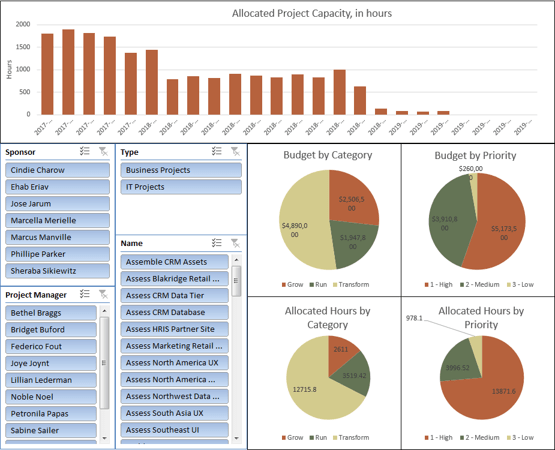
Filtering by sponsor or project manager is useful for examining a group of projects by accountability (sponsor) or responsibility (project manager).
The graphs show how project budgets are distributed across different categories and priorities of projects, and how resource allocations are distributed across different categories and priorities of projects.
Report on your project portfolio status with the Project Updates tab
2.2.10
Portfolio Manager Lite, Tab 11: Project Updates
The Project Updates tab is a PivotTable showing various fields from the Projects table to rapidly generate a portfolio-wide status report. You can add or remove fields from the Projects table using the PivotTable’s Field View pane.
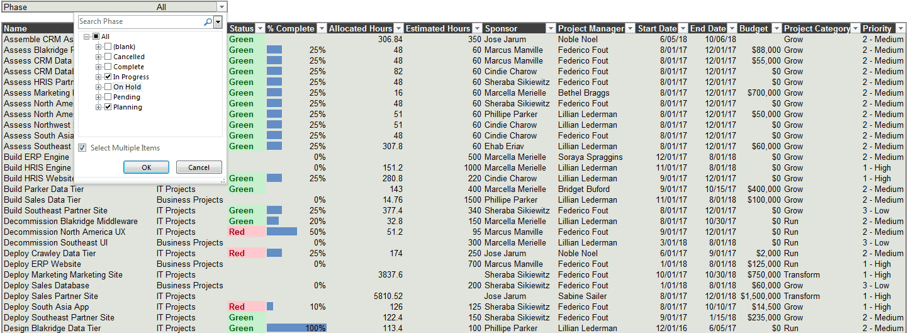
Filter entries by phase. The screenshot shows an expansion of this drop down at the top left.
Rearrange the columns by first clicking just below the header to select all cells in the column, and then dragging it to the desired position. Alternatively, arrange them in the Field View pane.
Tools and other requirements needed to complete the
resource management strategy
2.2.11
10 minutes
- Recommended: If you are below a level 4 on Info-Tech’s resource management maturity scale, use Info-Tech’s Portfolio Manager Lite to start.
- Use a commercial PPM tool if you already have one in use and feel that you can accurately maintain the data in this tool.
- Use this chart to estimate the amount of time it will take to accurately maintain the data for each reporting period.
- Determine who will be responsible for this maintenance.
- If there is no one currently available to maintain the data, allocate time for someone or you may even need a portfolio analyst.
- We will confirm roles and responsibilities in phase 3.
| Maturity Level
|
Dimensions
|
Time needed per month
|
| Small (1-25 employees)
|
Medium (25-75)
|
Large (75-100)
|
Enterprise (100+)
|
| 1-2
|
%, team, project, monthly update, 1 month forecast
|
2 hours
|
6 hours
|
20 hours
|
50 hours
|
| 3-4
|
%, person, phase, weekly update, 1 quarter forecast
|
4 hours
|
12 hours
|
50 hours
|
150 hours
|
| 5
|
%, person, task, continuous update, 1 year forecast
|
8+ hours
|
20+ hours
|
100+ hours
|
400+ hours
|
See also: Grow Your Own PPM Solution with Info-Tech’s Portfolio Manager 2017
Join hundreds of Info-Tech clients who are successfully growing their own PPM solution.
If you are looking for a more robust resource management solution, or prefer to allocate staff time in hours rather than percentages, see Info-Tech’s Portfolio Manager 2017.
Similar to Portfolio Manager Lite, Portfolio Manager 2017 is a Microsoft Excel-based PPM solution that provides project visibility, forecasting, historical insight, and portfolio analytics capabilities for your PMO without a large upfront investment for a commercial solution.
Watch Info-Tech’s Portfolio Manager 2017 Video – Introduction and Demonstration.
System Requirements
To use all functions of Portfolio Manager 2017, you need Excel 2013 or Excel 2016 running on Windows, with the following add-ins:
- Power Query (Excel 2013 only)
- Power Pivot
- Power View
Power View is only available on select editions of Excel 2013 and 2016, but you can still use Portfolio Manager 2017 without Power View.
If you are unsure, speak to your IT help desk or an Info-Tech analyst for help.
For a new PMO, start with the new reality
CASE STUDY
Industry Law Enforcement
Source Info-Tech Client
“Because we already have enterprise licensing for an expensive commercial tool, everyone else thinks it’s logical to start there. I think we’re going to start with something quick and dirty like Excel.” – EPMO Director, Law Enforcement Services
Situation
- This was an enterprise PMO, but with relatively low organizational maturity.
- The IT department had relatively high project management maturity, but the enterprise was under-evolved at the portfolio level.
- Other areas of the organization already had licensing and deployment of a top-tier commercial PPM tool.
- There were no examples of a resource management practice.
Complication
- There was executive visibility on larger and more strategic projects.
- There were no constraints on the use of resources for smaller projects.
- The PMO was generally expected to provide project governance with their limited resources.
- The organization lacked an understanding of the difference between project and portfolio management. Consequently, it was difficult to create resource management practices at the portfolio level due to a lack of resourcing.
Resolution
- The organization deferred the implementation of the commercial PPM tool.
- They added high-level resource management using spreadsheets.
- Executive focus was reoriented around overall resource capacity as the principle constraint for project approvals.
- They introduced deeper levels of planning granularity over time.
- When the planning granularity gets down to the task level, they move toward the commercial solution.
Step 2.3: Build process steps to ensure data accuracy and sustainability
PHASE 1
1.1 Set a course of action
1.2 Estimate supply and demand
PHASE 2
2.1 Select resource management dimensions
2.2 Select resource management tools
2.3 Build process steps
PHASE 3
3.1 Pilot your process for viability
3.2 Plan stakeholder engagement
This step will walk you through the following activities:
- Draft a high-level resource management workflow
- Build on the workflow to determine how data will be collected at each step, and who will support the process
- Document your provisional resource management process
This step involves the following participants:
- PMO Director / Portfolio Manager
- Functional / Resource Managers
- Project Managers
Outcomes of this step
- A high-level resource management workflow, customized from Info-Tech’s sample workflow
- Process for collecting resource supply data for each reporting period
- Process for capturing the project demand within each reporting period
- Process for identifying and documenting resource constraints and issues for each reporting period
- Standard protocol for resolving resource issues within each reporting period
- Process for finalizing and communicating resource allocations for the forecast window
- A customized Resource Management Playbook, documenting the standard operating procedure for the processes
Make sustainability the goal of your resource management practices
A resource management process is doing more harm than good if it doesn’t facilitate the flow of accurate and usable data week after week, month after month, year after year.
When resource management strategies fail, it can typically be tied back to the same culprit: unrealistic expectations from the outset.
If a resource management process strives for a level of data precision that staff cannot juggle day to day, over the long run, then things will eventually fall apart as staff and decision makers alike lose faith in the data and the relevancy of the process.
Two things can be done to help avoid this fate:
- Strive for accuracy over precision. If your department’s process maturity is low, and staff are ping-ponged from task to task, fire to fire, throughout any given day, then striving for precise data is ill advised. Keep your granularity of allocation more high level, and strive for data that is “maintainably” accurate rather than “unmaintainably” precise.
- Keep the process simple. Use the advice in this step to develop a sustainable process, one that is easy to follow with clearly defined responsibilities and accountabilities at each step.
Info-Tech Insight
It's not about what you put together as a one-time snapshot. It's about what you can and will maintain every week, even during a crisis. When you stop maintaining resource management data, it’s nearly impossible to catch up and you’re usually forced to start fresh.
Maintain reliable resourcing data with an easy-to-follow, repeatable process
Info-Tech recommends following a simple five-step process for resource management.
1. Collect resource supply data
- Resources
- Resource Managers
2. Collect project demand data
- Resource Managers
- Project Managers
- PMO
3. Identify sources of supply/demand imbalance
4. Resolve conflicts and balance project and non-project allocations
- Resource Managers
- Project Managers
- PMO
- Steering Committee,
CIO, other executives
5. Approve allocations for forecast window
- PMO
- Steering Committee, CIO, other executives
This is a sample workflow with sample roles and responsibilities. This step will help you customize the appropriate steps for your department.
Info-Tech Insight
This process aims to control the resource supply to meet the demand – project and non-project alike. Coordinate this process with other portfolio management processes, ensuring that up-to-date resource data is available for project approval, portfolio reporting, closure, etc.
Draft your own high-level resource management workflow
2.3.1
60 to 90 minutes
Participants
- Portfolio Manager
- Project Managers
- Resource Managers
- Business Analysts
Input
- Process data requirements
Output
- High-level description of your target-state process
Materials
- Whiteboard or recipe cards
Conduct a table-top planning exercise to map out, at a high-level, your required and desired process steps.
While Info-Tech recommends a simple five-step process (see previous slide), you may need to flesh out your process into additional steps, depending upon the granularity of your seven dimensions and the complexity of your resource management tool. A table-top planning exercise can be helpful to ensure the right process steps are covered.
- On a whiteboard or using white 4x6 recipe cards, write the unique steps of a resource management process. Use the process example at the bottom of this slide as a guide.
- Use a green marker or green cards to write artifacts or deliverables that result from each step.
- Use a red marker or red cards to address potential issues, problems, or risks that you can foresee at each step.
For the purposes of this activity, avoid getting into too much detail by keeping to your focus on the high-level data points that will be required to keep supply and demand balanced on an ongoing basis.
"[I]t’s important not to get too granular with your time tracking. While it might be great to get lots of insight into how your team is performing, being too detailed can eat into your team’s productive work time. A good rule of thumb to work by is if your employees’ timesheets include time spent time tracking, then you’ve gone too granular."
– Nicolas Jacobeus
Use Info-Tech’s Resource Management Playbook to help evolve your high-level steps into a repeatable practice
Once you’ve determined a high-level workflow, you’ll need to flesh out the organizational details for how data will be collected at each step and who will support the process.
Use Info-Tech’s Resource Management Playbook to help determine and communicate the “who, what, when, where, why, and how” of each of your high-level process steps.
The playbook template is intended to function as your resource management standard operating procedure. Customize Section 3 of the template to record the specific organizational details of how data will be collected at each process step, and the actions and decisions the data collection process will necessitate.
- Activities 2.3.2-2.3.6 in this step will help you customize the process steps in Info-Tech’s five-step resource management model and record these in the template. If you developed a customized process in activity 2.3.1, you will need to add to/take away from the activity slides and customize the template accordingly.
- Lean on the seven dimensions of resource management that you developed in step 2.1 to determine the cadence and frequency of data collection. For instance, if your update frequency is monthly, you will need to ensure you collect your supply-demand data prior to that, giving yourself enough time to analyze it and reconcile imbalances with stakeholders before refreshing your monthly reporting data.
Download Info-Tech’s Resource Management Playbook
How the next five activities will help you develop your playbook
2.3 Resource Management Playbook
Each of the slides for activities 2.3.2-2.3.6 are comprised of a task-at-a glance box as well as “important decisions to document” for each step.
Work as a group to complete the task-at-a-glance boxes for each step. Use the “important decisions to document” notes to help brainstorm the “how” for each step. These details should be recorded below the task-at-a-glance boxes in the playbook – see point 6 in the legend below.
Screenshot of Section 3 of the RM Playbook.
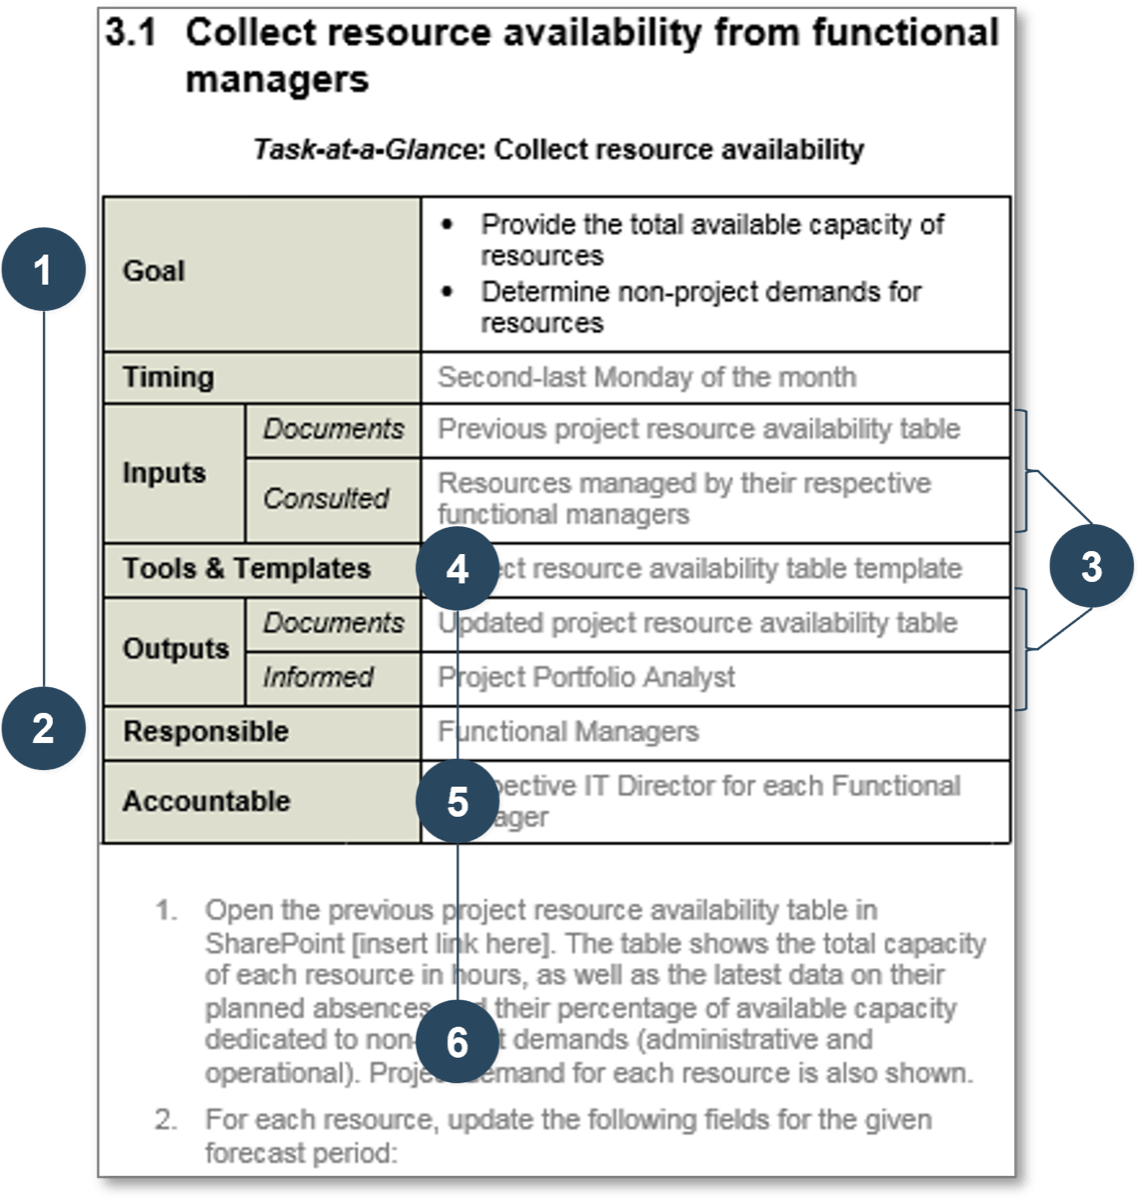
Screenshot Legend:
- Review your existing steps, tools, and templates used for this task. Alternatively, review the example provided in the RM Playbook.
- Designate the responsible party/parties for this process. Who carries out the task?
- Document the inputs and outputs for the task: artifacts, consulted and informed parties.
- If applicable, document the tools and templates used for the task.
- Designate the accountable party for this task. Only a single party can be accountable.
- Describe the “how” of the task below the Task-at-a-Glance table.
Step one: determine the logistics for collecting resource supply data for each reporting period
2.3.2
20 minutes
Step one in your resource management process should be ensuring a perpetually current view into your resource supply.
Resource supply in this context should be understood as the time, per your scope of allocation (i.e. individual, team, skill, etc.) that is leftover or available once non-project demands have been taken out of the equation. In short, the goal of this process step is to determine the non-project demands for the forecast period.
The important decisions to document for this step include:
- What data will be collected and from whom? For example, functional managers to update resource potential capacity and non-project resource allocations.
- How often will data be collected and when? For example, data will be collected third Monday of the month, three days before our monthly update frequency.
- How will the data be collected? For example, tool admin to send out data to update on third Monday; resource managers update the data and email back to tool admin.
Document your process for determining resource supply in Section 3.1 of Info-Tech’s Resource Management Playbook.
Task-at-a-glance:
| Inputs
|
Artifacts
|
i.e. historical usage data
|
| Consulted
|
i.e. project resources
|
| Tools & Templates
|
i.e. time tracking template
|
| Outputs
|
Artifacts
|
i.e. updated template
|
| Informed
|
i.e. portfolio analyst
|
| Timing
|
i.e. every second Monday
|
| Responsible
|
i.e. functional managers
|
| Accountable
|
i.e. IT directors
|
Step two: map out how project demand will be captured within each reporting period
2.3.3
20 minutes
Step two in your resource management process will be to determine the full extent of project demand for your forecast period.
Project demand in this context can entail both in-flight projects as well as new project plans or new project requests that are proposing to consume capacity during the forecast period. In short, the goal of this process step is to determine all of the project demands for the forecast period.
The important decisions to document for this step include:
- What data will be collected and from whom? For example, project managers to update project allocations for in-flight projects, and PMO will provide proposed allocations for new project requests.
- How often will data be collected and when? For example, data will be collected third Tuesday of the month, two days before our monthly update frequency.
- How will the data be collected? For example, tool admin to send out data to update on third Tuesday; project managers update the data and email back to tool admin.
Document your process for determining project demand in Section 3.2 of Info-Tech’s Resource Management Playbook.
Task-at-a-glance
| Inputs
|
Artifacts
|
i.e. historical usage data
|
| Consulted
|
i.e. project resources
|
| Tools & Templates
|
i.e. project demand template
|
| Outputs
|
Artifacts
|
i.e. updated demand table
|
| Informed
|
i.e. portfolio analyst
|
| Timing
|
i.e. every second Monday
|
| Responsible
|
i.e. project managers
|
| Accountable
|
i.e. PMO director
|
Step three: record how resource constraints and issues for each reporting period will be identified and documented
2.3.4
20 minutes
Step three in your resource management process will be to analyze your resource supply and project demand data to identify points of conflict.
Once the supply-demand data has been compiled, it will need to be analyzed for points of imbalance and conflict. The goal of this process step is to analyze the raw data and to make it consumable by other stakeholders in preparation for a reconciliation or rebalancing process.
The important decisions to document for this step include:
- How will the data be checked for inaccuracies? For example, tool admin to enter and QA data; reach out by the following Wednesday at noon with inconsistencies; managers to respond no later than next day by noon.
- What reports will employed? For example, a refreshed demand spreadsheet will be made available.
- What is an acceptable range for over- and under-allocations? For example, the acceptable tolerance for allocation is 15%; that is, report only those resources that are less than 85% allocated, or more than 115% allocated.
Document your process for identifying resource constraints and issues in Section 3.3 of Info-Tech’s Resource Management Playbook.
Task-at-a-glance
| Inputs
|
Artifacts
|
i.e. supply/demand data
|
| Consulted
|
i.e. no one
|
| Tools & Templates
|
i.e. Portfolio Manager Lite
|
| Outputs
|
Artifacts
|
i.e. list of issues
|
| Informed
|
i.e. no one
|
| Timing
|
i.e. every second Tuesday
|
| Responsible
|
i.e. portfolio analyst
|
| Accountable
|
i.e. PMO director
|
Step four: establish a standard protocol for resolving resource issues within each reporting period
2.3.5
20 minutes
Step four in your resource management process should be to finalize your capacity management book of record for the reporting period and prepare recommendations for resolving conflicts and issues.
The reconciliation process will likely take place at a meeting amongst the management of the PMO and representatives from the various functional groups within the department. The goal of this step is to get the right roles and individuals to agree upon proposed reconciliations and to sign-off on resource allocations.
The important decisions to document for this step include:
- What reports will be distributed and in what form? For example, refreshed spreadsheet will be available on the PMO SharePoint site.
- When will the reports be generated and for whom? For example, fourth Tuesday of the month, end of day – accessible for all managers.
- Who has input into how conflicts should be resolved? For example, conflicts will be resolved at monthly resource management meeting. All meeting participants have input, but the PMO director will have ultimate decision-making authority.
Document your process for resolving resource constraints and issues in Section 3.4 of Info-Tech’s Resource Management Playbook.
| Inputs
|
Artifacts
|
i.e. meeting agenda
|
| Consulted
|
i.e. meeting participants
|
| Tools & Templates
|
i.e. capacity reports
|
| Outputs
|
Artifacts
|
i.e. minutes and resolutions
|
| Informed
|
i.e. steering committee
|
| Timing
|
i.e. every second Thursday
|
| Responsible
|
i.e. PMO director
|
| Accountable
|
i.e. CIO
|
Step five: record how resource allocations will be finalized and communicated for the forecast window
2.3.6
20 minutes
The final step in your resource management process is to clarify how resource allocations will be documented in your resource management solution and reported to the department.
Once a plan to rebalance supply and demand for the reporting period has been agreed on, you will need to ensure that the appropriate data is updated in your resource management book of record, and that allocation decisions are communicated to the appropriate stakeholders.
The important decisions to document for this step include:
- Who has ultimate authority for allocation decisions? For example, the CIO has final authority when conflicts need to be escalated and must approve all allocations for the forecast period.
- Who will update the book of record and when? For example, the tool admin will update the data before the end of the day following the resource management meeting.
- Who needs to be informed and of what? For example, resource plans will be updated in SharePoint for resources and managers to review.
Document your process for approving and finalizing allocation in Section 3.5 of Info-Tech’s Resource Management Playbook.
Task-at-a-glance
| Inputs
|
Artifacts
|
i.e. minutes and resolutions
|
| Consulted
|
i.e. CIO, IT directors
|
| Tools & Templates
|
i.e. Portfolio Manager Lite
|
| Outputs
|
Artifacts
|
i.e. updated availability table
|
| Informed
|
i.e. steering committee
|
| Timing
|
i.e. every second Friday
|
| Responsible
|
i.e. portfolio analyst
|
| Accountable
|
i.e. PMO director
|
Finalize your provisional resource management process in the Playbook Template
2.3 Resource Management Playbook
Use Info-Tech’s Resource Management Playbook to solidify your processes in a formalized operating plan.
Throughout this phase, we have been customizing sections 1, 2, and 3 of the Resource Management Playbook.
Before we move to pilot and implement your resource management strategy in the next phase of this blueprint, ensure that sections 1-3 of your playbook have been drafted and are ready to be communicated and shared with stakeholders.
- Avoid getting too granular in your process requirements. Keep it to high-level data requirements. Imposing too much detail in your playbook is a recipe for failure.
- The playbook should remain provisional throughout your pilot phase. Aspects of your process will likely need to be changed or tweaked as they are met with some day-to-day realities. As with any “living document,” it can be helpful to explicitly assign responsibilities for updating the playbook over the long term to ensure it stays relevant.
"People are spending far more time creating these elaborate [time-tracking] systems than it would have taken just to do the task. You’re constantly on your app refiguring, recalculating, re-categorizing... A better strategy would be [returning] to the core principles of good time management…Block out your calendar for the non-negotiable things. [Or] have an organized prioritized task list." – Laura Stack (quoted in Zawacki)
If you want additional support, have our analysts guide you through this phase as part of an Info-Tech workshop
Book a workshop with our Info-Tech analysts:
- To accelerate this project, engage your IT team in an Info-Tech workshop with an Info-Tech analyst team.
- Info-Tech analysts will join you and your team onsite at your location or welcome you to Info-Tech’s historic Toronto office to participate in an innovative onsite workshop.
- Contact your account manager (www.infotech.com/account), or email Workshops@InfoTech.com for more information.
The following are sample activities that will be conducted by Info-Tech analysts with your team:
2.1 Wireframe a resource management strategy using Info-Tech’s seven dimensions of resource management
Action the decision points across Info-Tech’s seven dimensions to ensure your resource management process is guided by realistic data and process goals.
2.3 Draft a high-level resource management workflow and elaborate it into a repeatable practice
Customize Info-Tech’s five-step resource management process model. Then, document how the process will operate by customizing the Resource Management Playbook.
Phase 3
Implement Sustainable Resource Management Practices
Phase 3 outline
Call 1-888-670-8889 or email GuidedImplementations@InfoTech.com for more information.
Complete these steps on your own, or call us to complete a guided implementation. A guided implementation is a series of 2-3 advisory calls that help you execute each phase of a project. They are included in most advisory memberships.
Guided Implementation 3: Implement Sustainable Resource Management Practices
Proposed Time to Completion (in weeks): 4-12 weeks
Step 3.1: Pilot your resource management process
Start with an analyst kick-off call:
- Review your resource management dimensions and tools
- Review your provisional resource management processes
- Discuss your ideas for a pilot
Then complete these activities…
- Select receptive project/functional managers to work with
- Define the scope of your pilot and determine logistics
- Finalize resource management roles and responsibilities
With these tools & templates:
- Process Pilot Plan Template
- Resource Management Playbook
- Project Portfolio Analyst Job Description
Step 3.2: Plan to engage your stakeholders
Review findings with analyst:
- Results of your pilot, team feedback, and lessons learned
- Your stakeholder landscape
Then complete these activities…
- Brainstorm and plan for potential resistance to change, objections, and fatigue from stakeholders
- Plan for next steps
With these tools & templates:
- Resource Management Playbook
Phase 3 Results & Insights:
Engagement paves the way for smoother adoption. An engagement approach (rather than simply communication) turns stakeholders into advocates who can help boost your message, sustain the change, and realize benefits without constant intervention or process command-and-control.
Step 3.1: Pilot your resource management process to assess viability
PHASE 1
1.1 Set a course of action
1.2 Estimate supply and demand
PHASE 2
2.1 Select resource management dimensions
2.2 Select resource management tools
2.3 Build process steps
PHASE 3
3.1 Pilot your process for viability
3.2 Plan stakeholder engagement
This step will walk you through the following activities:
- Select receptive project and functional managers to work with during your pilot
- Define the scope of your pilot and determine logistics
- Plan to obtain feedback, document lessons learned, and create an action plan for any changes
- Finalize resource management roles and responsibilities
This step involves the following participants:
- CIO
- PMO Director / Portfolio Manager
- Project Managers
- Resource Managers
Outcomes of this step
- A pilot team
- A process pilot plan that defines the scope, logistics, and process for retrospection
- Roles, responsibilities, and accountabilities for resource management
- Project Portfolio Analyst job description template
Pilot your new processes to test feasibility and address issues before a full deployment
Adopting the right set of practices requires a significant degree of change that necessitates buy-in from varied stakeholders throughout IT and the business.
Rome wasn’t built in a day. Similarly, your visibility into resource usage and availability won’t happen overnight.
Resist the urge to deploy a big-bang rollout of your research management practices. This approach is ill advised for two main reasons:
- It will put more of a strain on the implementation team in the near term, with a larger pool of end users to train and collect data from.
- Putting untested practices in a department-wide spotlight could lead to mass confusion in the near-term and color the new processes in a negative light, leading to a loss of stakeholder trust and engagement right out of the gate.
Start with a pilot phase. Identify receptive project managers and functional managers to work with, and leverage their insights to help iron out the kinks in your process before unveiling your practices to IT and business users at large.
This step will help you:
- Plan and execute a pilot of the processes we developed in Phase 2.
- Incorporate the lessons learned from that pilot to strengthen your playbook and ease the communication process.
Info-Tech Insight
Engagement paves the way for smoother adoption. An engagement approach (rather than simply communication) turns stakeholders into advocates who can help boost your message, sustain the change, and realize benefits without constant intervention or process command-and-control.
Plan your pilot like you would any project to ensure it’s well defined and its goals are clearly articulated
Use Info-Tech’s Process Pilot Plan Template to help define the scope of your pilot and set appropriate goals for the test run of your new processes.
A process pilot is a limited scope of an implementation (constrained by time and resources involved) to test the viability and effectiveness of the process as it has been designed.
- Investing time and energy into a pilot phase can help to lower implementation risk, enhance the details and steps within a process, and improve stakeholder relations prior to a full scale rollout.
- More than a dry run, however, a pilot should be approached strategically and planned out to limit the scope of it and achieve specific outcomes.
- Leverage a planning document to ensure your process pilot is grounded in a common set of definitions, that the pilot is delivering value and insight, and that ultimately the pilot can serve as a starting point for a full-scale process implementation.
"The advantages to a pilot are several. First, risk is constrained. Pilots are closely monitored so if a problem does occur, it can be fixed immediately. Second, the people working in the pilot can become trainers as you roll the process out to the rest of the organization. Third, the pilot is another opportunity for skeptics to visit the pilot process and learn from those working in it. There’s nothing like seeing a new process working for people to change their minds." – Daniel Madison
Download Info-Tech’s Process Pilot Plan Template
Select receptive project and functional managers to work with during your pilot
3.1.1
20 to 60 minutes
Input
- Project management staff and functional managers
Output
Materials
- Stakeholder Engagement Workbook
- Process Pilot Plan Template
Participants
- Process owner (PMO director or portfolio owner)
- CIO
Info-Tech recommends selecting project managers and functional managers who are aware of your role and some of the supply-demand challenges to assist in the implementation process.
- If receptive project and functional managers are known, schedule a 15-minute meeting with them to inquire if they would be willing to be part of the pilot process.
- If receptive project managers are not known, use Info-Tech’s Stakeholder Engagement Workbook to conduct a formal selection process.
- Enter a list of potential pilot project managers in tab 3.
- Rate project managers in terms of influence, pilot interest, and potential deployment contribution within tab 4.
- Review tab 5 in the workbook. Receptive project managers will appear in the top quadrants. Ideal project managers for the pilot are located in the top right quadrant of the graph.
Document the project and functional managers involved in your pilot in Section 3 of Info-Tech’s Process Pilot Plan Template.
Define the scope of your pilot and determine logistics
Input
- Sections 1 through 4 of the Process Pilot Plan Template
Output
Materials
- Process Pilot Plan Template
Participants
- Process Owner (PMO Director or Portfolio Owner)
- CIO
- Project and Resource Managers
Use Info-Tech’s Process Pilot Plan Template to design the details of your pilot.
Investing time into planning your pilot phase strategically will ensure a clear scope, better communications for those piloting the processes, and overall, better, more actionable results during the pilot phase. The Process Pilot Plan Template is broken into five sections to assist in these goals:
- Pilot Overview and Scope
- Success and Risk Factors
- Stakeholders Involved and Communications Plan
- Pilot Retrospective and Feedback Protocol
- Lessons Learned
- The duration of your pilot should go at least one allocation period, depending on your frequency of updates, e.g. one week or month.
- Estimates of time commitments should be captured for each stakeholder. During the retrospective at the end of the pilot, you should capture actuals to help determine the time-cost of the process itself and measure its sustainability.
- Once the template is completed, schedule time to share and communicate it with the pilot team and executive sponsors of the process.
While you should invest time in this planning document, continue to lean on the Resource Management Playbook as well as a process guide throughout the pilot phase.
Execute your pilot and prepare to make process revisions before the full rollout
Hit play! Begin the process pilot and get familiar with the work routine and resource management solution.
Some things to keep in mind during the pilot include:
- Depending on the solution you’re using, you will likely need to spend one day or less to populate the tool. During the pilot, measure the time and effort required to manage the data within the tool. Compare with the original estimate from activity 2.2.2. Determine whether time and effort required are viable on an ongoing basis (i.e. can you do it every week or month) and have value.
- Meet with the pilot team and other stakeholders regularly during the pilot – at least weekly. Allow the team (and yourself) to speak honestly and openly about what isn’t working. The pilot is your chance to make things better.
- Keep notes about what will need to change in the RM Playbook. For major changes, you may have to tweak the process during the pilot itself. Update the process documents as needed and communicate the changes and why they’re being made. If required, update the scope of the pilot in the Process Pilot Plan Template.
Obtain feedback from the pilot group to improve your processes before a wider rollout
3.1.3
30 minutes
Input
- What’s working and what isn’t in the process
Output
Materials
- Whiteboard
- Sticky notes
- Process Pilot Plan Template
Participants
- Process Owner (PMO Director or Portfolio Owner)
- Pilot Team
Pilot projects allow you to validate your assumptions and leverage lessons learned. During the planning of the pilot, you should have scheduled a retrospective meeting with the pilot team to formally assess strengths and weaknesses in the process you have drafted.
- Schedule the retrospective shortly after the pilot is completed. Info-Tech recommends a stop/start/continue activity with pilot participants to obtain and capture feedback.
- Have members of the meeting record any processes/activities on sticky notes that should:
- Stop: because they are ineffective or not useful
- Start: because they would be useful for the tool and have not been incorporated into current processes
- Continue: because they are useful and positively contribute to intended process outcomes
An example of how to structure a stop/start/continue activity on a whiteboard using sticky notes.
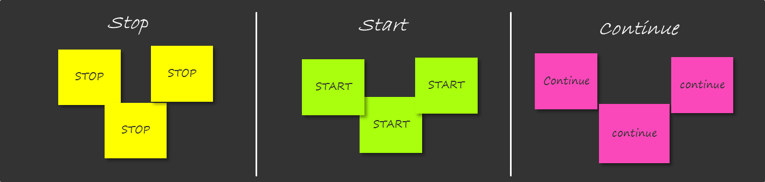
See below for additional instructions
Document lessons learned and create an action plan for any changes to the resource management processes
3.1.4
30 minutes
As a group, discuss everyone’s responses and organize according to top priority (mark with a 1) and lower priority/next steps (mark with a 2). At this point, you can also remove any sticky notes that are repetitive or no longer relevant.
Once you have organized based on priority, be sure to come to a consensus with the group regarding which actions to take. For example, if the group agrees that they should “stop holding meetings weekly,” come to a consensus regarding how often meetings will be held, i.e. monthly.
Create an action plan for the top priority items that require changes (the stops and starts). Record in this slide or your preferred medium. Be sure to include who is responsible for the action and the date that it will be implemented.
| Priority
|
Action Required
|
Who is Responsible
|
Implementation Date
|
| Stop: Holding meetings weekly
|
Hold meetings monthly
|
Jane Doe, PMO
|
Next Meeting: November 1, 2017
|
| Start: Discussing backlog during meetings
|
Ensure that backlog data is up to date for discussion on date of next meeting
|
John Doe, Portfolio Manager
|
November 1, 2017
|
Document the outcomes of the start/stop/continue exercise and your action plan in Section 6 of Info-Tech’s Process Pilot Plan Template.
Review actions that can be taken based on the results of your pilot
| Situation
|
Action
|
Next Steps
|
| The dimensions that we chose for our strategy have proven to be too difficult to accurately maintain.
|
The dimensions that we chose for our strategy have proven to be too difficult to accurately maintain.
|
Reassess the dimensions that you chose for your strategy. Make sure that you are not overcommitting yourself based on your maturity level. You can always go back and adjust for a higher level of resource management maturity once you have mastered your current level. For example, if you chose “weekly” as your update frequency and this has proven to be too much to maintain, try updating monthly for a few months. Once you have mastered this update frequency, it will be easier to adjust to a weekly update process.
|
| We were able to maintain the data for our pilot based on the dimensions that we chose. However, allocating projects based on realized capacity did not alleviate any of our resourcing issues and resources still seem to be working on more projects than they can handle.
|
Determine other factors at the organization that would help to maintain the data and work toward reclaiming capacity.
|
Continue working with the dimensions that you chose and maintain the accuracy of this data. The next step is to identify other factors that are contributing to your resource allocation problems and begin reclaiming capacity. Continue forward to the resource management roadmap section and work on changing organizational structures and worker behavior to maximize capacity for project work.
|
| We were able to easily and accurately maintain the data, which led to positive results and improvement in resource allocation issues.
|
If your strategy is easily maintained, identify factors that will help your organization reclaim capacity.
|
Continue to maintain this data, and eventually work toward maintaining it at a more precise level. For example, if you are currently using an update frequency of “monthly” and succeeding, think about moving toward a “weekly” frequency within a few months. Once you feel confident that you can maintain project and resource data, continue on to the roadmap section to discover ways to reclaim resource capacity through organizational and behavioral change.
|
Finalize resource management roles and responsibilities
3.1.5
15 to 30 minutes
Input
- Tasks for resource management
- Stakeholder involved
Output
- Roles, responsibilities, and accountabilities for resource management
Materials
- Resource Management Playbook
Participants
- PMO Director/ Portfolio Manager
- Functional Managers
- Project Managers
Perform a RACI exercise to help standardize terminology around roles and responsibilities and to ensure that expectations are consistent across stakeholders and teams.
- A RACI will help create a clear understanding of the tasks and expectations for each stakeholder at each process step, assigning responsibilities and accountability for resource management outcomes.
Responsible
Accountable
Consulted
Informed
| Roles
|
CIO
|
PMO
|
Portfolio Analyst
|
Project Manager
|
Functional Manager
|
| Collect supply data
|
I
|
A
|
R
|
I
|
C
|
| Collect demand data
|
I
|
A
|
R
|
C
|
I
|
| Identify conflicts
|
I
|
C/A
|
R
|
C
|
C
|
| Resolve conflicts
|
C
|
A/R
|
I
|
R
|
R
|
| Approve allocations
|
A
|
R
|
I
|
R
|
I
|
Document your roles and responsibilities in Section 2 of Info-Tech’s Resource Management Playbook.
Use Info-Tech’s Portfolio Analyst job description to help fill any staffing needs around data maintenance
3.1 Project Portfolio Analyst/PMO Analyst Job Description
You will need to determine responsibilities and accountabilities for portfolio management functions within your team.
If you do not have a clearly identifiable portfolio manager at this time, you will need to clarify who will wear which hats in terms of facilitating intake and prioritization, high-level capacity awareness, and portfolio reporting.
- Use Info-Tech’s Project Portfolio Analyst job description template to help clarify some of the required responsibilities to support your PPM strategy.
- If you need to bring in an additional staff member to help support the strategy, you can customize the job description template to help advertise the position. Simply edit the text in grey within the template.
- If you have other PPM tasks that you need to define responsibilities for, you can use the RASCI chart on the final tab of the PPM Strategy Development Tool.
Download Info-Tech’s Project Portfolio Analyst Job Description Template
Finalize the Resource Management Playbook and prepare to communicate your processes
Once you’ve completed the pilot process and made the necessary tweaks, you should finalize your Resource Management Playbook and prepare to communicate it.
Revisit your RM Playbook from step 2.3 and ensure it has been updated to reflect the process changes that were identified in activity 3.1.4.
- If during the pilot process the data was too difficult or time consuming to maintain, revisit the dimensions you have chosen and select dimensions that are easier to accurately maintain. Tweak your process steps in the playbook accordingly.
- In the long term, if you are not observing any capacity being reclaimed, revisit the roadmap that we’ll prepare in step 3.2 and address some of these inhibitors to organizational change.
- In the next step, we will also be repurposing some of the content from the playbook, as well as from previous activities, to include them in your presentation to stakeholders, using Info-Tech’s Resource Management Communications Template.
Download Info-Tech’s Resource Management Playbook
Info-Tech Best Practice
Make your process standardization comprehensive. The RM Playbook should serve as your resource management standard operating procedure. In addition to providing a walk-through of the process, an SOP also clarifies project governance by clearly defining roles and responsibilities.
Step 3.2: Plan to engage your stakeholders with your playbook
PHASE 1
1.1 Set a course of action
1.2 Estimate supply and demand
PHASE 2
2.1 Select resource management dimensions
2.2 Select resource management tools
2.3 Build process steps
PHASE 3
3.1 Pilot your process for viability
3.2 Plan stakeholder engagement
This step will walk you through the following activities:
- Brainstorm and plan for potential resistance to change, objections, and fatigue from stakeholders
- Plan for next steps in reclaiming project capacity
- Plan for next steps in overcoming supply-demand reconciliation challenges
This step involves the following participants:
- CIO
- PMO Director / Portfolio Manager
- Pilot Team from Step 3.1
Outcomes of this step
- Plan for communicating responses and objections from stakeholders and staff
- Plan to manage structural/enabling factors that influence success of the resource management strategy
- Description of next steps in reclaiming project capacity and overcoming supply-demand reconciliation challenges
- Final draft of the customized Resource Management Playbook
Develop a resource management roadmap to communicate and reinforce the strategy
A roadmap will help anticipate, plan, and address barriers and opportunities that influence the success of the resource management strategy.
This step of the project will ensure the new strategy is adopted and applied with maximum success by helping you manage challenges and opportunities across three dimensions:
1. Executive Stakeholder Factors
For example, resistance to adopting new assumptions about ratio of project versus non-project work.
2. Workforce/Team Factors
For example, resistance to moving from individual- to team-based allocations.
3. Structural Factors
For example, ensuring priorities are stable within the chosen resource planning horizon.
See Info-Tech’s Drive Organizational Change from the PMOfor comprehensive tools and guidance on achieving organizational buy-in for your new resource management practices.
Info-Tech Insight
Communicate, communicate, communicate. Staff are 34% more likely to adapt to change quickly during the implementation and adoption phases when they are provided with a timeline of impending changes specific to their department. (McLean & Company)
Anticipate a wide range of responses toward your new processes
While your mandate may be backed by an executive sponsor, you will need to influence stakeholders from throughout the organization in order to succeed. Indeed, as EPMO leader, success will depend upon your ability to confirm and reaffirm commitments on soft or informal grounds. Prepare an engagement strategy that anticipates a wide range of responses.
|
|
Enthusiasts
|
Fence-sitters
|
Skeptics
|
Saboteurs
|
| What they look like:
|
Put all their energy into learning new skills and behaviors.
|
Start to use new skills and behaviors at a sluggish pace.
|
Look for alternate ways of implementing the change.
|
Refuse to learn anything new or try new behaviors.
|
| How they contribute:
|
Lead the rest of the group.
|
Provide an undercurrent of movement from old behaviors to new.
|
Challenge decisions and raise risk points with managers.
|
May raise valid points about the process that should be fixed.
|
| How to manage them:
|
Give them space to learn and lead others.
|
Keep them moving forward by testing their progress.
|
Listen to them, but don’t give in to their demands.
|
Keep communicating with them until you convert them.
|
| How to leverage them:
|
Have them lead discussions and training sessions.
|
Use them as an example to forecast the state once the change is adopted.
|
Test new processes by having them try to poke holes in them.
|
If you can convert them, they will lead the Skeptics and Fence-sitters.
|
Info-Tech Insight
Hone your stakeholder engagement strategy. Most people affected by an IT-enabled change tend to be fence-sitters. Small minorities will be enthusiasts, saboteurs, and skeptics. Your communication strategy should focus on engaging the skeptics, saboteurs, and enthusiasts. Fence-sitters will follow.
Define plans to deal with resistance to change, objections, and fatigue
Be prepared to confront skeptics and saboteurs when communicating the change.
- Use the templates on the following slide to:
- Brainstorm possible objections from stakeholders and staff. Prioritize objections that are likely to occur.
- Develop responses to objections.
- Develop a document and plan for proactively communicating responses and objections to show people that you understand their point of view.
- Revise the communications messaging and plan to include proactive objection handling.
- Discuss the likelihood and impact of “saboteurs” who aren’t convinced or affected by change management efforts.
- Explore contingency plans for dealing with difficult saboteurs. These individuals can negate the progress of the rest of the team by continuing to resist the process and spreading toxic energy. If necessary, be ruthless with these individuals. Let them know that the rest of the group is moving on without them, and if they can’t or won’t adopt the new standards, then they can leave.
Info-Tech Insight
Communicate well and engage often. Agility and continuous improvement are good, but can degenerate into volatility if change isn’t managed properly. People will perceive change to be volatile if their expectations aren’t managed through communications and engagement planning.
Info-Tech Best Practice
The individuals best positioned to provide insight and influence change positively are also best positioned to create resistance.
These people should be engaged early and often in the implementation process – not just to make them feel included or part of the change, but also because their insight could very likely identify risks, barriers, and opportunities that need to be addressed.
Develop a plan to manage stakeholder resistance to the new resource management strategy
3.2.1
30 minutes
Brainstorm potential implications and objections that executive stakeholders might raise about your new processes.
| Dimension
|
Decision
|
Potential Impact, Implications, and Objections
|
Possible Responses and Actions
|
| i.e. Default Project Ratio
|
50%
|
“This can’t be right...”
|
“We conducted a thorough time audit to establish this ratio.”
|
| “We need to spend more time on project work.”
|
“Realistic estimates will help us control new project intake, which will help us optimize time allocated to projects.”
|
| i.e. Frequency
|
Monthly
|
“This data isn’t detailed enough, we need to know what people are working on right now.”
|
“Maintaining an update frequency of weekly would require approximately [X] extra hours of PMO effort. We can work toward weekly as we mature.”
|
| i.e. Scope
|
Person
|
“That is a lot of people to keep track of.”
|
“Managing individuals is still the job of the project manager; we are responsible for allocating individuals to projects.”
|
| i.e. Granularity of Work Assignment
|
Project
|
“We need to know exactly what tasks are being worked on and what the progress is.”
|
“Assigning at task level is very difficult to accurately maintain. Once we have mastered a project-level granularity we can move toward task level.”
|
| i.e. Forecast Horizon
|
One month
|
“We need to know what each resource is working on next year.”
|
“With a monthly forecast, our estimates are dependable. If we forecast a year in advance, this estimate will not be accurate.”
|
Document the outcomes of this activity on slide 26 of Info-Tech’s Resource Management Communications Template.
Develop a plan to manage staff/team resistance to the new resource management strategy
3.2.2
30 minutes
Brainstorm potential implications and objections that individual staff and members of project teams might raise about your new processes.
| Dimension
|
Decision
|
Potential Impact, Implications, and Objections
|
Possible Responses and Actions
|
| i.e. Default Project Ratio
|
50%
|
“There’s too much support work.”
|
“We conducted a thorough time audit to establish this ratio. Realistic estimates will help us control new project intake, which will help us optimize your project time.”
|
| i.e. Frequency
|
Monthly
|
“I don’t have time to give you updates on project progress.”
|
“This update frequency requires only [X] amount of time from you per week/month.”
|
| i.e. Granularity
|
Project
|
“I need more clarity on what I’m working on.”
|
“Team members and project managers are in the best position to define and assign (or self-select) individual tasks.”
|
| i.e. Forecast Horizon
|
One month
|
“I need to know what my workload will be further in advance.”
|
“You will still have a high-level understanding of what you will be working on in the future, but projects will only be officially forecasted one month in advance.”
|
| i.e. Allocation Cadence
|
Monthly
|
“We need a more frequent cadence.”
|
“We can work toward weekly cadence as we mature.”
|
Document the outcomes of this activity on slide 27 of Info-Tech’s Resource Management Communications Template.
Develop a plan to manage structural/enabling factors that influence success of the resource management strategy
3.2.3
30 minutes
Brainstorm a plan to manage other risks and challenges to implementing your processes.
| Dimension
|
Decision
|
Potential Impact, Implications, and Objections
|
Possible Responses and Actions
|
| i.e. Default Project Ratio
|
50%
|
“We have approved too many projects to allocate so little time to project work.”
|
Nothing has changed – this was always the amount of time that would actually go toward projects. If you are worried about a backlog, stop approving projects until you have completed the current workload.
|
| i.e. Frequency
|
Monthly
|
“Status reports aren’t reliably accurate and up to date more than quarterly.”
|
Enforce strict requirements to provide monthly status updates for 1-3 key KPIs.
|
| i.e. Scope
|
Person
|
“How can we keep track of what each individual is working on?”
|
Establish a simple, easy reporting mechanism so that resources are reporting their own progress.
|
| i.e. Granularity
|
Project
|
“How will we know the status of a project without knowing what tasks are completed?”
|
It is in the domain of the project manager to know what tasks have been completed and to report overall project progress.
|
| i.e. Forecast Horizon
|
One Month
|
“It will be difficult to plan for resource needs in advance.”
|
Planning a month in advance allows you to address conflicts or issues before they are urgent.
|
Document the outcomes of this activity on slide 28 of Info-Tech’s Resource Management Communications Template.
Finalize your communications plan and prepare to present the new processes to the organization
Use Info-Tech’s Resource Management Communications Template to record the challenges your resource management strategy is addressing and how it is addressing them.
Highlight organizational factors that necessitated the change.
- Stakeholders and staff understandably tend to dislike change for the sake of change. Use Info-Tech’s Resource Management Communications Template to document the pain points that your process change is addressing and explain the intended benefits for all who will be subject to the new procedures.
Determine goals and benefits for implementation success.
- Provide metrics by which the implementation will be deemed a success. Providing this horizon will provide some structure for stakeholders and hopefully help to encourage process discipline.
Clearly indicate what is required of people to adopt new processes.
- Document your Resource Management Playbook. Be sure to include specific roles and responsibilities so there is no doubt regarding who is accountable for what.
Download Info-Tech’s Resource Management Communications Template
"You need to be able to communicate effectively with major stakeholders – you really need their buy-in. You need to demonstrate credibility with your audience in the way you communicate and show how portfolio [management] is a structured decision-making process." – Dr. Shan Rajegopal (quoted in Akass, “What Makes a Successful Portfolio Manager”)
Review tactics for keeping your processes on track
Once the strategy is adopted, the next step is to be prepared to address challenges as they come up. Review the tactics in the table below for assistance.
| Challenge
|
Resolution
|
Next Step
|
| Workers are distracted because they are working on too many projects at once; their attention is split and they are unproductive.
|
Workers are distracted because they are working on too many projects at once; their attention is split and they are unproductive.
|
Review portfolio practices for ways to limit work in progress (WIP).
|
| Employees are telling project managers what they want to hear and not giving honest estimates about the way their time is spent.
|
Ensure that employees understand the value of honest time tracking. If you’re allocating your hours to the wrong projects, it is your projects that suffer. If you are overallocated, be honest and share this with management.
|
Display employee time-tracking reports on a public board so that everyone will see where their time is spent. If they are struggling to complete projects by their deadlines they must be able to demonstrate the other work that is taking up their time.
|
| Resources are struggling with projects because they do not have the necessary expertise.
|
Perform a skills audit to determine what skills employees have and assign them to projects accordingly.
|
If an employee with a certain skill is in high demand, consider hiring more resources who are able to complete this work.
|
See below for additional challenges and tactics
Review tactics for keeping supply and demand aligned
Once the strategy is adopted, the next step is to use the outputs of the strategy to reclaim capacity and ensure supply and demand remain aligned. Review the tactics in the table below for assistance.
| Challenge
|
Resolution
|
Next Step
|
| There is insufficient project capacity to take on new work, but demand continues to grow.
|
Extend project due date and manage the expectations of project sponsors with data. If possible, reclaim capacity from non-project work.
|
Customize the playbook to address insufficient project capacity.
|
| There is significant fluctuation in demand, making it extremely challenging to stick to allocations.
|
Project managers can build in additional contingencies to project plans based on resourcing data, with plans for over-delivering with surplus capacity. In addition, the CIO can leverage business relationships to curb chaotic demand. The portfolio manager should analyze the project portfolio for clues on expanding demand.
|
Customize the playbook to address large fluctuations in demand.
|
| On a constant basis, there are conflicting project demands over specific skills.
|
Re-evaluate the definition of a project to guard the value of the portfolio. Continually prioritize projects based on their business values as of today.
|
Customize the playbook to address conflicting project demands. Feed into any near- and long-term staffing plans.
|
Prepare to communicate your new resource management practices and reap their benefits
As you roll out your resource management strategy, familiarize yourself with the capability improvements that will drive your resource management success metrics.
- Increased capacity awareness through the ability to more efficiently and more effectively collect and track complex, diverse, and dynamic project data across the project portfolio.
- Improved supply management. Increased awareness of resource capacity (current and forecasted) combined with the ability to see the results of resource allocations across the portfolio will help ensure that project resources are used as effectively as possible.
- Improved demand management. Increased capacity awareness, combined with reliable supply management, will help PMOs set realistic limits on the amount and kind of IT projects the organization can take on at any given time. The ability to present user-friendly reports to key decision makers will help the PMO to ensure that the projects that are approved are realistically attainable and strategically aligned.
- Increased portfolio success. Improvements in the three areas indicated above should result in more realistic demands on project workers/managers, better products, and better service to all stakeholders. While successfully implemented PPM solutions should produce more efficient PPM processes, ideally they should also drive improved project stakeholder satisfaction across the organization.
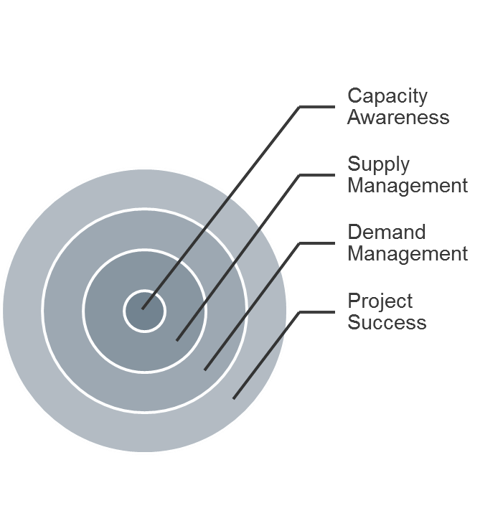
Info-Tech client achieves resource management success by right-sizing its data requirements and focusing on reporting
CASE STUDY
Industry Manufacturing
Source Info-Tech Client
“We were concerned that the staff would not want to do timesheets. With one level of task definition, it’s not really timesheets. It’s more about reconciling our allocations.” – PMO Director, Manufacturing
Challenge
- In a very fast-paced environment, the PMO had developed a meaningful level of process maturity.
- There had never been time to slow down enough to introduce a mature PPM tool set.
- The executive leadership had started to ask for more throughput of highly visible IT projects.
Solution
- There had never been oversight on how much IT time went toward escalated support issues and smaller enhancement requests.
- Staff had grown accustomed to a lack of documentation rigor surrounding the portfolio.
- Despite a historic baseline of the ratio between strategic projects, small projects, and support, the lack of recordkeeping made it hard to validate or reconcile these ratios.
Results
- The organization introduced a robust commercial PPM tool.
- They were able to restrict the granularity of data to a high level in order to limit the time required to enter and manage, and track the actuals.
- They prepared executive leadership for their renewed focus on the allocation of resources to strategically important projects.
- Approval of projects was right-sized based on the actual capacity and realized through improved timesheet recordkeeping.
If you want additional support, have our analysts guide you through this phase as part of an Info-Tech workshop
Book a workshop with our Info-Tech analysts:
- To accelerate this project, engage your IT team in an Info-Tech workshop with an Info-Tech analyst team.
- Info-Tech analysts will join you and your team onsite at your location or welcome you to Info-Tech’s historic Toronto office to participate in an innovative onsite workshop.
- Contact your account manager (www.infotech.com/account), or email Workshops@InfoTech.com for more information.
The following are sample activities that will be conducted by Info-Tech analysts with your team:
3.1 Define the scope of your pilot and set appropriate goals for the test-run of your new processes
An effective pilot lowers implementation risk, enhances the details and steps within a process, and improves stakeholder relations prior to a full scale rollout.
3.2 Develop a plan to manage stakeholder and staff resistance to the new resource management practice
Proactively plan for communicating responses and objections to show people that you understand their point of view and win their buy-in.
Insight breakdown
Insight 1
A matrix organization creates many small, untraceable demands that are often overlooked in resource management efforts, which lead to underestimating total demand and overcommitting resources. To capture them and enhance the success of your resource management effort, focus on completeness rather than precision. Precision of data will improve over time as your process maturity grows.
Insight 2
Draft the resource management practice with sustainability in mind. It is about what you can and will maintain every week, even during a crisis: it is not about what you put together as a one-time snapshot. Once you stop maintaining resource data, it’s nearly impossible to catch up.
Insight 3
Engagement paves the way for smoother adoption. An engagement approach (rather than simply communication) turns stakeholders into advocates who can help boost your message, sustain the change, and realize benefits without constant intervention or process command-and-control.
Summary of accomplishment
Knowledge Gained
- Disconnect between traditional resource management paradigms and today’s reality of work environment
- Differentiation of accuracy and precision in capacity data
- Snapshot of resource capacity supply and demand
- Seven dimensions of resource management strategy
- How to create sustainability of a resource management practice
Processes Optimized
- Collecting resource supply data
- Capturing the project demand
- Identifying and documenting resource constraints and issues
- Resolving resource issues
- Finalizing and communicating resource allocations for the forecast window
Deliverable Completed
- Resource Management Supply-Demand Calculator, to create an initial estimate of resource capacity supply and demand
- Time-tracking survey emails, to validate assumptions made for creating the initial snapshot of resource capacity supply and demand
- Resource Management Playbook, which documents your resource management strategy dimensions, process steps, and responses to challenges
- PPM Solution Vendor Demo Script, to structure your resource management tool demos and interactions with vendors to ensure that their solutions can fully support your resource management practices
- Portfolio Manager Lite, a spreadsheet-based resource management solution to facilitate the flow of data
- Process Pilot Plan, to ensure that the pilot delivers value and insight necessary for a wider rollout
- Project Portfolio Analyst job description, to help your efforts in bringing in additional staff to provide support for the new resource management practice
- Resource Management Communications presentation, with which to engage your stakeholders during the new process rollout
Research contributors and experts
Trevor Bramwell, ICT Project Manager Viridor Waste Management
John Hansknecht, Director of Technology University of Detroit Jesuit High School & Academy
Brian Lasby, Project Manager Toronto Catholic District School Board
Jean Charles Parise, CIO & DSO Office of the Auditor General of Canada
Darren Schell, Associate Executive Director of IT Services University of Lethbridge
Bibliography
actiTIME. “How Poor Tracking of Work Time Affects Your Business.” N.p., Oct. 2016. Web.
Akass, Amanda. “What Makes a Successful Portfolio Manager.” Pcubed, n.d. Web.
Alexander, Moira. “5 Steps to avoid overcommitting resources on your IT projects.” TechRepublic. 18 July 2016. Web.
Anderson, Ryan. “Some Shocking Statistics About Interruptions in Your Work Environment.” Filevine, 9 July 2015. Web.
Bondale, Kiron. “Focus less on management and more on the resources with resource management.” Easy in Theory, Difficult in Practice. 16 July 2014. Web.
Burger, Rachel. “10 Software Options that Will Make Your Project Resource Allocation Troubles Disappear.” Capterra Project Management Blog, 6 January 2016. Web.
Cooper, Robert, G. “Effective Gating: Make product innovation more productive by using gates with teeth.” Stage-Gate International and Product Development Institute. March/April 2009. Web.
Dimensional Research. “Lies, Damned Lies and Timesheet Data.” Replicon, July 2013. Web.
Edelman Trust Barometer. “Leadership in a Divided World.” 2016. Web.
Frank, T.A. “10 Execs with Time-Management Secrets You Should Steal.” Monday*. Issue 2: Nov-Dec 2014. Drucker Institute. Web.
Huth, Susanna. “Employees waste 759 hours each year due to workplace distractions.” The Telegraph, 22 Jun 2015. Web.
Jacobeus, Nicolas. “How Detailed Does Your Agency Time Tracking Need to Be?” Scale Blog, 18 Jul 2016. Web.
Lessing, Lawrence. Free Culture. Lulu Press Inc.: 30 July 2016.
Kwak, James. “The Importance of Excel. The Baseline Scenario, 9 Feb 2013. Web.
Madison, Daniel. “The Five Implementation Options to Manage the Risk in a New Process.” BPMInstitute.org. n.d. Web.
Mark, Gloria. Multitasking in the Digital Age. Morgan & Claypool Publishers. 1 April 2015
Maron, Shim. “Accountability Vs. Responsibility In Project Management.” Workfront, 10 June 2016. Web.
PM Solutions. “Resource Management and the PMO: Three Strategies for Addressing Your Biggest Challenge.” N.p., 2009. Web.
Project Management Institute. “Pulse of the Profession 2014.” PMI, 2014. Web.
Planview. “Capacity Planning Fuels Innovation Speed.” 2016. Web.
Rajda, Vilmos. “The Case Against Project Portfolio Management.” PMtimes, 1 Dec 2010. Web.
Reynolds, Justin. “The Sad Truth about Nap Pods at Work.” TINYpulse, 22 Aug 2016. Web.
Schulte, Brigid. “Work interrupts can cost you 6 hours a day. An efficiency expert explains how to avoid them.” Washington Post, 1 June 2015. Web.
Stone, Linda. "Continuous Partial Attention." Lindastone.net. N.p., n.d. Web.
Zawacki, Kevin. “The Perils of Time Tracking.” Fast Company, 26 Jan 2015. Web.


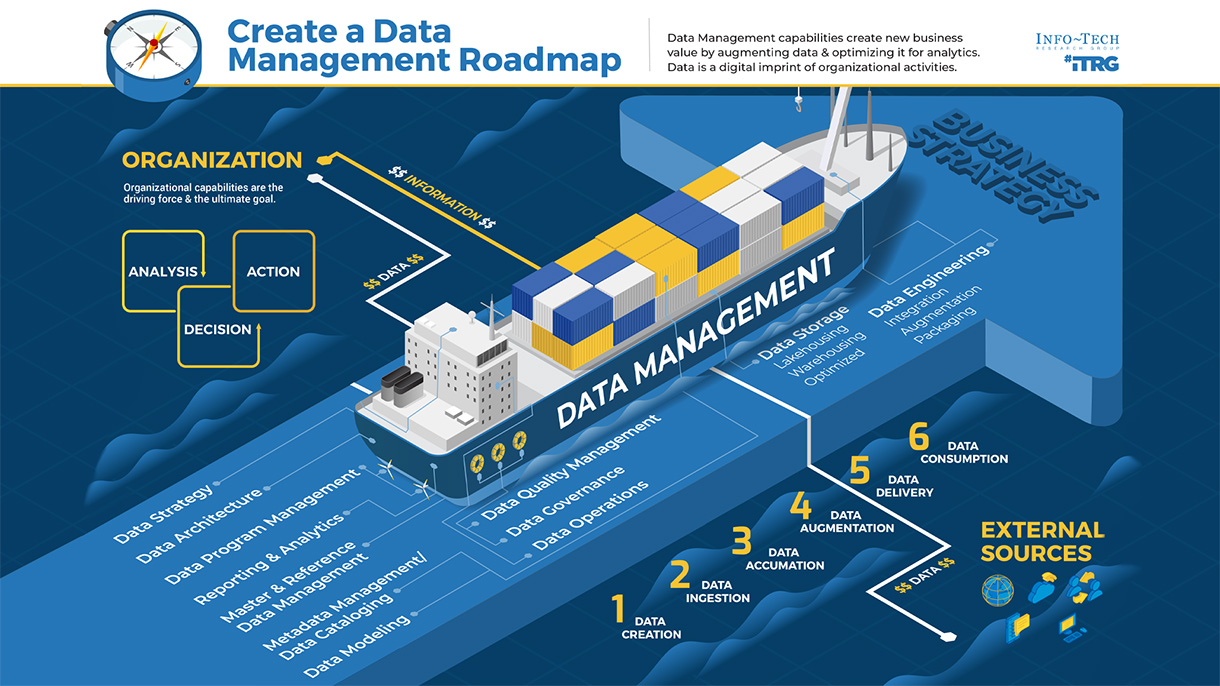
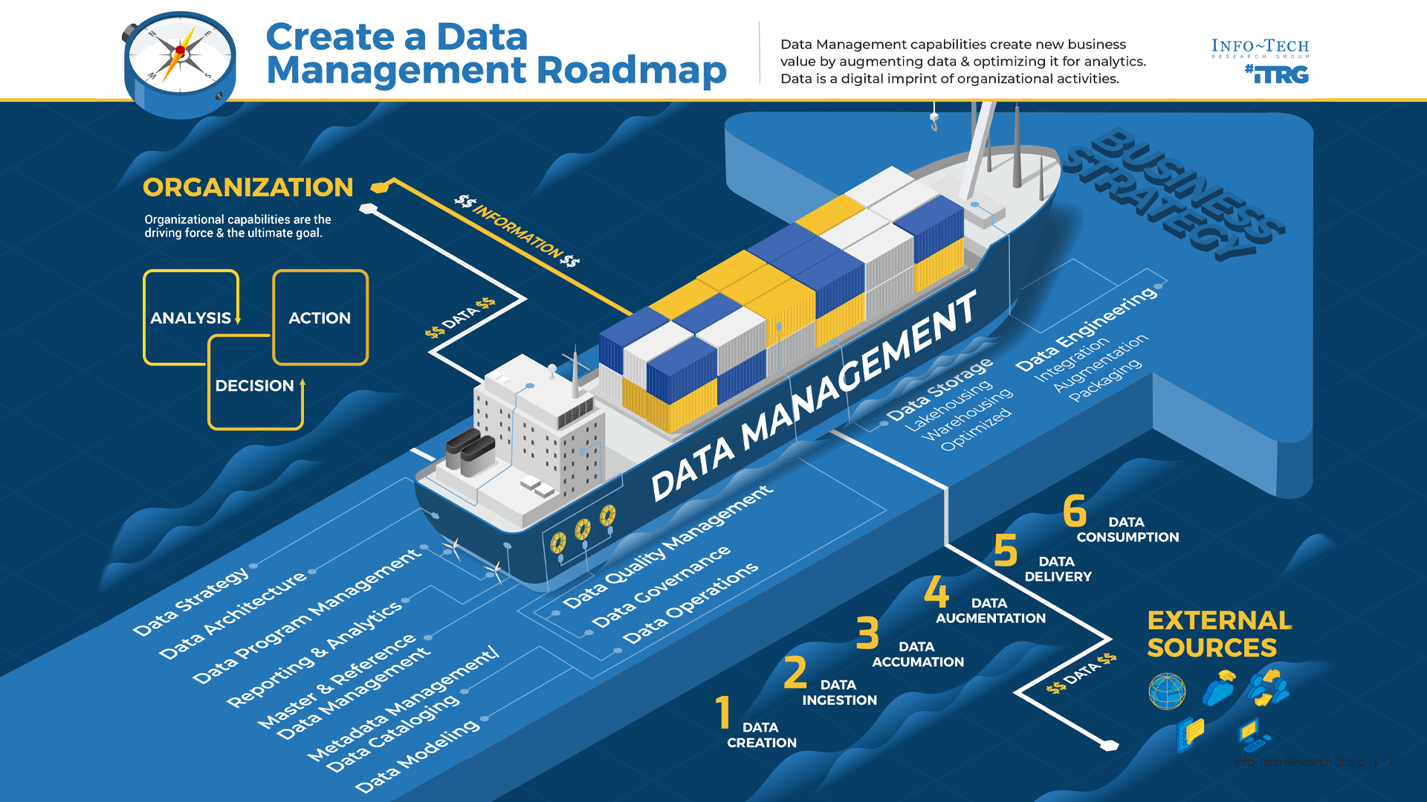
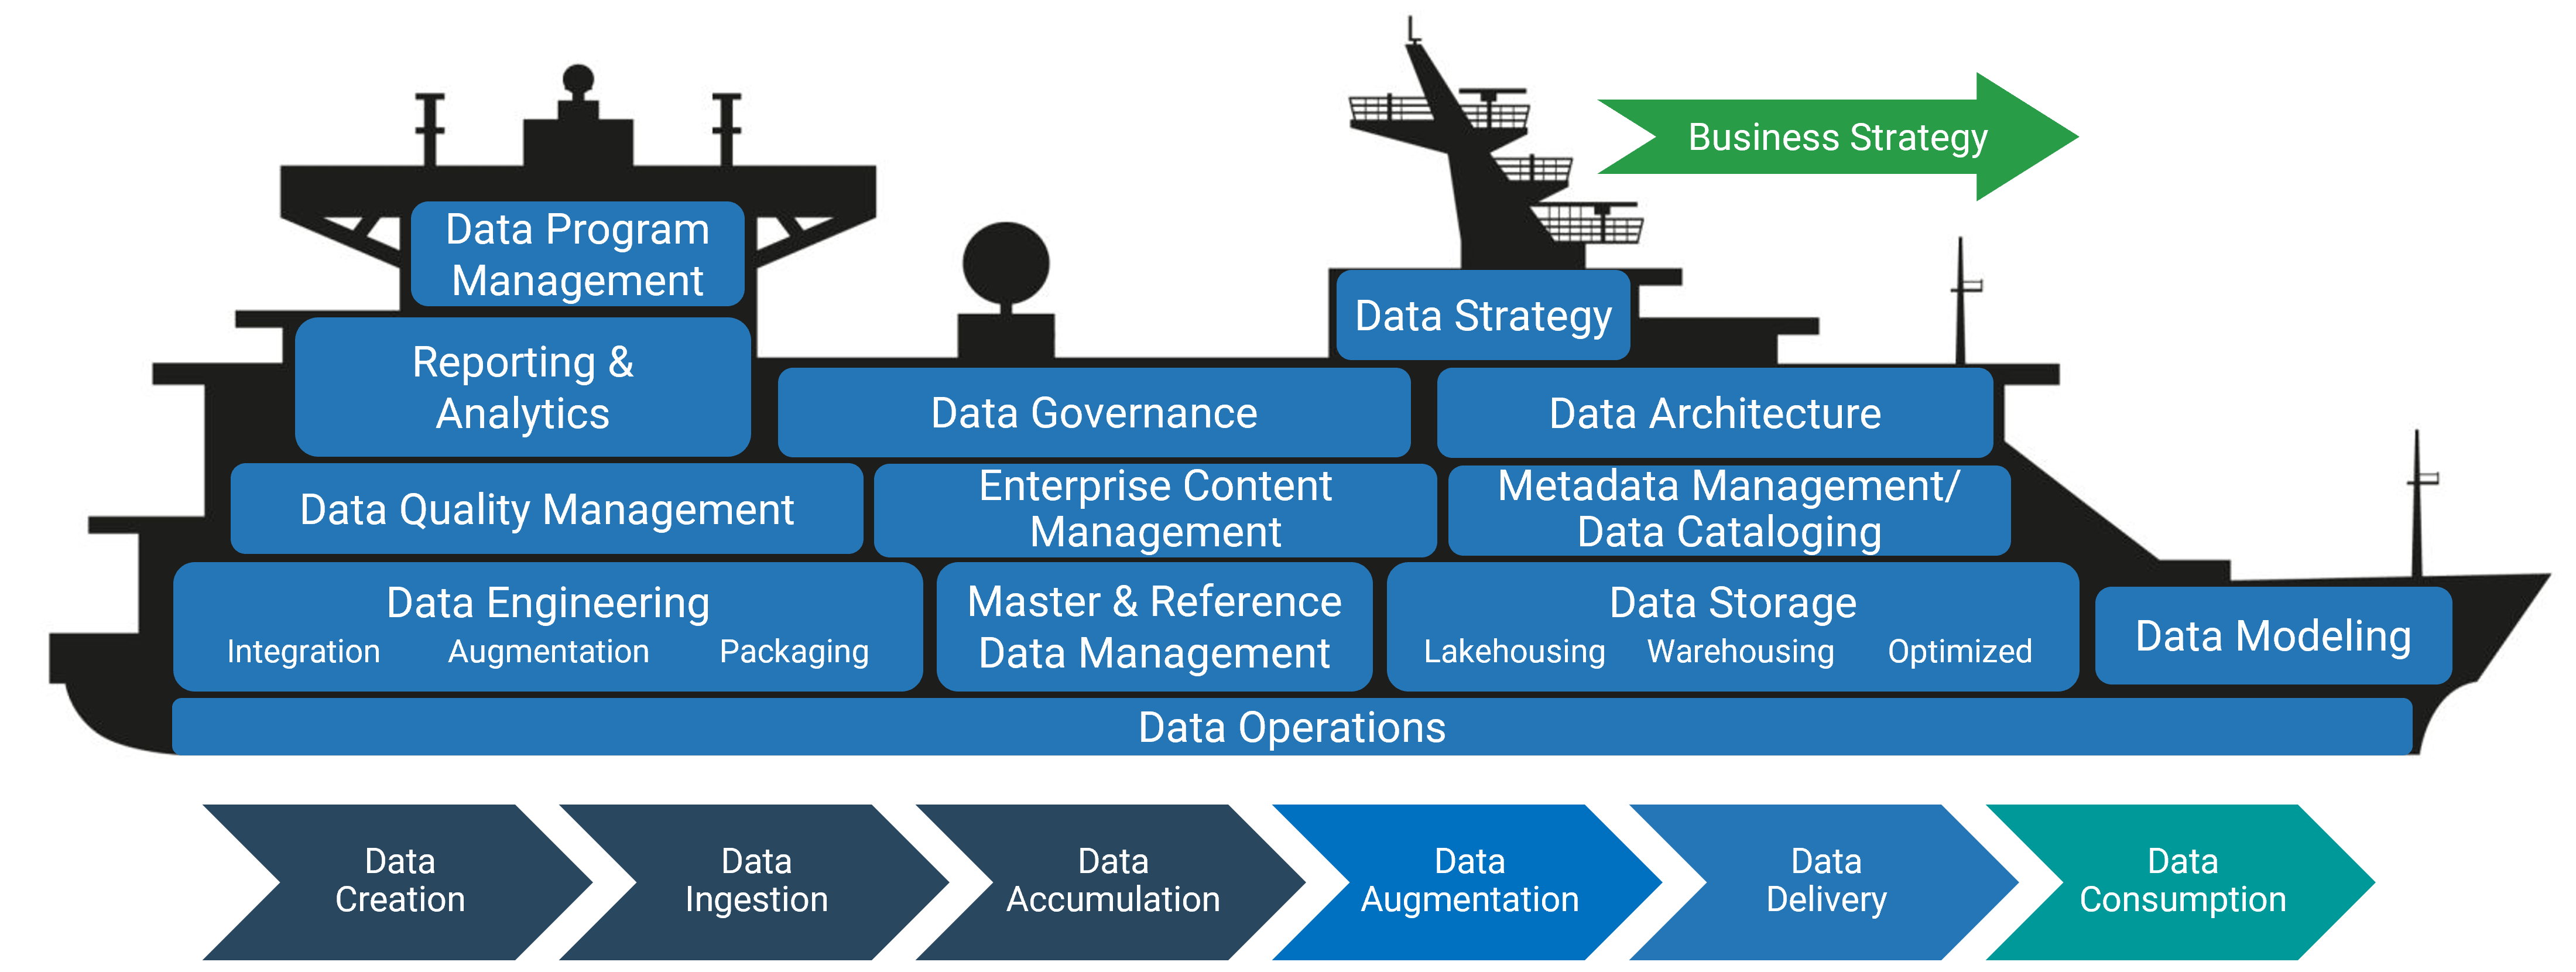
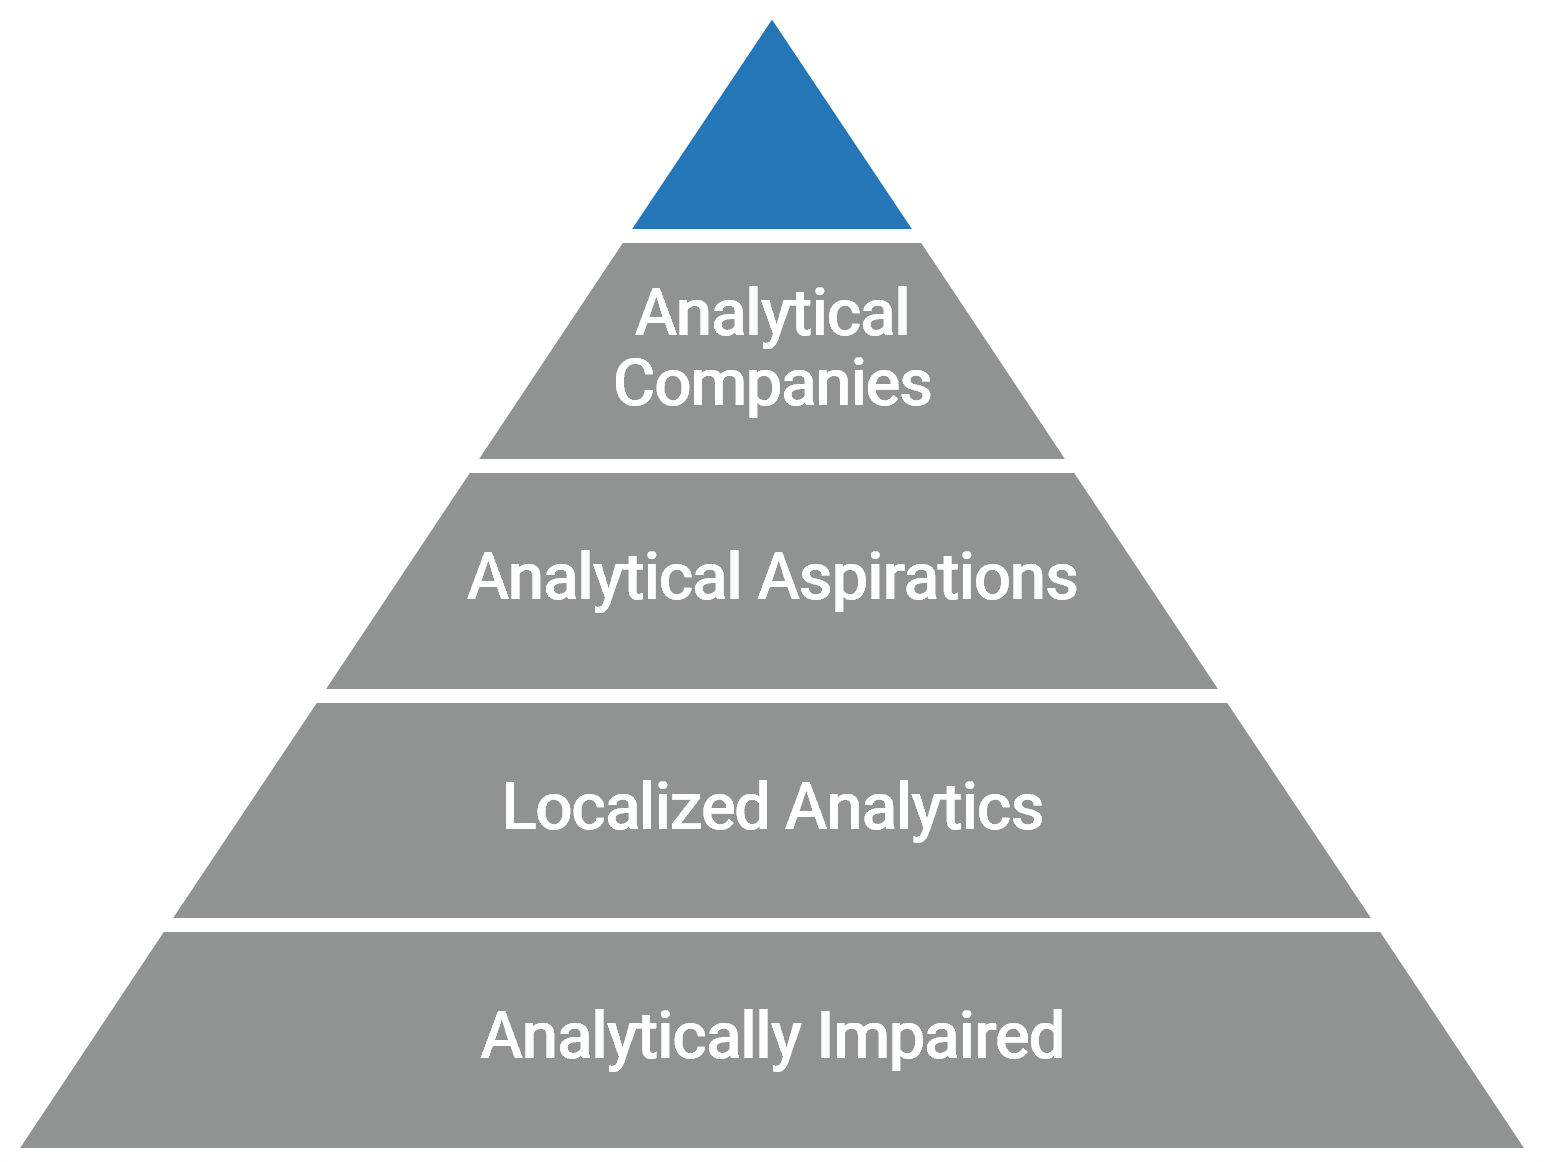
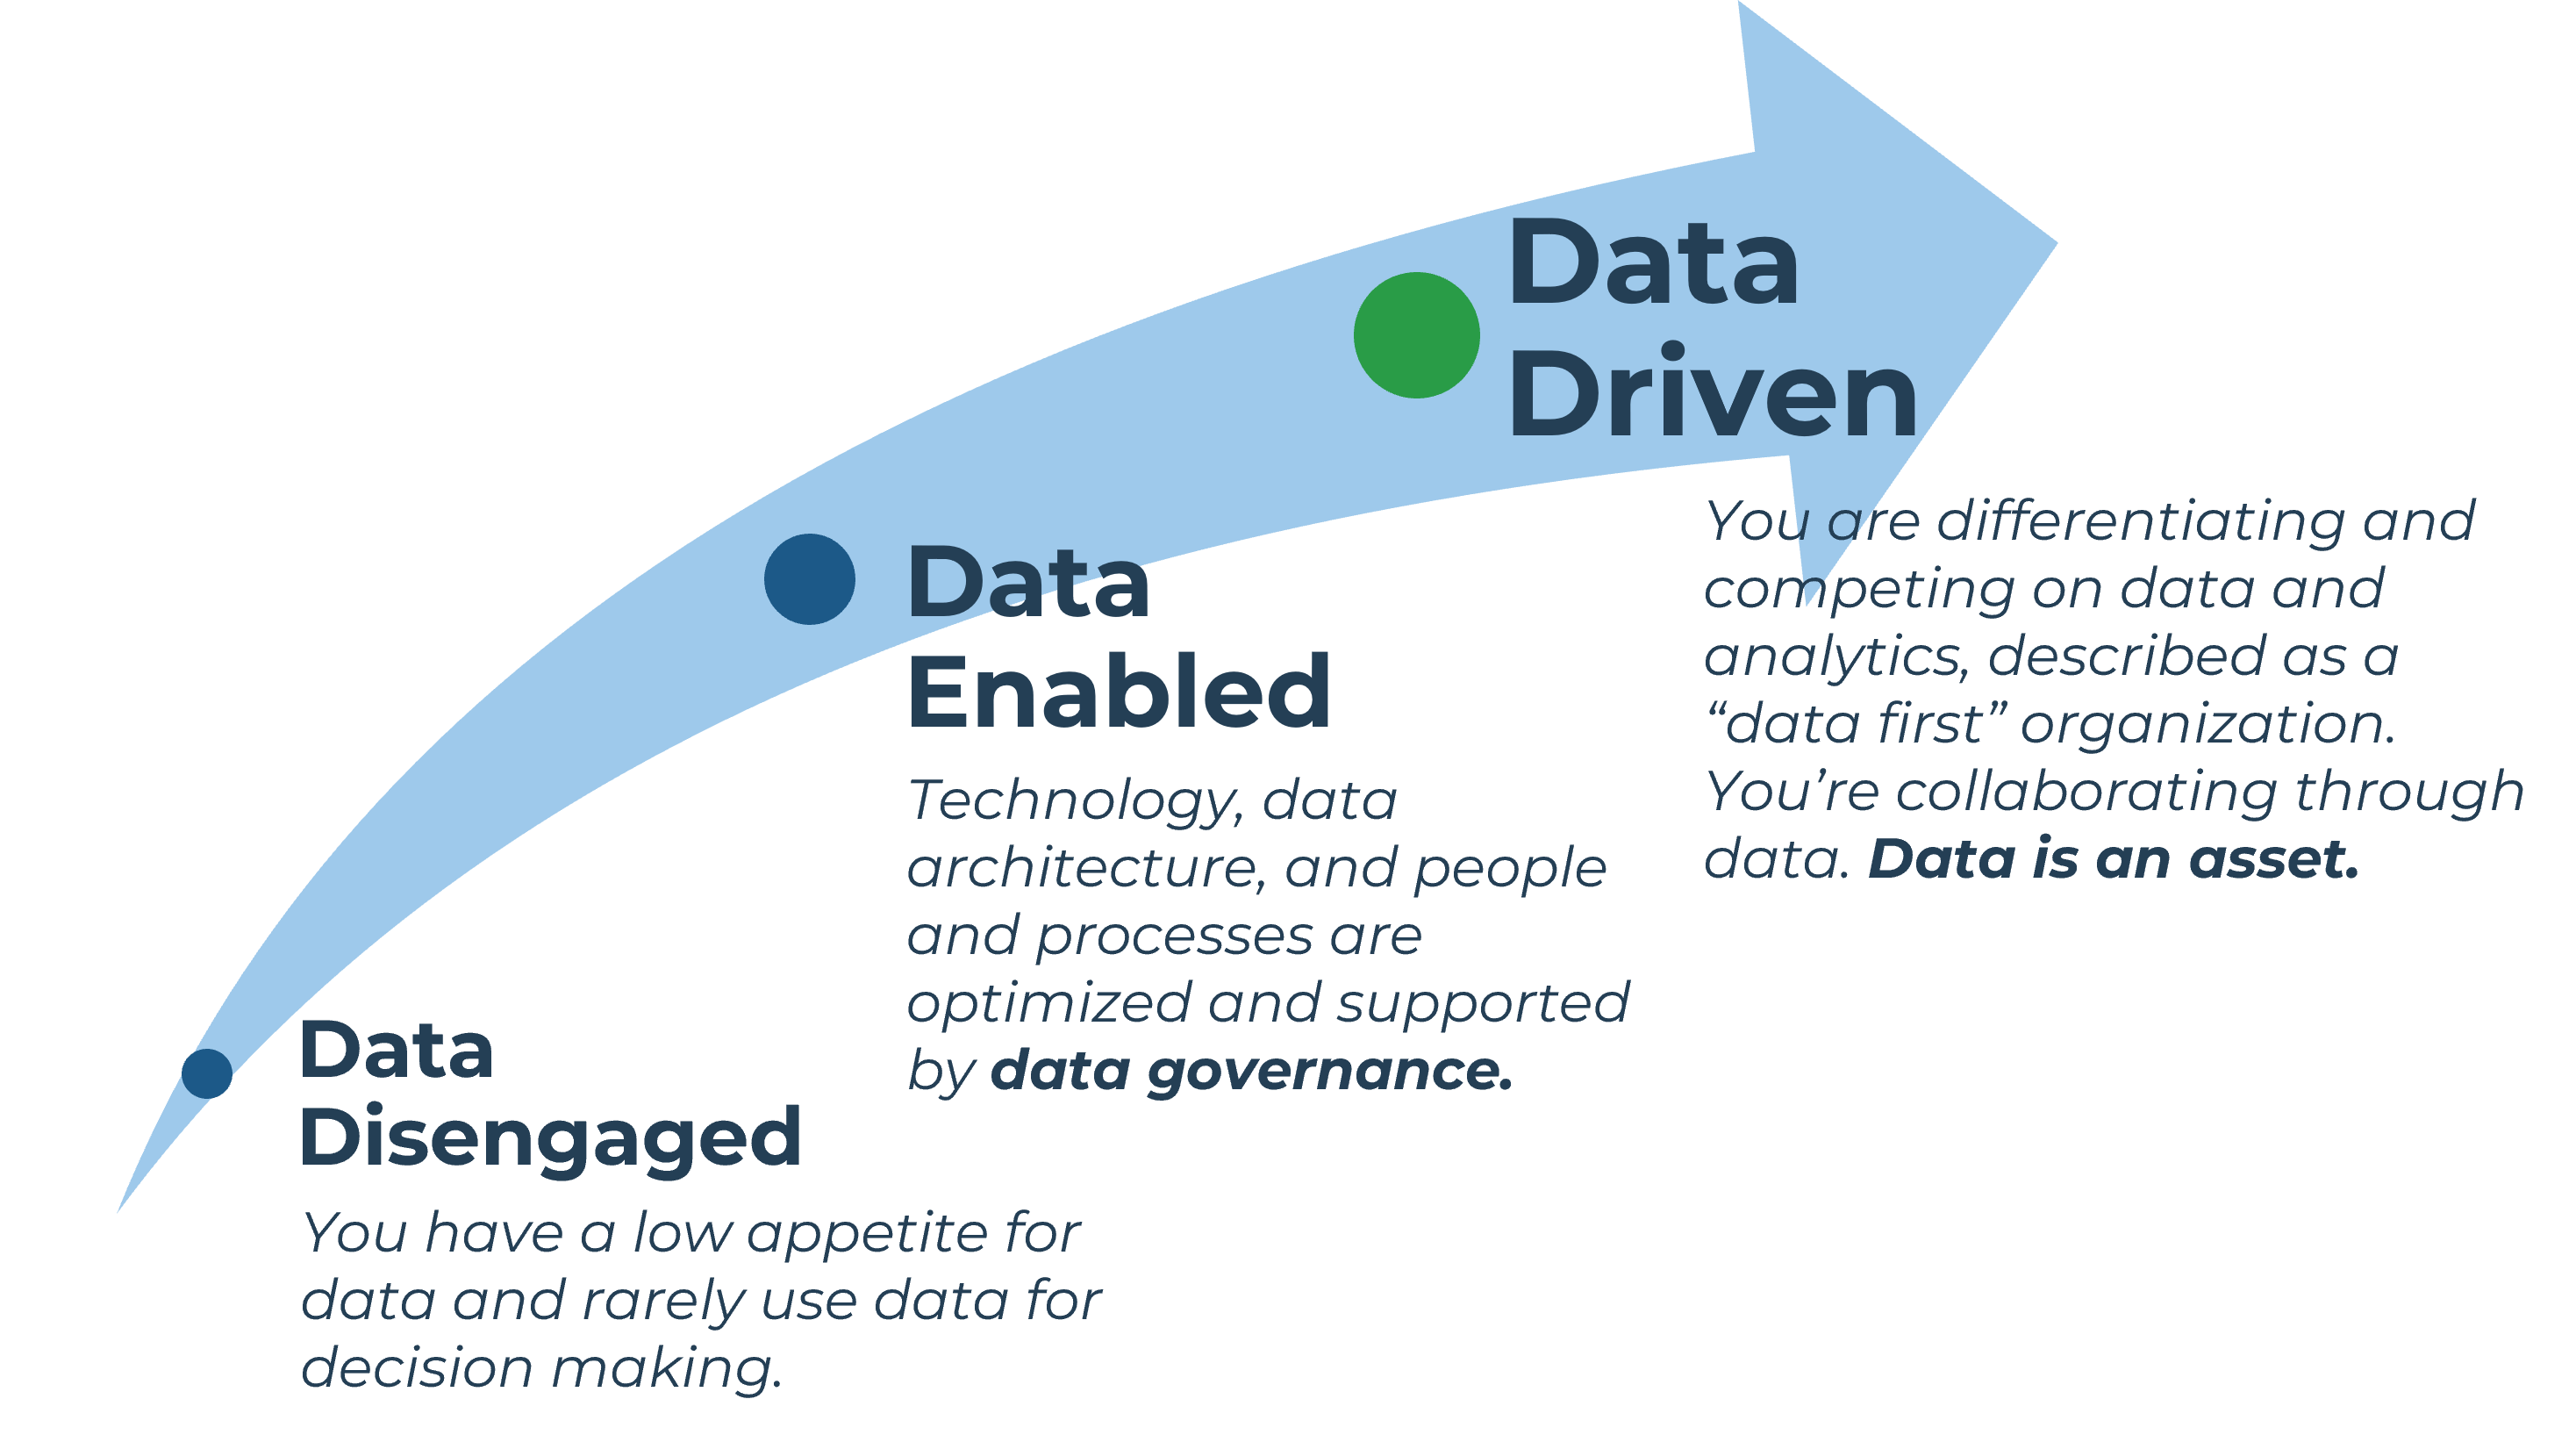
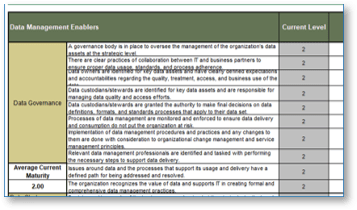

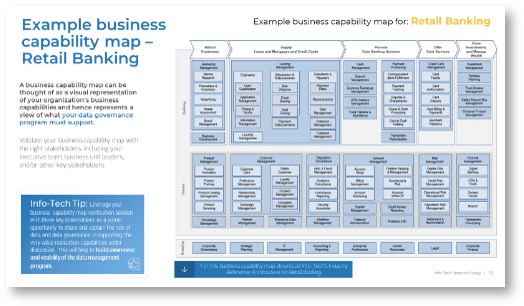
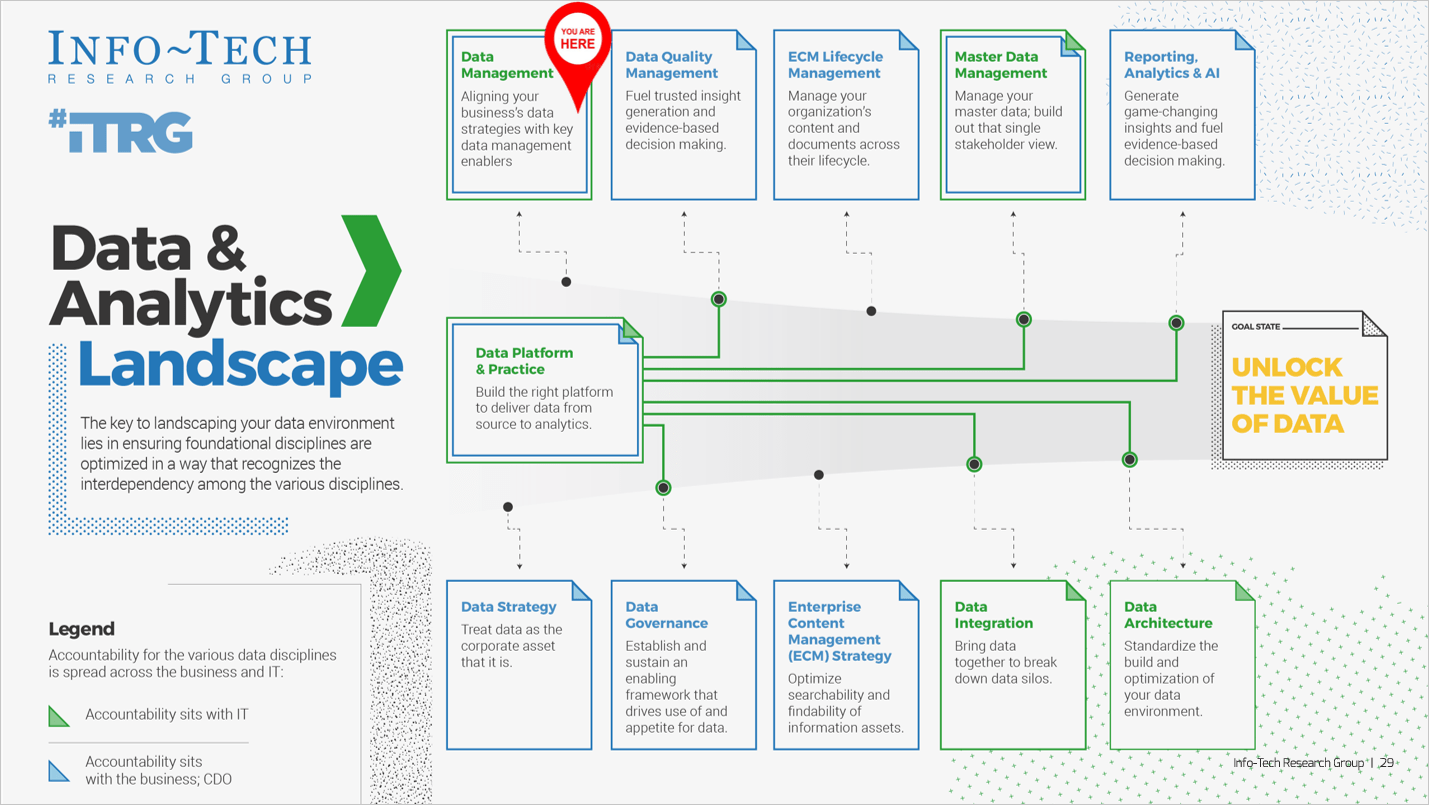
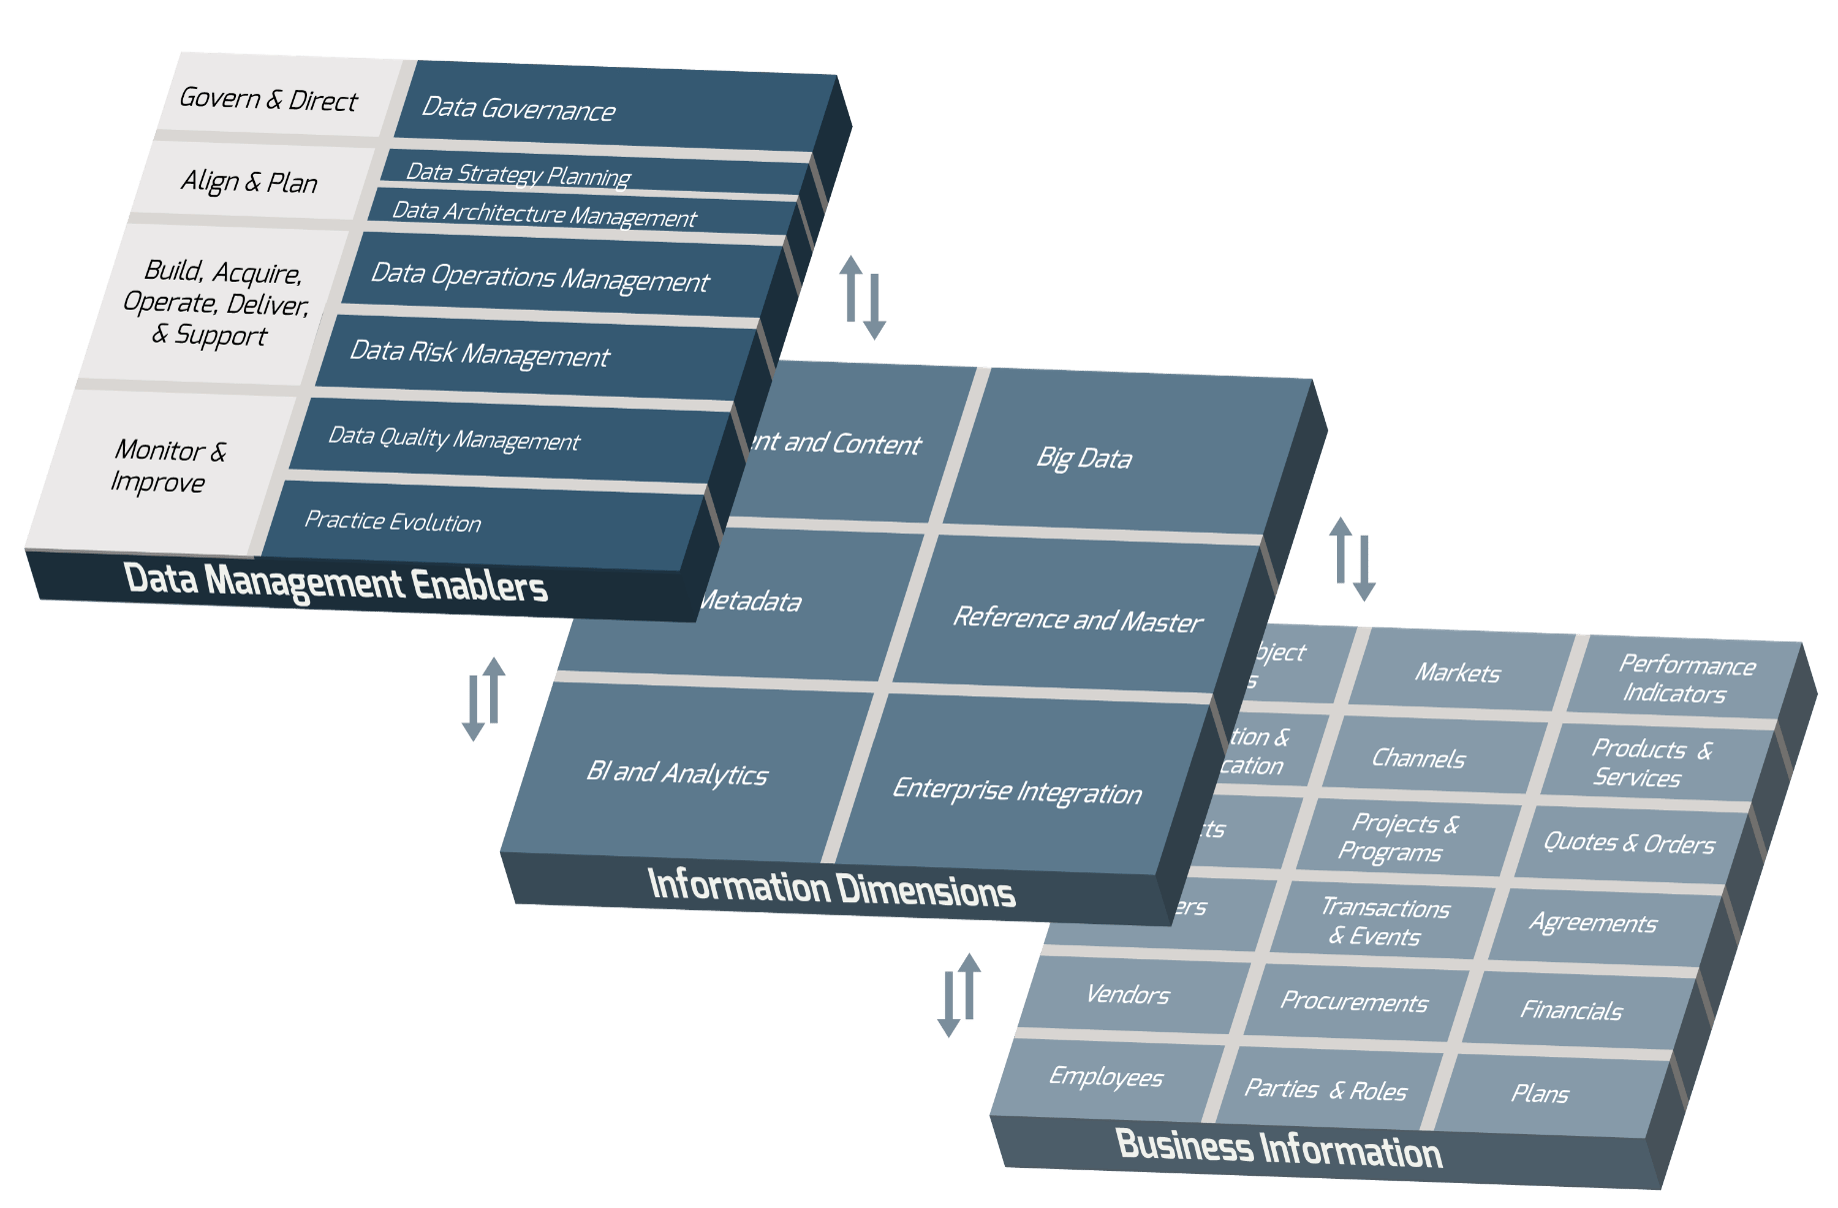

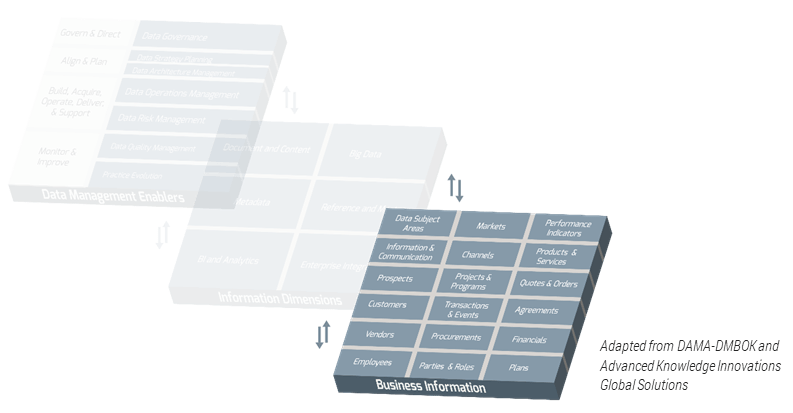
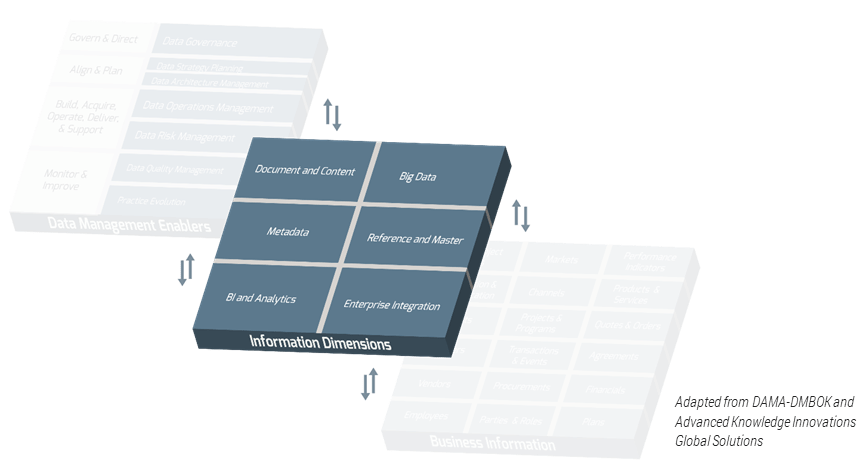
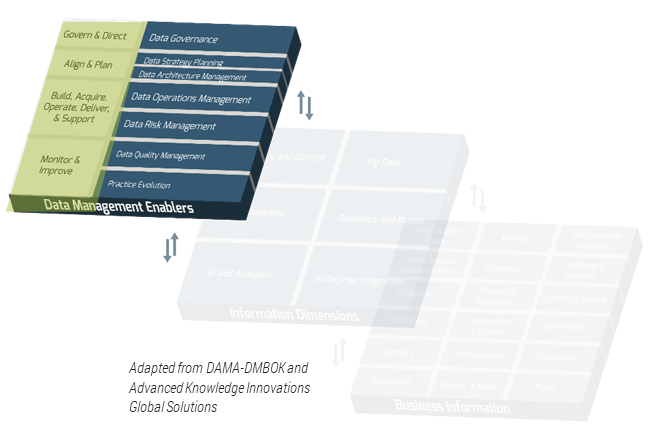
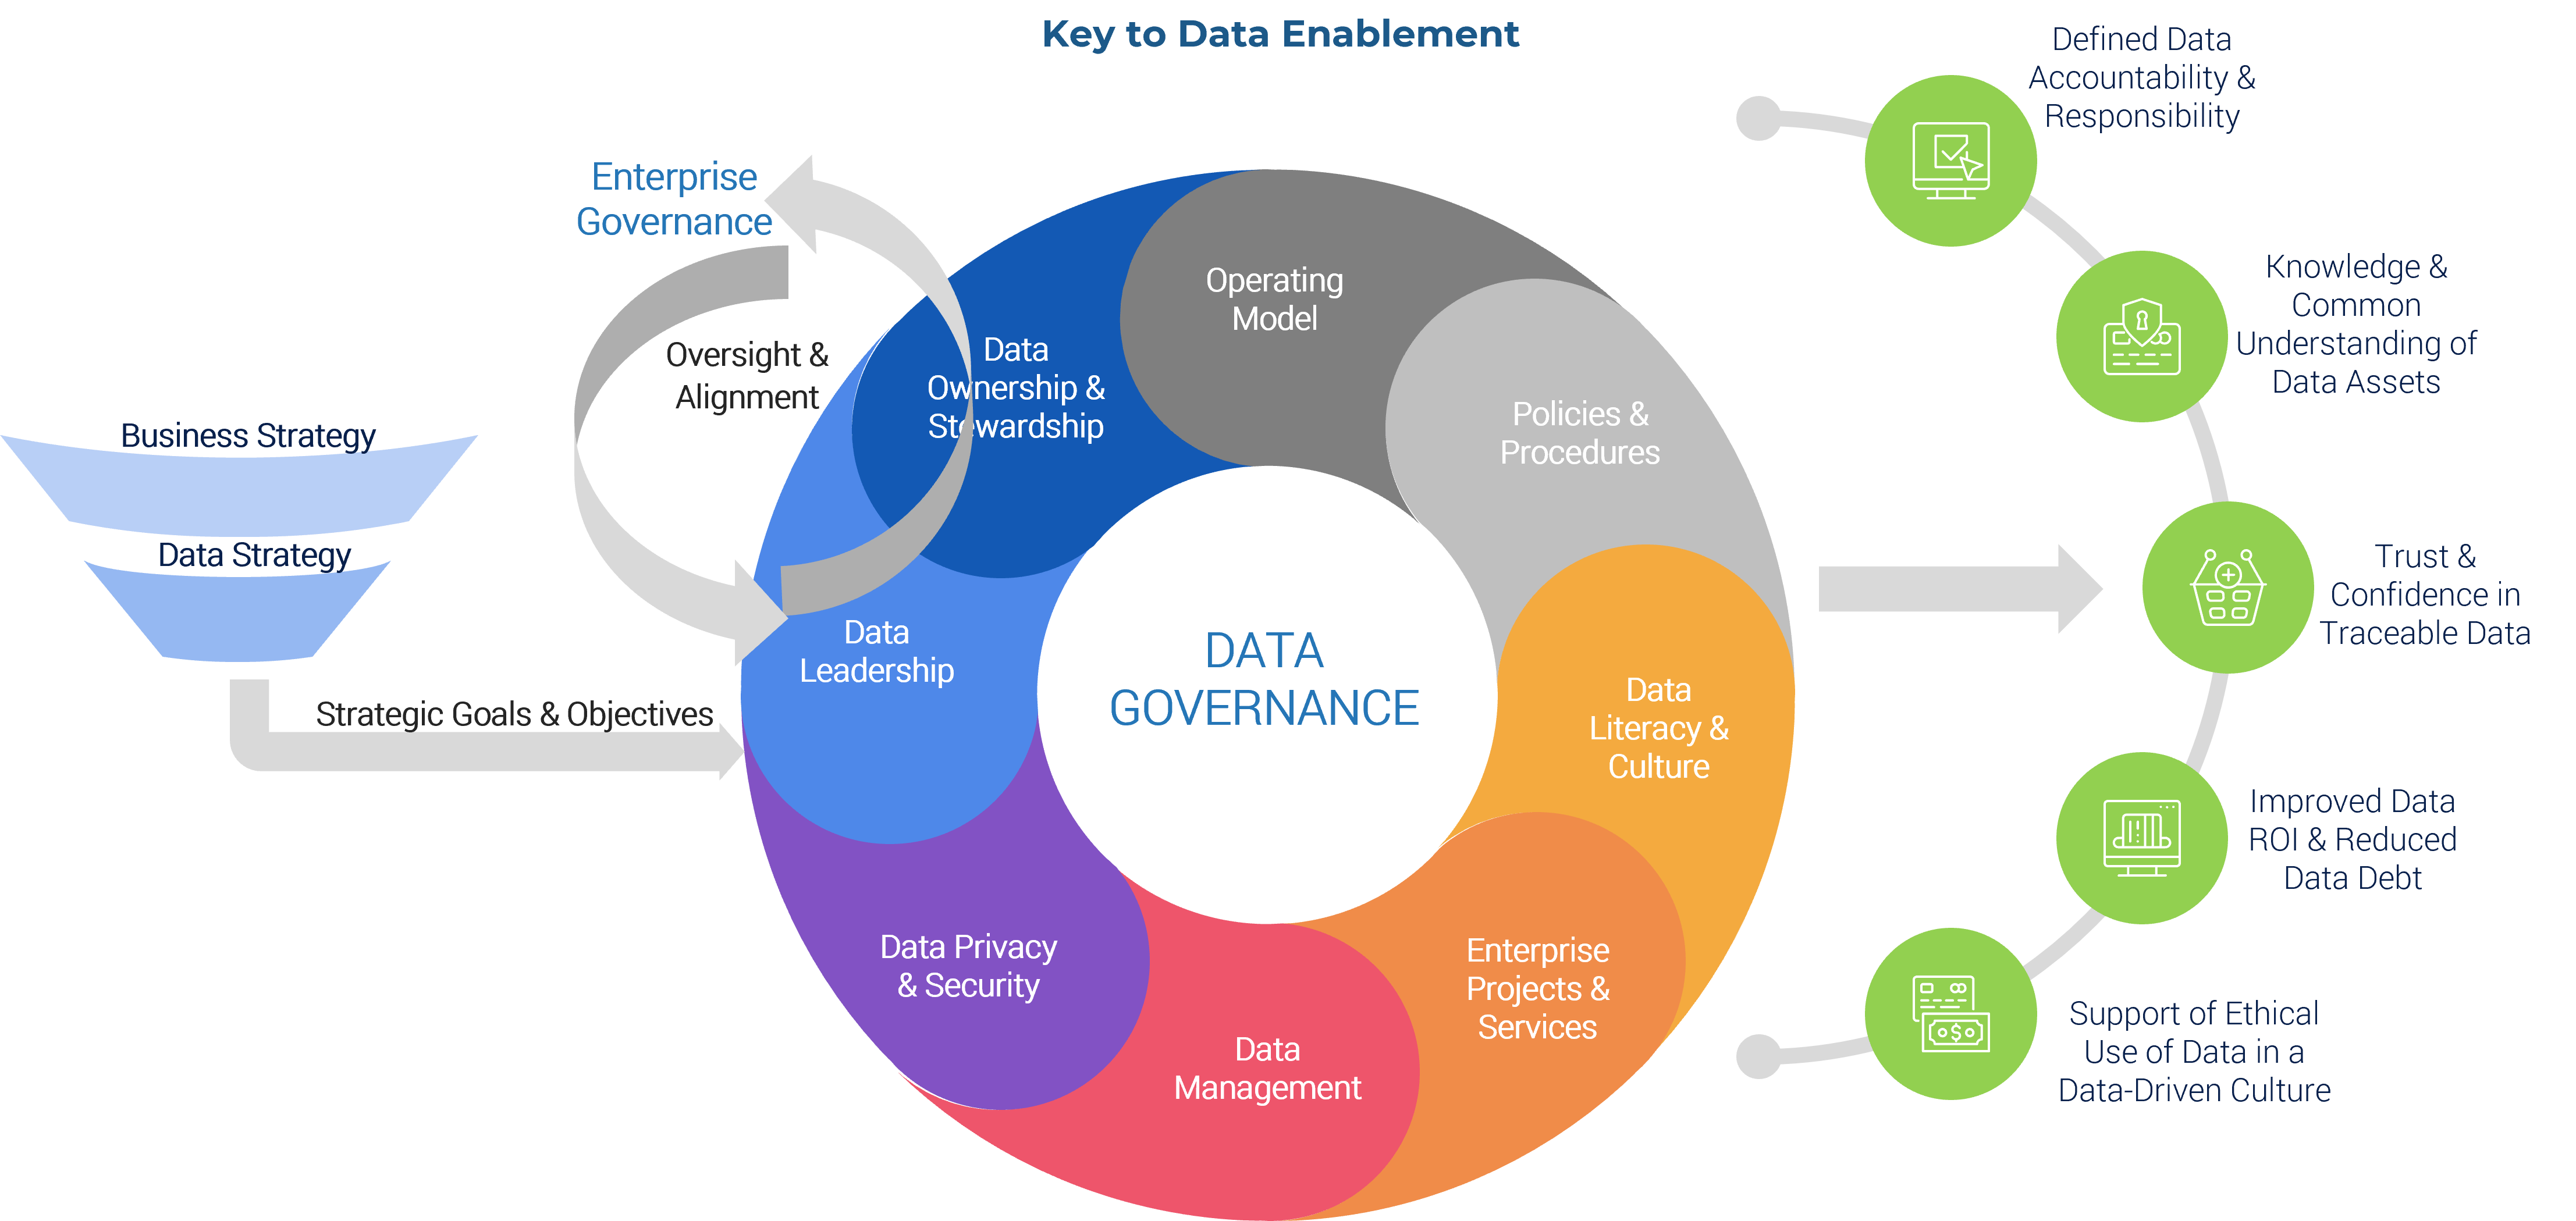
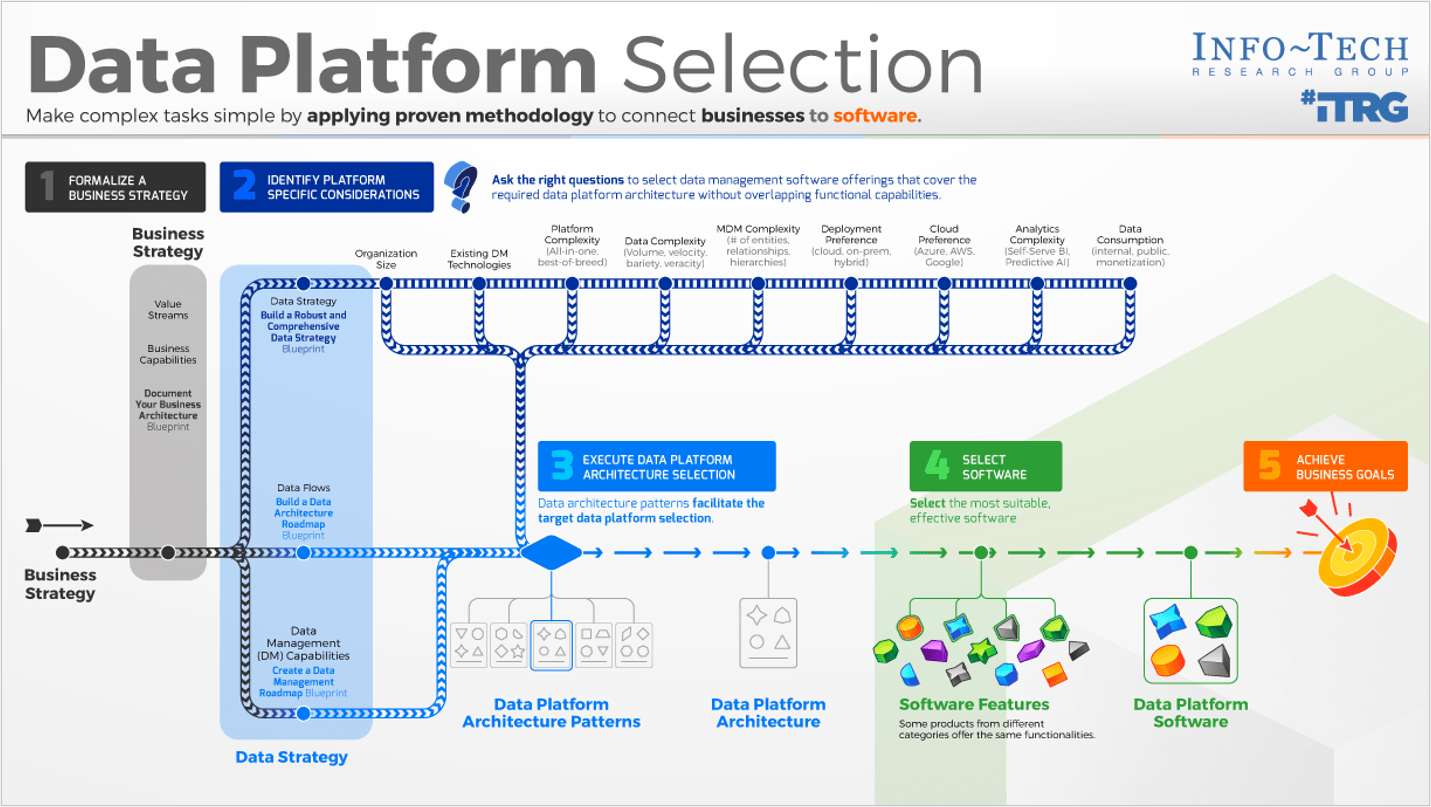
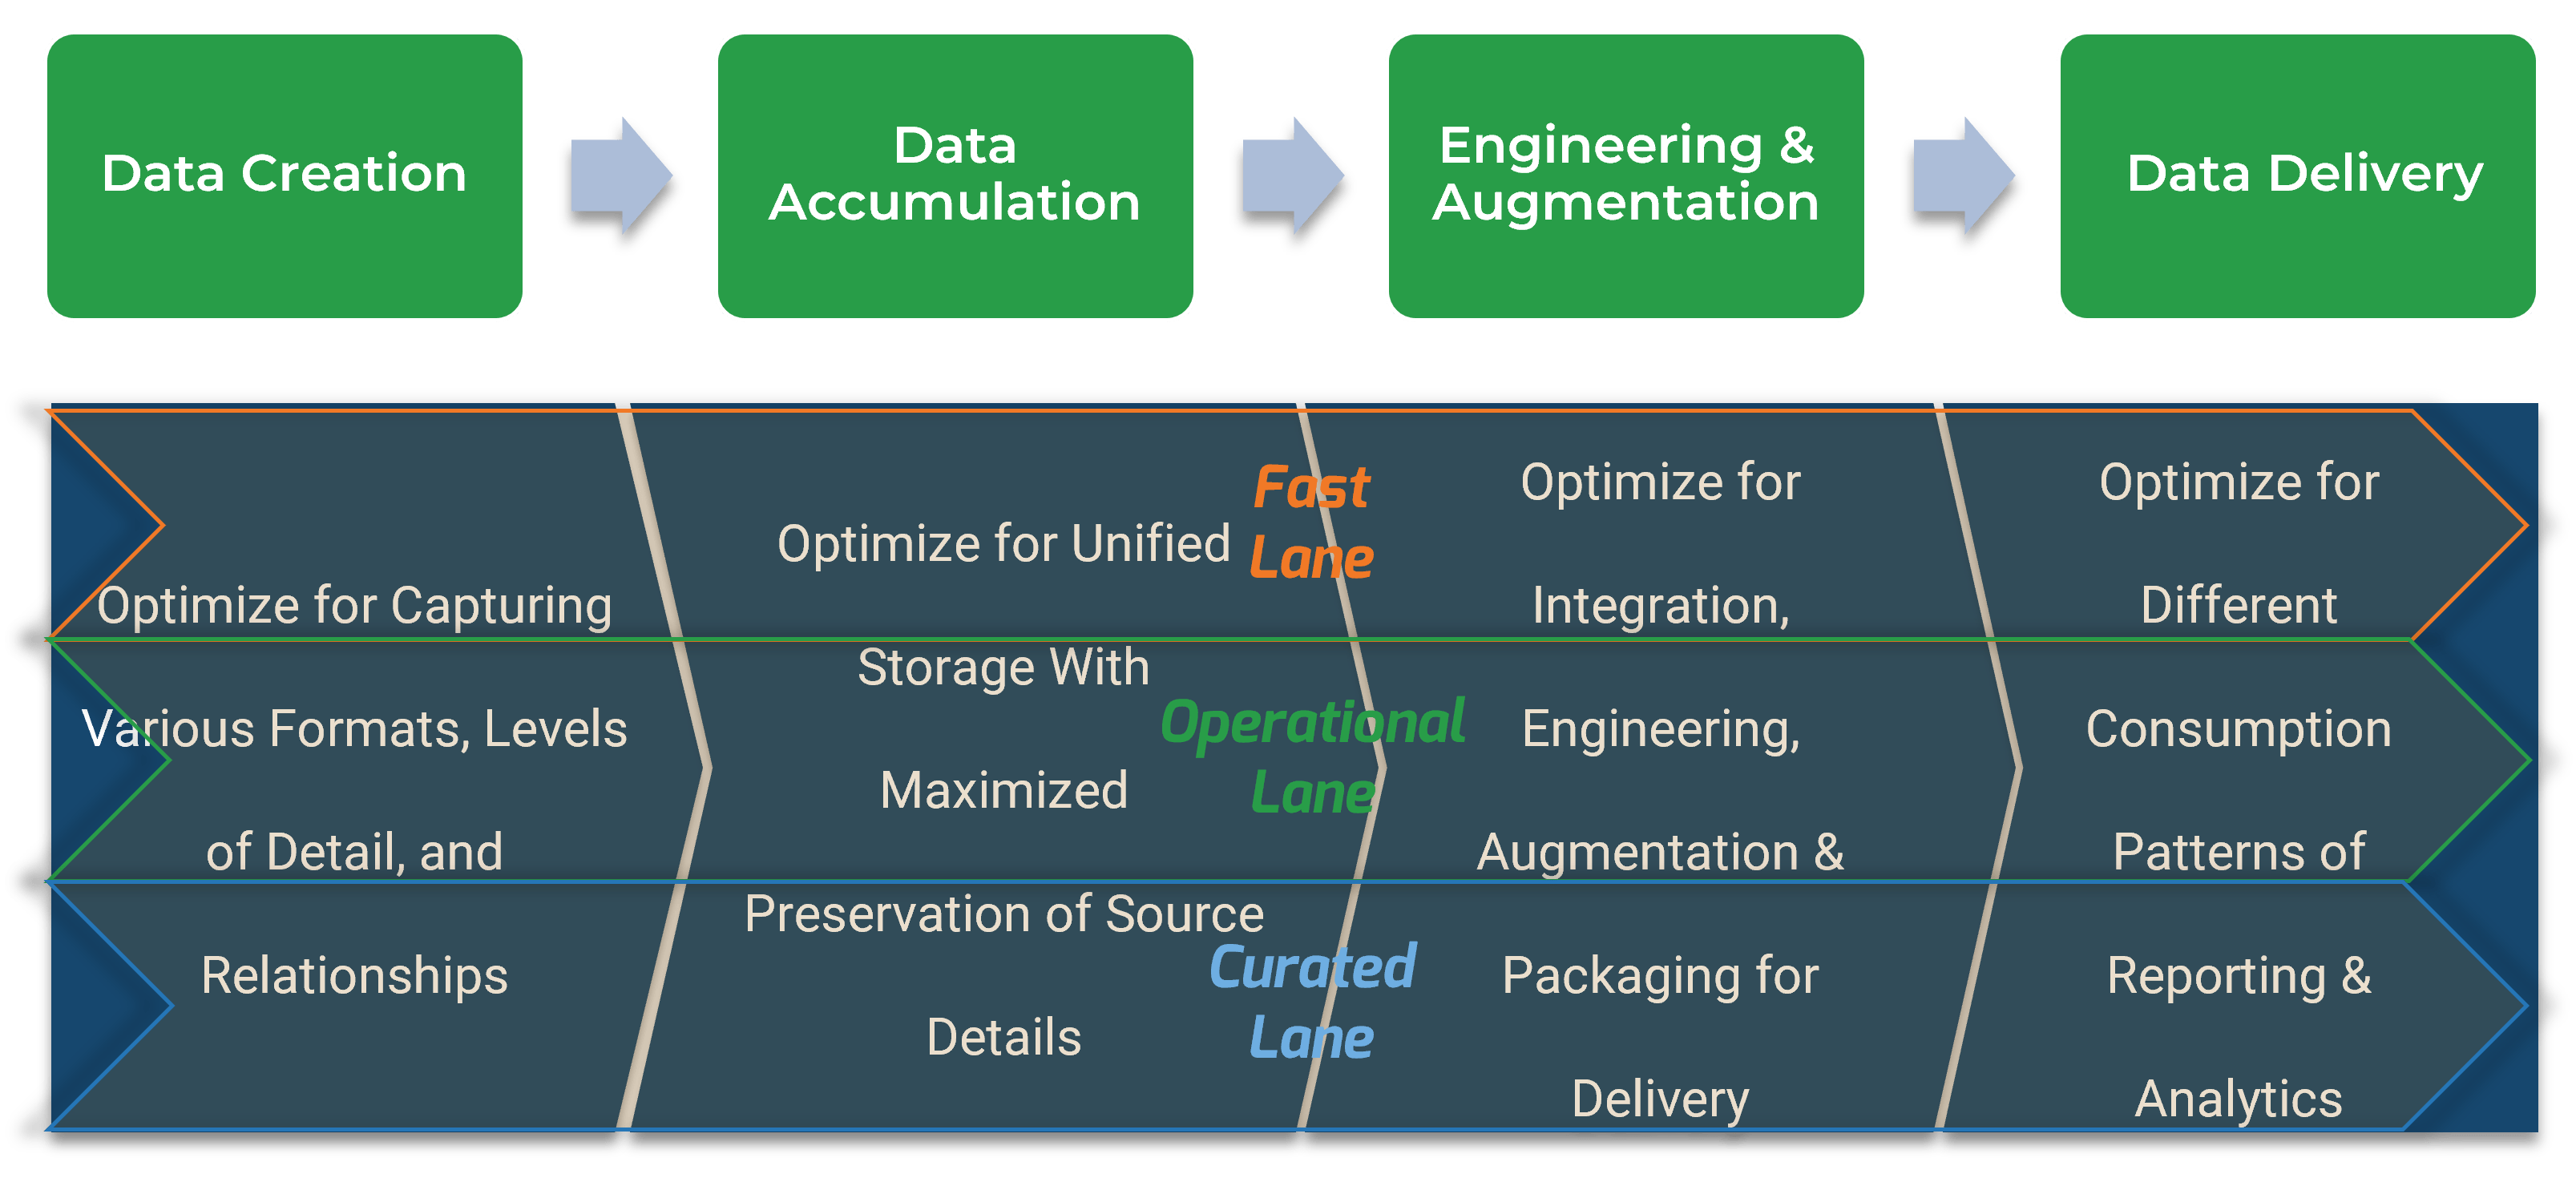
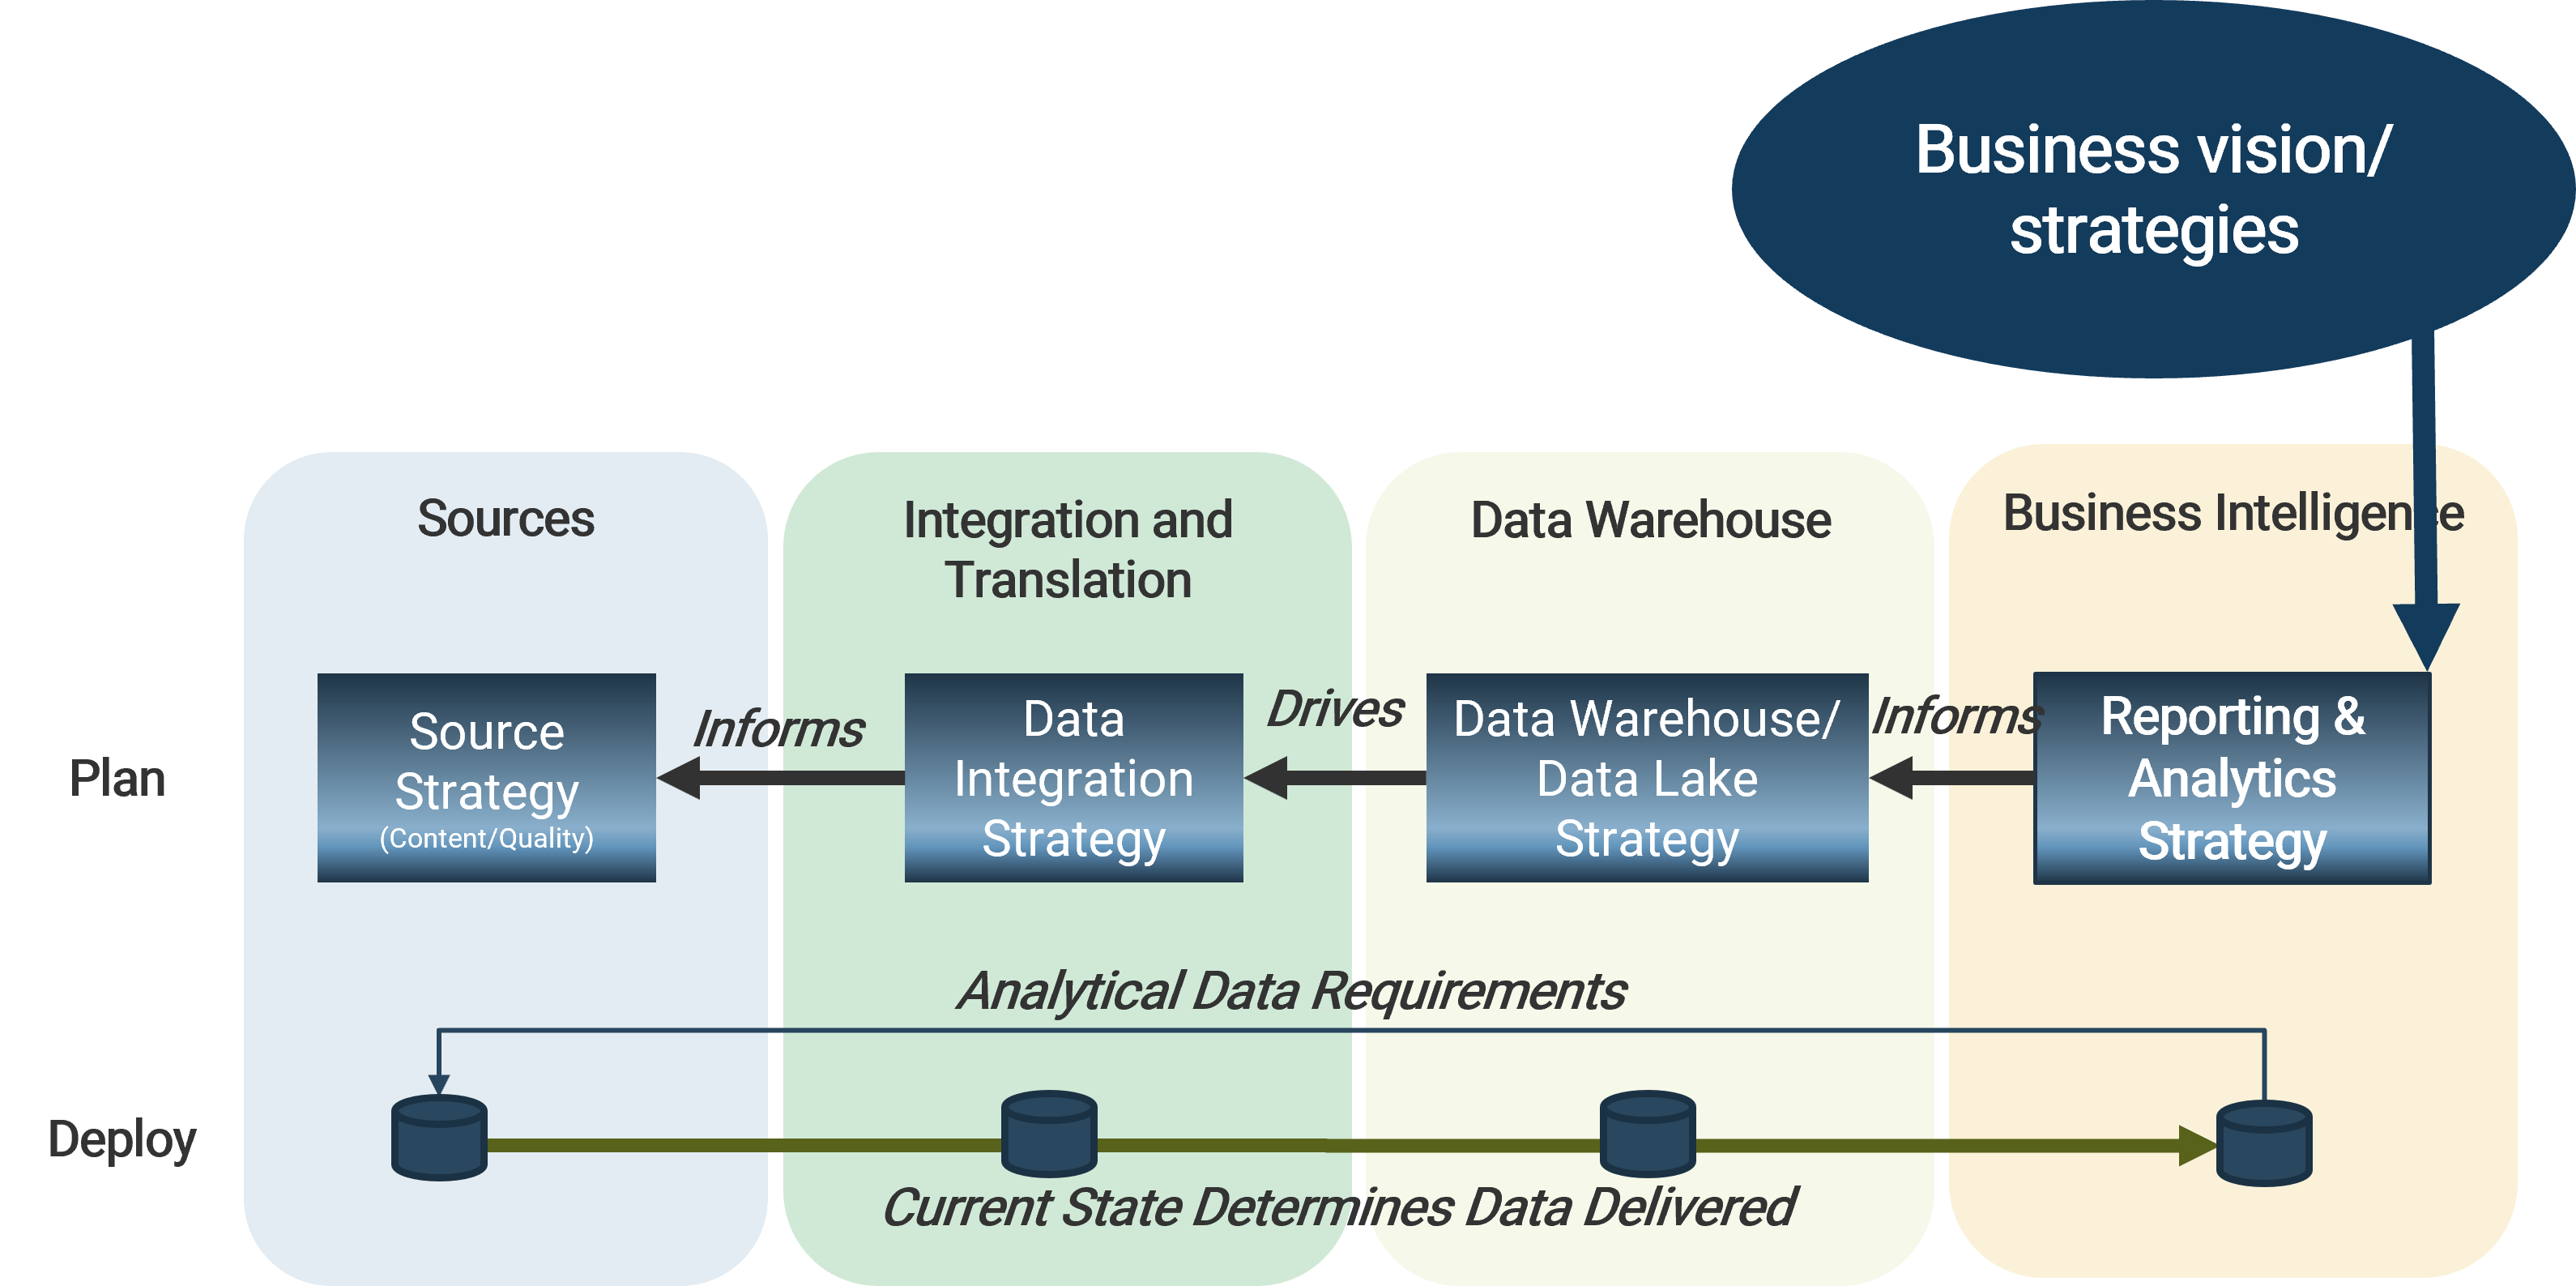
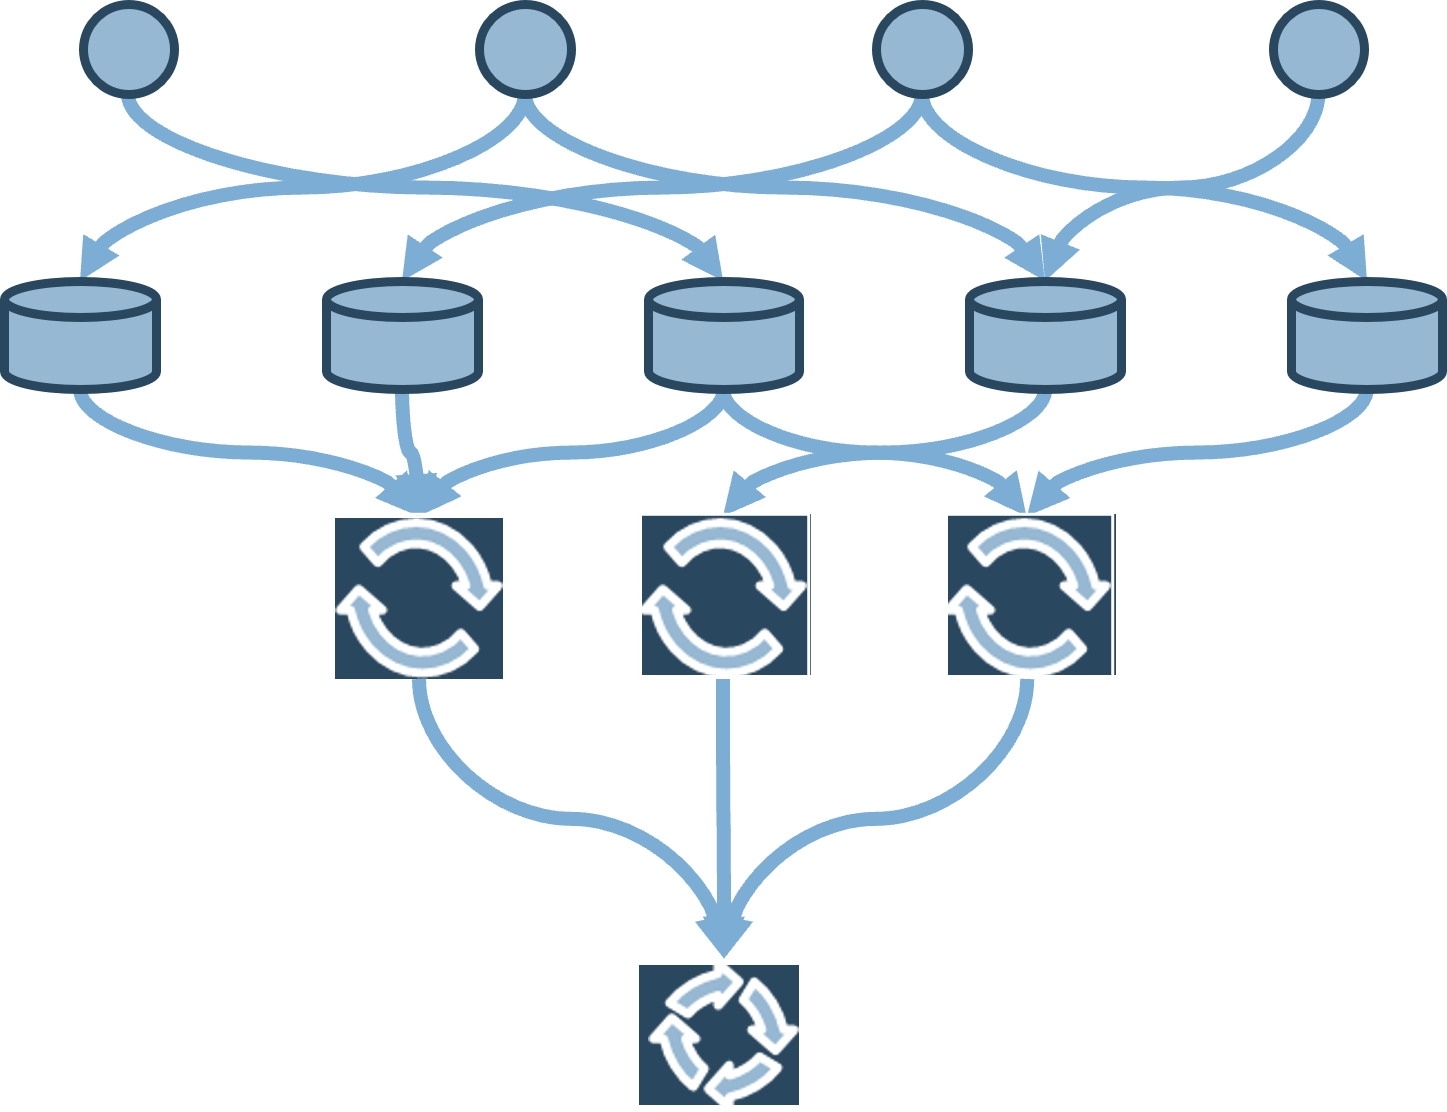

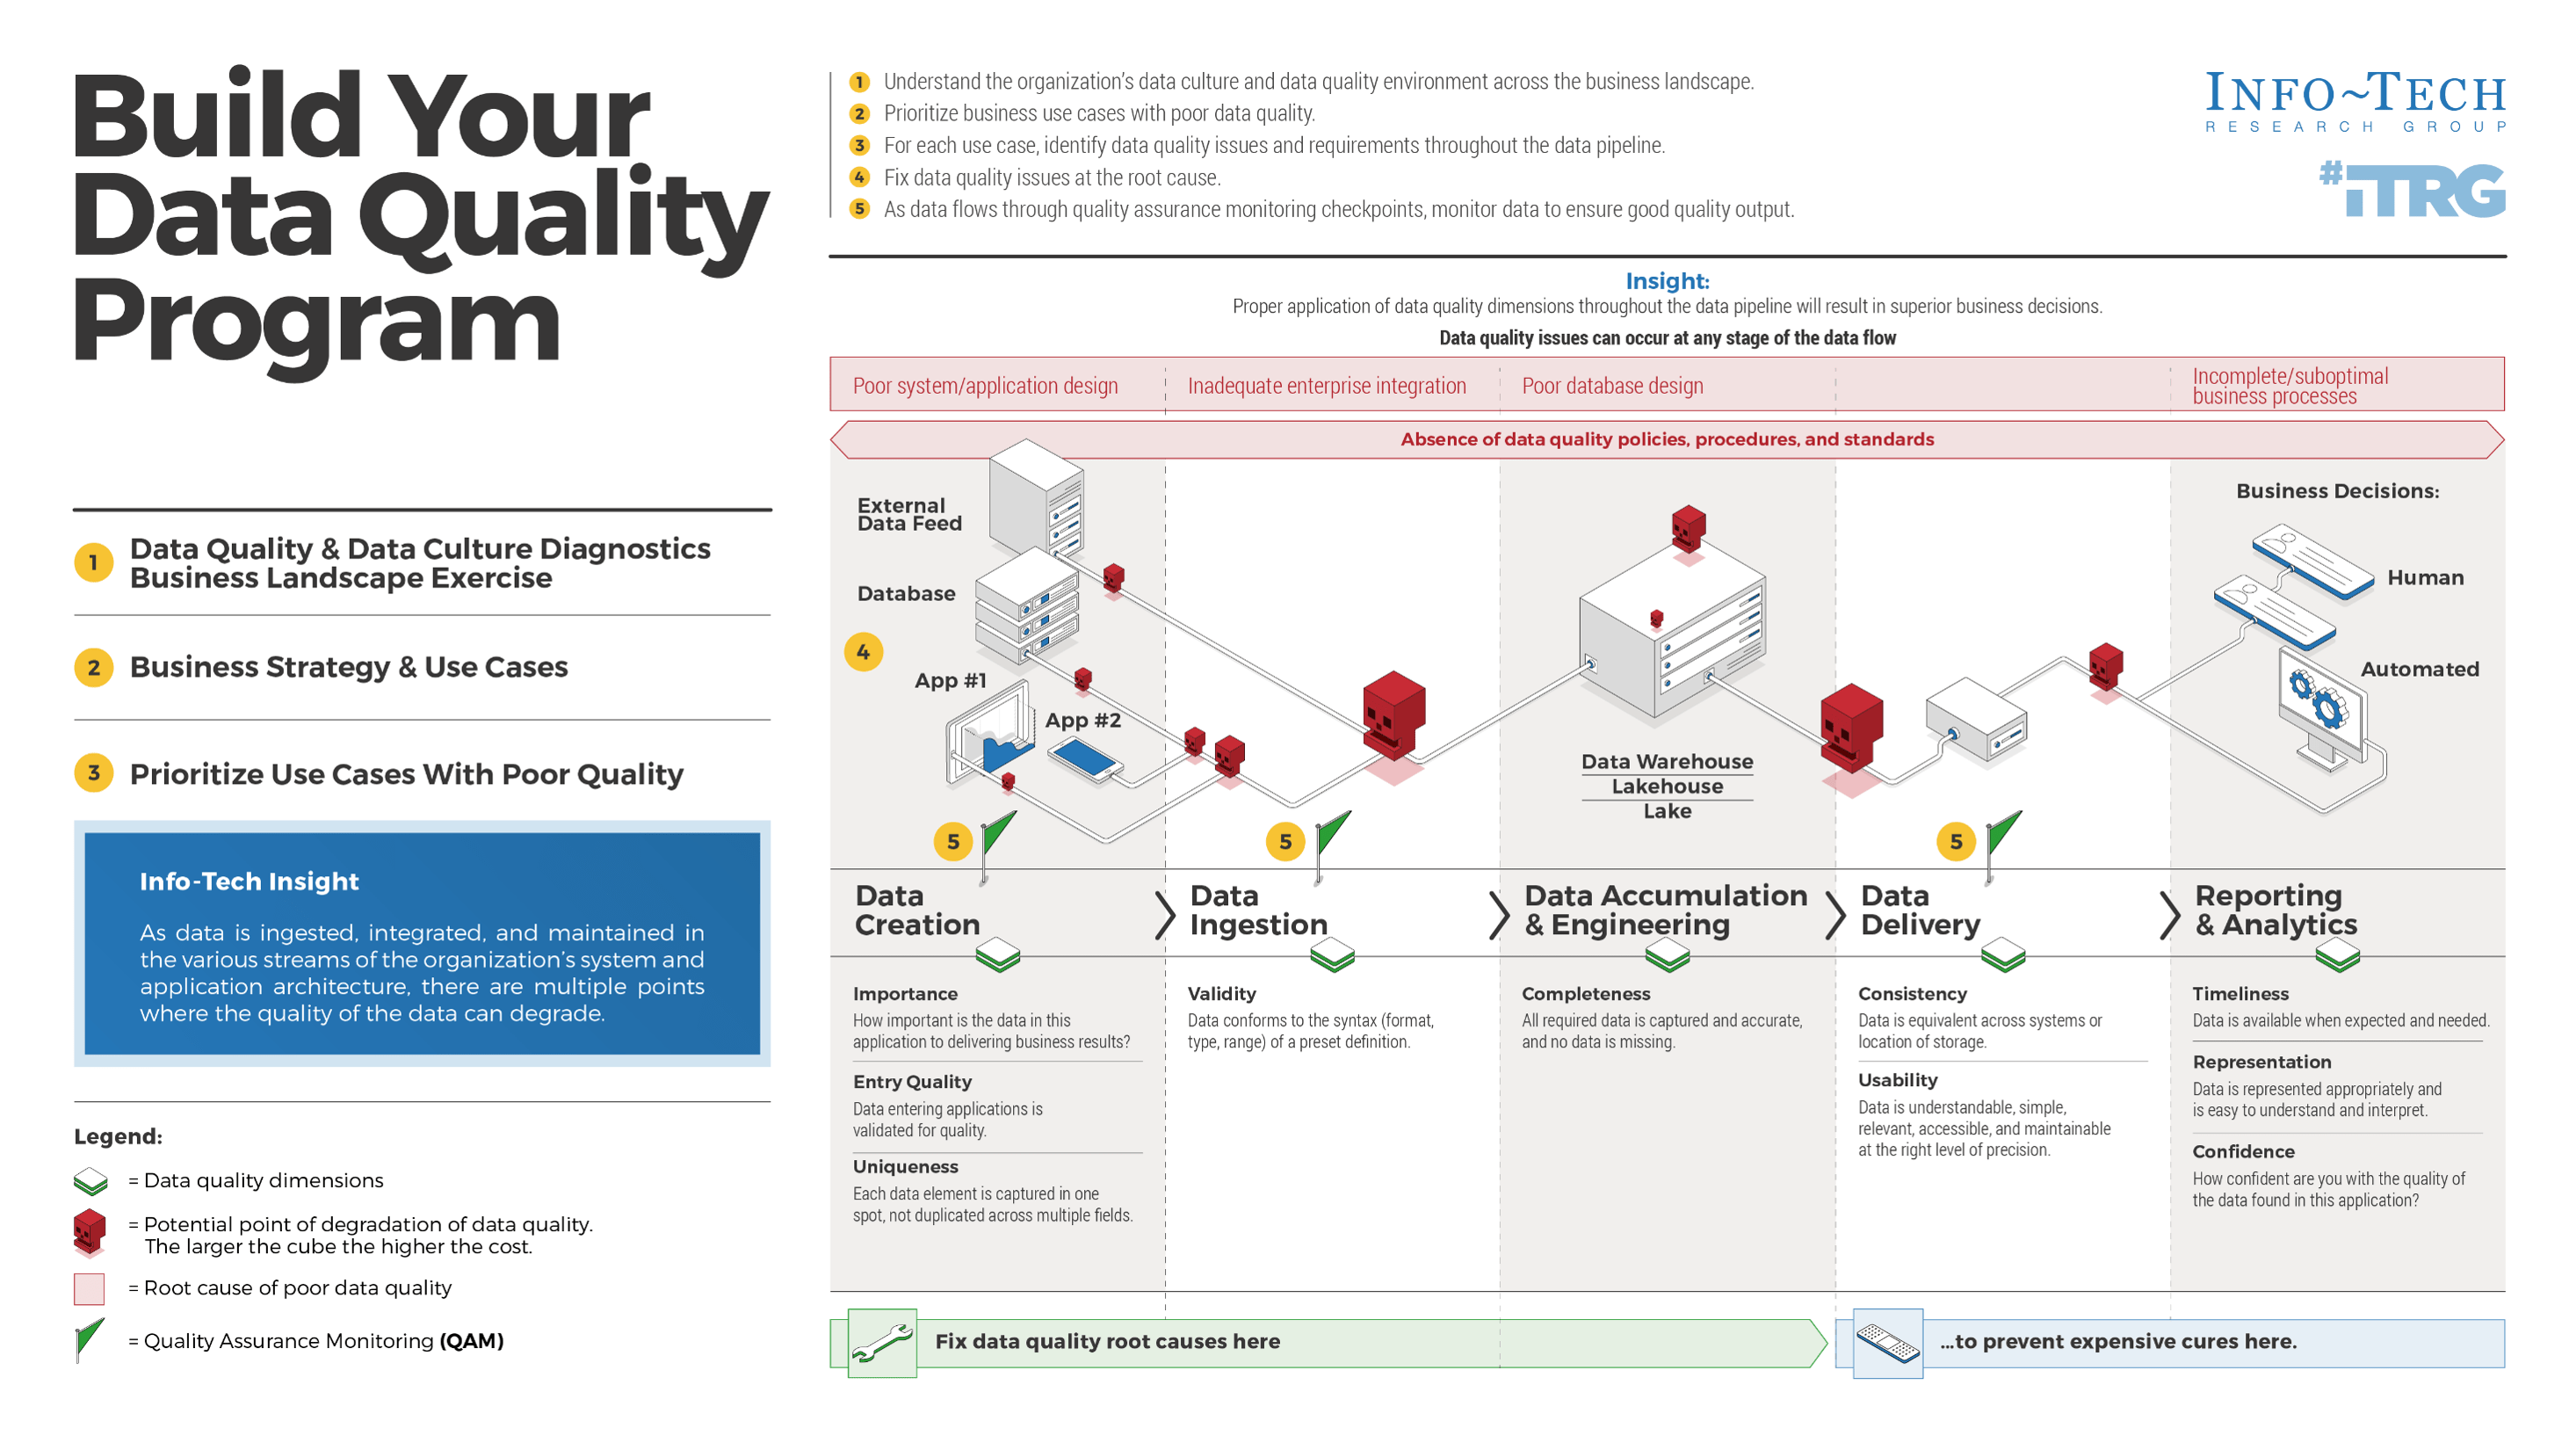
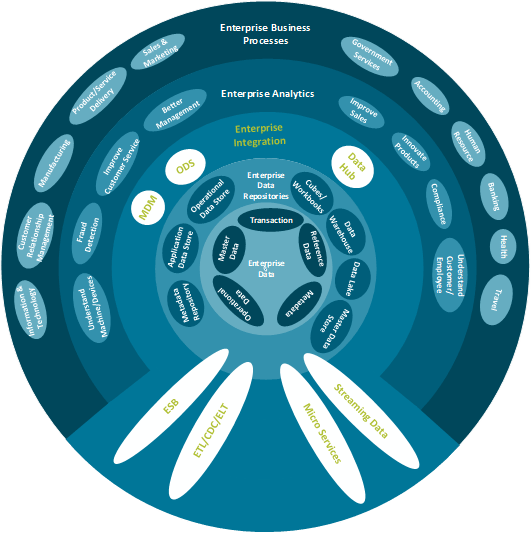
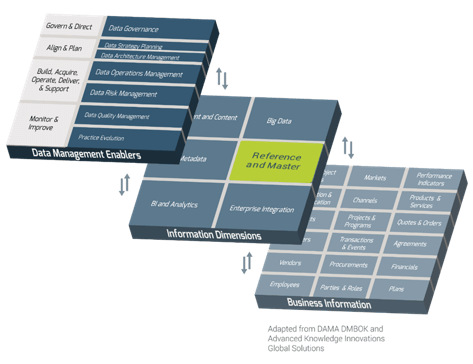
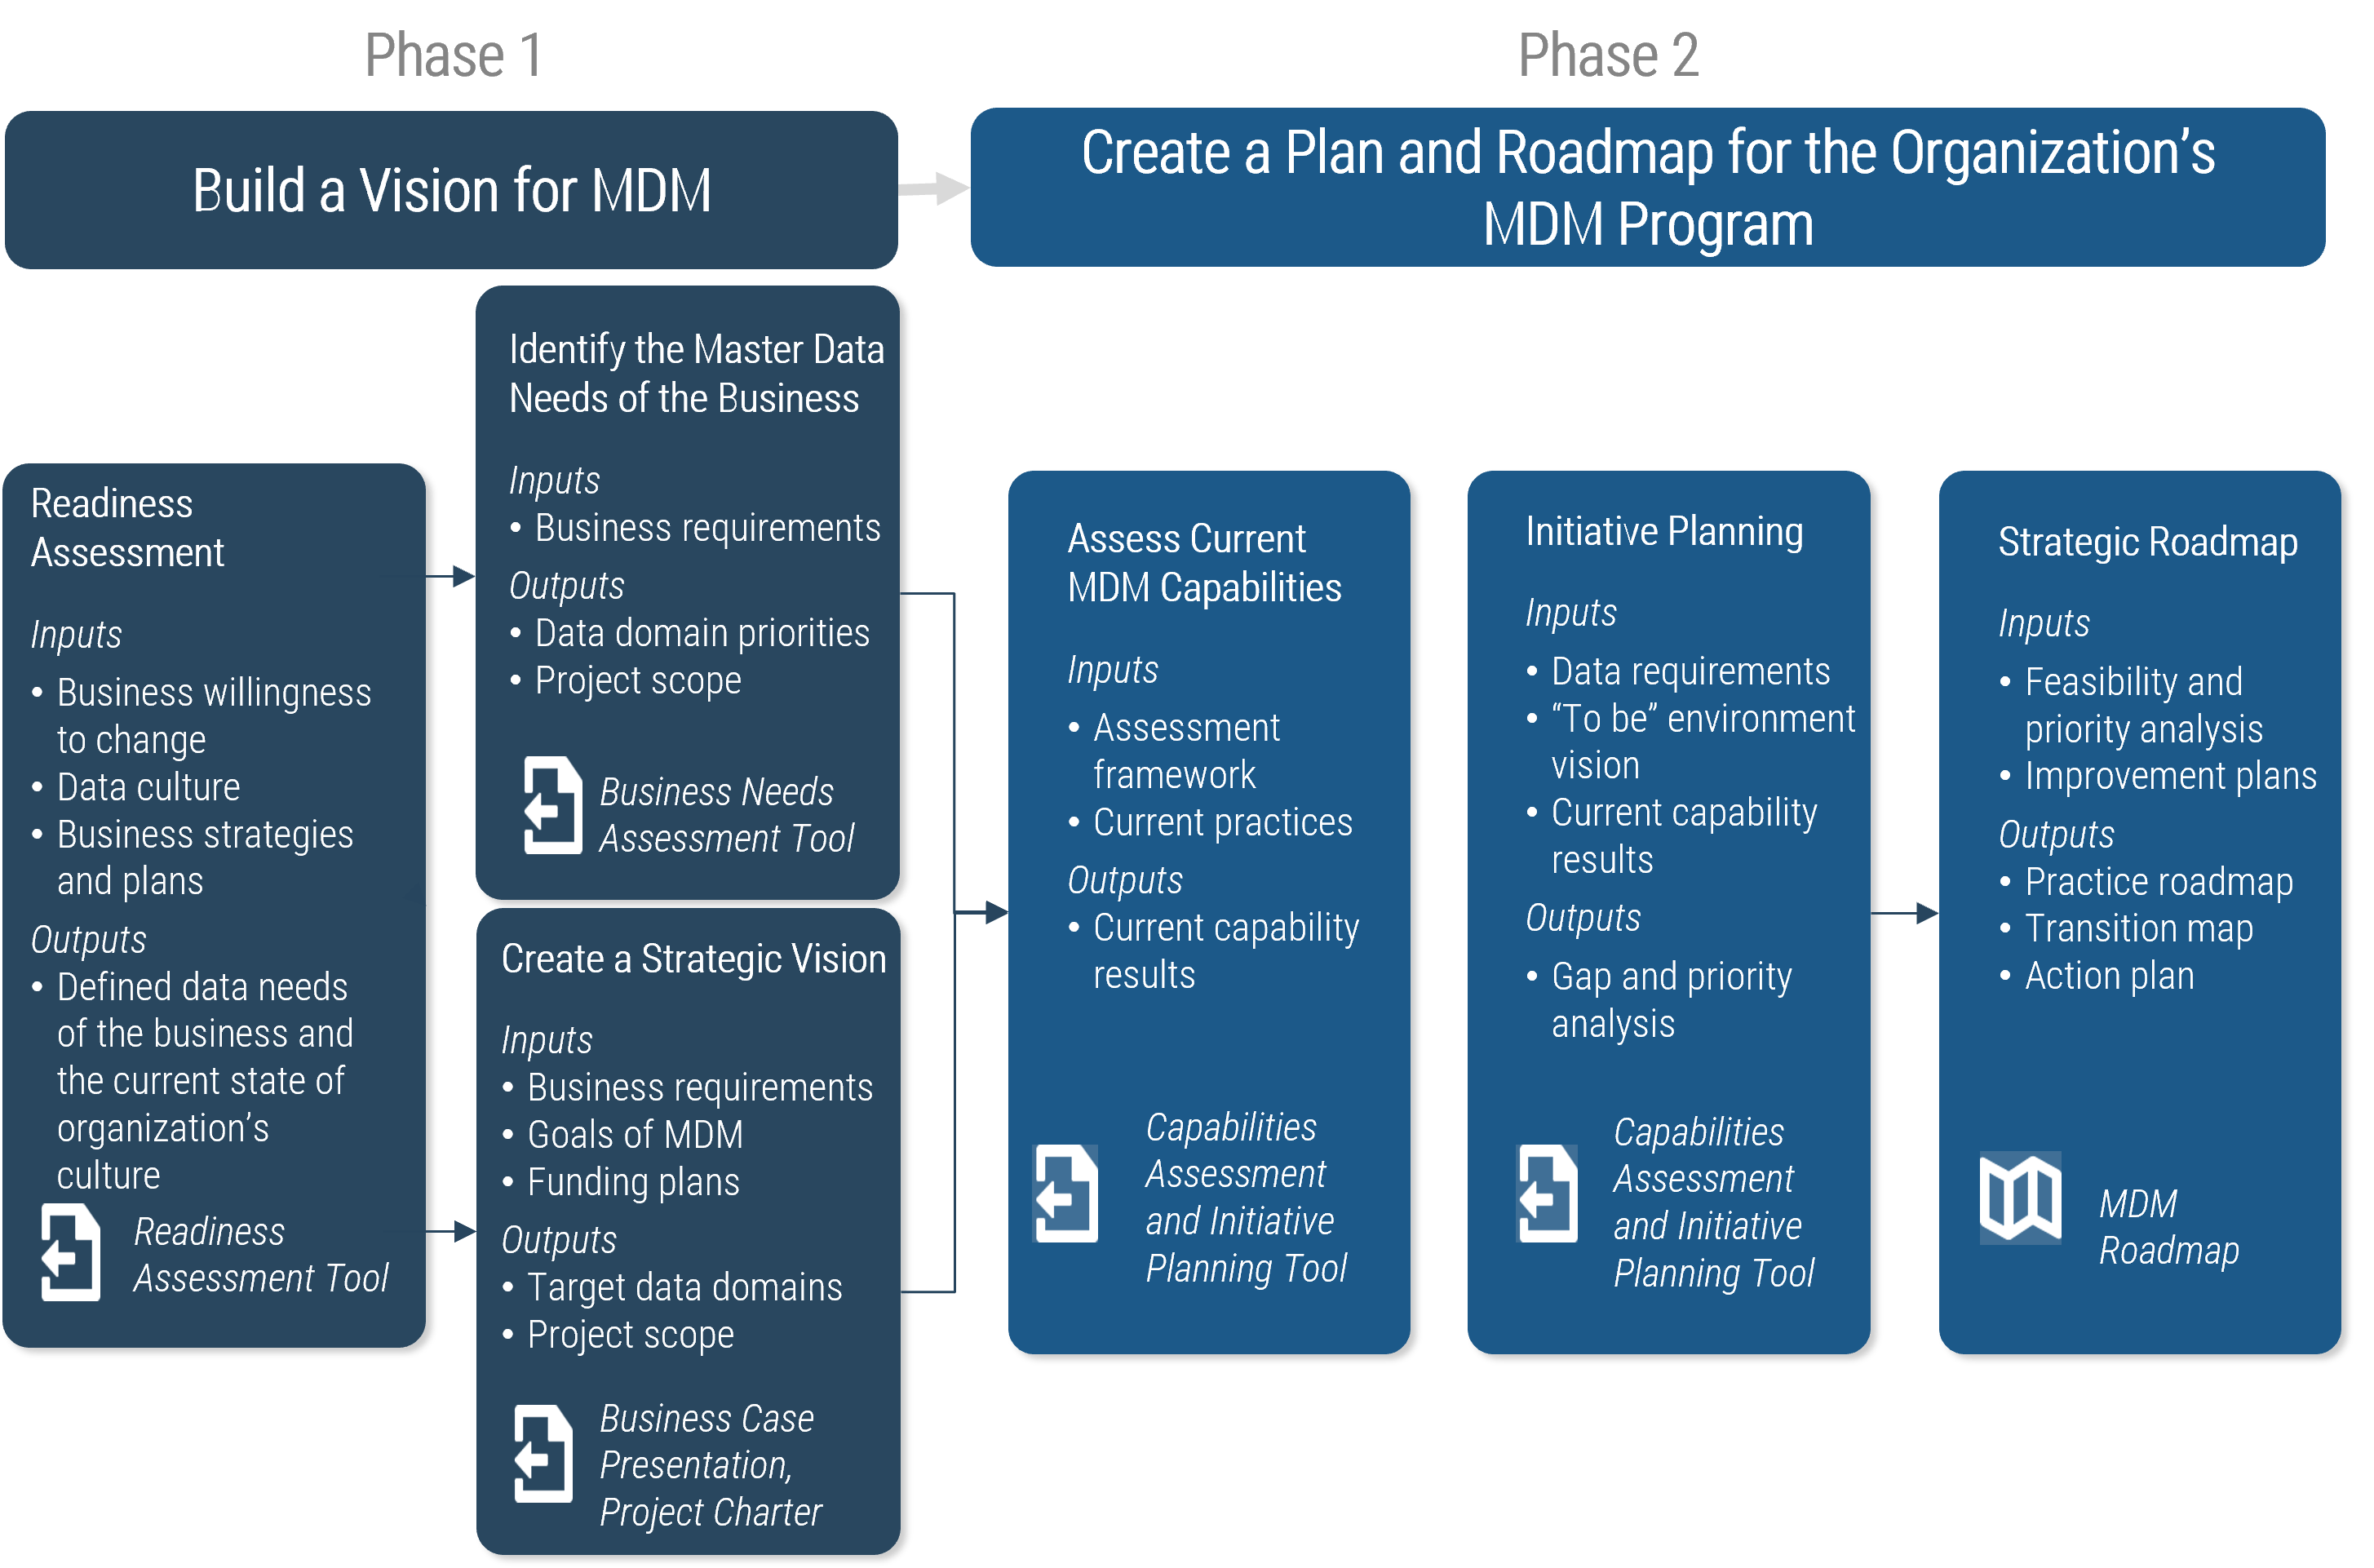
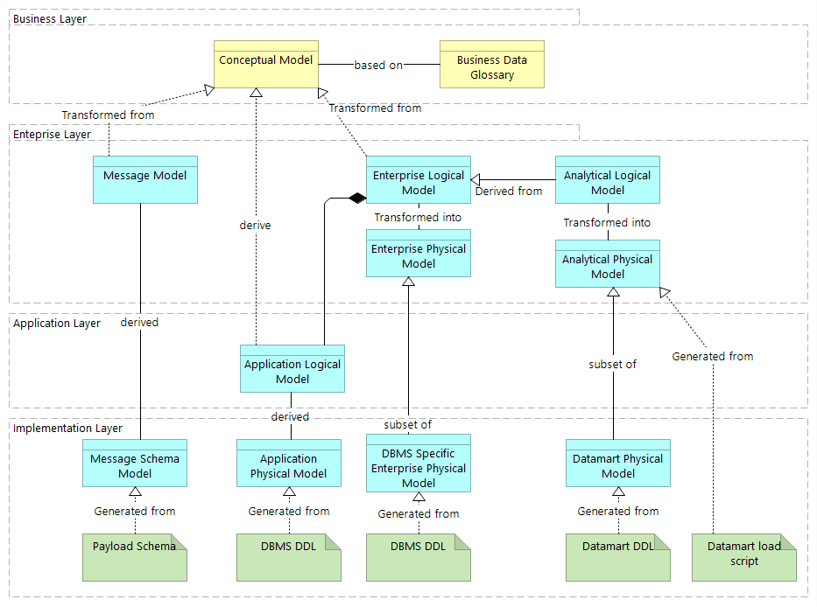
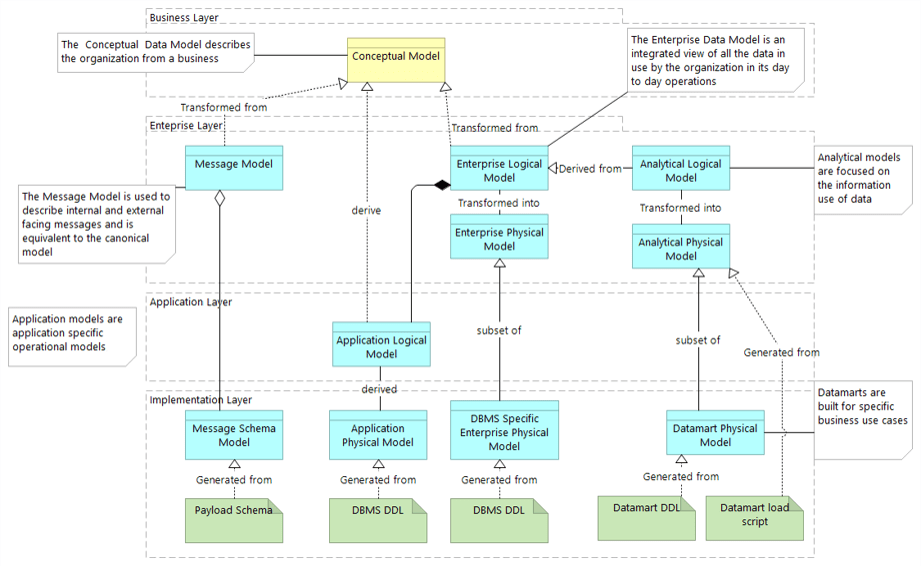
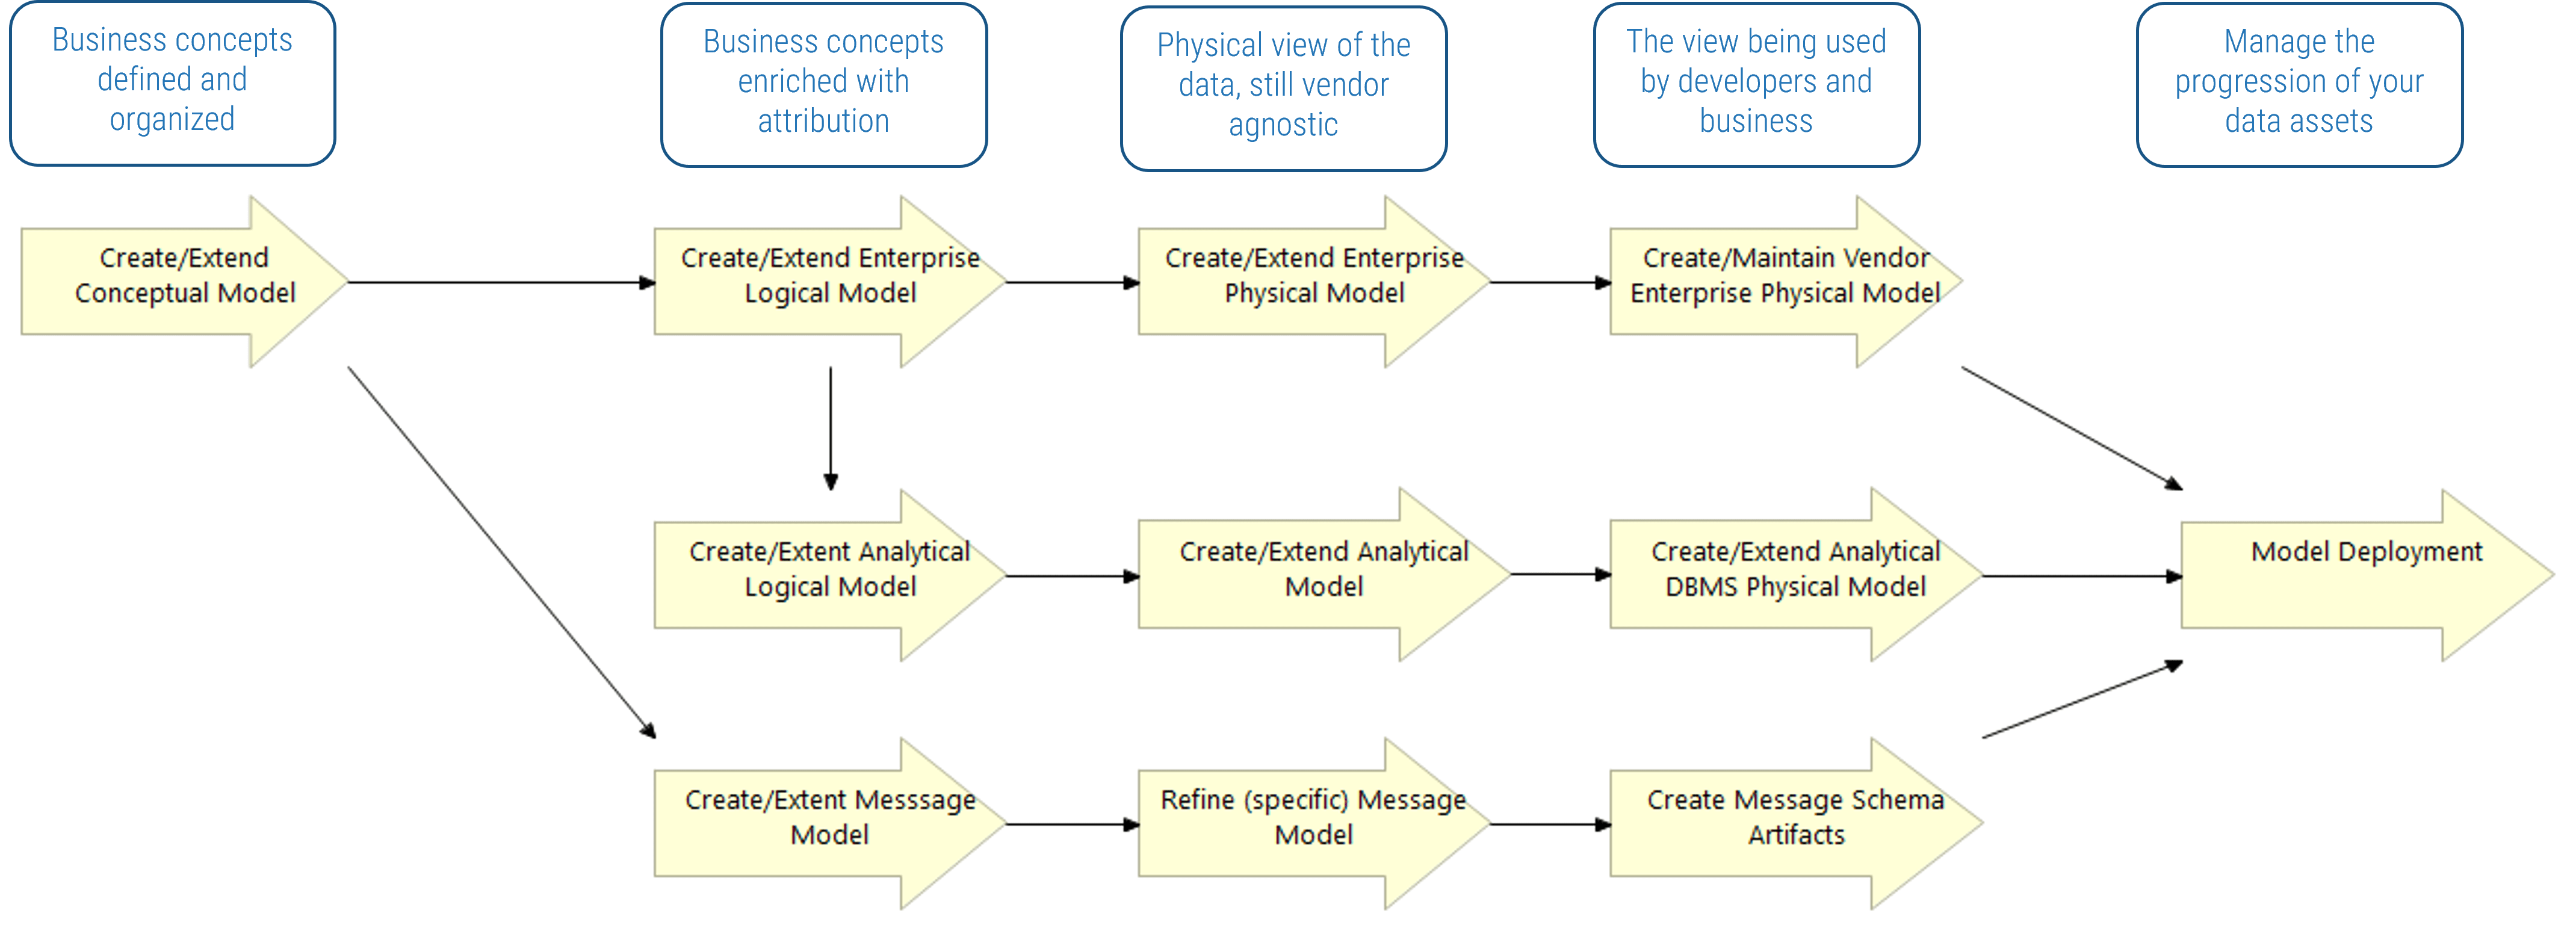
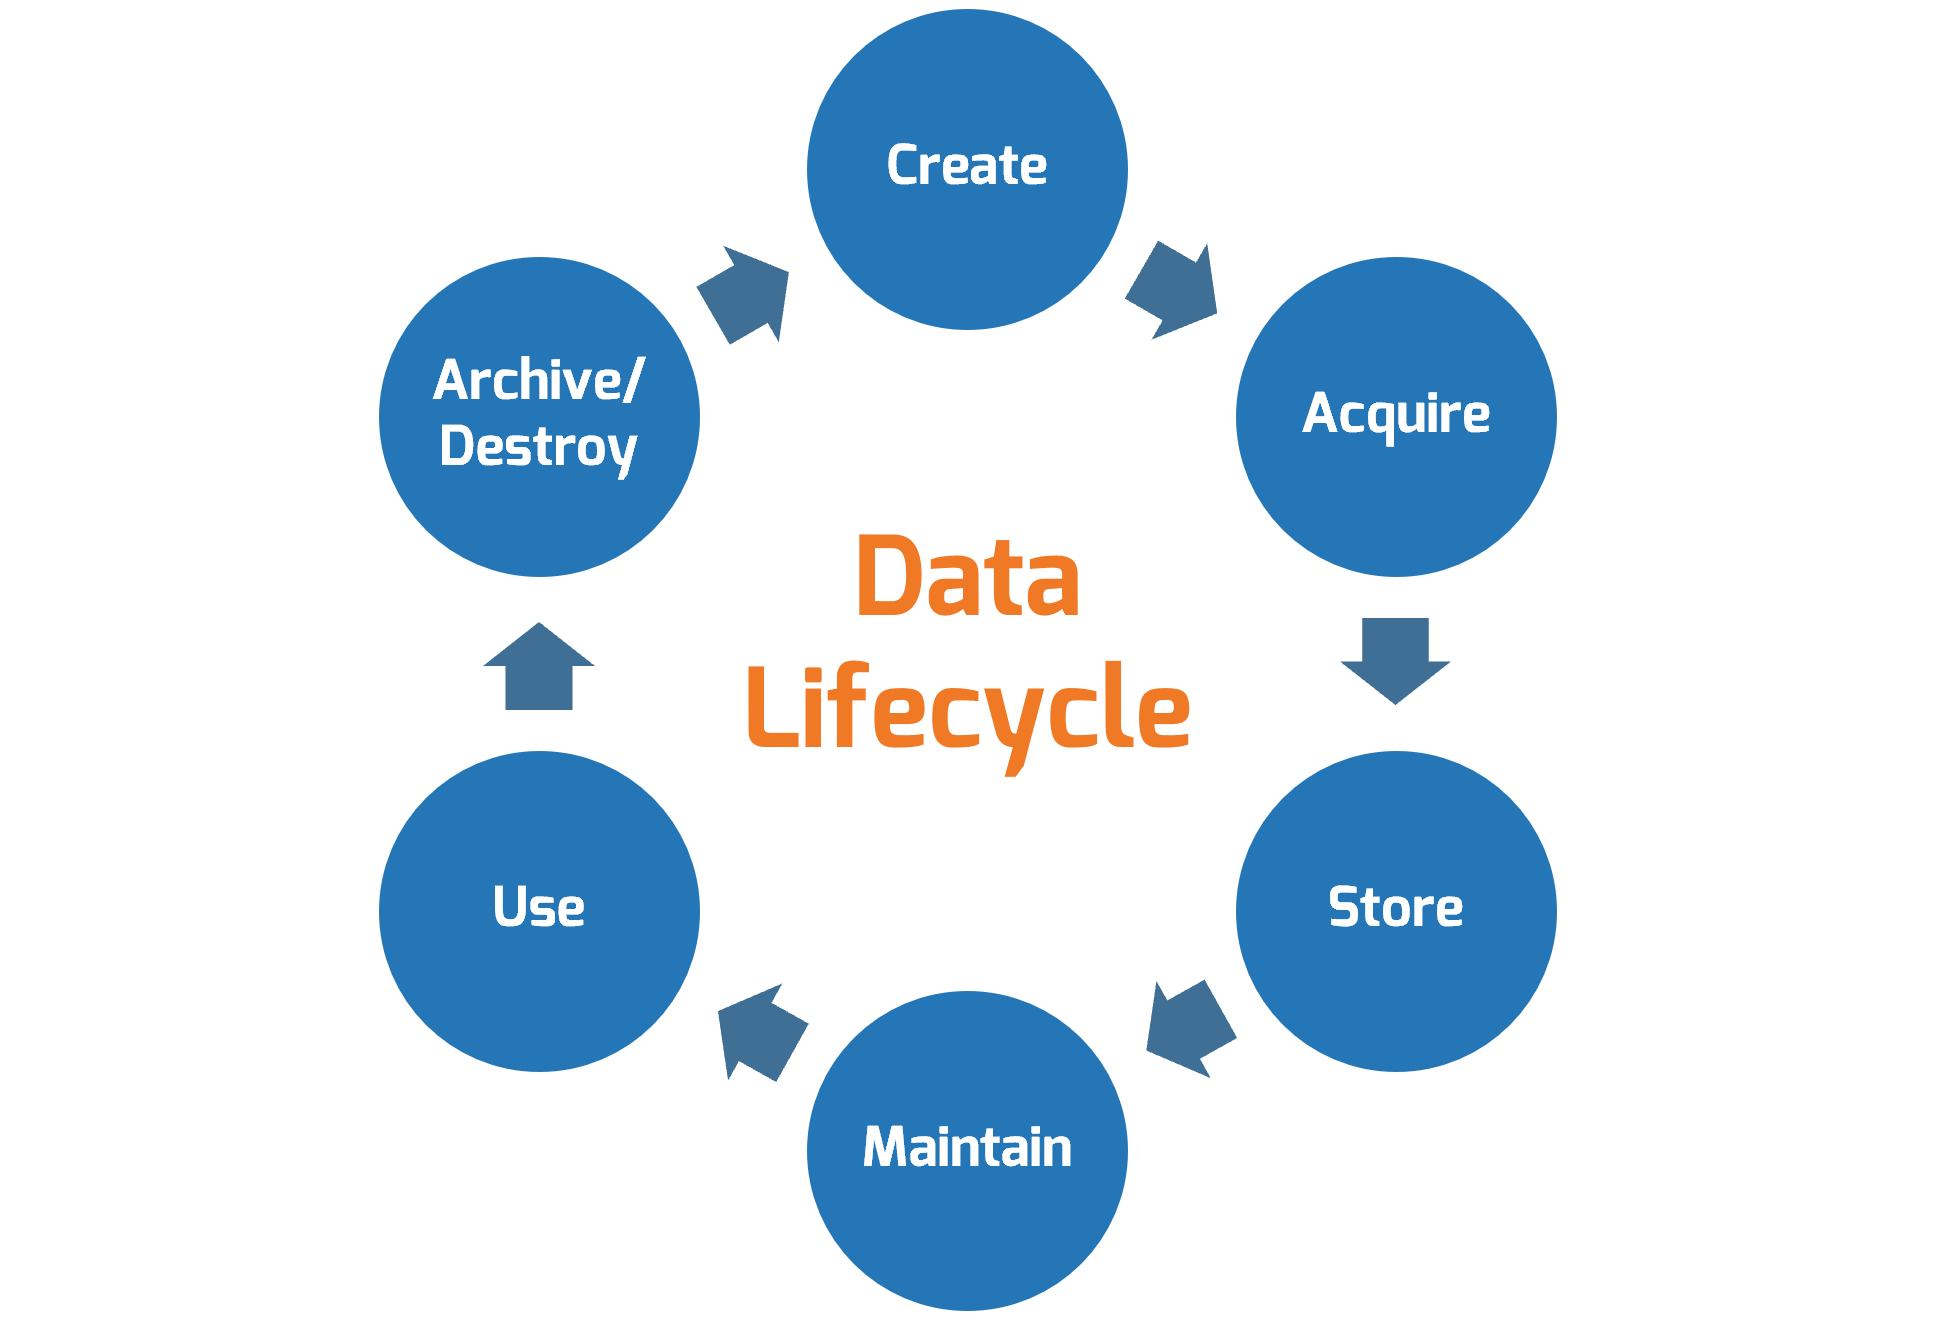
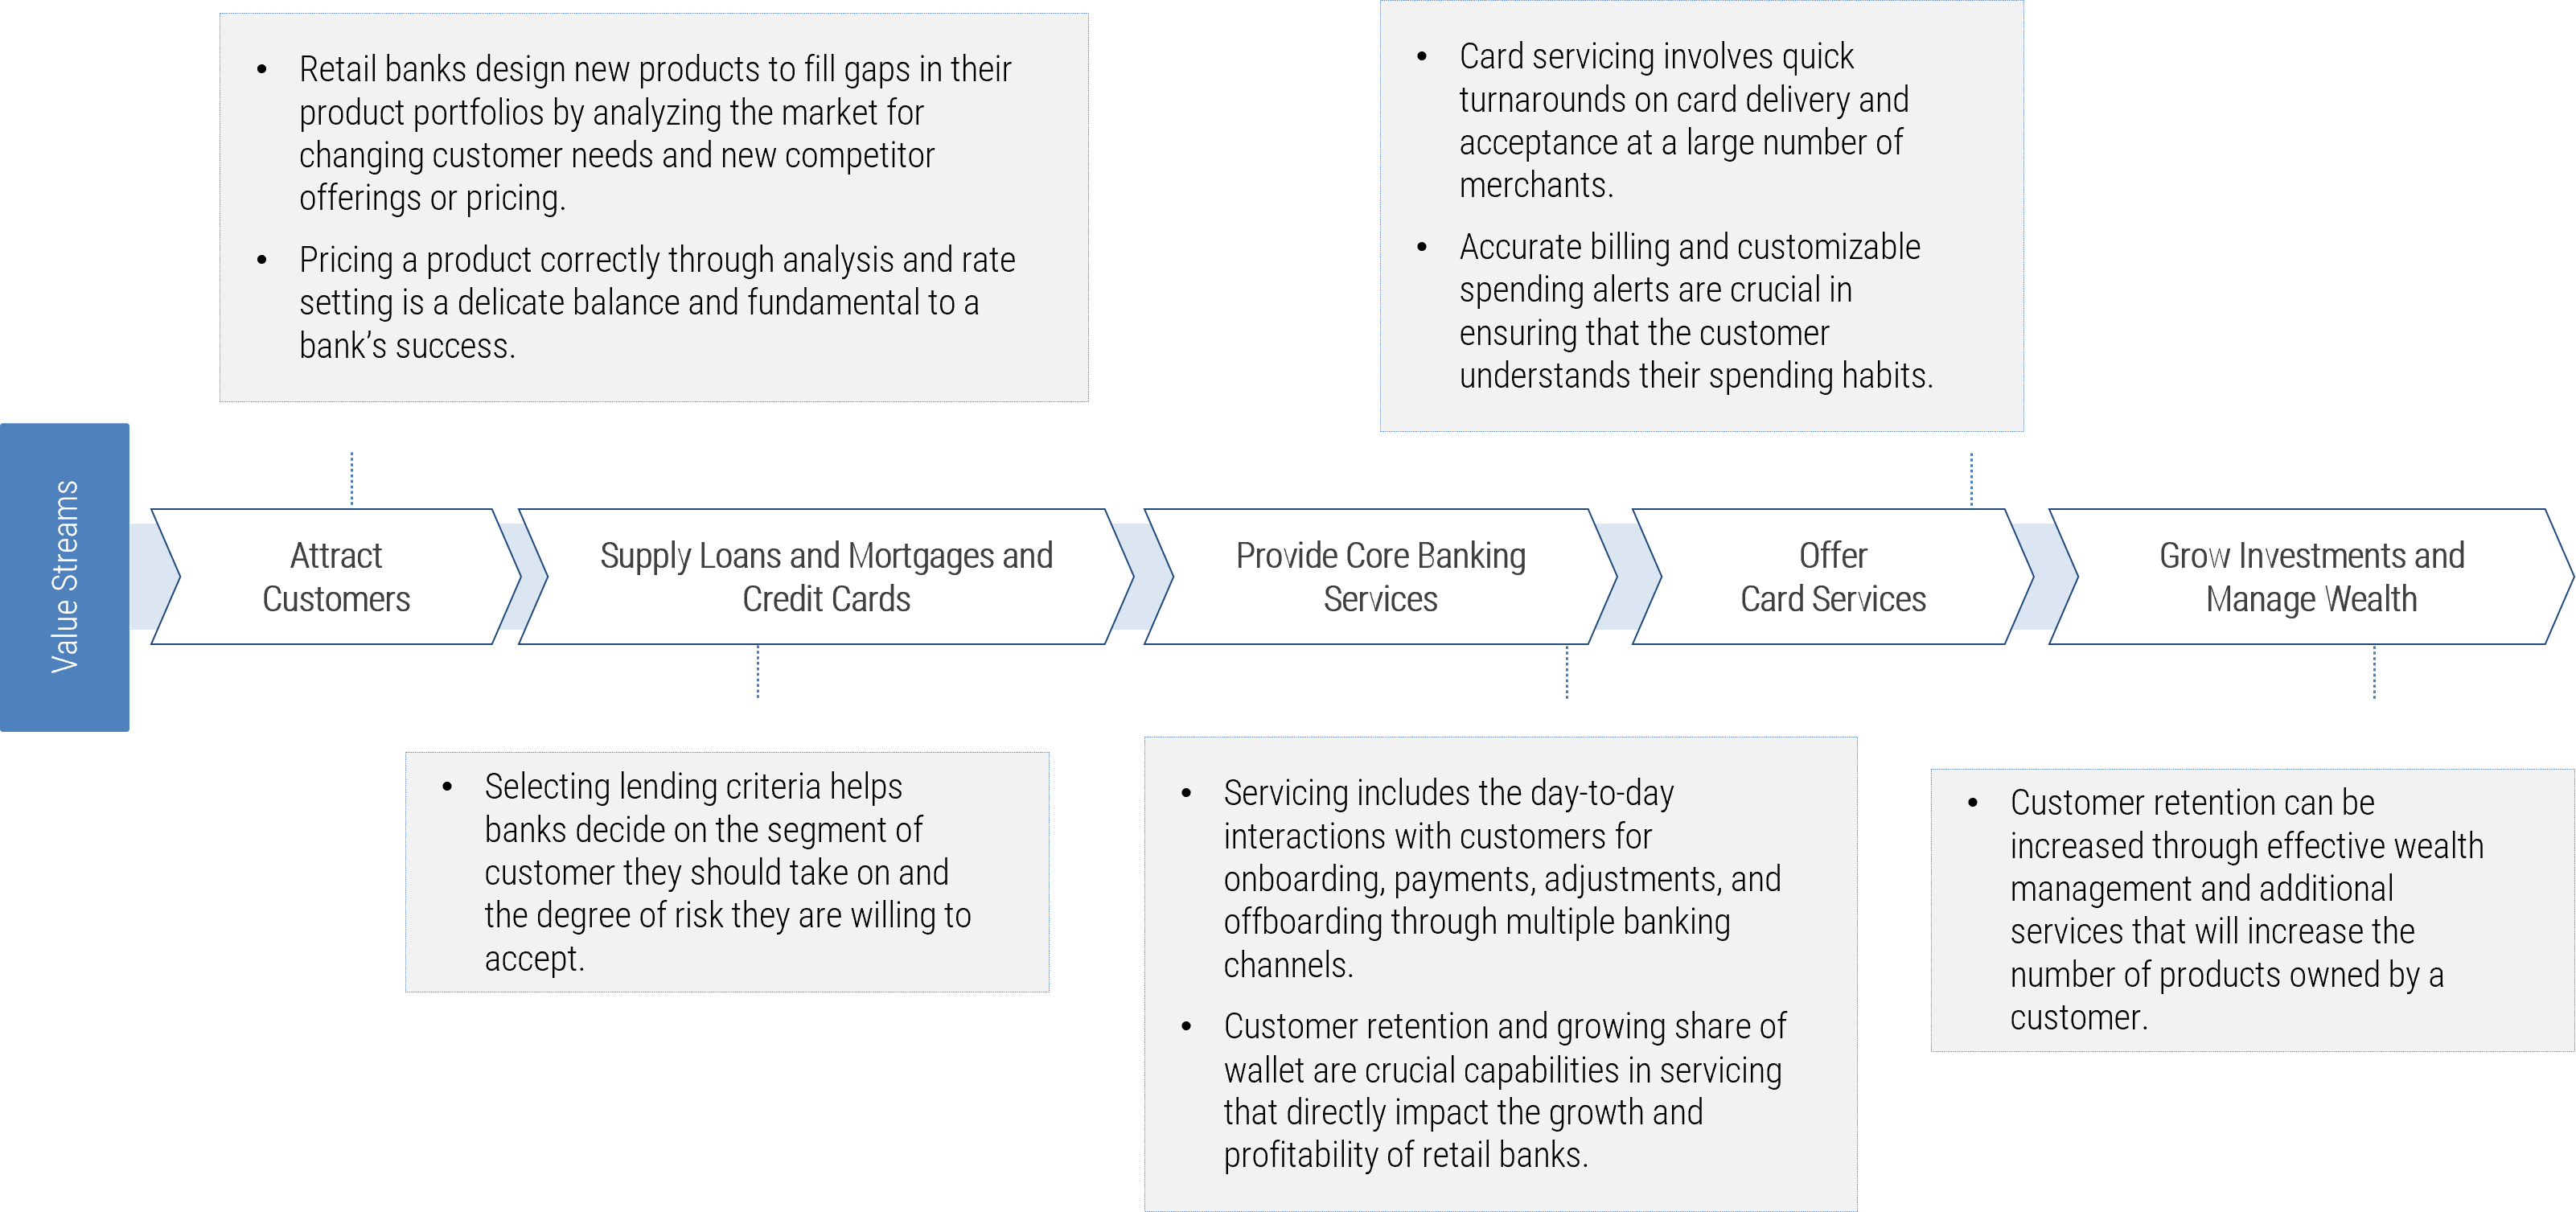
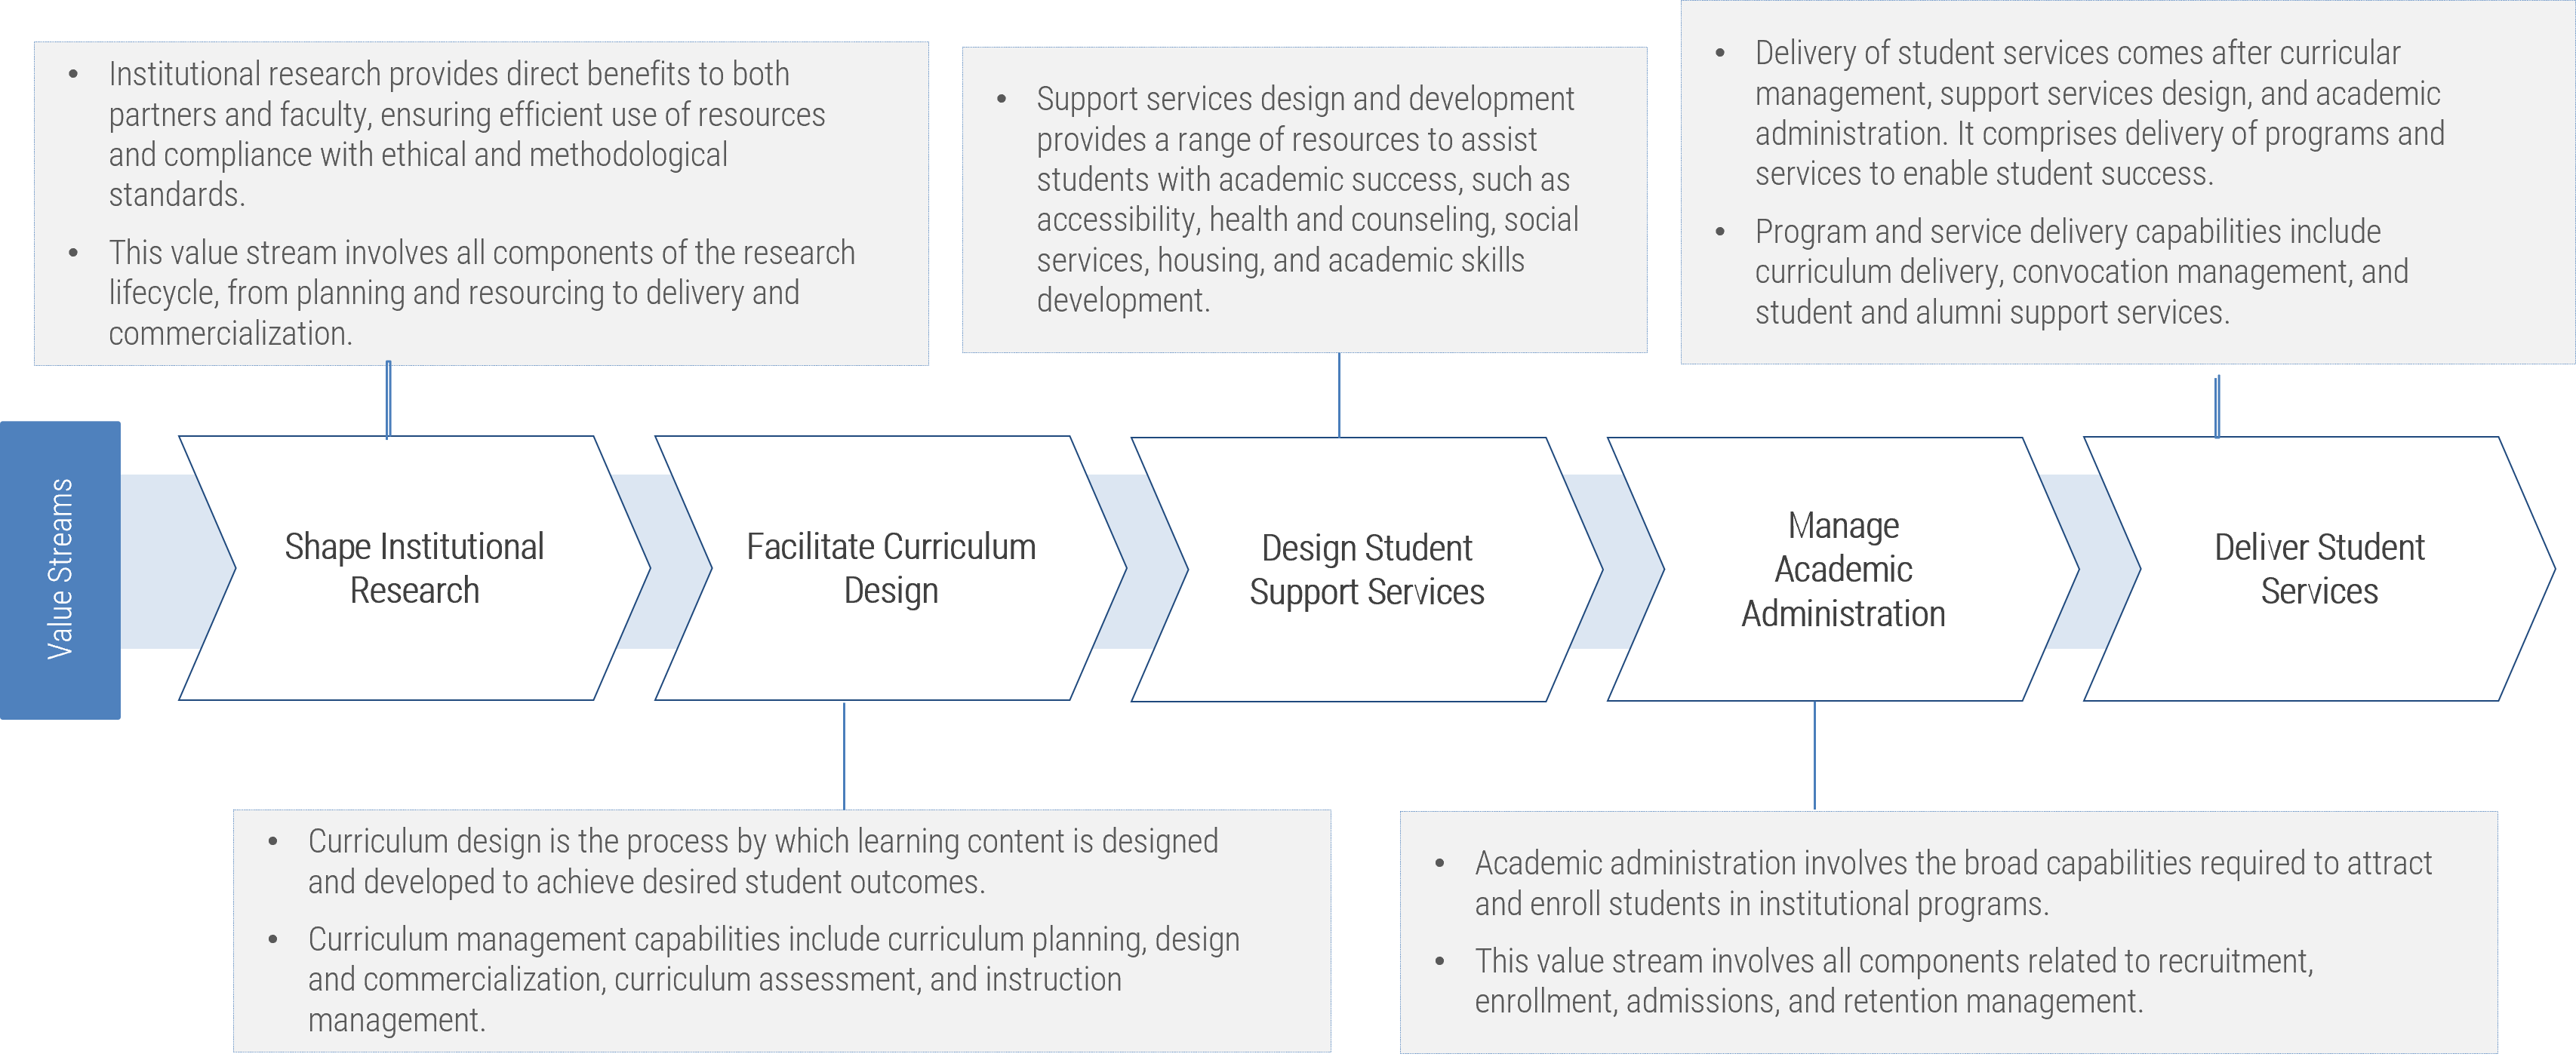
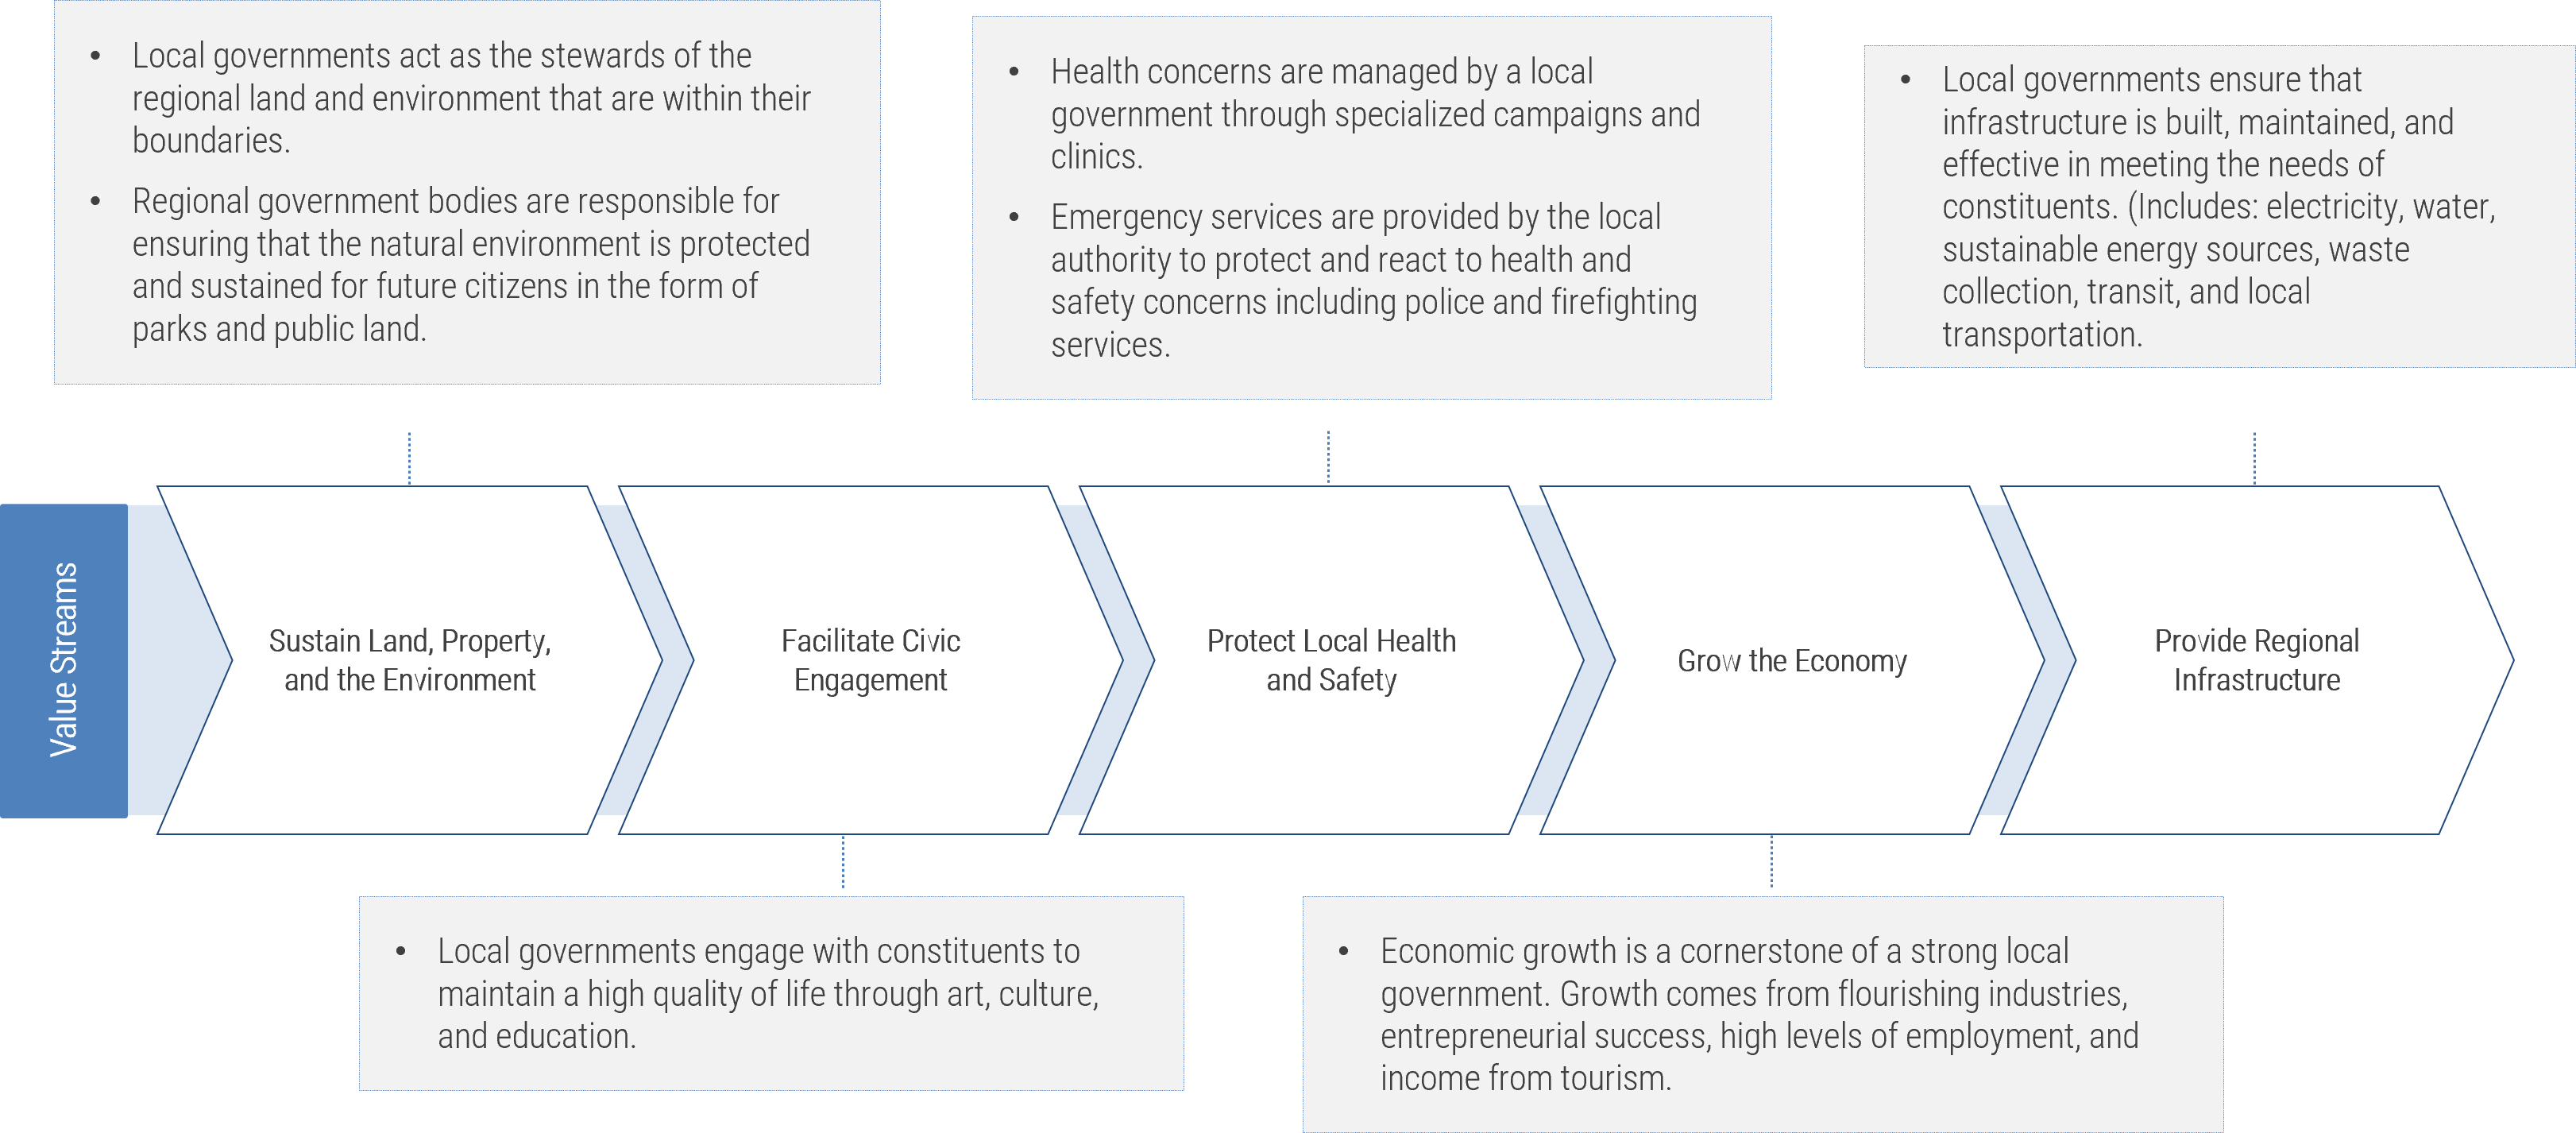
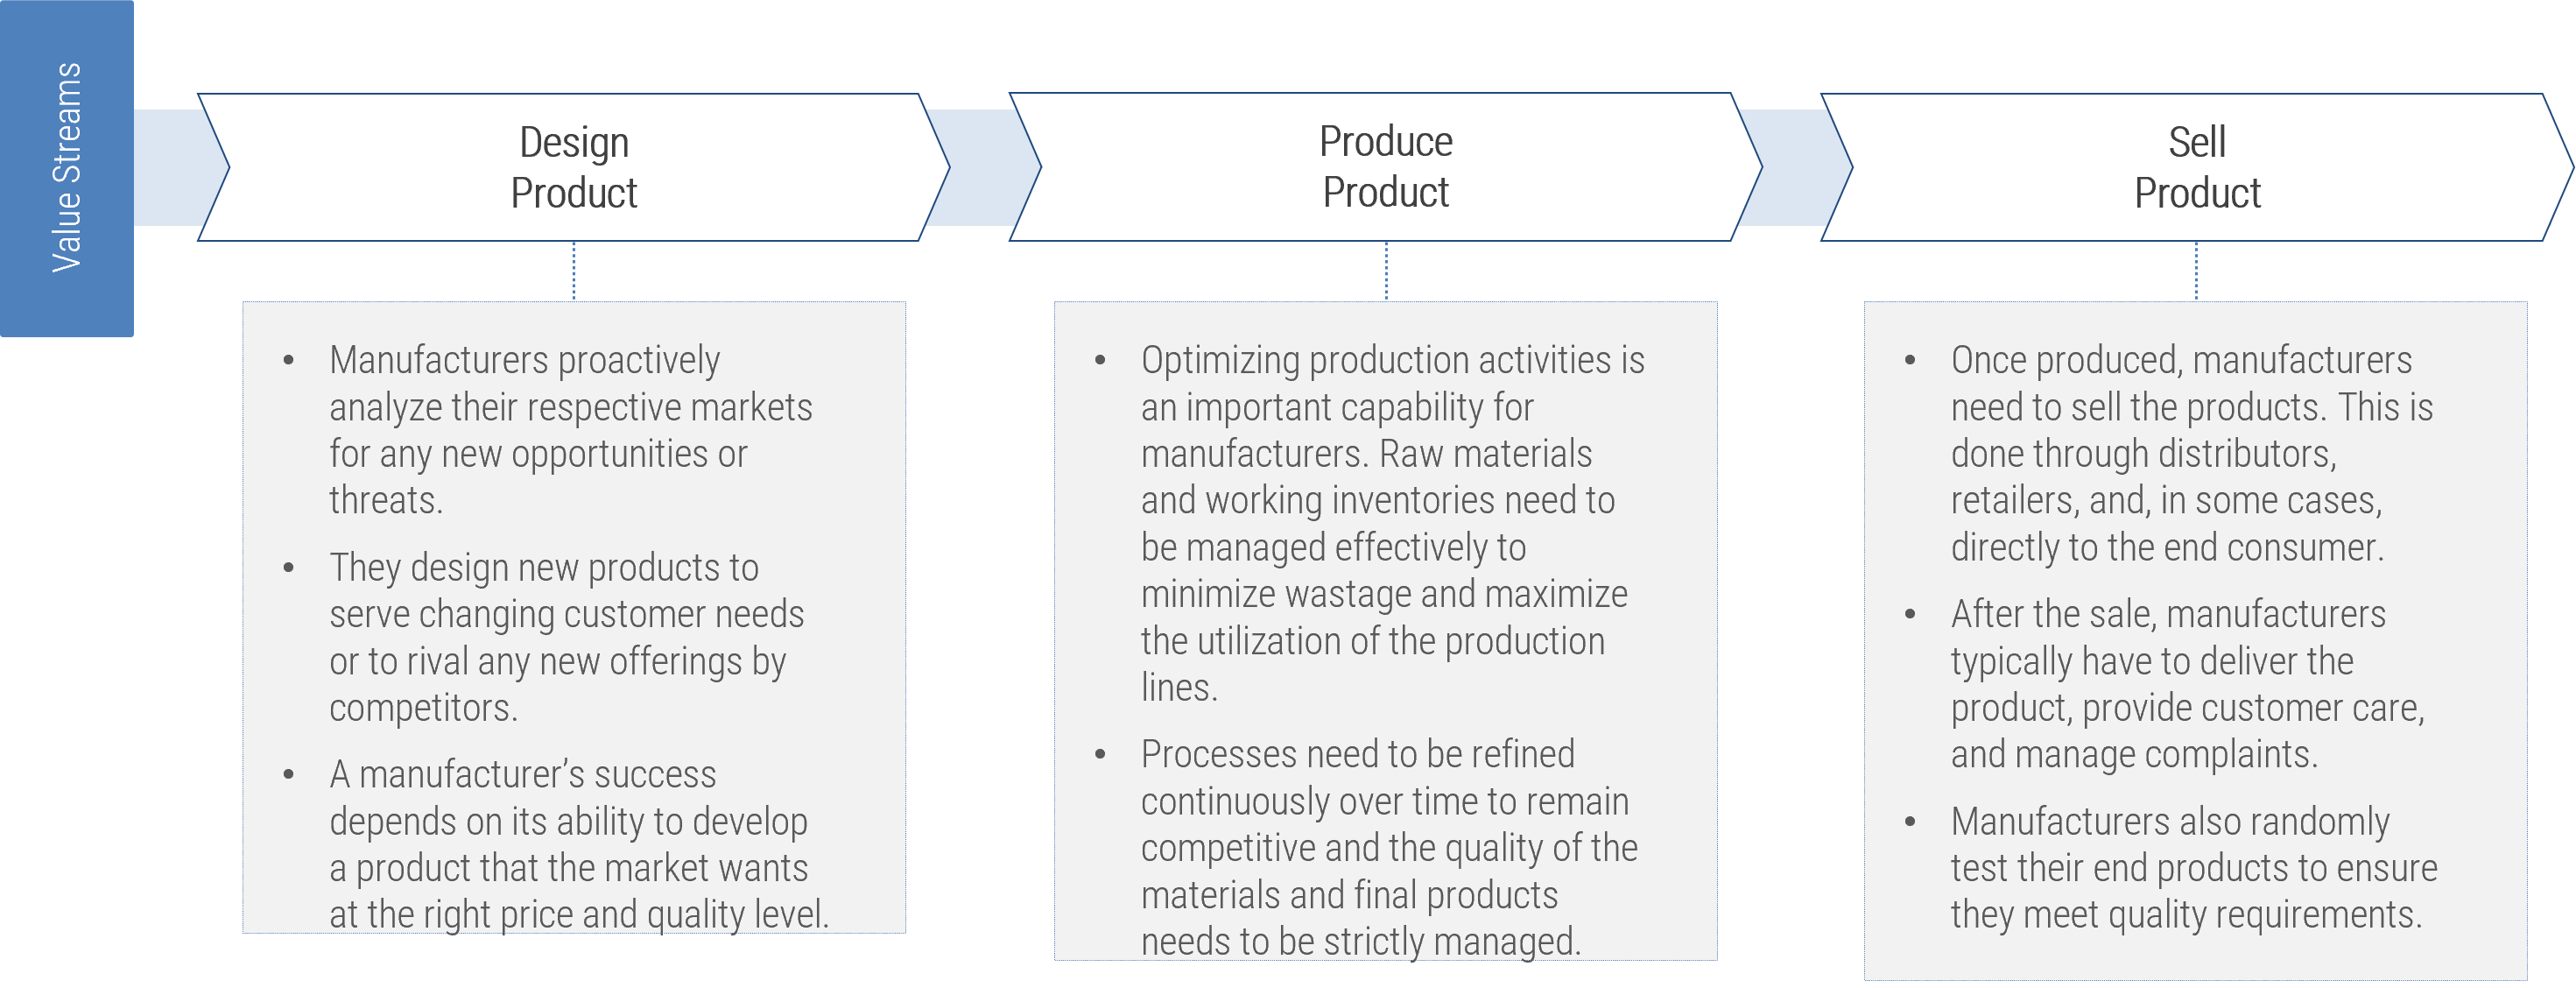
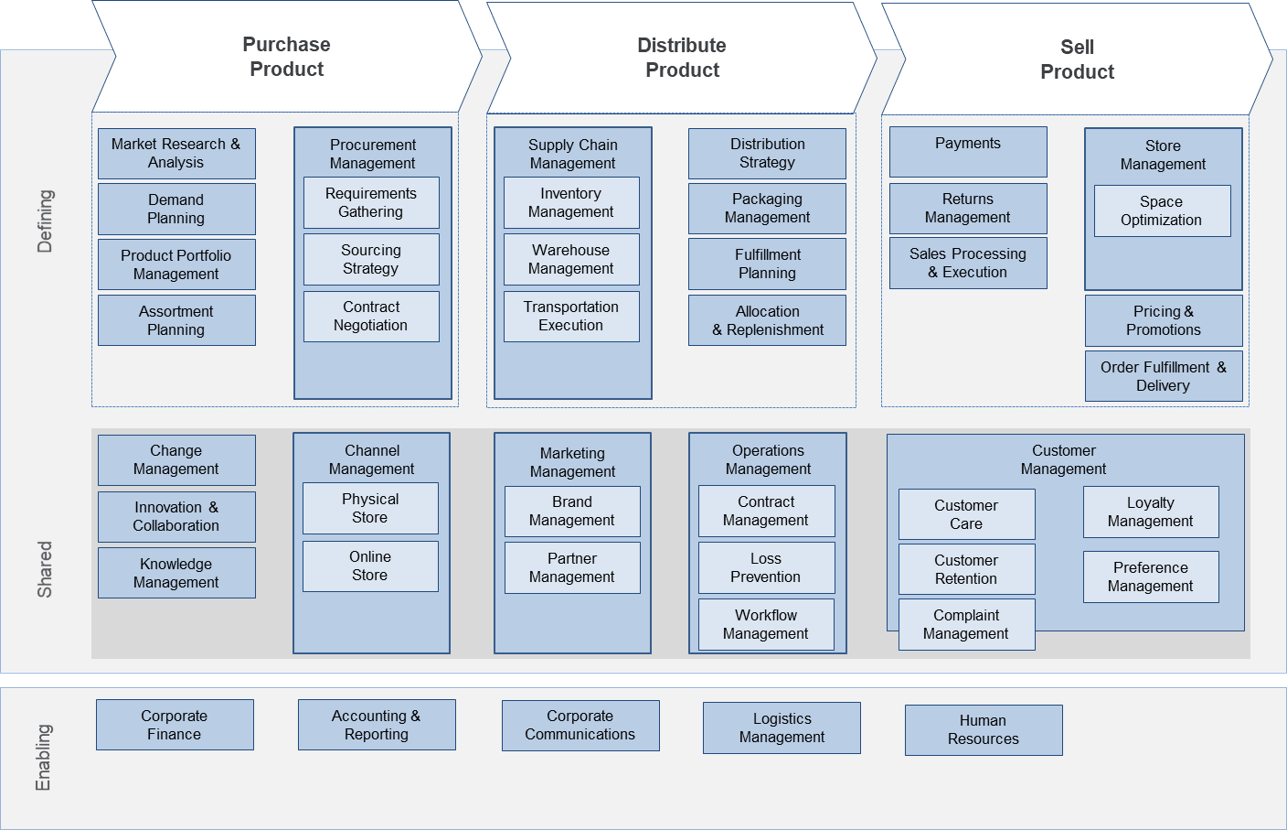
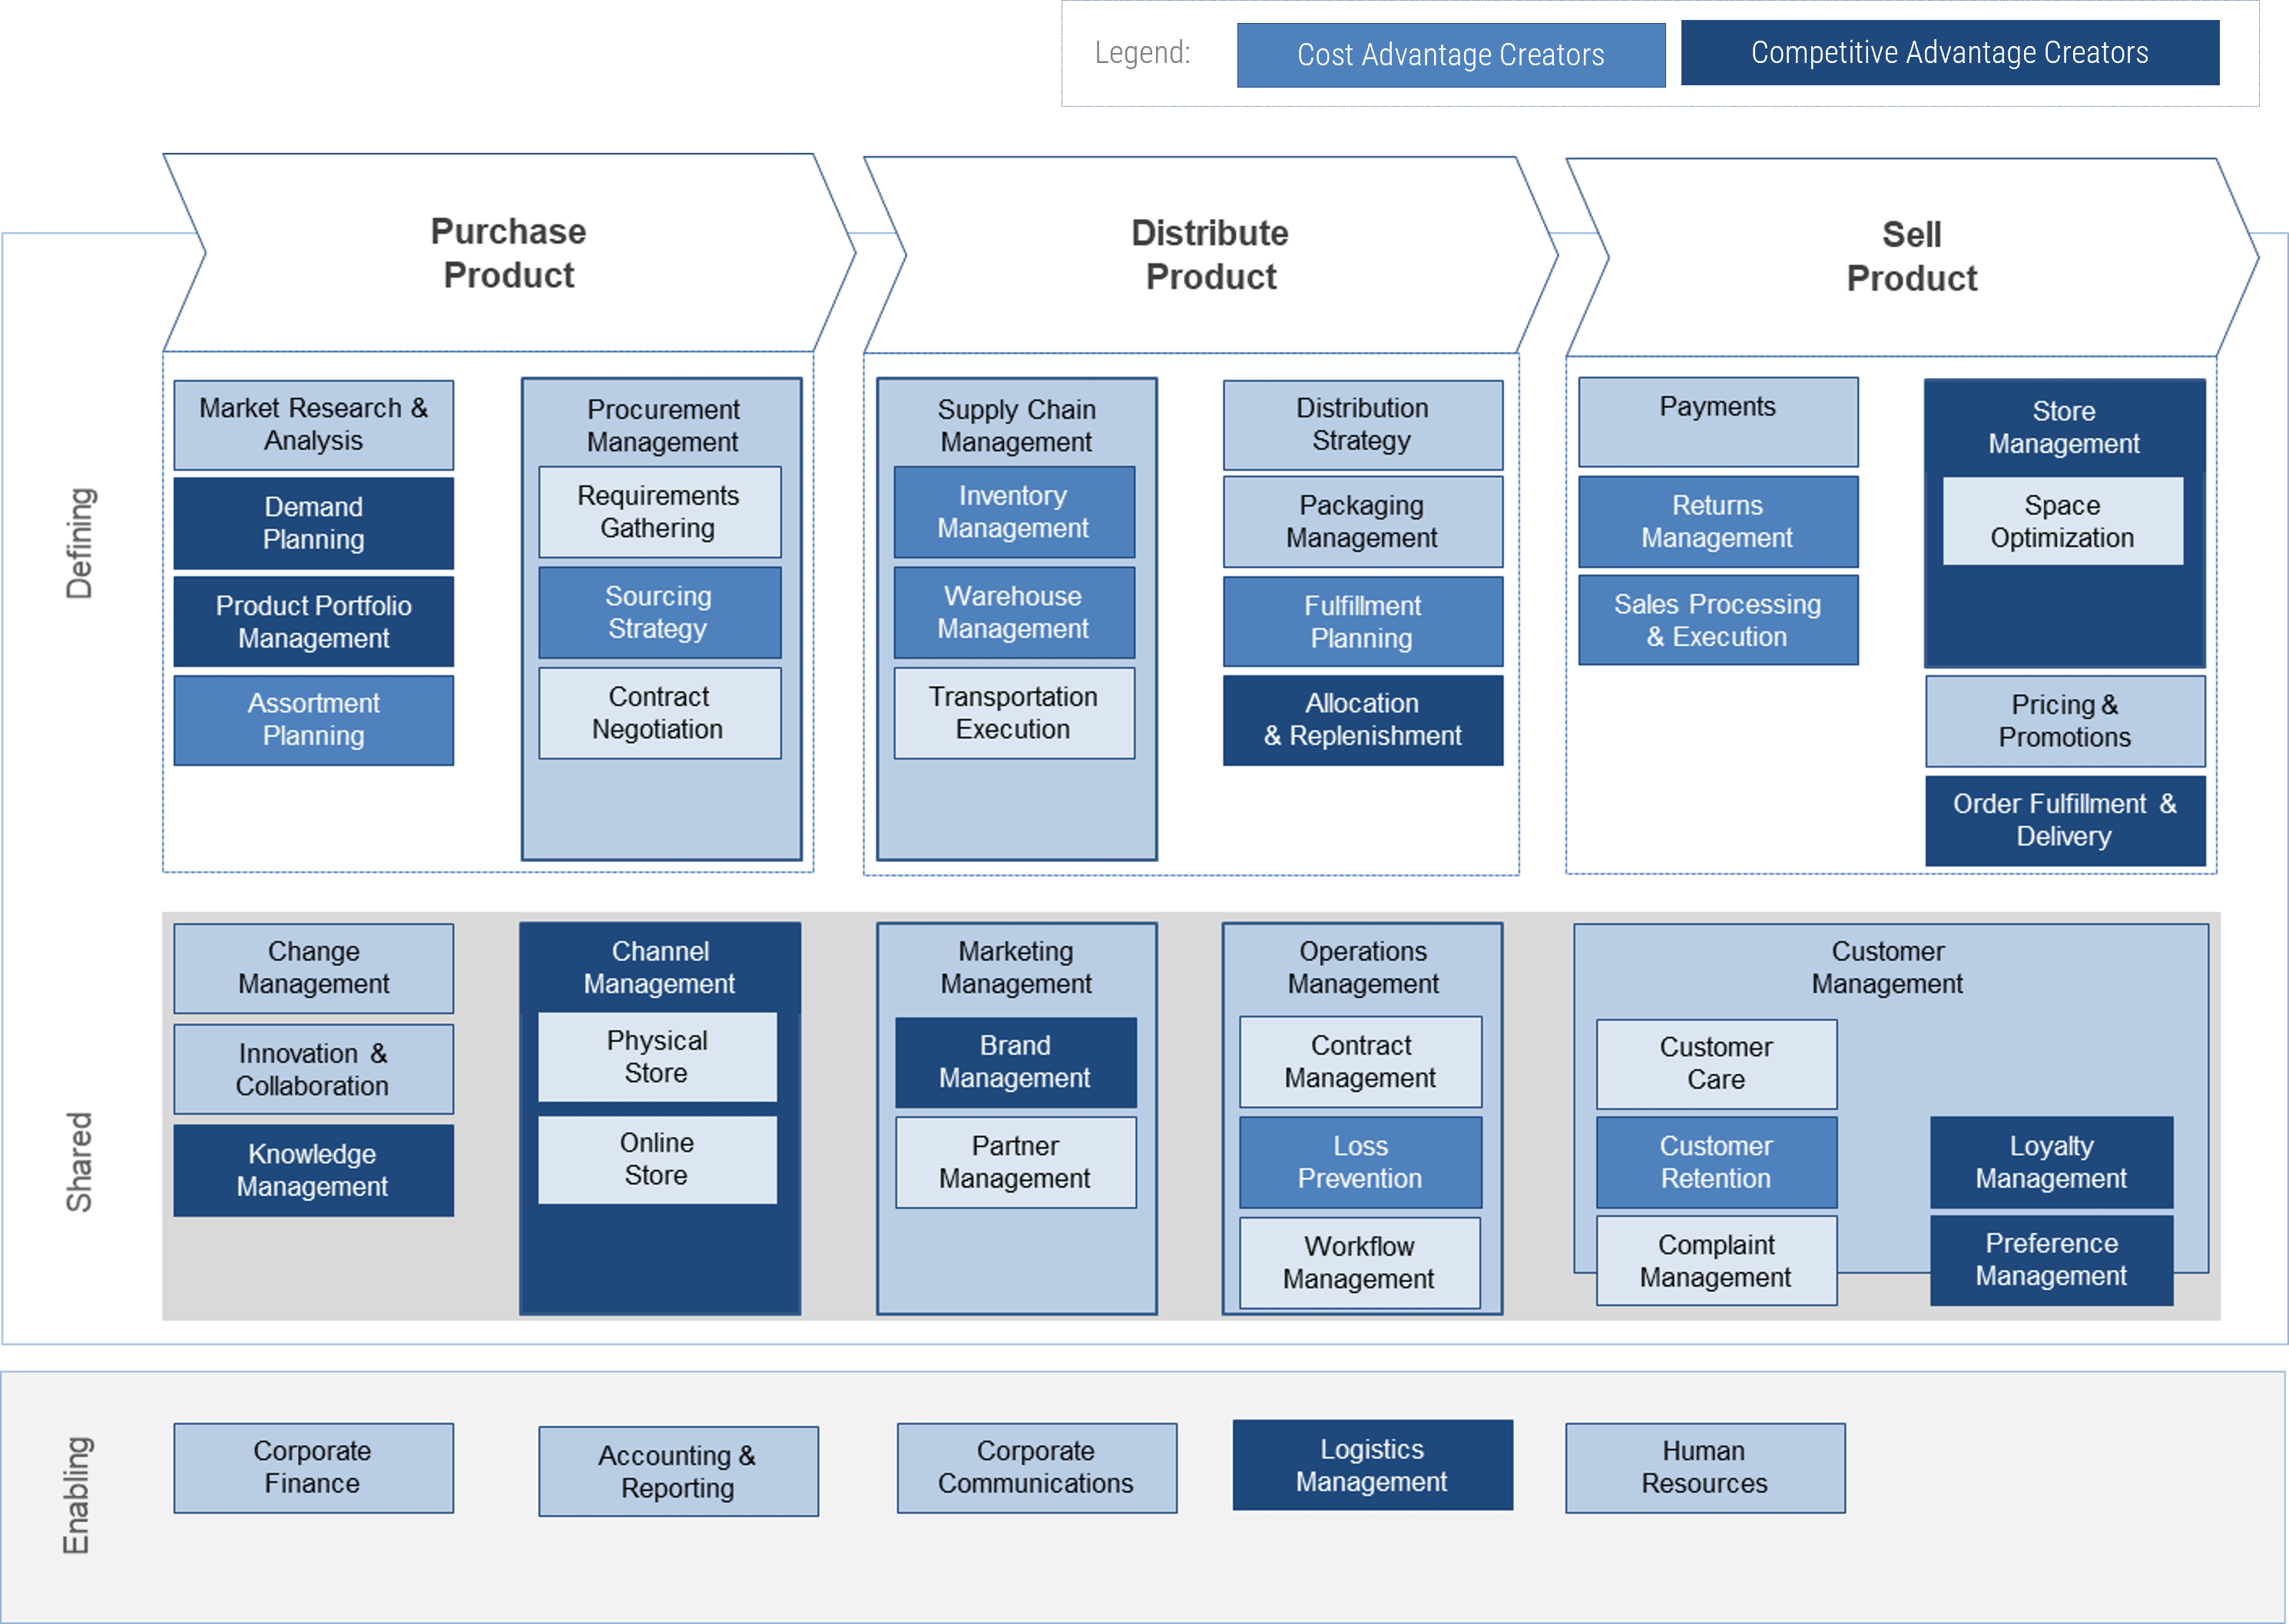
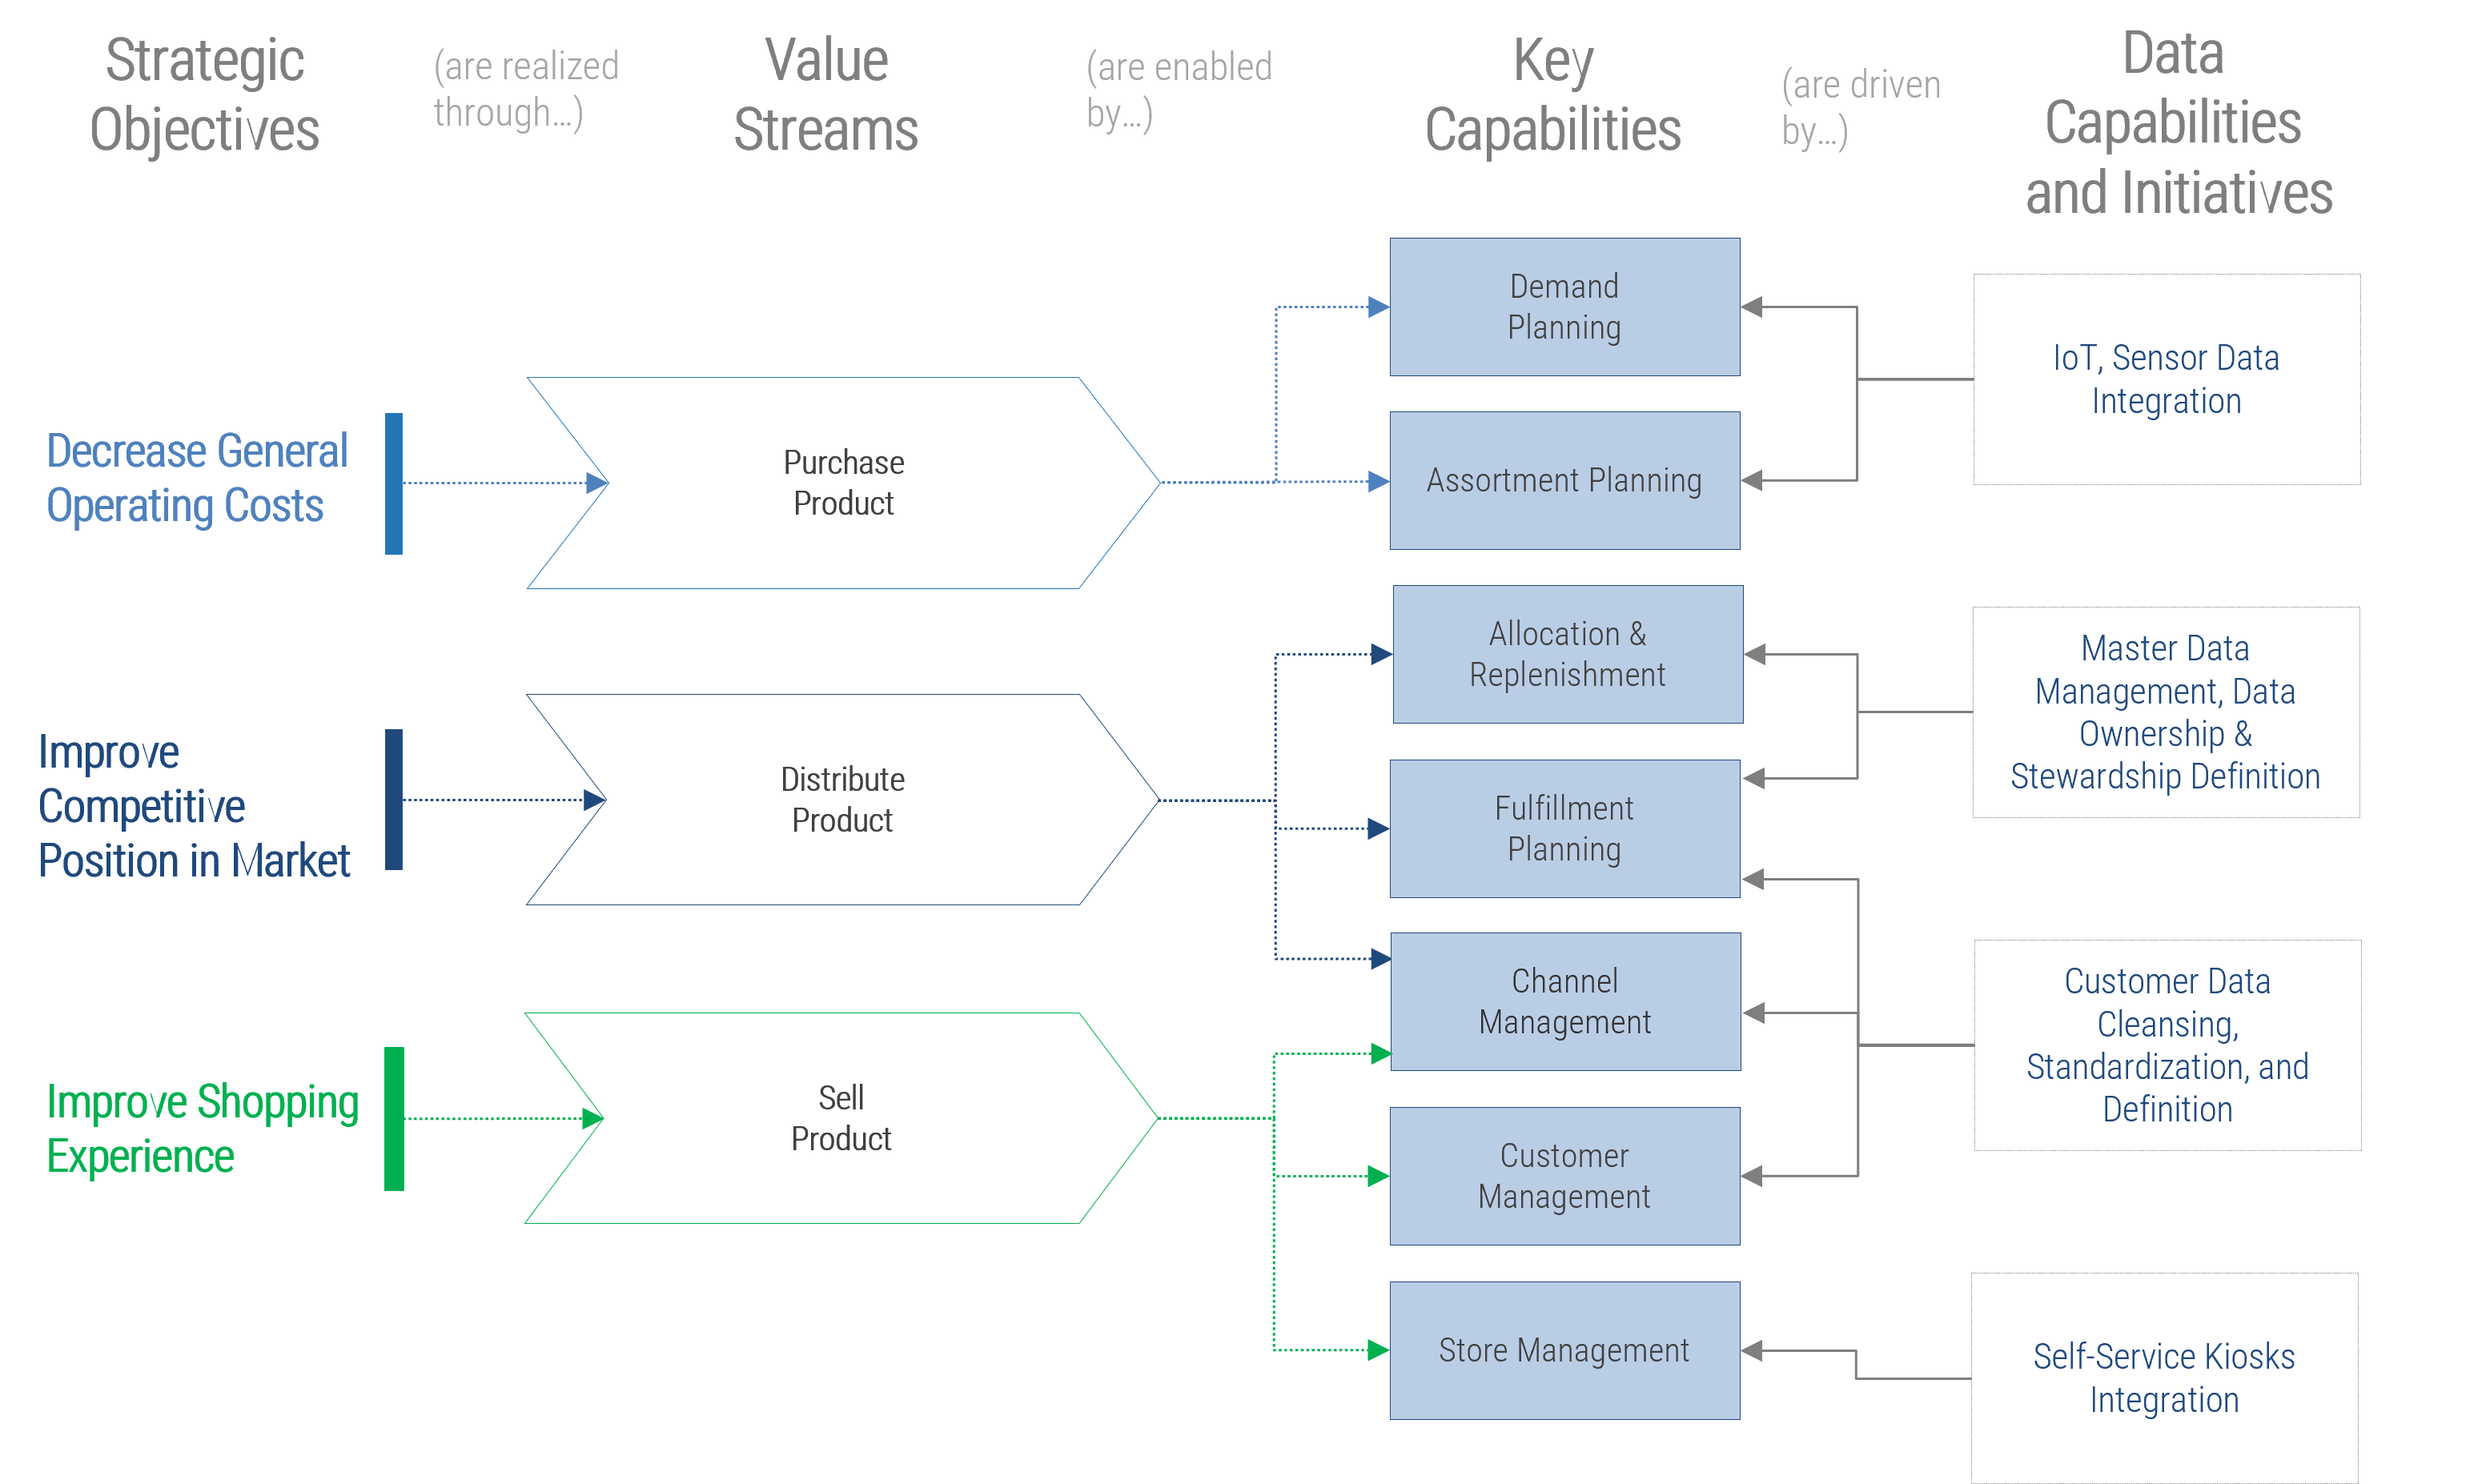
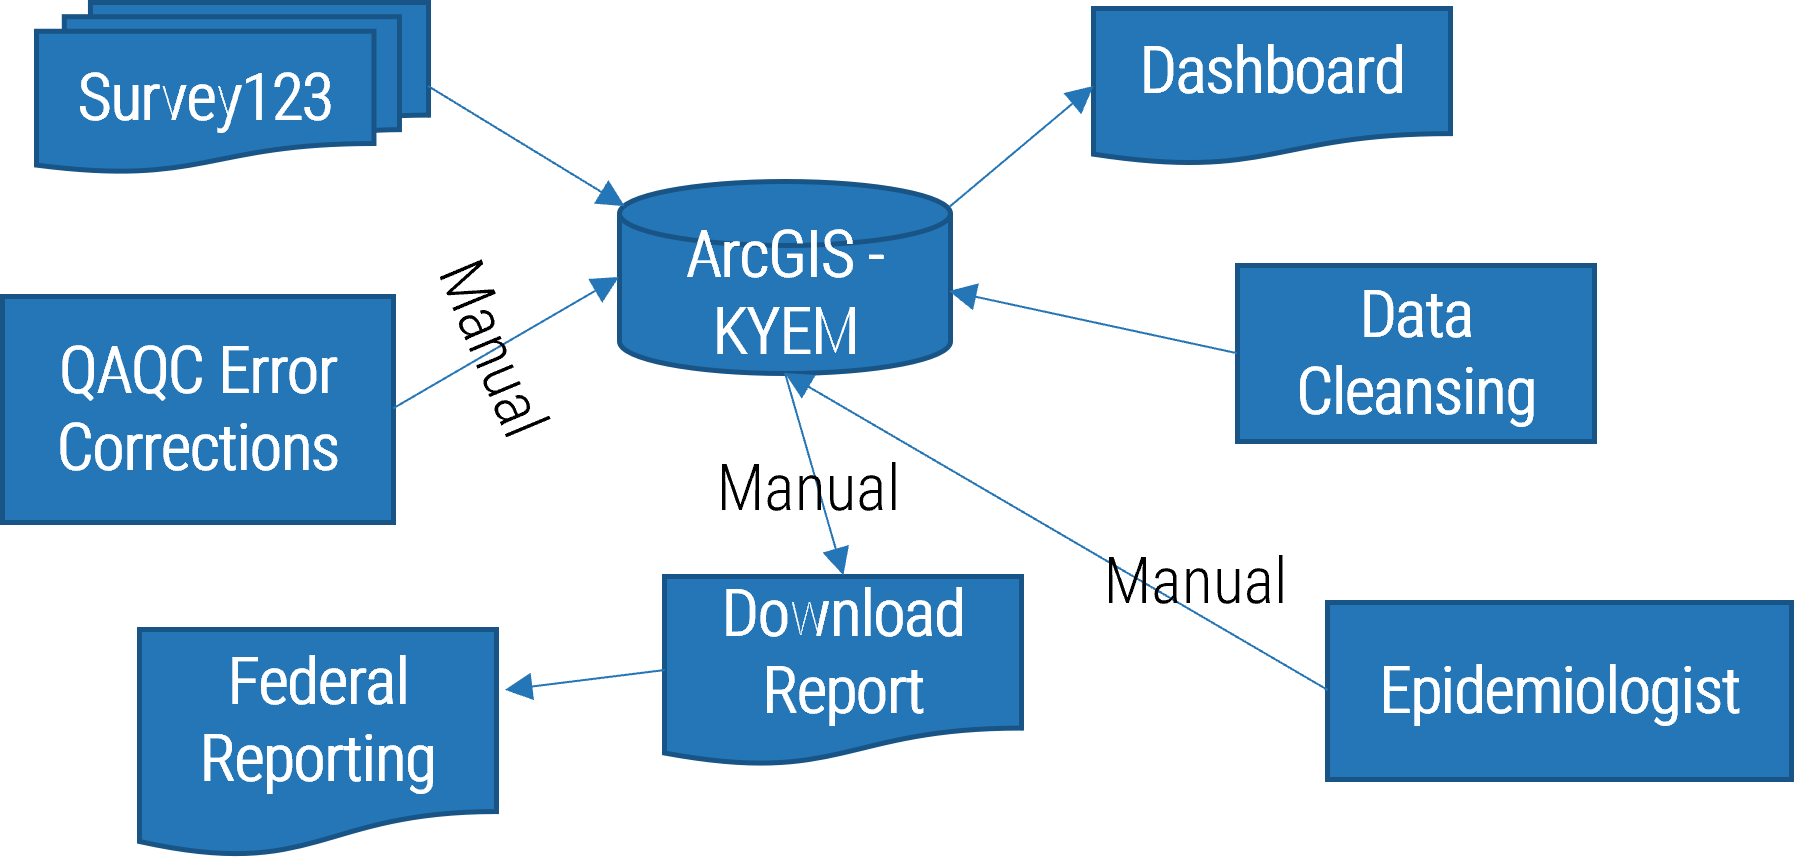
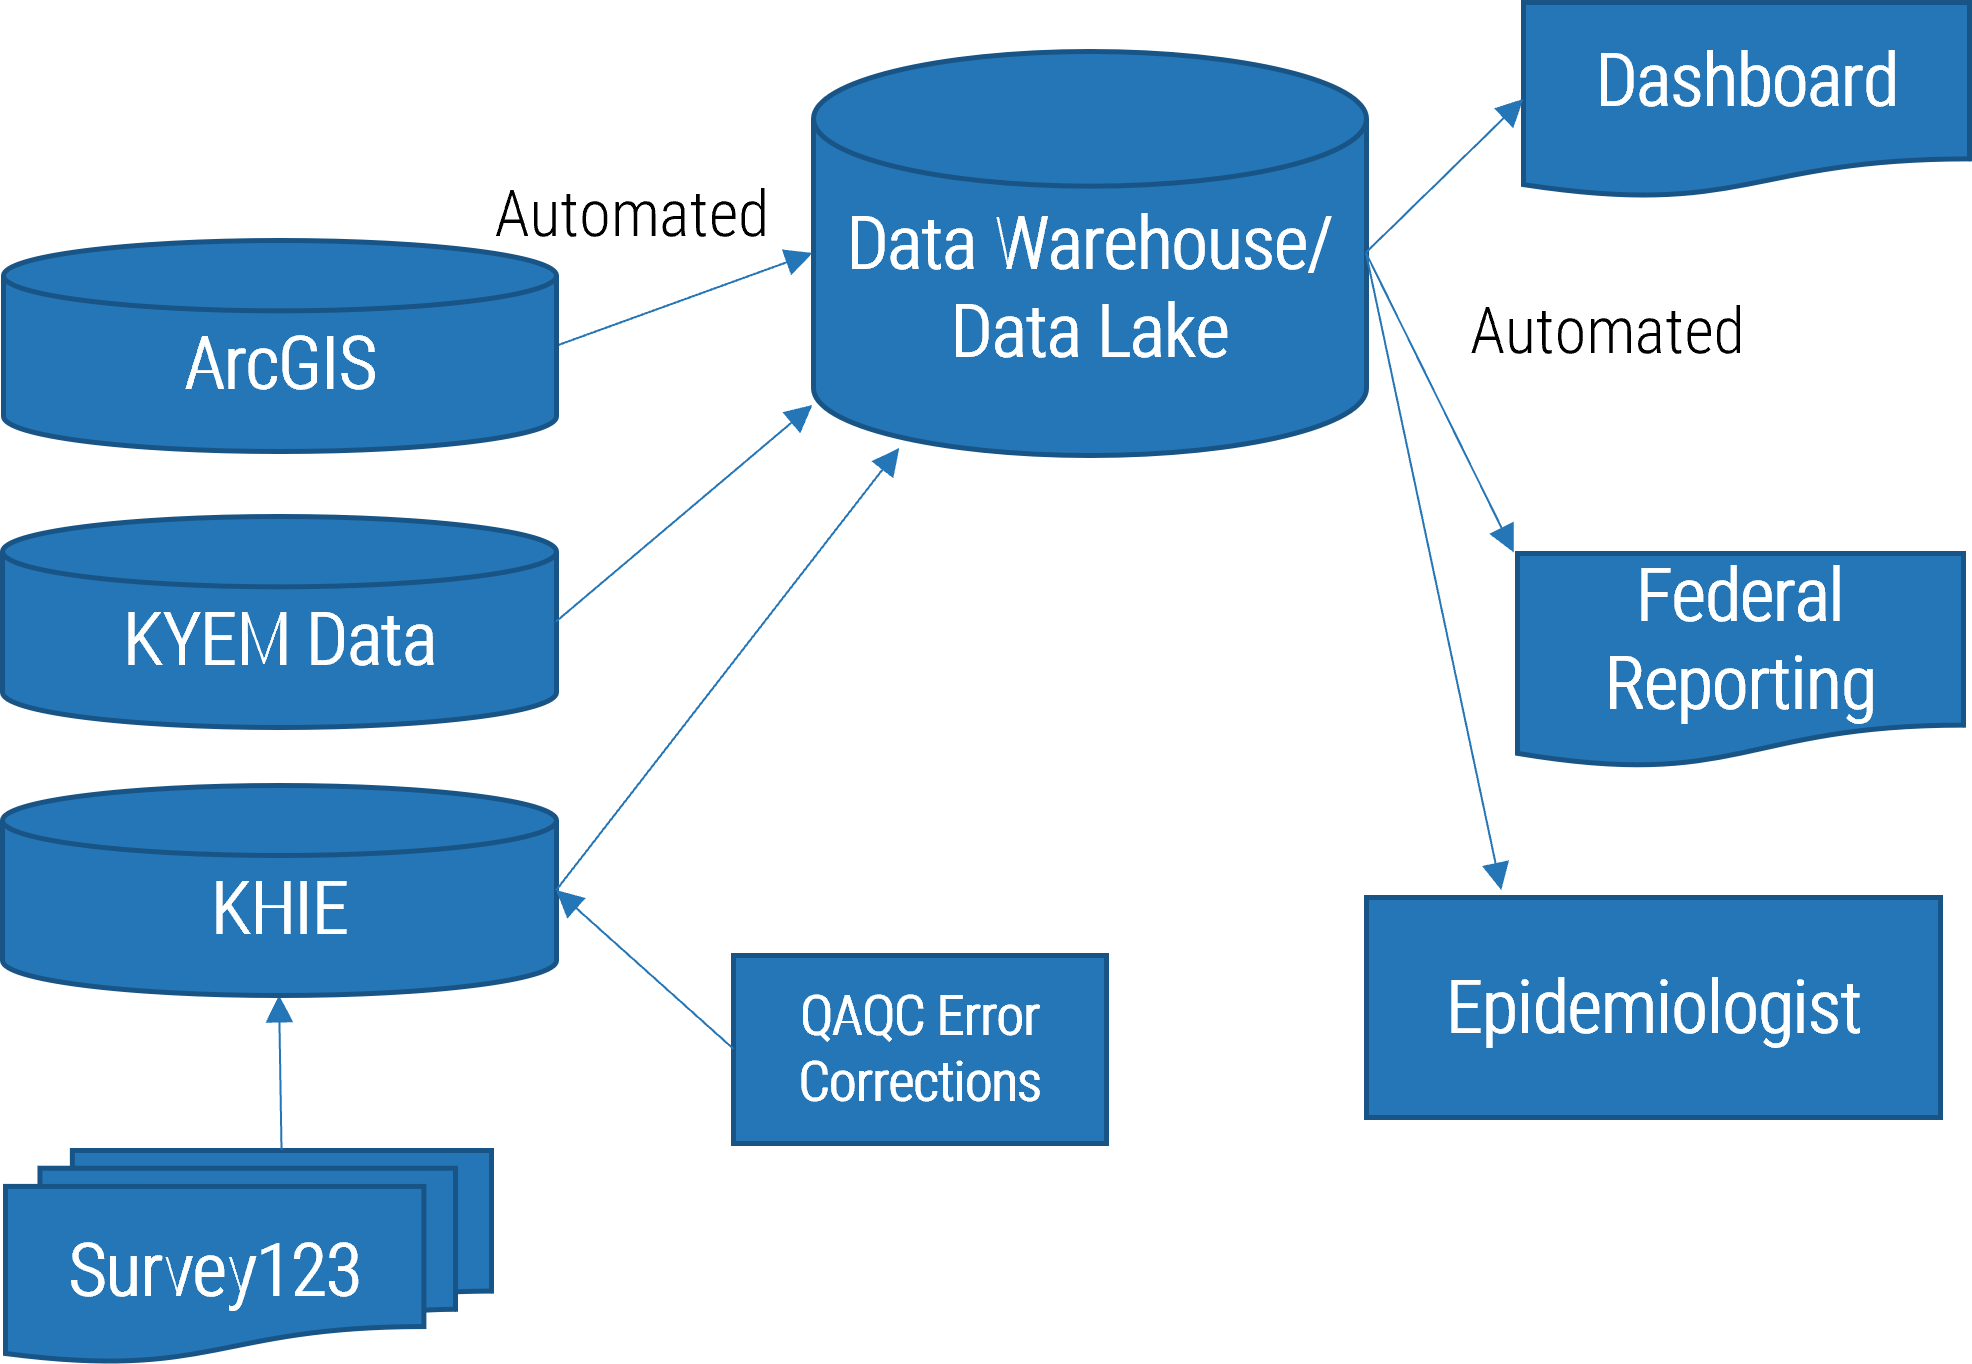

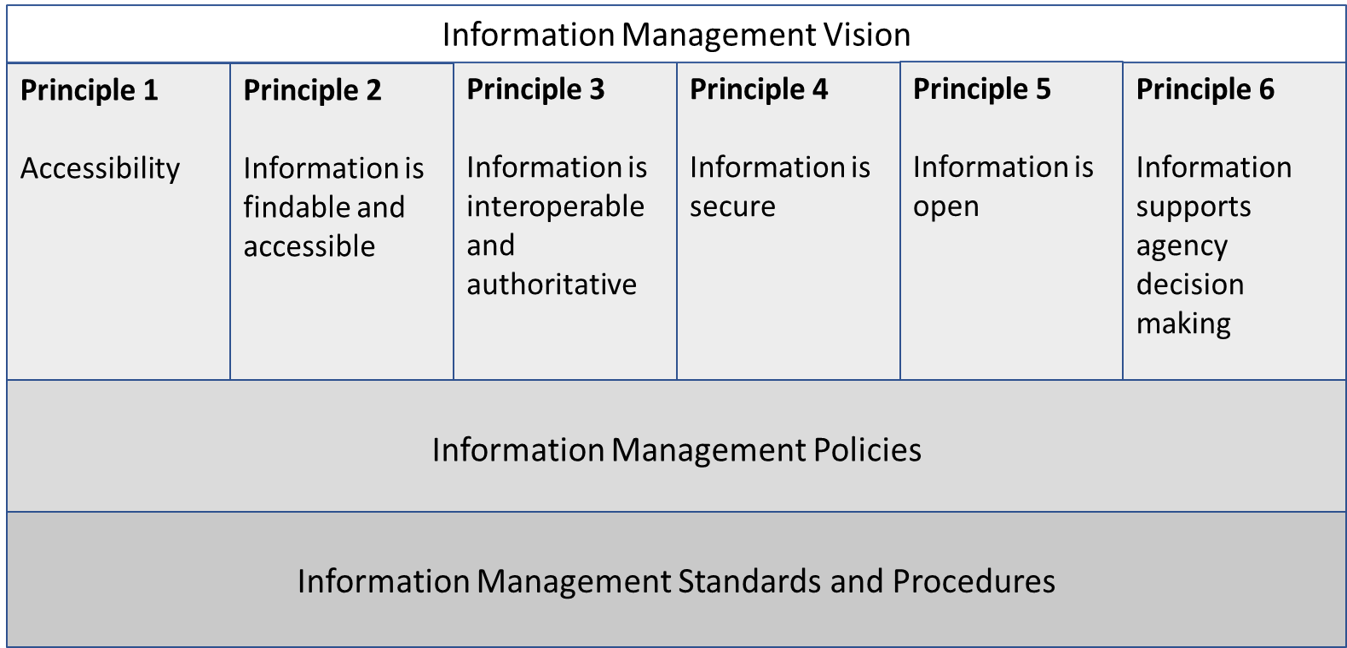
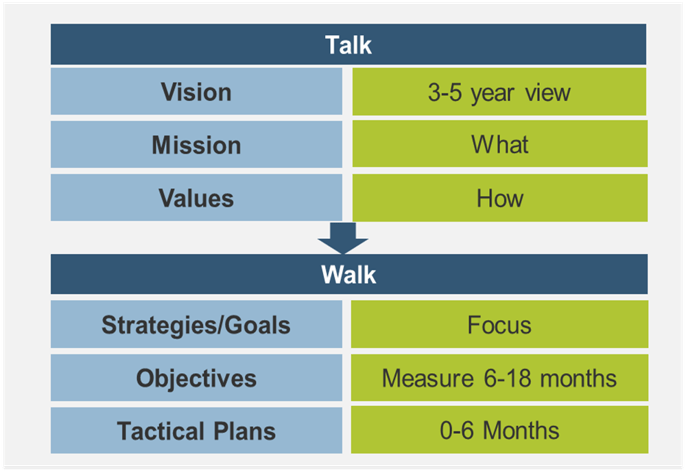
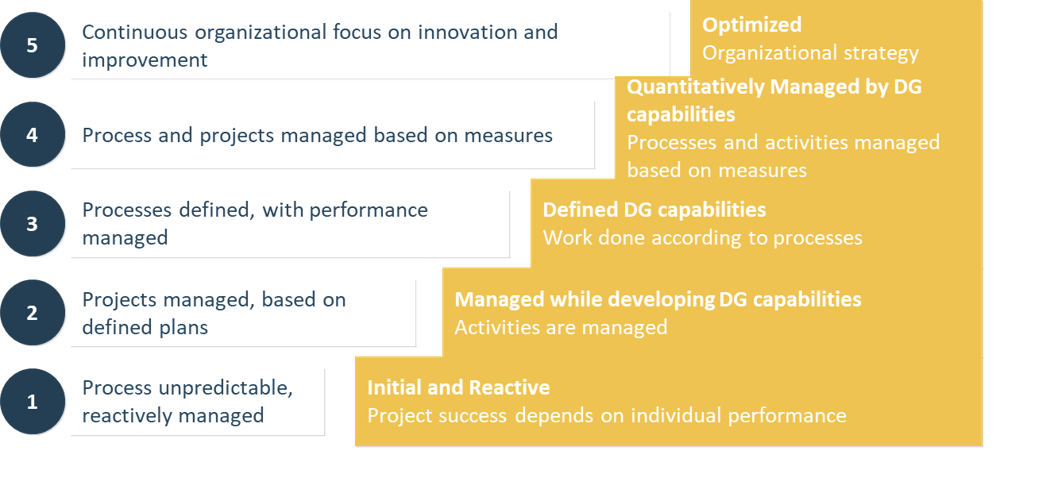
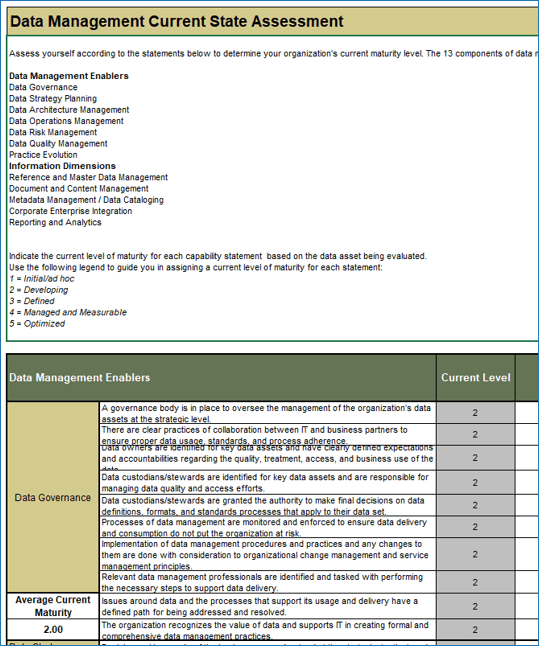
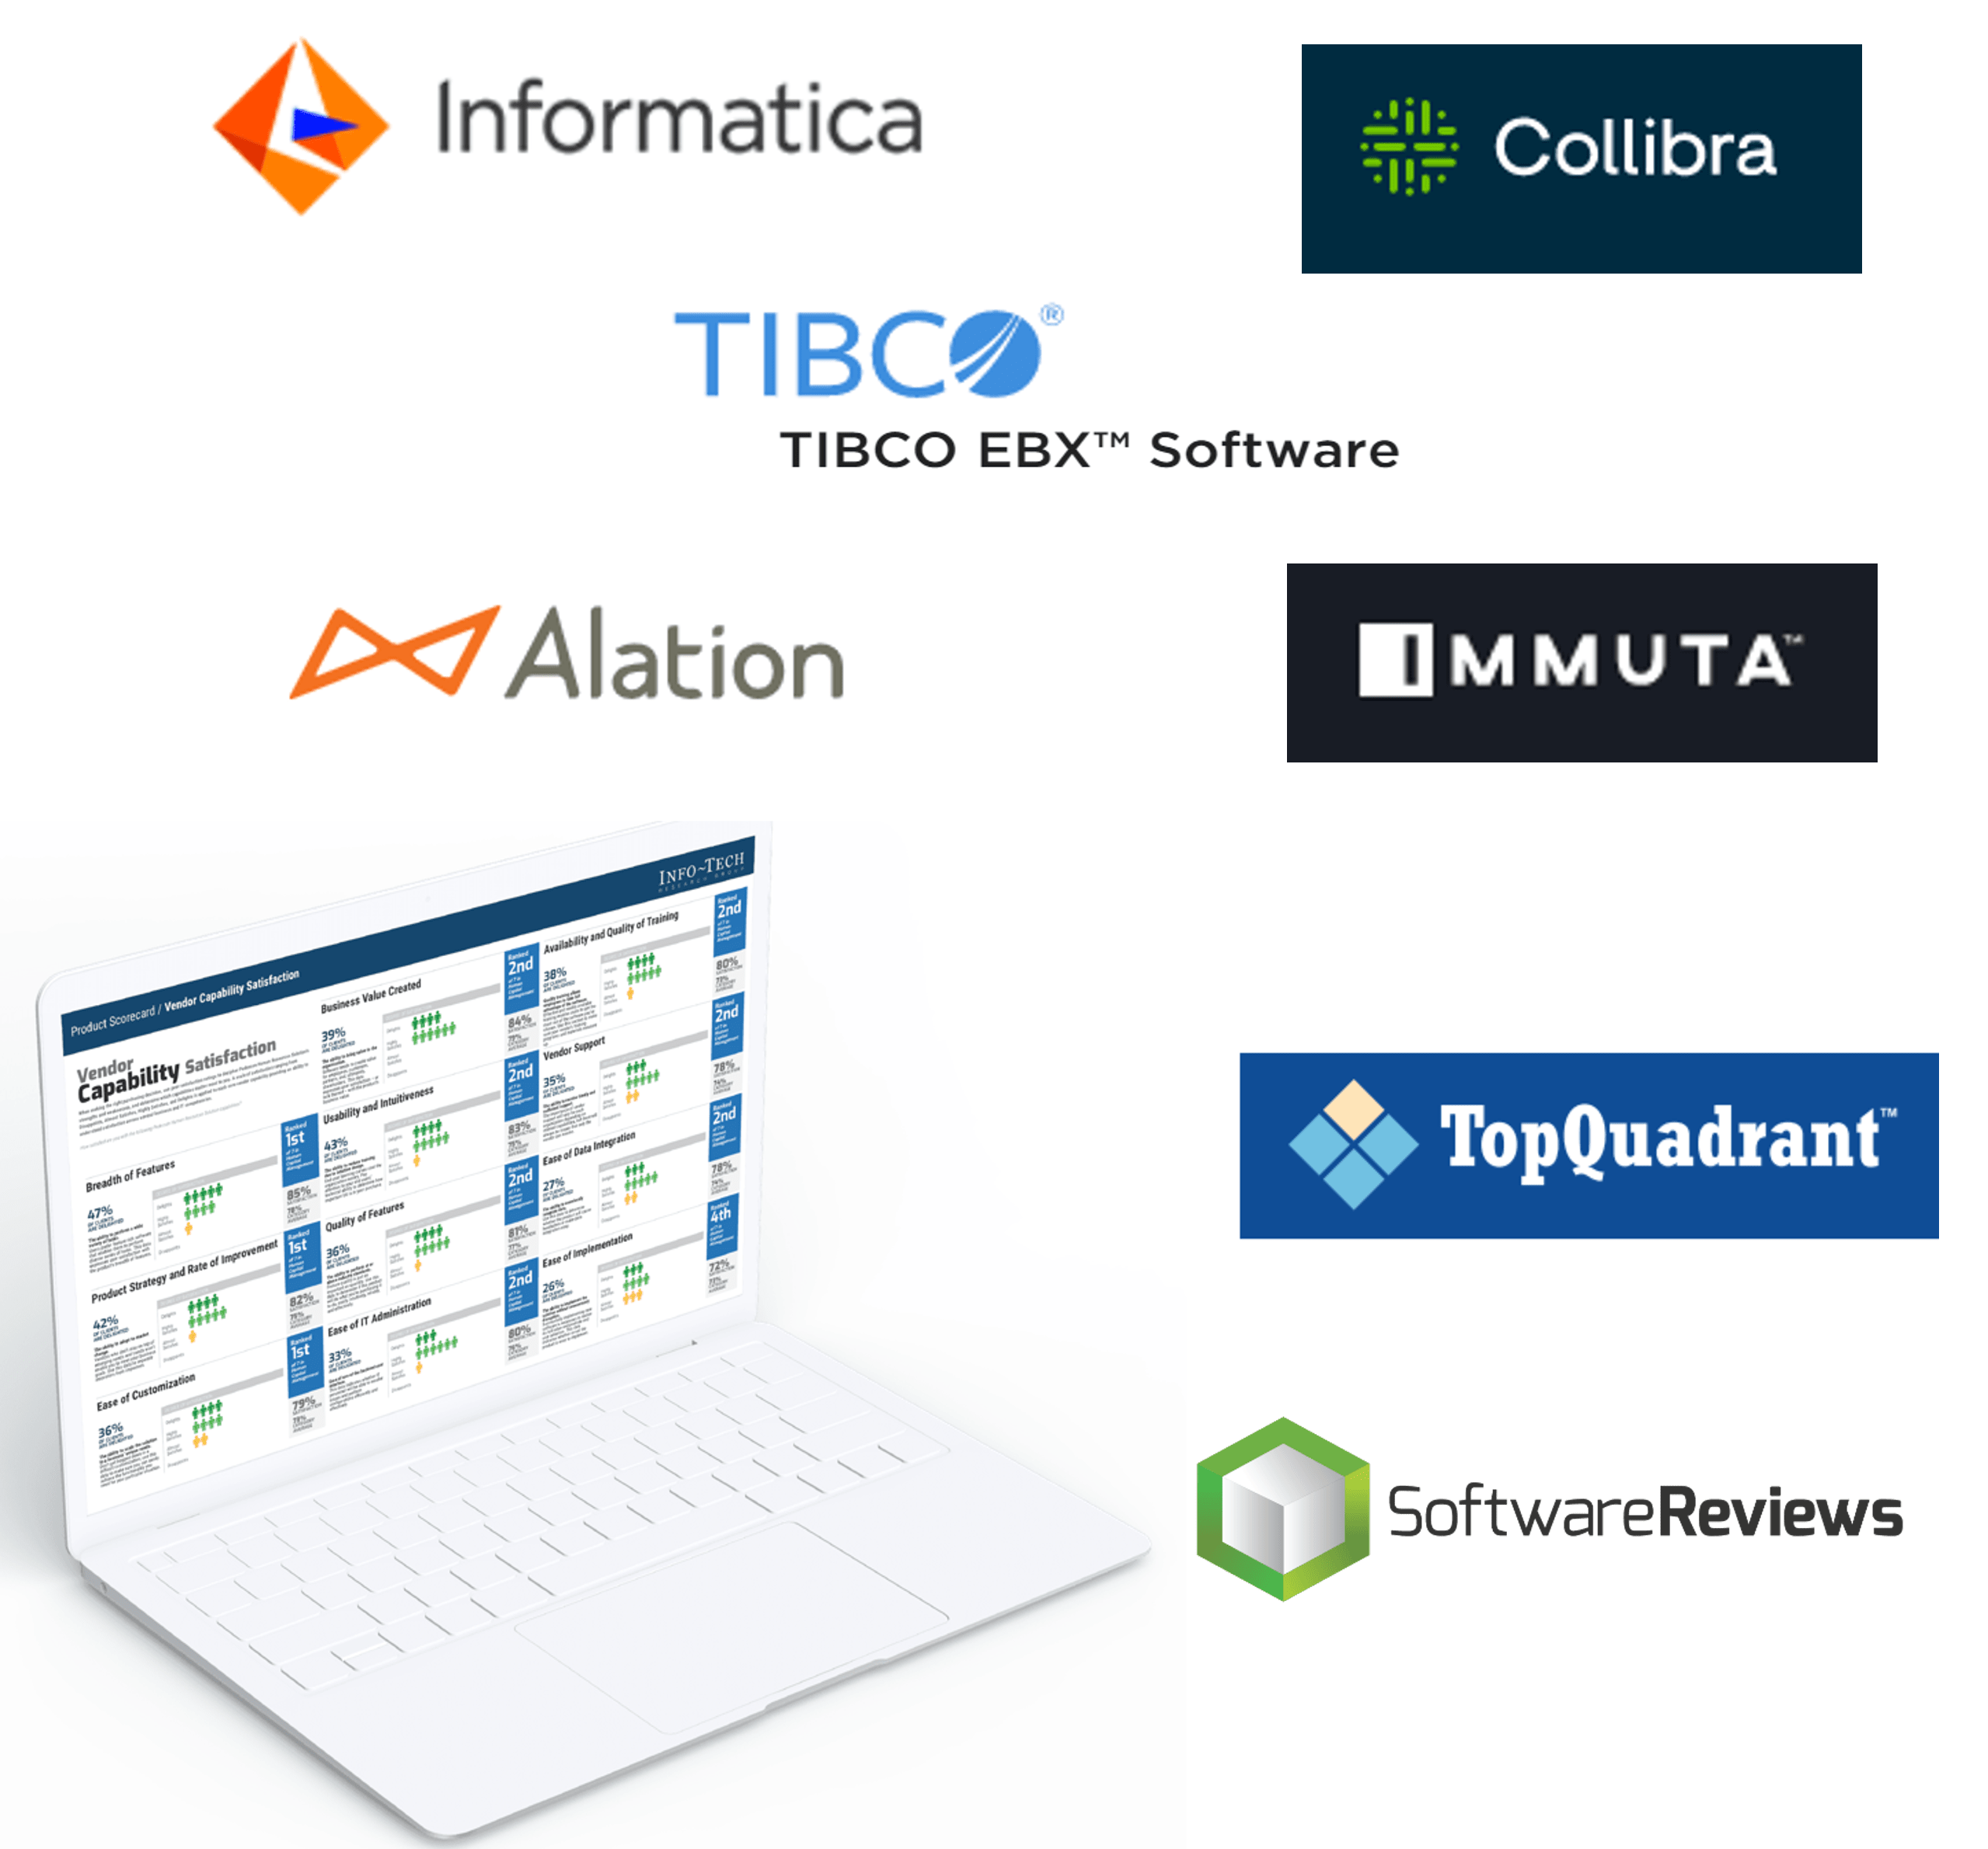

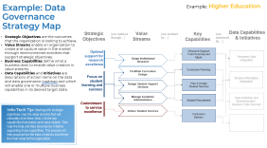
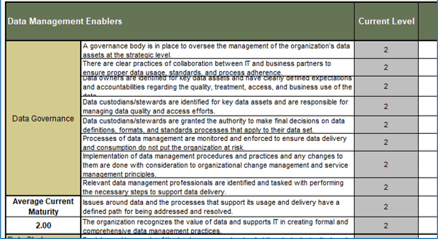

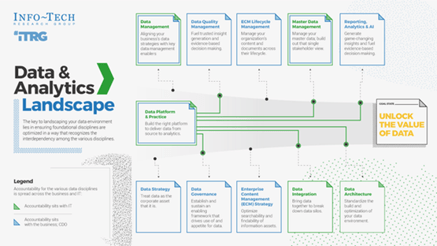


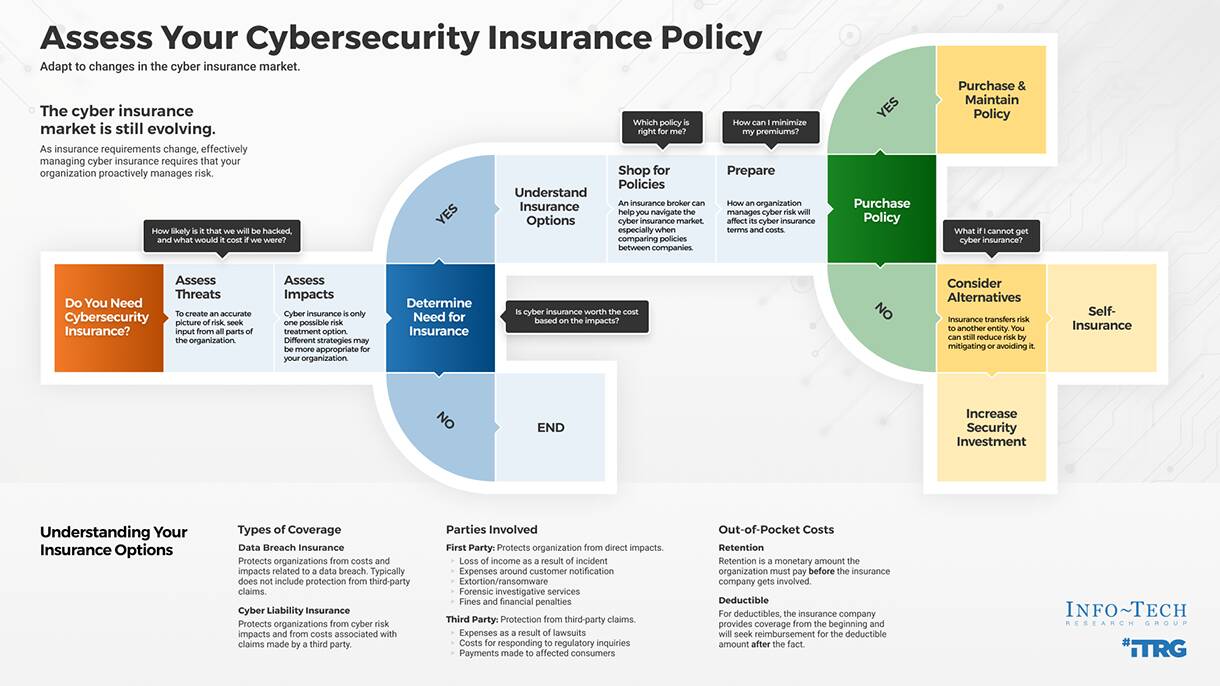


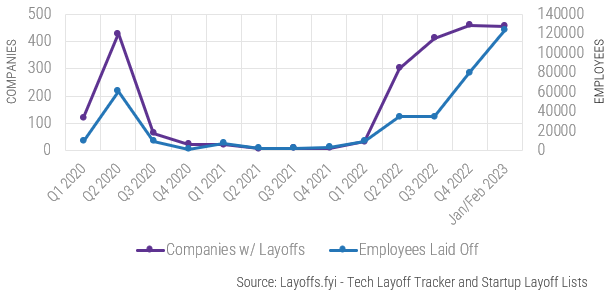
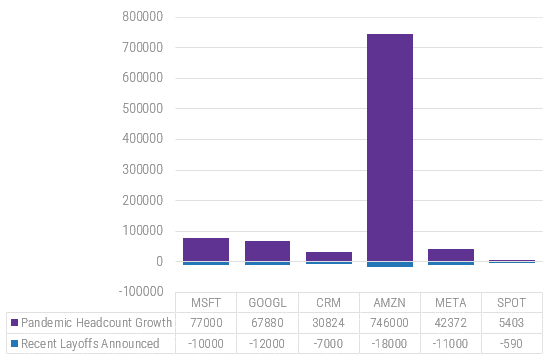
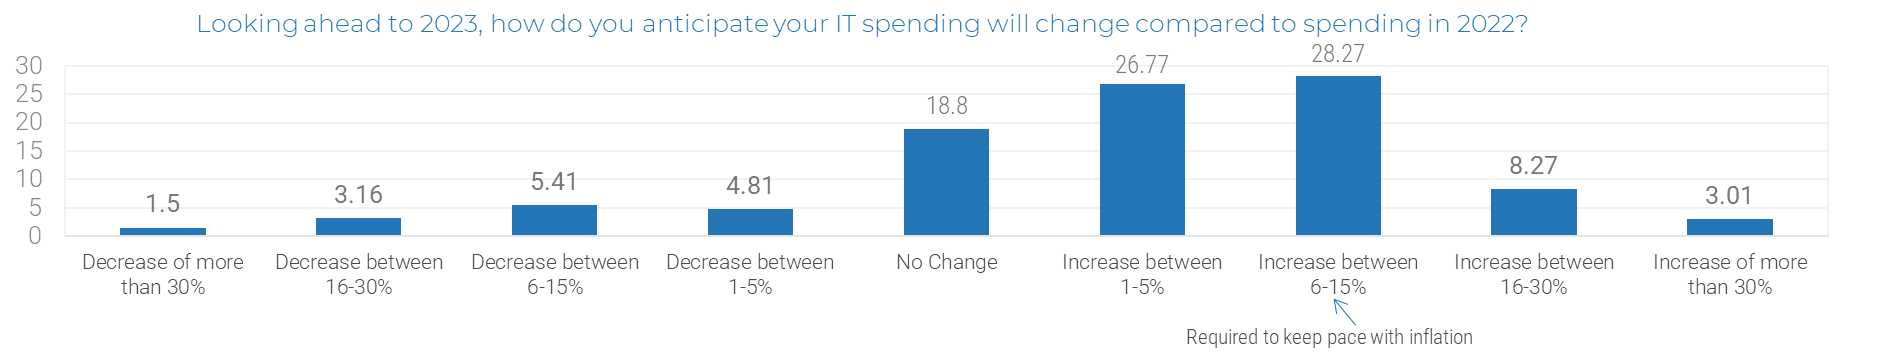

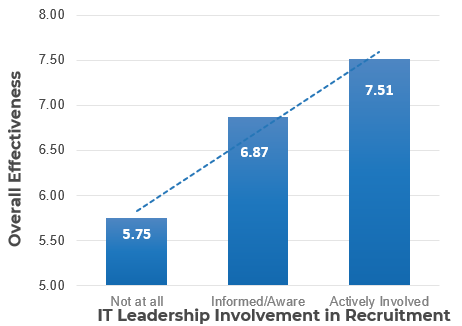
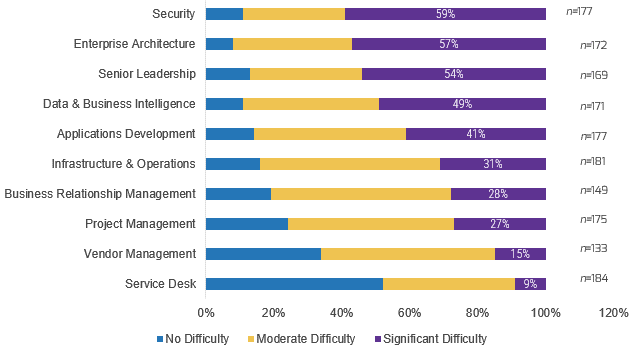
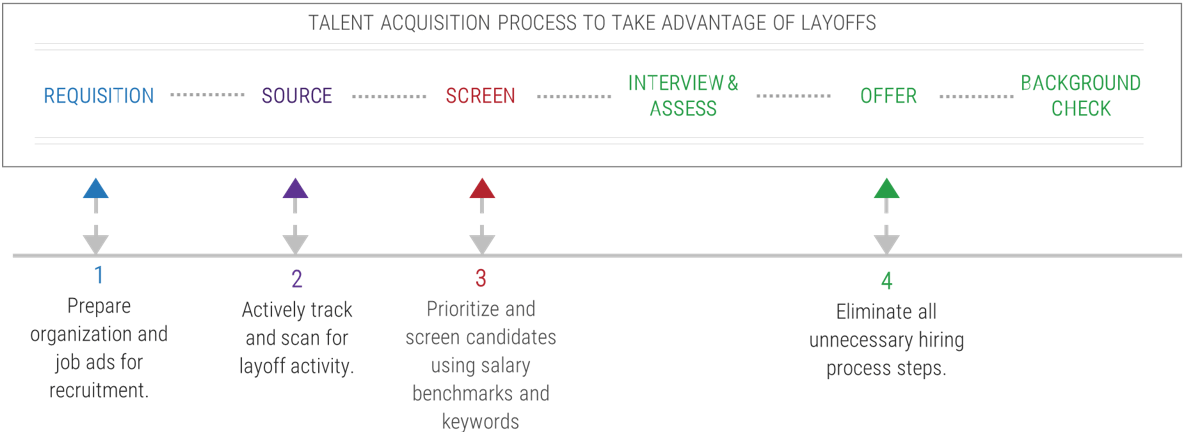
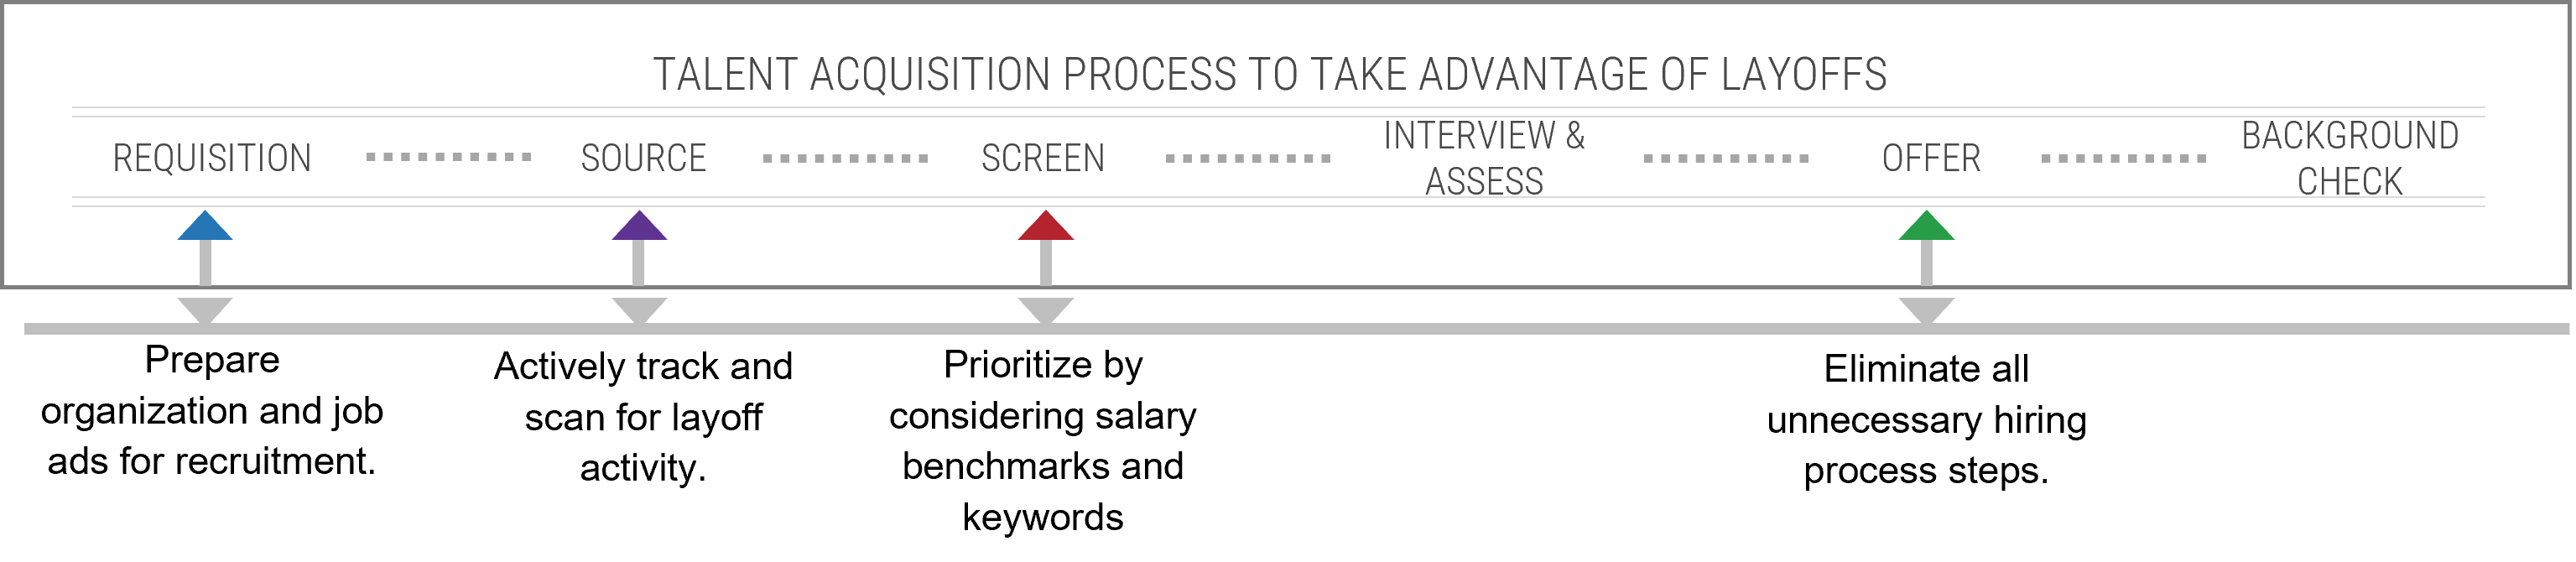

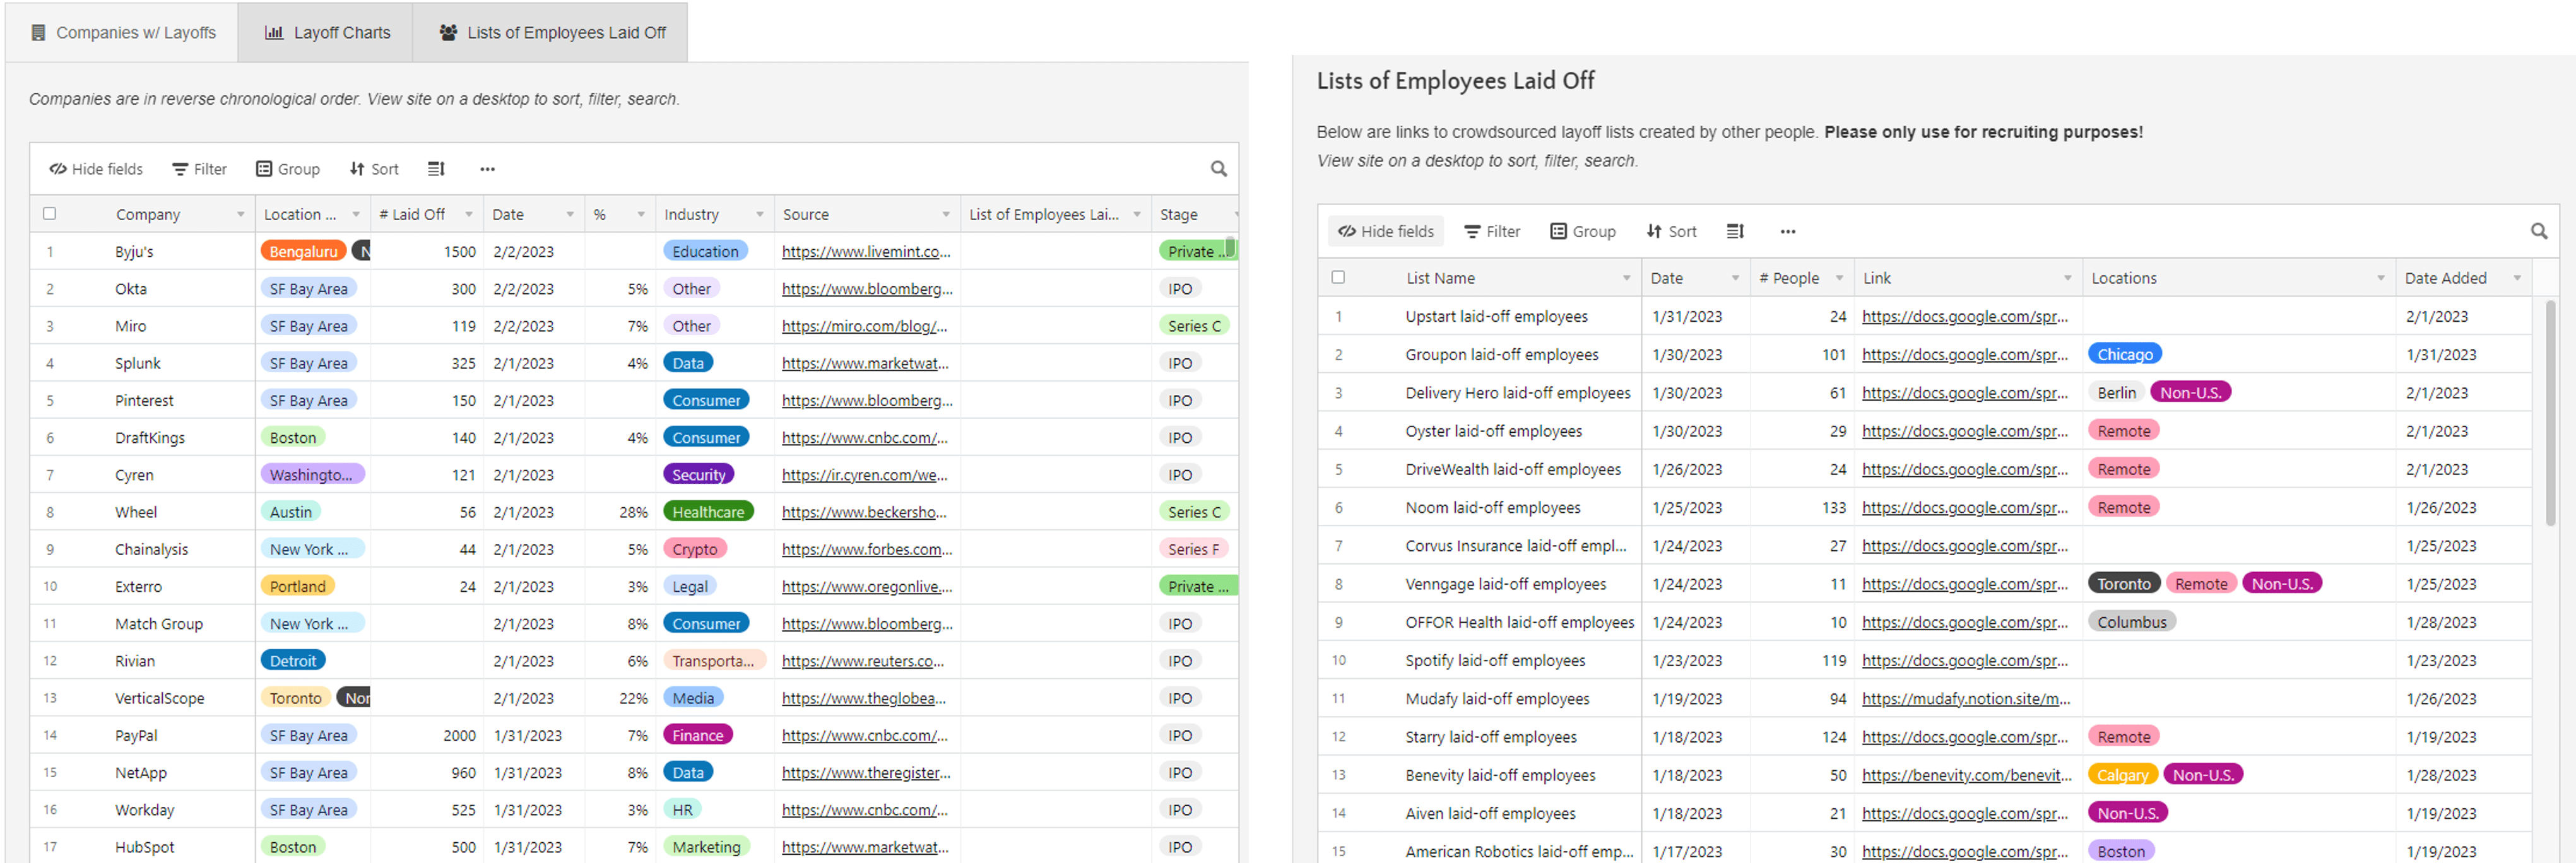
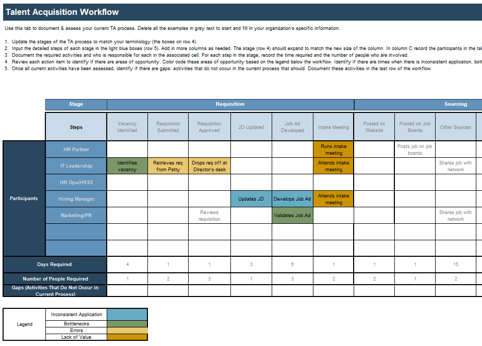
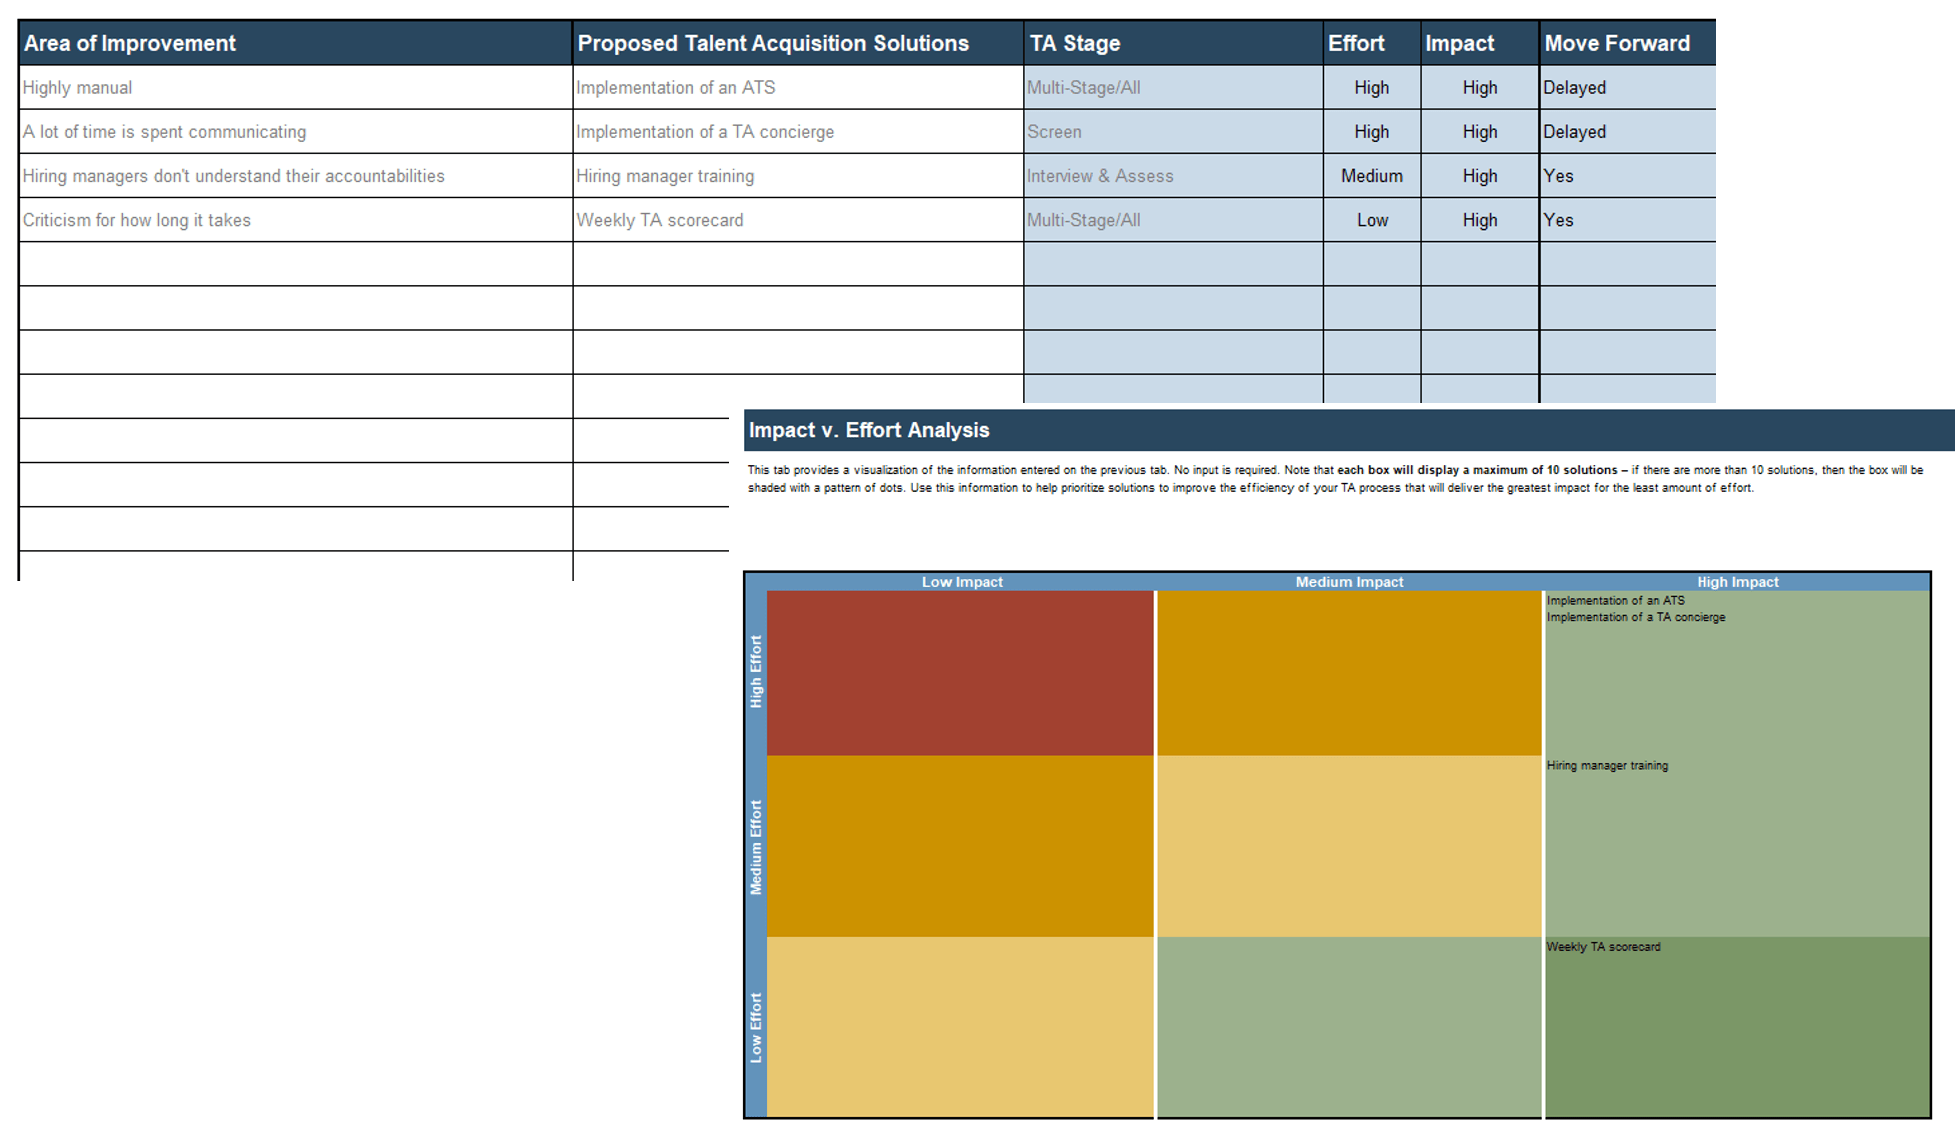


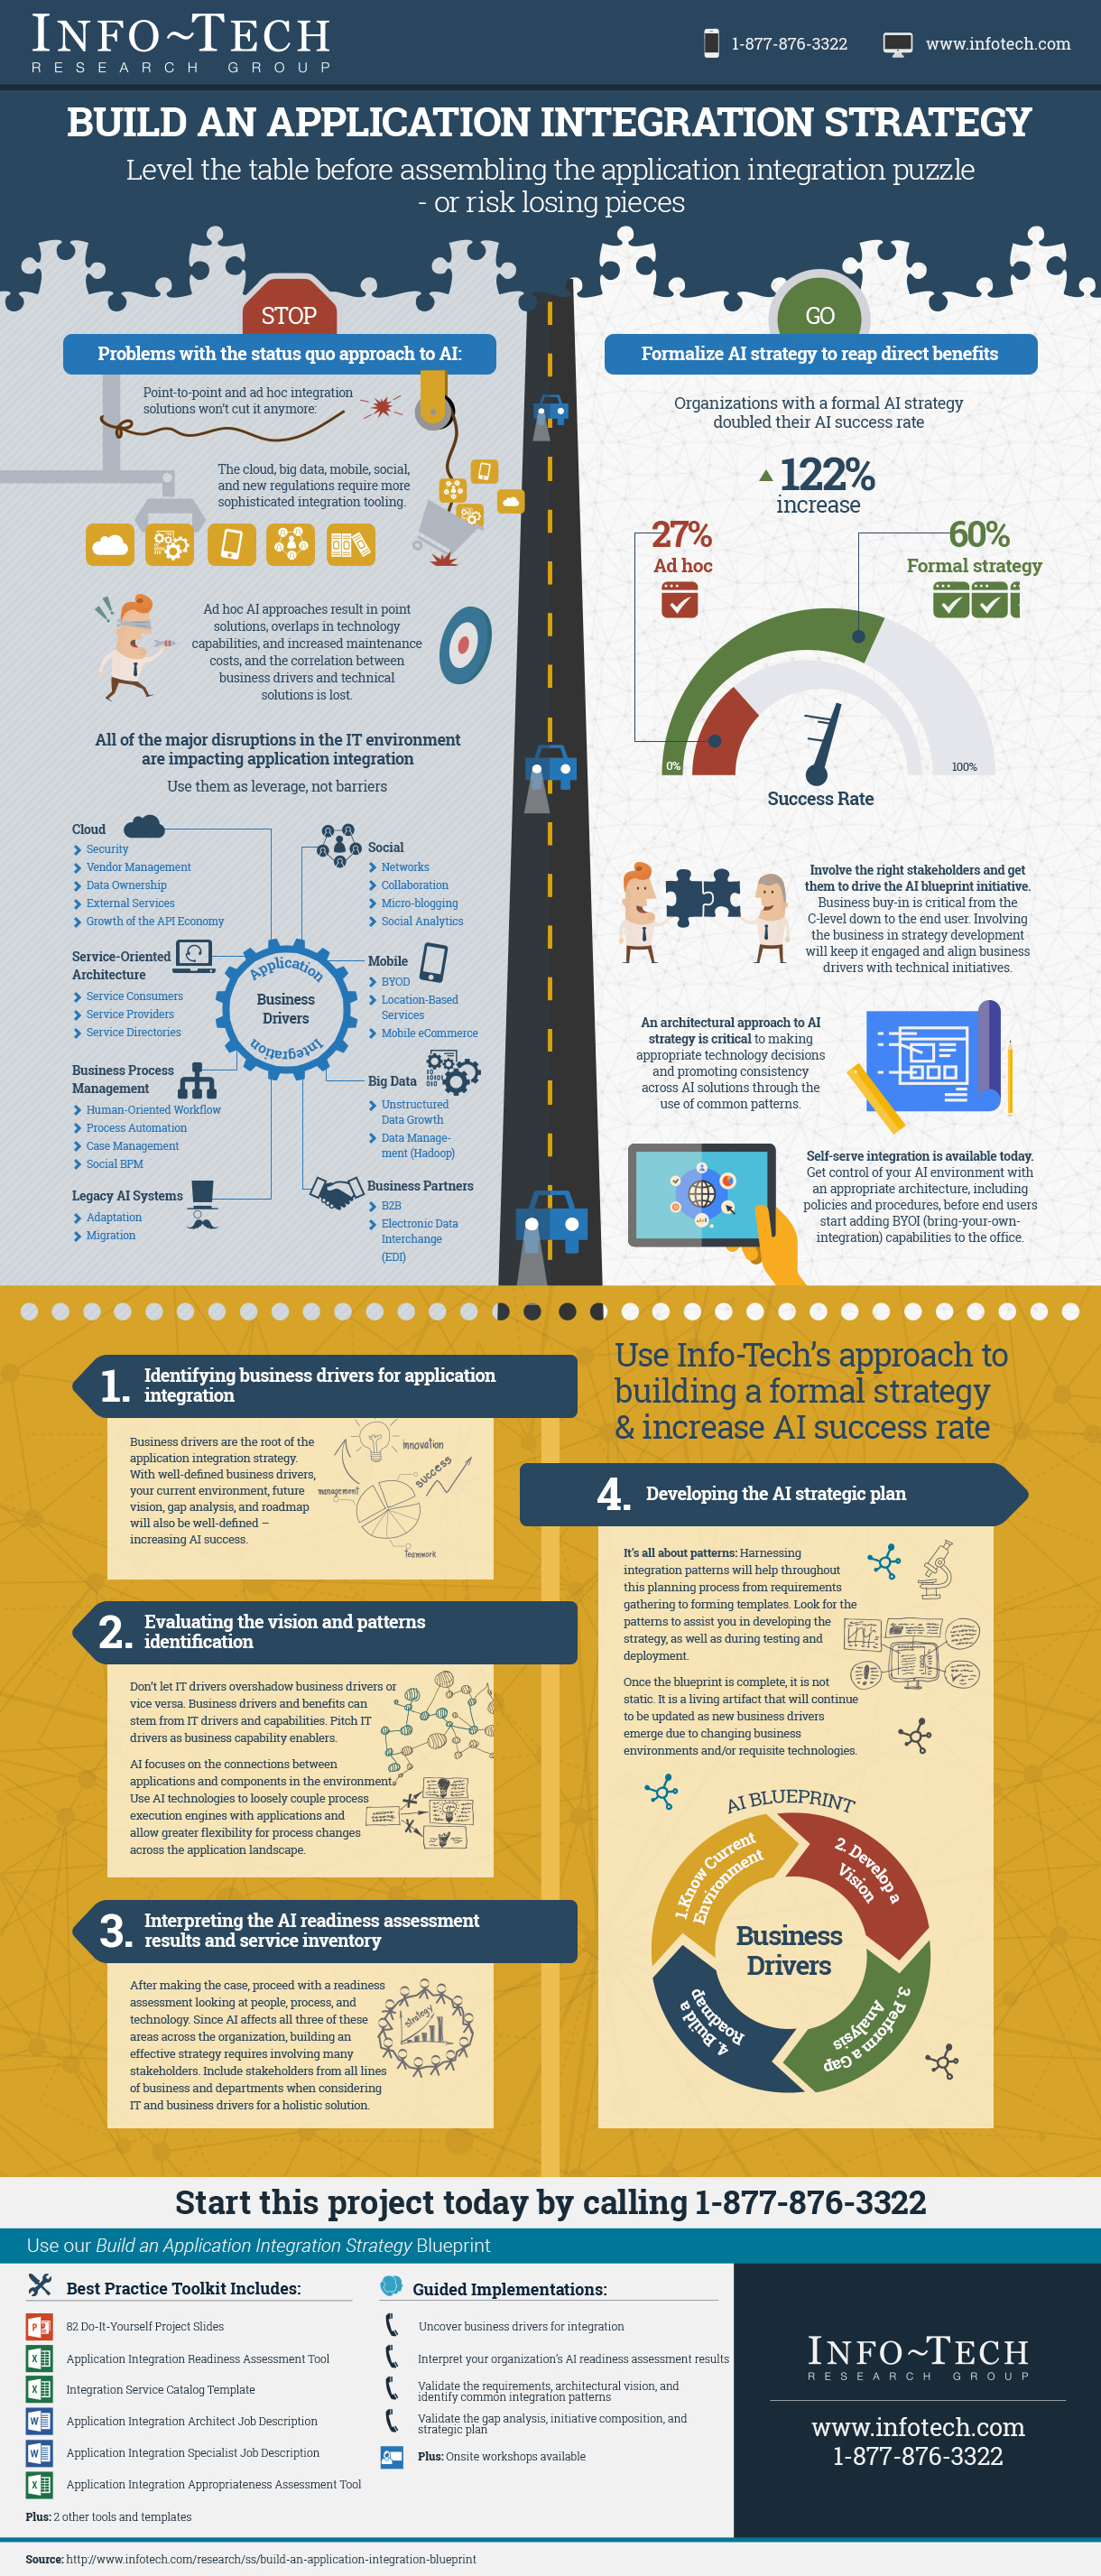


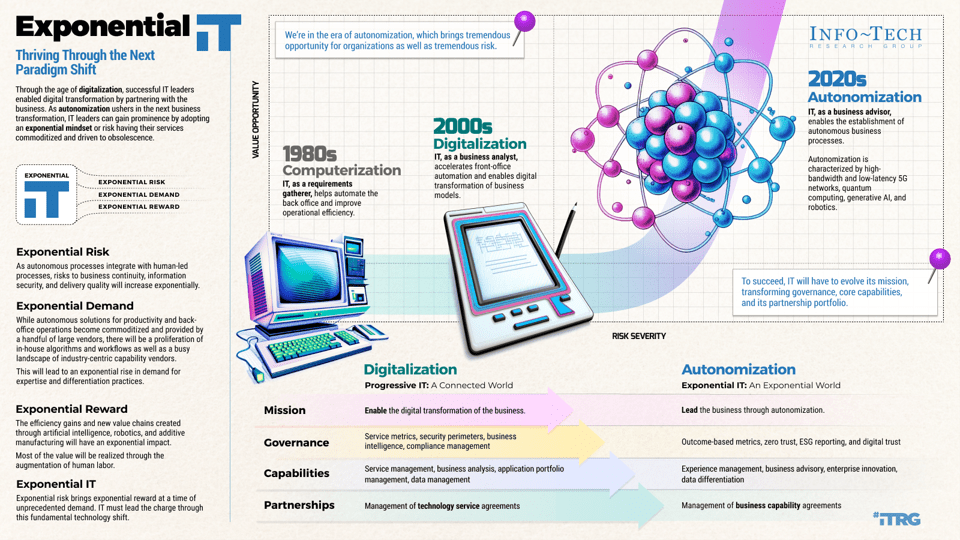

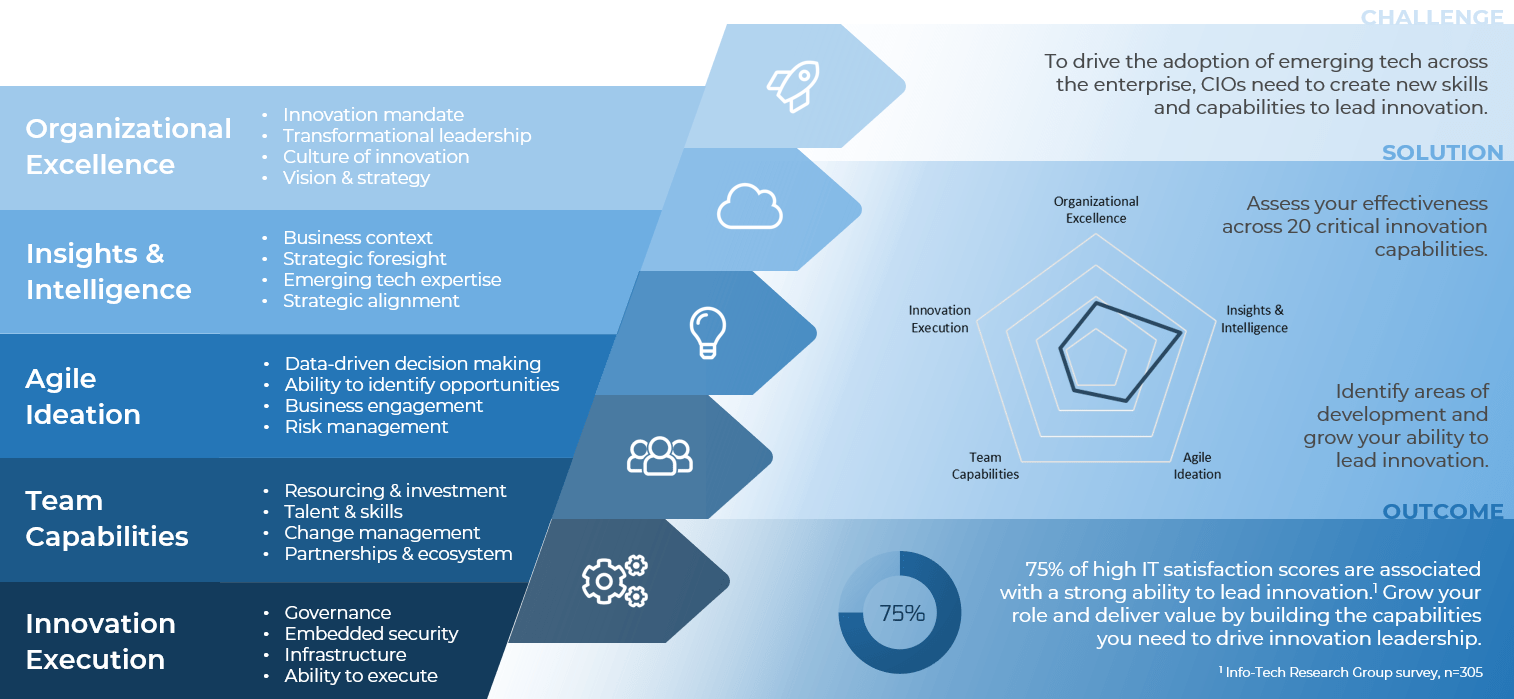
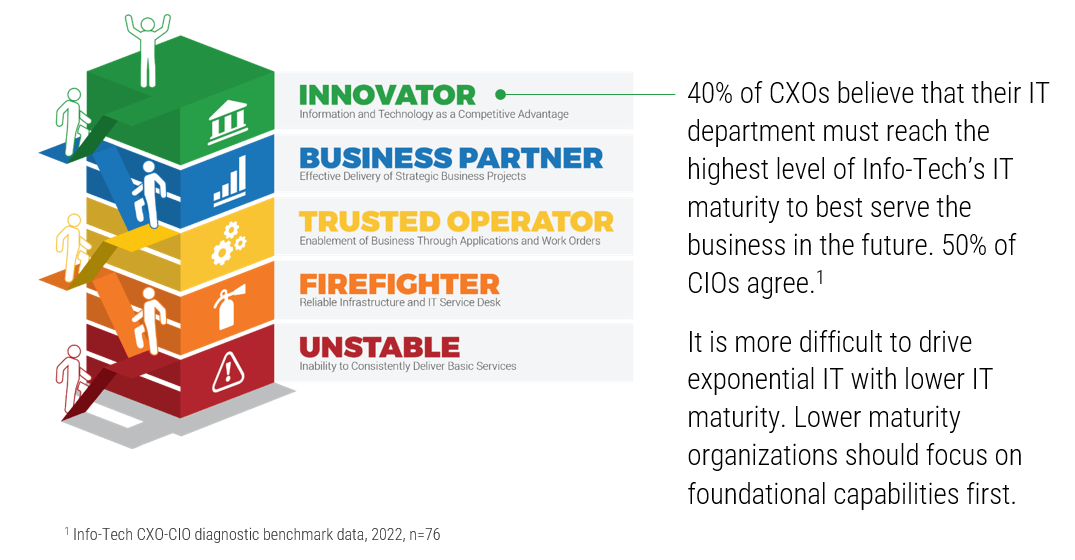
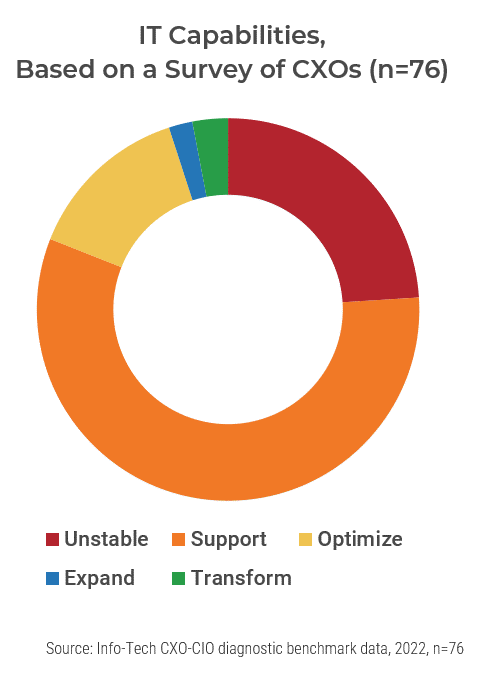
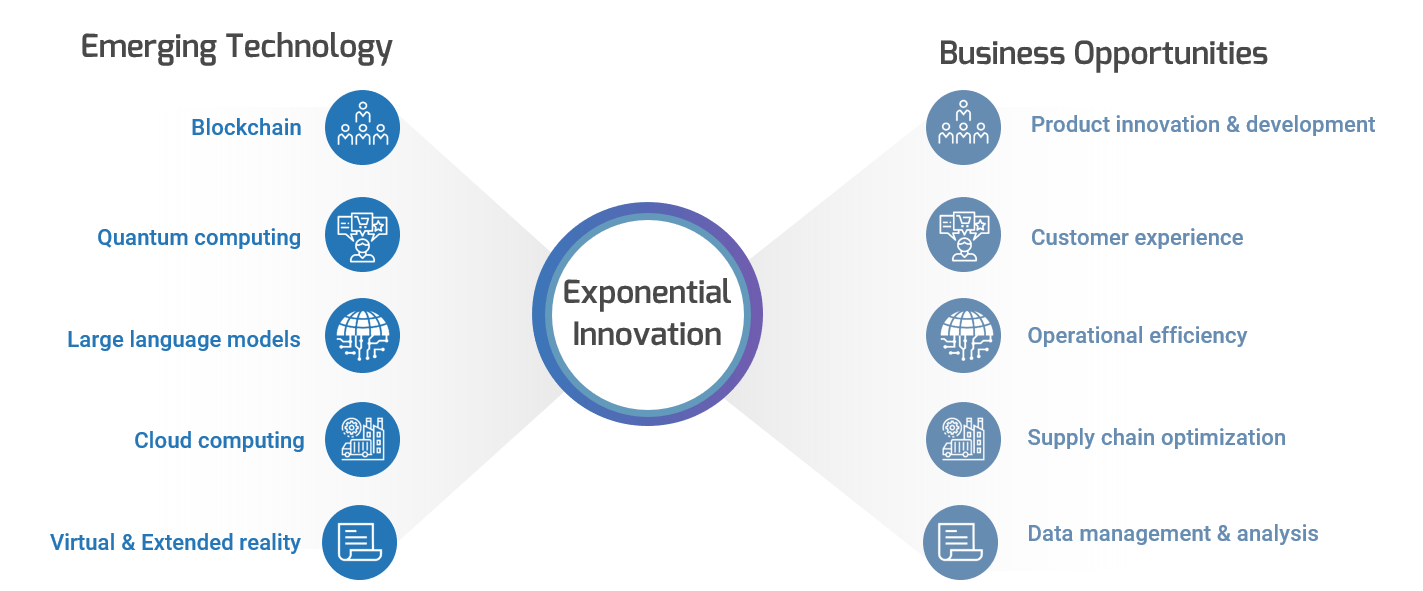
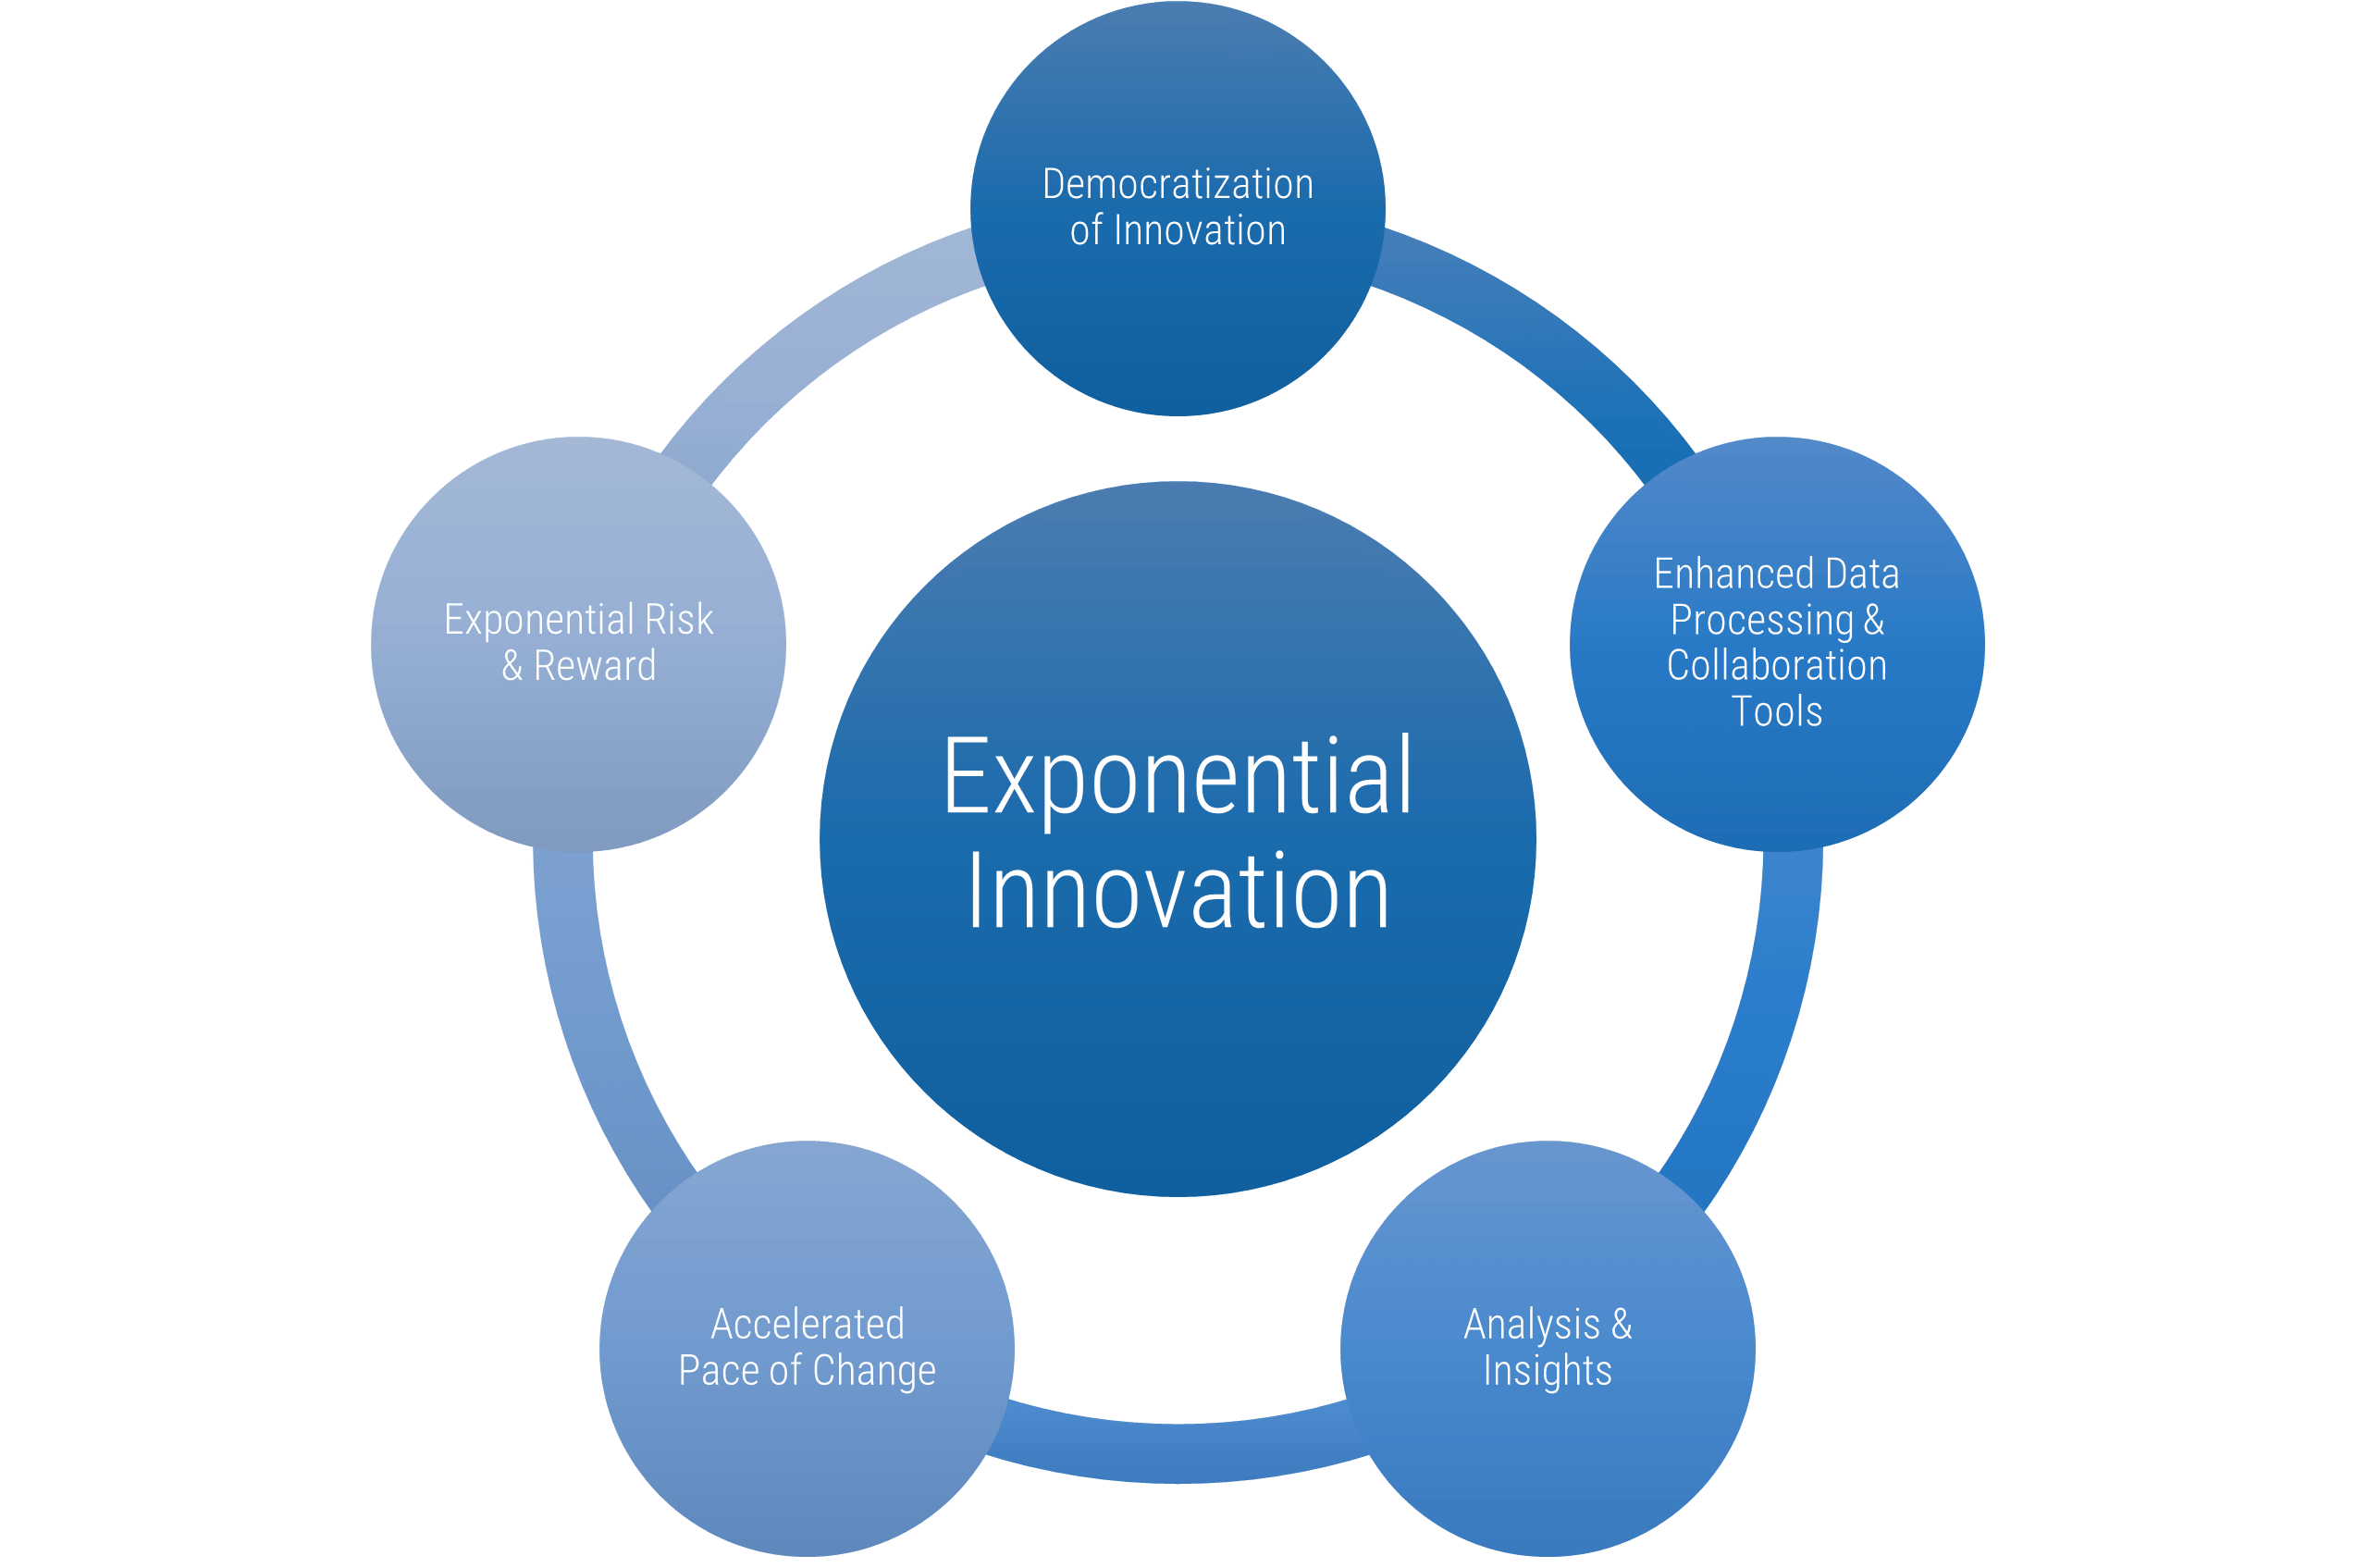
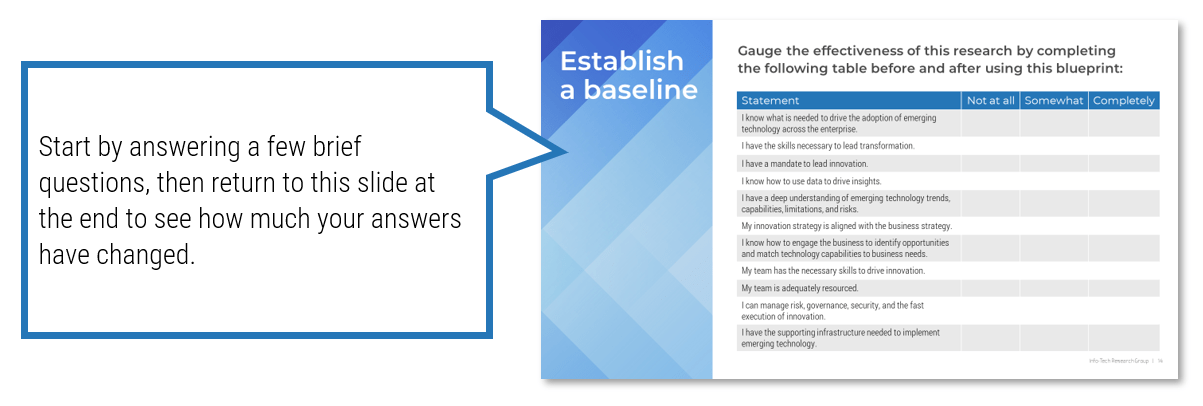
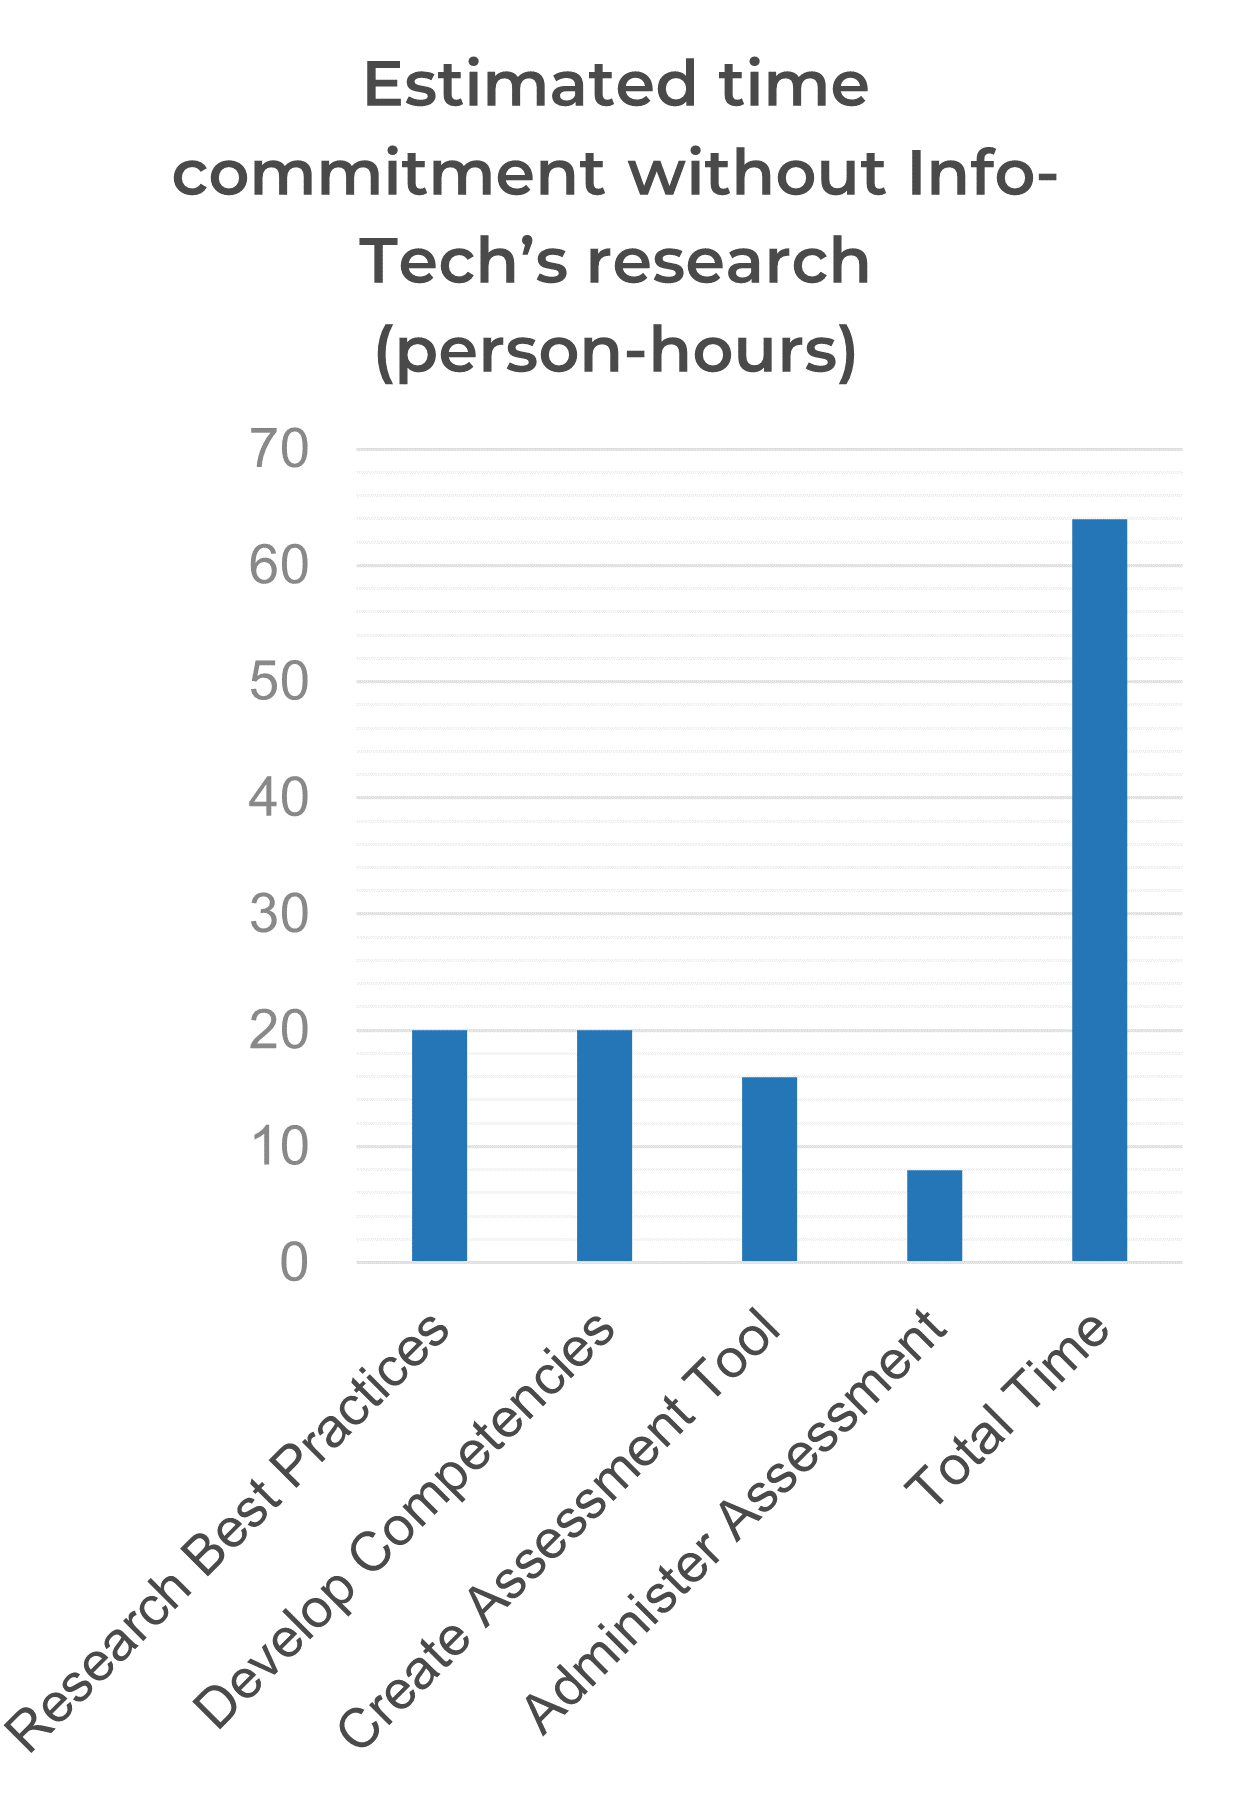
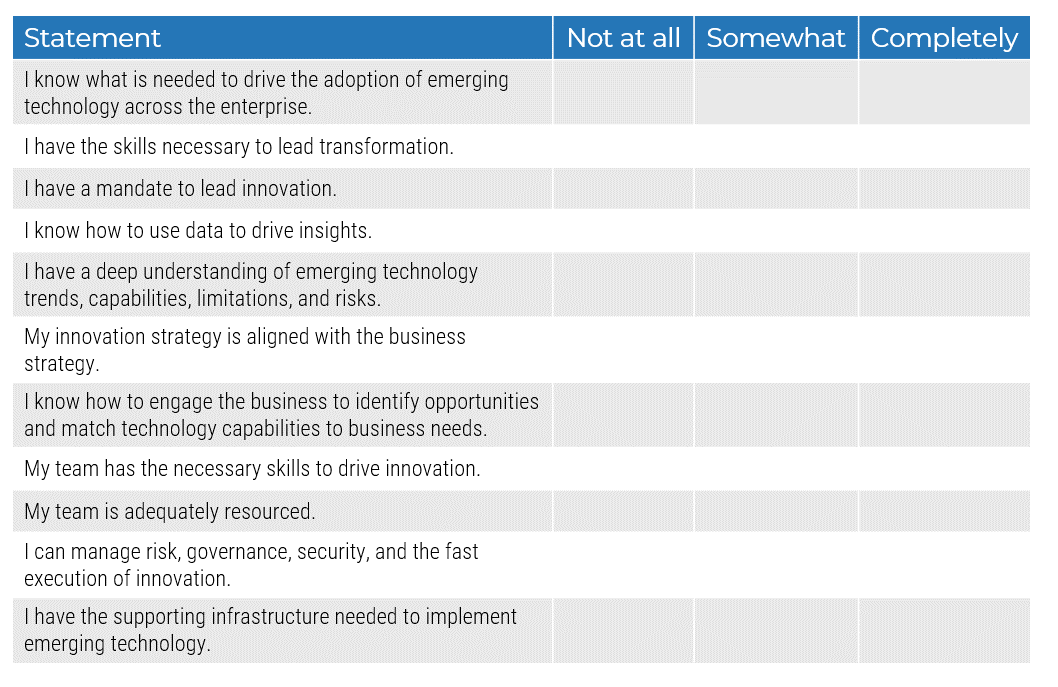
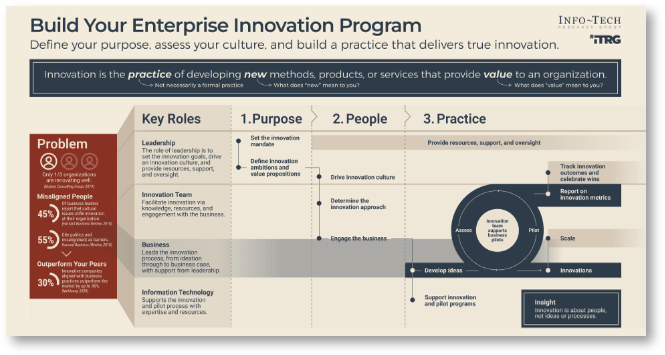


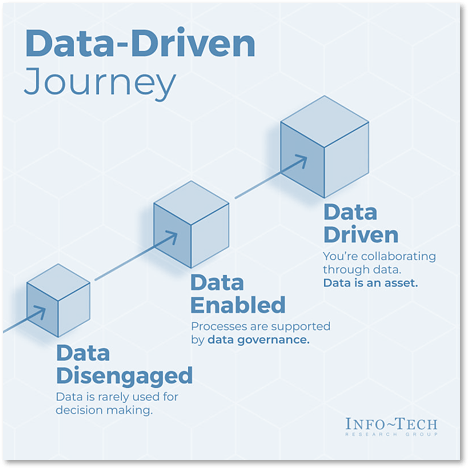
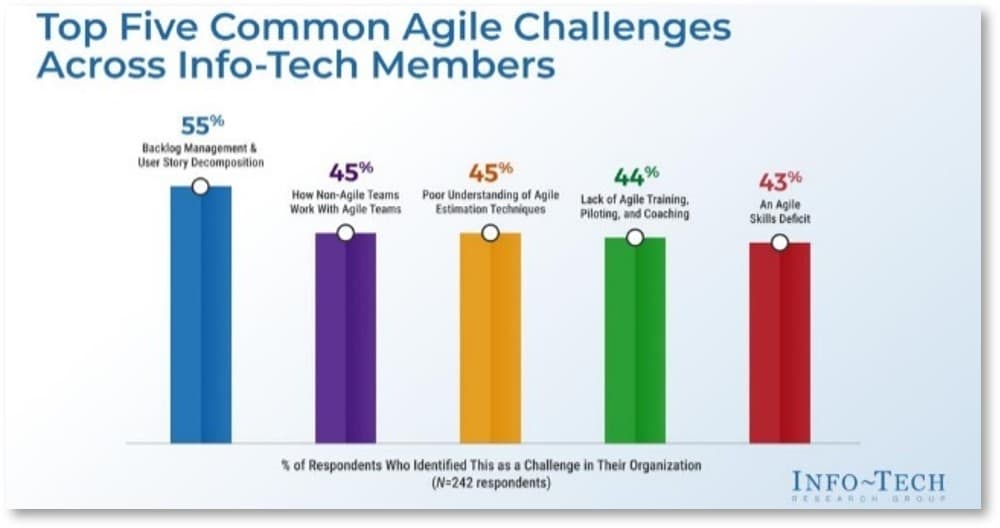

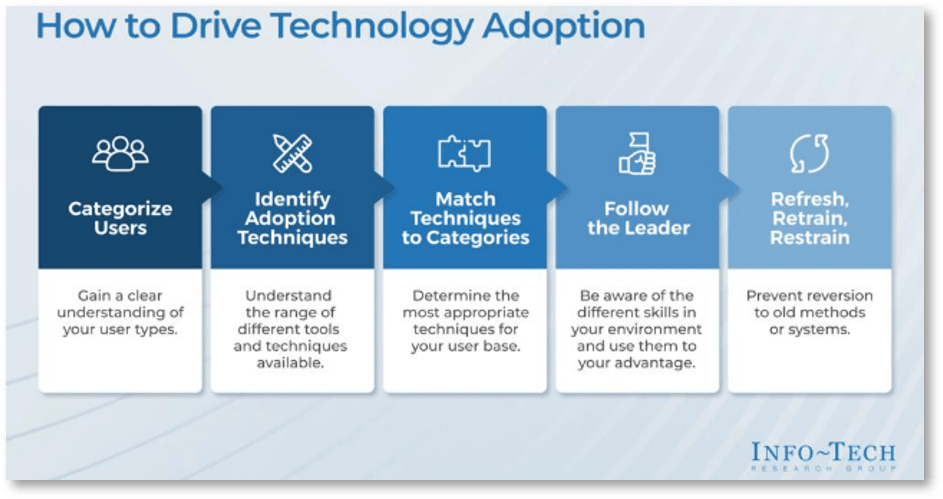

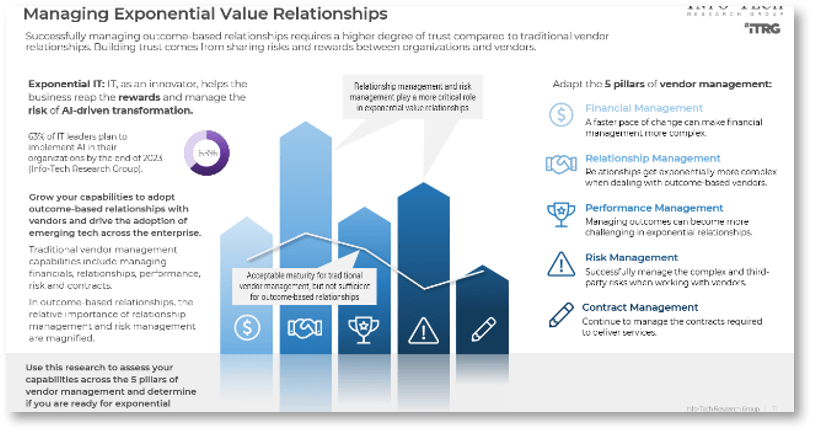
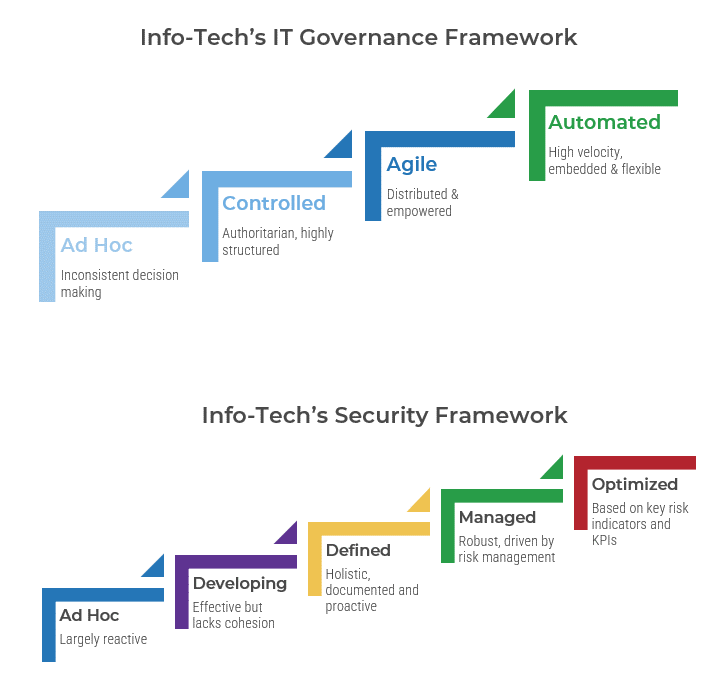

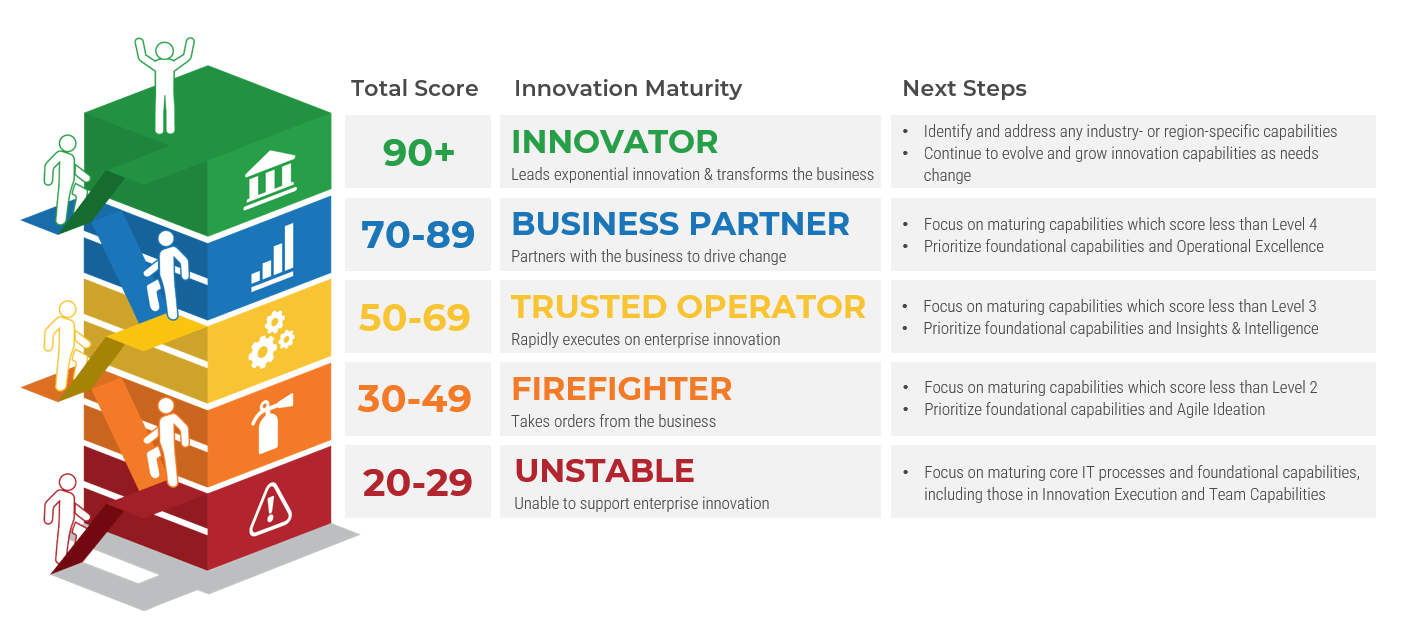


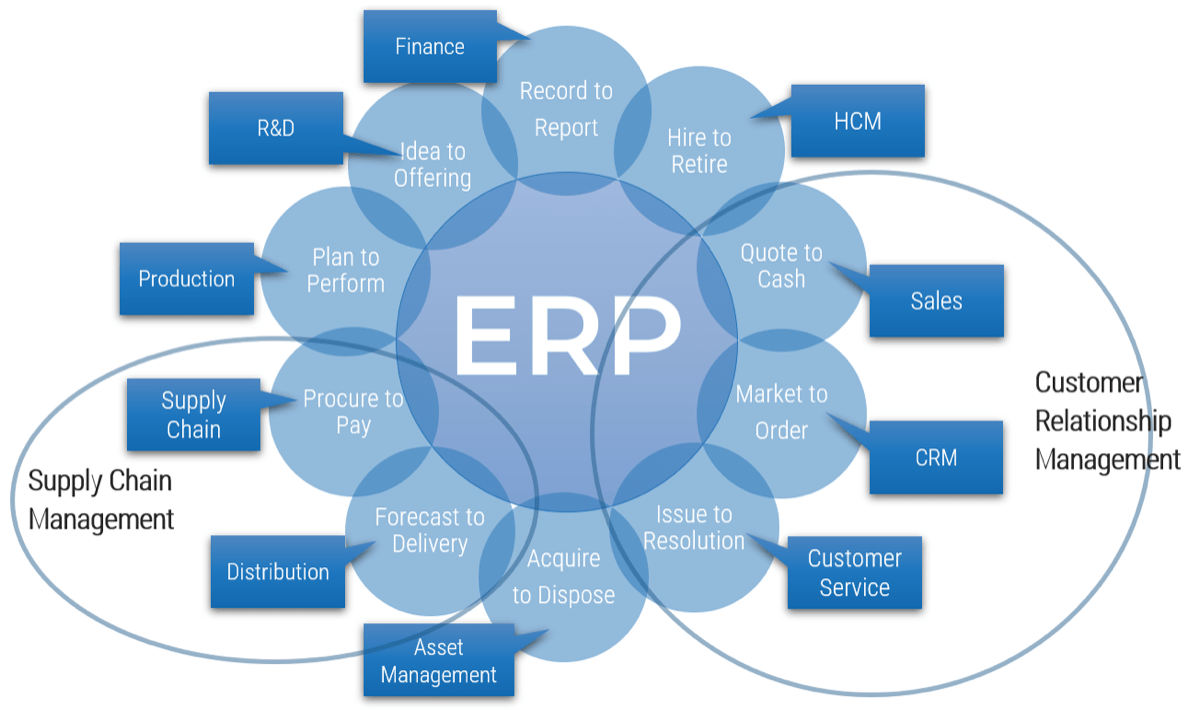
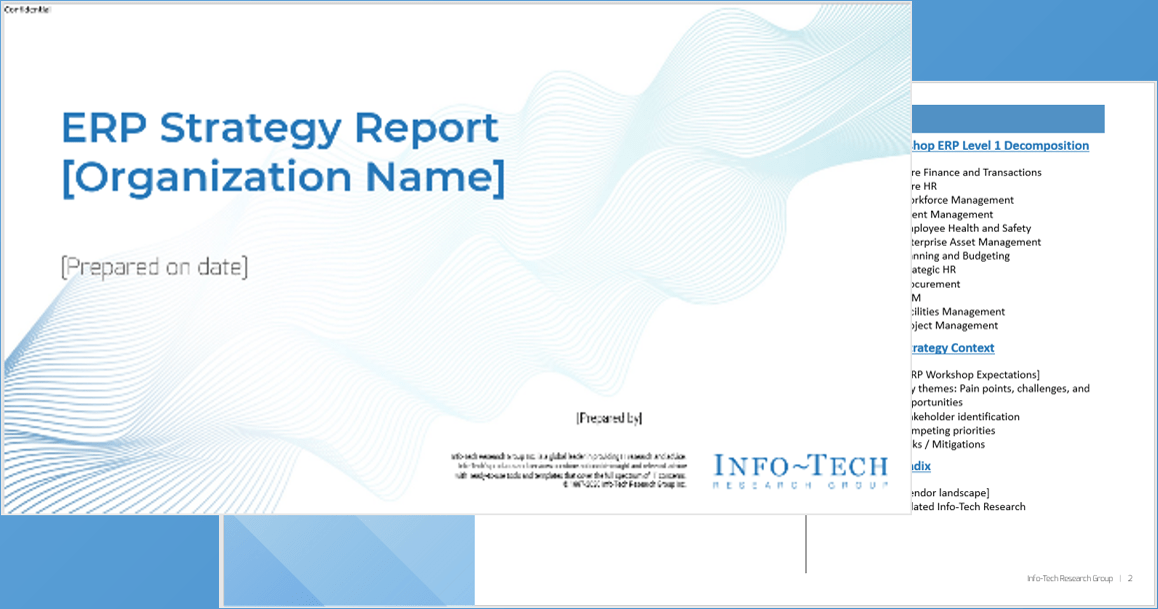
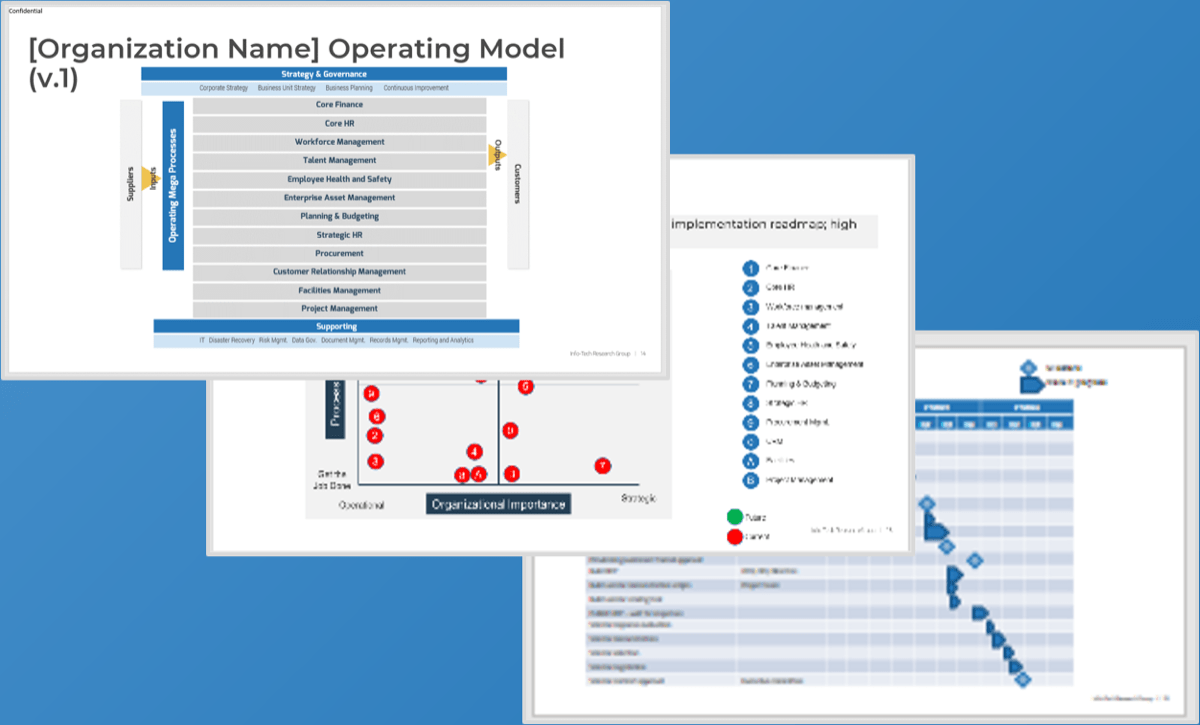
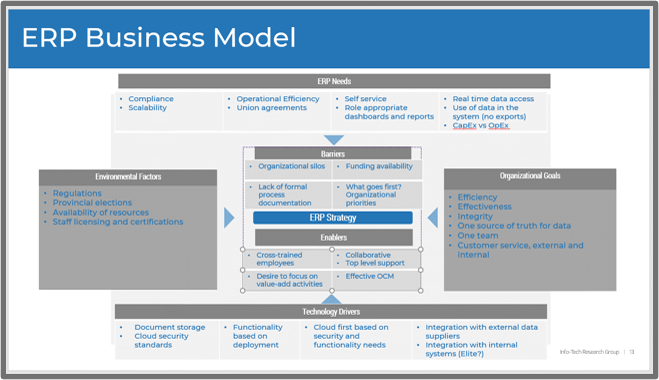
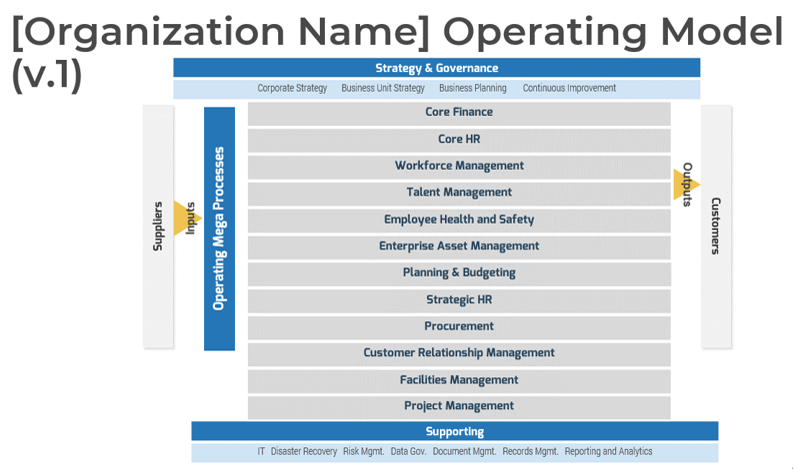
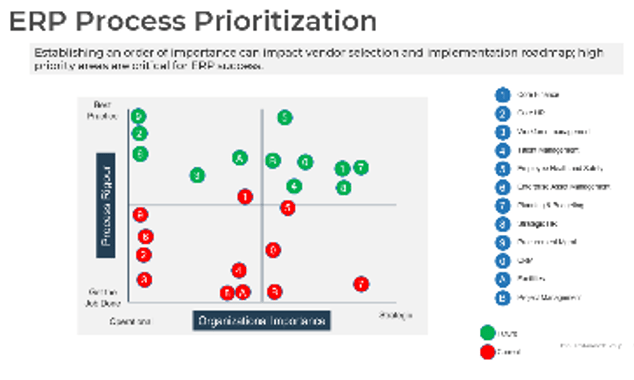
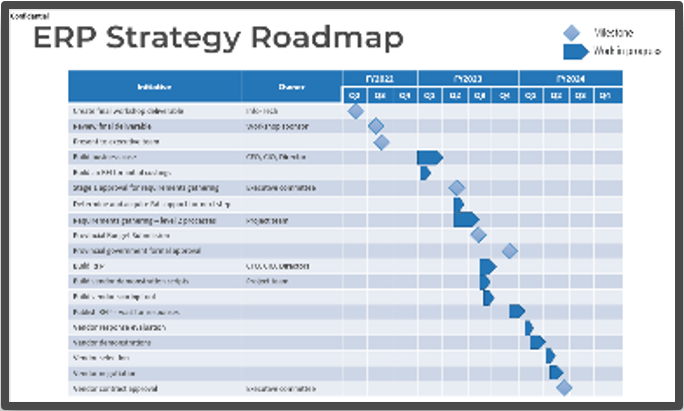
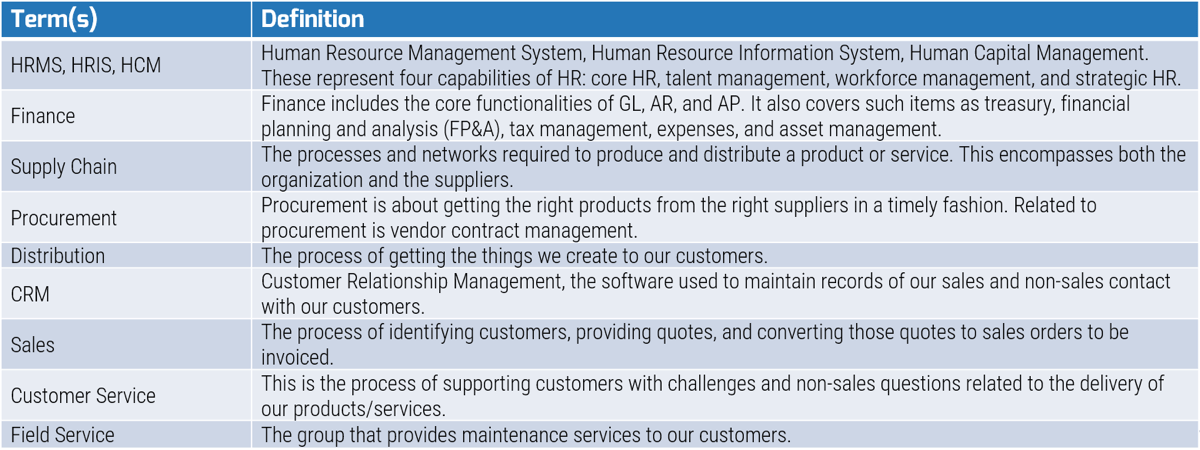
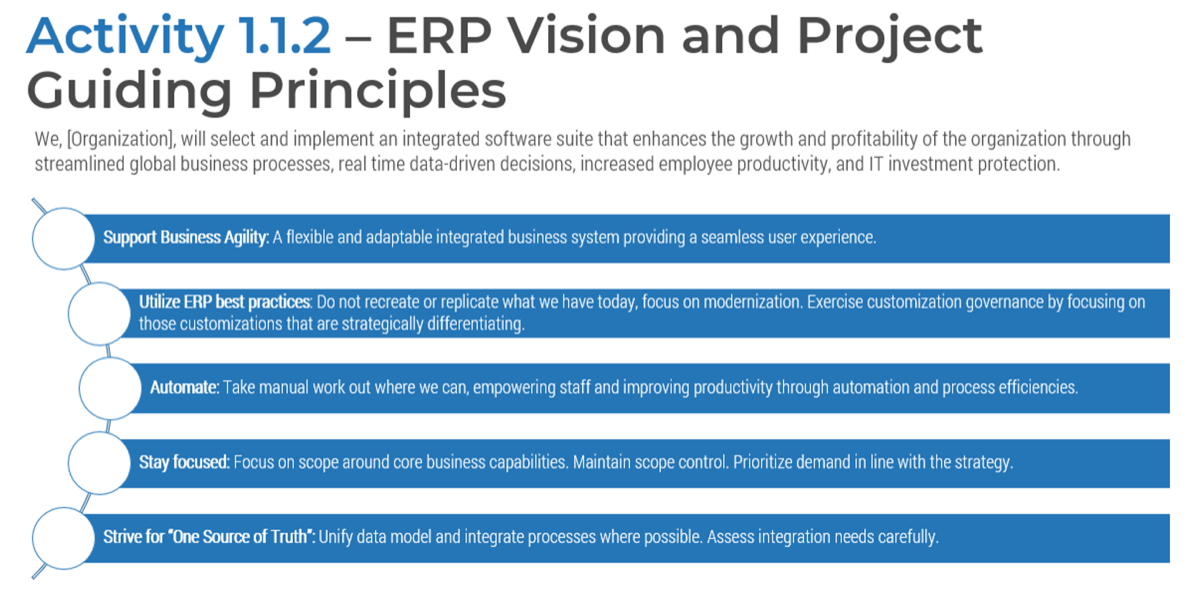
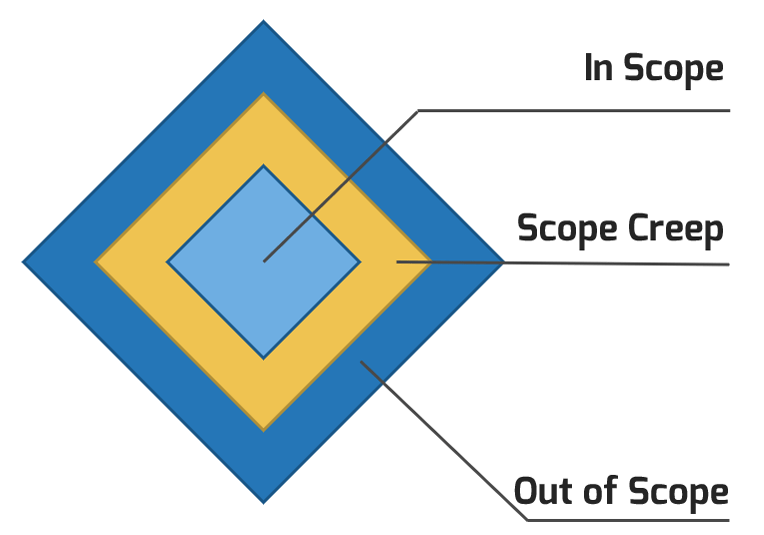

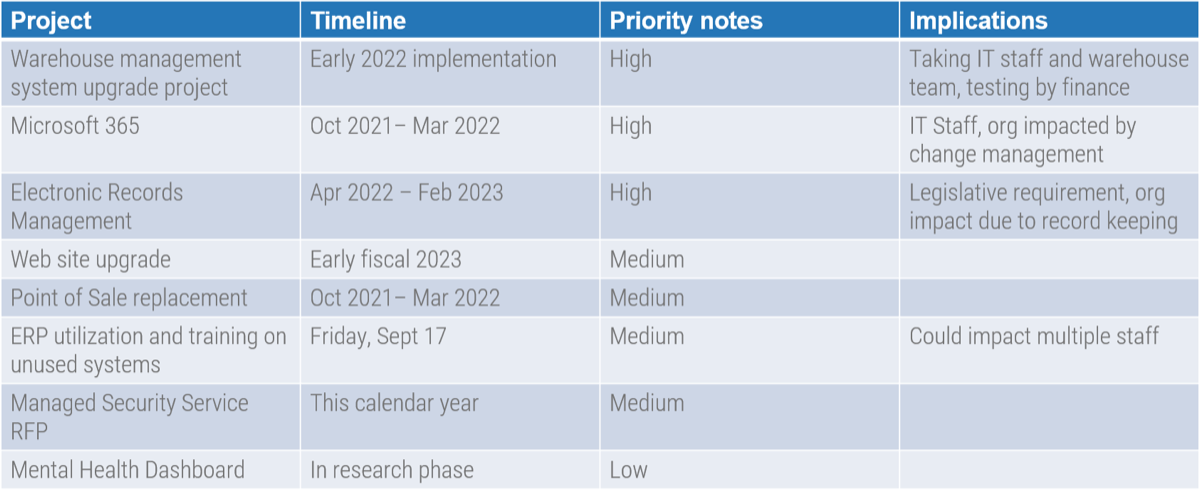
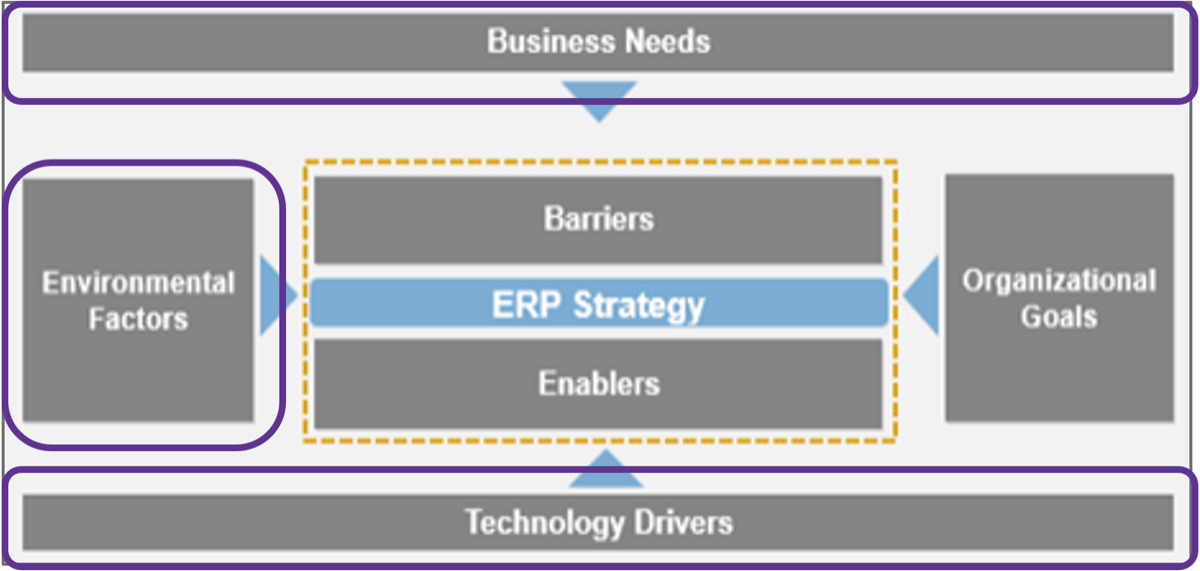
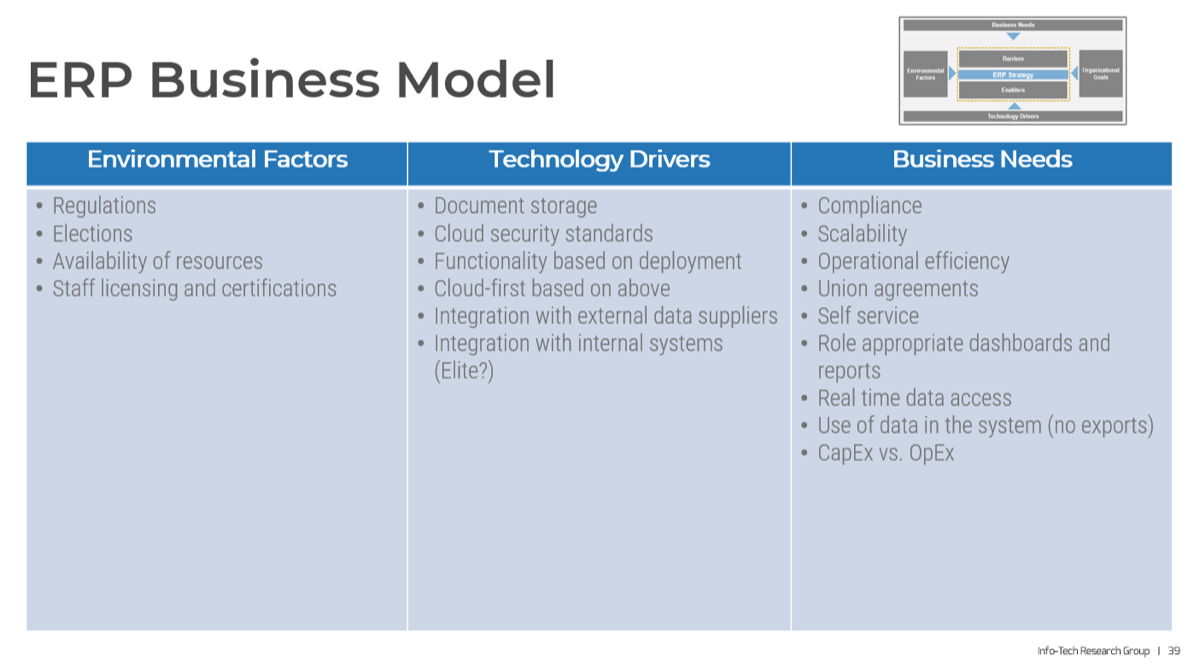
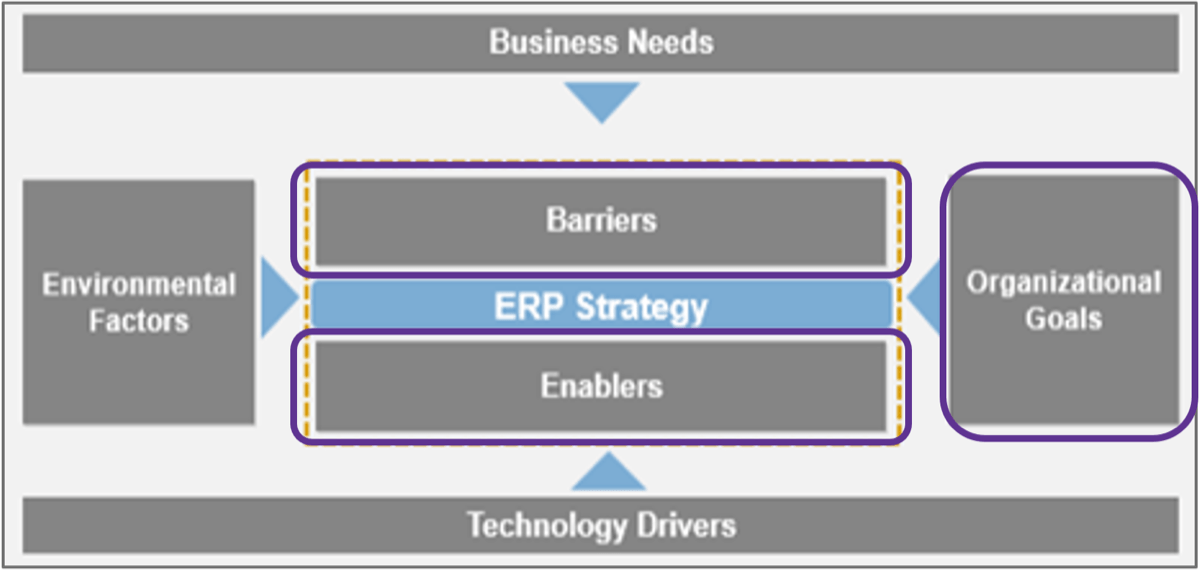
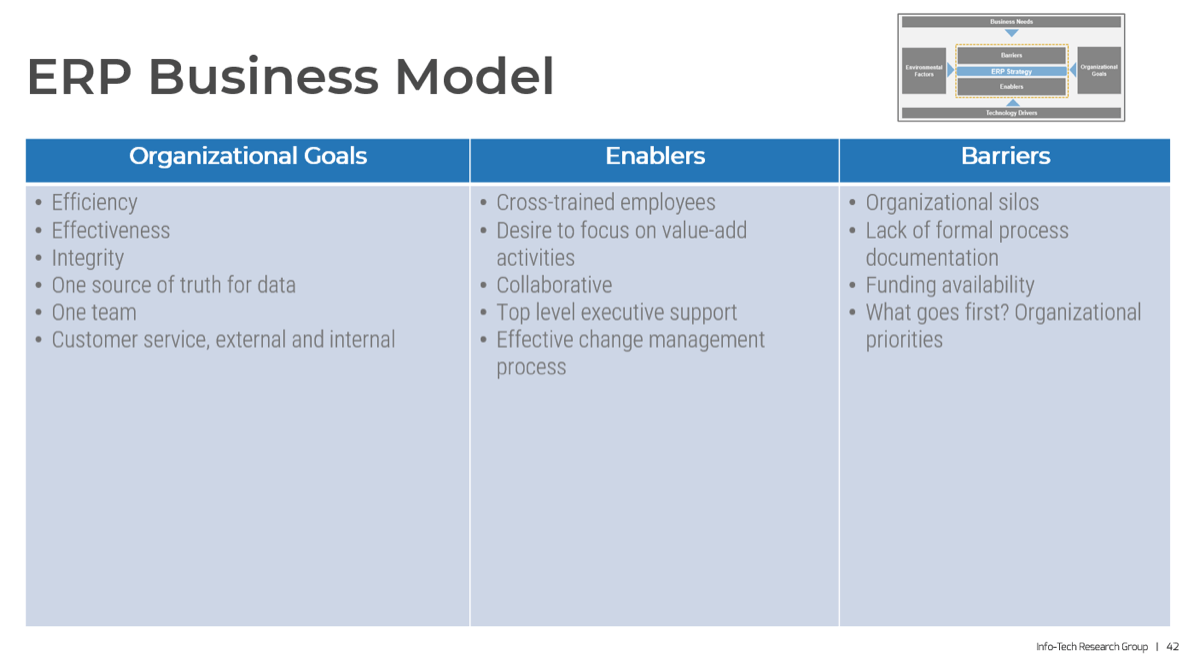
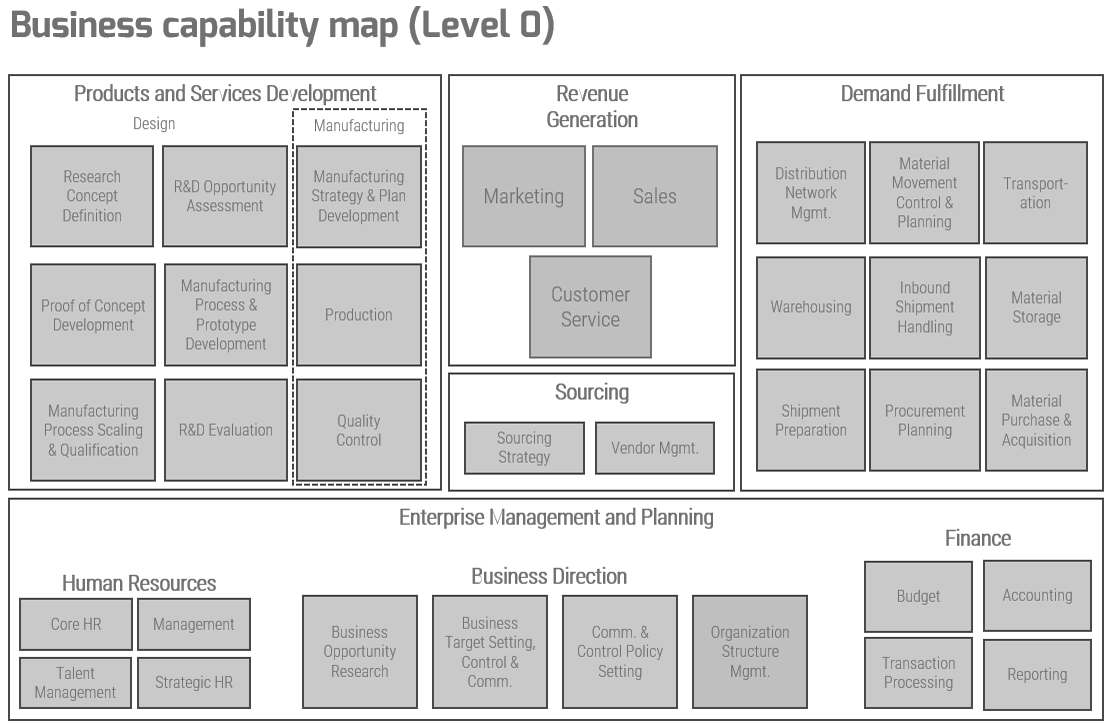
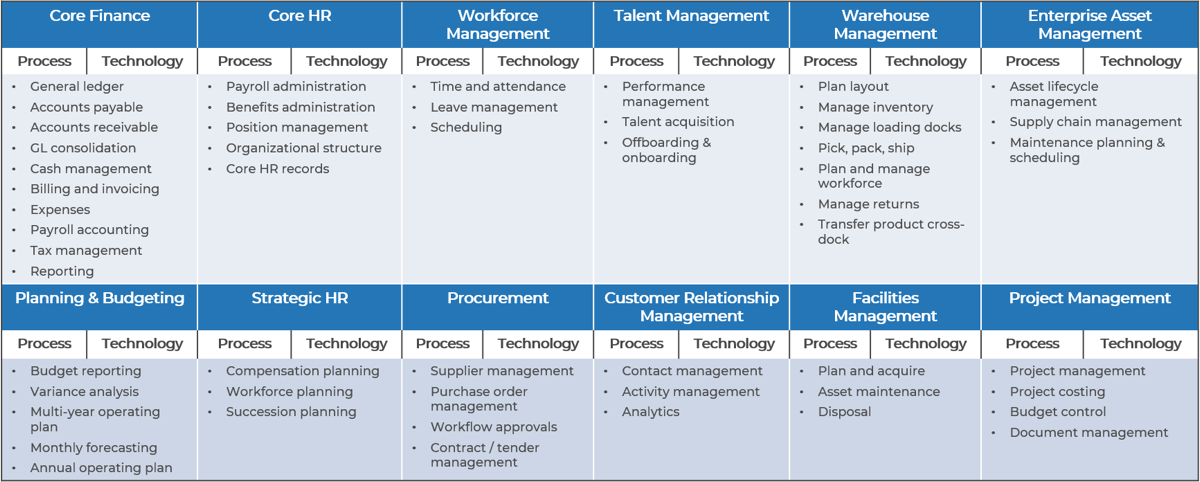
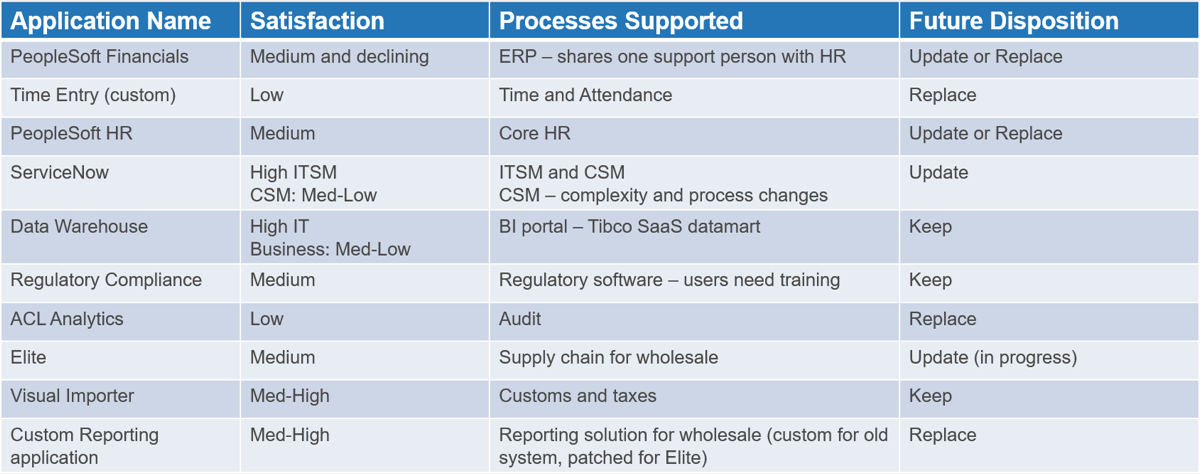
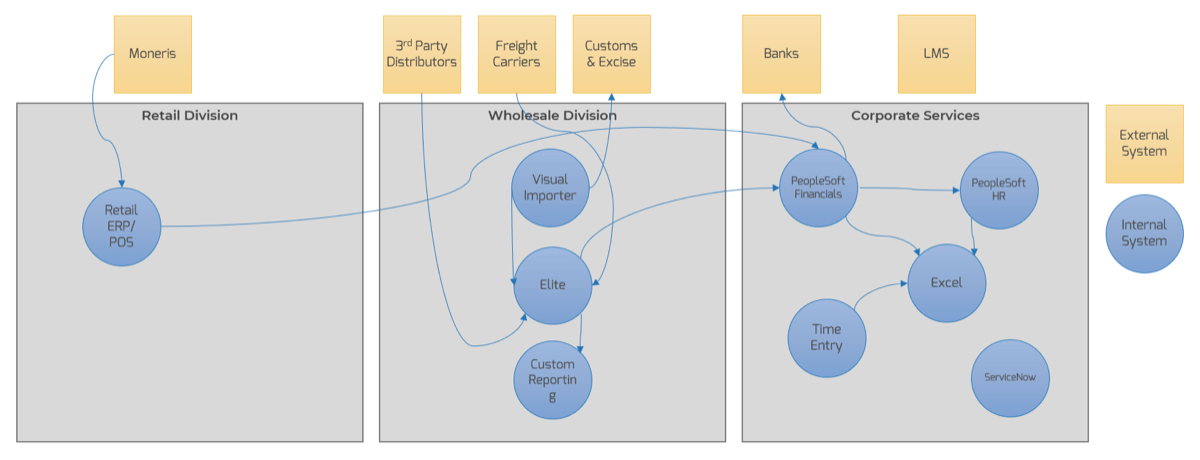
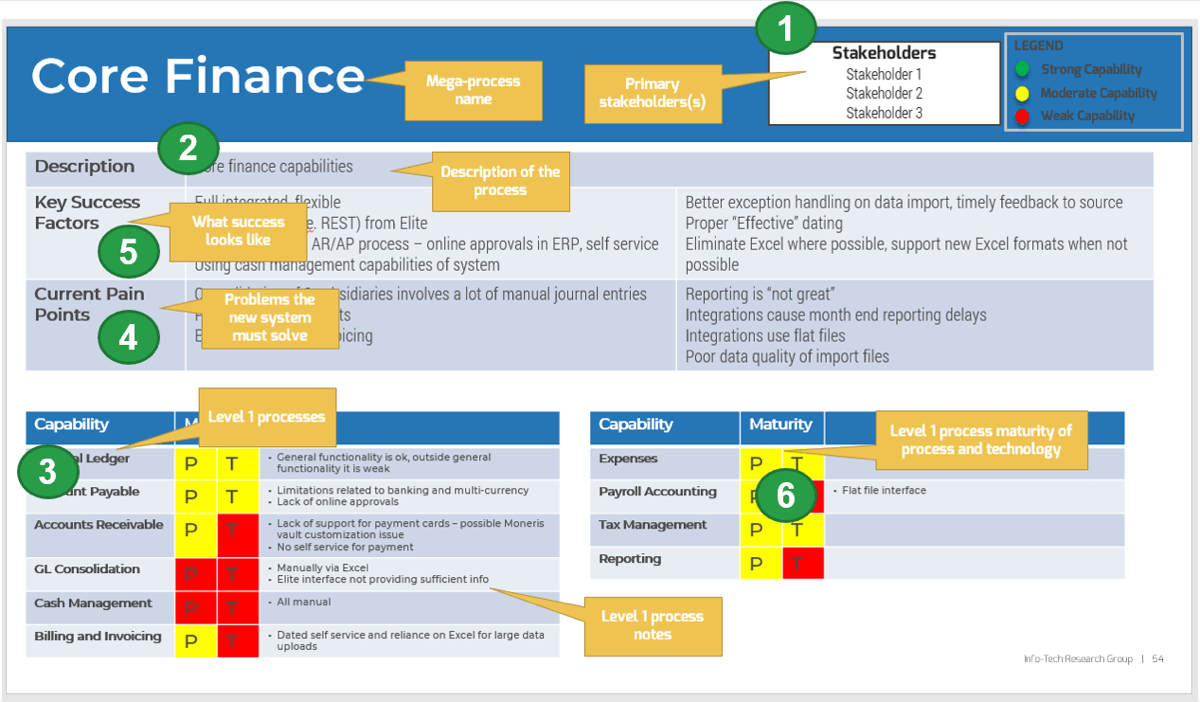
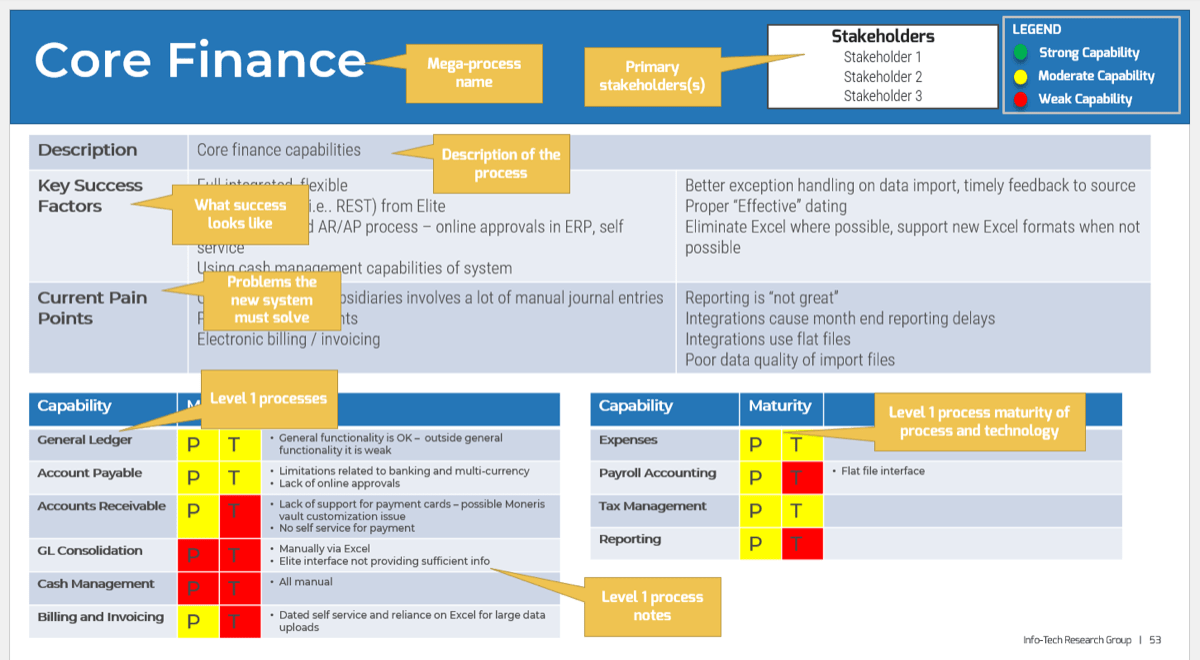
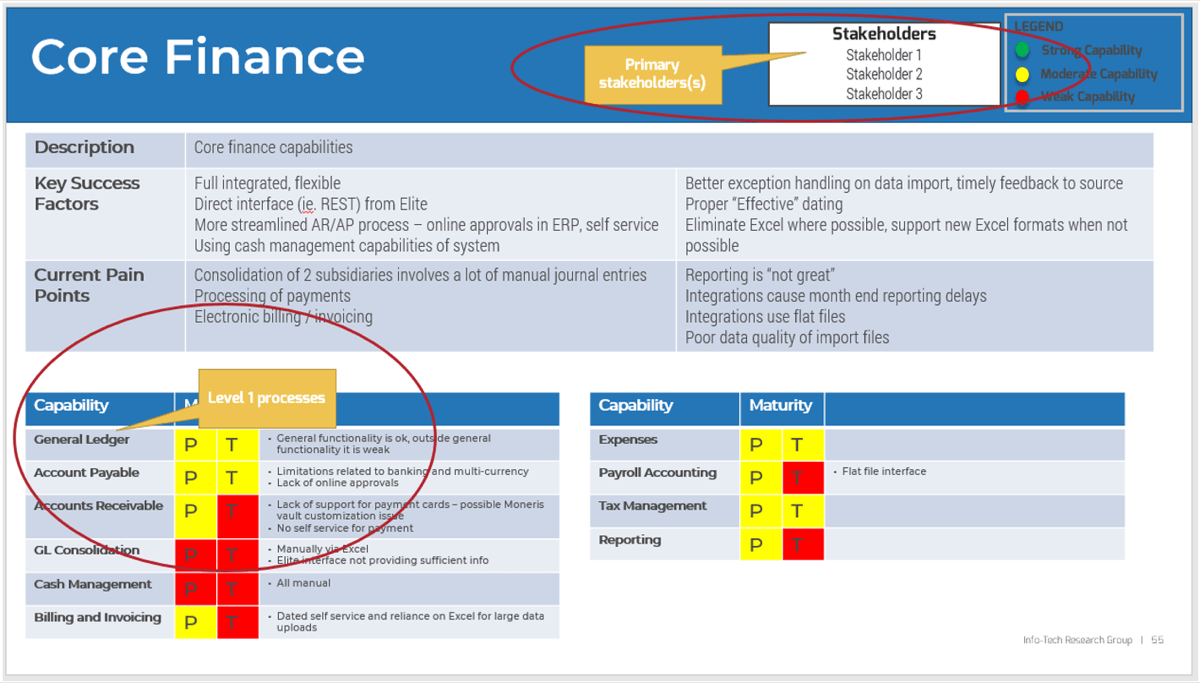
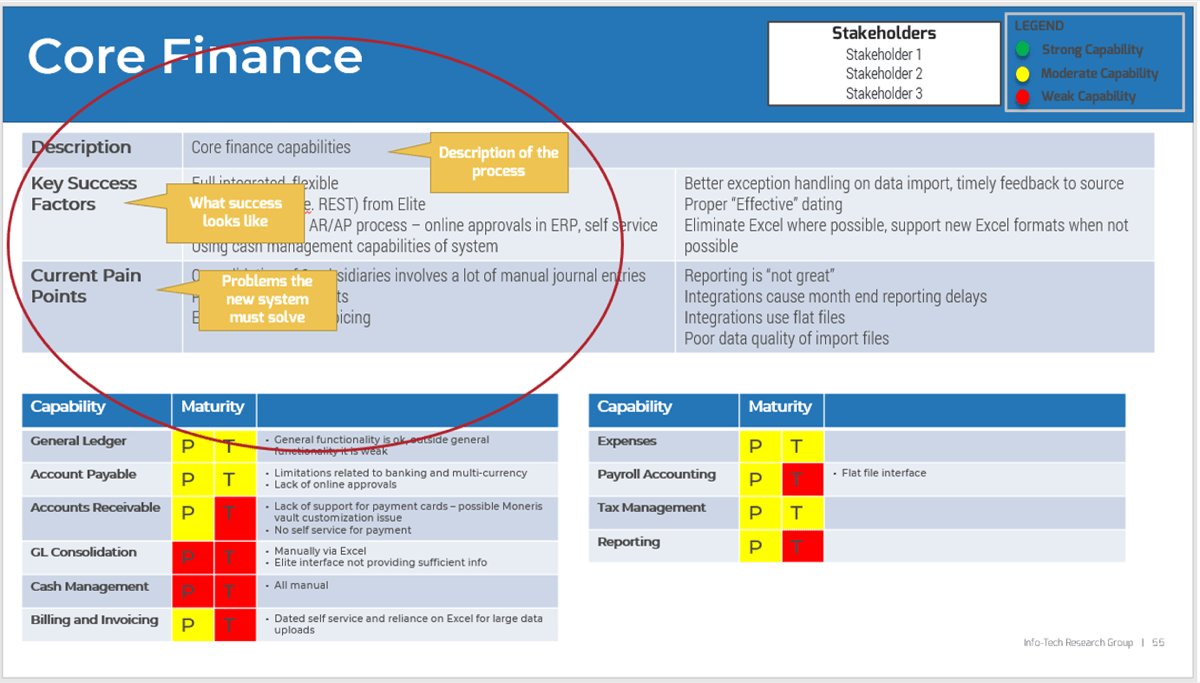
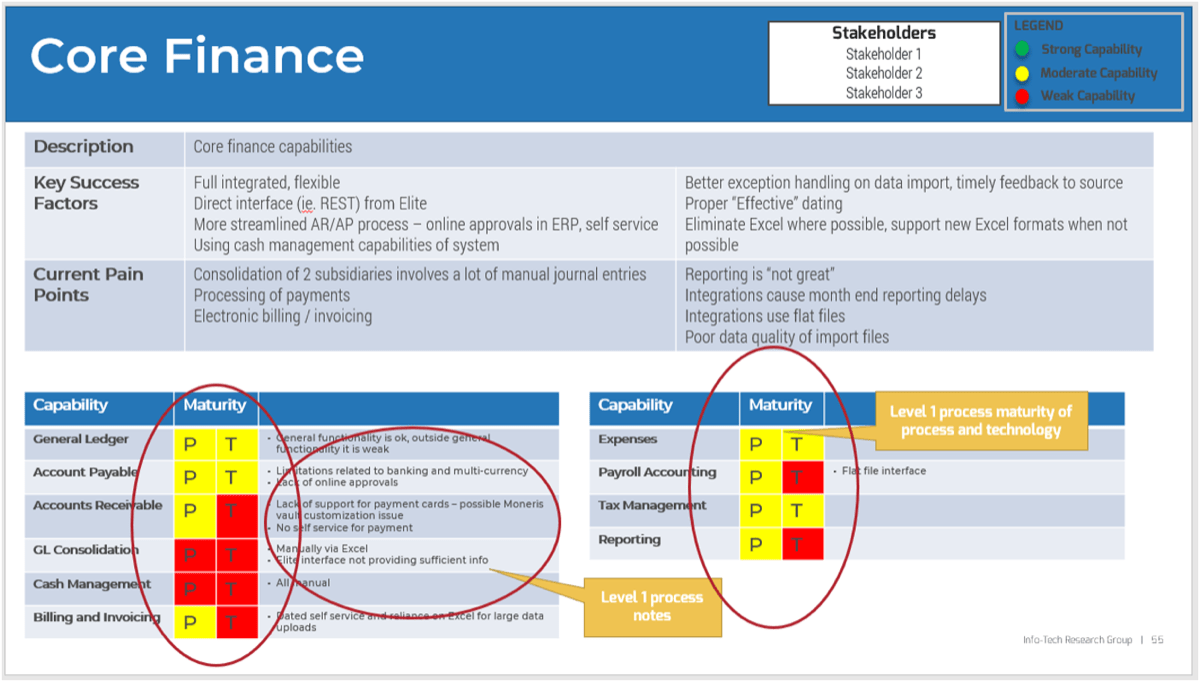
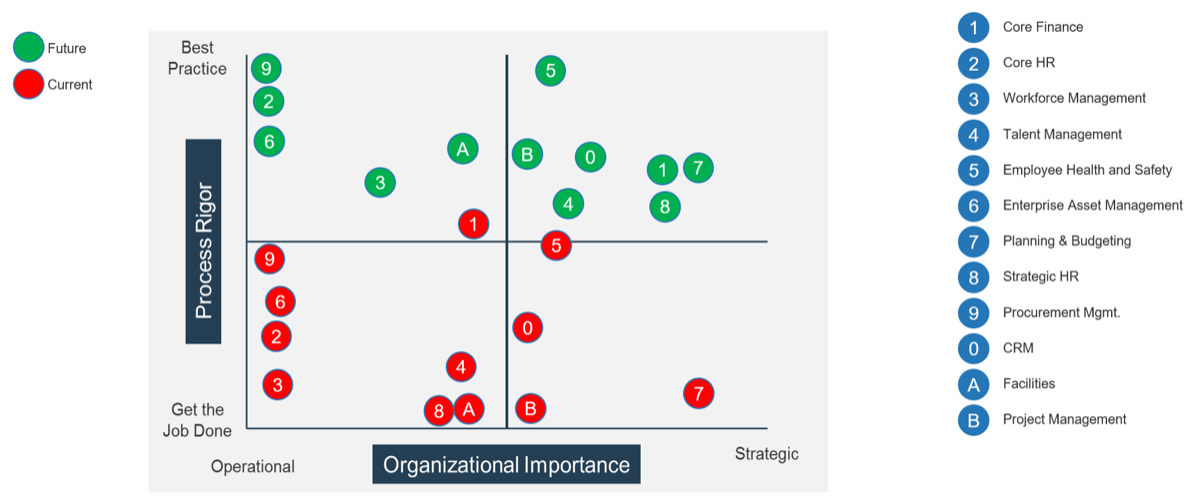
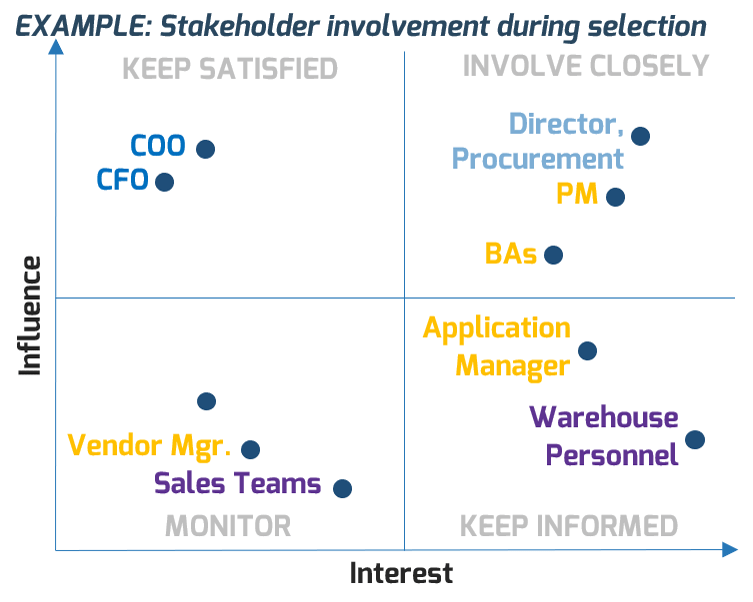
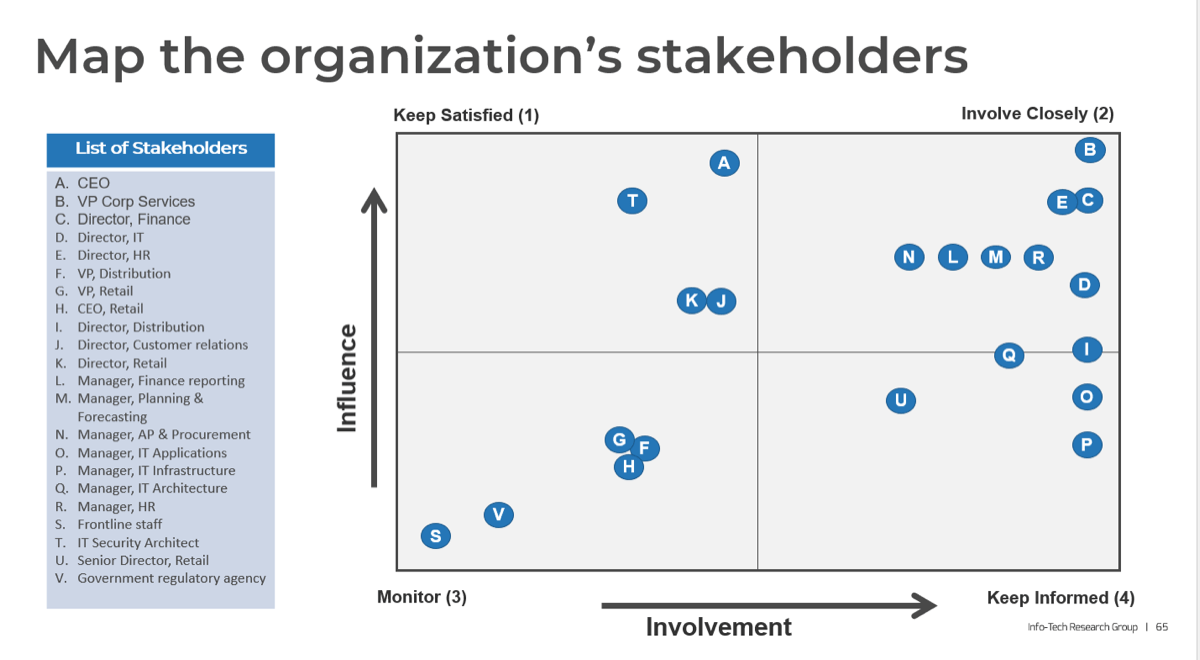
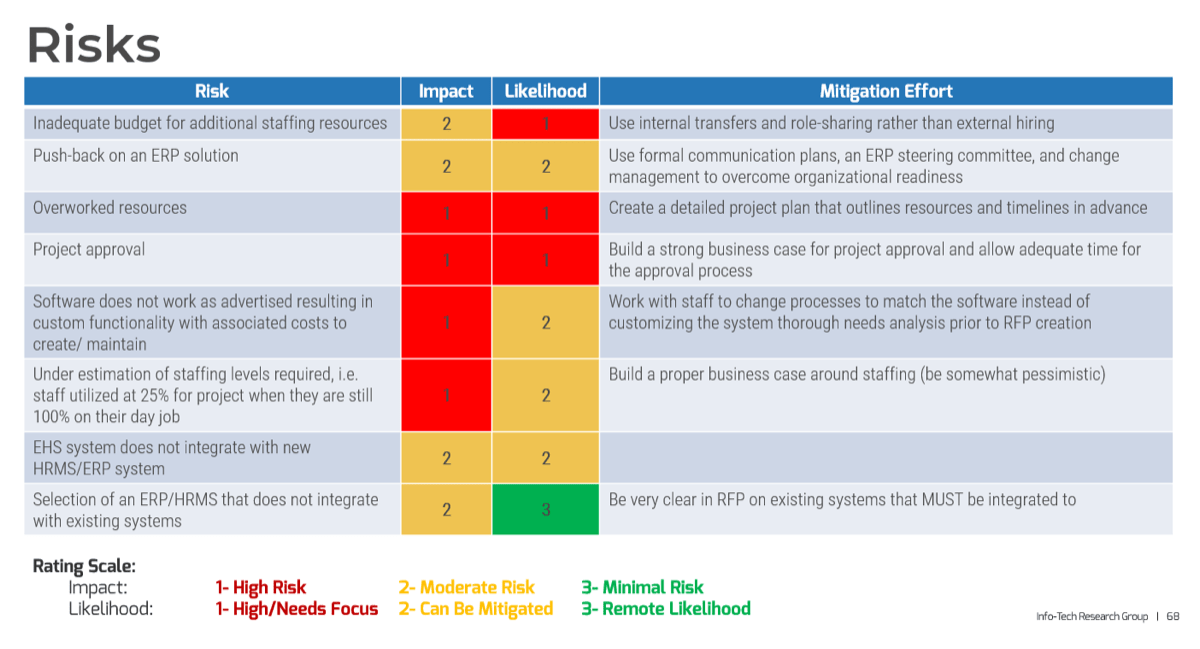
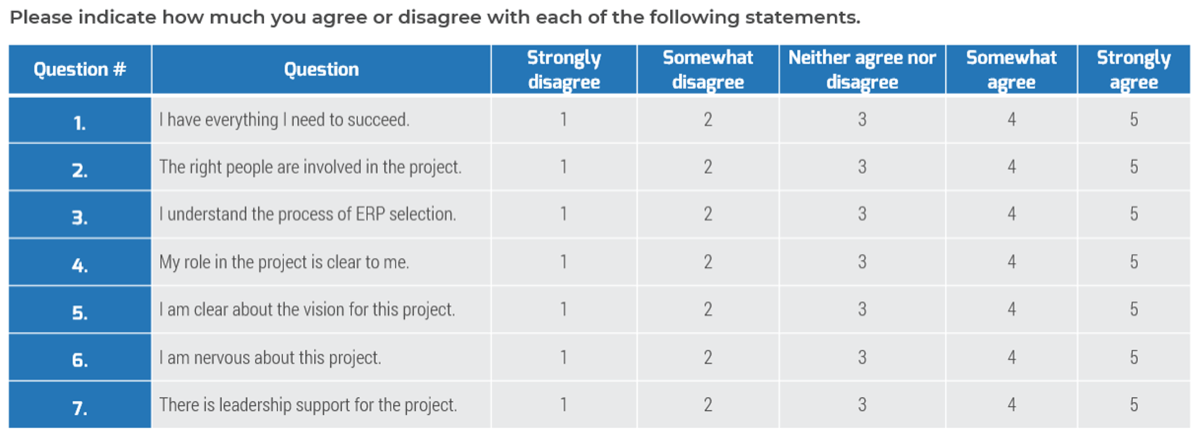
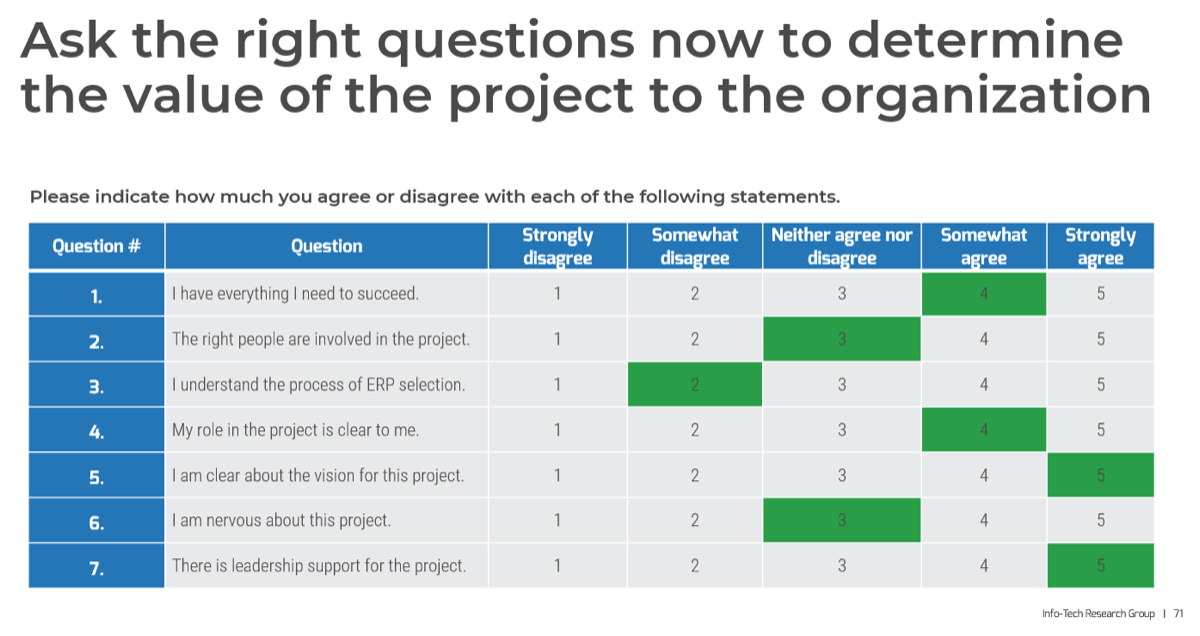
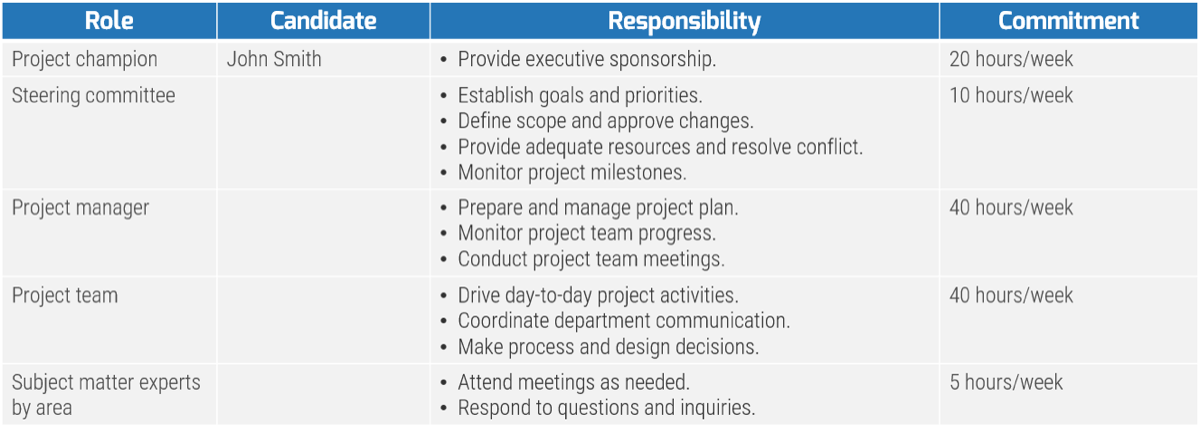
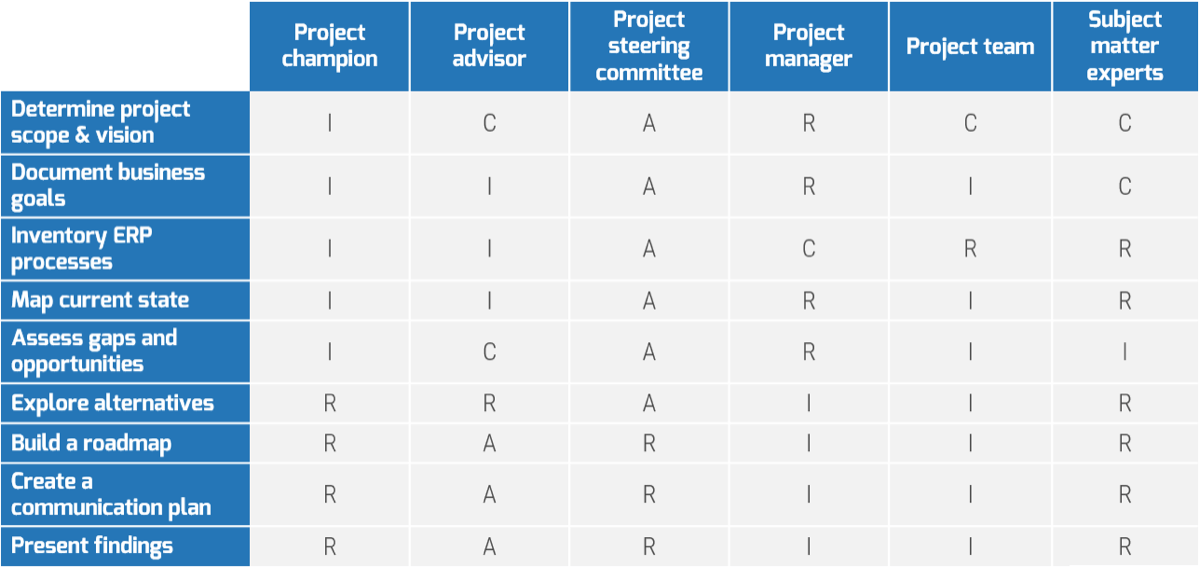
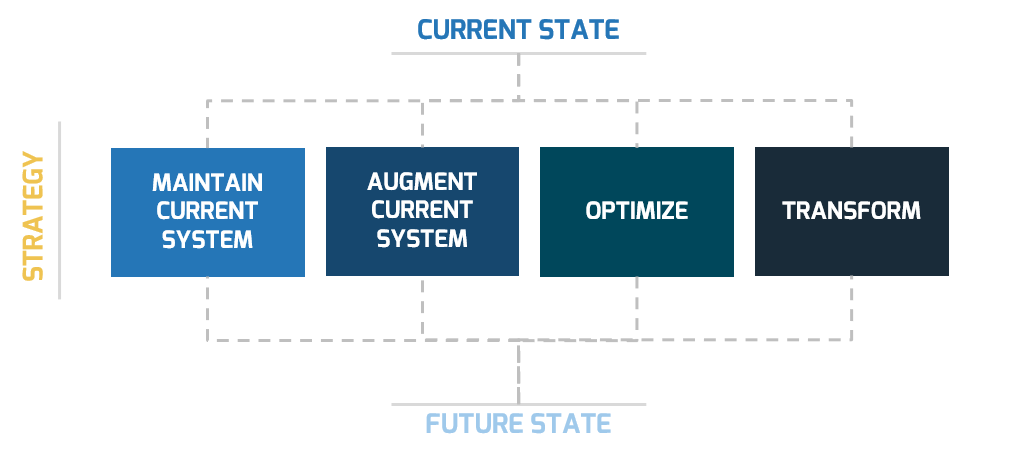
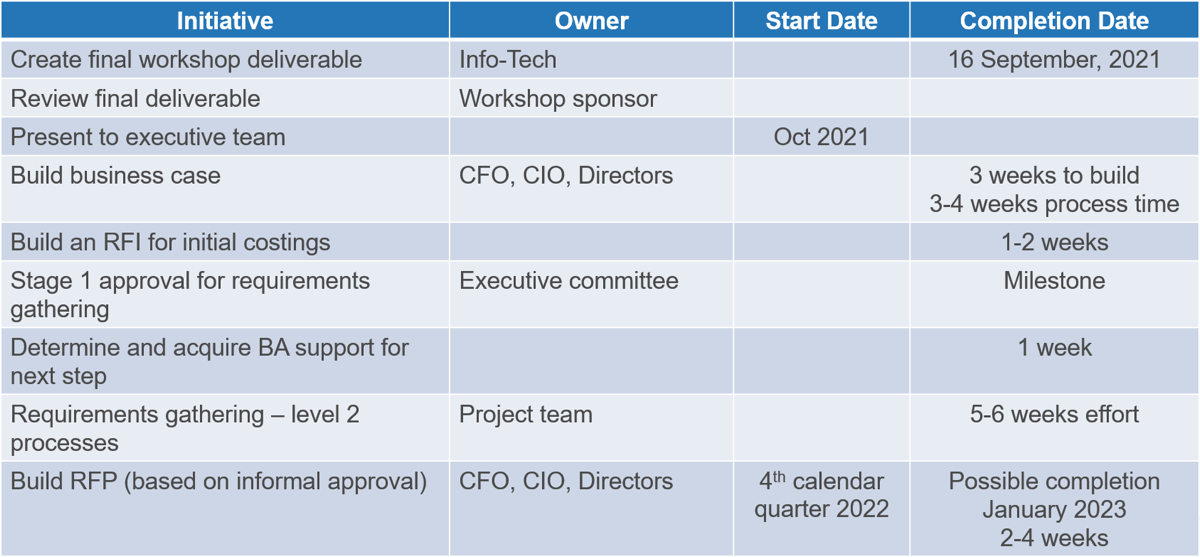
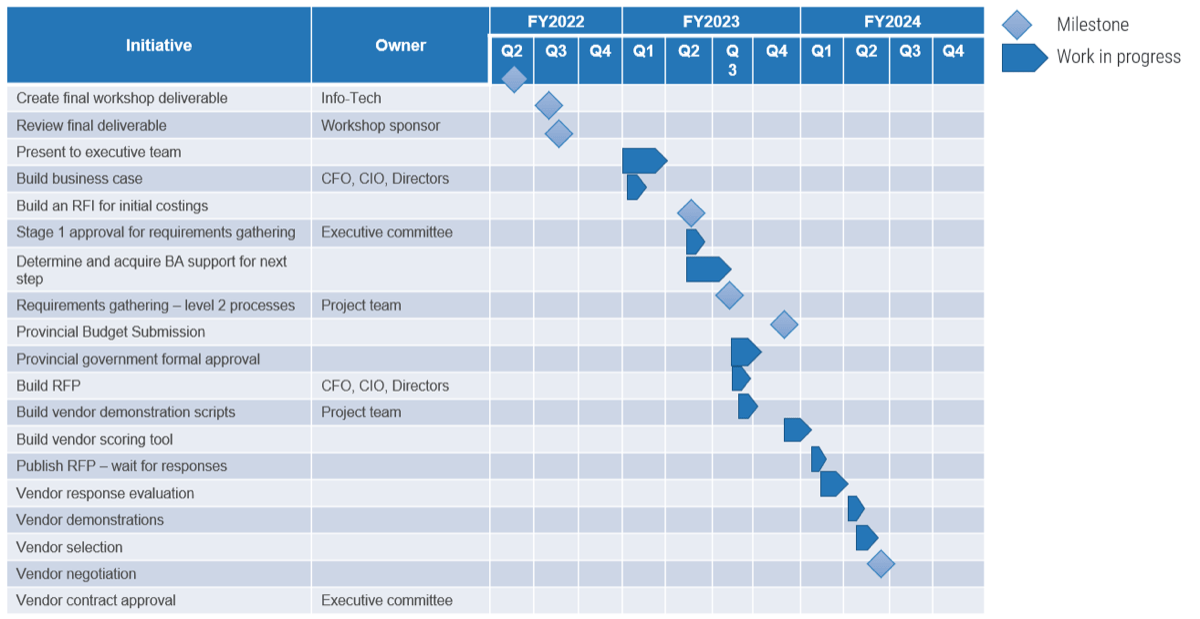
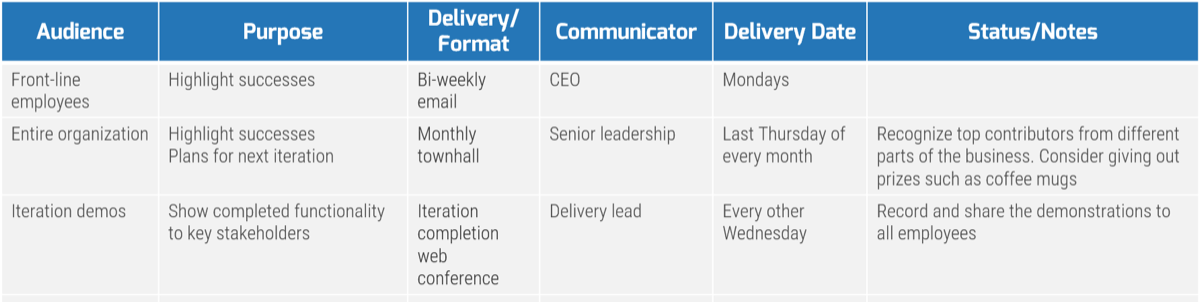


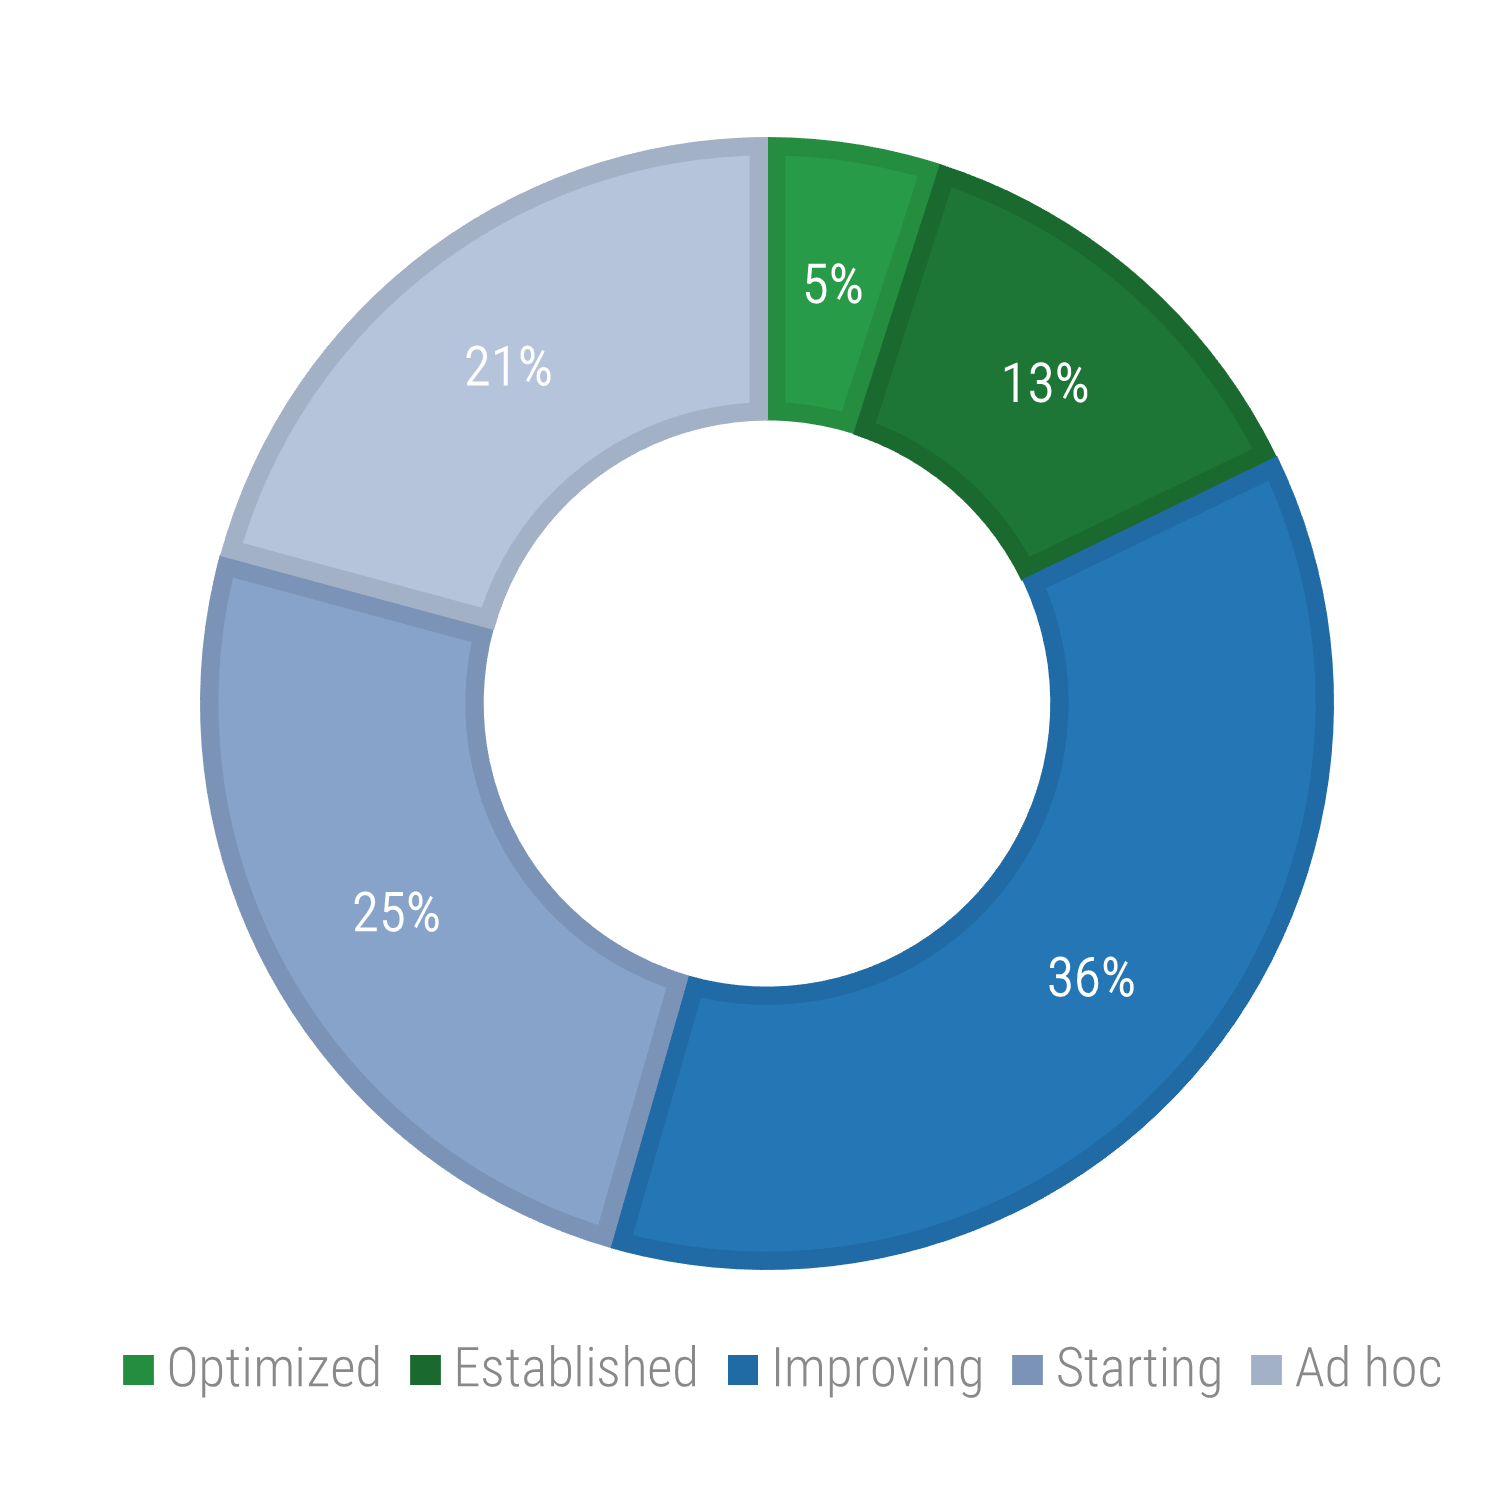
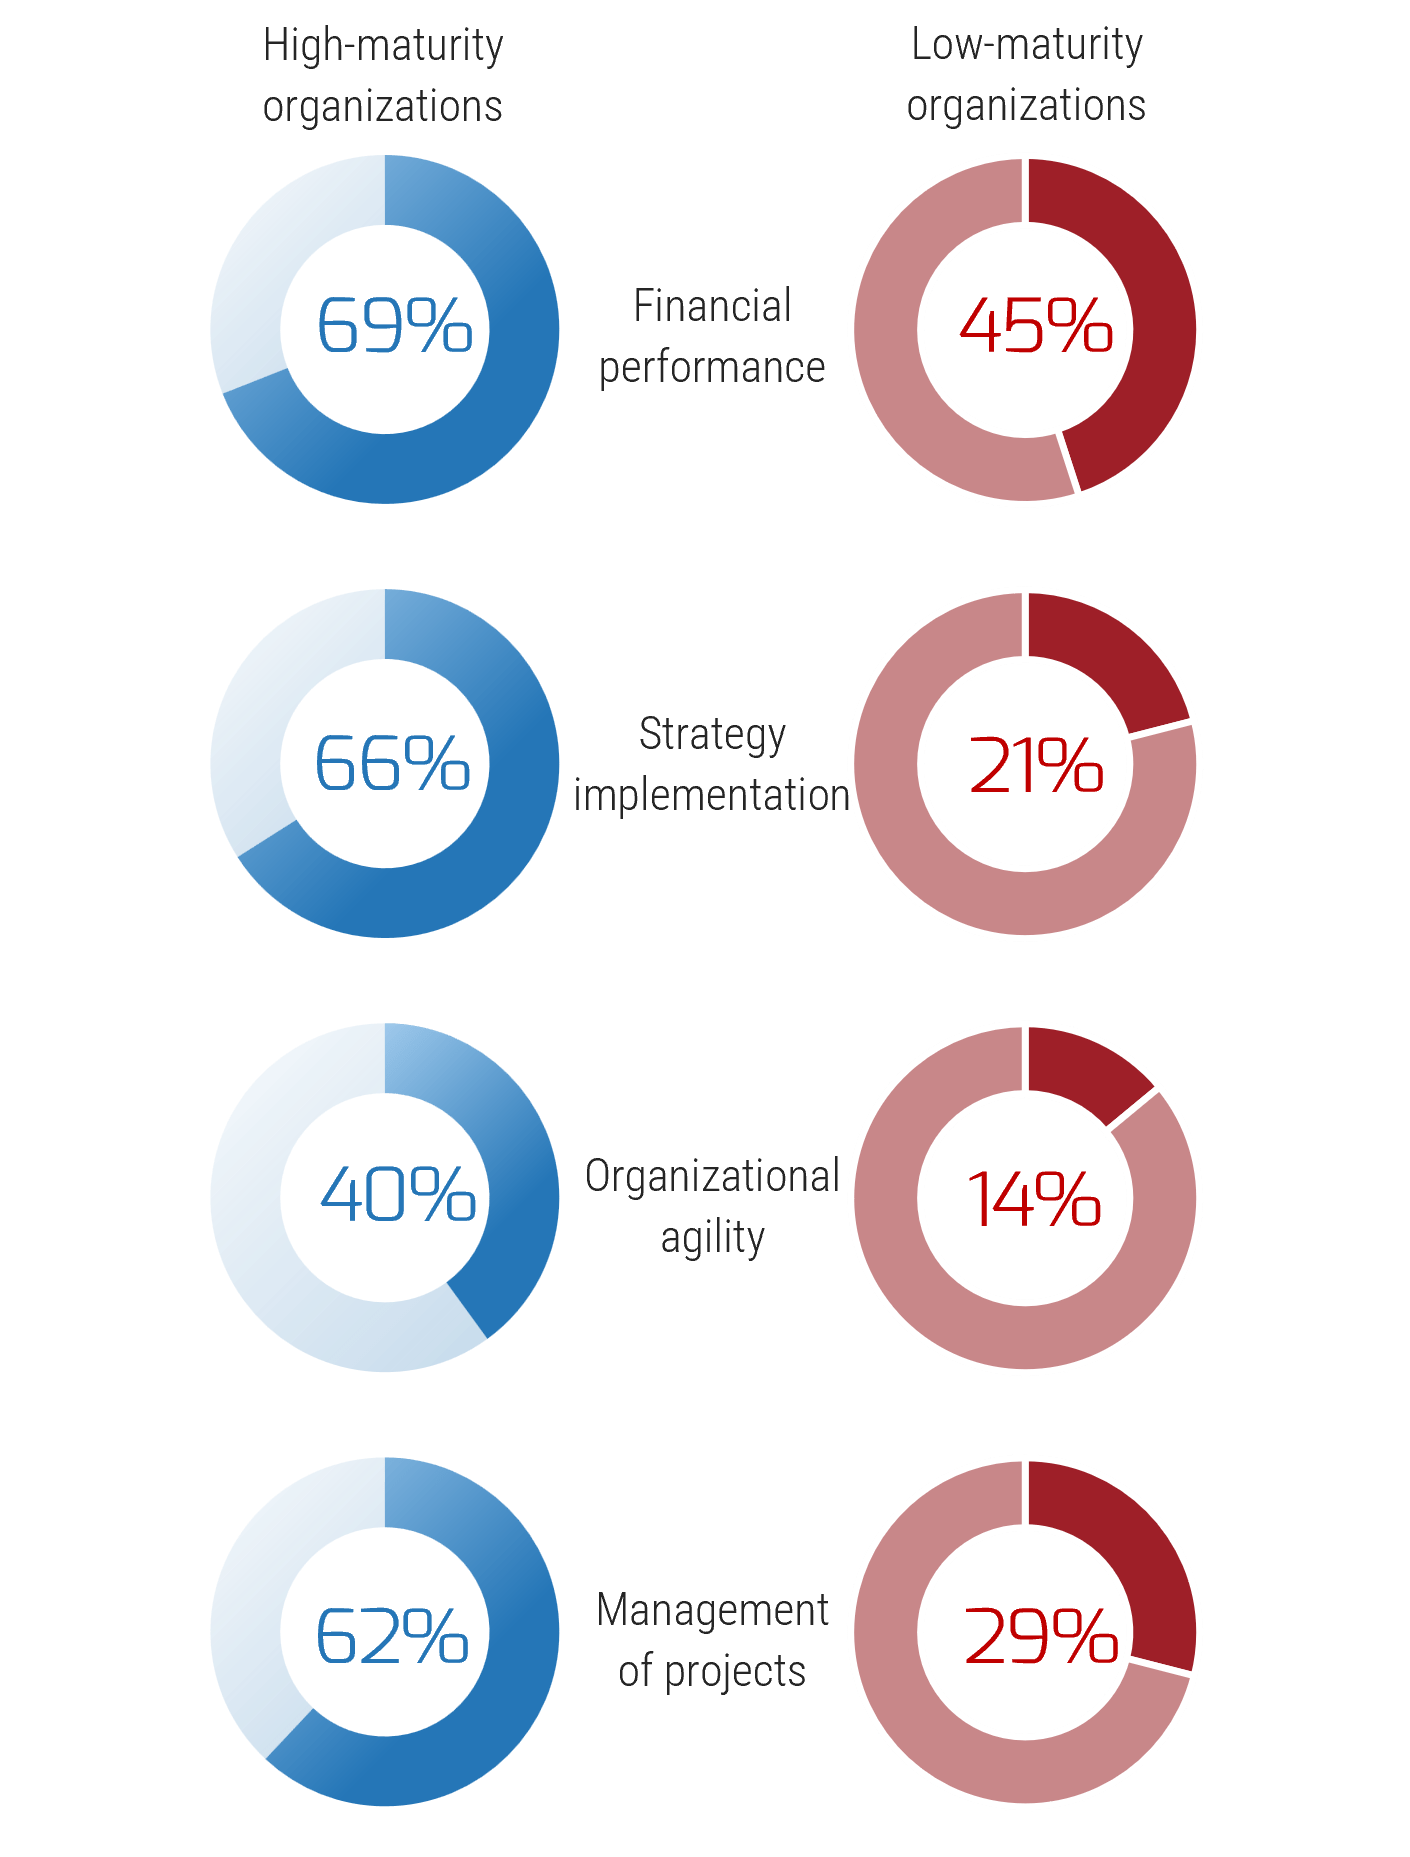
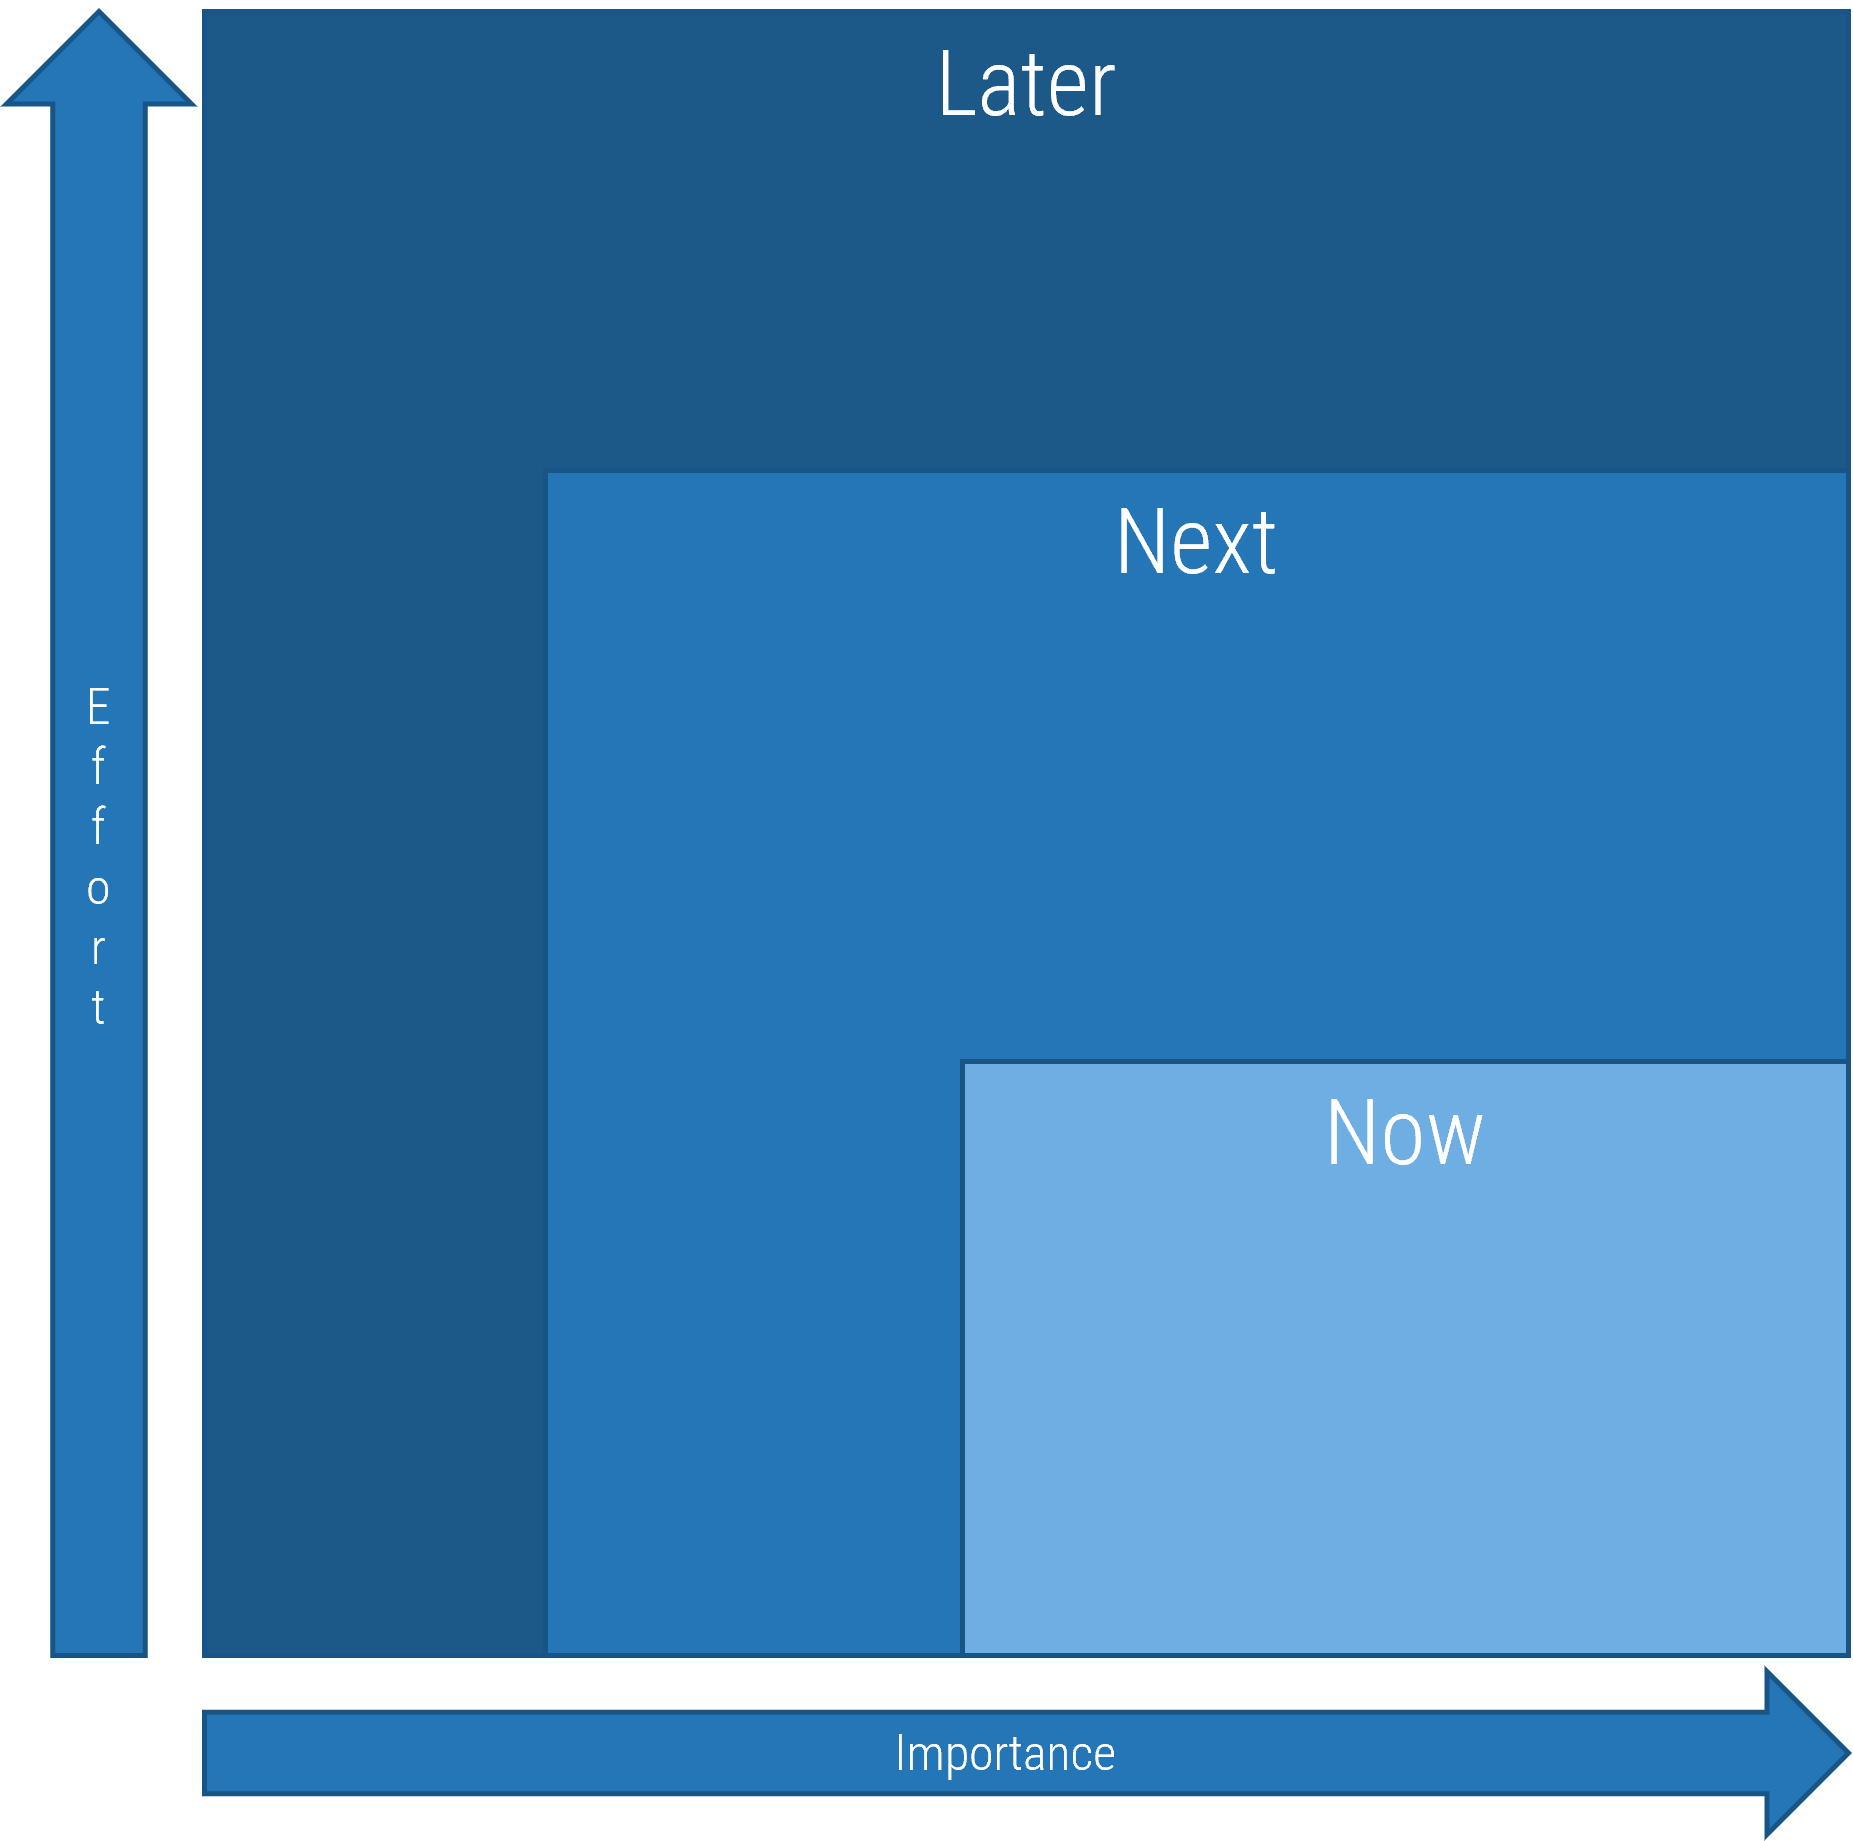

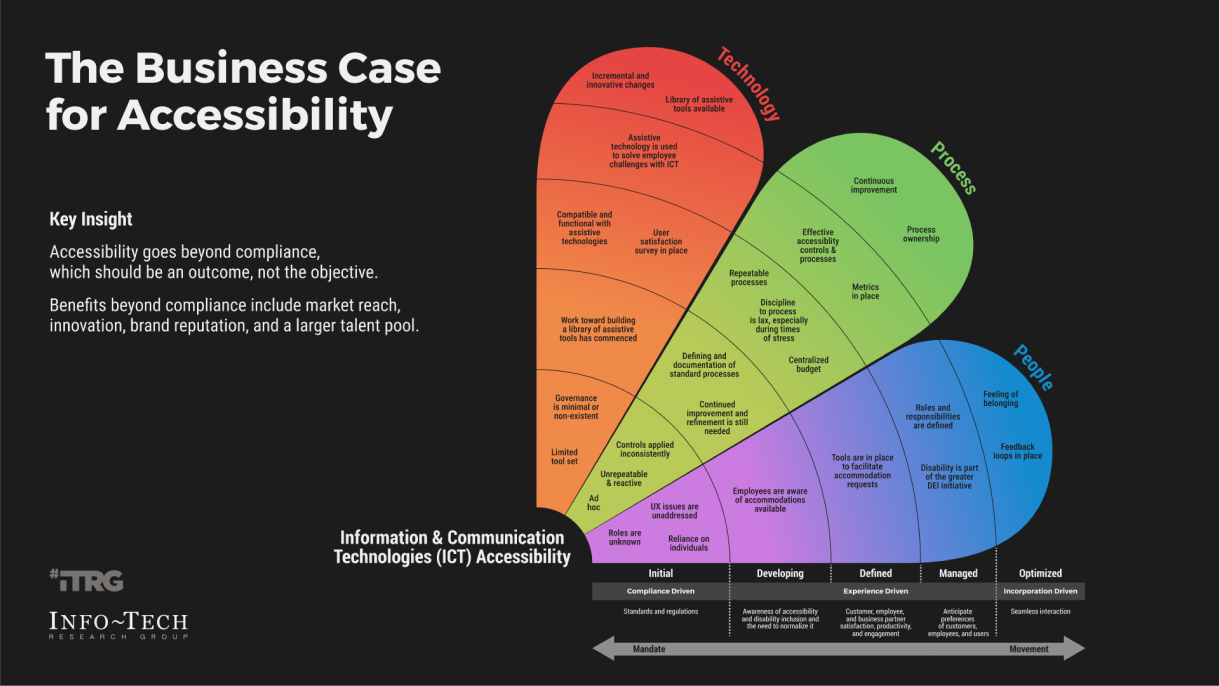

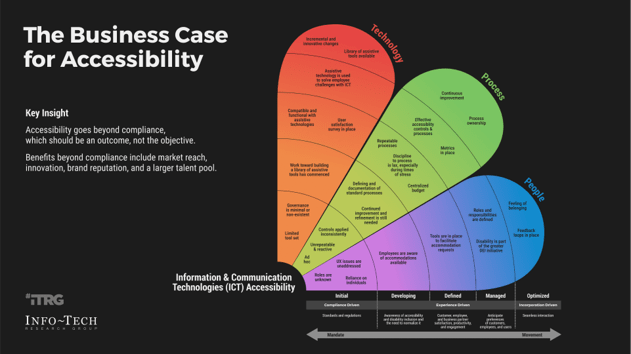

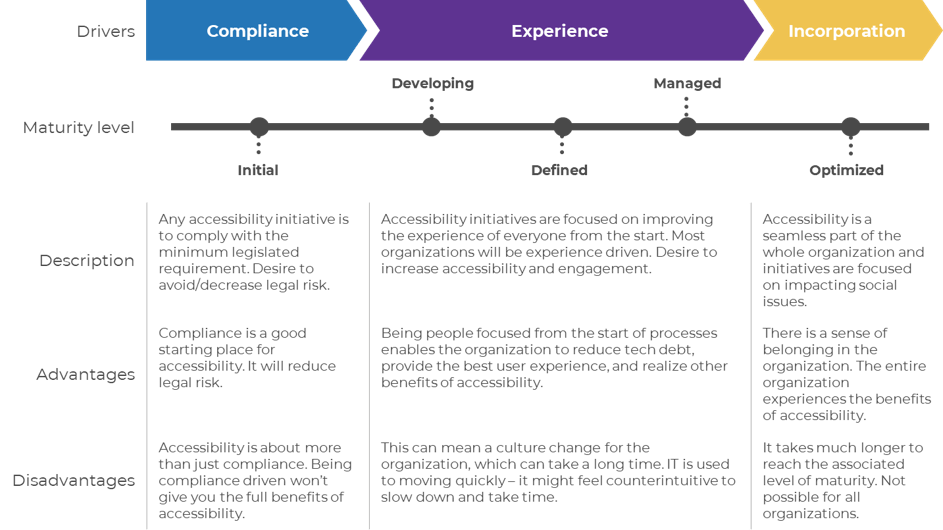

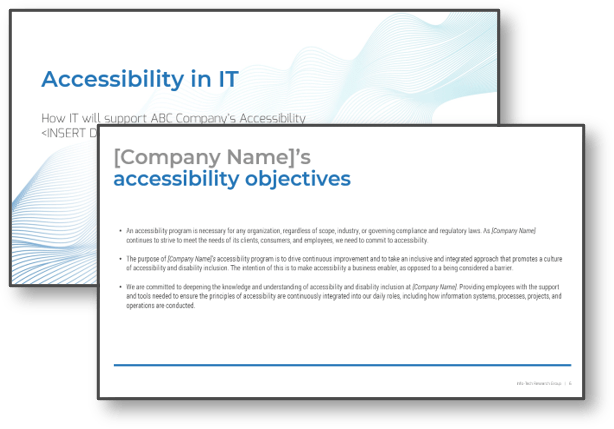
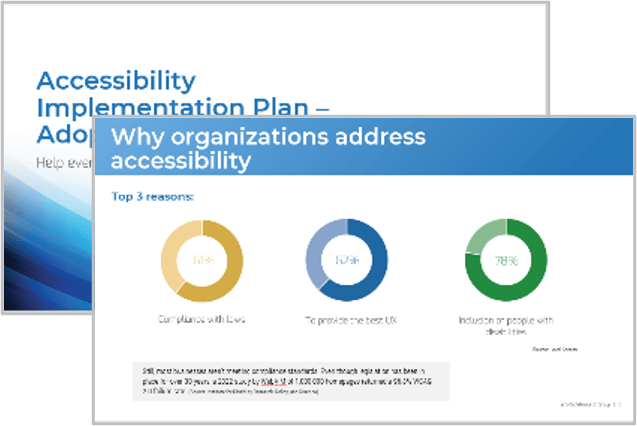
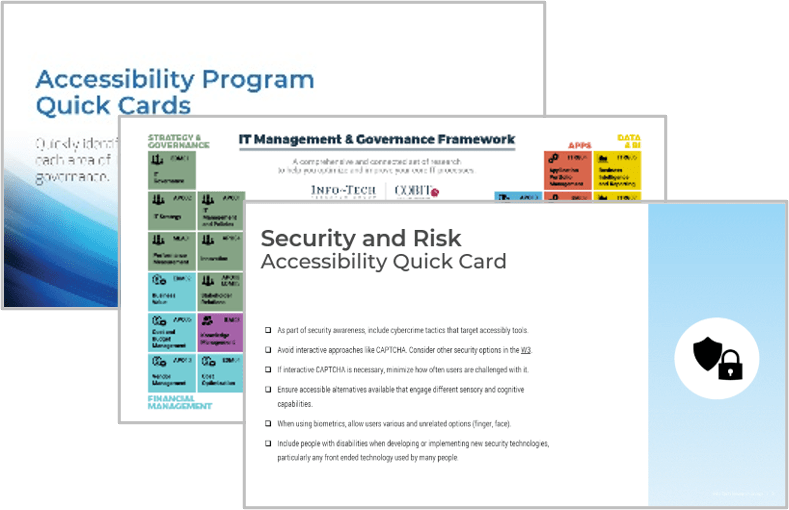
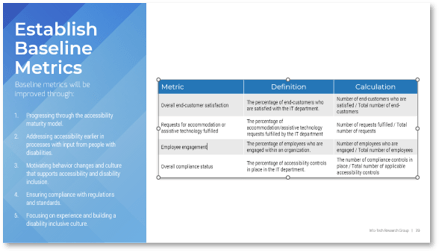
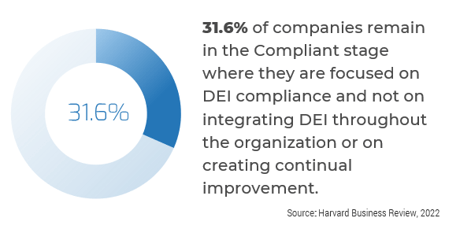
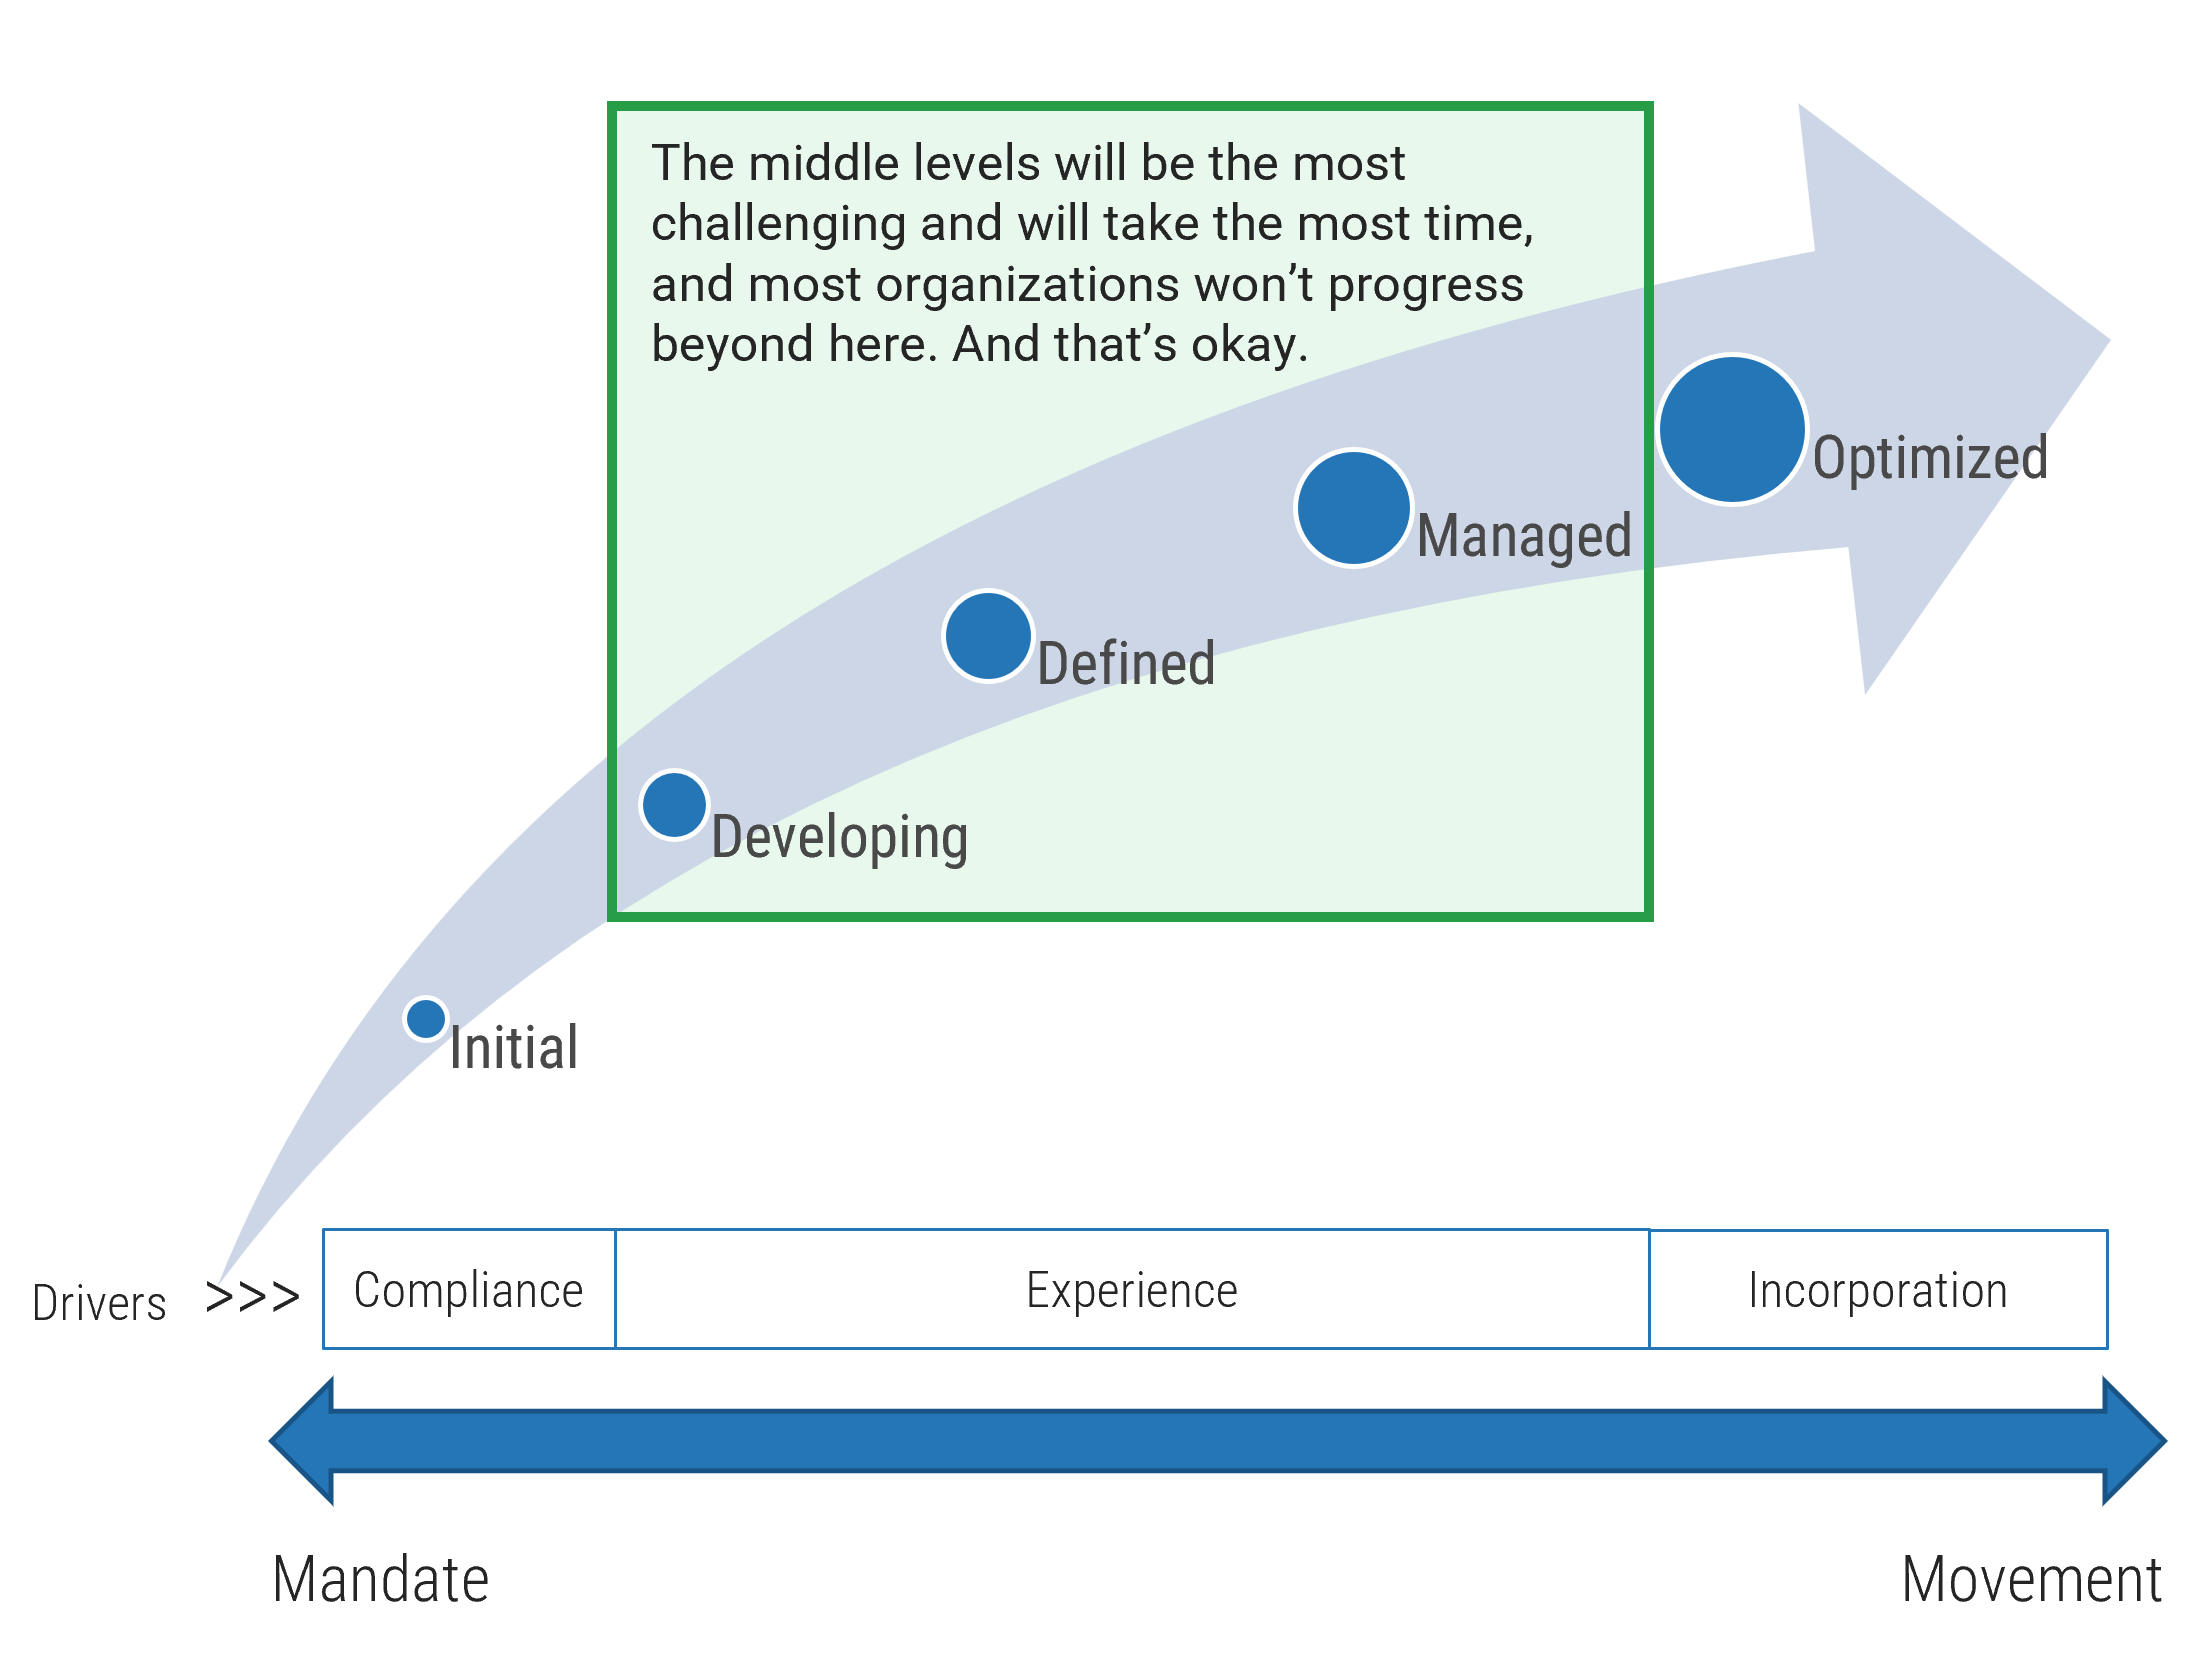
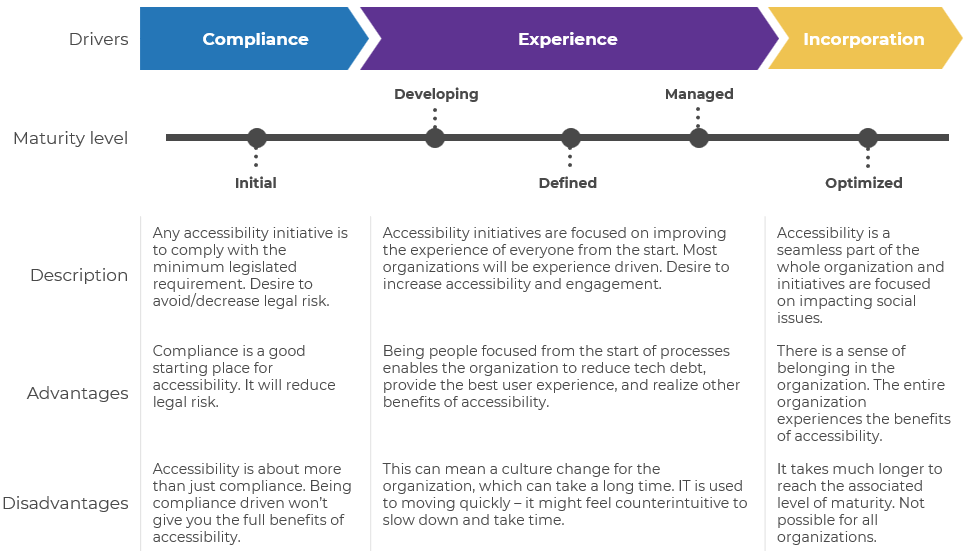
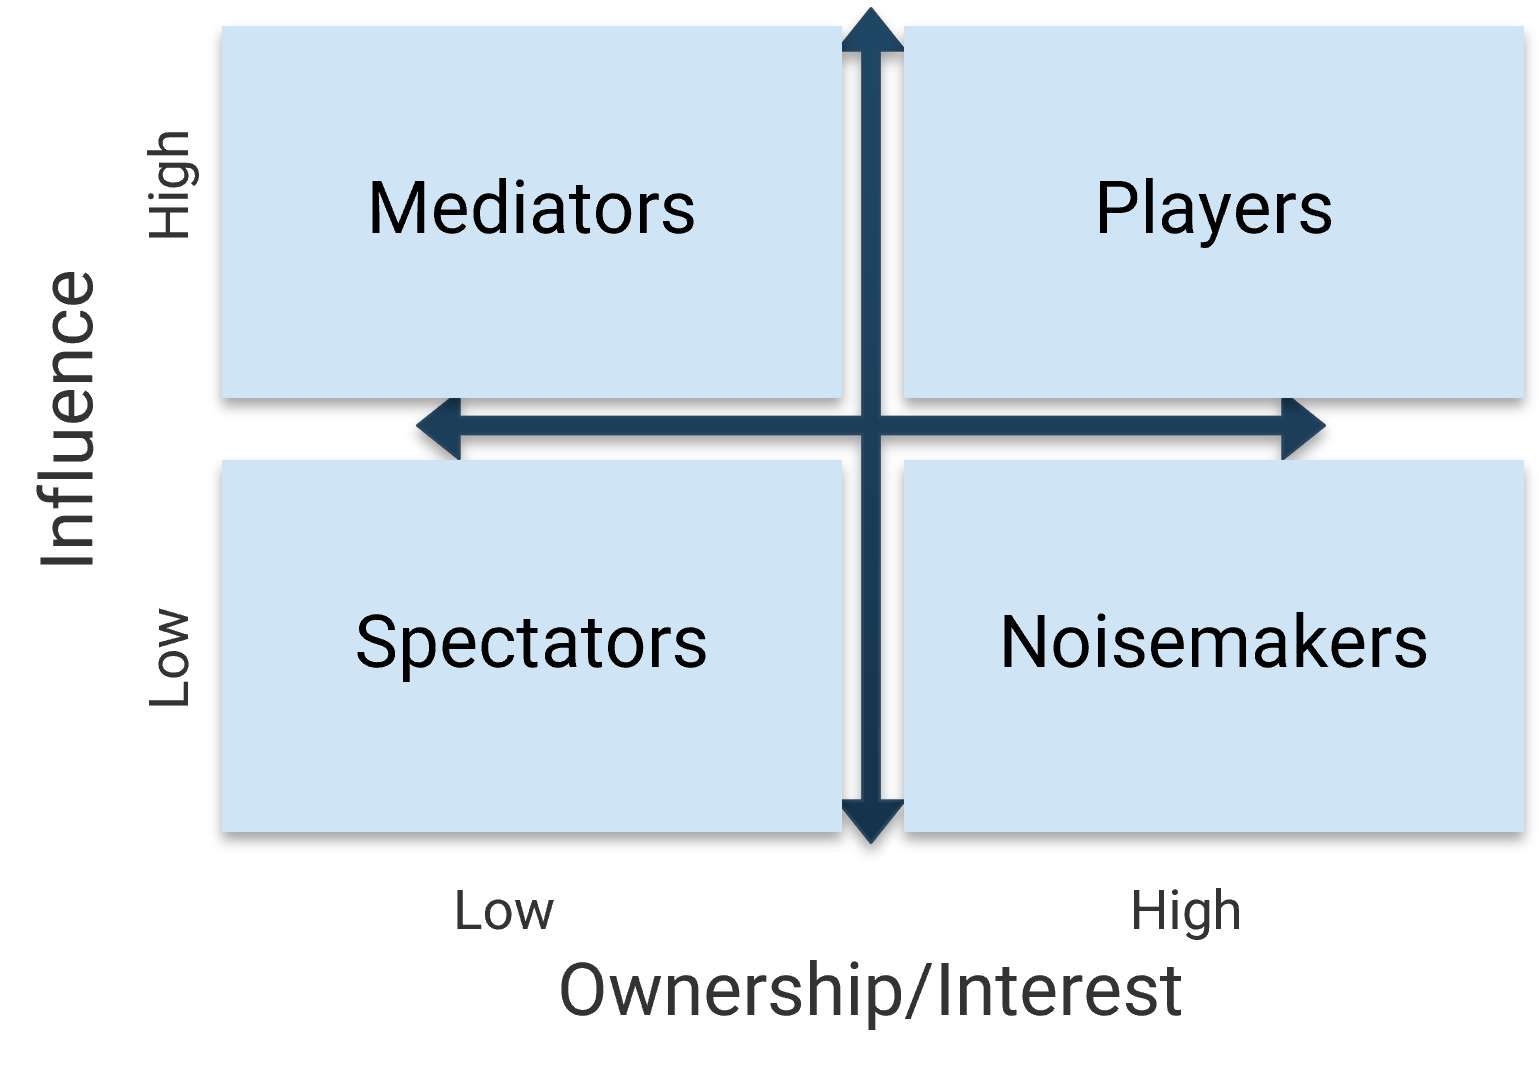
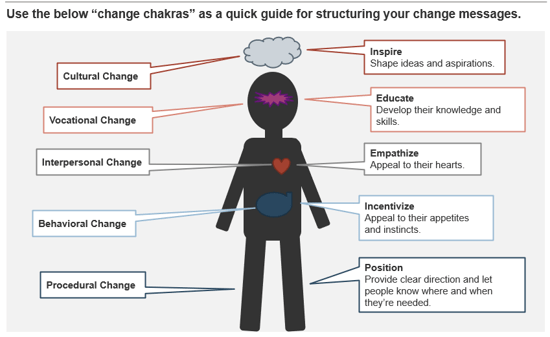
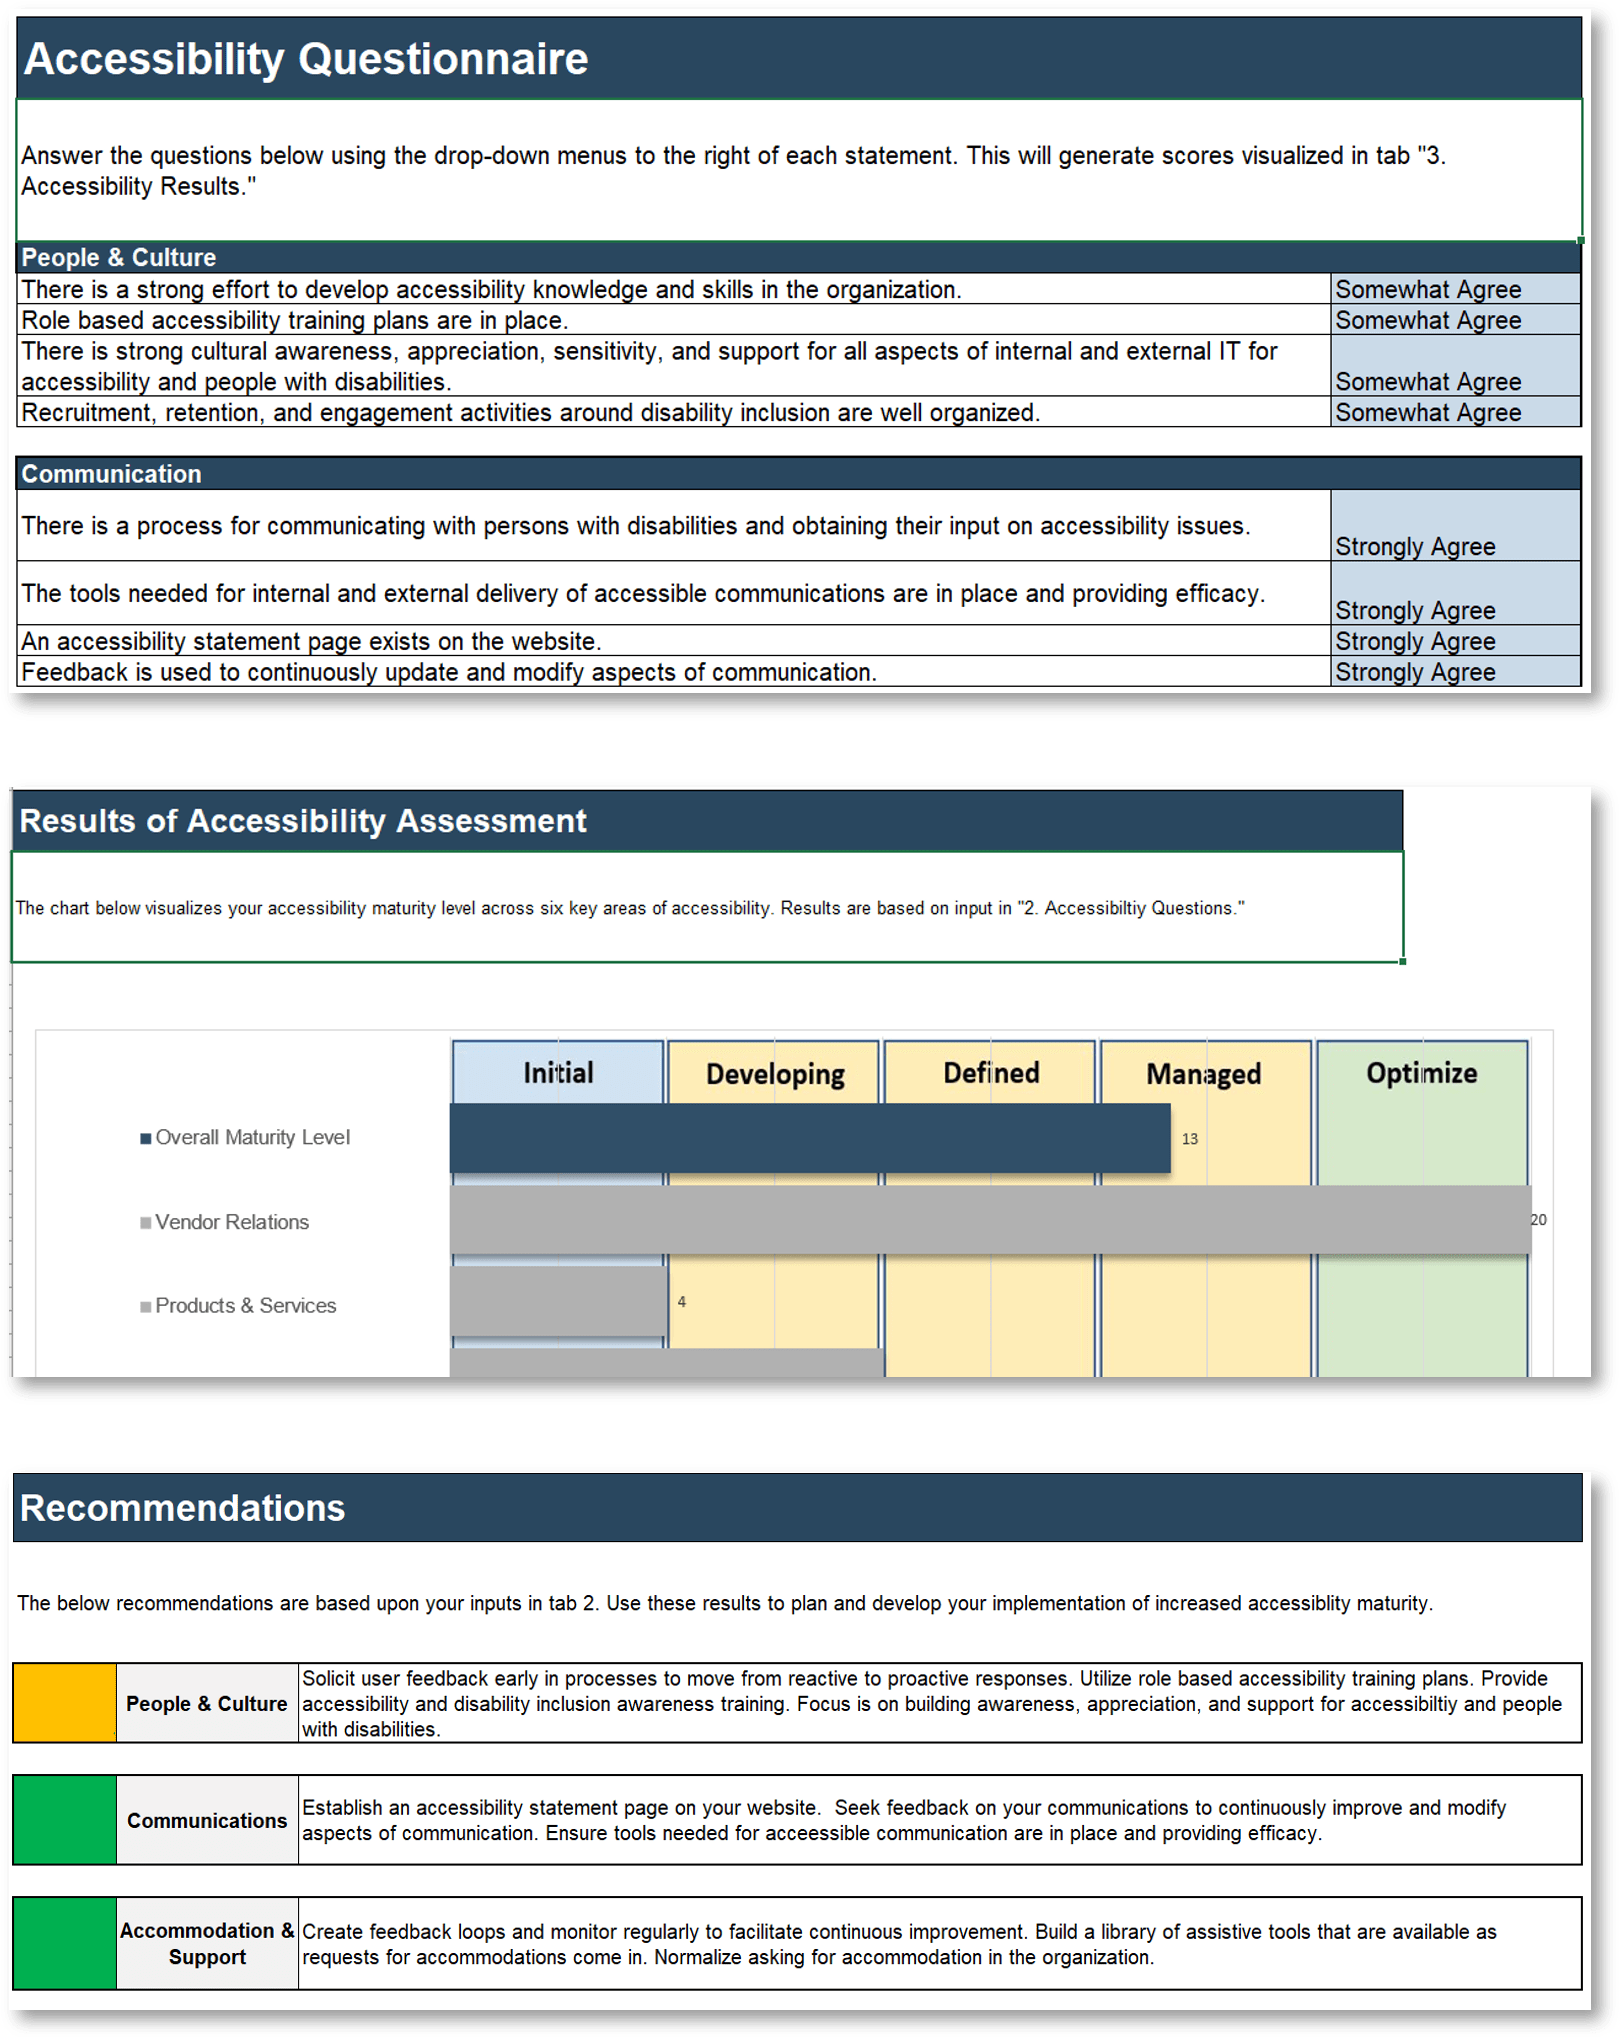
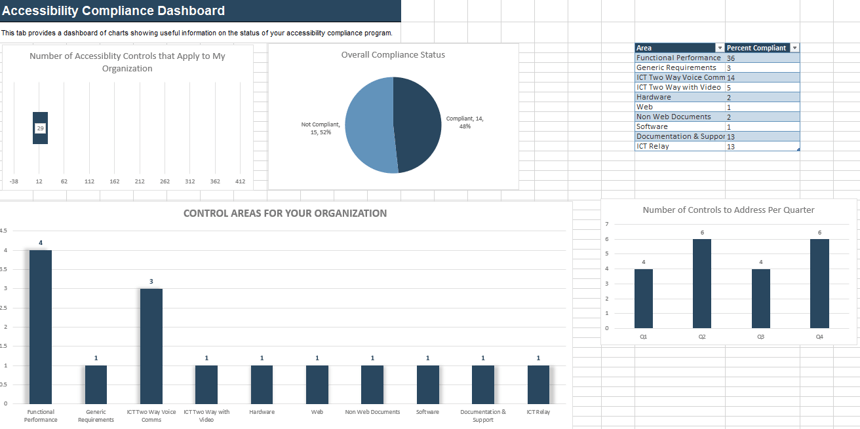
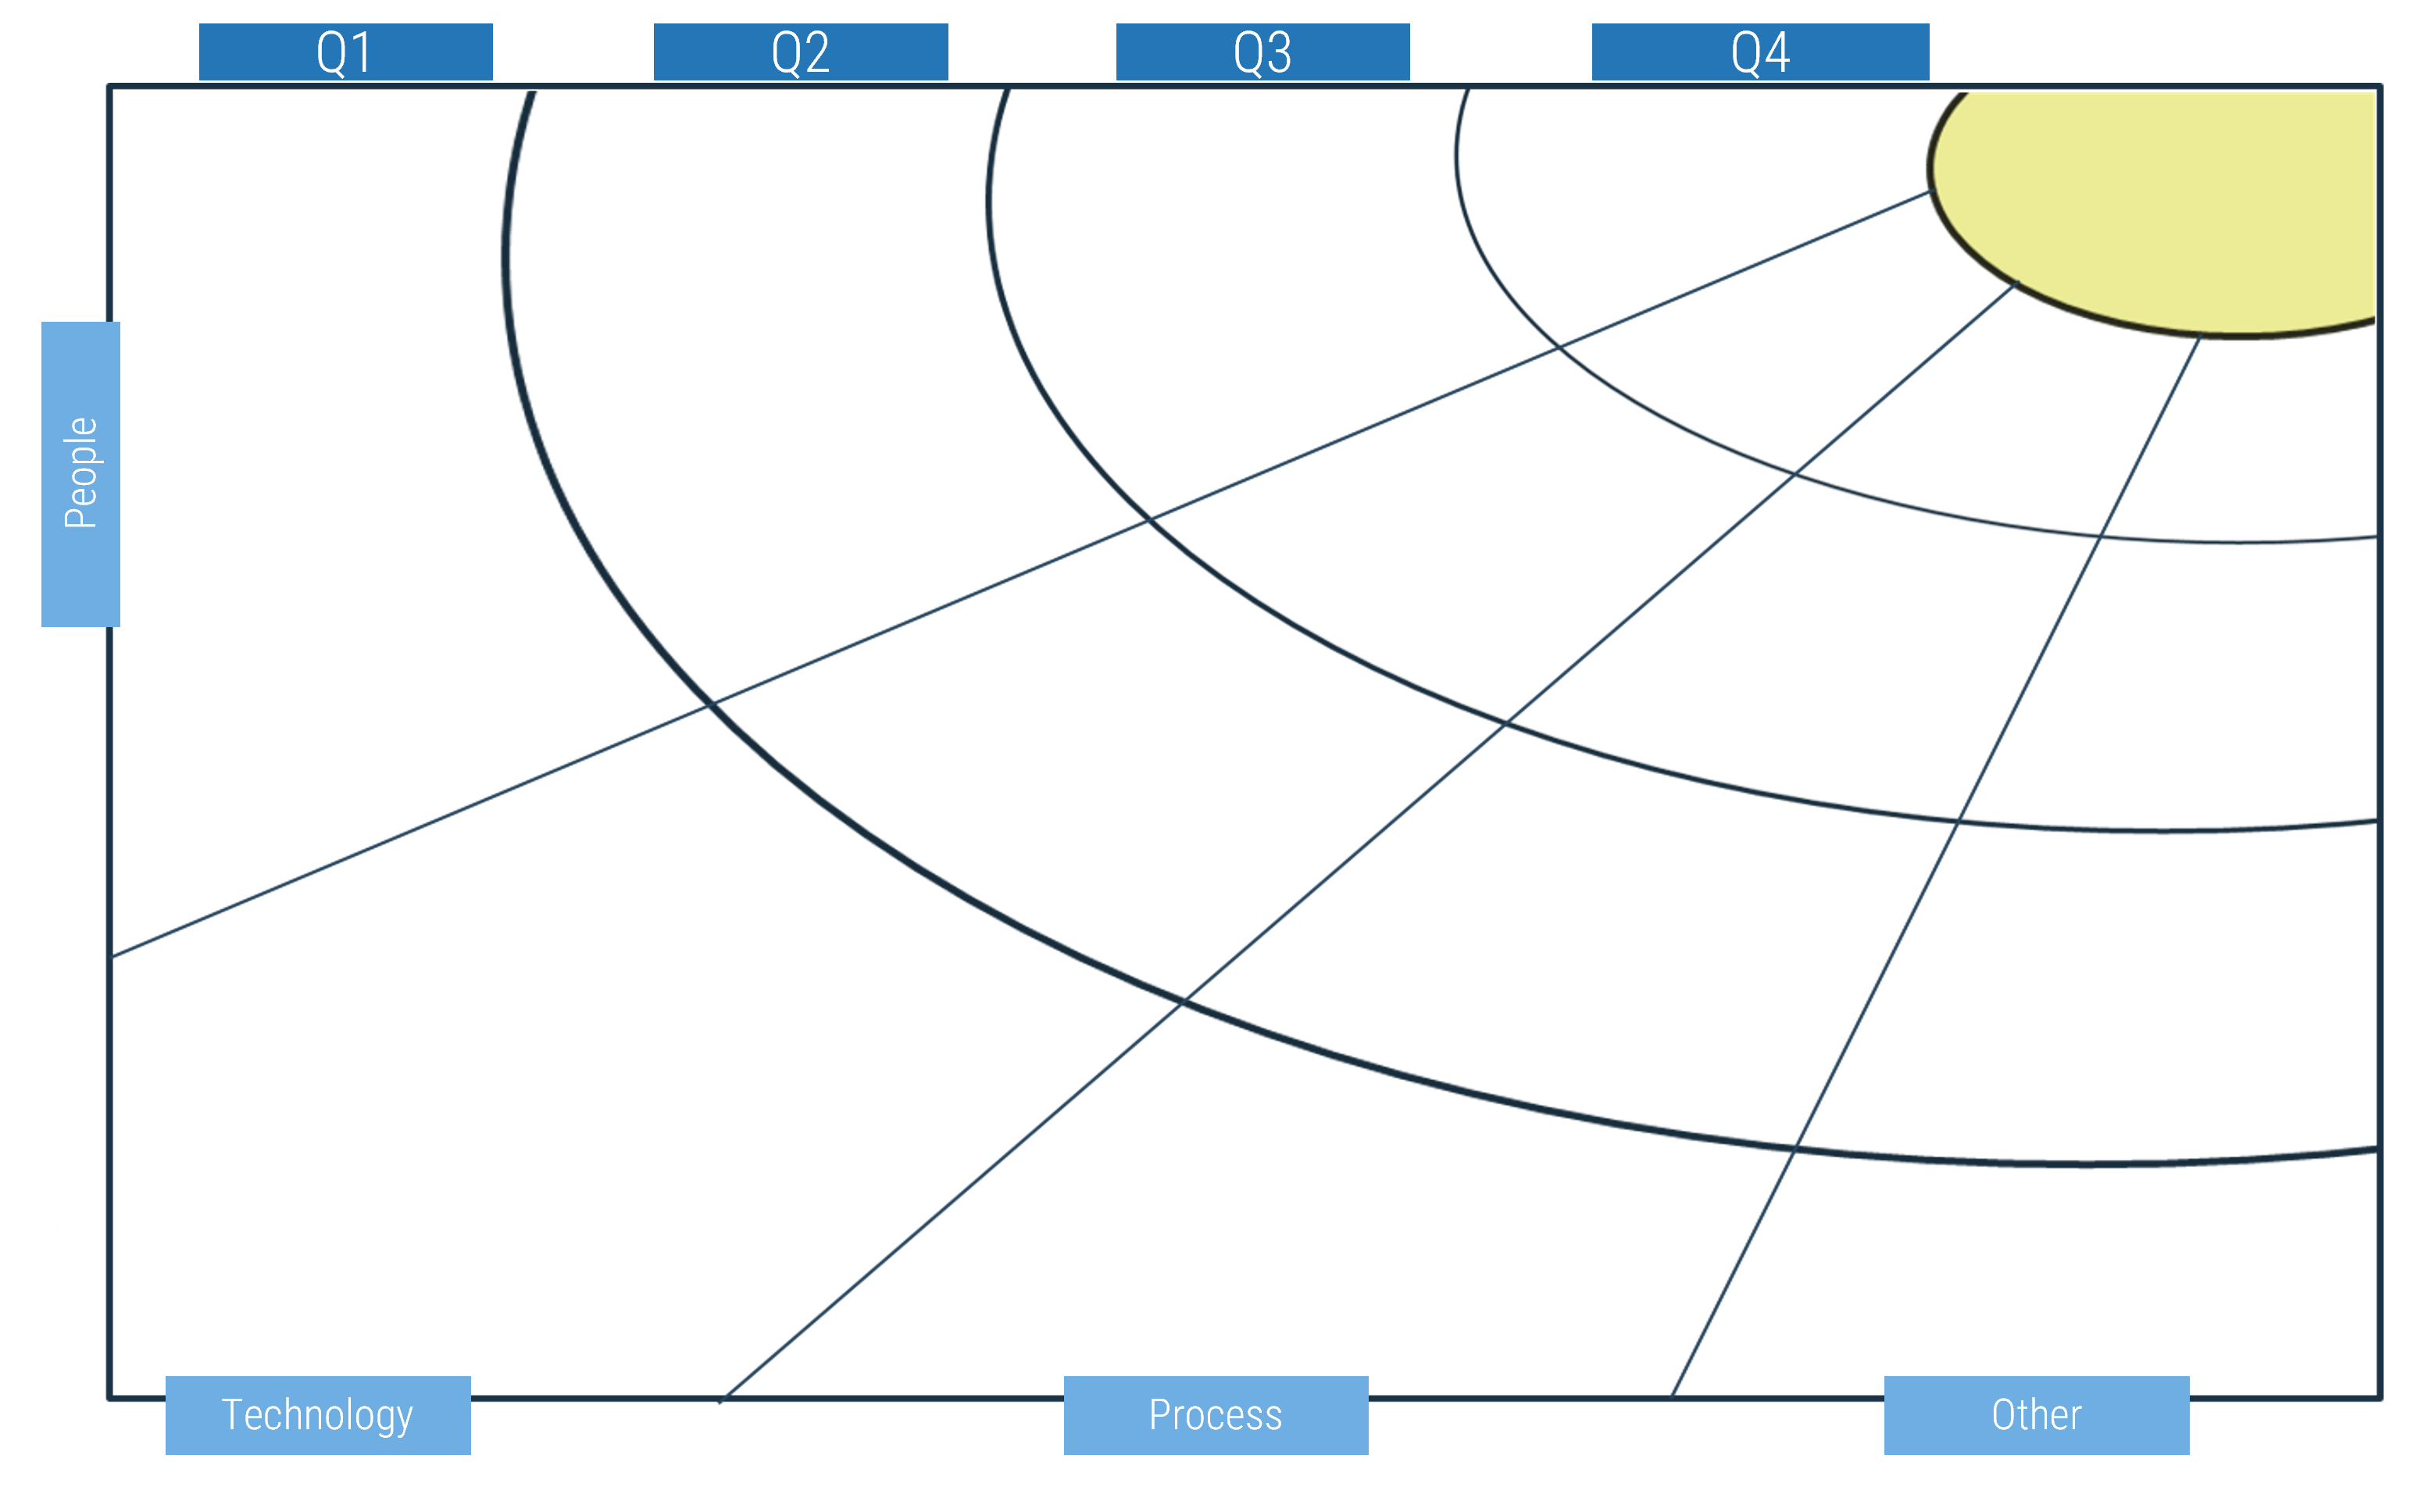
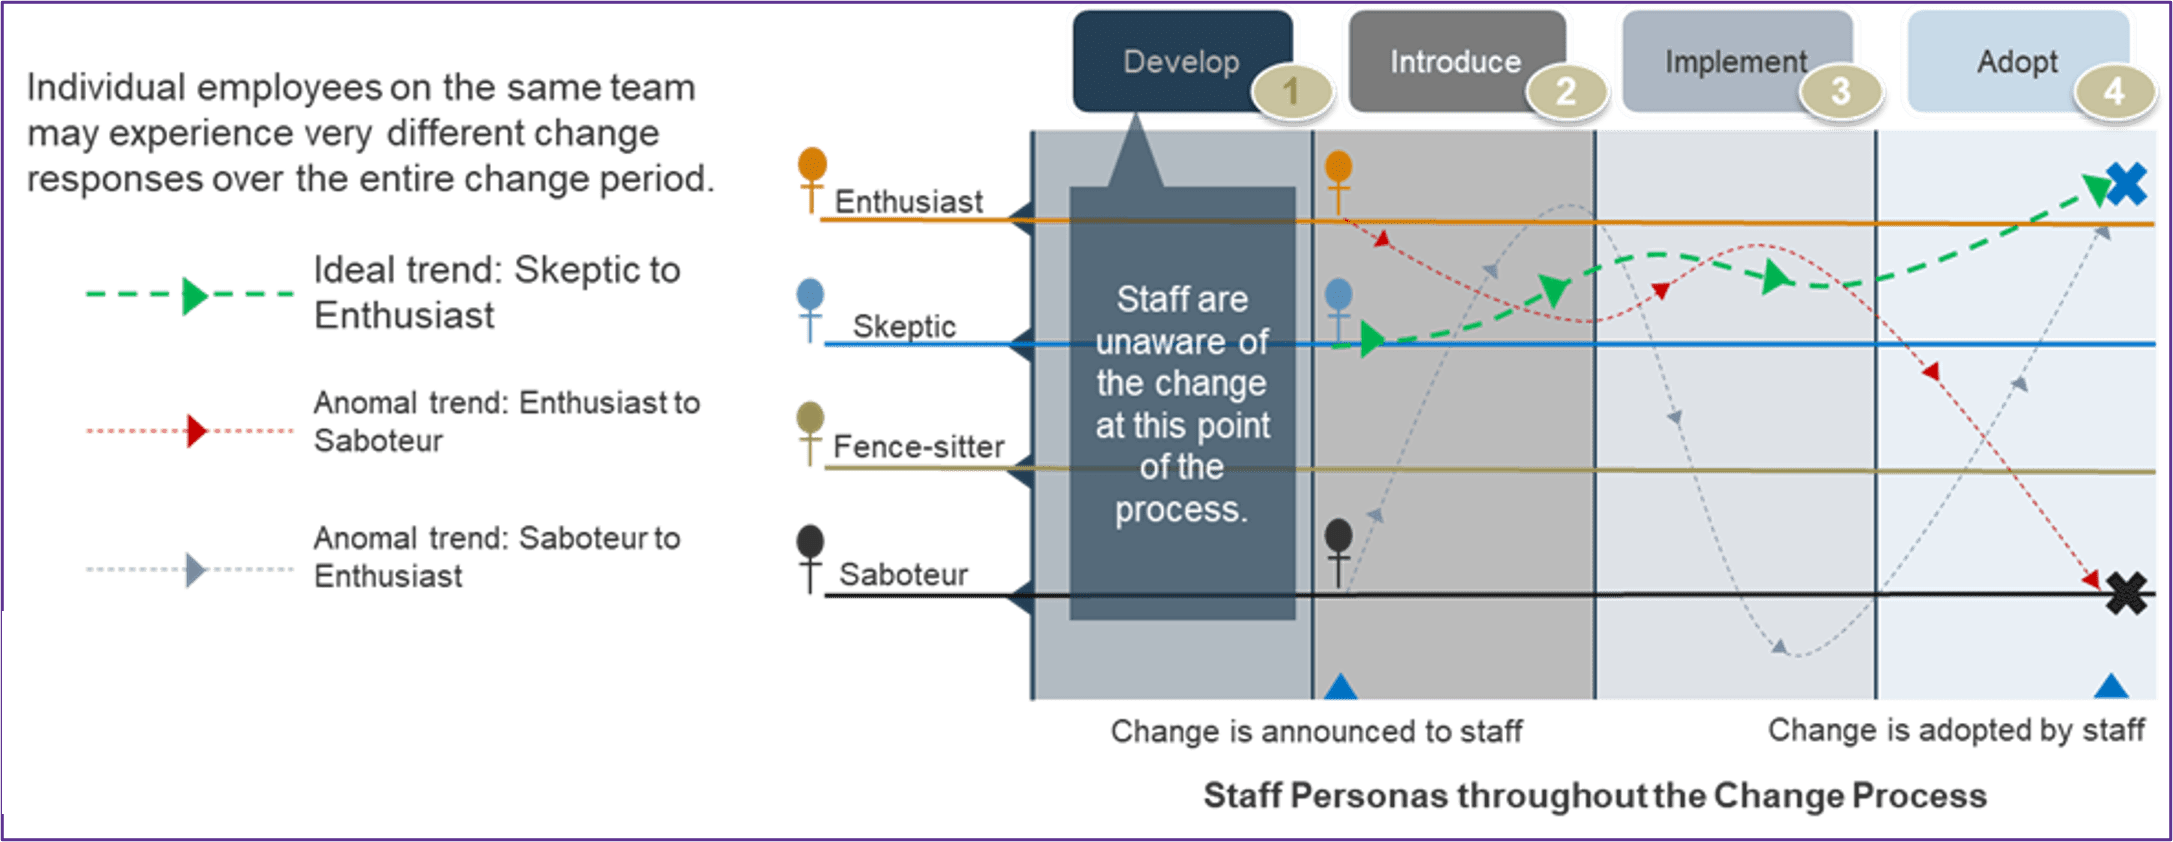
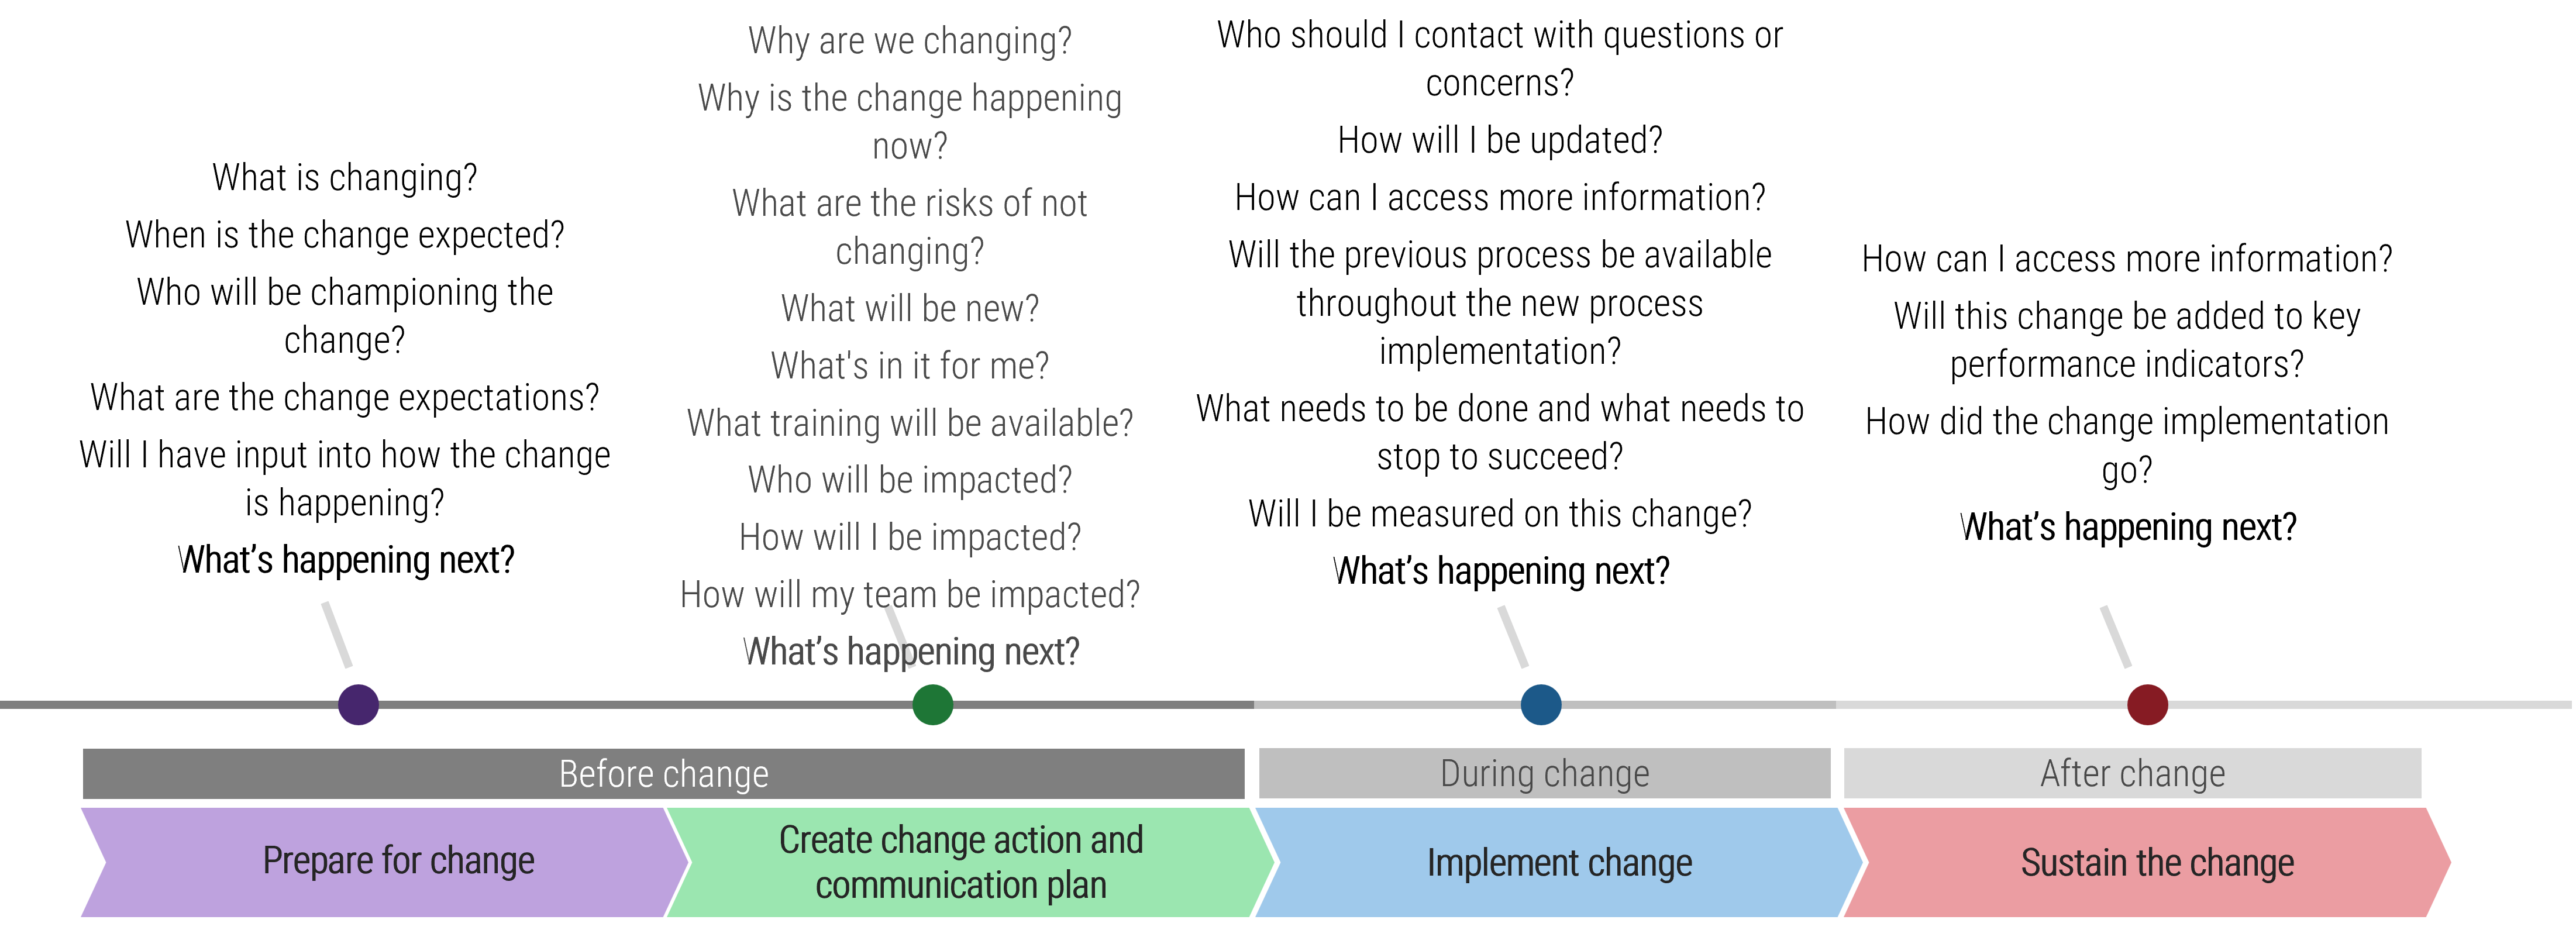
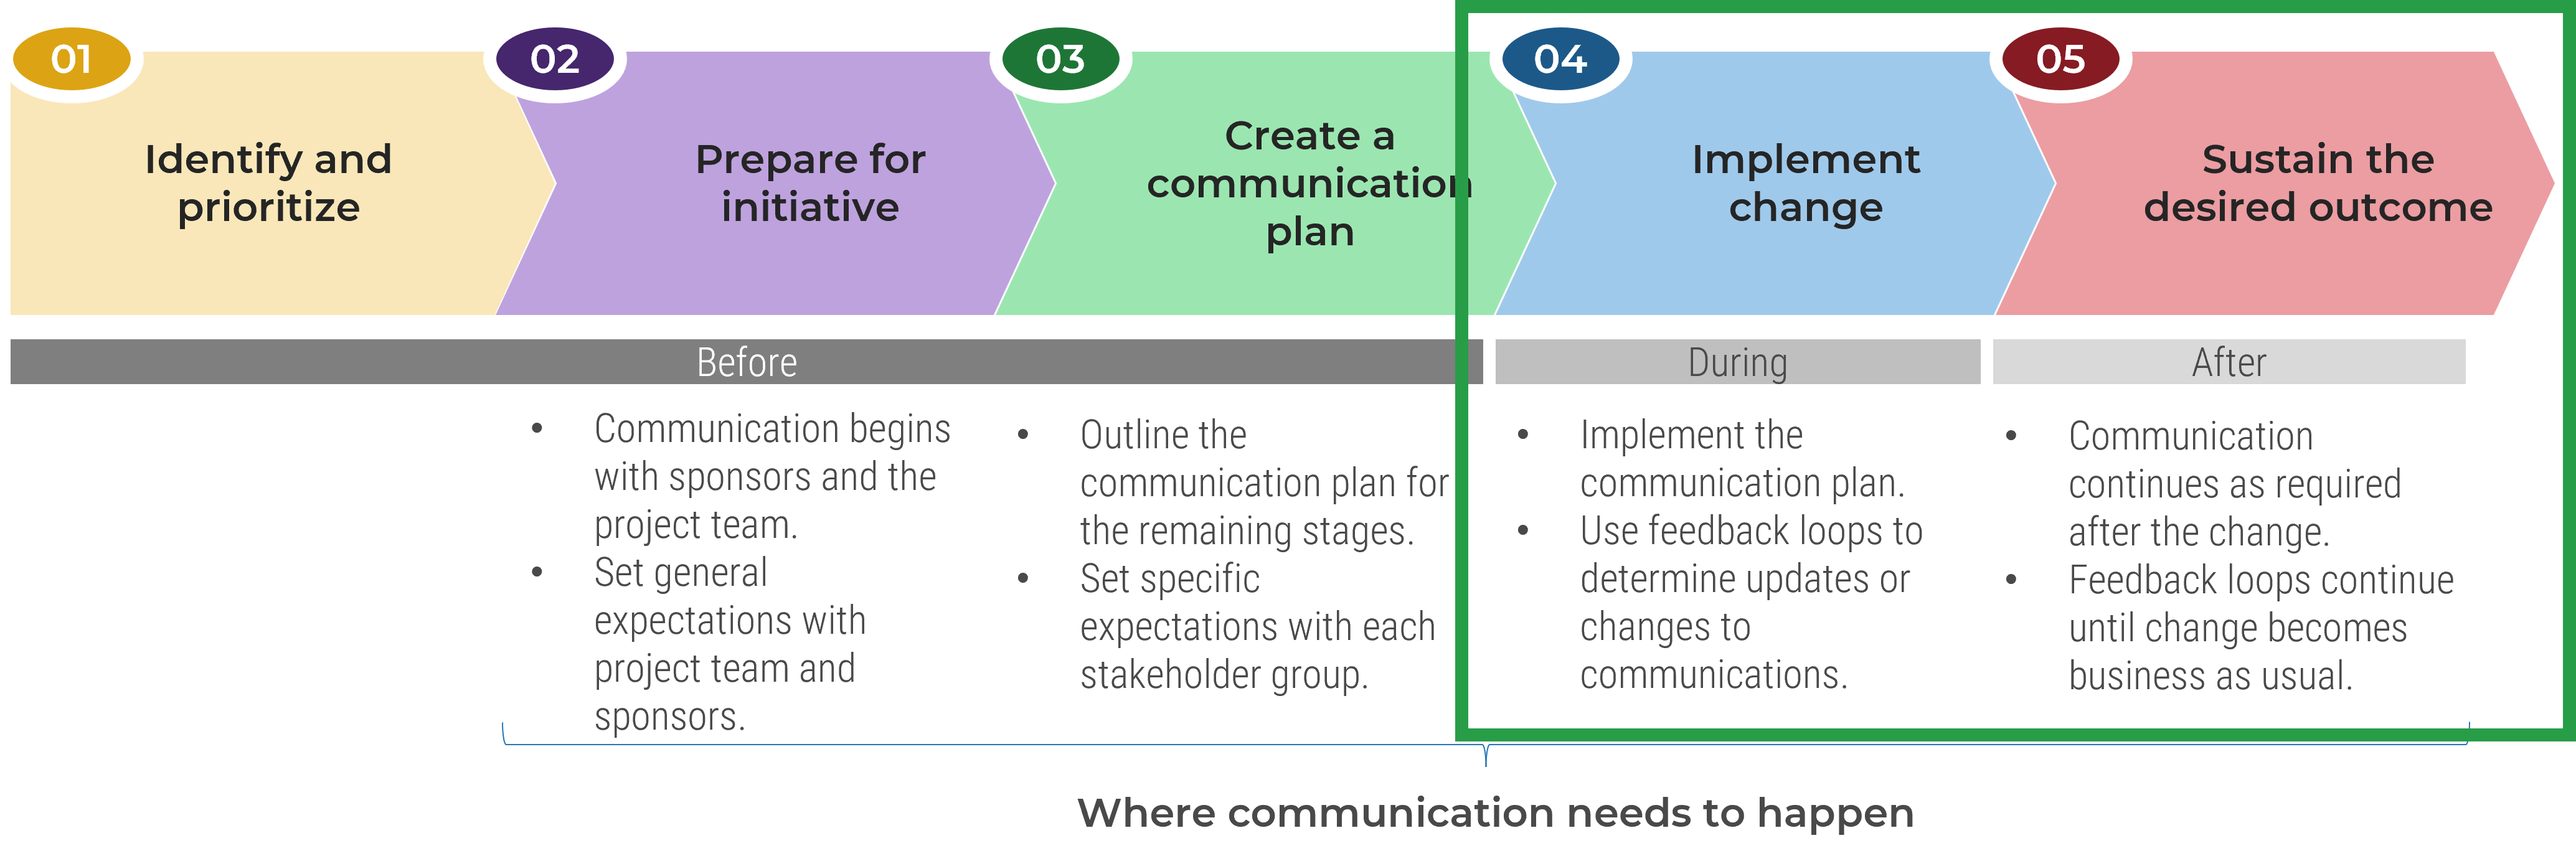
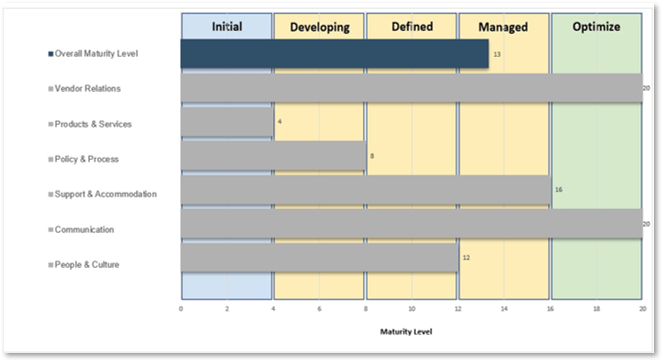


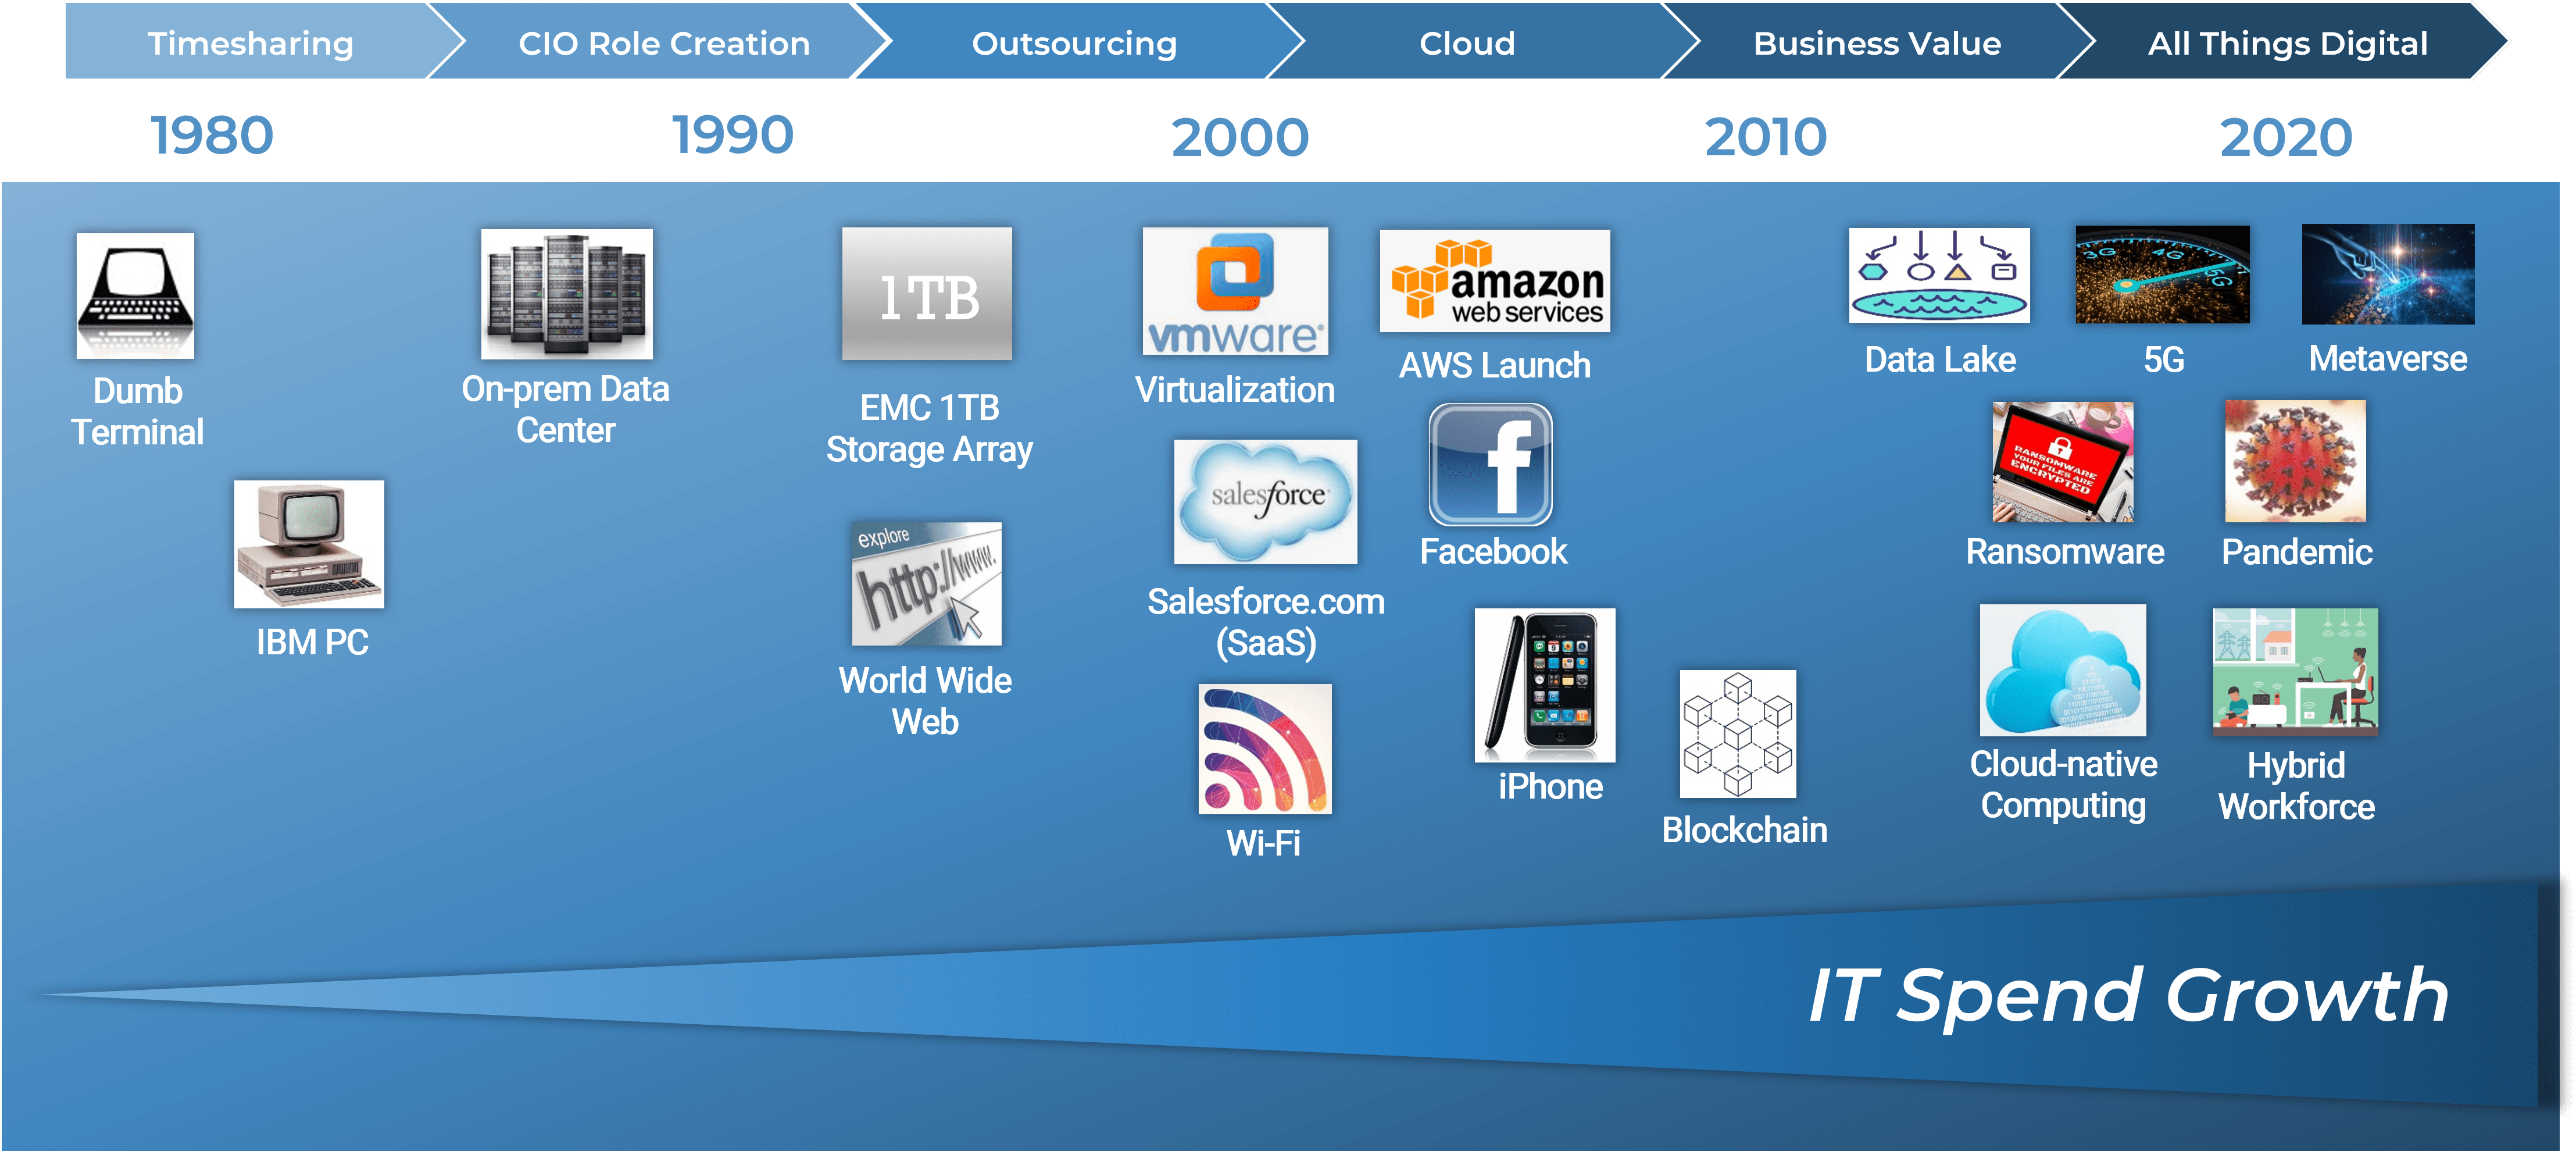
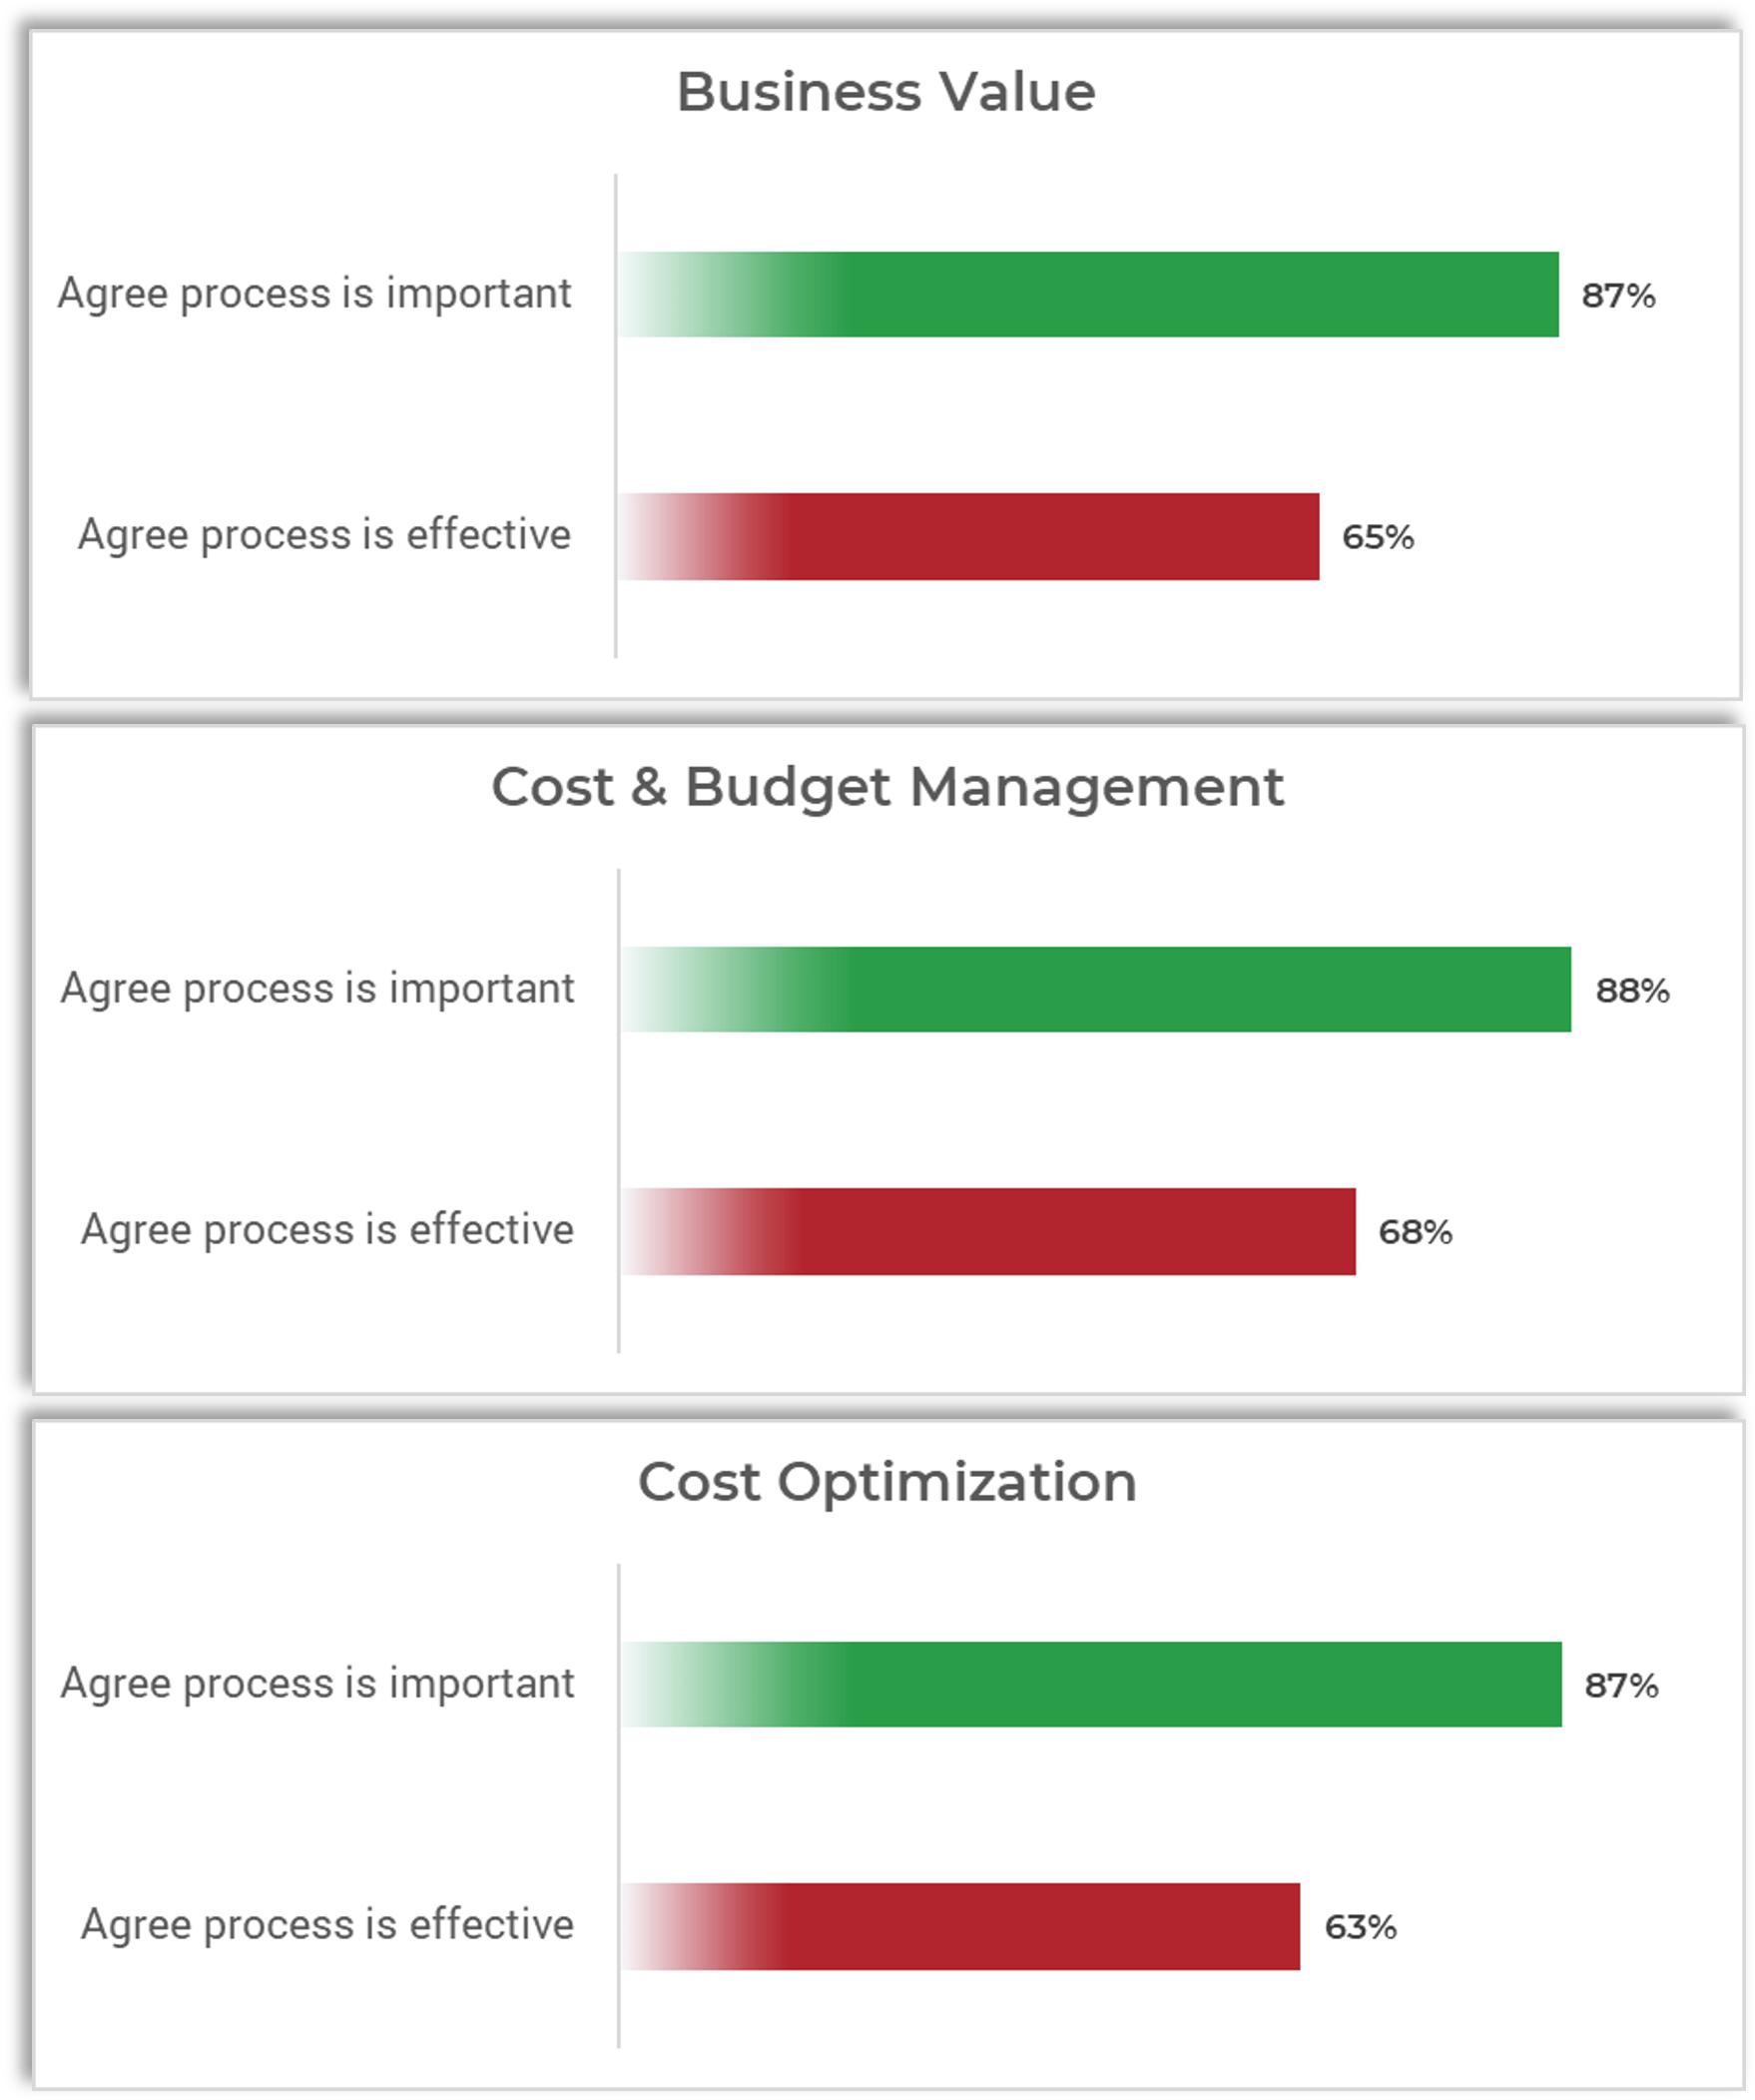
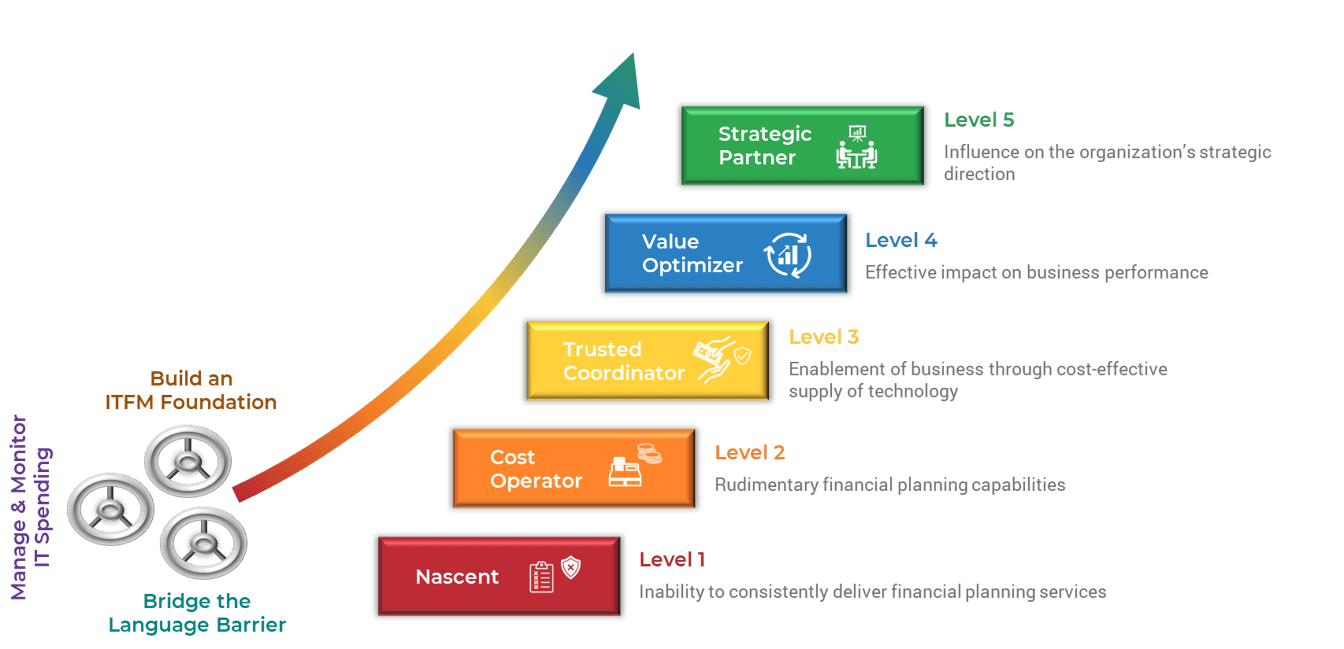
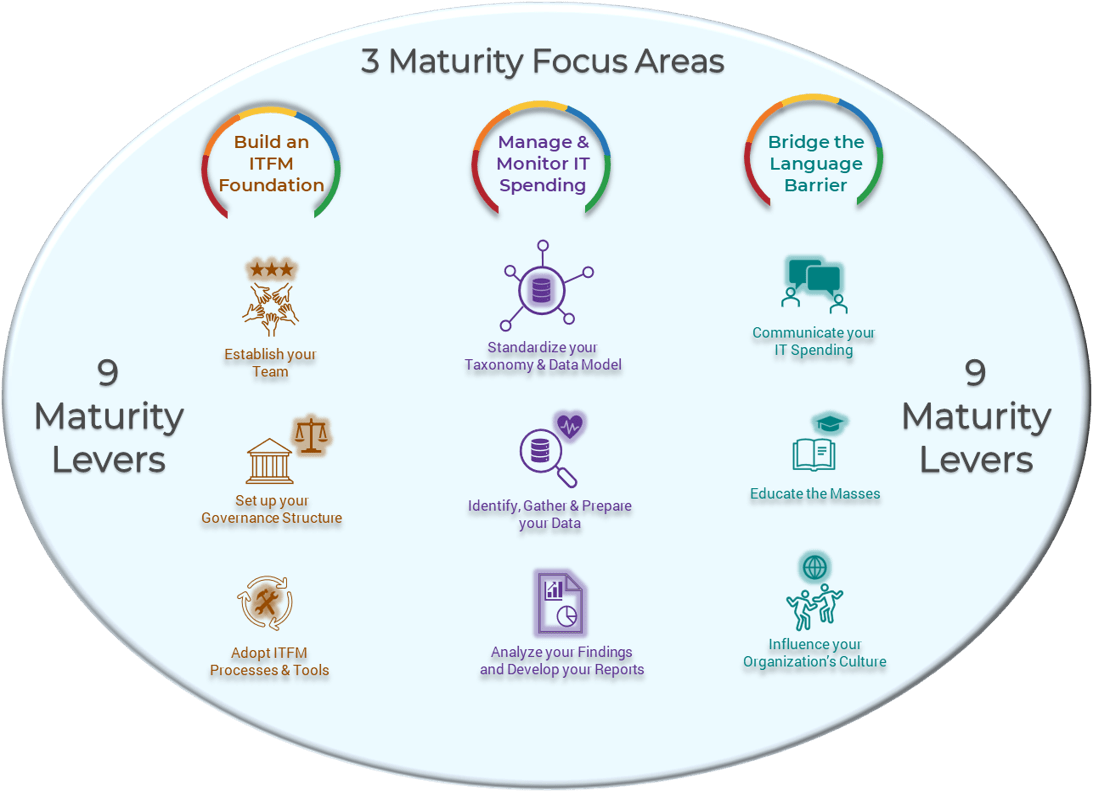
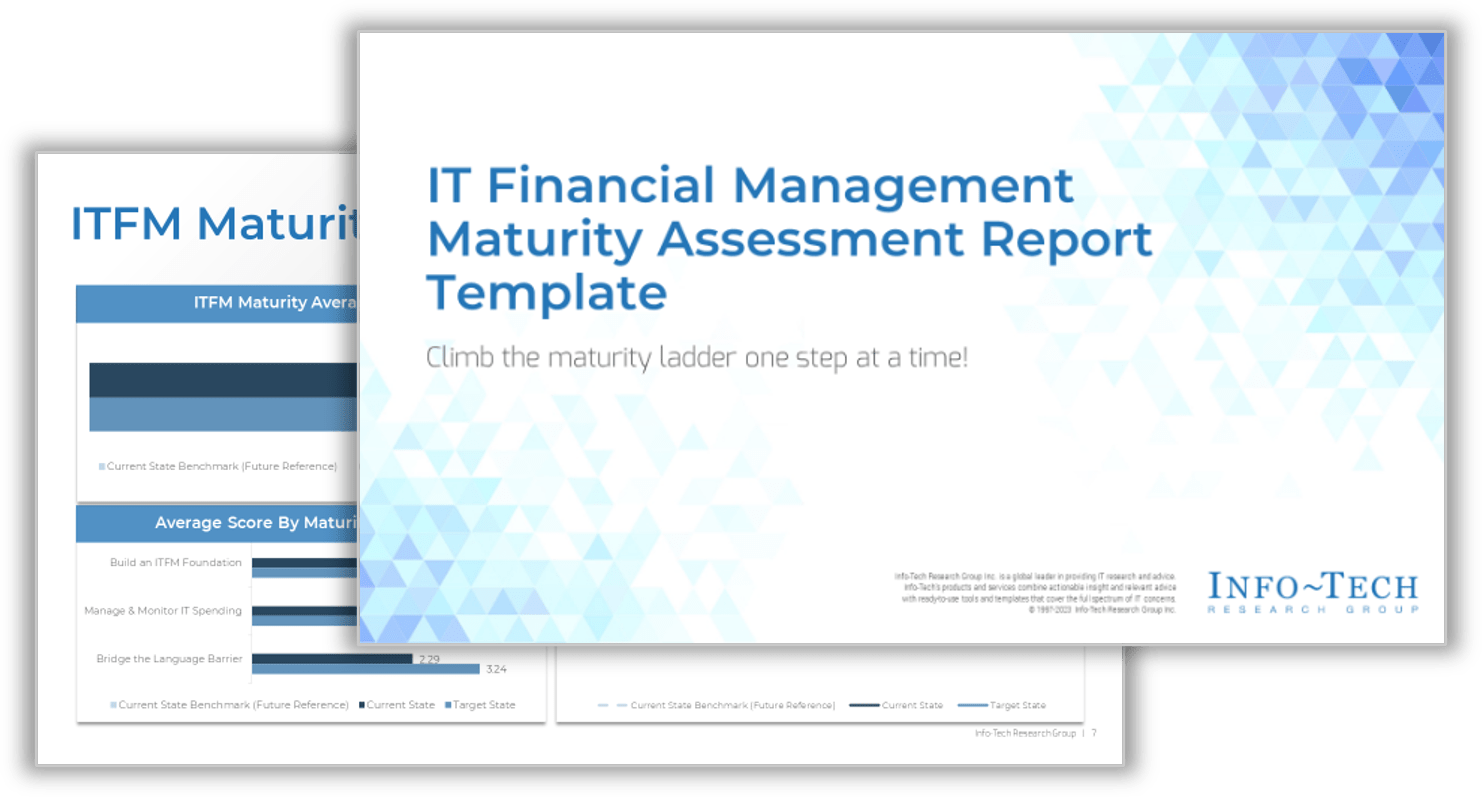
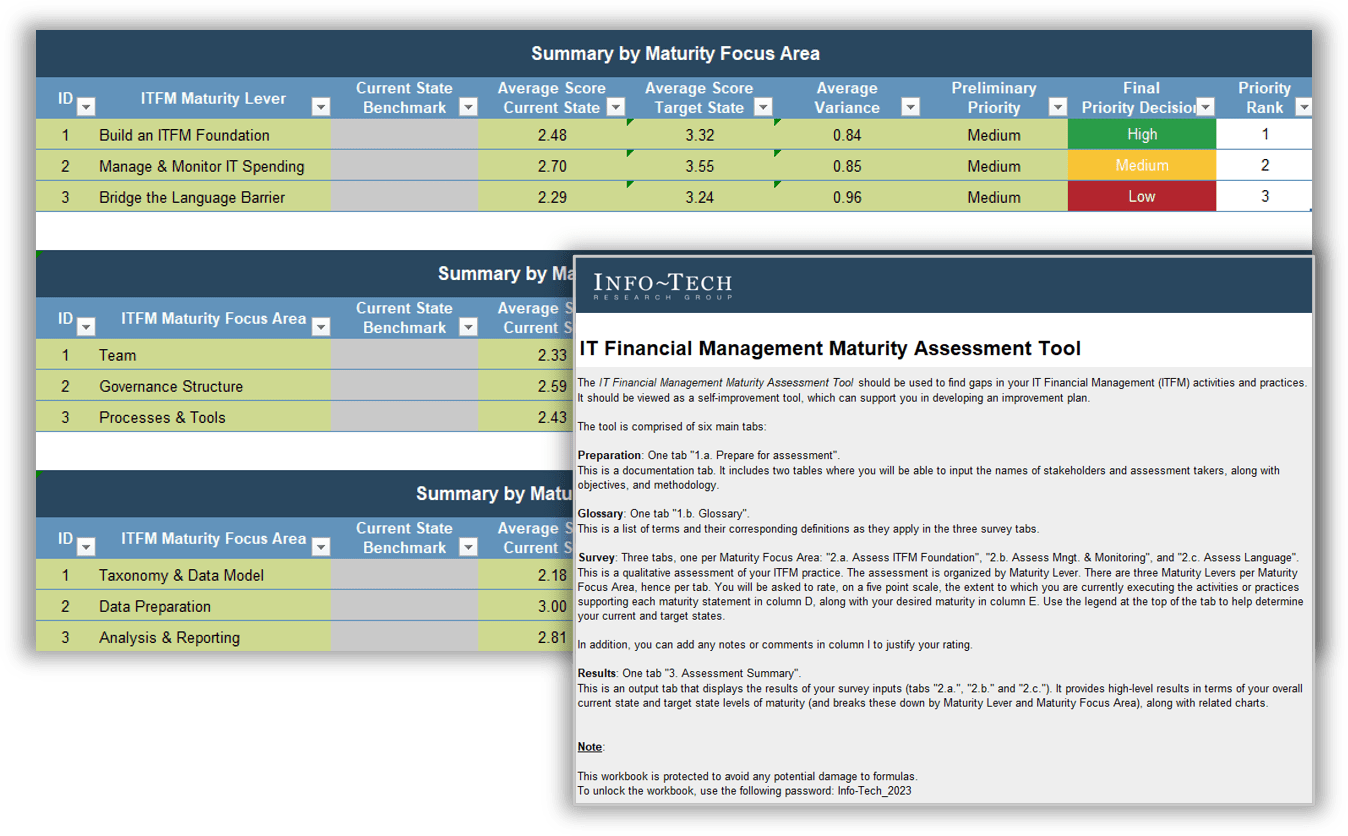
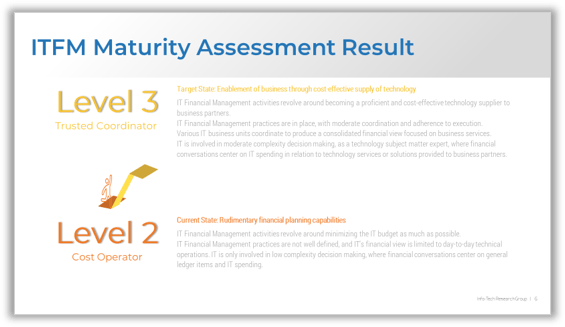
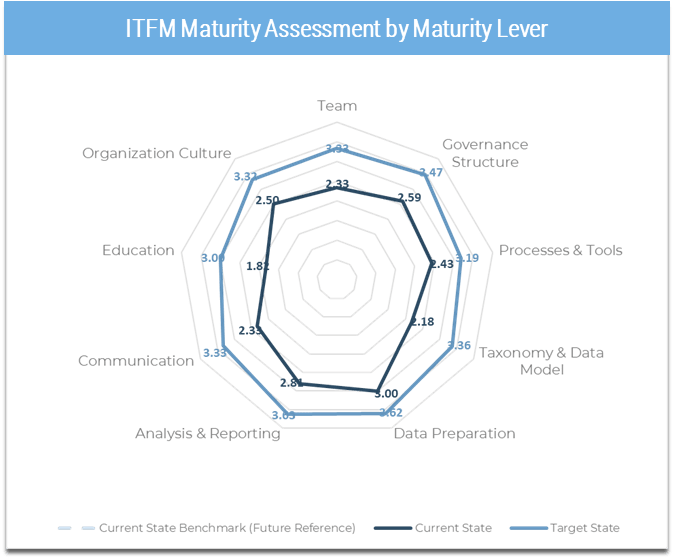
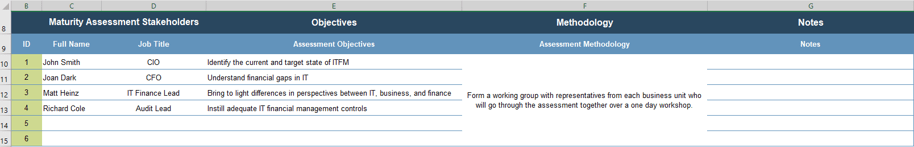
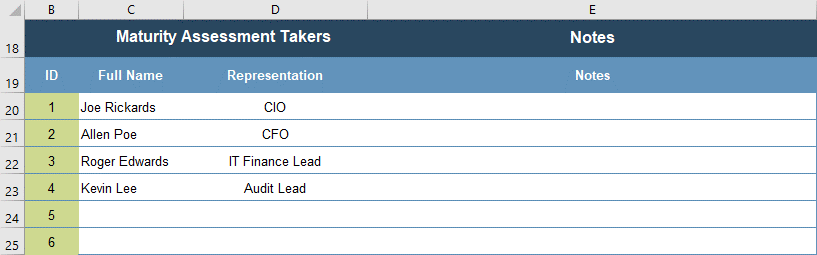
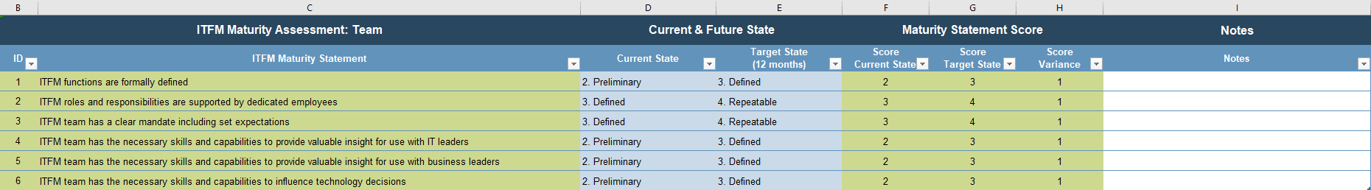
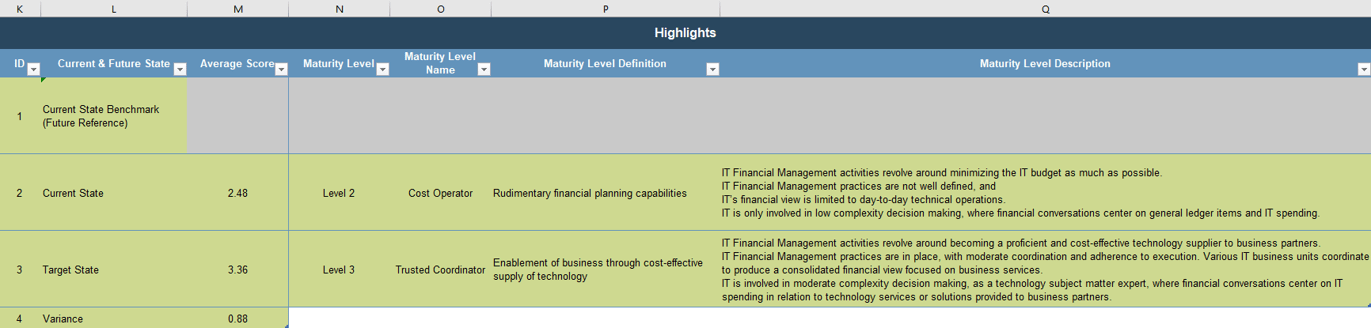
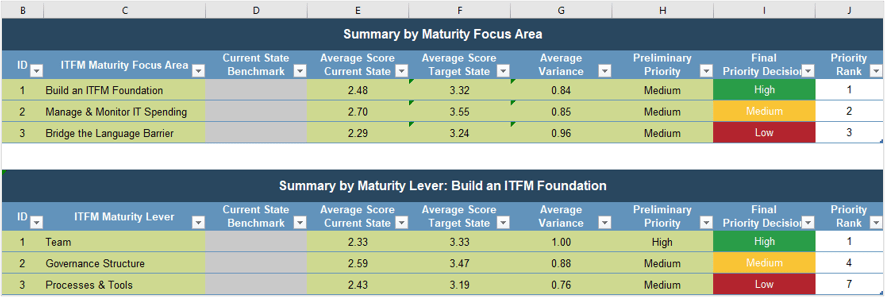
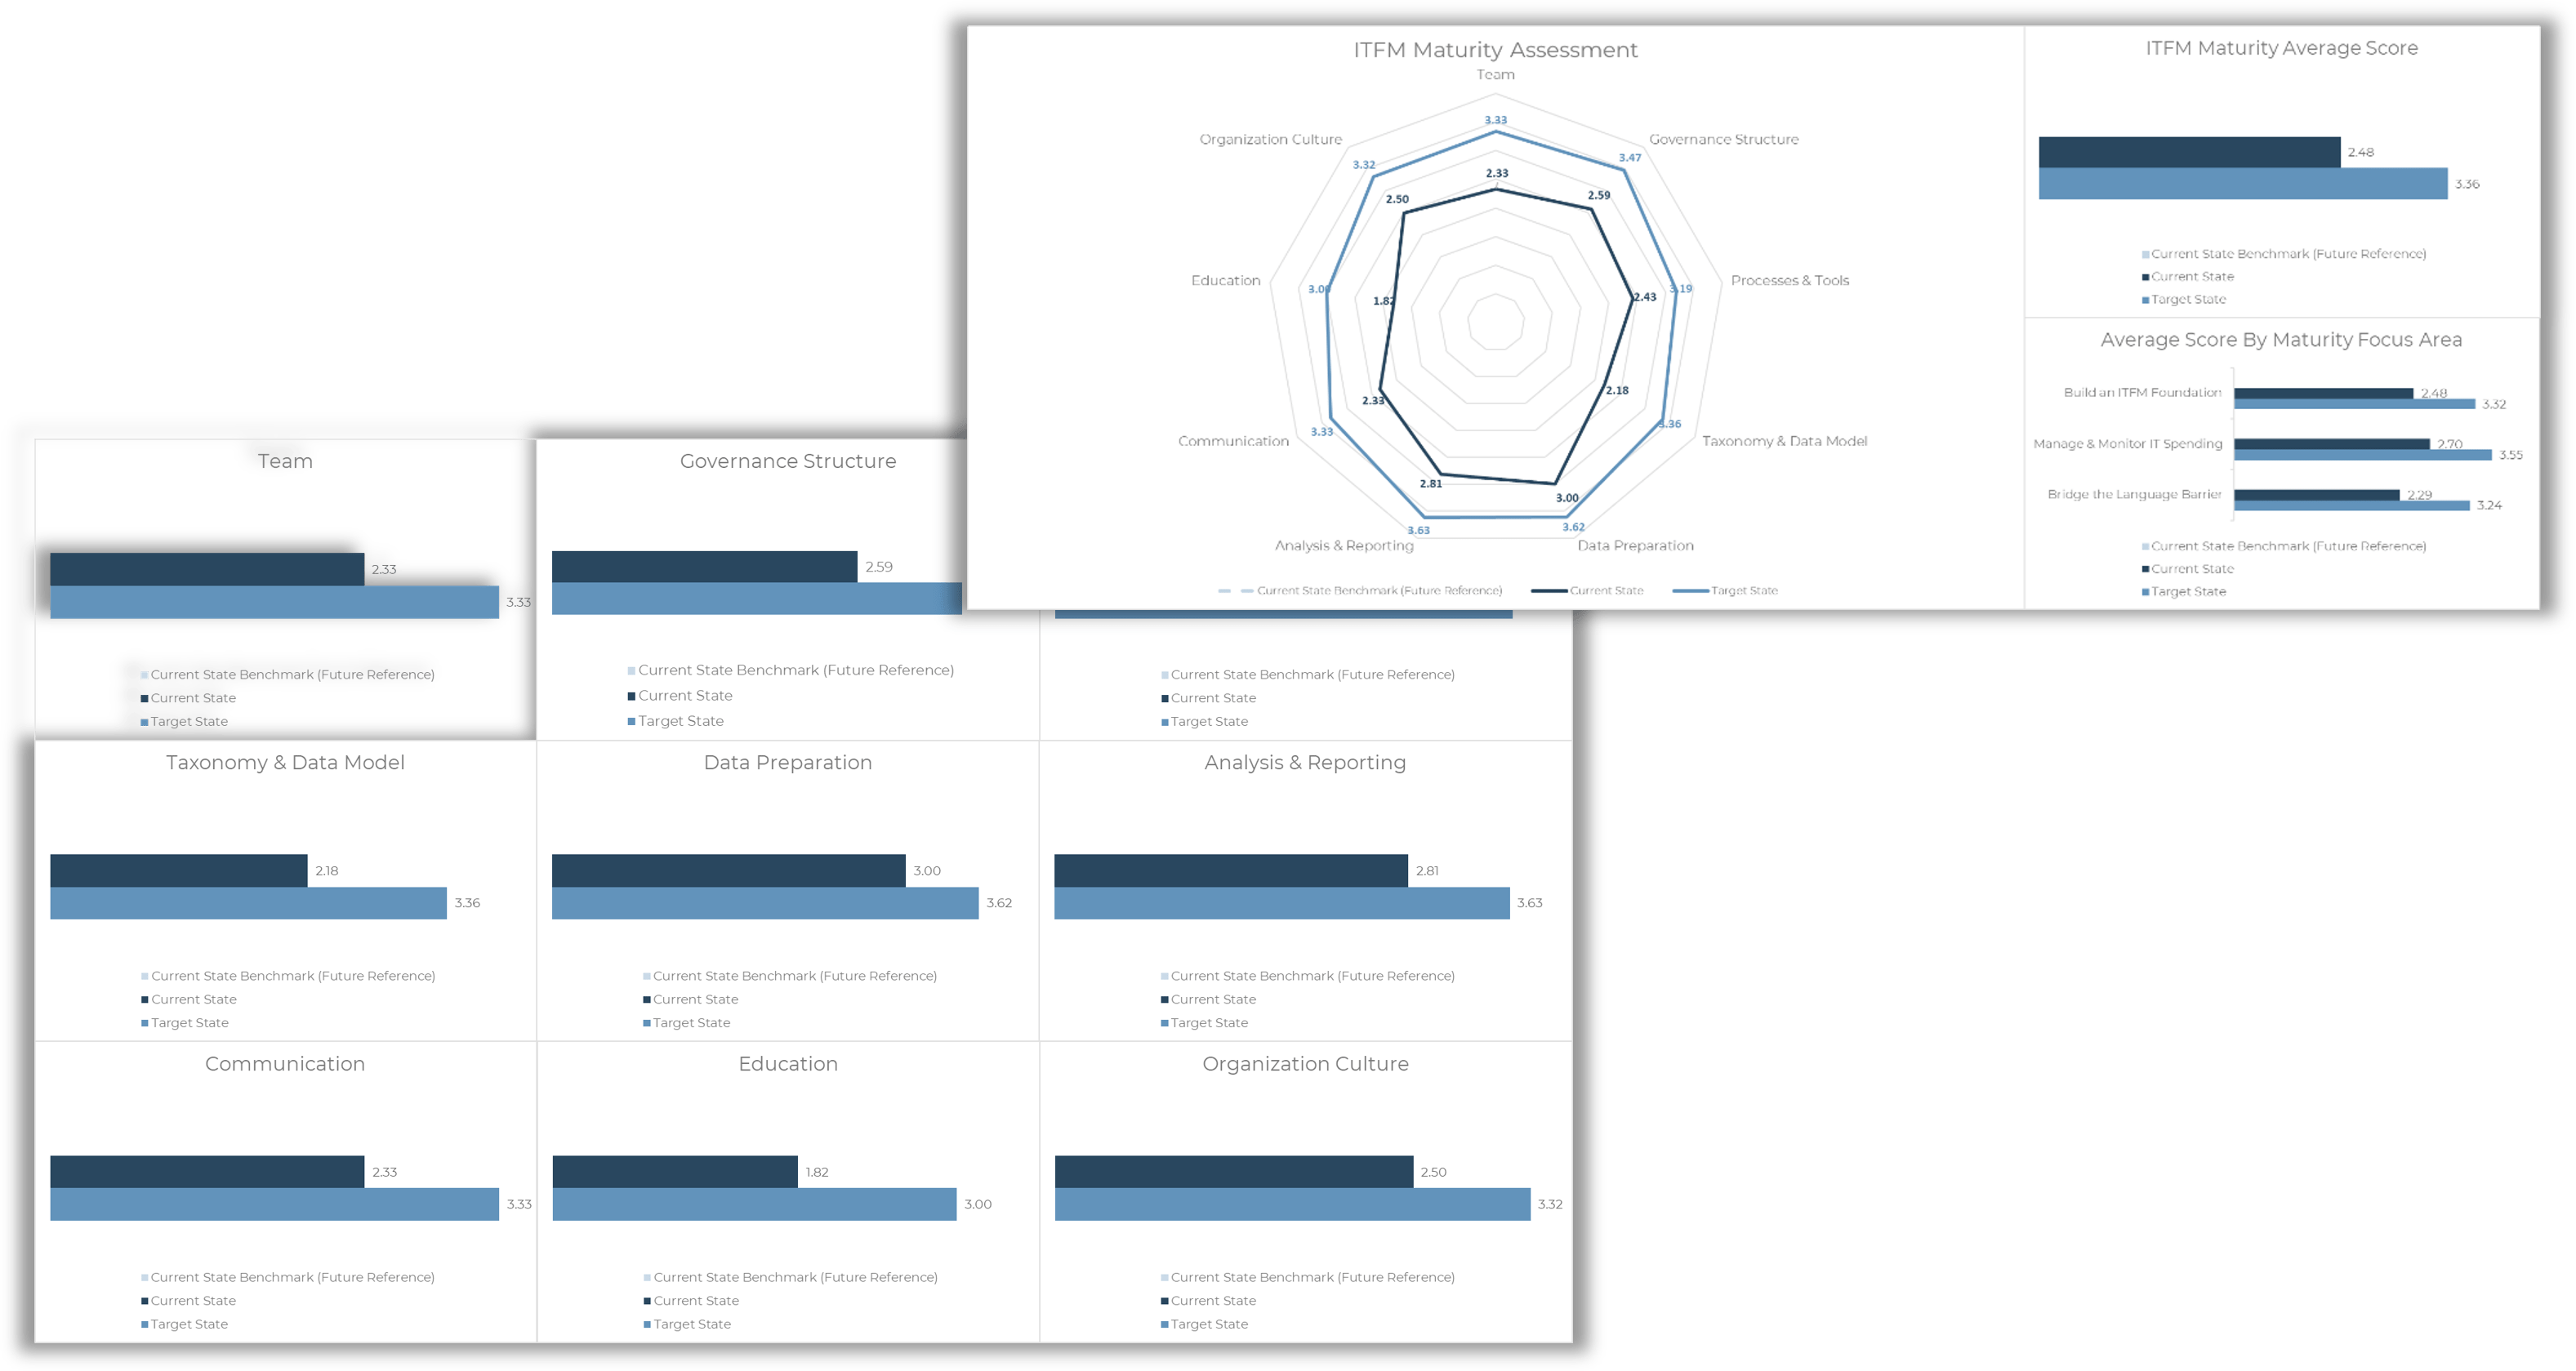
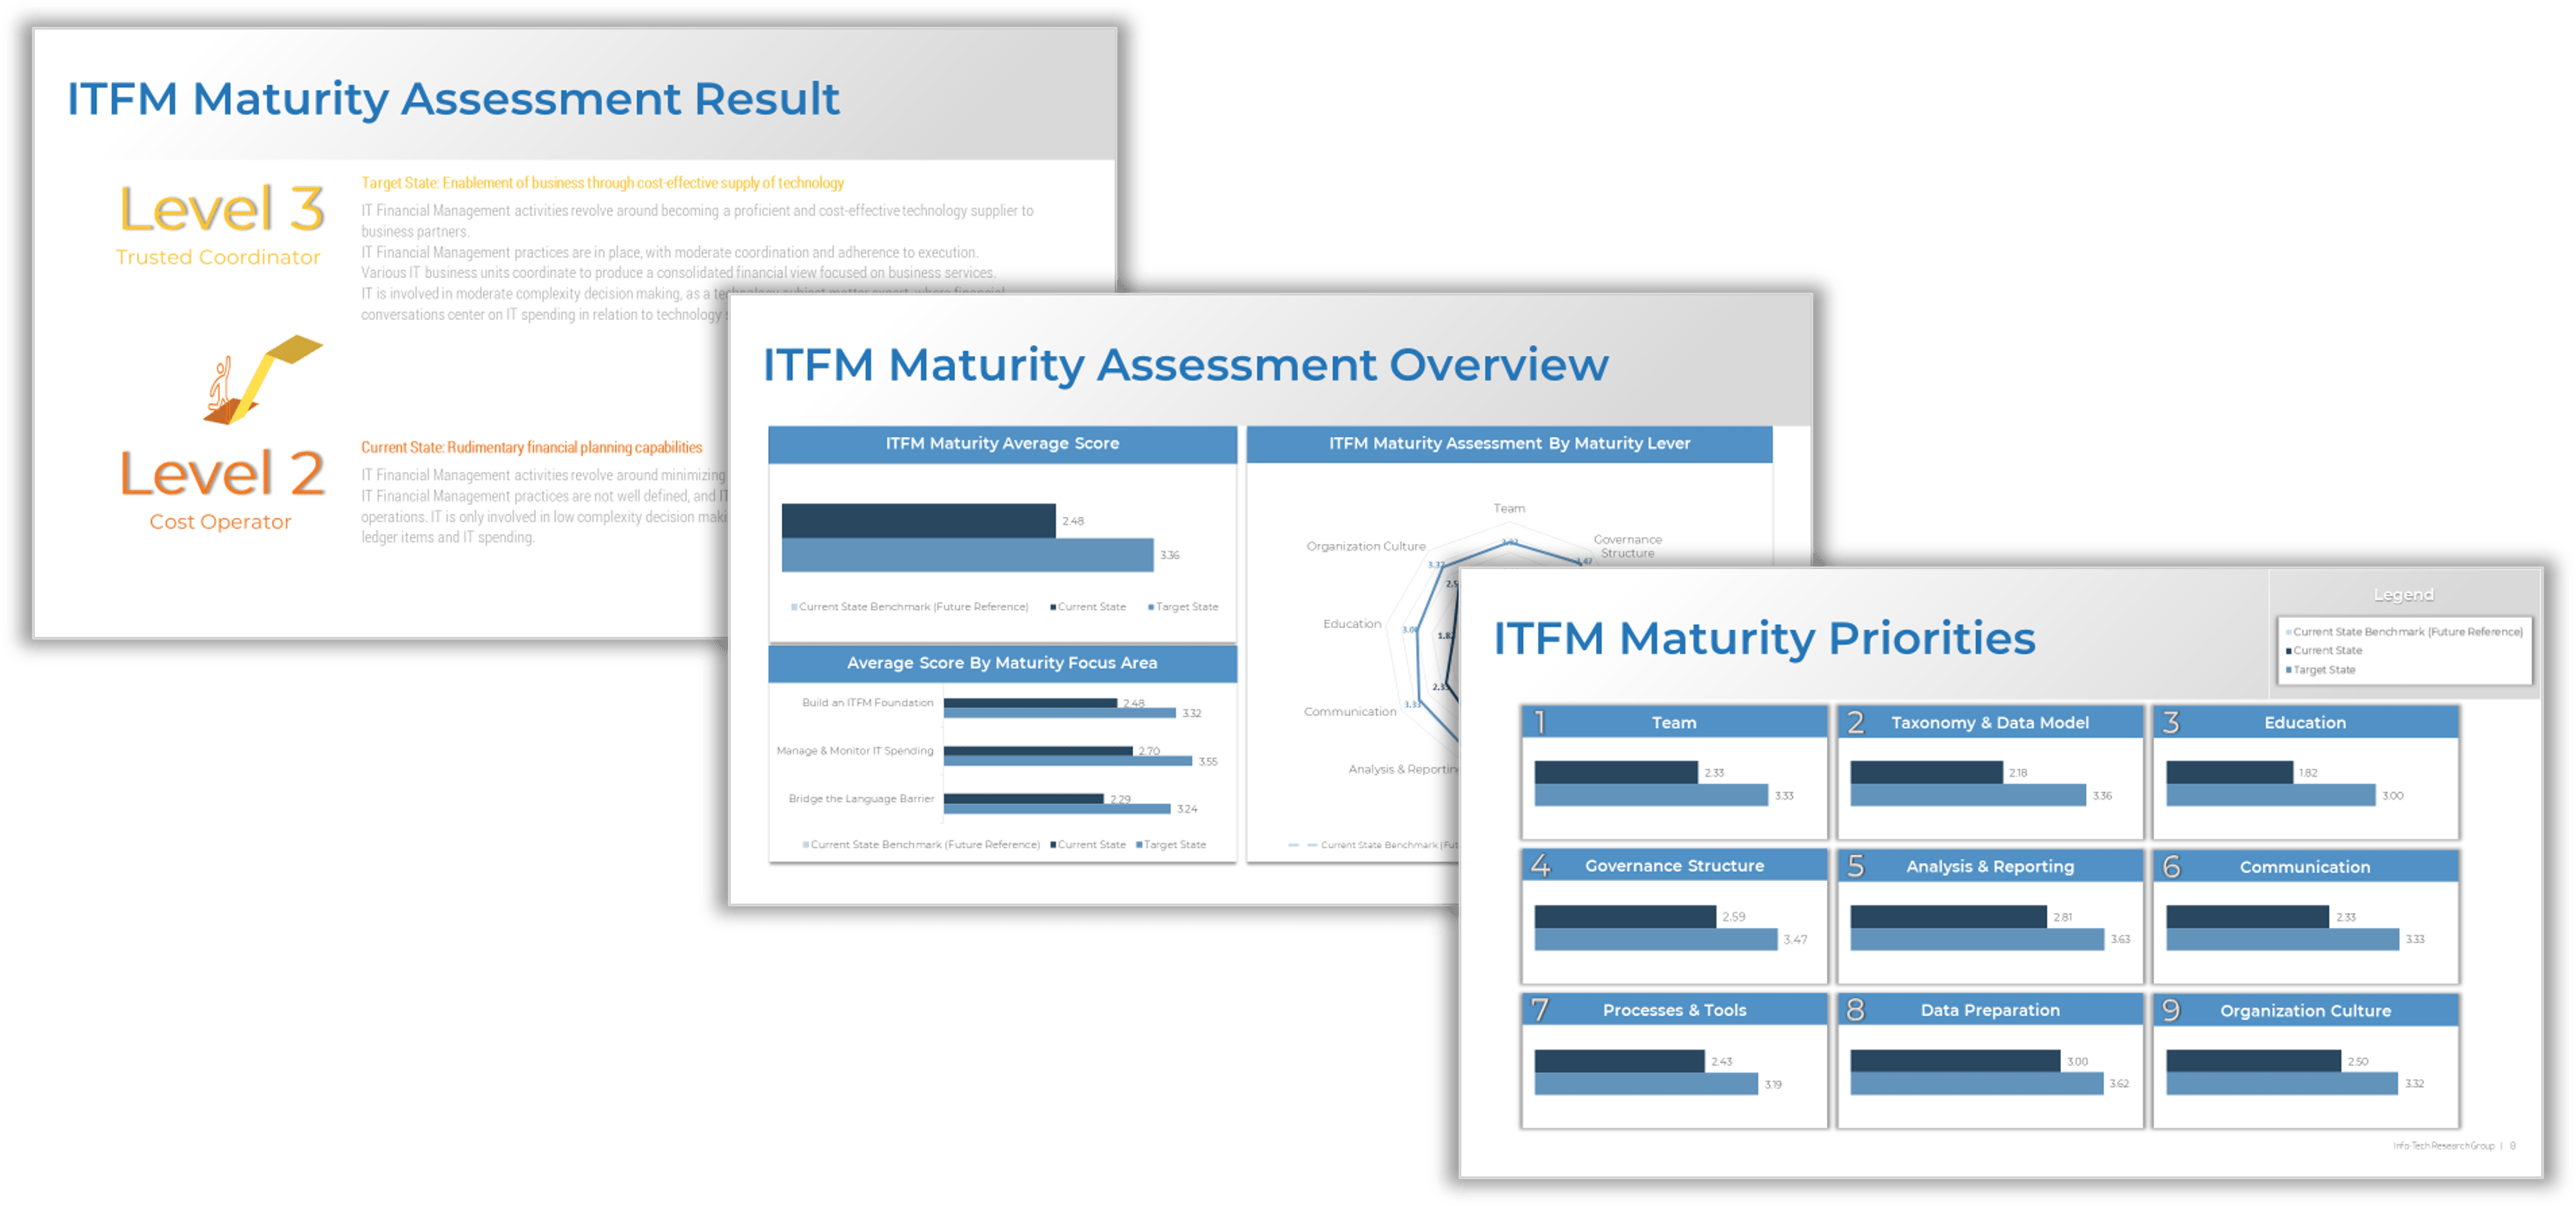


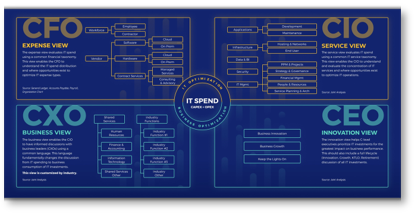
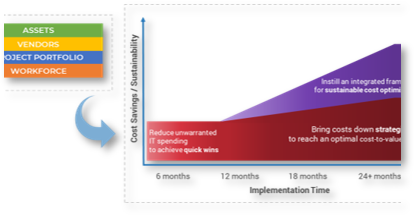


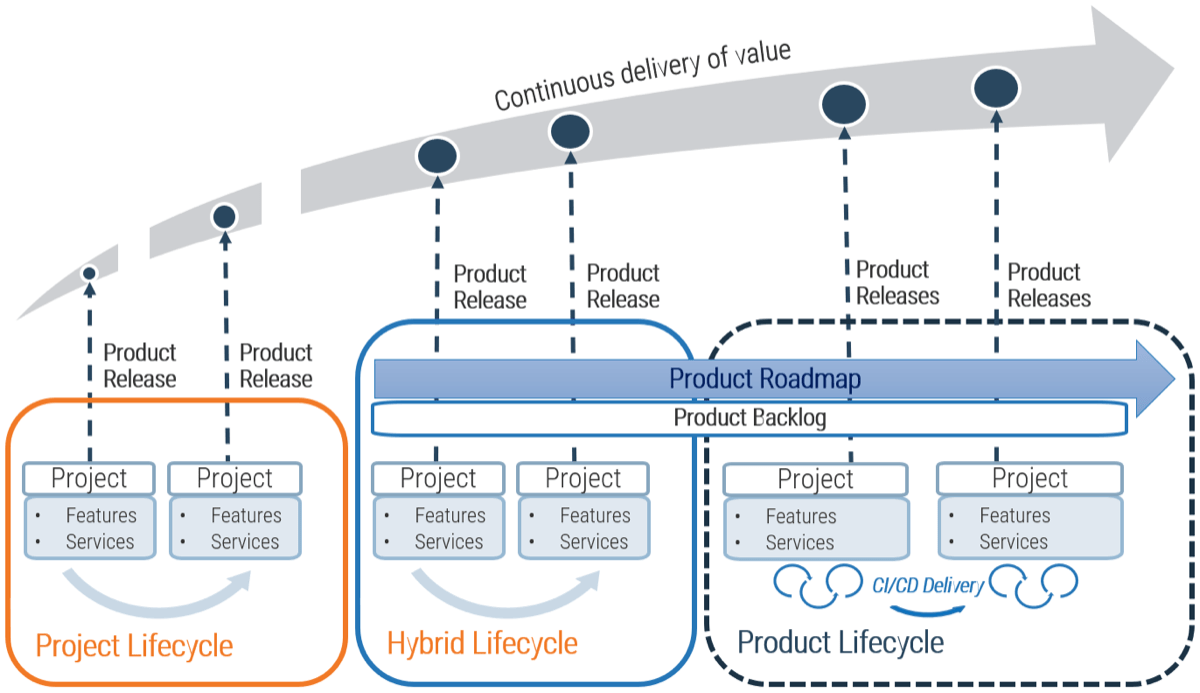

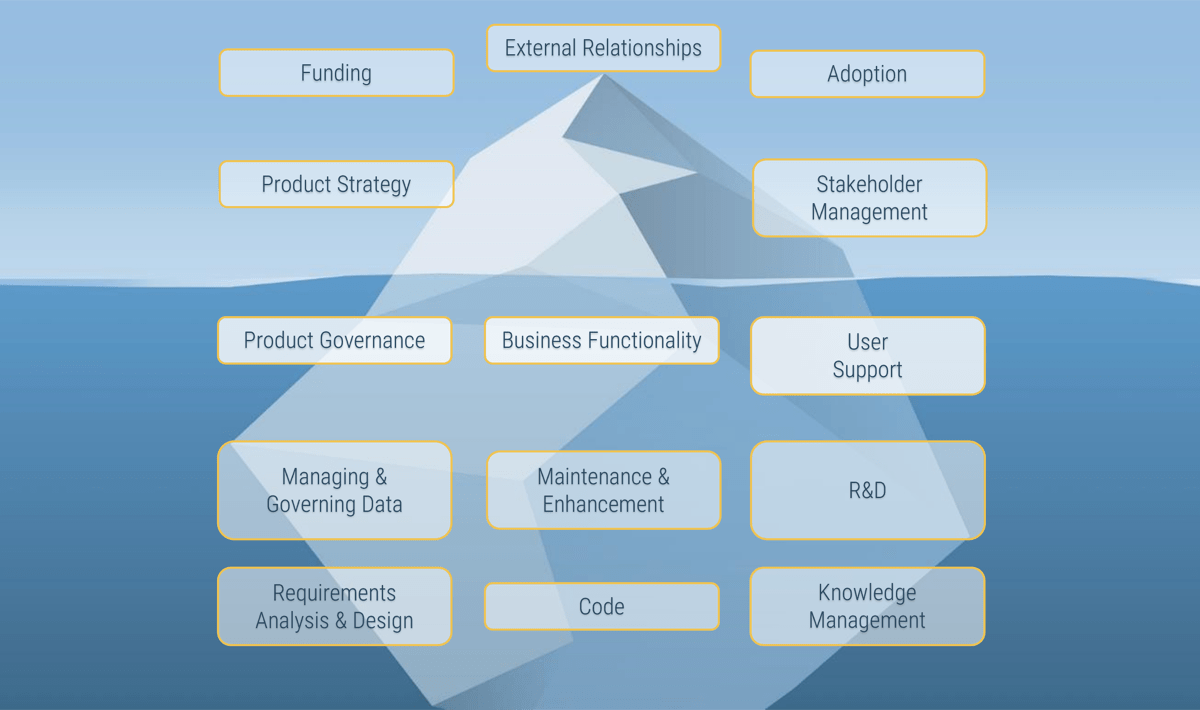

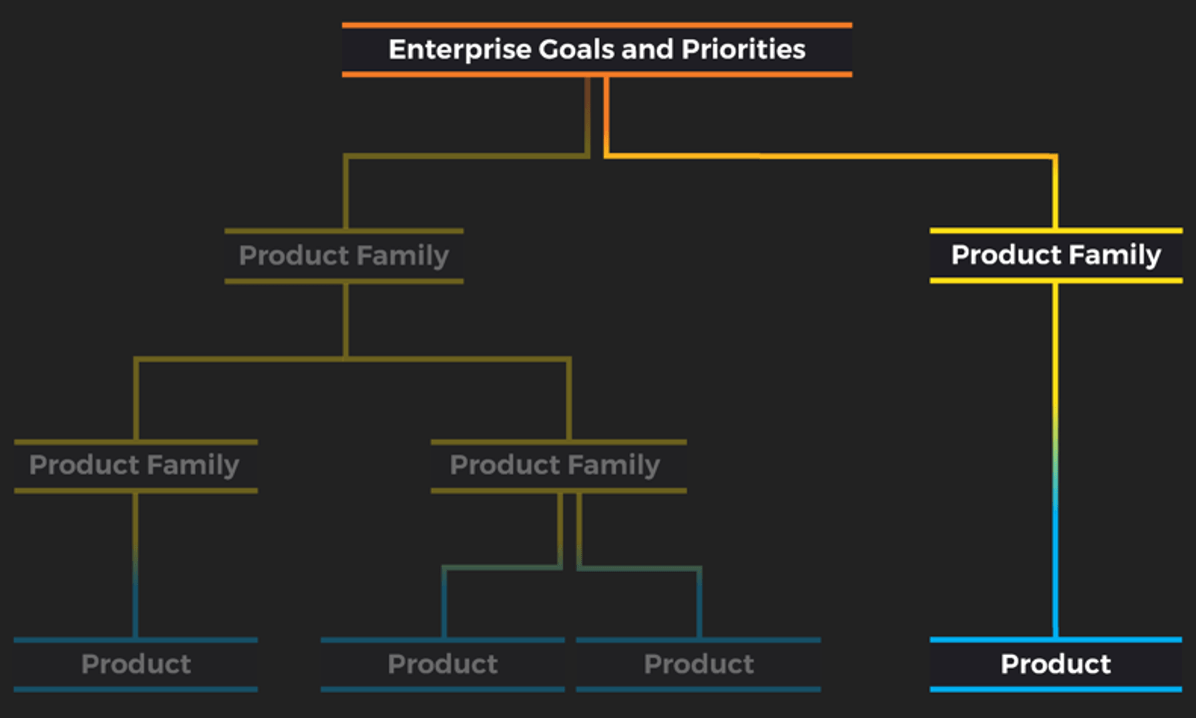
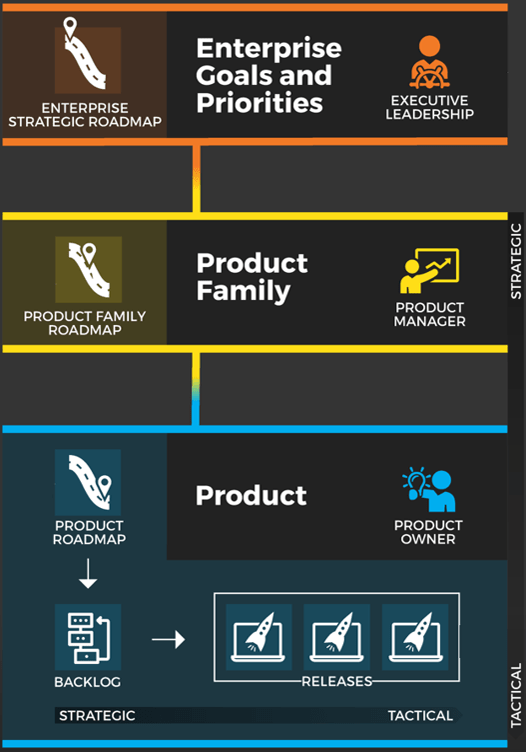
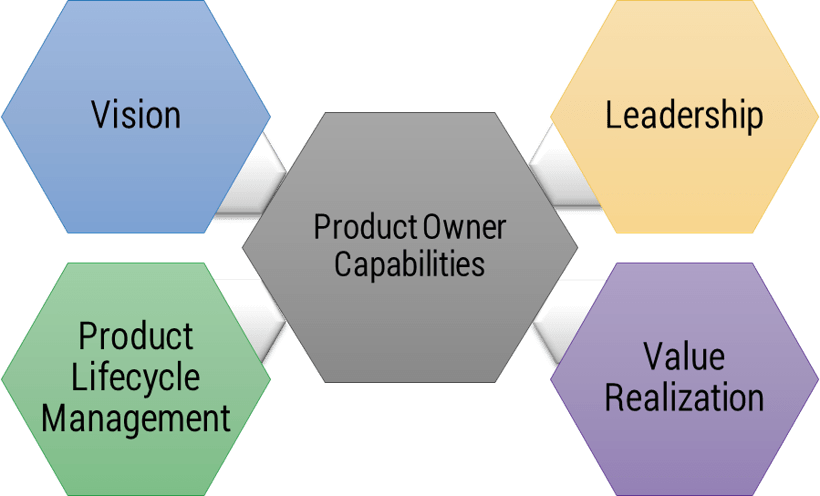
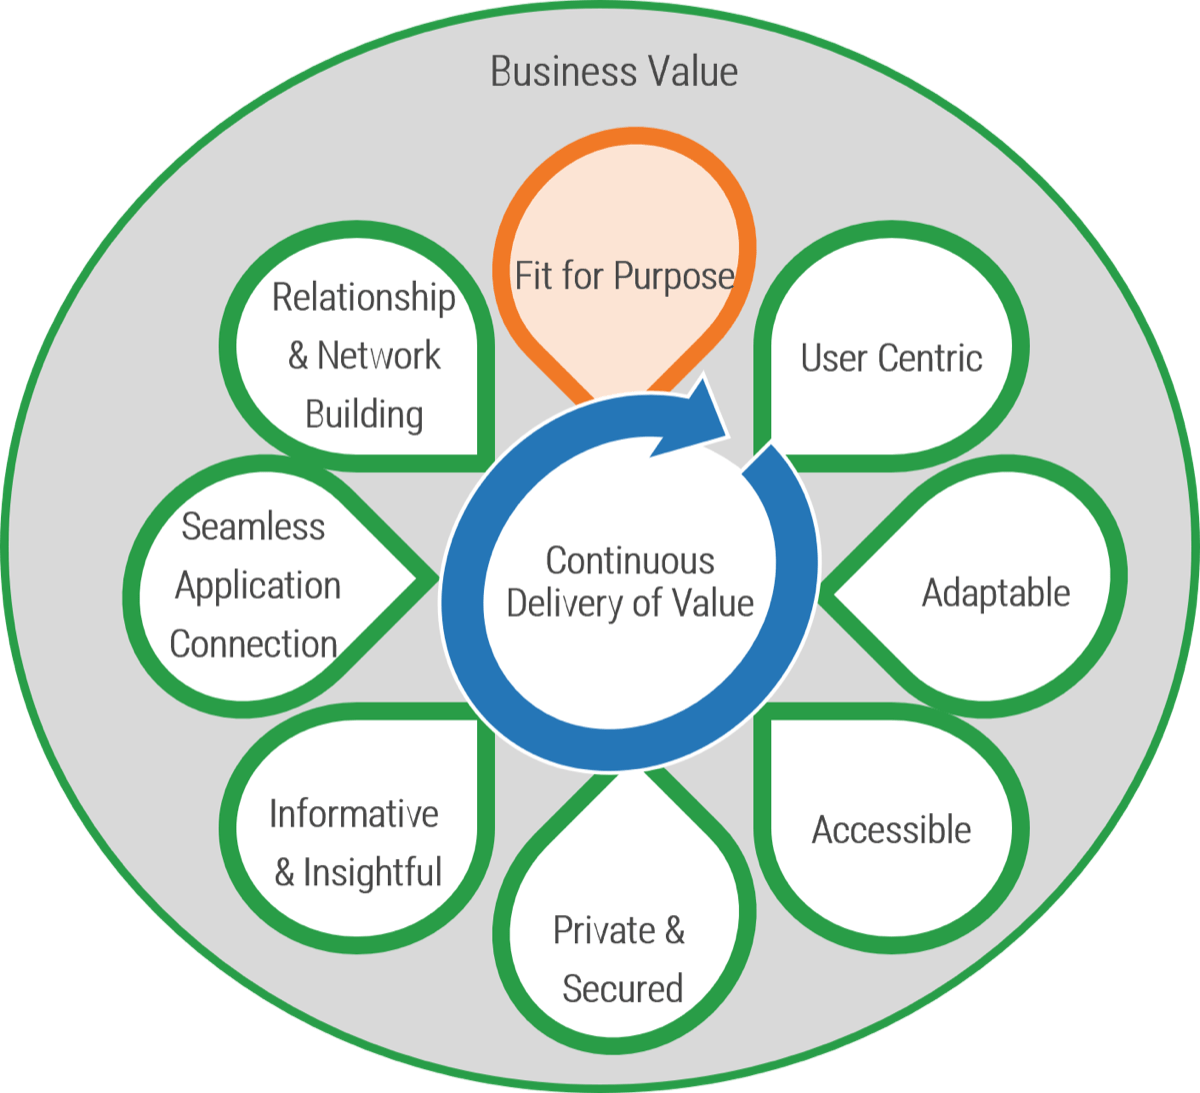


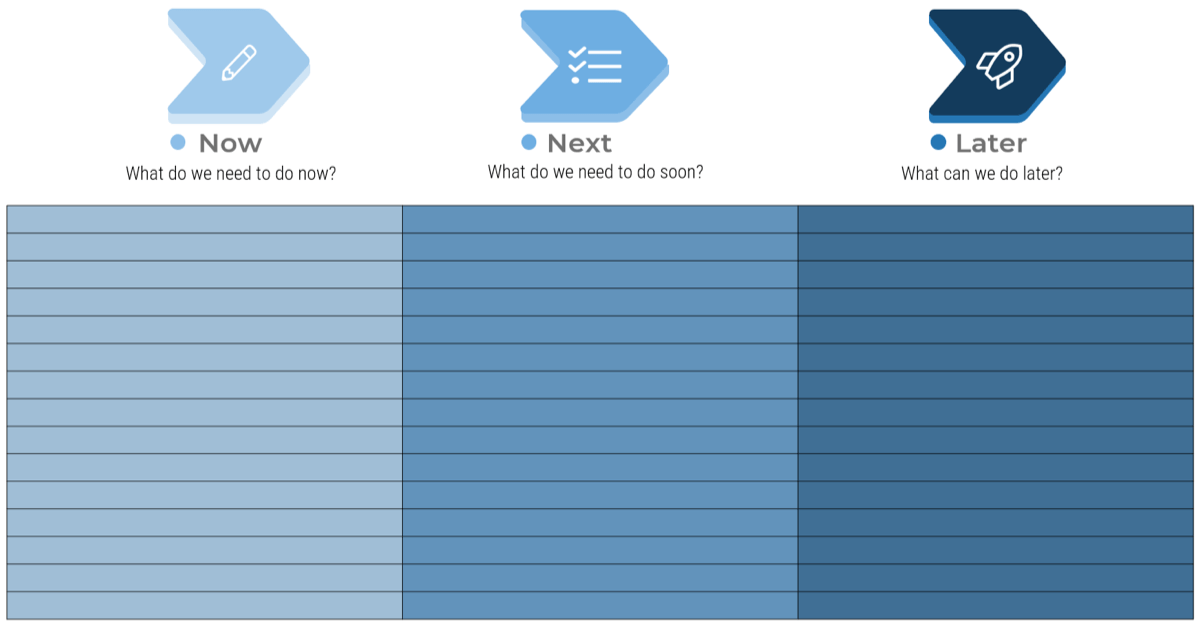
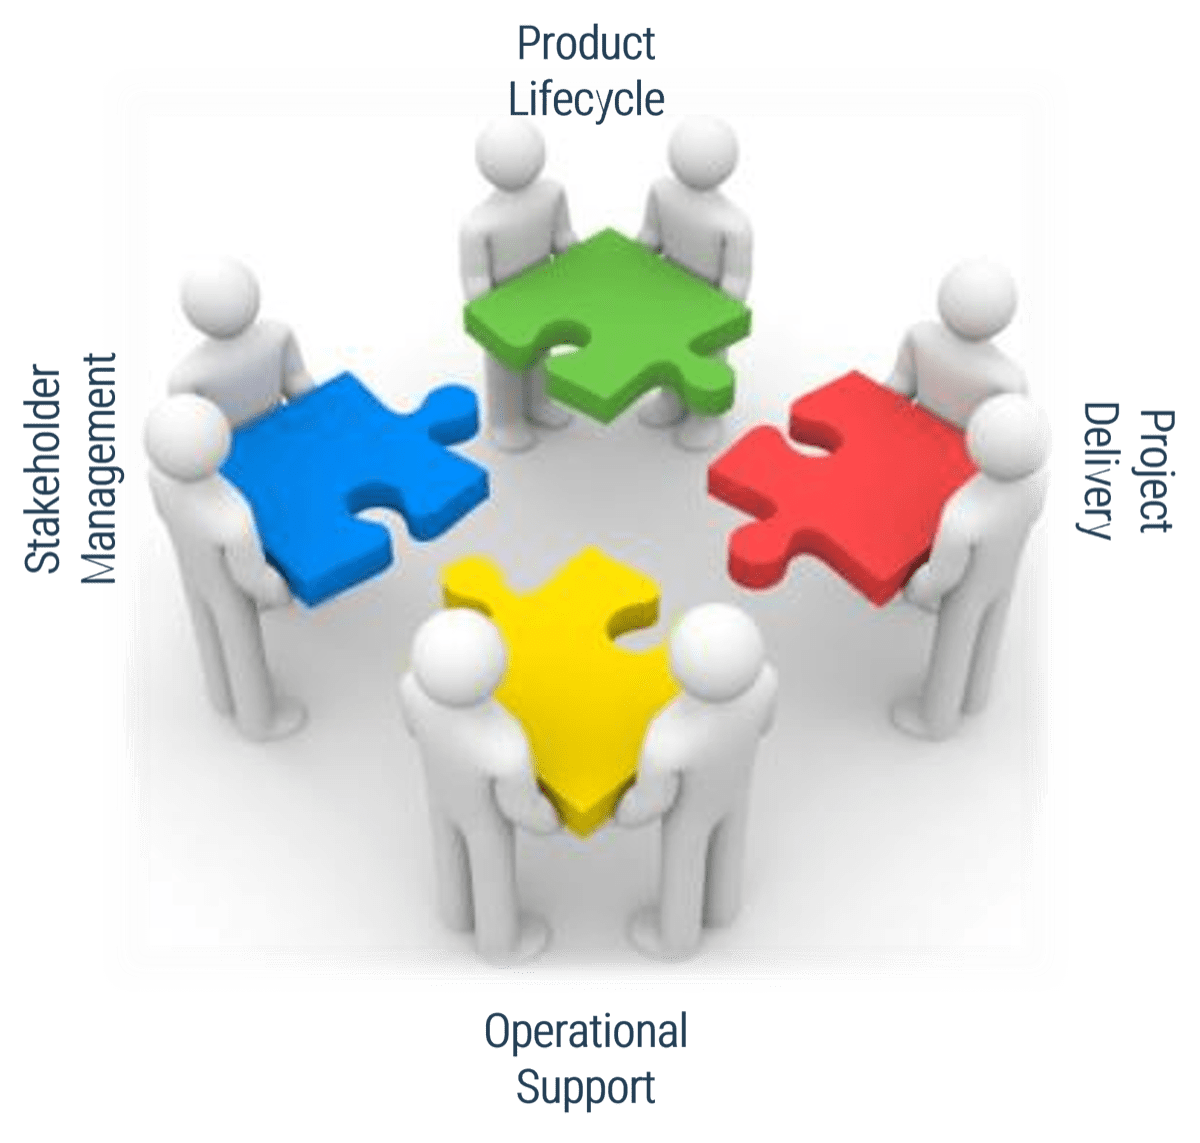
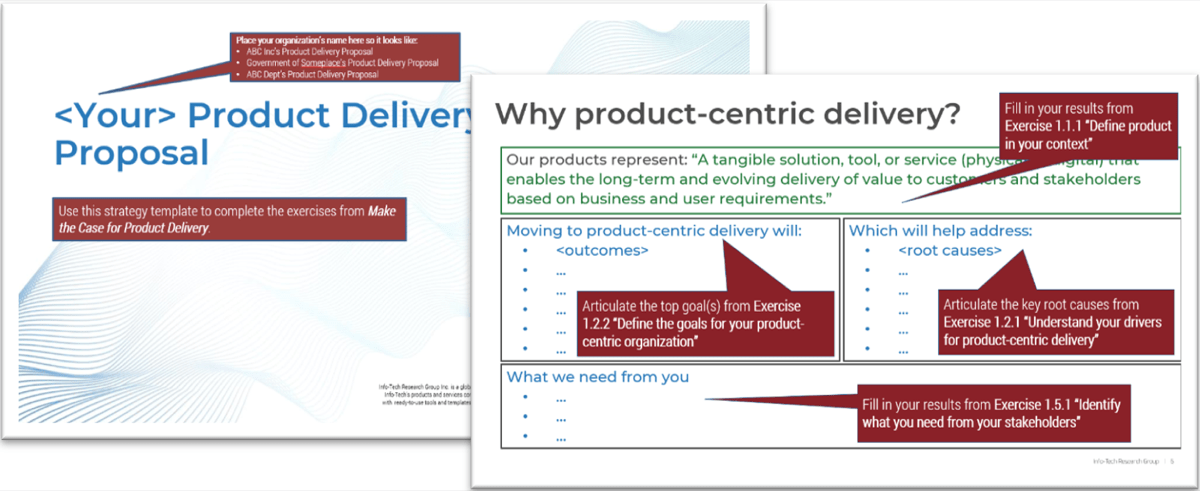
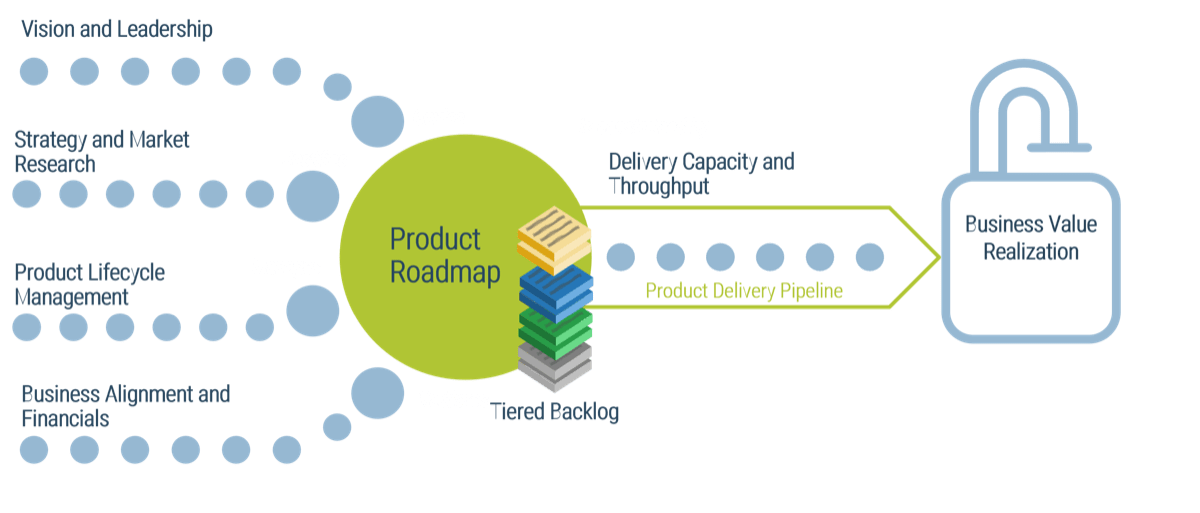

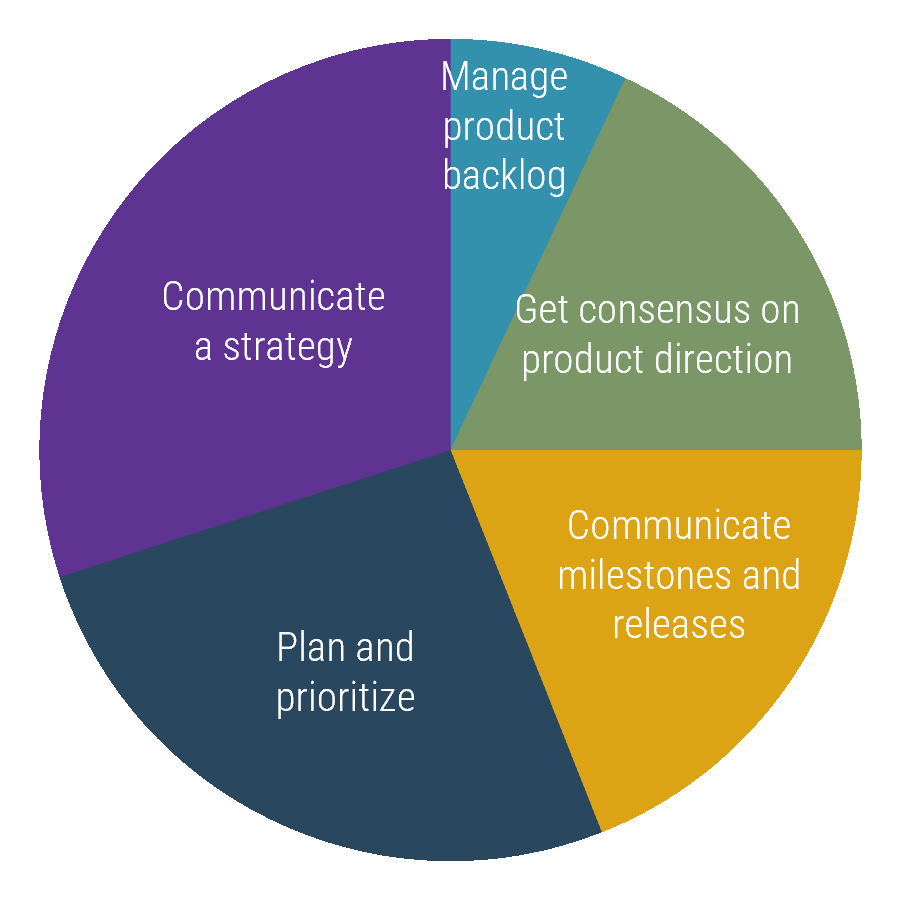
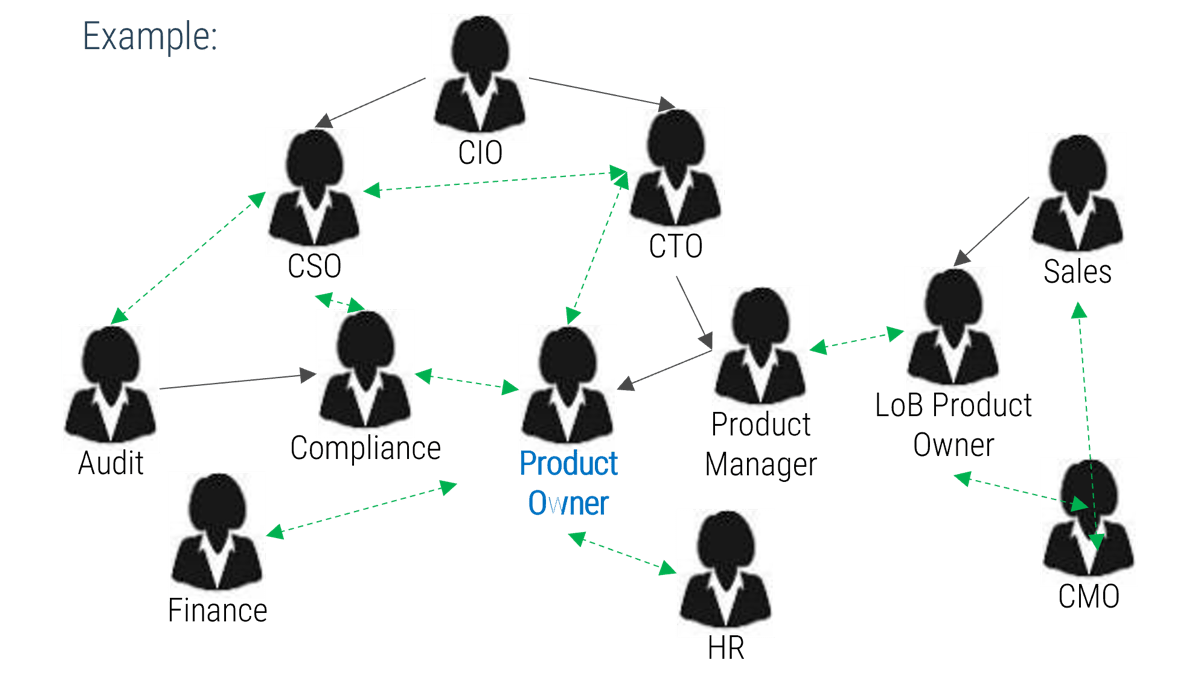
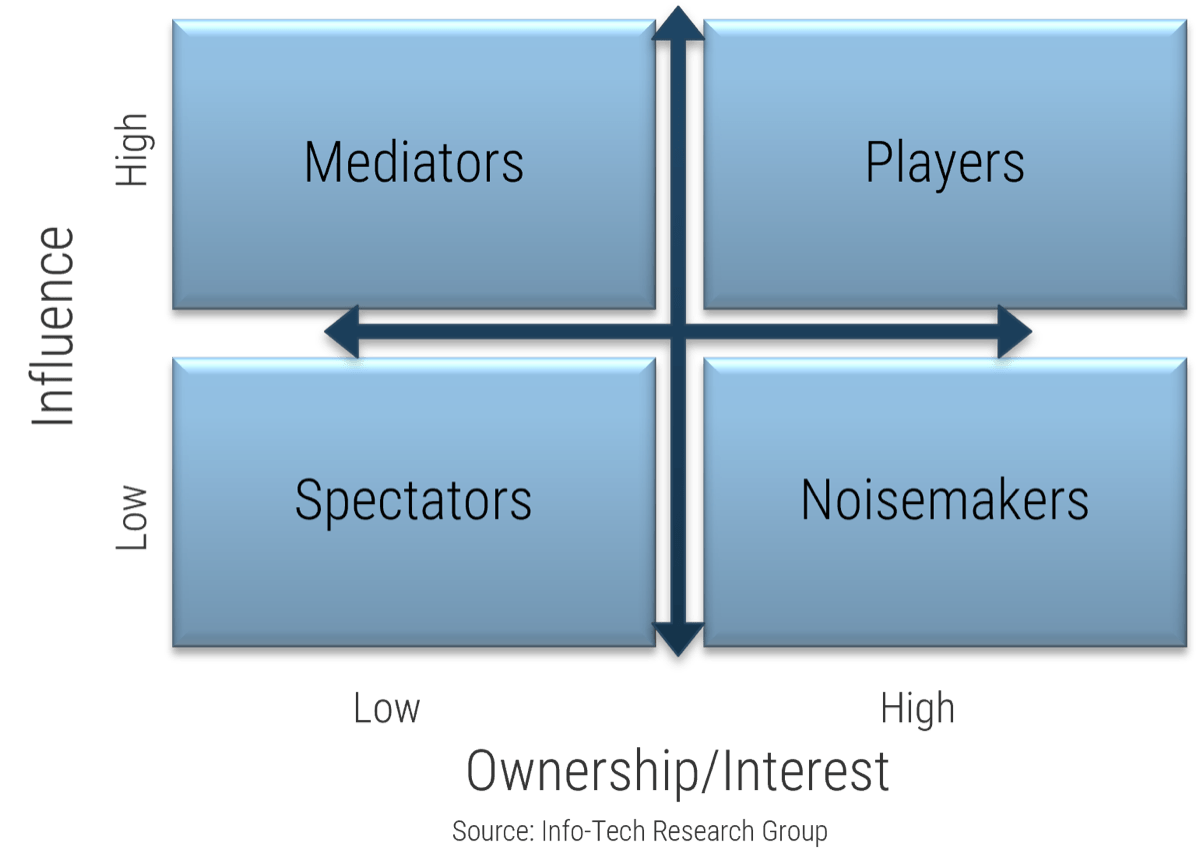
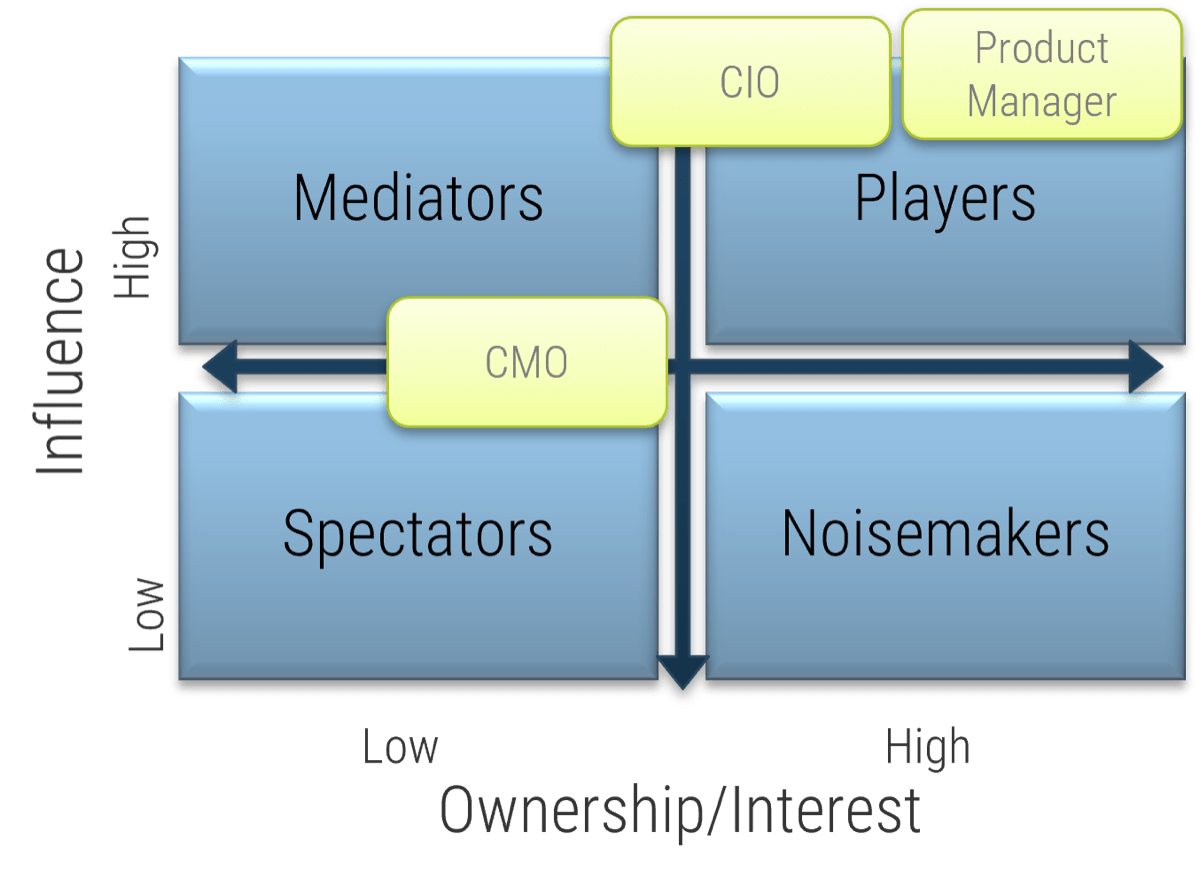
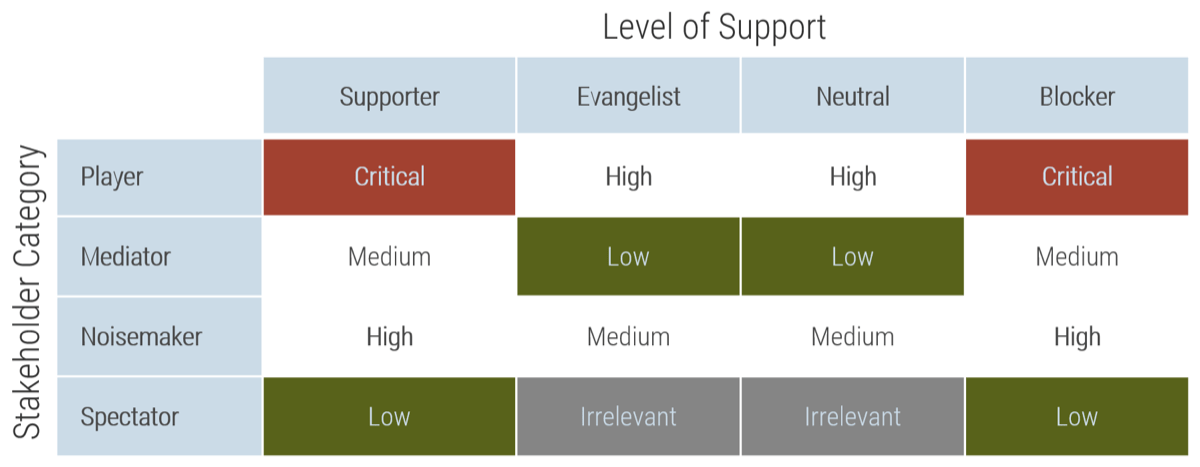
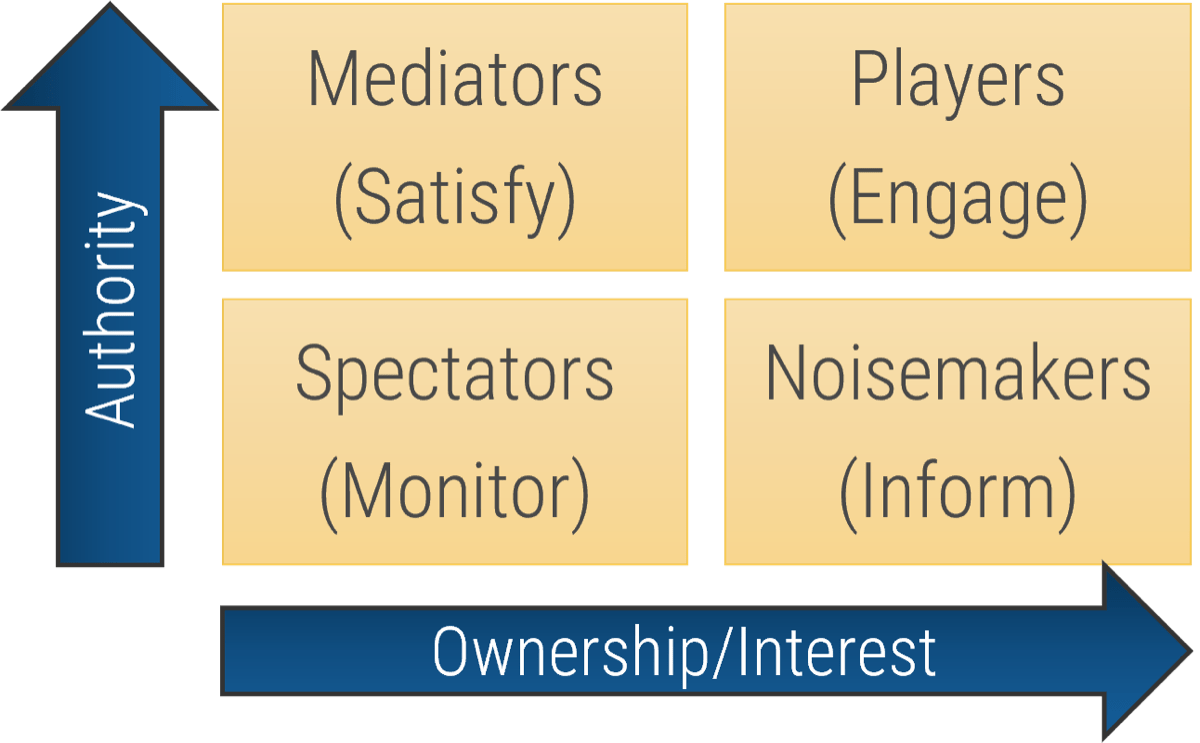
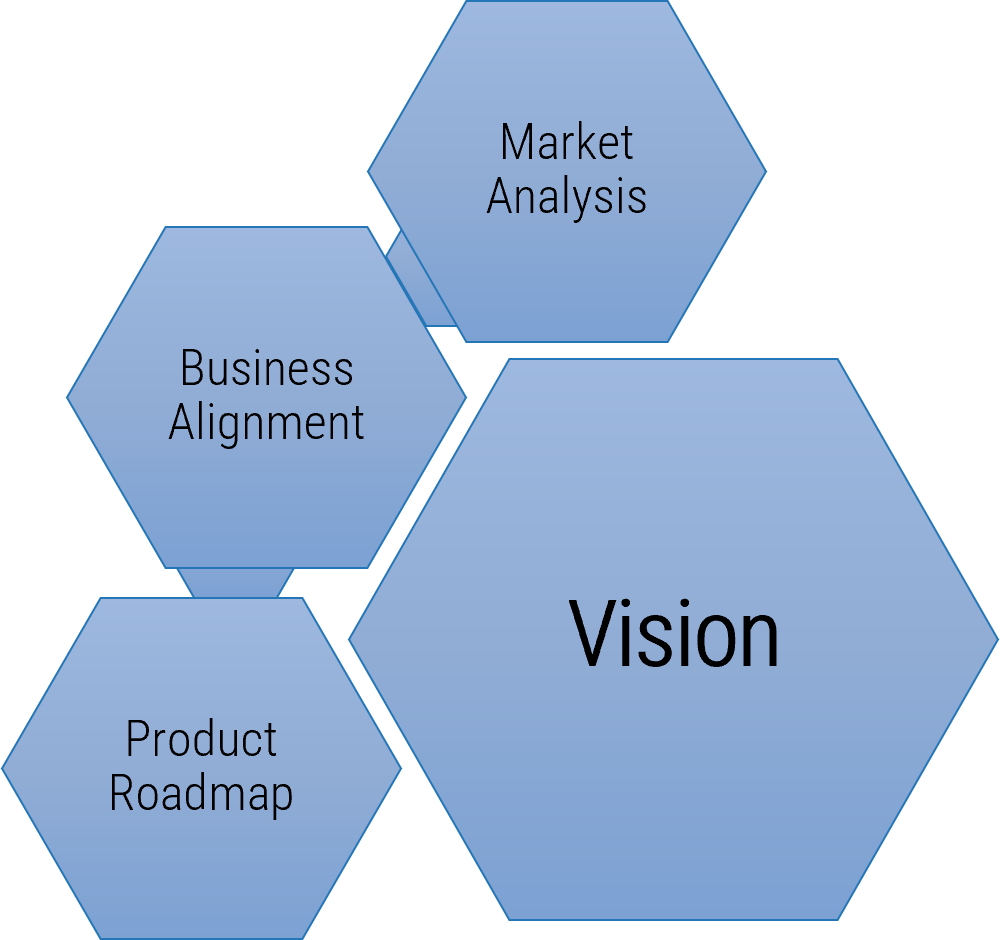
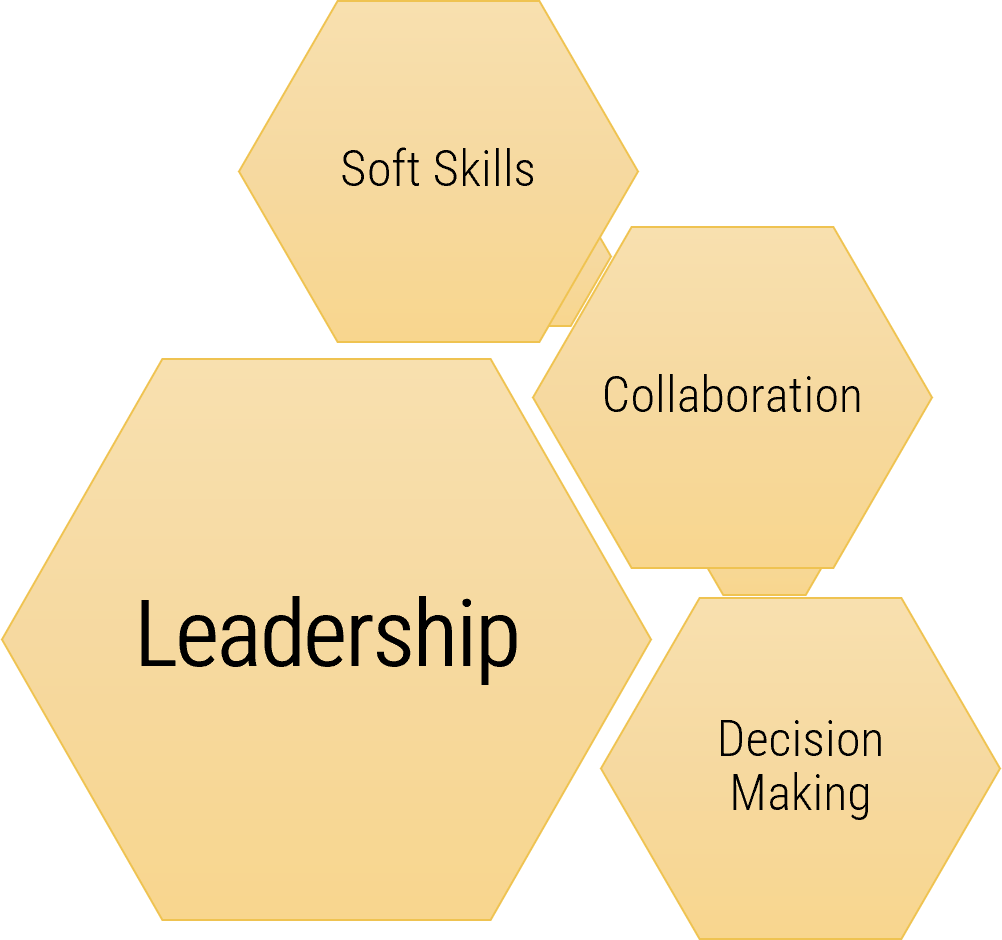
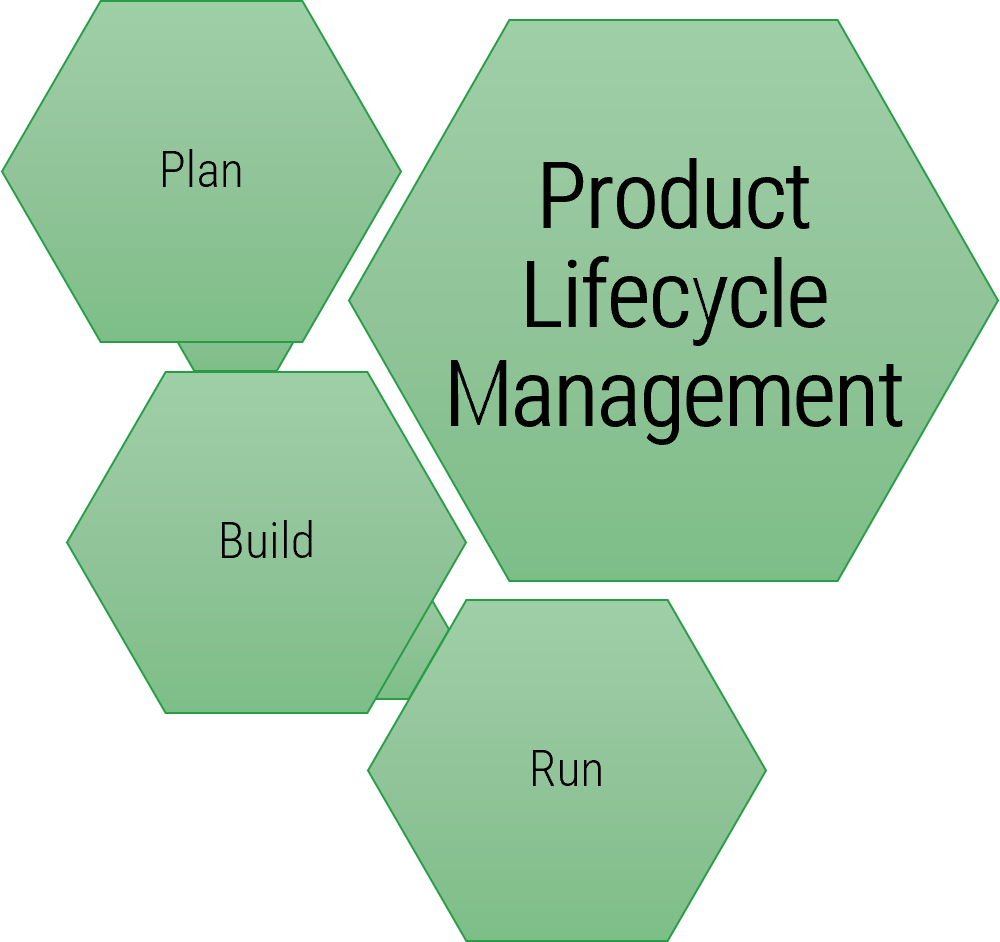


 IT Steering Committee Charter Template.">
 IT Steering Committee Stakeholder Survey ">
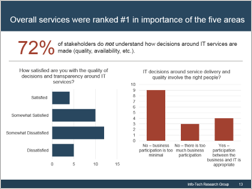 understand how decisions around IT services are made (quality, availability, etc.). Two graphs are included in the screenshot. One of the bar graphs shows the satisfaction with the quality of decisions and transparency around IT services. The other bar graph displays IT decisions around service delivery and quality that involve the right people.">
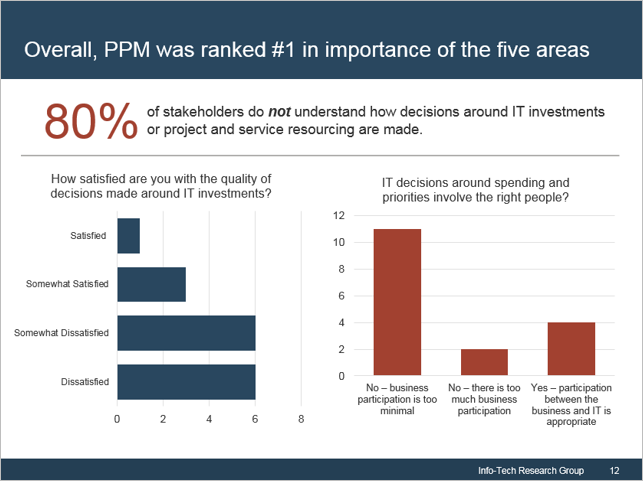 not understand how decisions around IT investments or project and service resourcing are made. Two bar graphs are displayed. One of the bar graphs shows the satisfaction with the quality of decisions made around IT investments. The other graph display IT decisions around spending priorities involving the right people.">
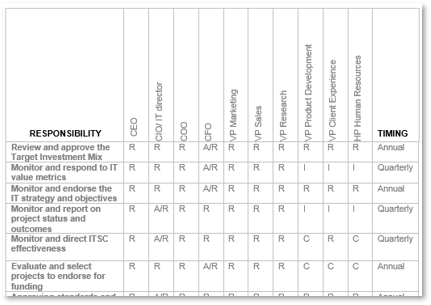

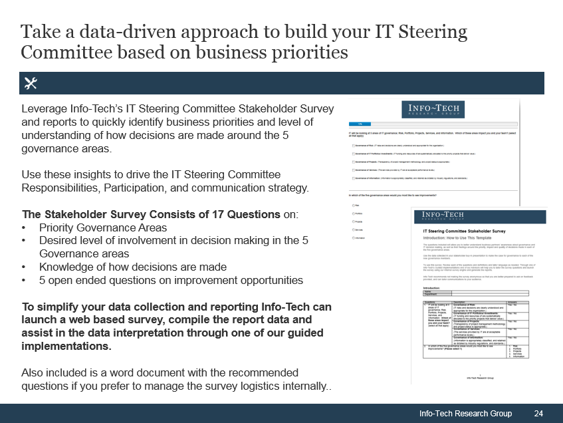
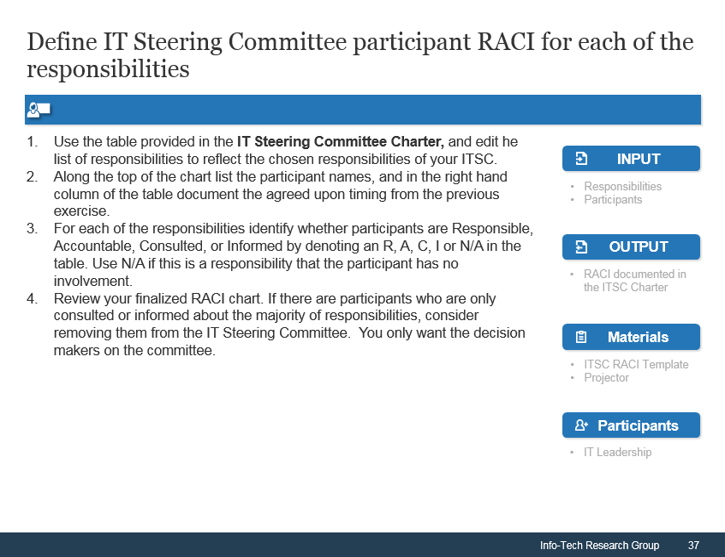
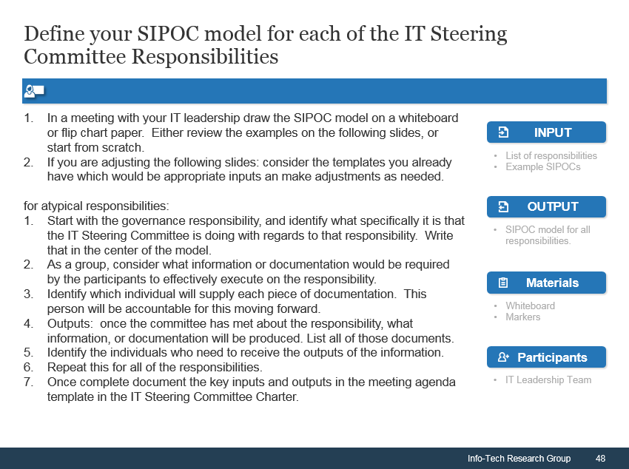
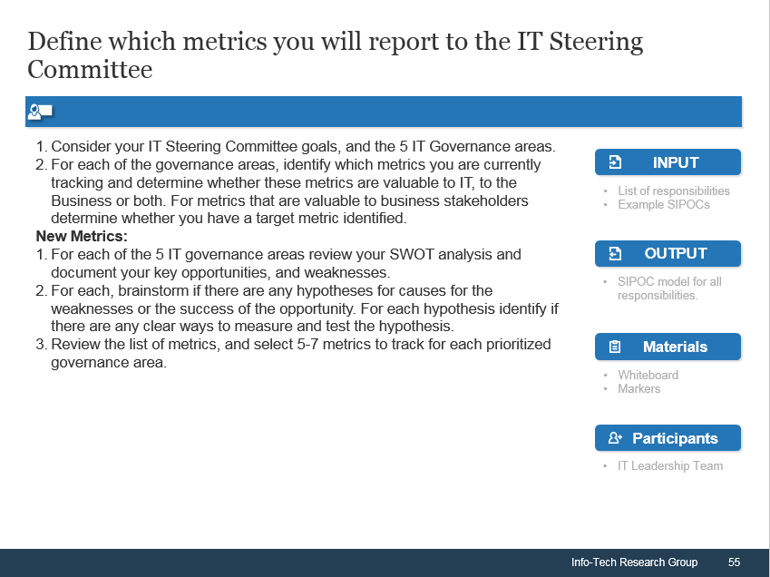
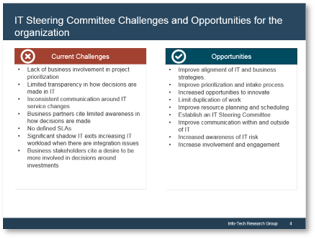
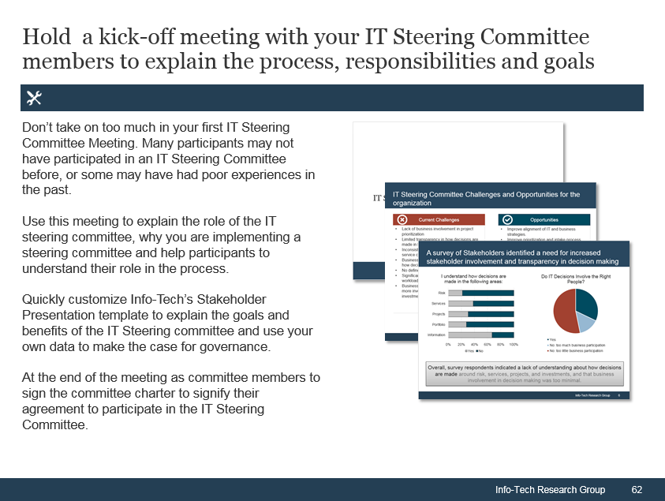
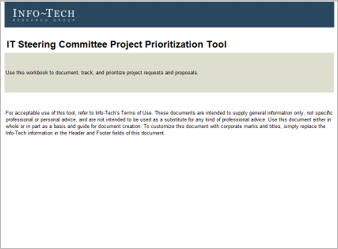
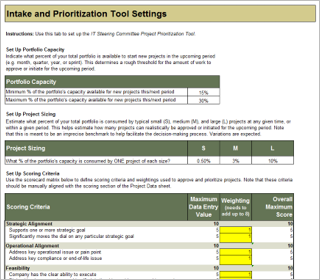
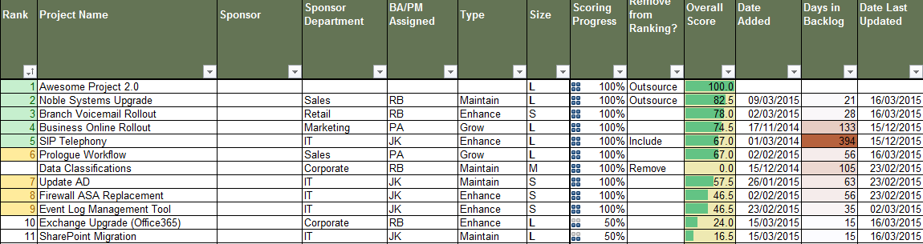
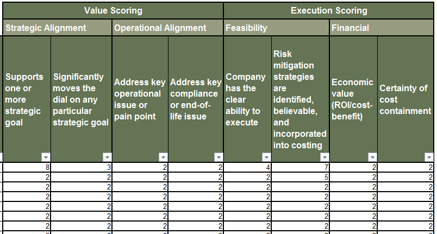 IT Steering Committee Project Prioritization Tool is depicted. The Data Tab is shown.">
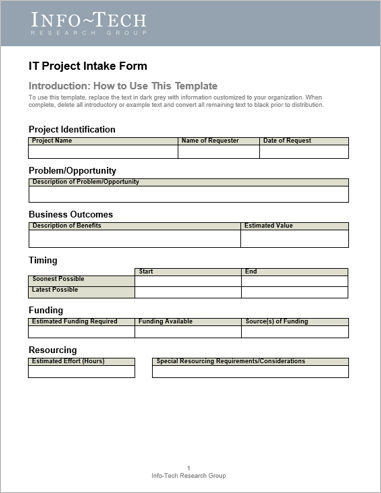


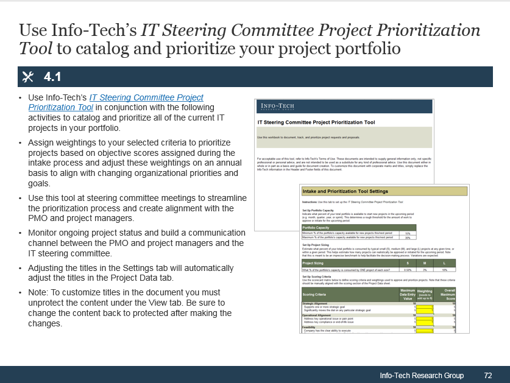 IT Steering Committee Project Prioritization Tool.">
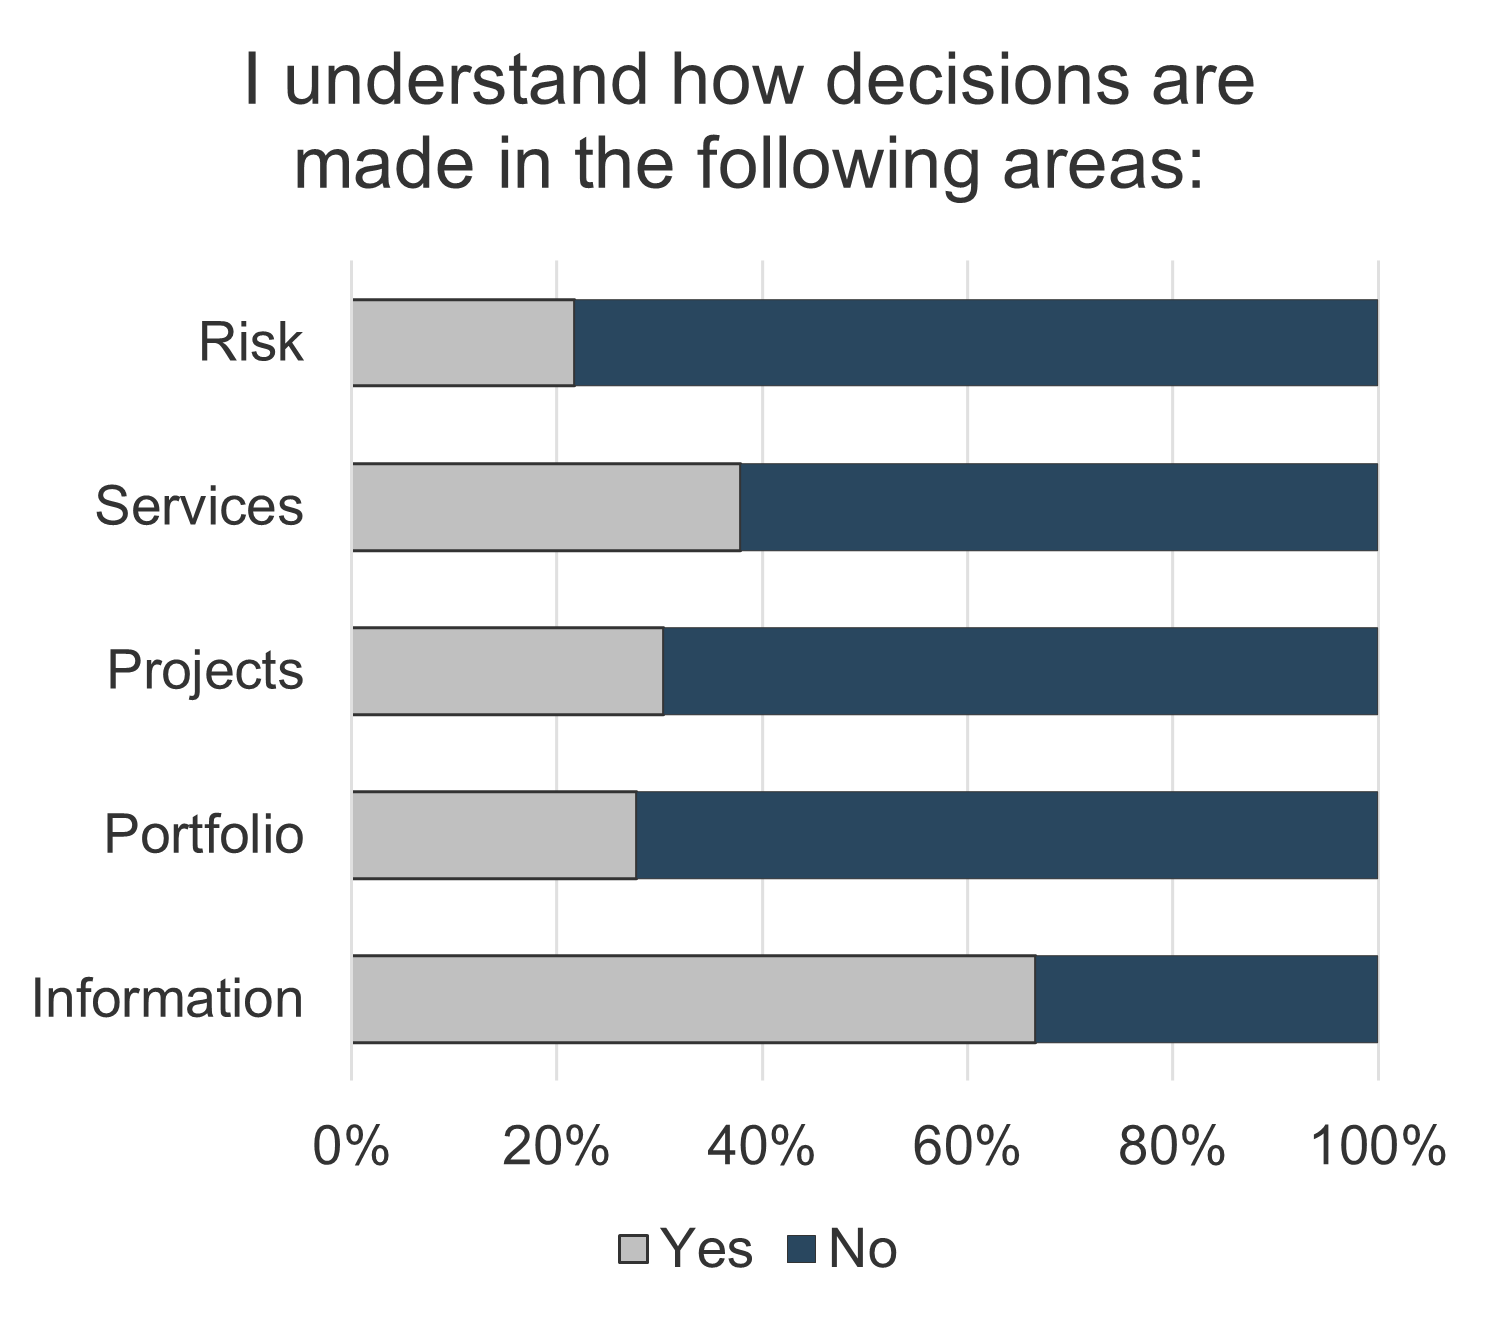
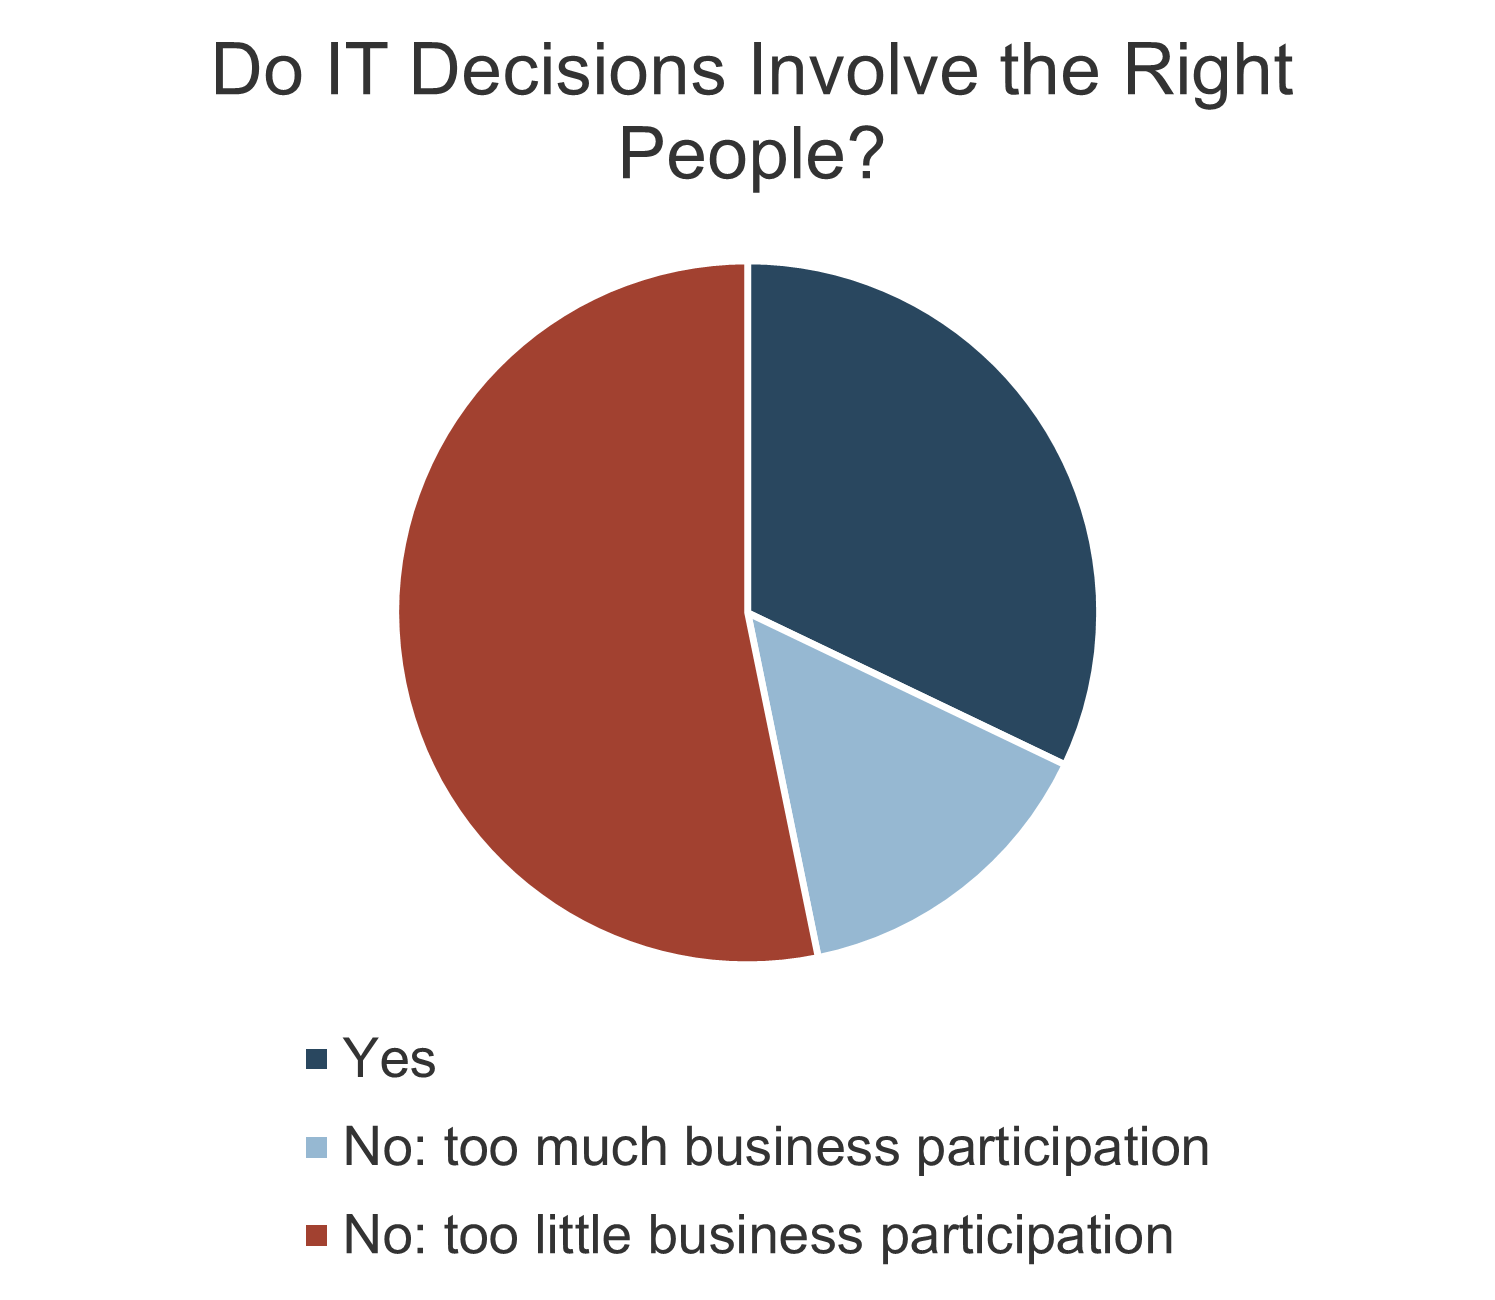
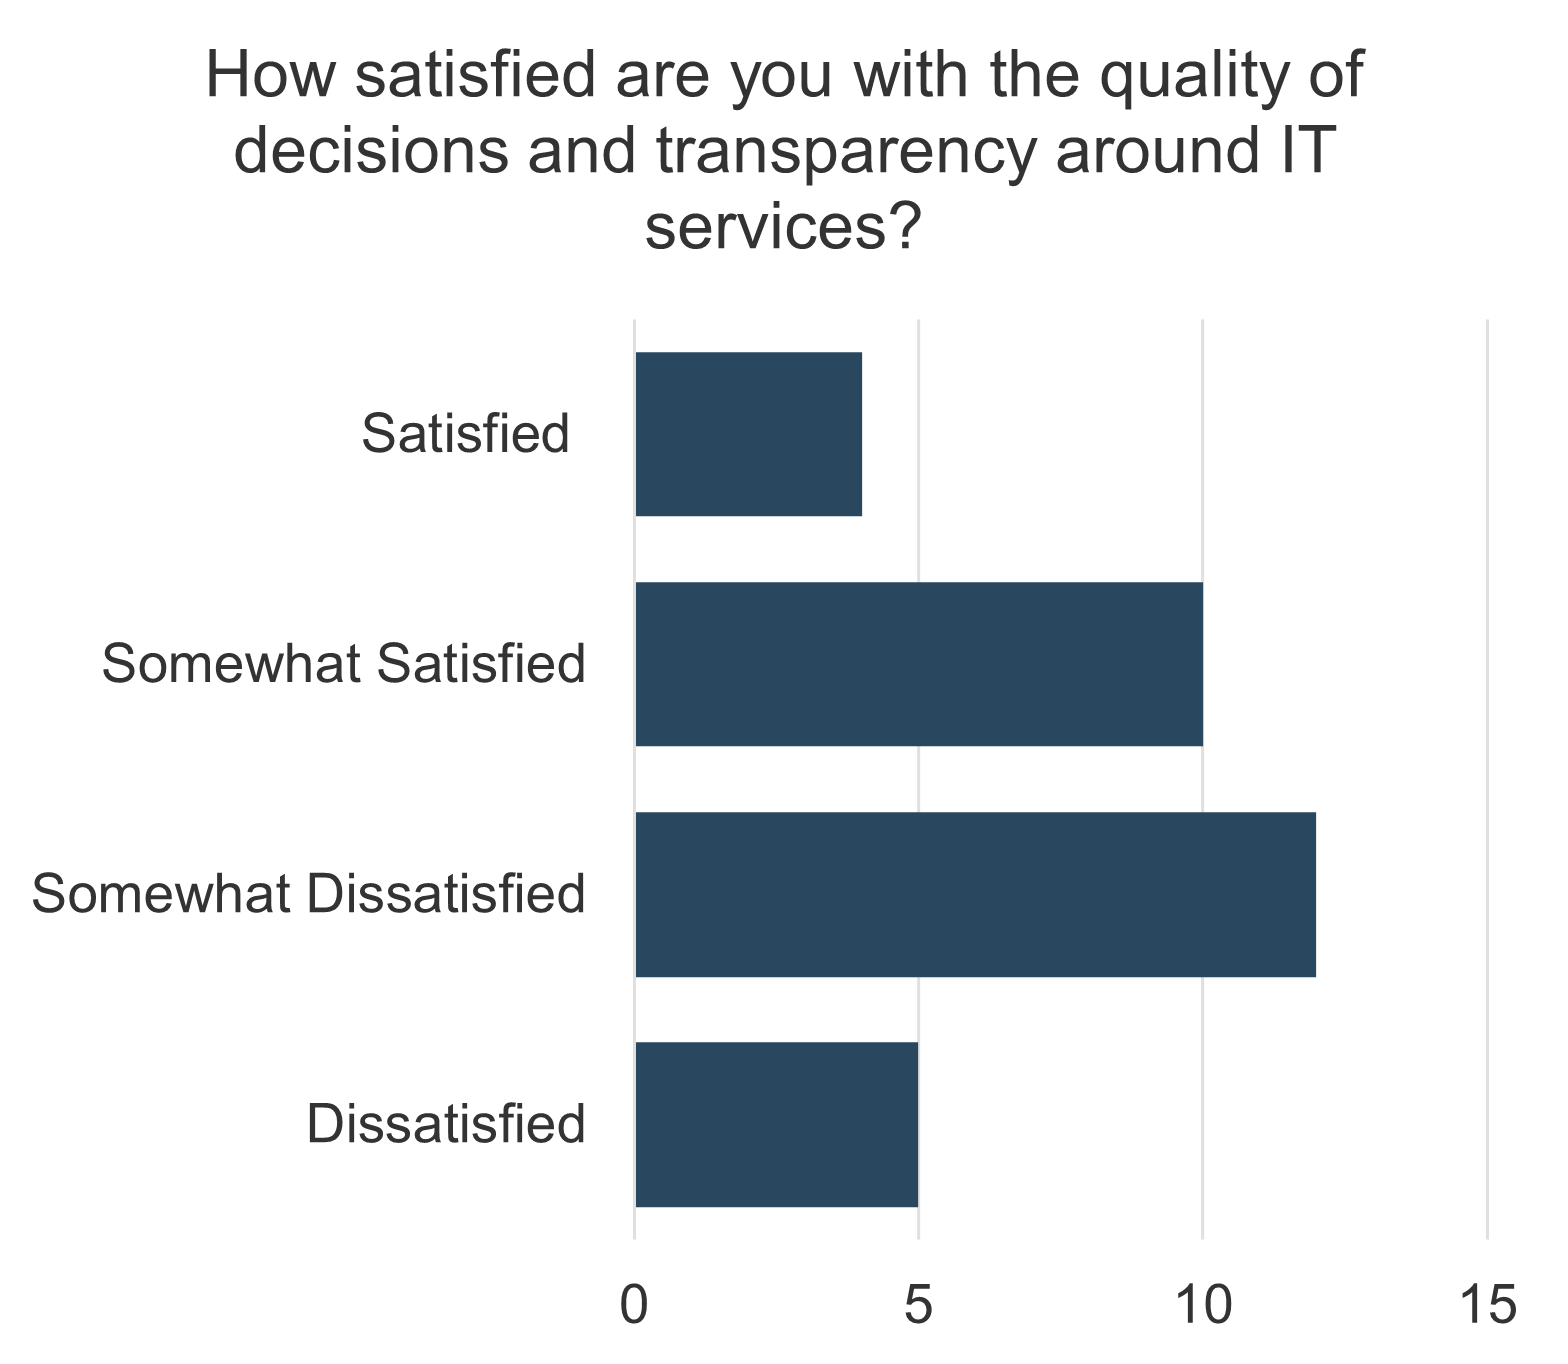
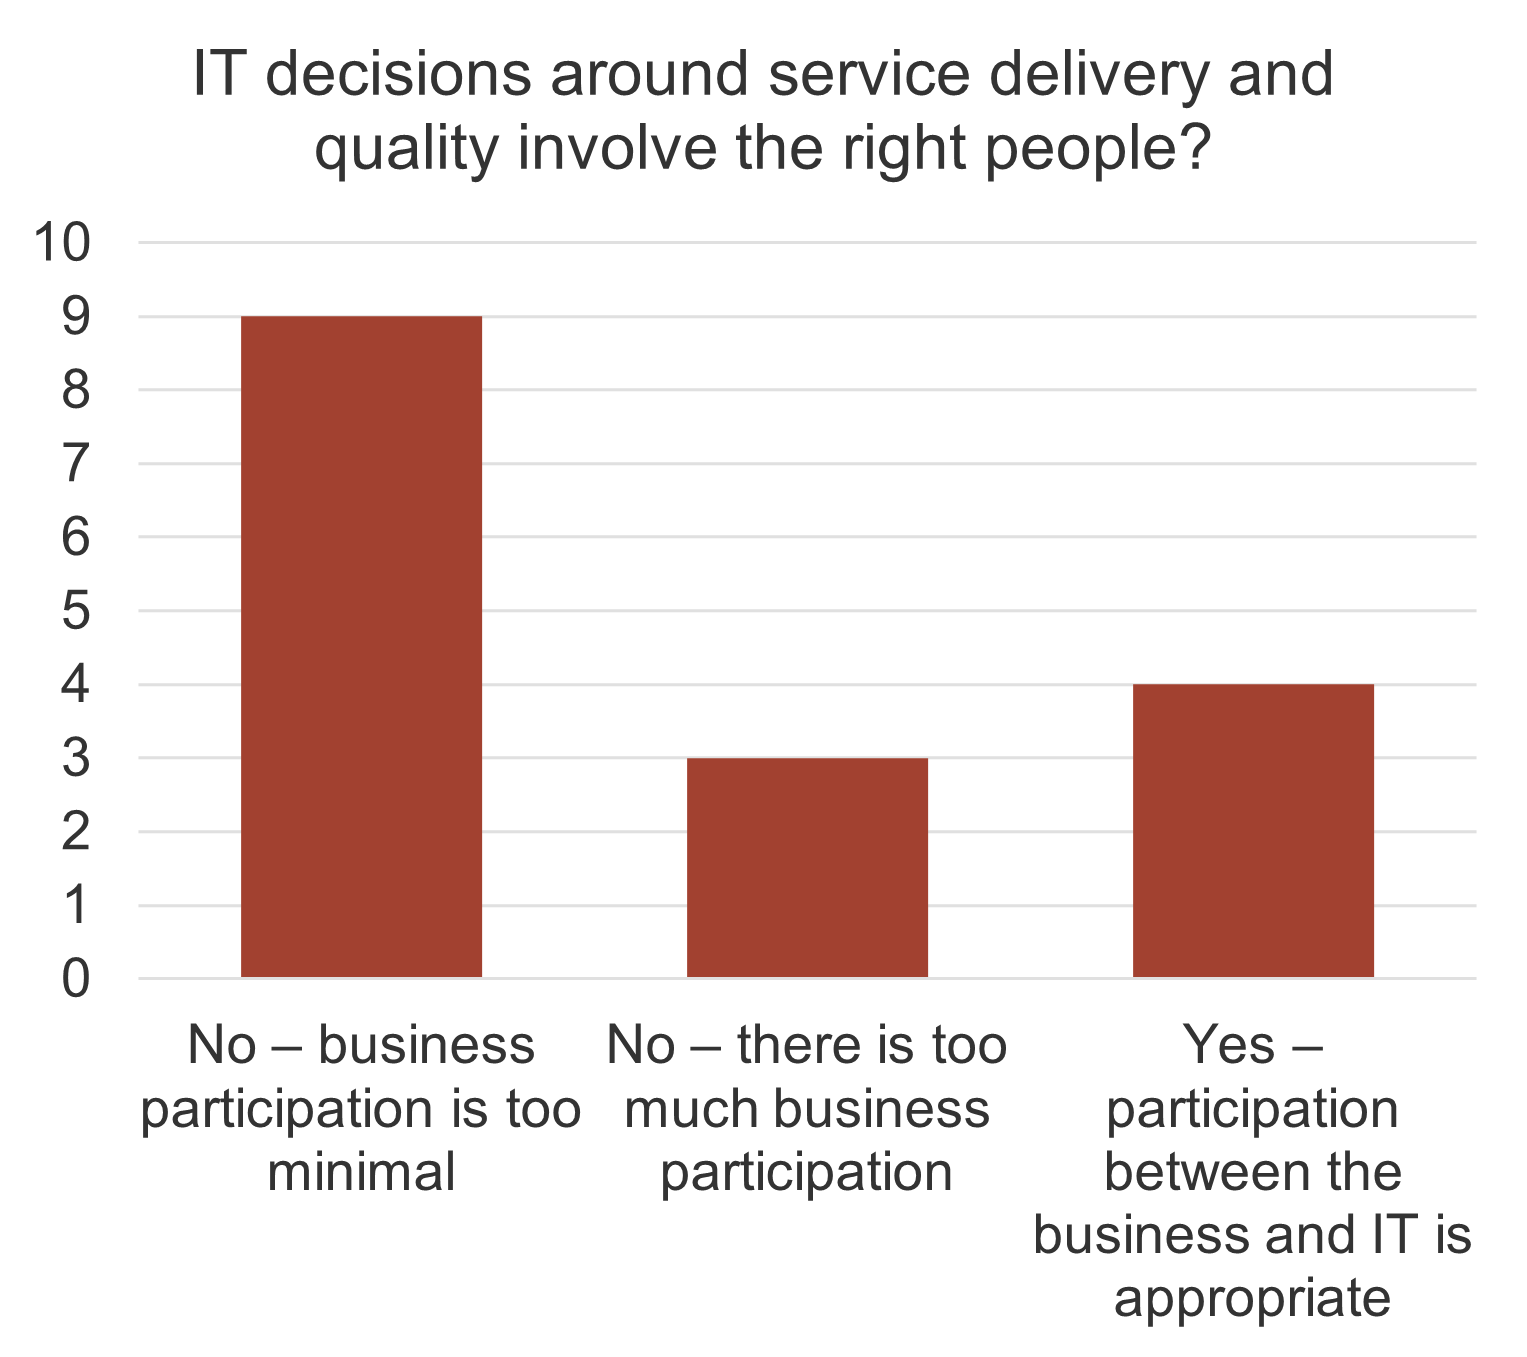
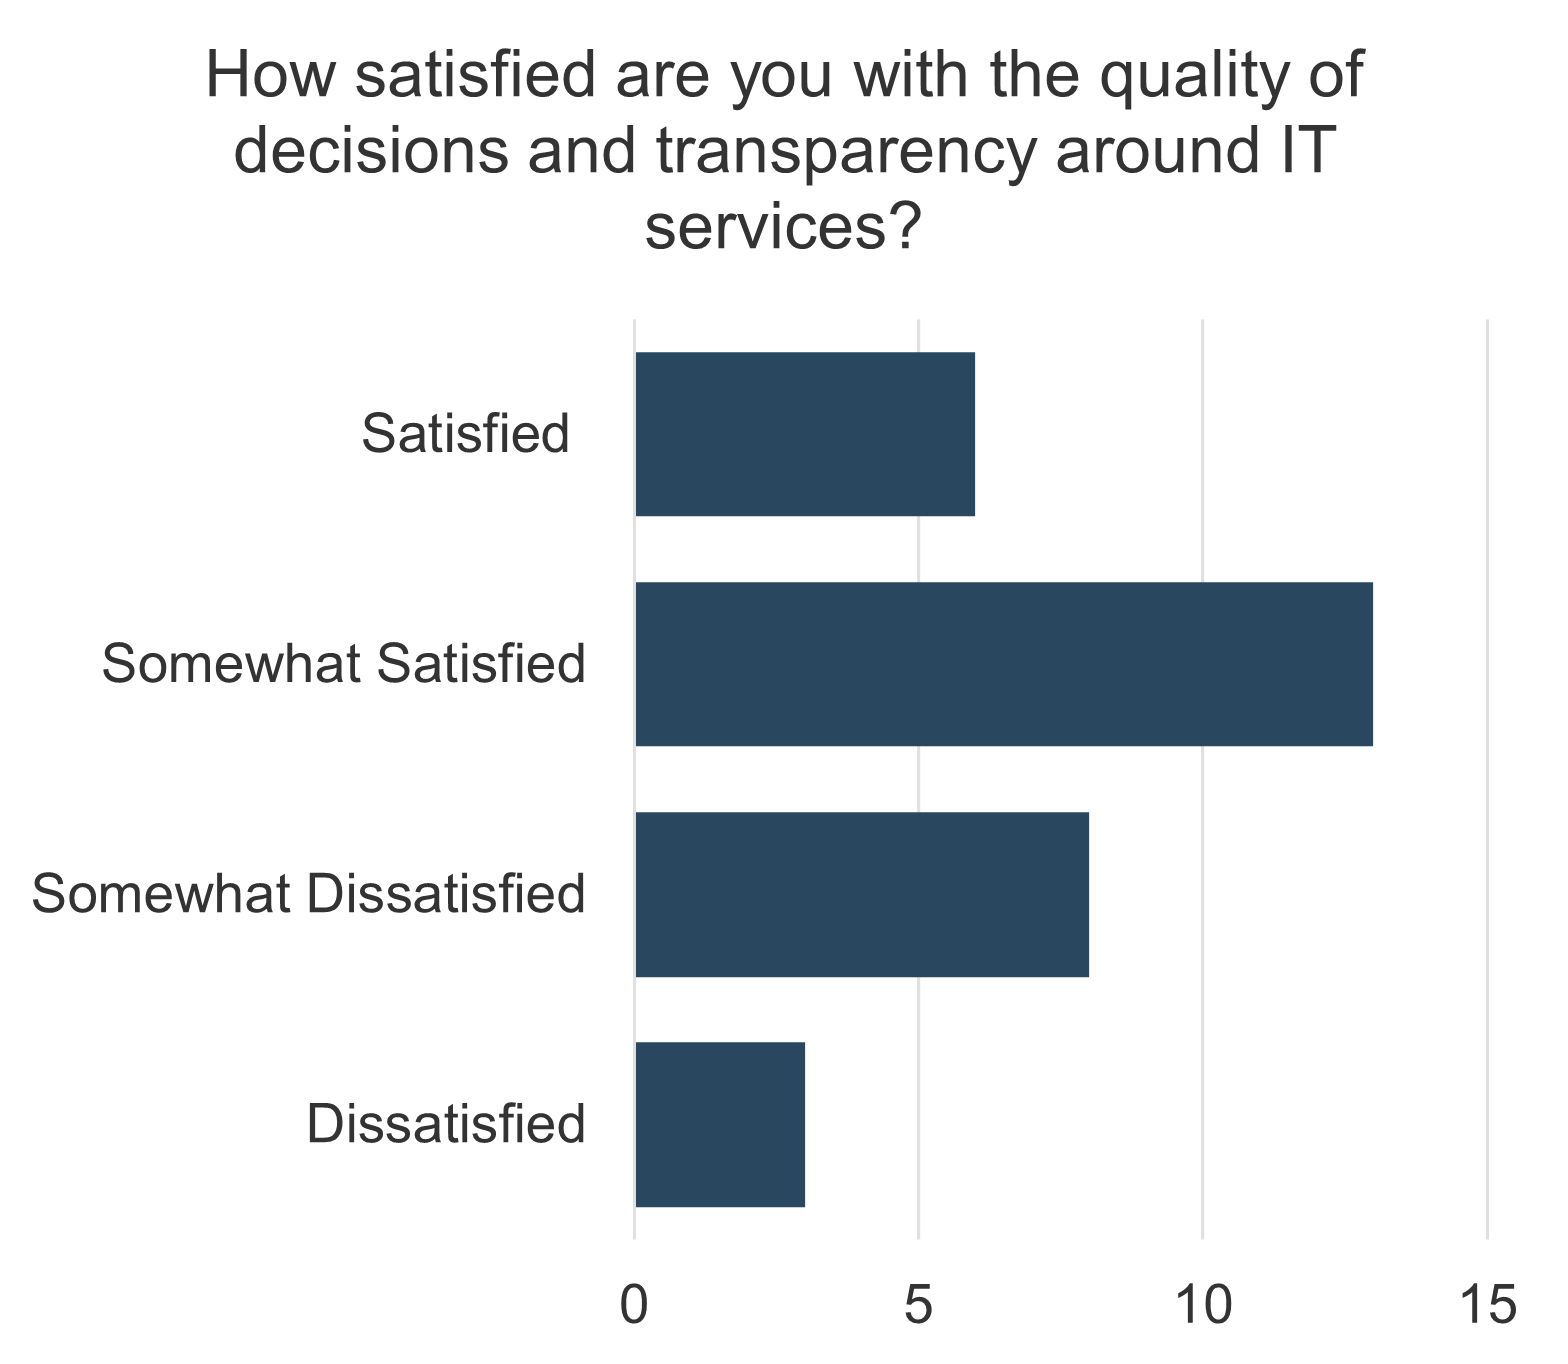
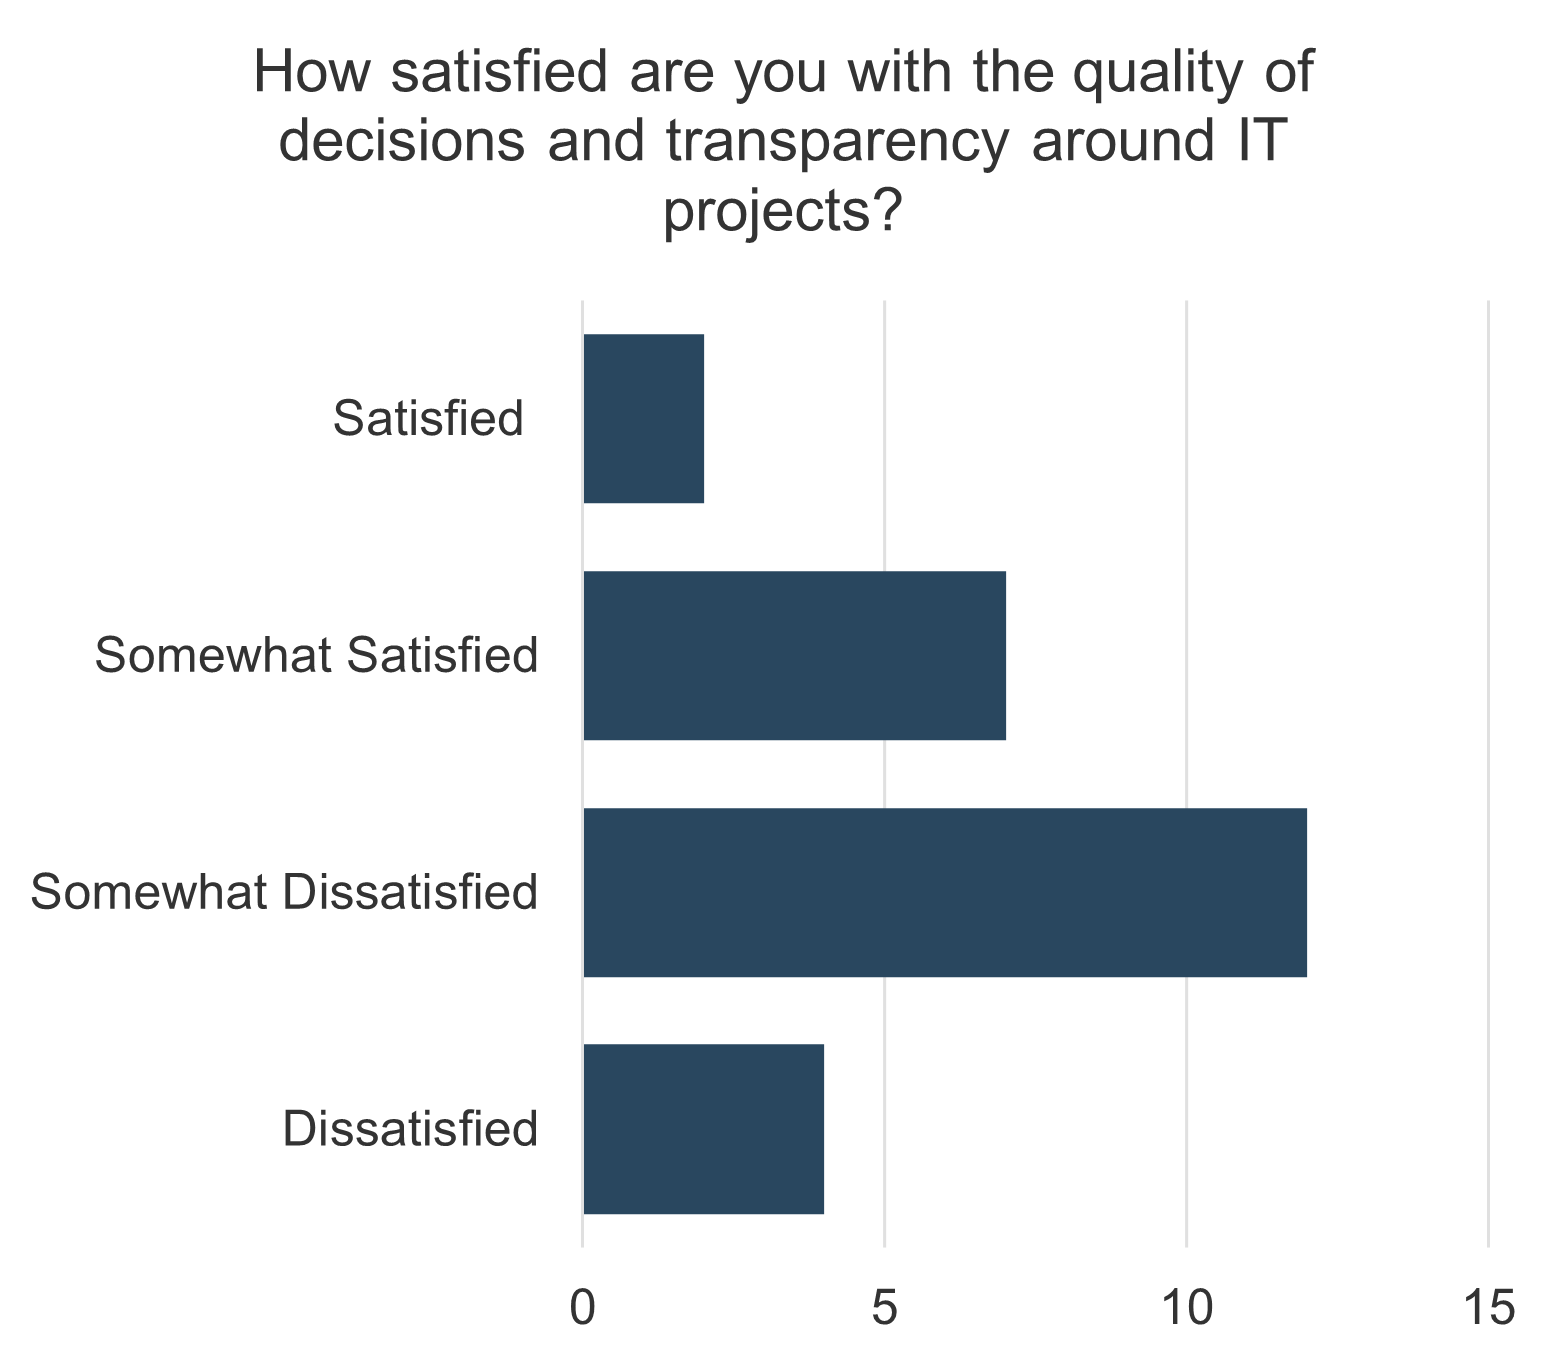
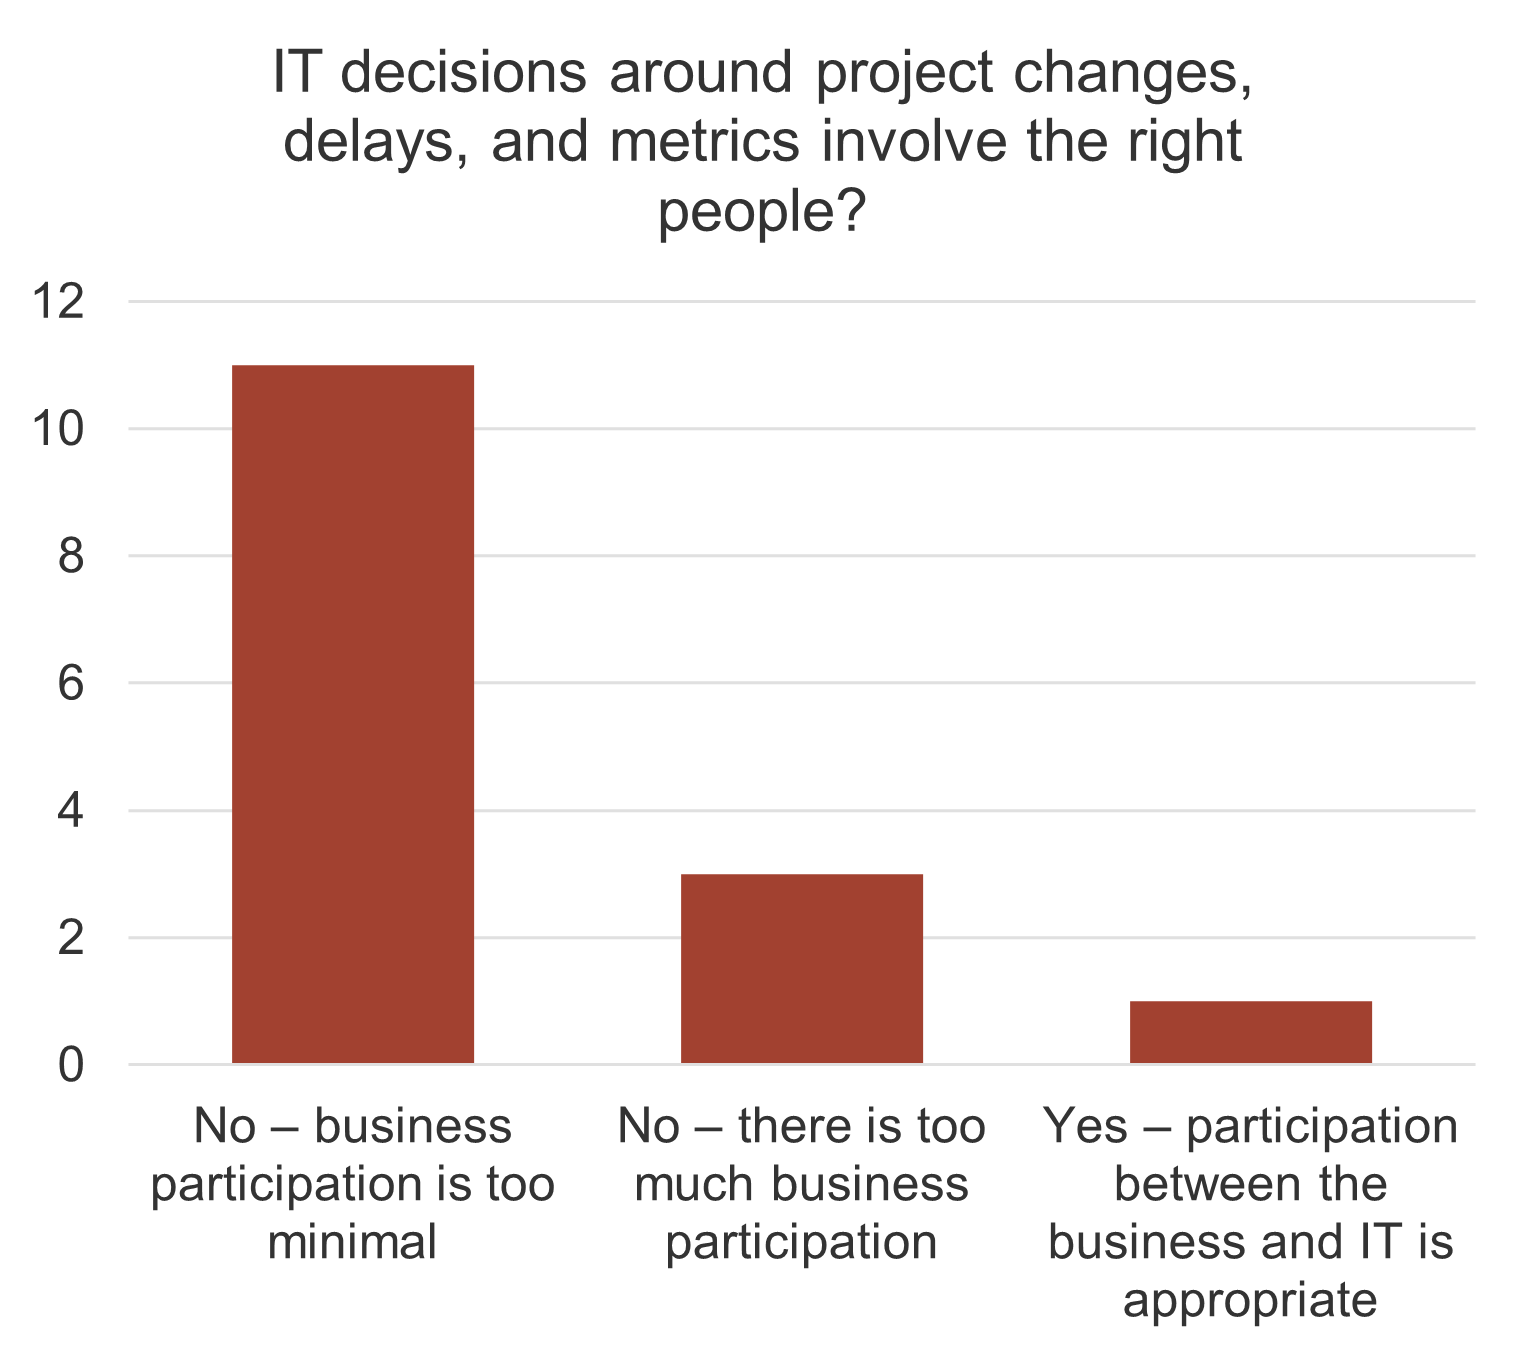
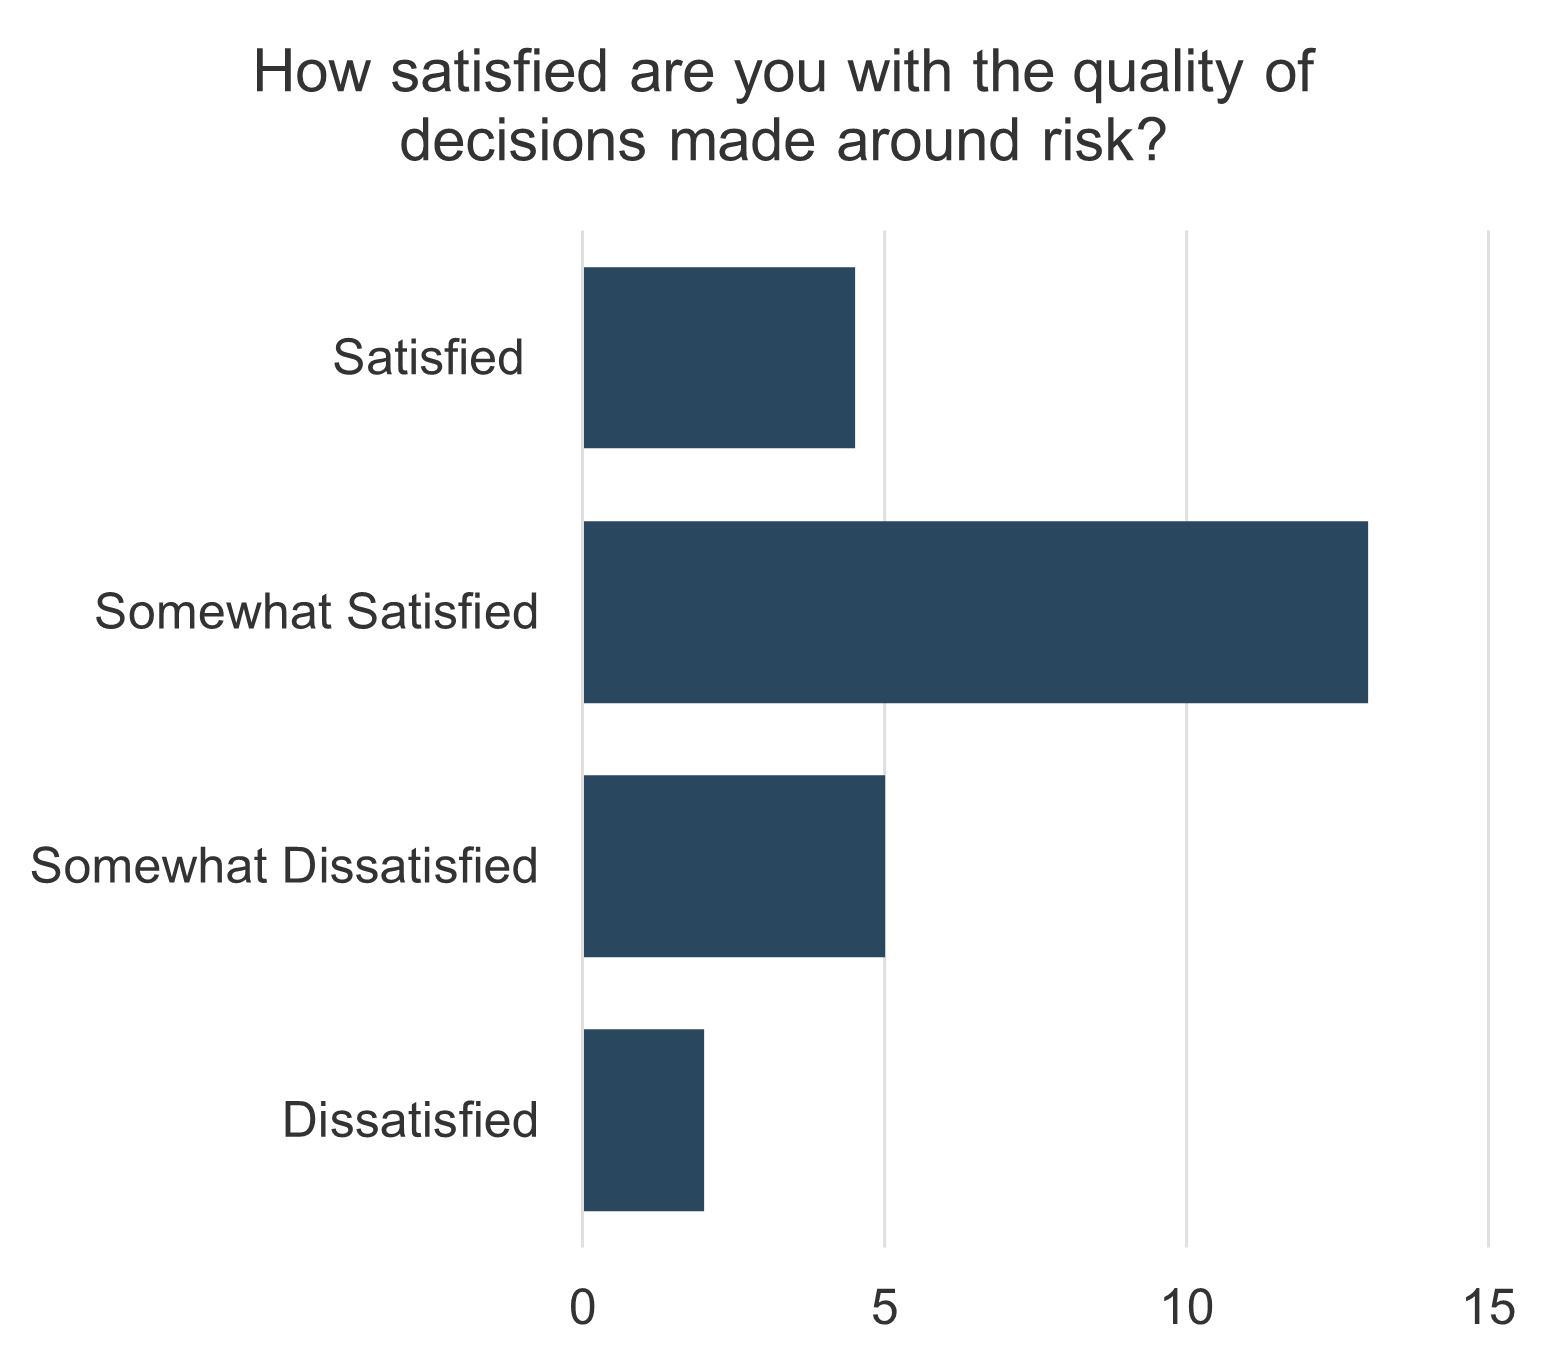
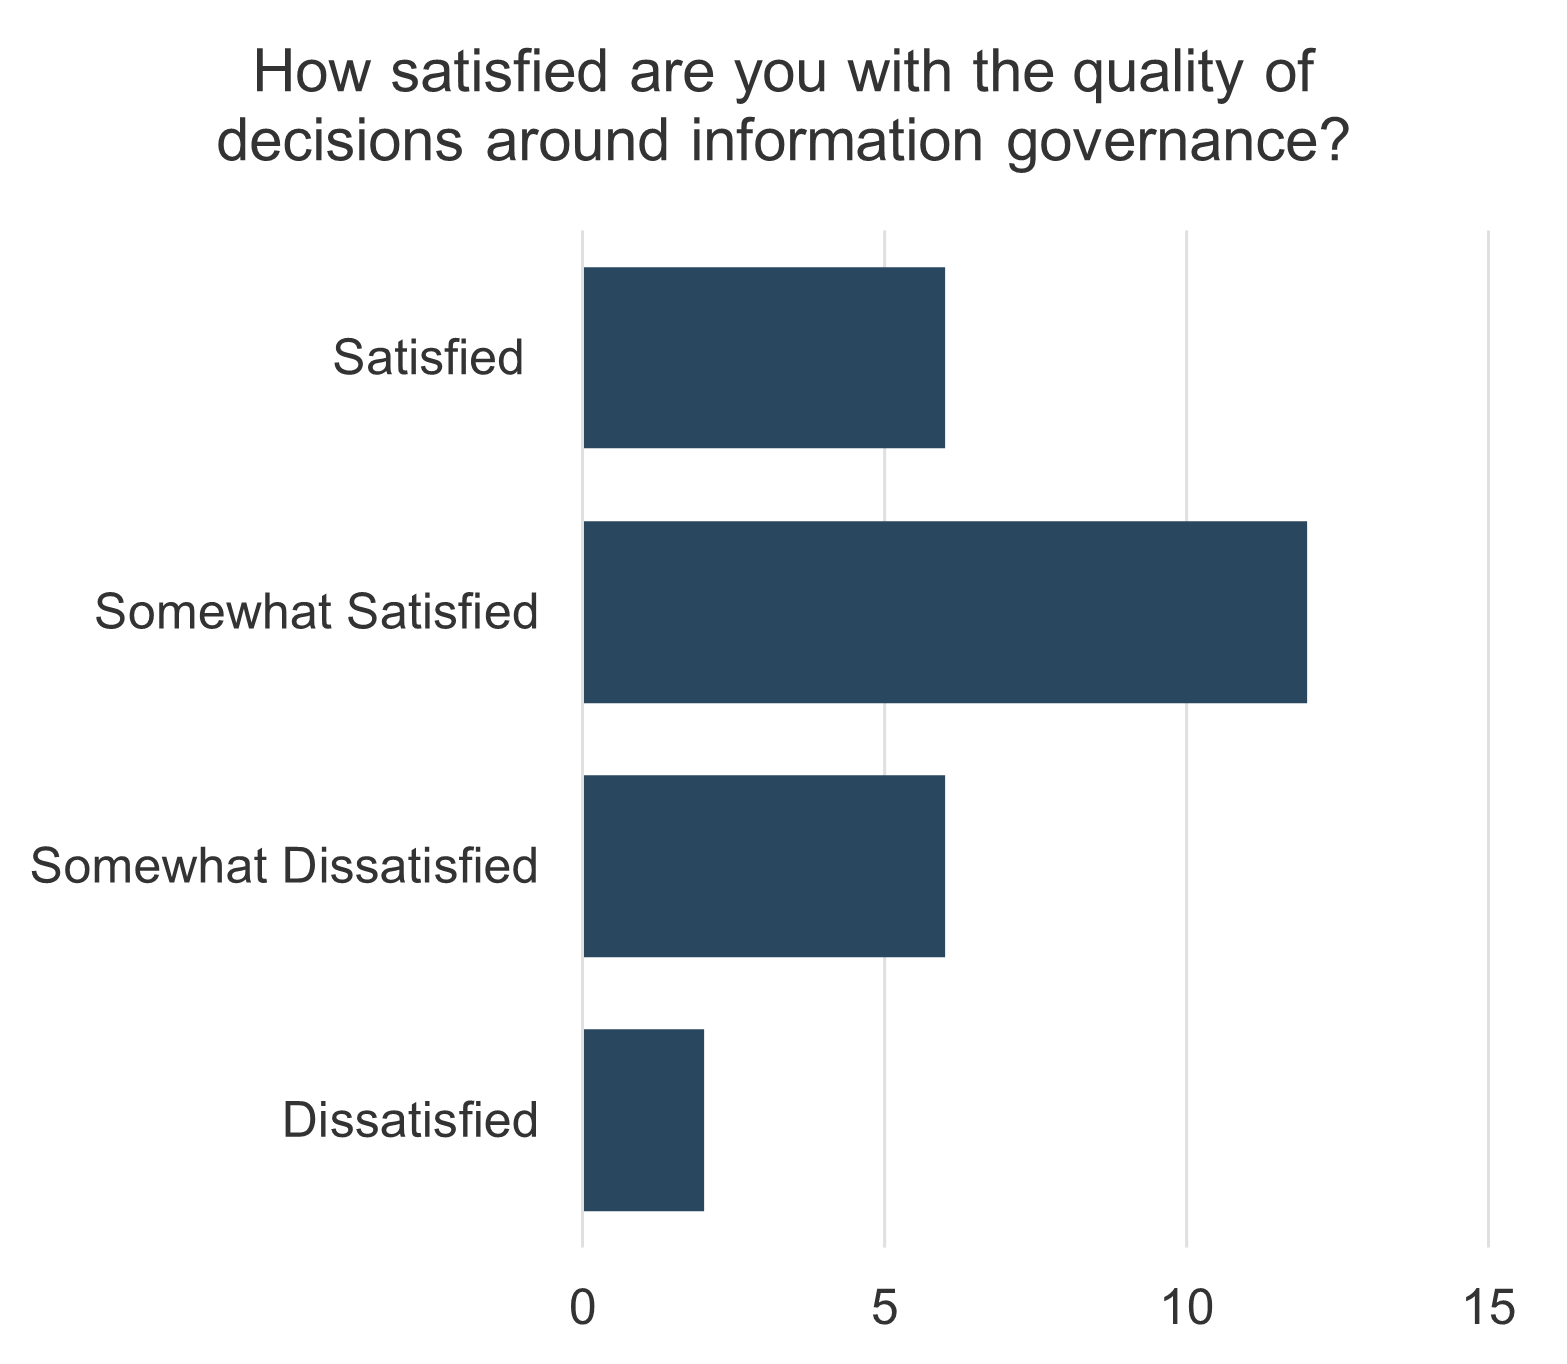
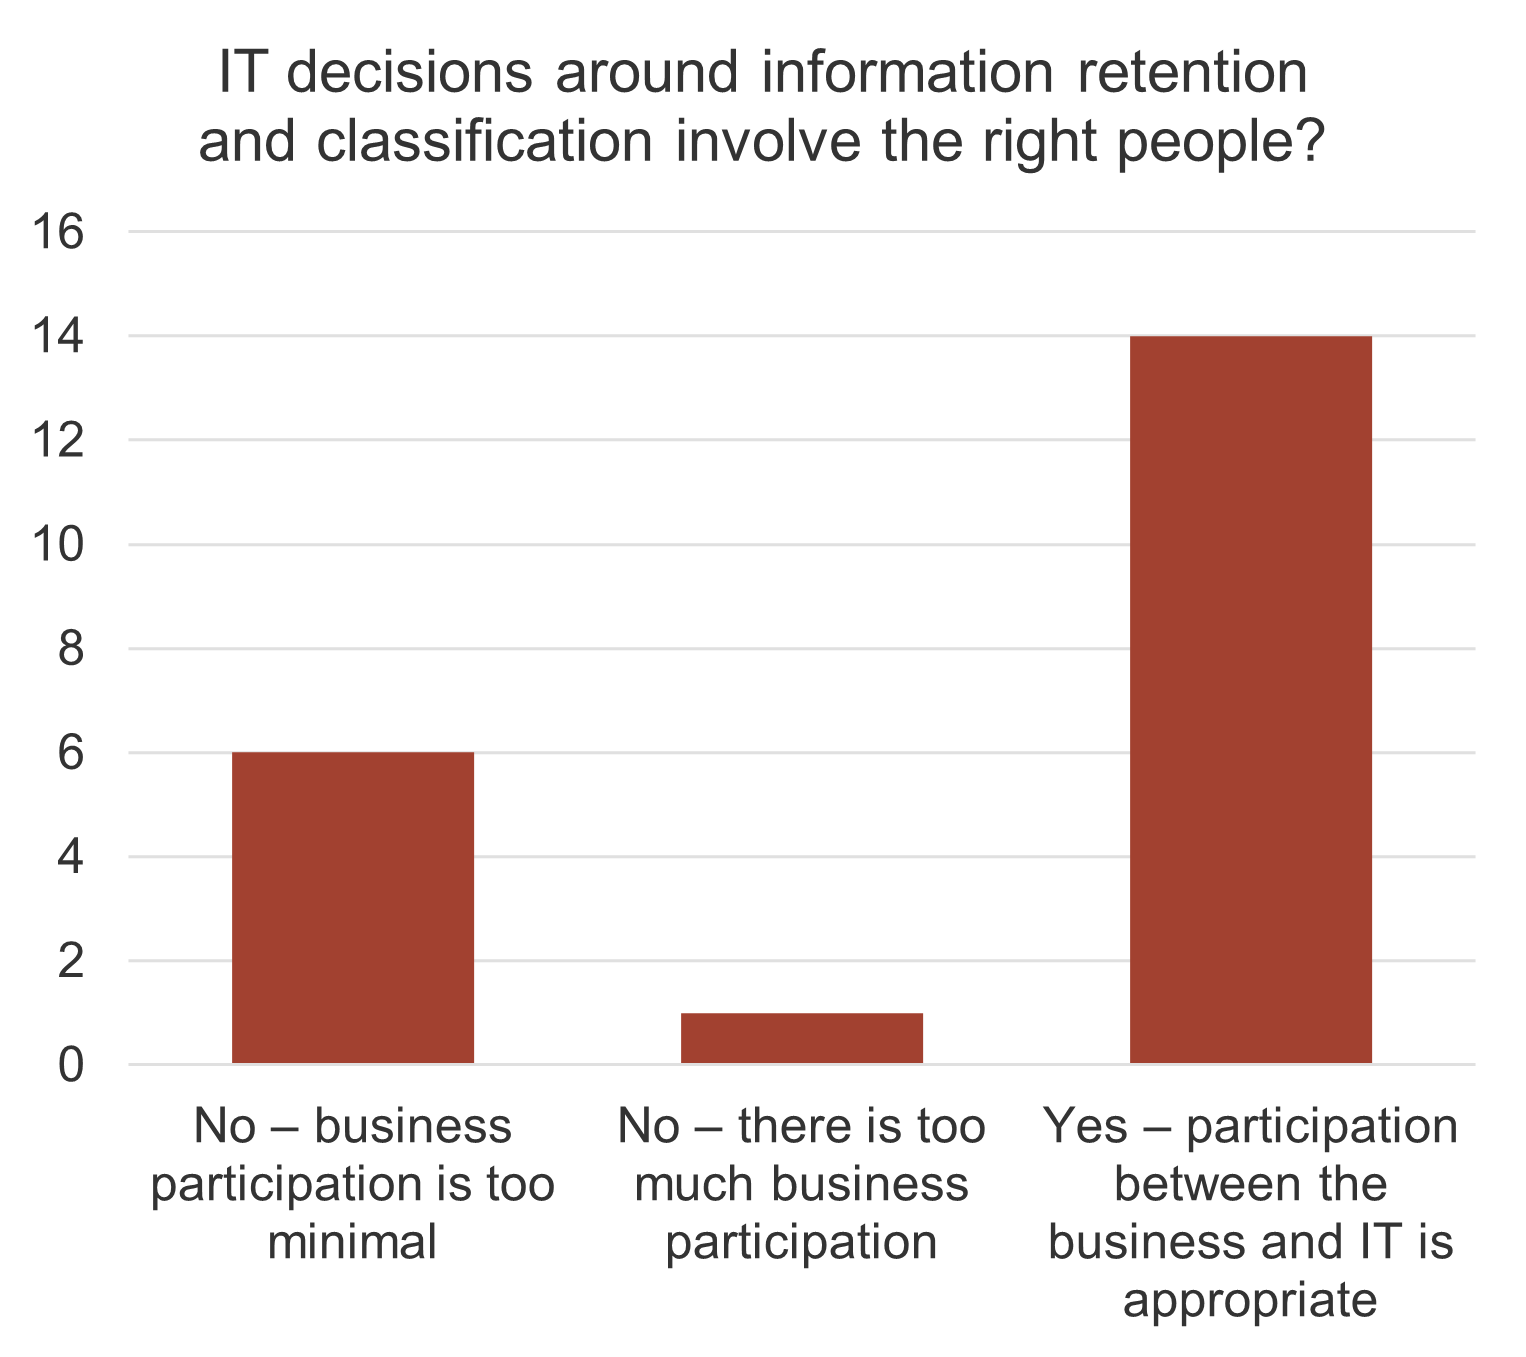


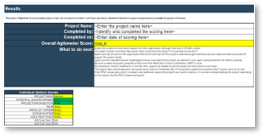
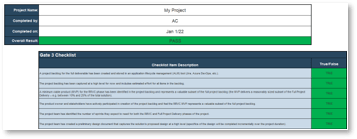
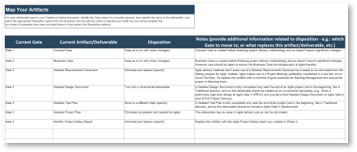


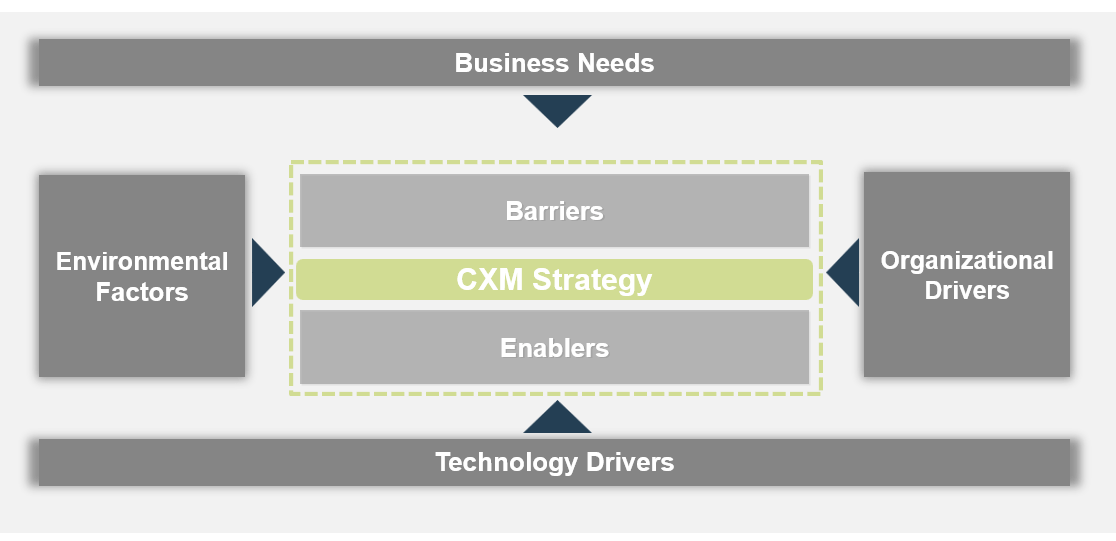
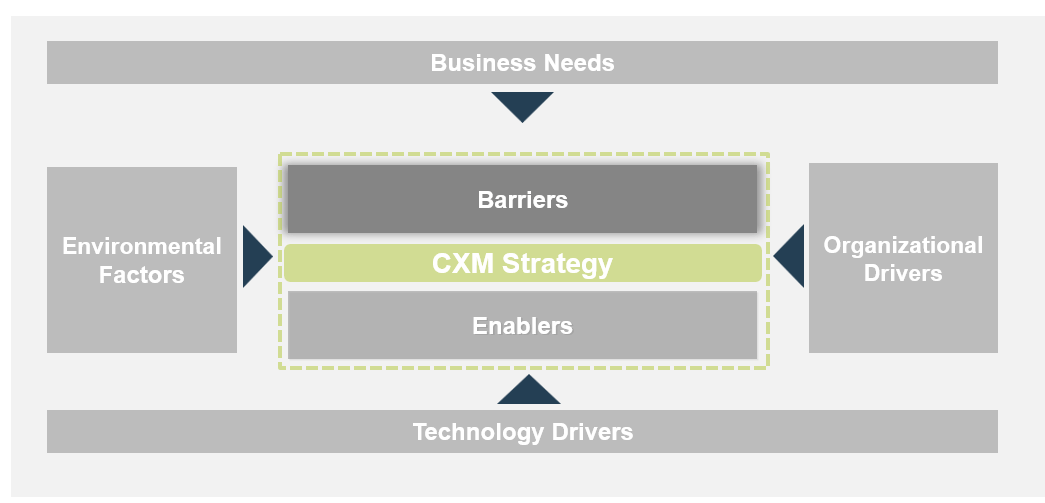
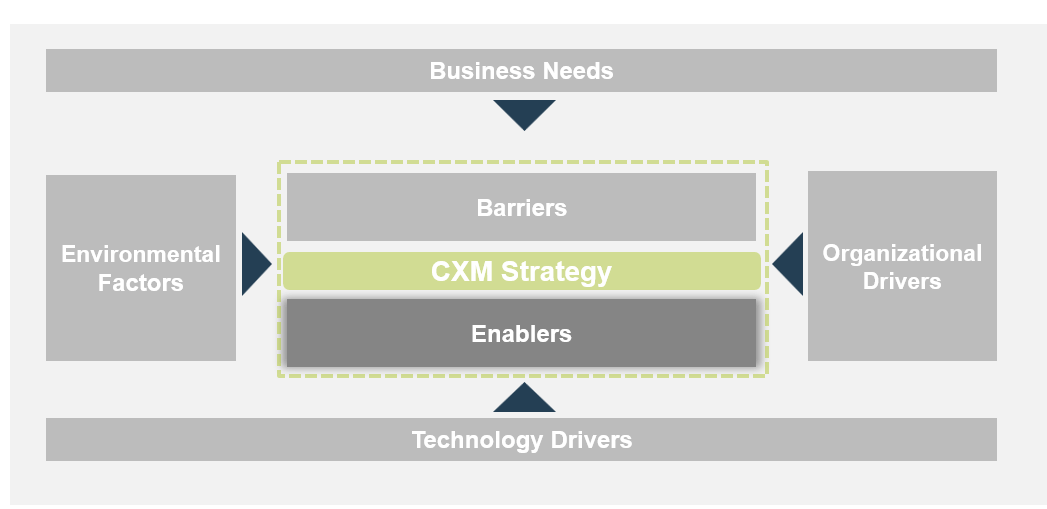
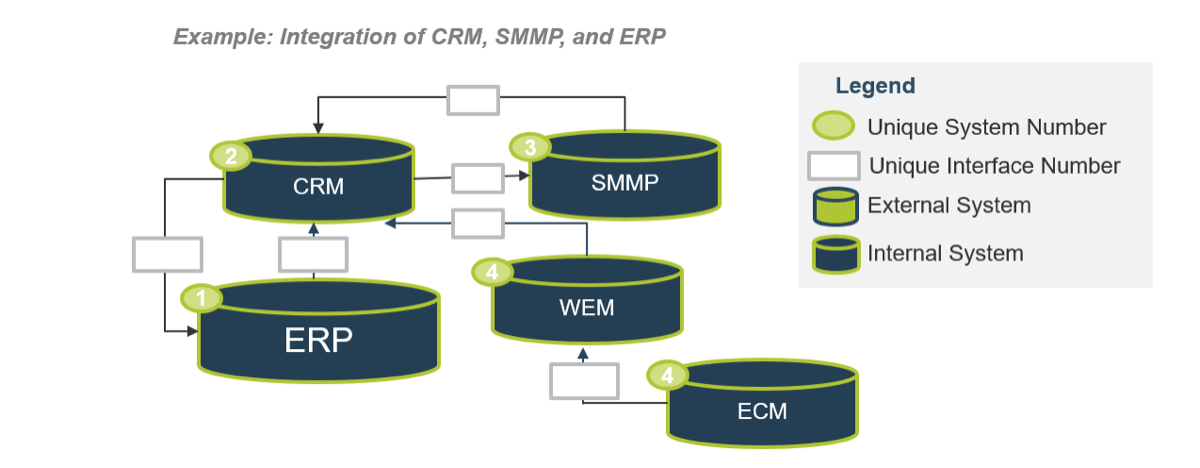
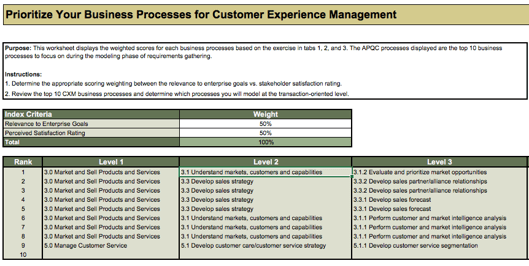
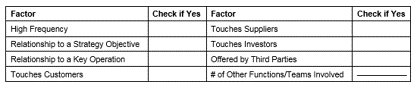
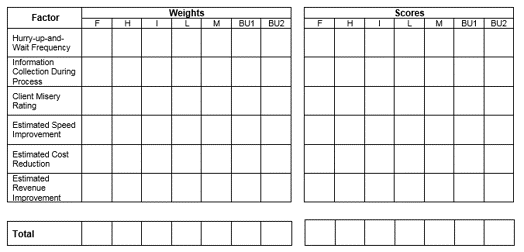
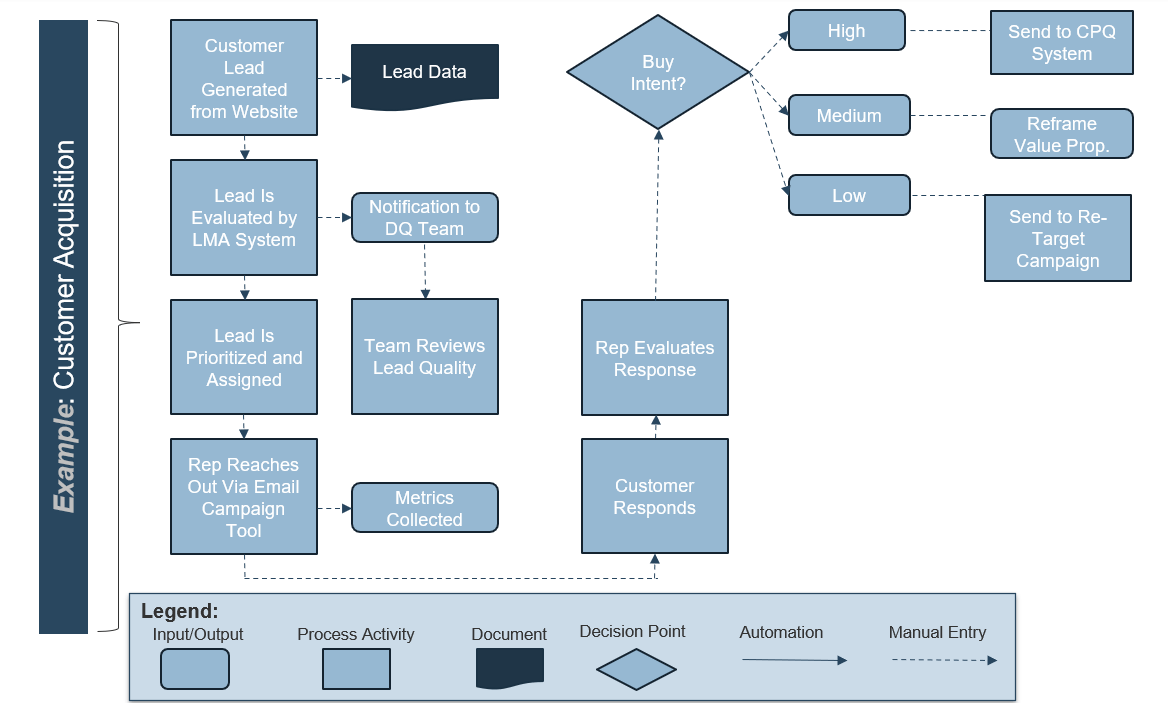
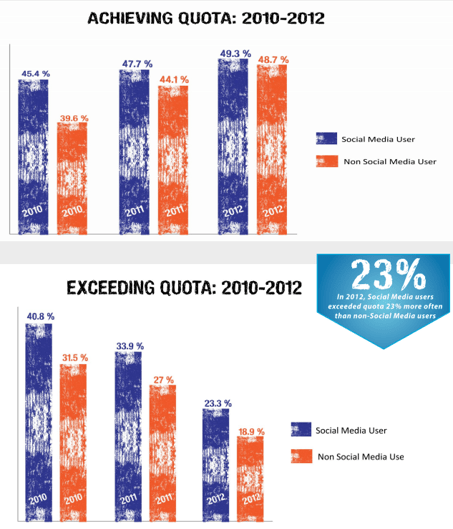
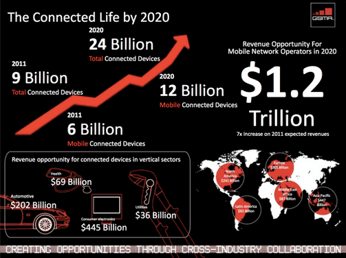
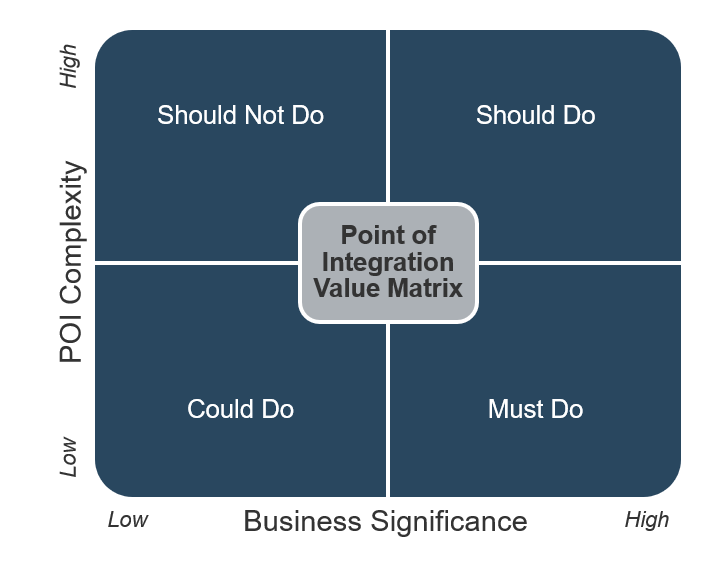
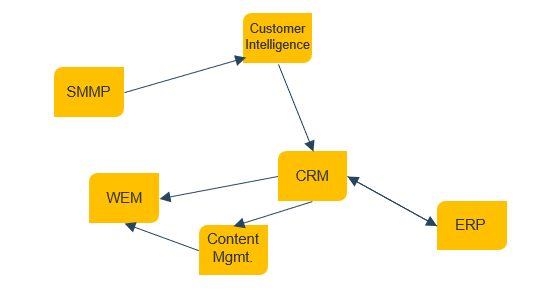
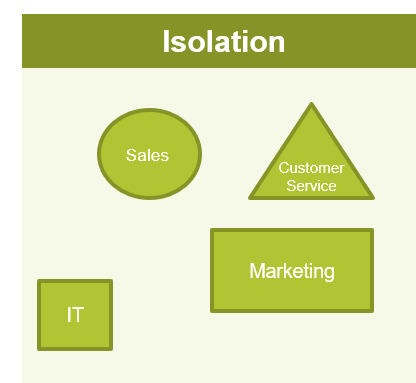
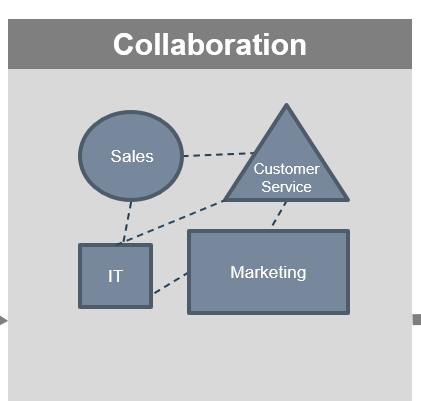
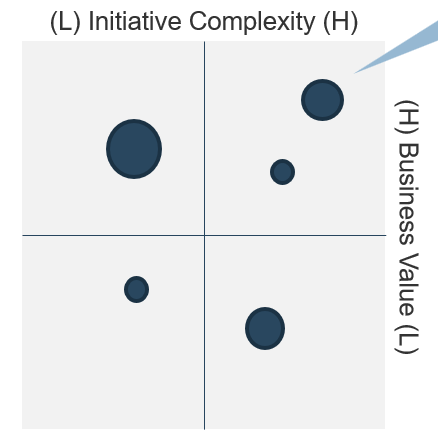

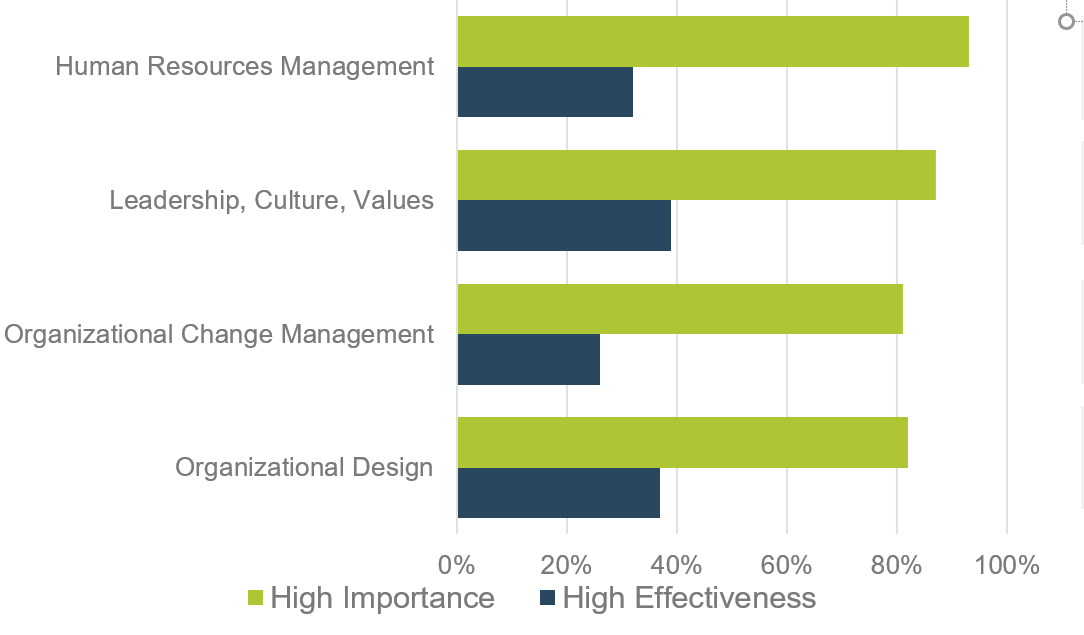
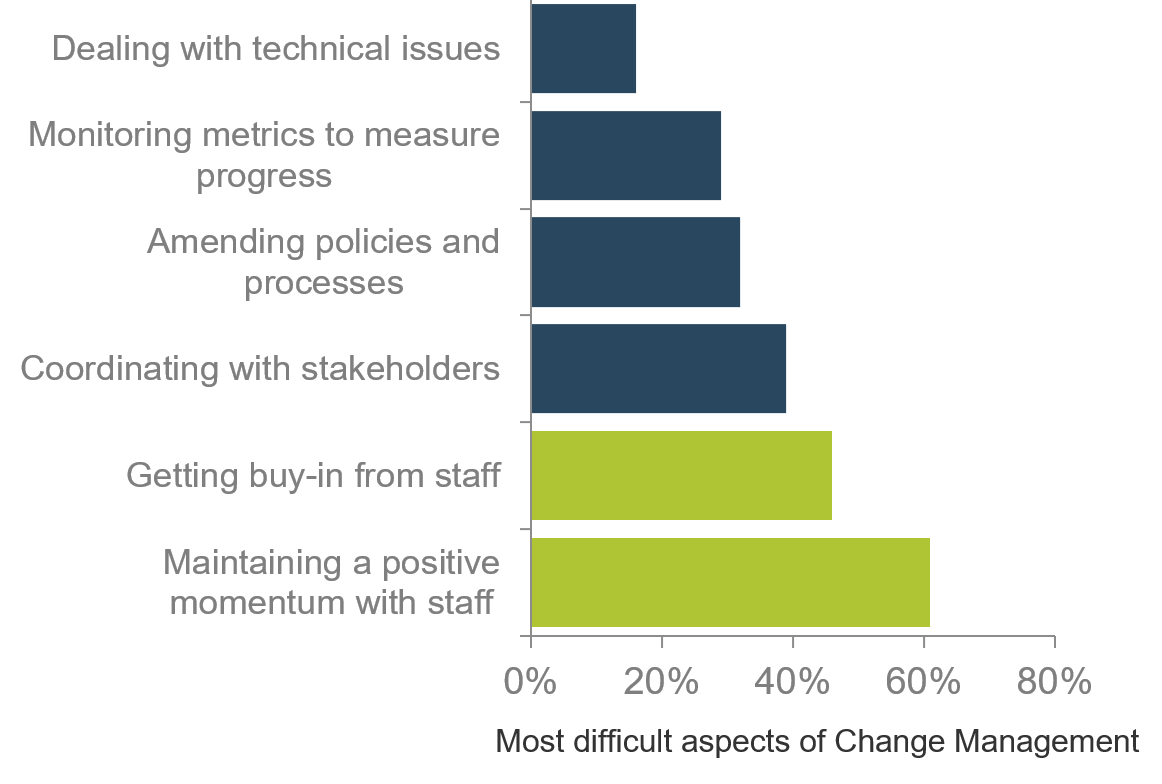
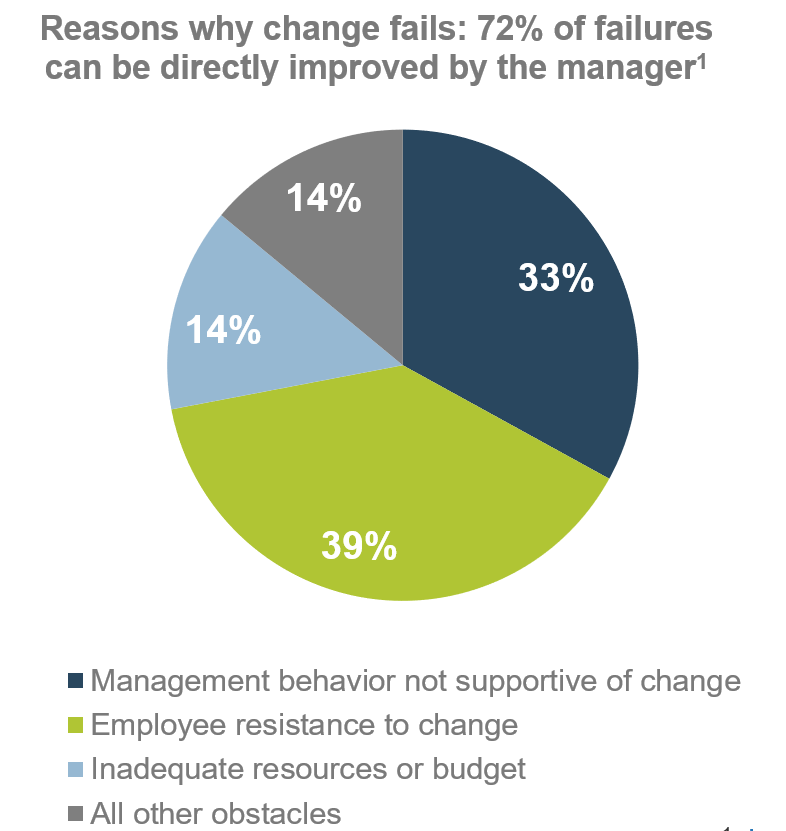
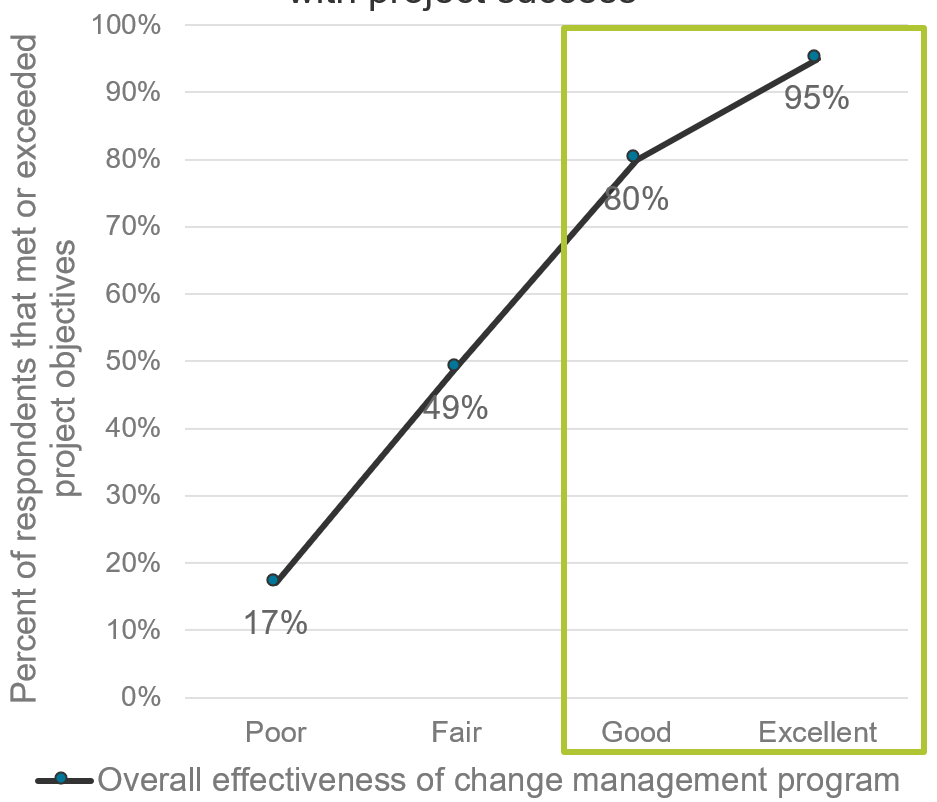
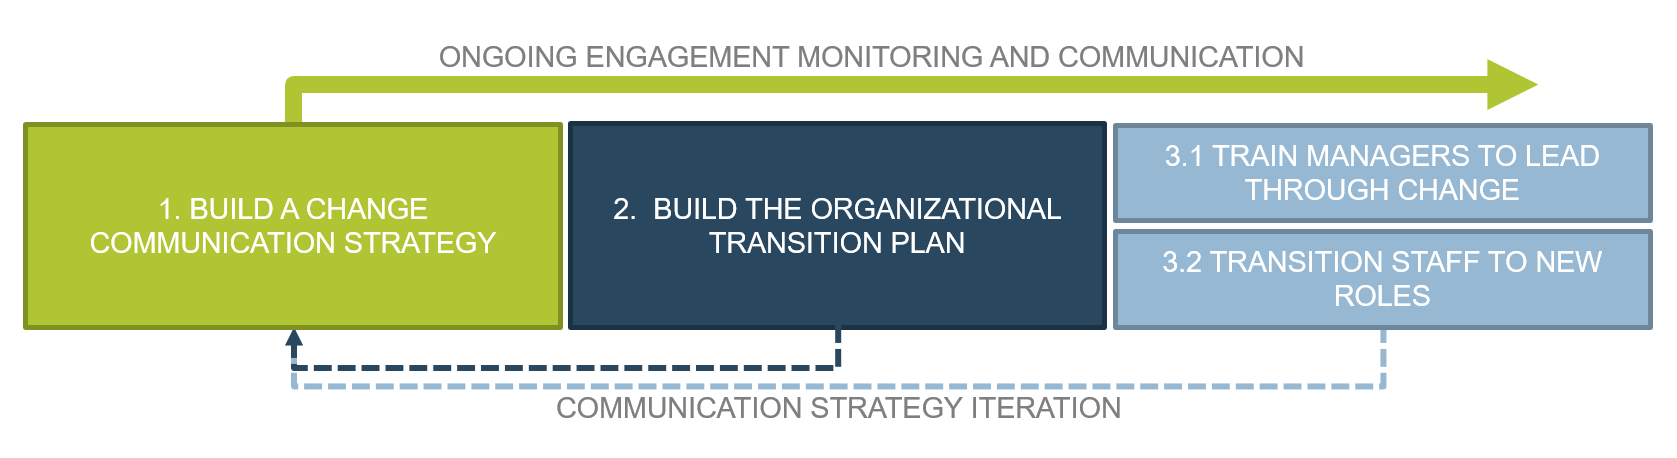
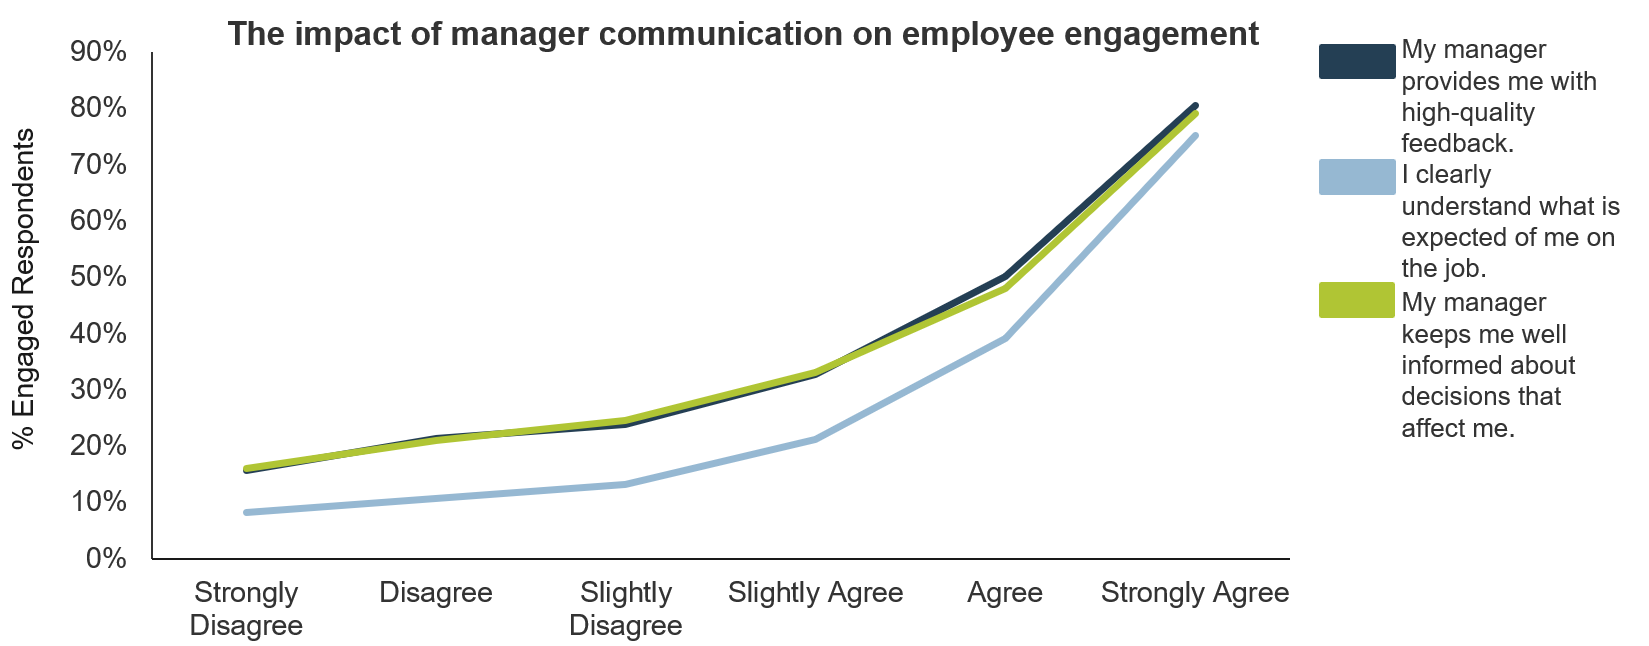

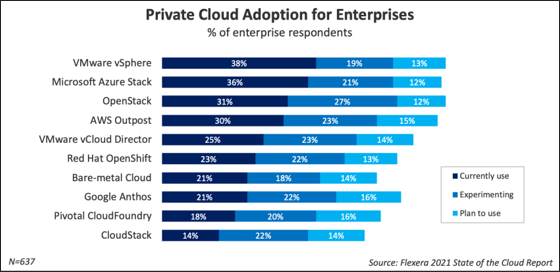

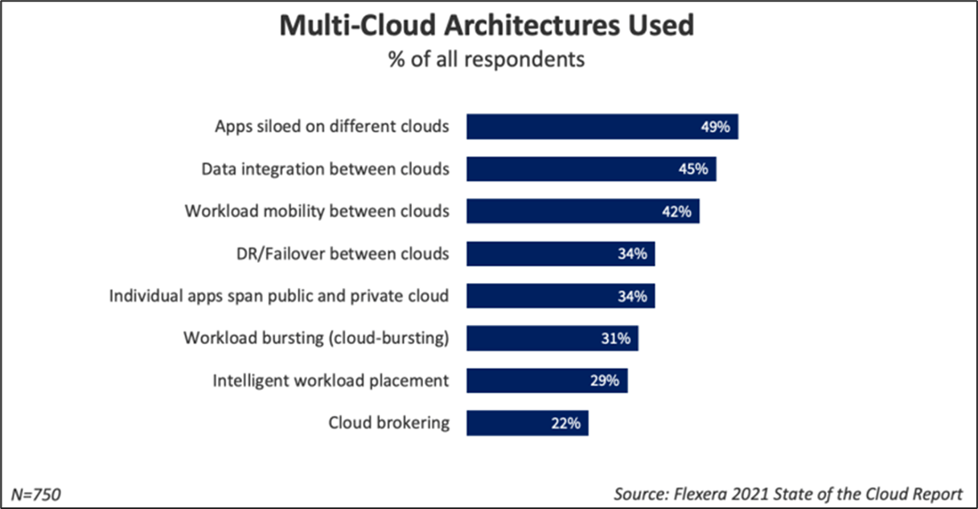
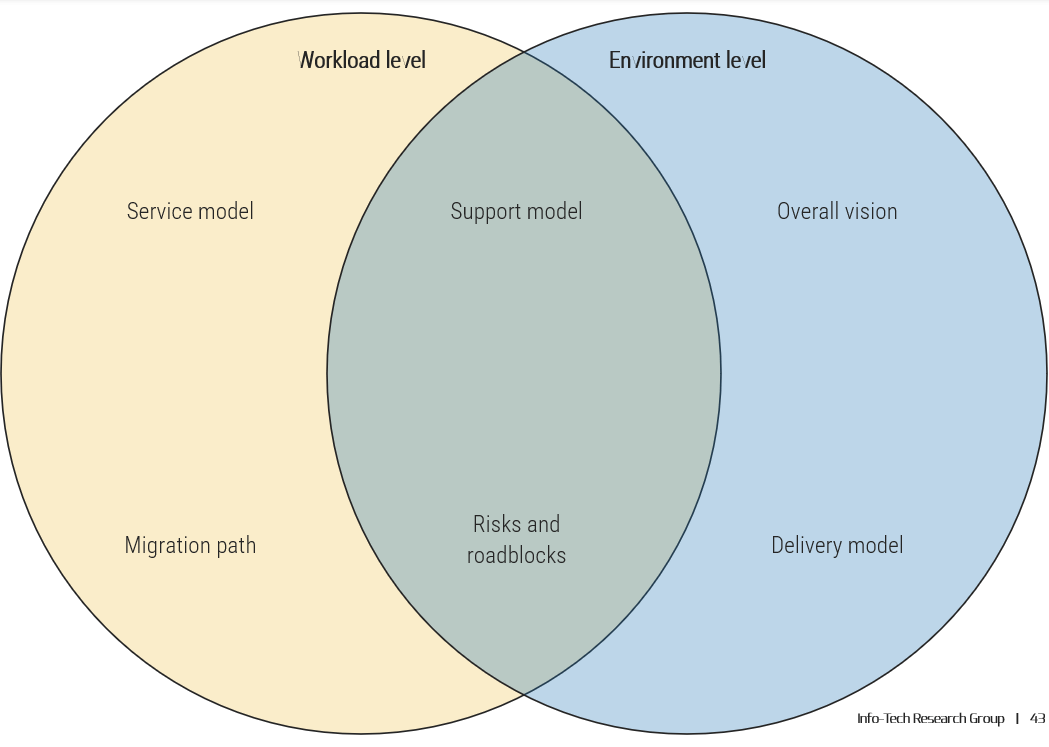
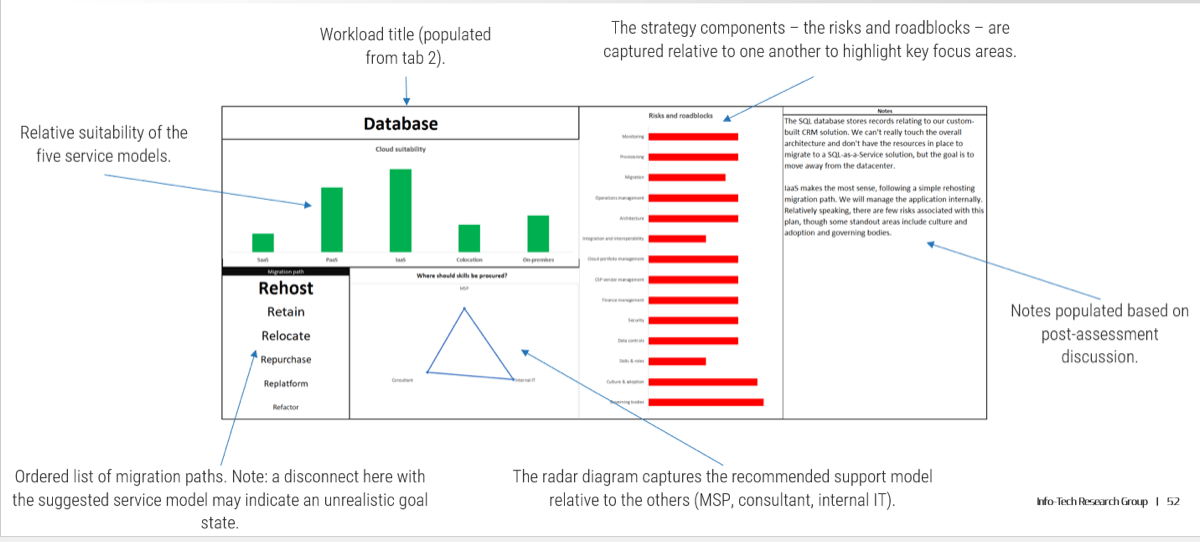
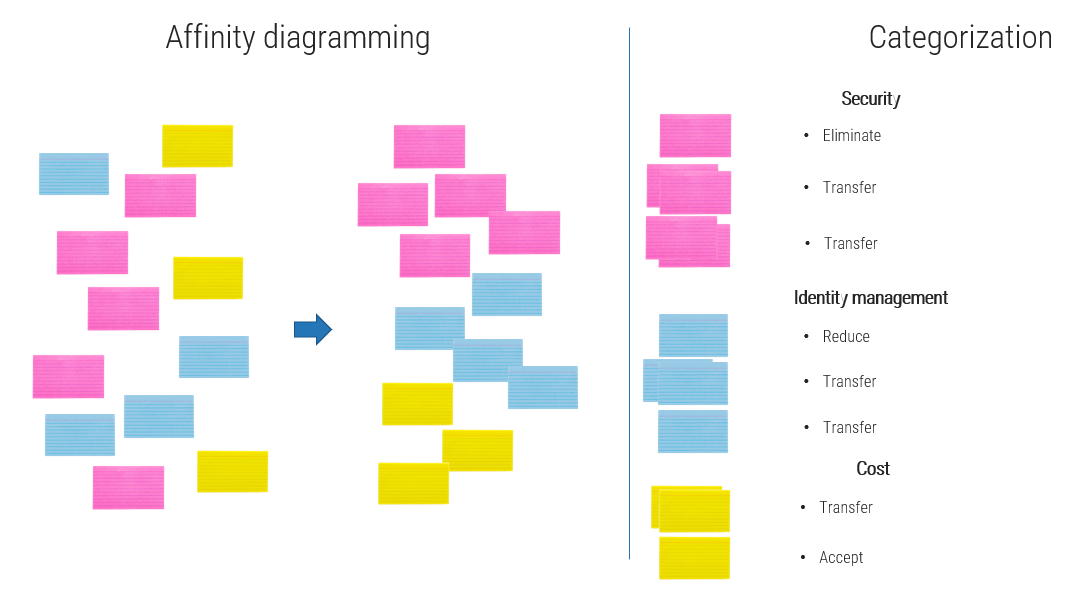
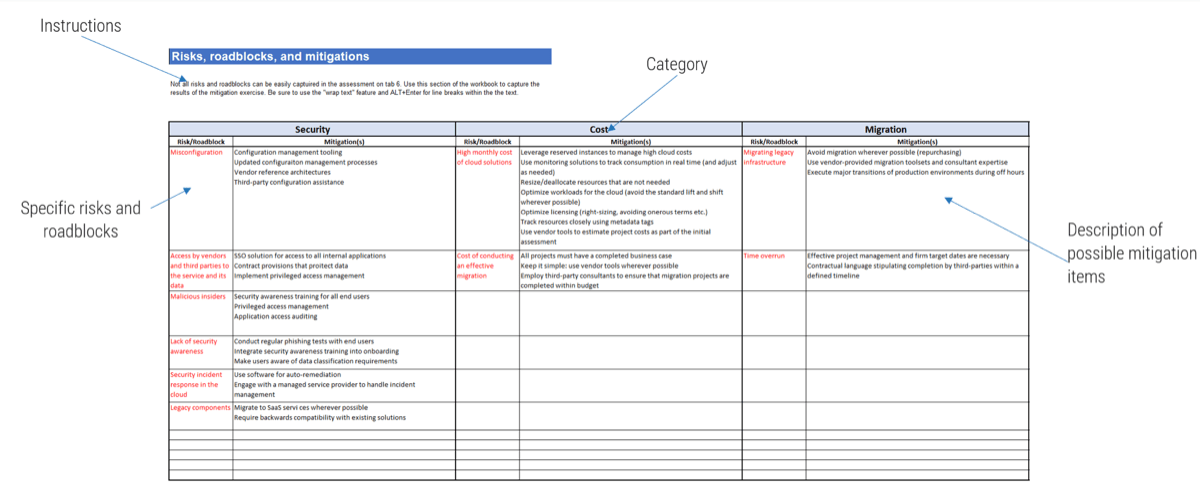


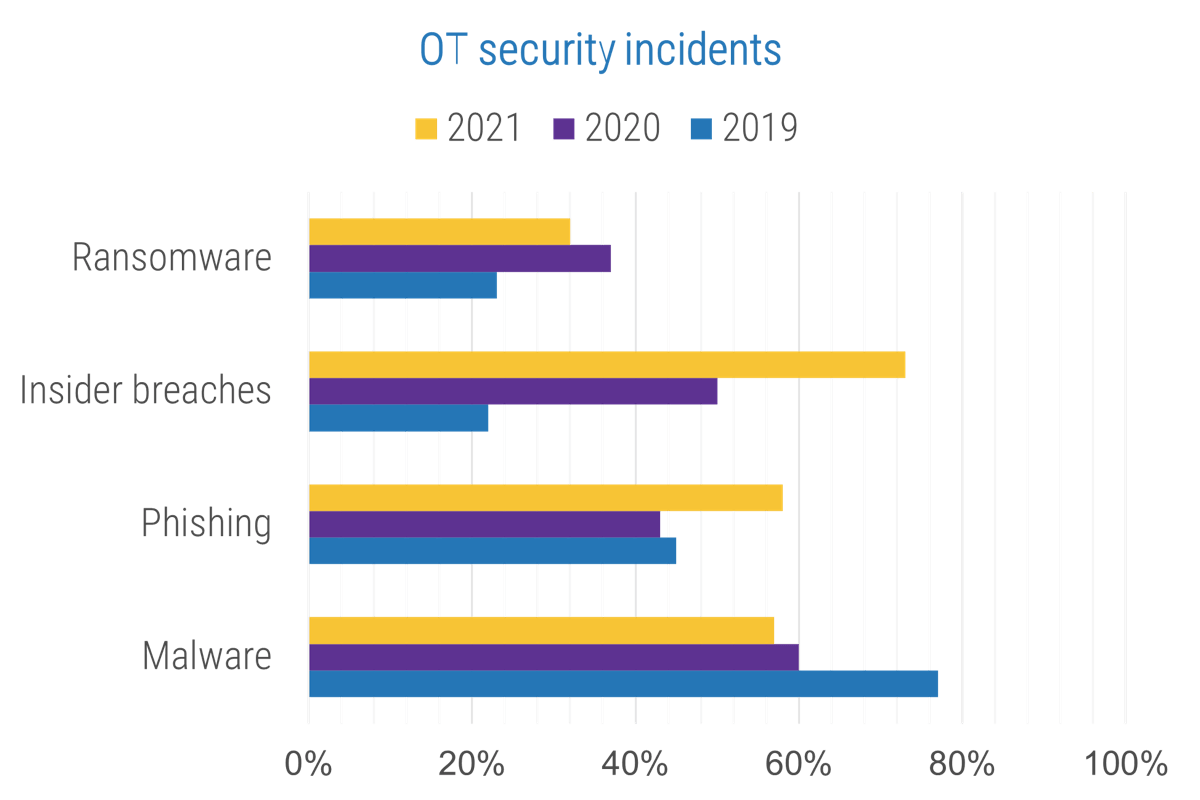

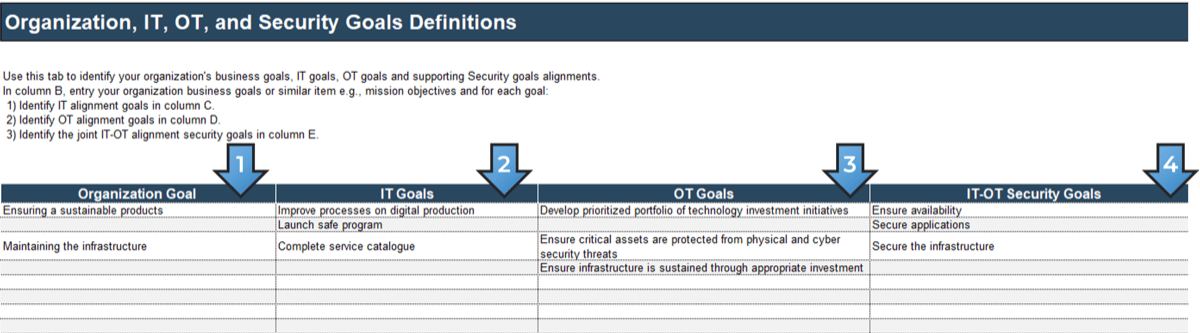
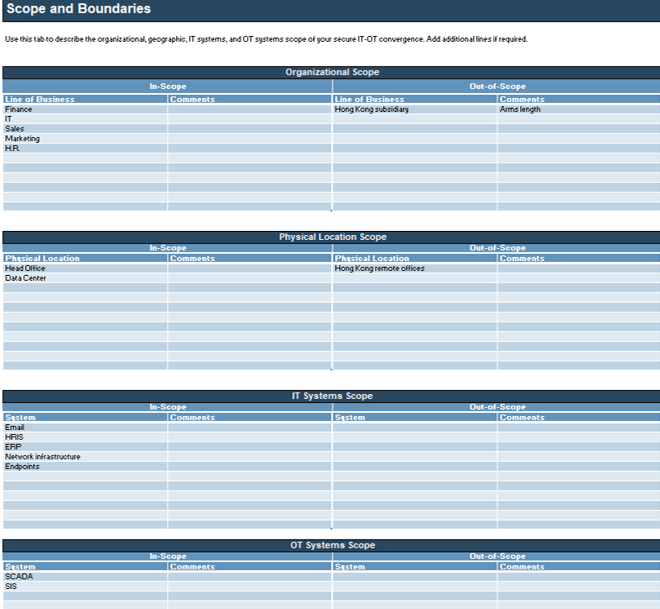
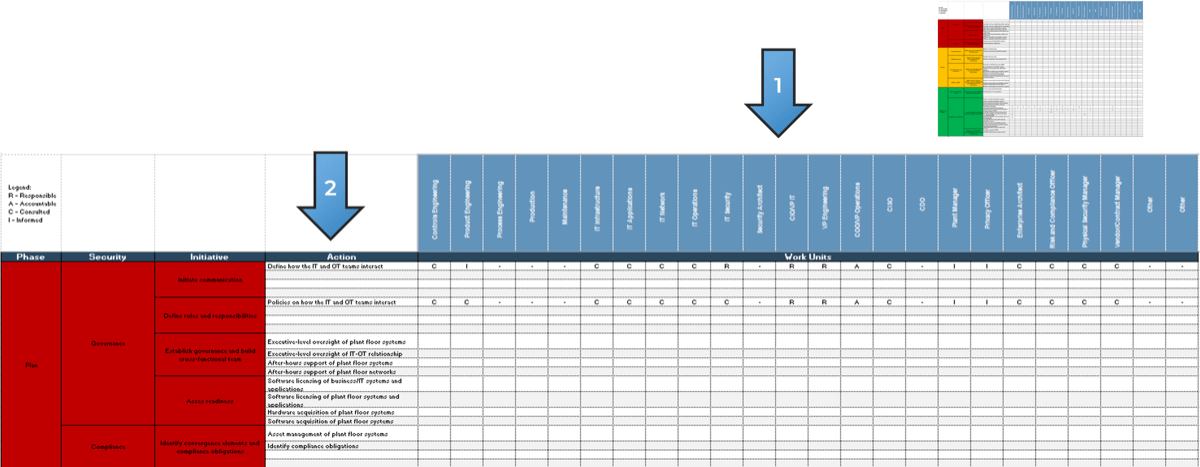
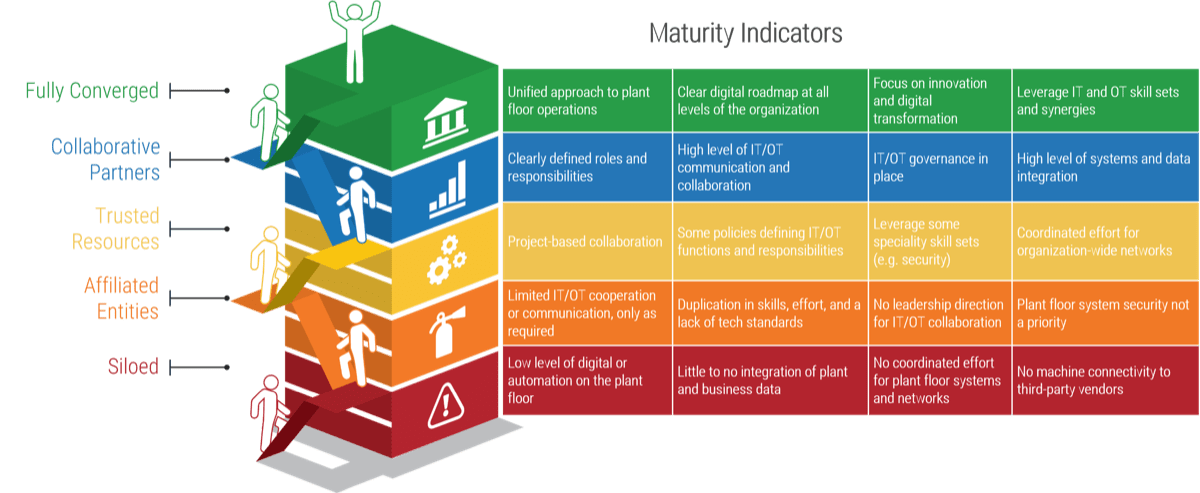
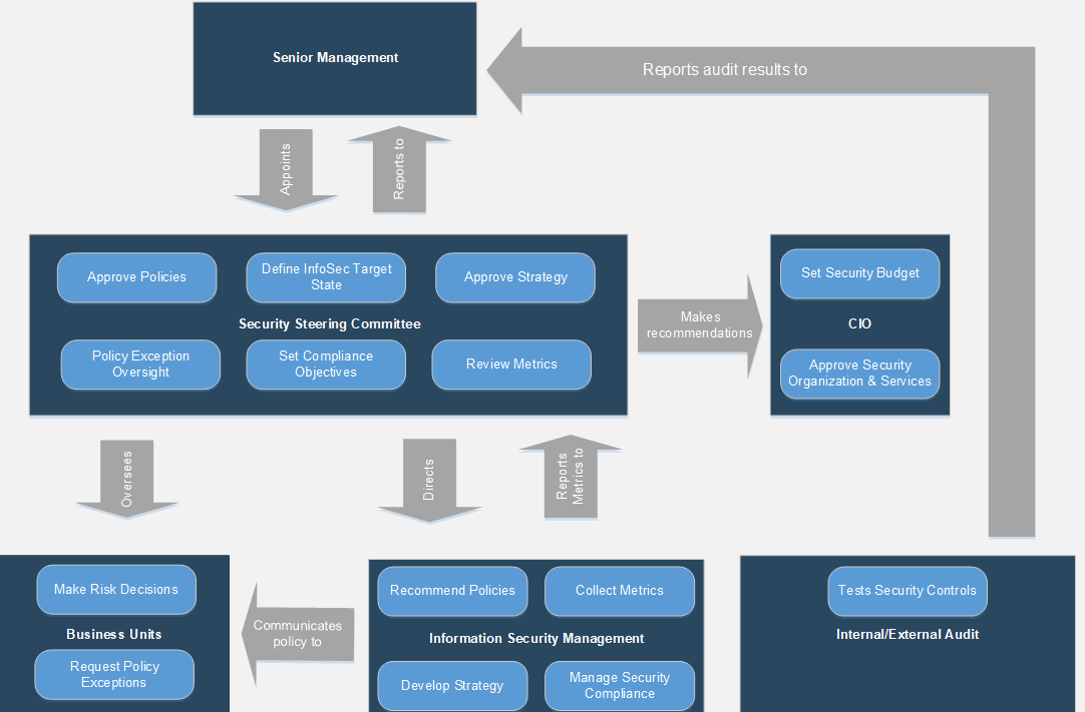
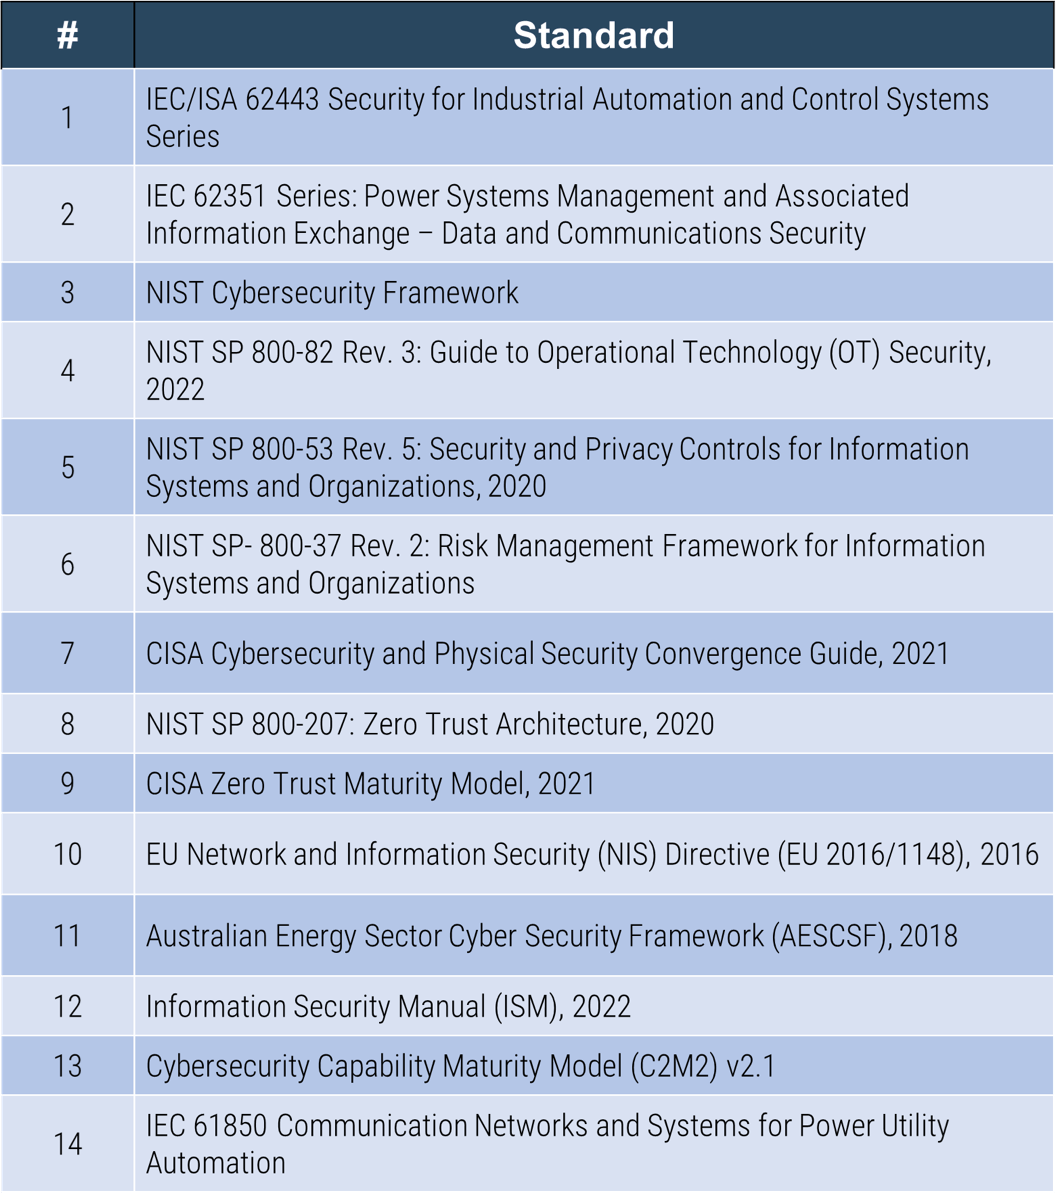
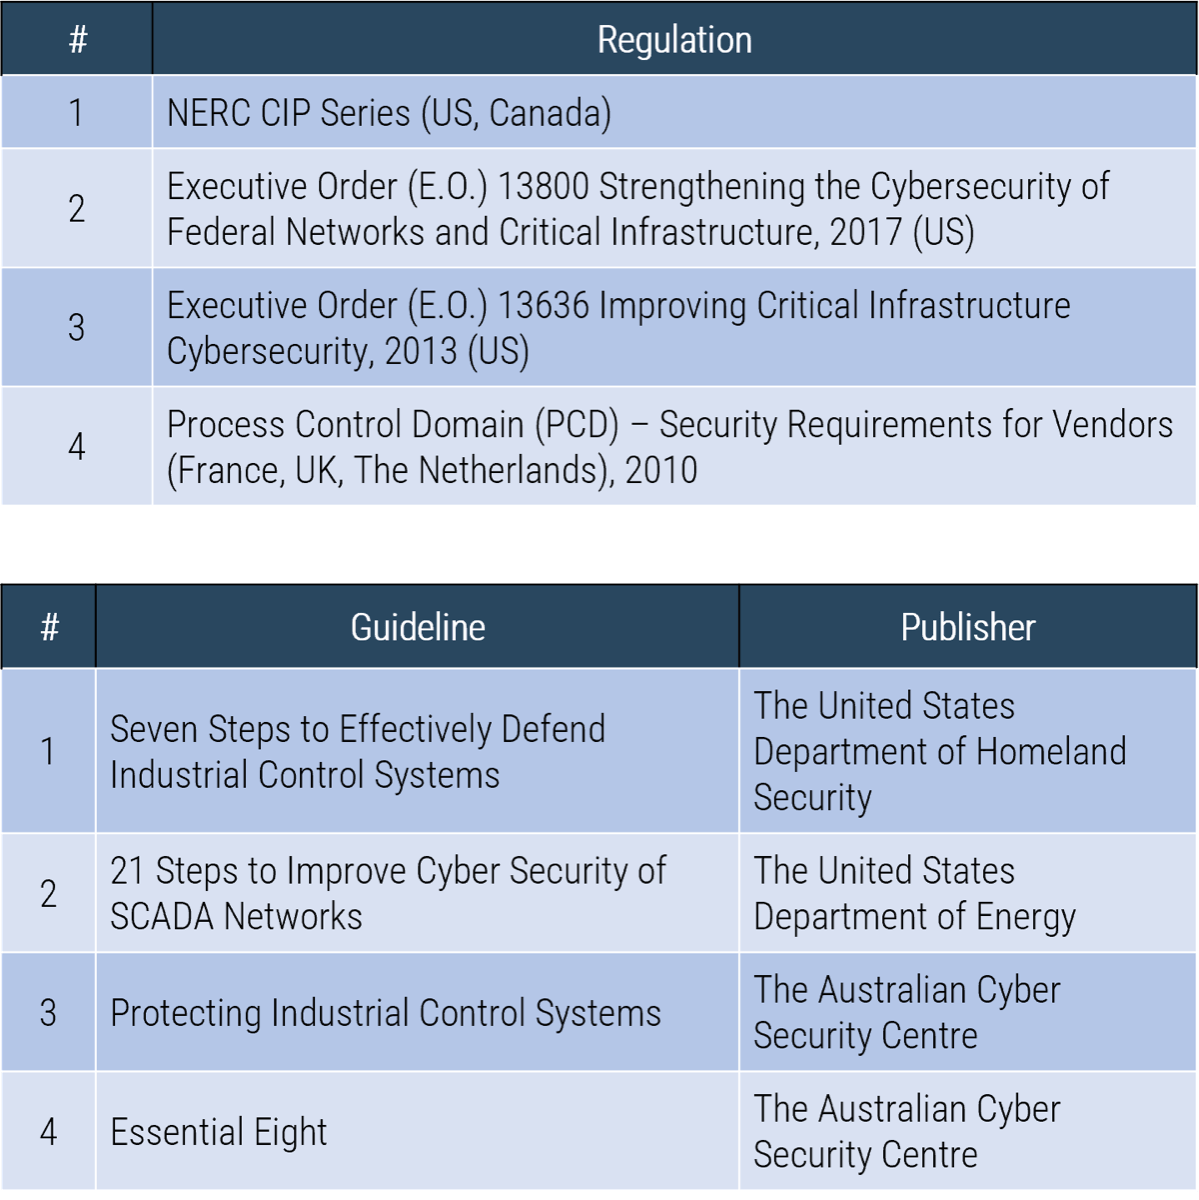
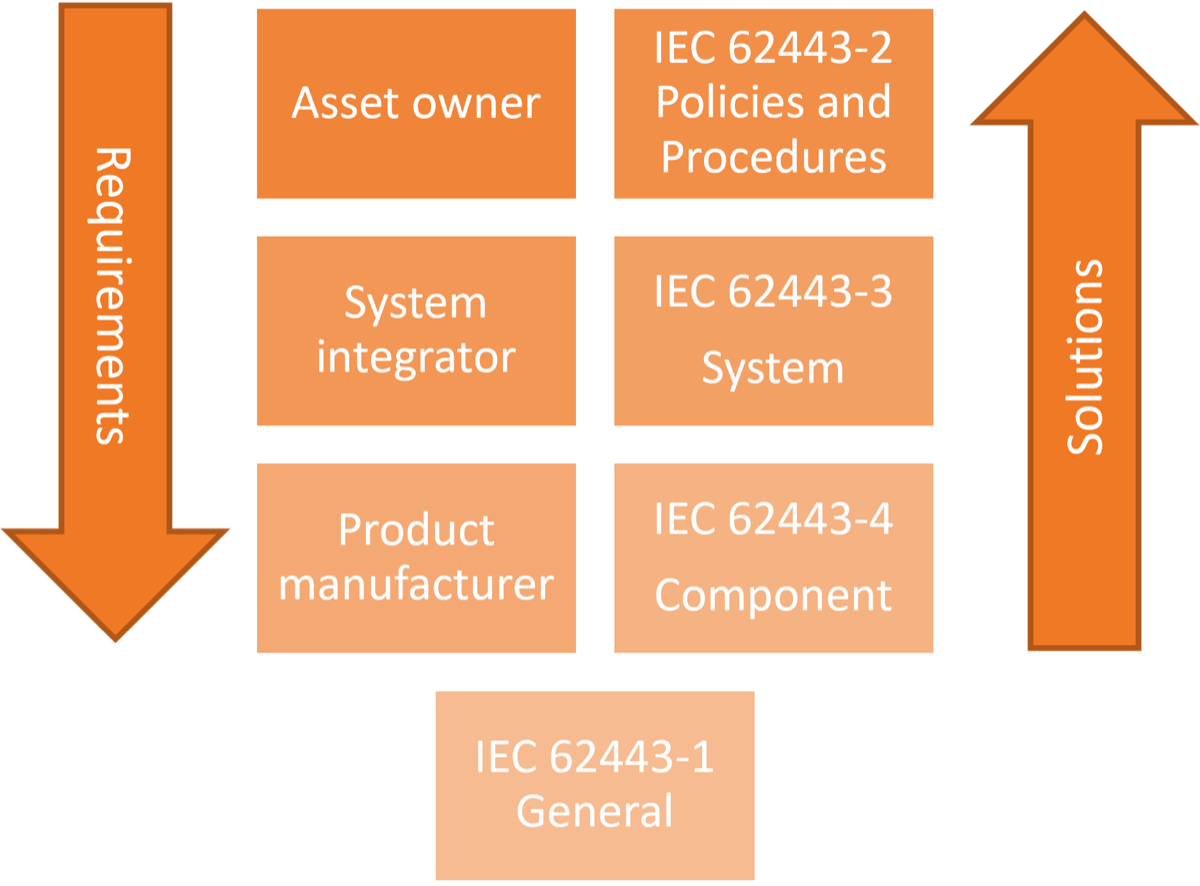
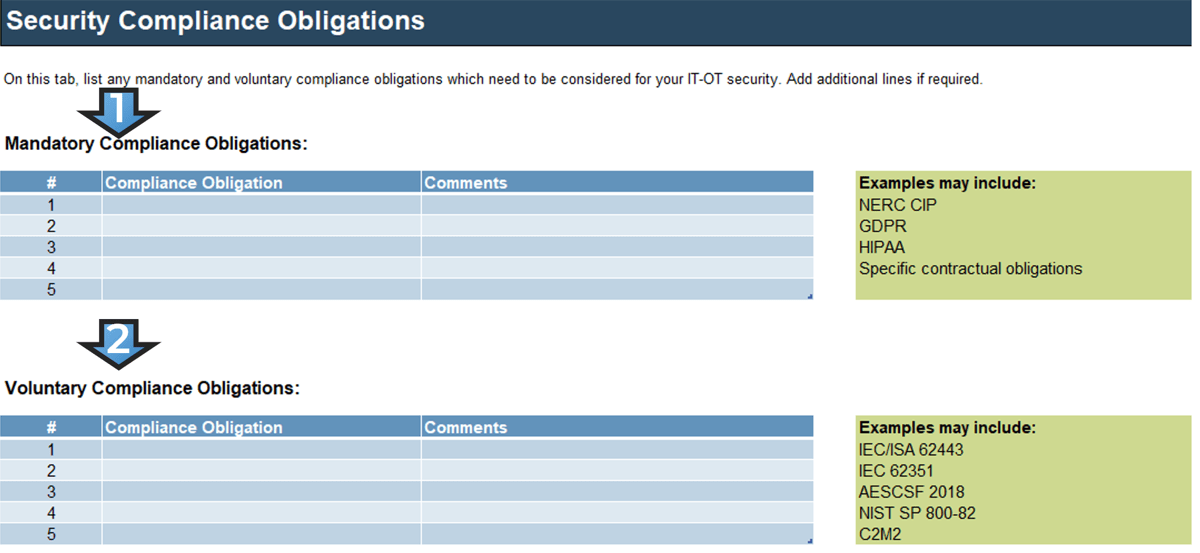
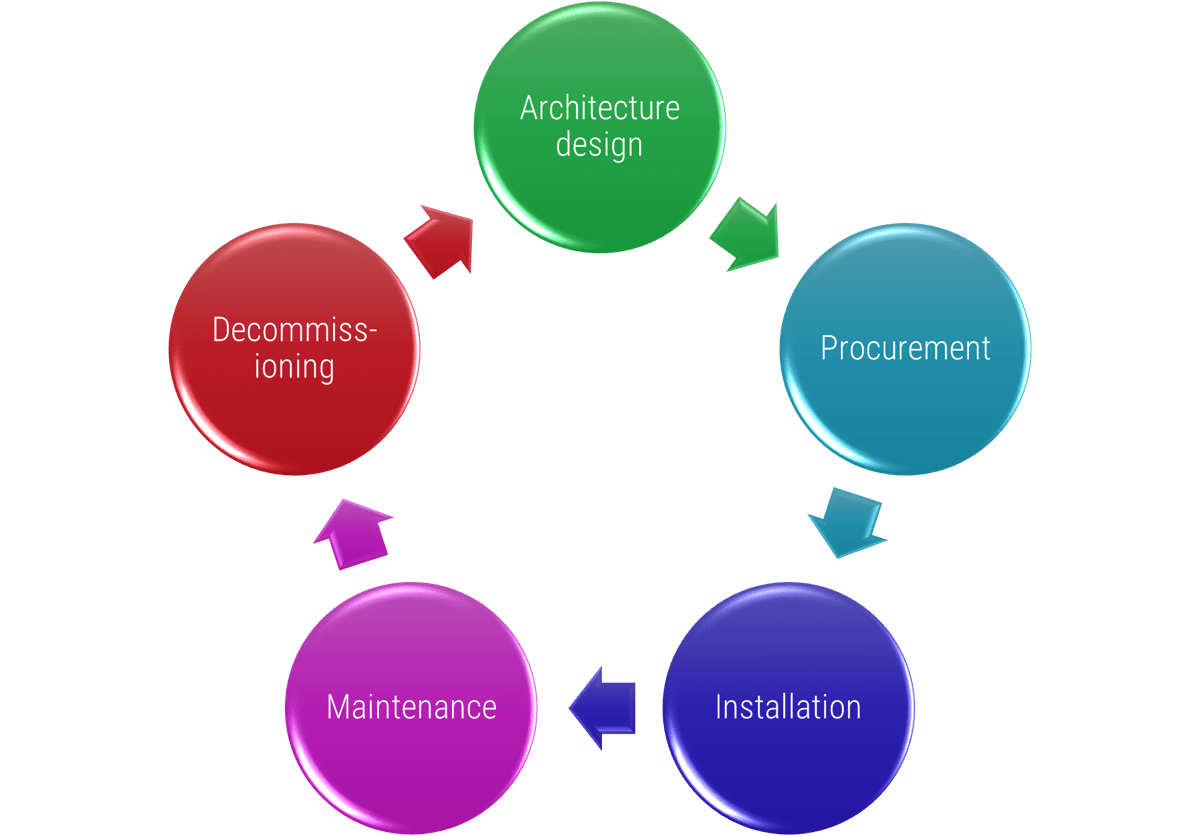
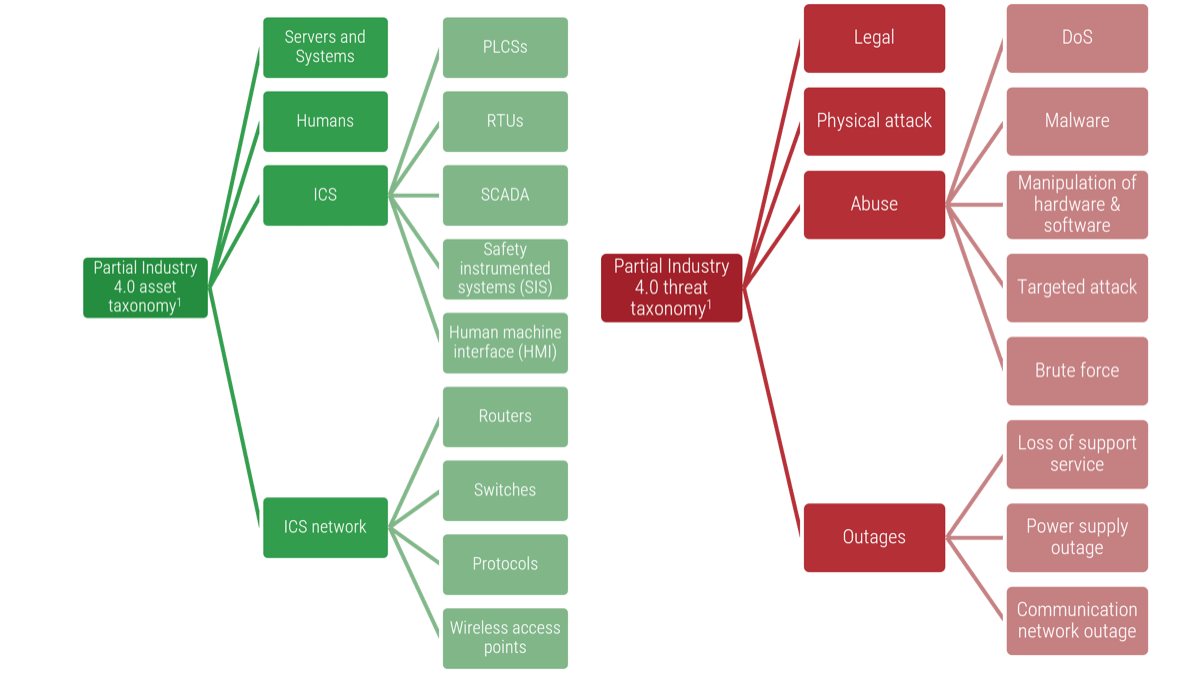
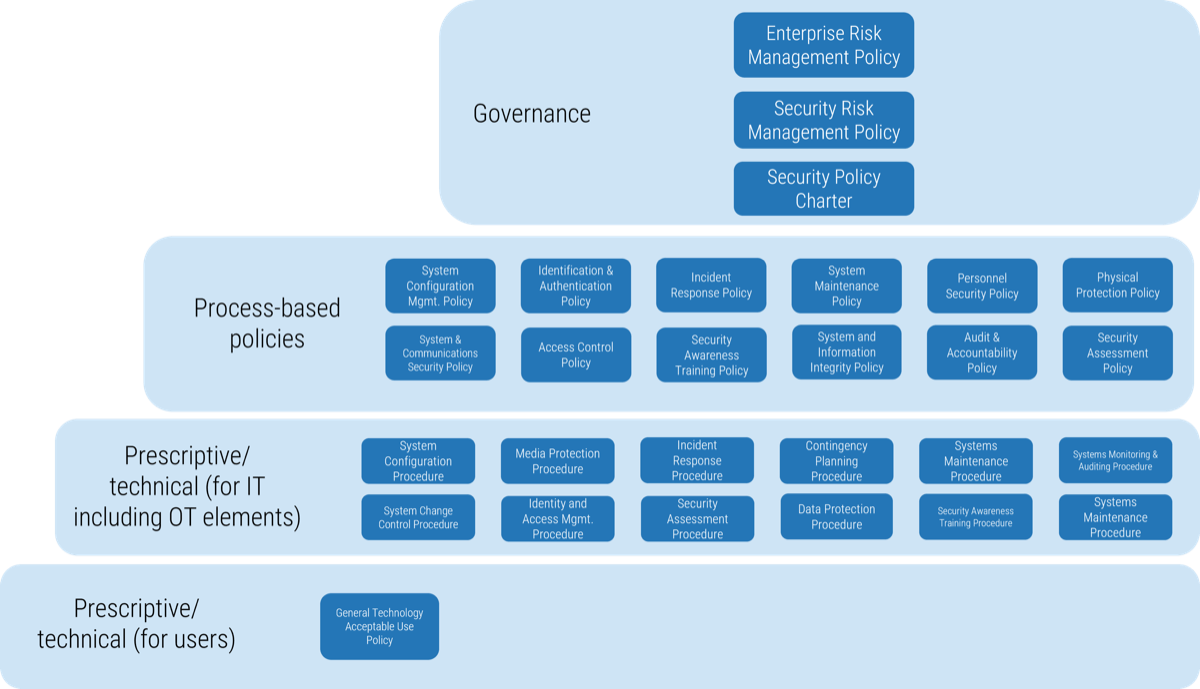
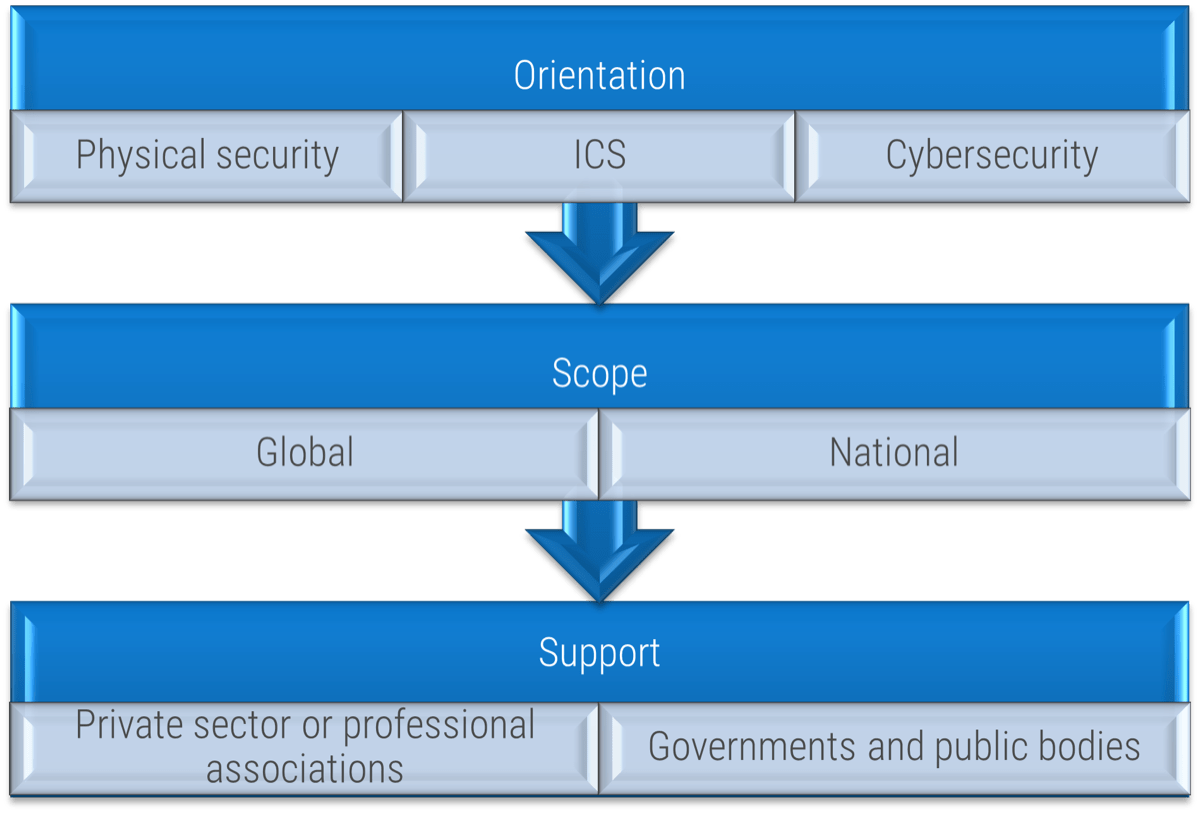 (Source: ENISA, 2015.)
 (Source: “Purdue Enterprise Reference Architecture (PERA) model,” ISA-99.)


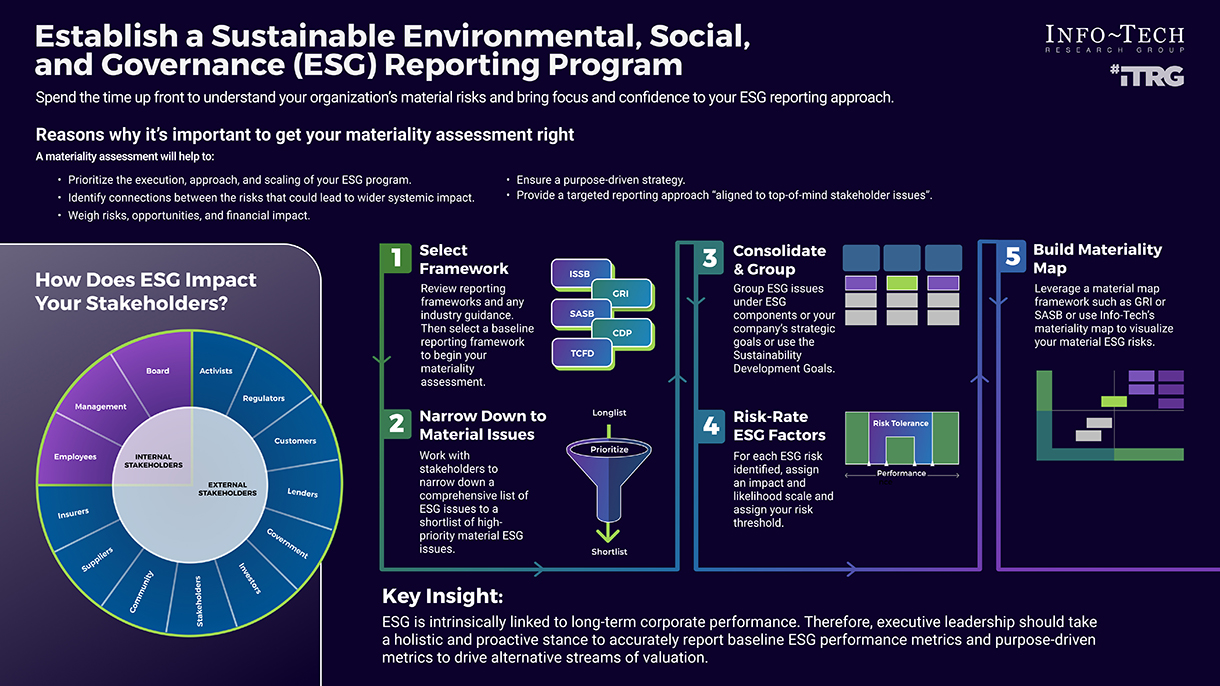


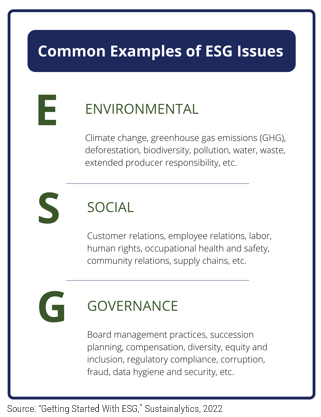
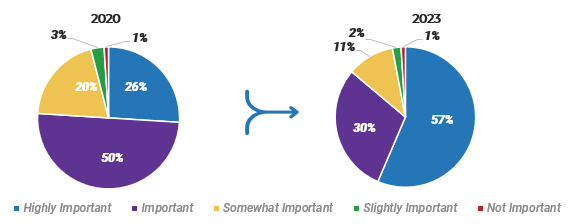
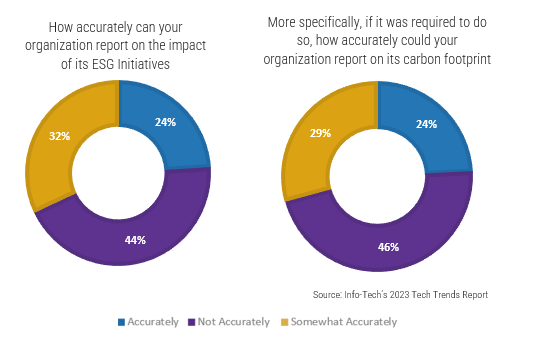
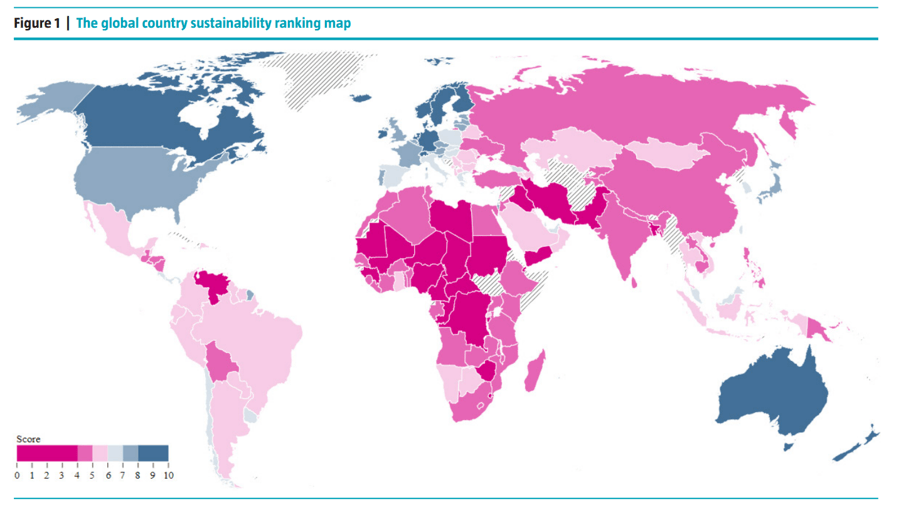
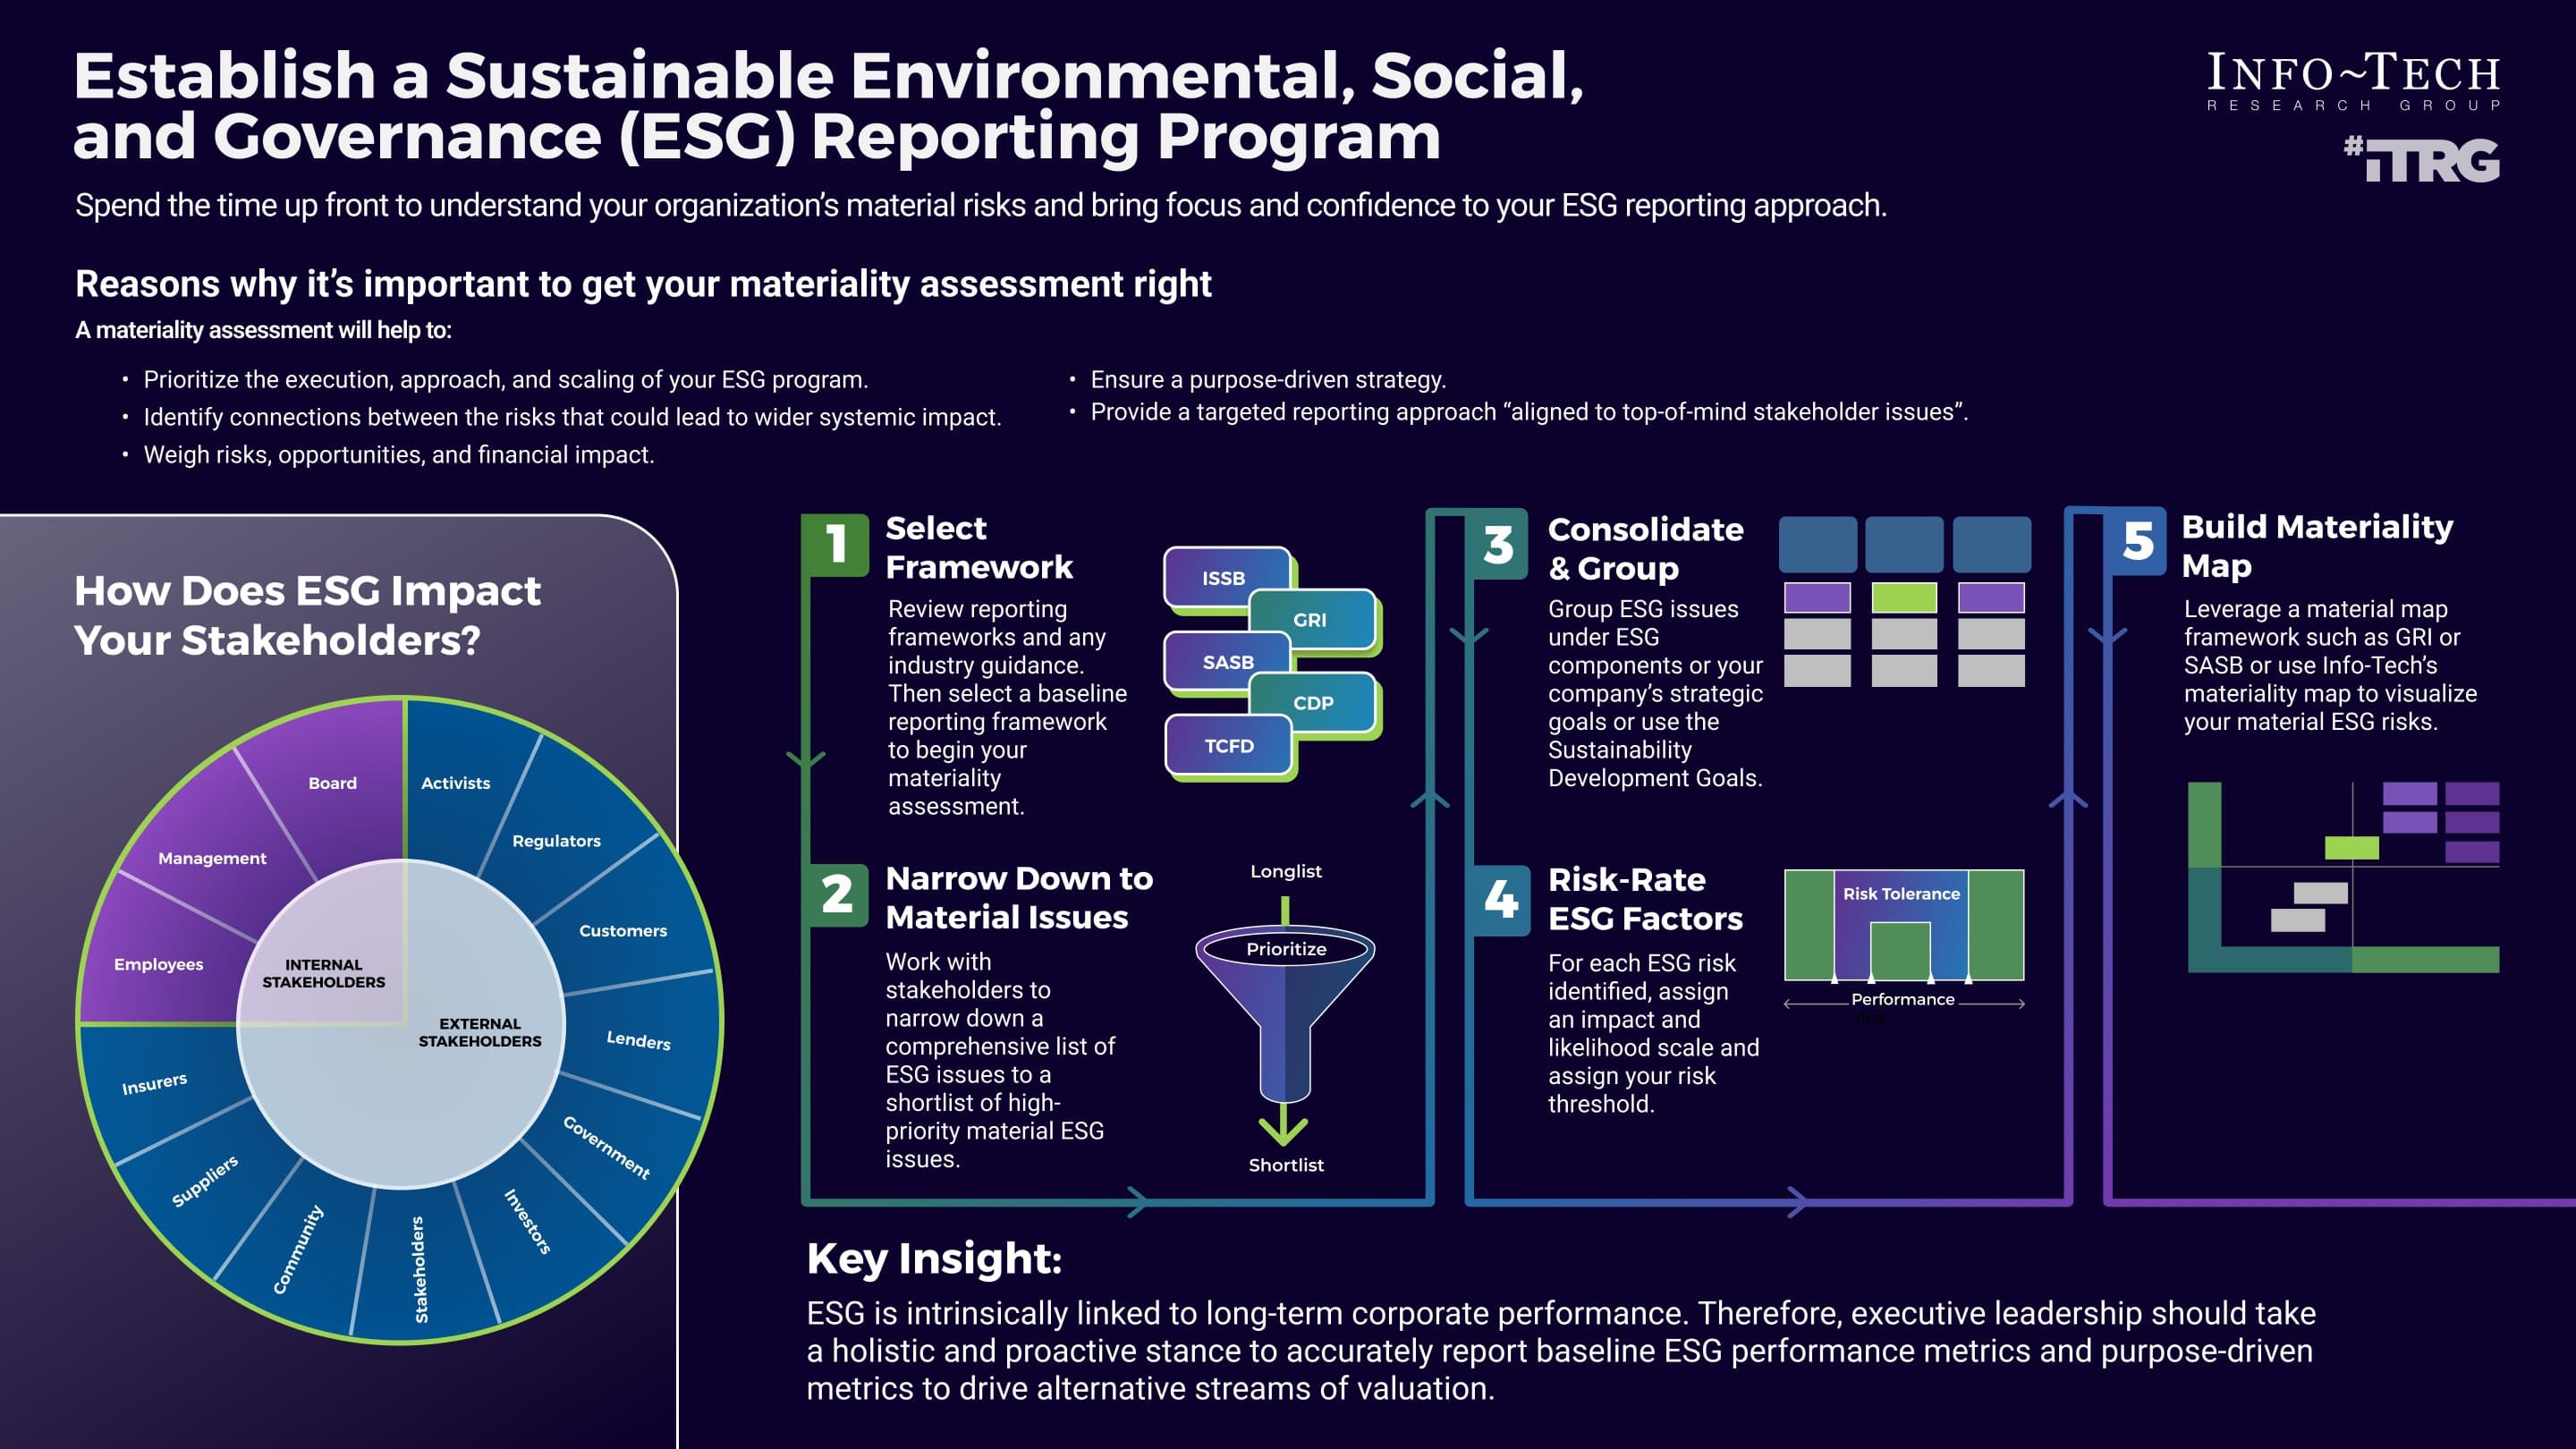


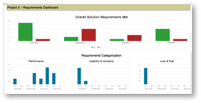
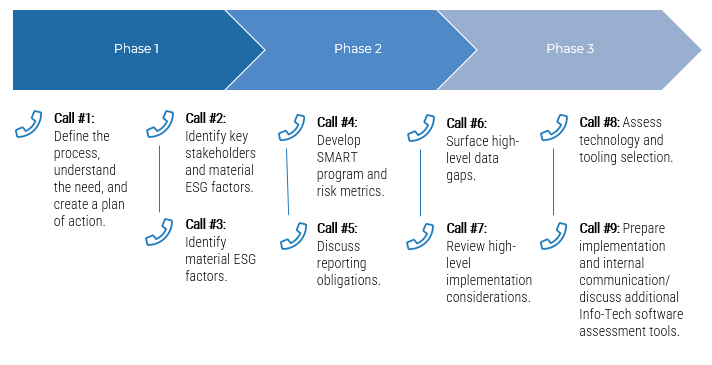
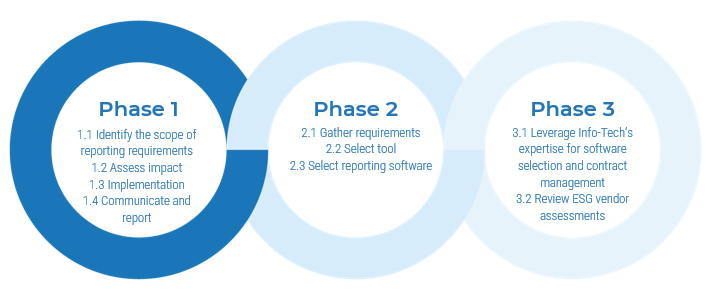
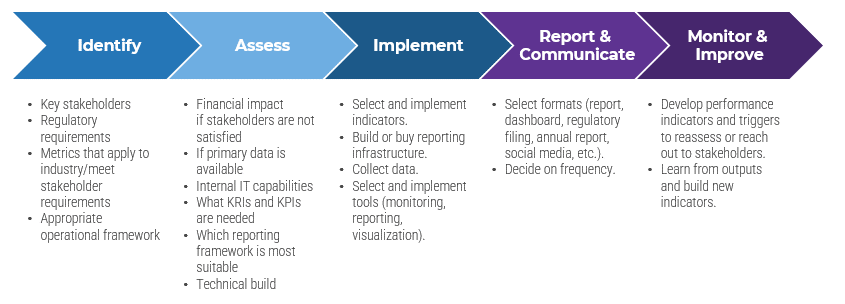
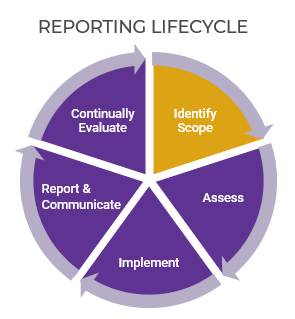
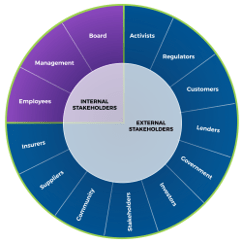
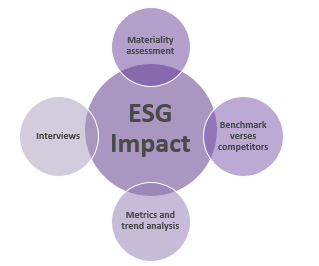
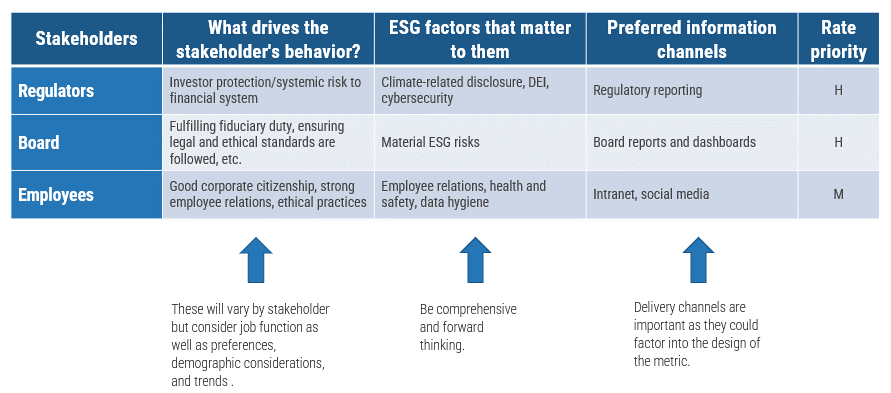
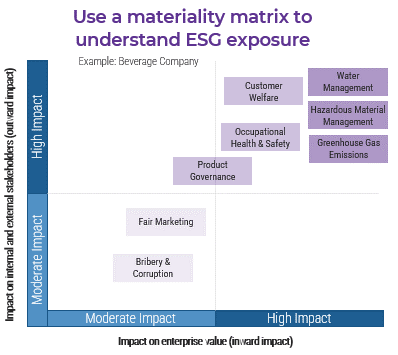
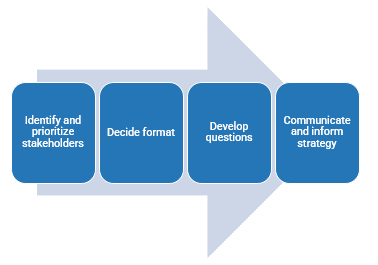
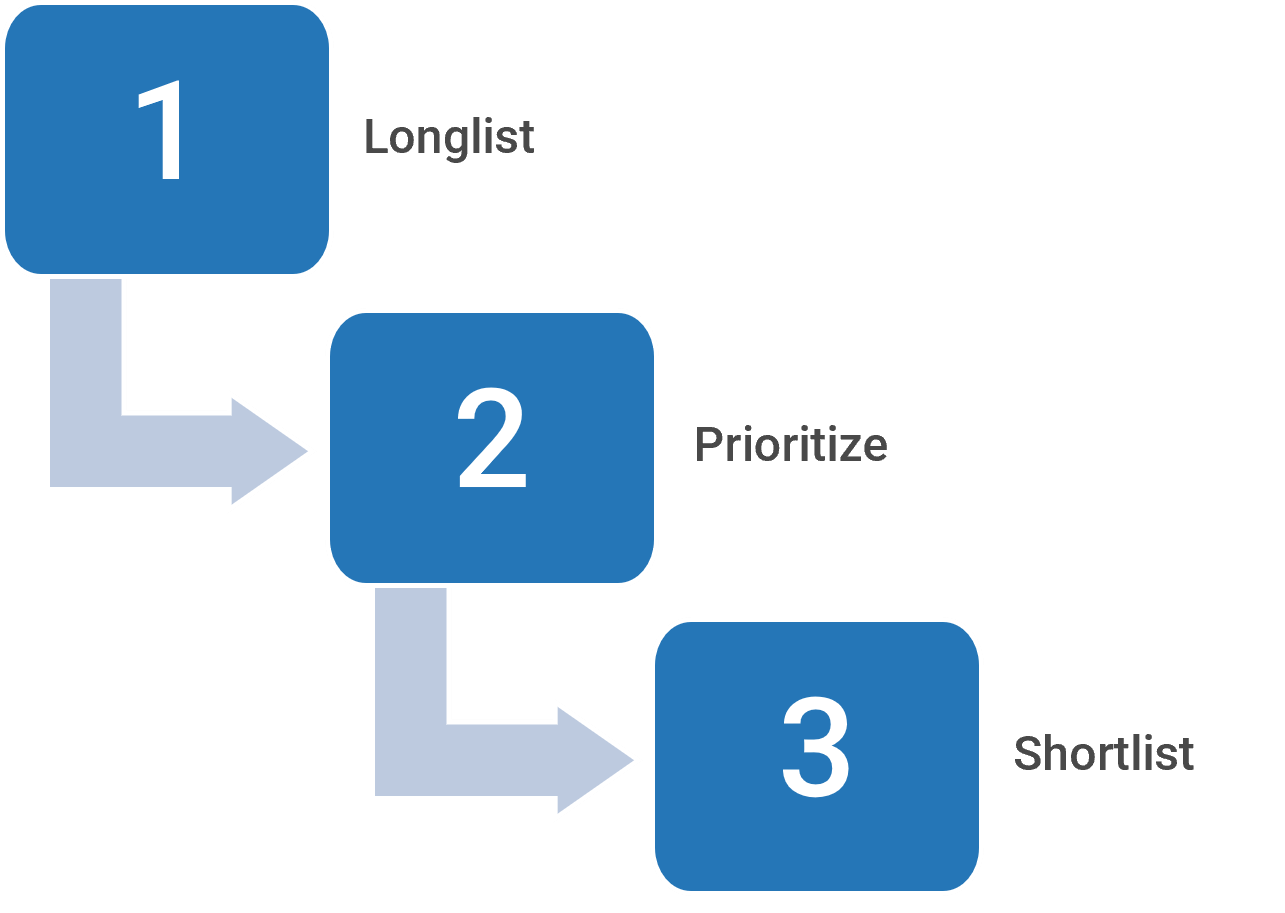
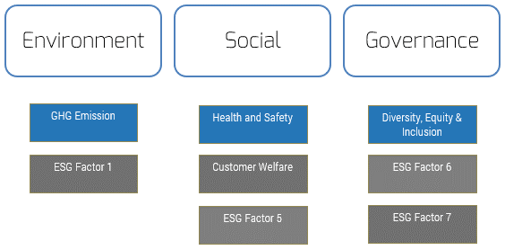
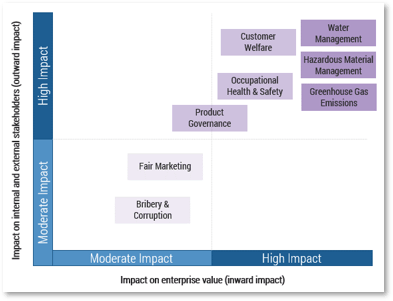
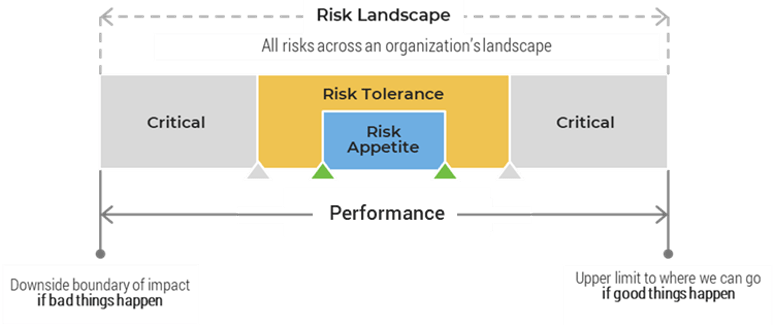

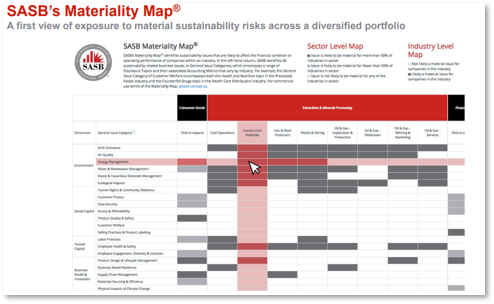

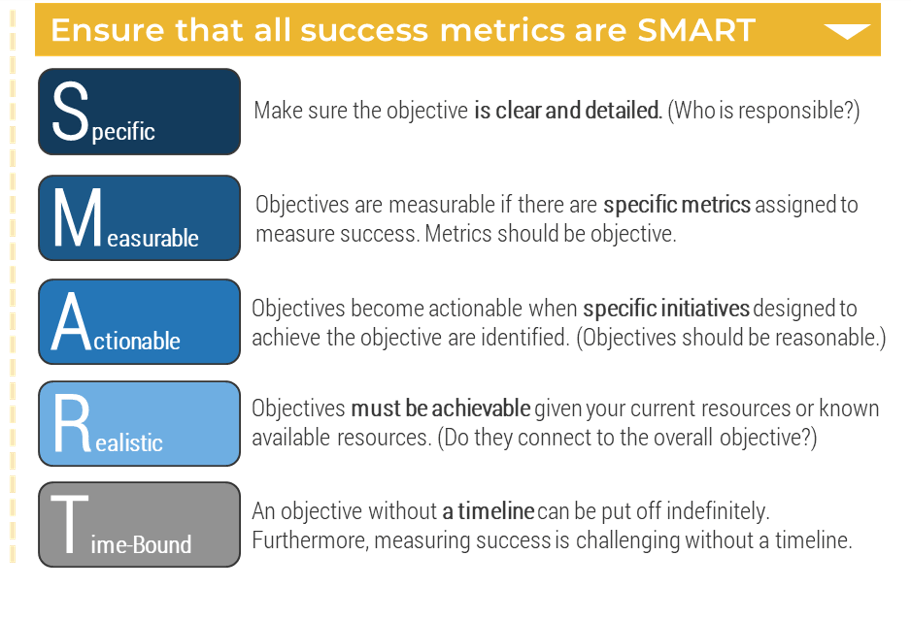
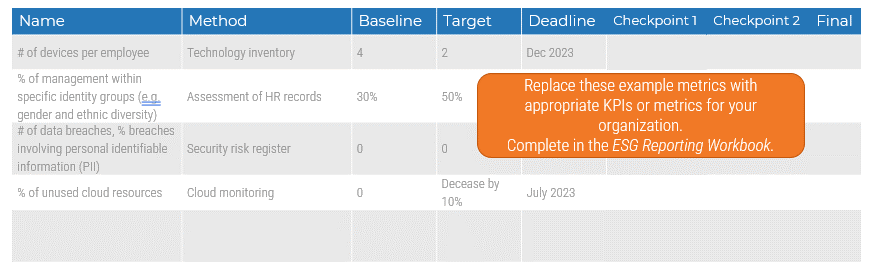
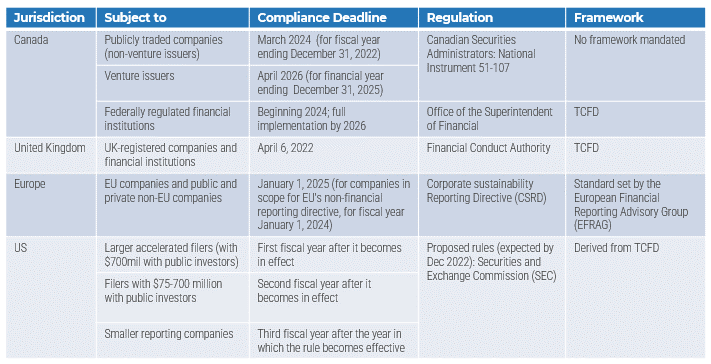
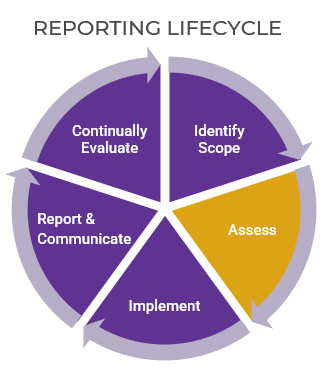
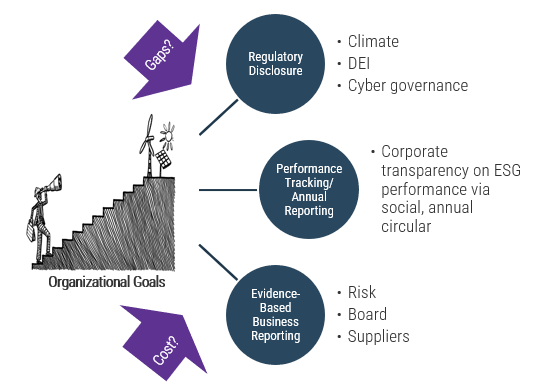
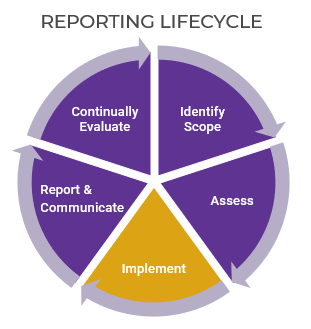


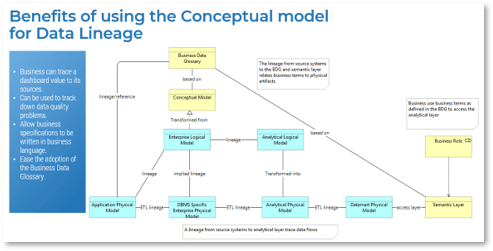
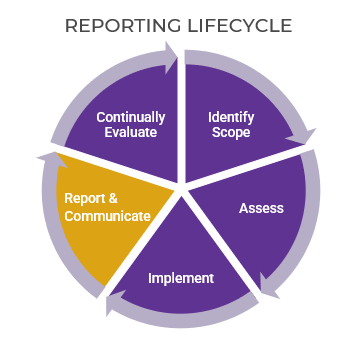
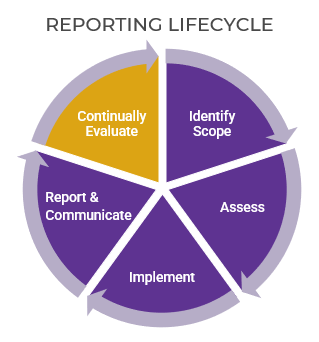
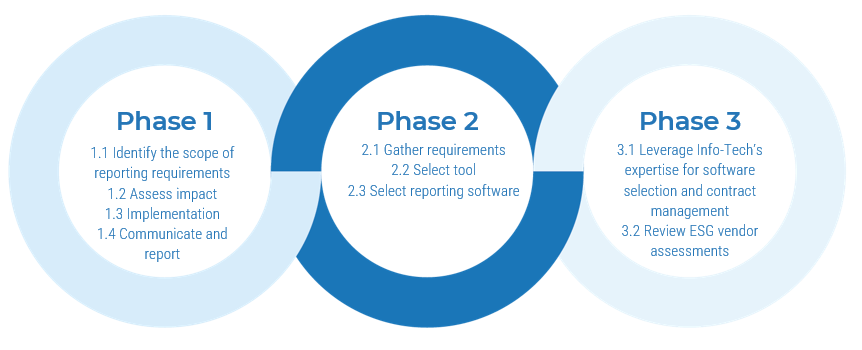


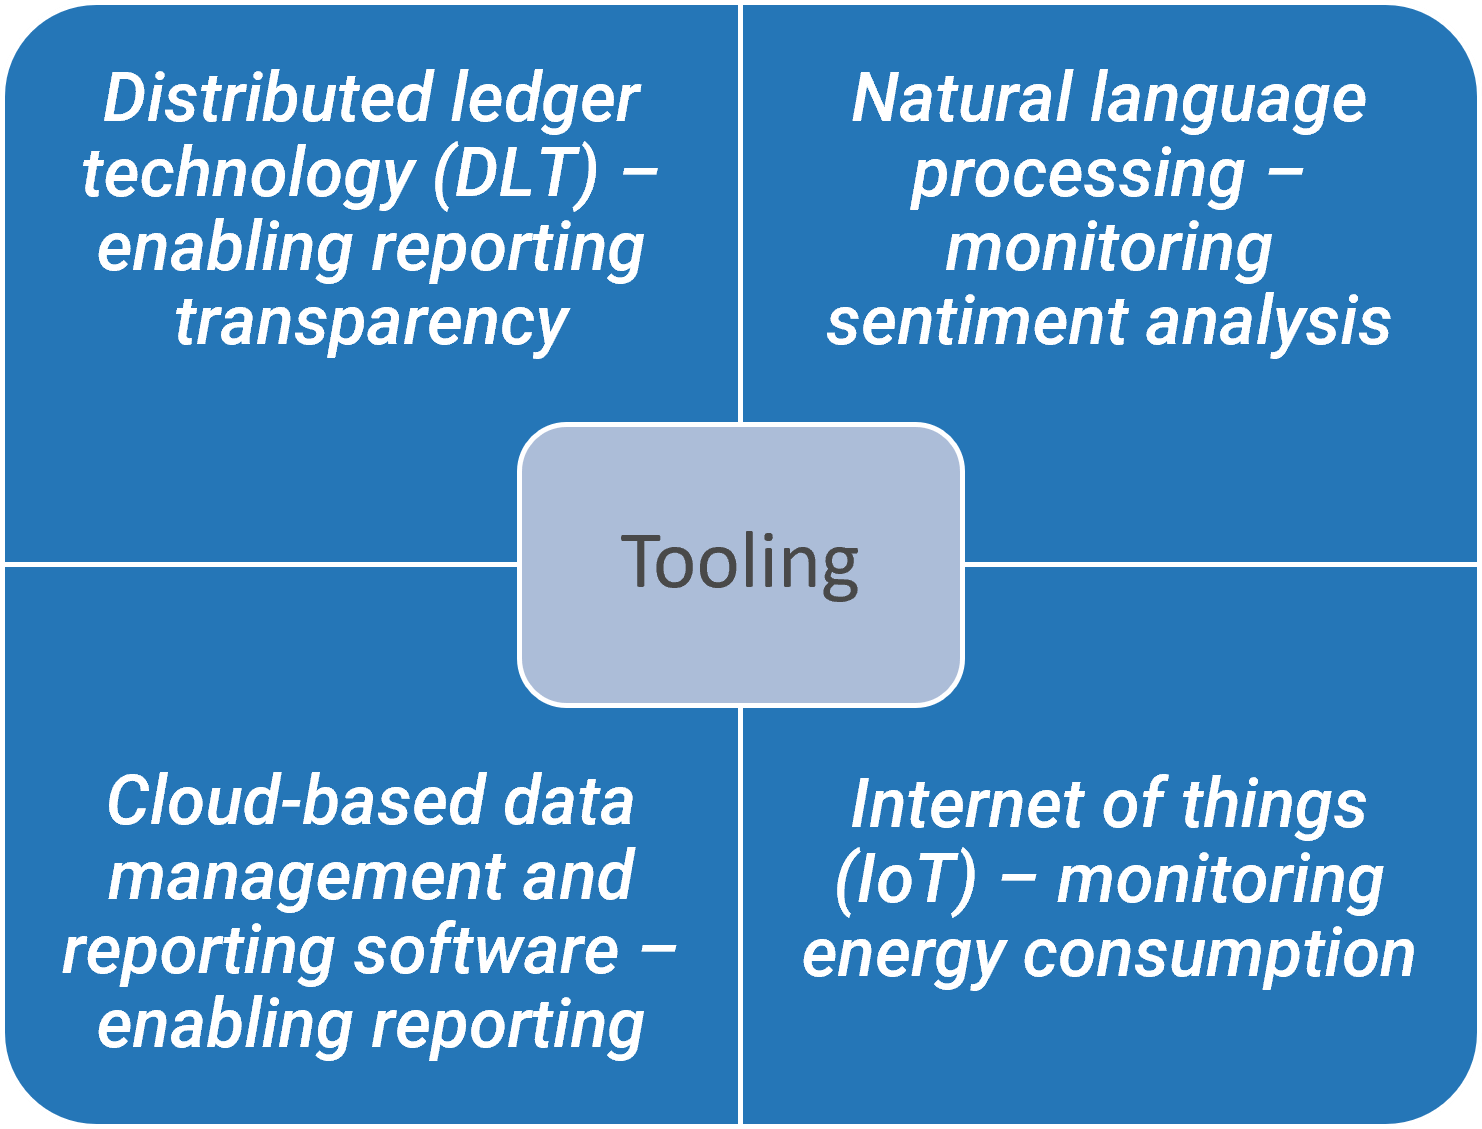
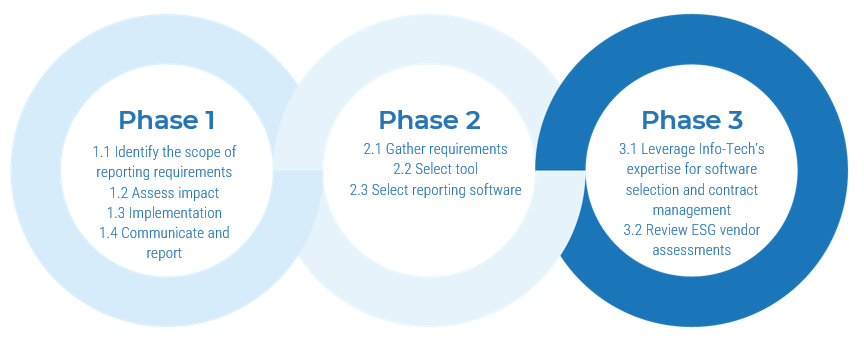

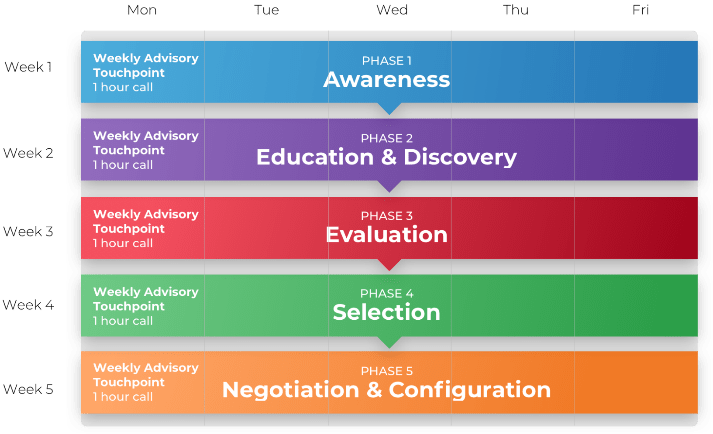
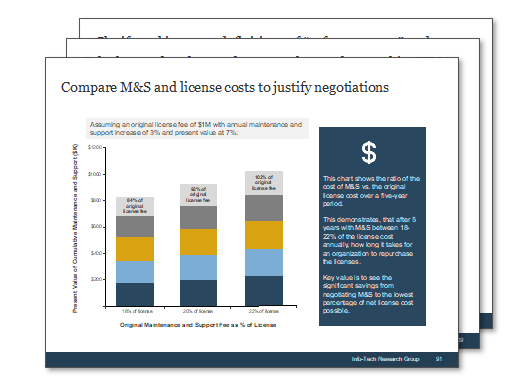

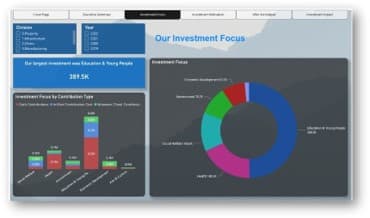


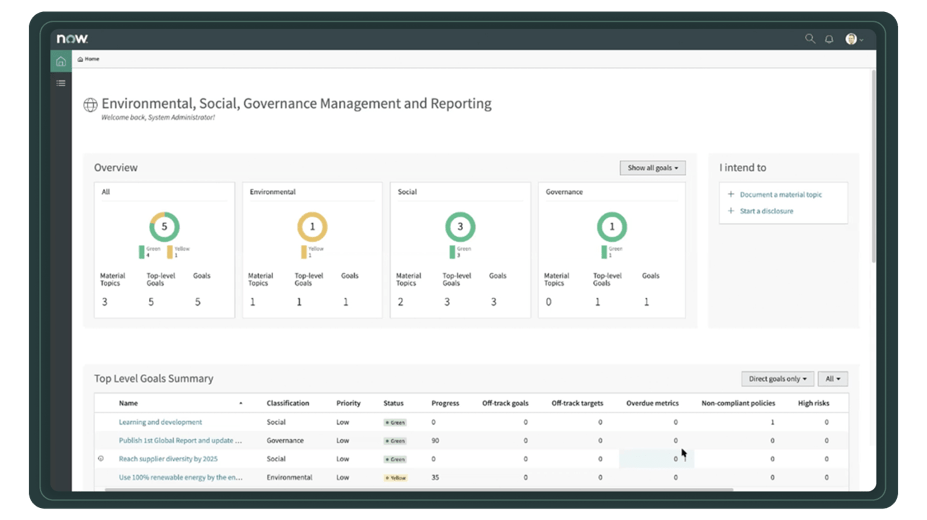


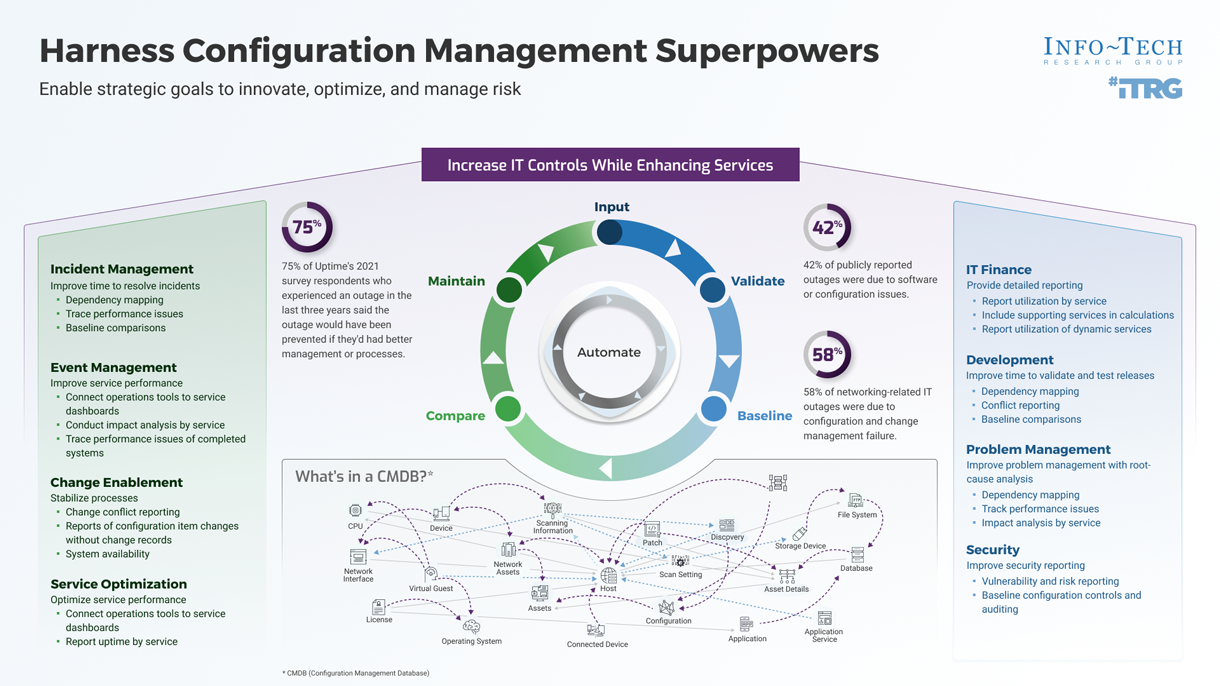

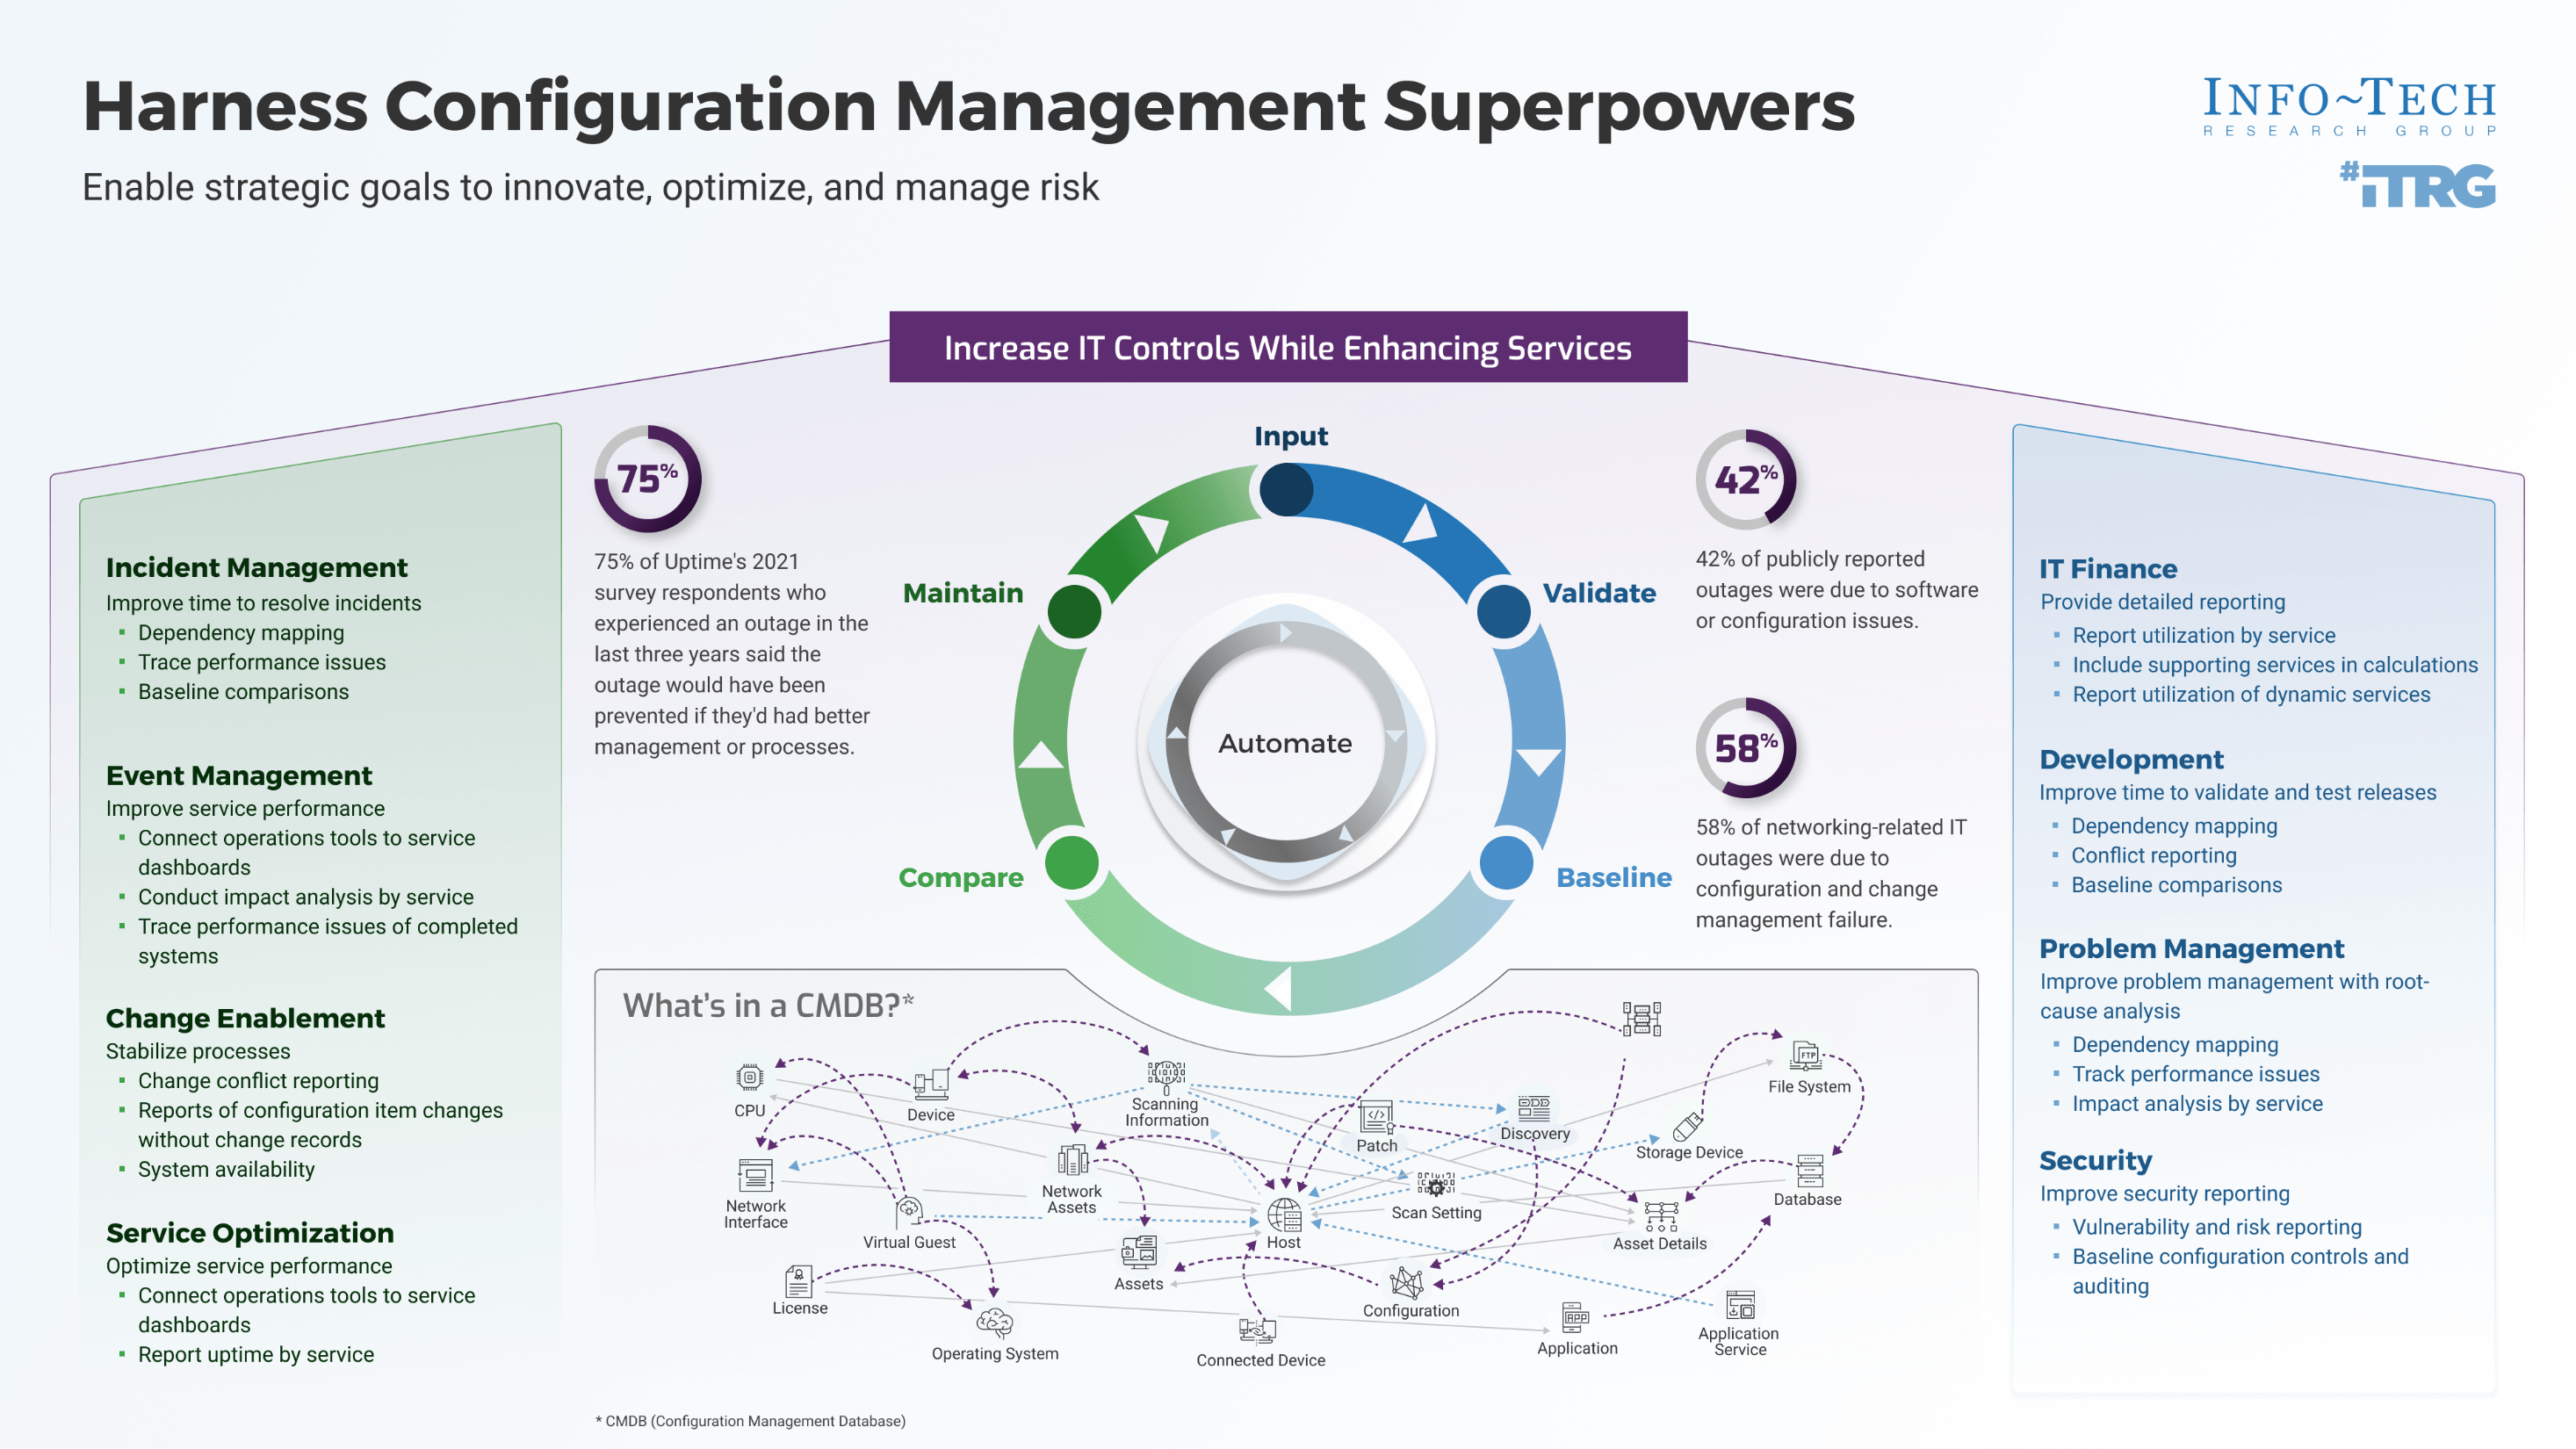
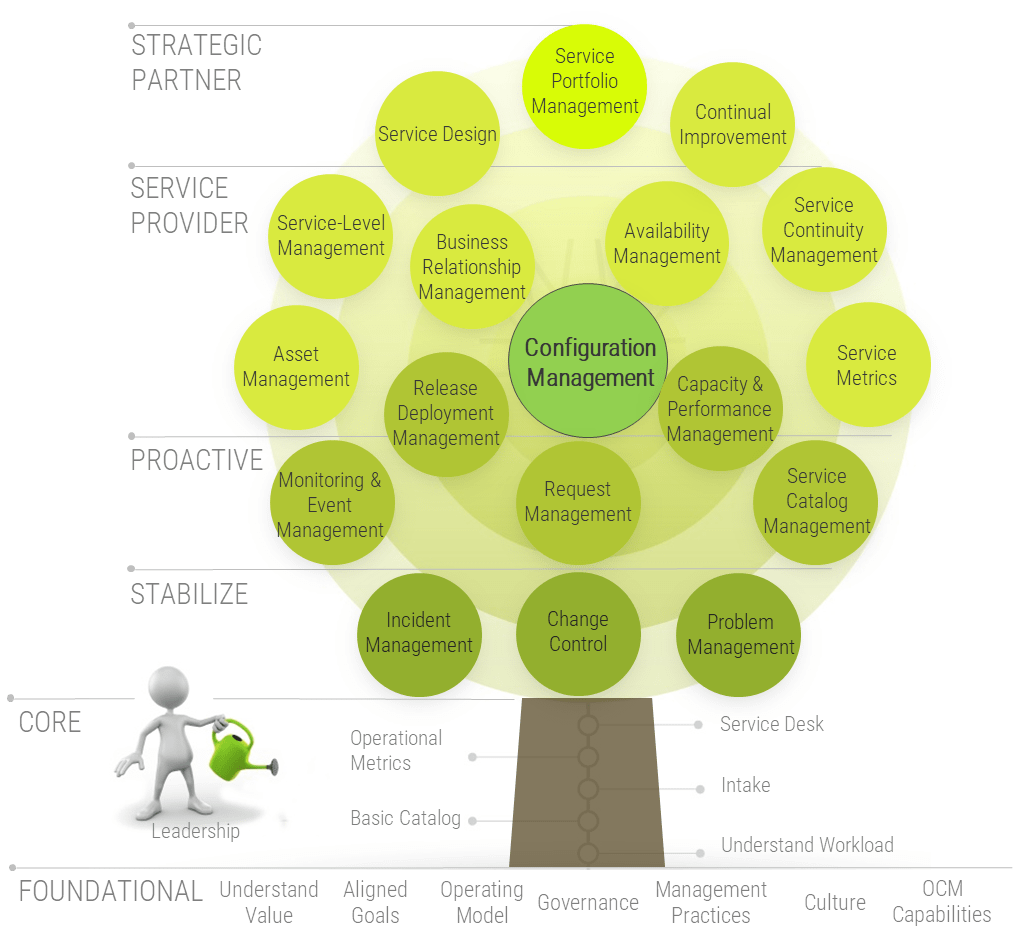
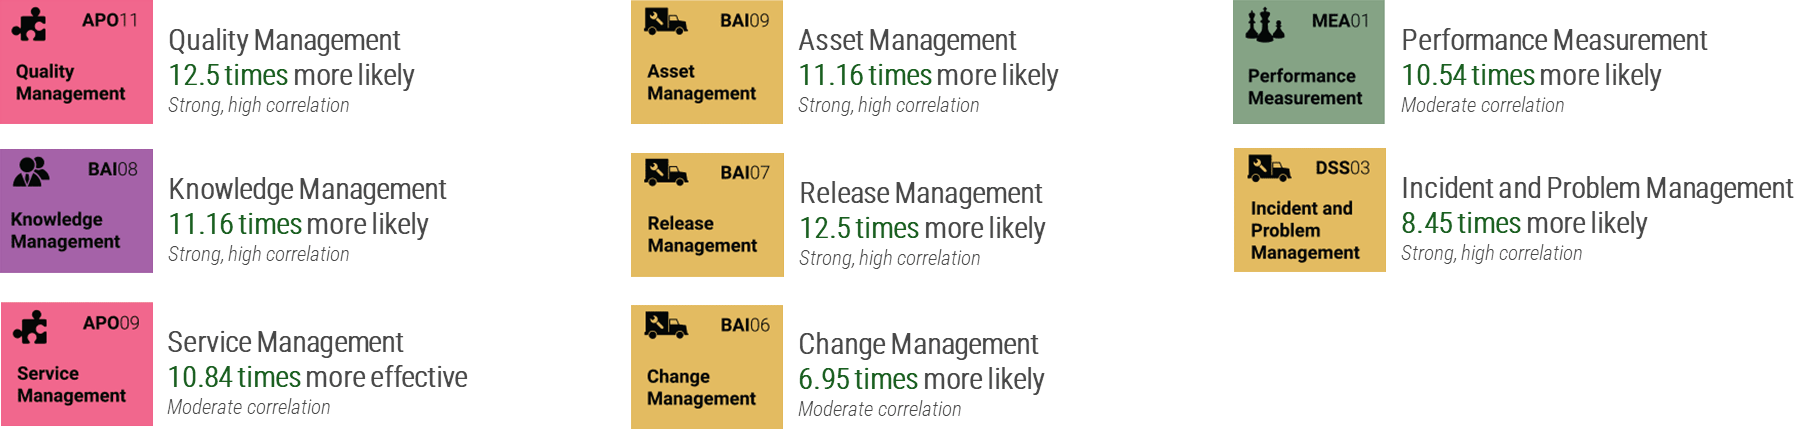
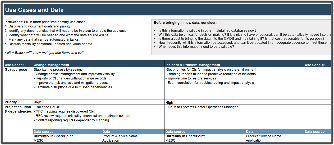
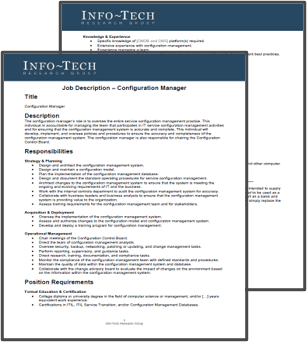
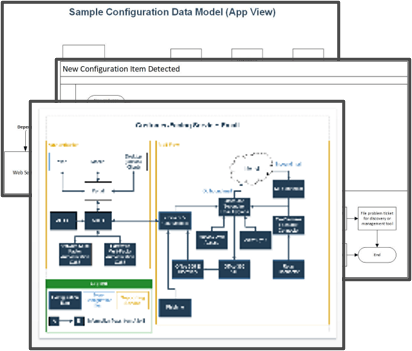
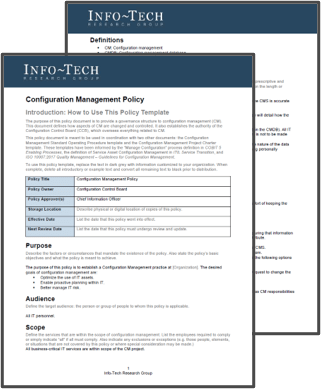
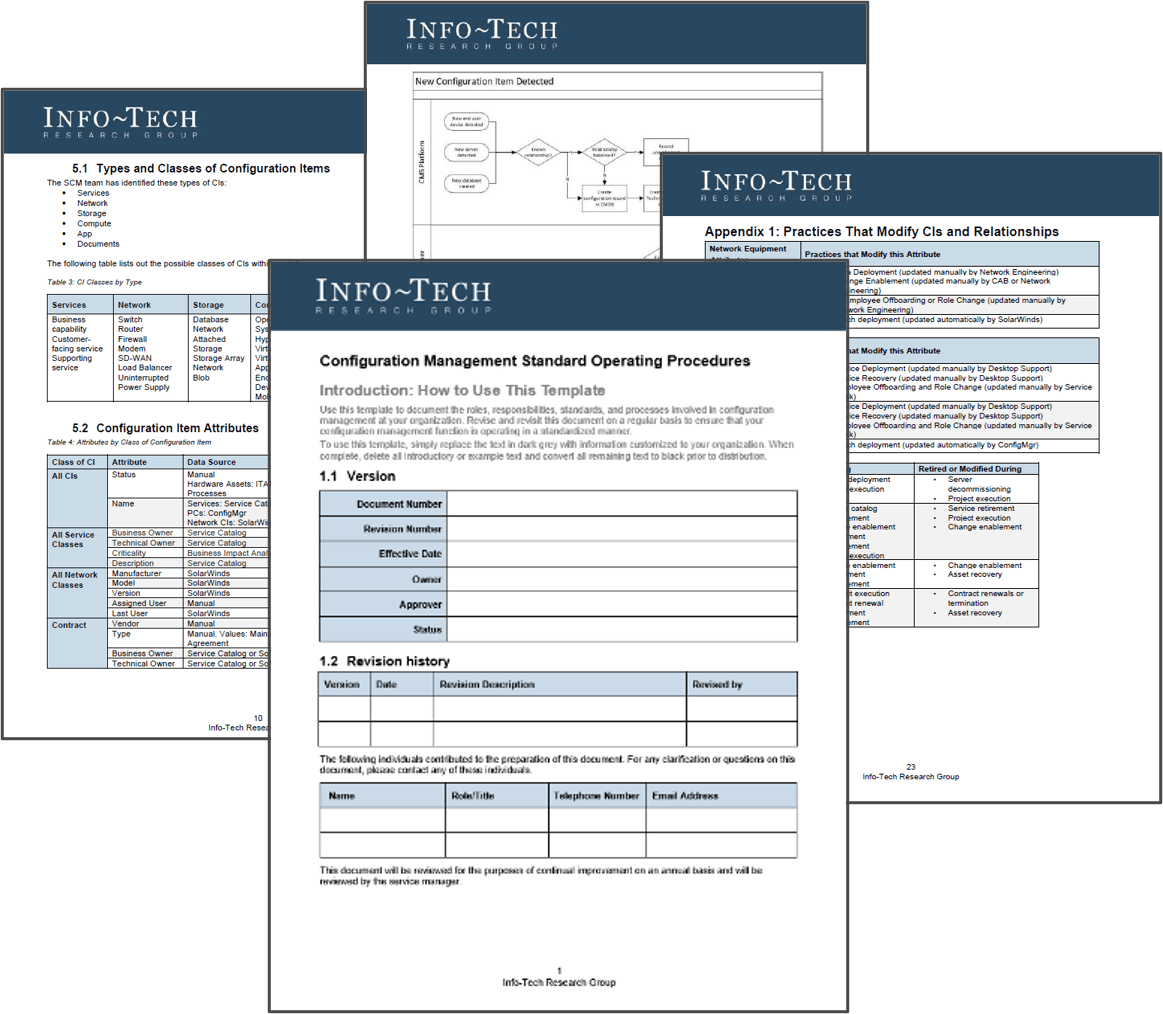
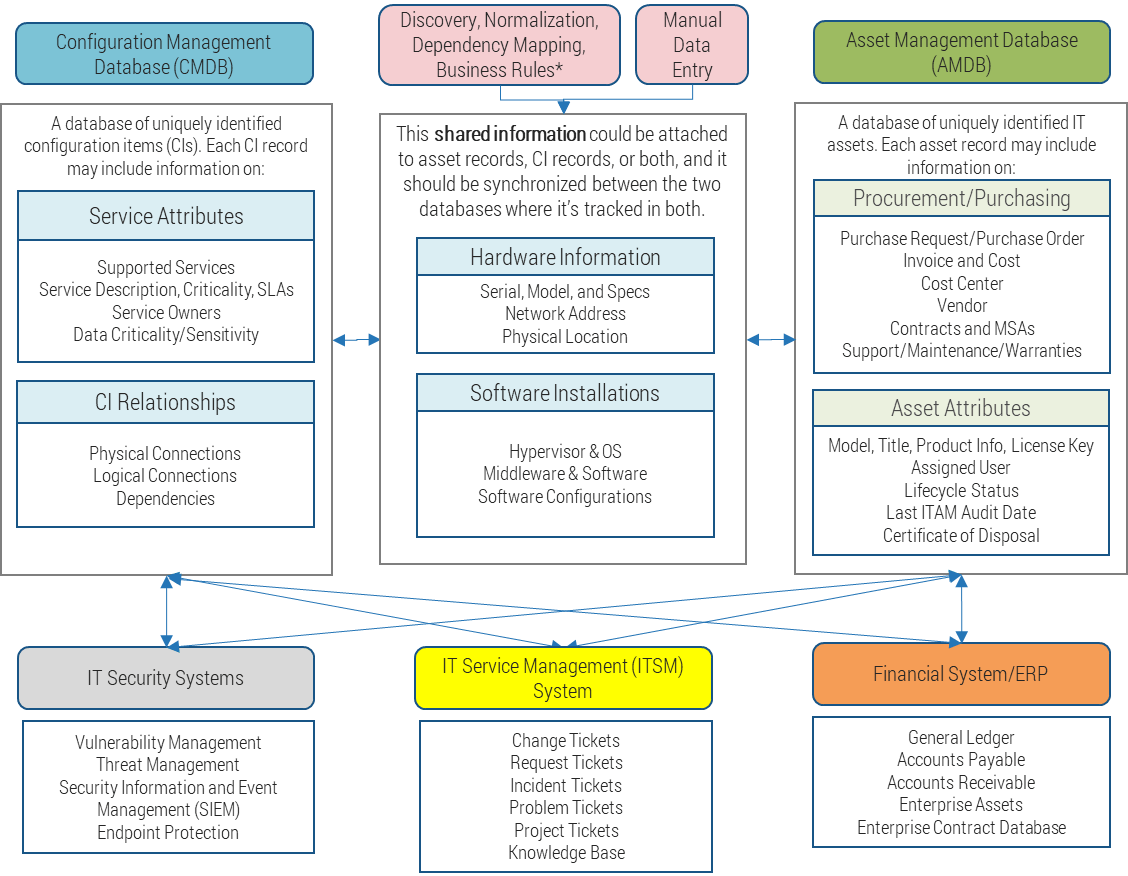
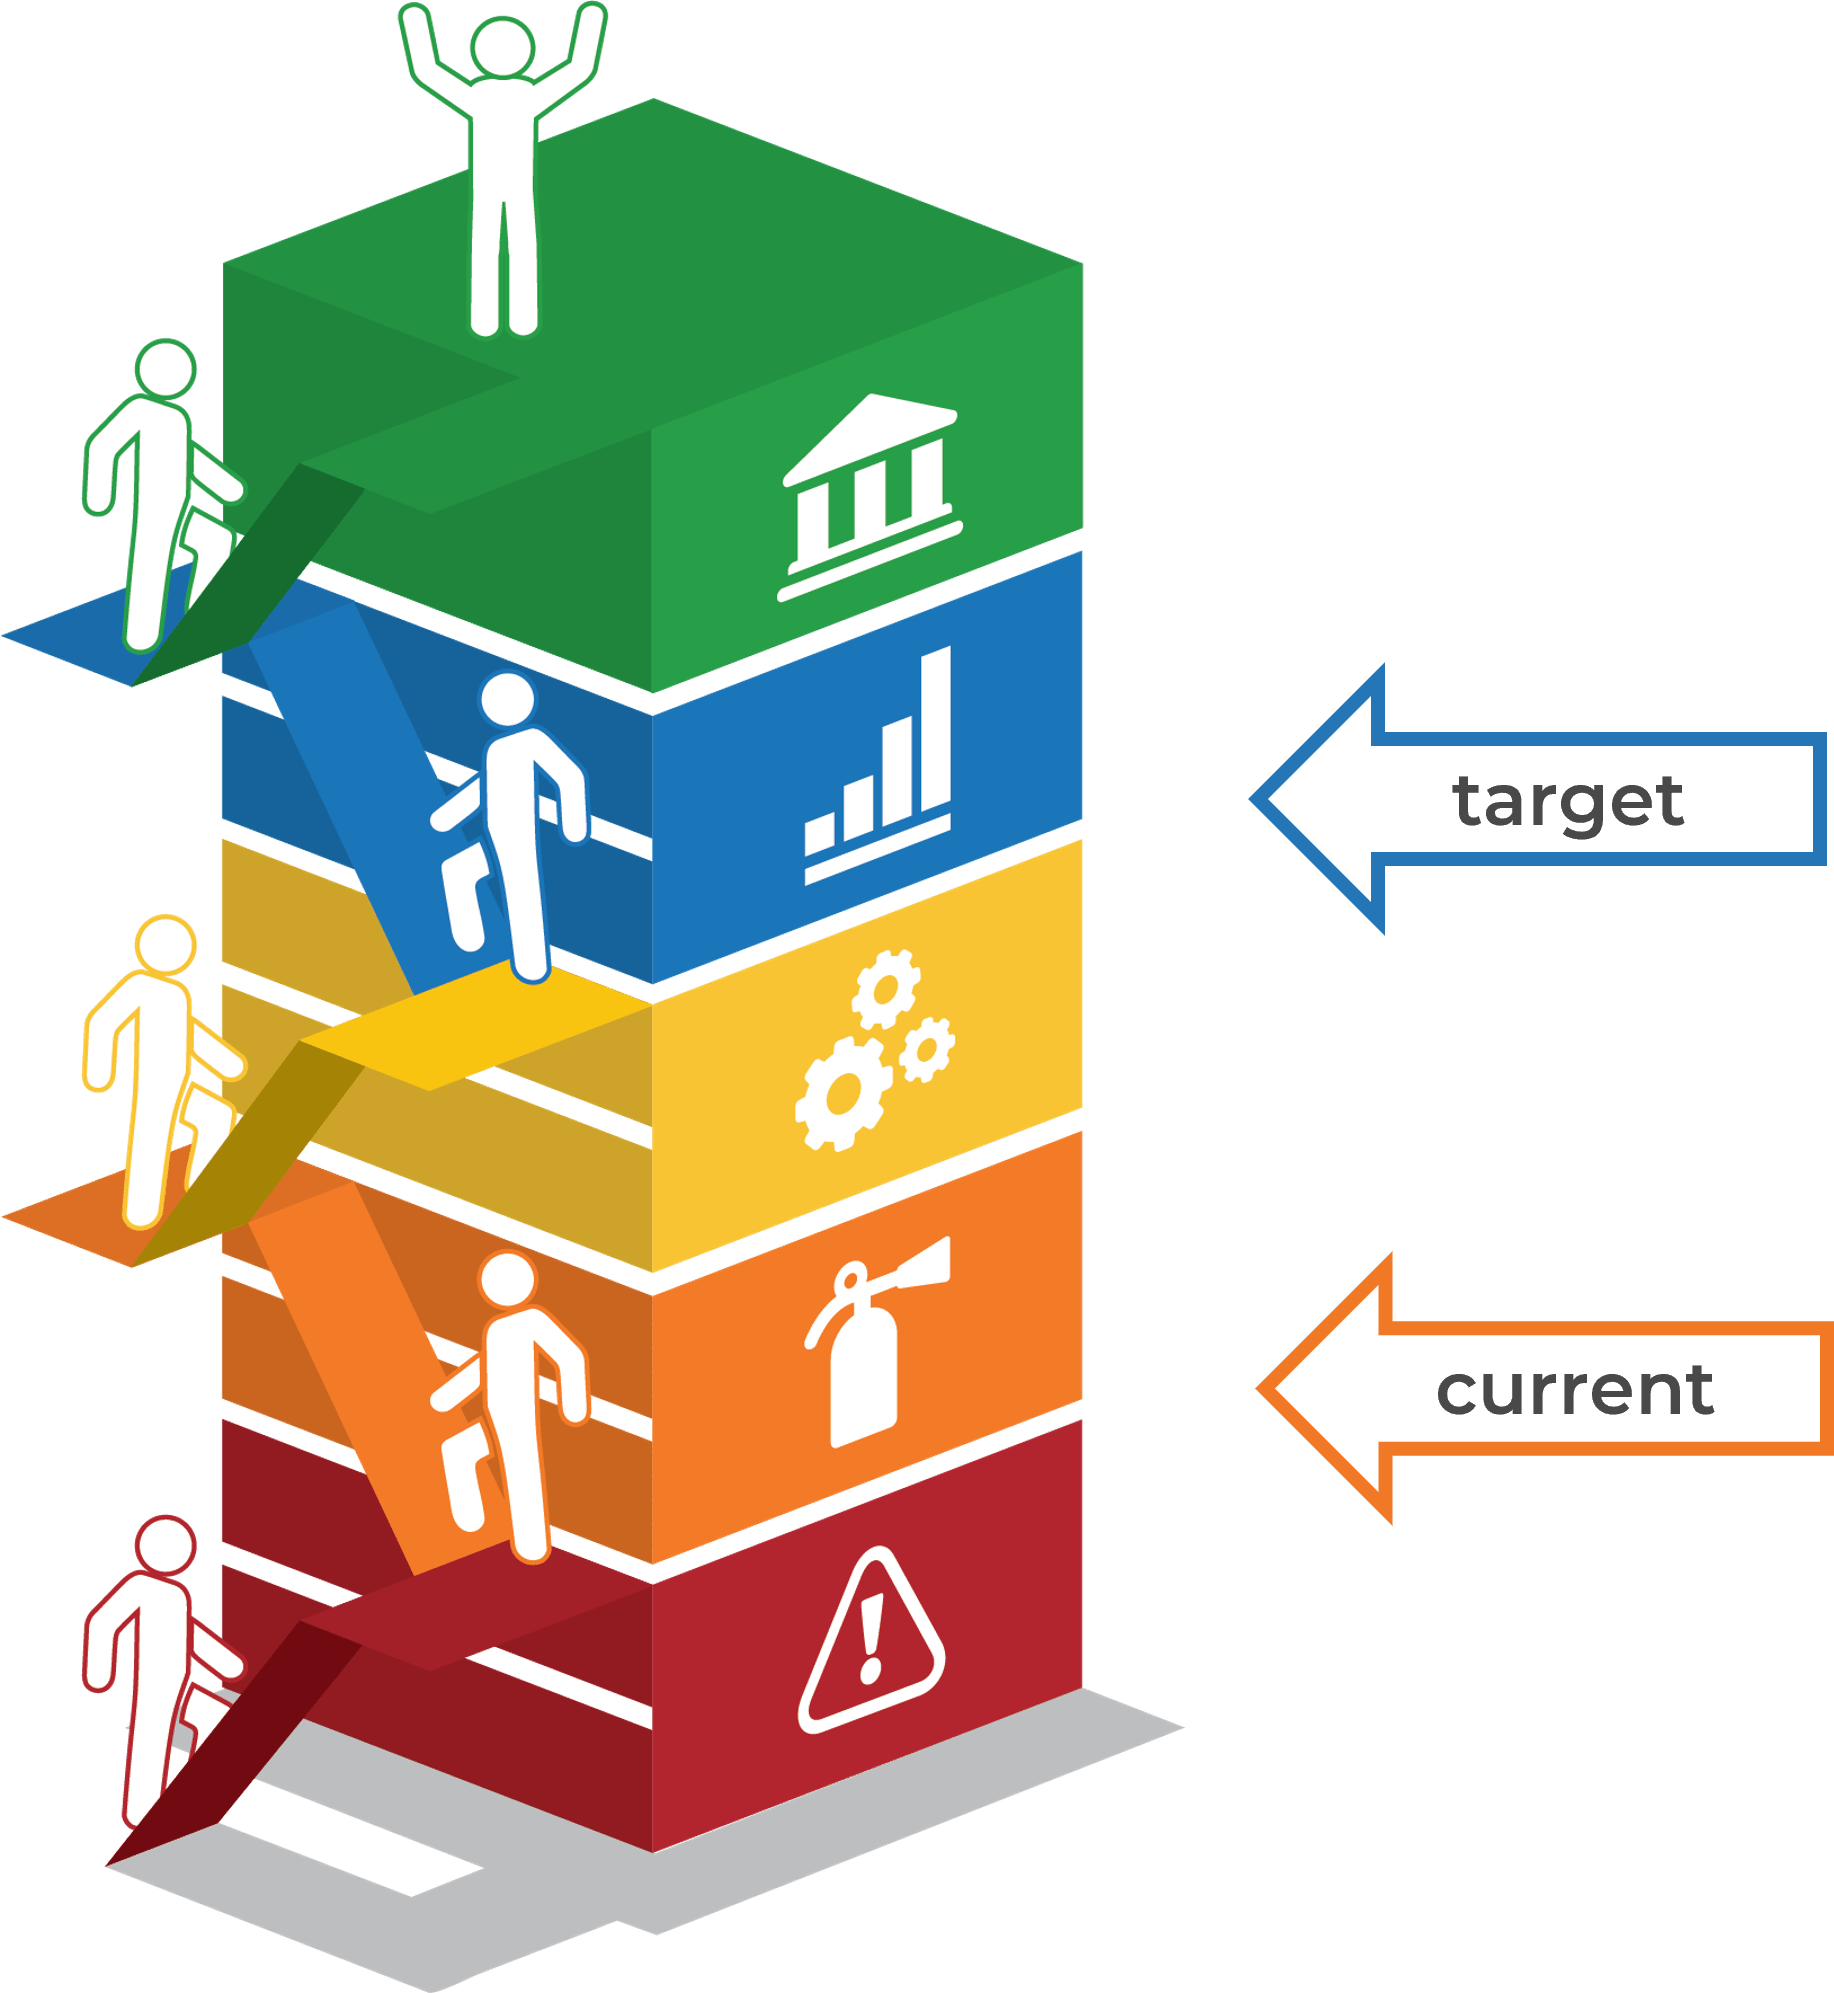
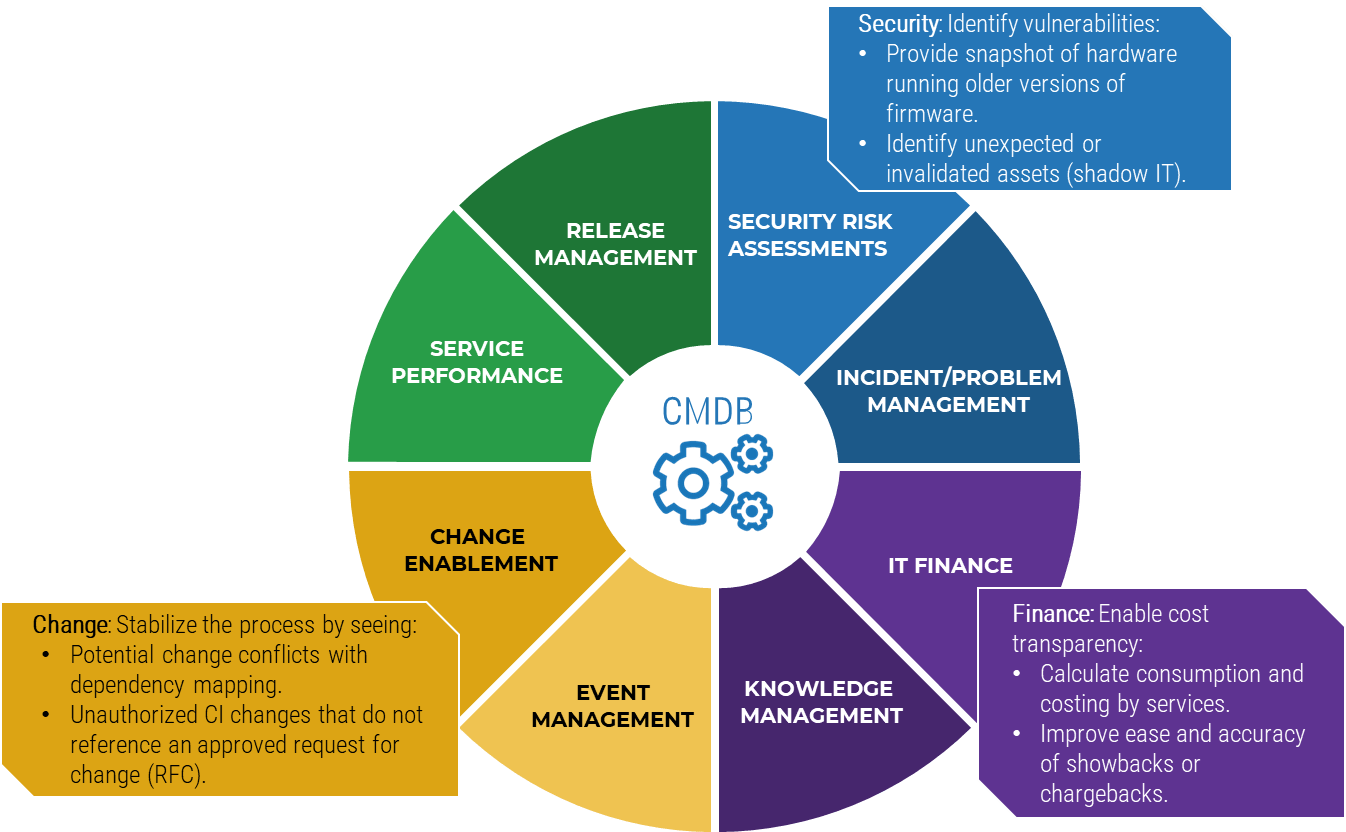


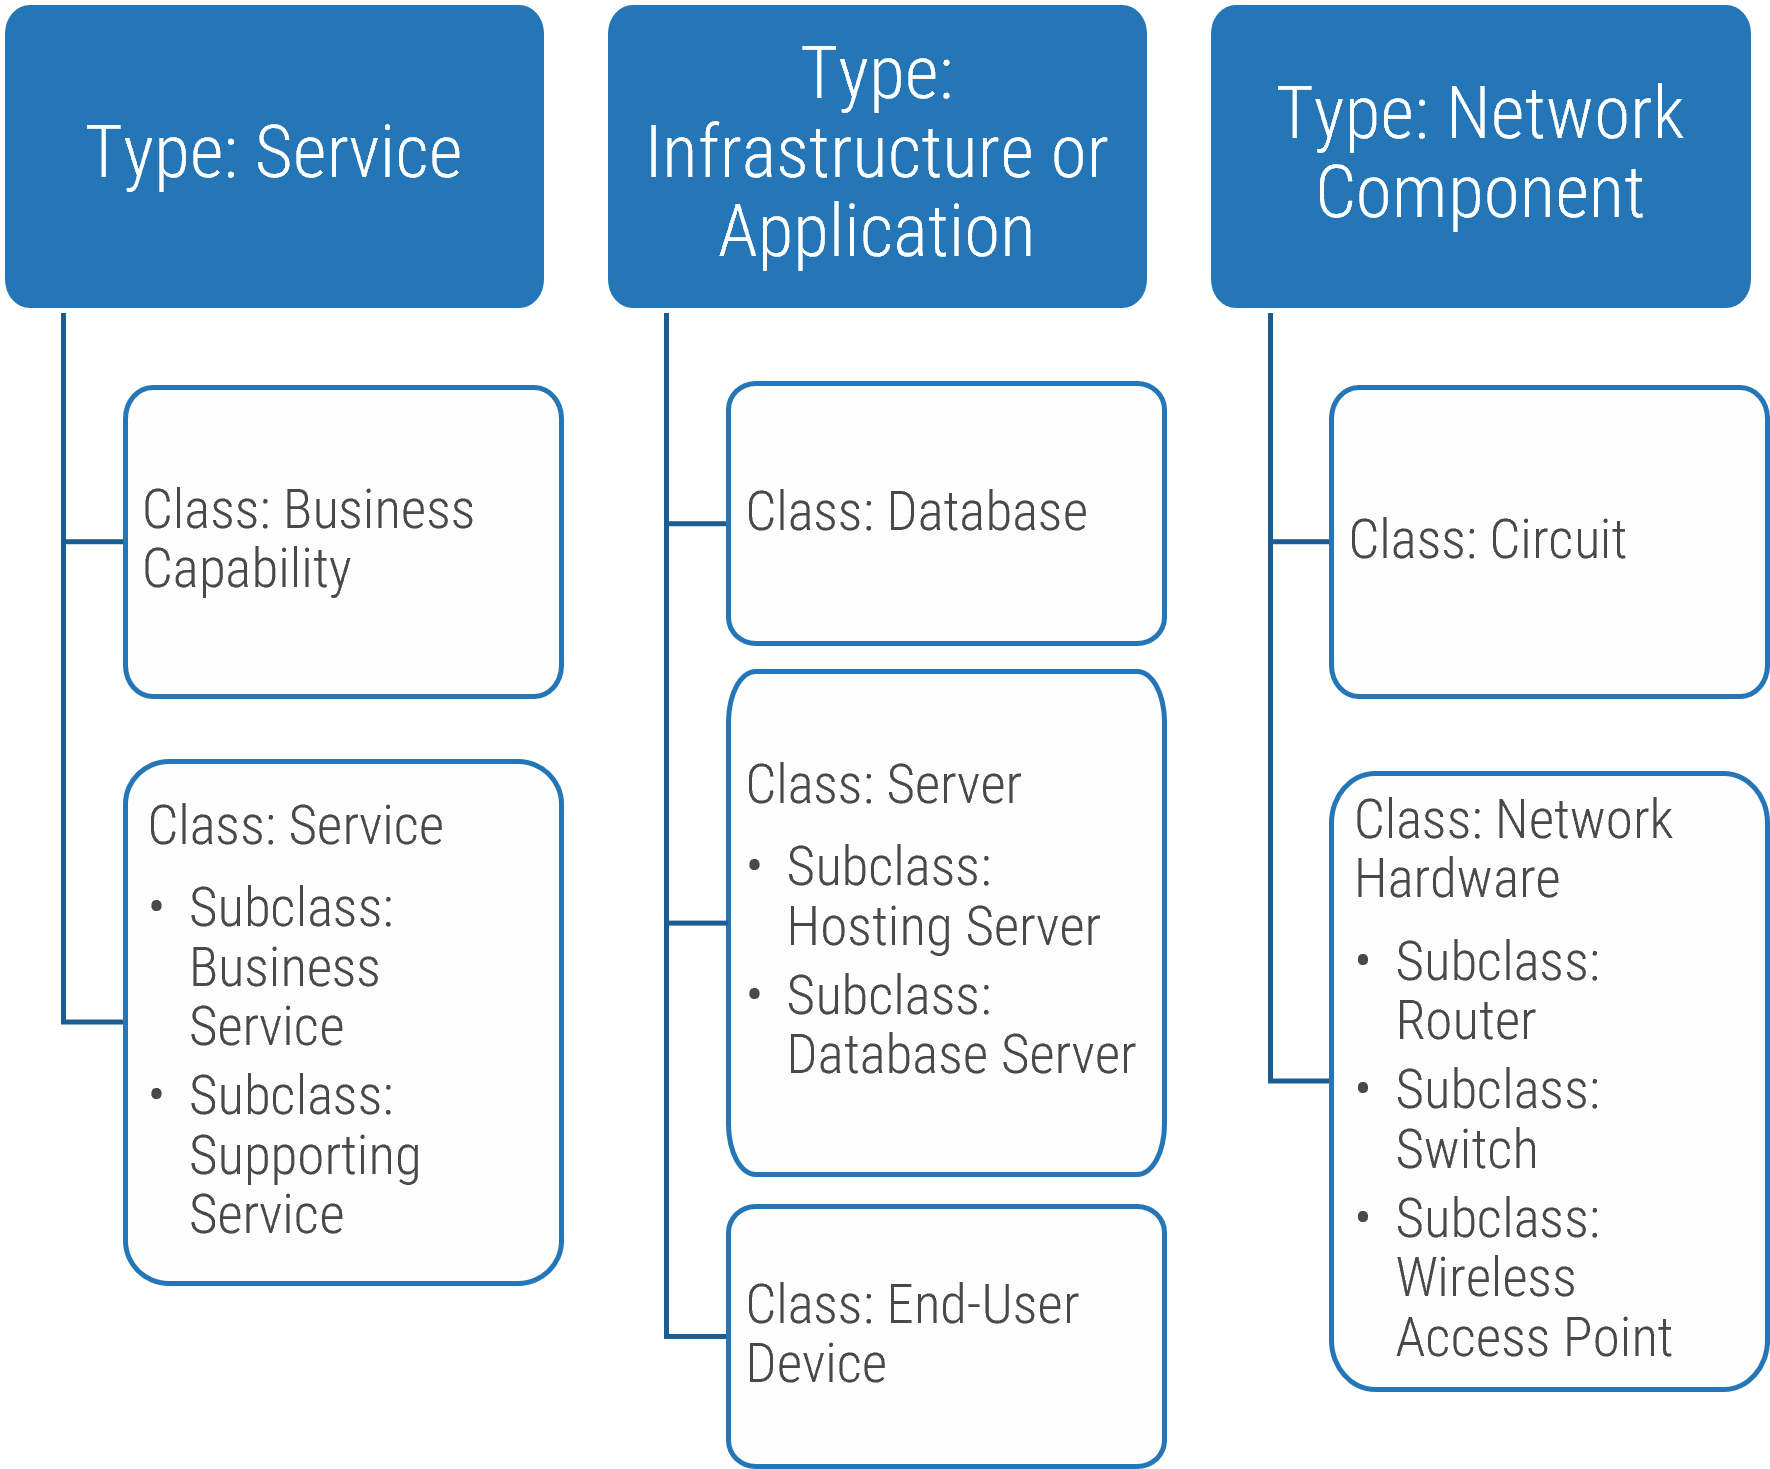
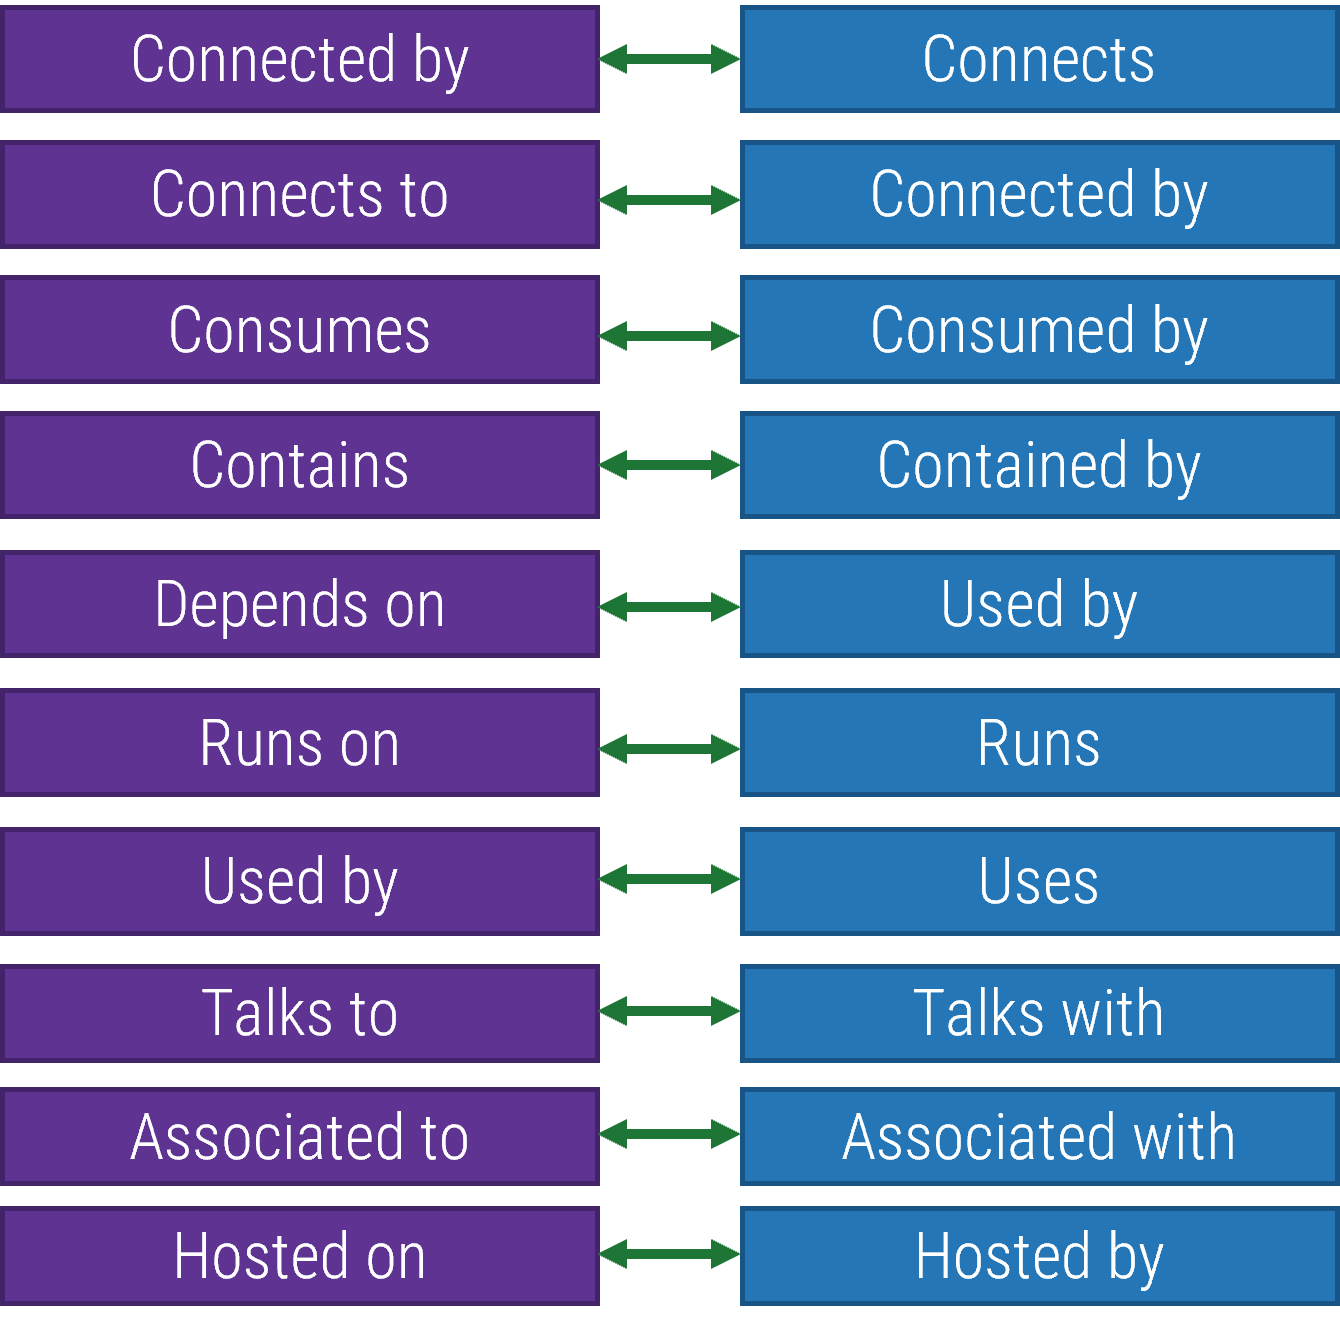

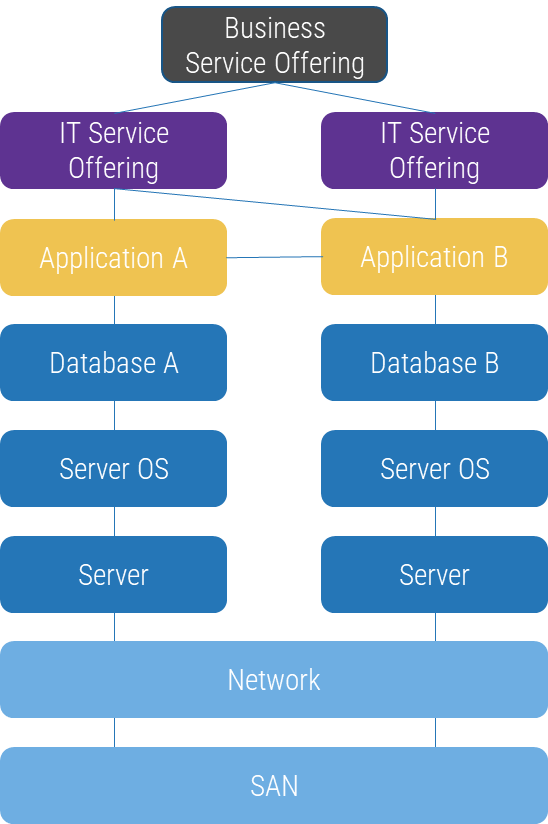
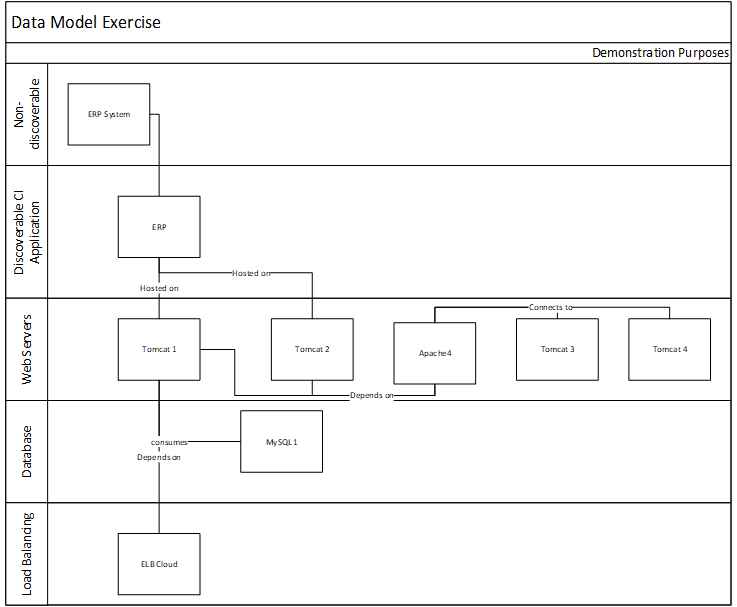
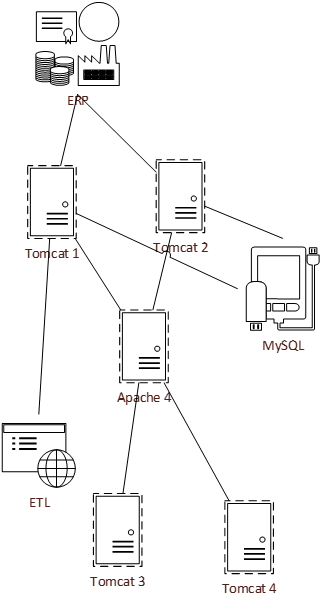
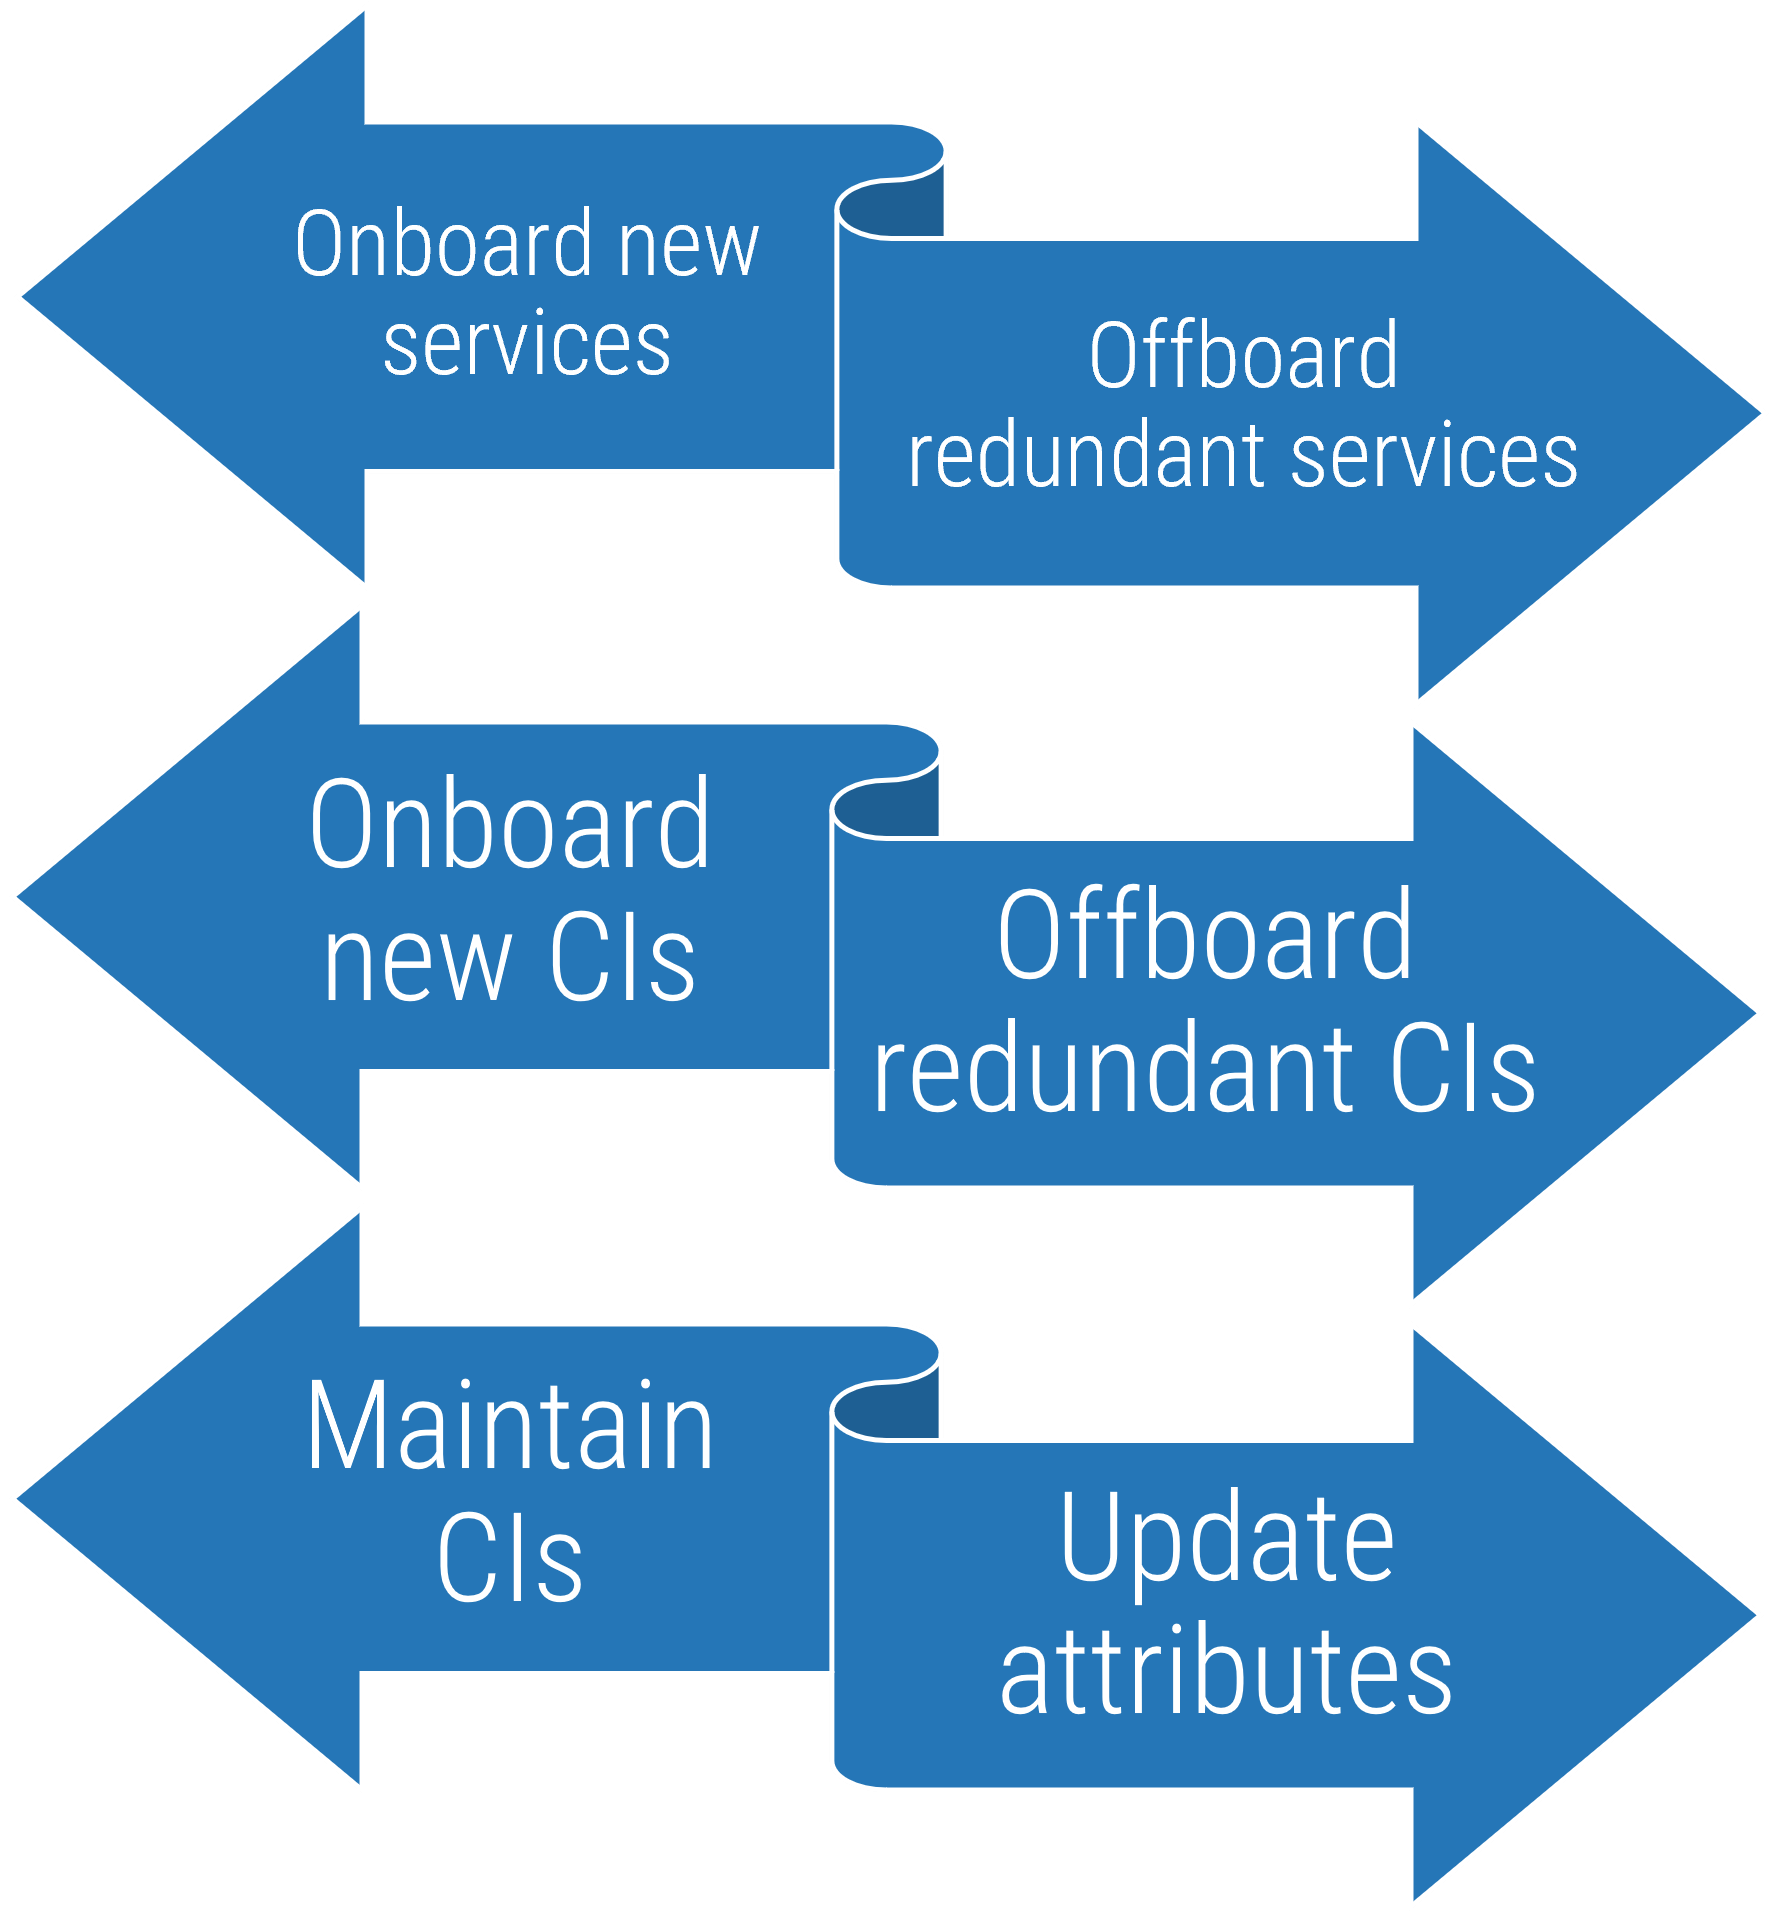
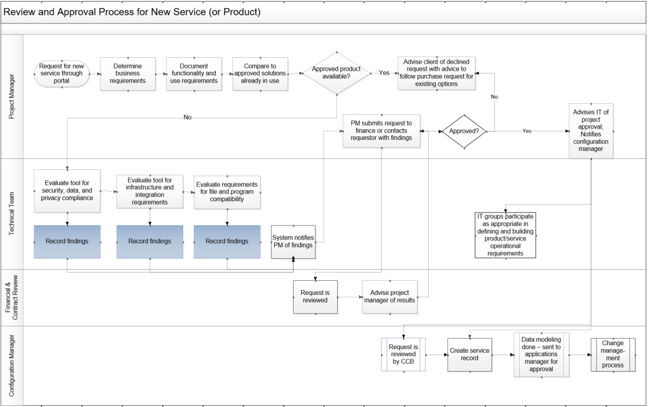
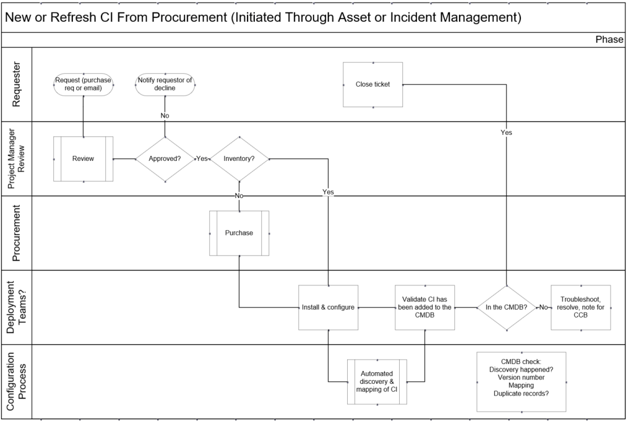
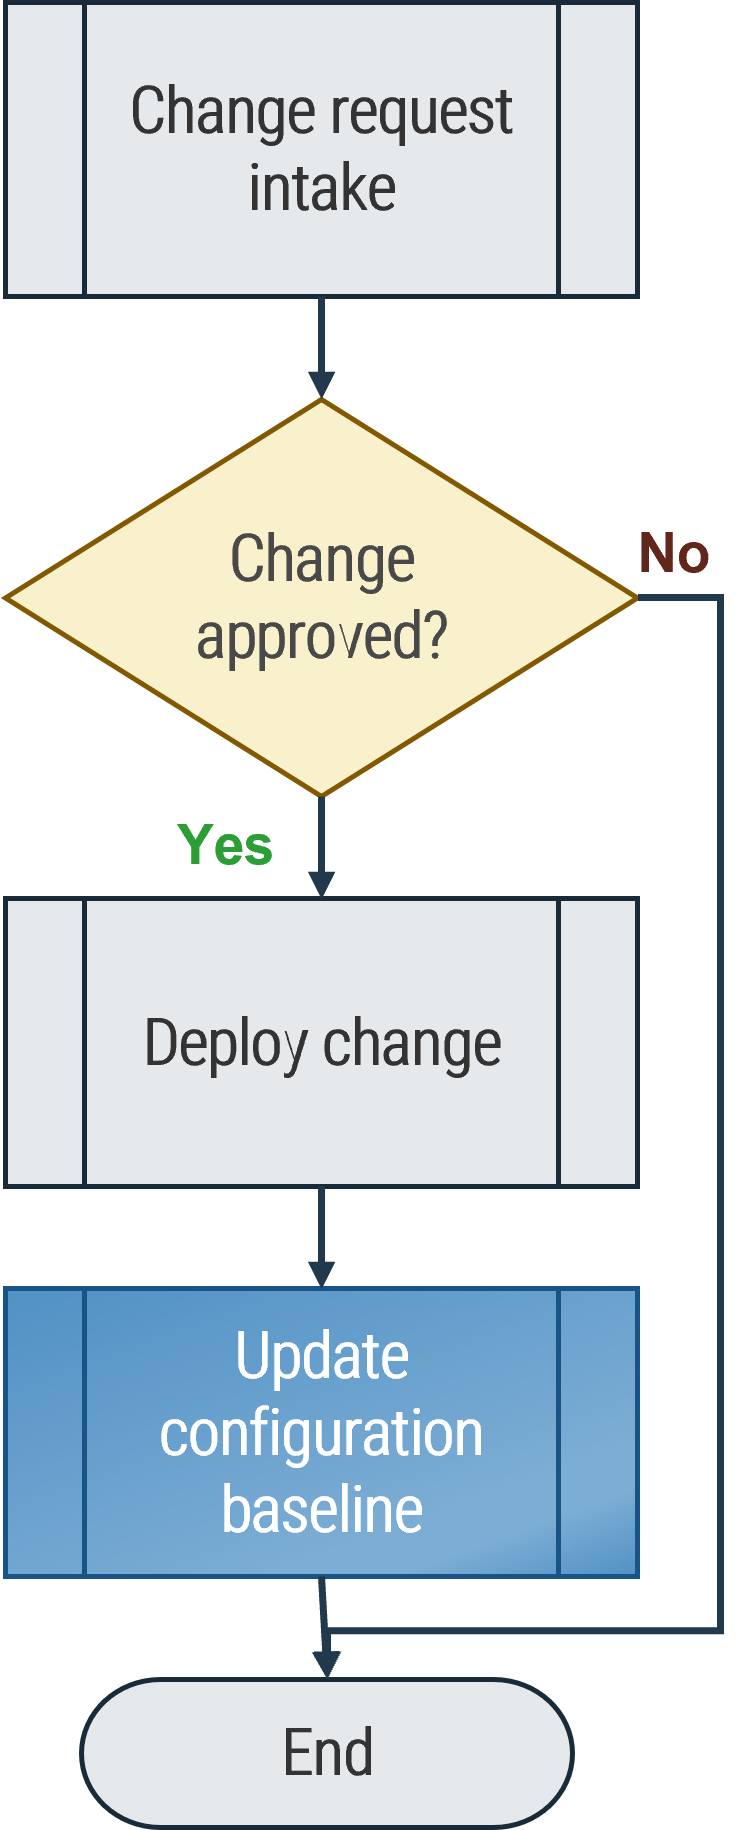
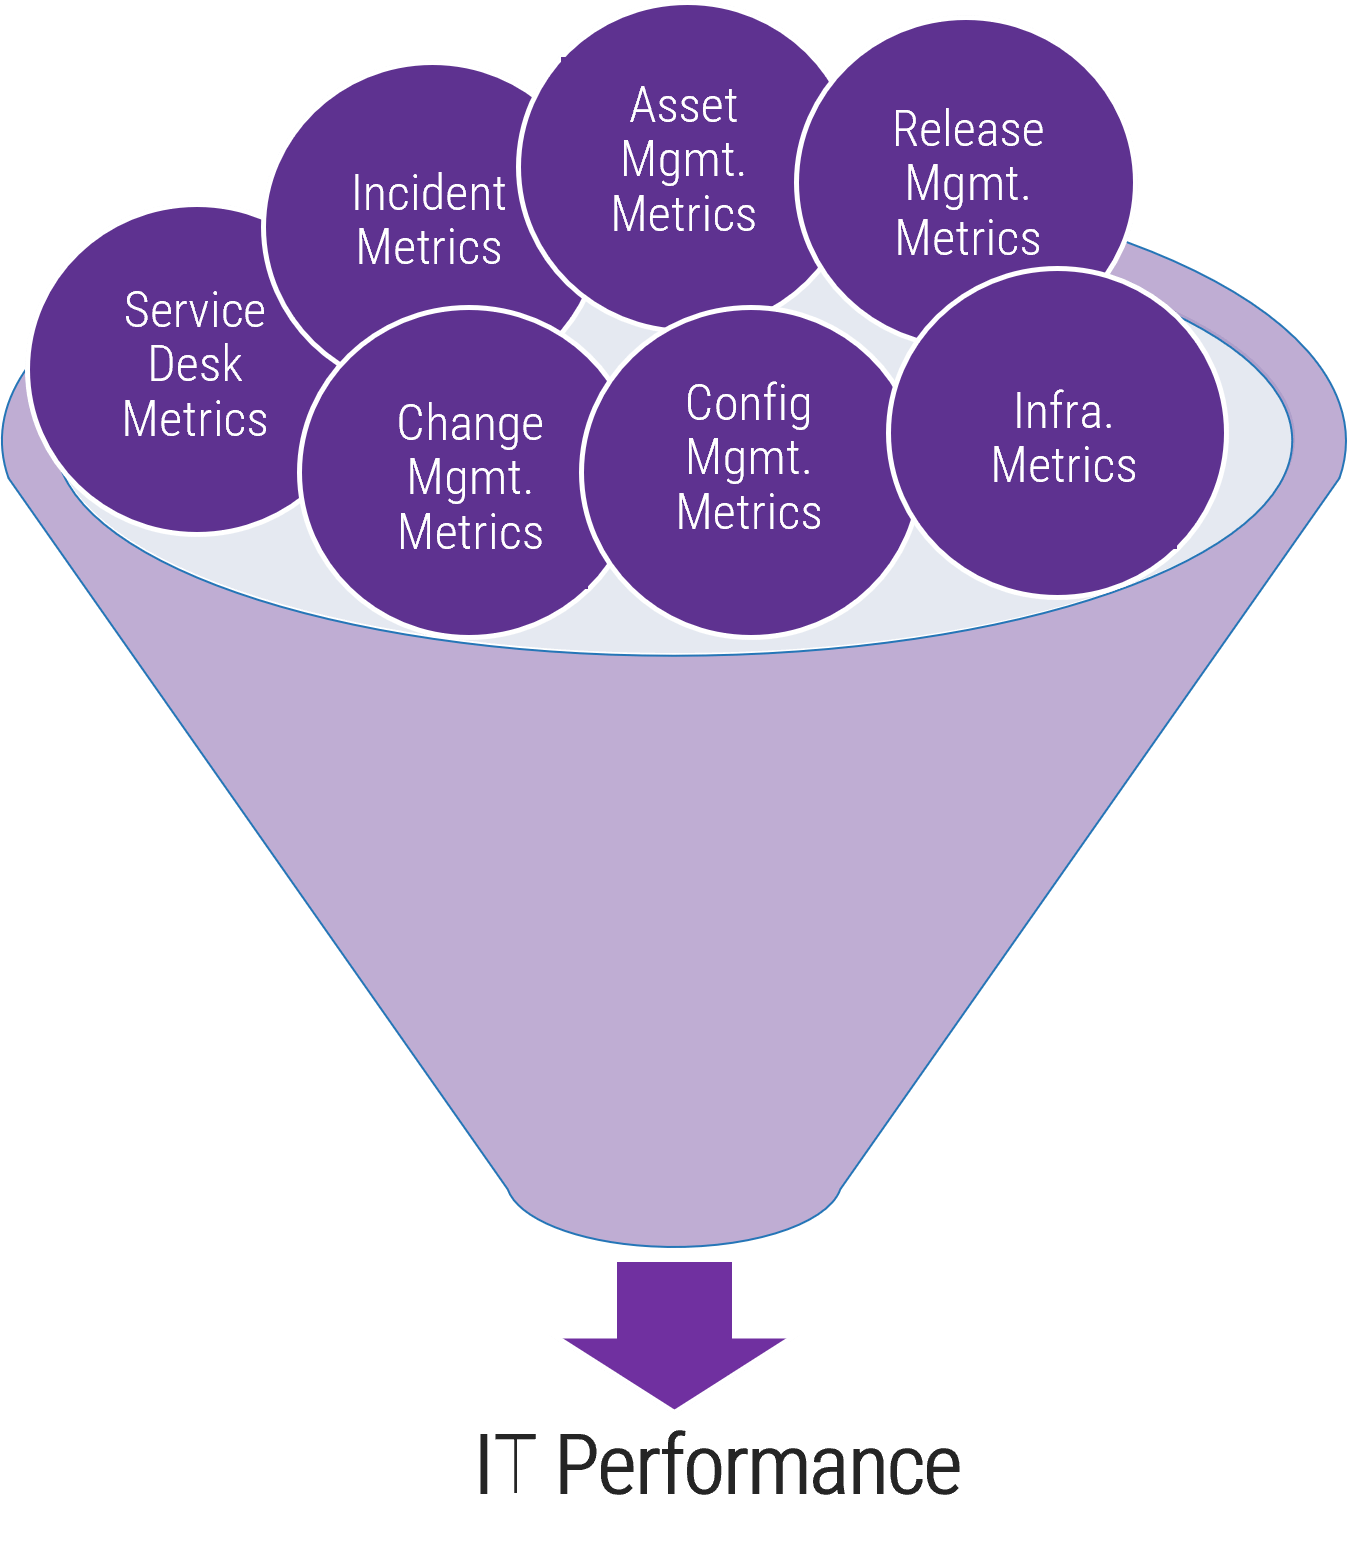
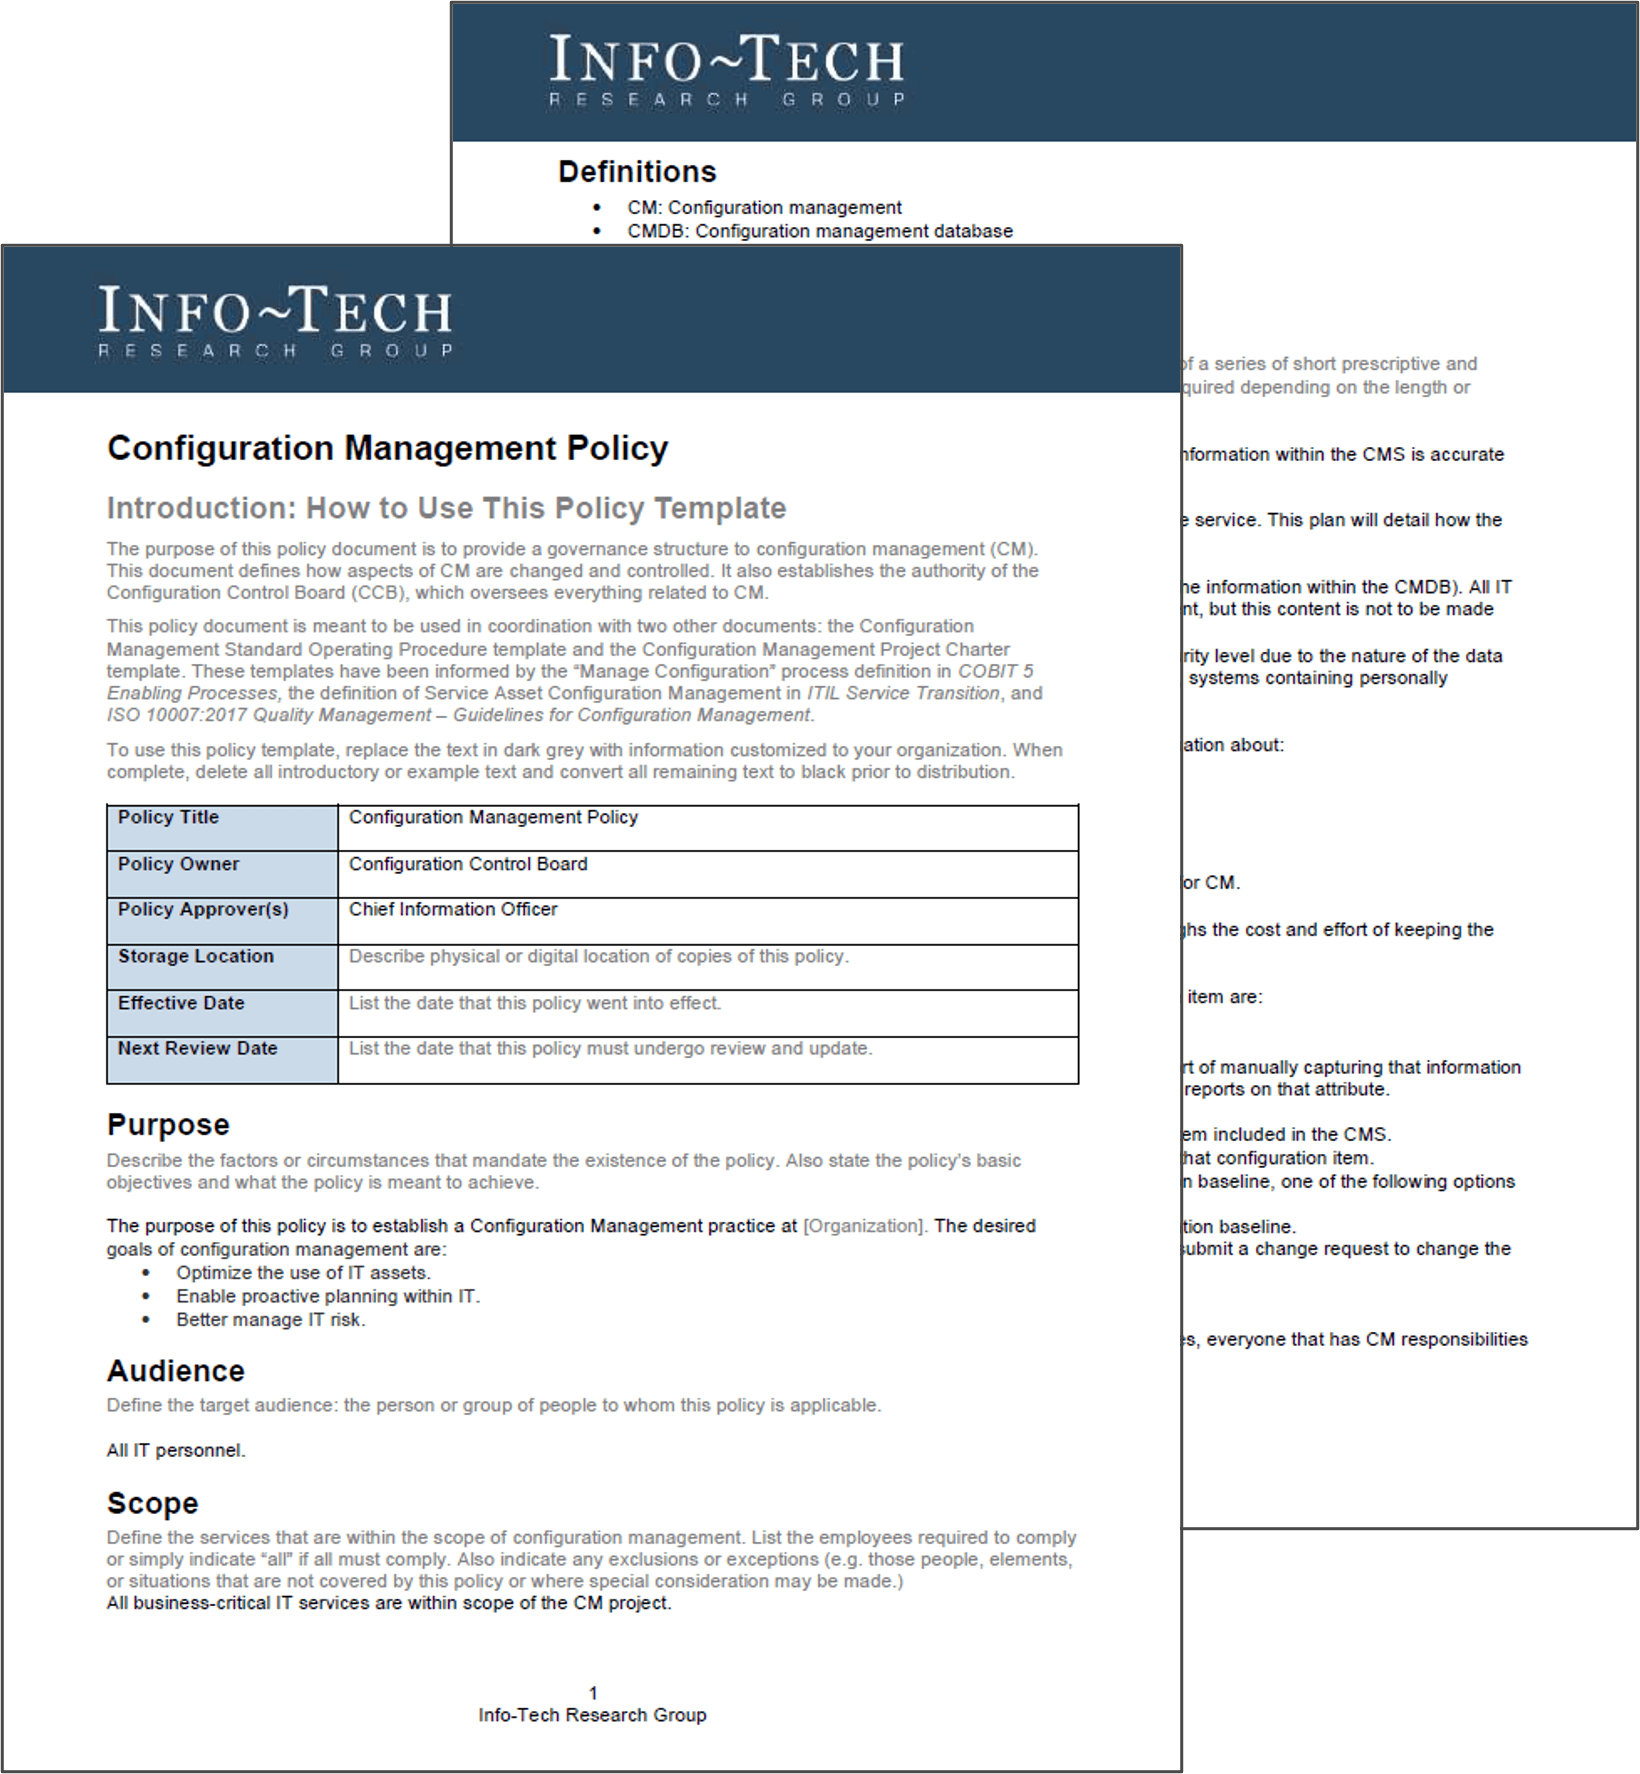
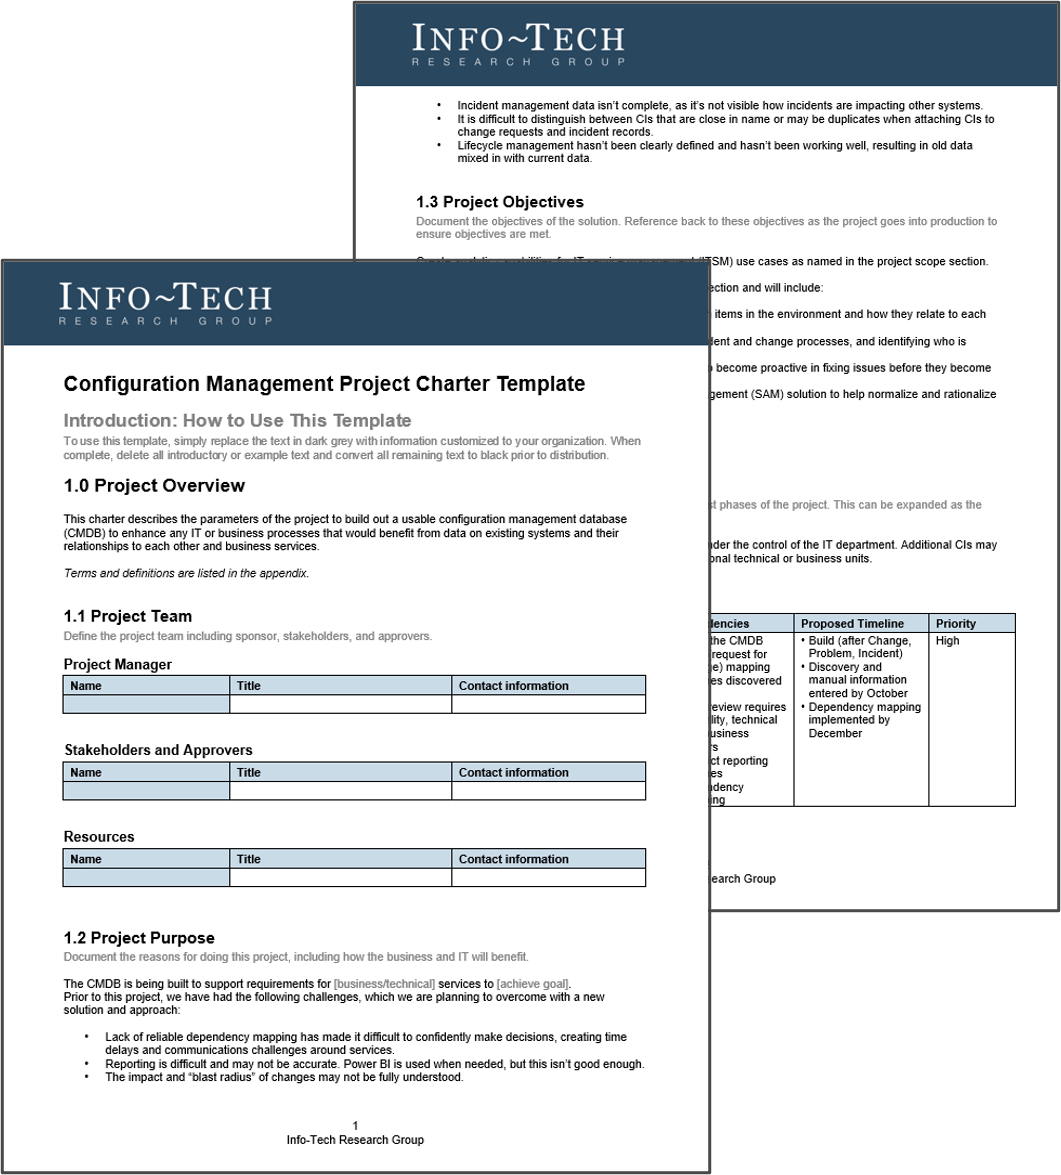

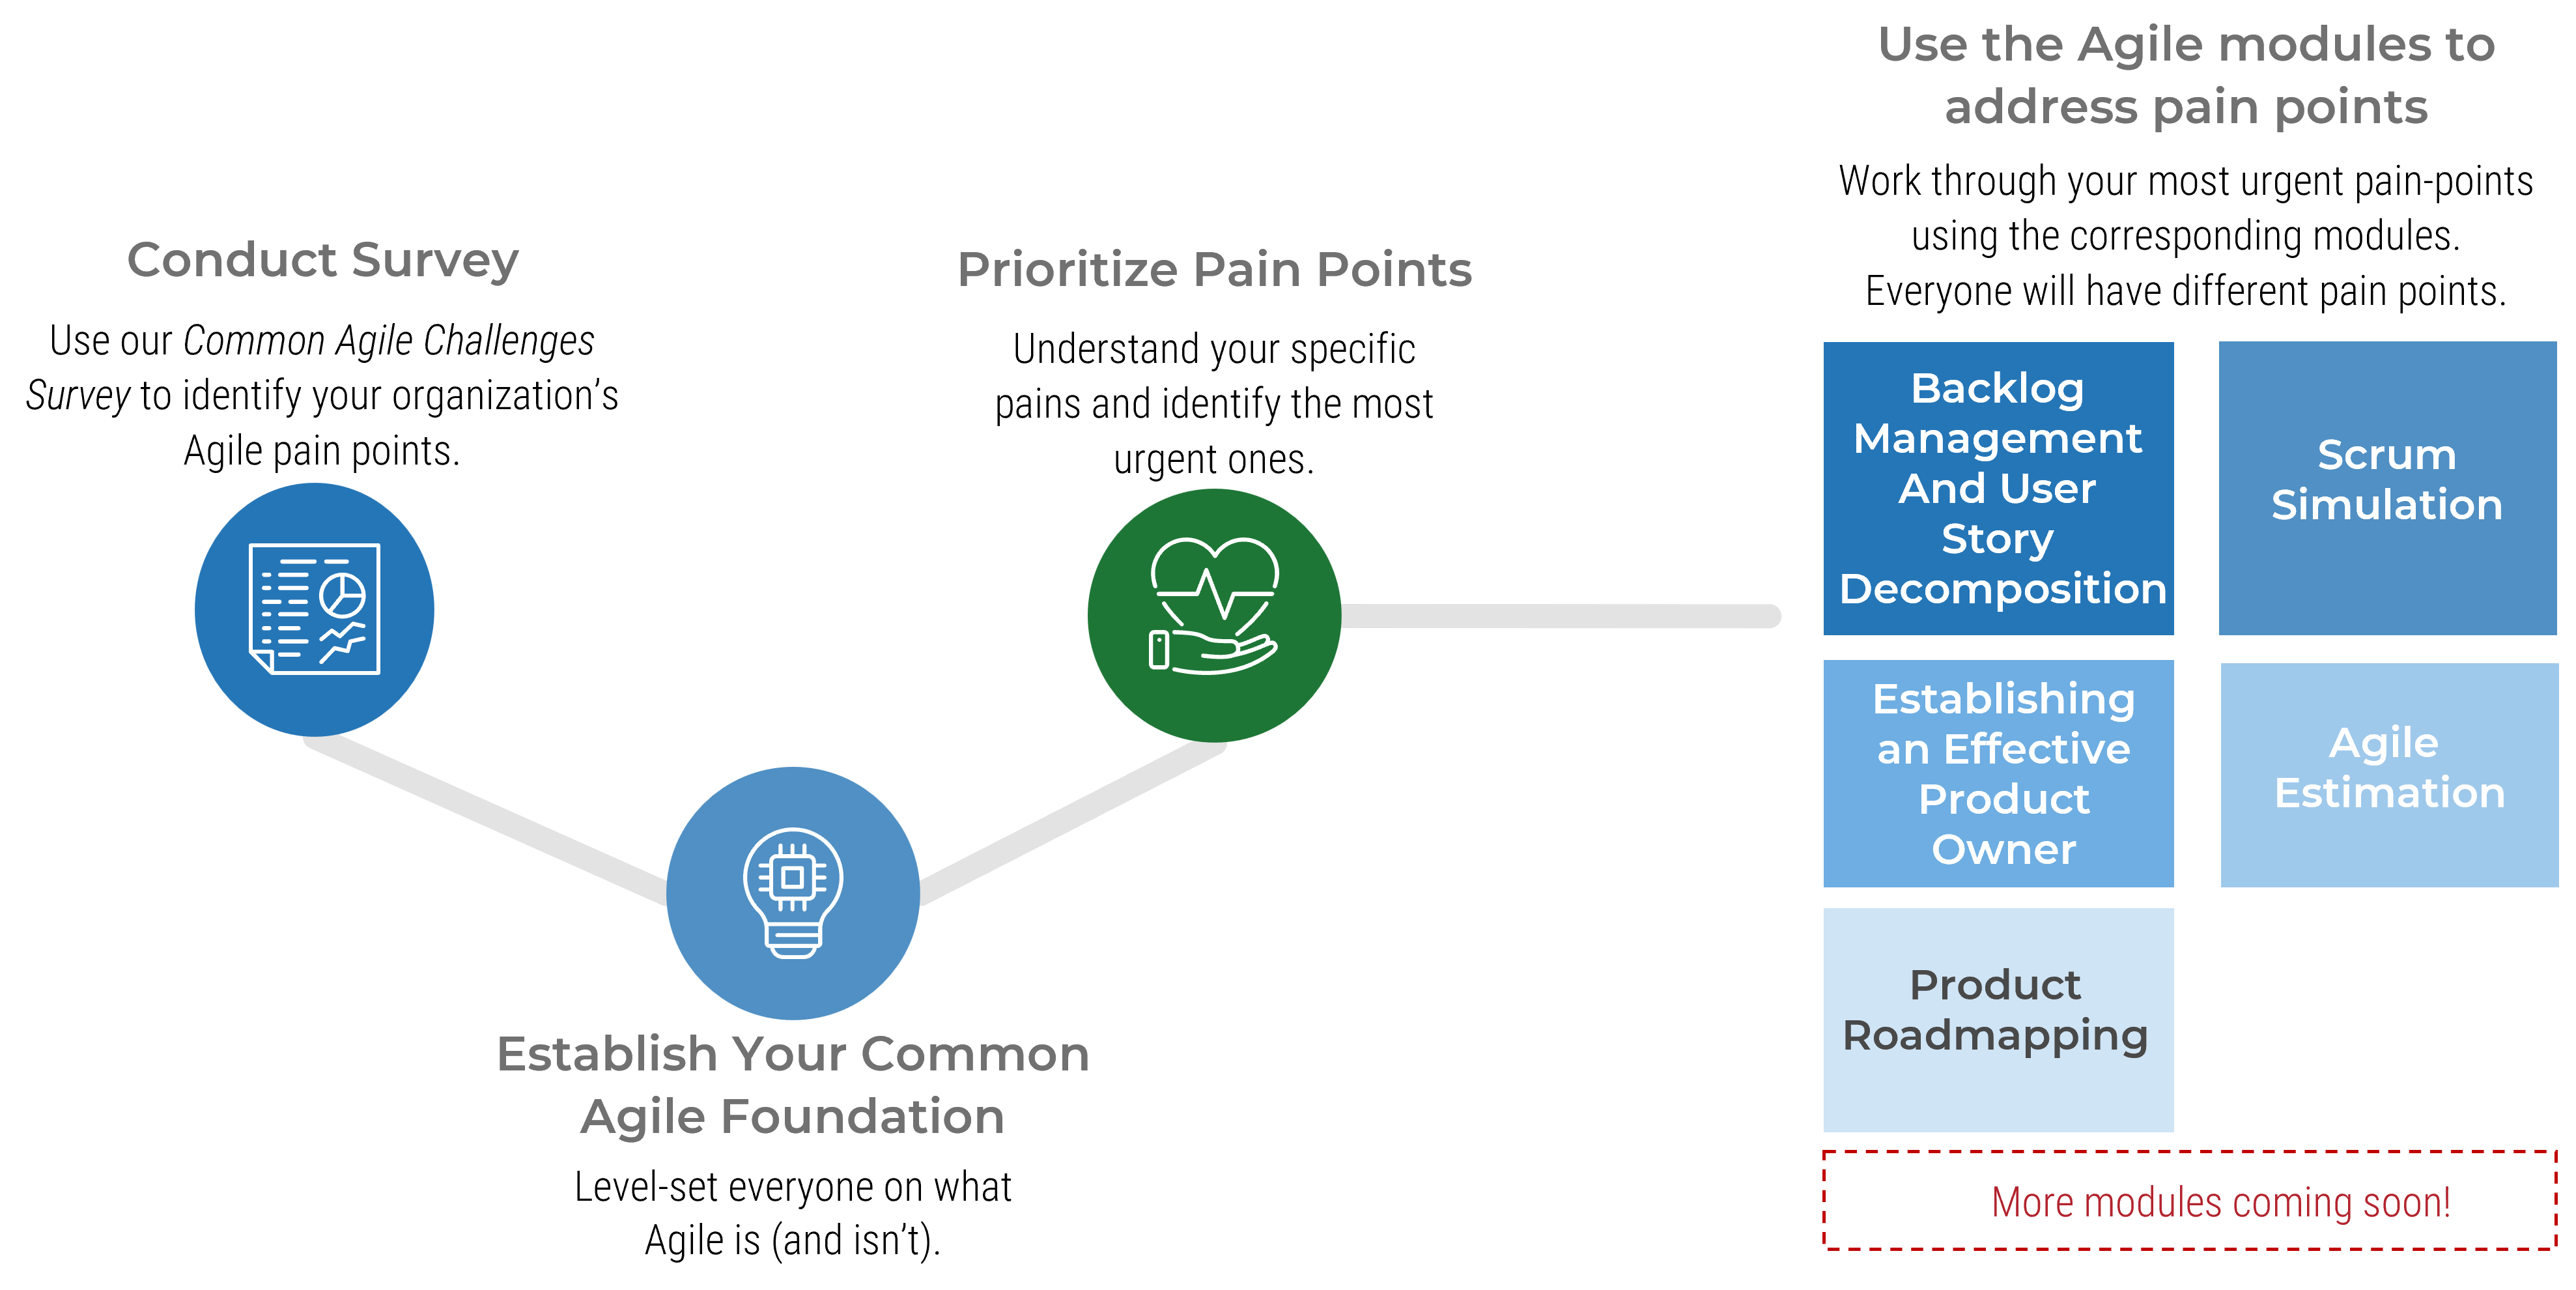
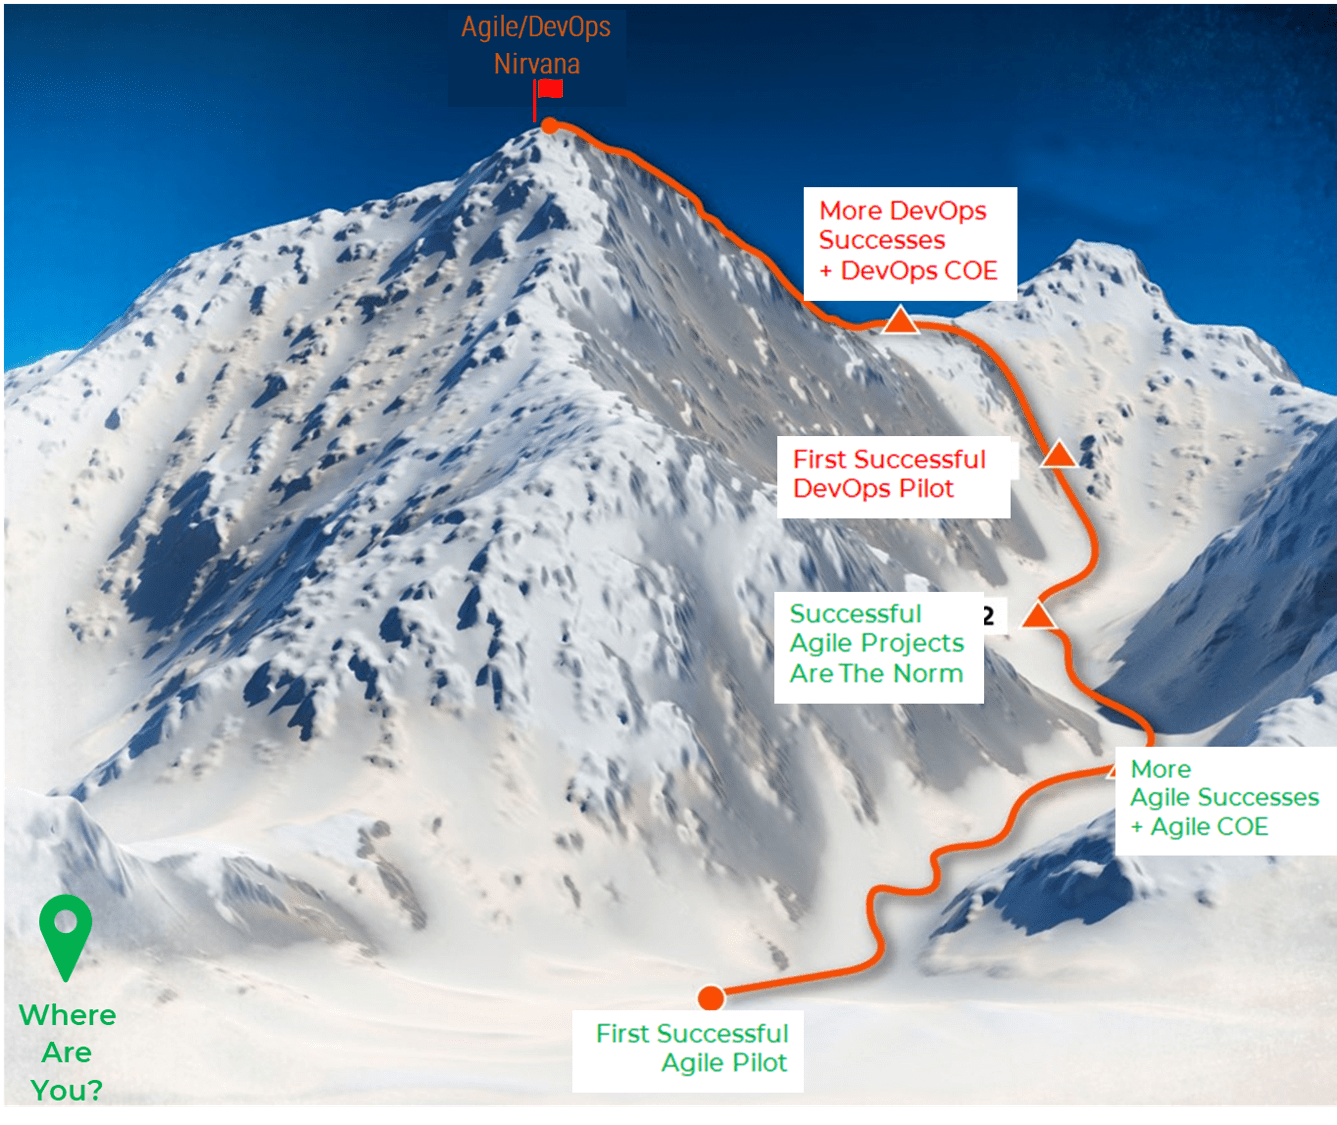
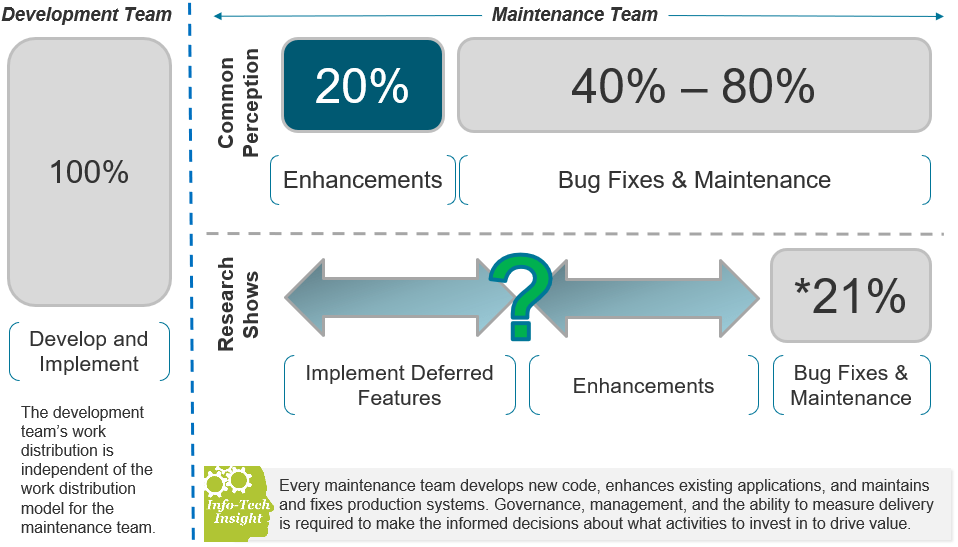
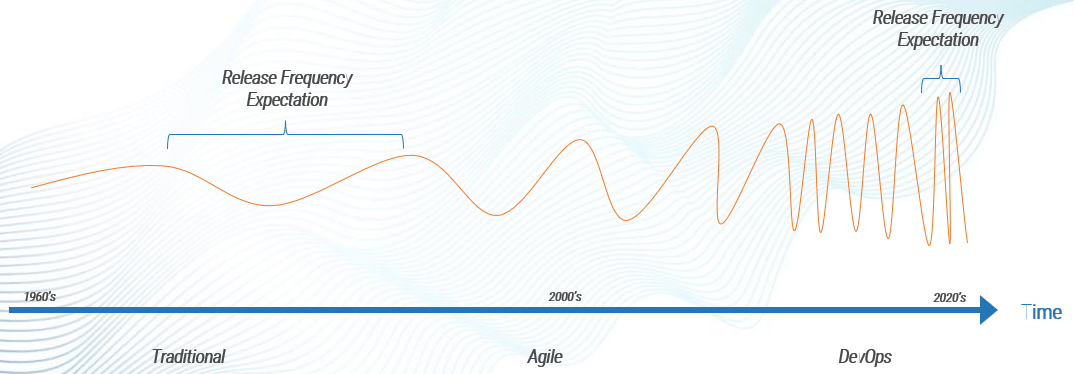
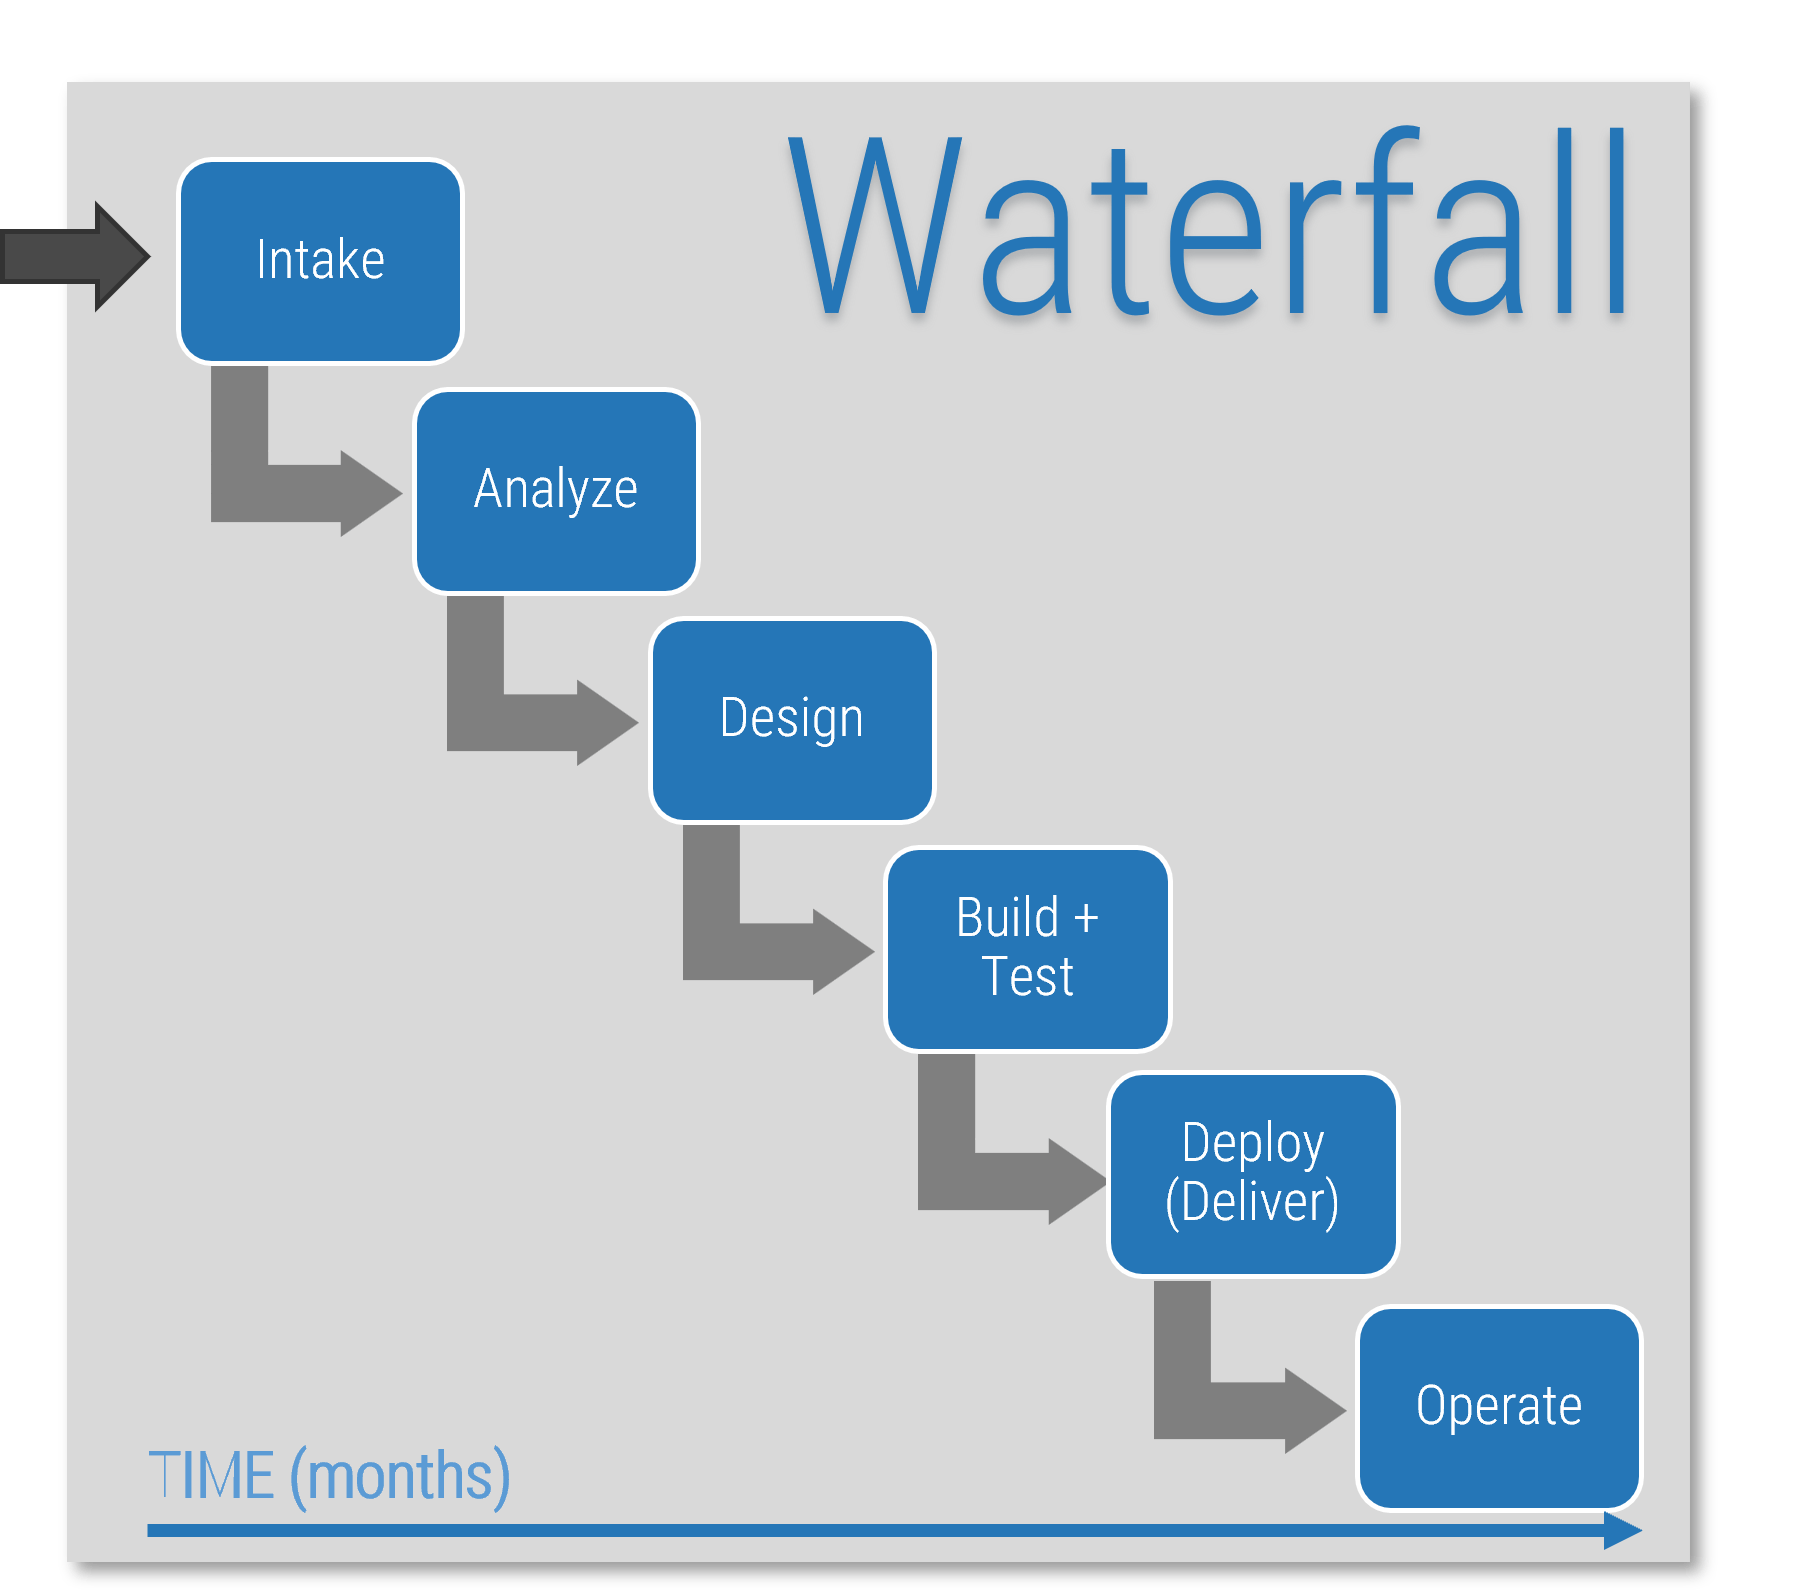
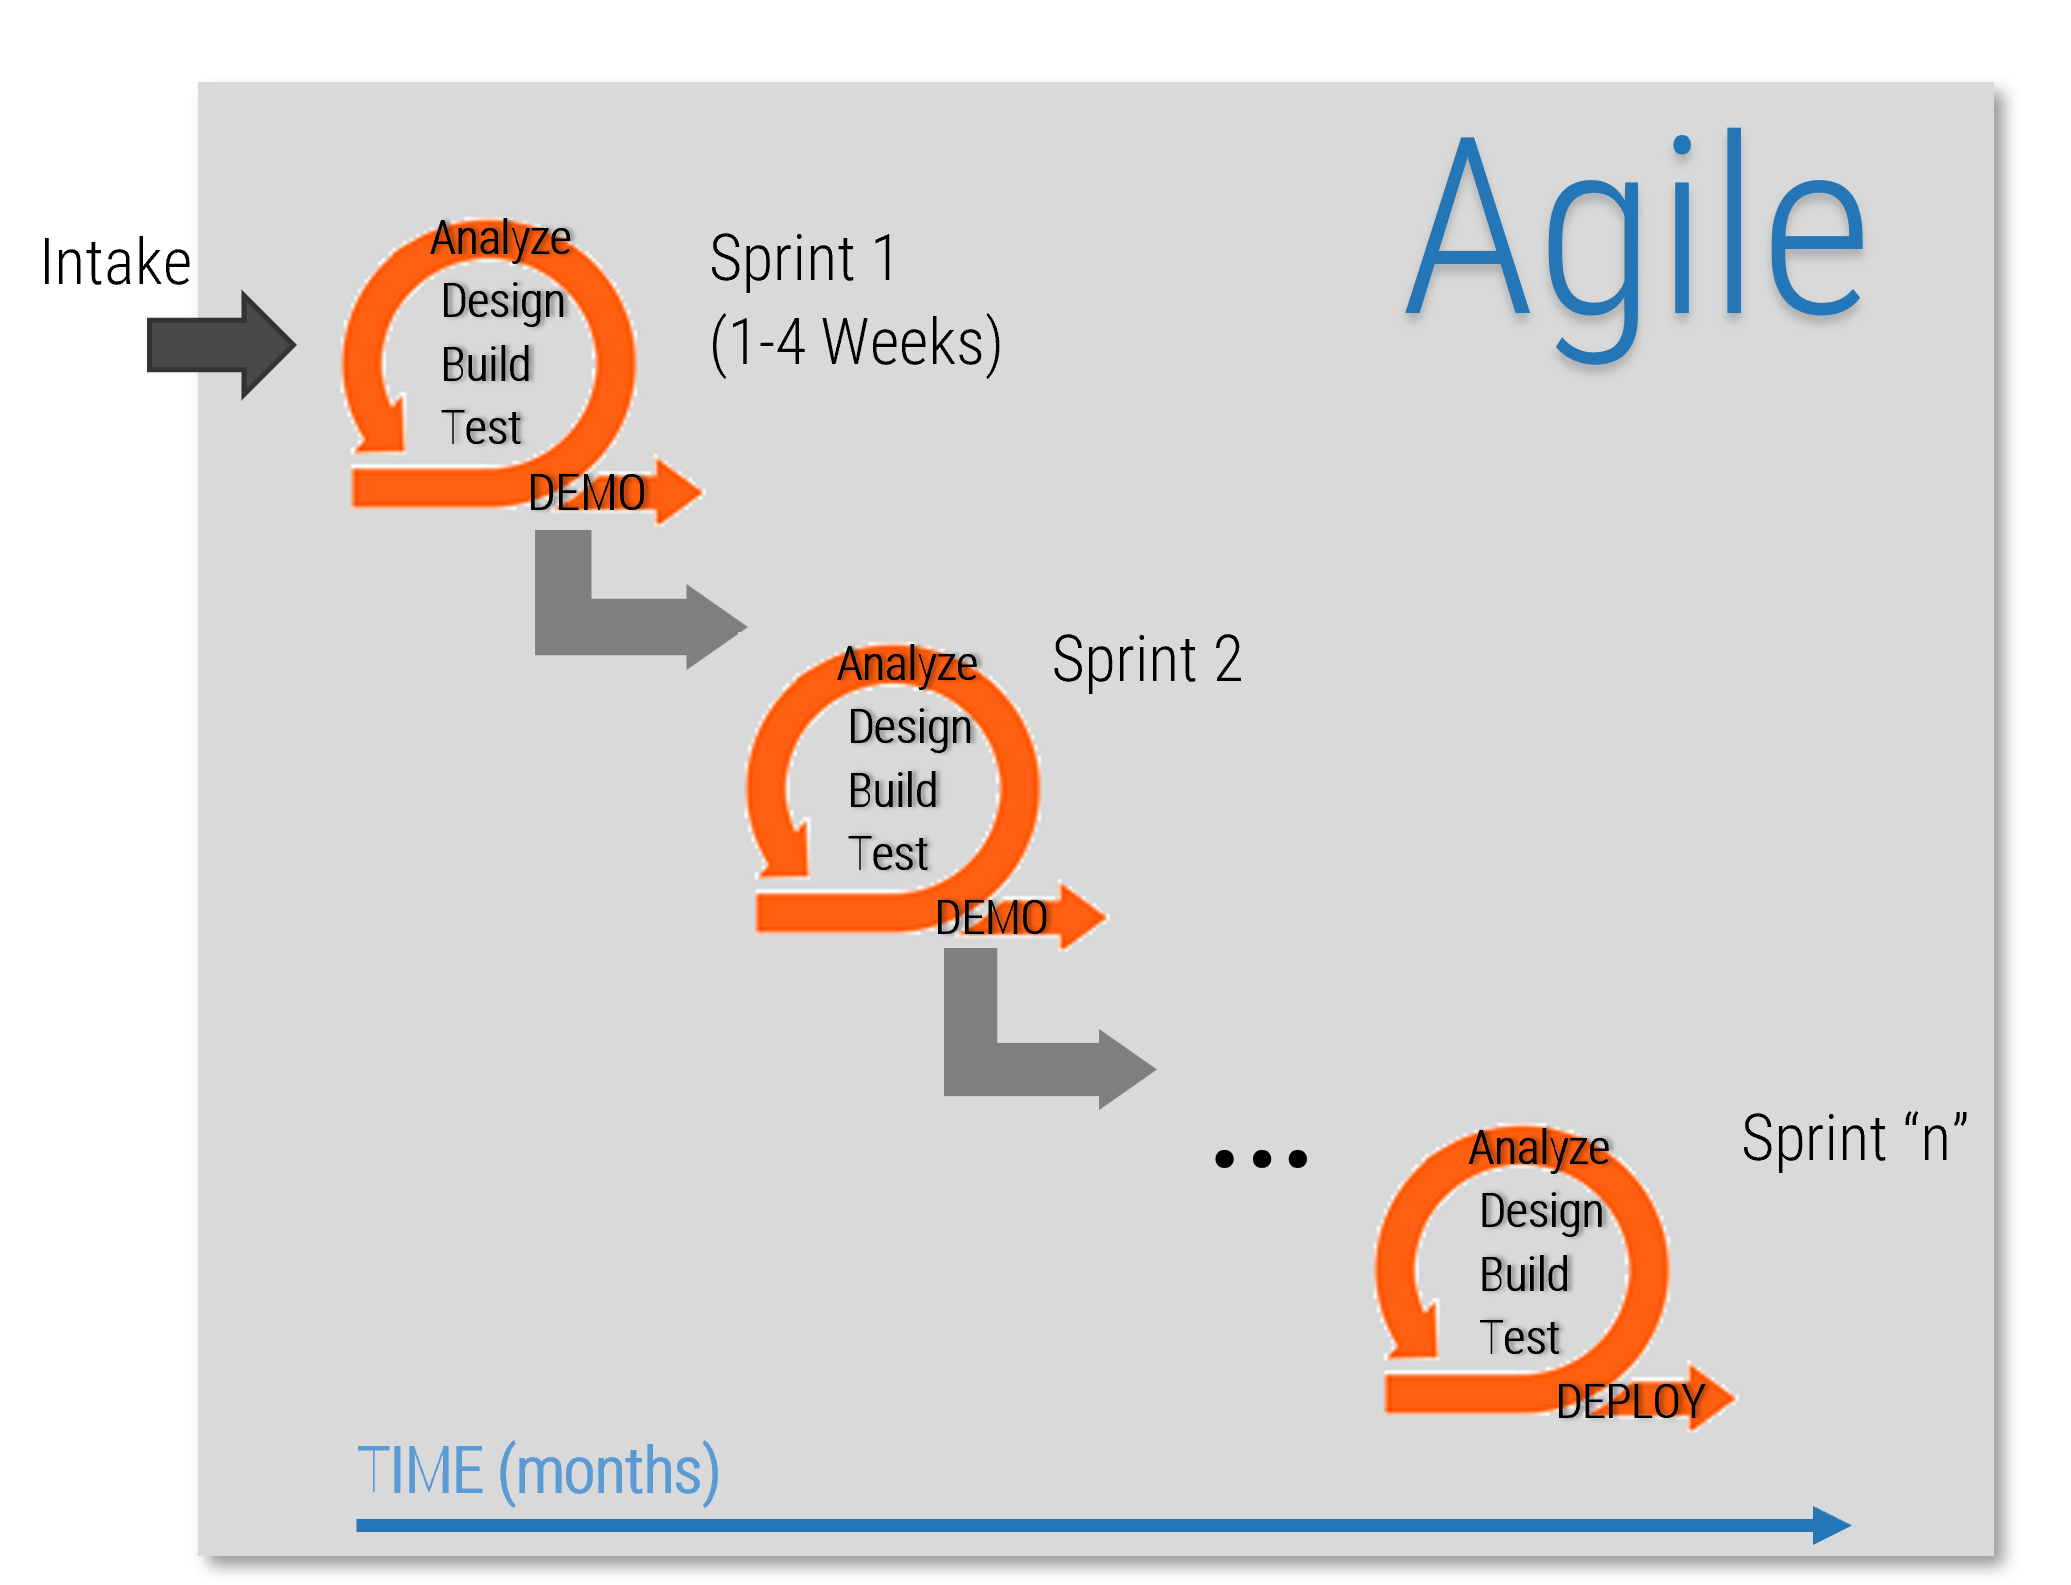
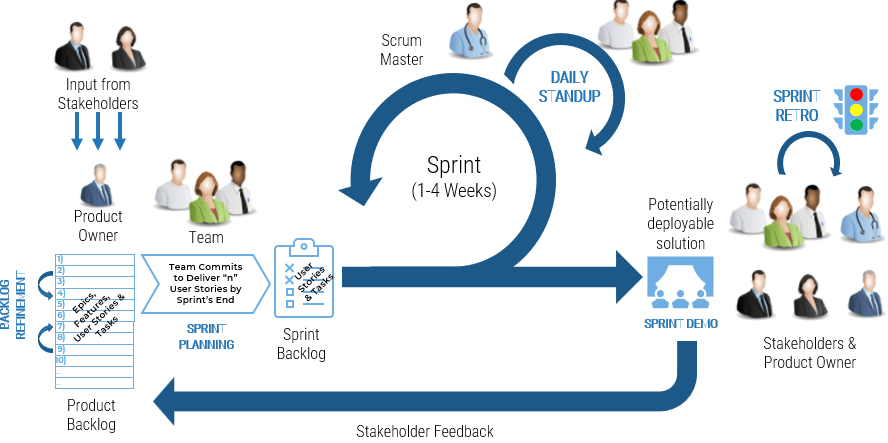
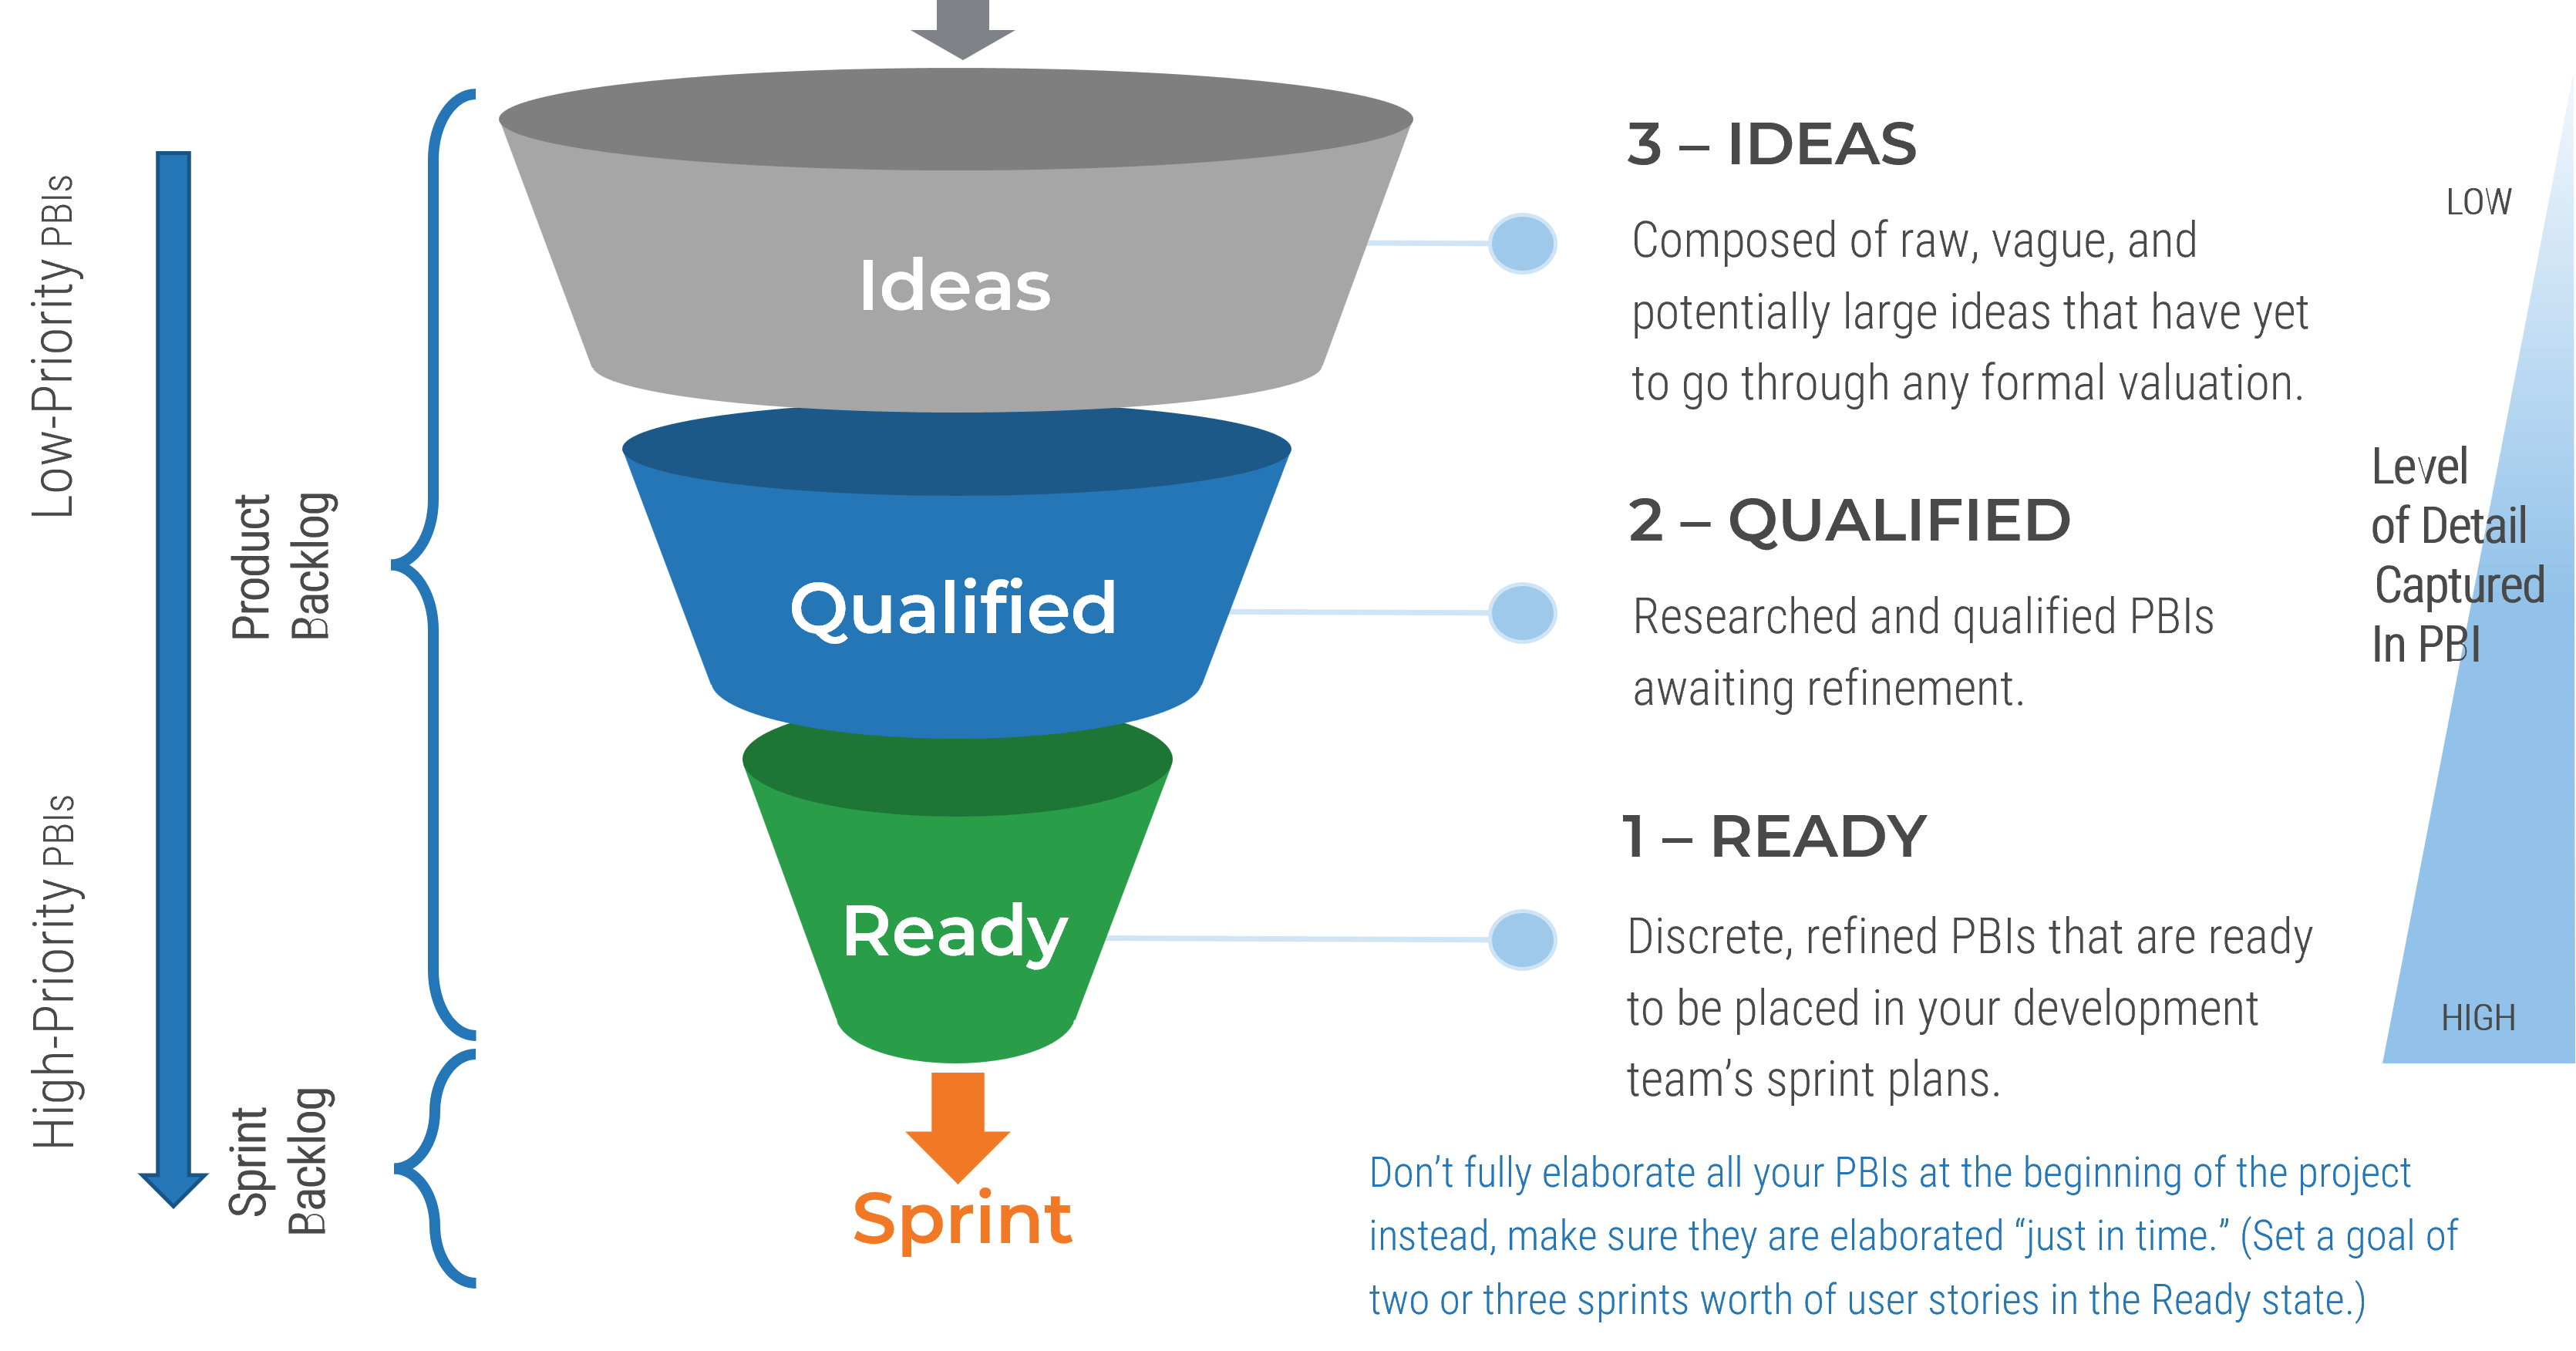
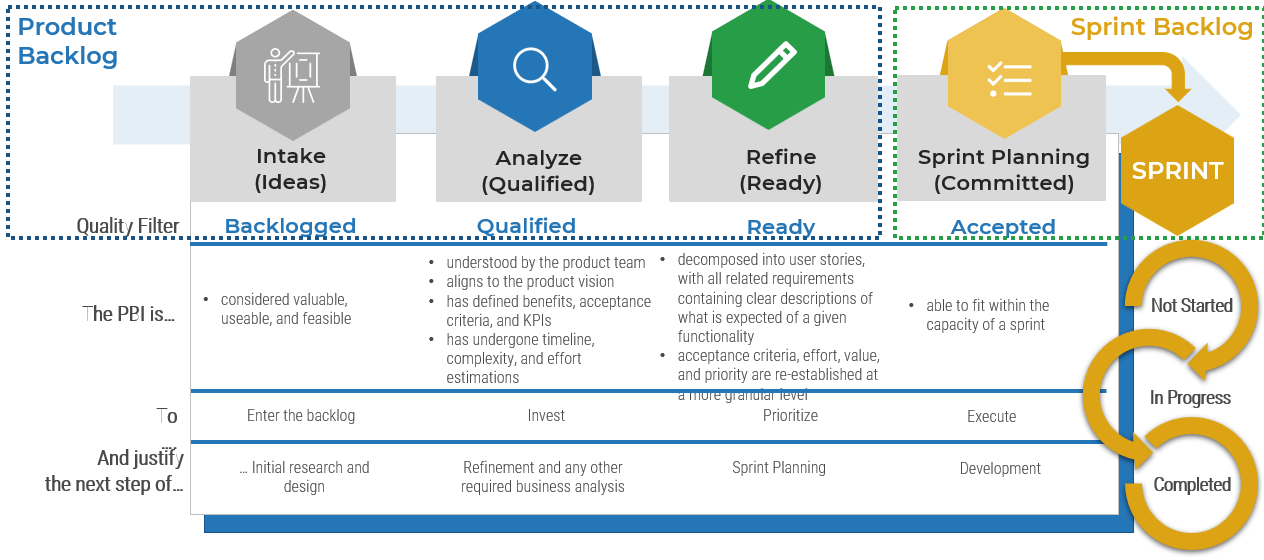
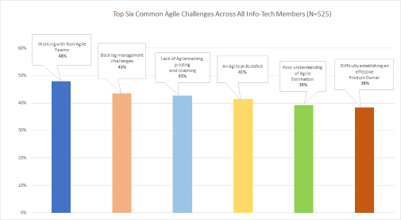
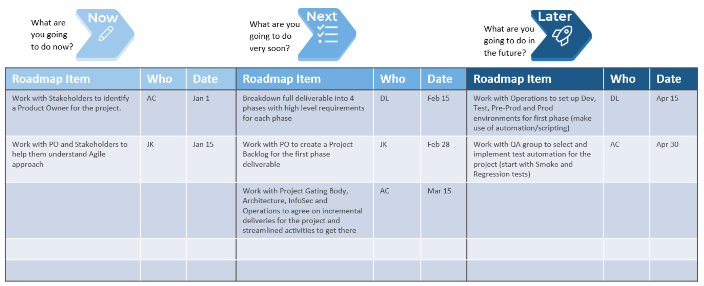
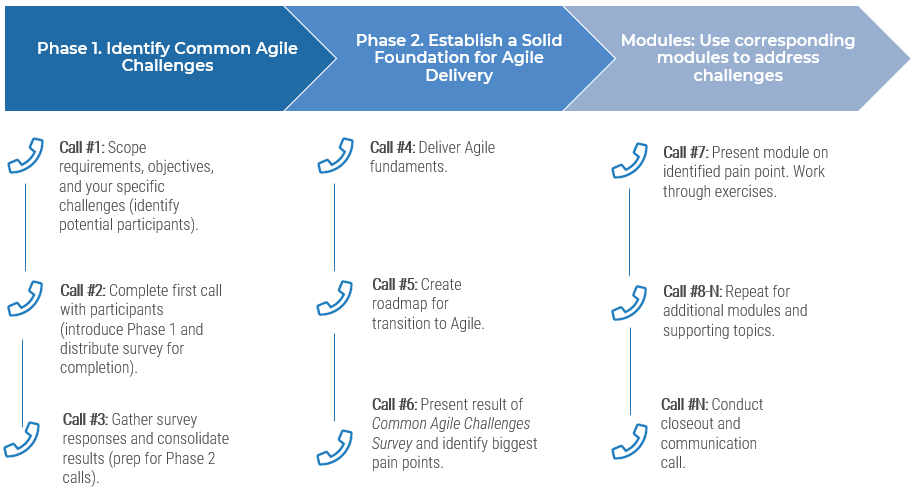
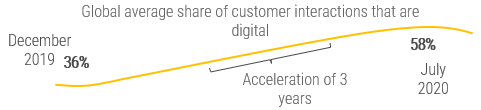
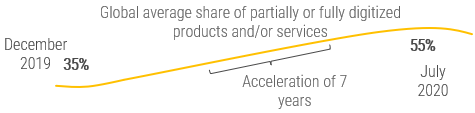
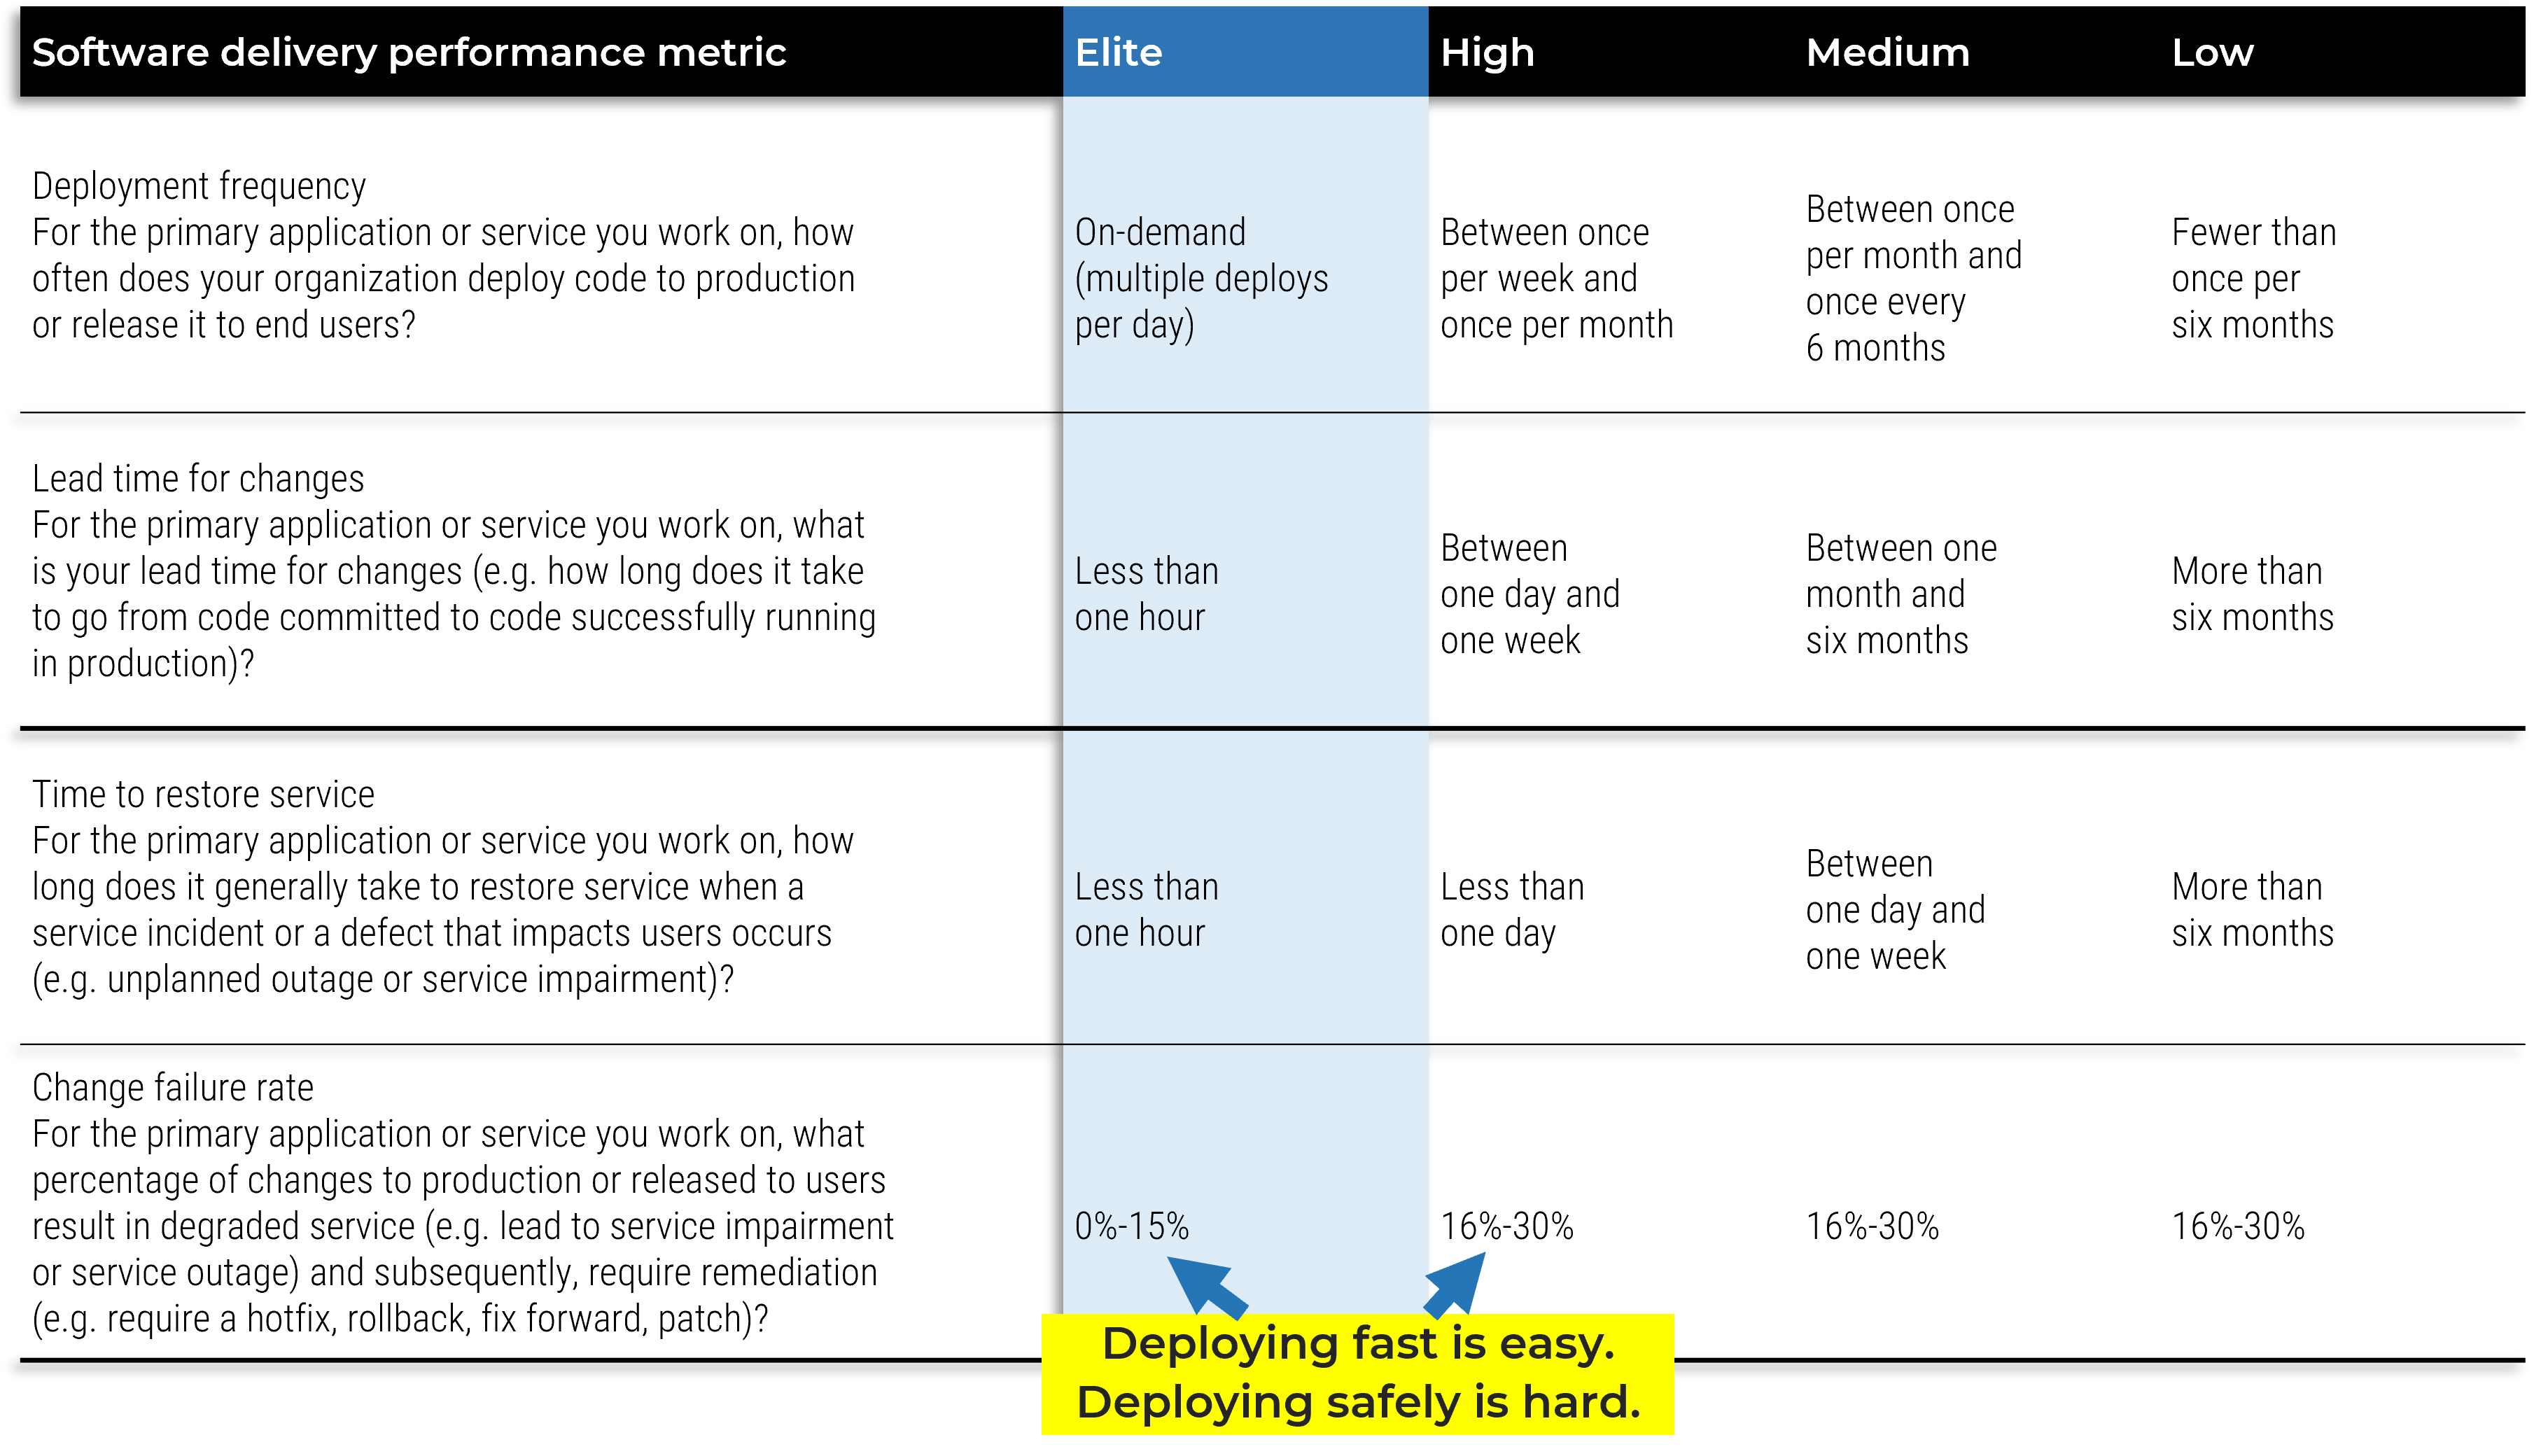


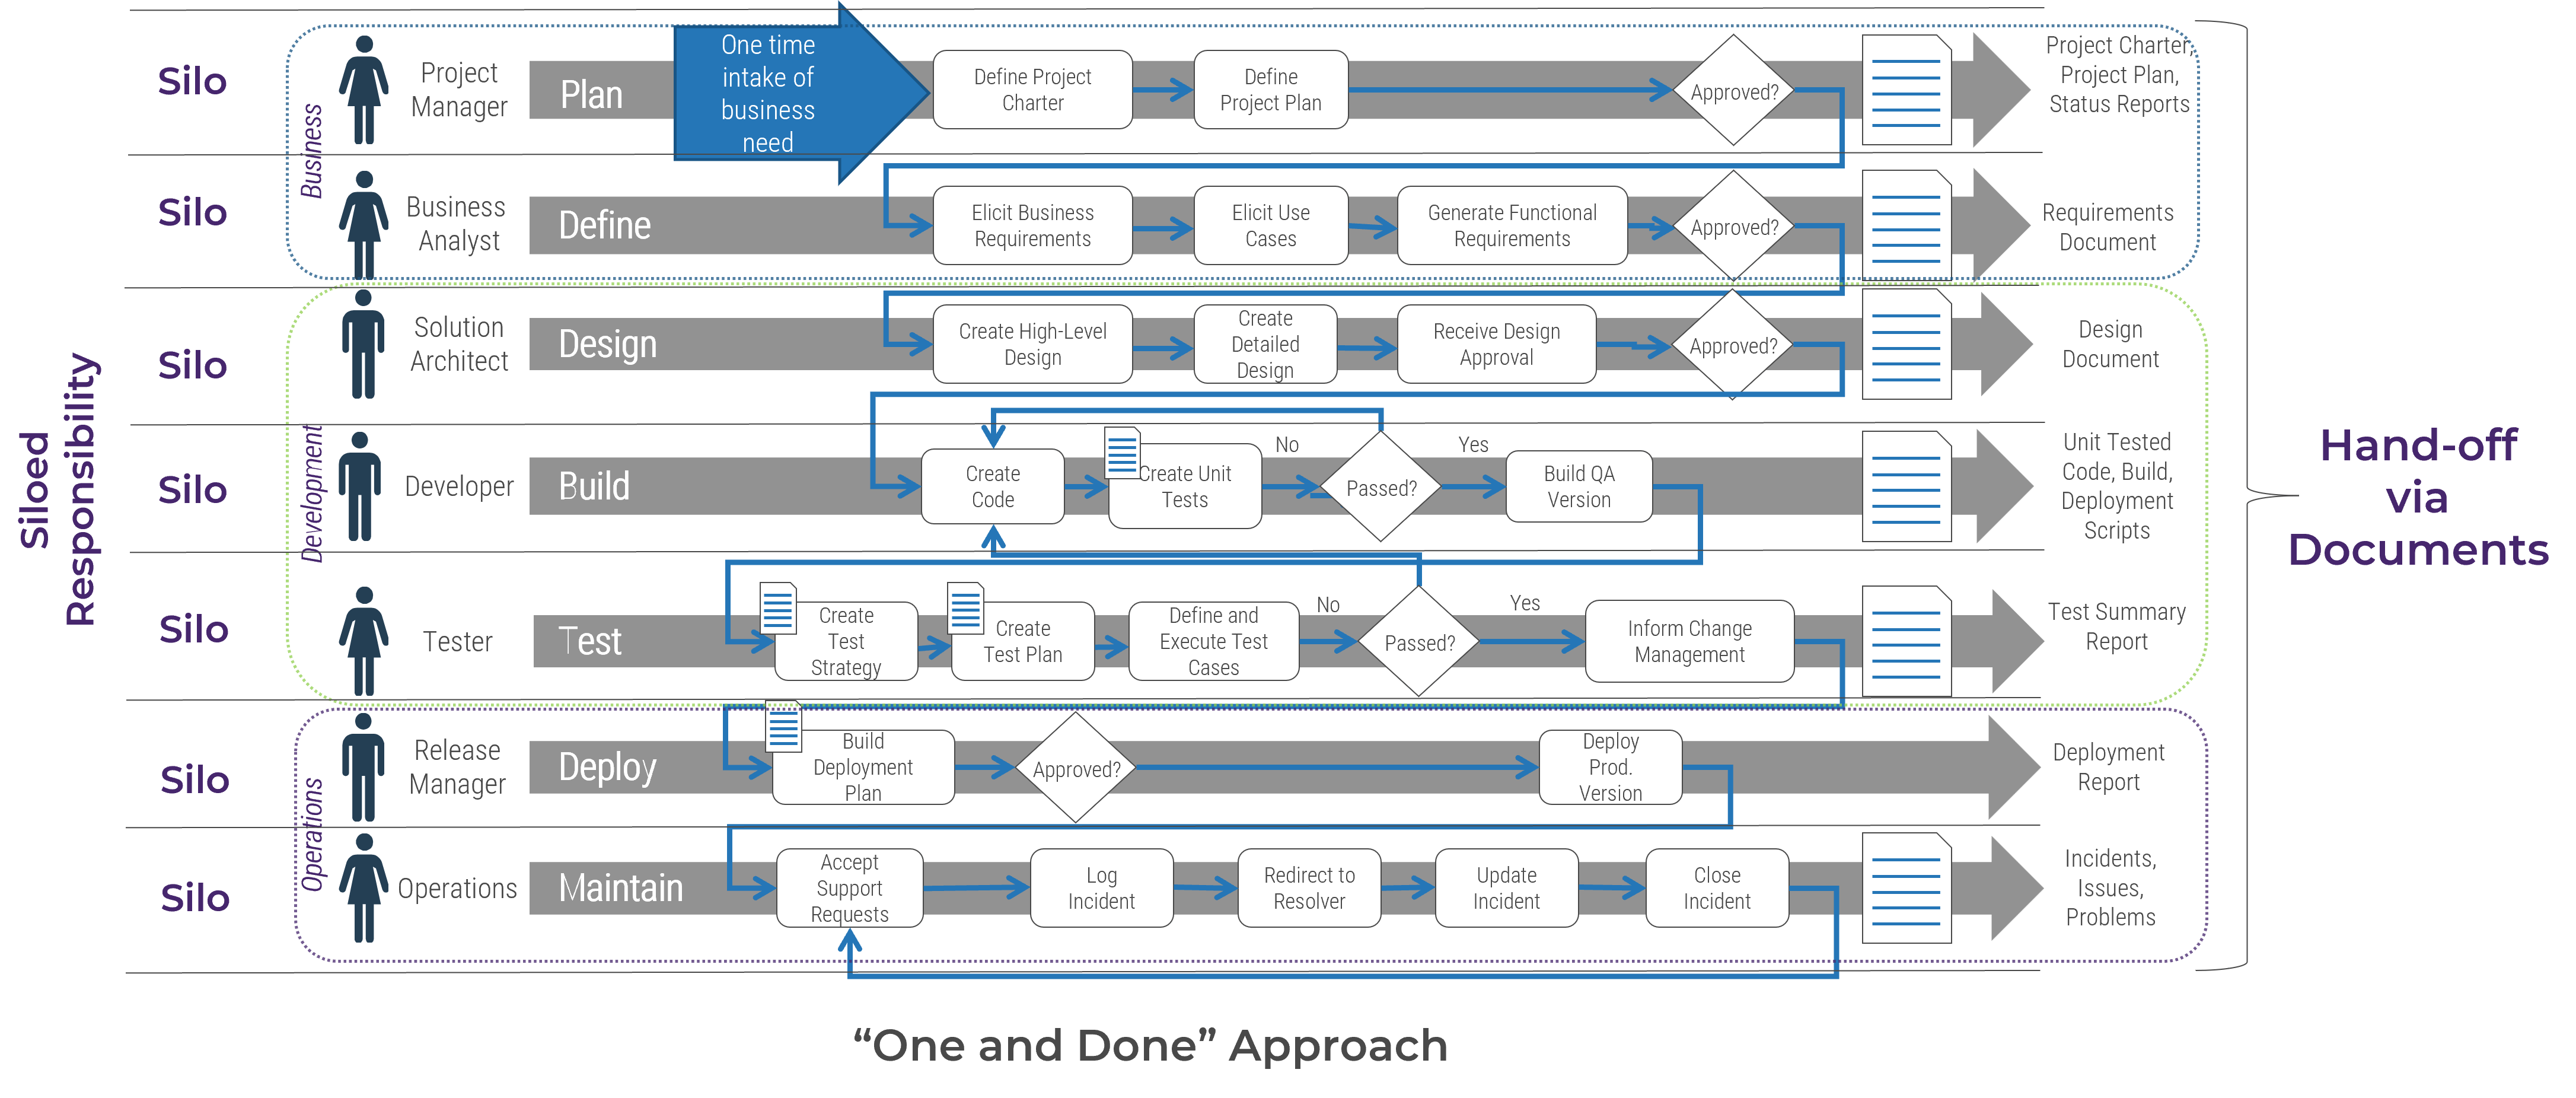
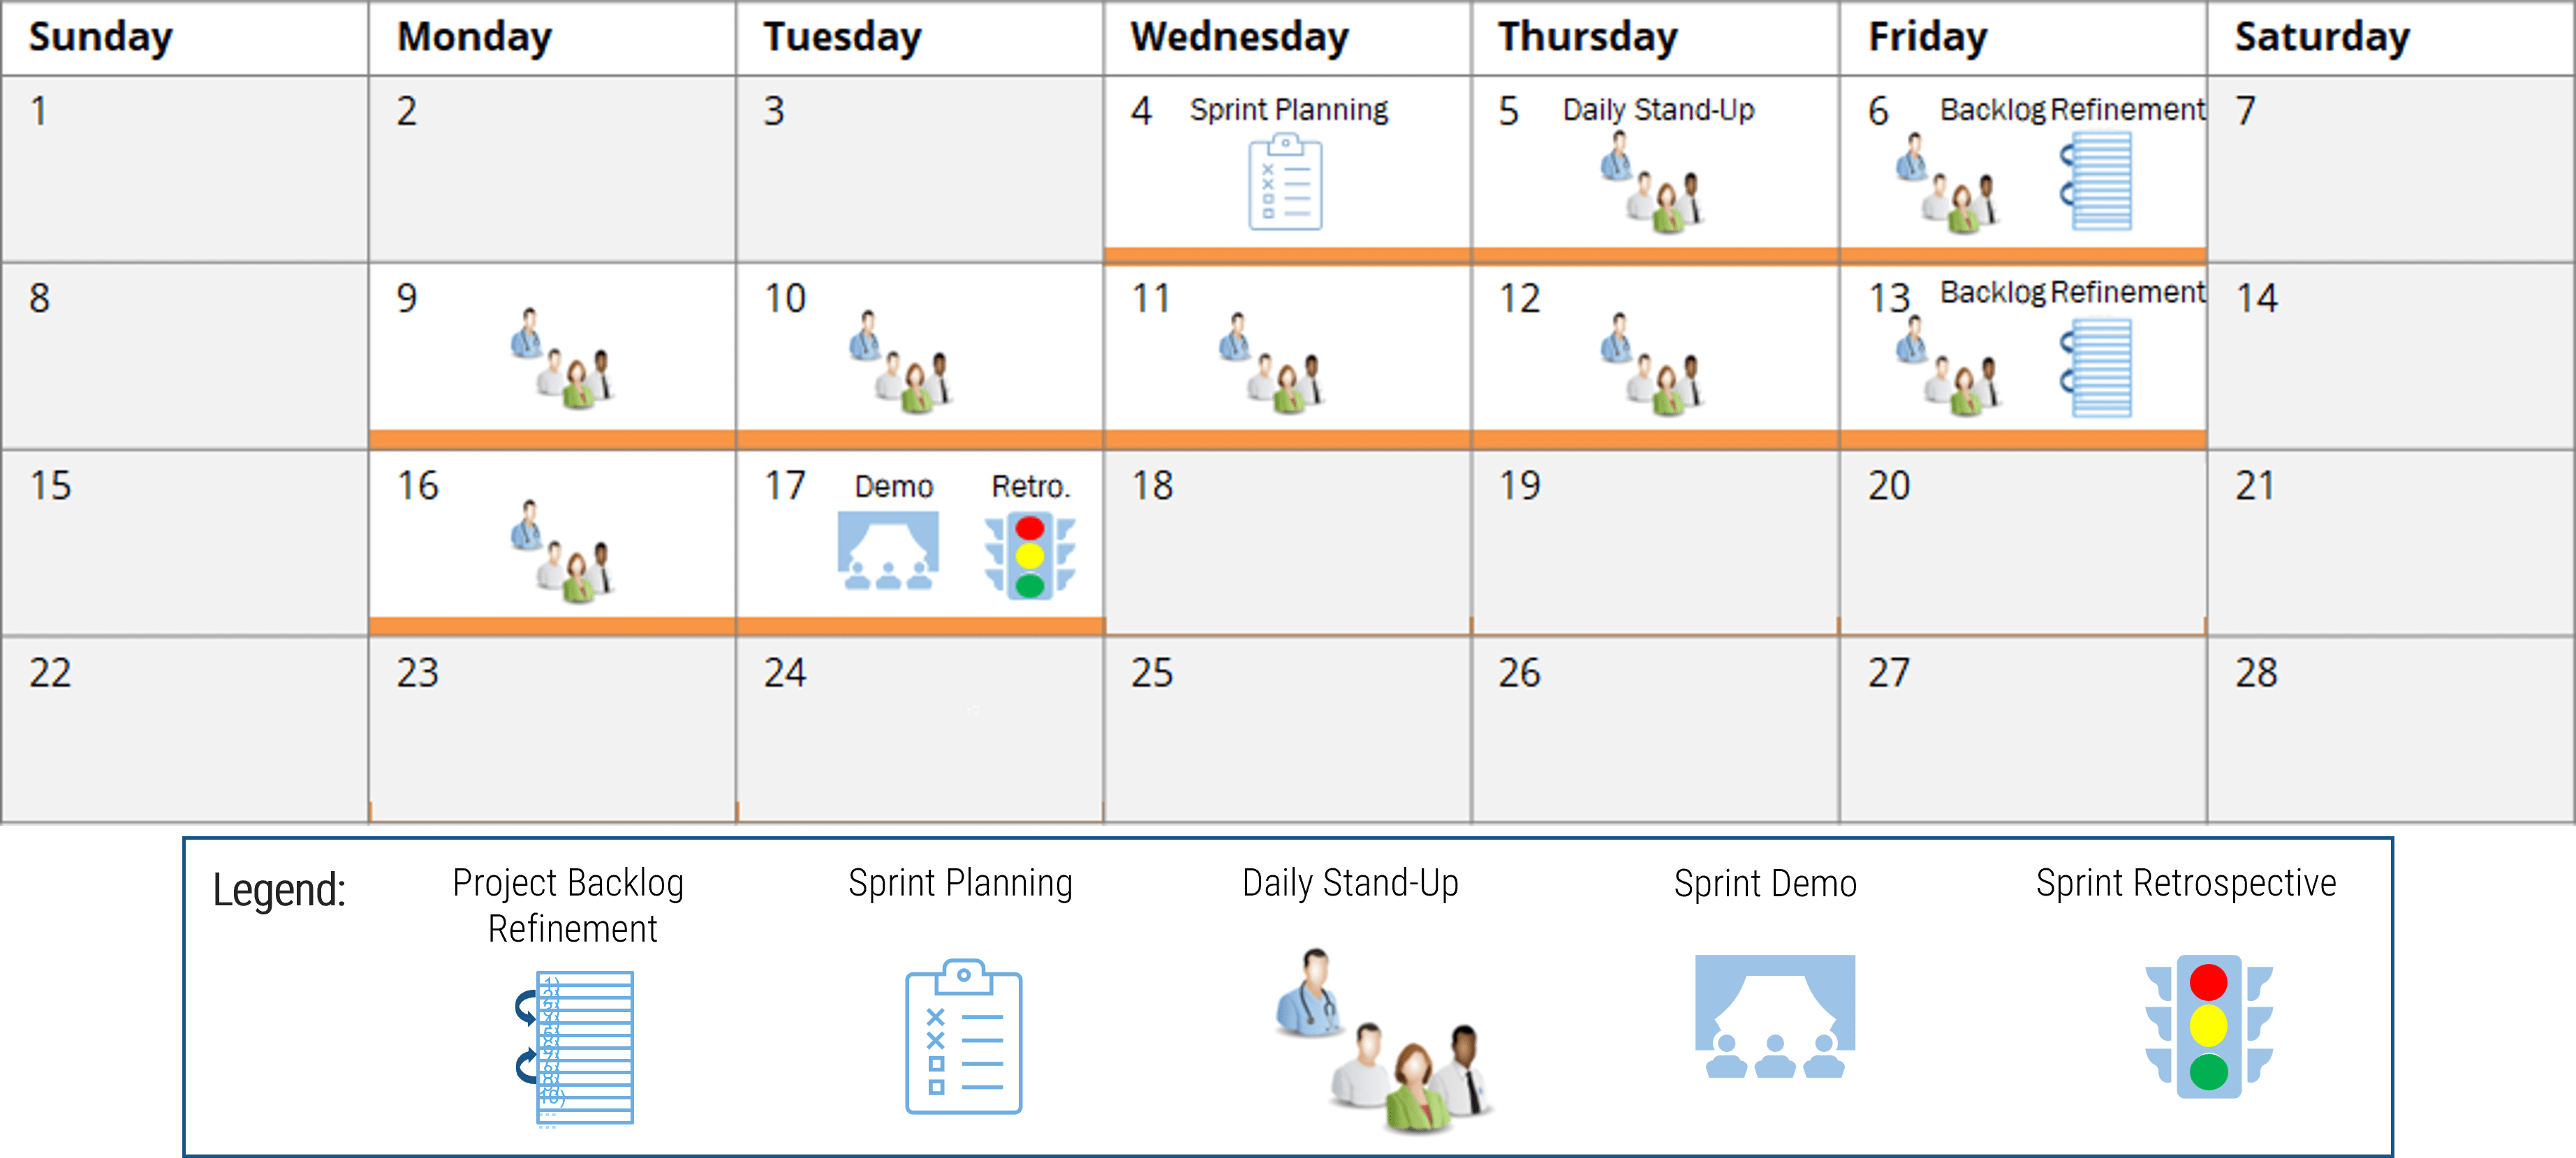
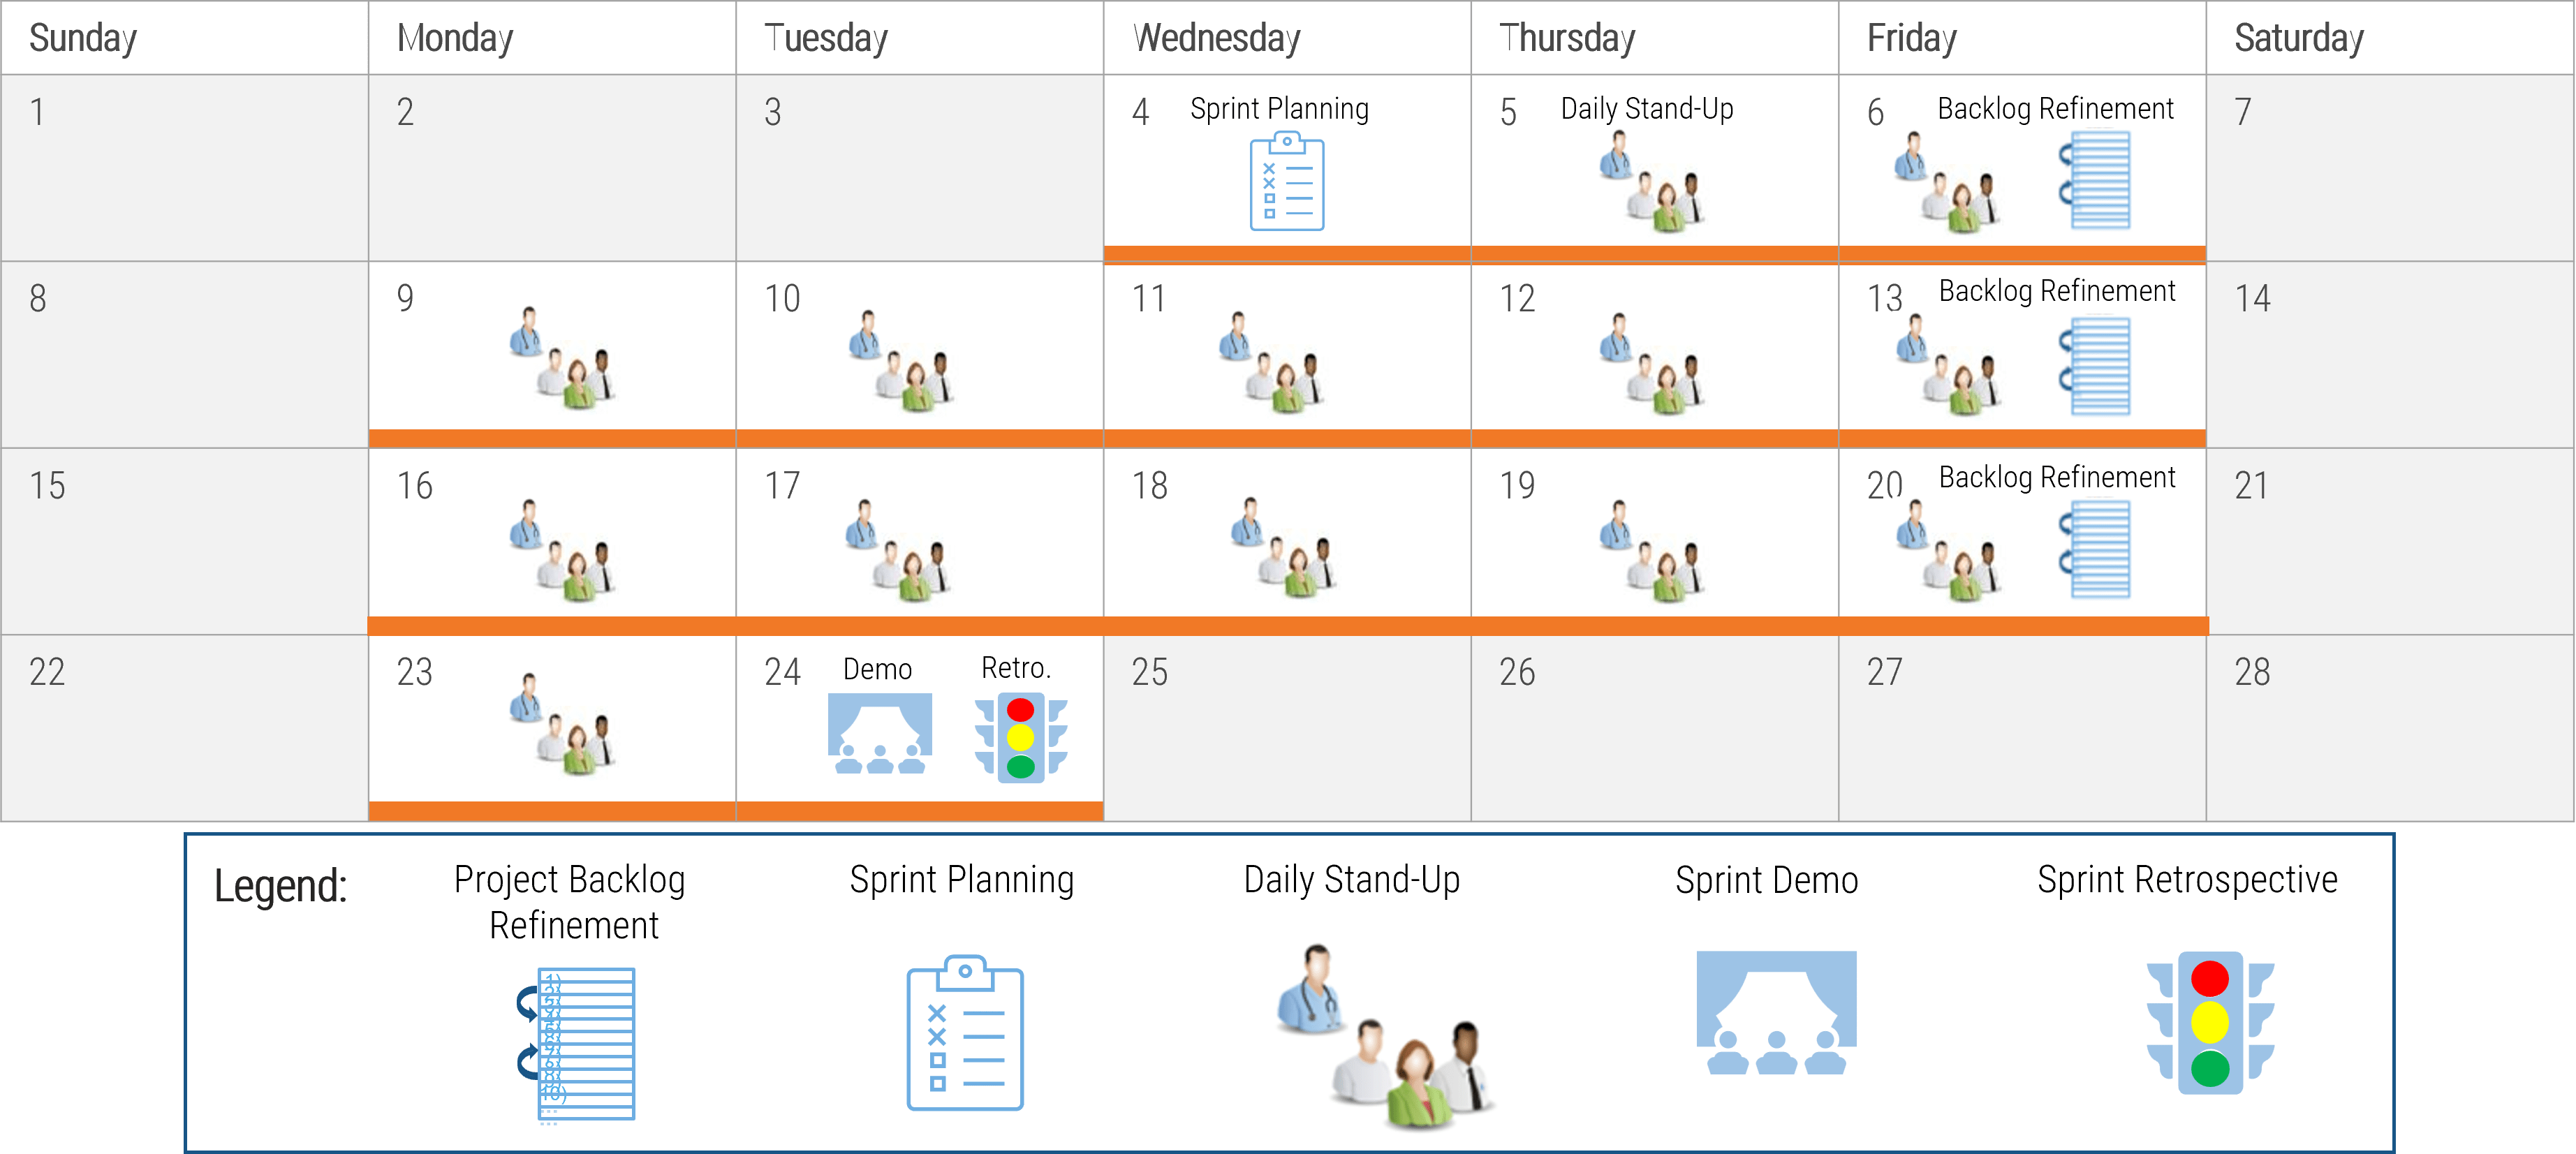

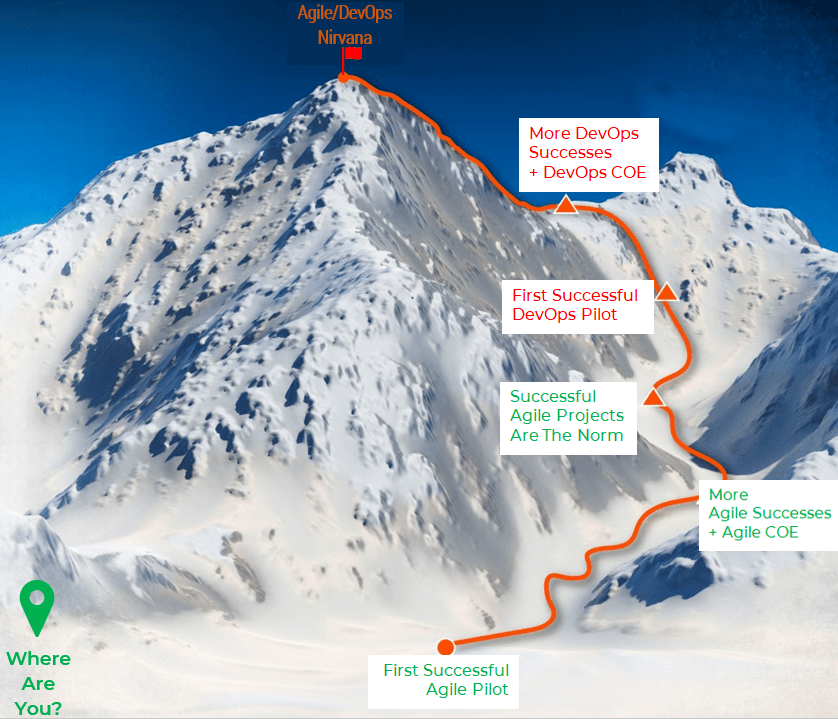
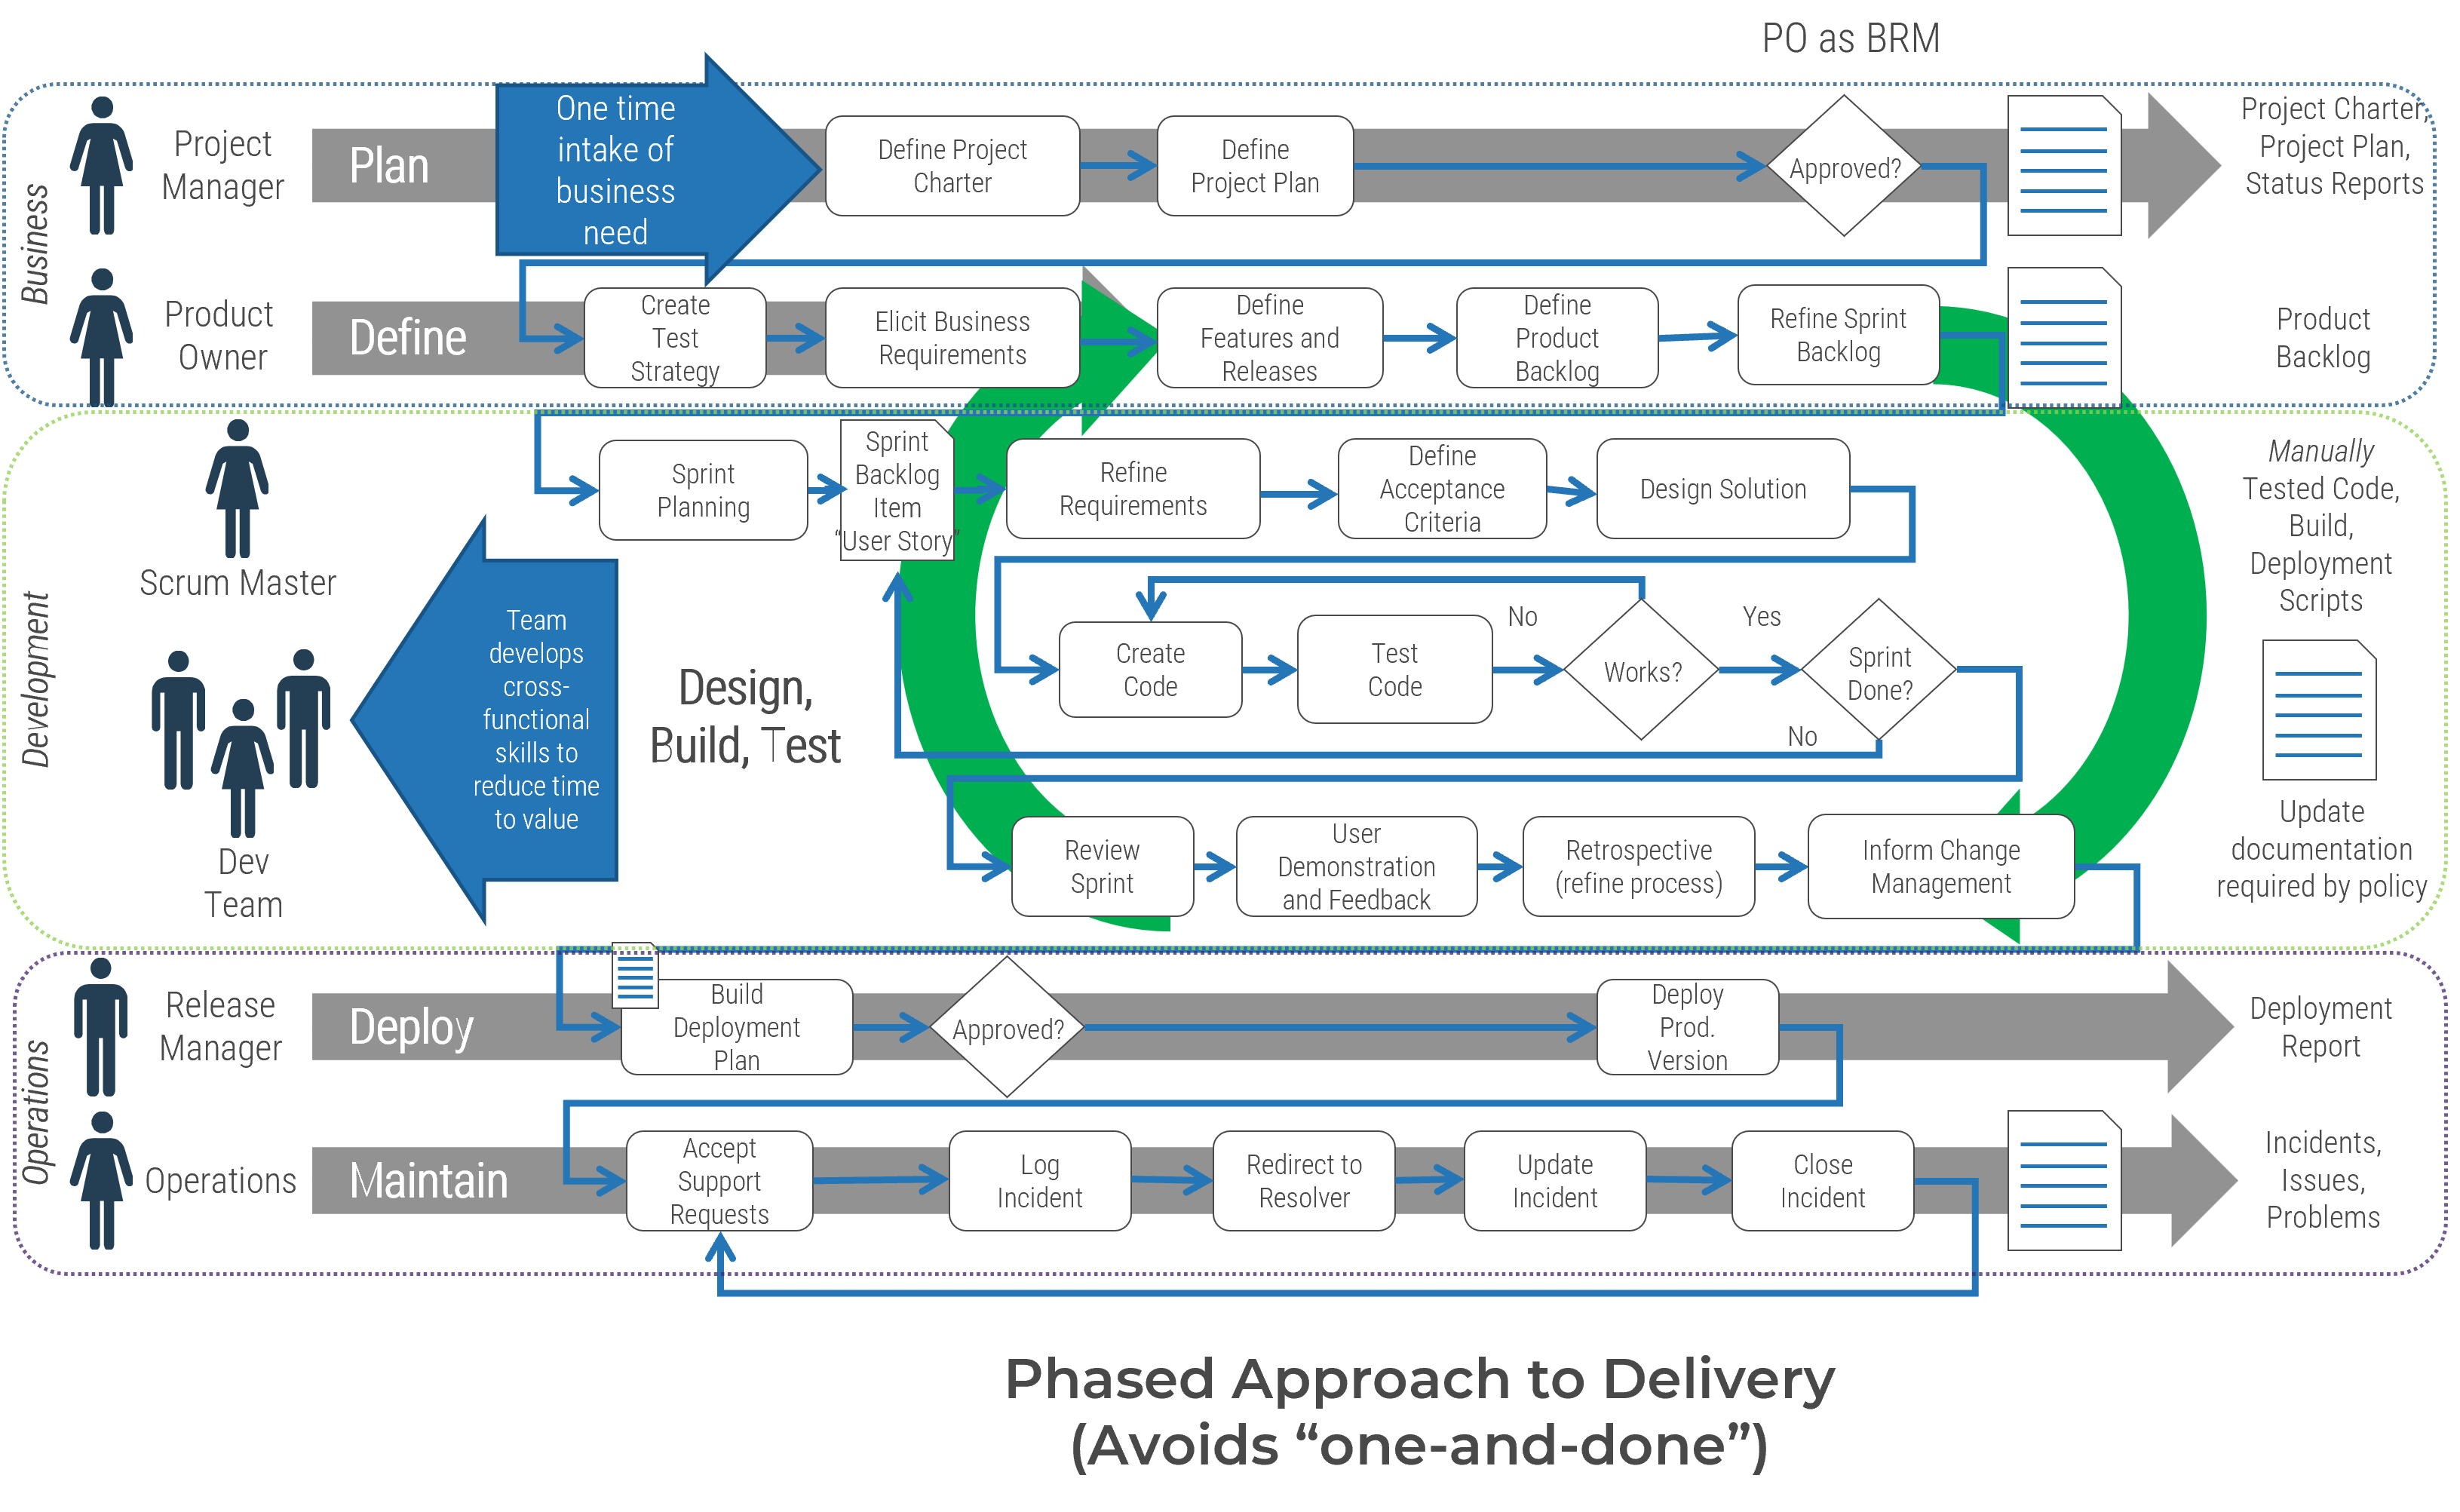
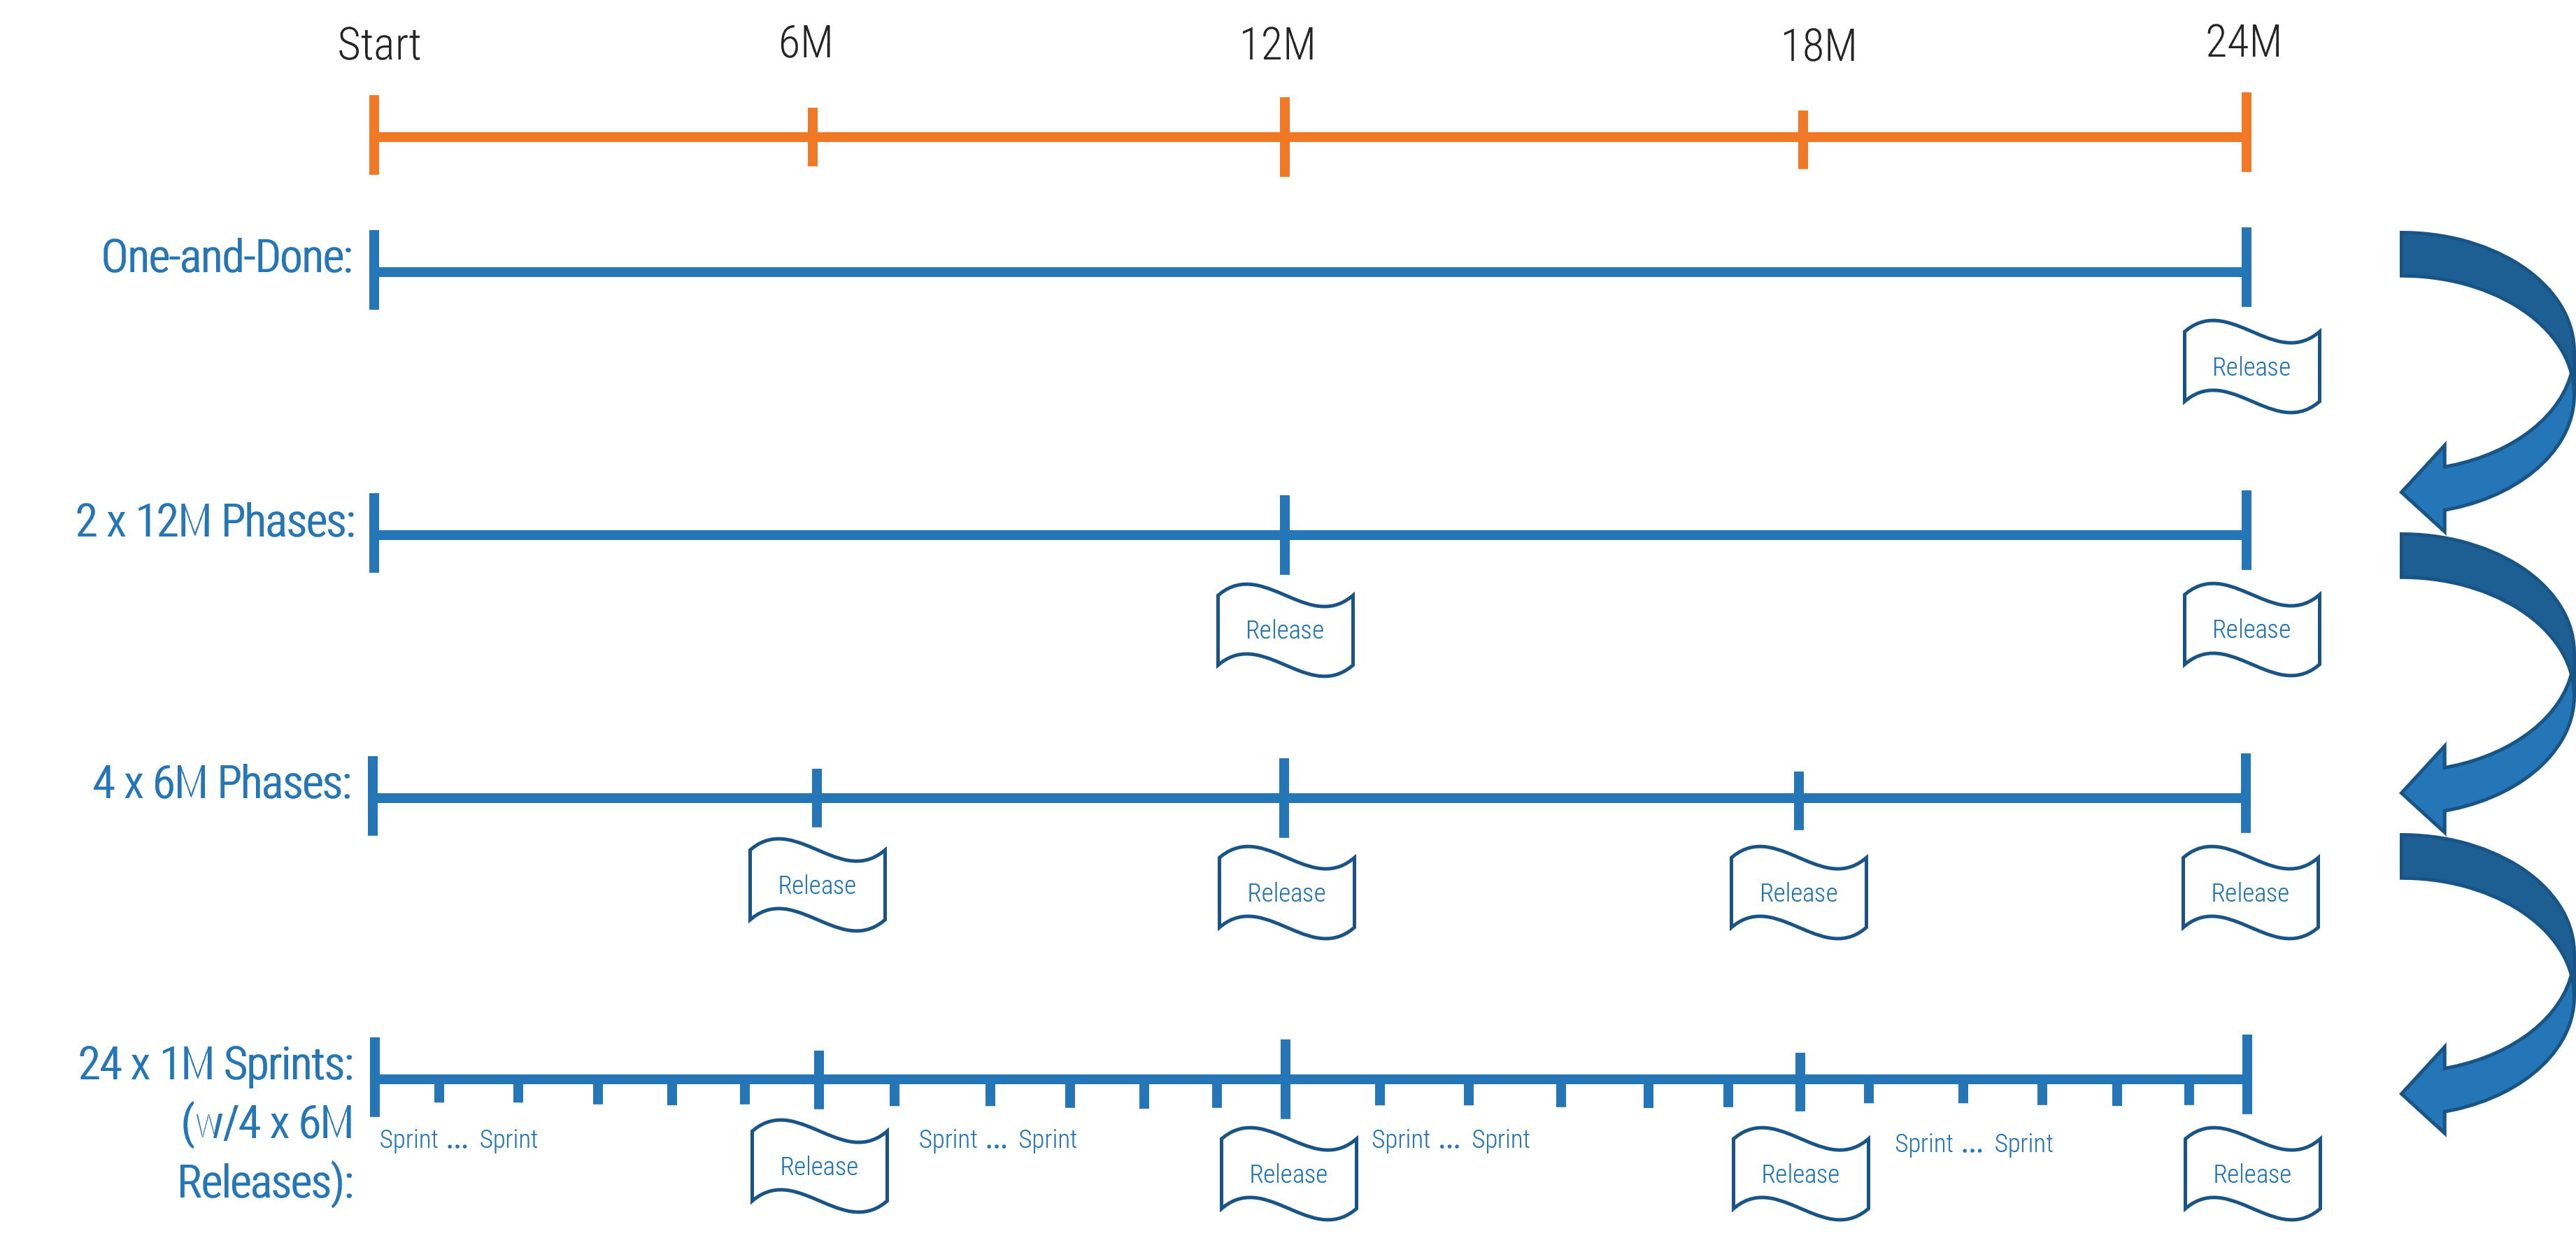

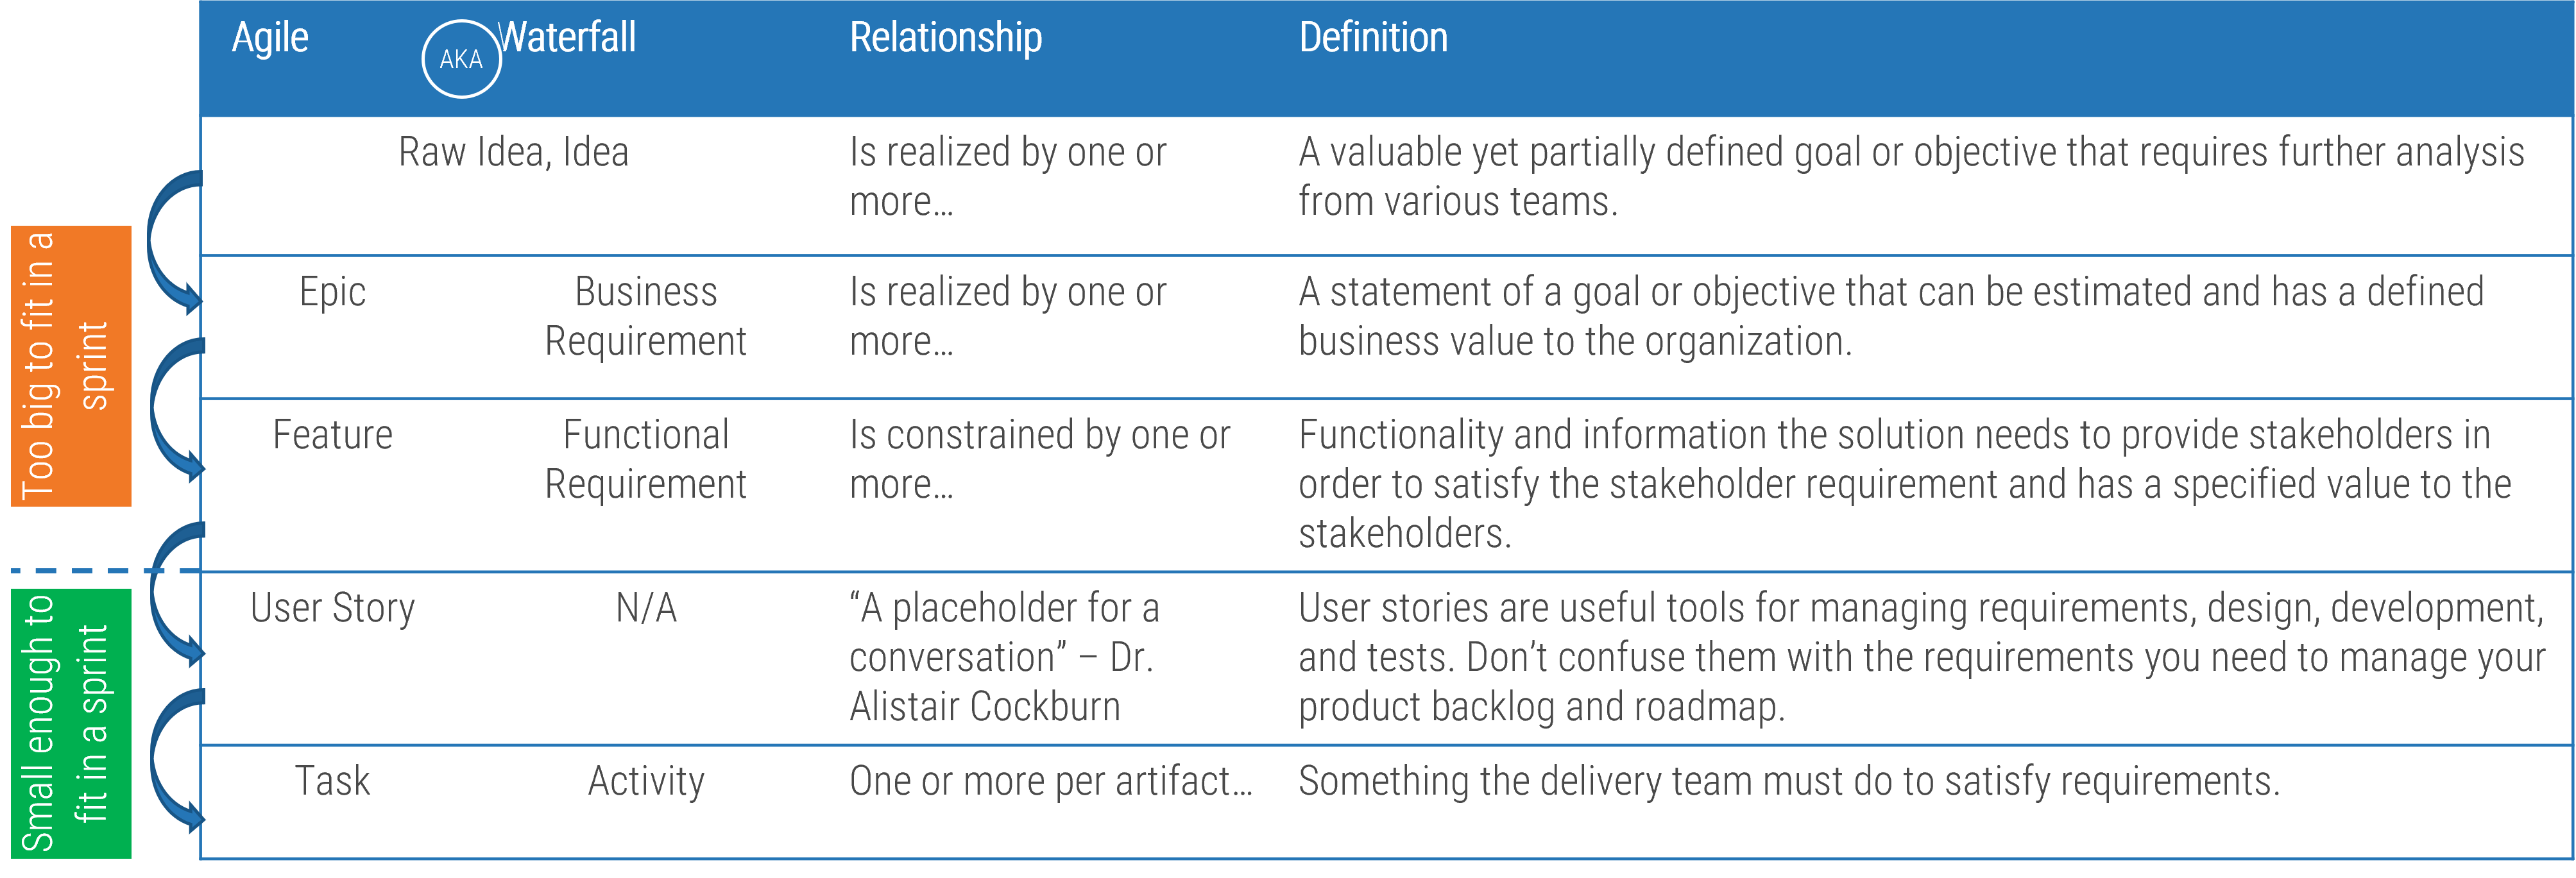

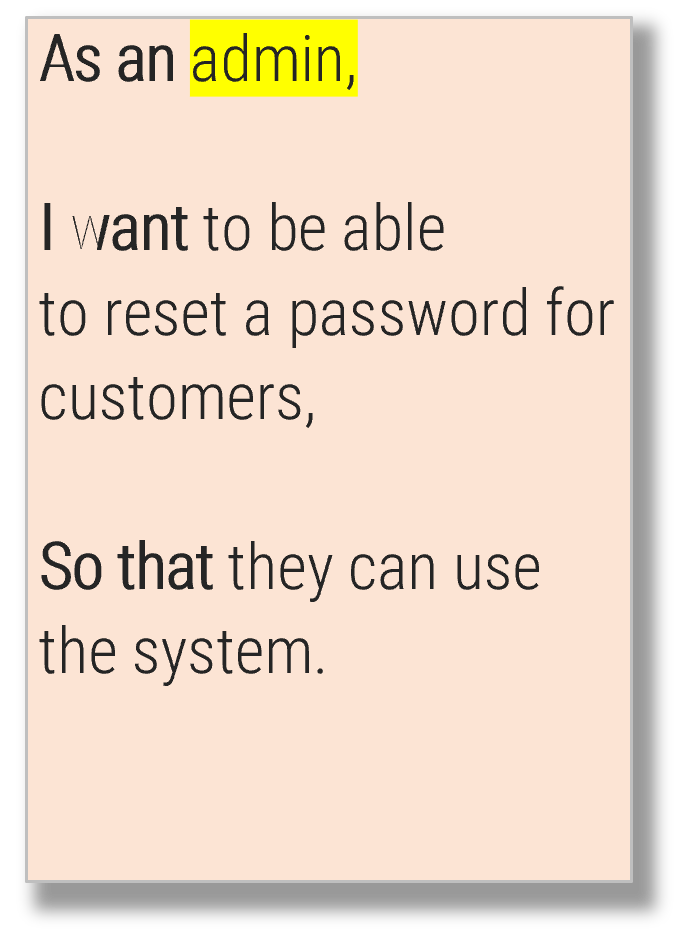

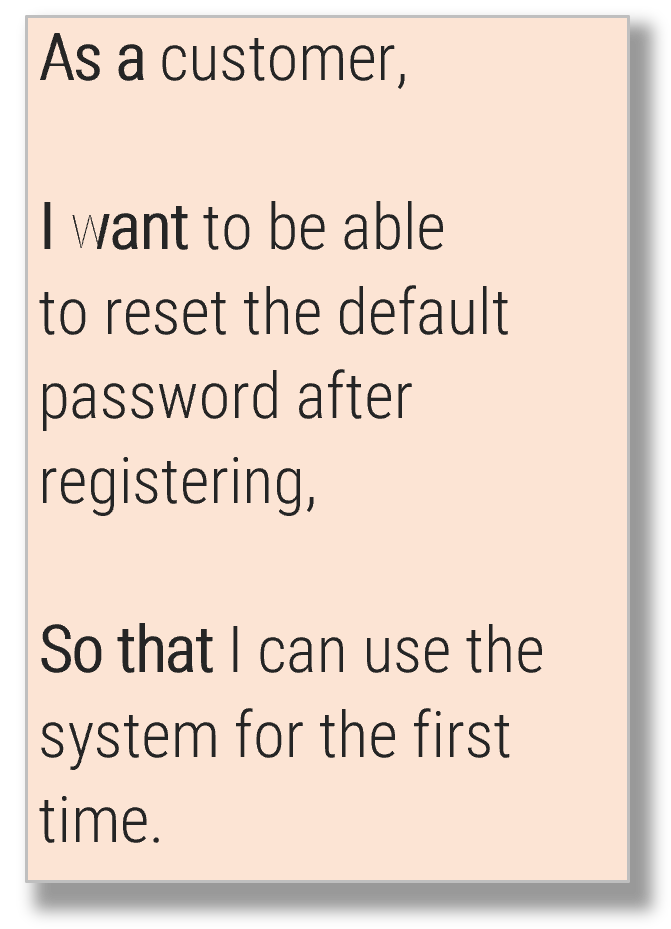
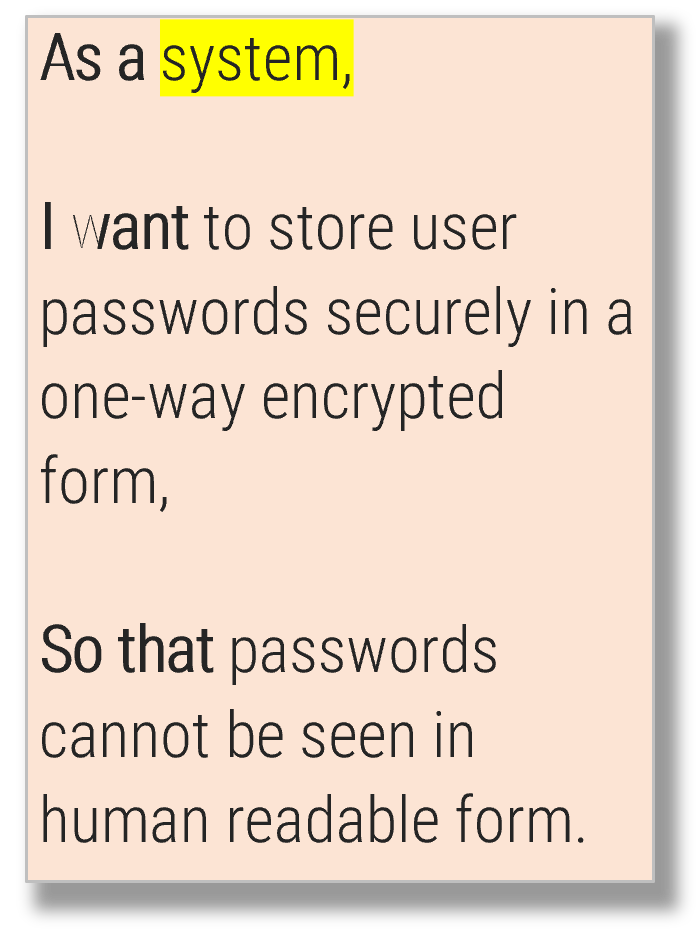
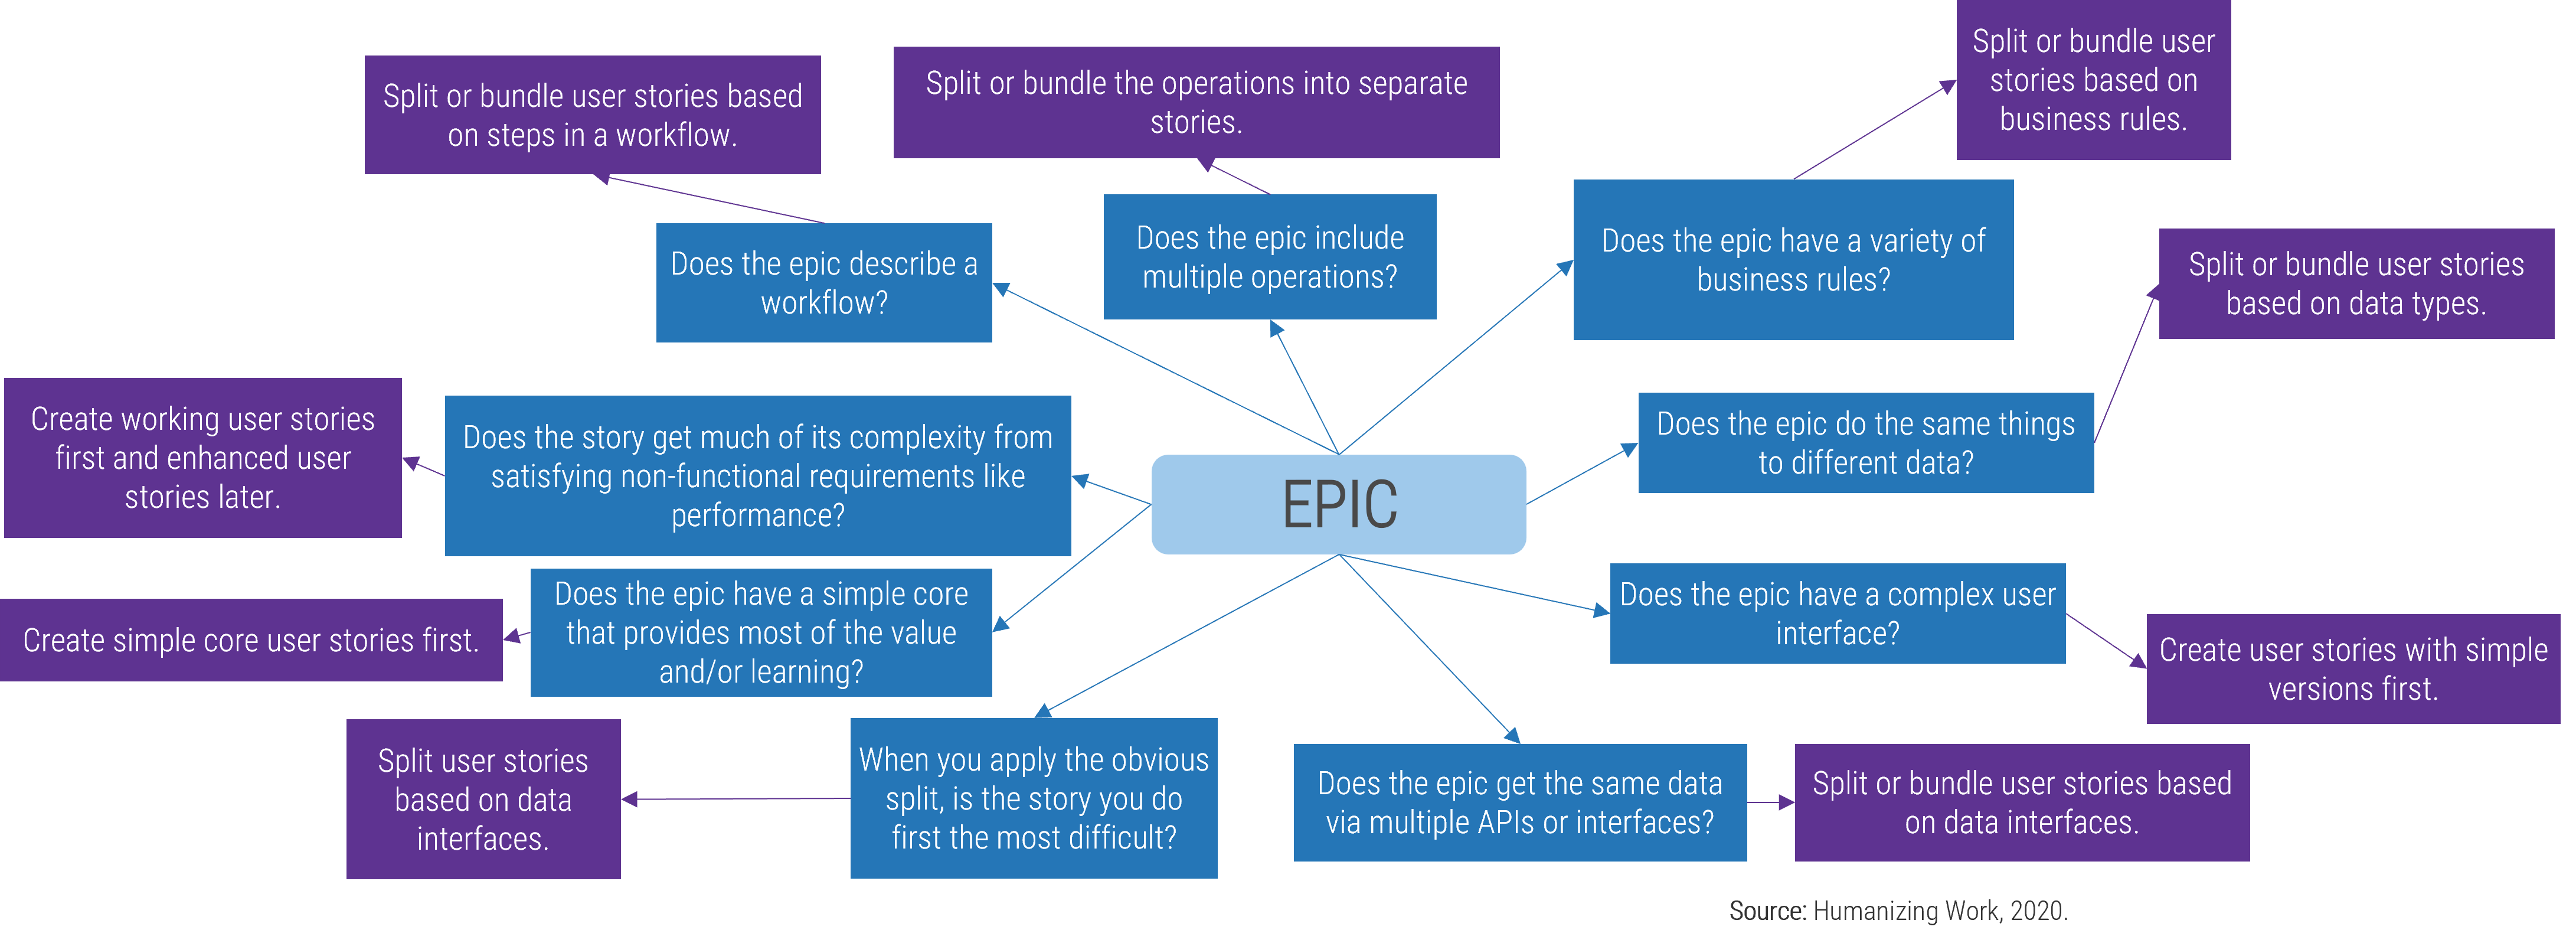
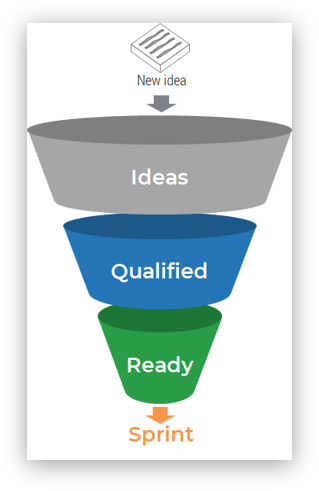
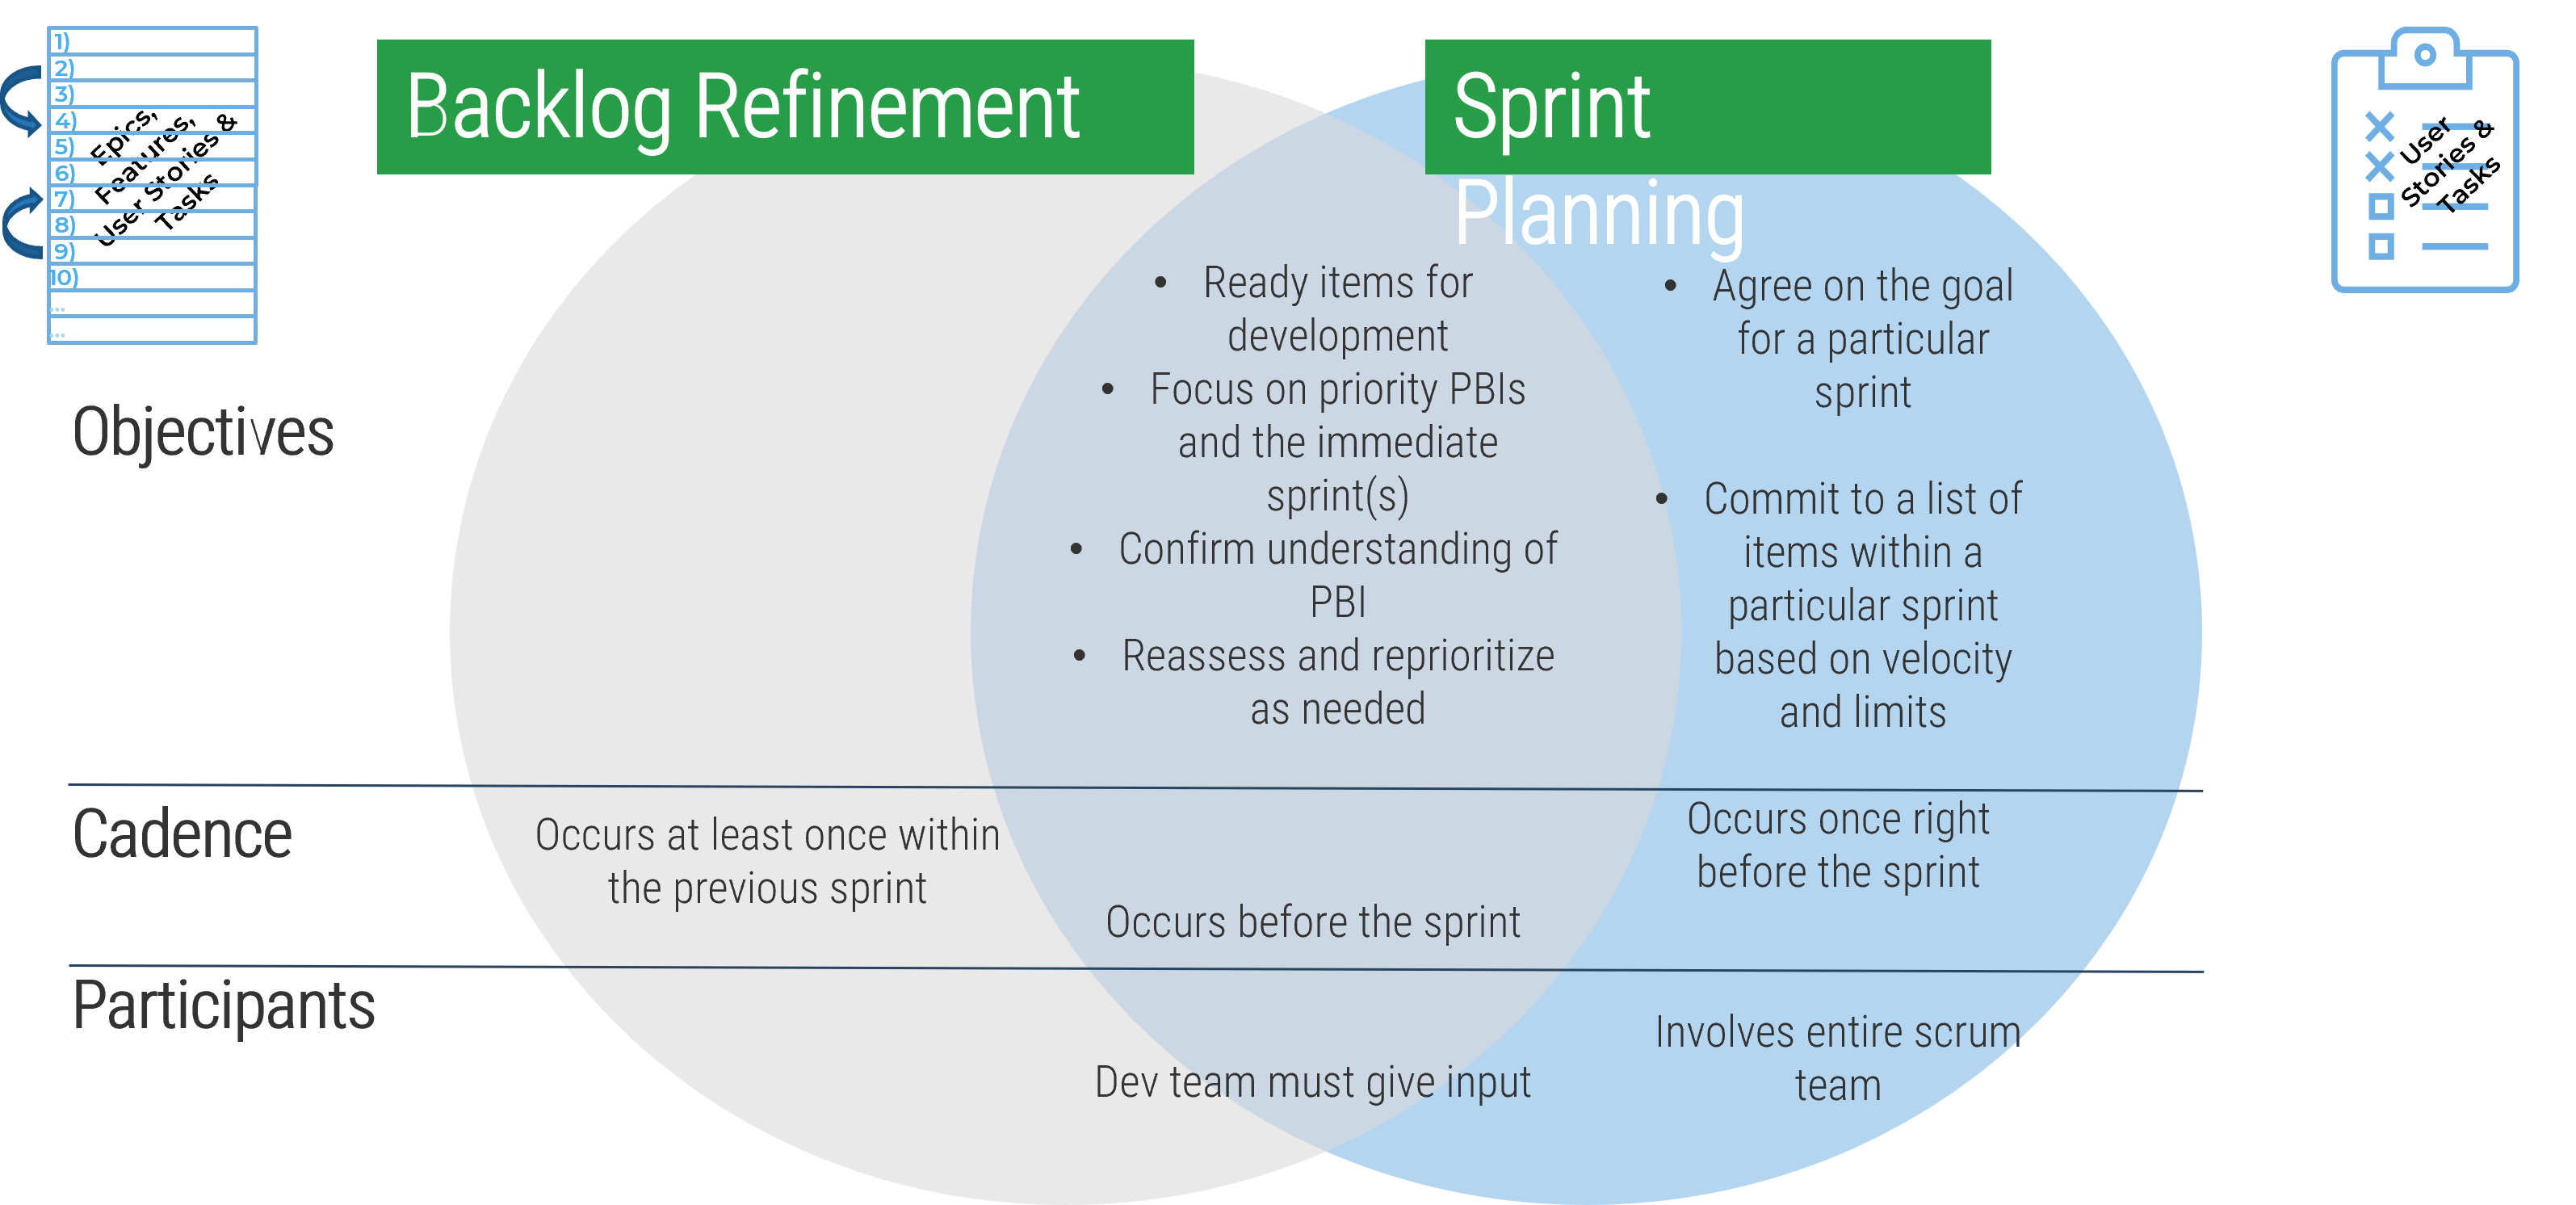
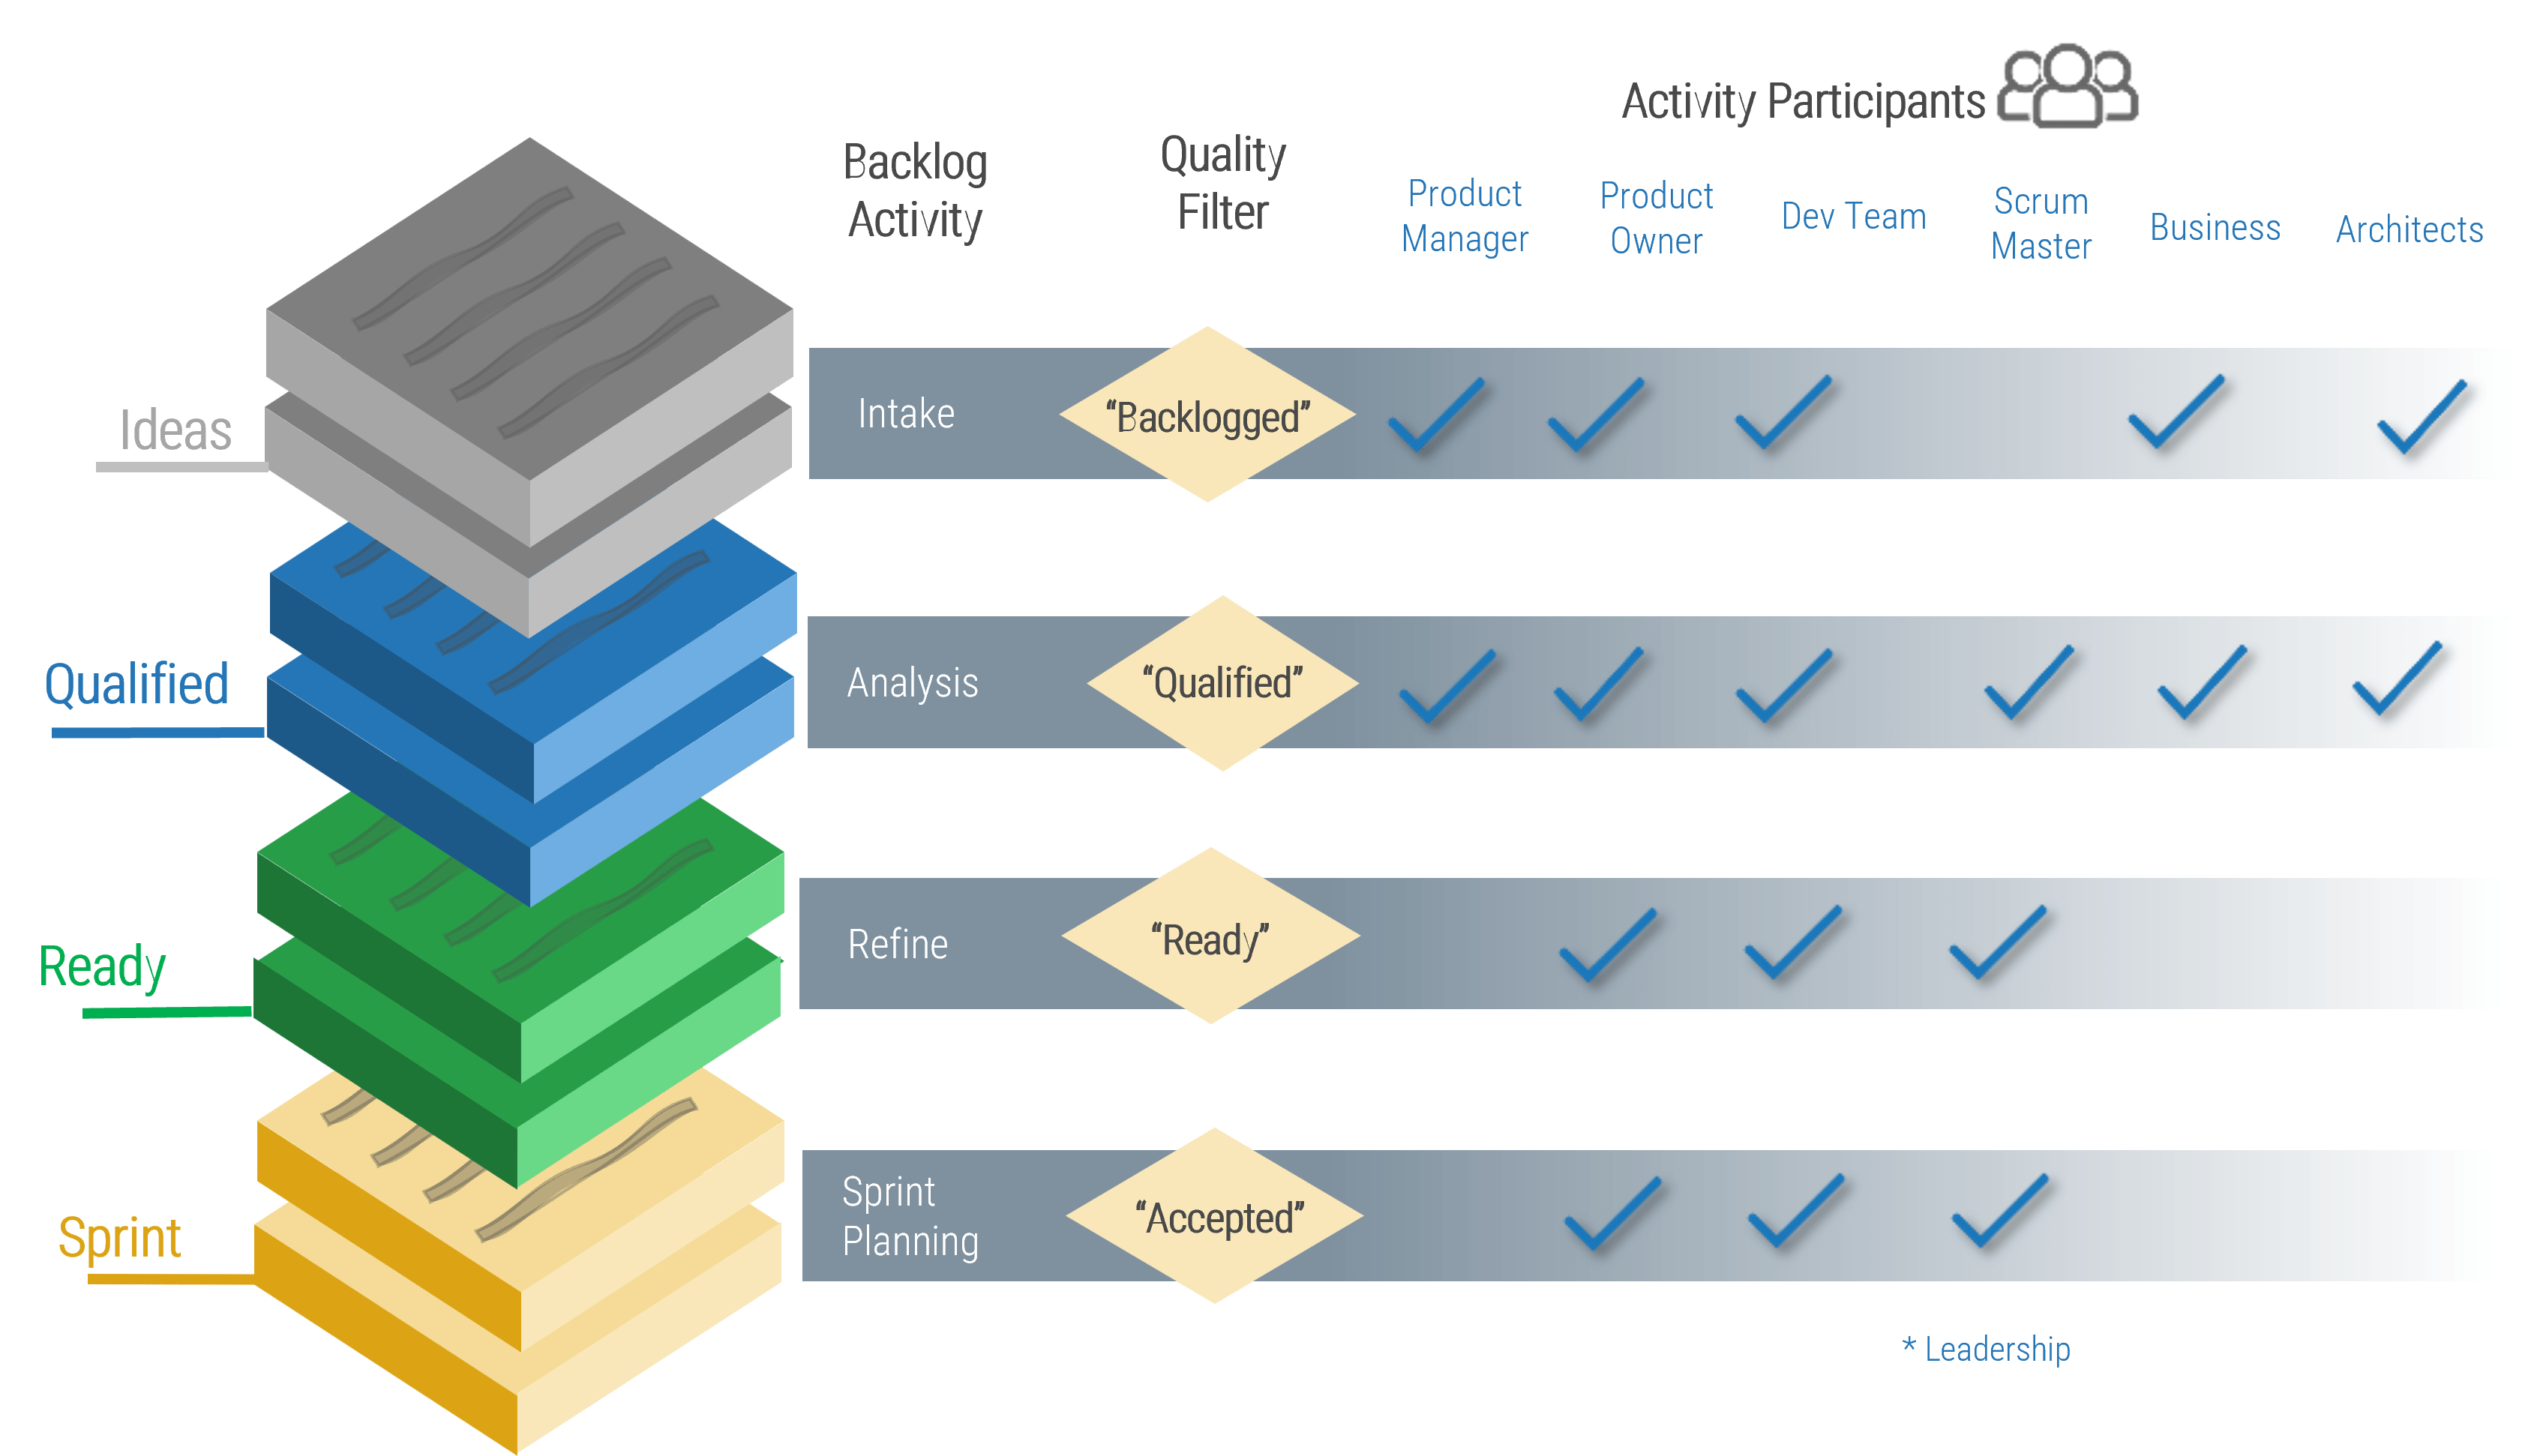

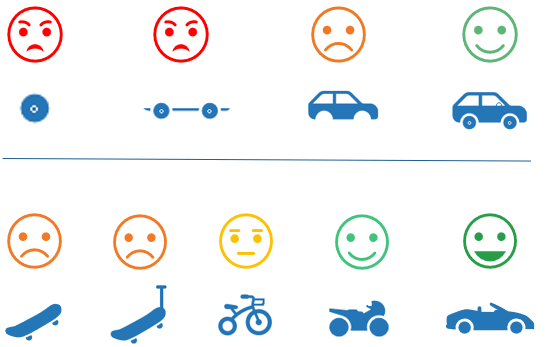
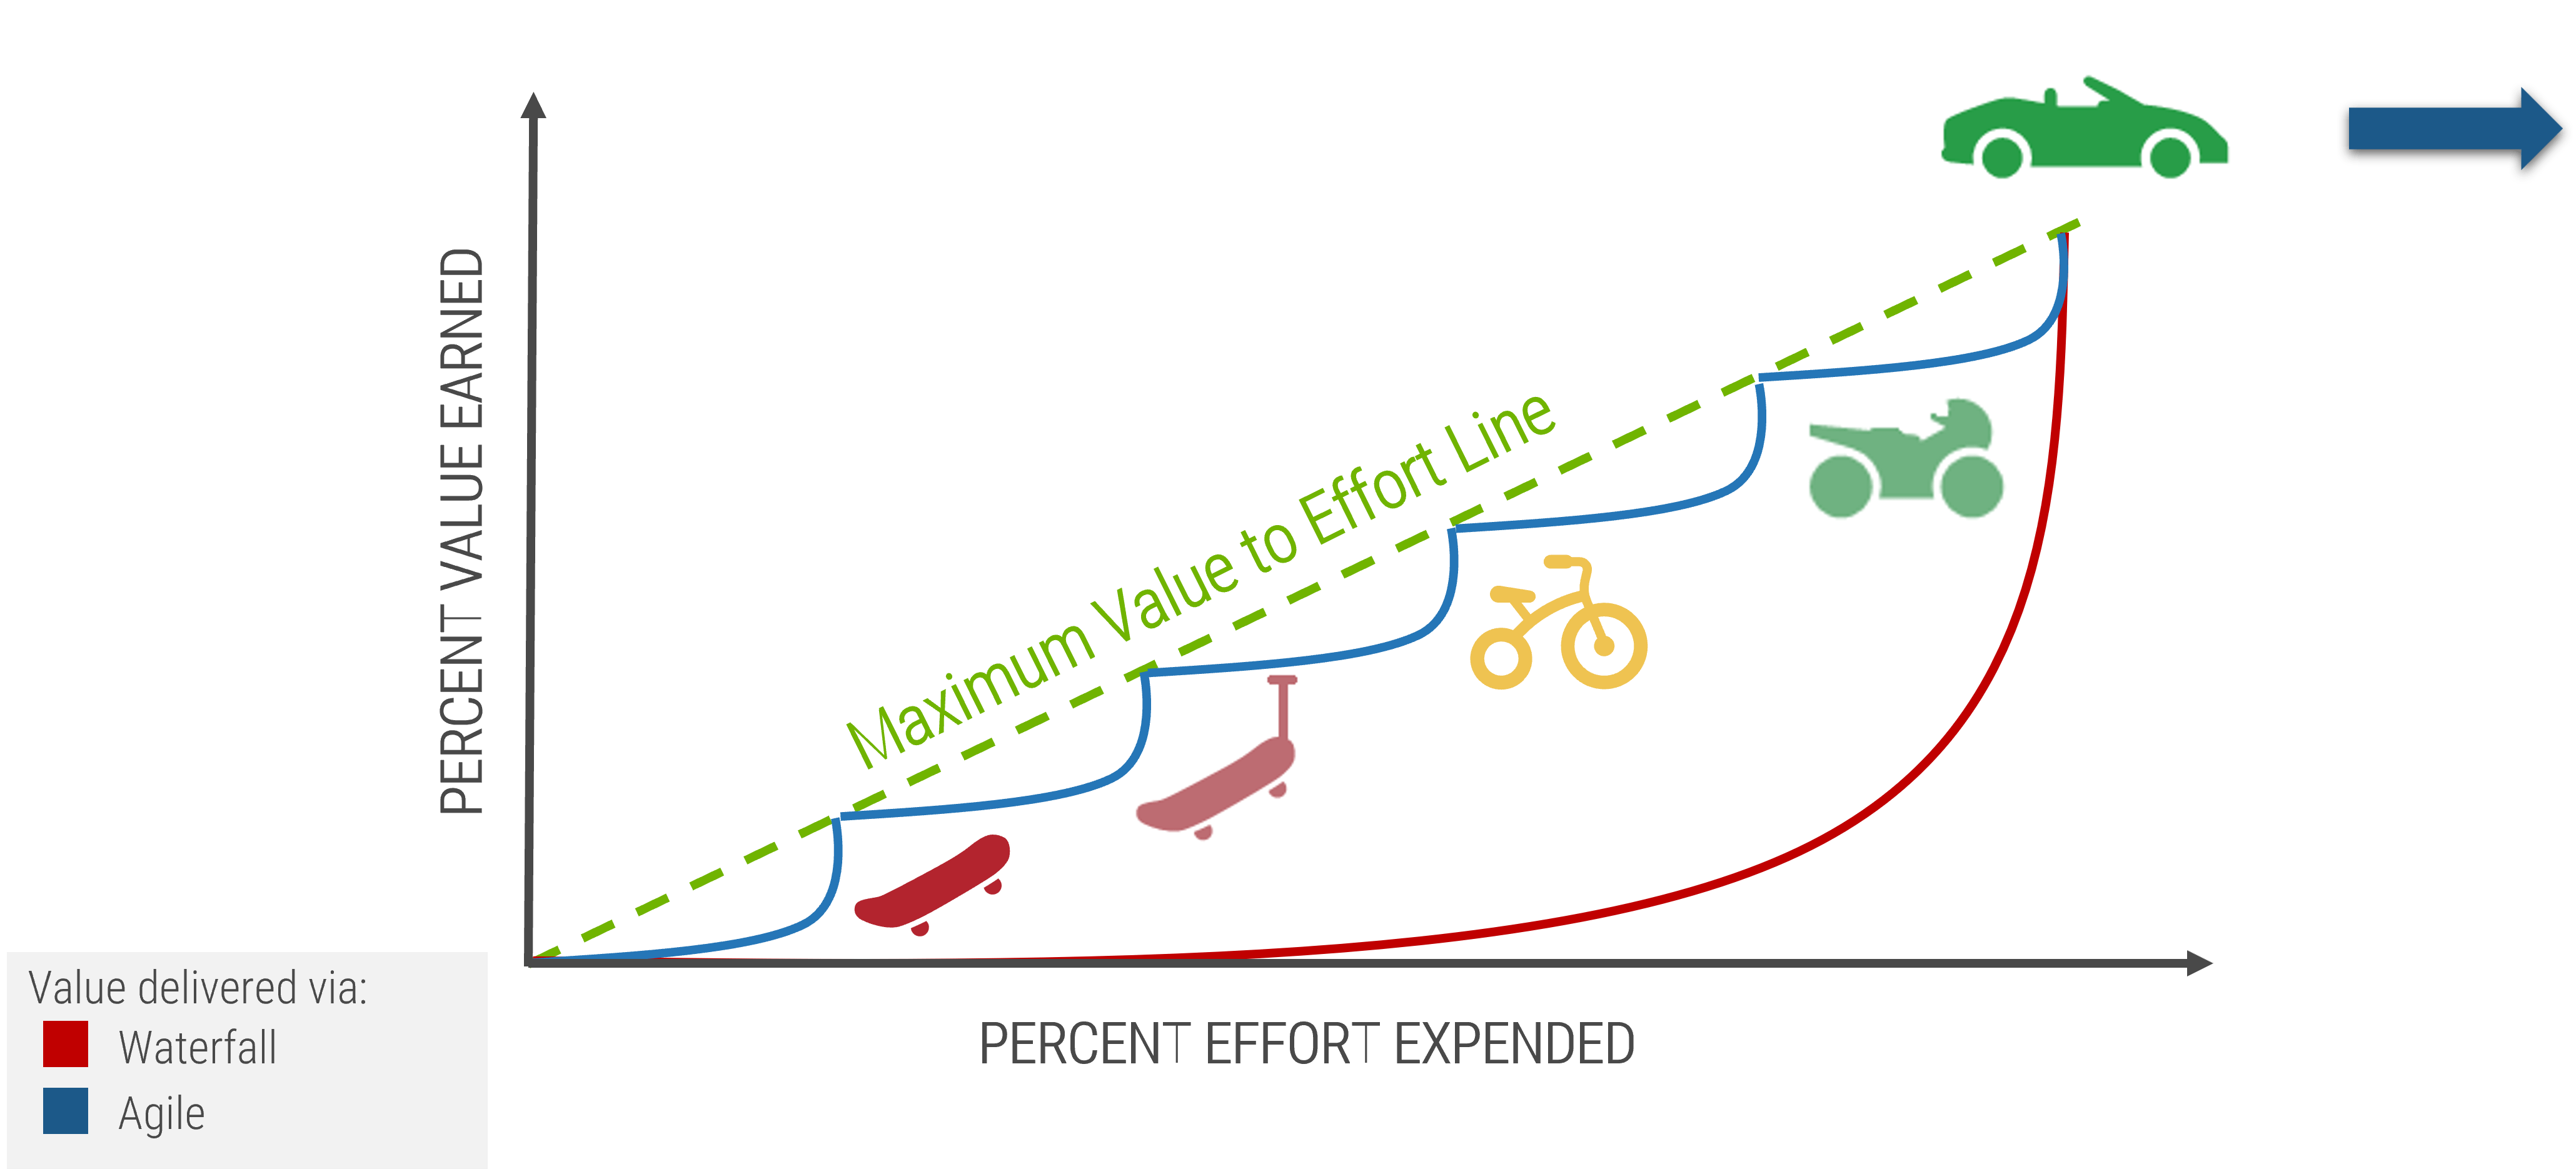
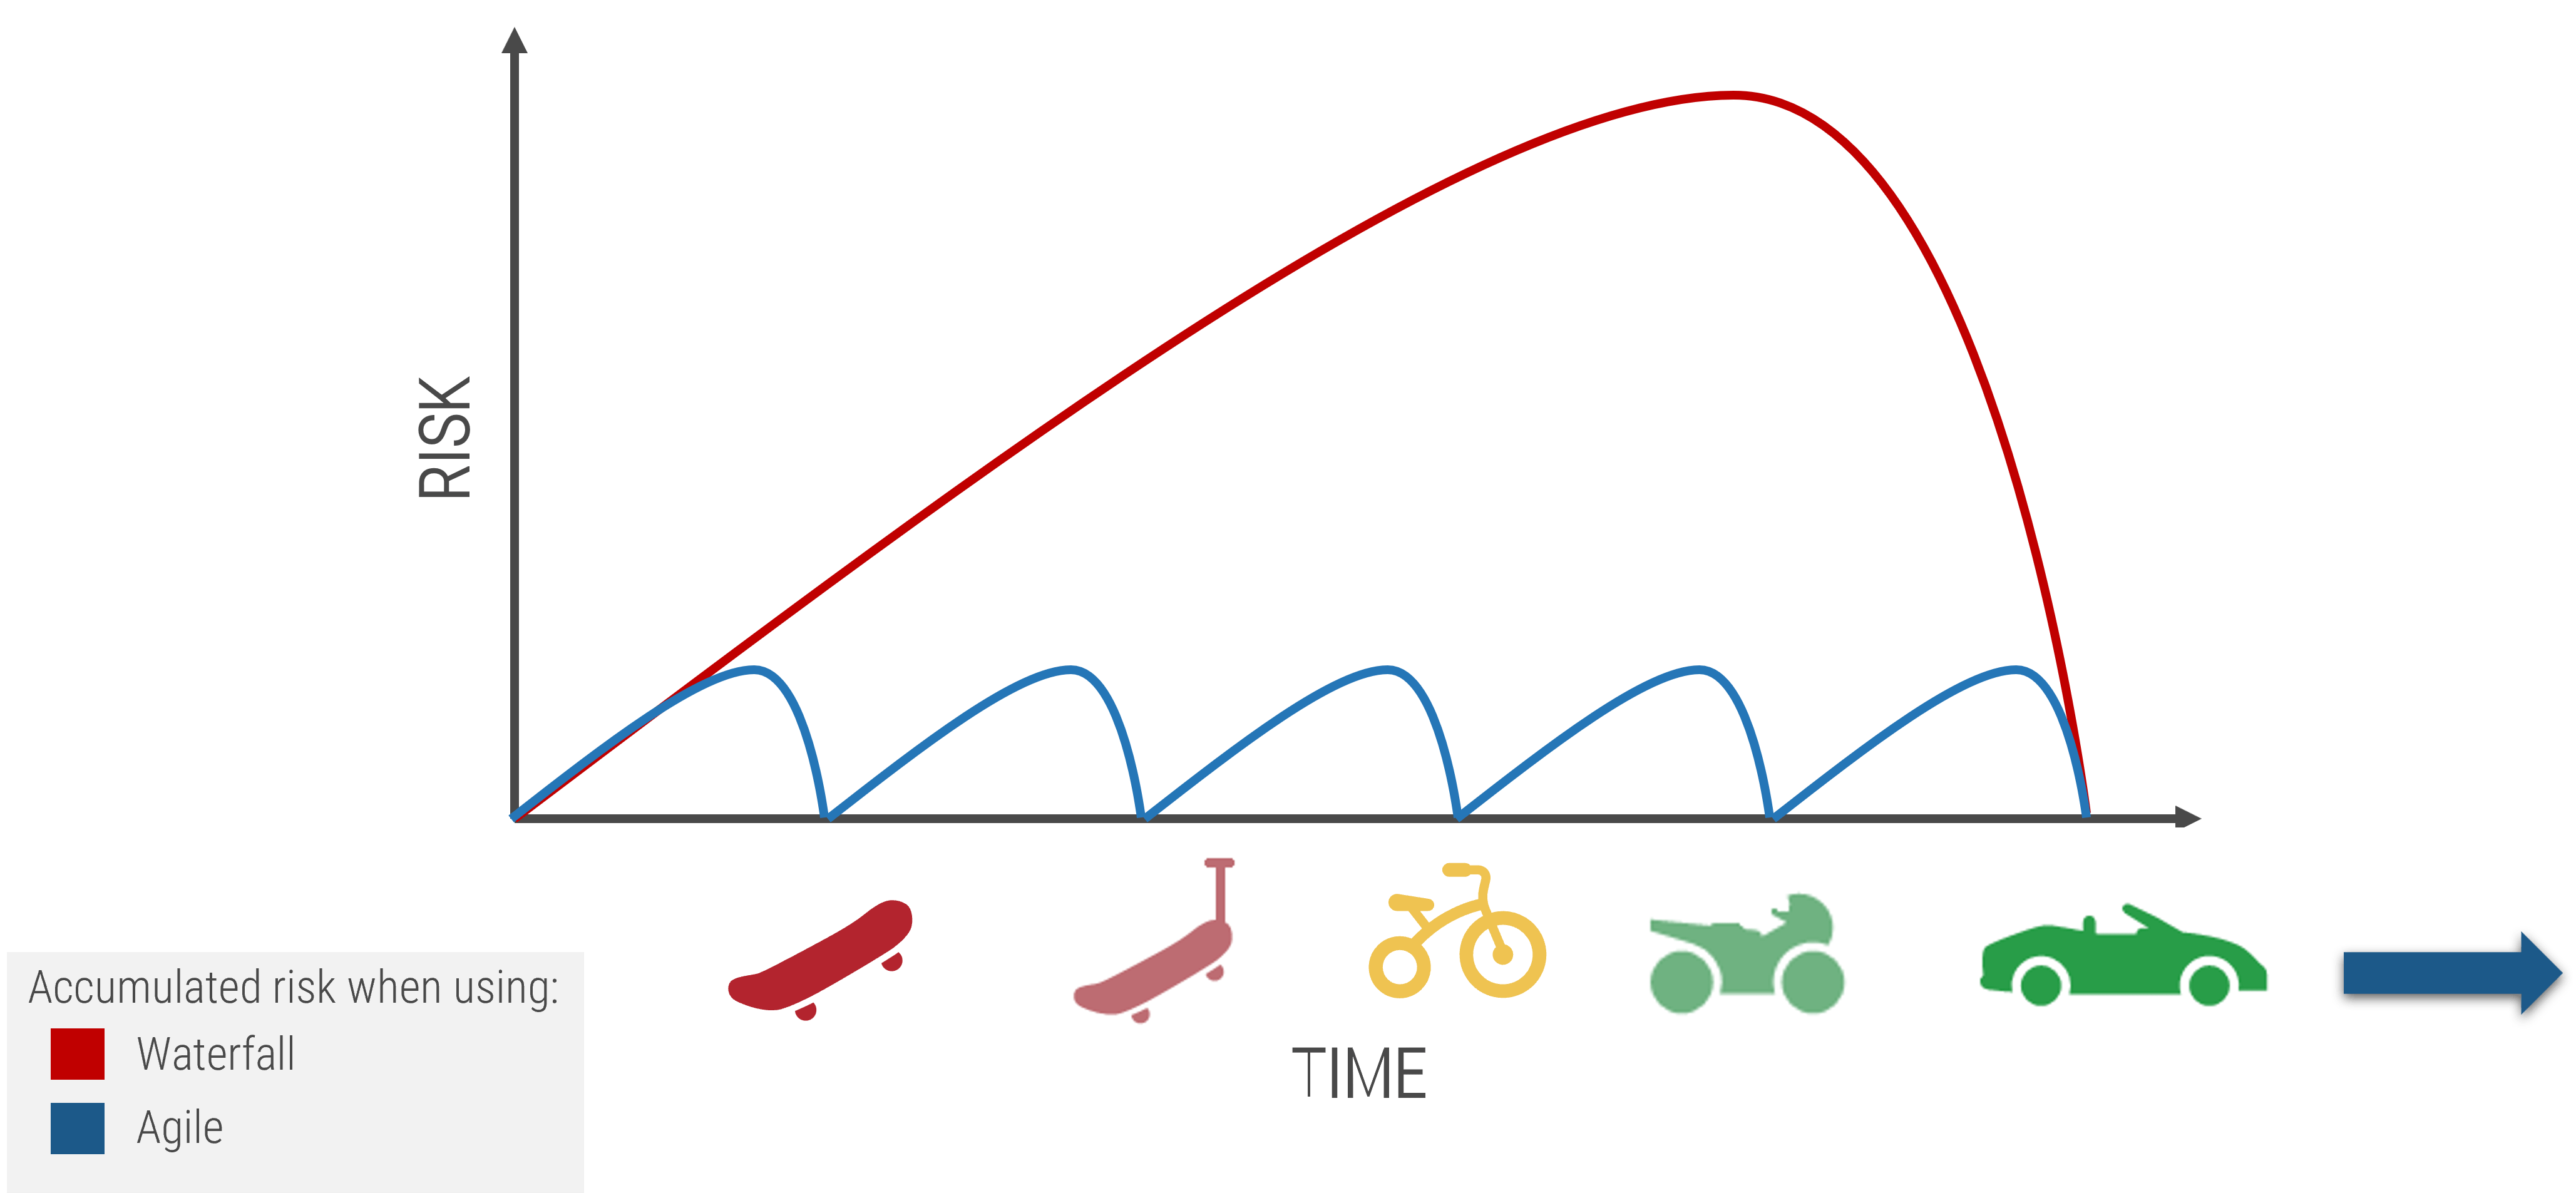
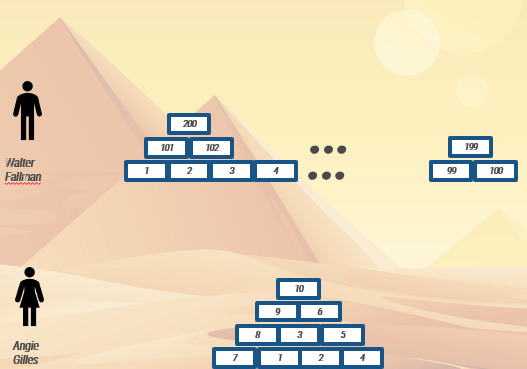
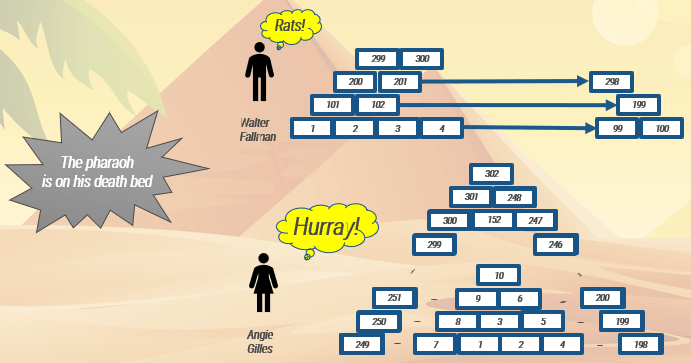
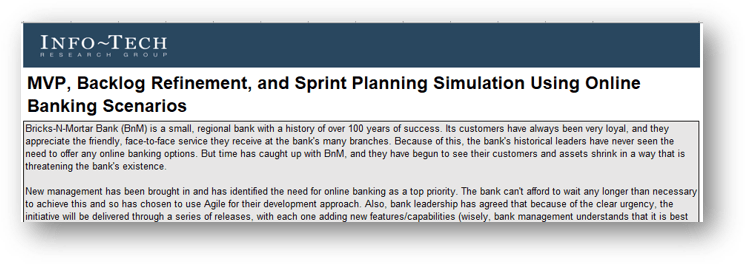
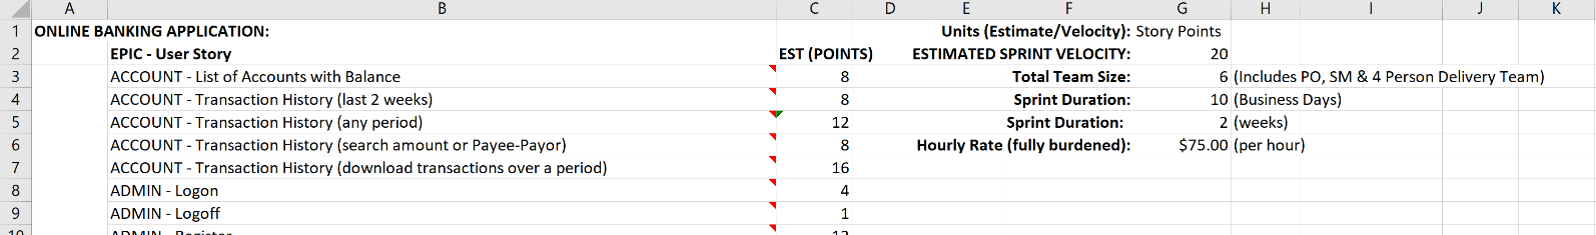
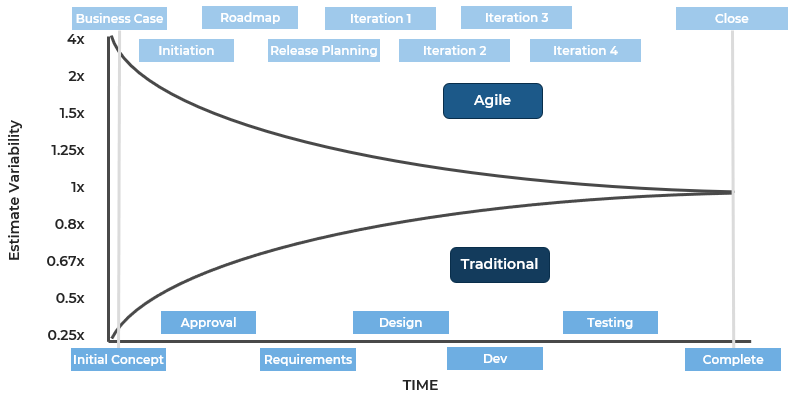
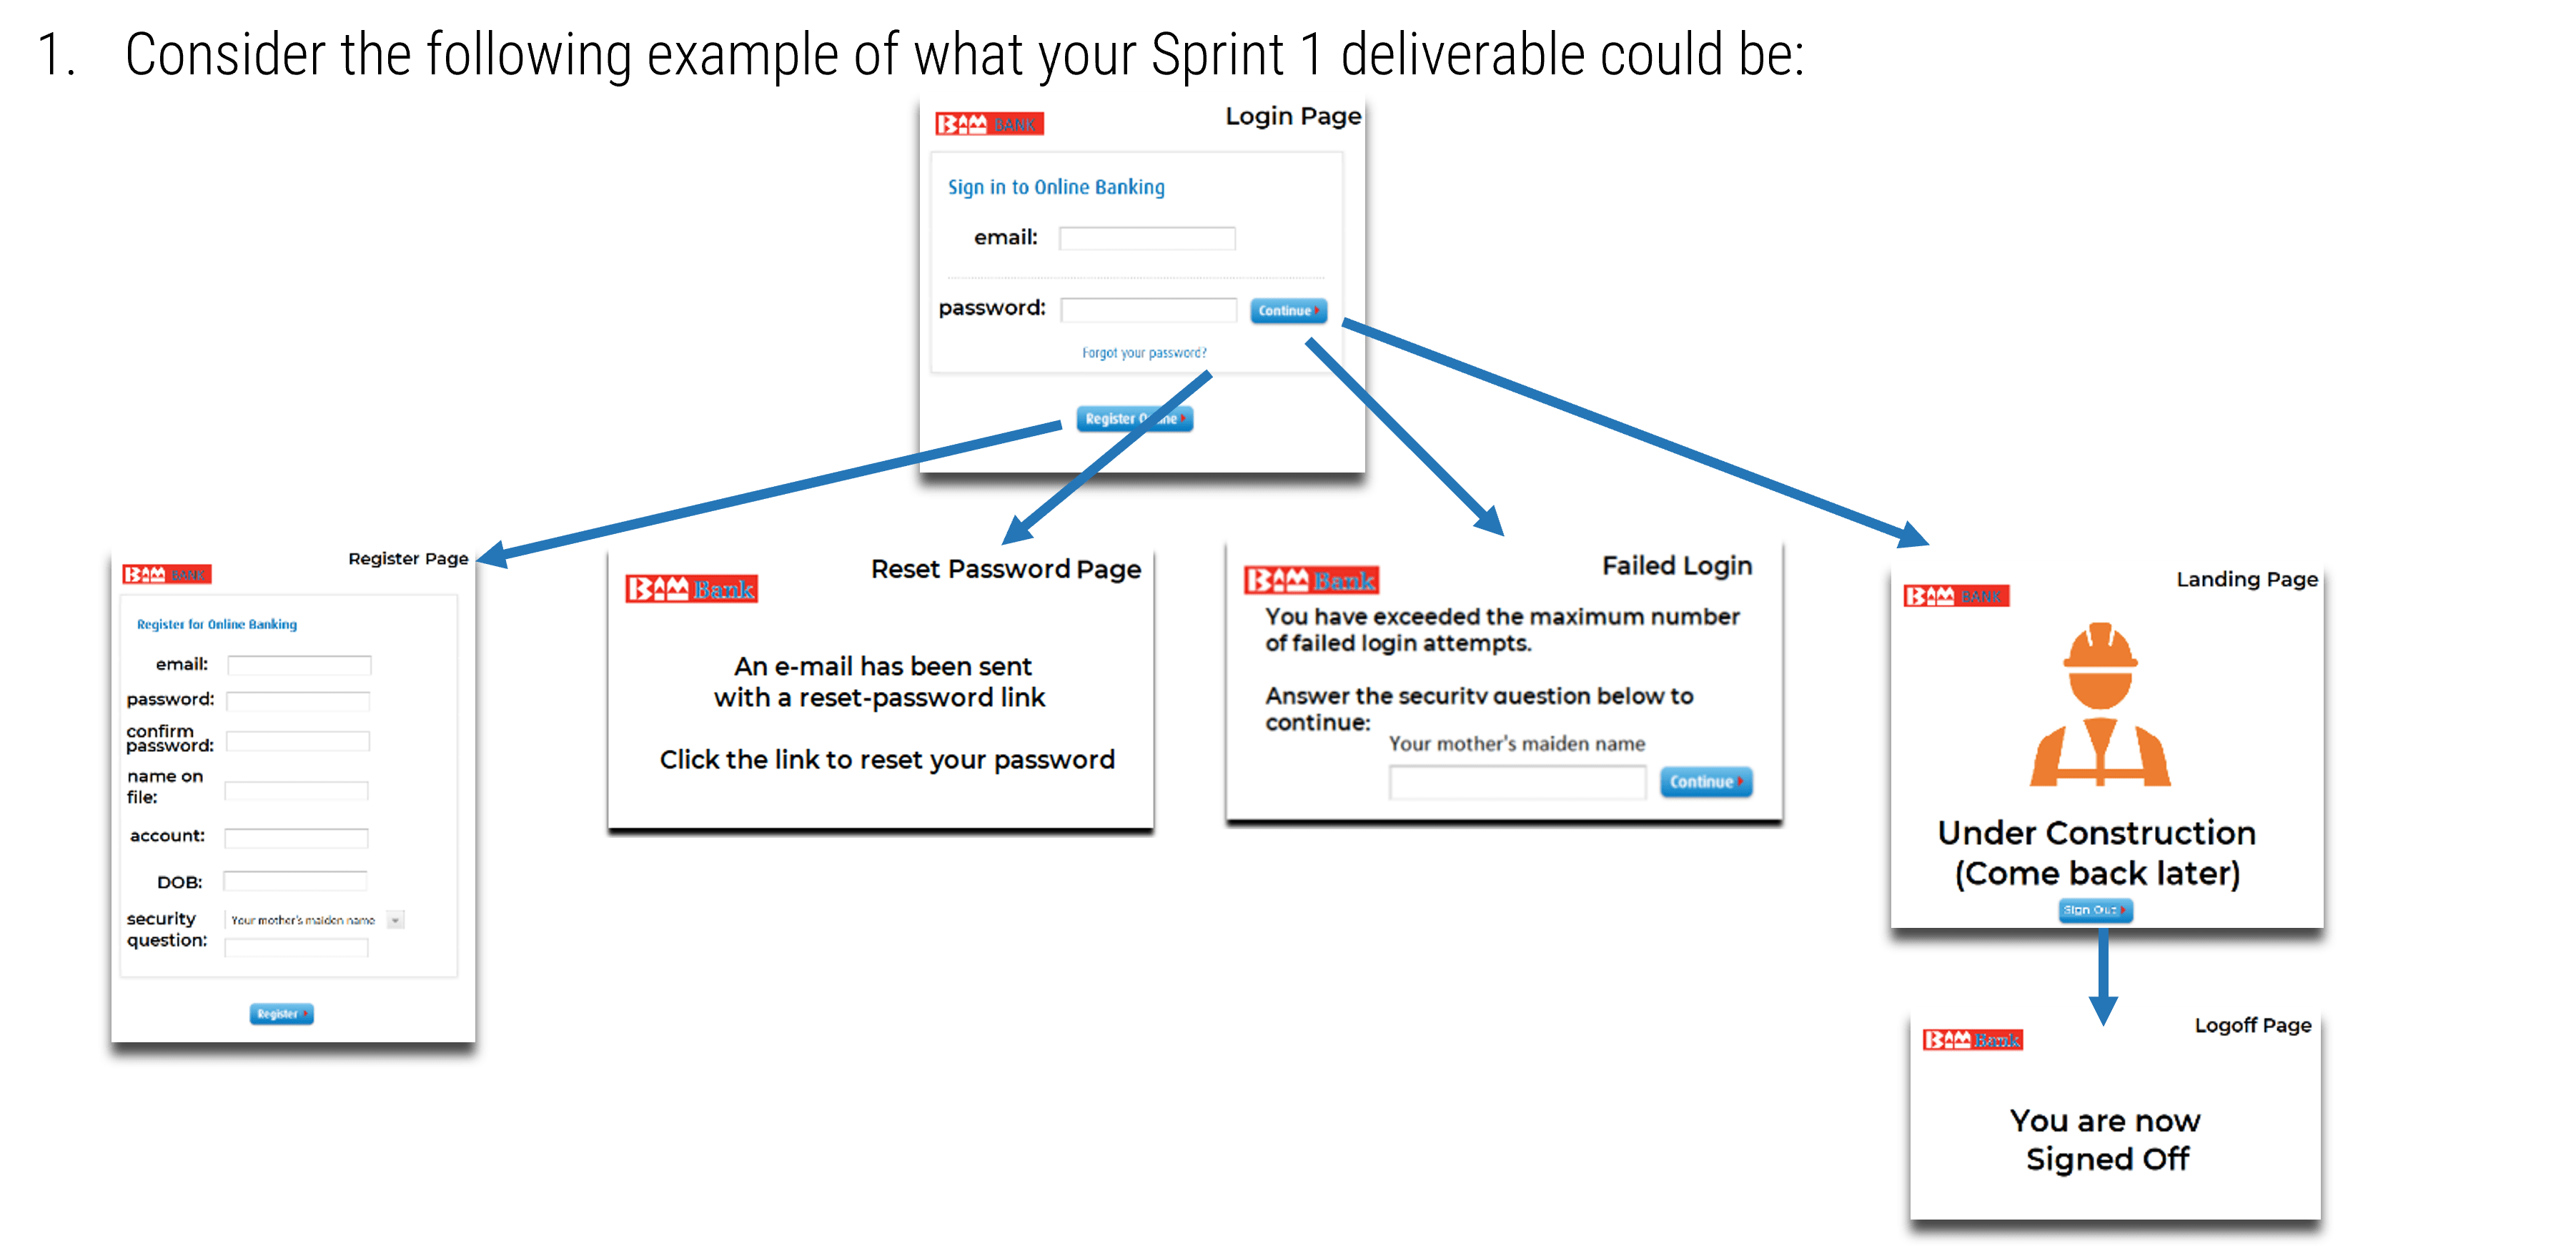

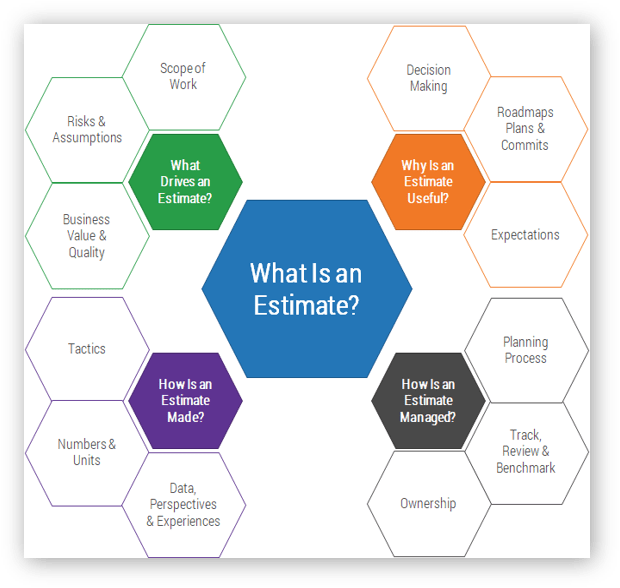

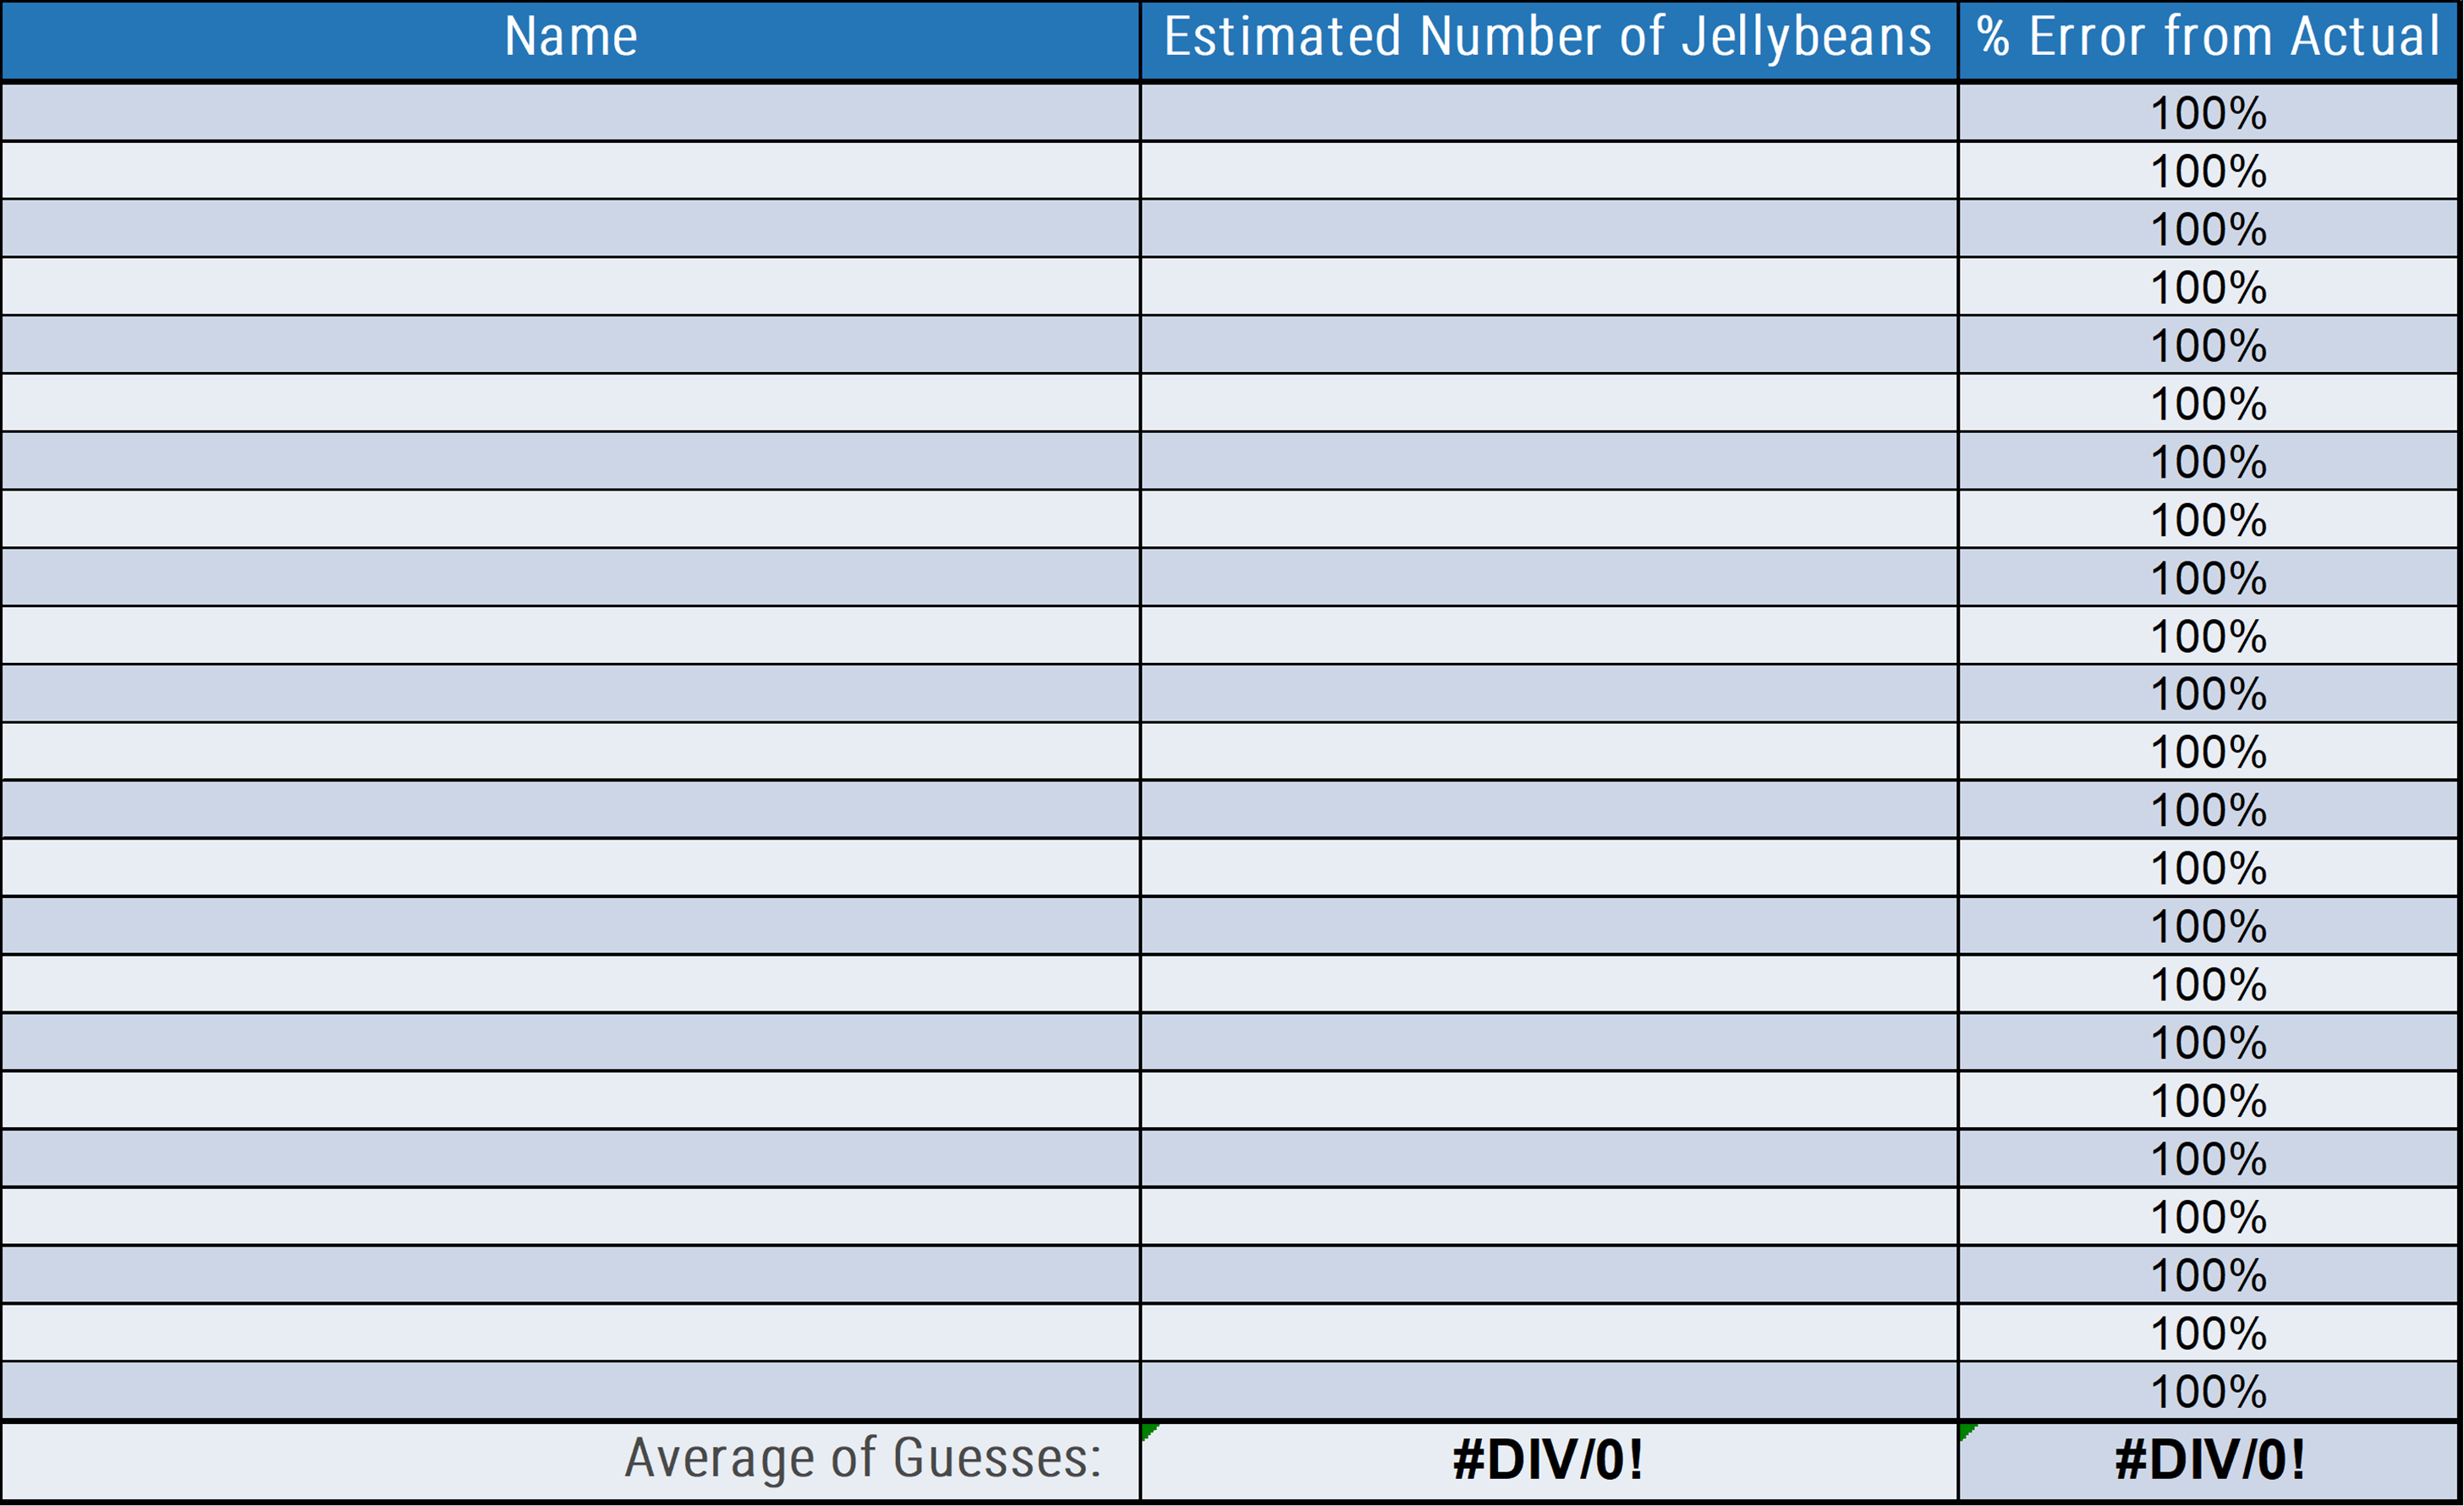

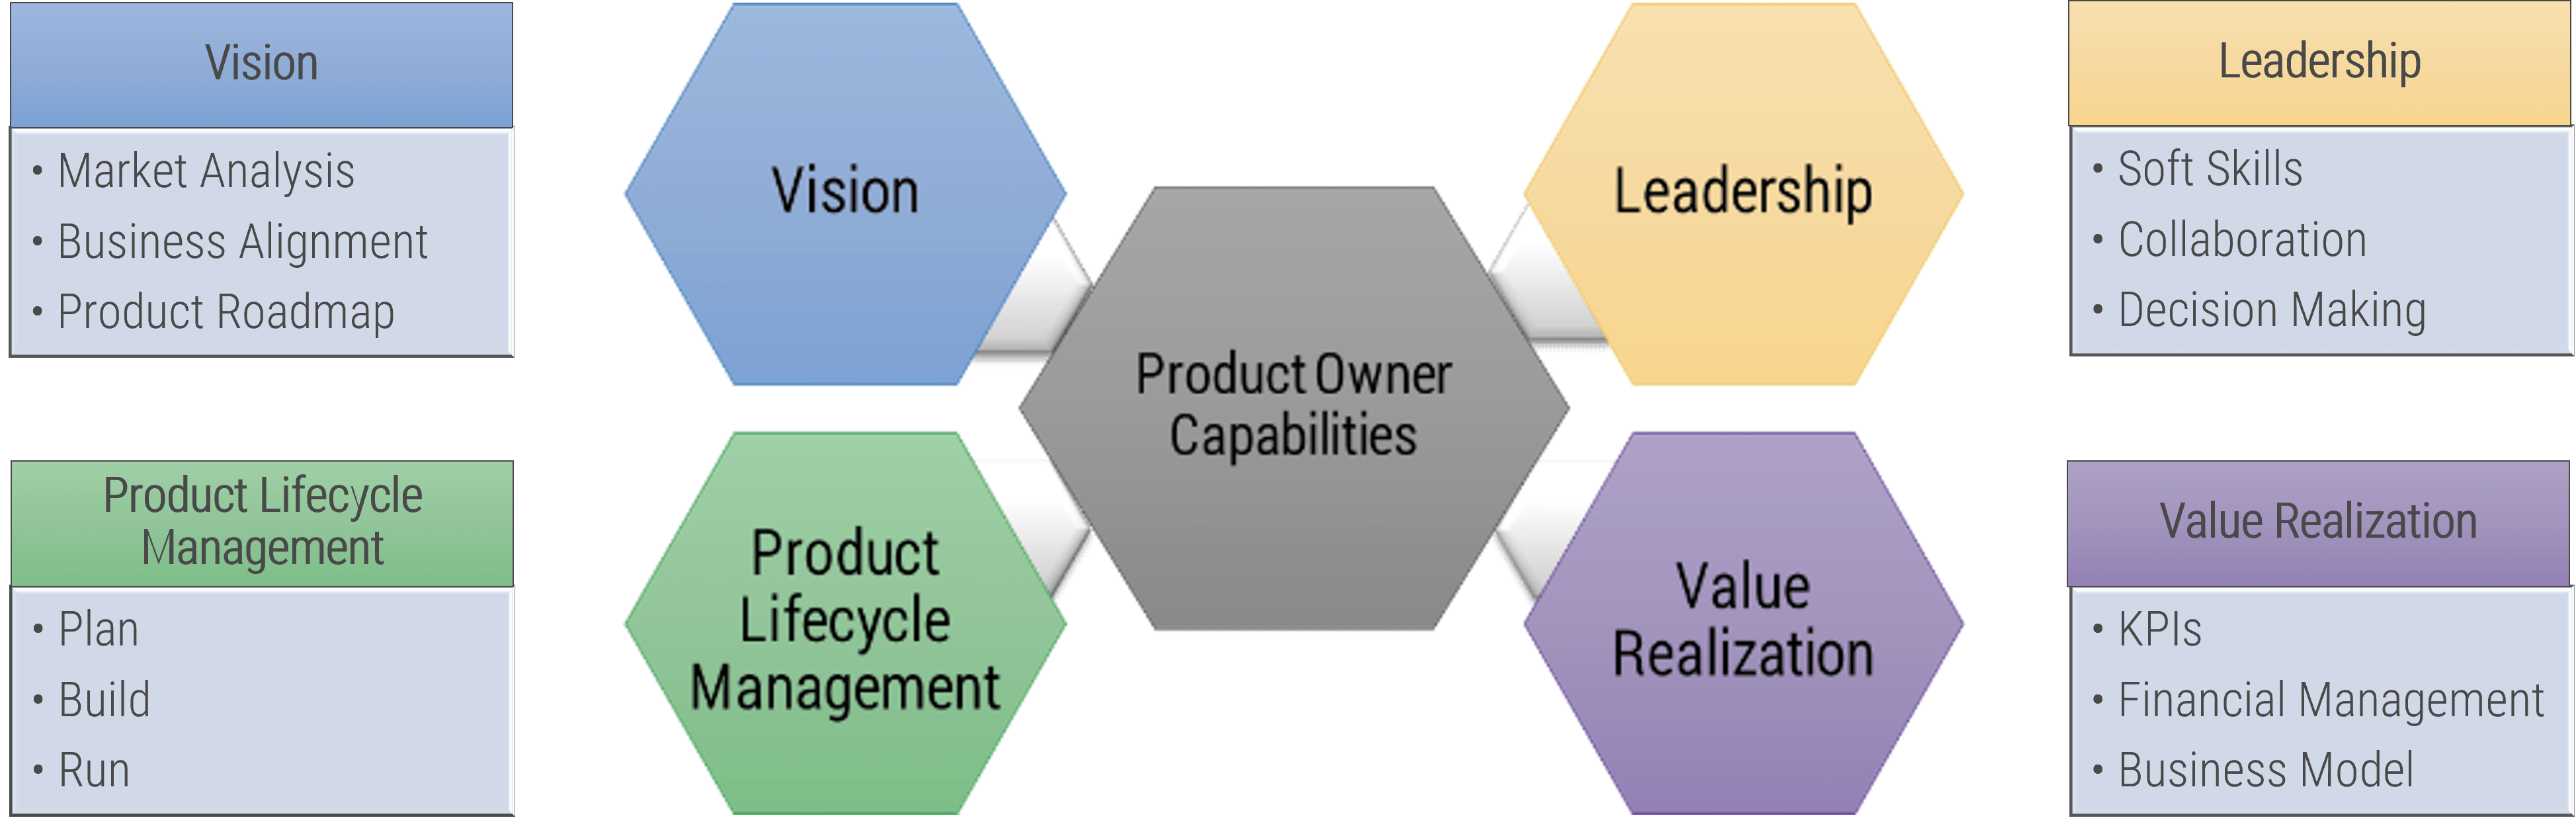
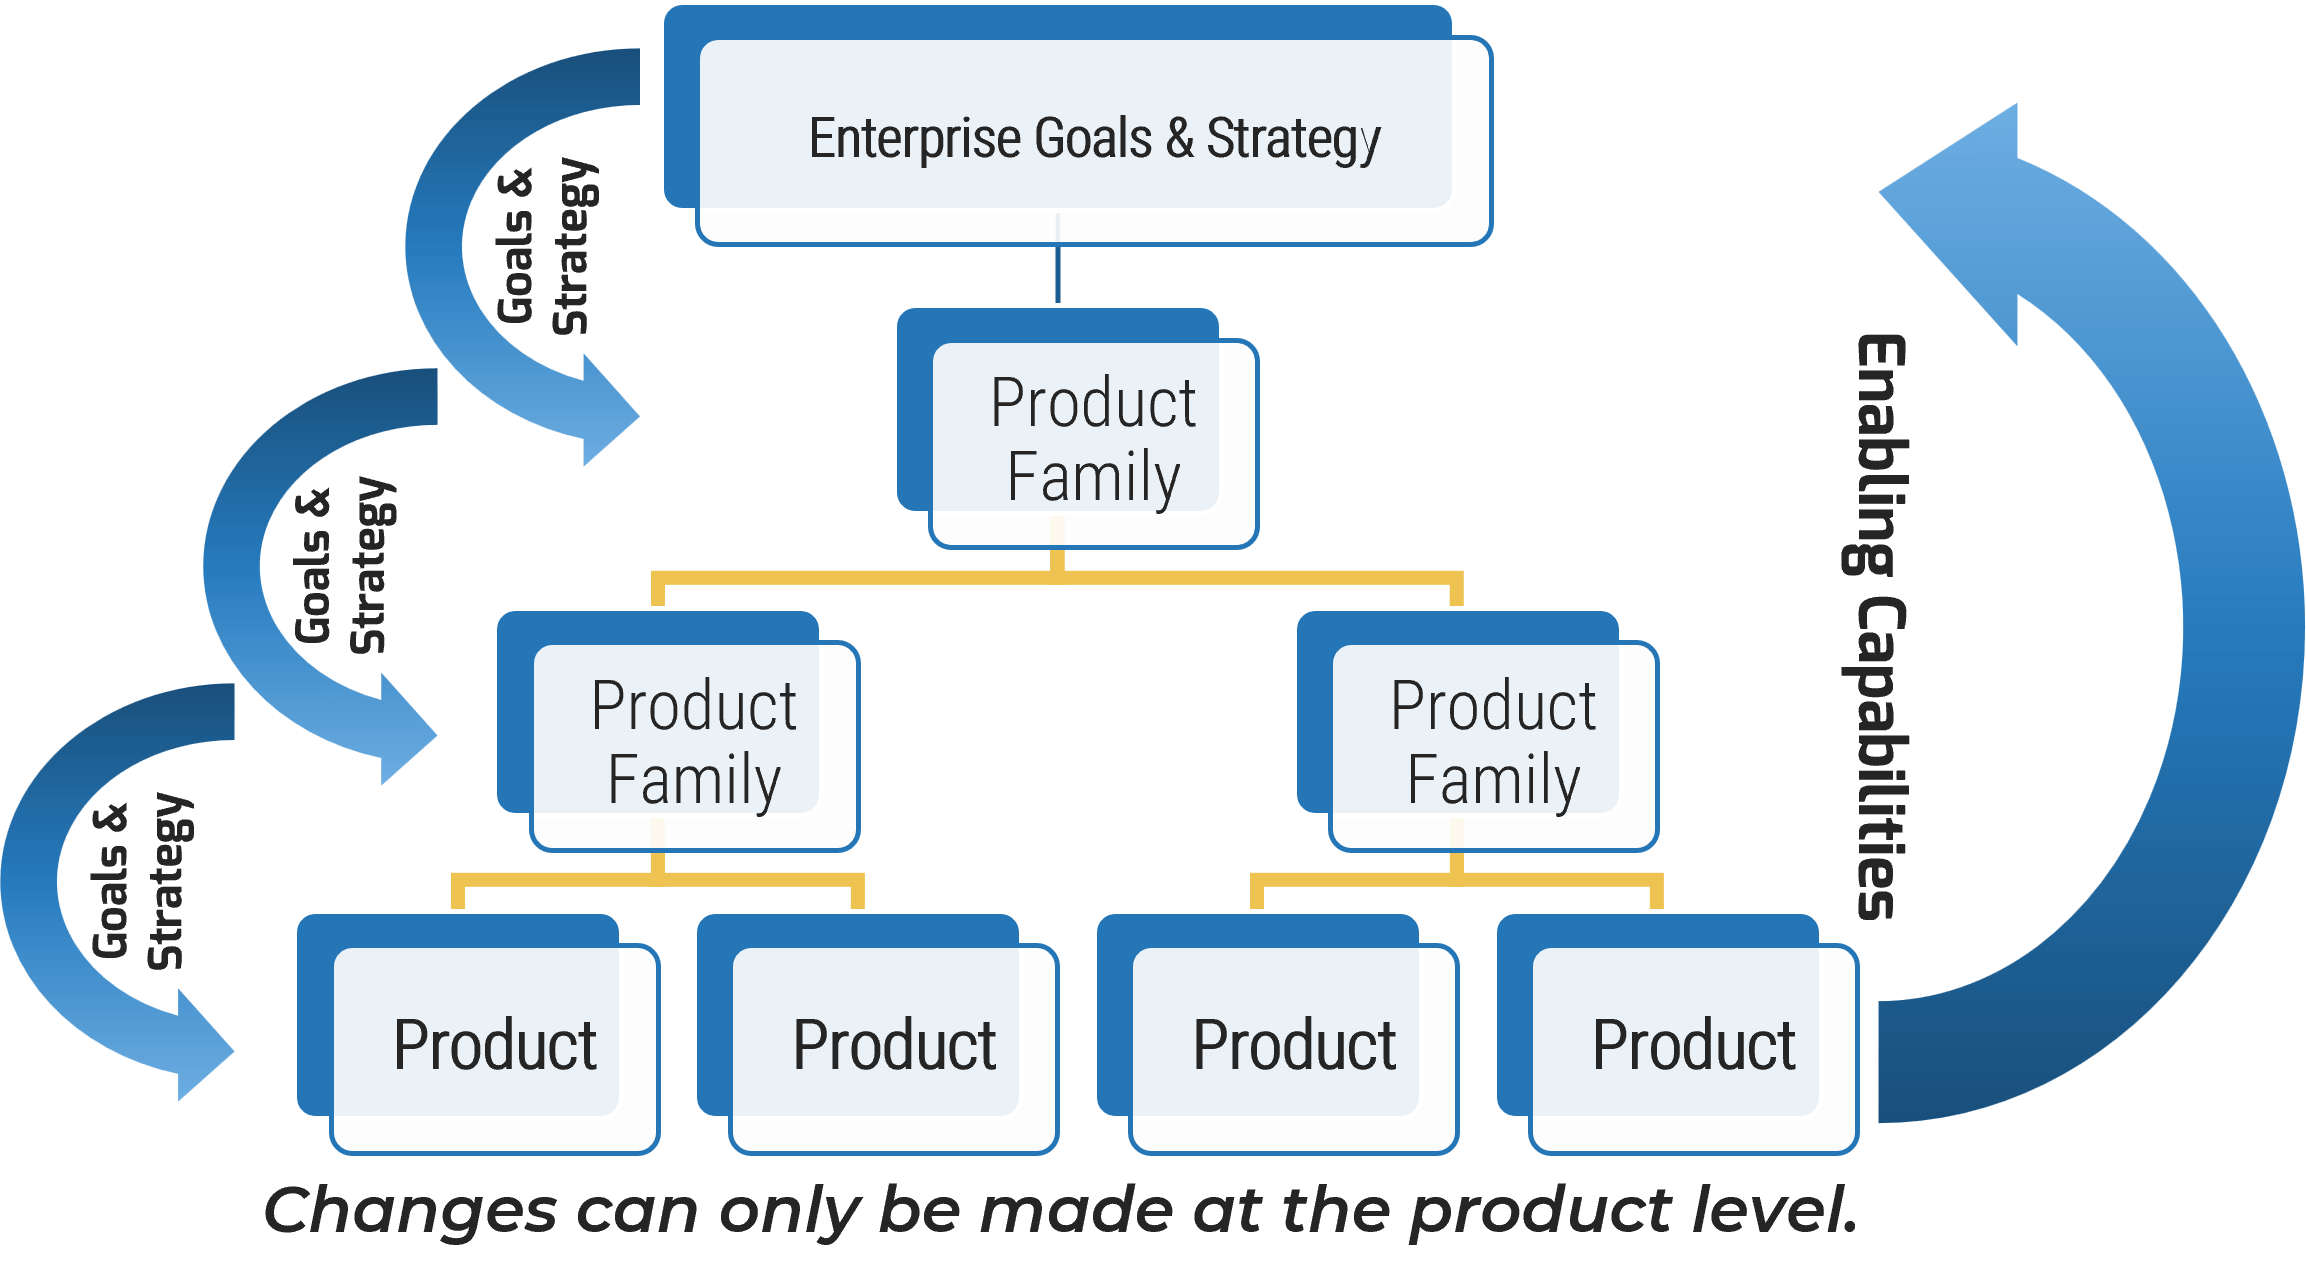
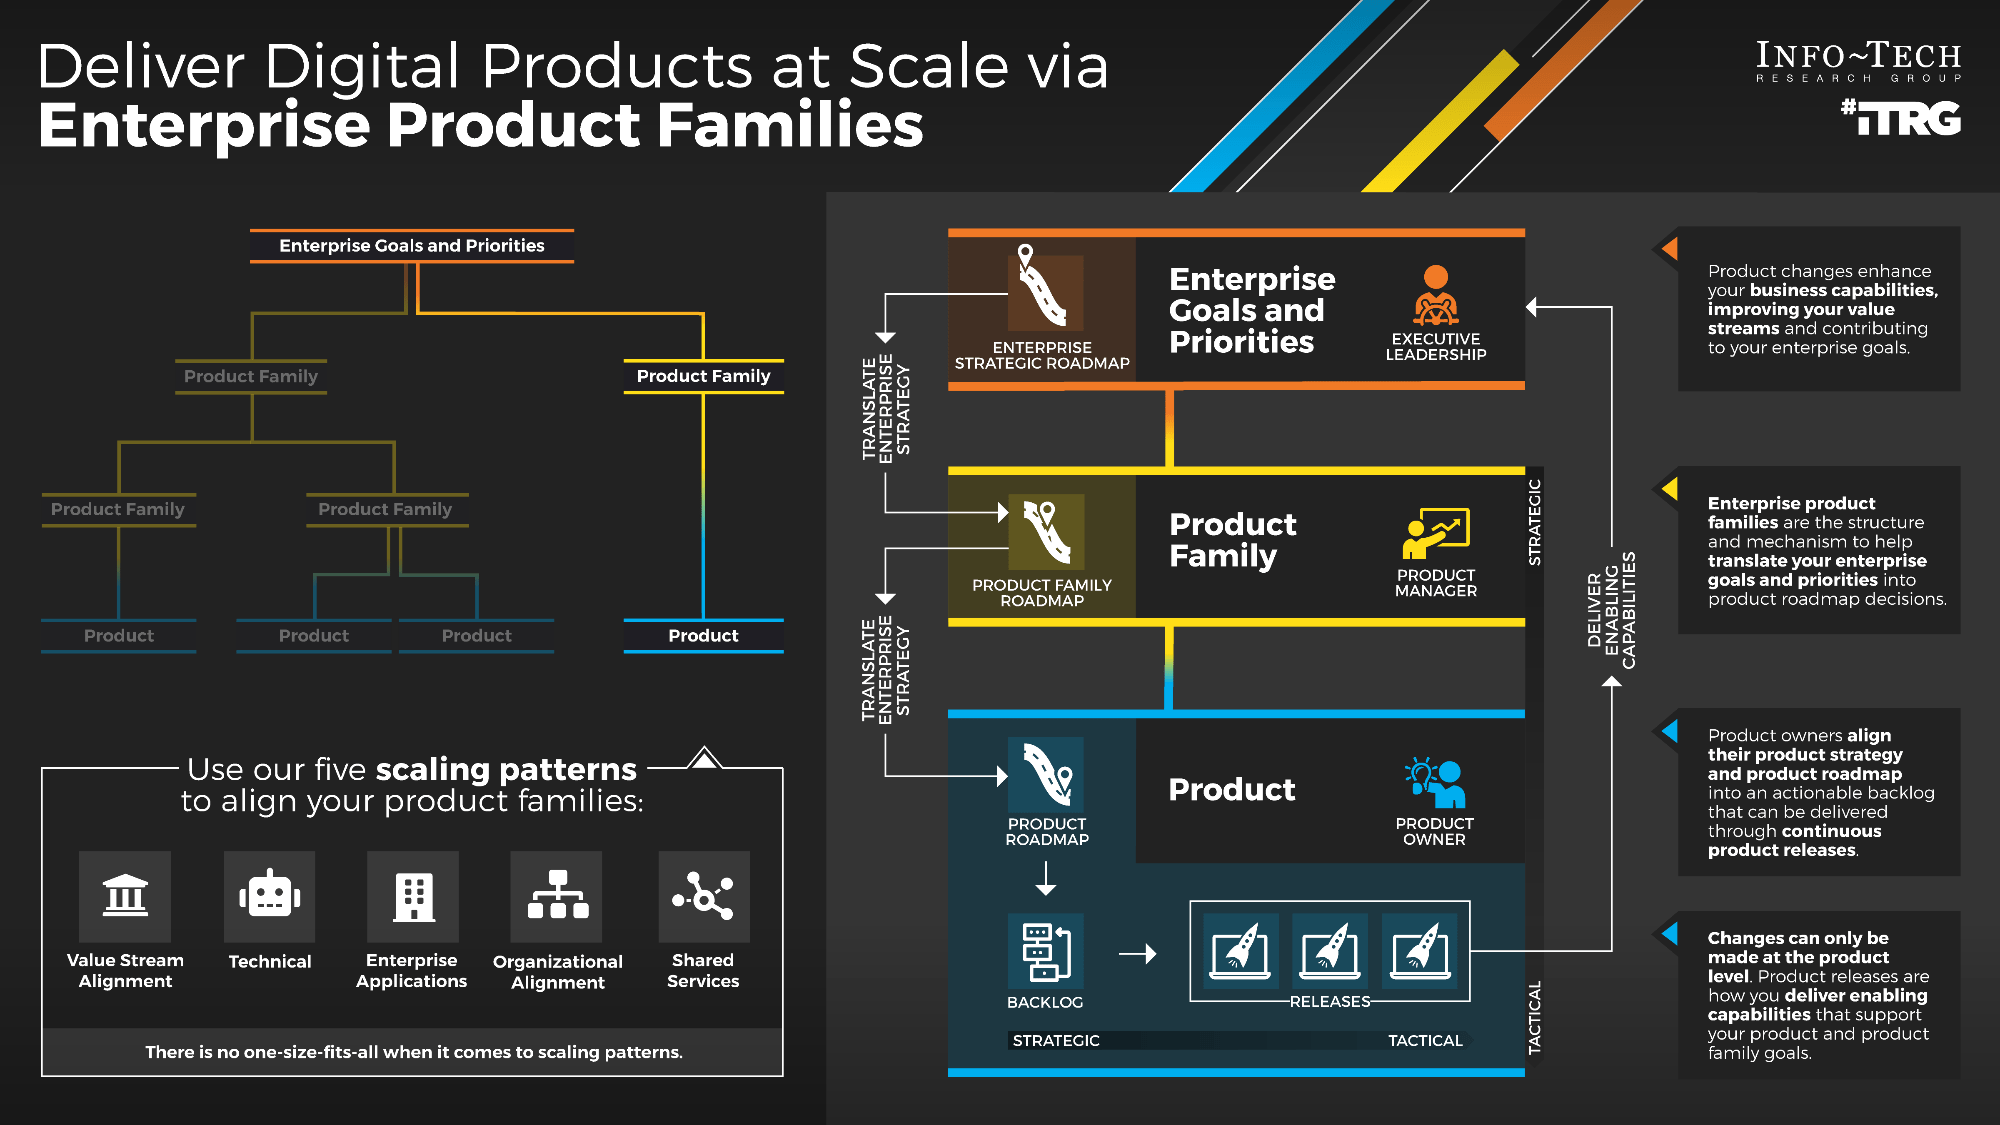
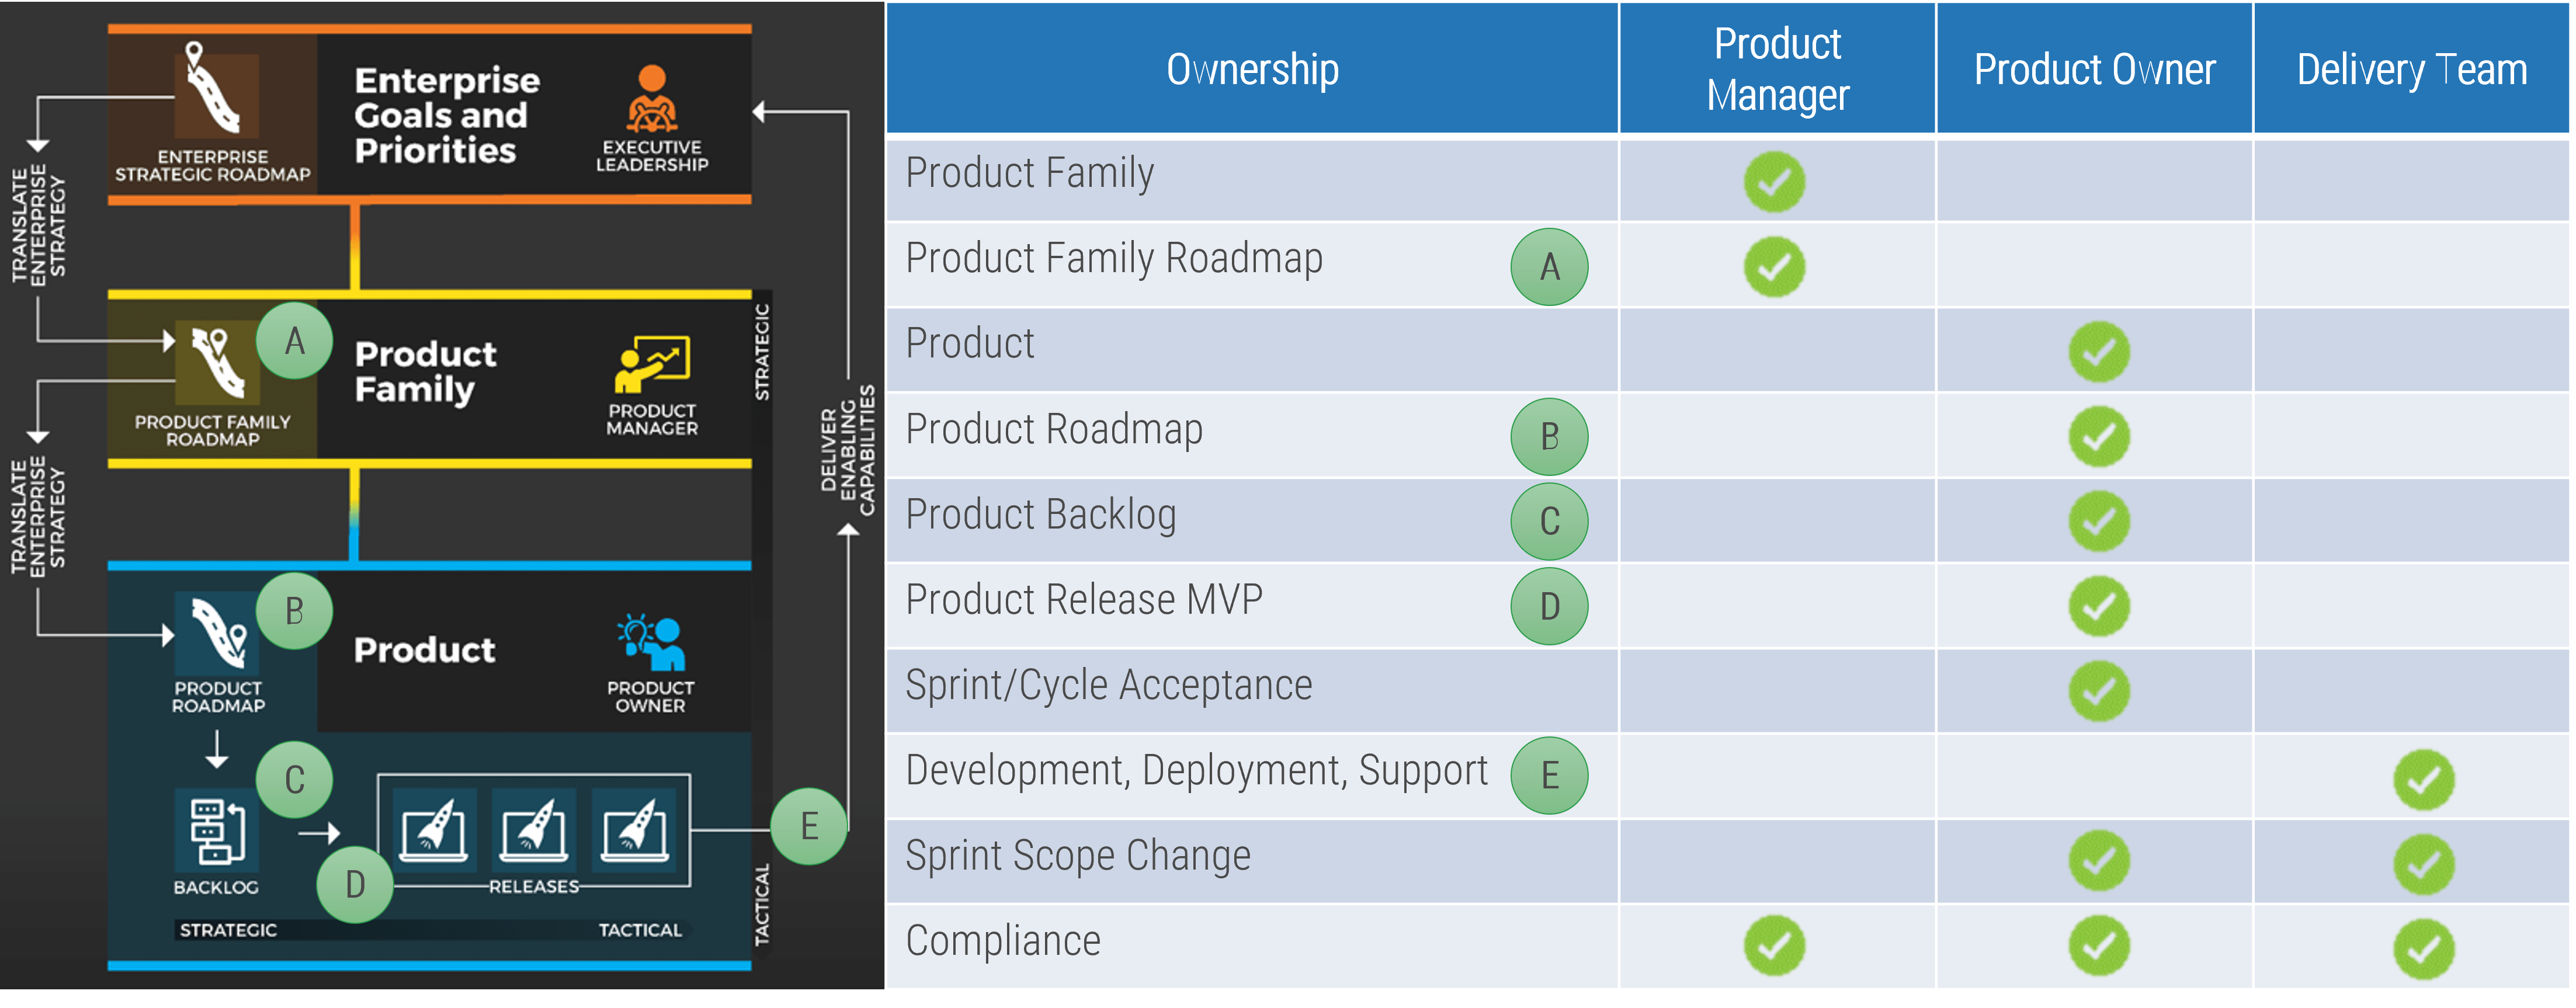
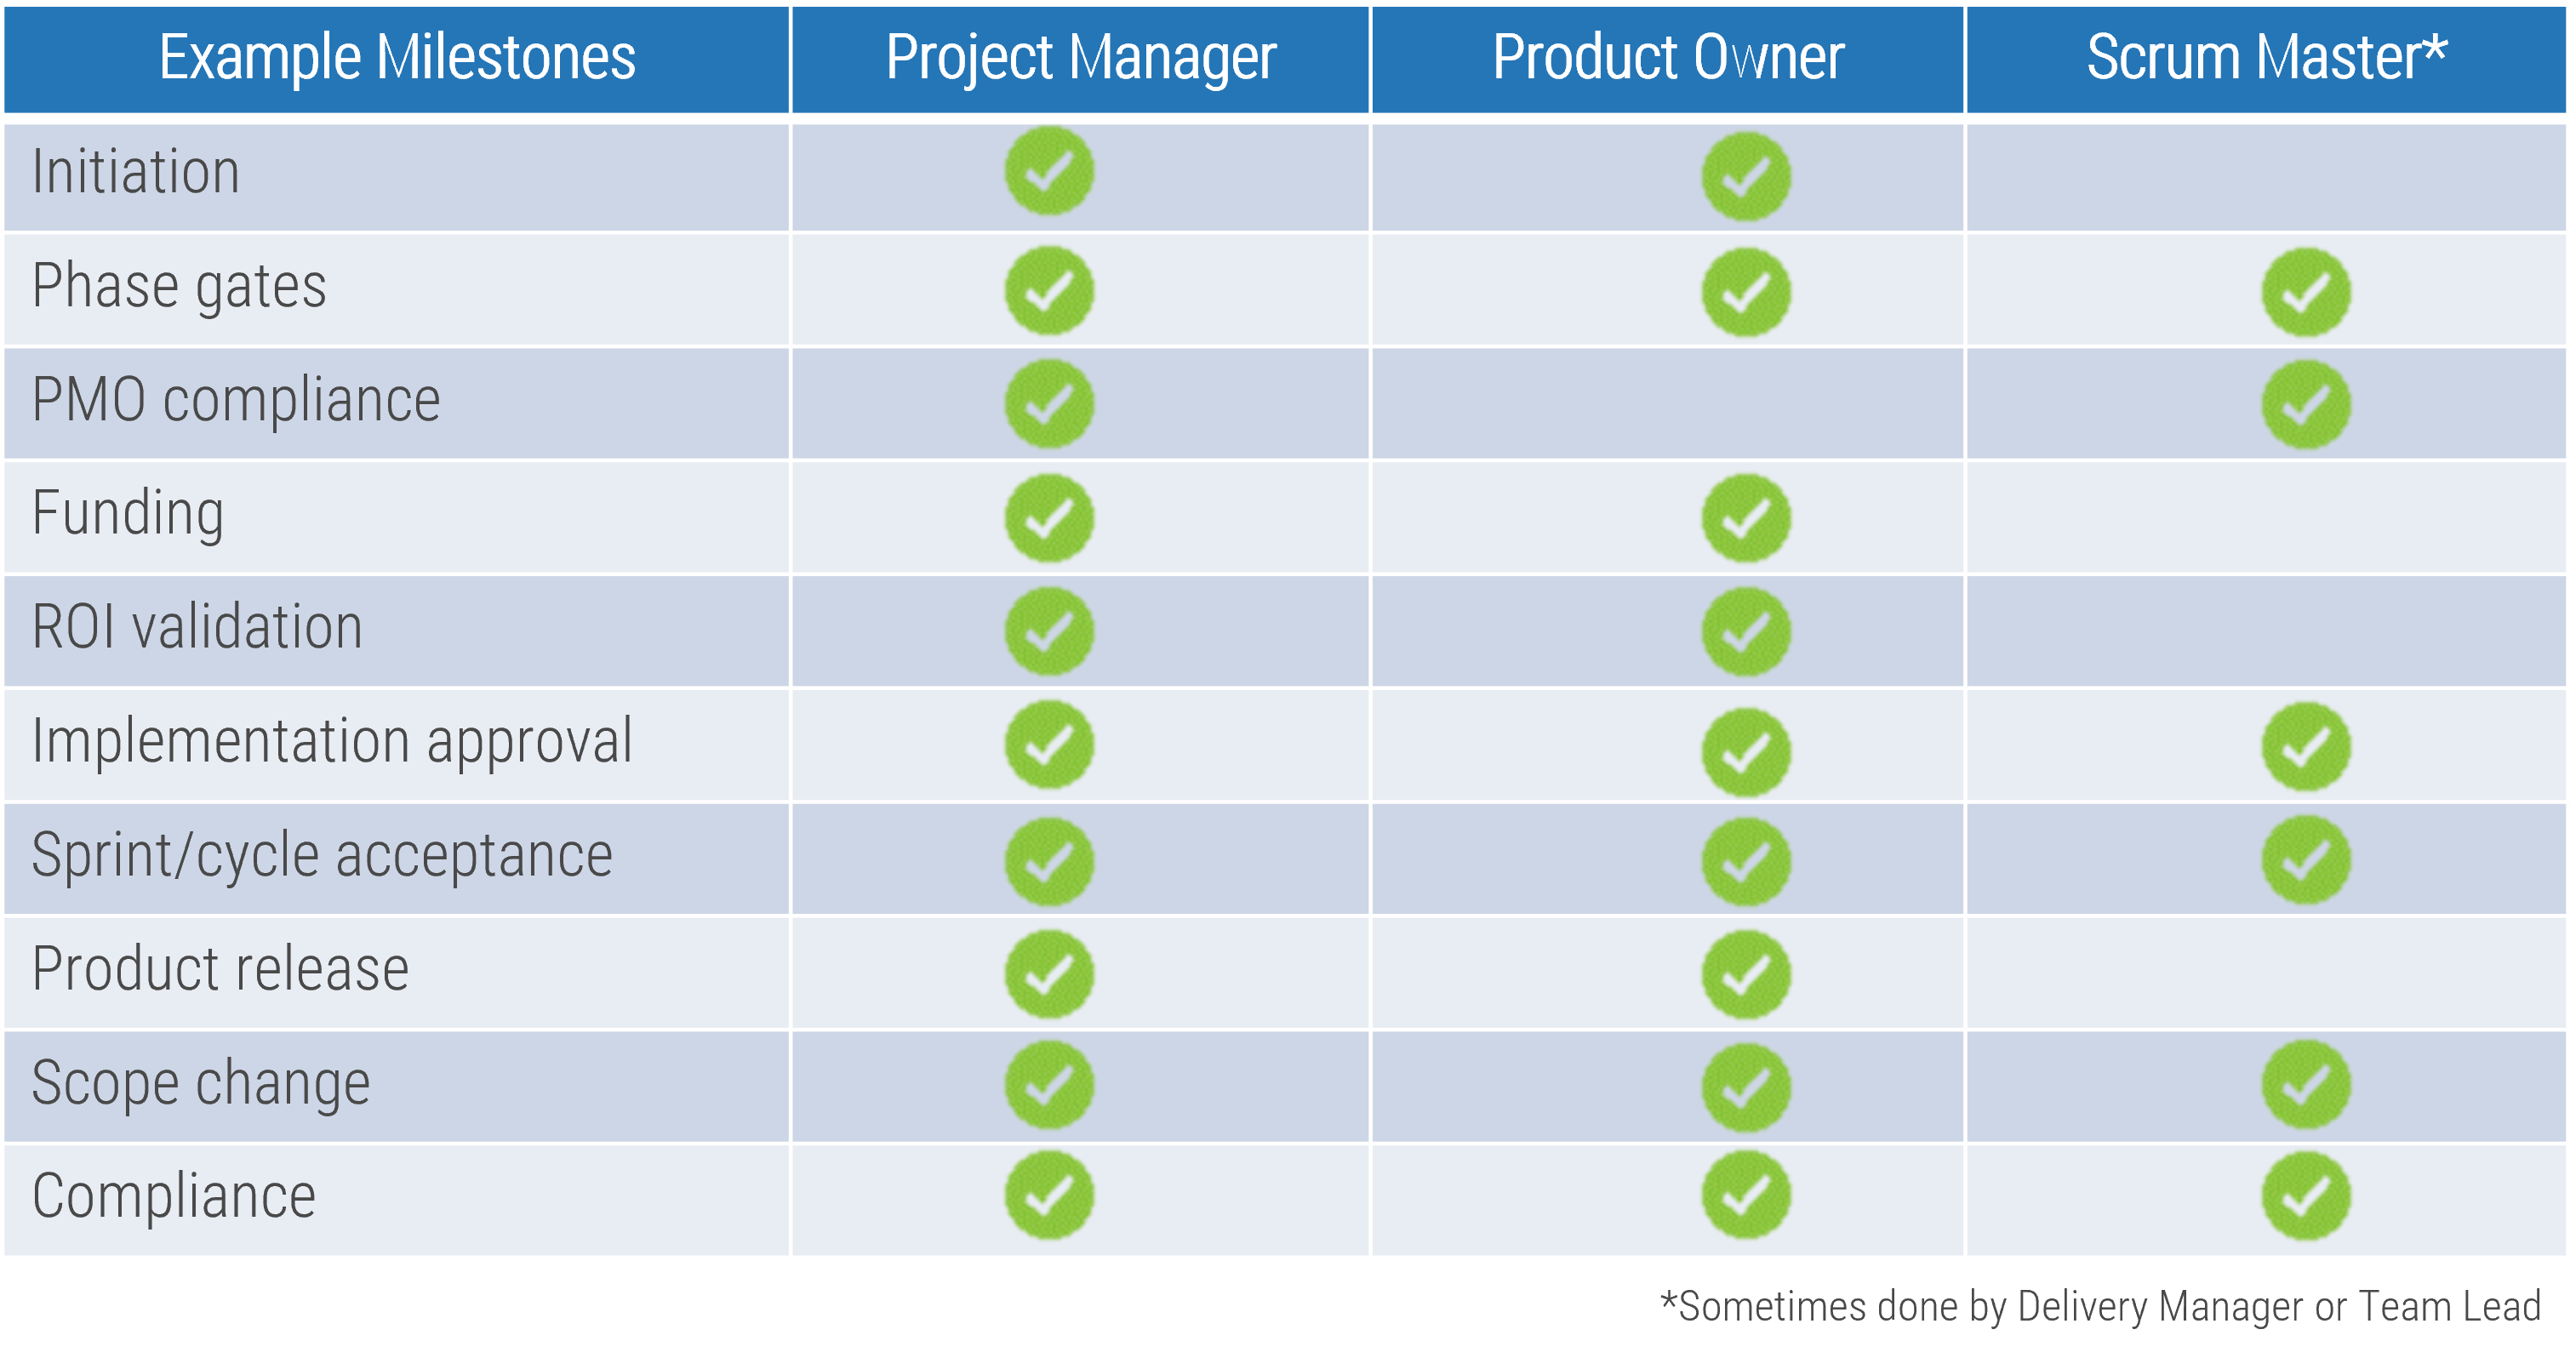
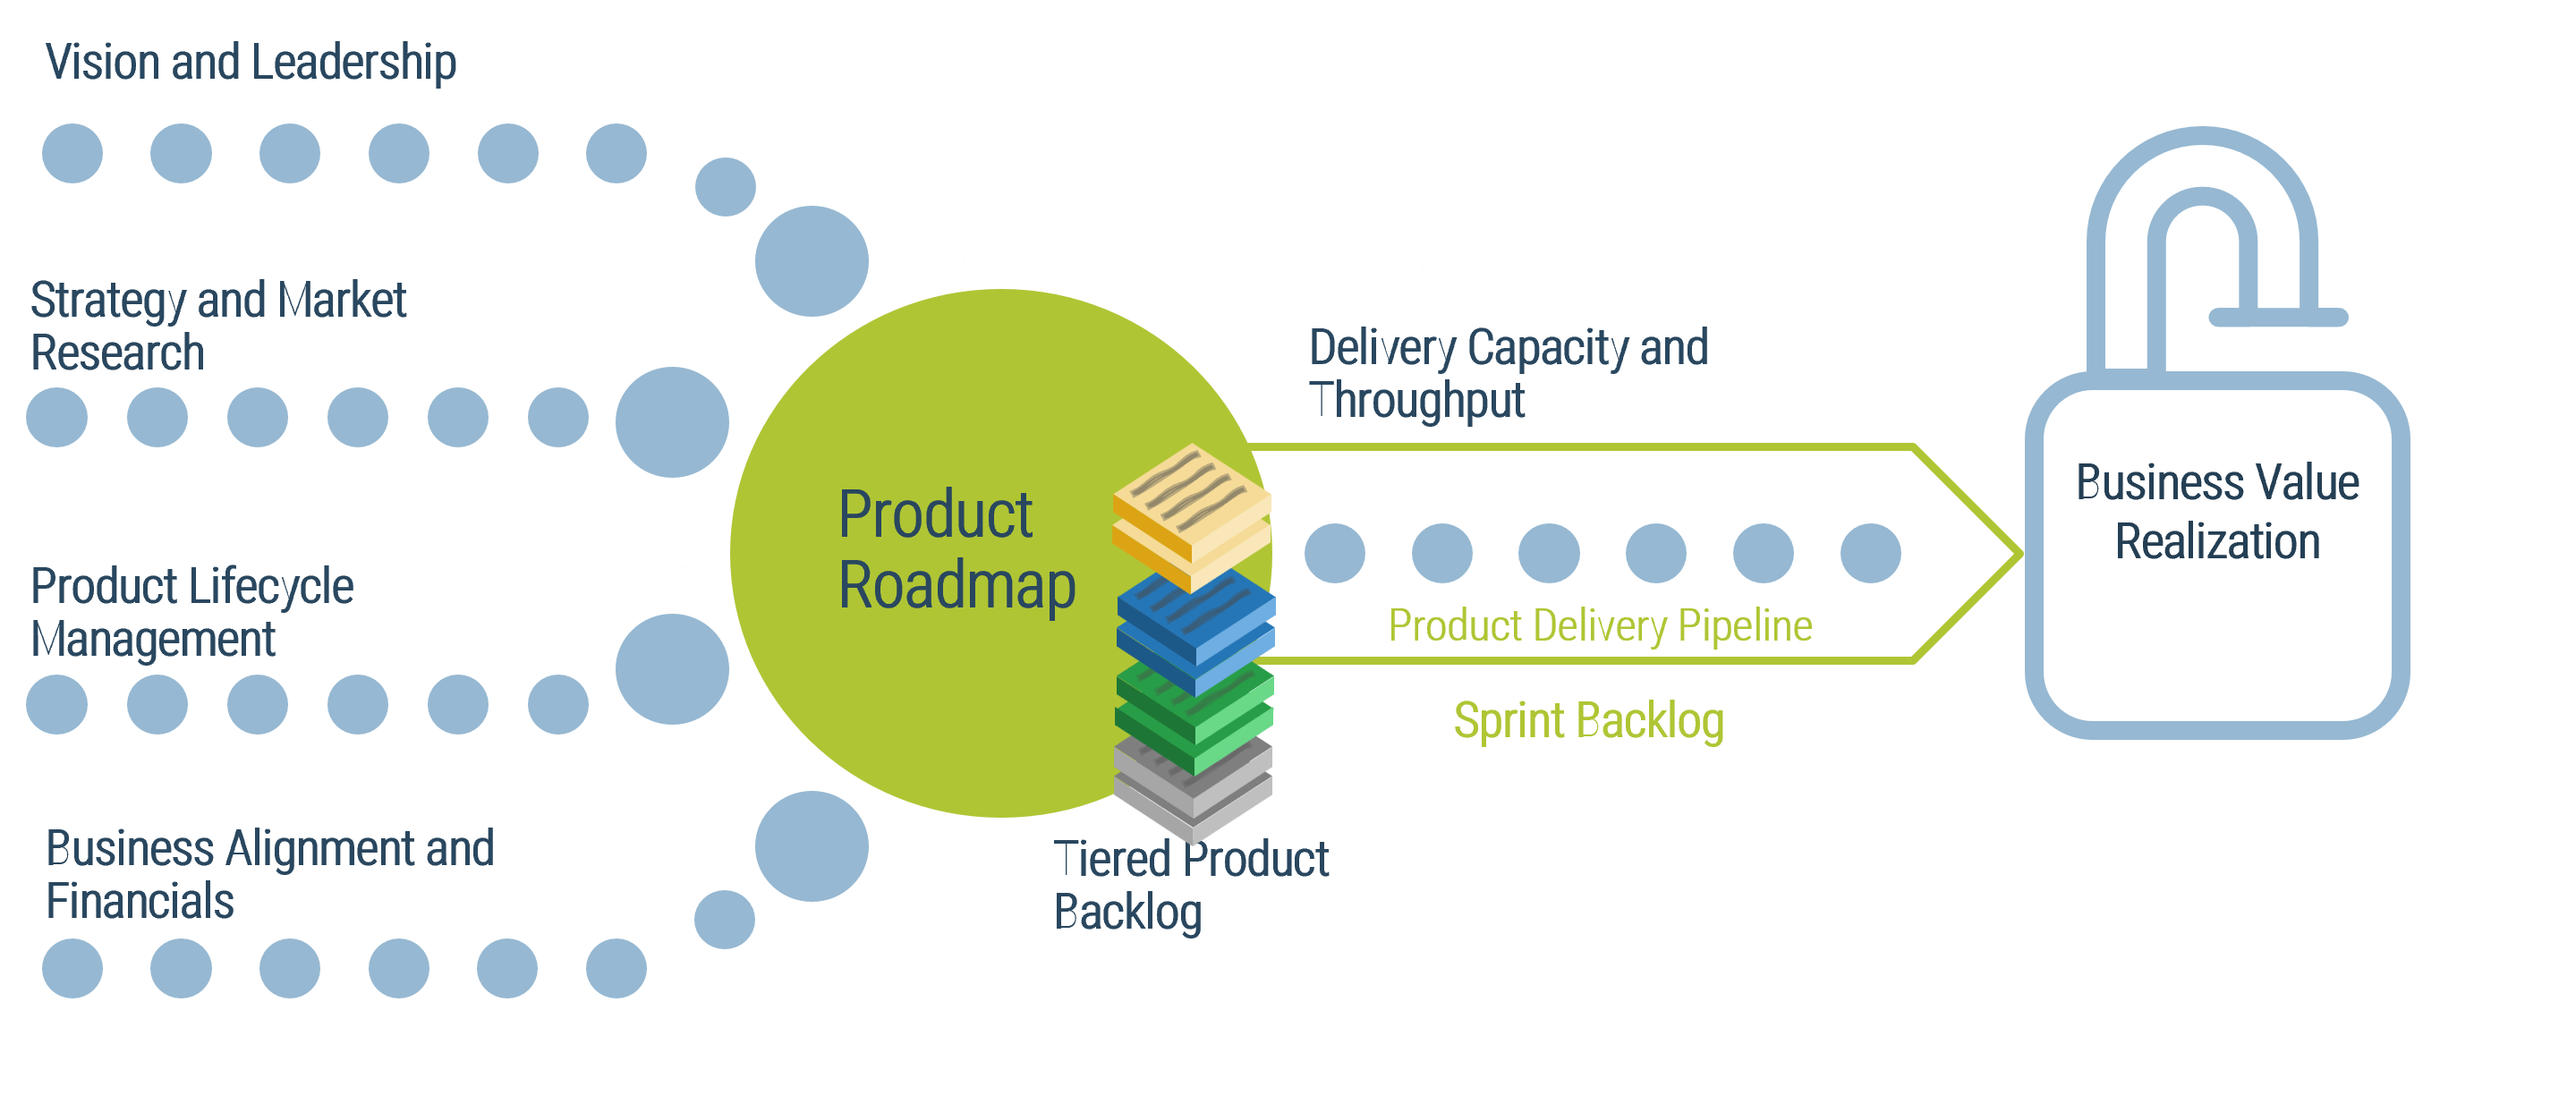
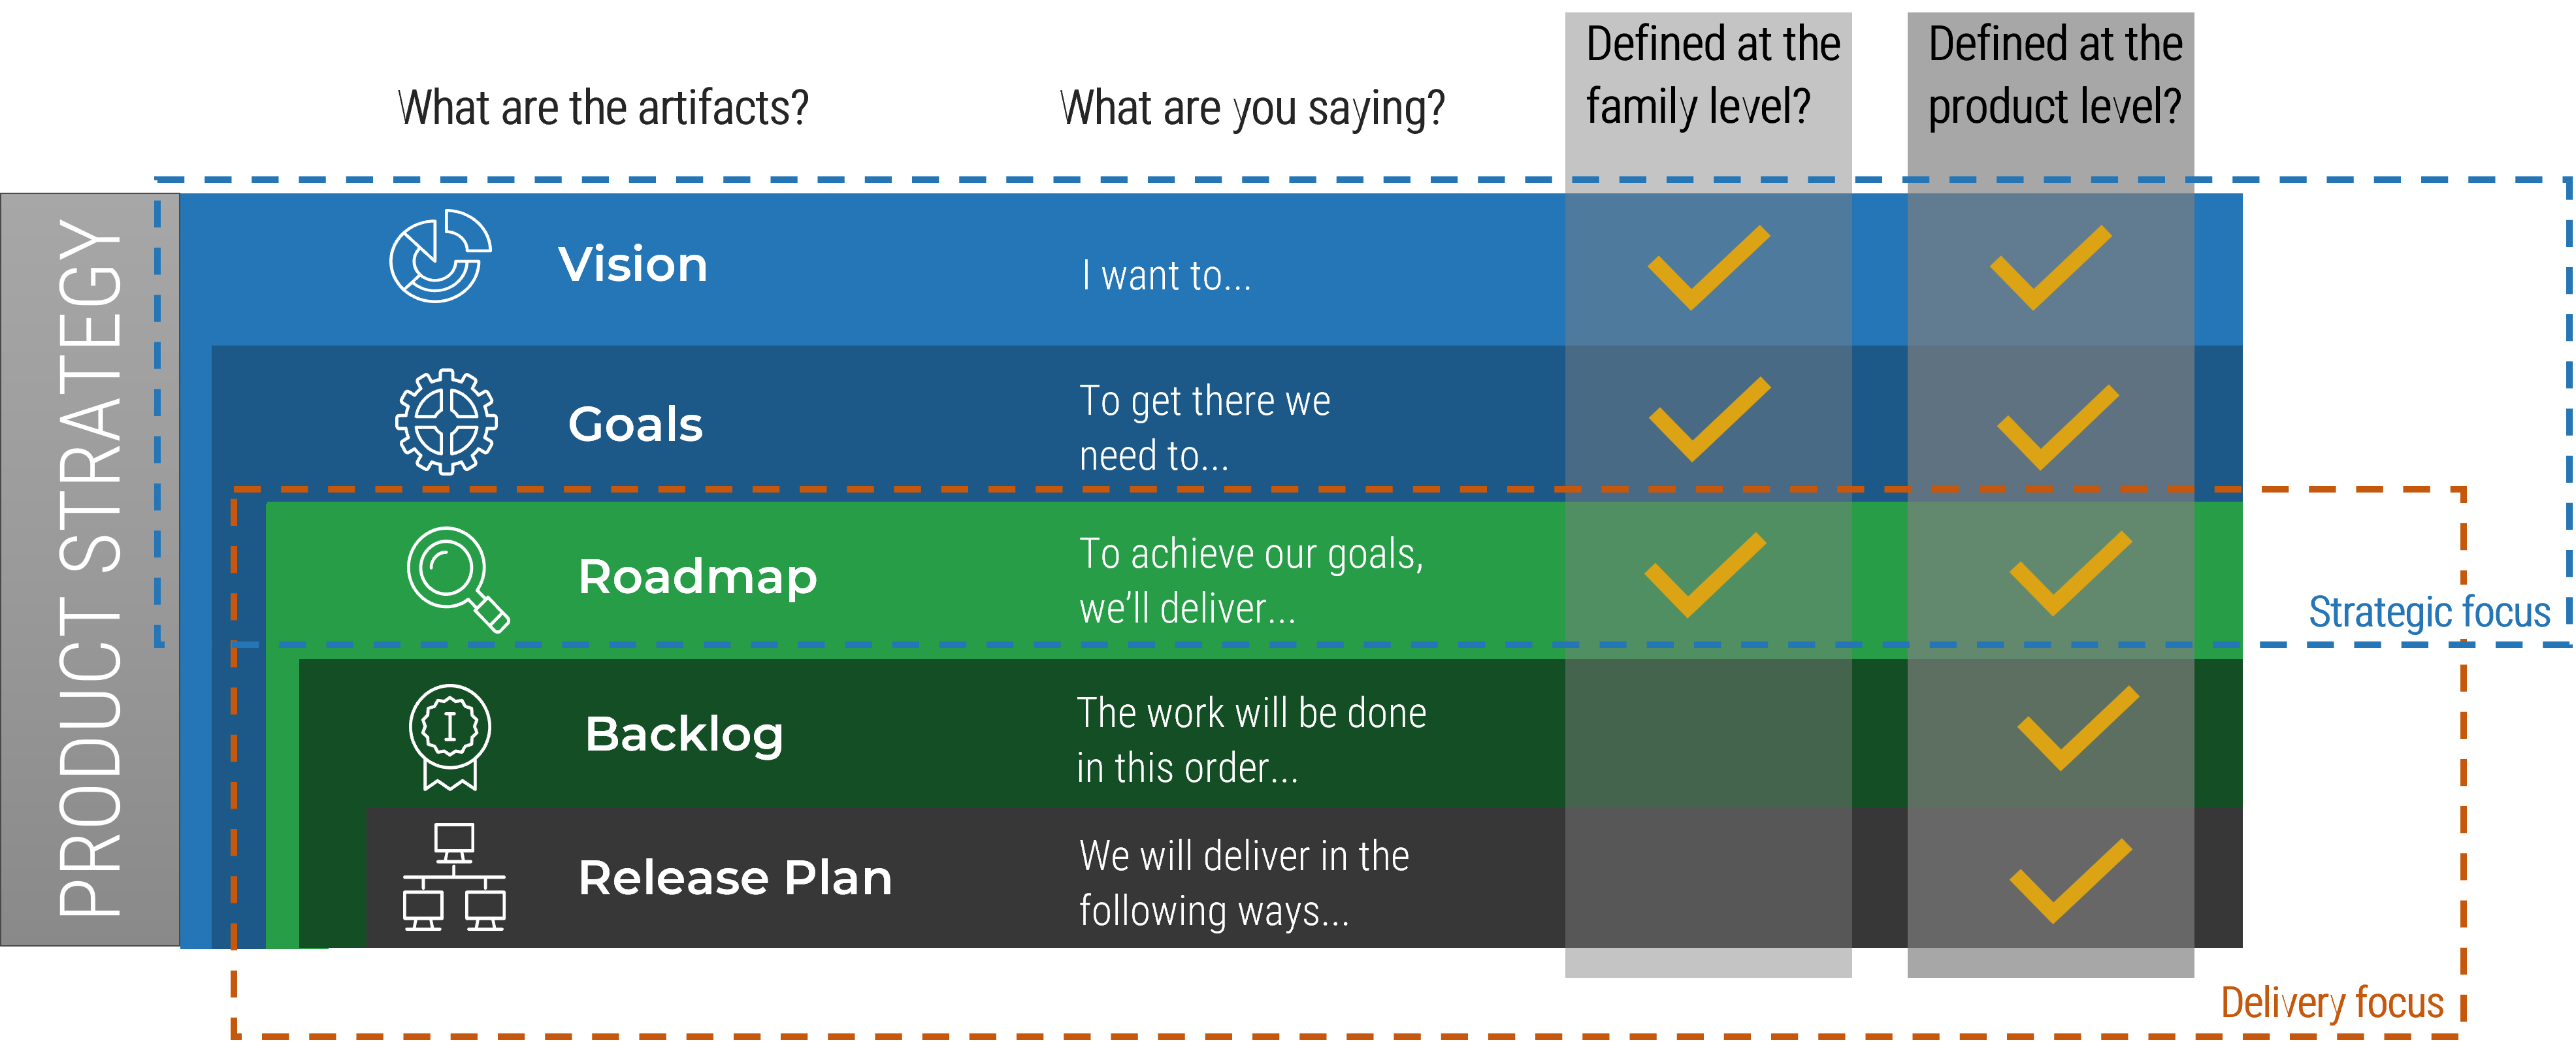
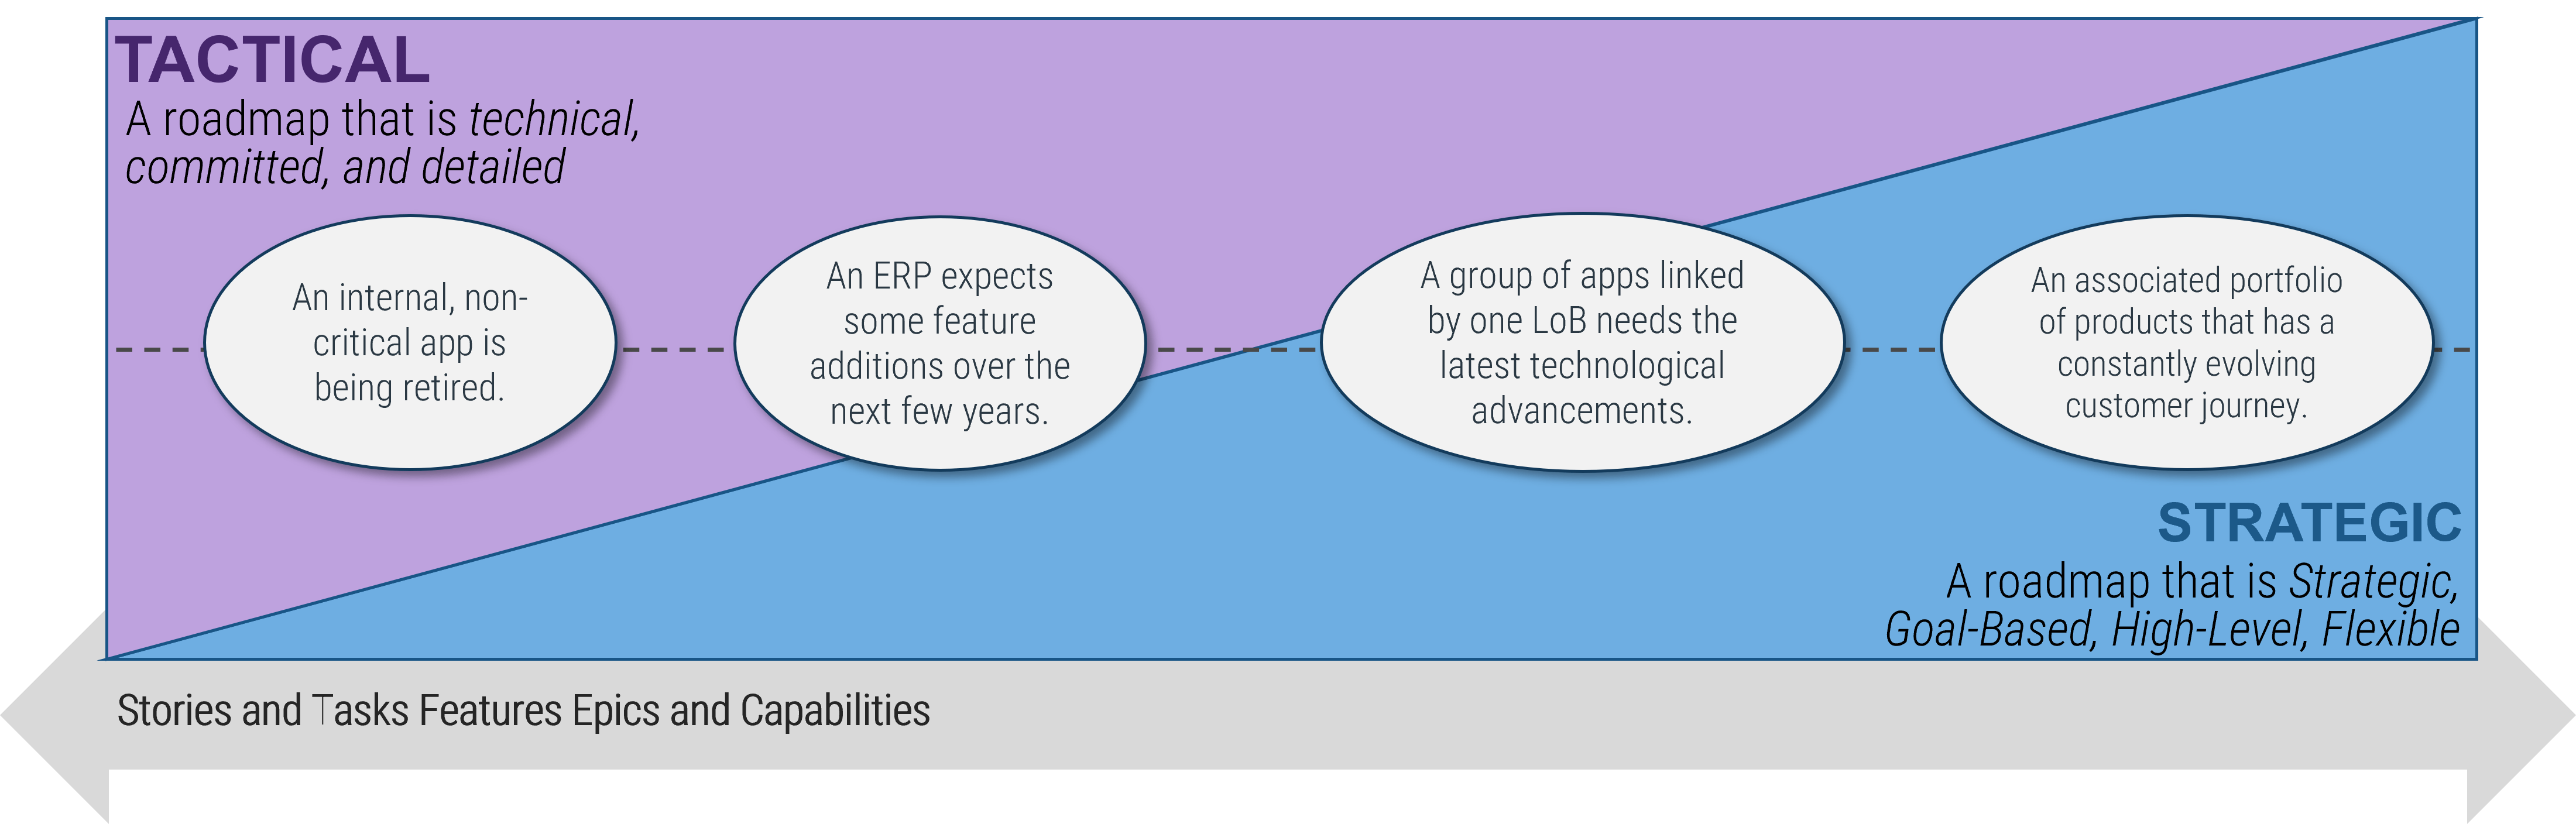
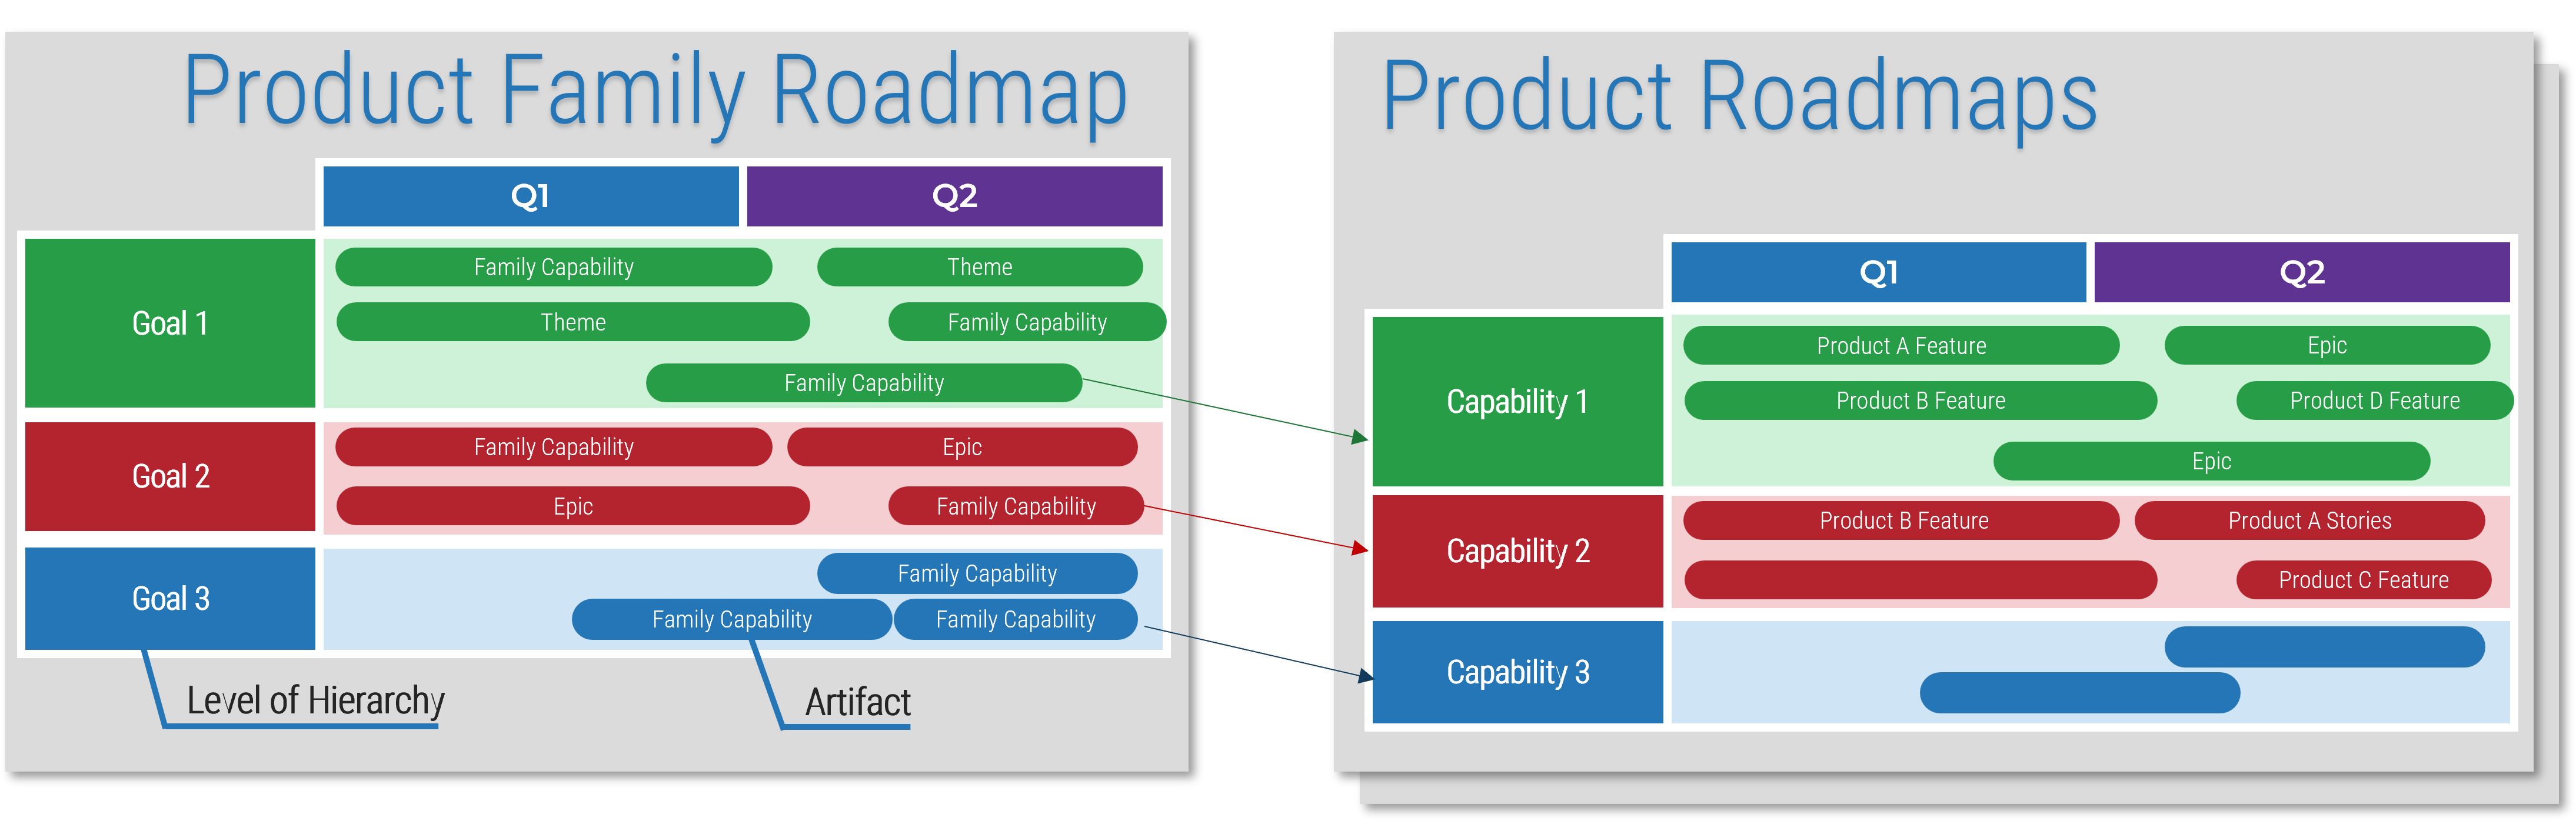
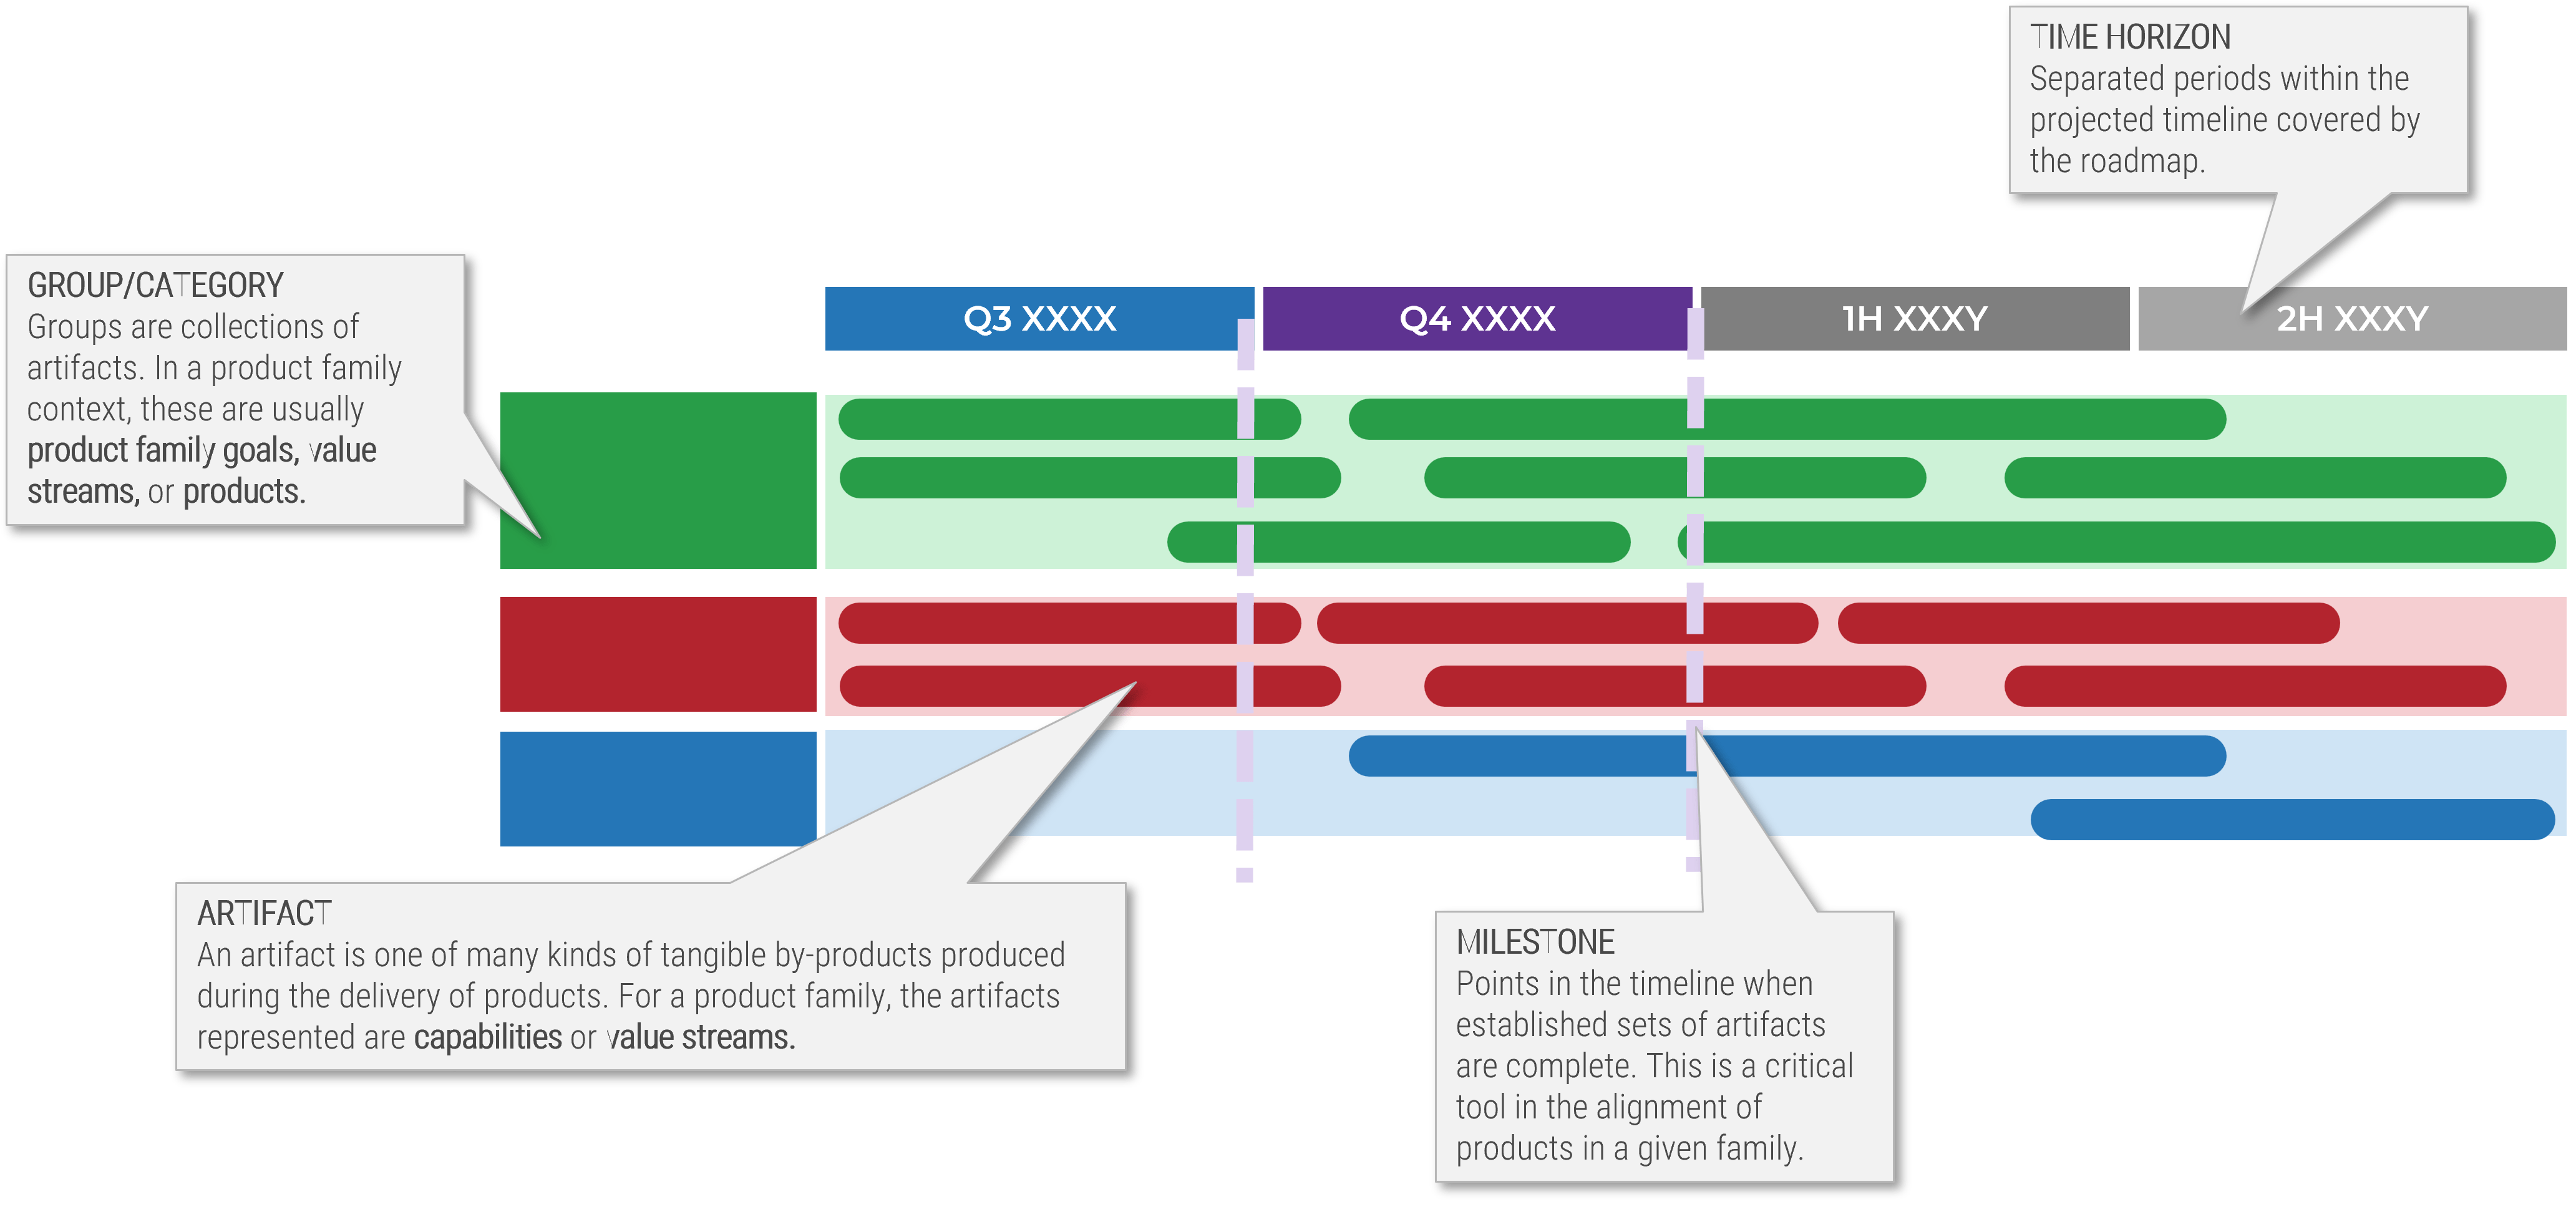
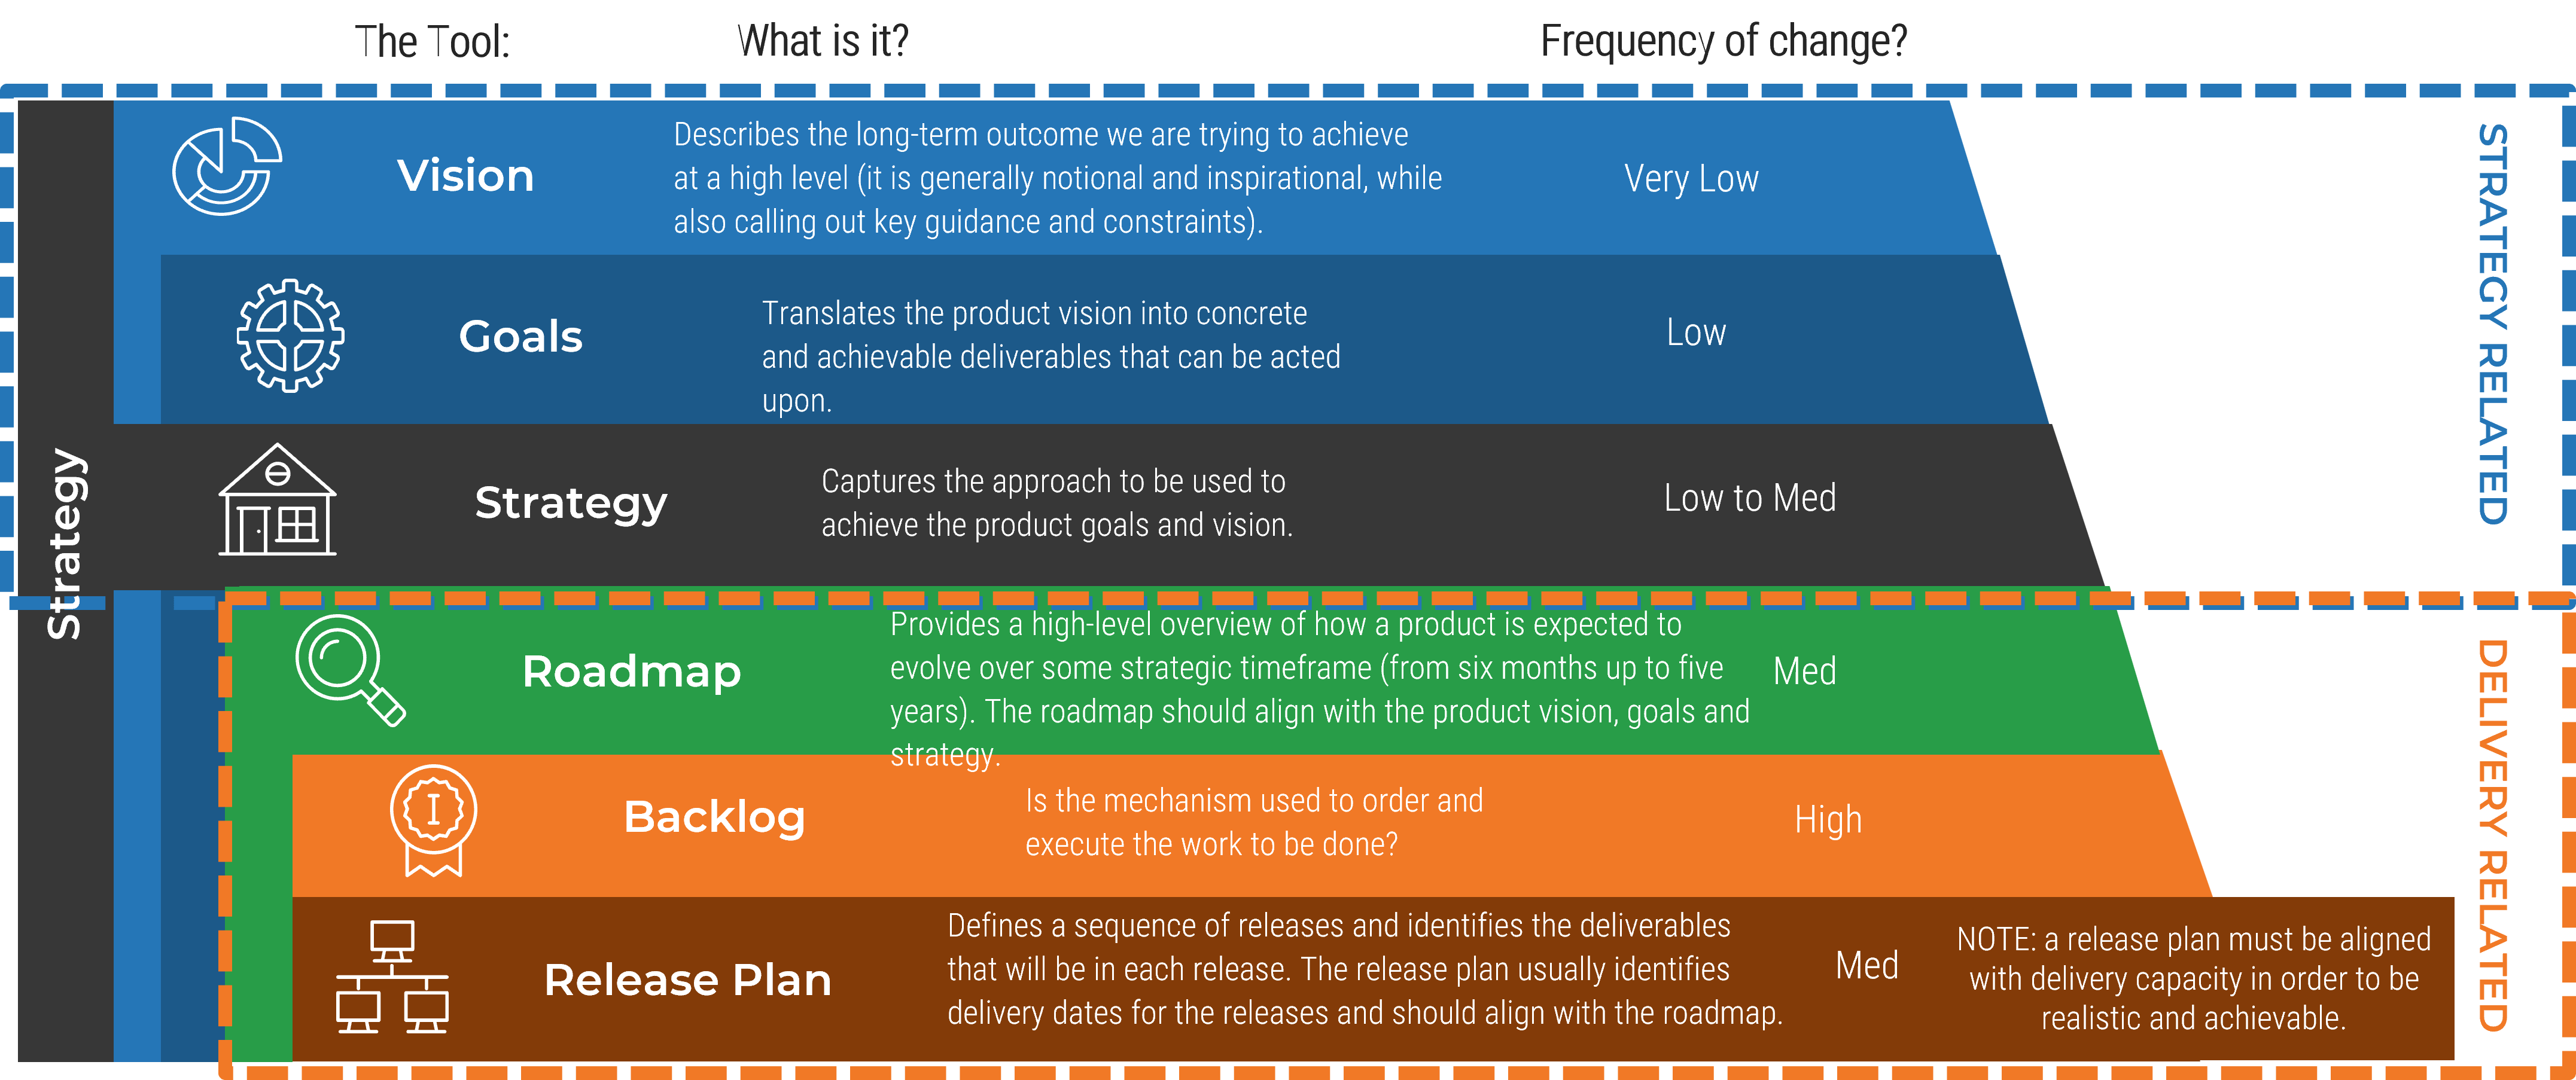


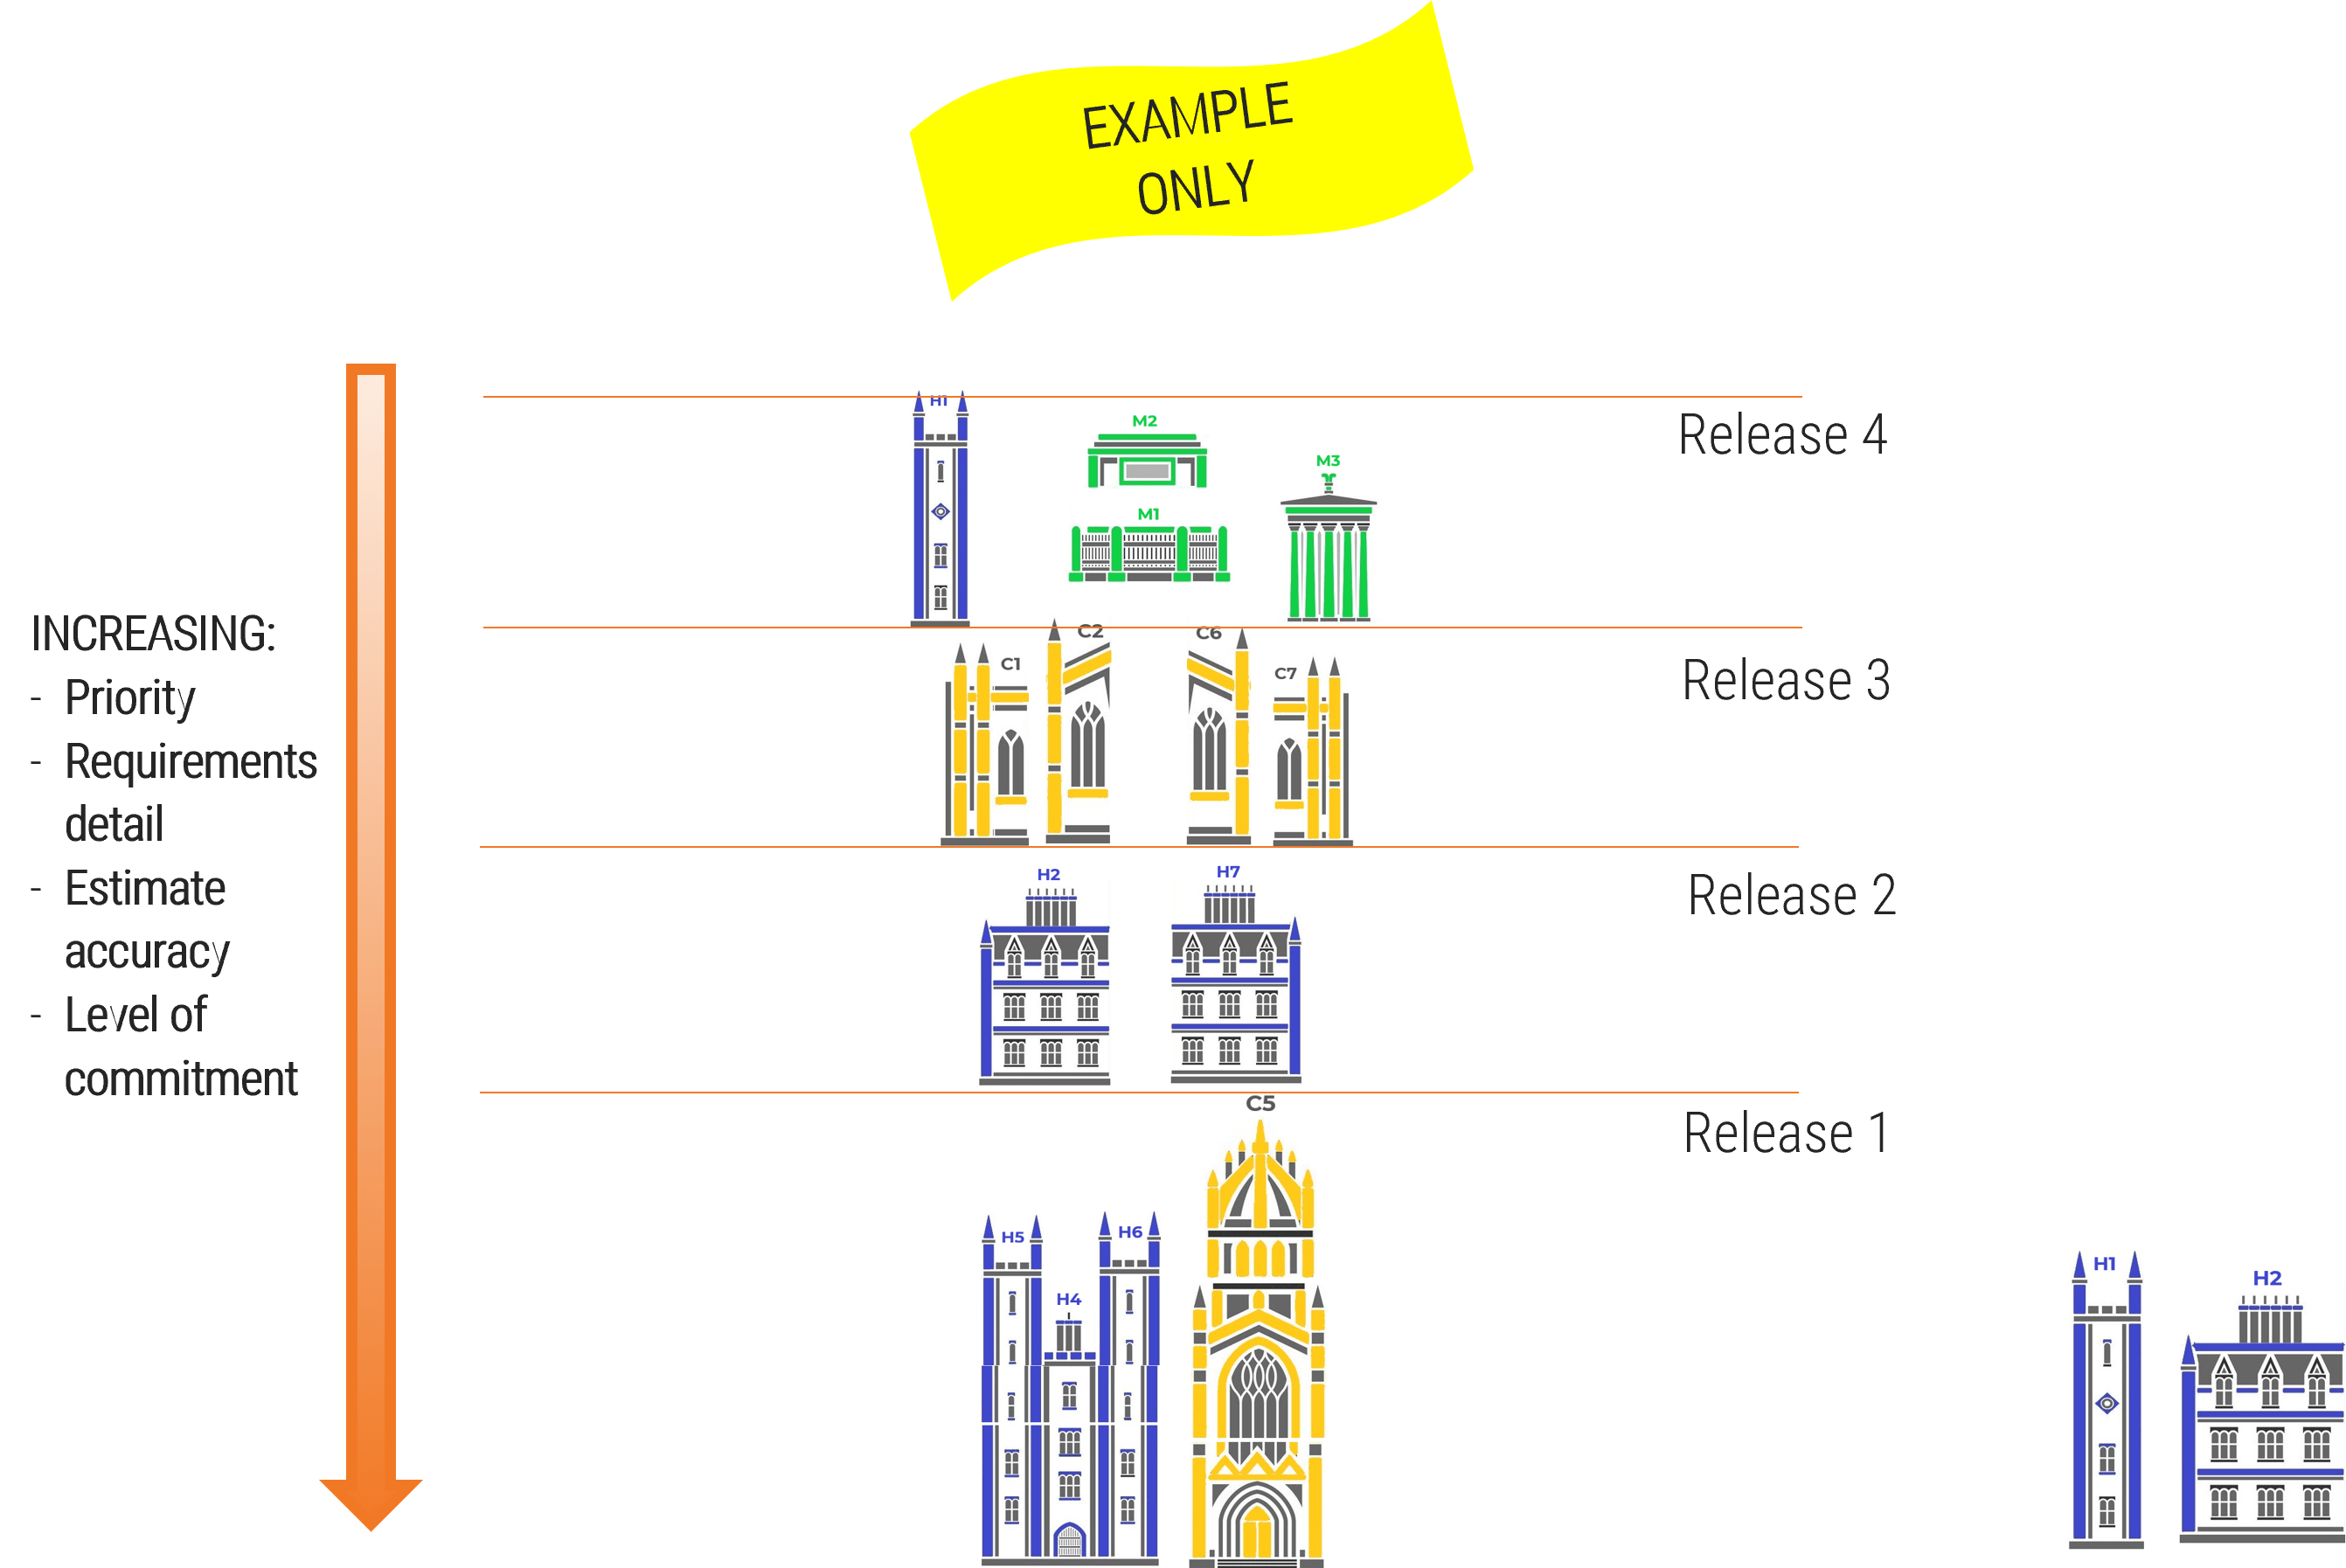
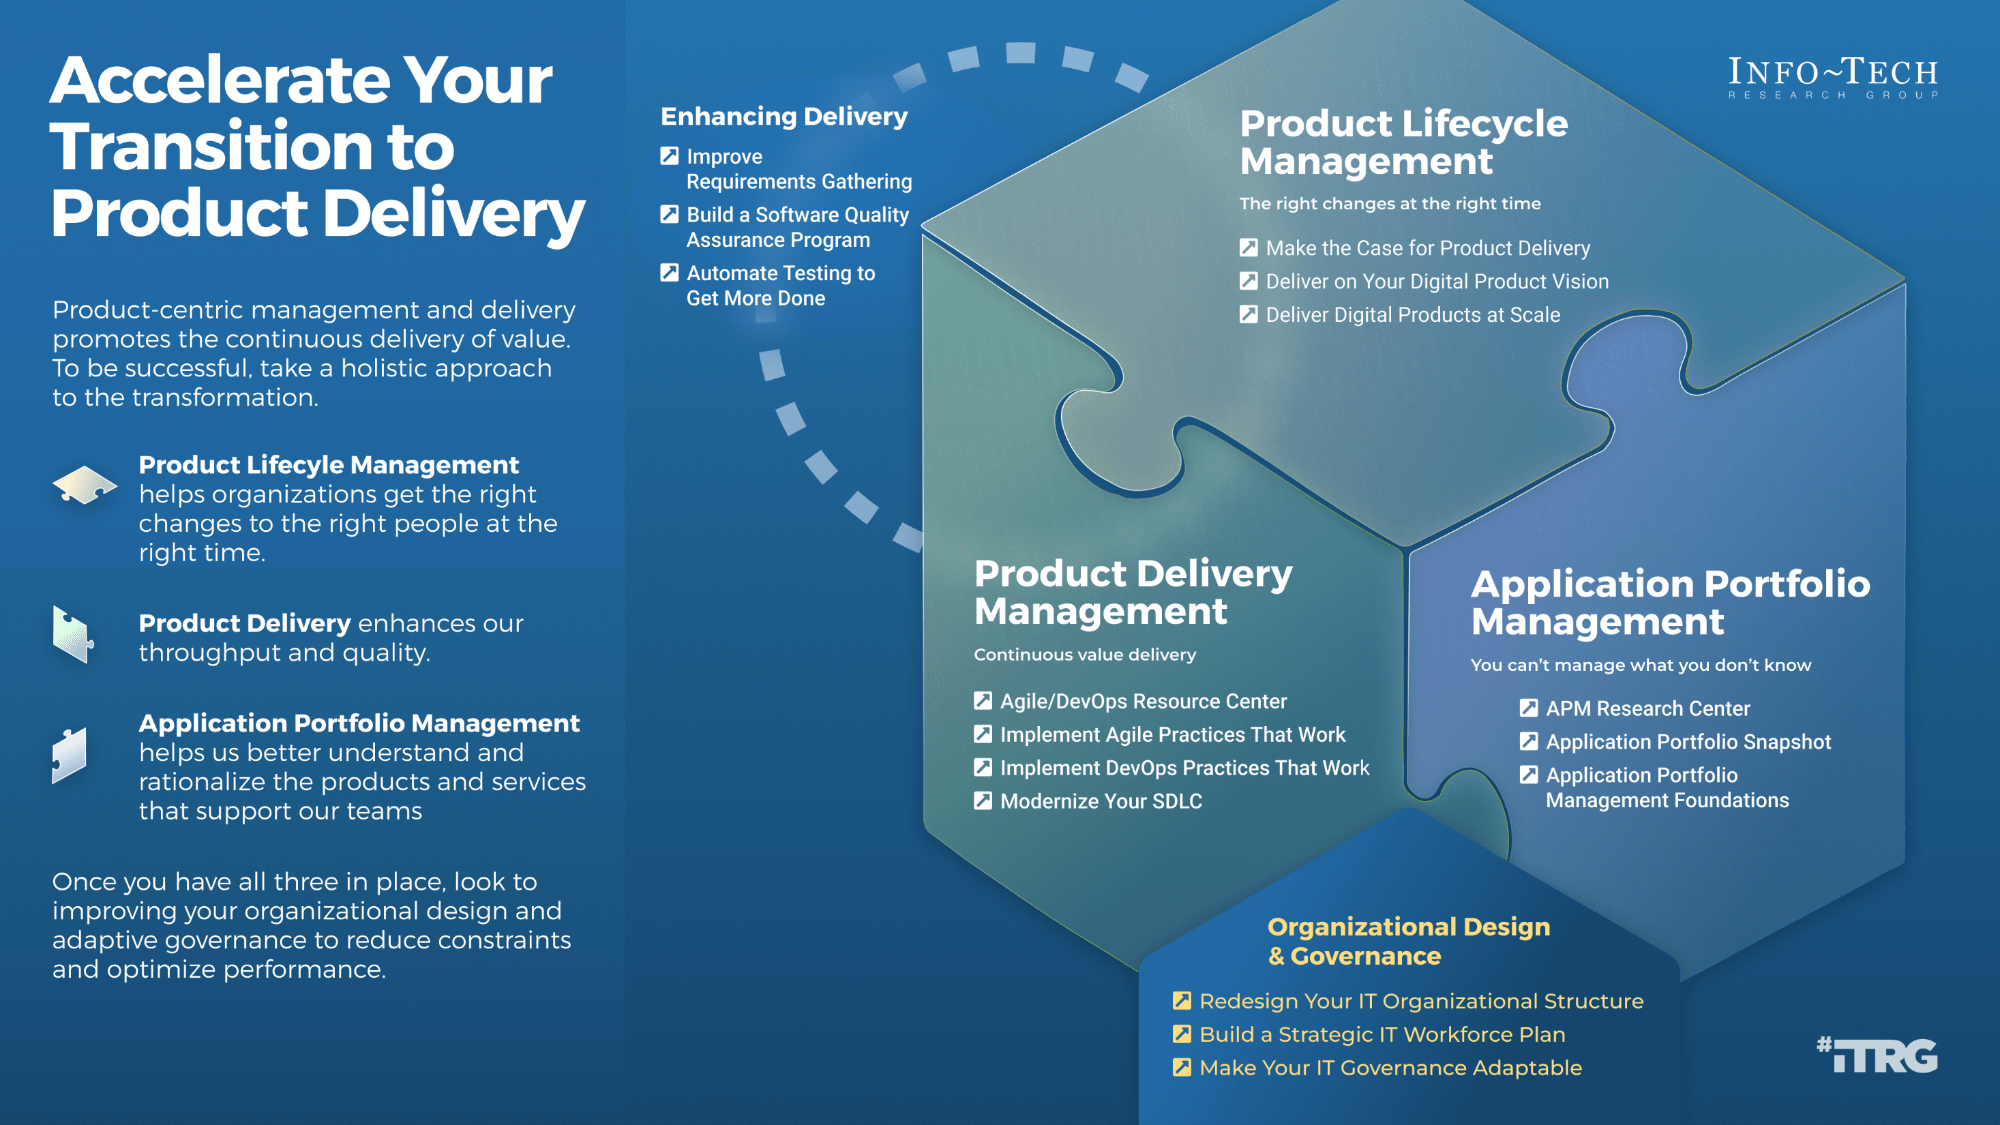
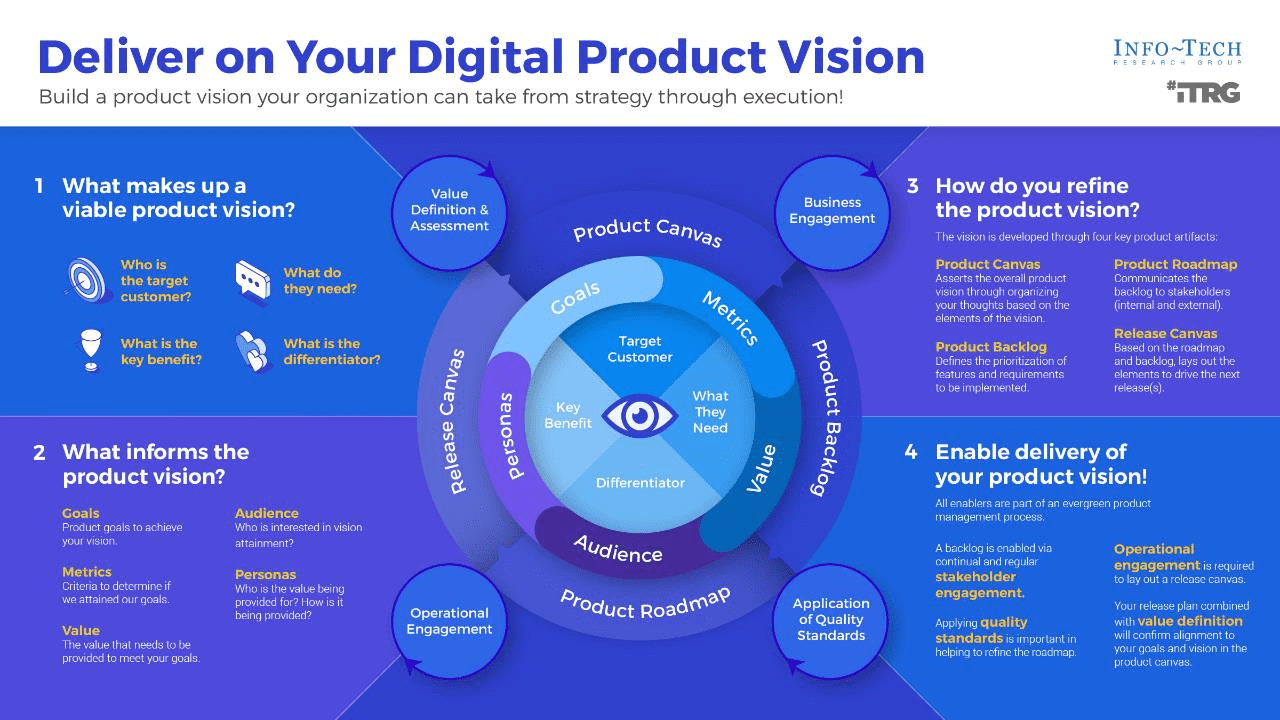
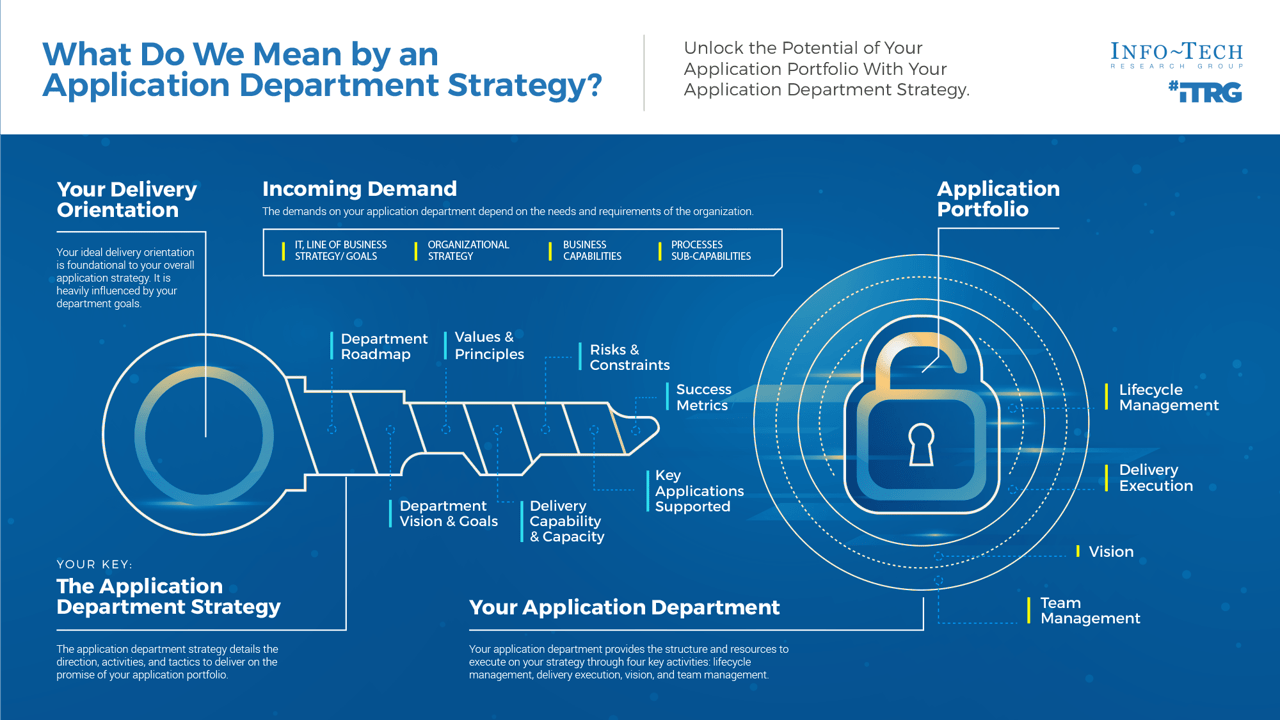
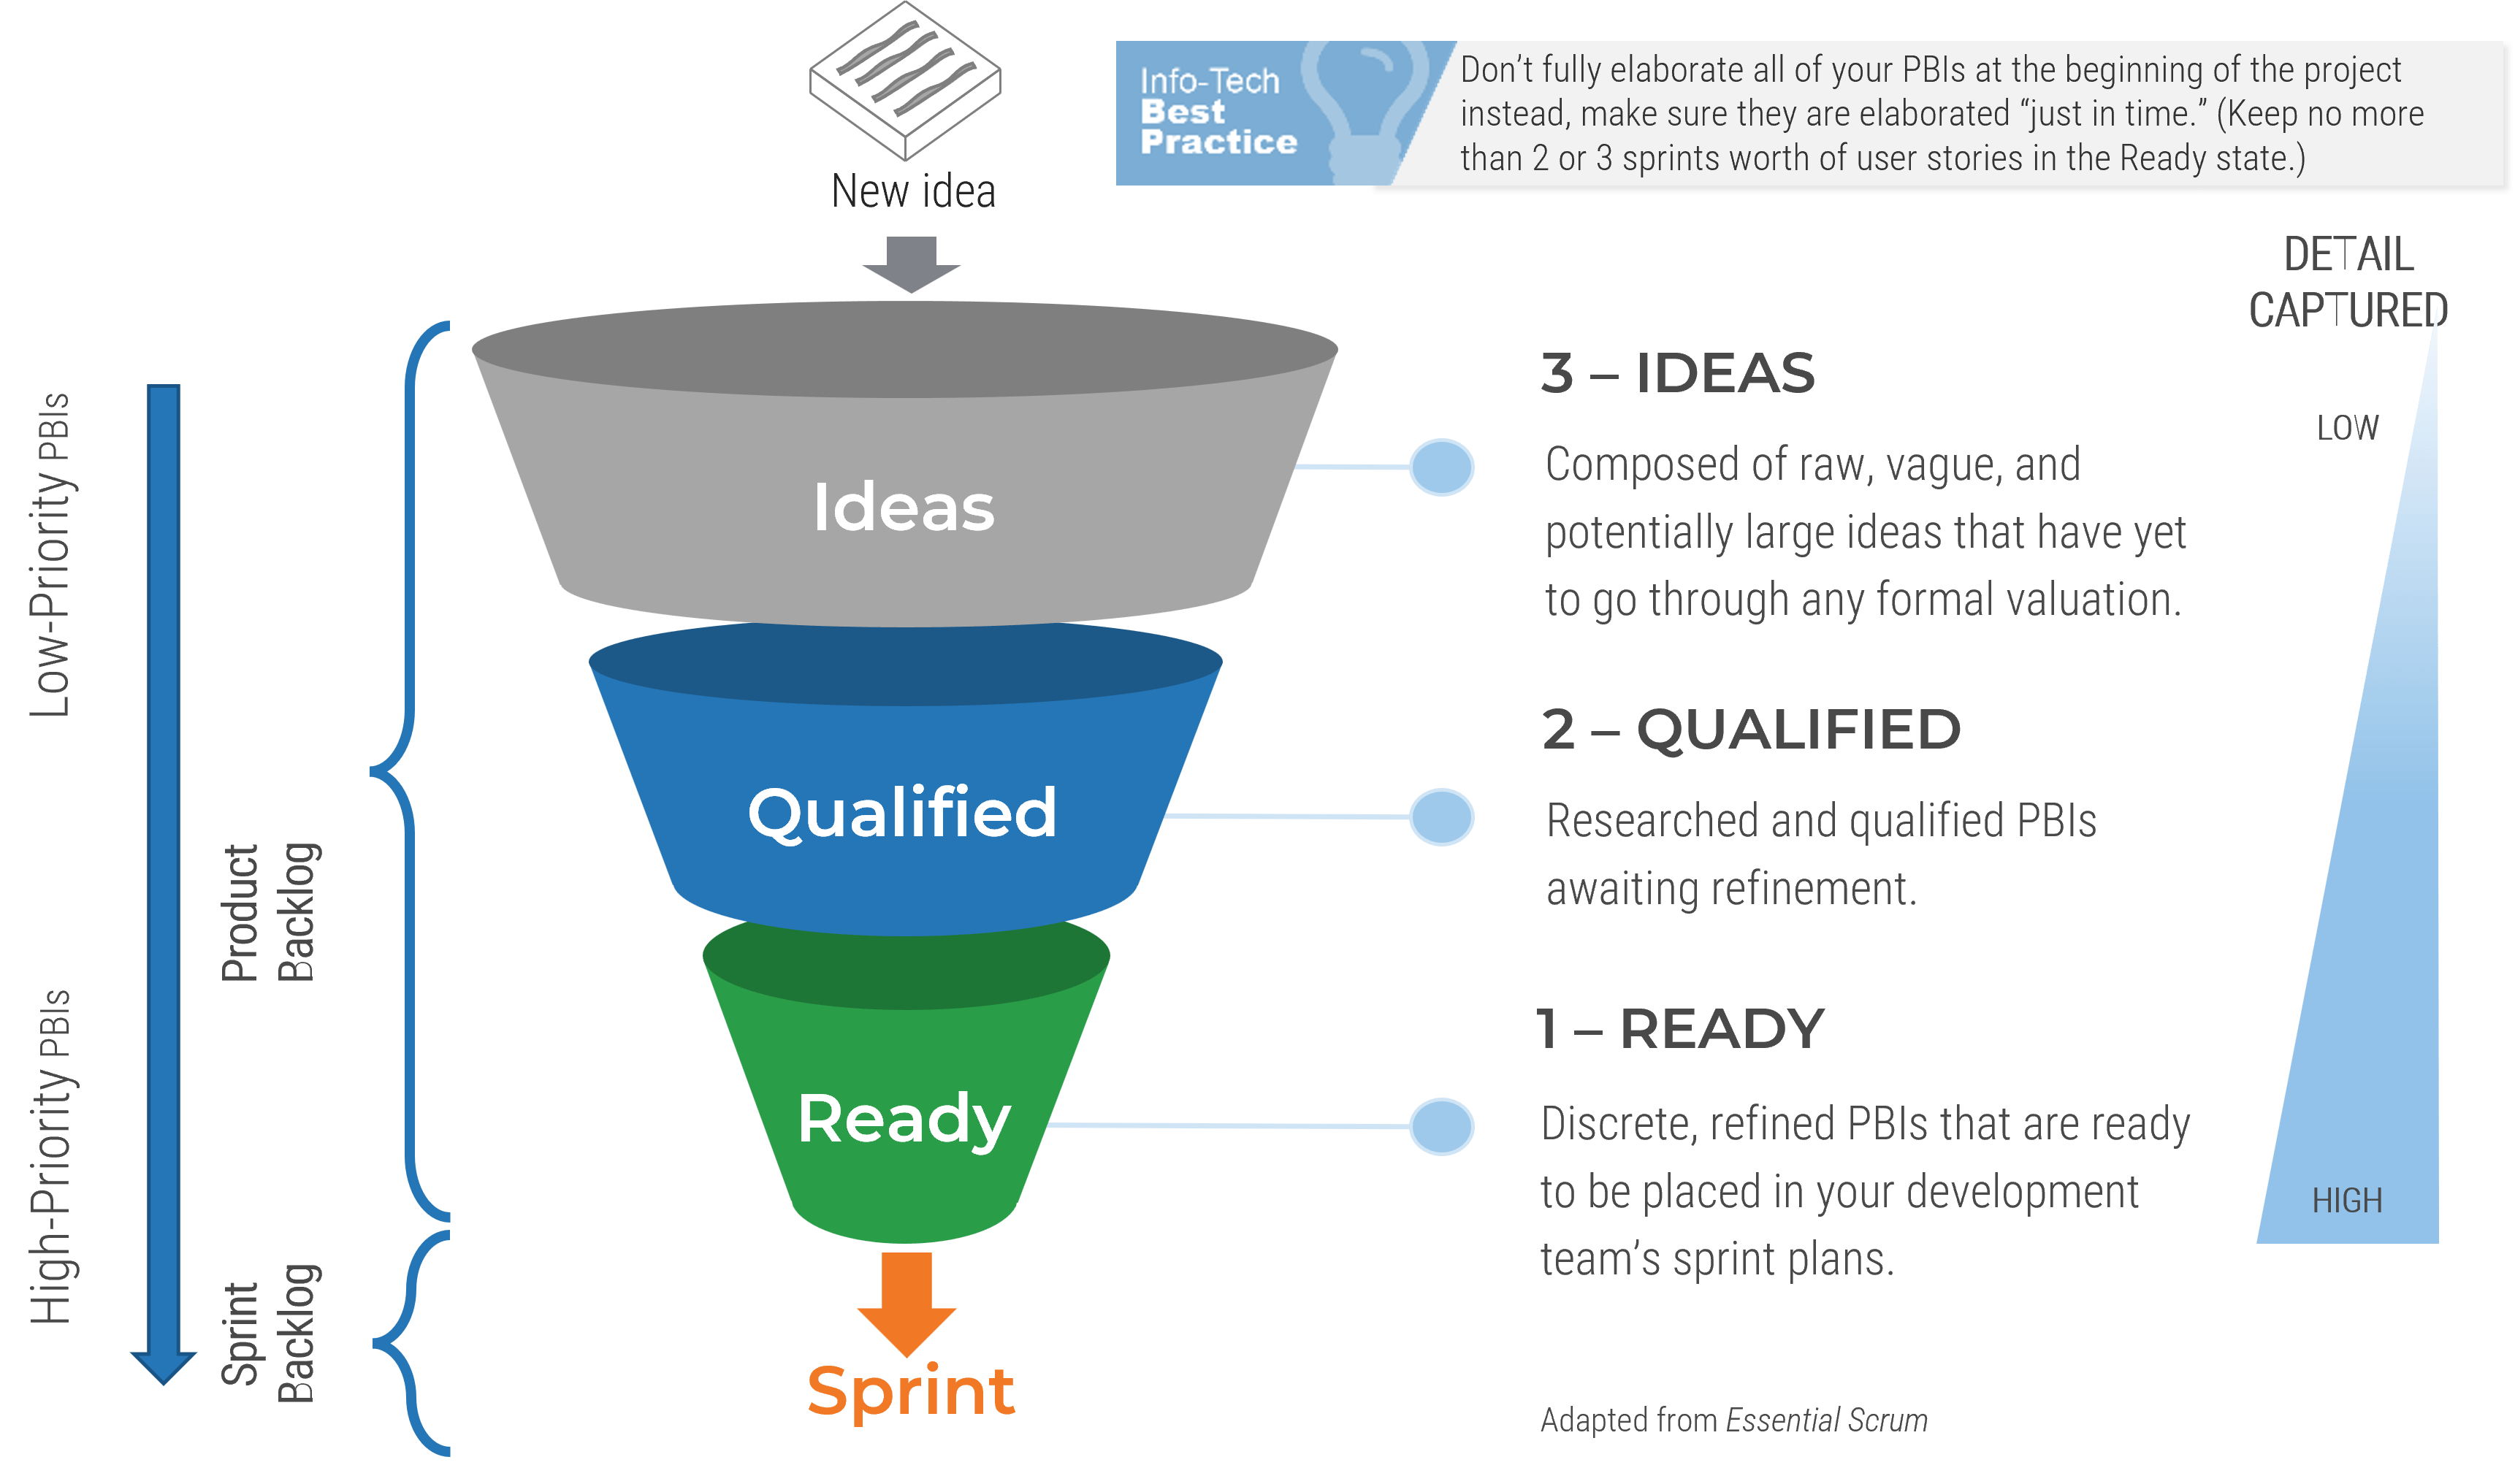
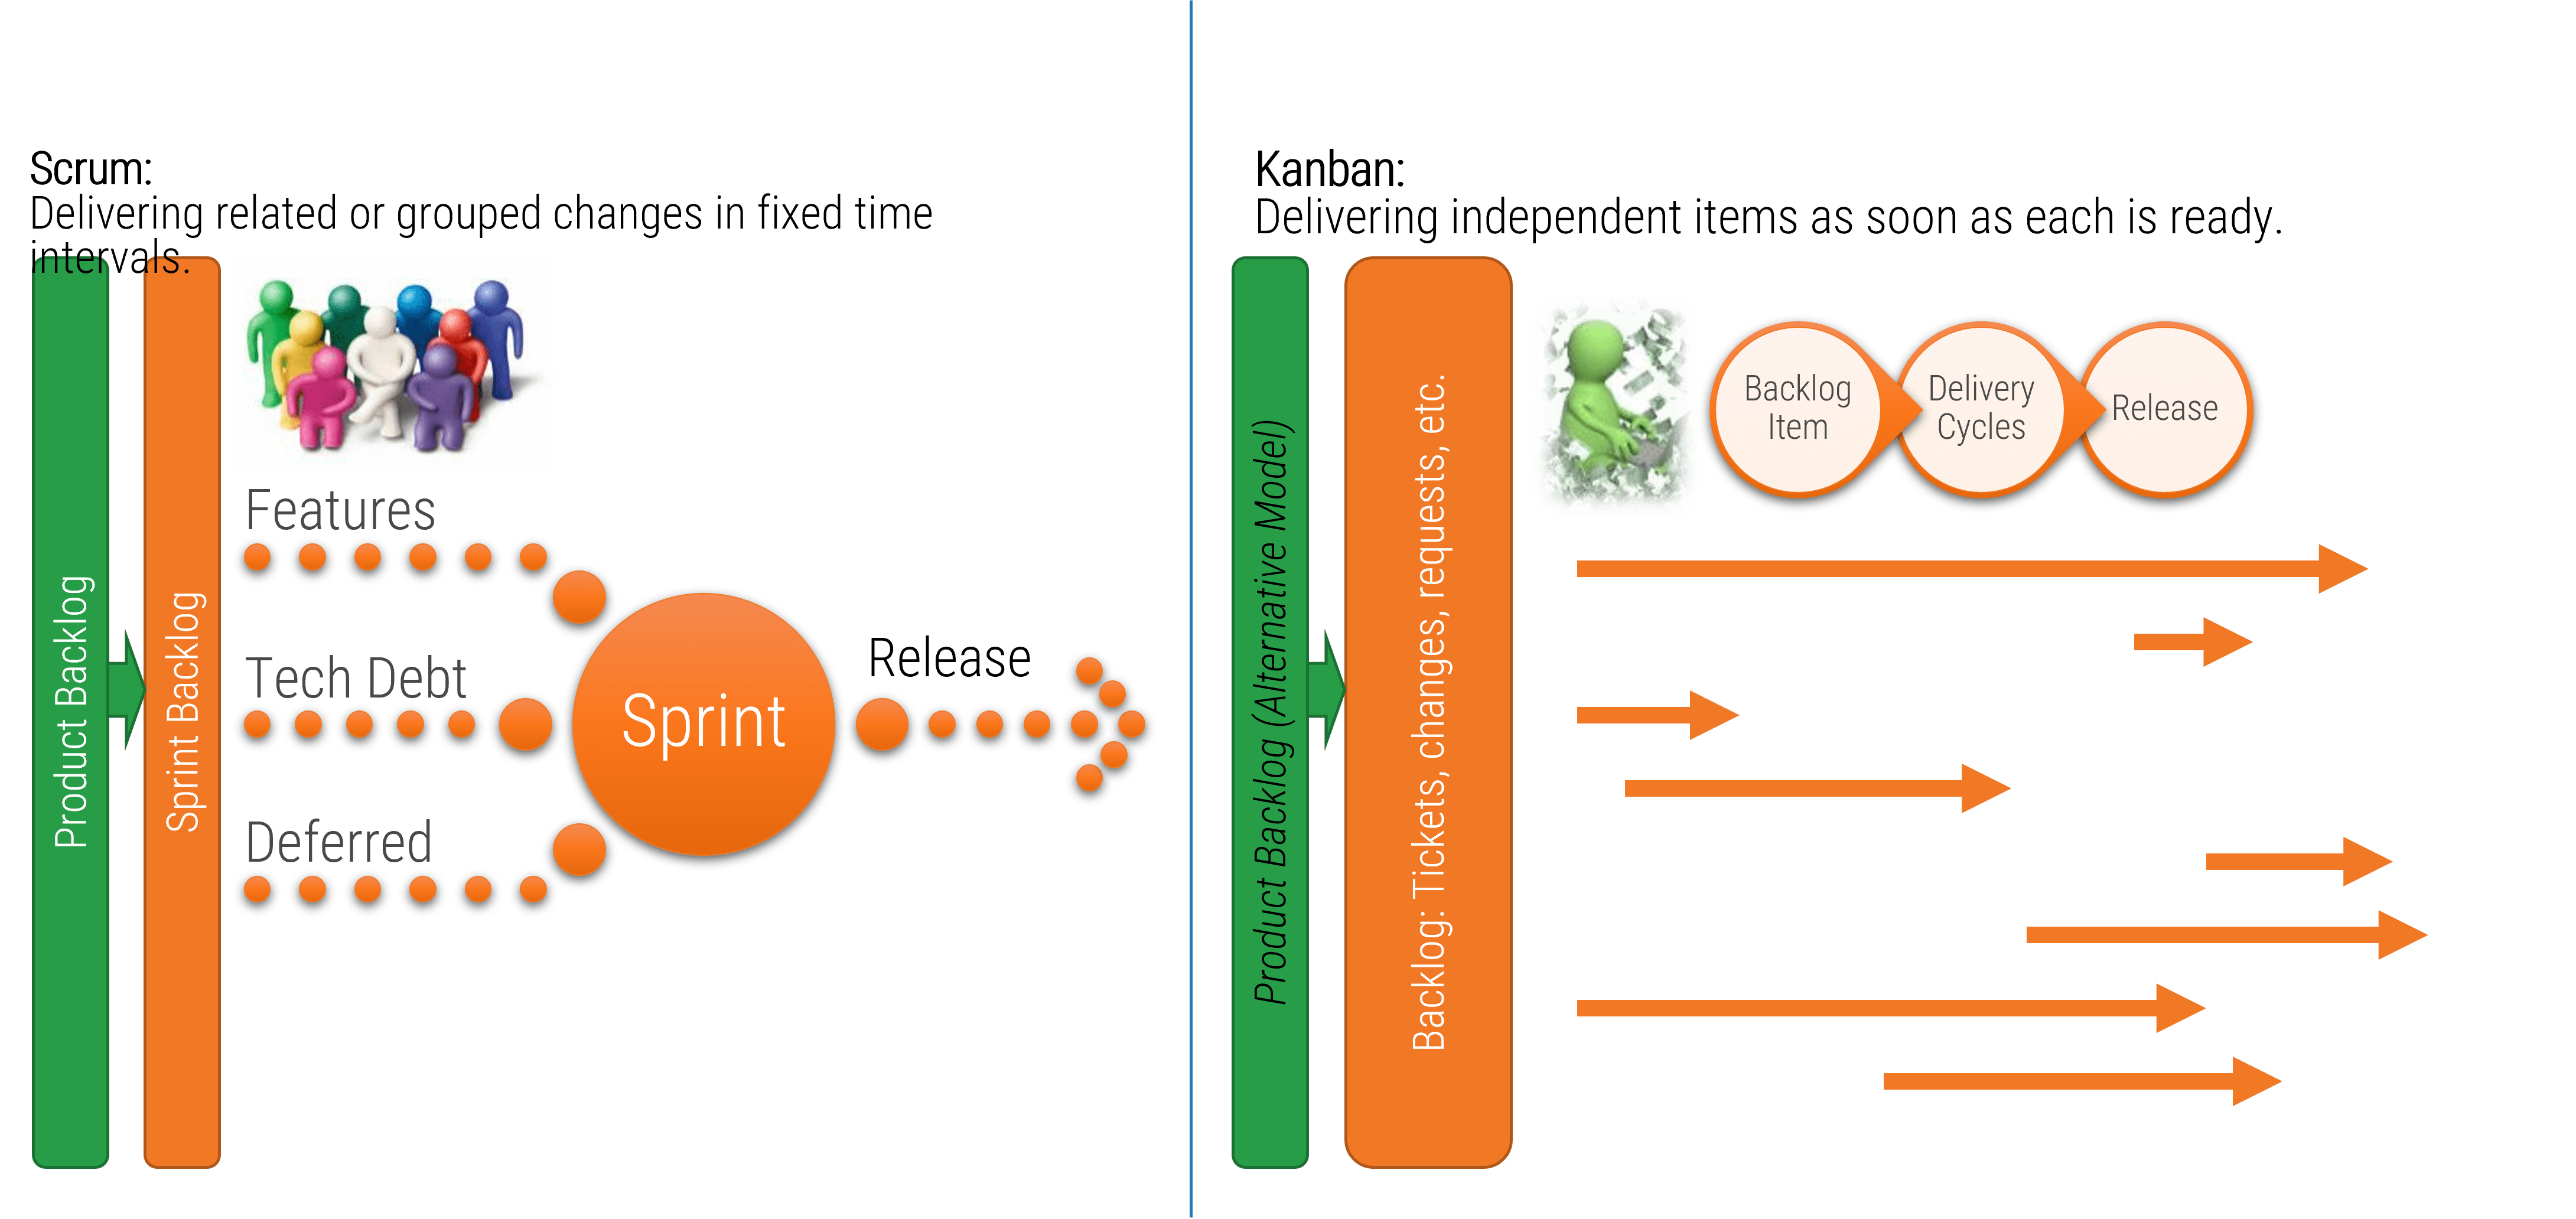
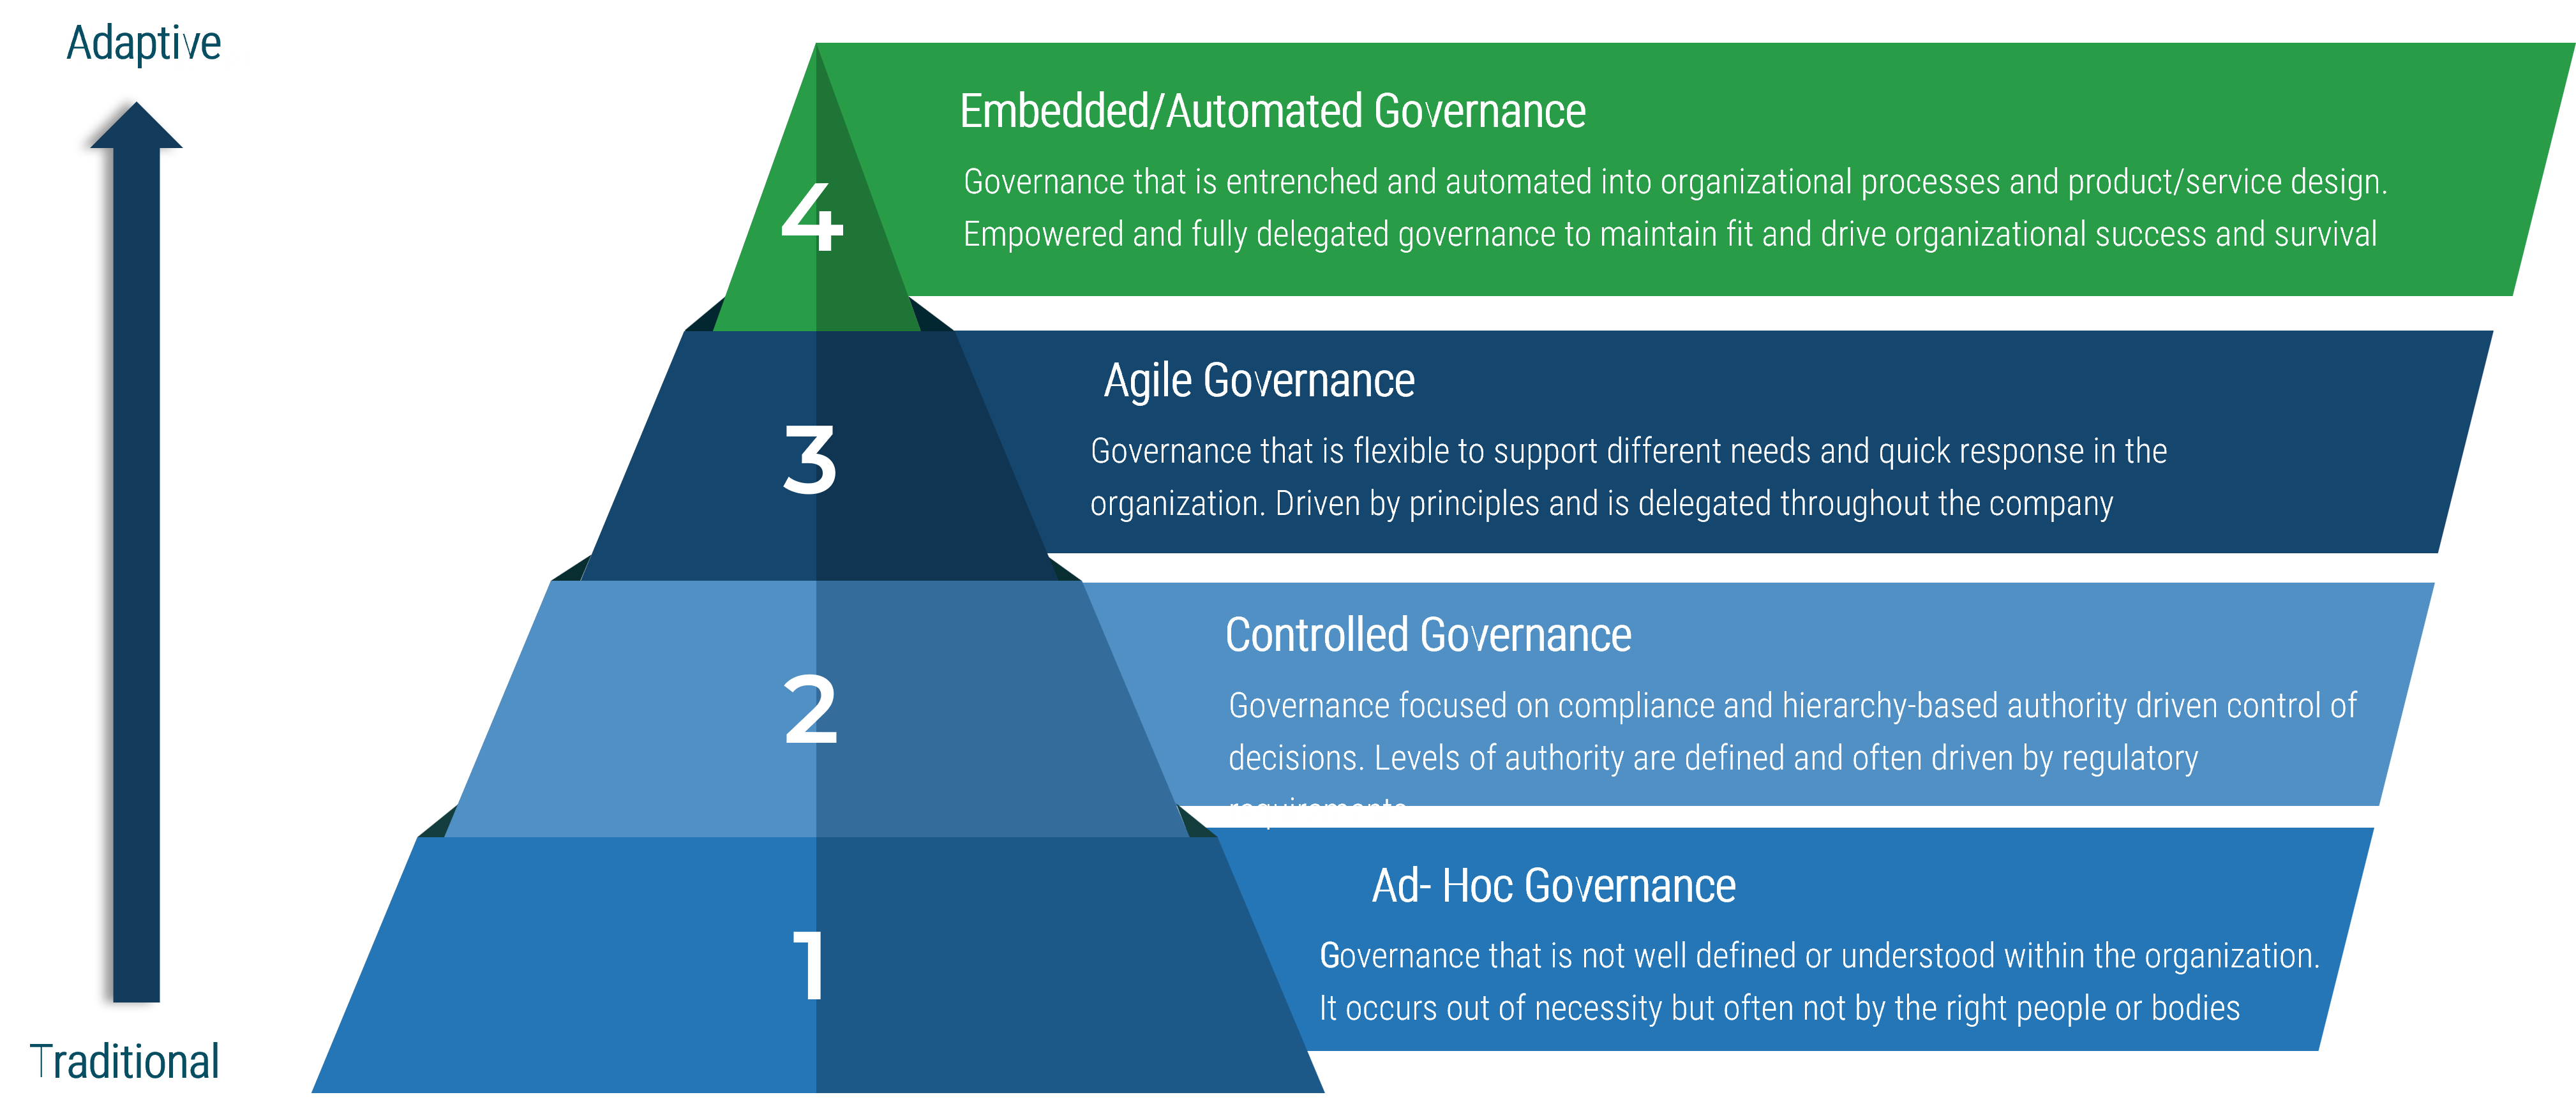
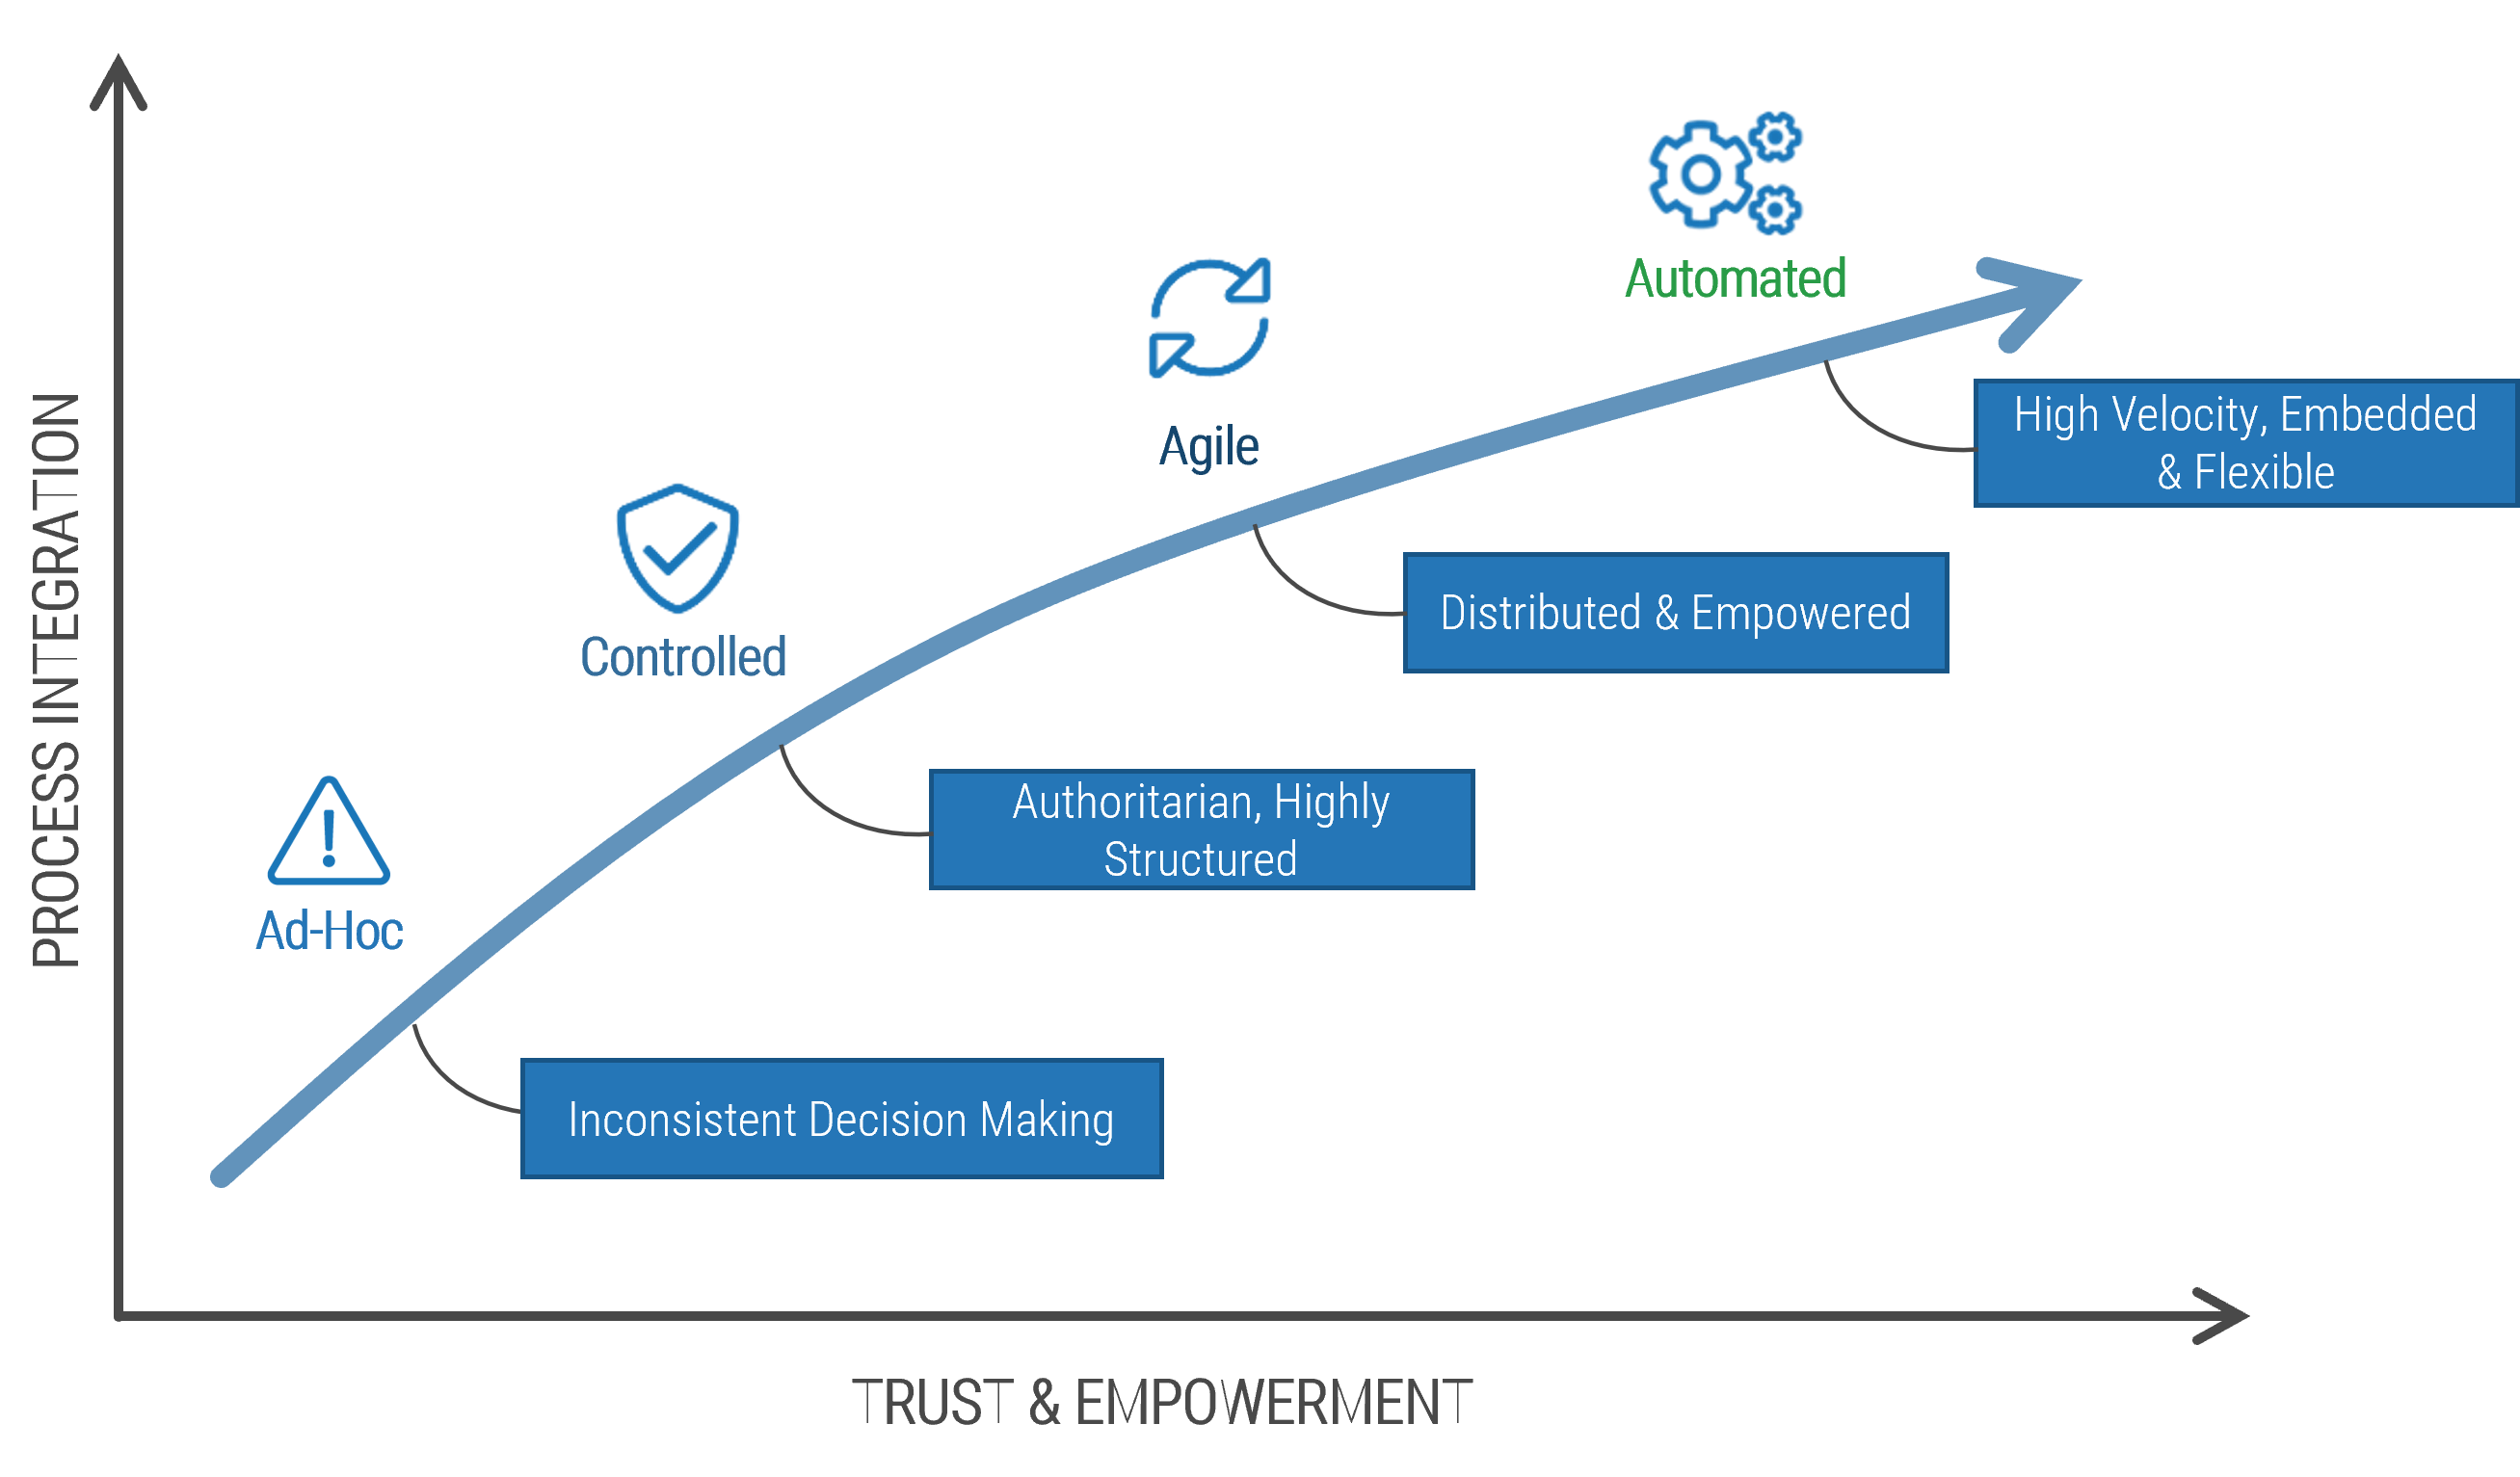
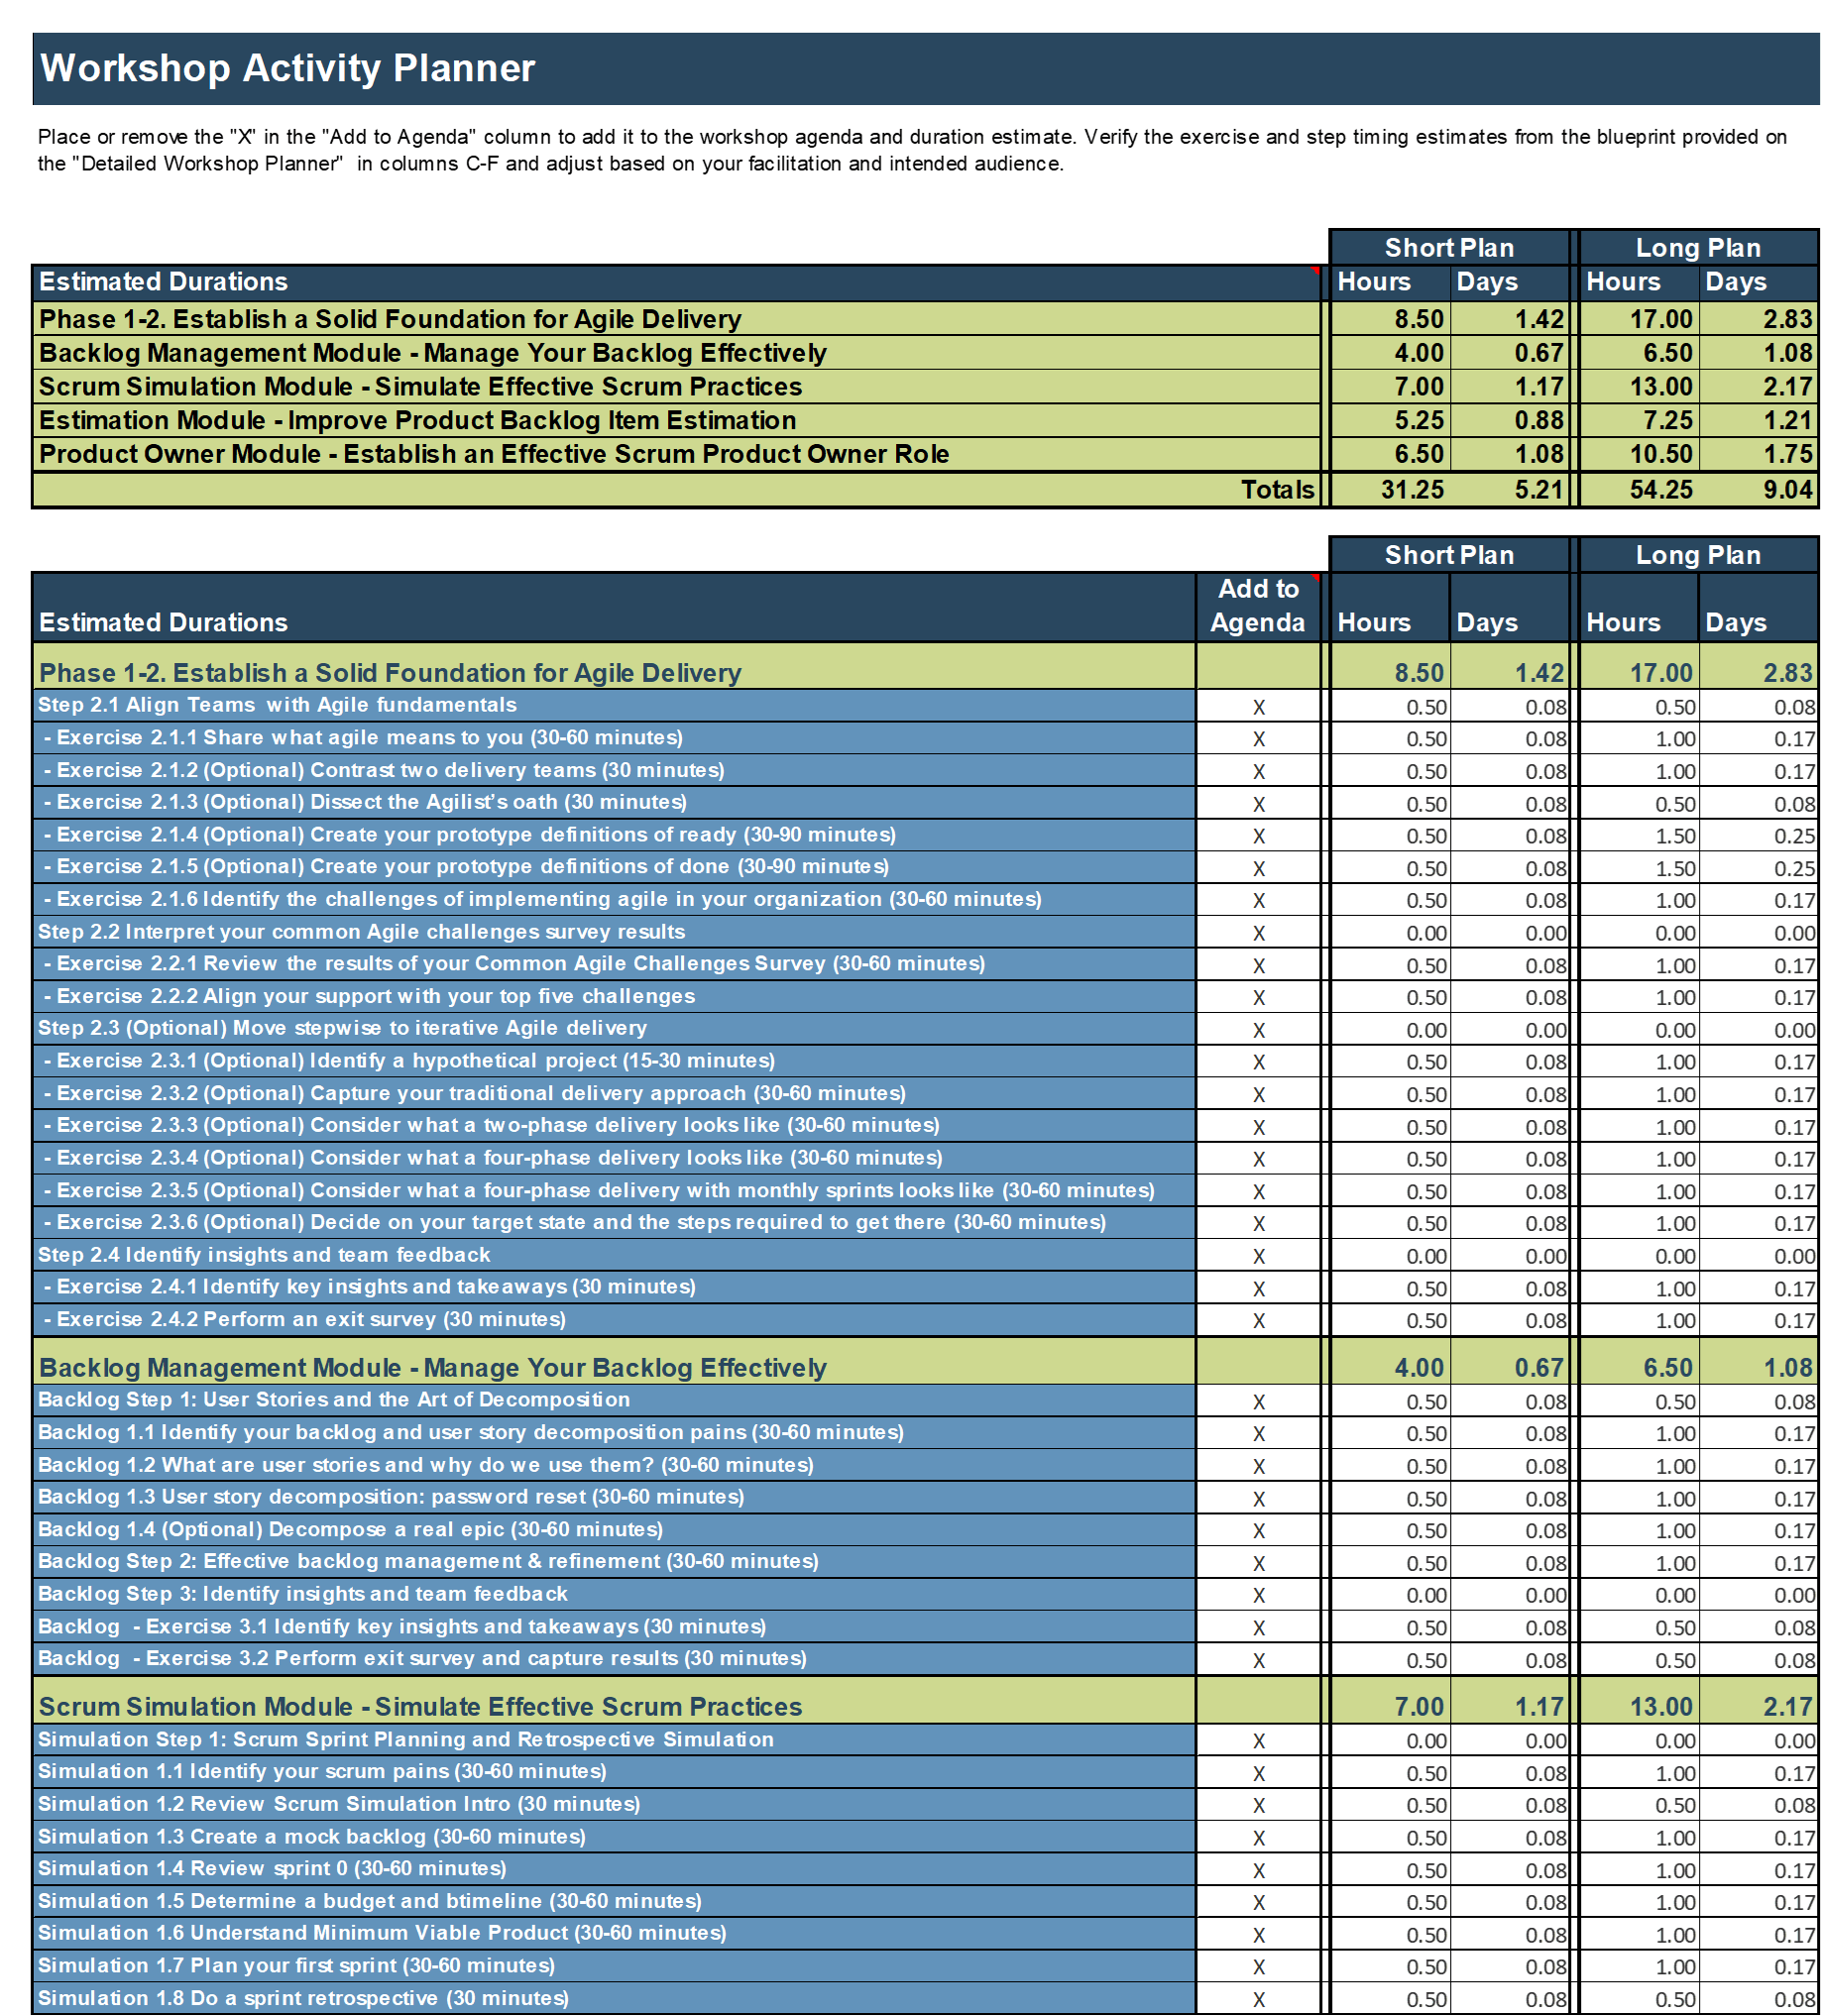
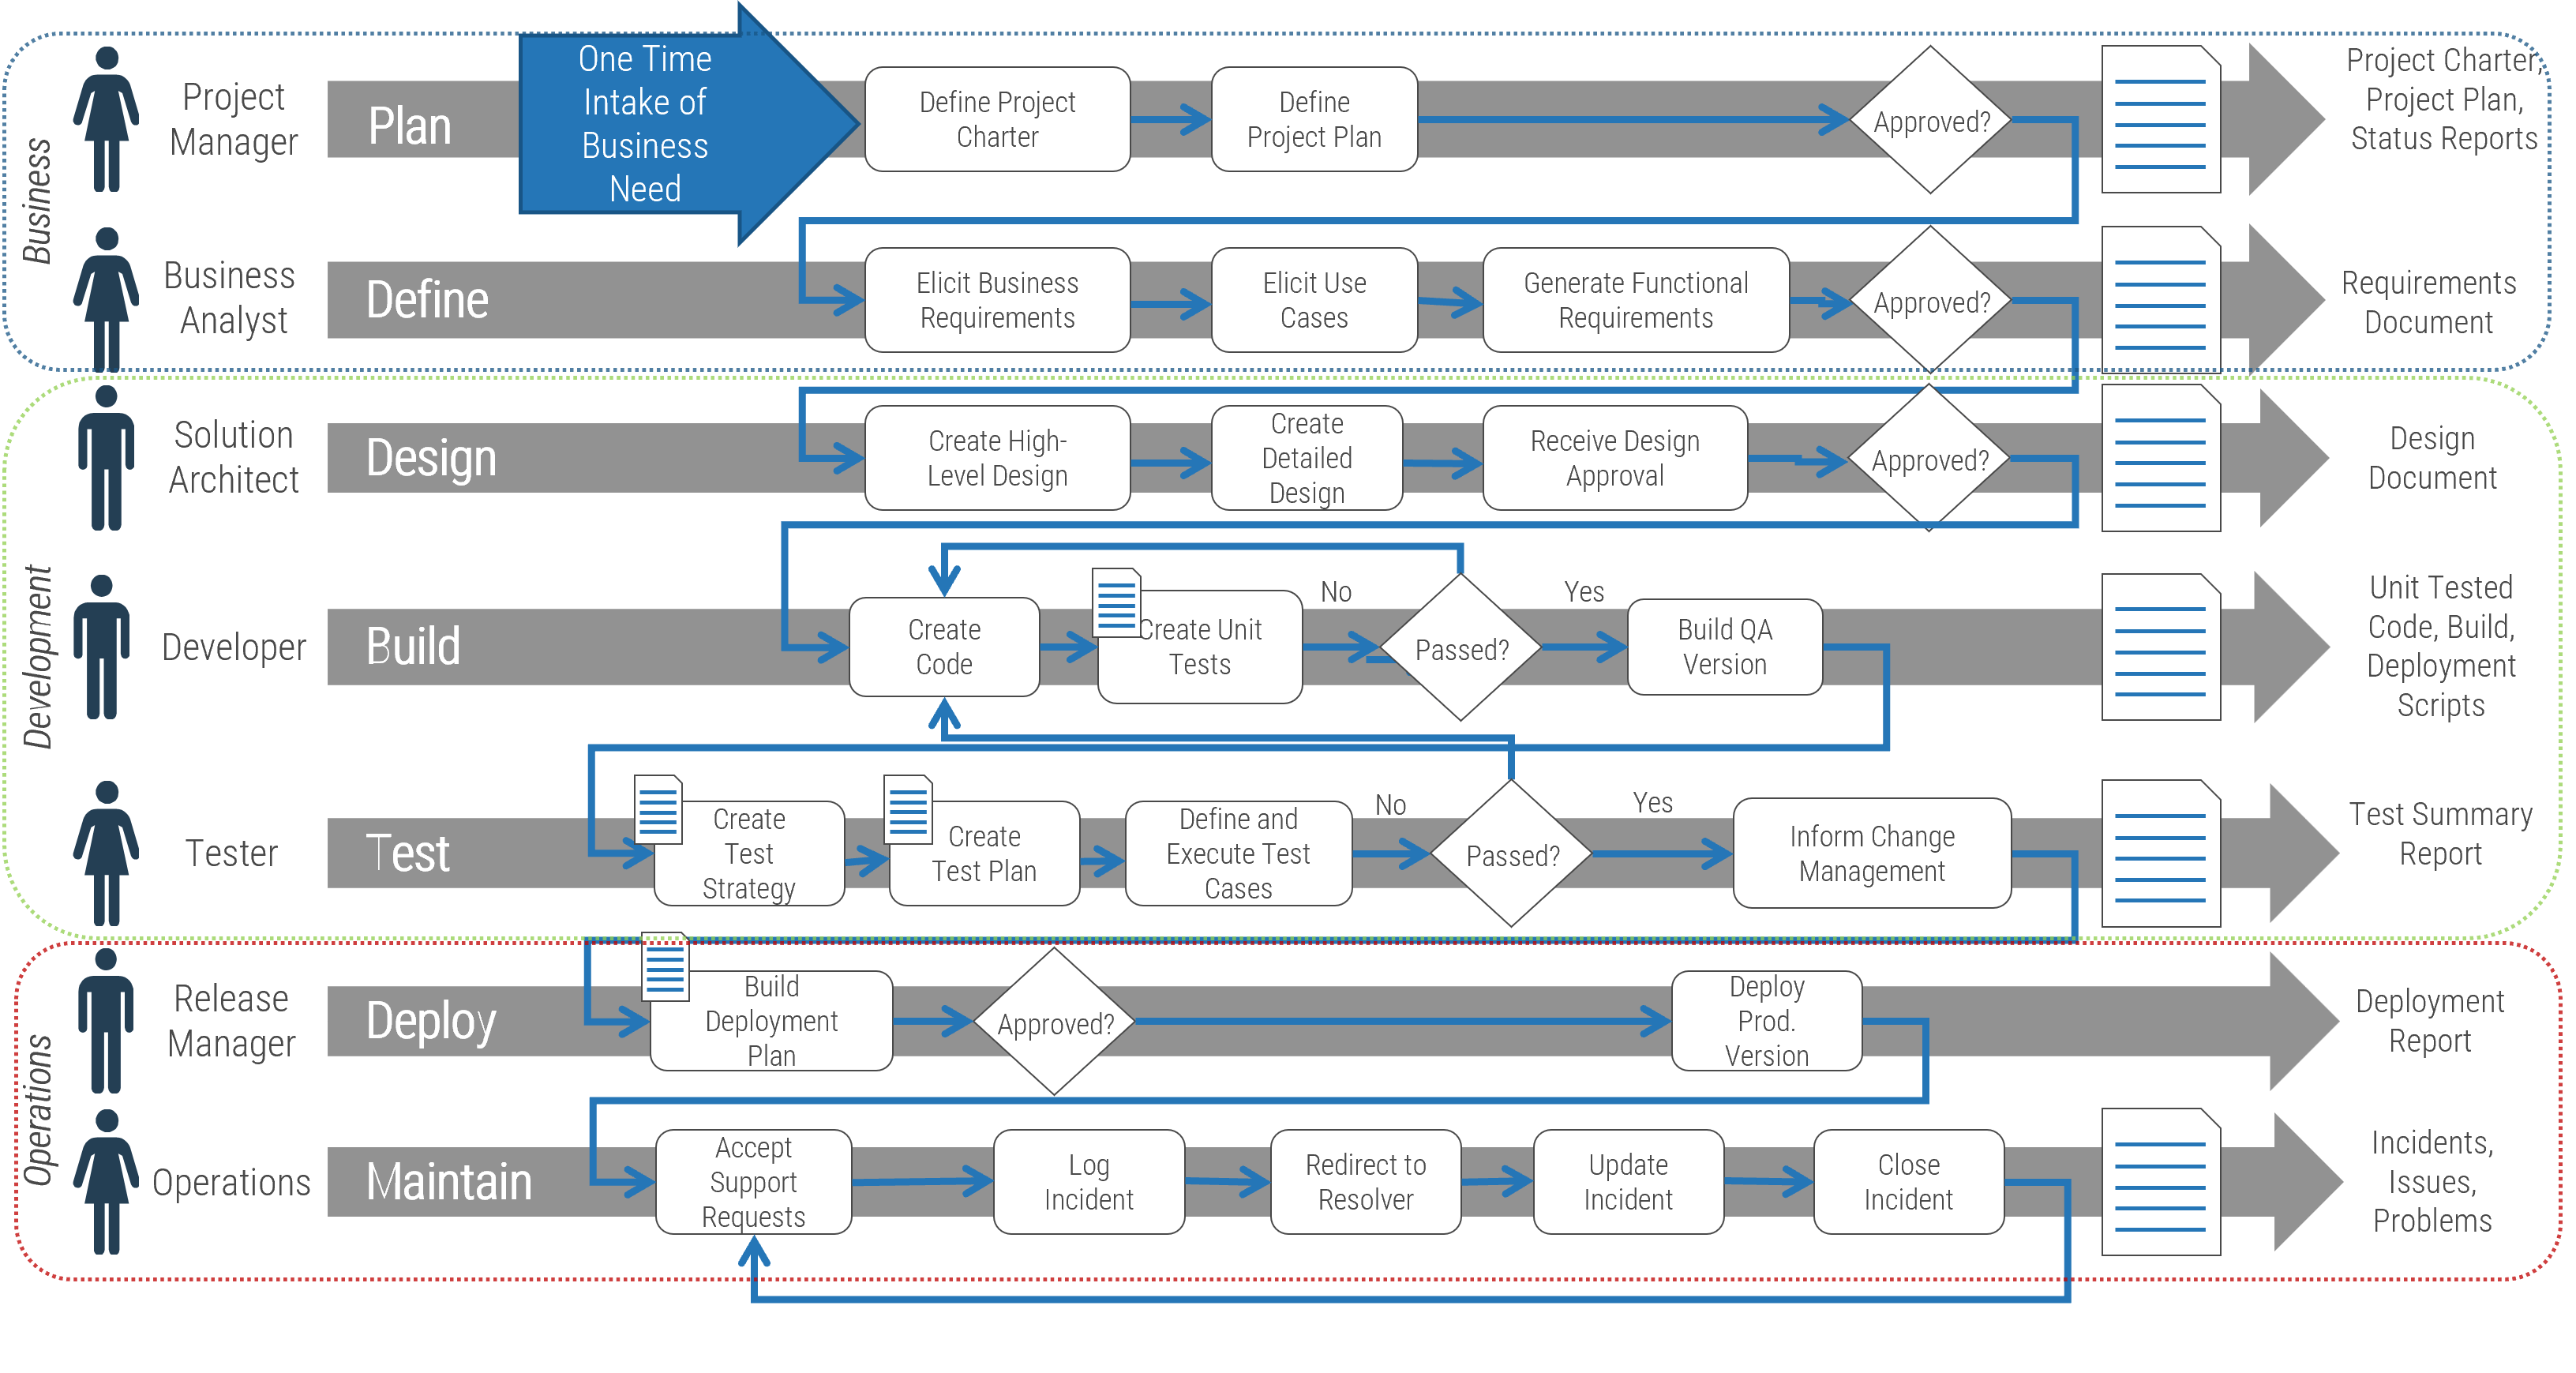
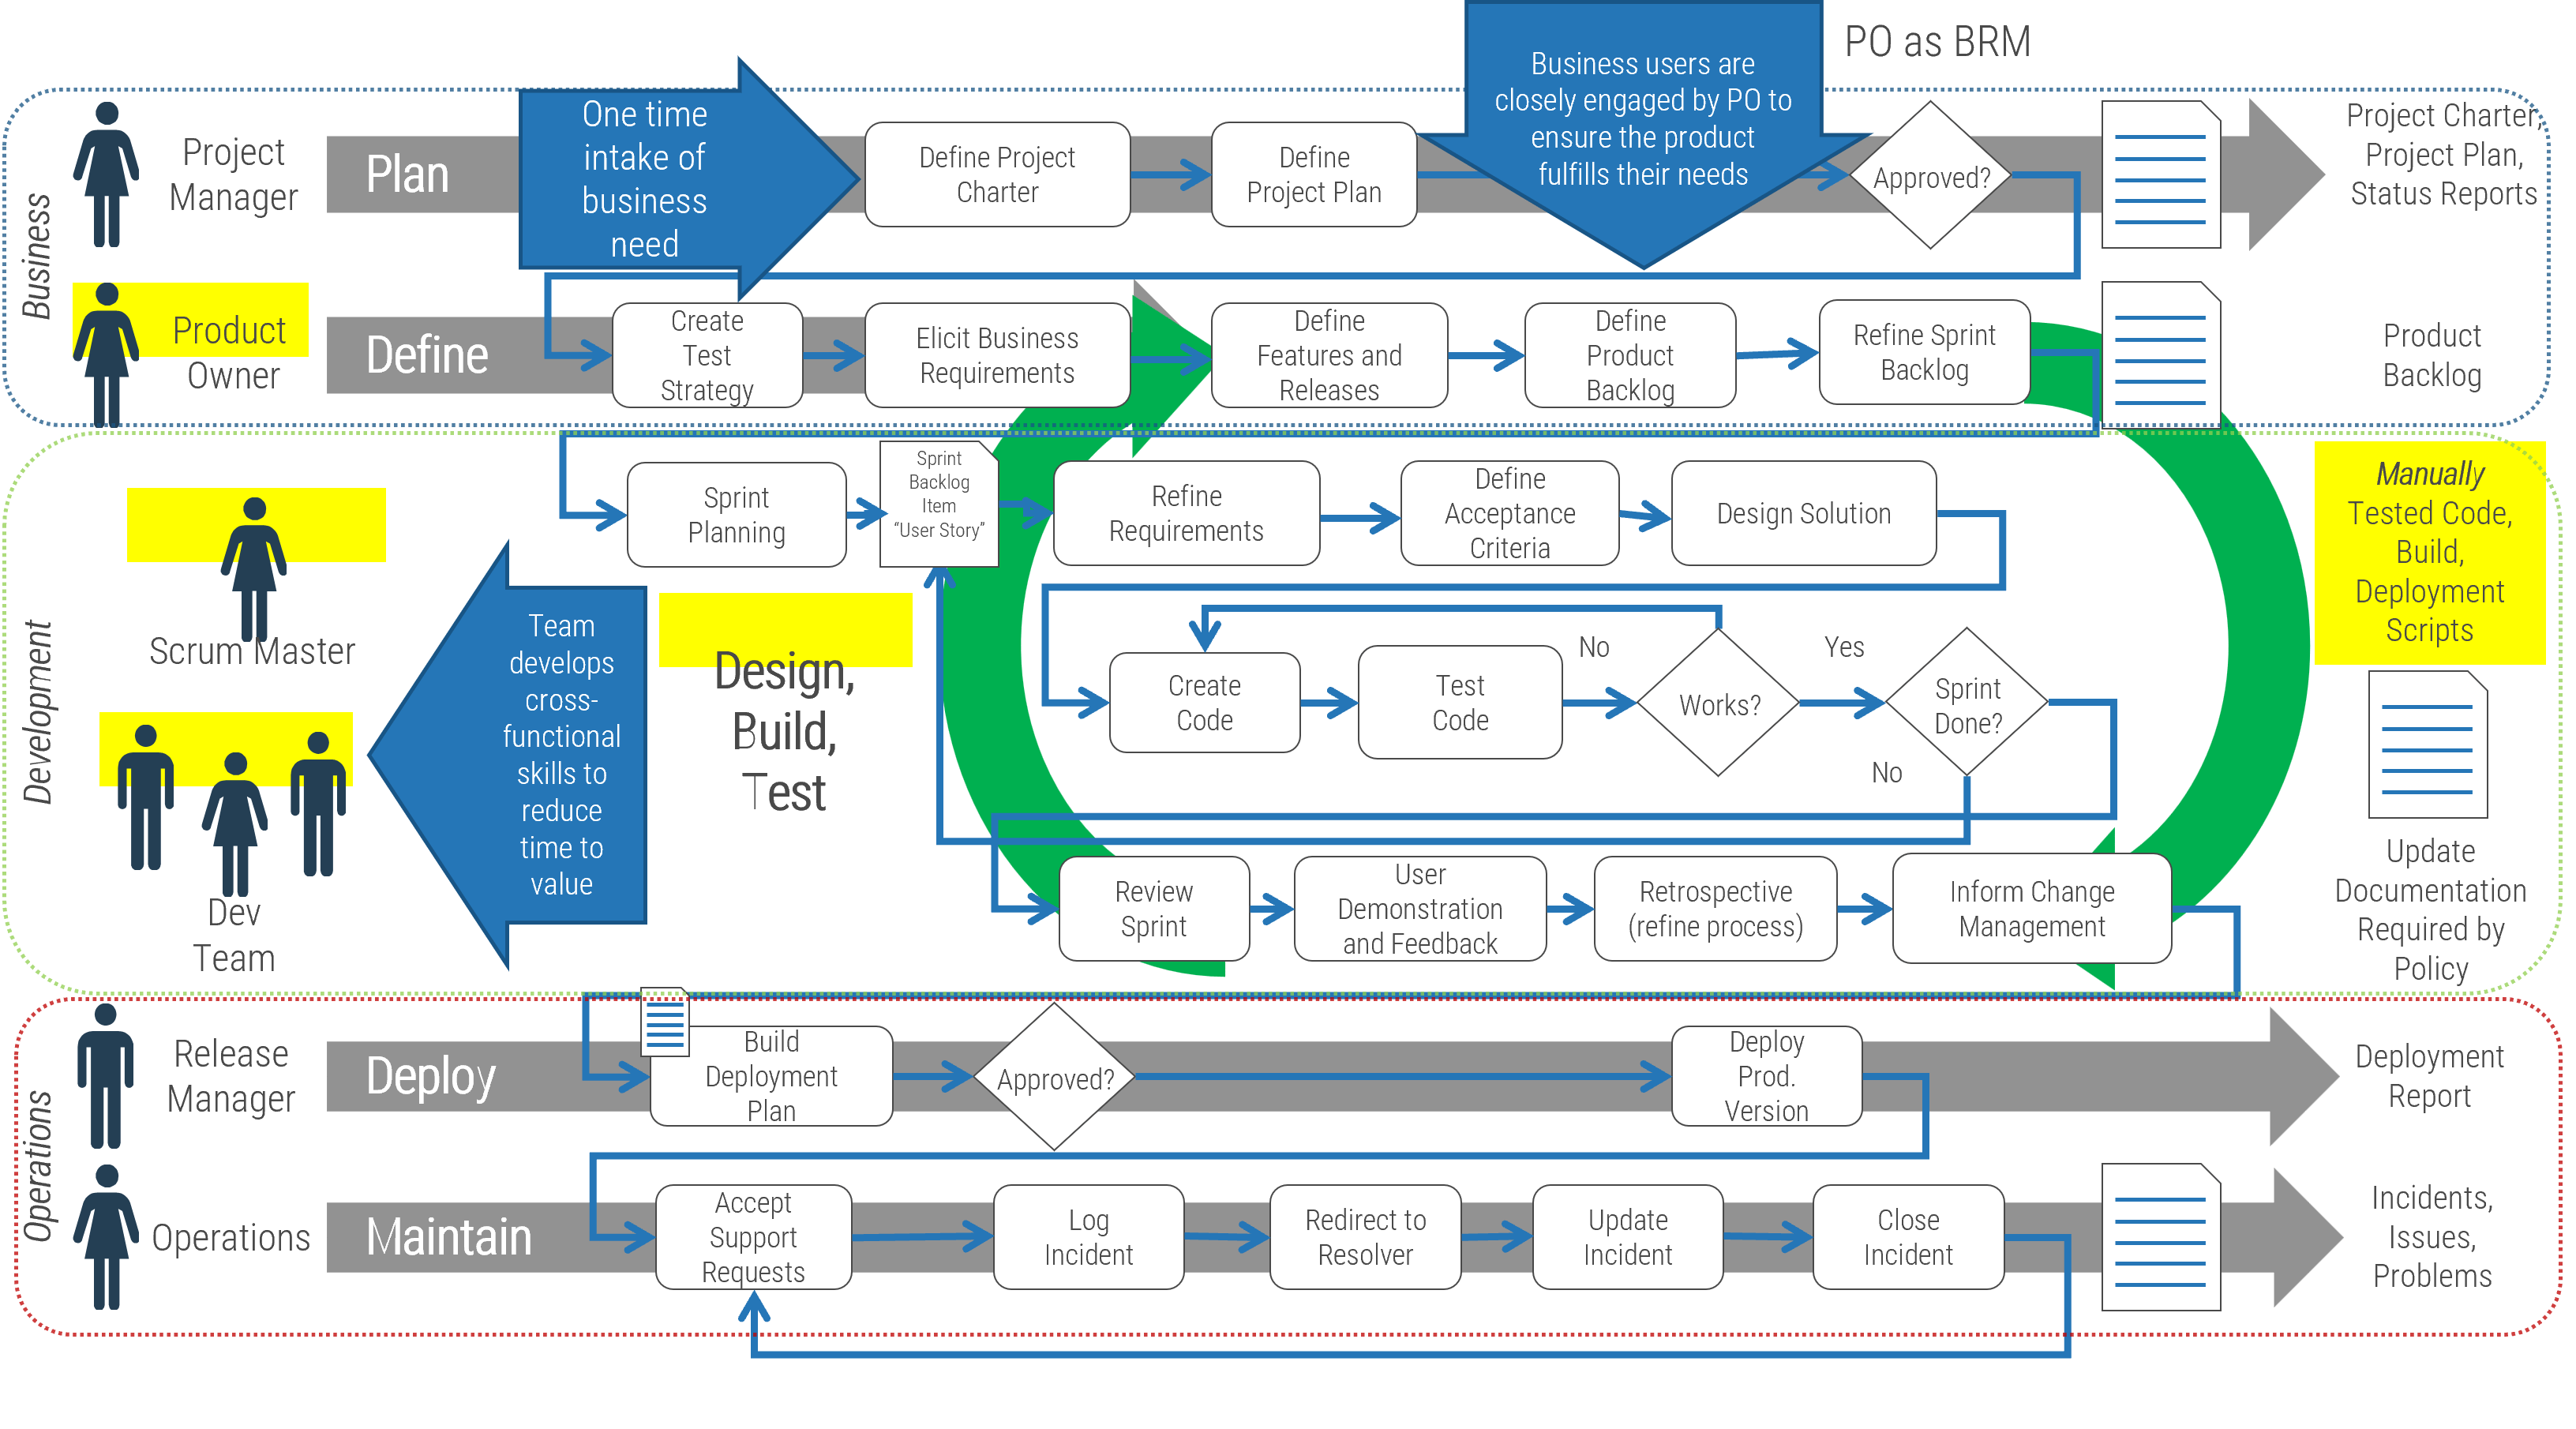
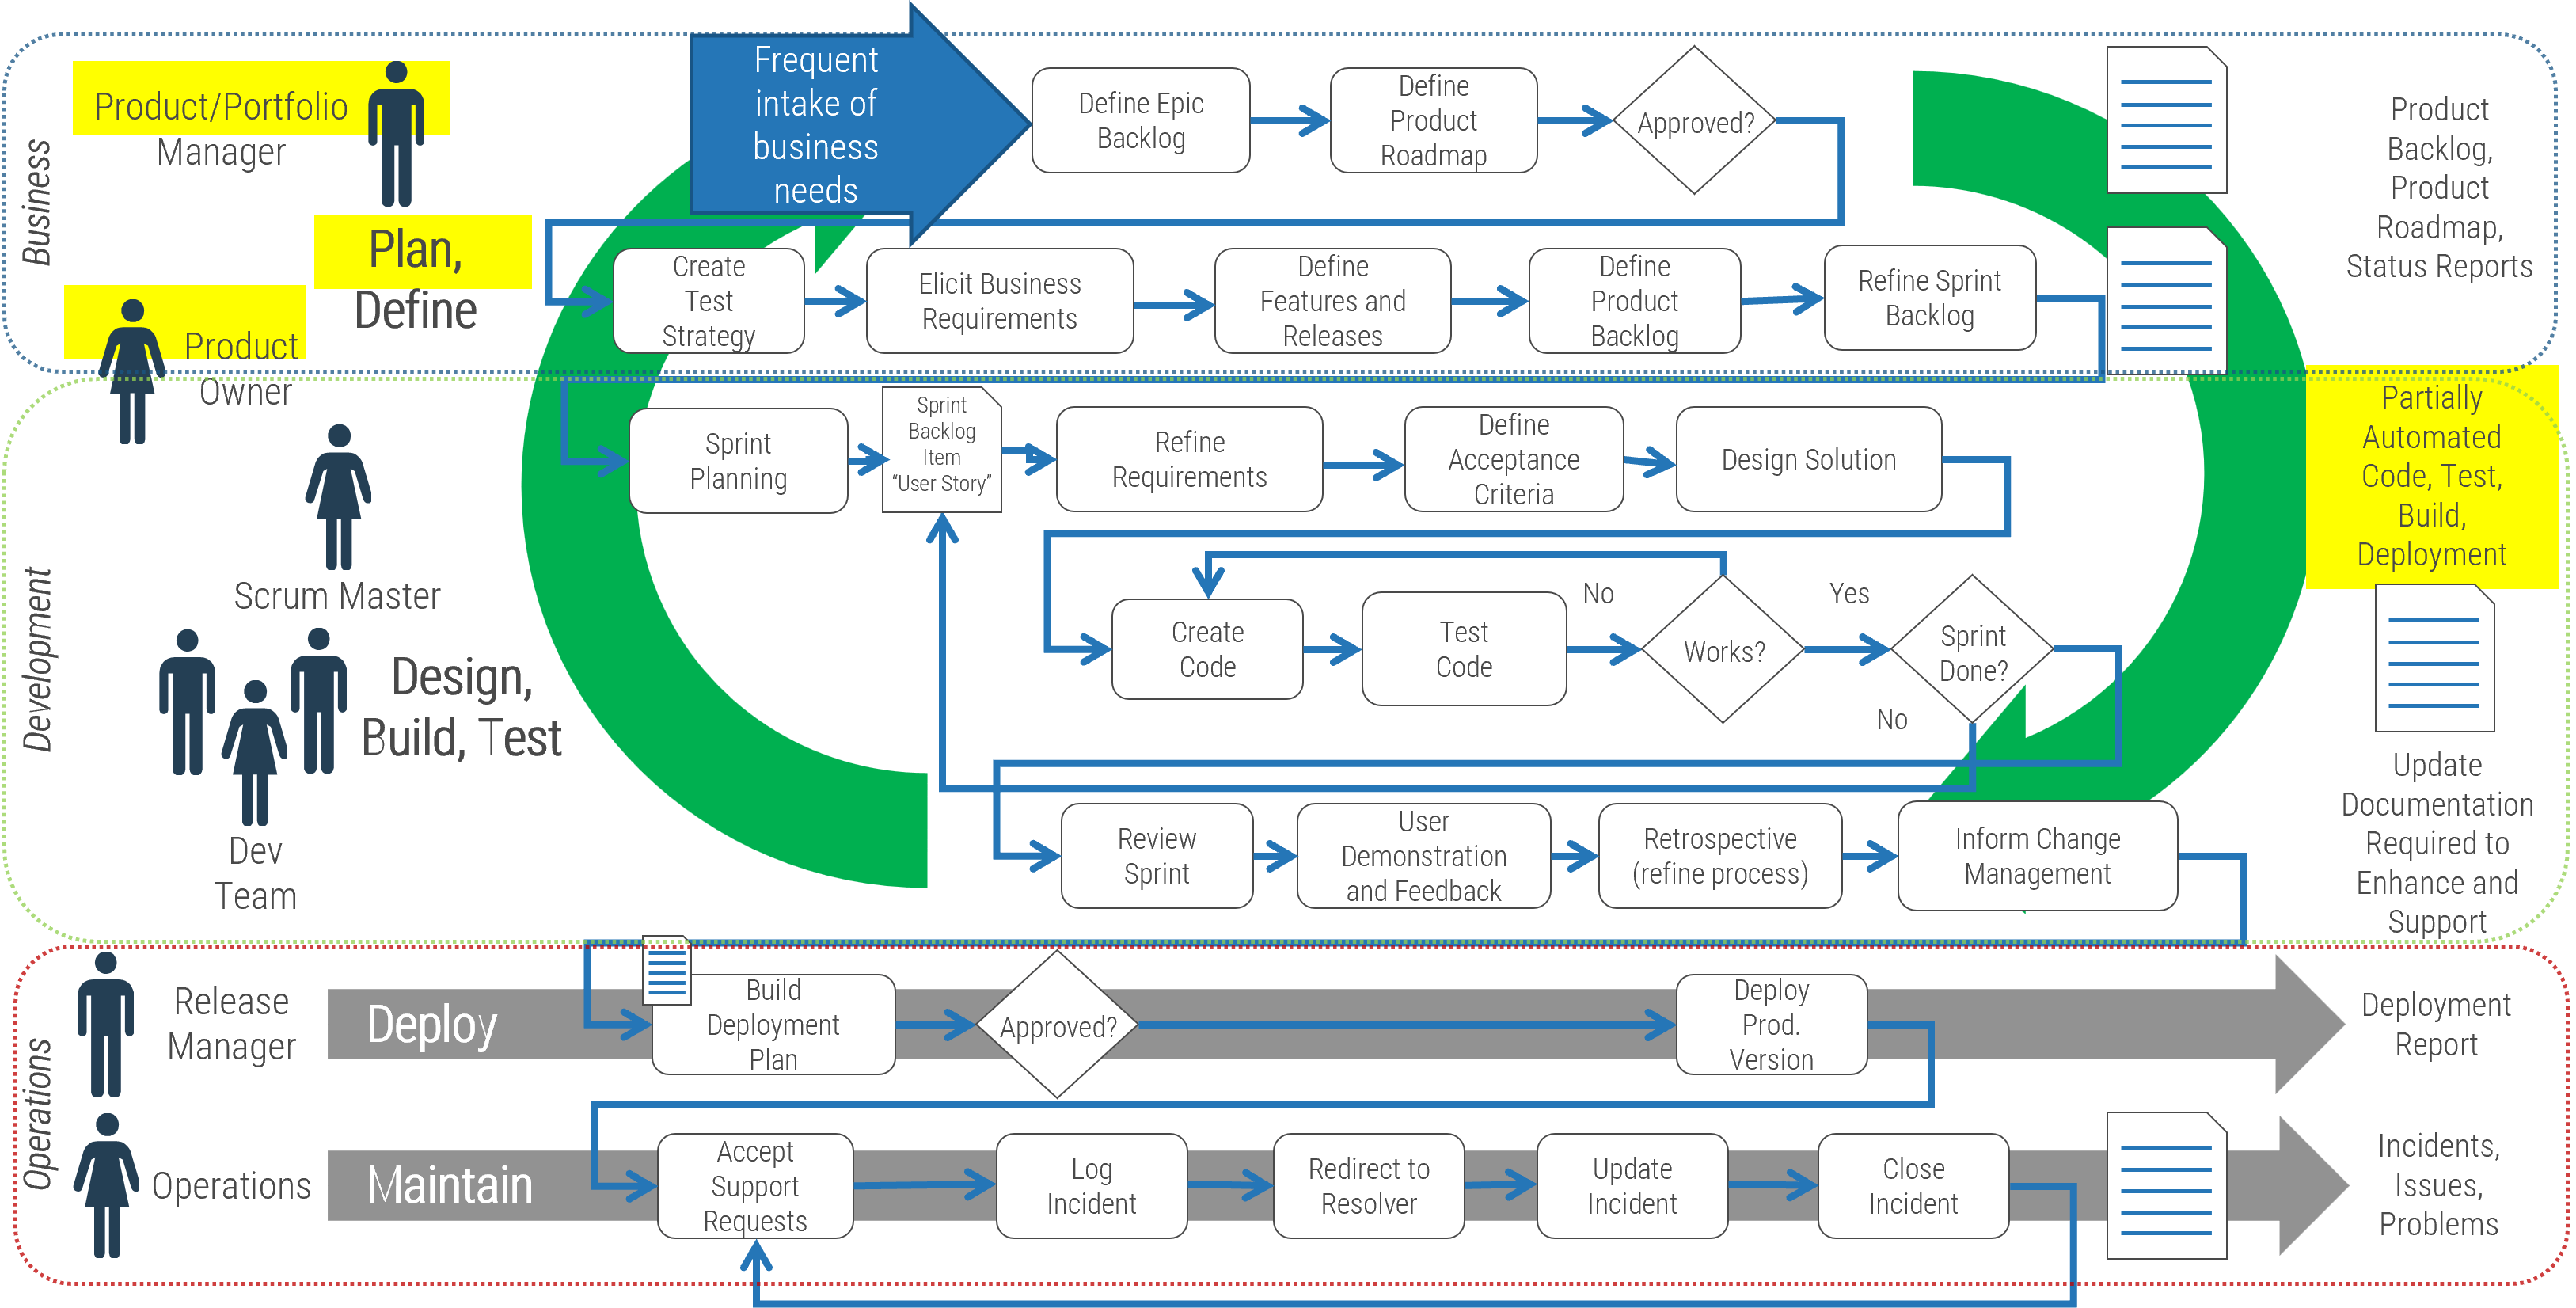
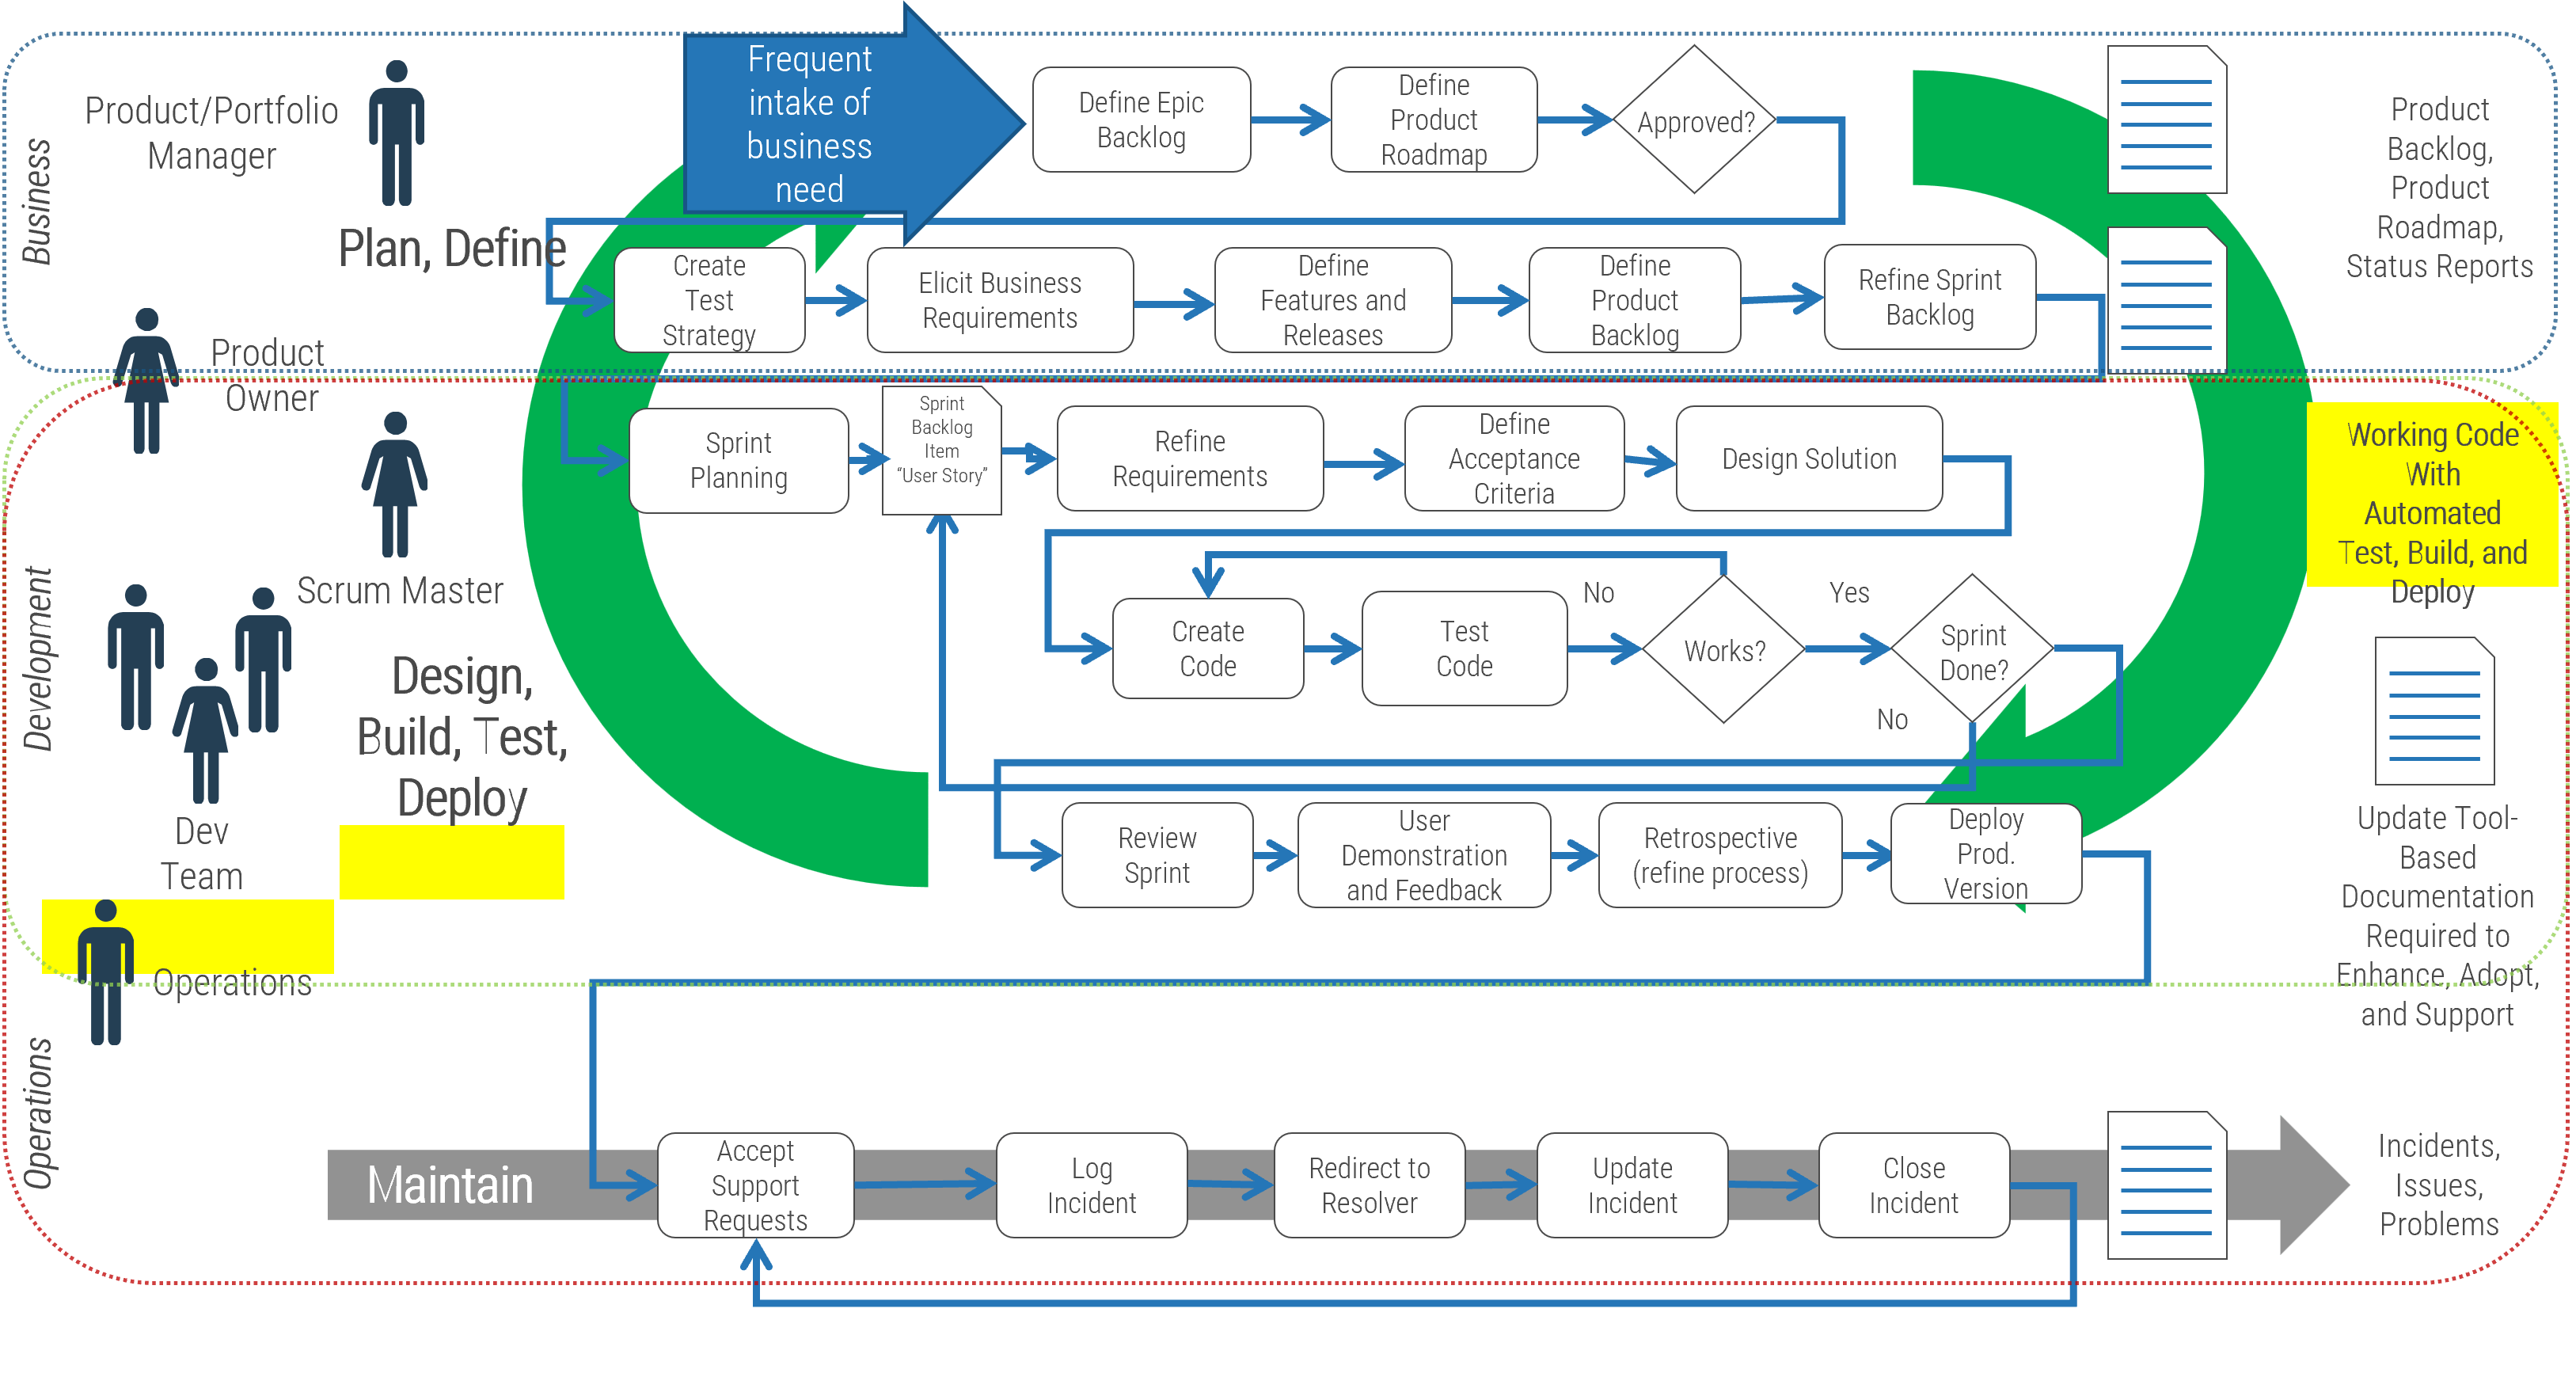
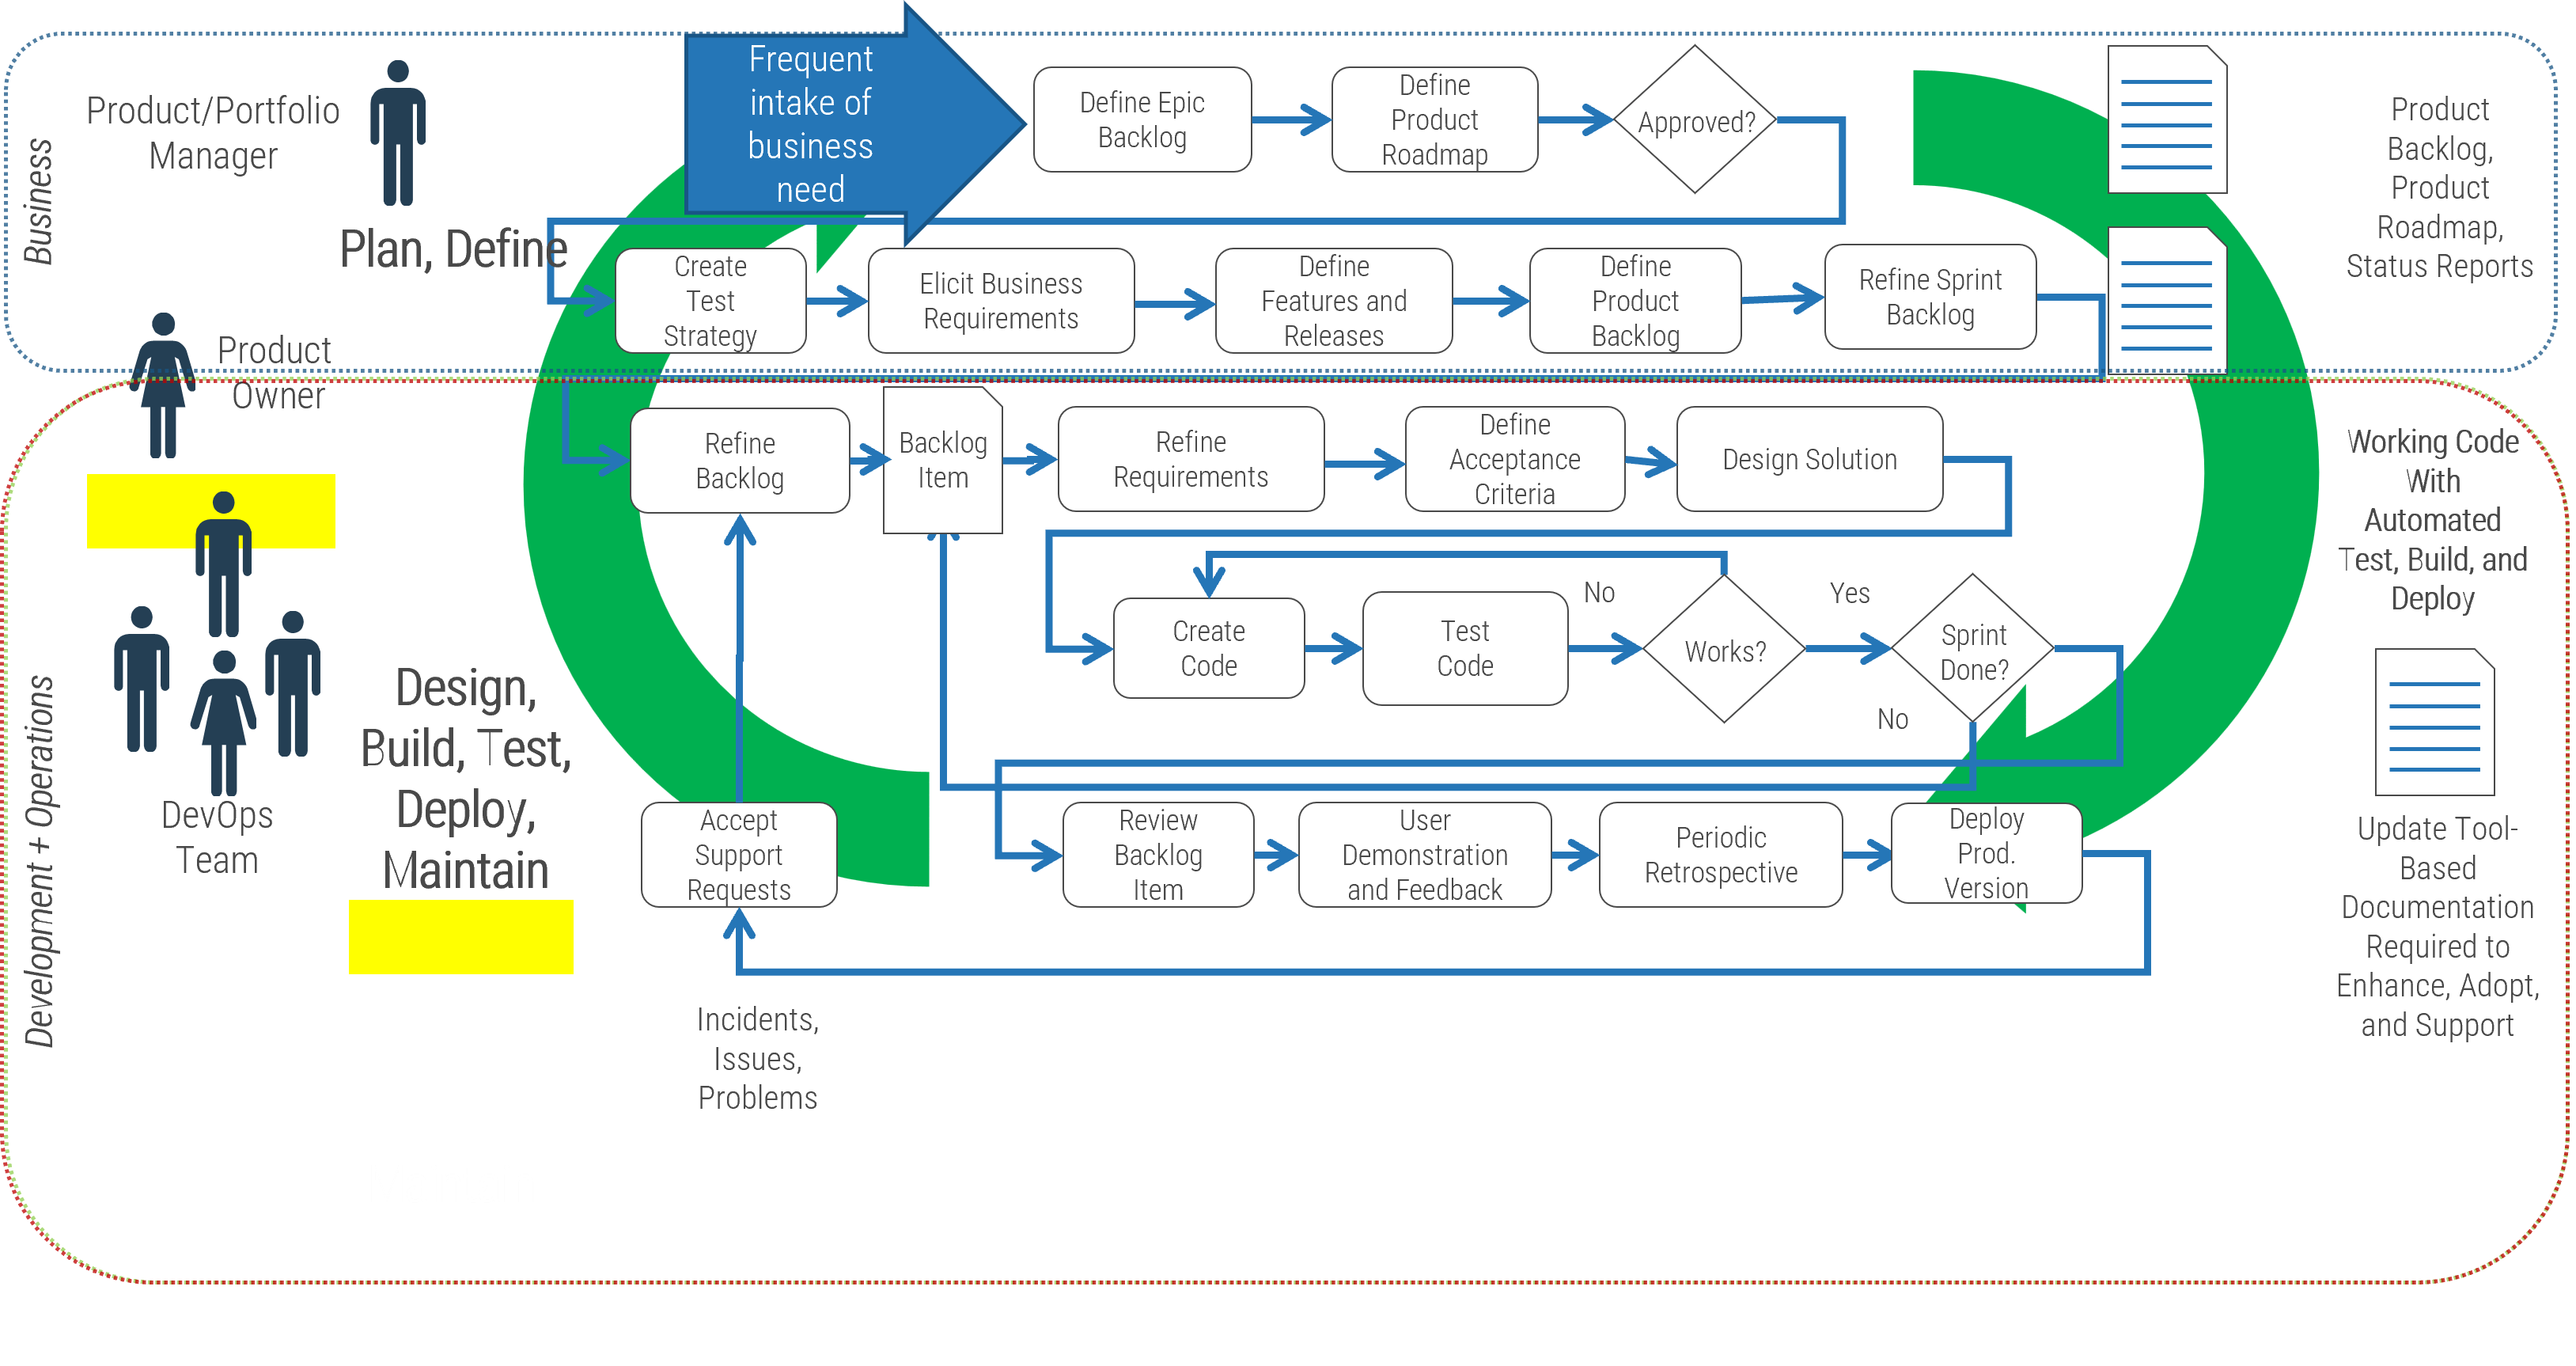
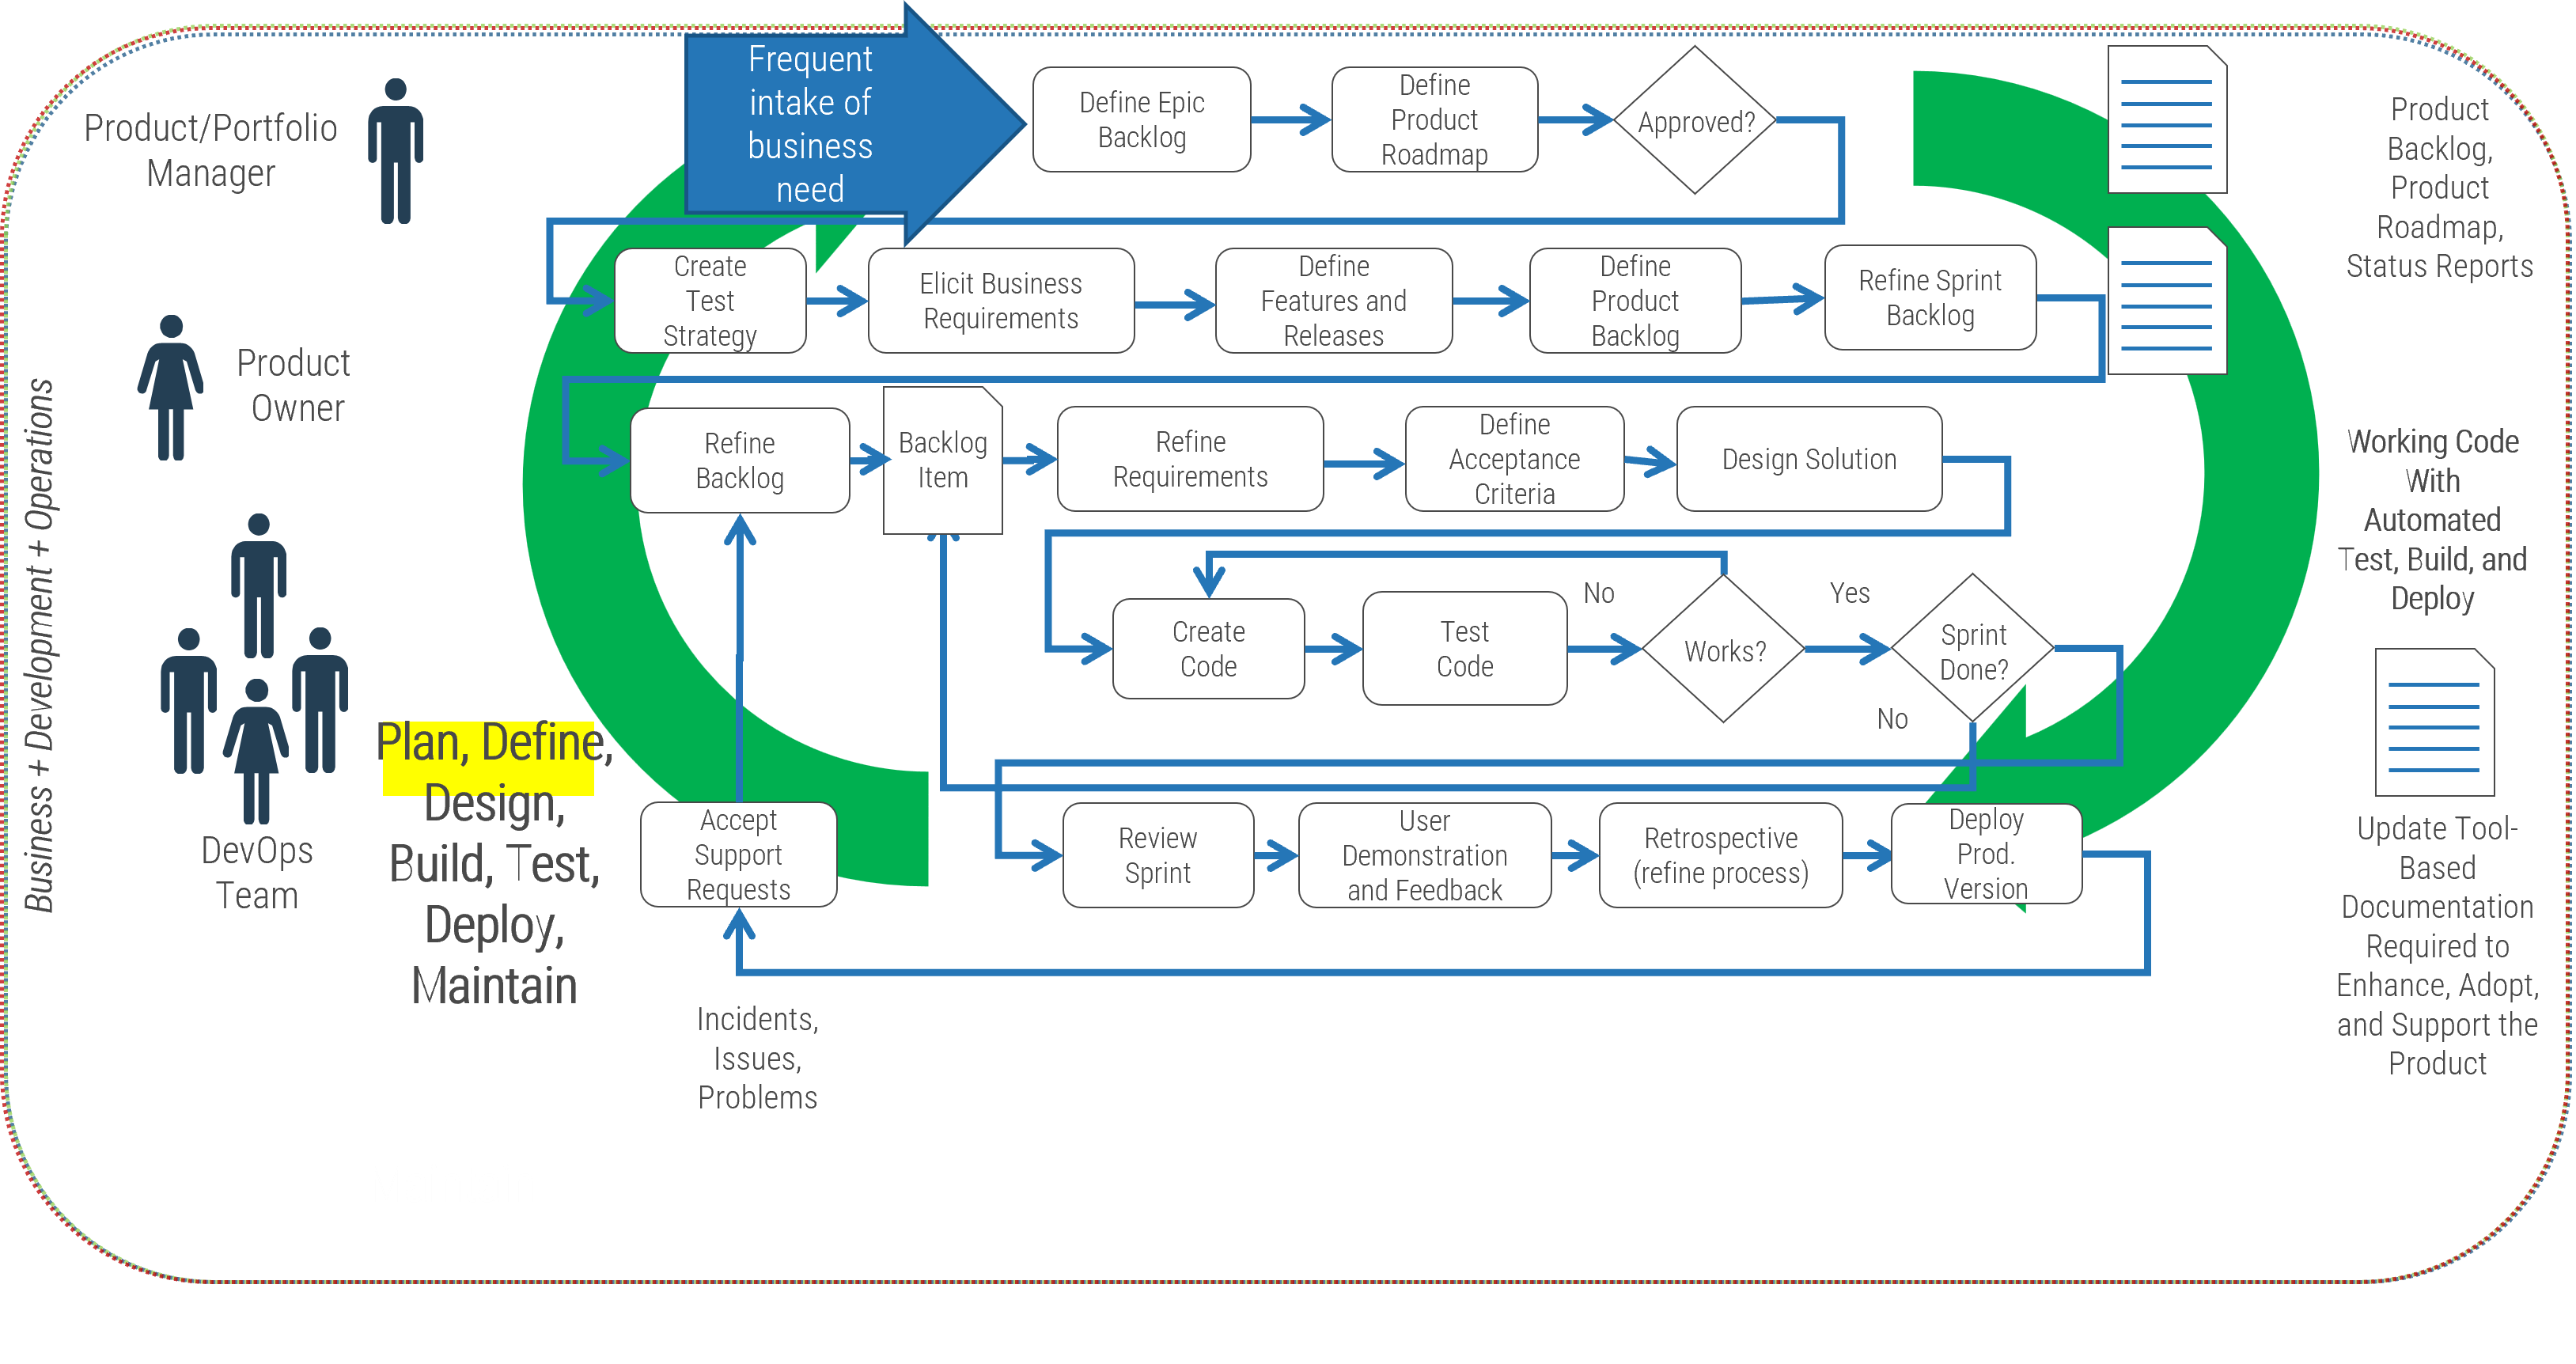


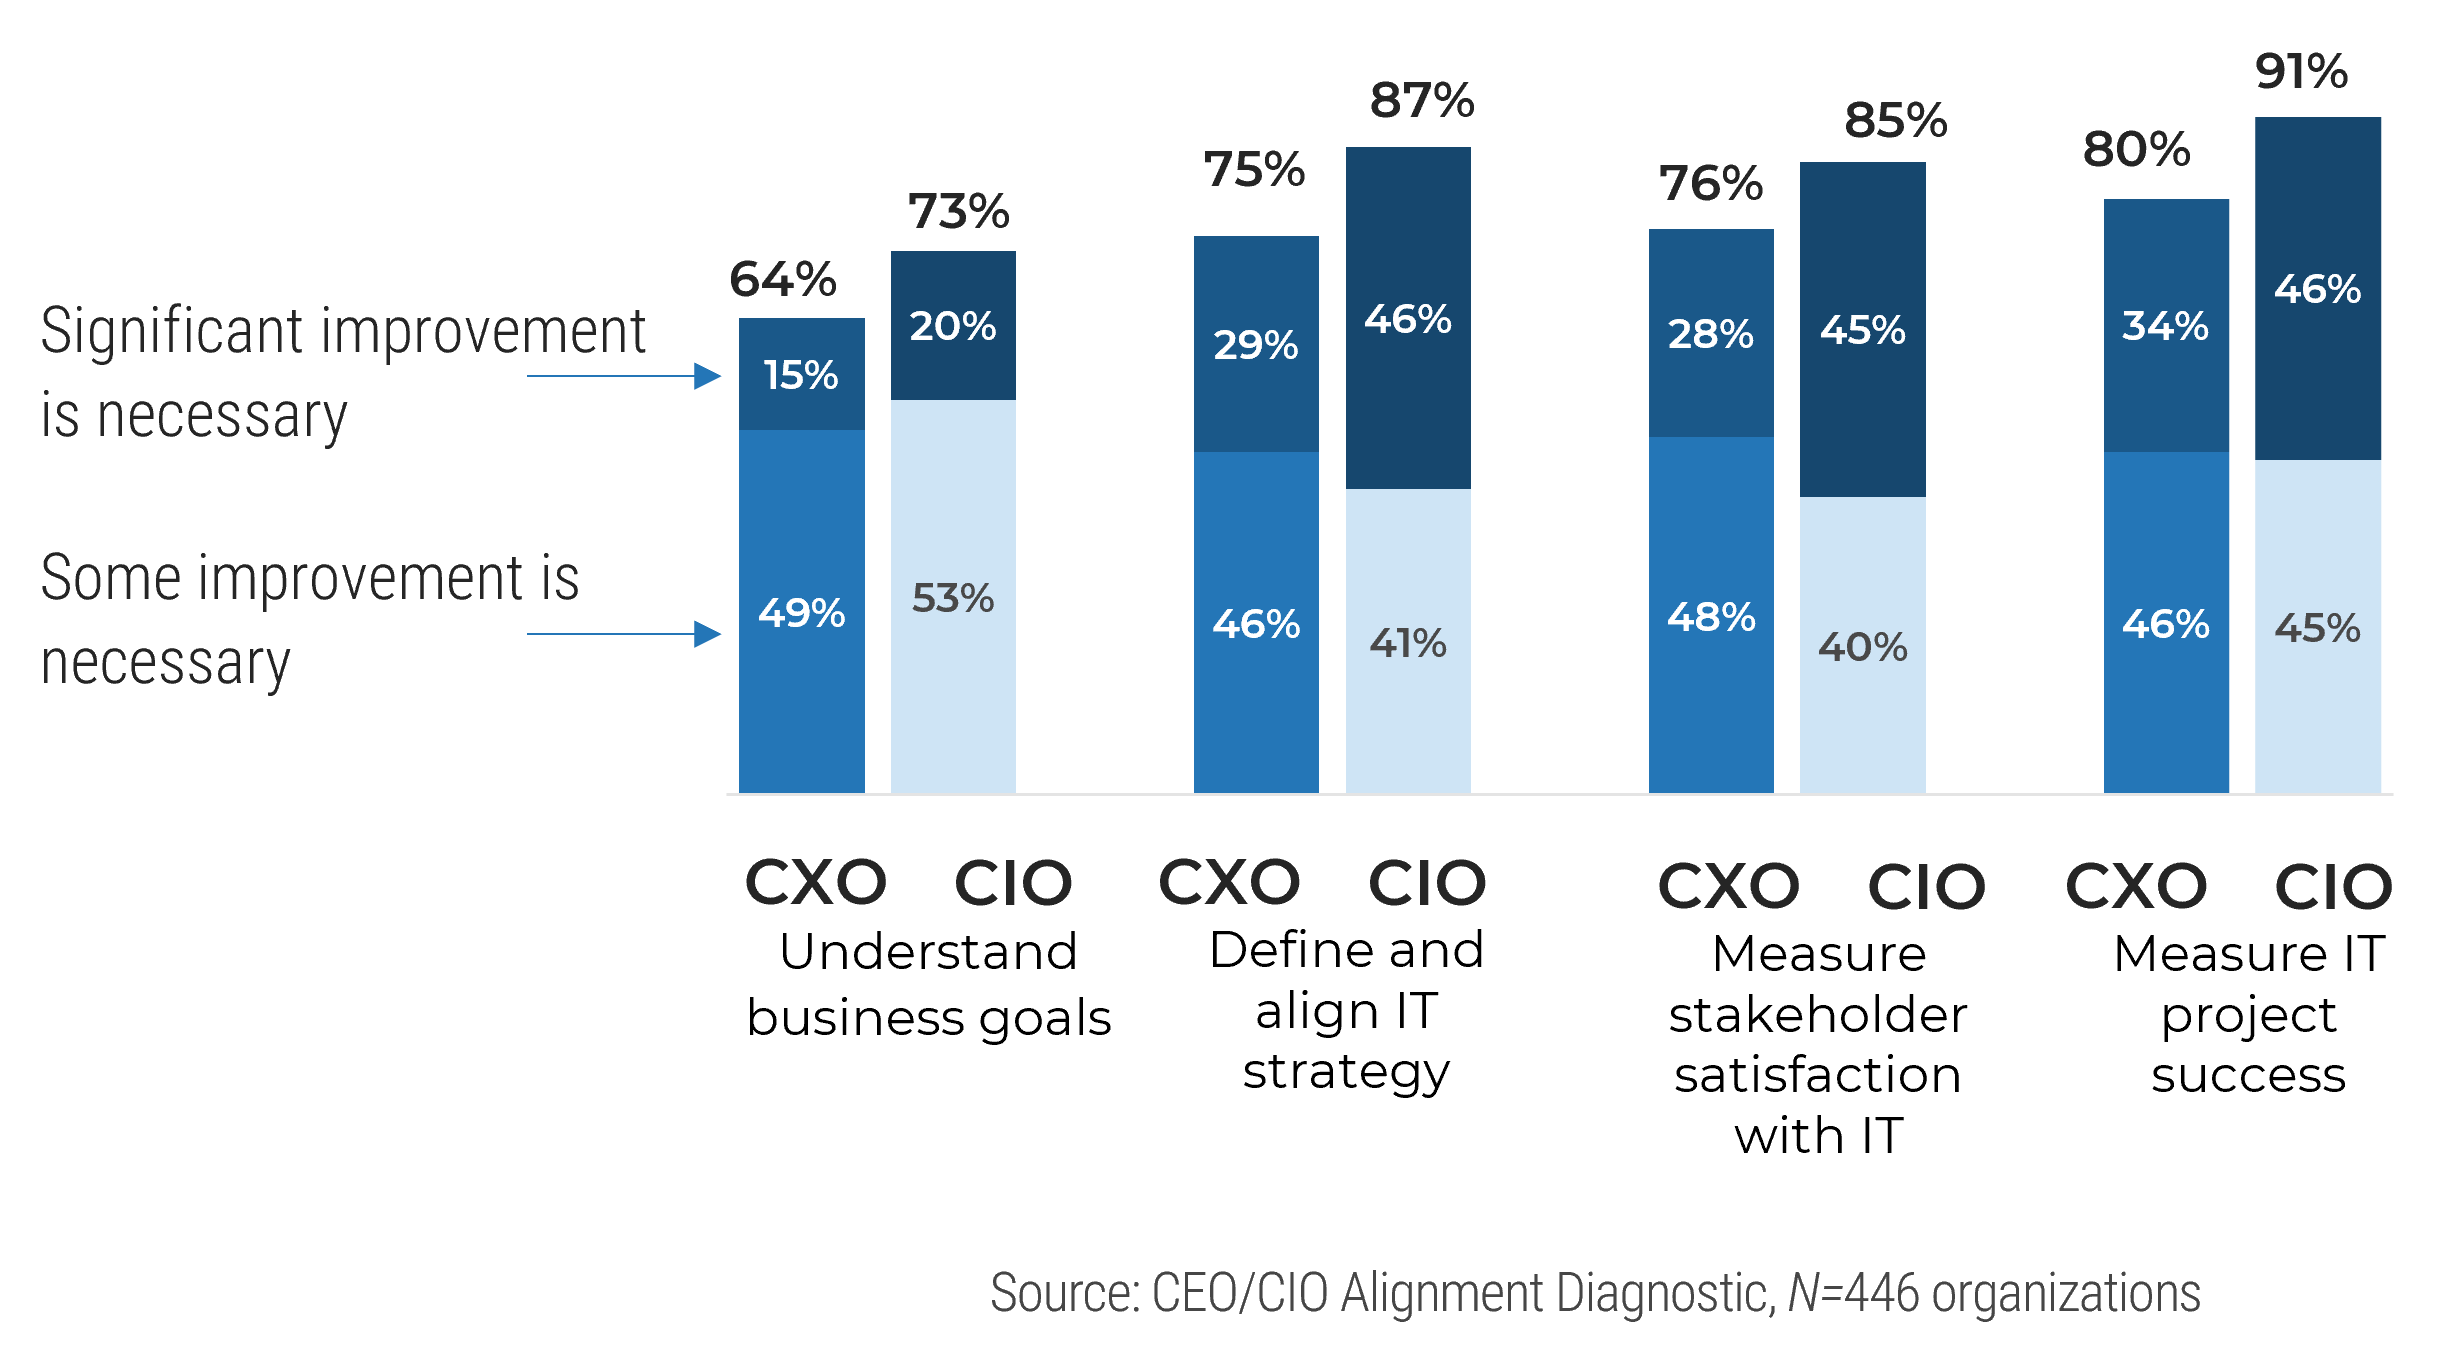

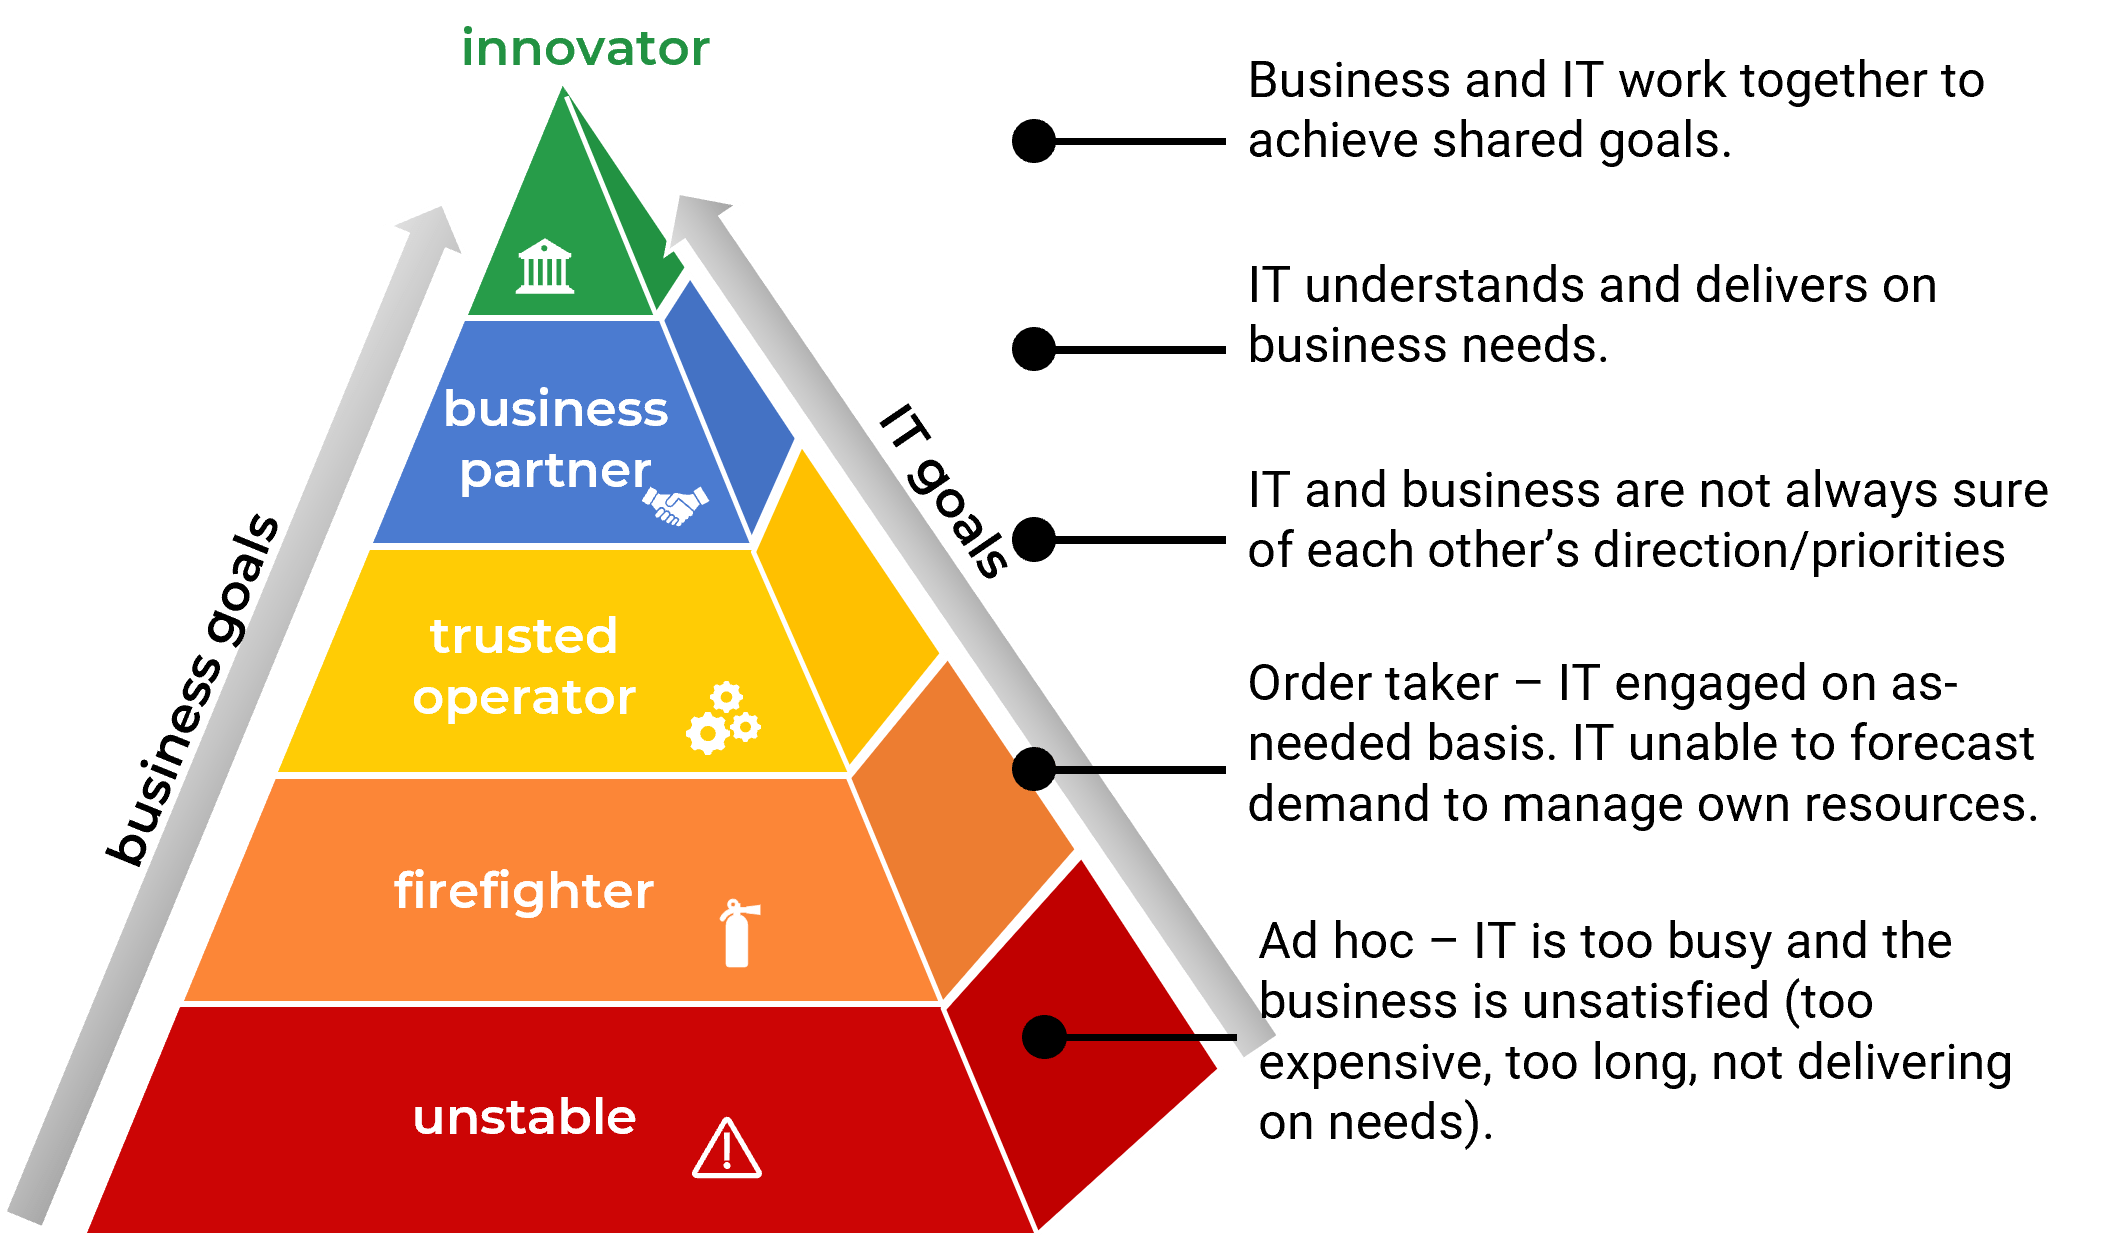
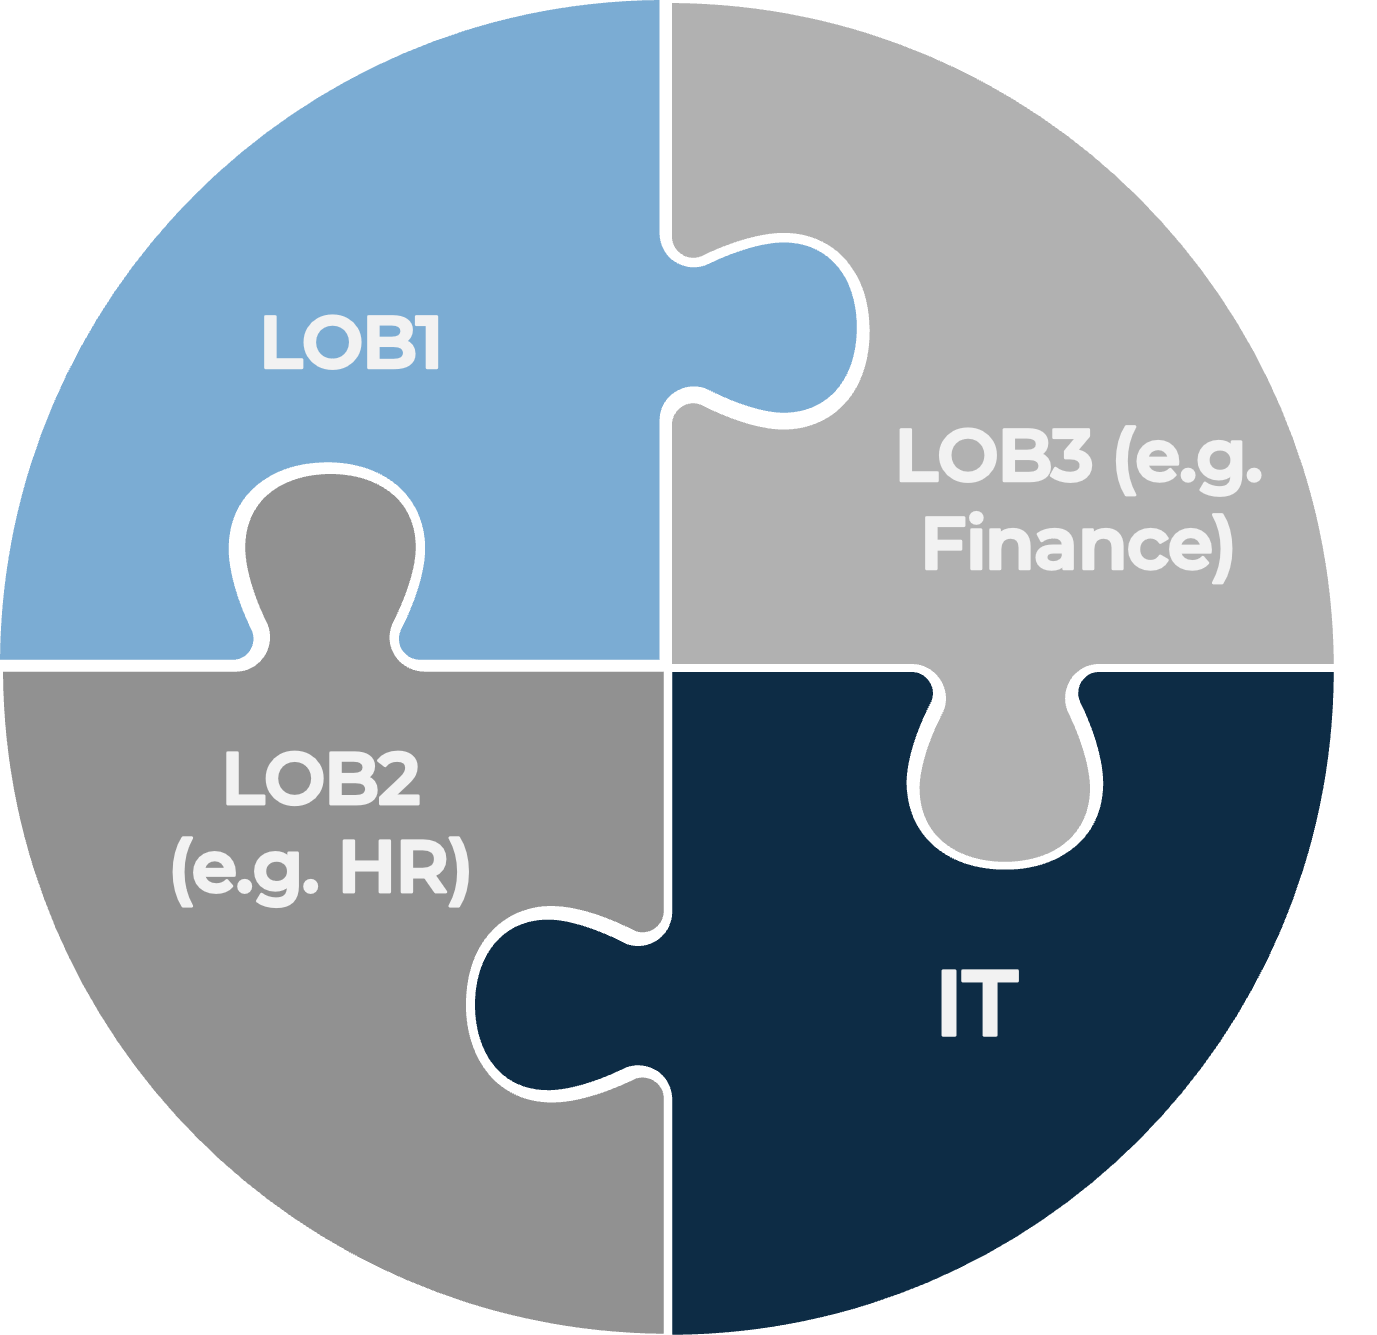
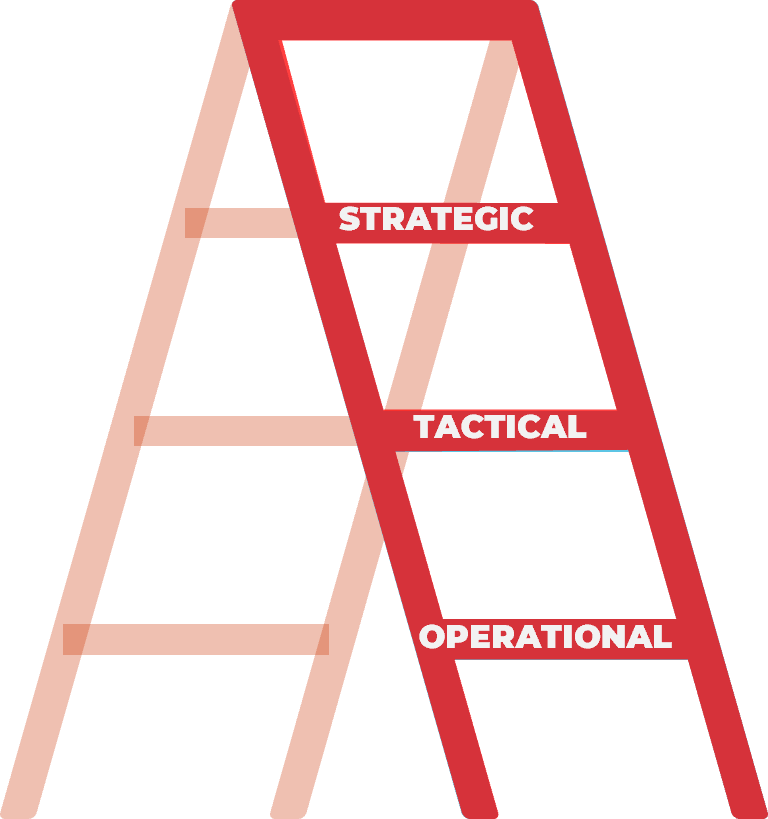


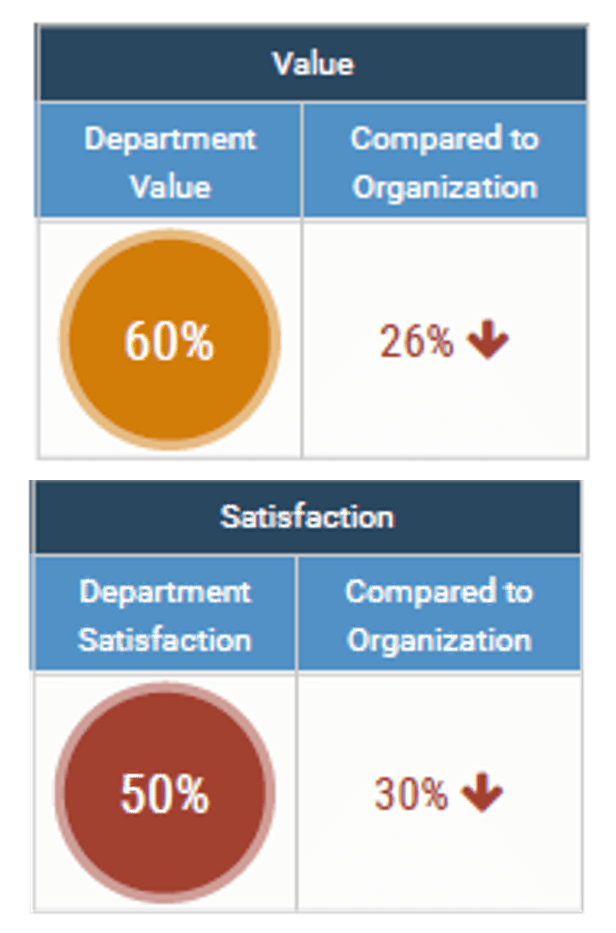
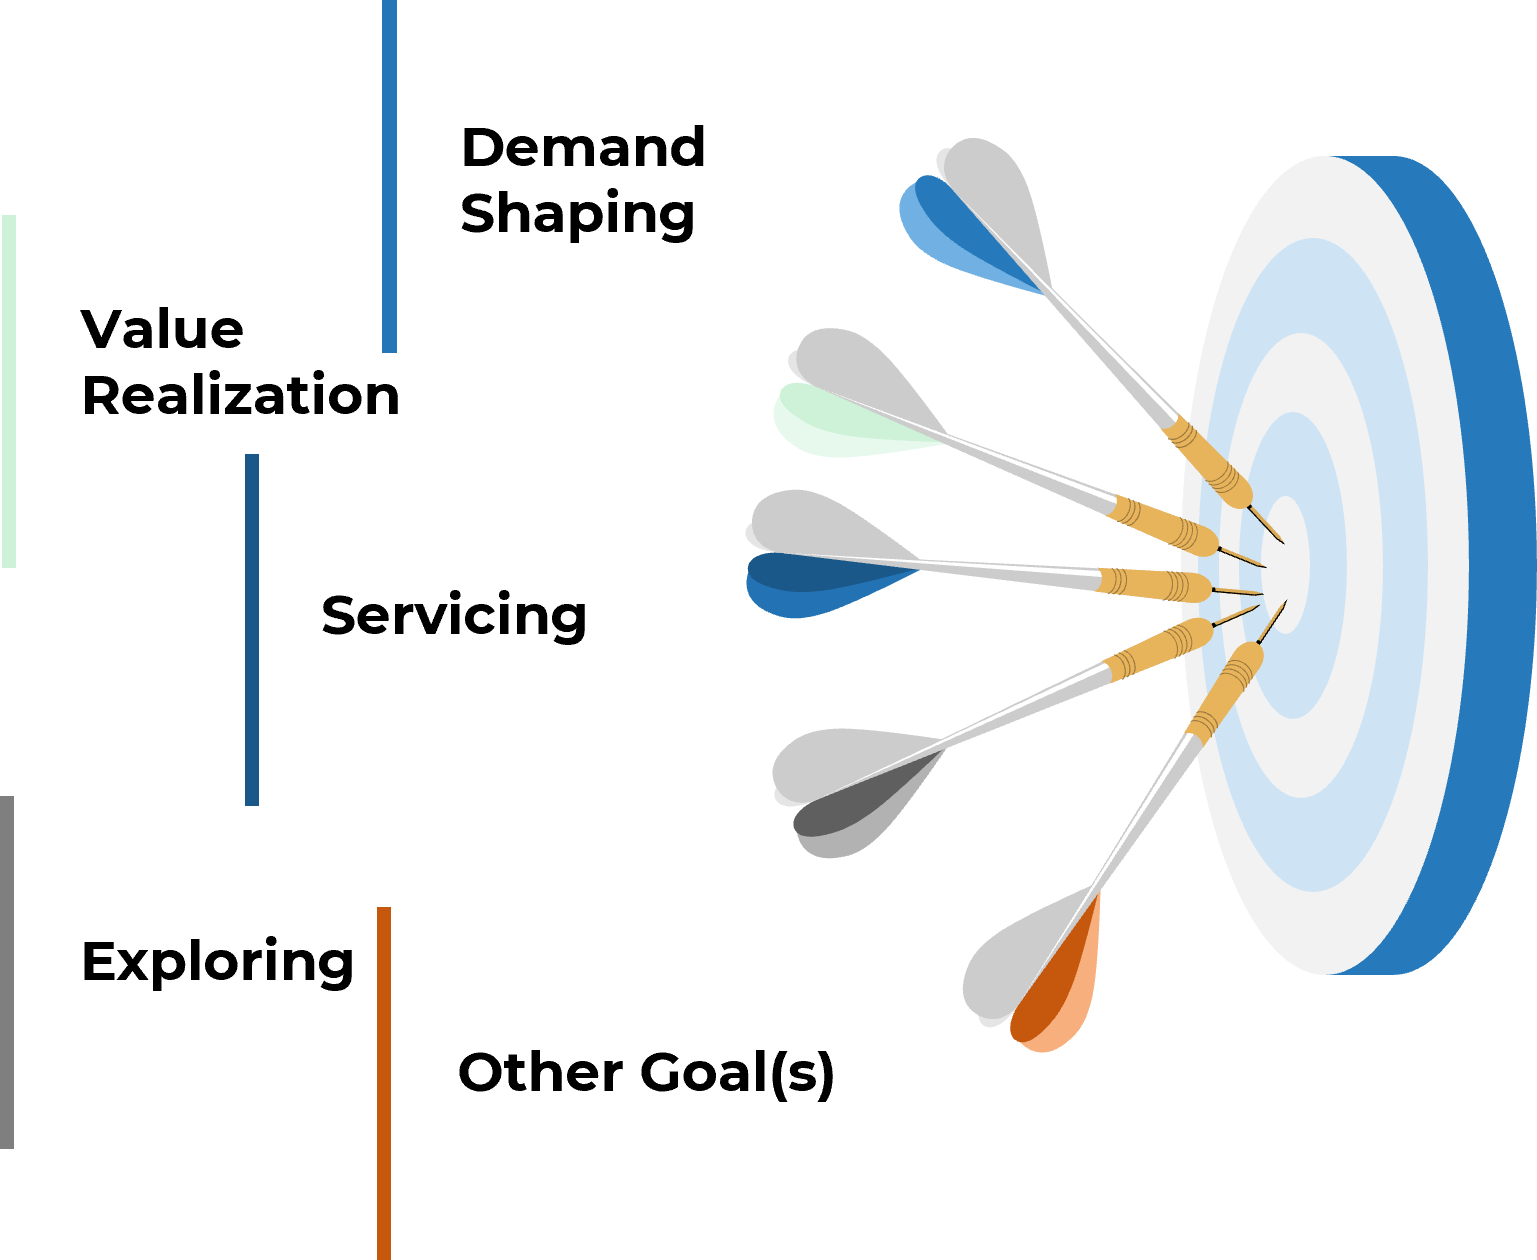
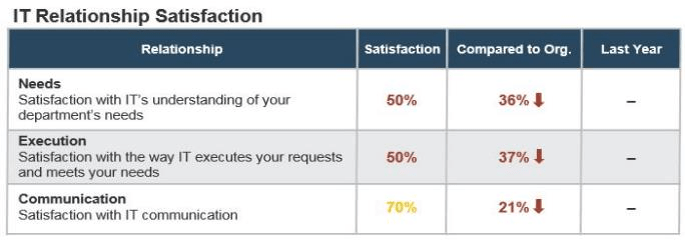

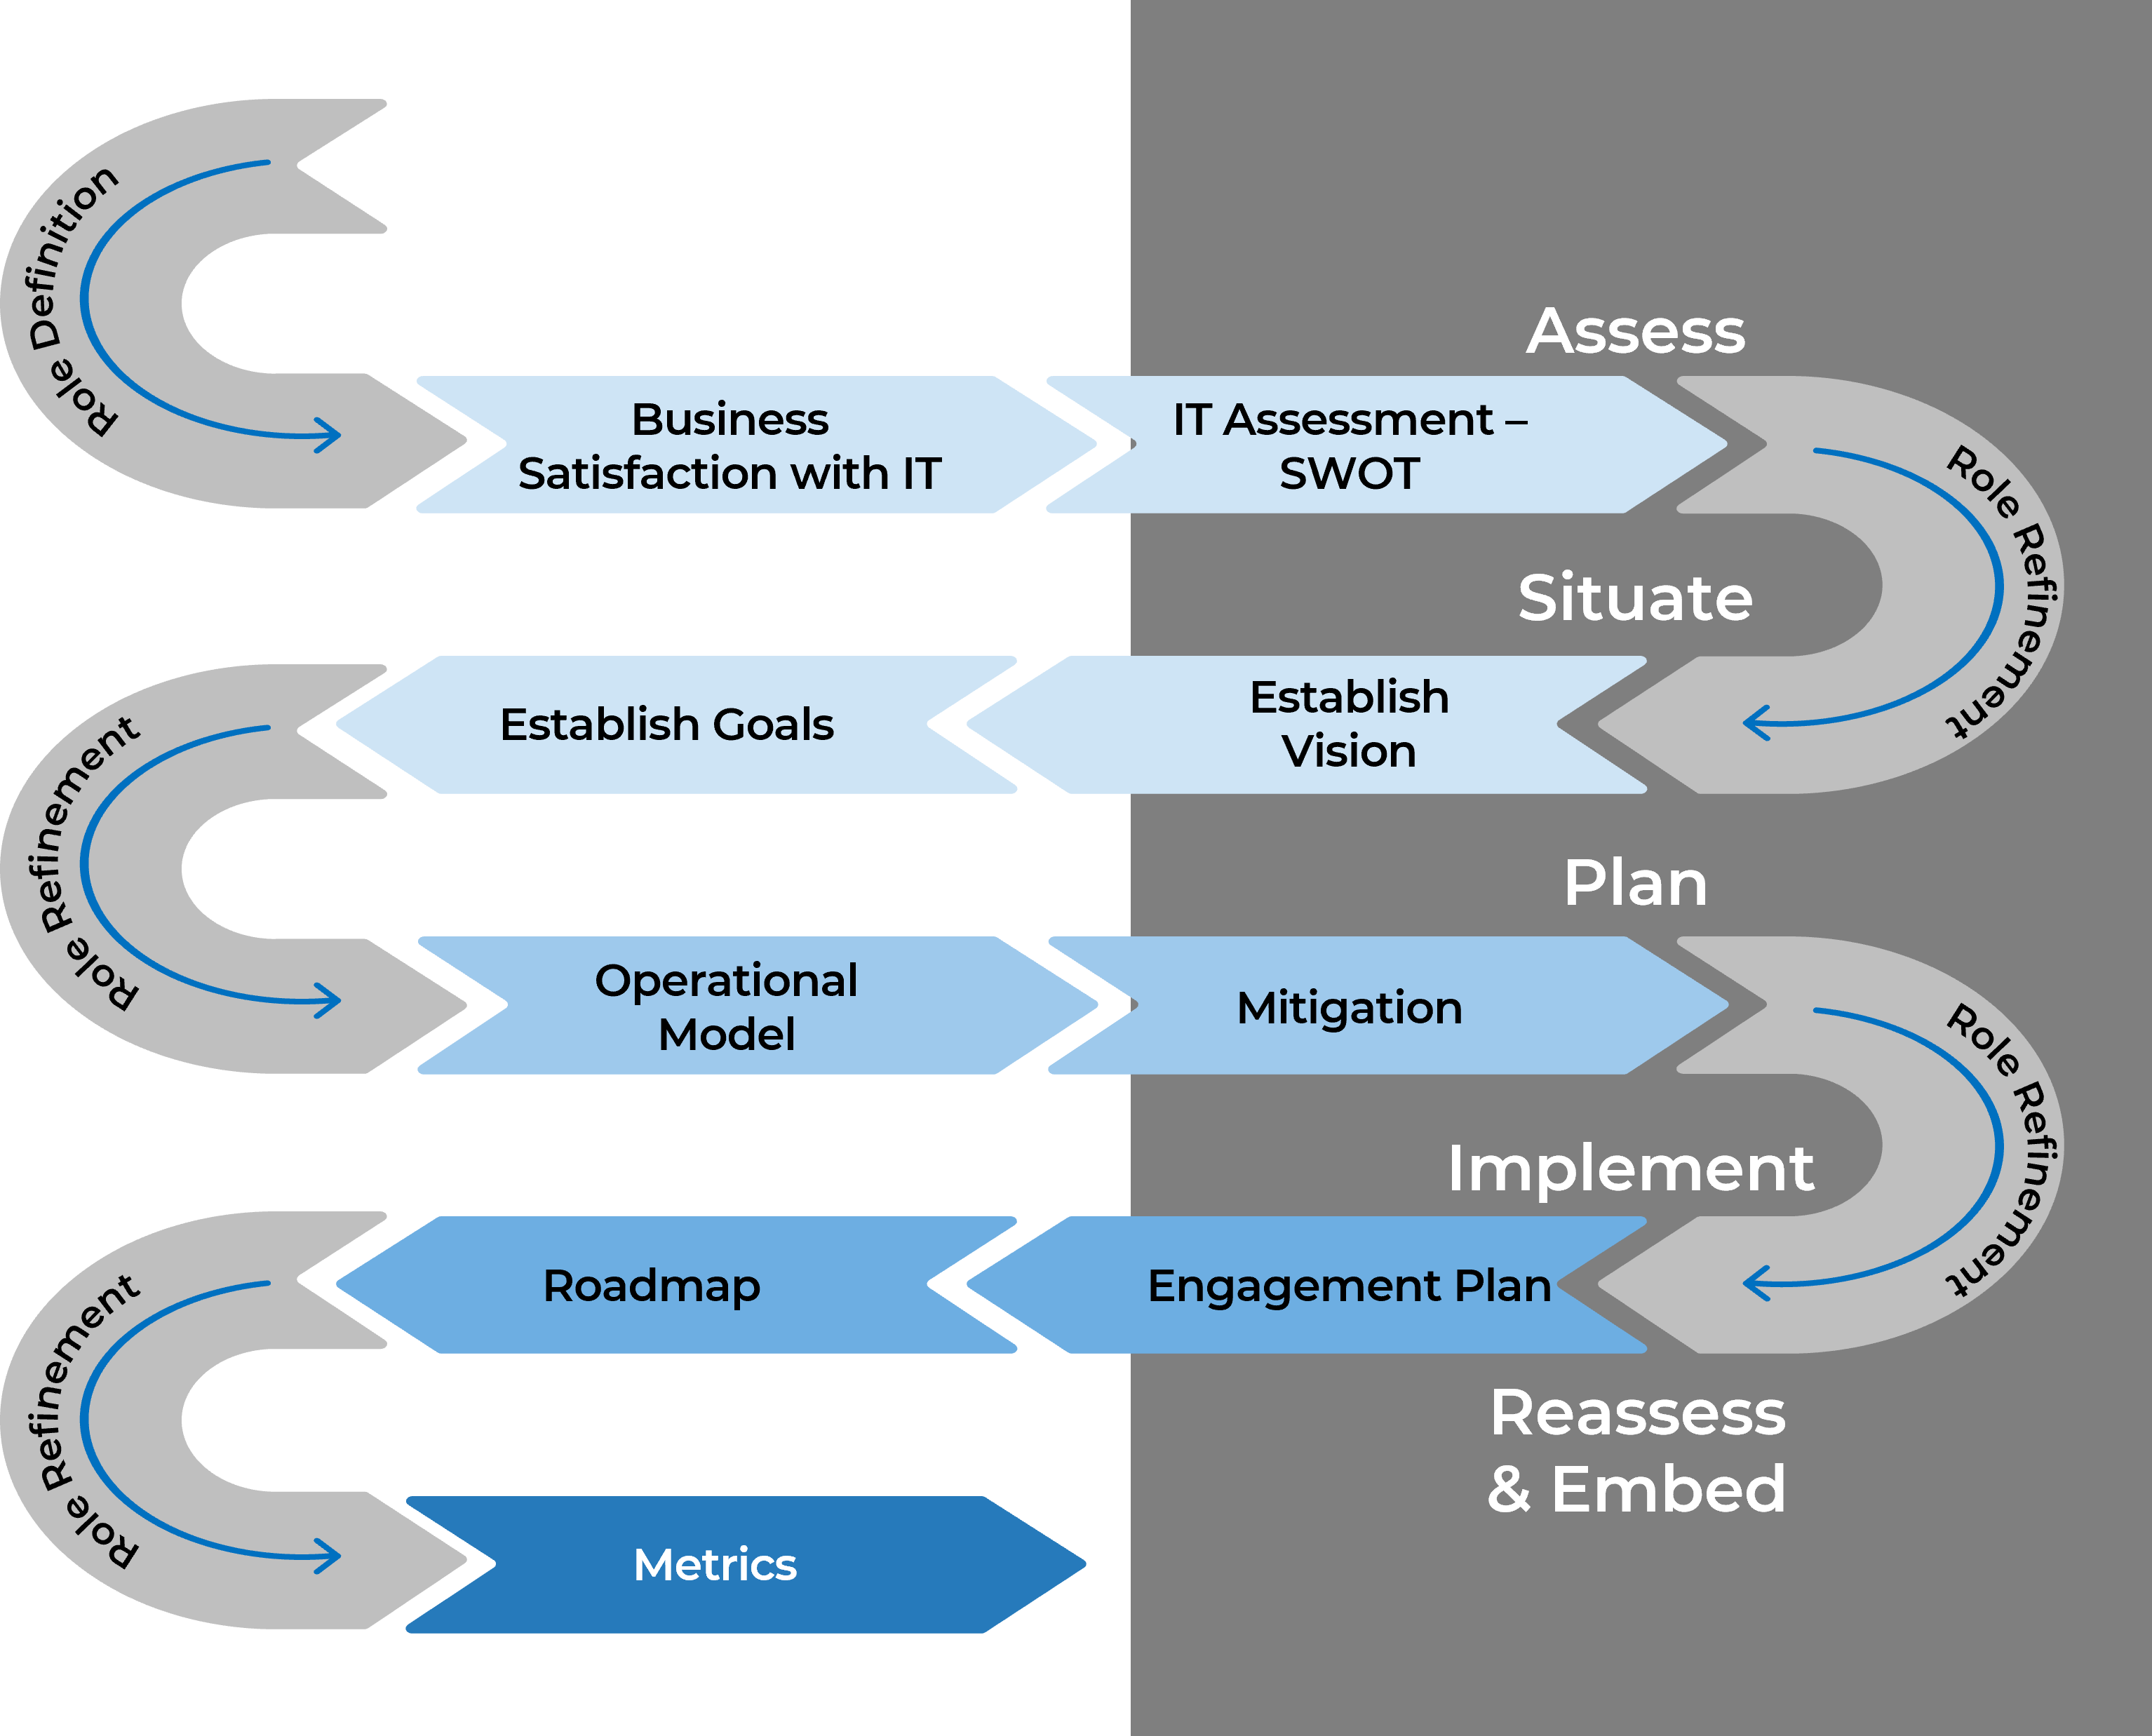
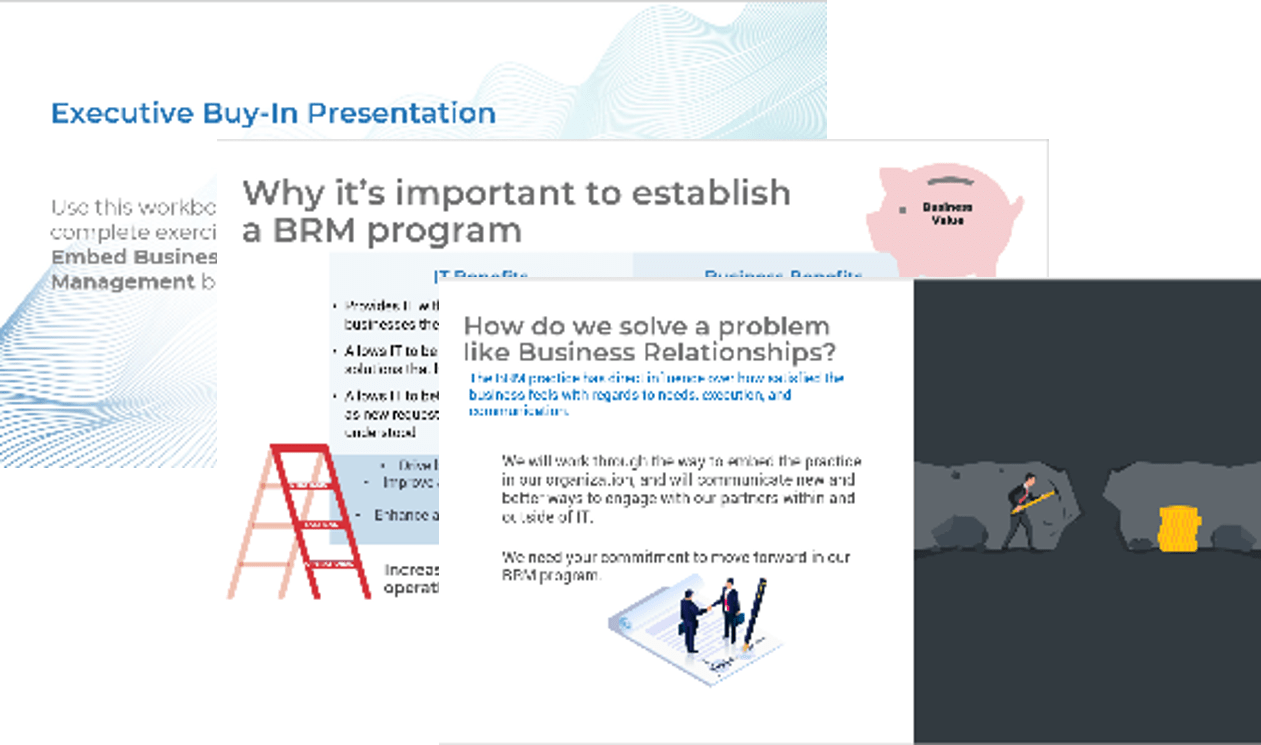
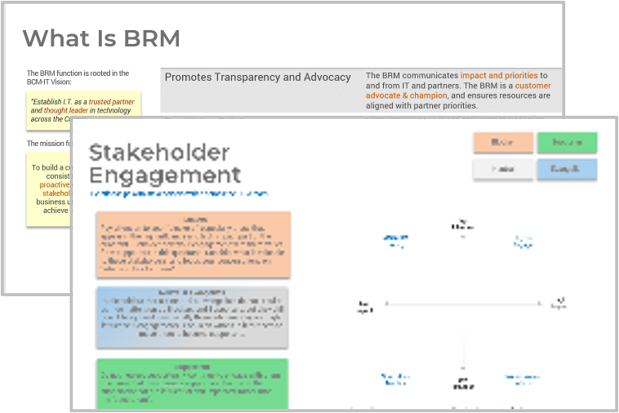
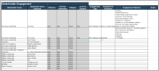
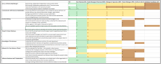


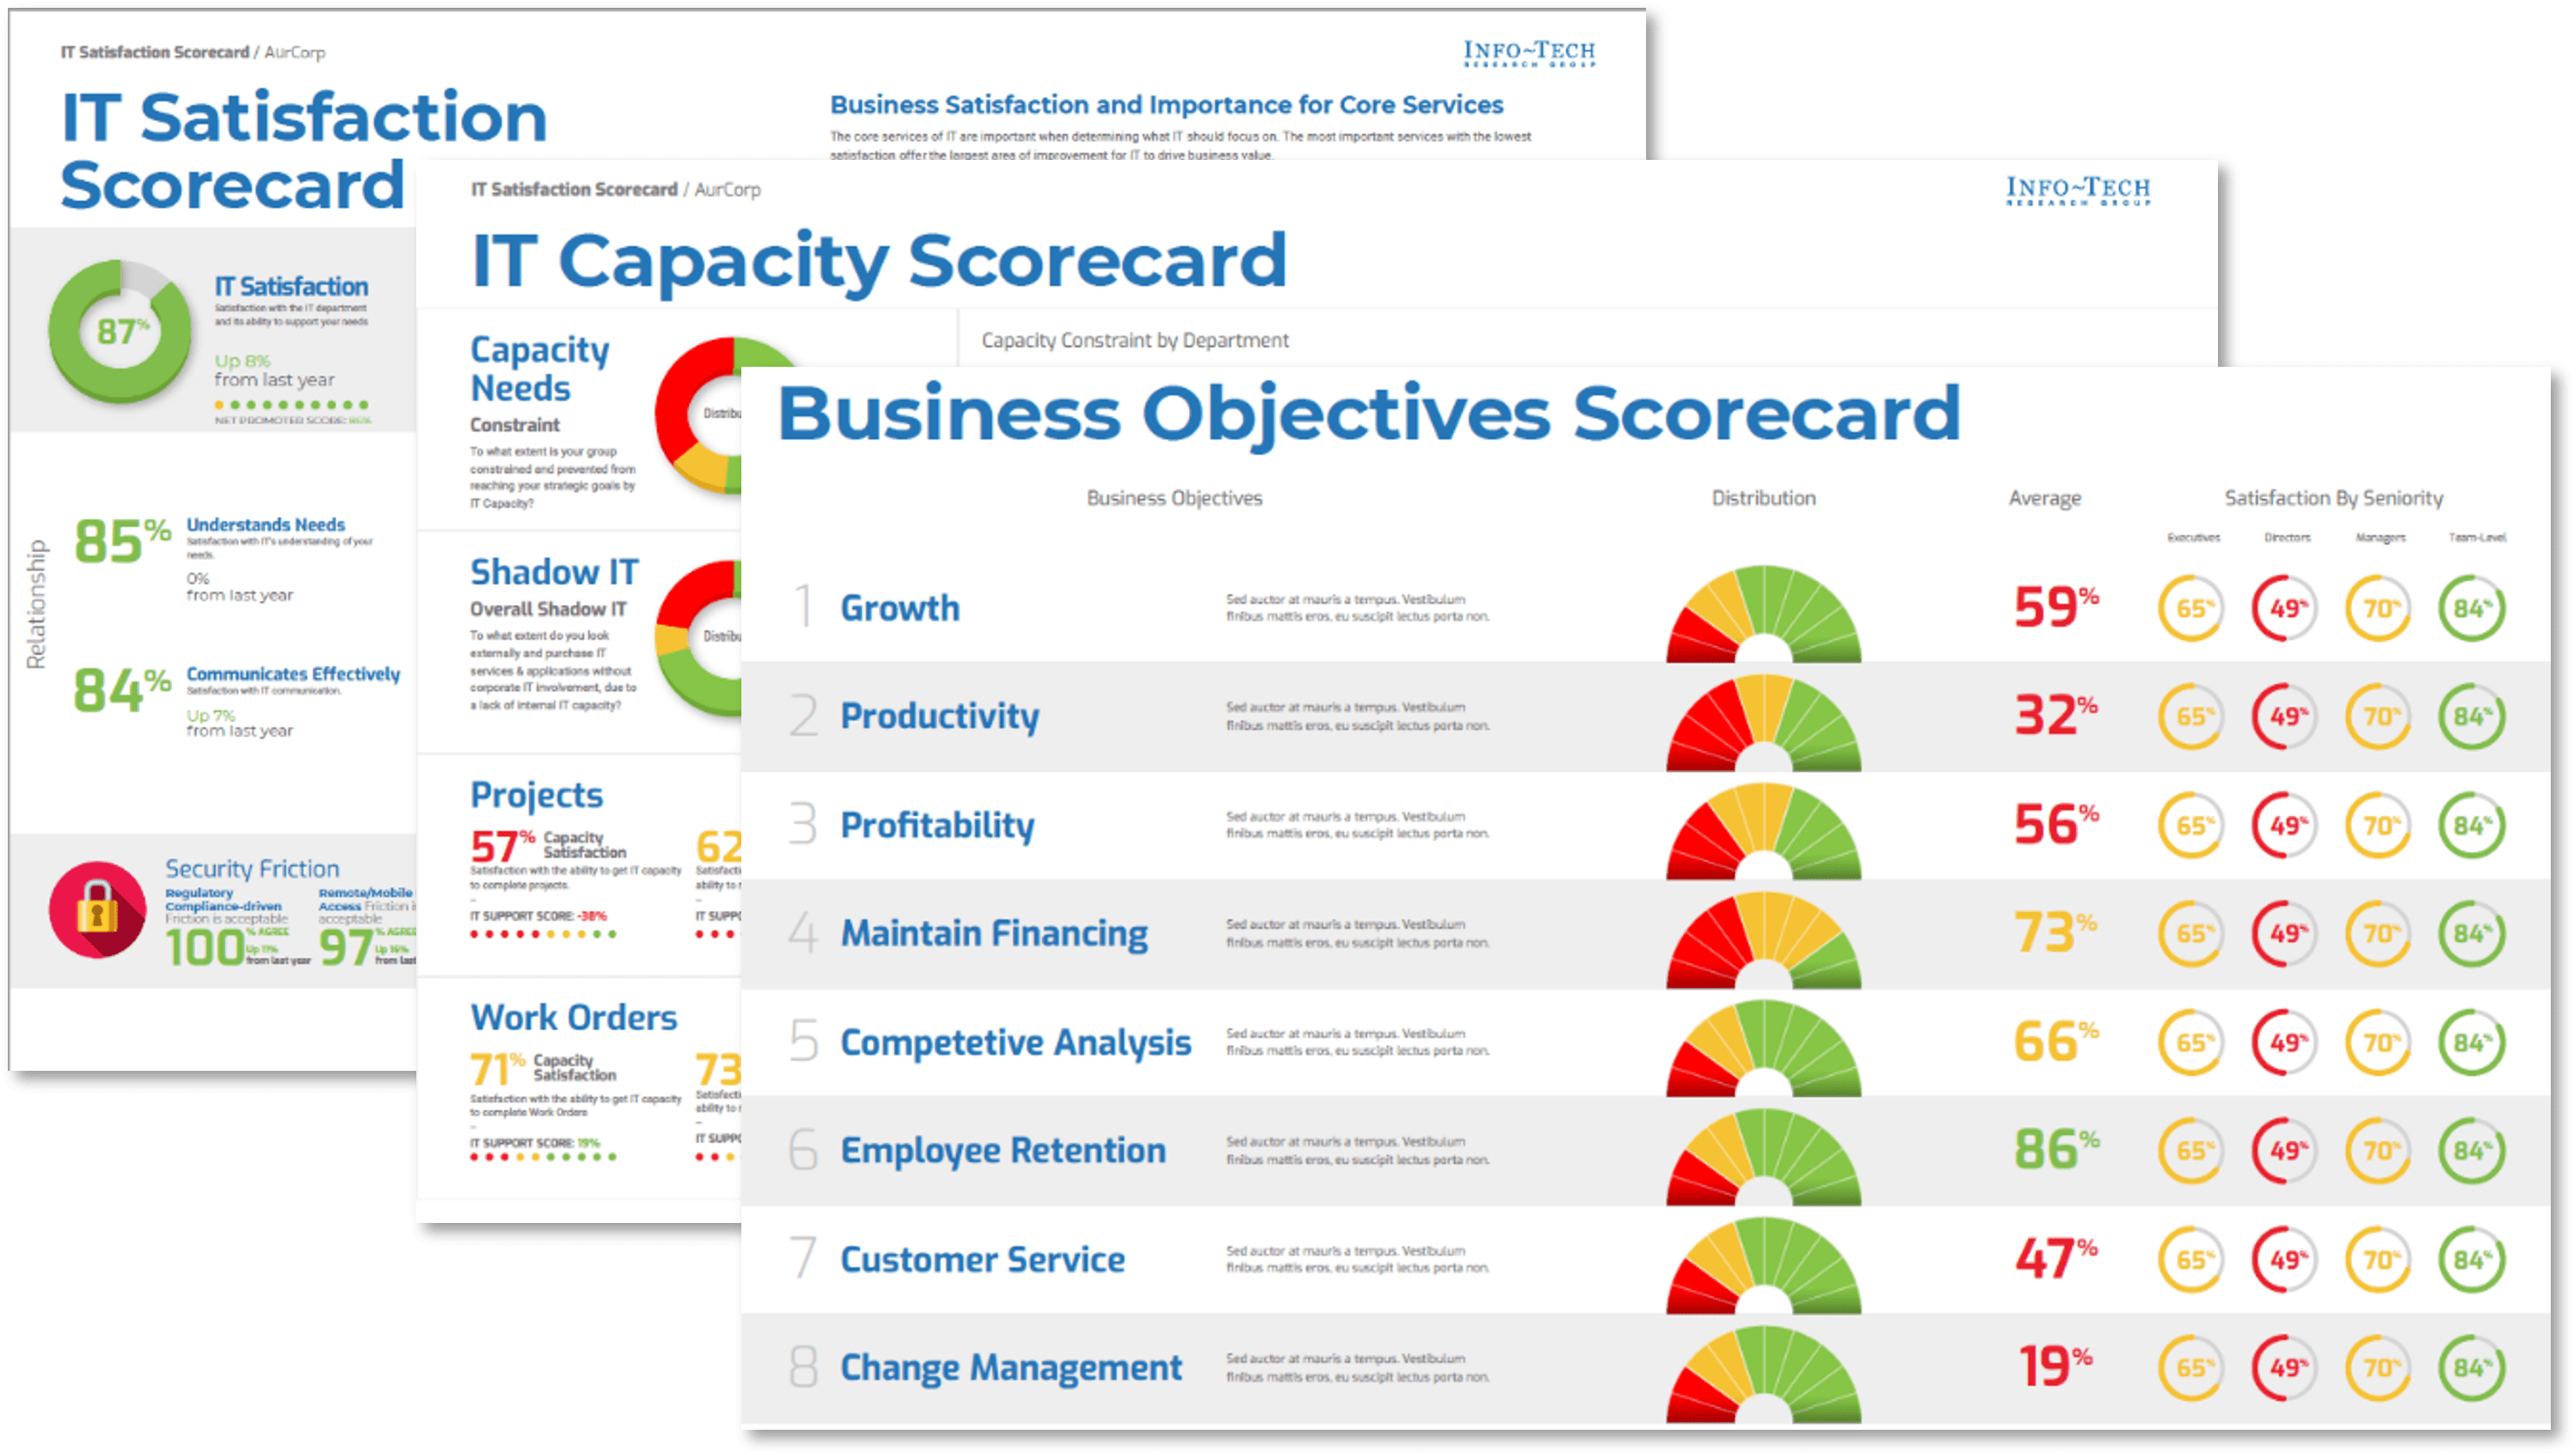


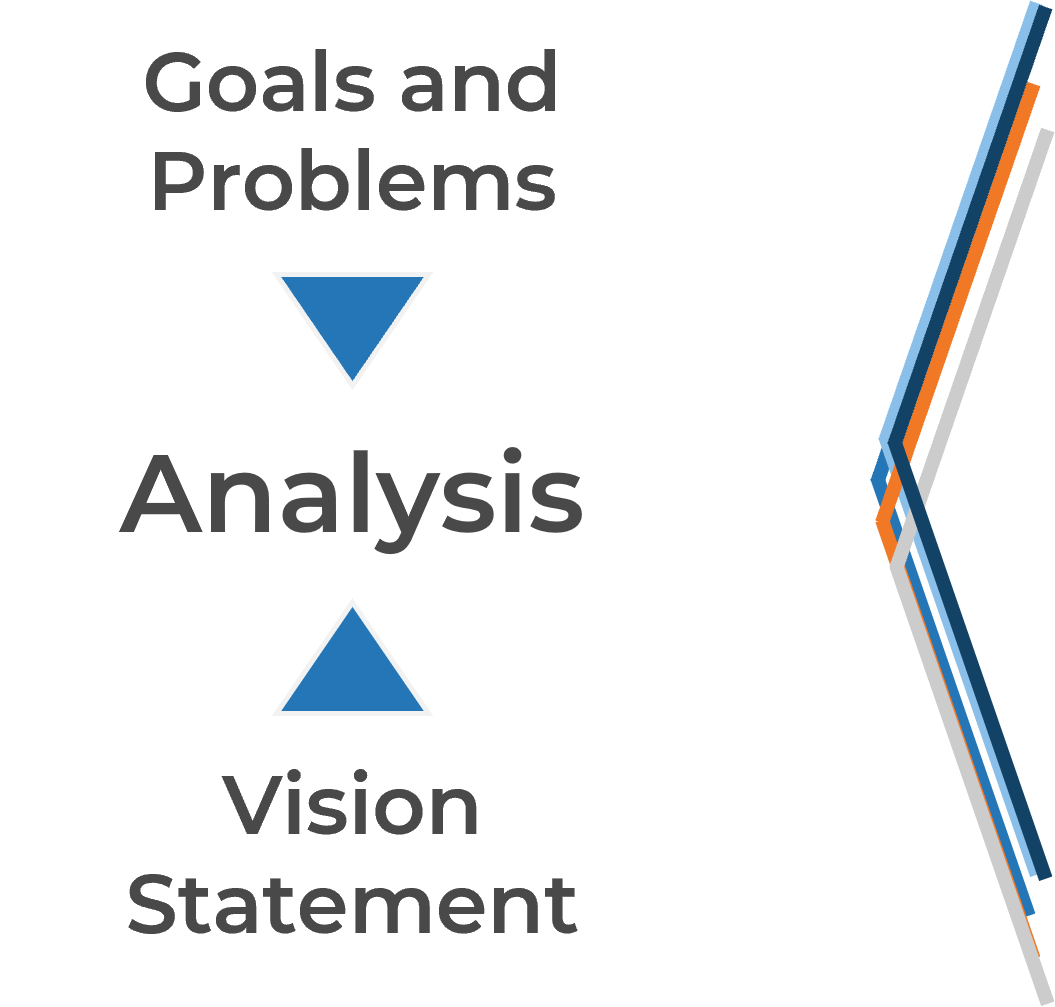


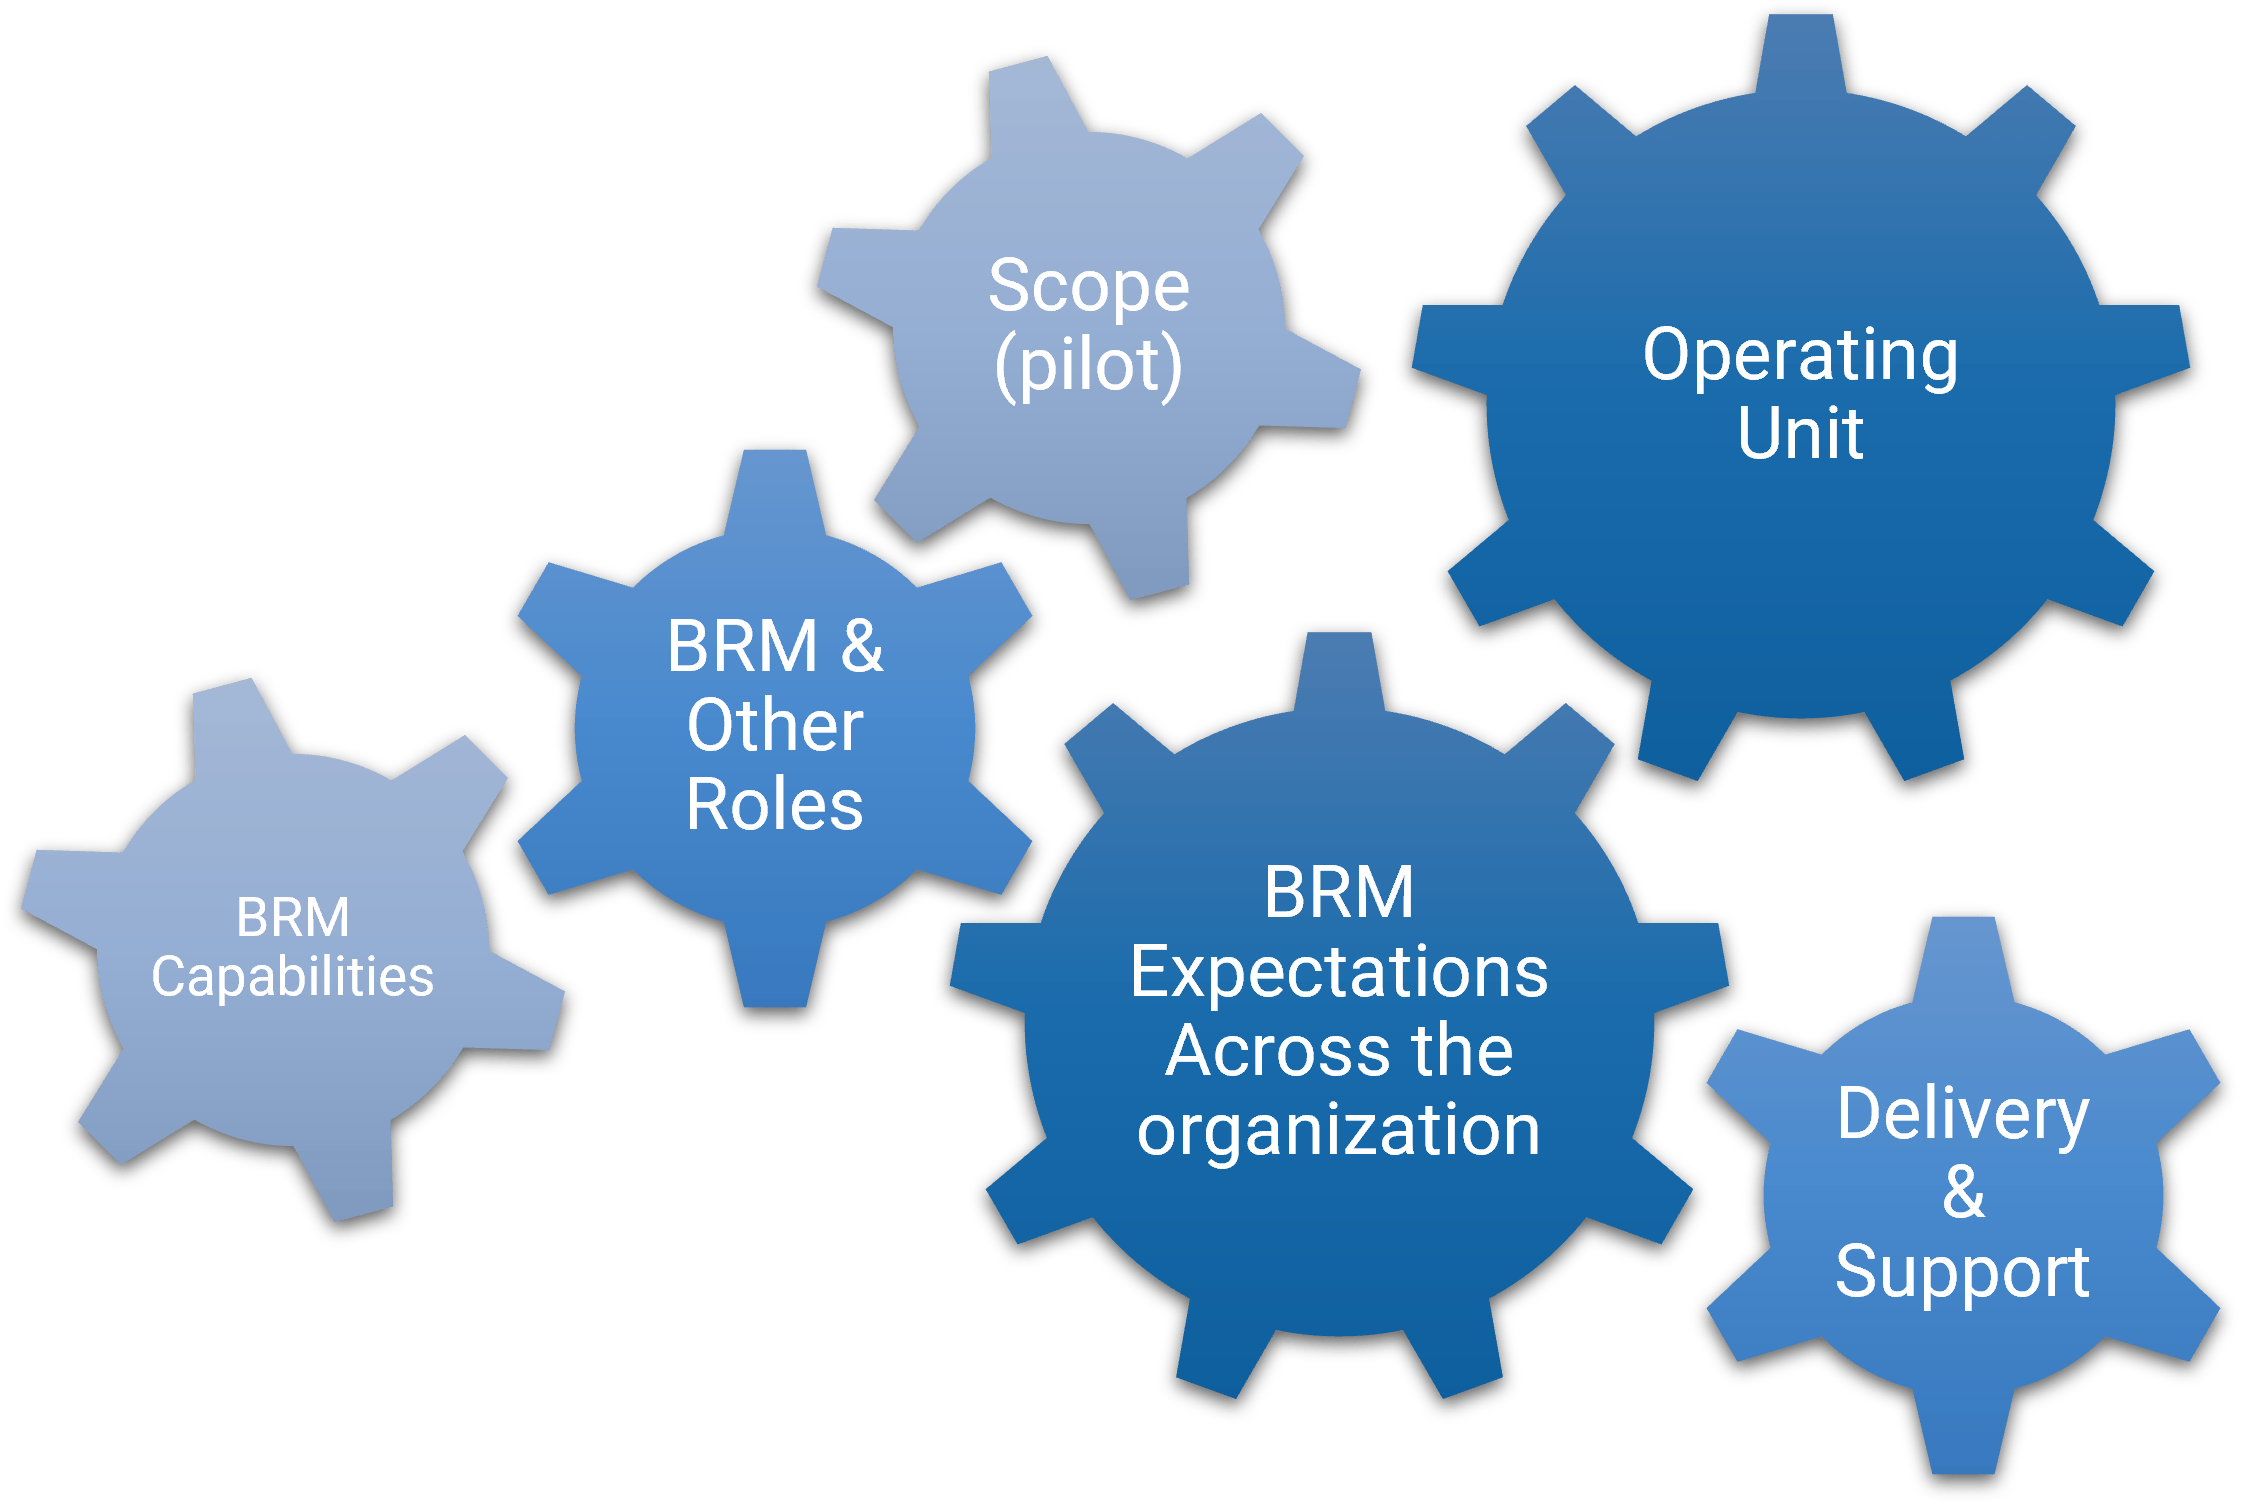
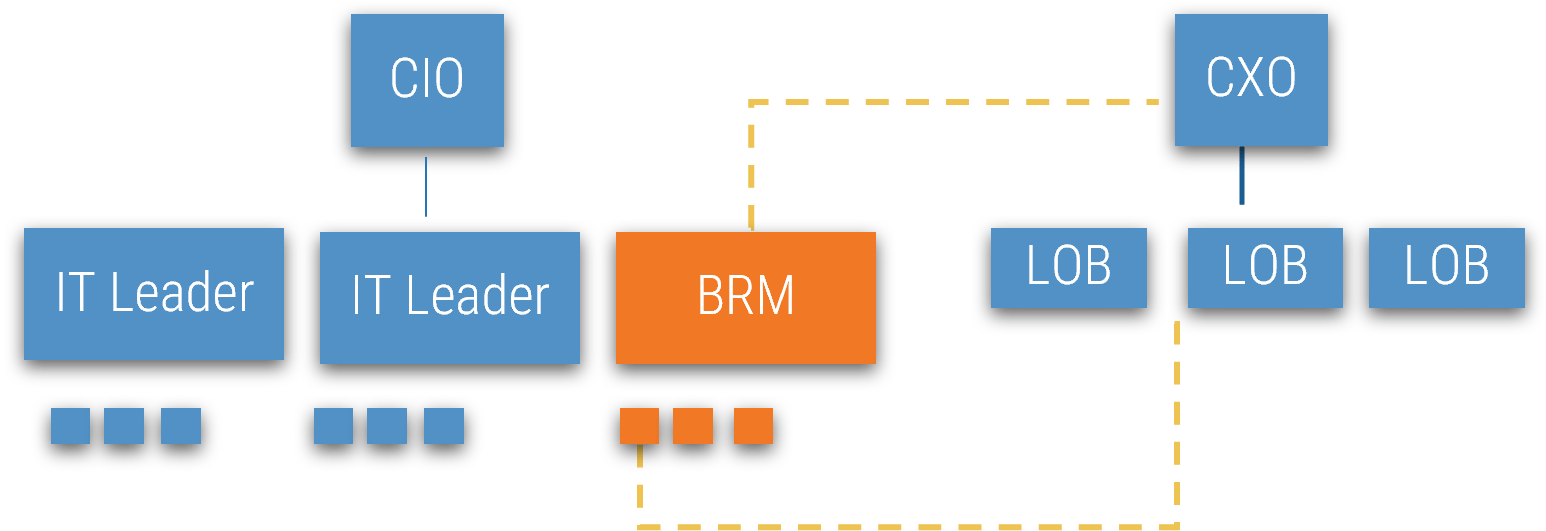
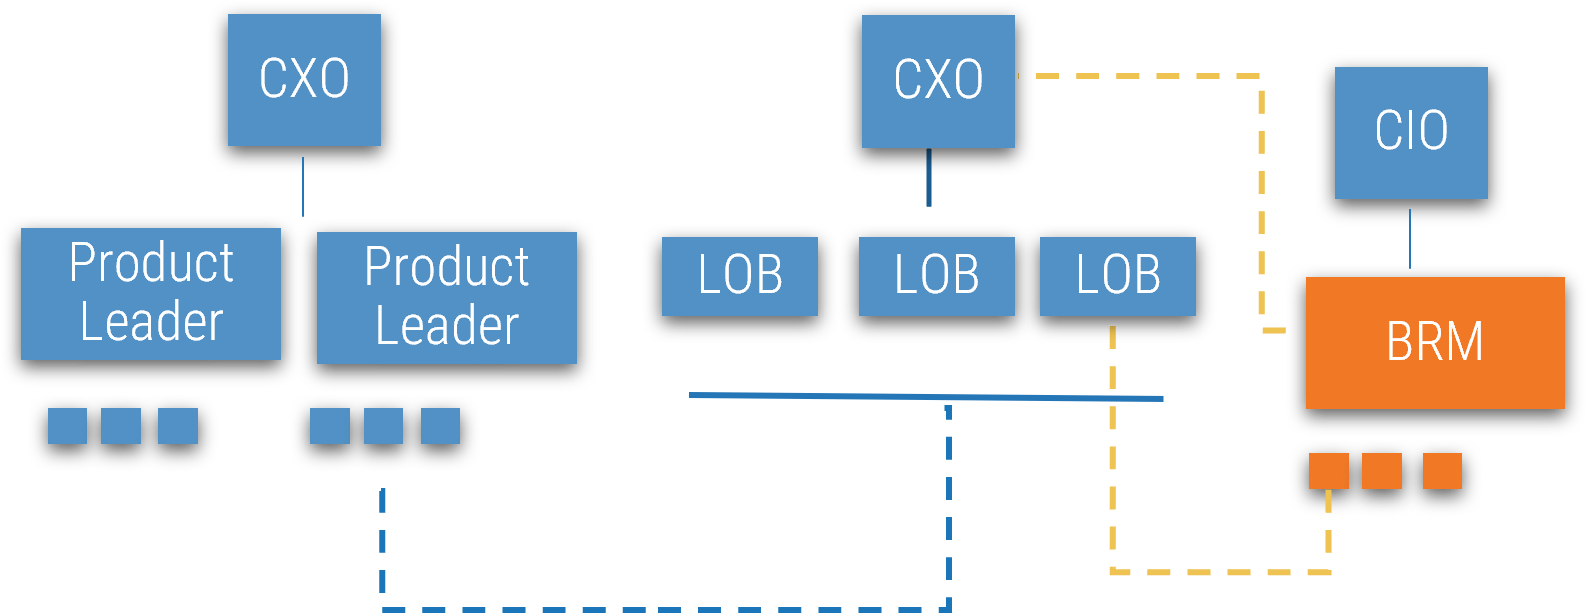
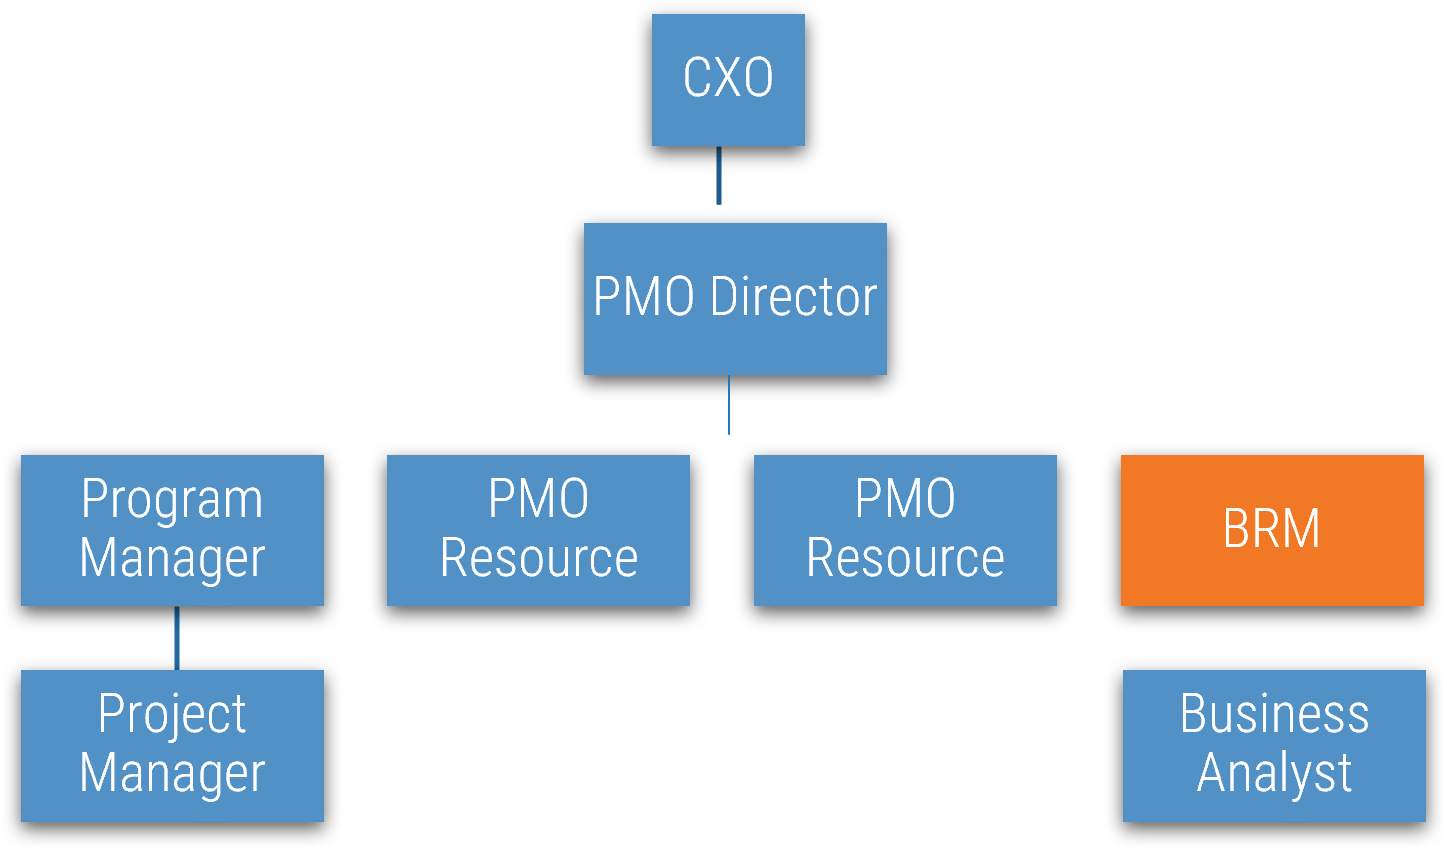


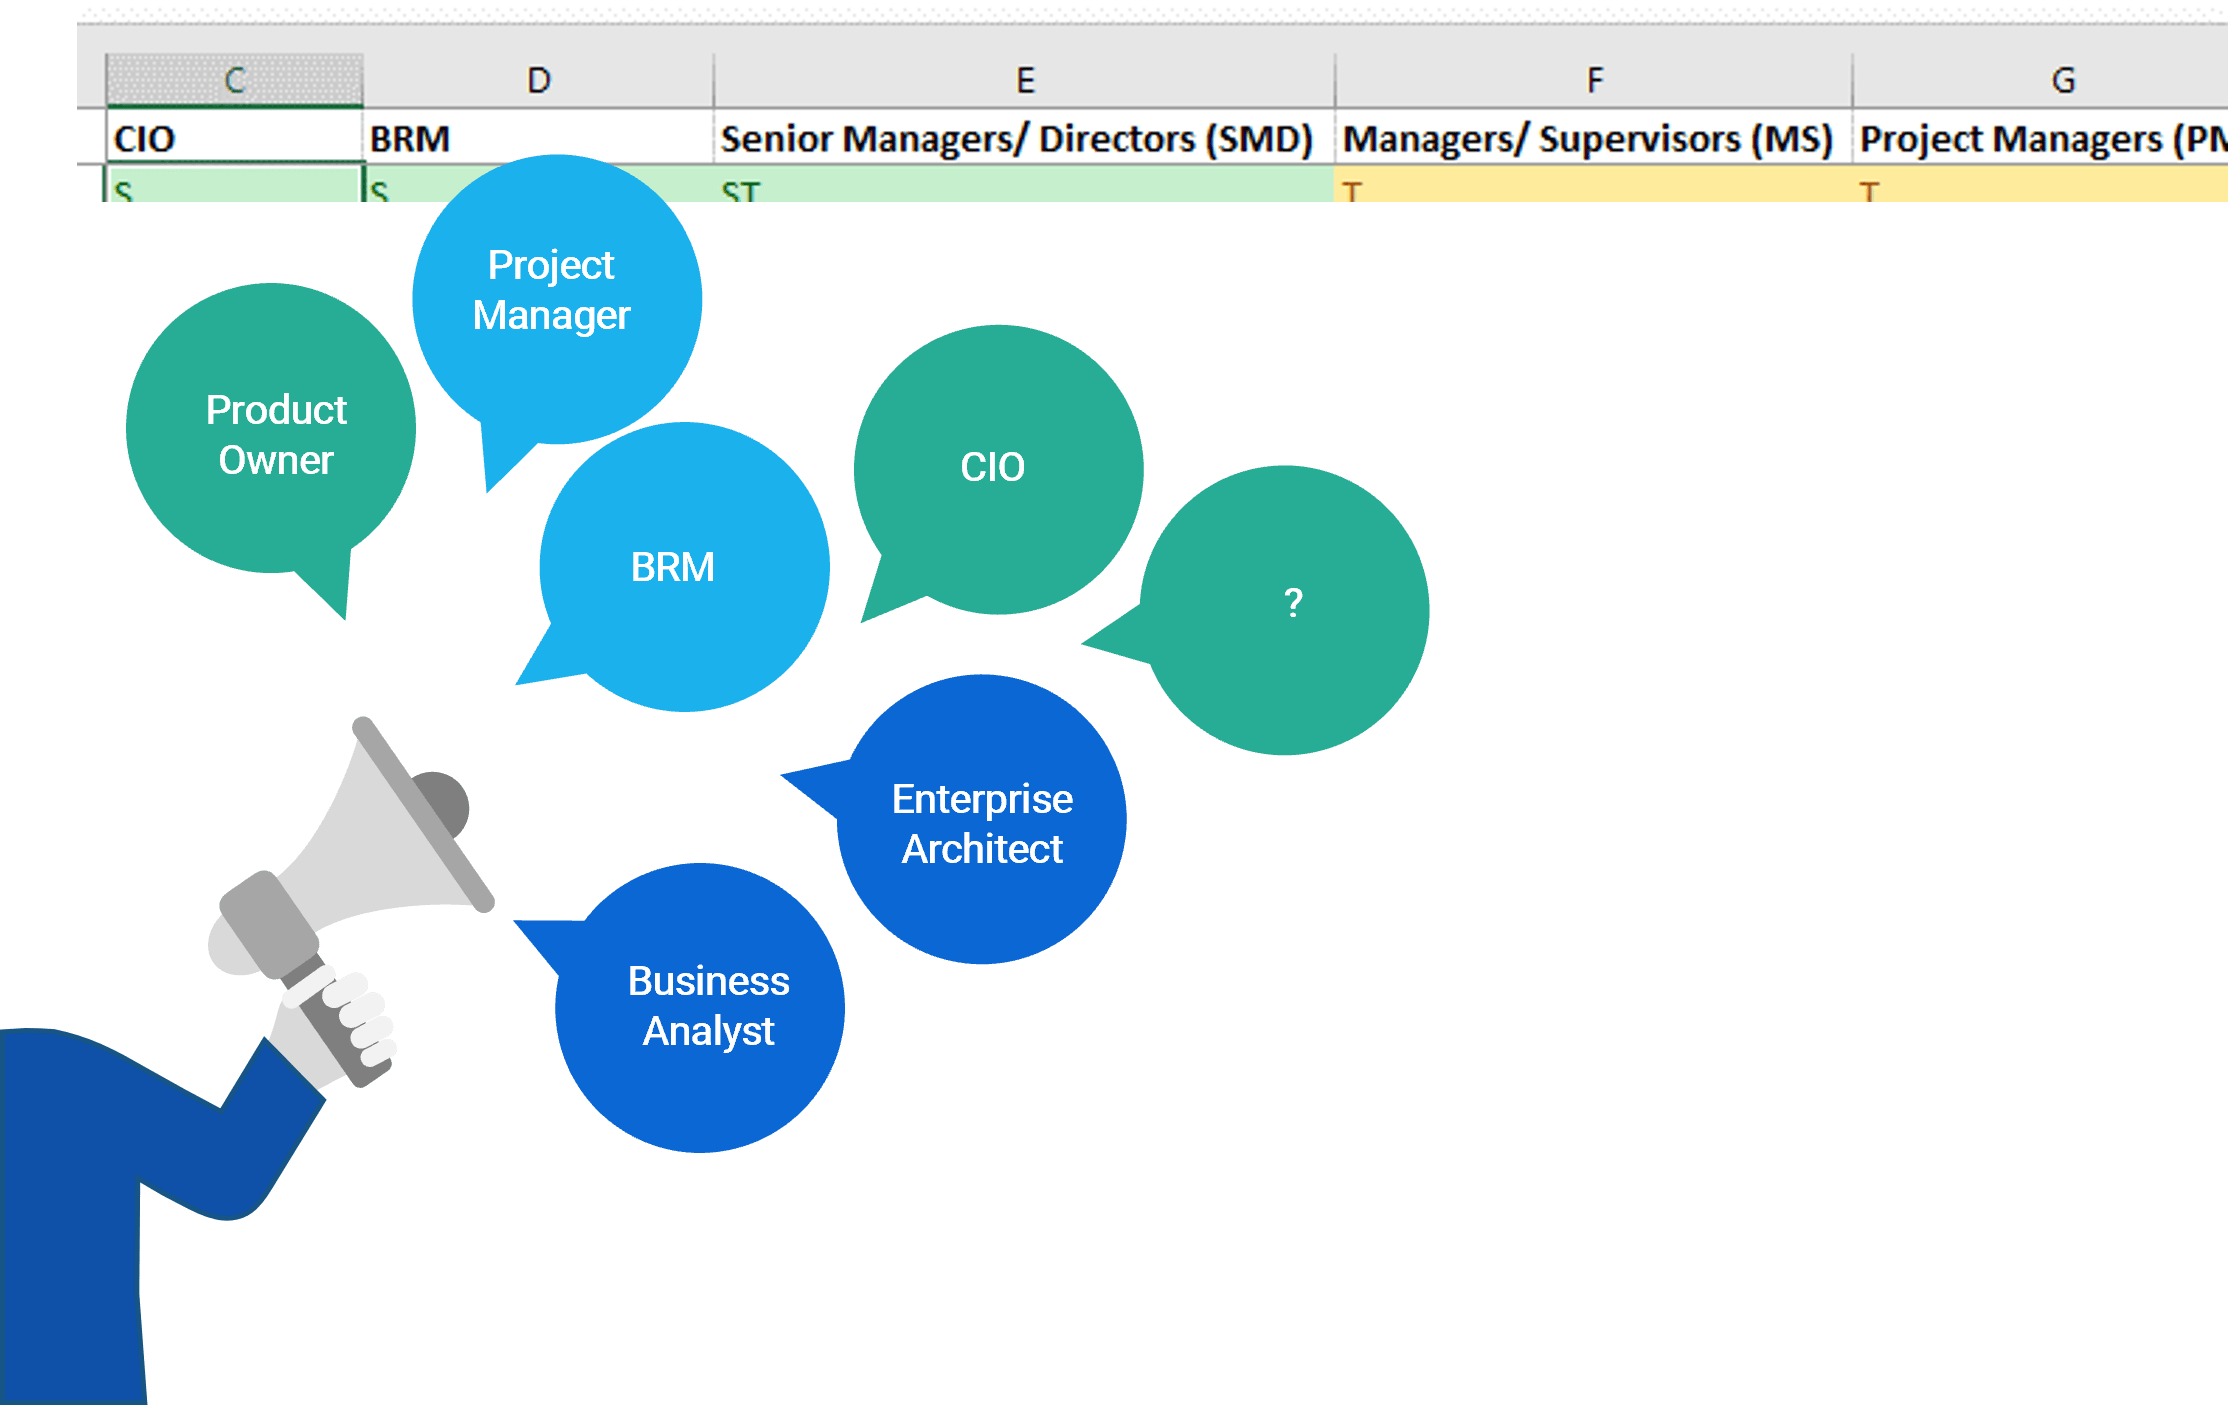
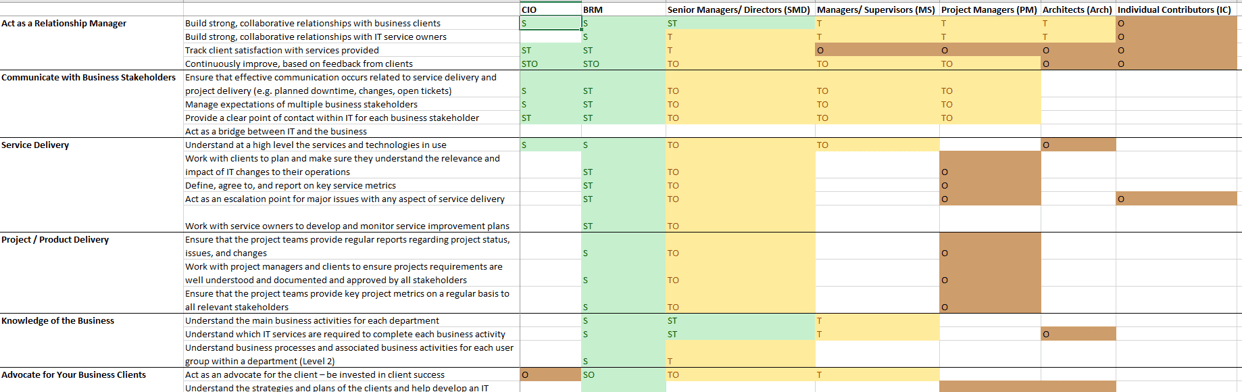
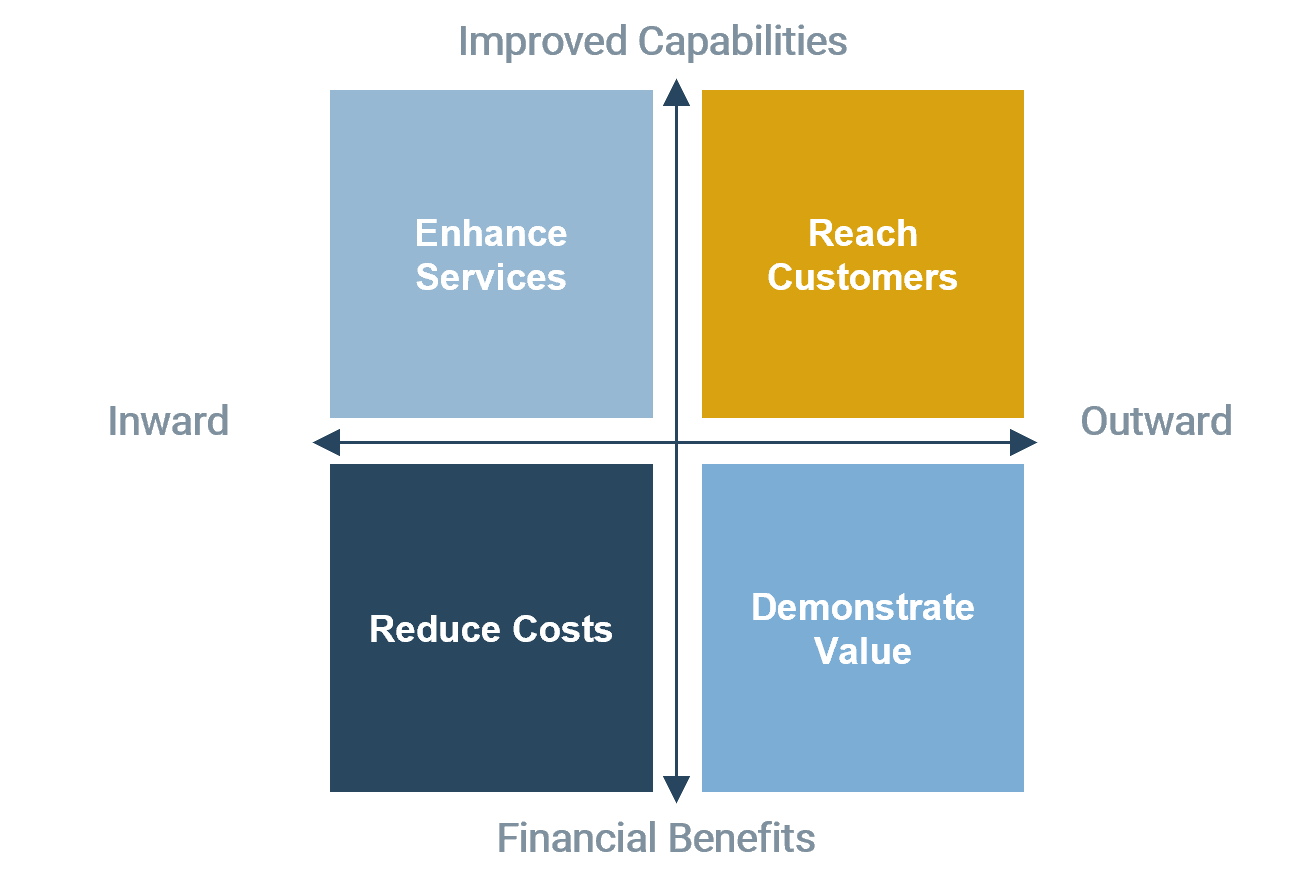
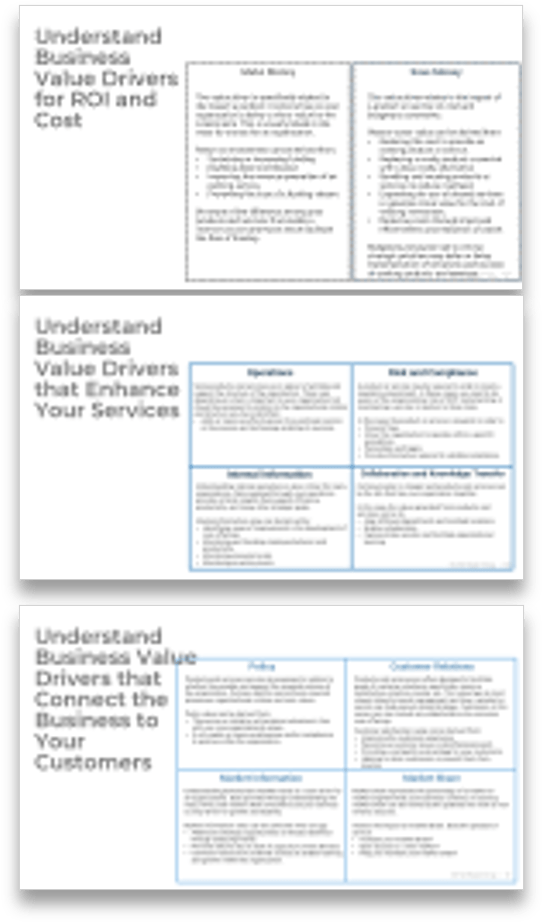

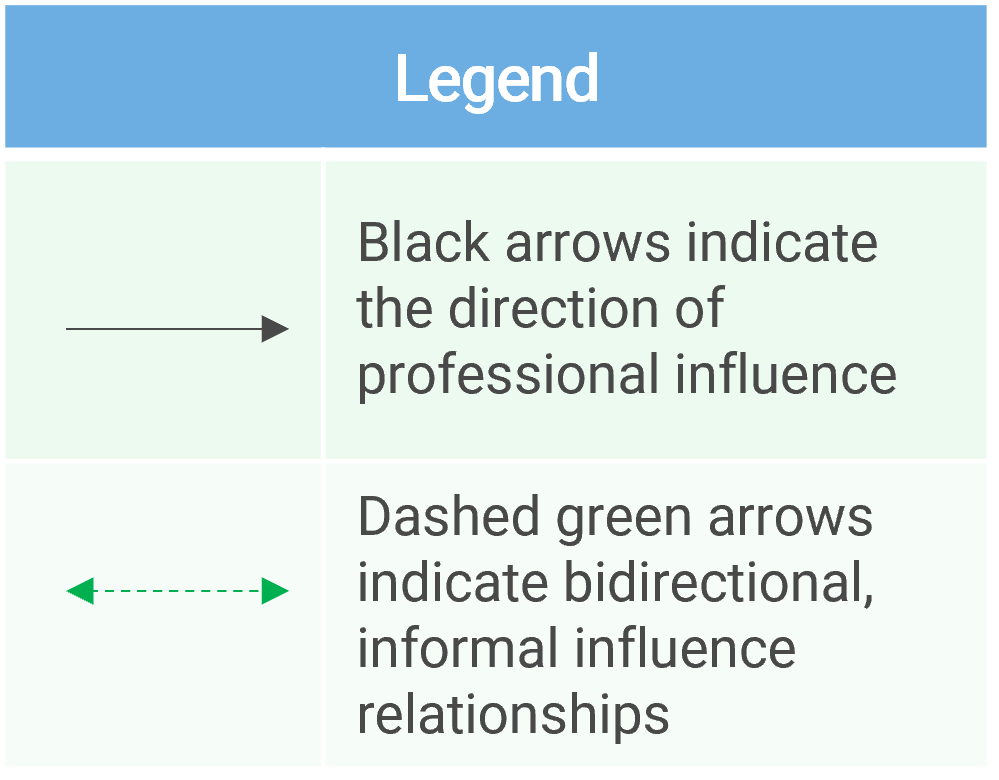
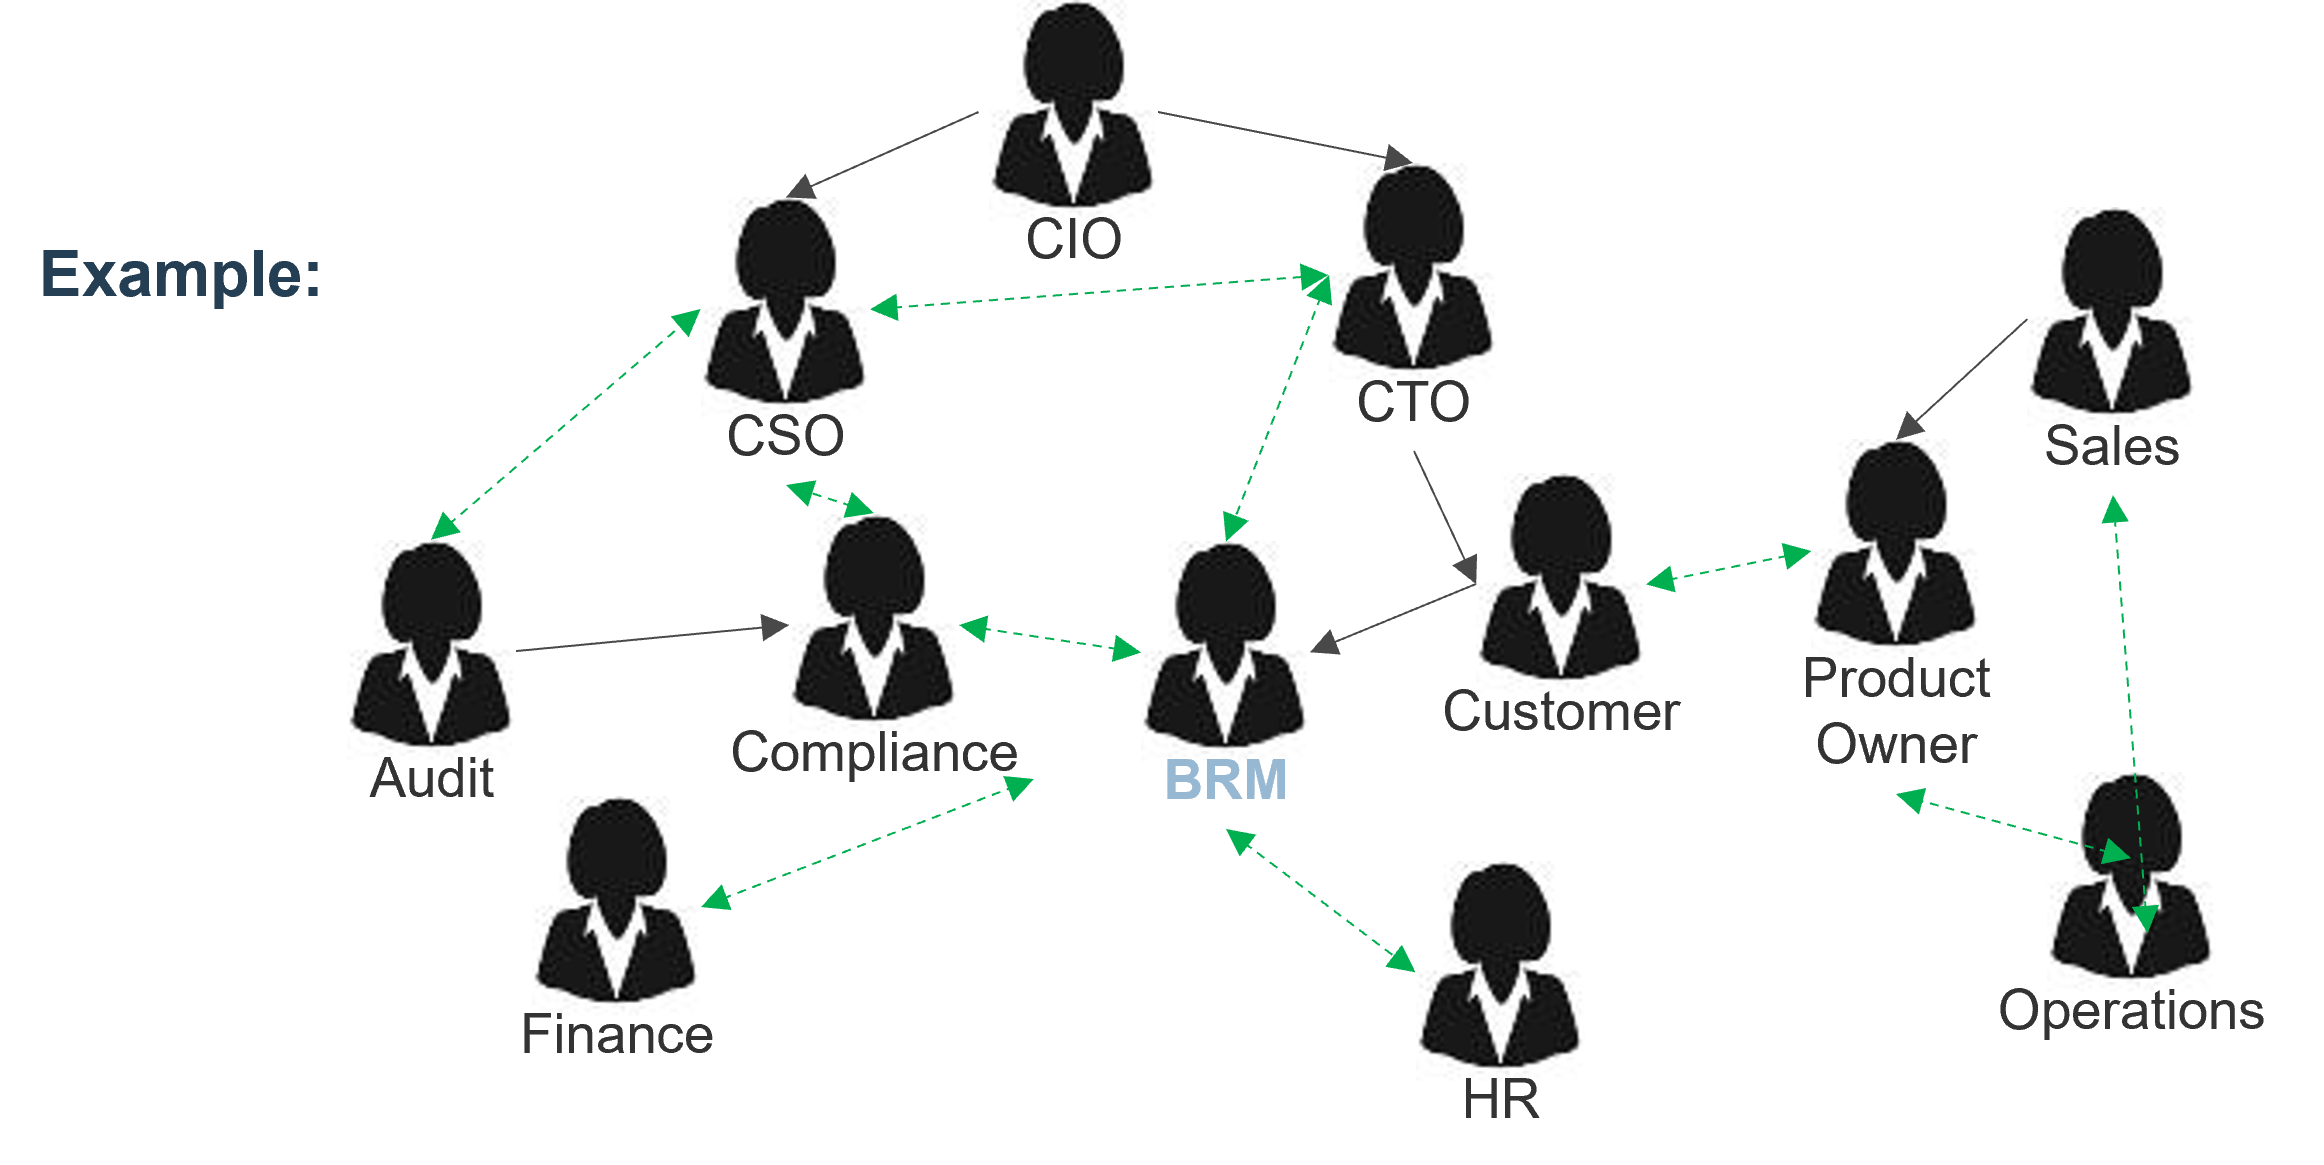
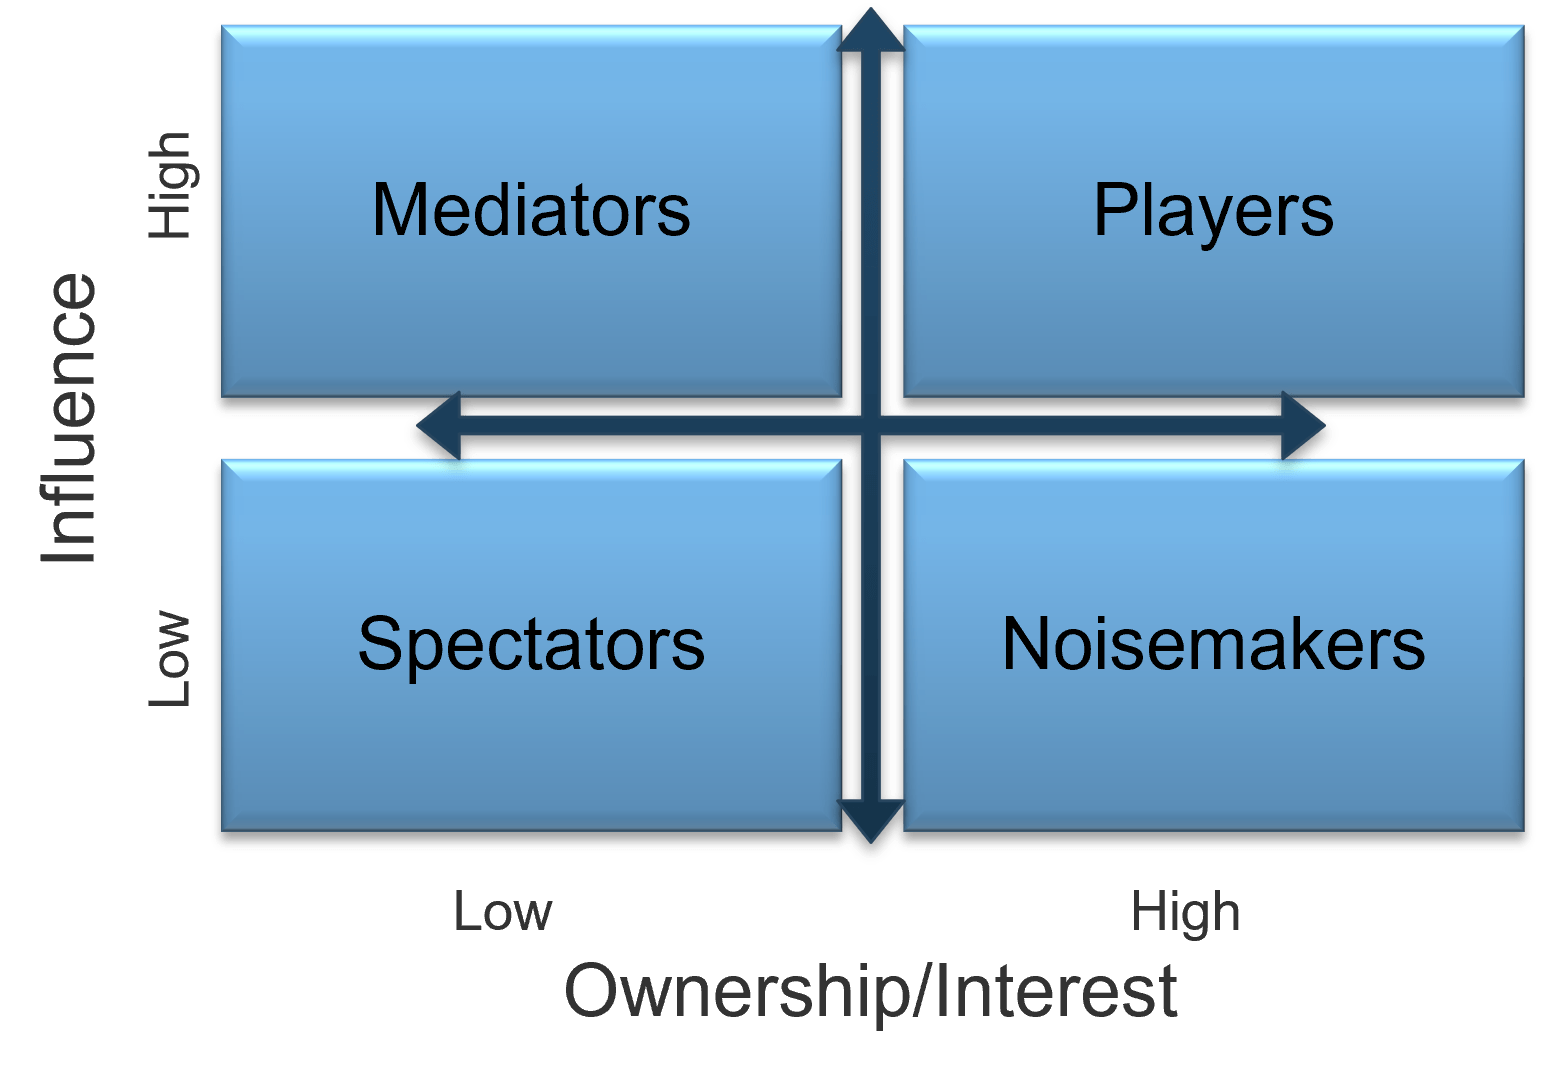
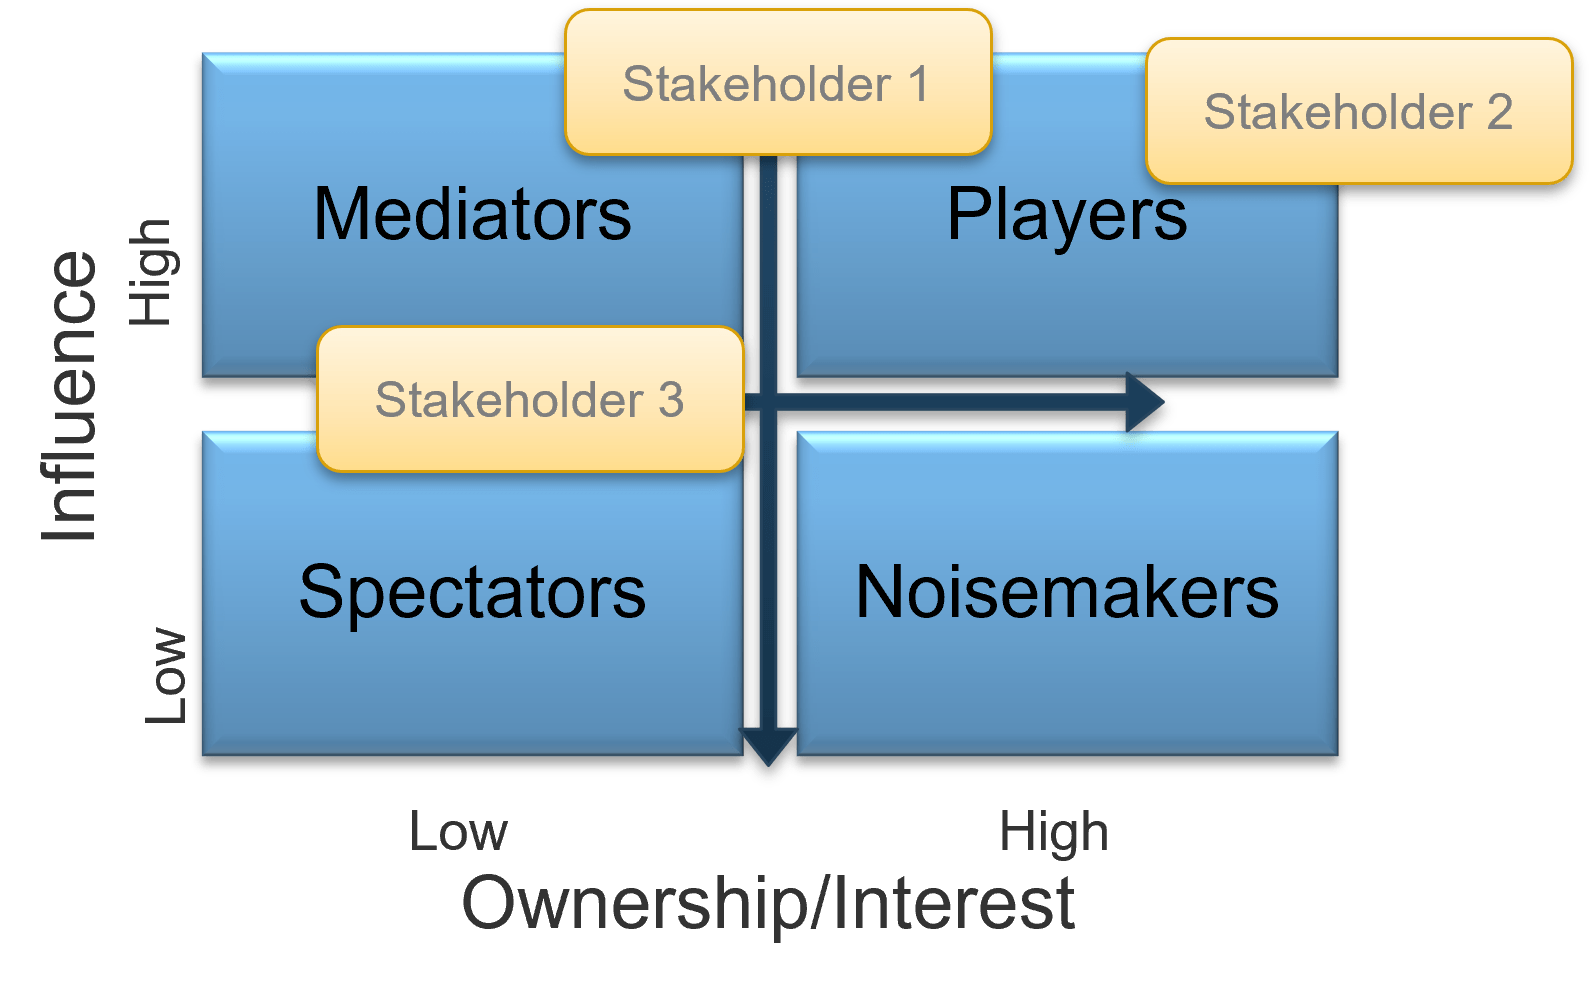
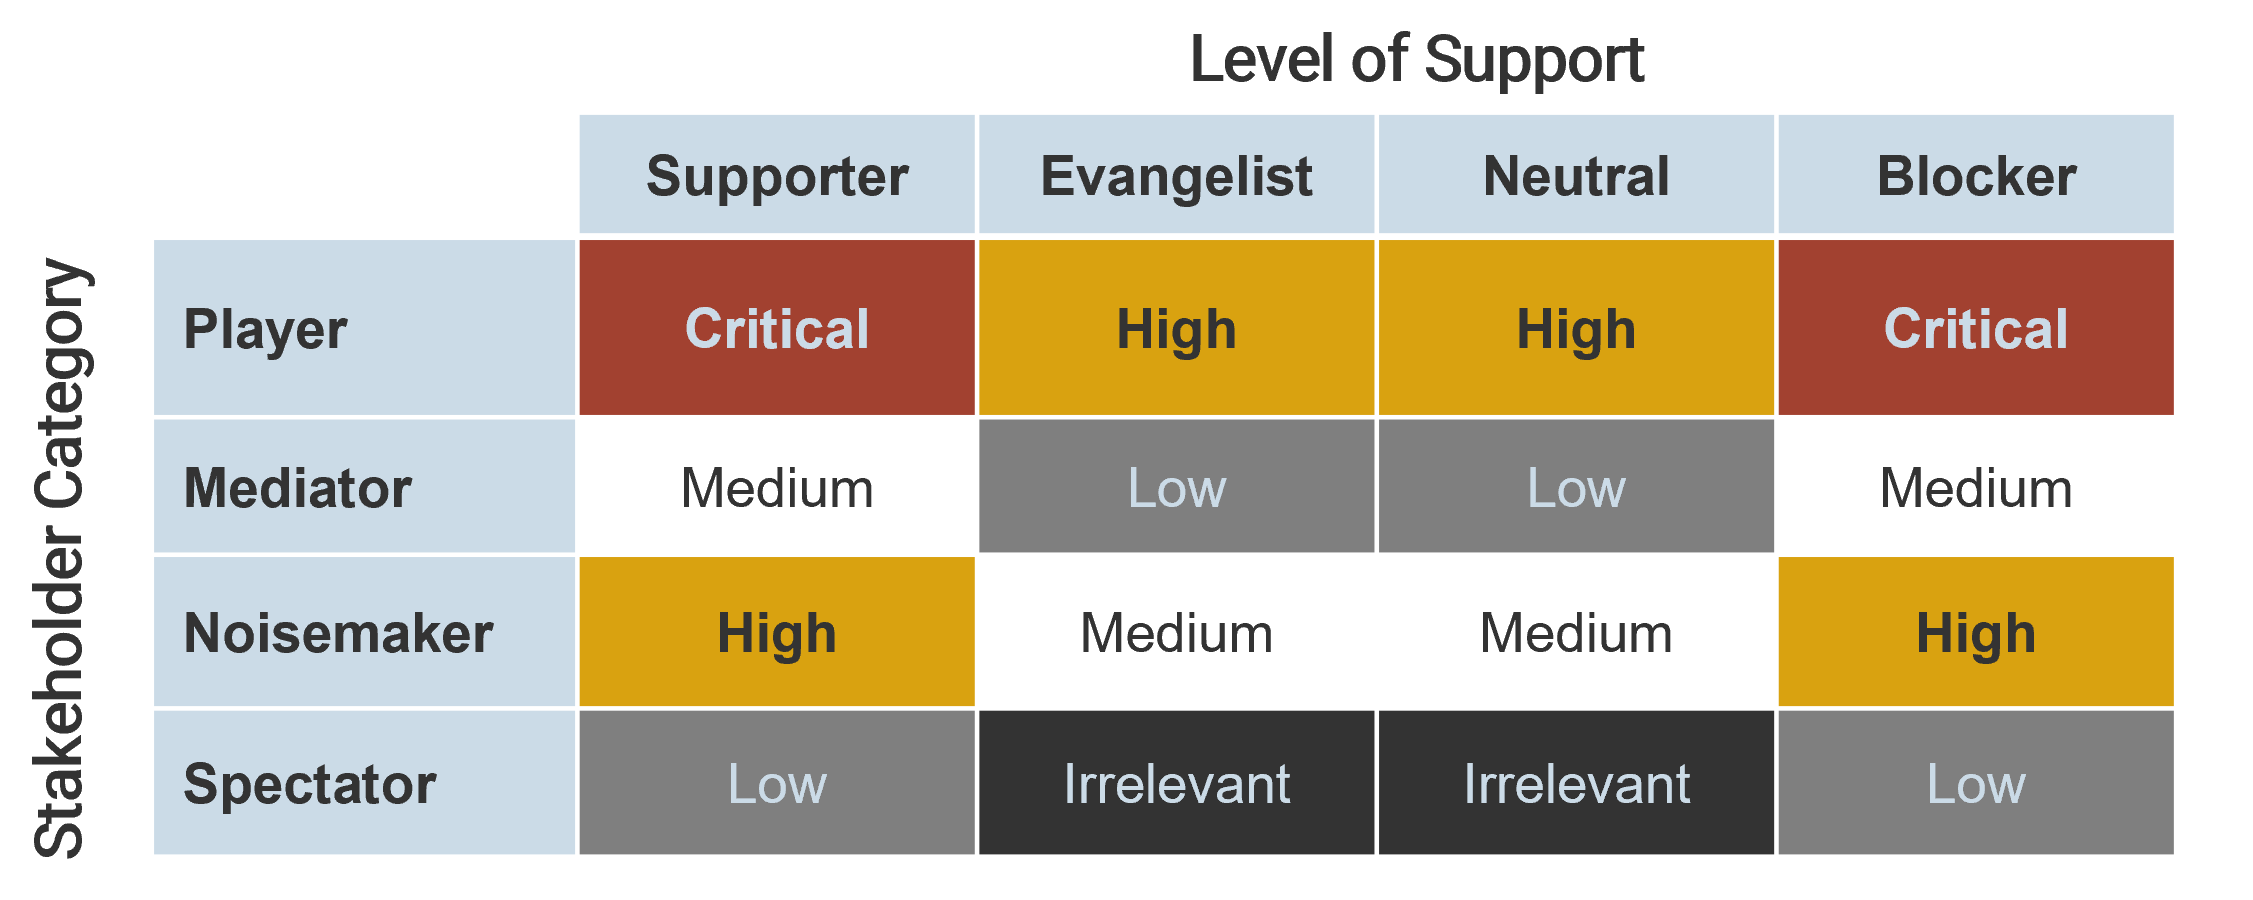
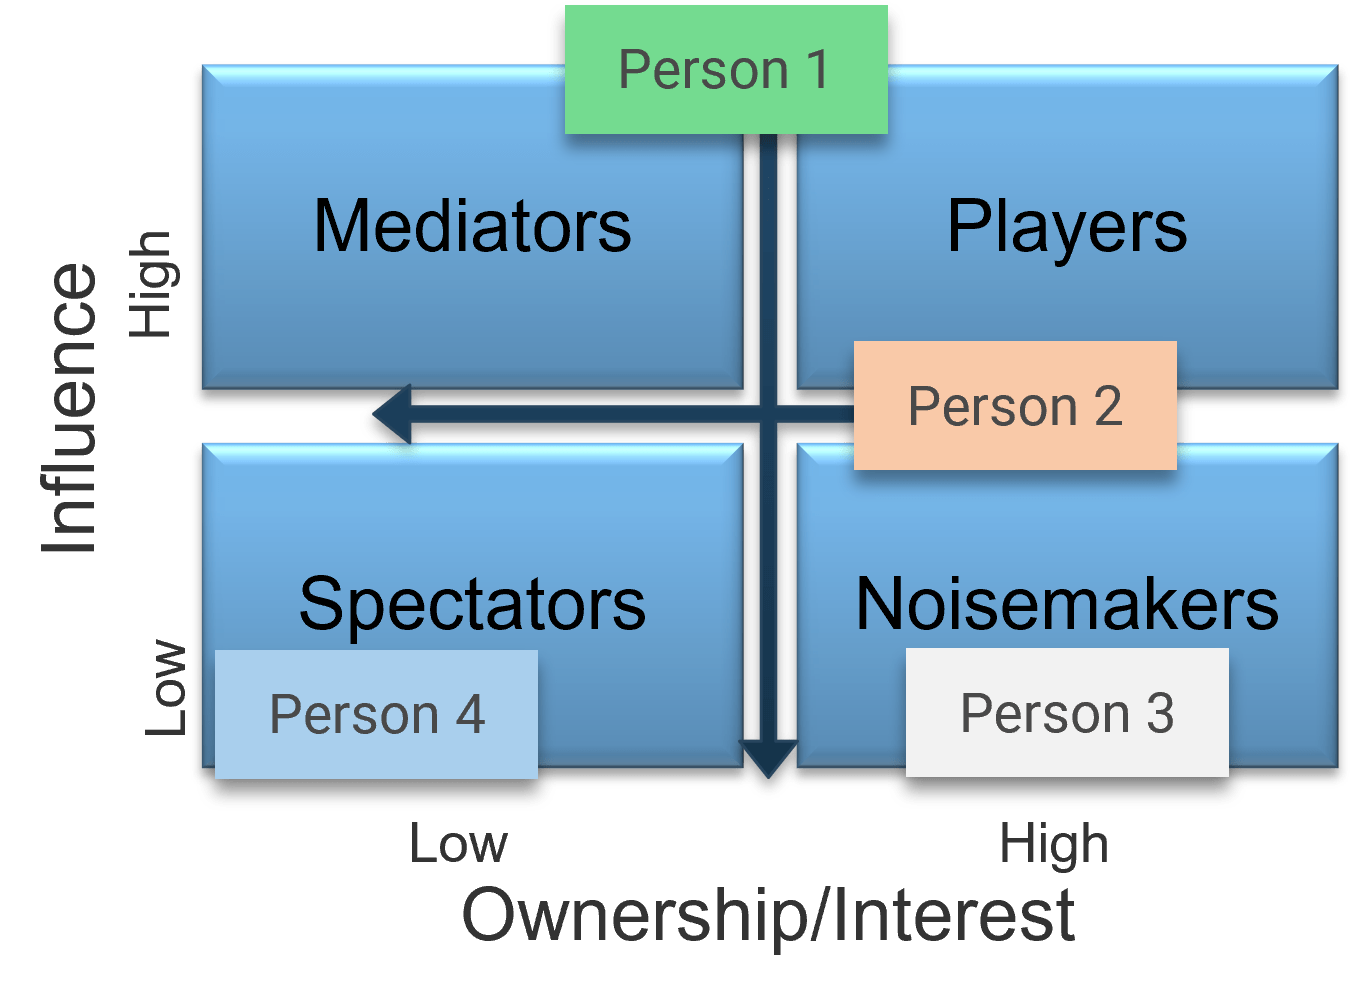


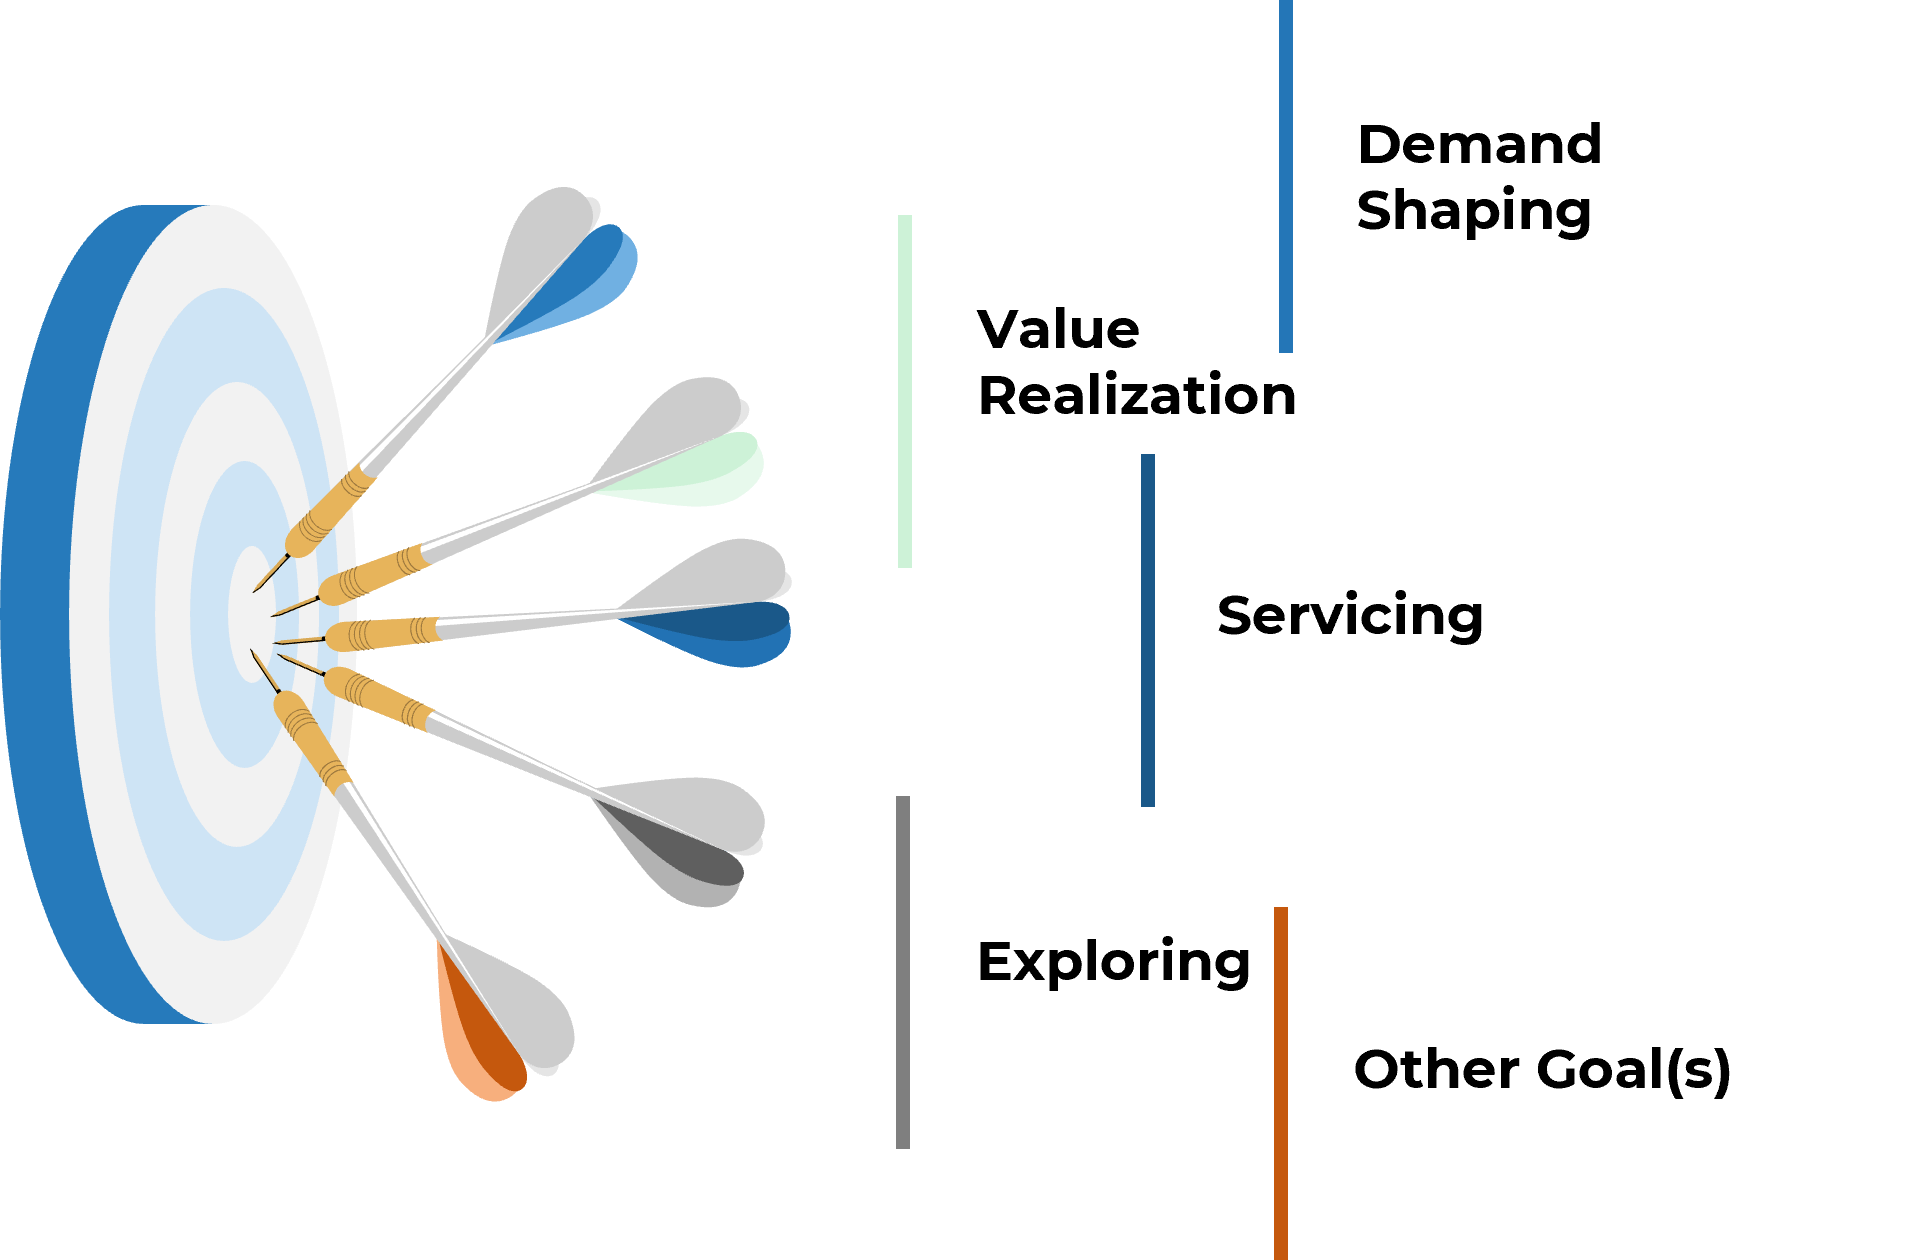
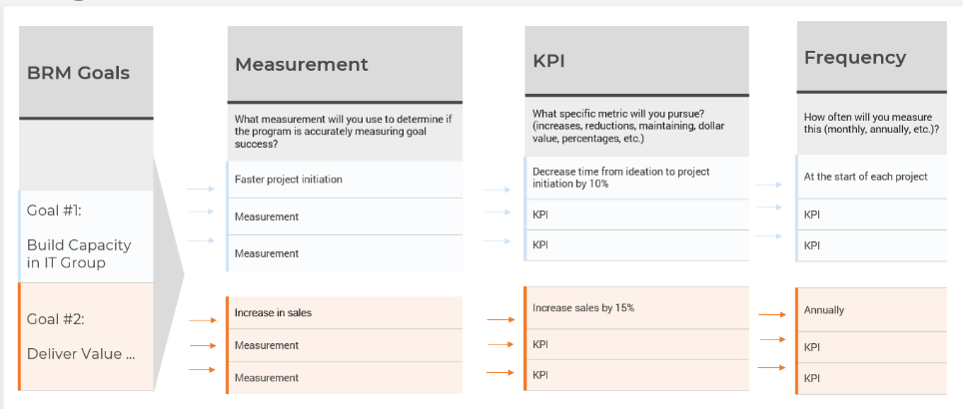


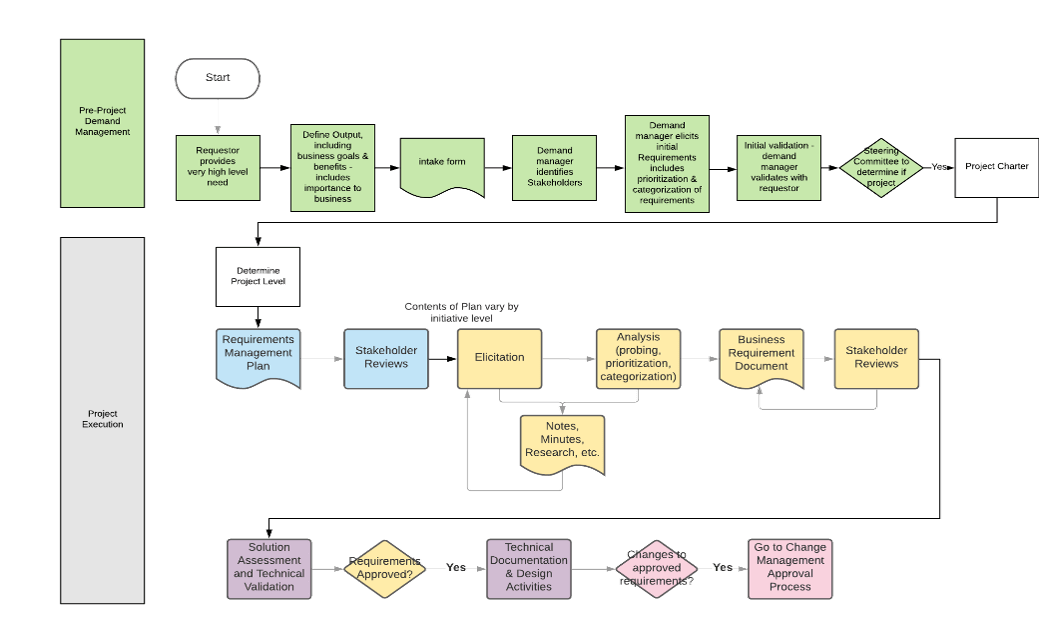
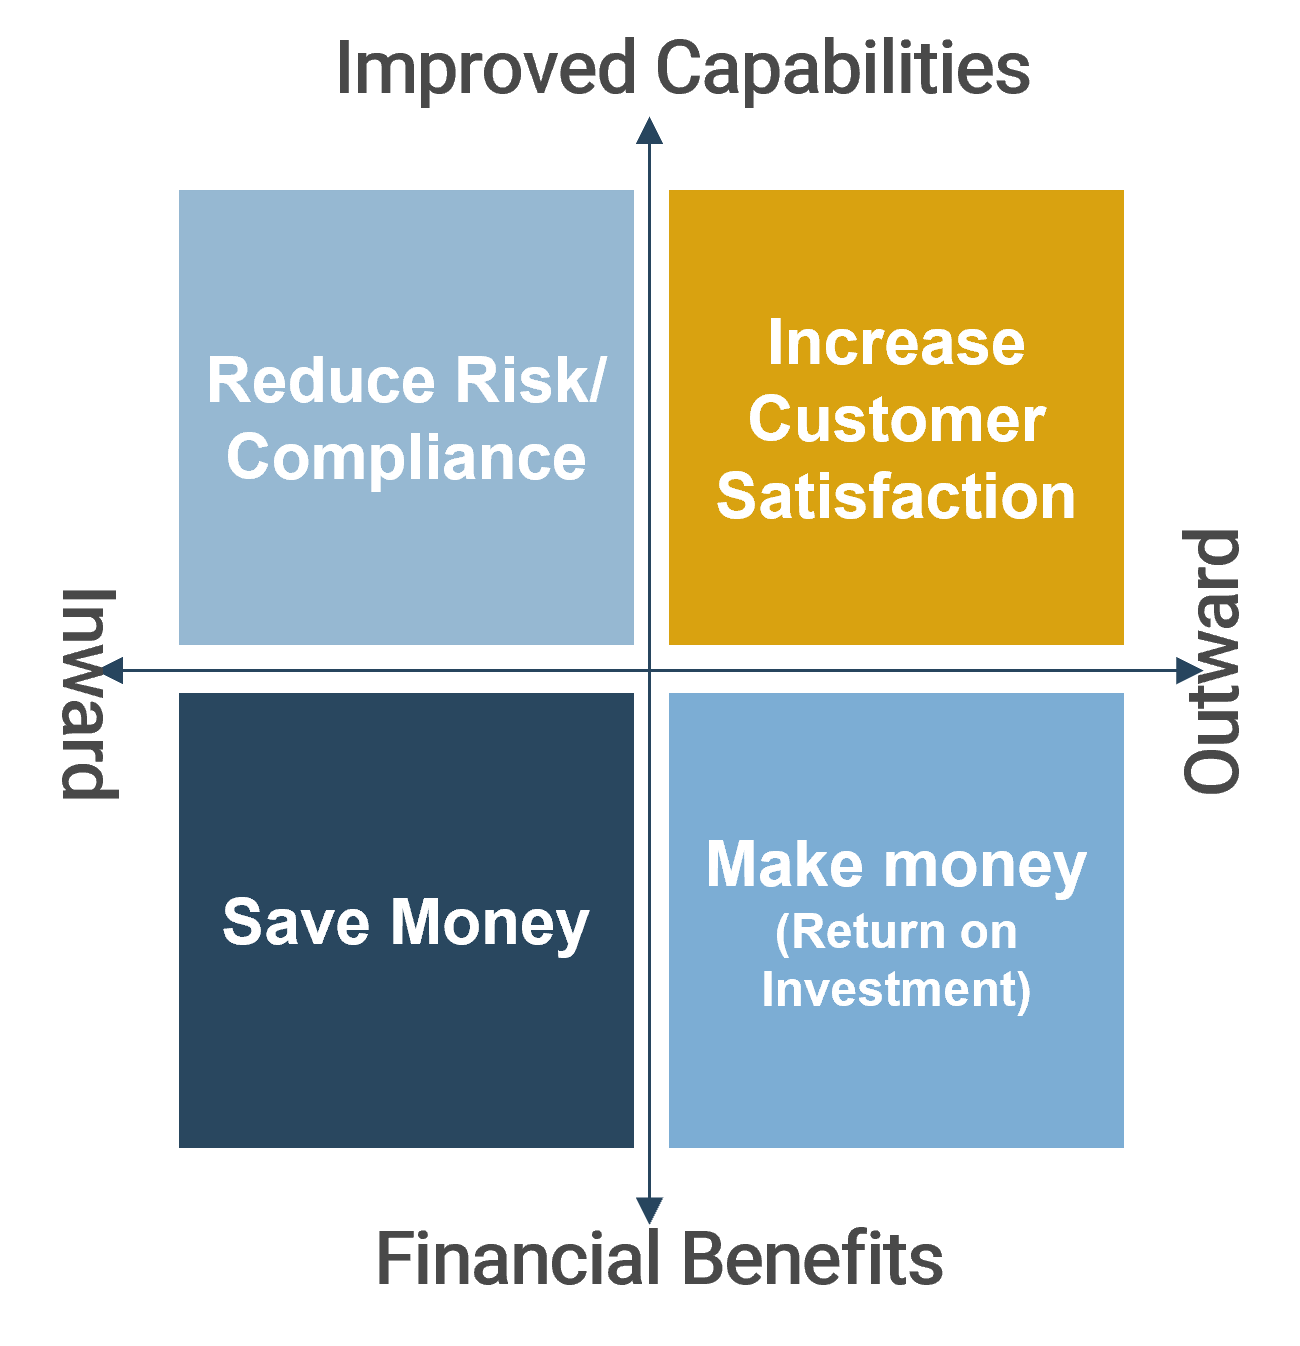
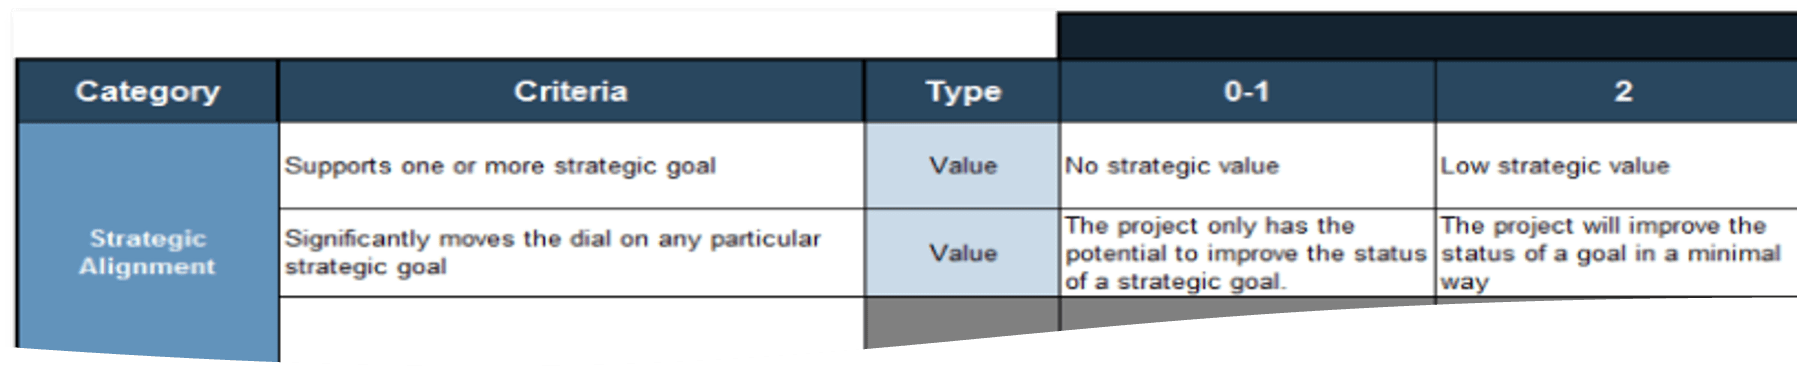
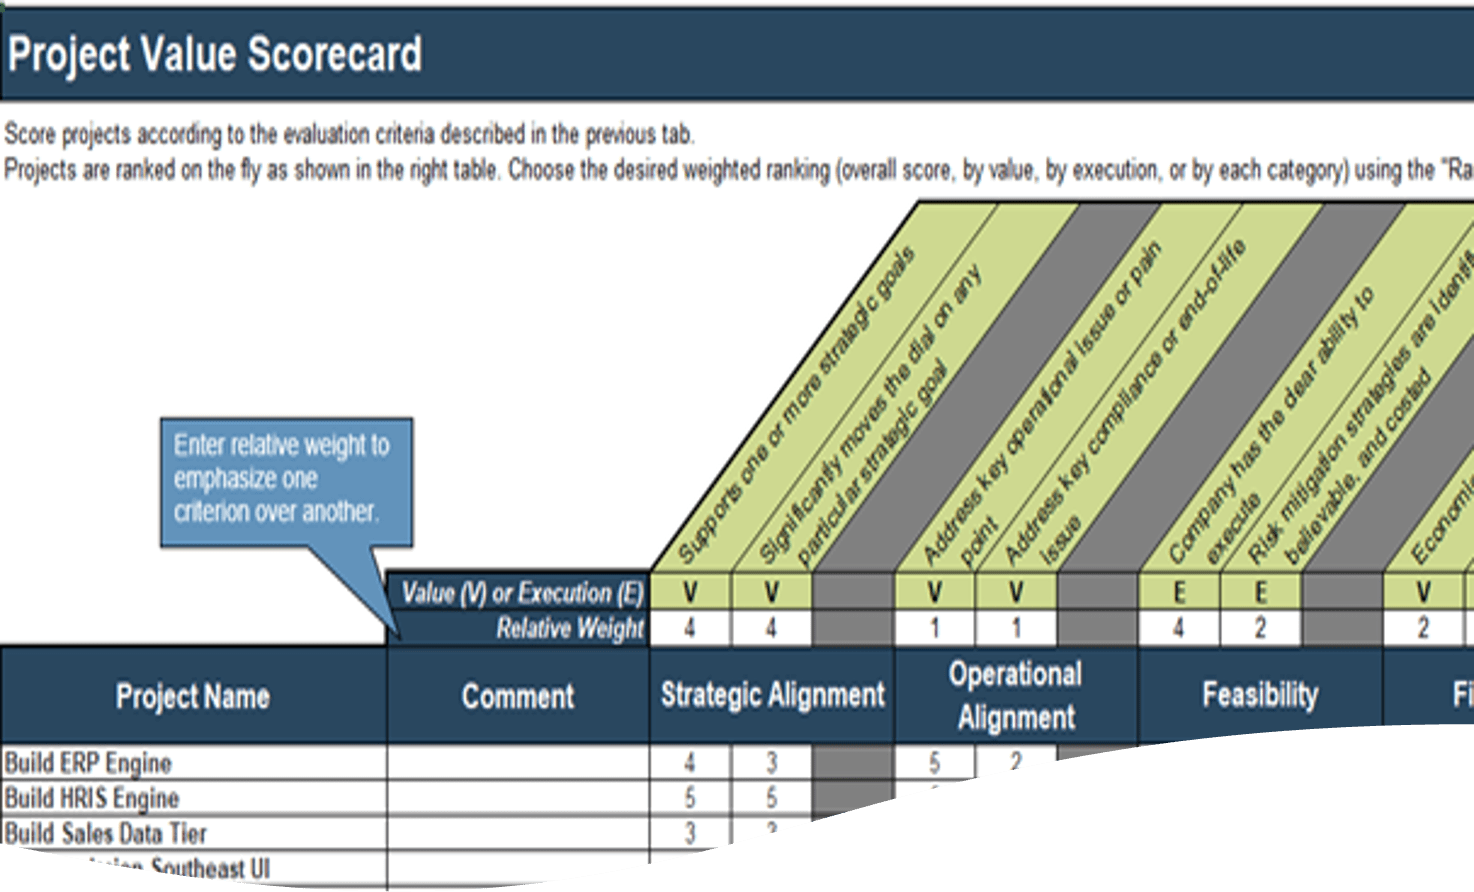
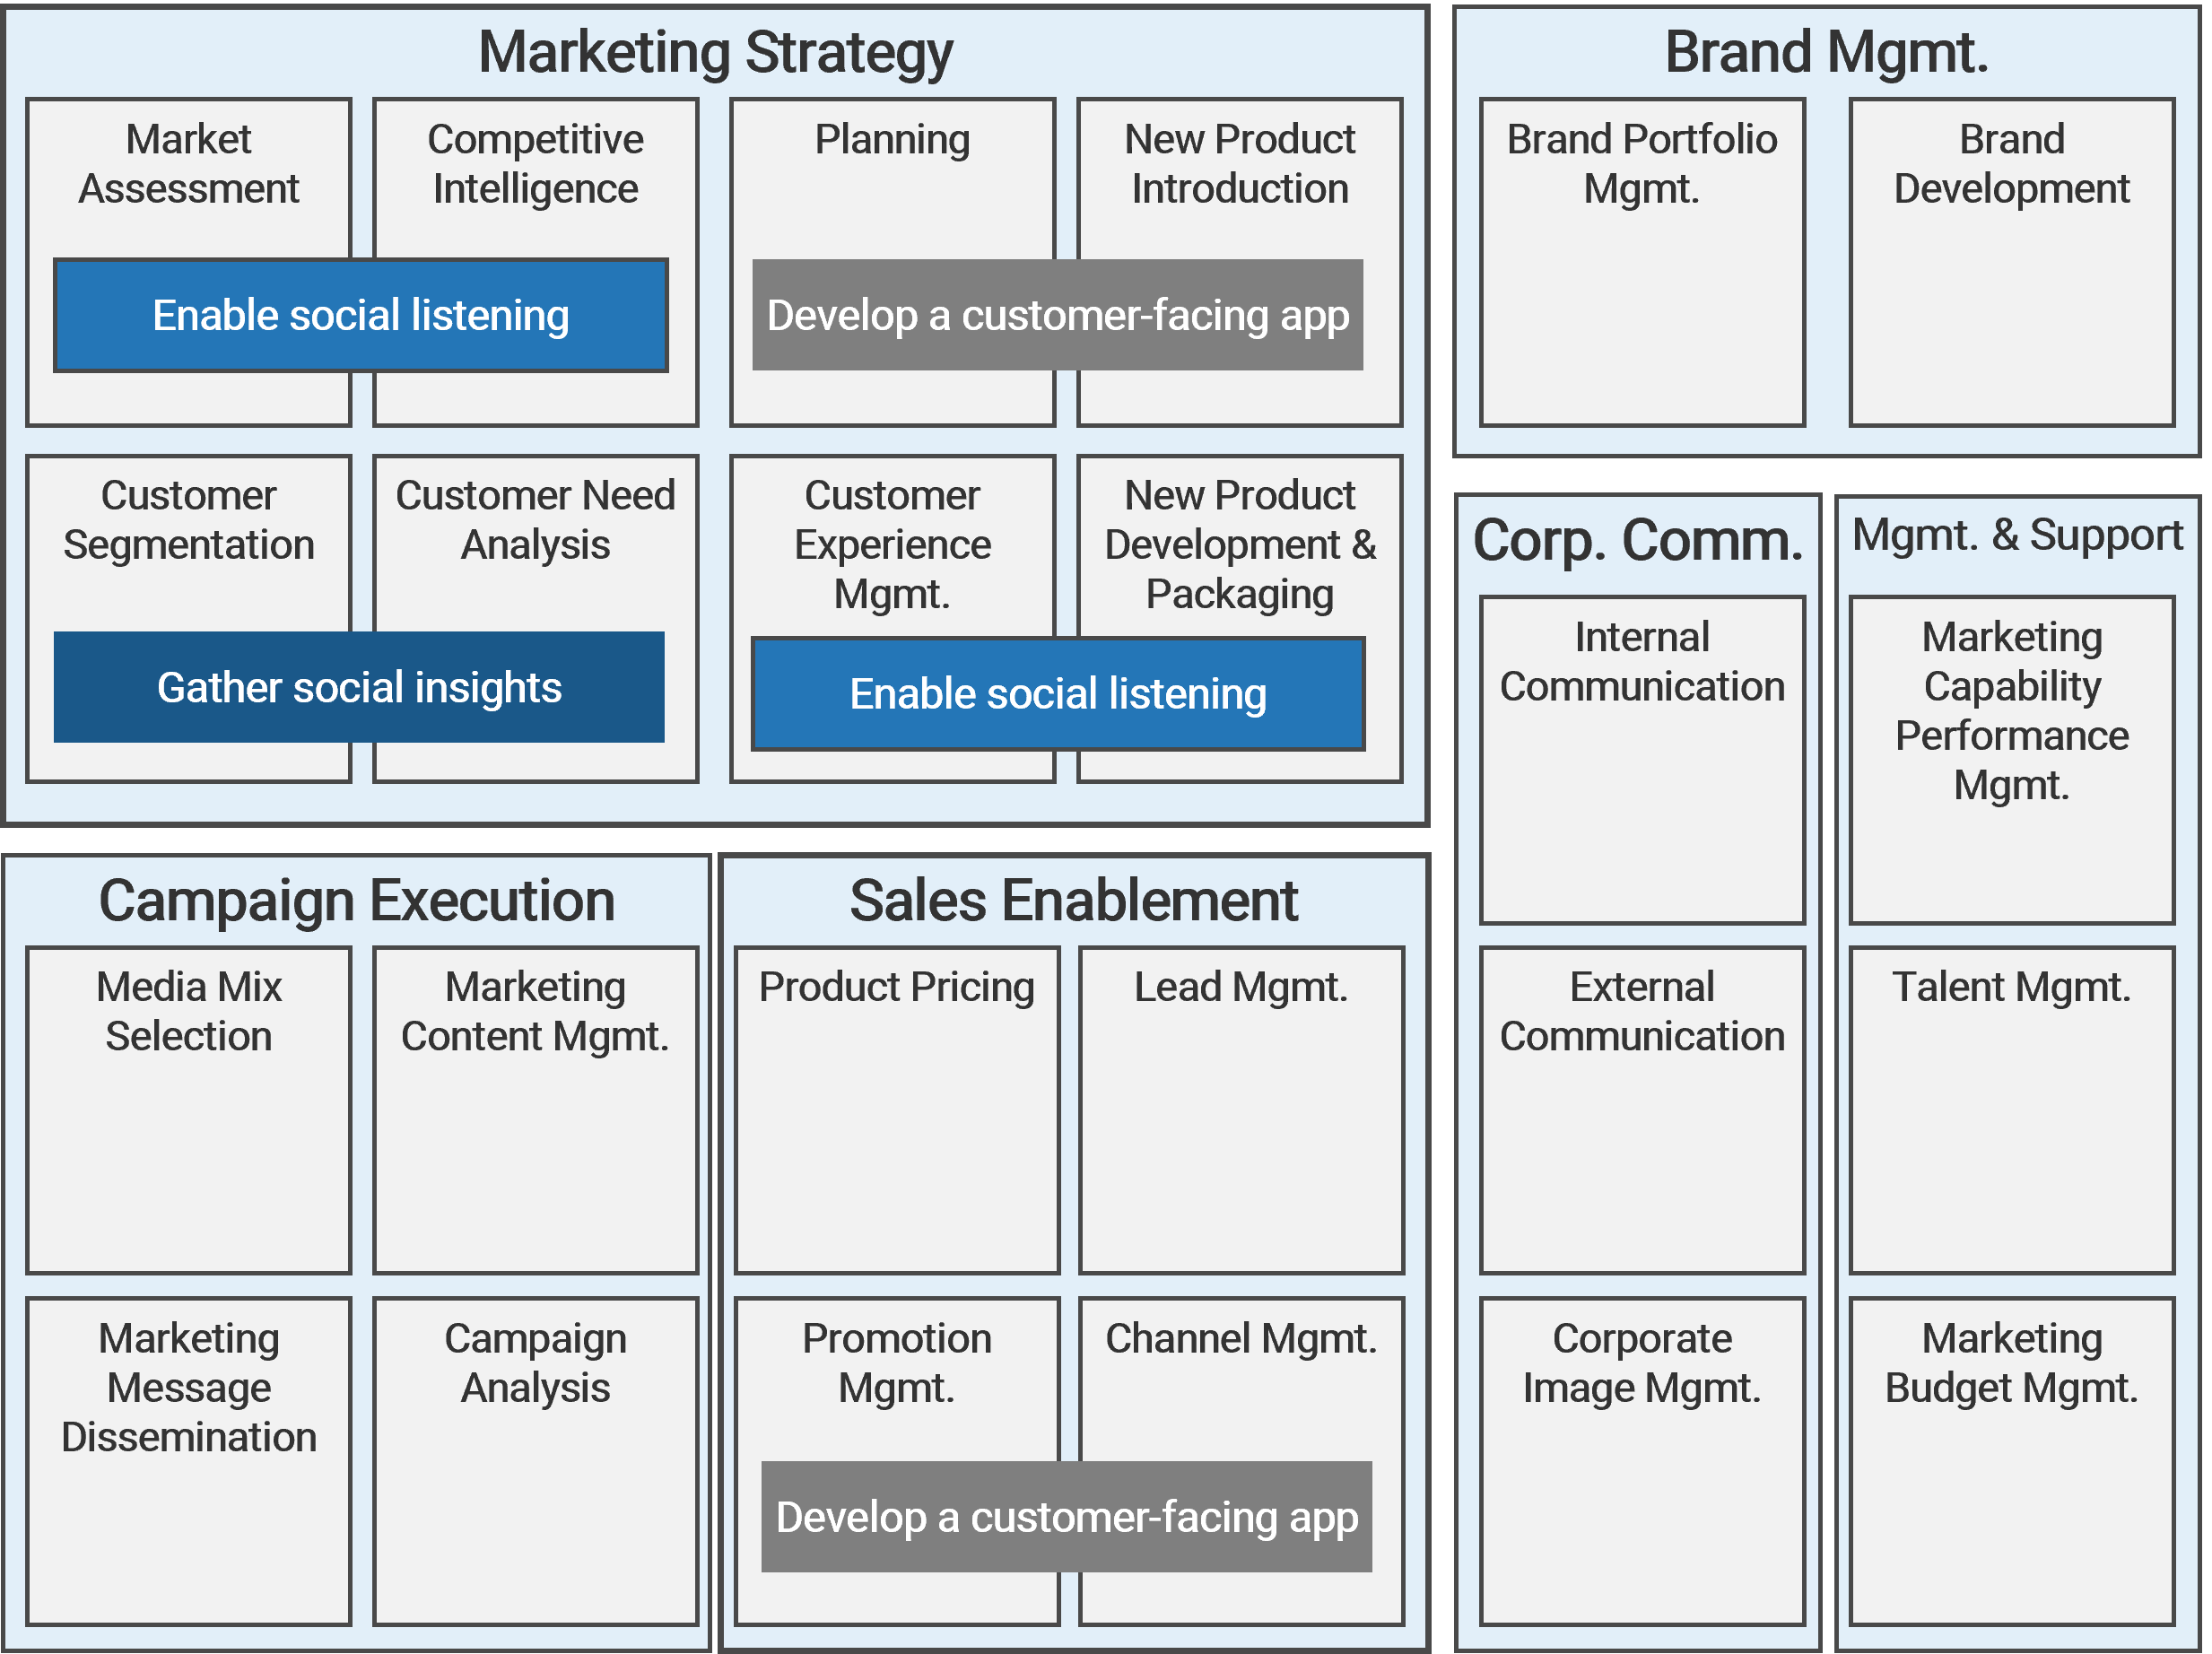
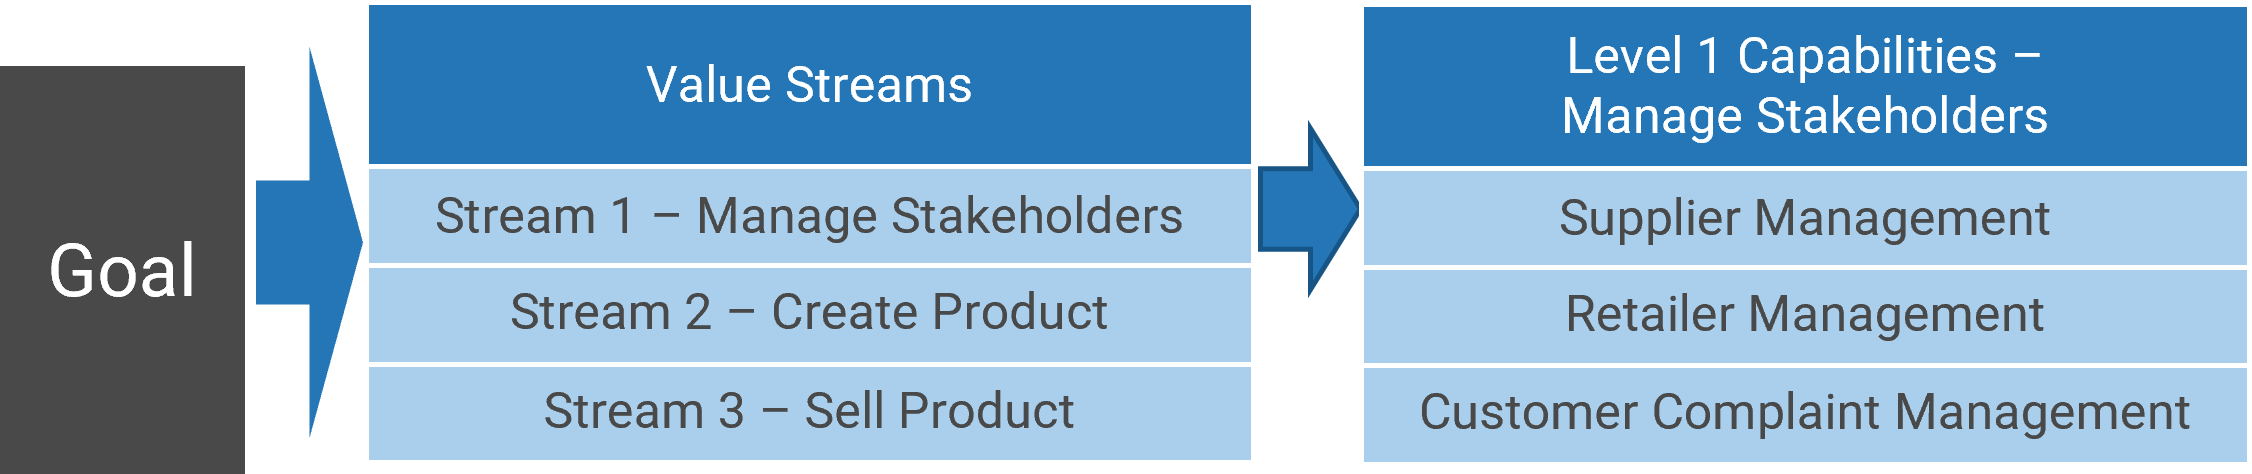

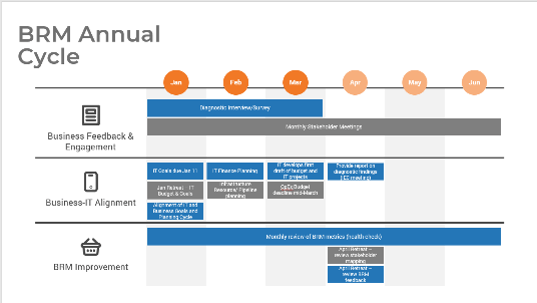
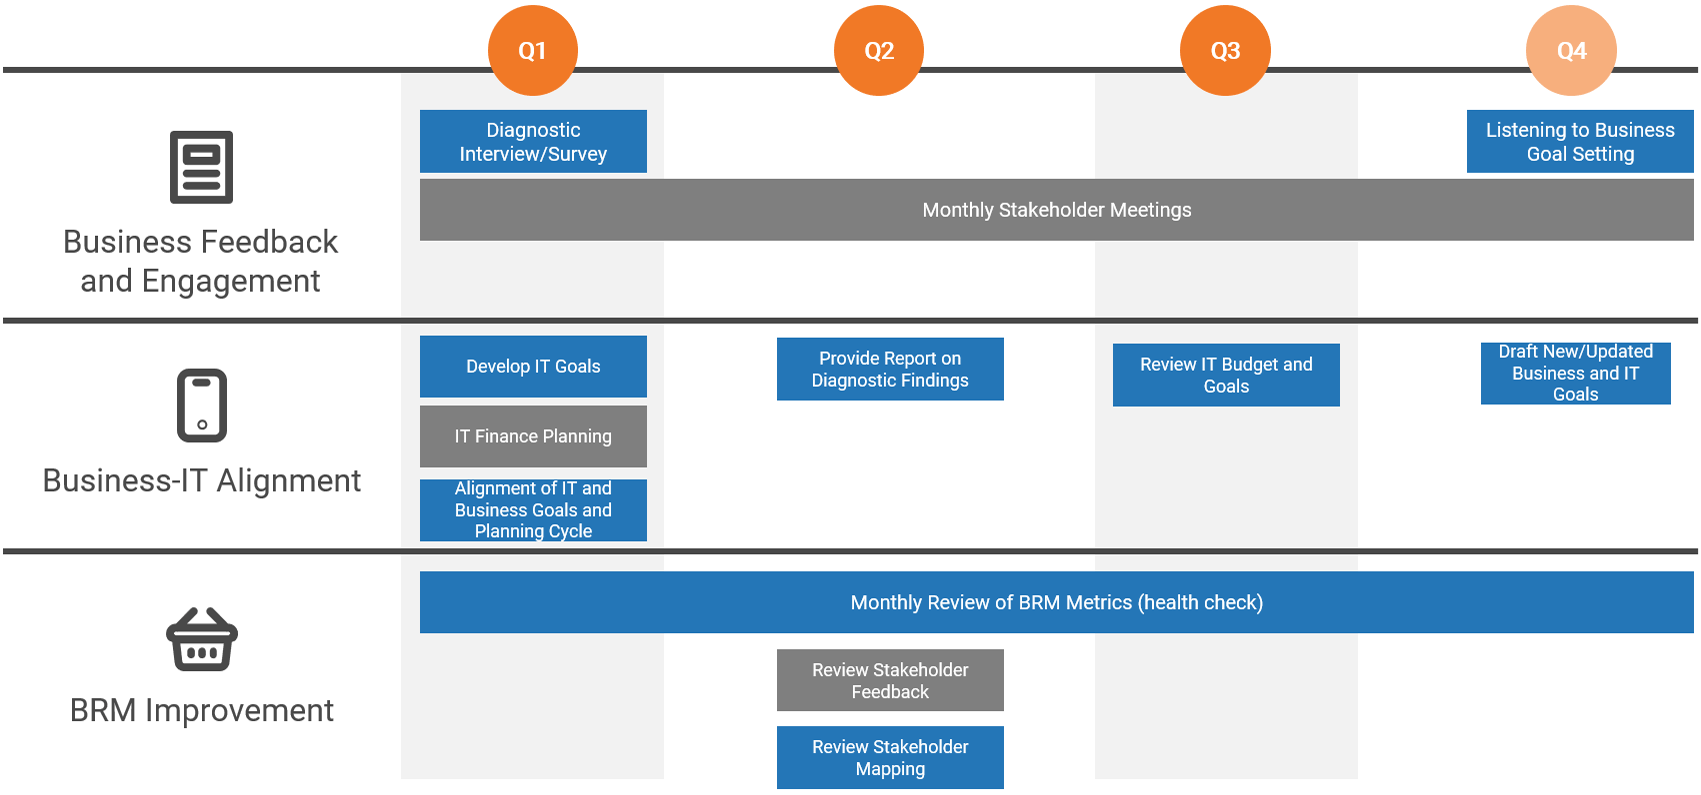
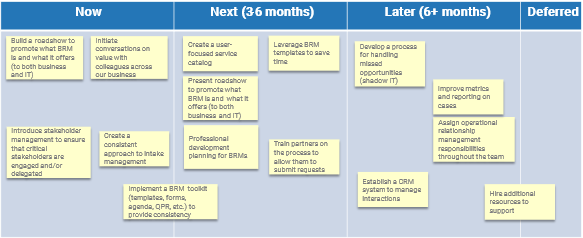
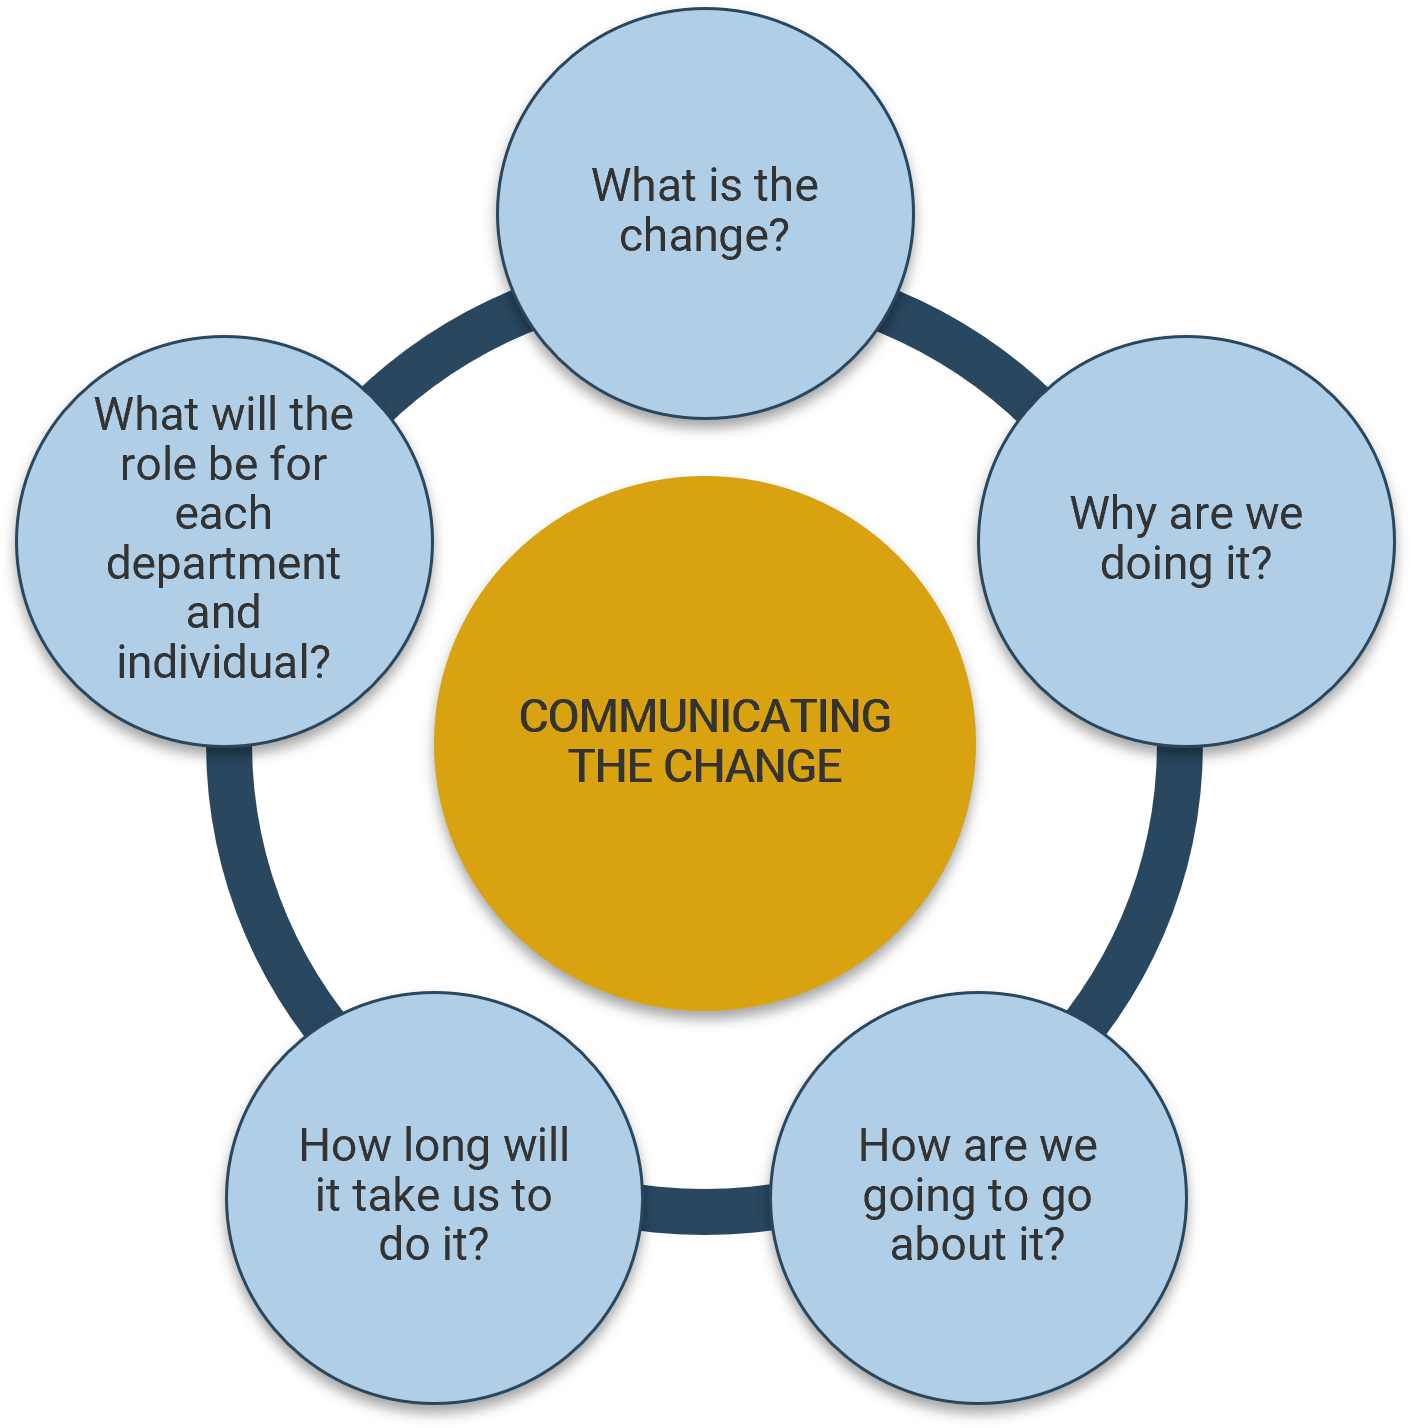


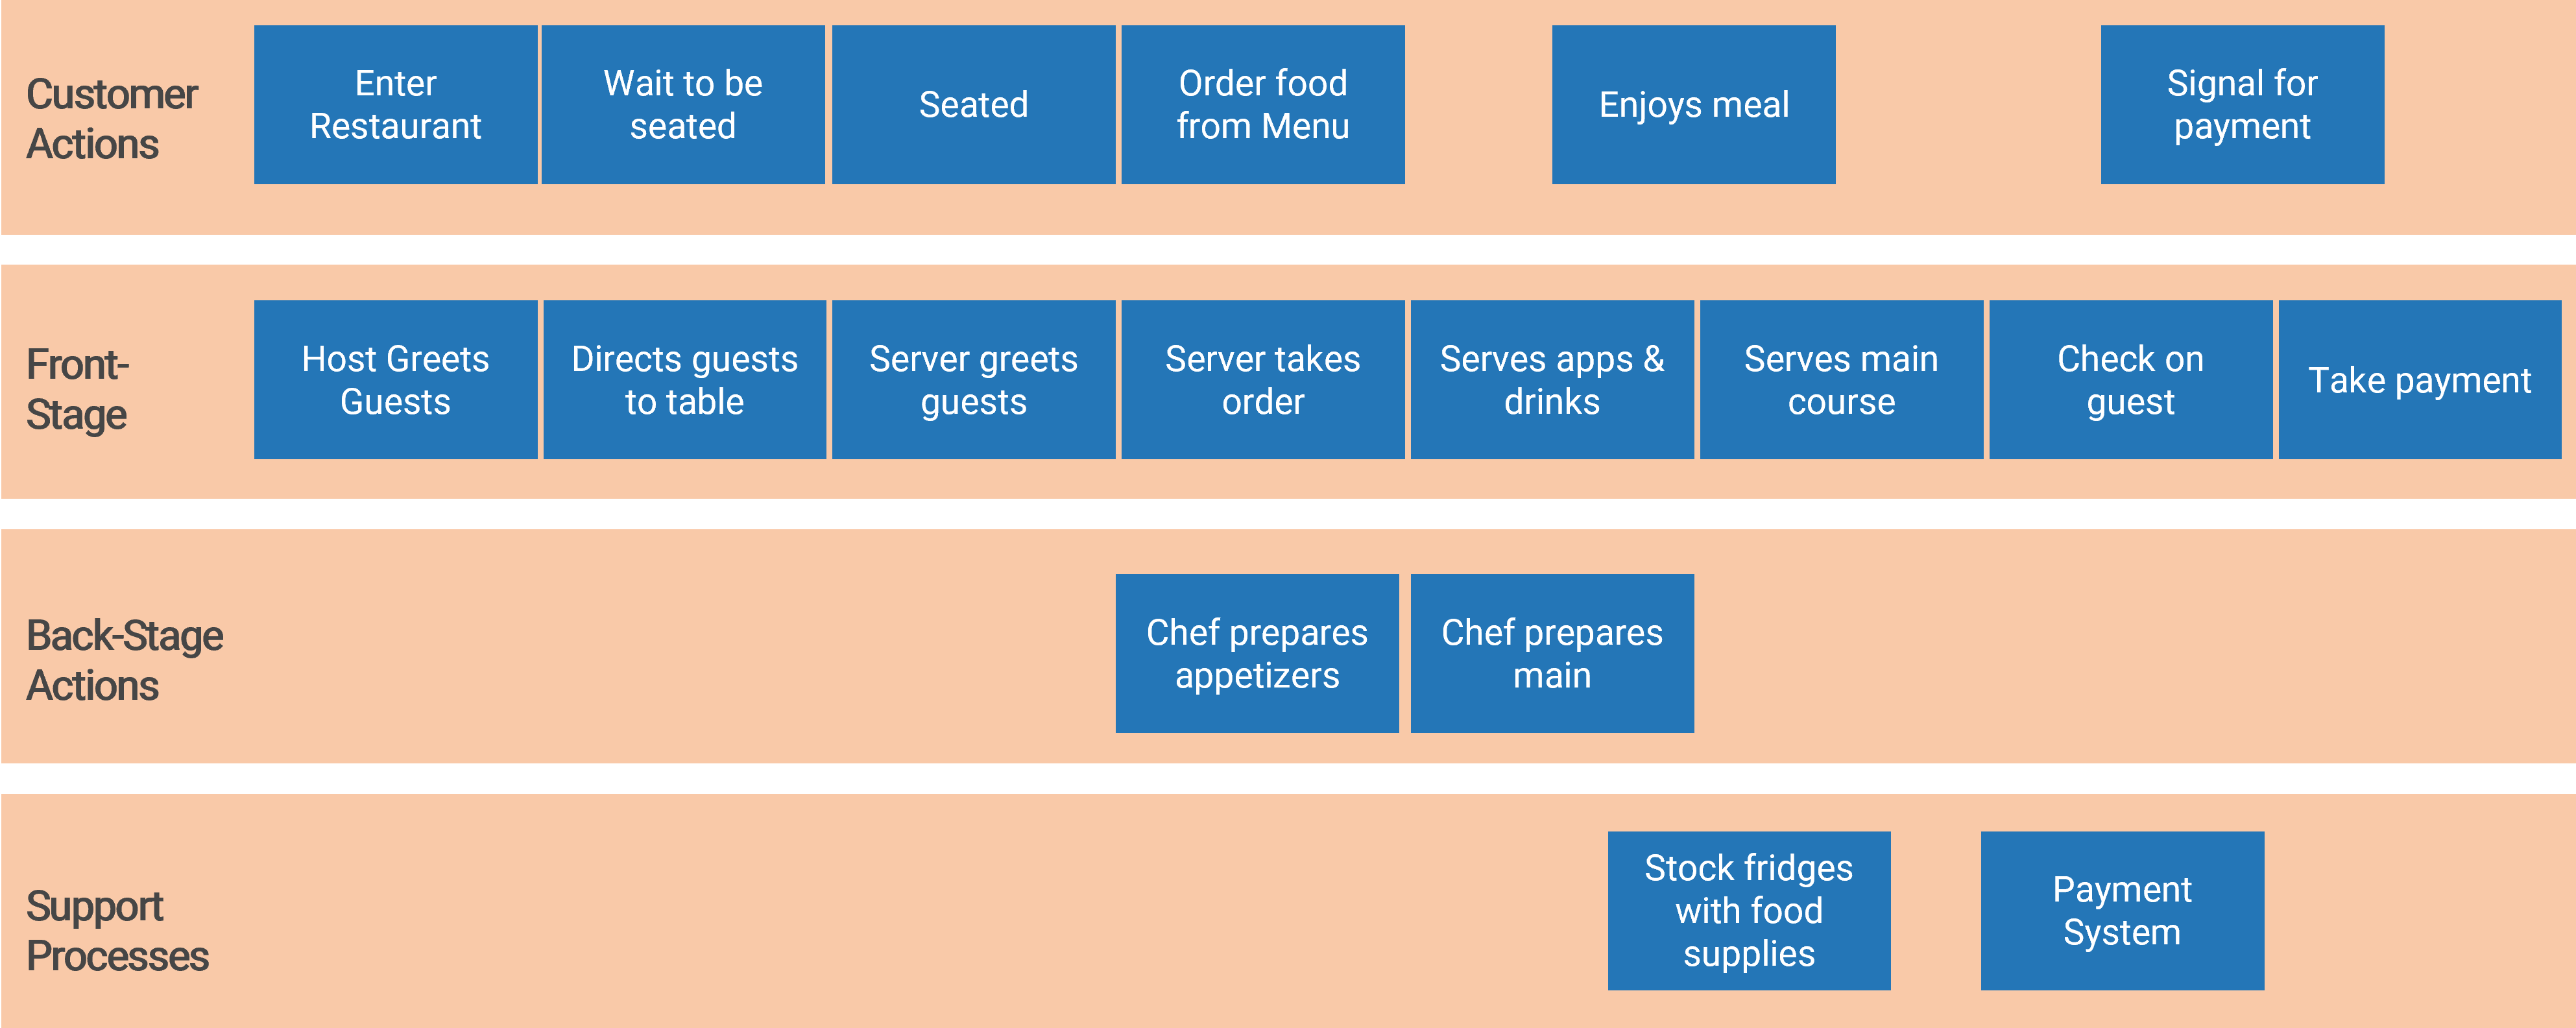
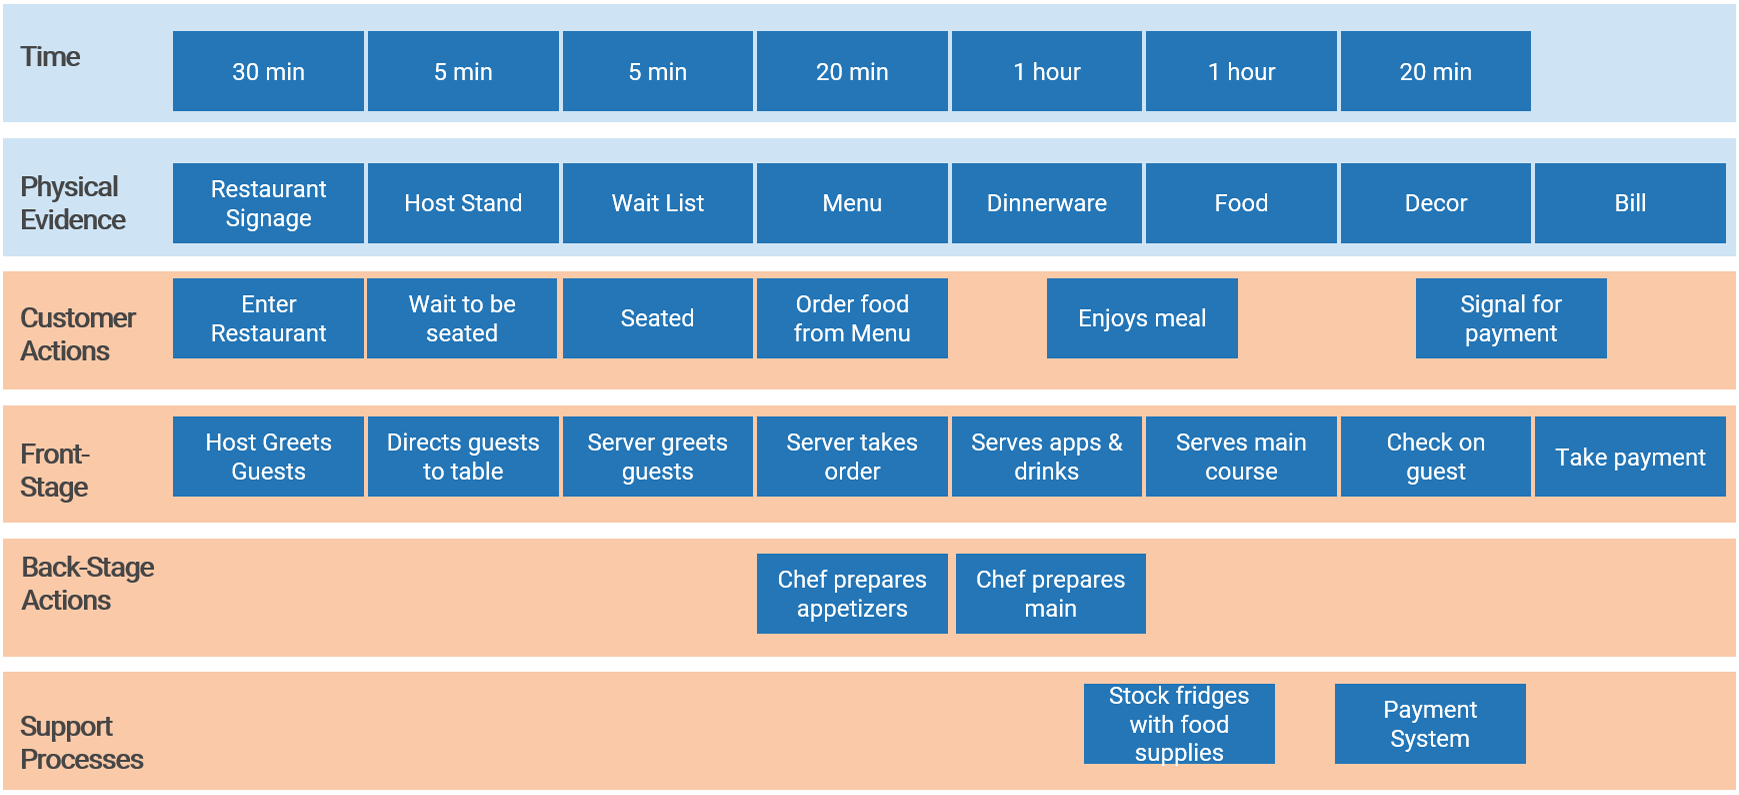

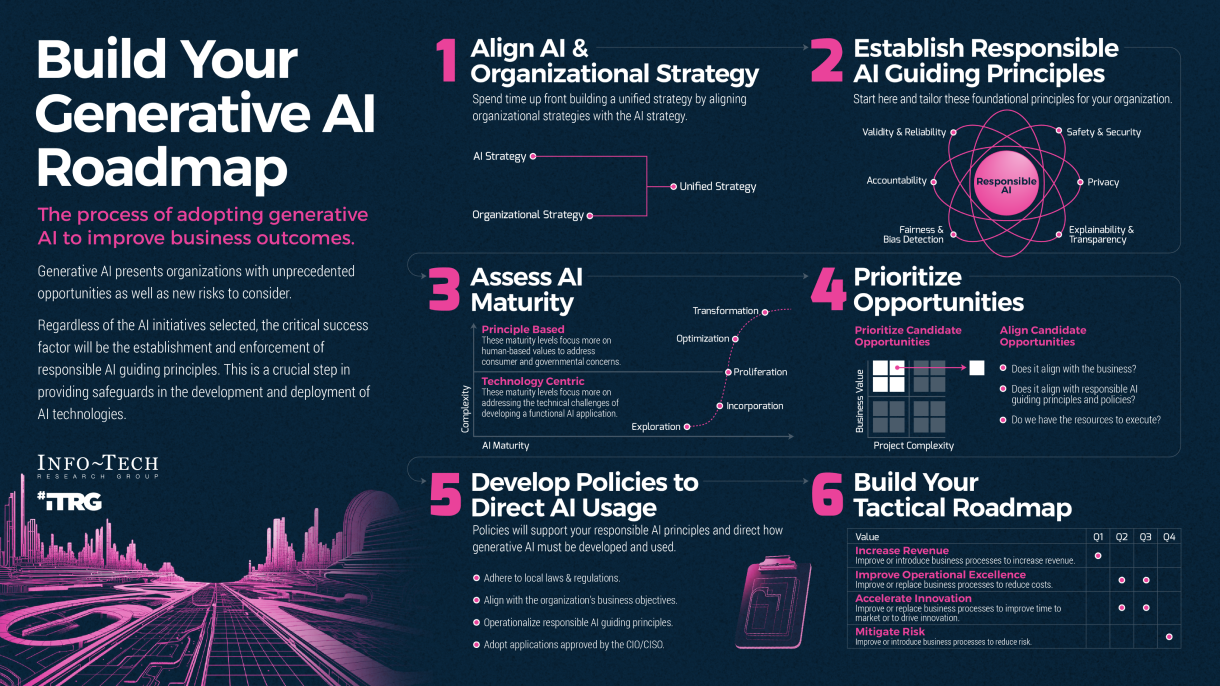

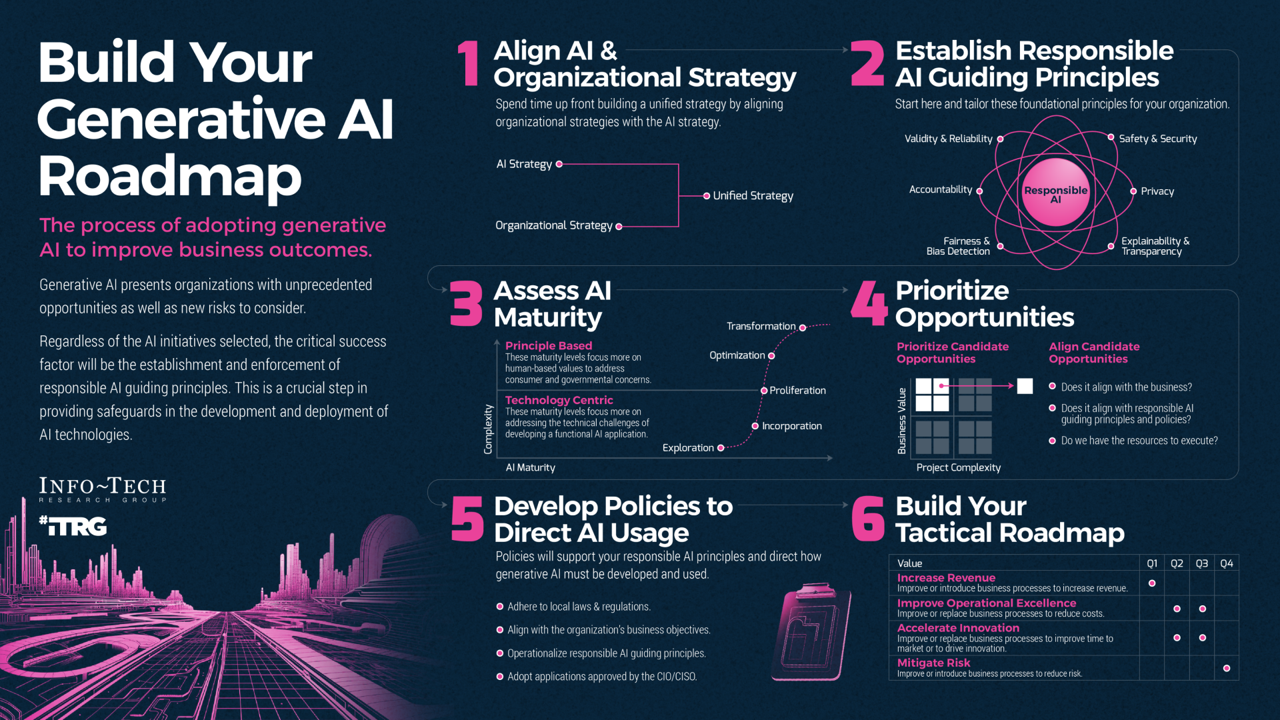
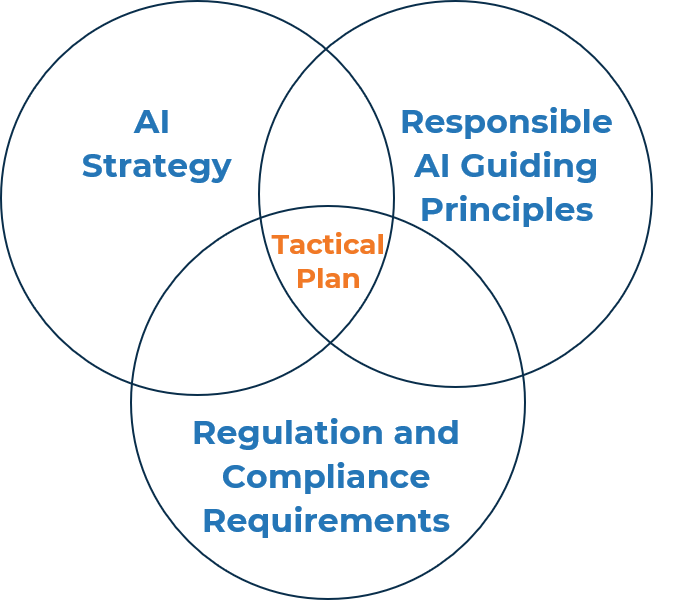

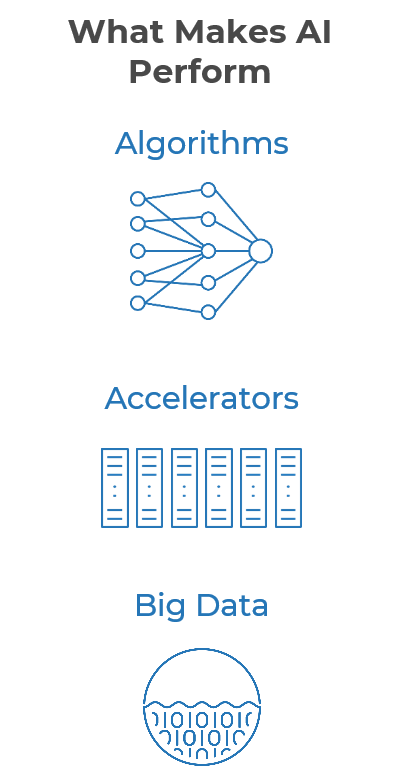
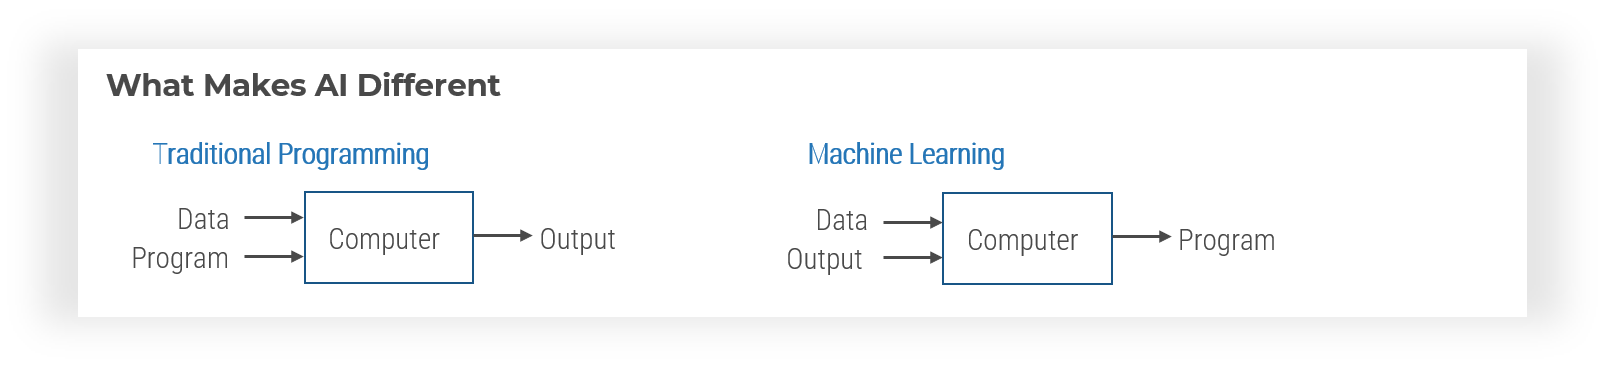
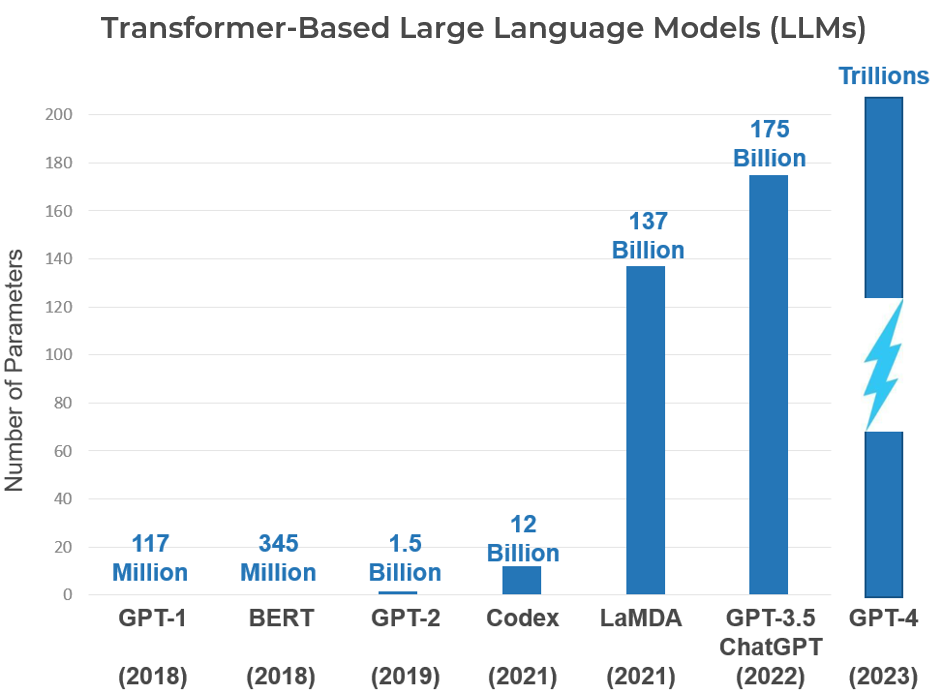
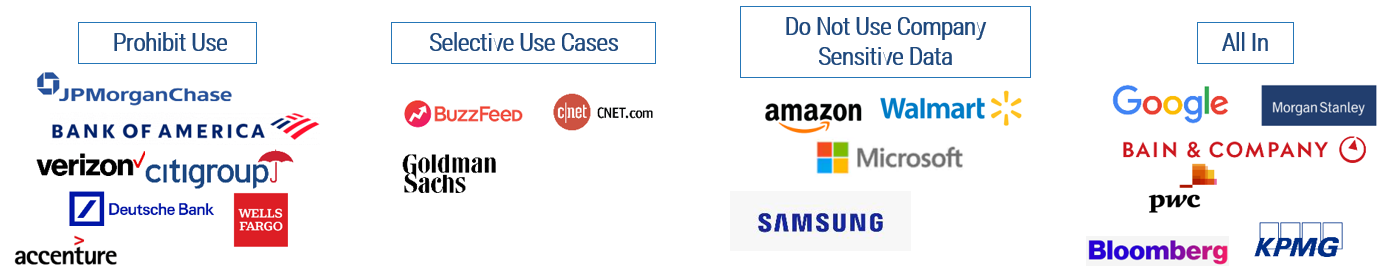

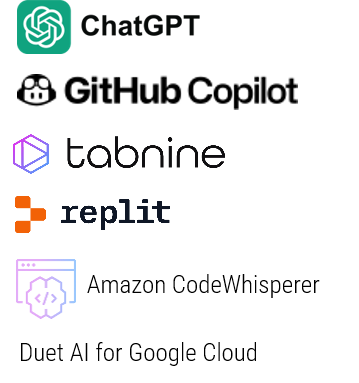
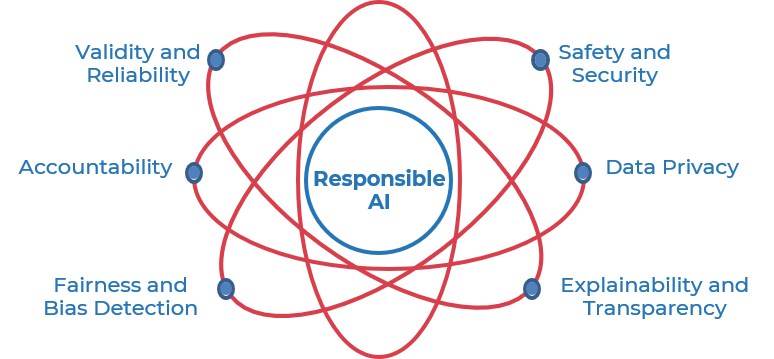
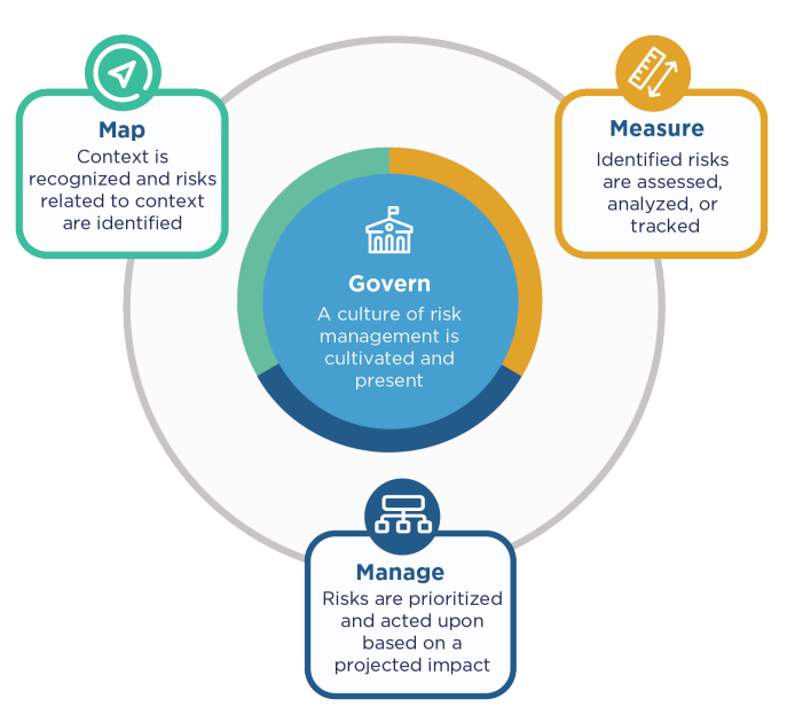
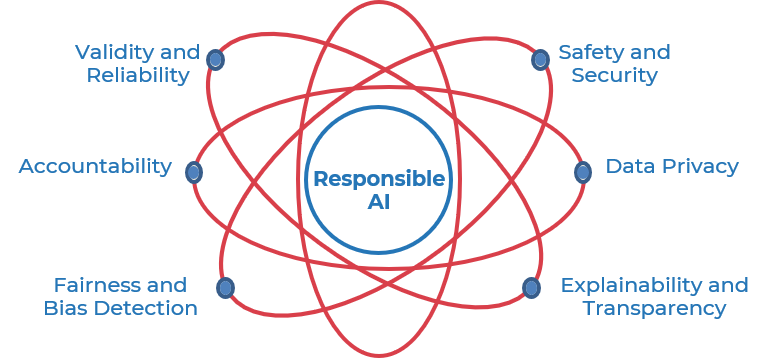

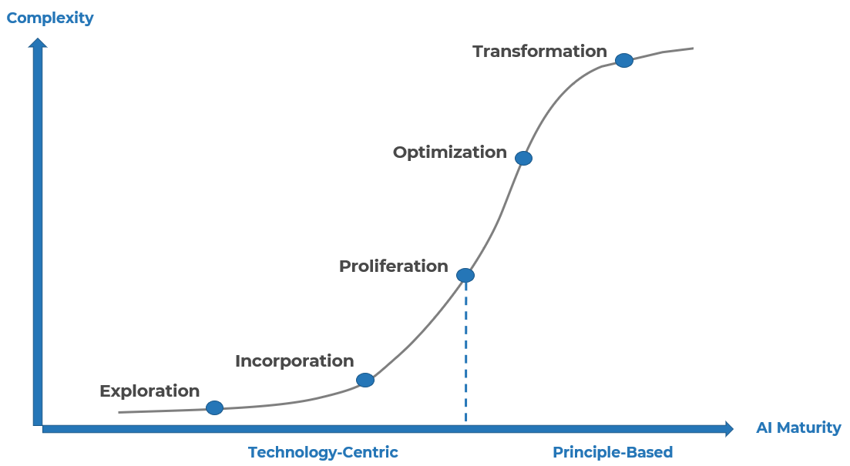
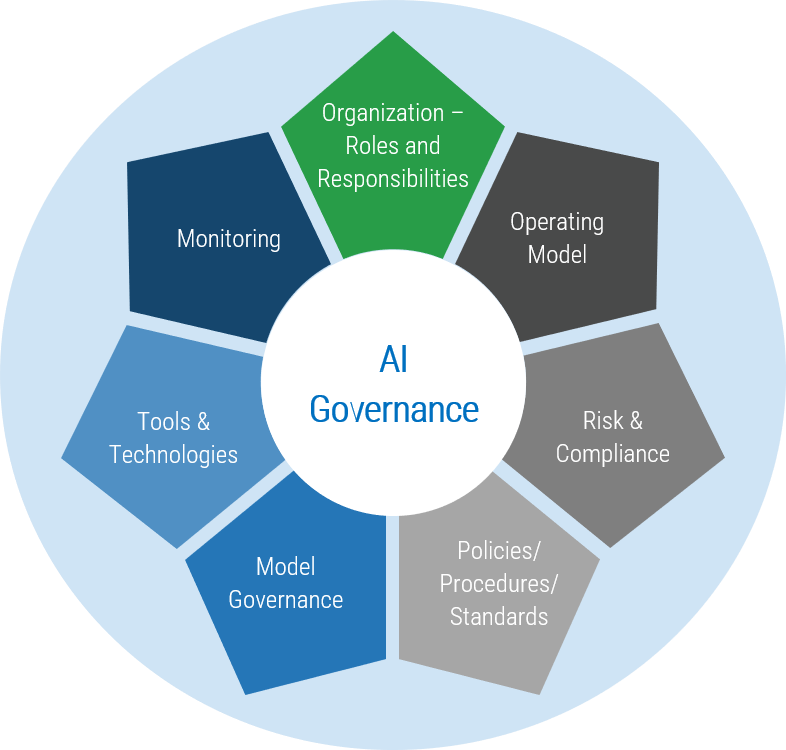
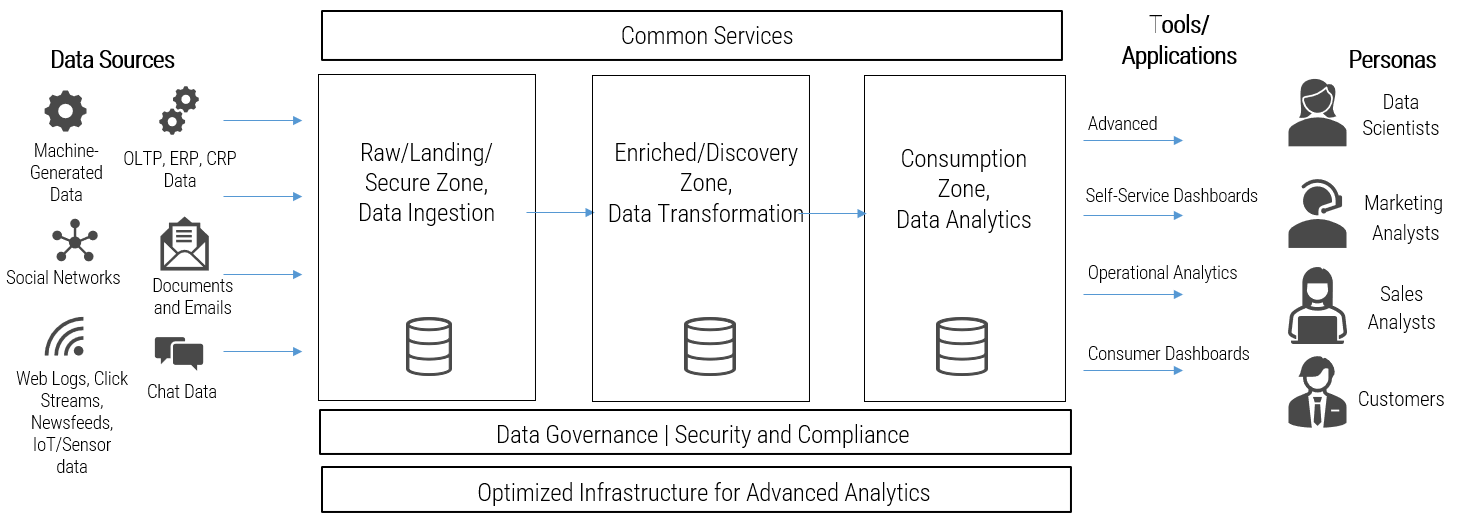
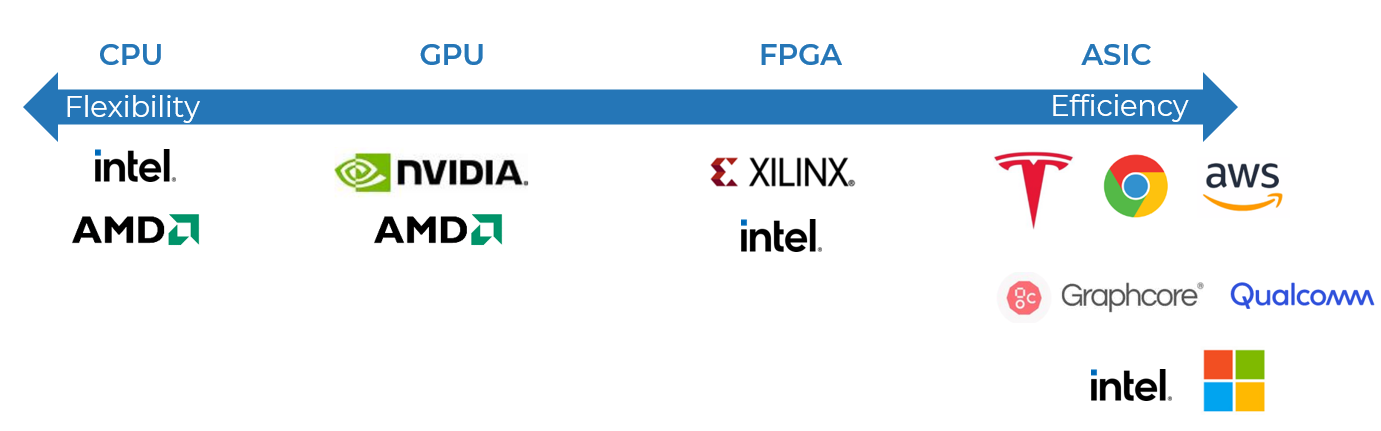
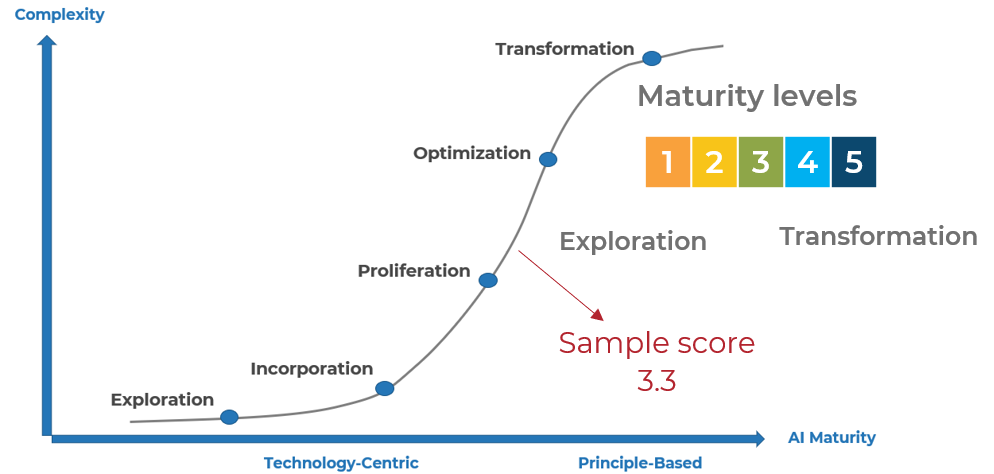
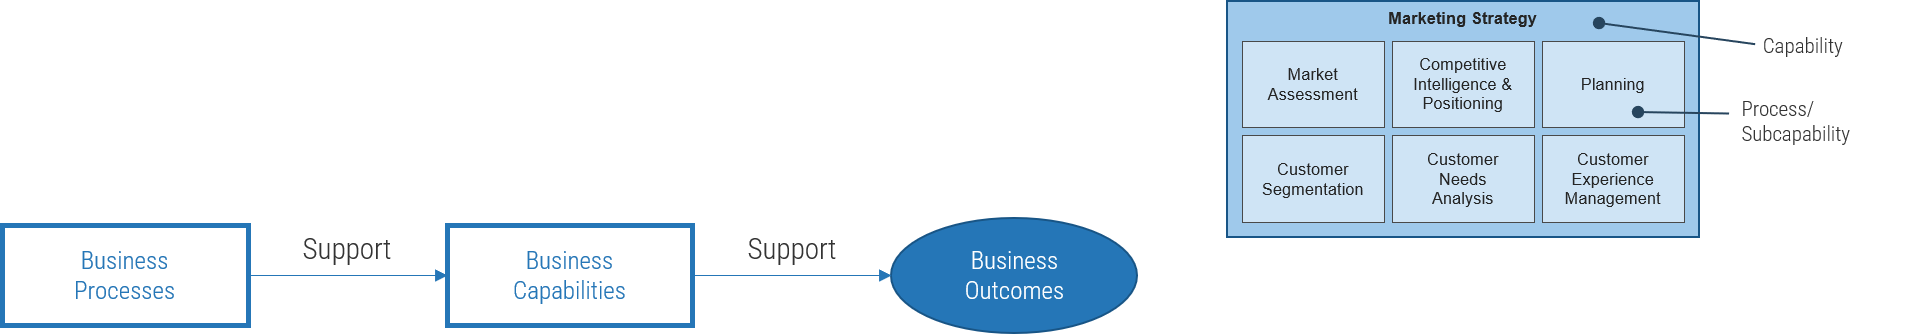
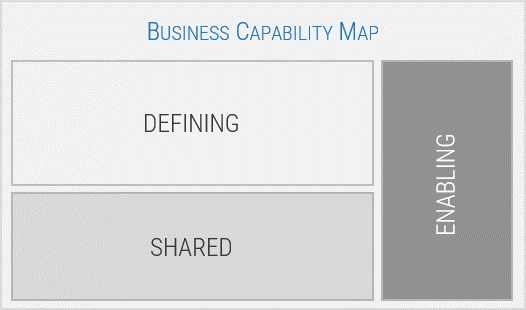
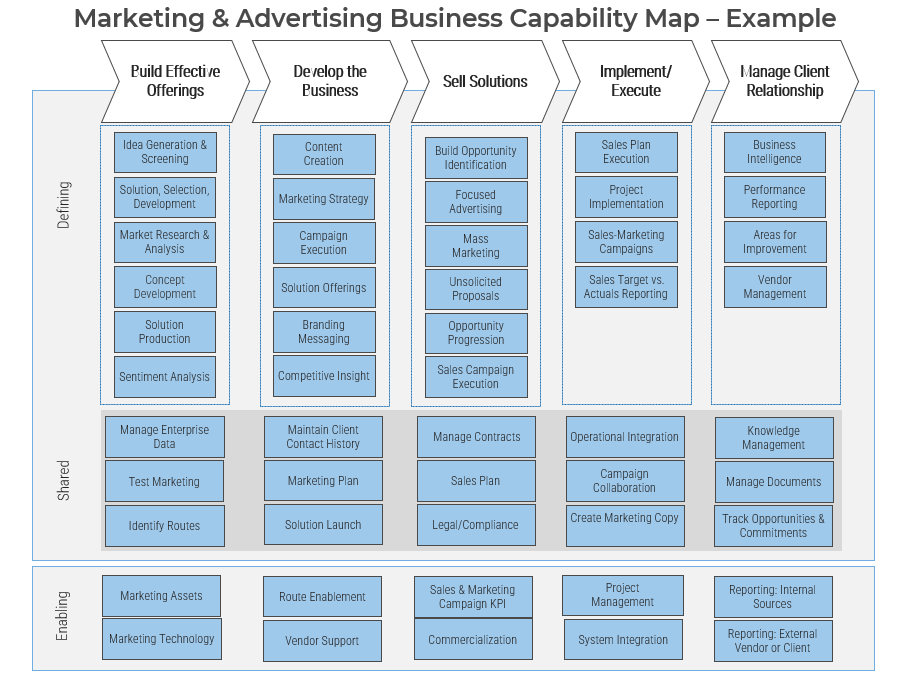
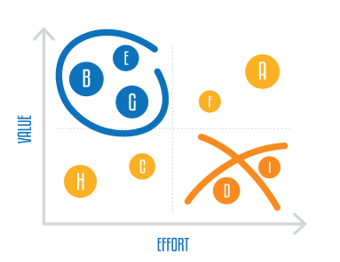
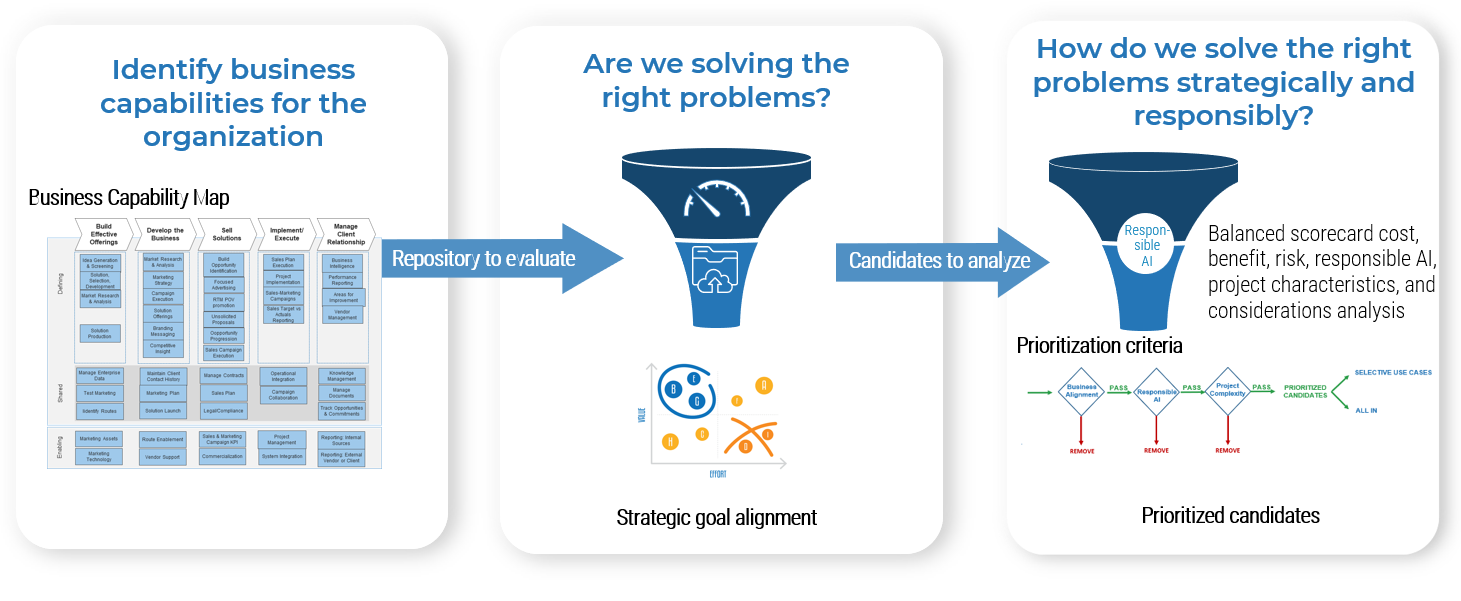
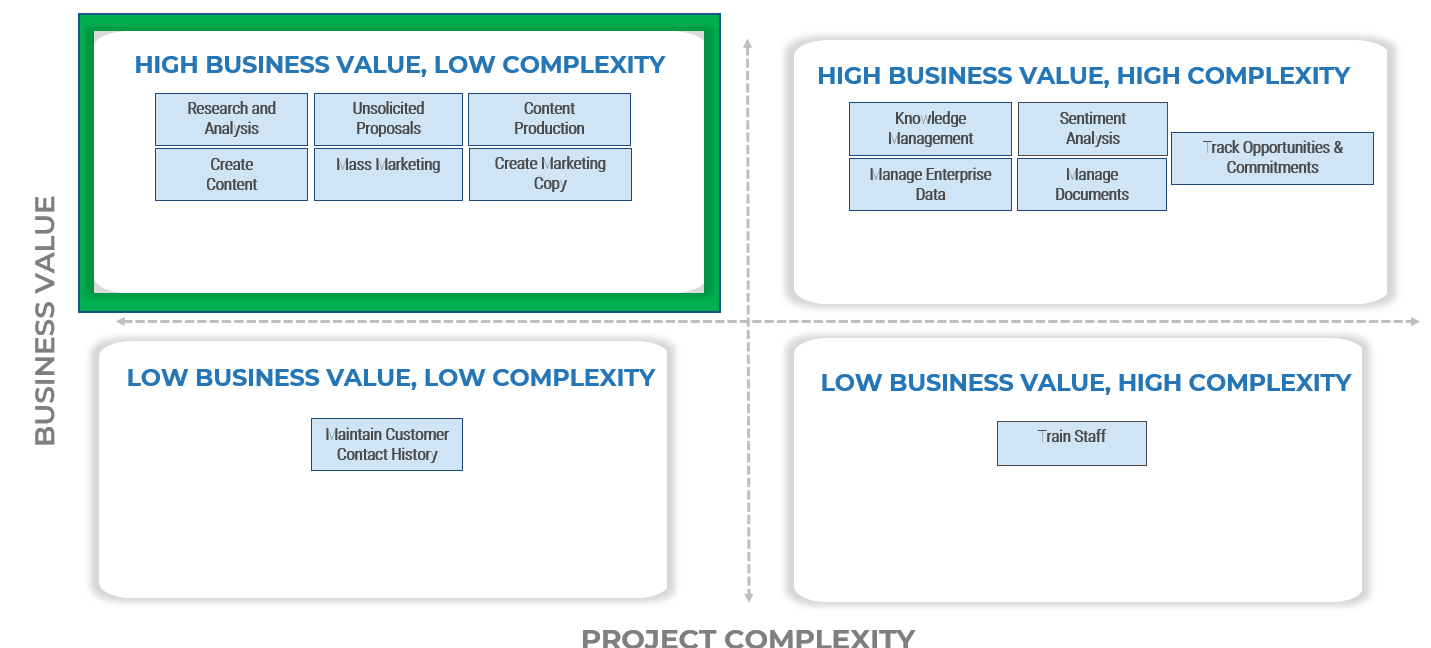
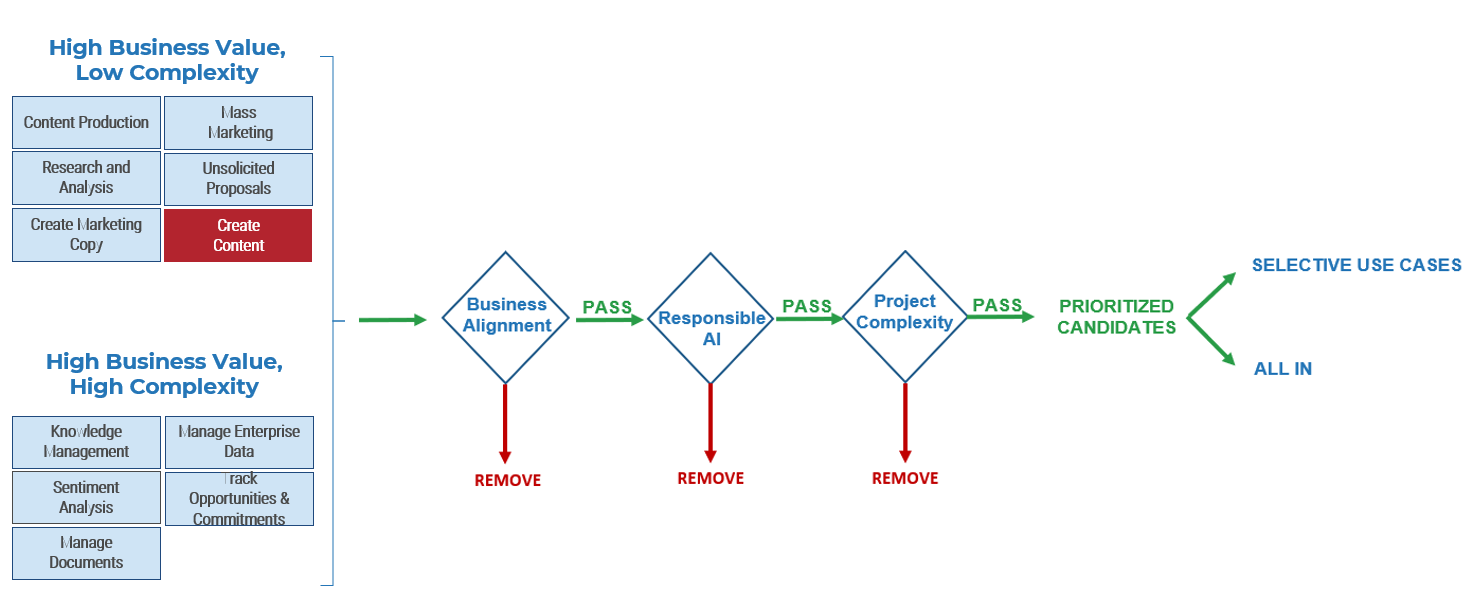
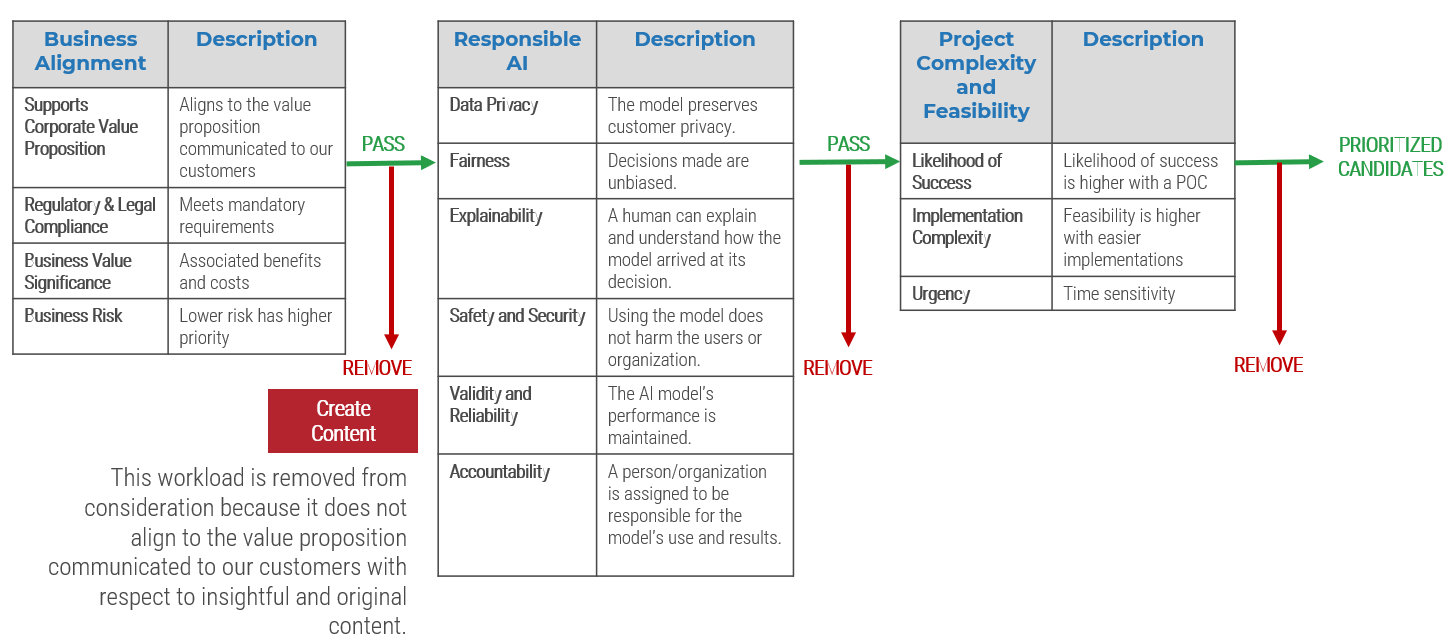
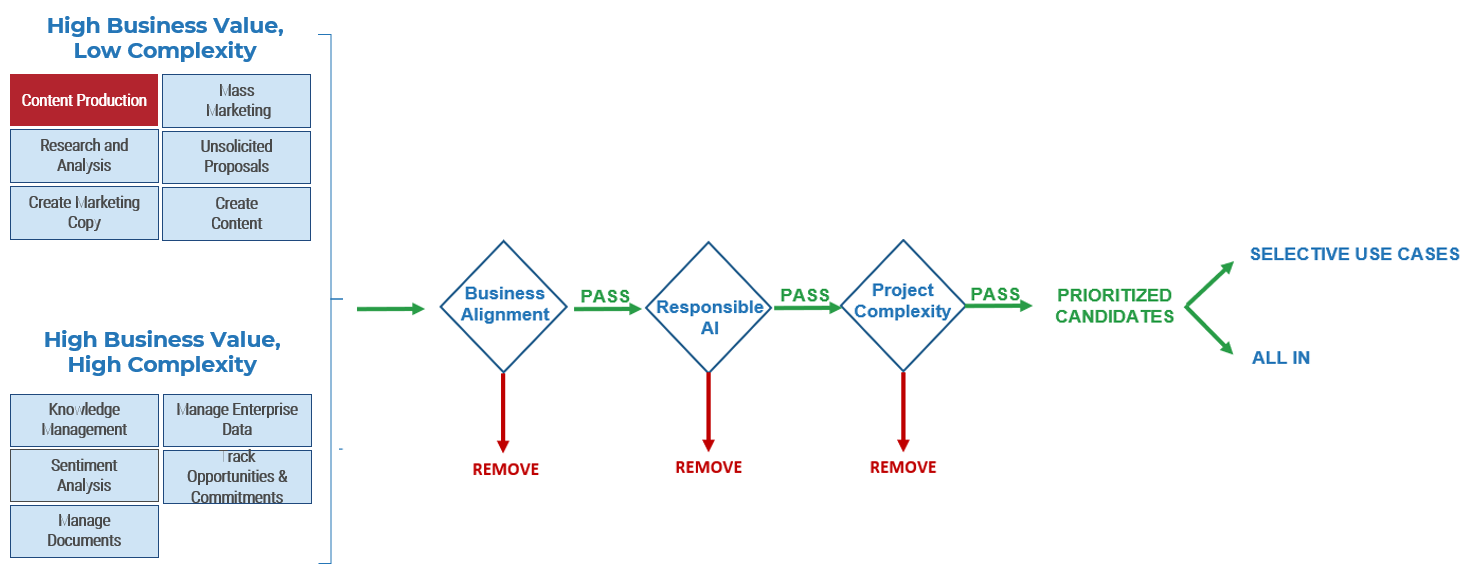
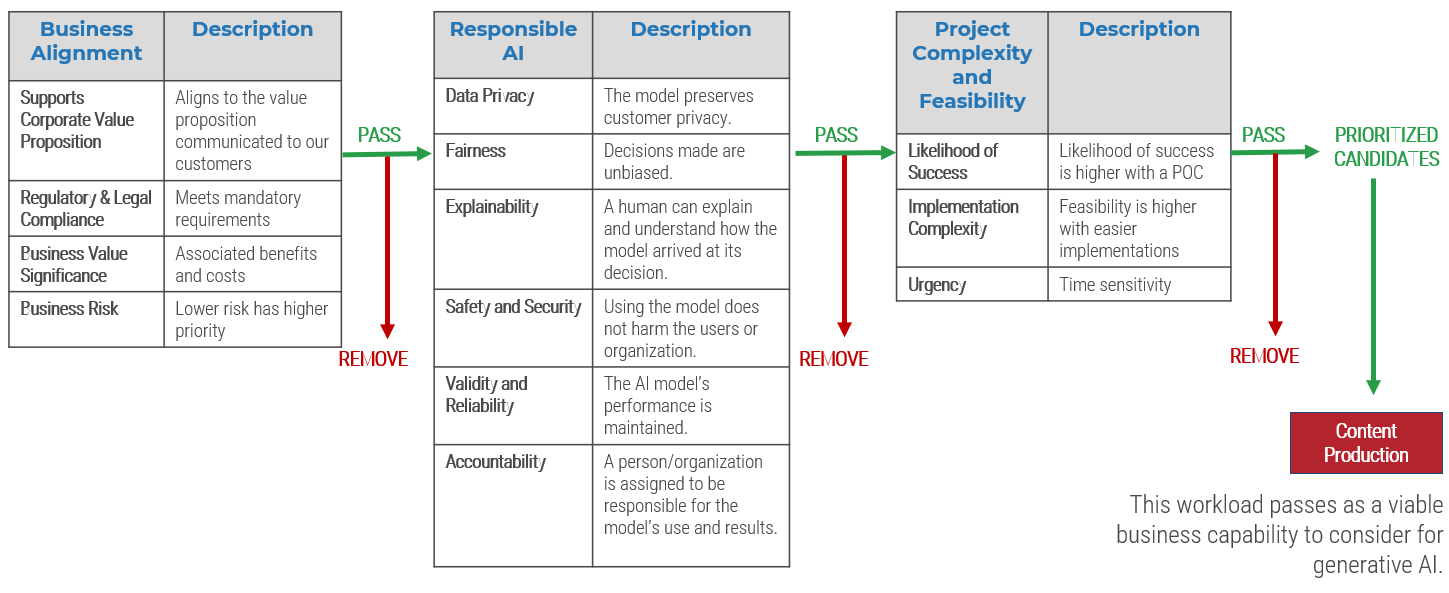
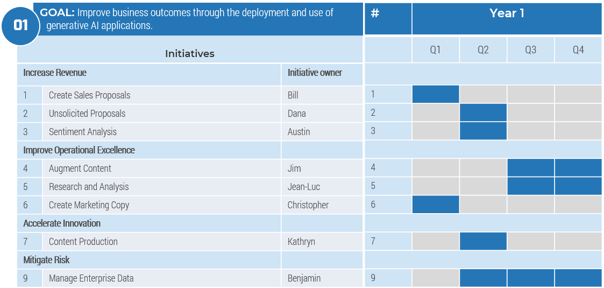


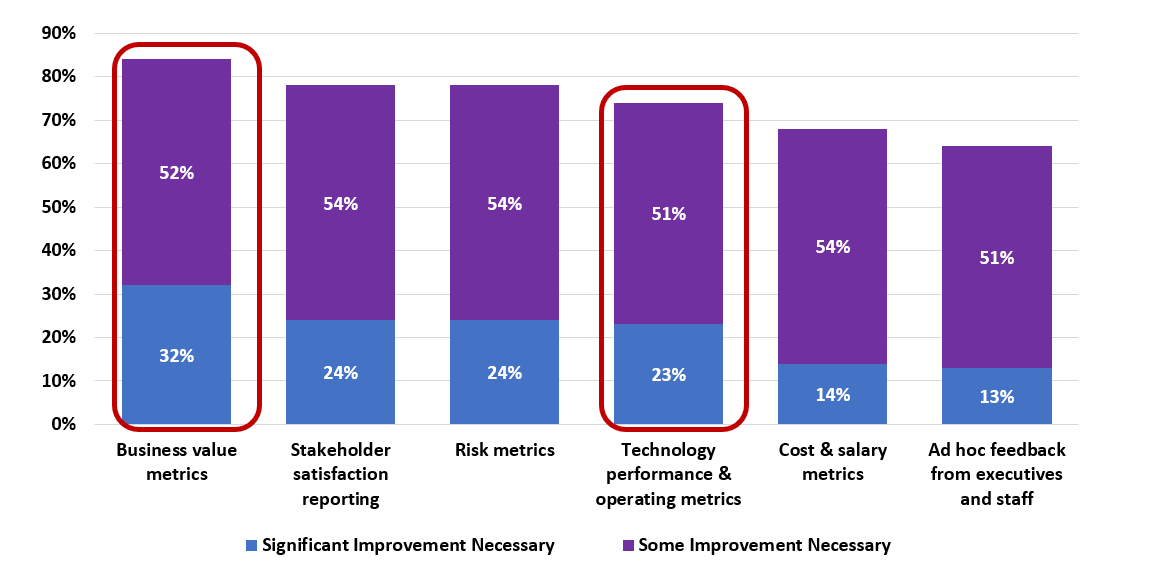


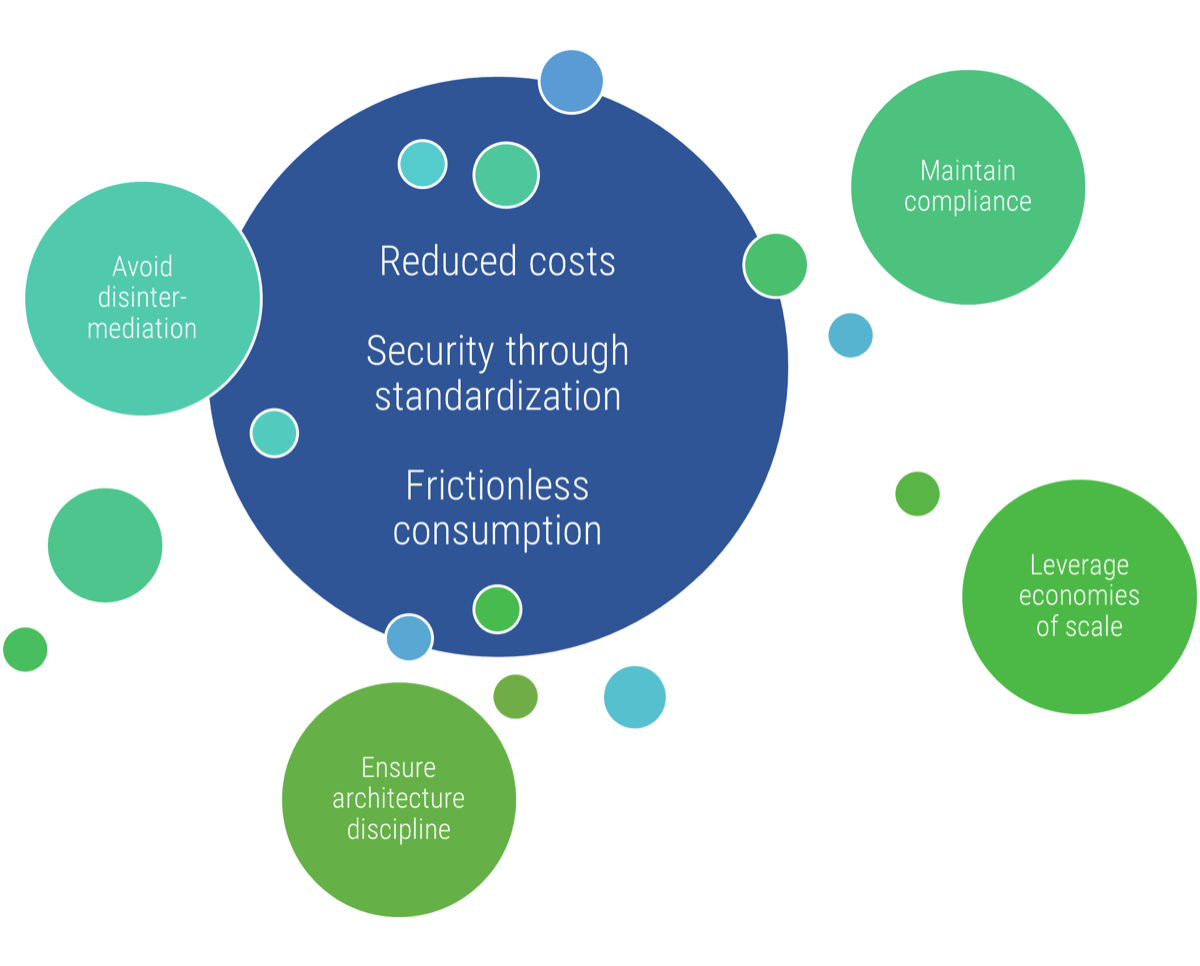
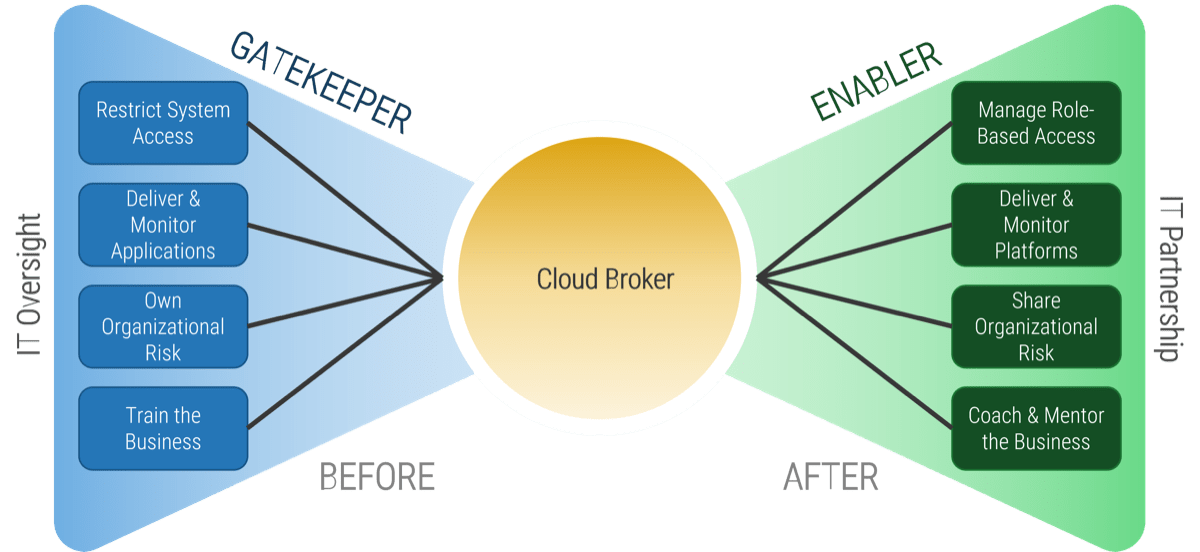
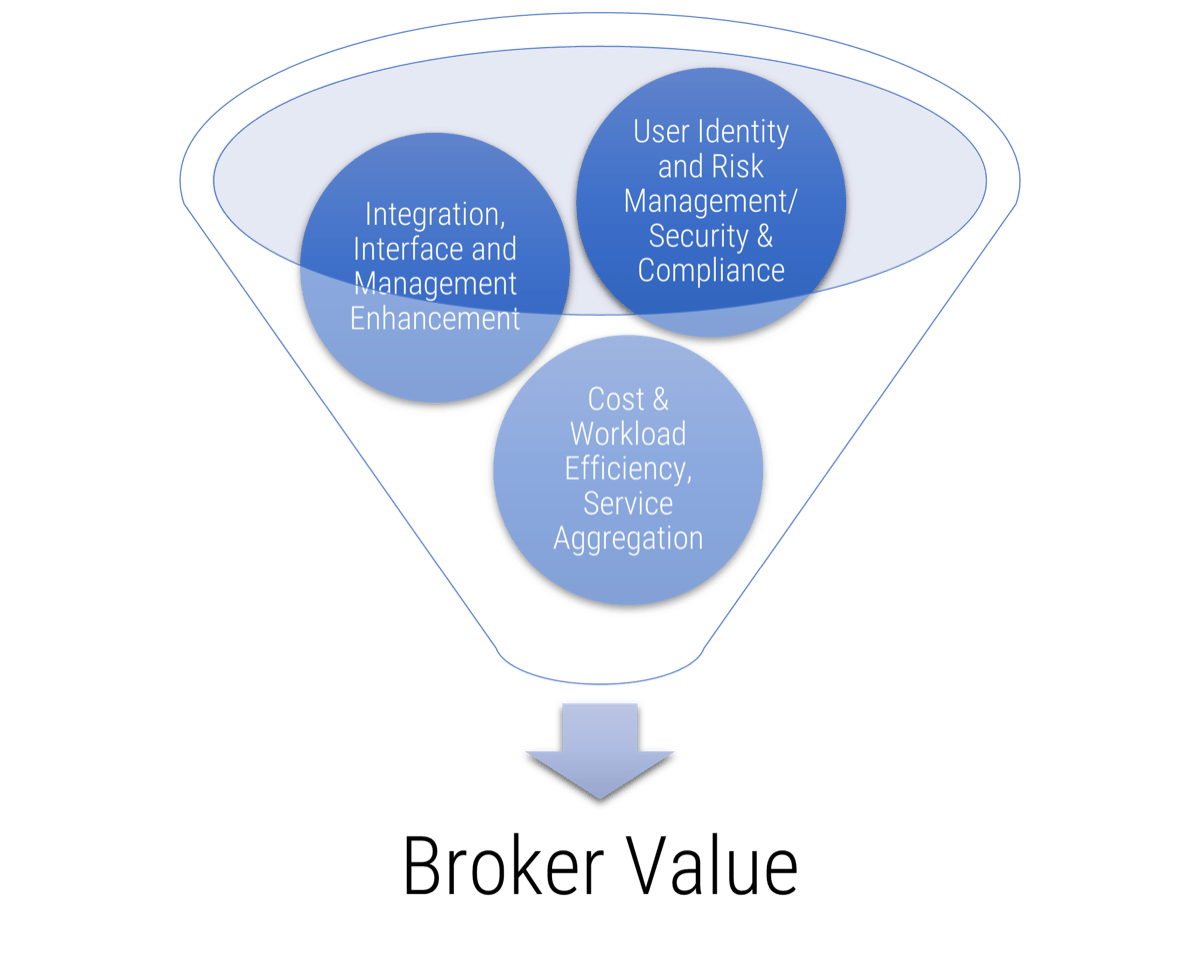
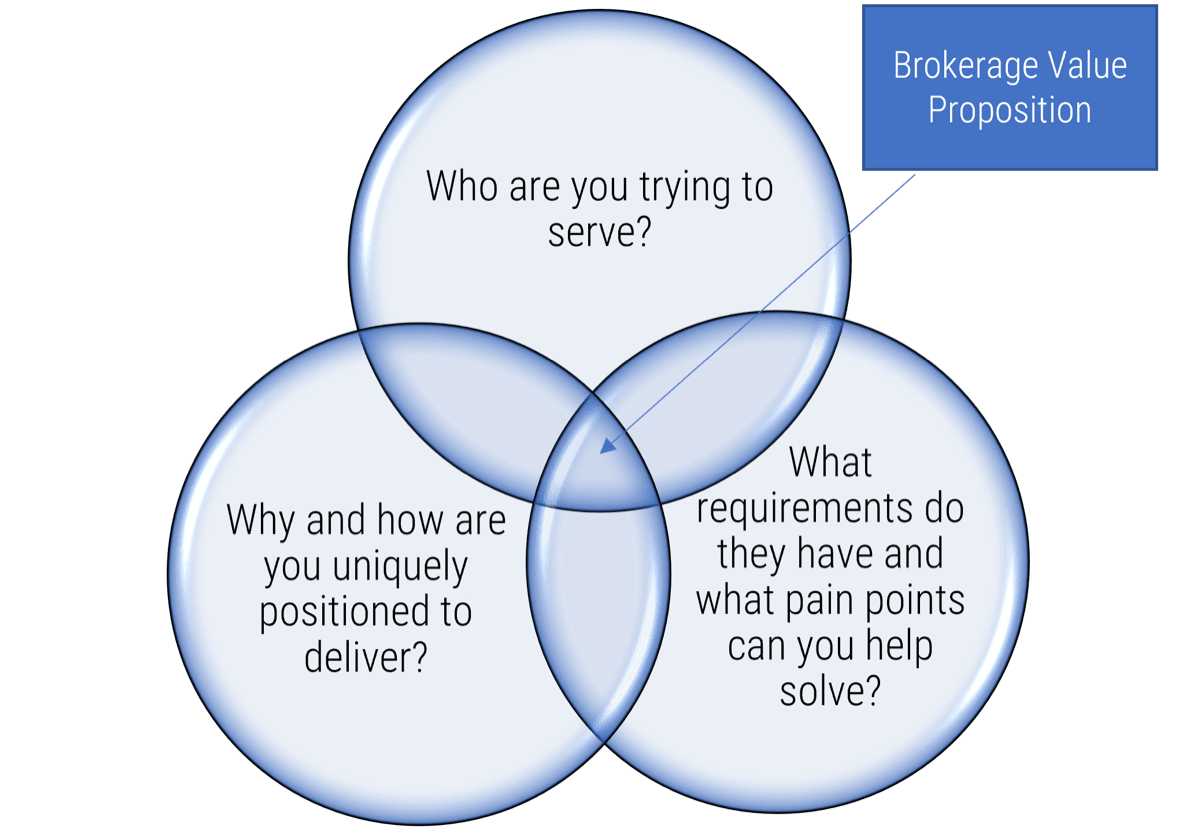
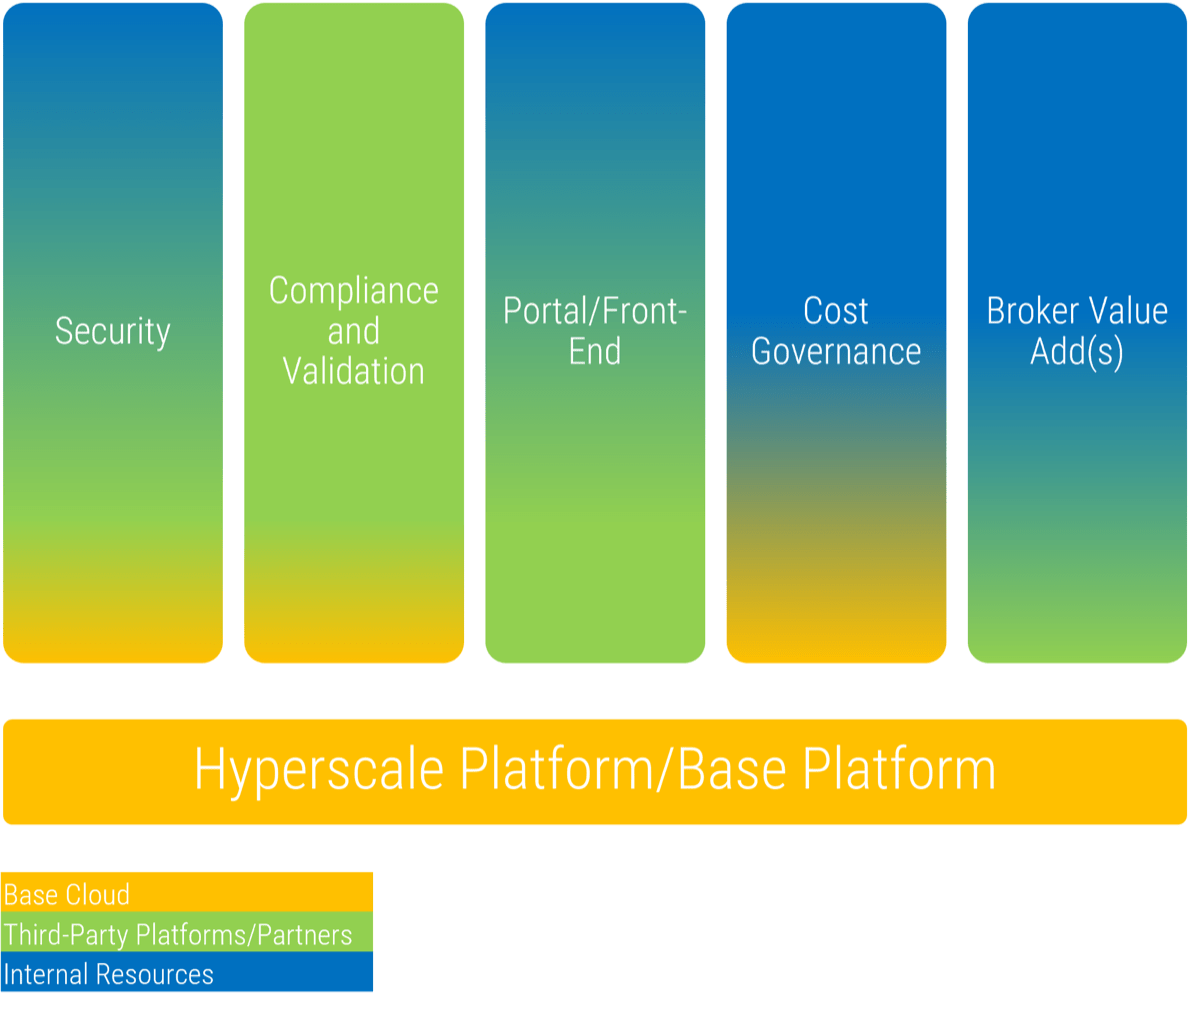
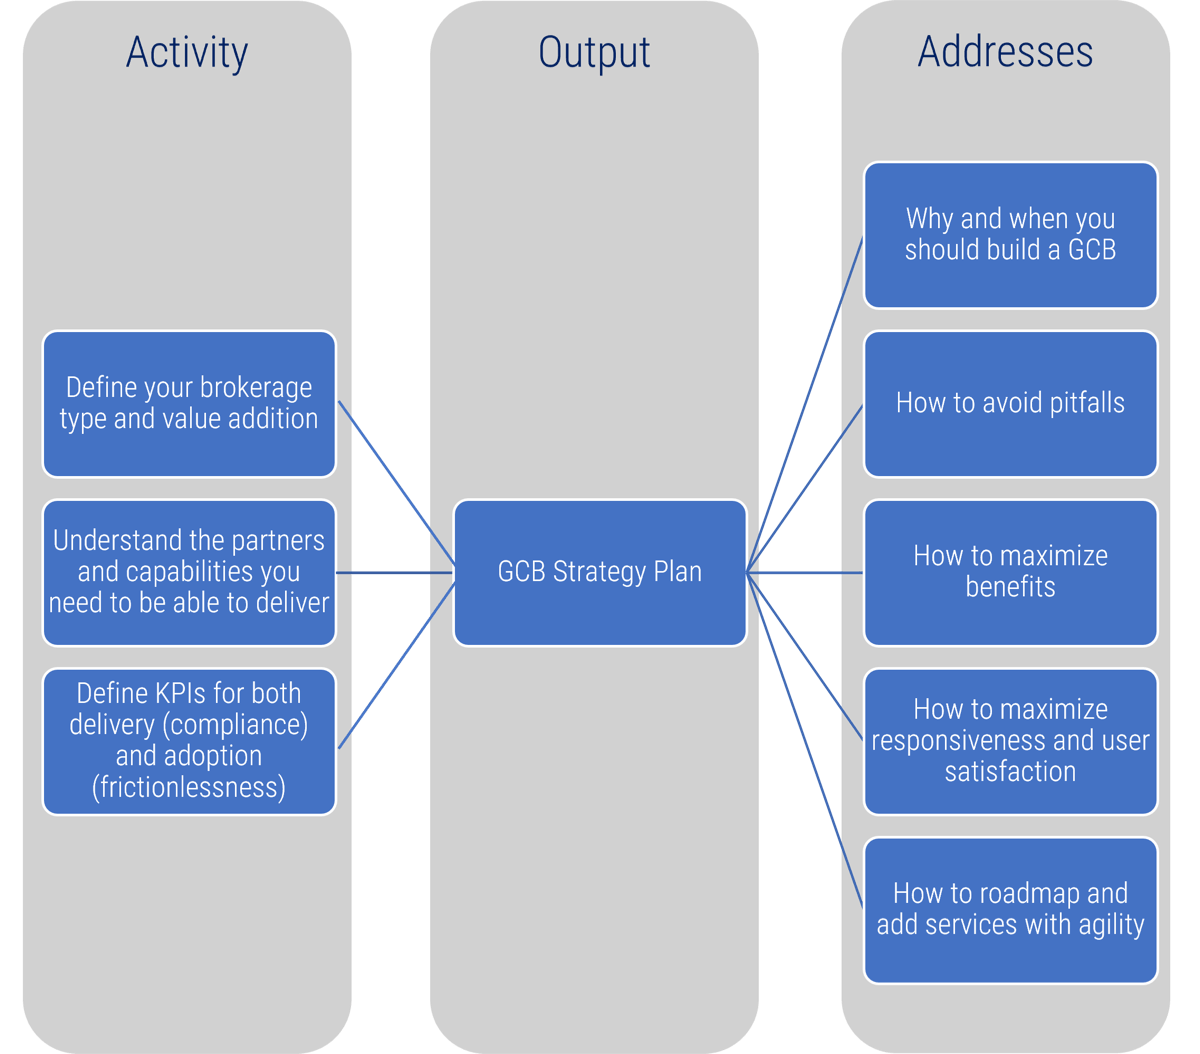

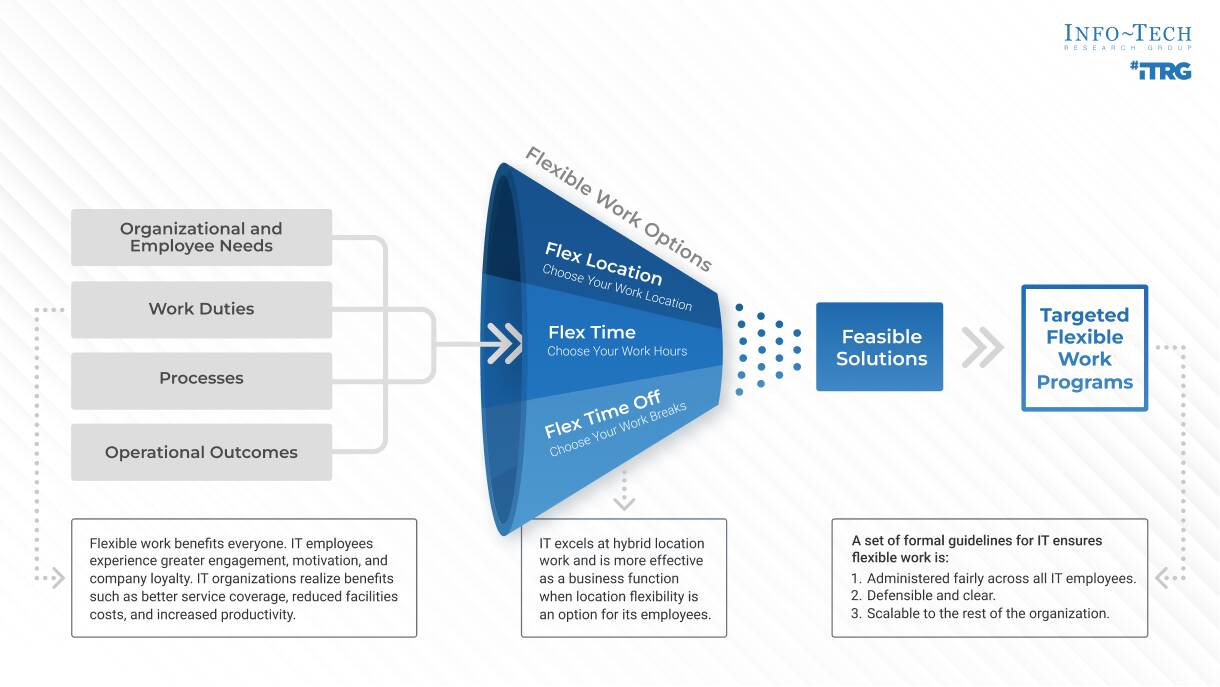
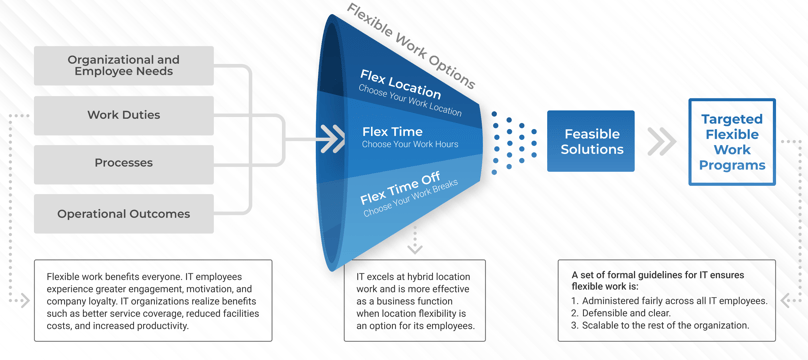
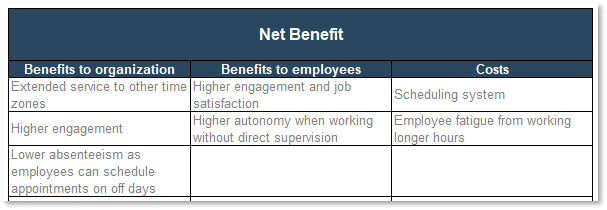
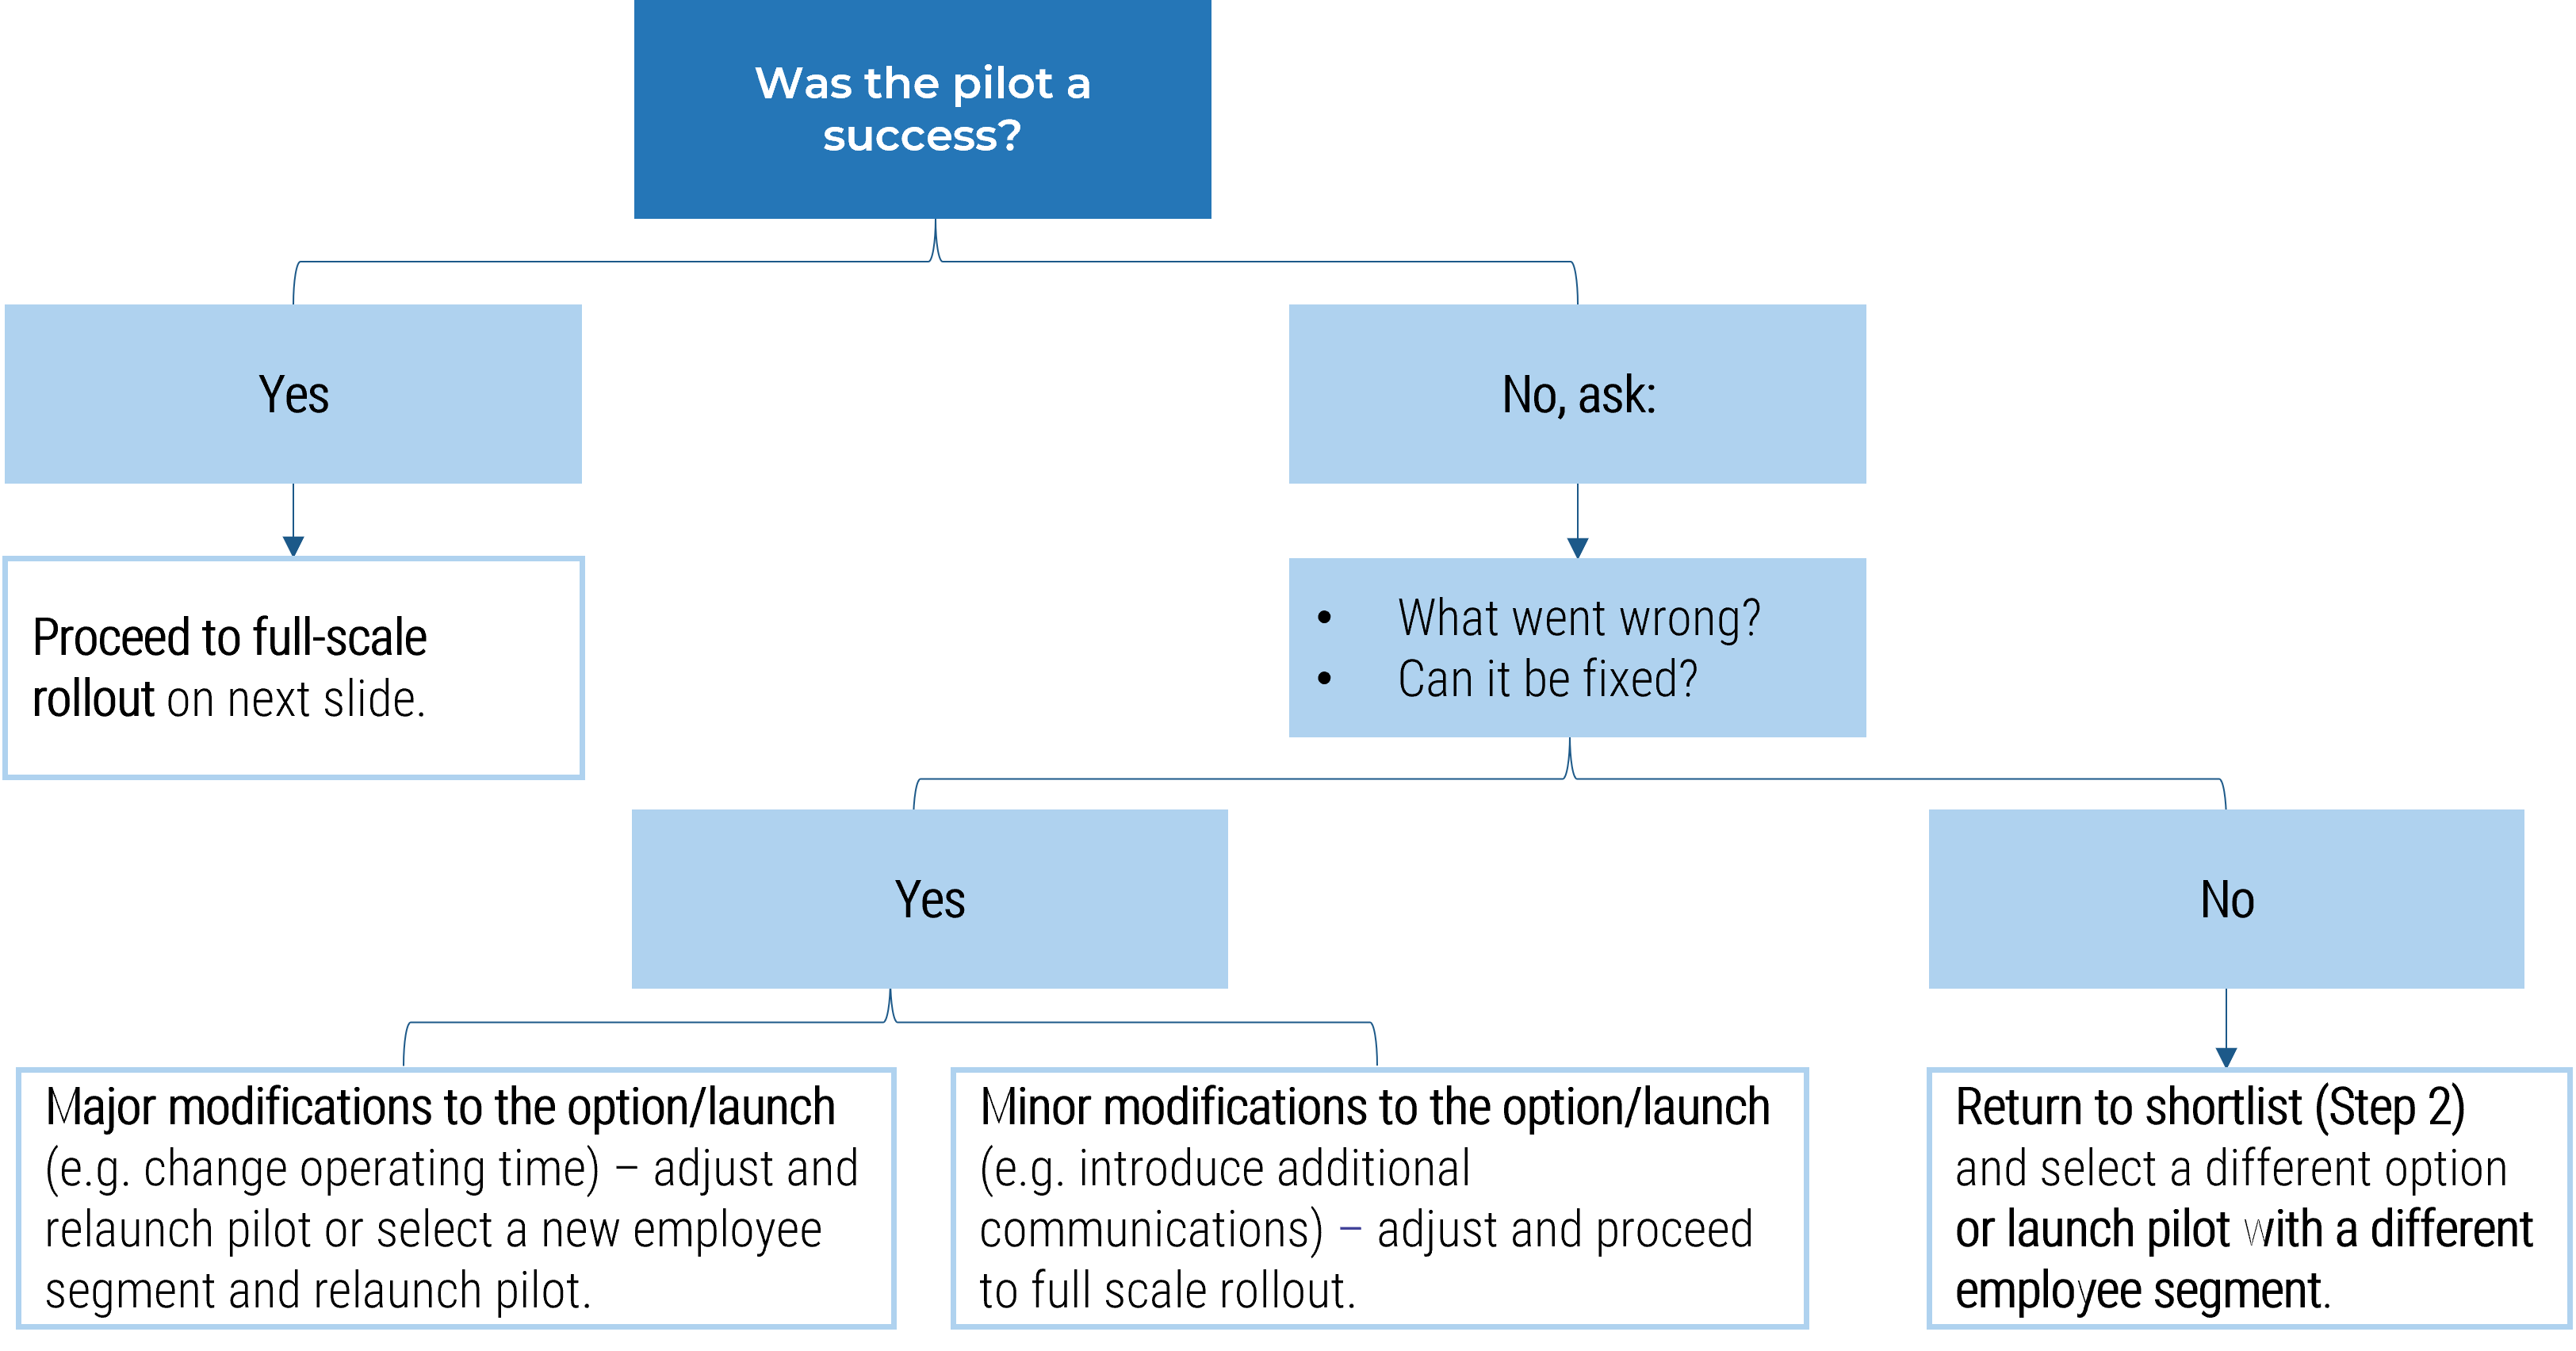


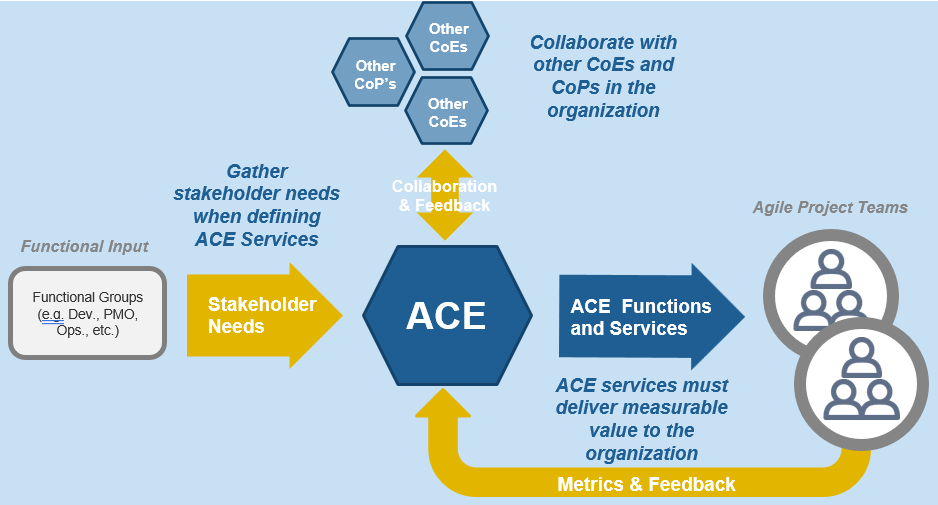
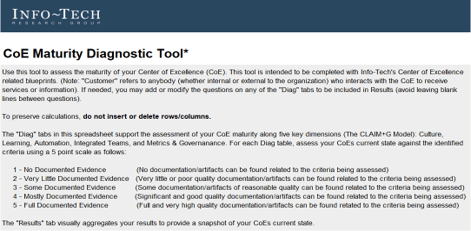
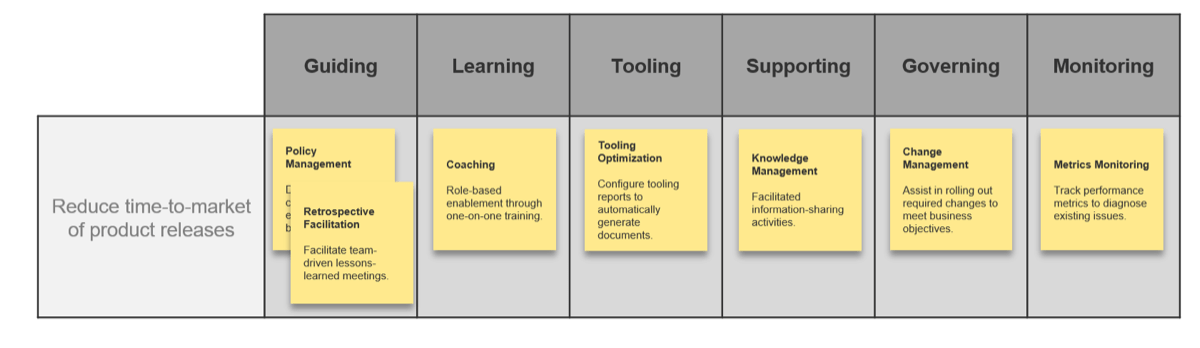
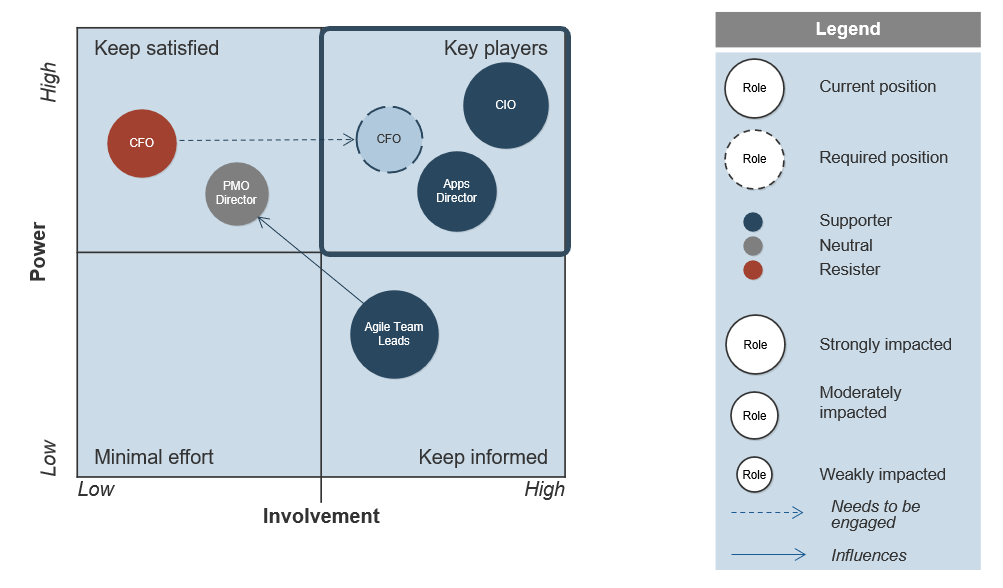
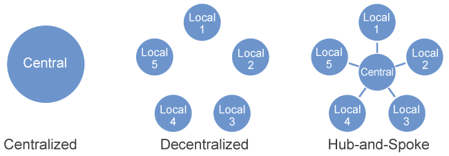
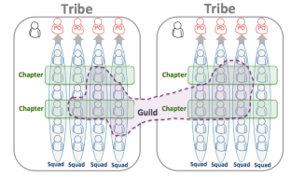
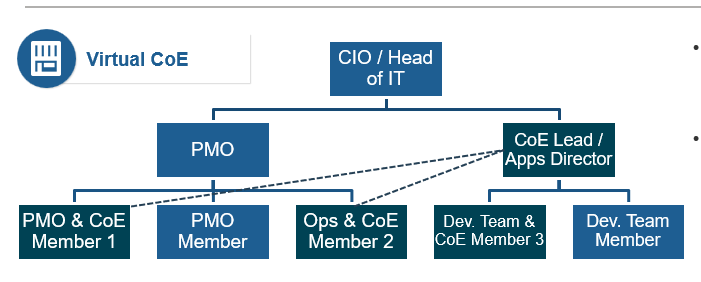
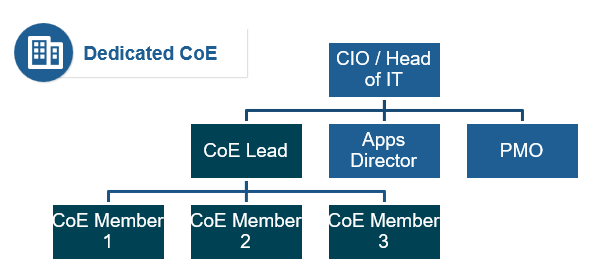
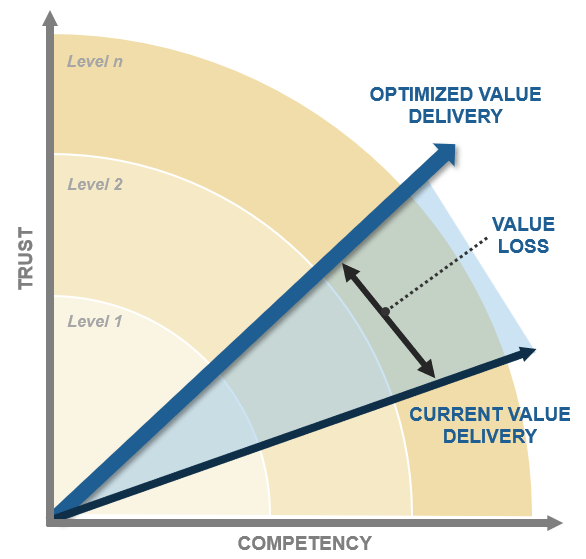
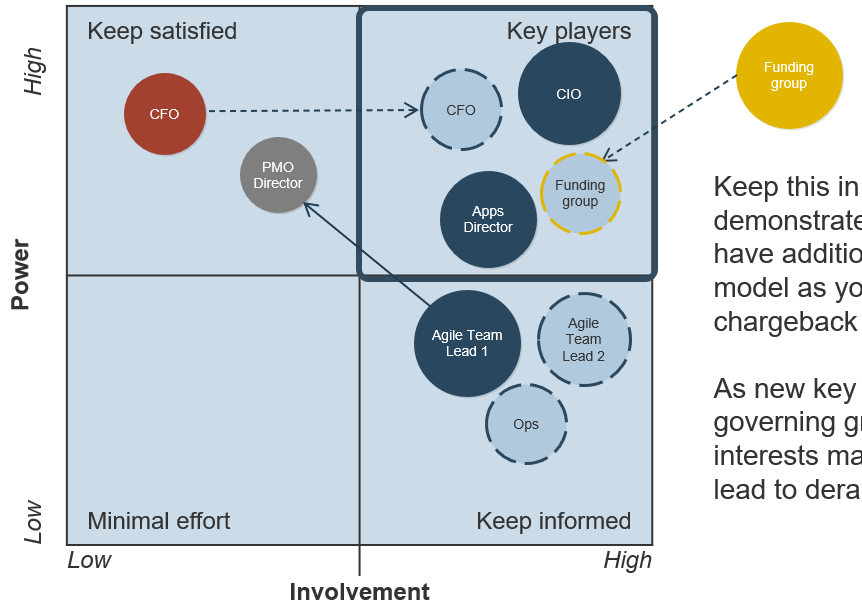
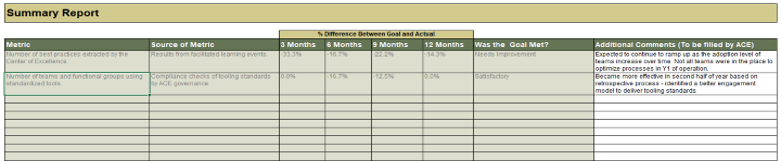

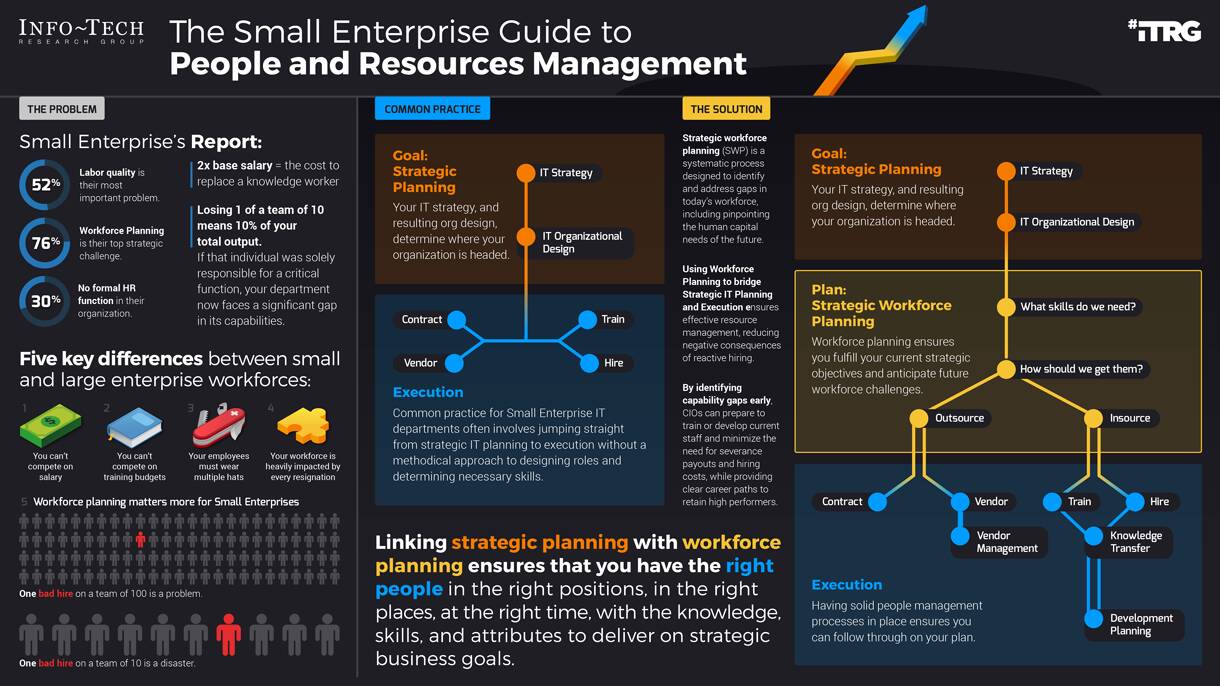


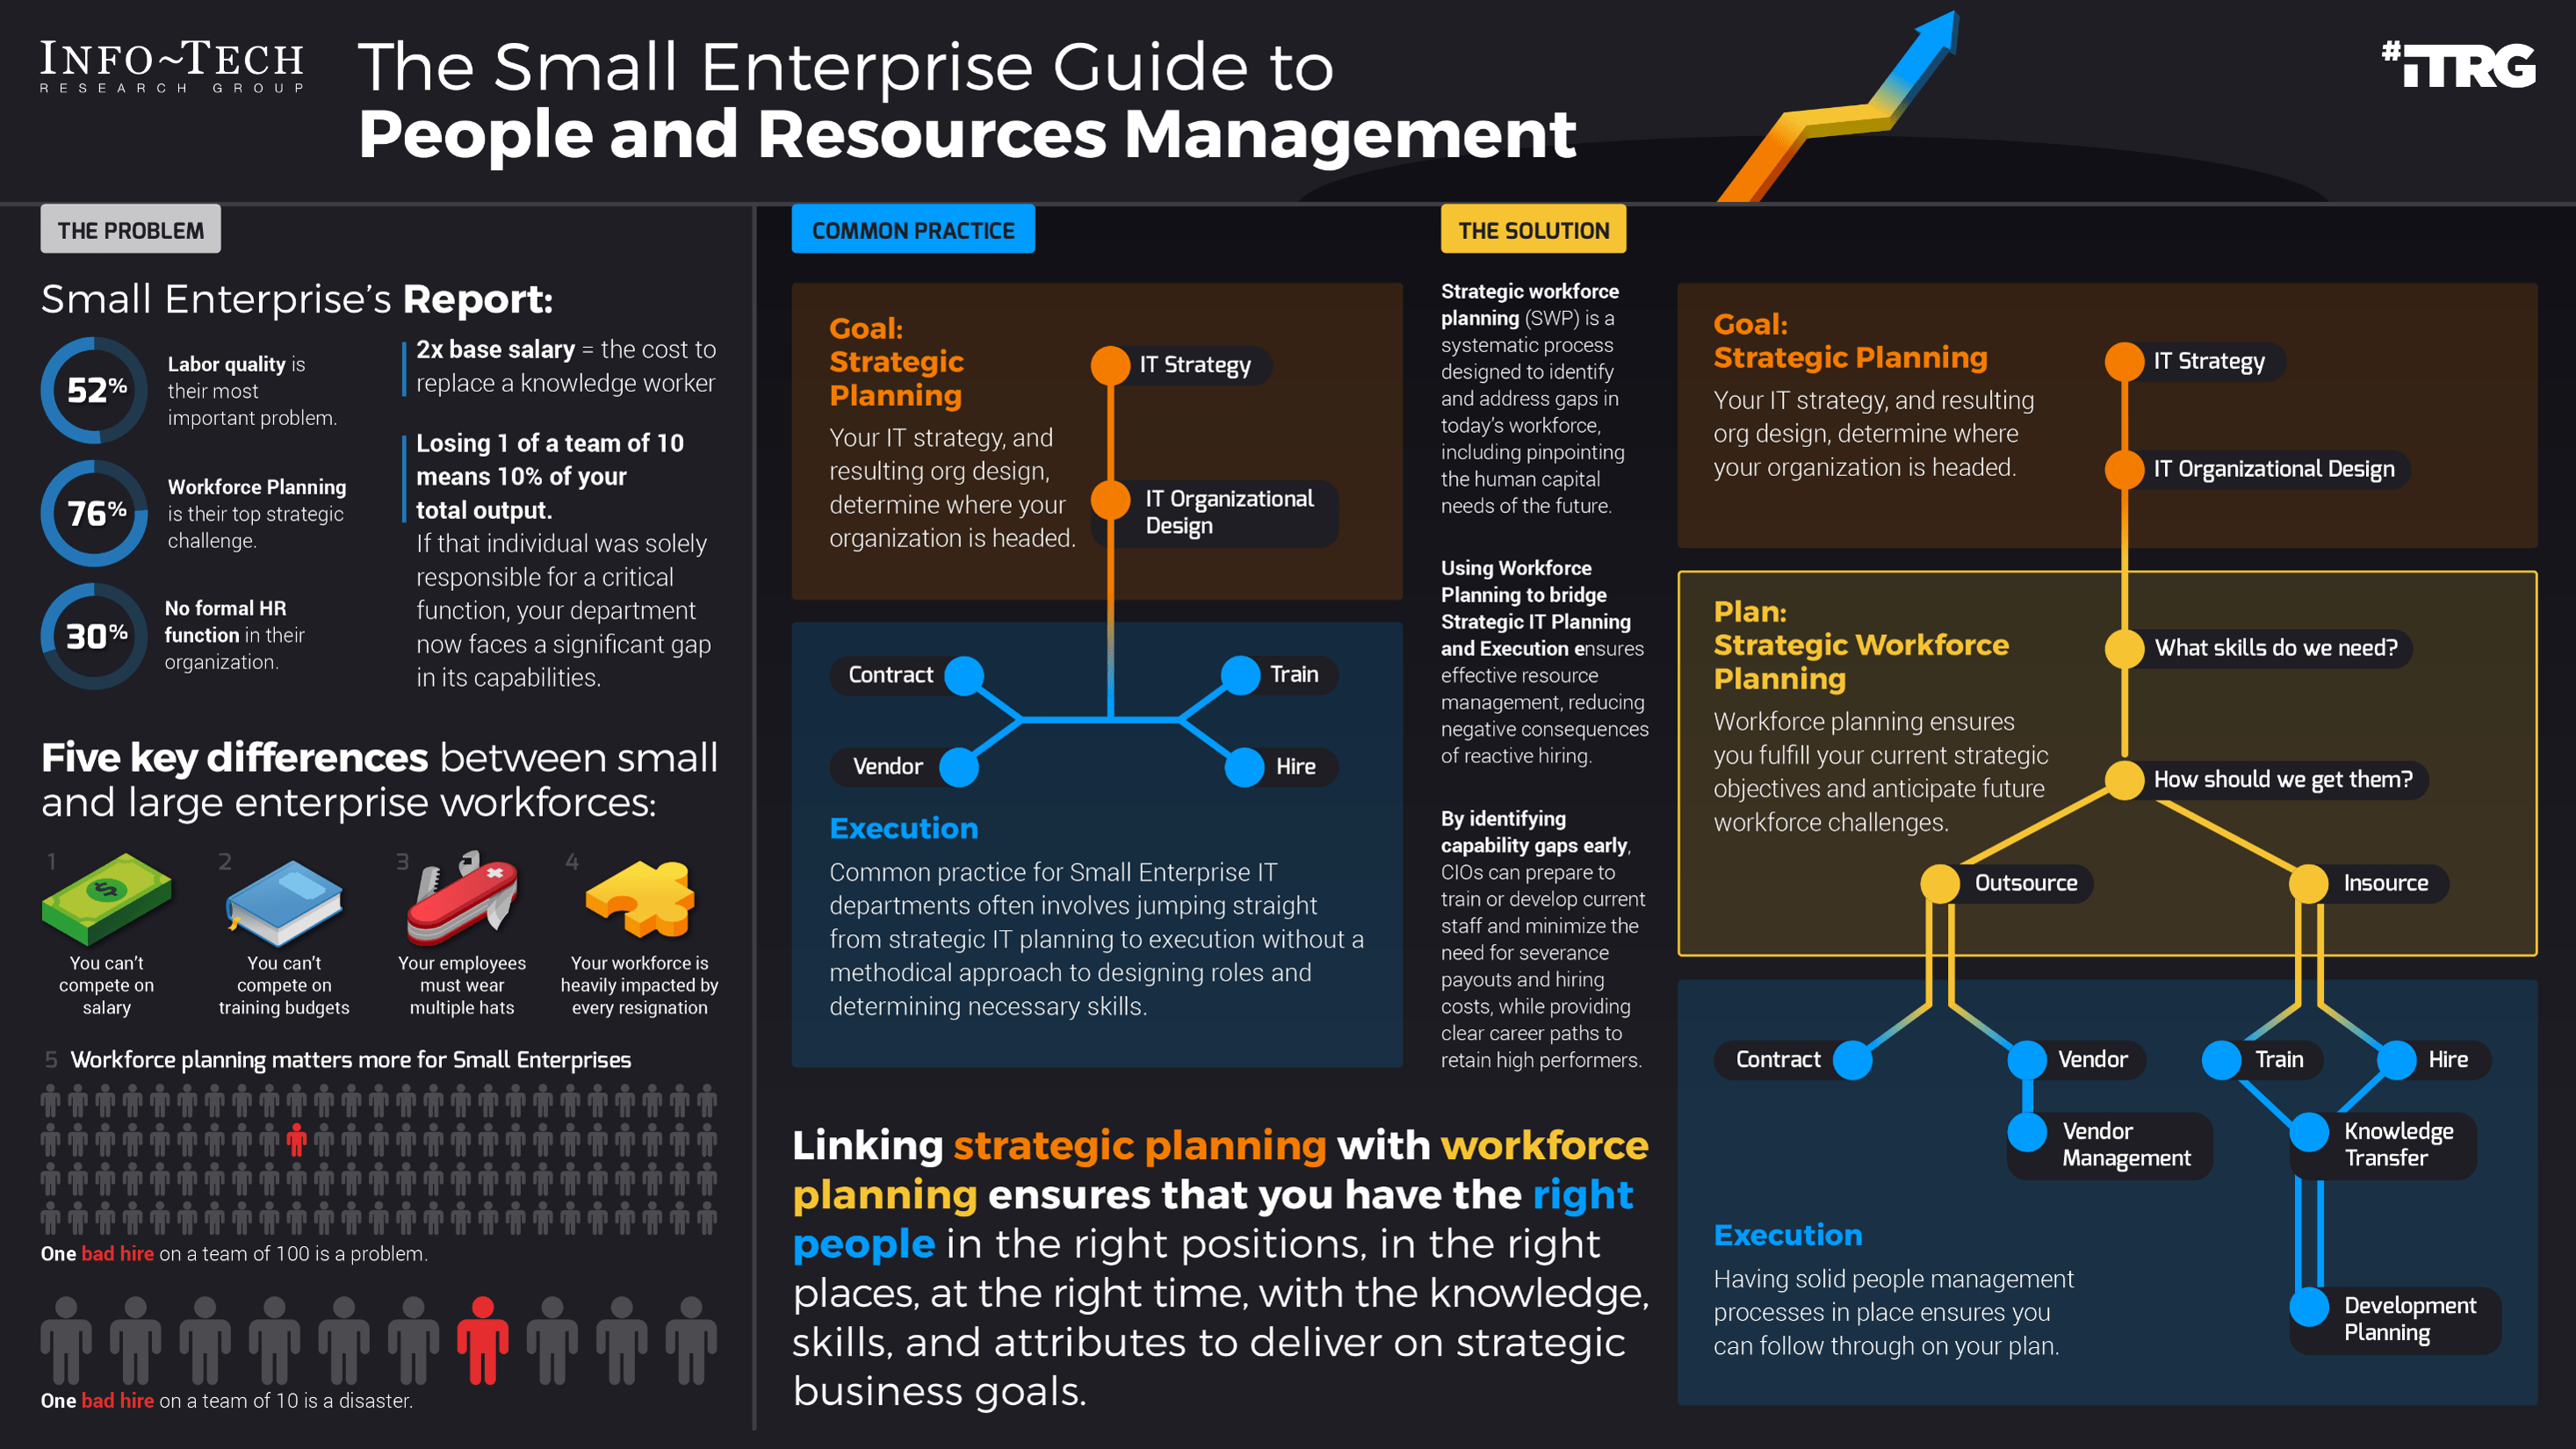
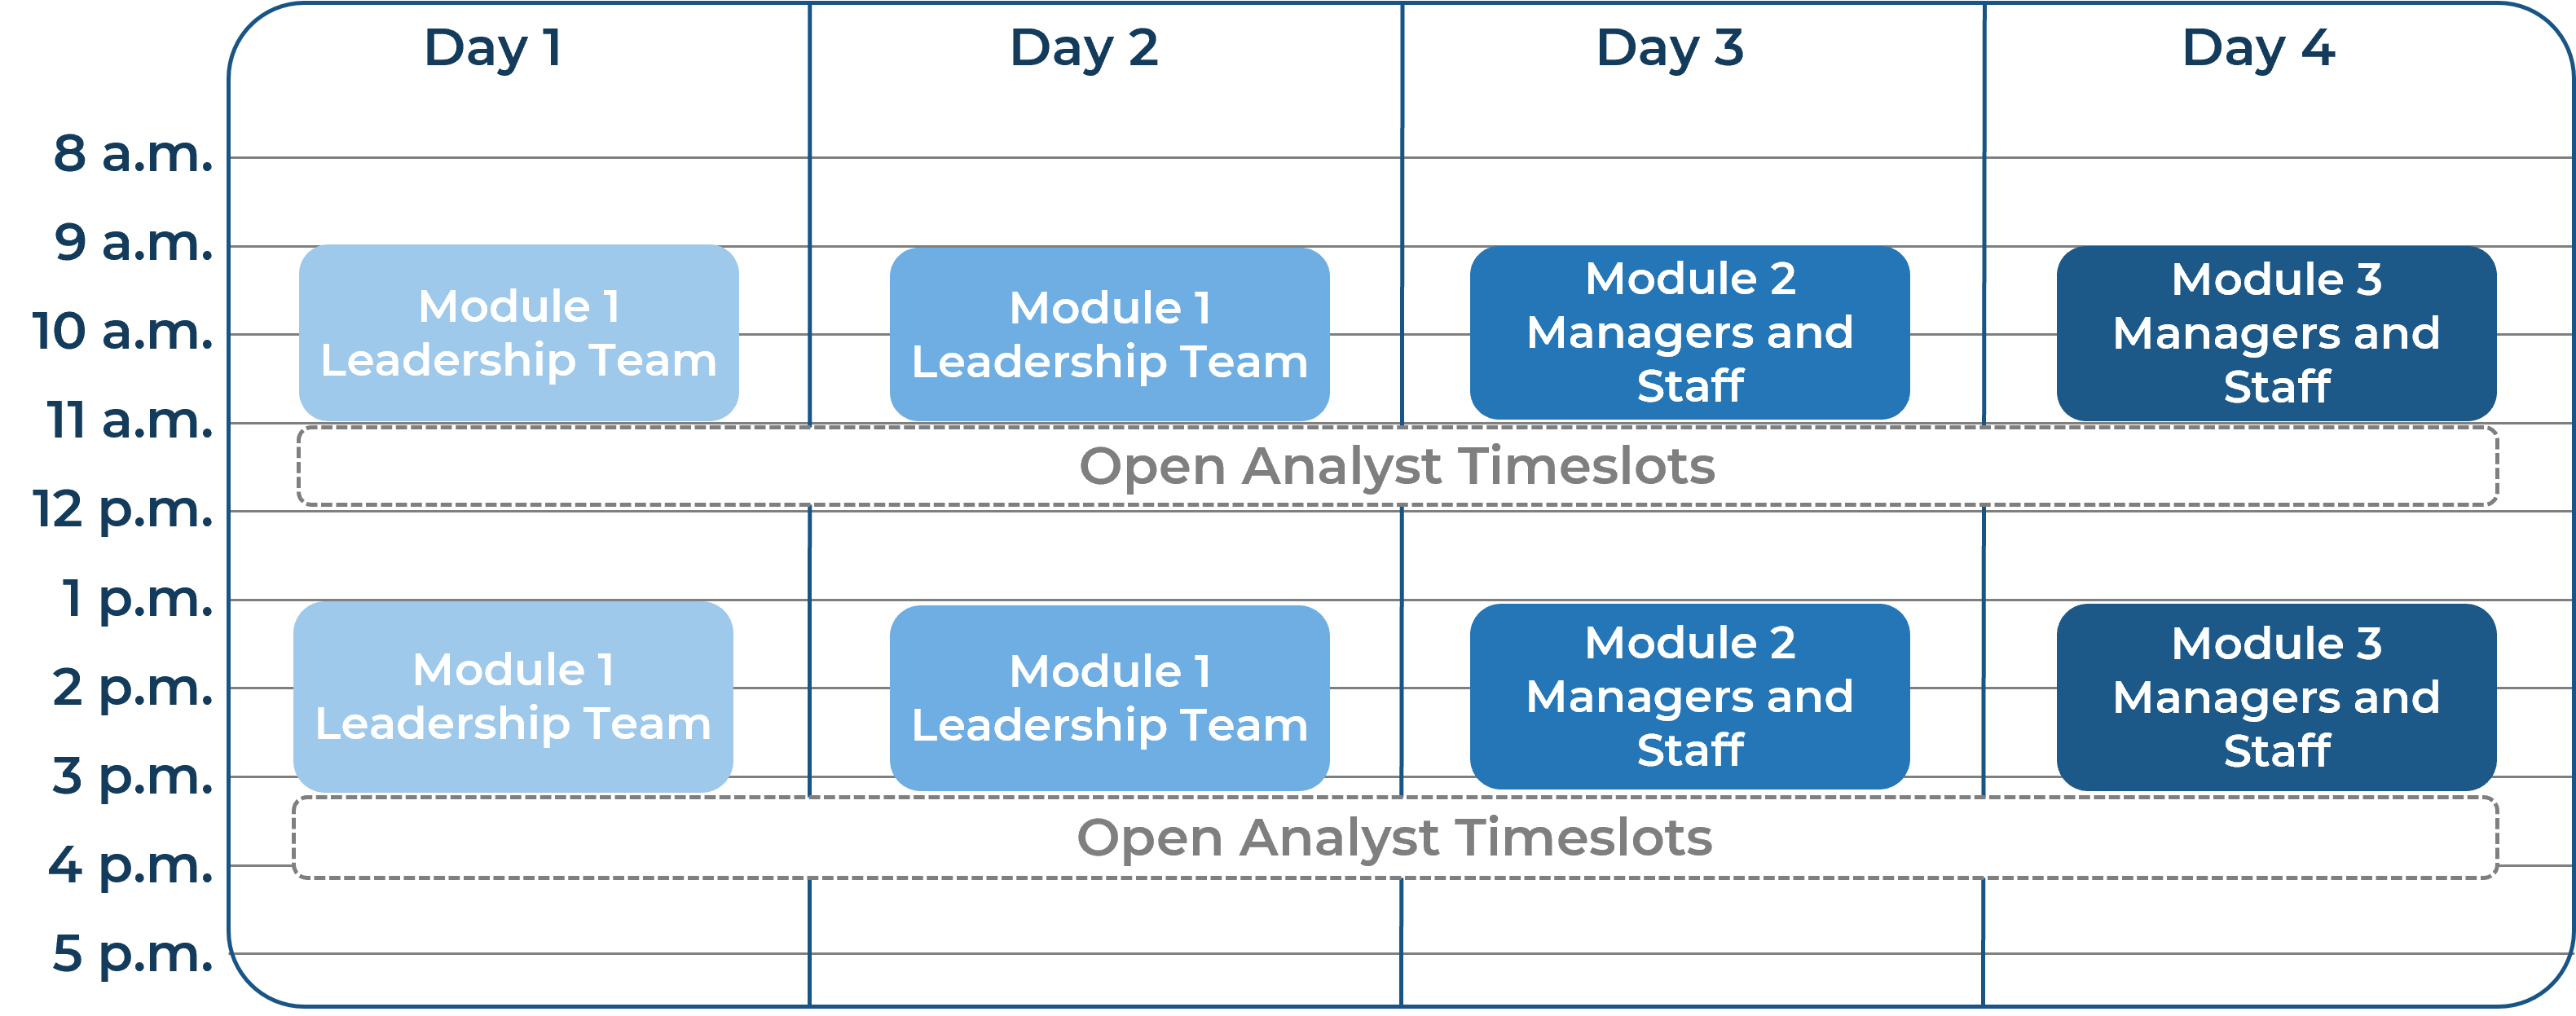
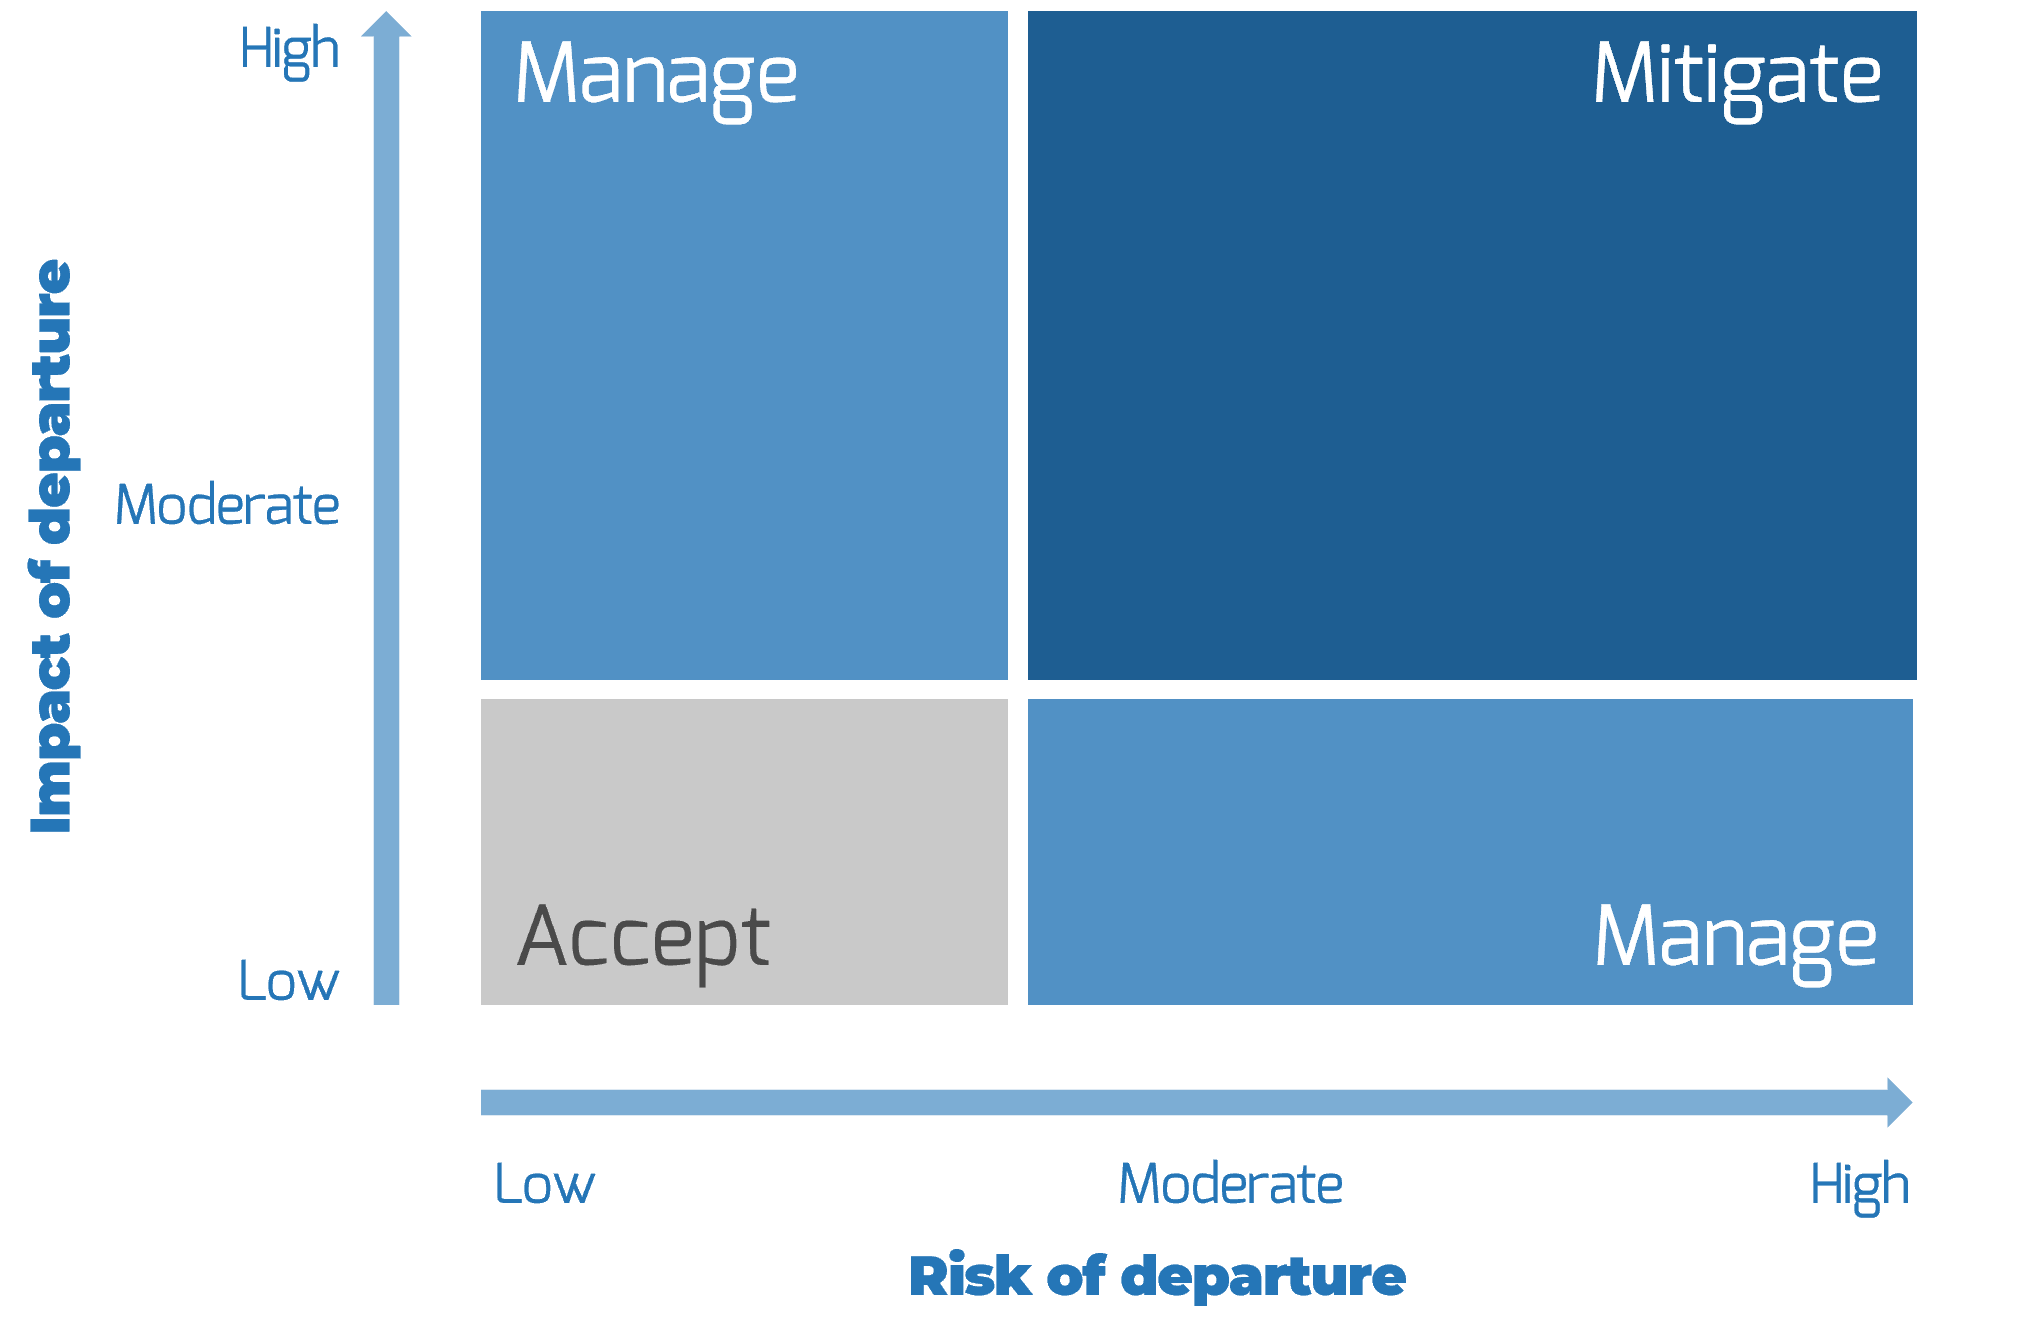


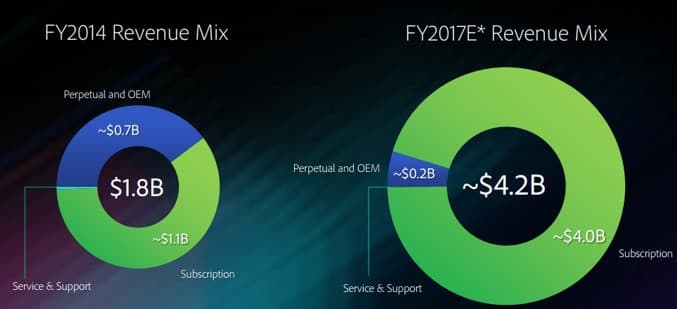
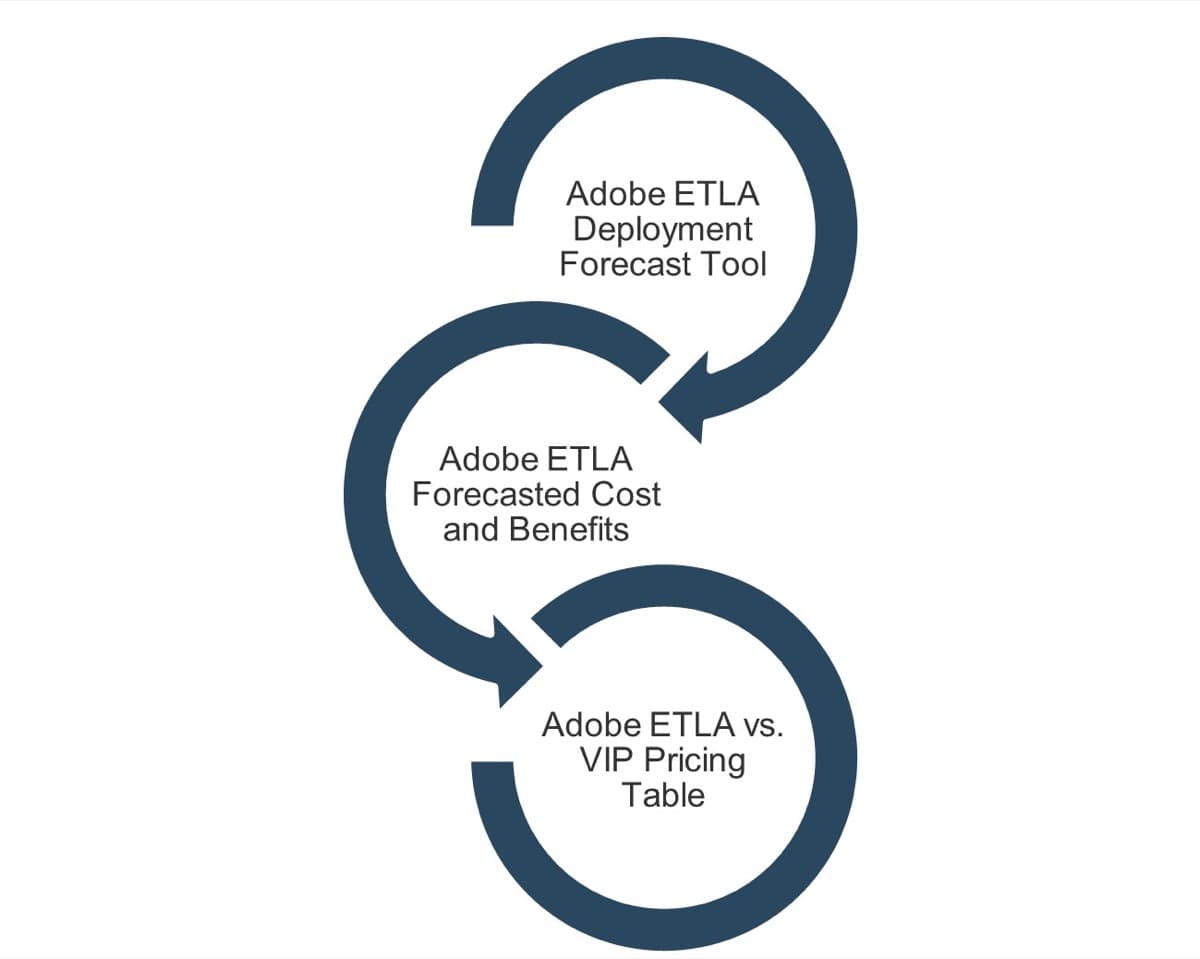
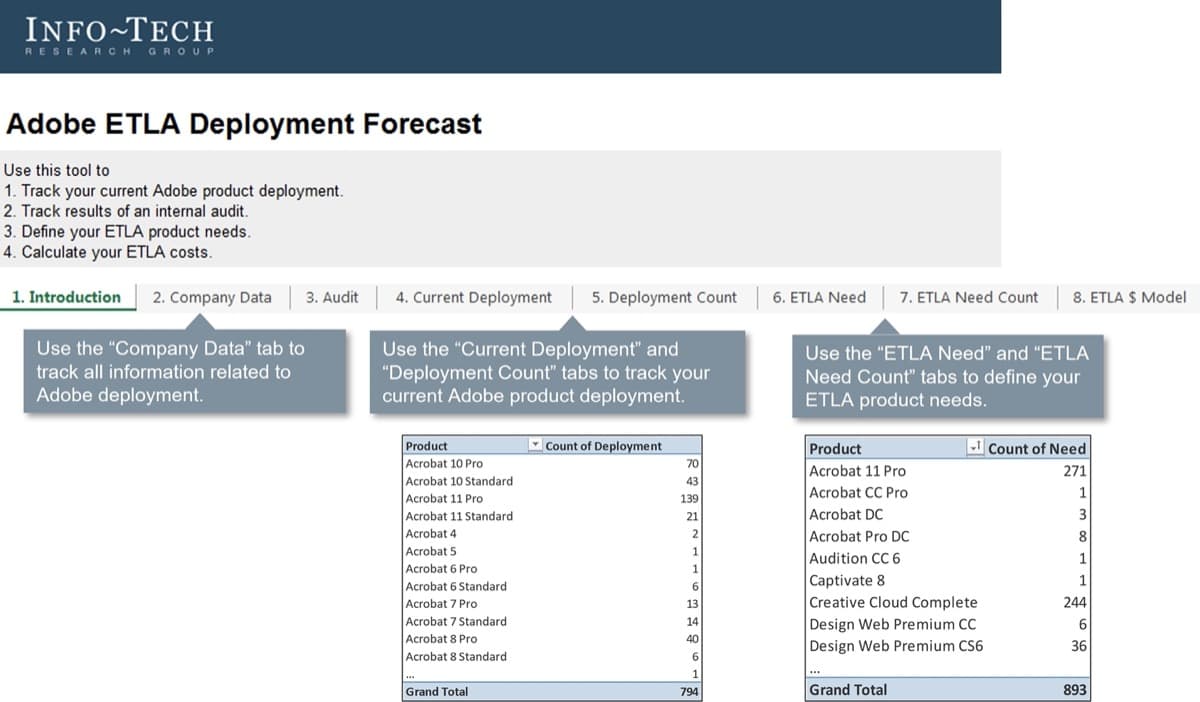

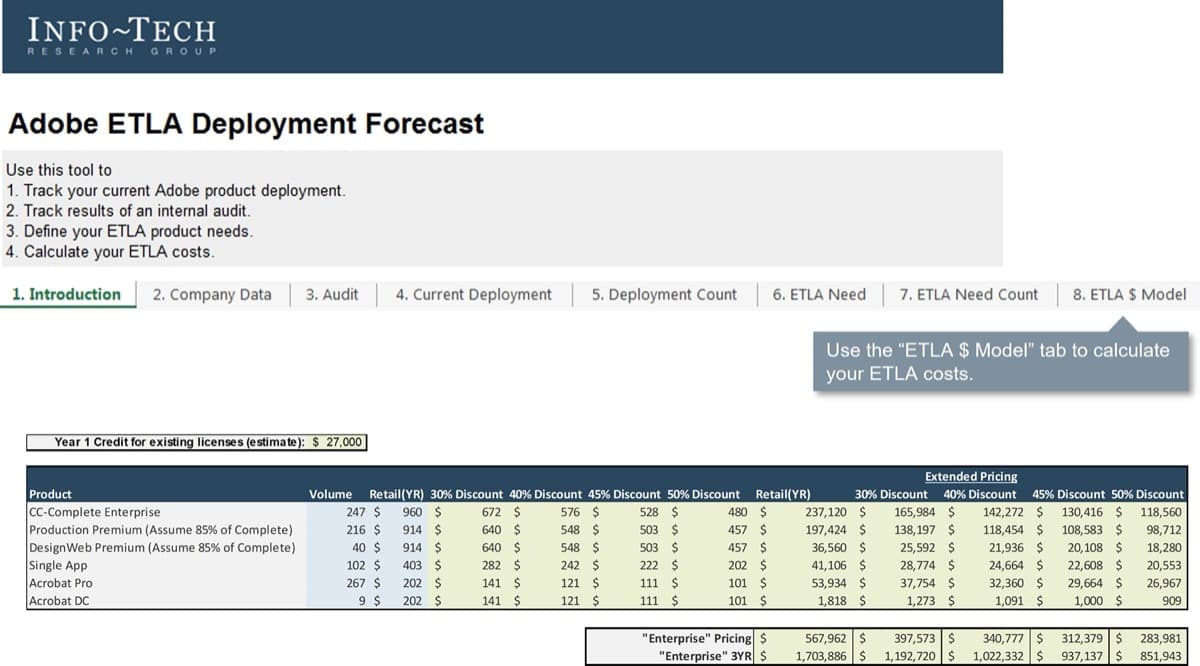
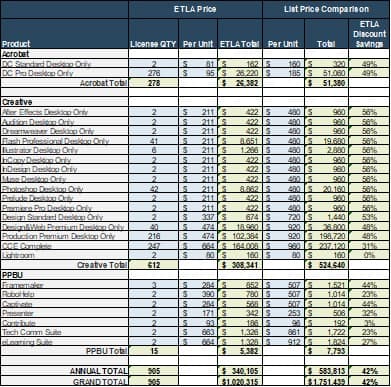
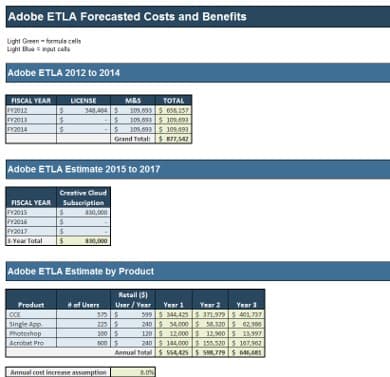
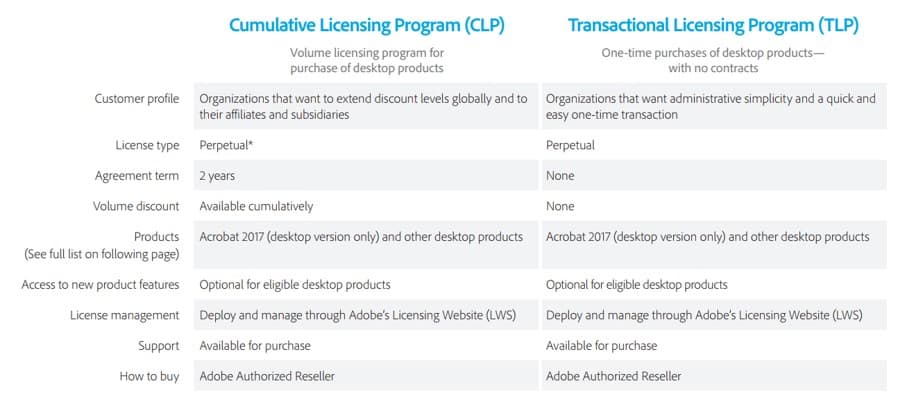
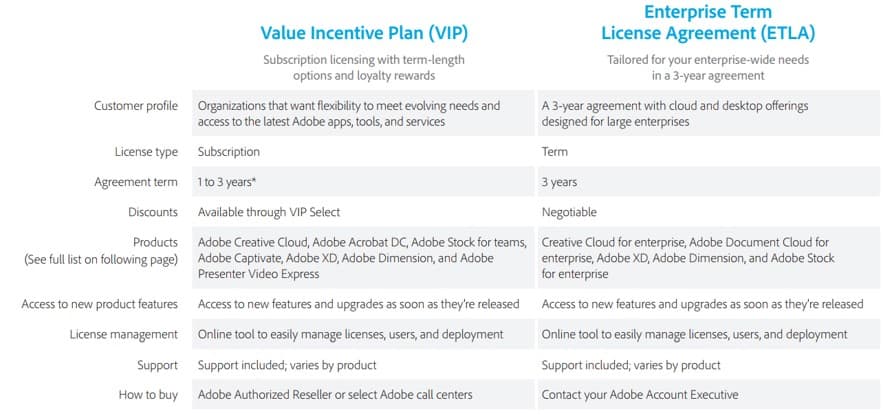

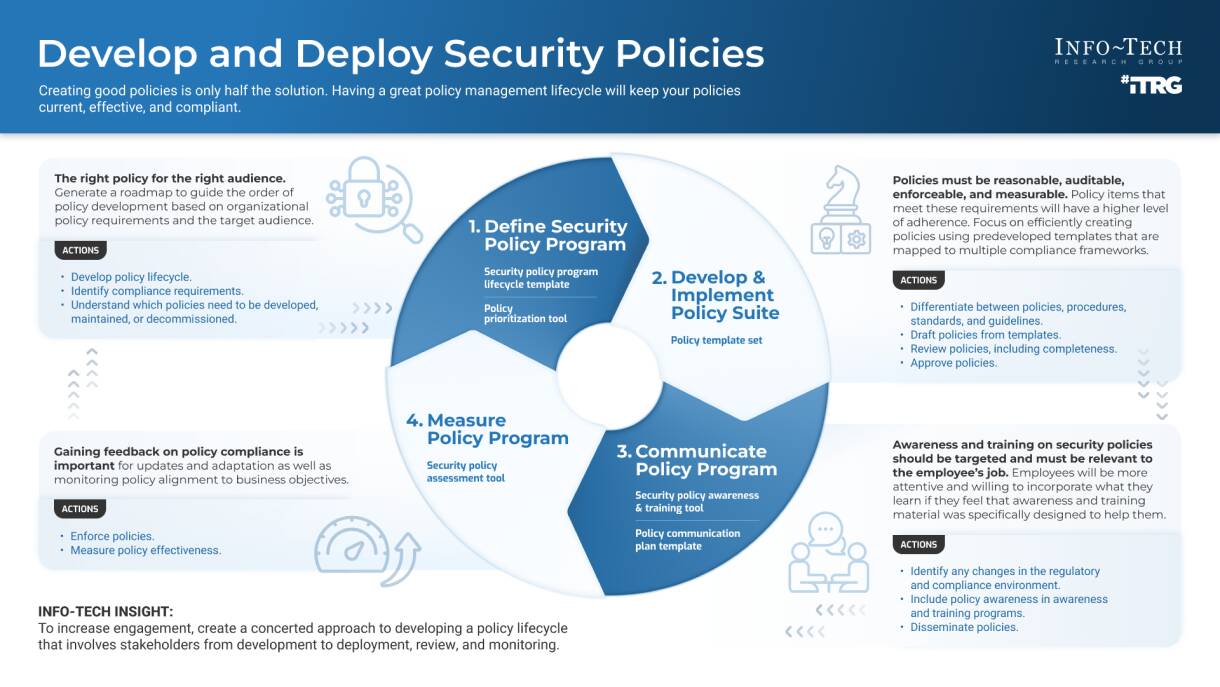

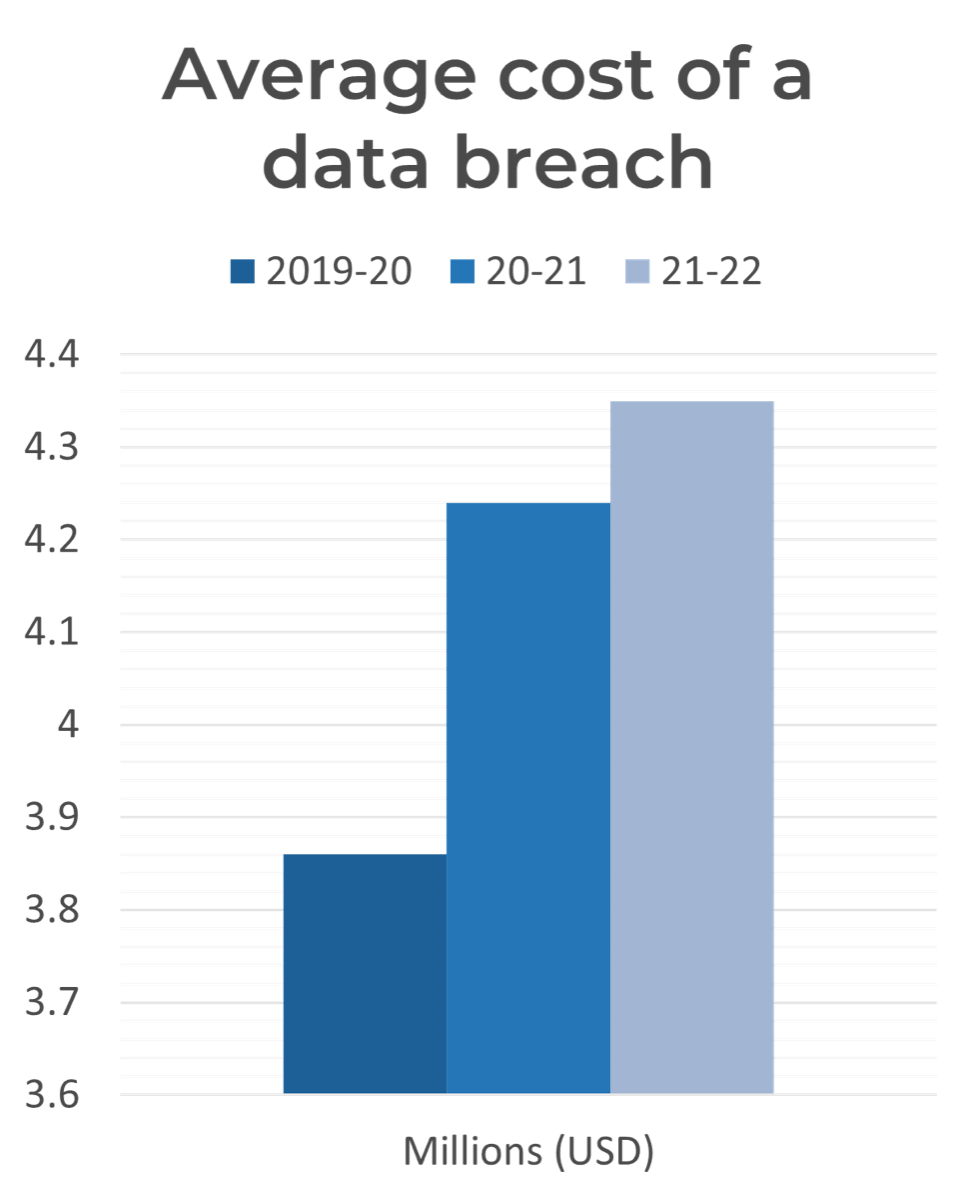
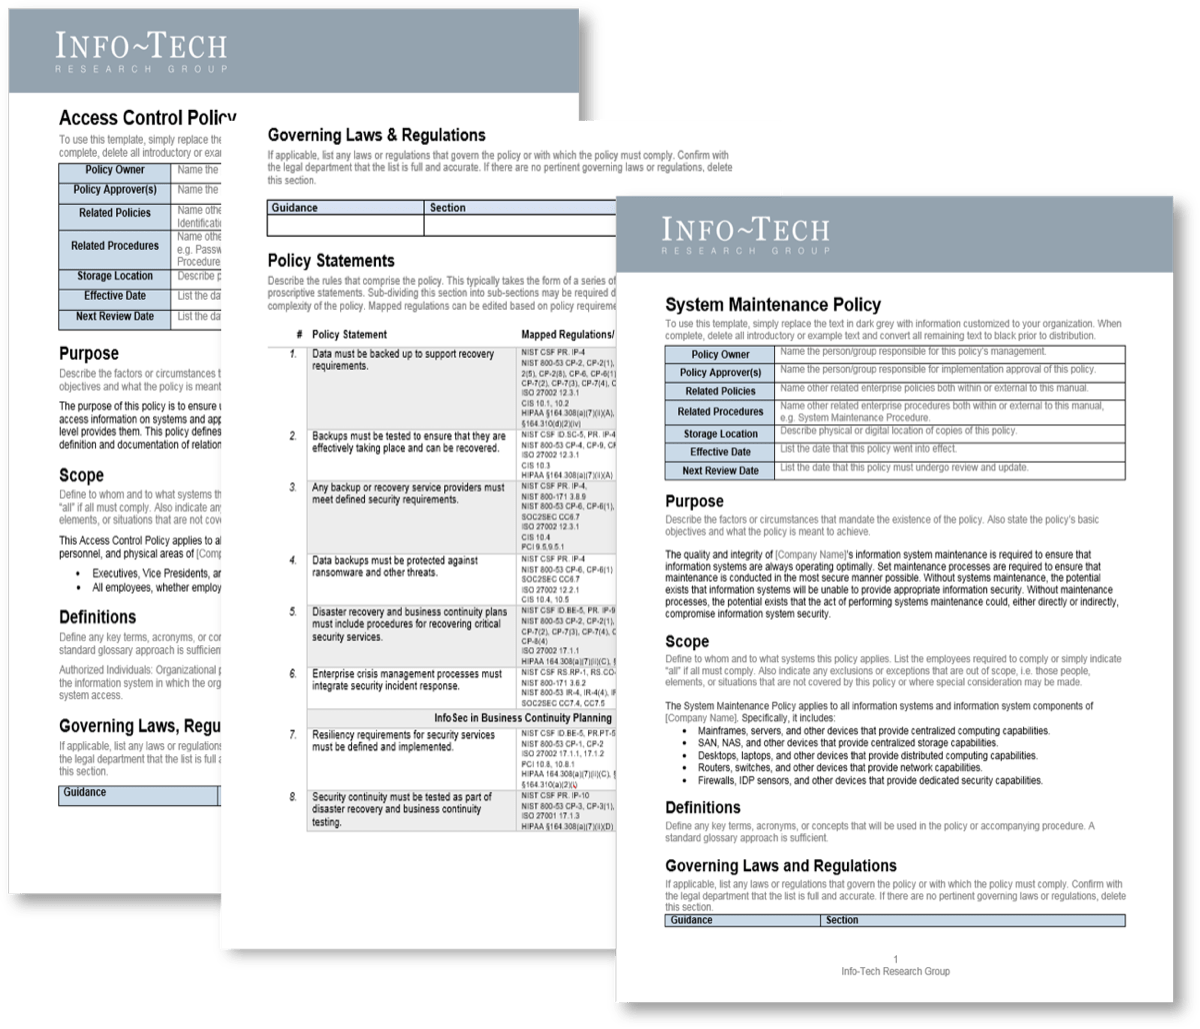
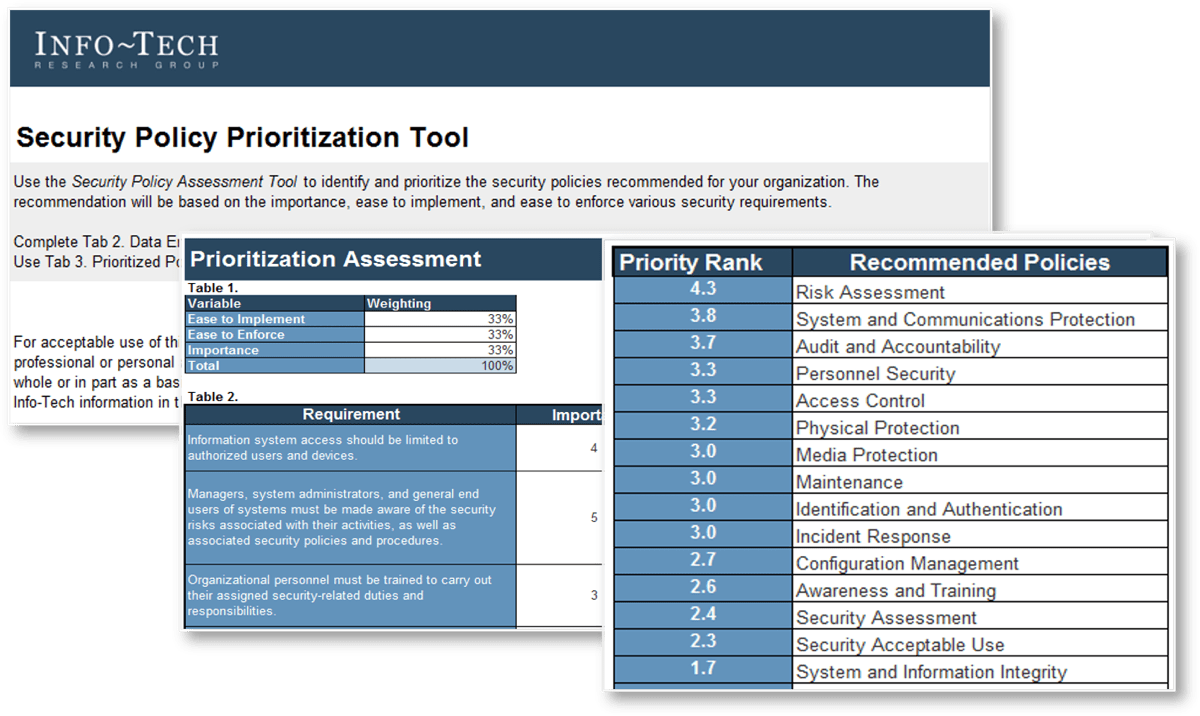
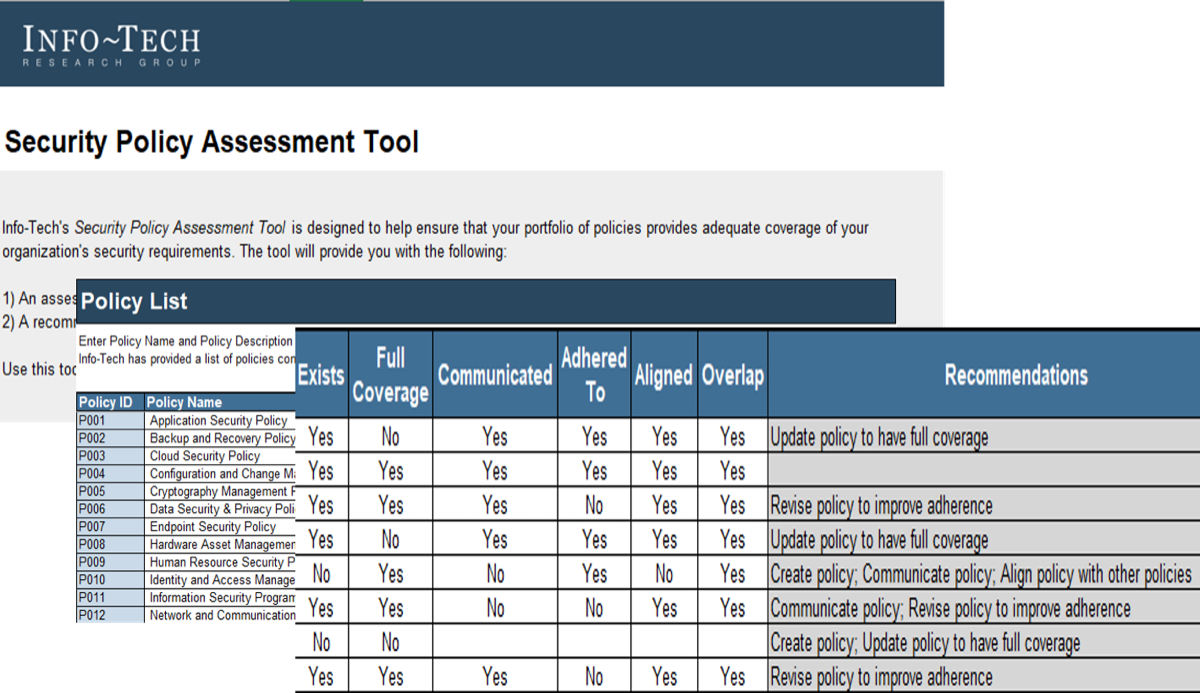
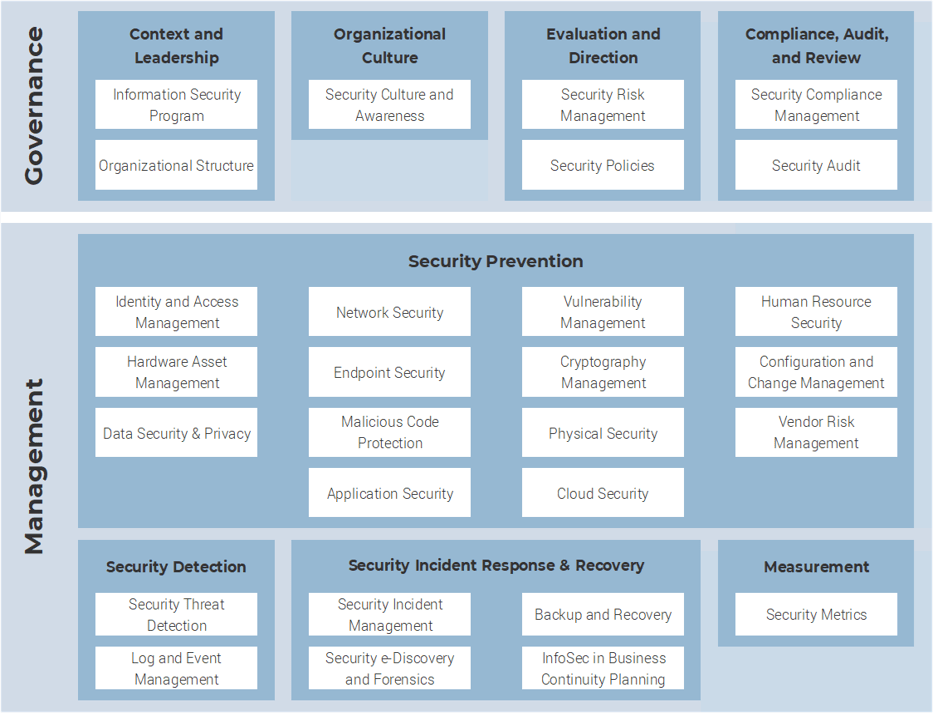
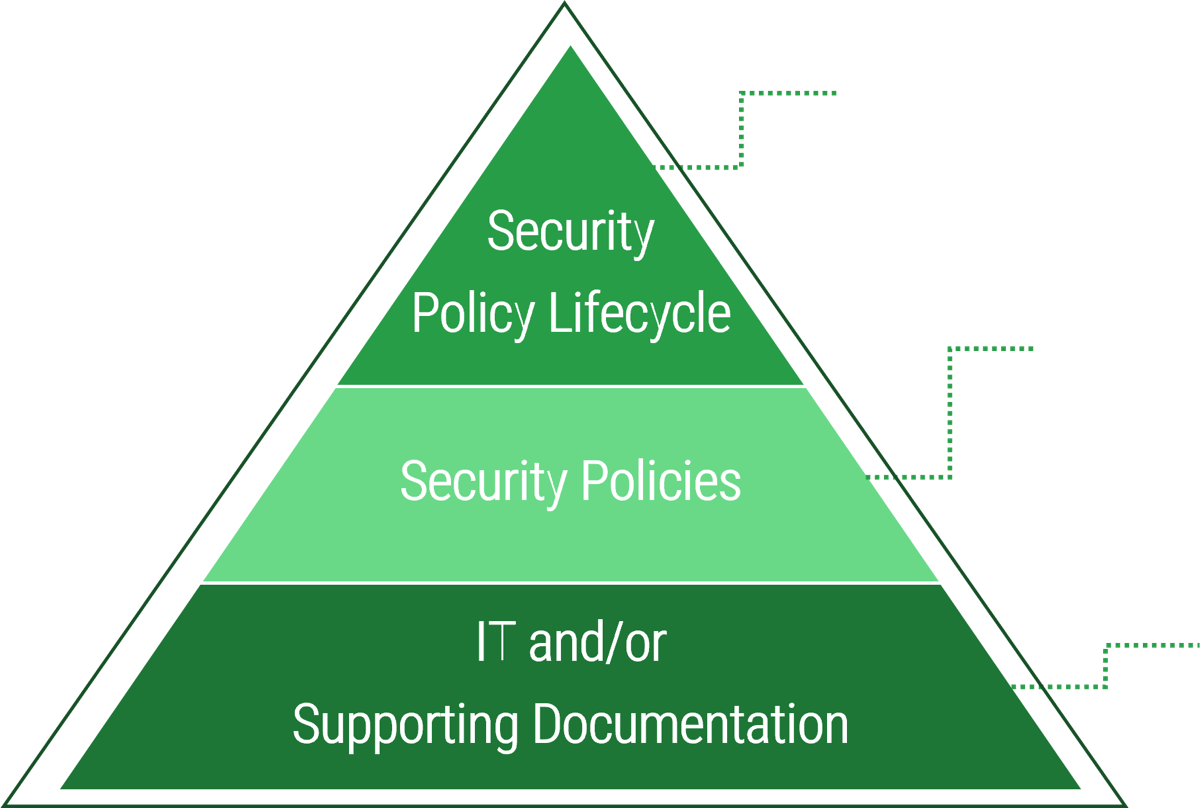

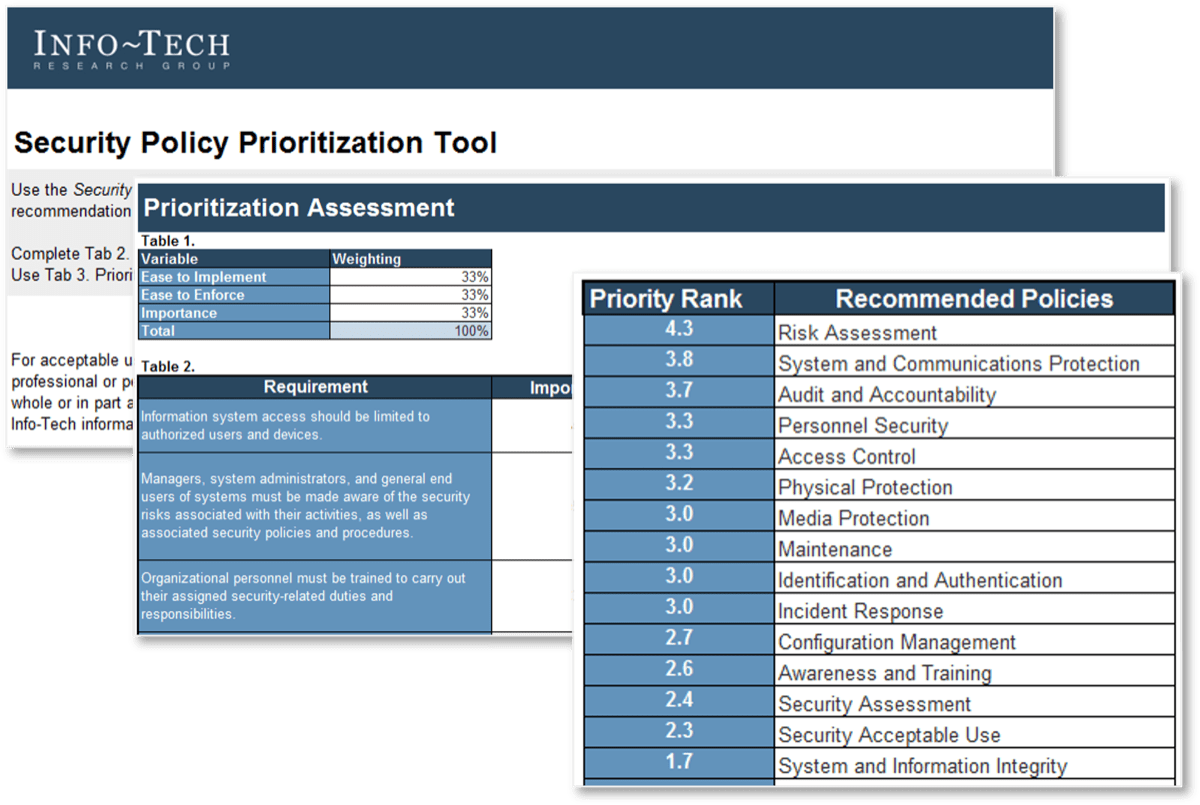


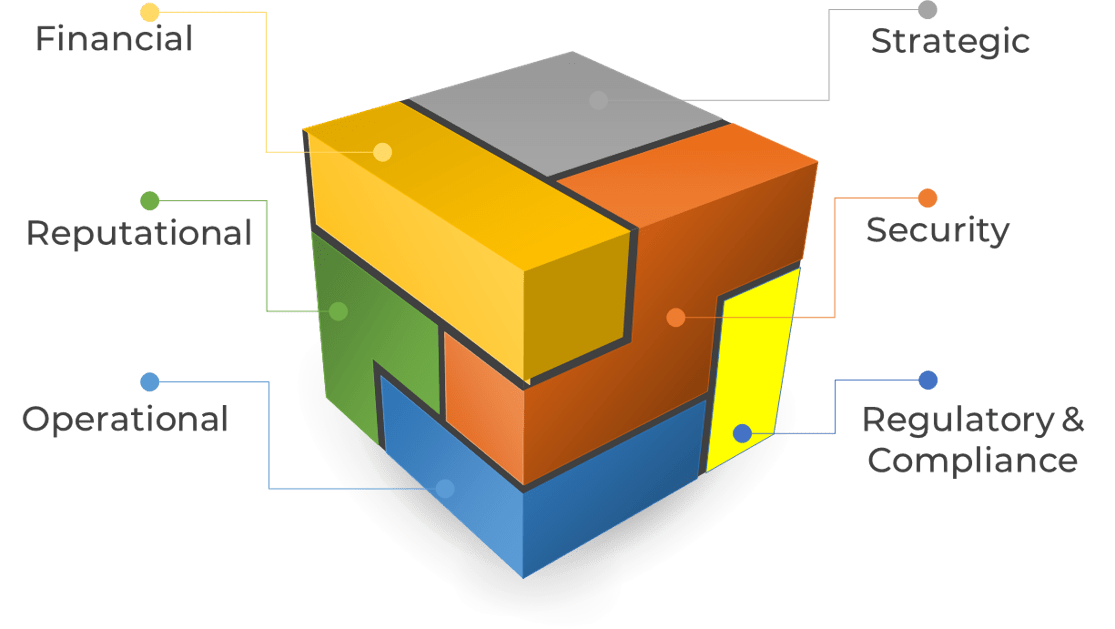


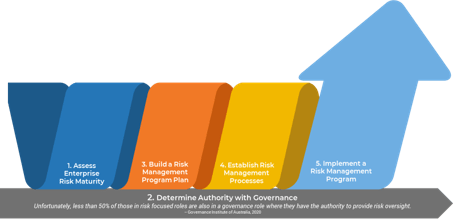


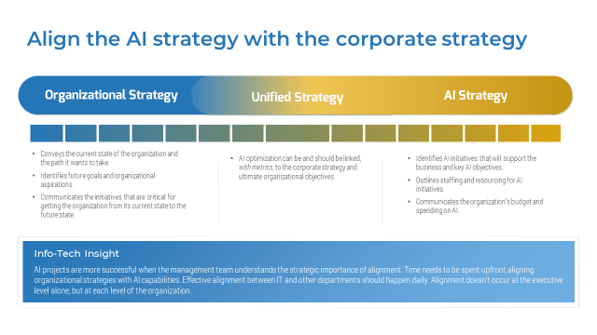

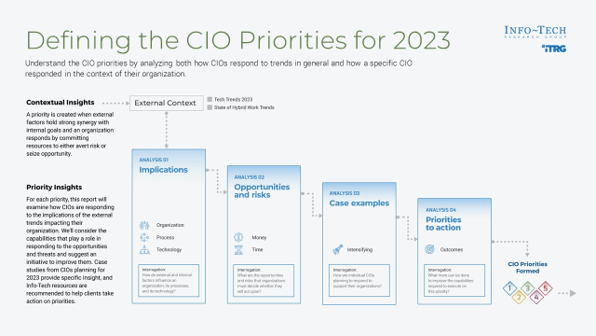
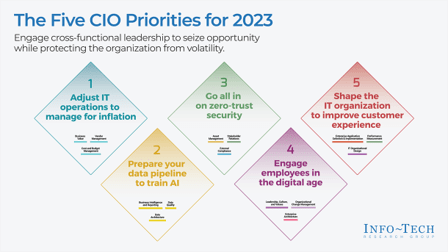

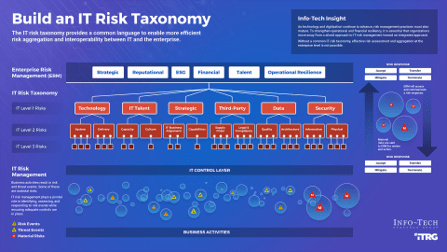
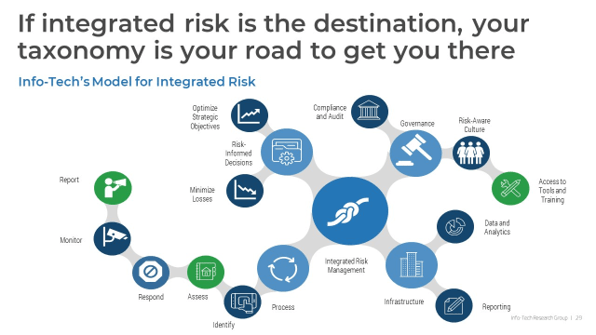

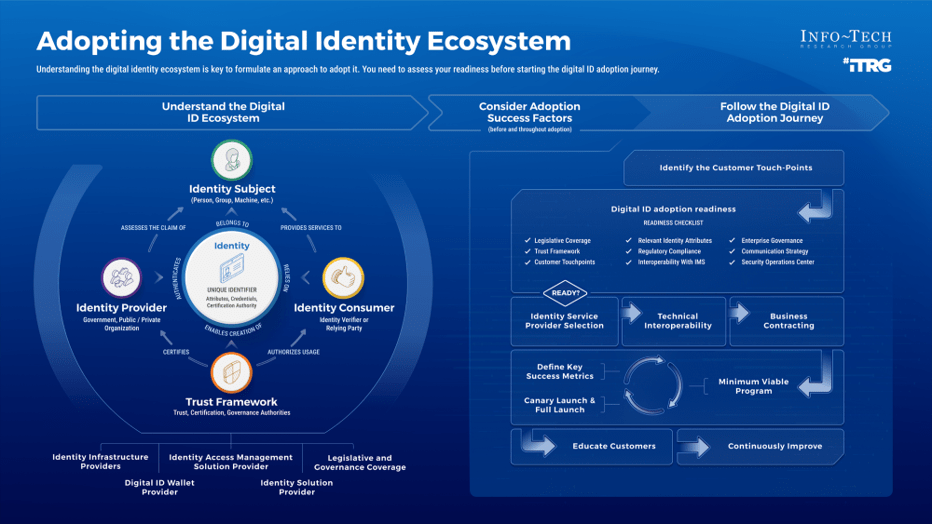
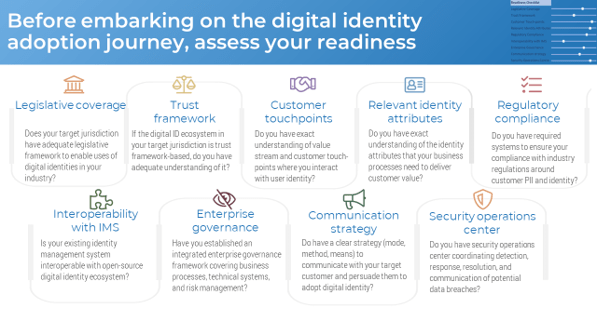


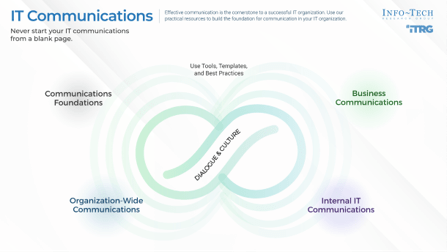
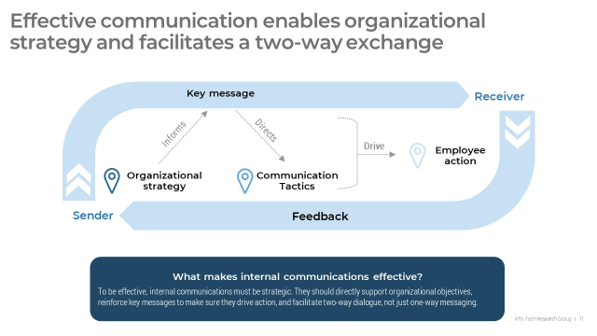

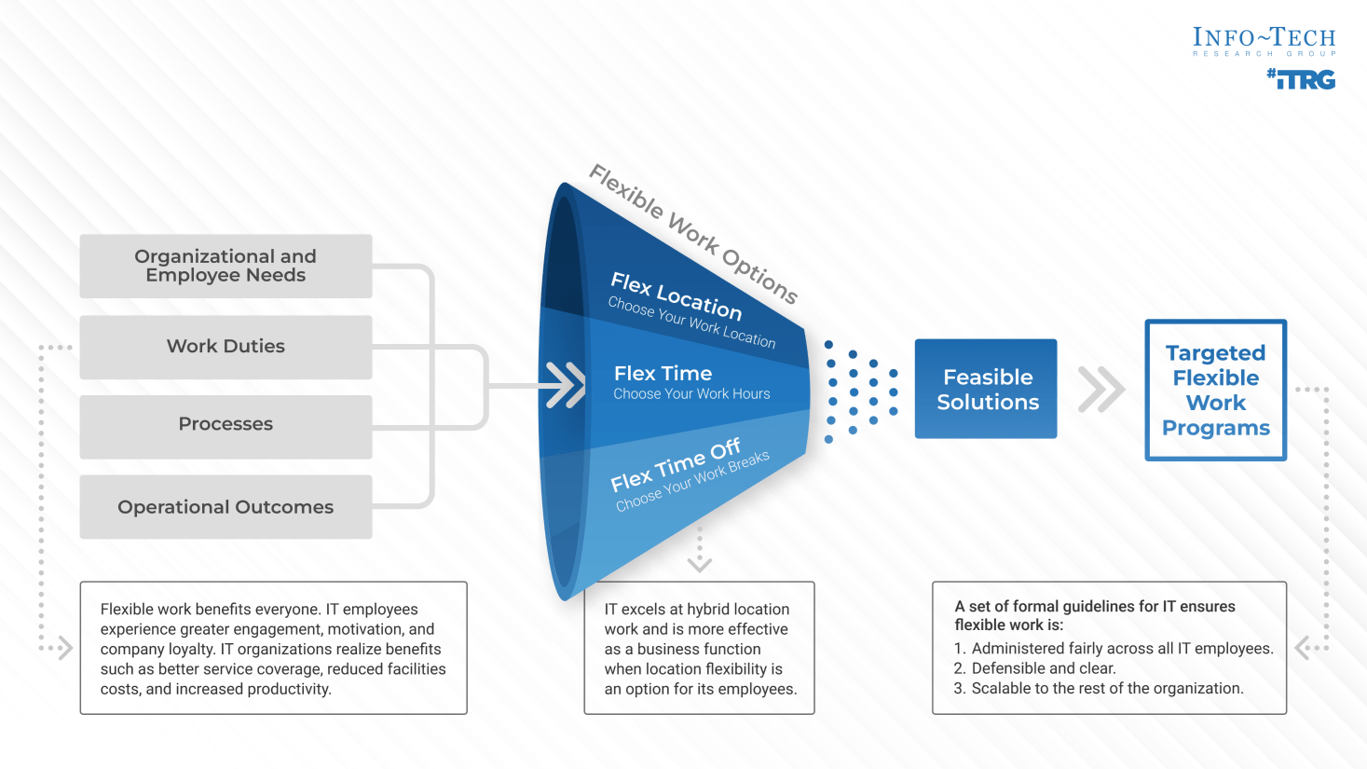
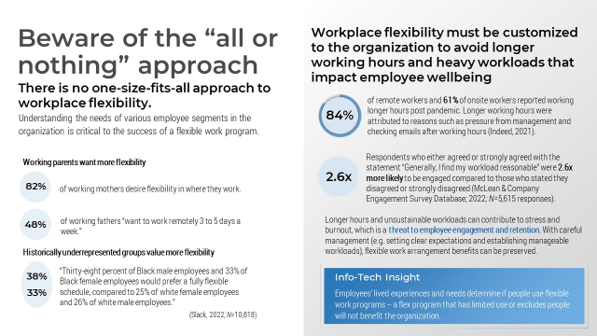

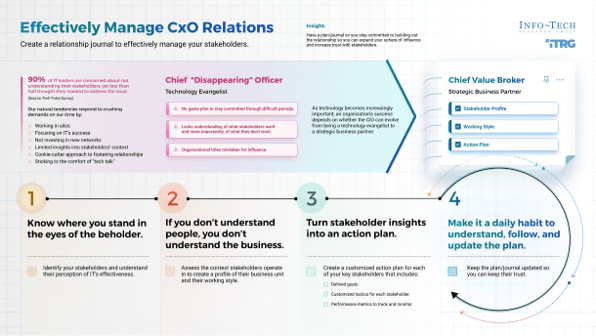
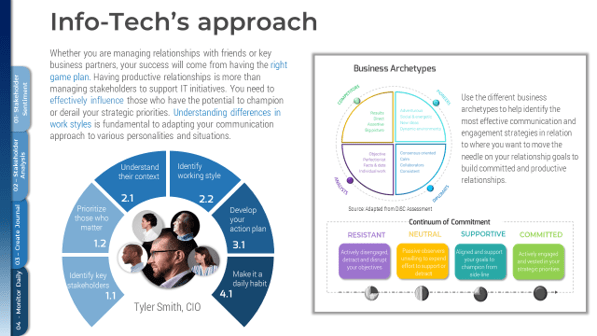
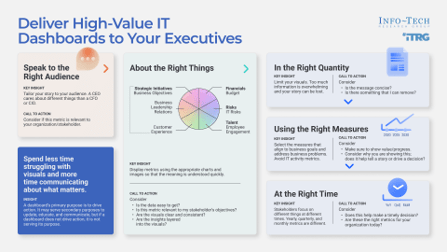
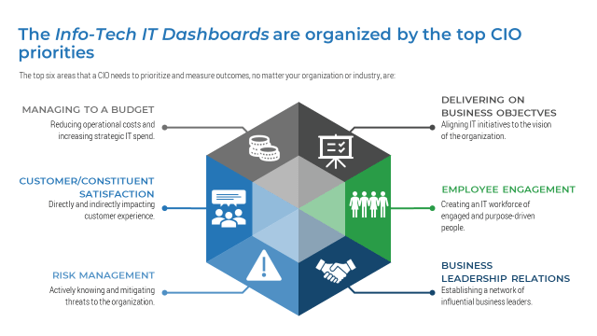

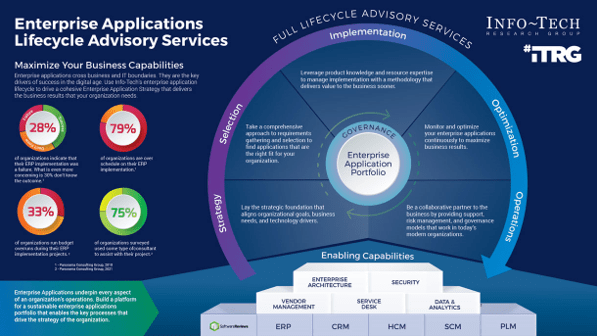
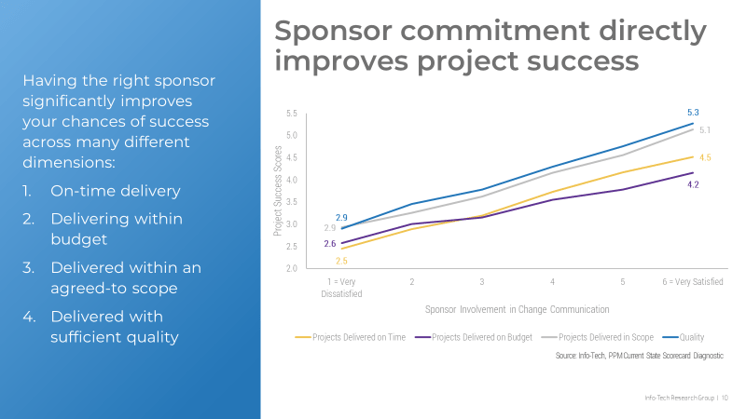

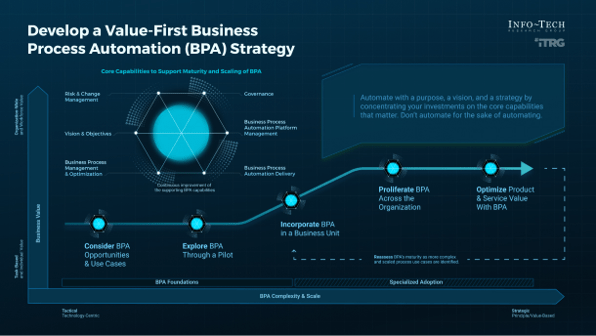
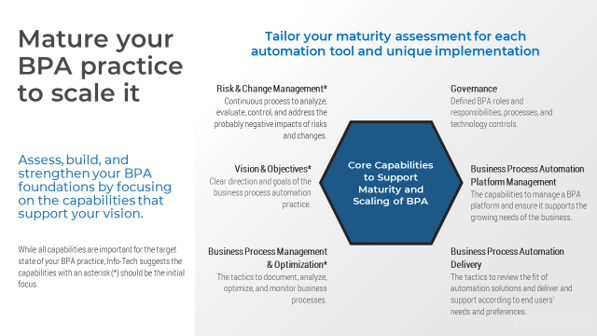

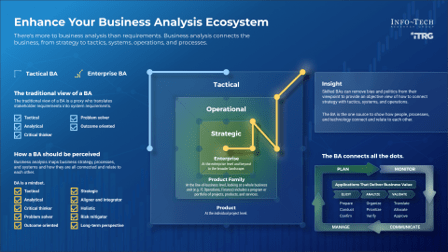
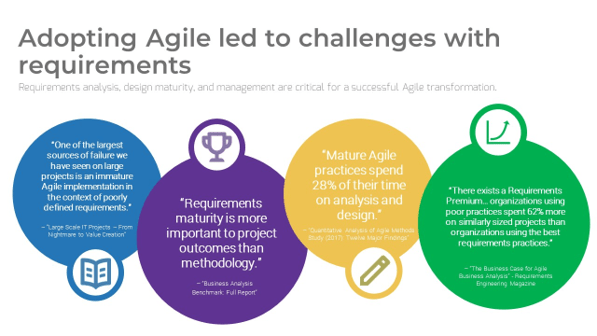

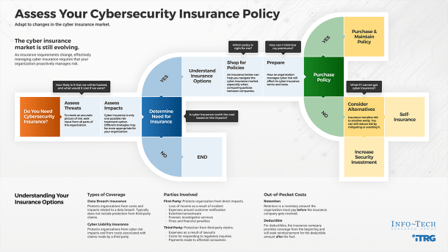
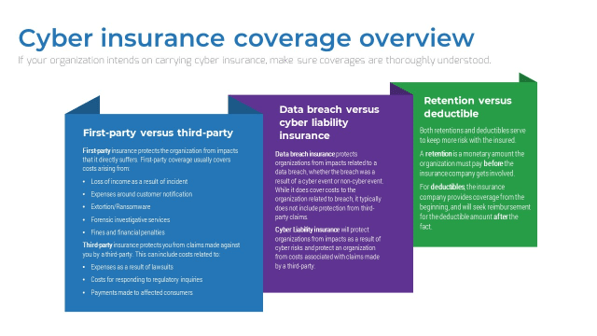

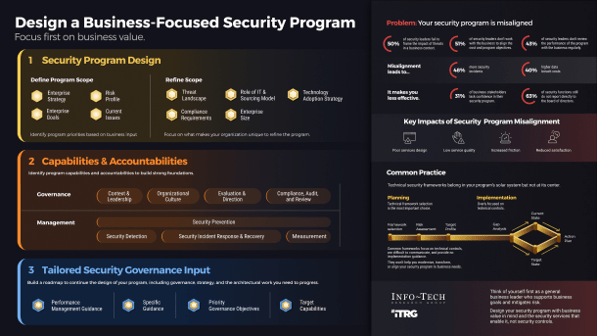
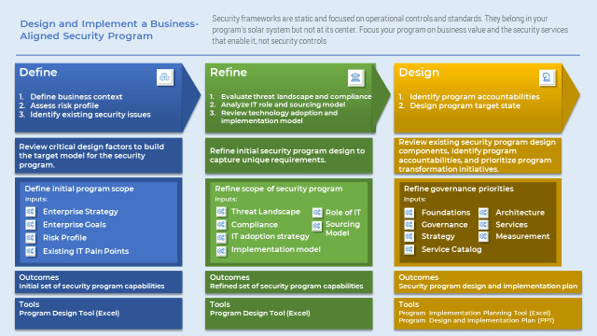

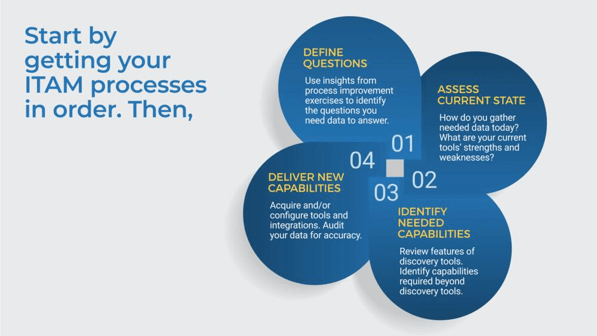
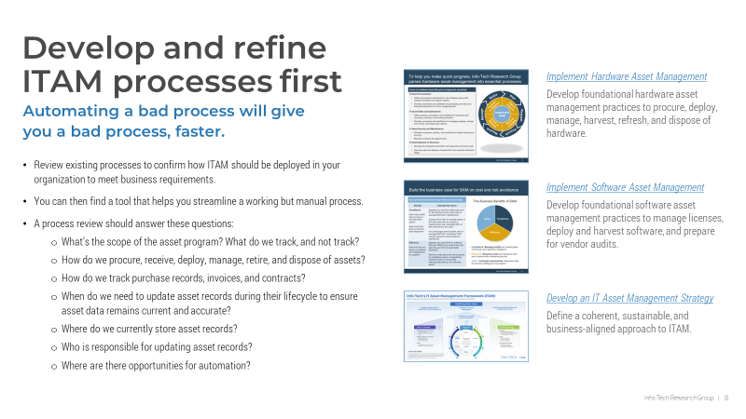

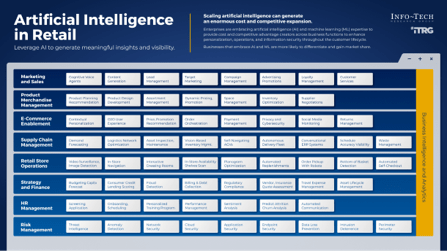
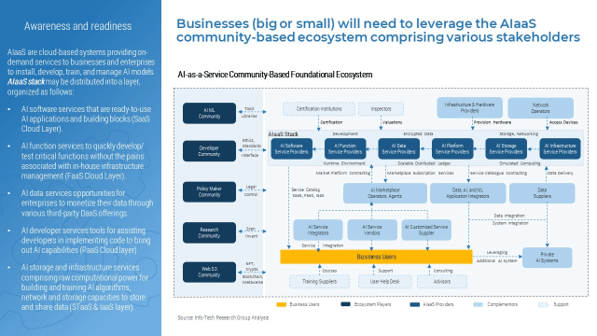

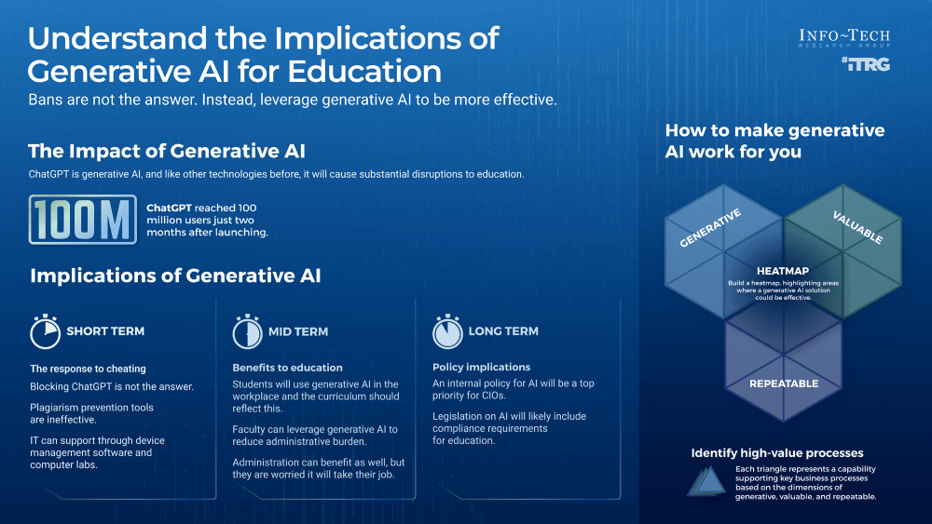
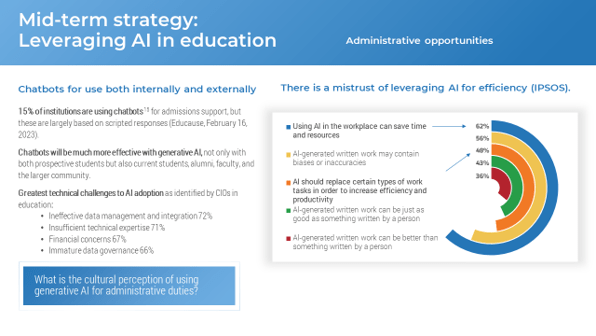
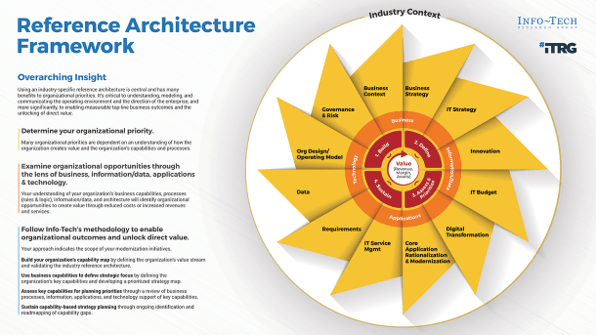
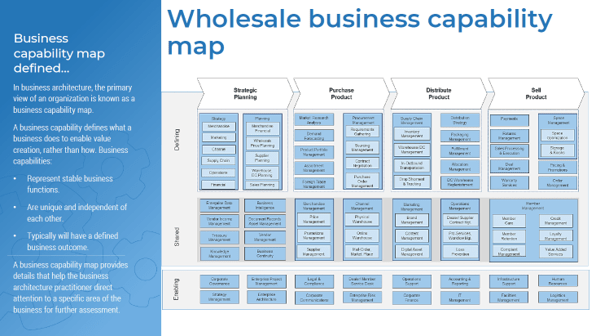

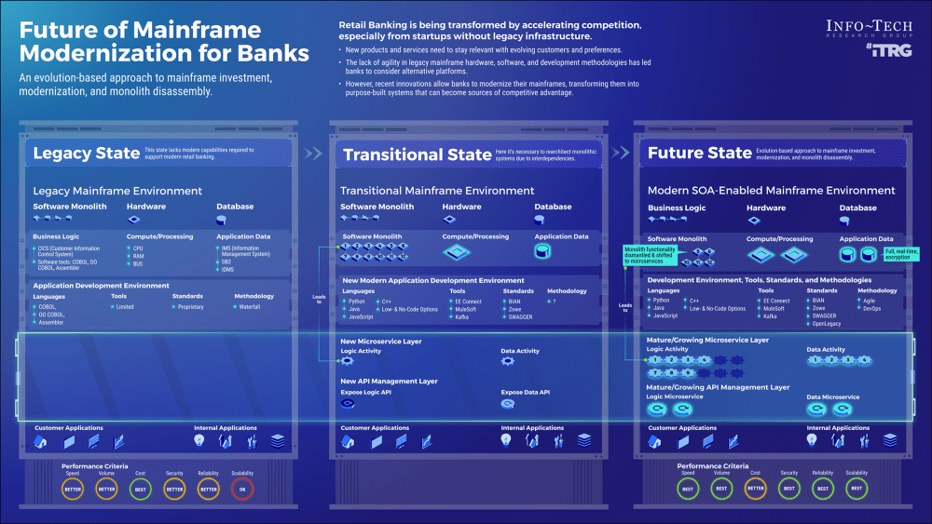
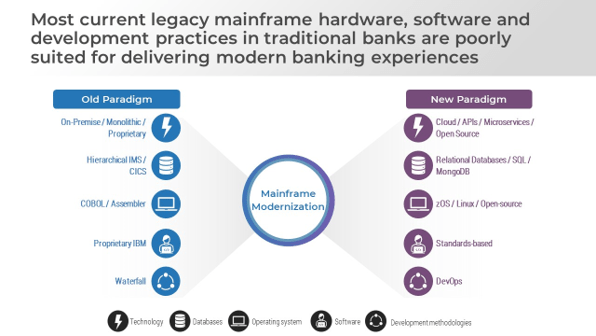

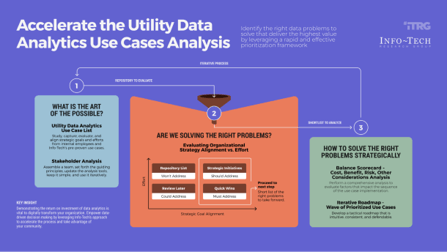
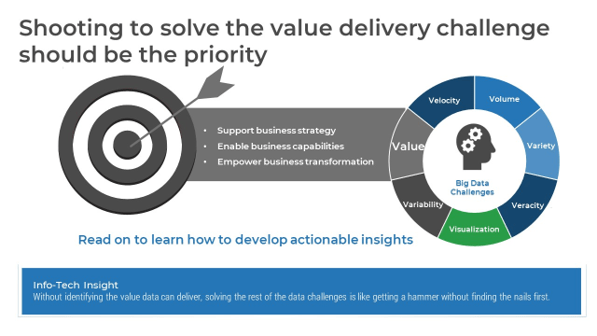


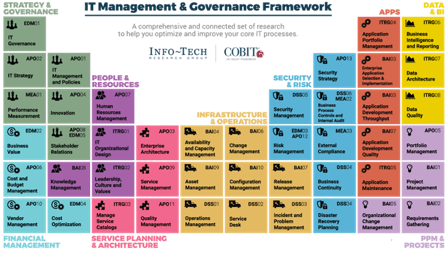


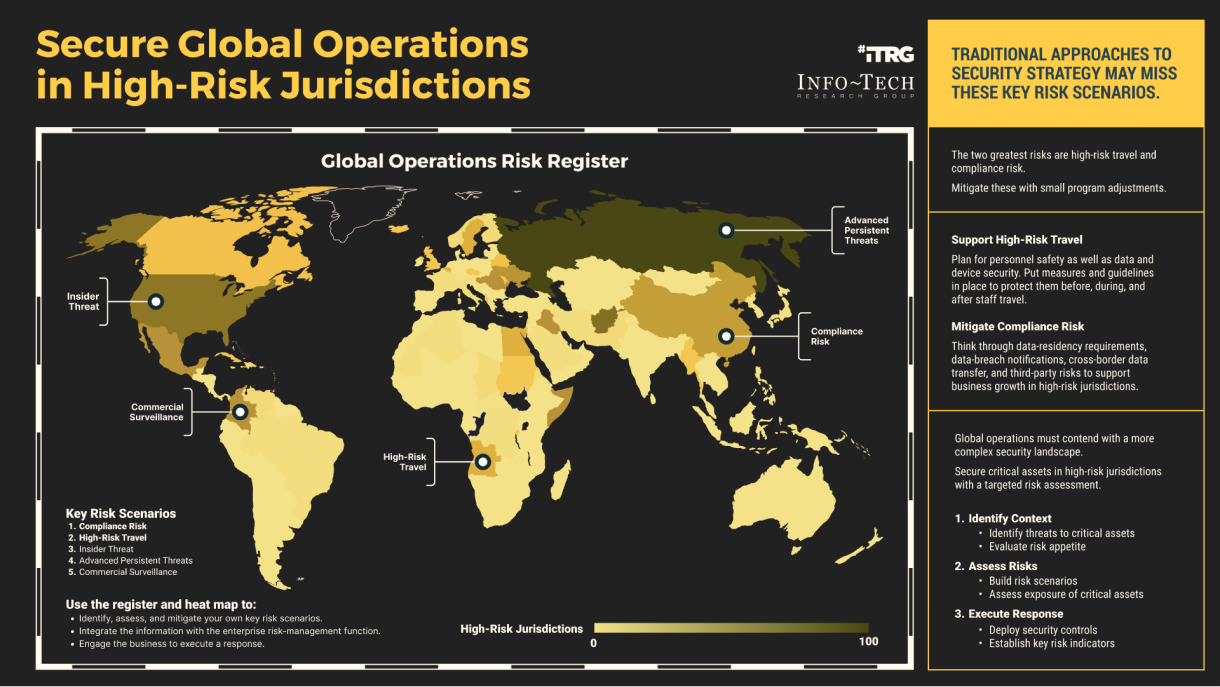


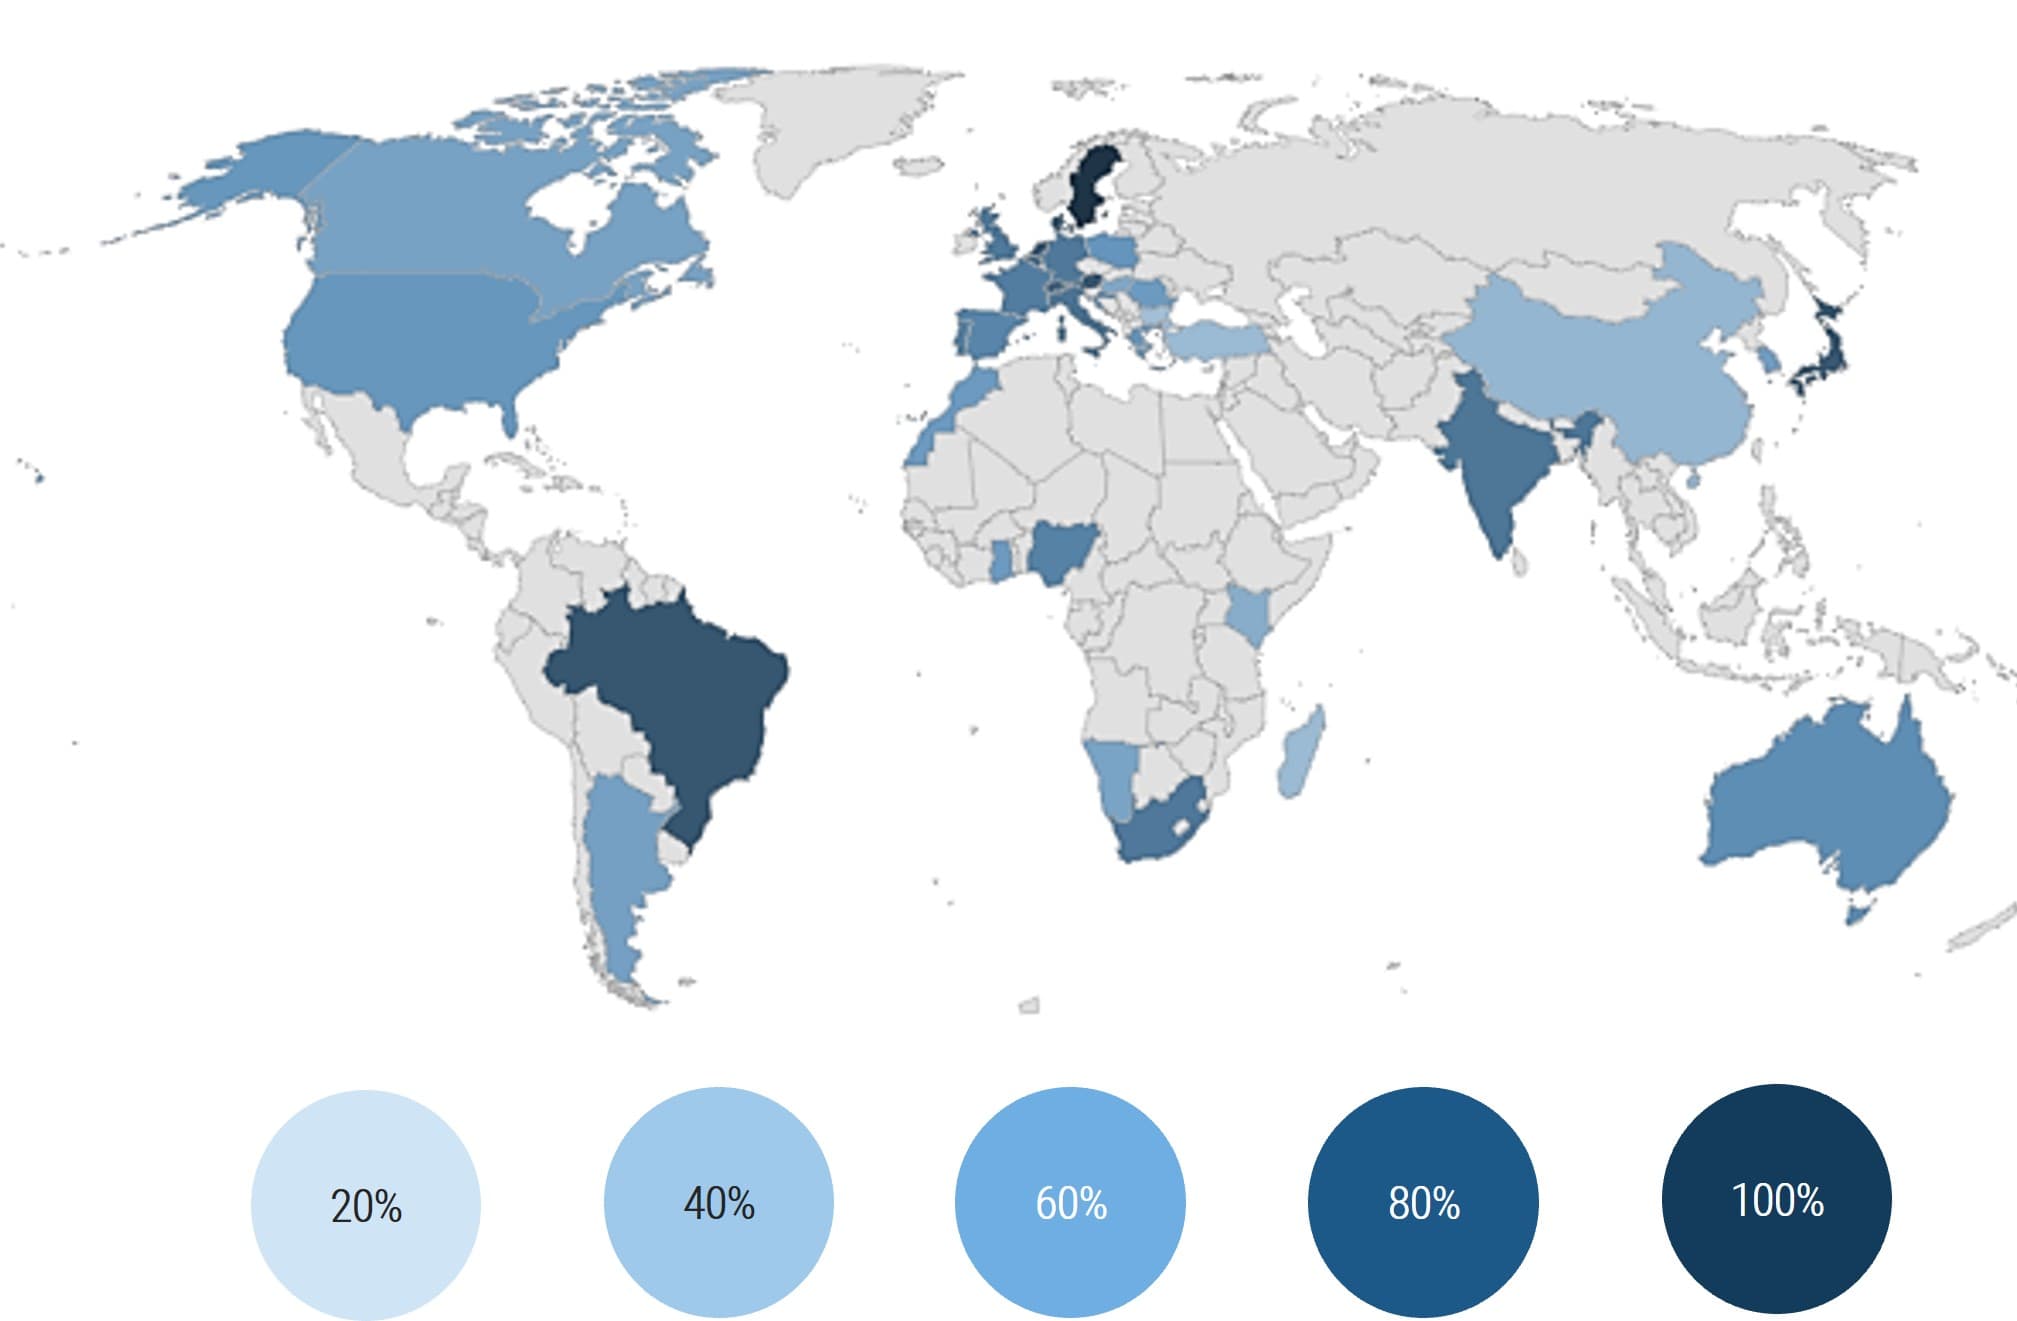
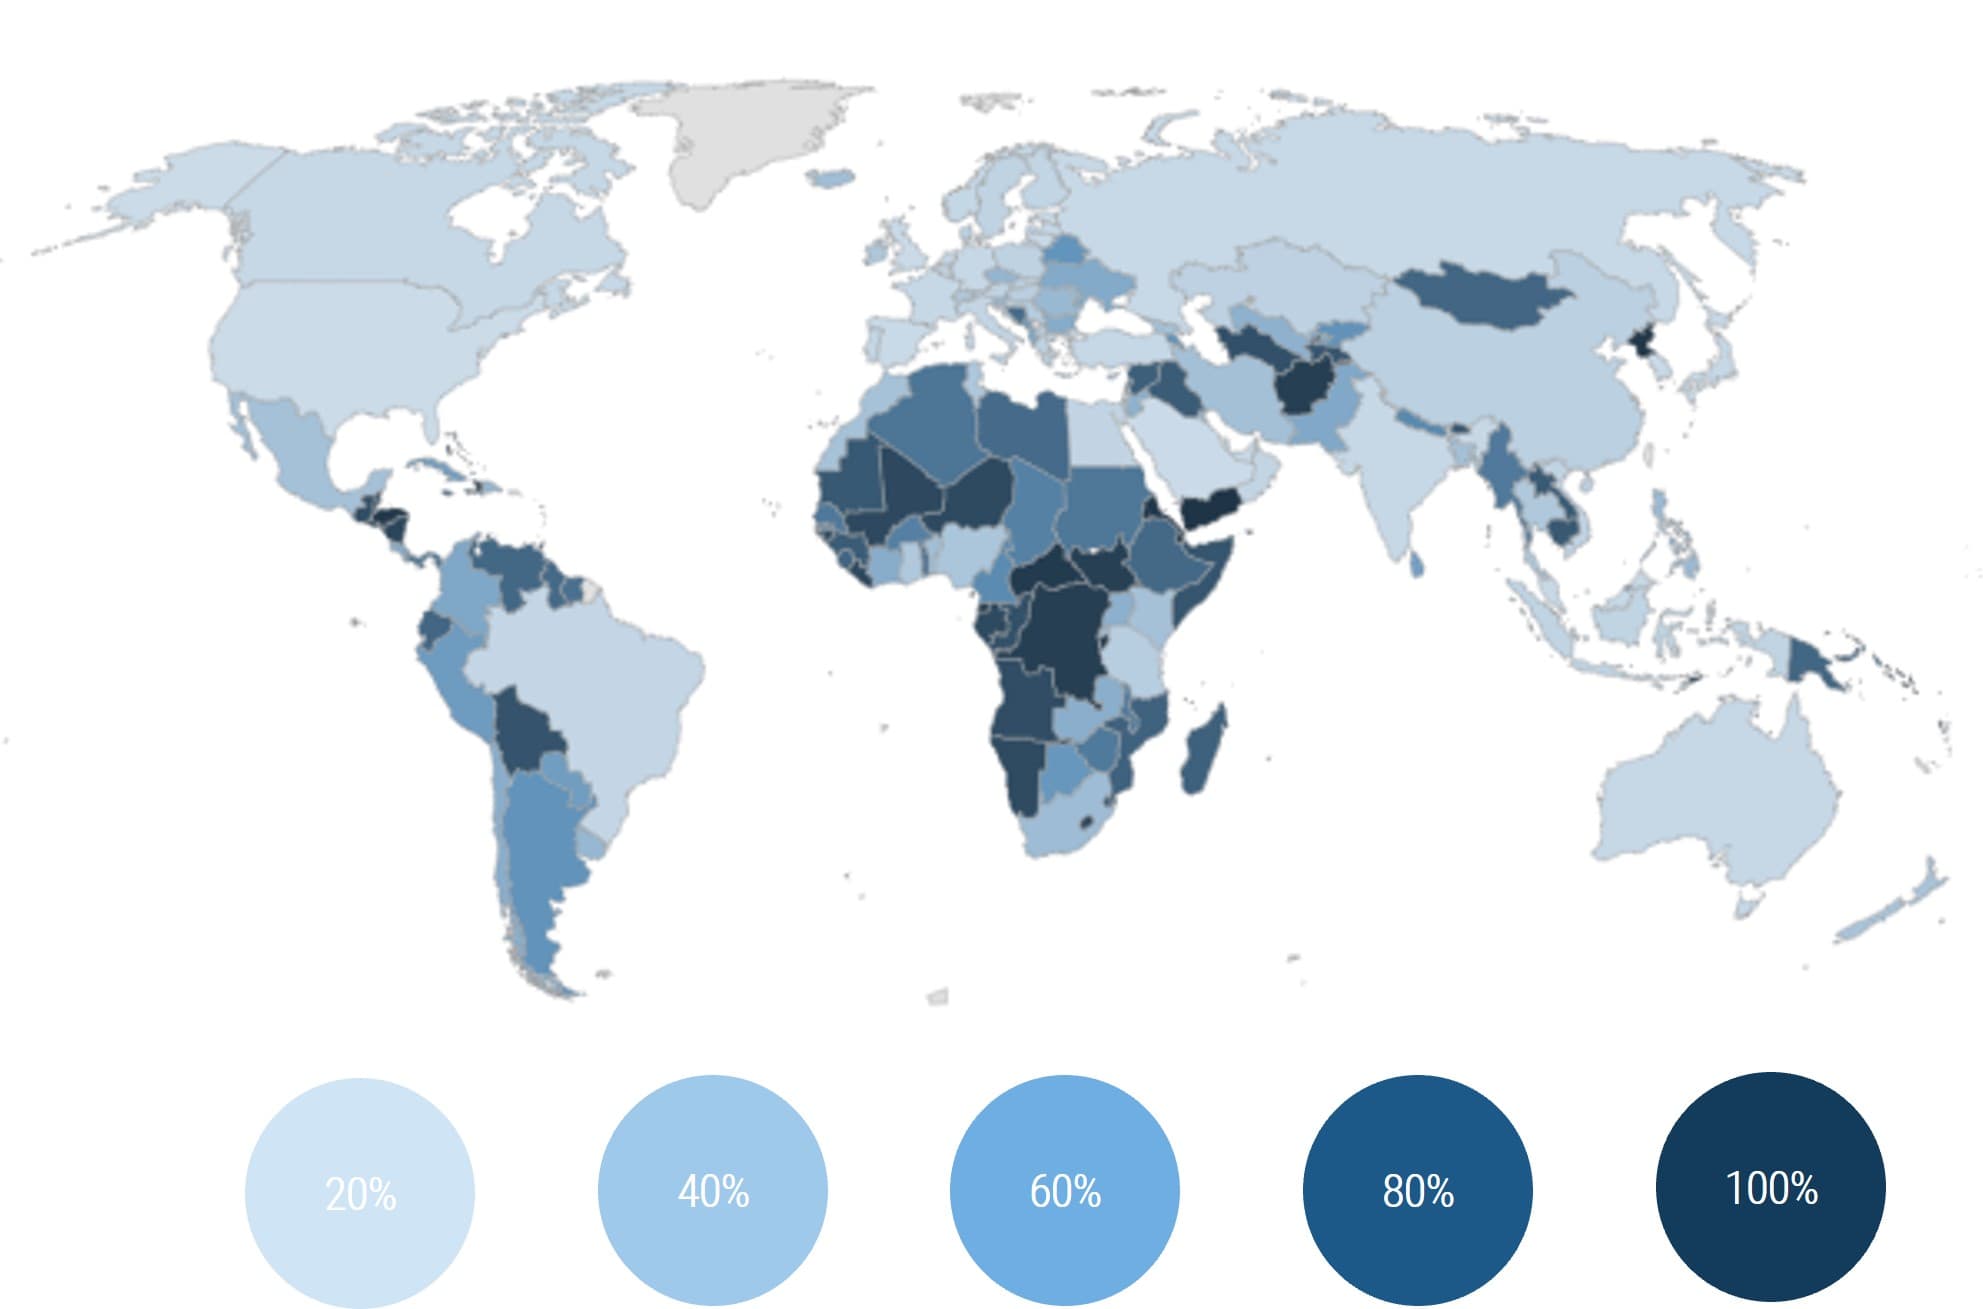
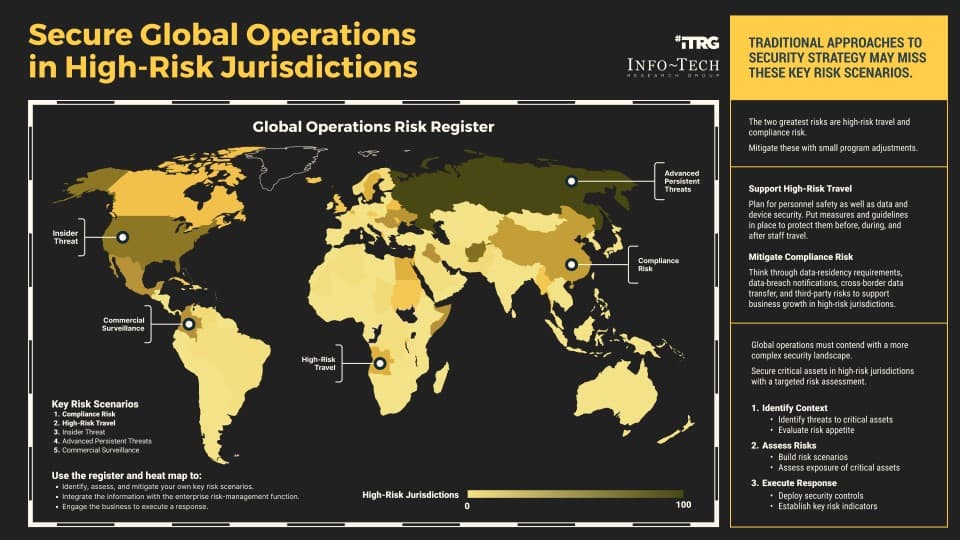
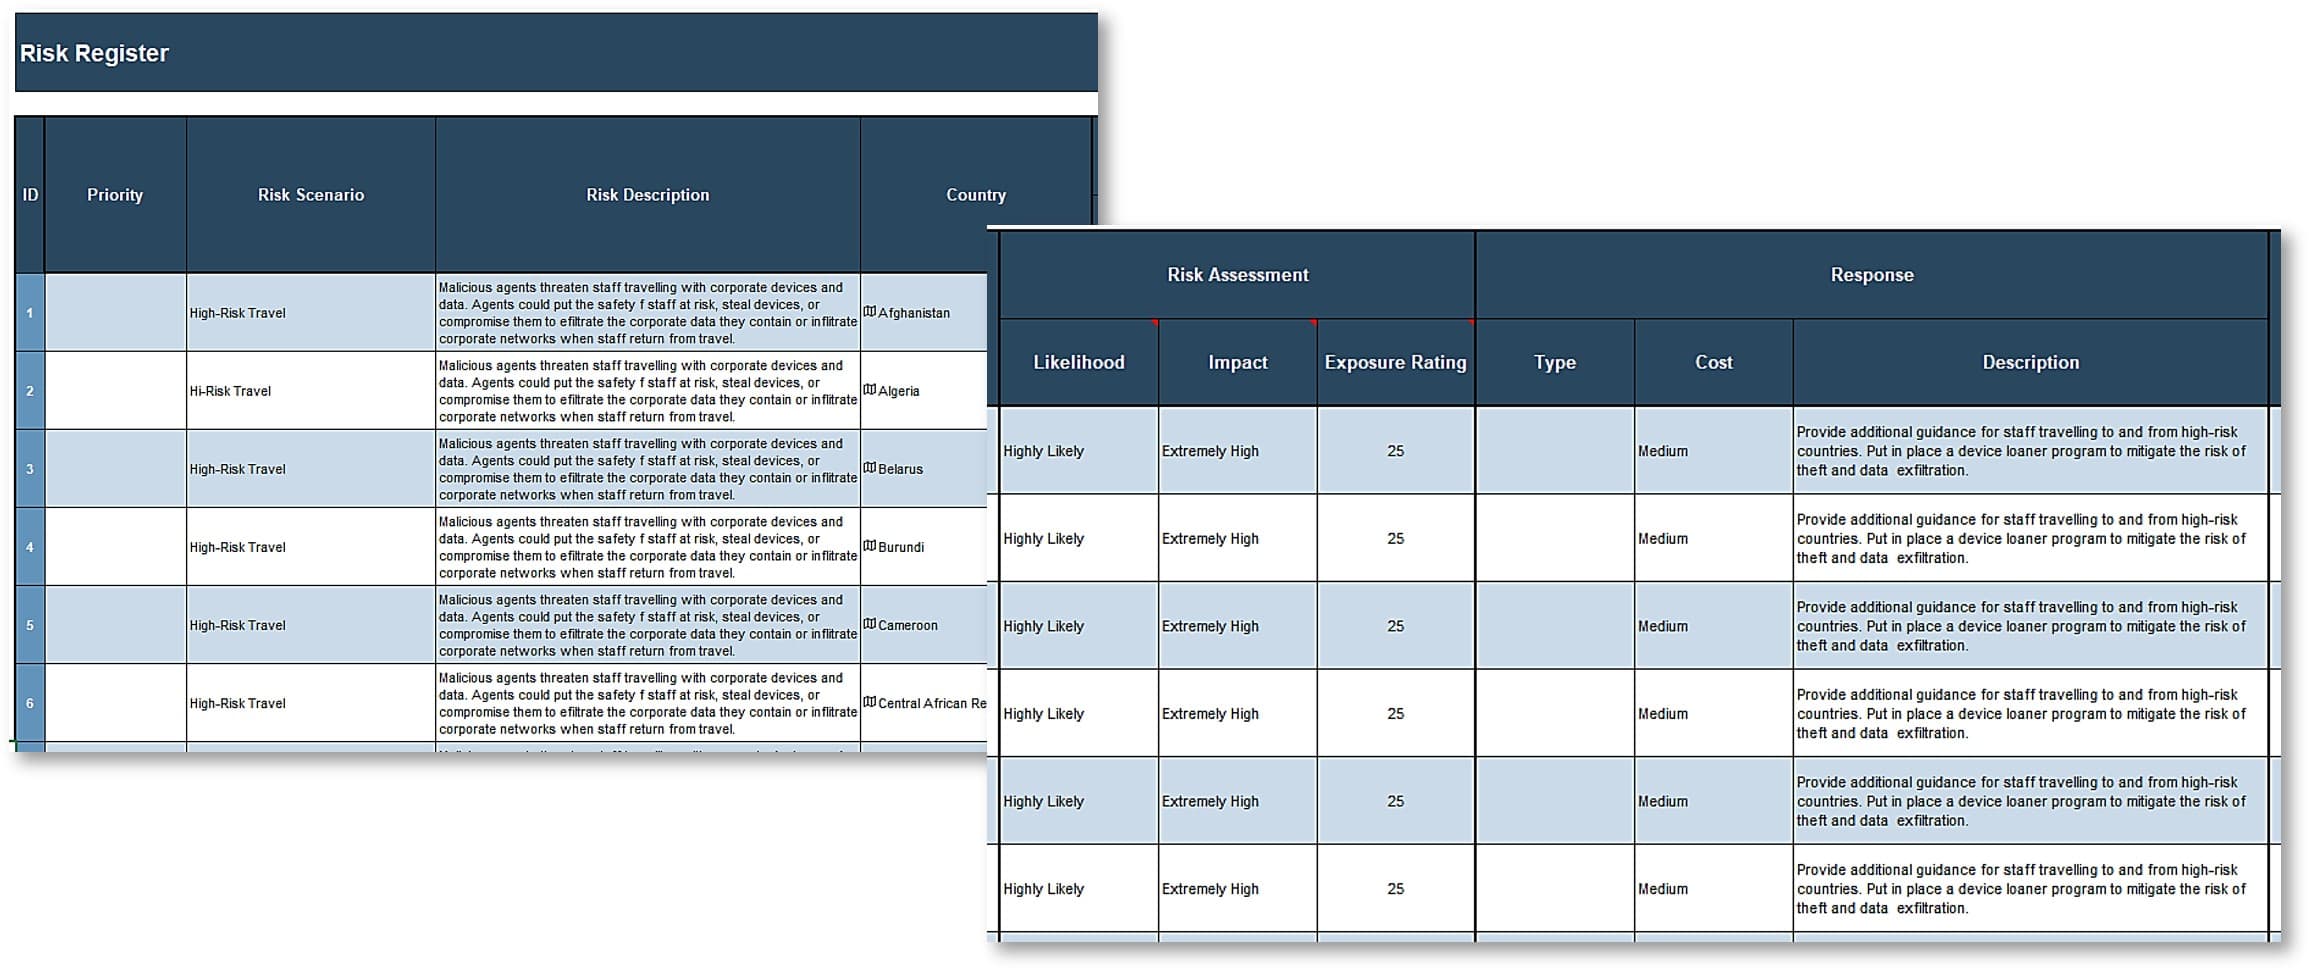
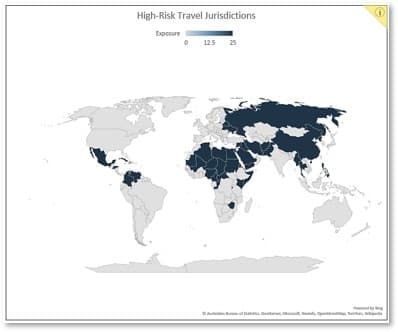
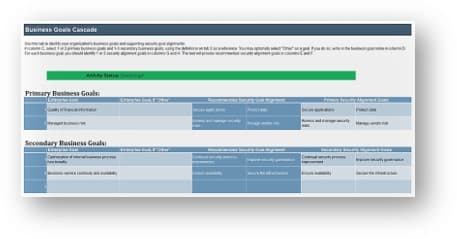
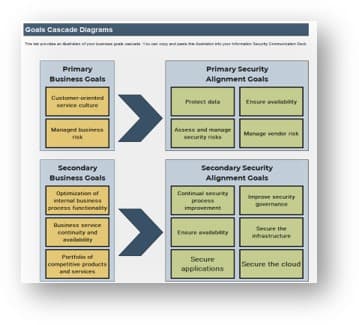
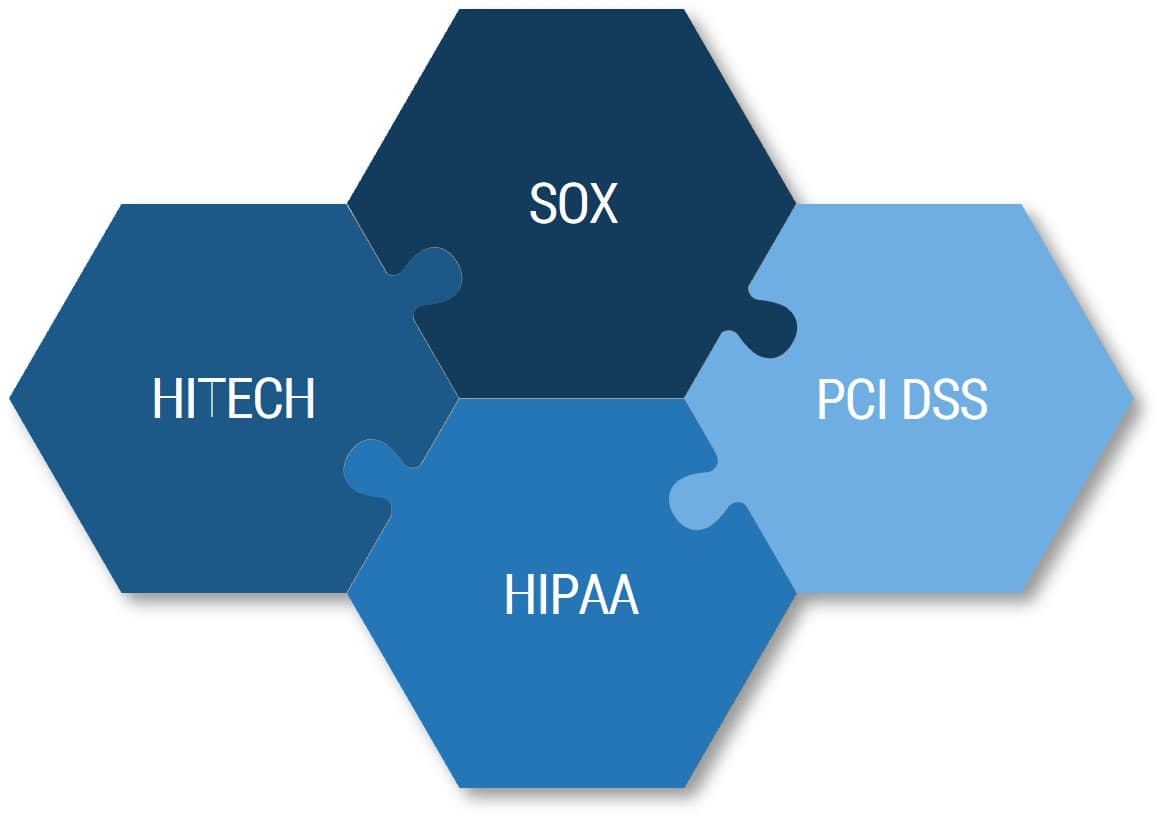
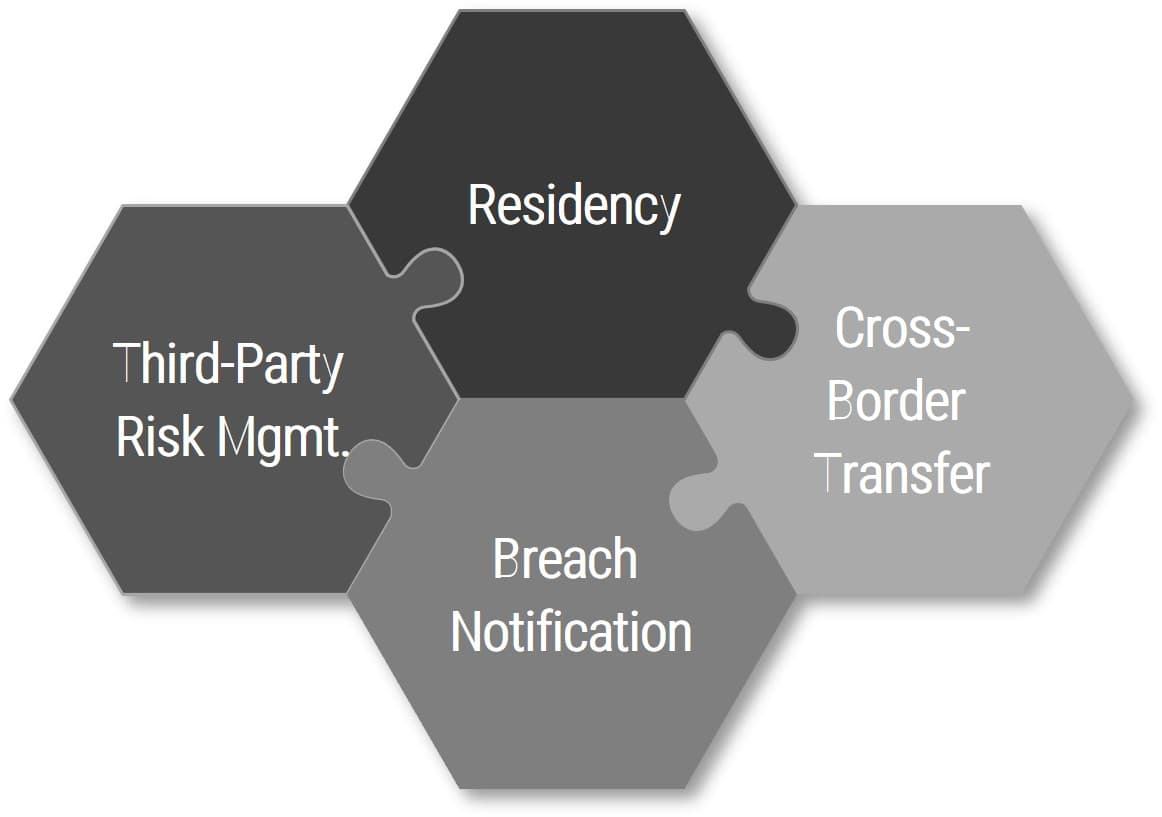
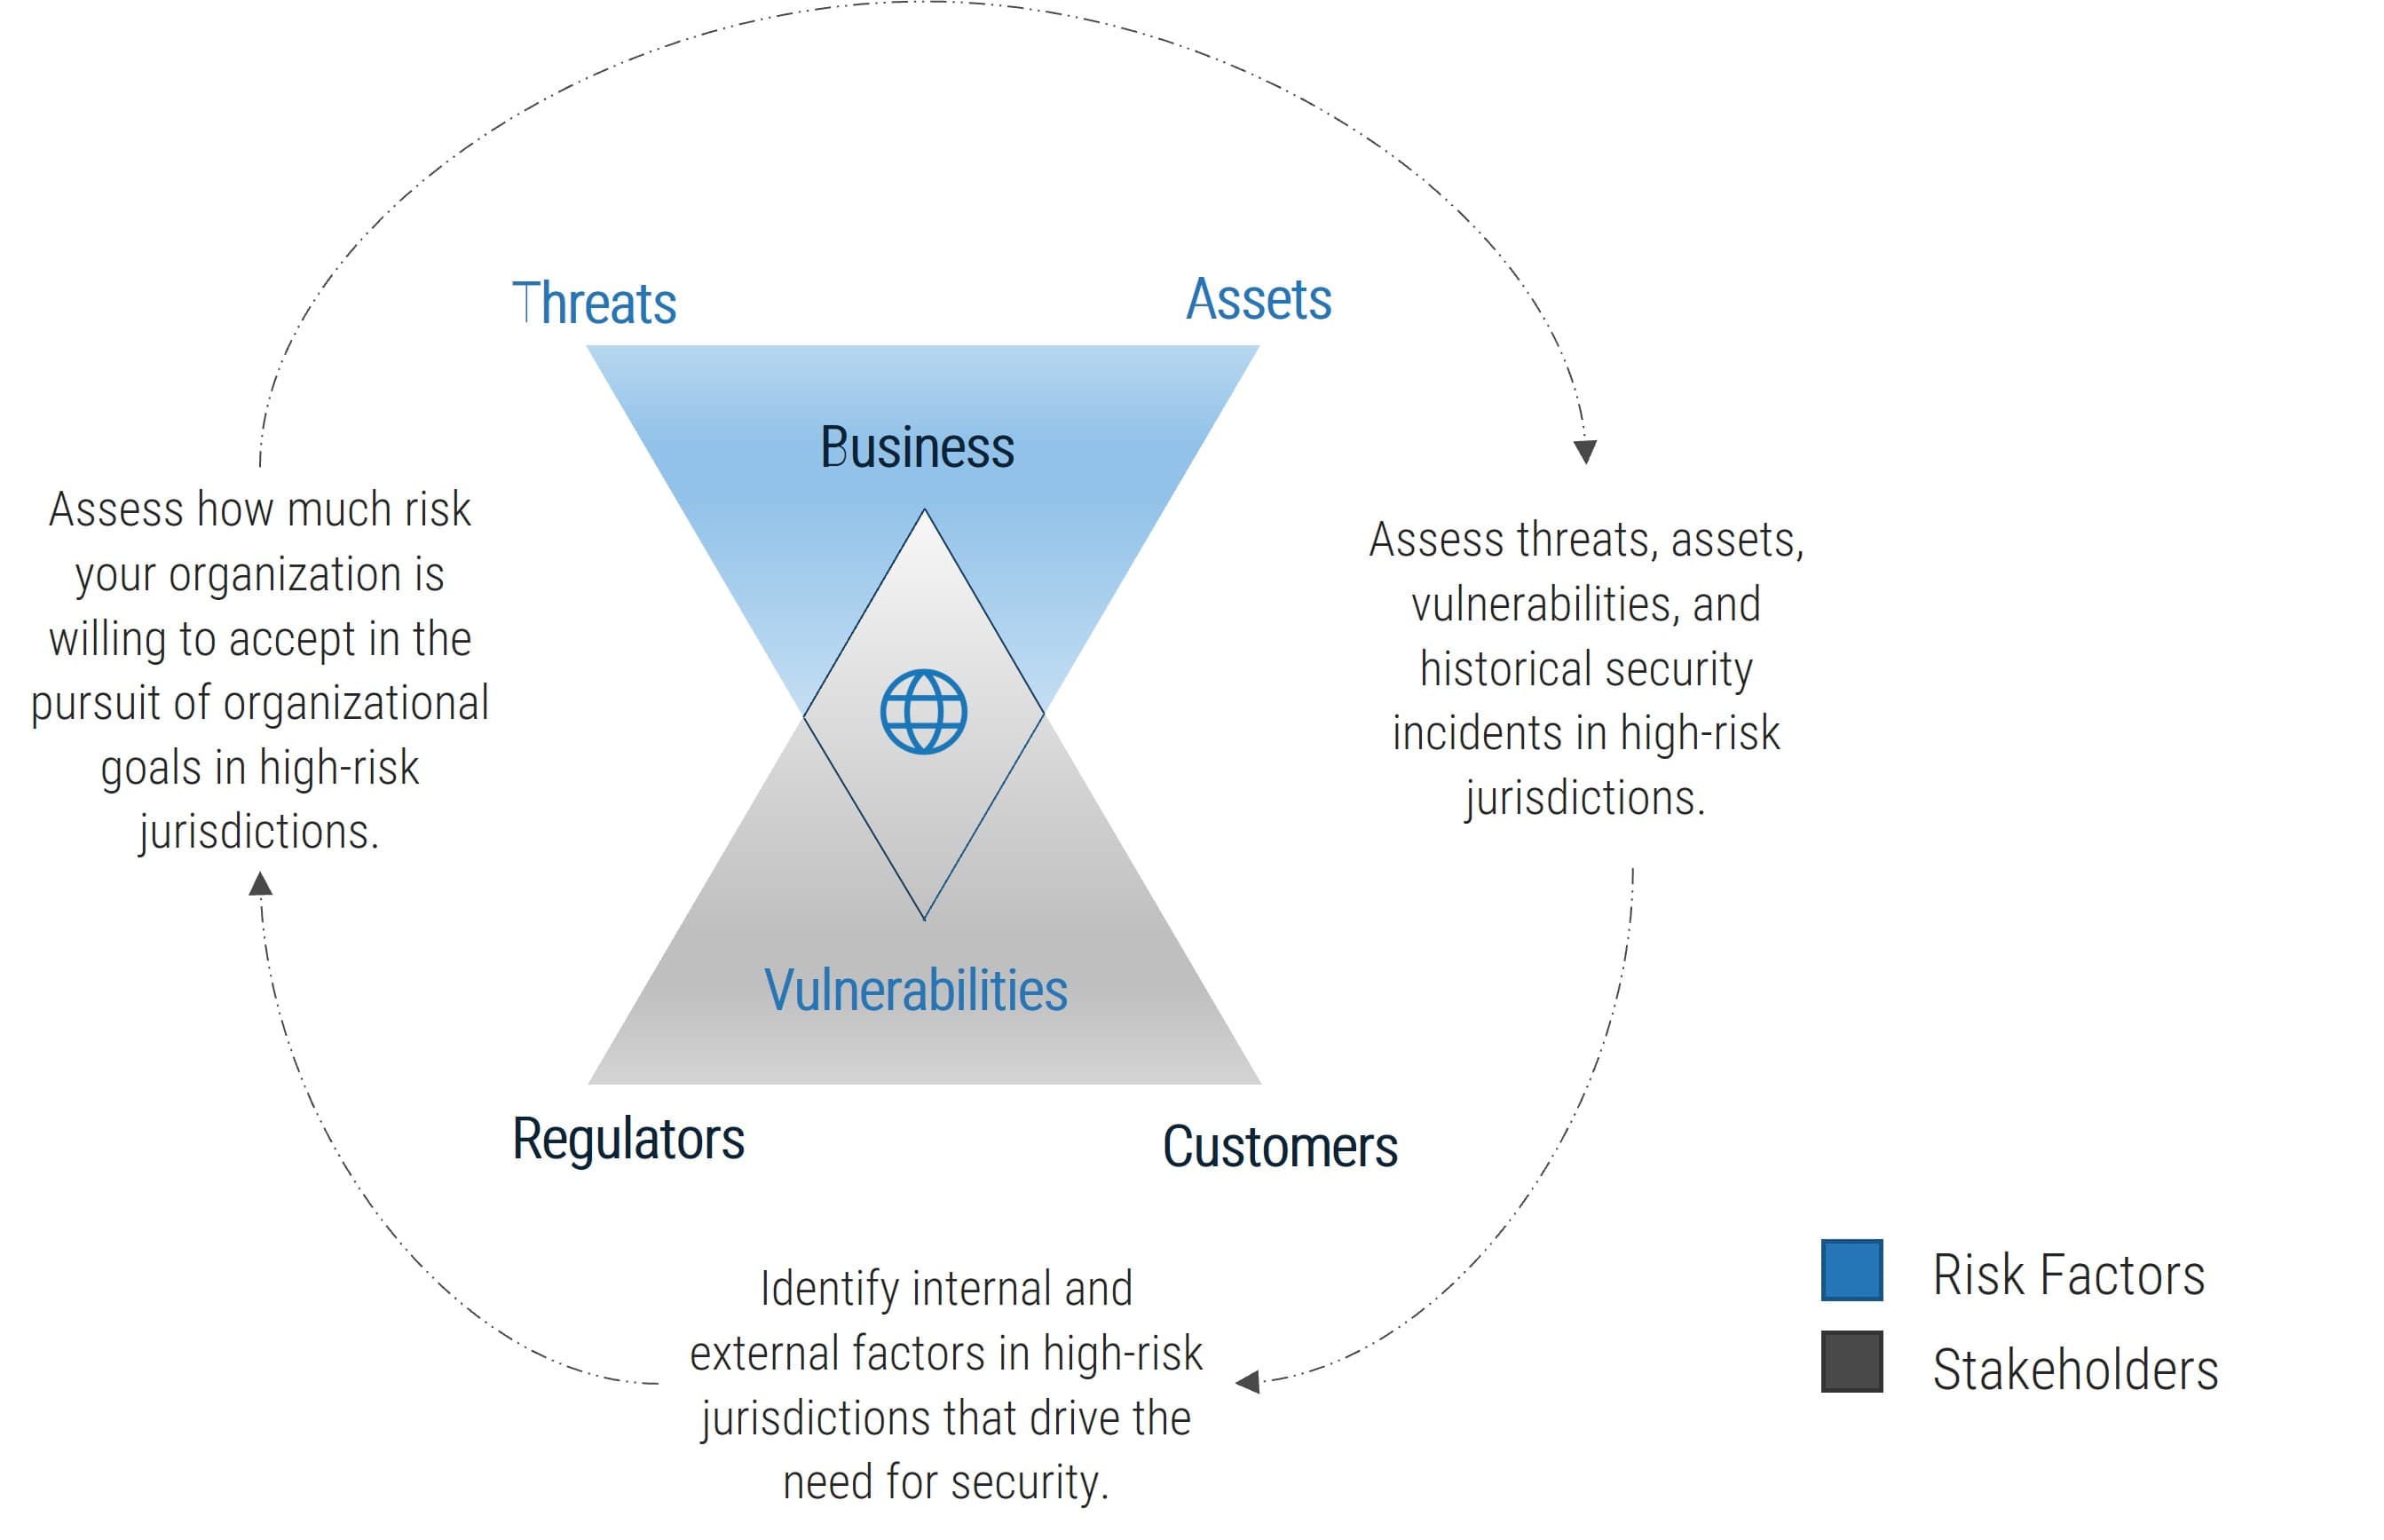
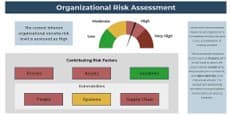
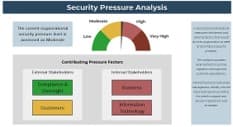
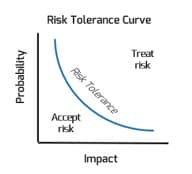
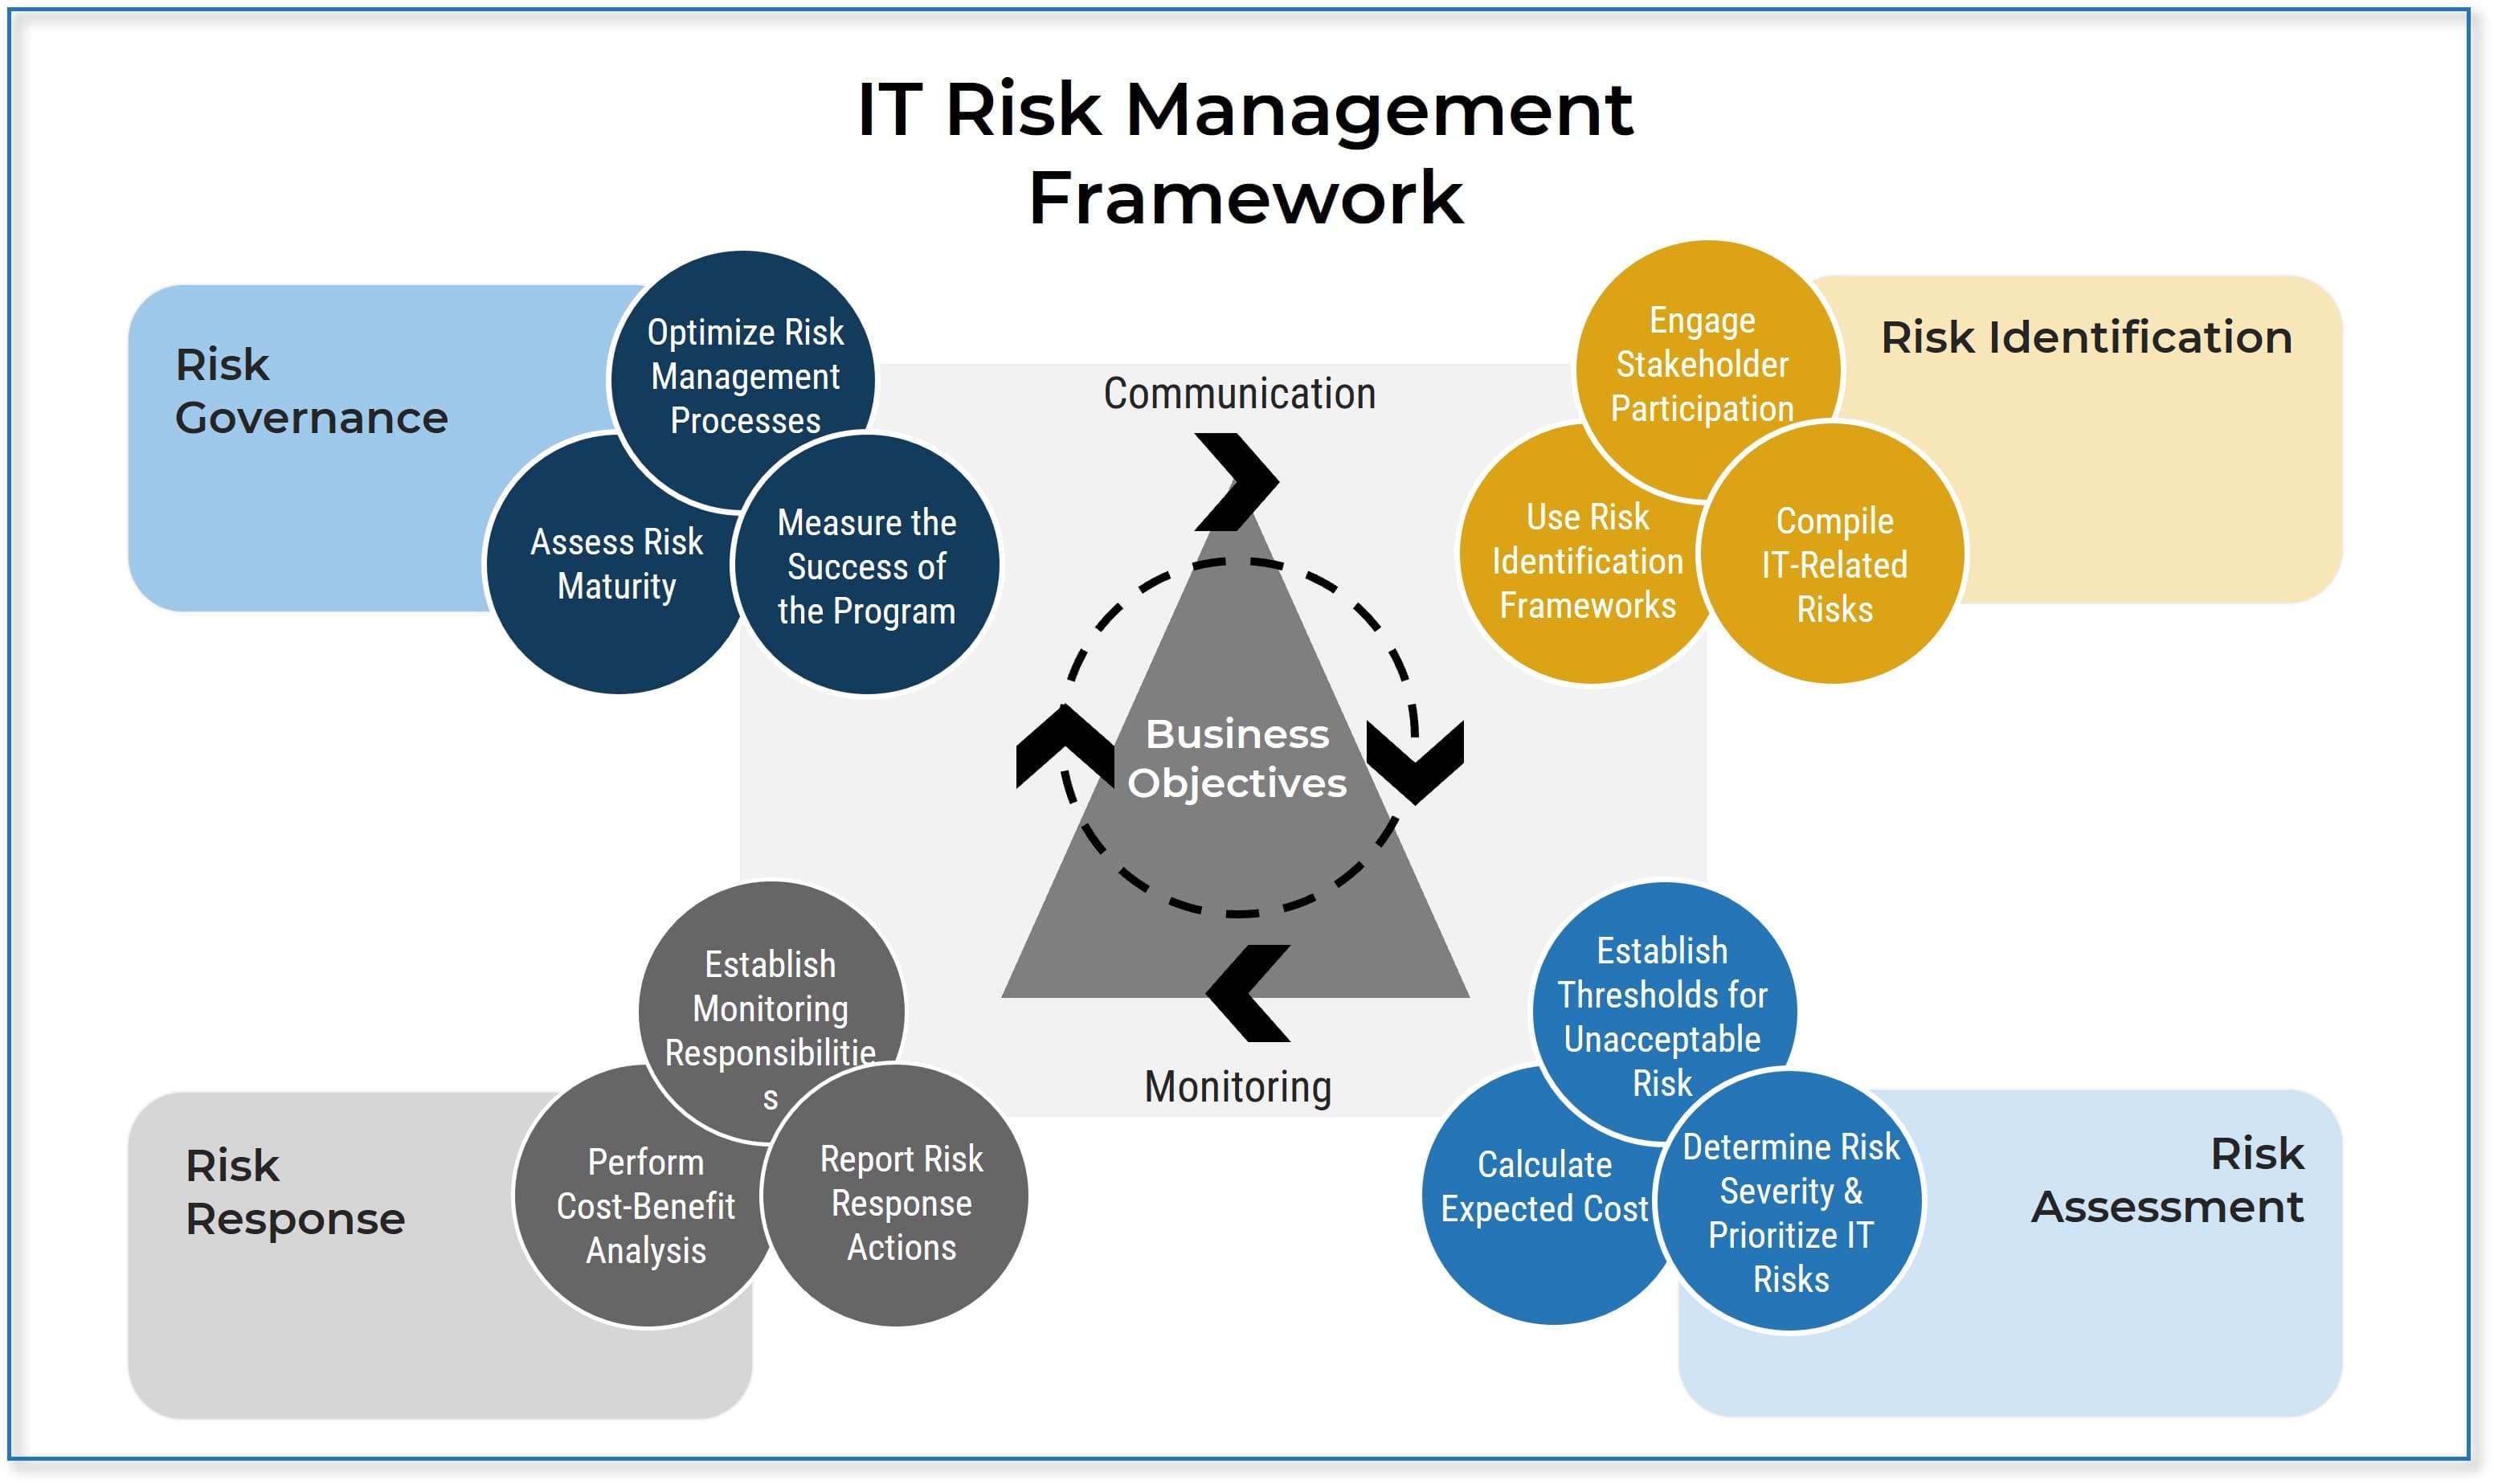
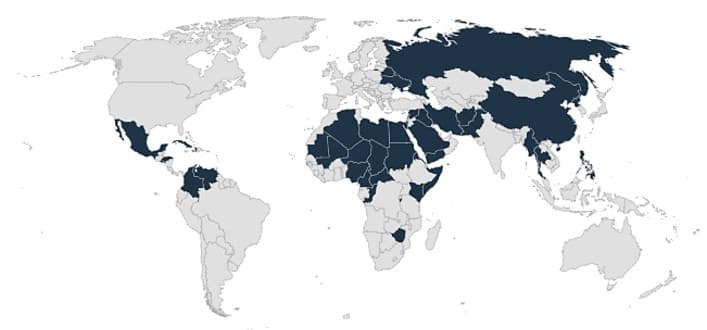
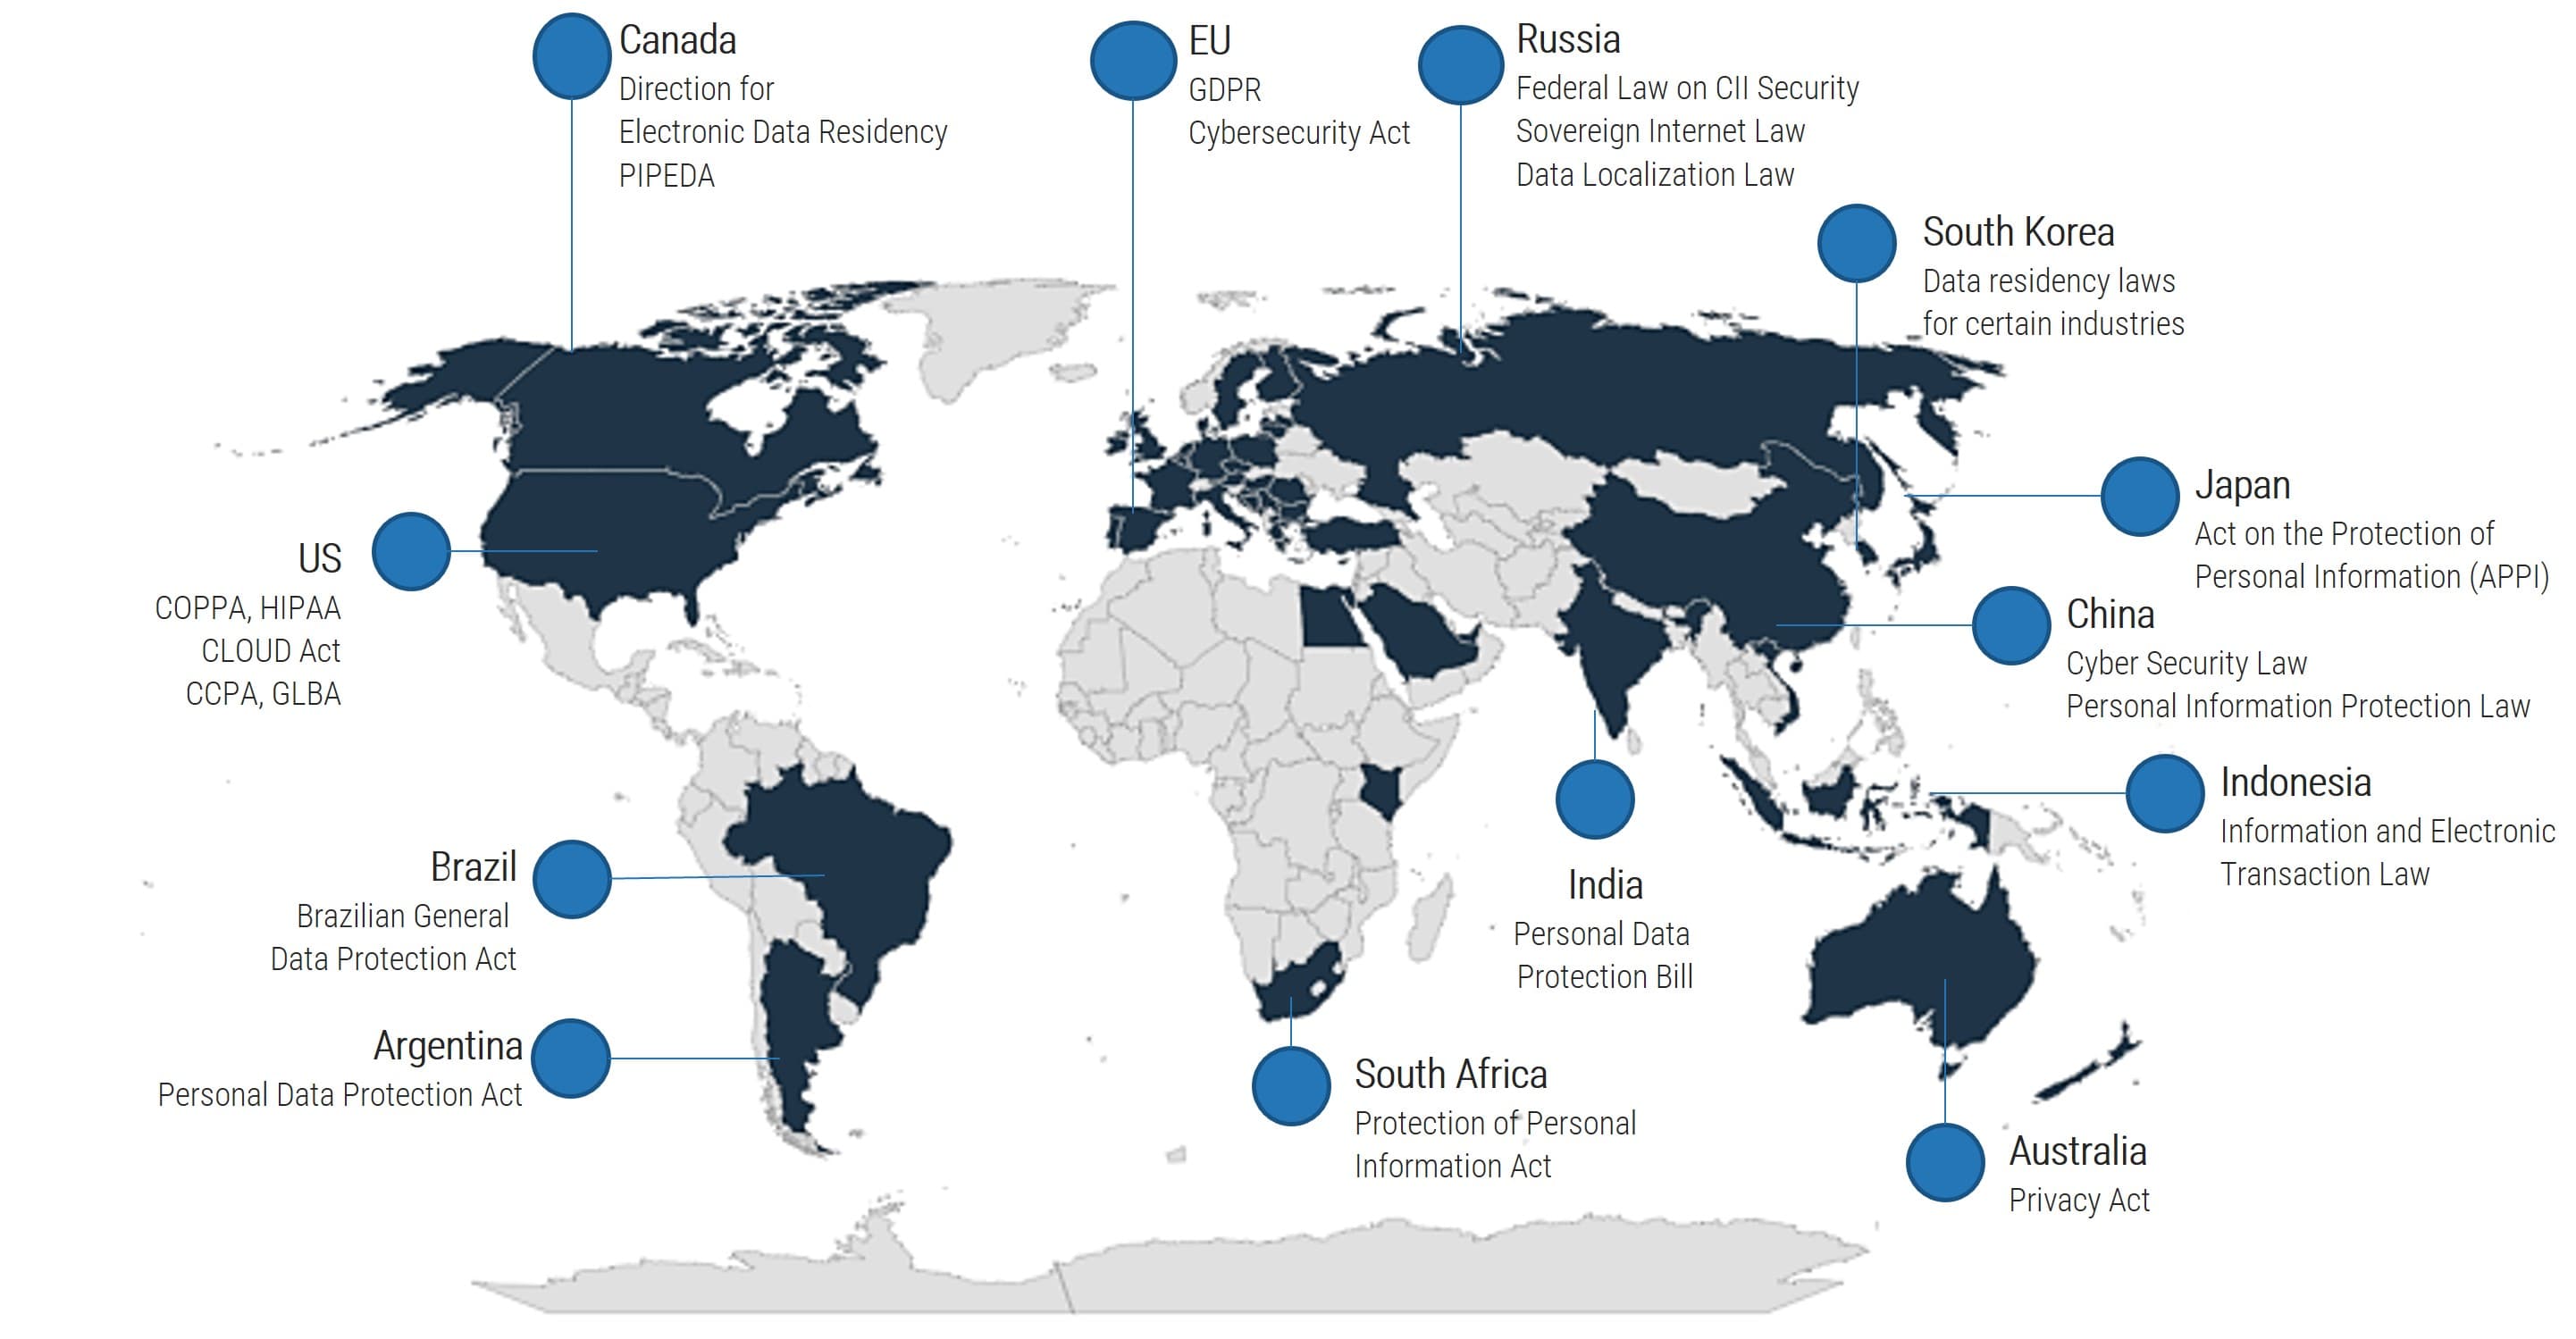
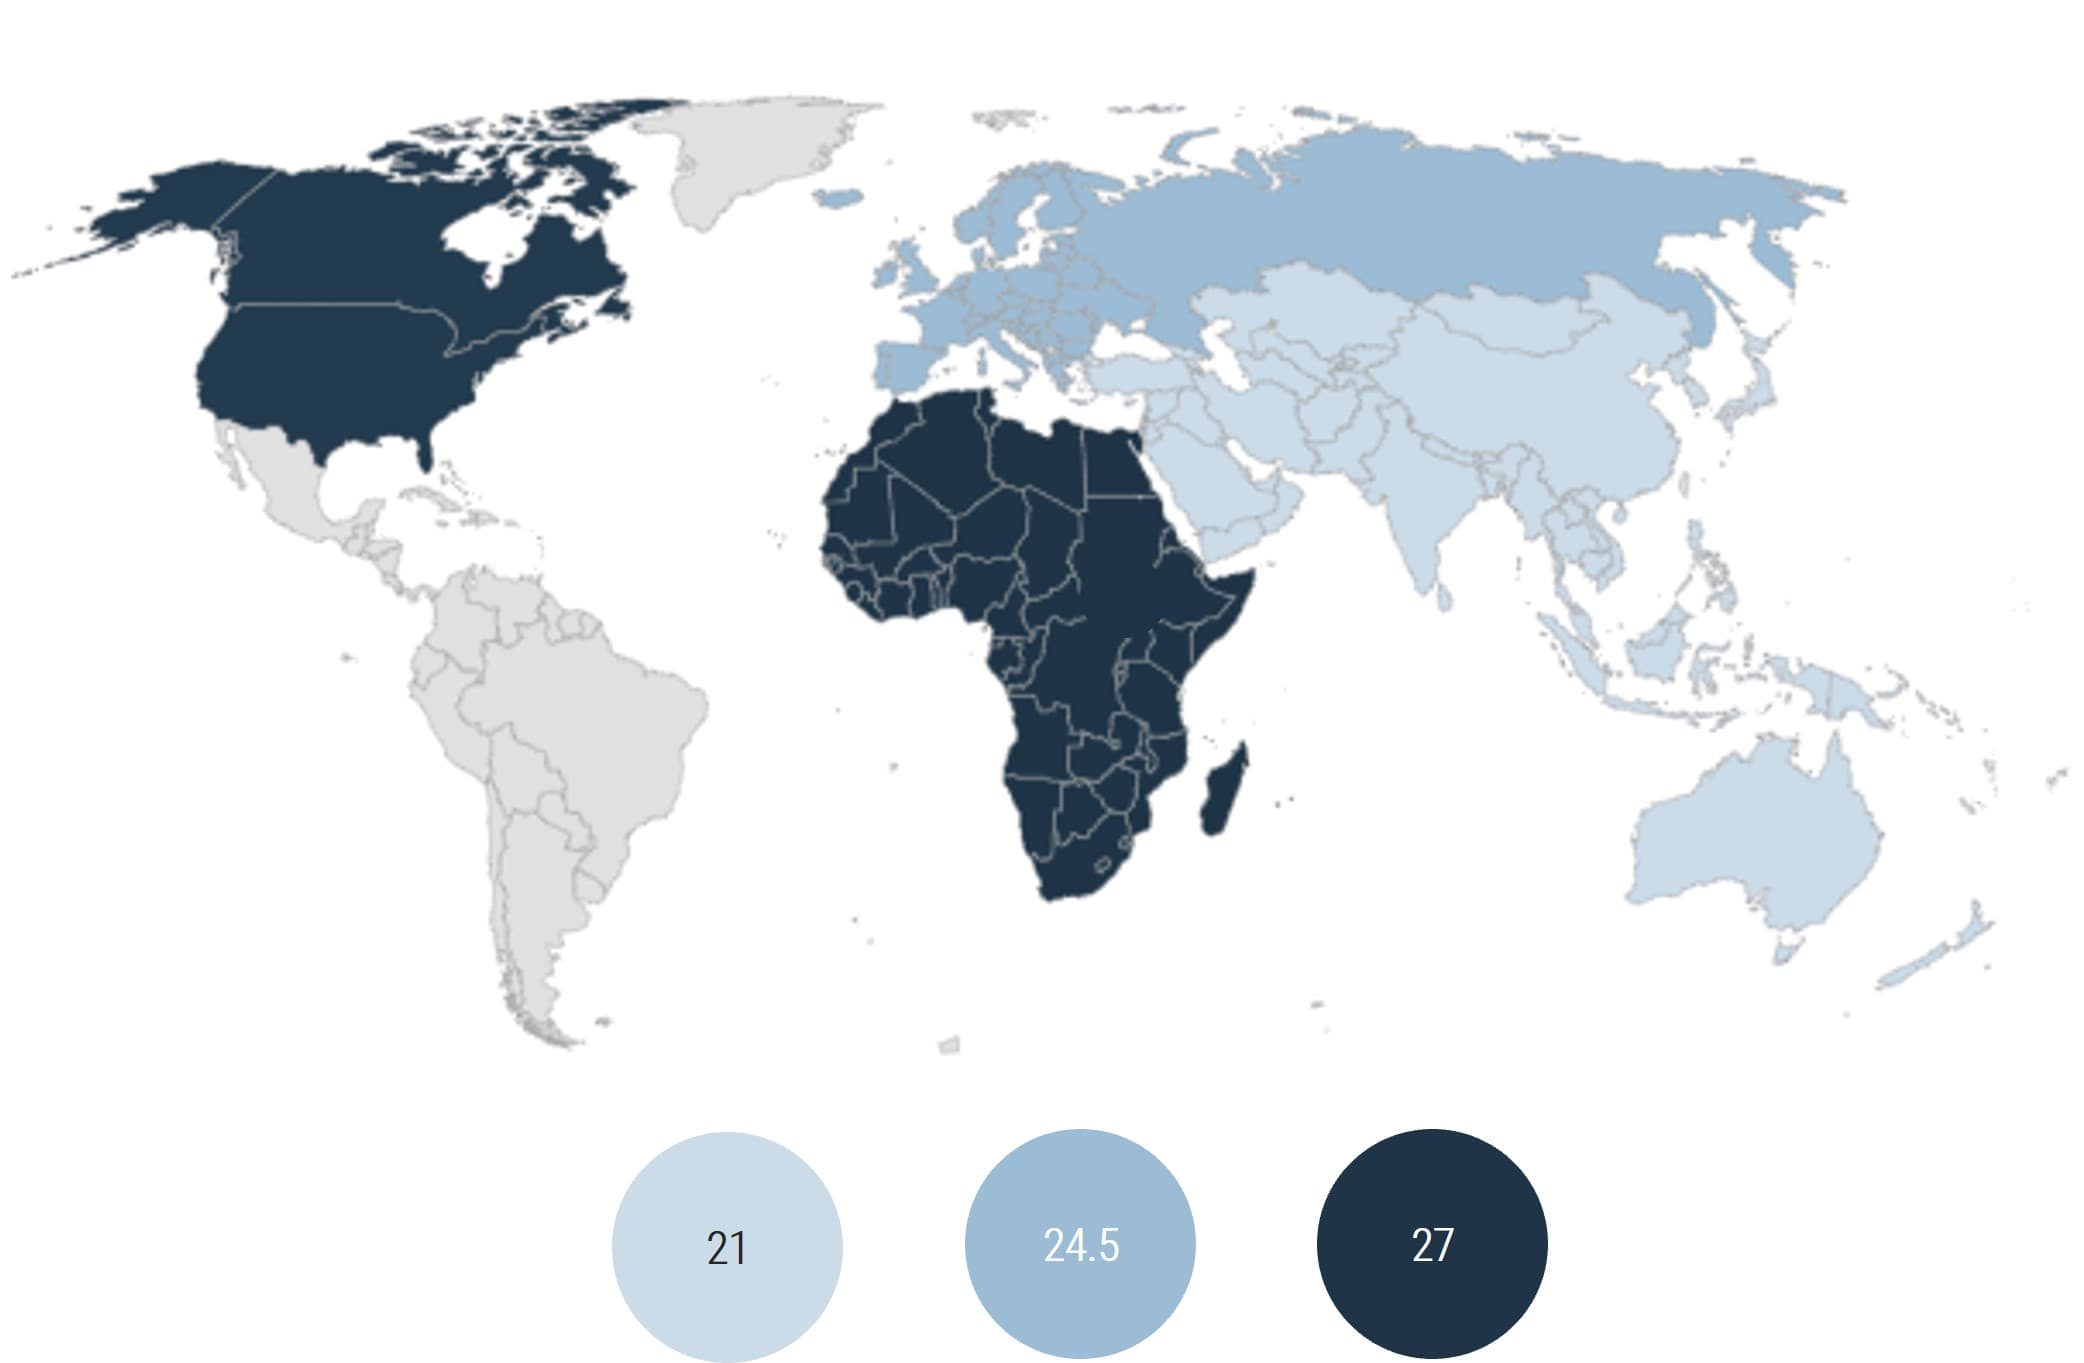
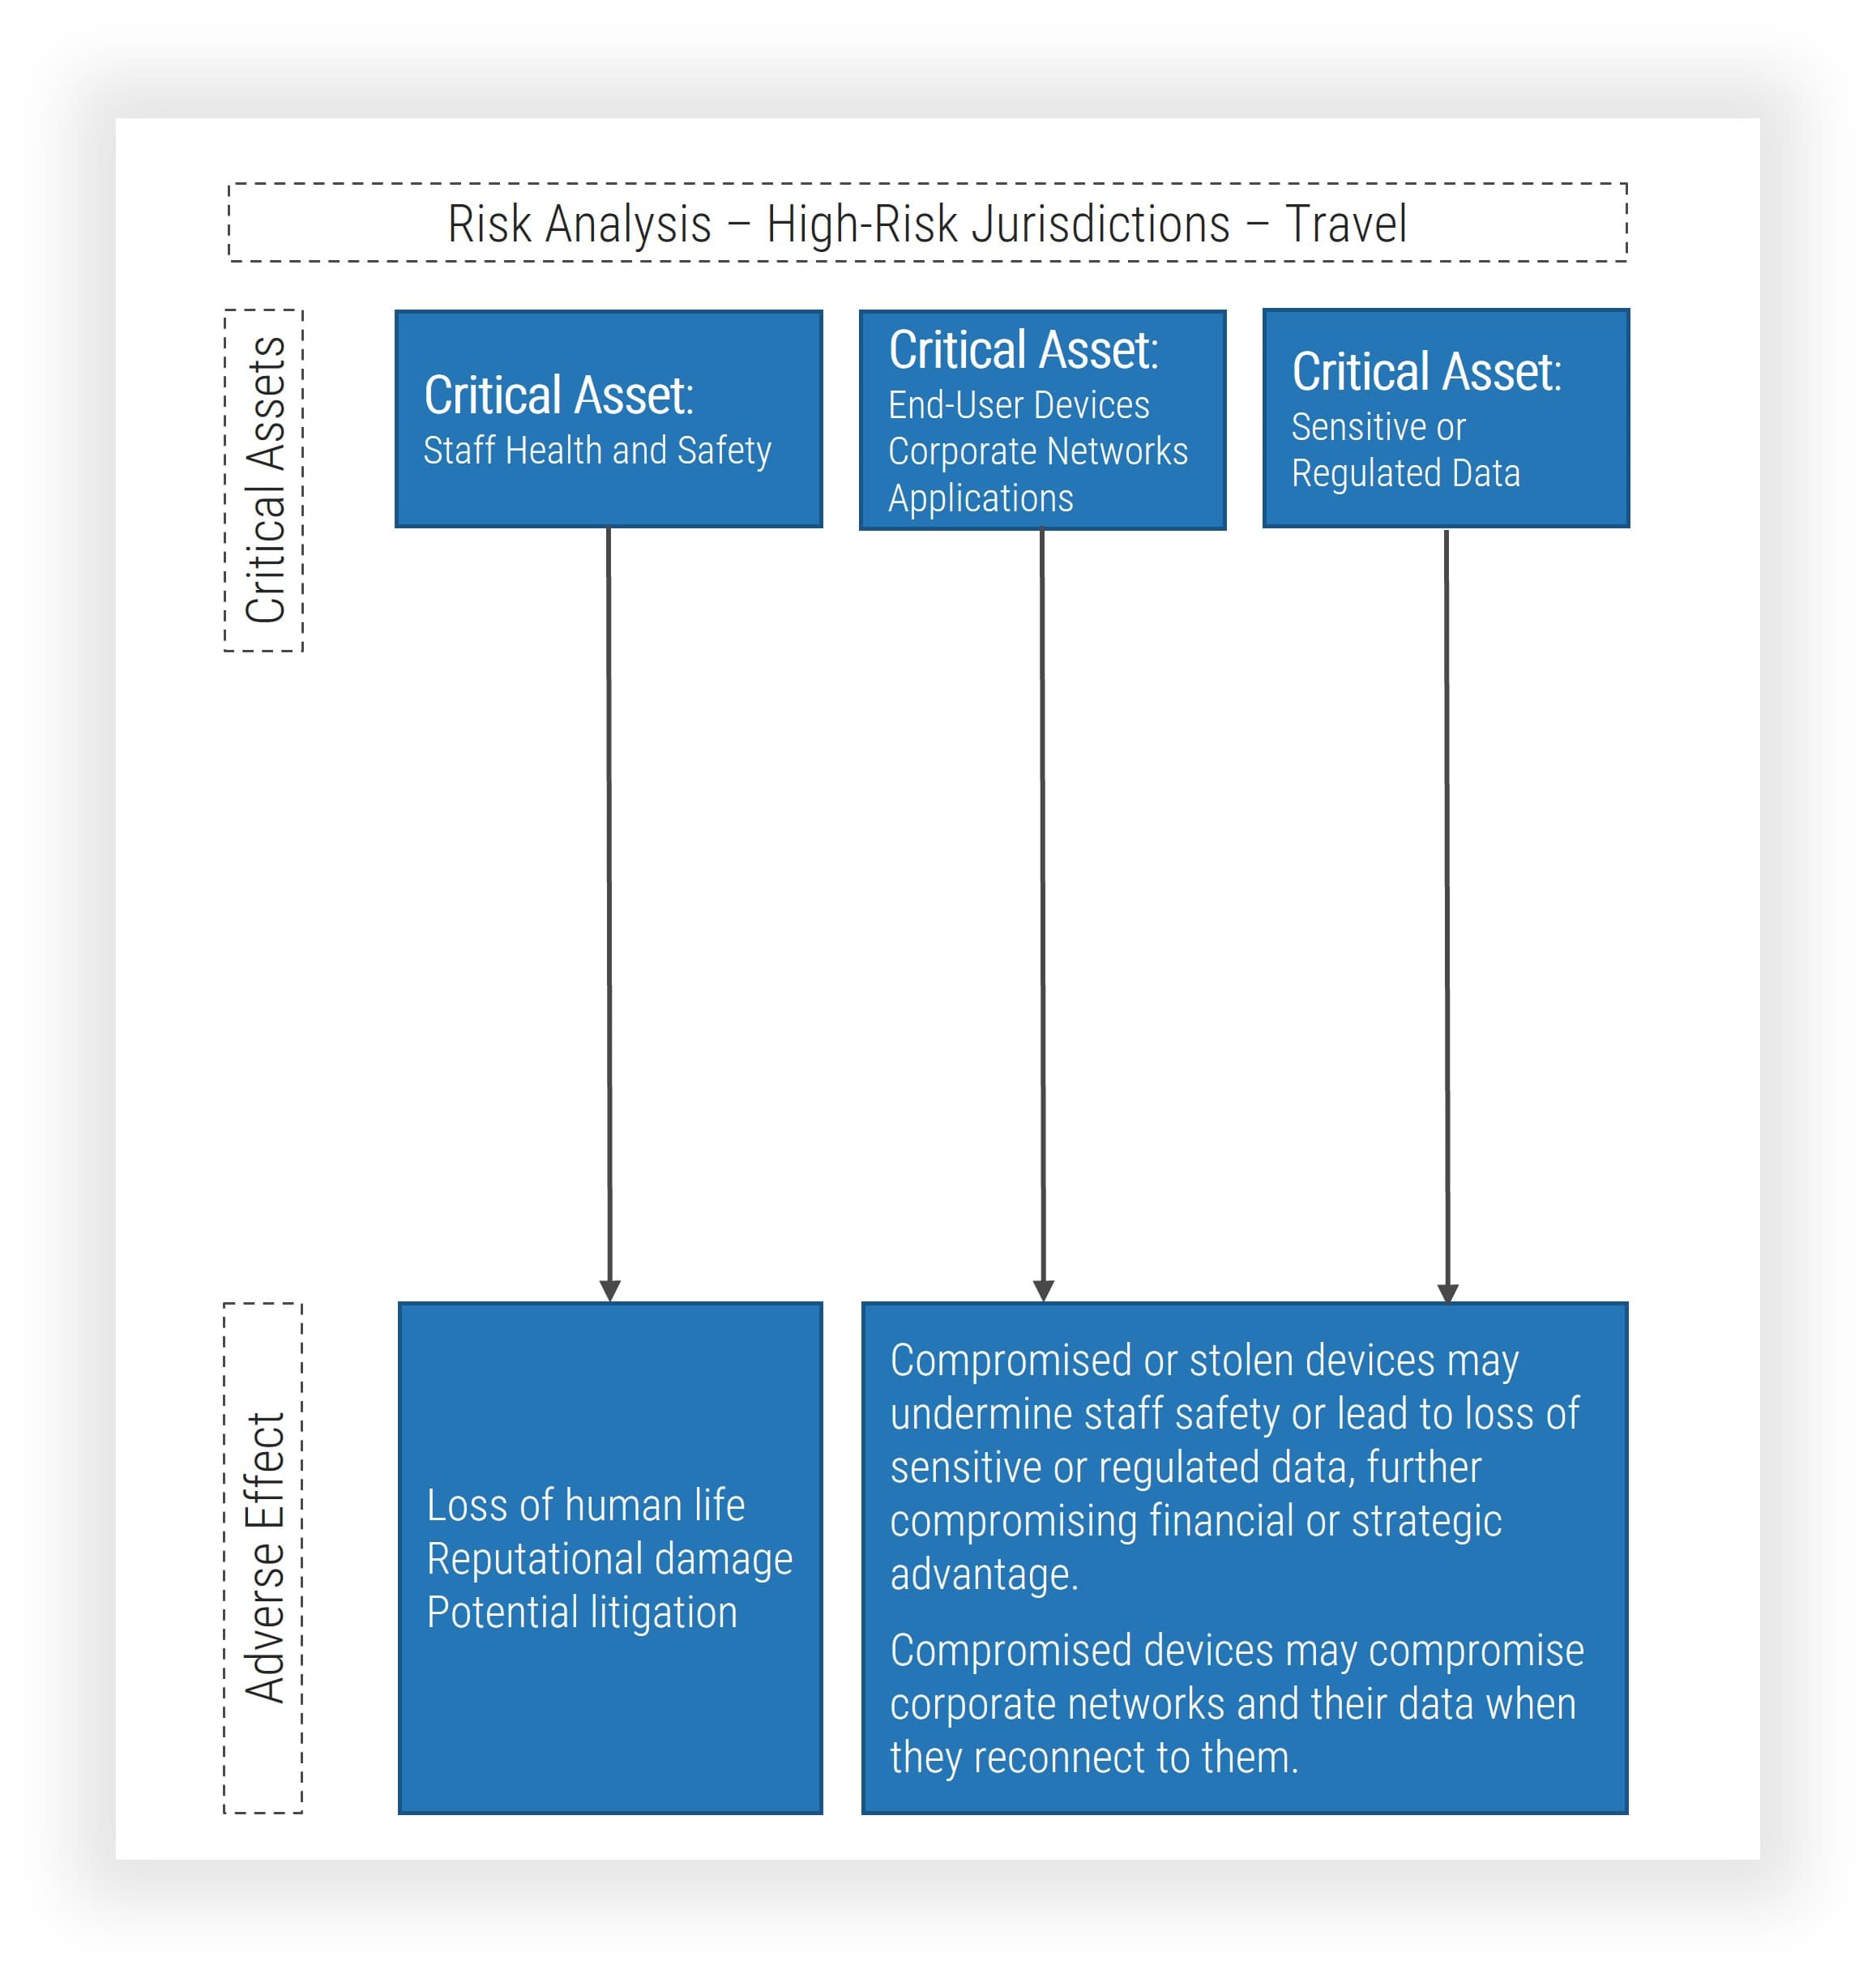
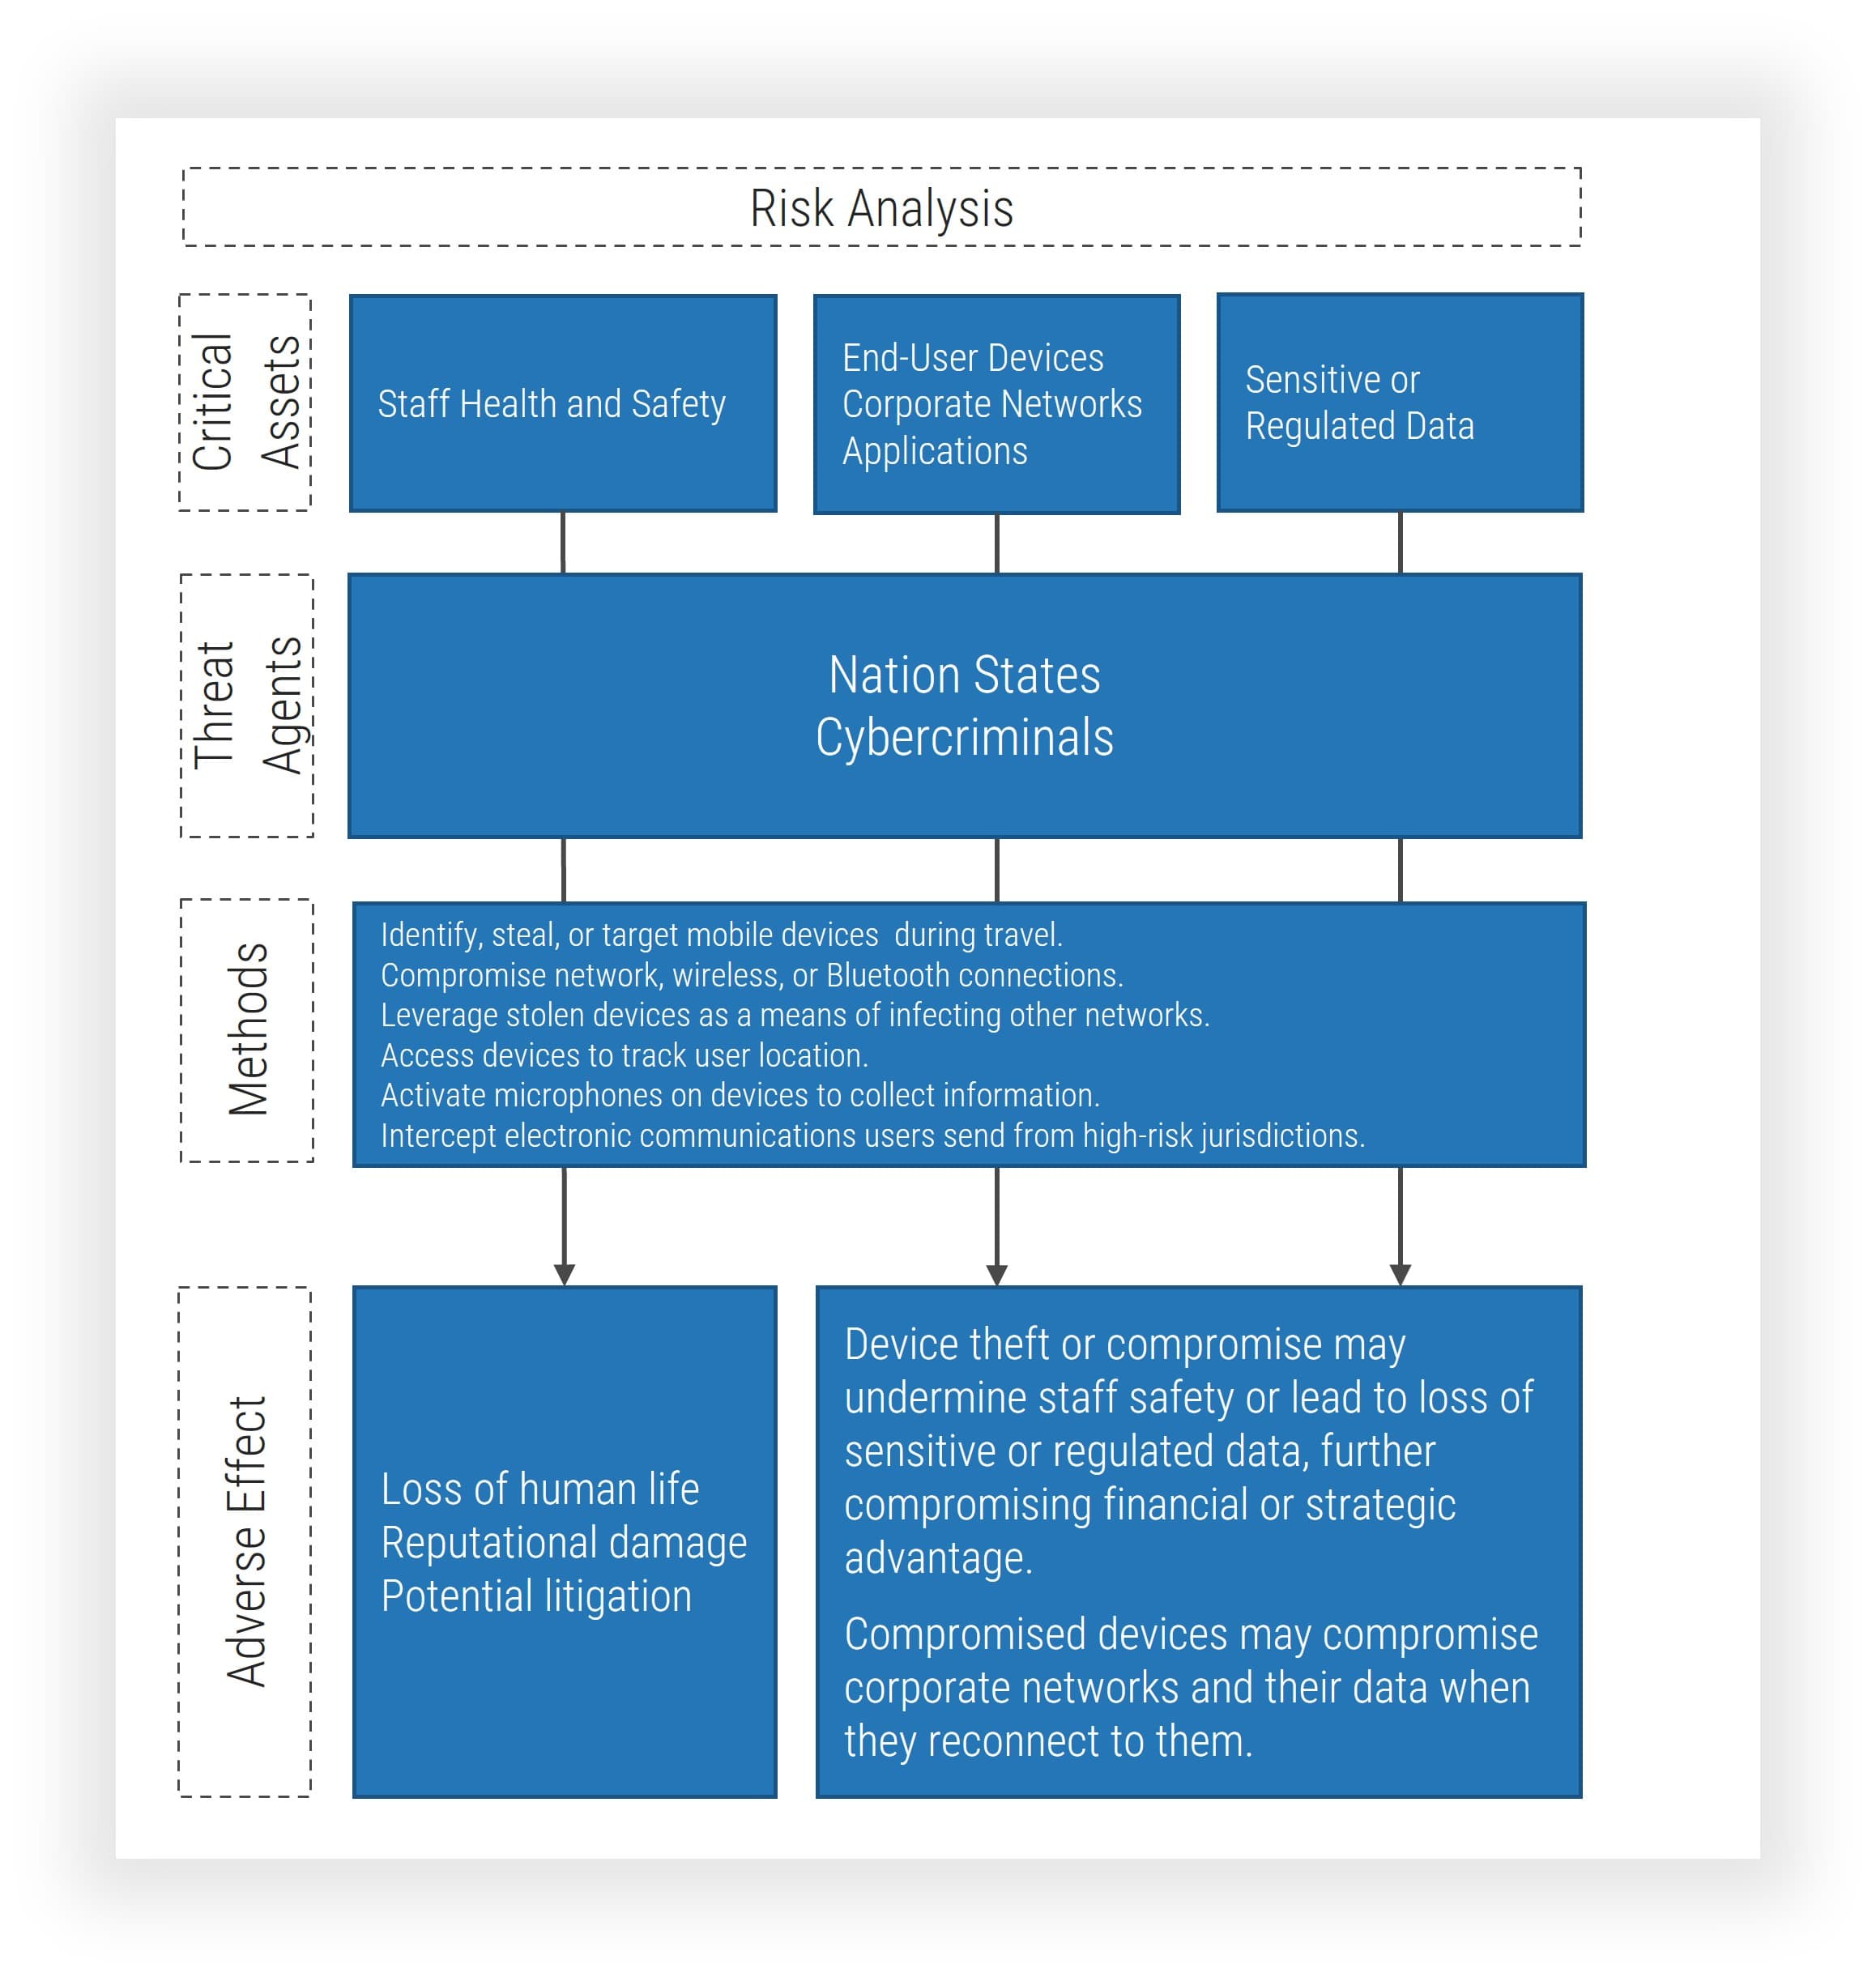
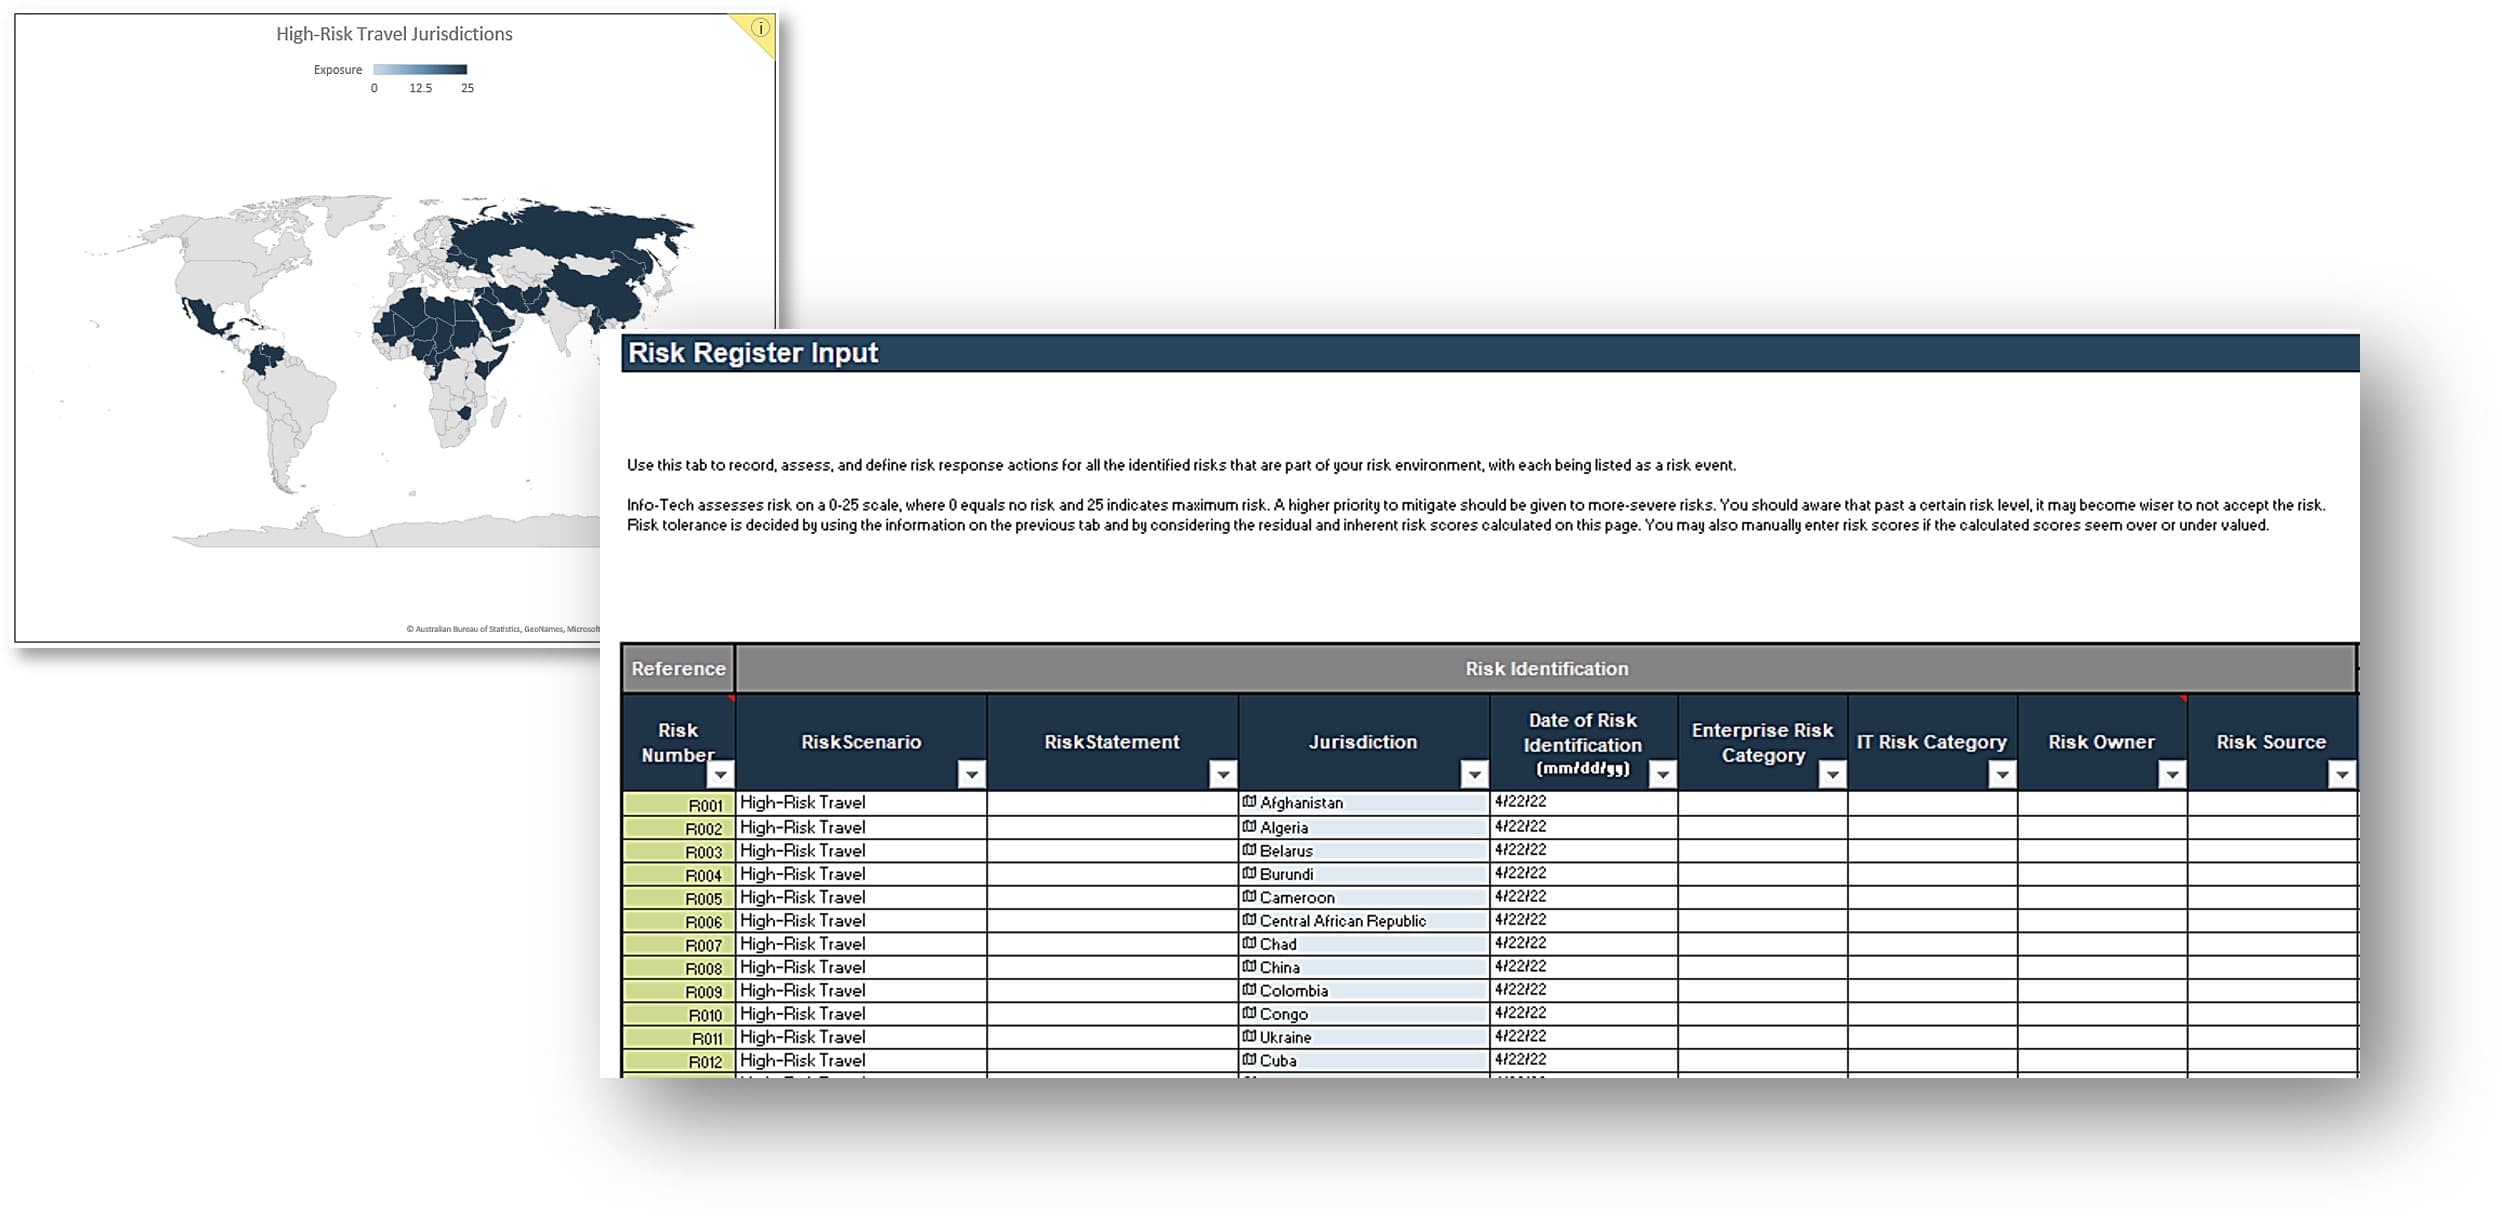
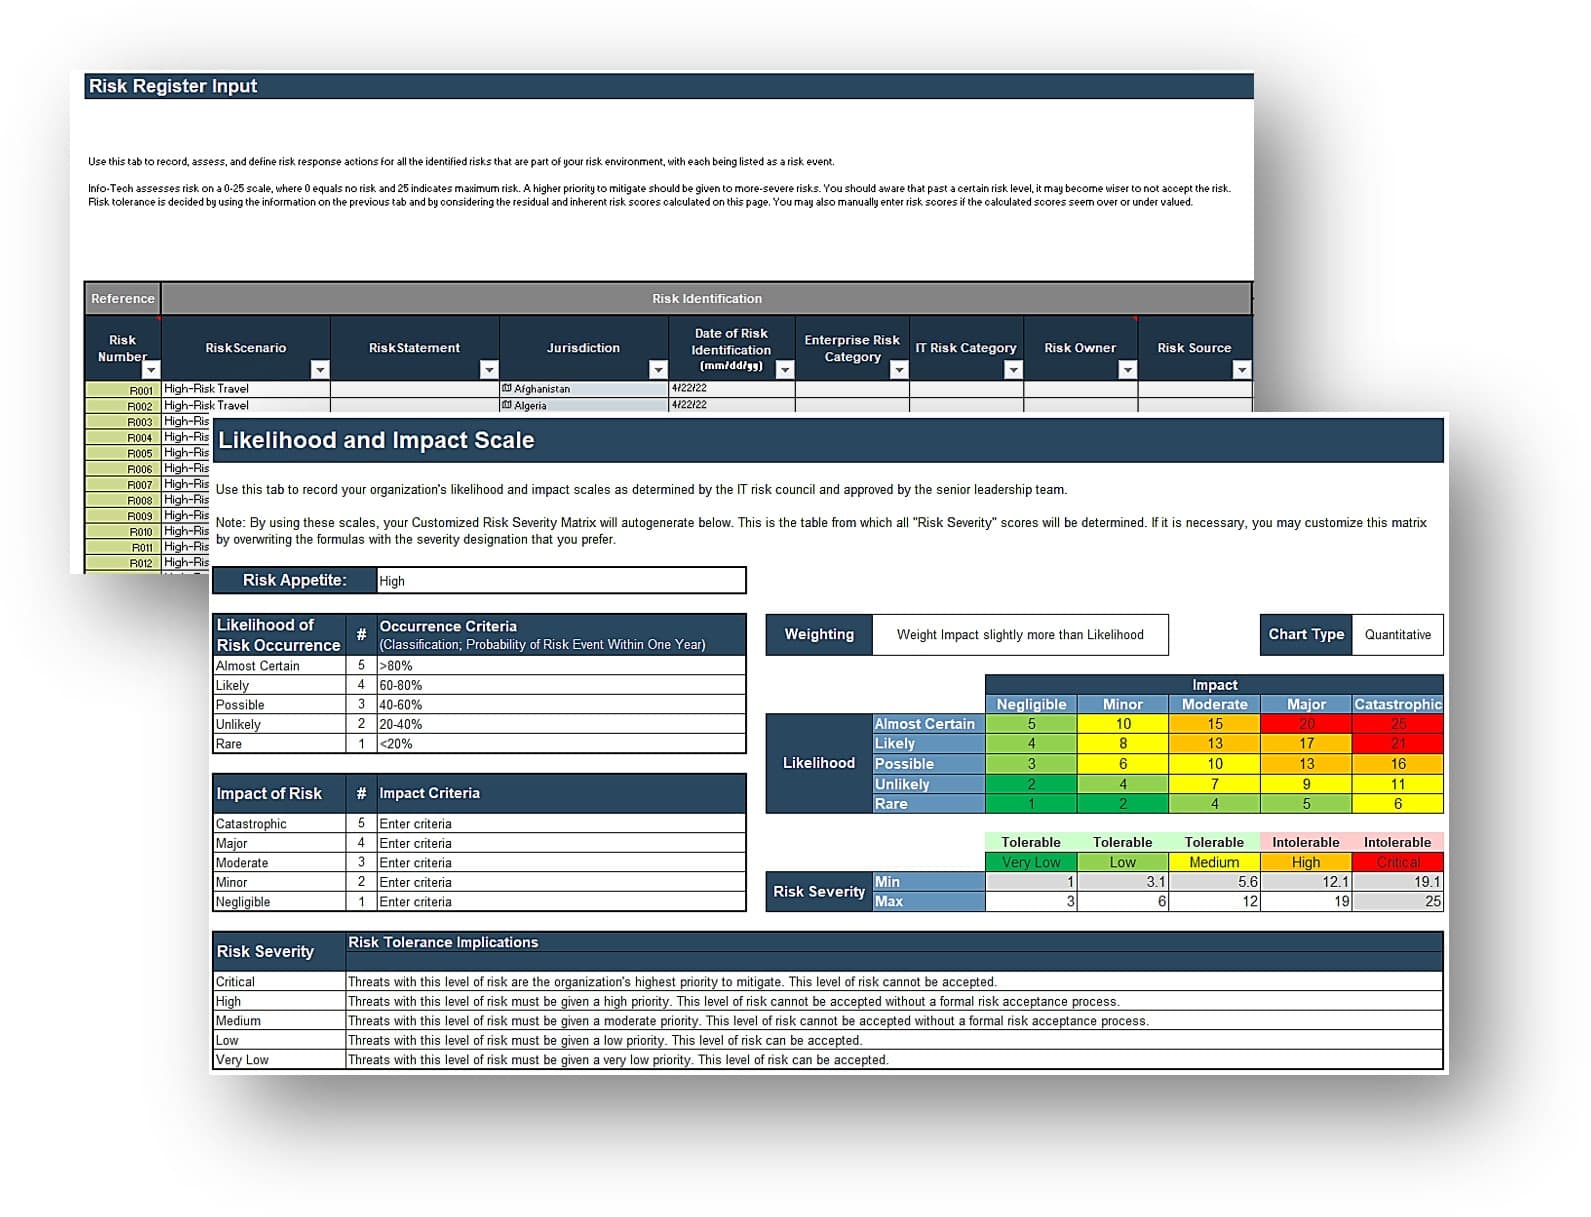
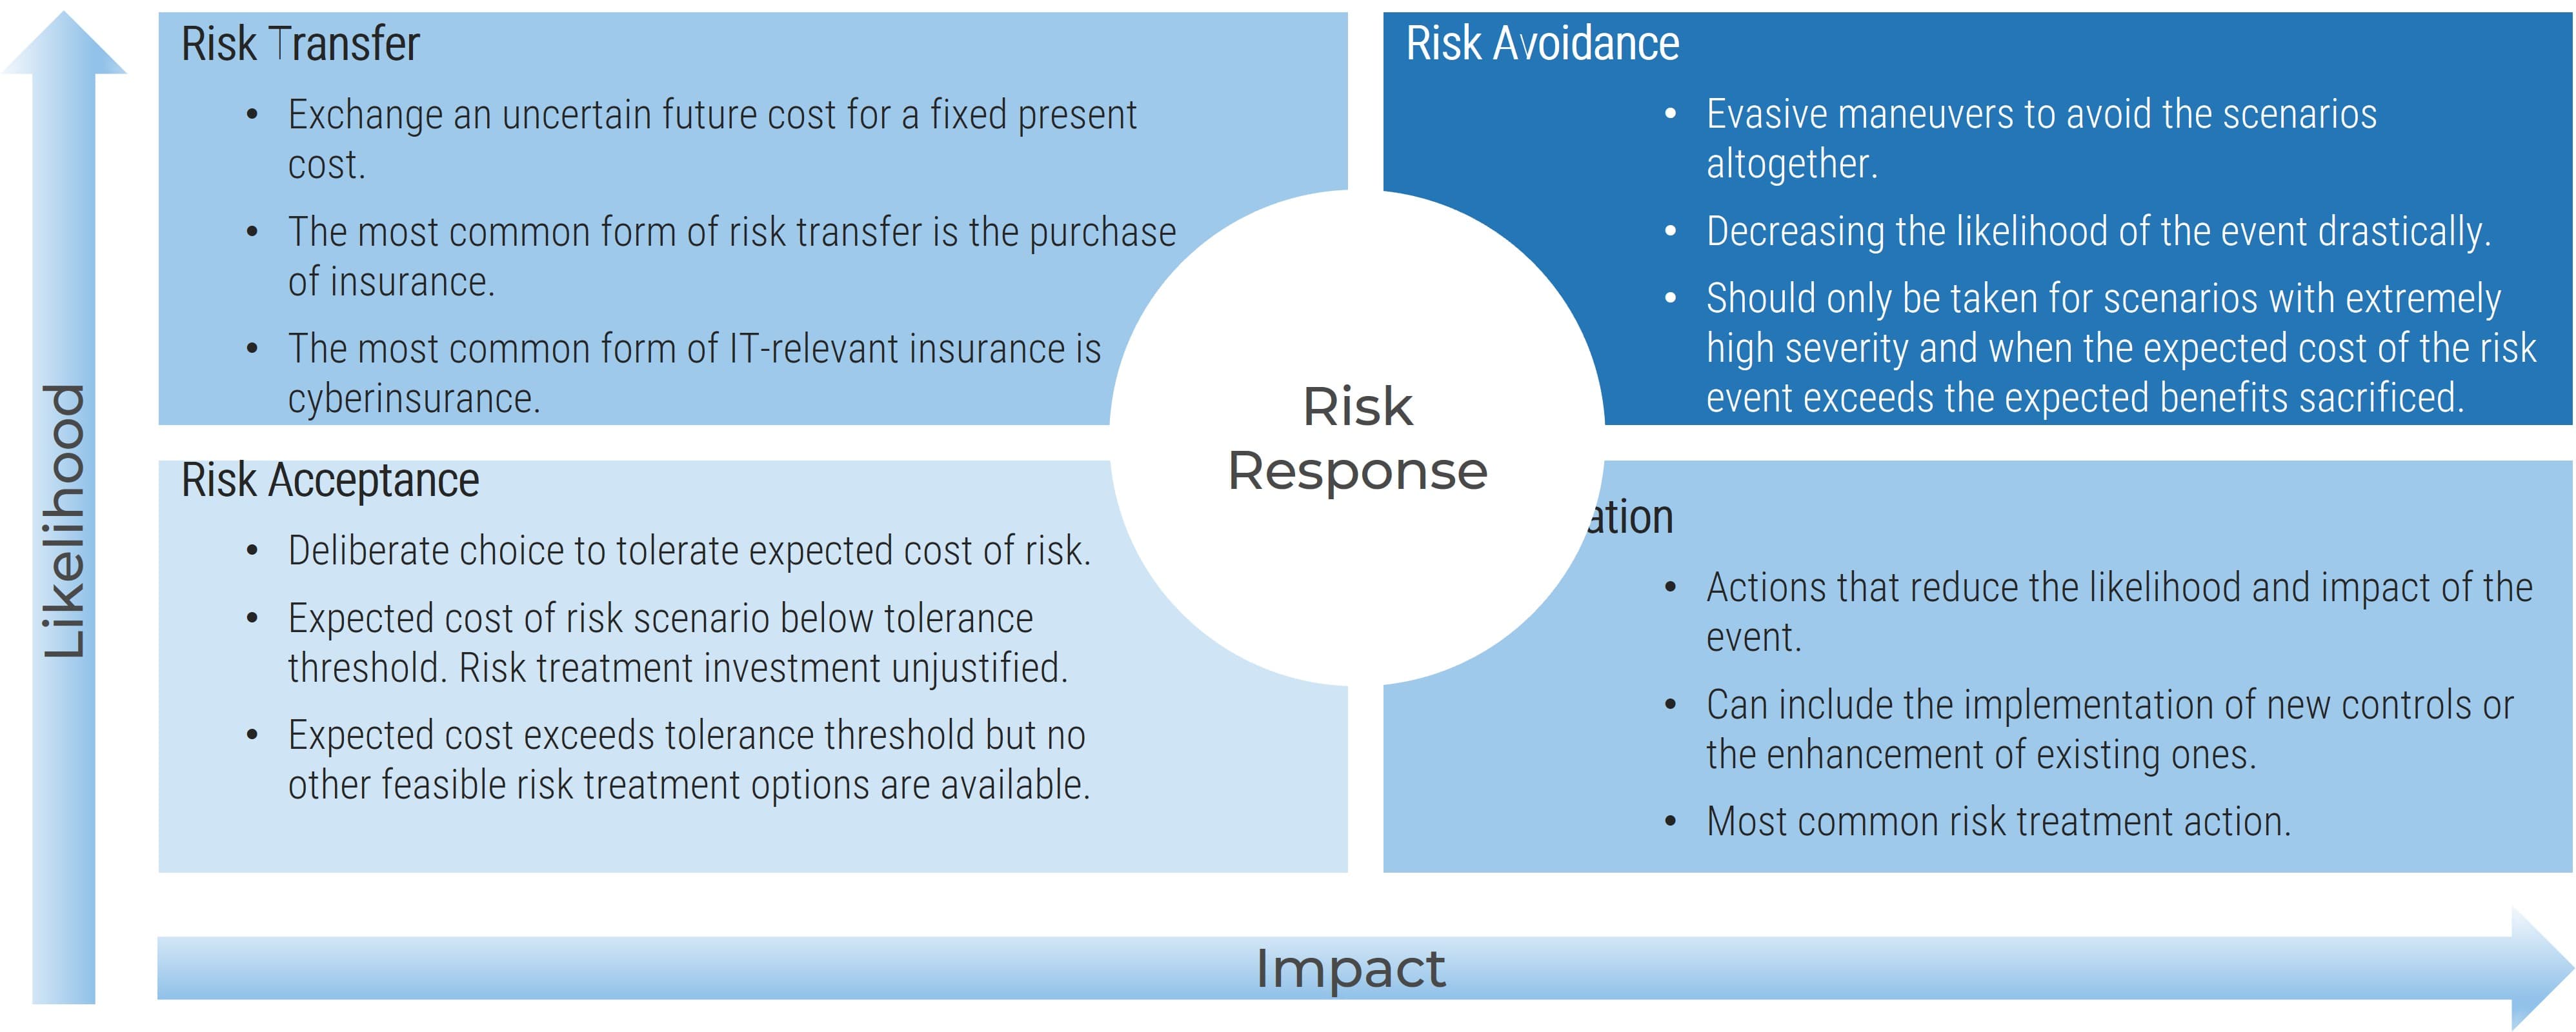
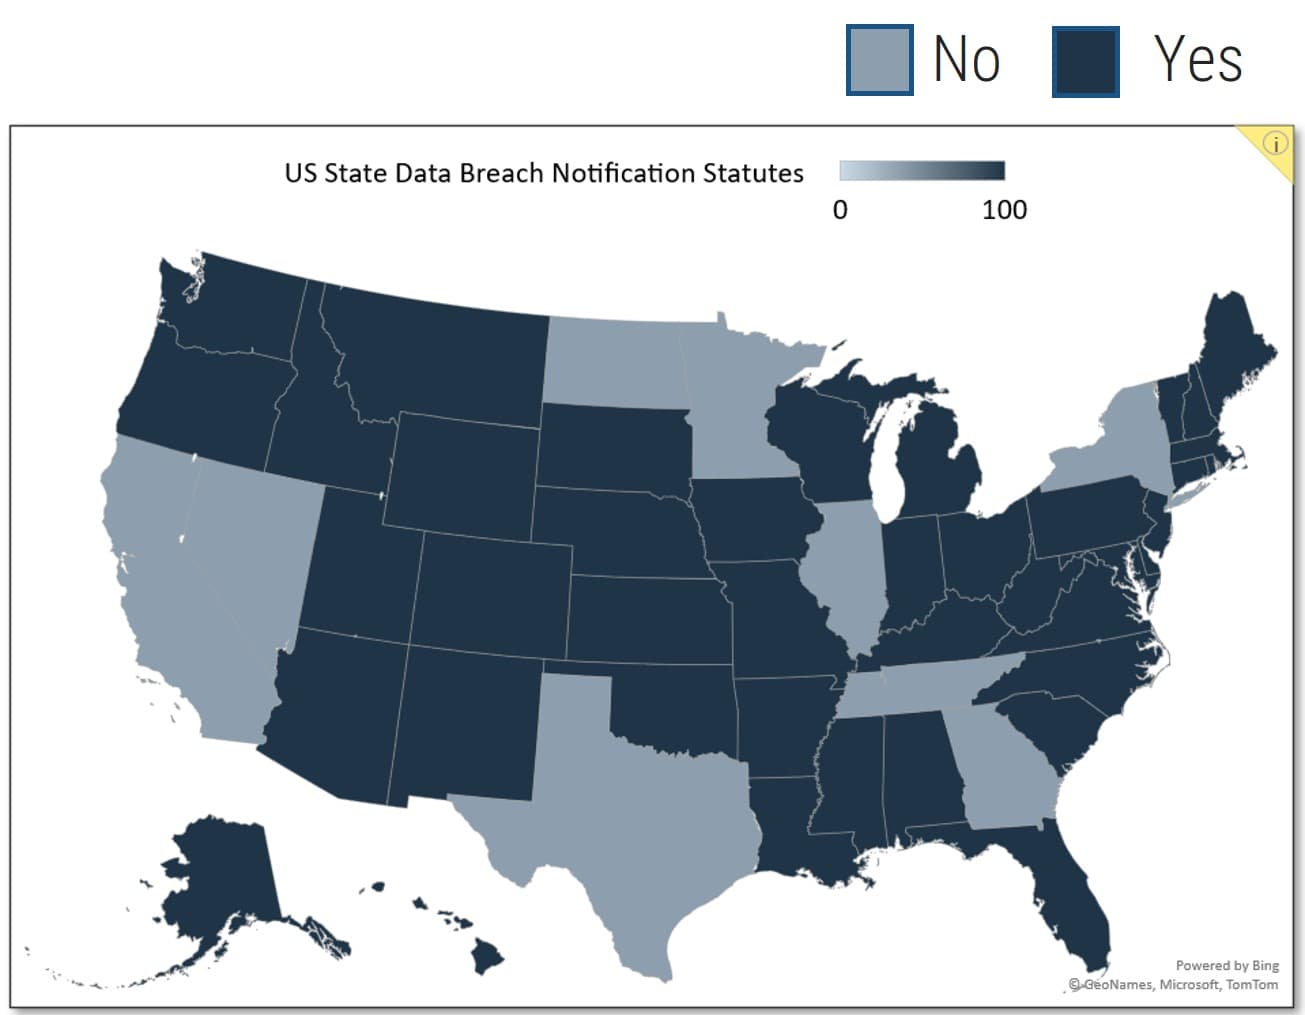
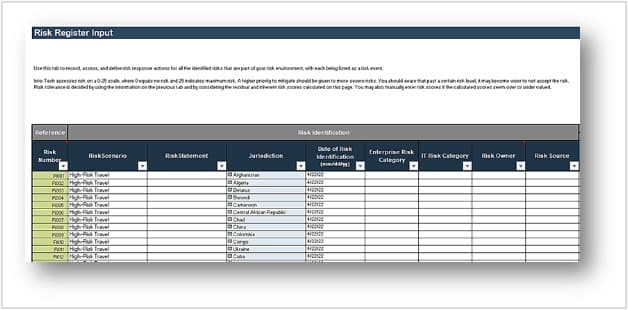
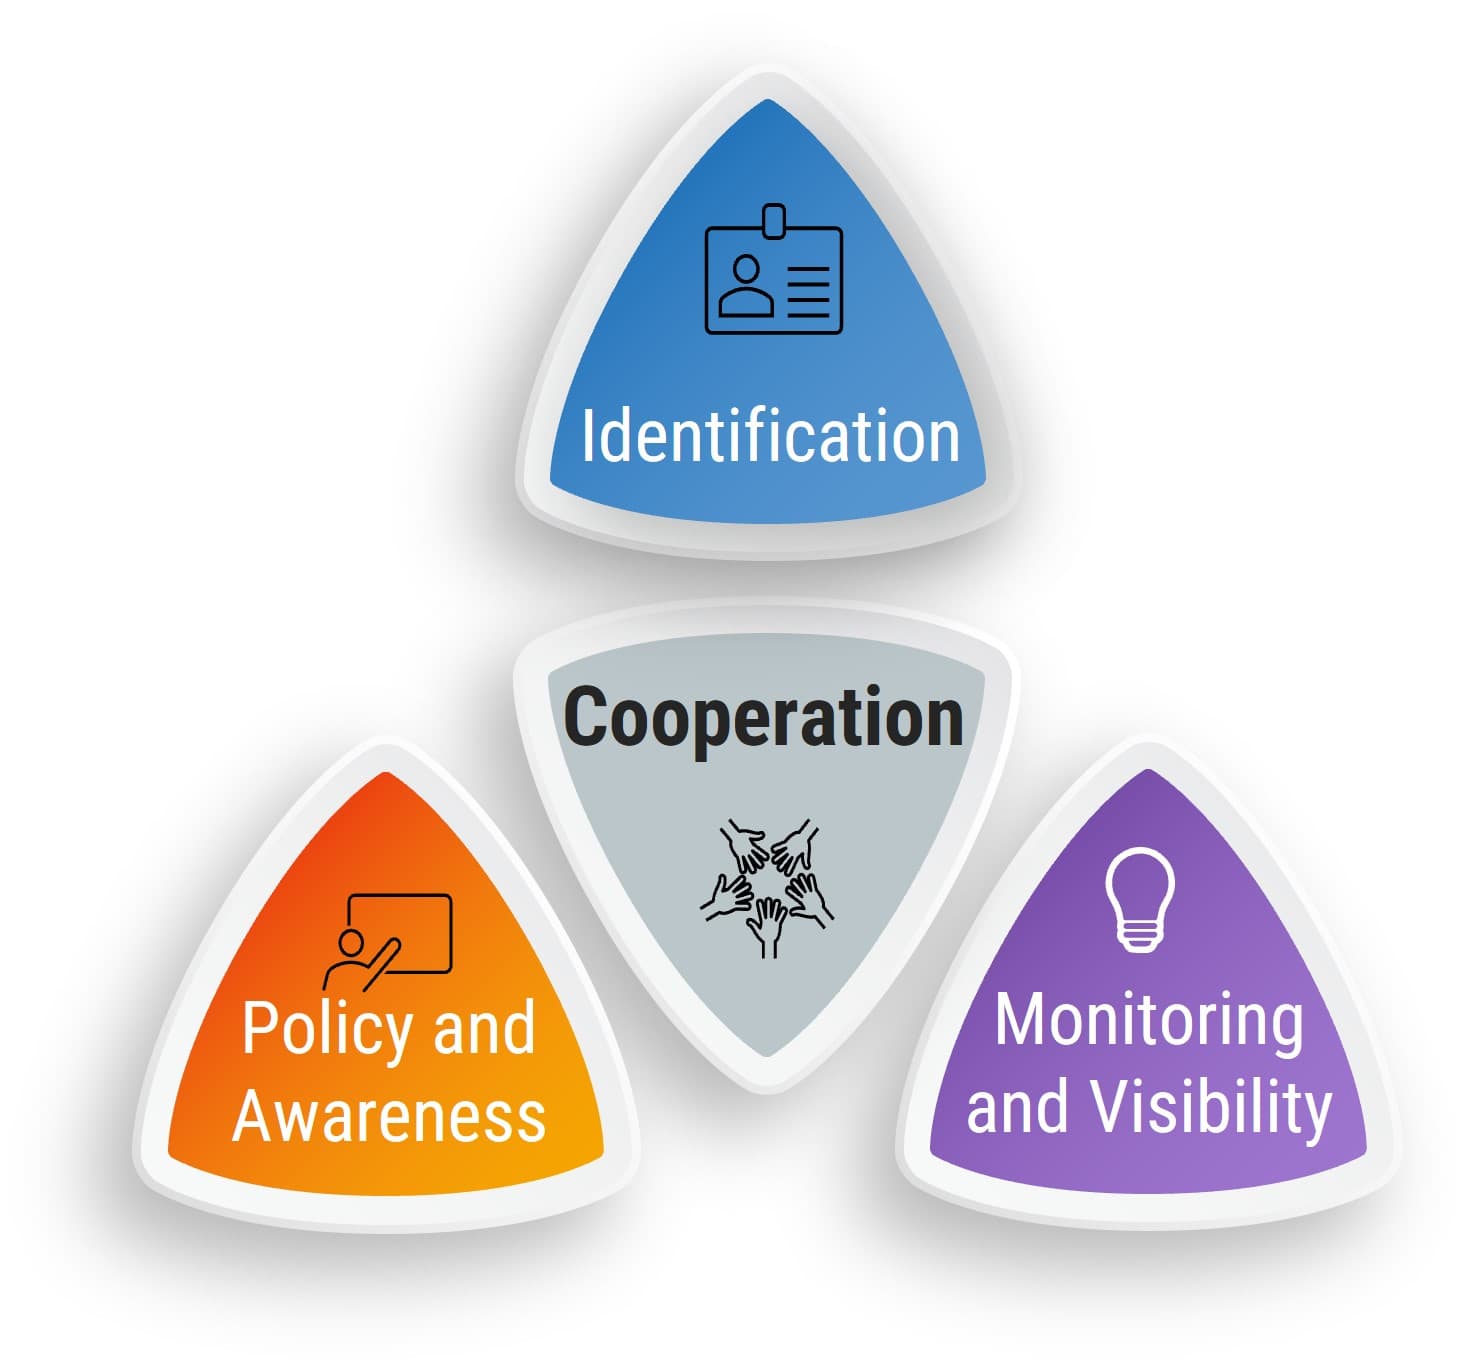
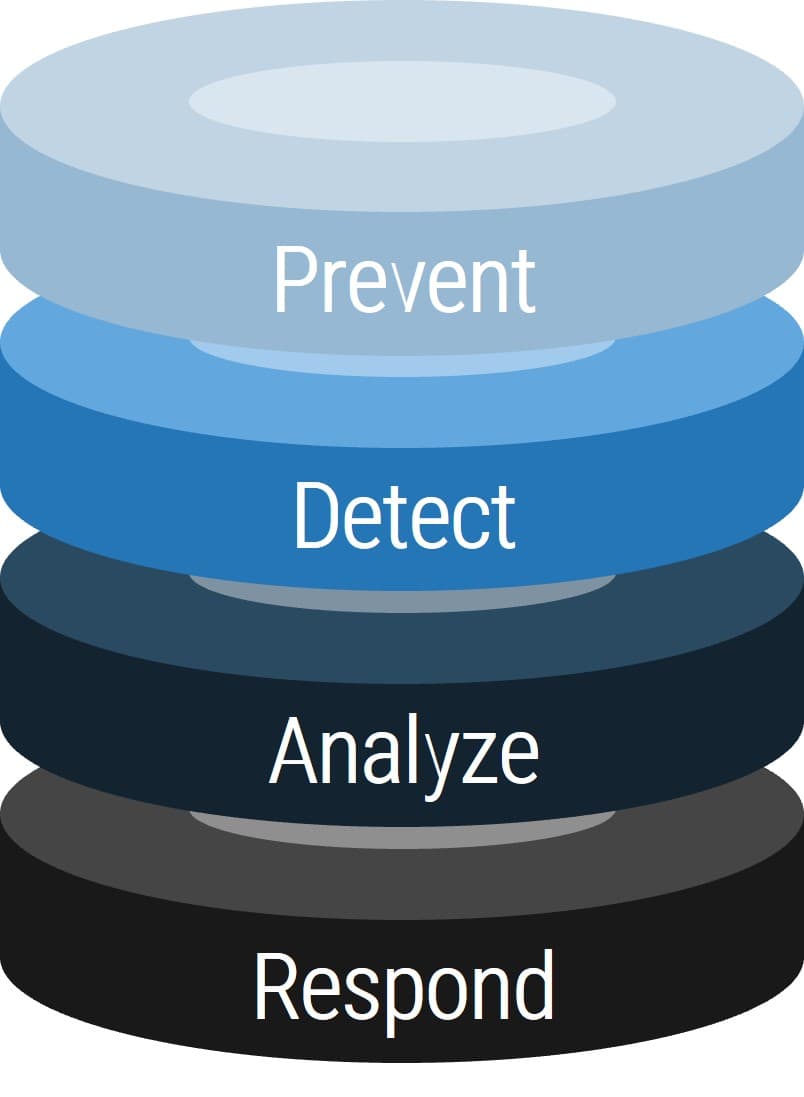
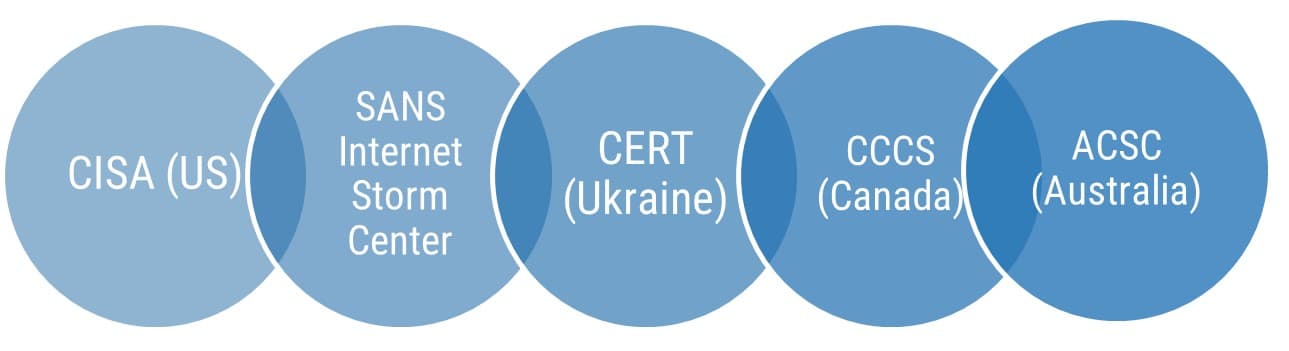

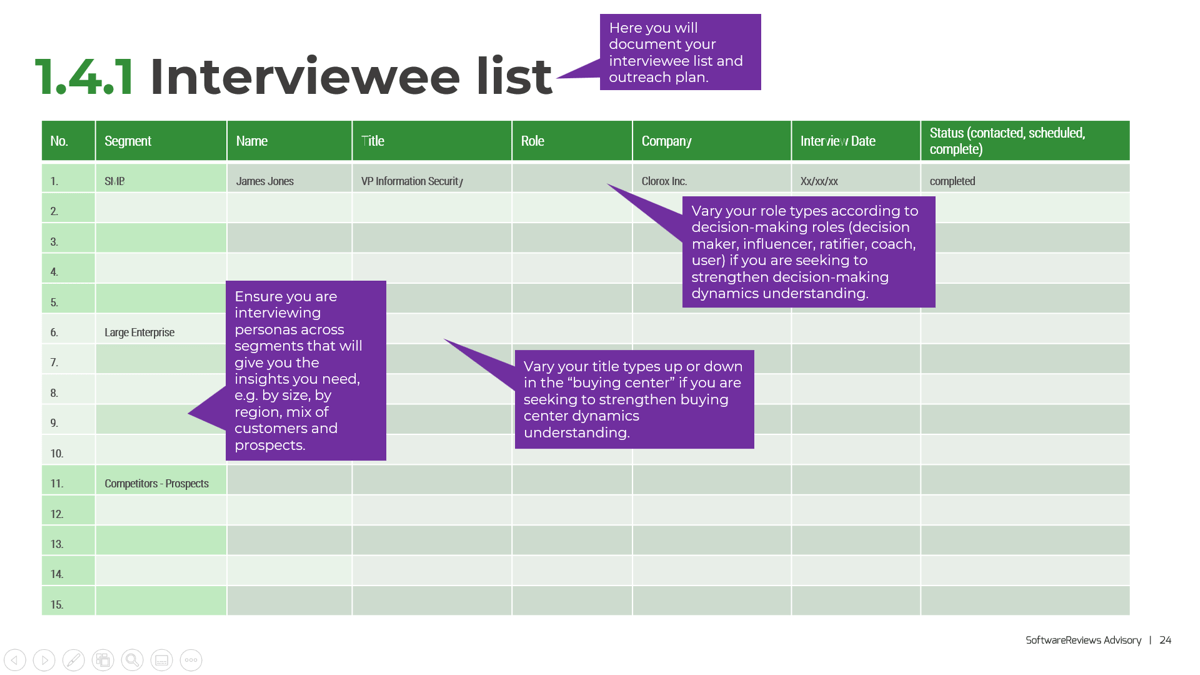


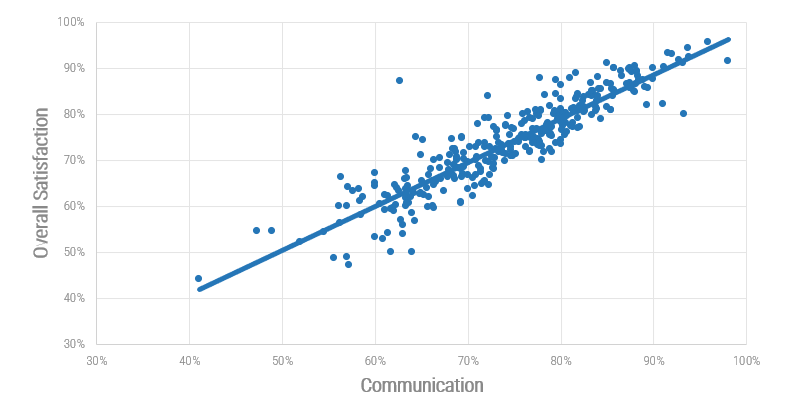
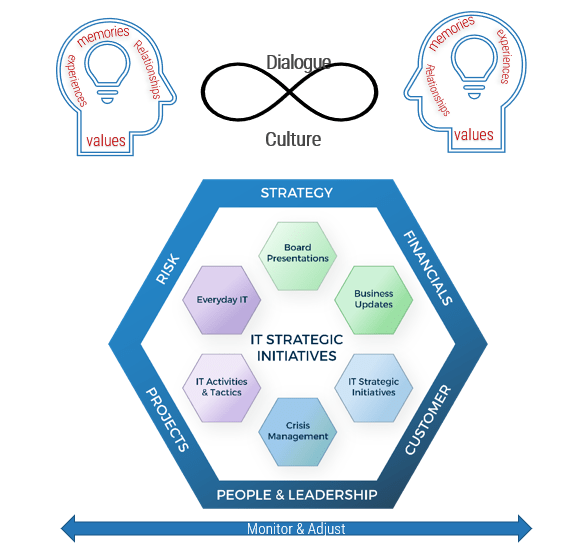
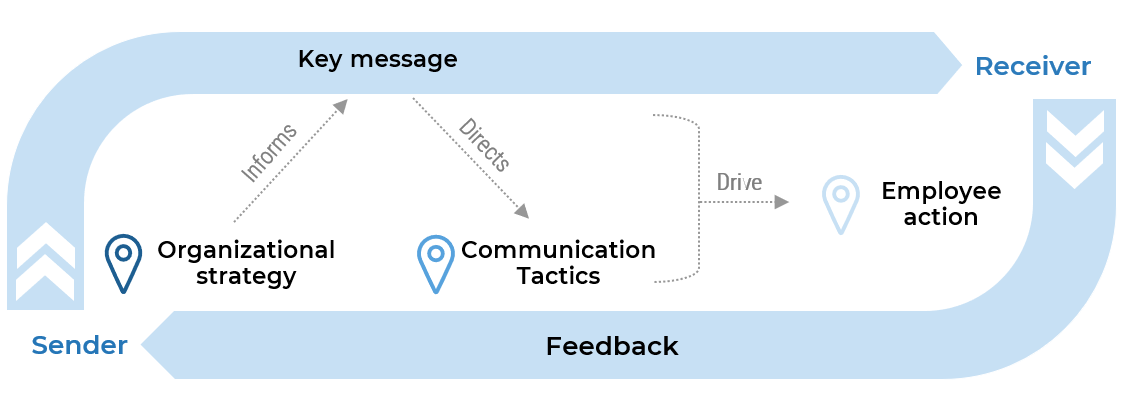
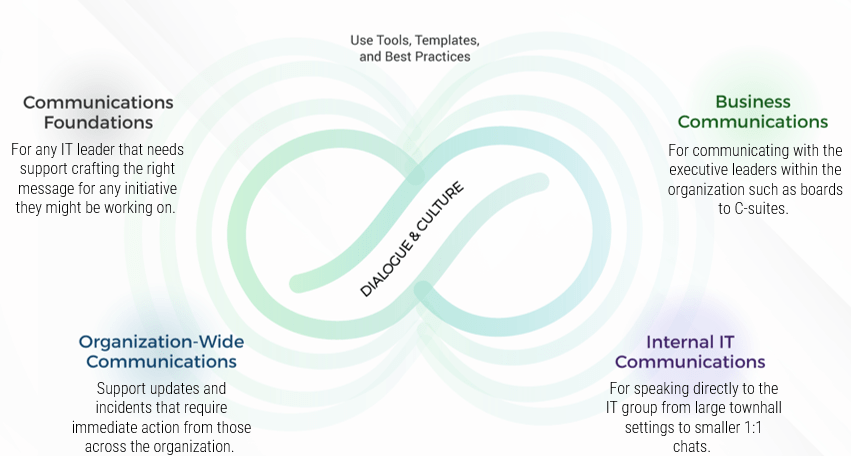
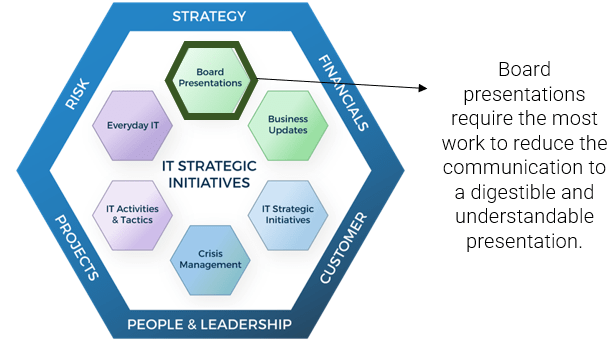
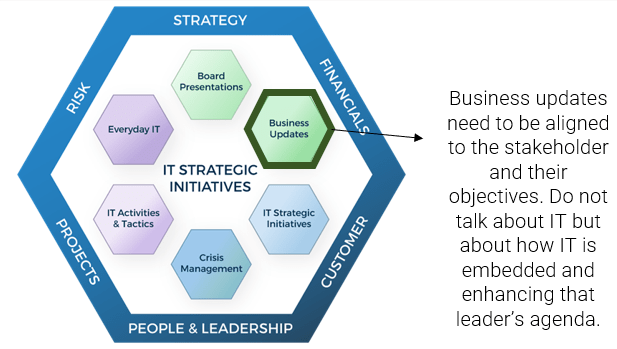
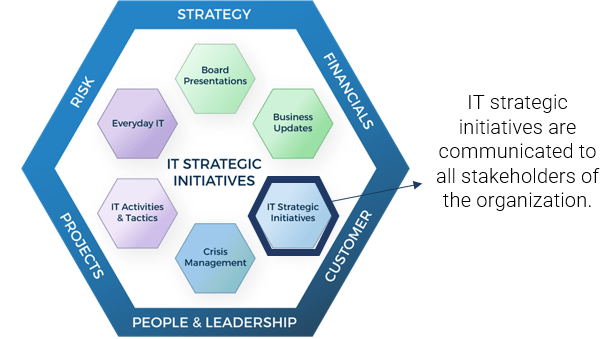
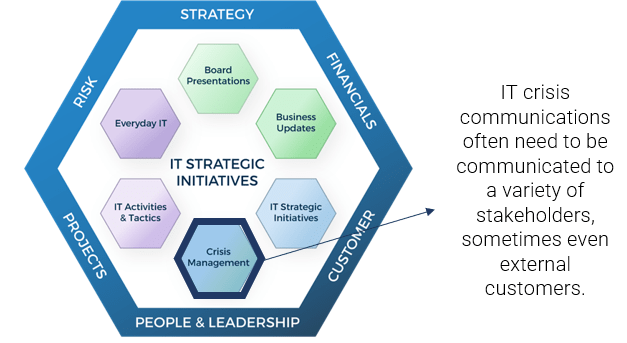
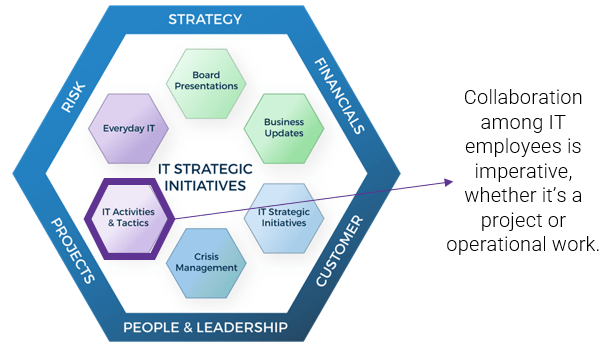
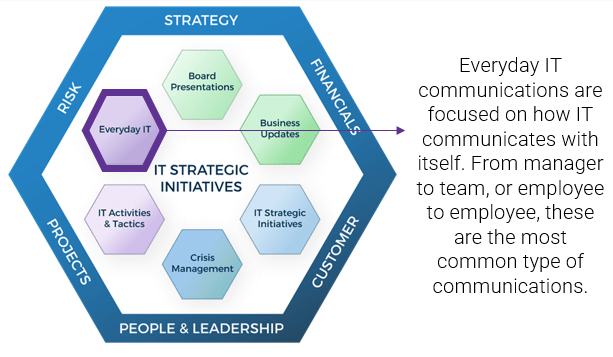


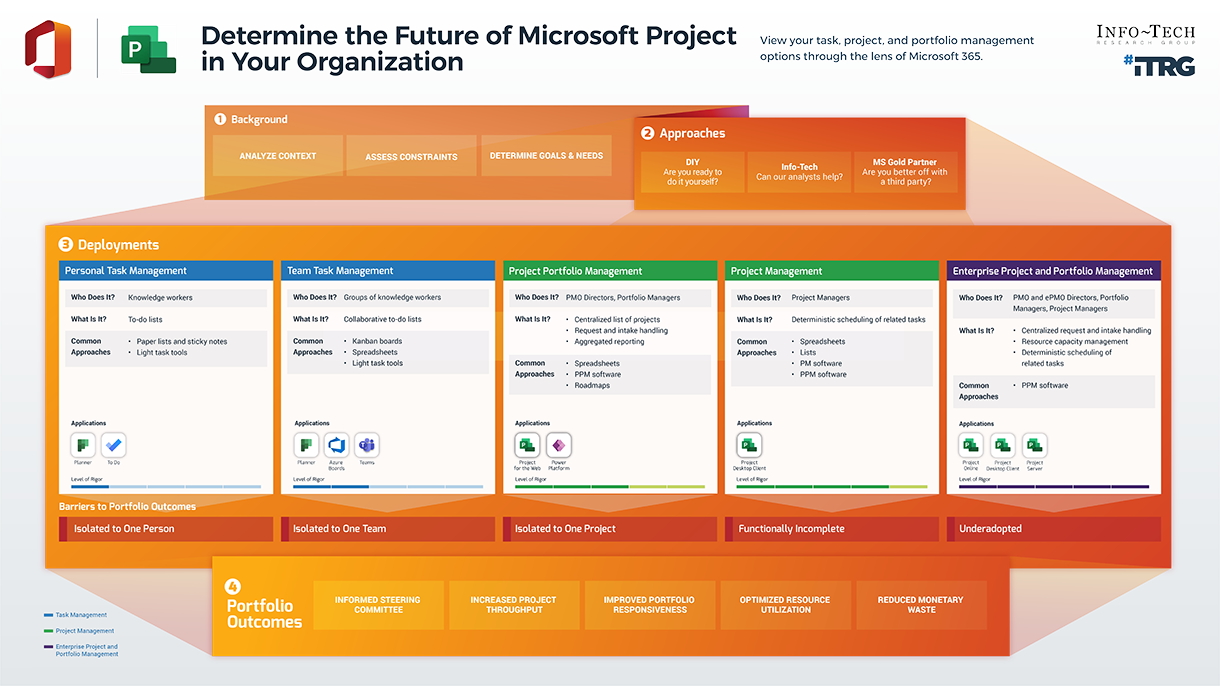
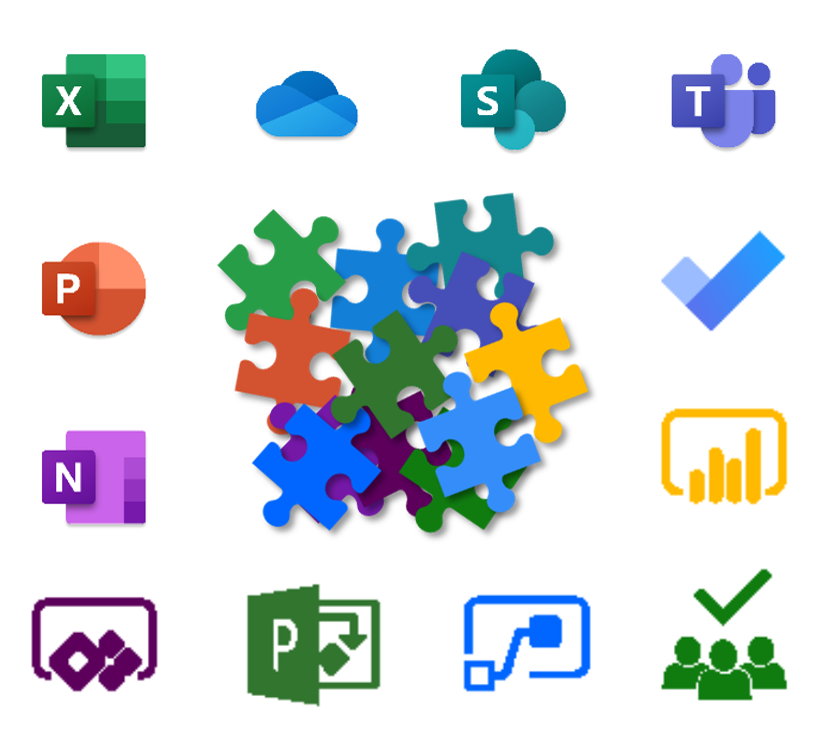
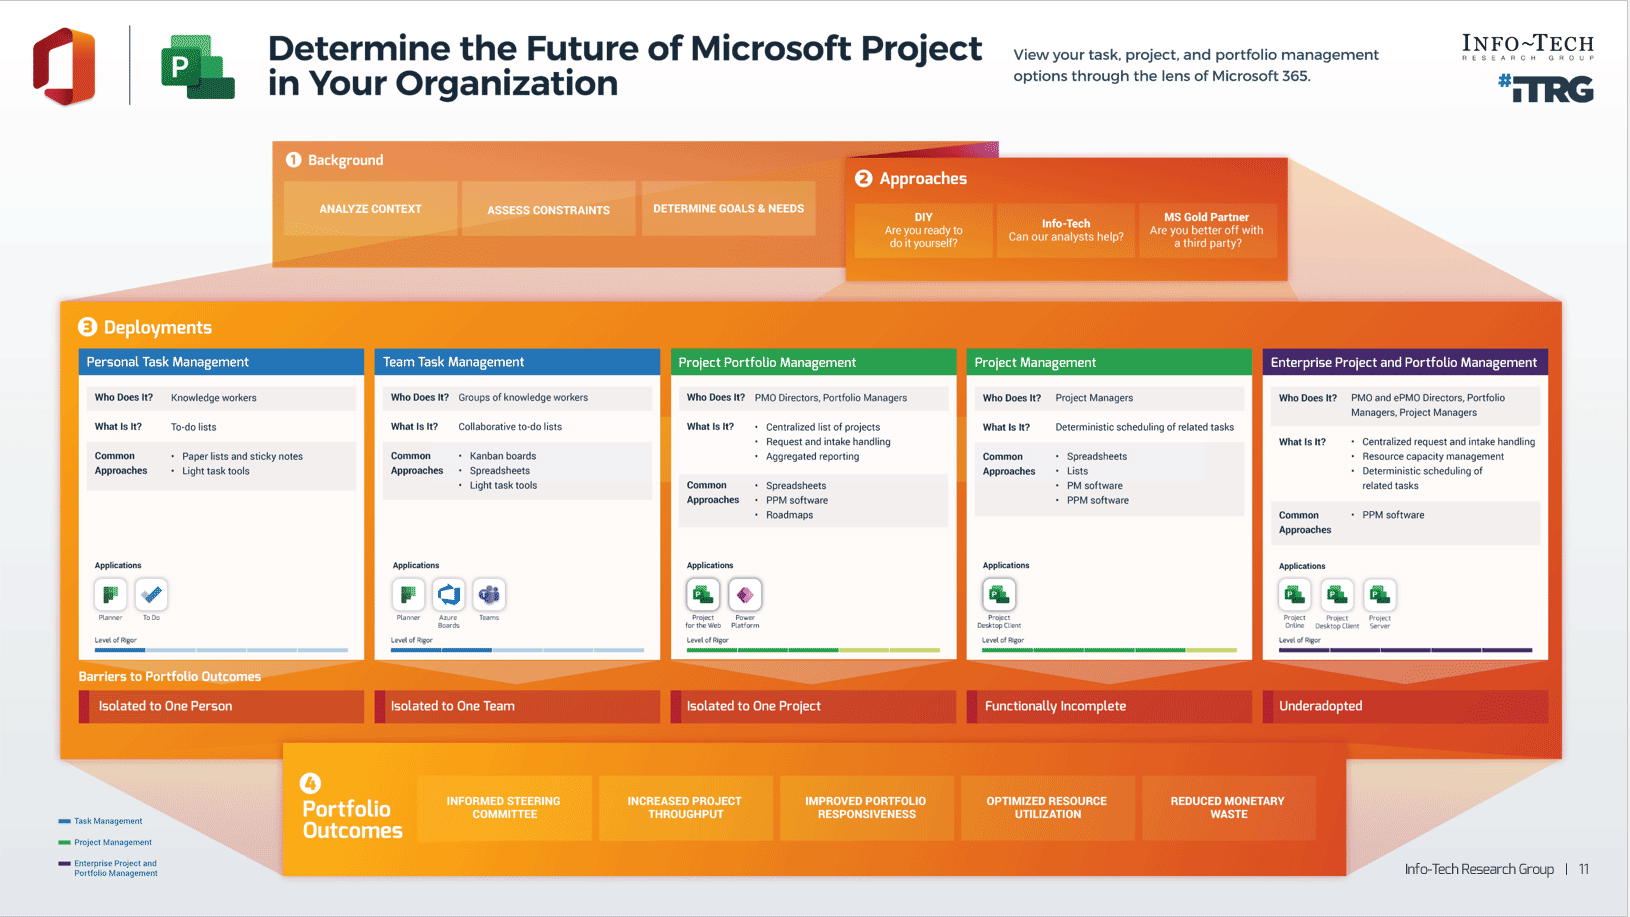
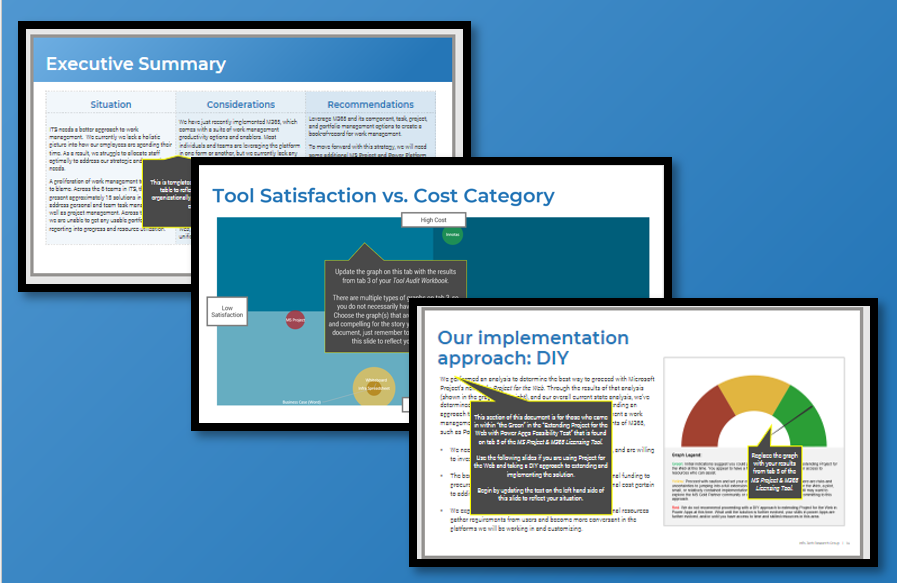
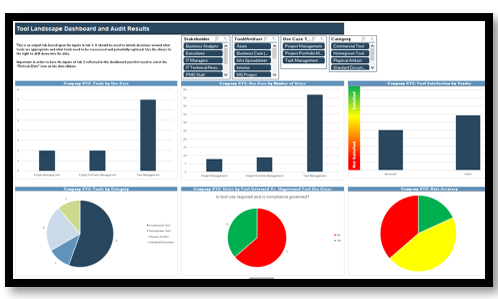
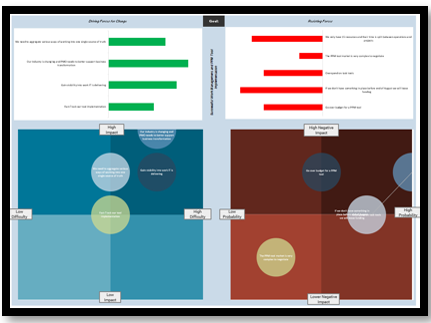
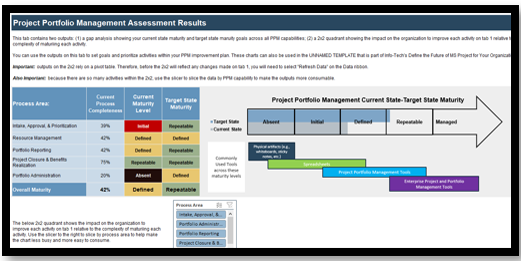
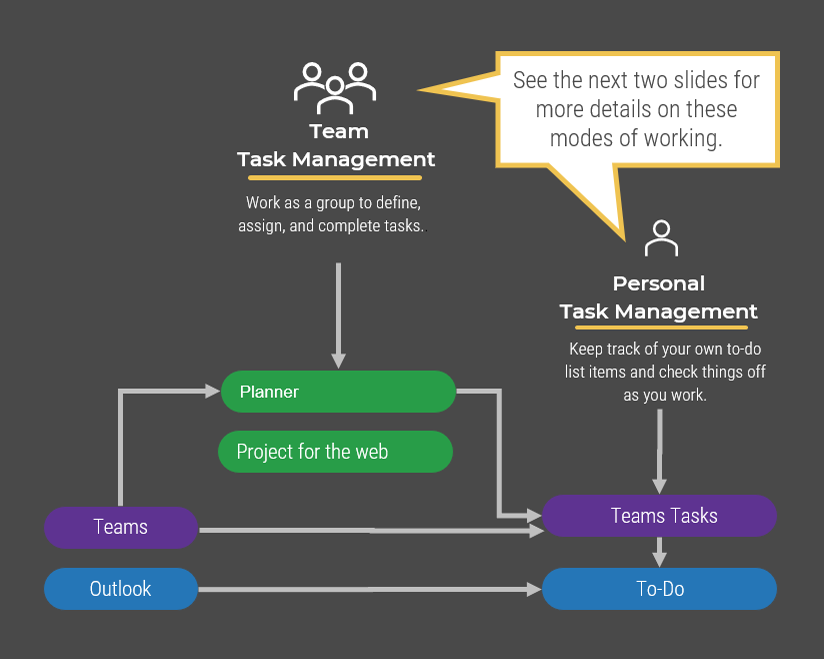
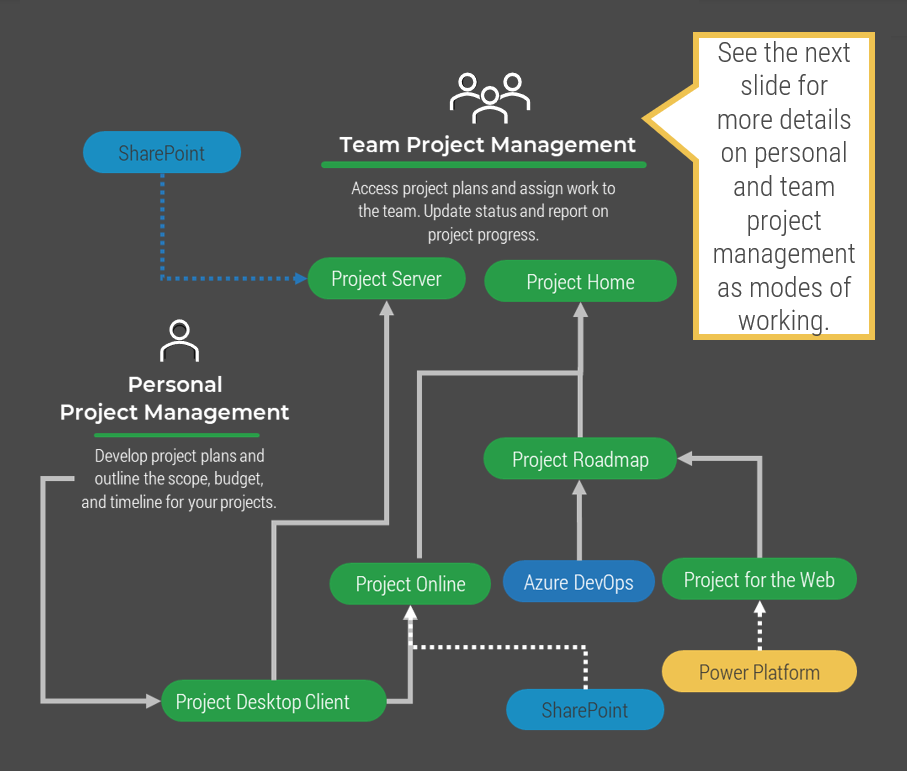
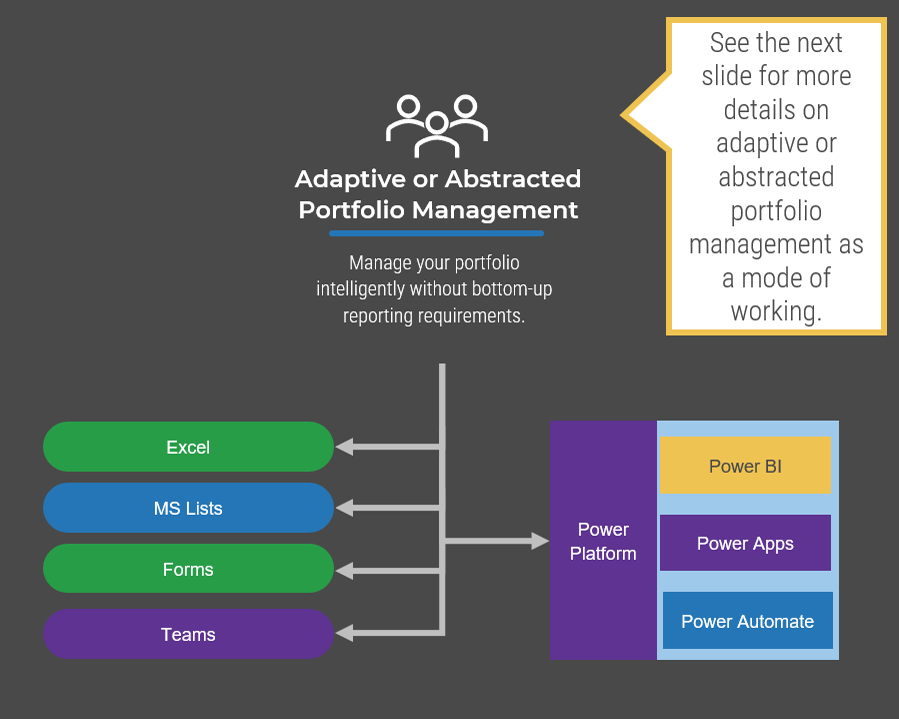
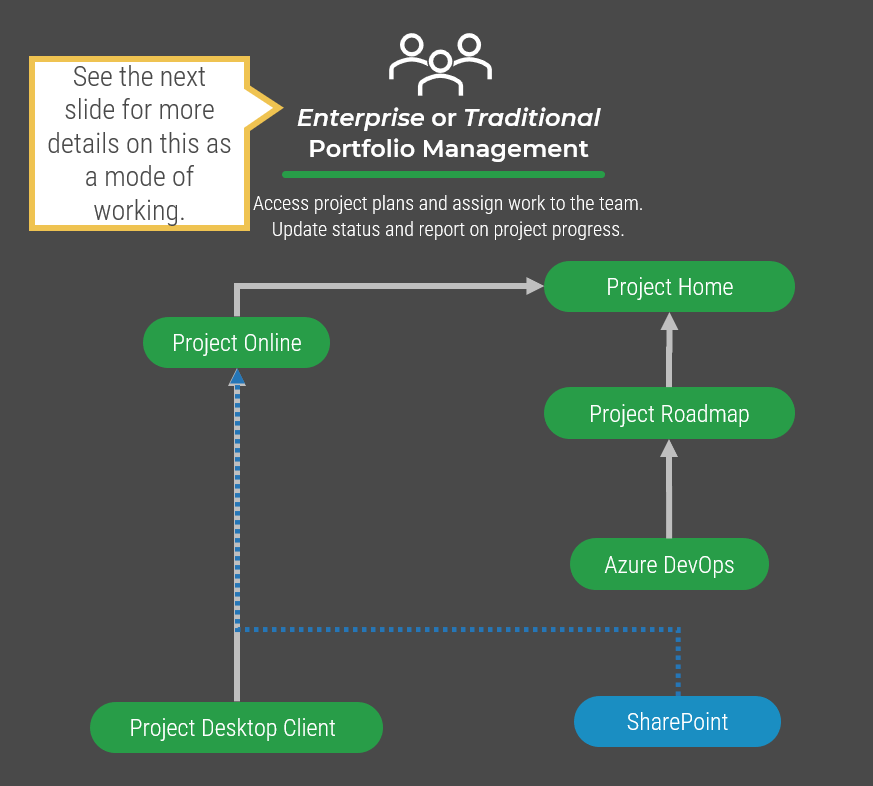
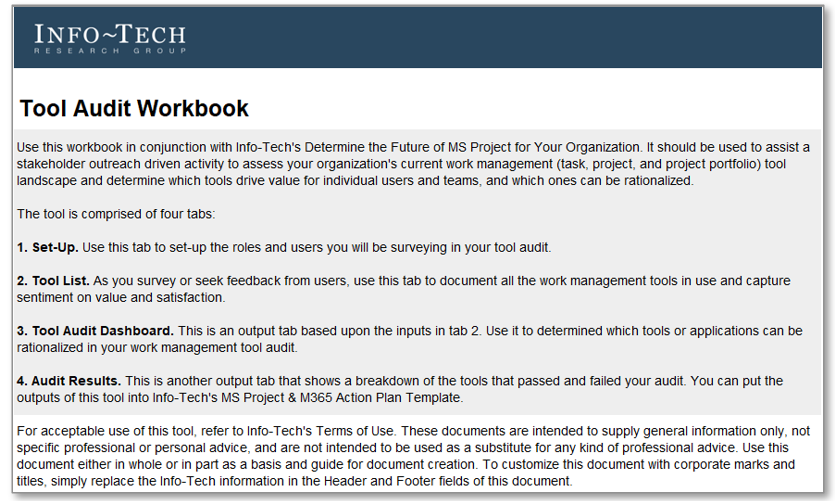
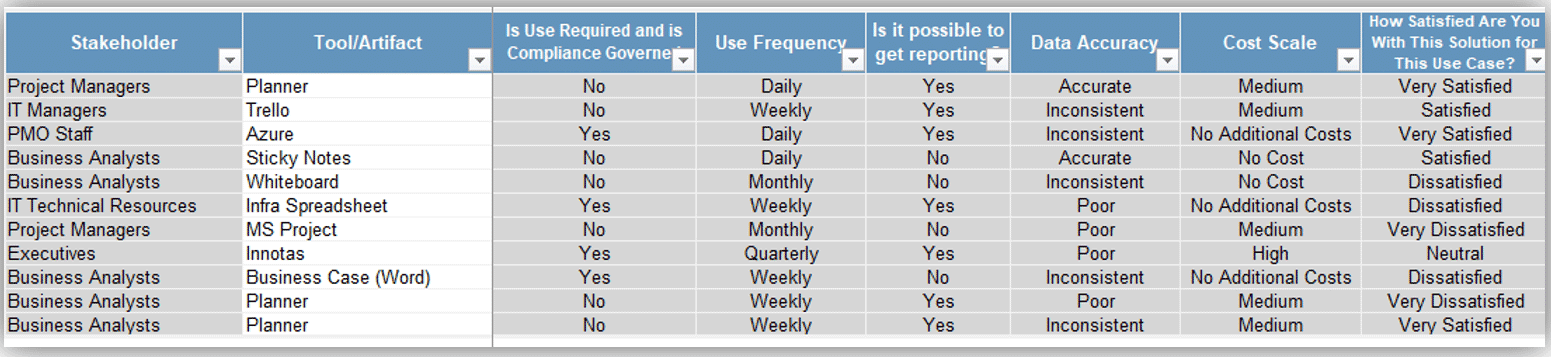
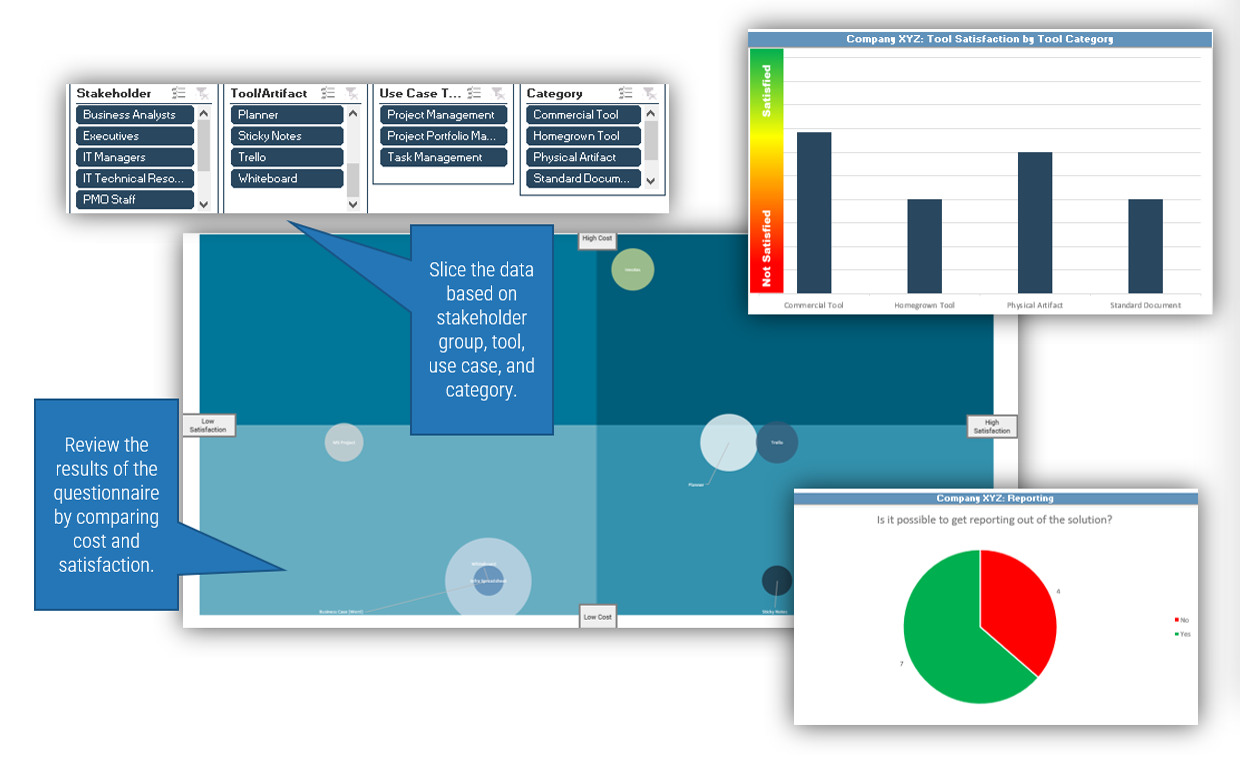
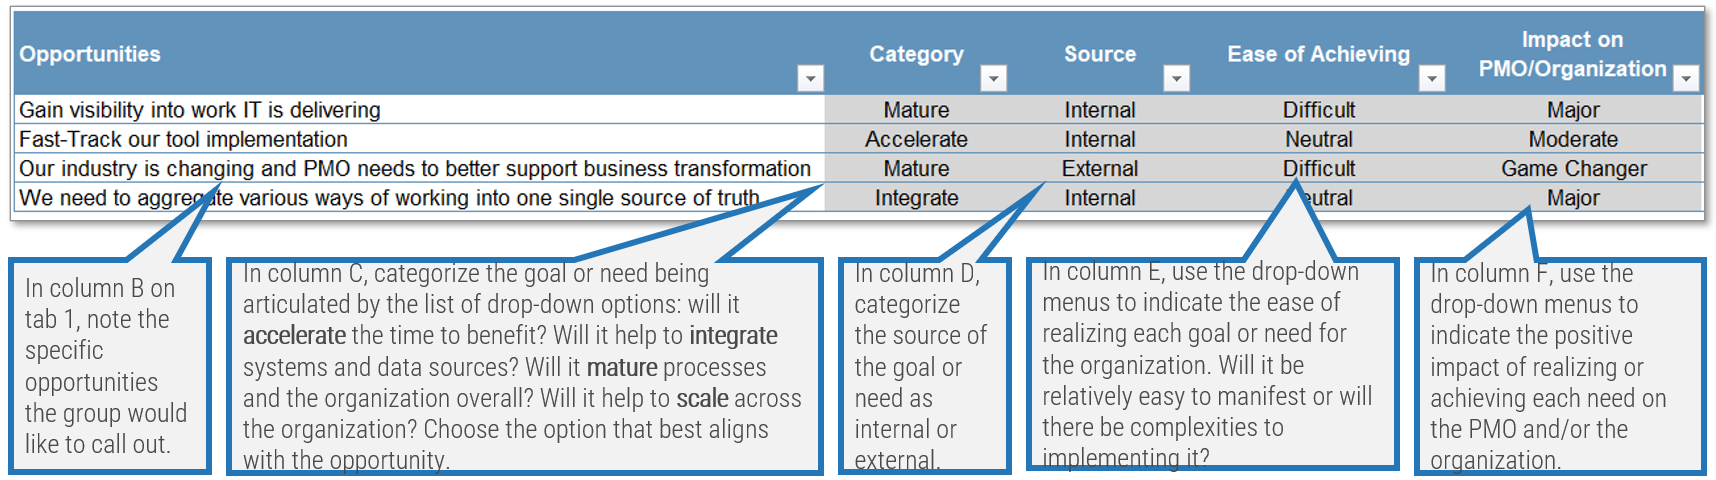
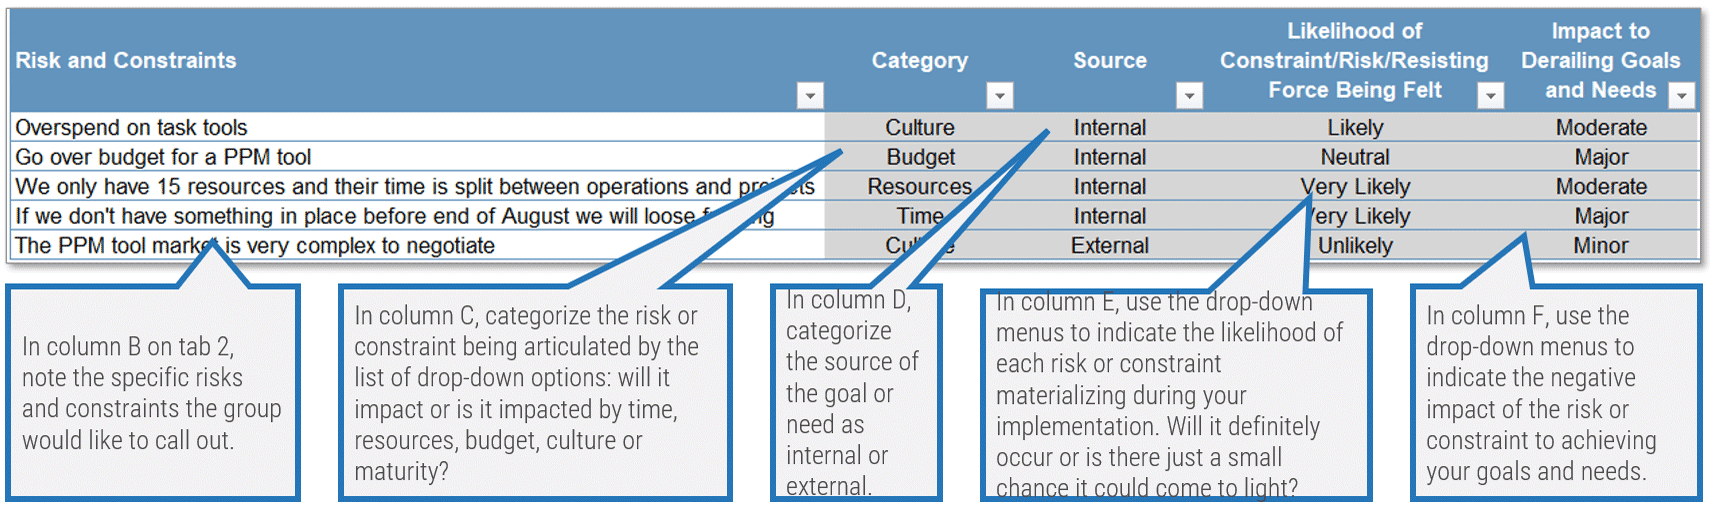
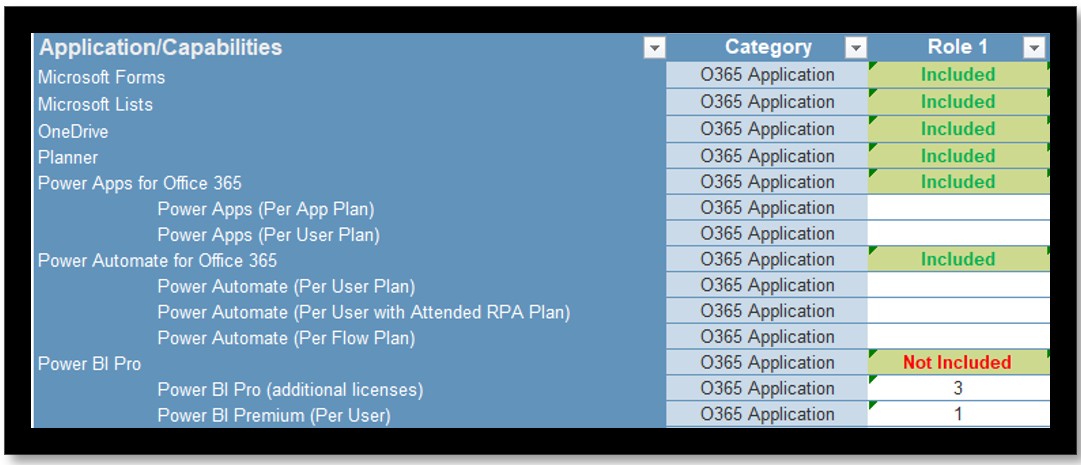
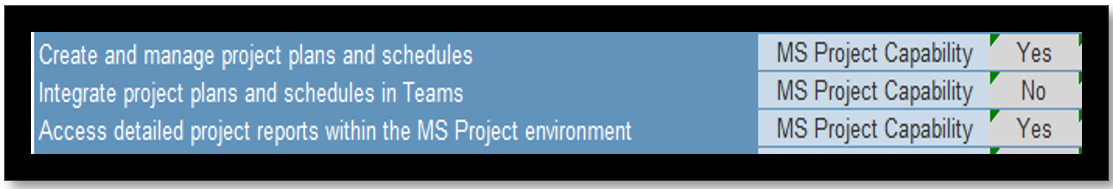
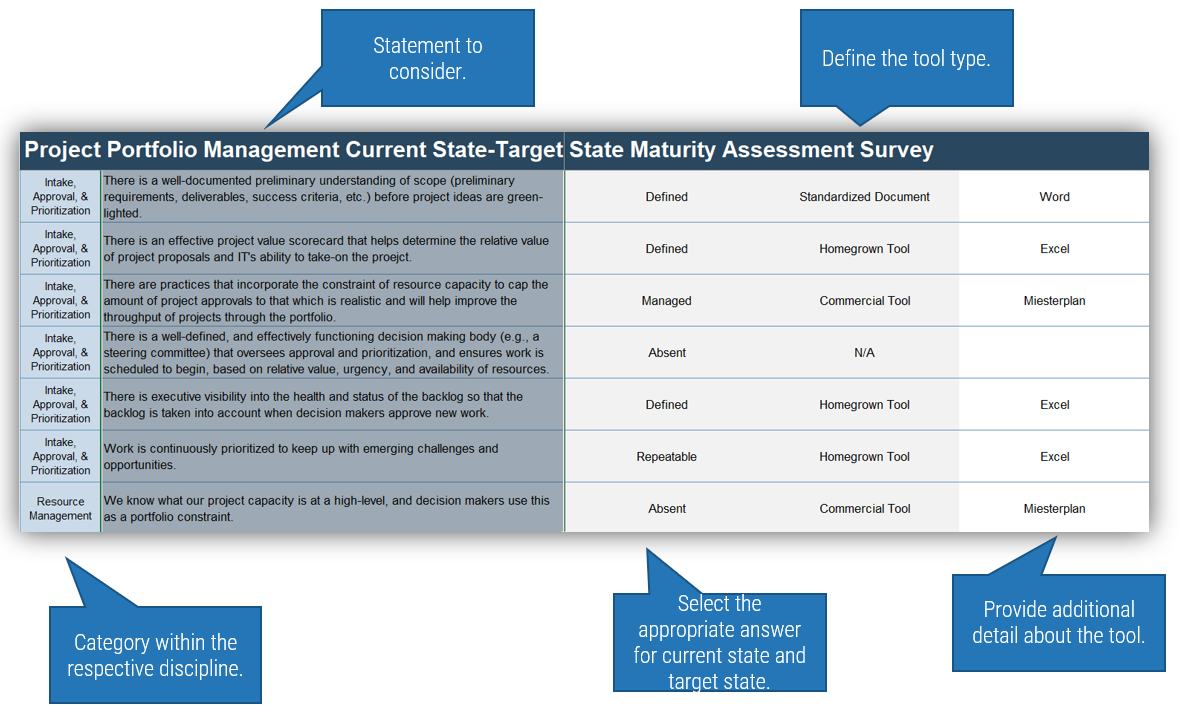
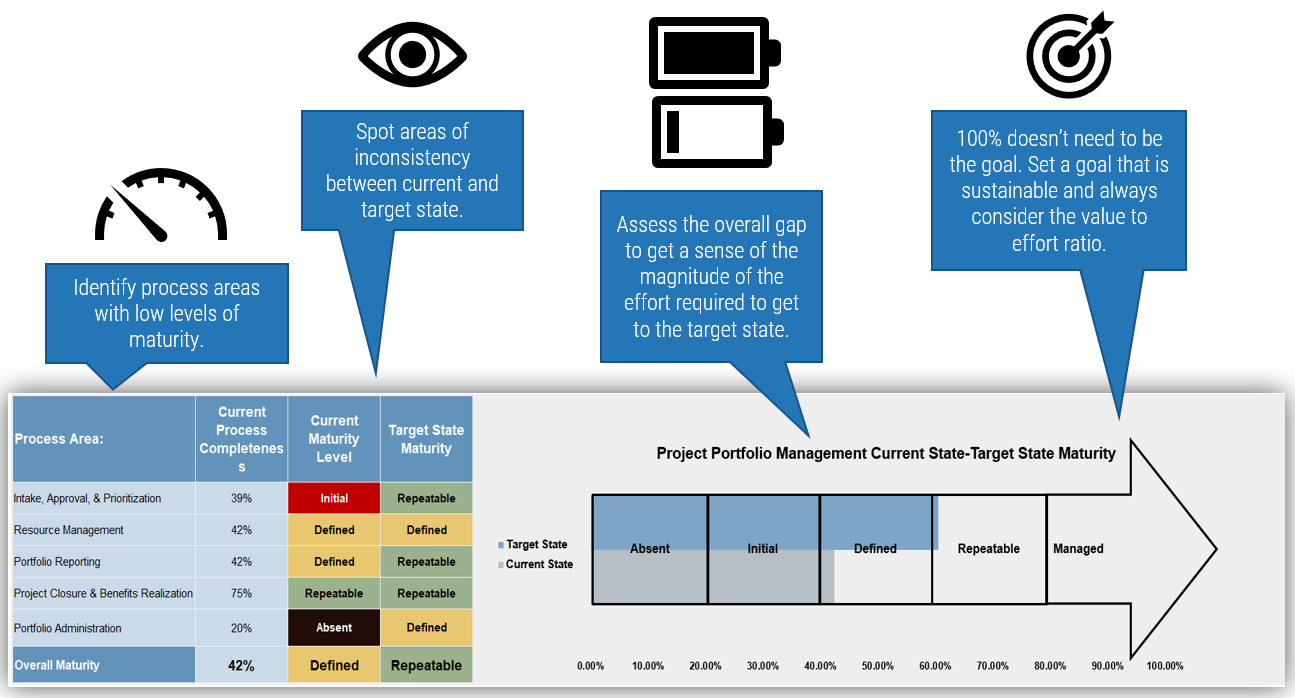
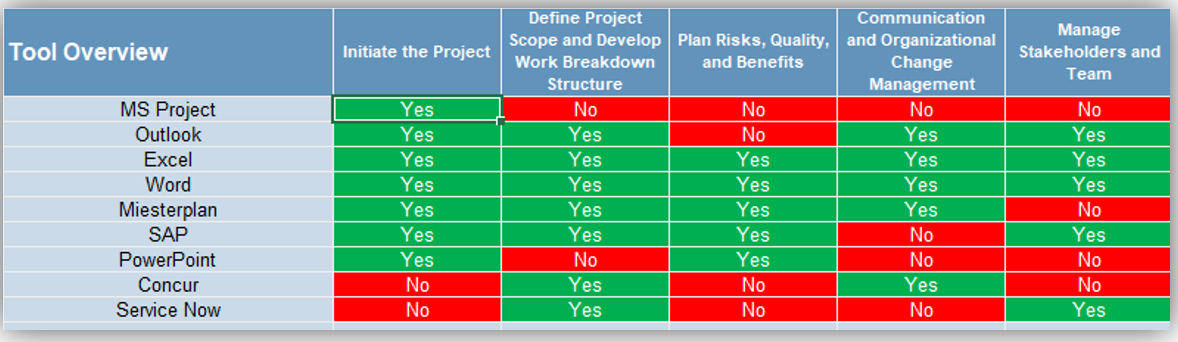
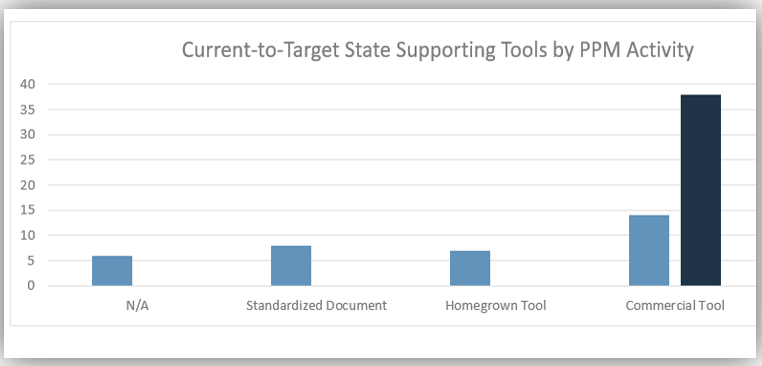
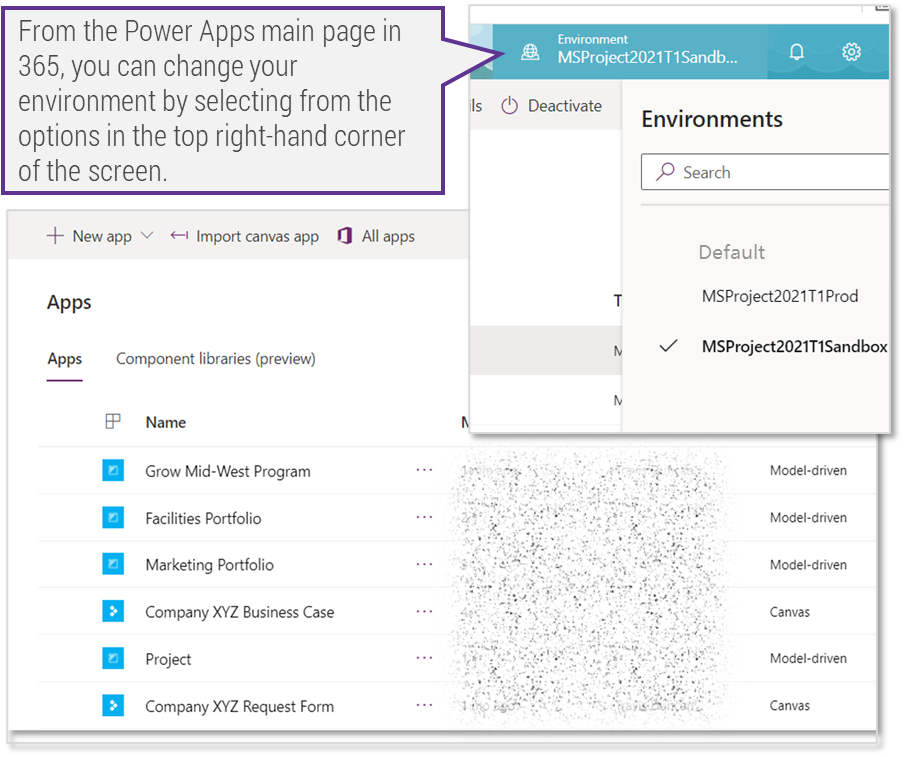
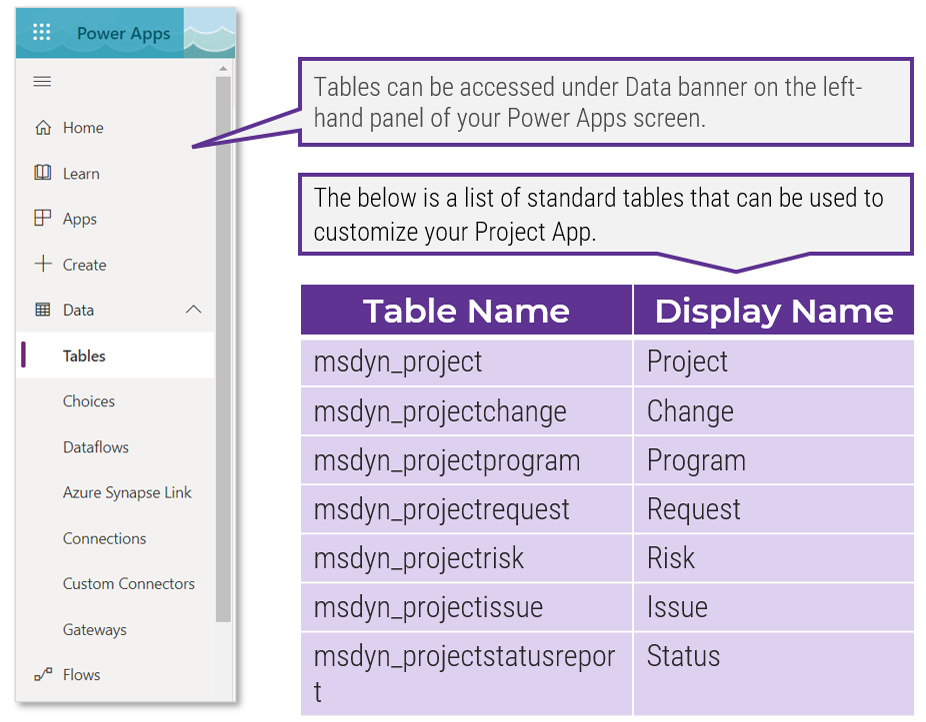
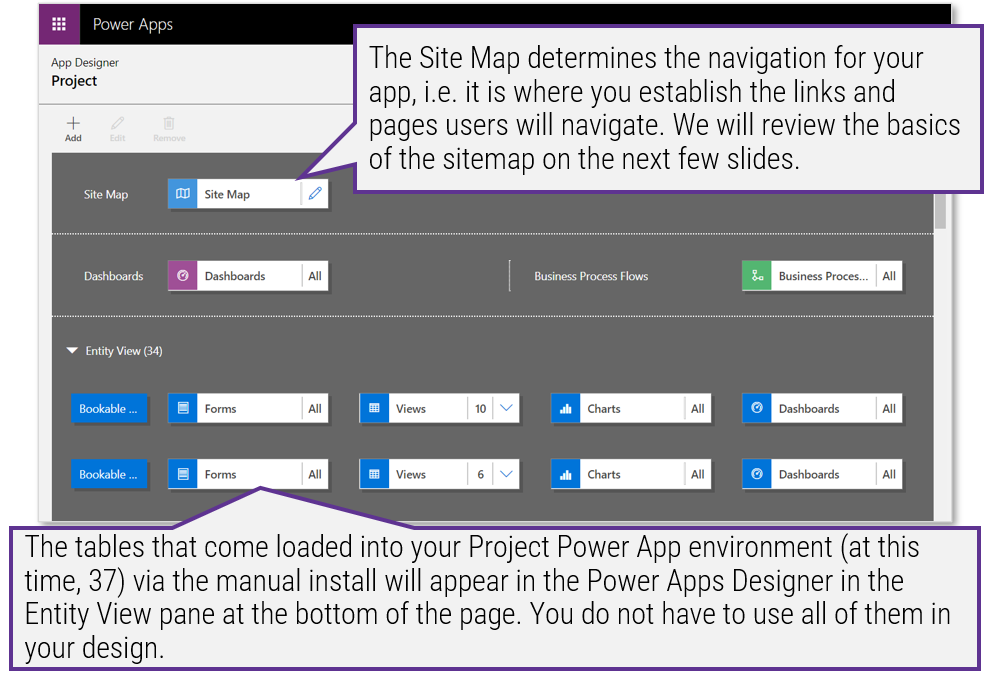
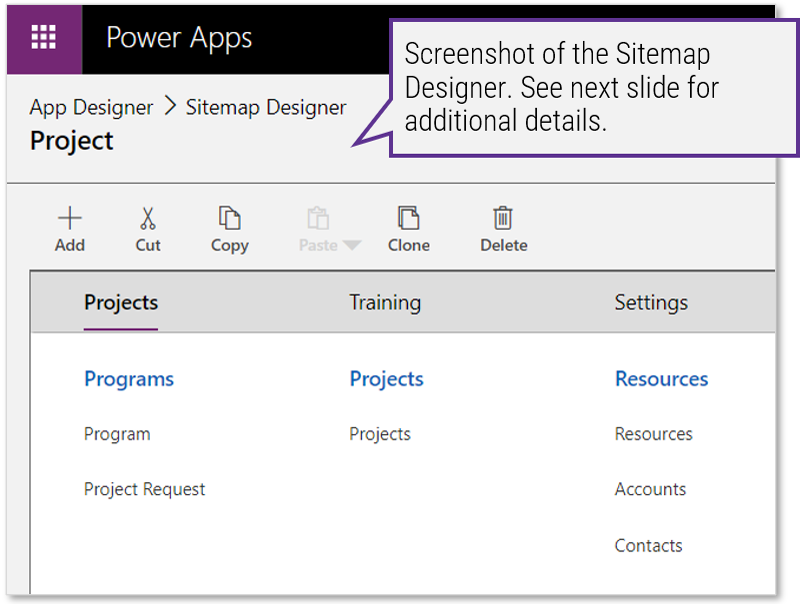
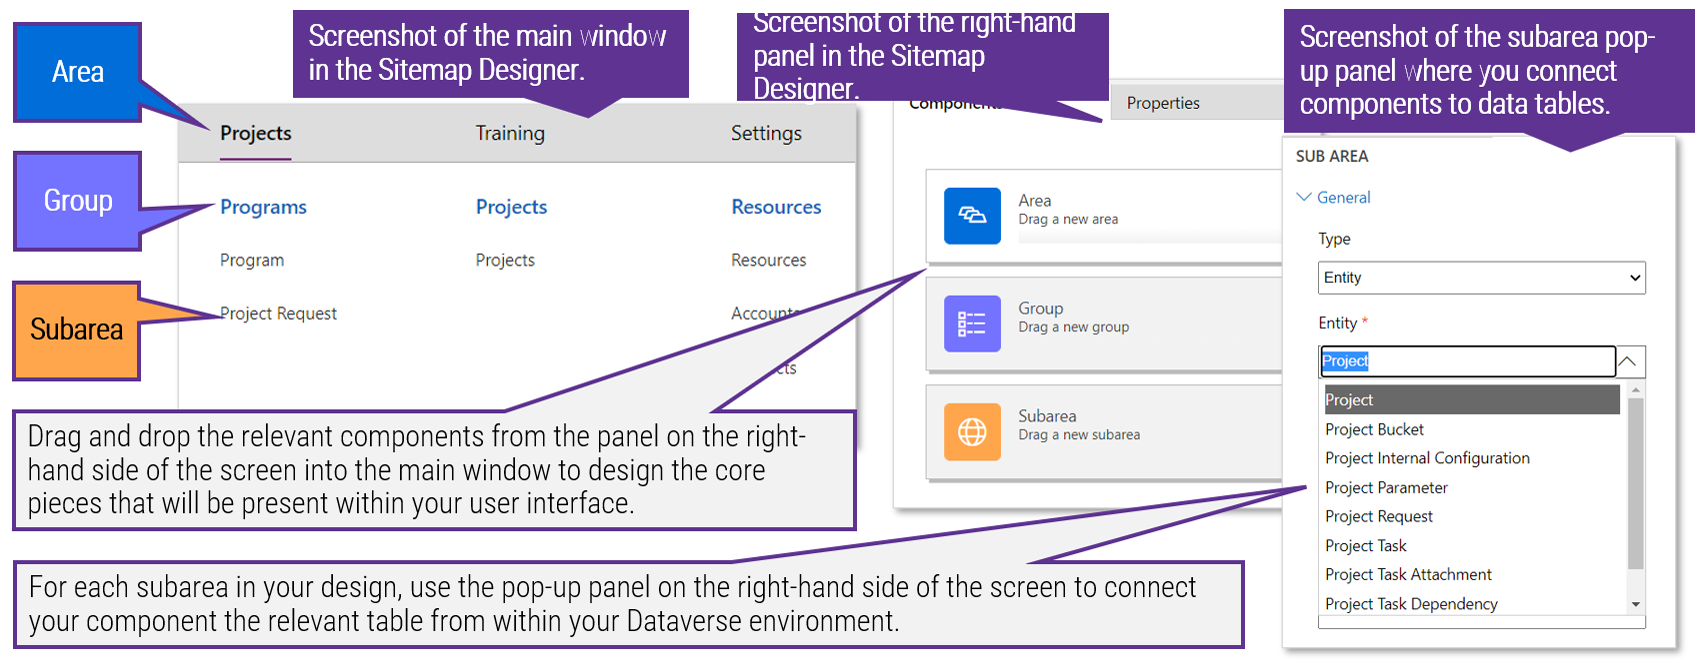
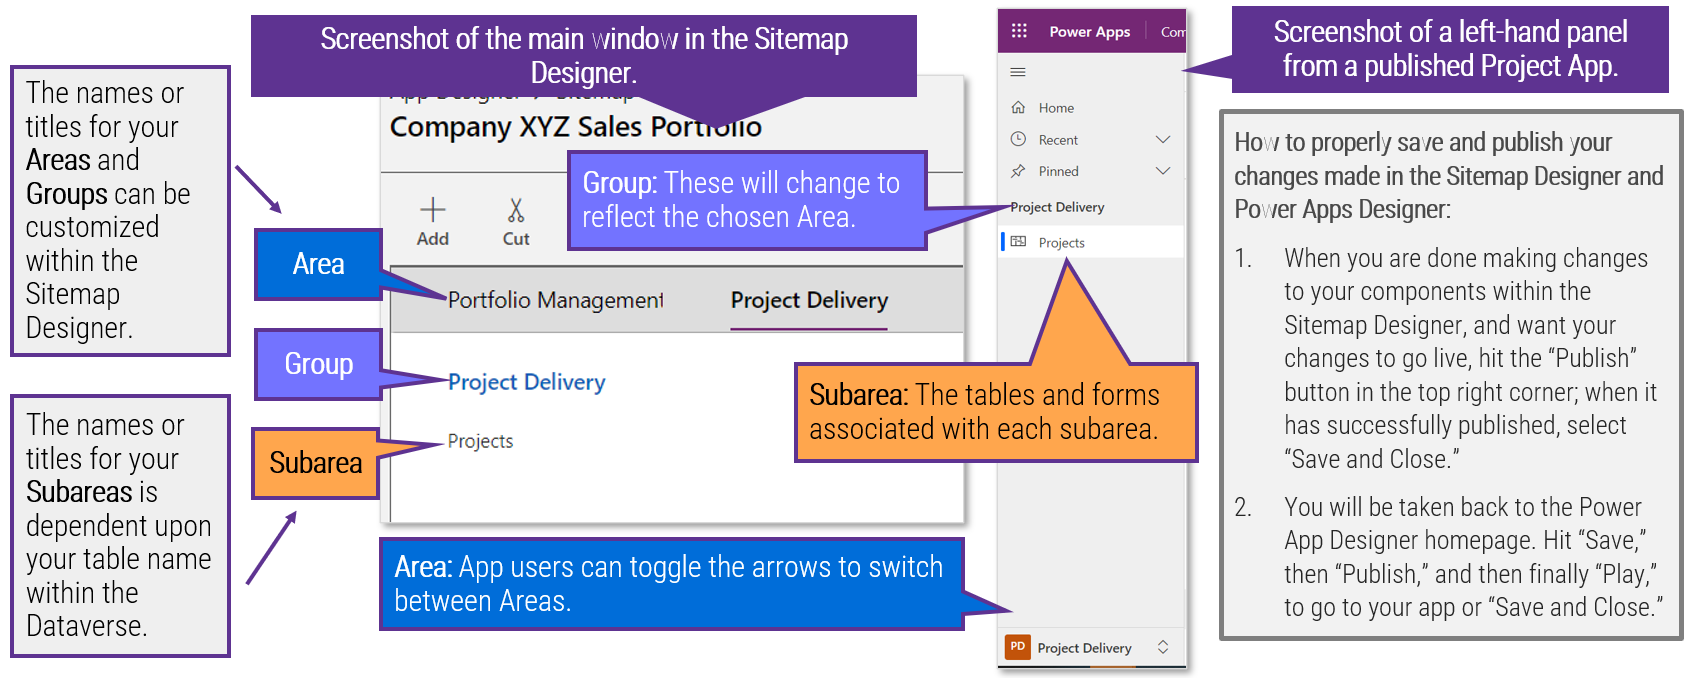
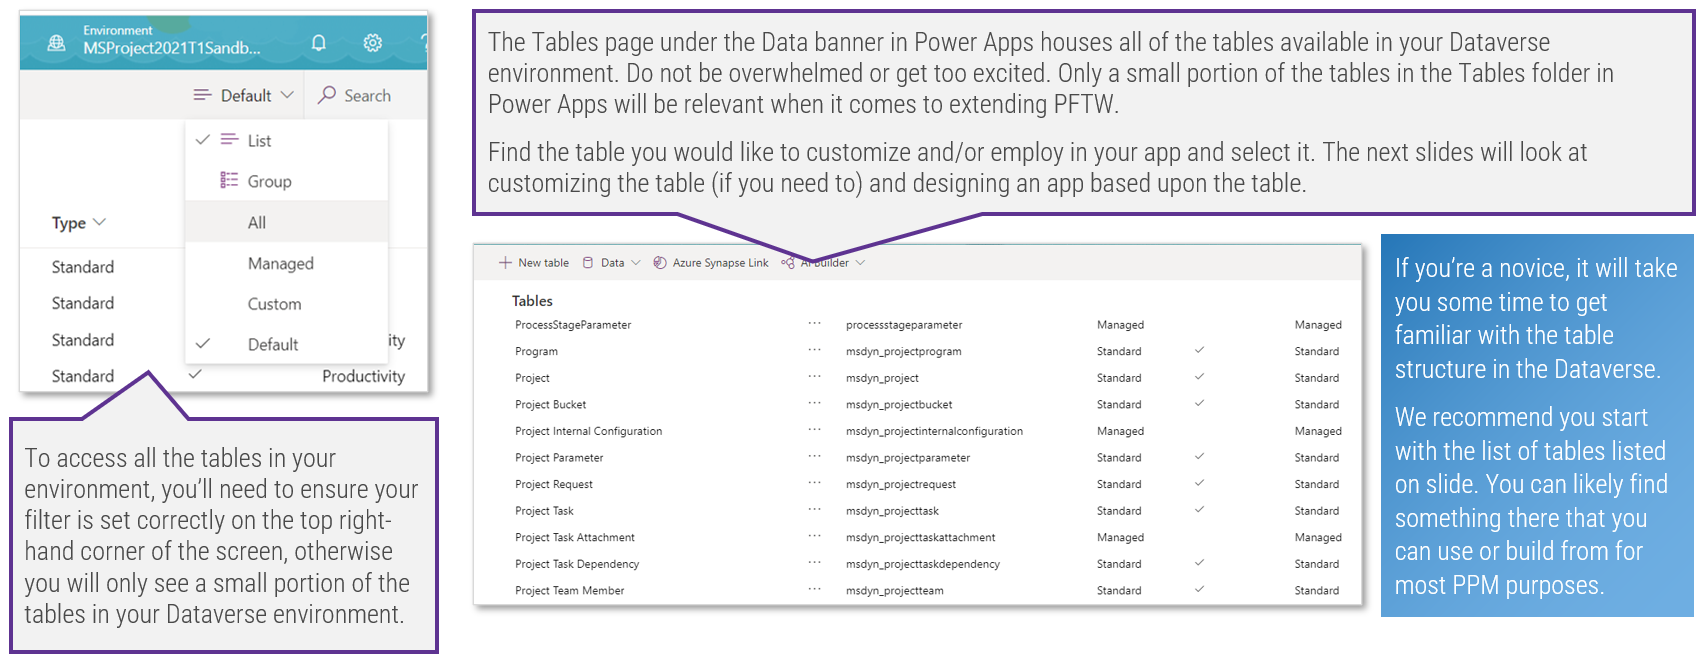
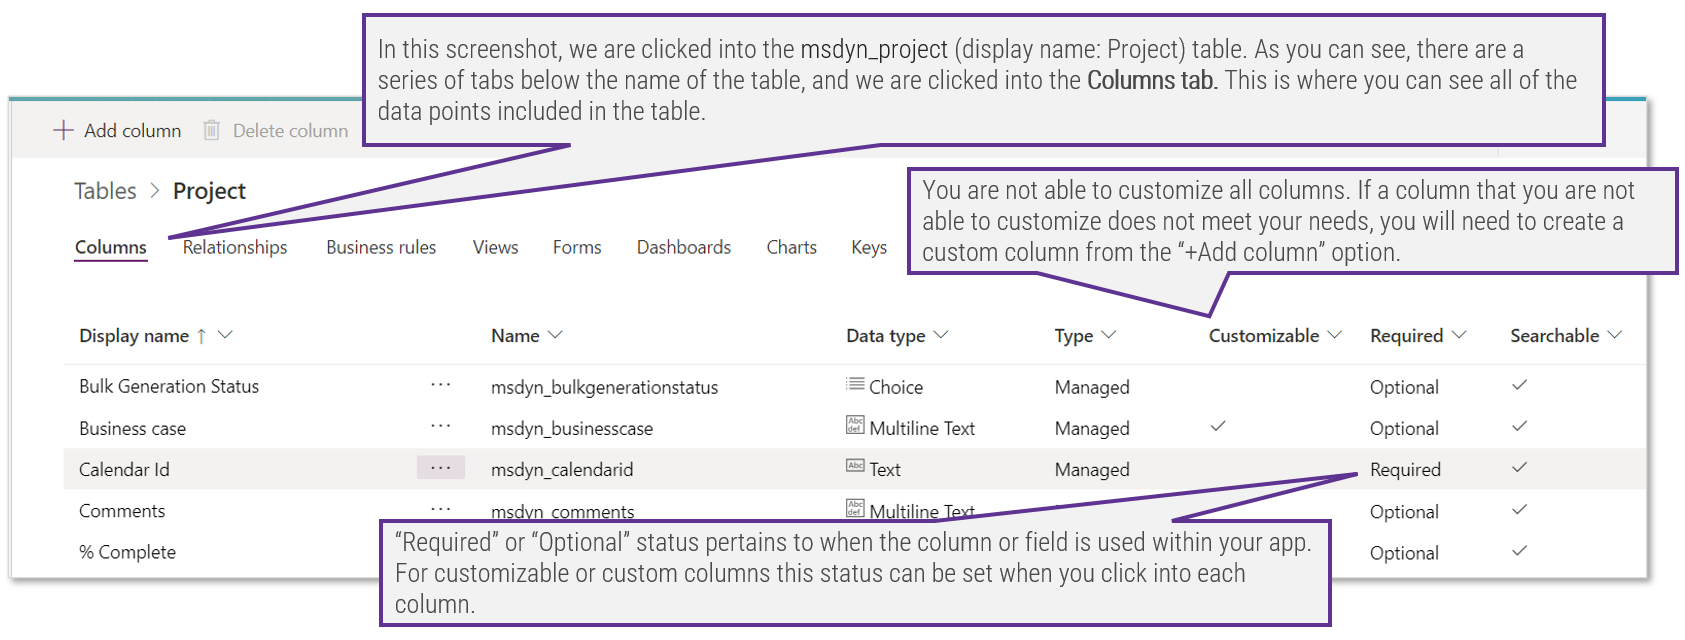
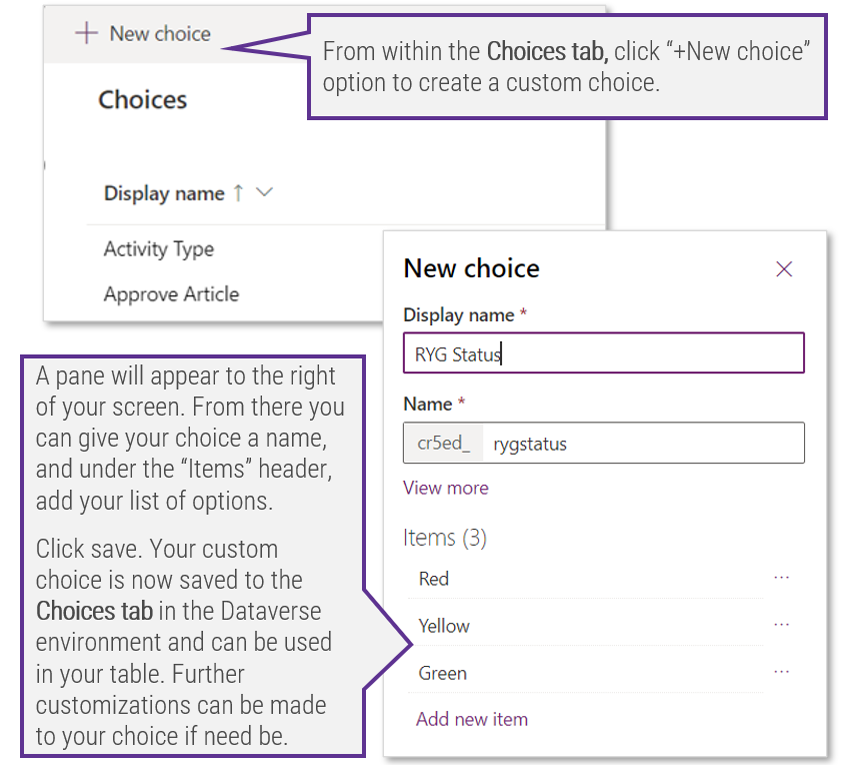
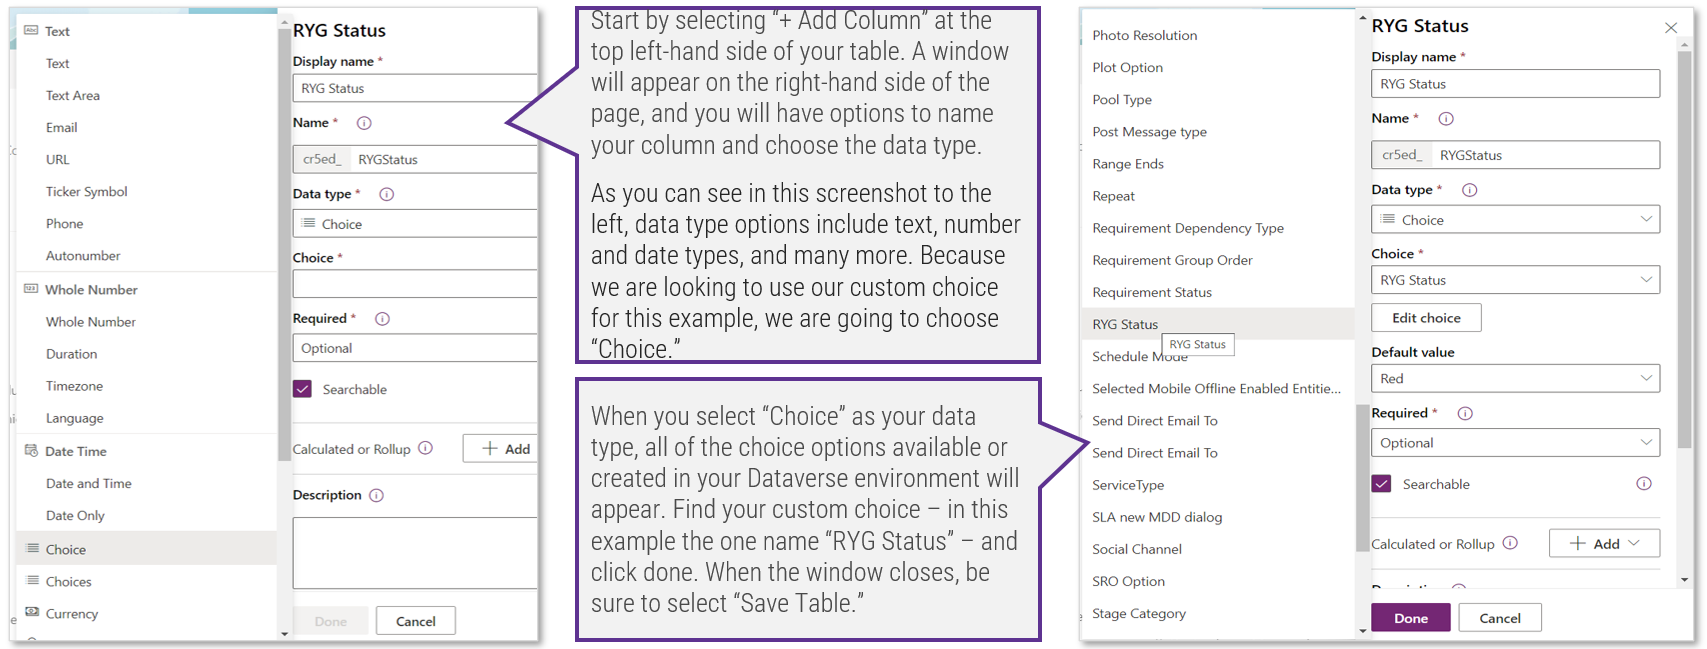
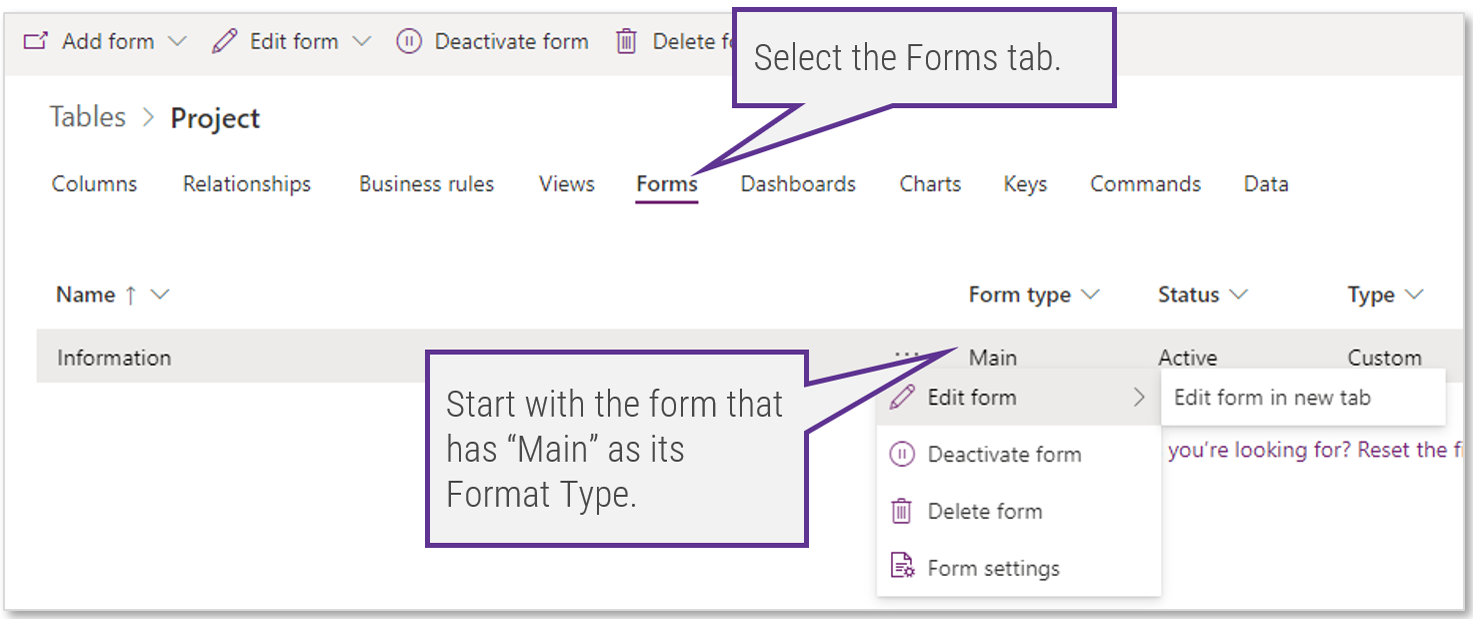
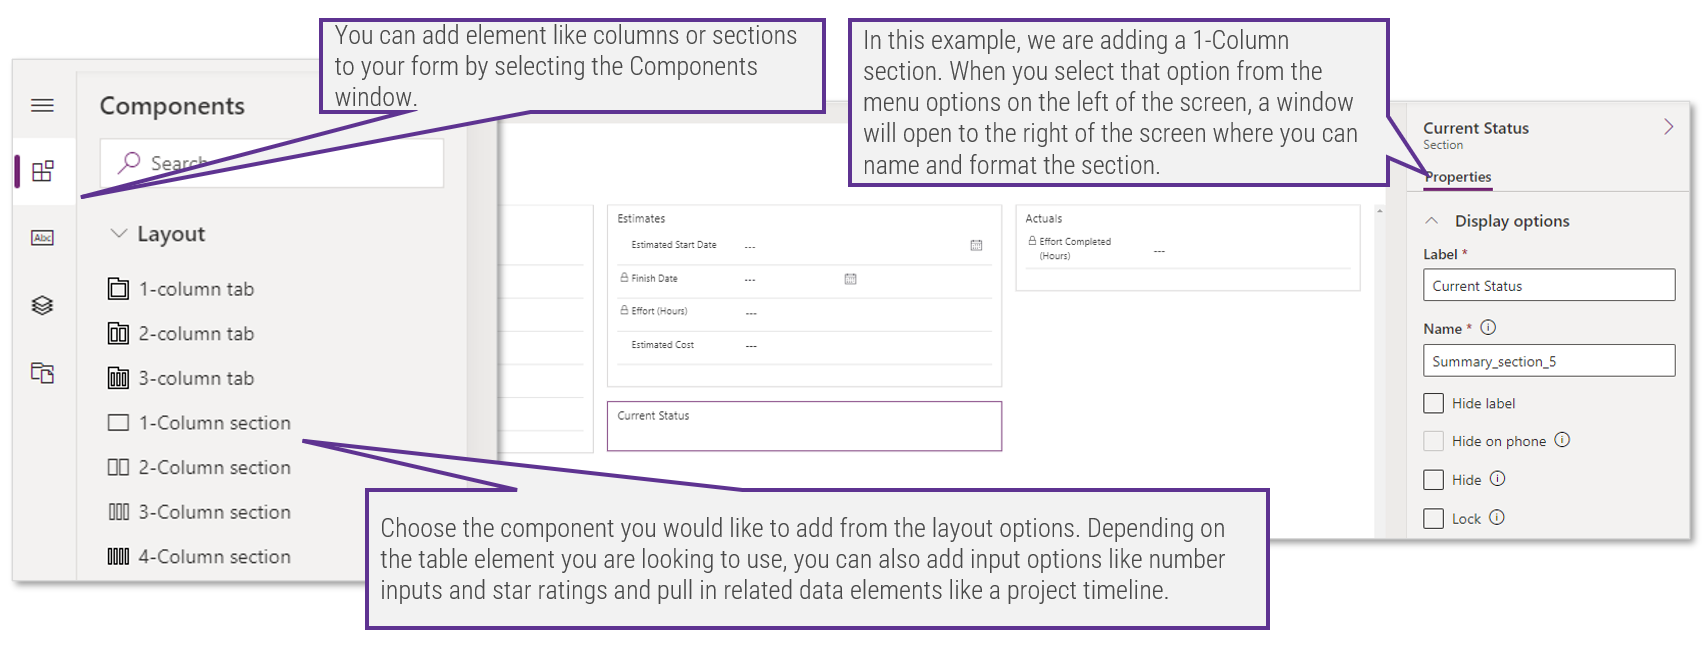
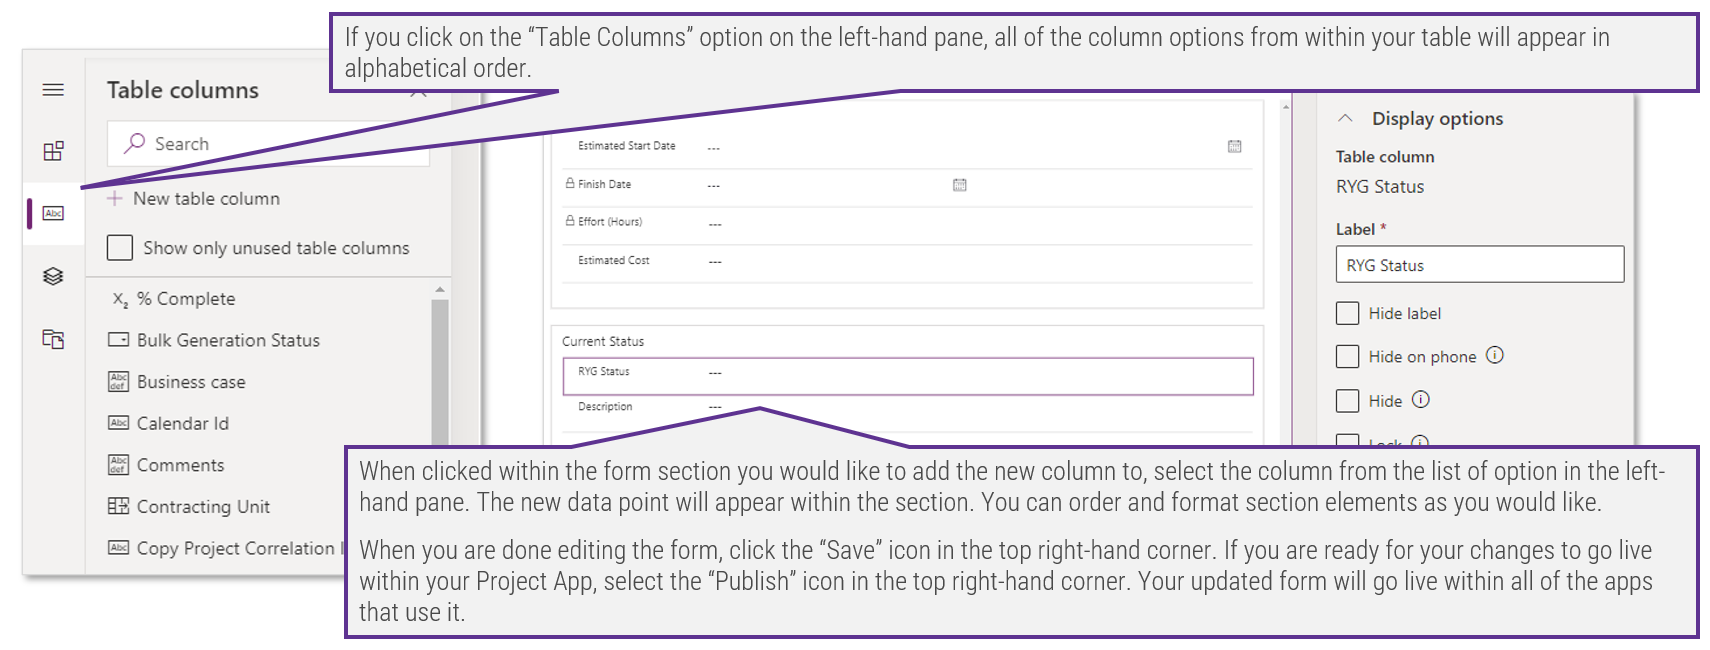
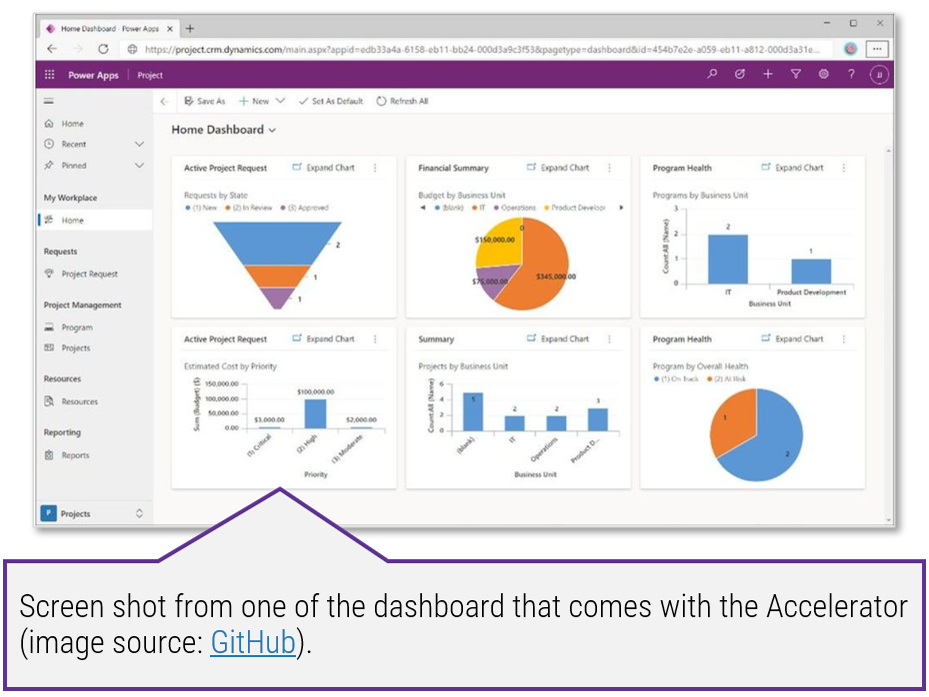
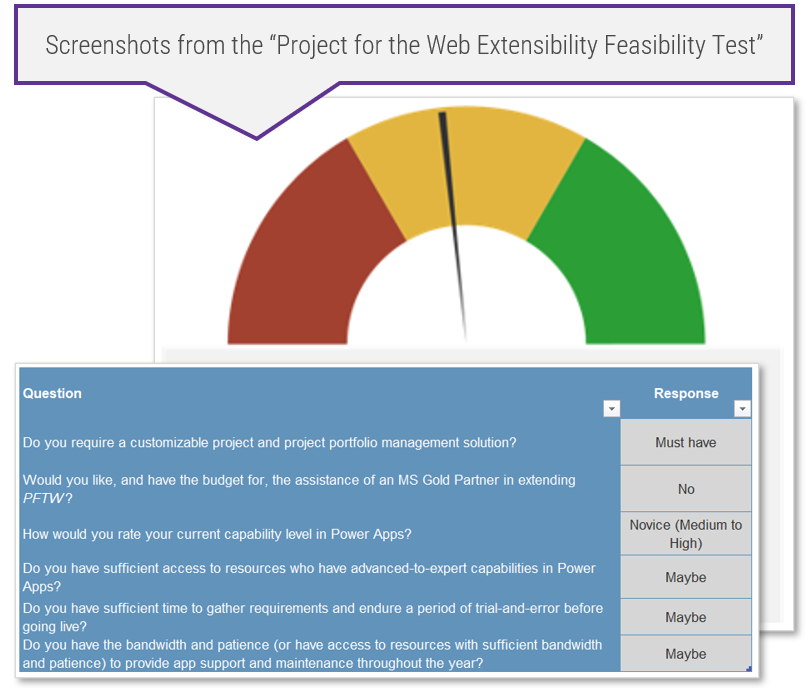

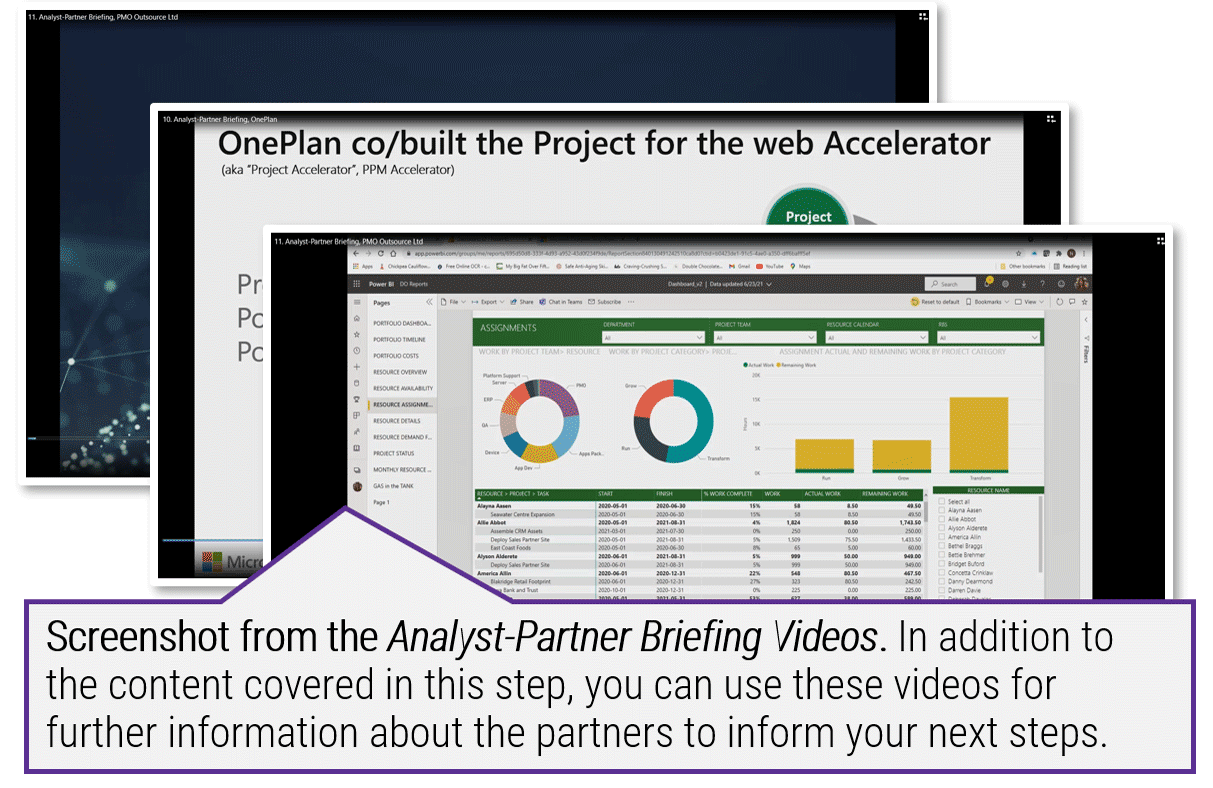
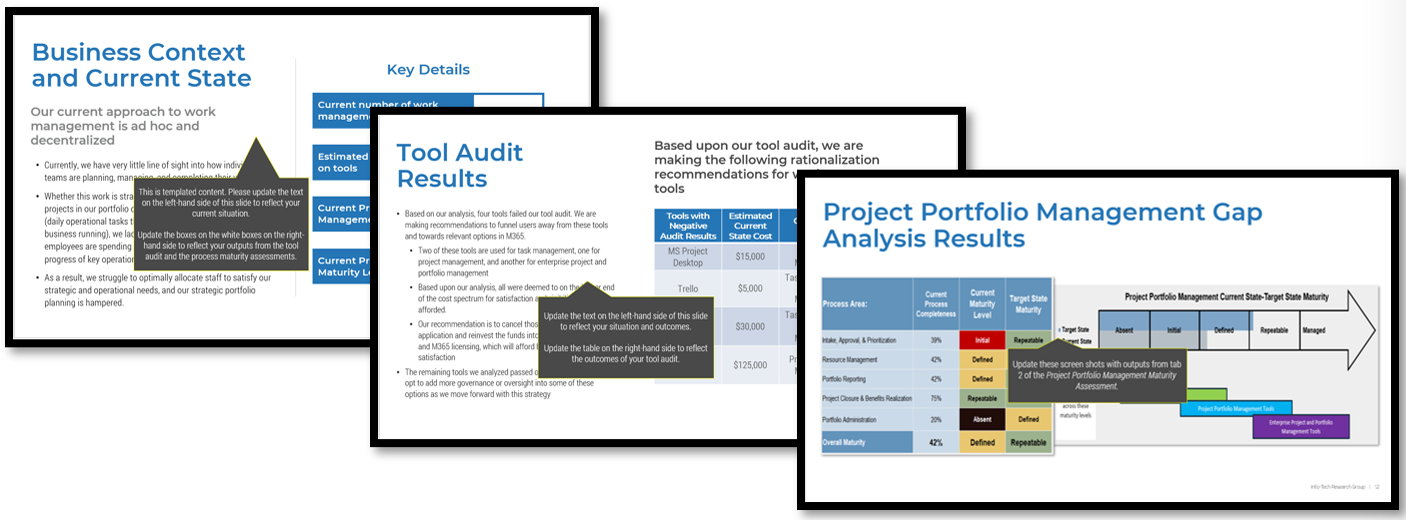
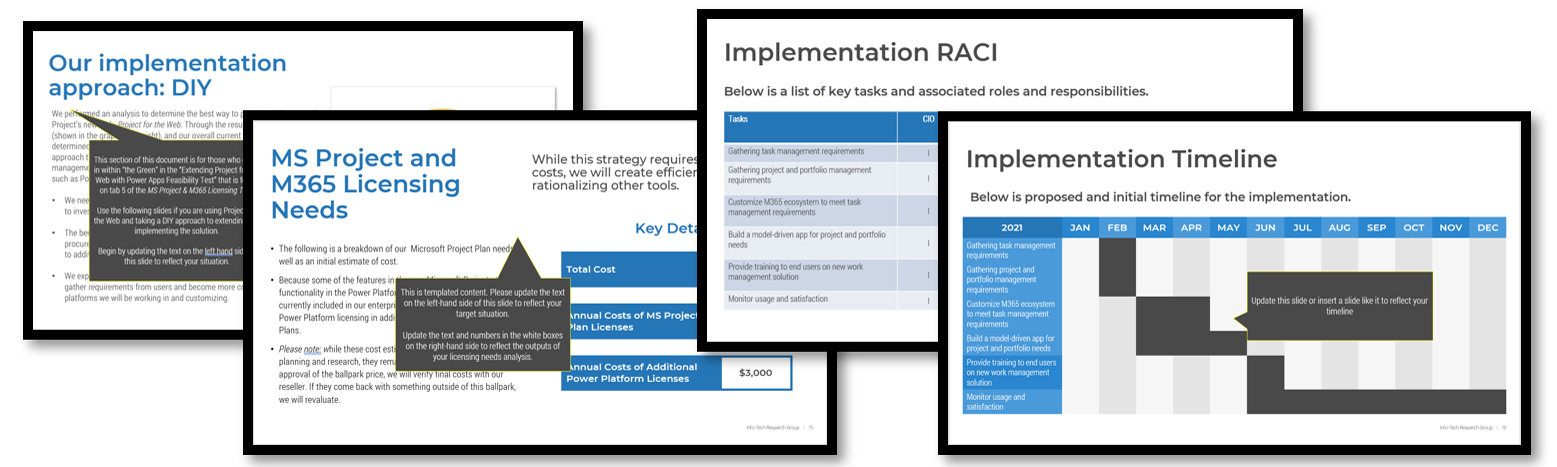
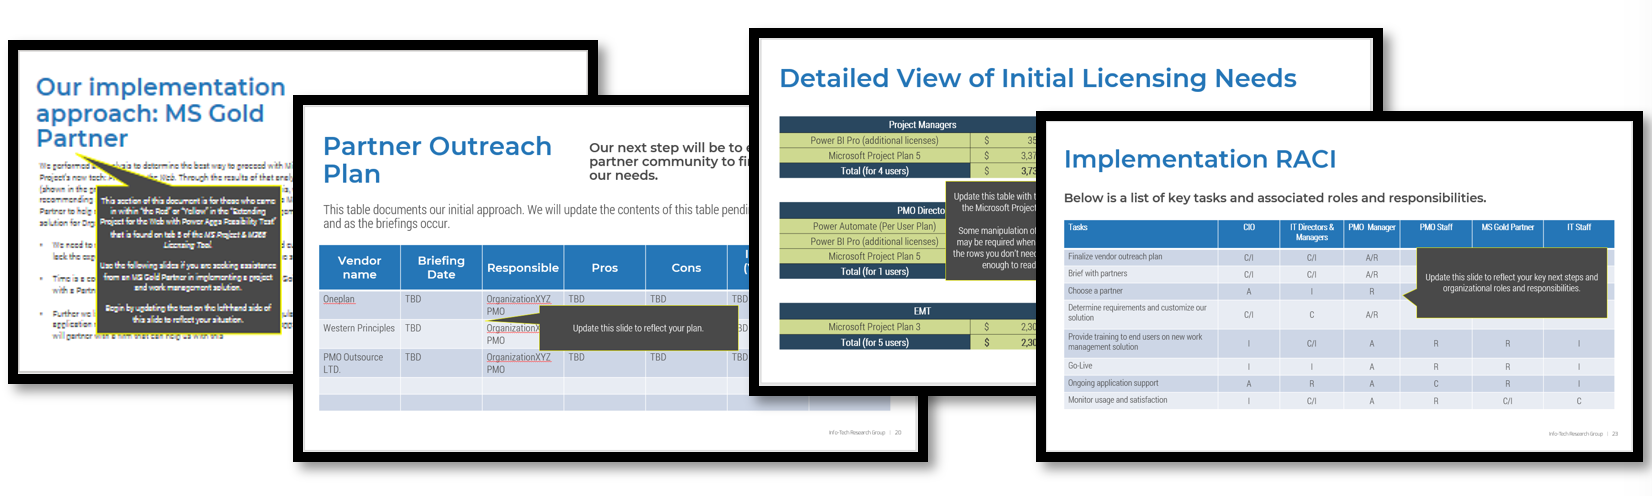


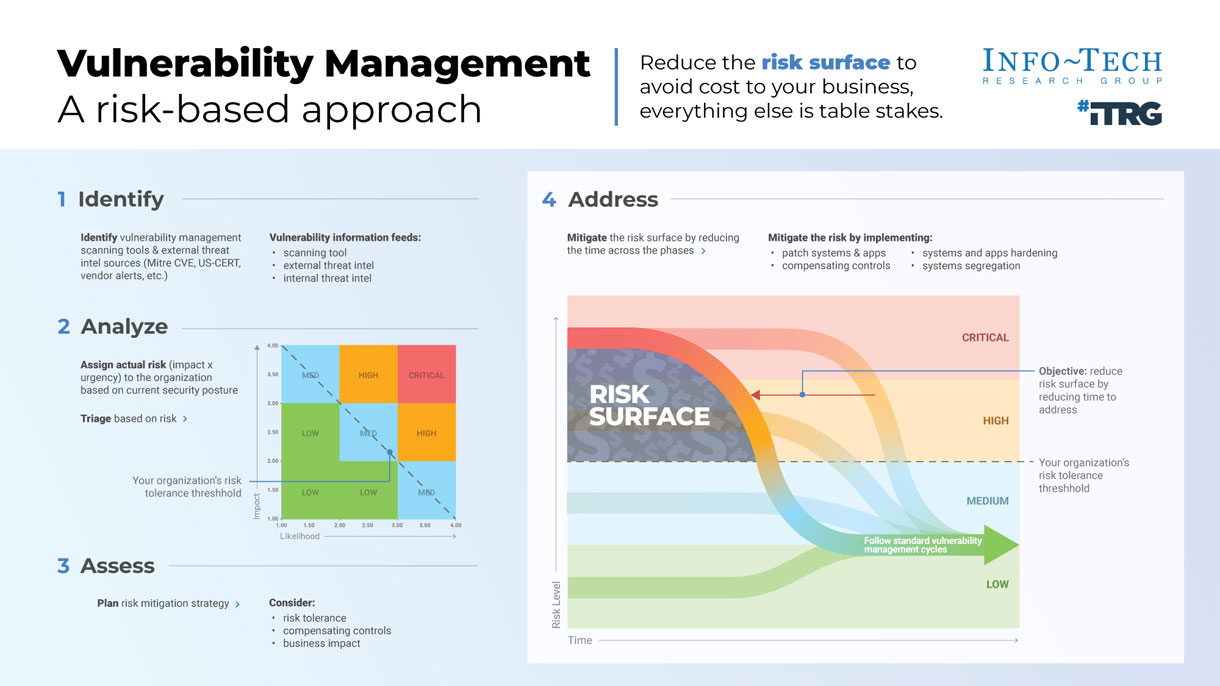

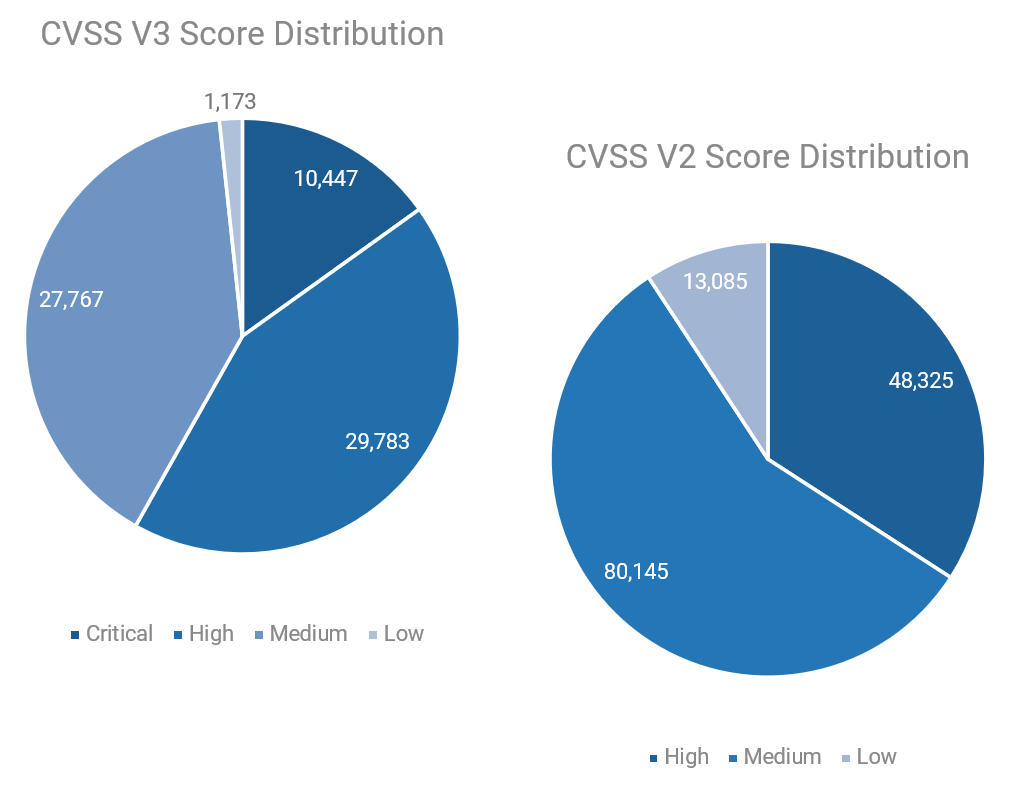
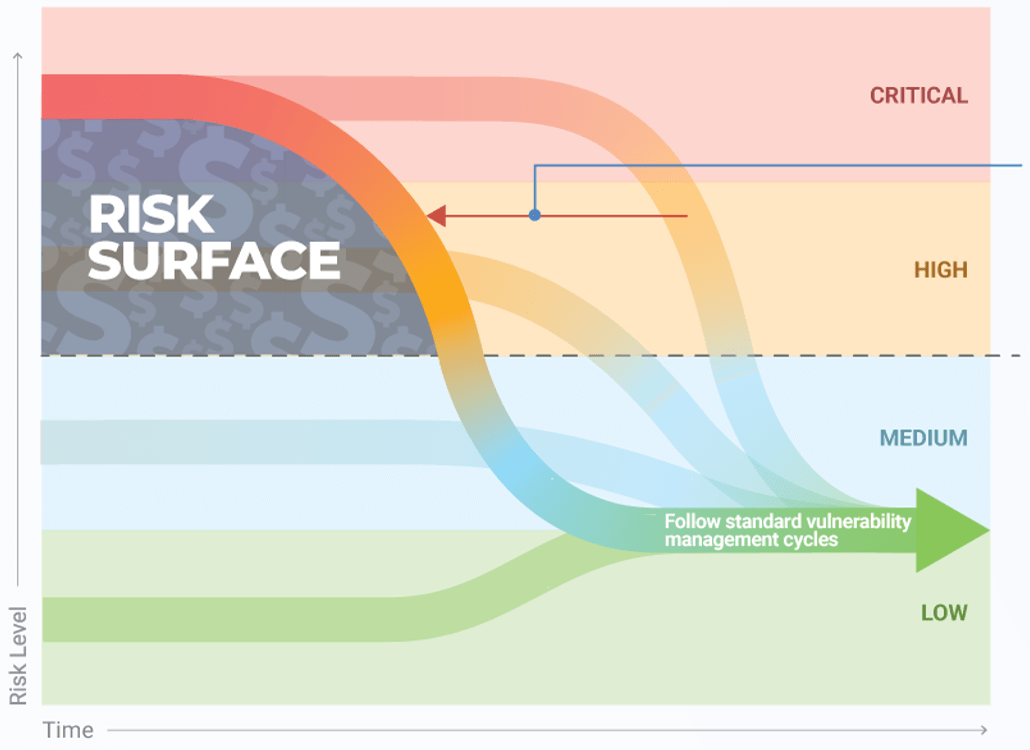
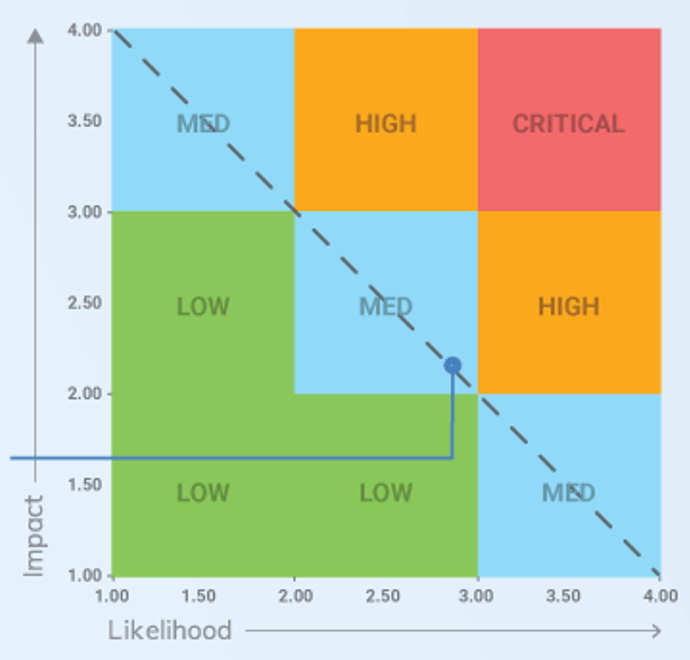
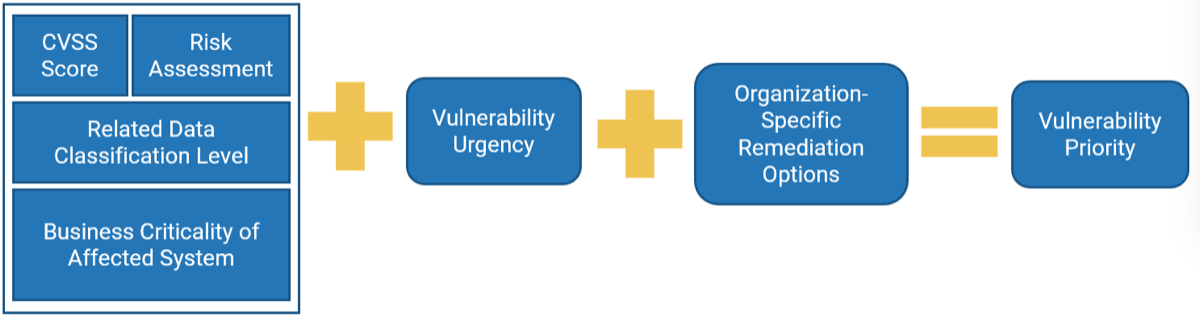
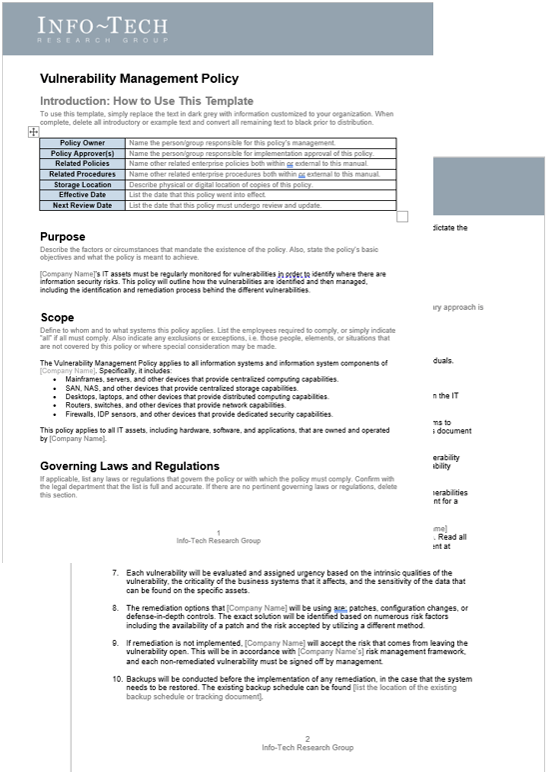
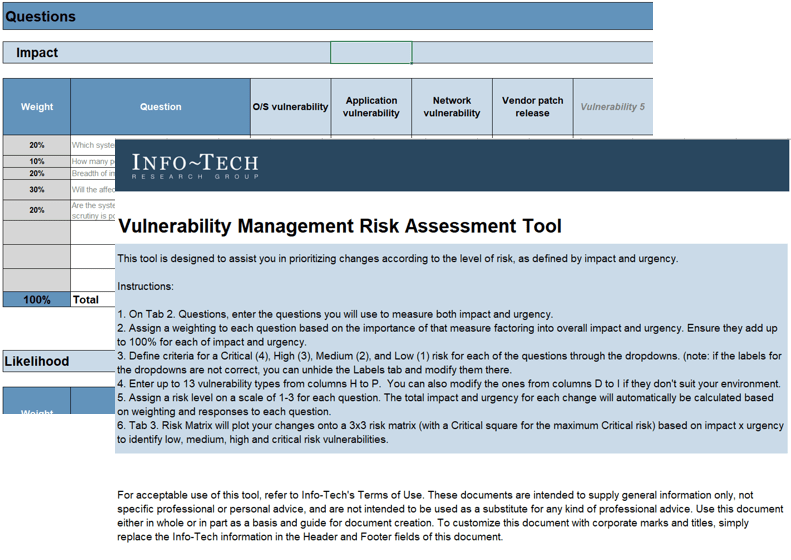

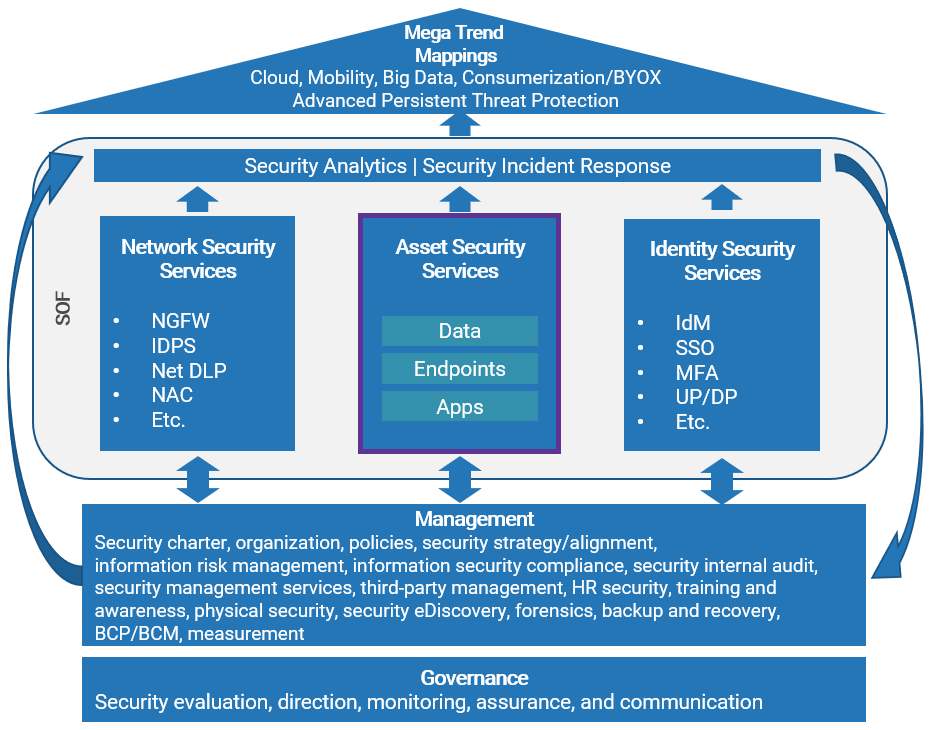
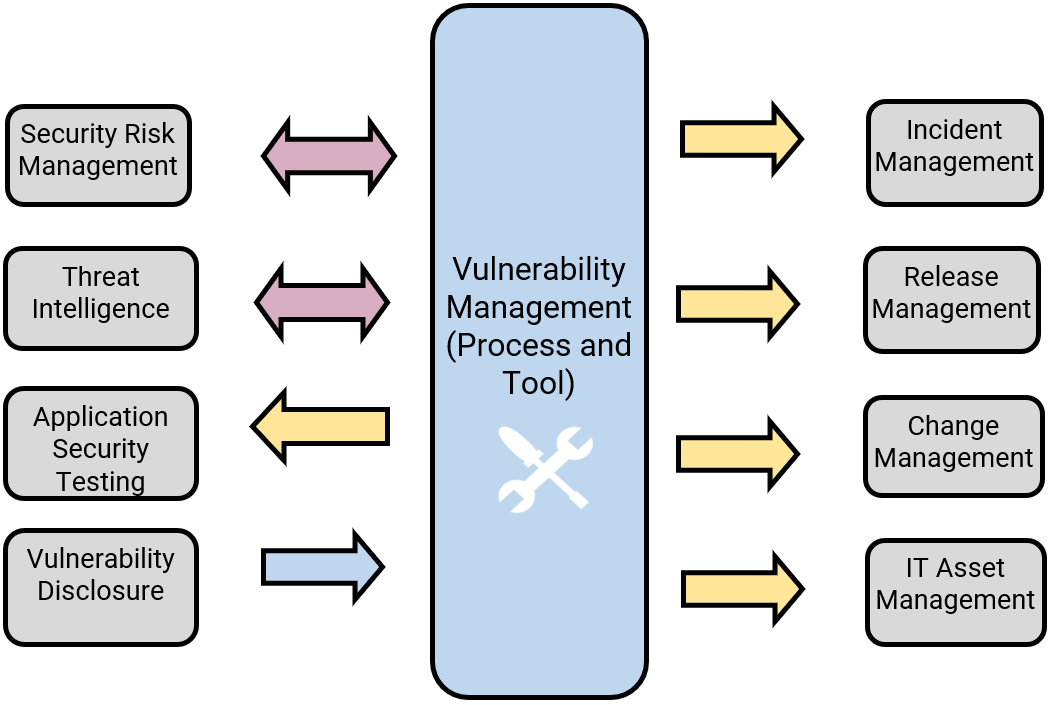
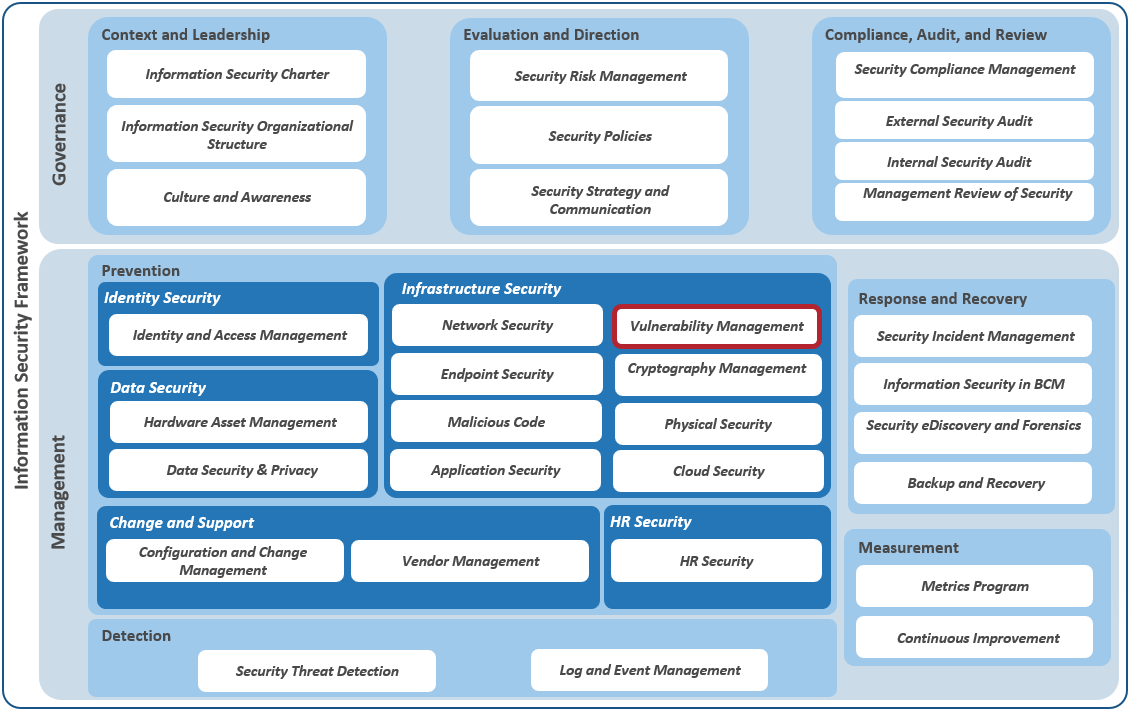


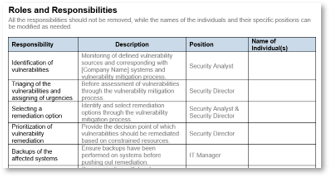
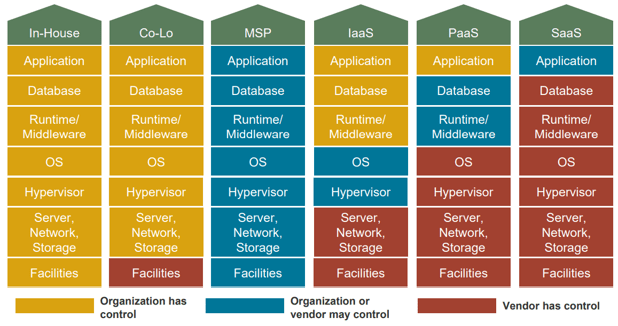


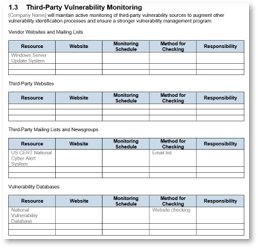
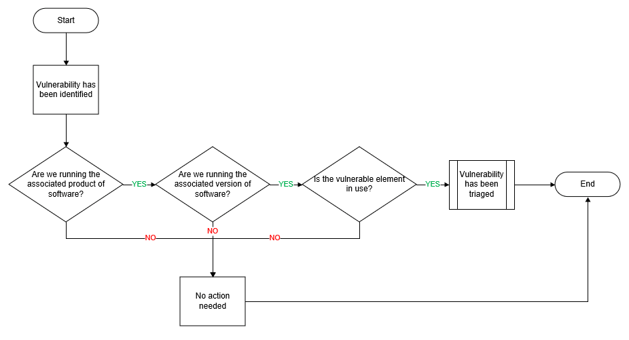
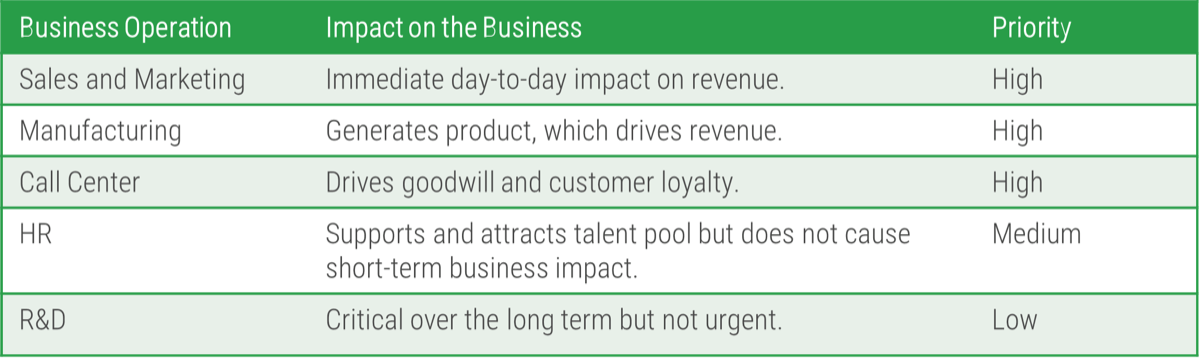

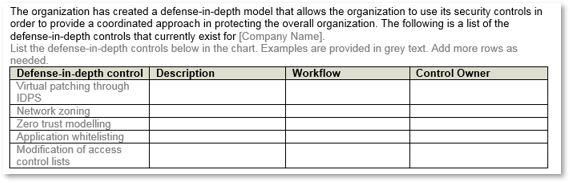


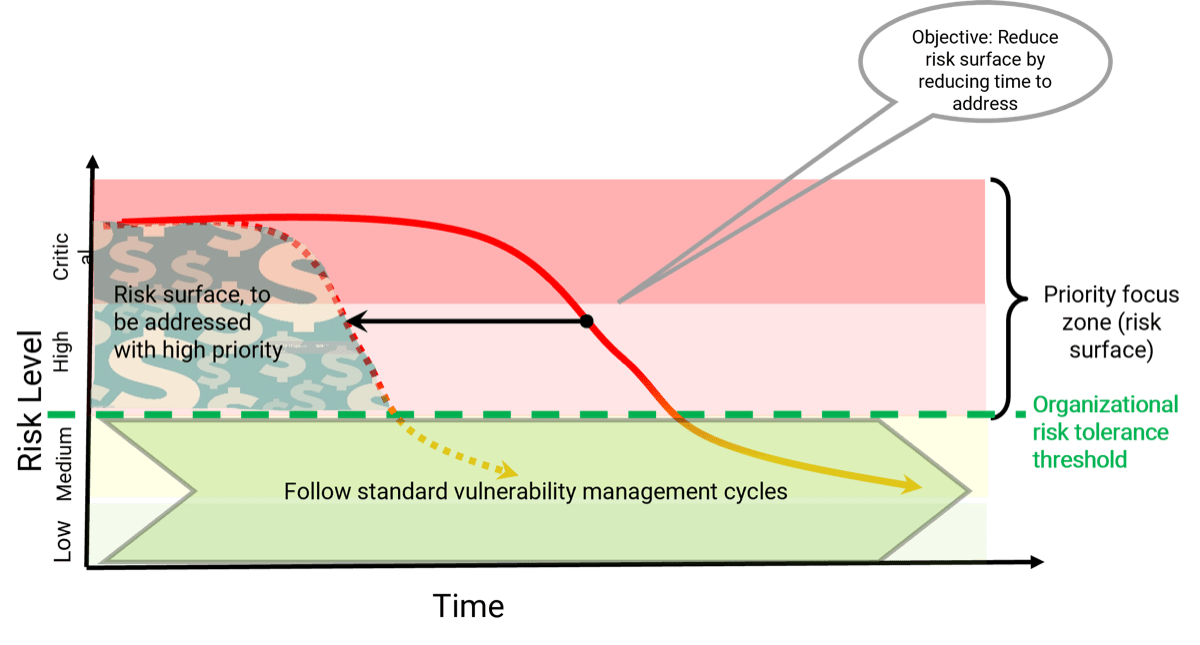
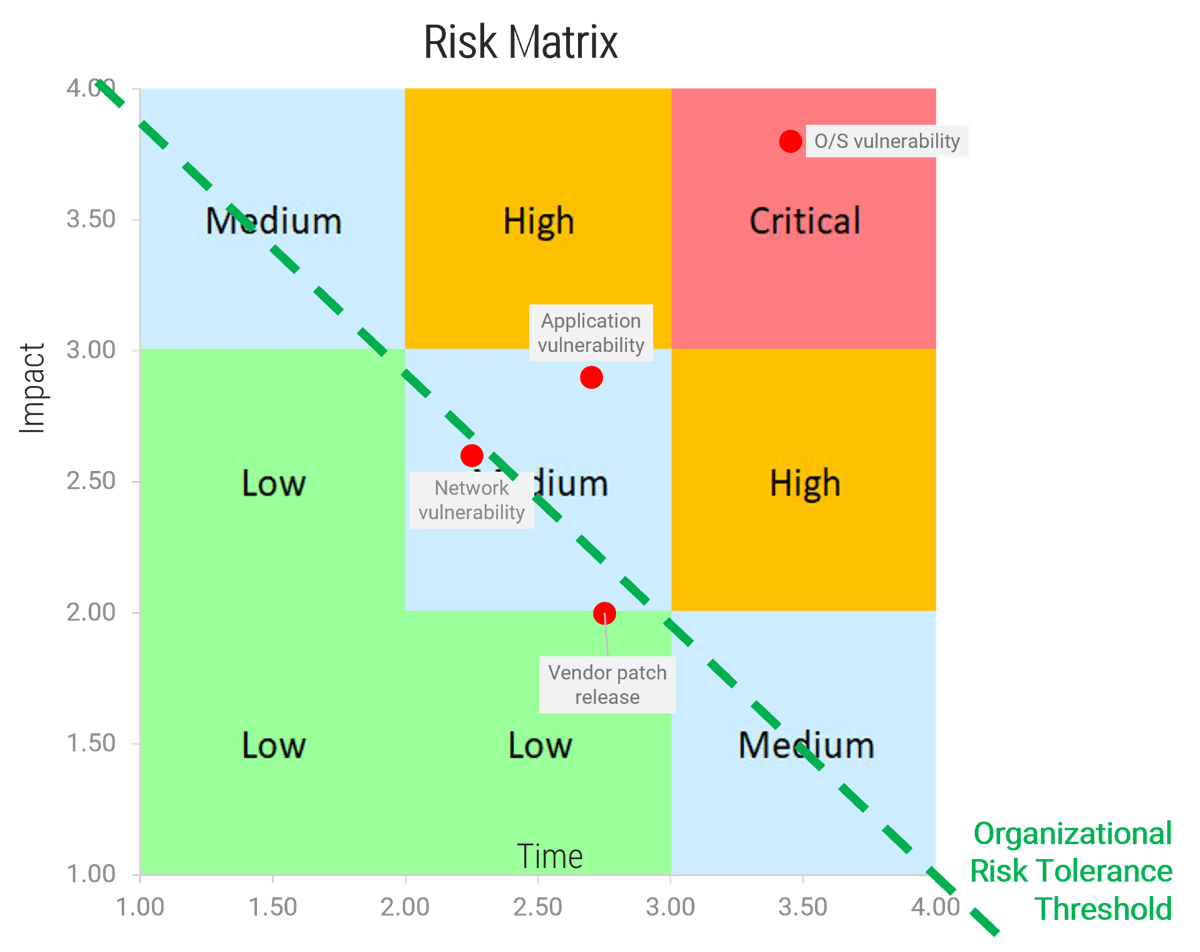
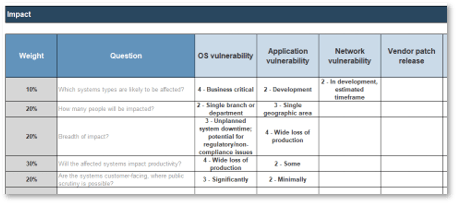
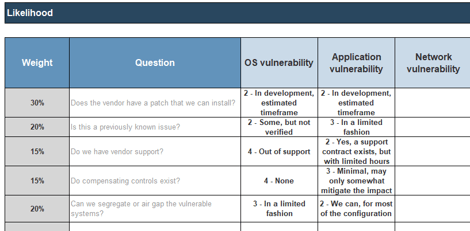


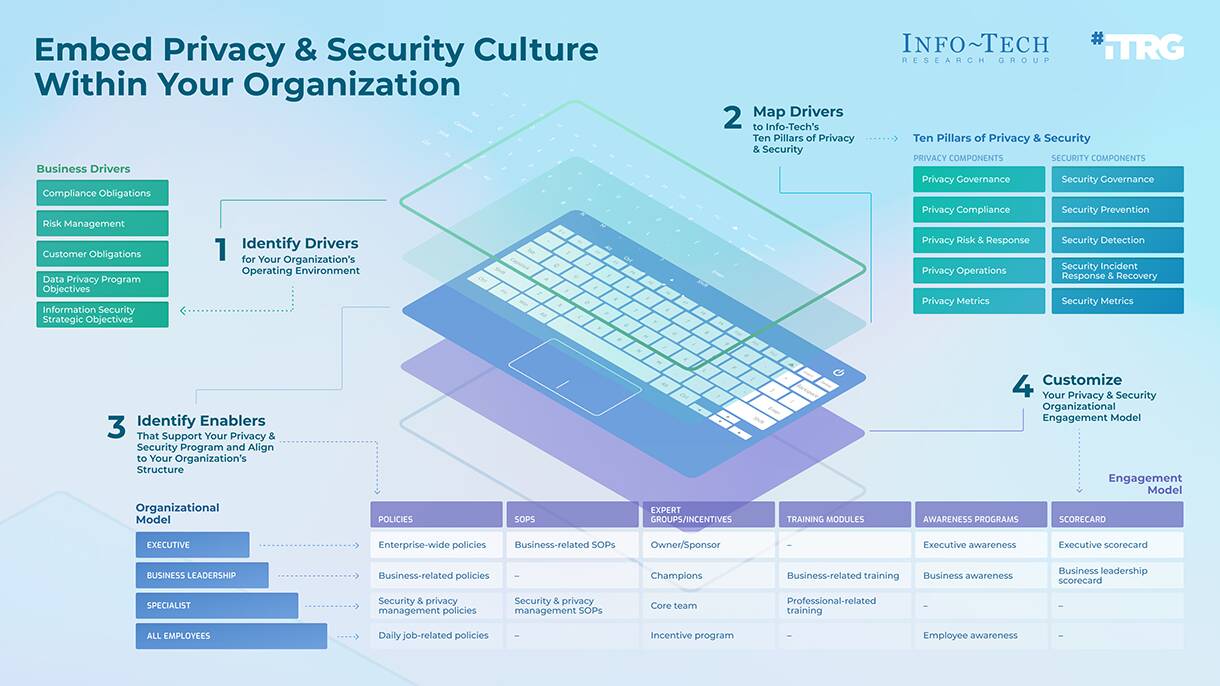


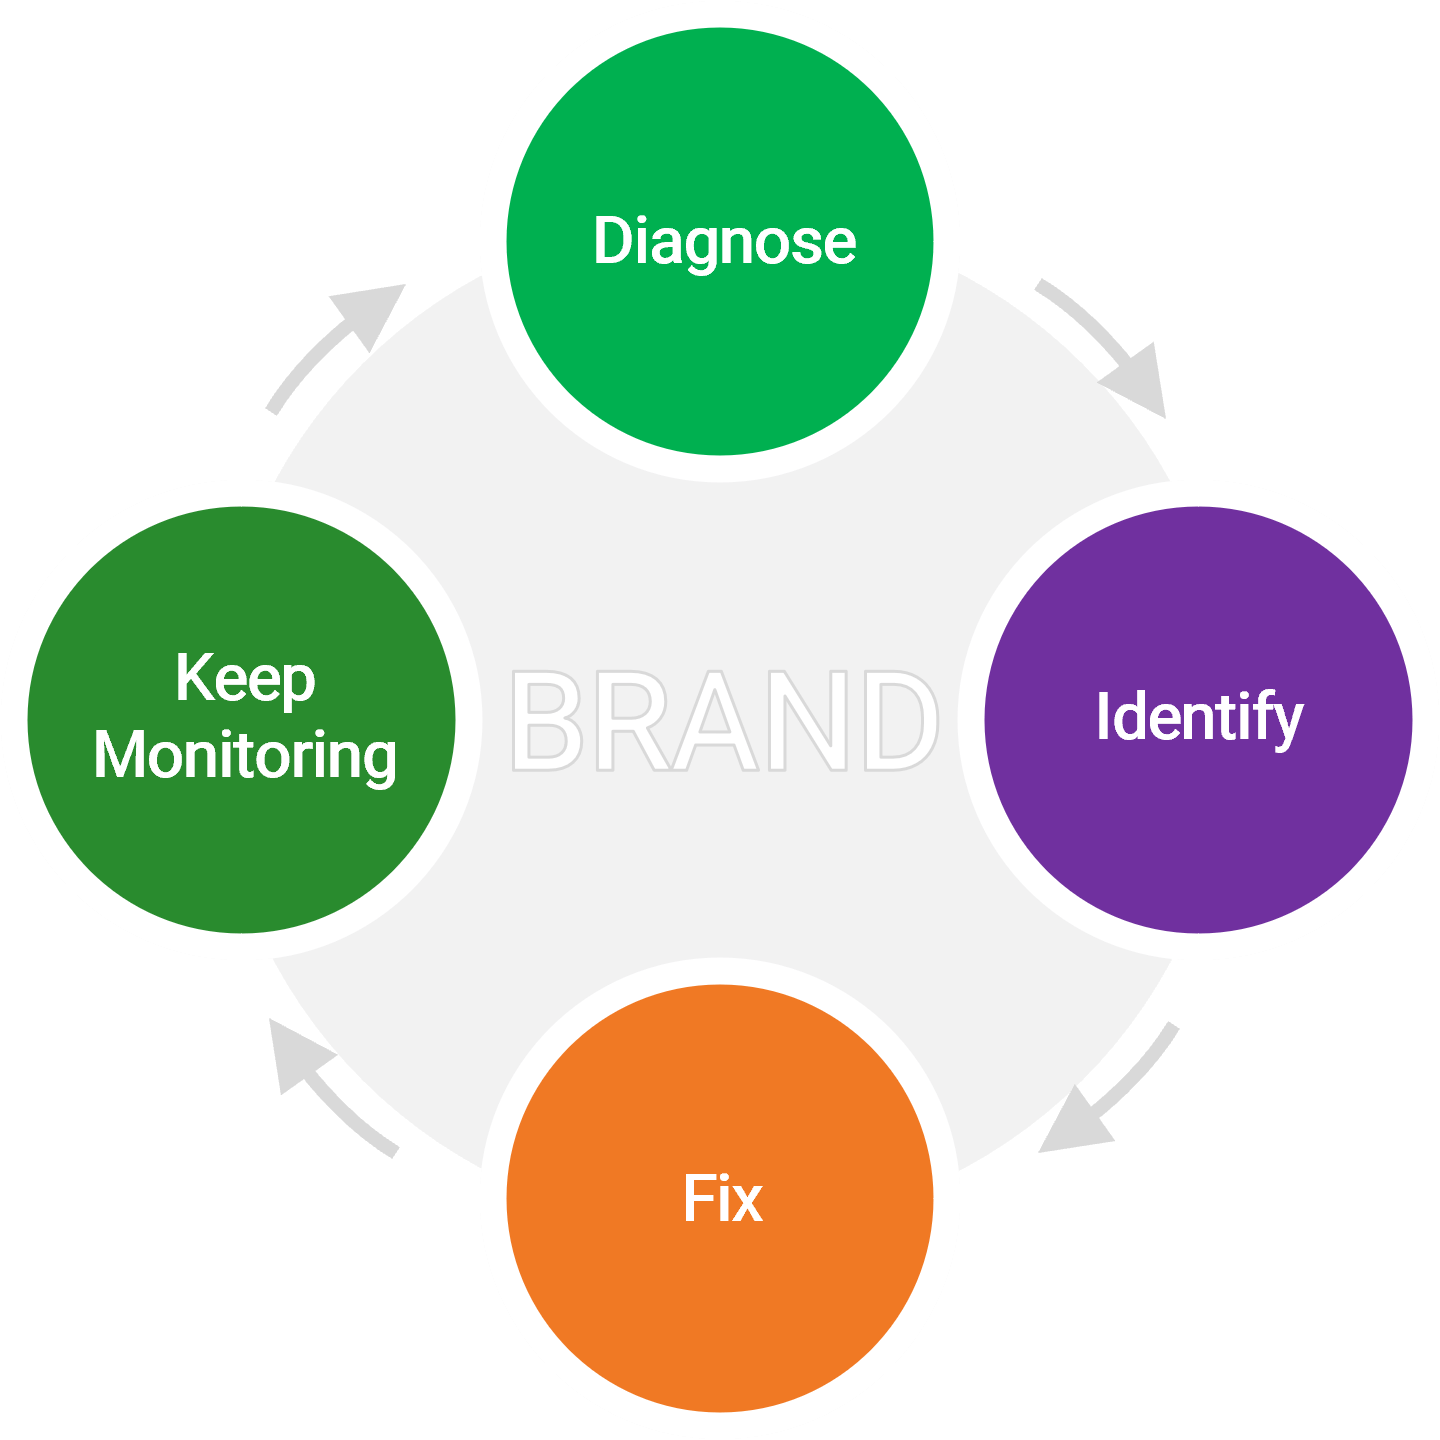


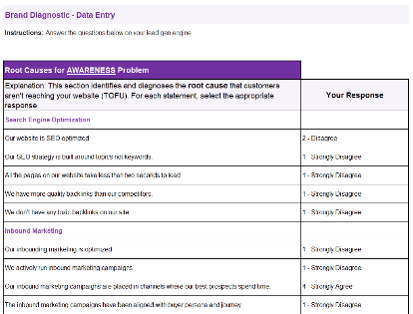

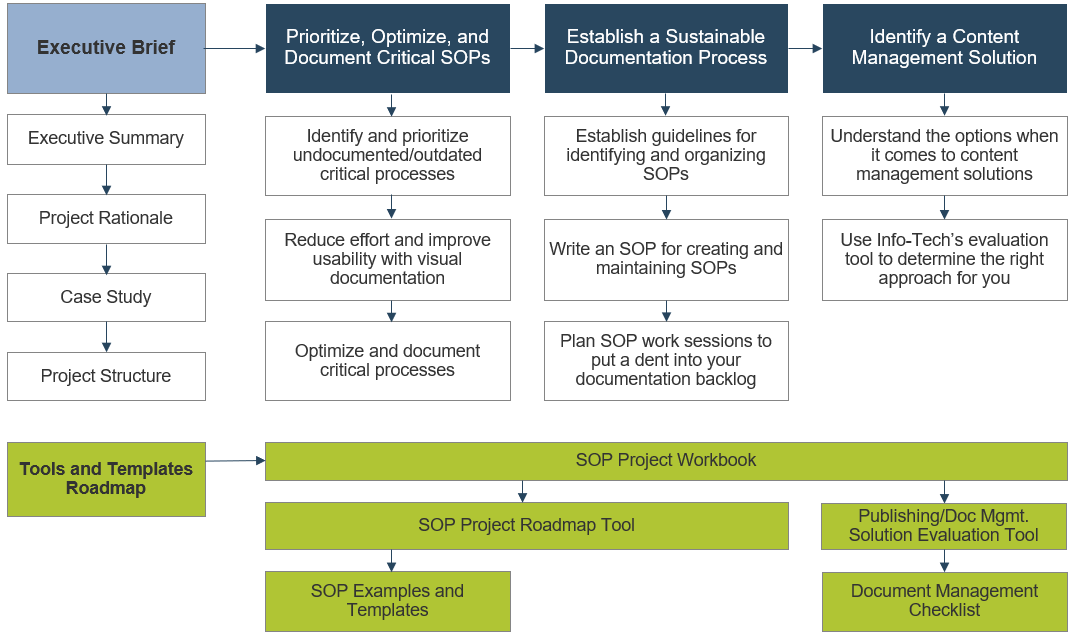
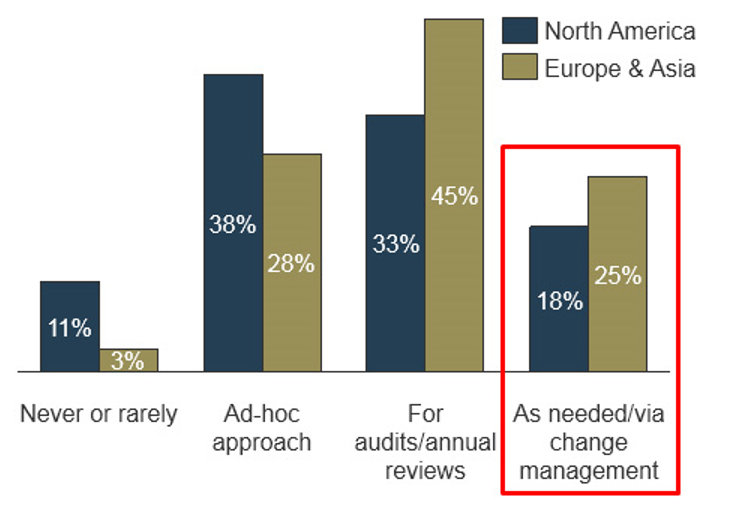
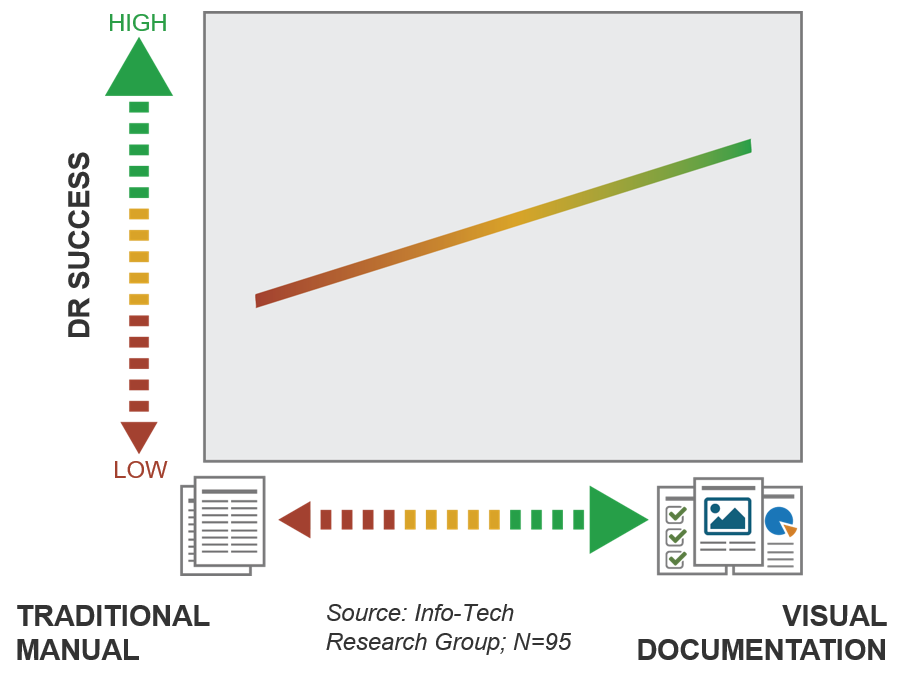
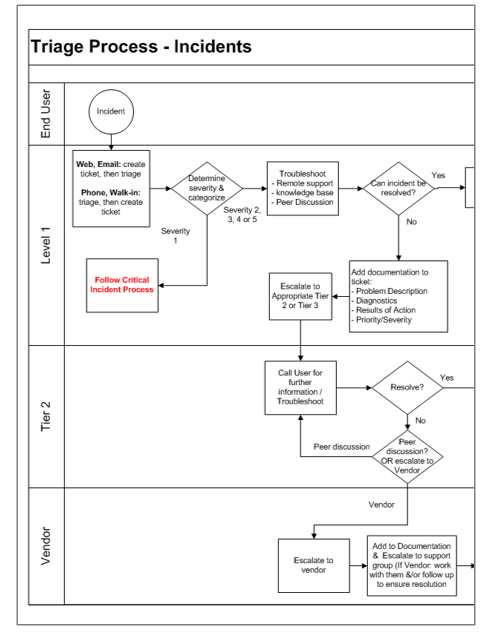
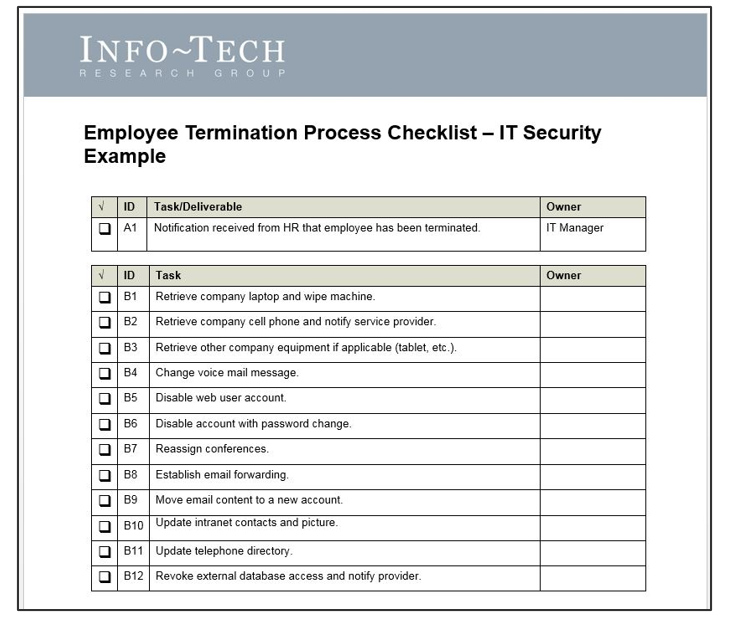
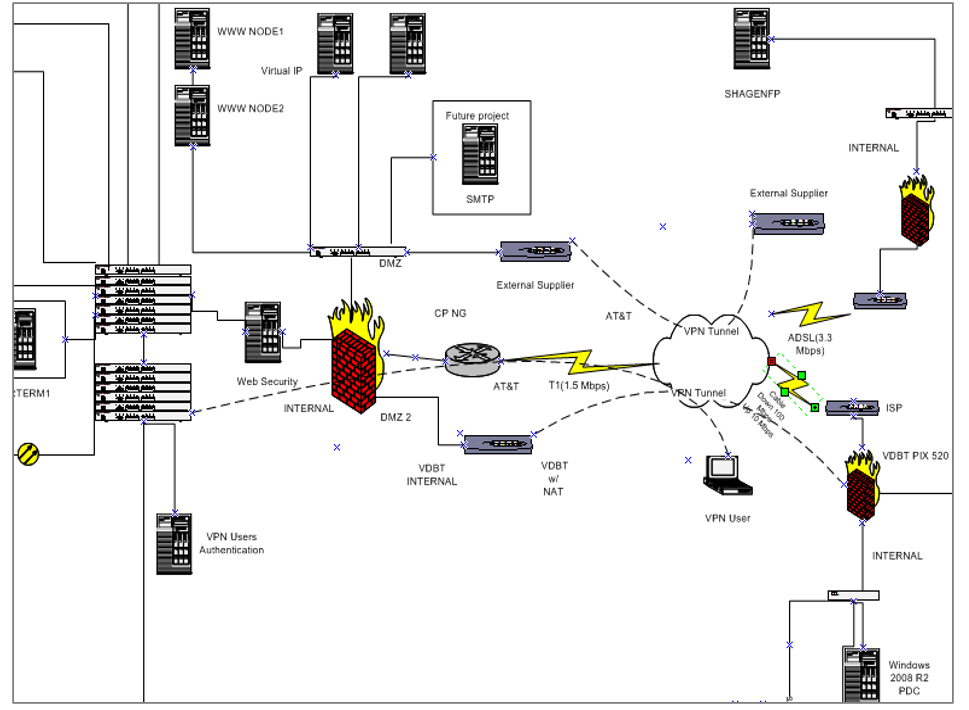
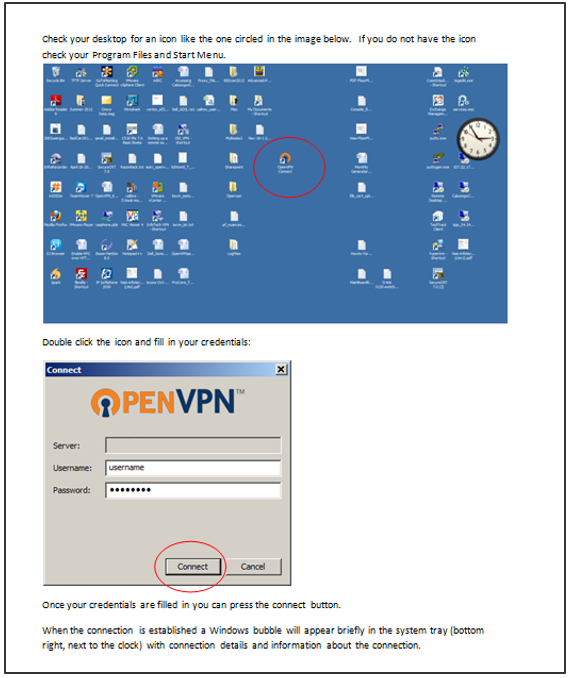
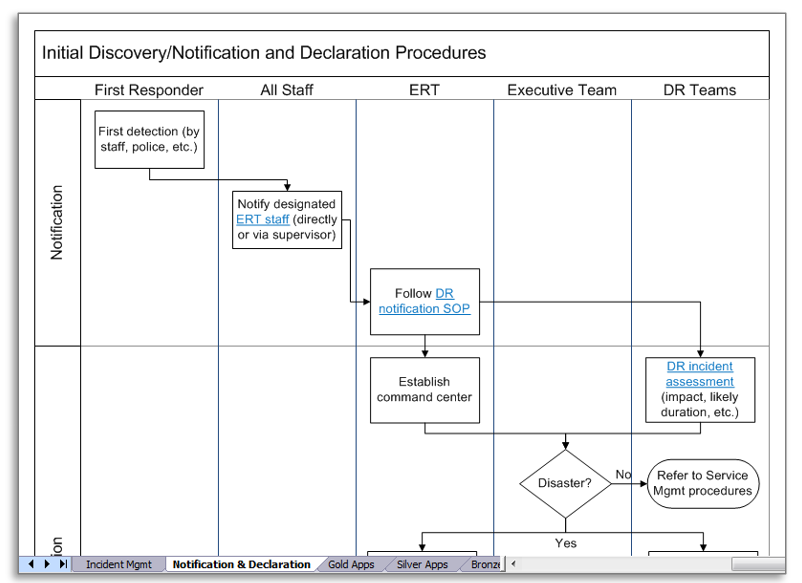
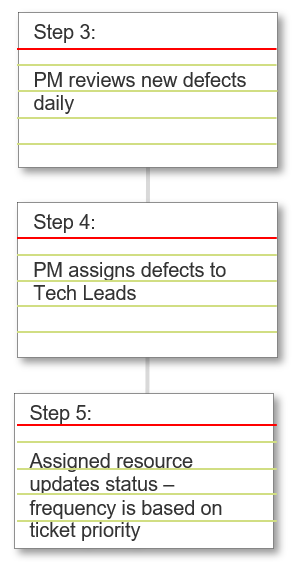
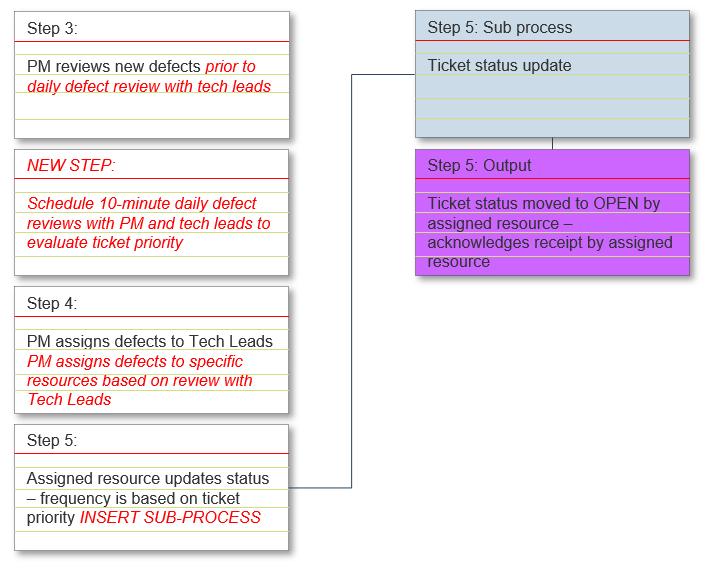
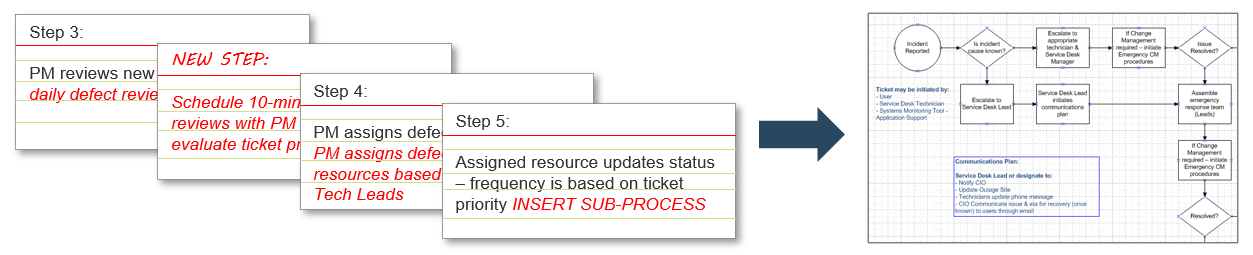
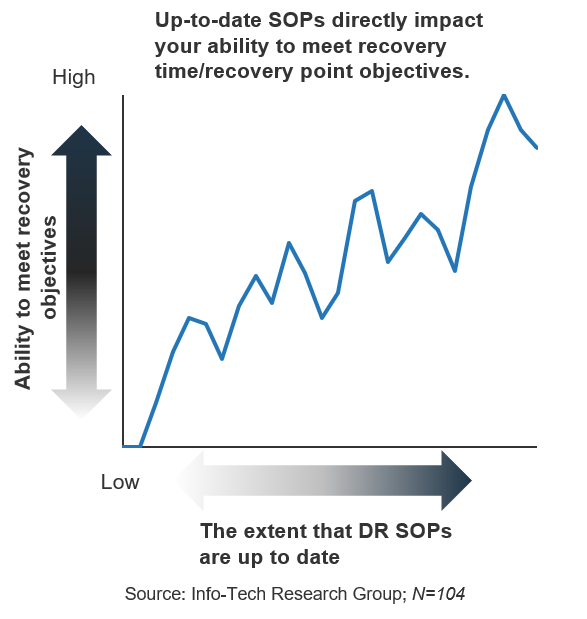
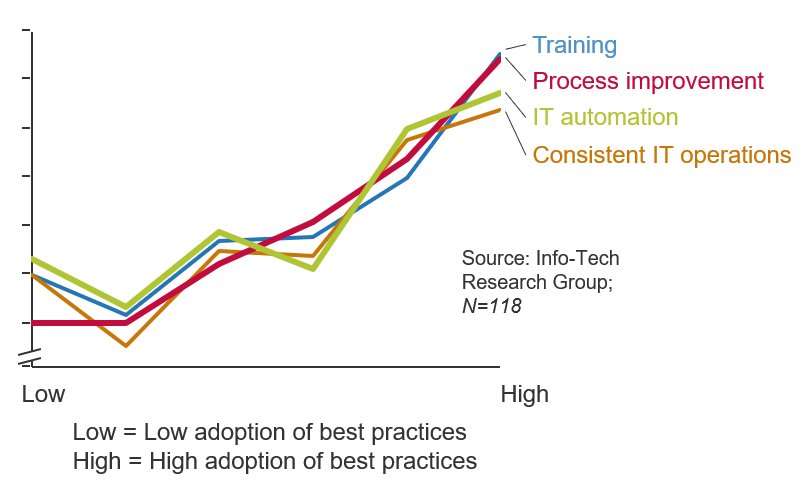
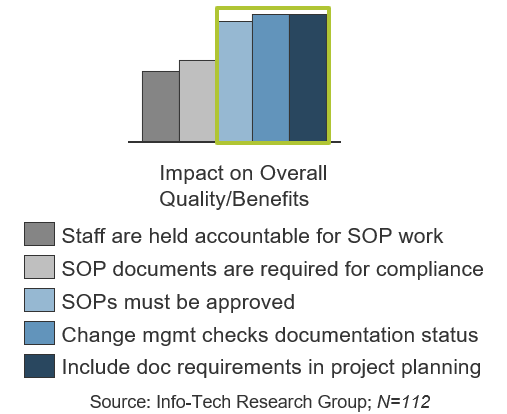
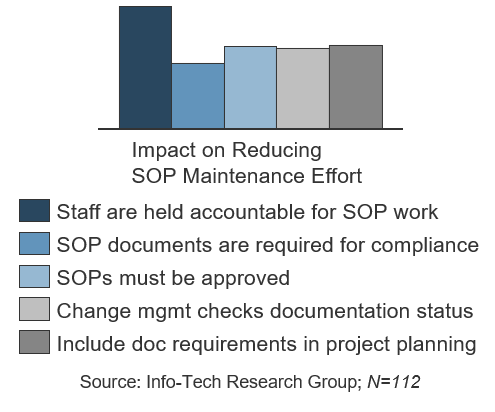
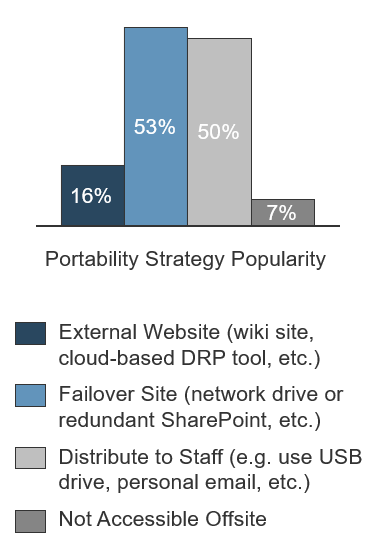
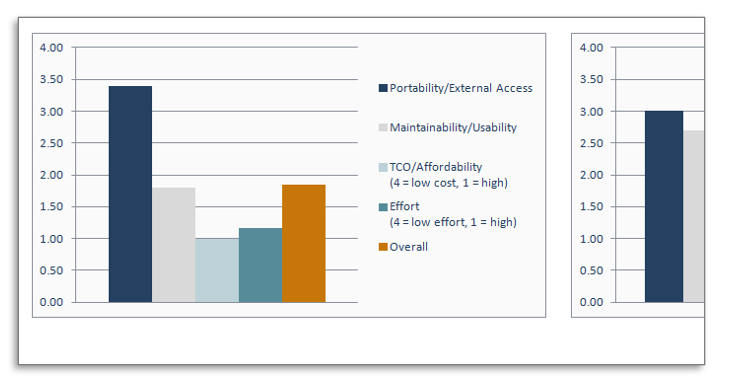


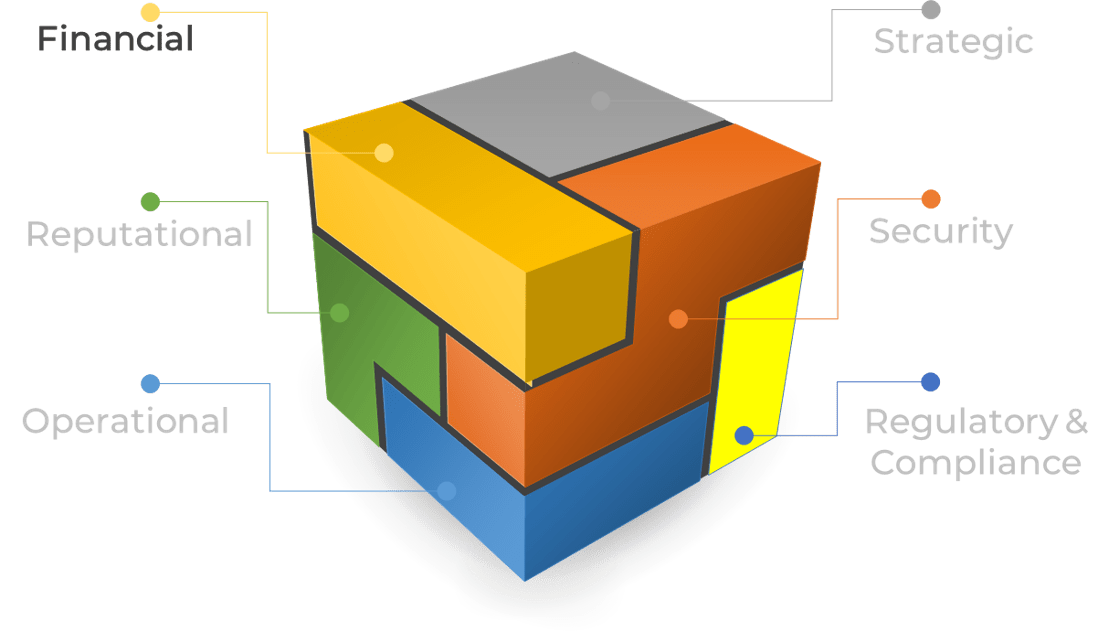
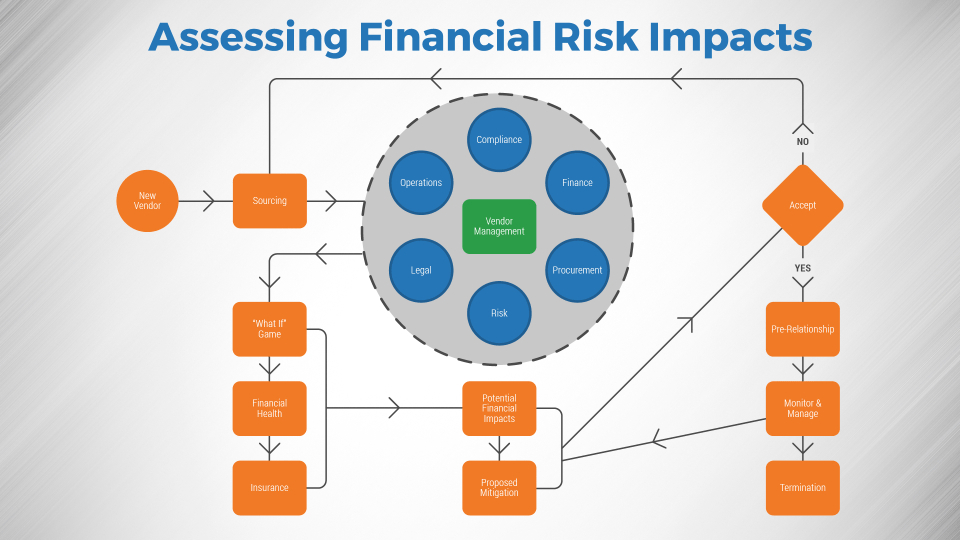


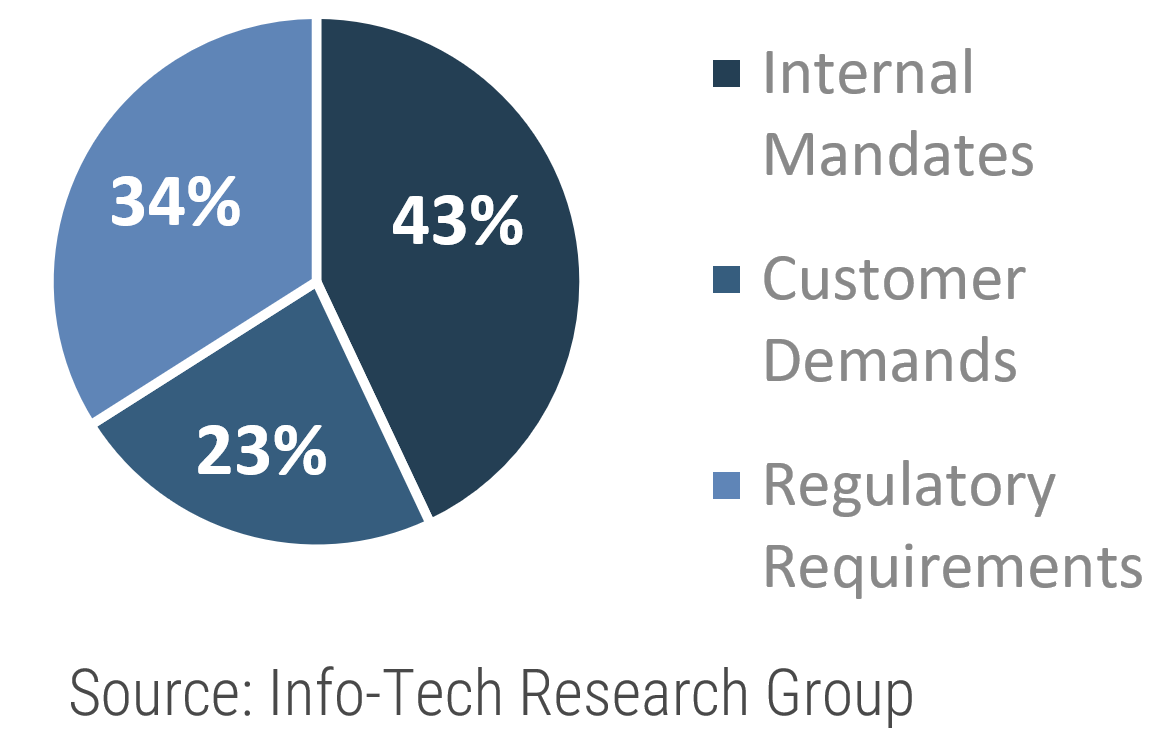
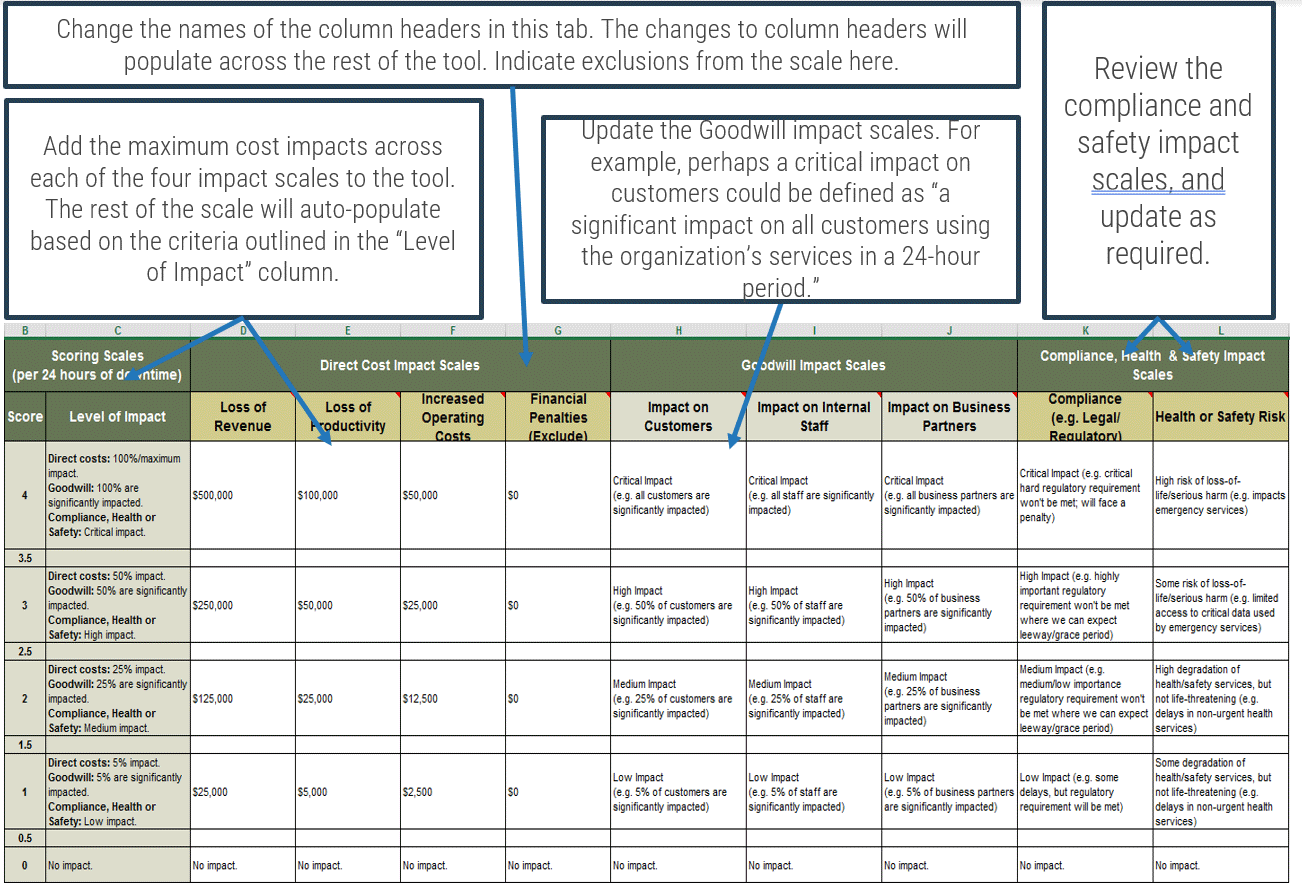
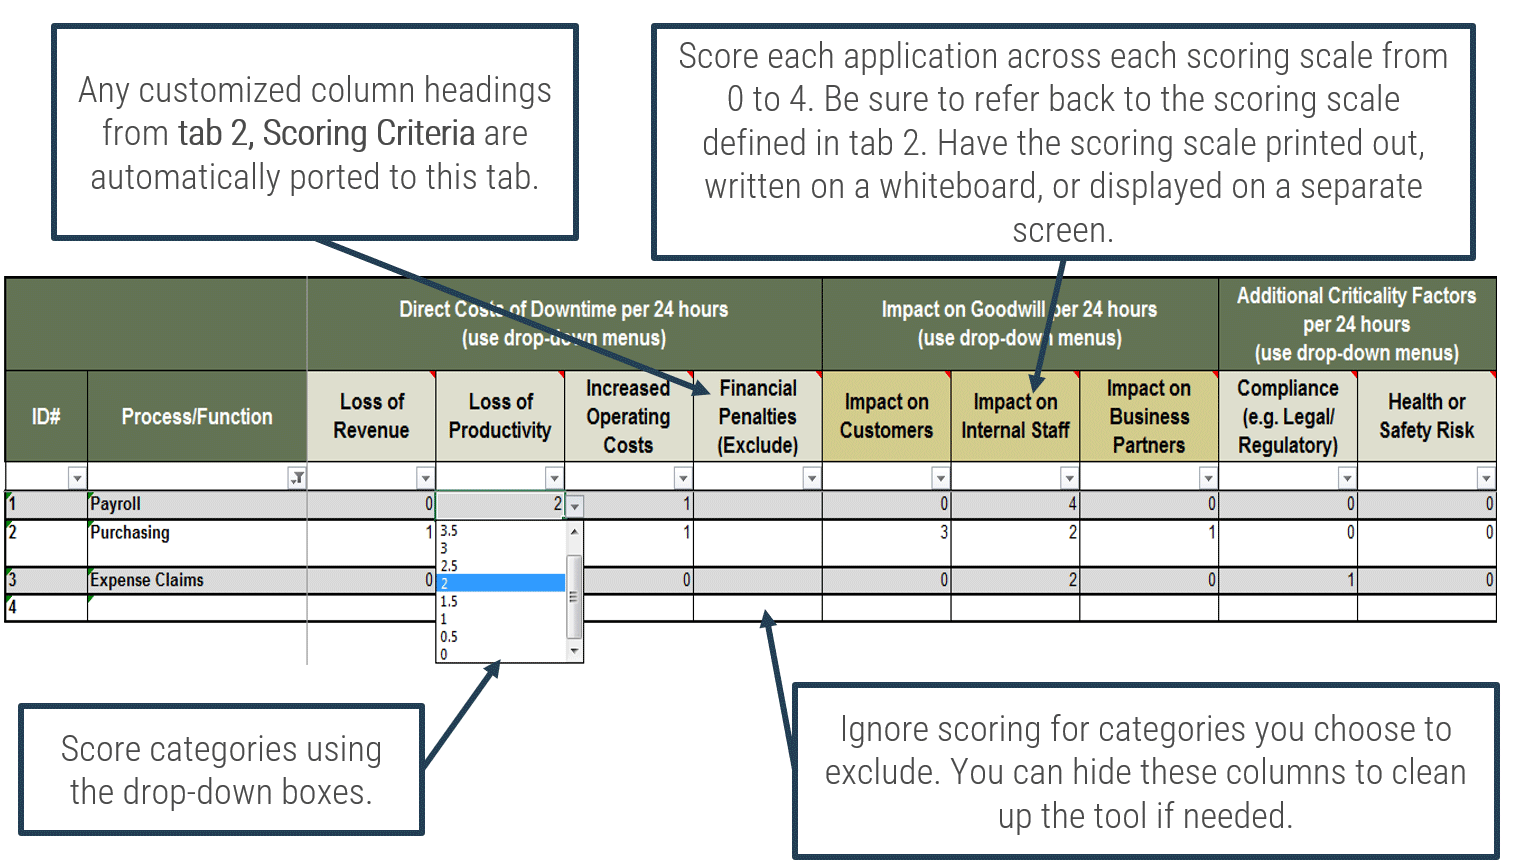
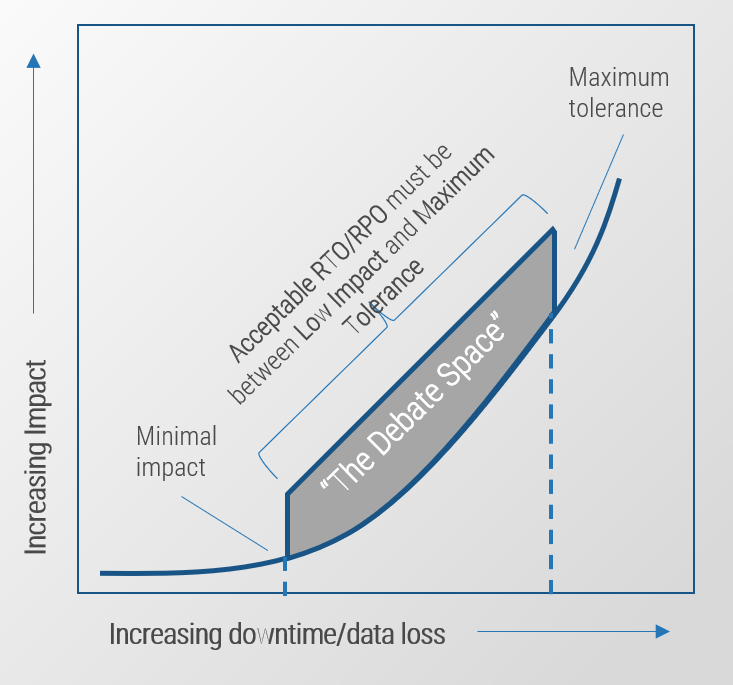
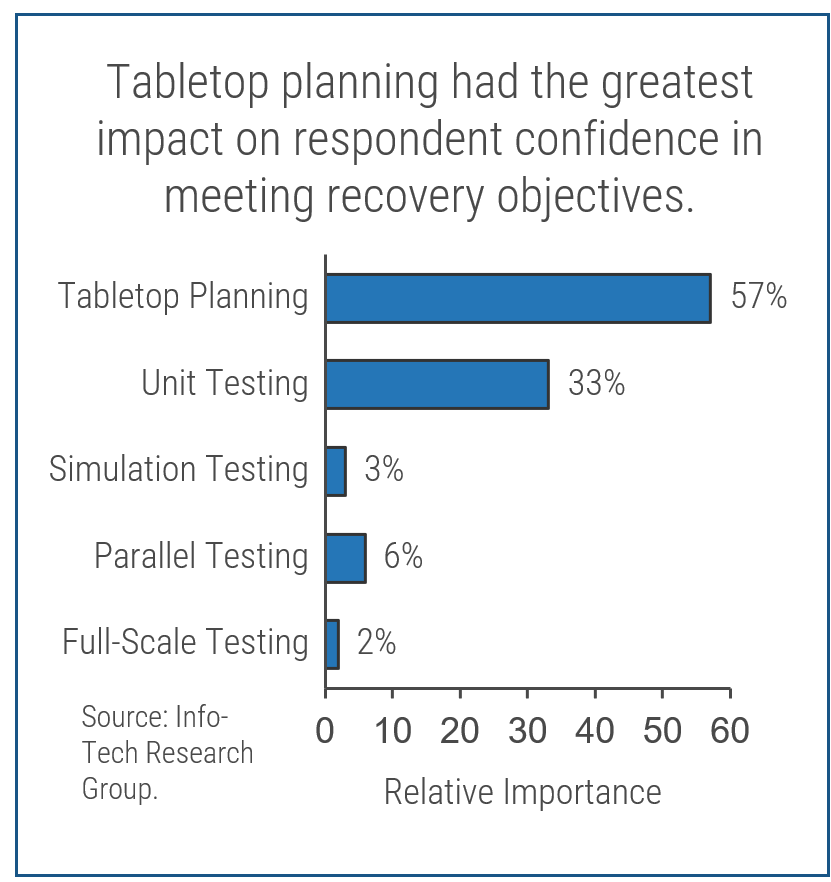


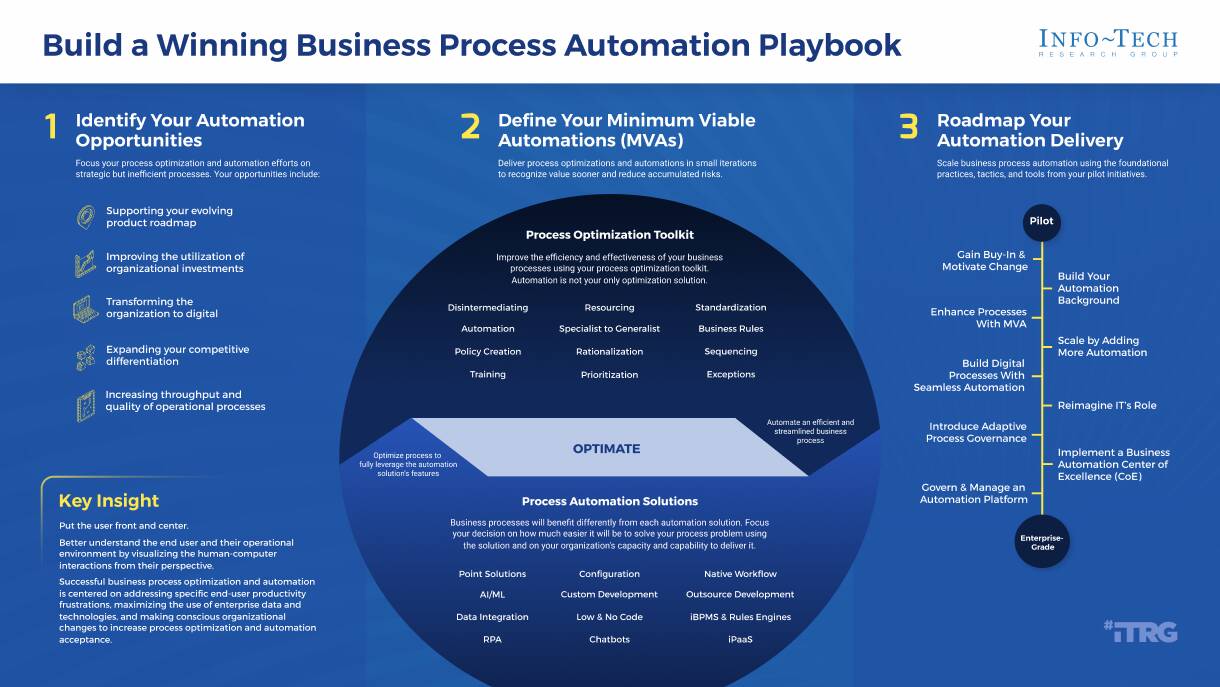


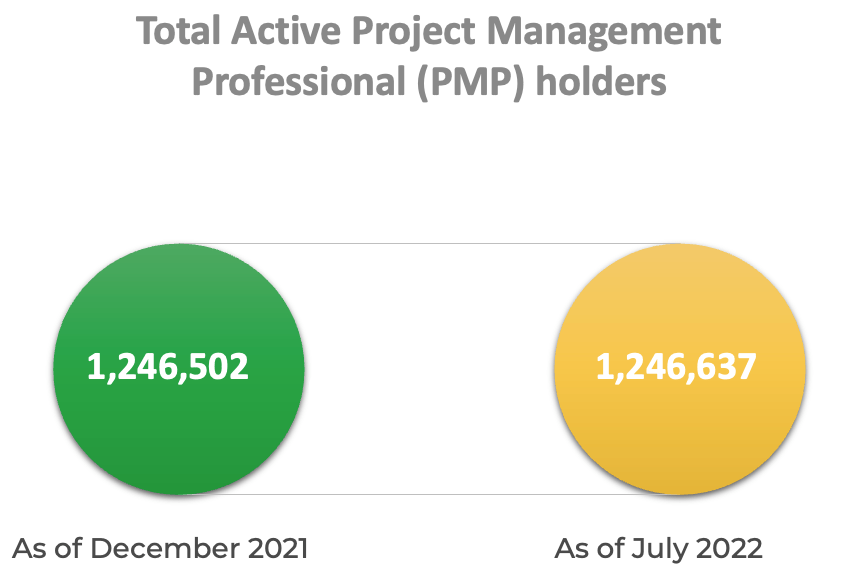
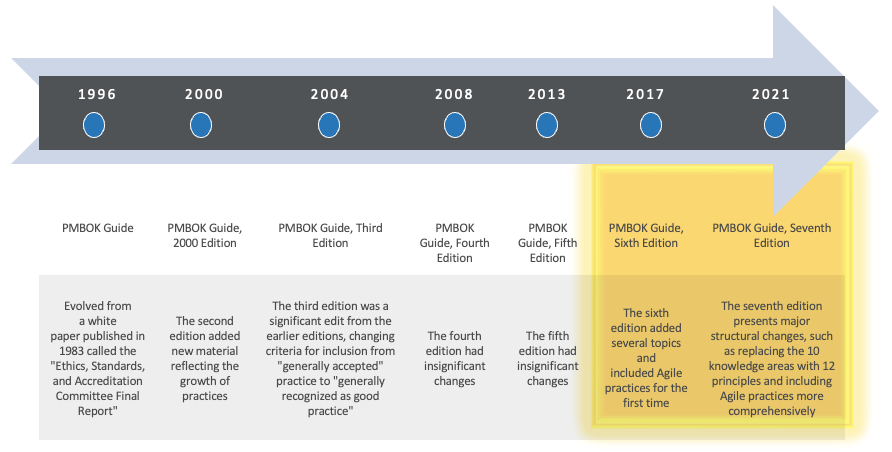
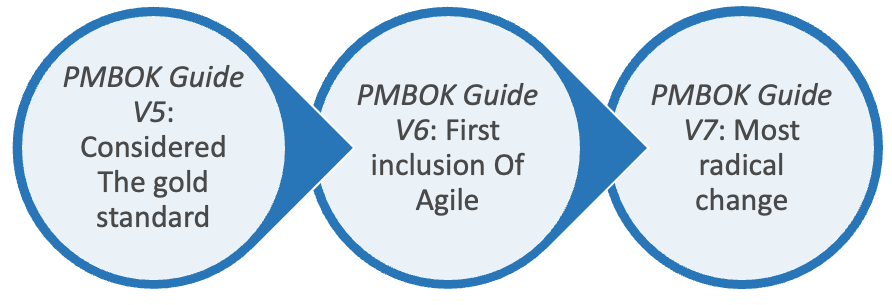
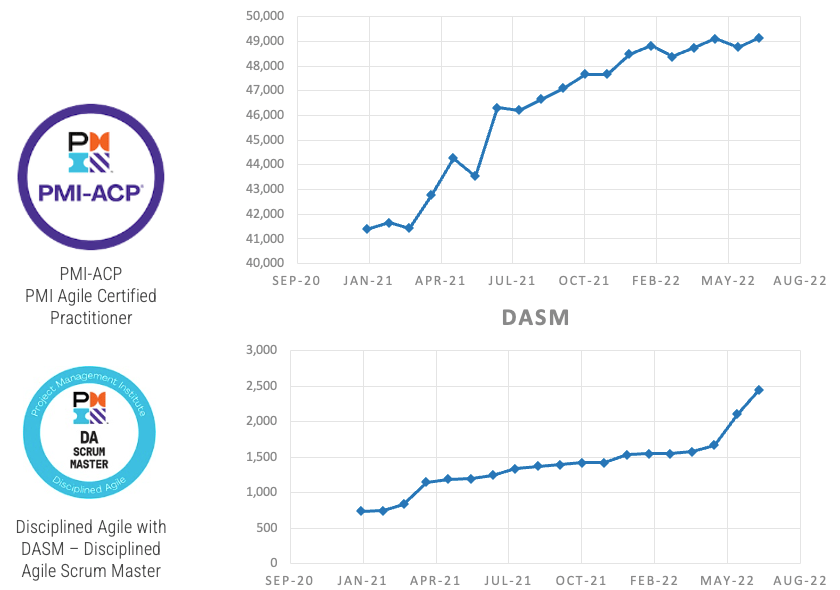
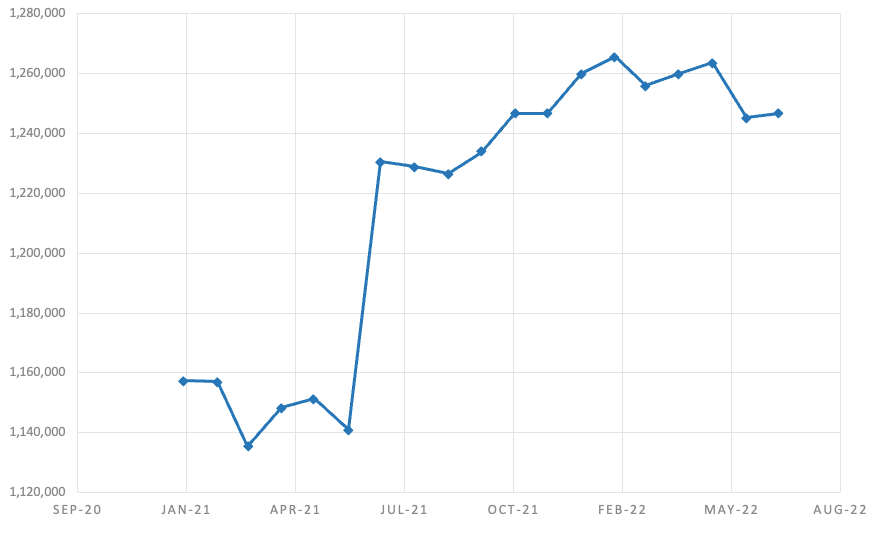
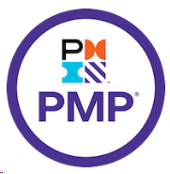
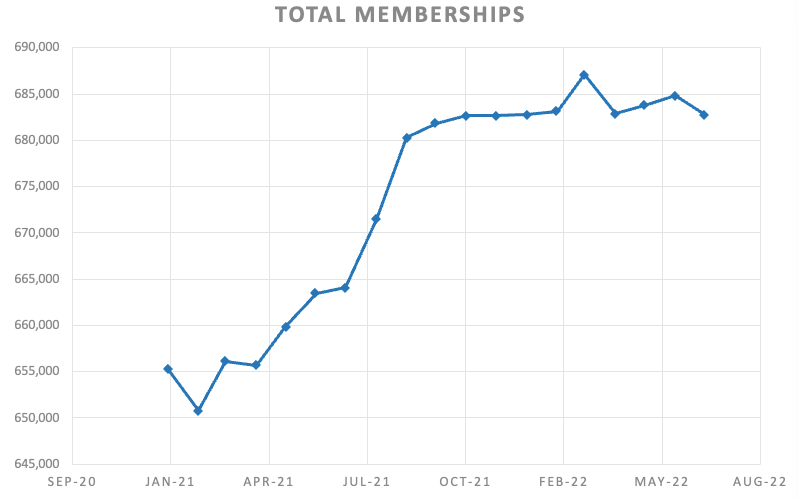

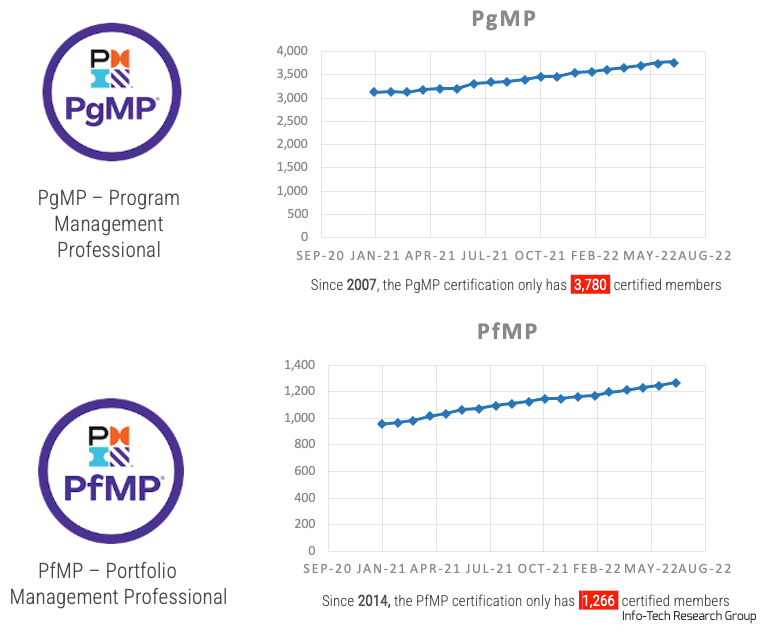
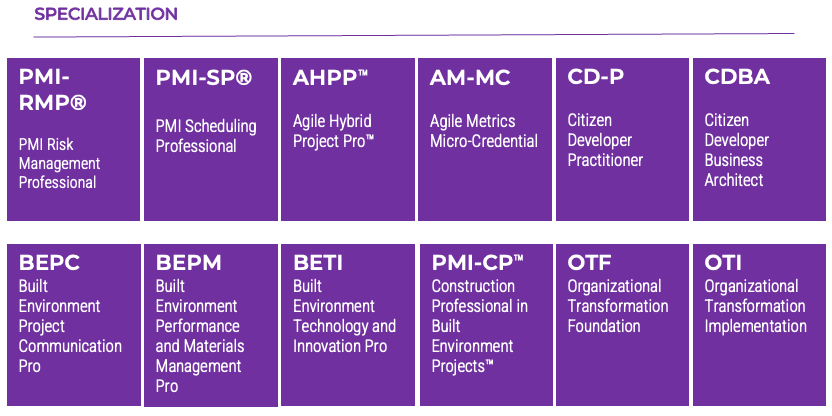
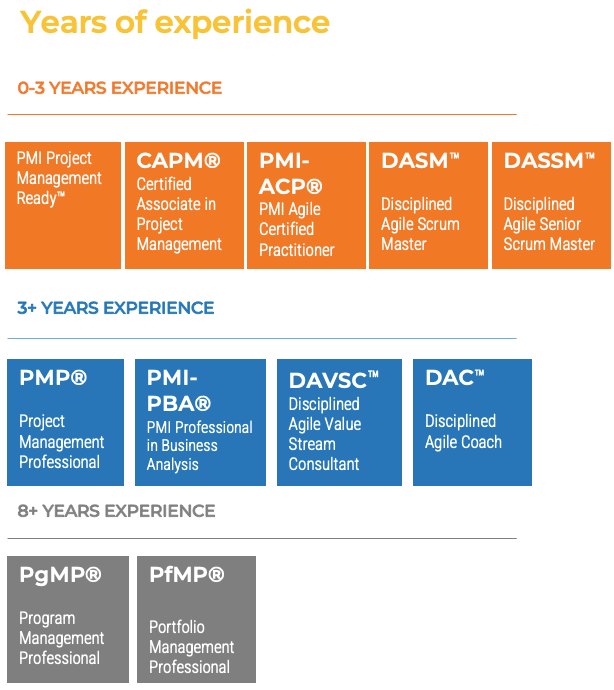
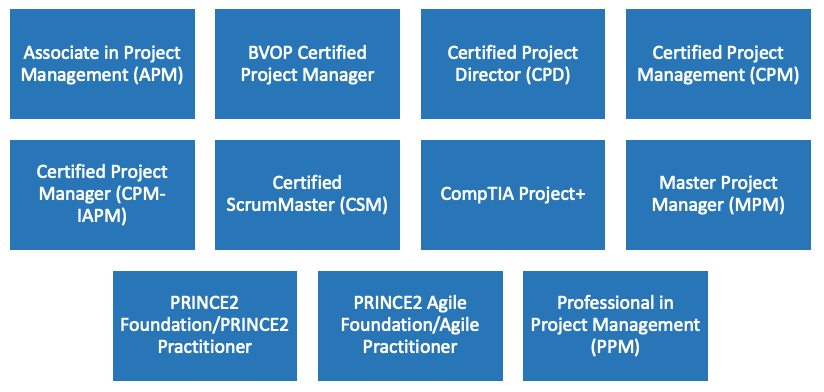
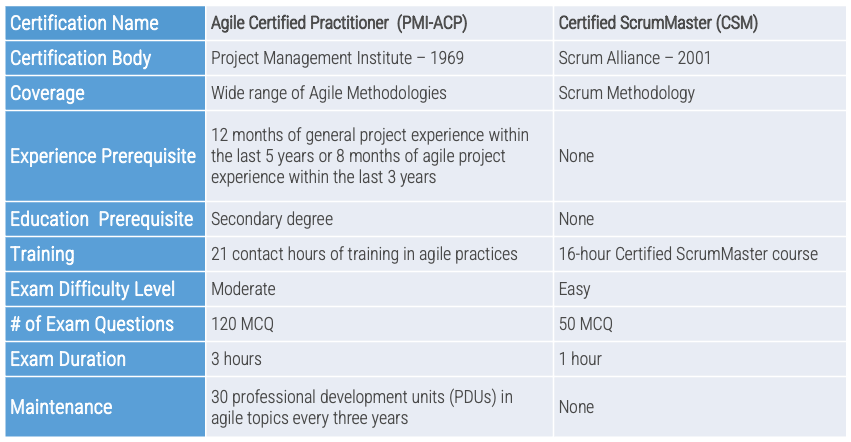


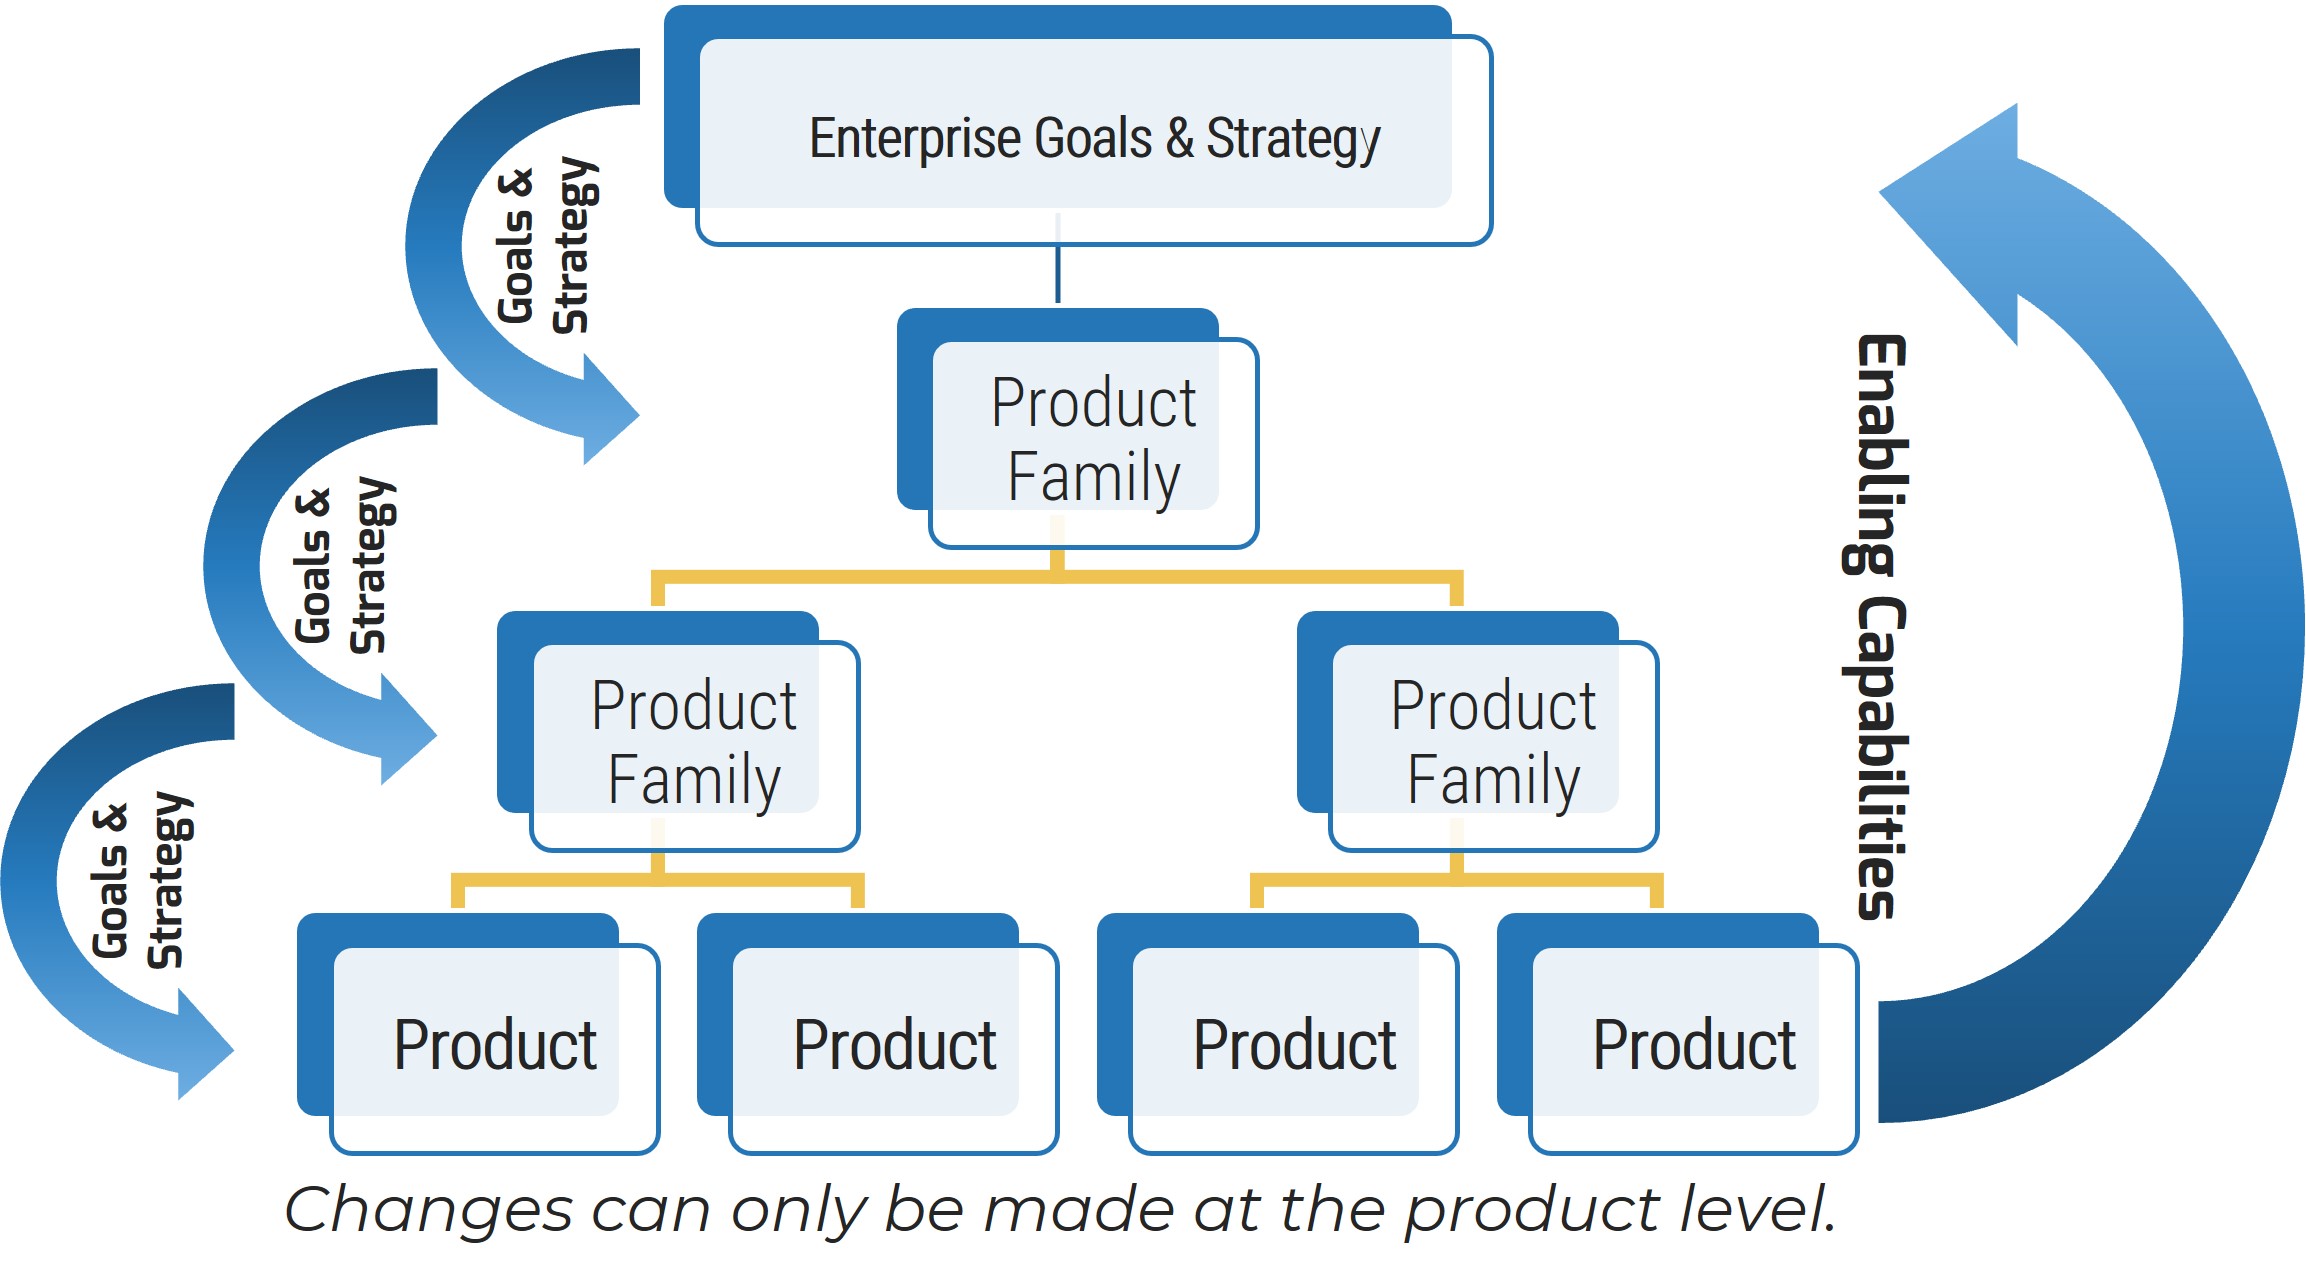

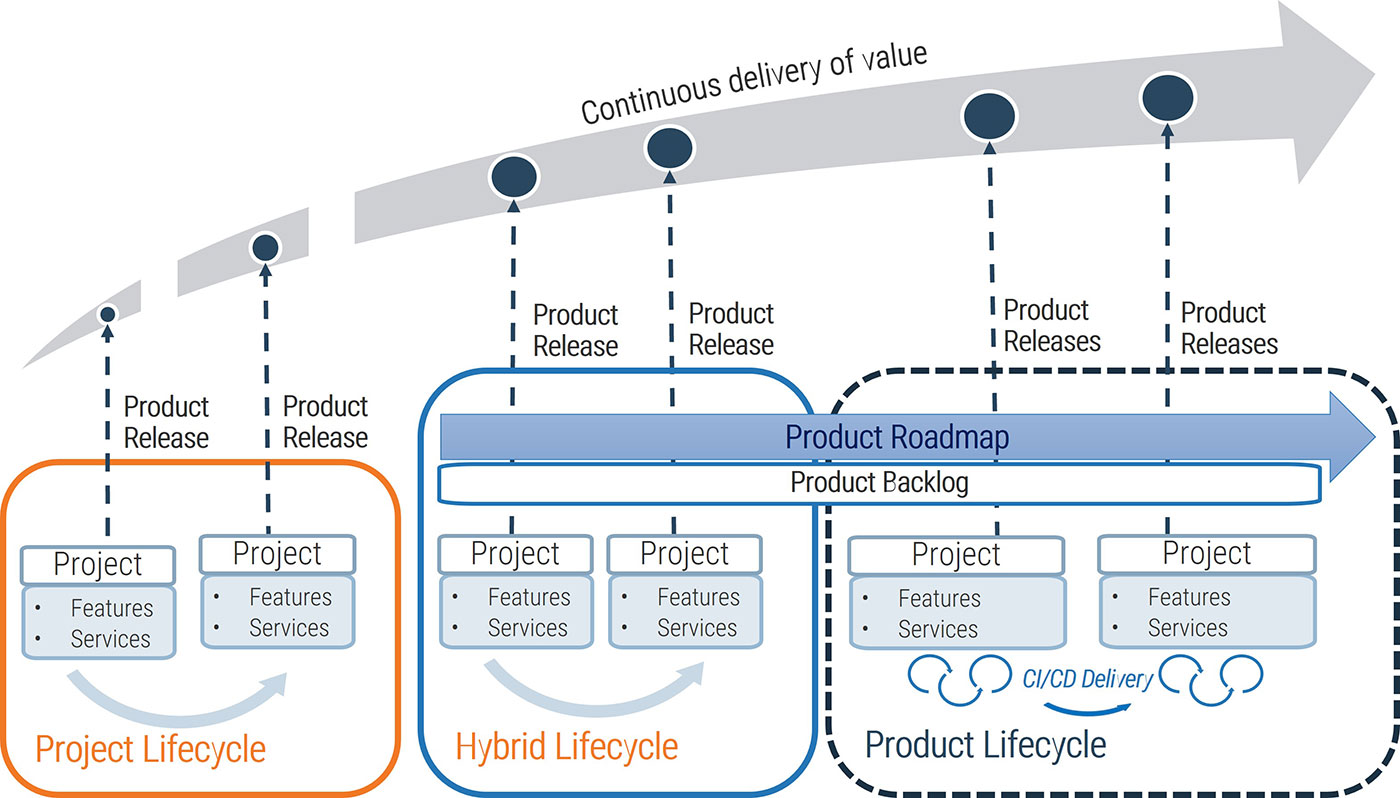
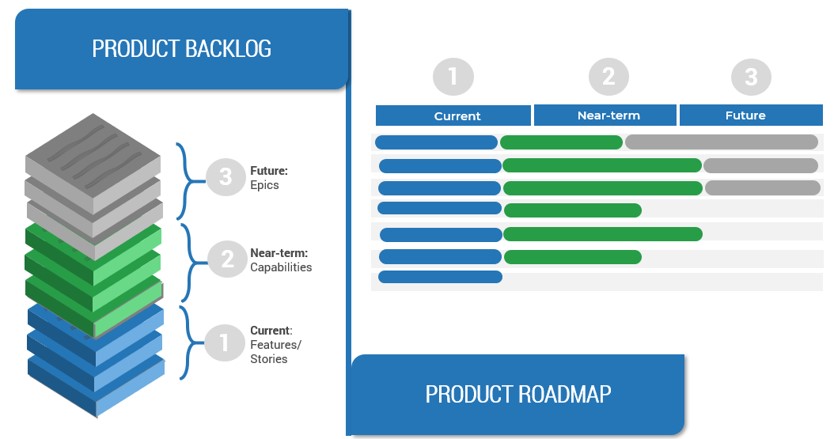
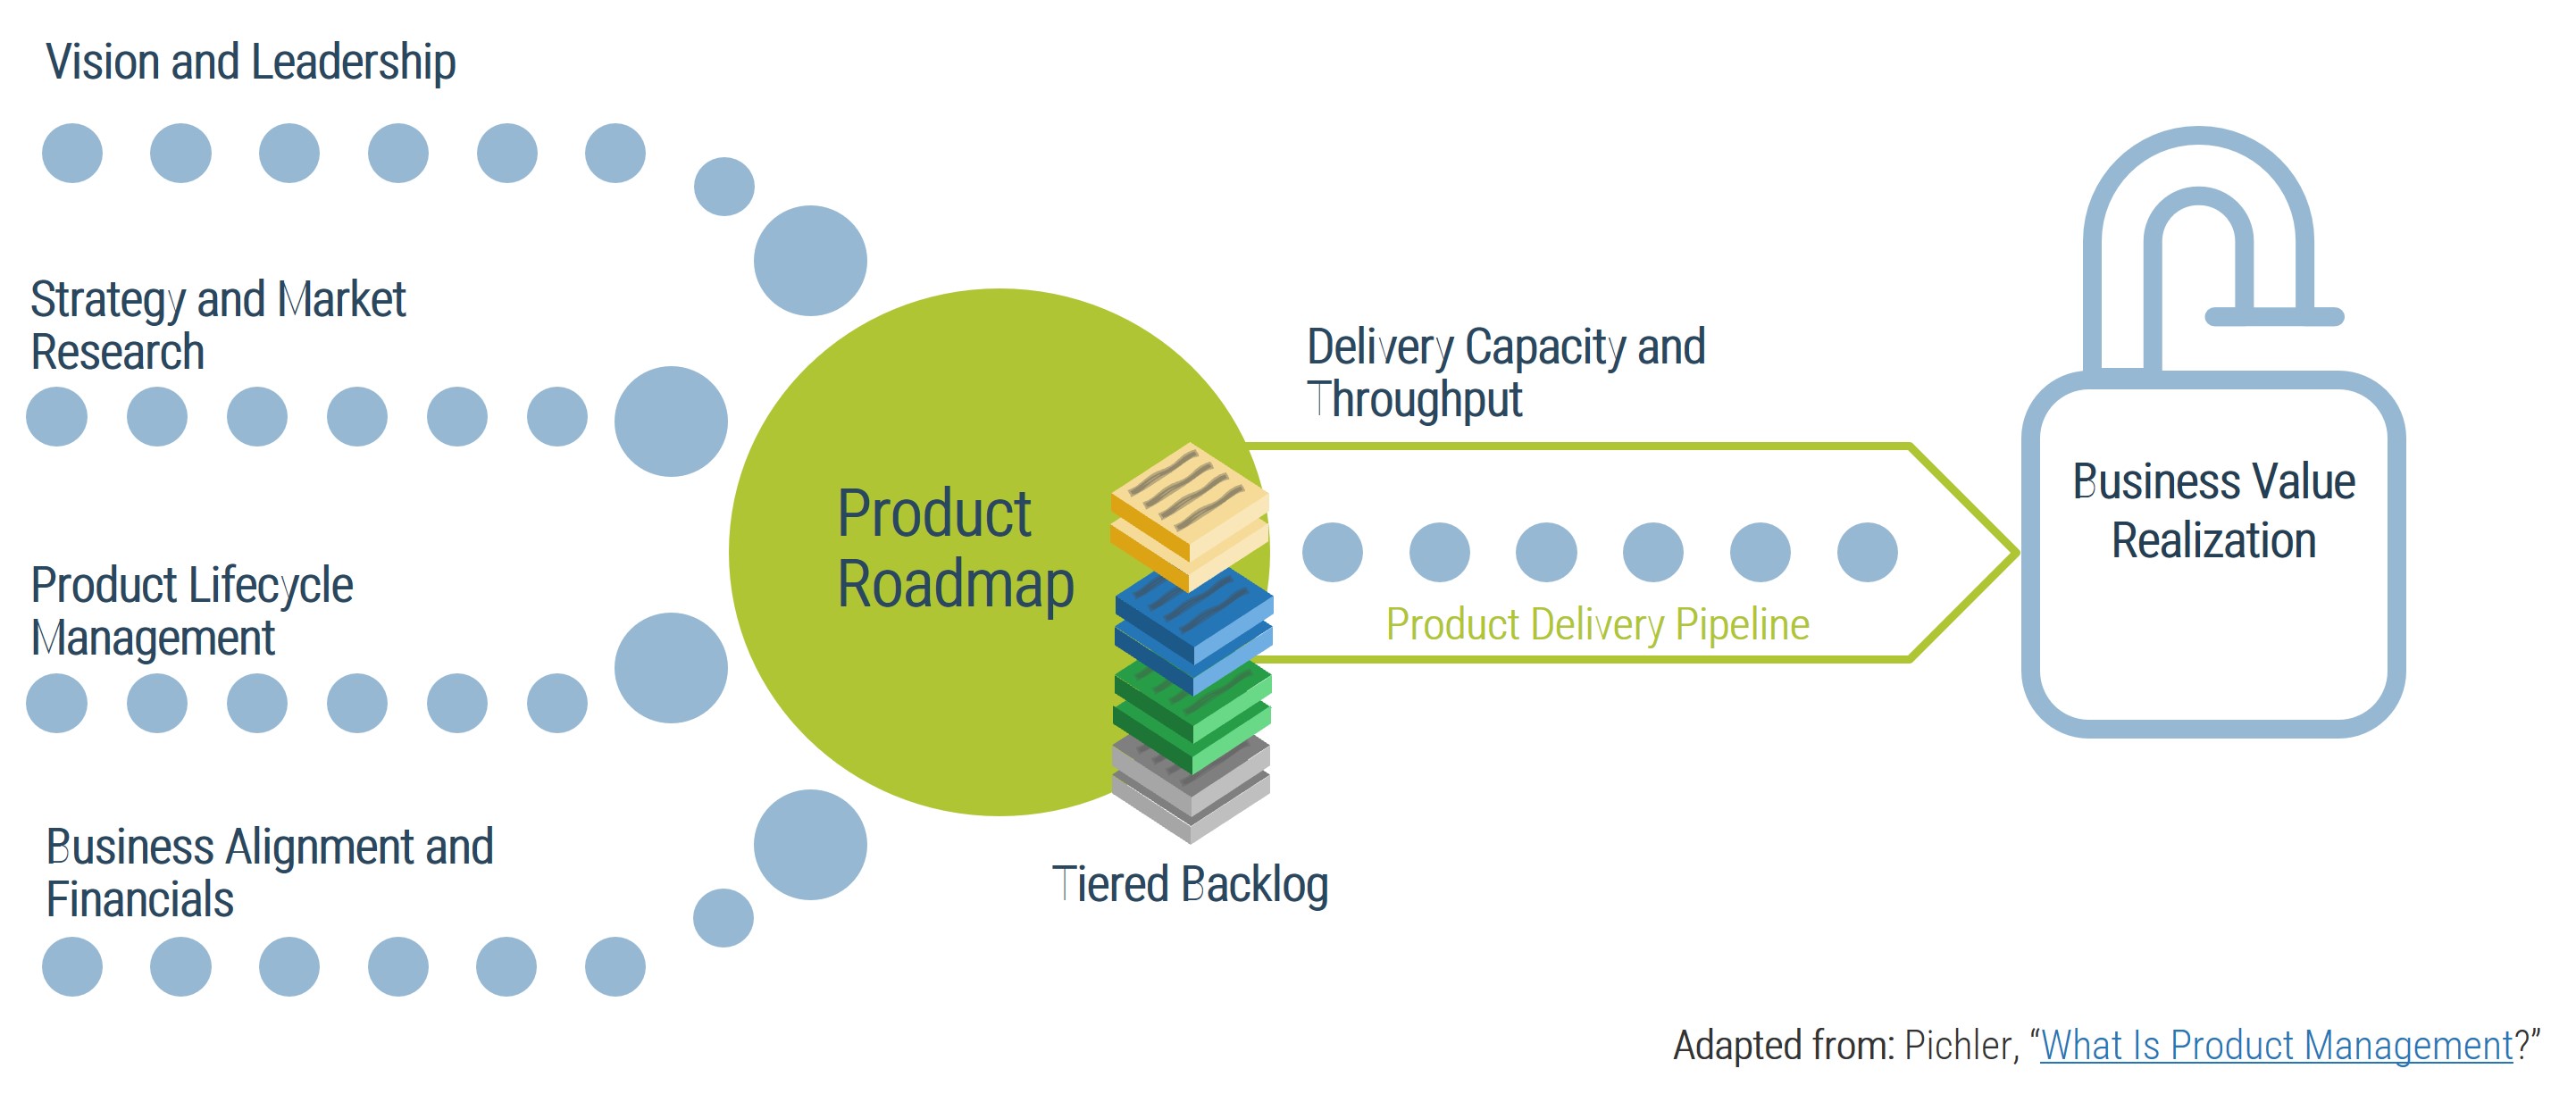
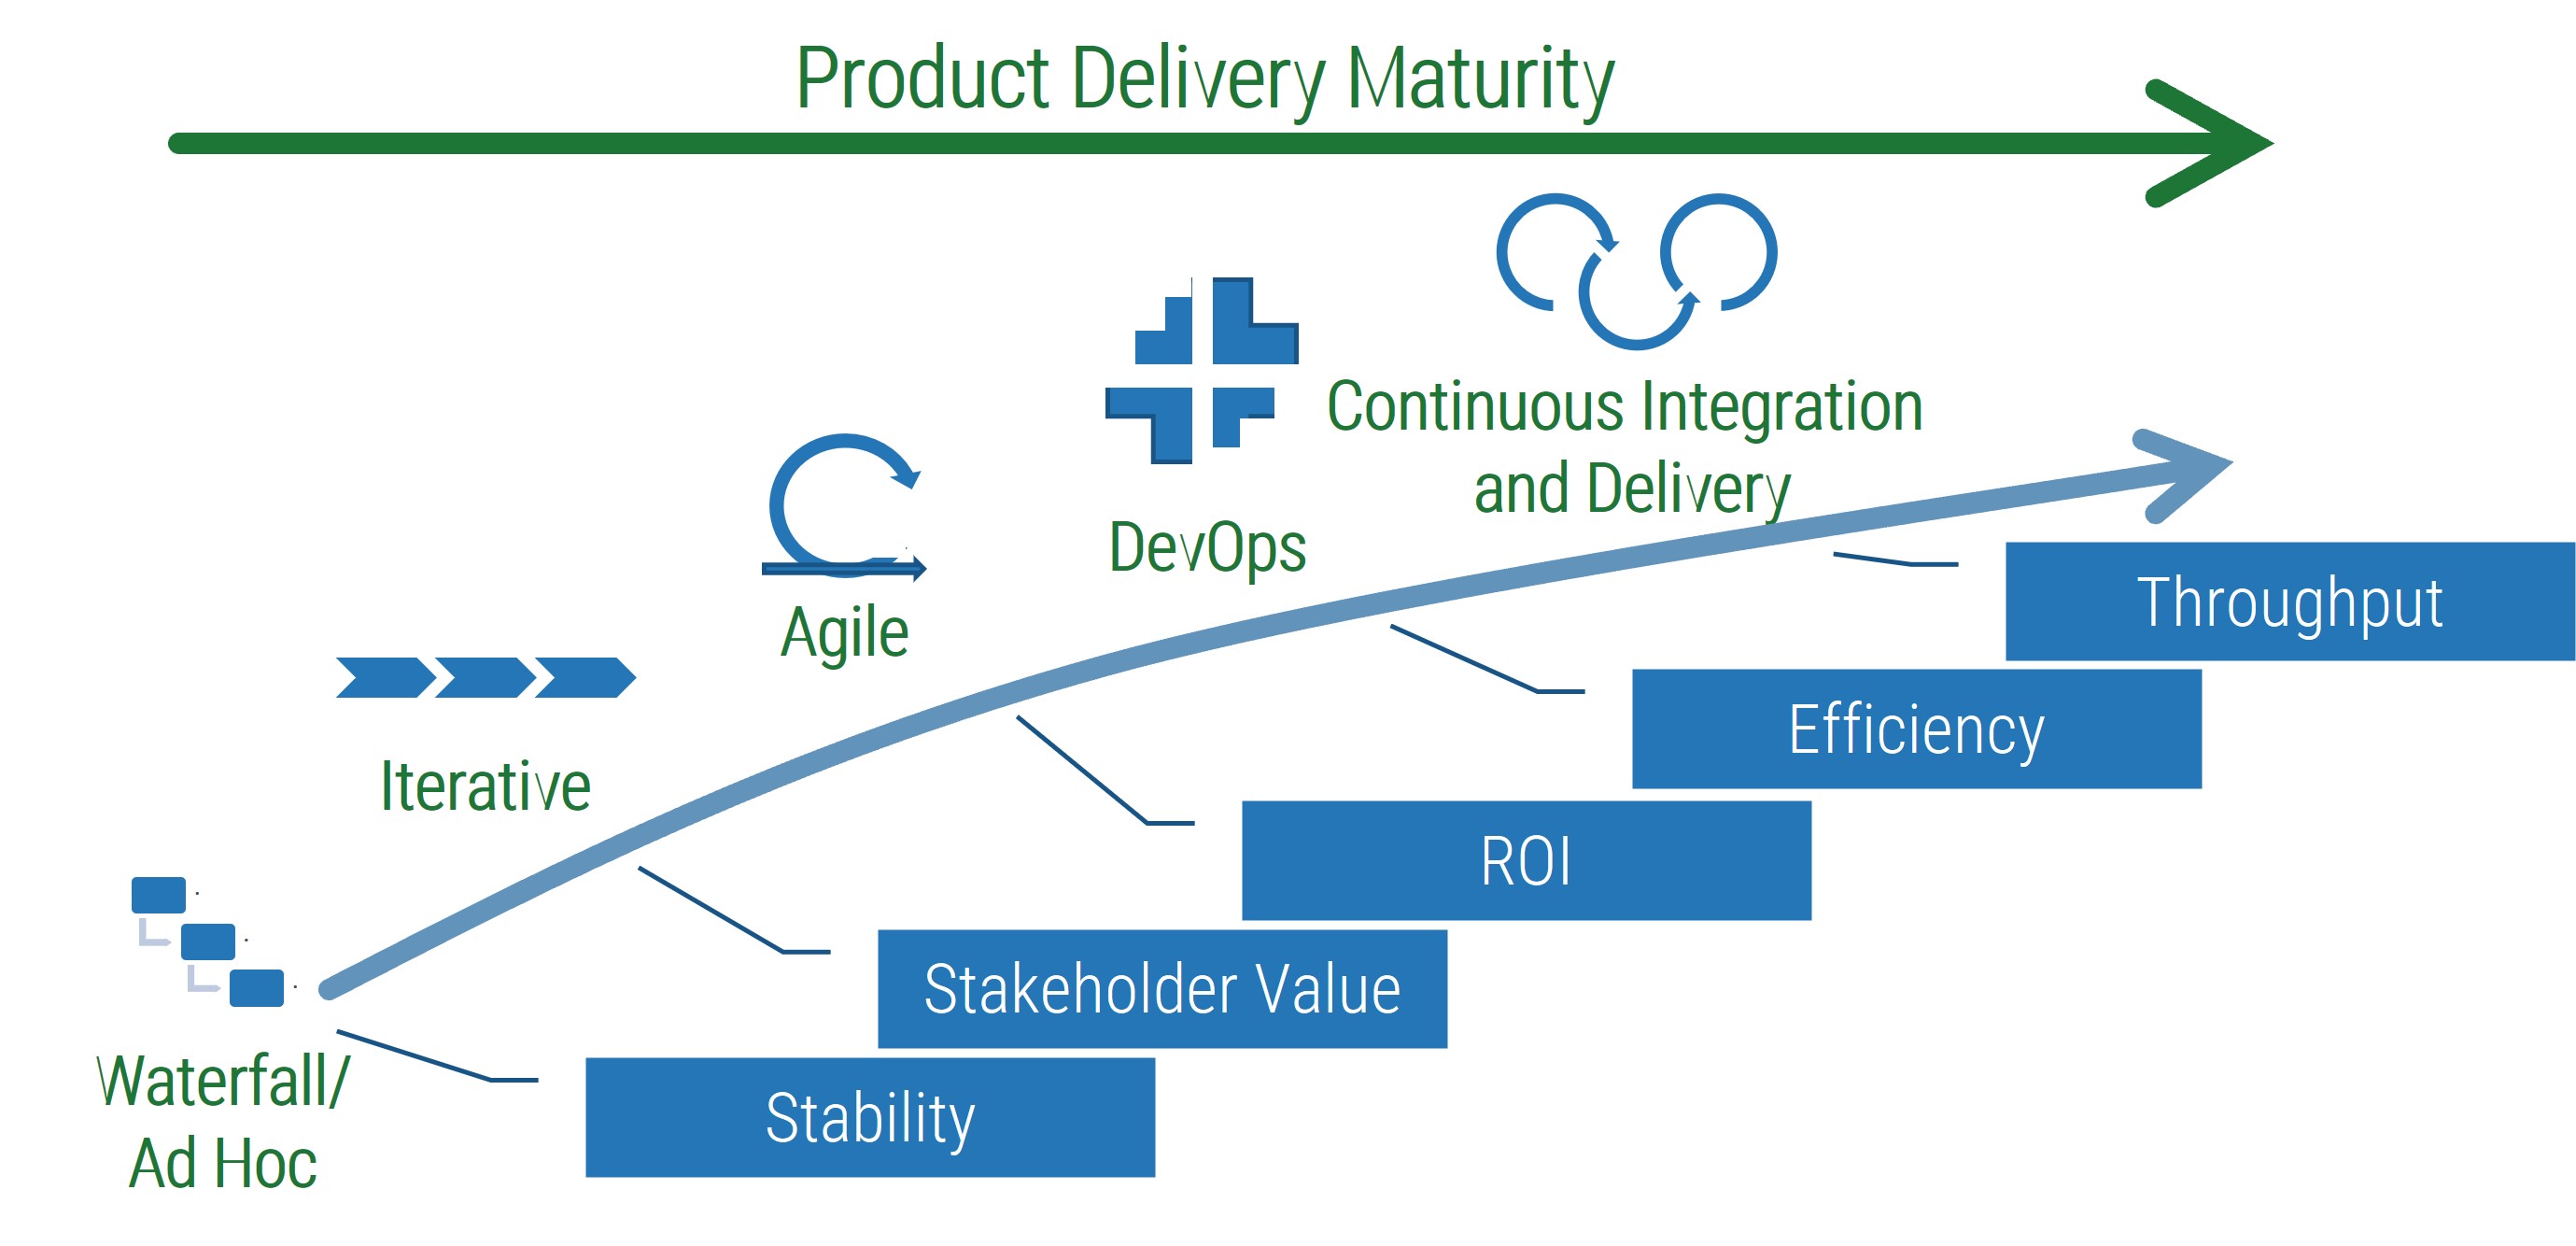
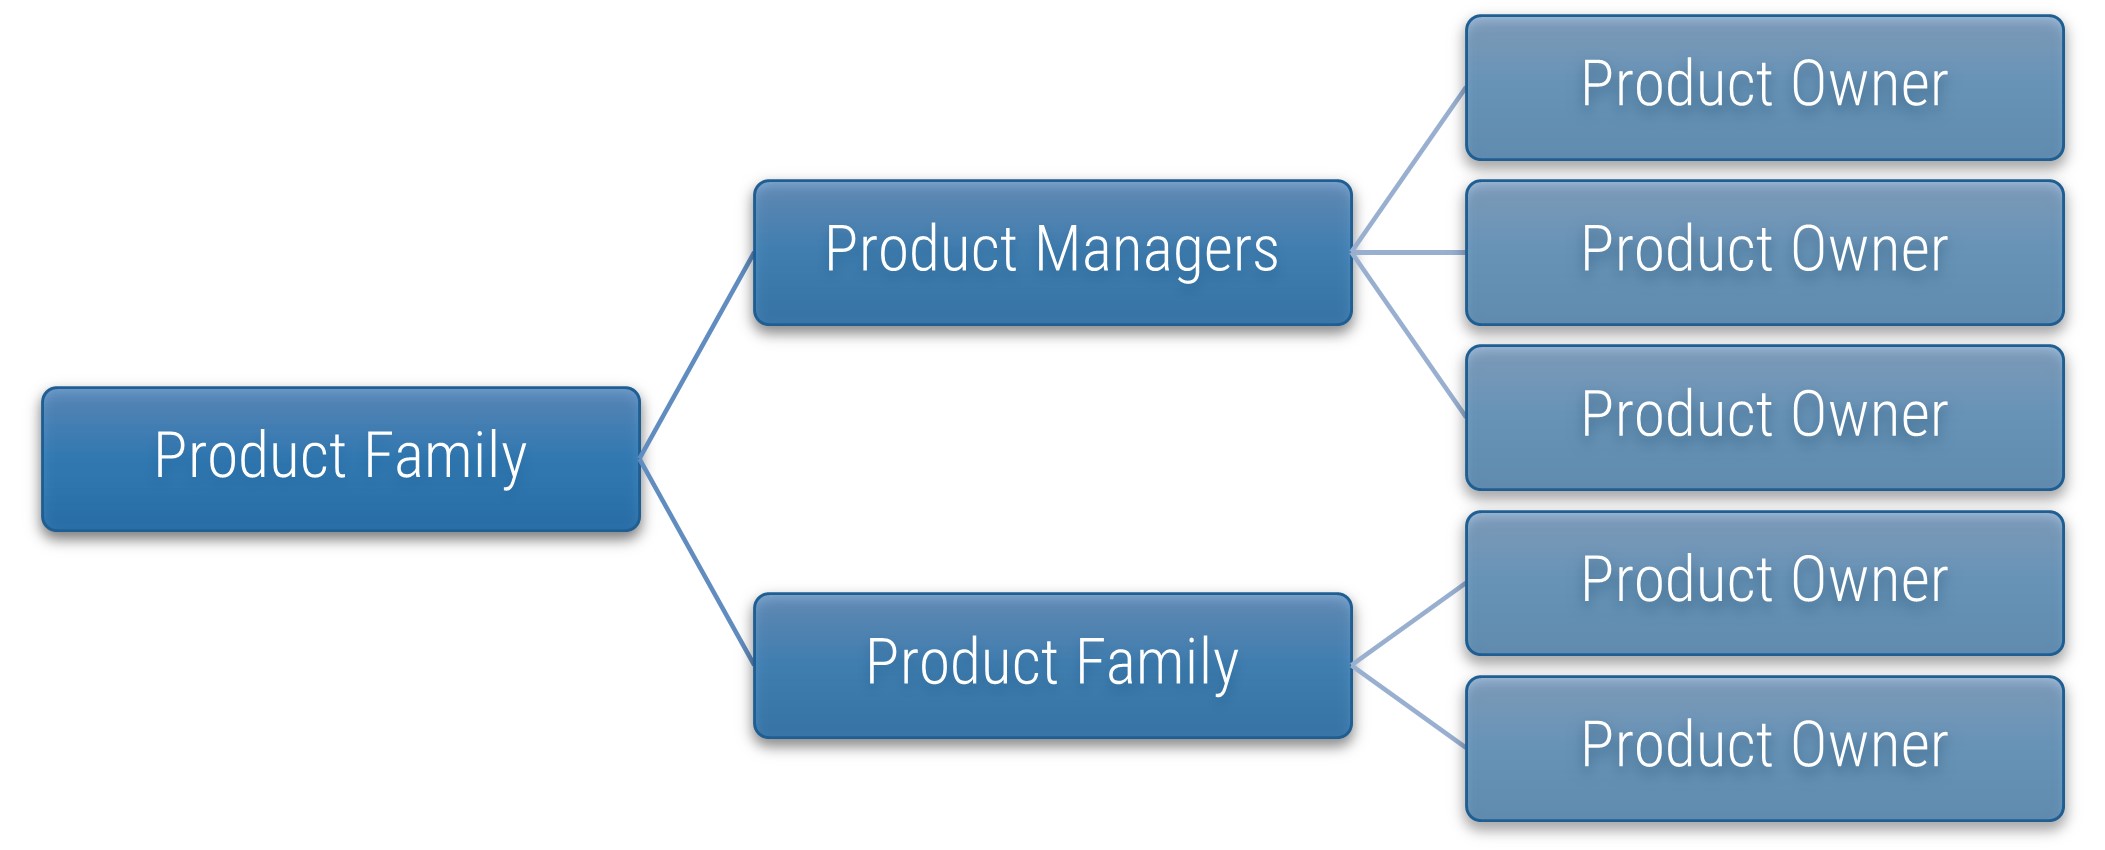
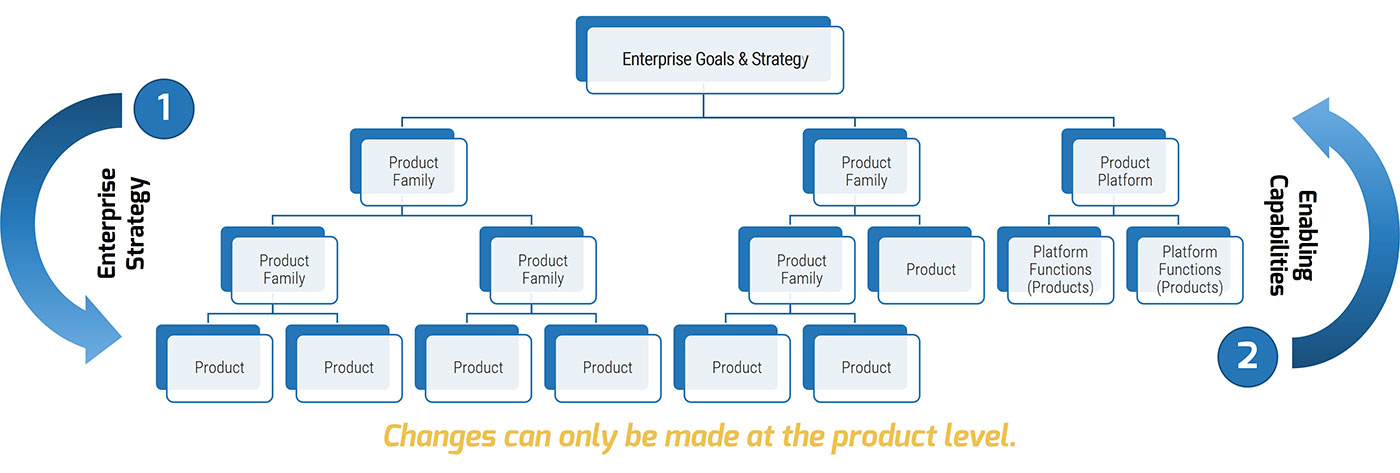
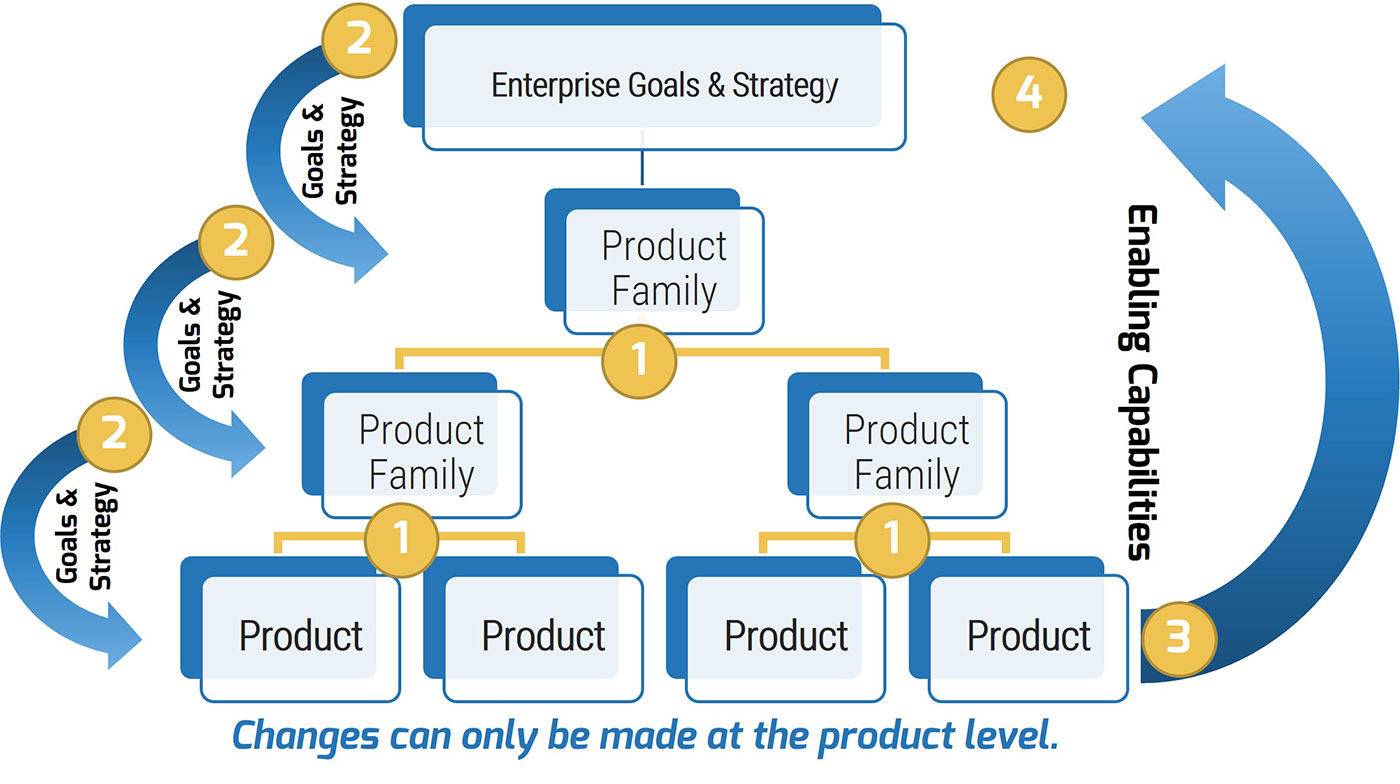
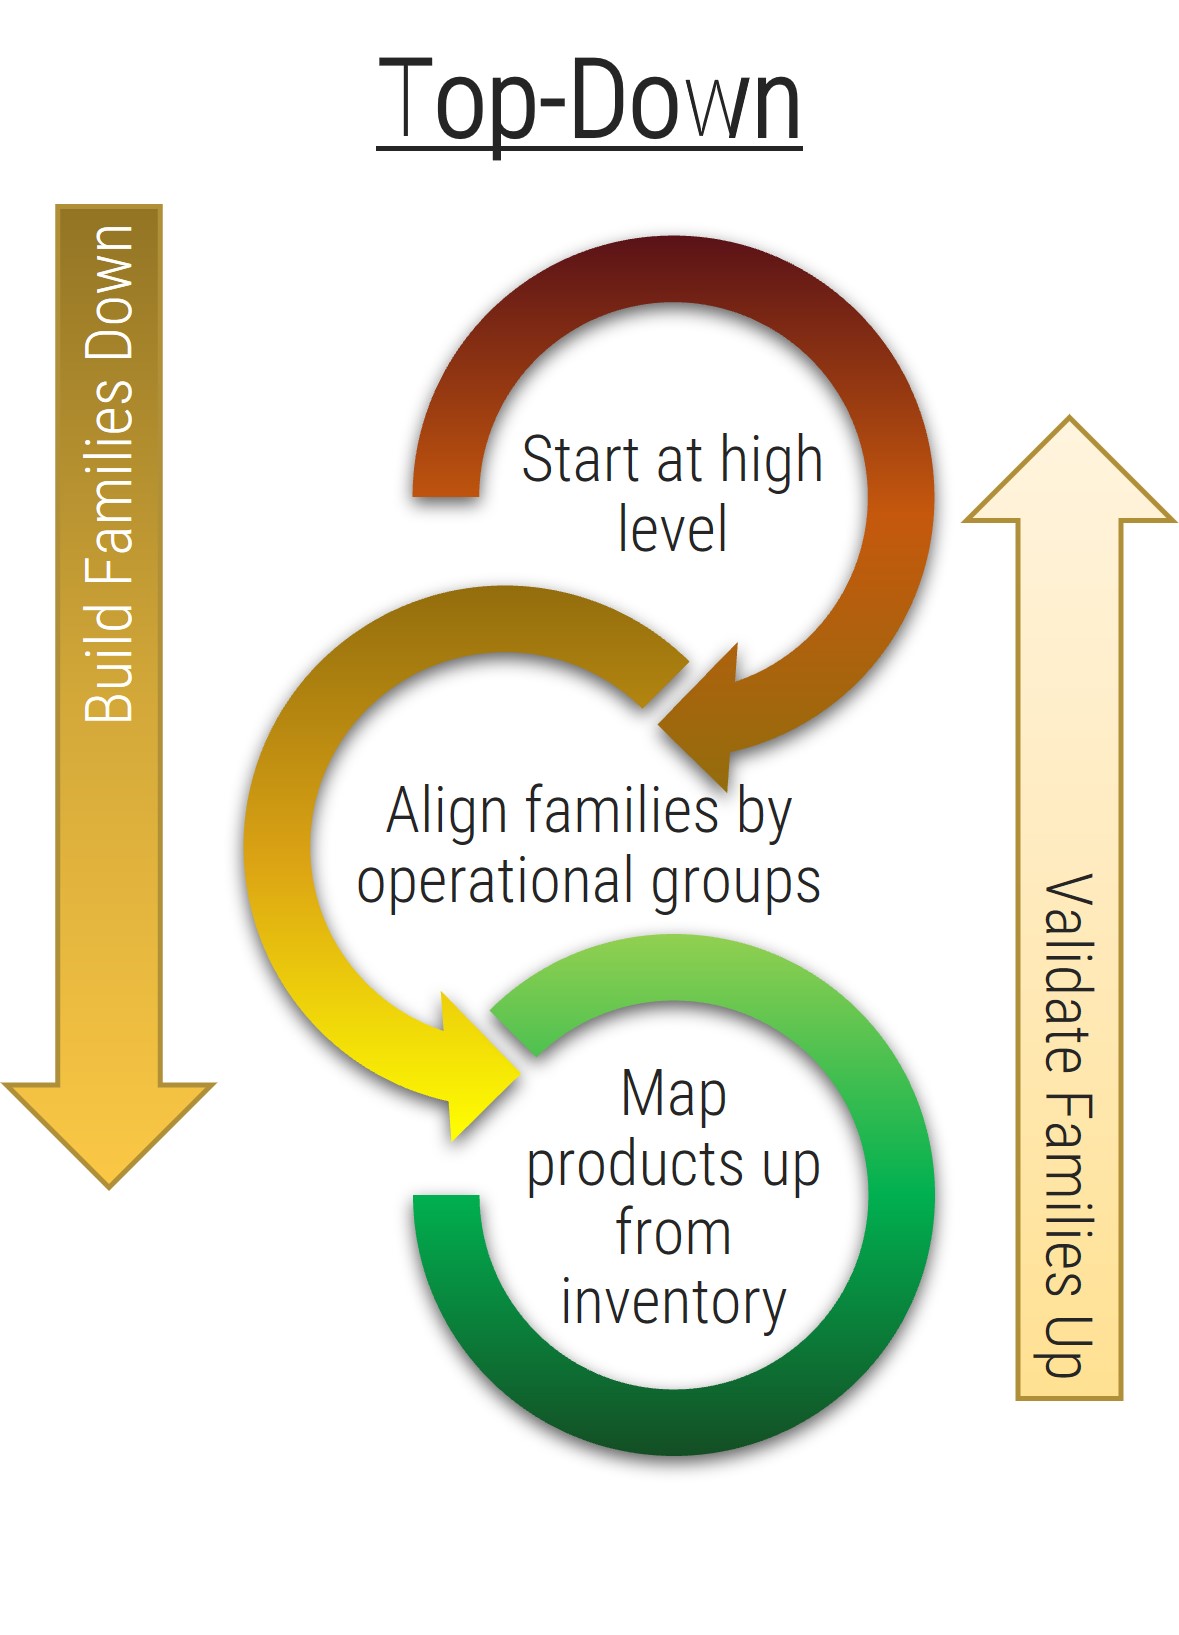
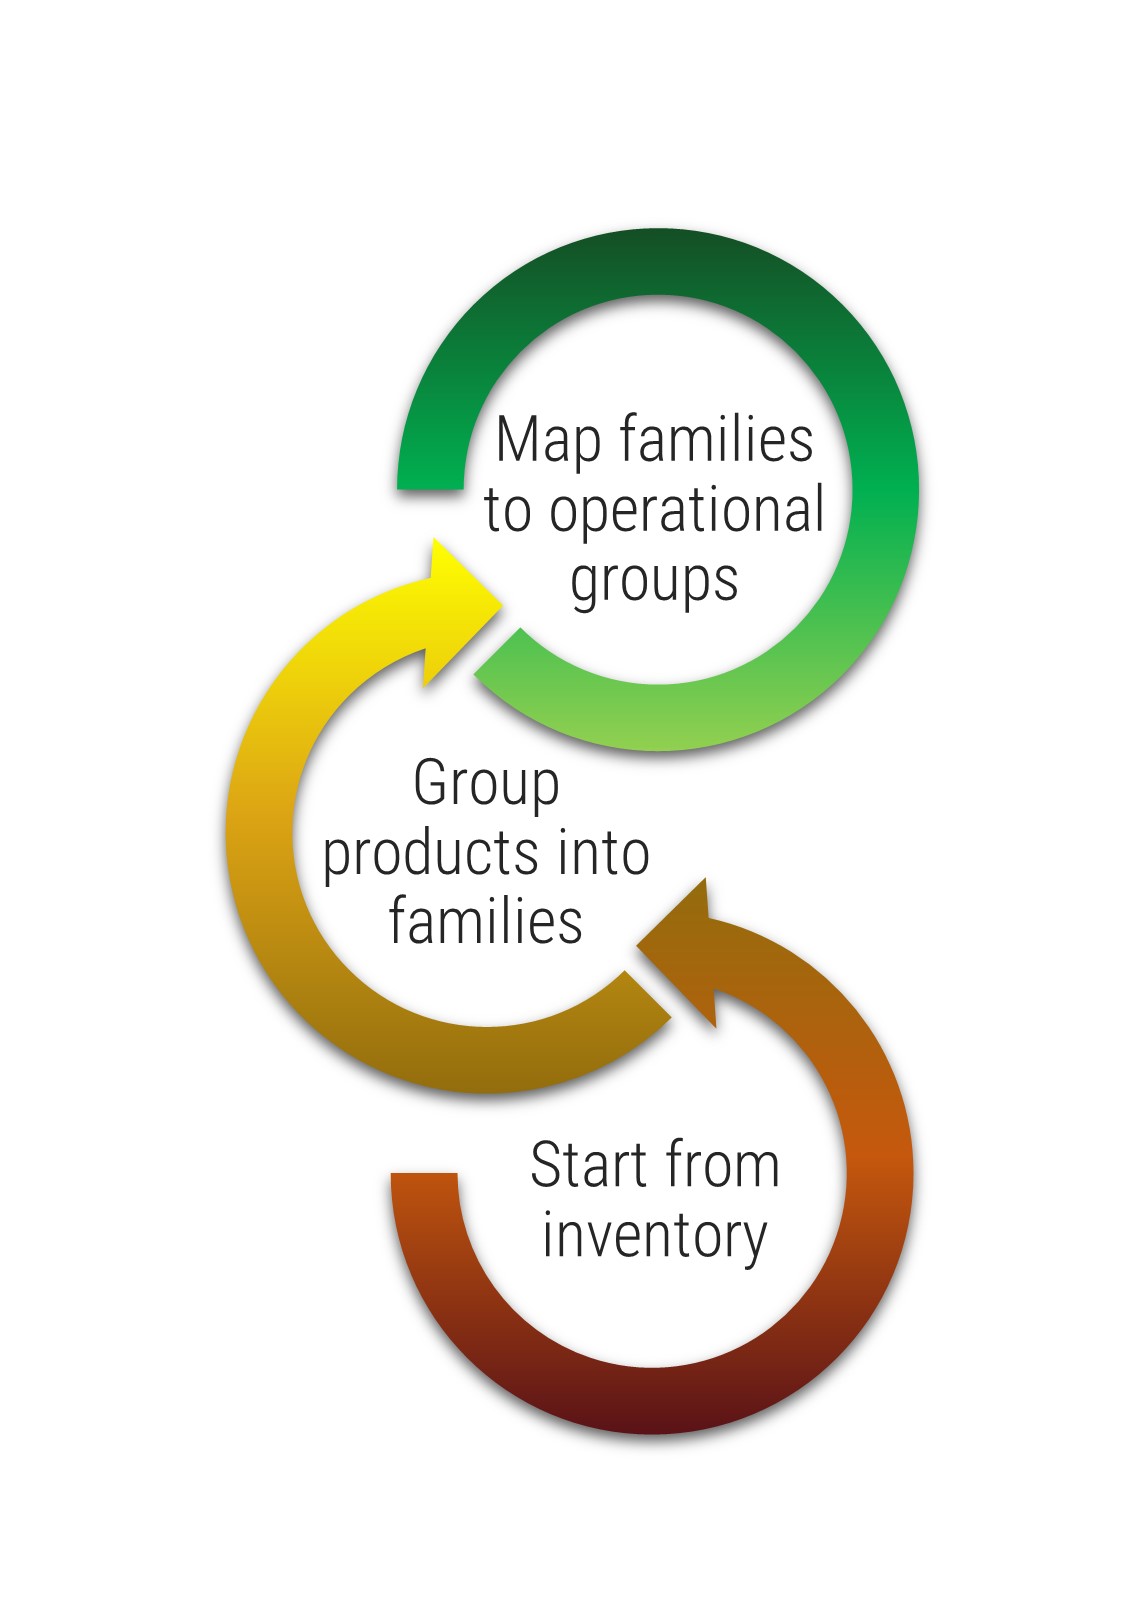
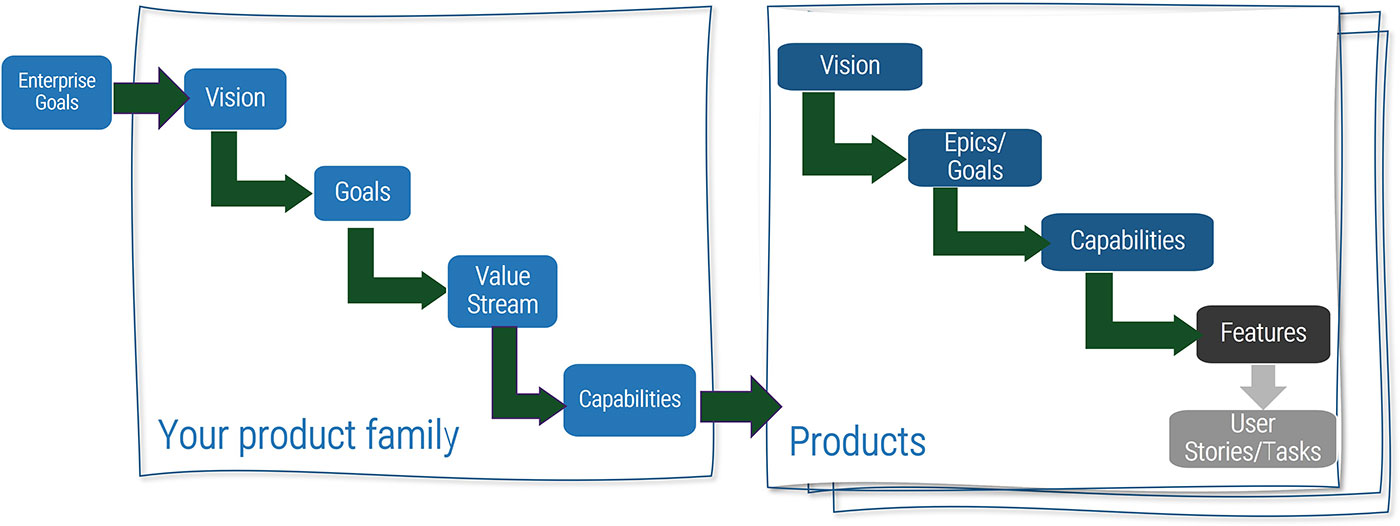
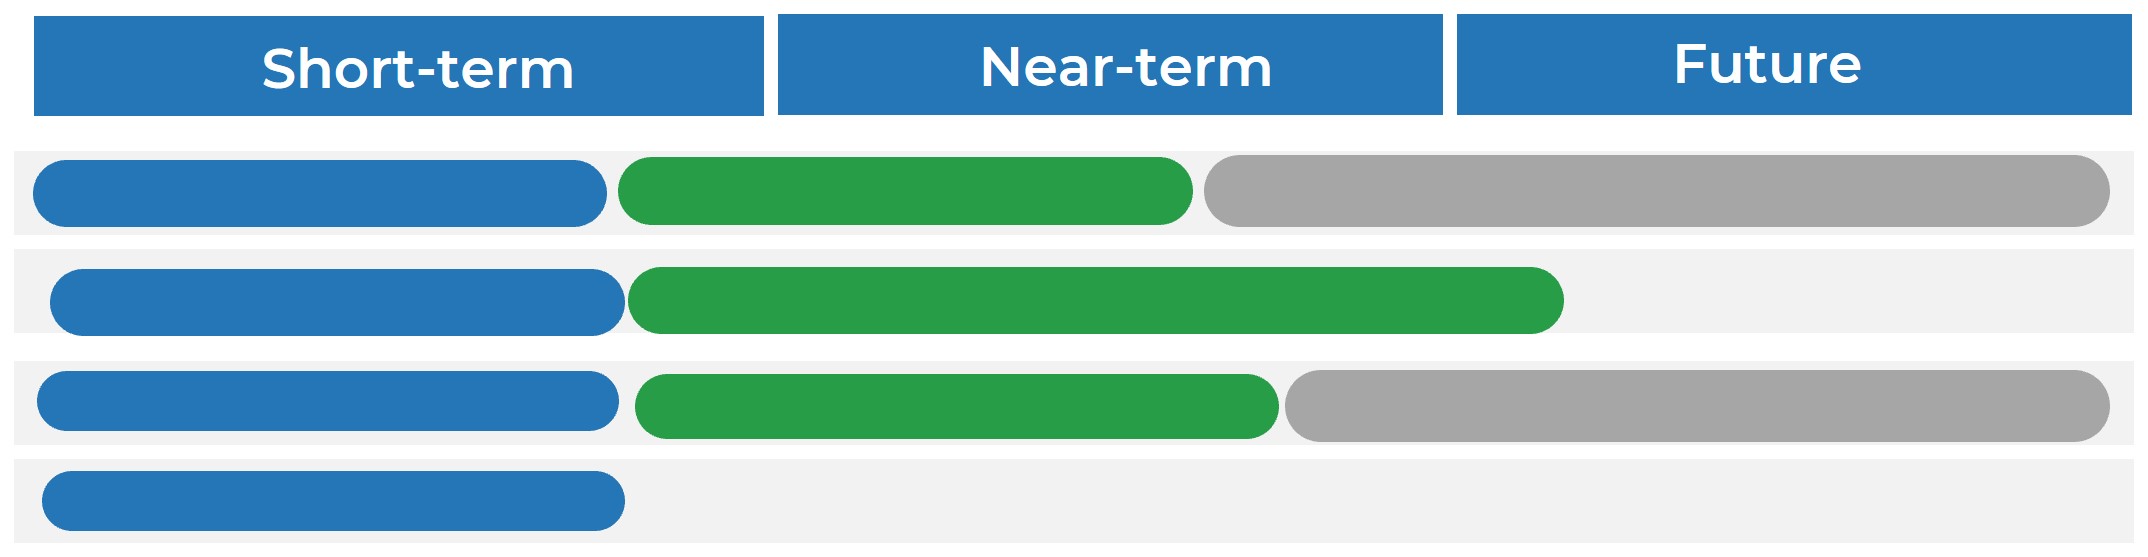
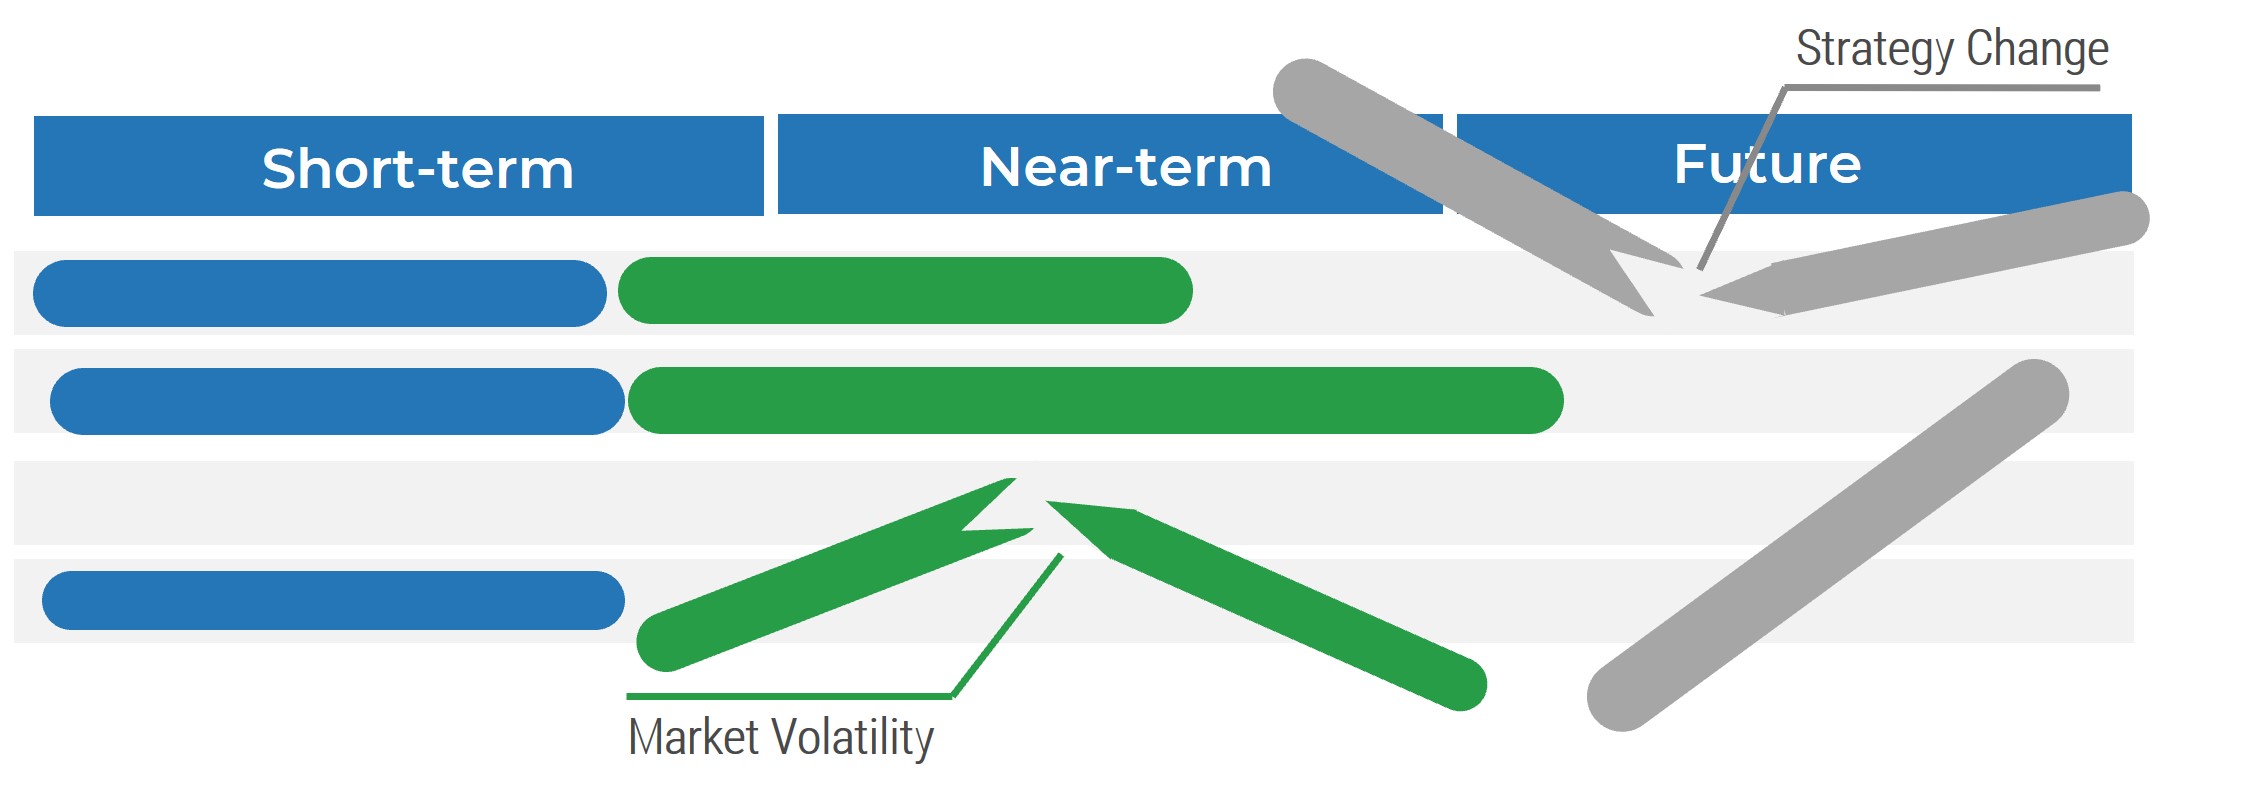
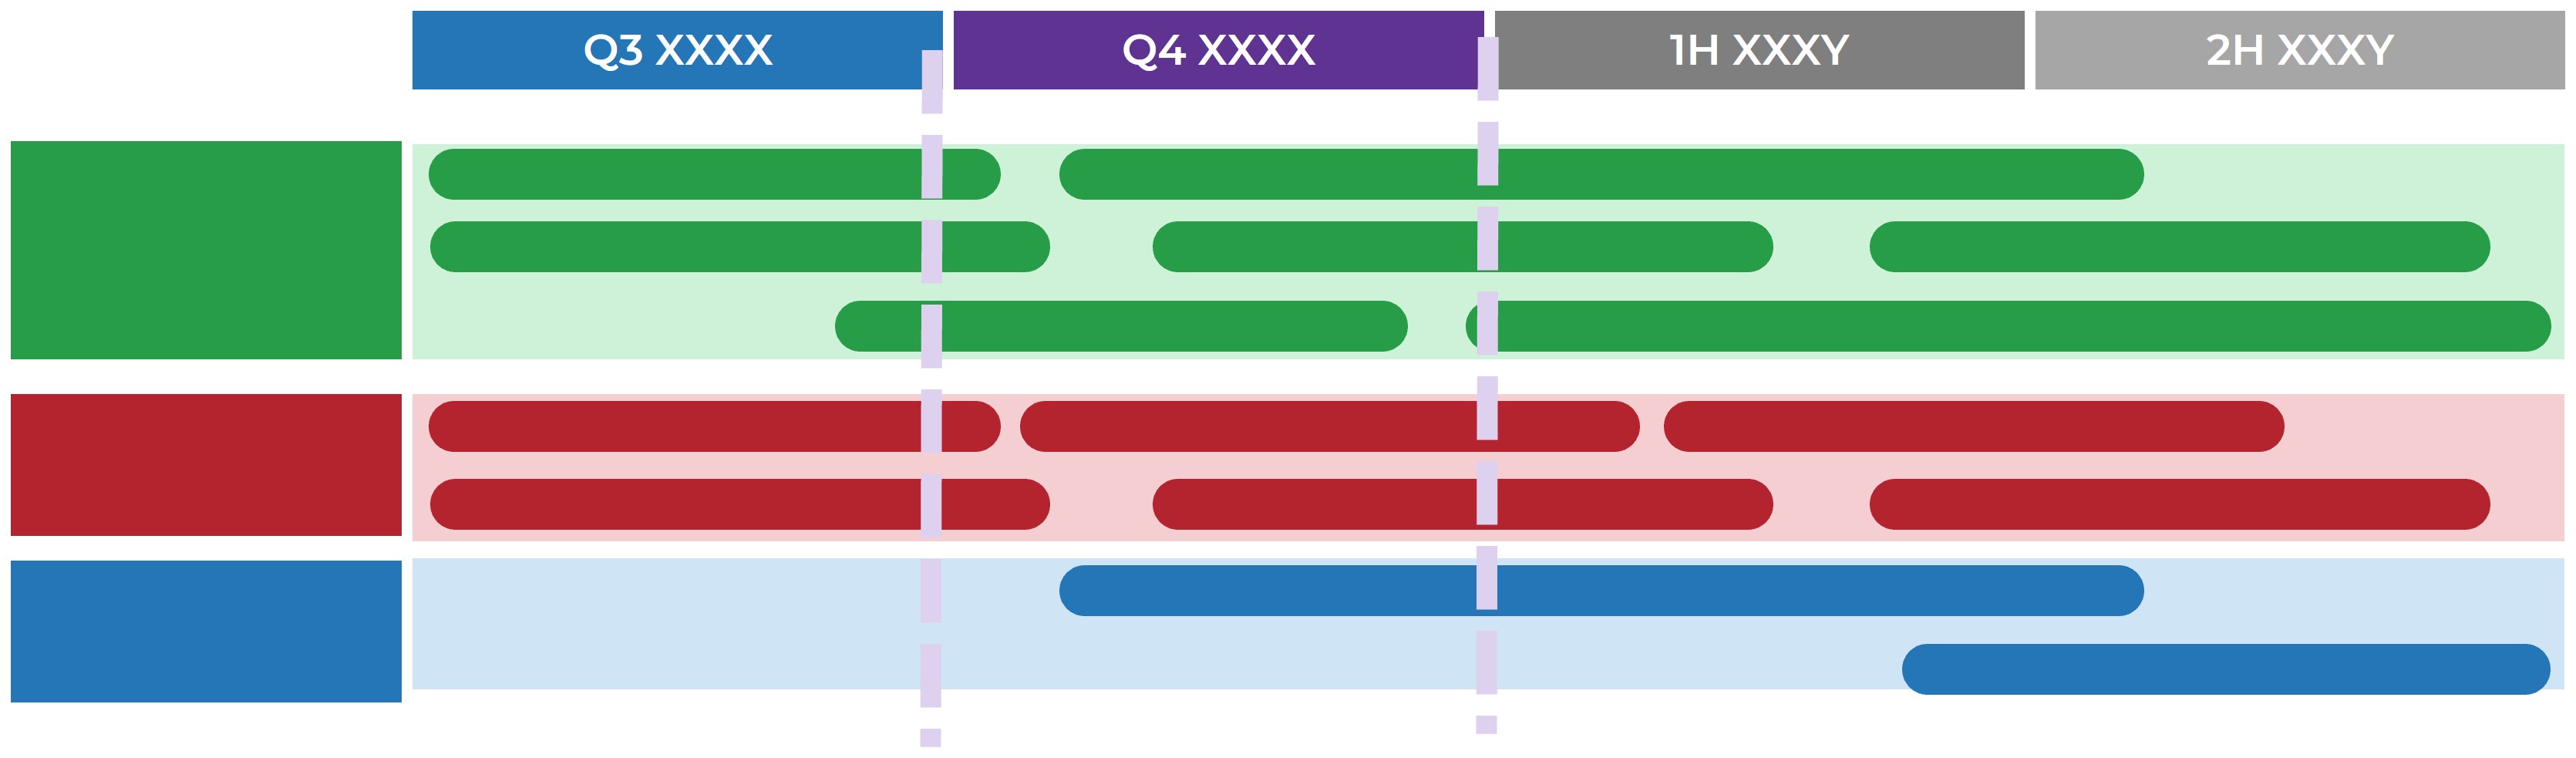
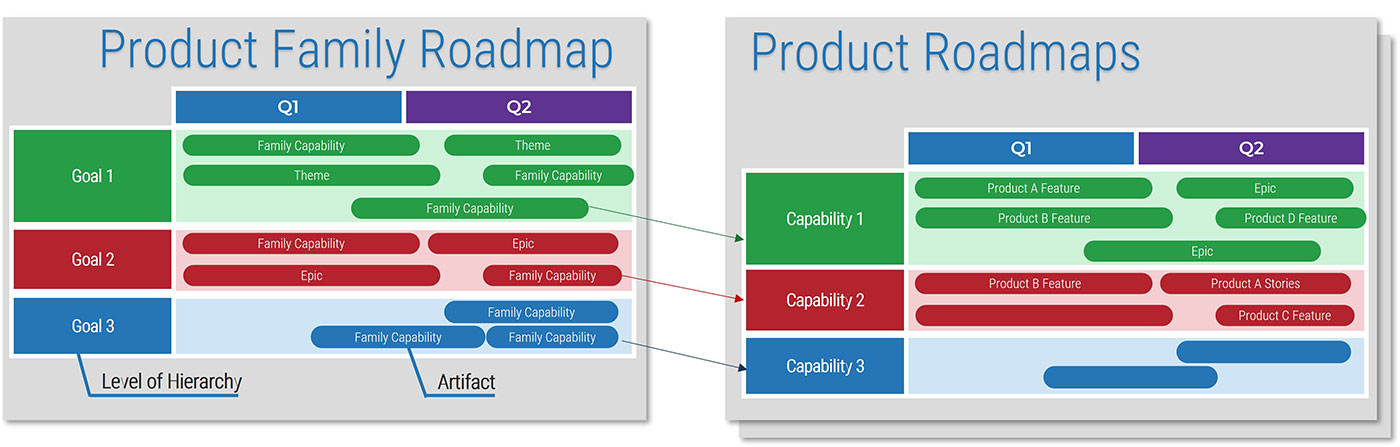
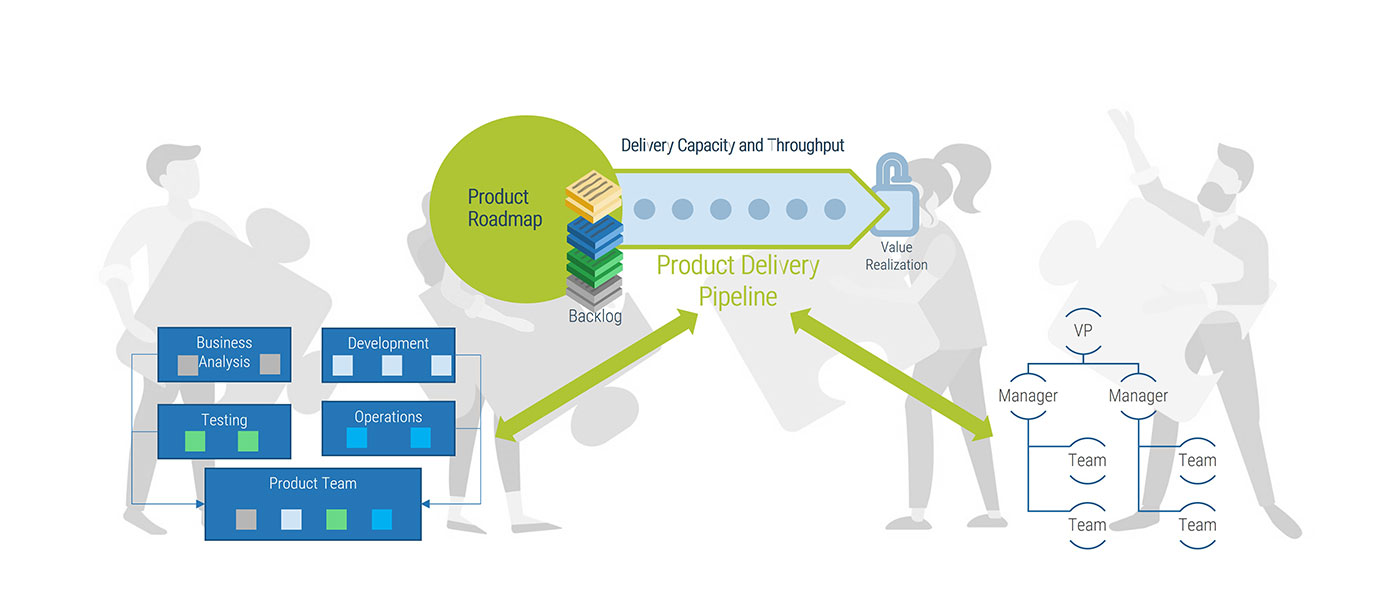
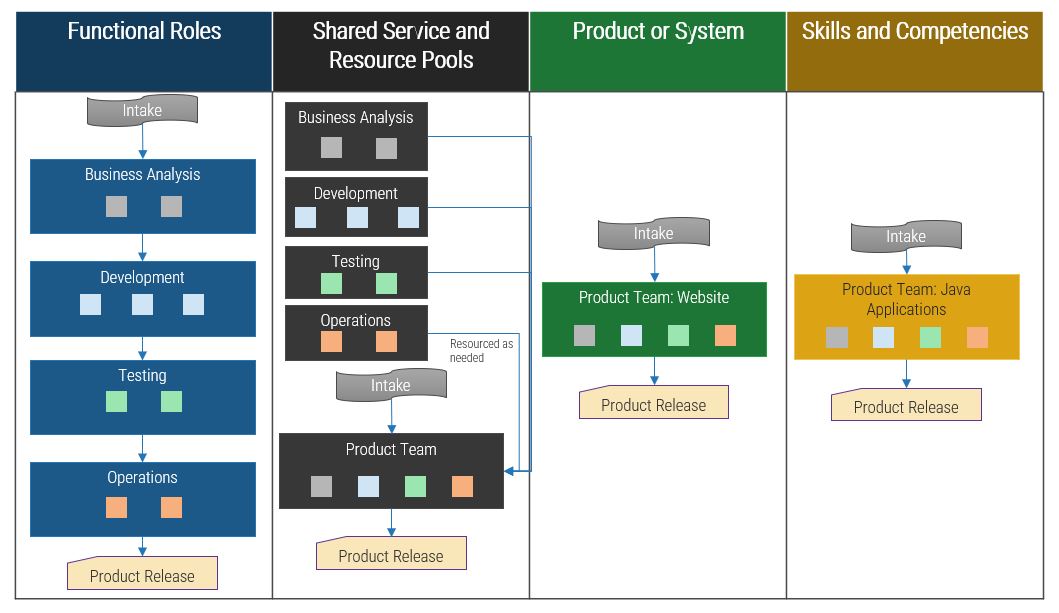
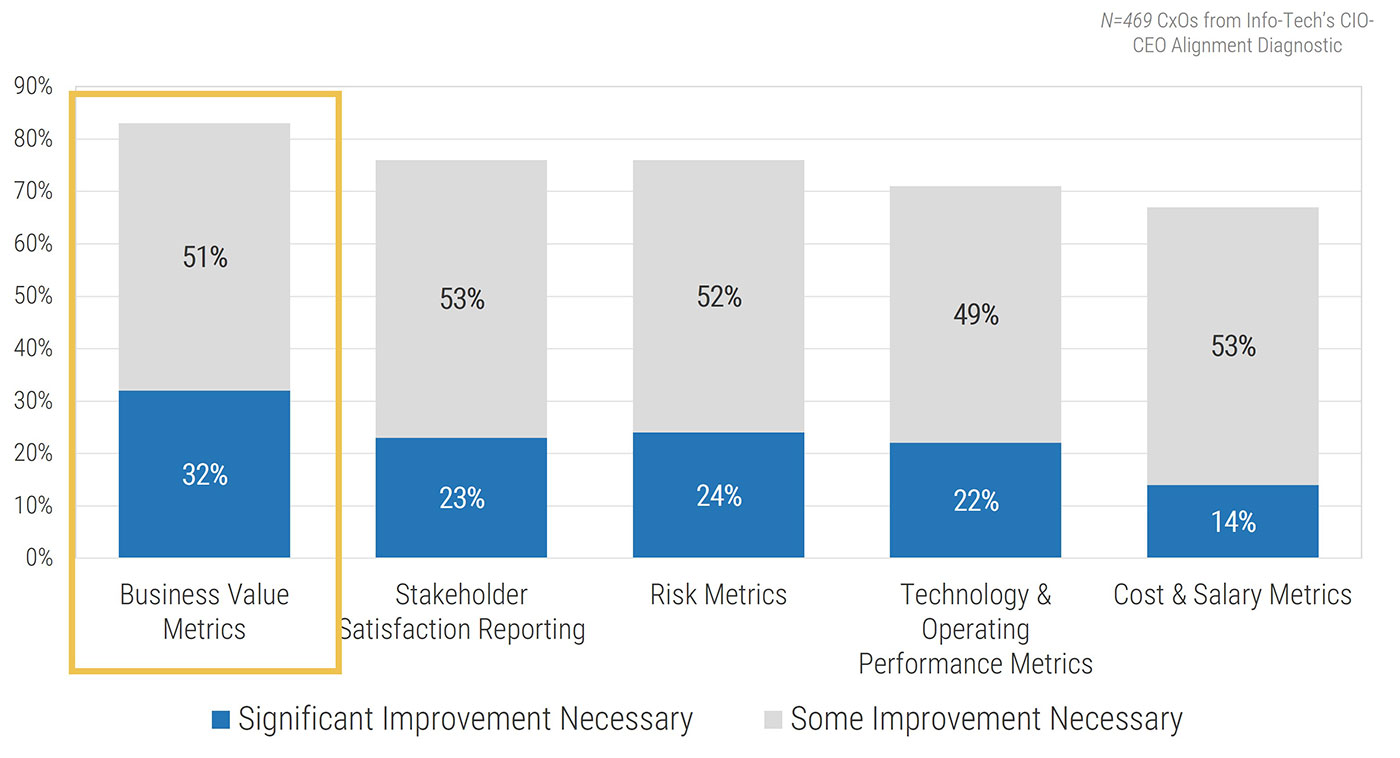

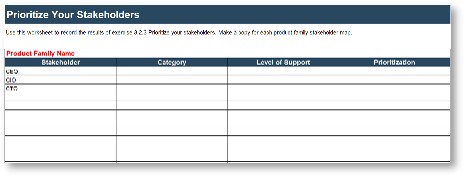
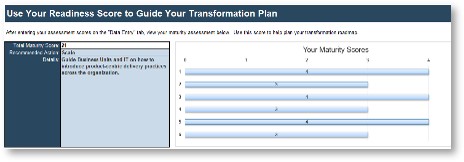
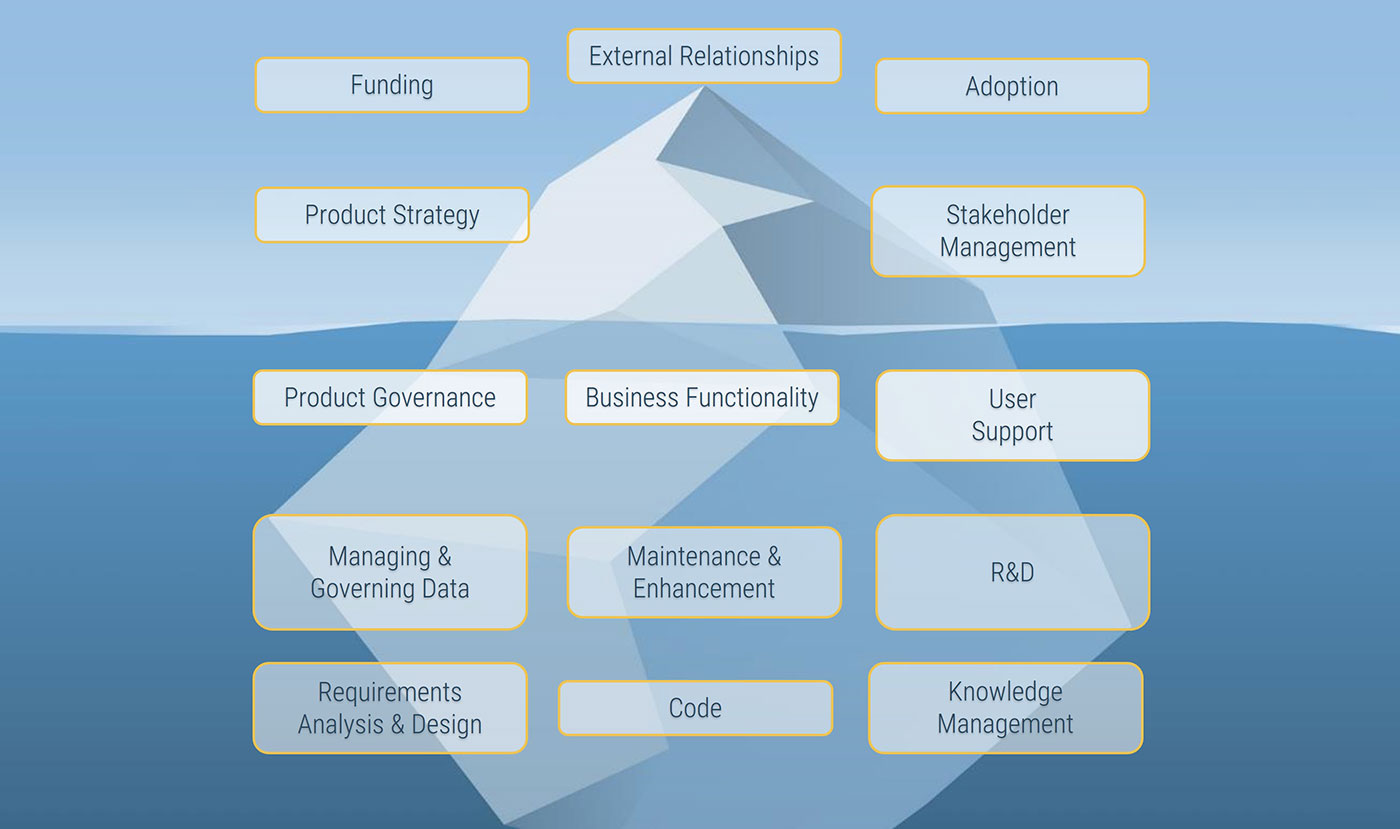
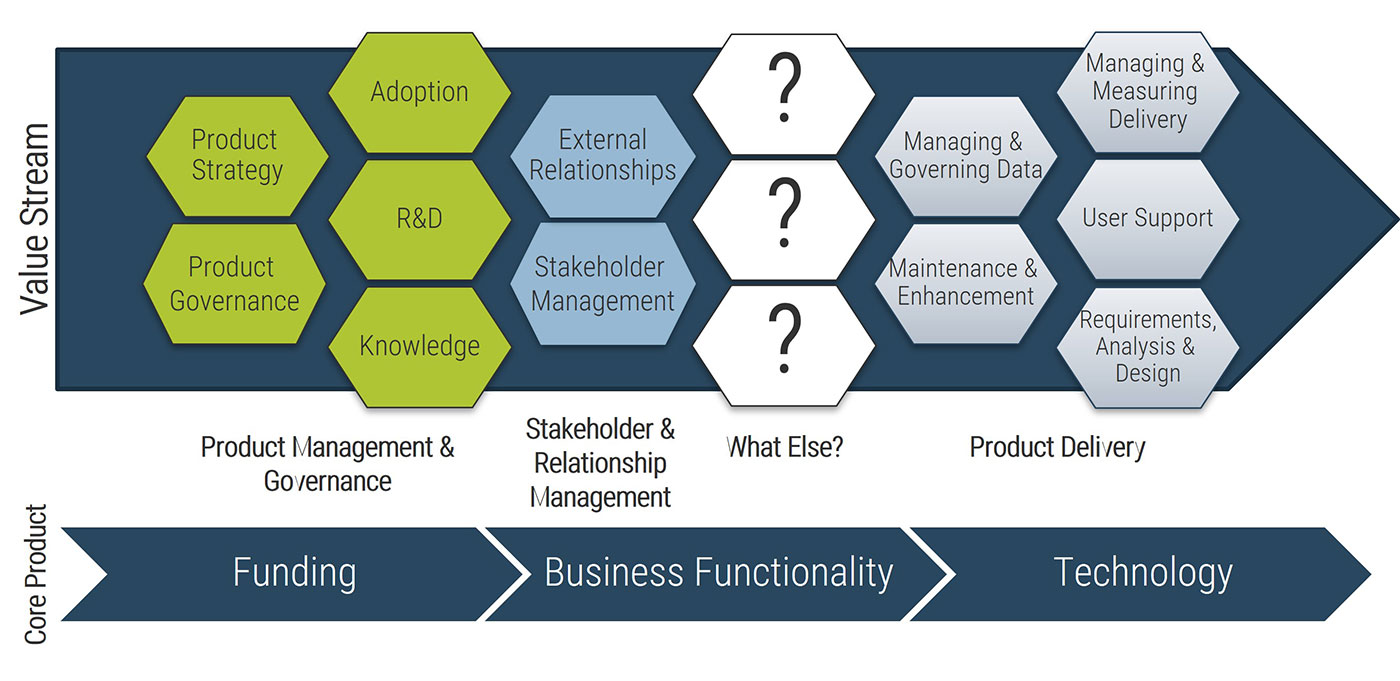
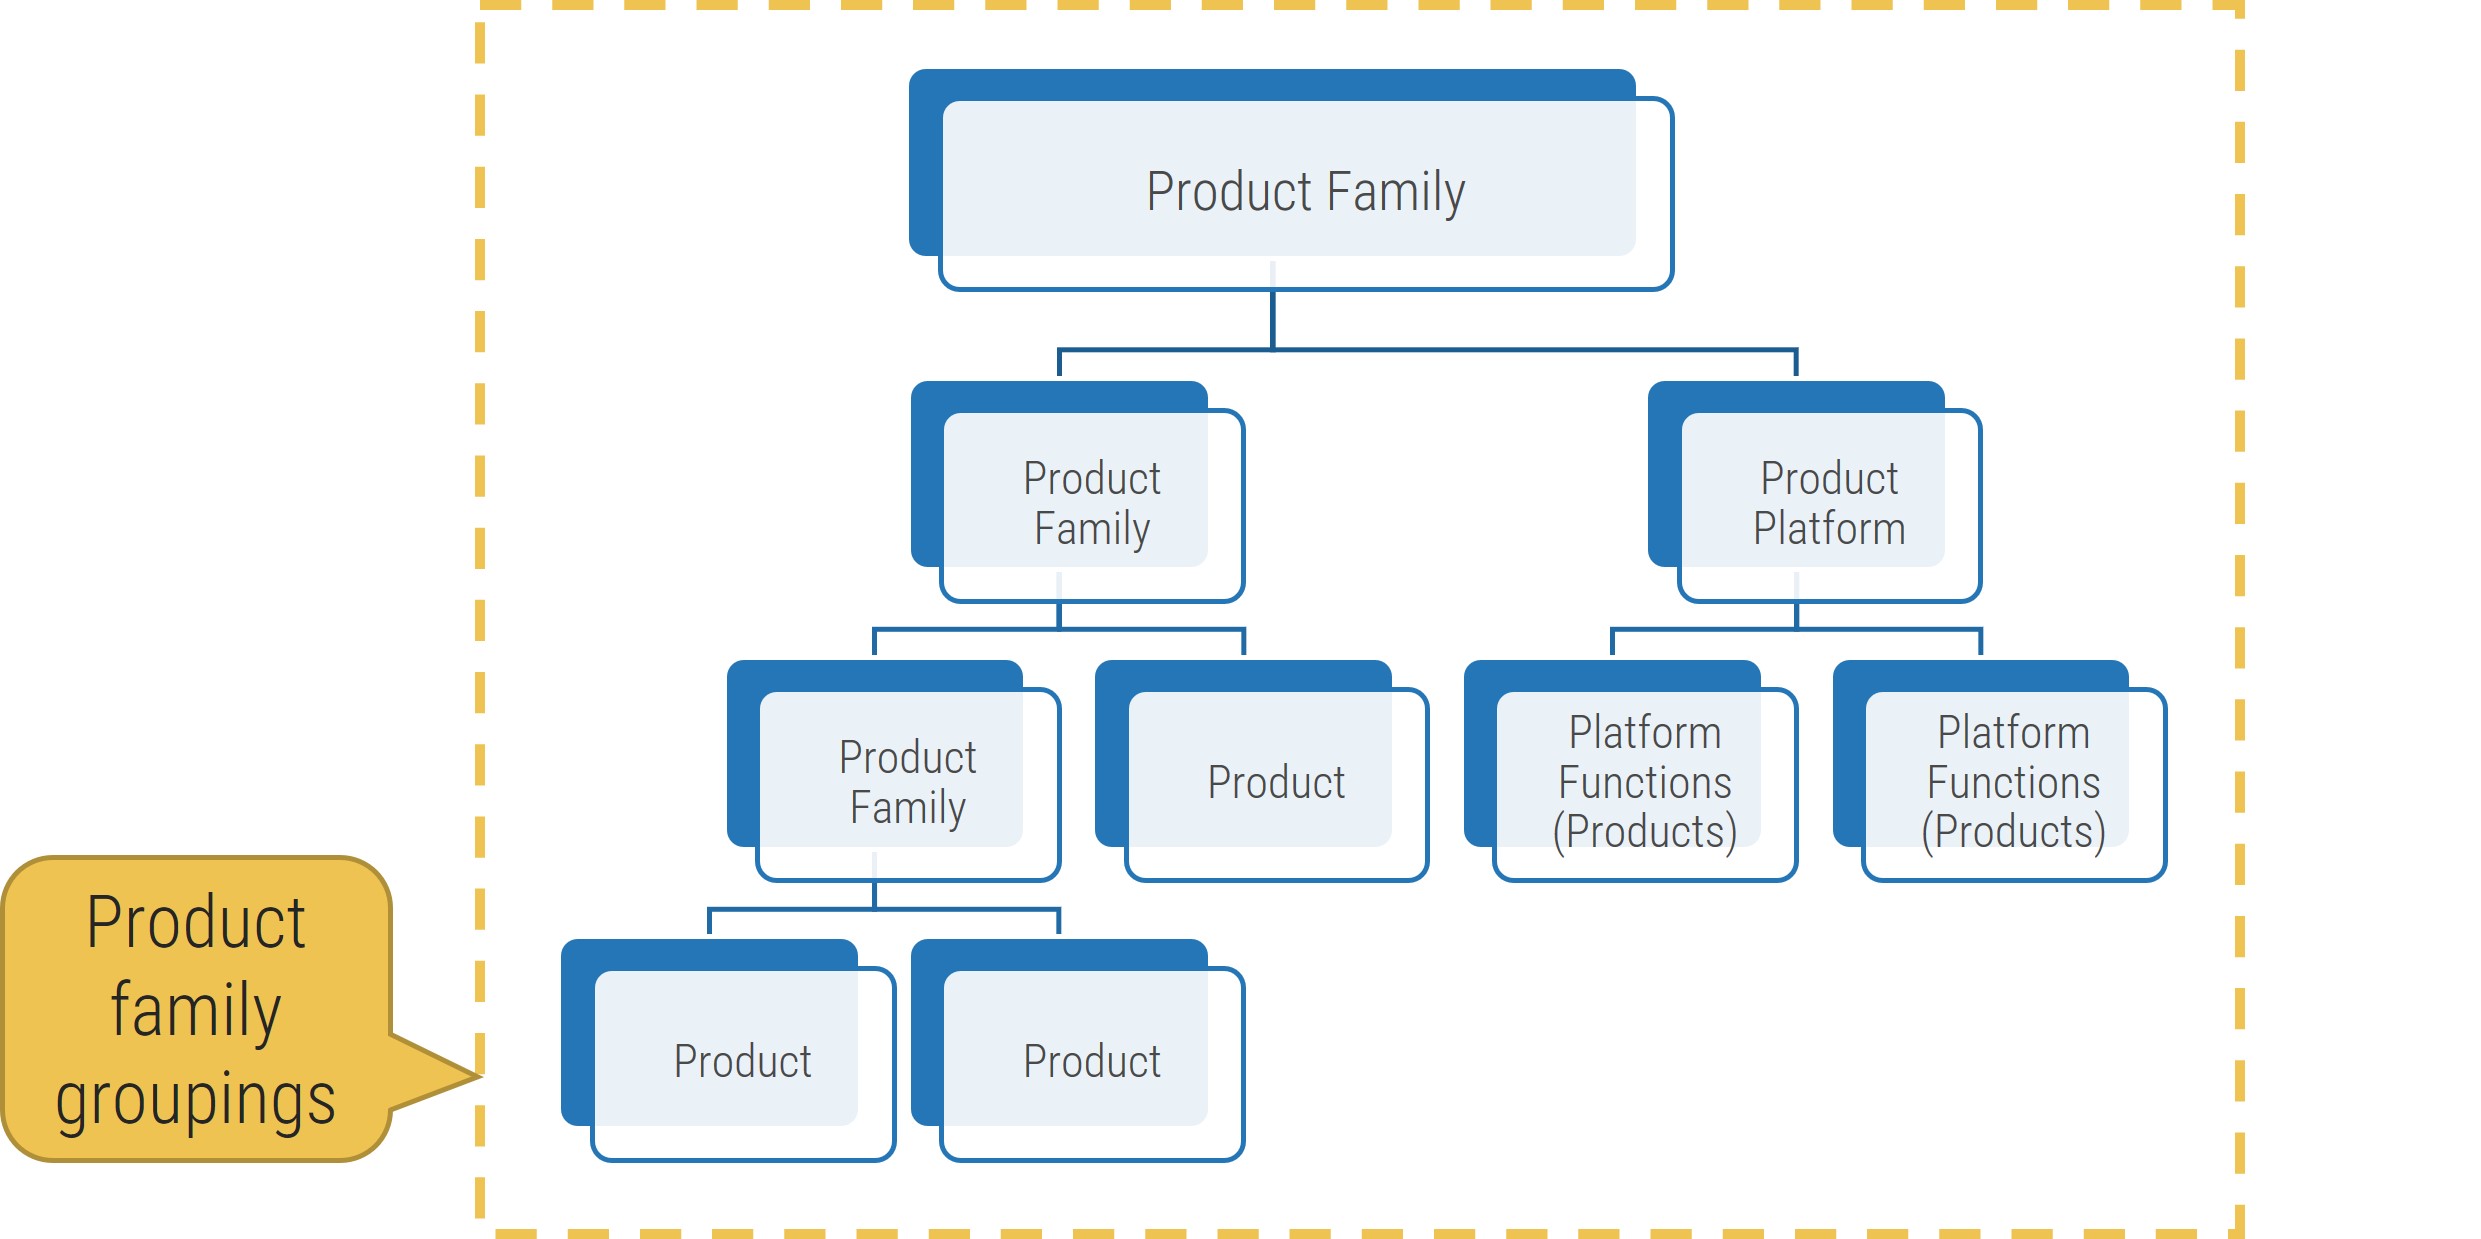
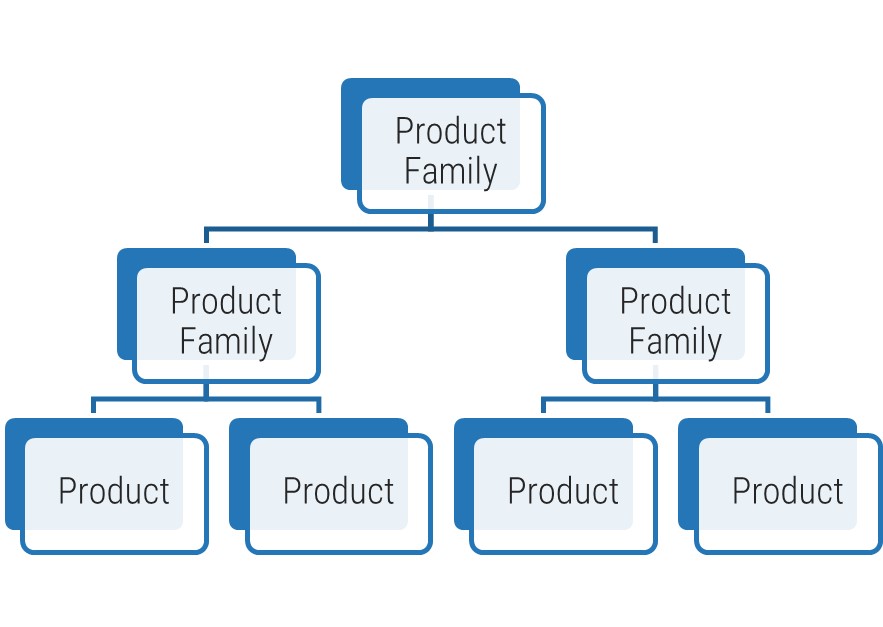
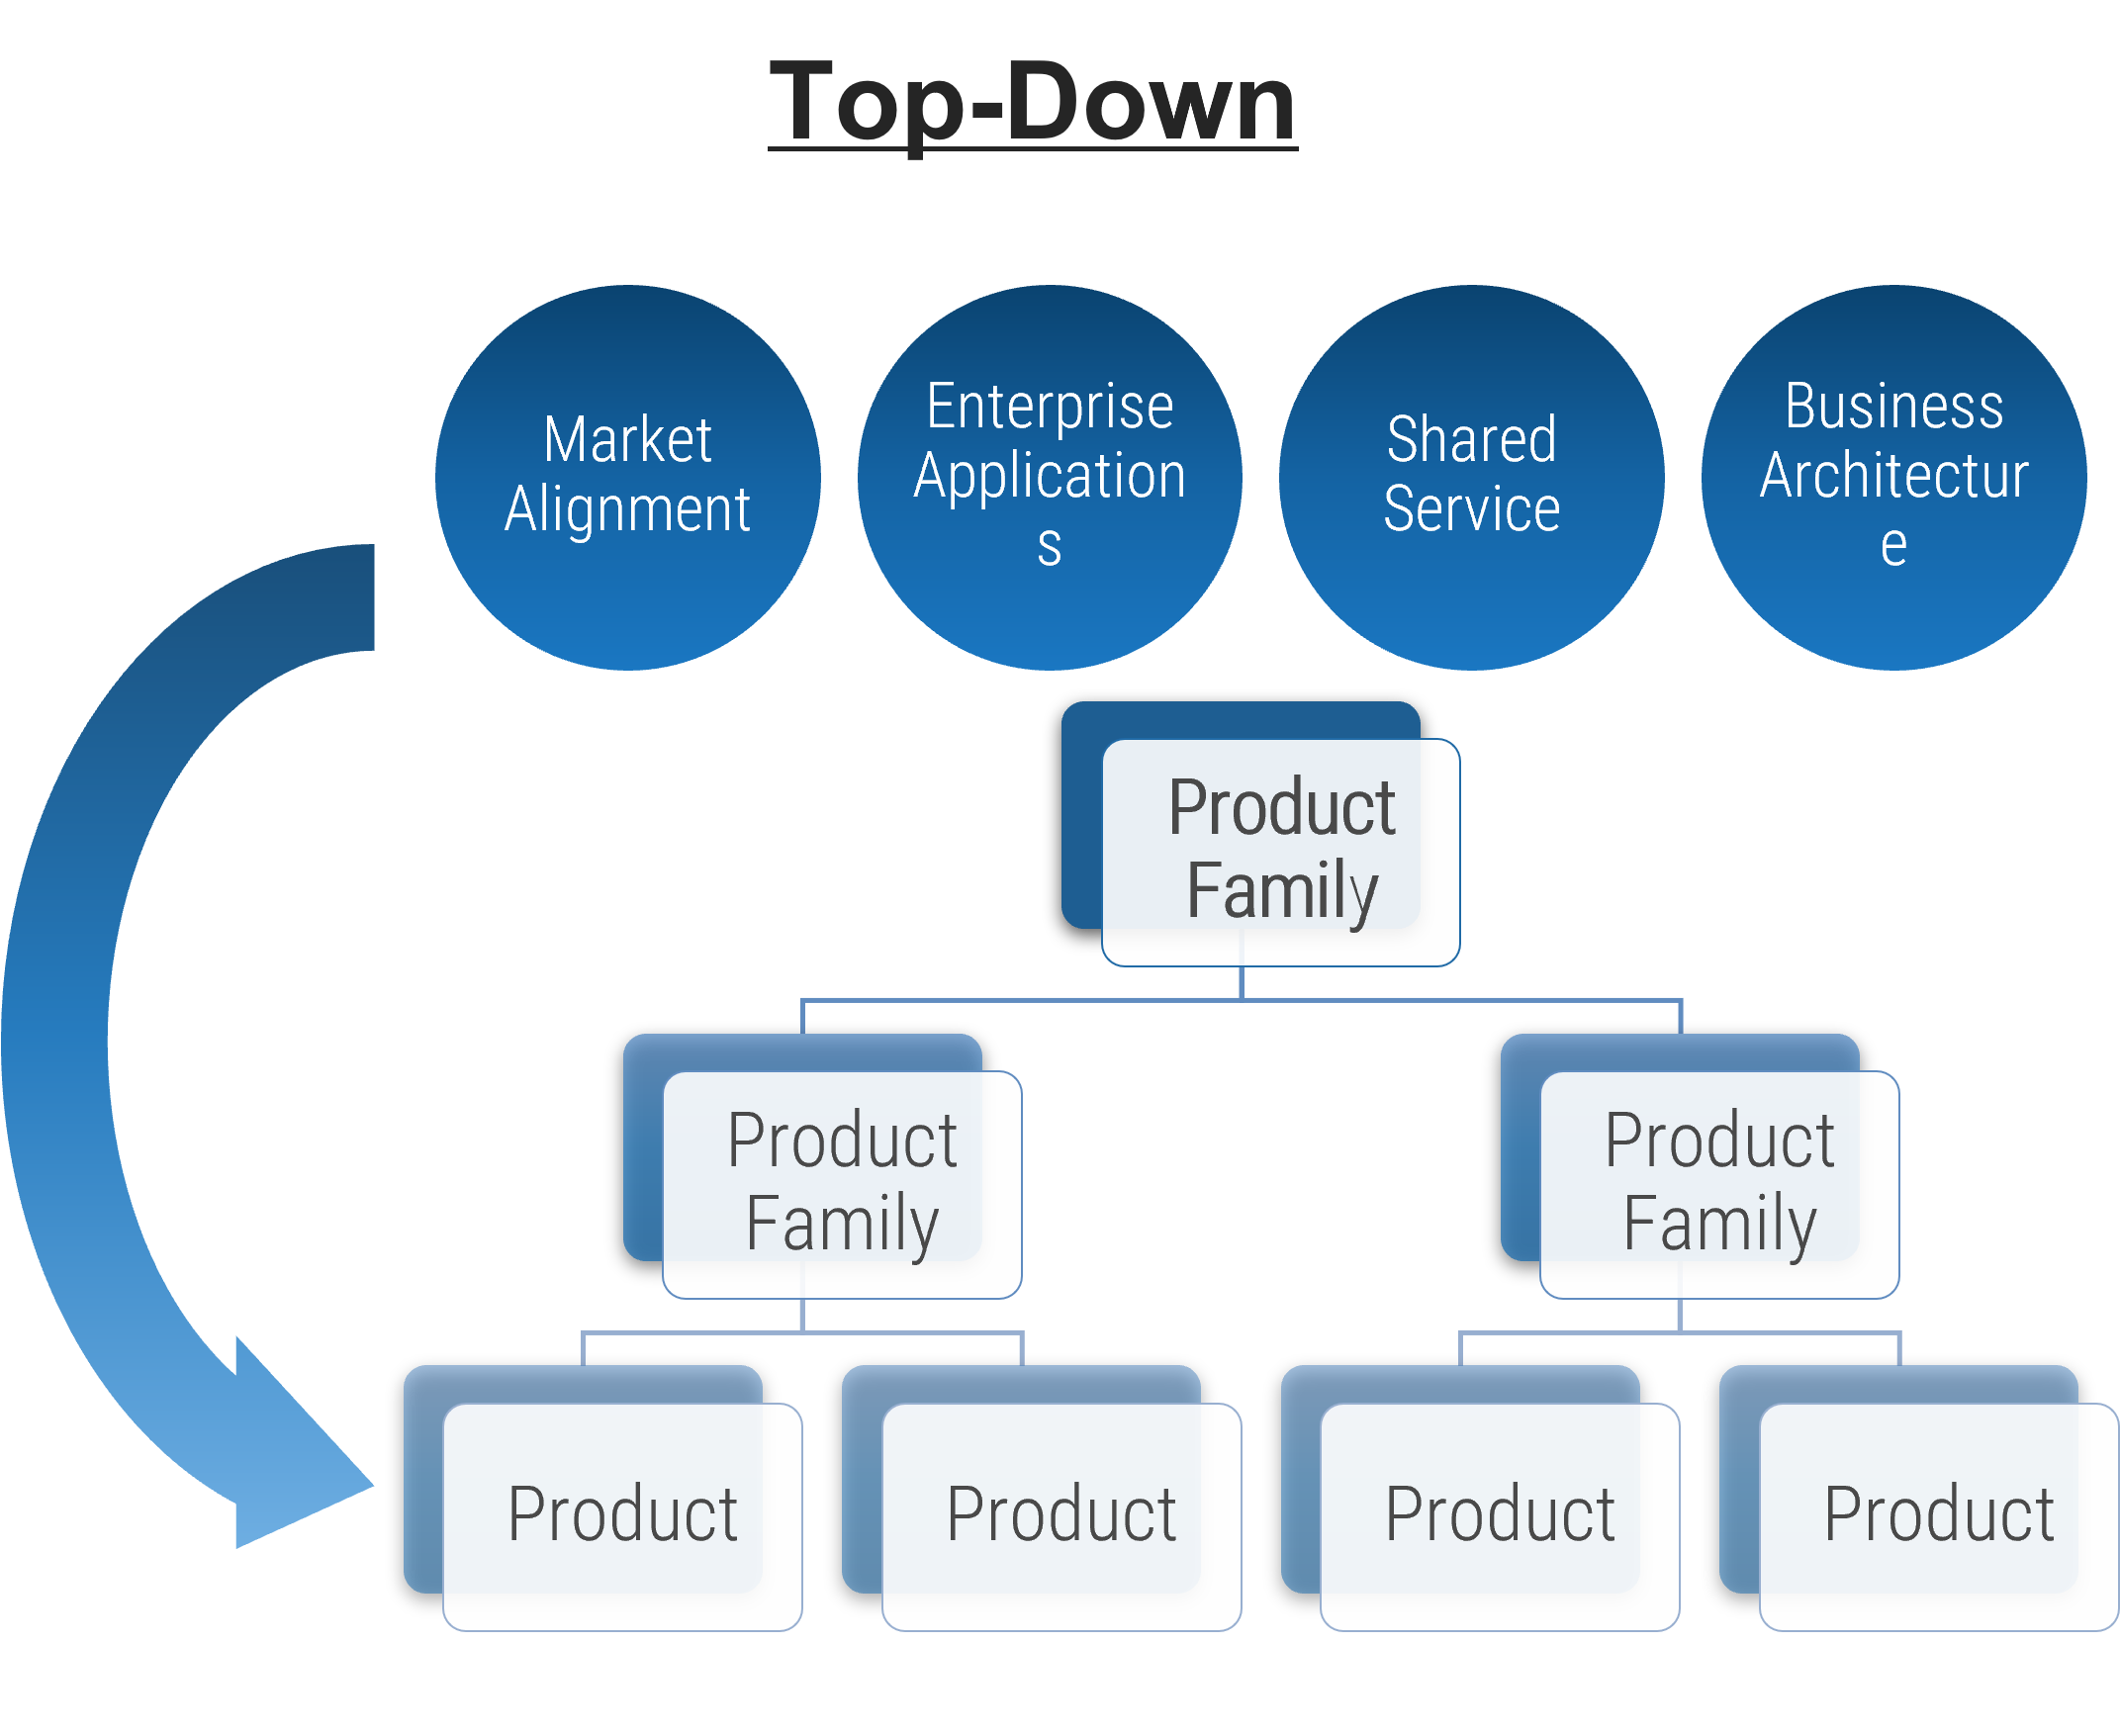
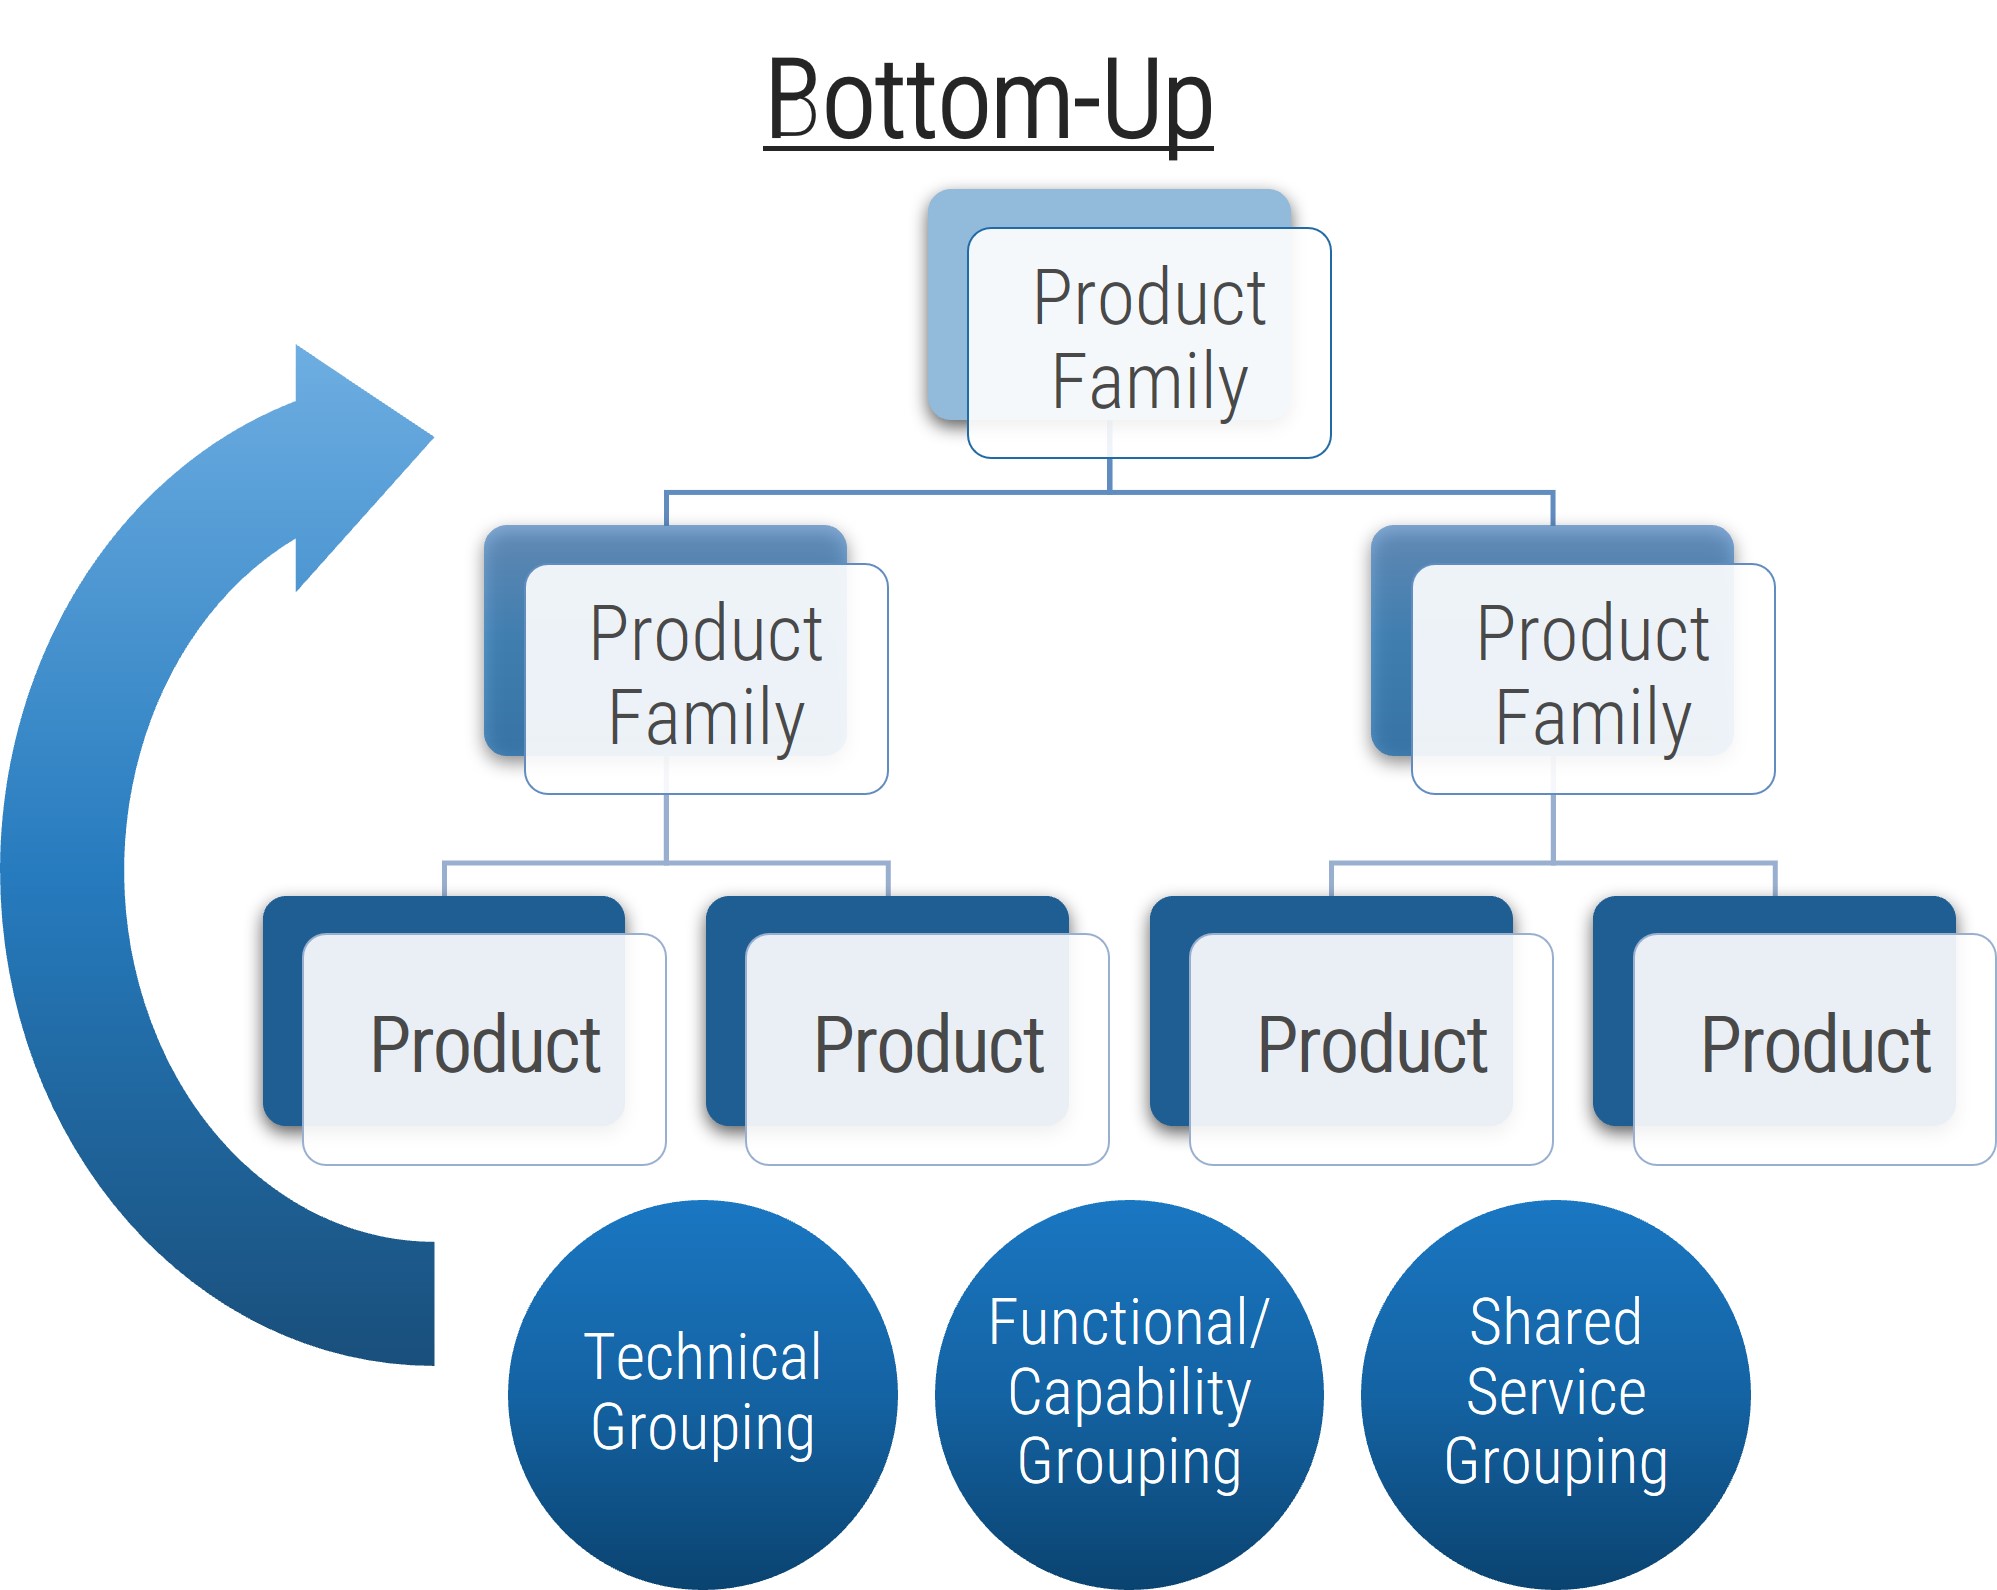
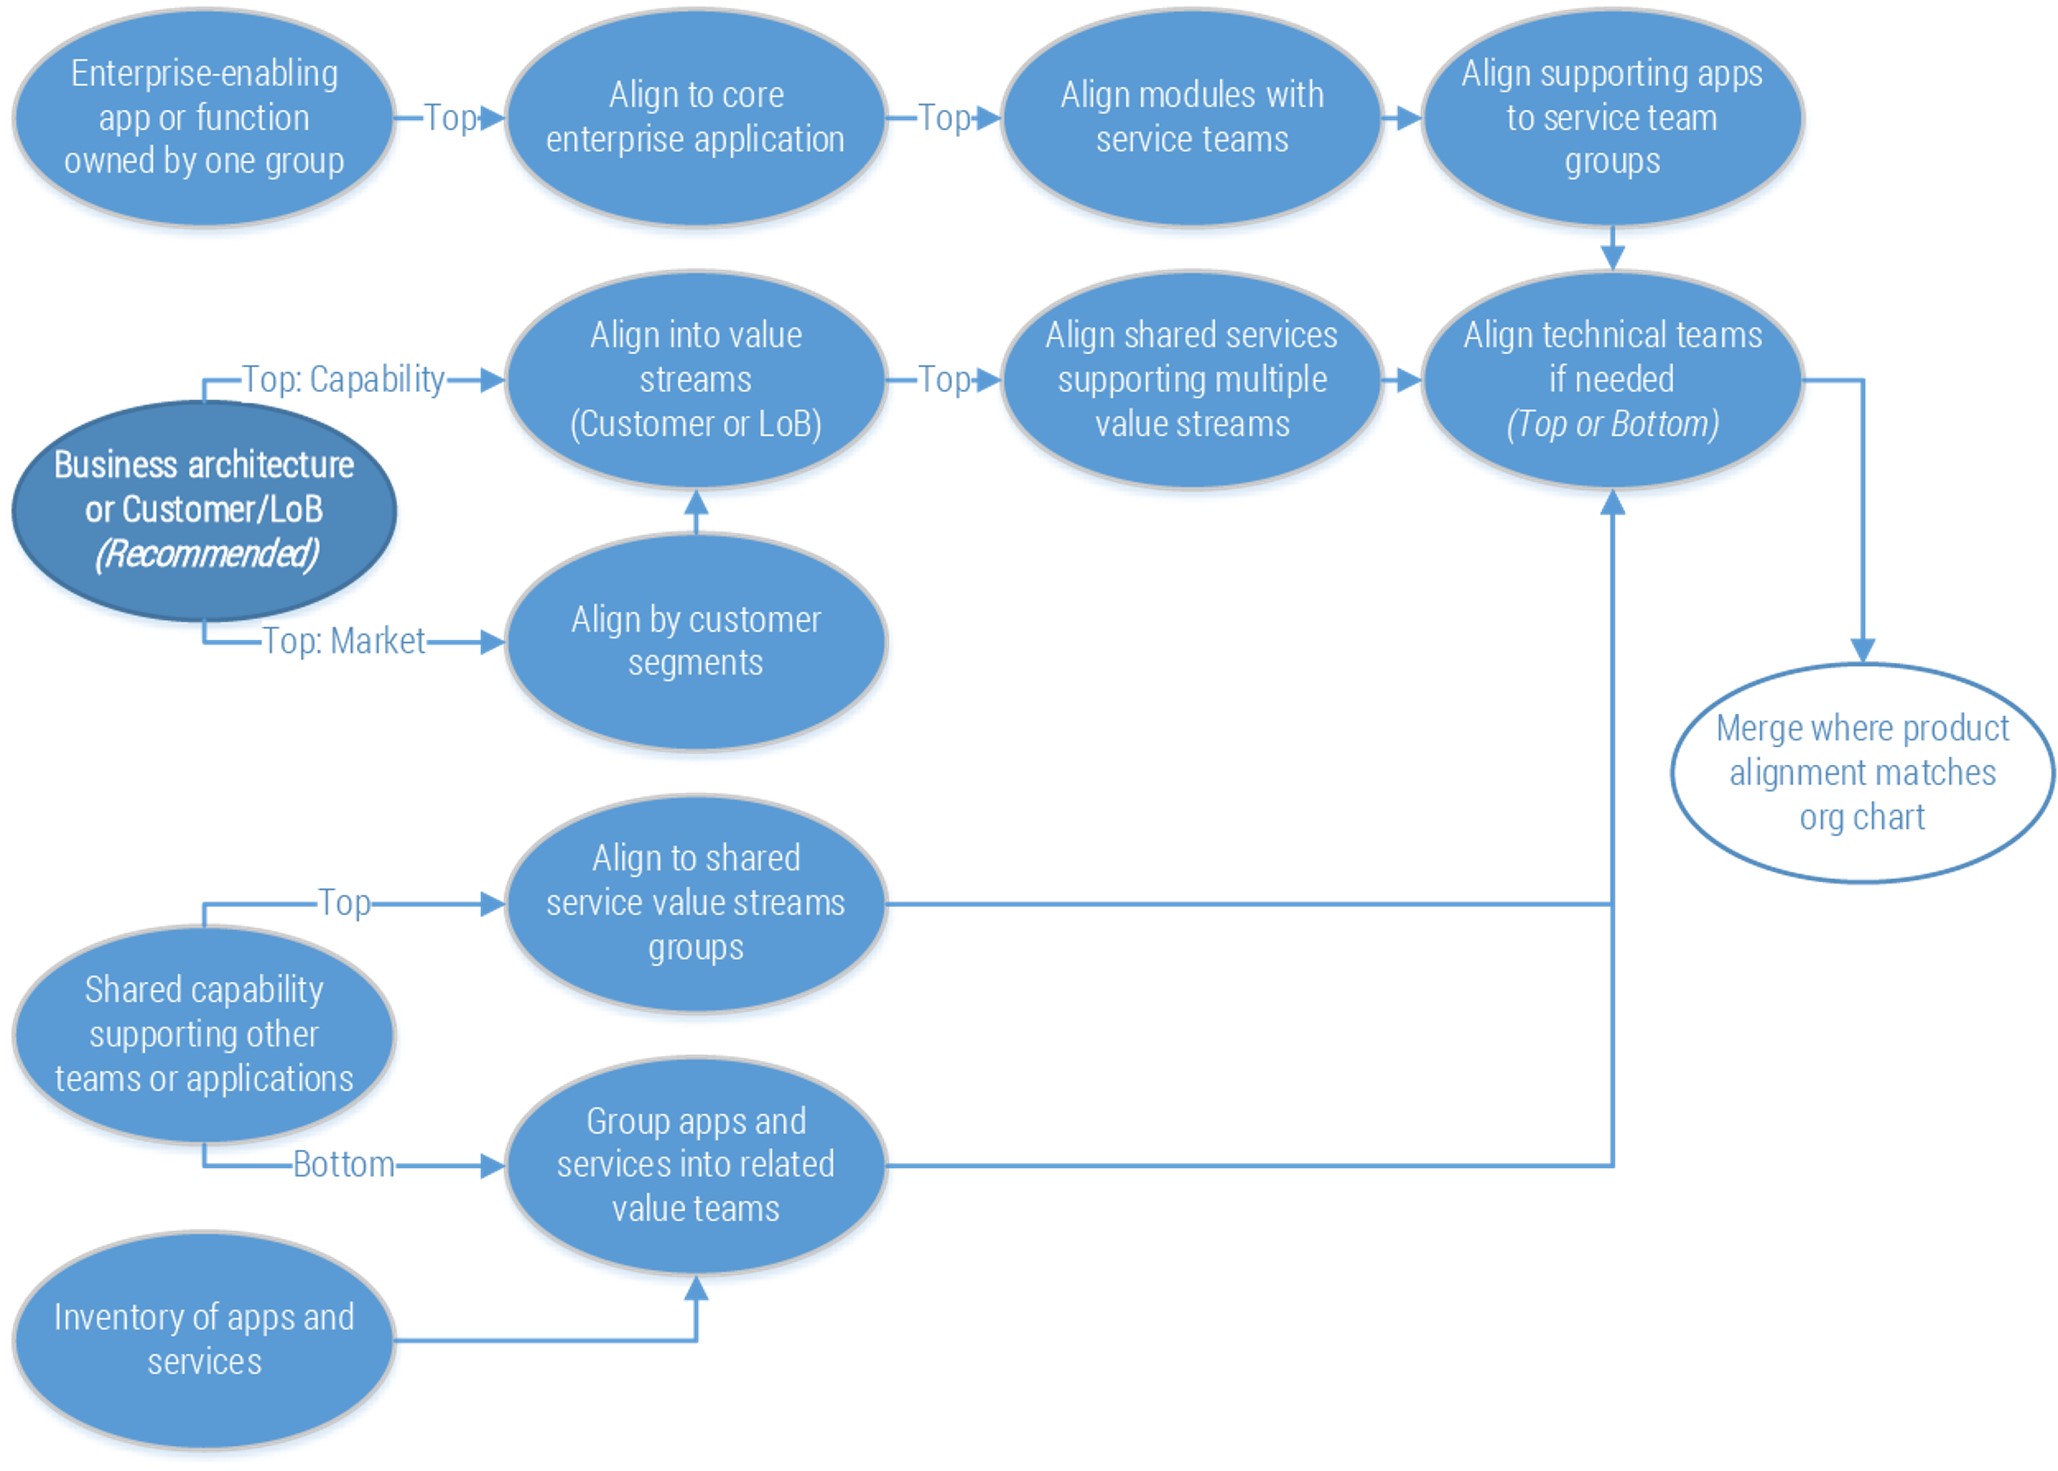
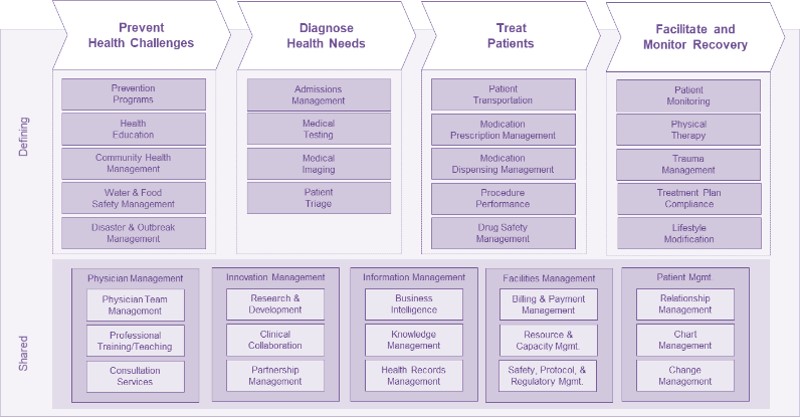
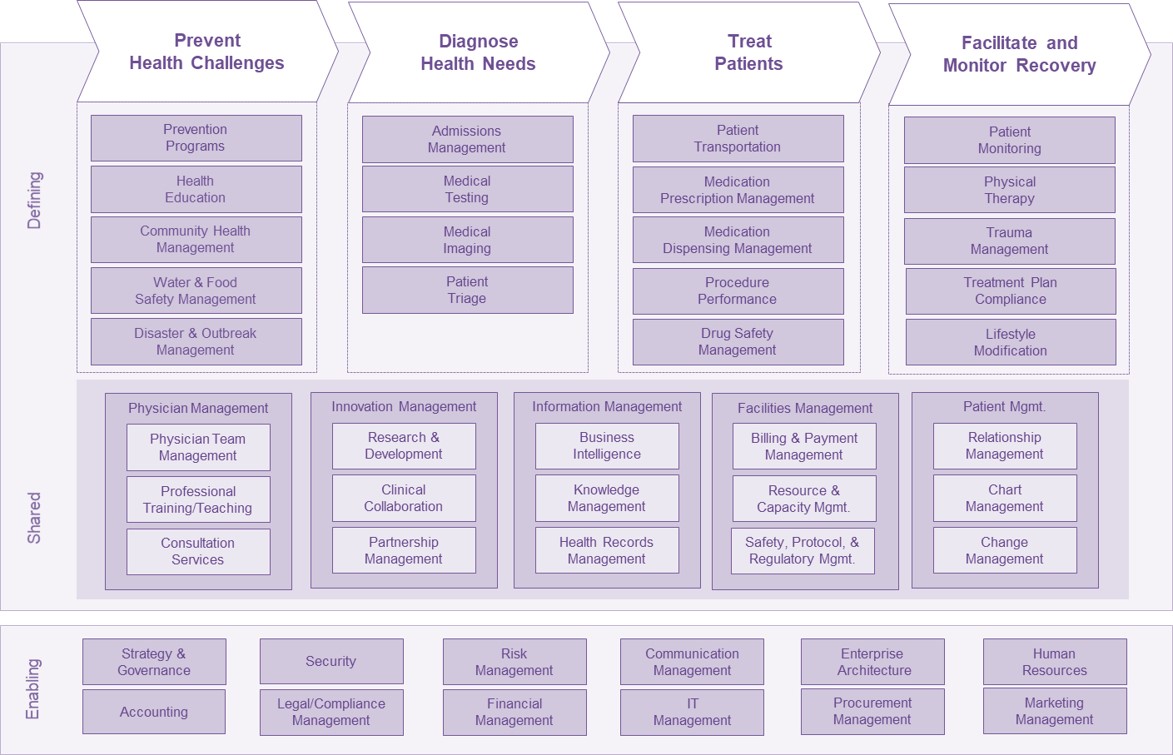
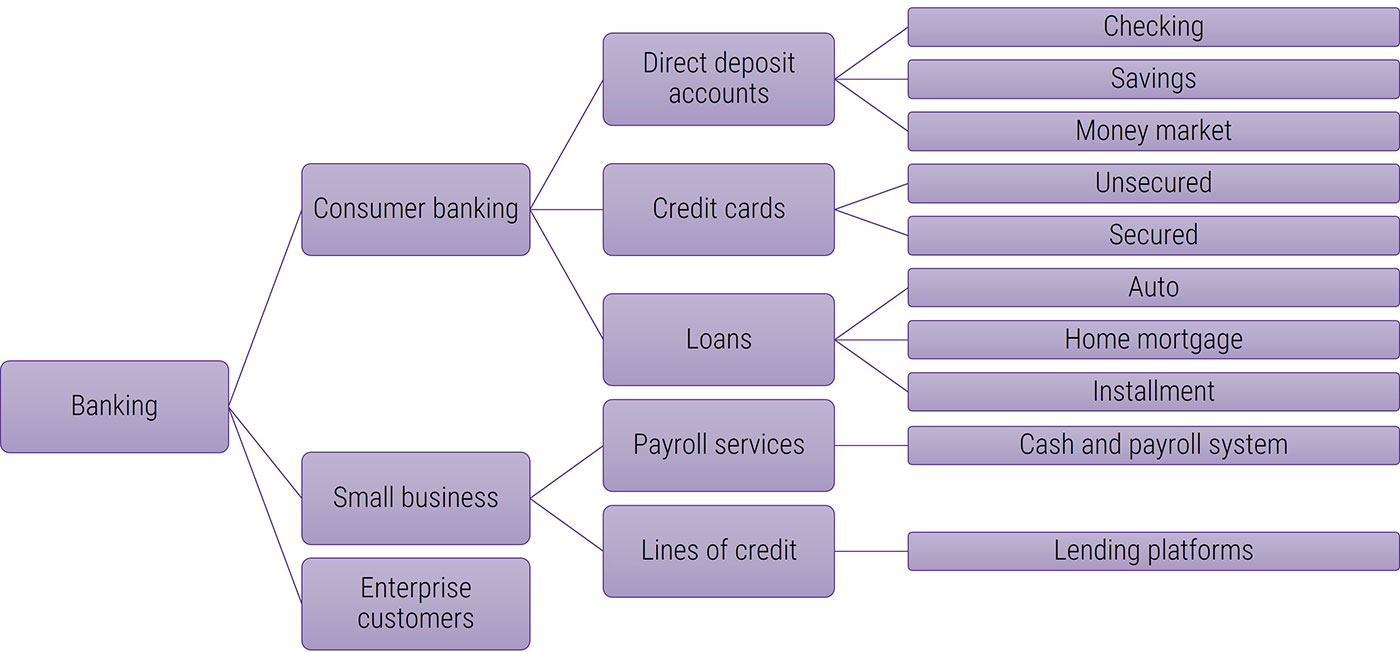
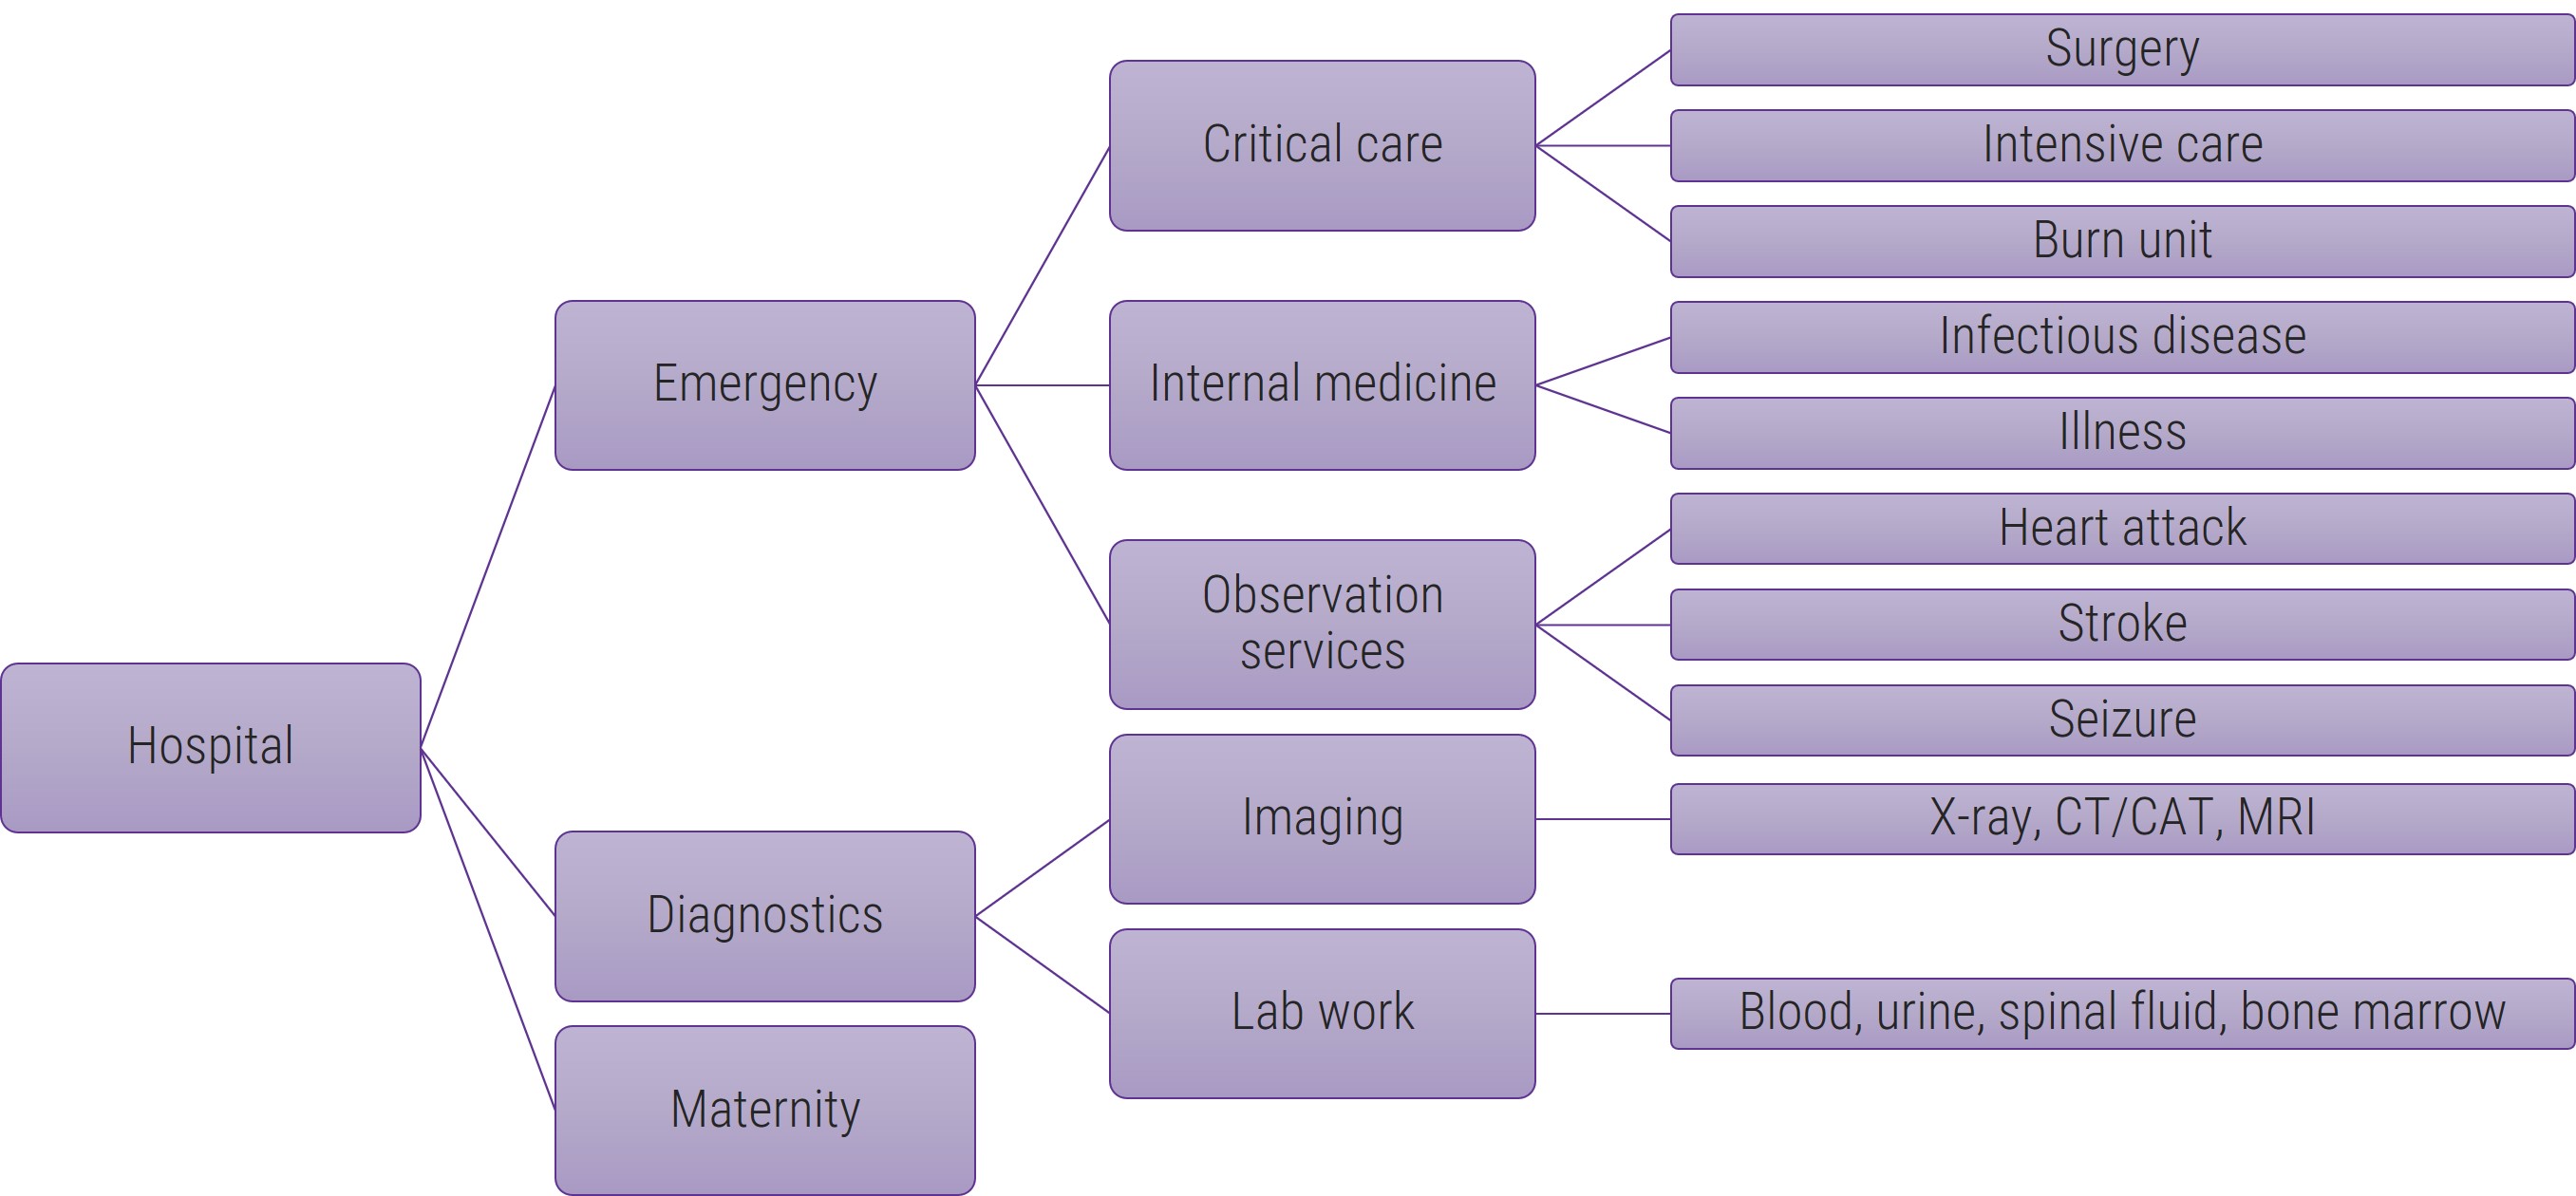
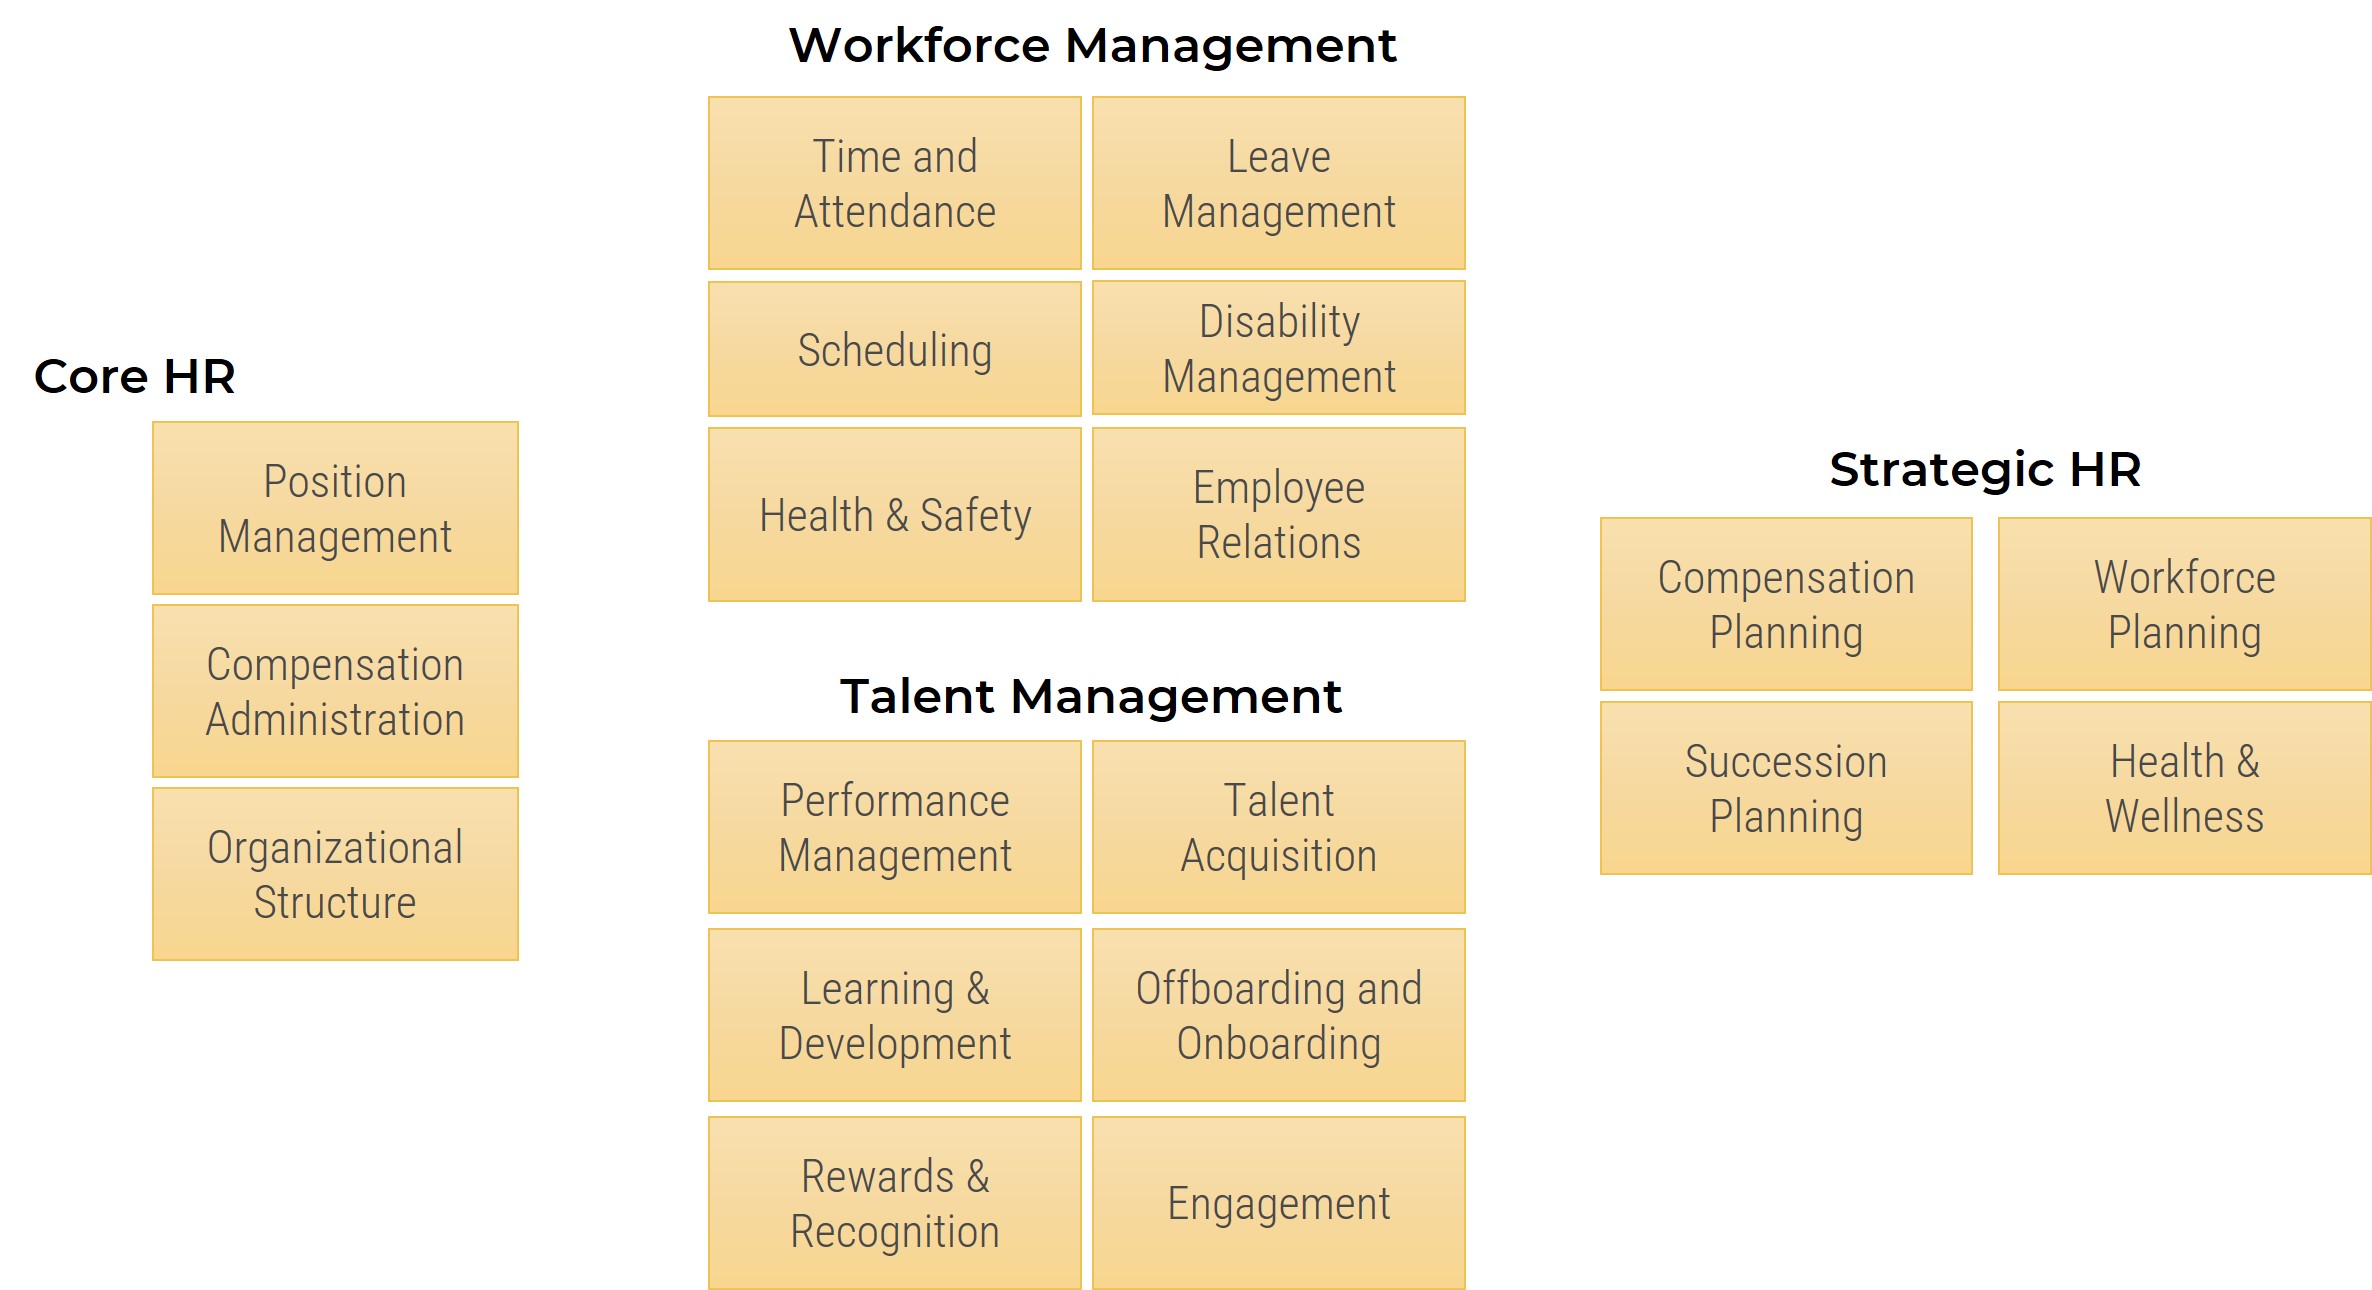
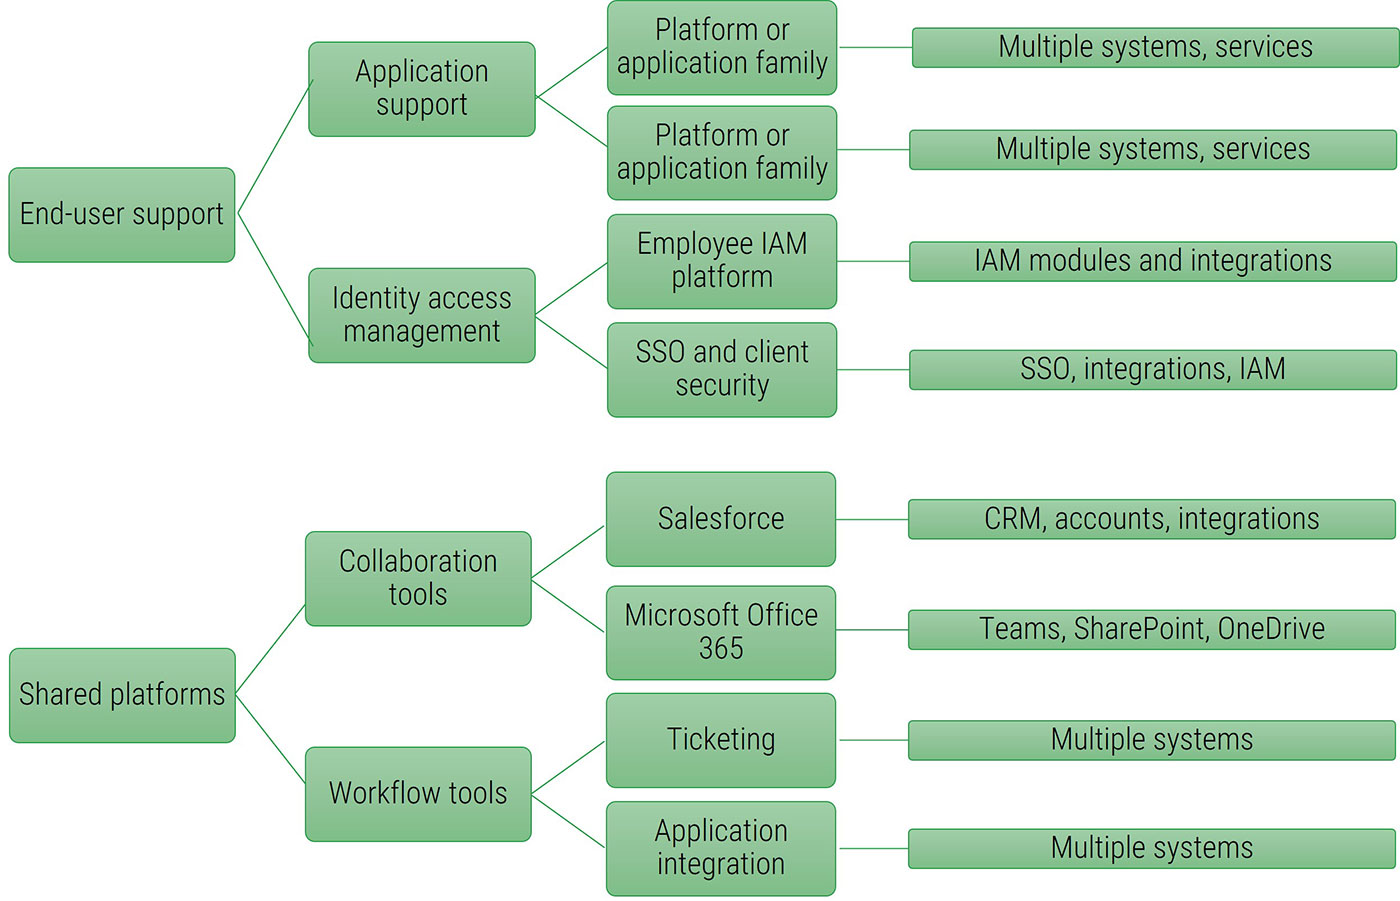
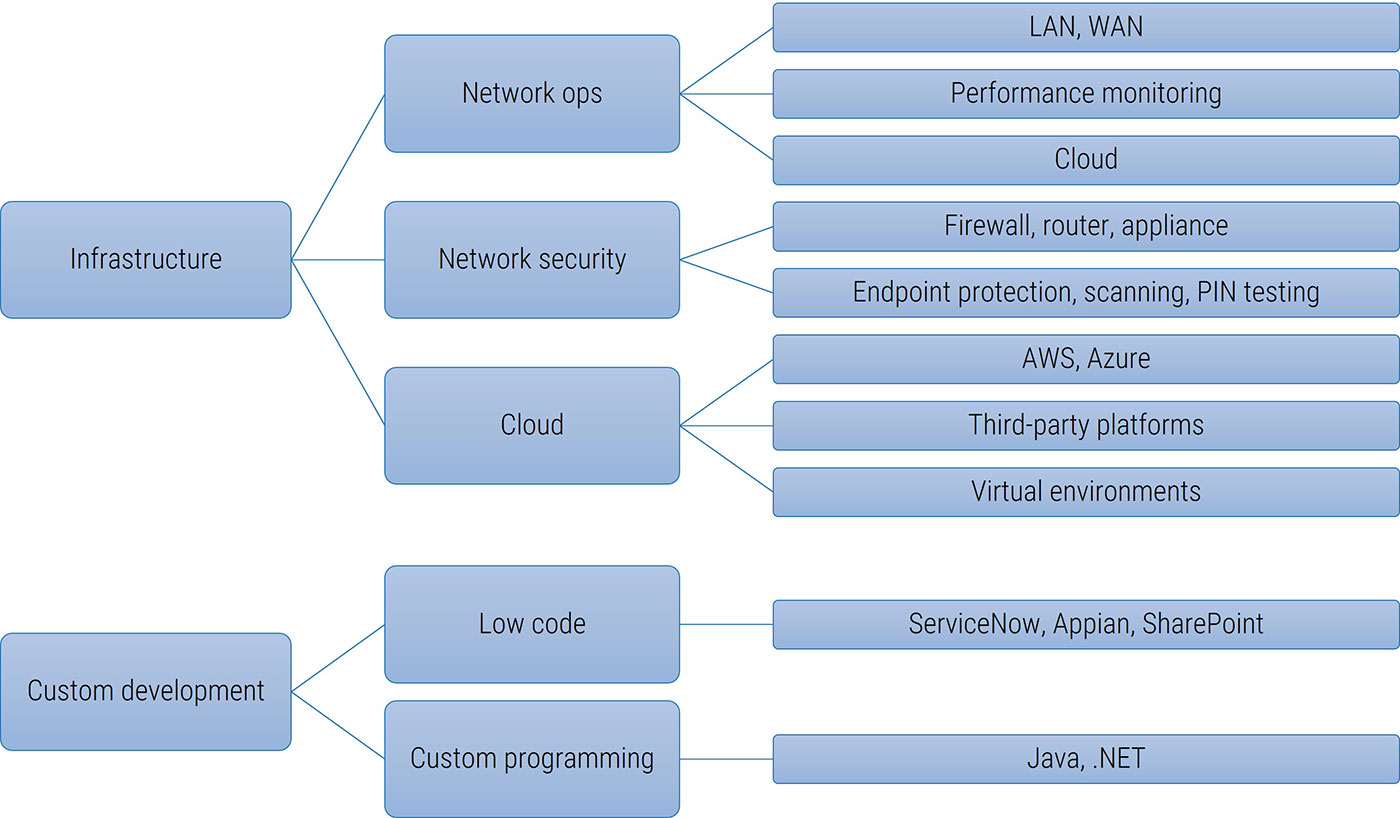
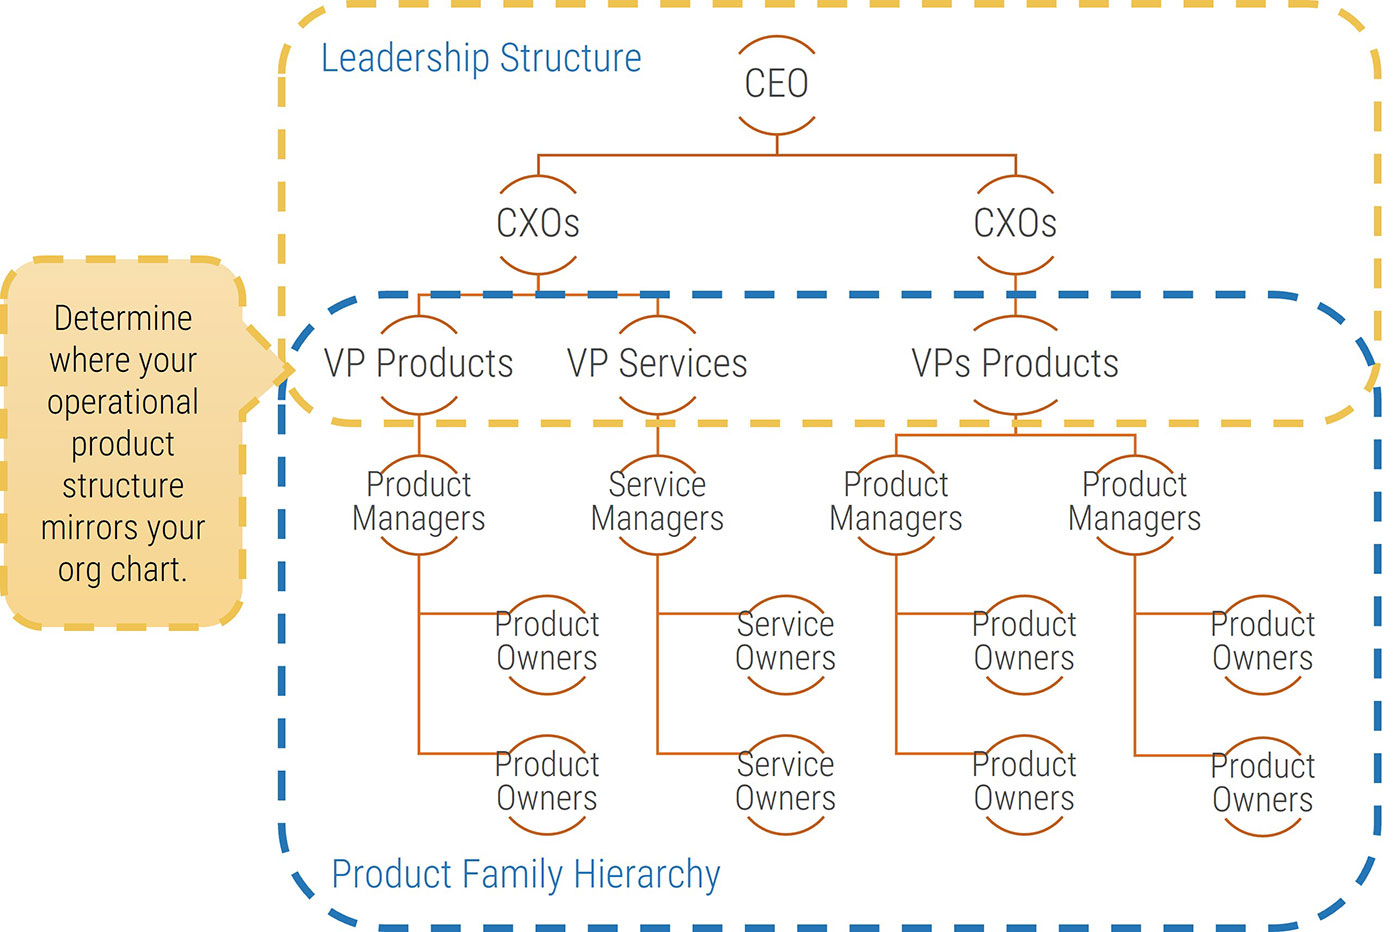
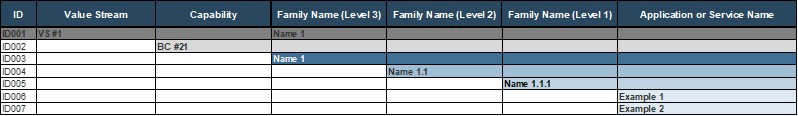

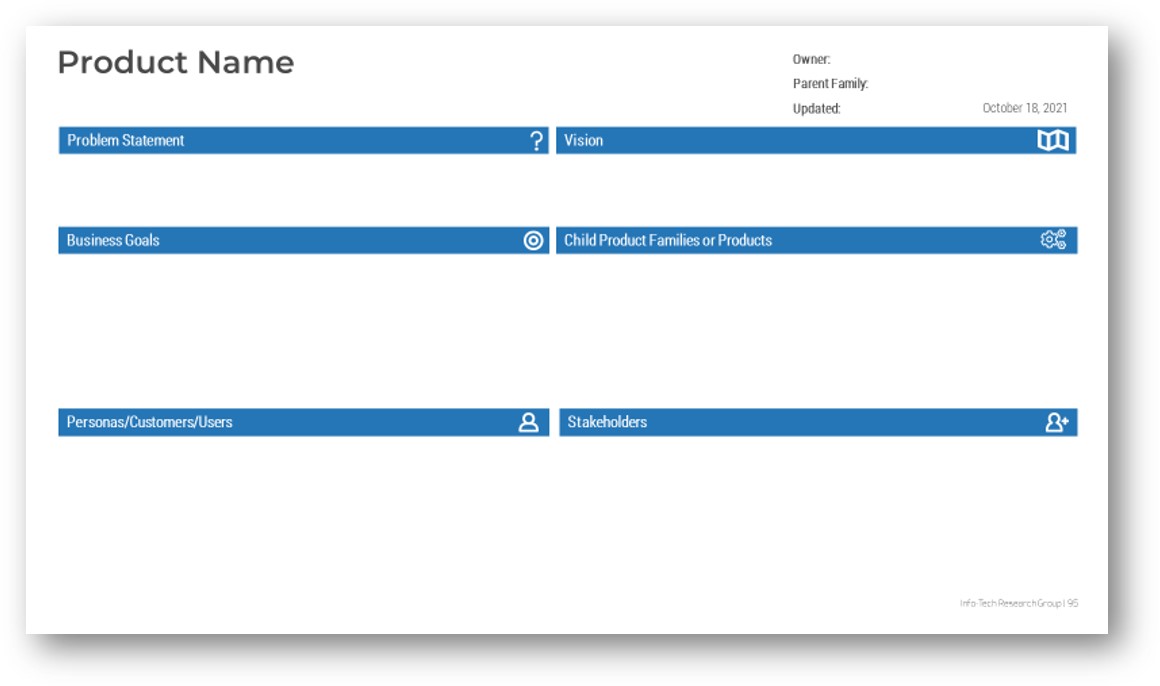
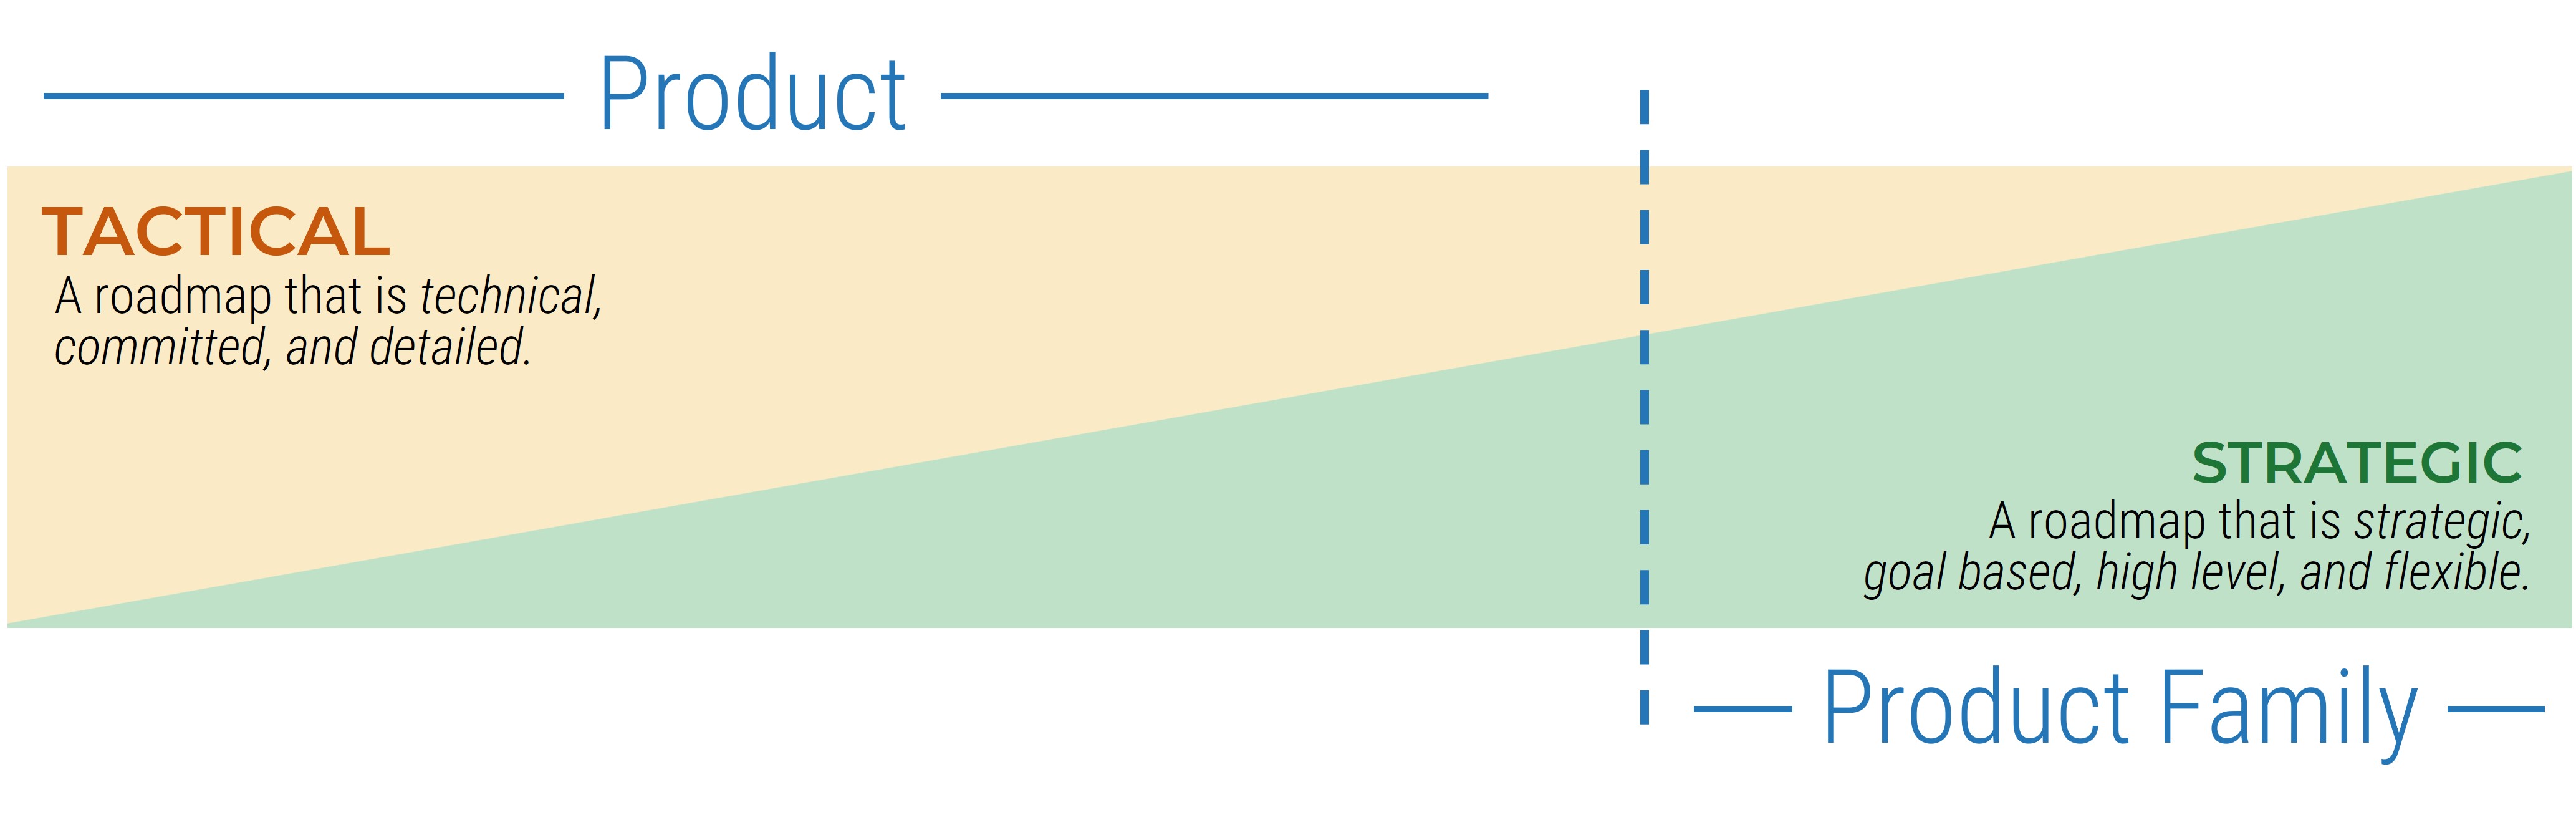
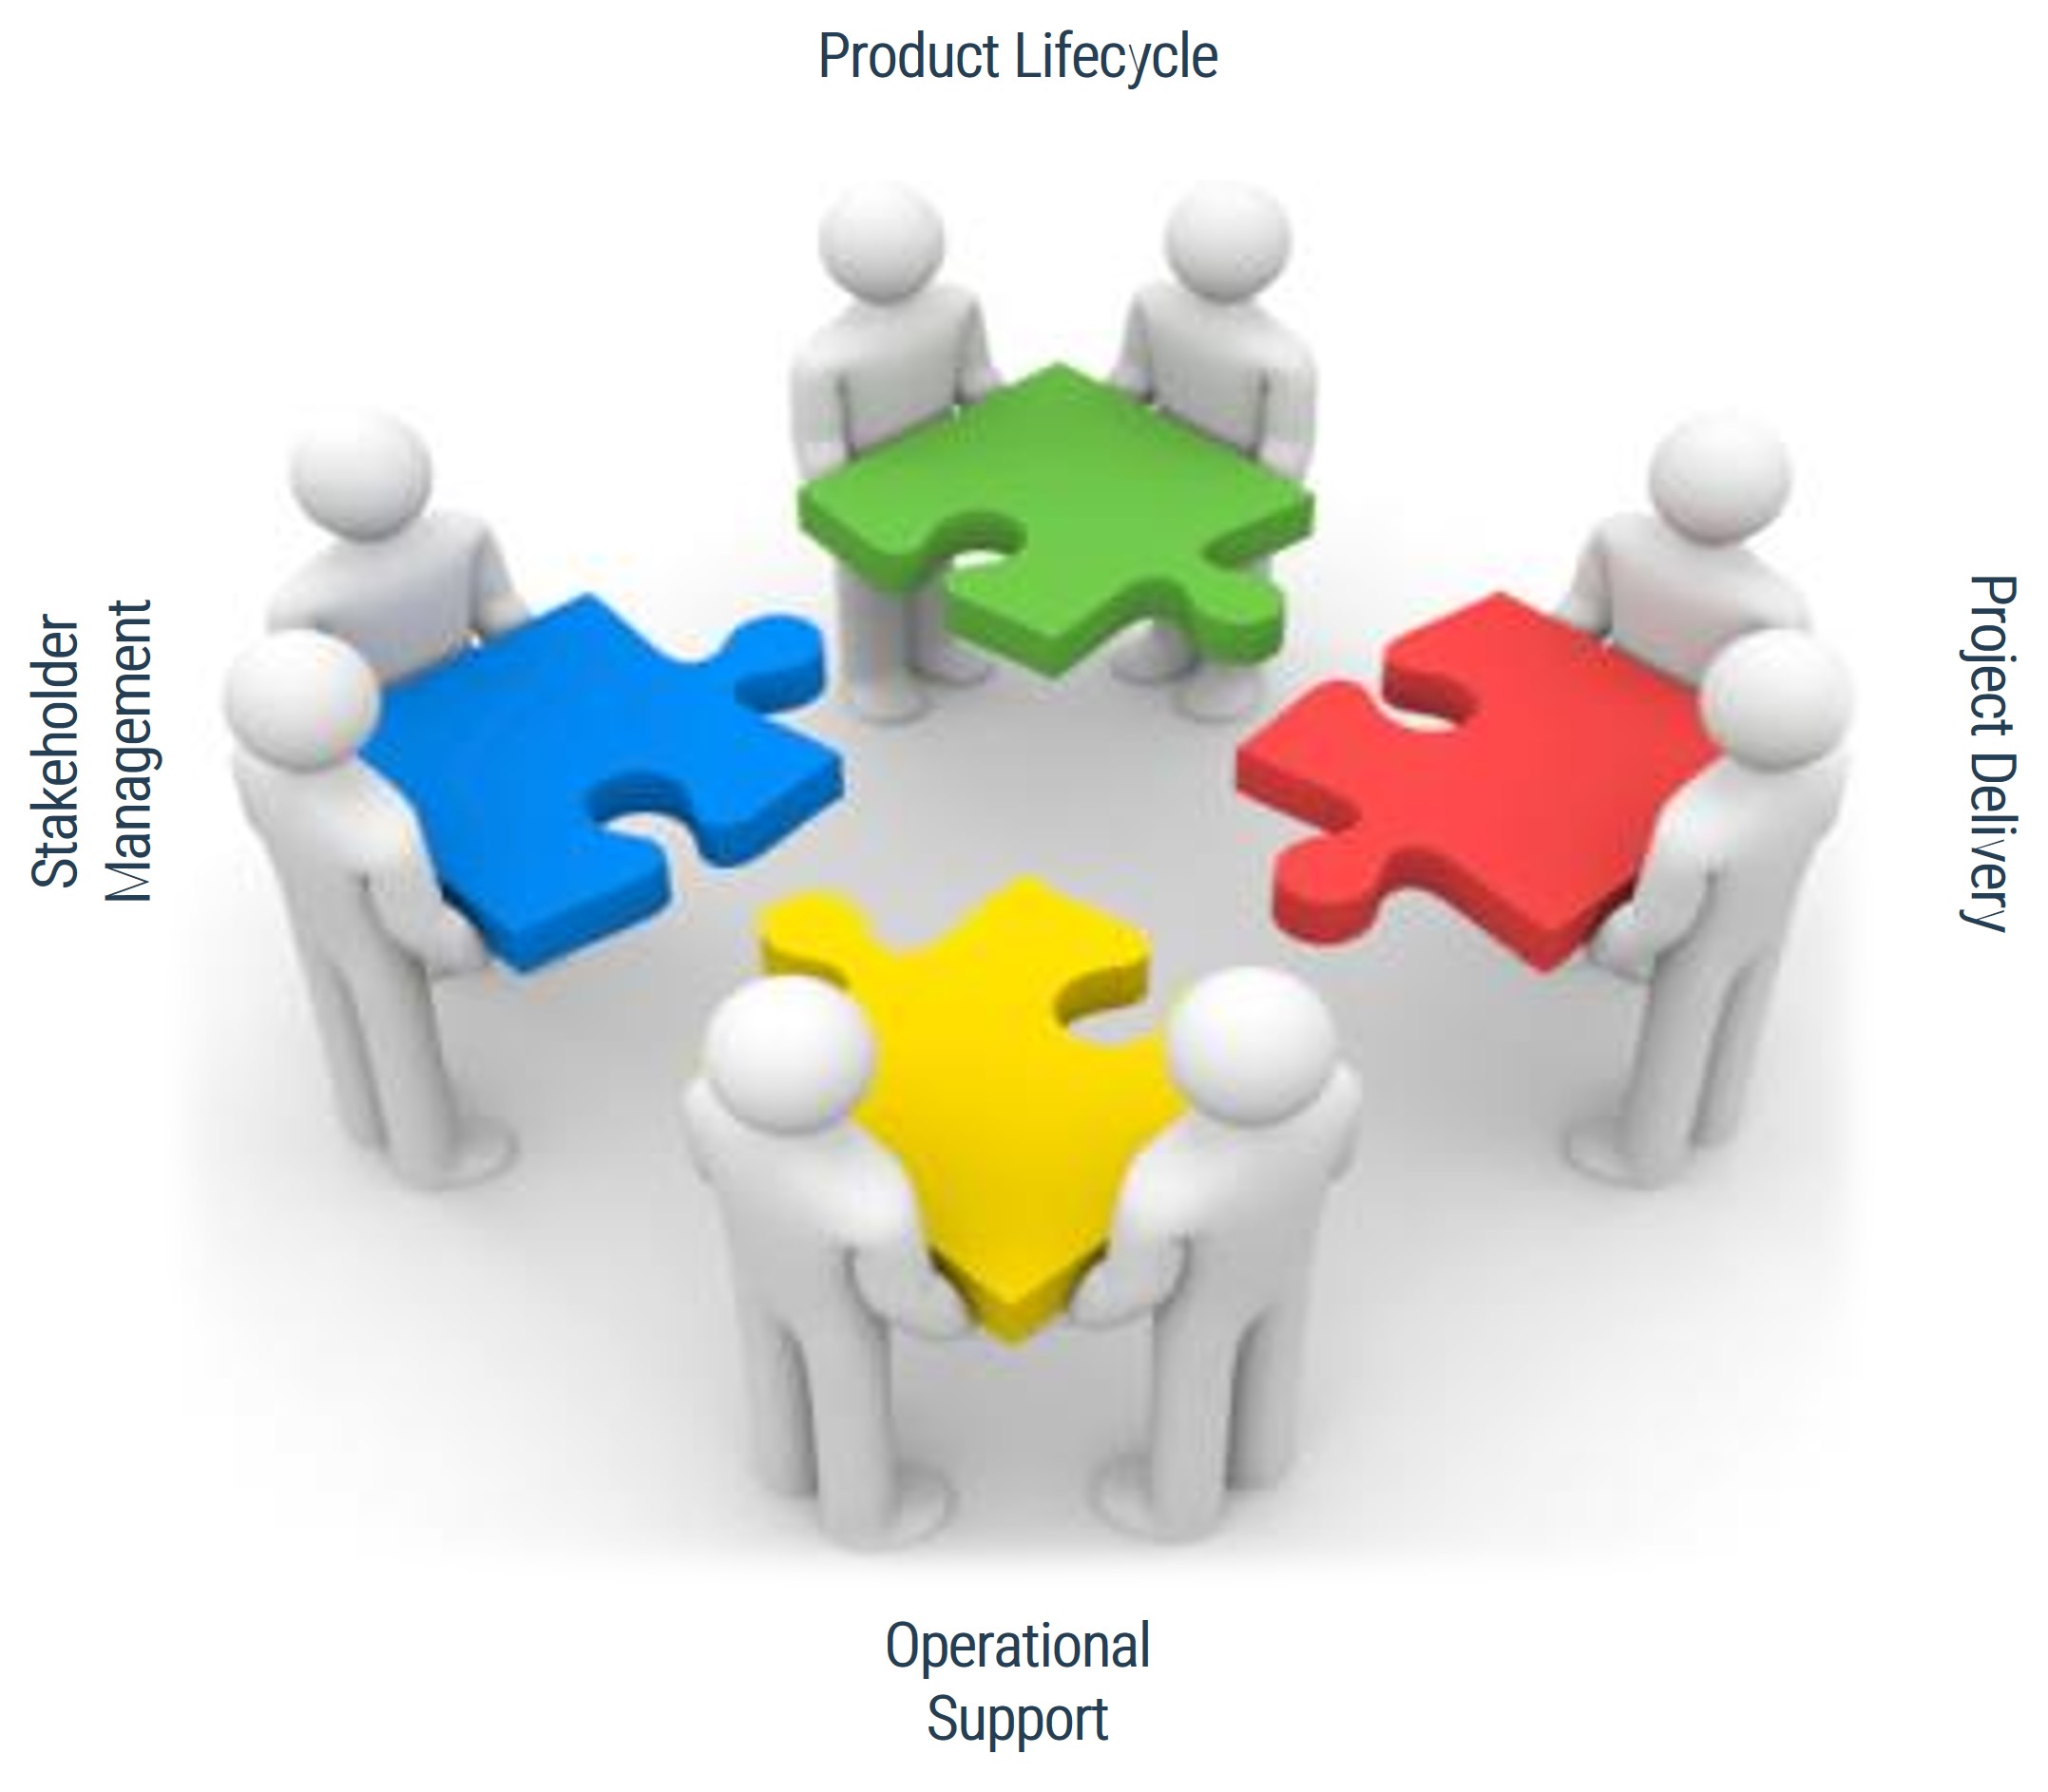
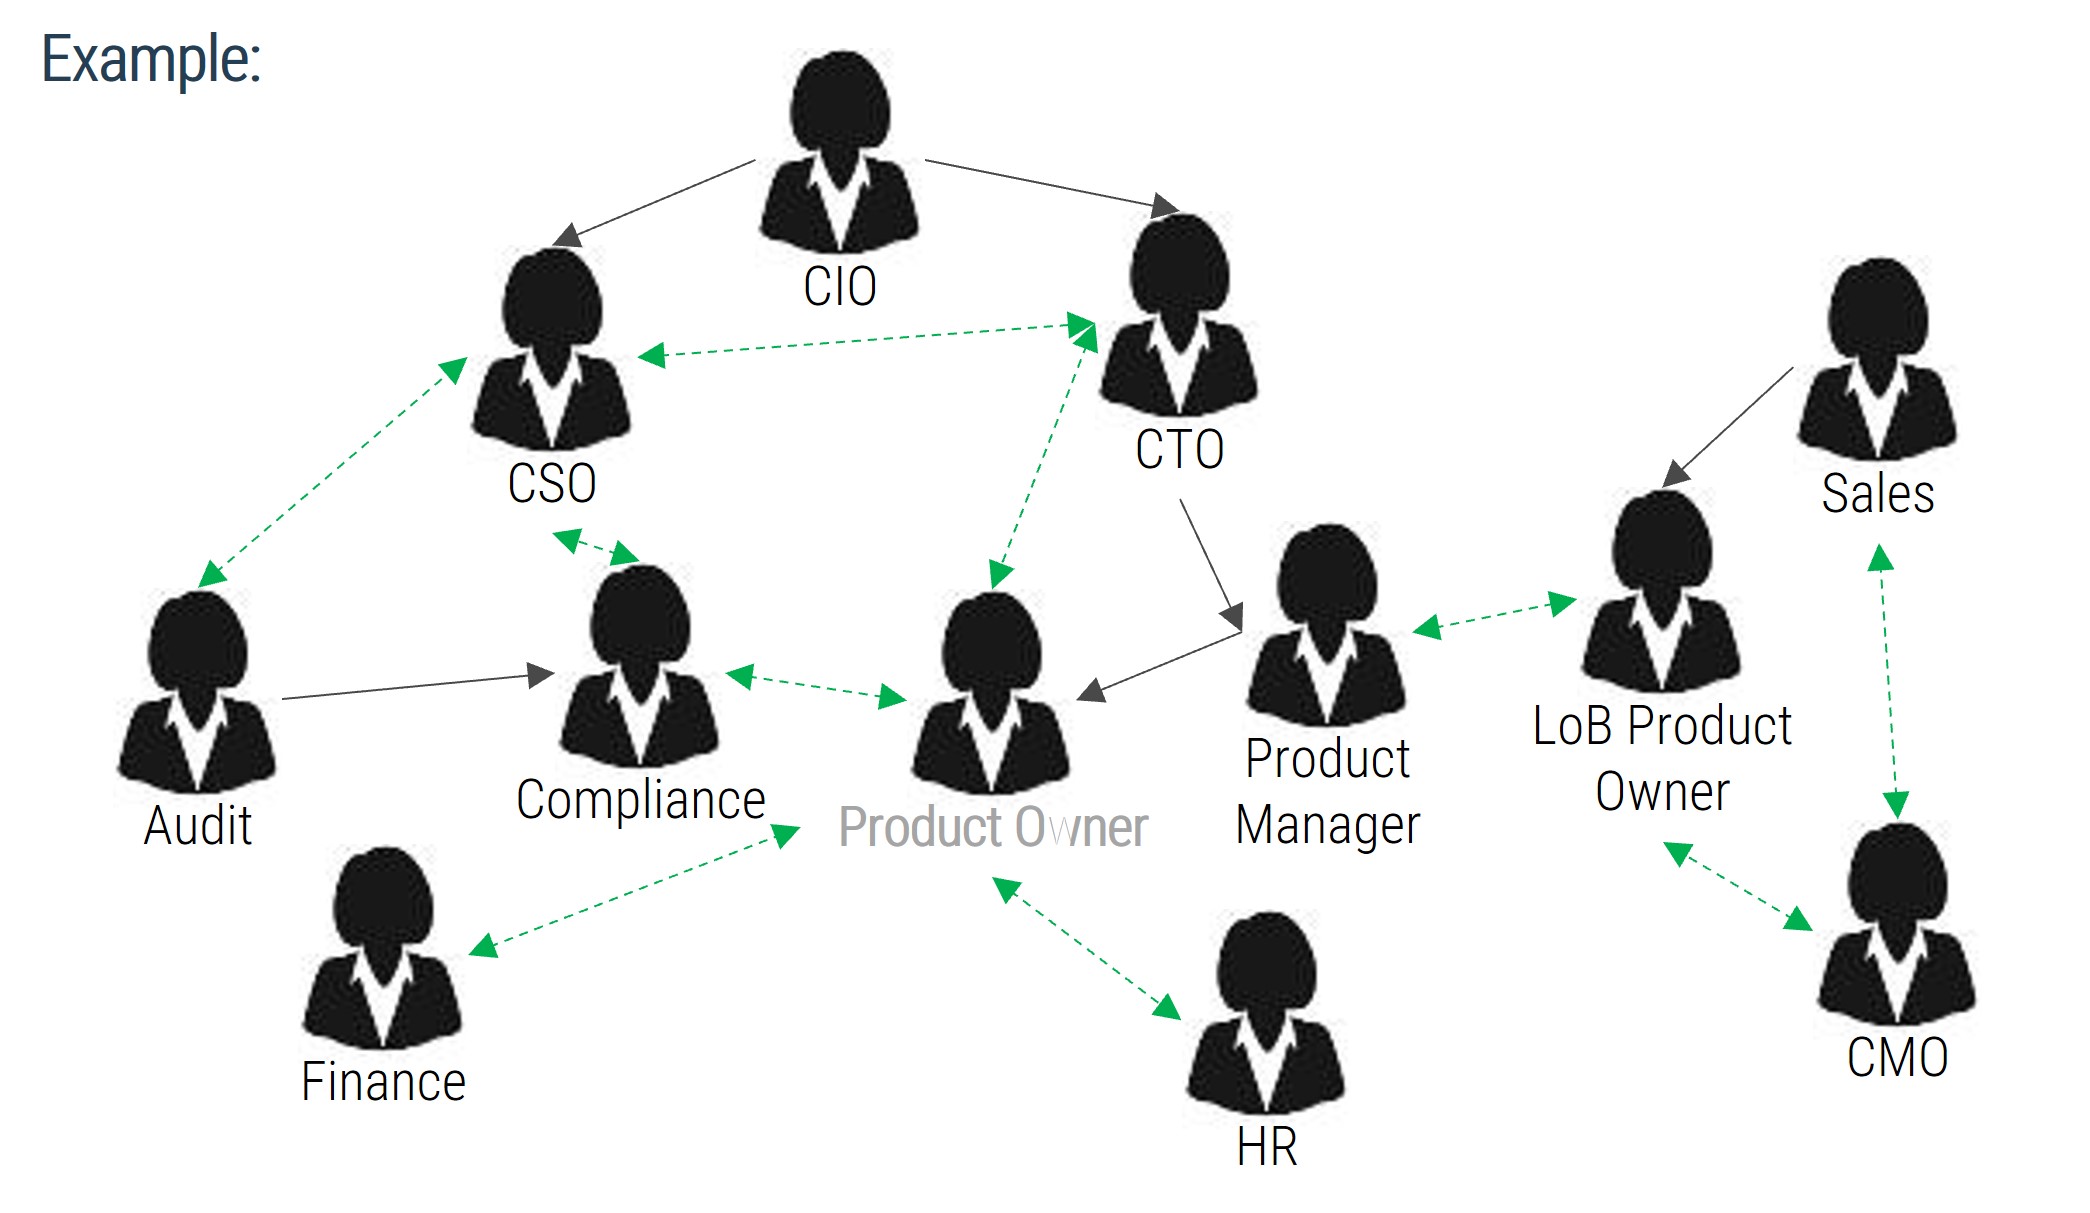
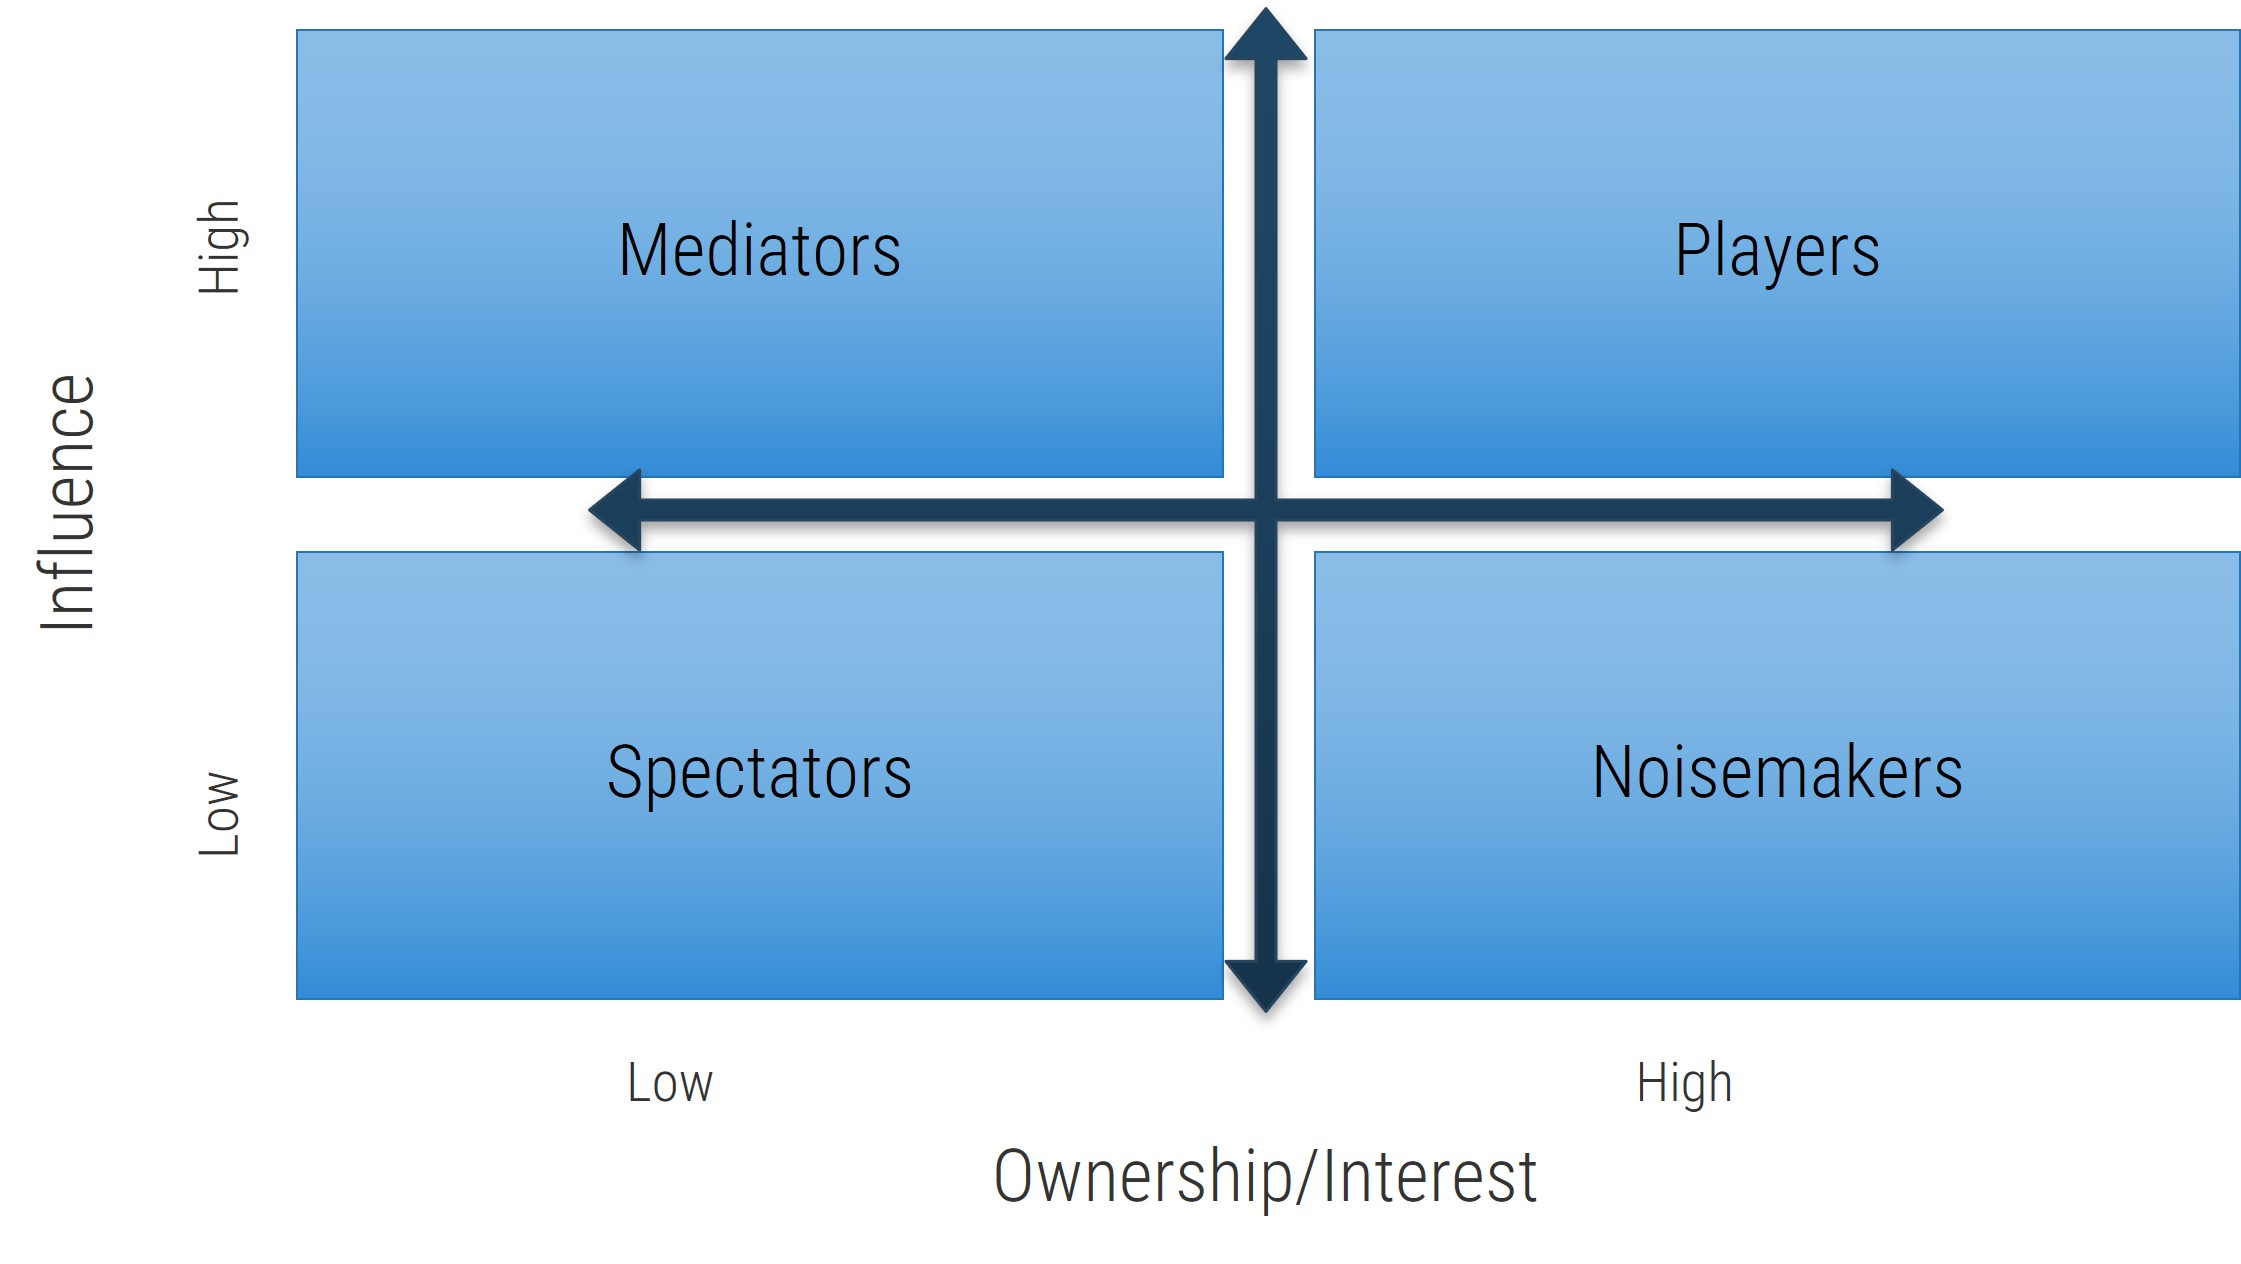
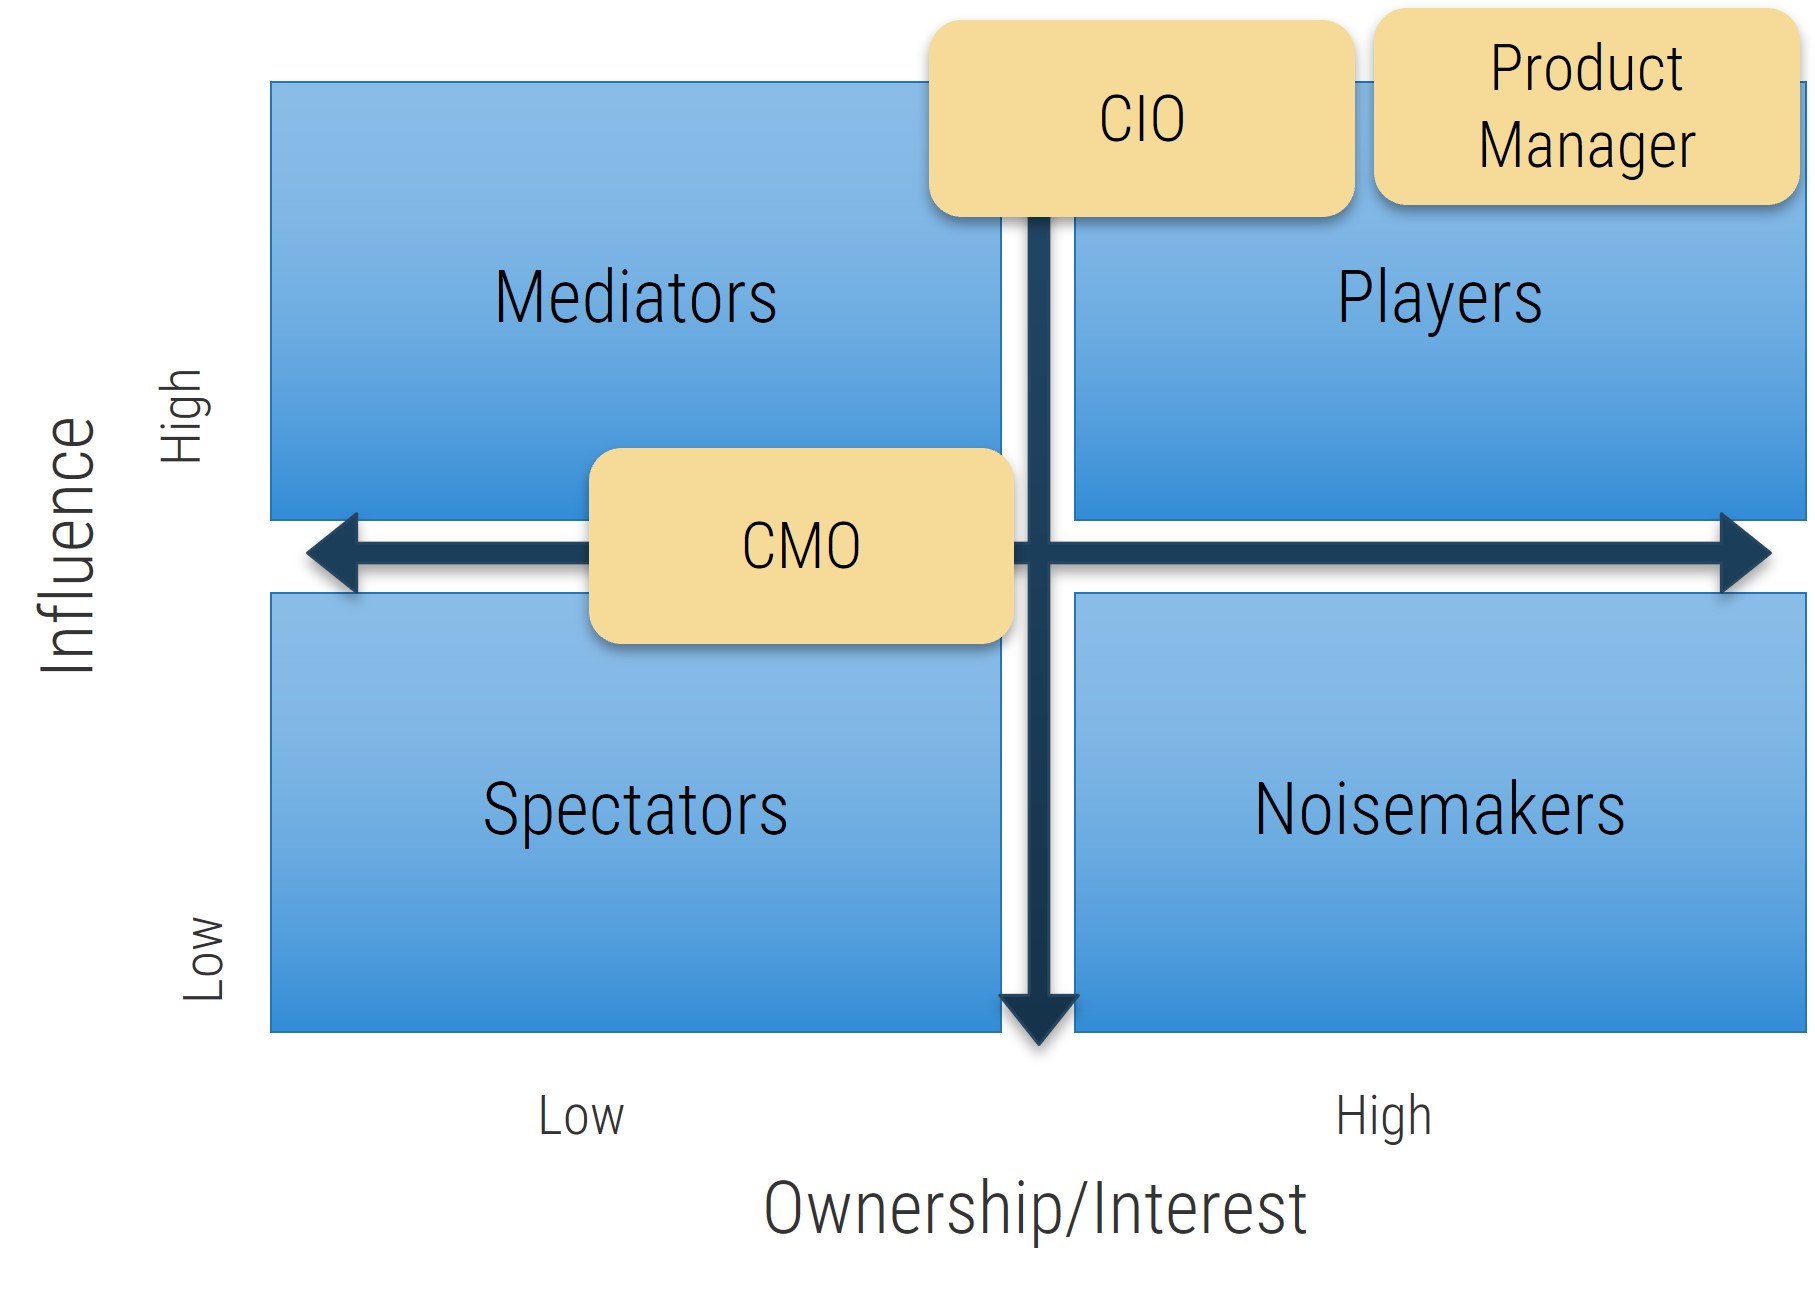
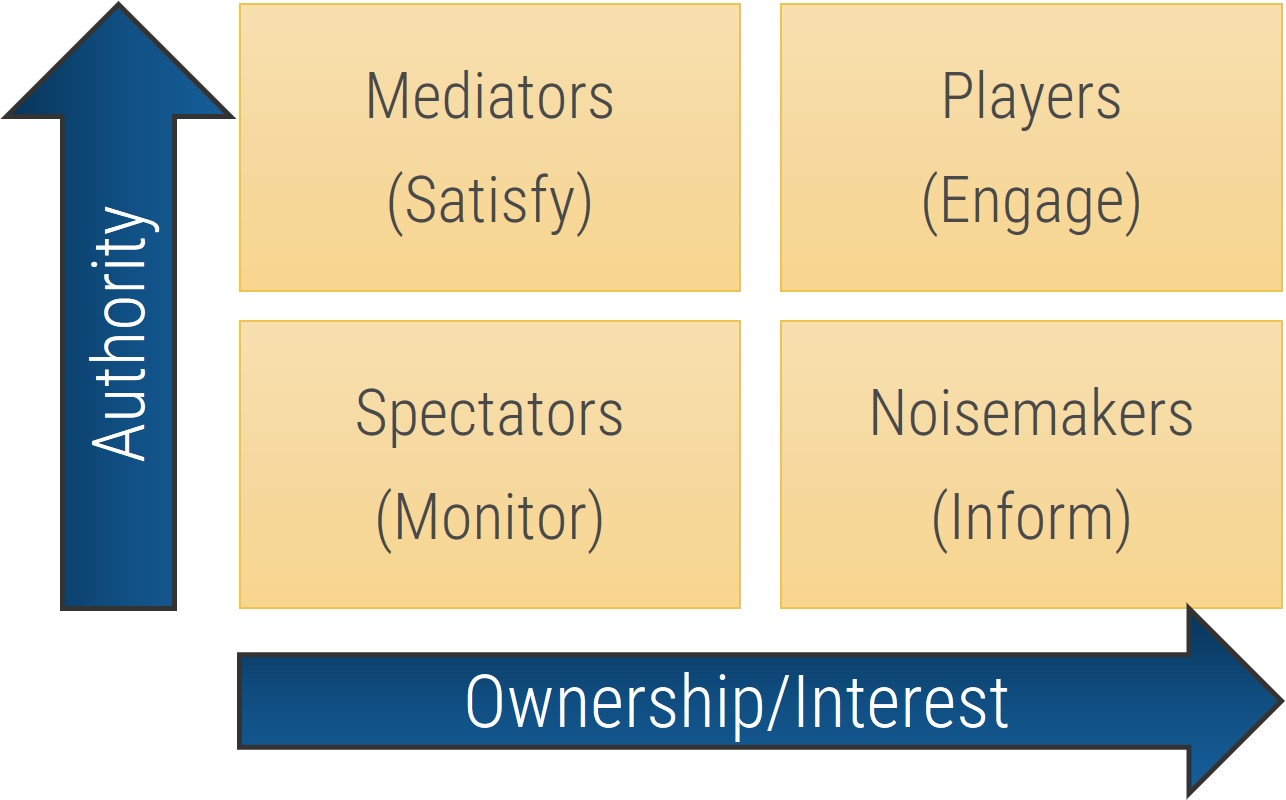
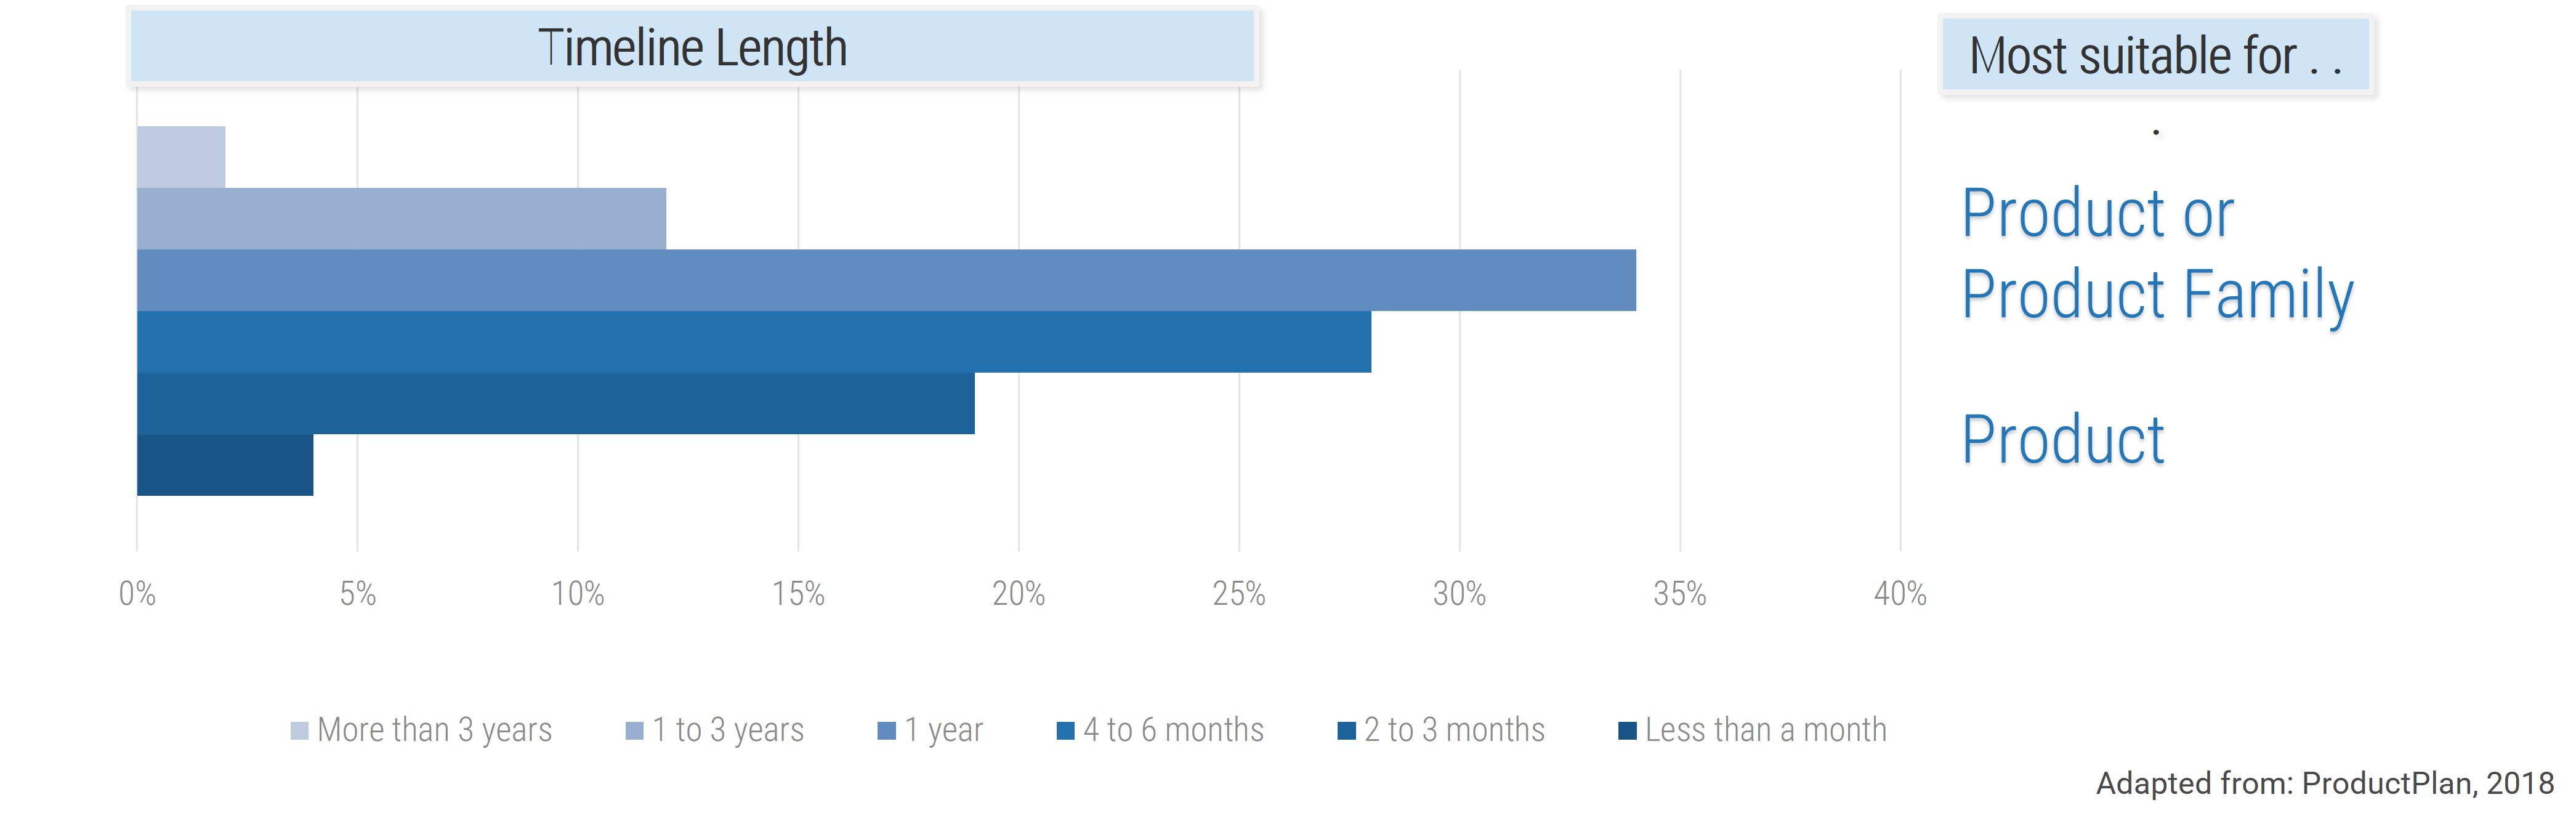
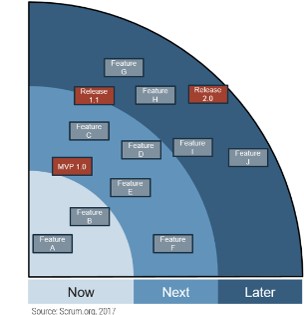
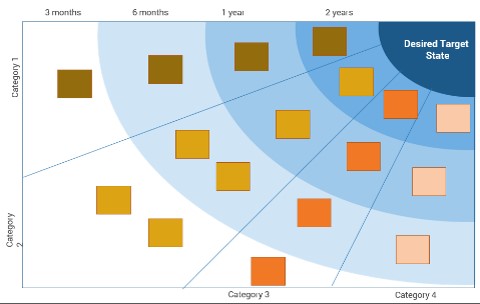
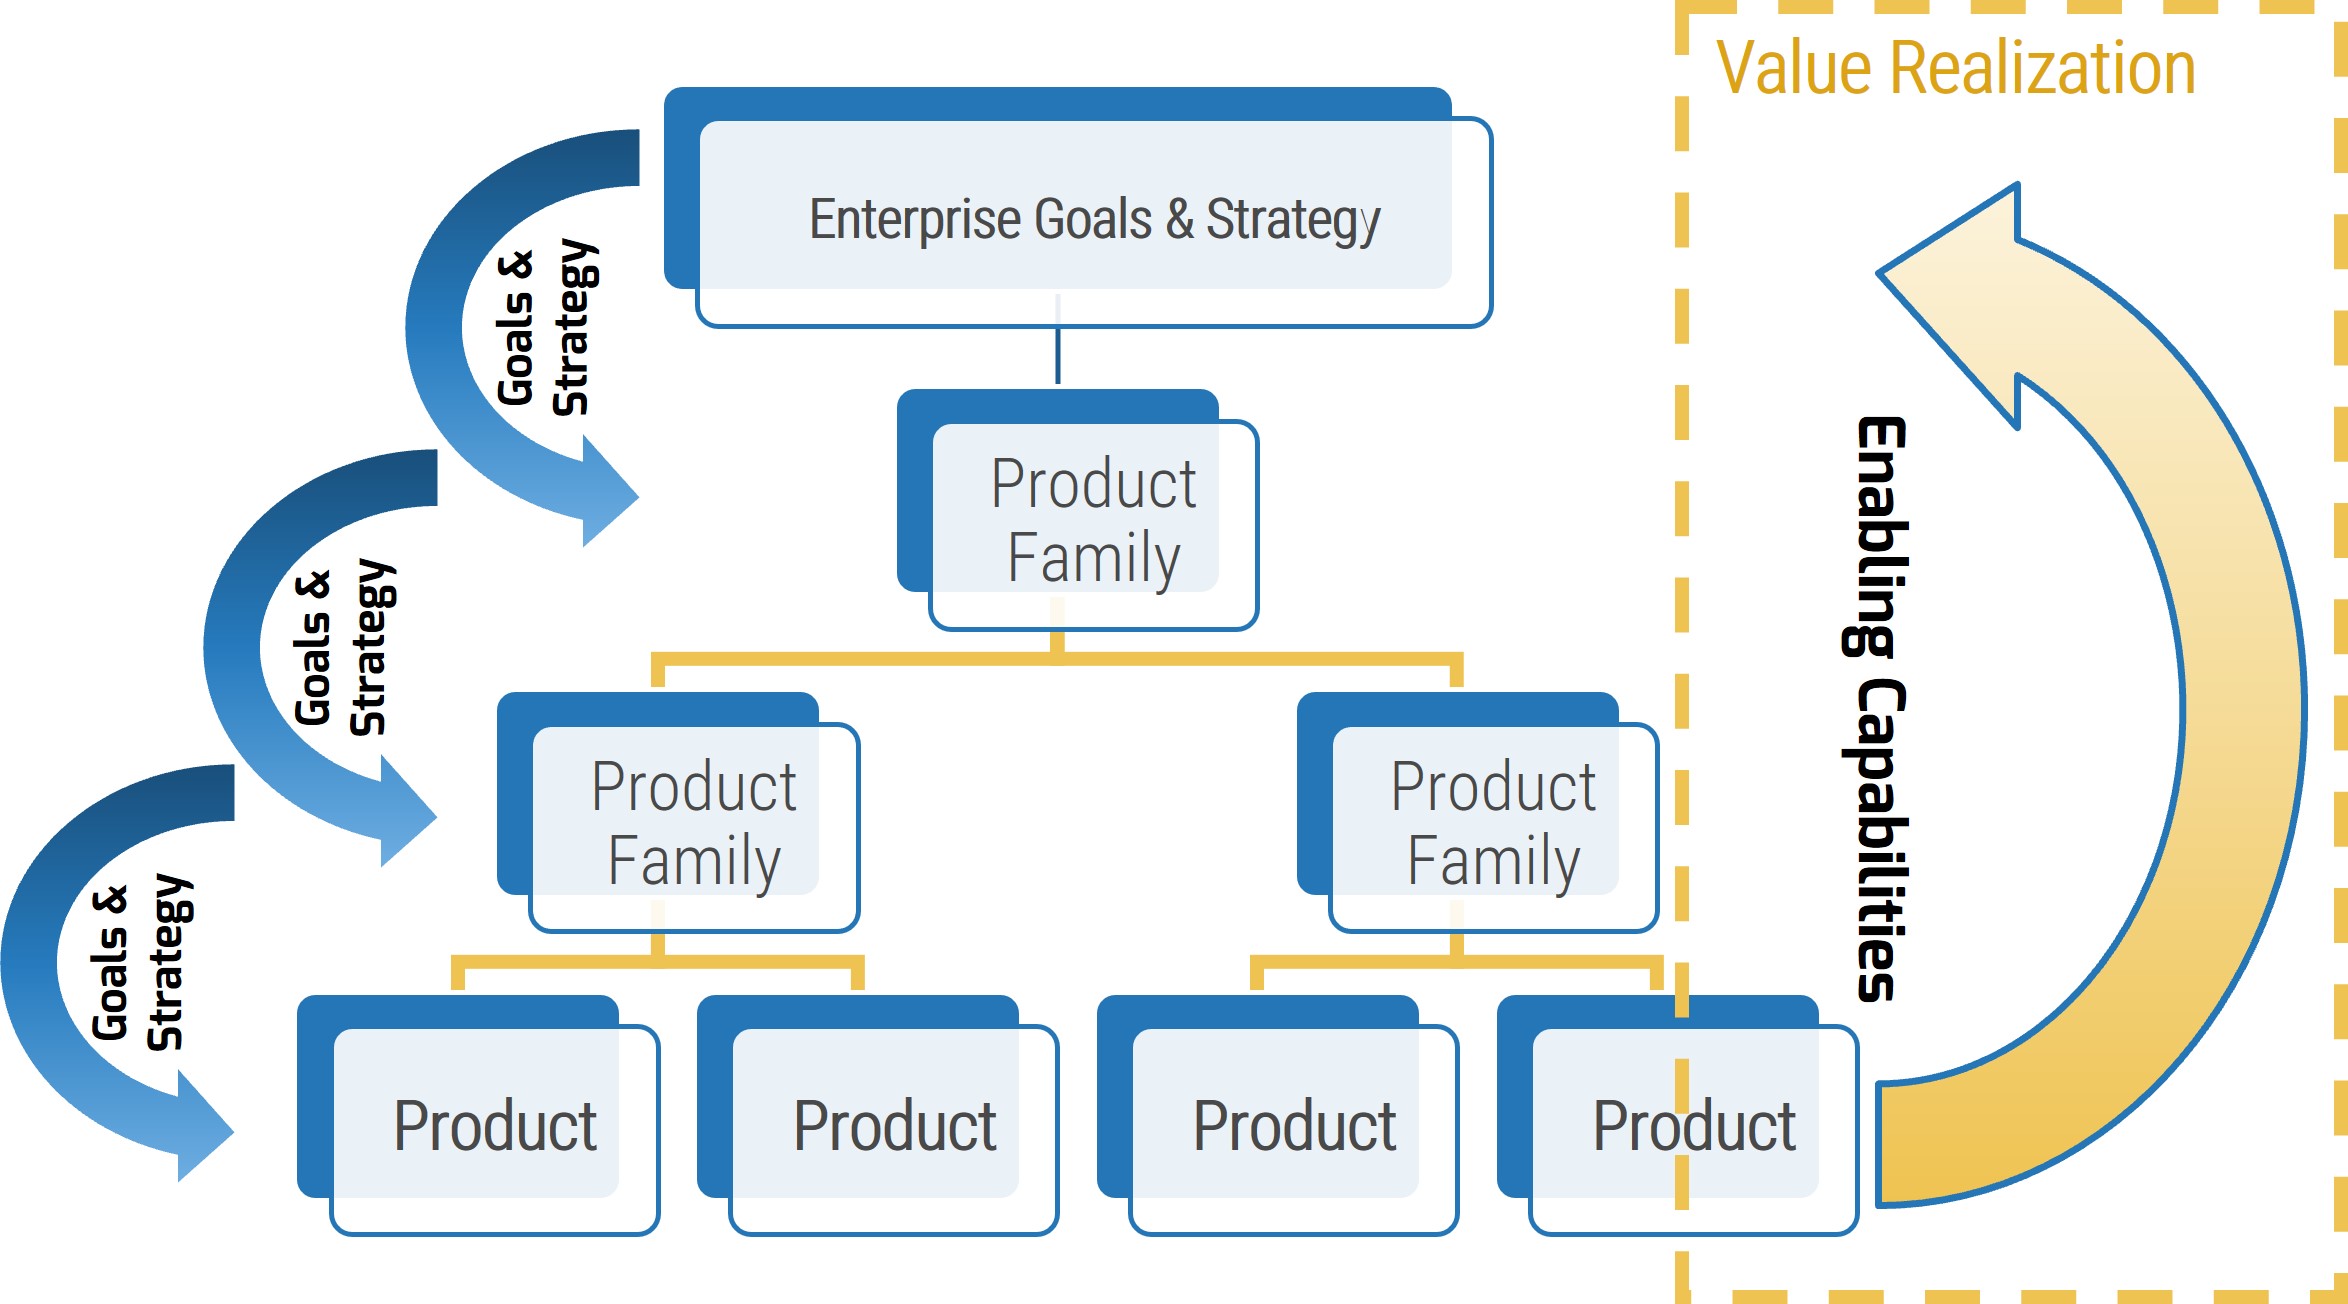
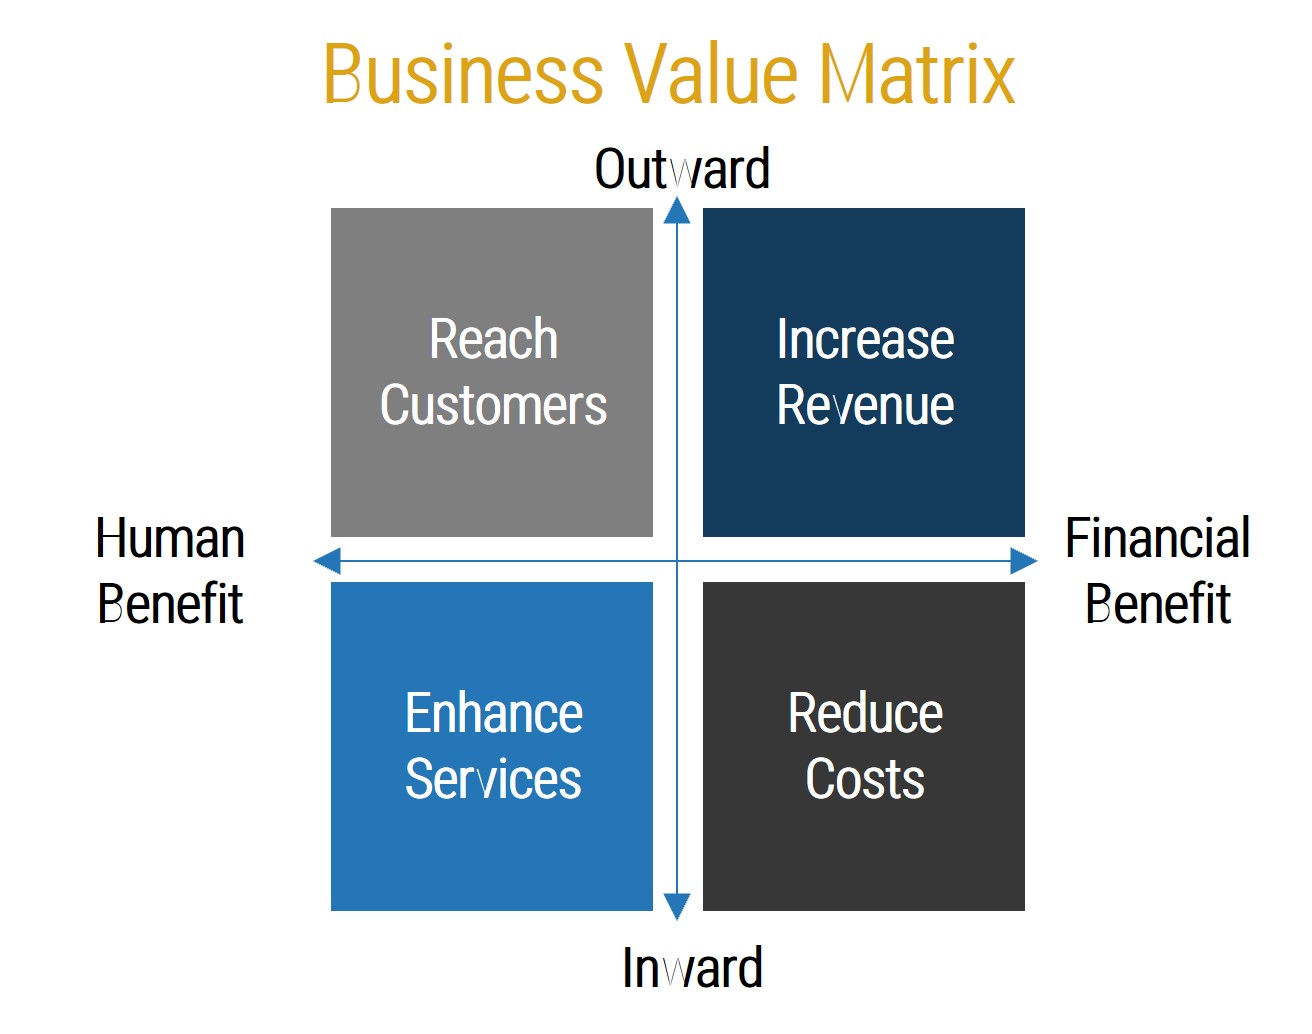
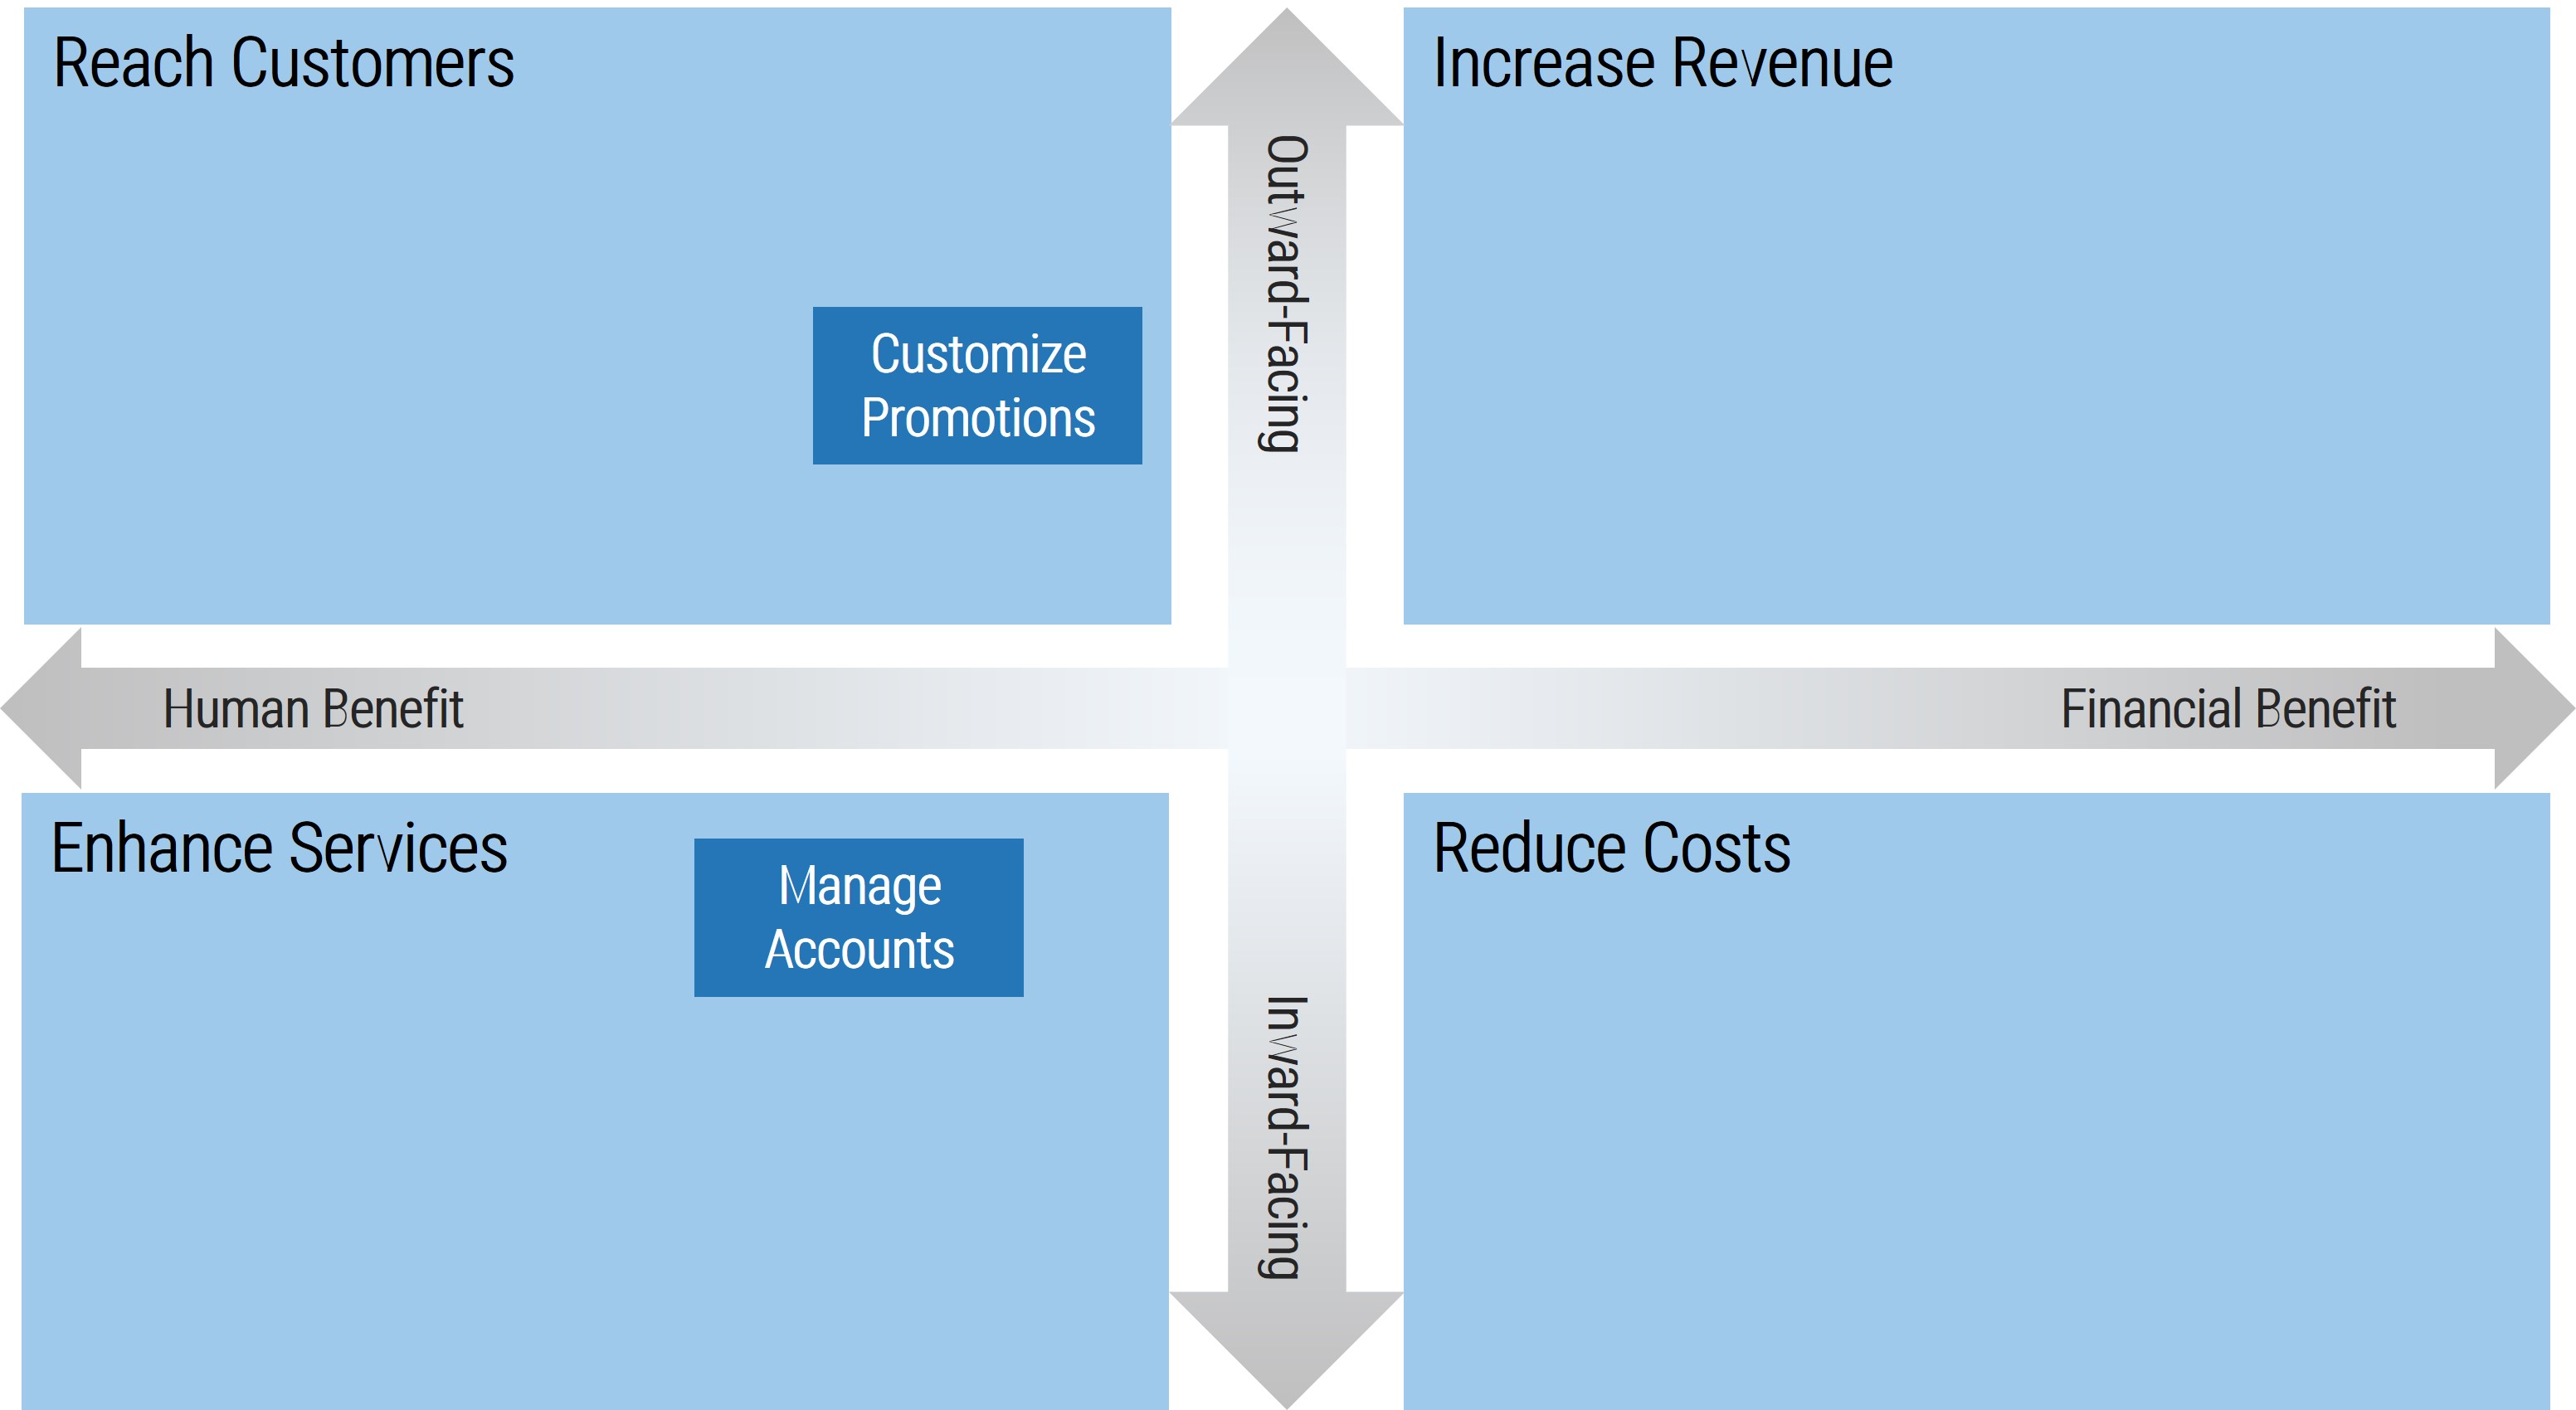
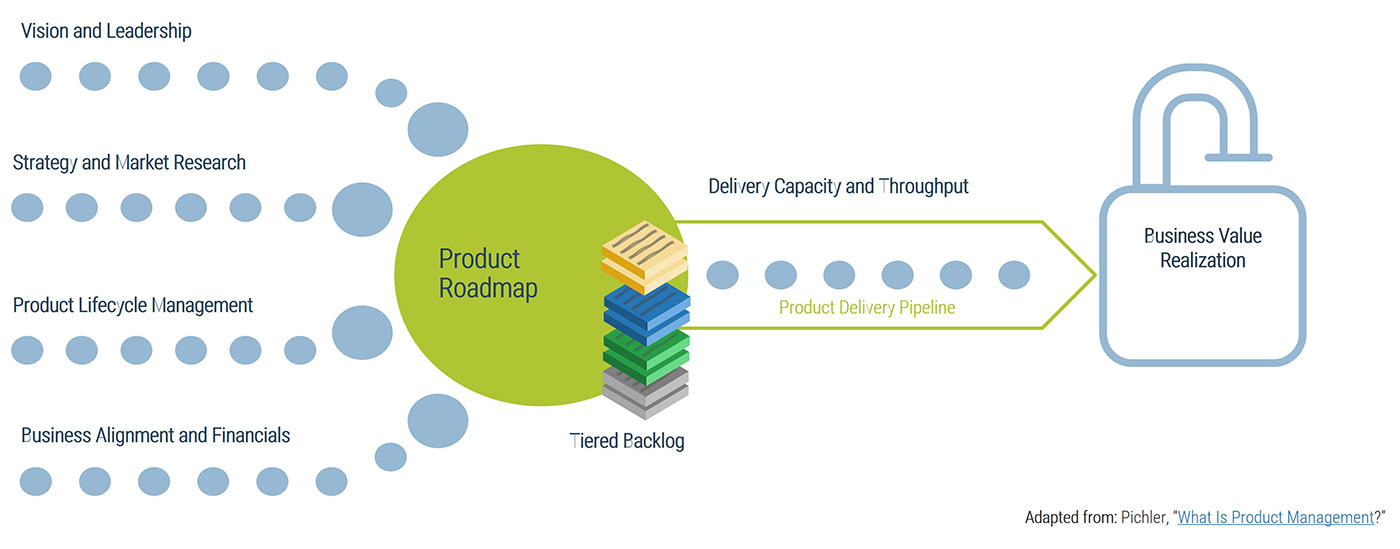
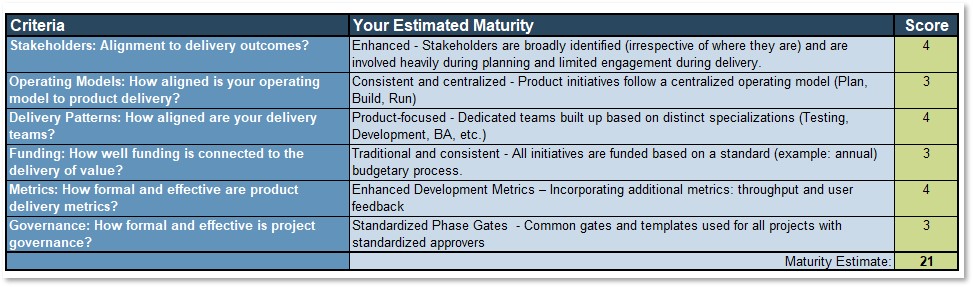
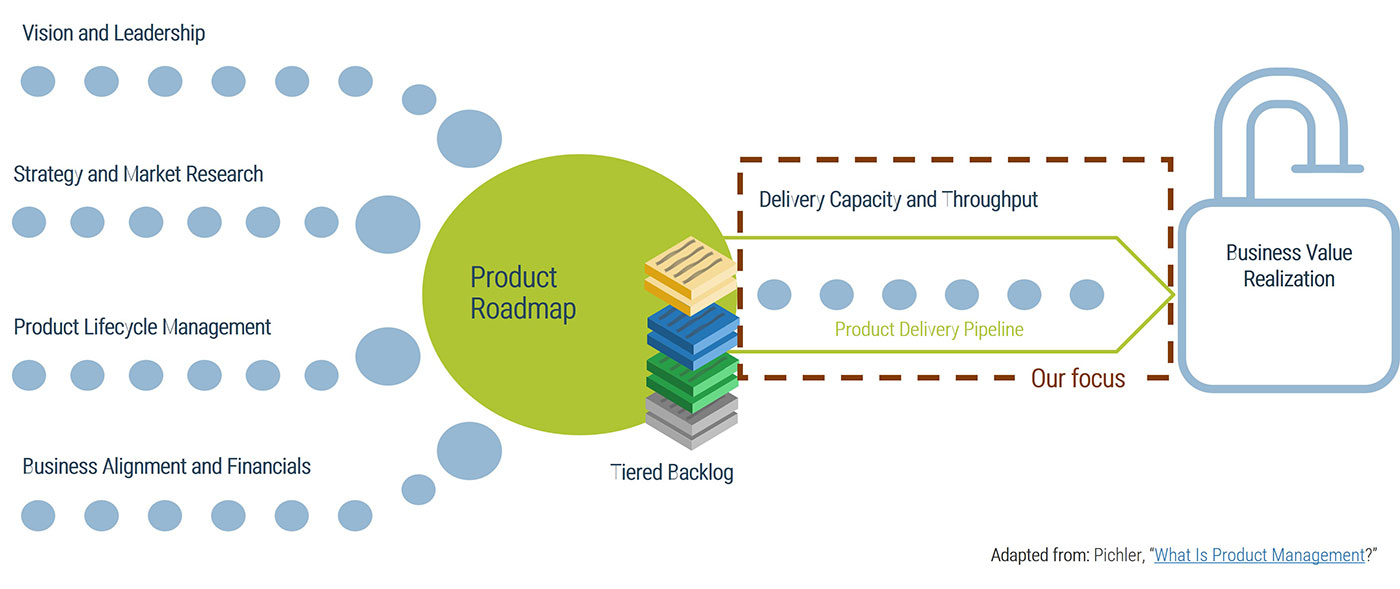
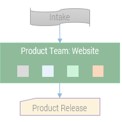
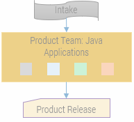
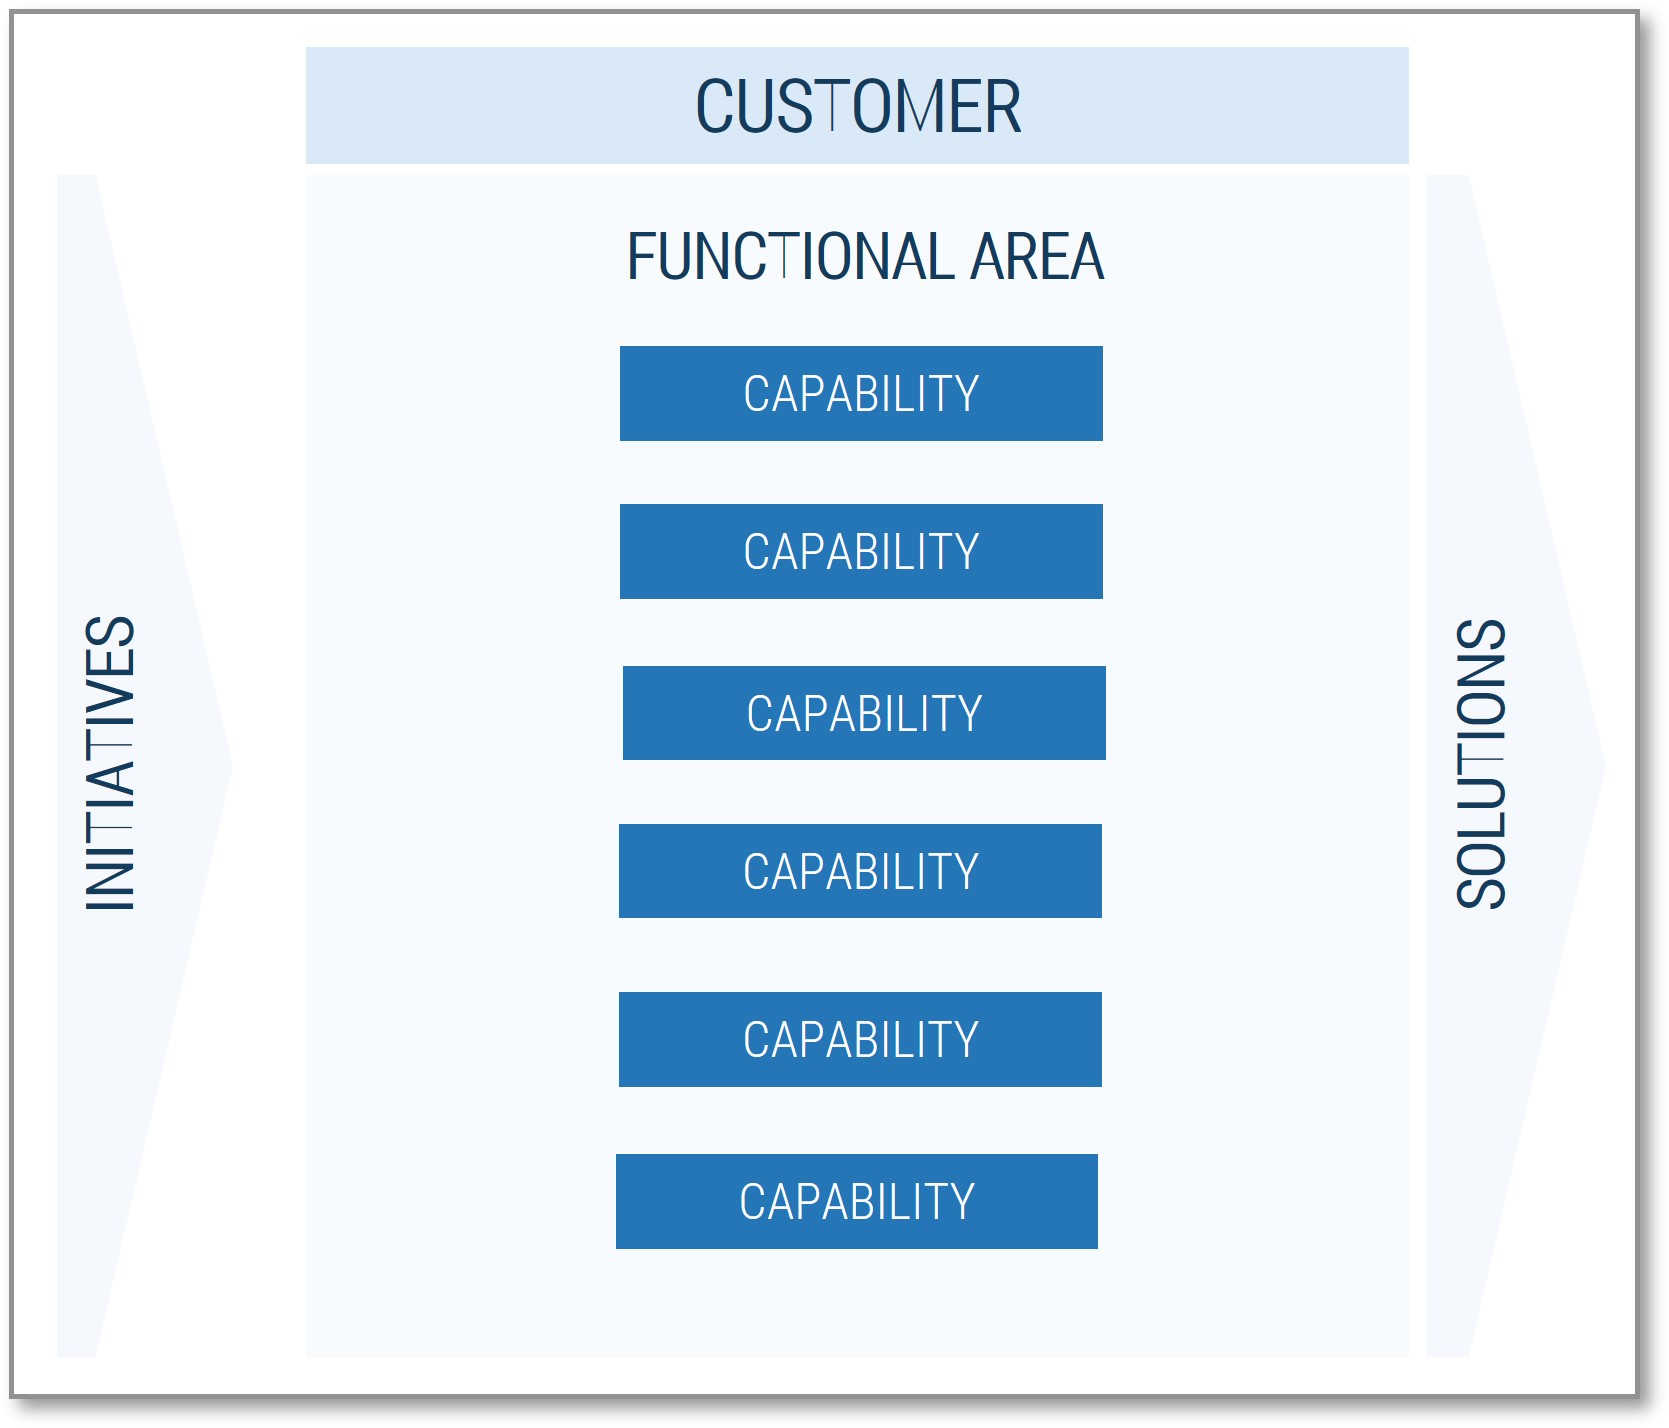
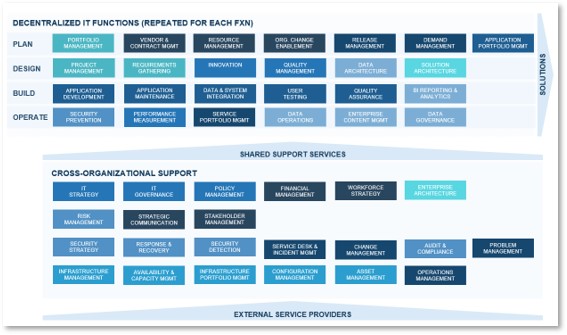
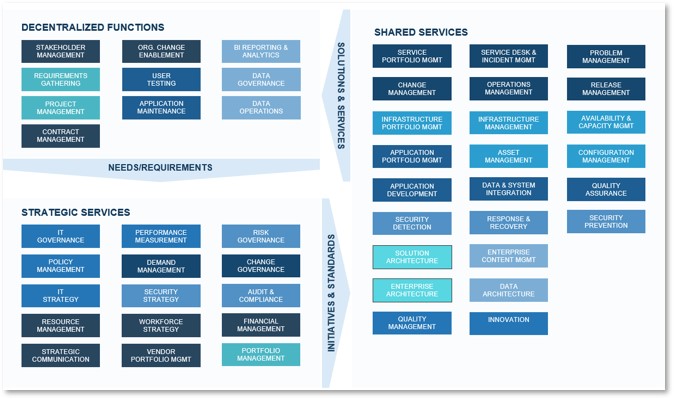
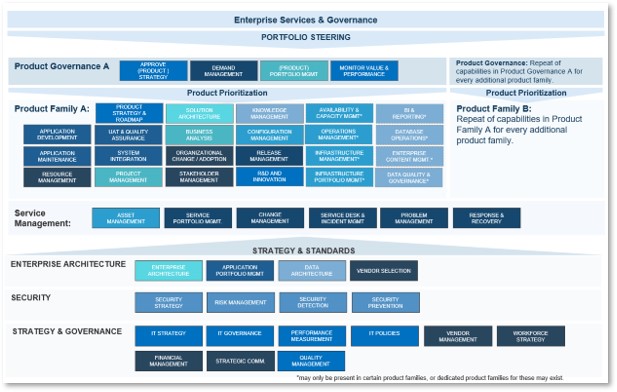
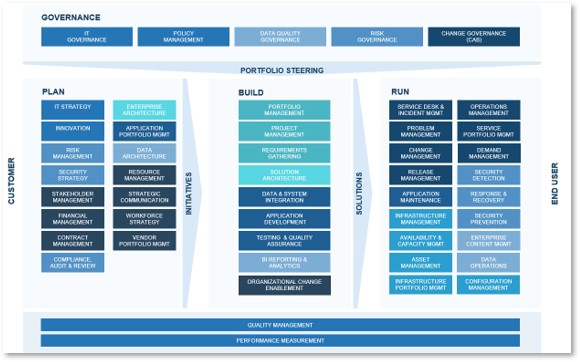
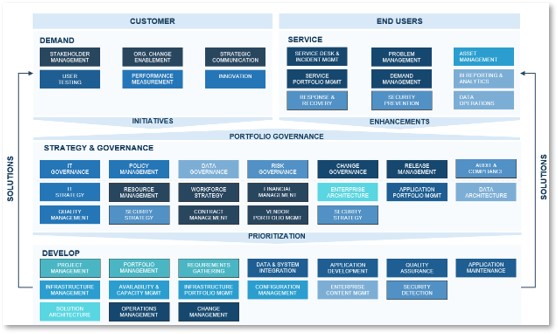
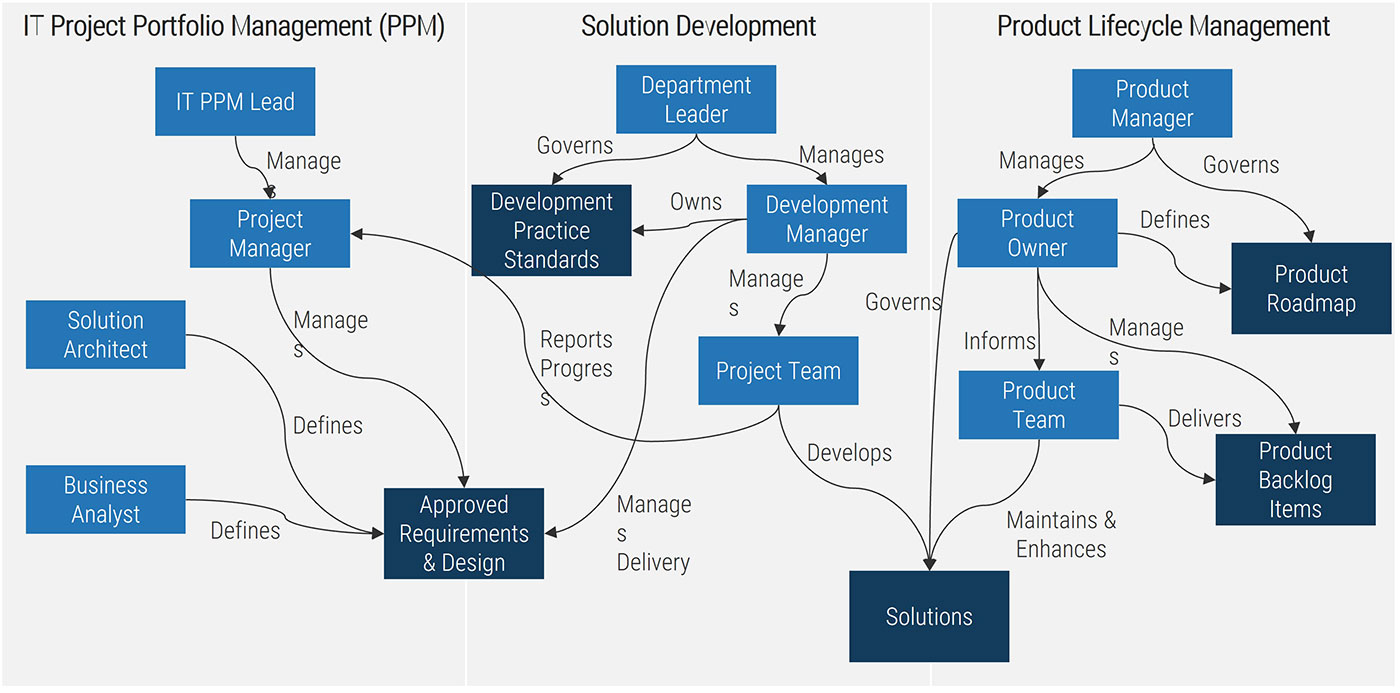
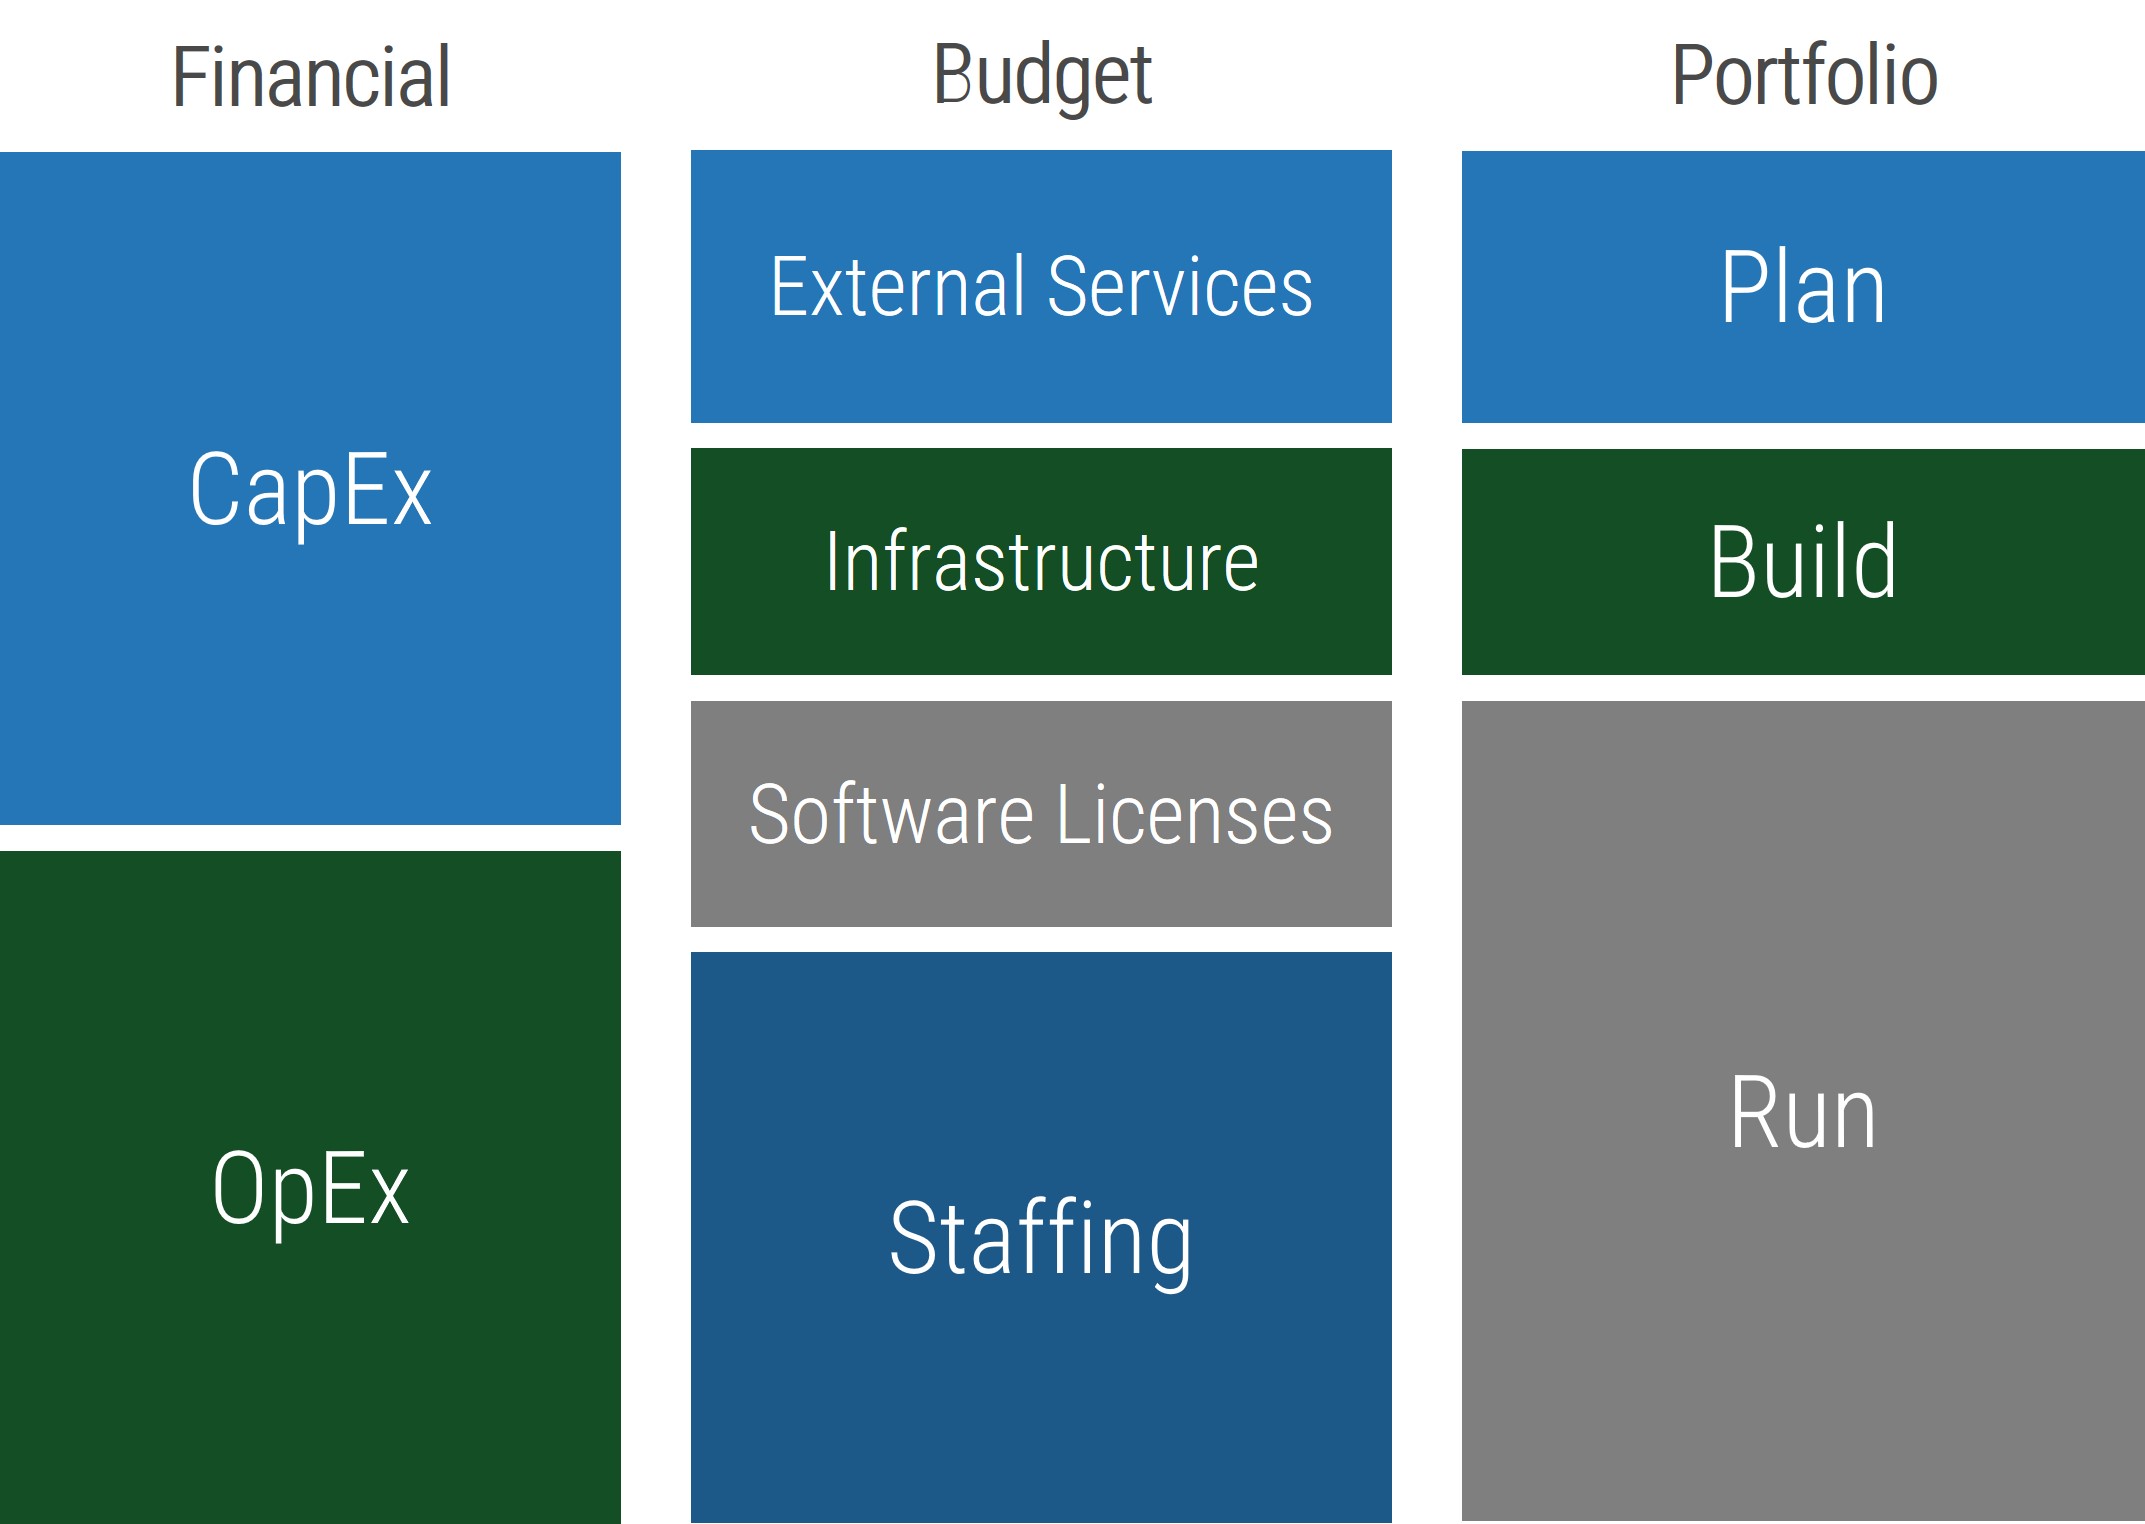
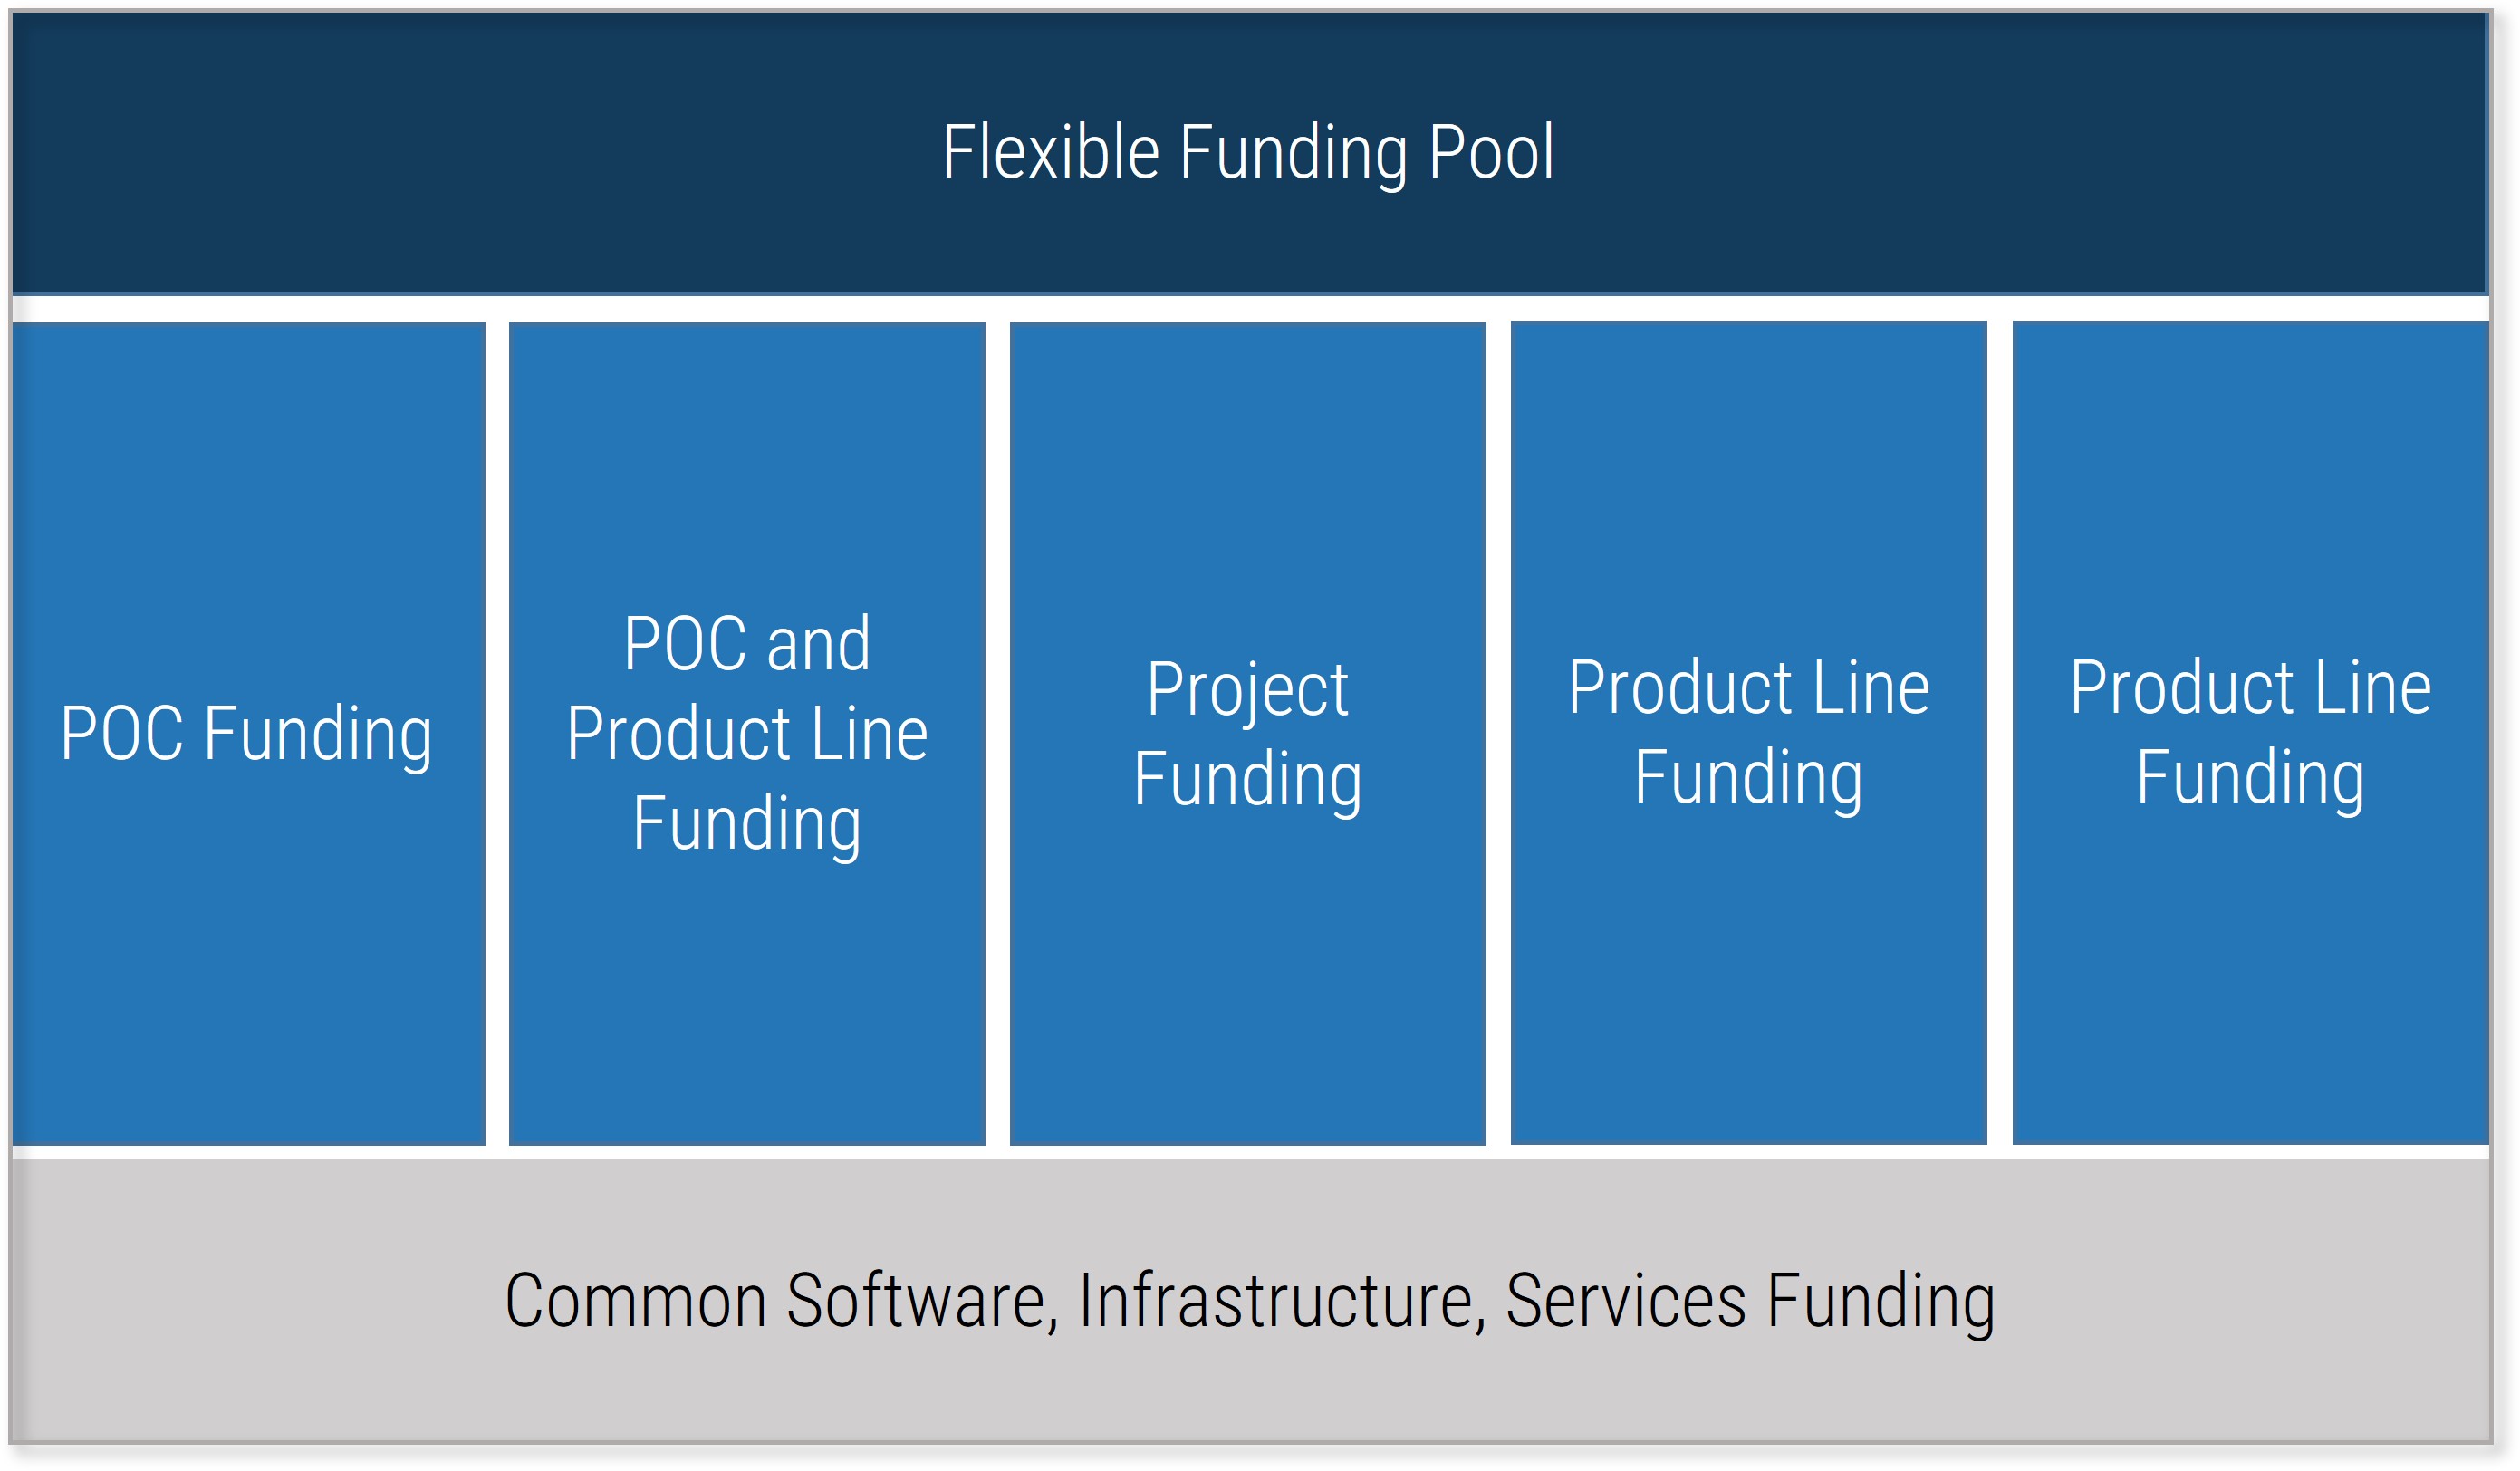
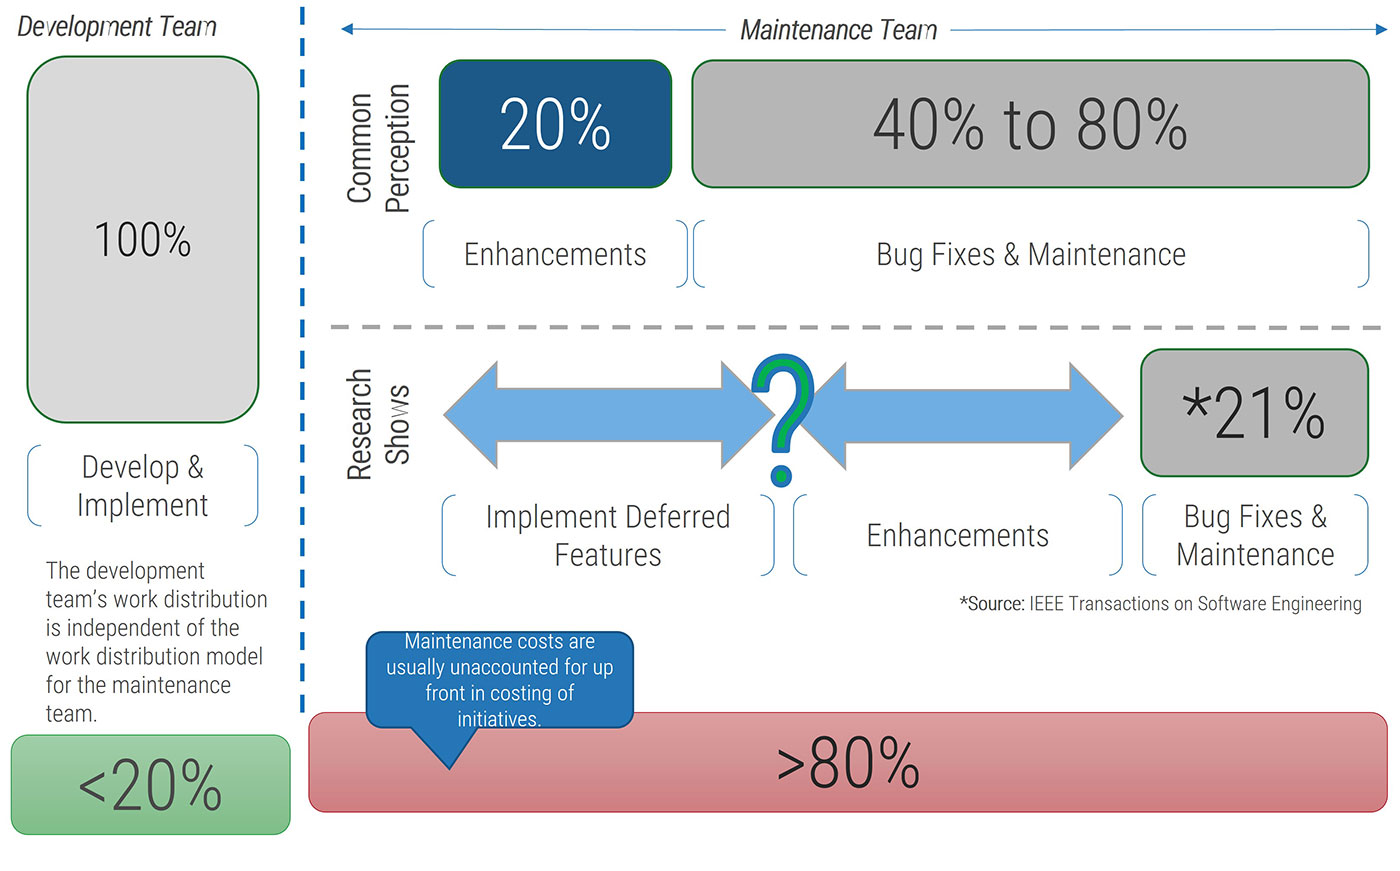
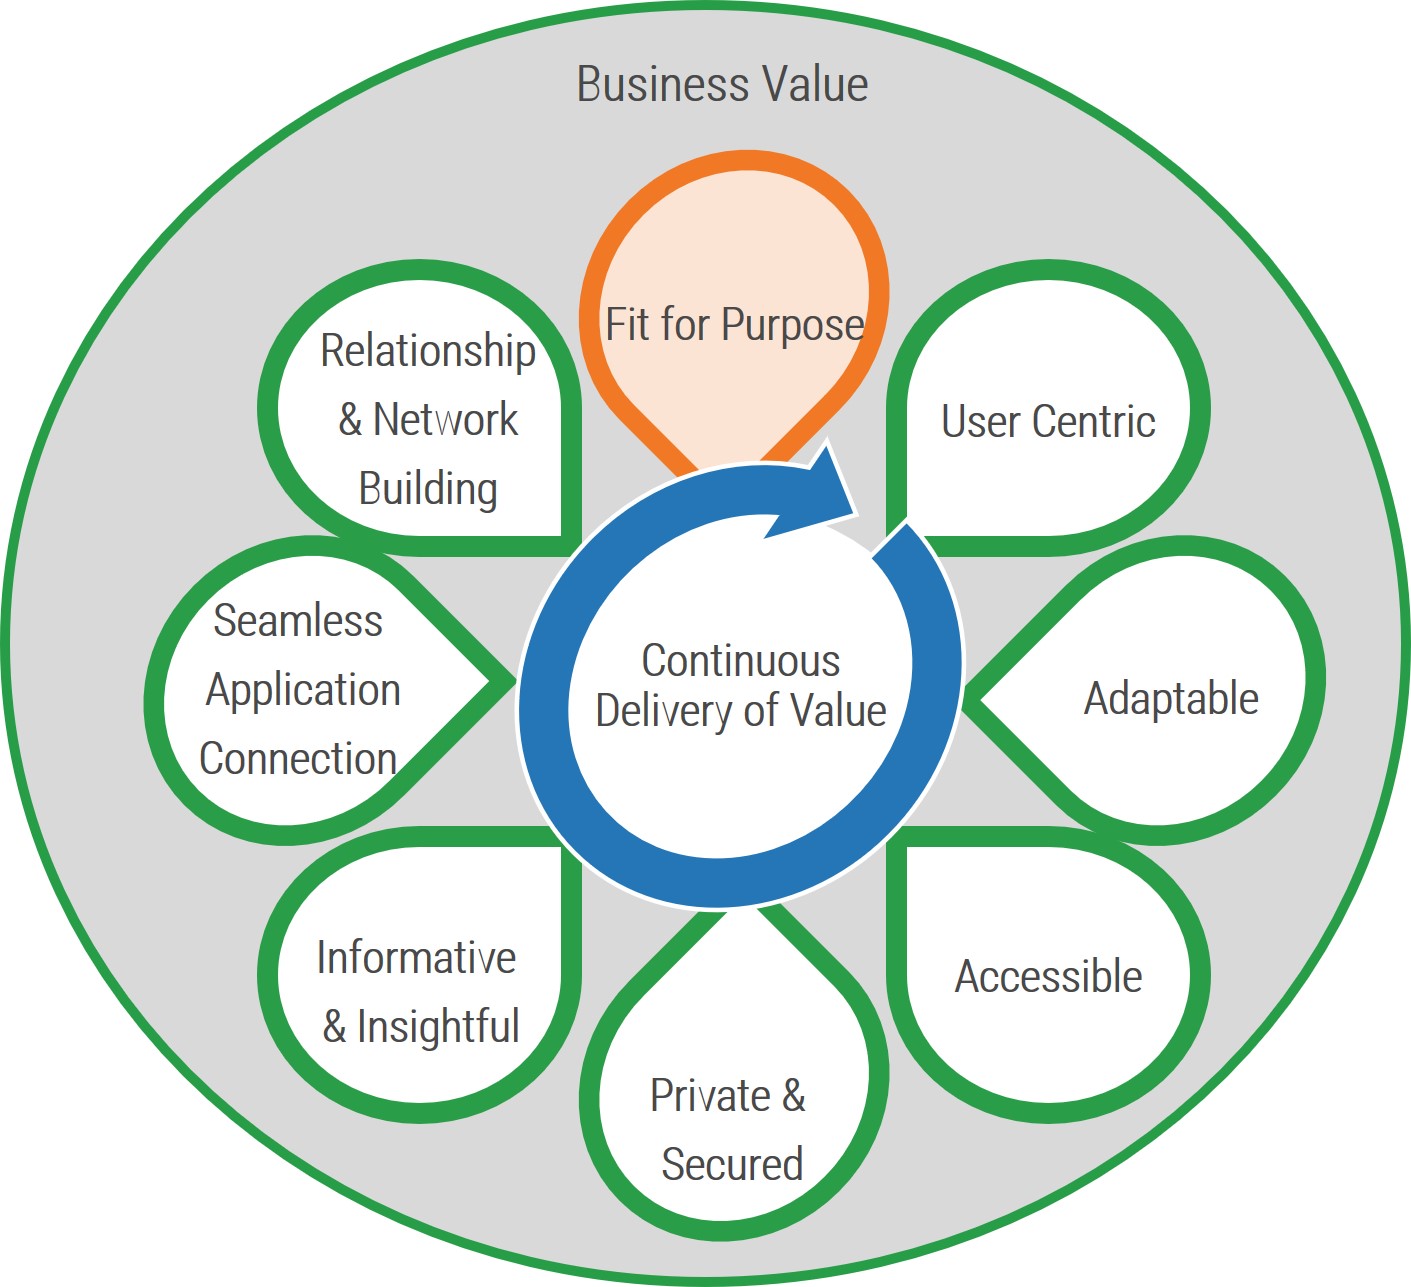
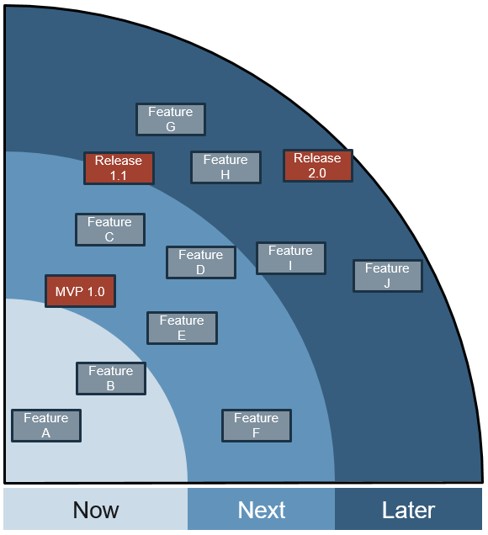


