Further reading
Mergers & Acquisitions: The Buy Blueprint
For IT leaders who want to have a role in the transaction process when their business is engaging in an M&A purchase.
EXECUTIVE BRIEF
Analyst Perspective
Don’t wait to be invited to the M&A table, make it.

Brittany Lutes
Research Analyst,
CIO Practice
Info-Tech Research Group

Ibrahim Abdel-Kader
Research Analyst,
CIO Practice
Info-Tech Research Group
IT has always been an afterthought in the M&A process, often brought in last minute once the deal is nearly, if not completely, solidified. This is a mistake. When IT is brought into the process late, the business misses opportunities to generate value related to the transaction and has less awareness of critical risks or inaccuracies.
To prevent this mistake, IT leadership needs to develop strong business relationships and gain respect for their innovative suggestions. In fact, when it comes to modern M&A activity, IT should be the ones suggesting potential transactions to meet business needs, specifically when it comes to modernizing the business or adopting digital capabilities.
IT needs to stop waiting to be invited to the acquisition or divestiture table. IT needs to suggest that the table be constructed and actively work toward achieving the strategic objectives of the business.
Executive Summary
Your Challenge
There are four key scenarios or entry points for IT as the acquiring organization in M&As:
- IT can suggest an acquisition to meet the business objectives of the organization.
- IT is brought in to strategy plan the acquisition from both the business’ and IT’s perspectives.
- IT participates in due diligence activities and valuates the organization potentially being acquired.
- IT needs to reactively prepare its environment to enable the integration.
Consider the ideal scenario for your IT organization.
Common Obstacles
Some of the obstacles IT faces include:
- IT is often told about the transaction once the deal has already been solidified and is now forced to meet unrealistic business demands.
- The business does not trust IT and therefore does not approach IT to define value or reduce risks to the transaction process.
- The people and culture element are forgotten or not given adequate priority.
These obstacles often arise when IT waits to be invited into the transaction process and misses critical opportunities.
Info-Tech's Approach
Prepare for a growth/integration transaction by:
- Recognizing the trend for organizations to engage in M&A activity and the increased likelihood that, as an IT leader, you will be involved in a transaction in your career.
- Creating a standard strategy that will enable strong program management.
- Properly considering all the critical components of the transaction and integration by prioritizing tasks that will reduce risk, deliver value, and meet stakeholder expectations.
Info-Tech Insight
As the number of merger, acquisition, and divestiture transactions continues to increase, so too does IT’s opportunity to leverage the growing digital nature of these transactions and get involved at the onset.
The changing M&A landscape
Businesses will embrace more digital M&A transactions in the post-pandemic world
- When the pandemic occurred, businesses reacted by either pausing (61%) or completely cancelling (46%) deals that were in the mid-transaction state (Deloitte, 2020). The uncertainty made many organizations consider whether the risks would be worth the potential benefits.
- However, many organizations quickly realized the pandemic is not a hindrance to M&A transactions but an opportunity. Over 16,000 American companies were involved in M&A transactions in the first six months of 2021 (The Economist). For reference, this had been averaging around 10,000 per six months from 2016 to 2020.
- In addition to this transaction growth, organizations have increasingly been embracing digital. These trends increase the likelihood that, as an IT leader, you will engage in an M&A transaction. However, it is up to you when you get involved in the transactions.
The total value of transactions in the year after the pandemic started was $1.3 billion – a 93% increase in value compared to before the pandemic. (Nasdaq)
Virtual deal-making will be the preferred method of 55% of organizations in the post-pandemic world. (Wall Street Journal, 2020)
Your challenge
IT is often not involved in the M&A transaction process. When it is, it’s often too late.
- The most important driver of an acquisition is the ability to access new technology (DLA Piper), and yet 50% of the time, IT isn’t involved in the M&A transaction at all (IMAA Institute, 2017).
- Additionally, IT’s lack of involvement in the process negatively impacts the business:
- Most organizations (60%) do not have a standardized approach to integration (Steeves and Associates).
- Weak integration teams contribute to the failure of 70% of M&A integrations (The Wall Street Journal, 2019).
- Less than half (47%) of organizations actually experience the positive results sought by the M&A transaction (Steeves and Associates).
- Organizations pursuing M&A and not involving IT are setting themselves up for failure.
Only half of M&A deals involve IT (Source: IMAA Institute, 2017)
Common Obstacles
These barriers make this challenge difficult to address for many organizations:
- IT is rarely afforded the opportunity to participate in the transaction deal. When IT is invited, this often happens later in the process where integration will be critical to business continuity.
- IT has not had the opportunity to demonstrate that it is a valuable business partner in other business initiatives.
- One of the most critical elements that IT often doesn’t take the time or doesn’t have the time to focus on is the people and leadership component.
- IT waits to be invited to the process rather then actively involving themselves and suggesting how value can be added to the process.
In hindsight, it’s clear to see: Involving IT is just good business.
47% of senior leaders wish they would have spent more time on IT due diligence to prevent value erosion. (Source: IMAA Institute, 2017)
“40% of acquiring businesses discovered a cybersecurity problem at an acquisition.” (Source: Okta)
Info-Tech's approach
Acquisitions & Divestitures Framework
Acquisitions and divestitures are inevitable in modern business, and IT’s involvement in the process should be too. This progression is inspired by:
- The growing trend for organizations to increase, decrease, or evolve through these types of transactions.
- Transactions that are driven by digital motivations, requiring IT’s expertise.
- A maturing business perspective of IT, preventing the difficulty that IT is faced with when invited into the transaction process late.
- There never being such a thing as a true merger, making the majority of M&A activity either acquisitions or divestitures.
The business’ view of IT will impact how soon IT can get involved
There are four key entry points for IT
- Innovator: IT suggests an acquisition to meet the business objectives of the organization.
- Business Partner: IT is brought in to strategy plan the acquisition from both the business’ and IT’s perspective.
- Trusted Operator: IT participates in due diligence activities and valuates the organization potentially being acquired.
- Firefighter: IT reactively engages in the integration with little time to prepare.
Merger, acquisition, and divestiture defined
Merger
A merger looks at the equal combination of two entities or organizations. Mergers are rare in the M&A space, as the organizations will combine assets and services in a completely equal 50/50 split. Two organizations may also choose to divest business entities and merge as a new company.
Acquisition
The most common transaction in the M&A space, where an organization will acquire or purchase another organization or entities of another organization. This type of transaction has a clear owner who will be able to make legal decisions regarding the acquired organization.
Divestiture
An organization may decide to sell partial elements of a business to an acquiring organization. They will separate this business entity from the rest of the organization and continue to operate the other components of the business.
Info-Tech Insight
A true merger does not exist, as there is always someone initiating the discussion. As a result, most M&A activity falls into acquisition or divestiture categories.
Buying vs. selling
The M&A process approach differs depending on whether you are the executive IT leader on the buy side or sell side
This blueprint is only focused on the buy side:
- More than two organizations could be involved in a transaction.
- Examples of buy-related scenarios include:
- Your organization is buying another organization with the intent of having the purchased organization keep its regular staff, operations, and location. This could mean minimal integration is required.
- Your organization is buying another organization in its entirety with the intent of integrating it into your original company.
- Your organization is buying components of another organization with the intent of integrating them into your original company.
- As the purchasing organization, you will probably be initiating the purchase and thus will be valuating the selling organization during due diligence and leading the execution plan.
The sell side is focused on:
- Examples of sell-related scenarios include:
- Your organization is selling to another organization with the intent of keeping its regular staff, operations, and location. This could mean minimal separation is required.
- Your organization is selling to another organization with the intent of separating to be a part of the purchasing organization.
- Your organization is engaging in a divestiture with the intent of:
- Separating components to be part of the purchasing organization permanently.
- Separating components to be part of a spinoff and establish a unit as a standalone new company.
- As the selling organization, you could proactively seek out suitors to purchase all or components of your organization, or you could be approached by an organization.
For more information on divestitures or selling your entire organization, check out Info-Tech’s Mergers & Acquisitions: The Sell Blueprint.
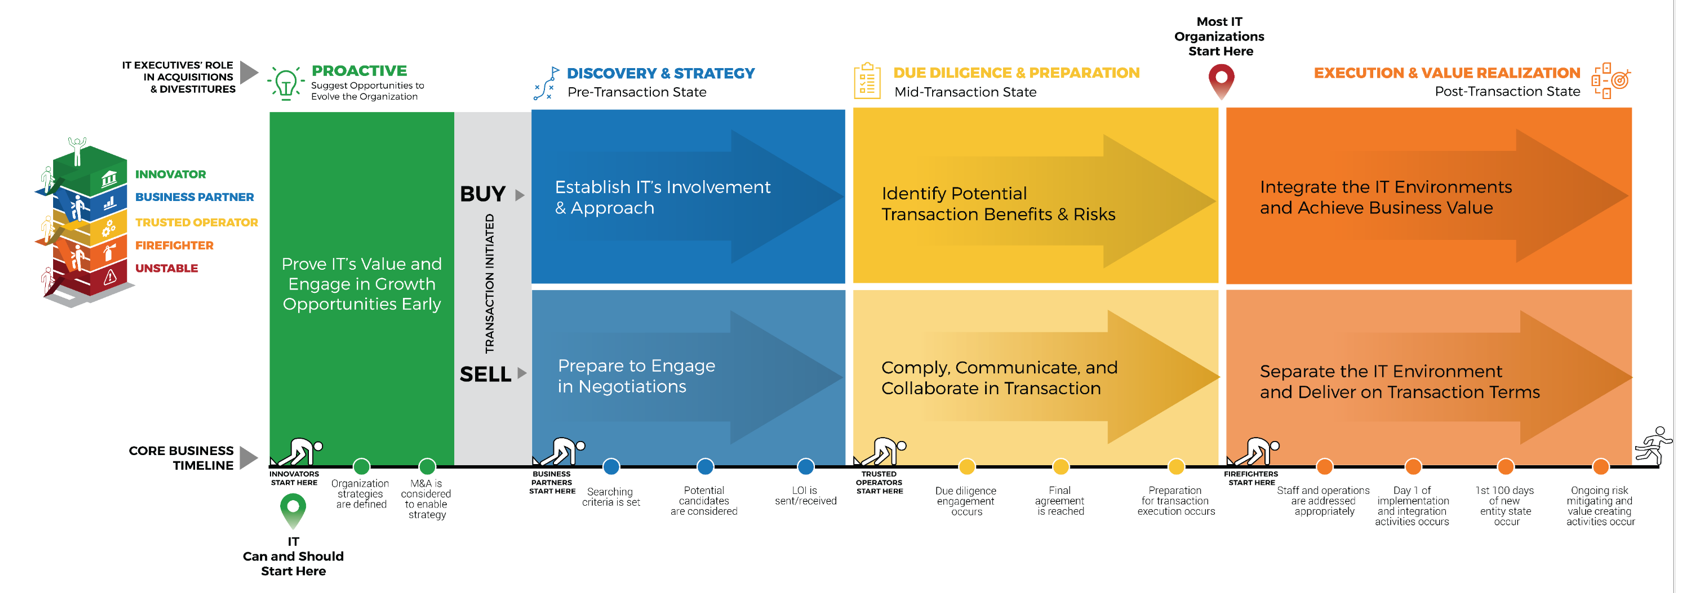
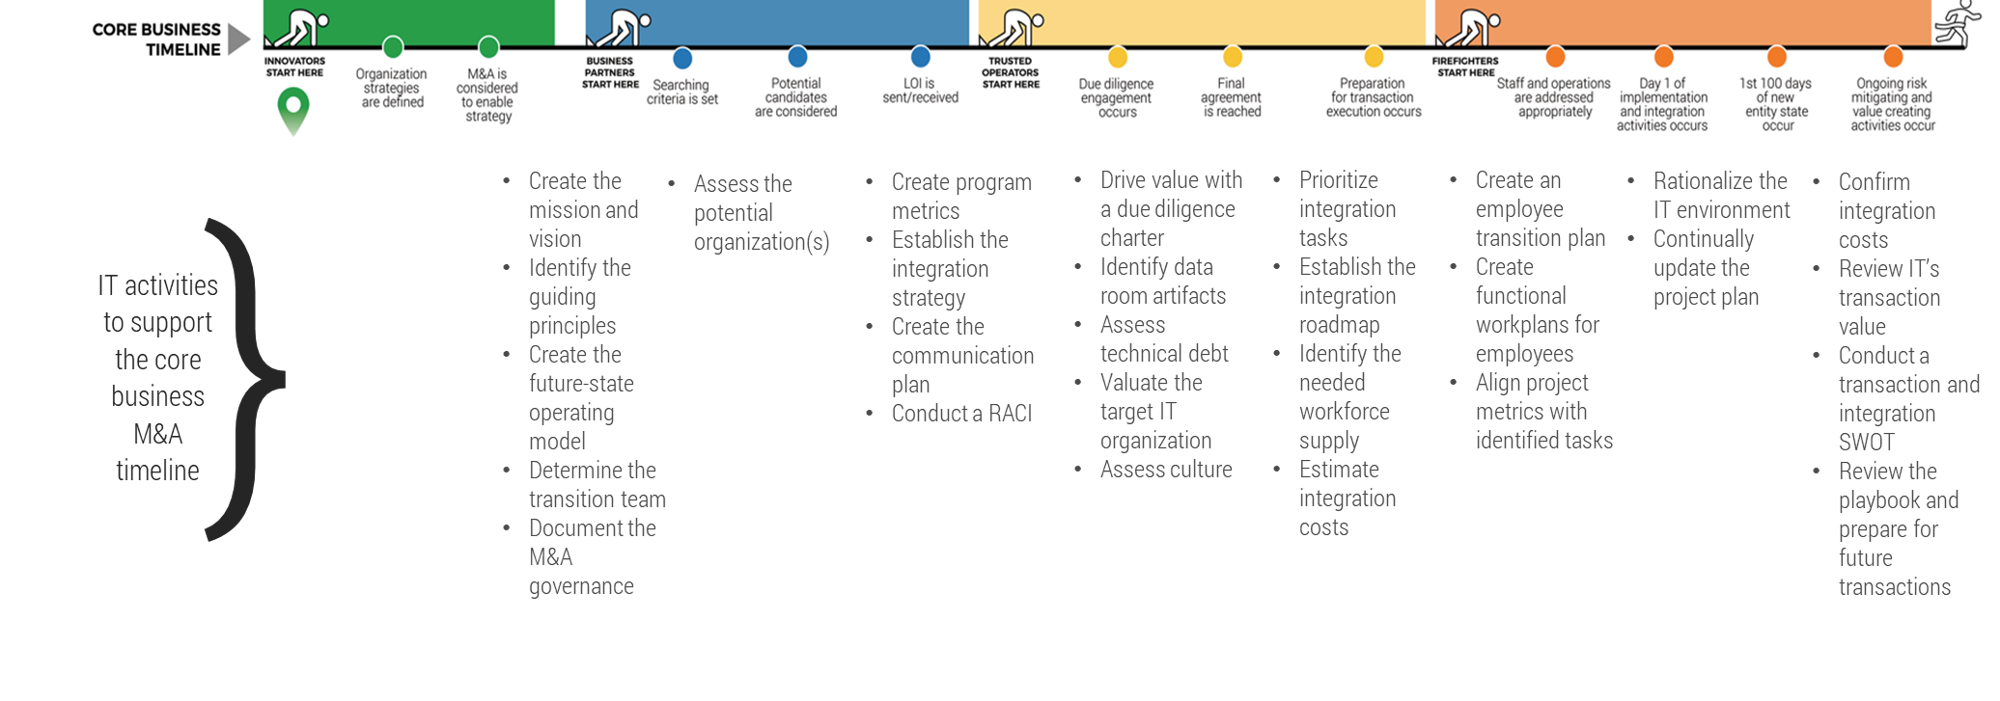
Core business timeline
For IT to be valuable in M&As, you need to align your deliverables and your support to the key activities the business and investors are working on.
Info-Tech’s methodology for Buying Organizations in Mergers, Acquisitions, or Divestitures
|
|
1. Proactive
|
2. Discovery & Strategy
|
3. Due Diligence & Preparation
|
4. Execution & Value Realization
|
Phase Steps
|
- Identify Stakeholders and Their Perspective of IT
- Assess IT’s Current Value and Future State
- Drive Innovation and Suggest Growth Opportunities
|
- Establish the M&A Program Plan
- Prepare IT to Engage in the Acquisition
|
- Assess the Target Organization
- Prepare to Integrate
|
- Execute the Transaction
- Reflection and Value Realization
|
Phase Outcomes
|
Be an innovative IT leader by suggesting how and why the business should engage in an acquisition or divestiture.
|
Create a standardized approach for how your IT organization should address acquisitions.
|
Evaluate the target organizations successfully and establish an integration project plan.
|
Deliver on the integration project plan successfully and communicate IT’s transaction value to the business.
|
Potential metrics for each phase
1. Proactive | 2. Discovery & Strategy | 3. Due Diligence & Preparation | 4. Execution & Value Realization |
- % Share of business innovation spend from overall IT budget
- % Critical processes with approved performance goals and metrics
- % IT initiatives that meet or exceed value expectation defined in business case
- % IT initiatives aligned with organizational strategic direction
- % Satisfaction with IT's strategic decision-making abilities
- $ Estimated business value added through IT-enabled innovation
- % Overall stakeholder satisfaction with IT
- % Percent of business leaders that view IT as an Innovator
|
- % IT budget as a percent of revenue
- % Assets that are not allocated
- % Unallocated software licenses
- # Obsolete assets
- % IT spend that can be attributed to the business (chargeback or showback)
- % Share of CapEx of overall IT budget
- % Prospective organizations that meet the search criteria
- $ Total IT cost of ownership (before and after M&A, before and after rationalization)
- % Business leaders that view IT as a Business Partner
|
- % Defects discovered in production
- $ Cost per user for enterprise applications
- % In-house-built applications vs. enterprise applications
- % Owners identified for all data domains
- # IT staff asked to participate in due diligence
- Change to due diligence
- IT budget variance
- Synergy target
|
- % Satisfaction with the effectiveness of IT capabilities
- % Overall end-customer satisfaction
- $ Impact of vendor SLA breaches
- $ Savings through cost-optimization efforts
- $ Savings through application rationalization and technology standardization
- # Key positions empty
- % Frequency of staff turnover
- % Emergency changes
- # Hours of unplanned downtime
- % Releases that cause downtime
- % Incidents with identified problem record
- % Problems with identified root cause
- # Days from problem identification to root cause fix
- % Projects that consider IT risk
- % Incidents due to issues not addressed in the security plan
- # Average vulnerability remediation time
- % Application budget spent on new build/buy vs. maintenance (deferred feature implementation, enhancements, bug fixes)
- # Time (days) to value realization
- % Projects that realized planned benefits
- $ IT operational savings and cost reductions that are related to synergies/divestitures
- % IT staff–related expenses/redundancies
- # Days spent on IT integration
- $ Accurate IT budget estimates
- % Revenue growth directly tied to IT delivery
- % Profit margin growth
|
The IT executive’s role in the buying transaction is critical
And IT leaders have a greater likelihood than ever of needing to support a merger, acquisition, or divestiture.
-
Reduced Risk
IT can identify risks that may go unnoticed when IT is not involved.
-
Increased Accuracy
The business can make accurate predictions around the costs, timelines, and needs of IT.
-
Faster Integration
Faster integration means faster value realization for the business.
-
Informed Decision Making
IT leaders hold critical information that can support the business in moving the transaction forward.
-
Innovation
IT can suggest new opportunities to generate revenue, optimize processes, or reduce inefficiencies.
The IT executive’s critical role is demonstrated by:
Reduced Risk
47% of senior leaders wish they would have spent more time on IT due diligence to prevent value erosion (IMAA Institute, 2017).Increased Accuracy
87% of respondents to a Deloitte survey effectively conducted a virtual deal, with a focus on cybersecurity and integration (Deloitte, 2020).Faster Integration
Integration costs range from as low as $4 million to as high as $3.8 billion, making the process an investment for the organization (CIO Dive).Informed Decision Making
Only 38% of corporate and 22% of private equity firms include IT as a significant aspect in their transaction approach (IMAA Institute, 2017).Innovation
Successful CIOs involved in M&As can spend 70% of their time on aspects outside of IT and 30% of their time on technology and delivery (CIO).
Playbook benefits
IT Benefits
- IT will be seen as an innovative partner to the business, and its suggestions and involvement in the organization will lead to benefits, not hindrances.
- Develop a streamlined method to valuate the potential organization being purchased and ensure risk management concerns are brought to the business’ attention immediately.
- Create a comprehensive list of items that IT needs to do during the integration that can be prioritized and actioned.
Business Benefits
- The business will get accurate and relevant information about the organization being acquired, ensuring that the anticipated value of the transaction is correctly planned for.
- Fewer business interruptions will happen, because IT can accurately plan for and execute the high-priority integration tasks.
- The business can make a fair offer to the purchased organization, having properly valuated all aspects being bought, including the IT environment.
Insight summary
Overarching Insight
As an IT executive, take control of when you get involved in a growth transaction. Do this by proactively identifying acquisition targets, demonstrating the value of IT, and ensuring that integration of IT environments does not lead to unnecessary and costly decisions.
Proactive Insight
CIOs on the forefront of digital transformation need to actively look for and suggest opportunities to acquire or partner on new digital capabilities to respond to rapidly changing business needs.
Discovery & Strategy Insight
IT organizations that have an effective M&A program plan are more prepared for the buying transaction, enabling a successful outcome. A structured strategy is particularly necessary for organizations expected to deliver M&As rapidly and frequently.
Due Diligence & Preparation Insight
Most IT synergies can be realized in due diligence. It is more impactful to consider IT processes and practices (e.g. contracts and culture) in due diligence rather than later in the integration.
Execution & Value Realization Insight
IT needs to realize synergies within the first 100 days of integration. The most successful transactions are when IT continuously realizes synergies a year after the transaction and beyond.
Blueprint deliverables
Key Deliverable: M&A Buy Playbook
The M&A Buy Playbook should be a reusable document that enables your IT organization to successfully deliver on any acquisition transaction.

M&A Buy One-Pager
See a one-page overview of each phase of the transaction.

M&A Buy Case Studies
Read a one-page case study for each phase of the transaction.

M&A Integration Project Management Tool (SharePoint)
Manage the integration process of the acquisition using this SharePoint template.

M&A Integration Project Management Tool (Excel)
Manage the integration process of the acquisition using this Excel tool if you can’t or don’t want to use SharePoint.

Info-Tech offers various levels of support to best suit your needs
DIY Toolkit
|
Guided Implementation
|
Workshop
|
Consulting
|
| "Our team has already made this critical project a priority, and we have the time and capability, but some guidance along the way would be helpful."
|
"Our team knows that we need to fix a process, but we need assistance to determine where to focus. Some check-ins along the way would help keep us on track."
|
"We need to hit the ground running and get this project kicked off immediately. Our team has the ability to take this over once we get a framework and strategy in place."
|
"Our team does not have the time or the knowledge to take this project on. We need assistance through the entirety of this project."
|
Diagnostics and consistent frameworks used throughout all four options
Guided Implementation
What does a typical GI on this topic look like?
A Guided Implementation (GI) is a series of calls with an Info-Tech analyst to help implement our best practices in your organization.
A typical GI is between 6 to 10 calls over the course of 2 to 4 months.
Proactive Phase
- Call #1: Scope requirements, objectives, and your specific challenges.
Discovery & Strategy Phase
- Call #2: Determine stakeholders and their perspectives of IT.
- Call #3: Identify how M&A could support business strategy and how to communicate.
Due Diligence & Preparation Phase
- Call #4: Establish a transaction team and acquisition strategic direction.
- Call #5: Create program metrics and identify a standard integration strategy.
- Call #6: Assess the potential organization(s).
- Call #7: Identify the integration program plan.
Execution & Value Realization Phase
- Call #8: Establish employee transitions to retain key staff.
- Call #9: Assess IT’s ability to deliver on the acquisition transaction.
The Buy Blueprint
Phase 1
Proactive
Phase 1
|
Phase 2
|
Phase 3
|
Phase 4
|
- 1.1 Identify Stakeholders and Their Perspective of IT
- 1.2 Assess IT’s Current Value and Future State
- 1.3 Drive Innovation and Suggest Growth Opportunities
|
- 2.1 Establish the M&A Program Plan
- 2.2 Prepare IT to Engage in the Acquisition
|
- 3.1 Assess the Target Organization
- 3.2 Prepare to Integrate
|
- 4.1 Execute the Transaction
- 4.2 Reflection and Value Realization
|
This phase will walk you through the following activities:
- Conduct the CEO-CIO Alignment diagnostic
- Conduct the CIO Business Vision diagnostic
- Visualize relationships among stakeholders to identify key influencers
- Group stakeholders into categories
- Prioritize your stakeholders
- Plan to communicate
- Valuate IT
- Assess the IT/digital strategy
- Determine pain points and opportunities
- Align goals to opportunities
- Recommend growth opportunities
This phase involves the following participants:
- IT and business leadership
What is the Proactive phase?
Embracing the digital drivers
As the number of merger, acquisition, or divestiture transactions driven by digital means continues to increase, IT has an opportunity to not just be involved in a transaction but actively seek out potential deals.
In the Proactive phase, the business is not currently considering a transaction. However, the business could consider one to reach its strategic goals. IT organizations that have developed respected relationships with the business leaders can suggest these potential transactions.
Understand the business’ perspective of IT, determine who the critical M&A stakeholders are, valuate the IT environment, and examine how it supports the business goals in order to suggest an M&A transaction.
In doing so, IT isn’t waiting to be invited to the transaction table – it’s creating it.
Goal: To support the organization in reaching its strategic goals by suggesting M&A activities that will enable the organization to reach its objectives faster and with greater-value outcomes.
Proactive Prerequisite Checklist
Before coming into the Proactive phase, you should have addressed the following:
- Understand what mergers, acquisitions, and divestitures are.
- Understand what mergers, acquisitions, and divestitures mean for the business.
- Understand what mergers, acquisitions, and divestitures mean for IT.
Review the Executive Brief for more information on mergers, acquisitions, and divestitures for purchasing organizations.
Proactive
Step 1.1
Identify M&A Stakeholders and Their Perspective of IT
Activities
- 1.1.1 Conduct the CEO-CIO Alignment diagnostic
- 1.1.2 Conduct the CIO Business Vision diagnostic
- 1.1.3 Visualize relationships among stakeholders to identify key influencers
- 1.1.4 Group stakeholders into categories
- 1.1.5 Prioritize your stakeholders
- 1.16 Plan to communicate
This step involves the following participants:
- IT executive leader
- IT leadership
- Critical M&A stakeholders
Outcomes of Step
Understand how the business perceives IT and establish strong relationships with critical M&A stakeholders.
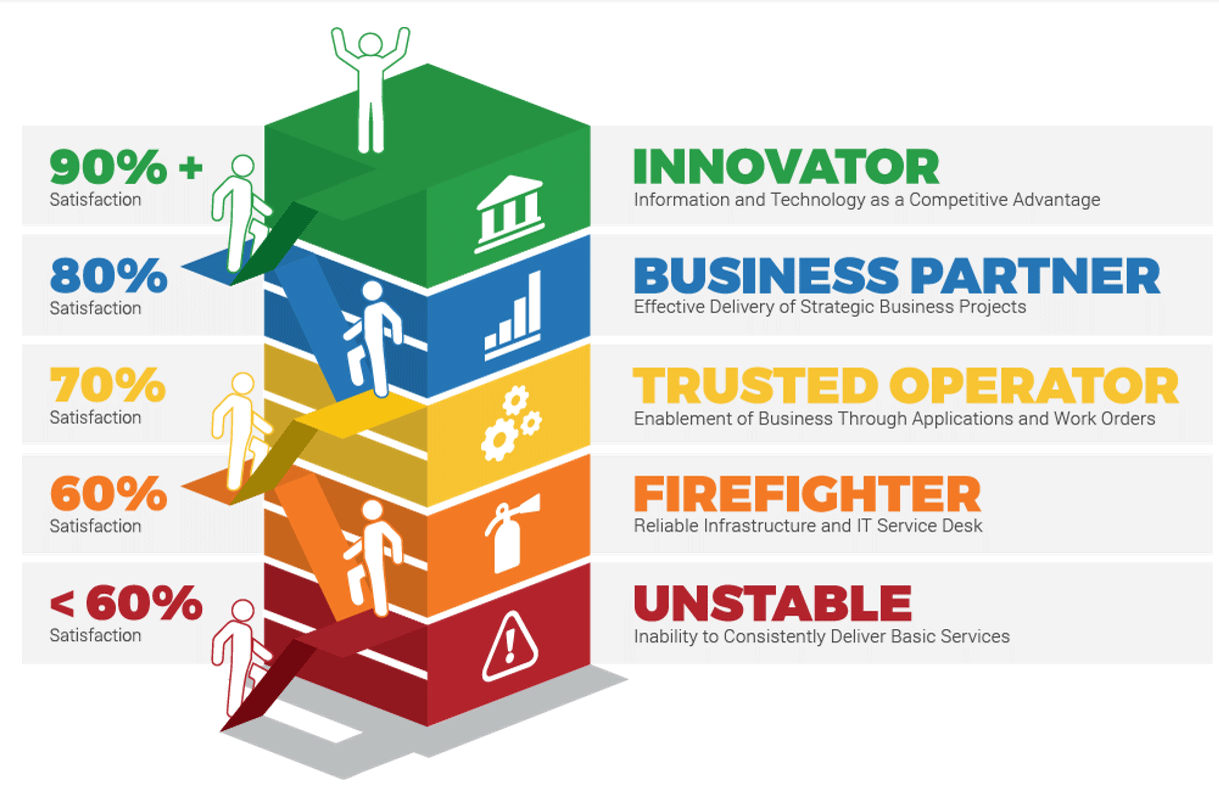
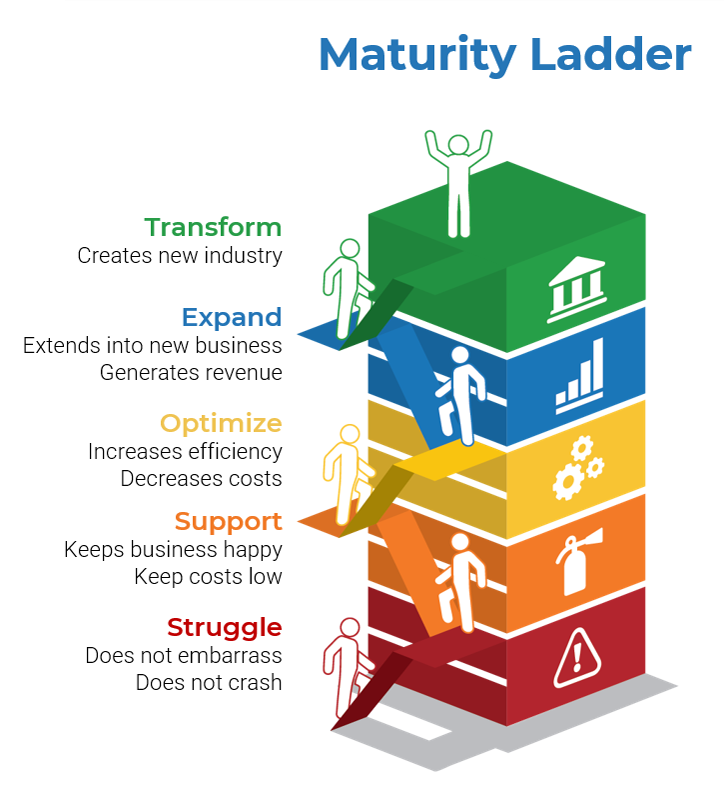
Business executives' perspectives of IT
Leverage diagnostics and gain alignment on IT’s role in the organization
- To suggest or get involved with a merger, acquisition, or divestiture, the IT executive leader needs to be well respected by other members of the executive leadership team and the business.
- Specifically, the Proactive phase relies on the IT organization being viewed as an Innovator within the business.
- Identify how the CEO/business executive currently views IT and where they would like IT to move within the Maturity Ladder.
- Additionally, understand how other critical department leaders view IT and how they view the partnership with IT.
Misalignment in target state requires further communication between the CIO and CEO to ensure IT is striving toward an agreed-upon direction.
Info-Tech’s CIO Business Vision (CIO BV) diagnostic measures a variety of high-value metrics to provide a well-rounded understanding of stakeholder satisfaction with IT.
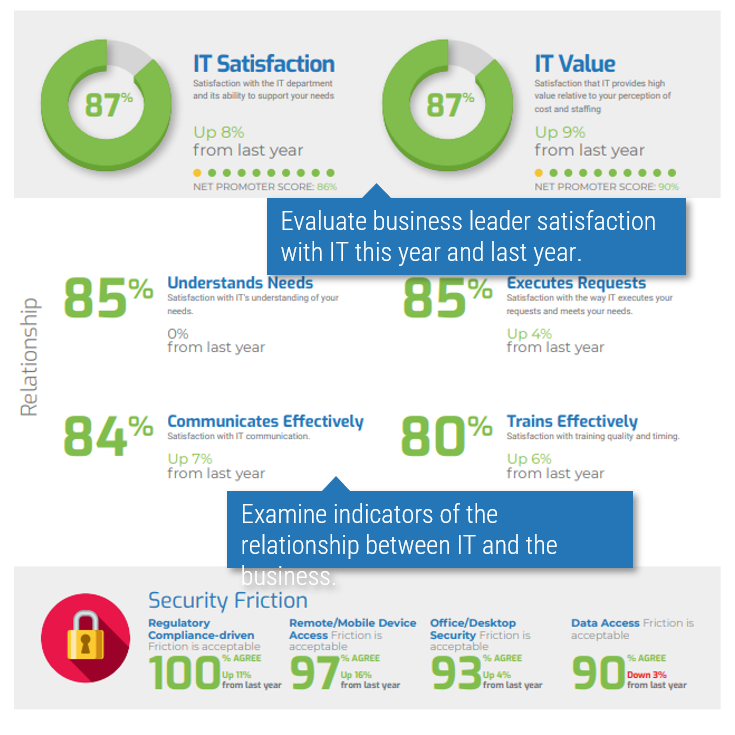
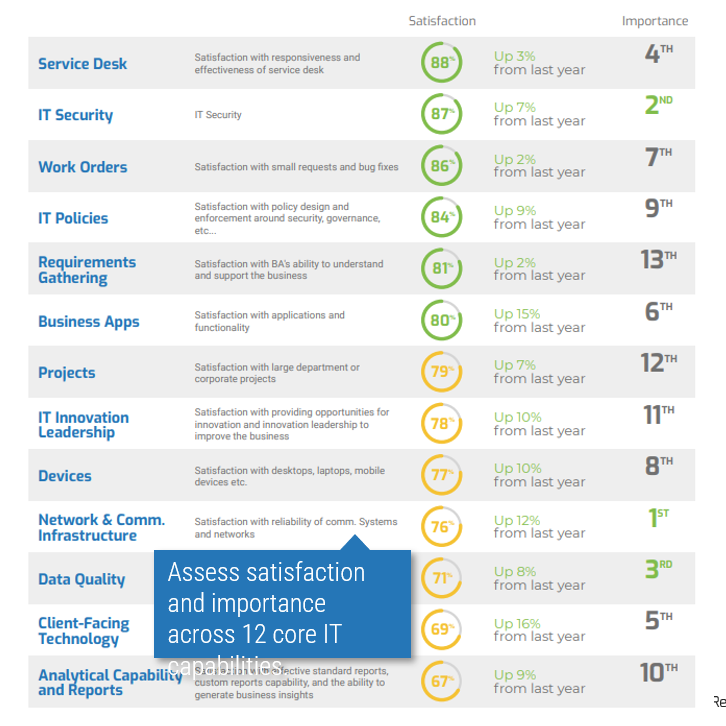
Business Satisfaction and Importance for Core Services
The core services of IT are important when determining what IT should focus on. The most important services with the lowest satisfaction offer the largest area of improvement for IT to drive business value.
1.1.1 Conduct the CEO-CIO Alignment diagnostic
2 weeks
Input: IT organization expertise and the CEO-CIO Alignment diagnostic
Output: An understanding of an executive business stakeholder’s perception of IT
Materials: CEO-CIO Alignment diagnostic, M&A Buy Playbook
Participants: IT executive/CIO, Business executive/CEO
- The CEO-CIO Alignment diagnostic can be a powerful input. Speak with your Info-Tech account representative to conduct the diagnostic. Use the results to inform current IT capabilities.
- You may choose to debrief the results of your diagnostic with an Info-Tech analyst. We recommend this to help your team understand how to interpret and draw conclusions from the results.
- Examine the results of the survey and note where there might be specific capabilities that could be improved.
- Determine whether there are any areas of significant disagreement between the you and the CEO. Mark down those areas for further conversations. Additionally, take note of areas that could be leveraged to support growth transactions or support your rationale in recommending growth transactions.
Download the sample report.
Record the results in the M&A Buy Playbook.
1.1.2 Conduct the CIO Business Vision diagnostic
2 weeks
Input: IT organization expertise, CIO BV diagnostic
Output: An understanding of business stakeholder perception of certain IT capabilities and services
Materials: CIO Business Vision diagnostic, Computer, Whiteboard and markers, M&A Buy Playbook
Participants: IT executive/CIO, Senior business leaders
- The CIO Business Vision (CIO BV) diagnostic can be a powerful tool for identifying IT capability focus areas. Speak with your account representative to conduct the CIO BV diagnostic. Use the results to inform current IT capabilities.
- You may choose to debrief the results of your diagnostic with an Info-Tech analyst. We recommend this to help your team understand how to interpret the results and draw conclusions from the diagnostic.
- Examine the results of the survey and take note of any IT services that have low scores.
- Read through the diagnostic comments and note any common themes. Especially note which stakeholders identified they have a favorable relationship with IT and which stakeholders identified they have an unfavorable relationship. For those who have an unfavorable relationship, identify if they will have a critical role in a growth transaction.
Download the sample report.
Record the results in the M&A Buy Playbook.
Create a stakeholder network map for M&A transactions
Follow the trail of breadcrumbs from your direct stakeholders to their influencers to uncover hidden stakeholders.
Example:
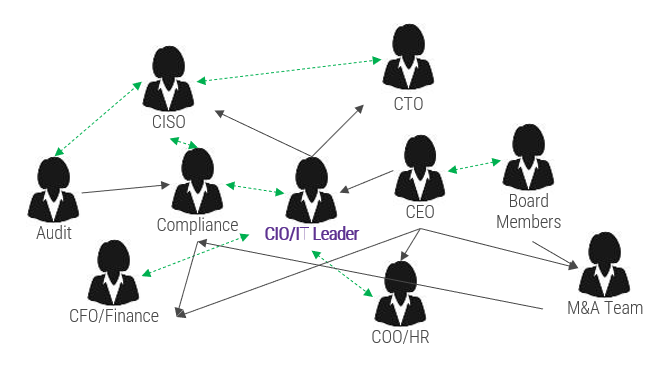
Legend
- Black arrows indicate the direction of professional influence
- Dashed green arrows indicate bidirectional, informal influence relationships
Info-Tech Insight
Your stakeholder map defines the influence landscape that the M&A transaction will occur within. This will identify who holds various levels of accountability and decision-making authority when a transaction does take place.
Use connectors to determine who may be influencing your direct stakeholders. They may not have any formal authority within the organization, but they may have informal yet substantial relationships with your stakeholders.
1.1.3 Visualize relationships among stakeholders to identify key influencers
1-3 hours
Input: List of M&A stakeholders
Output: Relationships among M&A stakeholders and influencers
Materials: M&A Buy Playbook
Participants: IT executive leadership
- The purpose of this activity is to list all the stakeholders within your organization that will have a direct or indirect impact on the M&A transaction.
- Determine the critical stakeholders, and then determine the stakeholders of your stakeholders and consider adding each of them to the stakeholder list.
- Assess who has either formal or informal influence over your stakeholders; add these influencers to your stakeholder list.
- Construct a diagram linking stakeholders and their influencers together.
- Use black arrows to indicate the direction of professional influence.
- Use dashed green arrows to indicate bidirectional, informal influence relationships.
Record the results in the M&A Buy Playbook.
Categorize your stakeholders with a prioritization map
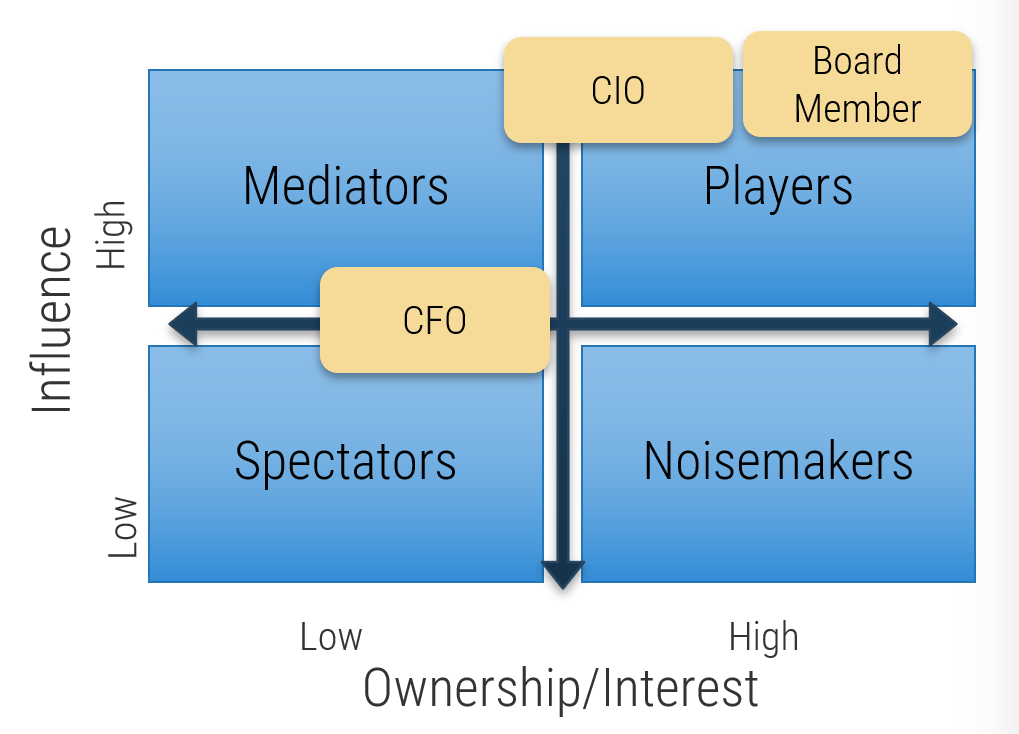
A stakeholder prioritization map helps IT leaders categorize their stakeholders by their level of influence and ownership in the merger, acquisition, or divestiture process.
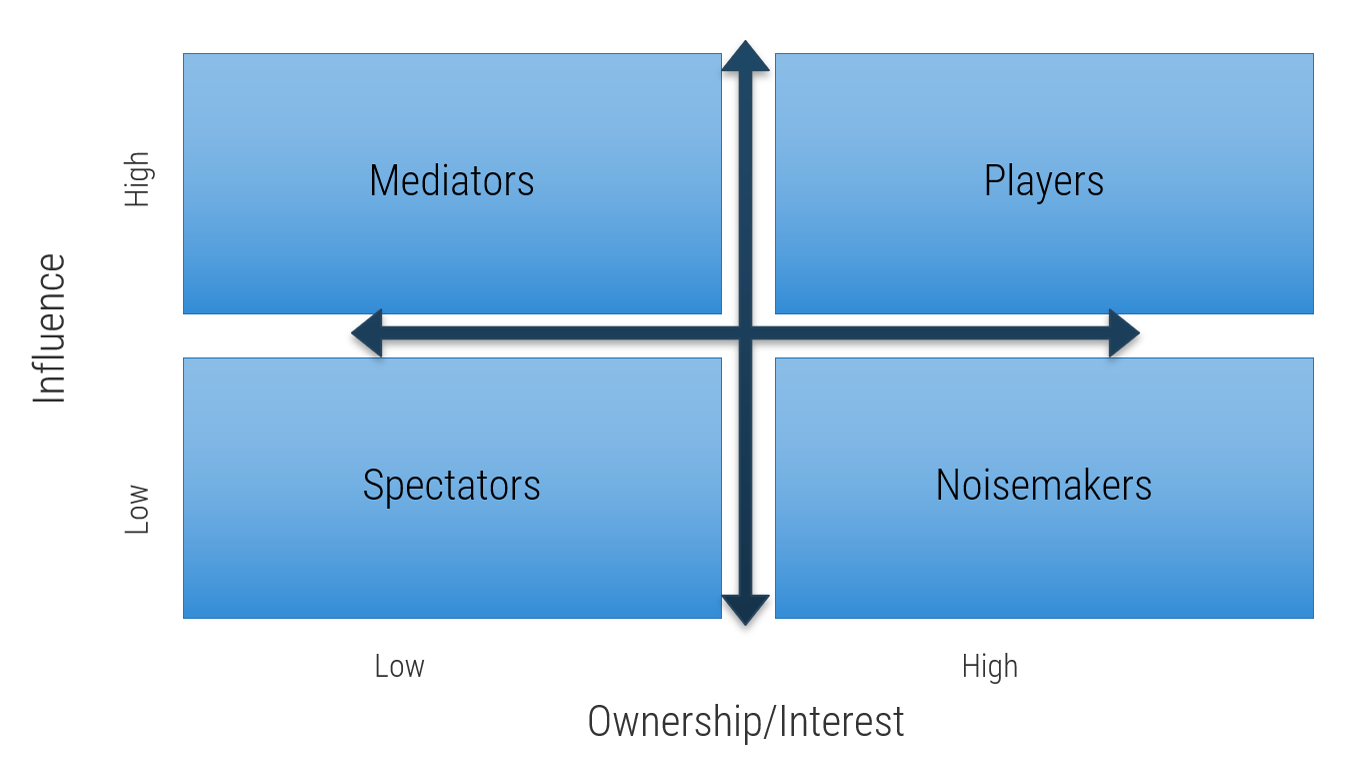
There are four areas in the map, and the stakeholders within each area should be treated differently.
Players – players have a high interest in the initiative and the influence to effect change over the initiative. Their support is critical, and a lack of support can cause significant impediment to the objectives.
Mediators – mediators have a low interest but significant influence over the initiative. They can help to provide balance and objective opinions to issues that arise.
Noisemakers – noisemakers have low influence but high interest. They tend to be very vocal and engaged, either positively or negatively, but have little ability to enact their wishes.
Spectators – generally, spectators are apathetic and have little influence over or interest in the initiative.
1.1.4 Group stakeholders into categories
30 minutes
Input: Stakeholder map, Stakeholder list
Output: Categorization of stakeholders and influencers
Materials: Flip charts, Markers, Sticky notes, M&A Buy Playbook
Participants: IT executive leadership, Stakeholders
- Identify your stakeholders’ interest in and influence on the M&A process as high, medium, or low by rating the attributes below.
- Map your results to the model to the right to determine each stakeholder’s category.
Level of Influence
- Power: Ability of a stakeholder to effect change.
- Urgency: Degree of immediacy demanded.
- Legitimacy: Perceived validity of stakeholder’s claim.
- Volume: How loud their “voice” is or could become.
- Contribution: What they have that is of value to you.
Level of Interest
How much are the stakeholder’s individual performance and goals directly tied to the success or failure of the product?
Record the results in the M&A Buy Playbook.
Prioritize your stakeholders
There may be too many stakeholders to be able to manage them all. Focus your attention on the stakeholders that matter most.
|
|
|
|
Level of Support
|
|
|
|
|
|
Supporter
|
Evangelist
|
Neutral
|
Blocker
|
| Stakeholder Category
|
Player
|
Critical
|
High
|
High
|
Critical
|
|
|
Mediator
|
Medium
|
Low
|
Low
|
Medium
|
|
|
Noisemaker
|
High
|
Medium
|
Medium
|
High
|
|
|
Spectator
|
Low
|
Irrelevant
|
Irrelevant
|
Low
|
Consider the three dimensions for stakeholder prioritization: influence, interest, and support. Support can be determined by answering the following question: How significant is that stakeholder to the M&A or divestiture process?
These parameters are used to prioritize which stakeholders are most important and should receive your focused attention.
1.1.5 Prioritize your stakeholders
30 minutes
Input: Stakeholder matrix
Output: Stakeholder and influencer prioritization
Materials: Flip charts, Markers, Sticky notes, M&A Buy Playbook
Participants: IT executive leadership, M&A/divestiture stakeholders
- Identify the level of support of each stakeholder by answering the following question: How significant is that stakeholder to the M&A transaction process?
- Prioritize your stakeholders using the prioritization scheme on the previous slide.
Stakeholder
|
Category
|
Level of Support
|
Prioritization
|
| CMO
|
Spectator
|
Neutral
|
Irrelevant
|
| CIO
|
Player
|
Supporter
|
Critical
|
Record the results in the M&A Buy Playbook.
Define strategies for engaging stakeholders by type
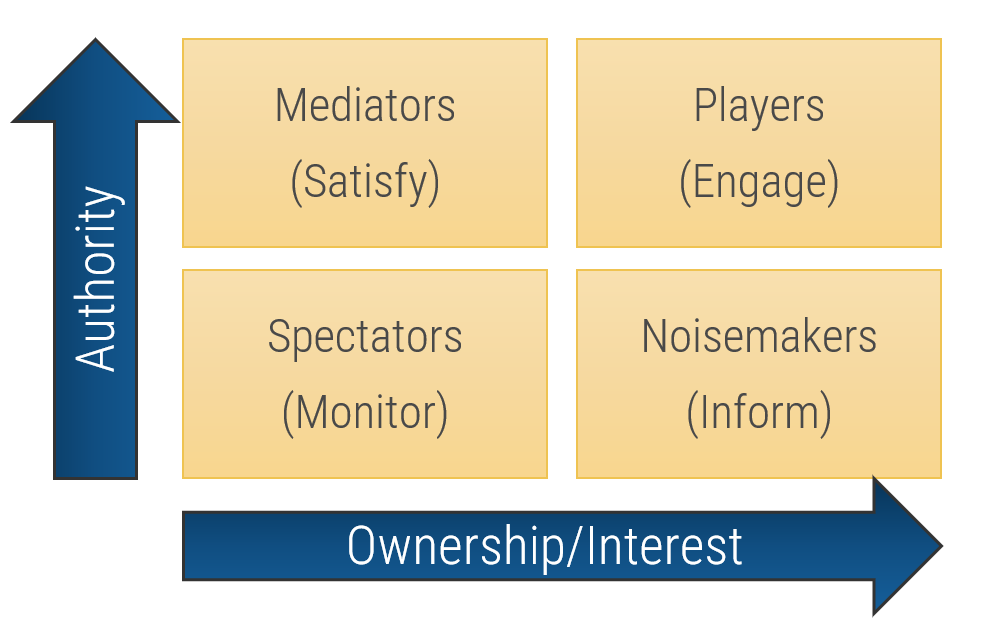
Type
|
Quadrant
|
Actions
|
| Players
|
High influence, high interest – actively engage
|
Keep them updated on the progress of the project. Continuously involve Players in the process and maintain their engagement and interest by demonstrating their value to its success.
|
| Mediators
|
High influence, low interest – keep satisfied
|
They can be the game changers in groups of stakeholders. Turn them into supporters by gaining their confidence and trust and including them in important decision-making steps. In turn, they can help you influence other stakeholders.
|
| Noisemakers
|
Low influence, high interest – keep informed
|
Try to increase their influence (or decrease it if they are detractors) by providing them with key information, supporting them in meetings, and using Mediators to help them.
|
| Spectators
|
Low influence, low interest – monitor
|
They are followers. Keep them in the loop by providing clarity on objectives and status updates.
|
Info-Tech Insight
Each group of stakeholders draws attention and resources away from critical tasks. By properly identifying stakeholder groups, the IT executive leader can develop corresponding actions to manage stakeholders in each group. This can dramatically reduce wasted effort trying to satisfy Spectators and Noisemakers while ensuring the needs of Mediators and Players are met.
1.1.6 Plan to communicate
30 minutes
Input: Stakeholder priority, Stakeholder categorization, Stakeholder influence
Output: Stakeholder communication plan
Materials: Flip charts, Markers, Sticky notes, M&A Buy Playbook
Participants: IT executive leadership, M&A/divestiture stakeholders
The purpose of this activity is to make a communication plan for each of the stakeholders identified in the previous activities, especially those who will have a critical role in the M&A transaction process.
- In the M&A Buy Playbook, input the type of influence each stakeholder has on IT, how they would be categorized in the M&A process, and their level of priority. Use this information to create a communication plan.
- Determine the methods and frequency of communication to keep the necessary stakeholder satisfied and maintain or enhance IT’s profile within the organization.
Record the results in the M&A Buy Playbook.
Proactive
Step 1.2
Assess IT’s Current Value and Method to Achieve a Future State
Activities
- 1.2.1 Valuate IT
- 1.2.2 Assess the IT/digital strategy
This step involves the following participants:
- IT executive leader
- IT leadership
- Critical stakeholders to M&A
Outcomes of Step
Identify critical opportunities to optimize IT and meet strategic business goals through a merger, acquisition, or divestiture.
How to valuate your IT environment
And why it matters so much
- Valuating your current organization’s IT environment is a critical step that all IT organizations should take, whether involved in an M&A or not, to fully understand what it might be worth.
- The business investments in IT can be directly translated into a value amount. For every $1 invested in IT, the business might be gaining $100 in value back or possibly even loosing $100.
- Determining, documenting, and communicating this information ensures that the business takes IT’s suggestions seriously and recognizes why investing in IT is so critical.
- There are three ways a business or asset can be valuated:
- Cost Approach: Look at the costs associated with building, purchasing, replacing, and maintaining a given aspect of the business.
- Market Approach: Look at the relative value of a particular aspect of the business. Relative value can fluctuate and depends on what the markets and consequently society believe that particular element is worth.
- Discounted Cash Flow Approach: Focus on what the potential value of the business could be or the intrinsic value anticipated due to future profitability.
(Source: “Valuation Methods,” Corporate Finance Institute)
Four ways to create value through digital
- Reduced costs
- Improved customer experience
- New revenue sources
- Better decision making
(Source: McKinsey & Company)
1.2.1 Valuate IT
1 day
Input: Valuation of data, Valuation of applications, Valuation of infrastructure and operations, Valuation of security and risk
Output: Valuation of IT
Materials: Relevant templates/tools listed on the following slides, Capital budget, Operating budget, M&A Buy Playbook
Participants: IT executive/CIO, IT senior leadership
The purpose of this activity is to demonstrate that IT is not simply an operational functional area that diminishes business resources. Rather, IT contributes significant value to the business.
- Review each of the following slides to valuate IT’s data, applications, infrastructure and operations, and security and risk. These valuations consider several tangible and intangible factors and result in a final dollar amount.
- Input the financial amounts identified for each critical area into a summary slide. Use this information to determine where IT is delivering value to the organization.
Info-Tech Insight
Consistency is key when valuating your IT organization as well as other IT organizations throughout the transaction process.
Record the results in the M&A Buy Playbook.
Data valuation
Data valuation identifies how you monetize the information that your organization owns.
Create a data value chain for your organization
When valuating the information and data that exists in an organization, there are many things to consider.
Info-Tech has two tools that can support this process:
- Information Asset Audit Tool: Use this tool first to take inventory of the different information assets that exist in your organization.
- Data Valuation Tool: Once information assets have been accounted for, valuate the data that exists within those information assets.
Data Collection
|
Insight Creation
|
Value Creation
|
Data Valuation
|
01 Data Source
02 Data Collection Method
03 Data
|
04 Data Analysis
05 Insight
06 Insight Delivery
|
07 Consumer
08 Value in Data
|
09 Value Dimension
10 Value Metrics Group
11 Value Metrics
|
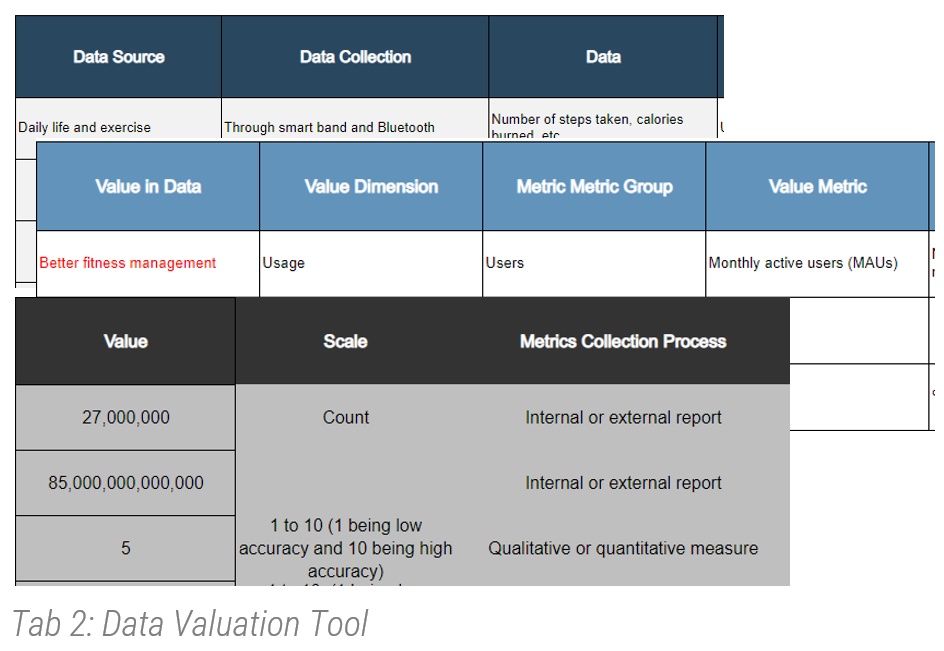
Instructions
- Using the Data Valuation Tool, start gathering information based on the eight steps above to understand your organization’s journey from data to value.
- Identify the data value spectrum. (For example: customer sales service, citizen licensing service, etc.)
- Fill out the columns for data sources, data collection, and data first.
- Capture data analysis and related information.
- Then capture the value in data.
- Add value dimensions such as usage, quality, and economic dimensions.
- Remember that economic value is not the only dimension, and usage/quality has a significant impact on economic value.
- Collect evidence to justify your data valuation calculator (market research, internal metrics, etc.).
- Finally, calculate the value that has a direct correlation with underlying value metrics.
Application valuation
Calculate the value of your IT applications
When valuating the applications and their users in an organization, consider using a business process map. This shows how business is transacted in the company by identifying which IT applications support these processes and which business groups have access to them. Info-Tech has a business process mapping tool that can support this process:
- Enterprise Integration Process Mapping Tool: Complete this tool first to map the different business processes to the supporting applications in your organization.
Instructions
- Start by calculating user costs. This is the product of the (# of users) × (% of time spent using IT) × (fully burdened salary).
- Identify the revenue per employee and divide that by the average cost per employee to calculate the derived productivity ratio (DPR).
- Once you have calculated the user costs and DPR, multiply those total values together to get the application value.
User Costs
|
|
|
Total User Costs
|
Derived Productivity Ratio (DPR)
|
|
Total DPR
|
Application Value
|
| # of users
|
% time spent using IT
|
Fully burdened salary
|
Multiply values from the 3 user costs columns
|
Revenue per employee
|
Average cost per employee
|
(Revenue P.E) ÷ (Average cost P.E)
|
(User costs) X (DPR)
|
- Once the total application value is established, calculate the combined IT and business costs of delivering that value. IT and business costs include inflexibility (application maintenance), unavailability (downtime costs, including disaster exposure), IT costs (common costs statistically allocated to applications), and fully loaded cost of active (full-time equivalent [FTE]) users.
- Calculate the net value of applications by subtracting the total IT and business costs from the total application value calculated in step 3.
IT and Business Costs
|
|
|
|
Total IT and Business Costs
|
Net Value of Applications
|
| Application maintenance
|
Downtime costs (include disaster exposure)
|
Common costs allocated to applications
|
Fully loaded costs of active (FTE) users
|
Sum of values from the four IT and business costs columns
|
(Application value) – (IT and business costs)
|
(Source: CSO)
Infrastructure valuation
Assess the foundational elements of the business’ information technology
The purpose of this exercise is to provide a high-level infrastructure valuation that will contribute to valuating your IT environment.
Calculating the value of the infrastructure will require different methods depending on the environment. For example, a fully cloud-hosted organization will have different costs than a fully on-premises IT environment.
Instructions:
- Start by listing all of the infrastructure-related items that are relevant to your organization.
- Once you have finalized your items column, identify the total costs/value of each item.
- For example, total software costs would include servers and storage.
- Calculate the total cost/value of your IT infrastructure by adding all of values in the right column.
Item
|
Costs/Value
|
| Hardware Assets Total Value
|
+$3.2 million
|
| Hardware Leased/Service Agreement
|
-$
|
| Software Purchased
|
+$
|
| Software Leased/Service Agreement
|
-$
|
| Operational Tools
|
|
| Network
|
|
| Disaster Recovery
|
|
| Antivirus
|
|
| Data Centers
|
|
| Service Desk
|
|
| Other Licenses
|
|
| Total:
|
|
For additional support, download the M&A Runbook for Infrastructure and Operations.
Risk and security
Assess risk responses and calculate residual risk
The purpose of this exercise is to provide a high-level risk assessment that will contribute to valuating your IT environment. For a more in-depth risk assessment, please refer to the Info-Tech tools below:
- Risk Register Tool
- Security M&A Due Diligence Tool
Instructions
- Review the probability and impact scales below and ensure you have the appropriate criteria that align to your organization before you conduct a risk assessment.
- Identify the probability of occurrence and estimated financial impact for each risk category detail and fill out the table on the right. Customize the table as needed so it aligns to your organization.
Probability of Risk Occurrence
|
Occurrence Criteria
(Classification; Probability of Risk Event Within One Year)
|
| Negligible
|
Very Unlikely; ‹20%
|
| Very Low
|
Unlikely; 20 to 40%
|
| Low
|
Possible; 40 to 60%
|
| Moderately Low
|
Likely; 60 to 80%
|
| Moderate
|
Almost Certain; ›80%
|
Note: If needed, you can customize this scale with the severity designations that you prefer. However, make sure you are always consistent with it when conducting a risk assessment.
Financial & Reputational Impact
|
Budgetary and Reputational Implications
(Financial Impact; Reputational Impact)
|
| Negligible
|
(‹$10,000; Internal IT stakeholders aware of risk event occurrence)
|
| Very Low
|
($10,000 to $25,000; Business customers aware of risk event occurrence)
|
| Low
|
($25,000 to $50,000; Board of directors aware of risk event occurrence)
|
| Moderately Low
|
($50,000 to $100,000; External customers aware of risk event occurrence)
|
| Moderate
|
(›$100,000; Media coverage or regulatory body aware of risk event occurrence)
|
Risk Category Details
|
Probability of Occurrence
|
Estimated Financial Impact
|
Estimated Severity (Probability X Impact)
|
| Capacity Planning
|
| Enterprise Architecture
|
| Externally Originated Attack
|
| Hardware Configuration Errors
|
| Hardware Performance
|
| Internally Originated Attack
|
| IT Staffing
|
| Project Scoping
|
| Software Implementation Errors
|
| Technology Evaluation and Selection
|
| Physical Threats
|
| Resource Threats
|
| Personnel Threats
|
| Technical Threats
|
| Total:
|
1.2.2 Assess the IT/digital strategy
4 hours
Input: IT strategy, Digital strategy, Business strategy
Output: An understanding of an executive business stakeholder’s perception of IT, Alignment of IT/digital strategy and overall organization strategy
Materials: Computer, Whiteboard and markers, M&A Buy Playbook
Participants: IT executive/CIO, Business executive/CEO
The purpose of this activity is to review the business and IT strategies that exist to determine if there are critical capabilities that are not being supported.
Ideally, the IT and digital strategies would have been created following development of the business strategy. However, sometimes the business strategy does not directly call out the capabilities it requires IT to support.
- On the left half of the corresponding slide in the M&A Buy Playbook, document the business goals, initiatives, and capabilities. Input this information from the business or digital strategies. (If more space for goals, initiatives, or capabilities is needed, duplicate the slide).
- On the other half of the slide, document the IT goals, initiatives, and capabilities. Input this information from the IT strategy and digital strategy.
For additional support, see Build a Business-Aligned IT Strategy.
Record the results in the M&A Buy Playbook.
Proactive
Step 1.3
Drive Innovation and Suggest Growth Opportunities
Activities
- 1.3.1 Determine pain points and opportunities
- 1.3.2 Align goals with opportunities
- 1.3.3 Recommend growth opportunities
This step involves the following participants:
- IT executive leader
- IT leadership
- Critical M&A stakeholders
Outcomes of Step
Establish strong relationships with critical M&A stakeholders and position IT as an innovative business partner that can suggest growth opportunities.
1.3.1 Determine pain points and opportunities
1-2 hours
Input: CEO-CIO Alignment diagnostic, CIO Business Vision diagnostic, Valuation of IT environment, IT-business goals cascade
Output: List of pain points or opportunities that IT can address
Materials: Computer, Whiteboard and markers, M&A Buy Playbook
Participants: IT executive/CIO, IT senior leadership, Business stakeholders
The purpose of this activity is to determine the pain points and opportunities that exist for the organization. These can be external or internal to the organization.
- Identify what opportunities exist for your organization. Opportunities are the potential positives that the organization would want to leverage.
- Next, identify pain points, which are the potential negatives that the organization would want to alleviate.
- Spend time considering all the options that might exist, and keep in mind what has been identified previously.
Opportunities and pain points can be trends, other departments’ initiatives, business perspectives of IT, etc.
Record the results in the M&A Buy Playbook.
1.3.2 Align goals with opportunities
1-2 hours
Input: CEO-CIO Alignment diagnostic, CIO Business Vision diagnostic, Valuation of IT environment, IT-business goals cascade, List of pain points and opportunities
Output: An understanding of an executive business stakeholder’s perception of IT, Foundations for growth strategy
Materials: Computer, Whiteboard and markers, M&A Buy Playbook
Participants: IT executive/CIO, IT senior leadership, Business stakeholders
The purpose of this activity is to determine whether a growth or separation strategy might be a good suggestion to the business in order to meet its business objectives.
- For the top three to five business goals, consider:
- Underlying drivers
- Digital opportunities
- Whether a growth or reduction strategy is the solution
- Just because a growth or reduction strategy is a solution for a business goal does not necessarily indicate M&A is the way to go. However, it is important to consider before you pursue suggesting M&A.
Record the results in the M&A Buy Playbook.
1.3.3 Recommend growth opportunities
1-2 hours
Input: Growth or separation strategy opportunities to support business goals, Stakeholder communication plan, Rationale for the suggestion
Output: M&A transaction opportunities suggested
Materials: M&A Buy Playbook
Participants: IT executive/CIO, Business executive/CEO
The purpose of this activity is to recommend a merger, acquisition, or divestiture to the business.
- Identify which of the business goals the transaction would help solve and why IT is the one to suggest such a goal.
- Leverage the stakeholder communication plan identified previously to give insight into stakeholders who would have a significant level of interest, influence, or support in the process.
Info-Tech Insight
With technology and digital driving many transactions, leverage this opening and begin the discussions with your business on how and why an acquisition would be a great opportunity.
Record the results in the M&A Buy Playbook.
By the end of this Proactive phase, you should:
Be prepared to suggest M&A opportunities to support your company’s goals through growth or acquisition transactions
Key outcome from the Proactive phase
Develop progressive relationships and strong communication with key stakeholders to suggest or be aware of transformational opportunities that can be achieved through growth or reduction strategies such as mergers, acquisitions, or divestitures.
Key deliverables from the Proactive phase
- Business perspective of IT examined
- Key stakeholders identified and relationship to the M&A process outlined
- Ability to valuate the IT environment and communicate IT’s value to the business
- Assessment of the business, digital, and IT strategies and how M&As could support those strategies
- Pain points and opportunities that could be alleviated or supported through an M&A transaction
- Acquisition or buying recommendations
The Buy Blueprint
Phase 2
Discovery & Strategy
| Phase 1 | Phase 2 | Phase 3 | Phase 4 |
- 1.1 Identify Stakeholders and Their Perspective of IT
- 1.2 Assess IT’s Current Value and Future State
- 1.3 Drive Innovation and Suggest Growth Opportunities
|
- 2.1 Establish the M&A Program Plan
- 2.2 Prepare IT to Engage in the Acquisition
|
- 3.1 Assess the Target Organization
- 3.2 Prepare to Integrate
|
- 4.1 Execute the Transaction
- 4.2 Reflection and Value Realization
|
This phase will walk you through the following activities:
- Create the mission and vision
- Identify the guiding principles
- Create the future-state operating model
- Determine the transition team
- Document the M&A governance
- Create program metrics
- Establish the integration strategy
- Conduct a RACI
- Create the communication plan
- Assess the potential organization(s)
This phase involves the following participants:
- IT executive/CIO
- IT senior leadership
- Company M&A team
Workshop Overview
Contact your account representative for more information.
workshops@infotech.com 1-888-670-8889
| Pre-Work | Day 1 | Day 2 | Day 3 | Day 4 | Day 5 |
| Establish the Transaction Foundation | Discover the Motivation for Acquiring | Formalize the Program Plan | Create the Valuation Framework | Strategize the Transaction | Next Steps and Wrap-Up (offsite) |
Activities |
- 0.1 Conduct the CIO Business Vision and CEO-CIO Alignment diagnostics
- 0.2 Identify key stakeholders and outline their relationship to the M&A process
- 0.3 Identify the rationale for the company's decisions to pursue an acquisition
|
- 1.1 Review the business rationale for the acquisition
- 1.2 Assess the IT/digital strategy
- 1.3 Identify pain points and opportunities tied to the acquisition
- 1.4 Create the IT vision statement, create the IT mission statement, and identify IT guiding principles
|
- 2.1 Create the future-state operating model
- 2.2 Determine the transition team
- 2.3 Document the M&A governance
- 2.4 Establish program metrics
|
- 3.1 Valuate your data
- 3.2 Valuate your applications
- 3.3 Valuate your infrastructure
- 3.4 Valuate your risk and security
- 3.5 Combine individual valuations to make a single framework
|
- 4.1 Establish the integration strategy
- 4.2 Conduct a RACI
- 4.3 Review best practices for assessing target organizations
- 4.4 Create the communication plan
|
- 5.1 Complete in-progress deliverables from previous four days
- 5.2 Set up review time for workshop deliverables and to discuss next steps
|
Deliverables |
- Business perspectives of IT
- Stakeholder network map for M&A transactions
|
- Business context implications for IT
- IT’s acquisition strategic direction
|
- Operating model for future state
- Transition team
- Governance structure
- M&A program metrics
|
- IT valuation framework
|
- Integration strategy
- RACI
- Communication plan
|
- Completed M&A program plan and strategy
- Prepared to assess target organization(s)
|
What is the Discovery & Strategy phase?
Pre-transaction state
The Discovery & Strategy phase during an acquisition is a unique opportunity for many IT organizations. IT organizations that can participate in the acquisition transaction at this stage are likely considered a strategic partner of the business.
For one-off acquisitions, IT being invited during this stage of the process is rare. However, for organizations that are preparing to engage in many acquisitions over the coming years, this type of strategy will greatly benefit from IT involvement. Again, the likelihood of participating in an M&A transaction is increasing, making it a smart IT leadership decision to, at the very least, loosely prepare a program plan that can act as a strategic pillar throughout the transaction.
During this phase of the pre-transaction state, IT will also be asked to participate in ensuring that the potential organization being sought will be able to meet any IT-specific search criteria that was set when the transaction was put into motion.
Goal: To identify a repeatable program plan that IT can leverage when acquiring all or parts of another organization’s IT environment, ensuring customer satisfaction and business continuity
Discovery & Strategy Prerequisite Checklist
Before coming into the Discovery & Strategy phase, you should have addressed the following:
- Understand the business perspective of IT.
- Know the key stakeholders and have outlined their relationships to the M&A process.
- Be able to valuate the IT environment and communicate IT's value to the business.
- Understand the rationale for the company's decisions to pursue an acquisition and the opportunities or pain points the acquisition should address.
Discovery & Strategy
Step 2.1
Establish the M&A Program Plan
Activities
- 2.1.1 Create the mission and vision
- 2.1.2 Identify the guiding principles
- 2.1.3 Create the future-state operating model
- 2.1.4 Determine the transition team
- 2.1.5 Document the M&A governance
- 2.1.6 Create program metrics
This step involves the following participants:
- IT executive/CIO
- IT senior leadership
- Company M&A team
Outcomes of Step
Establish an M&A program plan that can be repeated across acquisitions.
The vision and mission statements clearly articulate IT’s aspirations and purpose
The IT vision statement communicates a desired future state of the IT organization, whereas the IT mission statement portrays the organization’s reason for being. While each serves its own purpose, they should both be derived from the business context implications for IT.
|
|
Vision Statements
|
Mission Statements
|
Characteristics
|
- Describe a desired future
- Focus on ends, not means
- Concise
- Aspirational
- Memorable
|
- Articulate a reason for existence
- Focus on how to achieve the vision
- Concise
- Easy to grasp
- Sharply focused
- Inspirational
|
Samples
|
To be a trusted advisor and partner in enabling business innovation and growth through an engaged IT workforce. (Source: Business News Daily)
|
IT is a cohesive, proactive, and disciplined team that delivers innovative technology solutions while demonstrating a strong customer-oriented mindset. (Source: Forbes, 2013)
|
2.1.1 Create the mission and vision statements
2 hours
Input: Business objectives, IT capabilities, Rationale for the transaction
Output: IT’s mission and vision statements for growth strategies tied to mergers, acquisitions, and divestitures
Materials: Flip charts/whiteboard, Markers, M&A Buy Playbook
Participants: IT executive/CIO, IT senior leadership, Company M&A team
The purpose of this activity is to create mission and vision statements that reflect IT’s intent and method to support the organization as it pursues a growth strategy.
- Review the definitions and characteristics of mission and vision statements.
- Brainstorm different versions of the mission and vision statements.
- Edit the statements until you get to a single version of each that accurately reflects IT’s role in the growth process.
Record the results in the M&A Buy Playbook.
Guiding principles provide a sense of direction
IT guiding principles are shared, long-lasting beliefs that guide the use of IT in constructing, transforming, and operating the enterprise by informing and restricting IT investment portfolio management, solution development, and procurement decisions.
IT principles must be carefully constructed to make sure they are adhered to and relevant
Info-Tech has identified a set of characteristics that IT principles should possess. These characteristics ensure the IT principles are relevant and followed in the organization.
Approach focused. IT principles should be focused on the approach – how the organization is built, transformed, and operated – as opposed to what needs to be built, which is defined by both functional and non-functional requirements.
Business relevant. Create IT principles that are specific to the organization. Tie IT principles to the organization’s priorities and strategic aspirations.
Long lasting. Build IT principles that will withstand the test of time.
Prescriptive. Inform and direct decision making with actionable IT principles. Avoid truisms, general statements, and observations.
Verifiable. If compliance can’t be verified, people are less likely to follow the principle.
Easily Digestible. IT principles must be clearly understood by everyone in IT and by business stakeholders. IT principles aren’t a secret manuscript of the IT team. IT principles should be succinct; wordy principles are hard to understand and remember.
Followed. Successful IT principles represent a collection of beliefs shared among enterprise stakeholders. IT principles must be continuously communicated to all stakeholders to achieve and maintain buy-in.
In organizations where formal policy enforcement works well, IT principles should be enforced through appropriate governance processes.
Consider the example principles below
IT Principle Name
|
IT Principle Statement
|
| 1. Risk Management
|
We will ensure that the organization’s IT Risk Management Register is properly updated to reflect all potential risks and that a plan of action against those risks has been identified.
|
| 2. Transparent Communication
|
We will ensure employees are spoken to with respect and transparency throughout the transaction process.
|
| 3. Integration for Success
|
We will create an integration strategy that enables the organization and clearly communicates the resources required to succeed.
|
| 4. Managed Data
|
We will handle data creation, modification, integration, and use across the enterprise in compliance with our data governance policy.
|
| 5. Establish a single IT Environment
|
We will identify, prioritize, and manage the applications and services that IT provides in order to eliminate redundant technology and maximize the value that users and customers experience.
|
| 6. Compliance With Laws and Regulations
|
We will operate in compliance with all applicable laws and regulations for both our organization and the potentially purchased organization.
|
| 7. Defined Value
|
We will create a plan of action that aligns with the organization’s defined value expectations.
|
| 8. Network Readiness
|
We will ensure that employees and customers have immediate access to the network with minimal or no outages.
|
| 9. Operating to Succeed
|
We will bring all of IT into a central operating model within two years of the transaction.
|
2.1.2 Identify the guiding principles
2 hours
Input: Business objectives, IT capabilities, Rationale for the transaction, Mission and vision statements
Output: IT’s guiding principles for growth strategies tied to mergers, acquisitions, and divestitures
Materials: Flip charts/whiteboard, Markers, M&A Buy Playbook
Participants: IT executive/CIO, IT senior leadership, Company M&A team
The purpose of this activity is to create the guiding principles that will direct the IT organization throughout the growth strategy process.
- Review the role of guiding principles and the examples of guiding principles that organizations have used.
- Brainstorm different versions of the guiding principles. Each guiding principle should start with the phrase “We will…”
- Edit and consolidate the statements until you have a list of approximately eight to ten statements that accurately reflect IT’s role in the growth process.
- Review the guiding principles every six months to ensure they continue to support the delivery of the business’ growth strategy goals.
Record the results in the M&A Buy Playbook.
Create two IT teams to support the transaction
IT M&A Transaction Team
- The IT M&A Transaction Team should consist of the strongest members of the IT team who can be expected to deliver on unusual or additional tasks not asked of them in normal day-to-day operations.
- The roles selected for this team will have very specific skills sets or deliver on critical integration capabilities, making their involvement in the combination of two or more IT environments paramount.
- These individuals need to have a history of proving themselves very trustworthy, as they will likely be required to sign an NDA as well.
- Expect to have to certain duplicate capabilities or roles across the M&A transaction team and operational team.
IT Operational Team
- This group is responsible for ensuring the business operations continue.
- These employees might be those who are newer to the organization but can be counted on to deliver consistent IT services and products.
- The roles of this team should ensure that end users or external customers remain satisfied.
Key capabilities to support M&A
Consider the following capabilities when looking at who should be a part of the M&A transaction team.
Employees who have a significant role in ensuring that these capabilities are being delivered will be a top priority.
Infrastructure
- Systems Integration
- Data Management
Business Focus
- Service-Level Management
- Enterprise Architecture
- Stakeholder Management
- Project Management
Risk & Security
- Privacy Management
- Security Management
- Risk & Compliance Management
Build a lasting and scalable operating model
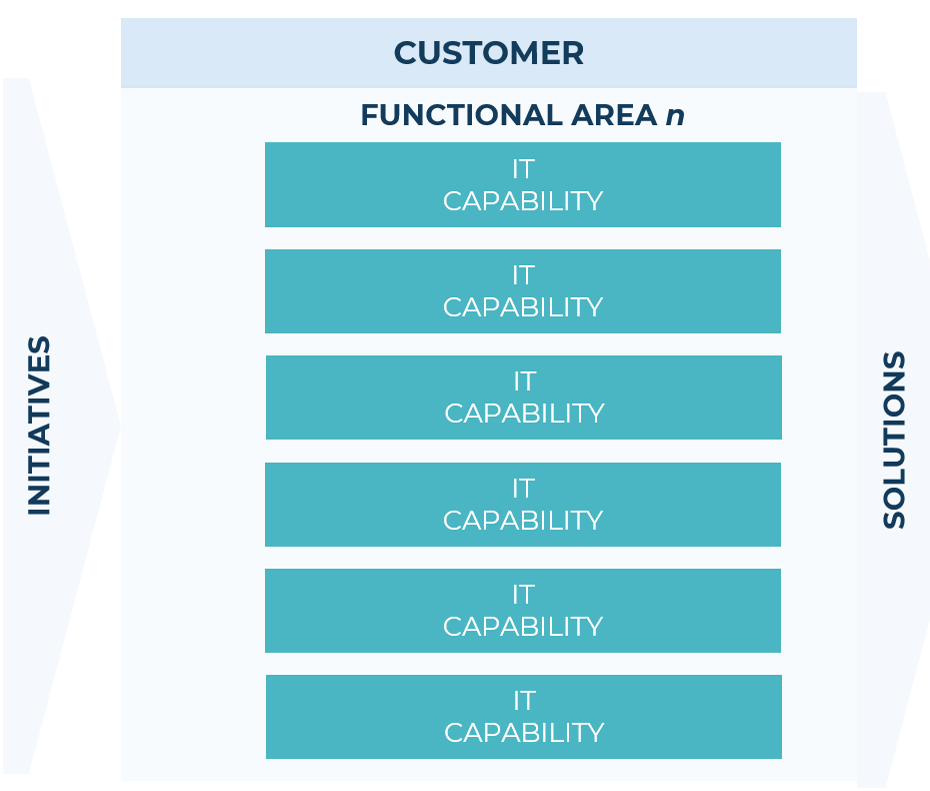
An operating model is an abstract visualization, used like an architect’s blueprint, that depicts how structures and resources are aligned and integrated to deliver on the organization’s strategy.
It ensures consistency of all elements in the organizational structure through a clear and coherent blueprint before embarking on detailed organizational design.
The visual should highlight which capabilities are critical to attaining strategic goals and clearly show the flow of work so that key stakeholders can understand where inputs flow in and outputs flow out of the IT organization.
As you assess the current operating model, consider the following:
- Does the operating model contain all the necessary capabilities your IT organization requires to be successful?
- What capabilities should be duplicated?
- Are there individuals with the skill set to support those roles? If not, is there a plan to acquire or develop those skills?
- A dedicated project team strictly focused on M&A is great. However, is it feasible for your organization? If not, what blockers exist?
Info-Tech Insight
Investing time up-front getting the operating model right is critical. This will give you a framework to rationalize future organizational changes, allowing you to be more iterative and allowing your model to change as the business changes.
2.1.3 Create the future-state operating model
4 hours
Input: Current operating model, IT strategy, IT capabilities, M&A-specific IT capabilities, Business objectives, Rationale for the transaction, Mission and vision statements
Output: Future-state operating model
Materials: Operating model, Capability overlay, Flip charts/whiteboard, Markers, M&A Buy Playbook
Participants: IT executive/CIO, IT senior leadership, Company M&A team
The purpose of this activity is to establish what the future-state operating model will be if your organization needs to adjust to support a growth transaction.
- Ensuring that all the IT capabilities are identified by the business and IT strategy, document your organization’s current operating model.
- Identify what core capabilities would be critical to the buying transaction process and integration. Highlight and make copies of those capabilities in the M&A Buy Playbook.
- Arrange the capabilities to clearly show the flow of inputs and outputs. Identify critical stakeholders of the process (such as customers or end users) if that will help the flow.
- Ensure the capabilities that will be decentralized are clearly identified. Decentralized capabilities do not exist within the central IT organization but rather in specific lines of businesses or products to better understand needs and deliver on the capability.
An example operating model is included in the M&A Buy Playbook. This process benefits from strong reference architecture and capability mapping ahead of time.
Record the results in the M&A Buy Playbook.
2.1.4 Determine the transition team
3 hours
Input: IT capabilities, Future-state operating model, M&A-specific IT capabilities, Business objectives, Rationale for the transaction, Mission and vision statements
Output: Transition team
Materials: Reference architecture, Organizational structure, Flip charts/whiteboard, Markers
Participants: IT executive/CIO, IT senior leadership, Company M&A team
The purpose of this activity is to create a team that will support your IT organization throughout the transaction. Determining which capabilities and therefore which roles will be required ensures that the business will continue to get the operational support it needs.
- Based on the outcome of activity 2.1.3, review the capabilities that your organization will require on the transition team. Group capabilities into functional groups containing capabilities that are aligned well with one another because they have similar responsibilities and functionalities.
- Replace the capabilities with roles. For example, stakeholder management, requirements gathering, and project management might be one functional group. Project management and stakeholder management might combine to create a project manager role.
- Review the examples in the M&A Buy Playbook and identify which roles will be a part of the transition team.
For more information, see Redesign Your Organizational Structure
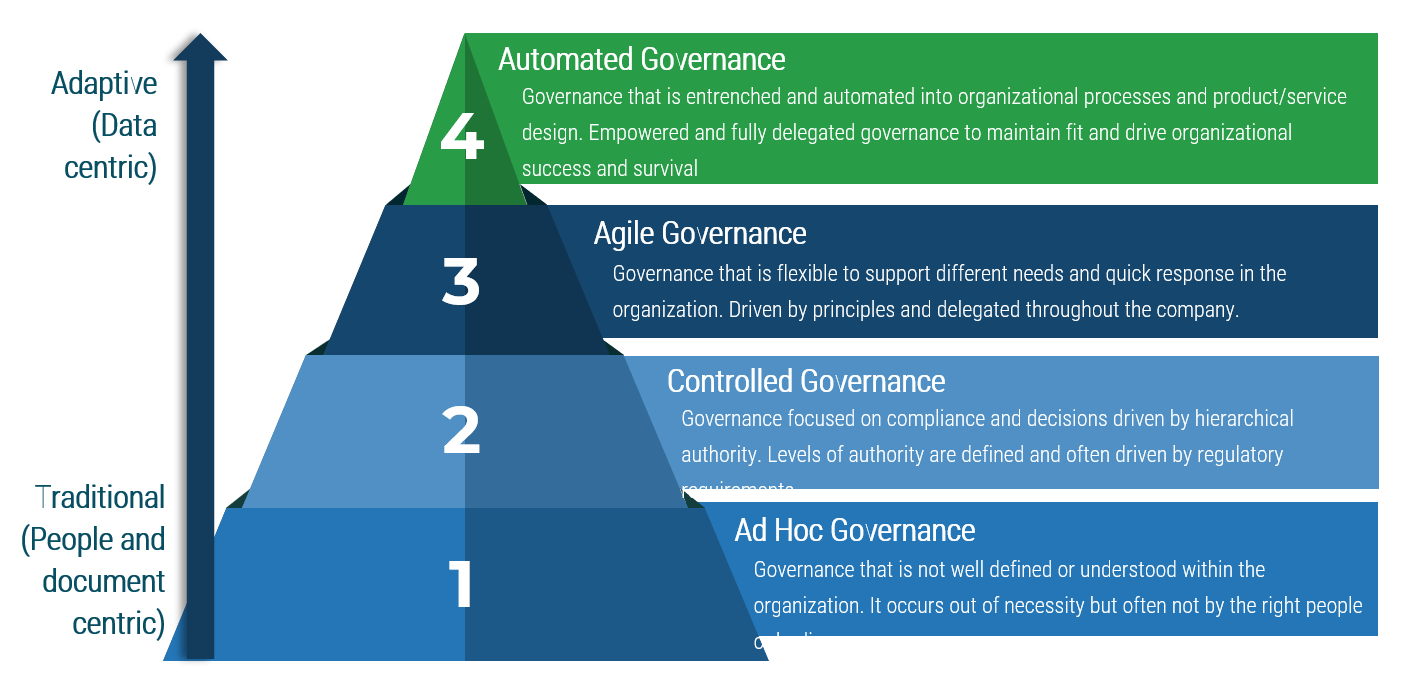
What is governance?
And why does it matter so much to IT and the M&A process?
- Governance is the method in which decisions get made, specifically as they impact various resources (time, money, and people).
- Because M&A is such a highly governed transaction, it is important to document the governance bodies that exist in your organization.
- This will give insight into what types of governing bodies there are, what decisions they make, and how that will impact IT.
- For example, funds to support integration need to be discussed, approved, and supplied to IT from a governing body overseeing the acquisition.
- A highly mature IT organization will have automated governance, while a seemingly non-existent governance process will be considered ad hoc.
2.1.5 Document M&A governance
1-2 hours
Input: List of governing bodies, Governing body committee profiles, Governance structure
Output: Documented method on how decisions are made as it relates to the M&A transaction
Materials: Flip charts/whiteboard, Markers, M&A Buy Playbook
Participants: IT executive/CIO, IT senior leadership, Company M&A team
The purpose of this activity is to determine the method in which decisions are made throughout the M&A transaction as it relates to IT. This will require understanding both governing bodies internal to IT and those external to IT.
- First, determine the other governance structures within the organization that will impact the decisions made about M&A. List out these bodies or committees.
- Create a profile for each committee that looks at the membership, purpose of the committee, decision areas (authority), and the process of inputs and outputs. Ensure IT committees that will have a role in this process are also documented. Consider the benefits realized, risks, and resources required for each.
- Organize the committees into a structure, identifying the committees that have a role in defining the strategy, designing and building, and running.
Record the results in the M&A Buy Playbook.
Current-state structure map – definitions of tiers
Strategy: These groups will focus on decisions that directly connect to the strategic direction of the organization.
Design & Build: The second tier of groups will oversee prioritization of a certain area of governance as well as design and build decisions that feed into strategic decisions.
Run: The lowest level of governance will be oversight of more-specific initiatives and capabilities within IT.
Expect tier overlap. Some committees will operate in areas that cover two or three of these governance tiers.
Measure the IT program’s success in terms of its ability to support the business’ M&A goals
Upper management will measure IT’s success based on your ability to support the underlying reasons for the M&A. Using business metrics will help assure business stakeholders that IT understands their needs and is working with the business to achieve them.
Business-Specific Metrics
- Revenue Growth: Increase in the top line as seen by market expansion, product expansion, etc. by percentage/time.
- Synergy Extraction: Reduction in costs as determined by the ability to identify and eliminate redundancies over time.
- Profit Margin Growth: Increase in the bottom line as a result of increased revenue growth and/or decreased costs over time.
IT-Specific Metrics
- IT operational savings and cost reductions due to synergies: Operating expenses, capital expenditures, licenses, contracts, applications, infrastructure over time.
- Reduction in IT staff expense and headcount: Decreased budget allocated to IT staff, and ability to identify and remove redundancies in staff.
- Meeting or improving on IT budget estimates: Delivering successful IT integration on a budget that is the same or lower than the budget estimated during due diligence.
- Meeting or improving on IT time-to-integration estimates: Delivering successful IT integration on a timeline that is the same or shorter than the timeline estimated during due diligence.
- Business capability support: Delivering the end state of IT that supports the expected business capabilities and growth.
Establish your own metrics to gauge the success of IT
Establish SMART M&A Success Metrics
| S pecific
|
Make sure the objective is clear and detailed.
|
| M easurable
|
Objectives are measurable if there are specific metrics assigned to measure success. Metrics should be objective.
|
| A ctionable
|
Objectives become actionable when specific initiatives designed to achieve the objective are identified.
|
| R ealistic
|
Objectives must be achievable given your current resources or known available resources.
|
| T ime-Bound
|
An objective without a timeline can be put off indefinitely. Furthermore, measuring success is challenging without a timeline.
|
- What should IT consider when looking to identify potential additions, deletions, or modifications that will either add value to the organization or reduce costs/risks?
- Provide a definition of synergies.
- IT operational savings and cost reductions due to synergies: Operating expenses, capital expenditures, licenses, contracts, applications, infrastructure.
- Reduction in IT staff expense and headcount: Decreased budget allocated to IT staff, and ability to identify and remove redundancies in staff.
- Meeting or improving on IT budget estimates: Delivering successful IT integration on a budget that is the same or lower than the budget estimated during due diligence.
- Meeting or improving on IT time-to-integration estimates: Delivering successful IT integration on a timeline that is the same or shorter than the timeline estimated during due diligence.
- Revenue growth: Increase in the top line as a result, as seen by market expansion, product expansion, etc.
- Synergy extraction: Reduction in costs, as determined by the ability to identify and eliminate redundancies.
- Profit margin growth: Increase in the bottom line as a result of increased revenue growth and/or decreased costs.
Metrics for each phase
1. Proactive | 2. Discovery & Strategy | 3. Valuation & Due Diligence | 4. Execution & Value Realization |
- % Share of business innovation spend from overall IT budget
- % Critical processes with approved performance goals and metrics
- % IT initiatives that meet or exceed value expectation defined in business case
- % IT initiatives aligned with organizational strategic direction
- % Satisfaction with IT's strategic decision-making abilities
- $ Estimated business value added through IT-enabled innovation
- % Overall stakeholder satisfaction with IT
- % Percent of business leaders that view IT as an Innovator
|
- % IT budget as a percent of revenue
- % Assets that are not allocated
- % Unallocated software licenses
- # Obsolete assets
- % IT spend that can be attributed to the business (chargeback or showback)
- % Share of CapEx of overall IT budget
- % Prospective organizations that meet the search criteria
- $ Total IT cost of ownership (before and after M&A, before and after rationalization)
- % Business leaders that view IT as a Business Partner
|
- % Defects discovered in production
- $ Cost per user for enterprise applications
- % In-house-built applications vs. enterprise applications
- % Owners identified for all data domains
- # IT staff asked to participate in due diligence
- Change to due diligence
- IT budget variance
- Synergy target
|
- % Satisfaction with the effectiveness of IT capabilities
- % Overall end-customer satisfaction
- $ Impact of vendor SLA breaches
- $ Savings through cost-optimization efforts
- $ Savings through application rationalization and technology standardization
- # Key positions empty
- % Frequency of staff turnover
- % Emergency changes
- # Hours of unplanned downtime
- % Releases that cause downtime
- % Incidents with identified problem record
- % Problems with identified root cause
- # Days from problem identification to root cause fix
- % Projects that consider IT risk
- % Incidents due to issues not addressed in the security plan
- # Average vulnerability remediation time
- % Application budget spent on new build/buy vs. maintenance (deferred feature implementation, enhancements, bug fixes)
- # Time (days) to value realization
- % Projects that realized planned benefits
- $ IT operational savings and cost reductions that are related to synergies/divestitures
- % IT staff–related expenses/redundancies
- # Days spent on IT integration
- $ Accurate IT budget estimates
- % Revenue growth directly tied to IT delivery
- % Profit margin growth
|
2.1.6 Create program metrics
1-2 hours
Input: IT capabilities, Mission, vision, and guiding principles, Rationale for the acquisition
Output: Program metrics to support IT throughout the M&A process
Materials: Flip charts/whiteboard, Markers, M&A Buy Playbook
Participants: IT executive/CIO, IT senior leadership, Company M&A team
The purpose of this activity is to determine how IT’s success throughout a growth transaction will be measured and determined.
- Document a list of appropriate metrics on the whiteboard. Remember to include metrics that demonstrate the business impact. You can use the sample metrics listed on the previous slide as a starting point.
- Set a target and deadline for each metric. This will help the group determine when it is time to evaluate progression.
- Establish a baseline for each metric based on information collected within your organization.
- Assign an owner for tracking each metric as well as someone to be accountable for performance.
Record the results in the M&A Buy Playbook.
Discovery & Strategy
Step 2.2
Prepare IT to Engage in the Acquisition
Activities
- 2.2.1 Establish the integration strategy
- 2.2.2 Conduct a RACI
- 2.2.3 Create the communication plan
- 2.2.4 Assess the potential organization(s)
This step involves the following participants:
- IT executive/CIO
- IT senior leadership
- Company M&A team
Outcomes of Step
Identify IT’s plan of action when it comes to the acquisition and align IT’s integration strategy with the business’ M&A strategy.
Integration strategies
There are several IT integration strategies that will help you achieve your target technology environment.
IT Integration Strategies
- Absorption. Convert the target organization’s strategy, structure, processes, and/or systems to that of the acquiring organization.
- Best-of-Breed. Pick and choose the most effective people, processes, and technologies to form an efficient operating model.
- Transformation Retire systems from both organizations and use collective capabilities, data, and processes to create something entirely new.
- Preservation Retain individual business units that will operate within their own capability. People, processes, and technologies are unchanged.
The approach IT takes will depend on the business objectives for the M&A.
- Generally speaking, the integration strategy is well understood and influenced by the frequency of and rationale for acquiring.
- Based on the initiatives generated by each business process owner, you need to determine the IT integration strategy that will best support the desired target technology environment.
Key considerations when choosing an IT integration strategy include:
- What are the main business objectives of the M&A?
- What are the key synergies expected from the transaction?
- What IT integration best helps obtain these benefits?
- What opportunities exist to position the business for sustainable growth?
Absorption and best-of-breed
Review highlights and drawbacks of absorption and best-of-breed integration strategies
Absorption
Highlights
- Recommended for businesses striving to reduce costs and drive efficiency gains.
- Economies of scale realized through consolidation and elimination of redundant applications.
- Quickest path to a single company operation and systems as well as lower overall IT cost.
Drawbacks
- Potential for disruption of the target company’s business operations.
- Requires significant business process changes.
- Disregarding the target offerings altogether may lead to inferior system decisions that do not yield sustainable results.
Best-of-Breed
Highlights
- Recommended for businesses looking to expand their market presence or acquire new products. Essentially aligning the two organizations in the same market.
- Each side has a unique offering but complementing capabilities.
- Potential for better buy-in from the target because some of their systems are kept, resulting in willingness to
Drawbacks
- May take longer to integrate because it tends to present increased complexity that results in higher costs and risks.
- Requires major integration efforts from both sides of the company. If the target organization is uncooperative, creating the desired technology environment will be difficult.
Transformation and preservation
Review highlights and drawbacks of transformation and preservation integration strategies
Transformation
Highlights
- This is the most customized approach, although it is rarely used.
- It is essential to have an established long-term vision of business capabilities when choosing this path.
- When executed correctly, this approach presents potential for significant upside and creation of sustainable competitive advantages.
Drawbacks
- This approach requires extensive time to implement, and the cost of integration work may be significant.
- If a new system is created without strategic capabilities, the organizations will not realize long-term benefits.
- The cost of correcting complexities at later stages in the integration effort may be drastic.
Preservation
Highlights
- This approach is appropriate if the merging organizations will remain fairly independent, if there will be limited or no communication between companies, and if the companies’ market strategies, products, and channels are entirely distinct.
- Environment can be accomplished quickly and at a low cost.
Drawbacks
- Impact to each business is minimal, but there is potential for lost synergies and higher operational costs. This may be uncontrollable if the natures of the two businesses are too different to integrate.
- Reduced benefits and limited opportunities for IT integration.
2.2.1 Establish the integration strategy
1-2 hours
Input: Business integration strategy, Guiding principles, M&A governance
Output: IT’s integration strategy
Materials: Flip charts/whiteboard, Markers, M&A Buy Playbook
Participants: IT executive/CIO, IT senior leadership, Company M&A team
The purpose of this activity is to determine IT’s approach to integration. The approach might differ slightly from transaction to transaction. However, the business’ approach to transactions should give insight into the general integration strategy IT should adopt.
- Make sure you have clearly articulated the business objectives for the M&A, the technology end state for IT, and the magnitude of the overall integration.
- Review and discuss the highlights and drawbacks of each type of integration.
- Use Info-Tech’s Integration Posture Selection Framework on the next slide to select the integration posture that will appropriately enable the business. Consider these questions during your discussion:
- What are the main business objectives of the M&A? What key IT capabilities will need to support business objectives?
- What key synergies are expected from the transaction? What opportunities exist to position the business for sustainable growth?
- What IT integration best helps obtain these benefits?
Record the results in the M&A Buy Playbook.
Integration Posture Selection Framework
Business M&A Strategy
|
Resultant Technology Strategy
|
M&A Magnitude (% of Acquirer Assets, Income, or Market Value)
|
IT Integration Posture
|
| A. Horizontal
|
Adopt One Model
|
‹10%
|
Absorption
|
|
|
|
10 to 75%
|
Absorption or Best-of-Breed
|
|
|
|
›75%
|
Best-of-Breed
|
| B. Vertical
|
Create Links Between Critical Systems
|
Any
|
- Preservation (Differentiated Functions)
- Absorption or Best-of-Breed (Non-Differentiated Functions)
|
| C. Conglomerate
|
Independent Model
|
Any
|
Preservation
|
| D. Hybrid: Horizontal & Conglomerate
|
Independent Model
|
Any
|
Preservation
|
2.2.2 Conduct a RACI
1-2 hours
Input: IT capabilities, Transition team, Integration strategy
Output: Completed RACI for transition team
Materials: Reference architecture, Organizational structure, Flip charts/whiteboard, Markers, M&A Buy Playbook
Participants: IT executive/CIO, IT senior leadership, Company M&A team
The purpose of this activity is to identify the core accountabilities and responsibilities for the roles identified as critical to your transition team. While there might be slight variation from transaction to transaction, ideally each role should be performing certain tasks.
- First, identify a list of critical tasks that need to be completed to support the purchase or acquisition. For example:
- Communicate with the company M&A team.
- Identify critical IT risks that could impact the organization after the transaction.
- Identify key artifacts to collect and review during due diligence.
- Next, identify at the activity level which role is accountable or responsible for each activity. Enter an A for accountable, R for responsible, or A/R for both.
Record the results in the M&A Buy Playbook.
Communication and change
Prepare key stakeholders for the potential changes
- Anytime you are starting a project or program that will depend on users and stakeholders to give up their old way of doing things, change will force people to become novices again, leading to lost productivity and added stress.
- Change management can improve outcomes for any project where you need people to adopt new tools and procedures, comply with new policies, learn new skills and behaviors, or understand and support new processes.
- M&As move very quickly, and it can be very difficult to keep track of which stakeholders you need to be communicating with and what you should be communicating.
- Not all organizations embrace or resist change in the same ways. Base your change communications on your organization’s cultural appetite for change in general.
- Organizations with a low appetite for change will require more direct, assertive communications.
- Organizations with a high appetite for change are more suited to more open, participatory approaches.
Three key dimensions determine the appetite for cultural change:
- Power Distance. Refers to the acceptance that power is distributed unequally throughout the organization.
In organizations with a high power distance, the unequal power distribution is accepted by the less powerful employees.
- Individualism. Organizations that score high in individualism have employees who are more independent. Those who score low in individualism fall into the collectivism side, where employees are strongly tied to one another or their groups.
- Uncertainty Avoidance. Describes the level of acceptance that an organization has toward uncertainty. Those who score high in this area find that their employees do not favor uncertain situations, while those that score low in this area find that their employees are comfortable with change and uncertainty.
2.2.3 Create the communication plan
1-2 hours
Input: IT’s M&A mission, vision, and guiding principles, M&A transition team, IT integration strategy, RACI
Output: IT’s M&A communication plan
Materials: Flip charts/whiteboard, Markers, RACI, M&A Buy Playbook
Participants: IT executive/CIO, IT senior leadership, Company M&A team
The purpose of this activity is to create a communication plan that IT can leverage throughout the initiative.
- Create a structured communication plan that allows for continuous communication with the integration management office, senior management, and the business functional heads.
- Outline key topics of communication, with stakeholders, inputs, and outputs for each topic.
- Review Info-Tech’s example communication plan in the M&A Buy Playbook and update it with relevant information.
- Does this communication plan make sense for your organization? What doesn’t make sense? Adjust the communication guide to suit your organization.
Record the results in the M&A Buy Playbook.
Assessing potential organizations
As soon as you have identified organizations to consider, it’s imperative to assess critical risks. Most IT leaders can attest that they will receive little to no notice when they have to assess the IT organization of a potential purchase. As a result, having a standardized template to quickly gauge the value of the business can be critical.
Ways to Assess
- News: Assess what sort of news has been announced in relation to the organization. Have they had any risk incidents? Has a critical vendor announced working with them?
- LinkedIn: Scan through the LinkedIn profiles of employees. This will give you a sense of what platforms they have based on their employees.
- Trends: Some industries will have specific solutions that are relevant and popular. Assess what the key players are (if you don’t already know) to determine the solution.
- Business Architecture: While this assessment won’t perfect, try to understand the business’ value streams and the critical business and IT capabilities that would be needed to support them.
2.2.4 Assess the potential organization(s)
1-2 hours
Input: Publicized historical risk events, Solutions and vendor contracts likely in the works, Trends
Output: IT’s valuation of the potential organization(s) for acquisition
Materials: M&A Buy Playbook
Participants: IT executive/CIO
The purpose of this activity is to assess the organization(s) that your organization is considering purchasing.
- Complete the Historical Valuation Worksheet in the M&A Buy Playbook to understand the type of IT organization that your company may inherit and need to integrate with.
- The business likely isn’t looking for in-depth details at this time. However, as the IT leader, it is your responsibility to ensure critical risks are identified and communicated to the business.
- Use the information identified to help the business narrow down which organizations should be targeted for the acquisition.
Record the results in the M&A Buy Playbook.
By the end of this pre-transaction phase you should:
Have a program plan for M&As and a repeatable M&A strategy for IT when engaging in growth transactions
Key outcomes from the Discovery & Strategy phase
- Be prepared to analyze and recommend potential organizations that the business can acquire or merge with, using a strong program plan that can be repeated across transactions.
- Create a M&A strategy that accounts for all the necessary elements of a transaction and ensures sufficient governance, capabilities, and metrics exist.
Key deliverables from the Discovery & Strategy phase
- Create vision and mission statements
- Establish guiding principles
- Create a future-state operating model
- Identify the key roles for the transaction team
- Identify and communicate the M&A governance
- Determine target metrics
- Identify the M&A operating model
- Select the integration strategy framework
- Conduct a RACI for key transaction tasks for the transaction team
- Document the communication plan
M&A Buy Blueprint
Phase 3
Due Diligence & Preparation
| Phase 1 | Phase 2 | Phase 3 | Phase 4 |
- 1.1 Identify Stakeholders and Their Perspective of IT
- 1.2 Assess IT’s Current Value and Future State
- 1.3 Drive Innovation and Suggest Growth Opportunities
|
- 2.1 Establish the M&A Program Plan
- 2.2 Prepare IT to Engage in the Acquisition
|
- 3.1 Assess the Target Organization
- 3.2 Prepare to Integrate
|
- 4.1 Execute the Transaction
- 4.2 Reflection and Value Realization
|
This phase will walk you through the following activities:
- Drive value with a due diligence charter
- Identify data room artifacts
- Assess technical debt
- Valuate the target IT organization
- Assess culture
- Prioritize integration tasks
- Establish the integration roadmap
- Identify the needed workforce supply
- Estimate integration costs
- Create an employee transition plan
- Create functional workplans for employees
- Align project metrics with identified tasks
This phase involves the following participants:
- IT executive/CIO
- IT senior leadership
- Company M&A team
- Business leaders
- Prospective IT organization
- Transition team
Workshop Overview
Contact your account representative for more information.
workshops@infotech.com 1-888-670-8889
| Pre-Work | Day 1 | Day 2 | Day 3 | Day 4 | Day 5 |
| Establish the Transaction Foundation | Discover the Motivation for Integration | Assess the Target Organization(s) | Create the Valuation Framework | Plan the Integration Roadmap | Next Steps and Wrap-Up (offsite) |
Activities |
- 0.1 Identify the rationale for the company's decisions to pursue an acquisition.
- 0.2 Identify key stakeholders and determine the IT transaction team.
- 0.3 Gather and evaluate the M&A strategy, future-state operating model, and governance.
|
- 1.1 Review the business rationale for the acquisition.
- 1.2 Identify pain points and opportunities tied to the acquisition.
- 1.3 Establish the integration strategy.
- 1.4 Create the due diligence charter.
|
- 2.1 Create a list of IT artifacts to be reviewed in the data room.
- 2.2 Conduct a technical debt assessment.
- 2.3 Assess the current culture and identify the goal culture.
- 2.4 Identify the needed workforce supply.
|
- 3.1 Valuate the target organization’s data.
- 3.2 Valuate the target organization’s applications.
- 3.3 Valuate the target organization’s infrastructure.
- 3.4 Valuate the target organization’s risk and security.
- 3.5 Combine individual valuations to make a single framework.
|
- 4.1 Prioritize integration tasks.
- 4.2 Establish the integration roadmap.
- 4.3 Establish and align project metrics with identified tasks.
- 4.4 Estimate integration costs.
|
- 5.1 Complete in-progress deliverables from previous four days.
- 5.2 Set up review time for workshop deliverables and to discuss next steps.
|
Deliverables |
- IT strategy
- IT operating model
- IT governance structure
- M&A transaction team
|
- Business context implications for IT
- Integration strategy
- Due diligence charter
|
- Data room artifacts
- Technical debt assessment
- Culture assessment
- Workforce supply identified
|
- IT valuation framework to assess target organization(s)
|
- Integration roadmap and associated resourcing
|
- Acquisition integration strategy for IT
|
What is the Due Diligence & Preparation phase?
Mid-transaction state
The Due Diligence & Preparation phase during an acquisition is a critical time for IT. If IT fails to proactively participate in this phase, IT will have to merely react to integration expectations set by the business.
While not all IT organizations are able to participate in this phase, the evolving nature of M&As to be driven by digital and technological capabilities increases the rationale for IT being at the table. Identifying critical IT risks, which will inevitably be business risks, begins during the due diligence phase.
This is also the opportunity for IT to plan how it will execute the planned integration strategy. Having access to critical information only available in data rooms will further enable IT to successfully plan and execute the acquisition to deliver the value the business is seeking through a growth transaction.
Goal: To thoroughly evaluate all potential risks associated with the organization(s) being pursued and create a detailed plan for integrating the IT environments
Due Diligence Prerequisite Checklist
Before coming into the Due Diligence & Preparation phase, you must have addressed the following:
- Understand the rationale for the company's decisions to pursue an acquisition and what opportunities or pain points the acquisition should alleviate.
- Identify the key roles for the transaction team.
- Identify the M&A governance.
- Determine target metrics.
- Select an integration strategy framework.
- Conduct a RACI for key transaction tasks for the transaction team.
Before coming into the Due Diligence & Preparation phase, we recommend addressing the following:
- Create vision and mission statements.
- Establish guiding principles.
- Create a future-state operating model.
- Identify the M&A operating model.
- Document the communication plan.
- Examine the business perspective of IT.
- Identify key stakeholders and outline their relationship to the M&A process.
- Be able to valuate the IT environment and communicate IT’s value to the business.
The Technology Value Trinity
Delivery of Business Value & Strategic Needs
-
Digital & Technology Strategy
The identification of objectives and initiatives necessary to achieve business goals.
-
IT Operating Model
The model for how IT is organized to deliver on business needs and strategies.
-
Information & Technology Governance
The governance to ensure the organization and its customers get maximum value from the use of information and technology.
All three elements of the Technology Value Trinity work in harmony to deliver business value and achieve strategic needs. As one changes, the others need to change as well.
- Digital and IT Strategy tells you what you need to achieve to be successful.
- IT Operating Model and Organizational Design is the alignment of resources to deliver on your strategy and priorities.
- Information & Technology Governance is the confirmation of IT’s goals and strategy, which ensures the alignment of IT and business strategy. It’s the mechanism by which you continuously prioritize work to ensure that what is delivered is in line with the strategy. This oversight evaluates, directs, and monitors the delivery of outcomes to ensure that the use of resources results in the achieving the organization’s goals.
Too often strategy, operating model and organizational design, and governance are considered separate practices. As a result, “strategic documents” end up being wish lists, and projects continue to be prioritized based on who shouts the loudest – not based on what is in the best interest of the organization.
Due Diligence & Preparation
Step 3.1
Assess the Target Organization
Activities
- 3.1.1 Drive value with a due diligence charter
- 3.1.2 Identify data room artifacts
- 3.1.3 Assess technical debt
- 3.1.4 Valuate the target IT organization
- 3.1.5 Assess culture
This step involves the following participants:
- IT executive/CIO
- IT senior leadership
- Company M&A team
- Business leaders
- Prospective IT organization
- Transition team
Outcomes of Step
This step of the process is when IT should actively evaluate the target organization being pursued for acquisition.
3.1.1 Drive value with a due diligence charter
1-2 hours
Input: Key roles for the transaction team, M&A governance, Target metrics, Selected integration strategy framework, RACI of key transaction tasks for the transaction team
Output: IT Due Diligence Charter
Materials: M&A Buy Playbook
Participants: IT executive/CIO, IT senior leadership, Company M&A team
The purpose of this activity is to create a charter leveraging the items completed in the previous phase, as listed on the Due Diligence Prerequisite Checklist slide, to gain executive sign-off.
- In the IT Due Diligence Charter in the M&A Buy Playbook, complete the aspects of the charter that are relevant for you and your organization.
- We recommend including these items in the charter:
- Communication plan
- Transition team roles
- Goals and metrics for the transaction
- Integration strategy
- Acquisition RACI
- Once the charter has been completed, ensure that business executives agree to the charter and sign off on the plan of action.
Record the results in the M&A Buy Playbook.
3.1.2 Identify data room artifacts
4 hours
Input: Future-state operating model, M&A governance, Target metrics, Selected integration strategy framework, RACI of key transaction tasks for the transaction team
Output: List of items to acquire and review in the data room
Materials: Critical domain lists on following slides, M&A Buy Playbook
Participants: IT executive/CIO, IT senior leadership, Company M&A team, Transition team
The purpose of this activity is to create a list of the key artifacts that should be asked for and reviewed during the due diligence process.
- Review the lists on the following pages as a starting point. Identify which domains, stakeholders, artifacts, and information should be requested for the data room. This information should be directed to the target organization.
- IT leadership may or may not be asked to enter the data room directly. Therefore, it’s important that you clearly identify these artifacts.
- List each question or concern, select the associated workstream in the M&A Buy Playbook, and update the status of the information retrieval.
- Use the comments section to document your discoveries or concerns.
Record the results in the M&A Buy Playbook.
Critical domains
Understand the key stakeholders and outputs for each domain
Each critical domain will likely have different stakeholders who know that domain best. Communicate with these stakeholders throughout the M&A process to make sure you are getting accurate information and interpreting it correctly.
Domain
|
Stakeholders
|
Key Artifacts
|
Key Information to request
|
| Business
|
- Enterprise Architecture
- Business Relationship Manager
- Business Process Owners
|
|
- Capability map (the M&A team should be taking care of this, but make sure it exists)
- Business satisfaction with various IT systems and services
|
| Leadership/IT Executive
|
|
|
- IT capital and operating budgets (from current year and previous year)
|
| Data & Analytics
|
- Chief Data Officer
- Data Architect
- Enterprise Architect
|
- Master data domains, system of record for each
- Unstructured data retention requirements
|
- Data architecture
- Master data domains, sources, and storage
- Data retention requirements
|
| Applications
|
- Applications Manager
- Application Portfolio Manager
- Application Architect
|
- Applications map
- Applications inventory
|
- Applications architecture
- Copy of all software license agreements
- Copy of all software maintenance agreements
|
| Infrastructure
|
- Head of Infrastructure
- Enterprise Architect
- Infrastructure Architect
- Infrastructure Manager
|
- Infrastructure map
- Infrastructure inventory
|
- Network architecture (including which data centers host which infrastructure and applications)
- Inventory (including integration capabilities of vendors, versions, switches, and routers)
- Copy of all hardware lease or purchase agreements
- Copy of all hardware maintenance agreements
- Copy of all outsourcing/external service provider agreements
- Copy of all service-level agreements for centrally provided, shared services and systems
|
| Products and Services
|
- Product Manager
- Head of Customer Interactions
|
|
- Product inventory
- Customer market strategy
|
Critical domains (continued)
Understand the key stakeholders and outputs for each domain
Domain | Stakeholders | Key Artifacts | Key Information to request |
| Operations | | |
- Service overview
- Service owners
- Access policies and procedures
- Availability and service levels
- Support policies and procedures
- Costs and approvals (internal and customer costs)
|
| IT Processes |
- CIO
- IT Management
- VP of IT Governance
- VP of IT Strategy
| |
- Processes in place and productivity levels (capacity)
- Critical processes/processes the organization feels they do particularly well
|
| IT People |
- CIO
- VP of Human Resources
|
- IT organizational chart
- Competency & capacity assessment
|
- IT organizational structure (including resources from external service providers such as contractors) with appropriate job descriptions or roles and responsibilities
- IT headcount and location
|
| Security | | |
- Information security staff
- Information security service providers
- Information security tools
- In-flight information security projects
|
| Projects | | |
- List of all future, ongoing, and recently completed projects
|
| Vendors |
- Head of Vendor Management
| |
- Inventory (including what will and will not be transitioning, vendors, versions, number of licenses)
|
Assess the target organization’s technical debt
The other organization could be costly to purchase if not yet modernizing.
- Consider the potential costs that your business will have to spend to get the other IT organization modernized or even digital.
- This will be highly affected by your planned integration strategy.
- A best-of-breed strategy might simply mean there's little to bring over from the other organization’s environment.
- It’s often challenging to identify a direct financial cost for technical debt. Consider direct costs but also assess categories of impact that can have a long-term effect on your business: lost customer, staff, or business partner goodwill; limited flexibility and resilience; and health, safety, and compliance impacts.
- Use more objective measures to track subjective impact. For example, consider the number of customers who could be significantly affected by each tech debt in the next quarter.
Focus on solving the problems you need to address.
Analyzing technical debt has value in that the analysis can help your organization make better risk management and resource allocation decisions.
Review these examples of technical debt
Do you have any of these challenges?
Applications
- Inefficient or incomplete code
- Fragile or obsolete systems of record that limit the implementation of new functionality
- Out-of-date IDEs or compilers
- Unsupported applications
Data & Analytics
- Data presented via API that does not conform to chosen standards (EDI, NRF-ARTS, etc.)
- Poor data governance
- No transformation between OLTP and the data warehouse
- Heavy use of OLTP for reporting
- Lack of AI model and decision governance, maintenance
End-User Computing
- Aging and slow equipment
- No configuration management
- No MDM/UEM
Security
- Unpatched/unpatchable systems
- Legacy firewalls
- No data classification system
- “Perimeter” security architecture
- No documented security incident response
- No policies, or unenforced policies
Operations
- Incomplete, ineffective, or undocumented business continuity and disaster recovery plans
- Insufficient backups or archiving
- Inefficient MACD processes
- Application sprawl with no record of installed applications or licenses
- No ticketing or ITSM system
- No change management process
- No problem management process
- No event/alert management
Infrastructure
- End-of-life/unsupported equipment
- Aging power or cooling systems
- Water- or halon-based data center fire suppression systems
- Out-of-date firmware
- No DR site
- Damaged or messy cabling
- Lack of system redundancy
- Integrated computers on business equipment (e.g. shop floor equipment, medical equipment) running out-of-date OS/software
Project & Portfolio Management
- No project closure process
- Ineffective project intake process
- No resource management practices
“This isn’t a philosophical exercise. Knowing what you want to get out of this analysis informs the type of technical debt you will calculate and the approach you will take.” (Scott Buchholz, CTO, Deloitte Government & Public Services Practice, The Wall Street Journal, 2015)
3.1.3 Assess technical debt
1-2 hours
Input: Participant views on organizational tech debt, Five to ten key technical debts, Business impact scoring scales, Reasonable next-quarter scenarios for each technical debt, Technical debt business impact analysis
Output: Initial list of tech debt for the target organization
Materials: Whiteboard, Sticky notes, Technical Debt Business Impact Analysis Tool, M&A Buy Playbook
Participants: IT executive/CIO, IT senior leadership, Business leaders, Transition team
The purpose of this activity is to assess the technical debt of the other IT organization. Taking on unnecessary technical debt is one of the biggest risks to the IT environment
- This activity can be completed by leveraging the blueprint Manage Your Technical Debt, specifically the Technical Debt Business Impact Analysis Tool. Complete the following activities in the blueprint:
- 1.2.1 Identify your technical debt
- 1.2.2 Select tech debt for your impact analysis
- 2.2.2 Estimate tech debt impact
- 2.2.3 Identify the most-critical technical debts
- Review examples of technical debt in the previous slide to assist you with this activity.
- Document the results from tab 3, Impact Analysis, in the M&A Buy Playbook if you are trying to record all artifacts related to the transaction in one place.
Record the results in the M&A Buy Playbook.
How to valuate an IT environment
And why it matters so much
- Valuating the target organization’s IT environment is a critical step to fully understand what it might be worth. Business partners are often not in the position to valuate the IT aspects to the degree that you would be.
- The business investments in IT can be directly translated to a value amount. Meaning for every $1 invested in IT, the business might be gaining $100 in value back or possibly even loosing $100.
- Determining, documenting, and communicating this information ensures that the business takes IT’s suggestions seriously and recognizes why investing in IT can be so critical.
- There are three ways a business or asset can be valuated:
- Cost Approach: Look at the costs associated with building, purchasing, replacing, and maintaining a given aspect of the business.
- Market Approach: Look at the relative value of a particular aspect of the business. Relative value can fluctuate and depends on what the markets and consequently society believe that particular element is worth.
- Discounted Cash Flow Approach: Focus on what the potential value of the business could be or the intrinsic value anticipated due to future profitability.
The IT valuation conducted during due diligence can have a significant impact on the final financials of the transaction for the business.
3.1.4 Valuate the target IT organization
1 day
Input: Valuation of data, Valuation of applications, Valuation of infrastructure and operations, Valuation of security and risk
Output: Valuation of target organization’s IT
Materials: Relevant templates/tools, Capital budget, Operating budget, M&A Buy Playbook
Participants: IT executive/CIO, IT senior leadership, Prospective IT organization
The purpose of this activity is to valuate the other IT organization.
- Review each of slides 42 to 45 to generate a valuation of IT’s data, applications, infrastructure, and security and risk. These valuations consider several tangible and intangible factors and result in a final dollar amount. For more information on this activity, review Activity 1.2.1 from the Proactive phase.
- Identify financial amounts for each critical area and add the financial output to the summary slide in the M&A Buy Playbook.
- Compare this information against your own IT organization’s valuation.
- Does it add value to your IT organization?
- Is there too much risk to accept if this transaction goes through?
Info-Tech Insight
Consistency is key when valuating your IT organization as well as other IT organizations throughout the transaction process.
Record the results in the M&A Buy Playbook.
Culture should not be overlooked, especially as it relates to the integration of IT environments
- There are three types of culture that need to be considered.
- Most importantly, this transition is an opportunity to change the culture that might exist in your organization’s IT environment.
- Make a decision on which type of culture you’d like IT to have post-transition.
Target Organization’s Culture
The culture that the target organization is currently embracing. Their established and undefined governance practices will lend insight into this.
Your Organization’s Culture
The culture that your organization is currently embracing. Examine people’s attitudes and behaviors within IT toward their jobs and the organization.
Ideal Culture
What will the future culture of the IT organization be once integration is complete? Are there aspects that your current organization and the target organization embrace that are worth considering?
Culture categories
Map the results of the IT Culture Diagnostic to an existing framework
Competitive
- Autonomy
- Confront conflict directly
- Decisive
- Competitive
- Achievement oriented
- Results oriented
- High performance expectations
- Aggressive
- High pay for good performance
- Working long hours
- Having a good reputation
- Being distinctive/different
|
Innovative
- Adaptable
- Innovative
- Quick to take advantage of opportunities
- Risk taking
- Opportunities for professional growth
- Not constrained by rules
- Tolerant
- Informal
- Enthusiastic
|
Traditional
- Stability
- Reflective
- Rule oriented
- Analytical
- High attention to detail
- Organized
- Clear guiding philosophy
- Security of employment
- Emphasis on quality
- Focus on safety
|
Cooperative
- Team oriented
- Fair
- Praise for good performance
- Supportive
- Calm
- Developing friends at work
- Socially responsible
|
Culture Considerations
- What culture category was dominant for each IT organization?
- Do you share the same dominant category?
- Is your current dominant culture category the most ideal to have post-integration?
3.1.5 Assess Culture
3-4 hours
Input: Cultural assessments for current IT organization, Cultural assessment for target IT organization
Output: Goal for IT culture
Materials: IT Culture Diagnostic, M&A Buy Playbook
Participants: IT executive/CIO, IT senior leadership, IT employees of current organization, IT employees of target organization, Company M&A team
The purpose of this activity is to assess the different cultures that might exist within the IT environments of both organizations. More importantly, your IT organization can select its desired IT culture for the long term if it does not already exist.
- Complete this activity by leveraging the blueprint Fix Your IT Culture, specifically the IT Culture Diagnostic. Fill out the diagnostic for the IT department in your organization:
- Answer the 16 questions in tab 2, Diagnostic.
- Find out your dominant culture and review recommendations in tab 3, Results.
- Document the results from tab 3, Results, in the M&A Buy Playbook if you are trying to record all artifacts related to the transaction in one place.
- Repeat the activity for the target organization.
- Leverage the information to determine what the goal for the culture of IT will be post-integration if it will differ from the current culture.
Record the results in the M&A Buy Playbook.
Due Diligence & Preparation
Step 3.2
Prepare to Integrate
Activities
- 3.2.1 Prioritize integration tasks
- 3.2.2 Establish the integration roadmap
- 3.2.3 Identify the needed workforce supply
- 3.2.4 Estimate integration costs
- 3.2.5 Create an employee transition plan
- 3.2.6 Create functional workplans for employees
- 3.2.7 Align project metrics with identified tasks
This step involves the following participants:
- IT executive/CIO
- IT senior leadership
- Transition team
- Company M&A team
Outcomes of Step
Have an established plan of action toward integration across all domains and a strategy toward resources.
Don’t underestimate the importance of integration preparation
Integration is the process of combining the various components of one or more organizations into a single organization.
80% of integration should happen within the first two years. (Source: CIO Dive)
70% of M&A IT integrations fail due to components that could and should be addressed at the beginning. (Source: The Wall Street Journal, 2019)
Info-Tech Insight
Integration is not rationalization. Once the organization has integrated, it can prepare to rationalize the IT environment.
Integration needs
Identify your domain needs to support the target technology environment
Set up a meeting with your IT due diligence team to:
- Address data, applications, infrastructure, and other domain gaps.
- Discuss the people and processes necessary to achieve the target technology environment and support M&A business objectives.
Use this opportunity to:
- Identify data and application complexities between your organization and the target organization.
- Identify the IT people and process gaps, redundancies, and initiatives.
- Determine your infrastructure needs and identify redundancies.
- Does IT have the infrastructure to support the applications and business capabilities of the resultant enterprise?
- Identify any gaps between the current infrastructure in both organizations and the infrastructure required in the resultant enterprise.
- Identify any redundancies.
- Determine the appropriate IT integration strategies.
- Document your gaps, redundancies, initiatives, and assumptions to help you track and justify the initiatives that must be undertaken and help estimate the cost of integration.
Integration implications
Understand the implications for integration with respect to each target technology environment
Domain | Independent Models | Create Links Between Critical Systems | Move Key Capabilities to Common Systems | Adopt One Model |
Data & Analytics |
- Consider data sources that might need to be combined (e.g. financials, email lists, internet).
- Understand where each organization will warehouse its data and how it will be managed in a cost-effective manner.
- Consider your reporting and transactional needs. Initially systems may remain separate, but eventually they will need to be merged.
|
- Analyze whether or not the data types are compatible between companies.
- Understand the critical data needs and the complexity of integration activities.
- Consider your reporting and transactional needs. Initially systems may remain separate, but eventually they will need to be merged.
|
- Focus on the master data domains that represent the core of your business.
- Assess the value, size, location, and cleanliness of the target organization’s data sets.
- Determine the data sets that will be migrated to capture expected synergies and drive core capabilities while addressing how other data sets will be maintained and managed.
|
- Decide which applications to keep and which to terminate. This includes setting timelines for application retirement.
- Establish interim linkages and common interfaces for applications while major migrations occur.
|
Applications |
- Establish whether or not there are certain critical applications that still need to be linked (e.g. email, financials).
- Leverage the unique strengths and functionalities provided by the applications used by each organization.
- Confirm that adequate documentation and licensing exists.
|
- Decide which critical applications need to be linked versus which need to be kept separate to drive synergies. For example, financial, email, and CRM may need to be linked, while certain applications may remain distinct.
- Pay particular attention to the extent to which systems relating to customers, products, orders, and shipments need to be integrated.
|
- Determine the key capabilities that require support from the applications identified by business process owners.
- Assess which major applications need to be adopted by both organizations, based on the M&A goals.
- Establish interim linkages and common interfaces for applications while major migrations occur.
|
- Decide which applications to keep and which to terminate. This includes setting timelines for application retirement.
- Establish interim linkages and common interfaces for applications while major migrations occur.
|
Integration implications (continued)
Understand the implications for integration with respect to each target technology environment
Domain | Independent Models | Create Links Between Critical Systems | Move Key Capabilities to Common Systems | Adopt One Model |
Infrastructure |
- Assess the infrastructure demands created by retaining separate models (e.g. separate domains, voice, network integration).
- Evaluate whether or not there are redundant data centers that could be consolidated to reduce costs.
|
- Assess the infrastructure demands created by retaining separate models (e.g. separate domains, voice, network integration).
- Evaluate whether or not there are redundant data centers that could be consolidated to reduce costs.
|
- Evaluate whether certain infrastructure components, such as data centers, can be consolidated to support the new model while also eliminating redundancies. This will help reduce costs.
|
- Assess which infrastructure components need to be kept versus which need to be terminated to support the new application portfolio. Keep in mind that increasing the transaction volume on a particular application increases the infrastructure capacity that is required for that application.
- Extend the network to integrate additional locations.
|
IT People & Processes |
- Retain workers from each IT department who possess knowledge of key products, services, and legacy systems.
- Consider whether there are redundancies in staffing that could be eliminated.
- The IT processes of each organization will most likely remain separate.
- Consider the impact of the target organization on your IT processes.
|
- Retain workers from each IT department who possess knowledge of key products, services, and legacy systems.
- Consider whether there are redundancies in staffing that could be eliminated.
- Consider how critical IT processes of the target organization fit with your current IT processes.
|
- Identify which redundant staff members should be terminated by focusing on the key skills that will be necessary to support the common systems.
- If there is overlap with the IT processes in both organizations, you may wish to map out both processes to get a sense for how they might work together.
|
- Assess what processes will be prioritized to support IT strategies.
- Identify which redundant staff members should be terminated by focusing on the key skills that will be necessary to support the prioritized IT processes.
|
Integration implications (continued)
Understand the implications for integration with respect to each target technology environment
Domain | Independent Models | Create Links Between Critical Systems | Move Key Capabilities to Common Systems | Adopt One Model |
Leadership/IT Executive |
- Have insight into the goals and direction of the organization’s leadership. Make sure that a communication path has been established to receive information and provide feedback.
|
- The decentralized model will require some form of centralization and strong governance processes to enable informed decisions.
- Ensure that each area can deliver on its needs while not overstepping the goals and direction of the organization.
|
- This will help with integration in the sense that front-line employees can see a single organization beginning to form.
- In this model, there is the opportunity to select elements of each leadership style and strategy that will work for the larger organization.
|
- Leadership can provide a single and unified approach to how the strategic goals will be executed.
- More often than not, this would be the acquiring organization’s strategic direction.
|
Vendors |
- Determine which contracts the target organization currently has in place.
- Having different vendors in place will not be a bad model if it makes sense.
- Spend time reviewing the contracts and ensuring that each organization has the right contracts to succeed.
|
- Identify what redundancies might exist (ERPs, for example) and determine if the vendor would be willing to terminate one contract or another.
- Through integration, it might be possible to engage in one set of contract negotiations for a single application or technology.
|
- Identify whether there are opportunities to combine contracts or if they must remain completely separated until the end of the term.
- In an effort to capitalize on the contracts working well, reduce the contracts that might be hindering the organization.
|
- Speak to the vendor offering the contract.
- Going forward, ensure the contracts are negotiated to include clauses to allow for easier and more cost-effective integration.
|
Integration implications (continued)
Understand the implications for integration with respect to each target technology environment
Domain | Independent Models | Create Links Between Critical Systems | Move Key Capabilities to Common Systems | Adopt One Model |
Security |
- Both organizations would need to have a process for securing their organization.
- Sharing and accessing information might be more difficult, as each organization would need to keep the other organization separate to ensure the organization remains secure.
|
- Creating standard policies and procedures that each organization must adhere to would be critical here (for example, multifactor authentication).
- Establish a single path of communication between the two organizations, ensuring reliable and secure data and information sharing.
|
- Leverage the same solutions to protect the business as a whole from internal and external threats.
- Identify opportunities where there might be user points of failure that could be addressed early in the process.
|
- Determine what method of threat detection and response will best support the business and select that method to apply to the entire organization, both original and newly acquired.
|
Projects |
- Projects remain ongoing as they were prior to the integration.
- Some projects might be made redundant after the initial integration is over.
- Re-evaluate the projects after integration to ensure they continue to deliver on the business’ strategic direction.
|
- Determine which projects are similar to one another and identify opportunities to leverage business needs and solutions for each organization where possible.
- Review project histories to determine the rationale for and success of projects that could be reused in either organization going forward.
|
- Determine which projects should remain ongoing and which projects could wait to be implemented or could be completely stopped.
- There might be certain modernization projects ongoing that cannot be stopped.
- However, for all other projects, embrace a single portfolio.
|
- Completely reduce or remove all ongoing projects from the one organization and continue with only the projects of the other organization.
- Add in new projects when they arise as needed.
|
3.2.1 Prioritize integration tasks
2 hours
Input: Integration tasks, Transition team, M&A RACI
Output: Prioritized integration list
Materials: Integration task checklist, Integration roadmap
Participants: IT executive/CIO, IT senior leadership, Company M&A team
The purpose of this activity is to prioritize the different integration tasks that your organization has identified as necessary to this transaction. Some tasks might not be relevant for this particular transaction, and others might be critical.
- Download the SharePoint or Excel version of the M&A Integration Project Management Tool. Identify which integration tasks you want as part of your project plan. Alter or remove any tasks that are irrelevant to your organization. Add in tasks you think are missing.
- When deciding criticality of the task, consider the effect on stakeholders, those who are impacted or influenced in the process of the task, and dependencies (e.g. data strategy needs to be addressed first before you can tackle its dependencies, like data quality).
- Feel free to edit the way you measure criticality. The standard tool leverages a three-point scale. At the end, you should have a list of tasks in priority order based on criticality.
Record the updates in the M&A Integration Project Management Tool (SharePoint).
Record the updates in the M&A Integration Project Management Tool (Excel).
Integration checklists
Prerequisite Checklist
- Build the project plan for integration and prioritize activities
- Plan first day
- Plan first 30/100 days
- Plan first year
- Create an organization-aligned IT strategy
- Identify critical stakeholders
- Create a communication strategy
- Understand the rationale for the acquisition or purchase
- Develop IT's purchasing strategy
- Determine goal opportunities
- Create the mission and vision statements
- Create the guiding principles
- Create program metrics
- Consolidate reports from due diligence/data room
- Conduct culture assessment
- Create a transaction team
- Assess workforce demand and supply
- Plan and communicate potential layoffs
- Create an employee transition plan
- Identify the IT investment
Business
- Design an enterprise architecture
- Document your business architecture
- Identify and assess all of IT's risks
Leadership/IT Executive
- Build an IT budget
- Structure operating budget
- Structure capital budget
- Identify the needed workforce demand vs. capacity
- Establish and monitor key metrics
- Communicate value realized/cost savings
Data
- Confirm data strategy
- Confirm data governance
- Data architecture
- Data sources
- Data storage (on-premises vs. cloud)
- Enterprise content management
- Compatibility of data types between organizations
- Cleanliness/usability of target organization data sets
- Identify data sets that need to be combined to capture synergies/drive core capabilities
- Reporting and analytics capabilities
Applications
- Prioritize and address critical applications
- ERP
- CRM
- Email
- HRIS
- Financial
- Sales
- Risk
- Security
- Leverage application rationalization framework to determine applications to keep, terminate, or create
- Develop method of integrating applications
- Model critical applications that have dependencies on one another
- Identify the infrastructure capacity required to support critical applications
Operations
- Communicate helpdesk/service desk information
- Manage sales access to customer data
- Determine locations and hours of operation
- Consolidate phone lists and extensions
- Synchronize email address books
Integration checklists (continued)
Infrastructure
- Determine single network access
- Manage organization domains
- Consolidate data centers
- Compile inventory of vendors, versions, switches, and routers
- Review hardware lease or purchase agreements
- Review outsourcing/service provider agreements
- Review service-level agreements
- Assess connectivity linkages between locations
- Plan to migrate to a single email system if necessary
Vendors
- Establish a sustainable vendor management office
- Review vendor landscape
- Identify warranty options
- Rationalize vendor services and solutions
- Identify opportunities to mature the security architecture
People
- Design an IT operating model
- Redesign your IT organizational structure
- Conduct a RACI
- Conduct a culture assessment and identify goal IT culture
- Build an IT employee engagement program
- Determine critical roles and systems/process/products they support
- Create a list of employees to be terminated
- Create employee transition plans
- Create functional workplans
Projects
- Stop duplicate or unnecessary target organization projects
- Communicate project intake process
- Prioritize projects
Products & Services
- Ensure customer services requirements are met
- Ensure customer interaction requirements are met
- Select a solution for product lifecycle management
Security
- Conduct a security assessment of target organization
- Develop accessibility prioritization and schedule
- Establish an information security strategy
- Develop a security awareness and training program
- Develop and manage security governance, risk, and compliance
- Identify security budget
- Build a data privacy and classification program
IT Processes
- Evaluate current process models
- Determine productivity/capacity levels of processes
- Identify processes to be terminated
- Identify process expectations from target organization
- Establish a communication plan
- Develop a change management process
- Establish/review IT policies
3.2.2 Establish the integration roadmap
2 hours
Input: Prioritized integration tasks, Employee transition plan, Integration RACI, Costs for activities, Activity owners
Output: Integration roadmap
Materials: M&A Integration Project Plan Tool (SharePoint), M&A Integration Project Plan Tool (Excel)
Participants: IT executive/CIO, IT senior leadership, Transition team, Company M&A team
The purpose of this activity is to create a roadmap to support IT throughout the integration process. Using the information gathered in previous activities, you can create a roadmap that will ensure a smooth integration.
- Leverage our M&A Integration Project Management Tool to track critical elements of the integration project. There are a few options available:
- Follow the instructions on the next slide if you are looking to upload our SharePoint project template.
- If you cannot or do not want to use SharePoint as your project management solution, download our Excel version of the tool.
**Remember that this your tool, so customize to your liking.
- Identify who will own or be accountable for each of the integration tasks and establish the time frame for when each project should begin and end. This will confirm which tasks should be prioritized.
Record the updates in the M&A Integration Project Management Tool (SharePoint).
Record the updates in the M&A Integration Project Management Tool (Excel).
Integration Project Management Tool (SharePoint Template)
Follow these instructions to upload our template to your SharePoint environment
- Create or use an existing SP site.
- Download the M&A Integration Project Plan Tool (SharePoint) .wsp file from the Mergers & Acquisitions: The Buy Blueprint landing page.
- To import a template into your SharePoint environment, do the following:
- Open PowerShell.
- Connect-SPO Service (need to install PowerShell module).
- Enter in your tenant admin URL.
- Enter in your admin credentials.
- Set-SPO Site https://YourDomain.sharepoint.com/sites/YourSiteHe... -DenyAddAndCustomizePages 0
OR
- Turn on both custom script features to allow users to run custom
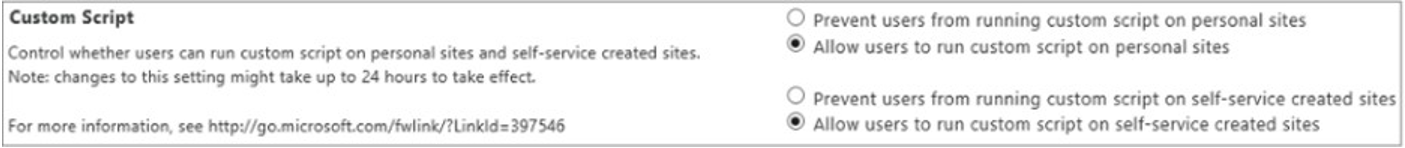
- Enable the SharePoint Server Standard Site Collection features.
- Upload the .wsp file in Solutions Gallery.
- Deploy by creating a subsite and select from custom options.
- Allow or prevent custom script
- Security considerations of allowing custom script
- Save, download, and upload a SharePoint site as a template
Refer to Microsoft documentation to understand security considerations and what is and isn’t supported:
For more information, check out the SharePoint Template: Step-by-Step Deployment Guide.
Participate in active workforce planning to transition employees
The chosen IT operating model, primary M&A goals, and any planned changes to business strategy will dramatically impact IT staffing and workforce planning efforts.
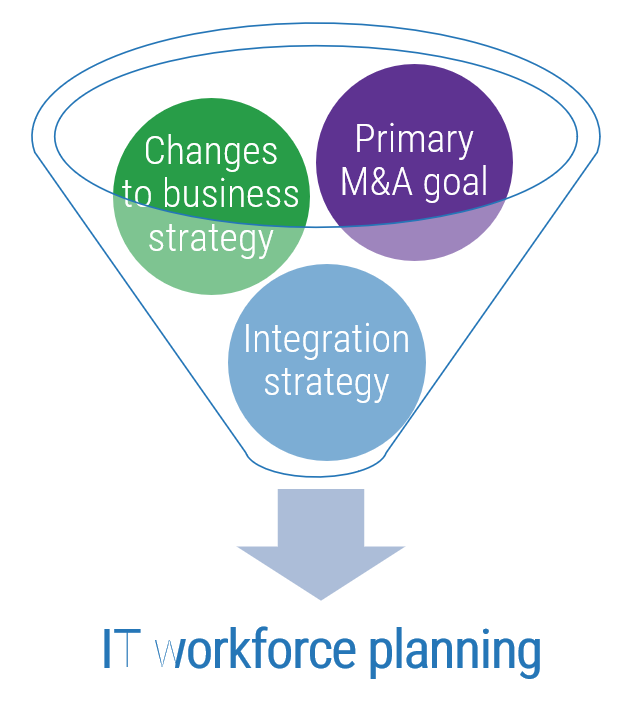
IT workforce planning
-
Primary M&A goals
If the goal of the M&A is cost cutting, then workforce planning will be necessary to identify labor redundancies.
-
Changes to business strategy
If business strategy will change after the merger, then workforce planning will typically be more involved than if business strategy will not change.
-
Integration strategy
For independent models, workforce planning will typically be unnecessary.
For connection of essential systems or absorption, workforce planning will likely be an involved, time-consuming process.
- Estimate the headcount you will need through the end of the M&A transition period.
- Outline the process you will use to assess staff for roles that have more than one candidate.
- Review employees in each department to determine the best fit for each role.
- Determine whether terminations will happen all together or in waves.
Info-Tech Insight
Don’t be a short-term thinker when it comes to workforce planning! IT teams that only consider the headcount needed on day one of the new entity will end up scrambling to find skilled resources to fill workforce gaps later in the transition period.
3.2.3 Identify the needed workforce supply
3-4 hours
Input: IT strategy, Prioritized integration tasks
Output: A clear indication of how many resources are required for each role and the number of resources that the organization actually has
Materials: Resource Management Supply-Demand Calculator
Participants: IT executive/CIO, IT senior leadership, Target organization employees, Company M&A team, Transition team
The purpose of this activity is to determine the anticipated amount of work that will be required to support projects (like integration), administrative, and keep-the-lights-on activities.
- Download the Resource Management Supply-Demand Calculator.
- The calculator requires minimal up-front staff participation: You can obtain meaningful results with participation from as few as one person with insight on the distribution of your resources and their average work week or month.
- The calculator will yield a report that shows a breakdown of your annual resource supply and demand, as well as the gap between the supply and demand. Further insight on project and non-project supply and demand are provided.
- Repeat the tool several times to identify the needs of your IT environment for day one, day 30/100, and year one. Anticipate that these will change over time. Also, do not forget to obtain this information from the target organization. Given that you will be integrating, it’s important to know how many staff they have in which roles.
**For additional information, please review slides starting from slide 44 in
Establish Realistic IT Resource Management Practices to see how to use the tool.
Record the results in the Resource Management Supply-Demand Calculator.
Resource Supply-Demand Calculator Output Example
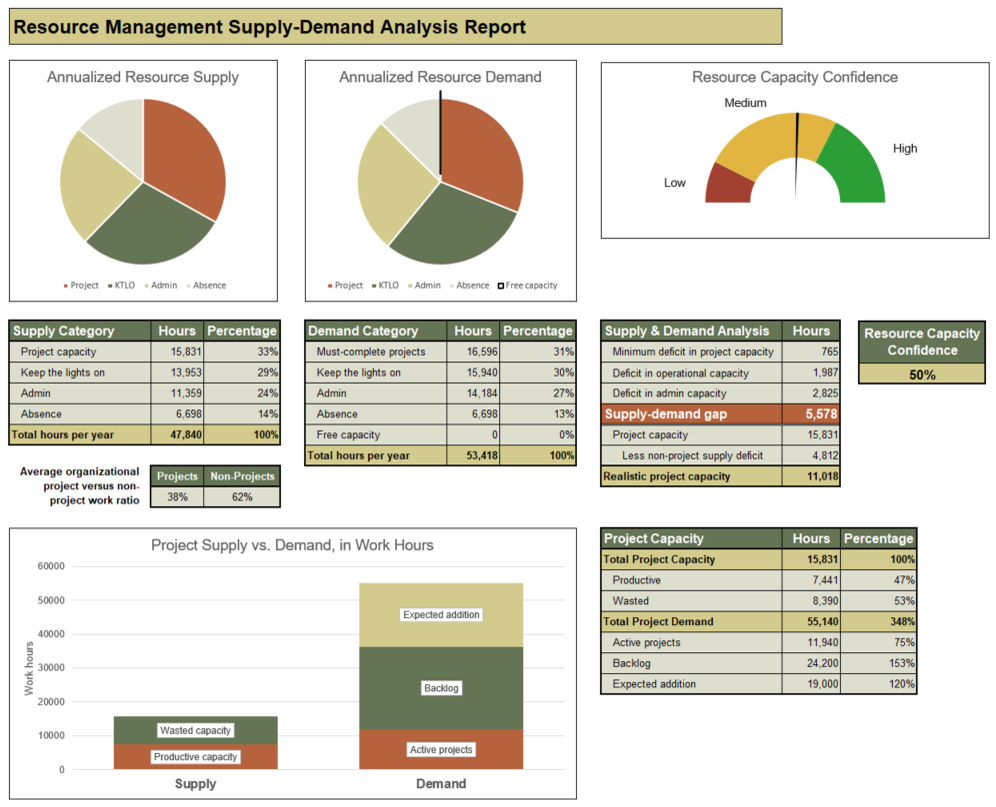
Resource Capacity Confidence. This figure is based on your confidence in supply confidence, demand stability, and the supply-demand ratio.
Importance of estimating integration costs
Change is the key driver of integration costs
Integration costs are dependent on the following:
- Meeting synergy targets – whether that be cost saving or growth related.
- Employee-related costs, licensing, and reconfiguration fees play a huge part in meeting synergy targets.
- Adjustments related to compliance or regulations – especially if there are changes to legal entities, reporting requirements, or risk-mitigation standards.
- Governance or third party–related support required to ensure timelines are met and the integration is a success.
Integration costs vary by industry type.
- Certain industries may have integration costs made up of mostly one type, differing from other industries, due to the complexity and different demands of the transaction. For example:
- Healthcare integration costs are mostly driven by regulatory, safety, and quality standards, as well as consolidation of the research and development function.
- Energy and Utilities tend to have the lowest integration costs due to most transactions occurring within the same sector rather than as a cross-sector investment. For example, oil and gas acquisitions tend to be for oil fields and rigs (strategic fixed assets), which can easily be added to the buyer’s portfolio.
Integration costs are more related to the degree of change required than the size of the transaction.
3.2.4 Estimate integration costs
3-4 hours
Input: Integration tasks, Transition team, Valuation of current IT environment, Valuation of target IT environment, Outputs from data room, Technical debt, Employees
Output: List of anticipated costs required to support IT integration
Materials: Integration task checklist, Integration roadmap, M&A Buy Playbook
Participants: IT executive/CIO, IT senior leadership, Company M&A team, Transition team
The purpose of this activity is to estimate the costs that will be associated with the integration. It’s important to ensure a realistic figure is identified and communicated to the larger M&A team within your company as early in the process as possible. This ensures that the funding required for the transaction is secured and budgeted for in the overarching transaction.
- On the associated slide in the M&A Buy Playbook, input:
- Task
- Domain
- Cost type
- Total cost amount
- Level of certainty around the cost
- Provide a copy of the estimated costs to the company’s M&A team. Also provide any additional information identified earlier to help them understand the importance of those costs.
Record the results in the M&A Buy Playbook.
Employee transition planning
Considering employee impact will be a huge component to ensure successful integration
- Meet With Leadership
- Plan Individual and Department Redeployment
- Plan Individual and Department Layoffs
- Monitor and Manage Departmental Effectiveness
- For employees, the transition could mean:
- Changing from their current role to a new role to meet requirements and expectations throughout the transition.
- Being laid off because the role they are currently occupying has been made redundant.
- It is important to plan for what the M&A integration needs will be and what the IT operational needs will be.
- A lack of foresight into this long-term plan could lead to undue costs and headaches trying to retain critical staff, rehiring positions that were already let go, and keeping redundant employees longer then necessary.
Info-Tech Insight
Being transparent throughout the process is critical. Do not hesitate to tell employees the likelihood that their job may be made redundant. This will ensure a high level of trust and credibility for those who remain with the organization after the transaction.
3.2.5 Create an employee transition plan
3-4 hours
Input: IT strategy, IT organizational design, Resource Supply-Demand Calculator output
Output: Employee transition plans
Materials: M&A Buy Playbook, Whiteboard, Sticky notes, Markers
Participants: IT executive/CIO, IT senior leadership, Company M&A team, Transition team
The purpose of this activity is to create a transition plan for employees.
- Transition planning can be done at specific individual levels or more broadly to reflect a single role. Consider these four items in the transition plan:
- Understand the direction of the employee transitions.
- Identify employees that will be involved in the transition (moved or laid off).
- Prepare to meet with employees.
- Meet with employees.
- For each employee that will be facing some sort of change in their regular role, permanent or temporary, create a transition plan.
- For additional information on transitioning employees, review the blueprint Streamline Your Workforce During a Pandemic.
**Note that if someone’s future role is a layoff, then there is no need to record anything for skills needed or method for skill development.
Record the results in the M&A Buy Playbook.
3.2.6 Create functional workplans for employees
3-4 hours
Input: Prioritized integration tasks, Employee transition plan, Integration RACI, Costs for activities, Activity owners
Output: Employee functional workplans
Materials: M&A Buy Playbook, Learning and development tools
Participants: IT executive/CIO, IT senior leadership, IT management team, Company M&A team, Transition team
The purpose of this activity is to create a functional workplan for the different employees so that they know what their key role and responsibilities are once the transaction occurs.
- First complete the transition plan from the previous activity (3.2.5) and the separation roadmap. Have these documents ready to review throughout this process.
- Identify the employees who will be transitioning to a new role permanently or temporarily. Creating a functional workplan is especially important for these employees.
- Identify the skills these employees need to have to support the separation. Record this in the corresponding slide in the M&A Buy Playbook.
- For each employee, identify someone who will be a point of contact for them throughout the transition.
It is recommended that each employee have a functional workplan. Leverage the IT managers to support this task.
Record the results in the M&A Buy Playbook.
Metrics for integration
Valuation & Due Diligence
- % Defects discovered in production
- $ Cost per user for enterprise applications
- % In-house-built applications vs. enterprise applications
- % Owners identified for all data domains
- # IT staff asked to participate in due diligence
- Change to due diligence
- IT budget variance
- Synergy target
Execution & Value Realization
- % Satisfaction with the effectiveness of IT capabilities
- % Overall end-customer satisfaction
- $ Impact of vendor SLA breaches
- $ Savings through cost-optimization efforts
- $ Savings through application rationalization and technology standardization
- # Key positions empty
- % Frequency of staff turnover
- % Emergency changes
- # Hours of unplanned downtime
- % Releases that cause downtime
- % Incidents with identified problem record
- % Problems with identified root cause
- # Days from problem identification to root cause fix
- % Projects that consider IT risk
- % Incidents due to issues not addressed in the security plan
- # Average vulnerability remediation time
- % Application budget spent on new build/buy vs. maintenance (deferred feature implementation, enhancements, bug fixes)
- # Time (days) to value realization
- % Projects that realized planned benefits
- $ IT operational savings and cost reductions that are related to synergies/divestitures
- % IT staff–related expenses/redundancies
- # Days spent on IT integration
- $ Accurate IT budget estimates
- % Revenue growth directly tied to IT delivery
- % Profit margin growth
3.2.7 Align project metrics with identified tasks
3-4 hours
Input: Prioritized integration tasks, Employee transition plan, Integration RACI, Costs for activities, Activity owners, M&A goals
Output: Integration-specific metrics to measure success
Materials: Roadmap template, M&A Buy Playbook
Participants: IT executive/CIO, IT senior leadership, Transition team
The purpose of this activity is to understand how to measure the success of the integration project by aligning metrics to each identified task.
- Review the M&A goals identified by the business. Your metrics will need to tie back to those business goals.
- Identify metrics that align to identified tasks and measure achievement of those goals. For each metric you consider, ask the following questions:
- What is the main goal or objective that this metric is trying to solve?
- What does success look like?
- Does the metric promote the right behavior?
- Is the metric actionable? What is the story you are trying to tell with this metric?
- How often will this get measured?
- Are there any metrics it supports or is supported by?
Record the results in the M&A Buy Playbook.
By the end of this mid-transaction phase you should:
Have successfully evaluated the target organization’s IT environment, escalated the acquisition risks and benefits, and prepared IT for integration.
Key outcomes from the Due Diligence & Preparation phase
- Participate in due diligence activities to accurately valuate the target organization(s) and determine if there are critical risks or benefits the current organization should be aware of.
- Create an integration roadmap that considers the tasks that will need to be completed and the resources required to support integration.
Key deliverables from the Due Diligence & Preparation phase
- Establish a due diligence charter
- Create a list of data room artifacts and engage in due diligence
- Assess the target organization’s technical debt
- Valuate the target IT organization
- Assess and plan for culture
- Prioritize integration tasks
- Establish the integration roadmap
- Identify the needed workforce supply
- Estimate integration costs
- Create employee transition plans
- Create functional workplans for employees
- Align project metrics with identified tasks
M&A Buy Blueprint
Phase 4
Execution & Value Realization
| Phase 1 | Phase 2 | Phase 3 | Phase 4 |
- 1.1 Identify Stakeholders and Their Perspective of IT
- 1.2 Assess IT’s Current Value and Future State
- 1.3 Drive Innovation and Suggest Growth Opportunities
|
- 2.1 Establish the M&A Program Plan
- 2.2 Prepare IT to Engage in the Acquisition
|
- 3.1 Assess the Target Organization
- 3.2 Prepare to Integrate
|
- 4.1 Execute the Transaction
- 4.2 Reflection and Value Realization
|
This phase will walk you through the following activities:
- Rationalize the IT environment
- Continually update the project plan
- Confirm integration costs
- Review IT’s transaction value
- Conduct a transaction and integration SWOT
- Review the playbook and prepare for future transactions
This phase involves the following participants:
- IT executive/CIO
- IT senior leadership
- Vendor management team
- IT transaction team
- Company M&A team
Workshop Overview
Contact your account representative for more information.
workshops@infotech.com 1-888-670-8889
| Pre-Work | Day 1 | Day 2 | Day 3 | Engage in Integration | Day 4 |
| Establish the Transaction Foundation | Discover the Motivation for Integration | Plan the Integration Roadmap | Prepare Employees for the Transition | Engage in Integration | Assess the Transaction Outcomes (Must be within 30 days of transaction date) |
Activities |
- 0.1 Understand the rationale for the company's decisions to pursue an acquisition.
- 0.2 Identify key stakeholders and determine the IT transaction team.
- 0.3 Gather and evaluate the M&A strategy, future-state operating model, and governance.
|
- 1.1 Review the business rationale for the acquisition.
- 1.2 Identify pain points and opportunities tied to the acquisition.
- 1.3 Establish the integration strategy.
- 1.4 Prioritize Integration tasks.
|
- 2.1 Establish the integration roadmap.
- 2.2 Establish and align project metrics with identified tasks.
- 2.3 Estimate integration costs.
|
- 3.1 Assess the current culture and identify the goal culture.
- 3.2 Identify the needed workforce supply.
- 3.3 Create an employee transition plan.
- 3.4 Create functional workplans for employees.
|
- I.1 Complete the integration by regularly updating the project plan.
- I.2 Begin to rationalize the IT environment where possible and necessary.
|
- 4.1 Confirm integration costs.
- 4.2 Review IT’s transaction value.
- 4.3 Conduct a transaction and integration SWOT.
- 4.4 Review the playbook and prepare for future transactions.
|
Deliverables |
- IT strategy
- IT operating model
- IT governance structure
- M&A transaction team
|
- Business context implications for IT
- Integration strategy
|
- Integration roadmap and associated resourcing
|
- Culture assessment
- Workforce supply identified
- Employee transition plan
|
- Rationalized IT environment
- Updated integration project plan
|
- SWOT of transaction
- M&A Buy Playbook refined for future transactions
|
What is the Execution & Value Realization phase?
Post-transaction state
Once the transaction comes to a close, it’s time for IT to deliver on the critical integration tasks. Set the organization up for success by having an integration roadmap. Retaining critical IT staff throughout this process will also be imperative to the overall transaction success.
Throughout the integration process, roadblocks will arise and need to be addressed. However, by ensuring that employees, technology, and processes are planned for ahead of the transaction, you as IT will be able to weather those unexpected concerns with greater ease.
Now that you as an IT leader have engaged in an acquisition, demonstrating the value IT was able to provide to the process is critical to establishing a positive and respected relationship with other senior leaders in the business. Be prepared to identify the positives and communicate this value to advance the business’ perception of IT.
Goal: To carry out the planned integration activities and deliver the intended value to the business
Execution Prerequisite Checklist
Before coming into the Execution & Value Realization phase, you must have addressed the following:
- Understand the rationale for the company's decisions to pursue an acquisition and what opportunities or pain points the acquisition should alleviate.
- Identify the key roles for the transaction team.
- Identify the M&A governance.
- Determine target metrics and align to project tasks.
- Select an integration strategy framework.
- Conduct a RACI for key transaction tasks for the transaction team.
- Create a list of data room artifacts and engage in due diligence (directly or indirectly).
- Prioritize integration tasks.
- Establish the integration roadmap.
- Identify the needed workforce supply.
- Create employee transition plans.
Before coming into the Execution & Value Realization phase, we recommend addressing the following:
- Create vision and mission statements.
- Establish guiding principles.
- Create a future-state operating model.
- Identify the M&A operating model.
- Document the communication plan.
- Examine the business perspective of IT.
- Identify key stakeholders and outline their relationship to the M&A process.
- Be able to valuate the IT environment and communicate IT's value to the business.
- Establish a due diligence charter.
- Assess the target organization’s technical debt.
- Valuate the target IT organization.
- Assess and plan for culture.
- Estimate integration costs.
- Create functional workplans for employees.
Integration checklists
Prerequisite Checklist
- Build the project plan for integration and prioritize activities
- Plan first day
- Plan first 30/100 days
- Plan first year
- Create an organization-aligned IT strategy
- Identify critical stakeholders
- Create a communication strategy
- Understand the rationale for the acquisition or purchase
- Develop IT's purchasing strategy
- Determine goal opportunities
- Create the mission and vision statements
- Create the guiding principles
- Create program metrics
- Consolidate reports from due diligence/data room
- Conduct culture assessment
- Create a transaction team
- Assess workforce demand and supply
- Plan and communicate potential layoffs
- Create an employee transition plan
- Identify the IT investment
Business
- Design an enterprise architecture
- Document your business architecture
- Identify and assess all of IT's risks
Leadership/IT Executive
- Build an IT budget
- Structure operating budget
- Structure capital budget
- Identify the needed workforce demand vs. capacity
- Establish and monitor key metrics
- Communicate value realized/cost savings
Data
- Confirm data strategy
- Confirm data governance
- Data architecture
- Data sources
- Data storage (on-premises vs. cloud)
- Enterprise content management
- Compatibility of data types between organizations
- Cleanliness/usability of target organization data sets
- Identify data sets that need to be combined to capture synergies/drive core capabilities
- Reporting and analytics capabilities
Applications
- Prioritize and address critical applications
- ERP
- CRM
- Email
- HRIS
- Financial
- Sales
- Risk
- Security
- Leverage application rationalization framework to determine applications to keep, terminate, or create
- Develop method of integrating applications
- Model critical applications that have dependencies on one another
- Identify the infrastructure capacity required to support critical applications
Operations
- Communicate helpdesk/service desk information
- Manage sales access to customer data
- Determine locations and hours of operation
- Consolidate phone lists and extensions
- Synchronize email address books
Integration checklists (continued)
Infrastructure
- Determine single network access
- Manage organization domains
- Consolidate data centers
- Compile inventory of vendors, versions, switches, and routers
- Review hardware lease or purchase agreements
- Review outsourcing/service provider agreements
- Review service-level agreements
- Assess connectivity linkages between locations
- Plan to migrate to a single email system if necessary
Vendors
- Establish a sustainable vendor management office
- Review vendor landscape
- Identify warranty options
- Rationalize vendor services and solutions
- Identify opportunities to mature the security architecture
People
- Design an IT operating model
- Redesign your IT organizational structure
- Conduct a RACI
- Conduct a culture assessment and identify goal IT culture
- Build an IT employee engagement program
- Determine critical roles and systems/process/products they support
- Create a list of employees to be terminated
- Create employee transition plans
- Create functional workplans
Projects
- Stop duplicate or unnecessary target organization projects
- Communicate project intake process
- Prioritize projects
Products & Services
- Ensure customer services requirements are met
- Ensure customer interaction requirements are met
- Select a solution for product lifecycle management
Security
- Conduct a security assessment of target organization
- Develop accessibility prioritization and schedule
- Establish an information security strategy
- Develop a security awareness and training program
- Develop and manage security governance, risk, and compliance
- Identify security budget
- Build a data privacy and classification program
IT Processes
- Evaluate current process models
- Determine productivity/capacity levels of processes
- Identify processes to be terminated
- Identify process expectations from target organization
- Establish a communication plan
- Develop a change management process
- Establish/review IT policies
Execution & Value Realization
Step 4.1
Execute the Transaction
Activities
- 4.1.1 Rationalize the IT environment
- 4.1.2 Continually update the project plan
This step involves the following participants:
- IT executive/CIO
- IT senior leadership
- Vendor management team
- IT transaction team
- Company M&A team
Outcomes of Step
Successfully execute on the integration and strategize how to rationalize the two (or more) IT environments and update the project plan, strategizing against any roadblocks as they might come.
Compile –› Assess –› Rationalize
Access to critical information often does not happen until day one
- As the transaction comes to a close and the target organization becomes the acquired organization, it’s important to start working on the rationalization of your organization.
- One of the most important elements will be to have a complete understanding of the acquired organization’s IT environment. Specifically, assess the technology, people, and processes that might exist.
- This rationalization will be heavily dependent on your planned integration strategy determined in the Discovery & Strategy phase of the process.
- If your IT organization was not involved until after that phase, then determine whether your organization plans on remaining in its original state, taking on the acquired organization’s state, or forming a best-of-breed state by combining elements.
- To execute on this, however, a holistic understanding of the new IT environment is required.
Some Info-Tech resources to support this initiative:
- Reduce and Manage Your Organization’s Insider Threat Risk
- Build an Application Rationalization Framework
- Rationalize Your Collaboration Tools
- Consolidate IT Asset Management
- Build Effective Enterprise Integration on the Back of Business Process
- Consolidate Your Data Centers
4.1.1 Rationalize the IT environment
6-12 months
Input: RACI chart, List of critical applications, List of vendor contracts, List of infrastructure assets, List of data assets
Output: Rationalized IT environment
Materials: Software Terms & Conditions Evaluation Tool
Participants: IT executive/CIO, IT senior leadership, Vendor management
The purpose of this activity is to rationalize the IT environment to reduce and eliminate redundant technology.
- Compile a list of the various applications and vendor contracts from the acquired organization and the original organization.
- Determine where there is repetition. Have a member of the vendor management team review those contracts and identify cost-saving opportunities.
This will not be a quick and easy activity to complete. It will require strong negotiation on the behalf of the vendor management team.
For additional information and support for this activity, see the blueprint Master Contract Review and Negotiations for Software Agreements.
4.1.2 Continually update the project plan
Reoccurring basis following transition
Input: Prioritized integration tasks, Integration RACI, Activity owners
Output: Updated integration project plan
Materials: M&A Integration Project Management Tool
Participants: IT executive/CIO, IT senior leadership, IT transaction team, Company M&A team
The purpose of this activity is to ensure that the project plan is continuously updated as your transaction team continues to execute on the various components outlined in the project plan.
- Set a regular cadence for the transaction team to meet, update and review the status of the various integration task items, and strategize how to overcome any roadblocks.
- Employ governance best practices in these meetings to ensure decisions can be made effectively and resources allocated strategically.
Record the updates in the M&A Integration Project Management Tool (SharePoint).
Record the updates in the M&A Integration Project Management Tool (Excel).
Execution & Value Realization
Step 4.2
Reflection and Value Realization
Activities
- 4.2.1 Confirm integration costs
- 4.2.2 Review IT’s transaction value
- 4.2.3 Conduct a transaction and integration SWOT
- 4.2.4 Review the playbook and prepare for future transactions
This step involves the following participants:
- IT executive/CIO
- IT senior leadership
- Transition team
- Company M&A team
Outcomes of Step
Review the value that IT was able to generate around the transaction and strategize on how to improve future acquisition transactions.
4.2.1 Confirm integration costs
3-4 hours
Input: Integration tasks, Transition team, Previous RACI, Estimated costs
Output: Actual integration costs
Materials: M&A Buy Playbook
Participants: IT executive/CIO, IT senior leadership, IT transaction team, Company M&A team
The purpose of this activity is to confirm the associated costs around integration. While the integration costs would have been estimated previously, it’s important to confirm the costs that were associated with the integration in order to provide an accurate and up-to-date report to the company’s M&A team.
- Taking all the original items identified previously in activity 3.2.4, identify if there were changes in the estimated costs. This can be an increase or a decrease.
- Ensure that each cost has a justification for why the cost changed from the original estimation.
Record the results in the M&A Buy Playbook.
Track synergy capture through the IT integration
The ultimate goal of the M&A is to achieve and deliver deal objectives. Early in the M&A, IT must identify, prioritize, and execute upon synergies that deliver value to the business and its shareholders. Continue to measure IT’s contribution toward achieving the organization’s M&A goals throughout the integration by keeping track of cost savings and synergies that have been achieved. When these achievements happen, communicate them and celebrate success.
- Define Synergy Metrics: Select metrics to track synergies through the integration.
- You can track value by looking at percentages of improvement in process-level metrics depending on the synergies being pursued.
- For example, if the synergy being pursued is increasing asset utilization, metrics could range from capacity to revenue generated through increased capacity.
- Prioritize Synergistic Initiatives: Estimate the cost and benefit of each initiative's implementation to compare the amount of business value to the cost. The benefits and costs should be illustrated at a high level. Estimating the exact dollar value of fulfilling a synergy can be difficult and misleading.
Steps
- Determine the benefits that each initiative is expected to deliver.
- Determine the high-level costs of implementation (capacity, time, resources, effort).
- Track Synergy Captures: Develop a detailed workplan to resource the roadmap and track synergy captures as the initiatives are undertaken.
Once 80% of the necessary synergies are realized, executive pressure will diminish. However, IT must continue to work toward the technology end state to avoid delayed progression.
4.2.2 Review IT’s transaction value
3-4 hours
Input: Prioritized integration tasks, Integration RACI, Activity owners, M&A company goals
Output: Transaction value
Materials: M&A Buy Playbook
Participants: IT executive/CIO, IT senior leadership, Company's M&A team
The purpose of this activity is to track how your IT organization performed against the originally identified metrics.
- If your organization did not have the opportunity to identify metrics earlier, determine from the company M&A team what those metrics might be. Review activity 3.2.7 for more information on metrics.
- Identify whether the metric (which should be used to support a goal) was at, below, or above the original target metric. This is a very critical task for IT to complete because it allows IT to confirm that they were successful engaging in the transaction and that the business can count on them in future transactions.
- Be sure to record accurate and relevant information on why the outcomes (good or bad) are supporting the M&A goals that were set out by the business.
Record the results in the M&A Buy Playbook.
4.2.3 Conduct a transaction and integration SWOT
2 hours
Input: Integration costs, Retention rates, Value IT contributed to the transaction
Output: Strengths, weaknesses, opportunities, and threats
Materials: Flip charts, Markers, Sticky notes
Participants: IT executive/CIO, IT senior leadership, Business transaction team
The purpose of this activity is to assess the positive and negative elements of the transaction.
- Consider the various internal and external elements that could have impacted the outcome of the transaction.
- Strengths. Internal characteristics that are favorable as they relate to your development environment.
- Weaknesses Internal characteristics that are unfavorable or need improvement.
- Opportunities External characteristics that you may use to your advantage.
- Threats External characteristics that may be potential sources of failure or risk.
Record the results in the M&A Buy Playbook.
M&A Buy Playbook review
With an acquisition complete, your IT organization is now more prepared then ever to support the business through future M&As
- Now that the transaction is more than 80% complete, take the opportunity to review the key elements that worked well and the opportunities for improvement in future transactions.
- Critically examine the M&A Buy Playbook your IT organization created and identify what worked well to help the transaction and where your organization could adjust to do better in future transactions.
- If your organization were to engage in another acquisition under your IT leadership, how would you go about the transaction to make sure the company meets its goals?
4.2.4 Review the playbook and prepare for future transactions
4 hours
Input: Transaction and integration SWOT
Output: Refined M&A playbook
Materials: M&A Buy Playbook
Participants: IT executive/CIO
The purpose of this activity is to revise the playbook and ensure it is ready to go for future transactions.
- Using the outputs from the previous activity, 4.2.3, determine what strengths and opportunities there were that should be leveraged in the next transaction.
- Likewise, determine which threats and weaknesses could be avoided in the future transactions.
Remember, this is your M&A Buy Playbook, and it should reflect the most successful outcome for you in your organization.
Record the results in the M&A Buy Playbook.
By the end of this post-transaction phase you should:
Have completed the integration post-transaction and be fluidly delivering the critical value that the business expected of IT.
Key outcomes from the Execution & Value Realization phase
- Ensure the integration tasks are being completed and that any blockers related to the transaction are being removed.
- Determine where IT was able to realize value for the business and demonstrate IT’s involvement in meeting target goals.
Key deliverables from the Execution & Value Realization phase
- Rationalize the IT environment
- Continually update the project plan for completion
- Confirm integration costs
- Review IT’s transaction value
- Conduct a transaction and integration SWOT
- Review the playbook and prepare for future transactions
Summary of Accomplishment
Problem Solved
Congratulations, you have completed the M&A Buy Blueprint!
Rather than reacting to a transaction, you have been proactive in tackling this initiative. You now have a process to fall back on in which you can be an innovative IT leader by suggesting how and why the business should engage in an acquisition. You now have:
- Created a standardized approach for how your IT organization should address acquisitions.
- Evaluated the target organizations successfully and established an integration project plan.
- Delivered on the integration project plan successfully and communicated IT’s transaction value to the business.
Now that you have done all of this, reflect on what went well and what can be improved in case if you have to do this all again in a future transaction.
If you would like additional support, have our analysts guide you through other phases as part of an Info-Tech workshop.
Contact your account representative for more information
workshops@infotech.com 1-888-670-8899
Research Contributors and Experts
Ibrahim Abdel-Kader
Research Analyst | CIO
Info-Tech Research Group
|
|
Brittany Lutes
Senior Research Analyst | CIO
Info-Tech Research Group
|
John Annand
Principal Research Director | Infrastructure
Info-Tech Research Group
|
|
Scott Bickley
Principal Research Director | Vendor Management
Info-Tech Research Group
|
Cole Cioran
Practice Lead | Applications
Info-Tech Research Group
|
|
Dana Daher
Research Analyst | Strategy & Innovation
Info-Tech Research Group
|
Eric Dolinar
Manager | M&A Consulting
Deloitte Canada
|
|
Christoph Egel
Director, Solution Design & Deliver
Cooper Tire & Rubber Company
|
Nora Fisher
Vice President | Executive Services Advisory
Info-Tech Research Group
|
|
Larry Fretz
Vice President | Industry
Info-Tech Research Group
|
Research Contributors and Experts
David Glazer
Vice President of Analytics
Kroll
|
|
Jack Hakimian
Senior Vice President | Workshops and Delivery
Info-Tech Research Group
|
Gord Harrison
Senior Vice President | Research & Advisory
Info-Tech Research Group
|
|
Valence Howden
Principal Research Director | CIO
Info-Tech Research Group
|
Jennifer Jones
Research Director | Industry
Info-Tech Research Group
|
|
Nancy McCuaig
Senior Vice President | Chief Technology and Data Office
IGM Financial Inc.
|
Carlene McCubbin
Practice Lead | CIO
Info-Tech Research Group
|
|
Kenneth McGee
Research Fellow | Strategy & Innovation
Info-Tech Research Group
|
Nayma Naser
Associate
Deloitte
|
|
Andy Neill
Practice Lead | Data & Analytics, Enterprise Architecture
Info-Tech Research Group
|
Research Contributors and Experts
Rick Pittman
Vice President | Research
Info-Tech Research Group
|
|
Rocco Rao
Research Director | Industry
Info-Tech Research Group
|
Mark Rosa
Senior Vice President & Chief Information Officer
Mohegan Gaming and Entertainment
|
|
Tracy-Lynn Reid
Research Lead | People & Leadership
Info-Tech Research Group
|
Jim Robson
Senior Vice President | Shared Enterprise Services (retired)
Great-West Life
|
|
Steven Schmidt
Senior Managing Partner Advisory | Executive Services
Info-Tech Research Group
|
Nikki Seventikidis
Senior Manager | Finance Initiative & Continuous Improvement
CST Consultants Inc.
|
|
Allison Straker
Research Director | CIO
Info-Tech Research Group
|
Justin Waelz
Senior Network & Systems Administrator
Info-Tech Research Group
|
|
Sallie Wright
Executive Counselor
Info-Tech Research Group
|
Bibliography
“5 Ways for CIOs to Accelerate Value During Mergers and Acquisitions.” Okta, n.d. Web.
Altintepe, Hakan. “Mergers and acquisitions speed up digital transformation.” CIO.com, 27 July 2018. Web.
“America’s elite law firms are booming.” The Economist, 15 July 2021. Web.
Barbaglia, Pamela, and Joshua Franklin. “Global M&A sets Q1 record as dealmakers shape post-COVID world.” Nasdaq, 1 April 2021. Web.
Boyce, Paul. “Mergers and Acquisitions Definition: Types, Advantages, and Disadvantages.” BoyceWire, 8 Oct. 2020. Web.
Bradt, George. “83% Of Mergers Fail -- Leverage A 100-Day Action Plan For Success Instead.” Forbes, 27 Jan. 2015. Web.
Capgemini. “Mergers and Acquisitions: Get CIOs, IT Leaders Involved Early.” Channel e2e, 19 June 2020. Web.
Chandra, Sumit, et al. “Make Or Break: The Critical Role Of IT In Post-Merger Integration.” IMAA Institute, 2016. Web.
Deloitte. “How to Calculate Technical Debt.” The Wall Street Journal, 21 Jan. 2015. Web.
Ernst & Young. “IT As A Driver Of M&A Success.” IMAA Institute, 2017. Web.
Fernandes, Nuno. “M&As In 2021: How To Improve The Odds Of A Successful Deal.” Forbes, 23 March 2021. Web.
“Five steps to a better 'technology fit' in mergers and acquisitions.” BCS, 7 Nov. 2019. Web.
Fricke, Pierre. “The Biggest Opportunity You’re Missing During an M&Aamp; IT Integration.” Rackspace, 4 Nov. 2020. Web.
Garrison, David W. “Most Mergers Fail Because People Aren't Boxes.” Forbes, 24 June 2019. Web.
Harroch, Richard. “What You Need To Know About Mergers & Acquisitions: 12 Key Considerations When Selling Your Company.” Forbes, 27 Aug. 2018. Web.
Hope, Michele. “M&A Integration: New Ways To Contain The IT Cost Of Mergers, Acquisitions And Migrations.” Iron Mountain, n.d. Web.
“How Agile Project Management Principles Can Modernize M&A.” Business.com, 13 April 2020. Web.
Hull, Patrick. “Answer 4 Questions to Get a Great Mission Statement.” Forbes, 10 Jan. 2013. Web.
Kanter, Rosabeth Moss. “What We Can Learn About Unity from Hostile Takeovers.” Harvard Business Review, 12 Nov. 2020. Web.
Koller, Tim, et al. “Valuation: Measuring and Managing the Value of Companies, 7th edition.” McKinsey & Company, 2020. Web.
Labate, John. “M&A Alternatives Take Center Stage: Survey.” The Wall Street Journal, 30 Oct. 2020. Web.
Lerner, Maya Ber. “How to Calculate ROI on Infrastructure Automation.” DevOps.com, 1 July 2020. Web.
Loten, Angus. “Companies Without a Tech Plan in M&A Deals Face Higher IT Costs.” The Wall Street Journal, 18 June 2019. Web.
Low, Jia Jen. “Tackling the tech integration challenge of mergers today” Tech HQ, 6 Jan. 2020. Web.
Lucas, Suzanne. “5 Reasons Turnover Should Scare You.” Inc. 22 March 2013. Web.
“M&A Trends Survey: The future of M&A. Deal trends in a changing world.” Deloitte, Oct. 2020. Web.
Maheshwari, Adi, and Manish Dabas. “Six strategies tech companies are using for successful divesting.” EY, 1 Aug. 2020. Web.
Majaski, Christina. “Mergers and Acquisitions: What's the Difference?” Investopedia, 30 Apr. 2021.
“Mergers & Acquisitions: Top 5 Technology Considerations.” Teksetra, 21 Jul. 2020. Web.
“Mergers Acquisitions M&A Process.” Corporate Finance Institute, n.d. Web.
“Mergers and acquisitions: A means to gain technology and expertise.” DLA Piper, 2020. Web.
Nash, Kim S. “CIOs Take Larger Role in Pre-IPO Prep Work.” The Wall Street Journal, 5 March 2015. Web.
Paszti, Laila. “Canada: Emerging Trends In Information Technology (IT) Mergers And Acquisitions.” Mondaq, 24 Oct. 2019. Web.
Patel, Kiison. “The 8 Biggest M&A Failures of All Time” Deal Room, 9 Sept. 2021. Web.
Peek, Sean, and Paula Fernandes. “What Is a Vision Statement?” Business News Daily, 7 May 2020. Web.
Ravid, Barak. “Tech execs focus on growth amid increasingly competitive M&A market.” EY, 28 April 2021. Web.
Resch, Scott. “5 Questions with a Mergers & Acquisitions Expert.” CIO, 25 June 2019. Web.
Salsberg, Brian. “Four tips for estimating one-time M&A integration costs.” EY, 17 Oct. 2019. Web.
Samuels, Mark. “Mergers and acquisitions: Five ways tech can smooth the way.” ZDNet, 15 Aug. 2018. Web.
“SAP Divestiture Projects: Options, Approach and Challenges.” Cognizant, May, 2014. Web.
Steeves, Dave. “7 Rules for Surviving a Merger & Acquisition Technology Integration.” Steeves and Associates, 5 Feb. 2020. Web.
Tanaszi, Margaret. “Calculating IT Value in Business Terms.” CSO, 27 May 2004. Web.
“The CIO Playbook. Nine Steps CIOs Must Take For Successful Divestitures.” SNP, 2016. Web.
“The Role of IT in Supporting Mergers and Acquisitions.” Cognizant, Feb. 2015. Web.
Torres, Roberto. “M&A playbook: How to prepare for the cost, staff and tech hurdles.” CIO Dive, 14 Nov. 2019. Web.
“Valuation Methods.” Corporate Finance Institute, n.d. Web.
Weller, Joe. “The Ultimate Guide to the M&A Process for Buyers and Sellers.” Smartsheet, 16 May 2019. Web.

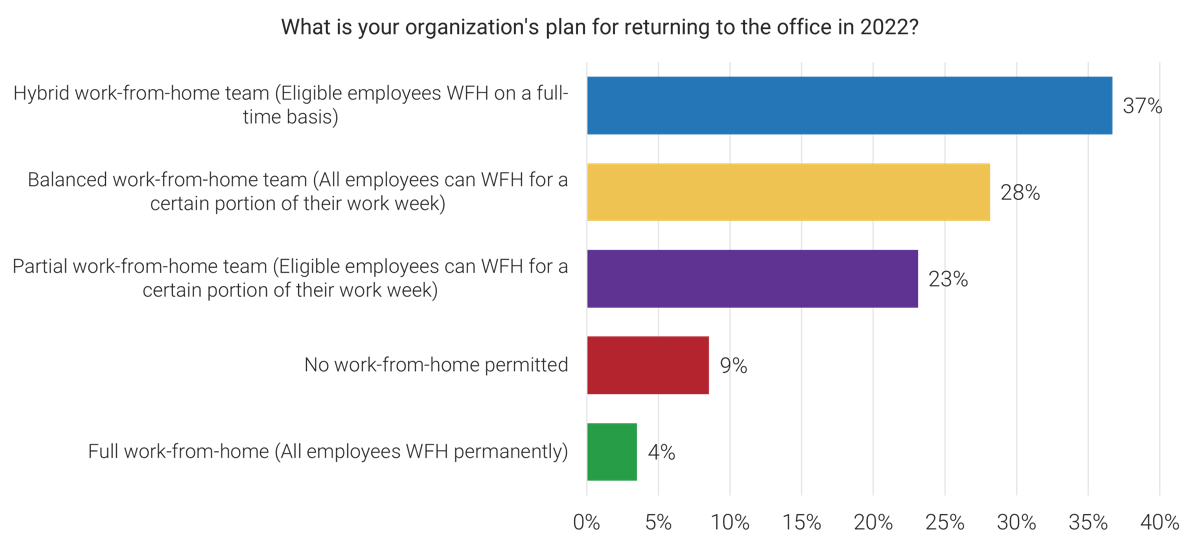
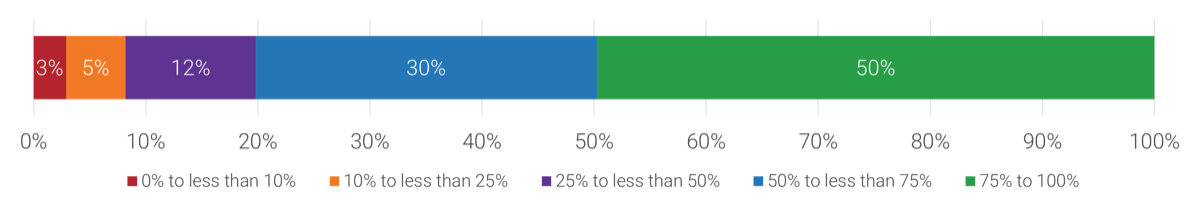
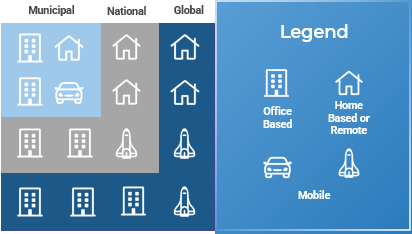
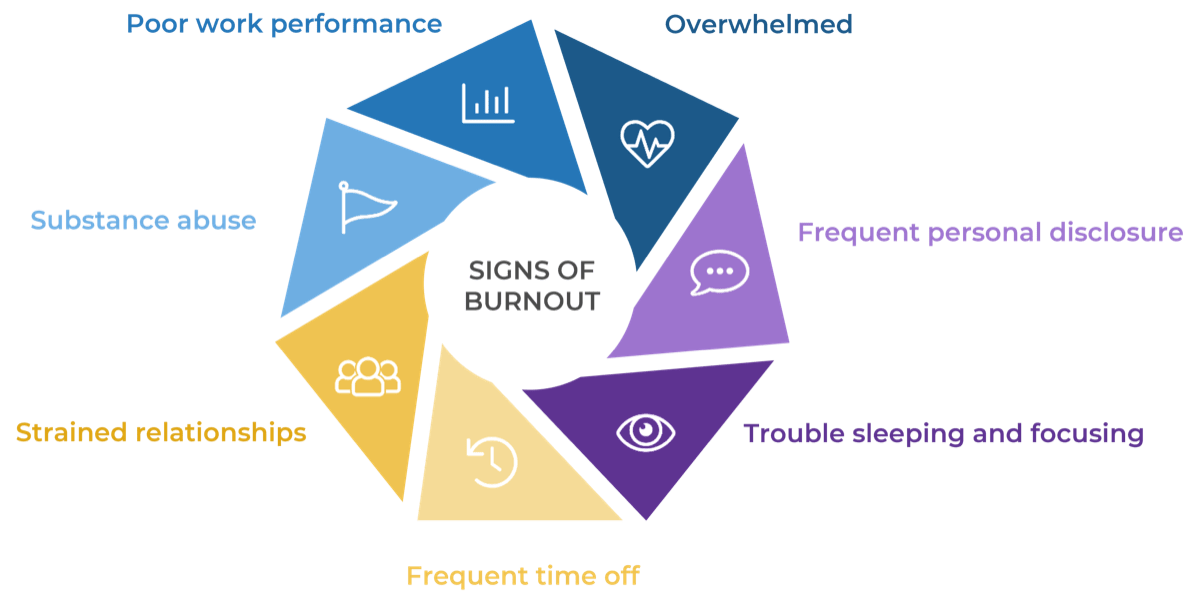
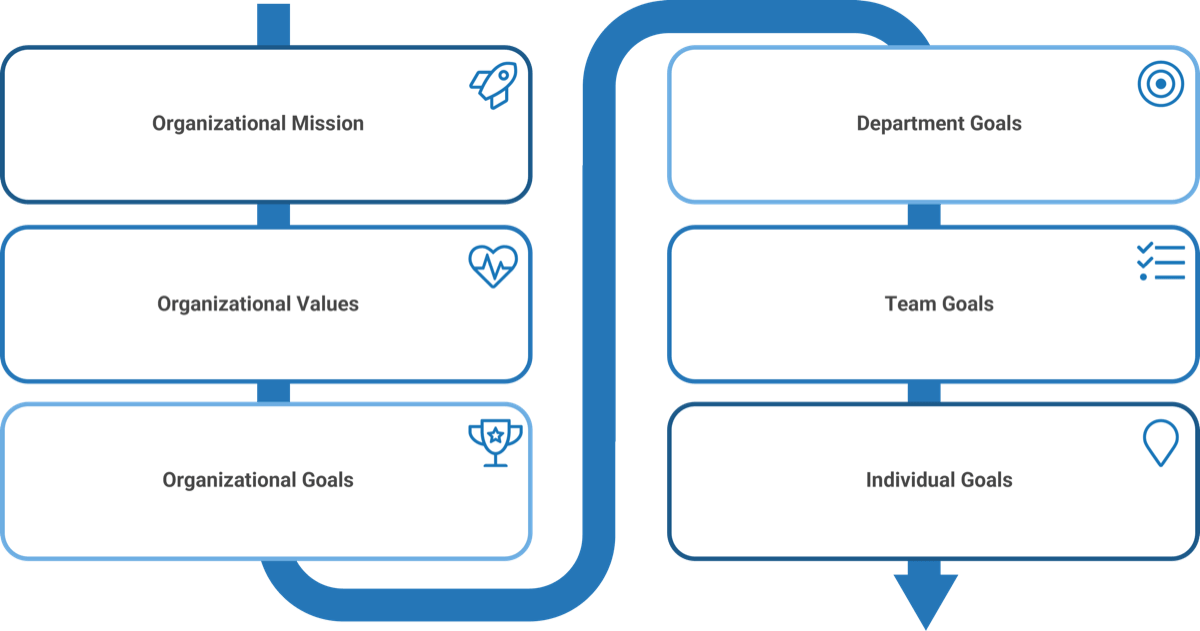
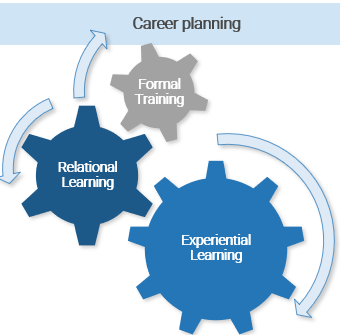


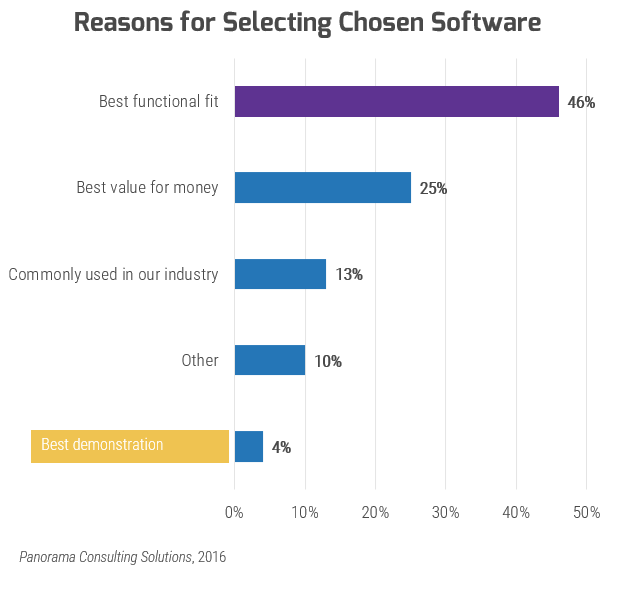
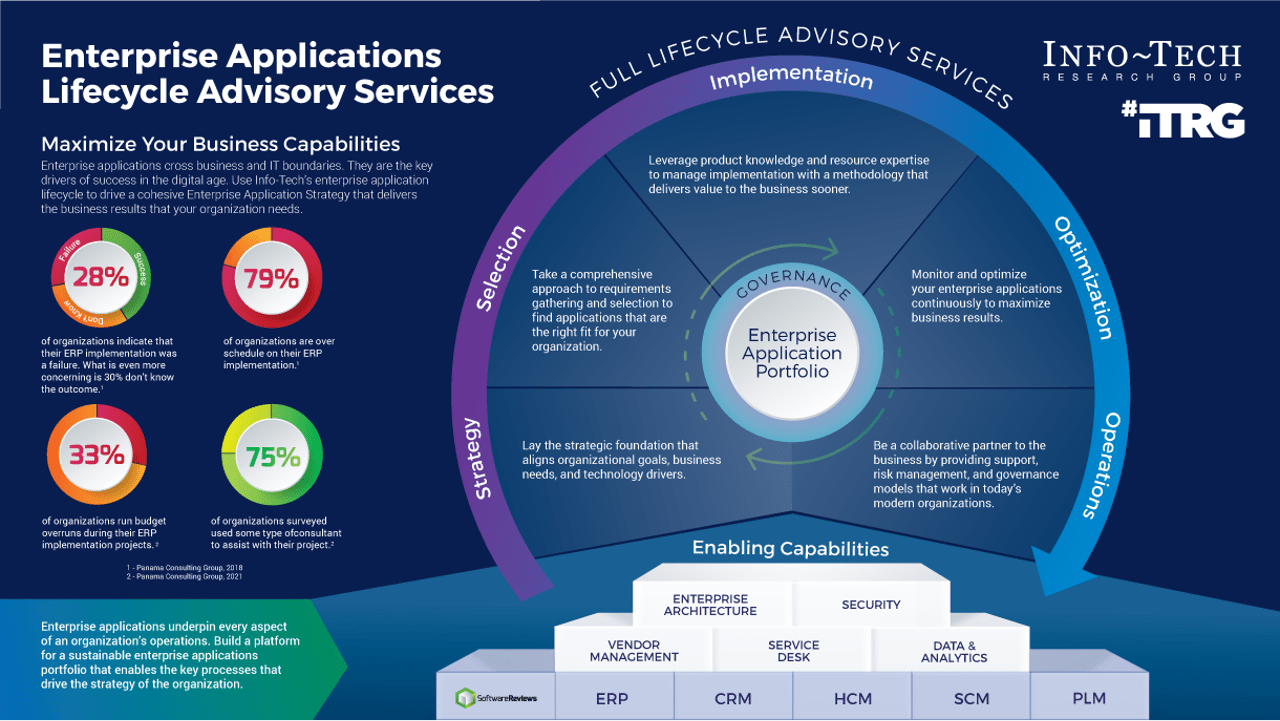
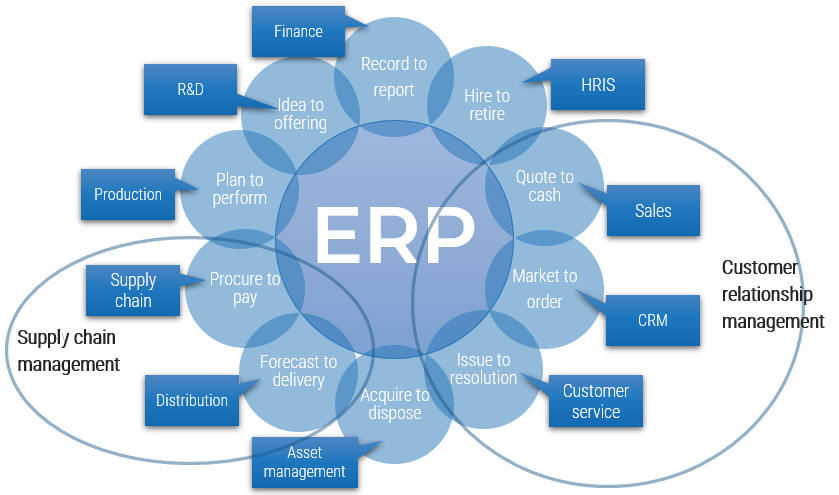
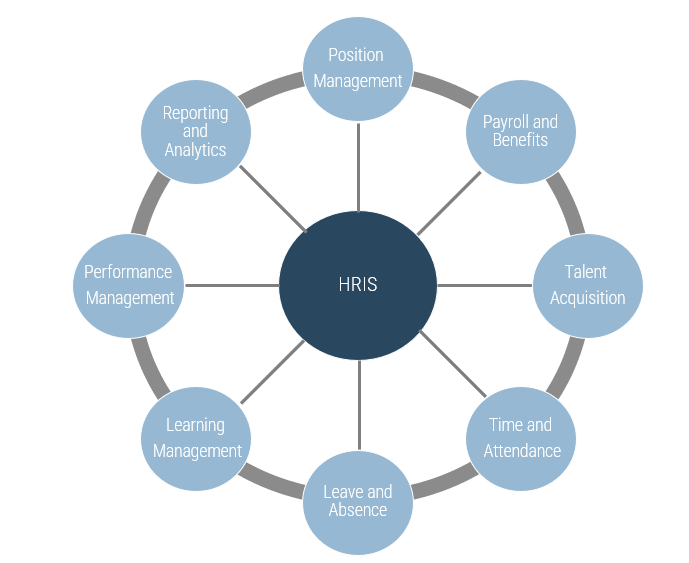
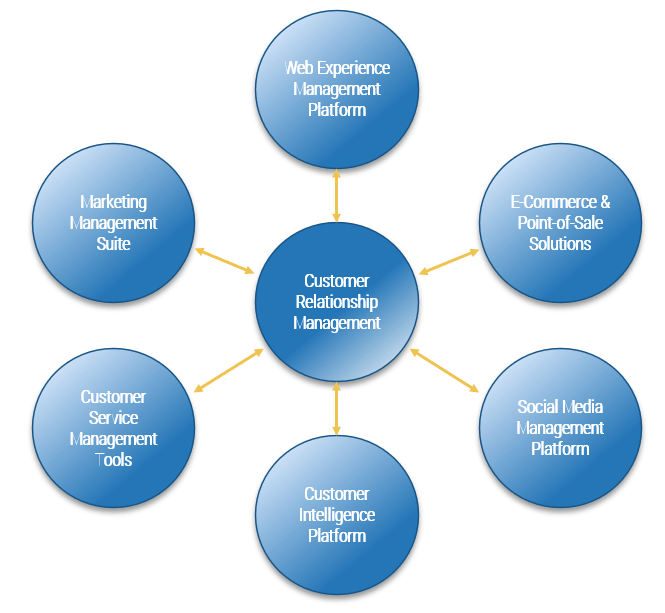
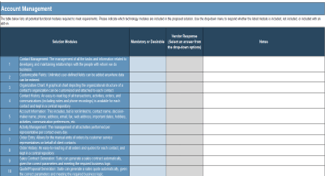
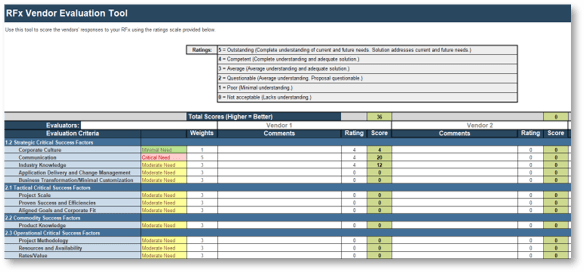
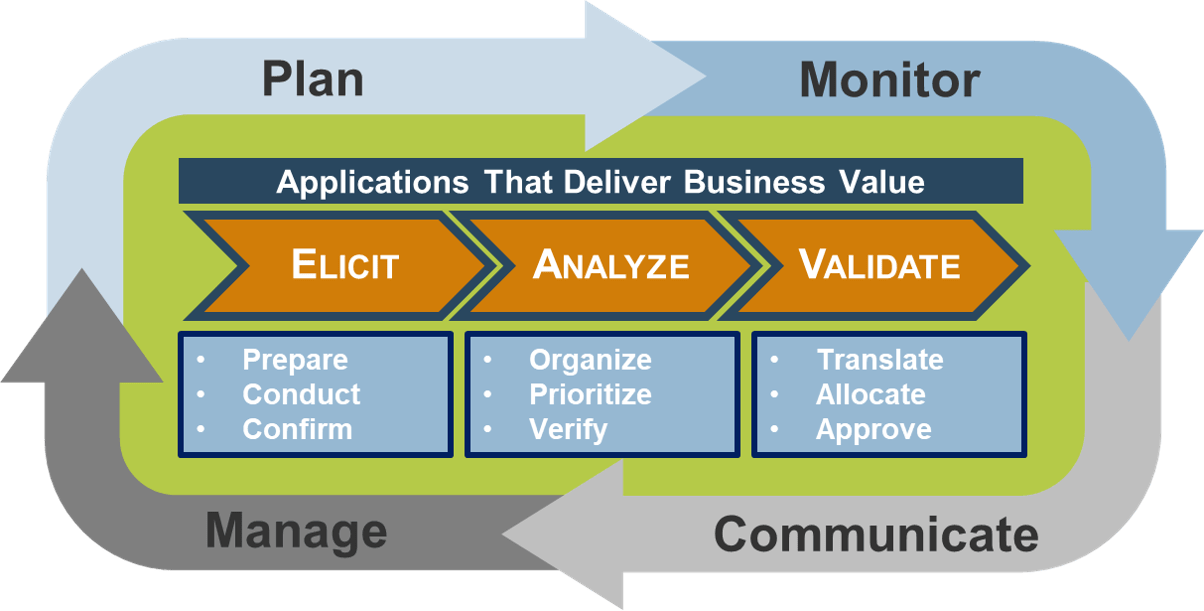
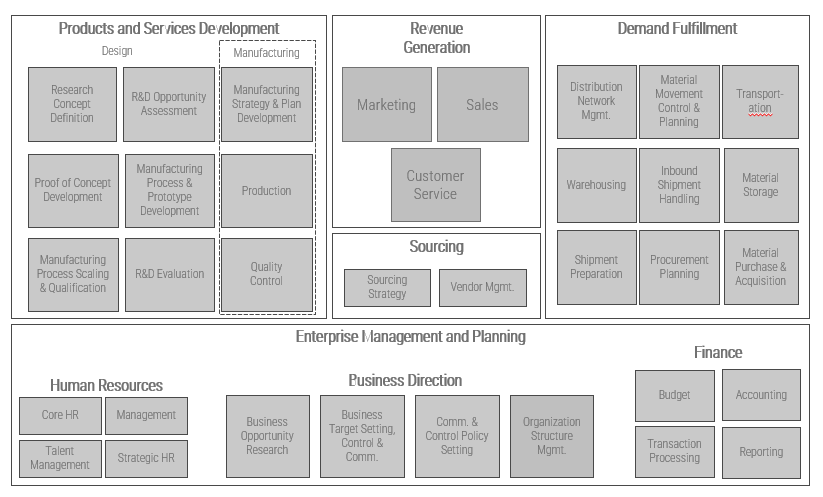
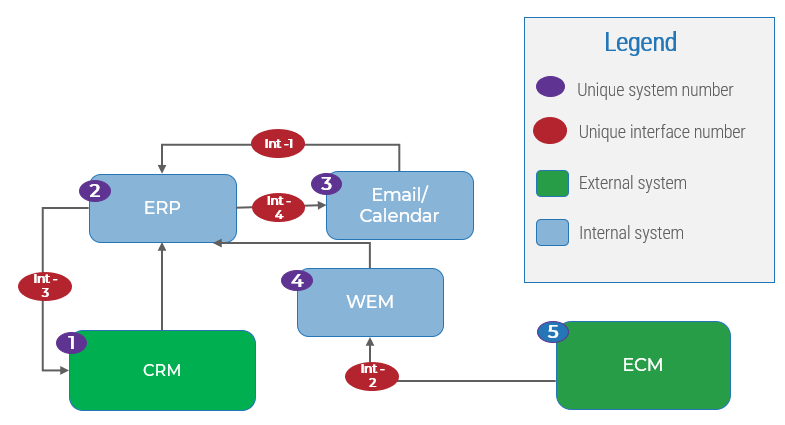
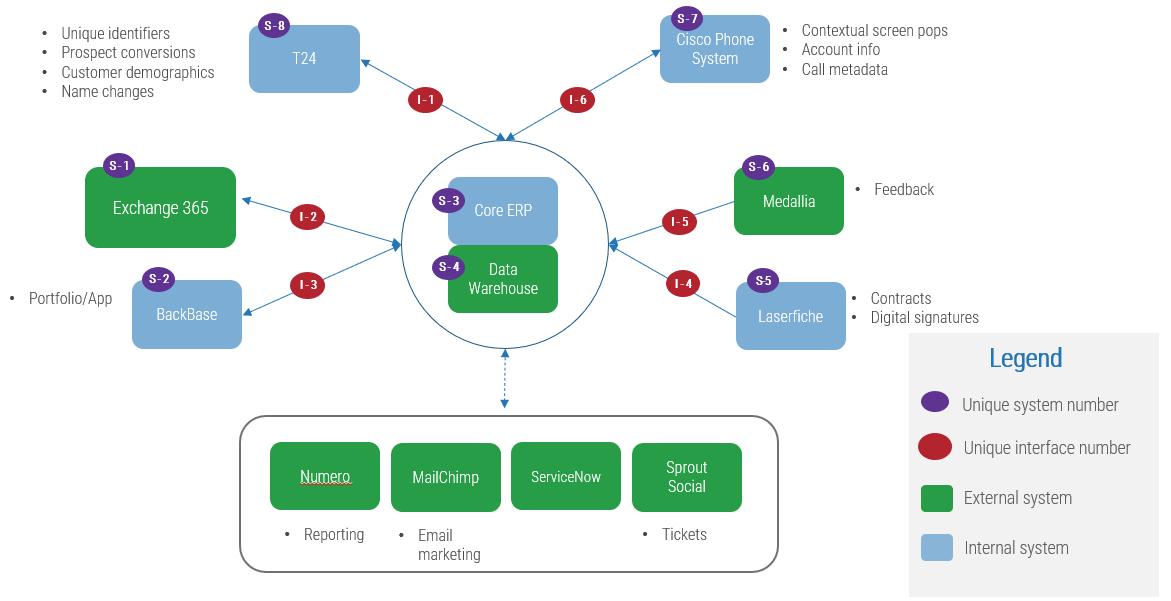
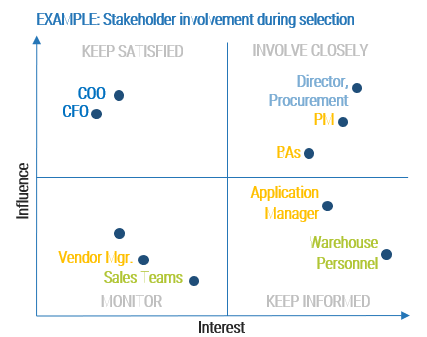
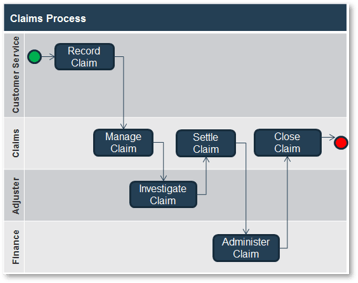
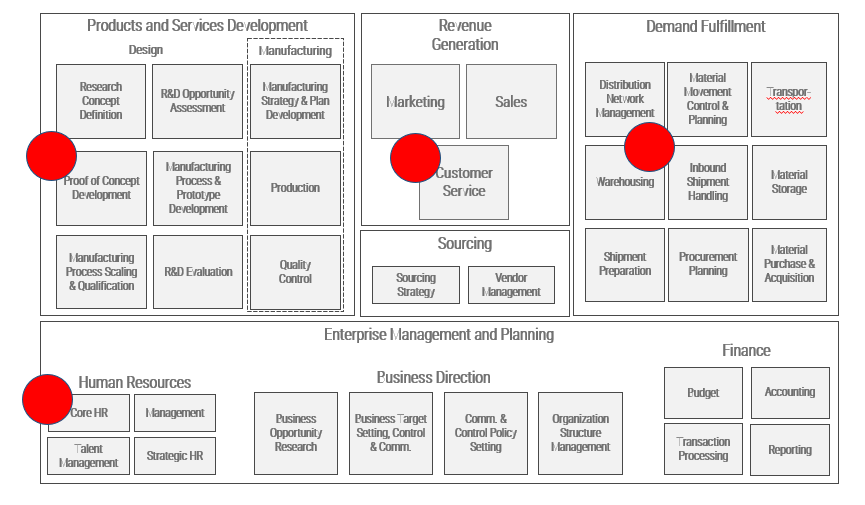
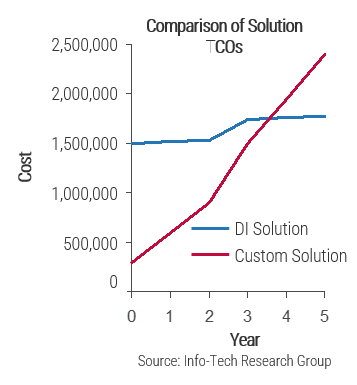

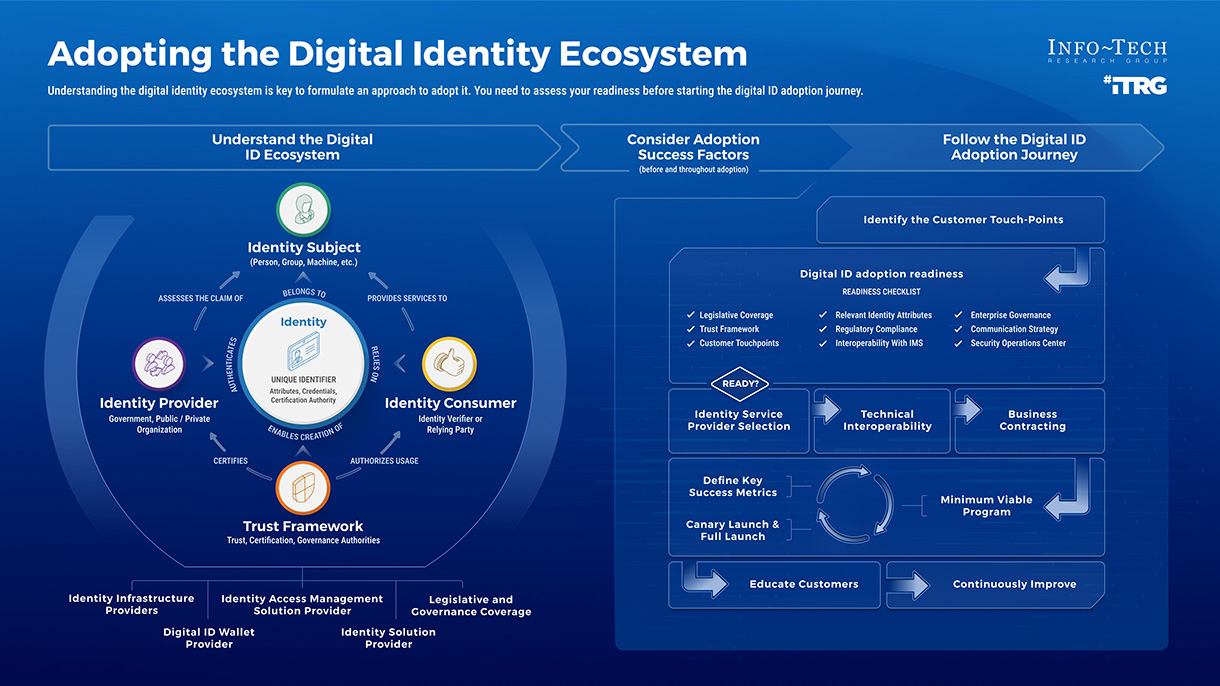

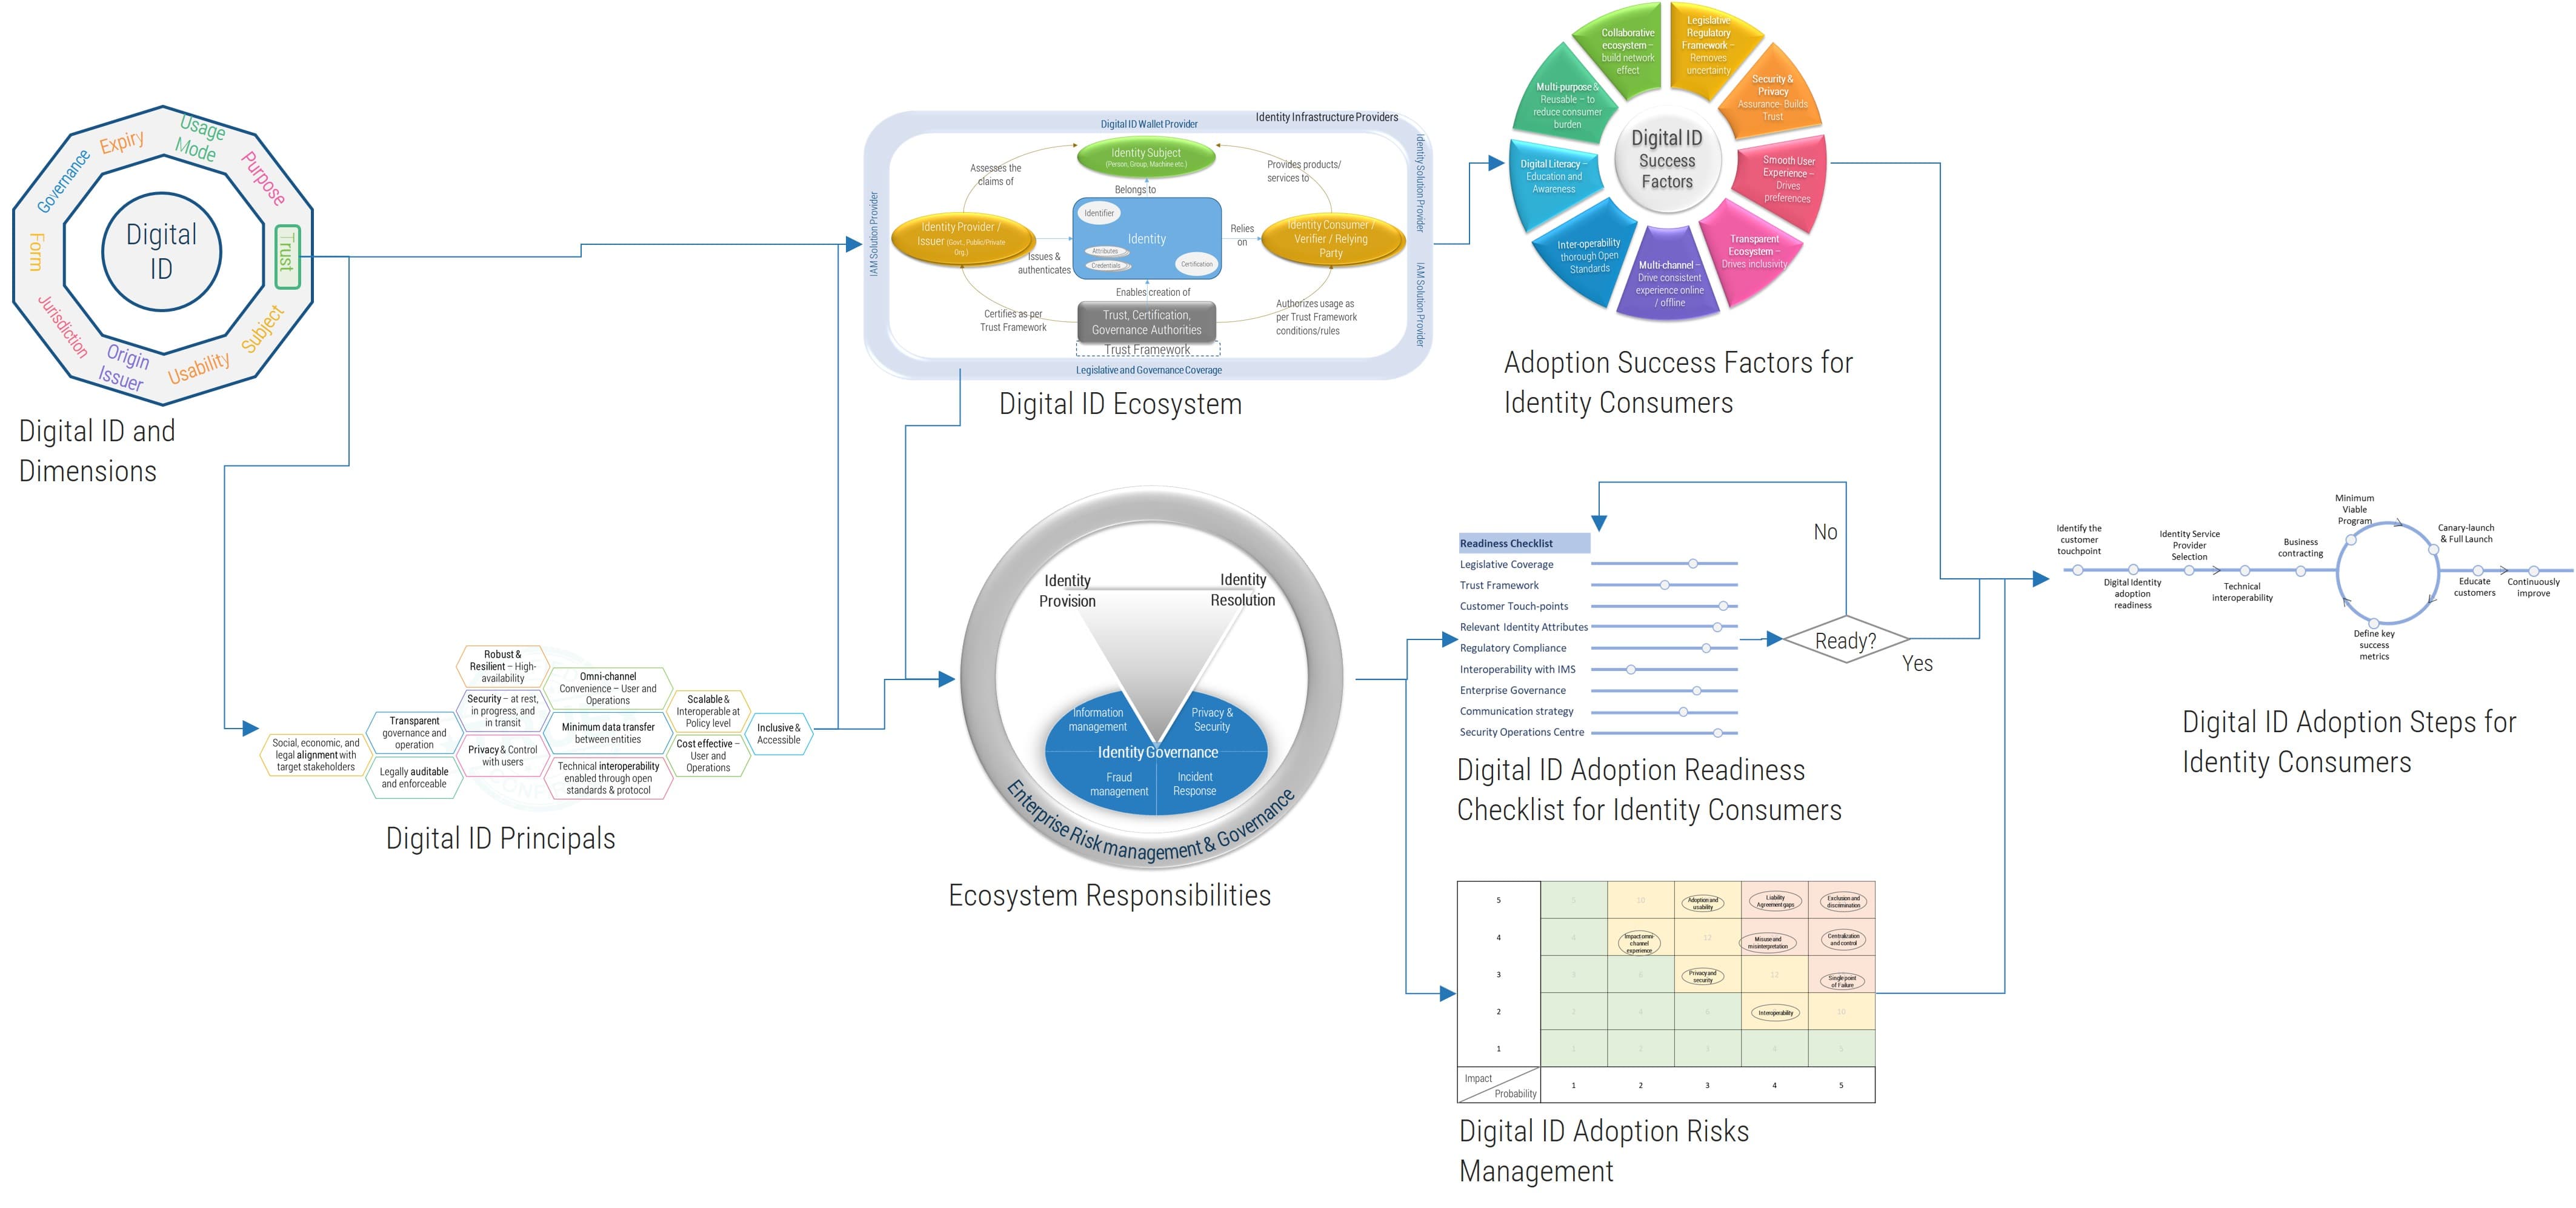
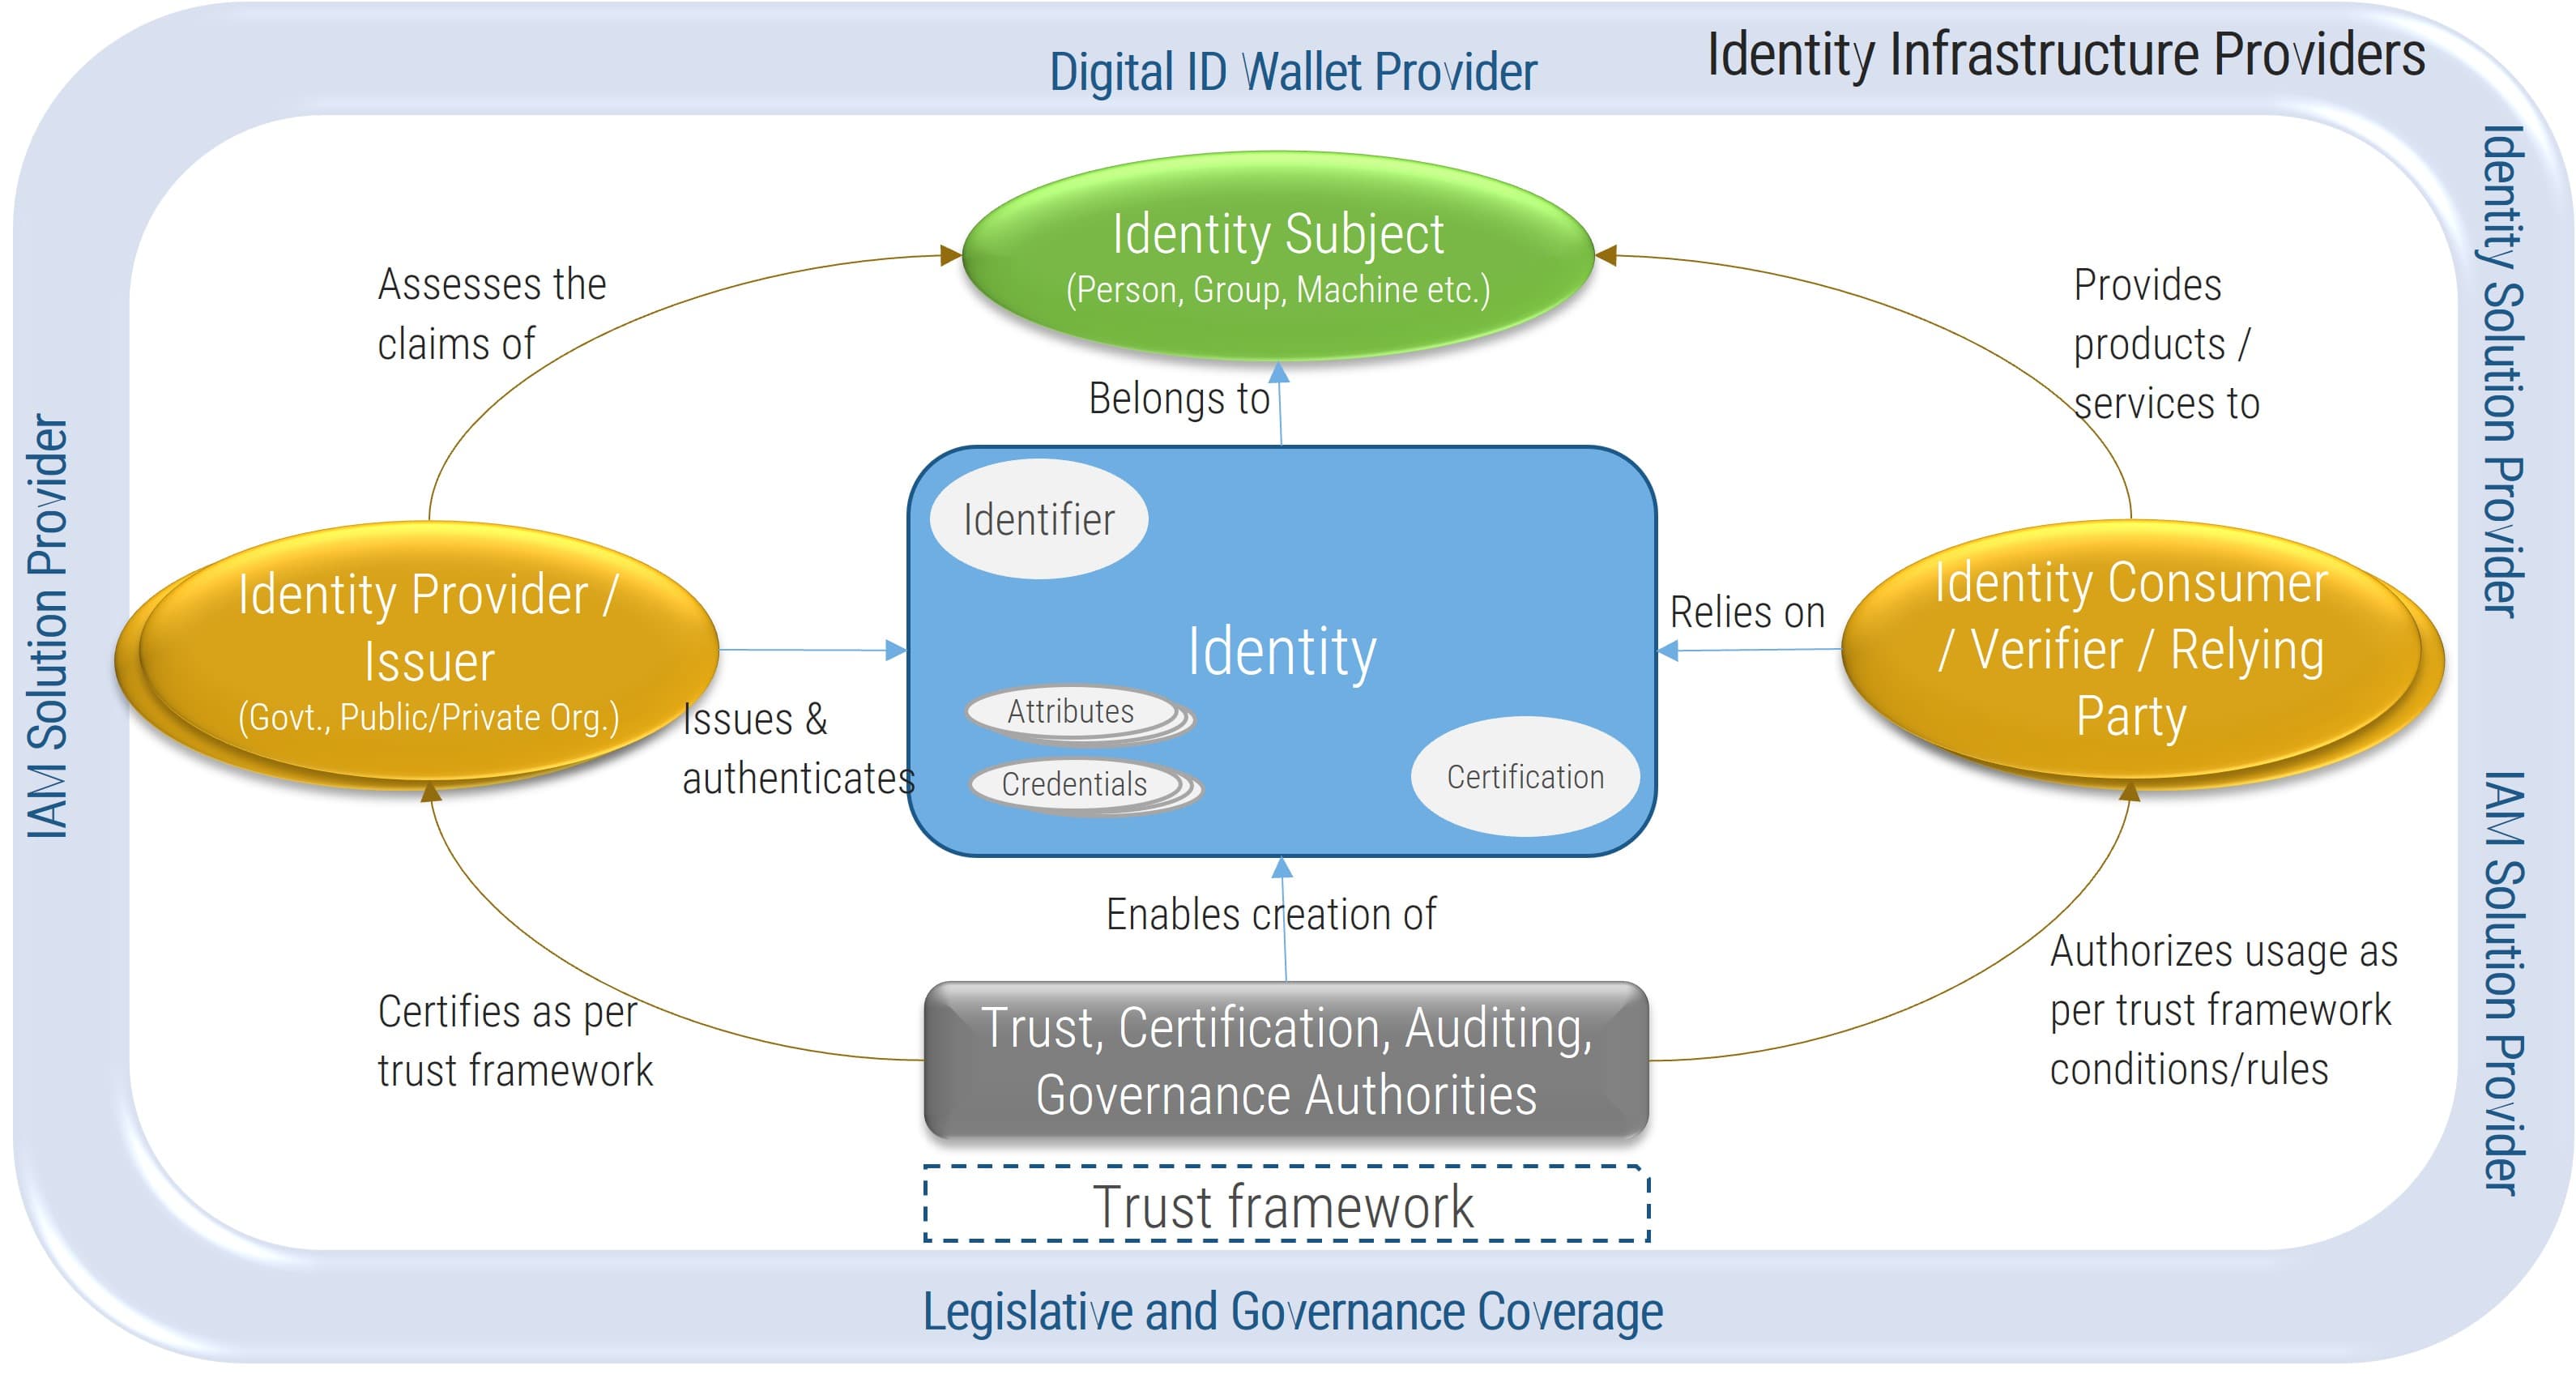
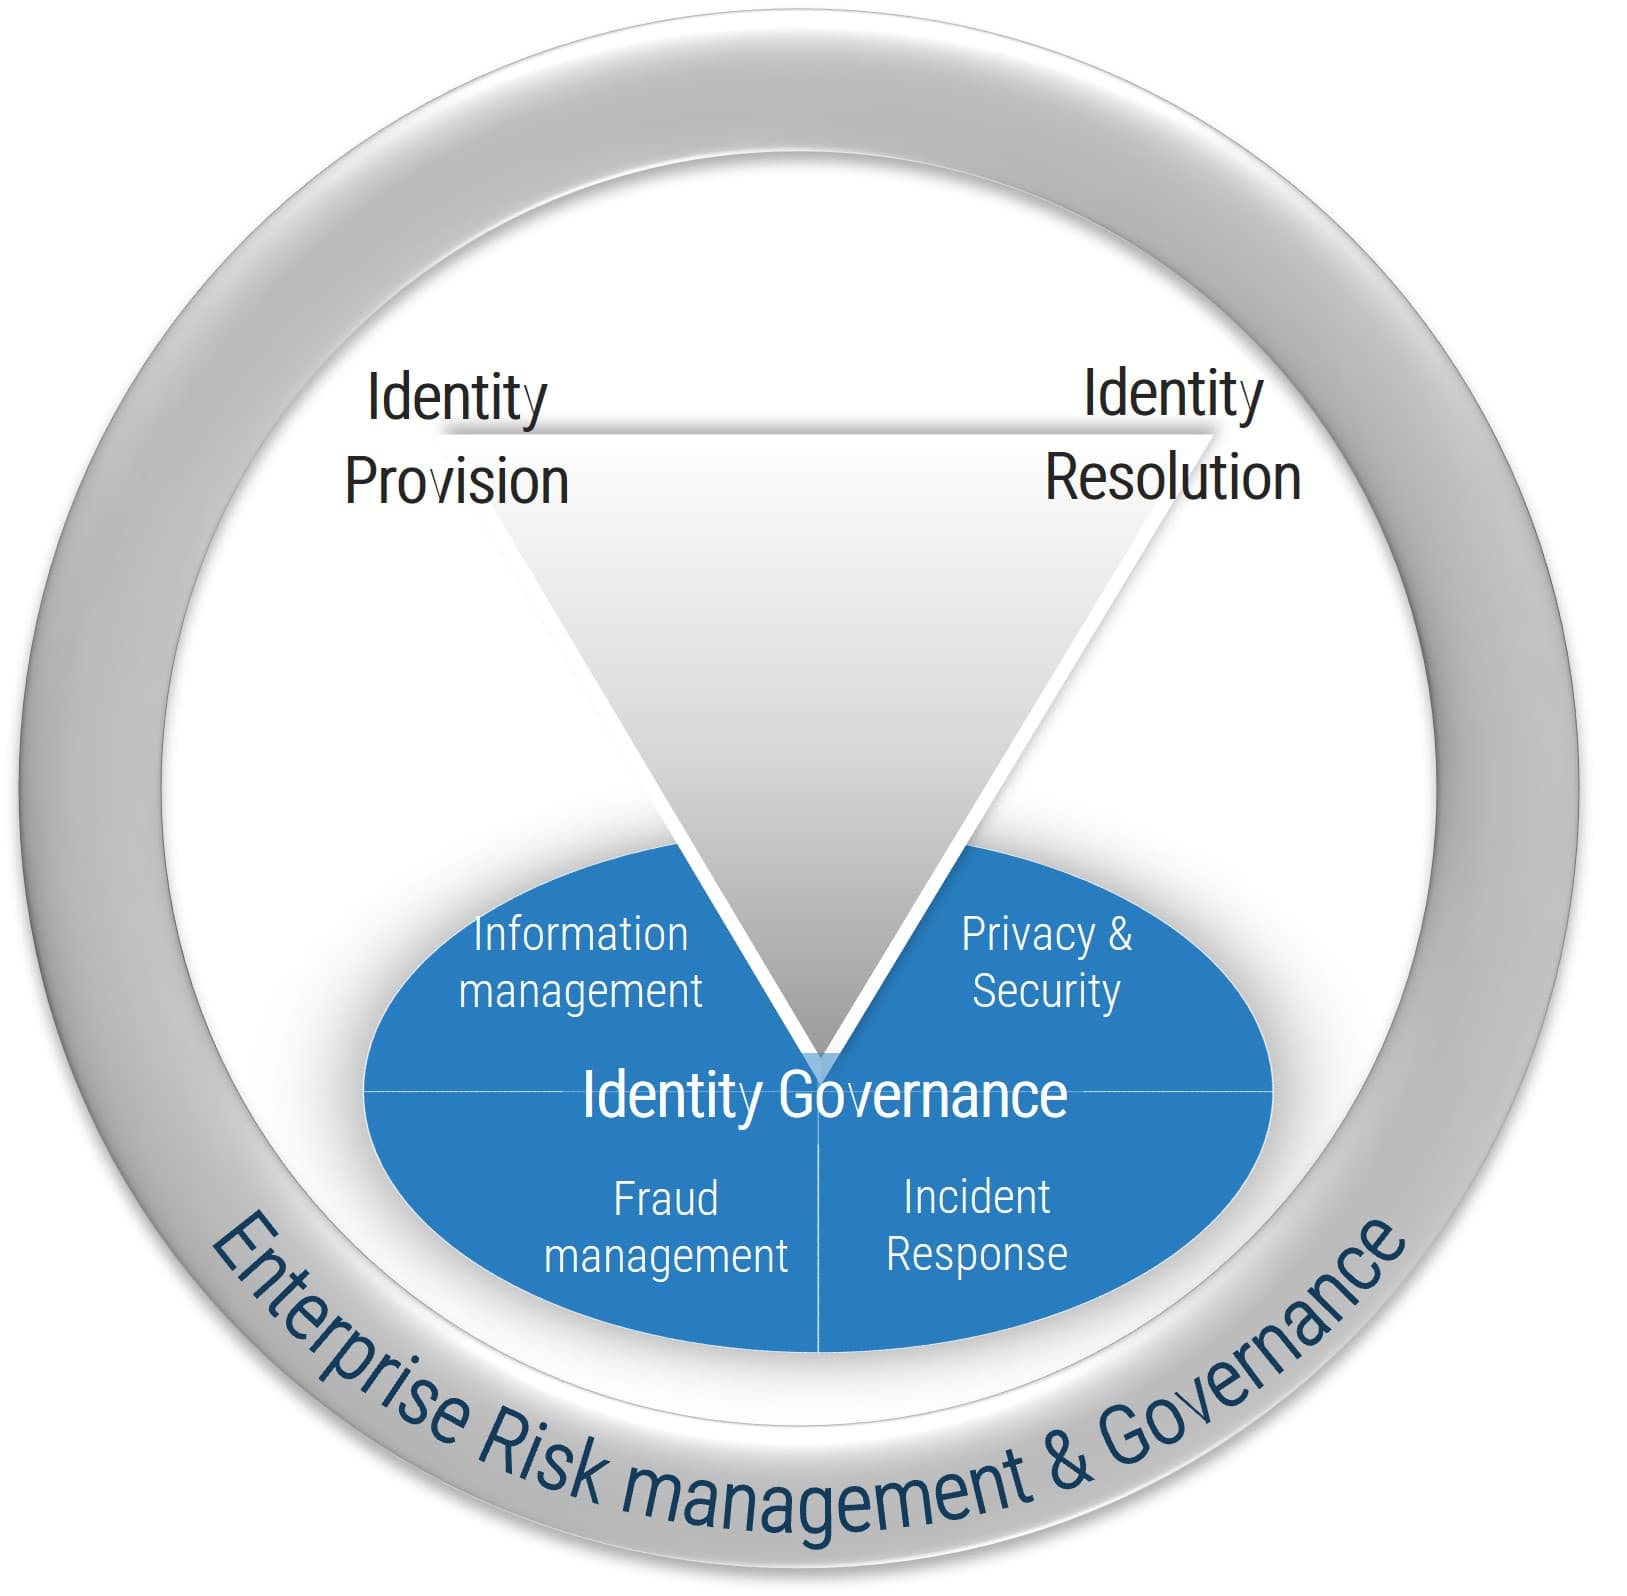
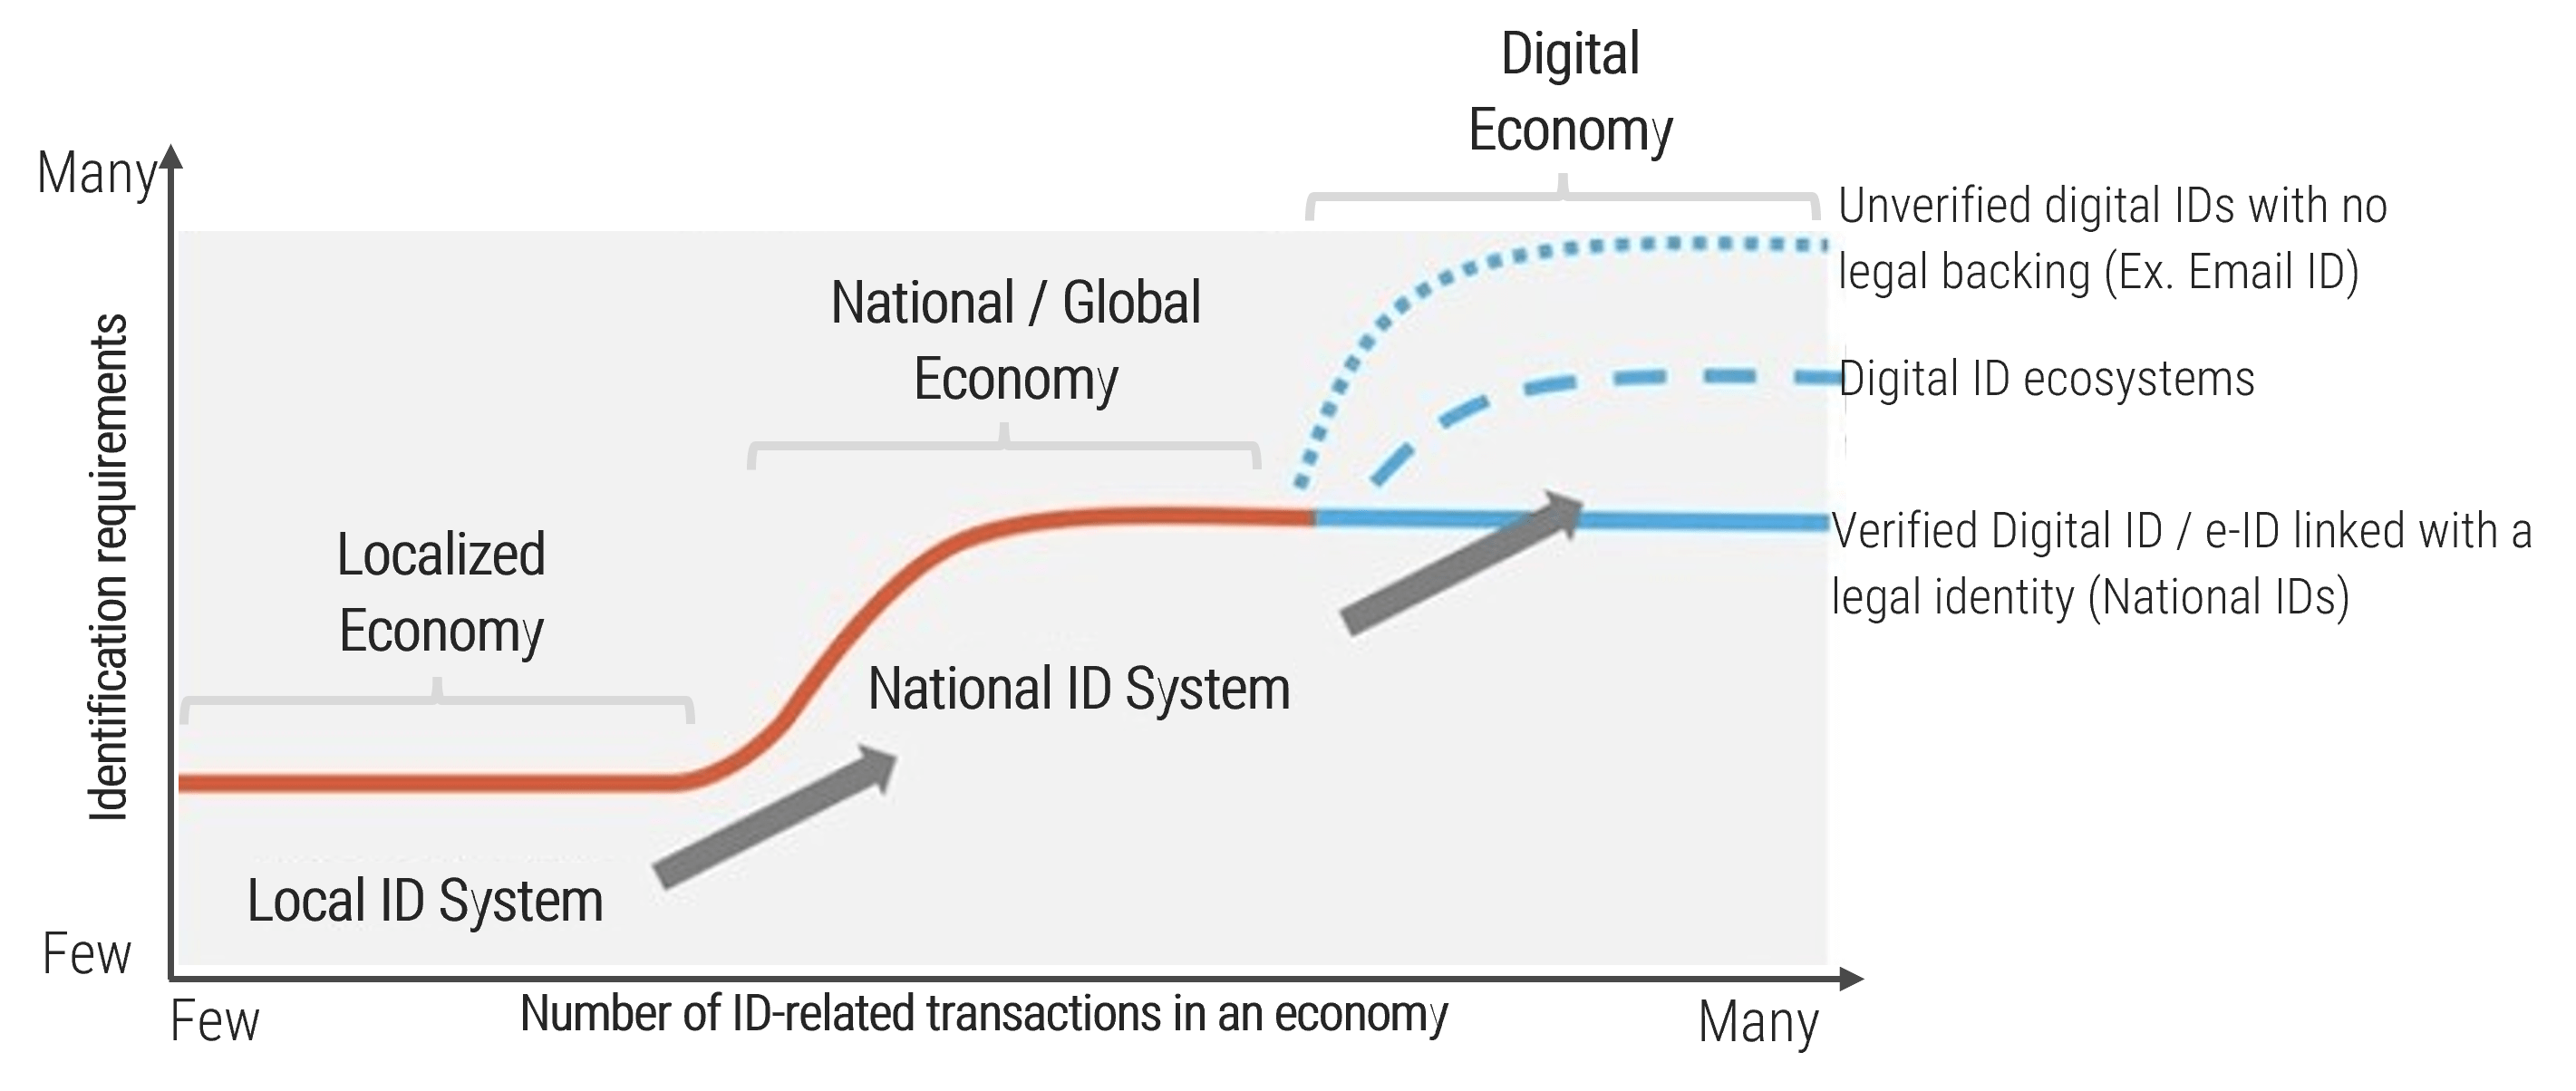
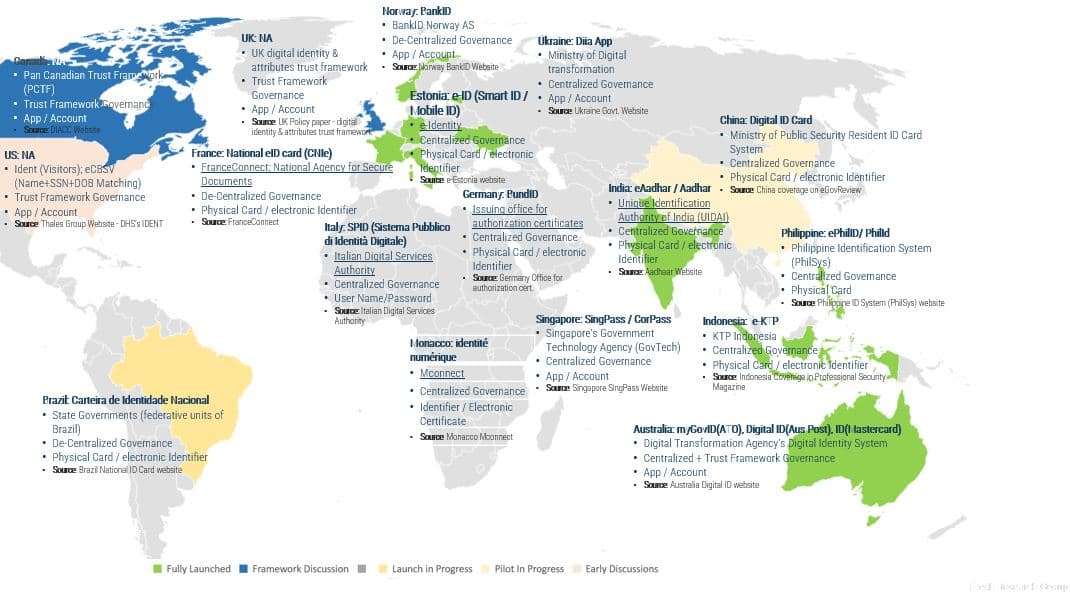
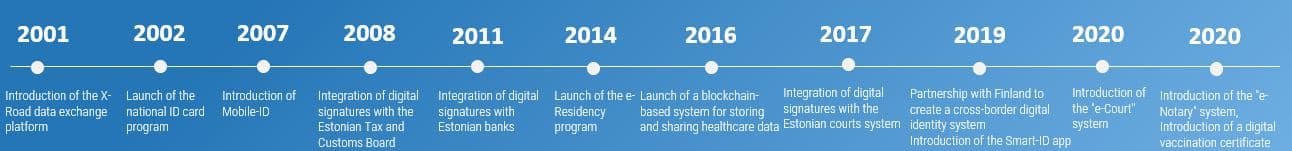
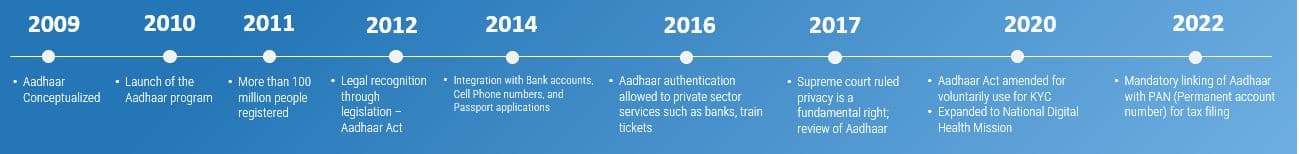
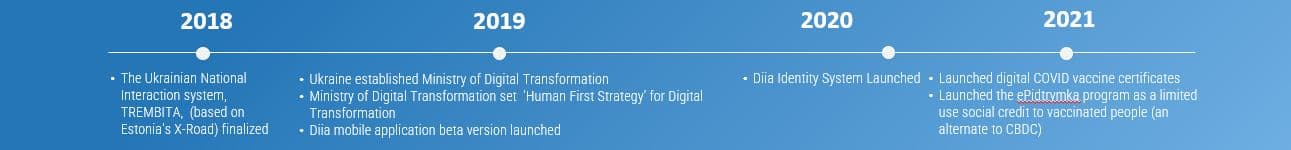
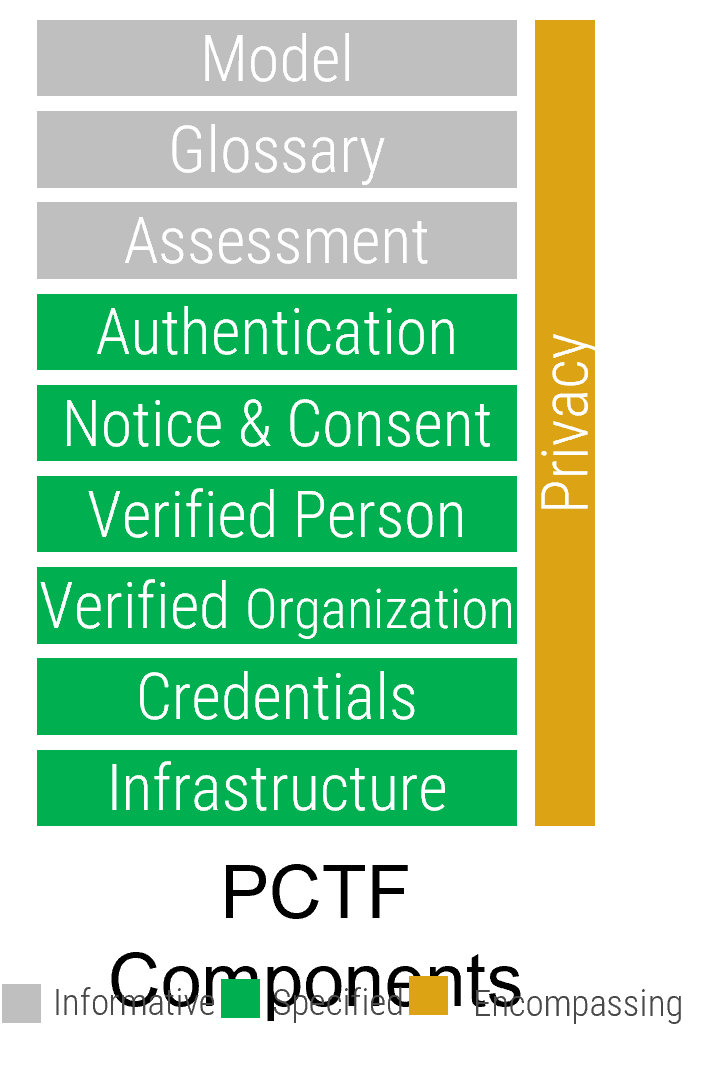
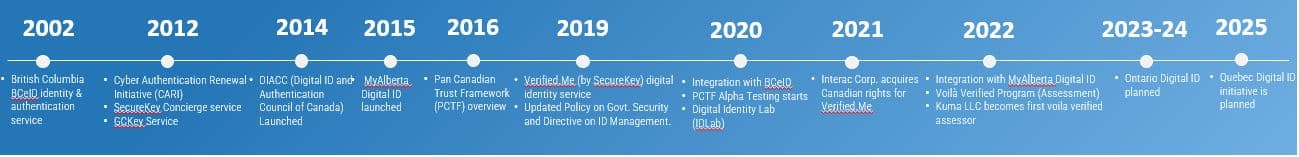
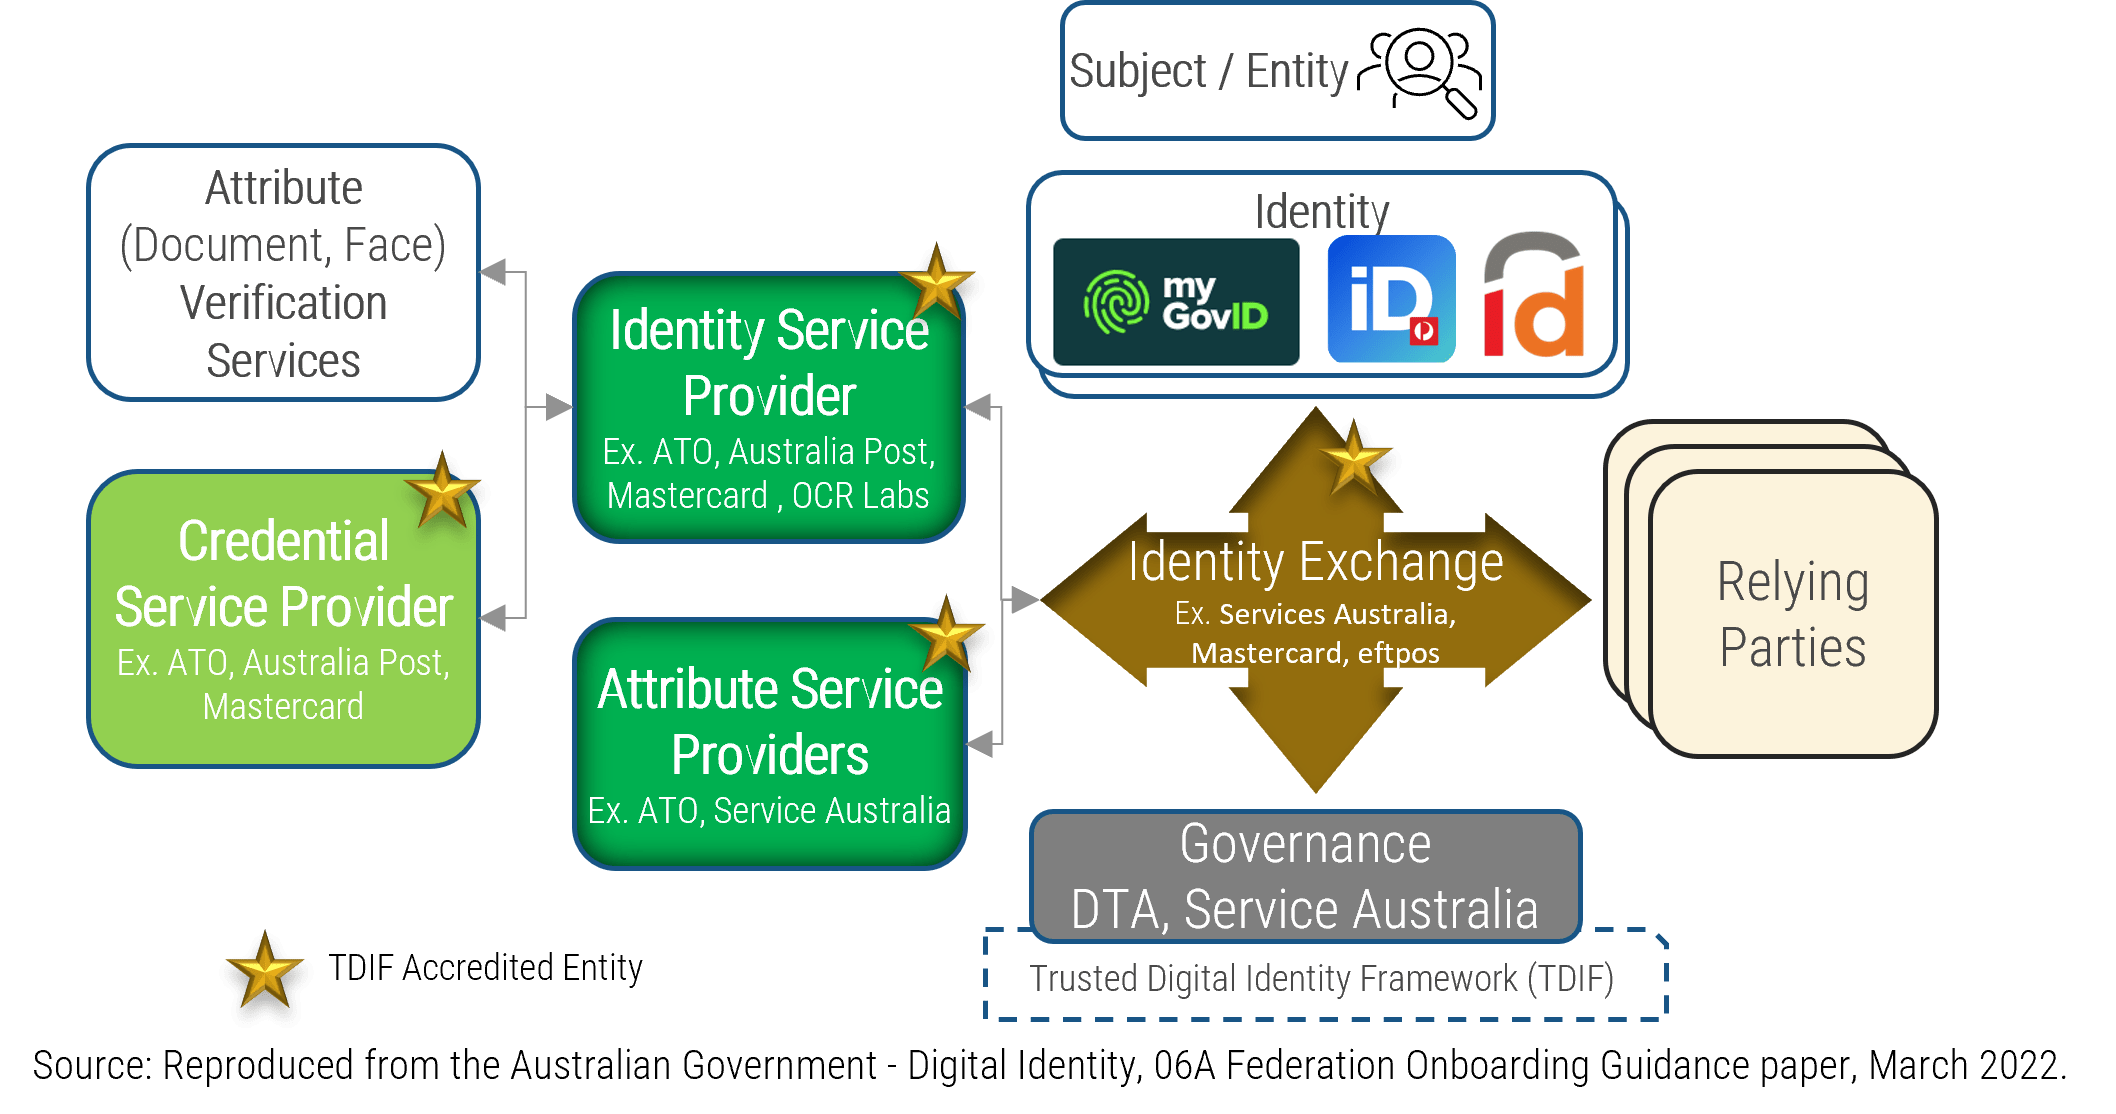
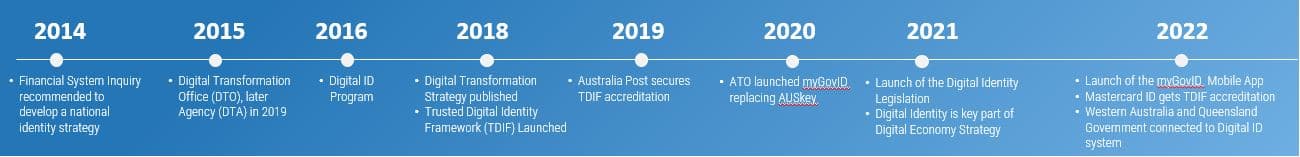
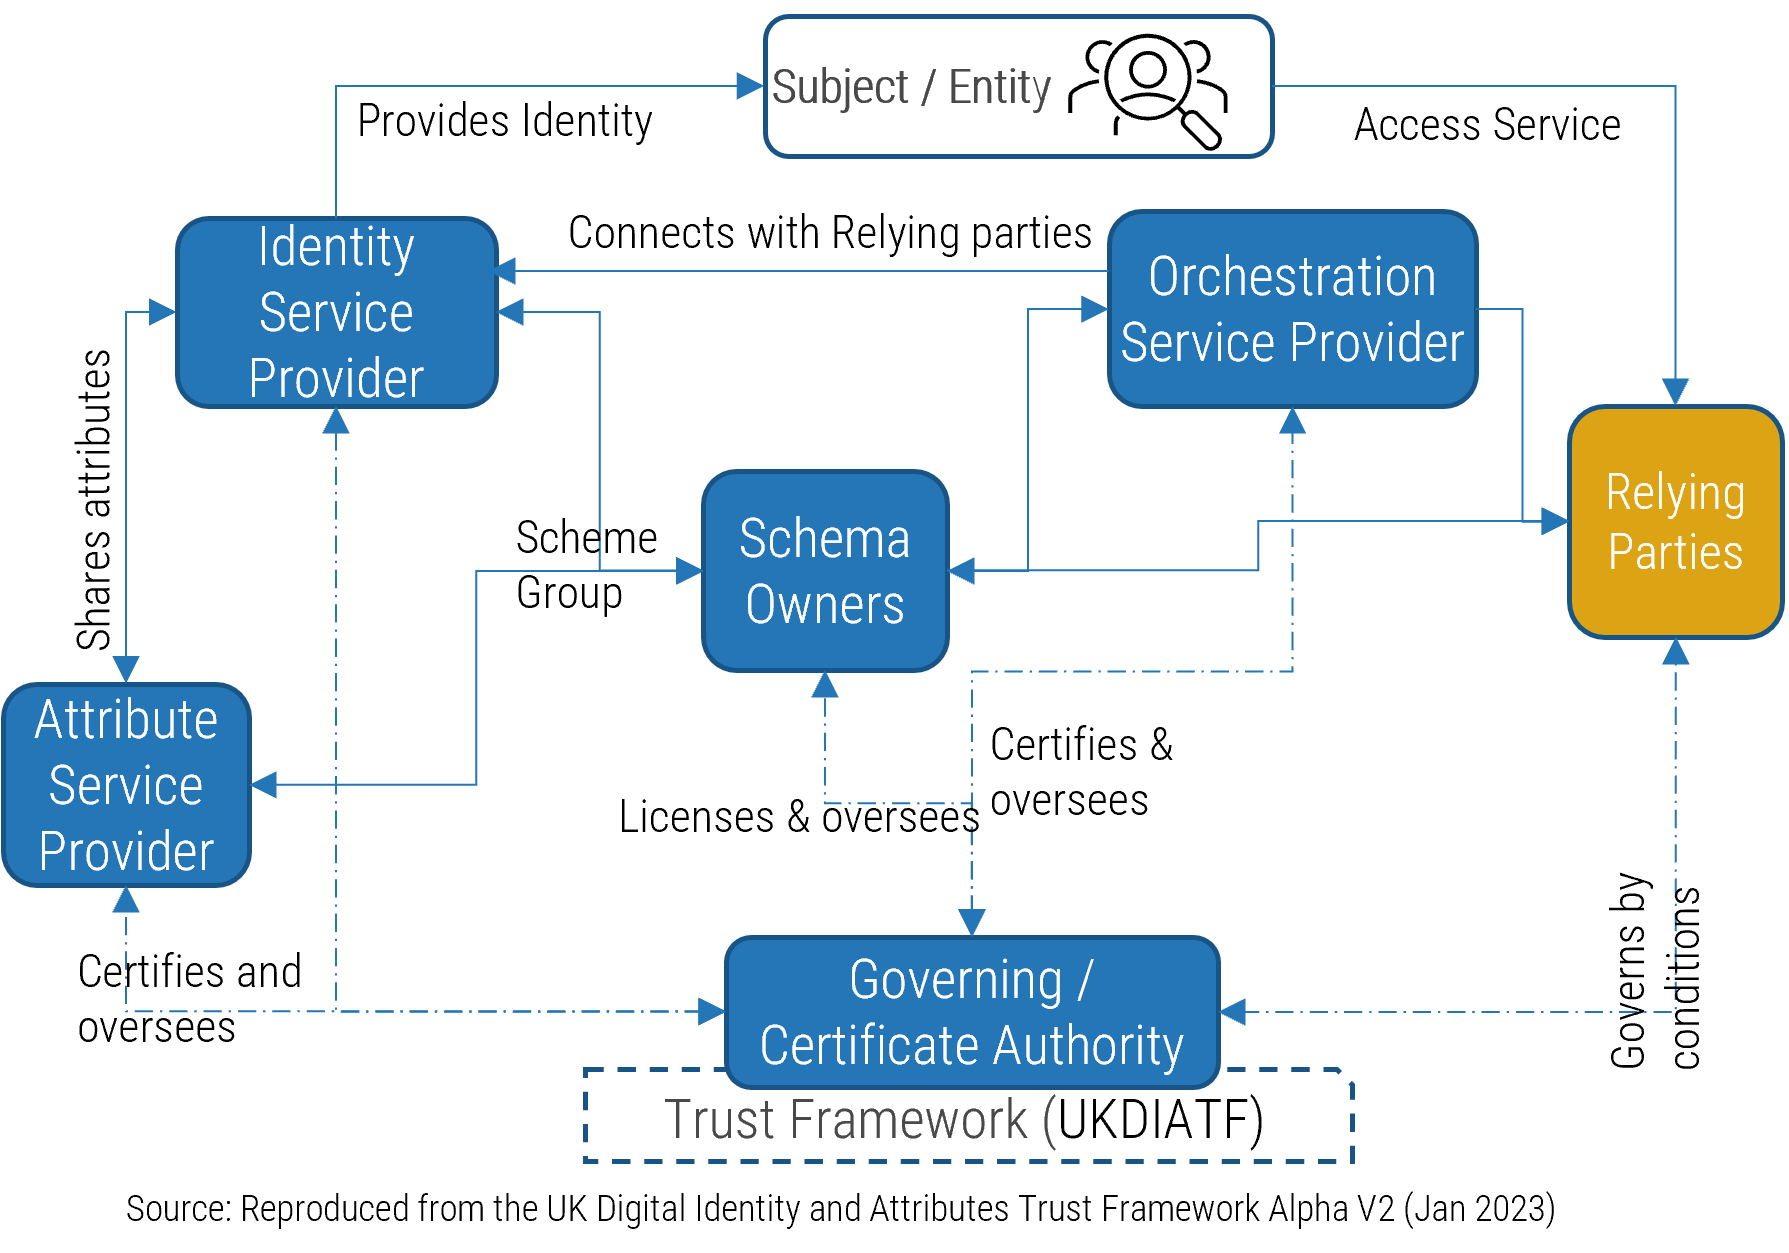
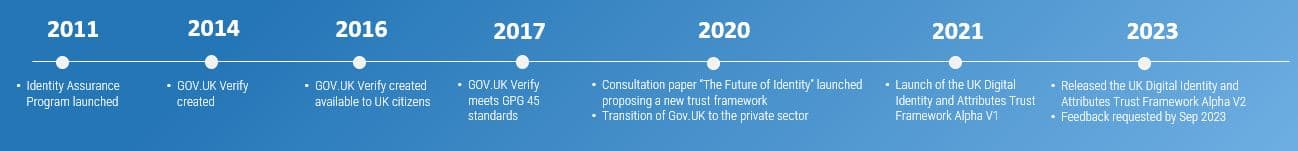
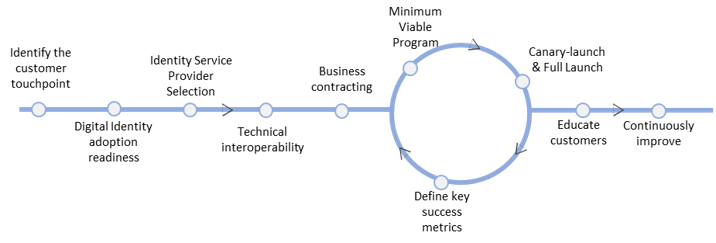
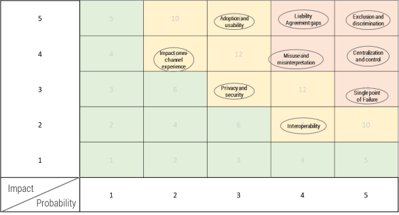


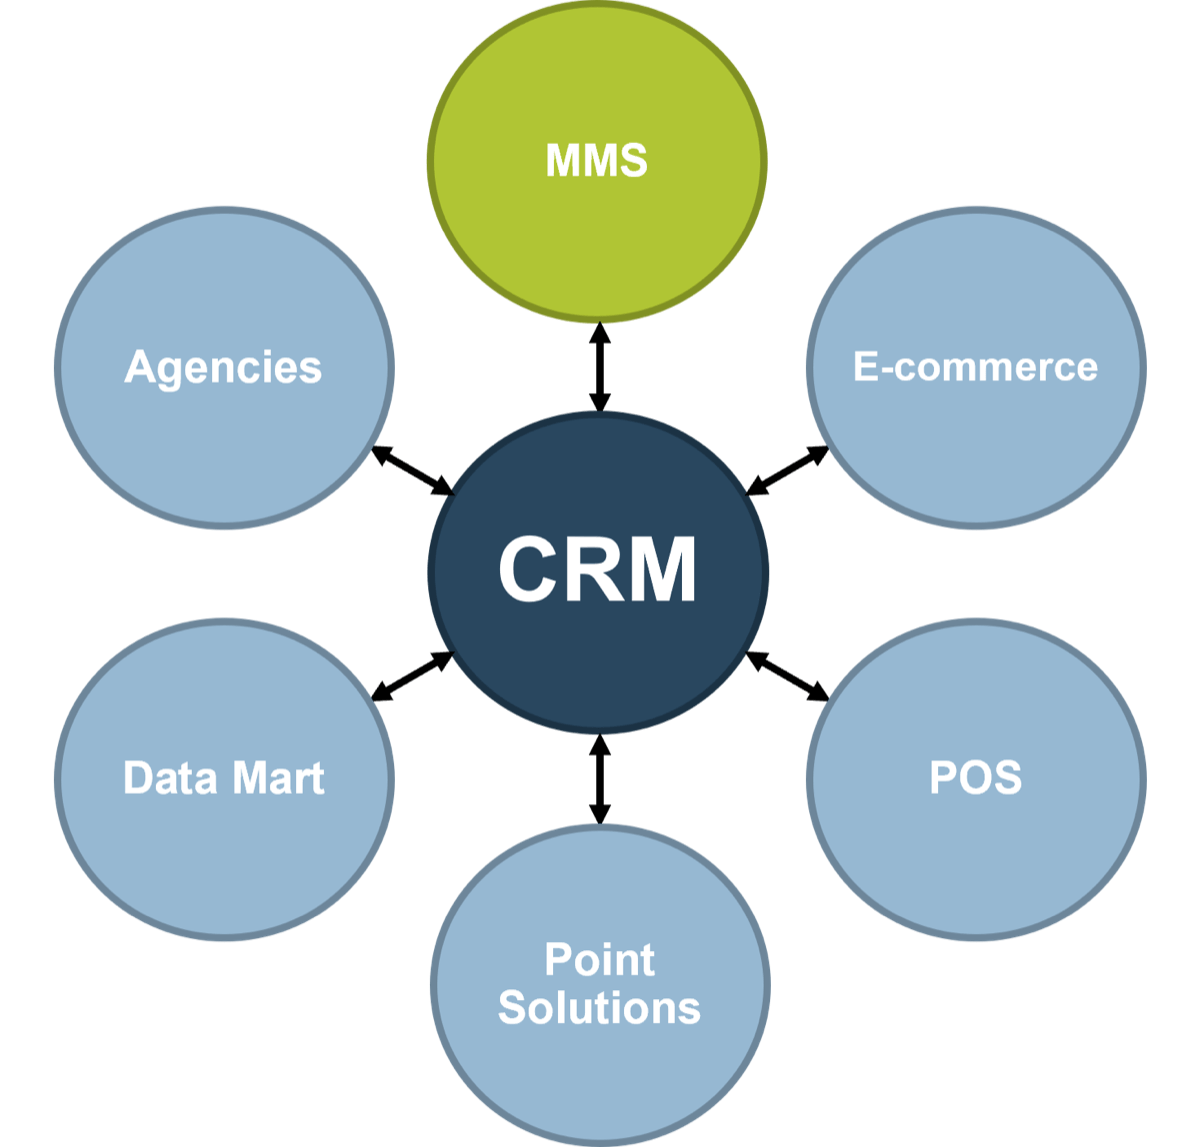


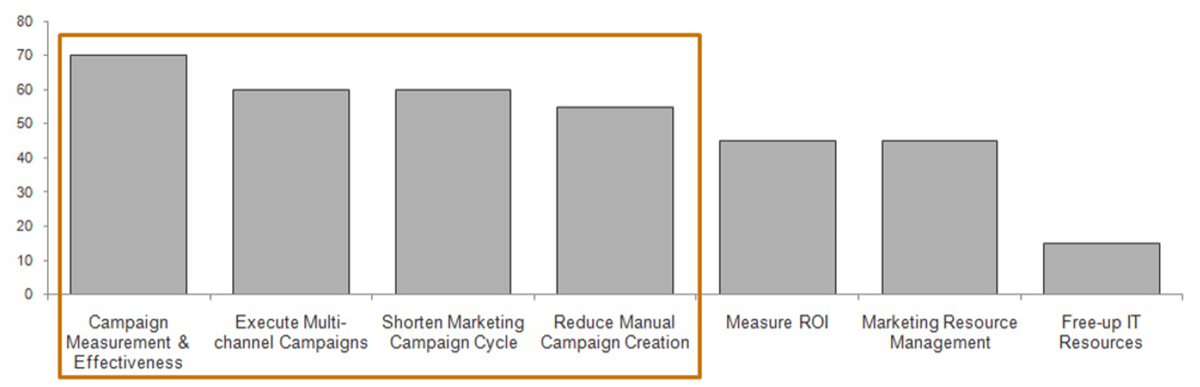
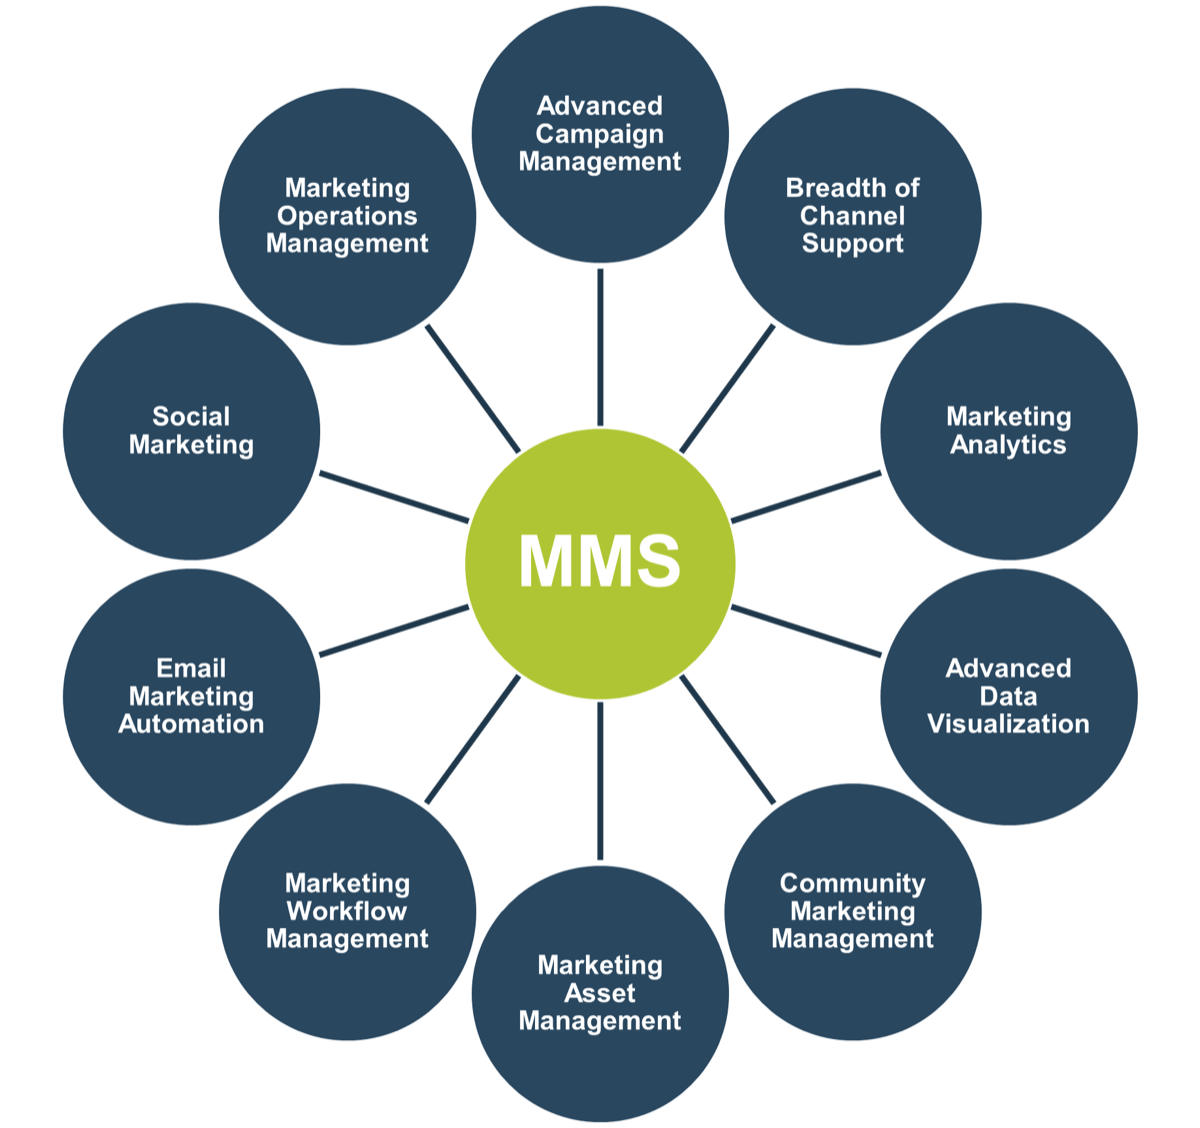
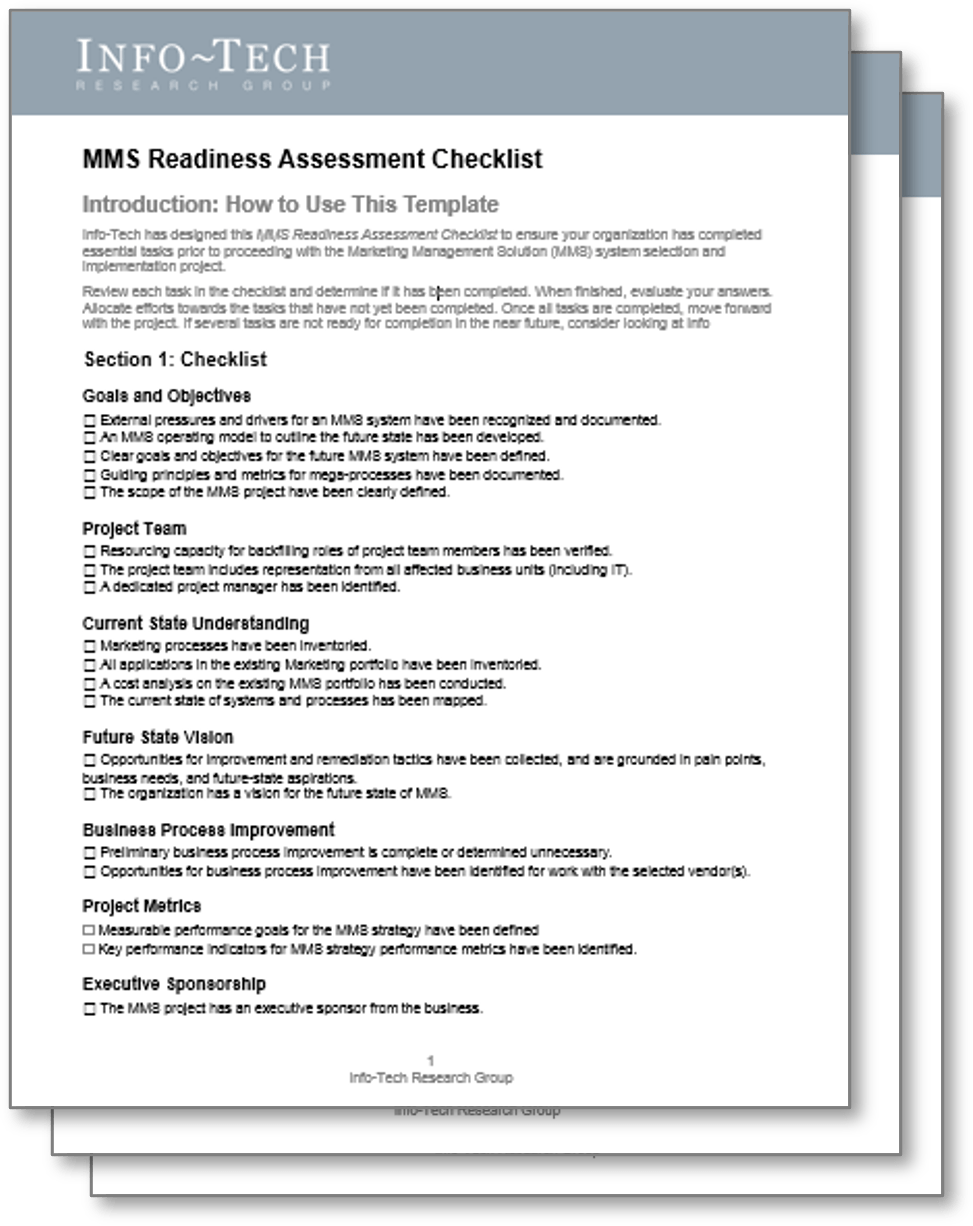

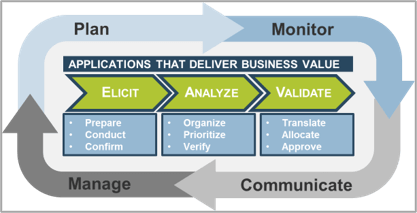
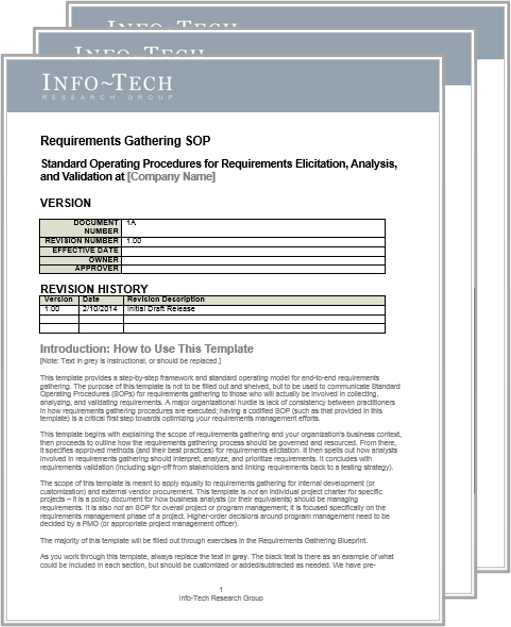
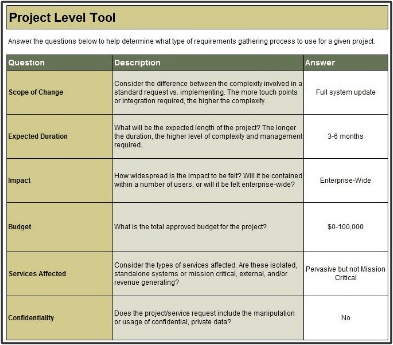

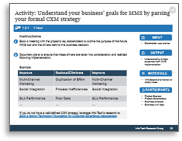
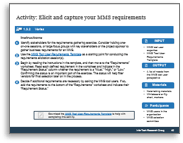


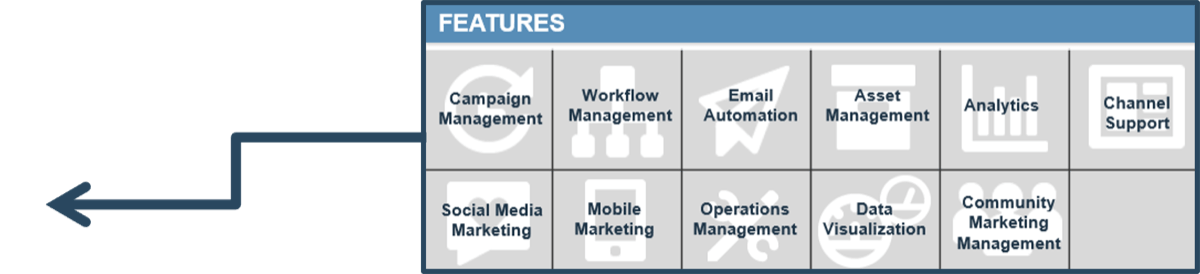
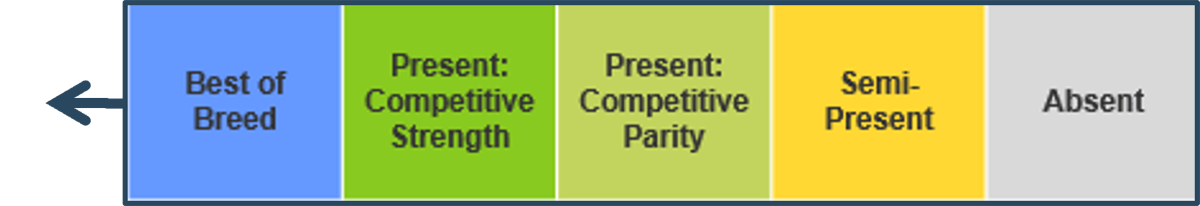
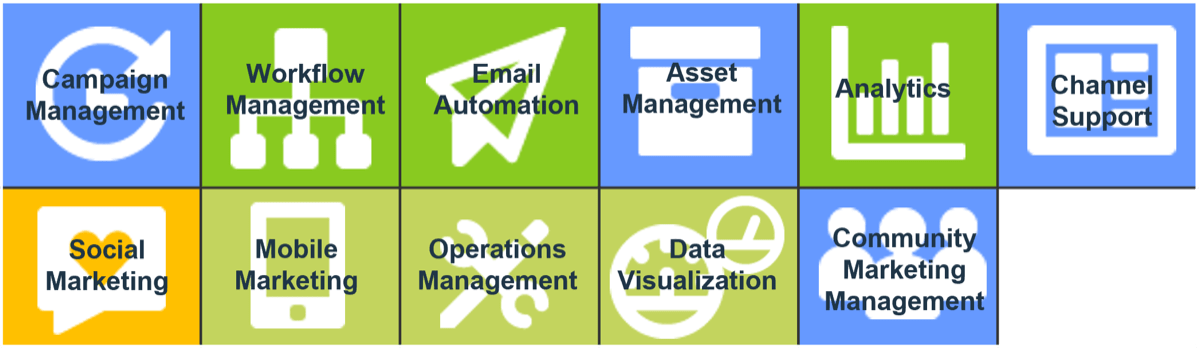
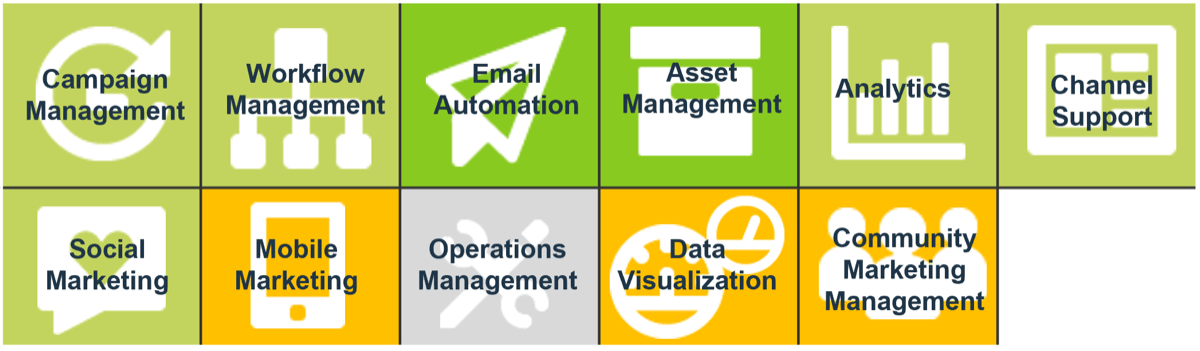
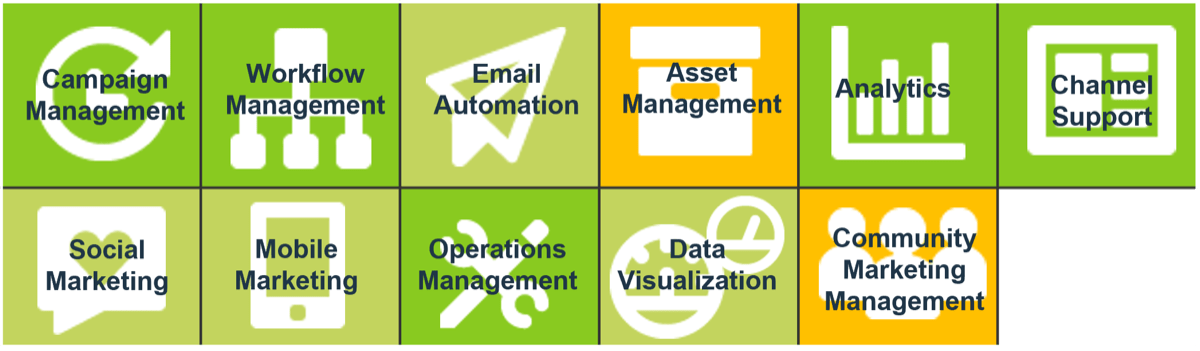
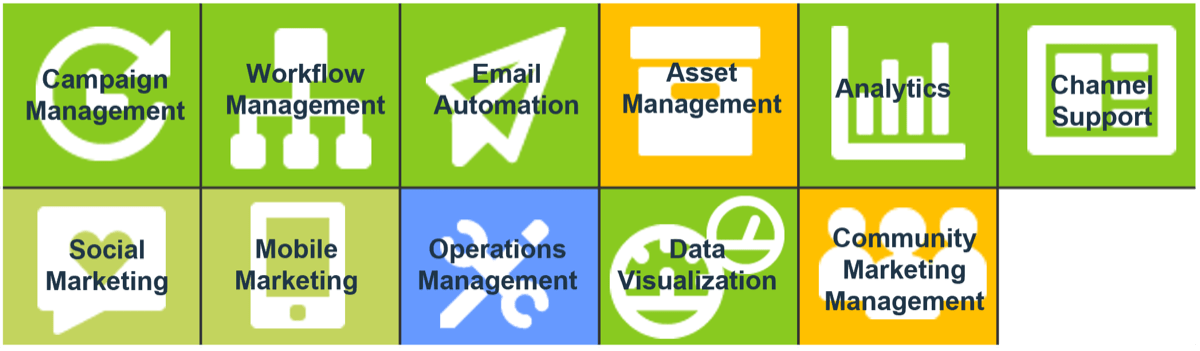
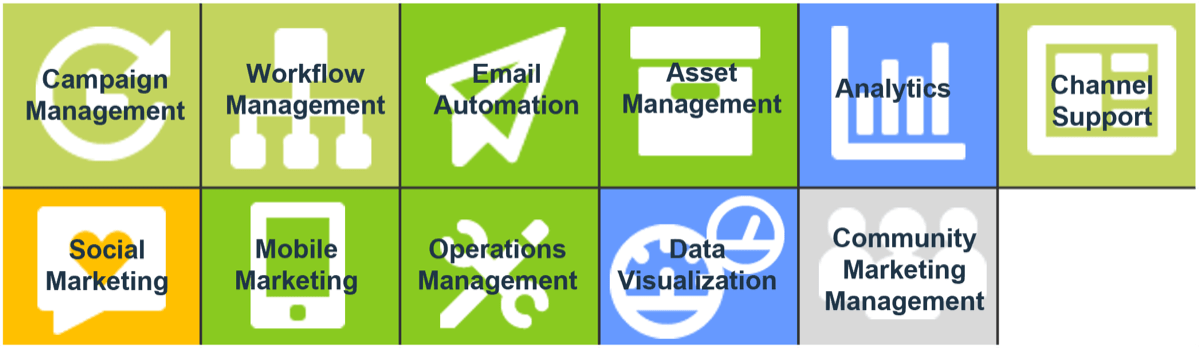


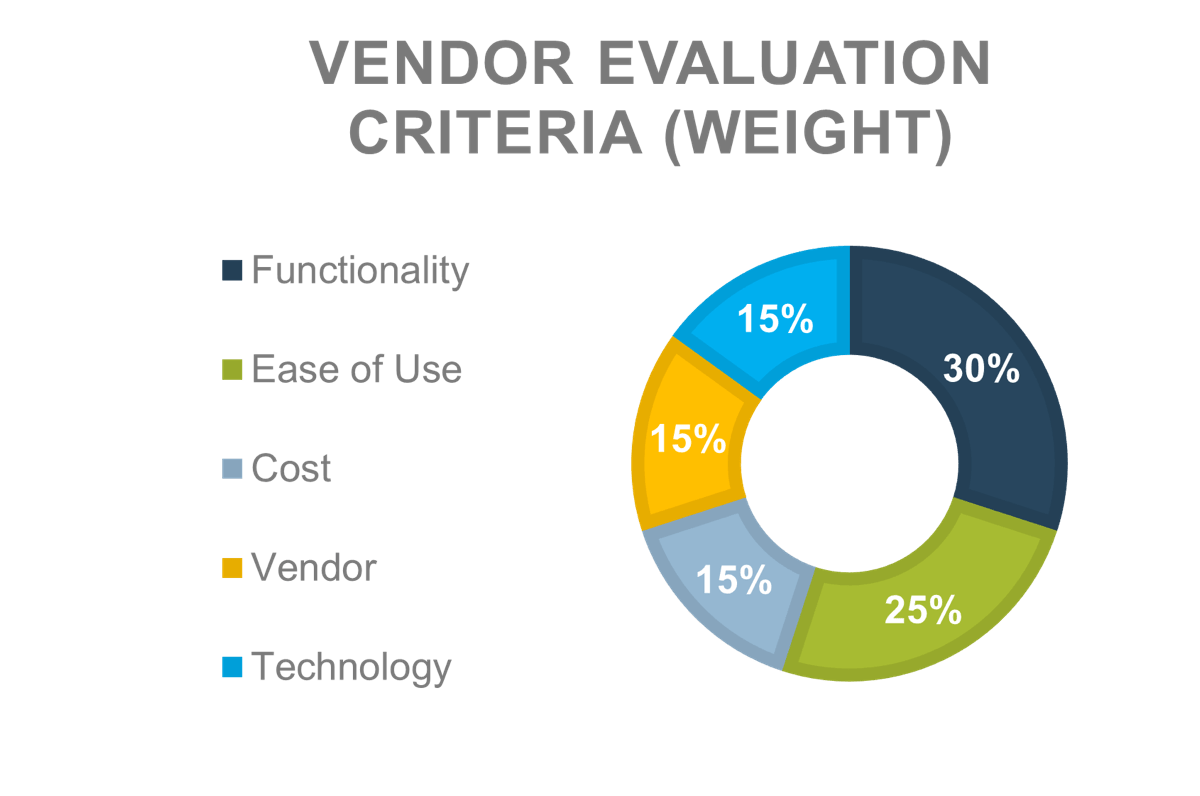

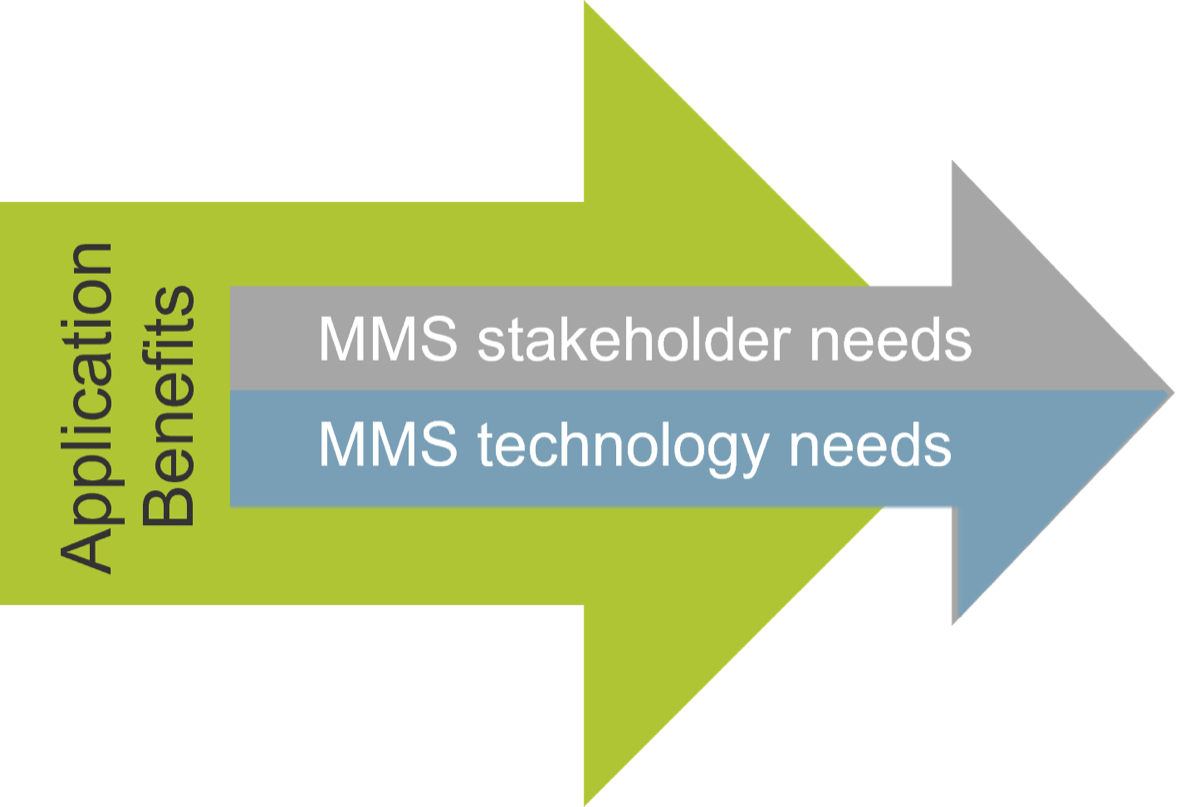

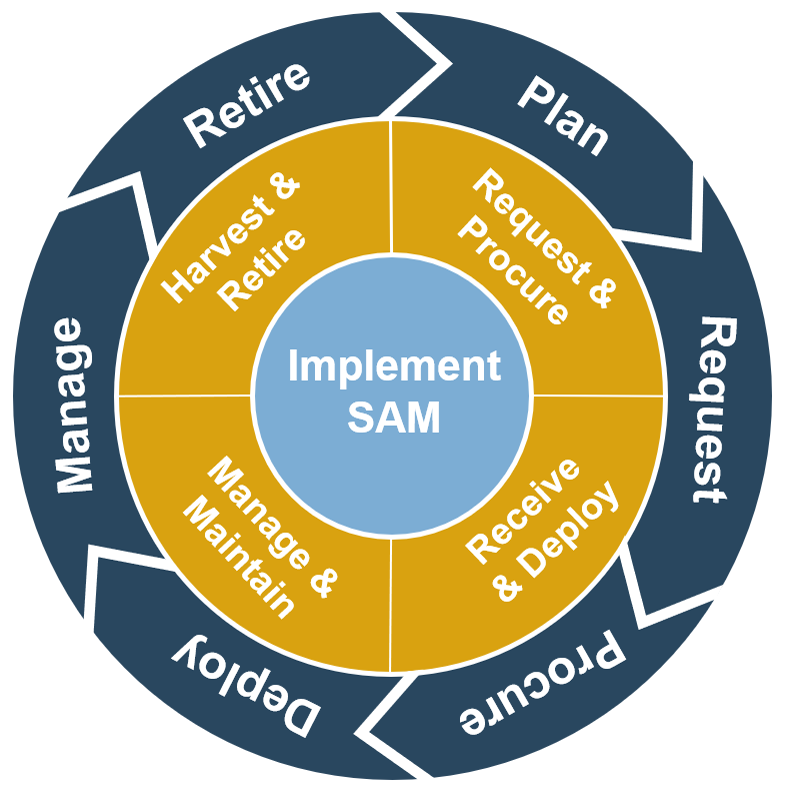
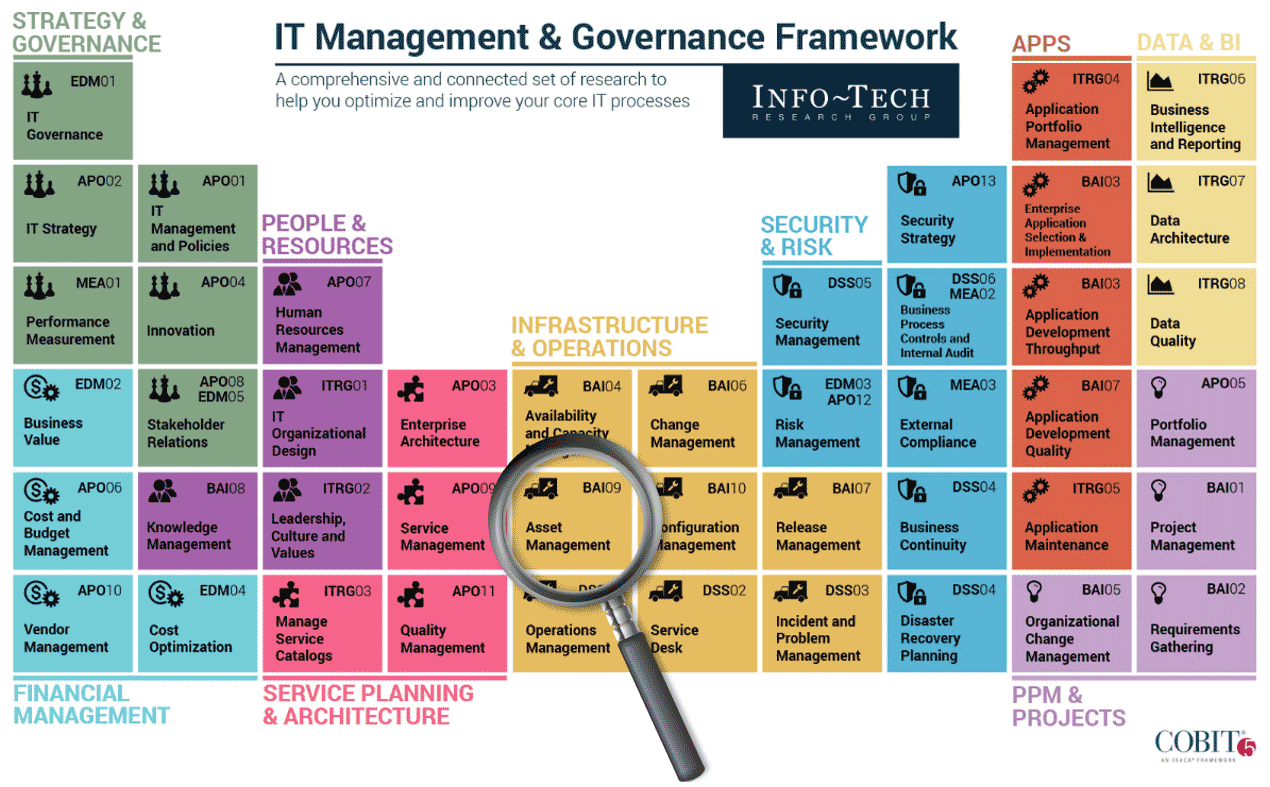
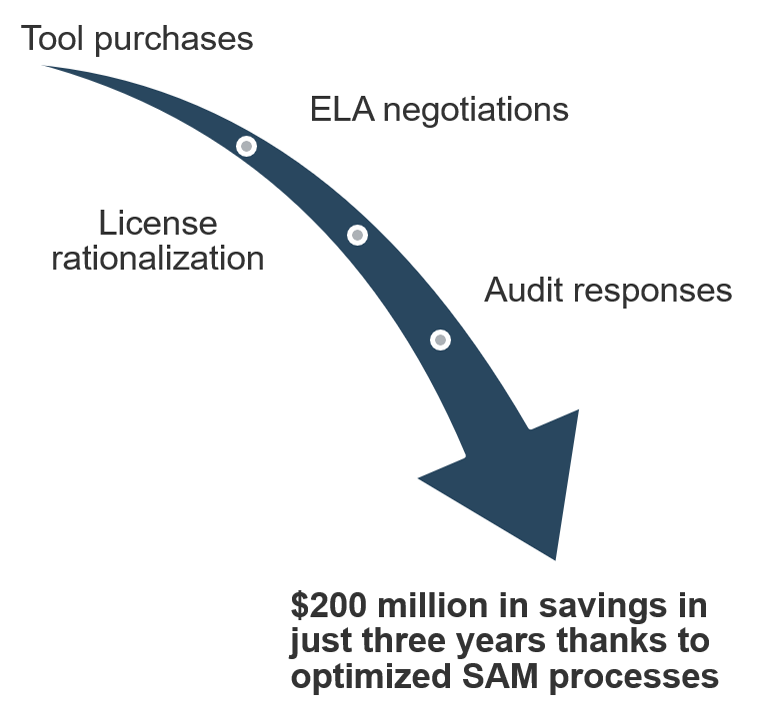
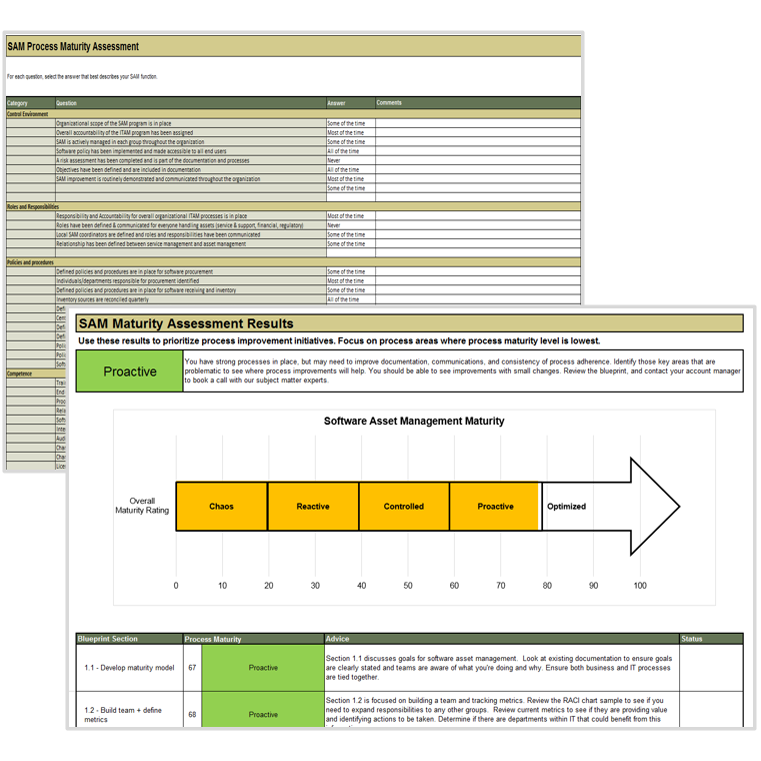
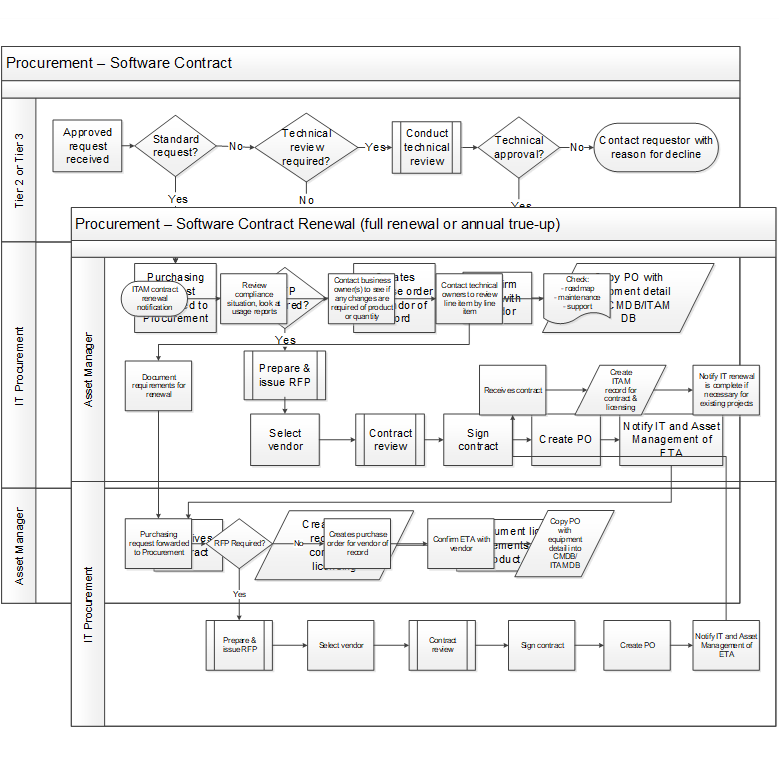
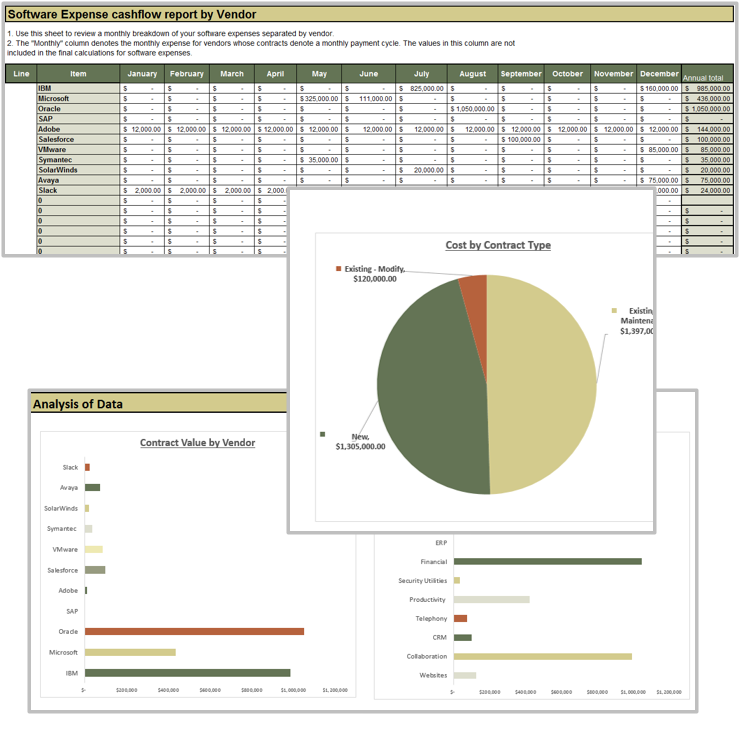
 Best-Practice Toolkit
 Onsite Workshop
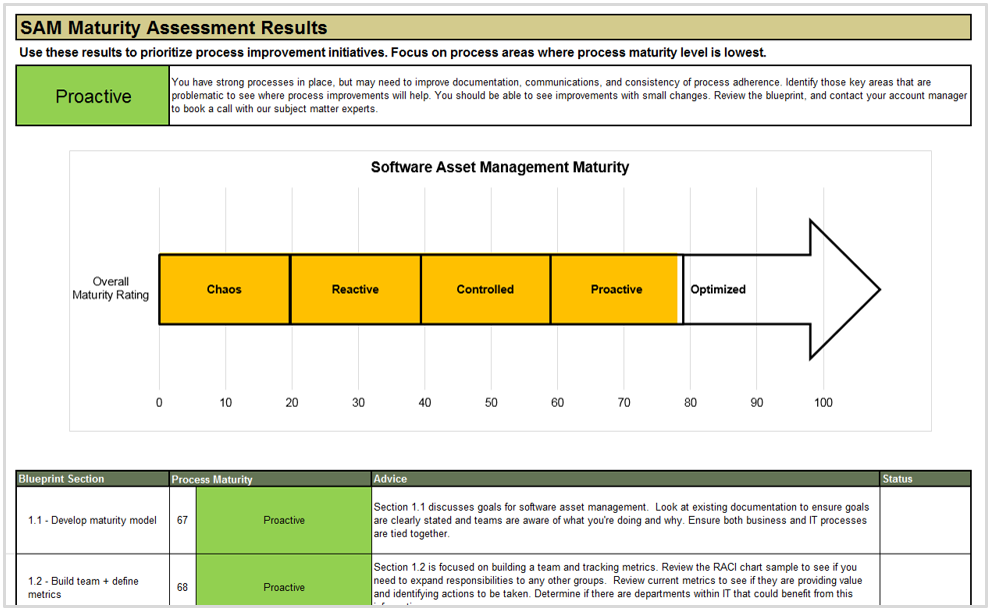
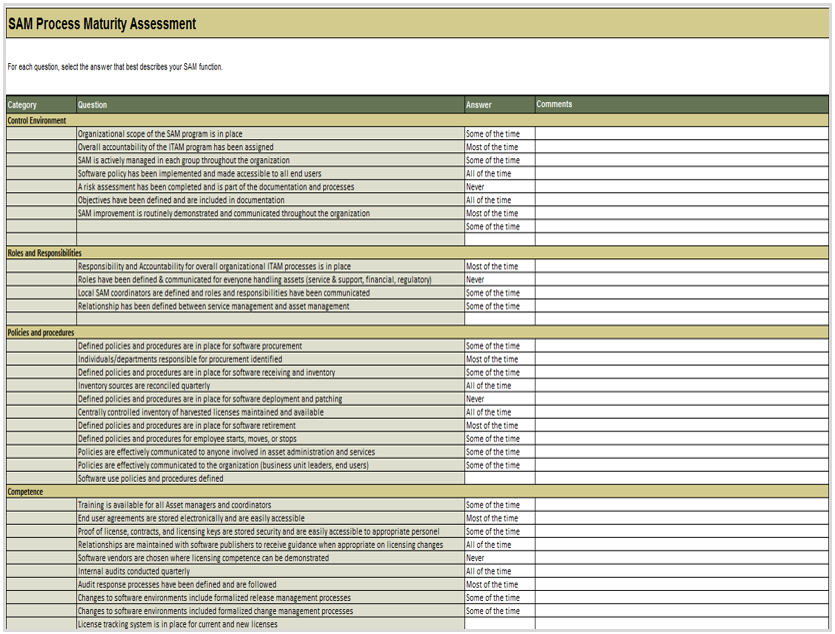
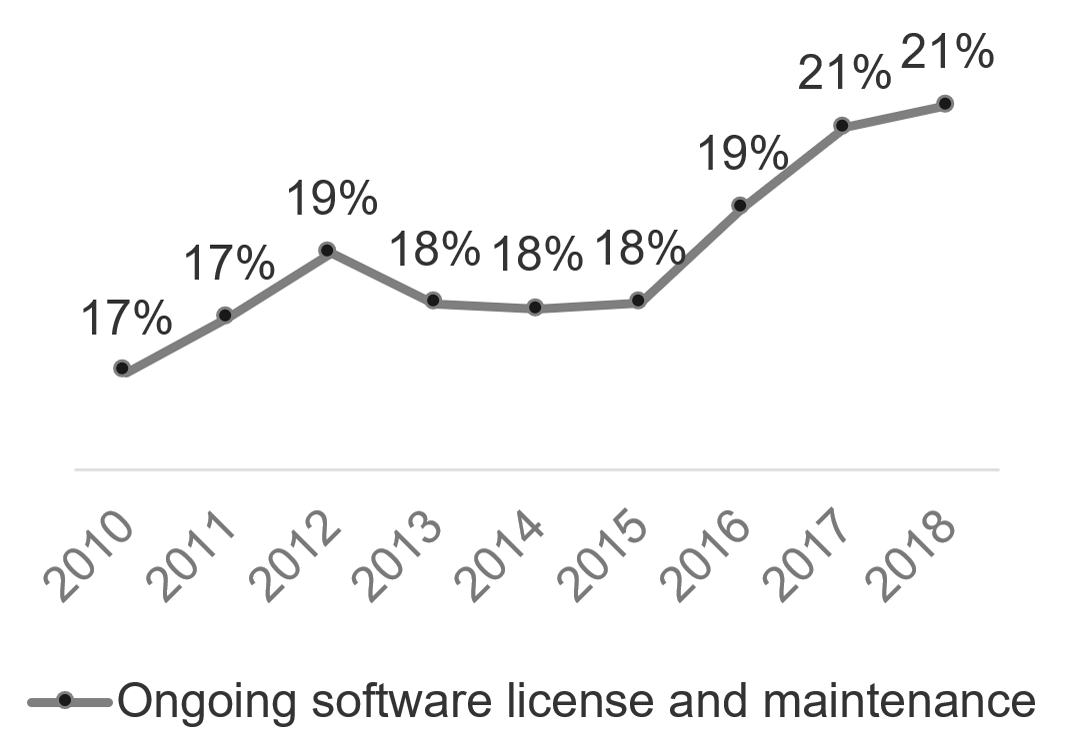
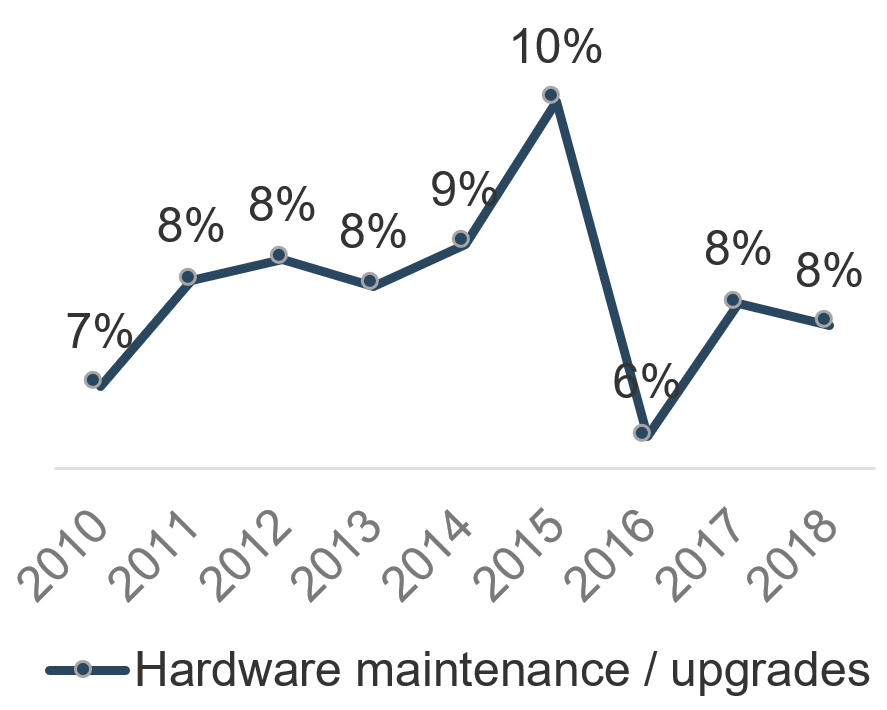
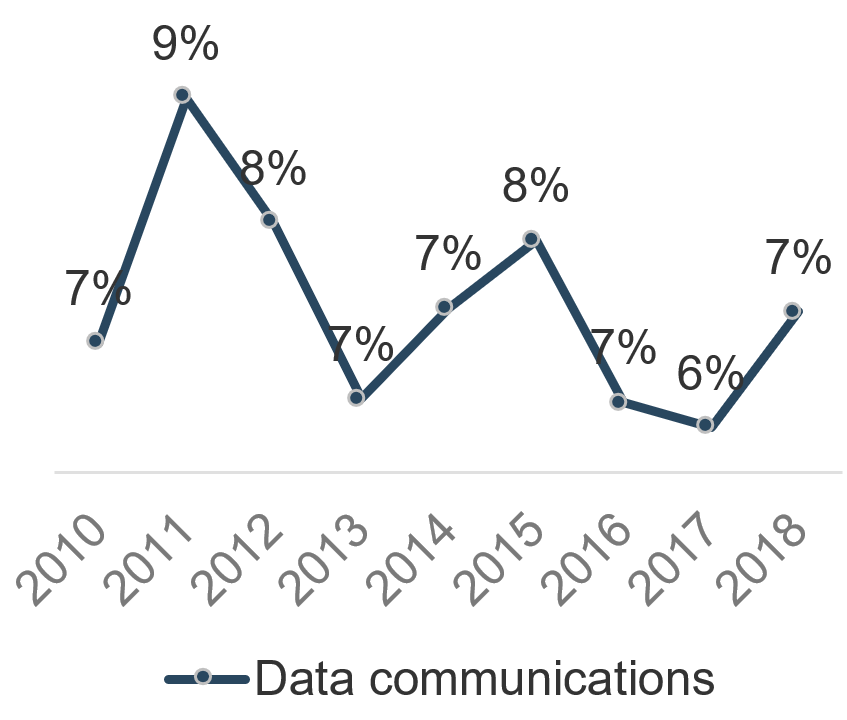
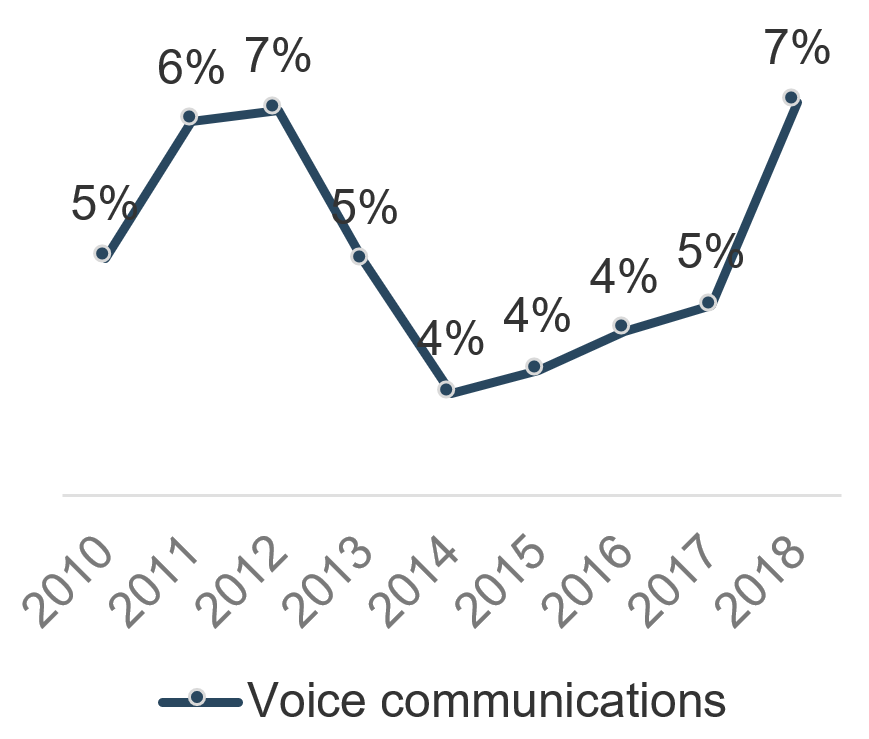
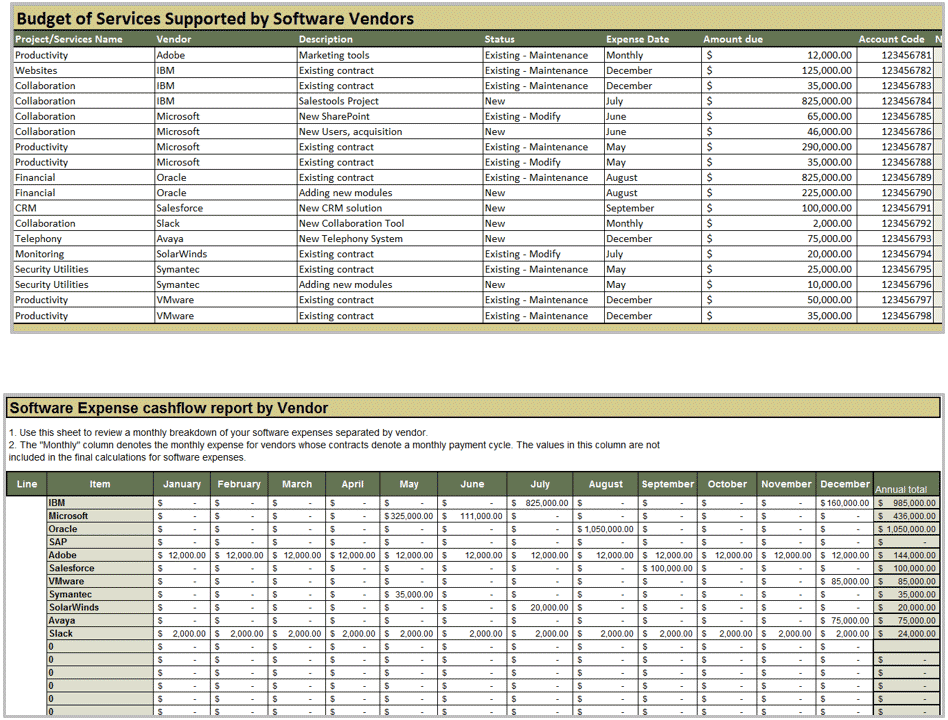
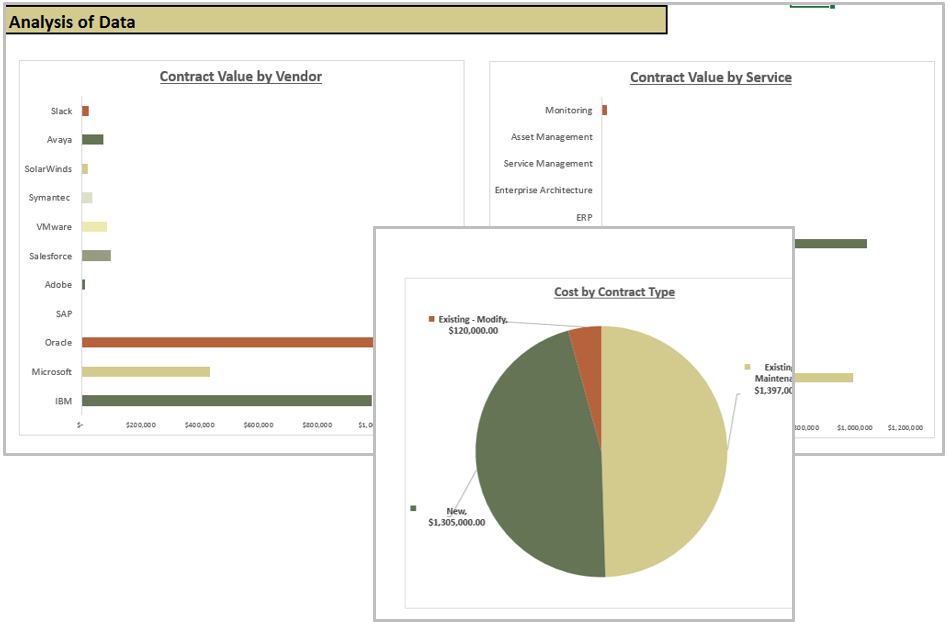

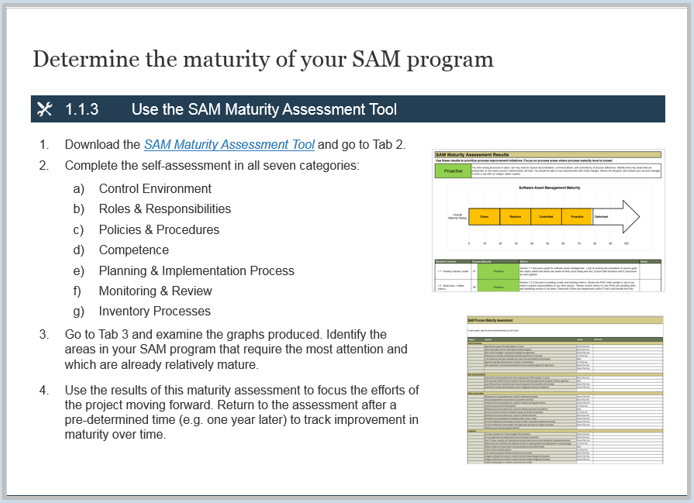
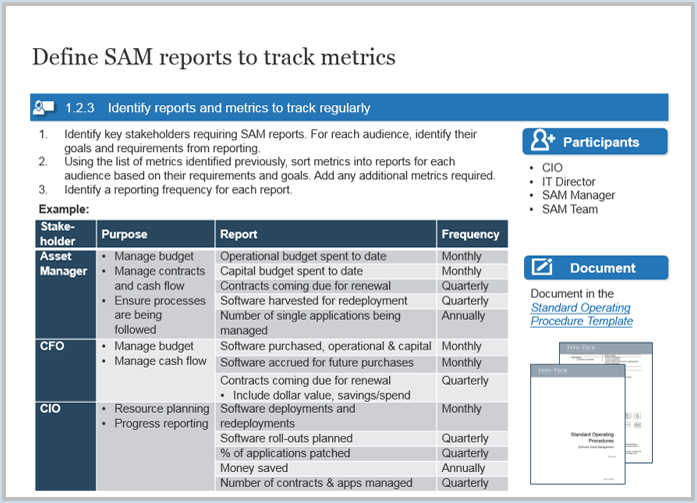

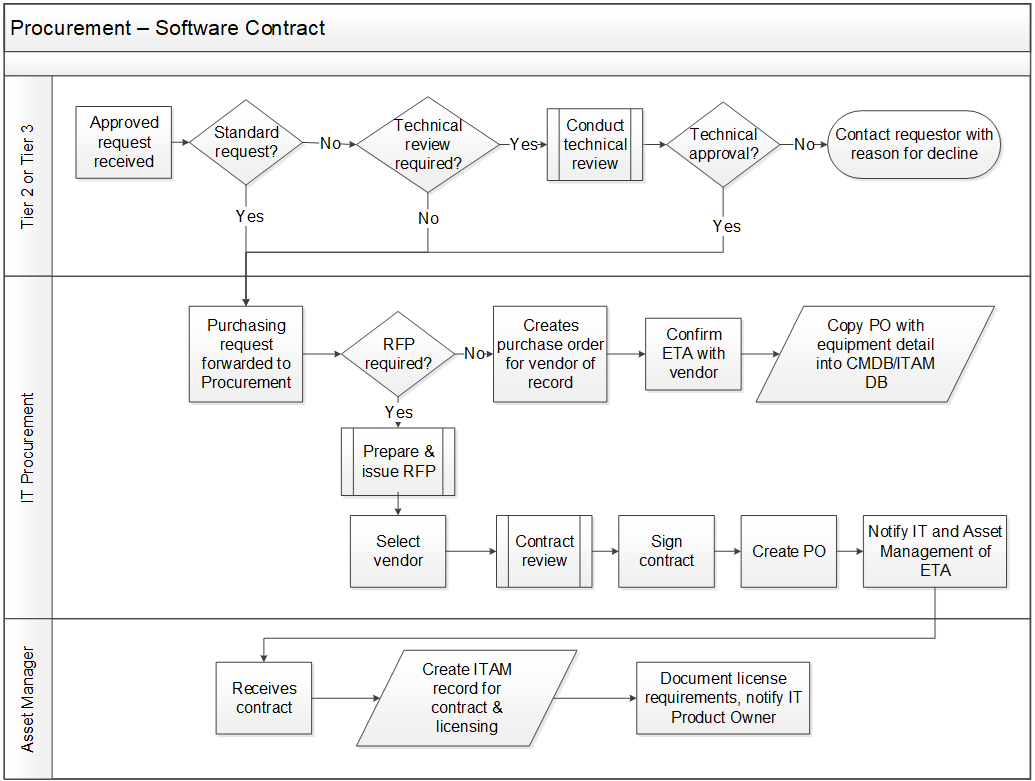
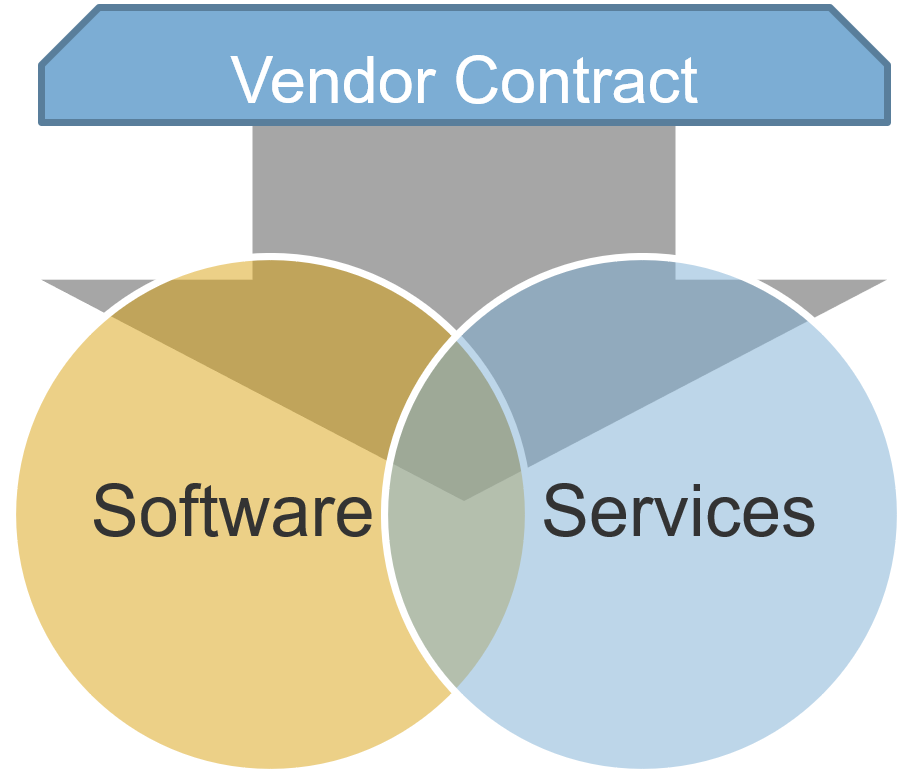
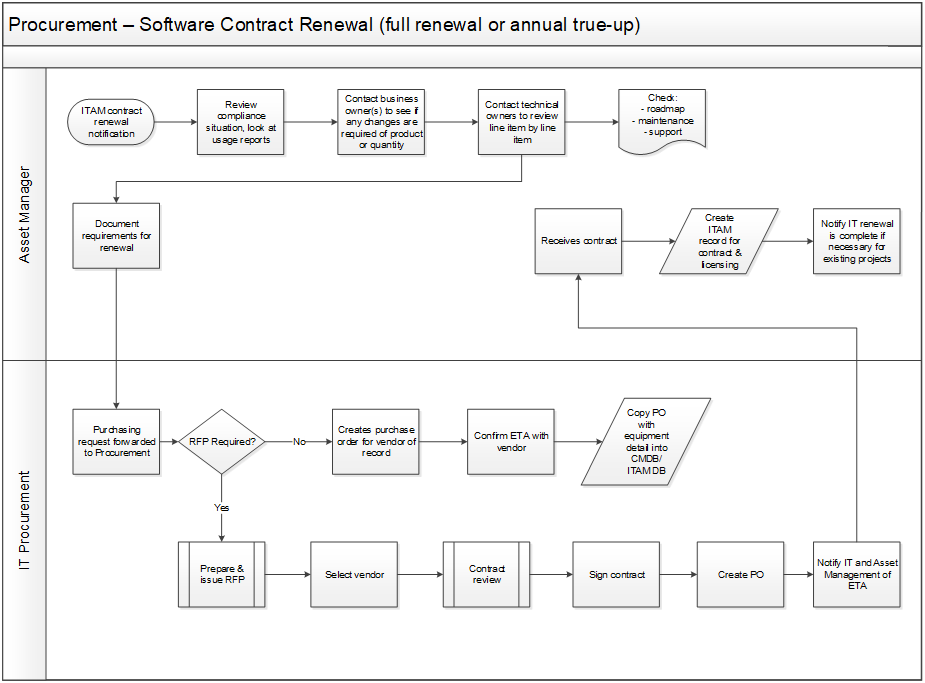
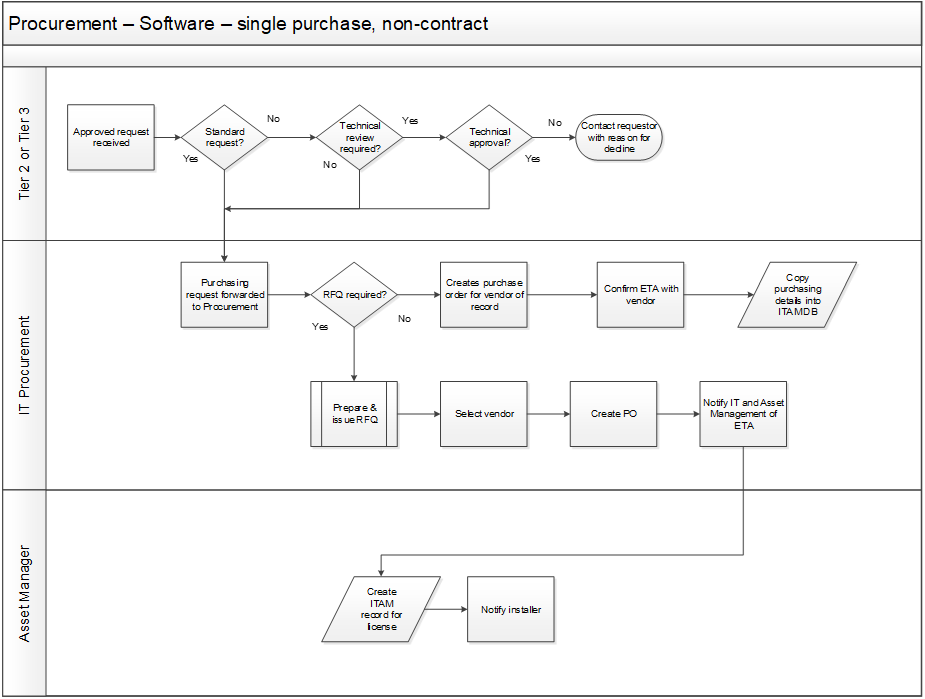
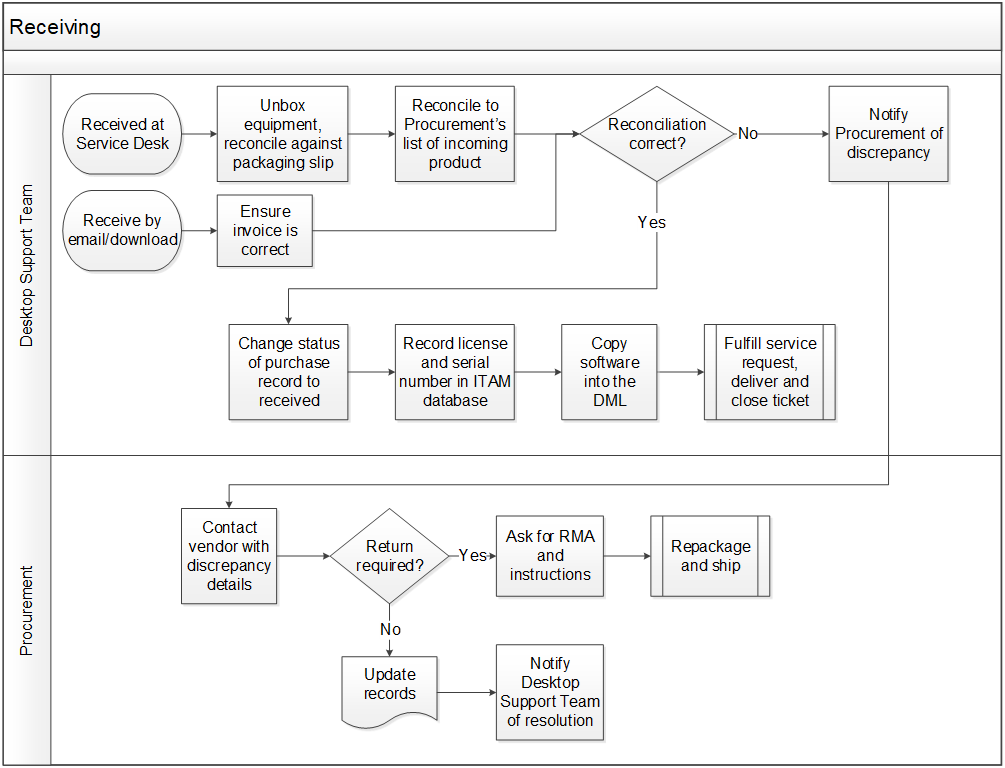
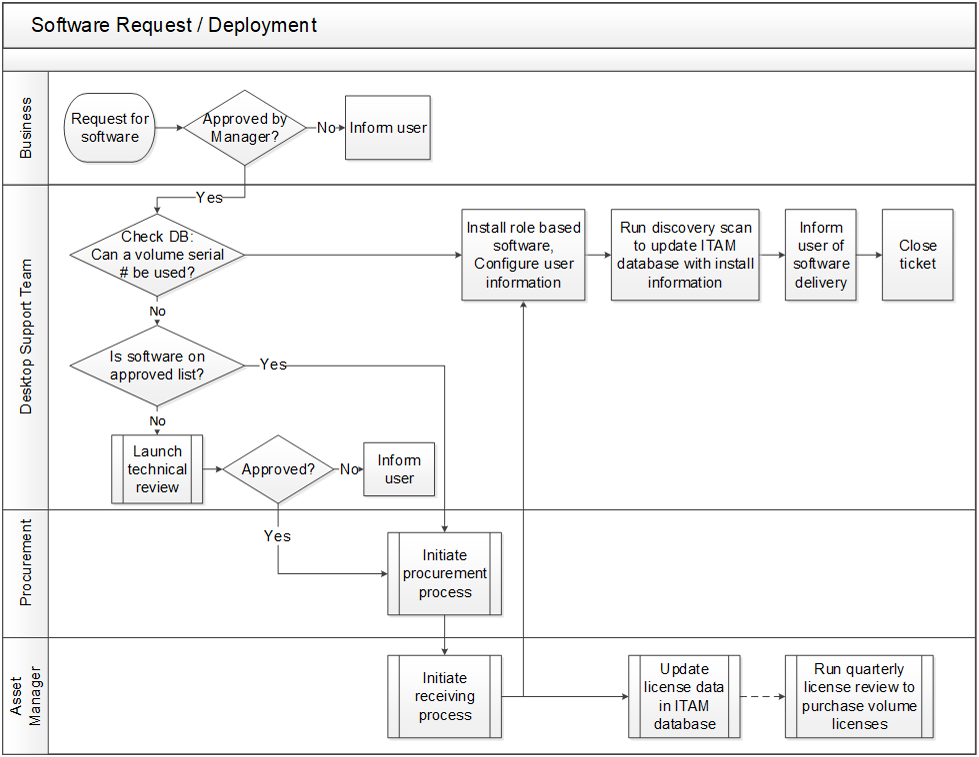
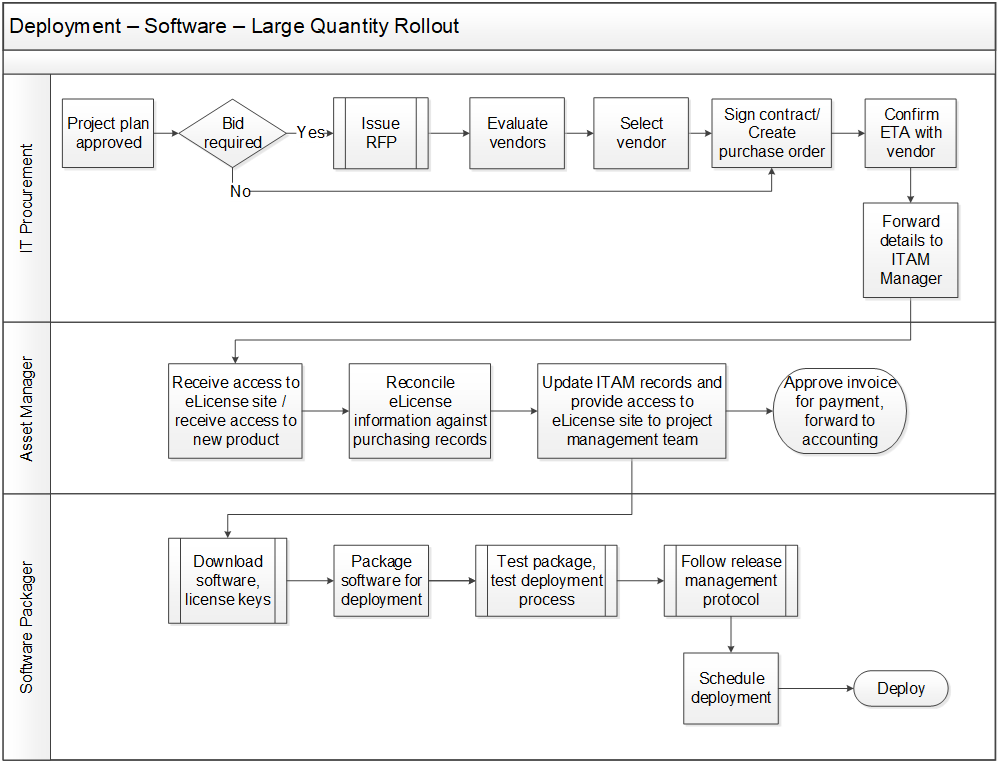
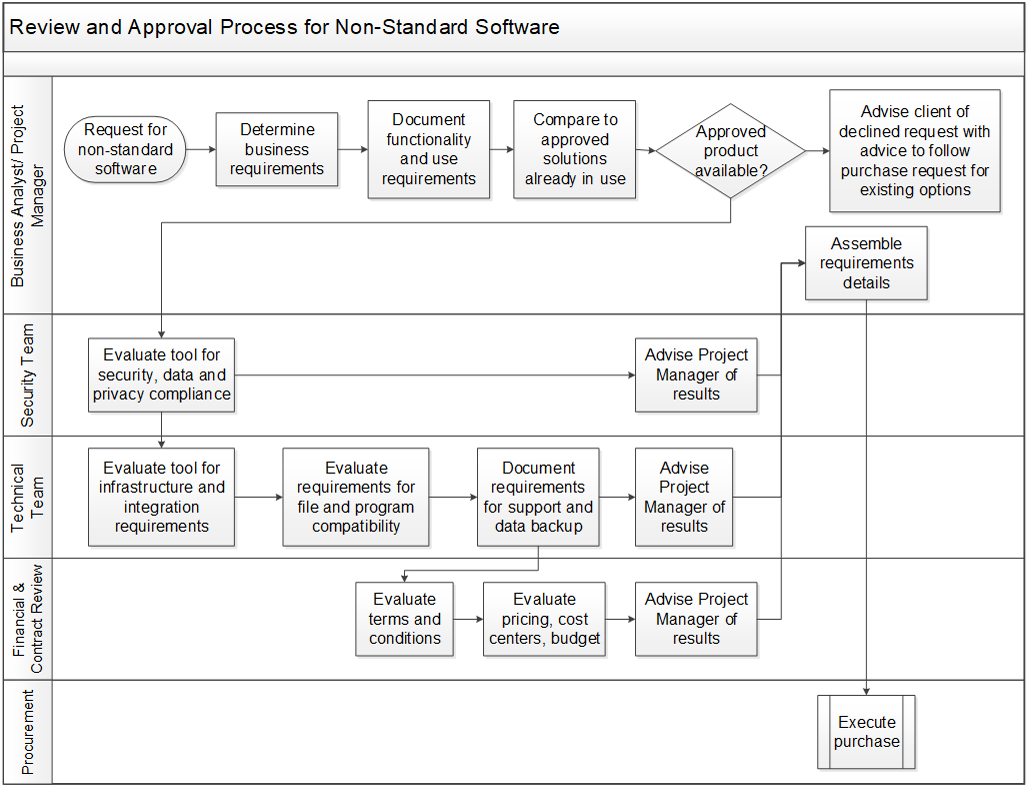
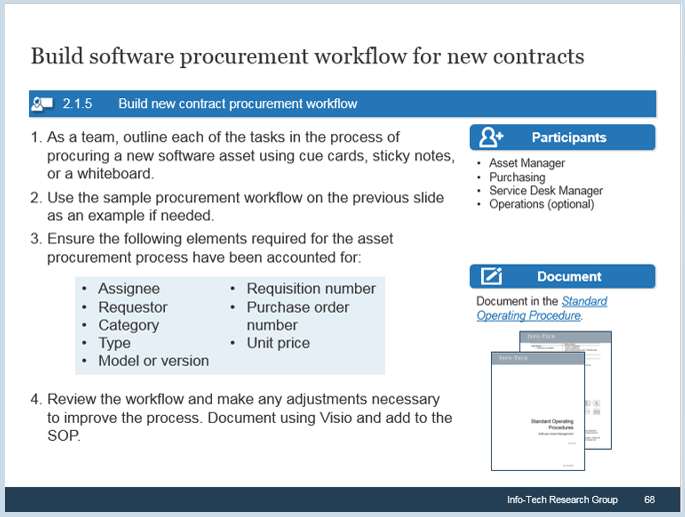
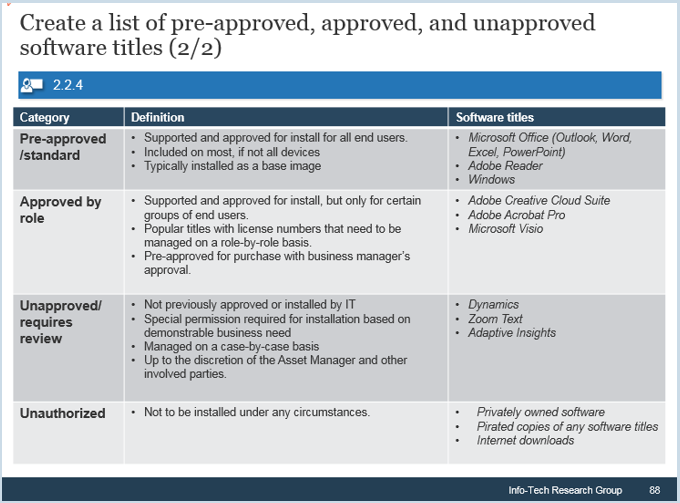
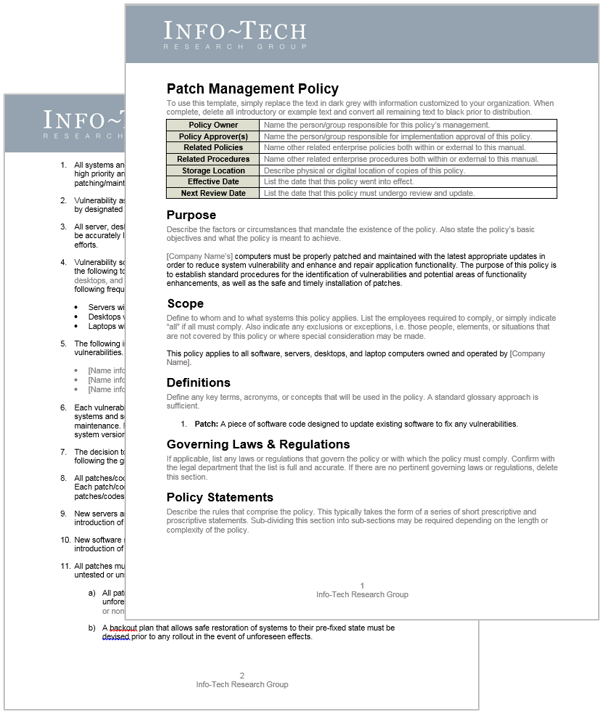
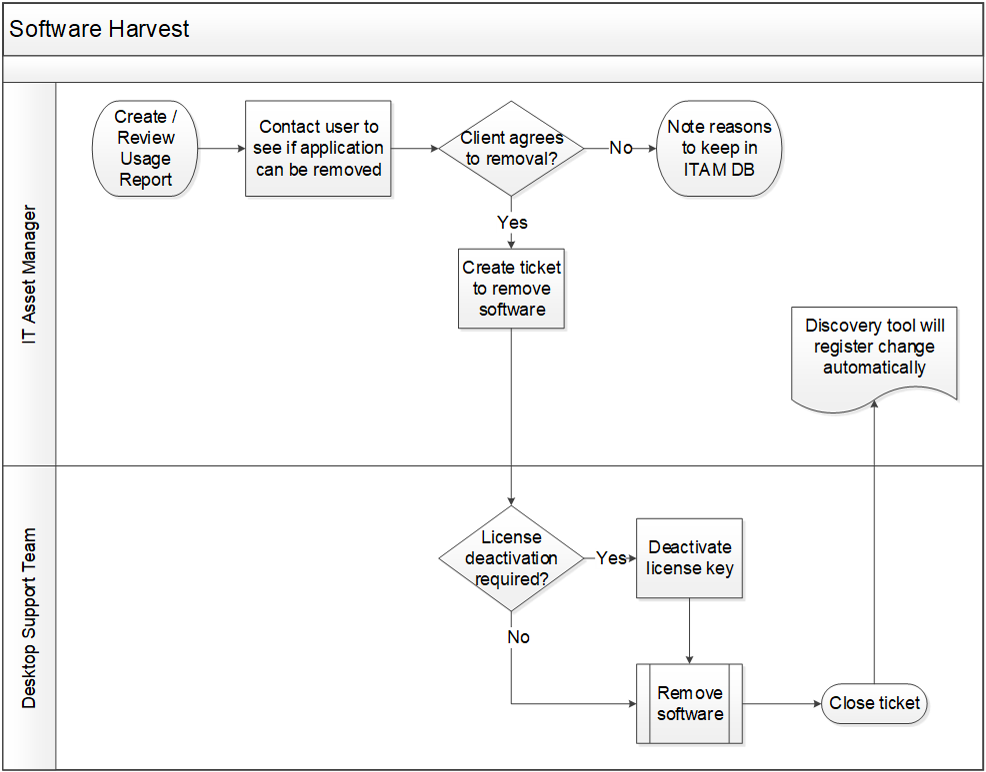
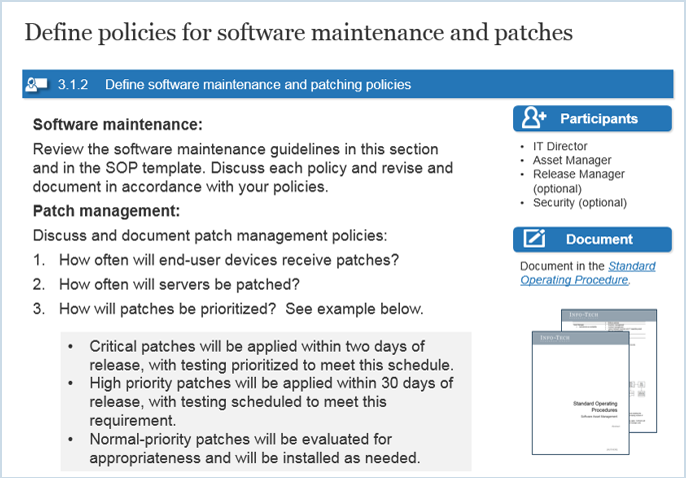
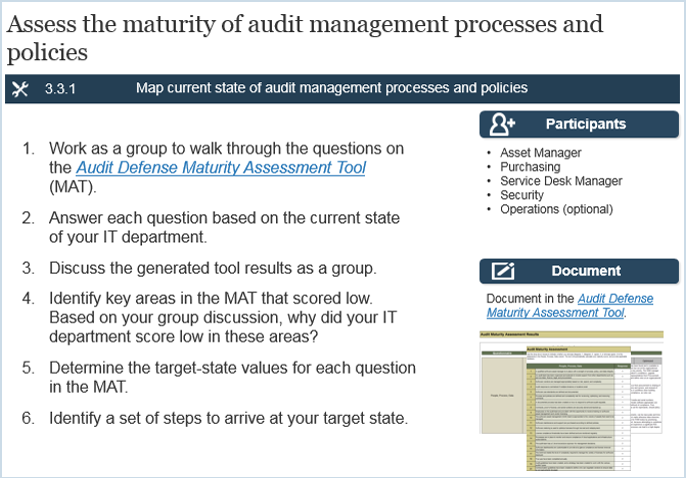
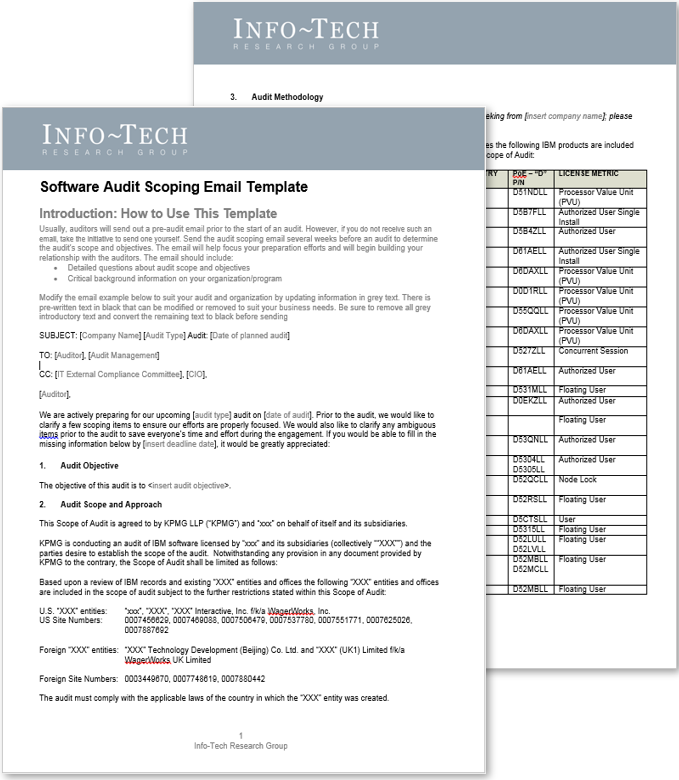
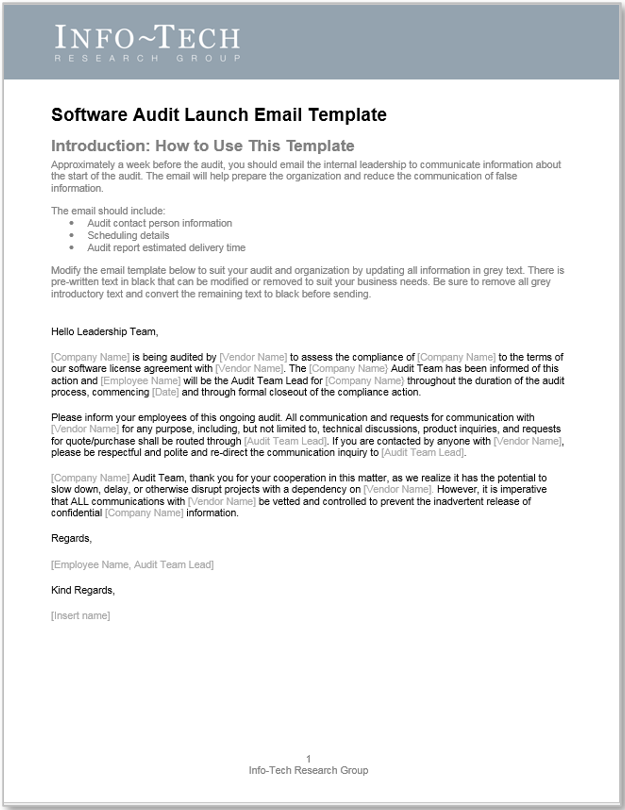
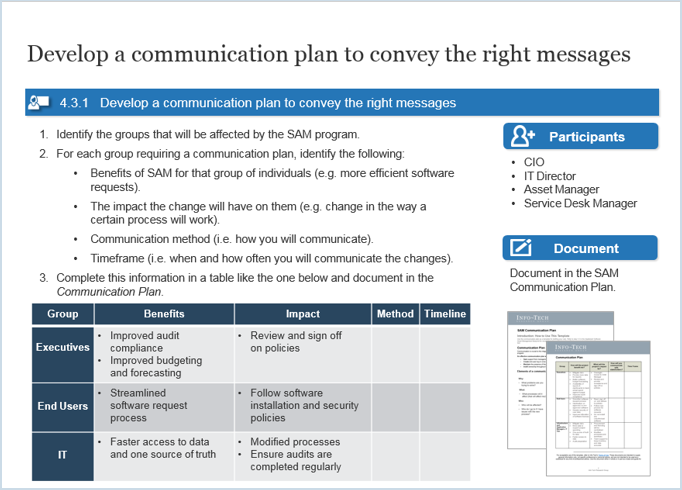
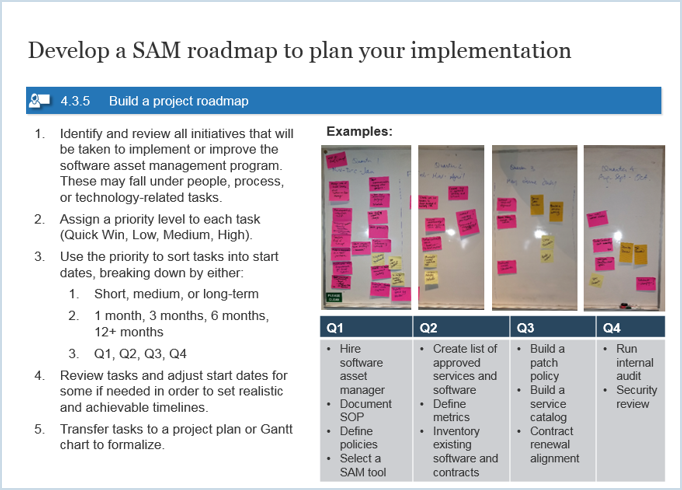


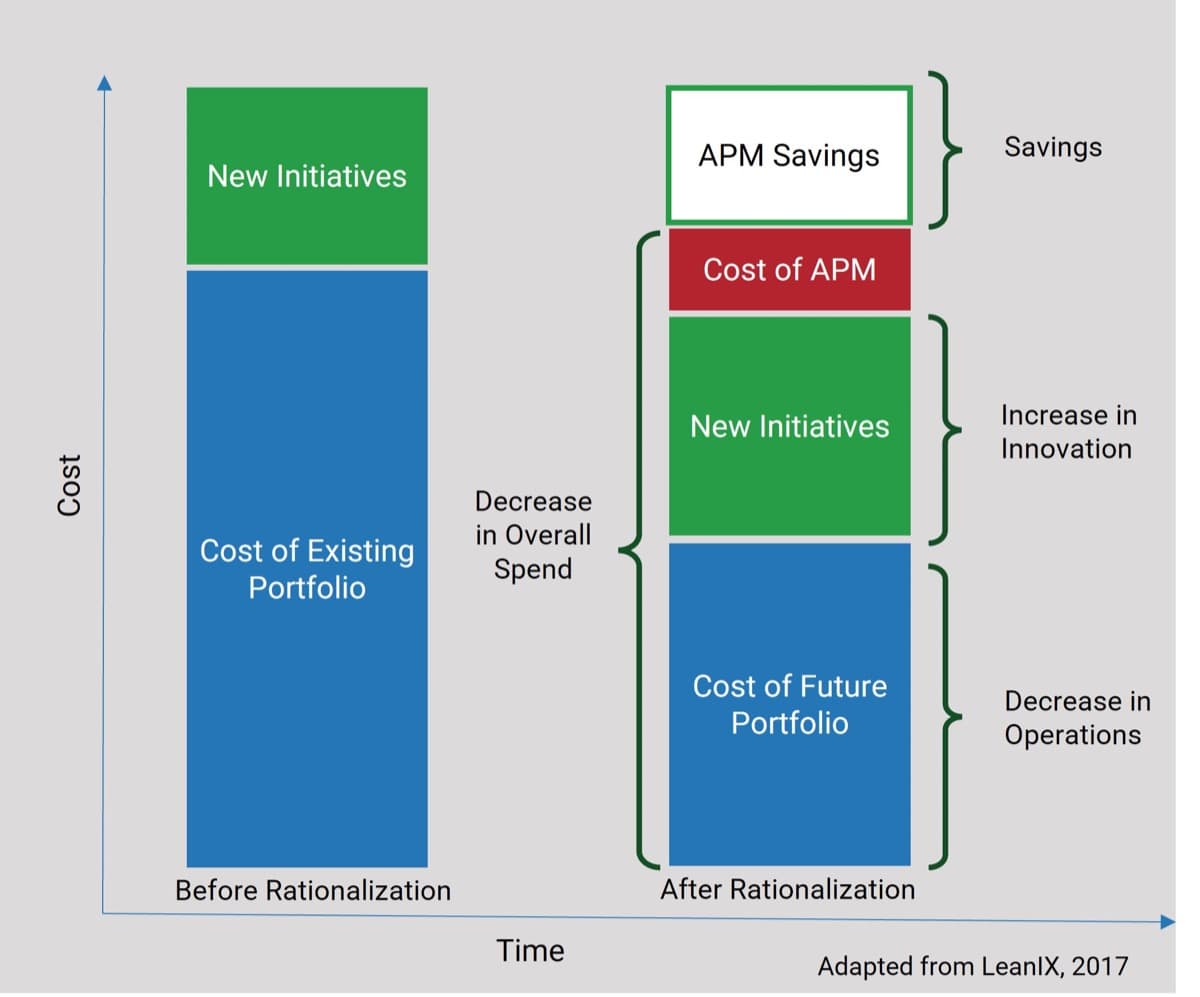
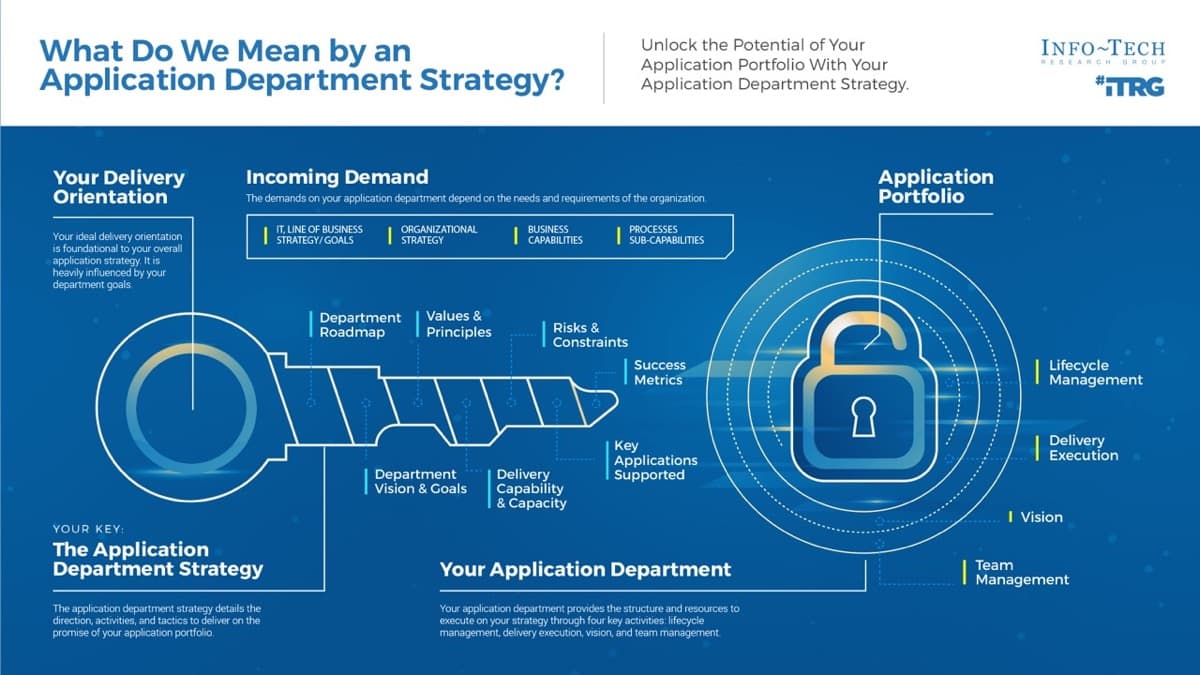
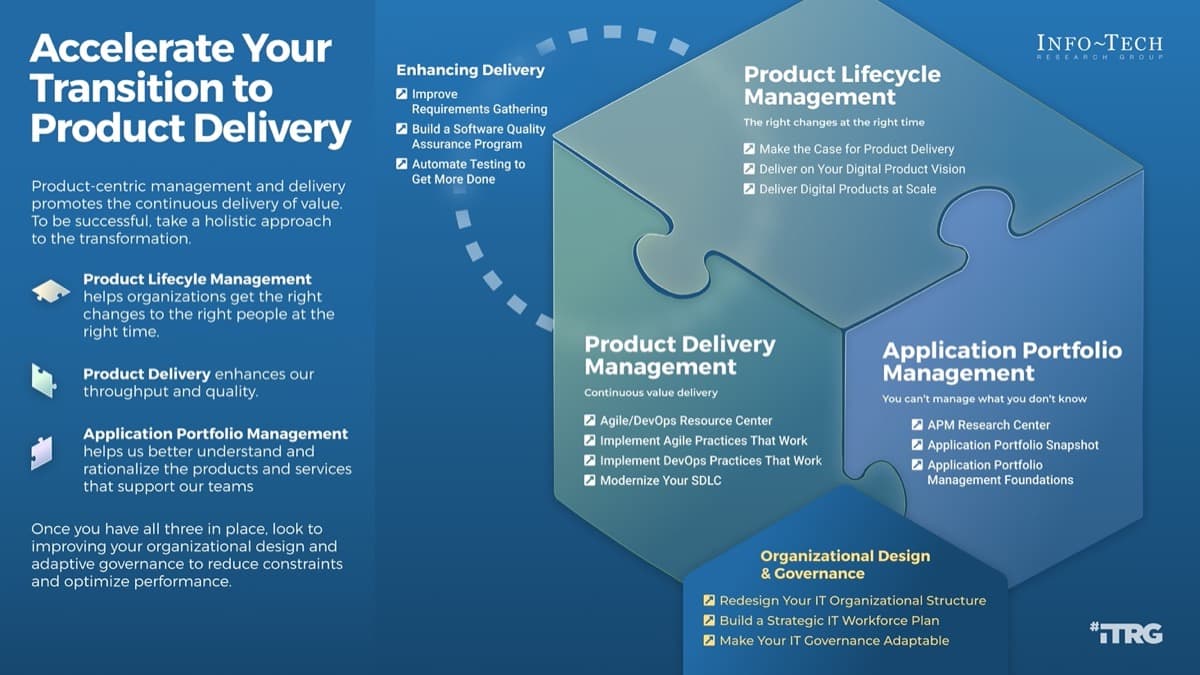
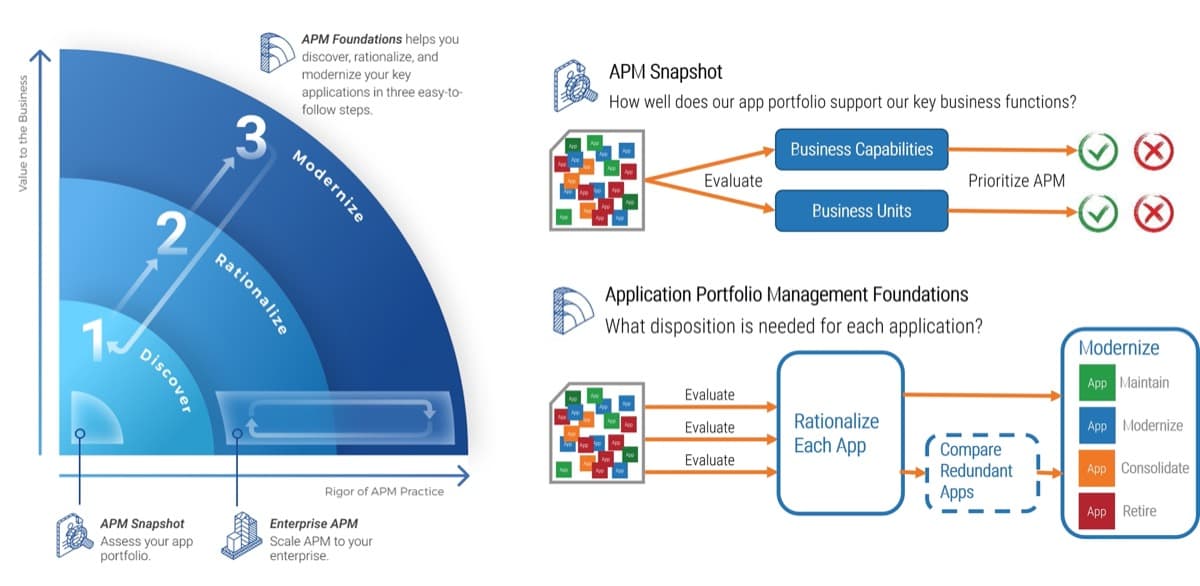
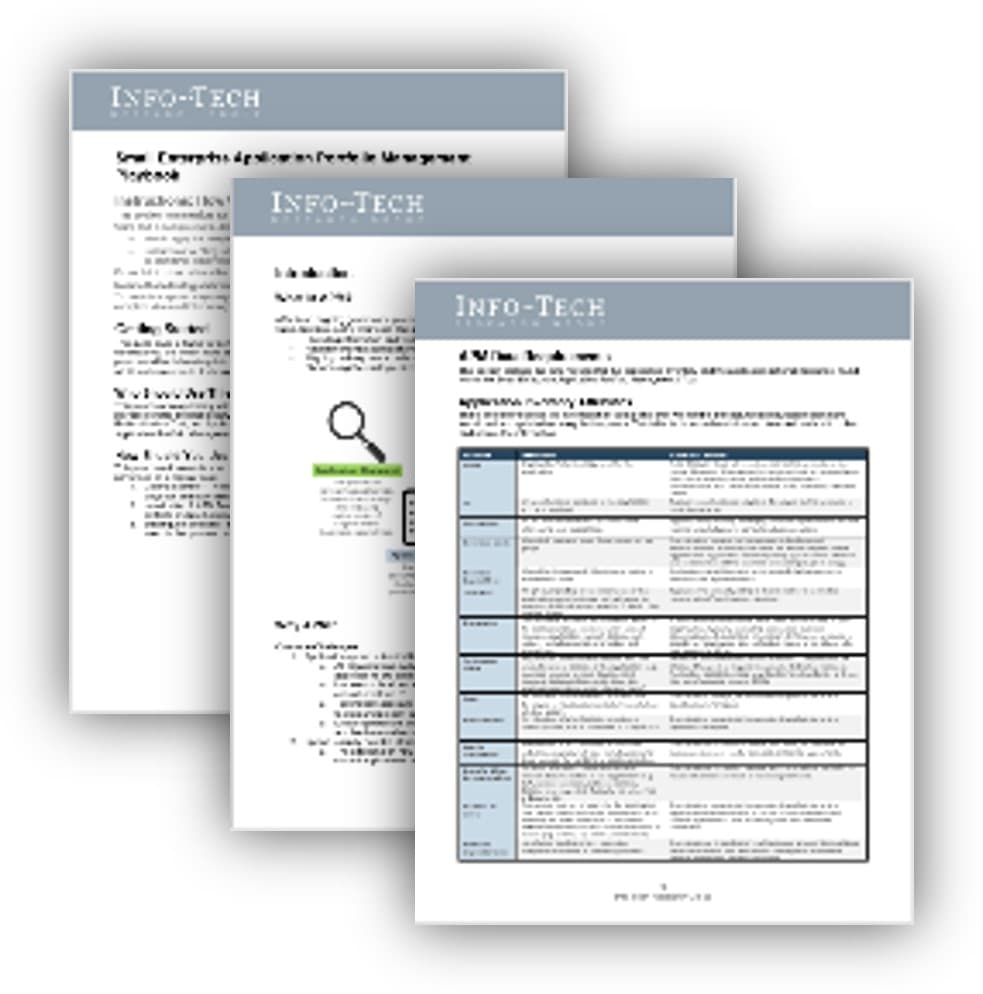
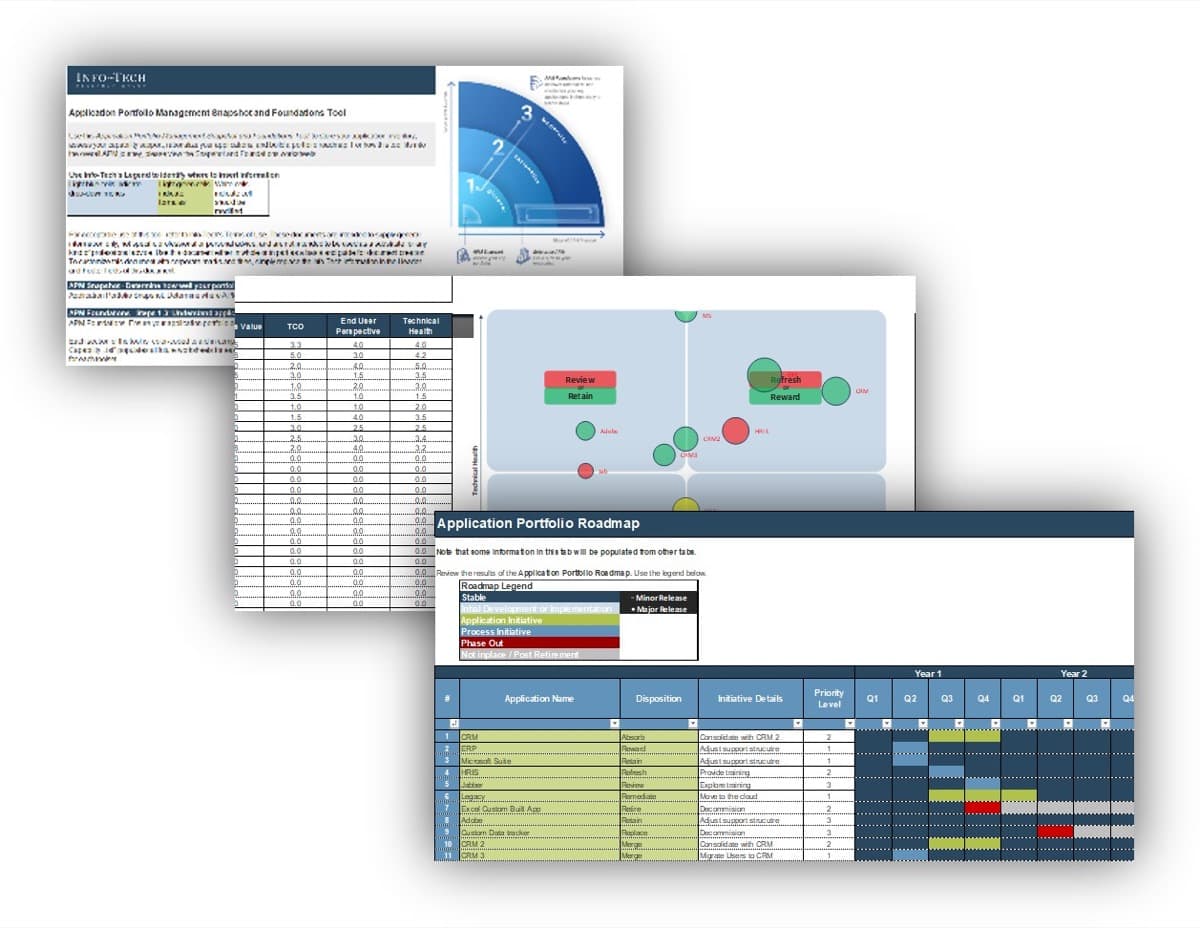
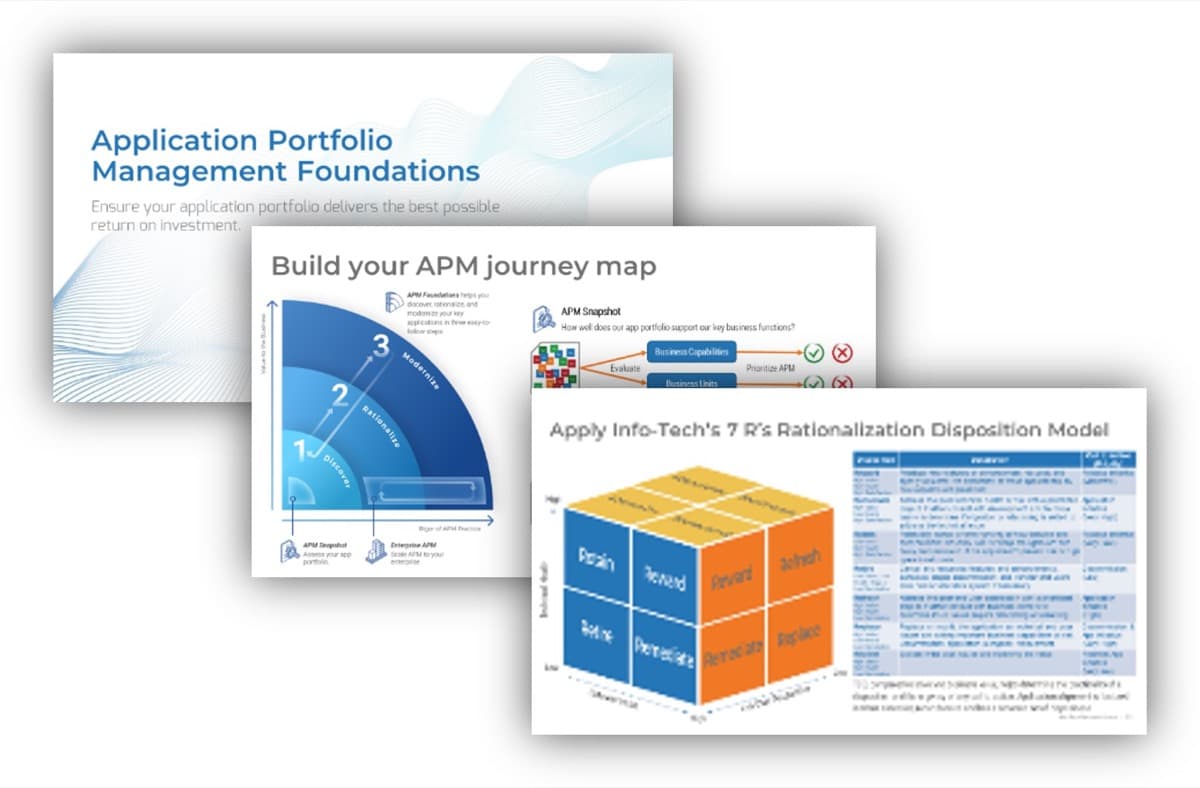
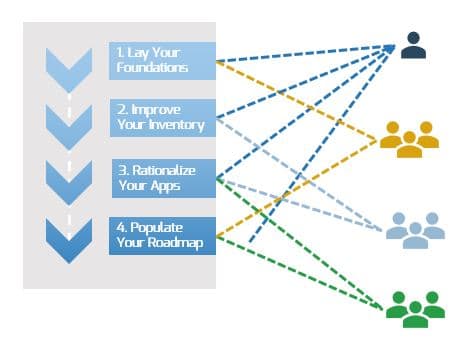
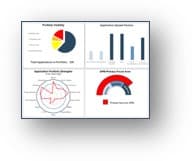

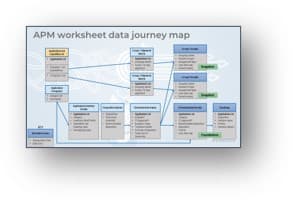

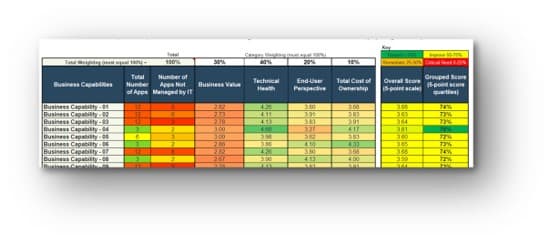
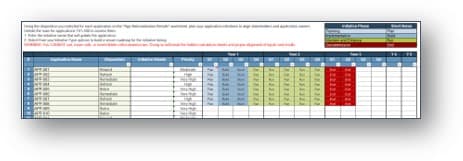
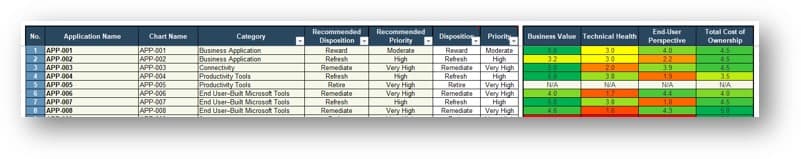
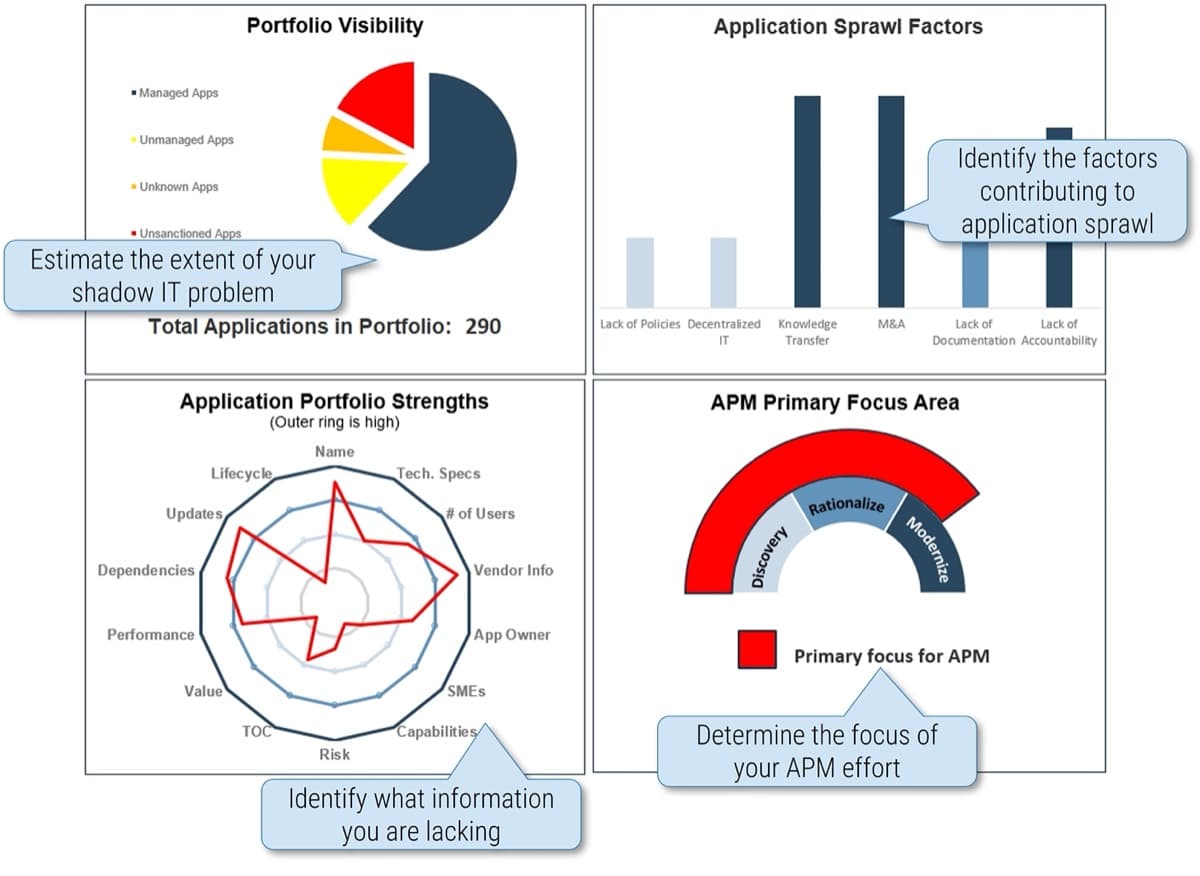
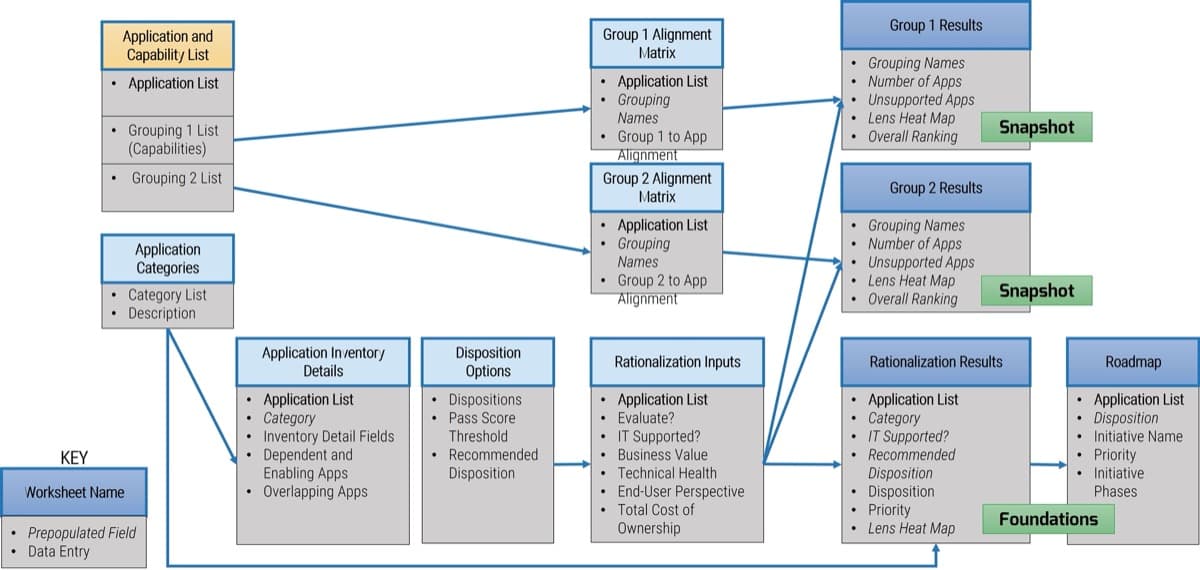
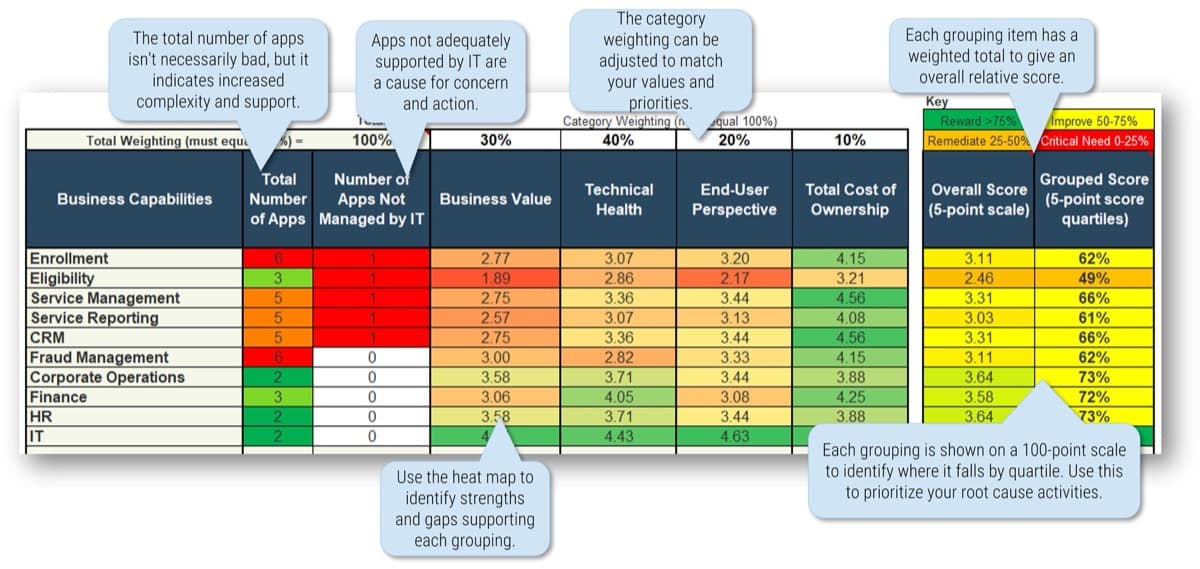
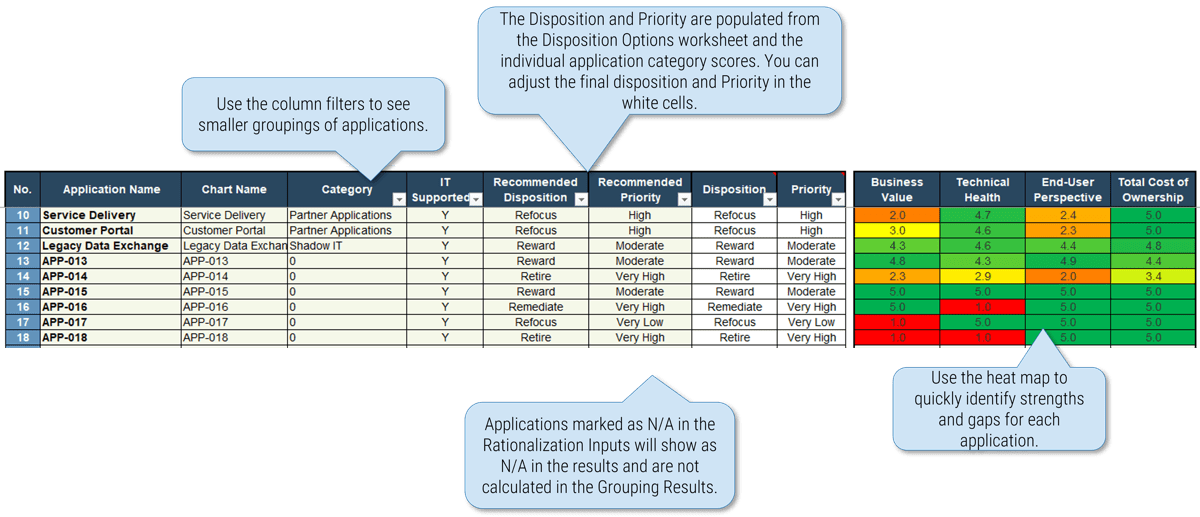
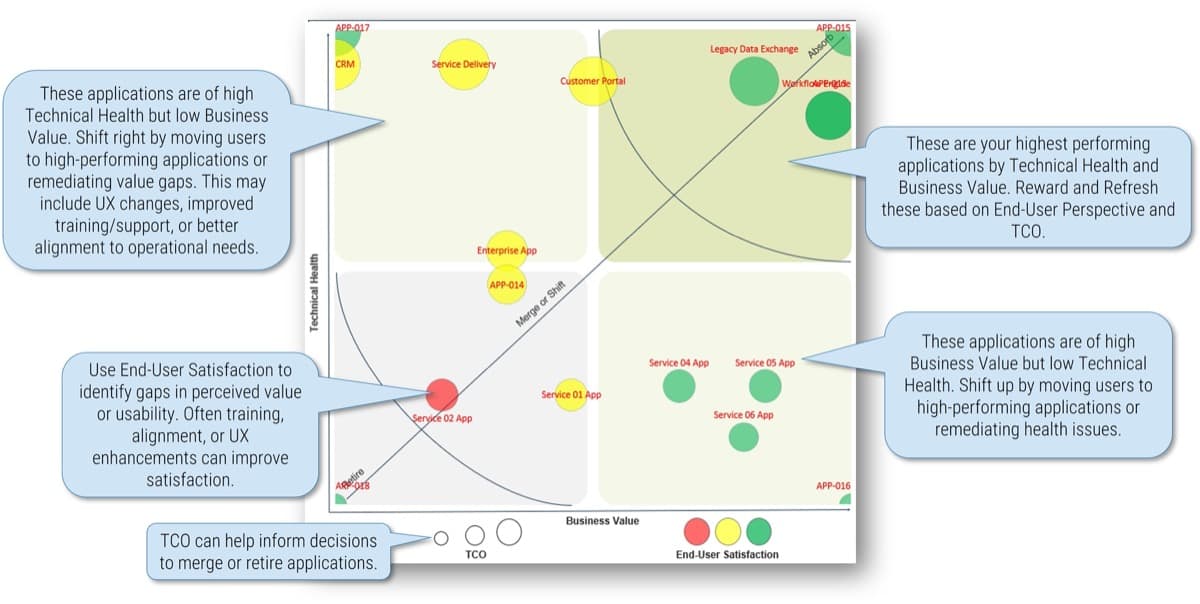
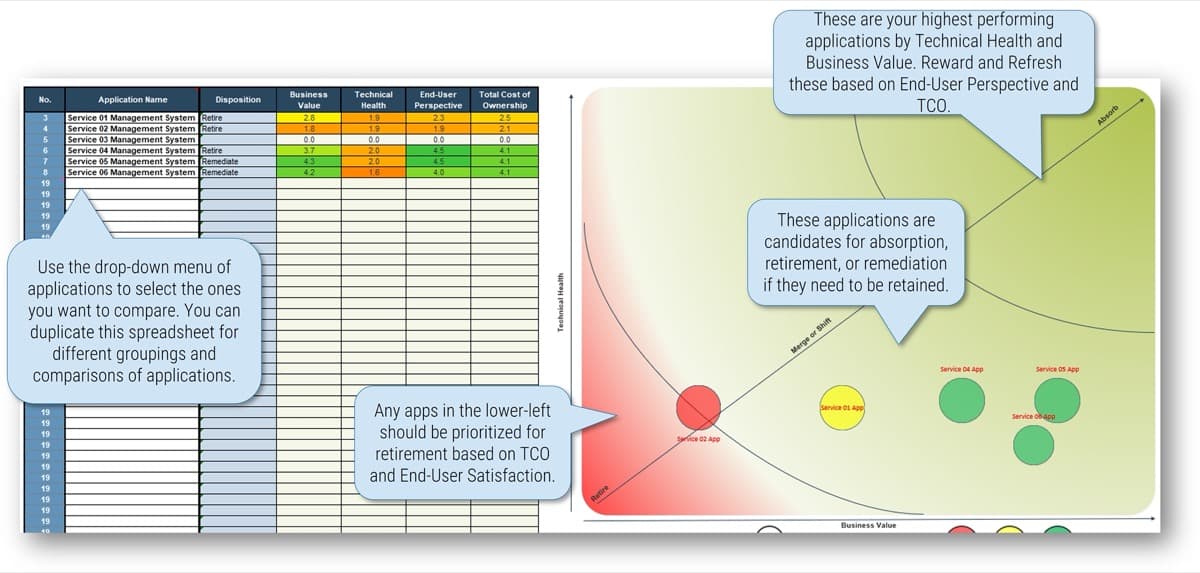
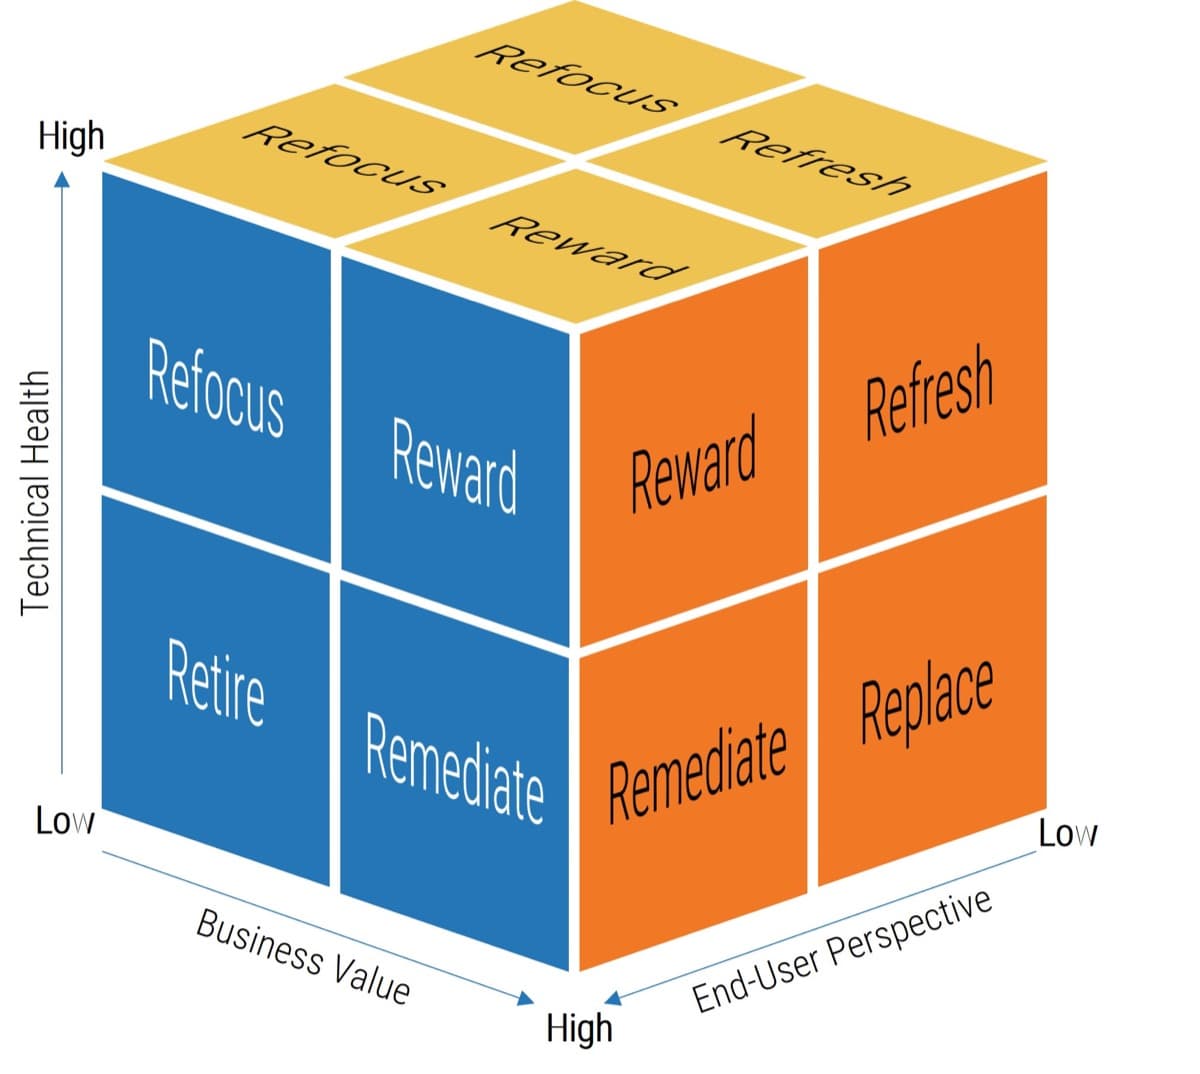
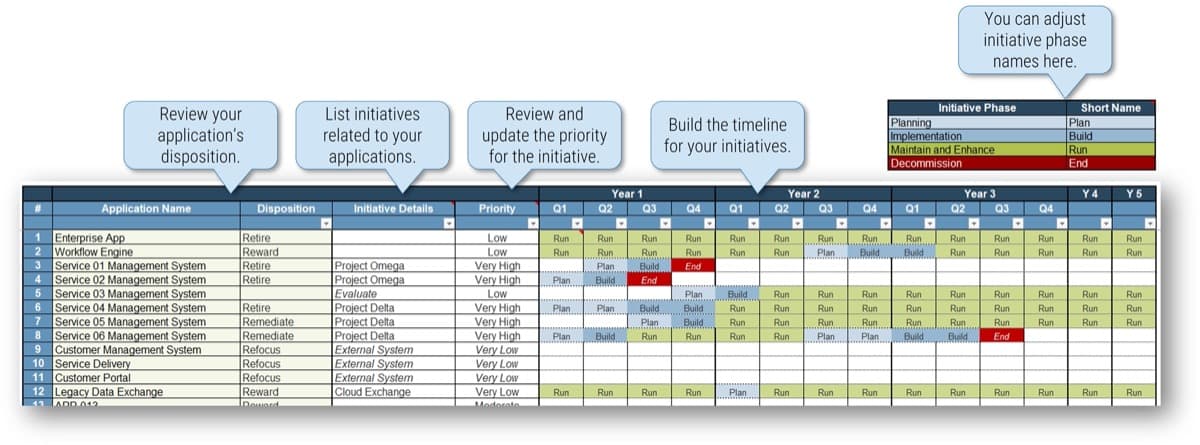
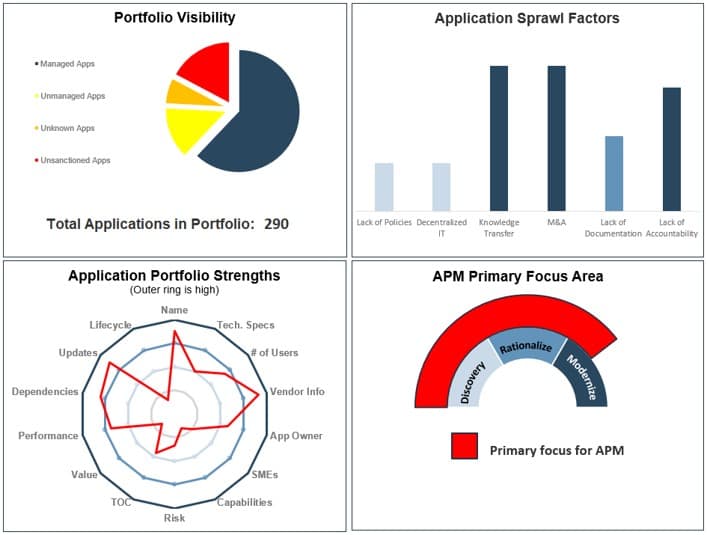

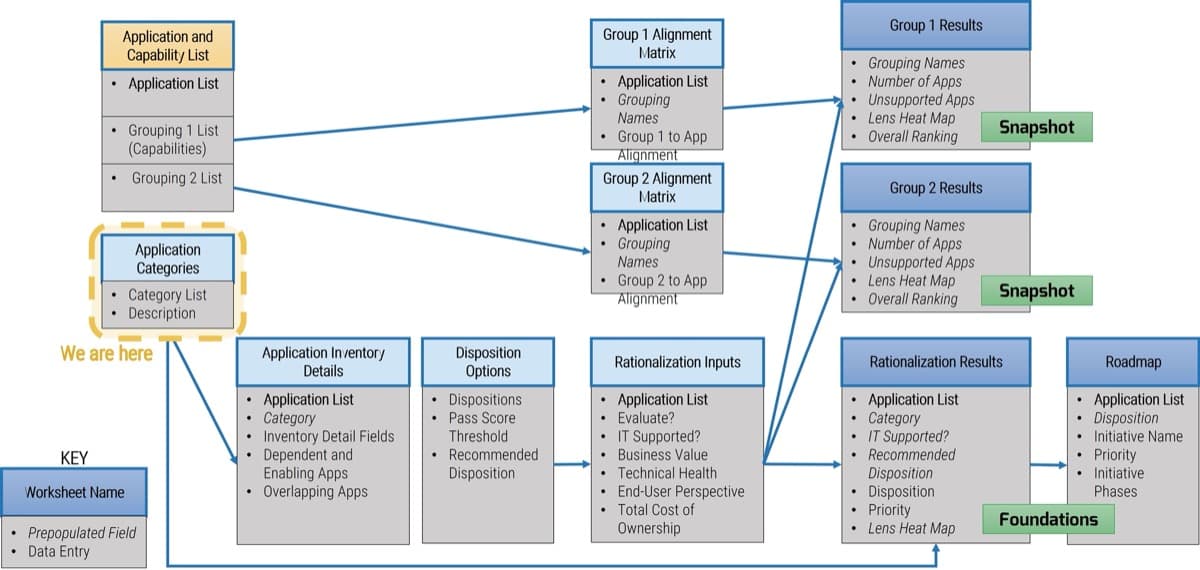
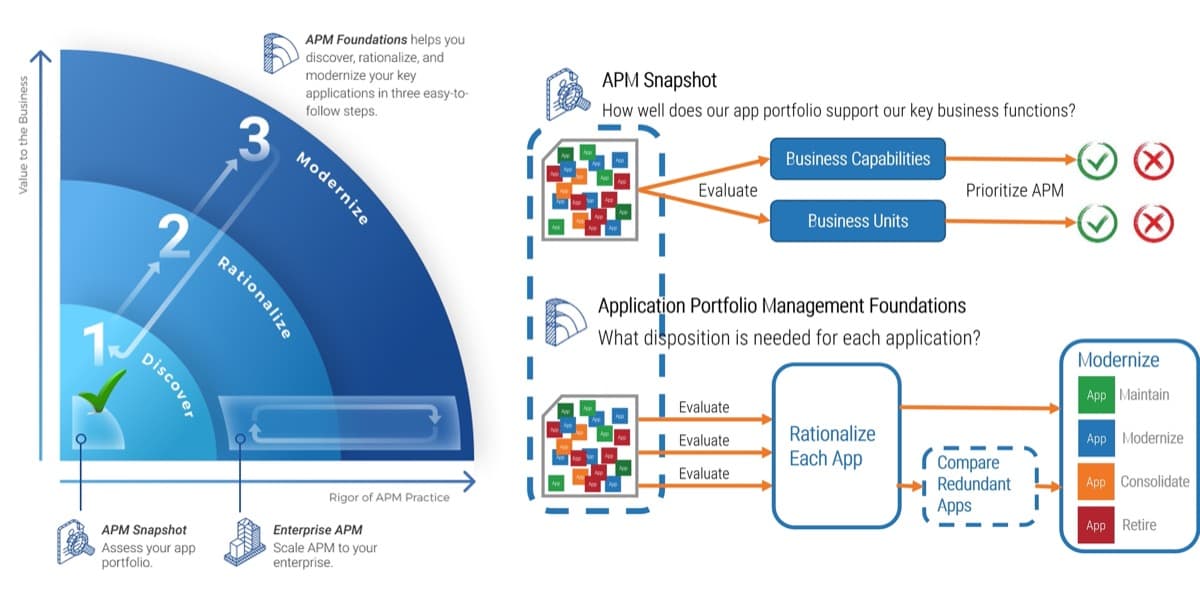
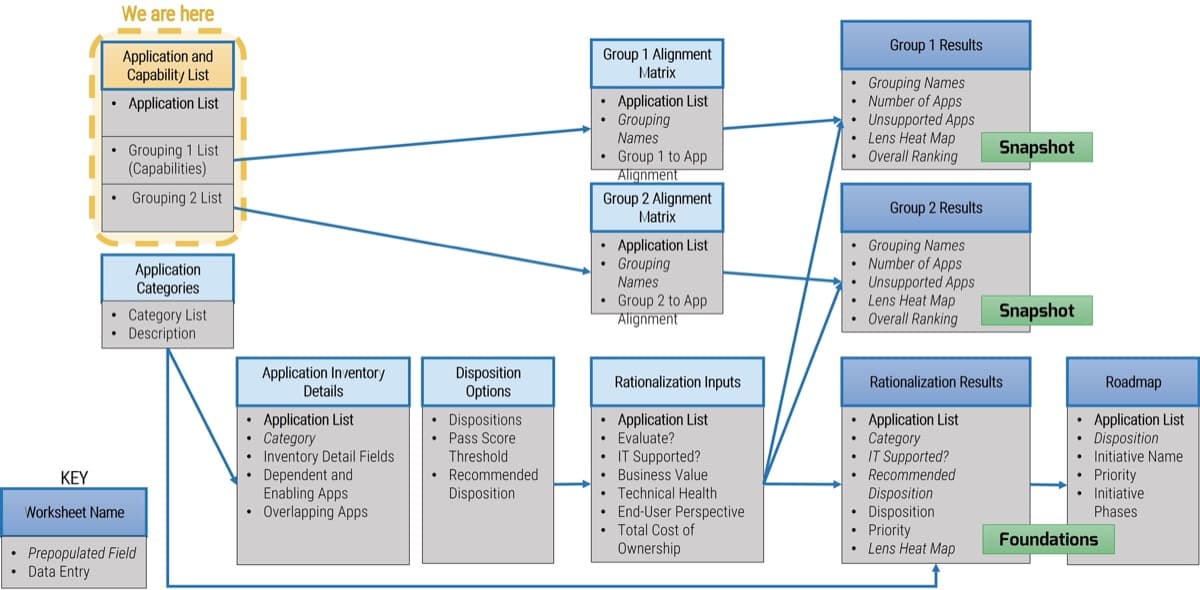
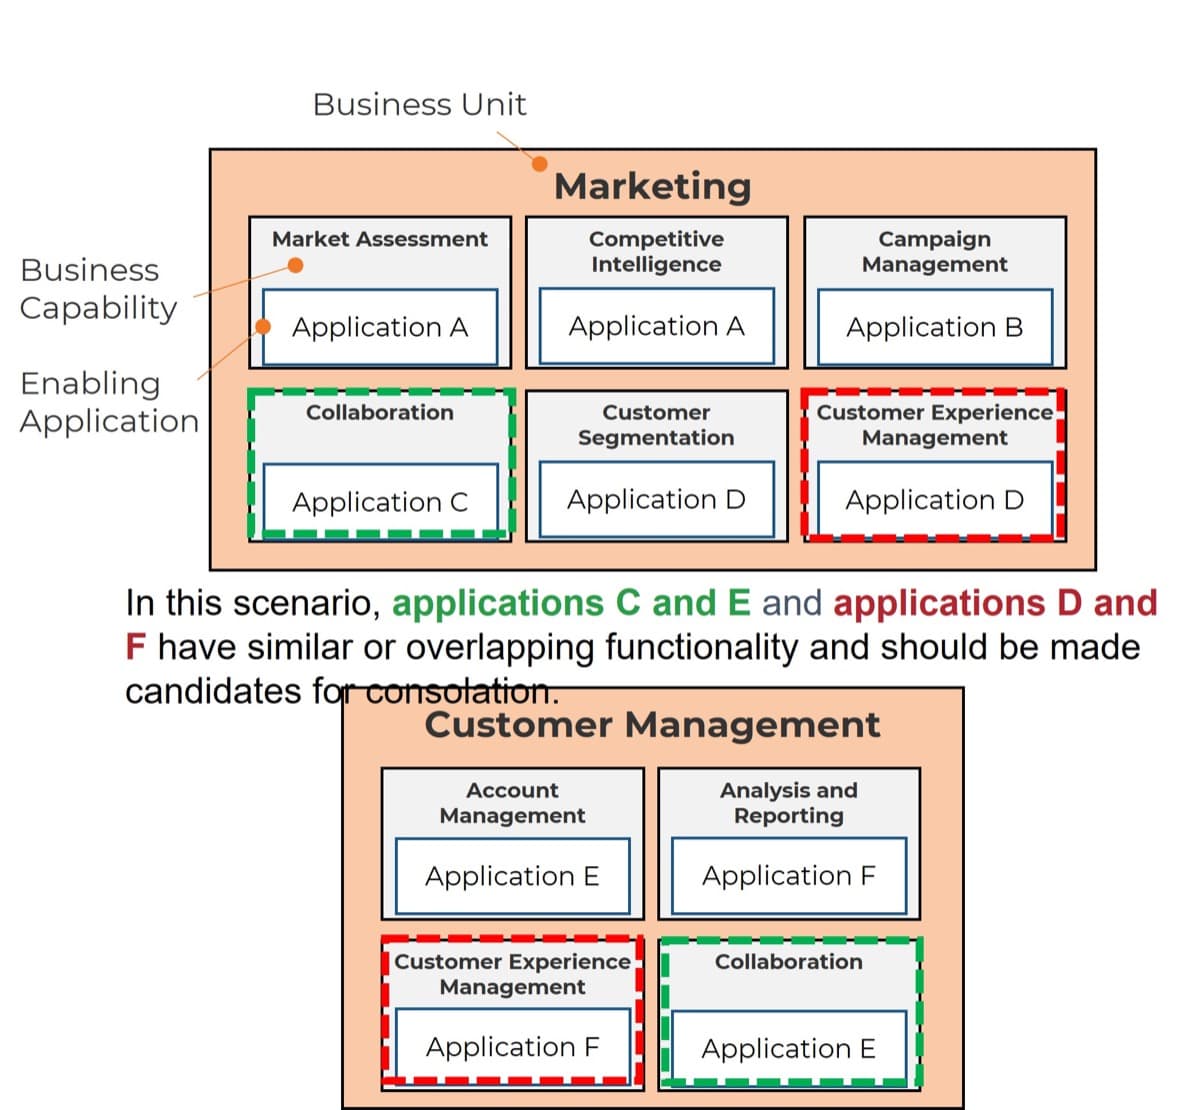
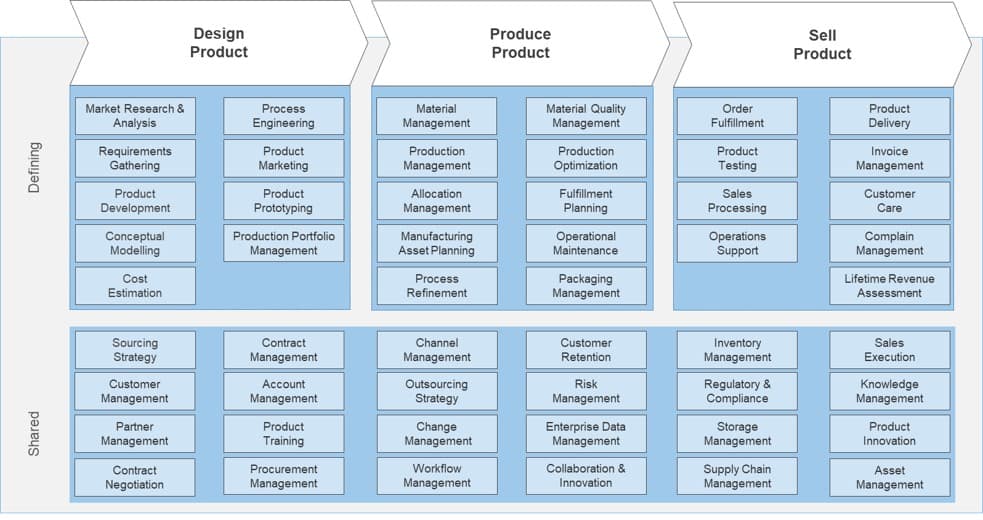
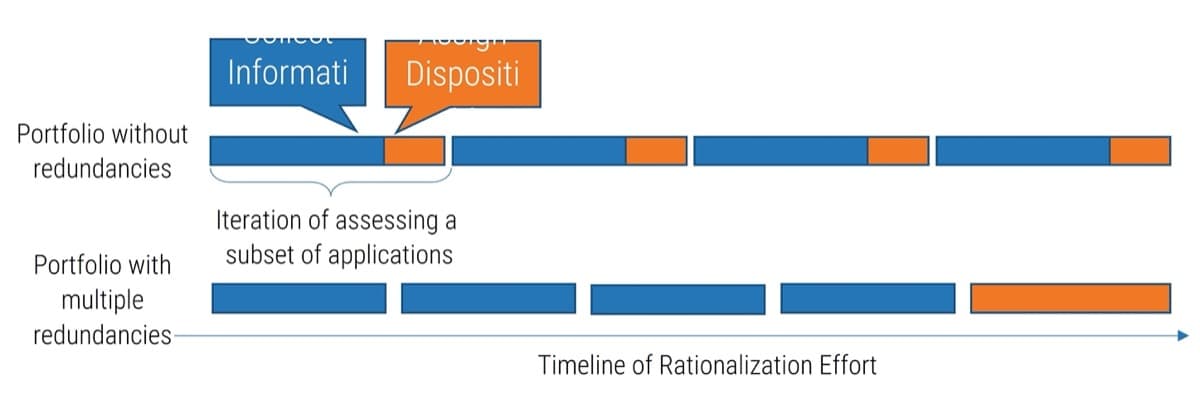
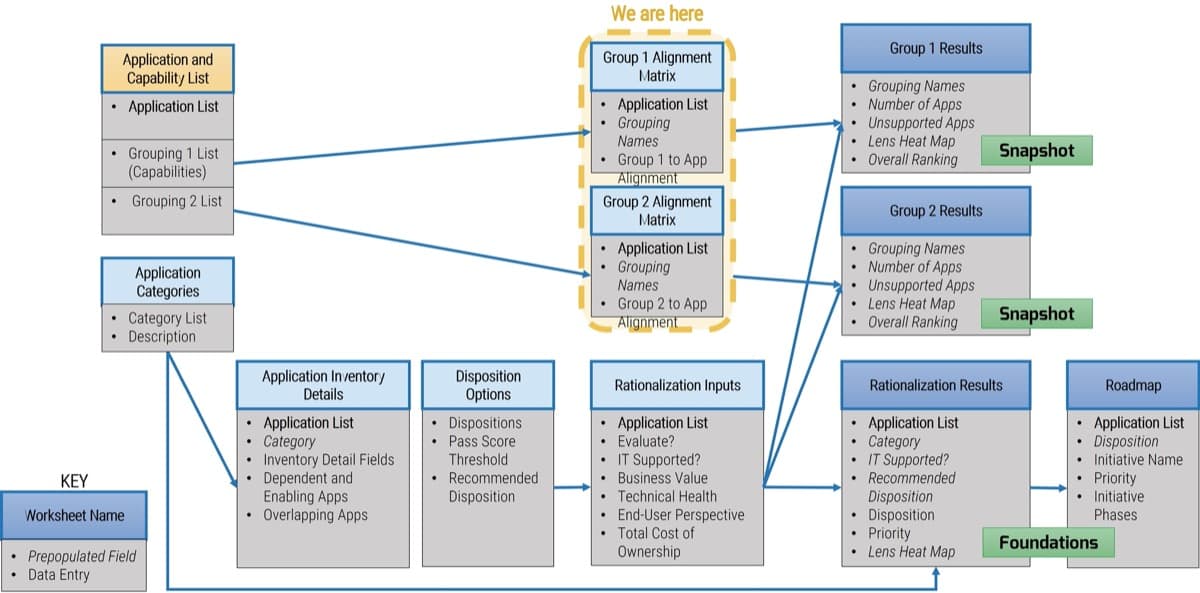
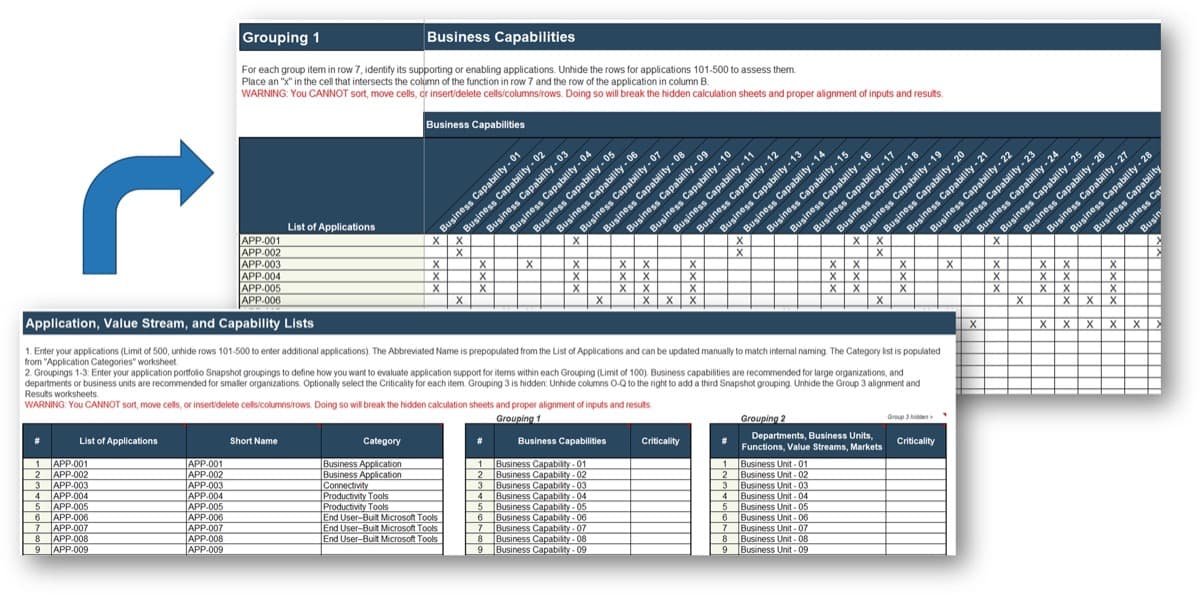
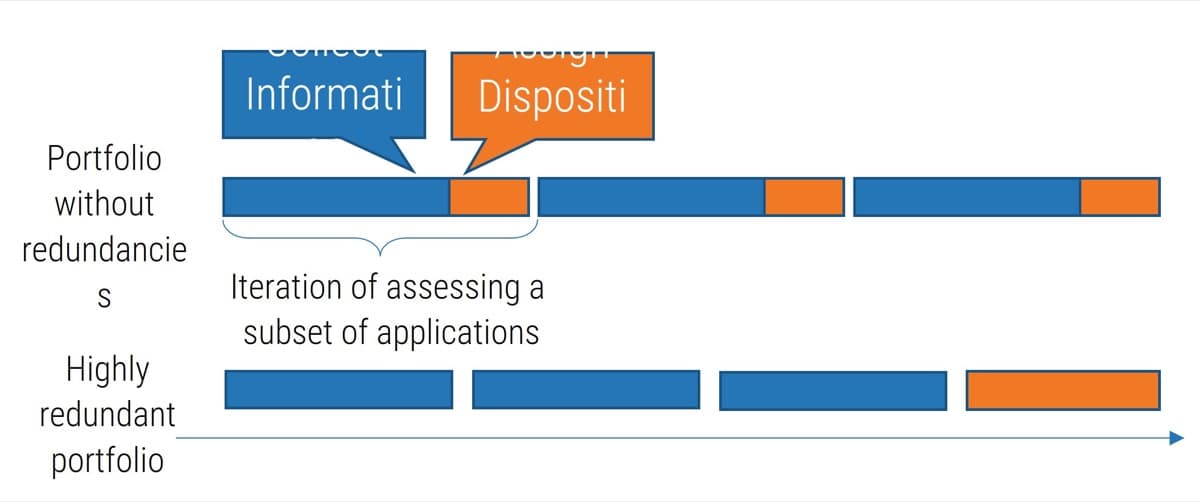
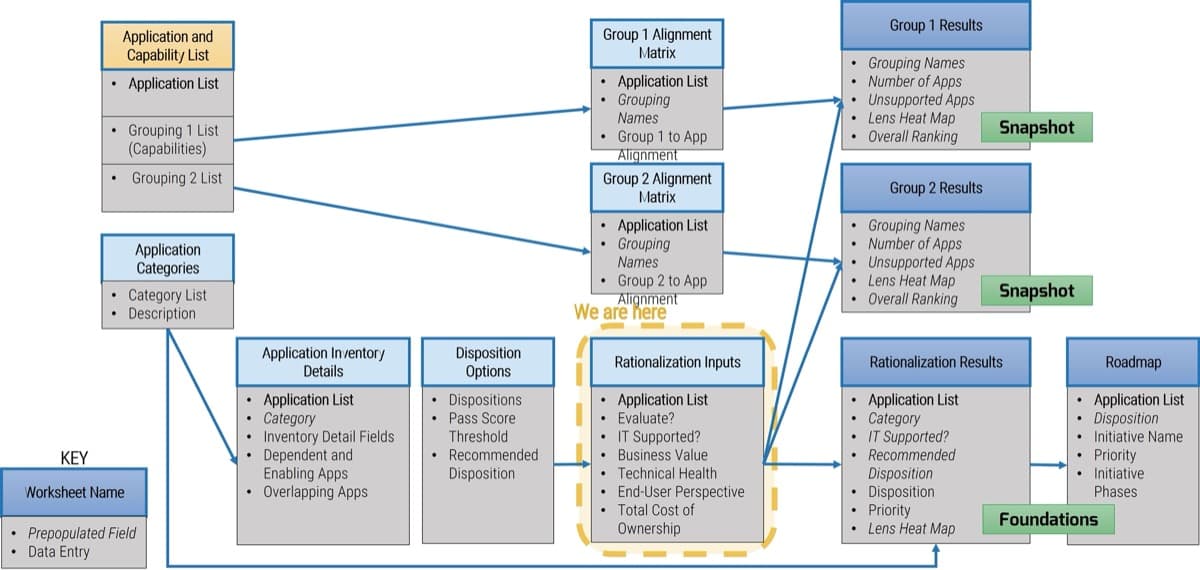
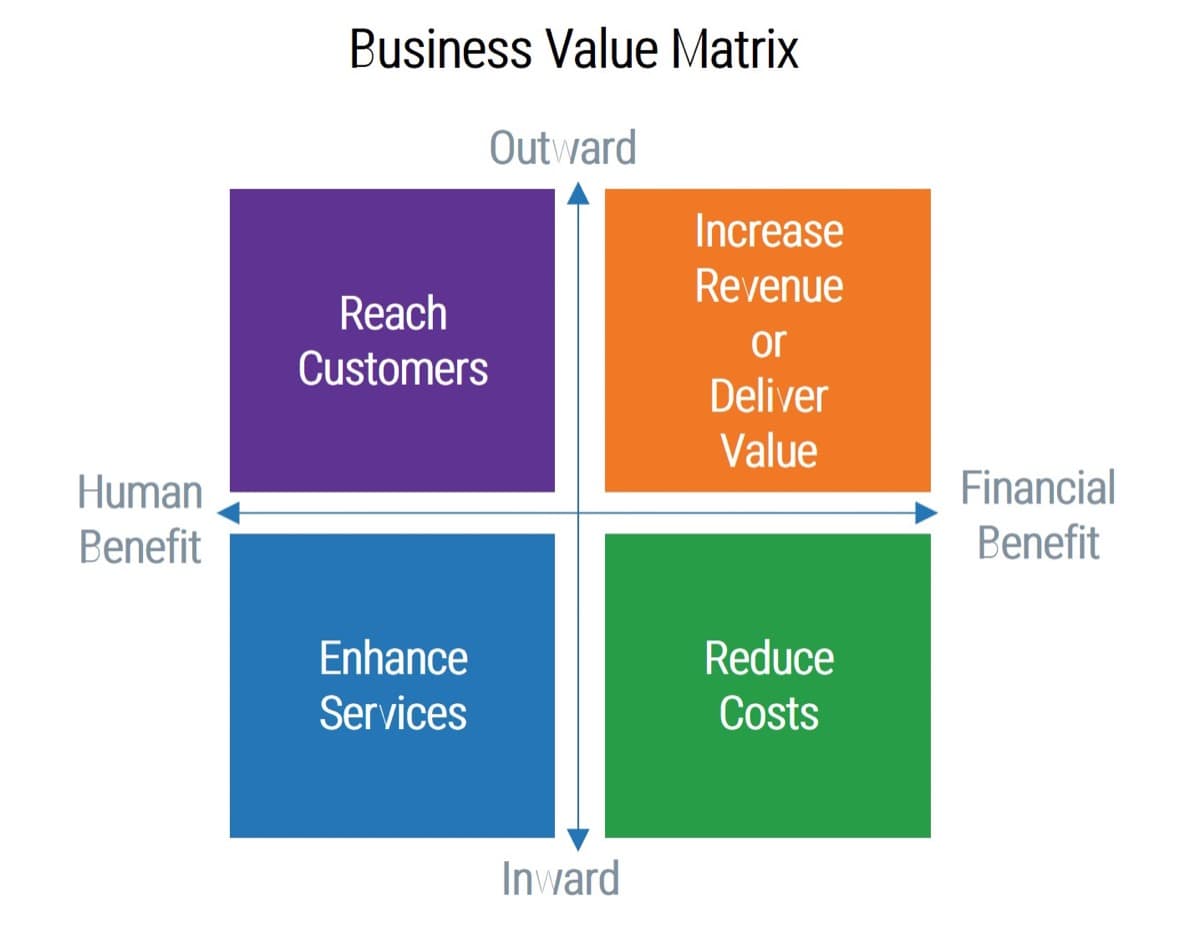
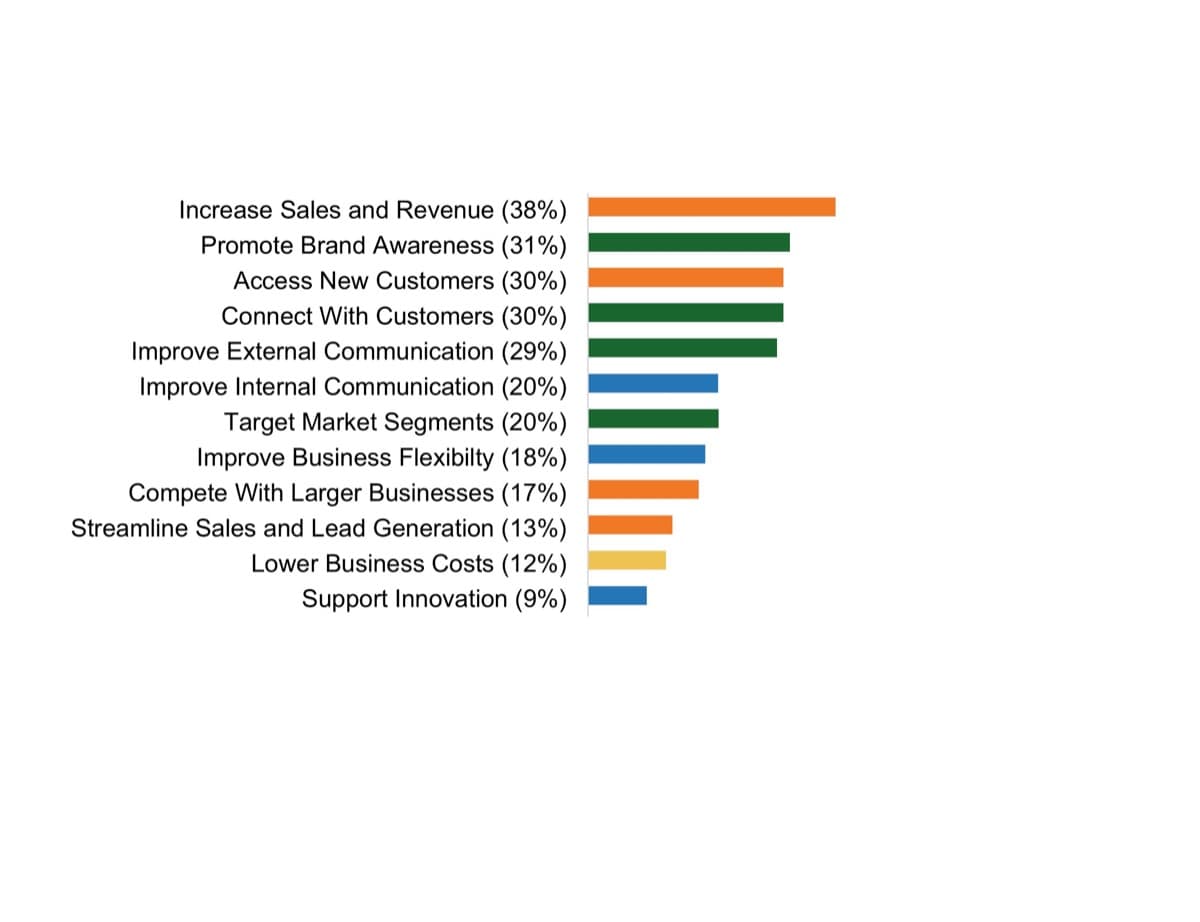
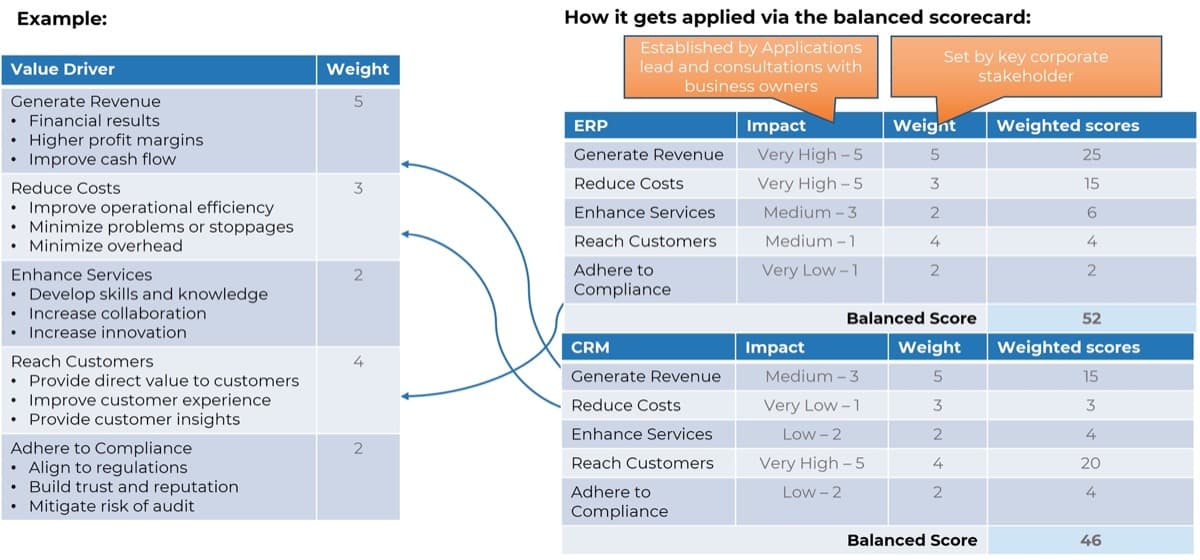
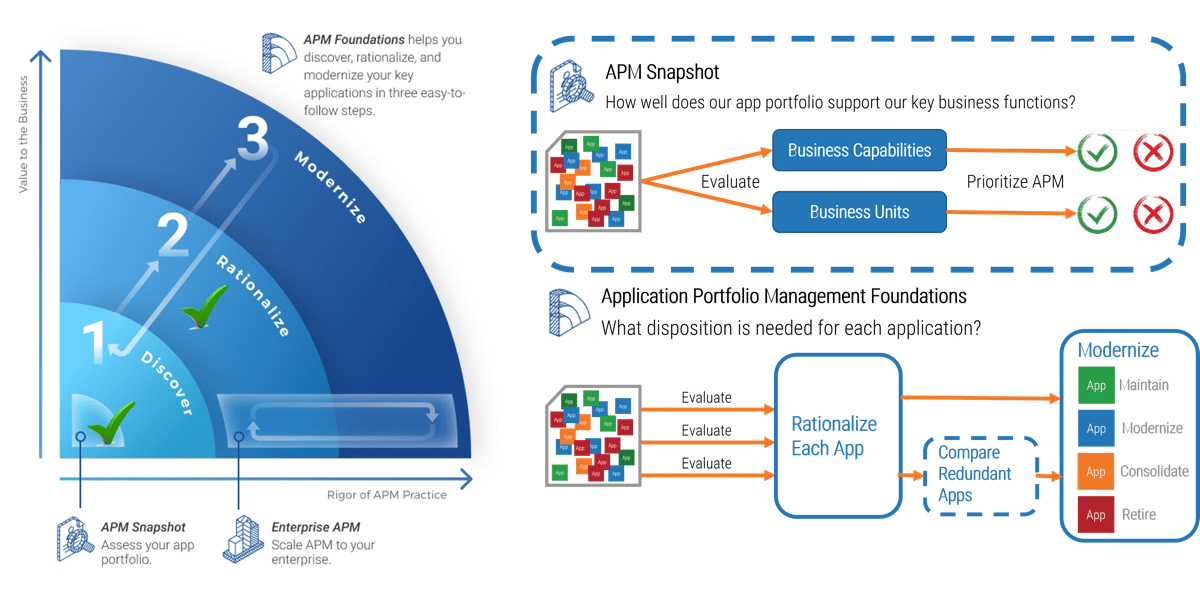
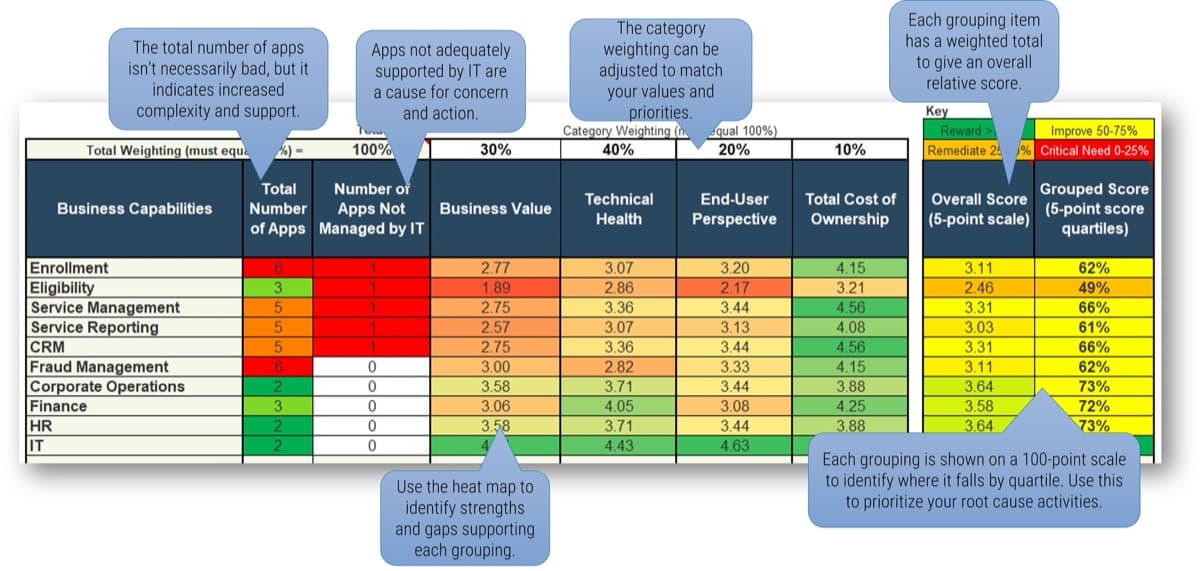
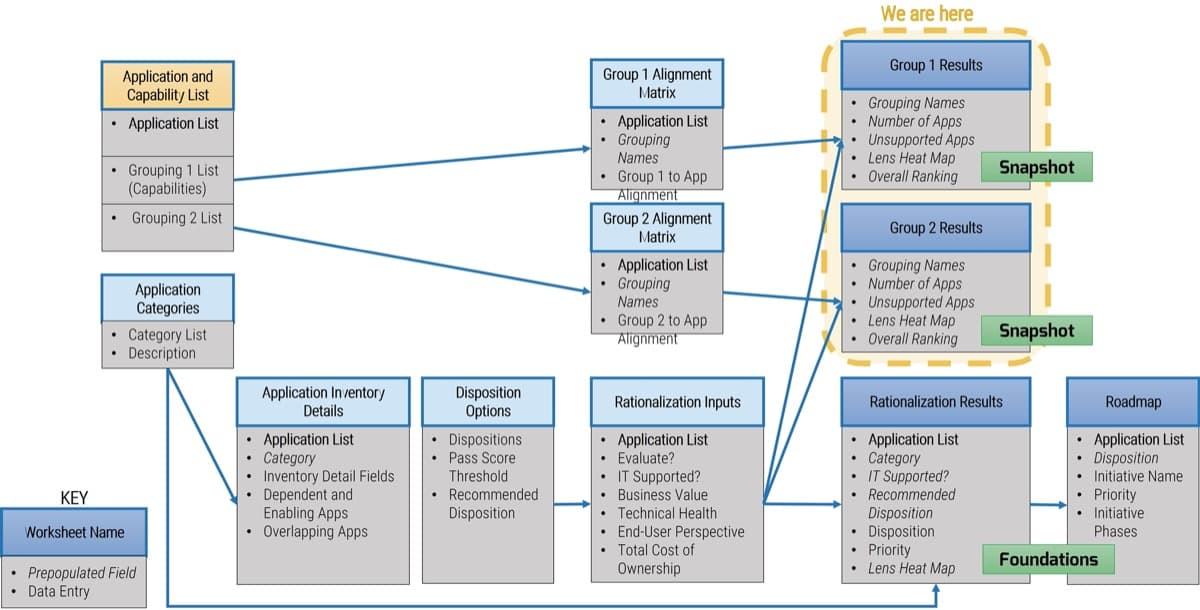
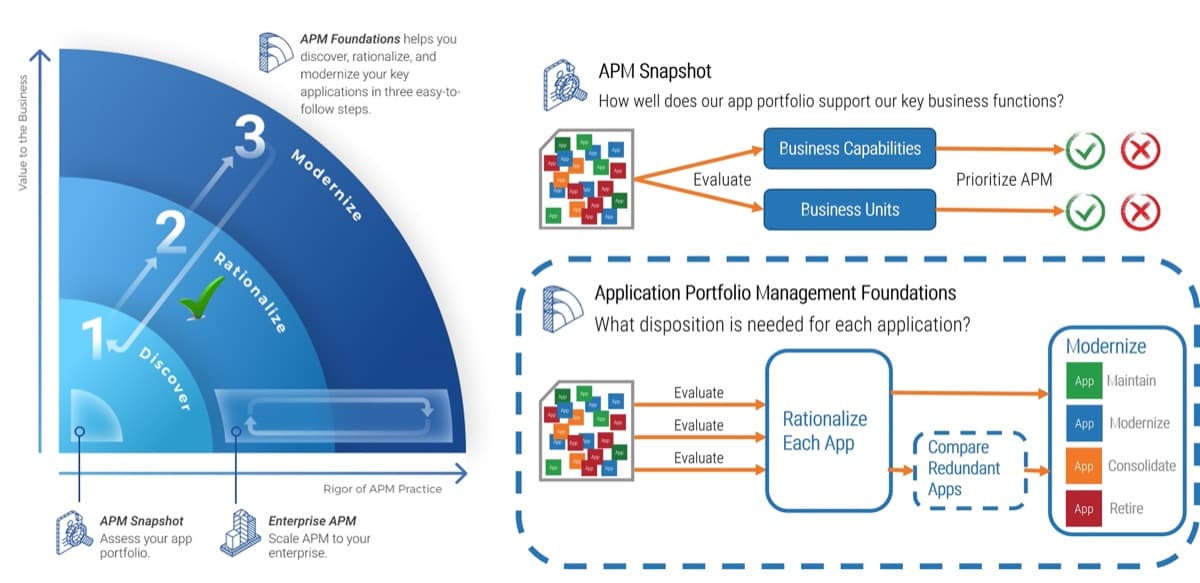
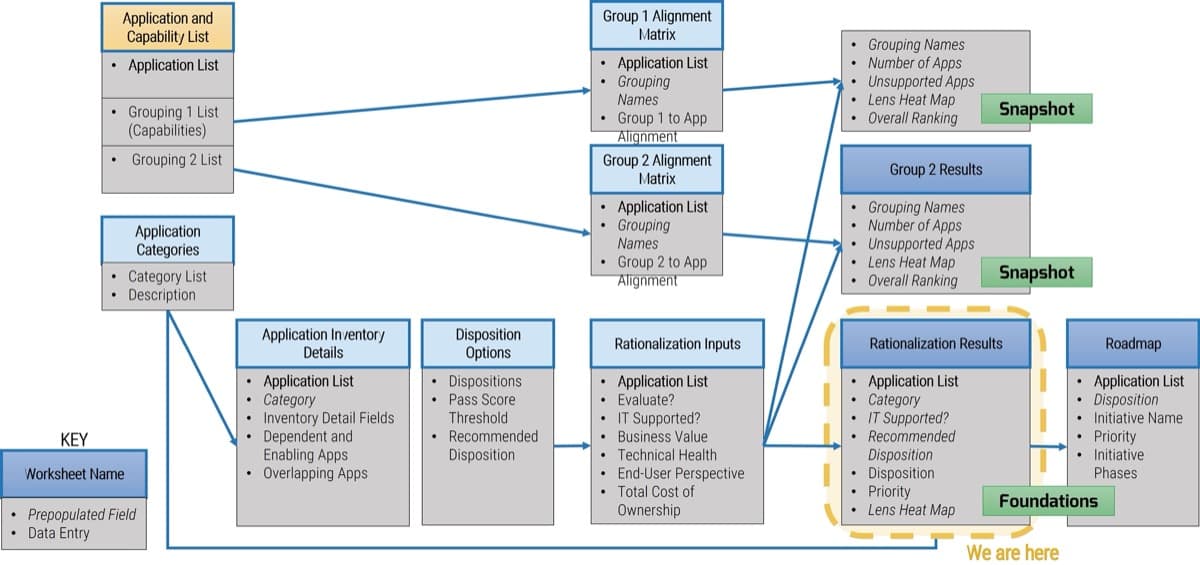
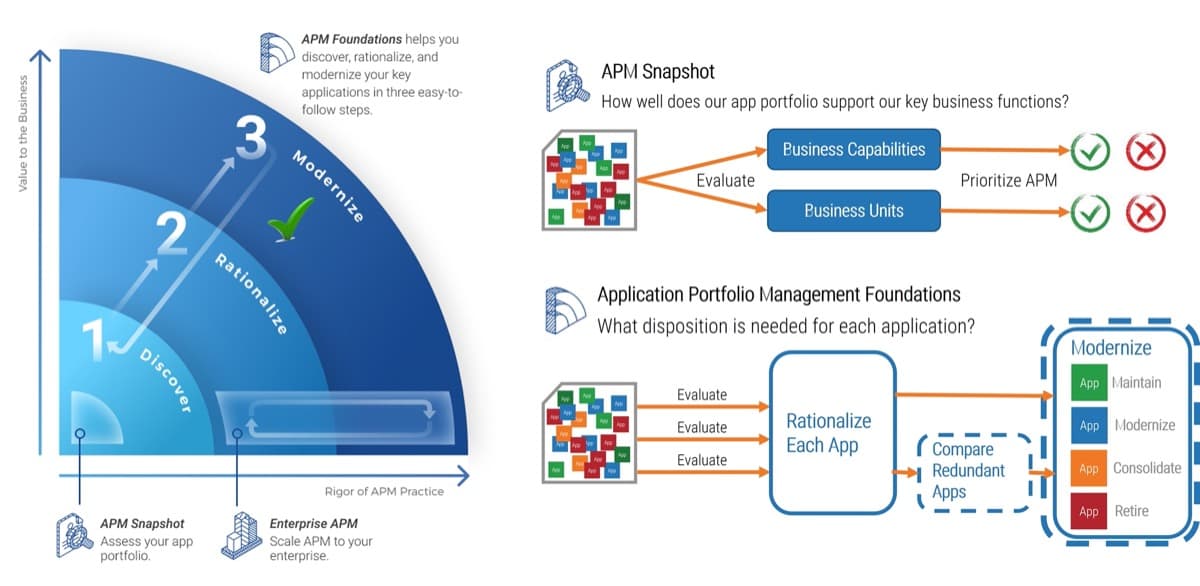
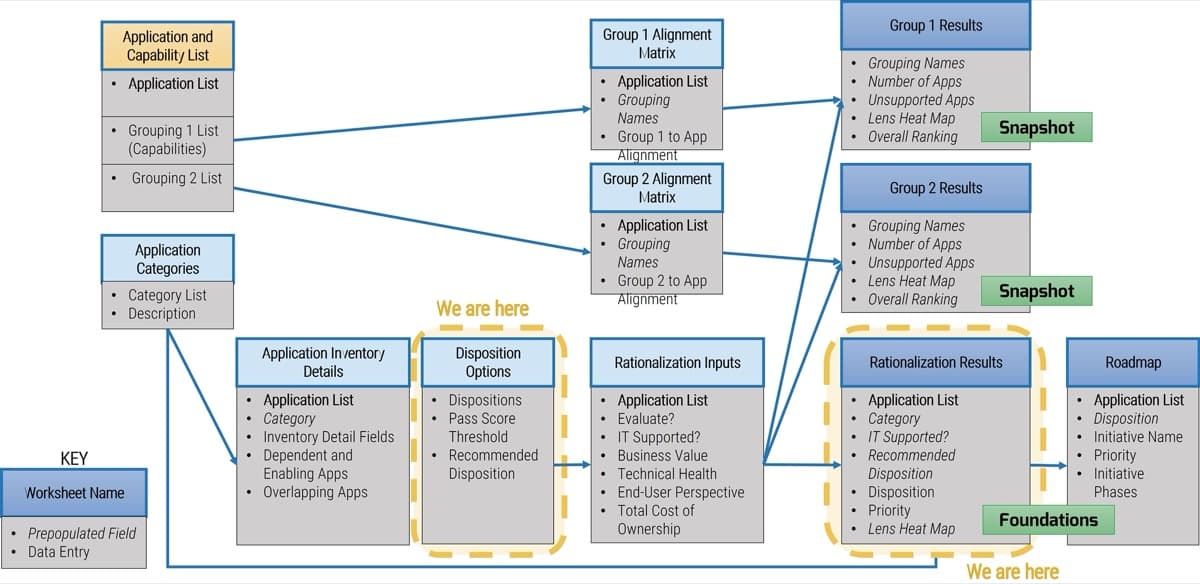

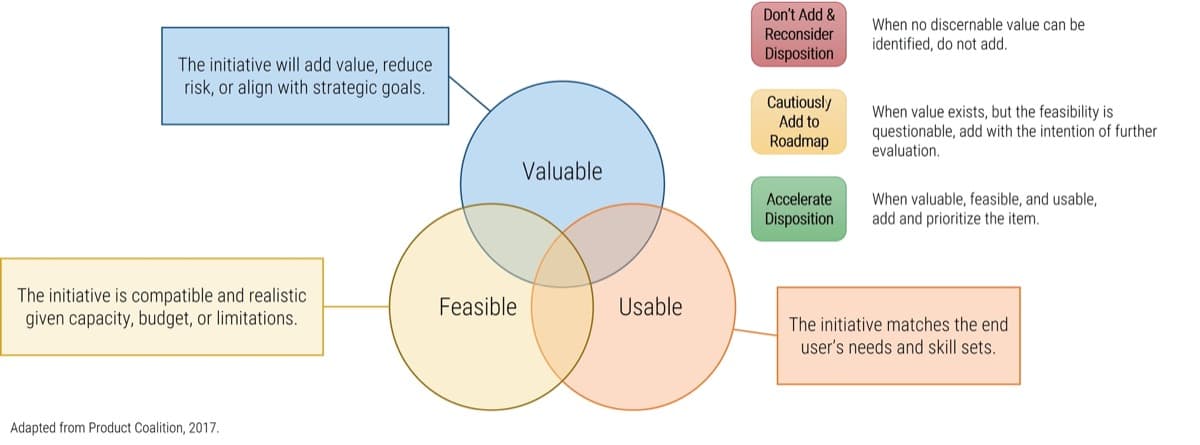
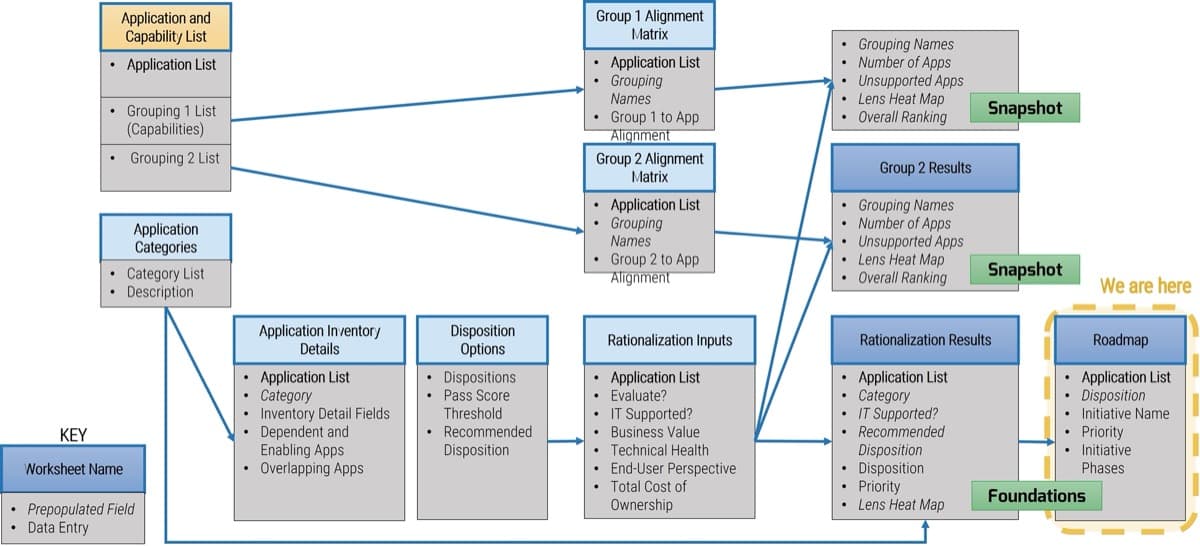
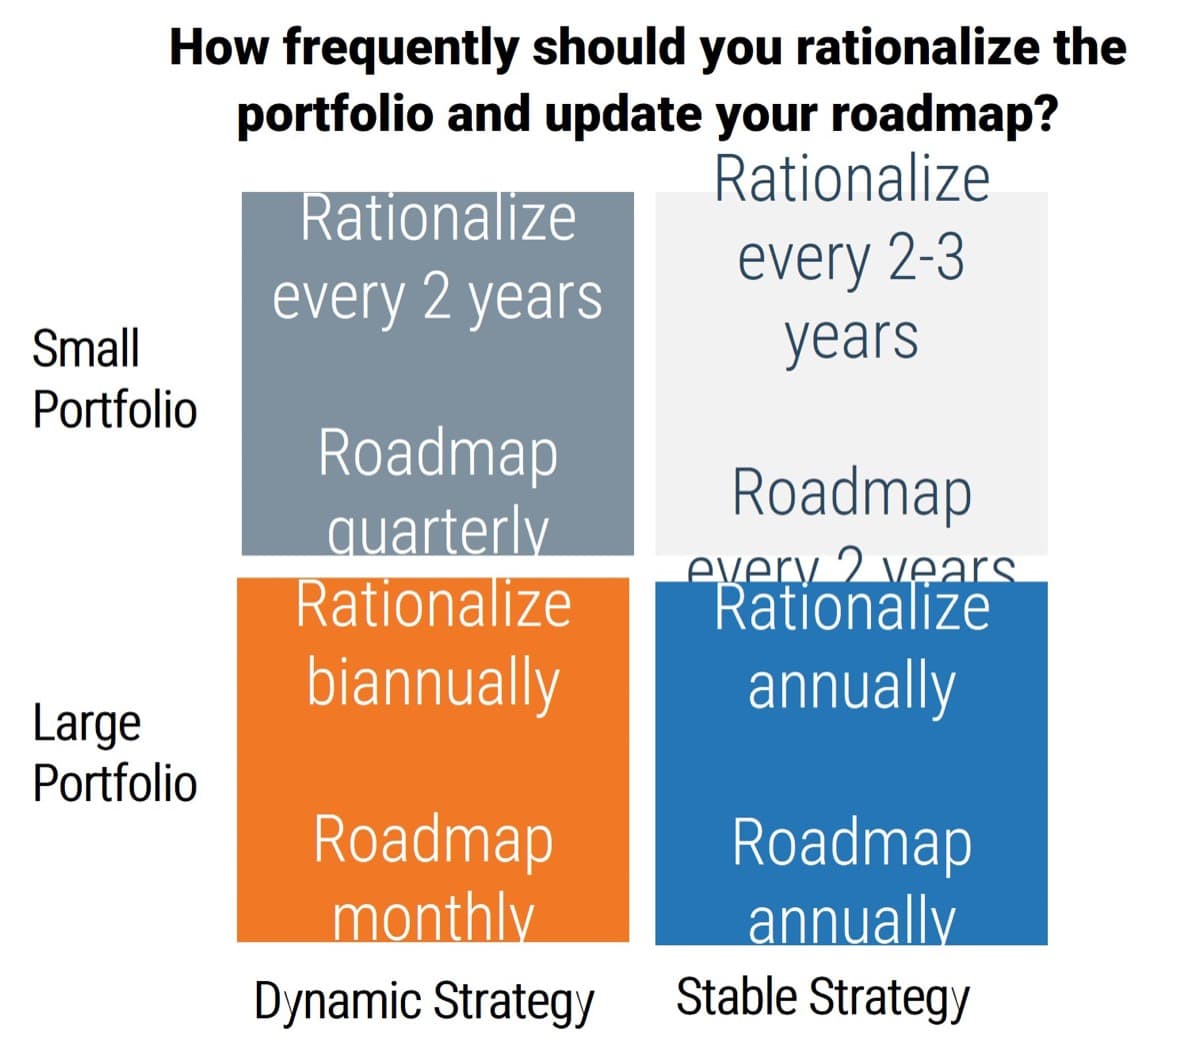
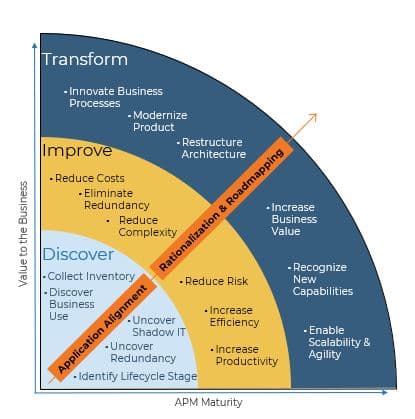

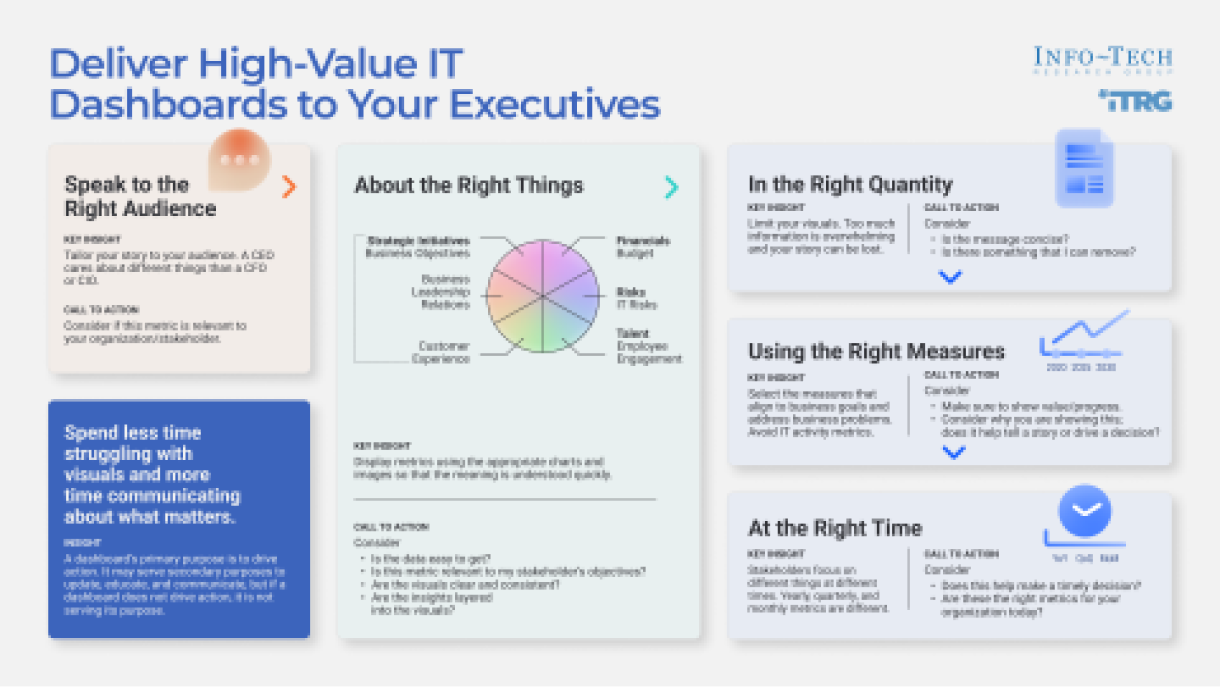

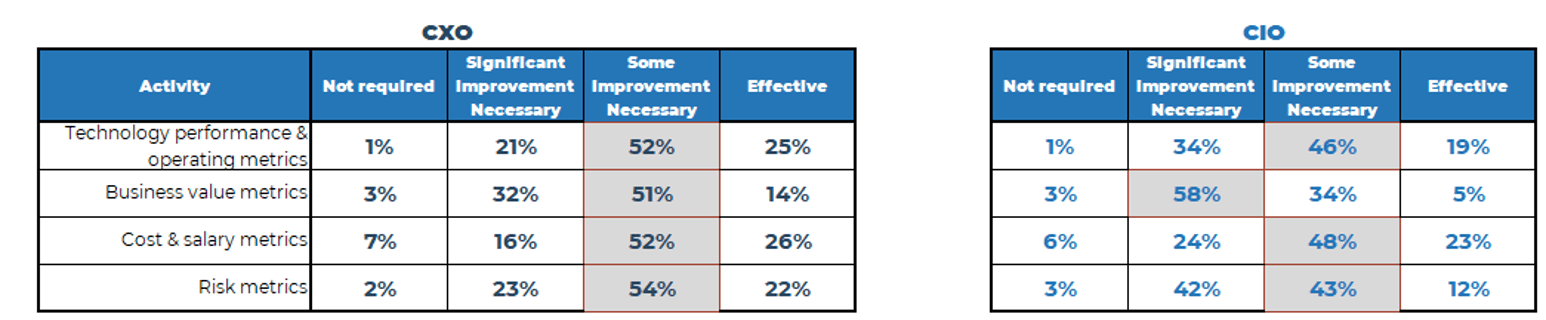


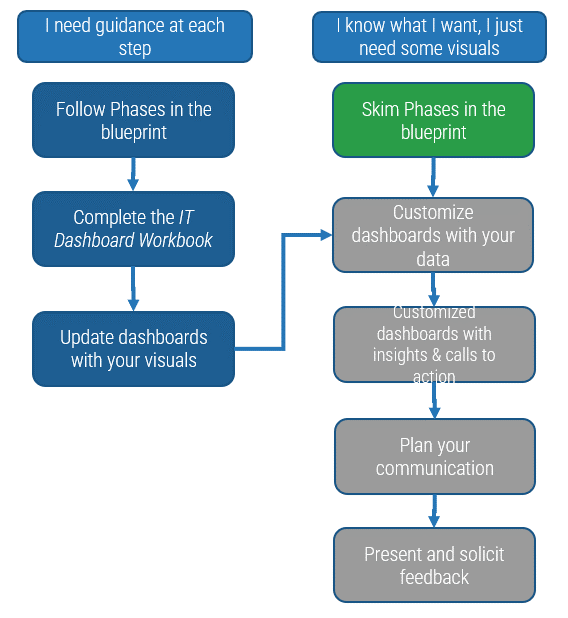
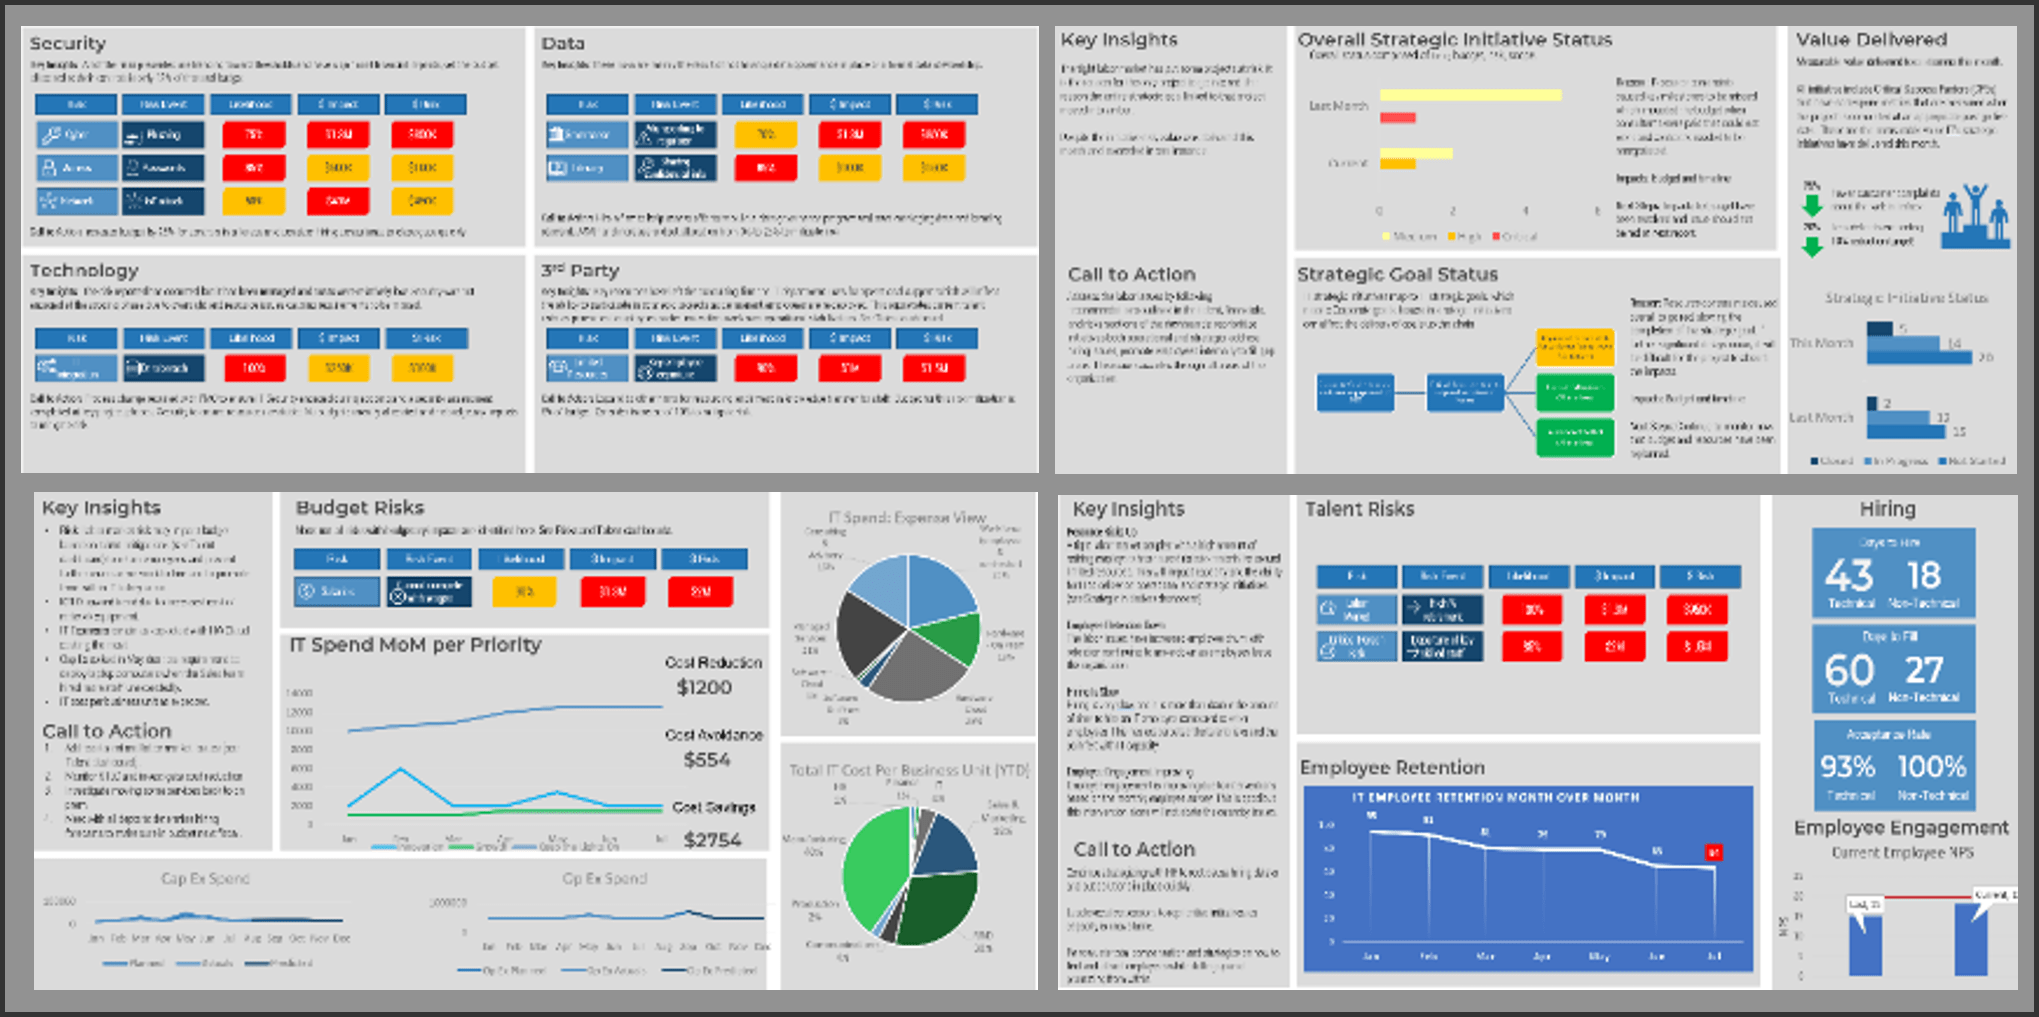
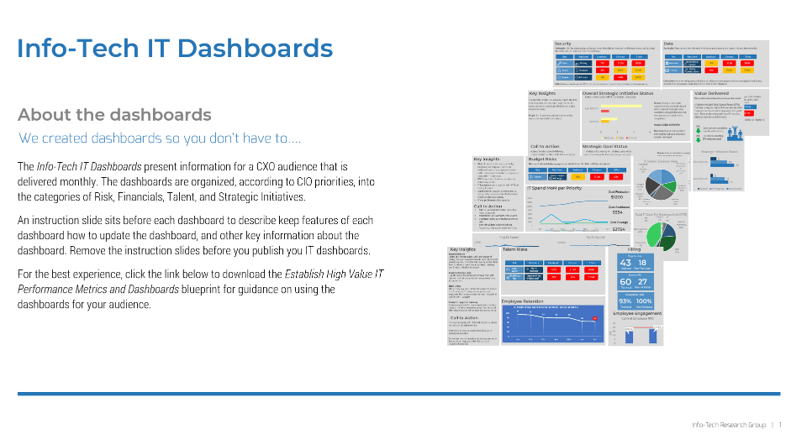
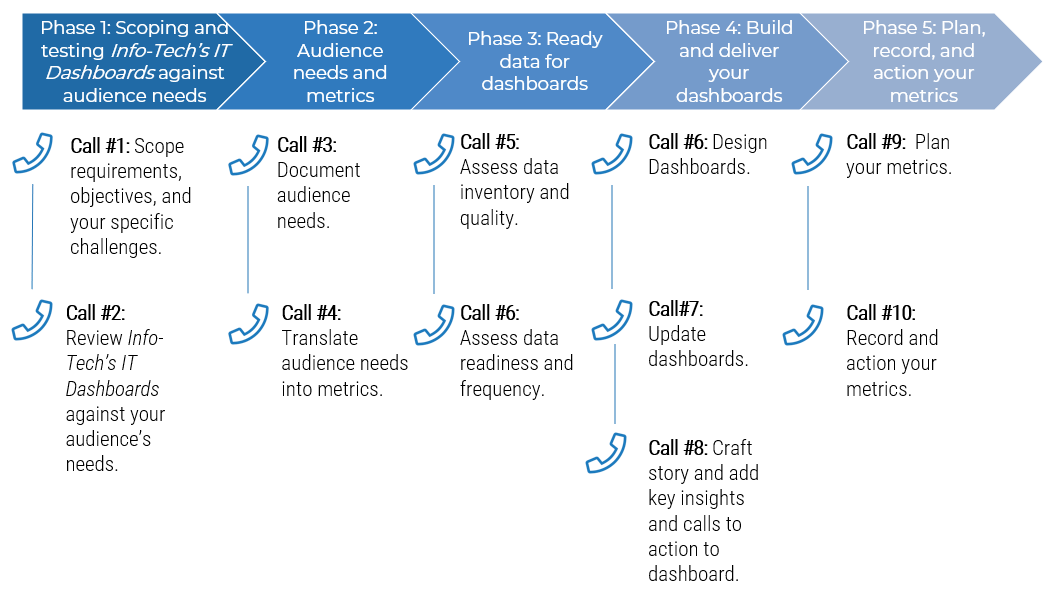
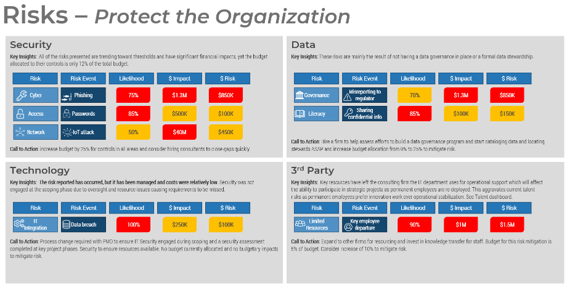
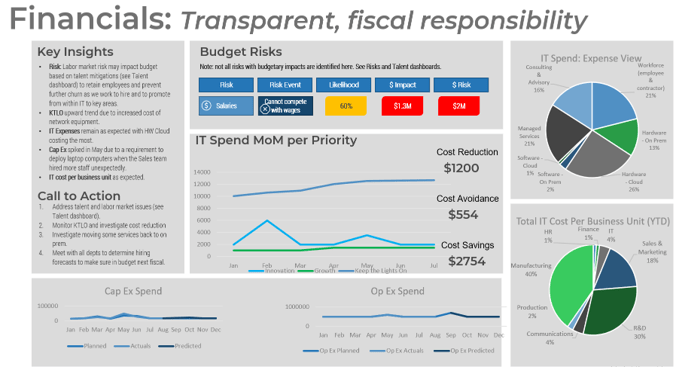
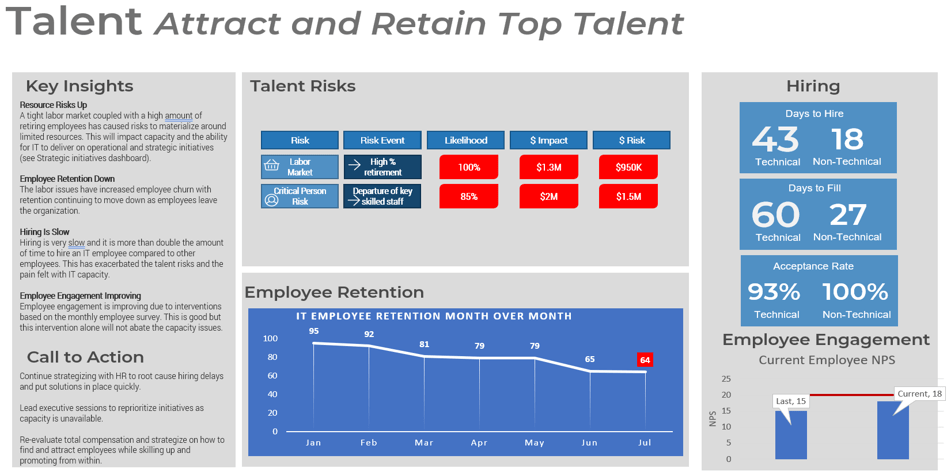
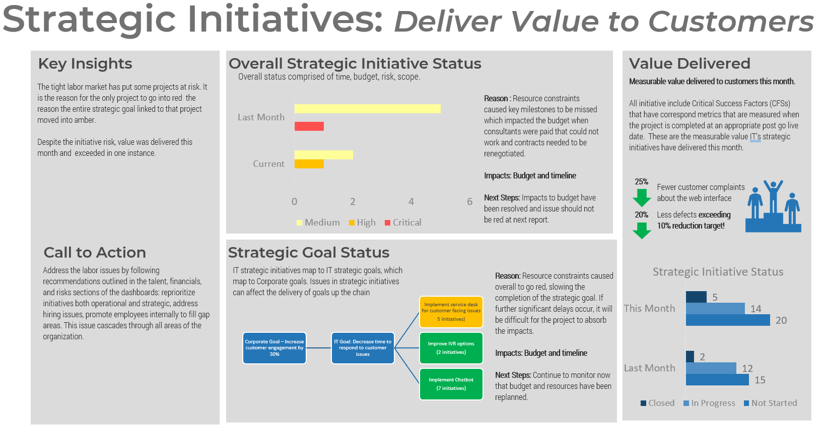
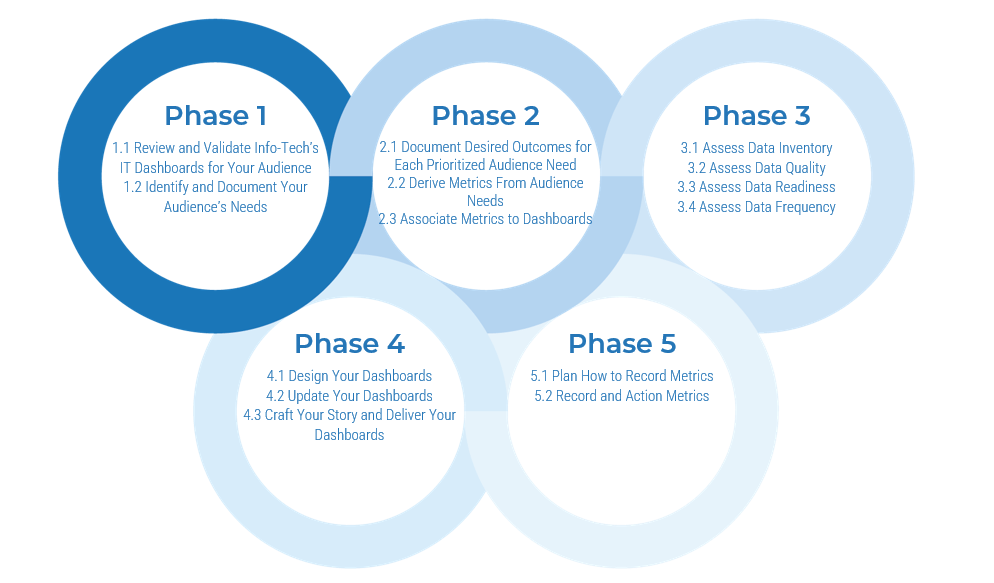
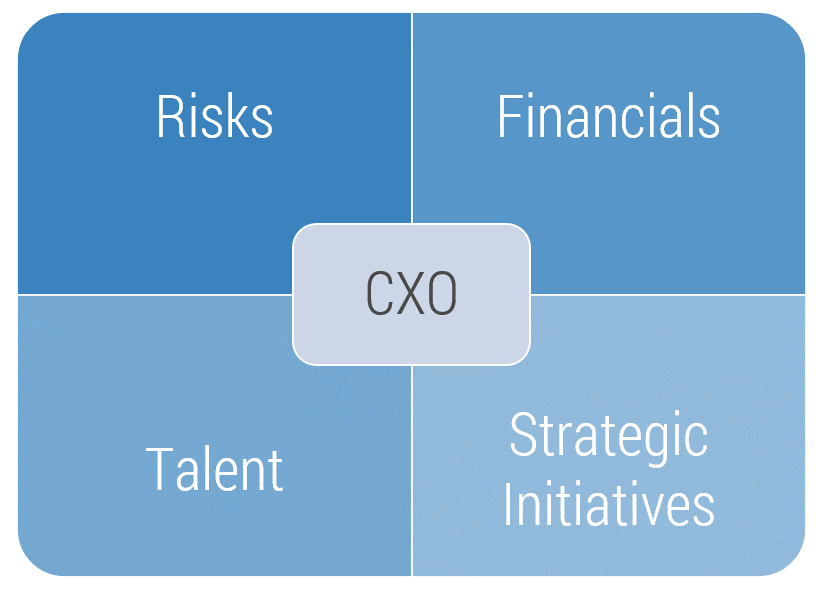
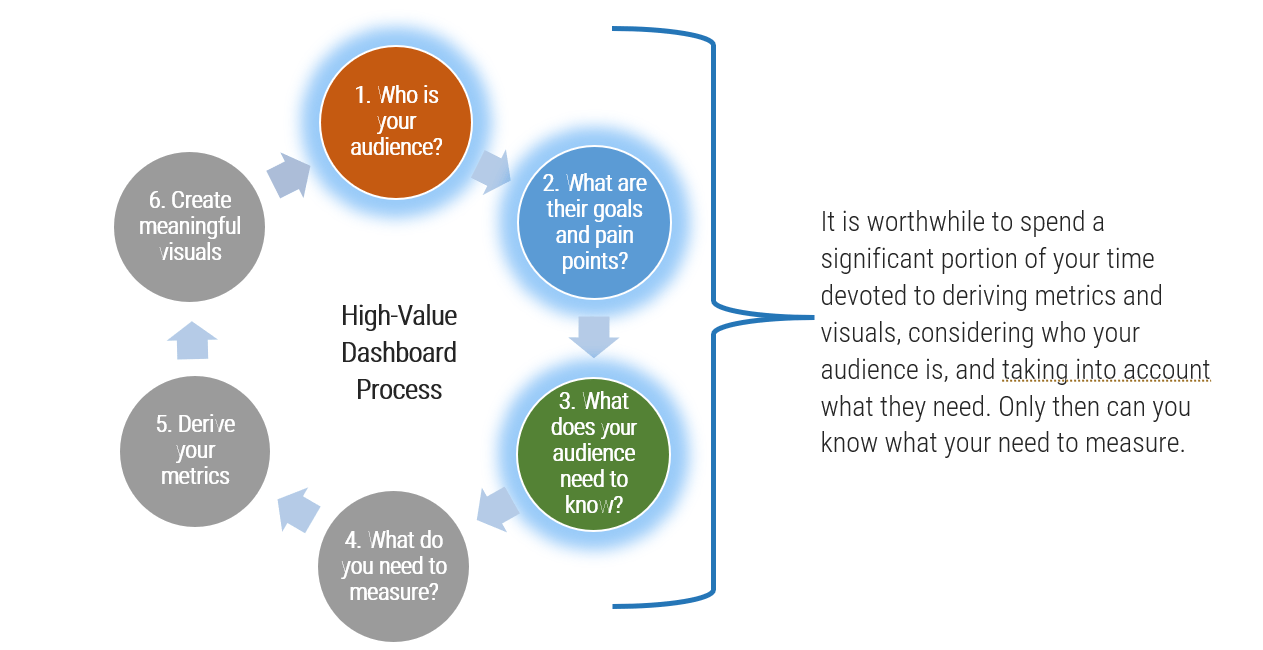
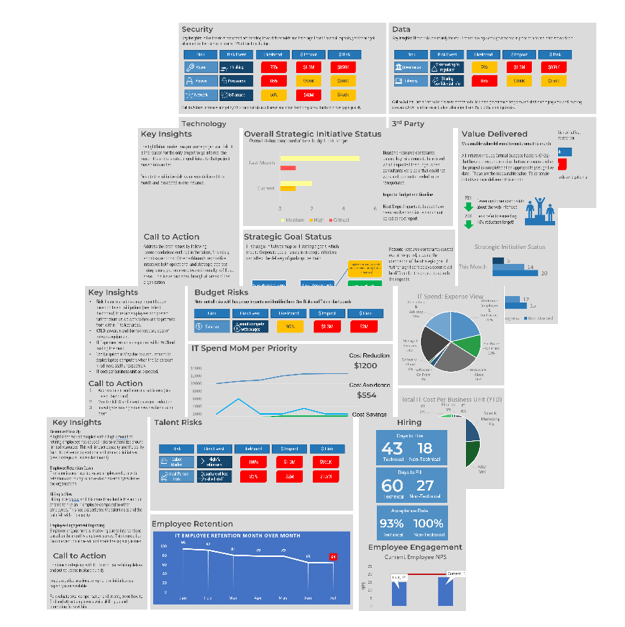
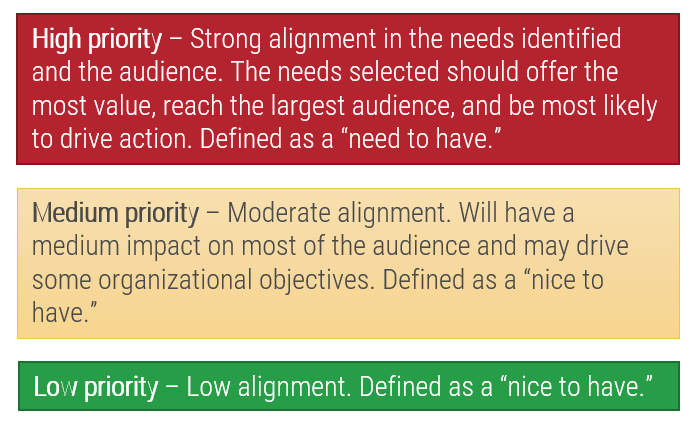
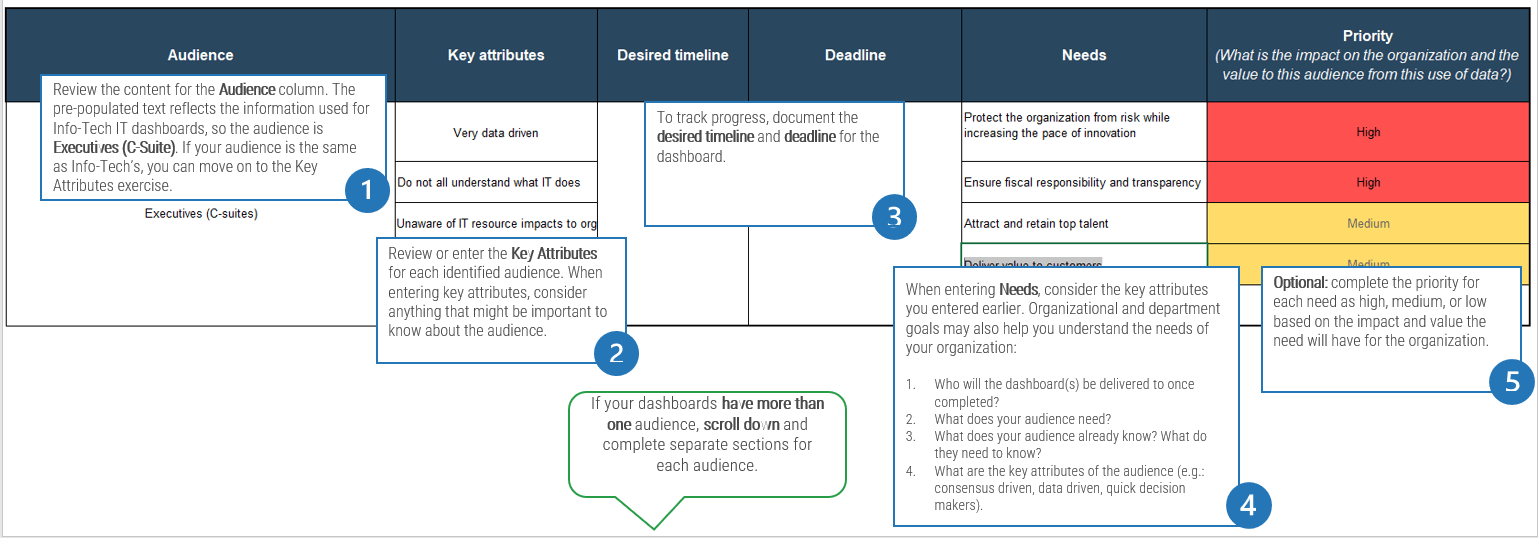
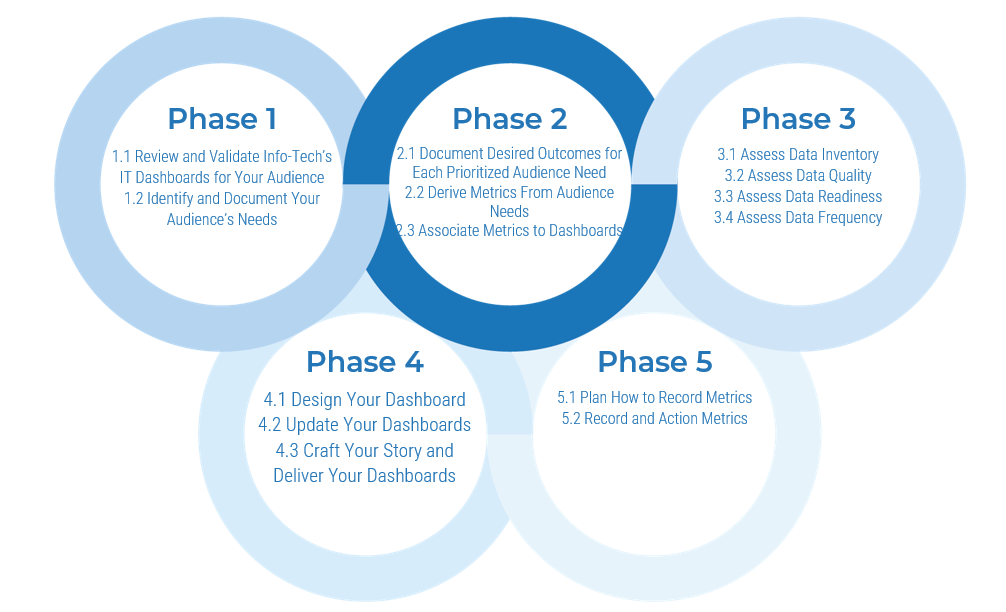
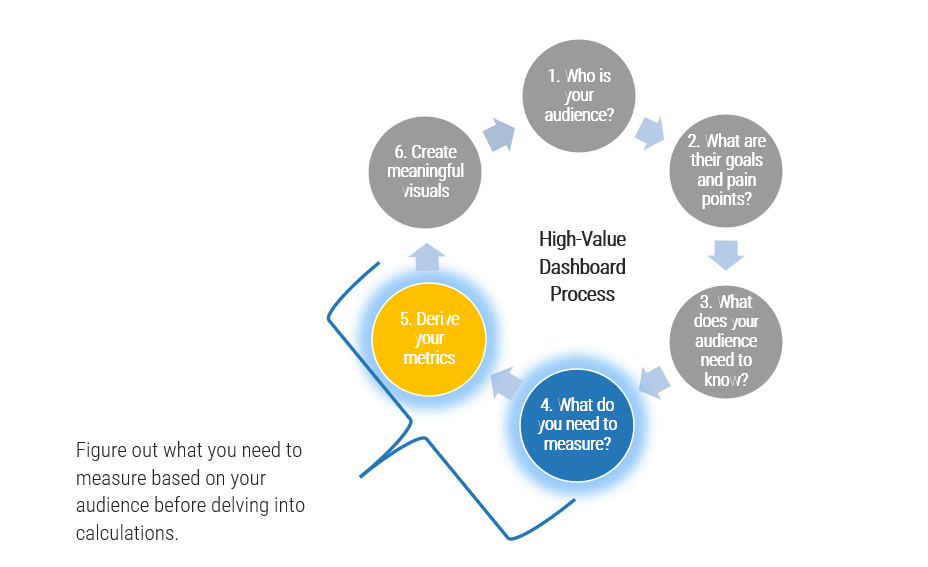
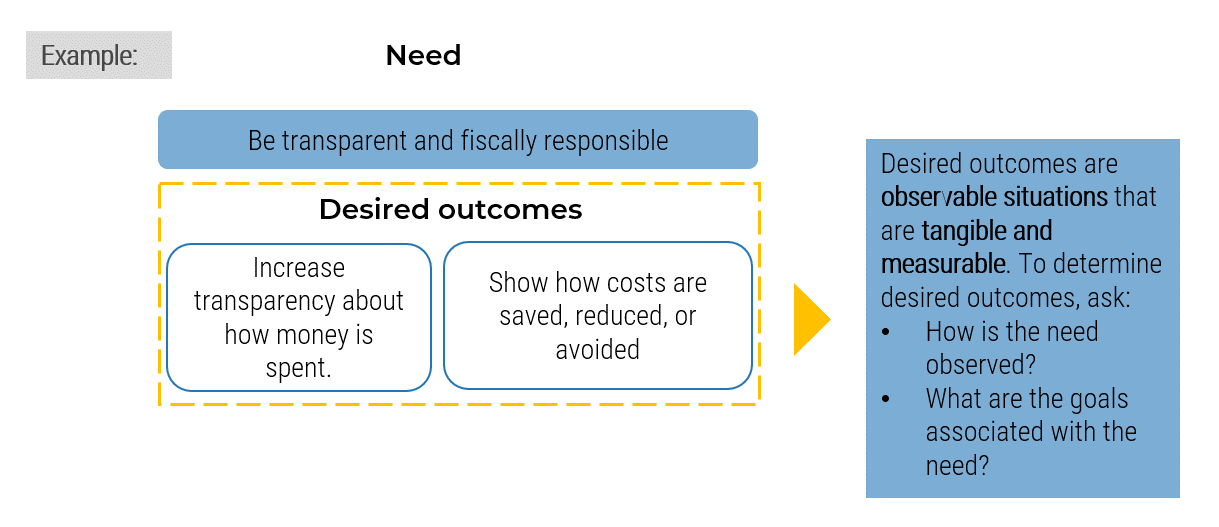
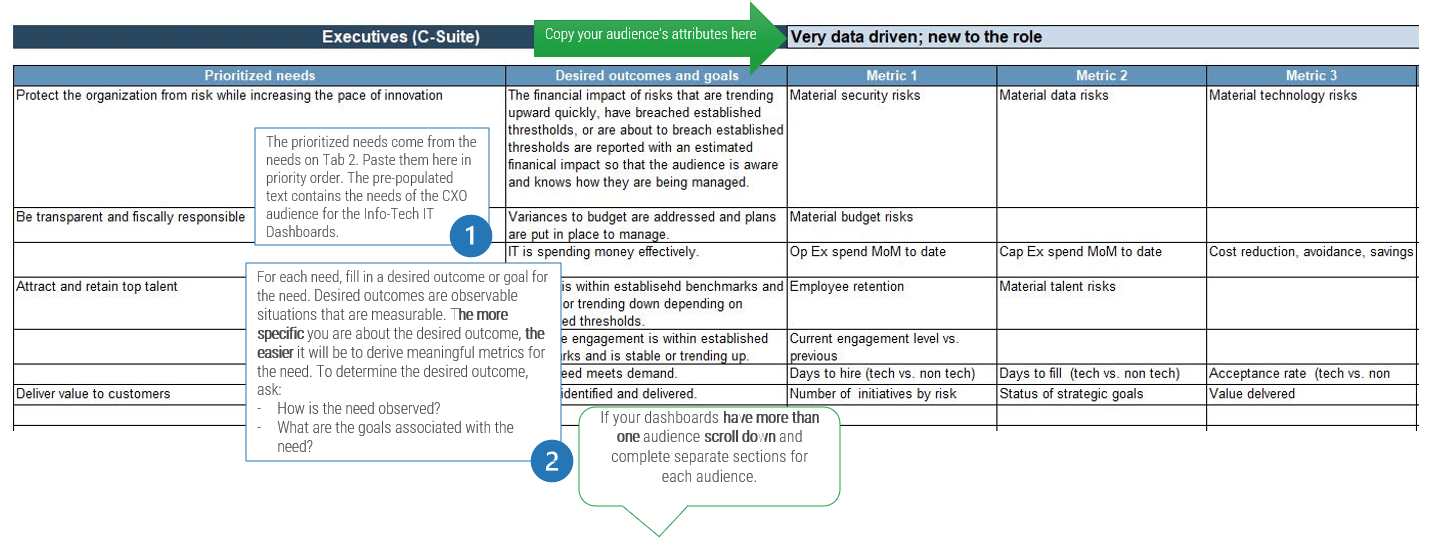
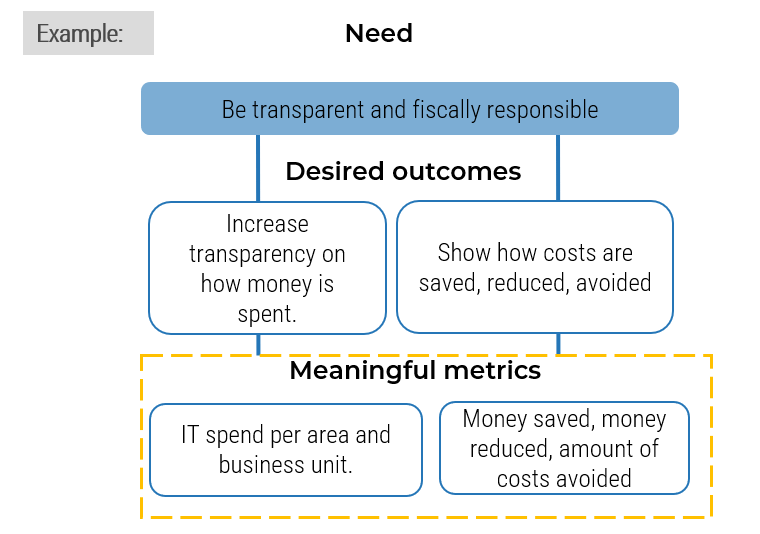
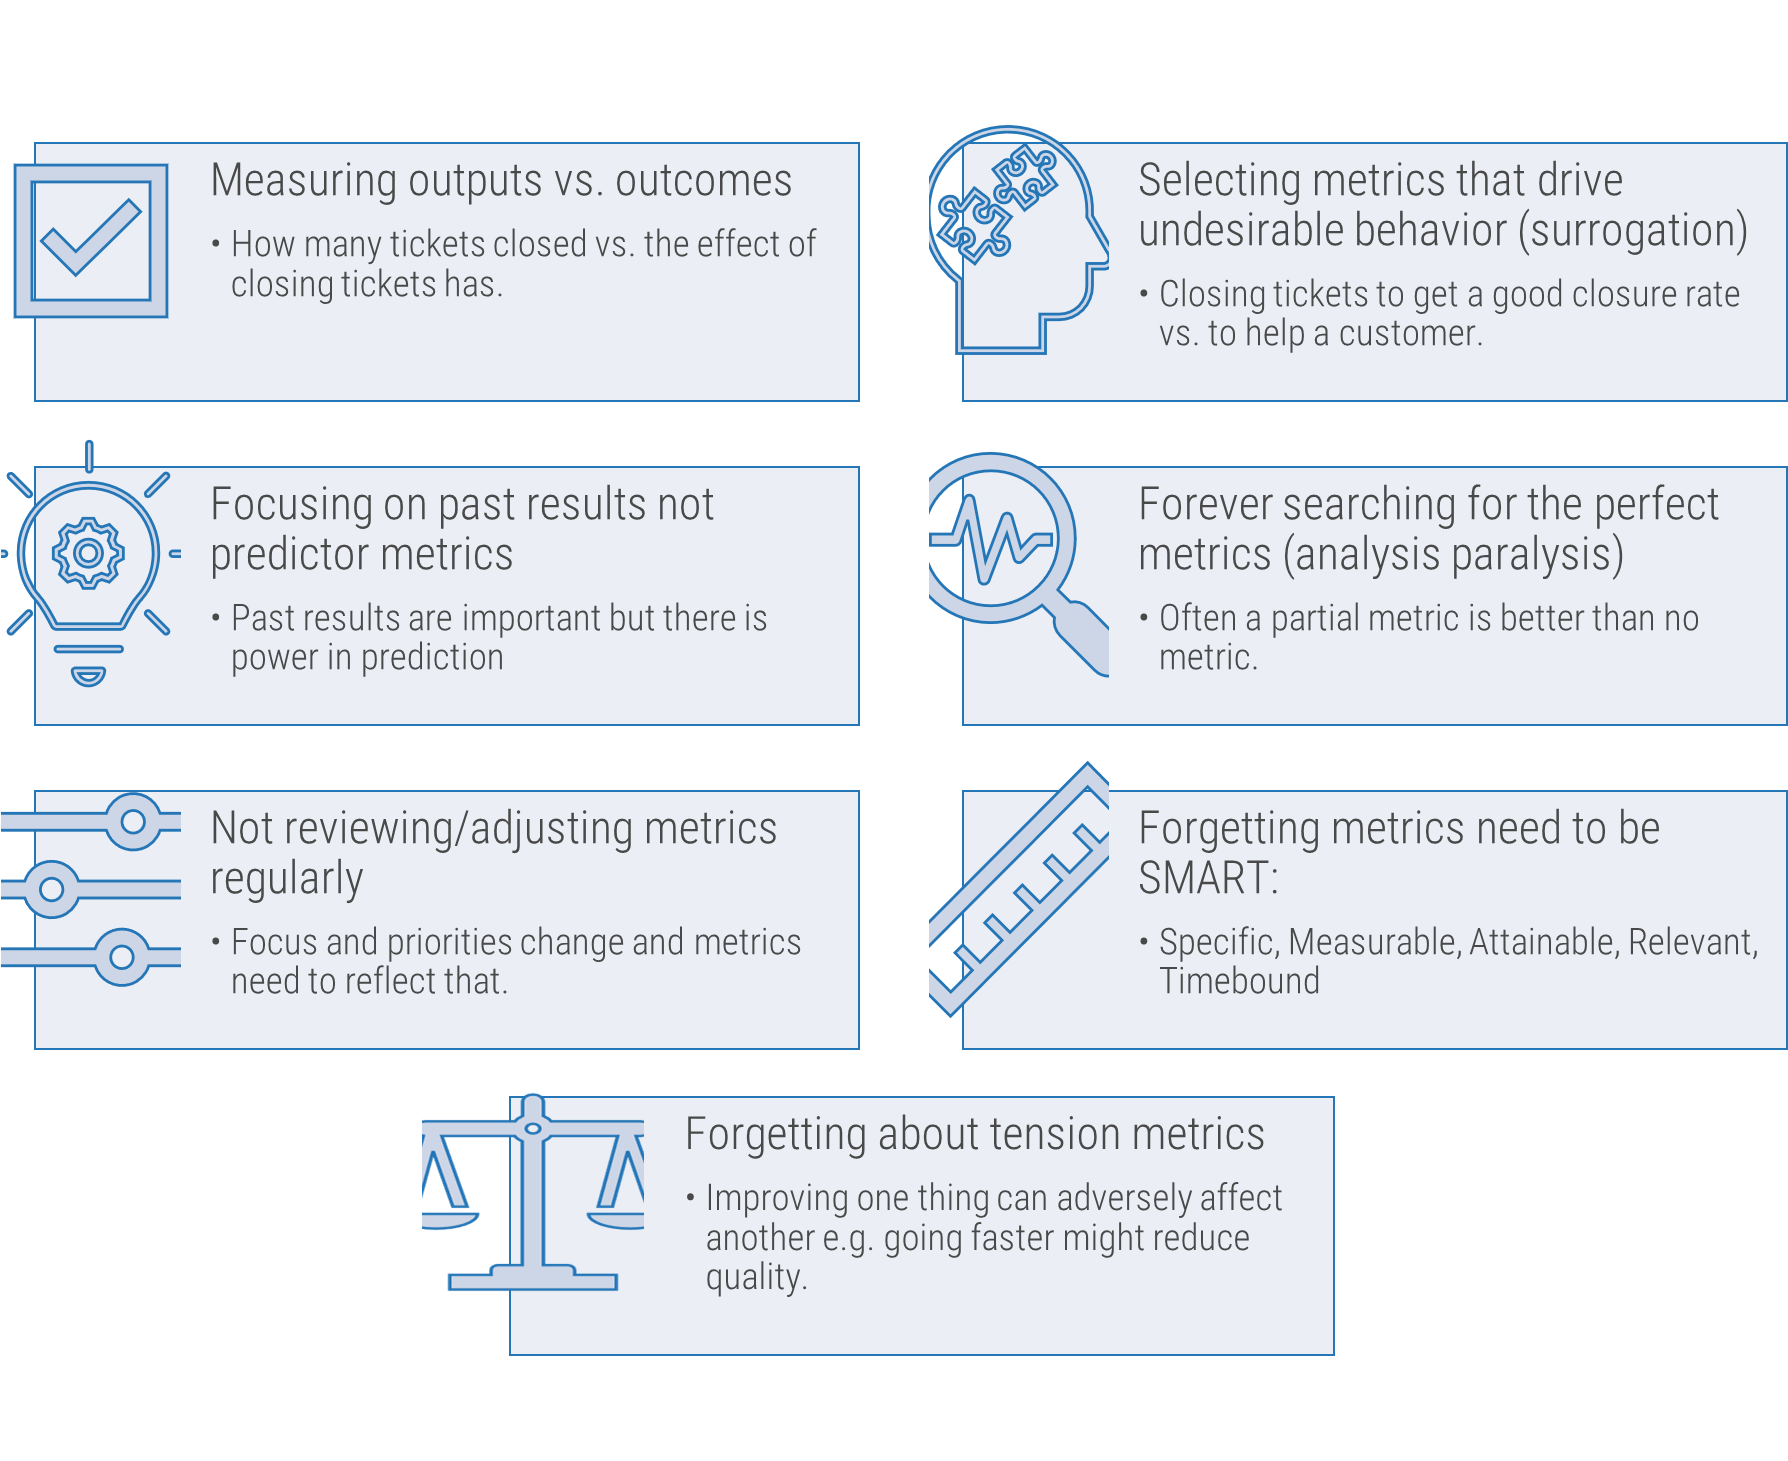
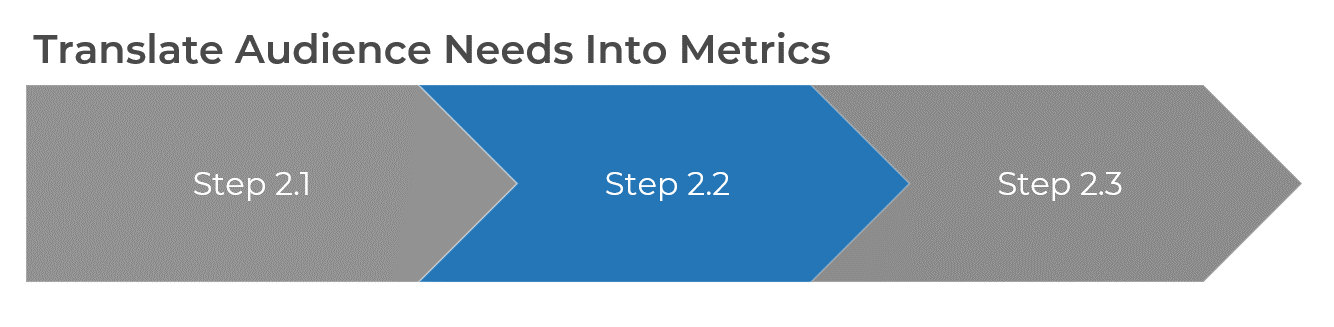
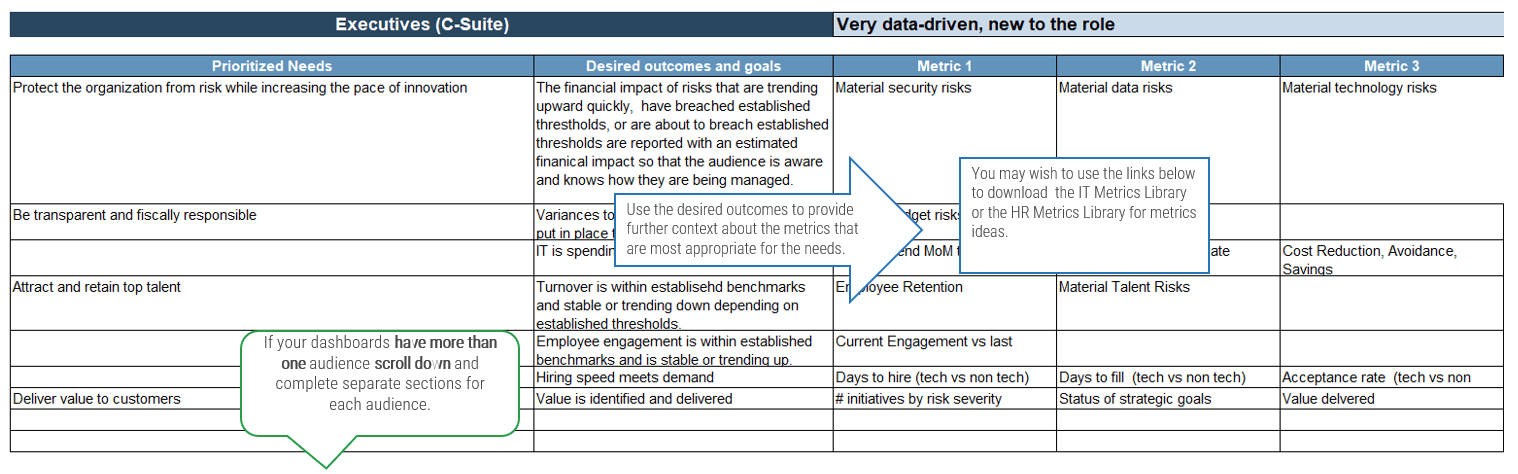
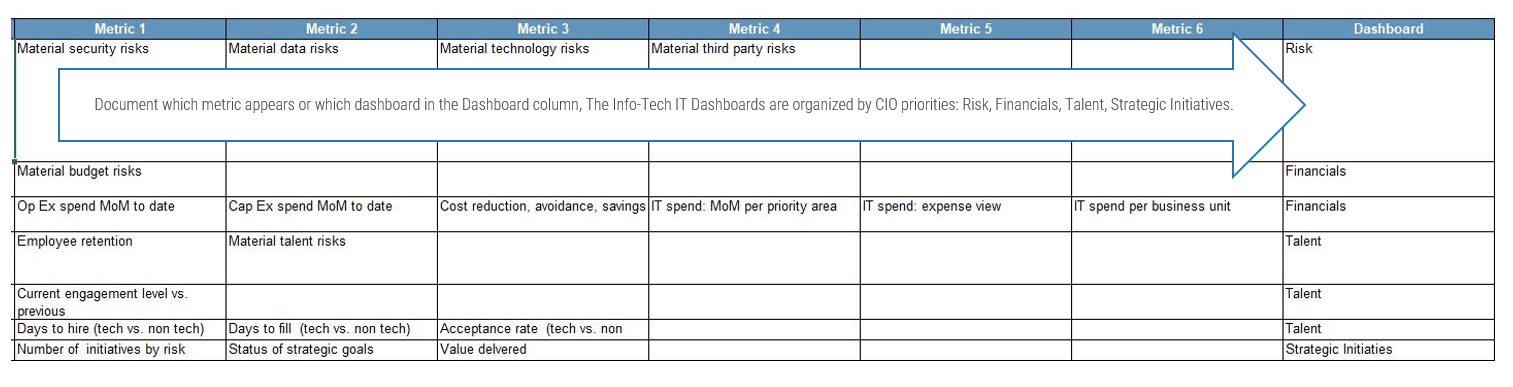
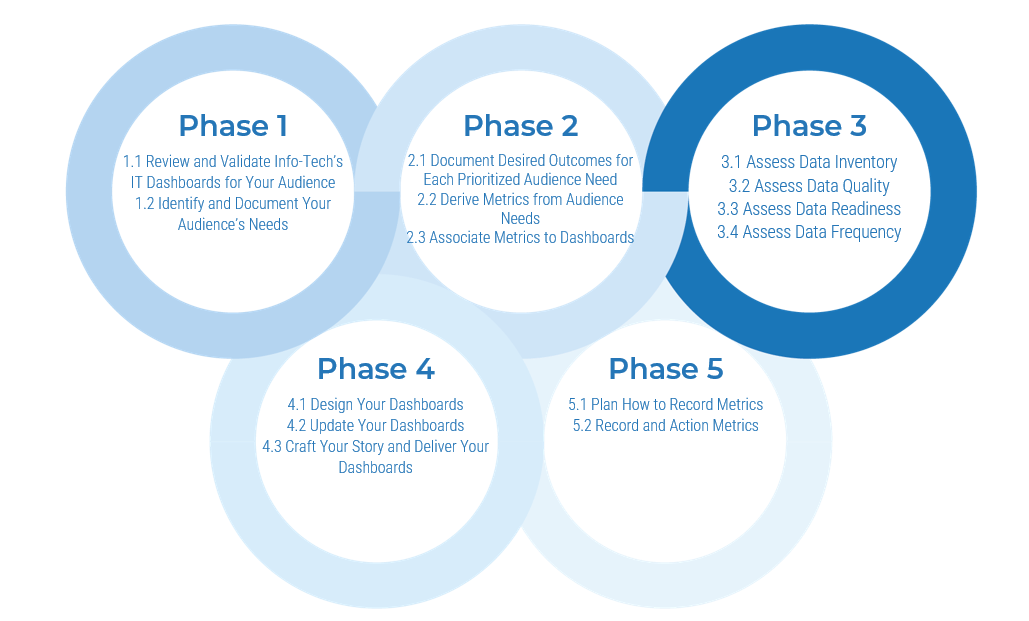
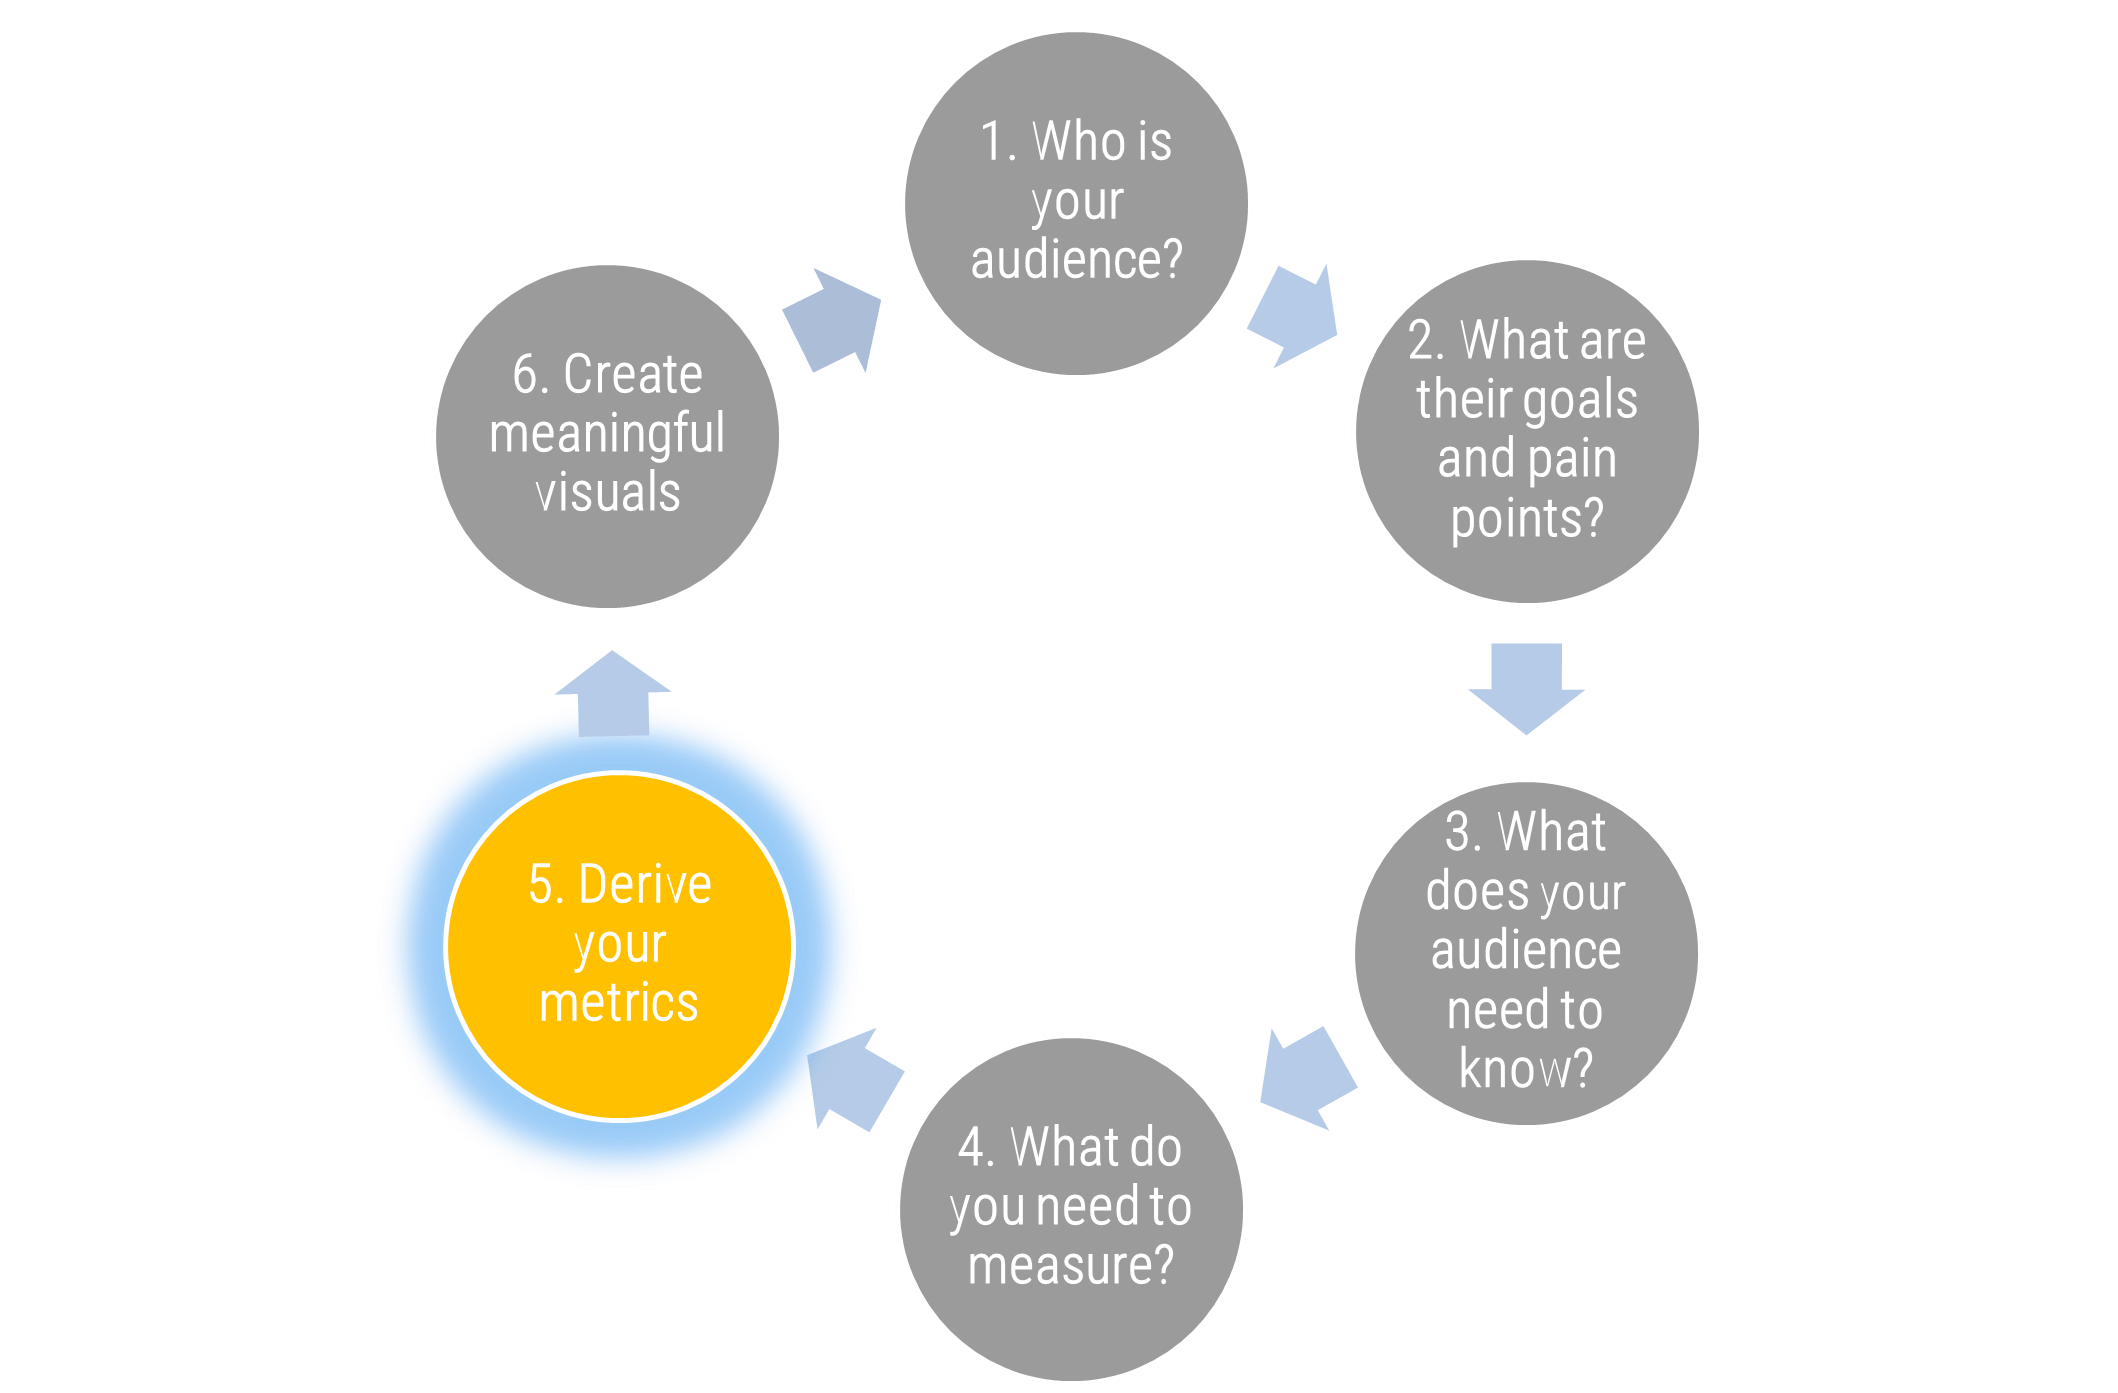
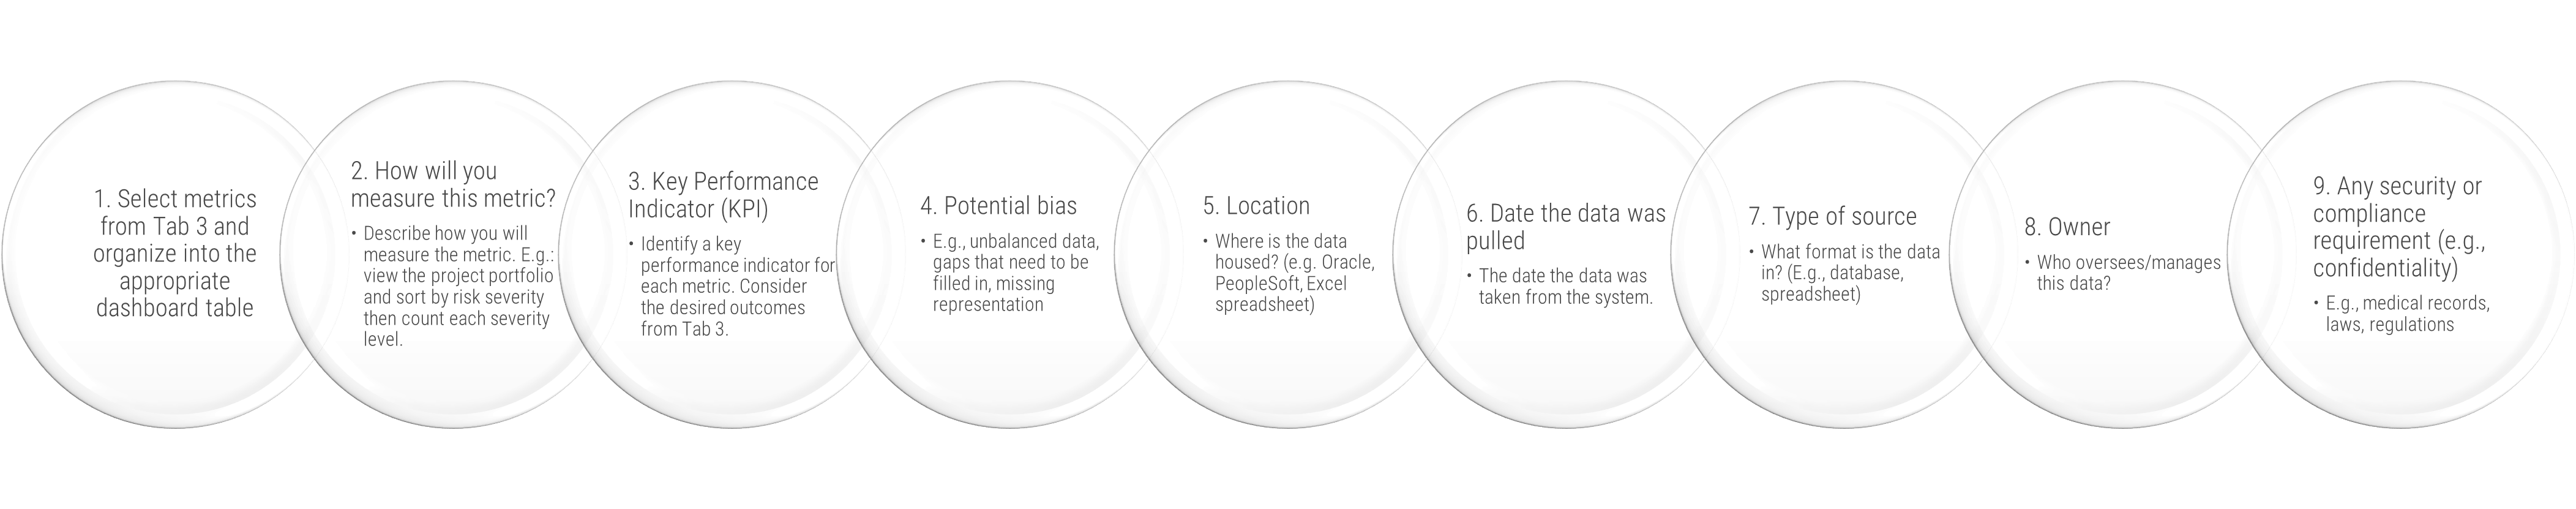
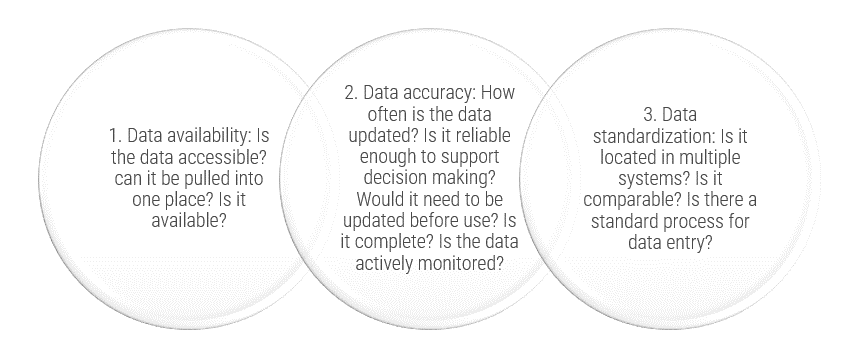
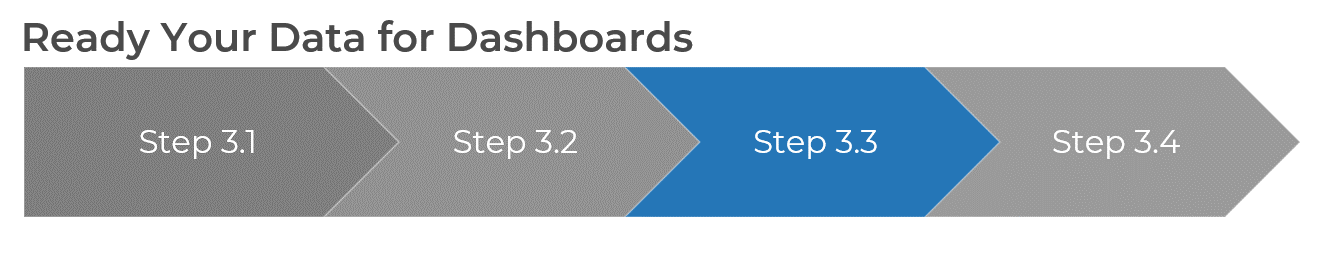
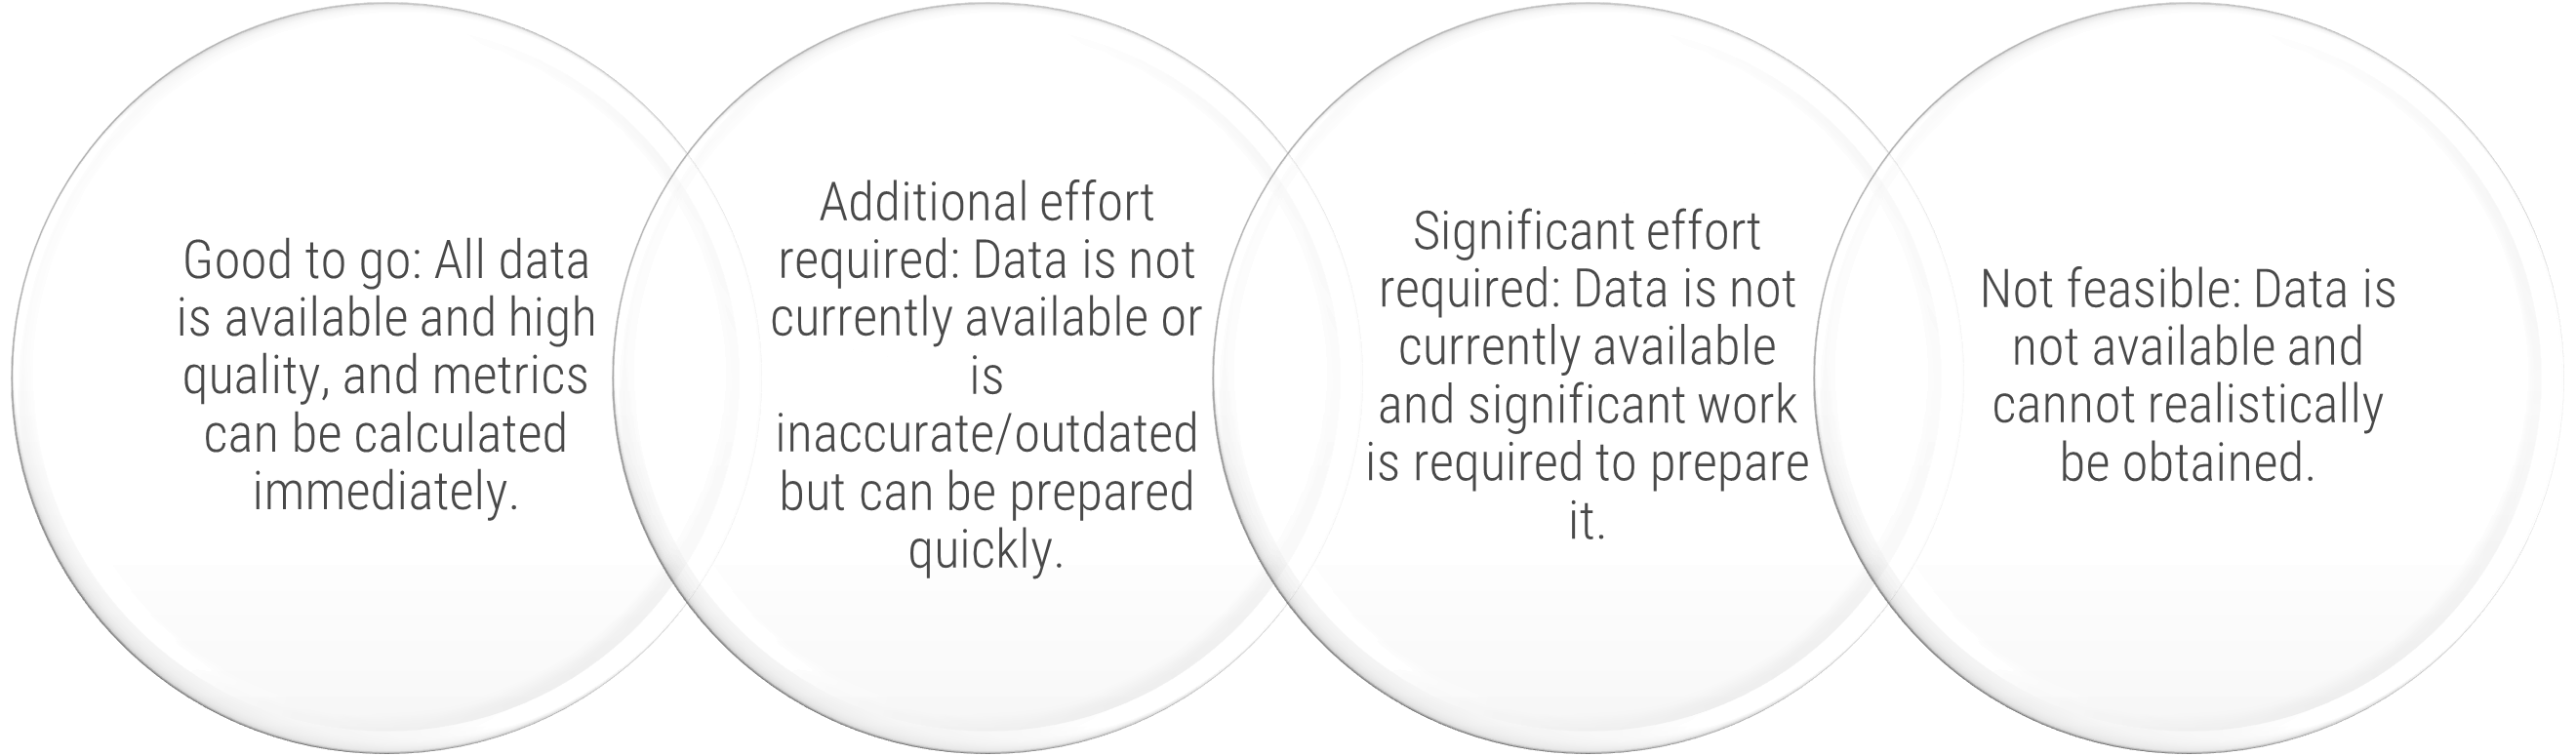
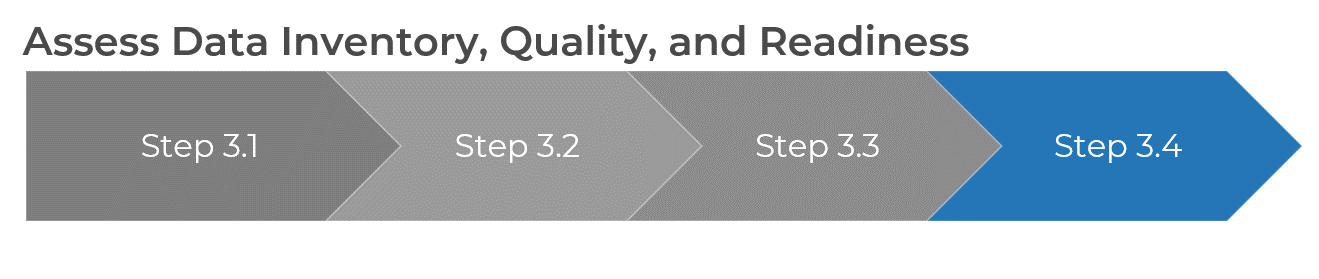
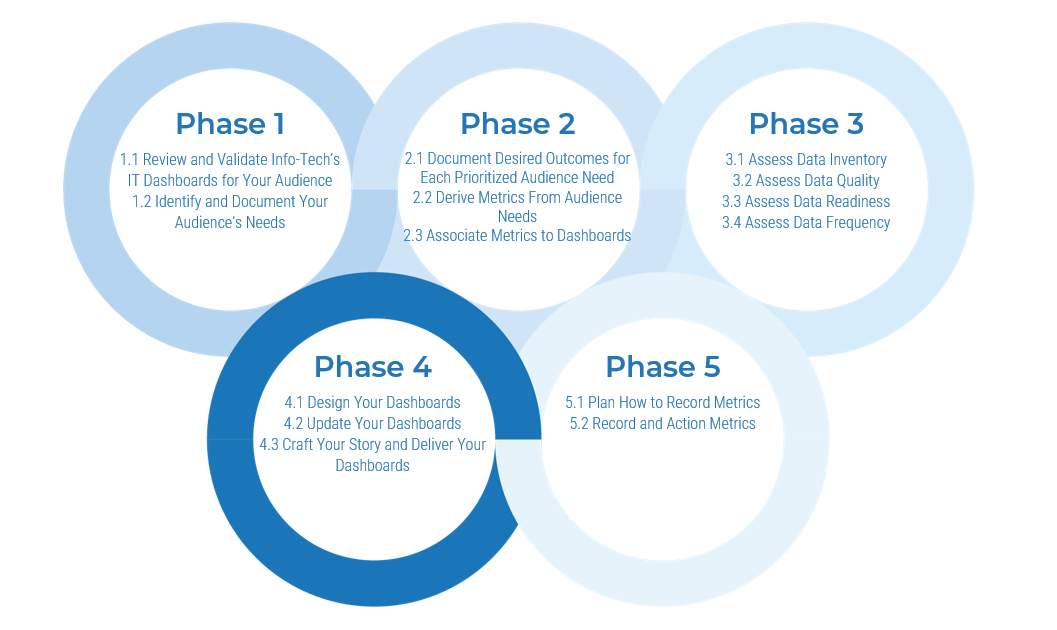
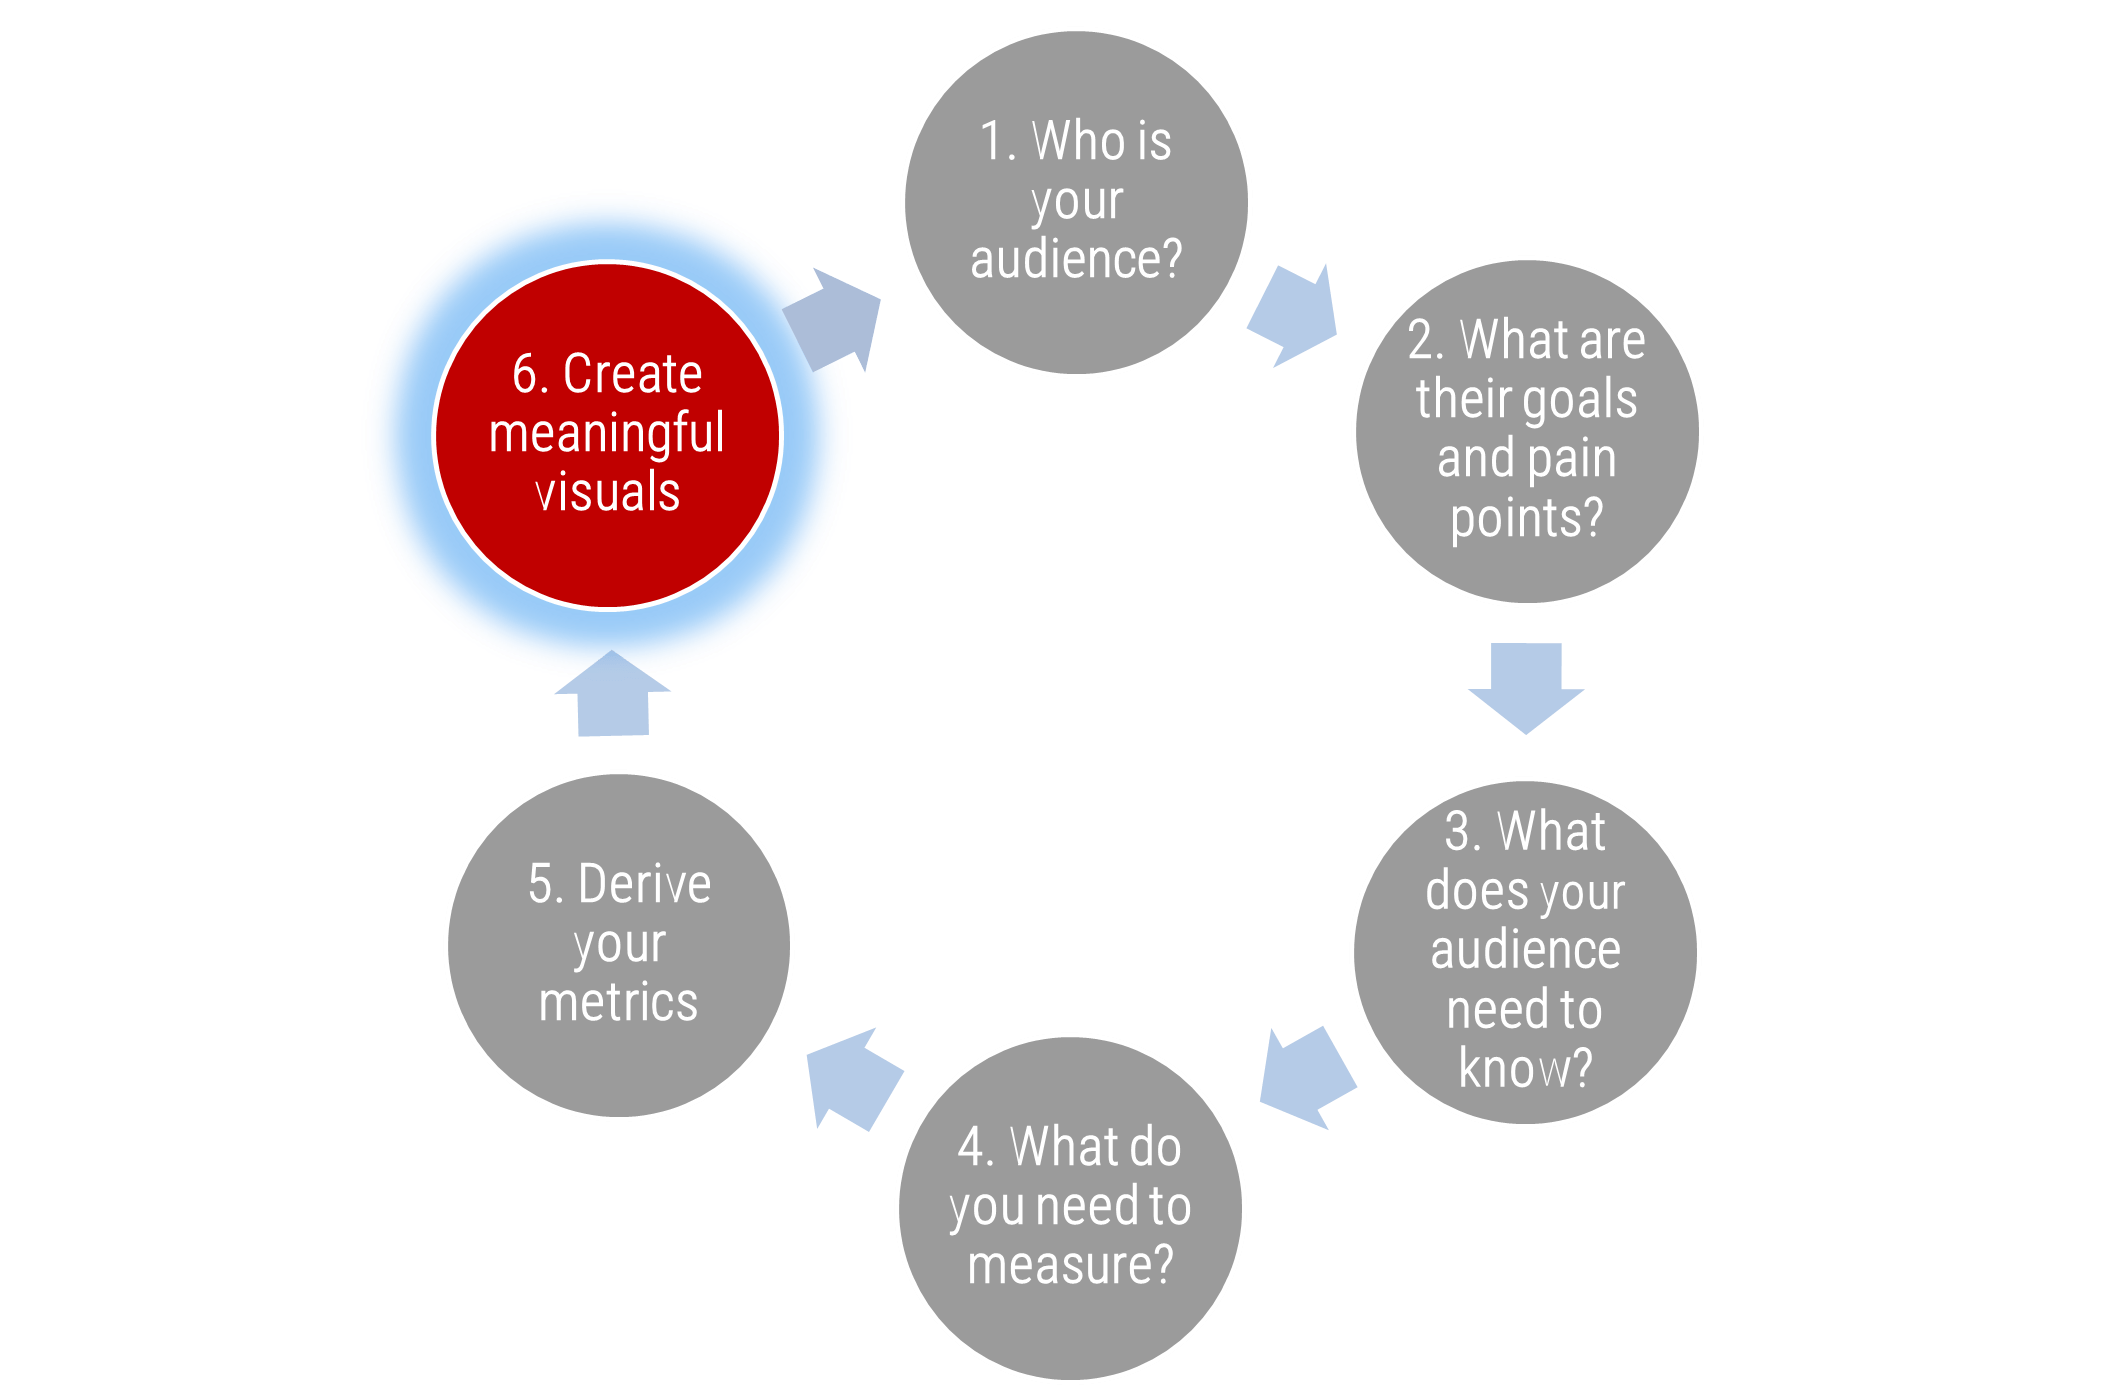
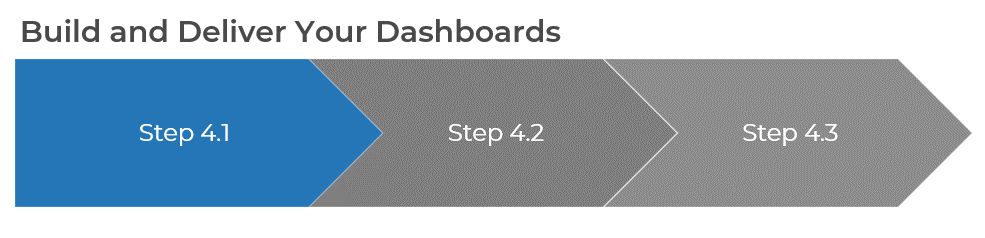
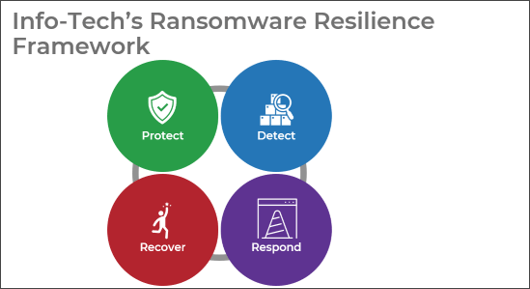
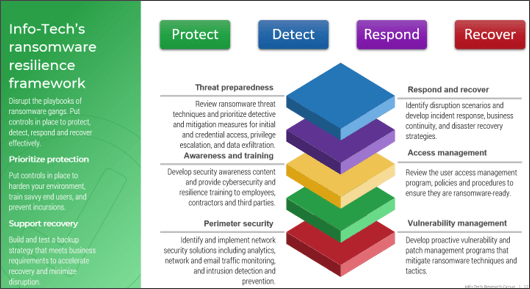


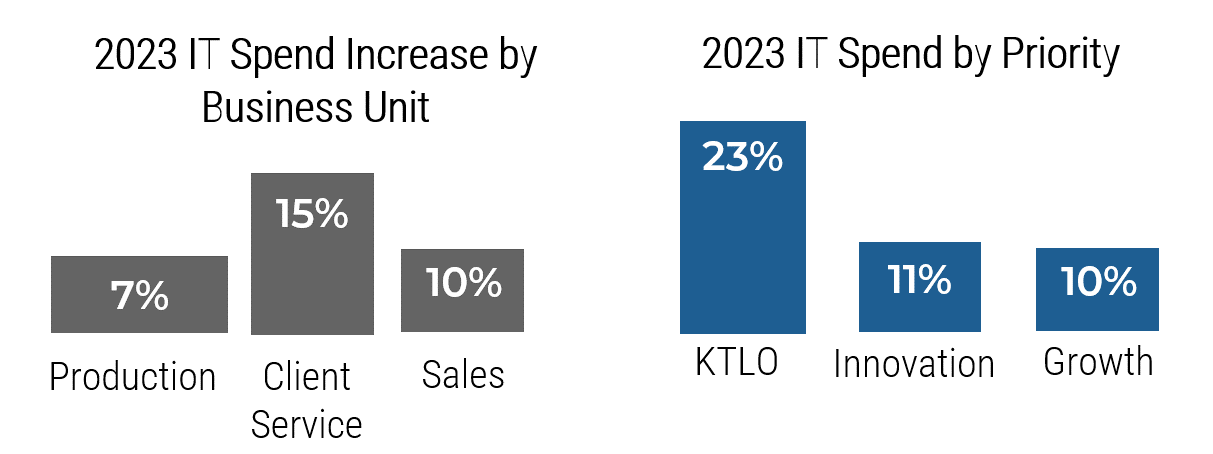
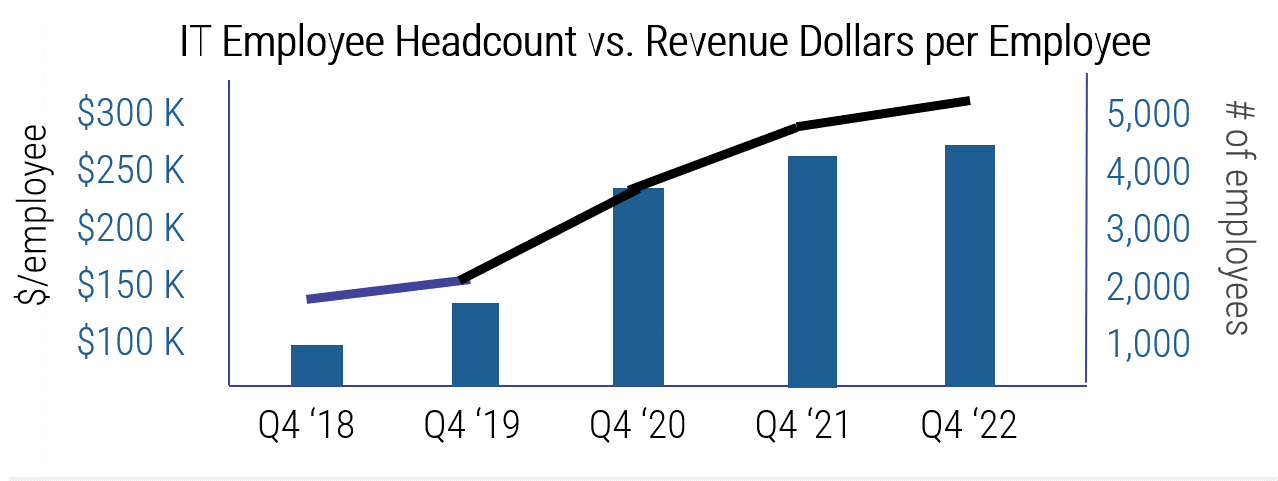
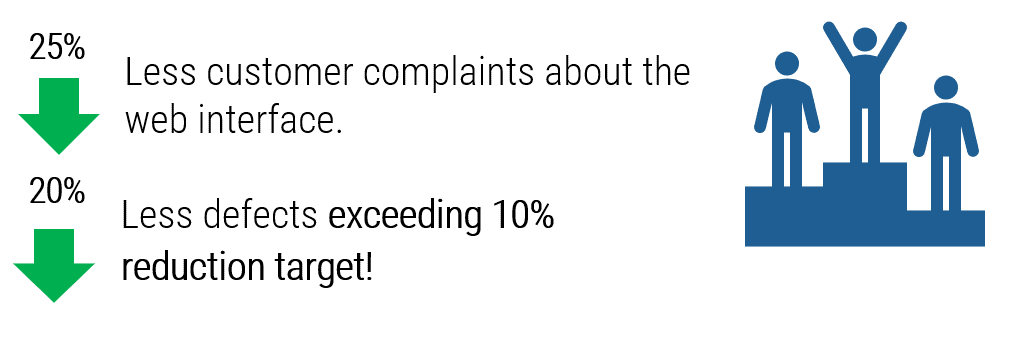
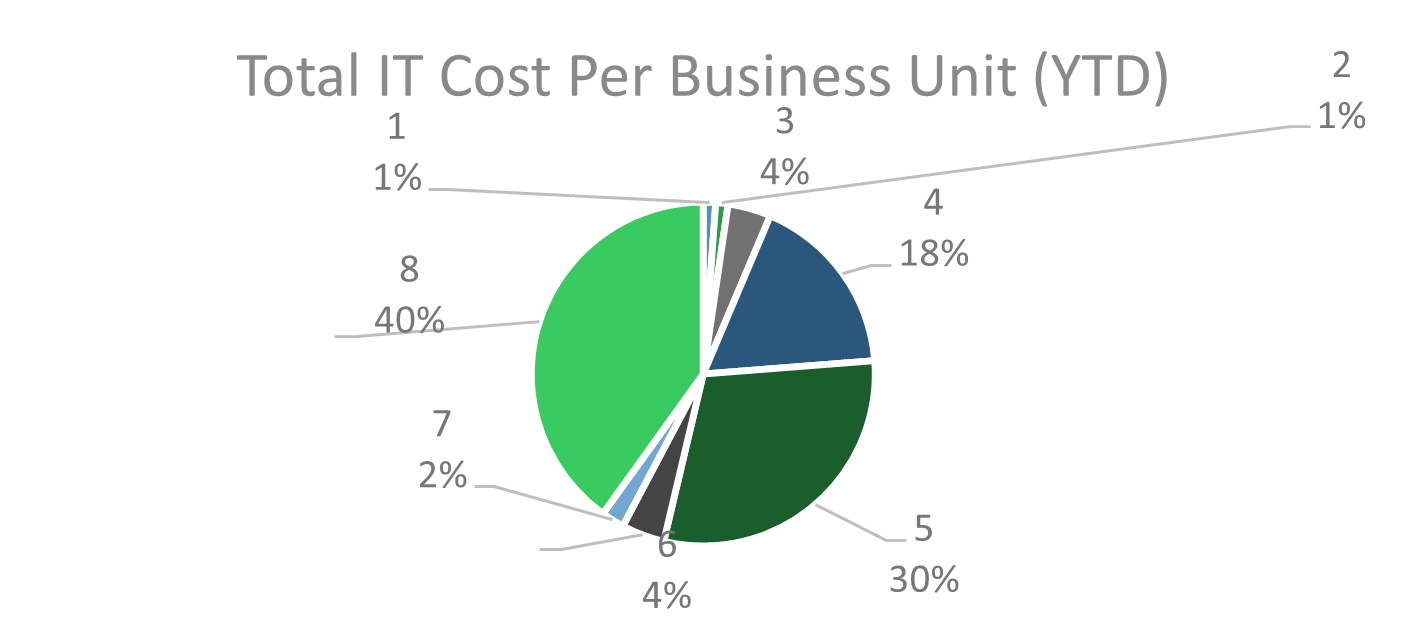
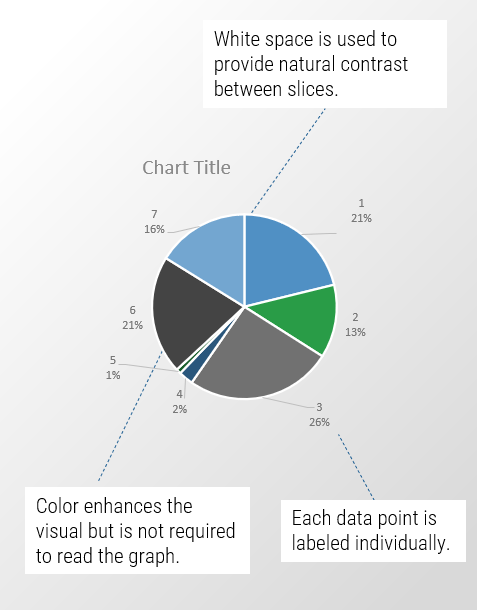
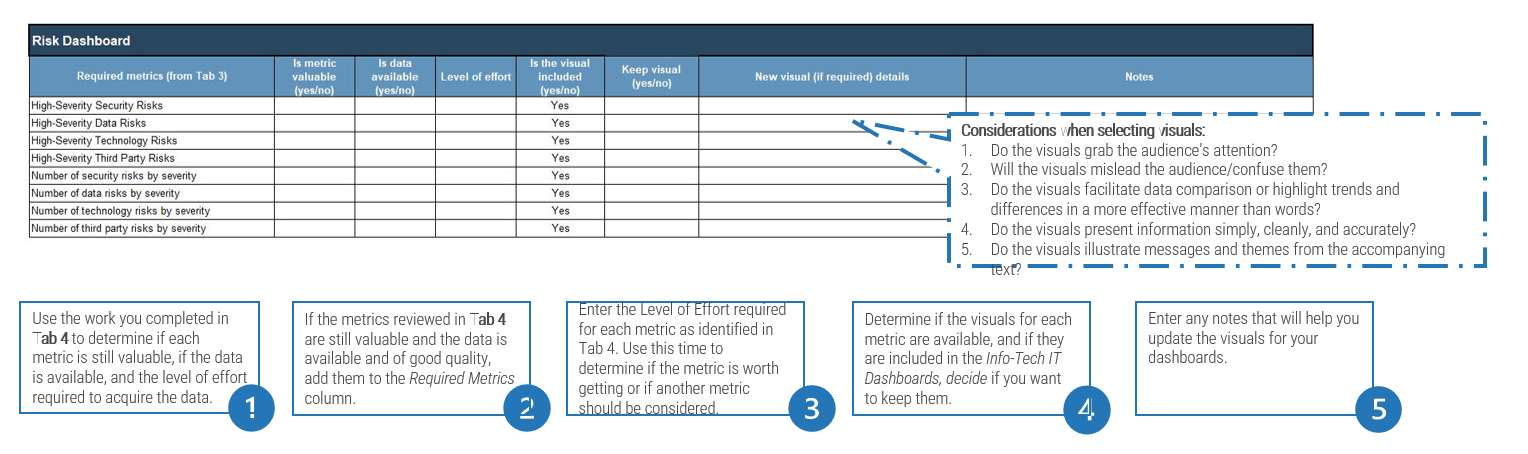
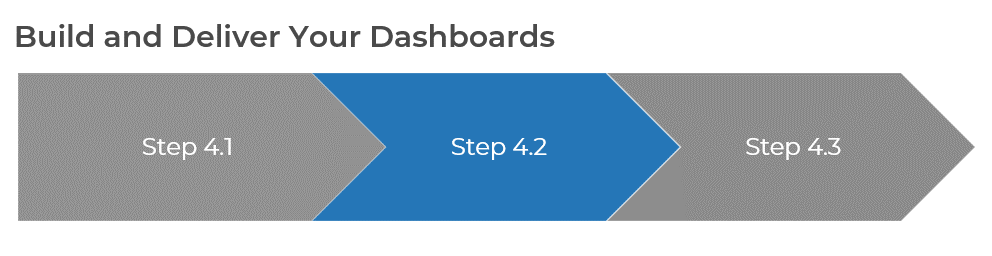
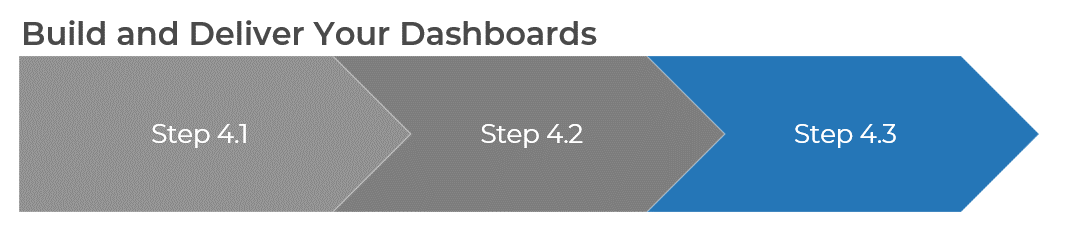
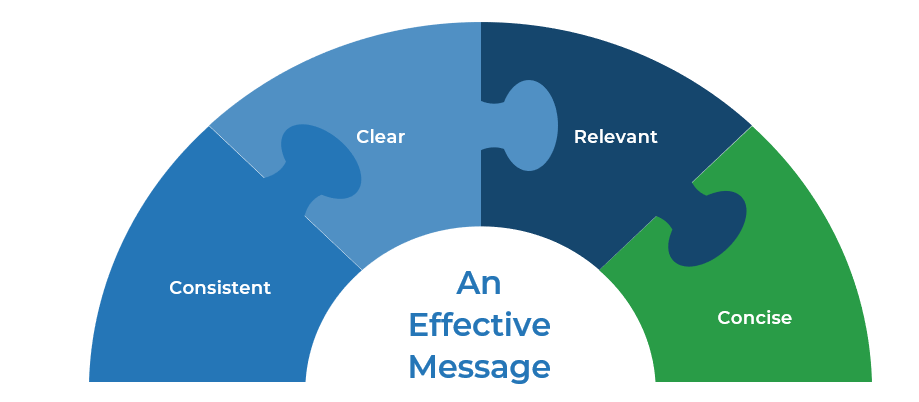
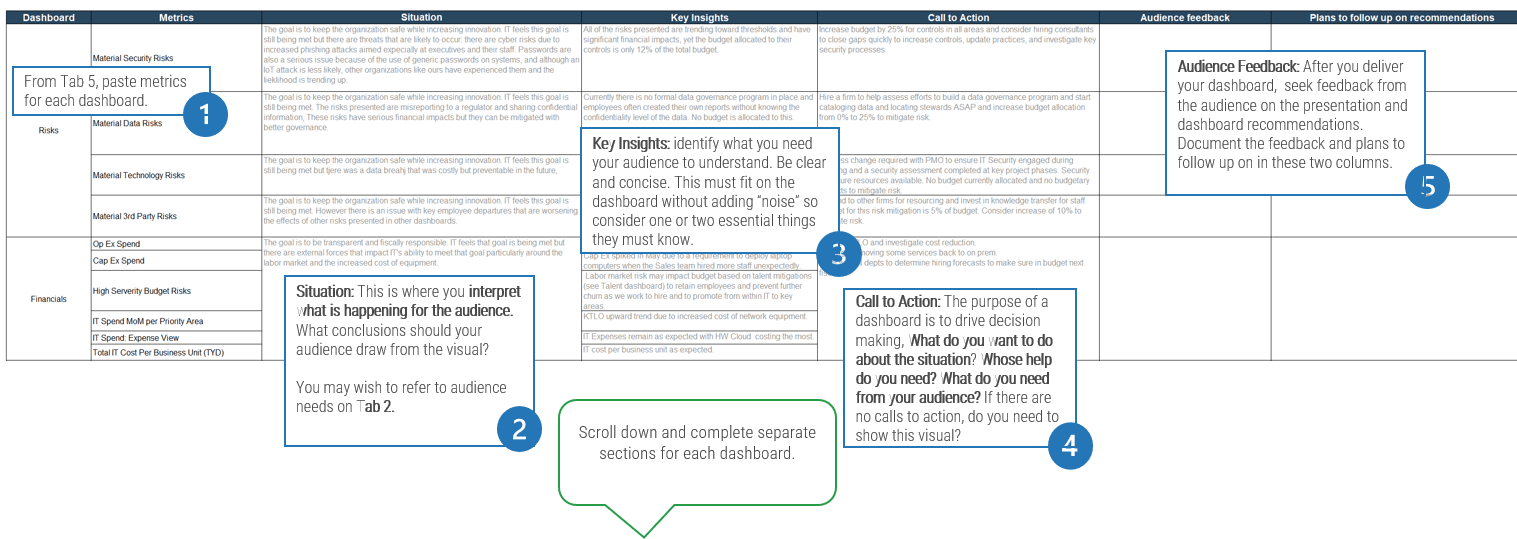
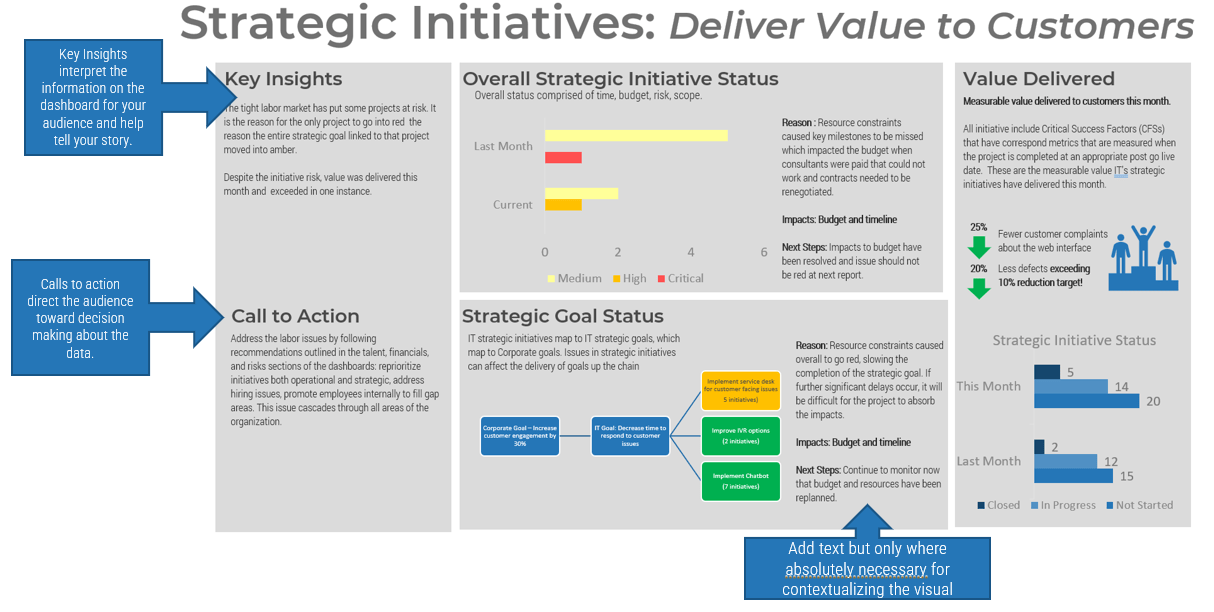
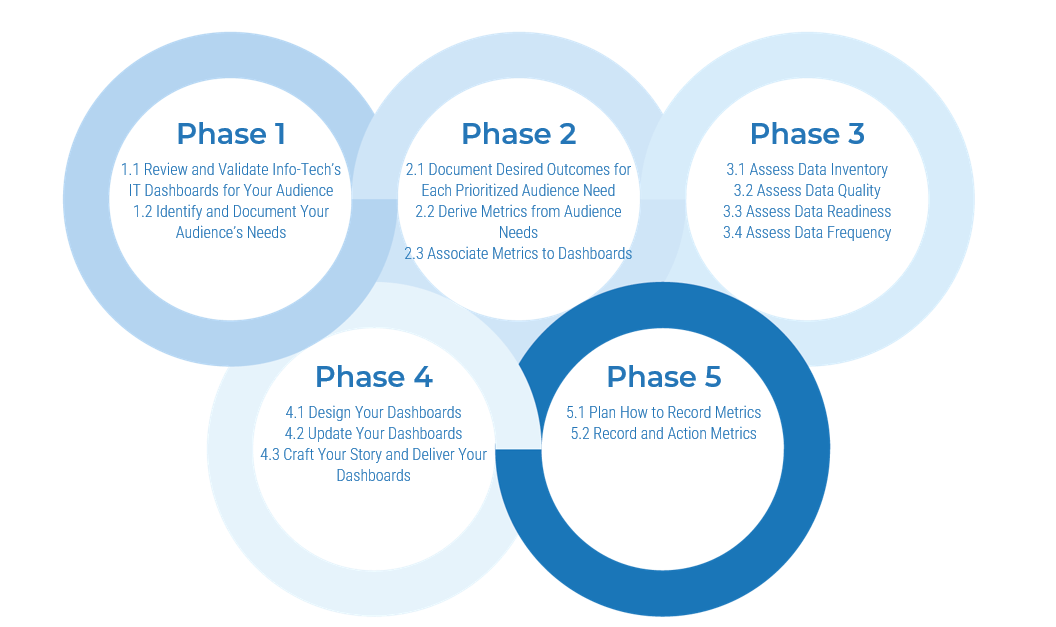
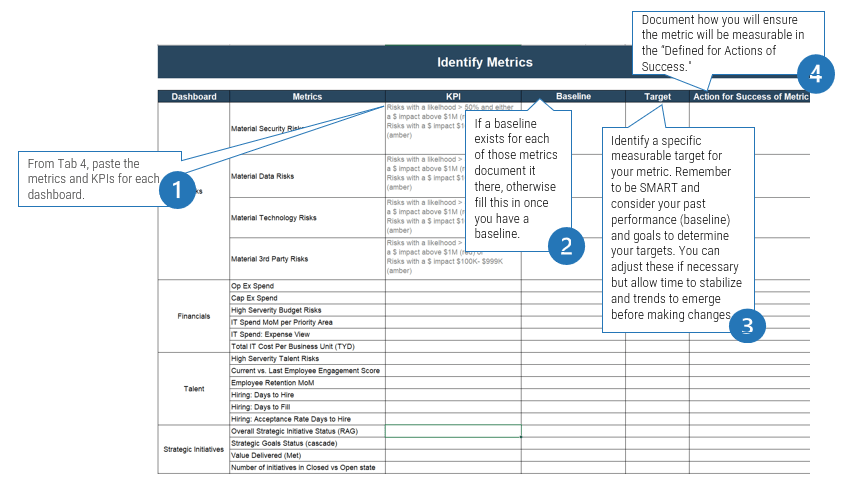
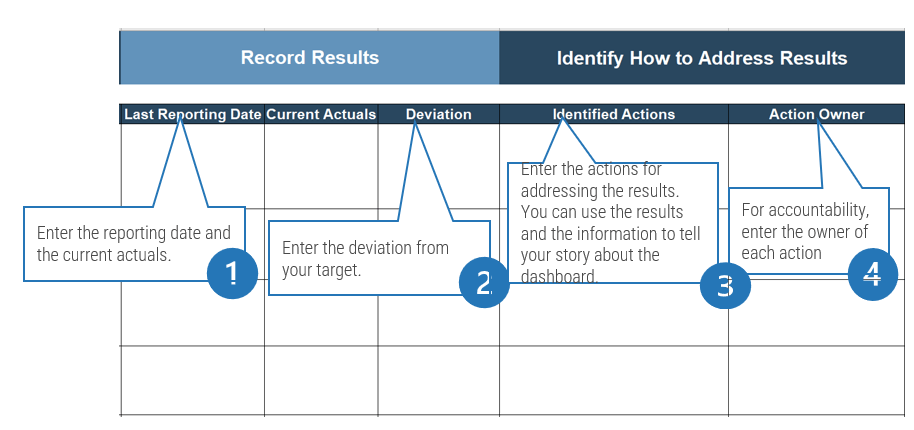
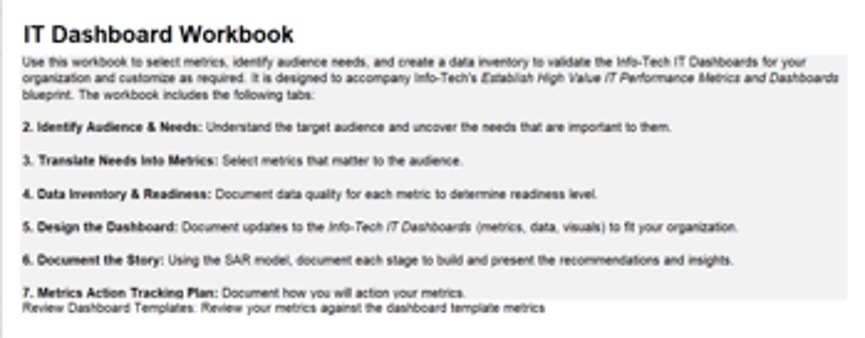


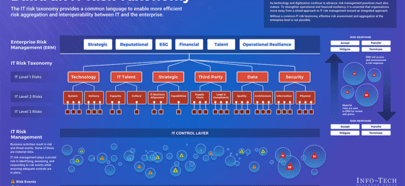
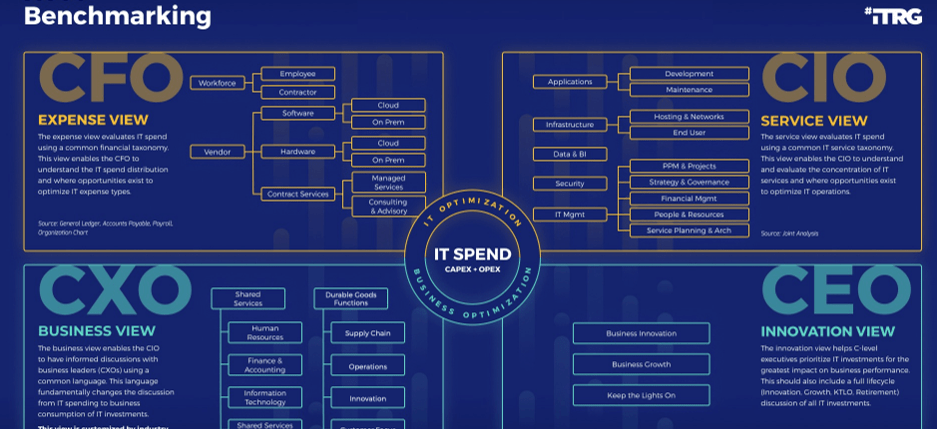
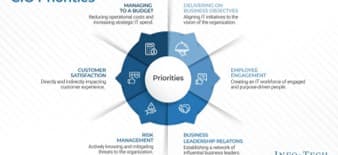
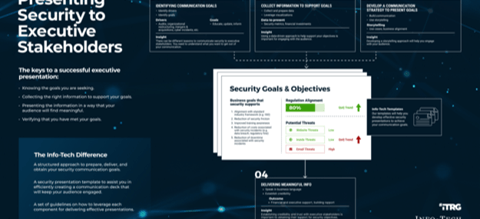


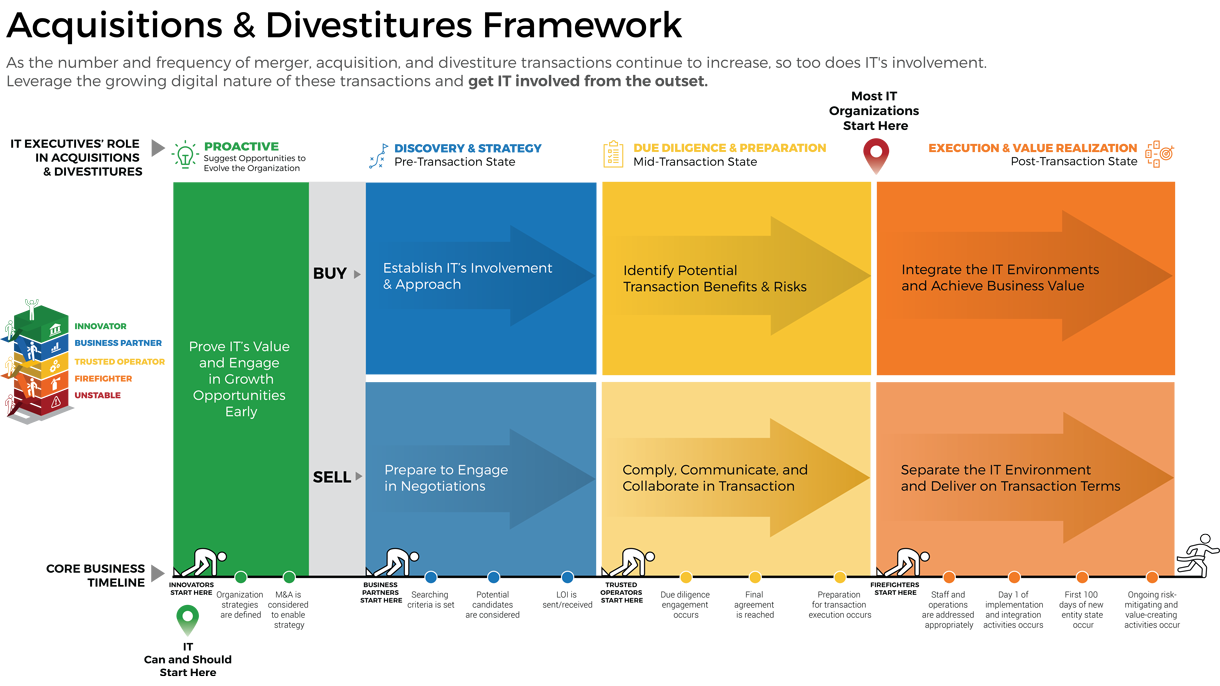


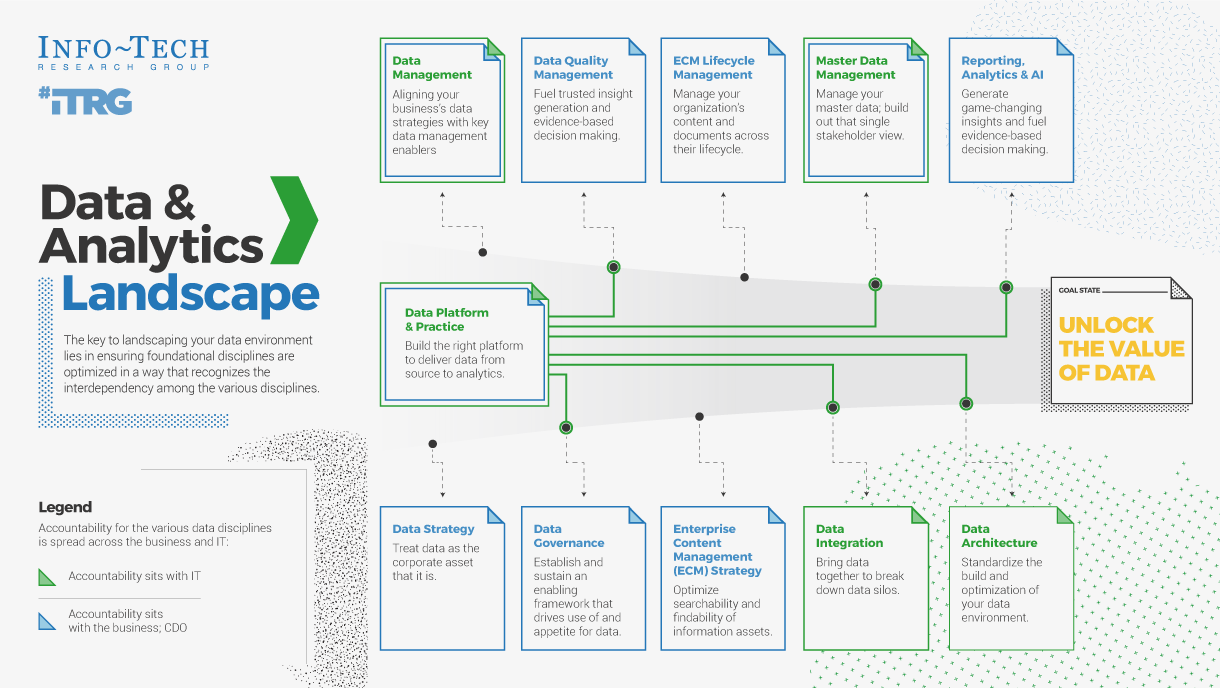


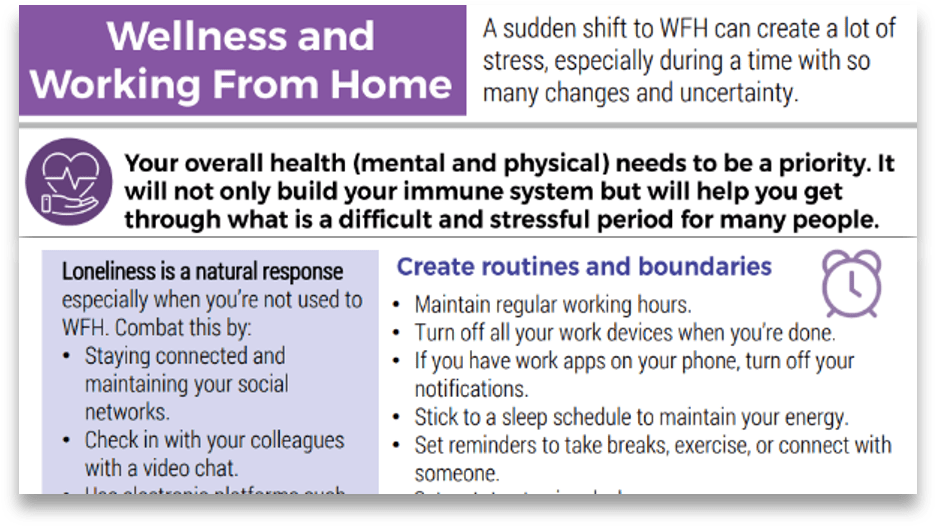