Further reading
Deliver Digital Products at Scale
Deliver value at the scale of your organization through defining enterprise product families.
Analyst Perspective
Product families align enterprise goals to product changes and value realization.


Our world is changing faster than ever, and the need for business agility continues to grow. Organizations are shifting from long-term project delivery to smaller, iterative product delivery models to be able to embrace change and respond to challenges and opportunities faster.
Unfortunately, many organizations focus on product delivery at the tactical level. Product teams may be individually successful, but how well are their changes aligned to division and enterprise goals and priorities?
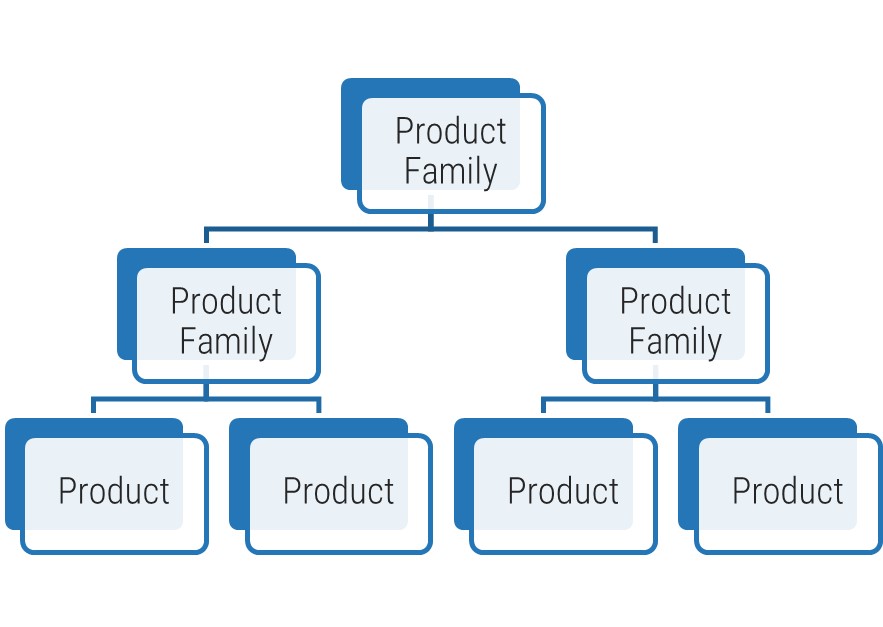
Grouping products into operationally aligned families is key to delivering the right value to the right stakeholders at the right time.
Product families translate enterprise goals, constraints, and priorities down to the individual product level so product owners can make better decisions and more effectively manage their roadmaps and backlogs. By scaling products into families and using product family roadmaps to align product roadmaps, product owners can deliver the capabilities that allow organizations to reach their goals.
In this blueprint, we’ll provide the tools and guidance to help you define what “product” means to your organization, use scaling patterns to build product families, align product and product family roadmaps, and identify impacts to your delivery and organizational design models.
Banu Raghuraman, Ari Glaizel, and Hans Eckman
Applications Practice
Info-Tech Research Group
Deliver Digital Products at Scale
Deliver value at the scale of your organization through defining enterprise product families.
EXECUTIVE BRIEF
Executive Summary
Your Challenge
- Products are the lifeblood of an organization. They deliver the capabilities needed to deliver value to customers, internal users, and stakeholders.
- The shift to becoming a product organization is intended to continually increase the value you provide to the broader organization as you grow and evolve.
- You need to clearly convey the direction and strategy of your product portfolio to gain alignment, support, and funding from your organization.
Common Obstacles
- IT organizations are traditionally organized to deliver initiatives in specific periods of time. This conflicts with product delivery, which continuously delivers value over the lifetime of a product.
- Delivering multiple products together creates additional challenges because each product has its own pedigree, history, and goals.
- Product owners struggle to prioritize changes to deliver product value. This creates a gap and conflict between product and enterprise goals.
Info-Tech’s Approach
Info-Tech’s approach will guide you through:
- Understanding the importance of product families in scaling product delivery.
- Defining products in your context and organizing products into operational families.
- Using product family roadmaps to align product roadmaps to enterprise goals and priorities.
- Evaluating the different approaches to improve your product family delivery pipelines and milestones.
Info-Tech Insight
Changes can only be made at the individual product or service level. To achieve enterprise goals and priorities, organizations needed to organize and scale products into operational families. This structure allows product managers to translate goals and constraints to the product level and allows product owners to deliver changes that support enabling capabilities. In this blueprint, we’ll help you define your products, scale them using the best patterns, and align your roadmaps and delivery models to improve throughput and value delivery.
Info-Tech’s approach
Operationally align product delivery to enterprise goals
The Info-Tech difference:
- Start by piloting product families to determine which approaches work best for your organization.
- Create a common definition of what a product is and identify products in your inventory.
- Use scaling patterns to build operationally aligned product families.
- Develop a roadmap strategy to align families and products to enterprise goals and priorities.
- Use products and families to evaluate delivery and organizational design improvements.
Deliver Digital Products at Scale via Enterprise Product Families
Product does not mean the same thing to everyone
Do not expect a universal definition of products.
Every organization and industry has a different definition of what a product is. Organizations structure their people, processes, and technologies according to their definition of the products they manage. Conflicting product definitions between teams increase confusion and misalignment of product roadmaps.
“A product [is] something (physical or not) that is created through a process and that provides benefits to a market.”
- Mike Cohn, Founding Member of Agile Alliance and Scrum Alliance
“A product is something ... that is created and then made available to customers, usually with a distinct name or order number.”
- TechTarget
“A product is the physical object ... , software or service from which customer gets direct utility plus a number of other factors, services, and perceptions that make the product useful, desirable [and] convenient.”
- Mark Curphey
Organizations need a common understanding of what a product is and how it pertains to the business. This understanding needs to be accepted across the organization.
“There is not a lot of guidance in the industry on how to define [products]. This is dangerous because what will happen is that product backlogs will be formed in too many areas. All that does is create dependencies and coordination across teams … and backlogs.”
– Chad Beier, "How Do You Define a Product?” Scrum.org
What is a product?
“A tangible solution, tool, or service (physical or digital) that enables the long-term and evolving delivery of value to customers and stakeholders based on business and user requirements.”
Info-Tech Insight
A proper definition of product recognizes three key facts:
- Products are long-term endeavors that don’t end after the project finishes.
- Products are not just “apps” but can be software or services that drive the delivery of value.
- There is more than one stakeholder group that derives value from the product or service.
Products and services share the same foundation and best practices
For the purpose of this blueprint, product/service and product owner/service owner are used interchangeably. Product is used for consistency but would apply to services as well.
Product = Service
“Product” and “service” are terms that each organization needs to define to fit its culture and customers (internal and external). The most important aspect is consistent use and understanding of:
- External products
- Internal products
- External services
- Internal services
- Products as a service (PaaS)
- Productizing services (SaaS)
Recognize the different product owner perspectives
Business:
- Customer facing, revenue generating
Technical:
Operations:
- Keep the lights on processes
Info-Tech Best Practice
Product owners must translate needs and constraints from their perspective into the language of their audience. Kathy Borneman, Digital Product Owner at SunTrust Bank, noted the challenges of finding a common language between lines of business and IT (e.g. what is a unit?).
Info-Tech Insight
Recognize that product owners represent one of three primary perspectives. Although all share the same capabilities, how they approach their responsibilities is influenced by their perspective.
“A Product Owner in its most beneficial form acts like an Entrepreneur, like a 'mini-CEO'. The Product Owner is someone who really 'owns' the product.”
– Robbin Schuurman, “Tips for Starting Product Owners”
Identify the differences between a project-centric and a product-centric organization
Project |
|
Product |
Fund projects |
Funding |
Fund products or teams |
Line of business sponsor |
Prioritization |
Product owner |
Makes specific changes to a product |
Product management |
Improve product maturity and support |
Assign people to work |
Work allocation |
Assign work to product teams |
Project manager manages |
Capacity management |
Team manages capacity |
Info-Tech Insight
Product delivery requires significant shifts in the way you complete development work and deliver value to your users. Make the changes that support improving end-user value and enterprise alignment.
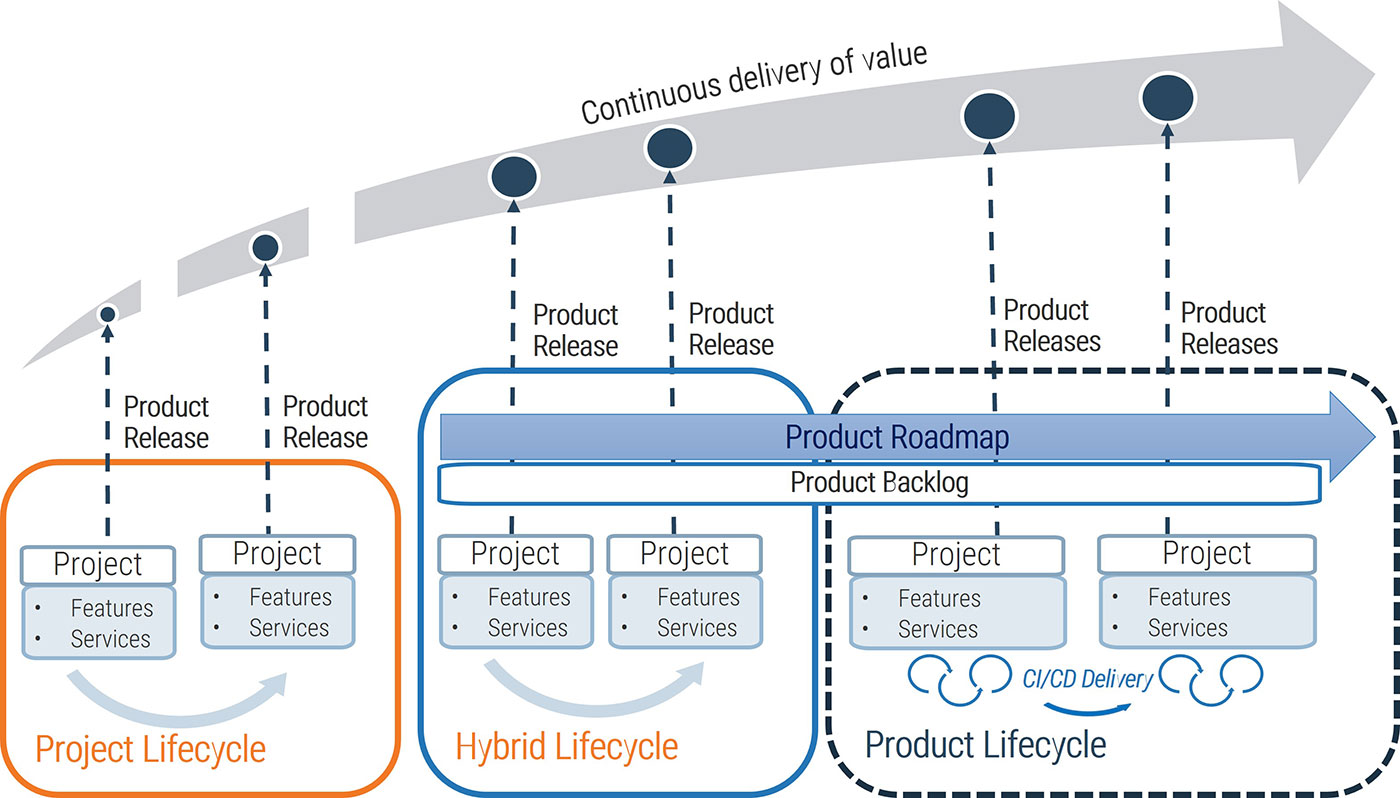
Projects can be a mechanism for delivering product changes and improvements
Projects within products
Regardless of whether you recognize yourself as a product-based or project-based shop, the same basic principles should apply. The purpose of projects is to deliver the scope of a product release. The shift to product delivery leverages a product roadmap and backlog as the mechanism for defining and managing the scope of the release. Eventually, teams progress to continuous integration/continuous delivery (CI/CD) where they can release on demand or as scheduled, requiring org change management.
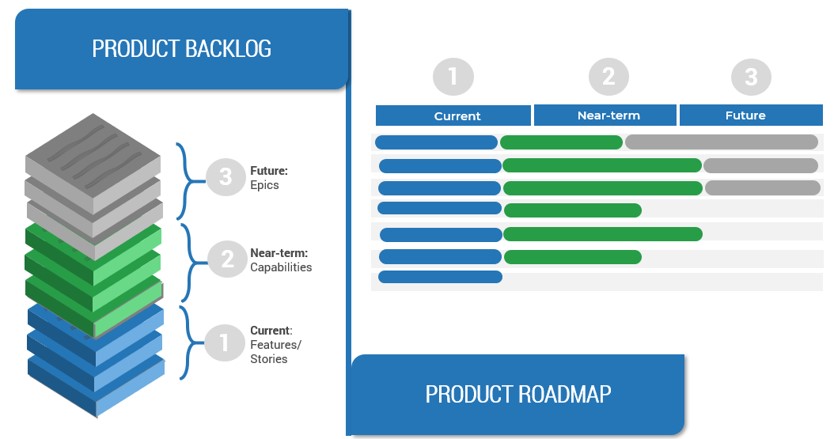
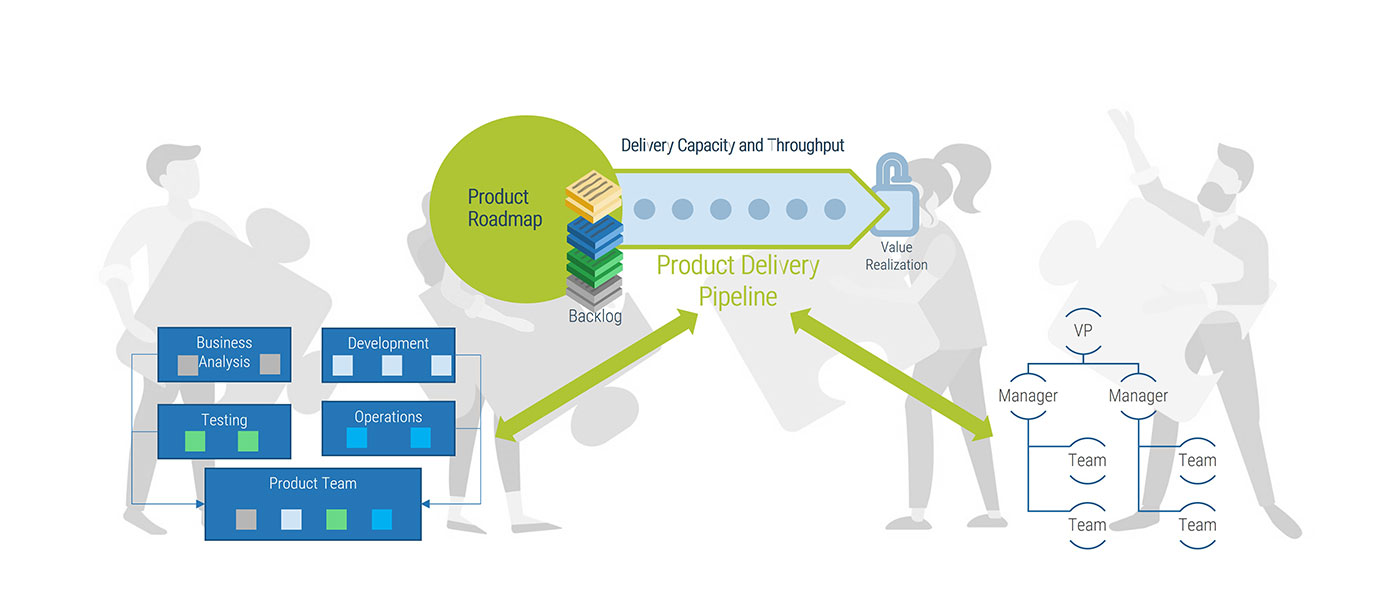
Define product value by aligning backlog delivery with roadmap goals
In each product plan, the backlogs show what you will deliver. Roadmaps identify when and in what order you will deliver value, capabilities, and goals.
Product roadmaps guide delivery and communicate your strategy
In Deliver on Your Digital Product Vision, we demonstrate how the product roadmap is core to value realization. The product roadmap is your communicated path, and as a product owner, you use it to align teams and changes to your defined goals while aligning your product to enterprise goals and strategy.
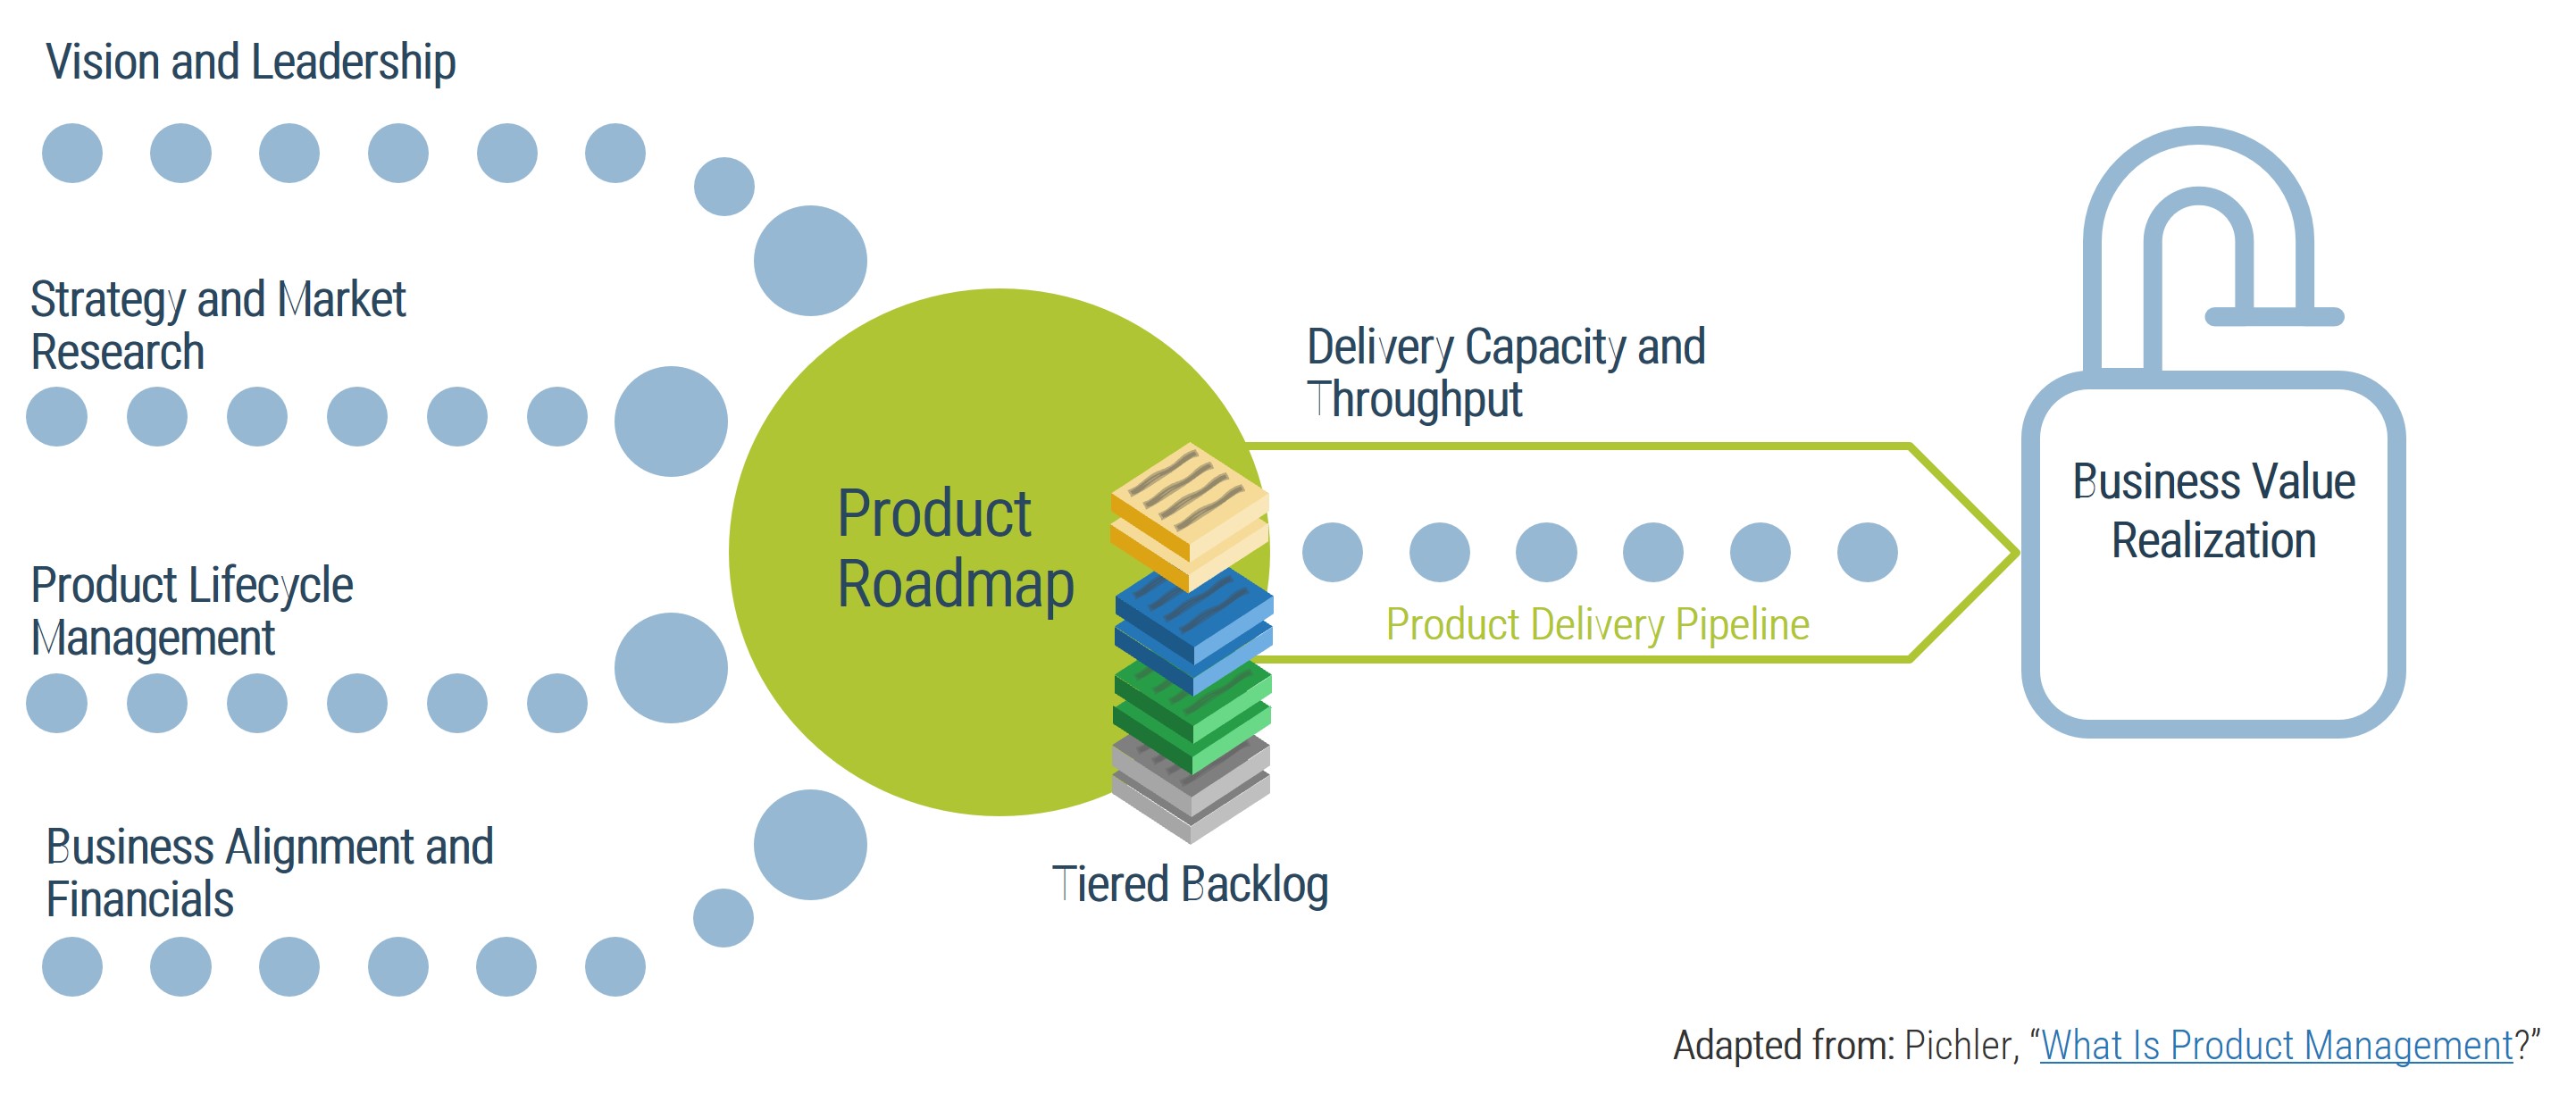
Info-Tech Insight
The quality of your product backlog – and your ability to realize business value from your delivery pipeline – is directly related to the input, content, and prioritization of items in your product roadmap.
Use Agile DevOps principles to expedite product-centric delivery and management
Delivering products does not necessarily require an Agile DevOps mindset. However, Agile methods facilitate the journey because product thinking is baked into them.
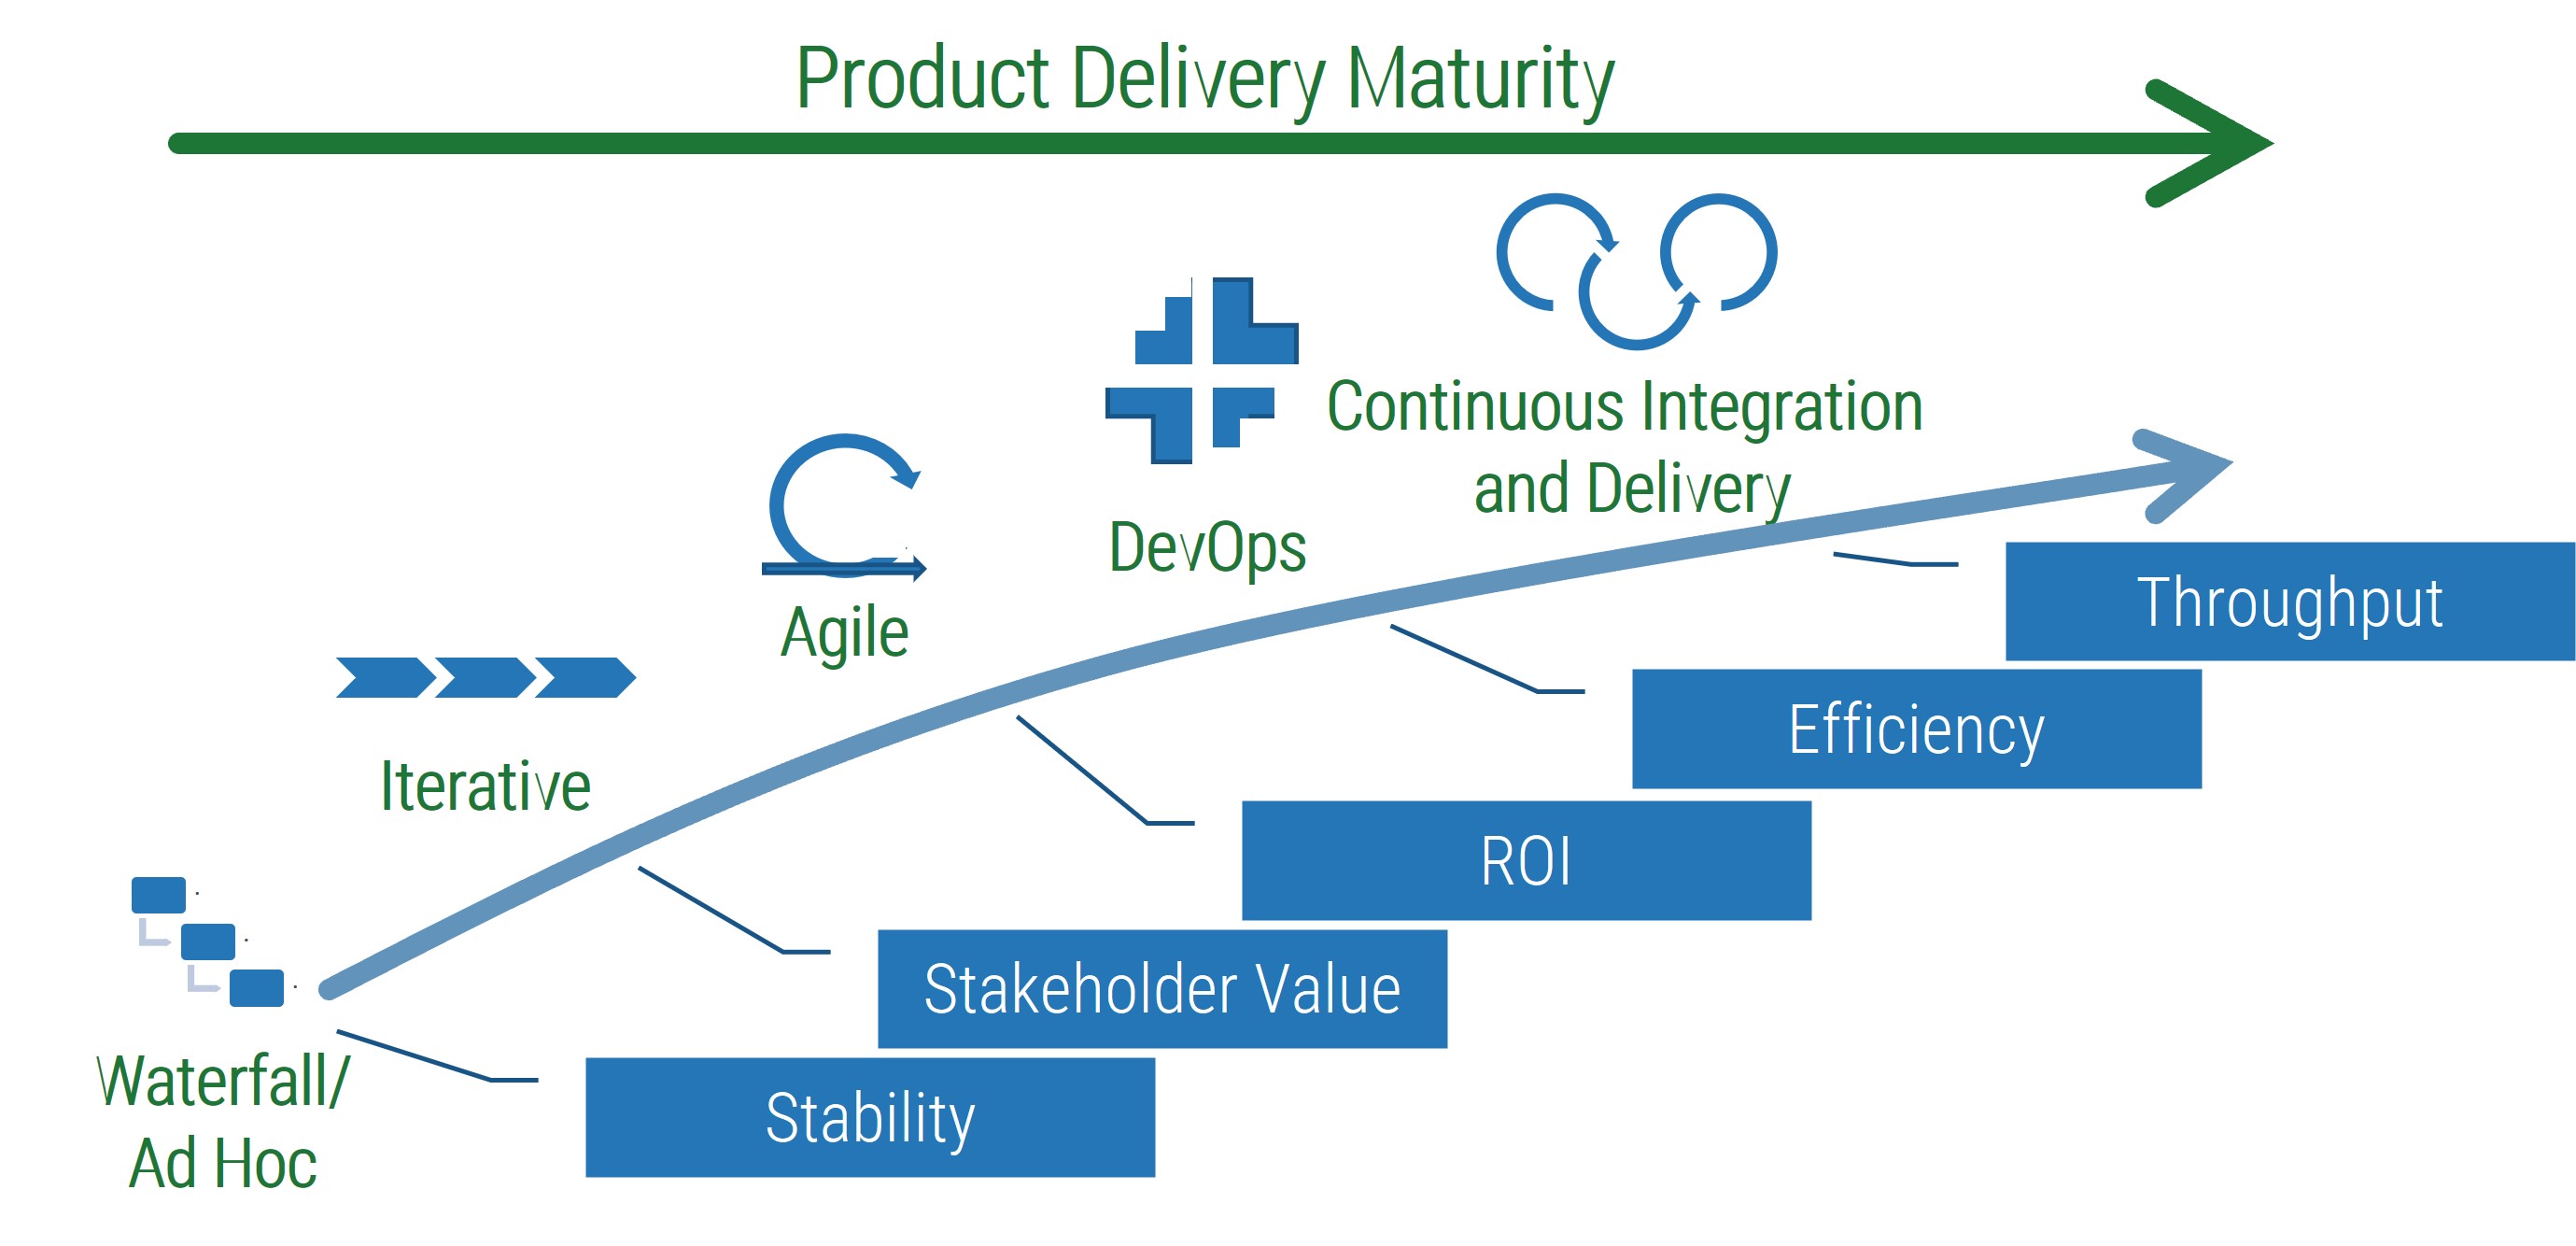
Based on: Ambysoft, 2018
Organizations start with Waterfall to improve the predictable delivery of product features.
Iterative development shifts the focus from delivery of features to delivery of user value.
Agile further shifts delivery to consider ROI. Often, the highest-value backlog items aren’t the ones with the highest ROI.
Lean and DevOps improve your delivery pipeline by providing full integration between product owners, development teams, and operations.
CI/CD reduces time in process by allowing release on demand and simplifying release and support activities.
Although teams will adopt parts of all these stages during their journey, it isn’t until you’ve adopted a fully integrated delivery chain that you’ve become product centric.
Scale products into related families to improve value delivery and alignment
Defining product families builds a network of related products into coordinated value delivery streams.
“As with basic product management, scaling an organization is all about articulating the vision and communicating it effectively. Using a well-defined framework helps you align the growth of your organization with that of the company. In fact, how the product organization is structured is very helpful in driving the vision of what you as a product company are going to do.”
– Rich Mironov, Mironov Consulting
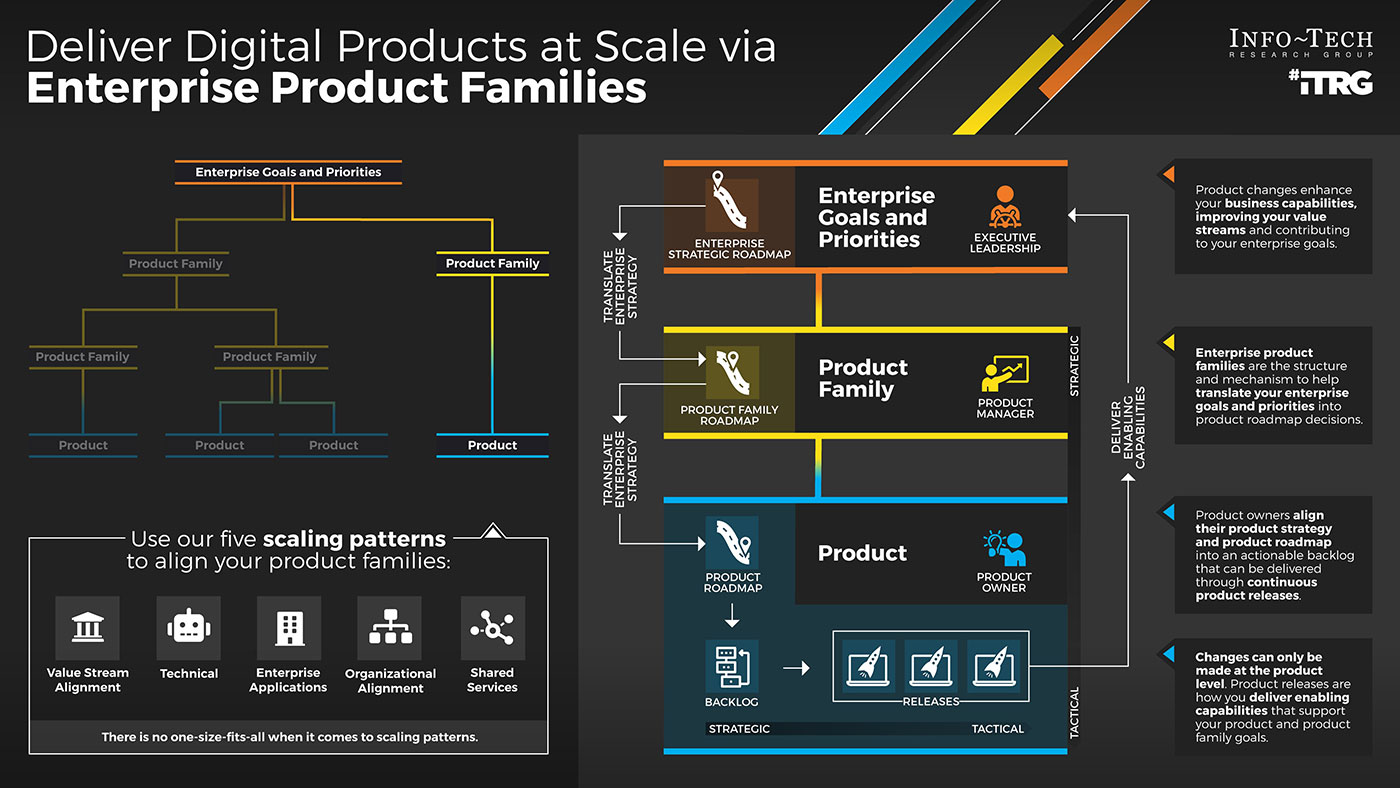
Product families translate enterprise goals into value-enabling capabilities
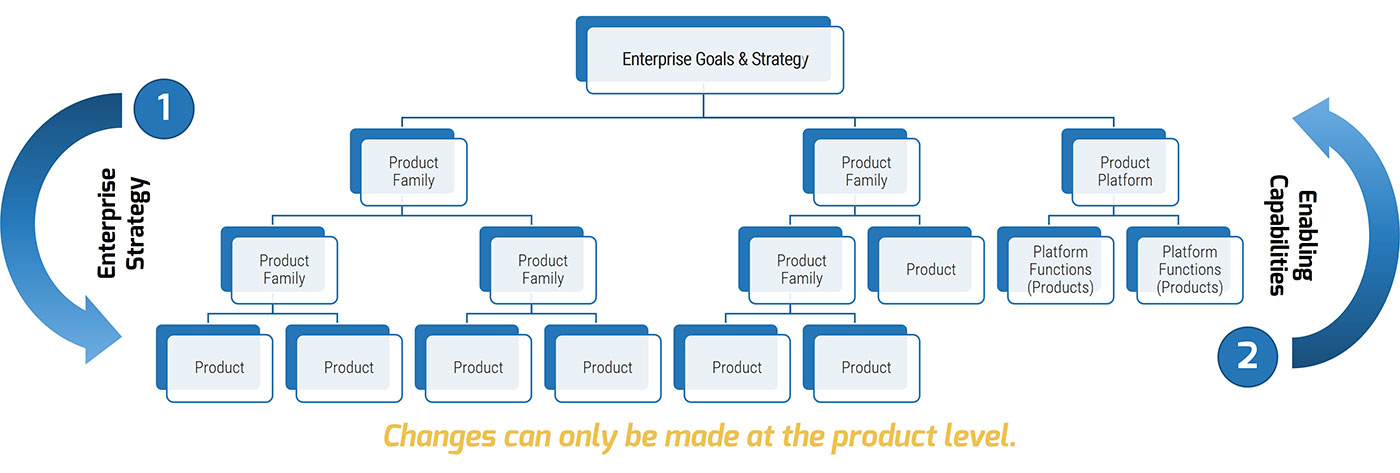
Info-Tech Insight
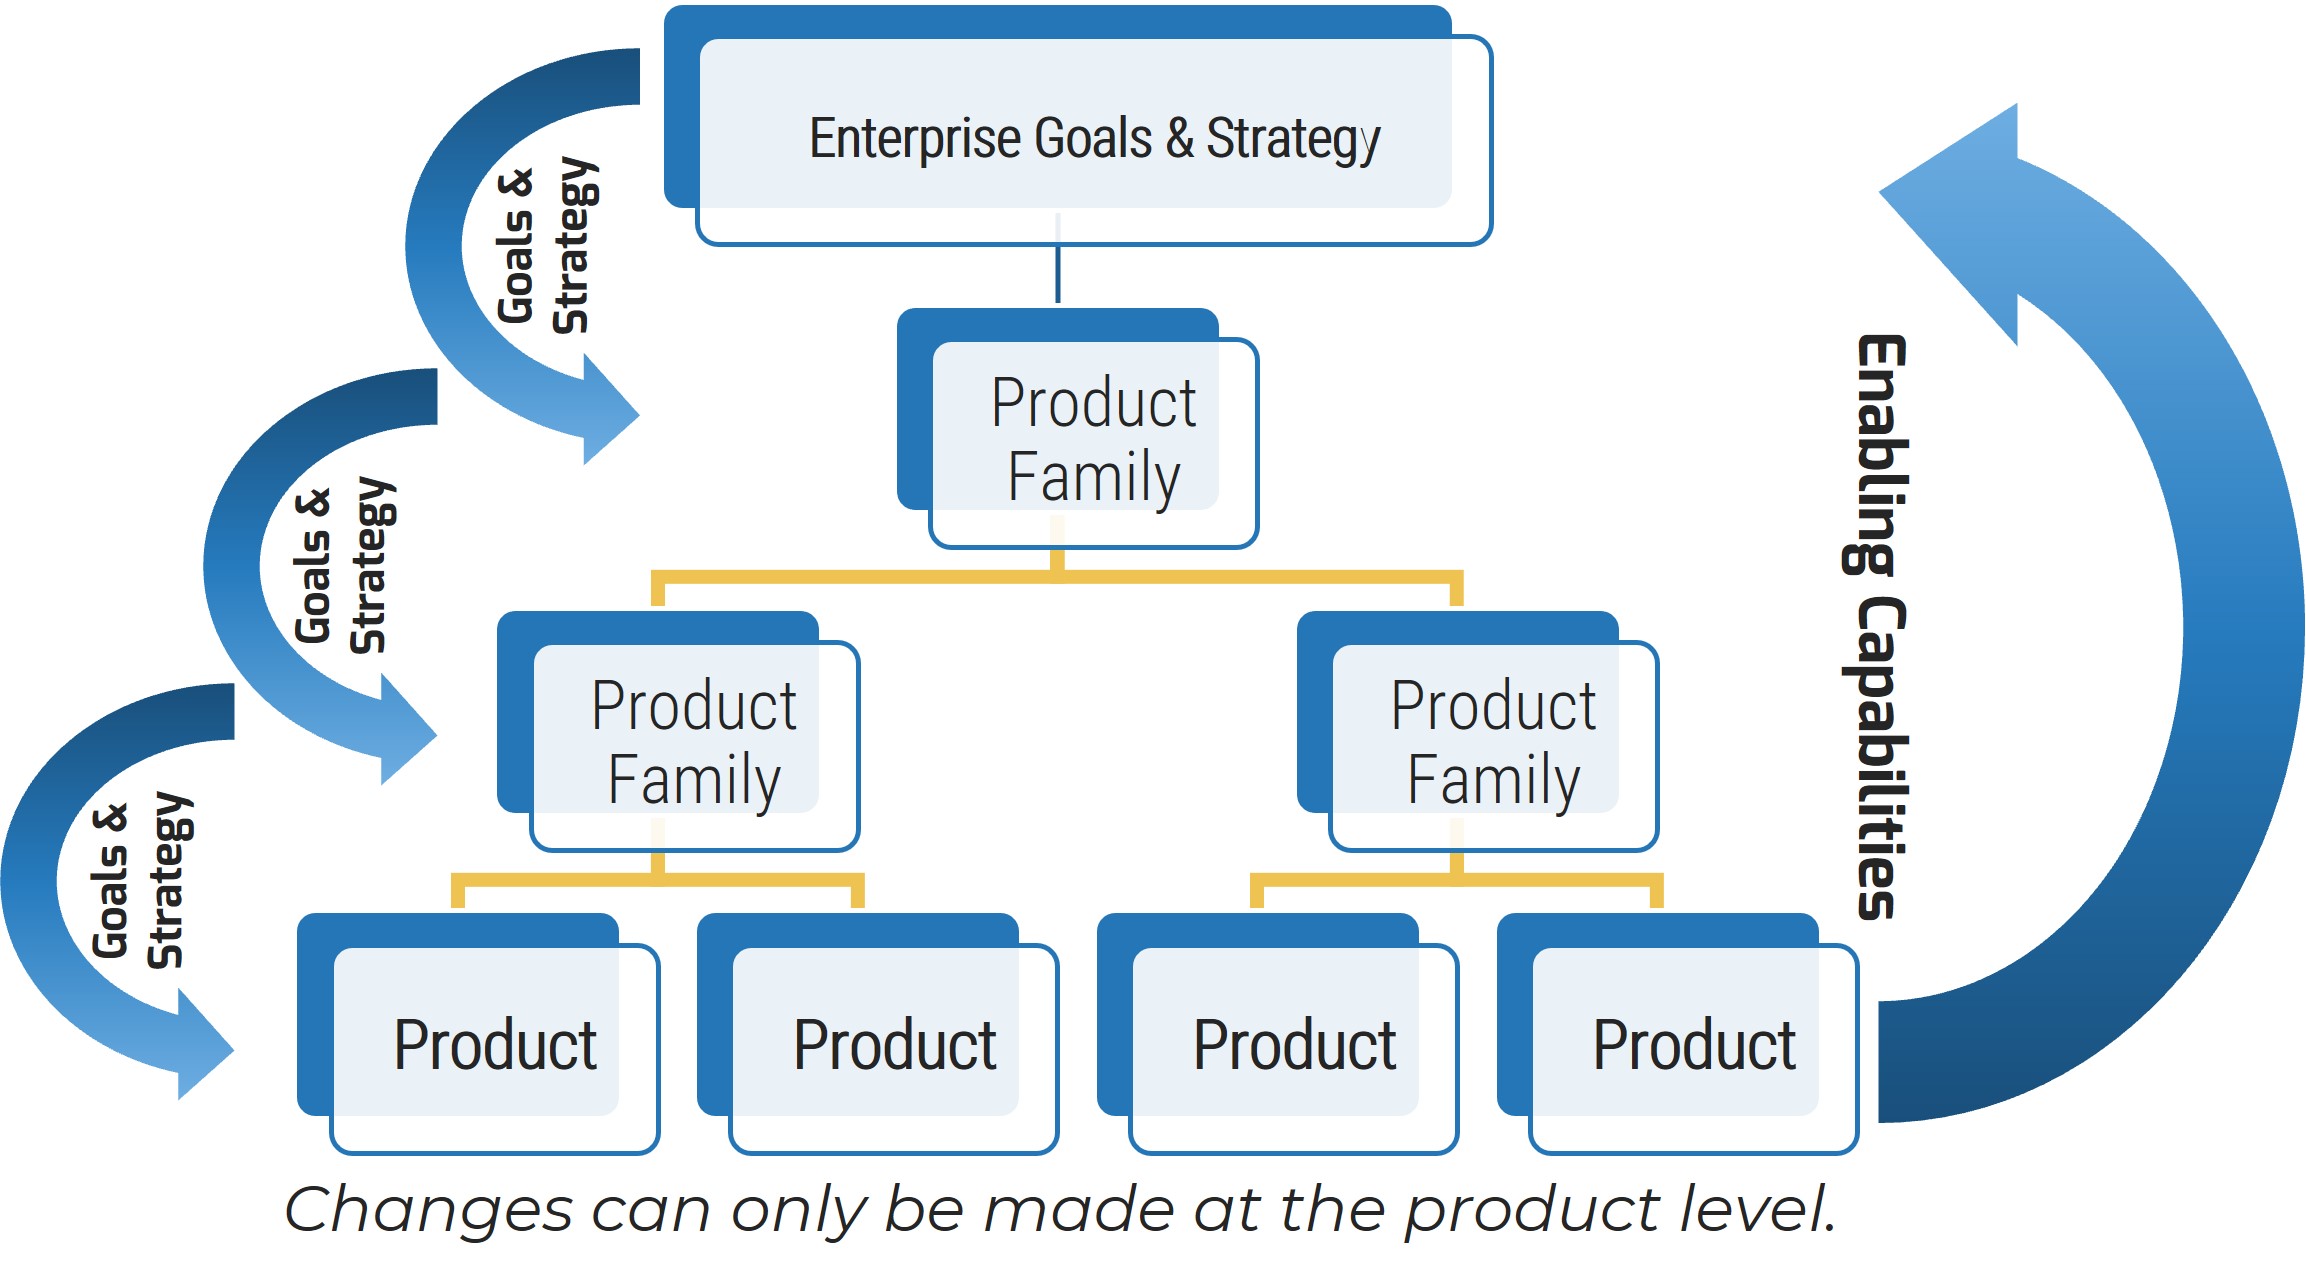
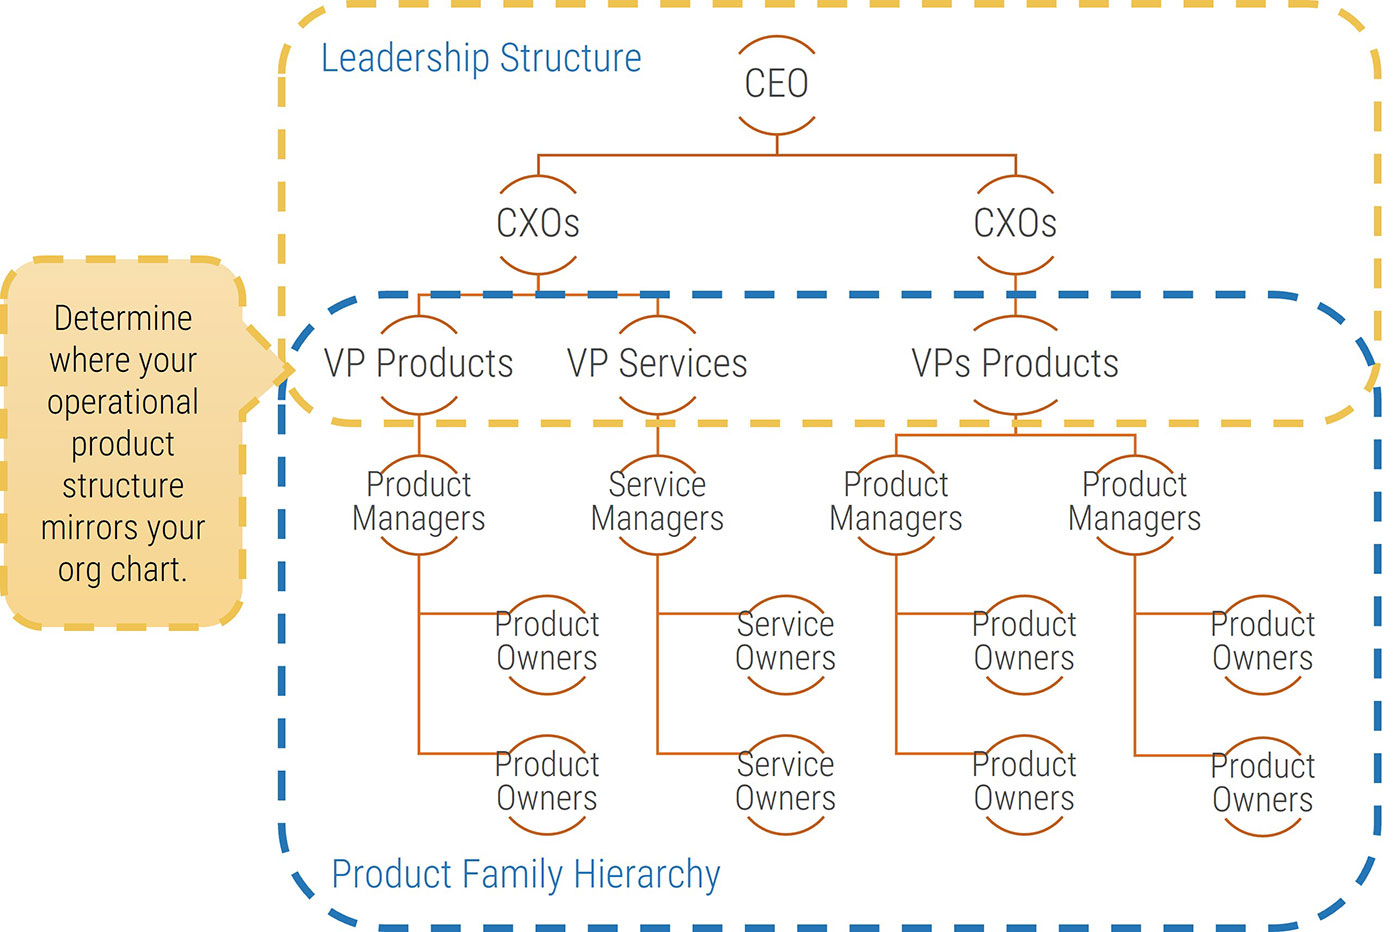
Your organizational goals and strategy are achieved through capabilities that deliver value. Your product hierarchy is the mechanism to translate enterprise goals, priorities, and constraints down to the product level where changes can be made.
Arrange product families by operational groups, not solely by your org chart
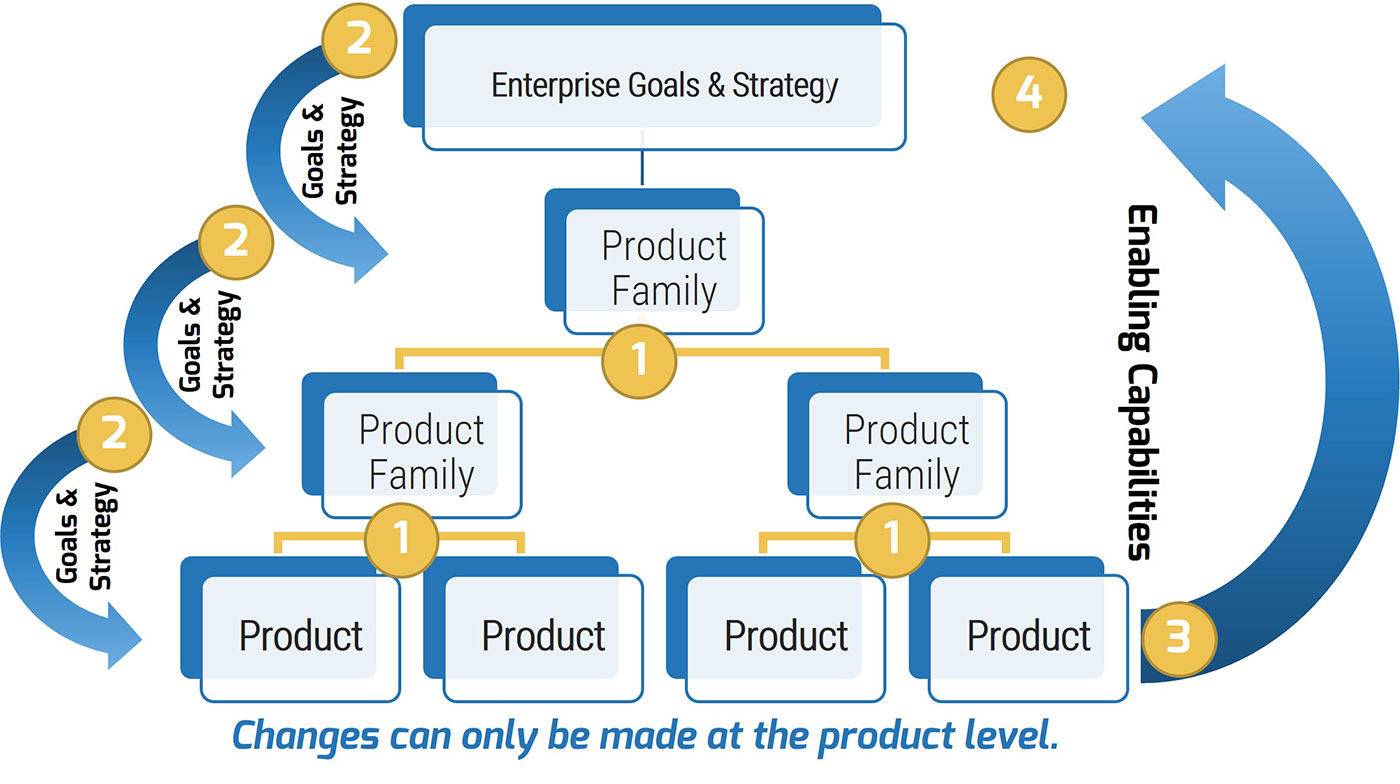
1. To align product changes with enterprise goals and priorities, you need to organize your products into operational groups based on the capabilities or business functions the product and family support.
2. Product managers translate these goals, priorities, and constraints into their product families, so they are actionable at the next level, whether that level is another product family or products implementing enhancements to meet these goals.
3. The product family manager ensures that the product changes enhance the capabilities that allow you to realize your product family, division, and enterprise goals.
4. Enabling capabilities realize value and help reach your goals, which then drives your next set of enterprise goals and strategy.
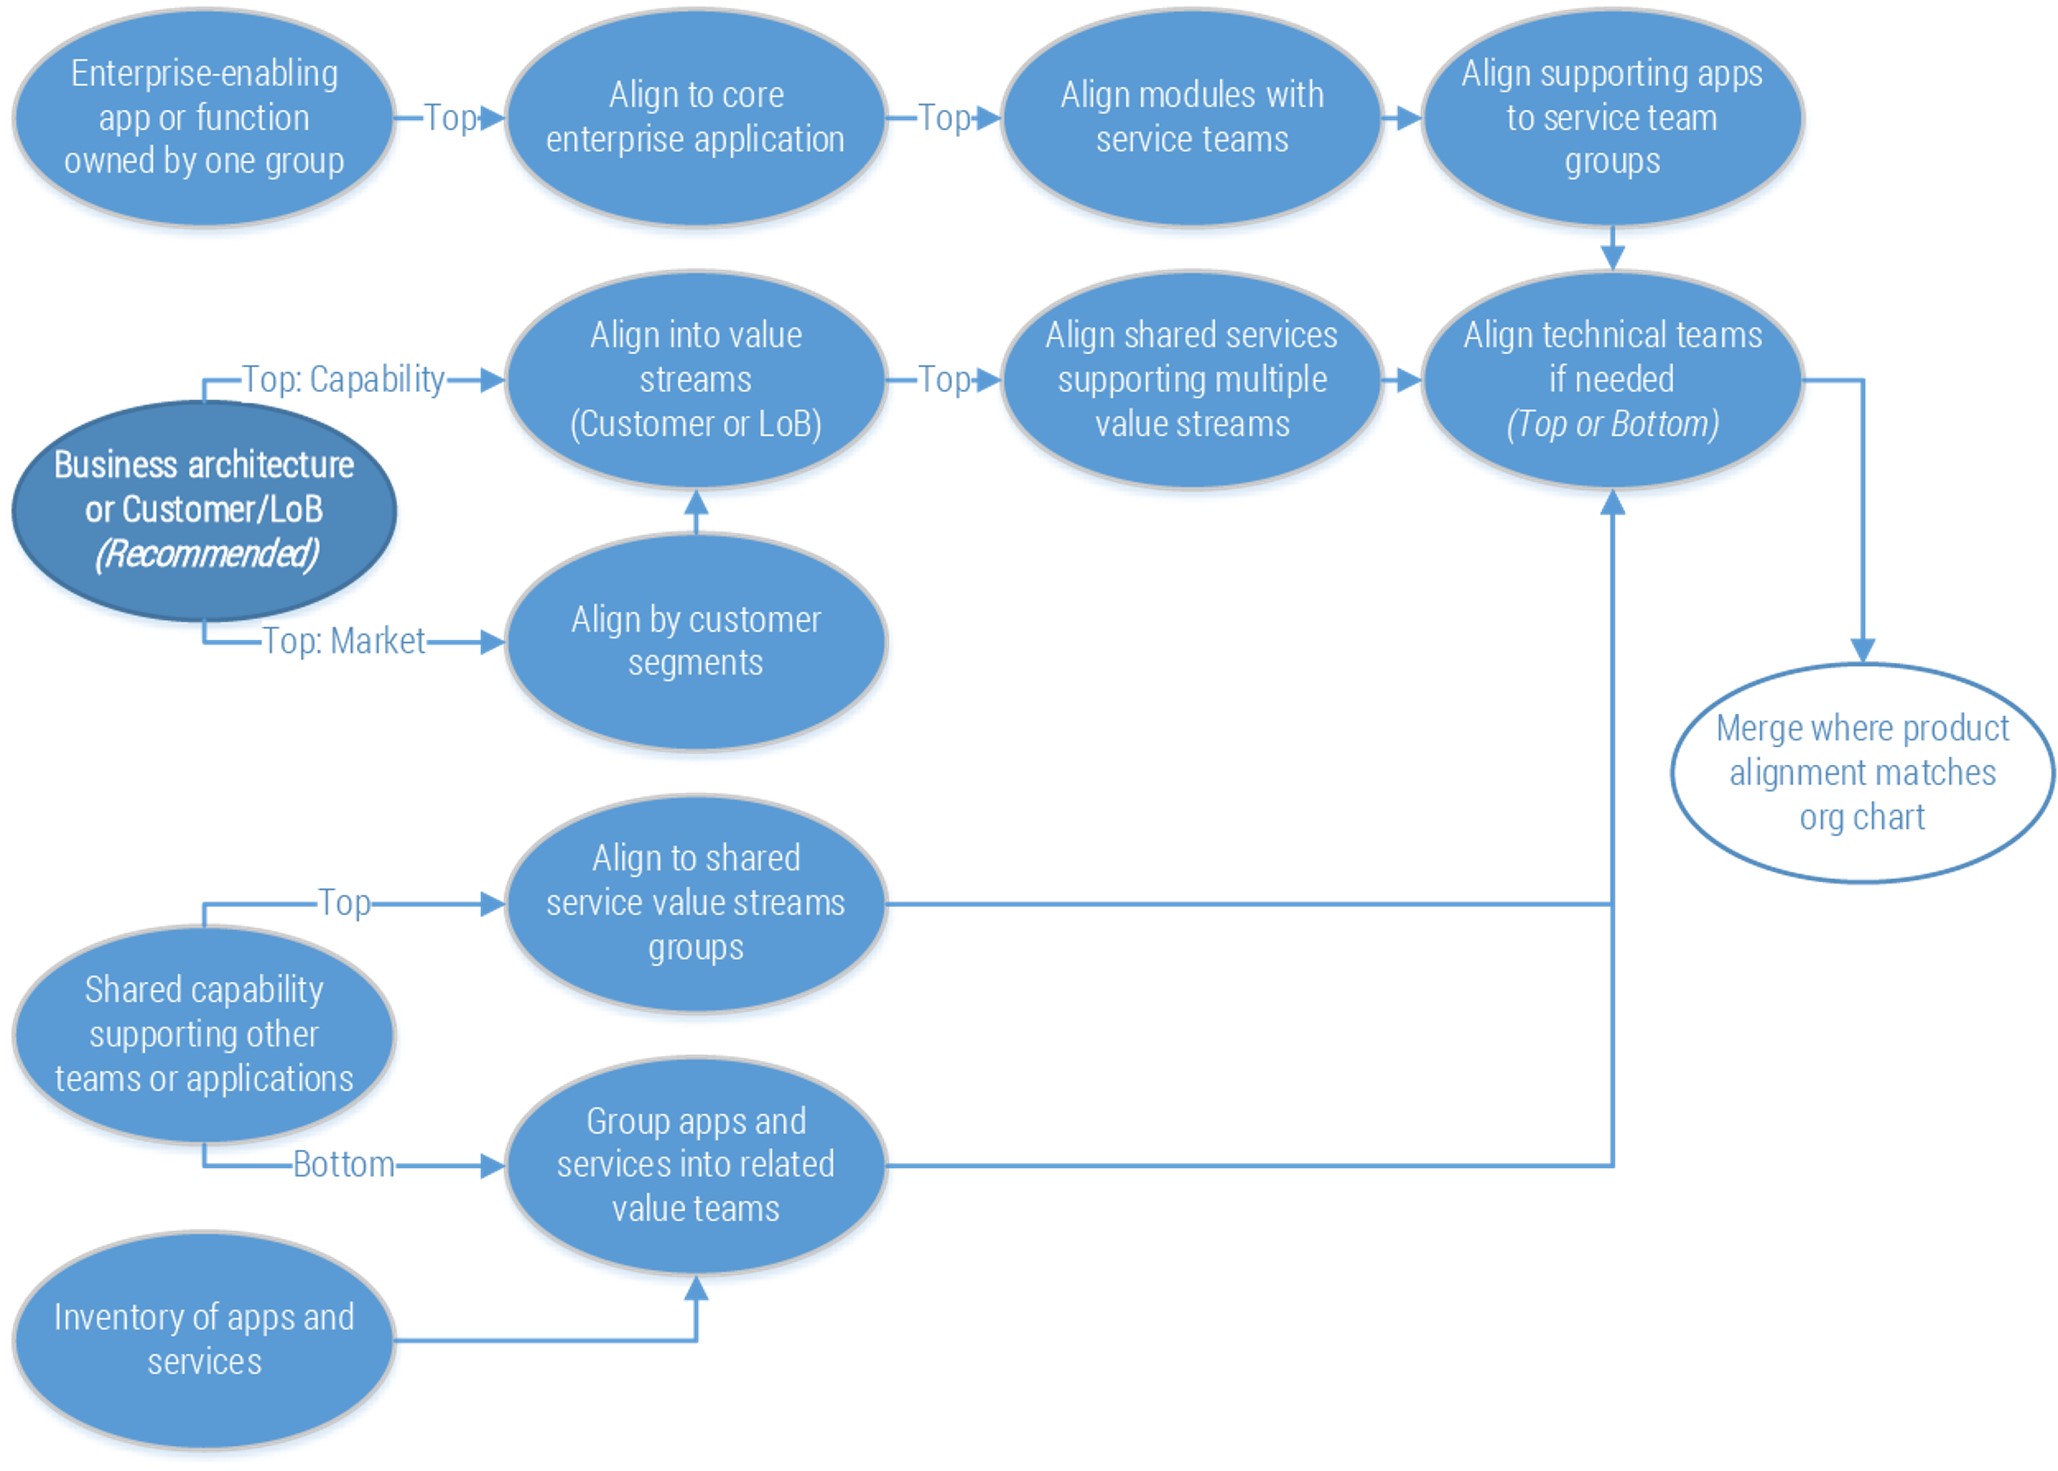
Approach alignment from both directions, validating by the opposite way
Defining your product families is not a one-way street. Often, we start from either the top or the bottom depending on our scaling principles. We use multiple patterns to find the best arrangement and grouping of our products and families.
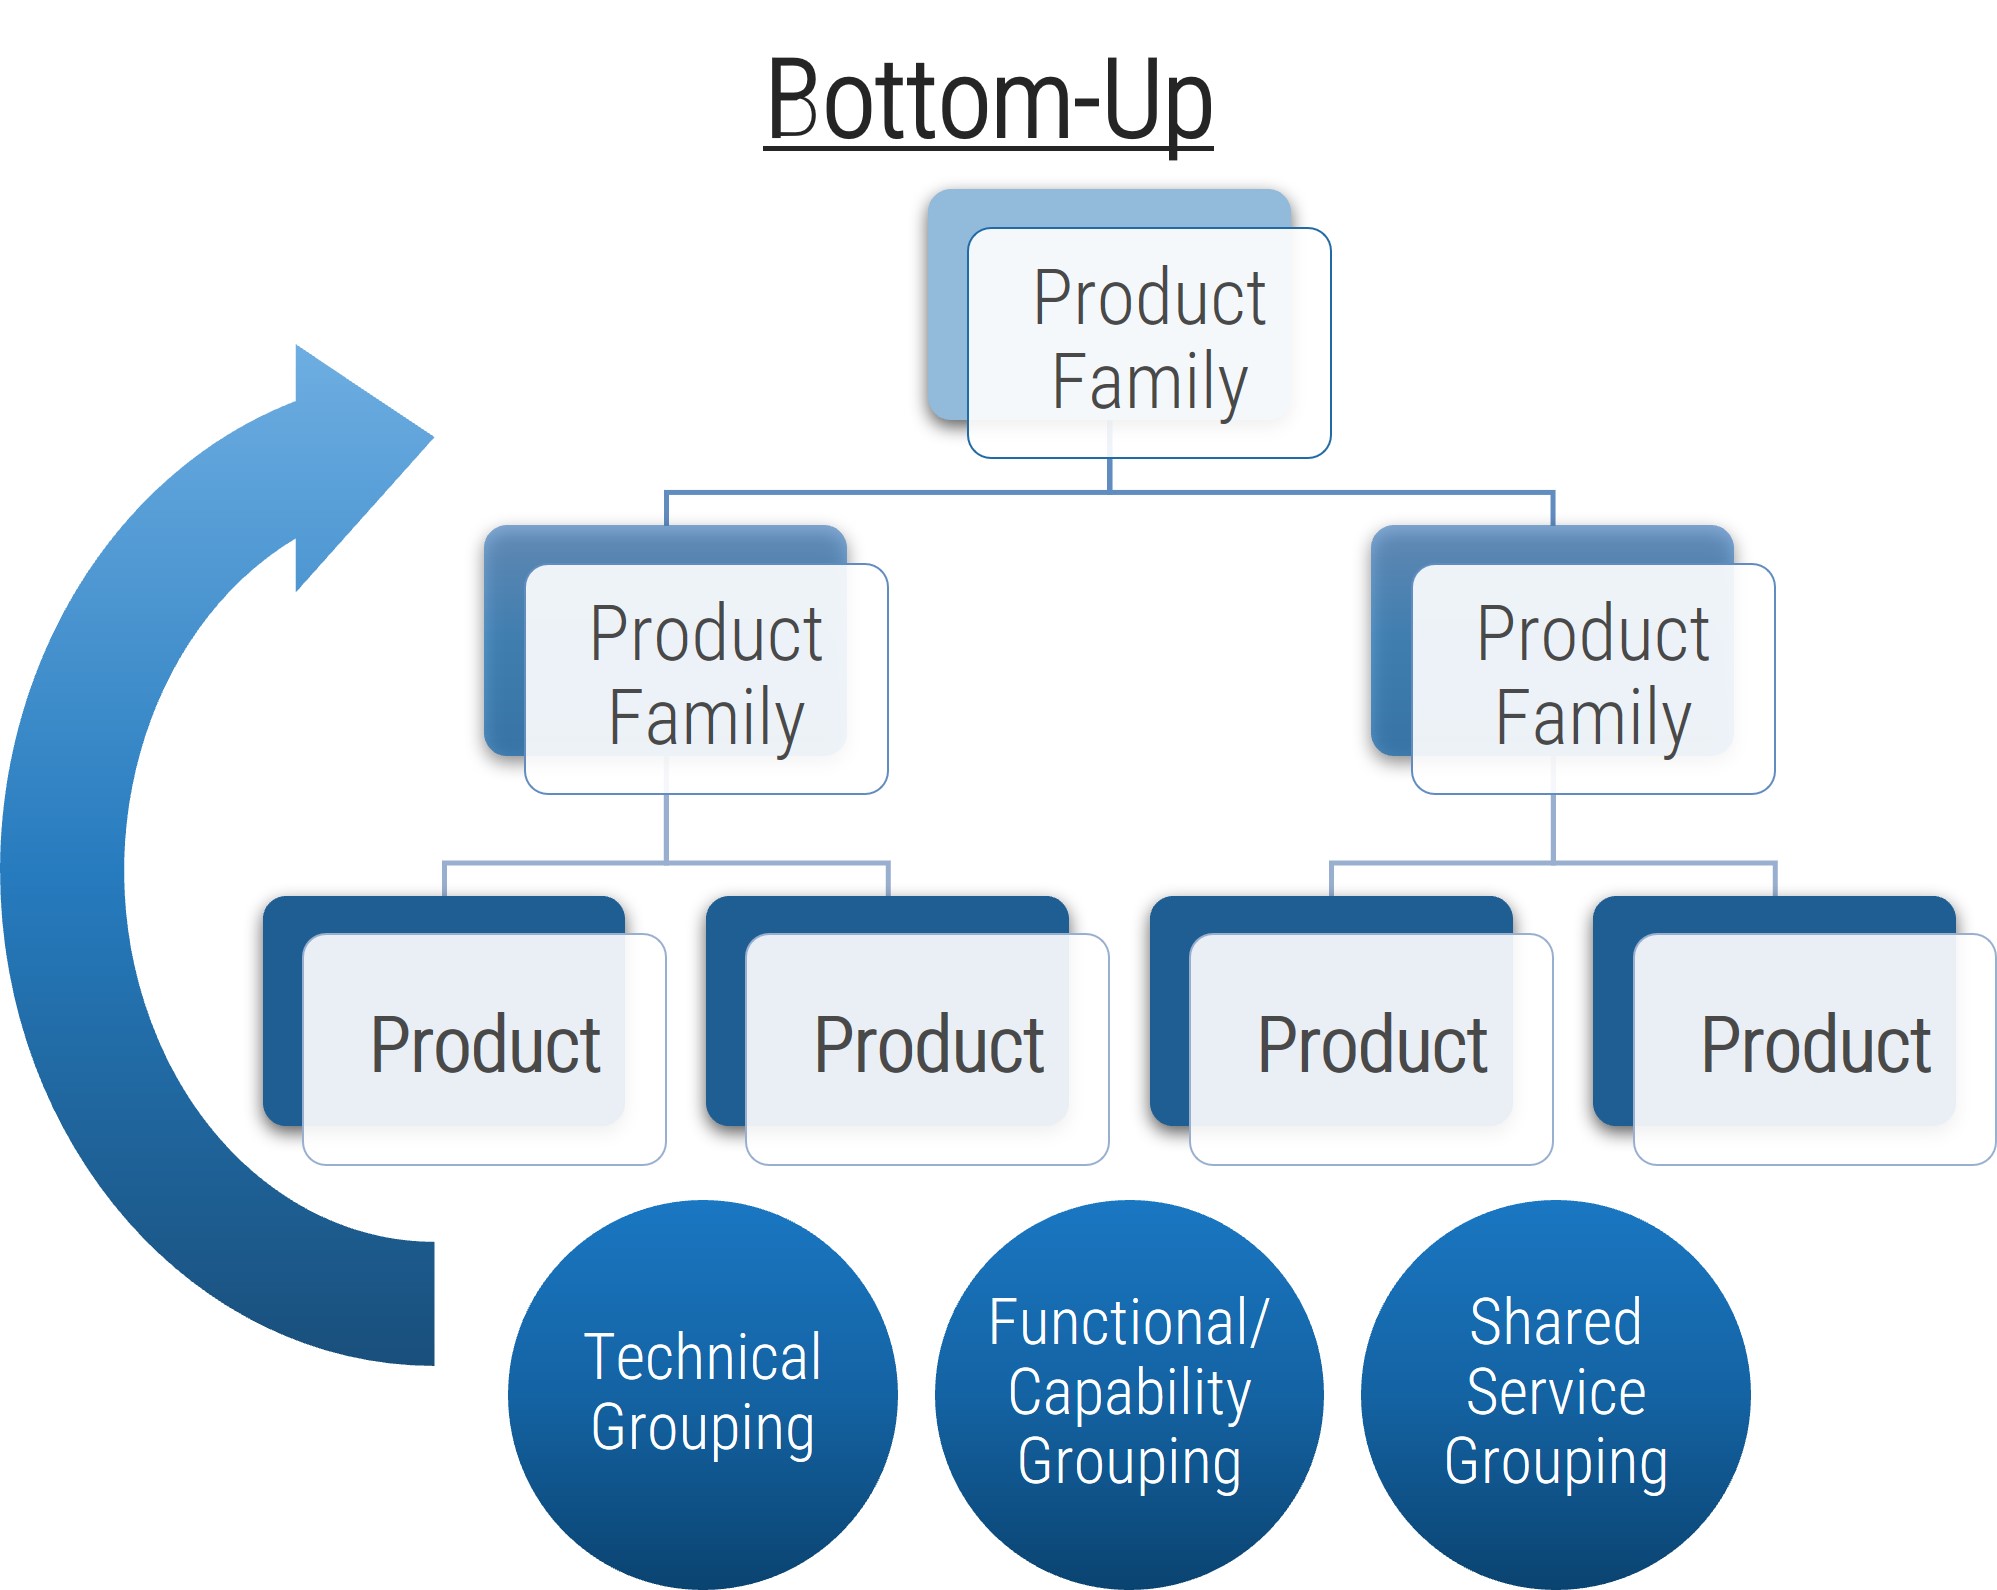
It may be helpful to work partway, then approach your scaling from the opposite direction, meeting in the middle. This way you are taking advantage of the strengths in both approaches.
Once you have your proposed structure, validate the grouping by applying the principles from the opposite direction to ensure each product and family is in the best starting group.
As the needs of your organization change, you may need to realign your product families into your new business architecture and operational structure.
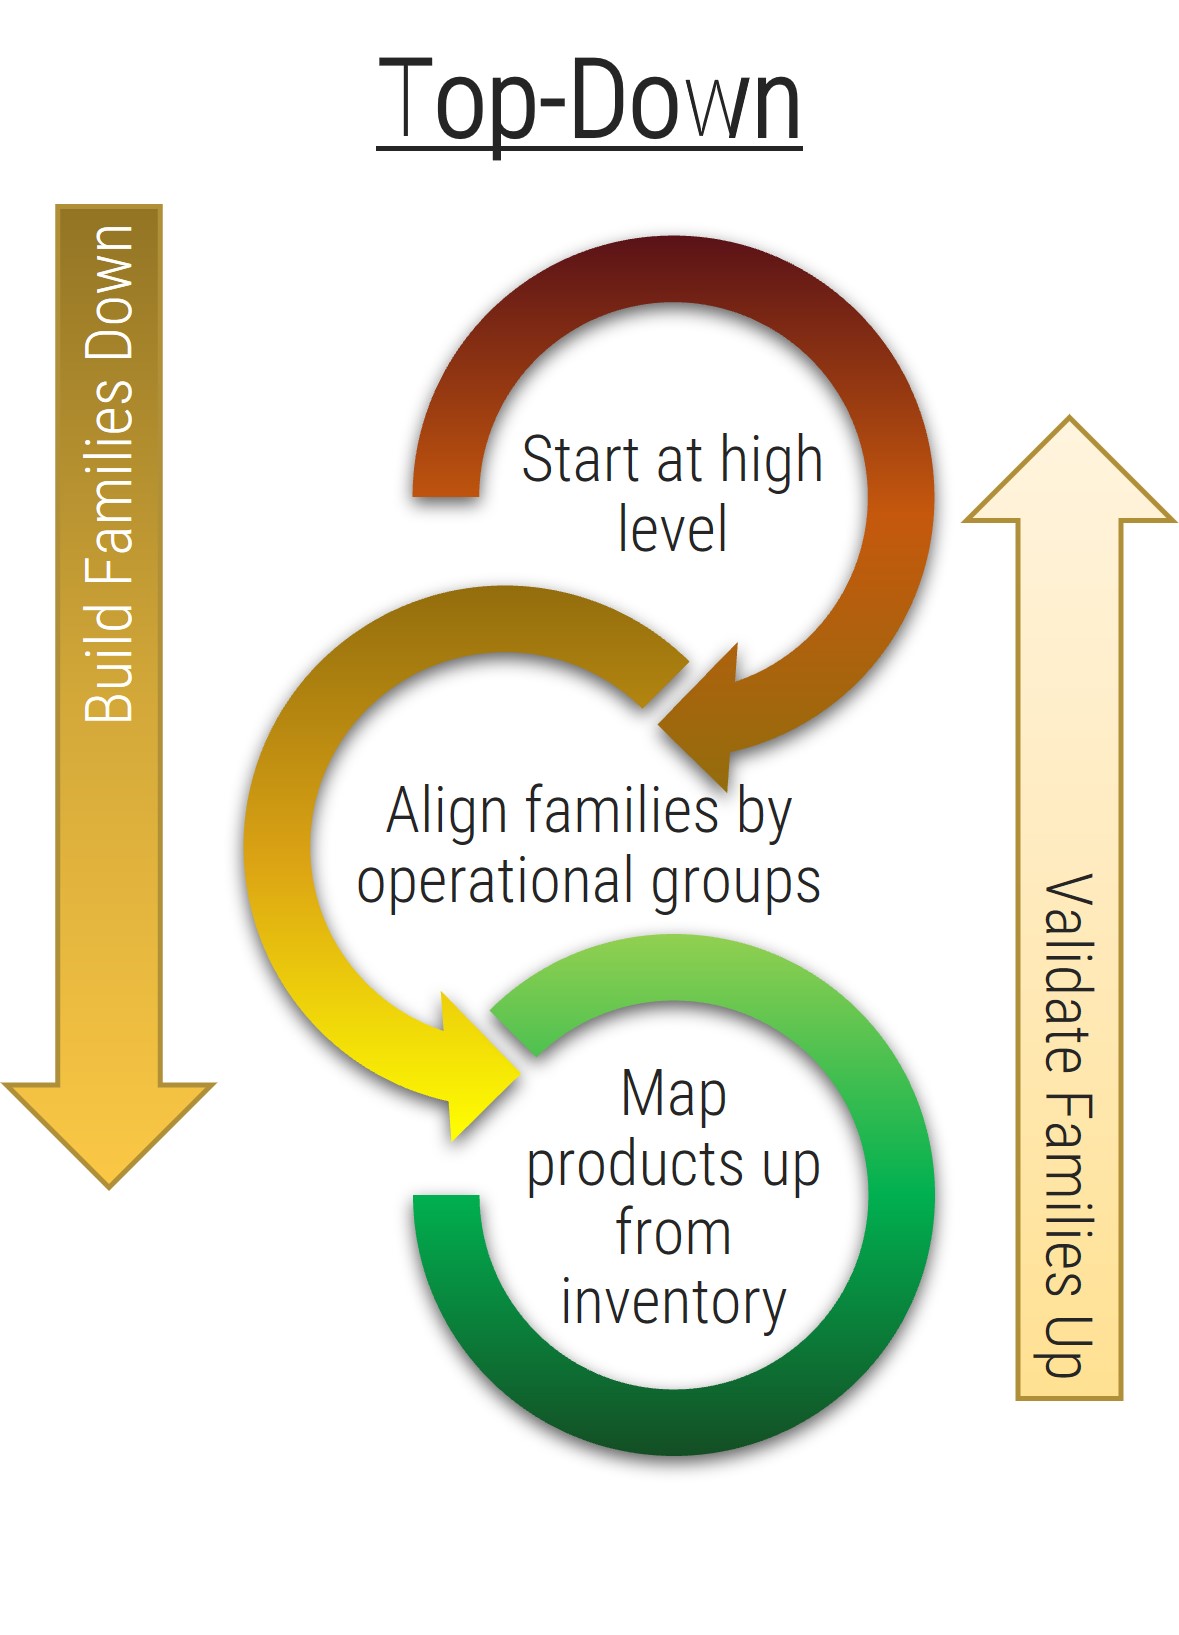
When to use: You have a business architecture defined or clear market/functional grouping of value streams.
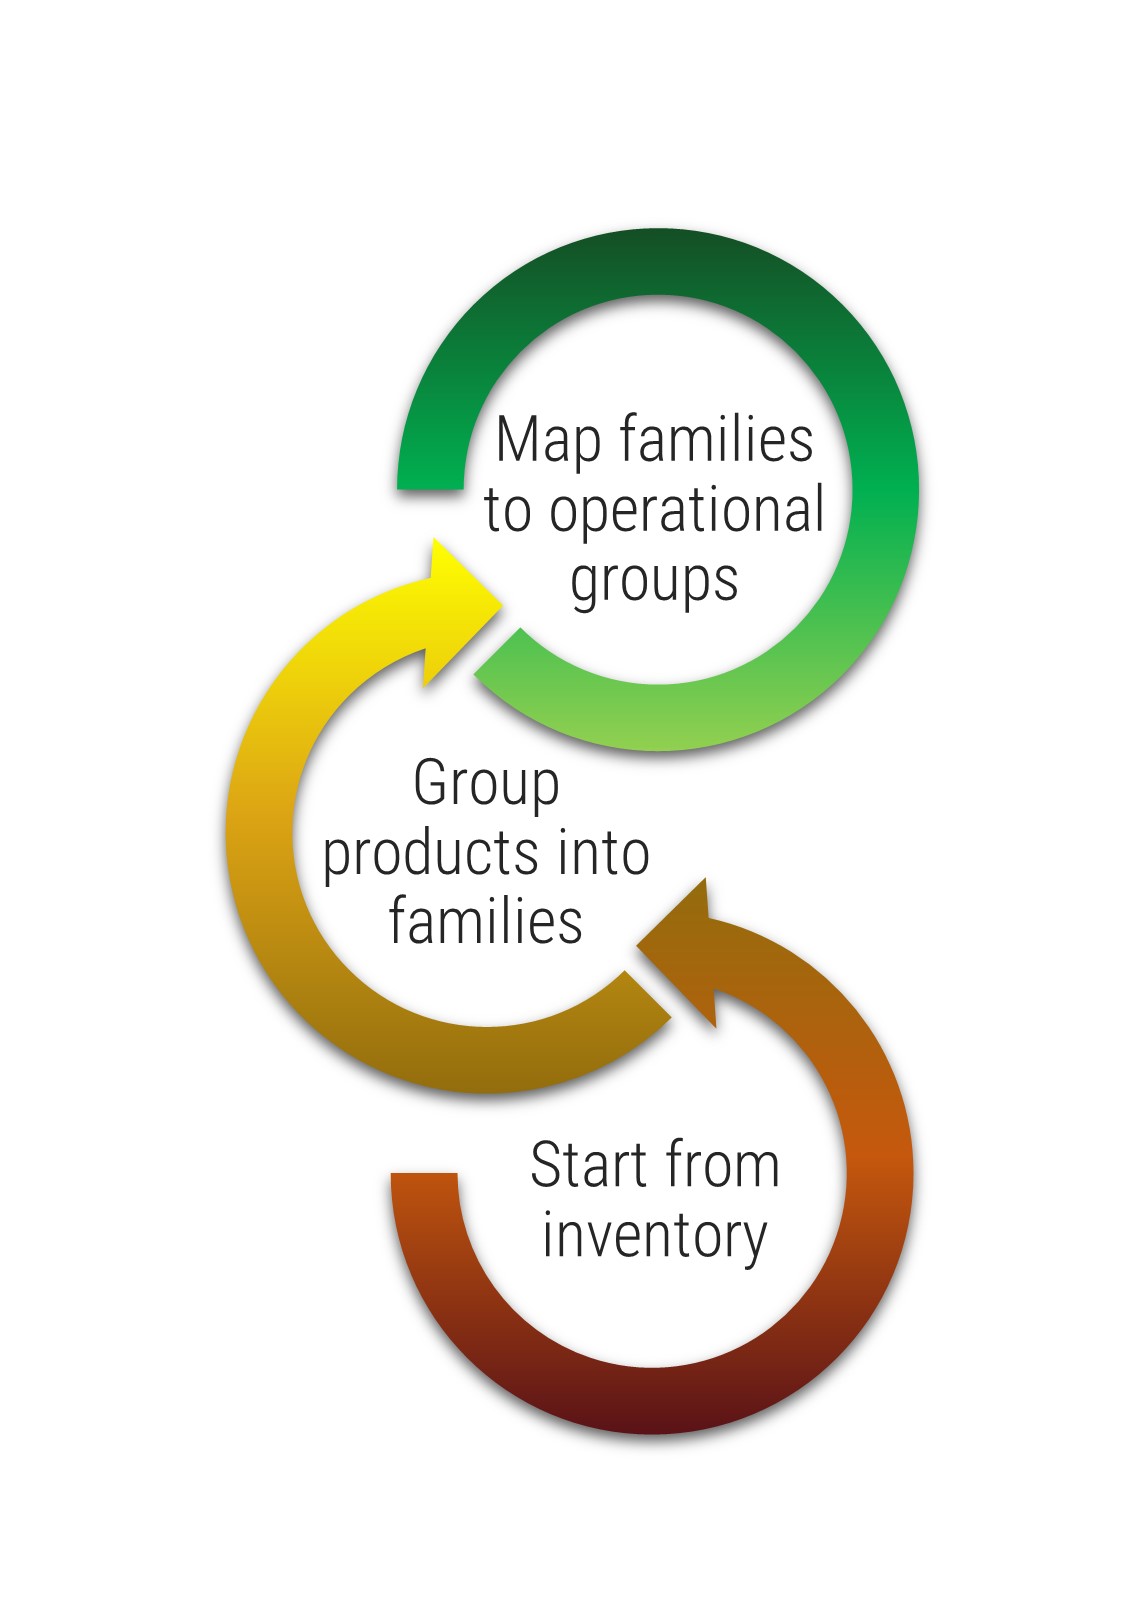
When to use: You are starting from an Application Portfolio Management application inventory to build or validate application families.
Leverage patterns for scaling products
Organizing your products and families is easier when leveraging these grouping patterns. Each is explained in greater detail on the following slides
Value Stream Alignment |
Enterprise Applications |
Shared Services |
Technical |
Organizational Alignment |
- Business architecture
- Value stream
- Capability
- Function
- Market/customer segment
- Line of business (LoB)
- Example: Customer group > value stream > products
|
- Enabling capabilities
- Enterprise platforms
- Supporting apps
- Example: HR > Workday/Peoplesoft > ModulesSupporting: Job board, healthcare administrator
|
- Organization of related services into service family
- Direct hierarchy does not necessarily exist within the family
- Examples: End-user support and ticketing, workflow and collaboration tools
|
- Domain grouping of IT infrastructure, platforms, apps, skills, or languages
- Often used in combination with Shared Services grouping or LoB-specific apps
- Examples: Java, .NET, low-code, database, network
|
- Used at higher levels of the organization where products are aligned under divisions
- Separation of product managers from organizational structure no longer needed because the management team owns product management role
|
Leverage the product family roadmap for alignment
It’s more than a set of colorful boxes. It’s the map to align everyone to where you are going.
Your product family roadmap
✓ Lays out a strategy for your product family.
✓ Is a statement of intent for your family of products.
✓ Communicates direction for the entire product family and product teams.
✓ Directly connects to the organization’s goals.
However, it is not:
x Representative of a hard commitment.
x A simple combination of your current product roadmaps.
Before connecting your family roadmap to products, think about what each roadmap typically presents
Info-Tech Insight
Your product family roadmap and product roadmap tell different stories. The product family roadmap represents the overall connection of products to the enterprise strategy, while the product roadmap focuses on the fulfillment of the product’s vision.
Product family roadmaps are more strategic by nature
While individual product roadmaps can be different levels of tactical or strategic depending on a variety of market factors, your options are more limited when defining roadmaps for product families.
Product
TACTICAL
A roadmap that is technical, committed, and detailed.
Product Family
STRATEGIC
A roadmap that is strategic, goal based, high level, and flexible.
Info-Tech Insight
Roadmaps for your product family are, by design, less detailed. This does not mean they aren’t actionable! Your product family roadmap should be able to communicate clear intentions around the future delivery of value in both the near and long term.
Consider volatility when structuring product family roadmaps
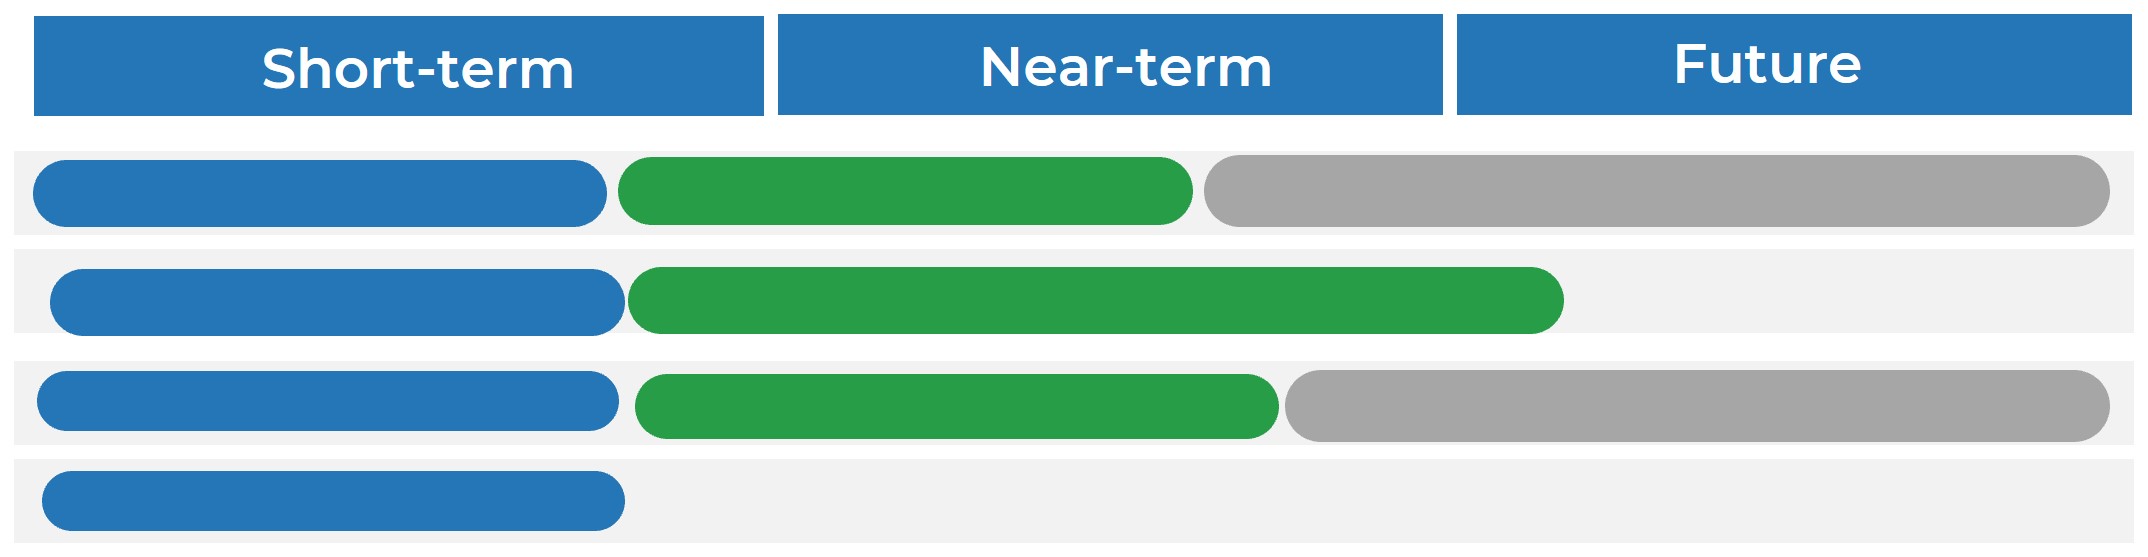
There is no such thing as a roadmap that never changes.
Your product family roadmap represents a broad statement of intent and high-level tactics to get closer to the organization’s goals.
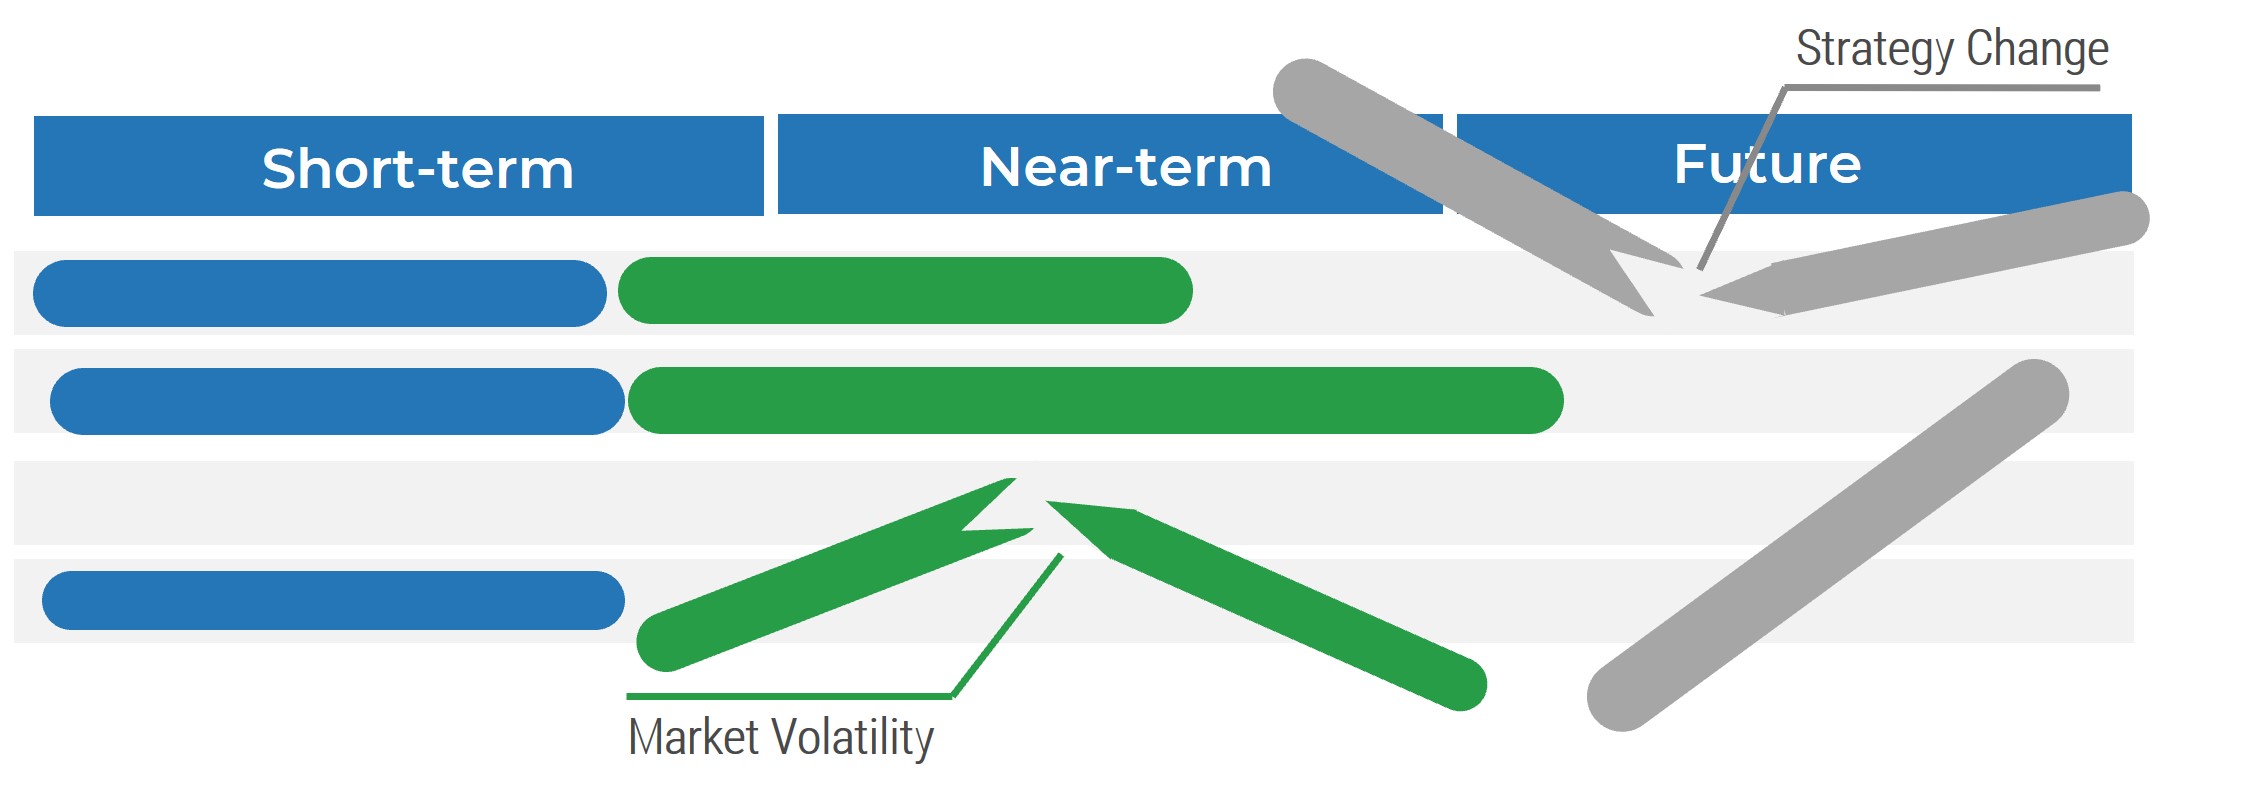
All good product family roadmaps embrace change!
Your strategic intentions are subject to volatility, especially those planned further in the future. The more costs you incur in planning, the more you leave yourself exposed to inefficiency and waste if those plans change.
Info-Tech Insight
A good product family roadmap is intended to manage and communicate the inevitable changes as a result of market volatility and changes in strategy.
Product delivery realizes value for your product family
While planning and analysis are done at the family level, work and delivery are done at the individual product level.
PRODUCT STRATEGY |
What are the artifacts? |
What are you saying? |
Defined at the family level? |
Defined at the product level? |
|
Vision |
I want to... |
✓ |
✓ |
Strategic focus
Delivery focus
|
Goals |
To get there we need to... |
✓ |
✓ |
Roadmap |
To achieve our goals, we’ll deliver... |
✓ |
✓ |
Backlog |
The work will be done in this order... |
|
✓ |
Release Plan |
We will deliver in the following ways... |
|
✓ |
Typical elements of a product family roadmap
While there are others, these represent what will commonly appear across most family-based roadmaps.
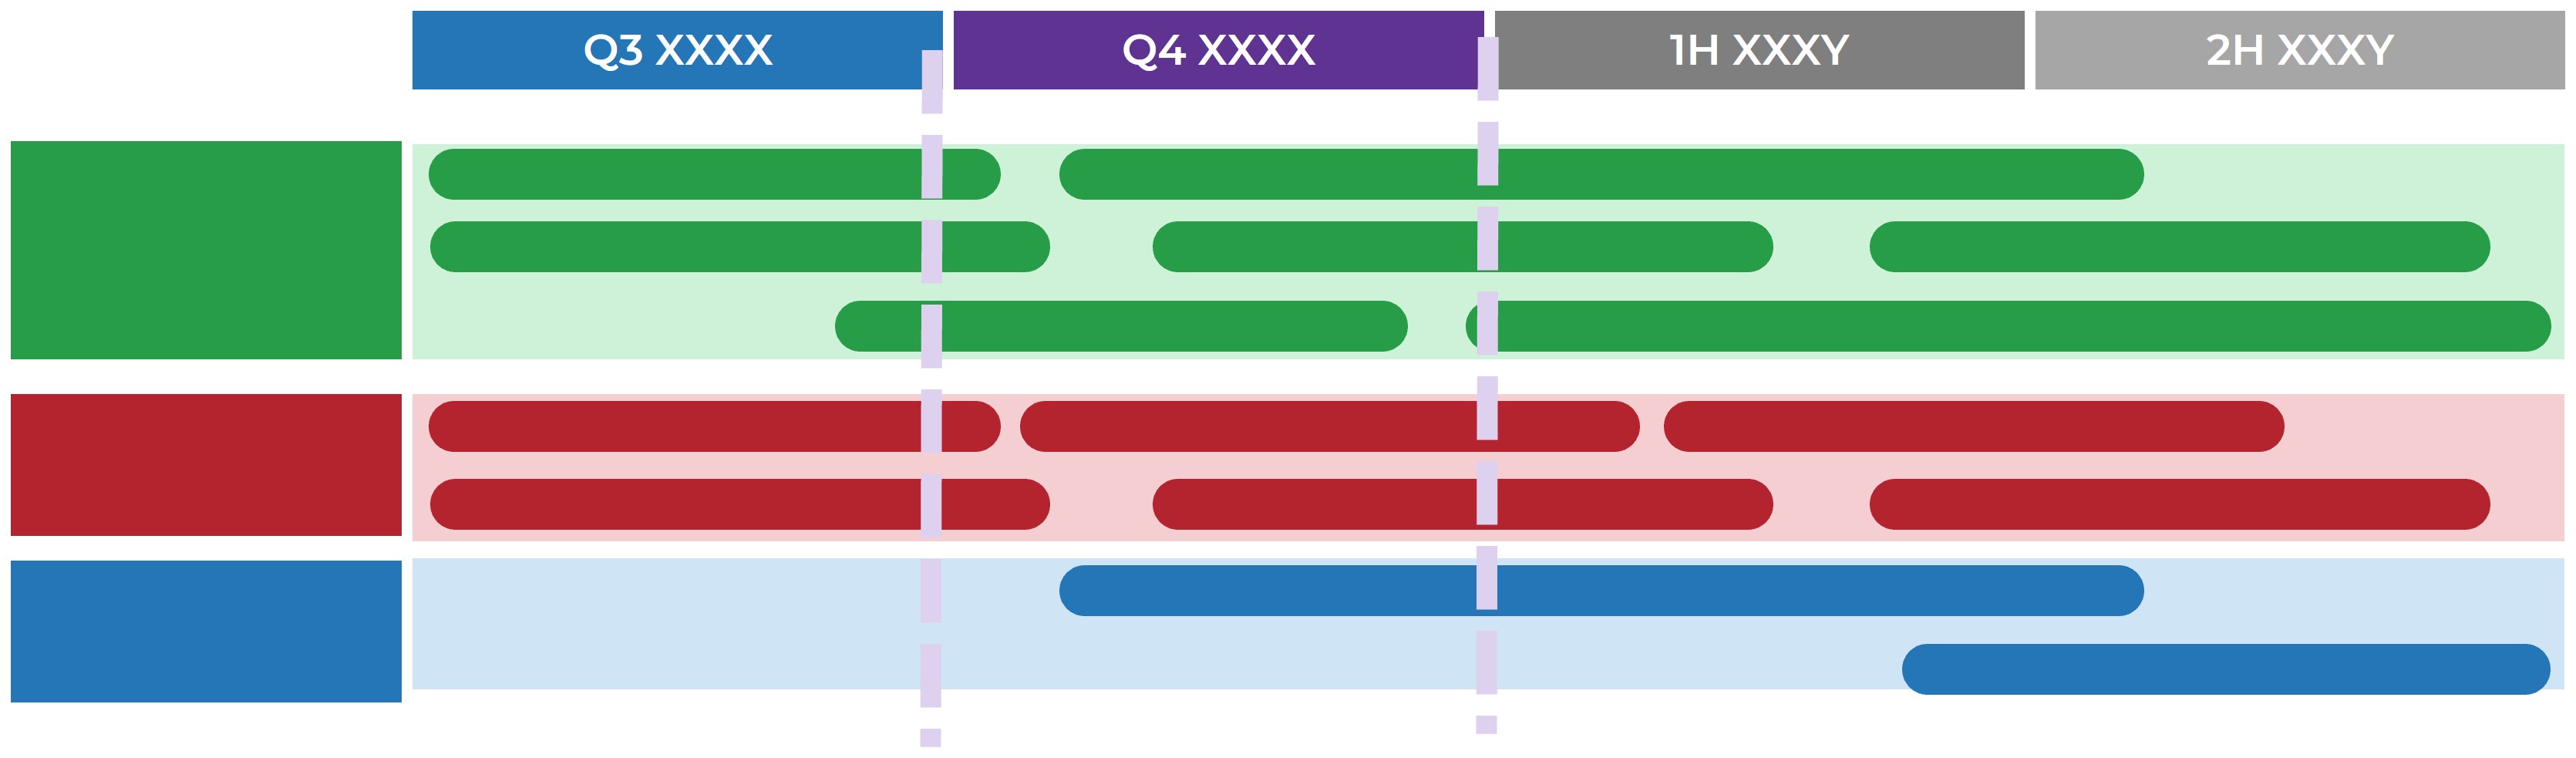
GROUP/CATEGORY: Groups are collections of artifacts. In a product family context, these are usually product family goals, value streams, or products.
ARTIFACT: An artifact is one of many kinds of tangible by-products produced during the delivery of products. For a product family, the artifacts represented are capabilities or value streams.
MILESTONE: Points in the timeline when established sets of artifacts are complete. This is a critical tool in the alignment of products in a given family.
TIME HORIZON: Separated periods within the projected timeline covered by the roadmap.
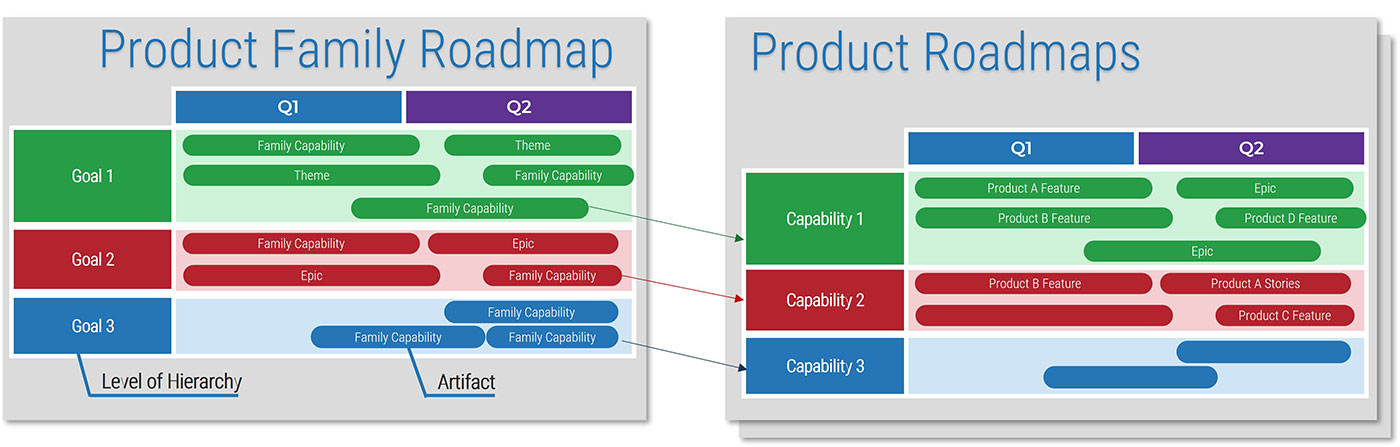
Connecting your product family roadmaps to product roadmaps
Your product and product family roadmaps should be connected at an artifact level that is common between both. Typically, this is done with capabilities, but it can be done at a more granular level if an understanding of capabilities isn’t available.
Multiple roadmap views can communicate differently, yet tell the same truth
|
Audience
|
Business/ IT Leaders
|
Users/Customers
|
Delivery Teams
|
Roadmap View |
Portfolio |
Product Family |
Technology |
|
Objectives
|
To provide a snapshot of the portfolio and priority products
|
To visualize and validate product strategy
|
To coordinate broad technology and architecture decisions
|
|
Artifacts
|
Line items or sections of the roadmap are made up of individual products, and an artifact represents a disposition at its highest level.
|
Artifacts are generally grouped by product teams and consist of strategic goals and the features that realize those goals.
|
Artifacts are grouped by the teams who deliver that work and consist of technical capabilities that support the broader delivery of value for the product family.
|
Your communication objectives are linked to your audience; ensure you know your audience and speak their language
I want to... | I need to talk to... | Because they are focused on... |
ALIGN PRODUCT TEAMS | Get my delivery teams on the same page. | Architects | Products Owners | PRODUCTS | A product that delivers value against a common set of goals and objectives. |
SHOWCASE CHANGES | Inform users and customers of product strategy. | Bus. Process Owners | End Users | FUNCTIONALITY | A group of functionality that business customers see as a single unit. |
ARTICULATE RESOURCE REQUIREMENTS | Inform the business of product development requirements. | IT Management | Business Stakeholders | FUNDING | An initiative that those with the money see as a single budget. |
Assess the impacts of product-centric delivery on your teams and org design
Product delivery can exist within any org structure or delivery model. However, when making the shift toward product management, consider optimizing your org design and product team structure to match your capacity and throughput needs.
Determine which delivery team structure best fits your product pipeline
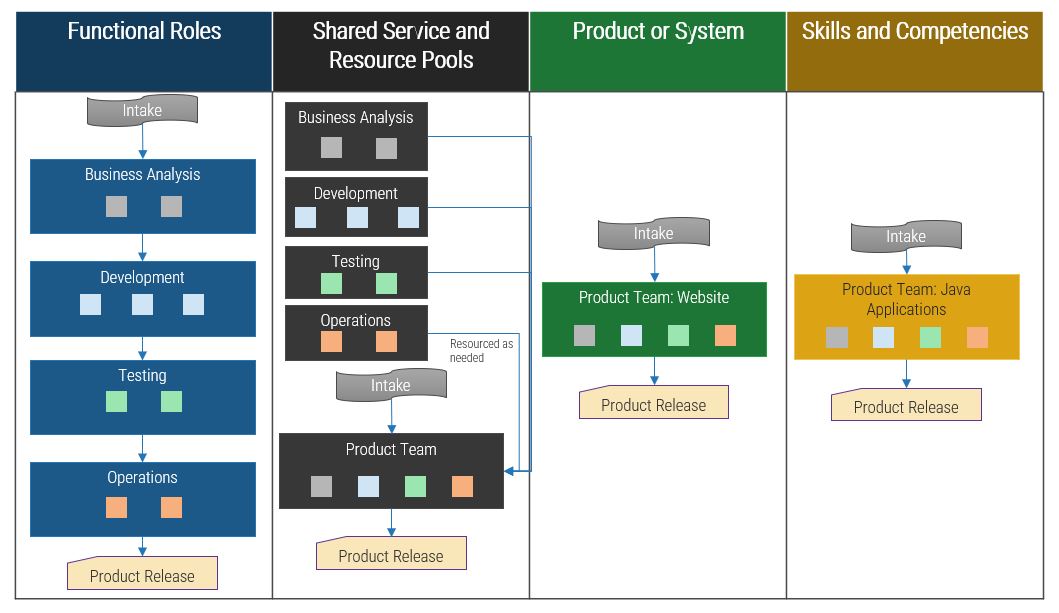
Weigh the pros and cons of IT operating models to find the best fit
There are many different operating models. LoB/Product Aligned and Hybrid Functional align themselves most closely with how products and product families are typically delivered.
- LoB/Product Aligned – Decentralized Model: Line of Business, Geographically, Product, or Functionally Aligned
A decentralized IT operating model that embeds specific functions within LoBs/product teams and provides cross-organizational support for their initiatives.
- Hybrid Functional: Functional/Product Aligned
A best-of-both-worlds model that balances the benefits of centralized and decentralized approaches to achieve both customer responsiveness and economies of scale.
- Hybrid Service Model: Product-Aligned Operating Model
A model that supports what is commonly referred to as a matrix organization, organizing by highly related service categories and introducing the role of the service owner.
- Centralized: Plan-Build-Run
A highly typical IT operating model that focuses on centralized strategic control and oversight in delivering cost-optimized and effective solutions.
- Centralized: Demand-Develop-Service
A centralized IT operating model that lends well to more mature operating environments. Aimed at leveraging economies of scale in an end-to-end services delivery model.
Consider how investment spending will differ in a product environment
Reward for delivering outcomes, not features
|
Autonomy
|
Flexibility
|
Accountability
|
|
Fund what delivers value
|
Allocate iteratively
|
Measure and adjust
|
|
Fund long-lived delivery of value through products (not projects).
Give autonomy to the team to decide exactly what to build.
|
Allocate to a pool based on higher-level business case.
Provide funds in smaller amounts to different product teams and initiatives based on need.
|
Product teams define metrics that contribute to given outcomes.
Track progress and allocate more (or less) funds as appropriate.
|
Adapted from Bain, 2019
Info-Tech Insight
Changes to funding require changes to product and Agile practices to ensure product ownership and accountability.
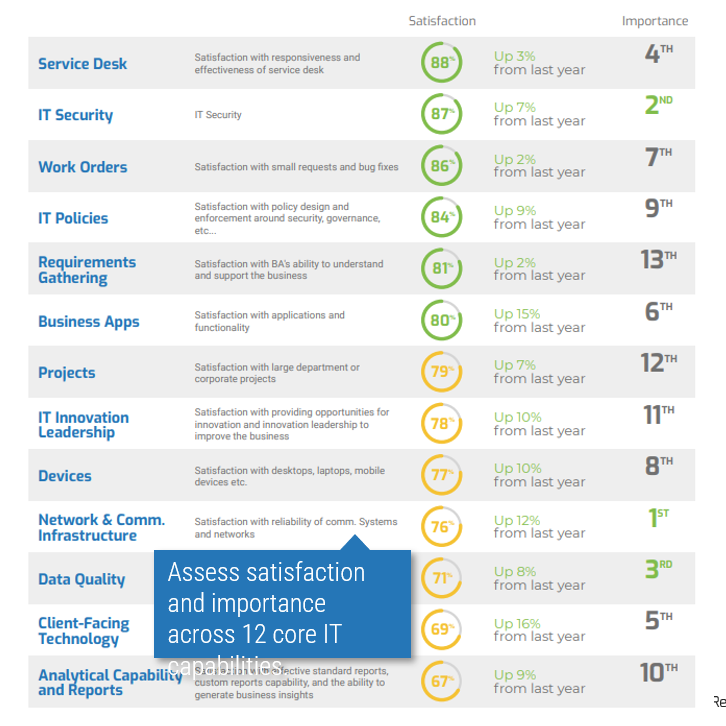
Why is having a common value measure important?
CIO-CEO Alignment Diagnostic
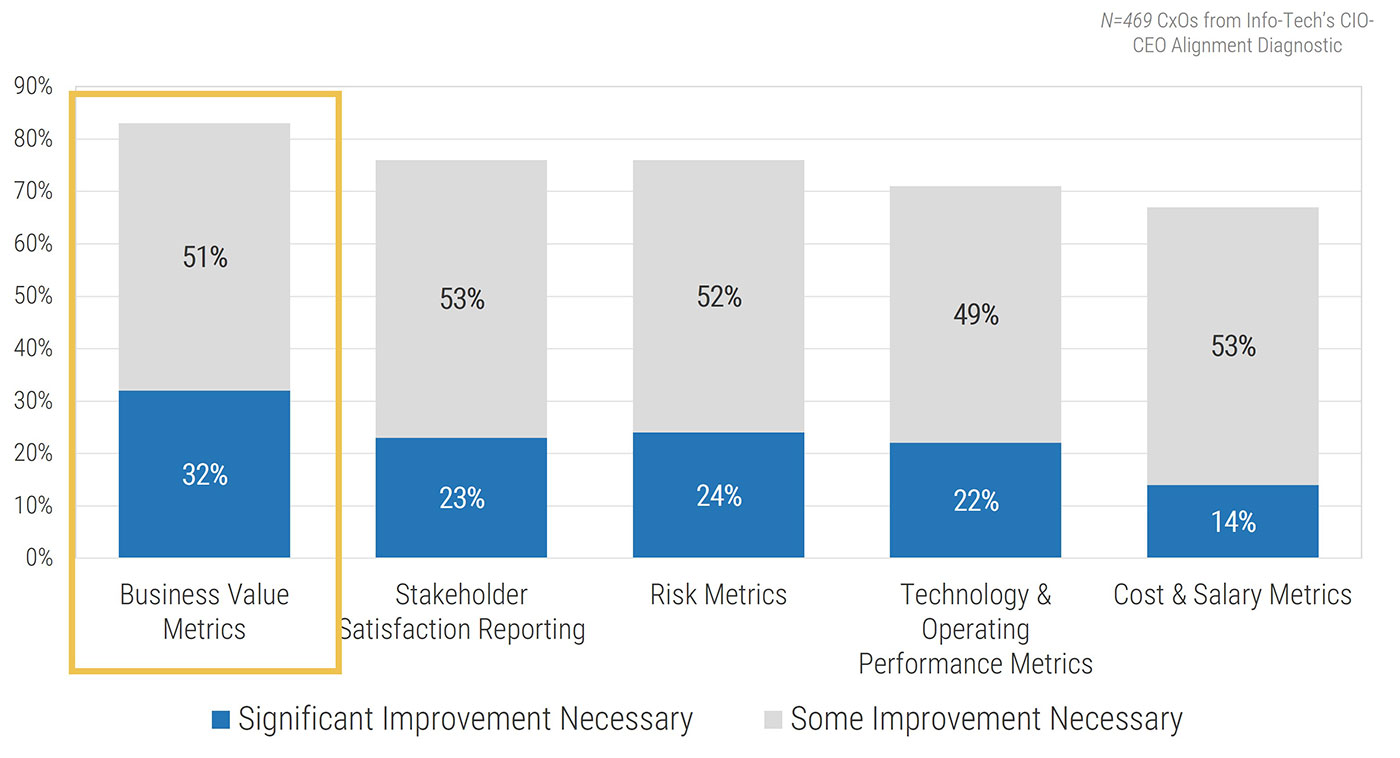
Over 700 Info-Tech members have implemented the Balanced Value Measurement Framework.
“The cynic knows the price of everything and the value of nothing.”
– Oscar Wilde
“Price is what you pay. Value is what you get.”
– Warren Buffett
Understanding where you derive value is critical to building solid roadmaps.
Measure delivery and success
Metrics and measurements are powerful tools to drive behavior change and decision making in your organization. However, metrics are highly prone to creating unexpected outcomes, so use them with great care. Use metrics judiciously to uncover insights but avoid gaming or ambivalent behavior, productivity loss, and unintended consequences.
Build good practices in your selection and use of metrics:
- Choose the metrics that are as close to measuring the desired outcome as possible.
- Select the fewest metrics possible and ensure they are of the highest value to your team, the safest from gaming behaviors and unintended consequences, and the easiest to gather and report.
- Never use metrics for reward or punishment; use them to develop your team.
- Automate as much metrics gathering and reporting as possible.
- Focus on trends rather than precise metrics values.
- Review and change your metrics periodically.
Executive Brief Case Study
INDUSTRY: Public Sector & Financial Services
SOURCE: Info-Tech Interviews
A tale of two product transformations
Two of the organizations we interviewed shared the challenges they experienced defining product families and the impact these challenges had on their digital transformations.
A major financial services organization (2,000+ people in IT) had employed a top-down line of business–focused approach and found itself caught in a vicious circle of moving applications between families to resolve cross-LoB dependencies.
A similarly sized public sector organization suffered from a similar challenge as grouping from the bottom up based on technology areas led to teams fragmented across multiple business units employing different applications built on similar technology foundations.
Results
Both organizations struggled for over a year to structure their product families. This materially delayed key aspects of their product-centric transformation, resulting in additional effort and expenditure delivering solutions piecemeal as opposed to as a part of a holistic product family. It took embracing a hybrid top-down and bottom-up approach and beginning with pilot product families to make progress on their transformation.

Cole Cioran
Practice Lead,
Applications Practice
Info-Tech Research Group
There is no such thing as a perfect product-family structure. There will always be trade-offs when you need to manage shifting demand from stakeholder groups spanning customers, business units, process owners, and technology owners.
Focusing on a single approach to structure your product families inevitably leads to decisions that are readily challenged or are brittle in the face of changing demand.
The key to accelerating a product-centric transformation is to build a hybrid model that embraces top-down and bottom-up perspectives to structure and evolve product families over time. Add a robust pilot to evaluate the structure and you have the key to unlocking the potential of product delivery in your organization.
Info-Tech’s methodology for Deliver Digital Products at Scale
| |
1. Become a Product-Centric Organization
|
2. Organize Products Into Product Families
|
3. Ensure Alignment Between Products and Families
|
4. Bridge the Gap Between Product Families and Delivery
|
5. Build Your Transformation Roadmap and Communication Plan
|
| Phase Steps |
1.1 Understand the organizational factors driving product-centric delivery
1.2 Establish your organization’s product inventory
|
2.1 Determine your approach to scale product families
2.2 Define your product families
|
3.1 Leverage product family roadmaps
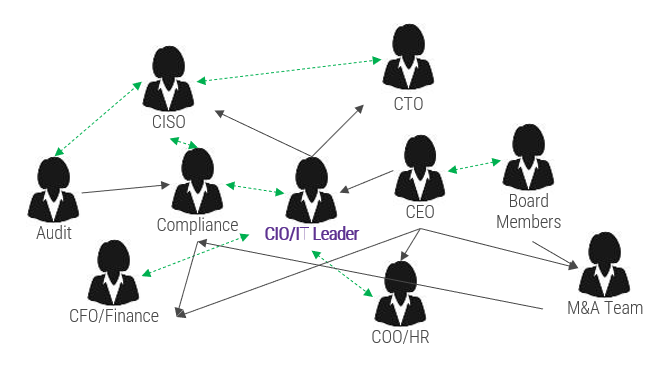
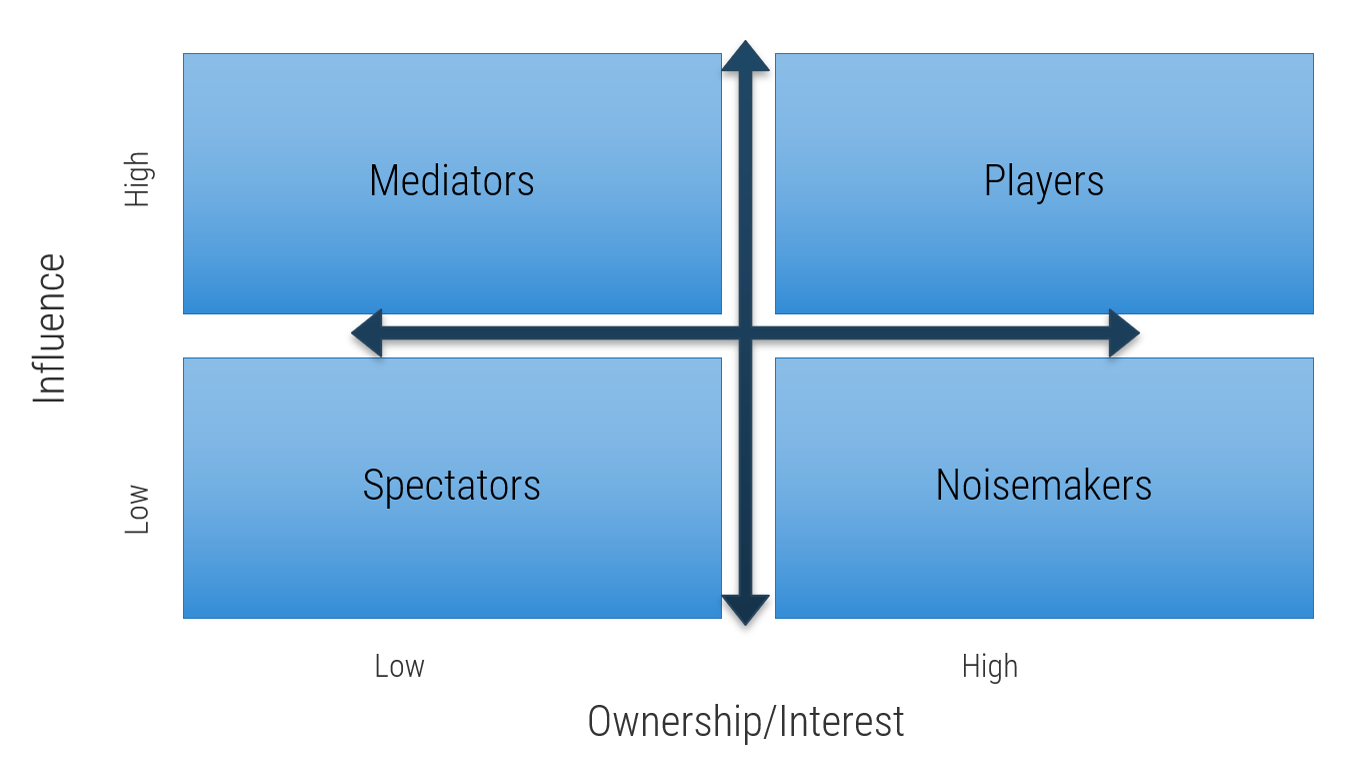
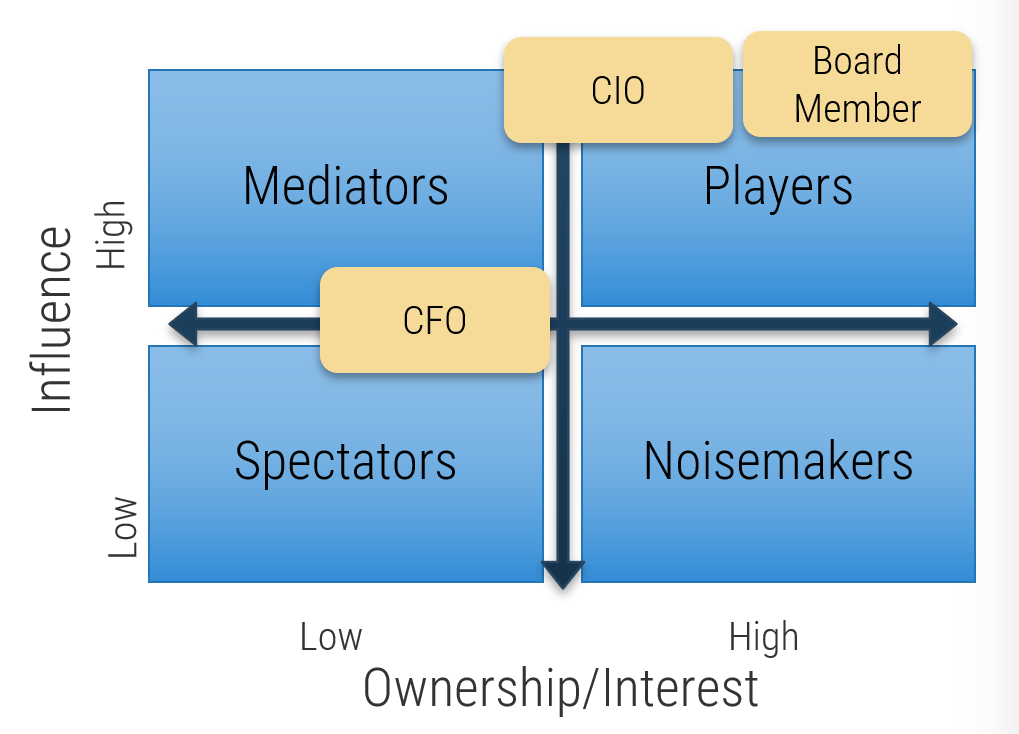
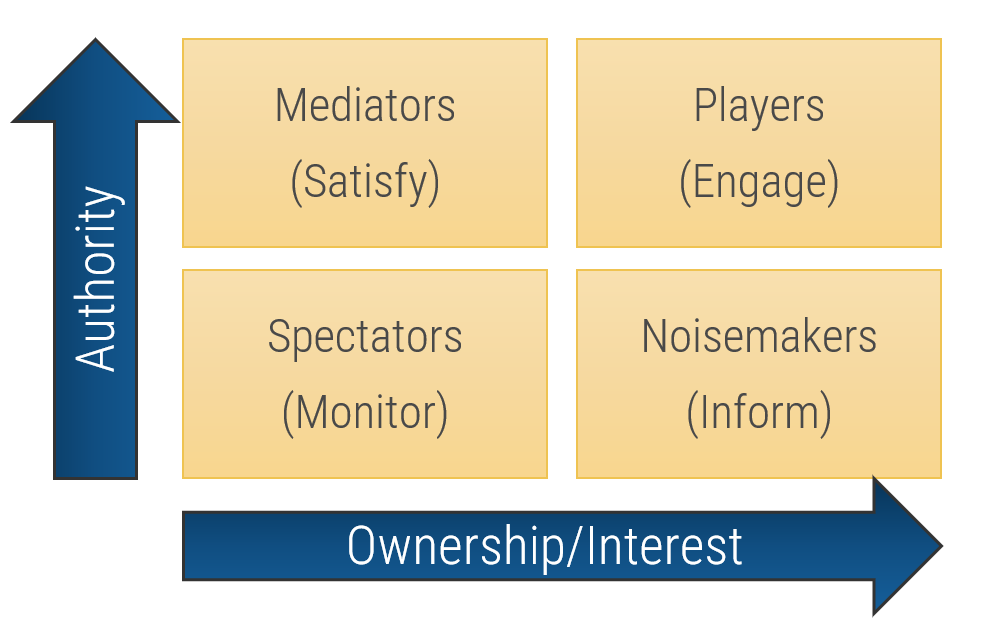
3.2 Use stakeholder management to improve roadmap communication
3.3 Configure your product family roadmaps
3.4 Confirm goal and value alignment of products and their product families
|
4.1 Assess your organization’s delivery readiness
4.2 Understand your delivery options
4.3 Determine your operating model
4.4 Identify how to fund product family delivery
|
5.1 Introduce your digital product family strategy
5.2 Communicate changes on updates to your strategy
5.3 Determine your next steps
|
| Phase Outcomes |
- Organizational drivers and goals for a product-centric delivery
- Definition of product
- Pilot list of products to scale
|
- Product scaling principles
- Scaling approach and direction
- Product family mapping
- Enabling applications
- Dependent applications
- Product family canvas
|
- Approach for communication of product family strategy
- Stakeholder management plan
- Defined key pieces of a product family roadmap
- An approach to confirming alignment between products and product families
|
- Assessment of delivery maturity
- Approach to structuring product delivery
- Operating model for product delivery
- Approach for product family funding
|
- Product family transformation roadmap
- Your plan for communicating your roadmap
- List of actionable next steps to start on your journey
|
Blueprint deliverables
Each step of this blueprint is accompanied by supporting deliverables to help you accomplish your goals:
Deliver Digital Products at Scale Workbook
Use this supporting workbook to document interim results from a number of exercises that will contribute to your overall strategy.
Deliver Digital Products at Scale Readiness Assessment
Your strategy needs to encompass your approaches to delivery. Understand where you need to focus using this simple assessment.
Key deliverable:
Digital Product Family Strategy Playbook
Record the results from the exercises to help you define, detail, and deliver digital products at scale.
Blueprint benefits
|
IT Benefits
- Improved product delivery ROI.
- Improved IT satisfaction and business support.
- Greater alignment between product delivery and product family goals.
- Improved alignment between product delivery and organizational models.
- Better support for Agile/DevOps adoption.
|
Business Benefits
- Increased value realization across product families.
- Faster delivery of enterprise capabilities.
- Improved IT satisfaction and business support.
- Greater alignment between product delivery and product family goals.
- Uniform understanding of product and product family roadmaps and key milestones.
|
Measure the value of this blueprint
Align product family metrics to product delivery and value realization.
| Member Outcome |
Suggested Metric |
Estimated Impact |
|
Increase business application satisfaction
|
Satisfaction with business applications (CIO Business Vision diagnostic)
|
20% increase within one year after implementation
|
|
Increase effectiveness of application portfolio management
|
Effectiveness of application portfolio management (Management & Governance diagnostic)
|
20% increase within one year after implementation
|
|
Increase importance and effectiveness of application portfolio
|
Importance and effectiveness to business ( Application Portfolio Assessment diagnostic)
|
20% increase within one year after implementation
|
|
Increase satisfaction of support of business operations
|
Support to business (CIO Business Vision diagnostic.
|
20% increase within one year after implementation
|
|
Successfully deliver committed work (productivity)
|
Number of successful deliveries; burndown
|
20% increase within one year after implementation
|
Info-Tech offers various levels of support to best suit your needs
DIY Toolkit
"Our team has already made this critical project a priority, and we have the time and capability, but some guidance along the way would be helpful."
Guided Implementation
"Our team knows that we need to fix a process, but we need assistance to determine where to focus. Some check-ins along the way would help keeps us on track."
Workshop
"We need to hit the ground running and get this project kicked off immediately. Our team has the ability to take this over once we get a framework and strategy in place."
Consulting
"Our team does not have the time or the knowledge to take this project on. We need assistance through the entirety of this project."
Diagnostics and consistent frameworks are used throughout all four options.
Guided Implementation
What does a typical GI on this topic look like?
Phase 1: Become a Product-Centric Organization |
Phase 2: Organize Products Into Product Families |
Phase 3: Ensure Alignment Between Products and Families |
Phase 4: Bridge the Gap Between Product Families and Delivery |
|
Call #1: Scope requirements, objectives, and your specific challenges.
Call #2: Define products and product families in your context.
Call #3: Understand the list of products in your context.
|
Call #4: Define your scaling principles and goals.
Call #5: Select a pilot and define your product families.
|
Call #6: Understand the product family roadmap as a method to align products to families.
Call #7: Define components of your product family roadmap and confirm alignment.
|
Call #8: Assess your delivery readiness.
Call #9: Discuss delivery, operating, and funding models relevant to delivering product families.
Call #10: Wrap up.
|
A Guided Implementation (GI) is a series of calls with an Info-Tech analyst to help implement our best practices in your organization. A typical GI is between 8 to 12 calls over the course of 4 to 6 months.
Workshop Overview
Contact your account representative for more information.
workshops@infotech.com 1-888-670-8889
| |
Day 1
Become a Product-Centric Organization
|
Day 2
Organize Products Into Product Families
|
Day 3
Ensure Alignment Between Products and Families
|
Day 4
Bridge the Gap Between Product Families and Delivery
|
Advisory
Next Steps and Wrap-Up (offsite)
|
|
Activities
|
1.1 Understand your organizational factors driving product-centric delivery.
1.2 Establish your organization’s product inventory.
2.1 Determine your approach to scale product families.
|
2.2 Define your product families.
|
3.1 Leverage product family roadmaps.
3.2 Use stakeholder management to improve roadmap communication.
3.3 Configure your product family roadmaps.
3.4 Confirm product family to product alignment.
|
4.1 Assess your organization’s delivery readiness.
4.2 Understand your delivery options.
4.3 Determine your operating model.
4.4 Identify how to fund product family delivery.
5.1 Learn how to introduce your digital product family strategy.
5.2 Communicate changes on updates to your strategy.
5.3 Determine your next steps.
|
- Execute communication plan and product family changes.
- Review the pilot family implementation and update the transformation roadmap.
- Begin advisory calls for related blueprints.
|
|
Key Deliverables
|
- Organizational drivers and goals for a product-centric delivery
- Definition of product
- Product scaling principles
- Scaling approach and direction
- Pilot list of products to scale
|
- Product family mapping
- Enabling applications
- Dependent applications
- Product family canvas
|
- Current approach for communication of product family strategy
- List of product family stakeholders and a prioritization plan for communication
- Defined key pieces of a product family roadmap
- An approach to confirming alignment between products and product families through a shared definition of business value
|
- Assessment results on your organization’s delivery maturity
- A preferred approach to structuring product delivery
- Your preferred operating model for delivering product families
- Understanding your preferred approach for product family funding
- Product family transformation roadmap
- Your plan for communicating your roadmap
- List of actionable next steps to start on your journey
|
- Organizational communication of product families and product family roadmaps
- Product family implementation and updated transformation roadmap
- Support for product owners, backlog and roadmap management, and other topics
|
Phase 1
Become a Product-Centric Organization
| Phase 1 | Phase 2 | Phase 3 | Phase 4 | Phase 5 |
|---|
1.1 Understand the organizational factors driving product-centric delivery 1.2 Establish your organization’s product inventory | 2.1 Determine your approach to scale product families 2.2 Define your product families | 3.1 Leverage product family roadmaps 3.2 Use stakeholder management to improve roadmap communication 3.3 Configure your product family roadmaps 3.4 Confirm product family to product alignment | 4.1 Assess your organization’s delivery readiness 4.2 Understand your delivery options 4.3 Determine your operating model 4.4 Identify how to fund product family delivery | 5.1 Learn how to introduce your digital product family strategy 5.2 Communicate changes on updates to your strategy 5.3 Determine your next steps |
This phase will walk you through the following activities:
1.1.1 Understand your drivers for product-centric delivery
1.1.2 Identify the differences between project and product delivery
1.1.3 Define the goals for your product-centric organization
1.2.1 Define “product” in your context
1.2.2 Identify and establish a pilot list of products
This phase involves the following participants:
- Product owners
- Product managers
- Development team leads
- Portfolio managers’
- Business analysts
Step 1.1
Understand the organizational factors driving product-centric delivery
Activities
1.1.1 Understand your drivers for product-centric delivery
1.1.2 Identify the differences between project and product delivery
1.1.3 Define the goals for your product-centric organization
This phase involves the following participants:
- Product owners
- Product managers
- Development team leads
- Portfolio managers’
- Business analysts
Outcomes of this step
- Organizational drivers to move to product-centric delivery
- List of differences between project and product delivery
- Goals for product-centric delivery
1.1.1 Understand your drivers for product-centric delivery
30-60 minutes
- Identify your pain points in the current delivery model.
- What is the root cause of these pain points?
- How will a product-centric delivery model fix the root cause?
- Record the results in the Deliver Digital Products at Scale Workbook.
| Pain Points |
Root Causes |
Drivers |
|
|
|
|
Output
- Organizational drivers to move to product-centric delivery.
Participants
- Product owners
- Product managers
- Development team leads
- Portfolio managers
- Business analysts
Record the results in the Deliver Digital Products at Scale Workbook.
1.1.2 Identify the differences between project and product delivery
30-60 minutes
- Consider project delivery and product delivery.
- Discuss what some differences are between the two.
Note: This exercise is not about identifying the advantages and disadvantages of each style of delivery. This is to identify the variation between the two.
- Record the results in the Deliver Digital Products at Scale Workbook.
| Project Delivery |
Product Delivery |
| Point in time |
What is changed |
| Method of funding changes |
Needs an owner |
| |
|
Output
- List of differences between project and product delivery
Participants
- Product owners
- Product managers
- Development team leads
- Portfolio managers
- Business analysts
Record the results in the Deliver Digital Products at Scale Workbook.
Identify the differences between a project-centric and a product-centric organization
| Project |
|
Product |
| Fund projects |
Funding |
Fund products or teams |
| Line of business sponsor |
Prioritization |
Product owner |
| Makes specific changes to a product |
Product management |
Improves product maturity and support |
| Assignment of people to work |
Work allocation |
Assignment of work to product teams |
| Project manager manages |
Capacity management |
Team manages capacity |
Info-Tech Insight
Product delivery requires significant shifts in the way you complete development work and deliver value to your users. Make the changes that support improving end-user value and enterprise alignment.
Projects can be a mechanism for funding product changes and improvements
Projects within products
Regardless of whether you recognize yourself as a product-based or project-based shop, the same basic principles should apply.
The purpose of projects is to deliver the scope of a product release. The shift to product delivery leverages a product roadmap and backlog as the mechanism for defining and managing the scope of the release.
Eventually, teams progress to continuous integration/continuous delivery (CI/CD) where they can release on demand or as scheduled, requiring org change management.
Use Agile DevOps principles to expedite product-centric delivery and management
Delivering products does not necessarily require an Agile DevOps mindset. However, Agile methods facilitate the journey because product thinking is baked into them.
Based on: Ambysoft, 2018
Organizations start with Waterfall to improve the predictable delivery of product features.
Iterative development shifts the focus from delivery of features to delivery of user value.
Agile further shifts delivery to consider ROI. Often, the highest-value backlog items aren’t the ones with the highest ROI.
Lean and DevOps improve your delivery pipeline by providing full integration between product owners, development teams, and operations.
CI/CD reduces time in process by allowing release on demand and simplifying release and support activities.
Although teams will adopt parts of all these stages during their journey, it isn’t until you’ve adopted a fully integrated delivery chain that you’ve become product centric.
1.1.3 Define the goals for your product-centric organization
30 minutes
- Review your list of drivers from exercise 1.1.1 and the differences between project and product delivery from exercise 1.1.2.
- Define your goals for achieving a product-centric organization.
Note: Your drivers may have already covered the goals. If so, review if you would like to change the drivers based on your renewed understanding of the differences between project and product delivery.
| Pain Points | Root Causes | Drivers | Goals |
|---|
| | | |
Output
- Goals for product-centric delivery
Participants
- Product owners
- Product managers
- Development team leads
- Portfolio managers’
- Business analysts
Record the results in the Deliver Digital Products at Scale Workbook.
Step 1.2
Establish your organization’s product inventory
Activities
1.2.1 Define “product” in your context
1.2.2 Identify and establish a pilot list of products
This step involves the following participants:
- Product owners
- Product managers
- Development team leads
- Portfolio managers’
- Business analysts
Outcomes of this step
- Your organizational definition of products and services
- A pilot list of active products
Product does not mean the same thing to everyone
Do not expect a universal definition of products.
Every organization and industry has a different definition of what a product is. Organizations structure their people, processes, and technologies according to their definition of the products they manage. Conflicting product definitions between teams increase confusion and misalignment of product roadmaps.
“A product [is] something (physical or not) that is created through a process and that provides benefits to a market.”
- Mike Cohn, Founding Member of Agile Alliance and Scrum Alliance
“A product is something ... that is created and then made available to customers, usually with a distinct name or order number.”
- TechTarget
“A product is the physical object ... , software or service from which customer gets direct utility plus a number of other factors, services, and perceptions that make the product useful, desirable [and] convenient.”
- Mark Curphey
Organizations need a common understanding of what a product is and how it pertains to the business. This understanding needs to be accepted across the organization.
“There is not a lot of guidance in the industry on how to define [products]. This is dangerous because what will happen is that product backlogs will be formed in too many areas. All that does is create dependencies and coordination across teams … and backlogs.”
– Chad Beier, "How Do You Define a Product?” Scrum.org
Products and services share the same foundation and best practices
For the purpose of this blueprint, product/service and product owner/service owner are used interchangeably. Product is used for consistency but would apply to services as well.
Product = Service
“Product” and “service” are terms that each organization needs to define to fit its culture and customers (internal and external). The most important aspect is consistent use and understanding of:
- External products
- Internal products
- External services
- Internal services
- Products as a service (PaaS)
- Productizing services (SaaS)
Recognize the different product owner perspectives
Business:
- Customer facing, revenue generating
Technical:
Operations
- Keep the lights on processes
Info-Tech Best Practice
Product owners must translate needs and constraints from their perspective into the language of their audience. Kathy Borneman, Digital Product Owner at SunTrust Bank, noted the challenges of finding a common language between lines of business and IT (e.g. what is a unit?).
Info-Tech Insight
Recognize that product owners represent one of three primary perspectives. Although all share the same capabilities, how they approach their responsibilities is influenced by their perspective.
“A Product Owner in its most beneficial form acts like an Entrepreneur, like a 'mini-CEO'. The Product Owner is someone who really 'owns' the product.”
– Robbin Schuurman, “Tips for Starting Product Owners”
Your product definition should include everything required to support it, not just what users see.
Establish where product management would be beneficial in the organization
What does not need product ownership?
- Individual features
- Transactions
- Unstructured data
- One-time solutions
- Non-repeatable processes
- Solutions that have no users or consumers
- People or teams
Characteristics of a discrete product
- Has end users or consumers
- Delivers quantifiable value
- Evolves or changes over time
- Has predictable delivery
- Has definable boundaries
- Has a cost to produce and operate
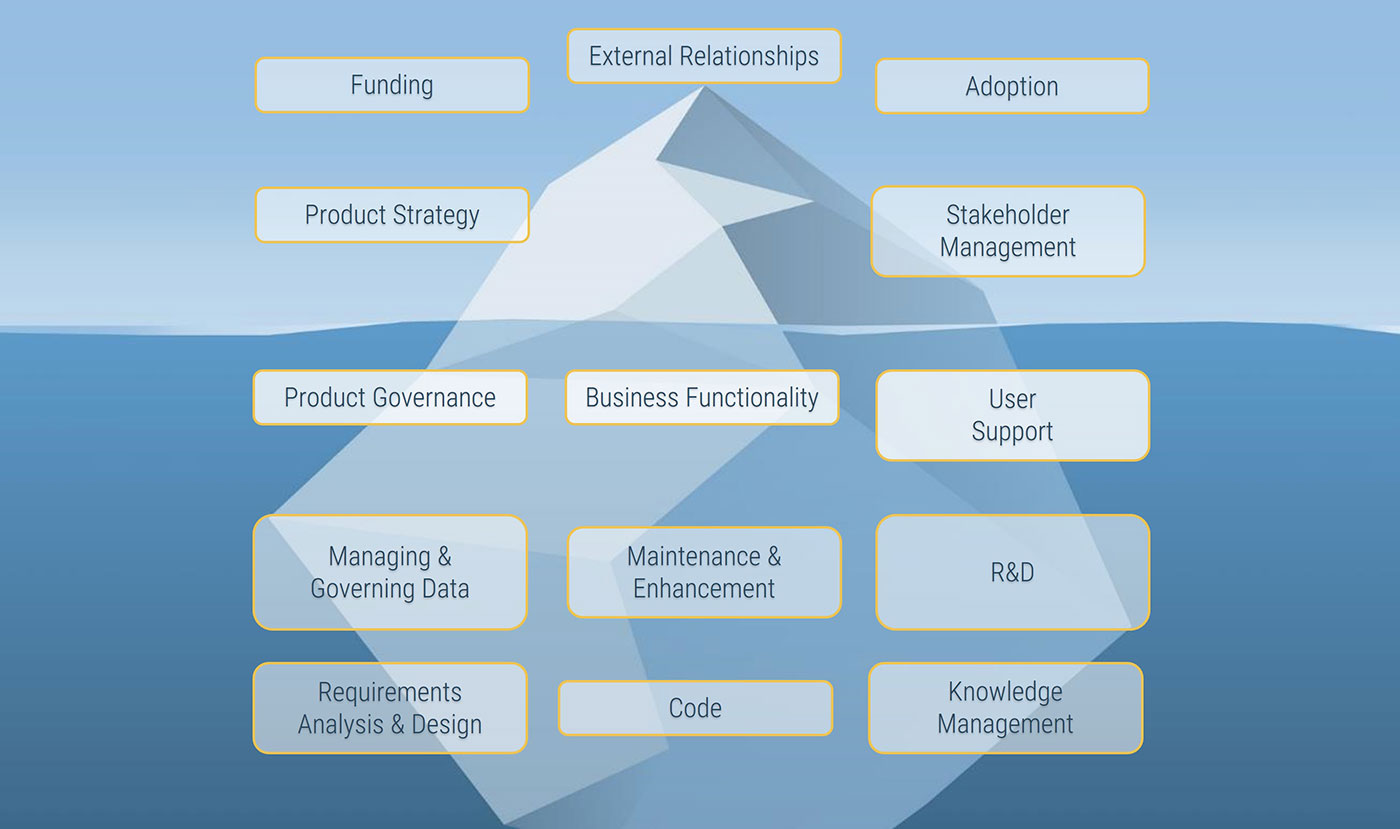
Product capabilities deliver value!
These are the various facets of a product. As a product owner, you are responsible for managing these facets through your capabilities and activities.
It is easy to lose sight of what matters when we look at a product from a single point of view. Despite what The Agile Manifesto says, working software is not valuable without the knowledge and support that people need in order to adopt, use, and maintain it. If you build it, they will not come. Product leaders must consider the needs of all stakeholders when designing and building products.
Define product value by aligning backlog delivery with roadmap goals
In each product plan, the backlogs show what you will deliver. Roadmaps identify when and in what order you will deliver value, capabilities, and goals.
Product roadmaps guide delivery and communicate your strategy
In Deliver on Your Digital Product Vision, we demonstrate how the product roadmap is core to value realization. The product roadmap is your communicated path, and as a product owner, you use it to align teams and changes to your defined goals while aligning your product to enterprise goals and strategy.
Info-Tech Insight
The quality of your product backlog – and your ability to realize business value from your delivery pipeline – is directly related to the input, content, and prioritization of items in your product roadmap.
What is a product?
Not all organizations will define products in the same way. Take this as a general example:
“A tangible solution, tool, or service (physical or digital) that enables the long-term and evolving delivery of value to customers and stakeholders based on business and user requirements.”
Info-Tech Insight
A proper definition of product recognizes three key facts:
- Products are long-term endeavors that don’t end after the project finishes.
- Products are not just “apps” but can be software or services that drive the delivery of value.
There is more than one stakeholder group that derives value from the product or service.
1.2.1 Define “product” in your context
30-60 minutes
- Discuss what “product” means in your organization.
- Create a common, enterprise-wide definition for “product.”
- Record the results in the Deliver Digital Products at Scale Workbook.
For example:
- An application, platform, or application family.
- Discrete items that deliver value to a user/customer.
Output
- Your enterprise/organizational definition of products and services
Participants
- Product owners
- Product managers
- Development team leads
- Portfolio managers’
- Business analysts
Record the results in the Deliver Digital Products at Scale Workbook.
1.2.2 Identify and establish a pilot list of products
1-2 hours
- Review any current documented application inventory. If you have these details in an existing document, share it with the team. Select the group of applications for your family scaling pilot.
- List your initial application inventory on the Product List tab of the Deliver Digital Products at Scale Workbook.
- If you previously completed an application inventory using one of our application portfolio management (APM) resources, you can paste values here. Do not paste cells, as Excel may create a cell reference or replace the current conditional formatting.
For each of the products listed, add the vision and goals of the product. Refer to Deliver on Your Digital Product Vision to learn more about identifying vision and goals or to complete the product vision canvas.
You’ll add business capabilities and vision in Phase 2, but you can add these now if they are available in your existing inventory.
Output
- A pilot list of active products
Participants
- Product owners
- Product managers
- Development team leads
- Portfolio managers’
- Business analysts
Record the results in the Deliver Digital Products at Scale Workbook.
Phase 2
Organize Products Into Product Families
| Phase 1 | Phase 2 | Phase 3 | Phase 4 | Phase 5 |
|---|
1.1 Understand the organizational factors driving product-centric delivery 1.2 Establish your organization’s product inventory | 2.1 Determine your approach to scale product families 2.2 Define your product families | 3.1 Leverage product family roadmaps 3.2 Use stakeholder management to improve roadmap communication 3.3 Configure your product family roadmaps 3.4 Confirm product family to product alignment | 4.1 Assess your organization’s delivery readiness 4.2 Understand your delivery options 4.3 Determine your operating model 4.4 Identify how to fund product family delivery | 5.1 Learn how to introduce your digital product family strategy 5.2 Communicate changes on updates to your strategy 5.3 Determine your next steps |
This phase will walk you through the following activities:
2.1.1 Define your scaling principles and goals
2.1.2 Define your pilot product family areas and direction
2.2.1 Arrange your applications and services into product families
2.2.2 Define enabling and supporting applications
2.2.3 Build your product family canvas
This phase involves the following participants:
- Product owners
- Product managers
- Development team leads
- Portfolio managers’
- Business analysts
Step 2.1
Determine your approach to scale product families
Activities
2.1.1 Define your scaling principles and goals
2.1.2 Define your pilot product family areas and direction
This step involves the following participants:
- Product owners
- Product managers
- Development team leads
- Portfolio managers’
- Business analysts
Outcomes of this step
- List of product scaling principles
- Scope of product scaling pilot and target areas
- Scaling approach and direction
Use consistent terminology for product and service families
In this blueprint, we refer to any grouping of products or services as a “family.” Your organization may prefer other terms, such as product/service line, portfolio, group, etc. The underlying principles for grouping and managing product families are the same, so define the terminology that fits best with your culture. The same is true for “products” and “services,” which may also be referred to in different terms.
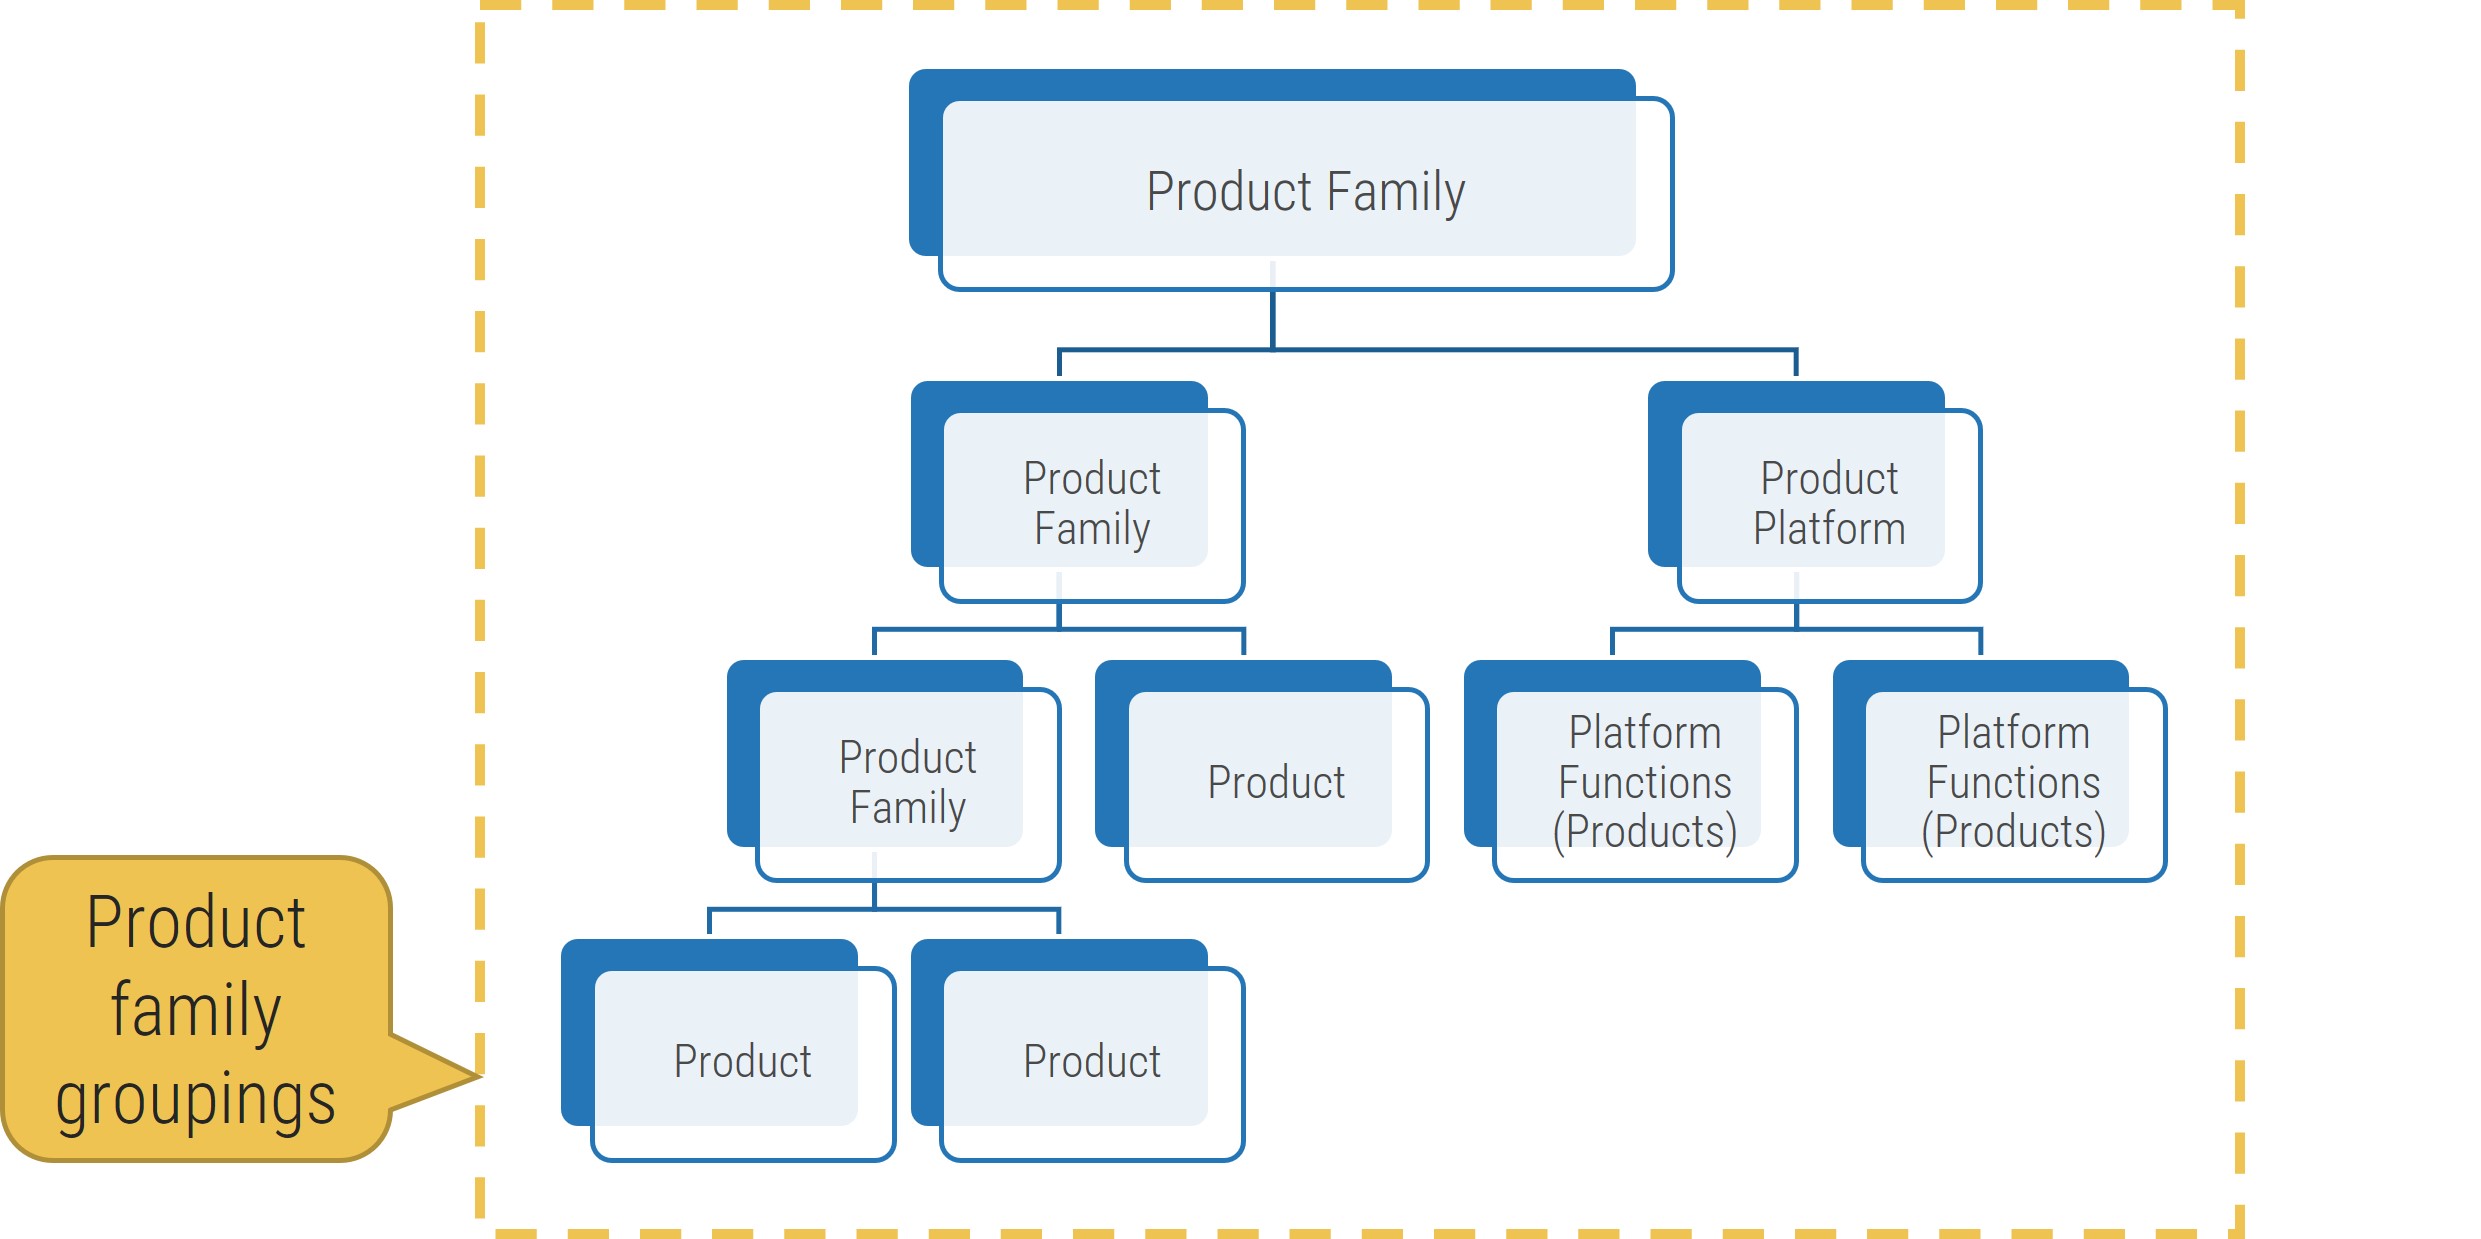
A product family is a logical and operational grouping of related products or services. The grouping provides a scaled hierarchy to translate goals, priorities, strategy, and constraints down the grouping while aligning value realization upwards.
Group product families by related purpose to improve business value
Families should be scaled by how the products operationally relate to each other, with clear boundaries and common purpose.
A product family contains...
- Vision
- Goals
- Cumulative roadmap of the products within the family
A product family can be grouped by...
- Function
- Value stream and capability
- Customer segments or end-user group
- Strategic purpose
- Underlying architecture
- Common technology or support structures
- And many more
Scale products into related families to improve value delivery and alignment
Defining product families builds a network of related products into coordinated value delivery streams.
“As with basic product management, scaling an organization is all about articulating the vision and communicating it effectively. Using a well-defined framework helps you align the growth of your organization with that of the company. In fact, how the product organization is structured is very helpful in driving the vision of what you as a product company are going to do.”
– Rich Mironov, Mironov Consulting
Product families translate enterprise goals into value-enabling capabilities
Info-Tech Insight
Your organizational goals and strategy are achieved through capabilities that deliver value. Your product hierarchy is the mechanism to translate enterprise goals, priorities, and constraints down to the product level where changes can be made.
Arrange product families by operational groups, not solely by your org chart
1. To align product changes with enterprise goals and priorities, you need to organize your products into operational groups based on the capabilities or business functions the product and family support.
2. Product managers translate these goals, priorities, and constraints into their product families, so they are actionable at the next level, whether that level is another product family or products implementing enhancements to meet these goals.
3. The product family manager ensures that the product changes enhance the capabilities that allow you to realize your product family, division, and enterprise goals.
4. Enabling capabilities realize value and help reach your goals, which then drives your next set of enterprise goals and strategy.
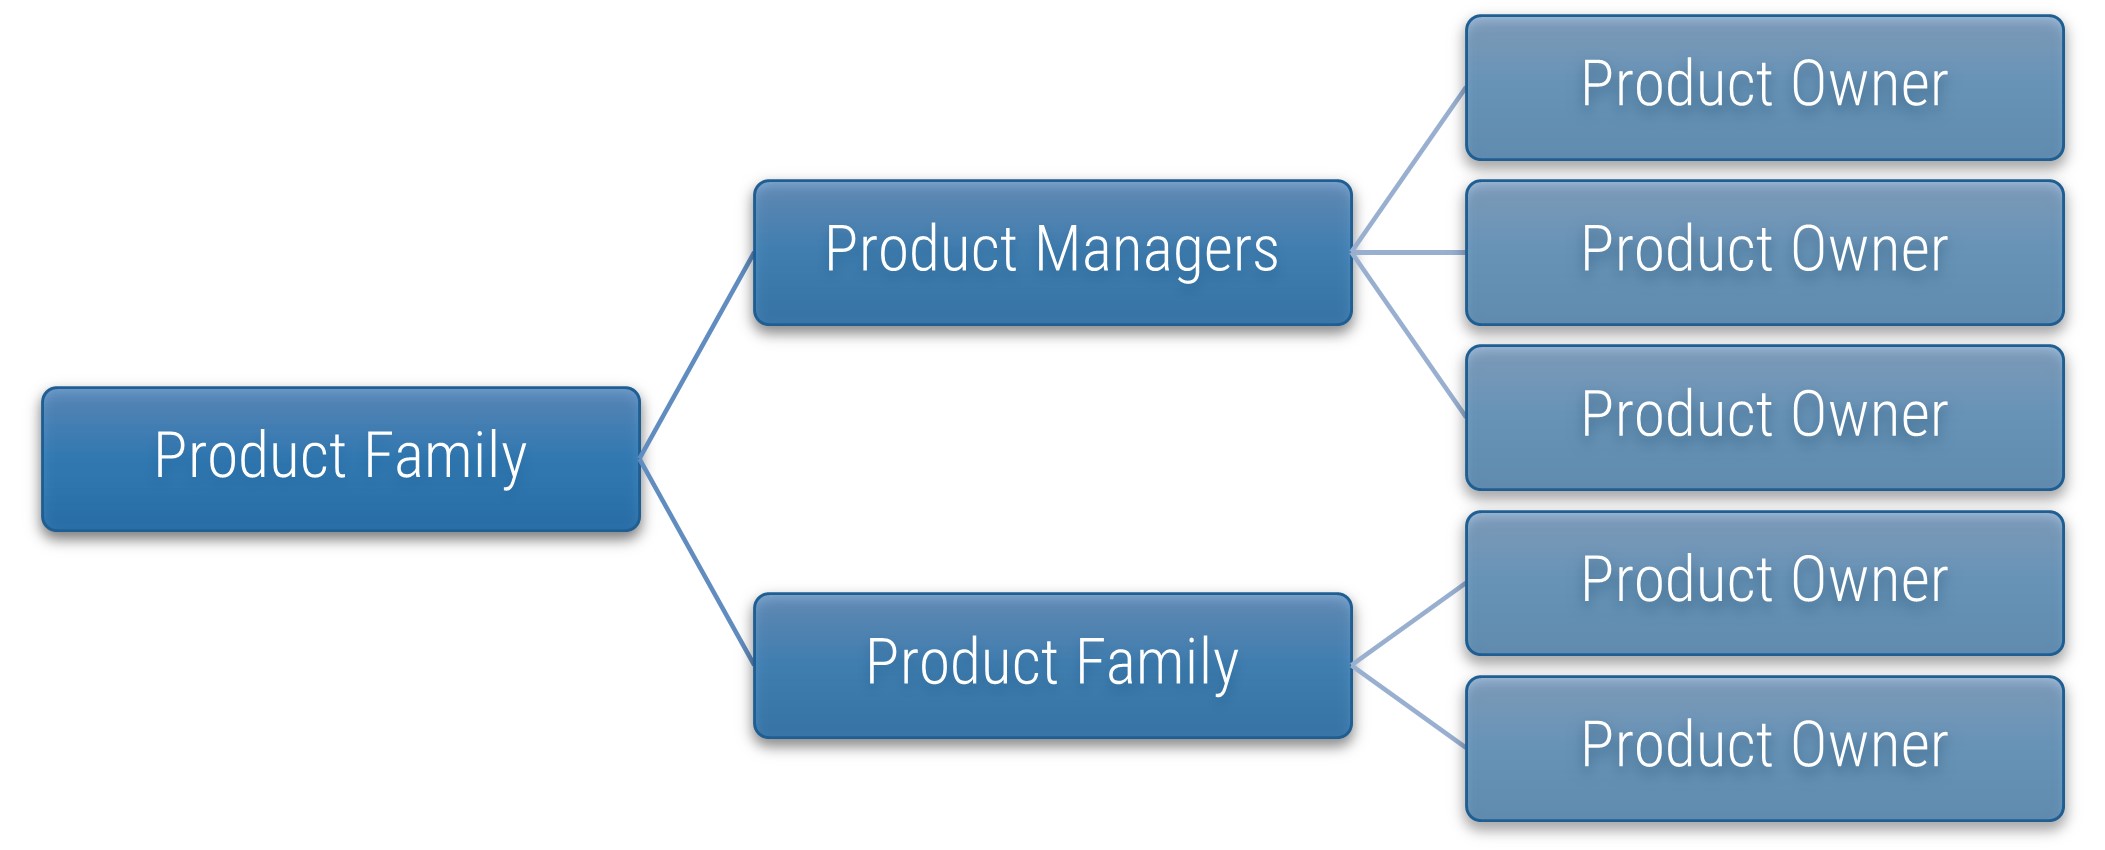
Product families need owners with a more strategic focus
Product Owner
(More tactical product delivery focus)
- Backlog management and prioritization
- Product vision and product roadmap
- Epic/story definition, refinement in conjunction with business stakeholders
- Sprint planning with Scrum Master and delivery team
- Working with Scrum Master to minimize disruption to team velocity
- Ensuring alignment between business and Scrum teams during sprints
- Profit and loss (P&L) product analysis and monitoring
Product Manager
(More strategic product family focus)
- Product strategy, positioning, and messaging
- Product family vision and product roadmap
- Competitive analysis and positioning
- New product innovation/definition
- Release timing and focus (release themes)
- Ongoing optimization of product-related marketing and sales activities
- P&L product analysis and monitoring
Info-Tech Insight
“Product owner” and “product manager” are terms that should be adapted to fit your culture and product hierarchy. These are not management relationships but rather a way to structure related products and services that touch the same end users. Use the terms that work best in your culture.
Download Build a Better Product Owner for role support.
2.1.1 Define your scaling principles and goals
30-60 minutes
- Discuss the guiding principles for your product scaling model. Your guiding principles should consider key business priorities, organizational culture, and division/team objectives, such as improving:
- Business agility and ability to respond to changes and needs.
- Alignment of product roadmaps to enterprise goals and priorities.
- Collaboration between stakeholders and product delivery teams.
- Resource utilization and productivity.
- The quality and value of products.
- Coordination between related products and services.
Output
- List of product scaling principles
Participants
- Product owners
- Product managers
- Development team leads
- Portfolio managers’
- Business analysts
Record the results in the Deliver Digital Products at Scale Workbook.
Start scaling with a pilot
You will likely use a combination of patterns that work best for each product area. Pilot your product scaling with a domain, team, or functional area before organizing your entire portfolio.
Learn more about each pattern.
Discuss the pros and cons of each.
Select a pilot product area.
Select a pattern.
Approach alignment from both directions, validating by the opposite way
Defining your product families is not a one-way street. Often, we start from either the top or the bottom depending on our scaling principles. We use multiple patterns to find the best arrangement and grouping of our products and families.
It may be helpful to work partway, then approach your scaling from the opposite direction, meeting in the middle. This way you are taking advantage of the strengths in both approaches.
Once you have your proposed structure, validate the grouping by applying the principles from the opposite direction to ensure each product and family is in the best starting group.
As the needs of your organization change, you may need to realign your product families into your new business architecture and operational structure.
When to use: You have a business architecture defined or clear market/functional grouping of value streams.
When to use: You are starting from an Application Portfolio Management application inventory to build or validate application families.
Top-down examples: Start with your enterprise structure or market grouping
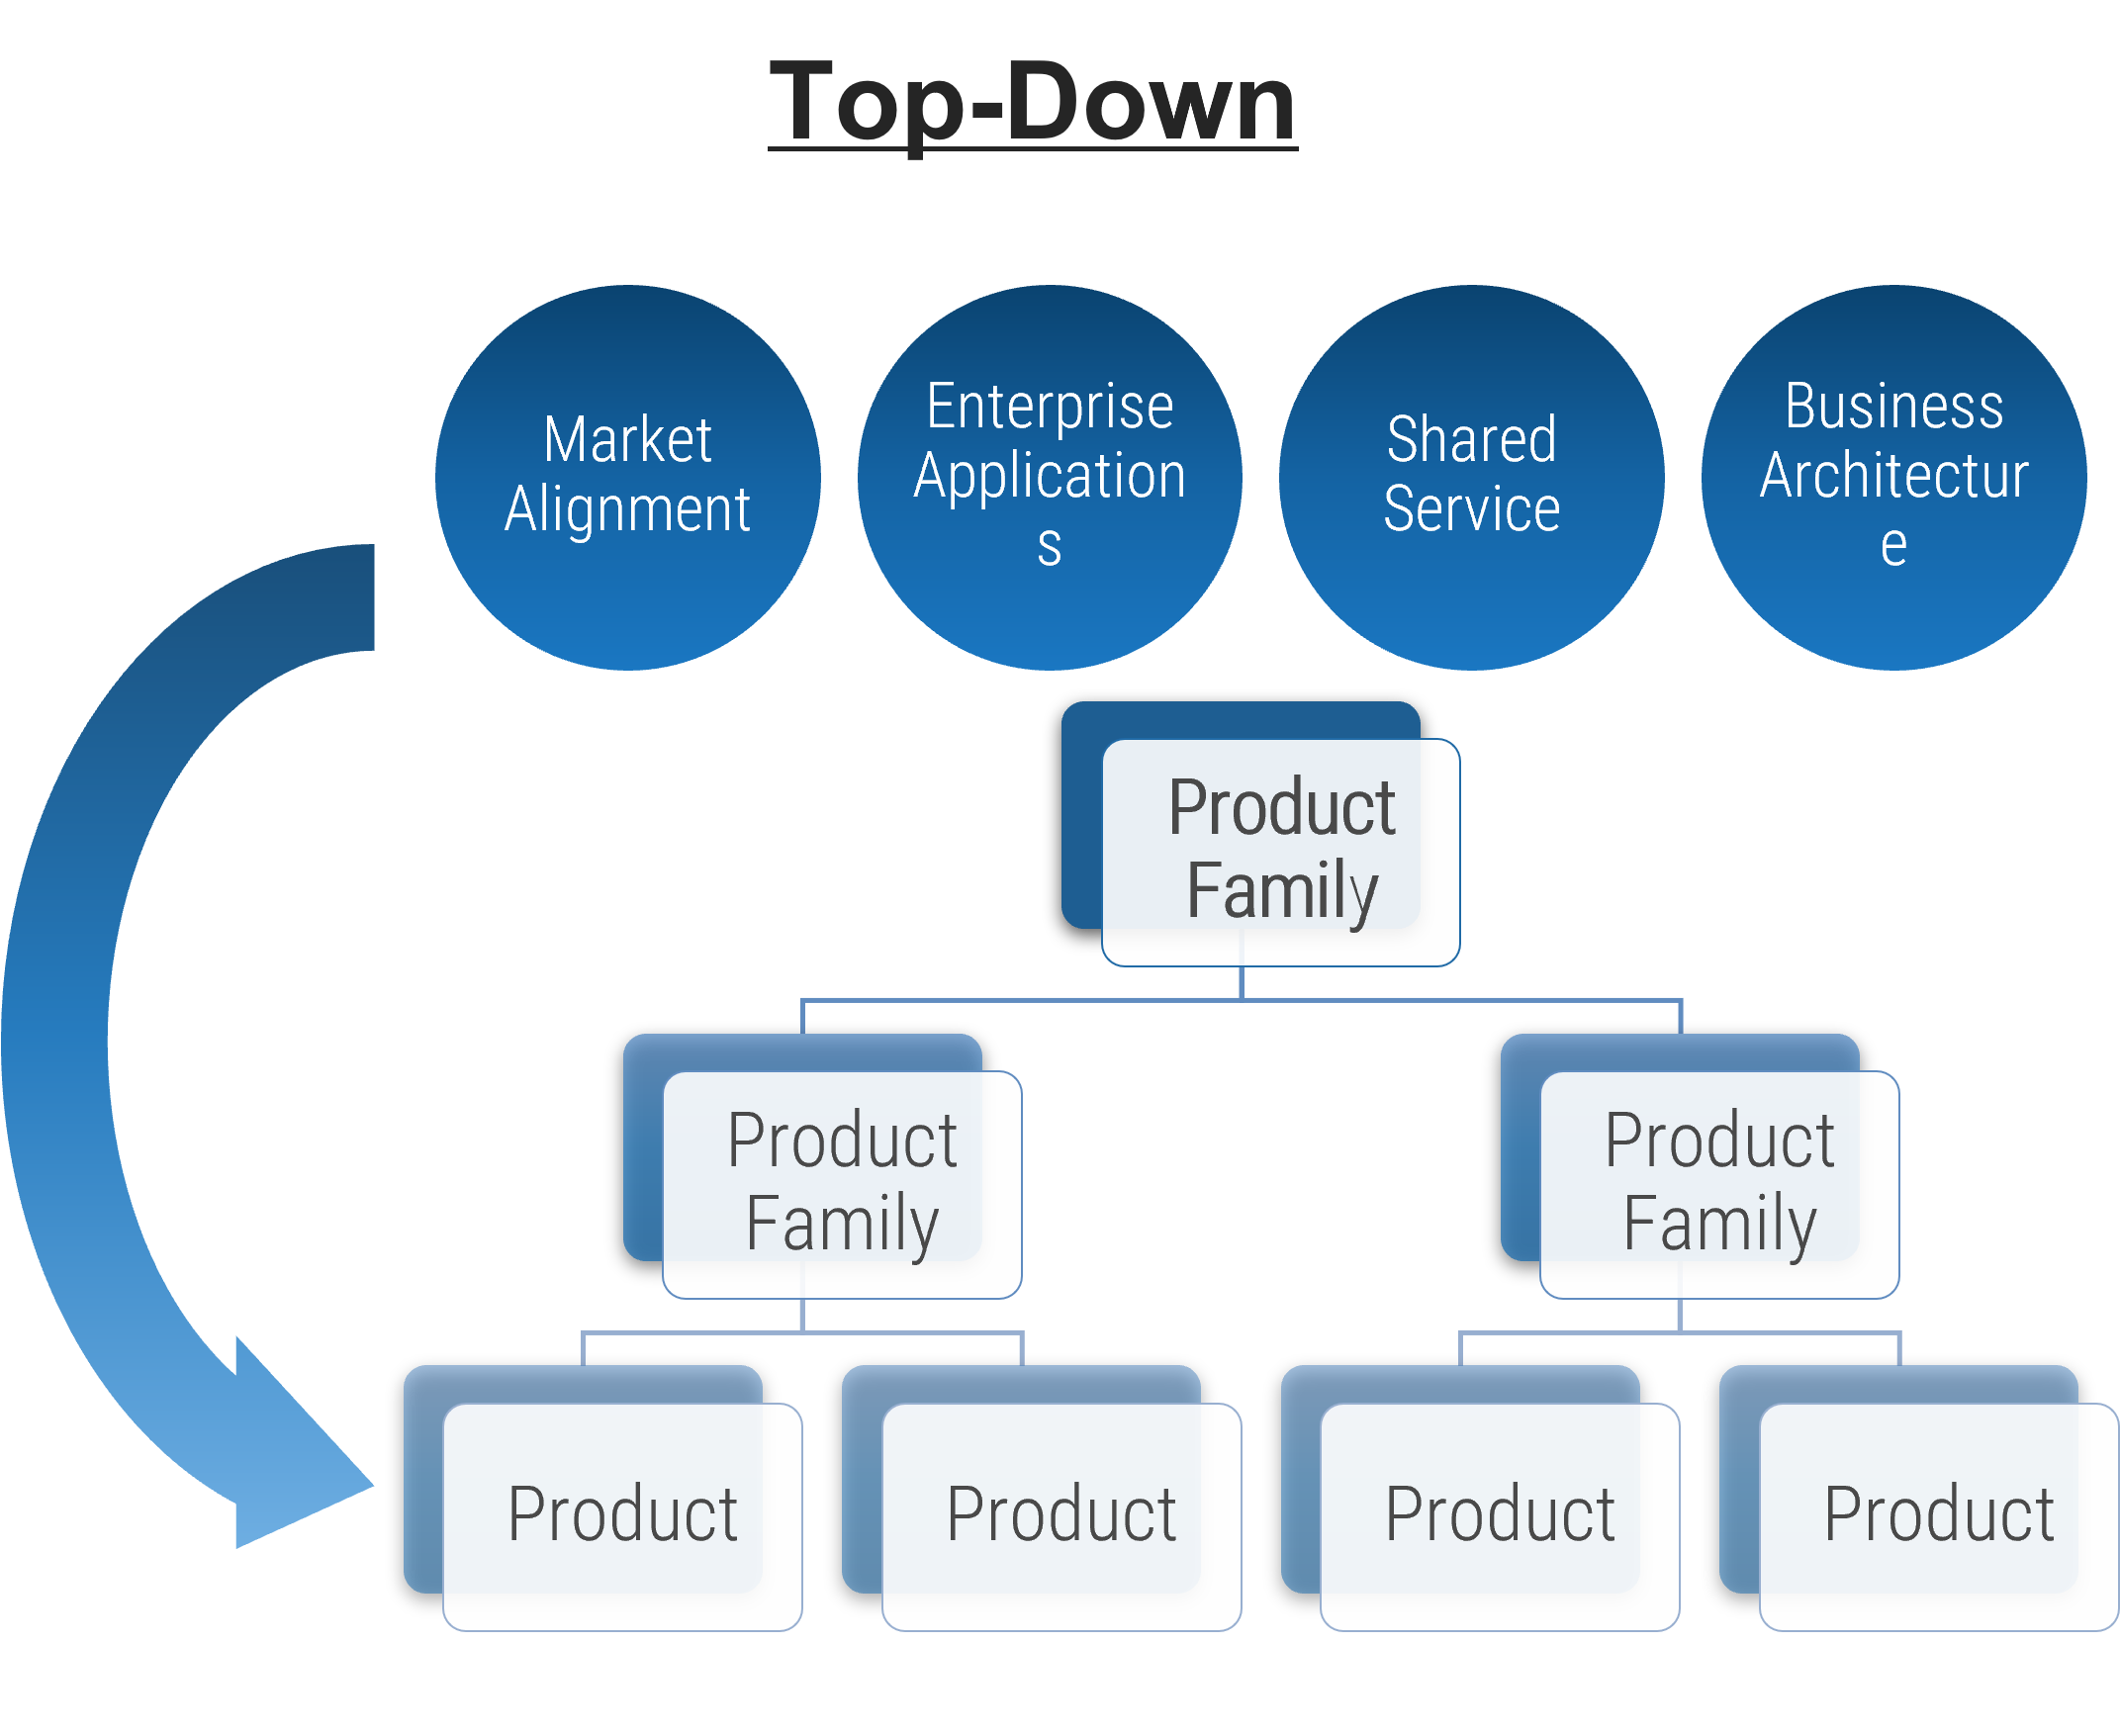
Examples:
| Market Alignment |
- Consumer Banking
- DDA: Checking, Savings, Money Market
- Revolving Credit: Credit Cards, Line of Credit
- Term Credit: Mortgage, Auto, Boat, Installment
|
| Enterprise Applications |
- Human Resources
- Benefits: Health, Dental, Life, Retirement
- Human Capital: Hiring, Performance, Training
- Hiring: Posting, Interviews, Onboarding
|
| Shared Service |
- End-User Support
- Desktop: New Systems, Software, Errors
- Security: Access Requests, Password Reset, Attestations
|
| Business Architecture |
|
Bottom-up examples: Start with your inventory
Based on your current inventory, start organizing products and services into related groups using one of the five scaling models discussed in the next step.
Examples:
| Technical Grouping |
- Custom Apps: Java, .NET, Python
- Cloud: Azure, AWS, Virtual Environments
- Low Code: ServiceNow, Appian
|
| Functional/Capability Grouping |
- CRM: Salesforce, Microsoft CRM
- Security Platforms: IAM, SSO, Scanning
- Workflow: Remedy, ServiceNow
|
| Shared Services Grouping |
- Workflow: Appian, Pega, ServiceNow
- Collaboration: SharePoint, Teams
- Data: Dictionary, Lake, BI/Reporting
|
2.1.2 Define your pilot product family areas and direction
30-60 minutes
- Using your inventory of products for your pilot, consider the top-down and bottom-up approaches.
- Identify areas where you will begin arranging your product into families.
- Prioritize these pilot areas into waves:
- First pilot areas
- Second pilot areas
- Third pilot areas
- Discuss and decide whether a top-down or bottom-up approach is the best place to start for each pilot group.
- Prioritize your pilot families in the order in which you want to organize them. This is a guide to help you get started, and you may change the order during the scaling pattern exercise.
Output
- Scope of product scaling pilot and target areas
Participants
- Product owners
- Product managers
- Development team leads
- Portfolio managers’
- Business analysts
Record the results in the Deliver Digital Products at Scale Workbook.
Step 2.2
Define your product families
Activities
2.2.1 Arrange your applications and services into product families
2.2.2 Define enabling and supporting applications
2.2.3 Build your product family canvas
This step involves the following participants:
- Product owners
- Product managers
- Development team leads
- Portfolio managers’
- Business analysts
Outcomes of this step
- Product family mapping
- Product families
- Enabling applications
- Dependent applications
- Product family canvas
Use three perspectives to guide scaling pattern selection
- One size does not fit all. There is no single or static product model that fits all product teams.
- Structure relationships based on your organizational needs and capabilities.
- Be flexible. Product ownership is designed to enable value delivery.
- Avoid structures that promote proxy product ownership.
- Make decisions based on products and services, not people. Then assign people to the roles.
|
Alignment perspectives: |
|
Value Stream
Align products based on the defined sources of value for a collection of products or services.
For example: Wholesale channel for products that may also be sold directly to consumers, such as wireless network service.
|
Users/Consumers
Align products based on a common group of users or product consumers.
For example: Consumer vs. small business vs. enterprise customers in banking, insurance, and healthcare.
|
Common Domain
Align products based on a common domain knowledge or skill set needed to deliver and support the products.
For example: Applications in a shared service framework supporting other products.
|
Leverage patterns for scaling products
Organizing your products and families is easier when leveraging these grouping patterns. Each is explained in greater detail on the following slides
| Value Stream Alignment | Enterprise Applications | Shared Services | Technical | Organizational Alignment |
|---|
- Business architecture
- Value stream
- Capability
- Function
- Market/customer segment
- Line of business (LoB)
- Example: Customer group > value stream > products
|
- Enabling capabilities
- Enterprise platforms
- Supporting apps
- Example: HR > Workday/Peoplesoft > ModulesSupporting: Job board, healthcare administrator
|
- Organization of related services into service family
- Direct hierarchy does not necessarily exist within the family
- Examples: End-user support and ticketing, workflow and collaboration tools
|
- Domain grouping of IT infrastructure, platforms, apps, skills, or languages
- Often used in combination with Shared Services grouping or LoB-specific apps
- Examples: Java, .NET, low-code, database, network
|
- Used at higher levels of the organization where products are aligned under divisions
- Separation of product managers from organizational structure no longer needed because the management team owns product management role
|
Select the best family pattern to improve alignment
Use scenarios to help select patterns
| |
Top-Down |
Bottom-Up |
|
We have a business architecture defined.
(See Document Your Business Architecture and industry reference architectures for help.)
|
Start with your business architecture |
Start with market segments |
We want to be more customer first or customer centric. |
Start with market segments |
|
Our organization has rigid lines of business and organizational boundaries. |
Start with LoB structure |
|
| Most products are specific to a business unit or division. |
Start with LoB structure |
|
Products are aligned to people, not how we are operationally organized. |
Start with market or LoB structure |
|
We are focusing on enterprise or enabling applications. |
1. Start with enterprise app and service team |
2. Align supporting apps |
We already have applications and services grouped into teams but want to evaluate if they are grouped in the best families. |
Validate using multiple patterns |
Validate using multiple patterns |
Our applications and services are shared across the enterprise or support multiple products, value streams, or shared capabilities. |
|
|
Our applications or services are domain, knowledge, or technology specific. |
|
Start by grouping inventory |
We are starting from an application inventory. (See the APM Research Center for help.) |
|
Start by grouping inventory |
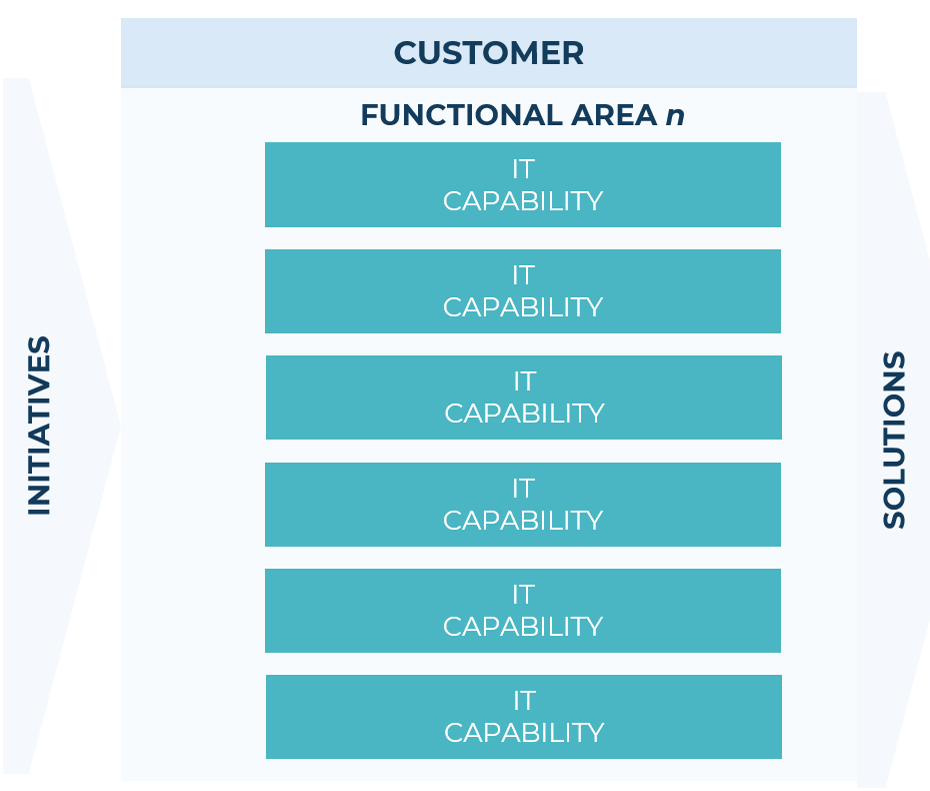
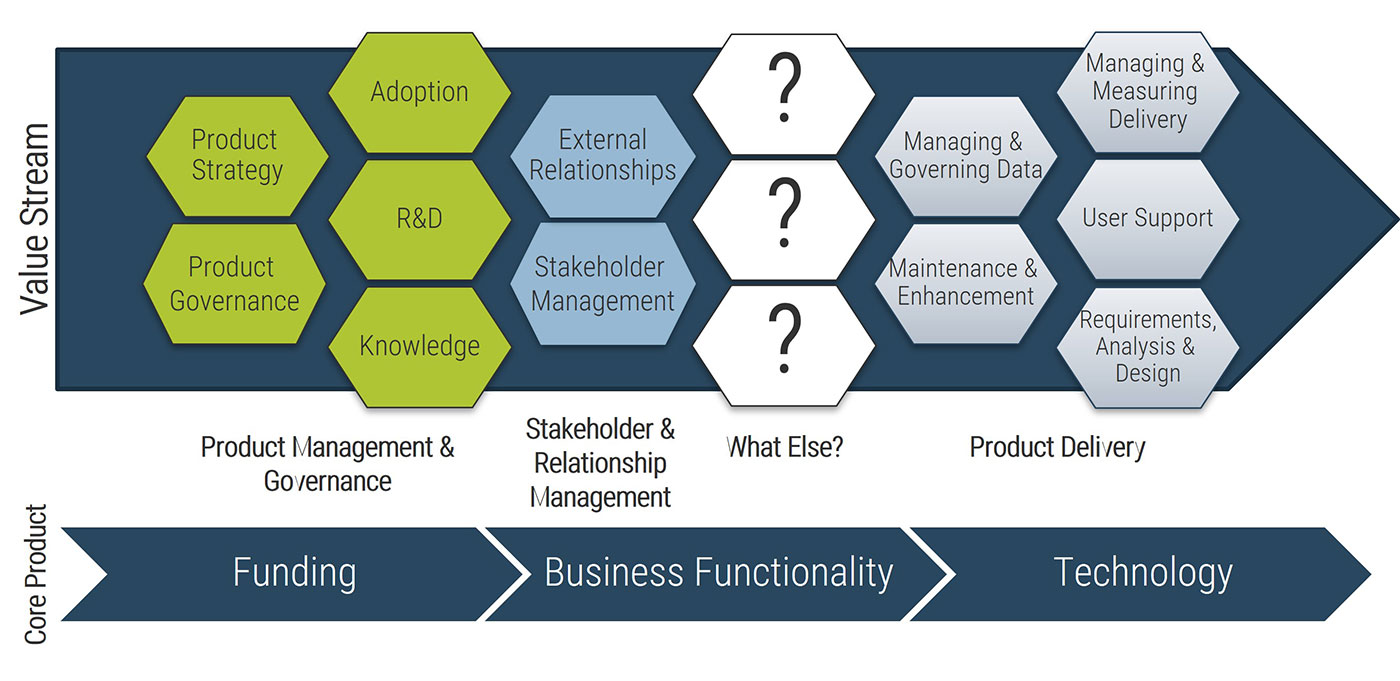
Pattern: Value Stream – Capability
Grouping products into capabilities defined in your business architecture is recommended because it aligns people/processes (services) and products (tools) into their value stream and delivery grouping. This requires an accurate capability map to implement.
Example:
- Healthcare is delivered through a series of distinct value streams (top chevrons) and shared services supporting all streams.
- Diagnosing Health Needs is executed through the Admissions, Testing, Imaging, and Triage capabilities.
- Products and services are needed to deliver each capability.
- Shared capabilities can also be grouped into families to better align capability delivery and maturity to ensure that the enterprise goals and needs are being met in each value stream the capabilities support.
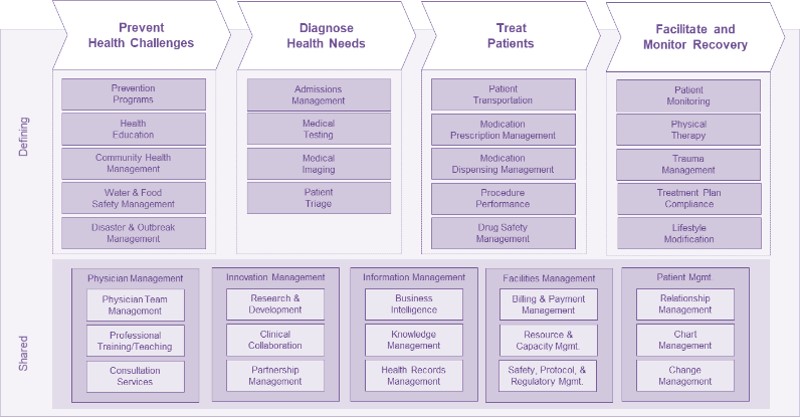
Sample business architecture/ capability map for healthcare
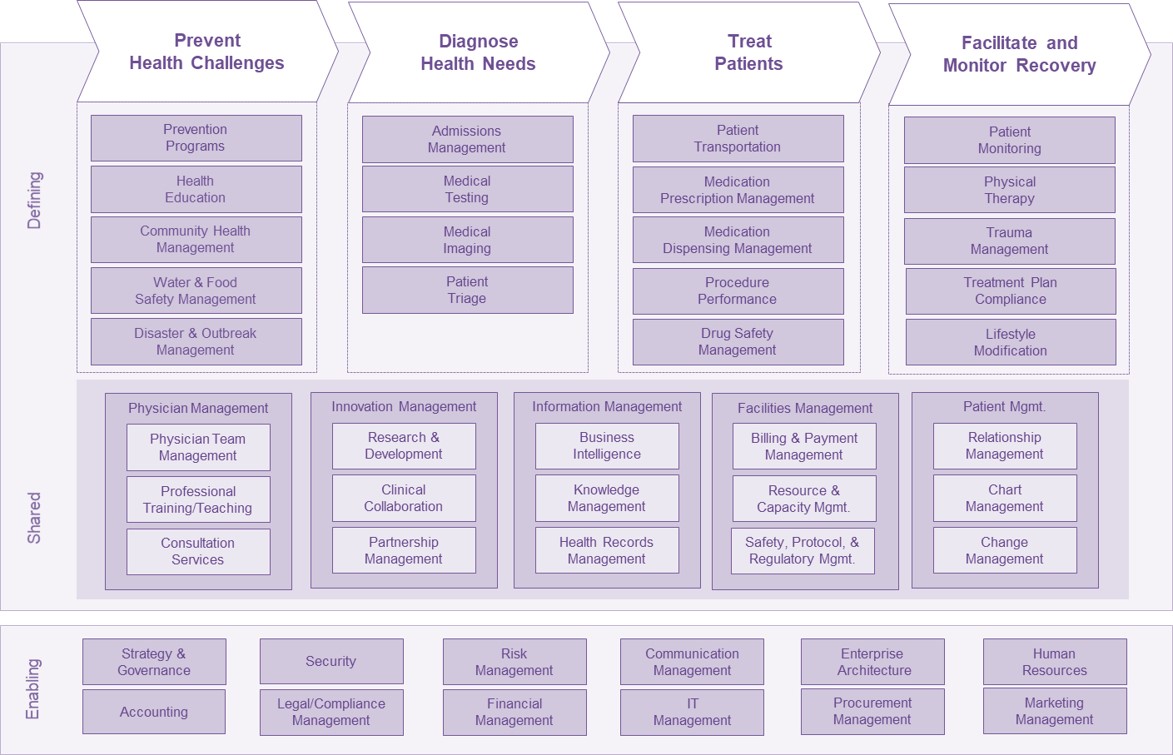
Your business architecture maps your value streams (value delivered to your customer or user personas) to the capabilities that deliver that value. A capability is the people, processes, and/or tools needed to deliver each value function.
Defining capabilities are specific to a value stream. Shared capabilities support multiple value streams. Enabling capabilities are core “keep the lights on” capabilities and enterprise functions needed to run your organization.
See Info-Tech’s industry coverage and reference architectures.
Download Document Your Business Architecture
Pattern: Value Stream – Market
Market/Customer Segment Alignment focuses products into the channels, verticals, or market segments in the same way customers and users view the organization.
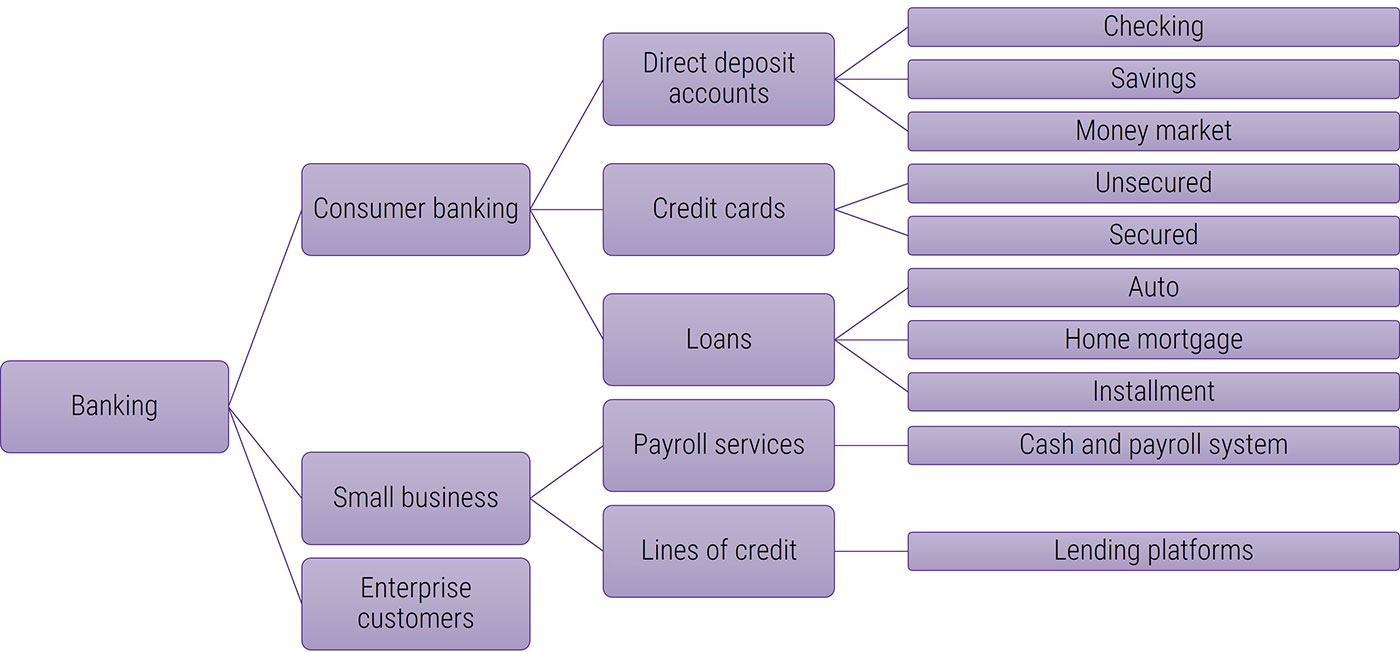
Example:
- Customers want one stop to solve all their issues, needs, and transactions.
- Banking includes consumer, small business, and enterprise.
- Consumer banking can be grouped by type of financial service: deposit accounts (checking, savings, money market), revolving credit (credit cards, lines of credit), term lending (mortgage, auto, installment).
- Each group of services has a unique set of applications and services that support the consumer product, with some core systems supporting the entire relationship.
Pattern: Value Stream – Line of Business (LoB)
Line of Business Alignment uses the operational structure as the basis for organizing products and services into families that support each area.
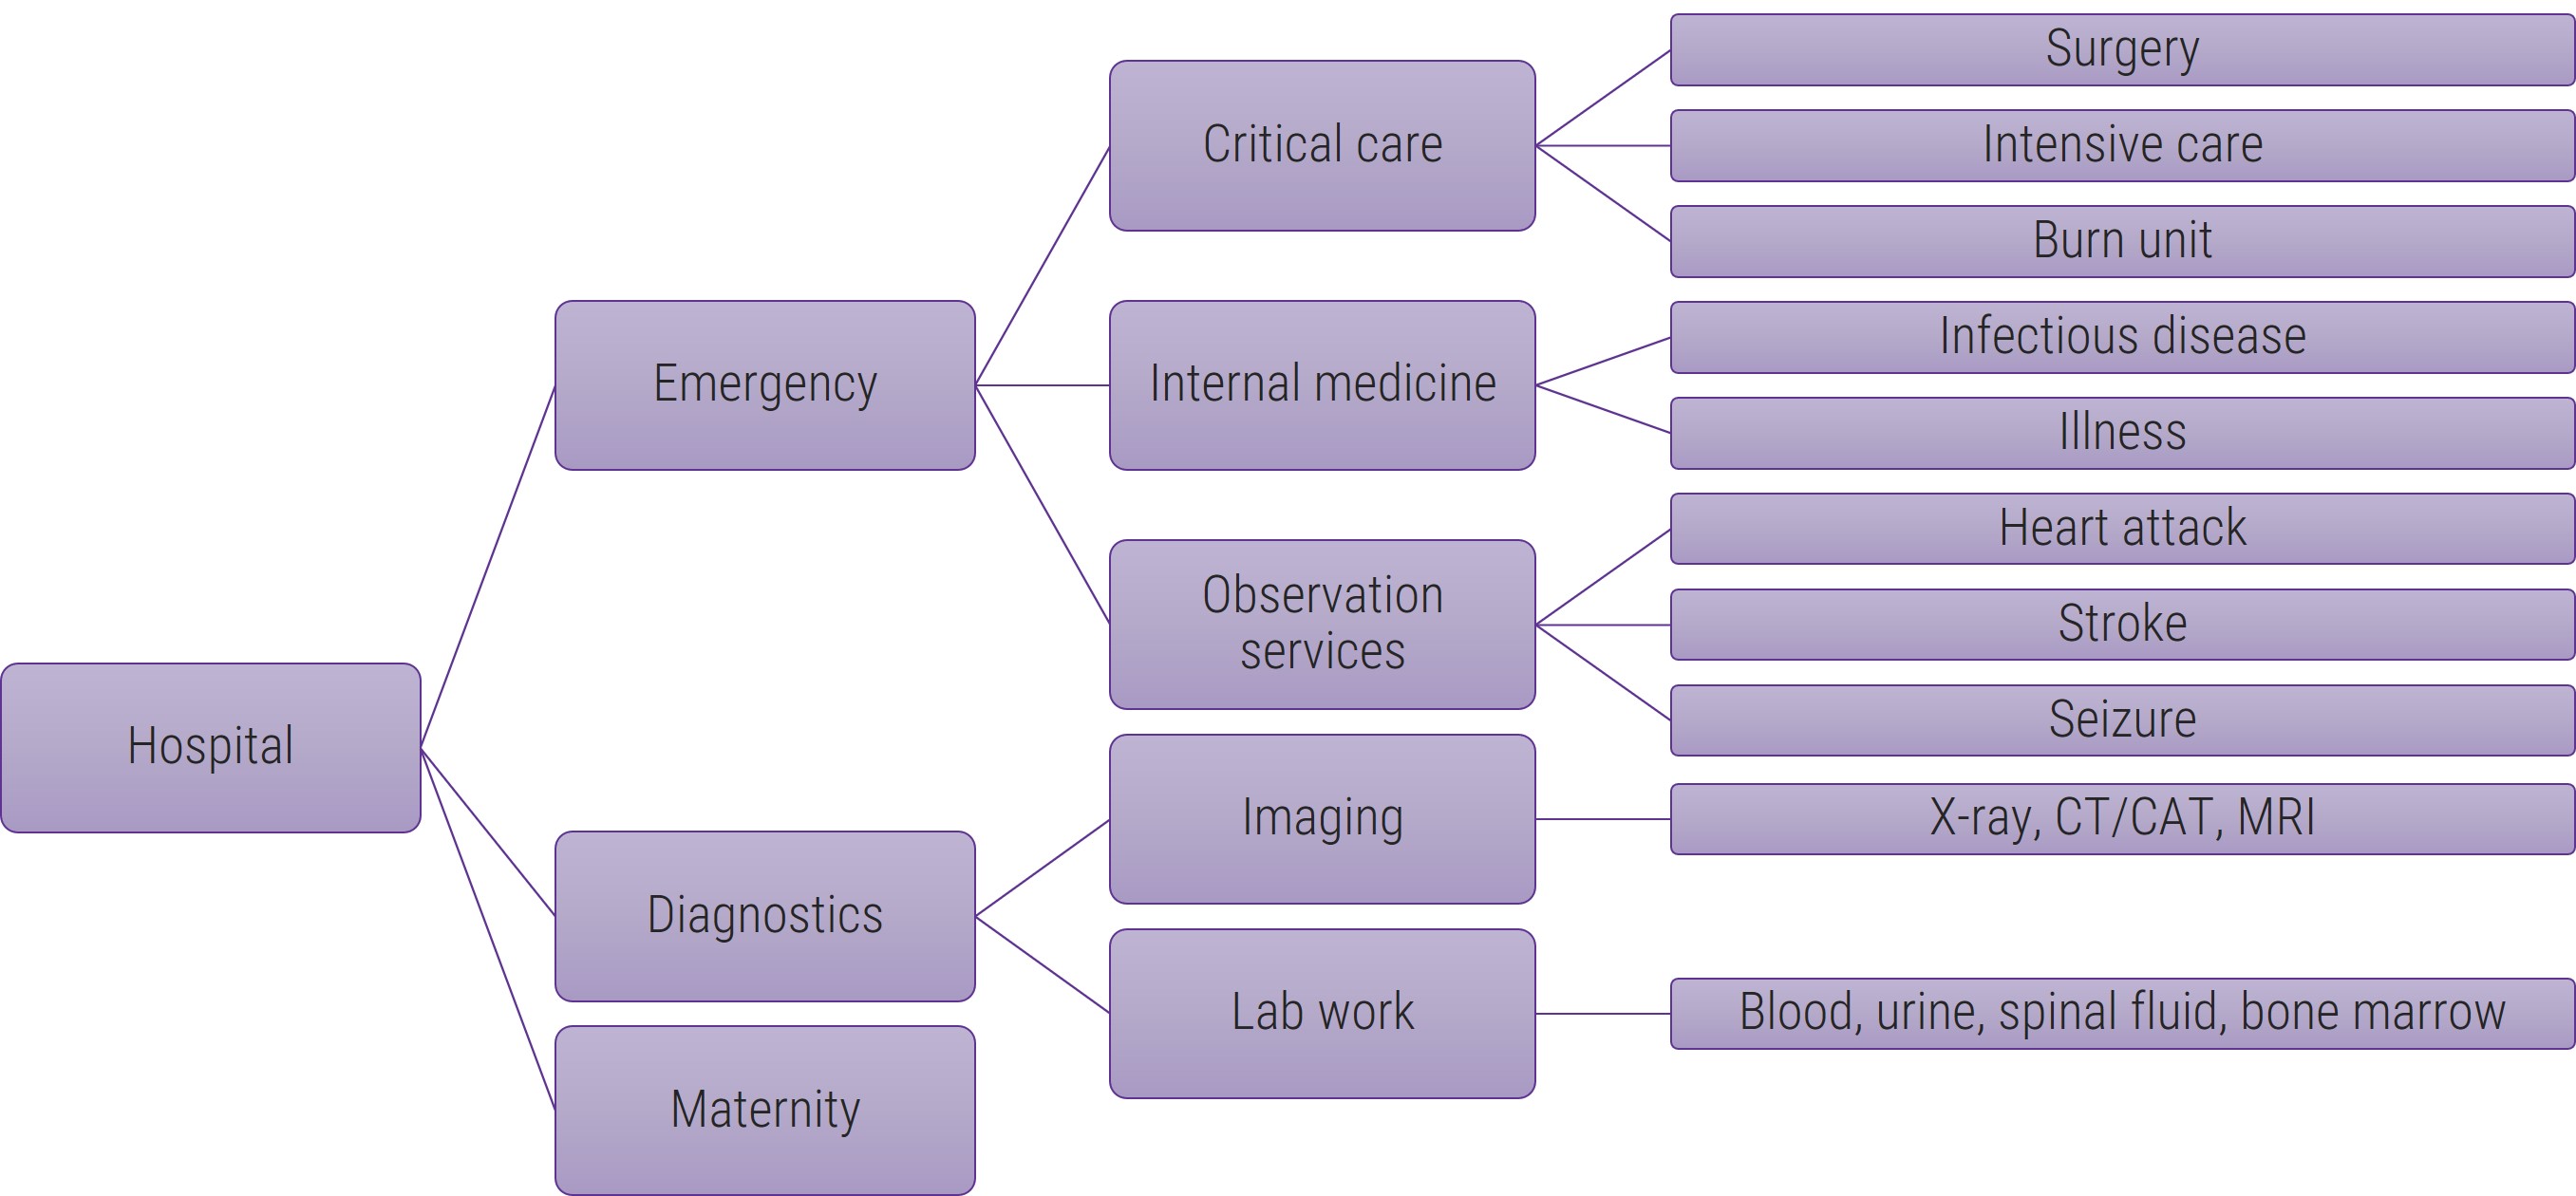
Example:
- LoB alignment favors continuity of services, tools, and skills based on internal operations over unified customer services.
- A hospital requires care and services from many different operational teams.
- Emergency services may be internally organized by the type of care and emergency to allow specialized equipment and resources to diagnose and treat the patients, relying on support teams for imaging and diagnostics to support care.
- This model may be efficient and logical from an internal viewpoint but can cause gaps in customer services without careful coordination between product teams.
Pattern: Enterprise Applications
A division or group delivers enabling capabilities, and the team’s operational alignment maps directly to the modules/components of an enterprise application and other applications that support the specific business function.
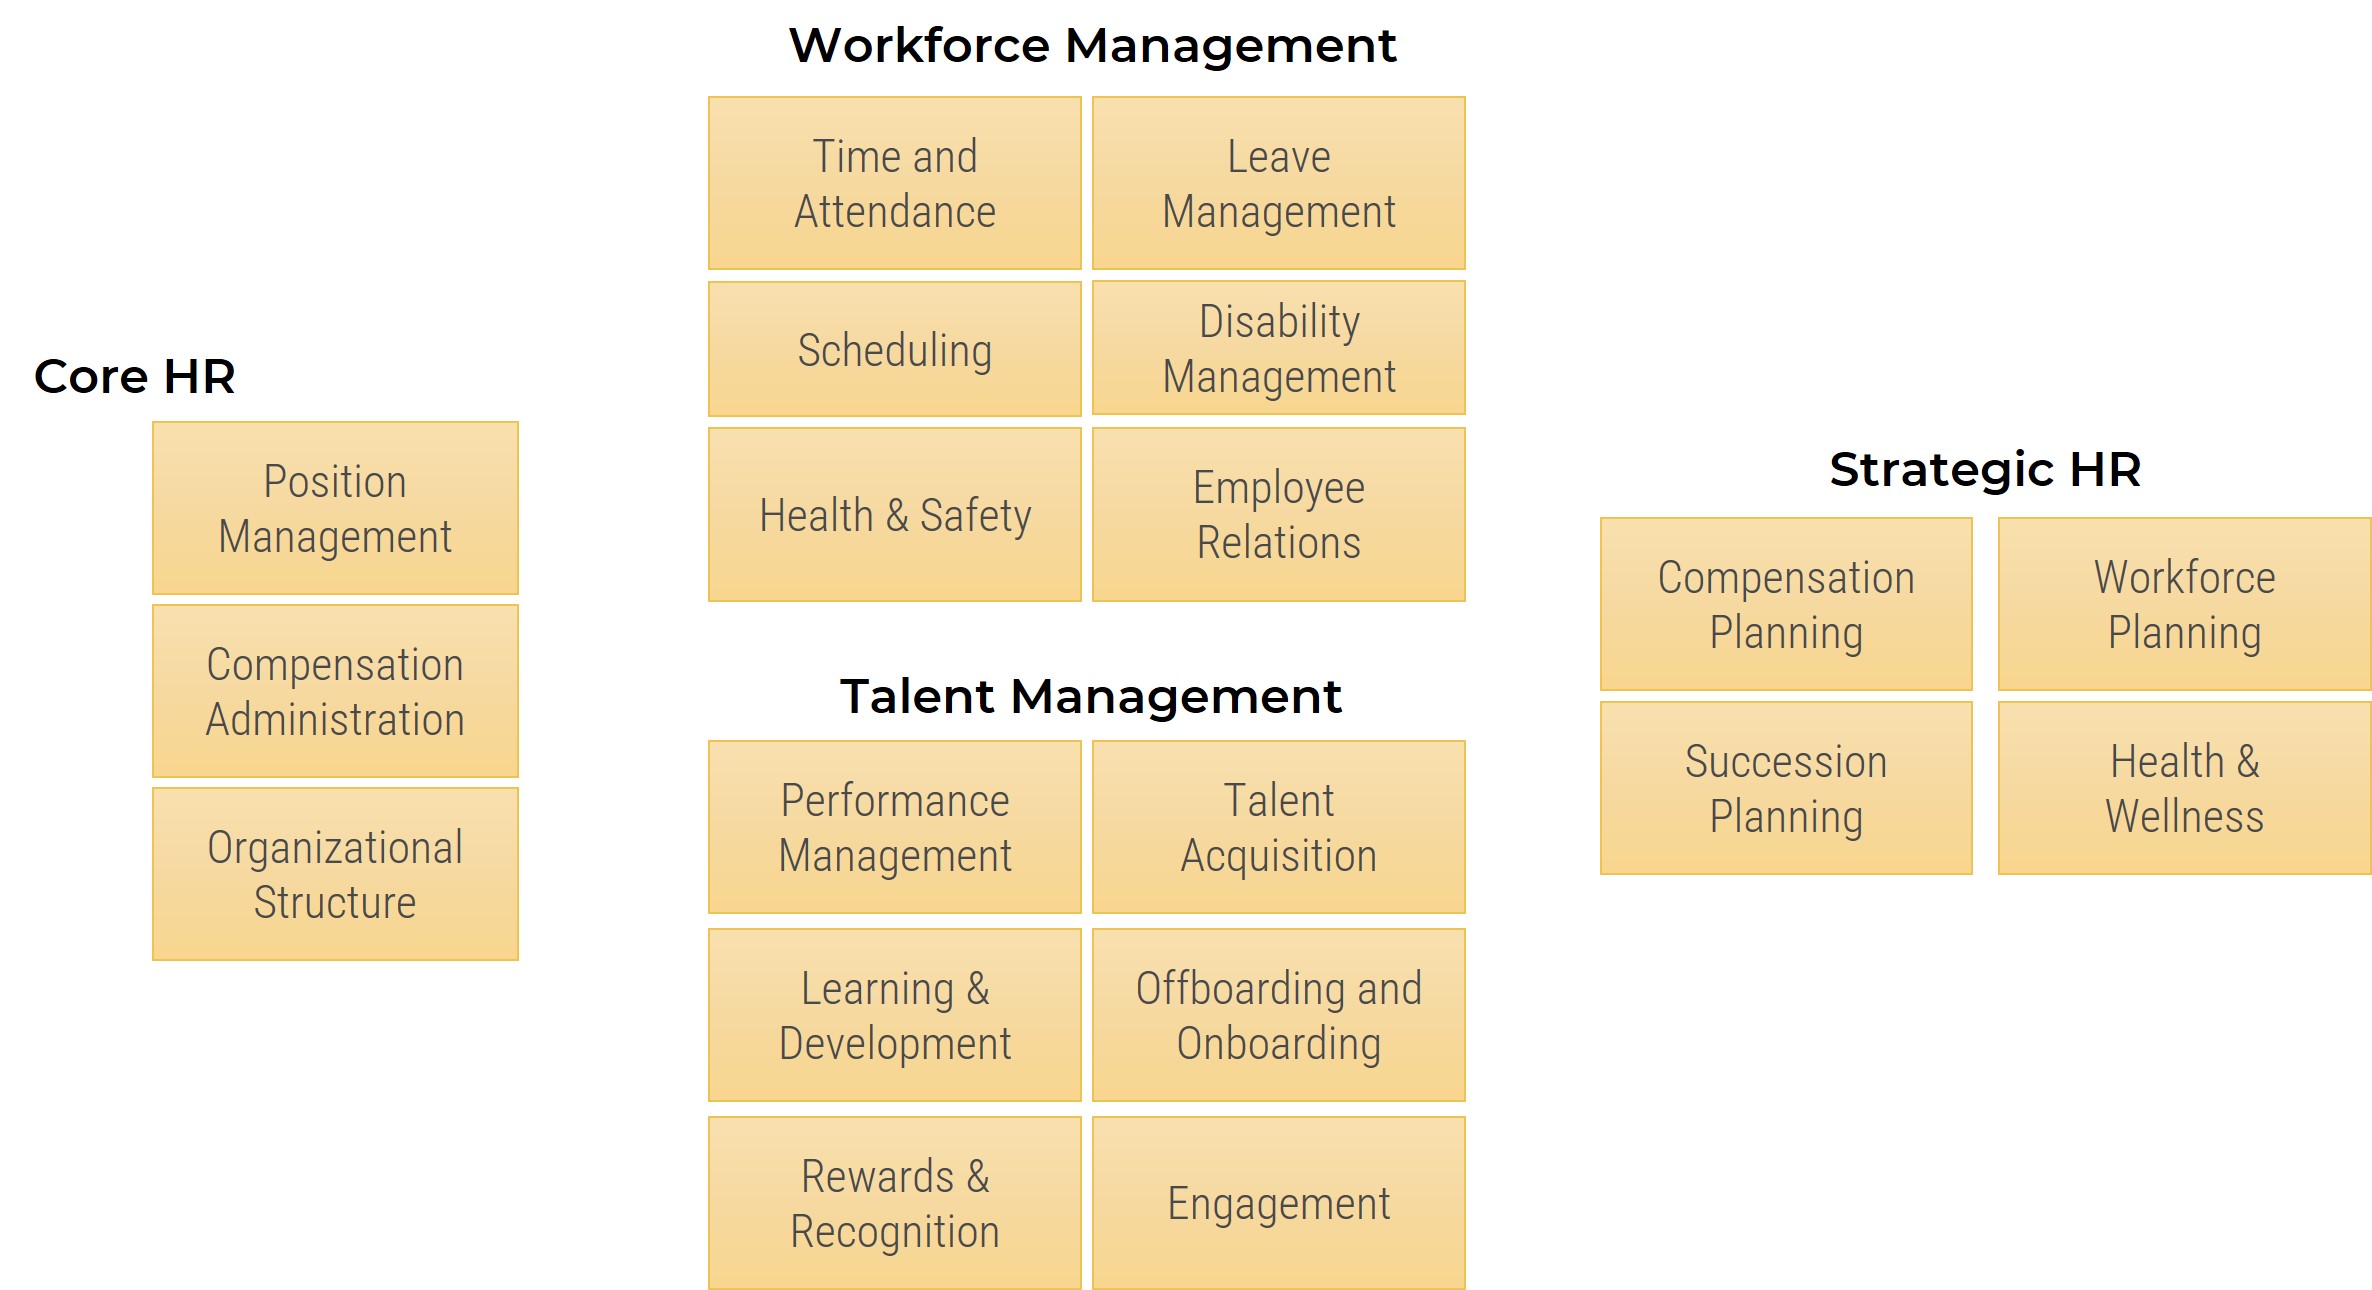
Example:
- Human resources is one corporate function. Within HR, however, there are subfunctions that operate independently.
- Each operational team is supported by one or more applications or modules within a primary HR system.
- Even though the teams work independently, the information they manage is shared with or ties into processes used by other teams. Coordination of efforts helps provide a higher level of service and consistency.
For additional information about HRMS, please download Get the Most Out of Your HRMS.
Pattern: Shared Services
Grouping by service type, knowledge area, or technology allows for specialization while families align service delivery to shared business capabilities.
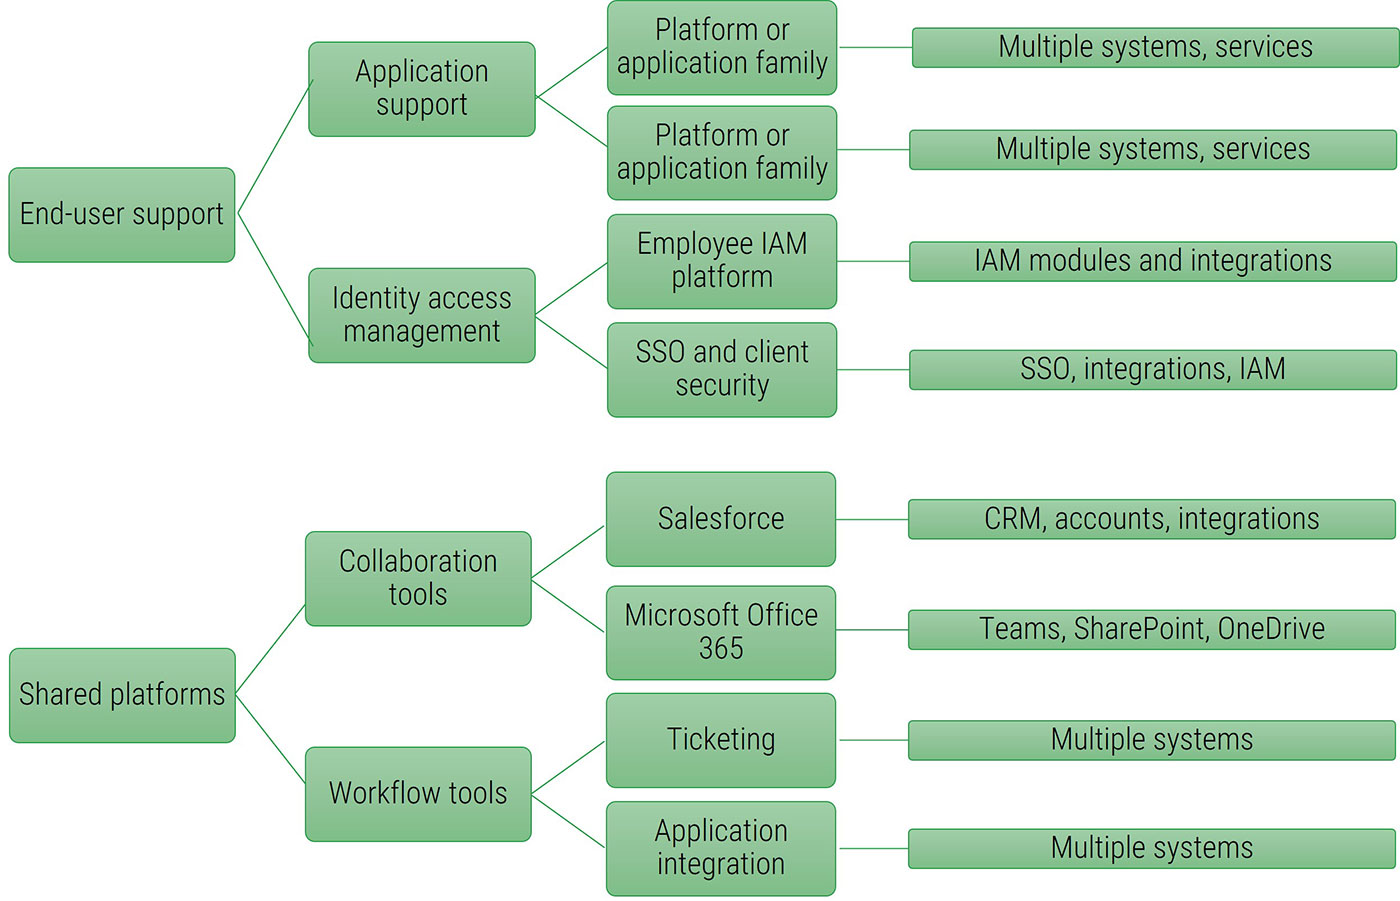
Example:
- Recommended for governance, risk, and compliance; infrastructure; security; end-user support; and shared platforms (workflow, collaboration, imaging/record retention). Direct hierarchies do not necessarily exist within the shared service family.
- Service groupings are common for service owners (also known as support managers, operations managers, etc.).
- End-user ticketing comes through a common request system, is routed to the team responsible for triage, and then is routed to a team for resolution.
- Collaboration tools and workflow tools are enablers of other applications, and product families might support multiple apps or platforms delivering that shared capability.
Pattern: Technical
Technical grouping is used in Shared Services or as a family grouping method within a Value Stream Alignment (Capability, Market, LoB) product family.
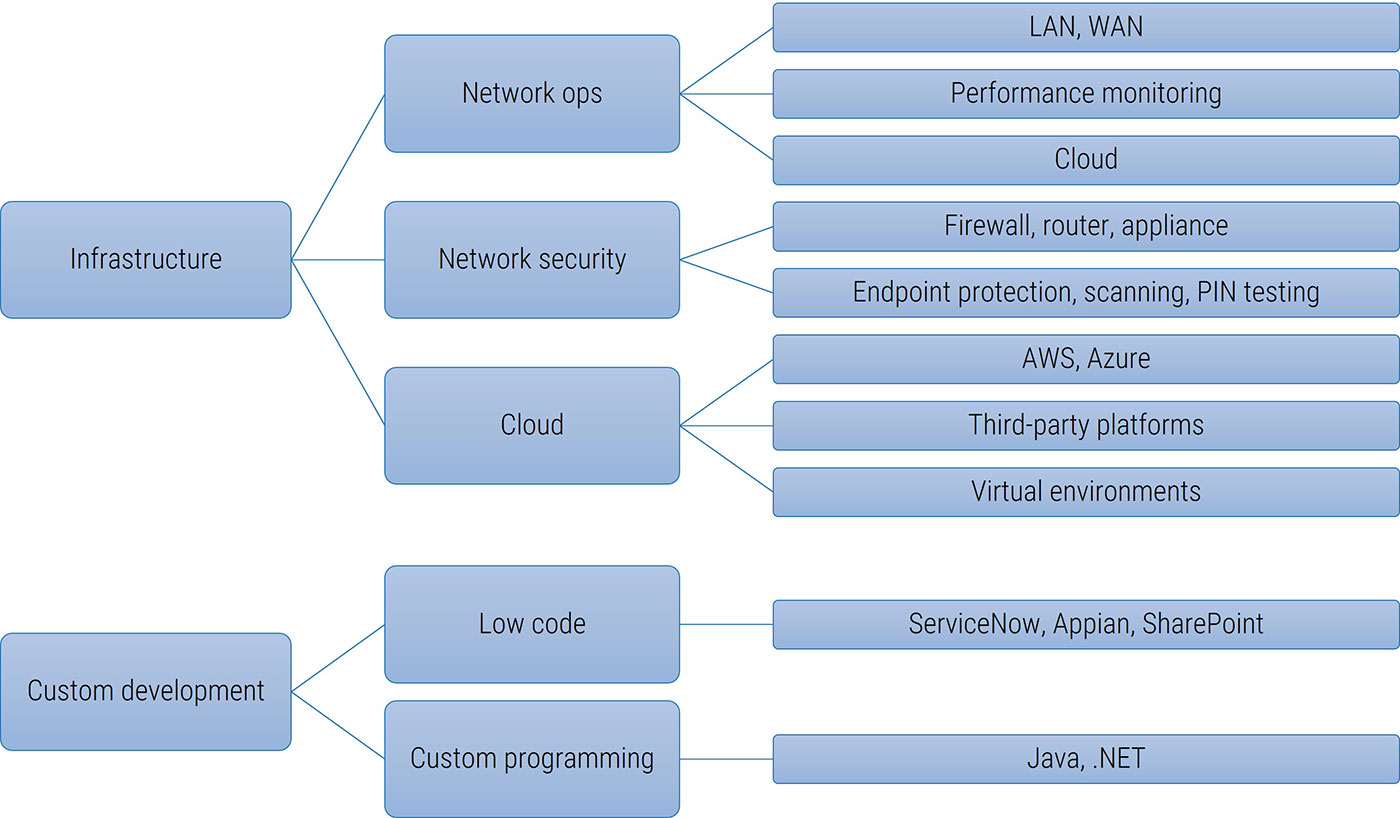
Example:
- Within Shared Services, Technical product grouping focuses on domains requiring specific experience and knowledge not common to typical product teams. This can also support insourcing so other product teams do not have to build their own capacity.
- Within a Market or LoB team, these same technical groups support specific tools and services within that product family only while also specializing in the business domain.
- Alignment into tool, platform, or skill areas improves delivery capabilities and resource scalability.
Pattern: Organizational Alignment
Eventually in your product hierarchy, the management structure functions as the product management team.
- When planning your product families, be careful determining when to merge product families into the management team structure.
- Since the goal of scaling products into families is to align product delivery roadmaps to enterprise goals and enable value realization, the primary focus of scaling must be operational.
- Alignment to the organizational chart should only occur when the product families report into an HR manager who has ownership for the delivery and value realization for all product and services within that family.
Download Build a Better Product Owner for role support.
2.2.1 Arrange your applications and services into product families
1-4 hours
- (Optional but recommended) Define your value streams and capabilities on the App Capability List tab in the Deliver Digital Products at Scale Workbook.
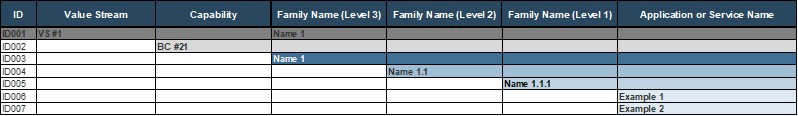
- On the Product Families tab, build your product family hierarchy using the following structure:
- Value Stream > Capability > Family 3 > Family 2 > Family 1 > Product/Service.
- If you are not using a Value Stream > Capability grouping, you can leave these blank for now.
 If you previously completed an application inventory using one of our application portfolio management (APM) resources, you can paste values here. Do not paste cells, as Excel may create a cell reference or replace the current conditional formatting.
Output
Participants
- Product owners
- Product managers
- Development team leads
- Portfolio managers
- Business analysts
Record the results in the Deliver Digital Products at Scale Workbook.
2.2.2 Define enabling and supporting applications
1-4 hours
- Review your grouping from the reverse direction or with different patterns to validate the grouping. Consider each grouping.
- Does it operationally align the products and families to best cascade enterprise goals and priorities while validating enabling capabilities?
- In the next phase, when defining your roadmap strategy, you may wish to revisit this phase and adjust as needed.
Select and enter enabling or dependent applications to the right of each product.

Output
- Product families
- Enabling applications
- Dependent applications
Participants
- Product owners
- Product managers
- Development team leads
- Portfolio managers
- Business analysts
Record the results in the Deliver Digital Products at Scale Workbook.
Use a product canvas to define key elements of your product family
A product canvas is an excellent tool for quickly providing important information about a product family.
Product owners/managers
Provide target state to align child product and product family roadmaps.
Stakeholders
Communicate high-level concepts and key metrics with leadership teams and stakeholders.
Strategy teams
Use the canvas as a tool for brainstorming, scoping, and ideation.
Operations teams
Share background overview to align operational team with end-user value.
Impacted users
Refine communication strategy and support based on user impacts and value realization.
Download Deliver on Your Digital Product Vision.
Product Family Canvas: Define your core information
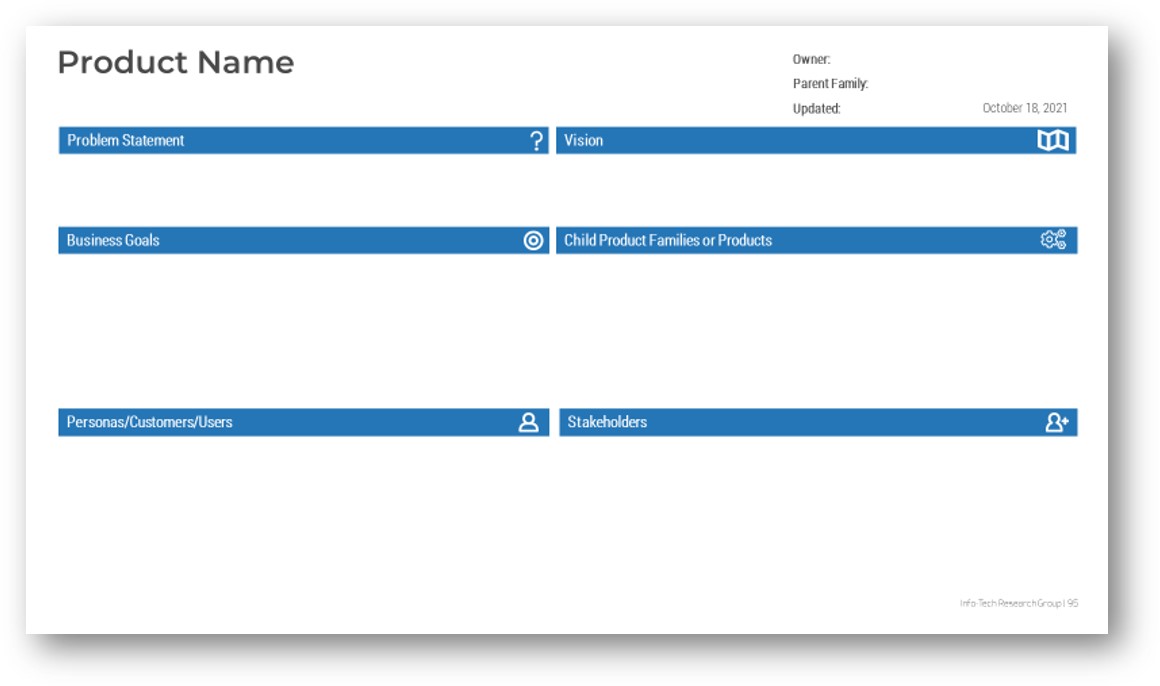
Problem Statement: The problem or need the product family is addressing
Business Goals: List of business objectives or goals for the product
Personas/Customers/Users: List of groups who consume the product/service
Vision: Vision, unique value proposition, elevator pitch, or positioning statement
Child Product Families or Products: List of product families or products within this family
Stakeholders: List of key resources, stakeholders, and teams needed to support the product or service
Download Deliver on Your Digital Product Vision.
2.2.3 Build your product family canvas
30-60 minutes
- Complete the following fields to build your product family canvas in your Digital Product Family Strategy Playbook:
- Product family name
- Product family owner
- Parent product family name
- Problem that the family is intending to solve (For additional help articulating your problem statement, refer to Deliver on Your Digital Product Vision.)
- Product family vision/goals (For additional help writing your vision, refer to Deliver on Your Digital Product Vision..)
- Child product or product family name(s)
- Primary customers/users (For additional help with your product personas, download and complete Deliver on Your Digital Product Vision..)
- Stakeholders (If you aren’t sure who your stakeholders are, fill this in after completing the stakeholder management exercises in phase 3.)
Output
Participants
- Product owners
- Product managers
- Development team leads
- Portfolio managers
- Business analysts
Record the results in the Digital Product Family Strategy Playbook.
Phase 3
Ensure Alignment Between Products and Families
| Phase 1 | Phase 2 | Phase 3 | Phase 4 | Phase 5 |
|---|
1.1 Understand the organizational factors driving product-centric delivery 1.2 Establish your organization’s product inventory | 2.1 Determine your approach to scale product families 2.2 Define your product families | 3.1 Leverage product family roadmaps 3.2 Use stakeholder management to improve roadmap communication 3.3 Configure your product family roadmaps 3.4 Confirm product family to product alignment | 4.1 Assess your organization’s delivery readiness 4.2 Understand your delivery options 4.3 Determine your operating model 4.4 Identify how to fund product family delivery | 5.1 Learn how to introduce your digital product family strategy 5.2 Communicate changes on updates to your strategy 5.3 Determine your next steps |
This phase will walk you through the following activities:
- 3.1.1 Evaluate your current approach to product family communication
- 3.2.1 Visualize interrelationships among stakeholders to identify key influencers
- 3.2.2 Group stakeholders into categories
- 3.2.3 Prioritize your stakeholders
- 3.3.1 Define the communication objectives and audience of your product family roadmaps
- 3.3.2 Identify the level of detail that you want your product family roadmap artifacts to represent
- 3.4.1 Validate business value alignment between products and their product families
This phase involves the following participants:
- Product owners
- Product managers
- Portfolio managers
- Business analysts
Step 3.1
Leverage product family roadmaps
Activities
3.1.1 Evaluate your current approach to product family communication
This step involves the following participants:
- Product owners
- Product managers
- Portfolio managers
- Business analysts
Outcomes of this step
- Understanding of what a product family roadmap is
- Comparison of Info-Tech’s position on product families to how you currently communicate about product families
Aligning products’ goals with families
Without alignment between product family goals and their underlying products, you aren’t seeing the full picture.
Adapted from: Pichler," What Is Product Management?"
- Aligning product strategy to enterprise goals needs to happen through the product family.
- A product roadmap has traditionally been used to express the overall intent and visualization of the product strategy.
- Connecting the strategy of your products with your enterprise goals can be done through the product family roadmap.
Leveraging product family roadmaps
It’s more than a set of colorful boxes.
✓ Lays out a strategy for your product family.
✓ Is a statement of intent for your family of products.
✓ Communicates direction for the entire product family and product teams.
✓ Directly connects to the organization’s goals.
However, it is not:
x Representative of a hard commitment.
x A simple combination of your current product roadmaps.
x A technical implementation plan.
Product family roadmaps
There is no such thing as a roadmap that never changes.
Your product family roadmap represents a broad statement of intent and high-level tactics to get closer to the organization’s goals.
All good product family roadmaps embrace change!
Your strategic intentions are subject to volatility, especially those planned further in the future. The more costs you incur in planning, the more you leave yourself exposed to inefficiency and waste if those plans change.
Info-Tech Insight
A good product family roadmap is intended to manage and communicate the inevitable changes as a result of market volatility and changes in strategy.
Product family roadmaps are more strategic by nature
While individual product roadmaps can be different levels of tactical or strategic depending on a variety of market factors, your options are more limited when defining roadmaps for product families.
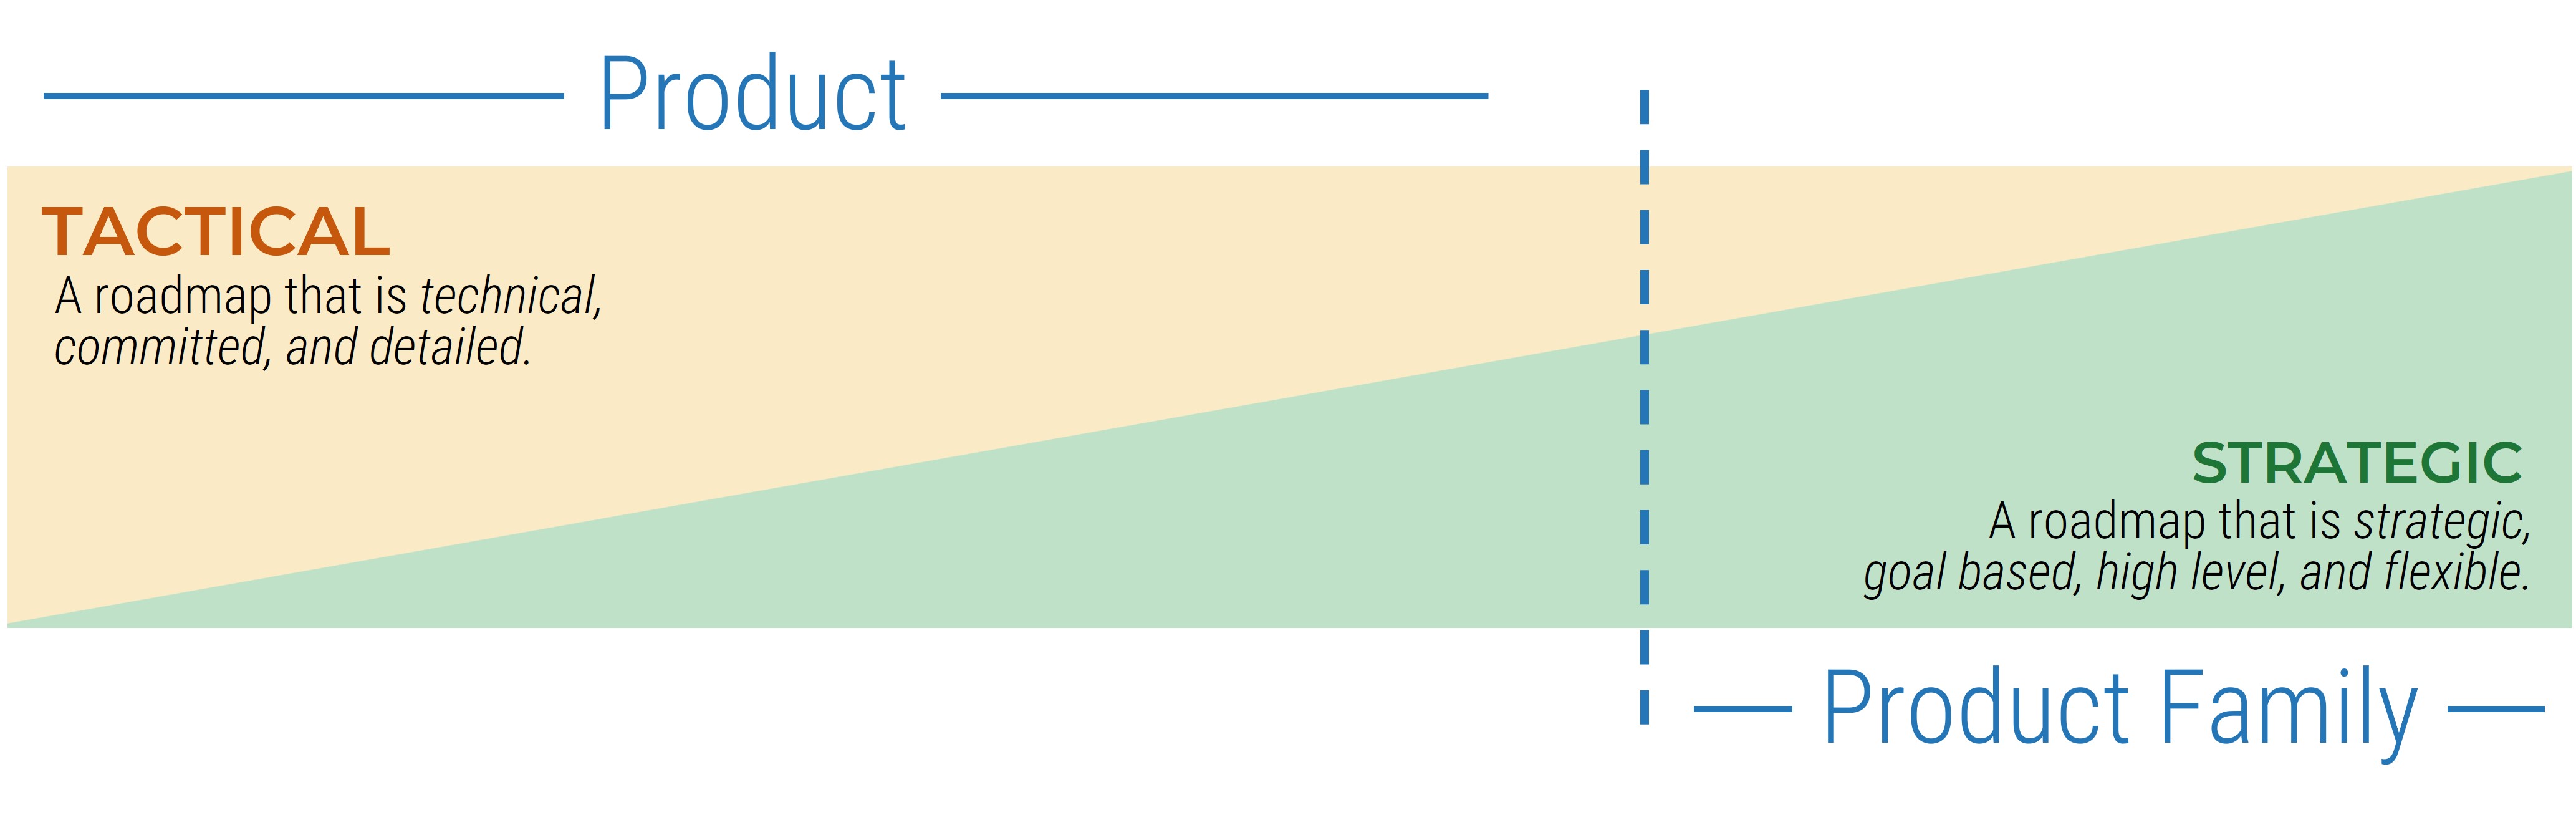
Info-Tech Insight
Roadmaps for your product family are, by design, less detailed. This does not mean they aren’t actionable! Your product family roadmap should be able to communicate clear intentions around the future delivery of value in both the near and long term.
Reminder: Your enterprise vision provides alignment for your product family roadmaps
Not knowing the difference between enterprise vision and goals will prevent you from both dreaming big and achieving your dream.
Your enterprise vision represents your “north star” – where you want to go. It represents what you want to do.
- Your enterprise goals represent what you need to achieve in order to reach your enterprise vision.
- A key element of operationalizing your vision.
- Your strategy, initiatives, and features will align with one or more goals.
Download Deliver on Your Digital Product Vision for support.
Multiple roadmap views can communicate differently, yet tell the same truth
Audience | Business/ IT Leaders | Users/Customers | Delivery Teams |
|---|
Roadmap View | Portfolio | Product Family | Technology |
|---|
Objectives | To provide a snapshot of the portfolio and priority products | To visualize and validate product strategy | To coordinate broad technology and architecture decisions |
|---|
Artifacts | Line items or sections of the roadmap are made up of individual products, and an artifact represents a disposition at its highest level. | Artifacts are generally grouped by product teams and consist of strategic goals and the features that realize those goals. | Artifacts are grouped by the teams who deliver that work and consist of technical capabilities that support the broader delivery of value for the product family. |
|---|
Typical elements of a product family roadmap
While there are others, these represent what will commonly appear across most family-based roadmaps.
GROUP/CATEGORY: Groups are collections of artifacts. In a product family context, these are usually product family goals, value streams, or products.
ARTIFACT: An artifact is one of many kinds of tangible by-products produced during the delivery of products. For a product family, the artifacts represented are capabilities or value streams.
MILESTONE: Points in the timeline when established sets of artifacts are complete. This is a critical tool in the alignment of products in a given family.
TIME HORIZON: Separated periods within the projected timeline covered by the roadmap.
3.1.1 Evaluate your current approach to product family communication
1-2 hours
- Write down how you currently communicate your intentions for your products and family of products.
- Compare and contrast this to how this blueprint defines product families and product family roadmaps.
- Consider the similarities and the key gaps between your current approach and Info-Tech’s definition of product family roadmaps.
Output
- Your documented approach to product family communication
Participants
- Product owners
- Stakeholders
Record the results in the Deliver Digital Products at Scale Workbook.
Step 3.2
Use stakeholder management to improve roadmap communication
Activities
3.2.1 Visualize interrelationships among stakeholders to identify key influencers
3.2.2 Group stakeholders into categories
3.2.3 Prioritize your stakeholders
Info-Tech Note
If you have done the stakeholder exercises in Deliver on Your Digital Product Vision or Build a Better Product Owner u don’t need to repeat the exercises from scratch.
You can bring the results forward and update them based on your prior work.
This step involves the following participants:
- Product owners
- Product managers
- Portfolio managers
- Business analysts
Outcomes of this step
- Relationships among stakeholders and influencers
- Categorization of stakeholders and influencers
- Stakeholder and influencer prioritization
Reminder: Not everyone is a user!
USERS
Individuals who directly obtain value from usage of the product.
STAKEHOLDERS
Represent individuals who provide the context, alignment, and constraints that influence or control what you will be able to accomplish.
FUNDERS
Individuals both external and internal that fund the product initiative. Sometimes they are lumped in as stakeholders. However, motivations can be different.
For more information, see Deliver on Your Digital Product Vision.
A stakeholder strategy is a key part of product family attainment
A roadmap is only “good” when it effectively communicates to stakeholders. Understanding your stakeholders is the first step in delivering great product family roadmaps.
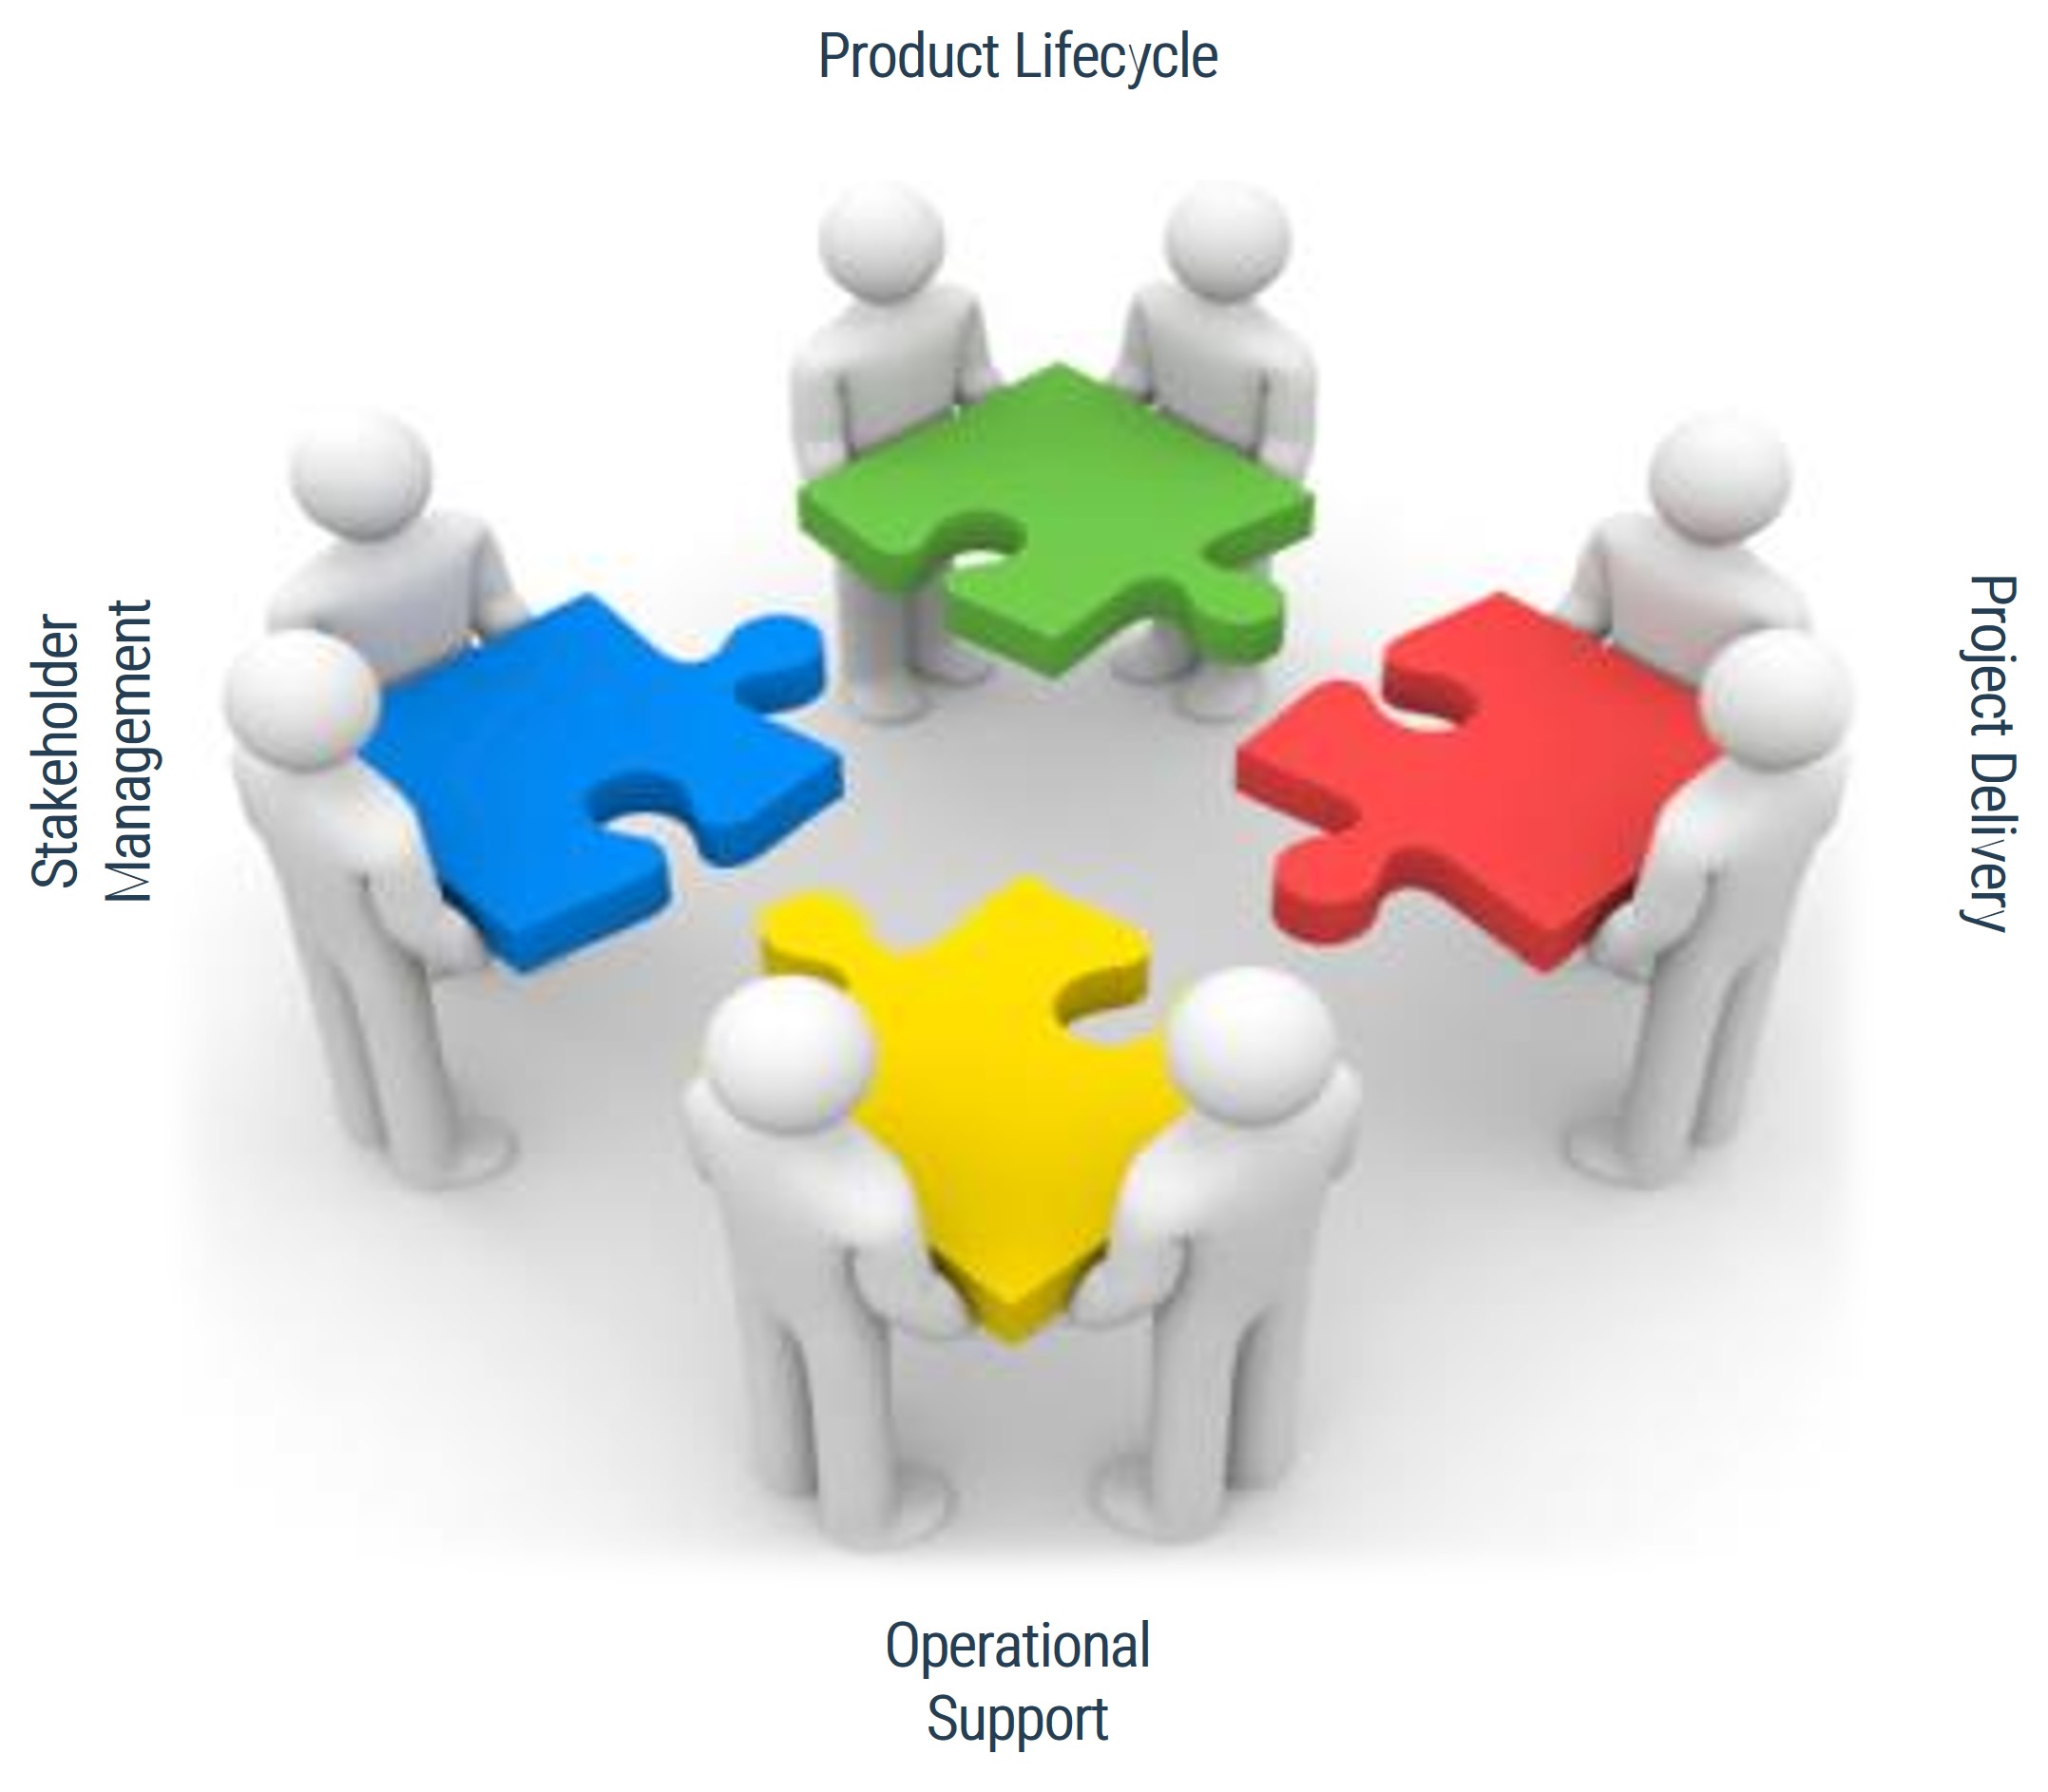
Create a stakeholder network map for product roadmaps and prioritization
Follow the trail of breadcrumbs from your direct stakeholders to their influencers to uncover hidden stakeholders.
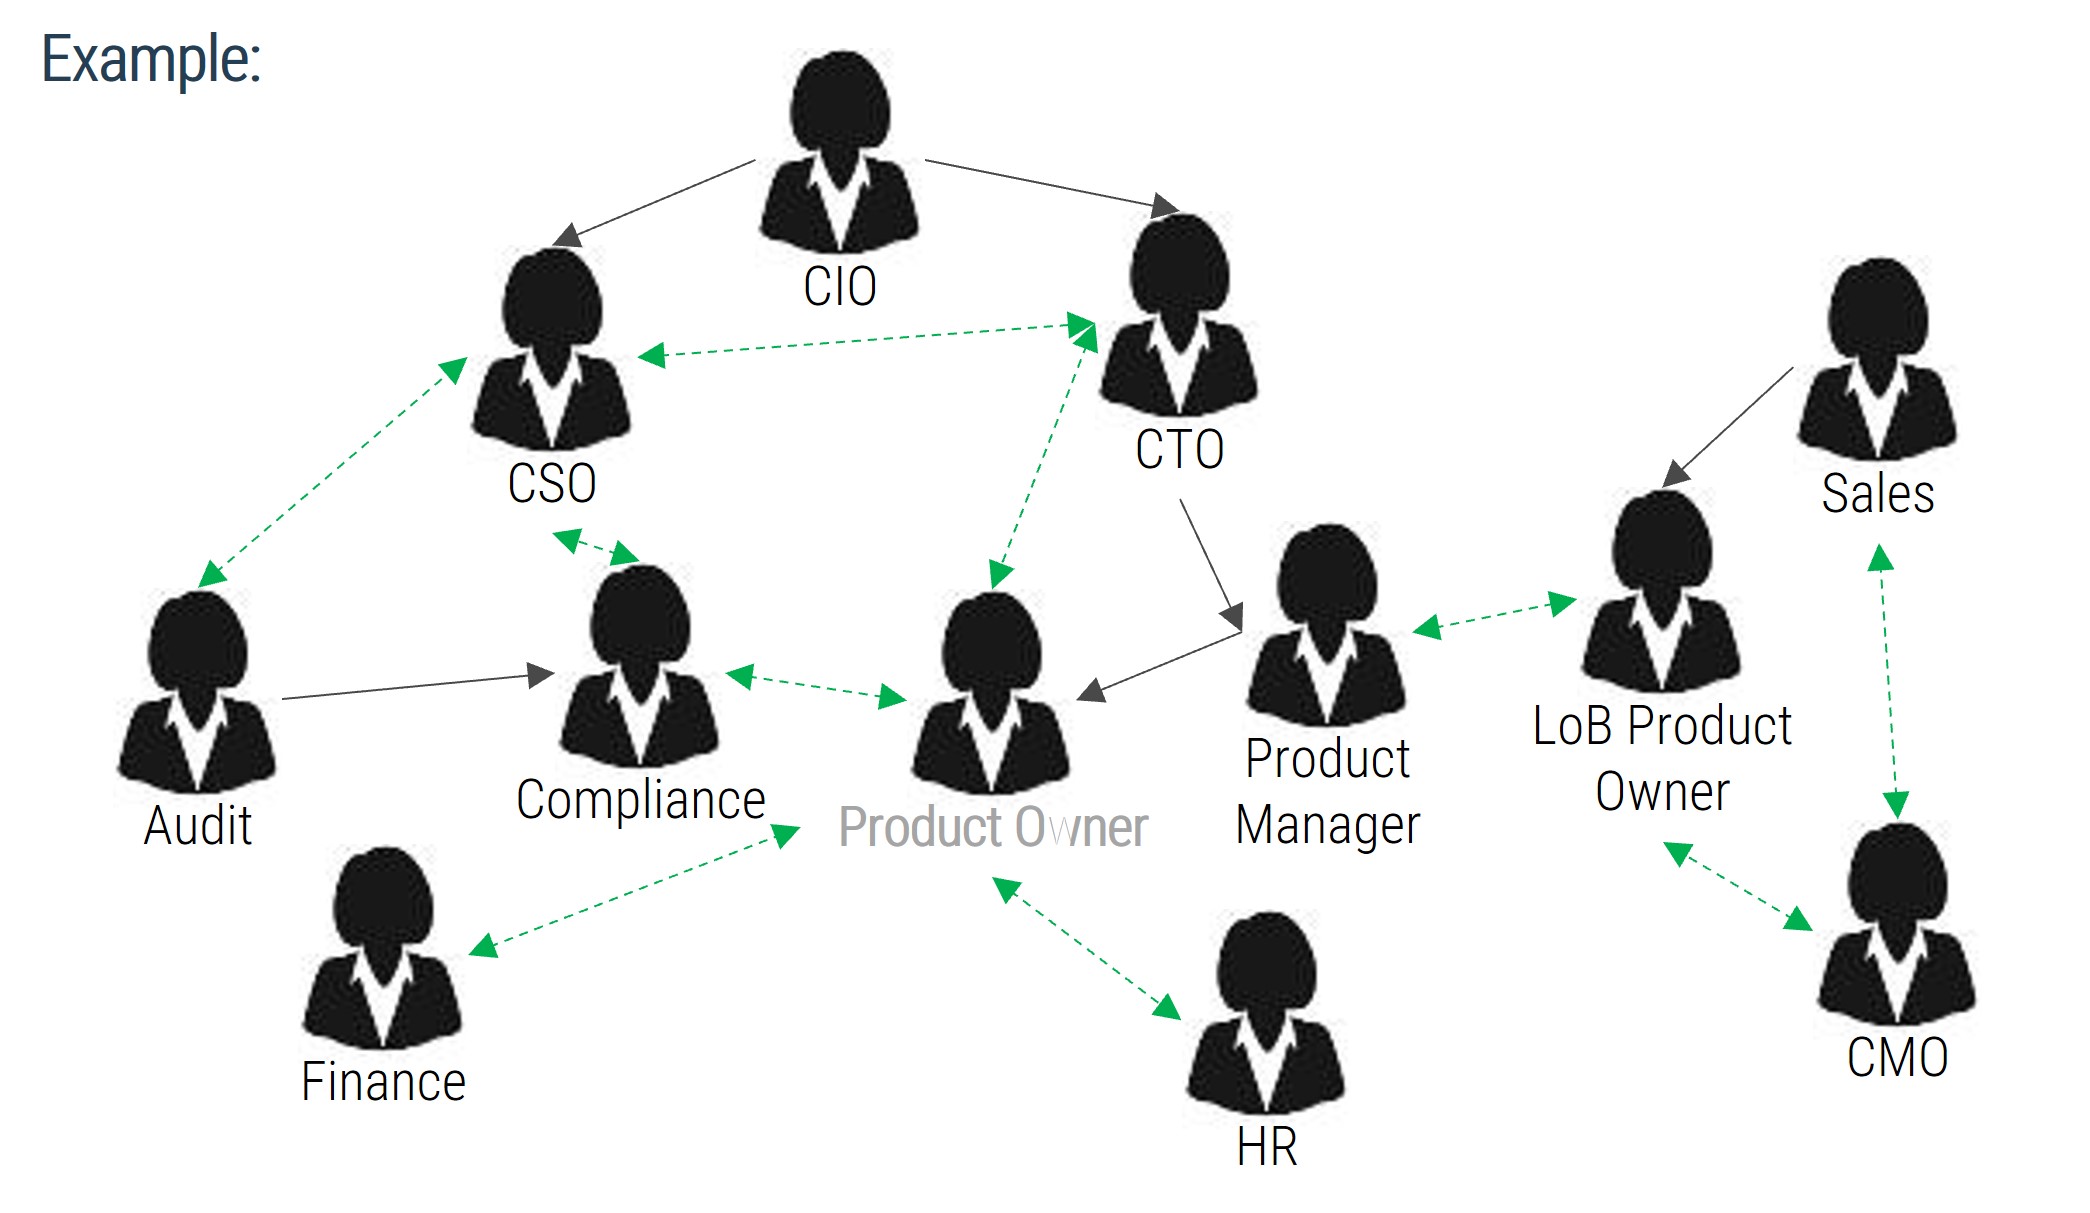
Legend
Black arrows: indicate the direction of professional influence
Dashed green arrows: indicate bidirectional, informal influence relationships
Info-Tech Insight
Your stakeholder map defines the influence landscape your product family operates in. It is every bit as important as the teams who enhance, support, and operate your product directly.
Use connectors to determine who may be influencing your direct stakeholders. They may not have any formal authority within the organization, but they may have informal yet substantial relationships with your stakeholders.
3.2.1 Visualize interrelationships among stakeholders to identify key influencers
60 minutes
- List direct stakeholders for your product.
- Determine the stakeholders of your stakeholders and consider adding each of them to the stakeholder list.
- Assess who has either formal or informal influence over your stakeholders; add these influencers to your stakeholder list.
- Construct a diagram linking stakeholders and their influencers together.
- Use black arrows to indicate the direction of professional influence.
- Use dashed green arrows to indicate bidirectional, informal influence relationships.
Output
- Relationships among stakeholders and influencers
Participants
- Product owners
- Stakeholders
Record the results in the Deliver Digital Products at Scale Workbook.
Categorize your stakeholders with a prioritization map
A stakeholder prioritization map helps product leaders categorize their stakeholders by their level of influence and ownership in the product and/or teams.
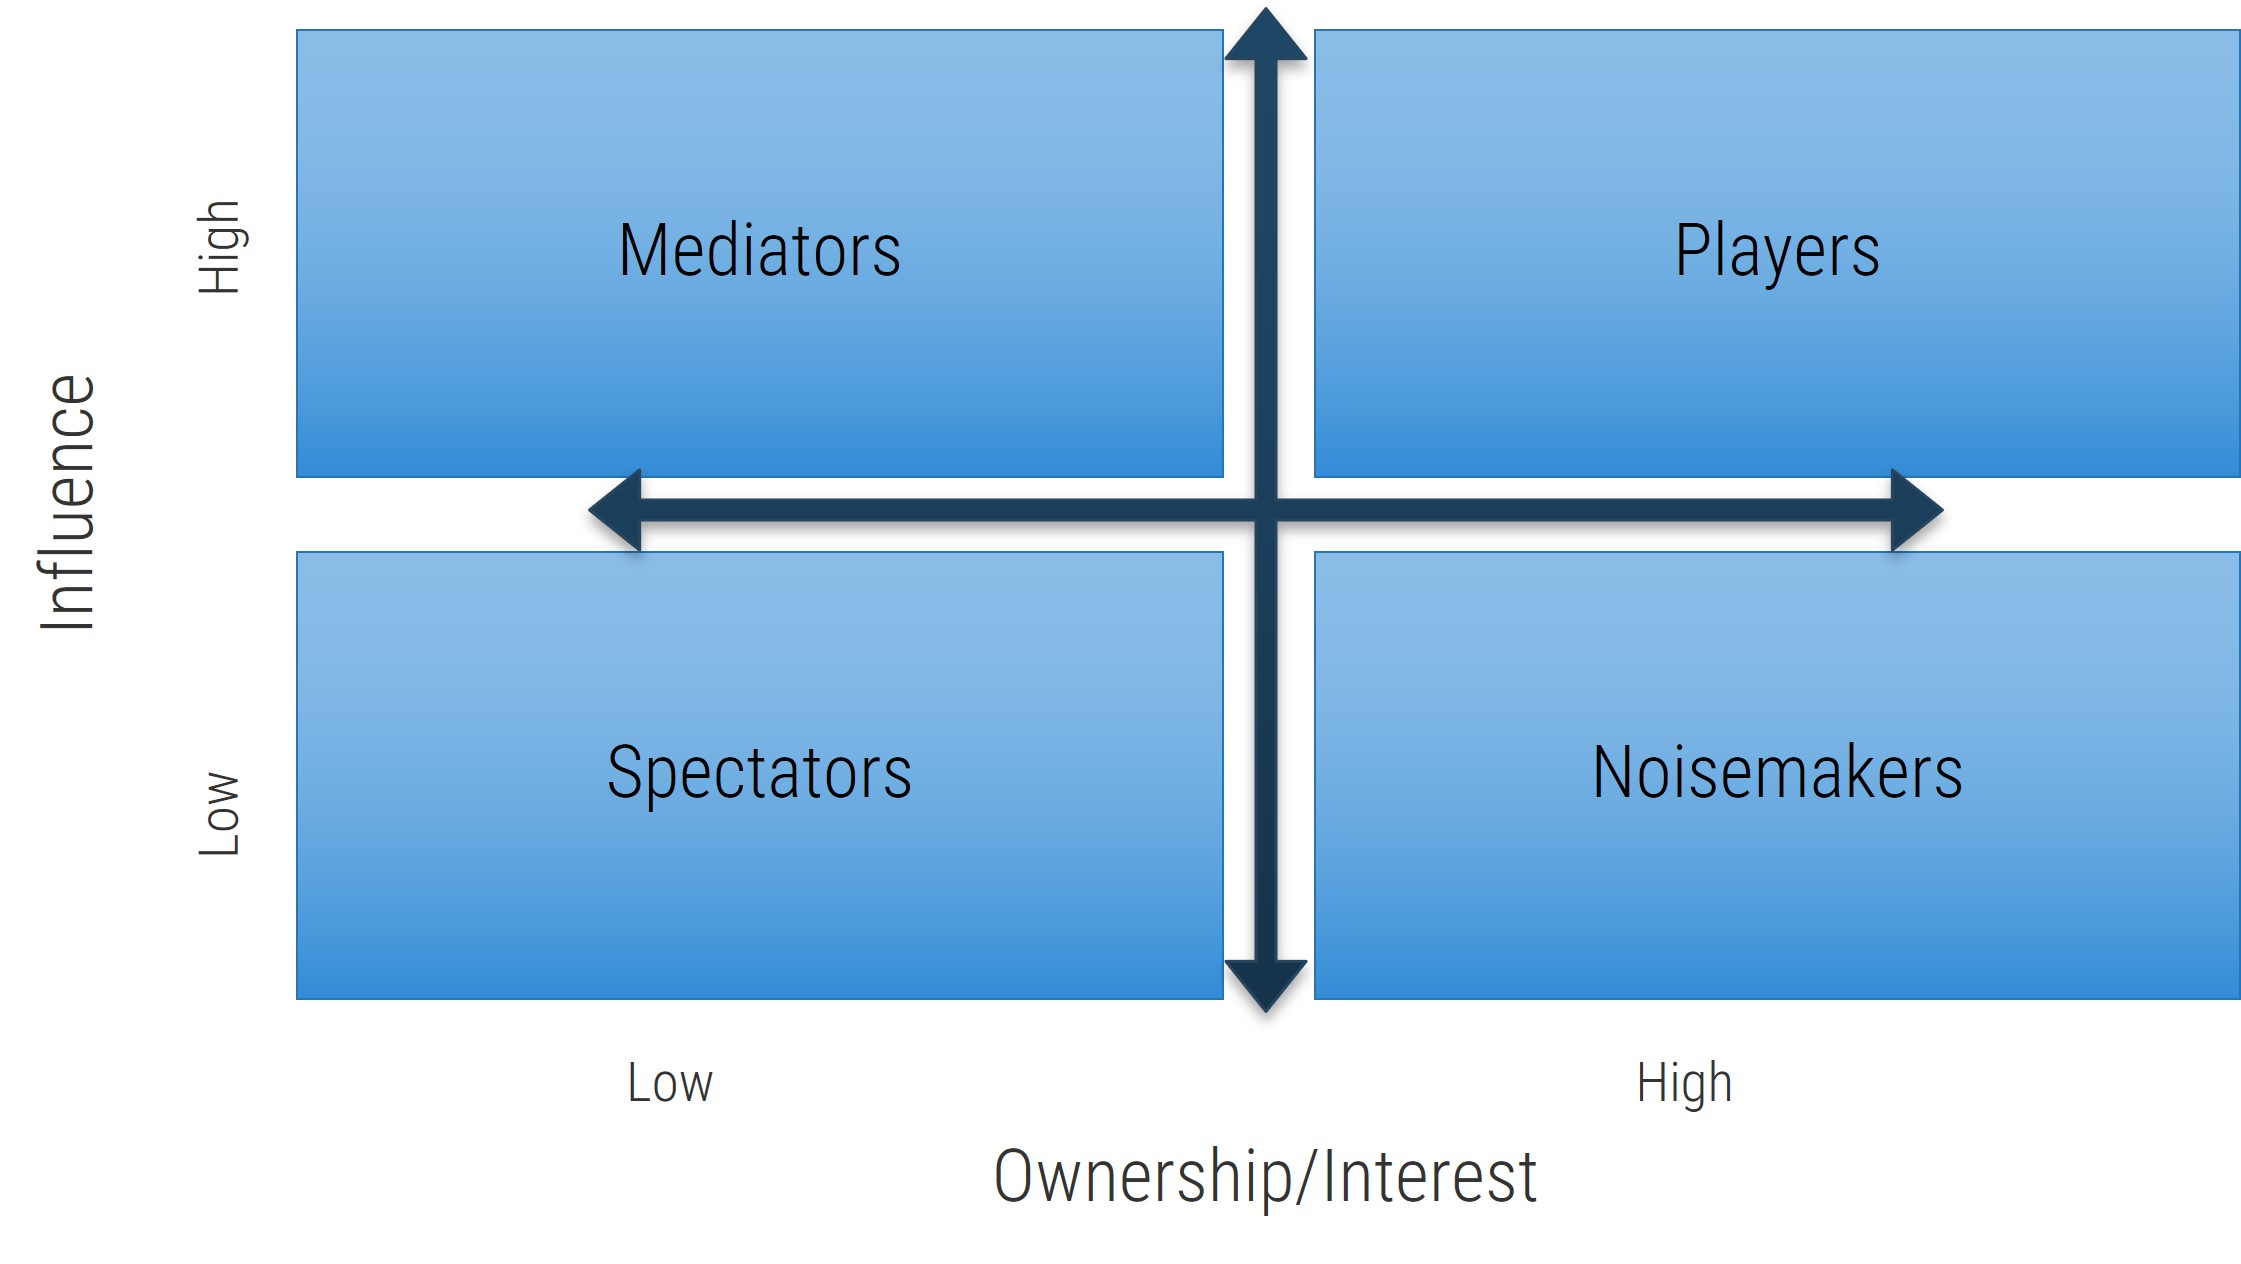
There are four areas in the map, and the stakeholders within each area should be treated differently.
Players – players have a high interest in the initiative and the influence to effect change over the initiative. Their support is critical, and a lack of support can cause significant impediment to the objectives.
Mediators – mediators have a low interest but significant influence over the initiative. They can help to provide balance and objective opinions to issues that arise.
Noisemakers – noisemakers have low influence but high interest. They tend to be very vocal and engaged, either positively or negatively, but have little ability to enact their wishes.
Spectators – generally, spectators are apathetic and have little influence over or interest in the initiative.
3.2.2 Group stakeholders into categories
30-60 minutes
- Identify your stakeholders’ interest in and influence on your product as high, medium, or low by rating the attributes below.
- Map your results to the model below to determine each stakeholder’s category.
| Level of Influence |
- Power: Ability of a stakeholder to effect change.
- Urgency: Degree of immediacy demanded.
- Legitimacy: Perceived validity of stakeholder’s claim.
- Volume: How loud their “voice” is or could become.
- Contribution: What they have that is of value to you.
|
| Level of Interest |
How much are the stakeholder’s individual performance and goals directly tied to the success or failure of the product? |
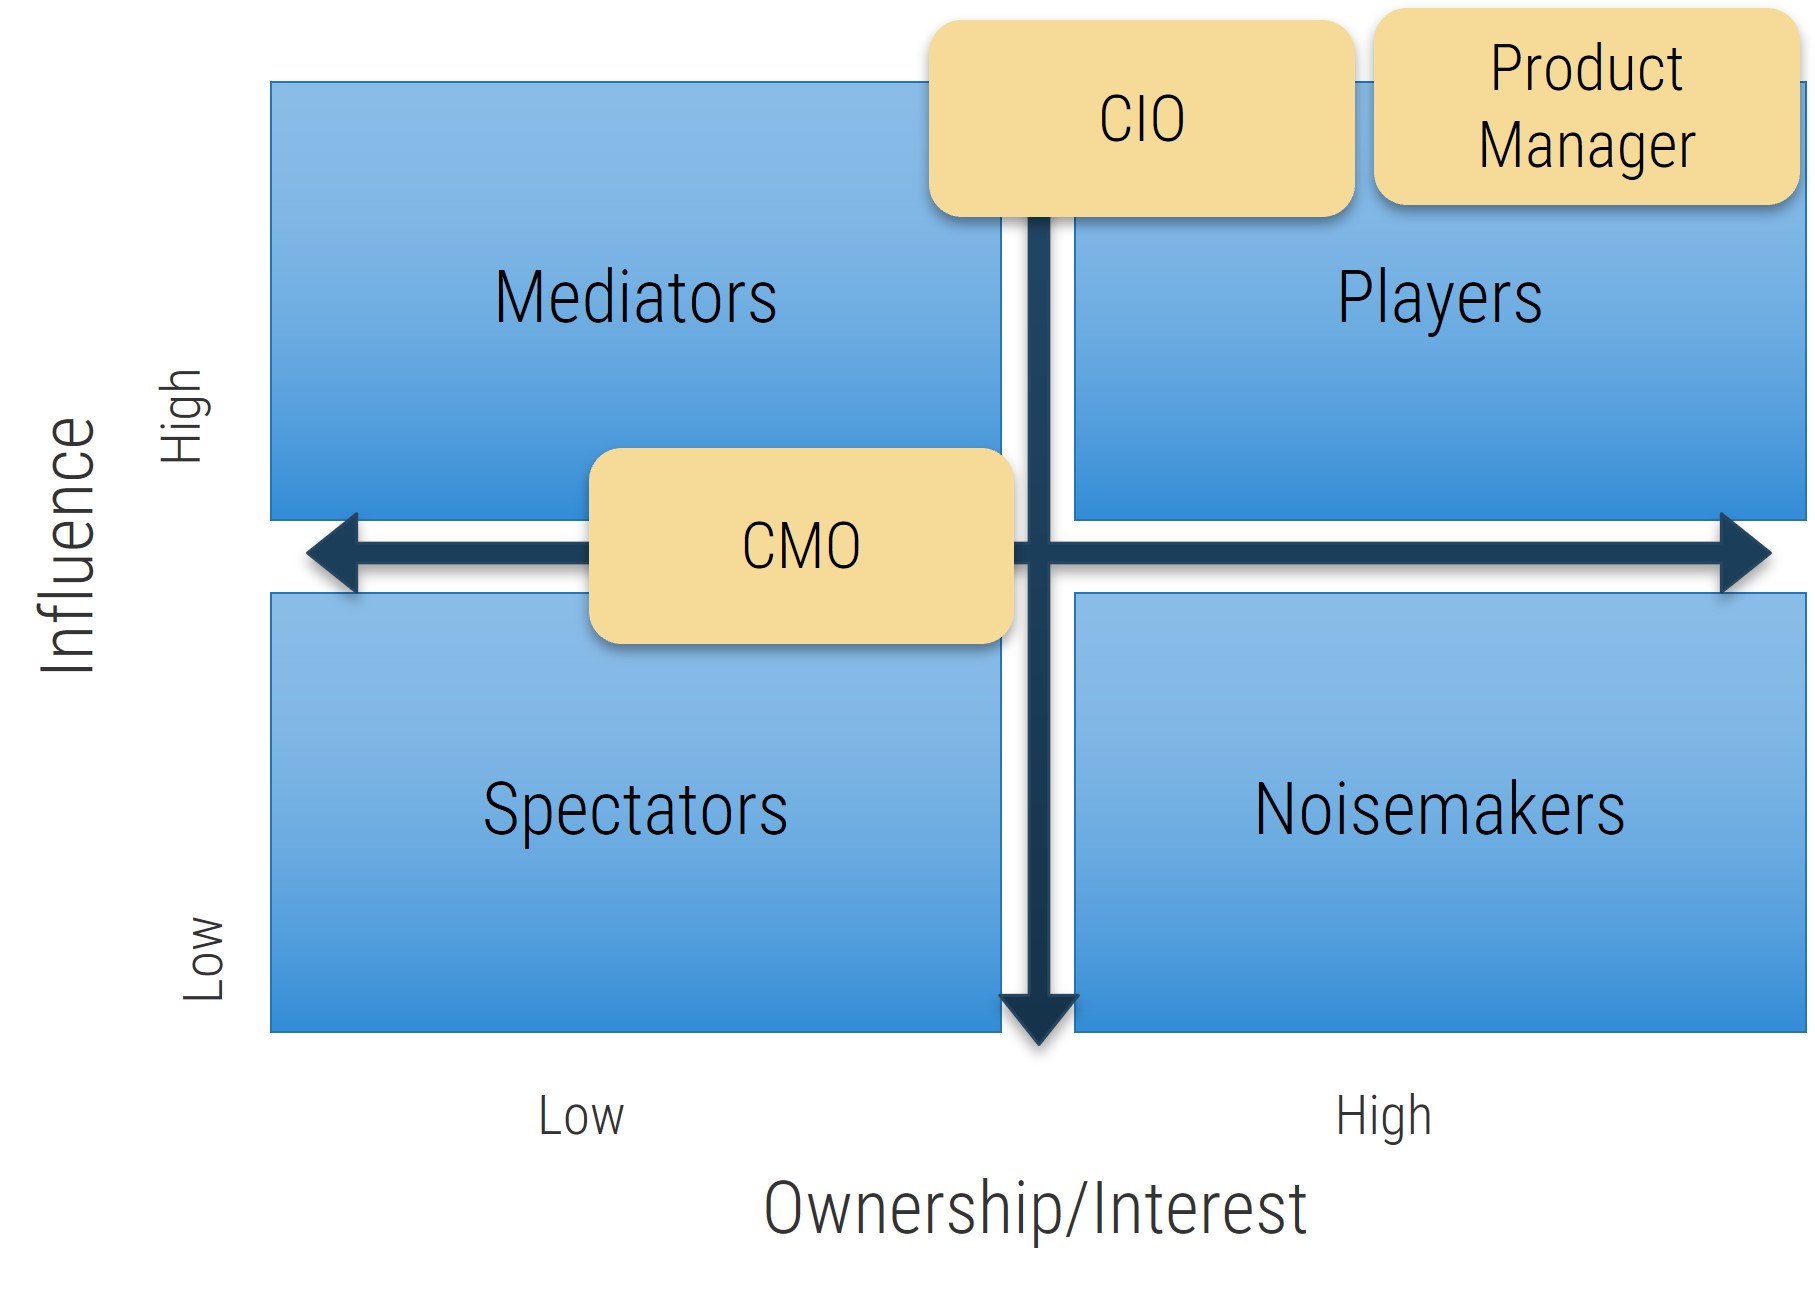
Output
- Categorization of stakeholders and influencers
Participants
- Product owners
- Stakeholders
Record the results in the Deliver Digital Products at Scale Workbook.
Prioritize your stakeholders
There may be too many stakeholders to be able to manage them all. Focus your attention on the stakeholders that matter most.
| |
Level of Support |
Stakeholder Category |
|
Supporter |
Evangelist |
Neutral |
Blocker |
Player |
Critical |
High |
High |
Critical |
Mediator |
Medium |
Low |
Low |
Medium |
Noisemaker |
High |
Medium |
Medium |
High |
Spectator |
Low |
Irrelevant |
Irrelevant |
Low |
Consider the three dimensions for stakeholder prioritization: influence, interest, and support. Support can be determined by answering the following question: How likely is it that this stakeholder would recommend your product?
These parameters are used to prioritize which stakeholders are most important and should receive your focused attention.
3.2.3 Prioritize your stakeholders
30 minutes
- Identify the level of support of each stakeholder by answering the following question: How likely is it that this stakeholder would endorse your product?
- Prioritize your stakeholders using the prioritization scheme on the previous slide.
Stakeholder | Category | Level of Support | Prioritization |
|---|
CMO | Spectator | Neutral | Irrelevant |
CIO | Player | Supporter | Critical |
| | | | |
| | | | |
Output
- Stakeholder and influencer prioritization
Participants
- Product owners
- Stakeholders
Record the results in the Deliver Digital Products at Scale Workbook.
Define strategies for engaging stakeholders by type
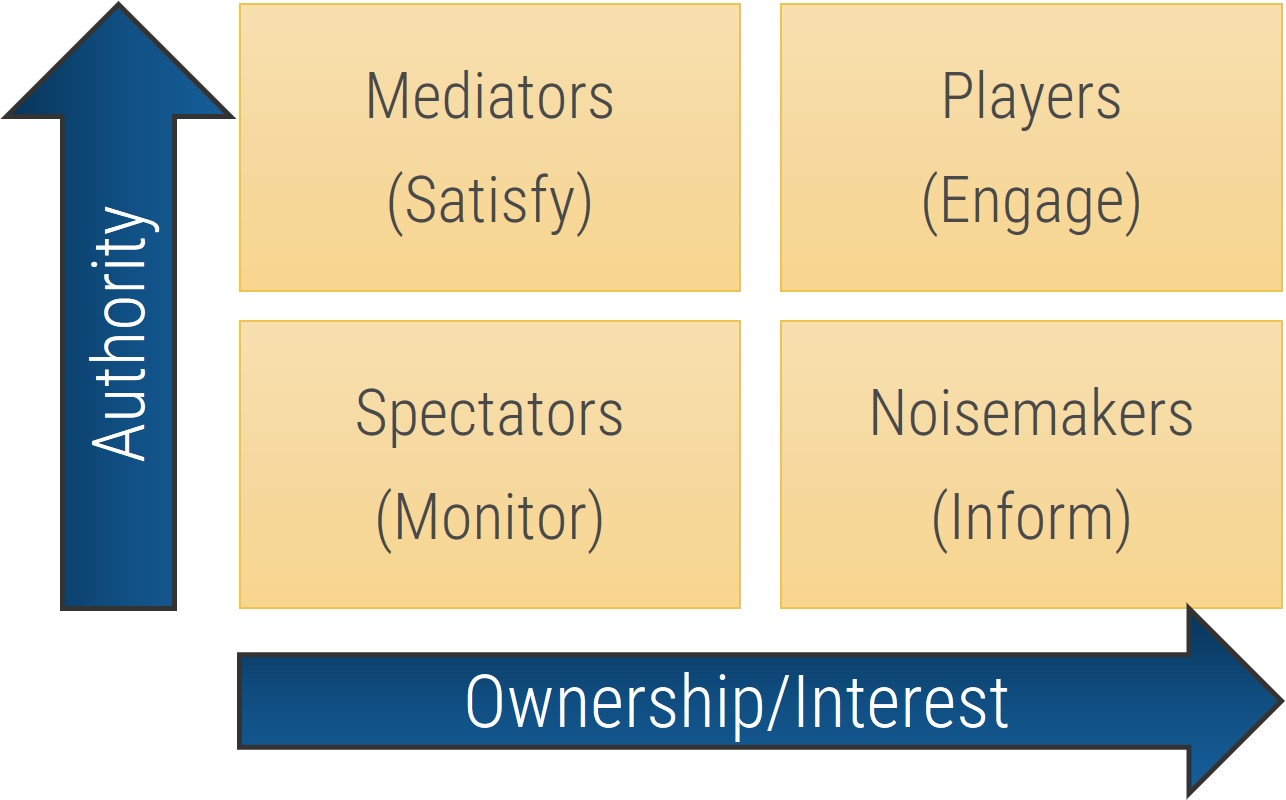
Type |
Quadrant |
Actions |
Players |
High influence, high interest – actively engage |
Keep them updated on the progress of the project. Continuously involve Players in the process and maintain their engagement and interest by demonstrating their value to its success. |
Mediators |
High influence, low interest – keep satisfied |
They can be the game changers in groups of stakeholders. Turn them into supporters by gaining their confidence and trust and including them in important decision-making steps. In turn, they can help you influence other stakeholders. |
Noisemakers |
Low influence, high interest – keep informed |
Try to increase their influence (or decrease it if they are detractors) by providing them with key information, supporting them in meetings, and using Mediators to help them. |
Spectators |
Low influence, low interest – monitor |
They are followers. Keep them in the loop by providing clarity on objectives and status updates. |
Info-Tech Insight
Each group of stakeholders draws attention and resources away from critical tasks. By properly identifying your stakeholder groups, the product owner can develop corresponding actions to manage stakeholders in each group. This can dramatically reduce wasted effort trying to satisfy Spectators and Noisemakers, while ensuring the needs of Mediators and Players are met.
Step 3.3
Configure your product family roadmaps
Activities
3.3.1 Define the communication objectives and audience of your product family roadmaps
3.3.2 Identify the level of detail that you want your product family roadmap artifacts to represent
Info-Tech Note
If you are unfamiliar with product roadmaps, Deliver on Your Digital Product Vision contains more detailed exercises we recommend you review before focusing on product family roadmaps.
This step involves the following participants:
- Product owners
- Product managers
- Portfolio managers
- Business analysts
Outcomes of this step
- An understanding of the key communication objectives and target stakeholder audience for your product family roadmaps
- A position on the level of detail you want your product family roadmap to operate at
Your communication objectives are linked to your audience; ensure you know your audience and speak their language
| I want to... |
I need to talk to... |
Because they are focused on... |
| ALIGN PRODUCT TEAMS |
Get my delivery teams on the same page. |
Architects |
Products Owners |
PRODUCTS |
A product that delivers value against a common set of goals and objectives. |
| SHOWCASE CHANGES |
Inform users and customers of product strategy. |
Bus. Process Owners |
End Users |
FUNCTIONALITY |
A group of functionality that business customers see as a single unit. |
| ARTICULATE RESOURCE REQUIREMENTS |
Inform the business of product development requirements. |
IT Management |
Business Stakeholders |
FUNDING |
An initiative that those with the money see as a single budget. |
3.3.1 Define the communication objectives and audience of your product family roadmaps
30-60 minutes
- Explicitly state the communication objectives and audience of your roadmap.
- Think of finishing this sentence: This roadmap is designed for … in order to …
You may want to consider including more than a single audience or objective.
Example:
Roadmap | Audience | Statement |
|---|
Internal Strategic Roadmap | Internal Stakeholders | This roadmap is designed to detail the strategy for delivery. It tends to use language that represents internal initiatives and names. |
Customer Strategic Roadmap | External Customers | This roadmap is designed to showcase and validate future strategic plans and internal teams to coordinate the development of features and enablers. |
Output
- Roadmap list with communication objectives and audience
Participants
- Product owners and product managers
- Application leaders
- Stakeholders
Record the results in the Deliver Digital Products at Scale Workbook.
The length of time horizons on your roadmap depend on the needs of the underlying products or families
Info-Tech Insight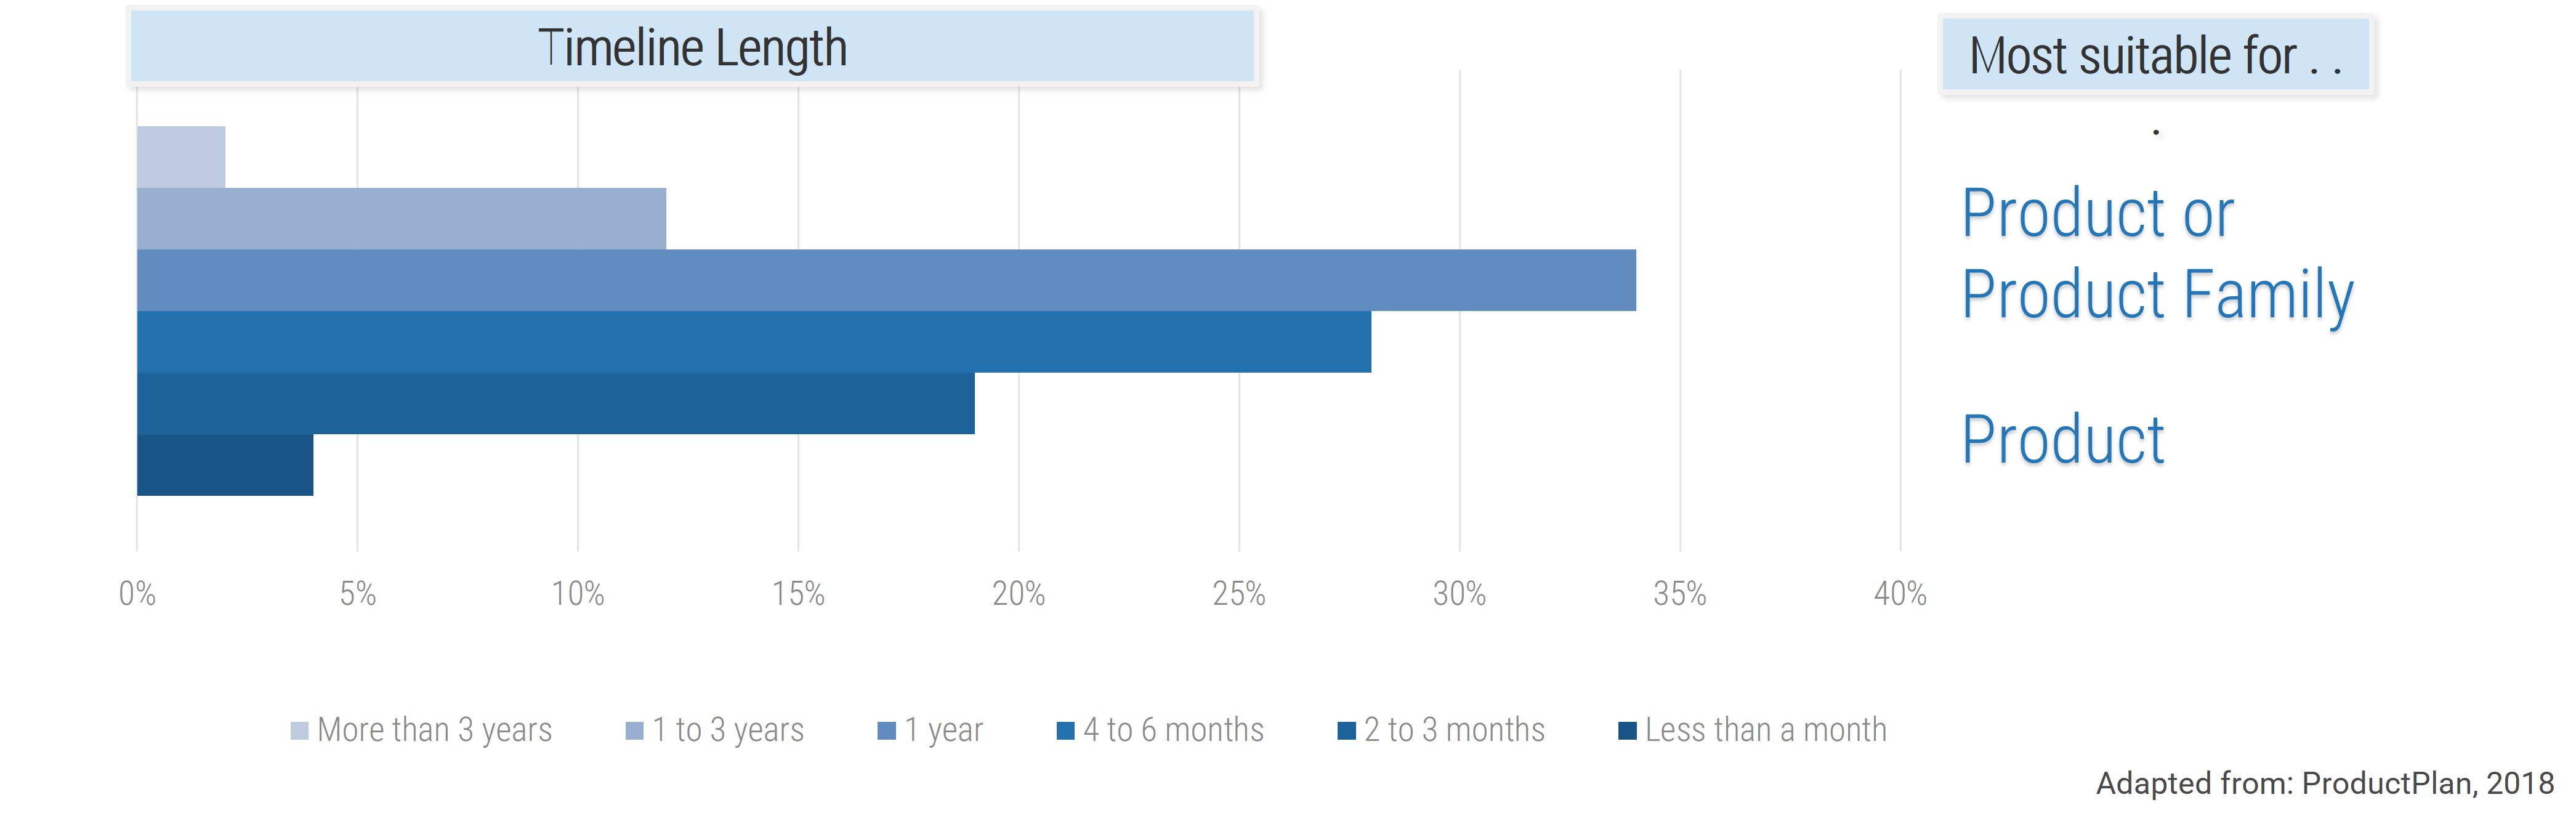
Given the relationship between product and product family roadmaps, the product family roadmap needs to serve the time horizons of its respective products.
This translates into product family roadmaps with timelines that, at a minimum, cover the full scope of the respective product roadmaps.
Based on your communication objectives, consider different ways to visualize your product family roadmap
Swimlane/Stream-Based – Understanding when groups of items intend to be delivered.
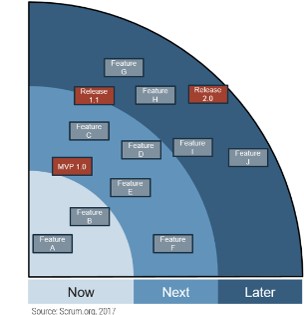
Now, Next, Later – Communicate an overall plan with rough intentions around delivery without specific date ranges.
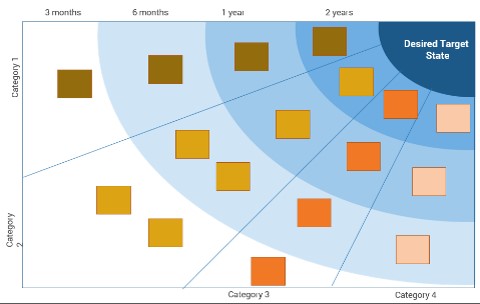
Sunrise Roadmap – Articulate the journey toward a given target state across multiple streams.
Before connecting your family roadmap to products, think about what each roadmap typically presents
Info-Tech Insight
Your product family roadmap and product roadmap tell different stories. The product family roadmap represents the overall connection of products to the enterprise strategy, while the product roadmap focuses on the fulfillment of the product’s vision.
Example: Connecting your product family roadmaps to product roadmaps
Your roadmaps should be connected at an artifact level that is common between both. Typically, this is done with capabilities, but you can do it at a more granular level if an understanding of capabilities isn’t available.
3.3.2 Identify the level of detail that you want your product family roadmap artifacts to represent
30-60 minutes
- Consider the different available artifacts for a product family (goals, value stream, capabilities).
- List the roadmaps that you wish to represent.
- Based on how you currently articulate details on your product families, consider:
- What do you want to use as the level of granularity for the artifact? Consider selecting something that has a direct connection to the product roadmap itself (for example, capabilities).
- For some roadmaps you will want to categorize your artifacts – what would work best in those cases?
Examples | Level of Hierarchy | Artifact Type |
|---|
Roadmap 1 | Goals | Capability |
Roadmap 2 | | |
Roadmap 3 | | |
Output
- Details on your roadmap granularity
Participants
- Product owners
- Product managers
- Portfolio managers
Record the results in the Deliver Digital Products at Scale Workbook.
Step 3.4
Confirm goal and value alignment of products and their product families
Activities
3.4.1 Validate business value alignment between products and their product families
This step involves the following participants:
- Product owners
- Product managers
- Portfolio managers
- Business analysts
Outcomes of this step
- Validation of the alignment between your product families and products
Confirming product to family value alignment
It isn’t always obvious whether you have the right value delivery alignment between products and product families.
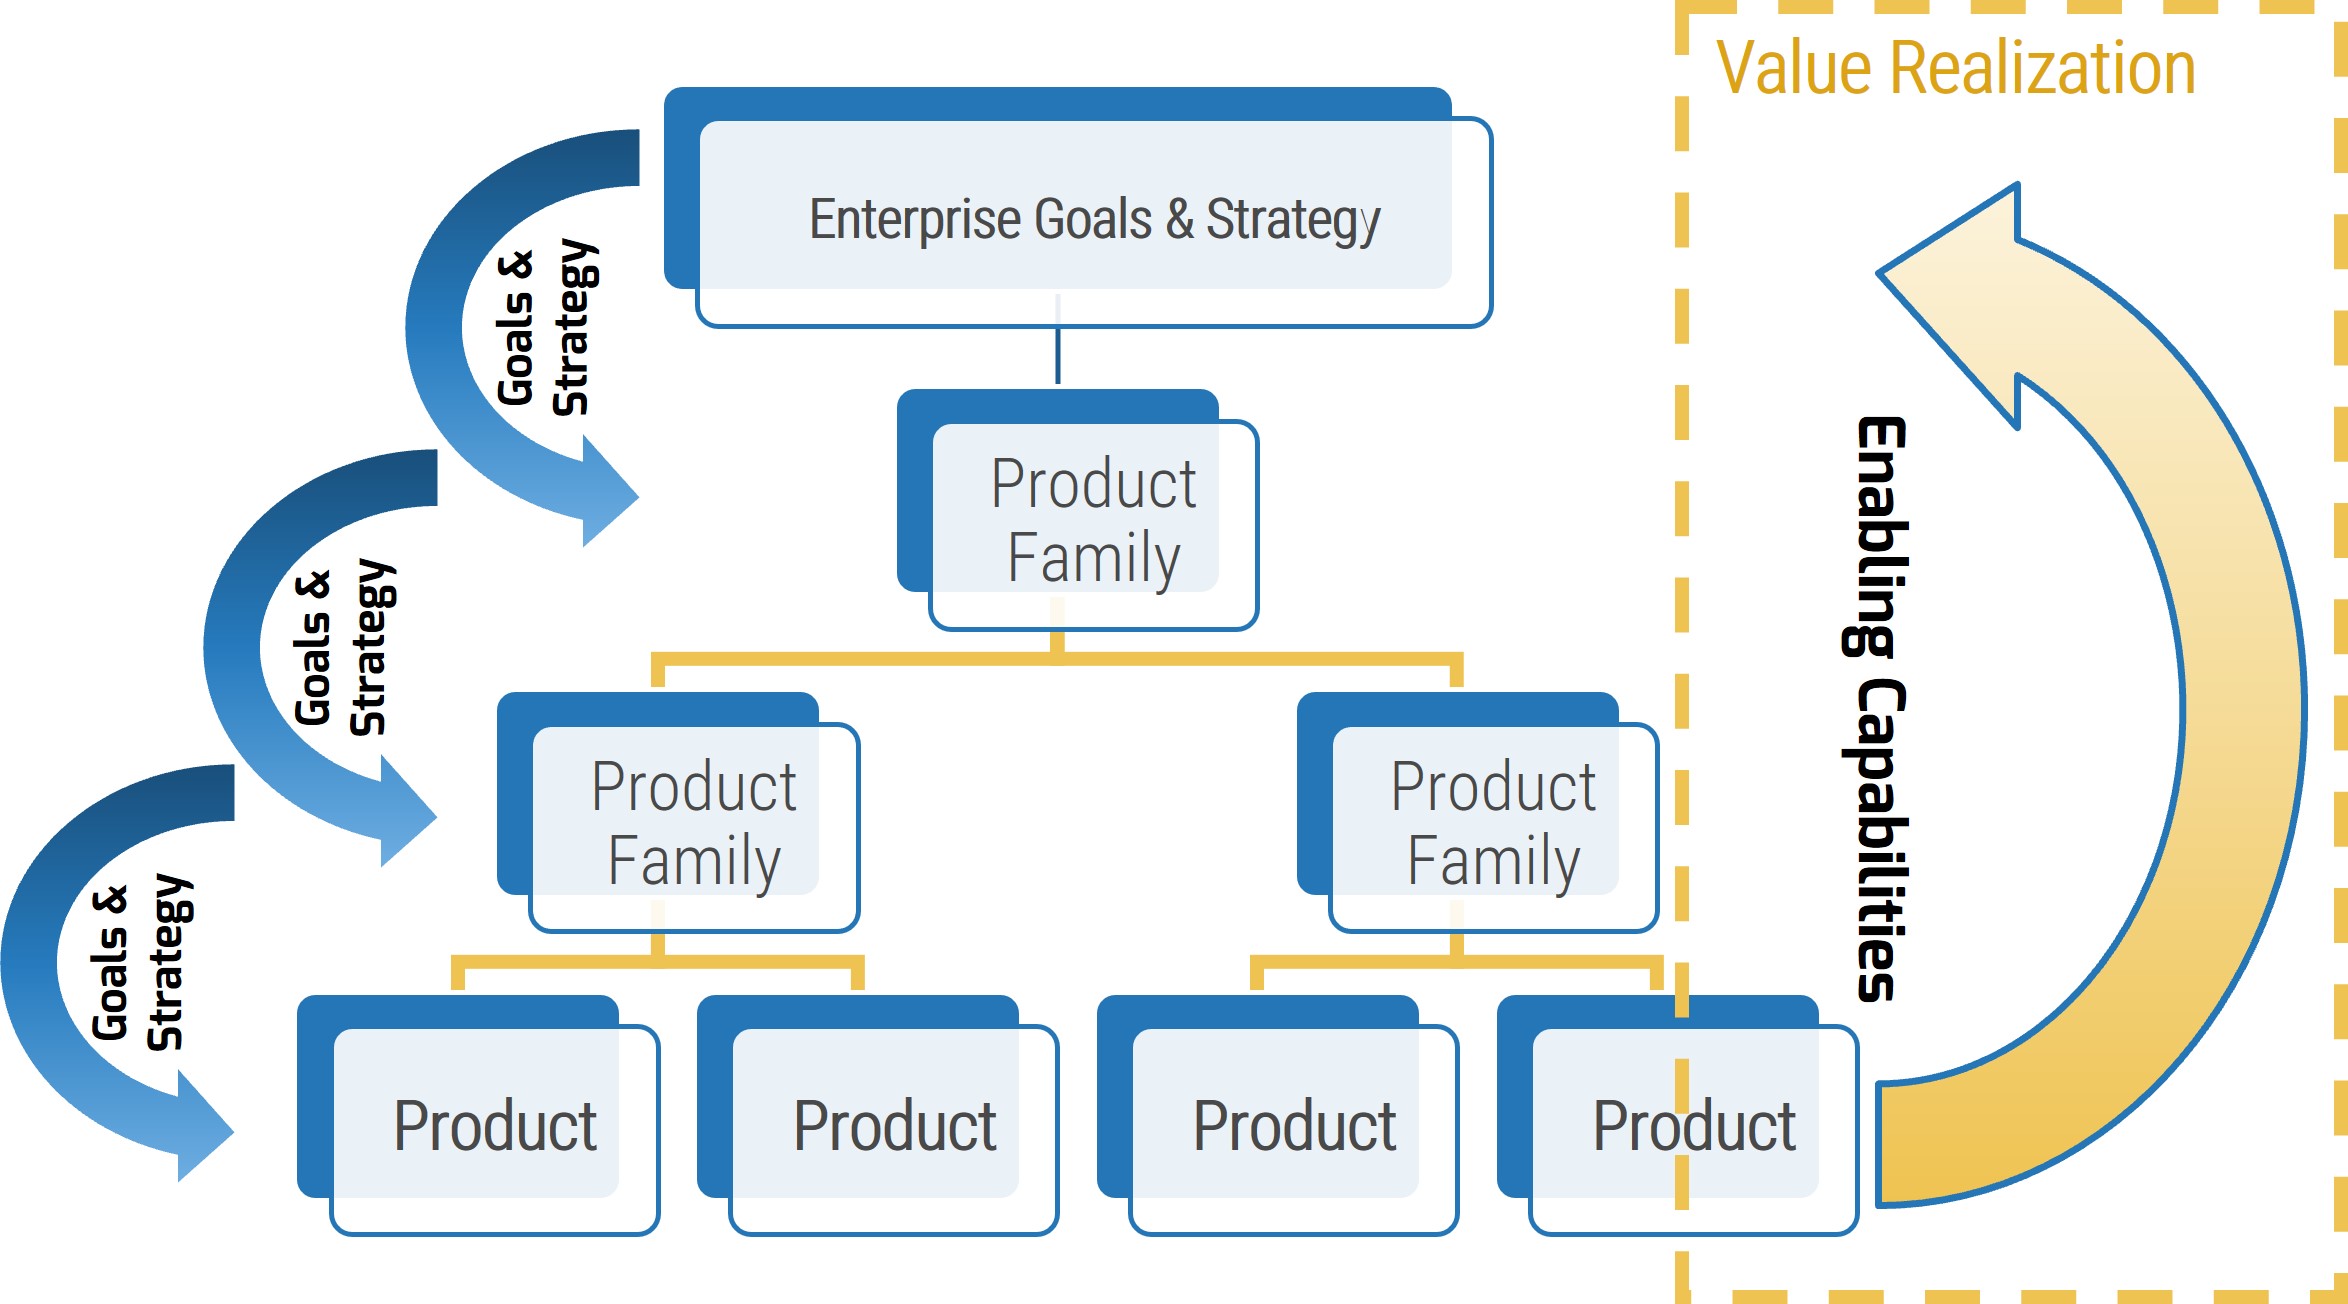
Product-to-family alignment can be validated in two different ways:
- Initial value alignment
Confirm the perceived business value at a family level is aligned with what is being delivered at a product level.
- Value measurement during the lifetime of the product
Validate family roadmap attainment through progression toward the specified product goals.
For more detail on calculating business value, see Build a Value Measurement Framework.
To evaluate a product family’s contribution, you need a common definition of value
Why is having a common value measure important?
CIO-CEO Alignment Diagnostic
Over 700 Info-Tech members have implemented the Balanced Value Measurement Framework.
“The cynic knows the price of everything and the value of nothing.”
– Oscar Wilde
“Price is what you pay. Value is what you get.”
– Warren Buffett
Understanding where you derive value is critical to building solid roadmaps.
All value in your product family is not created equal
Business value is the value of the business outcome the application produces and how effective the product is at producing that outcome. Dissecting value by the benefit type and the value source allows you to see the many ways in which a product or service brings value to your organization. Capture the value of your products in short, concise statements, like an elevator pitch.
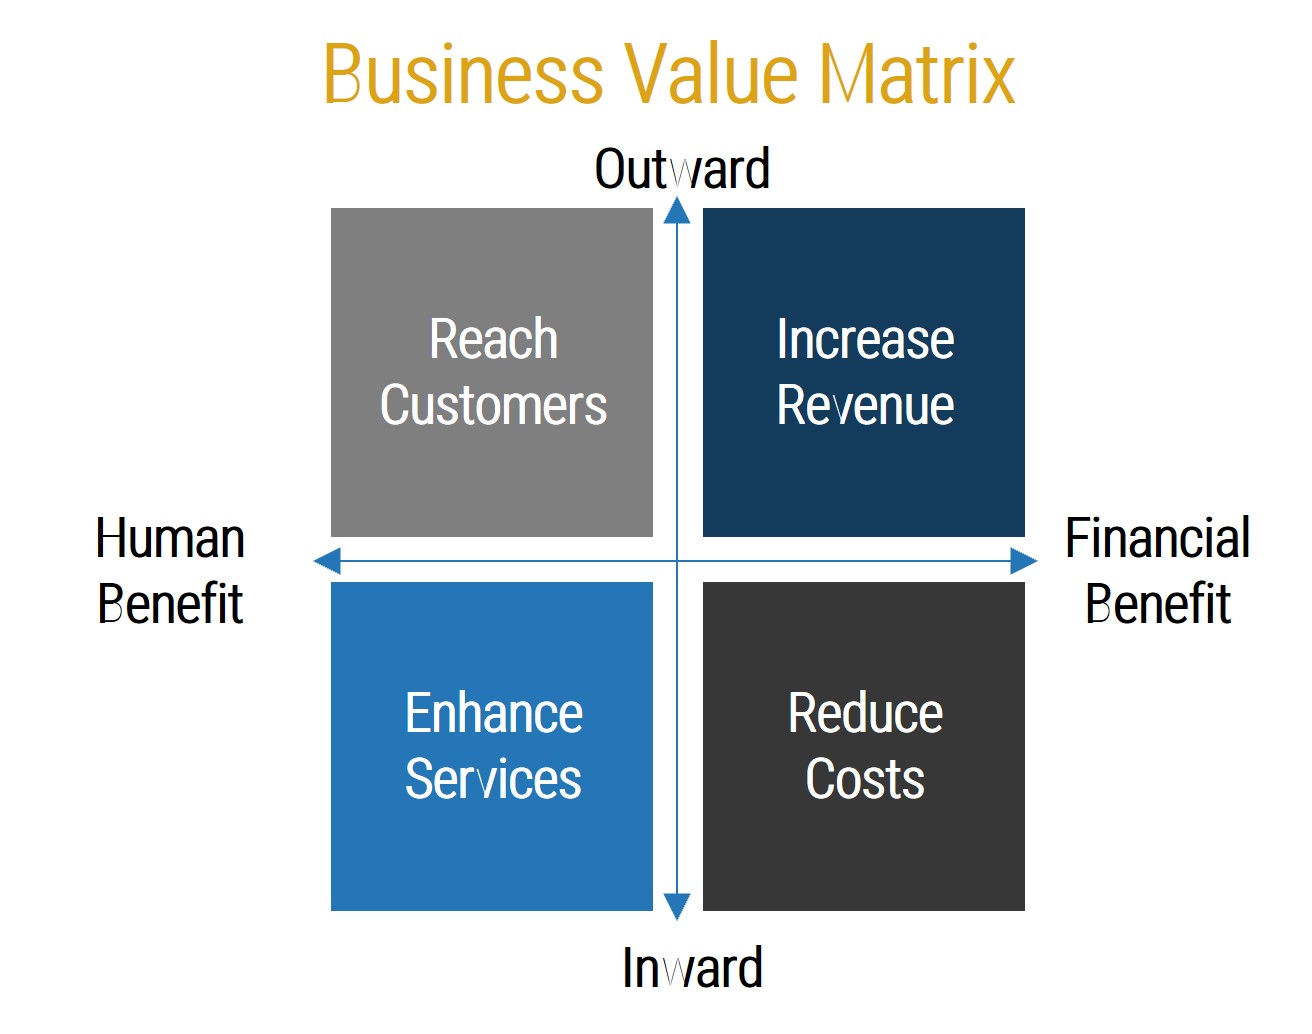
Increase Revenue
Product or service functions that are specifically related to the impact on your organization’s ability to generate revenue.
Reduce Costs
Reduction of overhead. The ways in which your product limits the operational costs of business functions.
Enhance Services
Functions that enable business capabilities that improve the organization’s ability to perform its internal operations.
Reach Customers
Application functions that enable and improve the interaction with customers or produce market information and insights.
Financial Benefits vs. Improved Capabilities
- Financial Benefit refers to the degree to which the value source can be measured through monetary metrics and is often quite tangible.
- Human Benefit refers to how a product or service can deliver value through a user’s experience.
Inward vs. Outward Orientation
- Inward refers to value sources that have an internal impact and improve your organization’s effectiveness and efficiency in performing its operations.
- Outward refers to value sources that come from your interaction with external factors, such as the market or your customers.
3.4.1 Validate business value alignment between products and their product families
30-60 minutes
- Draw the 2x2 Business Value Matrix on a flip chart or open the Business Value Matrix tab in the Deliver Digital Products at Scale Workbook to use in this exercise.
- Brainstorm and record the different types of business value that your product and product family produce on the sticky notes (one item per sticky note).
- As a team, evaluate how the product value delivered contributes to the product family value delivered. Note any gaps or differences between the two.
Download and complete Build a Value Measurement Framework for full support in focusing product delivery on business value–driven outcomes.
Output
- Confirmation of value alignment between product families and their respective products
Participants
- Product owners
- Product managers
Record the results in the Deliver Digital Products at Scale Workbook.
Example: Validate business value alignment between products and their product families
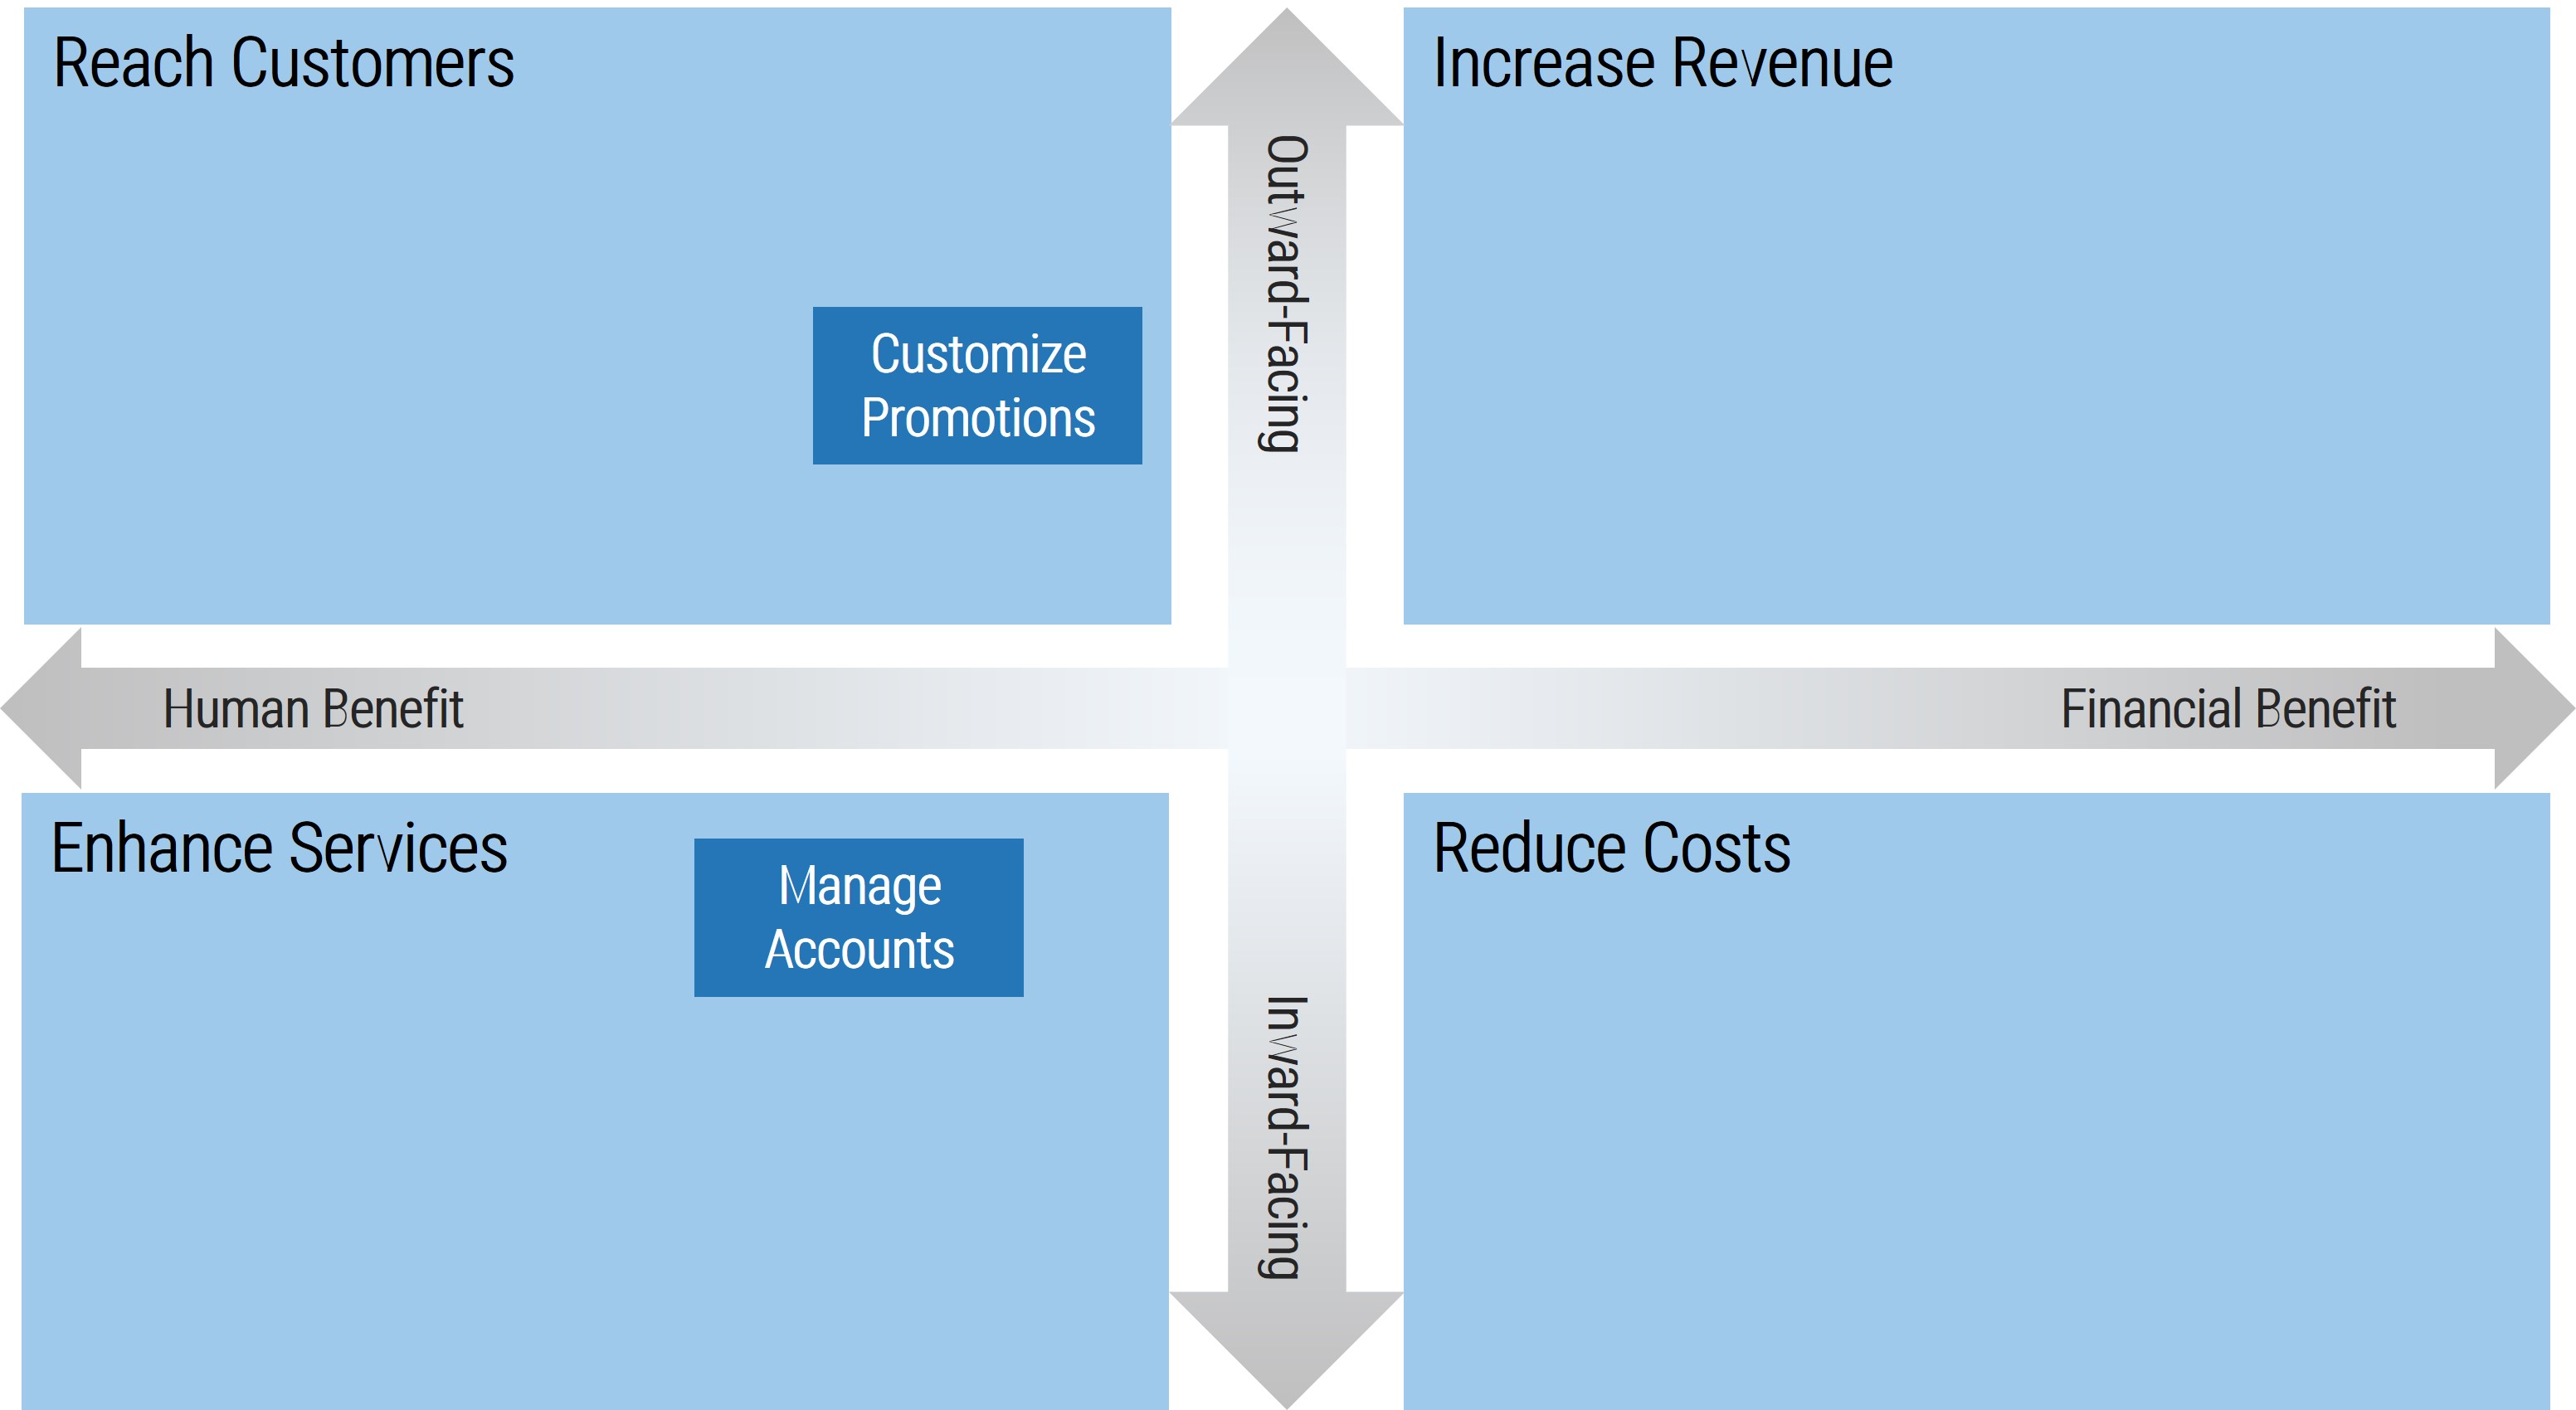
Measure product value with metrics tied to your business value sources and objectives
Assign metrics to your business value sources
Business Value Category |
Source Examples |
Metric Examples |
Profit Generation |
Revenue |
Customer Lifetime Value (LTV) |
Data Monetization |
Average Revenue per User (ARPU) |
Cost Reduction |
Reduce Labor Costs |
Contract Labor Cost |
Reduce Overhead |
Effective Cost per Install (eCPI) |
Service Enablement |
Limit Failure Risk |
Mean Time to Mitigate Fixes |
Collaboration |
Completion Time Relative to Deadline |
Customer and Market Reach |
Customer Satisfaction |
Net Promoter Score |
Customer Trends |
Number of Customer Profiles |
The importance of measuring business value through metrics
The better an organization is at using business value metrics to evaluate IT’s performance, the more satisfied the organization is with IT’s performance as a business partner. In fact, those that say they’re effective at business value metrics have satisfaction scores that are 30% higher than those that believe significant improvements are necessary (Info-Tech’s IT diagnostics).
Assigning metrics to your prioritized values source will allow you to more accurately measure a product’s value to the organization and identify optimization opportunities. See Info-Tech’s Related Research: Value, Delivery Metrics, Estimation blueprint for more information.
Your product delivery pipeline connects your roadmap with business value realization
The effectiveness of your product roadmap needs to be evaluated based on delivery capacity and throughput.
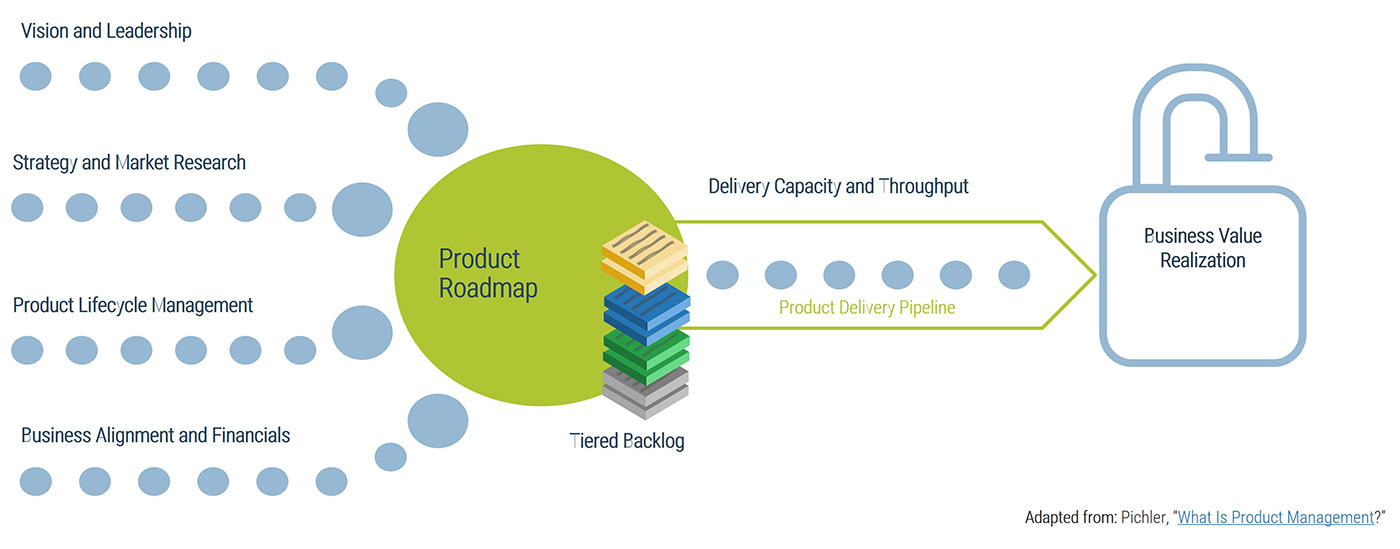
When thinking about product delivery metrics, be careful what you ask for…
As the saying goes “Be careful what you ask for, because you will probably get it.”
Metrics are powerful because they drive behavior.
- Metrics are also dangerous because they often lead to unintended negative outcomes.
- Choose your metrics carefully to avoid getting what you asked for instead of what you intended.
It’s a cautionary tale that also offers a low-risk path through the complexities of metrics use.
For more information on the use (and abuse) of metrics, see Select and Use SDLC Metrics Effectively.
Measure delivery and success
Metrics and measurements are powerful tools to drive behavior change and decision making in your organization. However, metrics are highly prone to creating unexpected outcomes, so use them with great care. Use metrics judiciously to uncover insights but avoid gaming or ambivalent behavior, productivity loss, and unintended consequences.
Build good practices in your selection and use of metrics:
- Choose the metrics that are as close to measuring the desired outcome as possible.
- Select the fewest metrics possible and ensure they are of the highest value to your team, the safest from gaming behaviors and unintended consequences, and the easiest to gather and report.
- Never use metrics for reward or punishment; use them to develop your team.
- Automate as much metrics gathering and reporting as possible.
- Focus on trends rather than precise metrics values.
- Review and change your metrics periodically.
Phase 4
Bridge the Gap Between Product Families and Delivery
| Phase 1 | Phase 2 | Phase 3 | Phase 4 | Phase 5 |
|---|
1.1 Understand the organizational factors driving product-centric delivery 1.2 Establish your organization’s product inventory | 2.1 Determine your approach to scale product families 2.2 Define your product families | 3.1 Leverage product family roadmaps 3.2 Use stakeholder management to improve roadmap communication 3.3 Configure your product family roadmaps 3.4 Confirm product family to product alignment | 4.1 Assess your organization’s delivery readiness 4.2 Understand your delivery options 4.3 Determine your operating model 4.4 Identify how to fund product family delivery | 5.1 Learn how to introduce your digital product family strategy 5.2 Communicate changes on updates to your strategy 5.3 Determine your next steps |
This phase will walk you through the following activities:
4.1.1 Assess your organization’s readiness to deliver digital product families
4.2.1 Consider pros and cons for each delivery model relative to how you wish to deliver
4.3.1 Understand the relationships between product management, delivery teams, and stakeholders
4.4.1 Discuss traditional vs. product-centric funding methods
This phase involves the following participants:
- Product owners
- Product managers
- Portfolio managers
- Delivery managers
Assess the impacts of product-centric delivery on your teams and org design
Product delivery can exist within any org structure or delivery model. However, when making the shift toward product management, consider optimizing your org design and product team structure to match your capacity and throughput needs.
Info-Tech Note
Realigning your delivery pipeline and org design takes significant effort and time. Although we won’t solve these questions here, it’s important to identify factors in your current or future models that improve value delivery.
Step 4.1
Assess your organization’s delivery readiness
Activities
4.1.1 Assess your organization’s readiness to deliver digital product families
This step involves the following participants:
- Product owners
- Product managers
- Portfolio managers
- Delivery managers
Outcomes of this step
- An understanding of the group’s maturity level when it comes to product delivery
Maturing product practices enables delivery of product families, not just products or projects
Just like product owners, product family owners are needed to develop long-term product value, strategy, and delivery. Projects can still be used as the source of funding and change management; however, the product family owner must manage product releases and operational support. The focus of this section will be on aligning product families to one or more releases.
4.1.1 Assess your organization’s readiness to deliver digital product families
30-60 minutes
- For each question in the Deliver Digital Products at Scale Readiness Assessment, ask yourself which of the five associated maturity statements most closely describes your organization.
- As a group, agree on your organization’s current readiness score for each of the six categories.
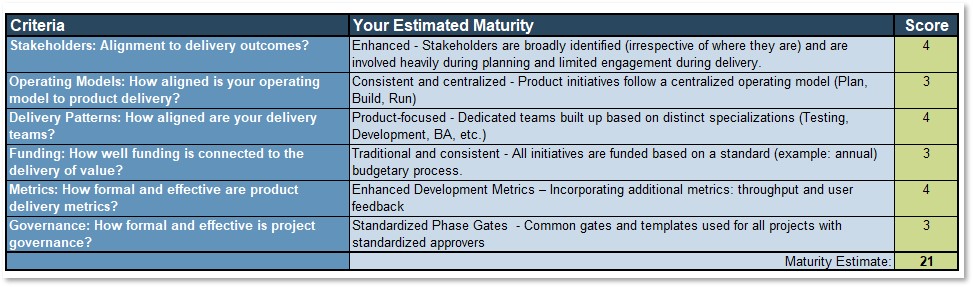
Output
- Product delivery readiness score
Participants
- Product managers
- Product owners
Download the Deliver Digital Products at Scale Readiness Assessment.
Value realization is constrained by your product delivery pipeline
Value is realized through changes made at the product level. Your pipeline dictates the rate, quality, and prioritization of your backlog delivery. This pipeline connects your roadmap goals to the value the goals are intended to provide.
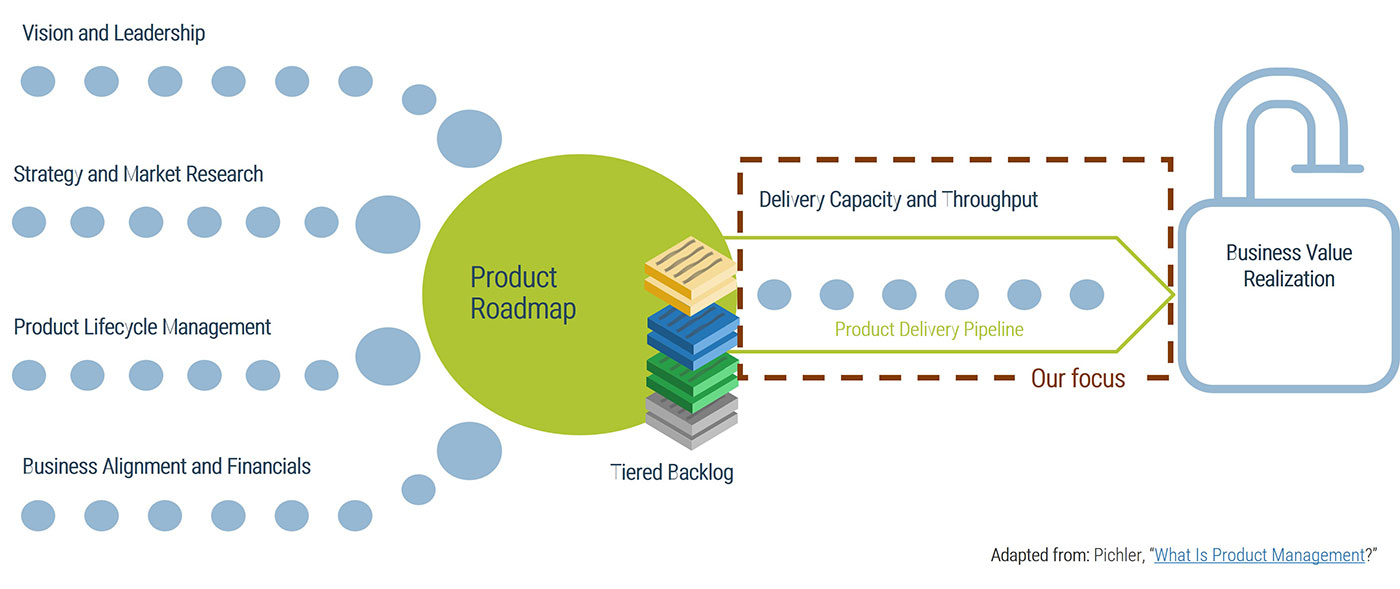
Product delivery realizes value for your product family
While planning and analysis are done at the family level, work and delivery are done at the individual product level.
PRODUCT STRATEGY | What are the artifacts? | What are you saying? | Defined at the family level? | Defined at the product level? | |
|---|
Vision | I want to... | ✓ | ✓ | Strategic focus Delivery focus |
|---|
Goals | To get there we need to... | ✓ | ✓ |
Roadmap | To achieve our goals, we’ll deliver... | ✓ | ✓ |
Backlog | The work will be done in this order... | | ✓ |
Release Plan | We will deliver in the following ways... | | ✓ |
Step 4.2
Understand your delivery options
Activities
4.2.1 Consider pros and cons for each delivery model relative to how you wish to deliver
This step involves the following participants:
- Product owners
- Product managers
- Portfolio managers
- Delivery managers
Outcomes of this step
- An understanding of the different team configuration options when it comes to delivery and their relevance to how you currently work
Define the scope of your product delivery strategy
The goal of your product delivery strategy is to establish streamlined, enforceable, and standardized product management and delivery capabilities that follow industry best practices. You will need to be strategic in how and where you implement your changes because this will set the stage for future adoption. Strategically select the most appropriate products, roles, and areas of your organization to implement your new or enhanced capabilities and establish a foundation for scaling.
Successful product delivery requires people who are knowledgeable about the products they manage and have a broad perspective of the entire delivery process, from intake to delivery, and of the product portfolio. The right people also have influence with other teams and stakeholders who are directly or indirectly impacted by product decisions. Involve team members who have expertise in the development, maintenance, and management of your selected products and stakeholders who can facilitate and promote change.
Learn about different patterns to structure and resource your product delivery teams
The primary goal of any product delivery team is to improve the delivery of value for customers and the business based on your product definition and each product’s demand. Each organization will have different priorities and constraints, so your team structure may take on a combination of patterns or may take on one pattern and then transform into another.
Delivery Team Structure Patterns |
How Are Resources and Work Allocated? |
Functional Roles |
Teams are divided by functional responsibilities (e.g. developers, testers, business analysts, operations, help desk) and arranged according to their placement in the software development lifecycle (SDLC). |
Completed work is handed off from team to team sequentially as outlined in the organization’s SDLC. |
Shared Service and Resource Pools |
Teams are created by pulling the necessary resources from pools (e.g. developers, testers, business analysts, operations, help desk). |
Resources are pulled whenever the work requires specific skills or pushed to areas where product demand is high. |
Product or System |
Teams are dedicated to the development, support, and management of specific products or systems. |
Work is directly sent to the teams who are directly managing the product or directly supporting the requester. |
Skills and Competencies |
Teams are grouped based on skills and competencies related to technology (e.g. Java, mobile, web) or familiarity with business capabilities (e.g. HR, finance). |
Work is directly sent to the teams who have the IT and business skills and competencies to complete the work. |
See the flow of work through each delivery team structure pattern
Staffing models for product teams
| |
Functional Roles |
Shared Service and Resource Pools |
Product or System |
Skills and Competencies |
| |
 |
 |
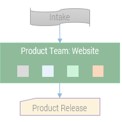 |
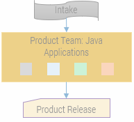 |
| Pros |
|
|
|
|
| Cons |
|
|
|
|
| Considerations |
! Product owners must break requests down into very small components to support Agile delivery as mini-Waterfalls
|
! Product owners must identify specialist requirements in the roadmap to ensure resources are available
|
! Product owners must ensure that there is a sufficient backlog of valuable work ready to keep the team utilized
|
! Product owners must remain independent of technology to ensure the right solution is built
|
| Use Case |
- When you lack people with cross-functional skills
|
- When you have specialists such as those skilled in security and operations who will not have full-time work on the product
|
- When you have people with cross-functional skills who can self-organize around the request
|
- When you have a significant investment in a specific technology stack
|
4.2.1 Consider pros and cons for each delivery model relative to how you wish to deliver
- Document your current staffing model for your product delivery teams.
- Evaluate the pros and cons of each model, as specified on the previous slide, relative to how you currently work.
- What would be the ideal target state for your team? If one model does not completely fit, is there a hybrid option worth considering? For example: Product-Based combined with Shared Service/Resource Pools for specific roles.
Functional Roles | Teams are divided by functional responsibilities (e.g. developers, testers, business analysts, operations, help desk) and arranged according to their placement in the software development lifecycle (SDLC). |
|---|
Shared Service and Resource Pools | Teams are created by pulling the necessary resources from pools (e.g. developers, testers, business analysts, operations, help desk). |
|---|
Product or System | Teams are dedicated to the development, support, and management of specific products or systems. |
|---|
Skills and Competencies | Teams are grouped based on skills and competencies related to technology (e.g. Java, mobile, web) or familiarity with business capabilities (e.g. HR, finance). |
|---|
Output
- An understanding of pros and cons for each delivery model and the ideal target state for your team
Participants
- Product managers
- Product owners
Record the results in the Digital Product Family Strategy Playbook.
Step 4.3
Determine your operating model
Activities
4.3.1 Understand the relationships between product management, delivery teams, and stakeholders
This step involves the following participants:
- Product owners
- Product managers
- Portfolio managers
- Delivery managers
Outcomes of this step
- An understanding of the potential operating models and what will work best for your organization
Reminder: Patterns for scaling products
The alignment of your product families should be considered in your operating model.
Value Stream Alignment |
Enterprise Applications |
Shared Services |
Technical |
Organizational Alignment |
- Business architecture
- Value stream
- Capability
- Function
- Market/customer segment
- Line of business (LoB)
- Example: Customer group > value stream > products
|
- Enabling capabilities
- Enterprise platforms
- Supporting apps
- Example: HR > Workday/Peoplesoft > ModulesSupporting: Job board, healthcare administrator
|
- Organization of related services into service family
- Direct hierarchy does not necessarily exist within the family
- Examples: End-user support and ticketing, workflow and collaboration tools
|
- Domain grouping of IT infrastructure, platforms, apps, skills, or languages
- Often used in combination with Shared Services grouping or LoB-specific apps
- Examples: Java, .NET, low-code, database, network
|
- Used at higher levels of the organization where products are aligned under divisions
- Separation of product managers from organizational structure no longer needed because the management team owns product management role
|
Ensure consistency in the application of your design principles with a coherent operating model
What is an operating model?
An operating model is an abstract visualization, used like an architect’s blueprint, that depicts how structures and resources are aligned and integrated to deliver on the organization’s strategy. It ensures consistency of all elements in the organizational structure through a clear and coherent blueprint before embarking on detailed organizational design
The visual should highlight which capabilities are critical to attaining strategic goals and clearly show the flow of work so that key stakeholders can understand where inputs flow in and outputs flow out of the IT organization.
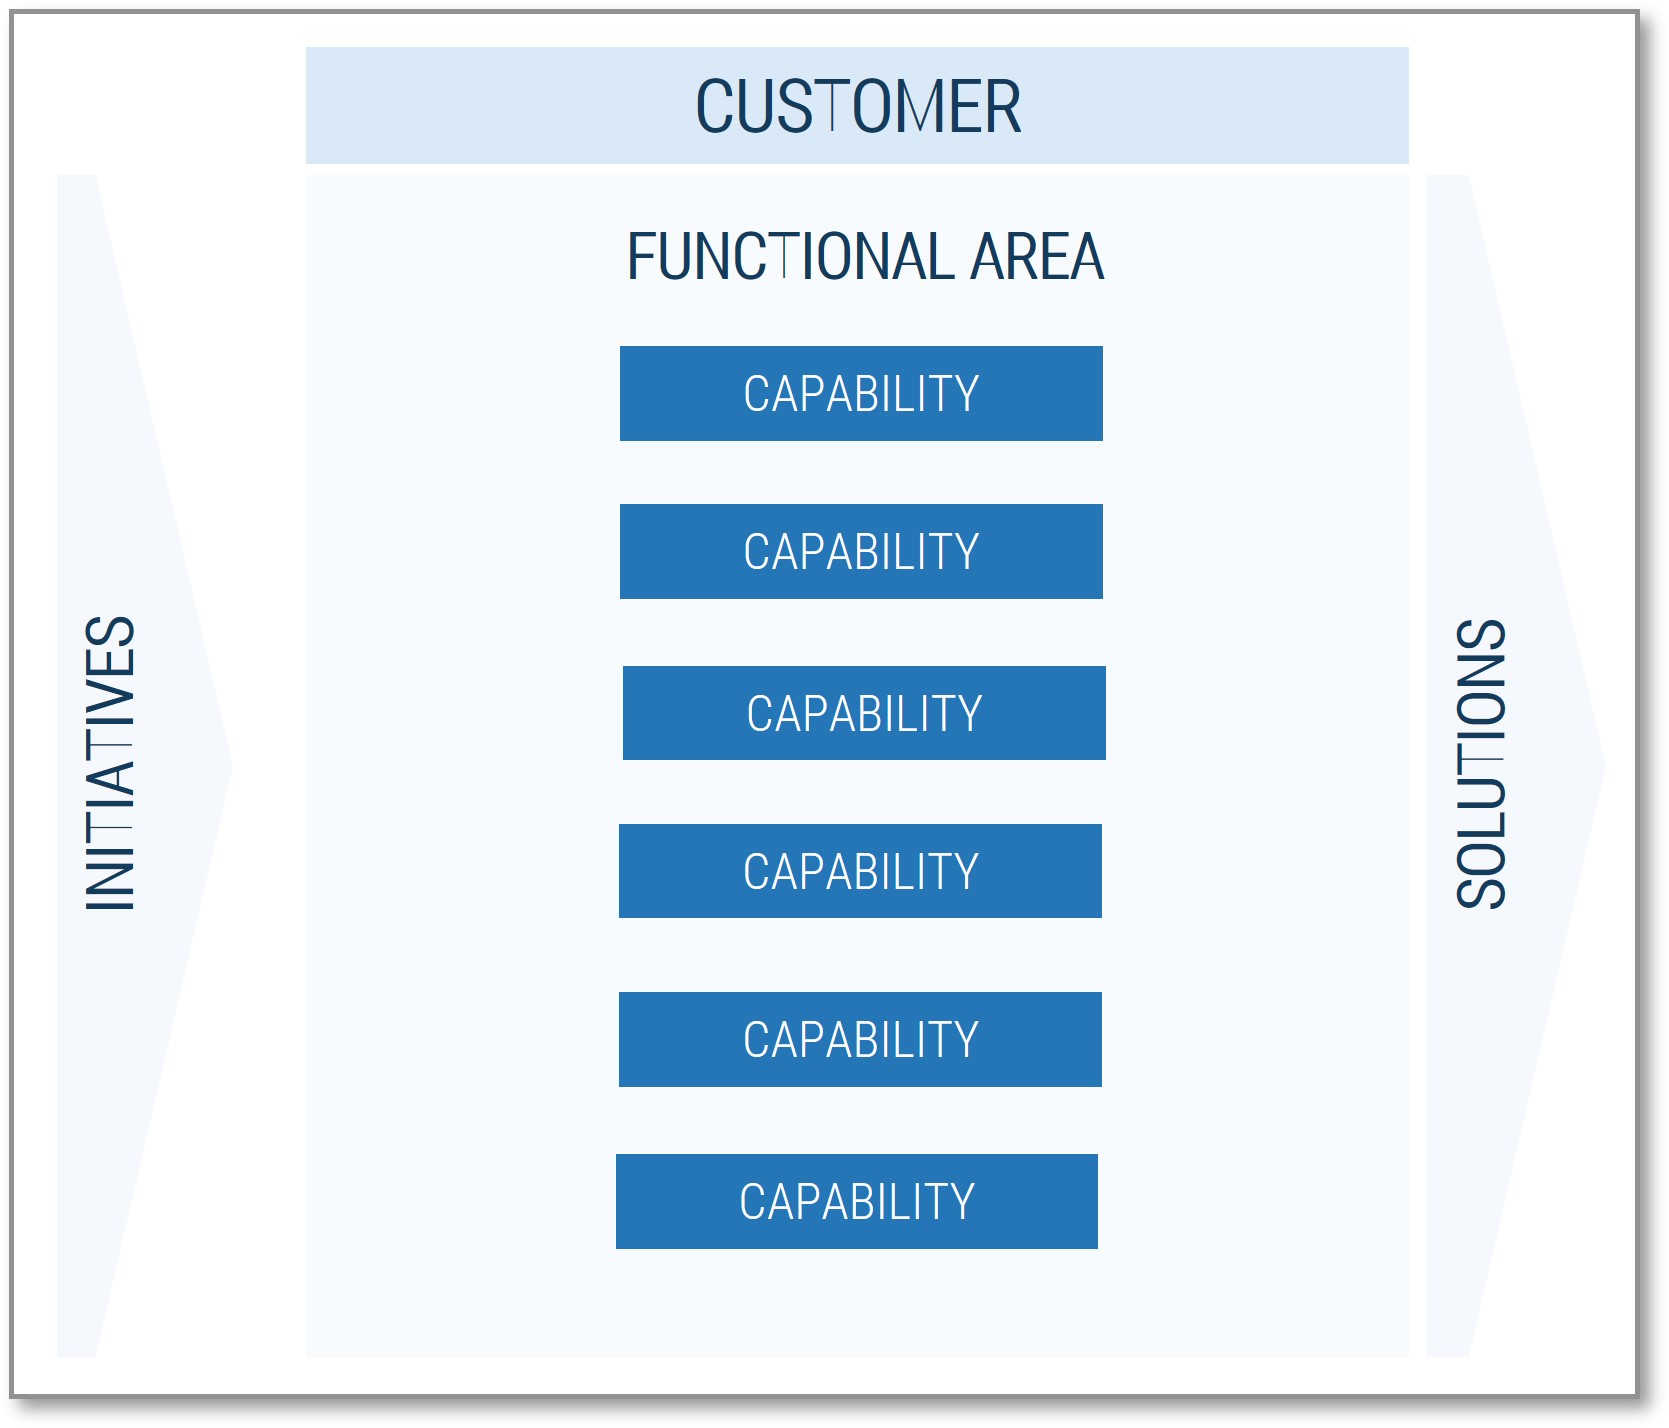
For more information, see Redesign Your IT Organizational Structure.
Weigh the pros and cons of IT operating models to find the best fit
- LoB/Product Aligned – Decentralized Model: Line of Business, Geographically, Product, or Functionally Aligned
A decentralized IT operating model that embeds specific functions within LoBs/product teams and provides cross-organizational support for their initiatives.
- Hybrid Functional: Functional/Product Aligned
A best-of-both-worlds model that balances the benefits of centralized and decentralized approaches to achieve both customer responsiveness and economies of scale.
- Hybrid Service Model: Product-Aligned Operating Model
A model that supports what is commonly referred to as a matrix organization, organizing by highly related service categories and introducing the role of the service owner.
- Centralized: Plan-Build-Run
A highly typical IT operating model that focuses on centralized strategic control and oversight in delivering cost-optimized and effective solutions.
- Centralized: Demand-Develop-Service
A centralized IT operating model that lends well to more mature operating environments. Aimed at leveraging economies of scale in an end-to-end services delivery model.
There are many different operating models. LoB/Product Aligned and Hybrid Functional align themselves most closely with how products and product families are typically delivered.
Decentralized Model: Line of Business, Geographically, Product, or Functionally Aligned
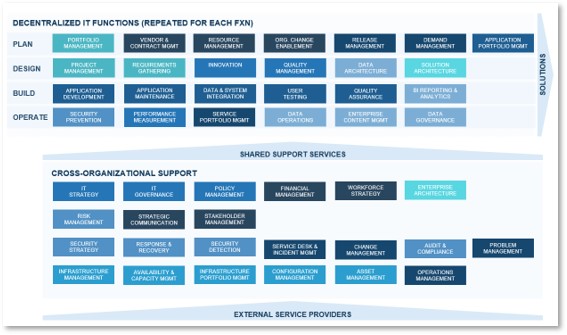
BENEFITS |
DRAWBACKS |
- Organization around functions (FXN) allows for diversity in approach in how areas are run to best serve specific business units needs.
- Each functional line exists largely independently, with full capacity and control to deliver service at the committed service level agreements.
- Highly responsive to shifting needs and demands with direct connection to customers and all stages of the solution development lifecycle.
- Accelerates decision making by delegating authority lower into the FXN.
- Promotes a flatter organization with less hierarchy and more direct communication with the CIO.
|
- Less synergy and integration across what different lines of business are doing can result in redundancies and unnecessary complexity.
- Higher overall cost to the IT group due to role and technology duplication across different FXN.
- Inexperience becomes an issue; requires more competent people to be distributed across the FXN.
- Loss of sight of the big picture – difficult to enforce standards around people/process/technology with solution ownership within the FXN.
|
For more information, see Redesign your IT Organizational Structure.
Hybrid Model: Functional/Product Aligned
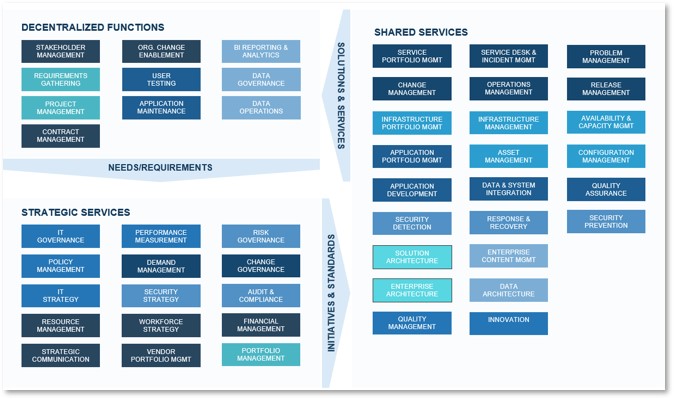
BENEFITS | DRAWBACKS |
|---|
- Best of both worlds of centralization and decentralization; attempts to channel benefits from both centralized and decentralized models.
- Embeds key IT functions that require business knowledge within functional areas, allowing for critical feedback.
- Balances a holistic IT strategy and architecture with responsiveness to needs of the organization.
- Achieves economies of scale where necessary through the delivery of shared services that can be requested by the function.
|
- May result in excessive cost through role and system redundancies across different functions
- Business units can have variable levels of IT competence; may result in different levels of effectiveness.
- No guaranteed synergy and integration across functions; requires strong communication, collaboration, and steering.
- Cannot meet every business unit’s needs – can cause tension from varying effectiveness of the IT functions placed within the functional areas.
|
For more information, see Redesign your IT Organizational Structure.
Hybrid Model: Product-Aligned Operating Model
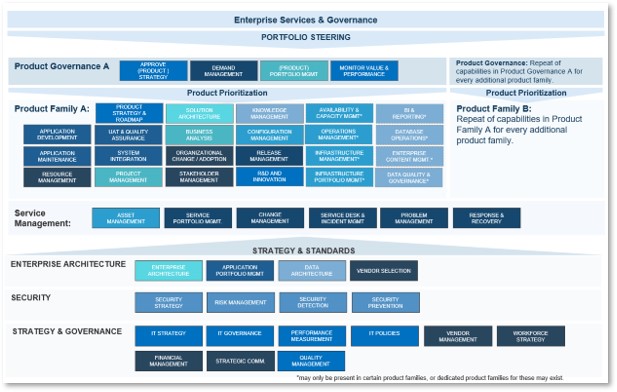
BENEFITS | DRAWBACKS |
|---|
- Focus is on the full lifecycle of a product – takes a strategic view of how technology enables the organization.
- Promotes centralized backlog around a specific value creator, rather than traditional project focus, which is more transactional.
- Dedicated teams around the product family ensure that you have all of the resources required to deliver on your product roadmap.
- Reduces barriers between IT and business stakeholders, focuses on technology as a key strategic enabler.
- Delivery is largely done through a DevOps methodology.
|
- Significant business involvement is required for success within this model, with business stakeholders taking an active role in product governance and potentially product management as well.
- Strong architecture standards and practices are required to make this successful because you need to ensure that product families are building in a consistent manner and limiting application sprawl.
- Introduced the need for practice standards to drive consistency in quality of delivered services.
- May result in increased cost through role redundancies across different squads.
|
For more information, see Redesign your IT Organizational Structure.
Centralized: Plan-Build-Run
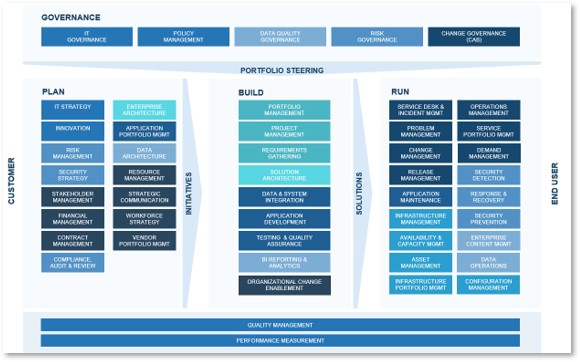
BENEFITS | DRAWBACKS |
|---|
- Effective at implementing long-term plans efficiently, separates maintenance and projects to allow each to have the appropriate focus.
- More oversight over financials; better suited for fixed budgets.
- Works across centralized technology domains to better align with the business's strategic objectives – allows for a top-down approach to decision making.
- Allows for economies of scale and expertise pooling to improve IT’s efficiency.
- Well suited for a project-driven environment that employs Waterfall or a hybrid project management methodology that is less iterative.
|
- Not optimized for unpredictable/shifting project demands, as decision making is centralized in the plan function.
- Less agility to deliver new features or solutions to the customer in comparison to decentralized models.
- Build (developers) and run (operations staff) are far removed from the business, resulting in lower understanding of business needs (as well as “passing the buck” – from development to operations).
- Requires strong hand-off processes to be defined and strong knowledge transfer from build to run functions in order to be successful.
|
For more information, see Redesign your IT Organizational Structure.
Centralized: Demand-Develop-Service
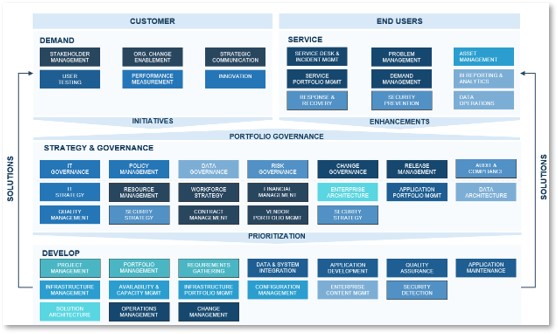
BENEFITS | DRAWBACKS |
|---|
- Aligns well with an end-to-end services model; constant attention to customer demand and service supply.
- Centralizes service operations under one functional area to serve shared needs across lines of business.
- Allows for economies of scale and expertise pooling to improve IT’s efficiency.
- Elevates sourcing and vendor management as its own strategic function; lends well to managed service and digital initiatives.
- Development and operations housed together; lends well to DevOps-related initiatives.
|
- Can be less responsive to business needs than decentralized models due to the need for portfolio steering to prioritize initiatives and solutions.
- Requires a higher level of operational maturity to succeed; stable supply functions (service mgmt., operations mgmt., service desk, security, data) are critical to maintaining business satisfaction.
- Requires highly effective governance around project portfolio, services, and integration capabilities.
- Effective feedback loop highly dependent on accurate performance measures.
|
For more information, see Redesign your IT Organizational Structure.
Assess how your product scaling pattern impacts your resource delivery model
| | Value Stream Alignment | Enterprise Applications | Shared Services | Technical |
|---|
Plan-Build-Run:
Centralized | Pro: Supports established and stable families. Con: Command-and-control nature inhibits Agile DevOps and business agility. | Pro: Supports established and stable families. Con: Command-and-control nature inhibits Agile DevOps and business agility. | Pro: Can be used to align high-level families. Con: Lacks flexibility at the product level to address shifting priorities in product demand. | Pro: Supports a factory model. Con: Lacks flexibility at the product level to address shifting priorities in product demand. |
|---|
Centralized Model 2:
Demand-Develop-
Service | Pro: Supports established and stable families. Con: Command-and-control nature inhibits Agile DevOps and business agility. | Pro: Supports established and stable families. Con: Command-and-control nature inhibits Agile DevOps and business agility. | Pro: Recommended for aligning high-level service families based on user needs. Con: Reduces product empowerment, prioritizing demand. Slow. | Pro: Supports factory models. Con: Reduces product empowerment, prioritizing demand. Slow. |
|---|
Decentralized Model:
Line of Business, Product, Geographically, or Functionally Aligned | Pro: Aligns product families to value streams, capabilities, and organizational structure. Con: Reduces shared solutions and may create duplicate apps and services. | Pro: Enterprise apps treated as distinct LoB groups. Con: Reduces shared solutions and may create duplicate apps and services. | Pro: Complements value stream alignment by consolidating shared apps and services. Con: Requires additional effort to differentiate local vs. shared solutions. | Pro: Fits within other groupings where technical expertise is needed. Con: Creates redundancy between localized and shared technical teams. |
|---|
Hybrid Model:
Functional/Product Aligned | Pro: Supports multiple patterns of product grouping. Con: Requires additional effort to differentiate local vs. shared solutions. | Pro: Supports multiple patterns of product grouping. Con: Requires additional effort to differentiate local vs. shared solutions. | Pro: Supports multiple patterns of product grouping. Con: Requires additional effort to differentiate local vs. shared solutions. | Pro: Supports multiple patterns of product grouping. Con: Creates redundancy between localized and shared technical teams. |
|---|
Hybrid Model: Product-Aligned Operating Model | Pro: Supports multiple patterns of product grouping. Con: Requires additional effort to differentiate local vs. shared solutions. | Pro: Supports multiple patterns of product grouping. Con: Requires additional effort to differentiate local vs. shared solutions. | Pro: Supports multiple patterns of product grouping. Con: Requires additional effort to differentiate local vs. shared solutions. | Pro: Supports multiple patterns of product grouping. Con: Creates redundancy between localized and shared technical teams. |
|---|
4.3.1 Understand the relationships between product management, delivery teams, and stakeholders
30-60 minutes
- Discuss the intake sources of product work.
- Trace the flow of requests down to the functional roles of your delivery team (e.g., developer, QA, operations).
- Indicate where key deliverables are produced, particularly those that are built in collaboration.
- Discuss the five operating models relative to your current operating model choice. How aligned are you?
- Review Info-Tech’s recommendation on the best-aligned operating models for product family delivery. Do you agree or disagree?
- Evaluate recommendations against how you operate/work.
Output
- Understanding of the relationships between key groups
- A preferred operating model
Participants
- Product owners
- Product managers
- Delivery managers
Record the results in the Digital Product Family Strategy Playbook.
4.3.1 Understand the relationships between product management, delivery teams, and stakeholders
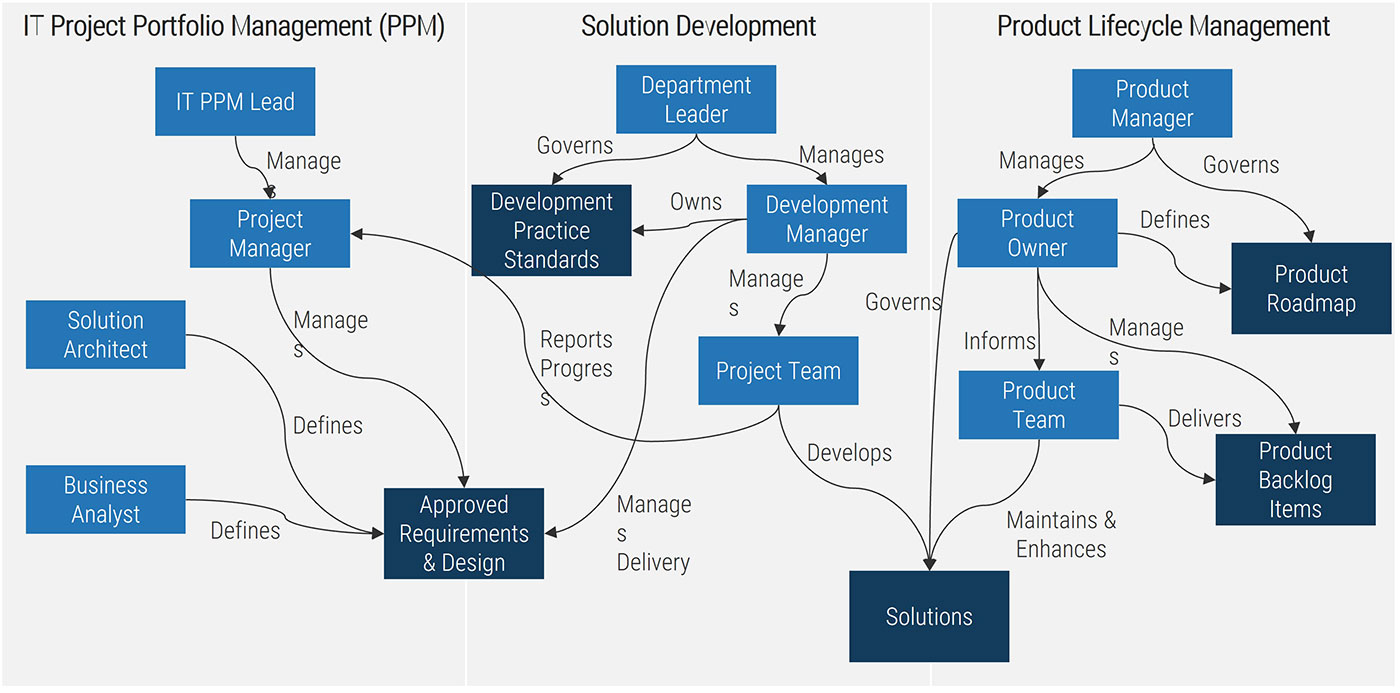
Output
- Understanding of the relationships between key groups
- A preferred operating model
Participants
- Product owners
- Product managers
- Delivery managers
Step 4.4
Identify how to fund product family delivery
Activities
4.4.1 Discuss traditional vs. product-centric funding methods
This step involves the following participants:
- Product owners
- Product managers
- Portfolio managers
- Delivery managers
Outcomes of this step
- An understanding of the differences between product-based and traditional funding methods
Why is funding so problematic?
We often still think about funding products like construction projects.
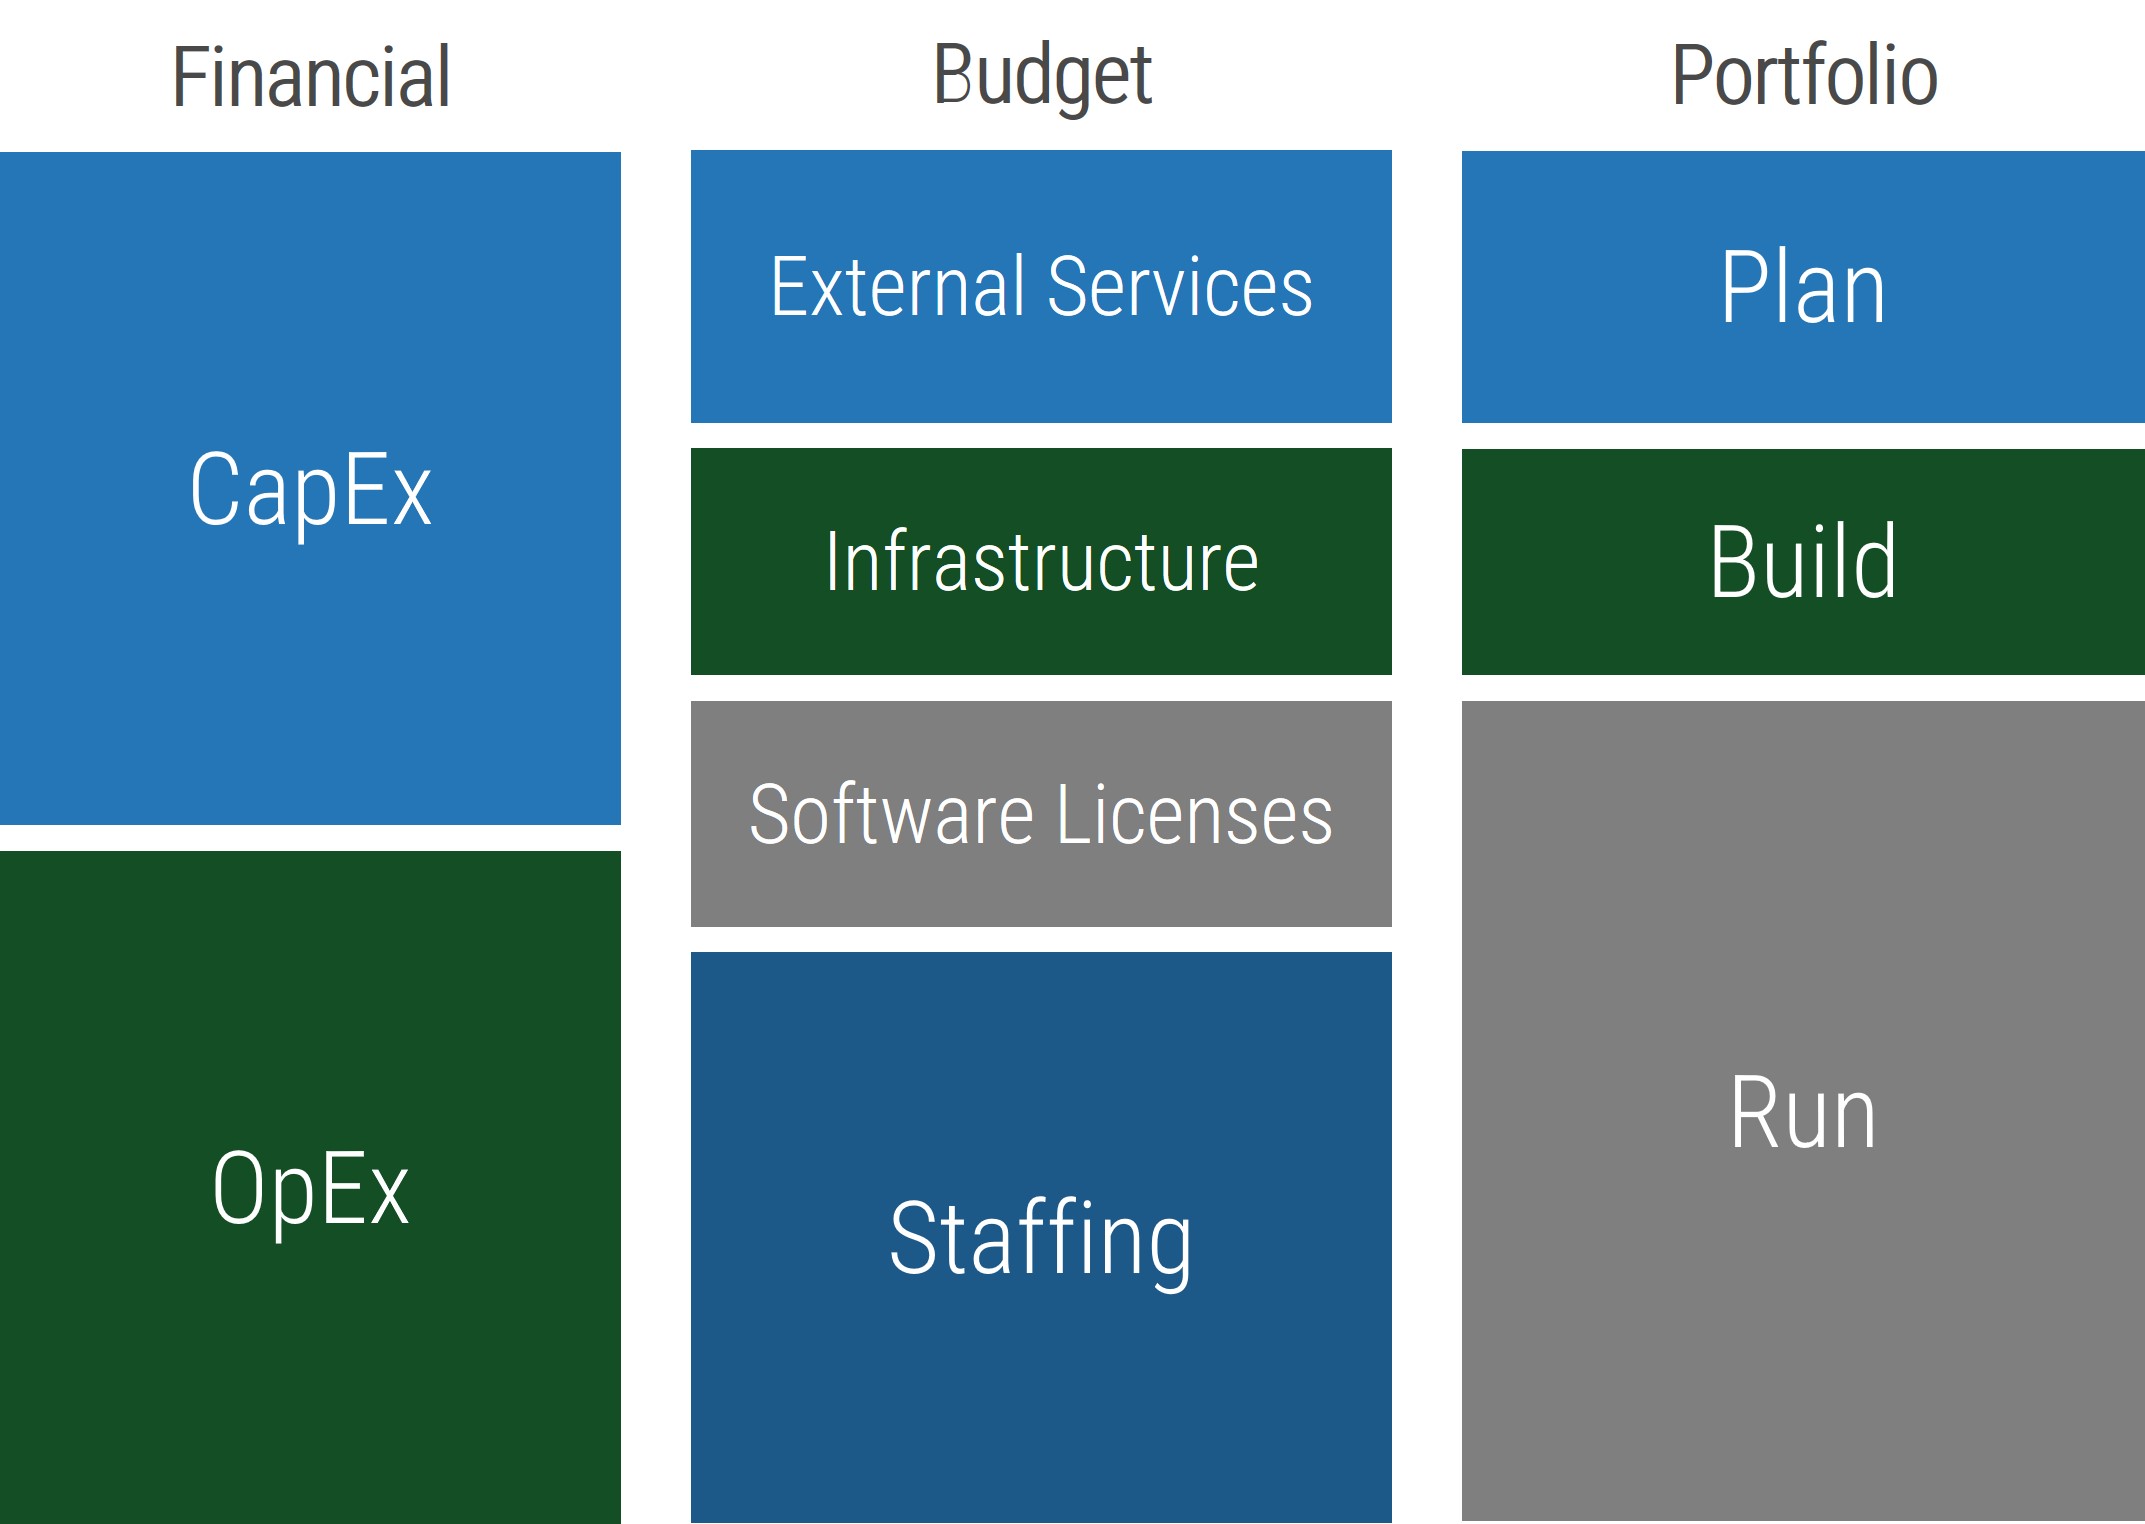
These models require increasing accuracy throughout the project lifecycle to manage actuals vs. estimates.
"Most IT funding depends on one-time expenditures or capital-funding mechanisms that are based on building-construction funding models predicated on a life expectancy of 20 years or more. Such models don’t provide the stability or flexibility needed for modern IT investments." – EDUCAUSE
Reminder: Projects don’t go away. The center of the conversation changes.
Projects within products
Regardless of whether you recognize yourself as a product-based or project-based shop, the same basic principles should apply.
The purpose of projects is to deliver the scope of a product release. The shift to product delivery leverages a product roadmap and backlog as the mechanism for defining and managing the scope of the release.
Eventually, teams progress to continuous integration/continuous delivery (CI/CD) where they can release on demand or as scheduled, requiring org change management.
Planning and budgeting for products and families
Reward for delivering outcomes, not features
| Autonomy | Flexibility | Accountability |
|---|
| Fund what delivers value | Allocate iteratively | Measure and adjust |
Fund long-lived delivery of value through products (not projects). Give autonomy to the team to decide exactly what to build. | Allocate to a pool based on higher-level business case. Provide funds in smaller amounts to different product teams and initiatives based on need. | Product teams define metrics that contribute to given outcomes. Track progress and allocate more (or less) funds as appropriate. |
Info-Tech Insight
Changes to funding require changes to product and Agile practices to ensure product ownership and accountability.
The Lean Enterprise Funding Model is an example of a different approach
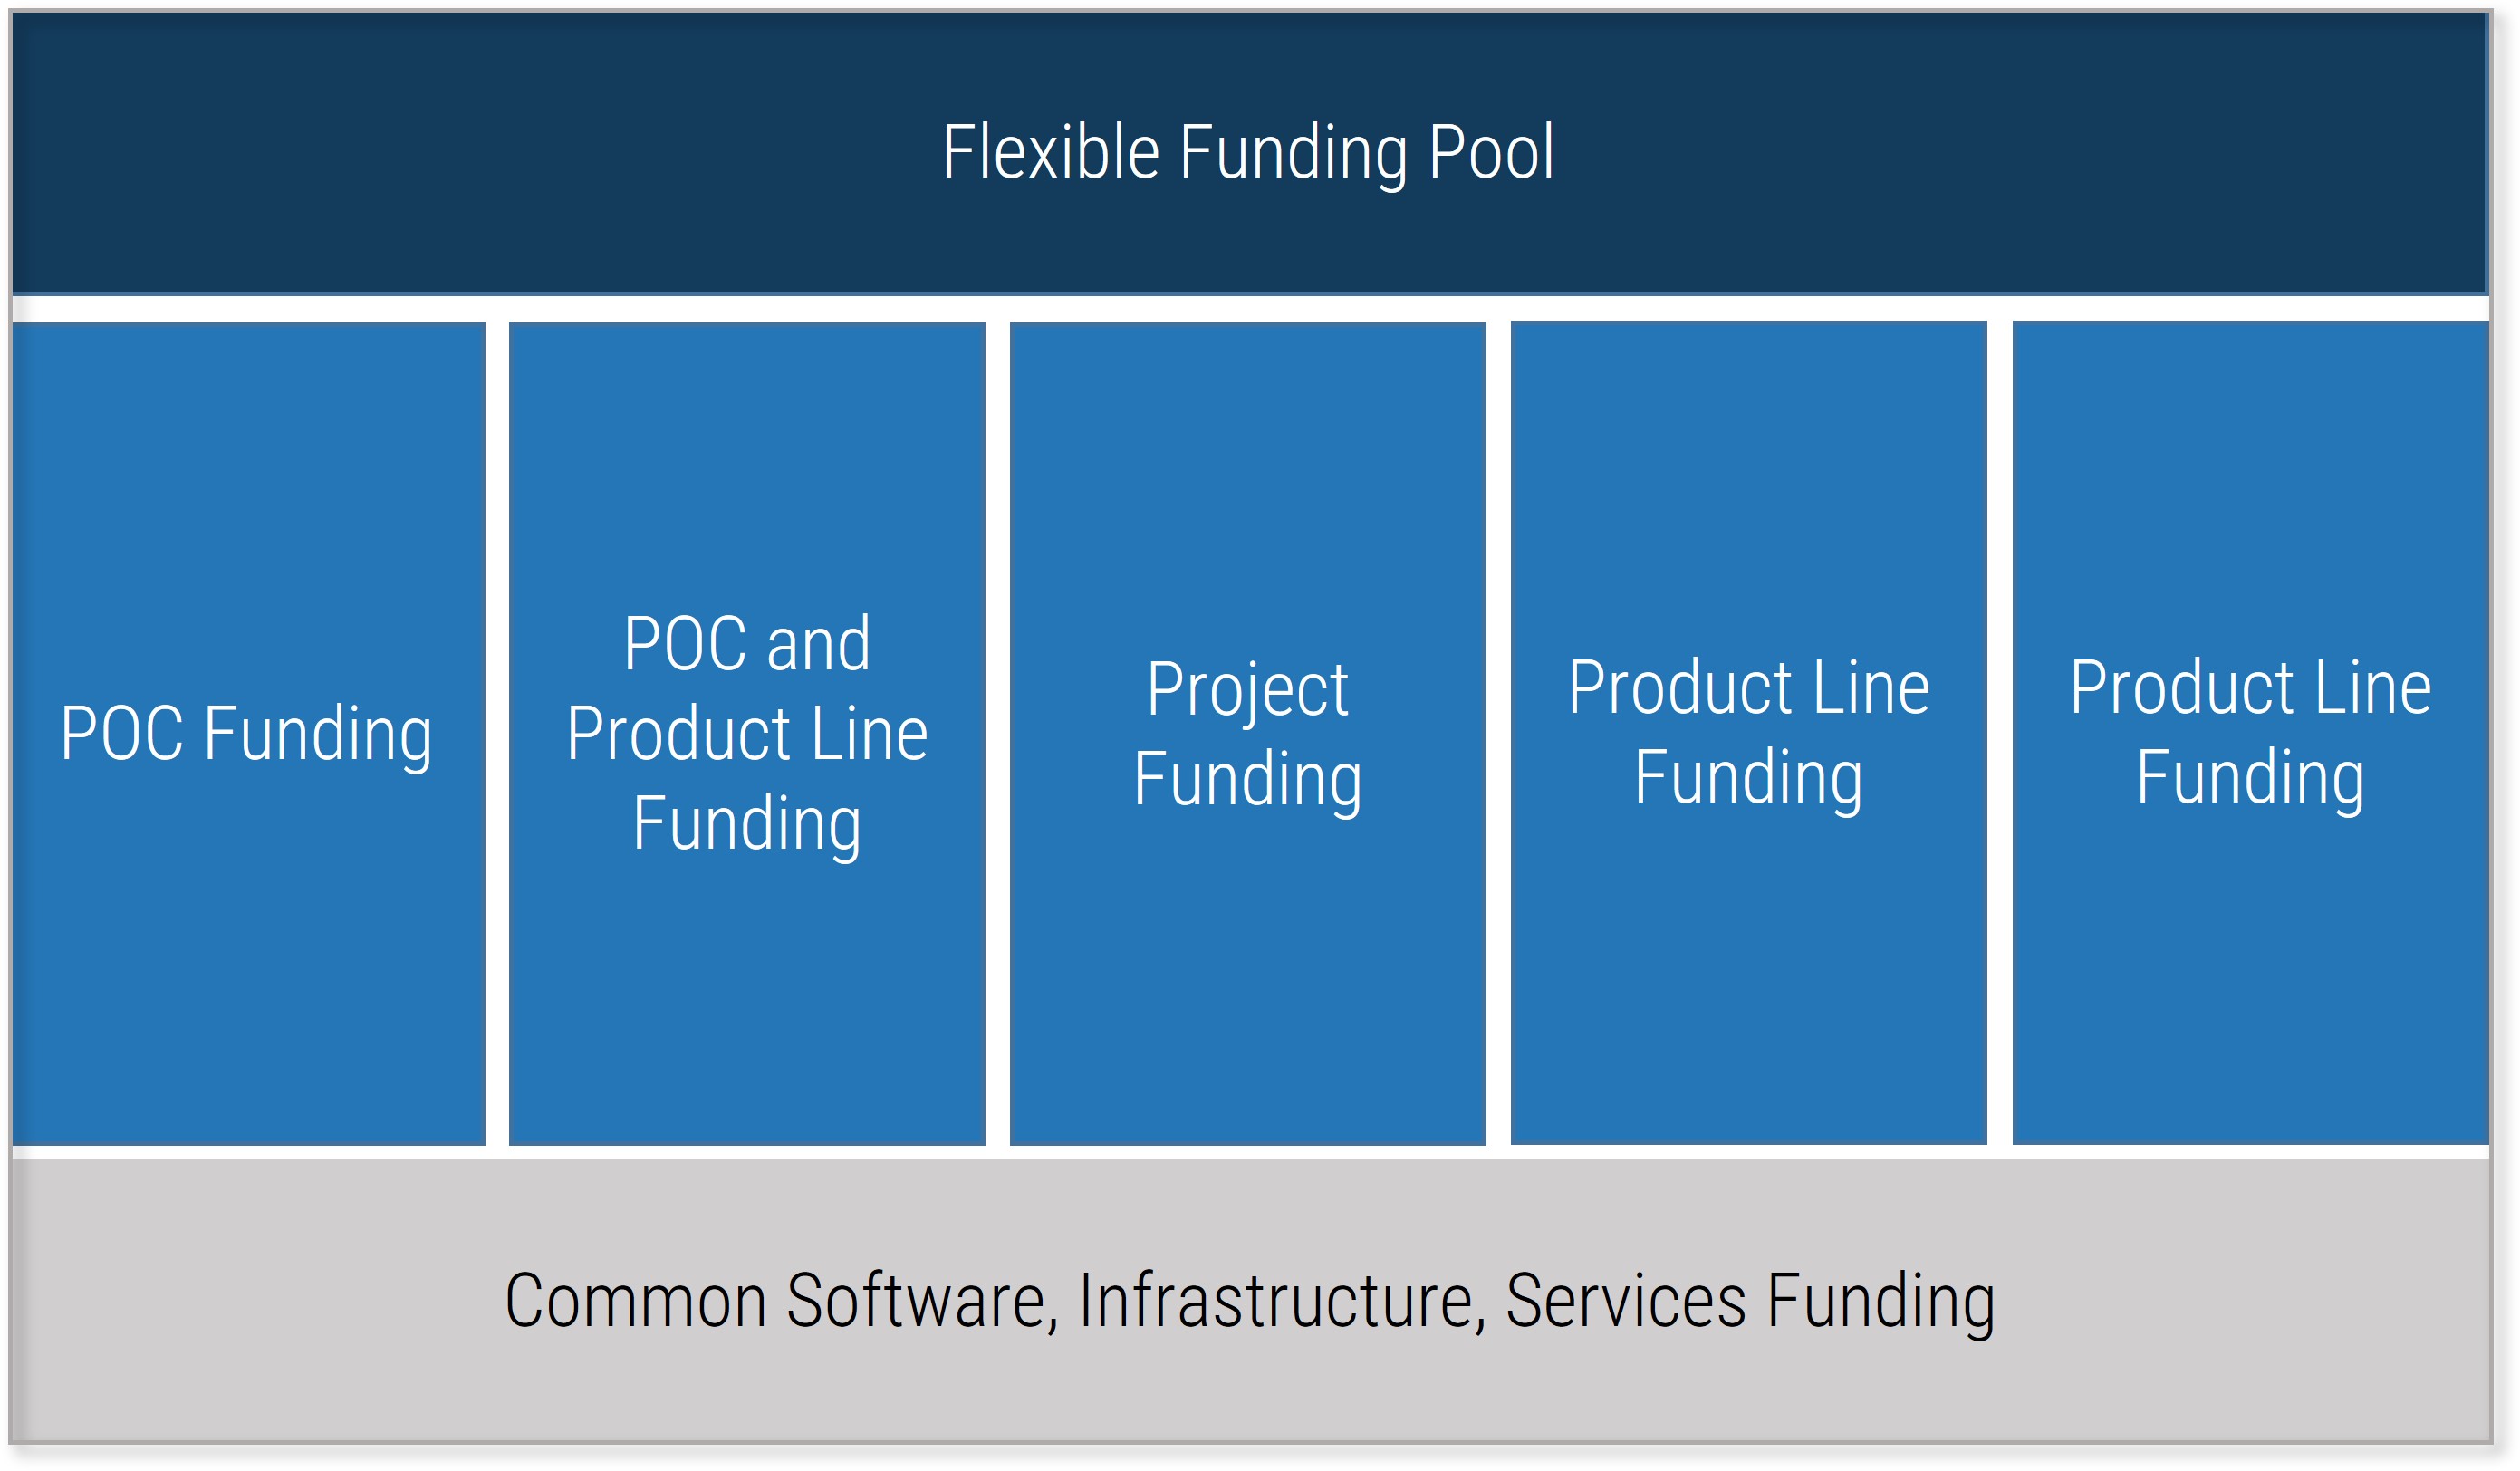
A flexible funding pool akin to venture capital models is maintained to support innovative ideas and fund proofs of concept for product and process improvements.
Proofs of concept (POCs) are run by standing innovation teams or a reserve of resources not committed to existing products, projects, or services.
Every product line has funding for all changes and ongoing operations and support.
Teams are funded continuously so that they can learn and improve their practices as much as possible.
Budgeting approaches must evolve as you mature your product operating environment
| |
TRADITIONAL PROJECTS WITH WATERFALL DELIVERY |
TRADITIONAL PROJECTS WITH AGILE DELIVERY |
PRODUCTS WITH AGILE PROJECT DELIVERY |
PRODUCTS WITH AGILE DELIVERY |
WHEN IS THE BUDGET TRACKED? |
Budget tracked by major phases |
Budget tracked by sprint and project |
Budget tracked by sprint and project |
Budget tracked by sprint and release |
HOW ARE CHANGES HANDLED? |
All change is by exception |
Scope change is routine, budget change is by exception |
Scope change is routine, budget change is by exception |
Budget change is expected on roadmap cadence |
WHEN ARE BENEFITS REALIZED? |
Benefits realization after project completion |
Benefits realization is ongoing throughout the life of the project |
Benefits realization is ongoing throughout the life of the product |
Benefits realization is ongoing throughout life of the product |
WHO “DRIVES”? |
Project Manager
- Project team delivery role
- Refines project scope, advocates for changes in the budget
- Advocates for additional funding in the forecast
|
Product Owner
- Project team delivery role
- Refines project scope, advocates for changes in the budget
- Advocates for additional funding in the forecast
|
Product Manager
- Product portfolio team role
- Forecasting new initiatives during delivery to continue to drive value throughout the life of the product
|
Product Manager
Product family team role
Forecasting new initiatives during delivery to continue to drive value throughout the life of the product
|
Info-Tech Insight
As you evolve your approach to product delivery, you will be decoupling the expected benefits, forecast, and budget. Managing them independently will improve your ability to adapt to change and drive the right outcomes!
Your strategy must include the cost to build and operate
Most investment happens after go-live, not in the initial build!
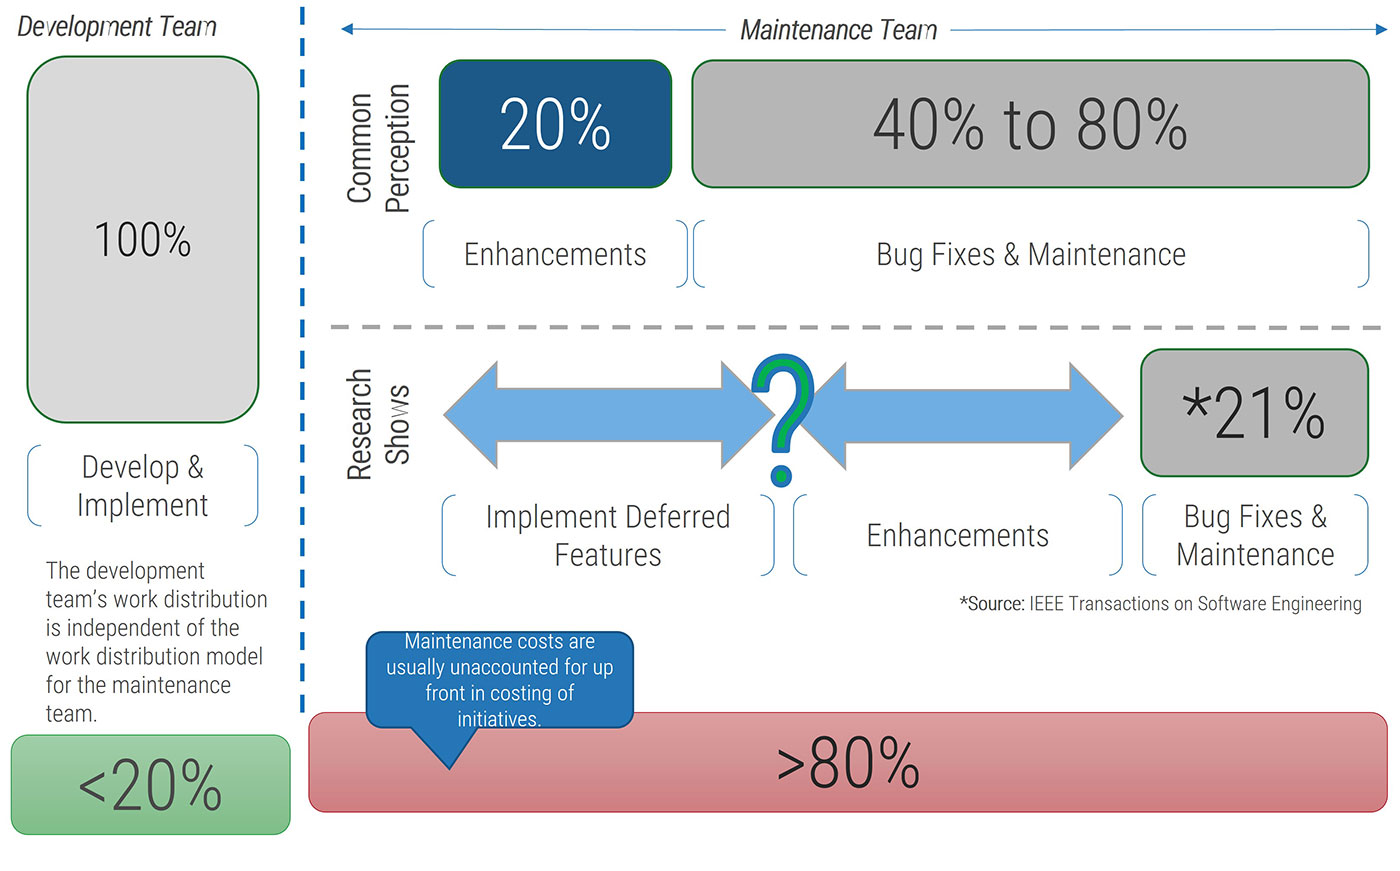
Adapted from: LookFar
Info-Tech Insight
While the exact balance point between development or implementation costs varies from application to application, over 80% of the cost is accrued after go-live.
Traditional accounting leaves software development CapEx on the table
Software development costs have traditionally been capitalized, while research and operations are operational expenditures.
The challenge has always been the myth that operations are only bug fixes, upgrades, and other operational expenditures. Research shows that most post-release work on developed solutions is the development of new features and changes to support material changes in the business. While projects could bundle some of these changes into capital expenditure, much of the business-as-usual work that goes on leaves capital expenses on the table because the work is lumped together as maintenance-related OpEx.
From “How to Stop Leaving Software CapEx on the Table With Agile and DevOps”
4.4.1 Discuss traditional vs. product-centric funding methods
30-60 minutes
- Discuss how products and product families are currently funded.
- Review how the Agile/product funding models differ from how you currently operate.
- What changes do you need to consider in order to support a product delivery model?
- For each change, identify the key stakeholders and list at least one action to take.
- Record the results in the Digital Product Family Strategy Playbook.
Output
- Understanding of funding principles and challenges
Participants
- Product owners
- Product managers
- Delivery managers
Record the results in the Digital Product Family Strategy Playbook.
Phase 5
Build Your Transformation Roadmap and Communication Plan
| Phase 1 | Phase 2 | Phase 3 | Phase 4 | Phase 5 |
|---|
1.1 Understand the organizational factors driving product-centric delivery 1.2 Establish your organization’s product inventory | 2.1 Determine your approach to scale product families 2.2 Define your product families | 3.1 Leverage product family roadmaps 3.2 Use stakeholder management to improve roadmap communication 3.3 Configure your product family roadmaps 3.4 Confirm product family to product alignment | 4.1 Assess your organization’s delivery readiness 4.2 Understand your delivery options 4.3 Determine your operating model 4.4 Identify how to fund product family delivery | 5.1 Learn how to introduce your digital product family strategy 5.2 Communicate changes on updates to your strategy 5.3 Determine your next steps |
This phase will walk you through the following activities:
5.1.1 Introduce your digital product family strategy
5.2.1 Define your communication cadence for your strategy updates
5.2.2 Define your messaging for each stakeholder
5.3.1 How do we get started?
This phase involves the following participants:
- Product owners
- Product managers
- Application leaders
- Stakeholders
Step 5.1
Introduce your digital product family strategy
Activities
5.1.1 Introduce your digital product family strategy
This step involves the following participants:
- Product owners and product managers
- Application leaders
- Stakeholders
Outcomes of this step
- A completed executive summary presenting your digital product strategy
Product decisions are traditionally made in silos with little to no cross-functional communication and strategic oversight
Software delivery teams and stakeholders traditionally make plans, strategies, and releases within their silos and tailor their decisions based on their own priorities. Interactions are typically limited to hand-offs (such as feature requests) and routing of issues and defects back up the delivery pipeline. These silos likely came about through well-intentioned training, mandates, and processes, but they do not sufficiently support today’s need to rapidly release and change platforms.
Siloed departments often have poor visibility into the activities of other silos, and they may not be aware of the ramifications their decisions have on teams and stakeholders outside of their silo.
- Silos may make choices that are optimal largely for themselves without thinking of the holistic impact on a platform’s structure, strategy, use cases, and delivery.
- The business may approve platform improvements without the consideration of the delivery team’s current capacity or the system’s complexity, resulting in unrealistic commitments.
- Quality standards may be misinterpreted and inconsistently enforced across the entire delivery pipeline.
In some cases, the only way to achieve greater visibility and communication for all roles across a platform’s lifecycle is implementing an overarching role or team.
“The majority of our candid conversations with practitioners and project management offices indicate that the platform ownership role is poorly defined and poorly executed.”
– Barry Cousins
Practice Lead, Applications – Project & Portfolio Management
Info-Tech Research Group
Use stakeholder management and roadmap views to improve communication
Proactive, clear communication with stakeholders, SMEs, and your product delivery team can significantly improve alignment and agreement with your roadmap, strategy, and vision.
When building your communication strategy, revisit the work you completed in phase 3 developing your:
- Roadmap types
- Stakeholder strategy
Type | Quadrant | Actions |
|---|
Players | High influence, high interest – actively engage | Keep them updated on the progress of the project. Continuously involve Players in the process and maintain their engagement and interest by demonstrating their value to its success. |
Mediators | High influence, low interest – keep satisfied | They can be the game changers in groups of stakeholders. Turn them into supporters by gaining their confidence and trust and including them in important decision-making steps. In turn, they can help you influence other stakeholders. |
Noisemakers | Low influence, high interest – keep informed | Try to increase their influence (or decrease it if they are detractors) by providing them with key information, supporting them in meetings, and using Mediators to help them. |
Spectators | Low influence, low interest – monitor | They are followers. Keep them in the loop by providing clarity on objectives and status updates. |
5.1.1 Introduce your digital product family strategy
30-60 minutes
This exercise is intended to help you lay out the framing of your strategy and the justification for the effort. A lot of these items can be pulled directly from the product canvas you created in phase 2. This is intended to be a single slide to frame your upcoming discussions.
- Update your vision, goals, and values on your product canvas. Determine which stakeholders may be impacted and what their concerns are. If you have many stakeholders, limit to Players and Influencers.
- Identify what you need from the stakeholders as a result of this communication.
- Keeping in mind the information gathered in steps 1 and 2, describe your product family strategy by answering three questions:
- Why do we need product families?
- What is in our way?
- Our first step will be... ?
Output
- An executive summary that introduces your product strategy
Participants
- Product owners and product managers
- Application leaders
- Stakeholders
Record the results in the Digital Product Family Strategy Playbook.
Example: Scaling delivery through product families
Why do we need product families?
- The growth of our product offerings and our company’s movement into new areas of growth mean we need to do a better job scaling our offerings to meet the needs of the organization.
What is in our way?
- Our existing applications and services are so dramatically different we are unsure how to bring them together.
Our first step will be...
- Taking a full inventory of our applications and services.
Step 5.2
Communicate changes on updates to your strategy
Activities
5.2.1 Define your communication cadence for your strategy updates
5.2.2 Define your messaging for each stakeholder
This step involves the following participants:
- Product owners and product managers
- Application leaders
- Stakeholders
Outcomes of this step
- A communication plan for when strategy updates need to be given
5.2.1 Define your communication cadence for your strategy updates
30 minutes
Remember the role of different artifacts when it comes to your strategy. The canvas contributes to the What, and the roadmap addresses the How. Any updates to the strategy are articulated and communicated through your roadmap.
- Review your currently defined roadmaps, their communication objectives, update frequency, and updates.
- Consider the impacted stakeholders and the strategies required to communicate with them.
- Fill in your communication cadence and communication method.
EXAMPLE:
Roadmap Name |
Audience/Stakeholders |
Communication Cadence
|
External Customer Roadmap |
Customers and External Users |
Quarterly (Website) |
Product Delivery Roadmap |
Development Teams, Infrastructure, Architects |
Monthly (By Email) |
Technology Roadmap |
Development Teams, Infrastructure, Architects |
Biweekly (Website) |
Output
- Clear communication cadence for your roadmaps
Participants
- Product owners and product managers
- Application leaders
- Stakeholders
Record the results in the Digital Product Family Strategy Playbook.
The “what” behind the communication
Leaders of successful change spend considerable time developing a powerful change message, i.e. a compelling narrative that articulates the desired end state and makes the change concrete and meaningful to staff.
The change message should:
- Explain why the change is needed.
- Summarize what will stay the same.
- Highlight what will be left behind.
- Emphasize what is being changed.
- Explain how change will be implemented.
- Address how change will affect various roles in the organization.
- Discuss the staff’s role in making the change successful.
Five elements of communicating change
- What is the change?
- Why are we doing it?
- How are we going to go about it?
- How long will it take us to do it?
- What is the role for each department and individual?
Source: Cornelius & Associates
How we engage with the message is just as important as the message itself
Why are we here?
Speak to what matters to them
Sell the improvement
Show real value
Discuss potential fears
Ask for their support
Be gracious
5.2.2 (Optional) Define your messaging for each stakeholder
30 minutes
It’s one thing to communicate the strategy, it’s another thing to send the right message to your stakeholders. Some of this will depend on the kind of news given, but the majority of this is dependent on the stakeholder and the cadence of communication.
- From exercise 5.2.1, take the information on the specific roadmaps, target audience, and communication cadence.
- Based on your understanding of the audience’s needs, what would the specific update try to get across?
- Pick a specific typical example of a change in strategy that you have gone through. (e.g. Product will be delayed by a quarter; key feature is being substituted for another.)
EXAMPLE:
Roadmap Name | Audience/ Stakeholder | Communication Cadence | Messaging |
|---|
External Customer Roadmap | Customers and External Users | Quarterly (Website) | |
Output
- Messaging plan for each roadmap type
Participants
- Product owners and product managers
- Application leaders
- Stakeholders
Record the results in the Digital Product Family Strategy Playbook.
Step 5.3
Determine your next steps
Activities
5.3.1 How do we get started?
This step involves the following participants:
- Product owners and product managers
- Application leaders
- Stakeholders
Outcomes of this step
- Understanding the steps to get started in your transformation
The “Now, Next, Later” roadmap
Use this when deadlines and delivery dates are not strict. This is best suited for brainstorming a product plan when dependency mapping is not required.
Now: What are you going to do now?
Next: What are you going to do very soon?
Later: What are you going to do in the future?
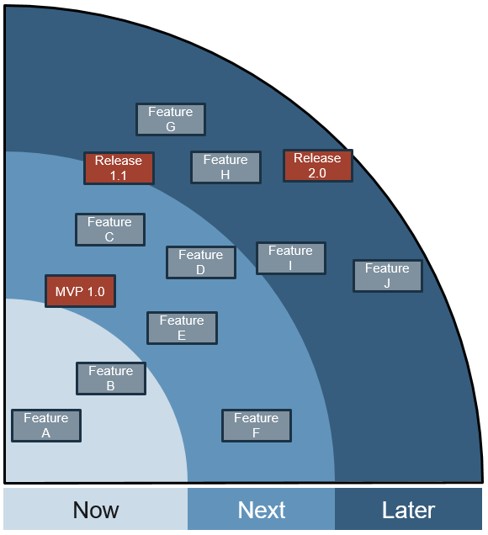
Source: “Tips for Agile product roadmaps & product roadmap examples,” Scrum.org, 2017
5.3.1 How do we get started?
30-60 minutes
- Identify what the critical steps are for the organization to embrace product-centric delivery.
- Group each critical step by how soon you need to address it:
- Now: Let’s do this ASAP.
- Next: Sometime very soon, let’s do these things.
- Later: Much further off in the distance, let’s consider these things.
Record the group results in the Deliver Digital Products at Scale Workbook.
Record changes for your product and product family in the Digital Product Family Strategy Playbook.
Source: “Tips for Agile product roadmaps & product roadmap examples,” Scrum.org, 2017
Output
- Product family transformation critical steps and basic roadmap
Participants
- Product owners and product managers
- Application leaders
- Stakeholders
Record the results in the Digital Product Family Strategy Playbook.
Record the results in the Deliver Digital Products at Scale Workbook.
Summary of Accomplishment
Problem Solved
The journey to become a product-centric organization is not short or easy. Like with any improvement or innovation, teams need to continue to evolve and mature with changes in their operations, teams, tools, and user needs.You’ve taken a big step completing your product family alignment. This provides a backbone for aligning all aspects of your organization to your enterprise goals and strategy while empowering product teams to find solutions closer to the problem. Continue to refine your model and operations to improve value realization and your product delivery pipelines to embrace business agility. Organizations that are most responsive to change will continue to outperform command-and-control leadership.
If you would like additional support, have our analysts guide you through other phases as part of an Info-Tech workshop.
Contact your account representative for more information.
workshops@infotech.com
1-888-670-8889
Research Contributors and Experts

Emily Archer
Lead Business Analyst,
Enterprise Consulting, authentic digital agency
Emily Archer is a consultant currently working with Fortune 500 clients to ensure the delivery of successful projects, products, and processes. She helps increase the business value returned for organizations’ investments in designing and implementing enterprise content hubs and content operations, custom web applications, digital marketing, and e-commerce platforms.

Founder & CTO
Strainprint Technologies Inc.
David Berg is a product commercialization expert that has spent the last 20 years of his career delivering product management and business development services across a broad range of industries. Early in his career, David worked with product management and engineering teams to build core network infrastructure products that secure and power the internet we benefit from today. David’s experience also includes working with clean technologies in the area of clean power generation, agritech, and Internet of Things infrastructure. Over the last five years, David has been focused on his latest venture, Strainprint Technologies, a data and analytics company focused on the medical cannabis industry. Strainprint has built the largest longitudinal medical cannabis dataset in the world with the goal to develop an understanding of treatment behavior, interactions, and chemical drivers to guide future product development.
Kathy Borneman
Digital Product Owner, SunTrust Bank
Kathy Borneman is a senior product owner who helps people enjoy their jobs again by engaging others in end-to-end decision making to deliver software and operational solutions that enhance the client experience and allow people to think and act strategically.

Charlie Campbell
Product Owner, Merchant e-Solutions
Charlie Campbell is an experienced problem solver with the ability to quickly dissect situations and recommend immediate actions to achieve resolution, liaise between technical and functional personnel to bridge the technology and communication gap, and work with diverse teams and resources to reach a common goal.

Yarrow Diamond
Sr. Director, Business Architecture
Financial Services
Yarrow Diamond is an experienced professional with expertise in enterprise strategy development, project portfolio management, and business process reengineering across financial services, healthcare and insurance, hospitality, and real estate environments. She has a master’s in Enterprise Architecture from Penn State University, LSSMBB, PMP, CSM, ITILv3.

Cari J. Faanes-Blakey, CBAP, PMI-PBA
Enterprise Business Systems Analyst,
Vertex, Inc.
Cari J. Faanes-Blakey has a history in software development and implementation as a Business Analyst and Project Manager for financial and taxation software vendors. Active in the International Institute of Business Analysis (IIBA), Cari participated on the writing team for the BA Body of Knowledge 3.0 and the certification exam.

Kieran Gobey
Senior Consultant Professional Services
Blueprint Software Systems
Kieran Gobey is an IT professional with 24 years of experience, focused on business, technology, and systems analysis. He has split his career between external and internal customer-facing roles, and this has resulted in a true understanding of what is required to be a Professional Services Consultant. His problem-solving skills and ability to mentor others have resulted in successful software implementations. Kieran’s specialties include deep system troubleshooting and analysis skills, facilitating communications to bring together participants effectively, mentoring, leadership, and organizational skills.

Rupert Kainzbauer
VP Product, Digital Wallets
Paysafe Group
Rupert Kainzbauer is an experienced senior leader with a passion for defining and delivering products that deliver real customer and commercial benefit. Together with a team of highly experienced and motivated product managers, he has successfully led highly complex, multi-stakeholder payments initiatives, from proposition development and solution design through to market delivery. Their domain experience is in building online payment products in high-risk and emerging markets, remittance, prepaid cards, and mobile applications.

Saeed Khan
Founder,
Transformation Labs
Saeed Khan has been working in high tech for 30 years in both Canada and the US and has held a number of leadership roles in Product Management over that time. He speaks regularly at conferences and has been writing publicly about technology product management since 2005. Through Transformation Labs, Saeed helps companies accelerate product success by working with product teams to improve their skills, practices, and processes. He is a cofounder of ProductCamp Toronto and currently runs a Meetup group and global Slack community called Product Leaders; the only global community of senior level product executives.

Hoi Kun Lo
Product Owner
Nielsen
Hoi Kun Lo is an experienced change agent who can be found actively participating within the IIBA and WITI groups in Tampa, FL and a champion for Agile, architecture, diversity, and inclusion programs at Nielsen. She is currently a Product Owner in the Digital Strategy team within Nielsen Global Watch Technology.

Abhishek Mathur
Sr Director, Product Management
Kasisto, Inc.
Abhishek Mathur is a product management leader, an artificial intelligence practitioner, and an educator. He has led product management and engineering teams at Clarifai, IBM, and Kasisto to build a variety of artificial intelligence applications within the space of computer vision, natural language processing, and recommendation systems. Abhishek enjoys having deep conversations about the future of technology and helping aspiring product managers enter and accelerate their careers.

Jeff Meister
Technology Advisor and Product Leader
Jeff Meister is a technology advisor and product leader. He has more than 20 years of experience building and operating software products and the teams that build them. He has built products across a wide range of industries and has built and led large engineering, design, and product organizations. Jeff most recently served as Senior Director of Product Management at Avanade, where he built and led the product management practice. This involved hiring and leading product managers, defining product management processes, solution shaping and engagement execution, and evangelizing the discipline through pitches, presentations, and speaking engagements. Jeff holds a Bachelor’s of Applied Science (Electrical Engineering) and a Bachelor’s of Arts from the University of Waterloo, an MBA from INSEAD (Strategy), and certifications in product management, project management, and design thinking.

Vincent Mirabelli
Principal,
Global Project Synergy Group
With over 10 years of experience in both the private and public sectors, Vincent Mirabelli possesses an impressive track record of improving, informing, and transforming business strategy and operations through process improvement, design and re-engineering, and the application of quality to business analysis, project management, and process improvement standards.

Oz Nazili
VP, Product & Growth
TWG
Oz Nazili is a product leader with a decade of experience in both building products and product teams. Having spent time at funded startups and large enterprises, he thinks often about the most effective way to deliver value to users. His core areas of interest include Lean MVP development and data-driven product growth.

Mark Pearson
Principal IT Architect, First Data Corporation
Mark Pearson is an executive business leader grounded in the process, data, technology, and operations of software-driven business. He knows the enterprise software landscape and is skilled in product, technology, and operations design and delivery within information technology organizations, outsourcing firms, and software product companies.

Brenda Peshak
Product Owner,
Widget Industries, LLC
Brenda Peshak is skilled in business process, analytical skills, Microsoft Office Suite, communication, and customer relationship management (CRM). She is a strong product management professional with a Master’s focused in Business Leadership (MBL) from William Penn University.

Mike Starkey
Director of Engineering
W.W. Grainger
Mike Starkey is a Director of Engineering at W.W. Grainger, currently focusing on operating model development, digital architecture, and building enterprise software. Prior to joining W.W. Grainger, Mike held a variety of technology consulting roles throughout the system delivery lifecycle spanning multiple industries such as healthcare, retail, manufacturing, and utilities with Fortune 500 companies.

Anant Tailor
Cofounder & Head of Product
Dream Payments Corp.
Anant Tailor is a cofounder at Dream Payments where he currently serves as the COO and Head of Product, having responsibility for Product Strategy & Development, Client Delivery, Compliance, and Operations. He has 20+ years of experience building and operating organizations that deliver software products and solutions for consumers and businesses of varying sizes. Prior to founding Dream Payments, Anant was the COO and Director of Client Services at DonRiver Inc, a technology strategy and software consultancy that he helped to build and scale into a global company with 100+ employees operating in seven countries. Anant is a Professional Engineer with a Bachelor’s degree in Electrical Engineering from McMaster University and a certificate in Product Strategy & Management from the Kellogg School of Management at Northwestern University.

Angela Weller
Scrum Master, Businessolver
Angela Weller is an experienced Agile business analyst who collaborates with key stakeholders to attain their goals and contributes to the achievement of the company’s strategic objectives to ensure a competitive advantage. She excels when mediating or facilitating teams.
Related Info-Tech Research
Product Delivery
Deliver on Your Digital Product Vision
- Build a product vision your organization can take from strategy through execution.
Build a Better Product Owner
- Strengthen the product owner role in your organization by focusing on core capabilities and proper alignment.
Build Your Agile Acceleration Roadmap
- Quickly assess the state of your Agile readiness and plan your path forward to higher value realization.
Implement Agile Practices That Work
- Improve collaboration and transparency with the business to minimize project failure.
Implement DevOps Practices That Work
- Streamline business value delivery through the strategic adoption of DevOps practices.
Extend Agile Practices Beyond IT
- Further the benefits of Agile by extending a scaled Agile framework to the business.
Build Your BizDevOps Playbook
- Embrace a team sport culture built around continuous business-IT collaboration to deliver great products.
Embed Security Into the DevOps Pipeline
- Shift security left to get into DevSecOps.
Spread Best Practices With an Agile Center of Excellence
- Facilitate ongoing alignment between Agile teams and the business with a set of targeted service offerings.
Enable Organization-Wide Collaboration by Scaling Agile
- Execute a disciplined approach to rolling out Agile methods in the organization.
Application Portfolio Management
APM Research Center
- See an overview of the APM journey and how we can support the pieces in this journey.
Application Portfolio Management for Small Enterprises
- There is no one-size-fits-all rationalization. Tailor your framework to meet your goals.
Streamline Application Maintenance
- Effective maintenance ensures the long-term value of your applications.
Build an Application Rationalization Framework
- Manage your application portfolio to minimize risk and maximize value.
Modernize Your Applications
- Justify modernizing your application portfolio from both business and technical perspectives.
Review Your Application Strategy
- Ensure your applications enable your business strategy.
Discover Your Applications
- Most application strategies fail. Arm yourself with the necessary information and team structure for a successful application portfolio strategy.
Streamline Application Management
- Move beyond maintenance to ensuring exceptional value from your apps.
Optimize Applications Release Management
- Facilitate ongoing alignment between Agile teams and the business with a set of targeted service offerings.
Embrace Business-Managed Applications
- Empower the business to implement their own applications with a trusted business-IT relationship.
Value, Delivery Metrics, Estimation
Build a Value Measurement Framework
- Focus product delivery on business value–driven outcomes.
Select and Use SDLC Metrics Effectively
- Be careful what you ask for, because you will probably get it.
Application Portfolio Assessment: End User Feedback
- Develop data-driven insights to help you decide which applications to retire, upgrade, re-train on, or maintain to meet the demands of the business.
Create a Holistic IT Dashboard
- Mature your IT department by measuring what matters.
Refine Your Estimation Practices With Top-Down Allocations
- Don’t let bad estimates ruin good work.
Estimate Software Delivery With Confidence
- Commit to achievable software releases by grounding realistic expectations.
Reduce Time to Consensus With an Accelerated Business Case
- Expand on the financial model to give your initiative momentum.
Optimize Project Intake, Approval, and Prioritization
- Deliver more projects by giving yourself the voice to say “no” or “not yet” to new projects.
Enhance PPM Dashboards and Reports
- Facilitate ongoing alignment between Agile teams and the business with a set of targeted service offerings.
Org Design and Performance
Redesign Your IT Organizational Structure
- Focus product delivery on business value–driven outcomes.
Build a Strategic Workforce Plan
- Have the right people, in the right place, at the right time.
Implement a New Organizational Structure
- Reorganizations are inherently disruptive. Implement your new structure with minimal pain for staff while maintaining IT performance throughout the change.
Improve Employee Engagement to Drive IT Performance
- Don’t just measure engagement, act on it.
Set Meaningful Employee Performance Measures
- Set holistic measures to inspire employee performance.
Master Organizational Change Management Practices
- PMOs, if you don't know who is responsible for org change, it's you.
Bibliography (Product Management)
“12th Annual State of Agile Report.” VersionOne, 9 April 2018. Web.
A, Karen. “20 Mental Models for Product Managers.” Product Management Insider, Medium, 2 Aug. 2018. Web.
Adams, Paul. “Product Teams: How to Build & Structure Product Teams for Growth.” Inside Intercom, 30 Oct. 2019. Web.
Agile Alliance. “Product Owner.” Agile Alliance. n.d. Web.
Ambysoft. “2018 IT Project Success Rates Survey Results.” Ambysoft. 2018. Web.
Banfield, Richard, et al. “On-Demand Webinar: Strategies for Scaling Your (Growing) Enterprise Product Team.” Pluralsight, 31 Jan. 2018. Web.
Berez, Steve, et al. “How to Plan and budget for Agile at Scale.” Bain & Company, 08 Oct 2019. Web
Blueprint. “10 Ways Requirements Can Sabotage Your Projects Right From the Start.” Blueprint. 2012. Web.
Breddels, Dajo, and Paul Kuijten. “Product Owner Value Game.” Agile2015 Conference, Agile Alliance 2015. Web.
Cagan, Martin. “Behind Every Great Product.” Silicon Valley Product Group. 2005. Web.
Cohn, Mike. “What Is a Product?” Mountain Goat Software. 6 Sept. 2016. Web.
Connellan, Thomas K. Inside the Magic Kingdom, Bard Press, 1997.
Curphey, Mark. “Product Definition.” SlideShare, 25 Feb. 2007. Web.
“Delegation Poker Product Image.” Management 3.0, n.d. Web.
Distel, Dominic, et al. “Finding the sweet spot in product-portfolio management.’ McKinsey, 4 Dec. 2020. Web
Eringa, Ron. “Evolution of the Product Owner.” RonEringa.com, 12 June 2016. Web.
Fernandes, Thaisa. “Spotify Squad Framework - Part I.” PM101, Medium, 6 Mar. 2017. Web.
Galen, Robert. “Measuring Product Ownership – What Does ‘Good’ Look Like?” RGalen Consulting, 5 Aug. 2015. Web.
Halisky, Merland, and Luke Lackrone. “The Product Owner’s Universe.” Agile2016 Conference, Agile Alliance, 2016. Web.
Kamer, Jurriaan. “How to Build Your Own ‘Spotify Model’.” The Ready, Medium, 9 Feb. 2018. Web.
Kendis Team. “Exploring Key Elements of Spotify’s Agile Scaling Model.” Scaled Agile Framework, Medium, 23 Jul. 2018. Web.
Lindstrom, Lowell. “7 Skills You Need to Be a Great Product Owner.” Scrum Alliance, n.d. Web.
Lukassen, Chris. “The Five Belts Of The Product Owner.” Xebia.com, 20 Sept. 2016. Web.
McCloskey, Heather. “Scaling Product Management: Secrets to Defeating Common Challenges.” ProductPlan, 12 July 2019. Web.
McCloskey, Heather. “When and How to Scale Your Product Team.” UserVoice, 21 Feb. 2017. Web.
Mironov, Rich. “Scaling Up Product Manager/Owner Teams.” Rich Mironov's Product Bytes, Mironov Consulting, 12 Apr. 2014 . Web.
Overeem, Barry. “A Product Owner Self-Assessment.” Barry Overeem, 6 Mar. 2017. Web.
Overeem, Barry. “Retrospective: Using the Team Radar.” Barry Overeem, 27 Feb. 2017. Web.
Pichler, Roman. “How to Scale the Scrum Product Owner.” Roman Pichler, 28 June 2016 . Web.
Pichler, Roman. “Product Management Framework.” Pichler Consulting Limited, 2014. Web.
Pichler, Roman. “Sprint Planning Tips for Product Owners.” LinkedIn, 4 Sept. 2018. Web.
Pichler, Roman. “What Is Product Management?” Pichler Consulting Limited, 26 Nov. 2014. Web.
Radigan, Dan. “Putting the ‘Flow' Back in Workflow With WIP Limits.” Atlassian, n.d. Web.
Rouse, Margaret. “Definition: product.” TechTarget, Sept. 2005. Web.
Schuurman, Robbin. “10 Tips for Product Owners on (Business) Value.” Scrum.org, 30 Nov. 2017. Web.
Schuurman, Robbin. “10 Tips for Product Owners on Agile Product Management.” Scrum.org, 28 Nov. 2017. Web.
Schuurman, Robbin. “10 Tips for Product Owners on Product Backlog Management.” Scrum.org, 5 Dec. 2017. Web.
Schuurman, Robbin. “10 Tips for Product Owners on the Product Vision.” Scrum.org, 29 Nov. 2017. Web.
Schuurman, Robbin. “Tips for Starting Product Owners.” Scrum.org, 27 Nov. 2017. Web.
Sharma, Rohit. “Scaling Product Teams the Structured Way.” Monetary Musings, 28 Nov. 2016. Web.
Shirazi, Reza. “Betsy Stockdale of Seilevel: Product Managers Are Not Afraid To Be Wrong.” Austin Voice of Product, 2 Oct. 2018. Web.
Steiner, Anne. “Start to Scale Your Product Management: Multiple Teams Working on Single Product.” Cprime, 6 Aug. 2019. Web.
“The Qualities of Leadership: Leading Change.” Cornelius & Associates, 2016. Web.
“The Standish Group 2015 Chaos Report.” The Standish Group. 2015. Web.
Theus, Andre. “When Should You Scale the Product Management Team?” ProductPlan, 7 May 2019. Web.
Tolonen, Arto. “Scaling Product Management in a Single Product Company.” Smartly.io, 26 Apr. 2018. Web.
Ulrich, Catherine. “The 6 Types of Product Managers. Which One Do You Need?” Medium, 19 Dec. 2017. Web.
Verwijs, Christiaan. “Retrospective: Do The Team Radar.” The Liberators, Medium, 10 Feb. 2017. Web.
Vlaanderen, Kevin. “Towards Agile Product and Portfolio Management”. Academia.edu. 2010. Web.
Bibliography (Roadmap)
Bastow, Janna. “Creating Agile Product roadmaps Everyone Understands.” ProdPad, 22 Mar. 2017. Accessed Sept. 2018.
Bastow, Janna. “The Product Tree Game: Our Favorite Way To Prioritize Features.” ProdPad, 21 Feb. 2016. Accessed Sept. 2018.
Chernak, Yuri. “Requirements Reuse: The State of the Practice.” 2012 IEEE International Conference, 12 June 2012, Herzliya, Israel. Web.
Fowler, Martin. “Application Boundary.” MartinFowler.com, 11 Sept. 2003. Accessed 20 Nov. 2017.
Harrin, Elizabeth. “Learn What a Project Milestone Is.” The Balance Careers, 10 May 2018. Accessed Sept. 2018.
“How to create a product roadmap.” Roadmunk, n.d. Accessed Sept. 2018.
Johnson, Steve. “How to Master the 3 Horizons of Product Strategy.” Aha!, 24 Sept. 2015. Accessed Sept. 2018.
Johnson, Steve. “The Product Roadmap vs. the Technology Roadmap.” Aha!, 23 June 2016. Accessed Sept. 2018
Juncal, Shaun. “How Should You Set Your Product Roadmap Timeframes?” ProductPlan, Web. Sept. 2018.
Leffingwell, Dean. “SAFe 4.0.” Scaled Agile, 2017. Web.
Maurya, Ash. “What is a Minimum Viable Product (MVP).” Leanstack, 12 June 2017. Accessed Sept. 2018.
Pichler, Roman. “10 Tips for Creating an Agile Product Roadmap.” Roman Pichler, 20 July 2016. Accessed Sept. 2018.
Pichler, Roman. Strategize: Product Strategy and Product Roadmap Practices for the Digital Age. Pichler Consulting, 2016.
“Product Roadmap Contents: What Should You Include?” ProductPlan, n.d. Accessed 20 Nov. 2017.
Saez, Andrea. “Why Your Roadmap Is Not a Release Plan.” ProdPad, 23 October 2015. Accessed Sept. 2018.
Schuurman, Robbin. “Tips for Agile product roadmaps & product roadmap examples.” Scrum.org, 7 Dec. 2017. Accessed Sept. 2018.
Bibliography (Vision and Canvas)
Adams, Paul. “The Future Product Canvas.” Inside Intercom, 10 Jan. 2014. Web.
“Aligning IT Funding Models to the Pace of Technology Change.” EDUCAUSE, 14 Dec. 2015. Web.
Altman, Igor. “Metrics: Gone Bad.” OpenView, 10 Nov. 2009. Web.
Barry, Richard. “The Product Vision Canvas – a Strategic Tool in Developing a Successful Business.” Polymorph, 2019. Web.
“Business Canvas – Business Models & Value Propositions.” Strategyzer, 2019. Web.
“Business Model Canvas.” Wikipedia: The Free Encyclopedia, 4 Aug. 2019. Web.
Charak, Dinker. “Idea to Product: The Working Model.” ThoughtWorks, 13 July 2017. Web.
Charak, Dinker. “Product Management Canvas - Product in a Snapshot.” Dinker Charak, 29 May 2017. Web.
Chudley, James. “Practical Steps in Determining Your Product Vision (Product Tank Bristol, Oct. 2018).” LinkedIn SlideShare. Uploaded by cxpartners, 2 Nov. 2018. Web.
Cowan, Alex. “The 20 Minute Business Plan: Business Model Canvas Made Easy.” COWAN+, 2019. Web.
Craig, Desiree. “So You've Decided To Become A Product Manager.” Start it up, Medium, 2 June 2019. Web.
Create an Aha! Business Model Canvas Strategic Model.” Aha! Support, 2019. Web.
Eick, Stephen. “Does Code Decay? Assessing the Evidence from Change Management Data.” IEEE Transactions on Software Engineering, vol. 27, no. 1, Jan. 2001, pp. 1-12. Web.
Eriksson, Martin. “The next Product Canvas.” Mind the Product, 22 Nov. 2013. Web.
“Experience Canvas: a Lean Approach: Atlassian Team Playbook.” Atlassian, 2019. Web.
Freeman, James. “How to Make a Product Canvas – Visualize Your Product Plan.” Edraw, 23 Dec. 2019. Web.
Fuchs, Danny. “Measure What Matters: 5 Best Practices from Performance Management Leaders.” OpenGov, 8 Aug. 2018. Web.
Gorisse, Willem. “A Practical Guide to the Product Canvas.” Mendix, 28 Mar. 2017. Web.
Gothelf, Jeff. “The Lean UX Canvas.” Jeff Gothelf, 15 Dec. 2016. Web.
Gottesdiener, Ellen. “Using the Product Canvas to Define Your Product: Getting Started.” EBG Consulting, 15 Jan. 2019. Web.
Gottesdiener, Ellen. “Using the Product Canvas to Define Your Product's Core Requirements.” EBG Consulting, 4 Feb. 2019. Web.
Gray, Mark Krishan. “Should I Use the Business Model Canvas or the Lean Canvas?” Emergn, 2019. Web.
Hanby, Jeff. "Software Maintenance: Understanding and Estimating Costs." LookFar, 21 Oct. 2016. Web.
“How do you define a product?” Scrum.org, 4 Apr 2017, Web
Juncal, Shaun. “How to Build a Product Roadmap Based on a Business Model Canvas.” ProductPlan, 19 June 2019. Web.
“Lean Canvas Intro - Uber Example.” YouTube, uploaded by Railsware Product Academy, 12 Oct. 2018. Web.
“Lesson 6: Product Canvas.” ProdPad Help Center, 2019. Web.
Lucero, Mario. “The Product Canvas.” Agilelucero.com, 22 June 2015. Web.
Maurya, Ash. “Create a New Lean Canvas.” Canvanizer, 2019. Web.
Maurya, Ash. “Don't Write a Business Plan. Create a Lean Canvas Instead.” LEANSTACK, 2019. Web.
Maurya, Ash. “Why Lean Canvas vs Business Model Canvas?” Medium, 27 Feb. 2012. Web.
Mirabelli, Vincent. “The Project Value Canvas.” Vincent Mirabelli, 2019. Web.
Mishra, LN. “Business Analysis Canvas – The Ultimate Enterprise Architecture.” BA Times, 19 June 2019. Web.
Muller. Jerry Z. “Why performance metrics isn’t always the best way to judge performance.” Fast Company, 3 April 2019. Web.
Perri, Melissa. “What Is Good Product Strategy?” Melissa Perri, 14 July 2016. Web.
Pichler, Roman. “A Product Canvas for Agile Product Management, Lean UX, Lean Startup.” Roman Pichler, 16 July 2012. Web.
Pichler, Roman. “Introducing the Product Canvas.” JAXenter, 15 Jan. 2013. Web.
Pichler, Roman. “Roman's Product Canvas: Introduction.” YouTube, uploaded by Roman Pichler, 3 Mar. 2017. Web.
Pichler, Roman. “The Agile Vision Board: Vision and Product Strategy.” Roman Pichler, 10 May 2011. Web.
Pichler, Roman. “The Product Canvas – Template.” Roman Pichler, 11 Oct. 2016. Web.
Pichler, Roman. “The Product Canvas Tutorial V1.0.” LinkedIn SlideShare. Uploaded by Roman Pichler, 14 Feb. 2013. Web.
Pichler, Roman. “The Product Vision Board: Introduction.” YouTube uploaded by Roman Pichler, 3 Mar. 2017. Web.
“Product Canvas PowerPoint Template.” SlideModel, 2019. Web.
Product Canvas.” SketchBubble, 2019, Web.
“Product Canvas.” YouTube, uploaded by Wojciech Szramowski, 18 May 2016. Web.
“Product Roadmap Software to Help You Plan, Visualize, and Share Your Product Roadmap.” Productboard, 2019. Web.
Roggero, Giulio. “Product Canvas Step-by-Step.” LinkedIn SlideShare, uploaded by Giulio Roggero, 18 May 2013. Web.
Royce, Dr. Winston W. “Managing the Development of Large Software Systems.” Scf.usc.edu, 1970. Web.
Ryan, Dustin. “The Product Canvas.” Qdivision, Medium, 20 June 2017. Web.
Snow, Darryl. “Product Vision Board.” Medium, 6 May 2017. Web.
Stanislav, Shymansky. “Lean Canvas – a Tool Your Startup Needs Instead of a Business Plan.” Railsware, 12 Oct. 2018. Web.
Stanislav, Shymansky. “Lean Canvas Examples of Multi-Billion Startups.” Railsware, 20 Feb. 2019. Web.
“The Product Vision Canvas.” YouTube, Uploaded by Tom Miskin, 20 May 2019. Web.
Tranter, Leon. “Agile Metrics: the Ultimate Guide.” Extreme Uncertainty, n.d. Web.
“Using Business Model Canvas to Launch a Technology Startup or Improve Established Operating Model.” AltexSoft, 27 July 2018. Web.
Veyrat, Pierre. “Lean Business Model Canvas: Examples + 3 Pillars + MVP + Agile.” HEFLO BPM, 10 Mar. 2017. Web.
“What Are Software Metrics and How Can You Track Them?” Stackify, 16 Sept. 2017. Web
“What Is a Product Vision?” Aha!, 2019. Web.


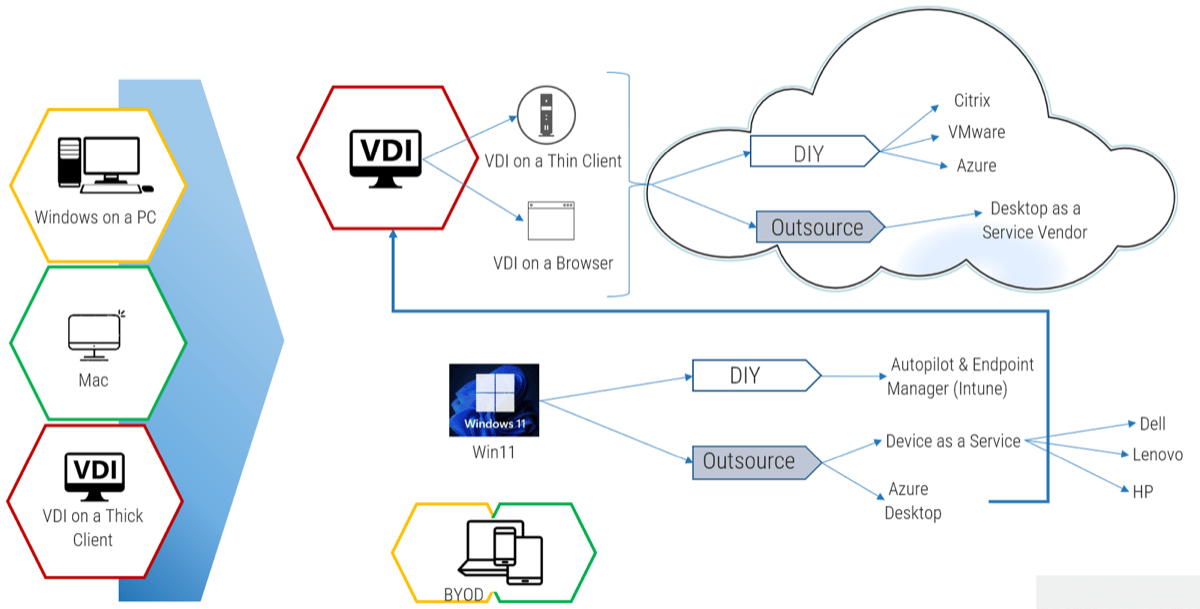
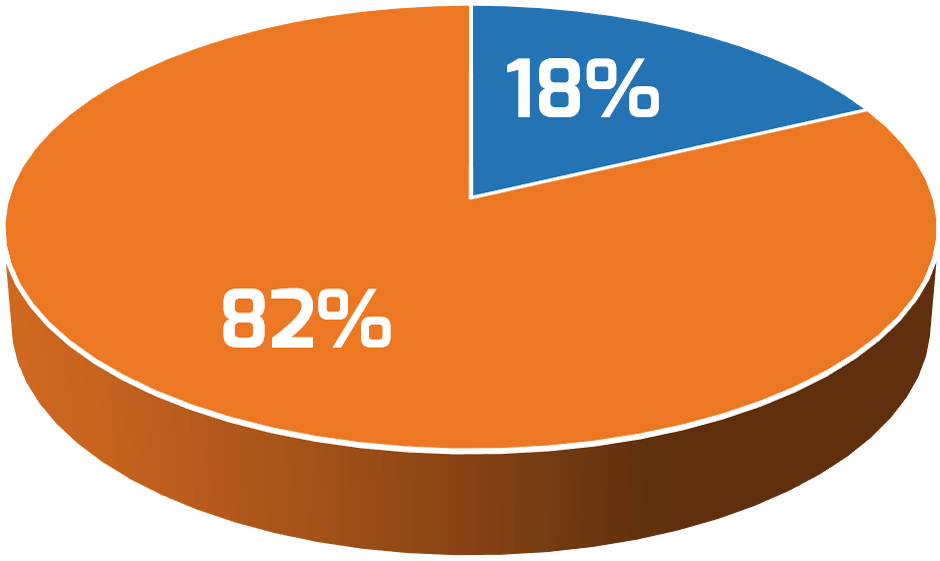
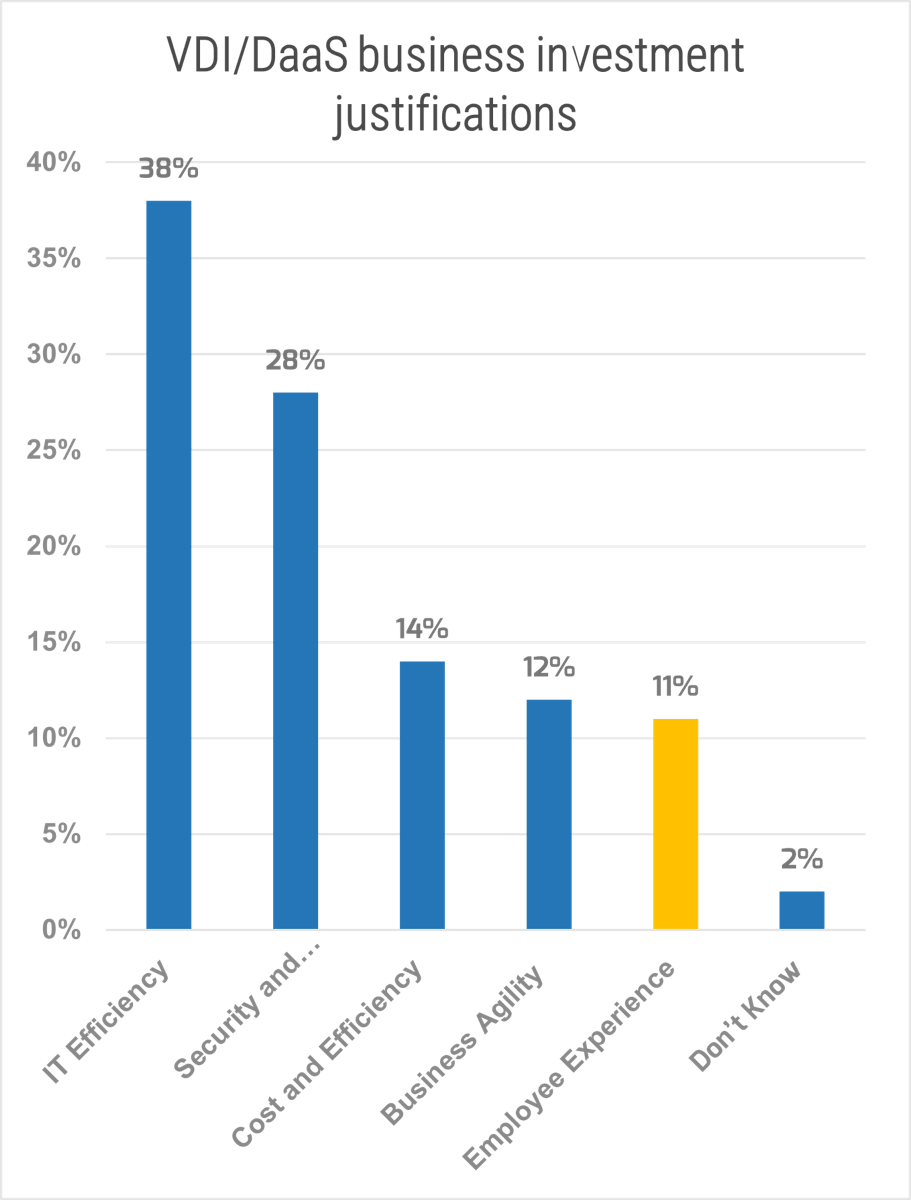
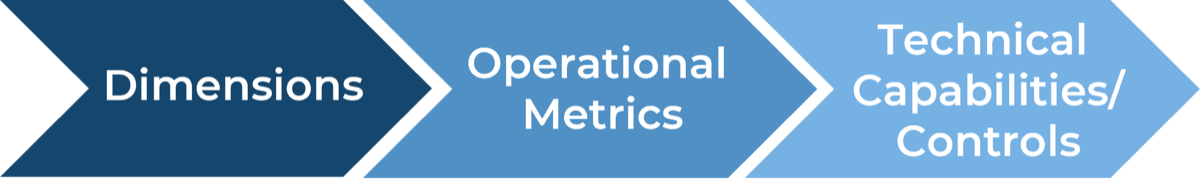
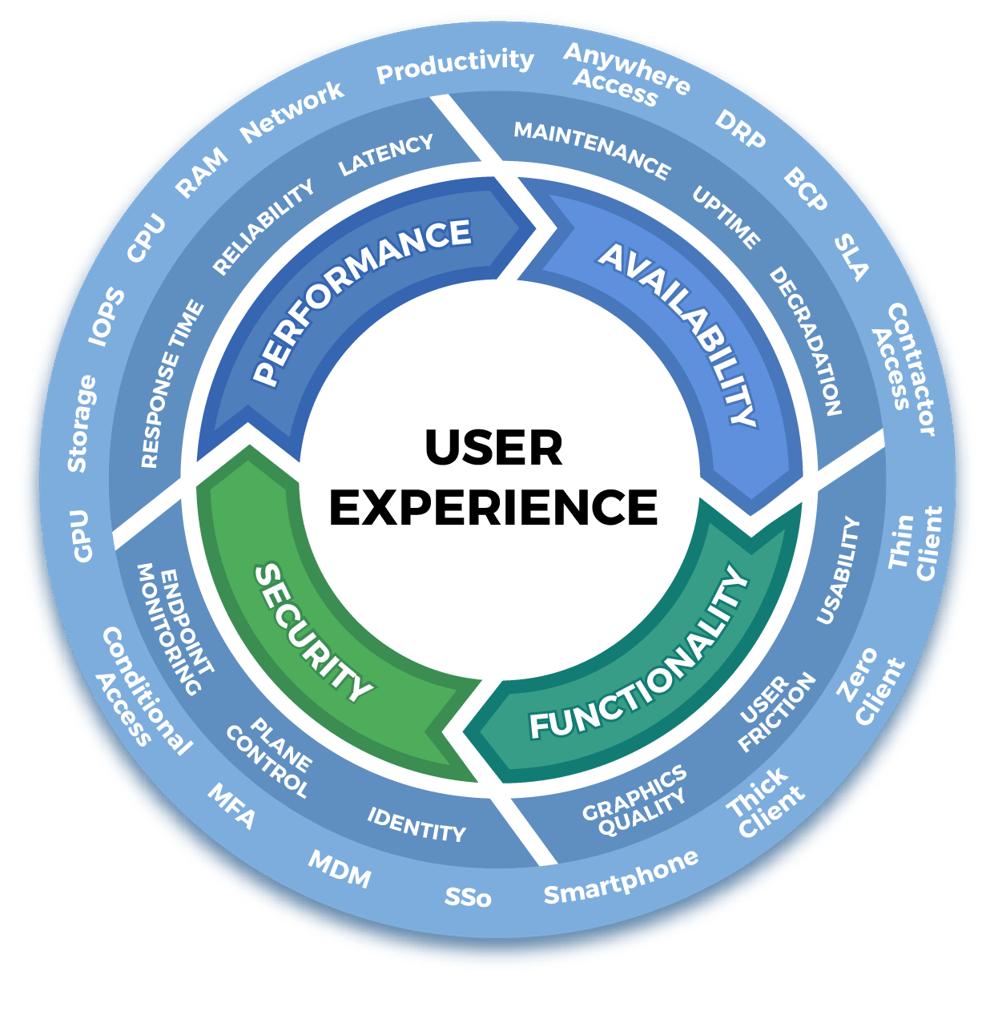
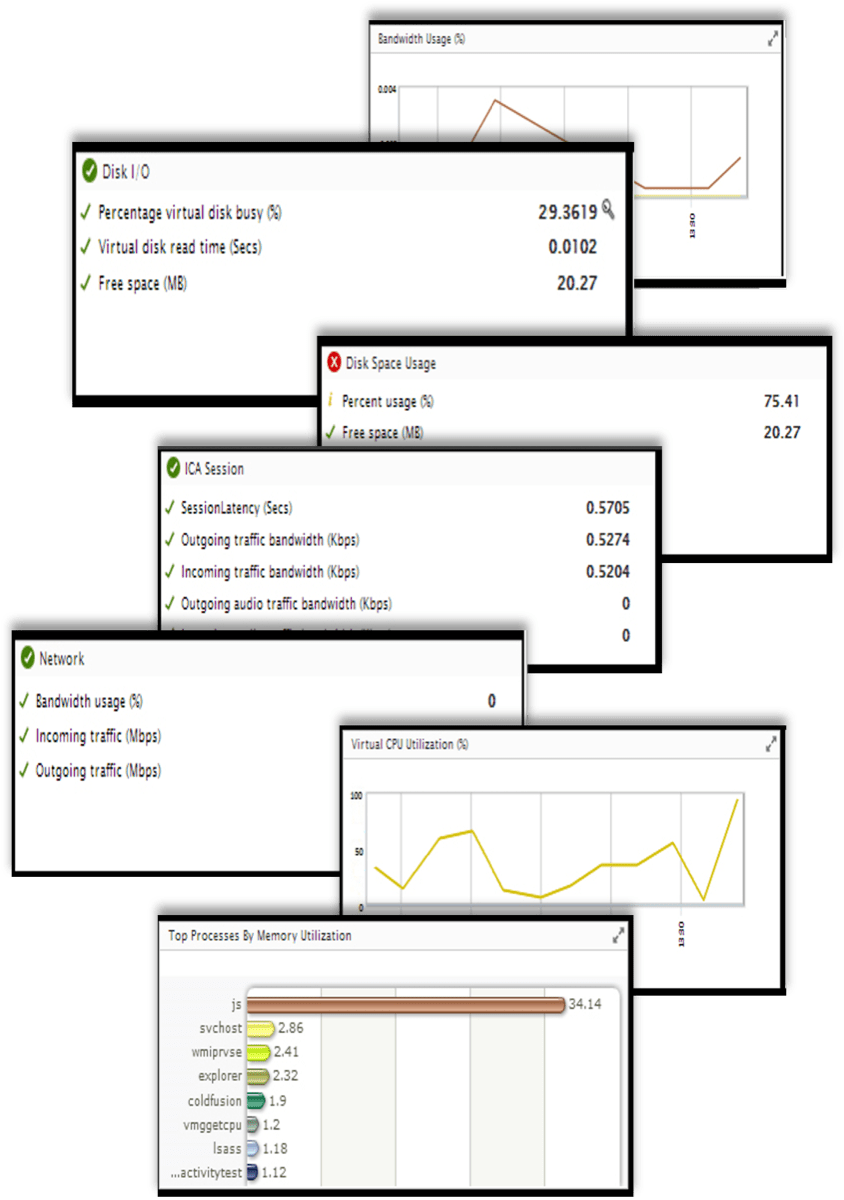
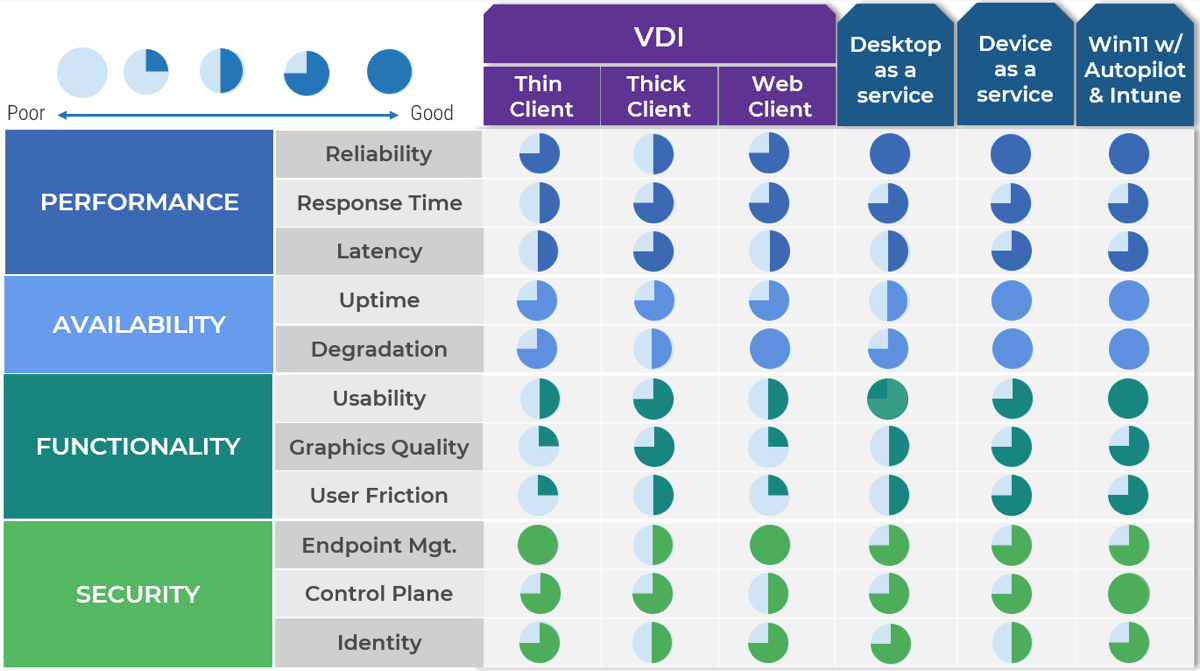
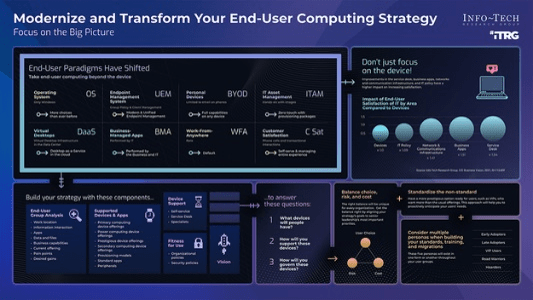


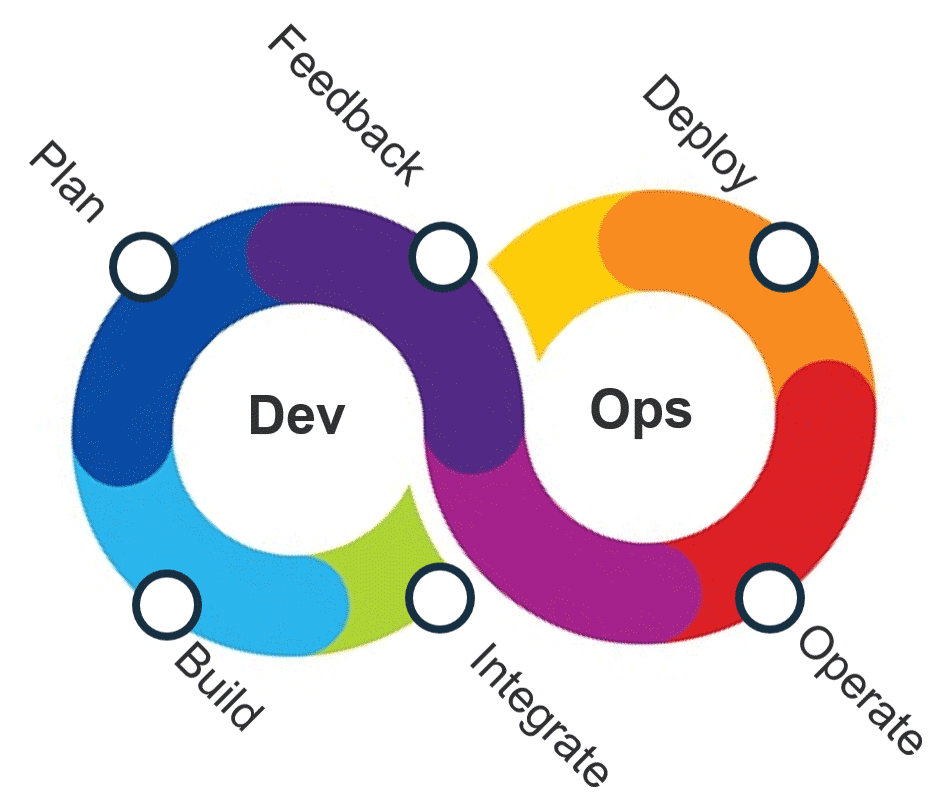


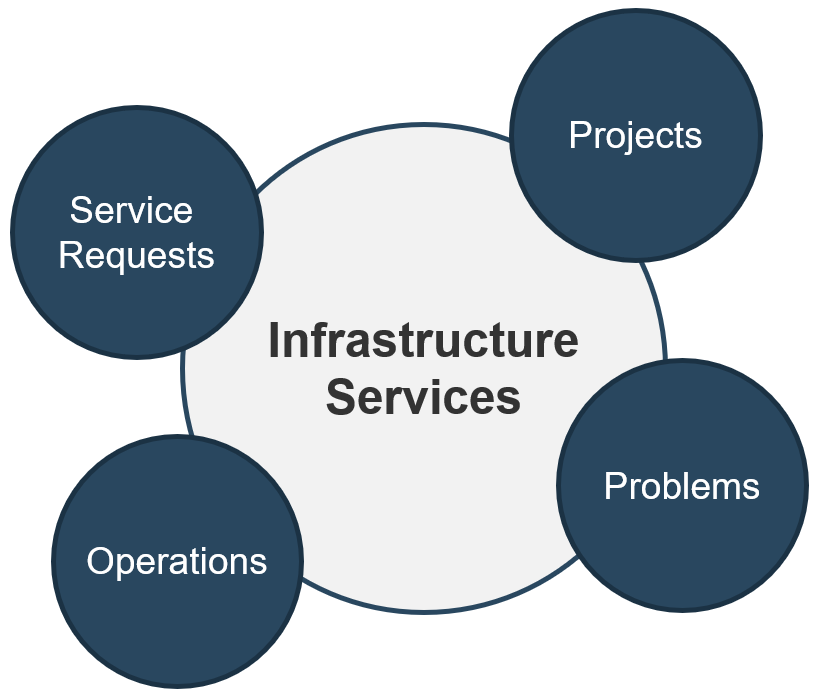


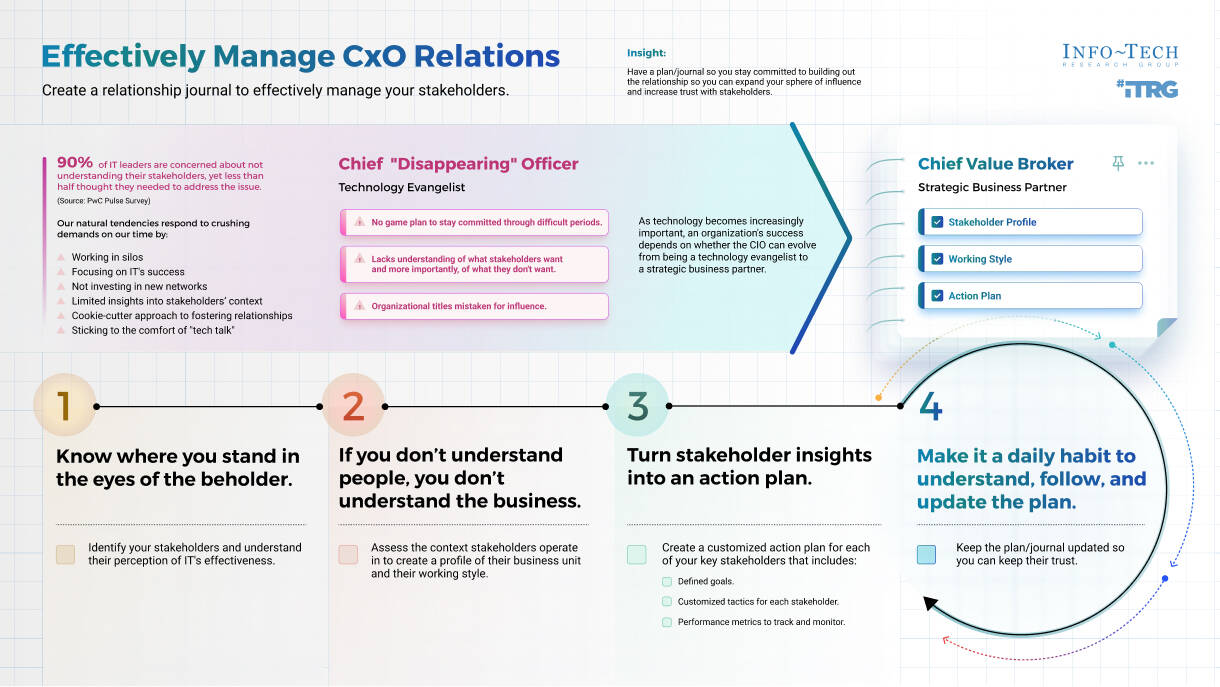

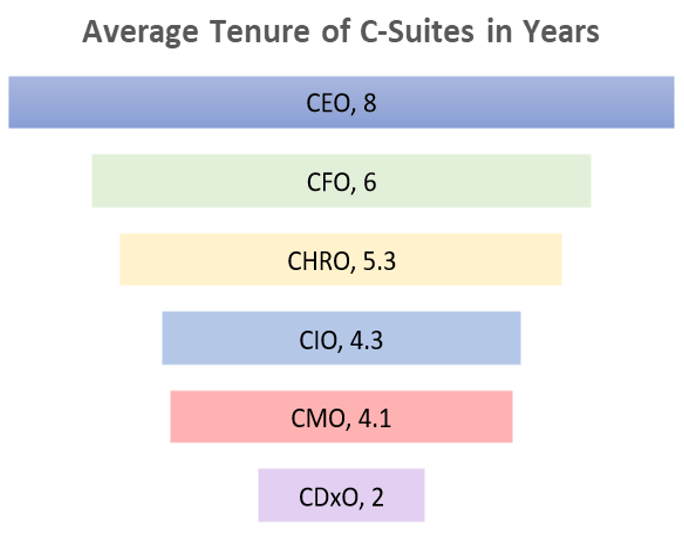
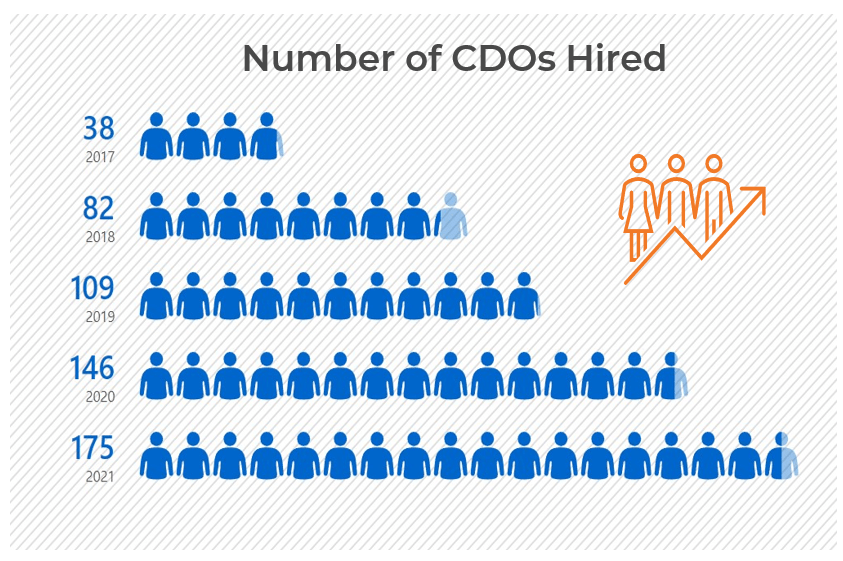
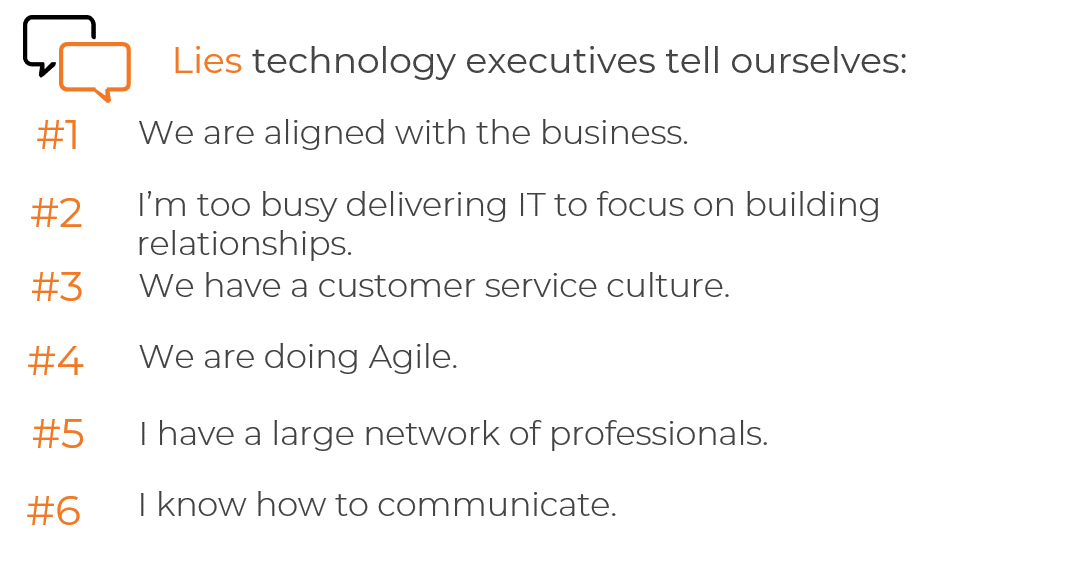

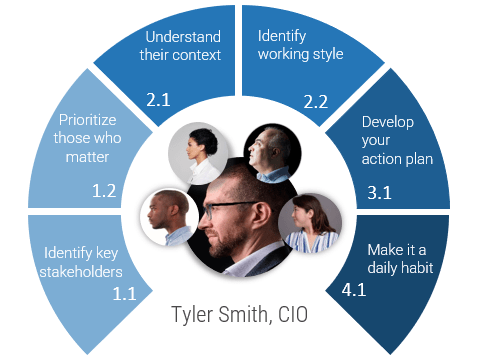
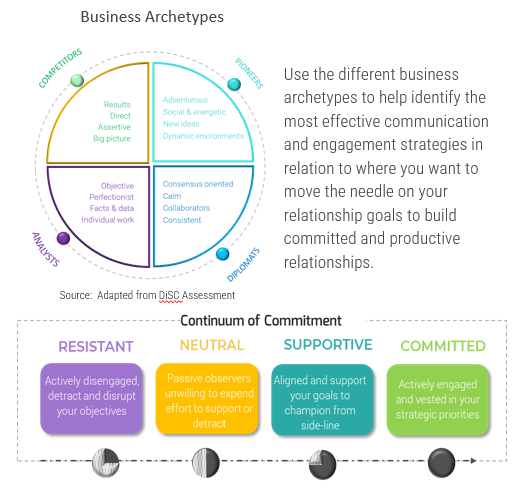


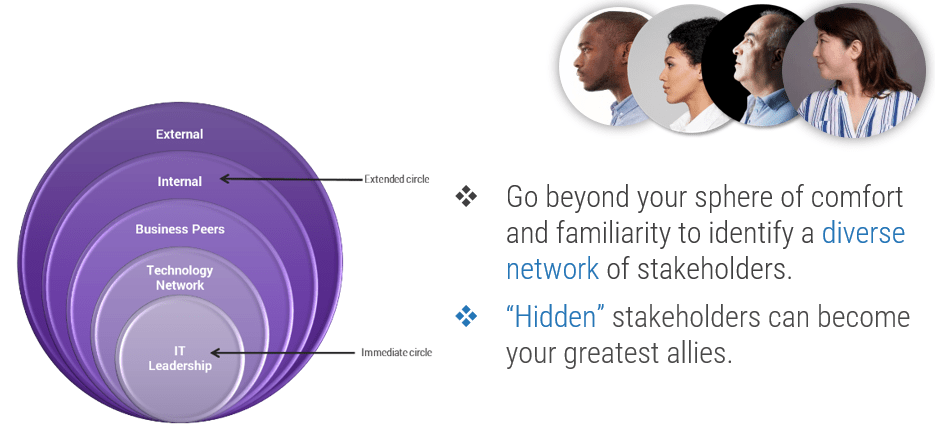
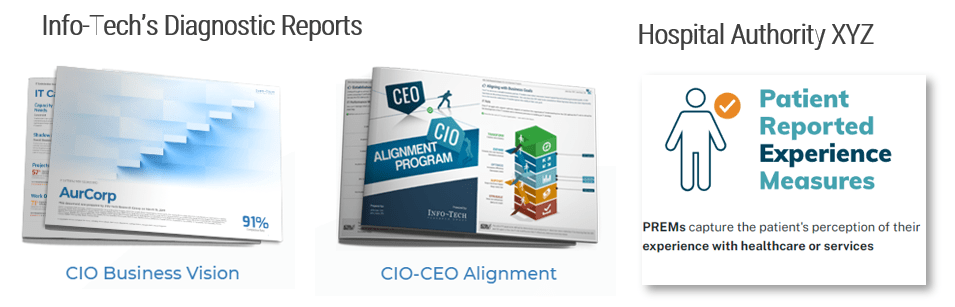
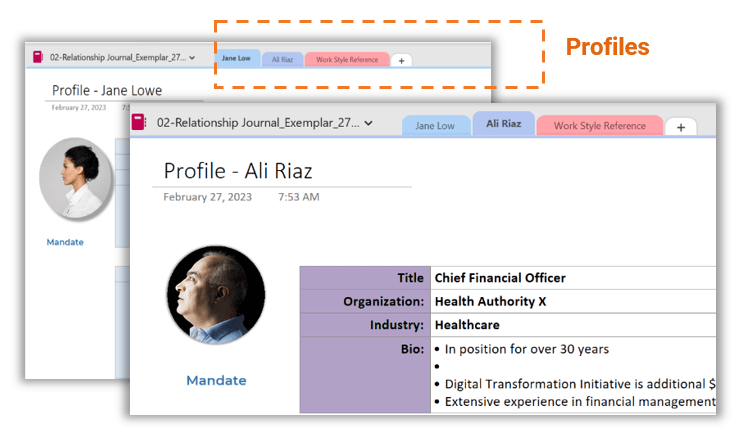
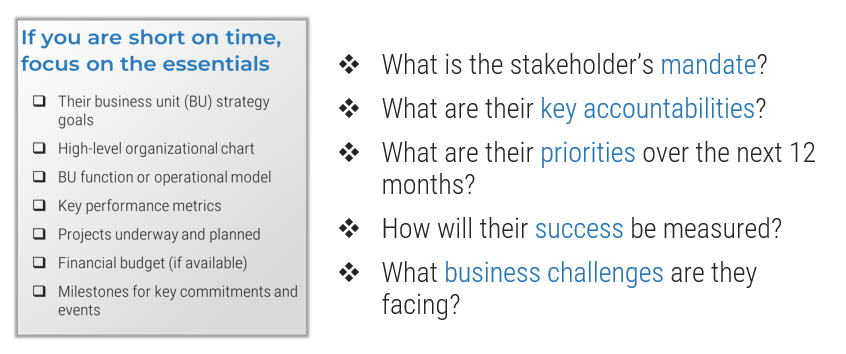
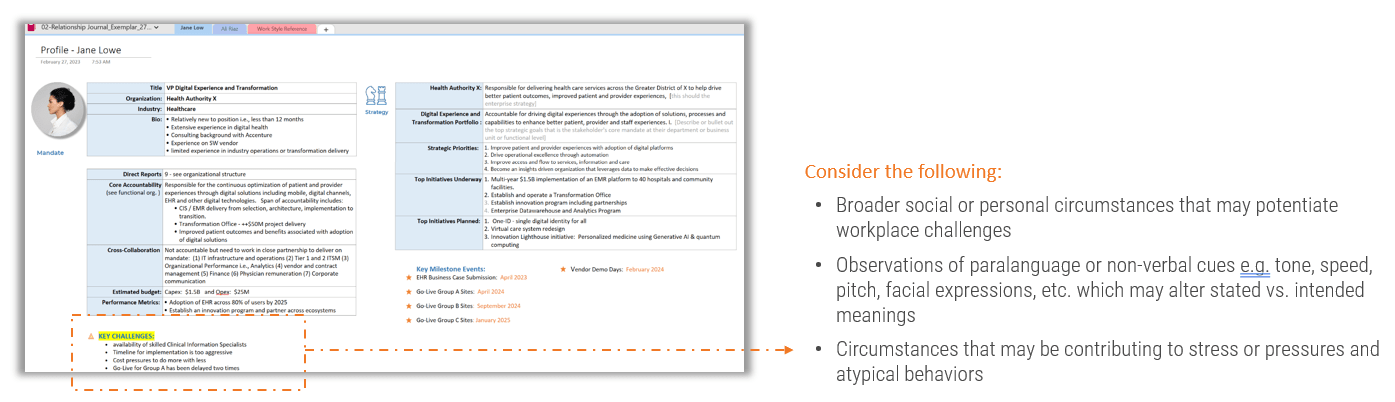
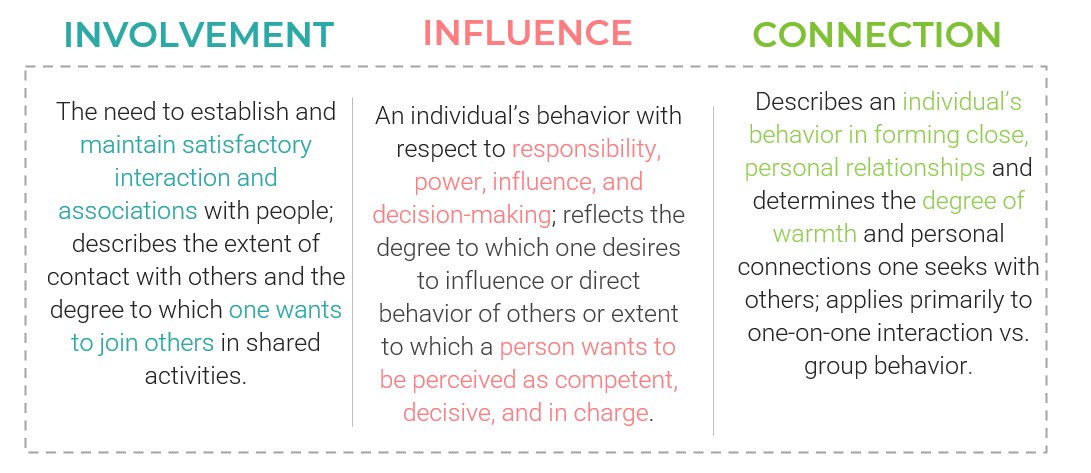
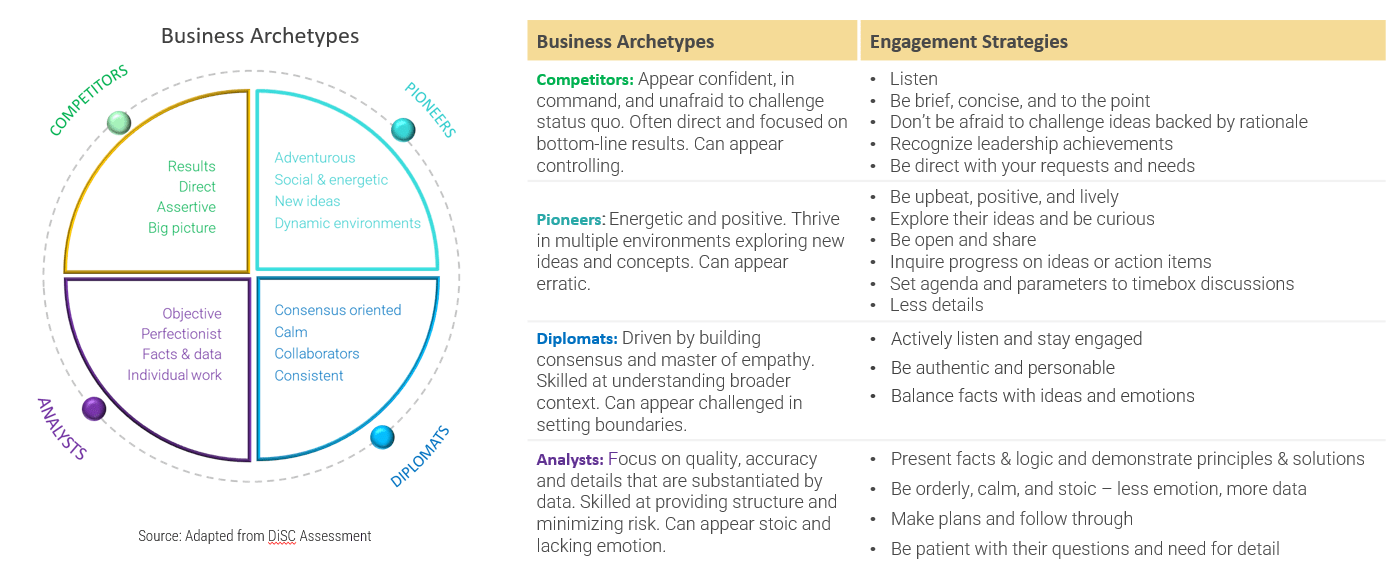


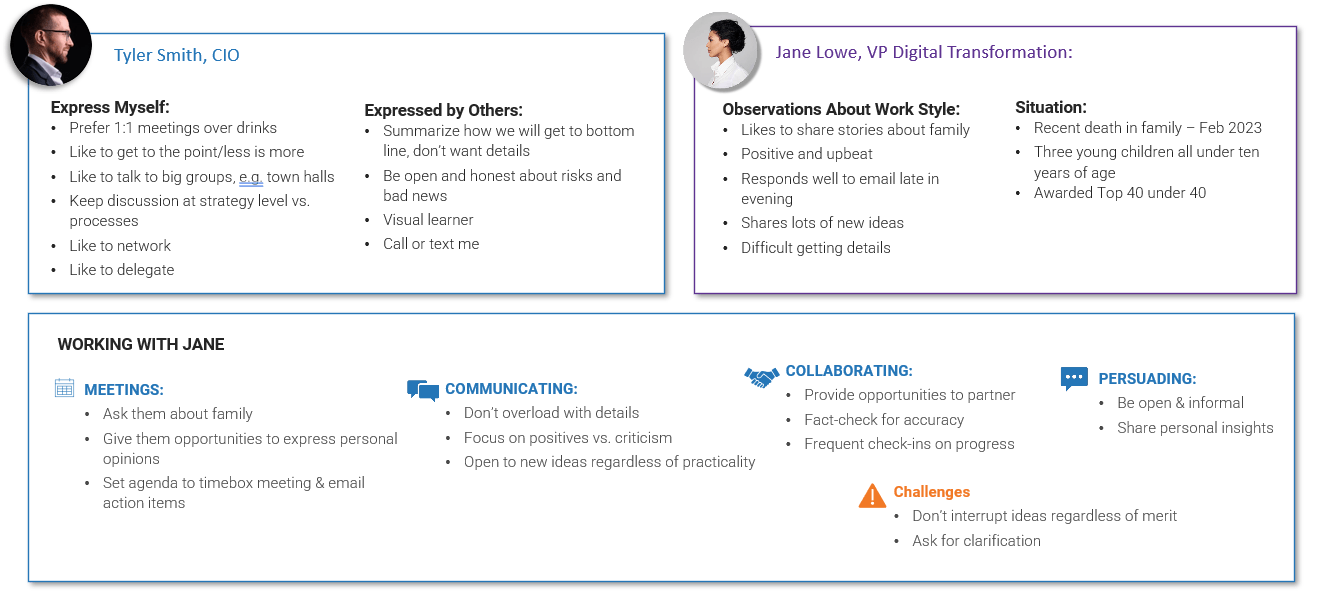
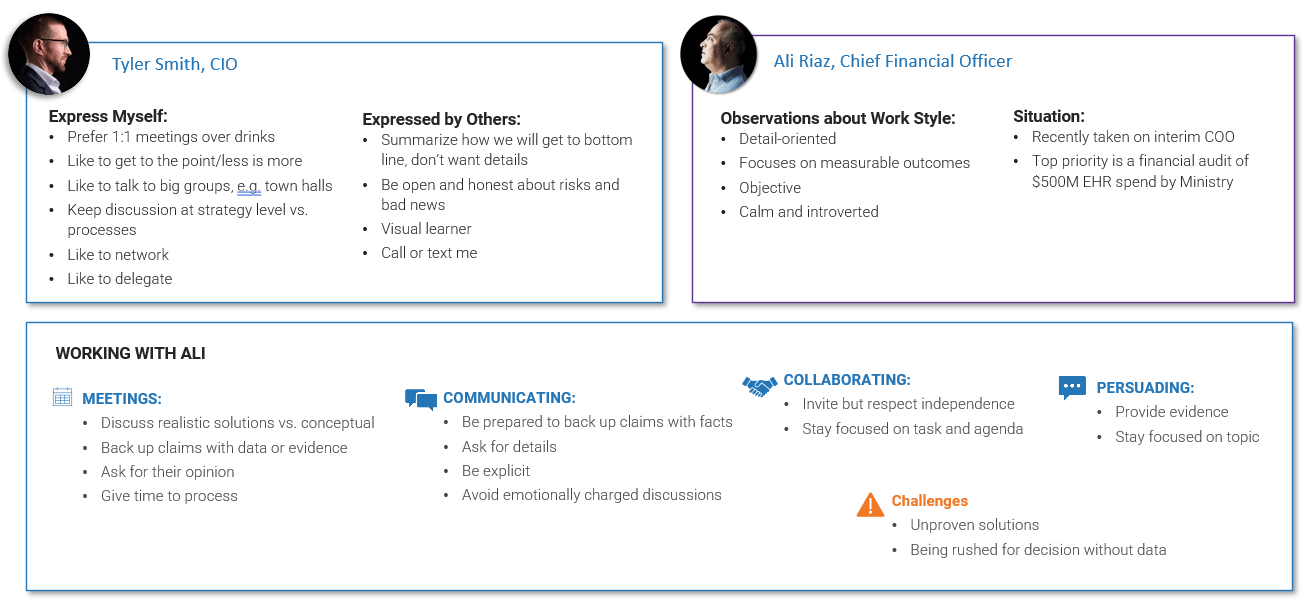
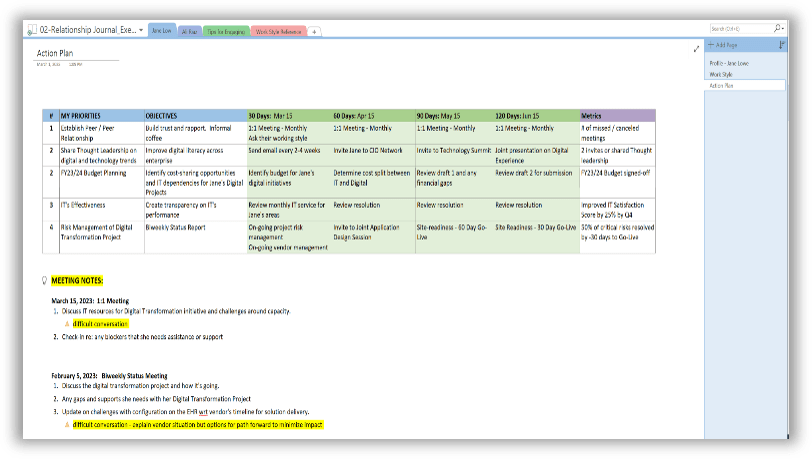

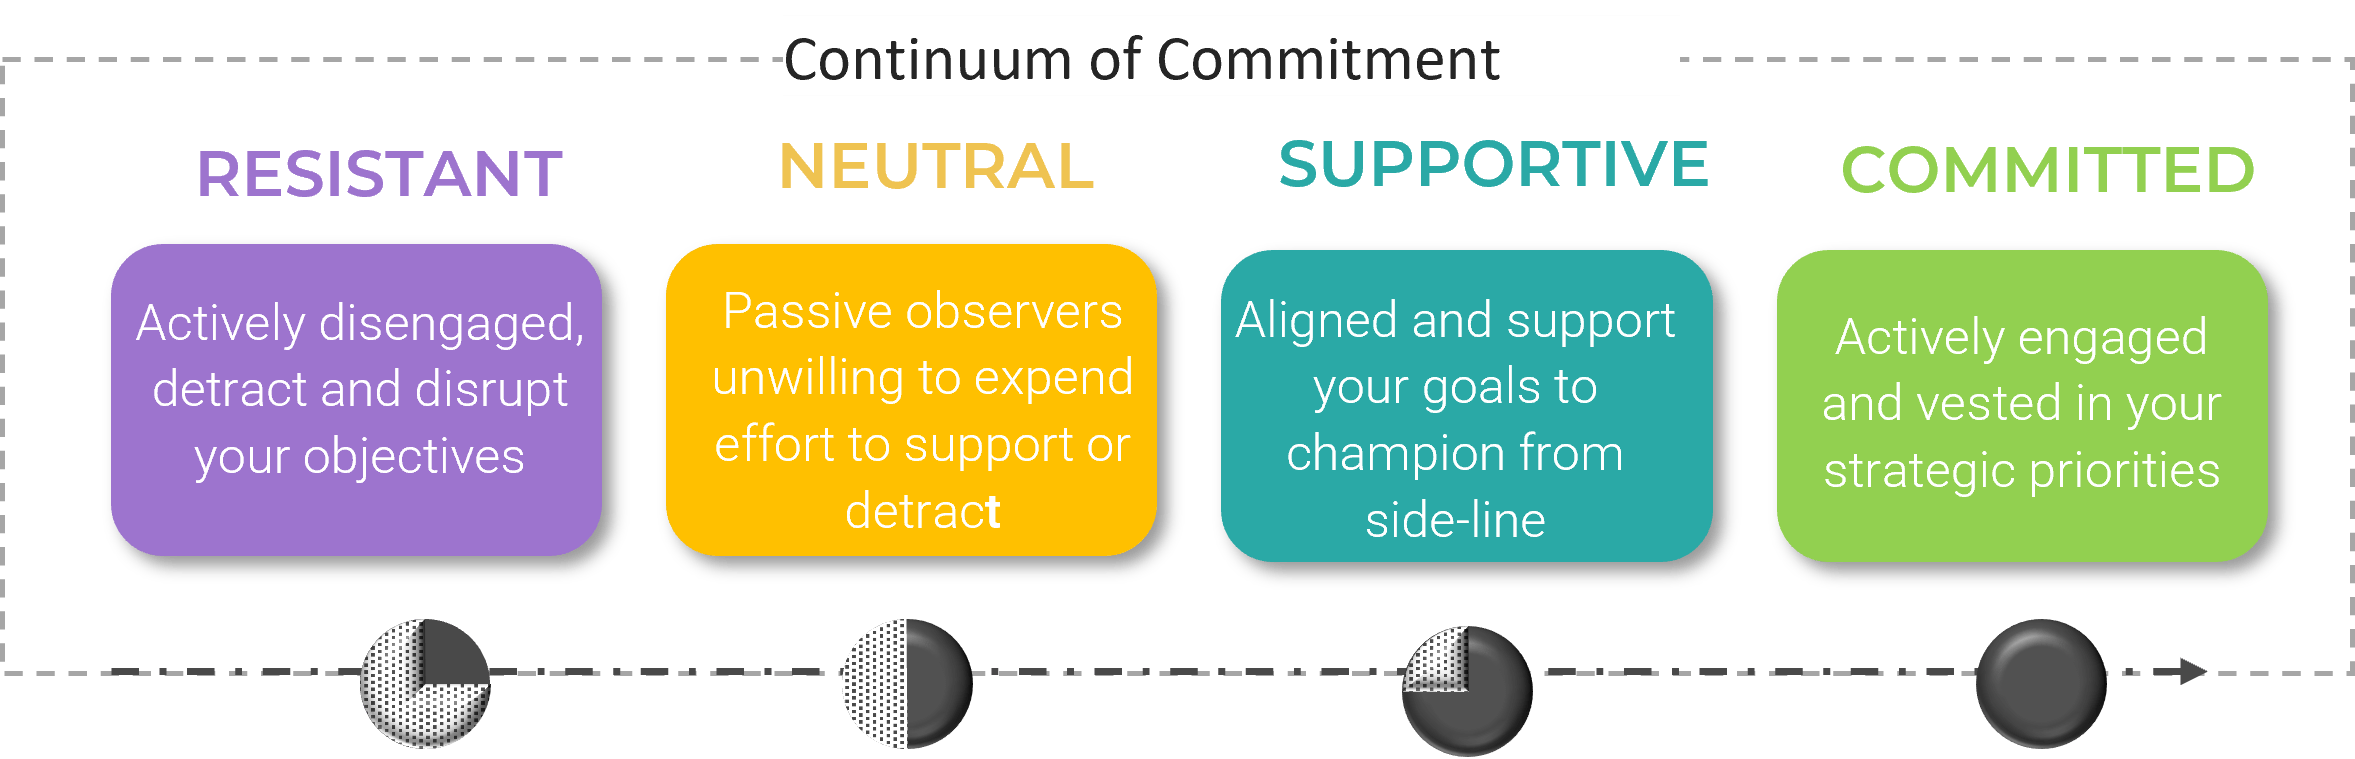
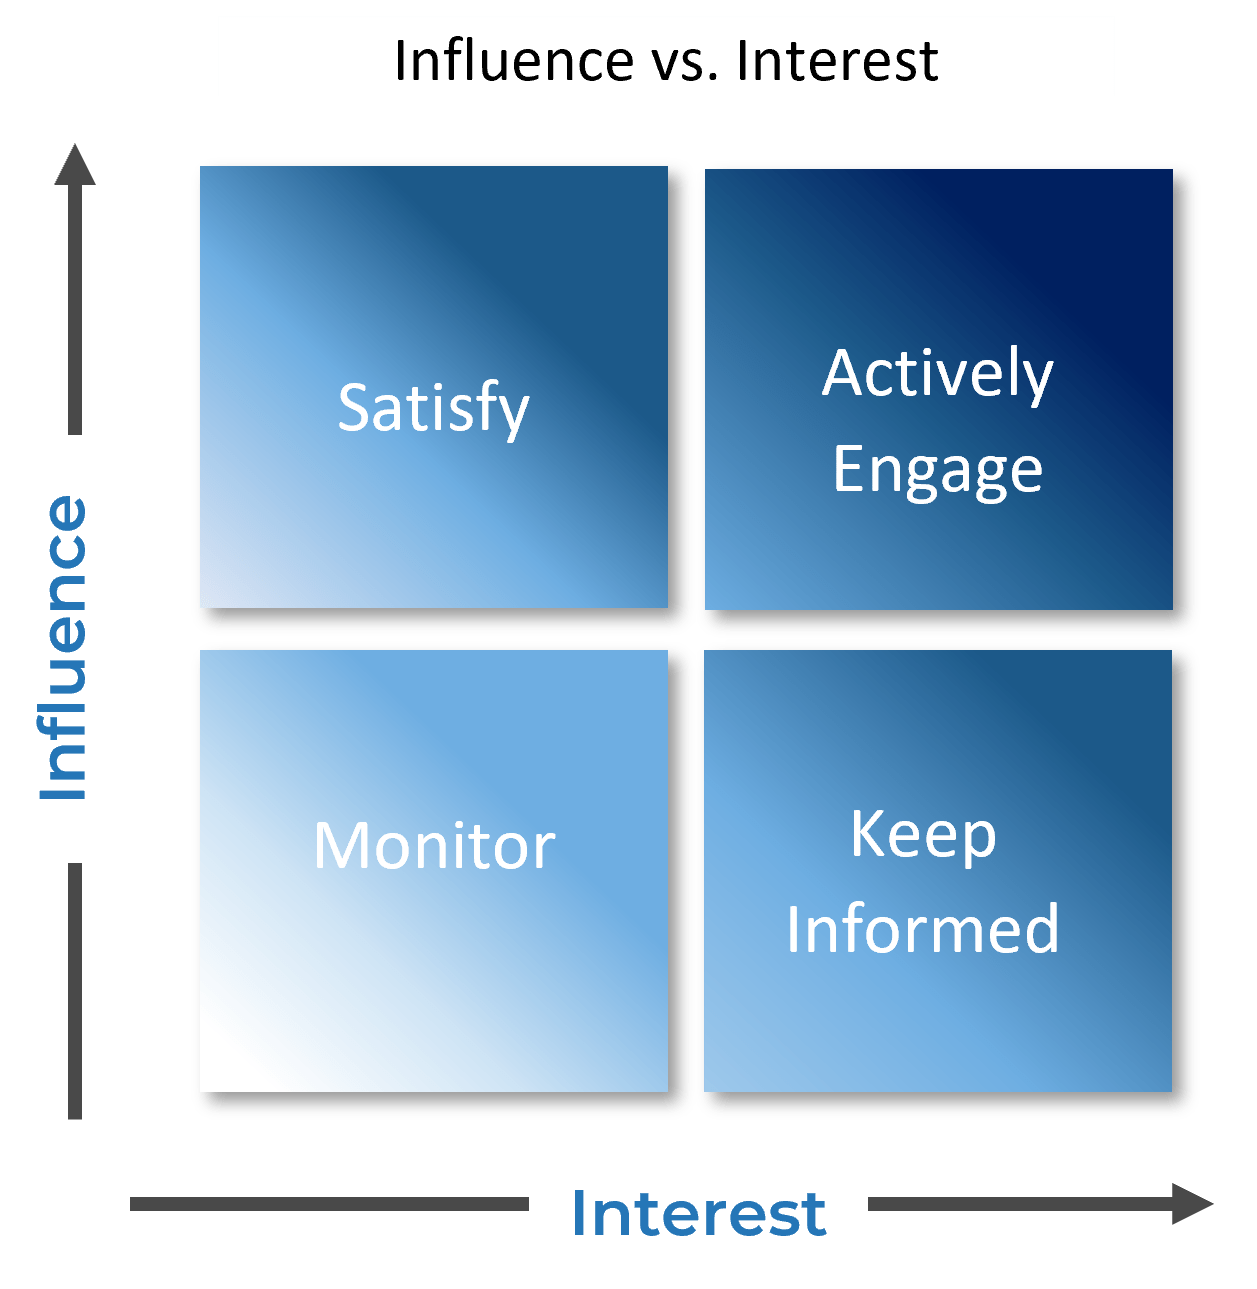
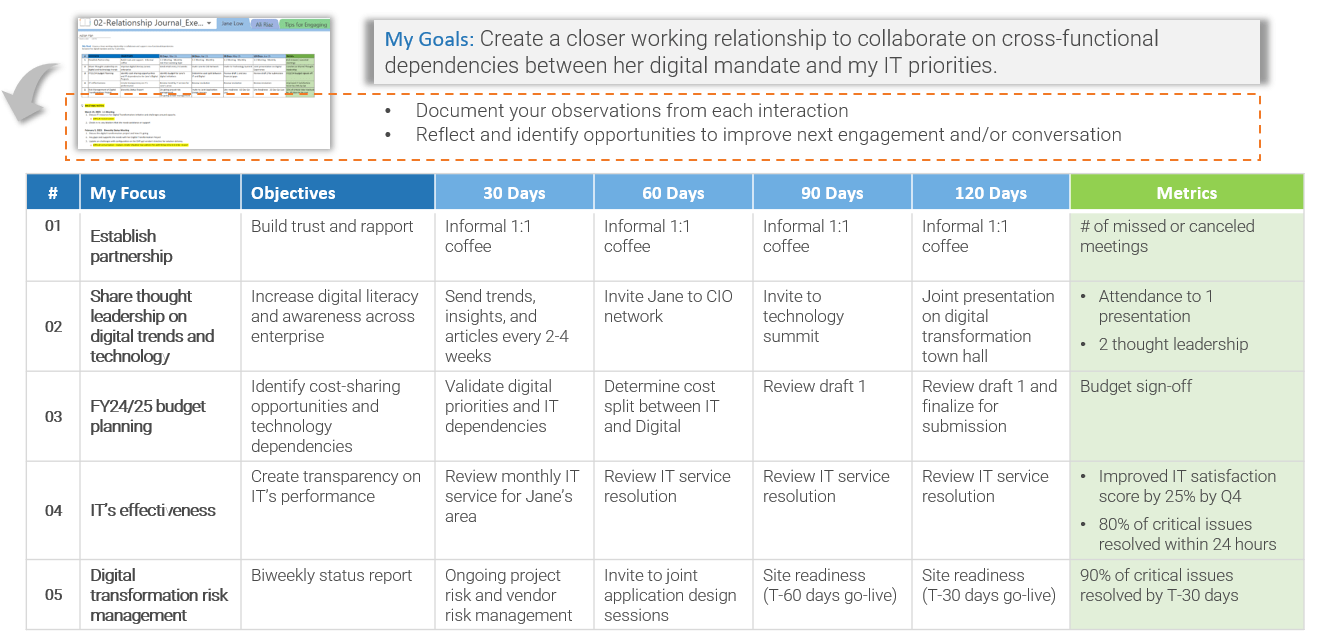
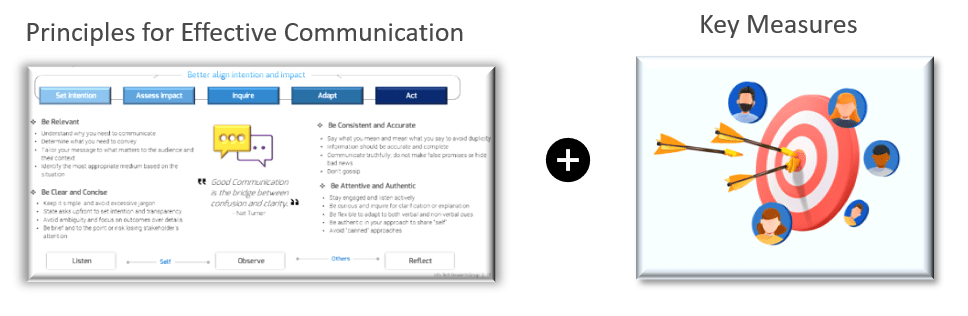
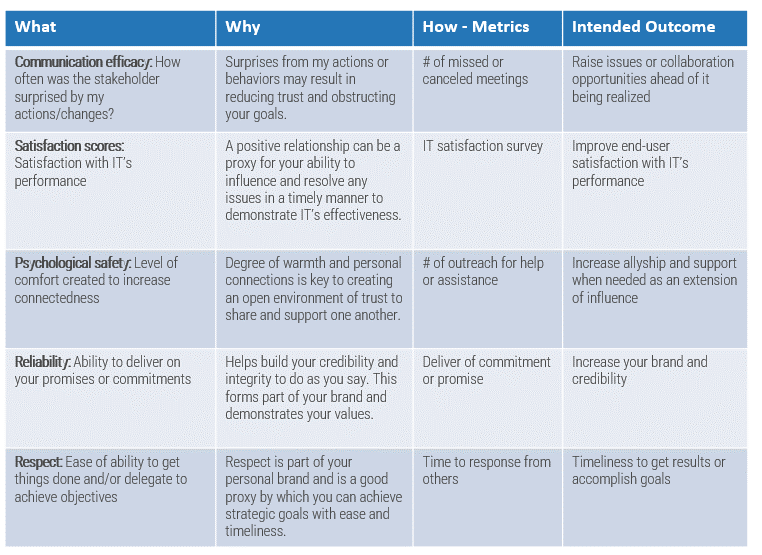


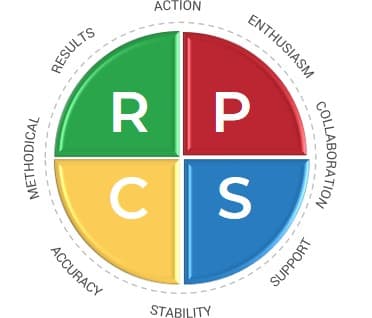
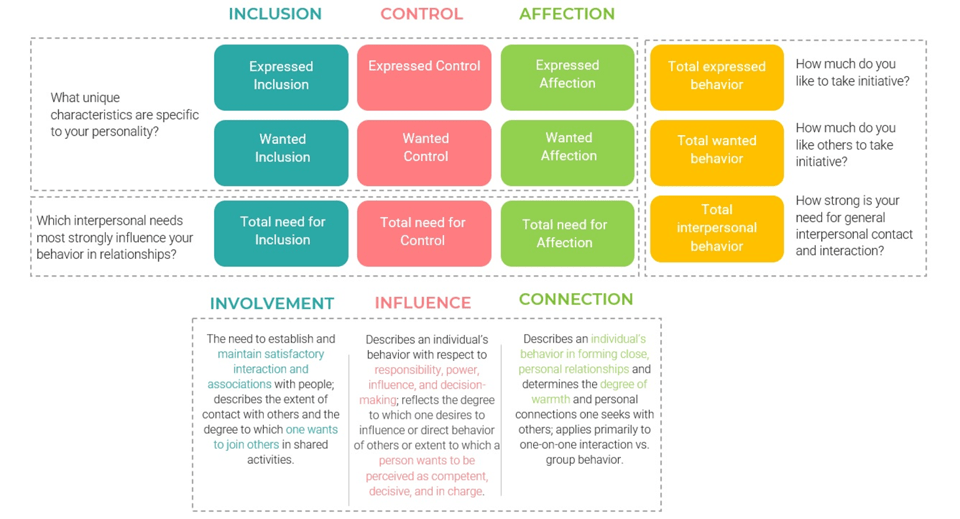
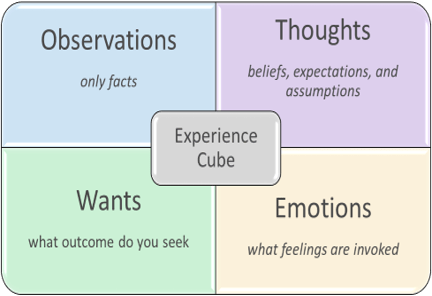


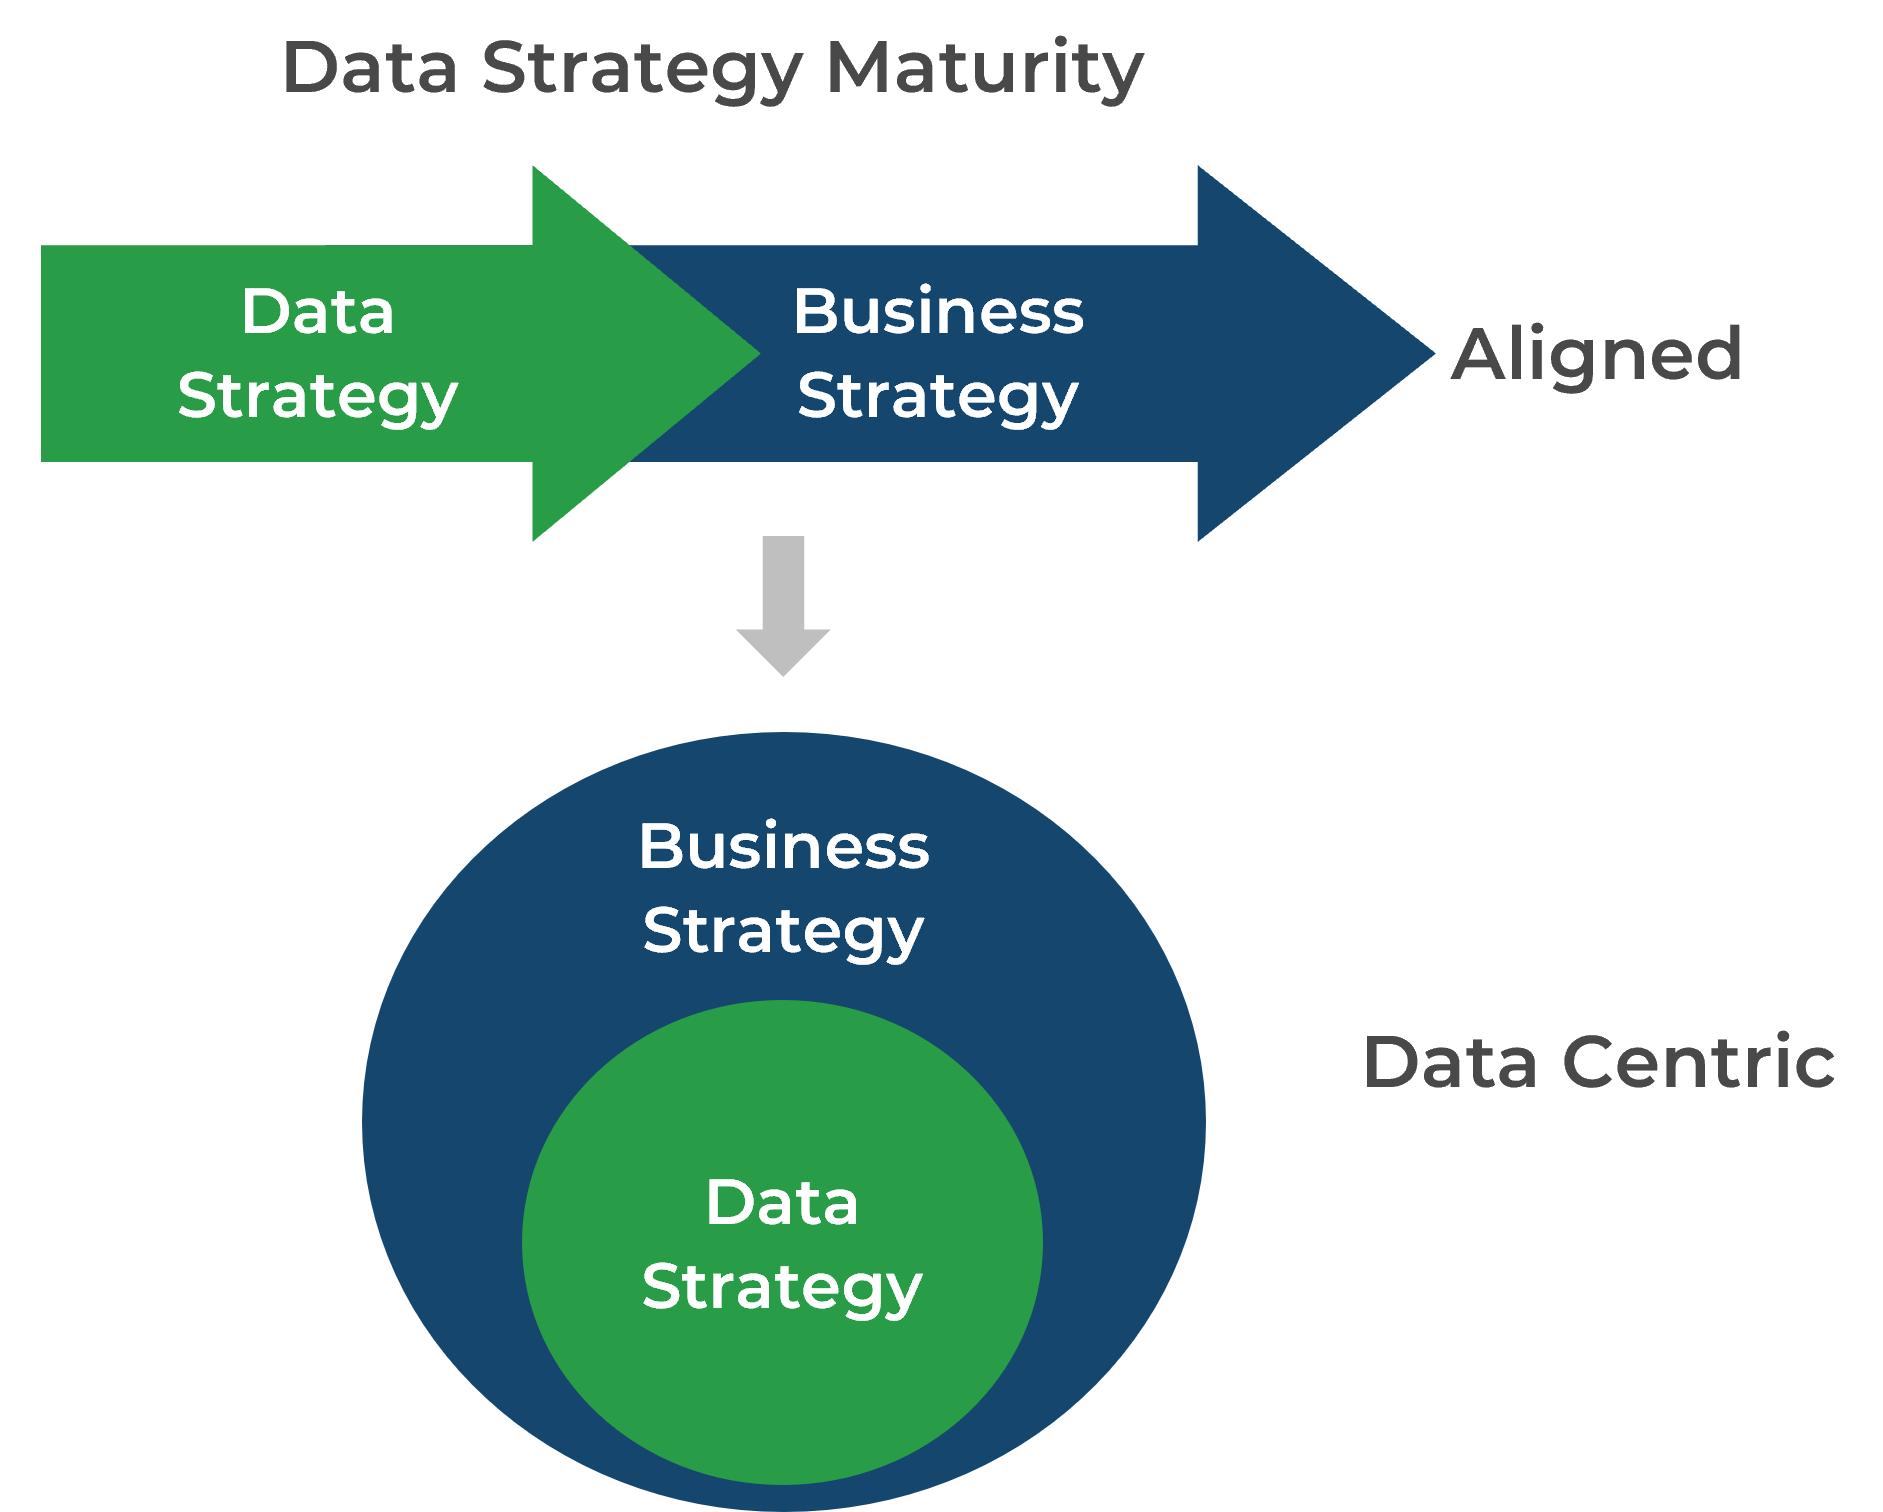
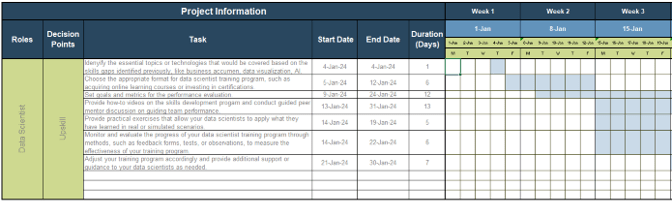
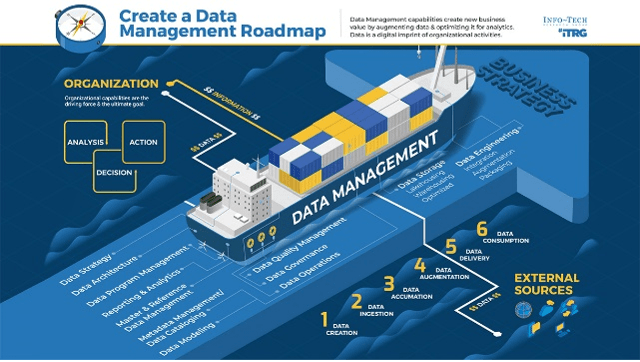

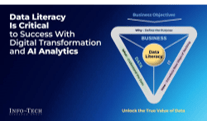


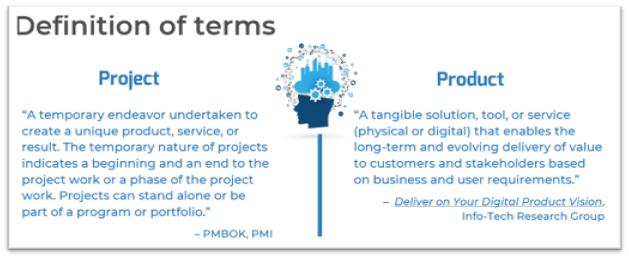
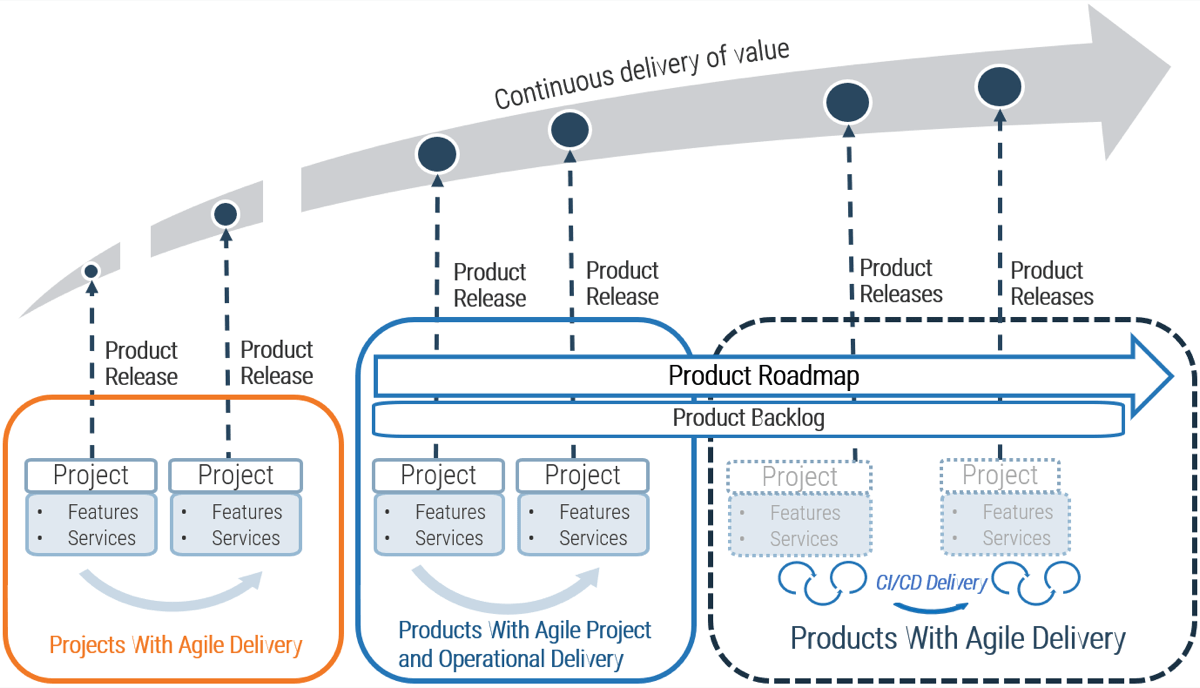

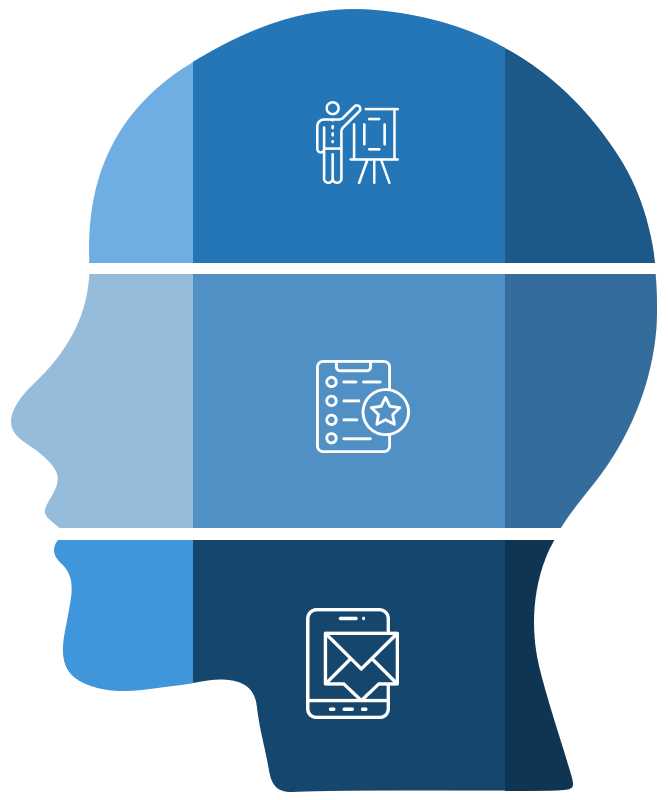

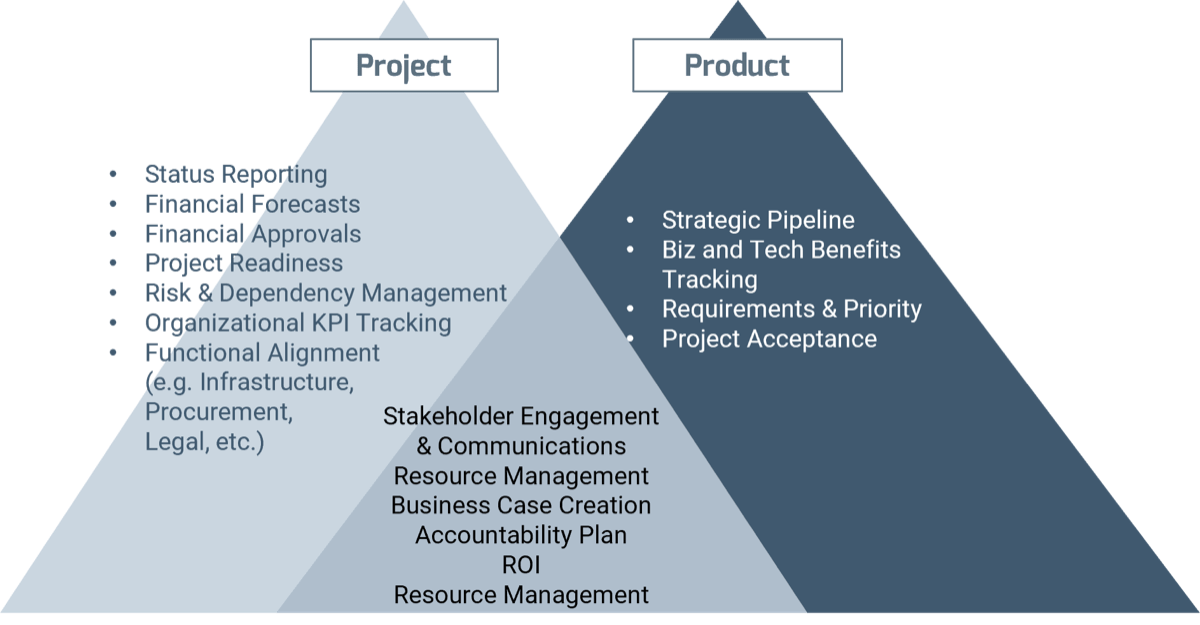
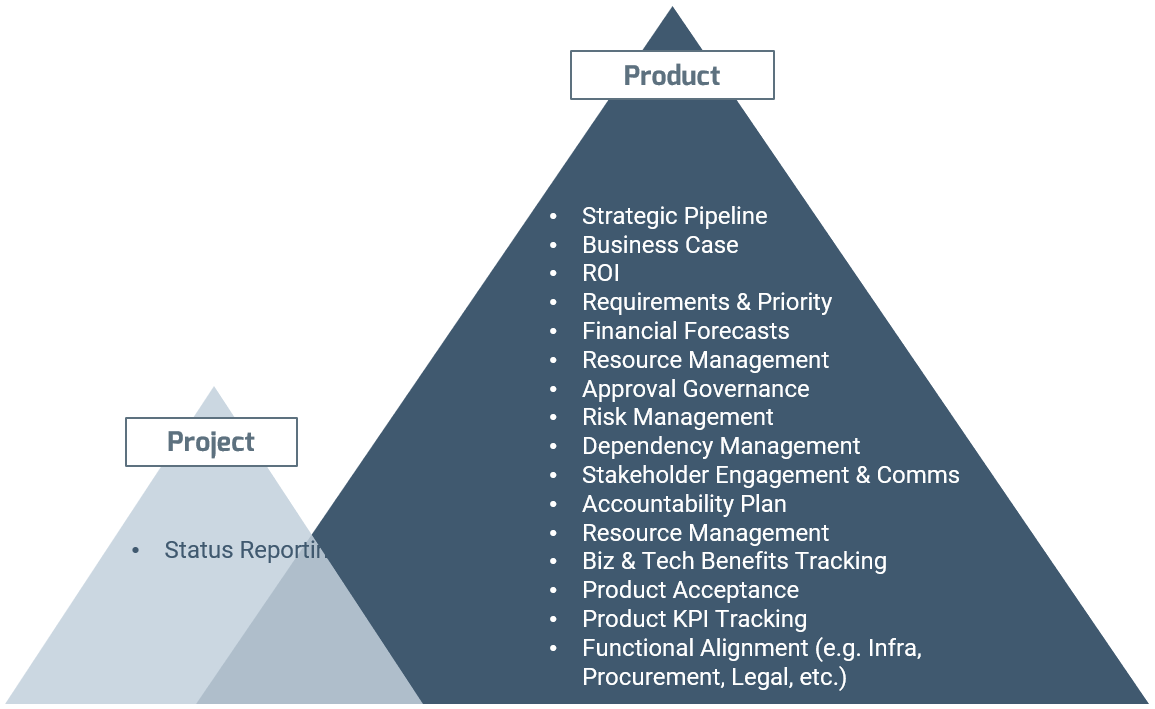


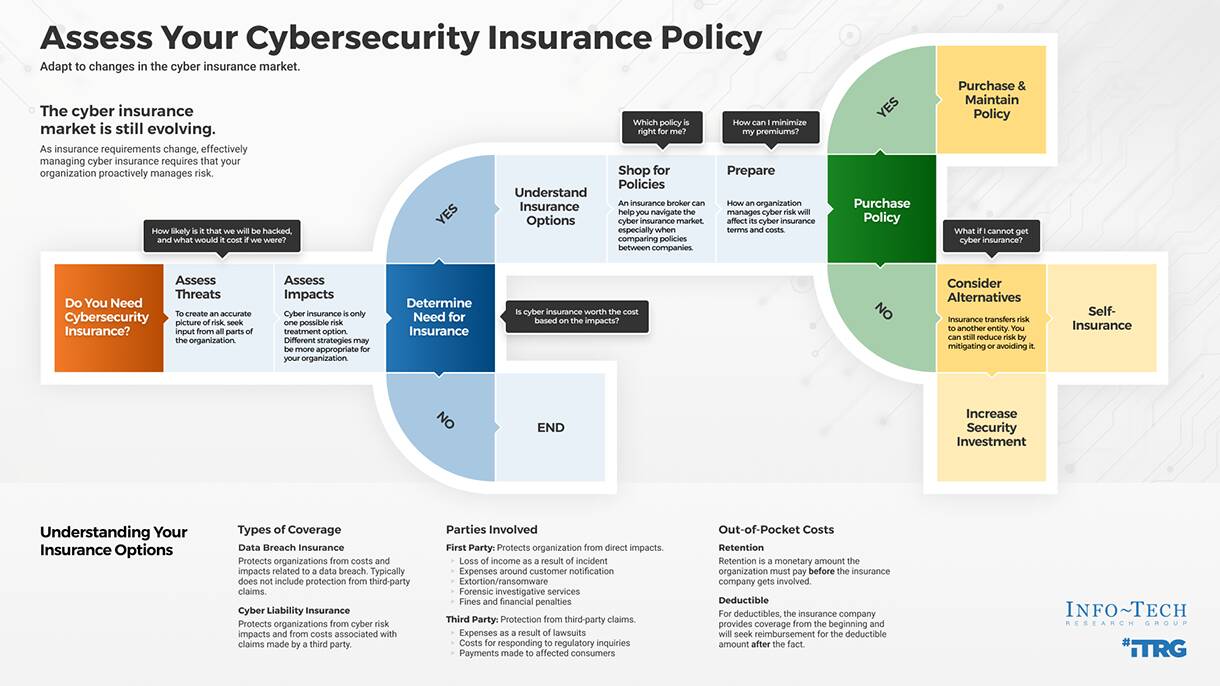

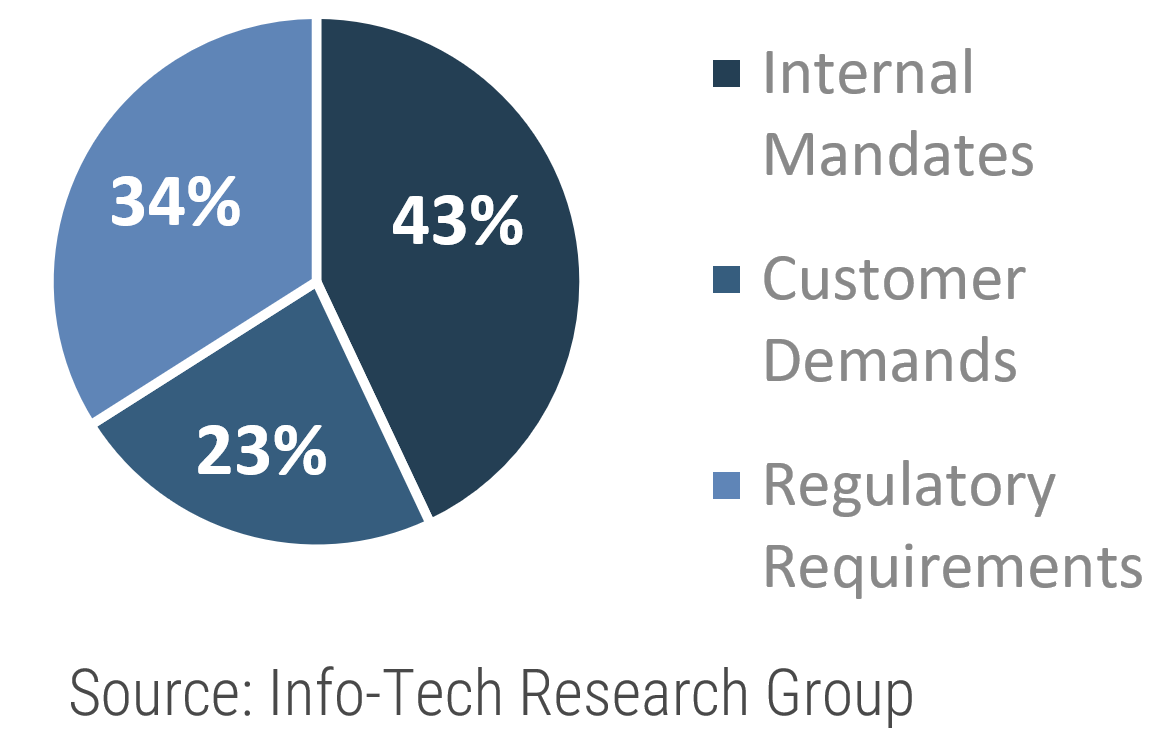
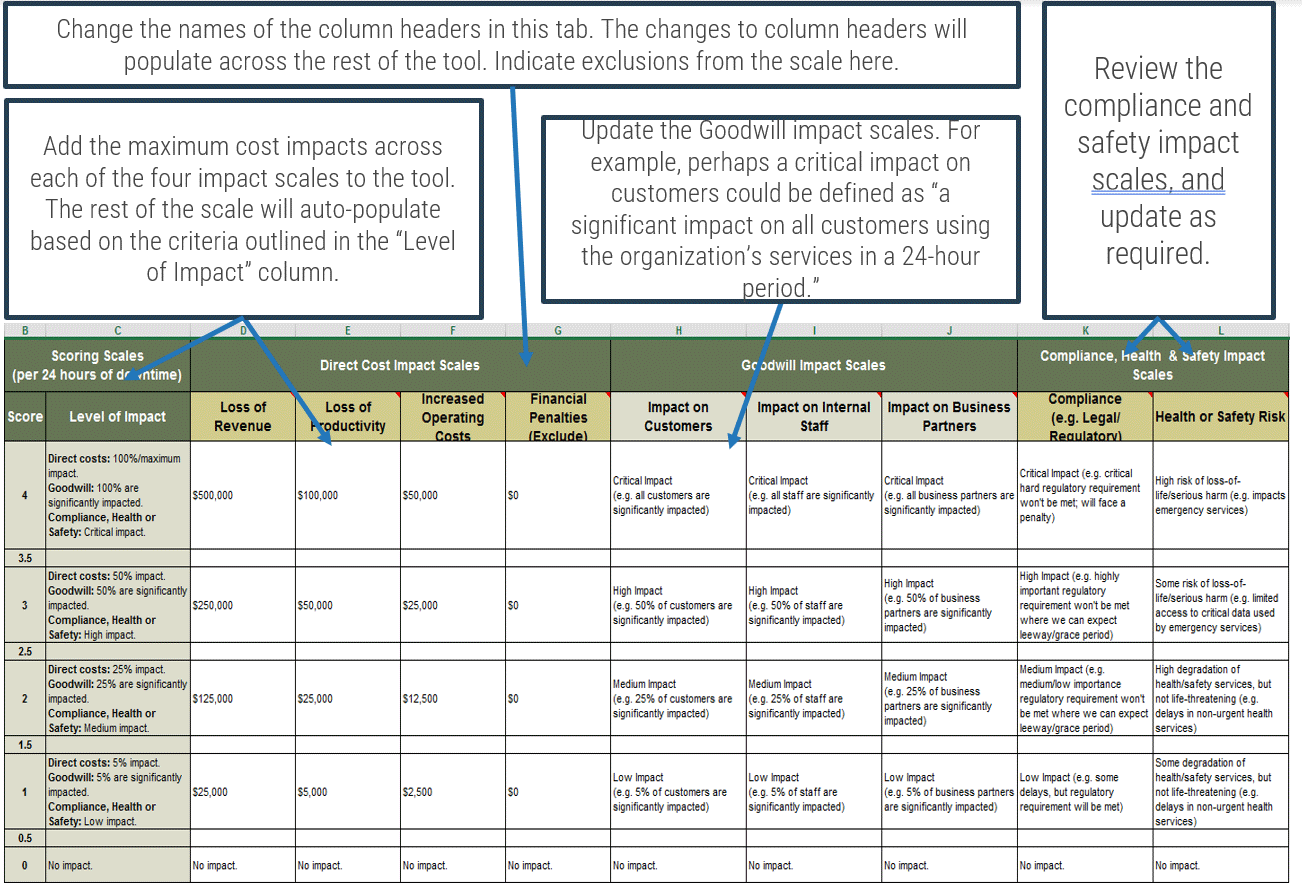
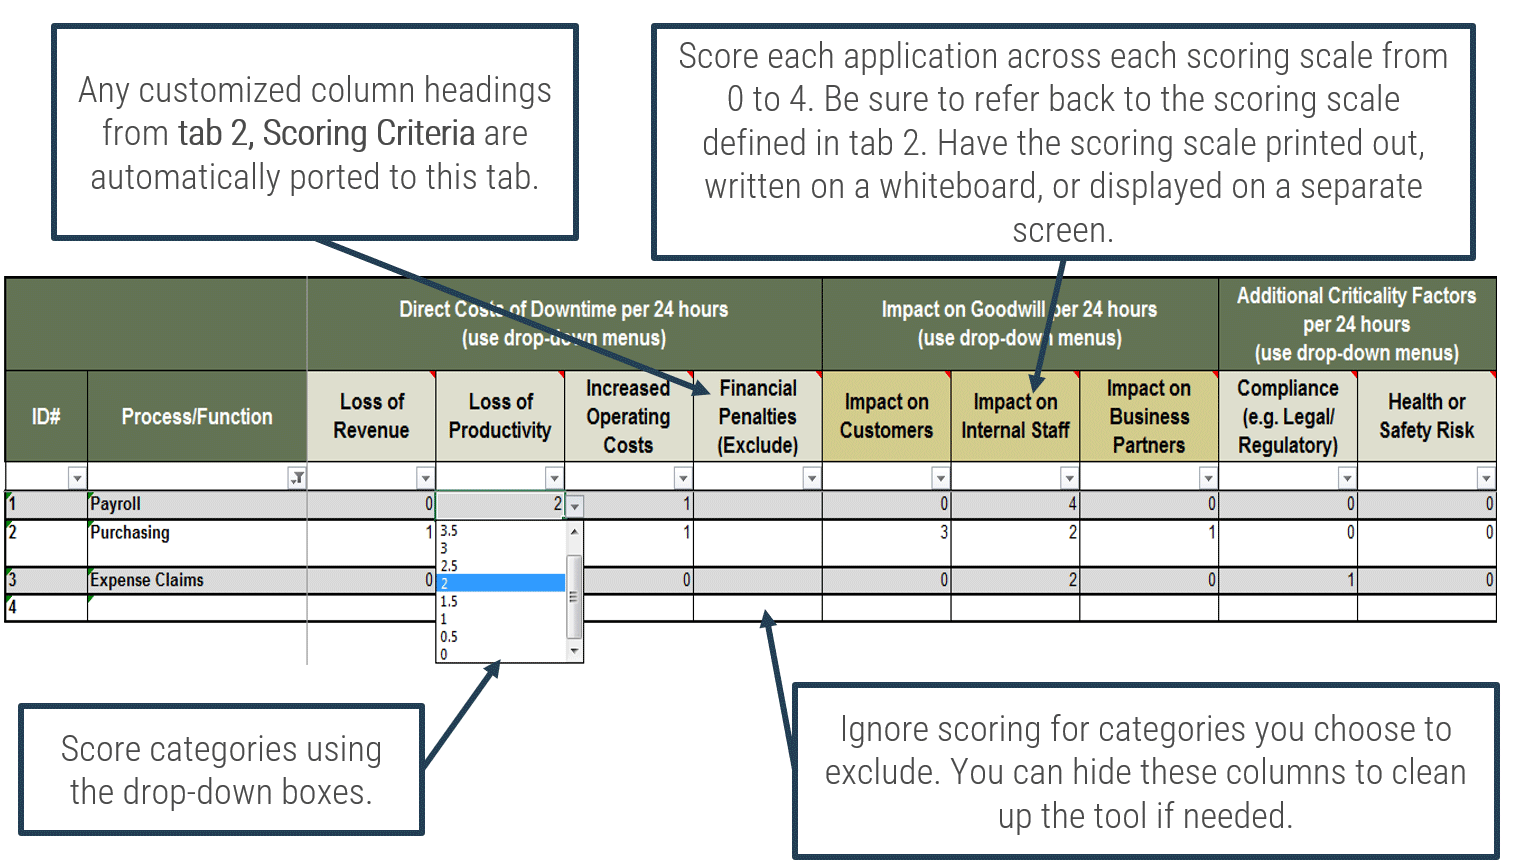
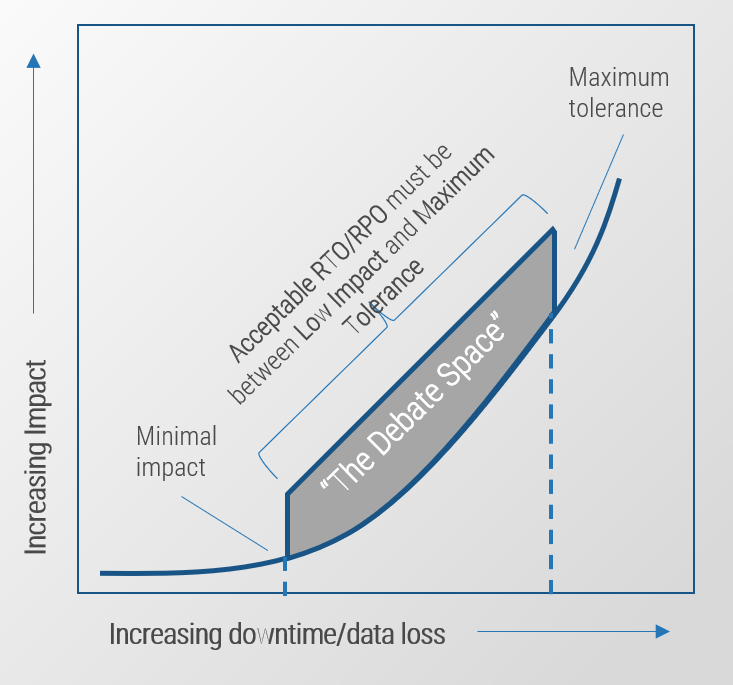
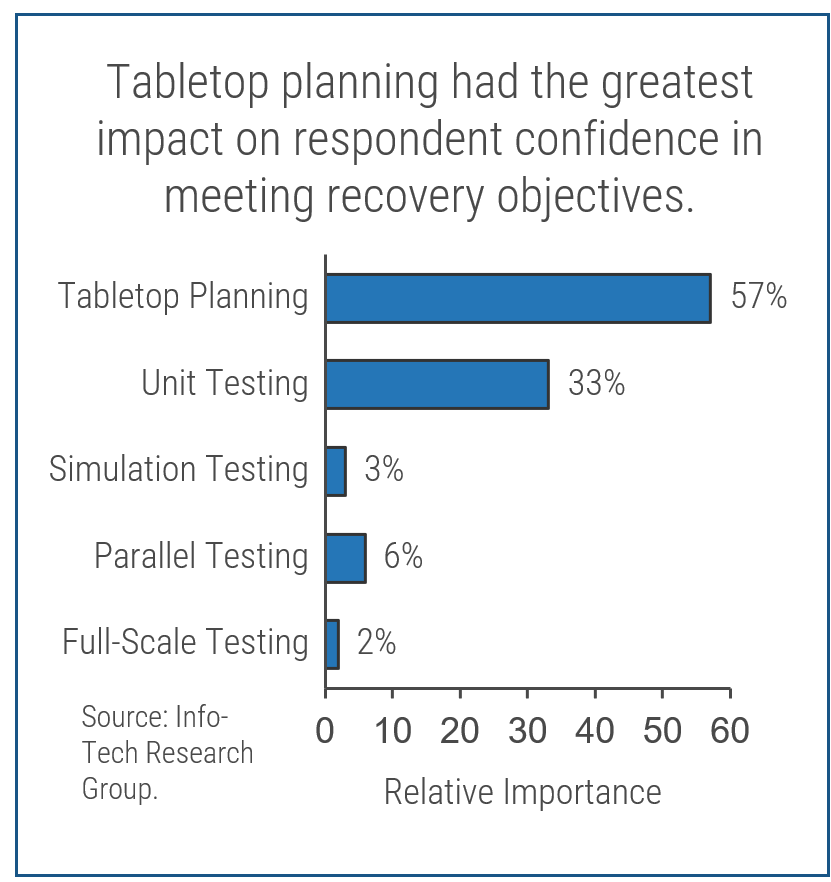

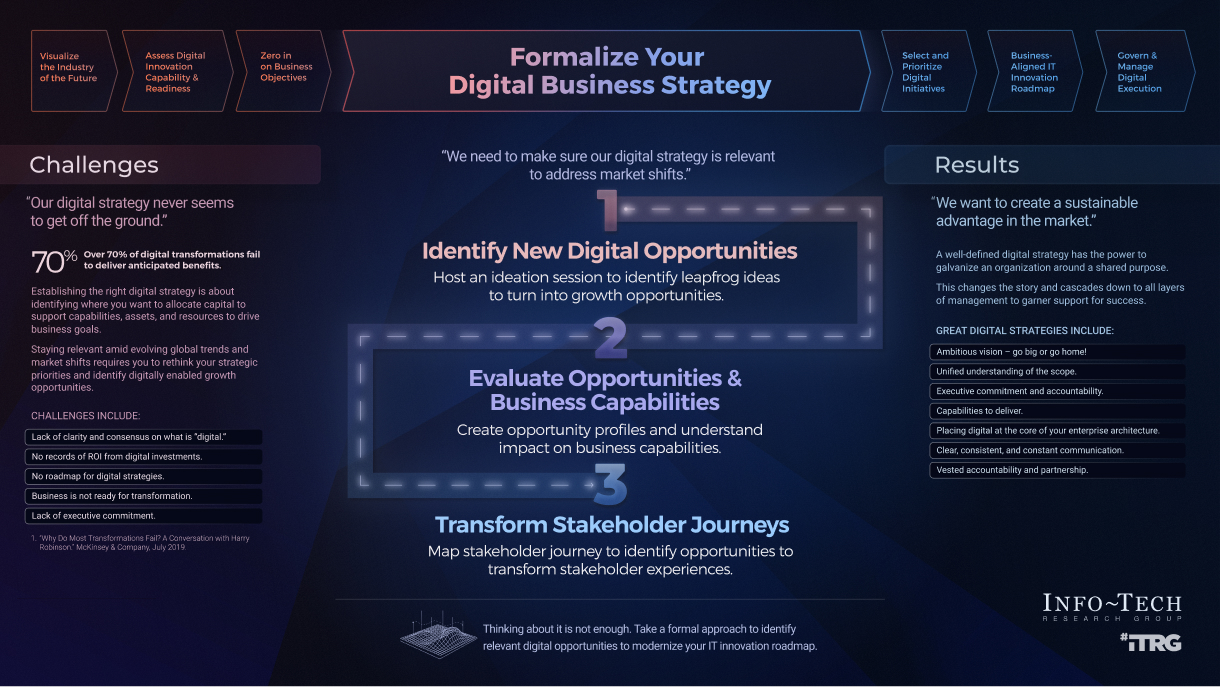
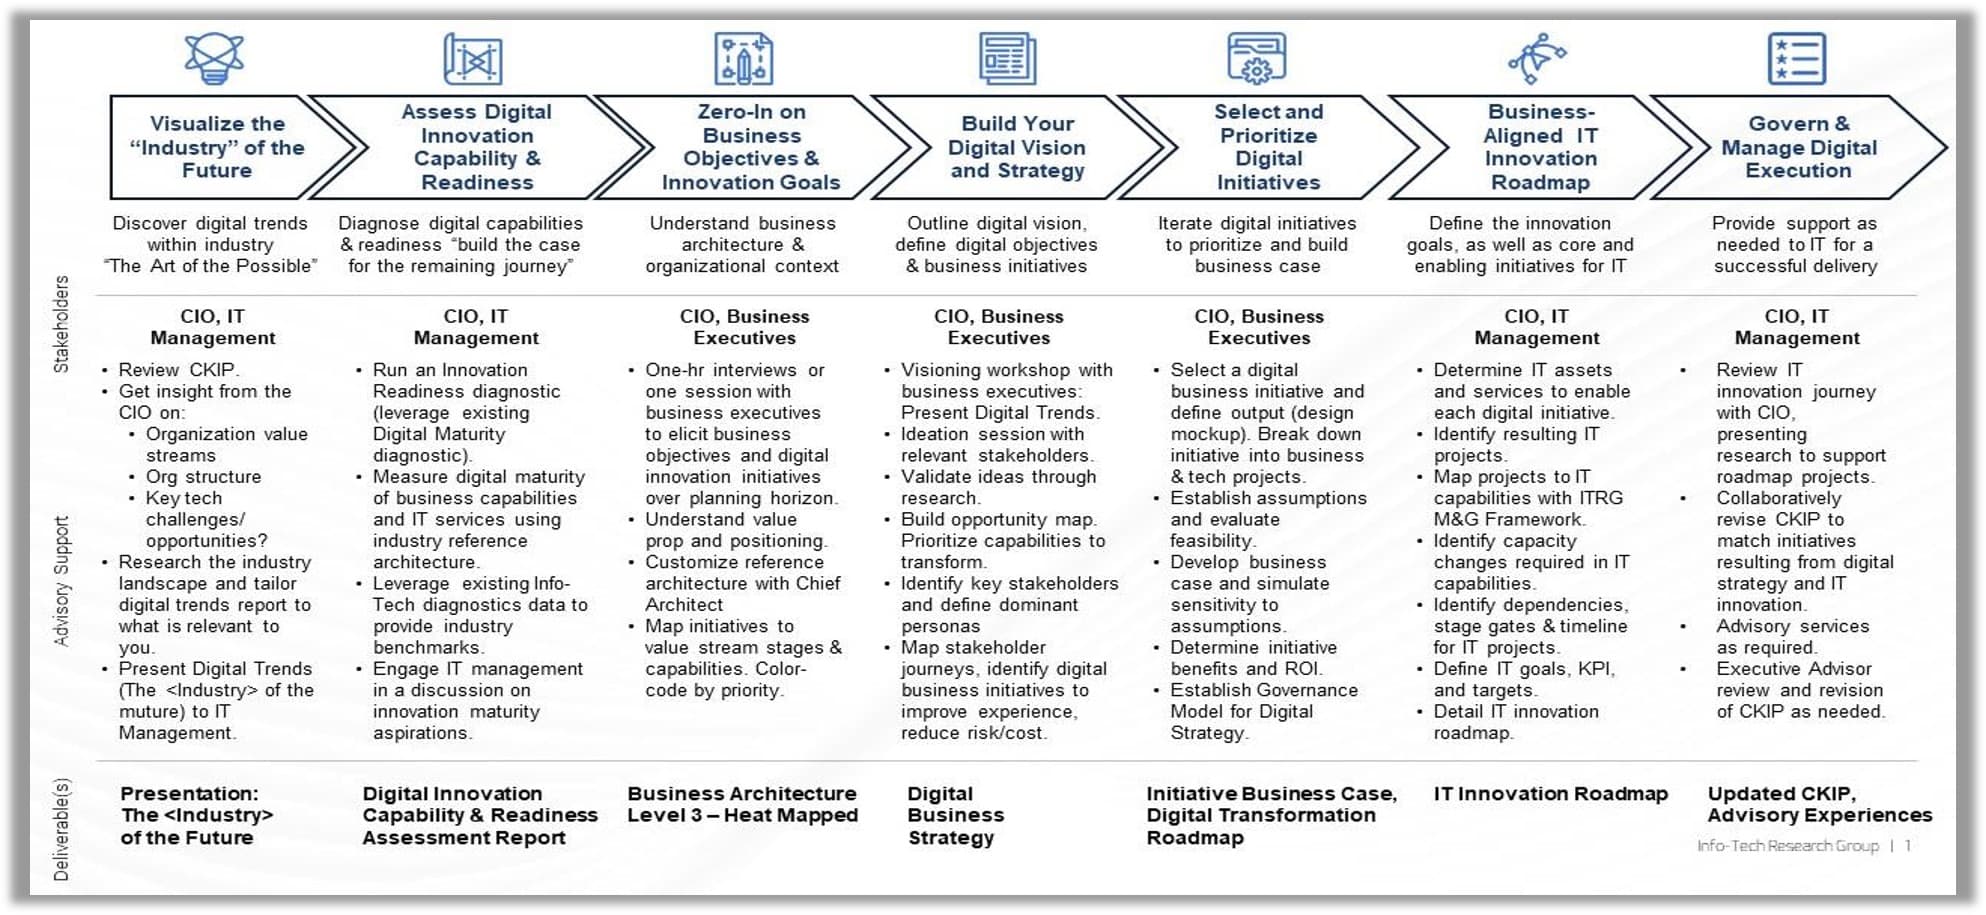
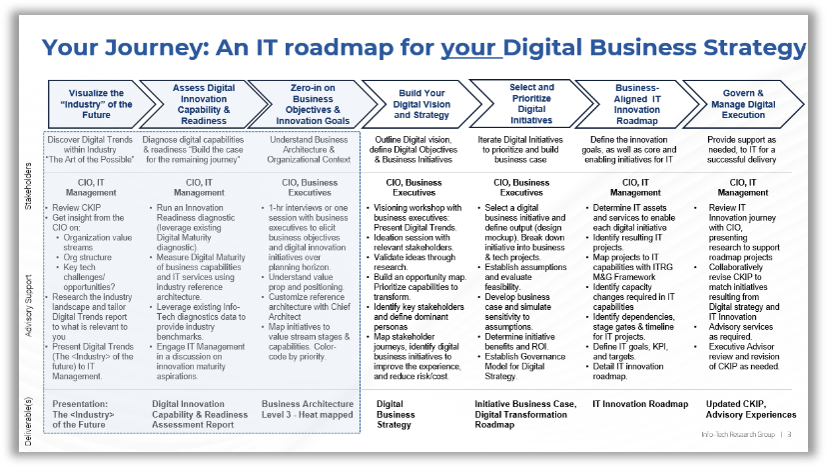

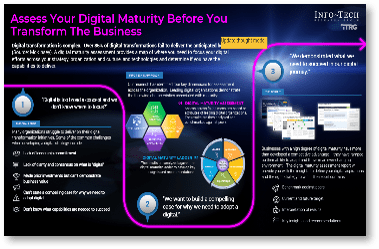
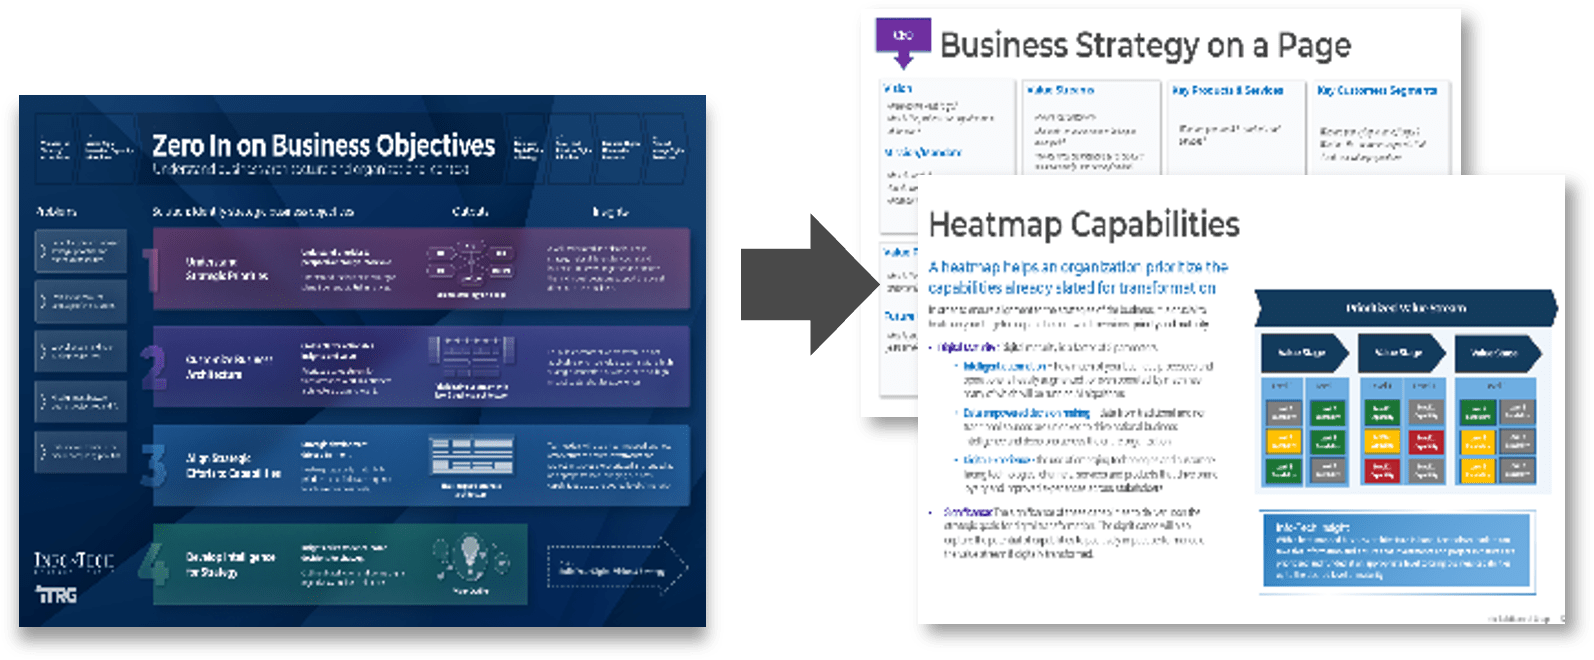
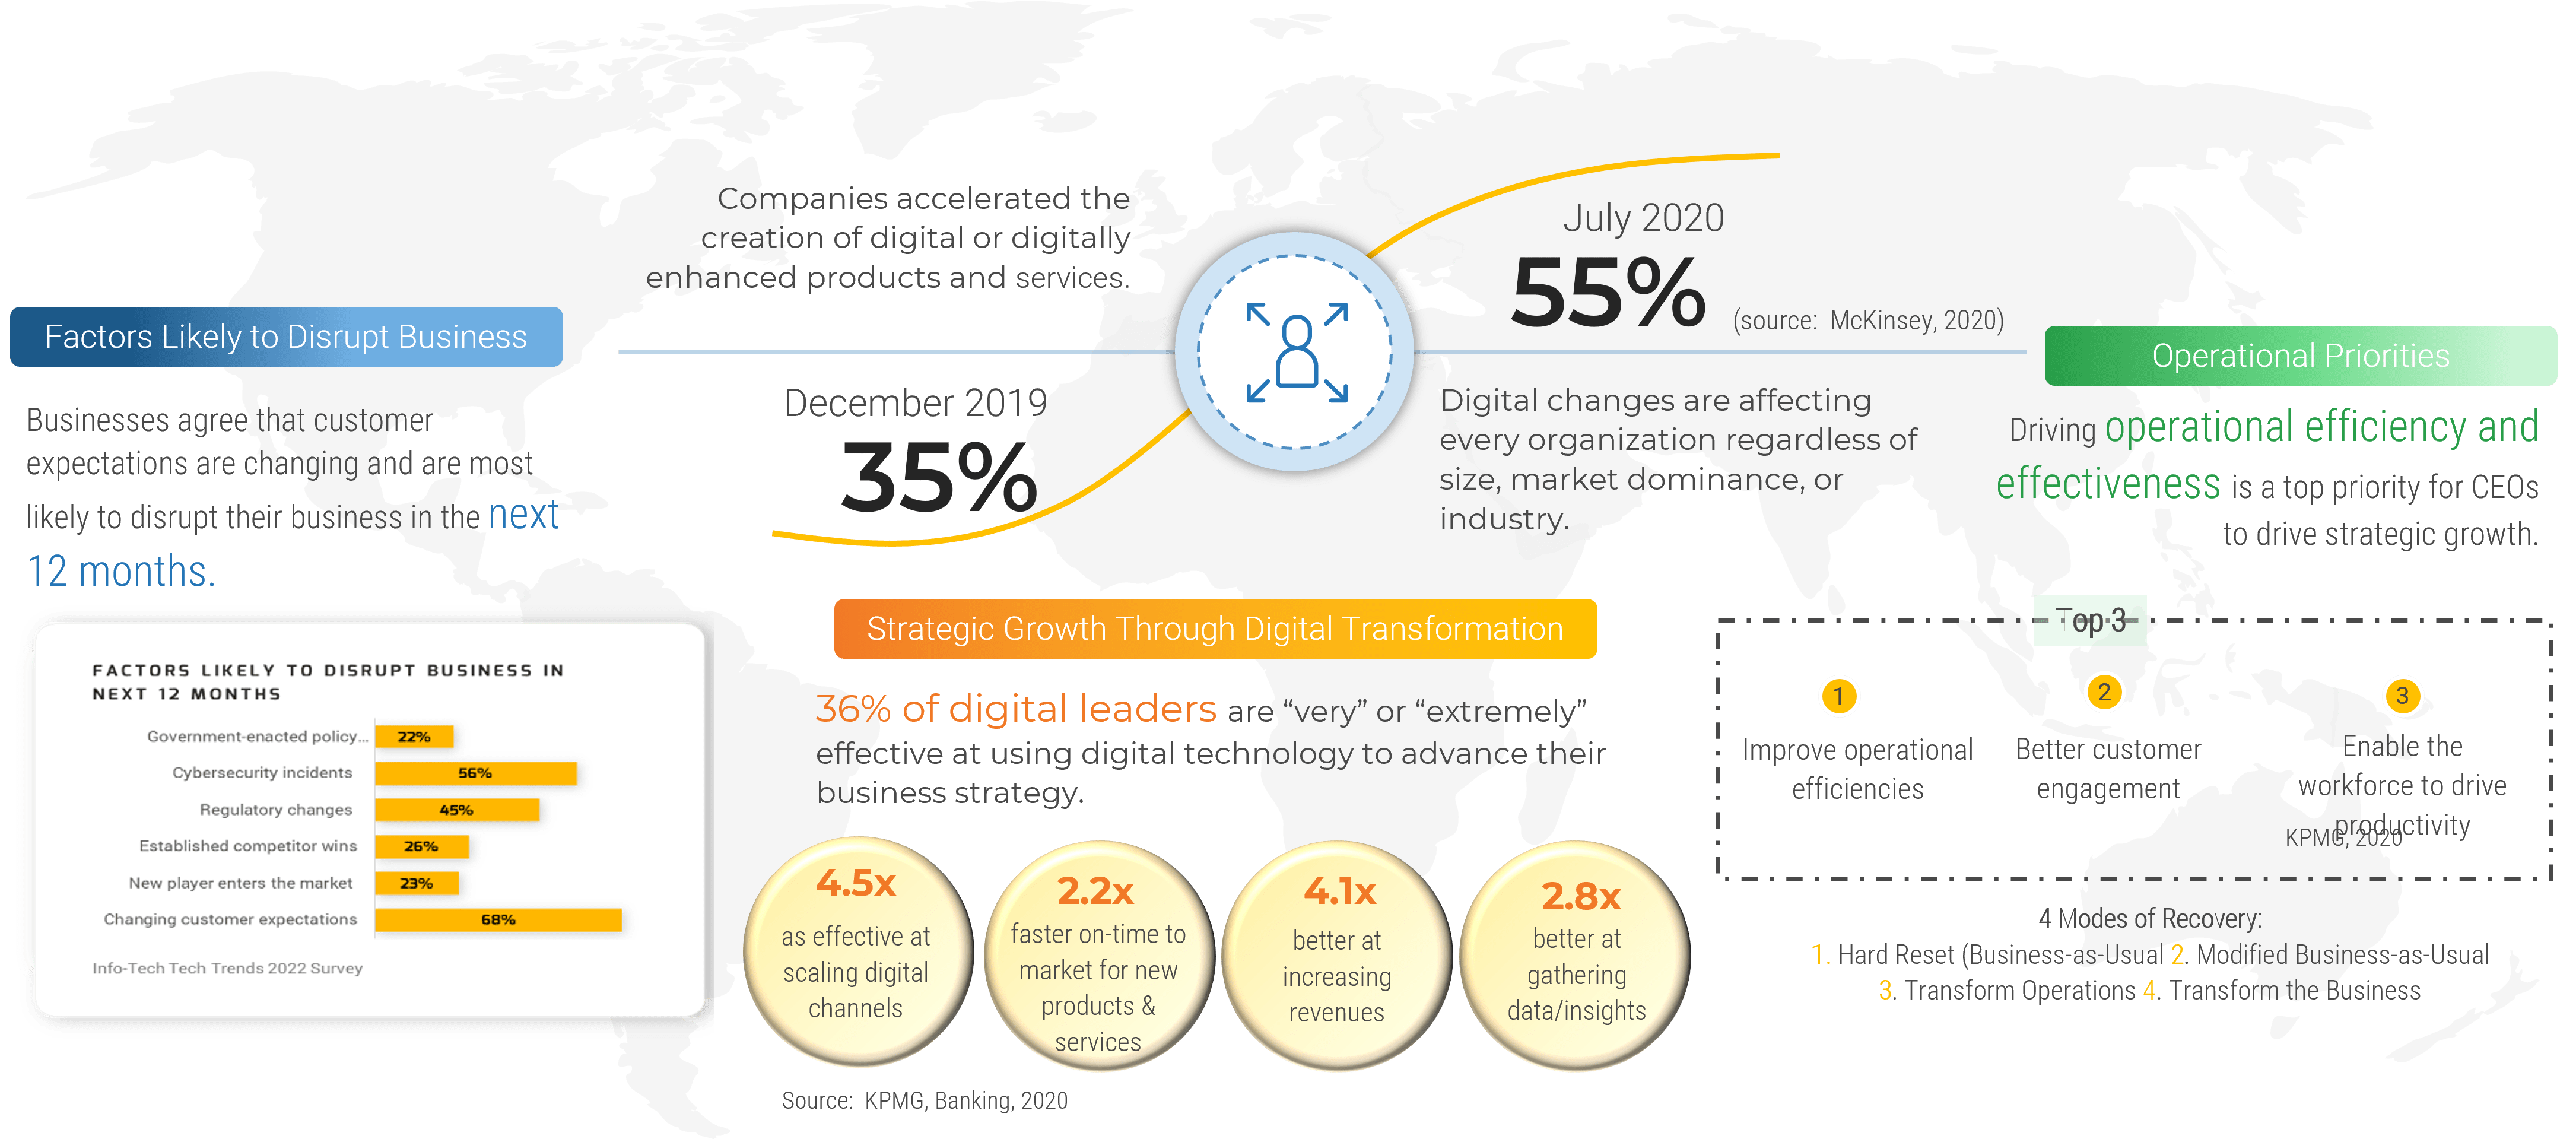
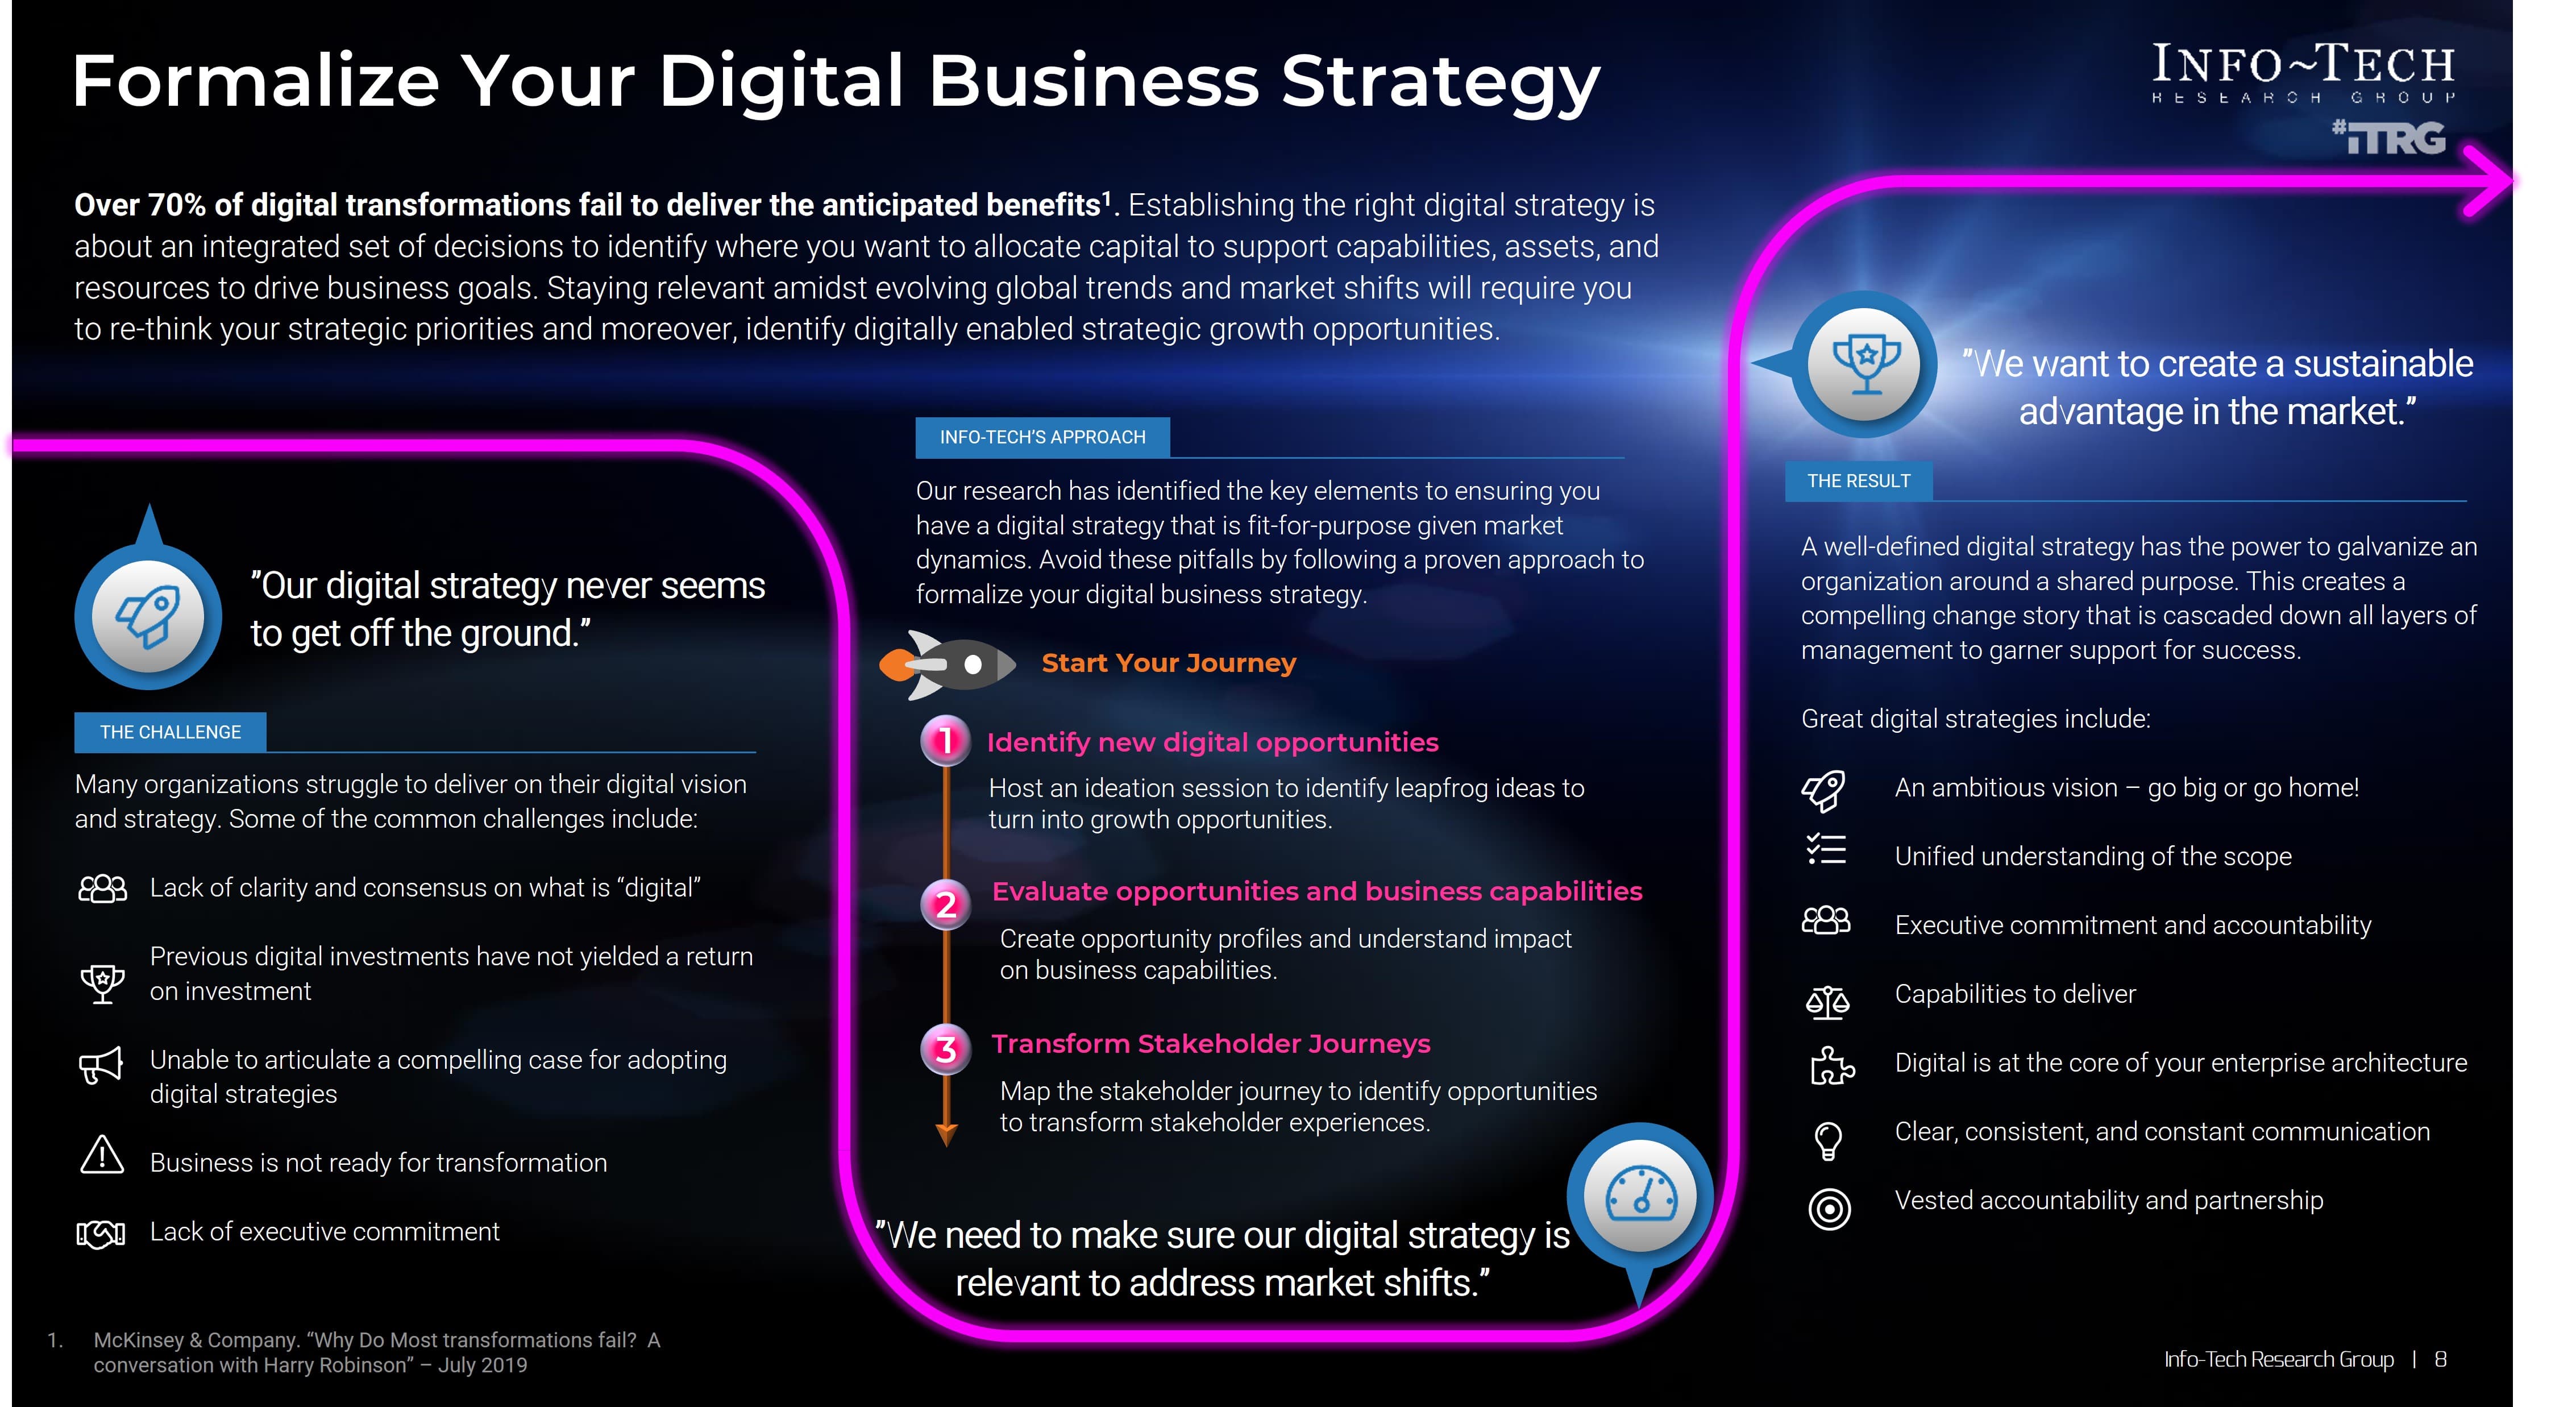

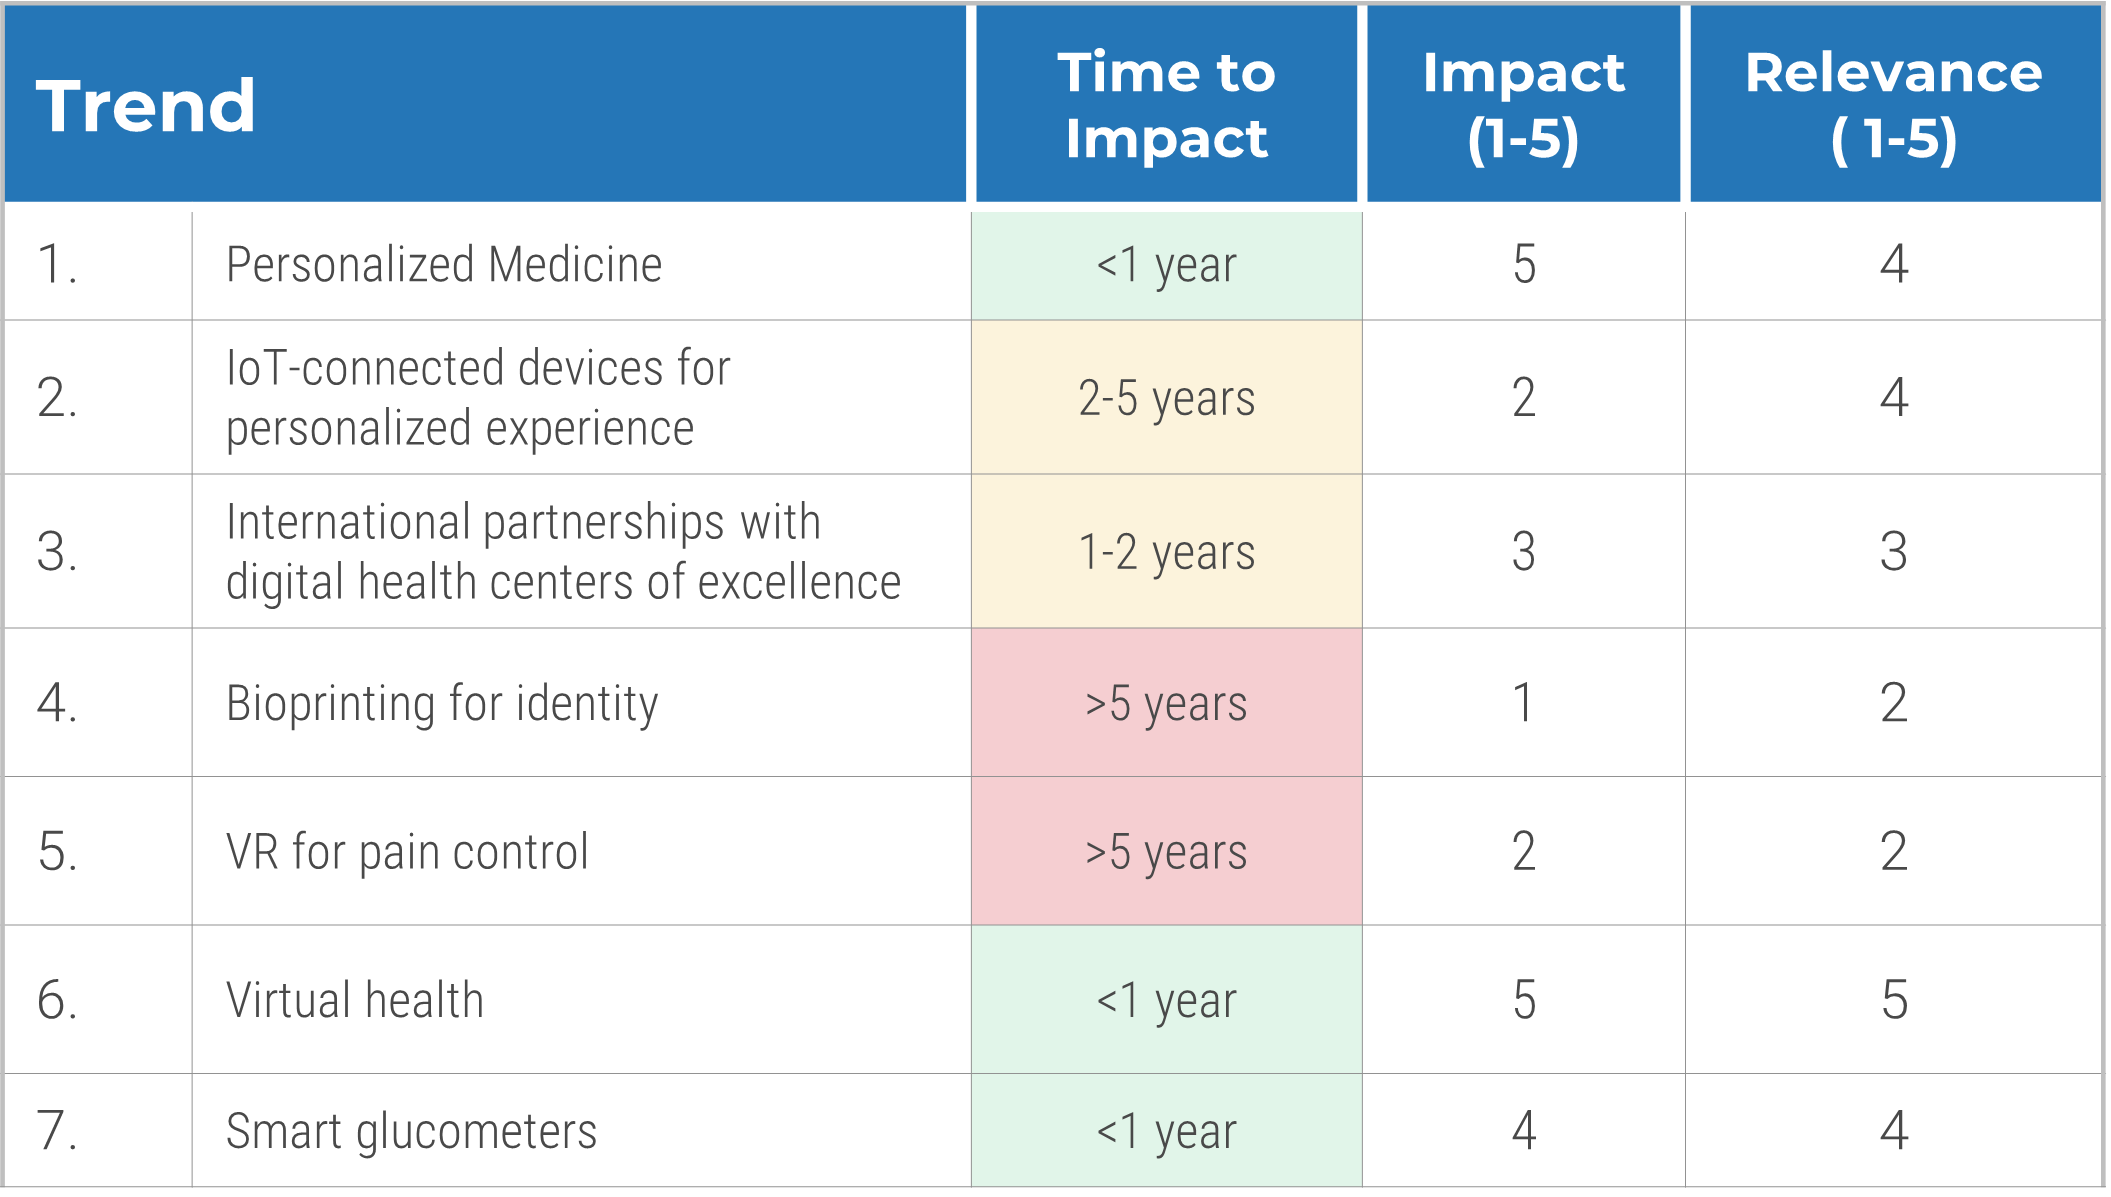
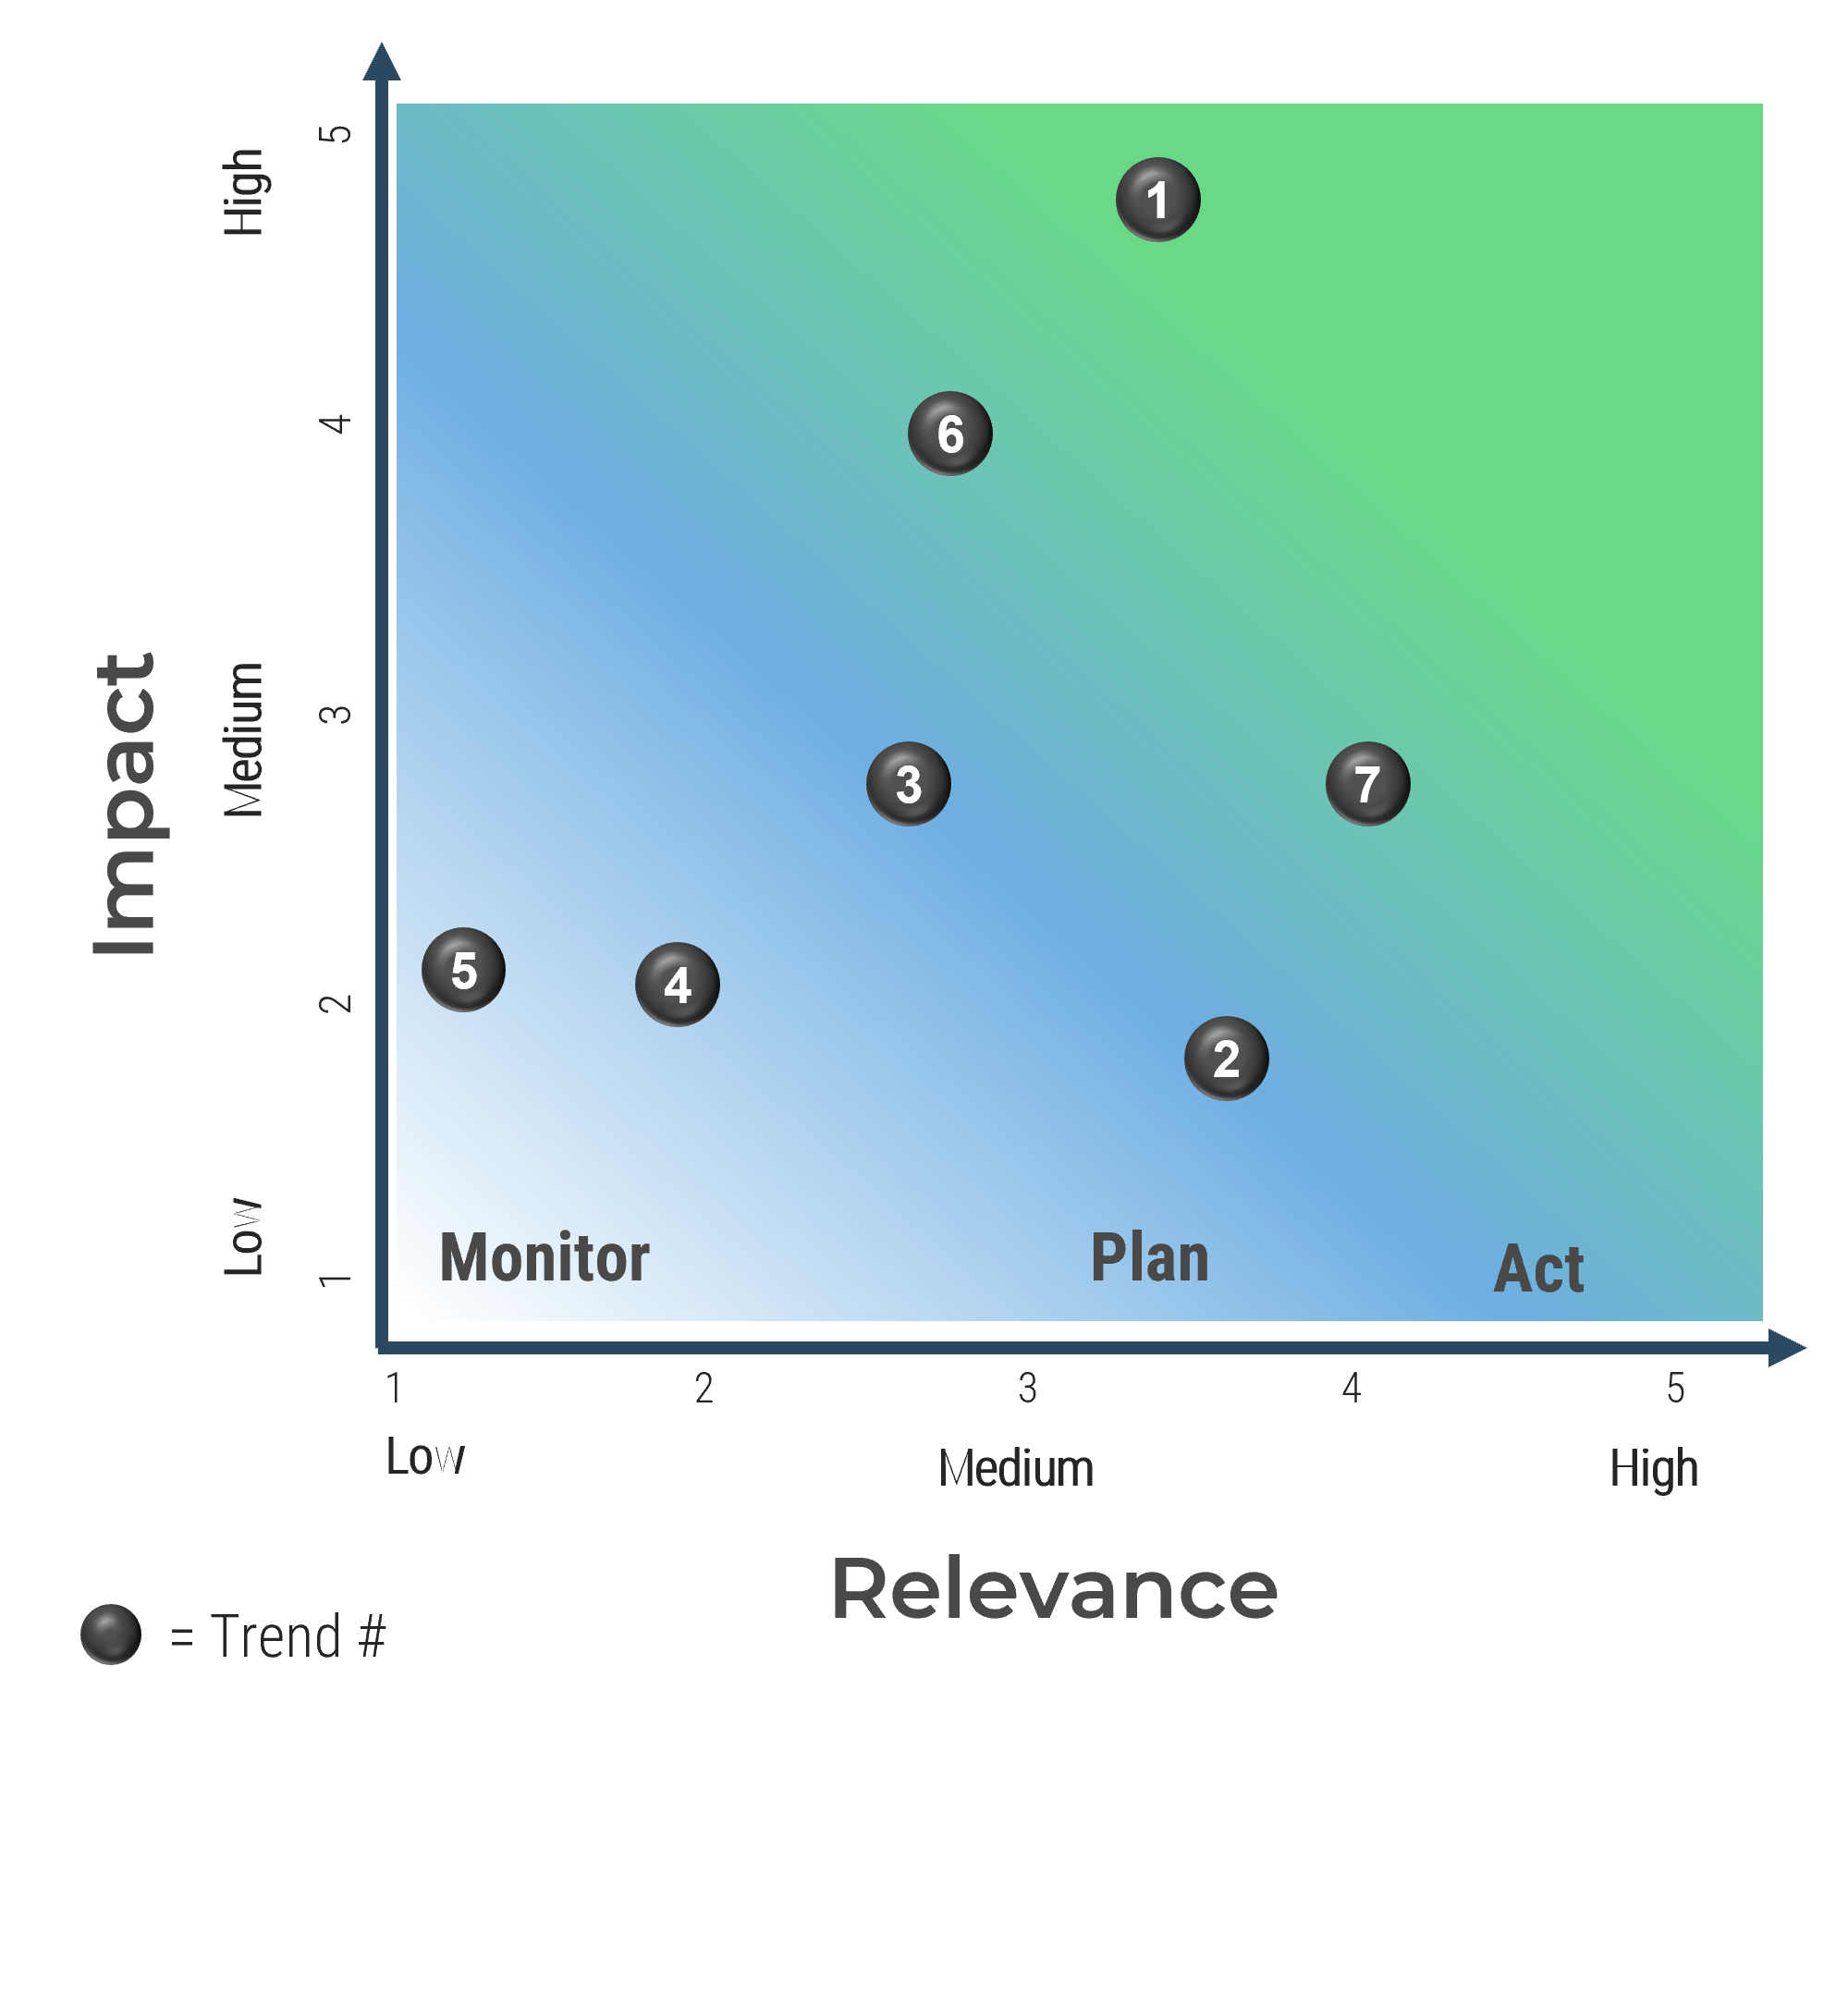
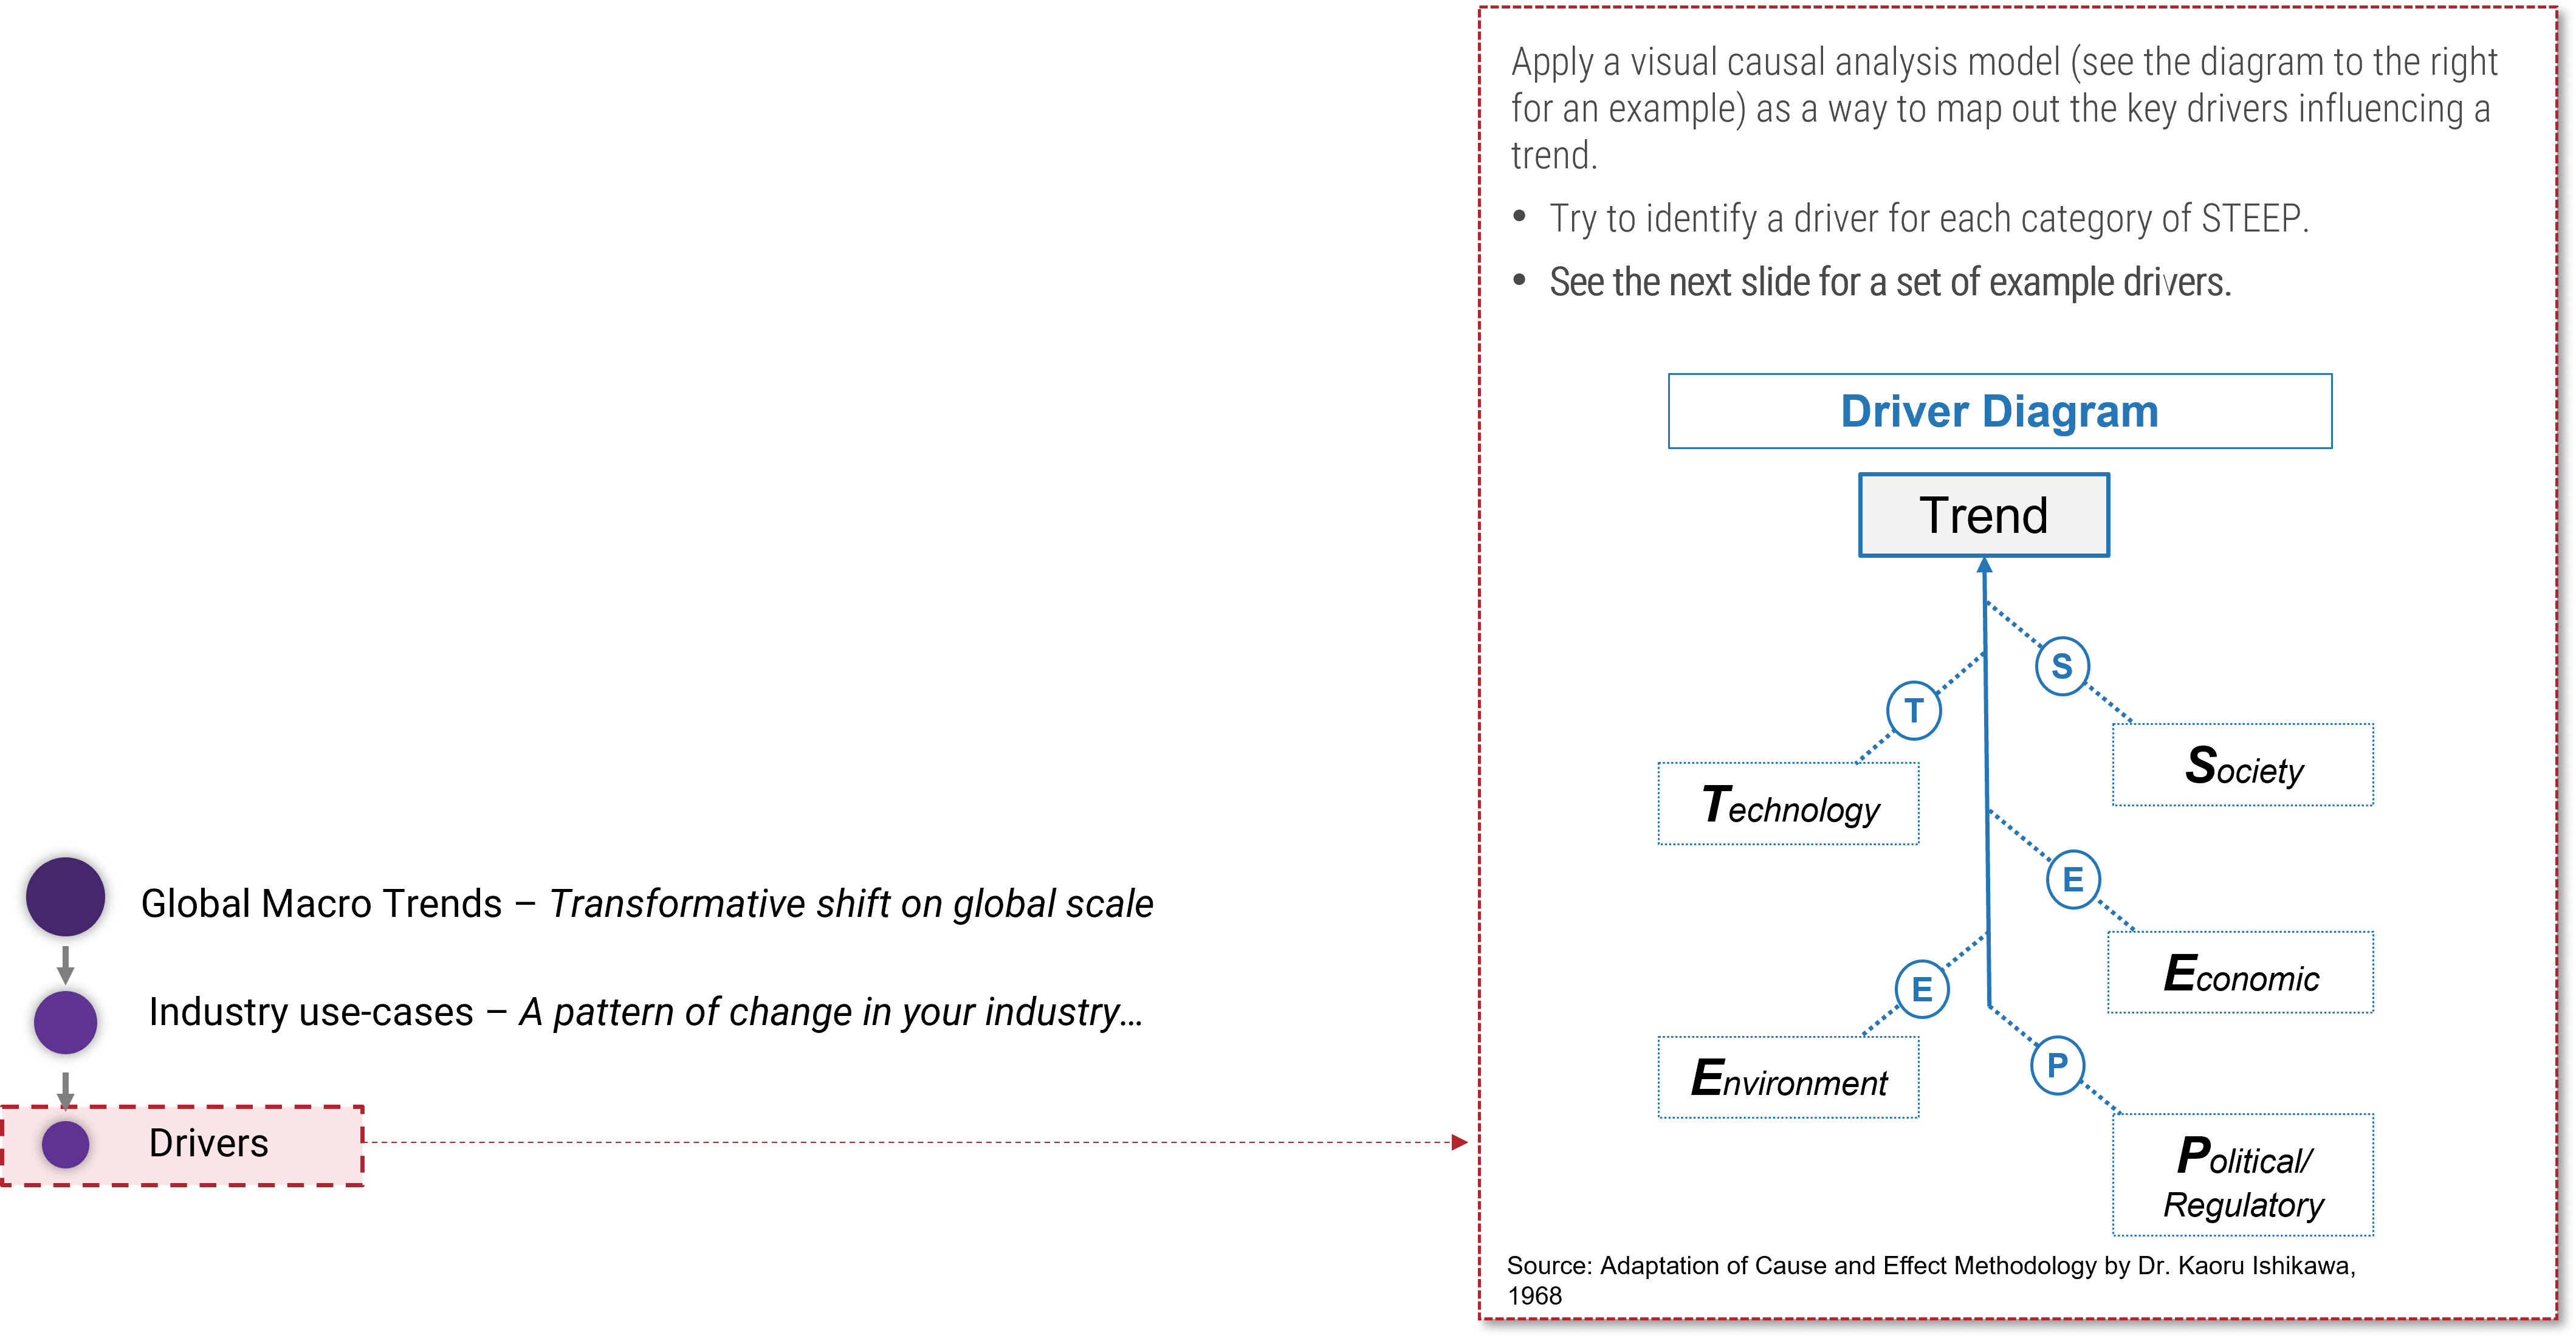

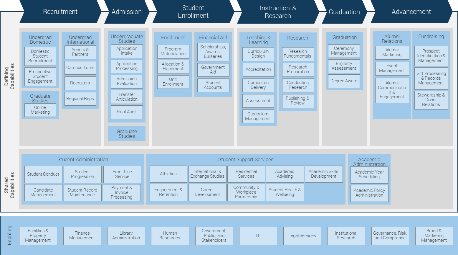 Industry Reference Architecture
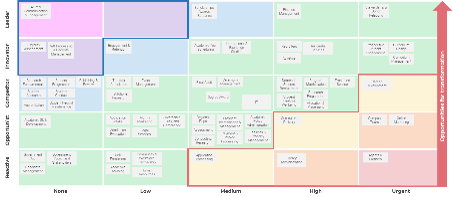 Prioritized Opportunities for Transformation
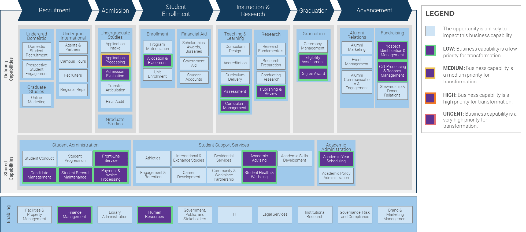
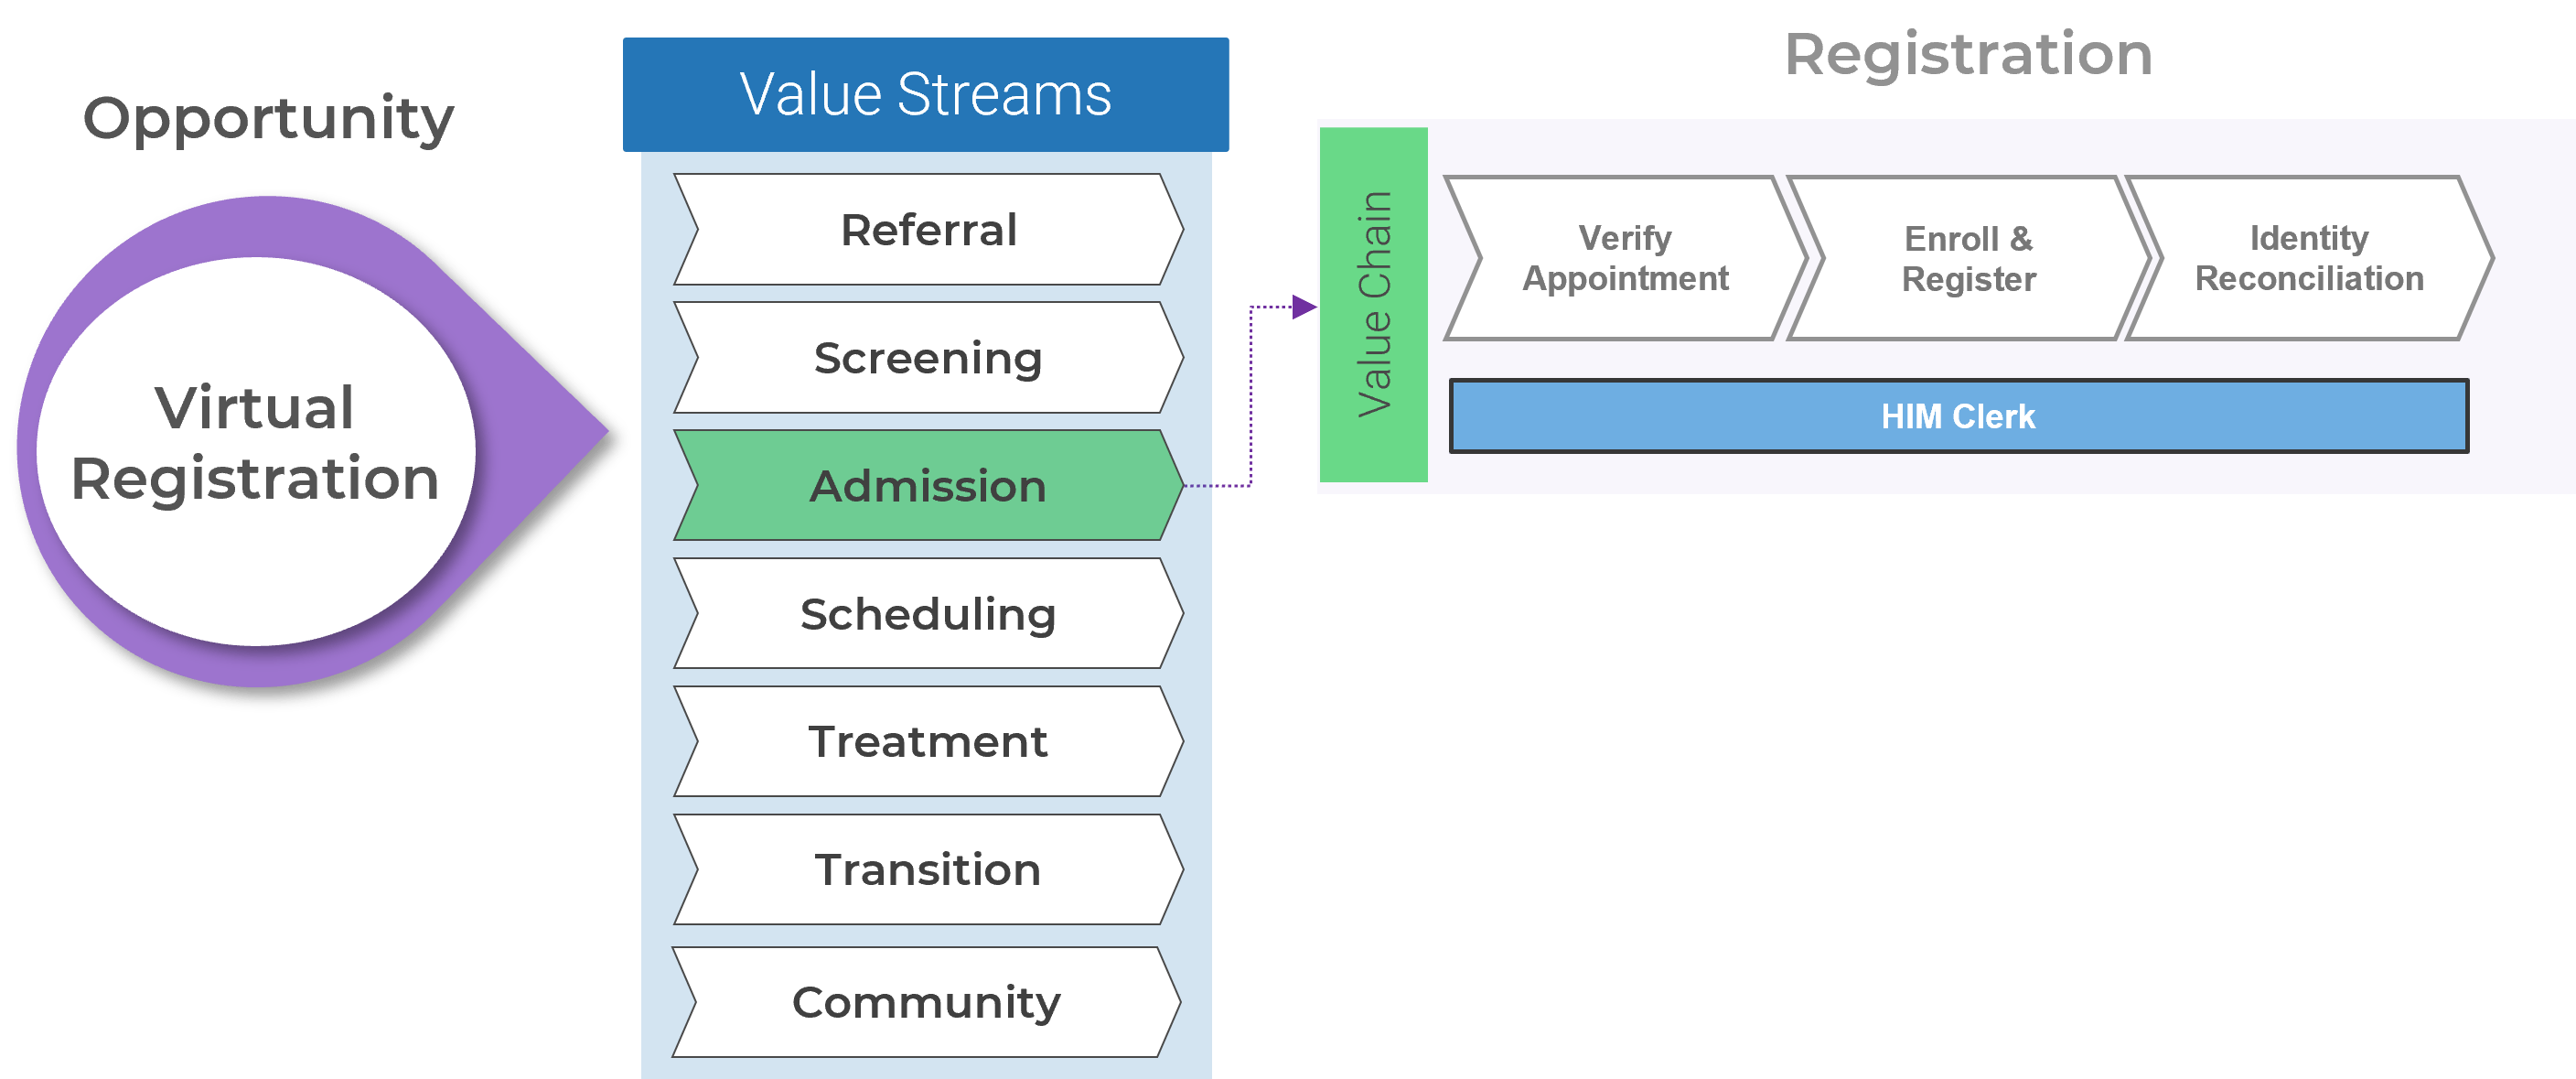
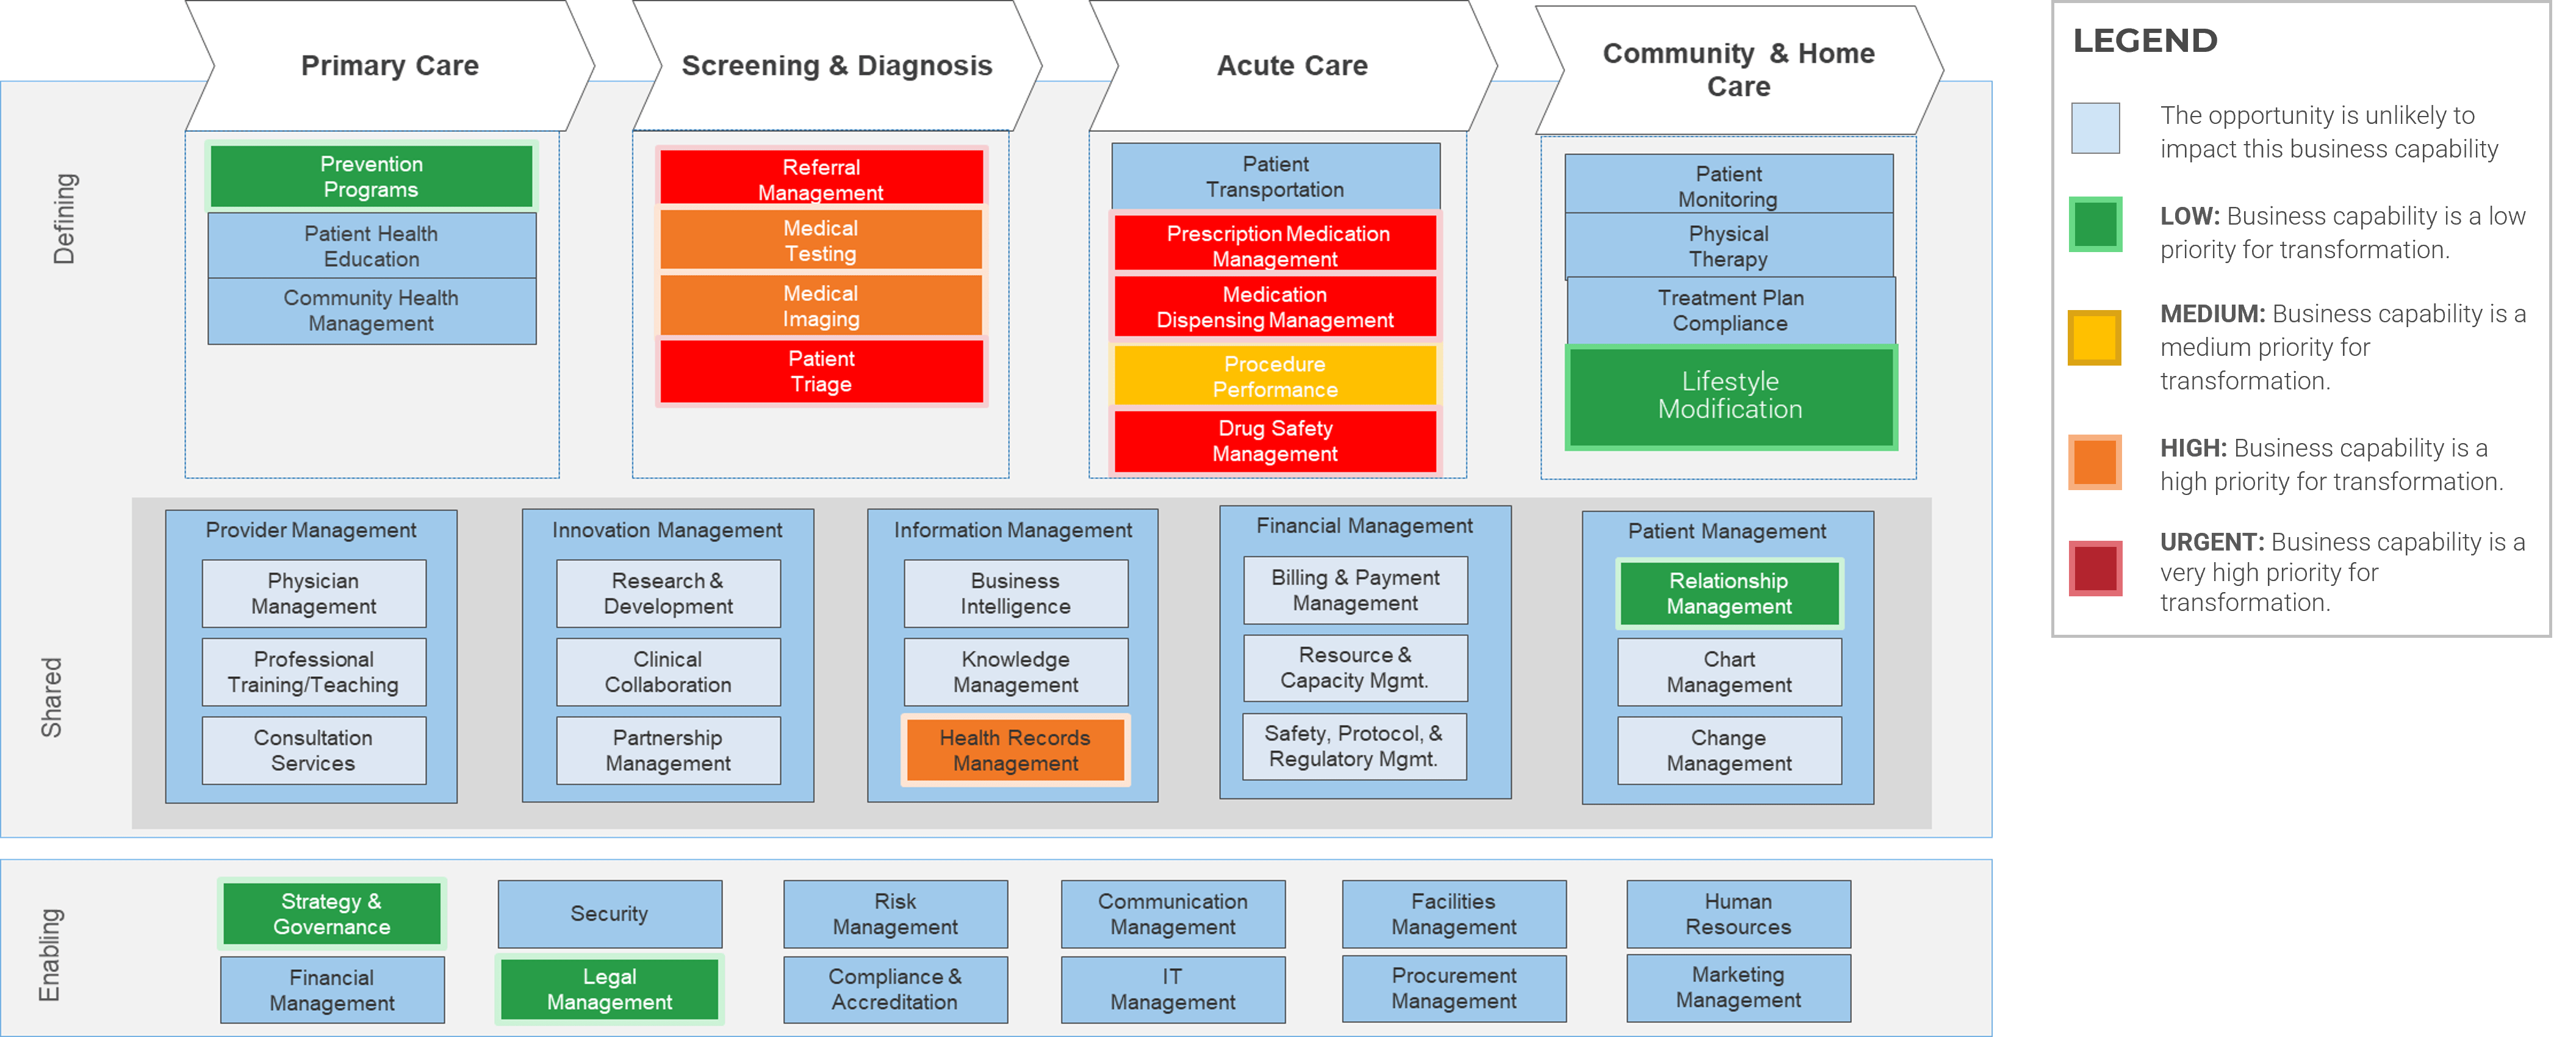
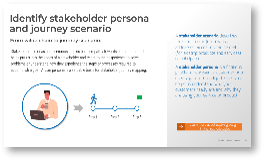 Stakeholder Persona
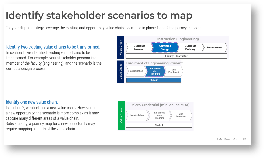 1-Journey Use Case
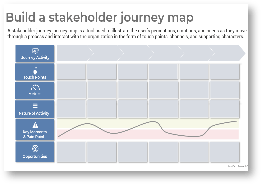 Map Stakeholder Journey
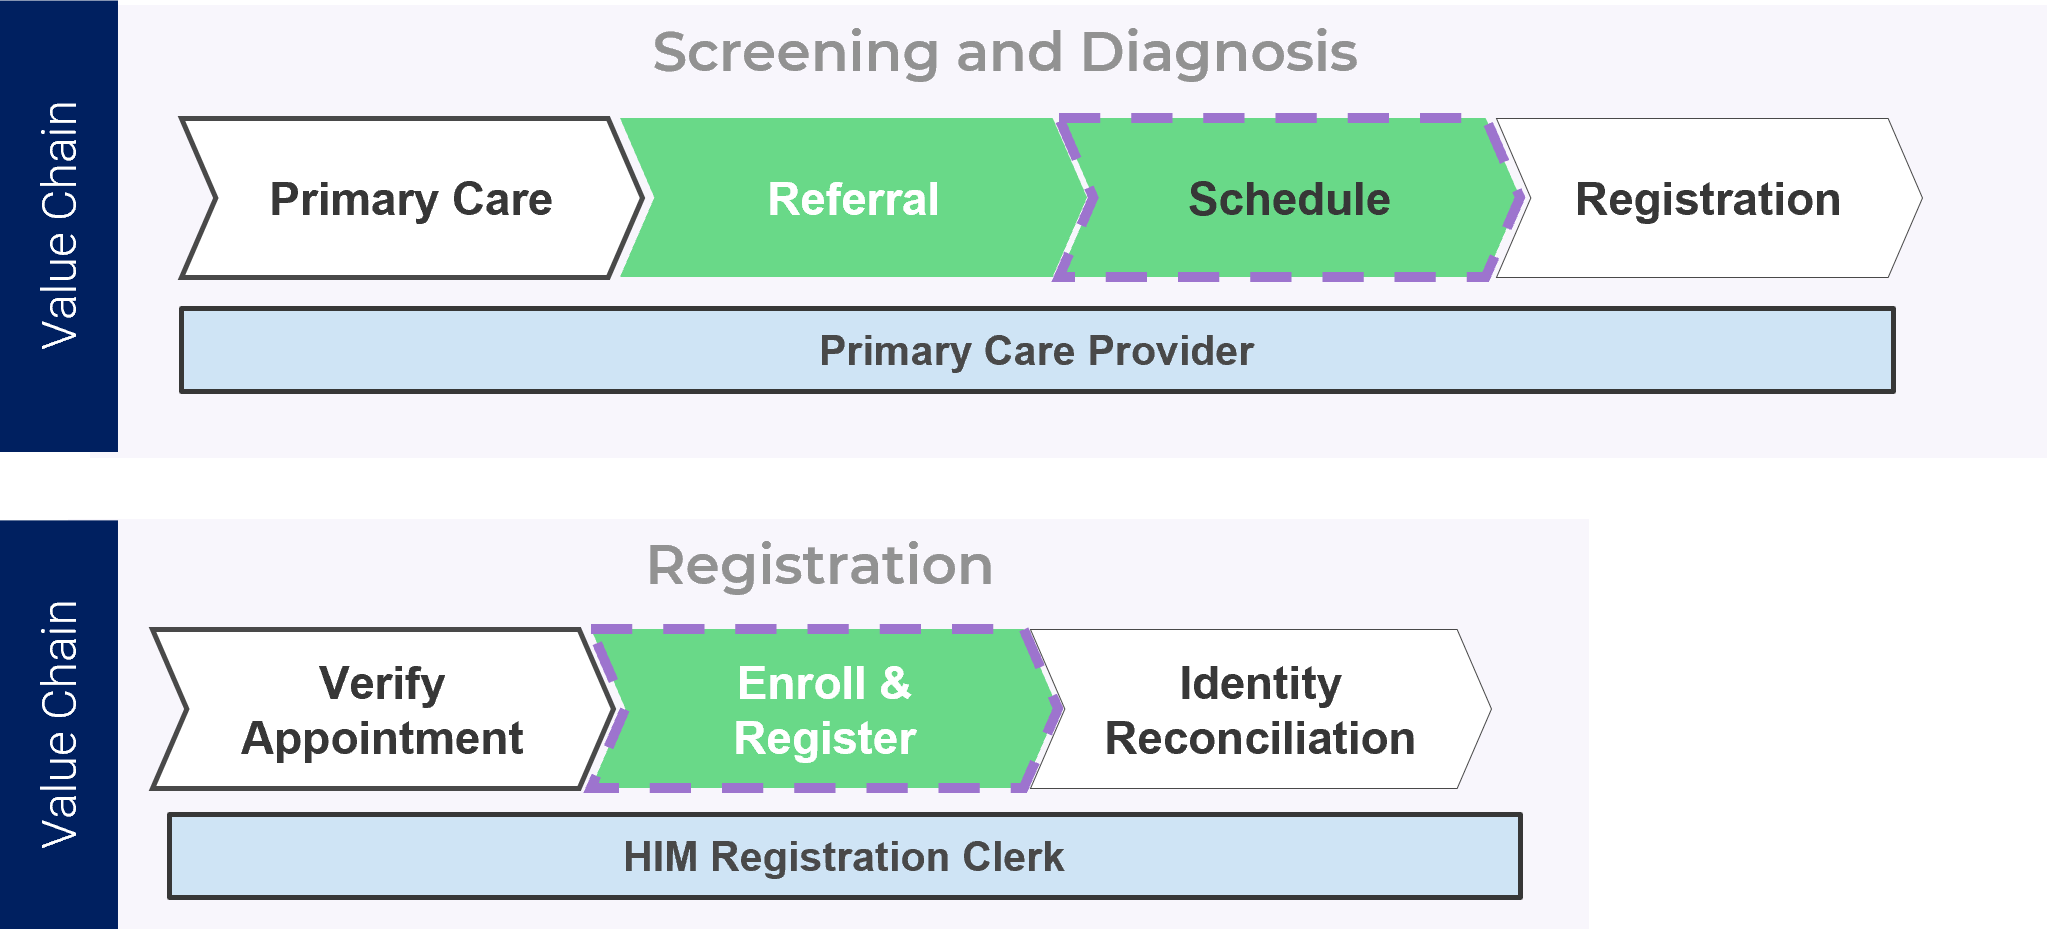
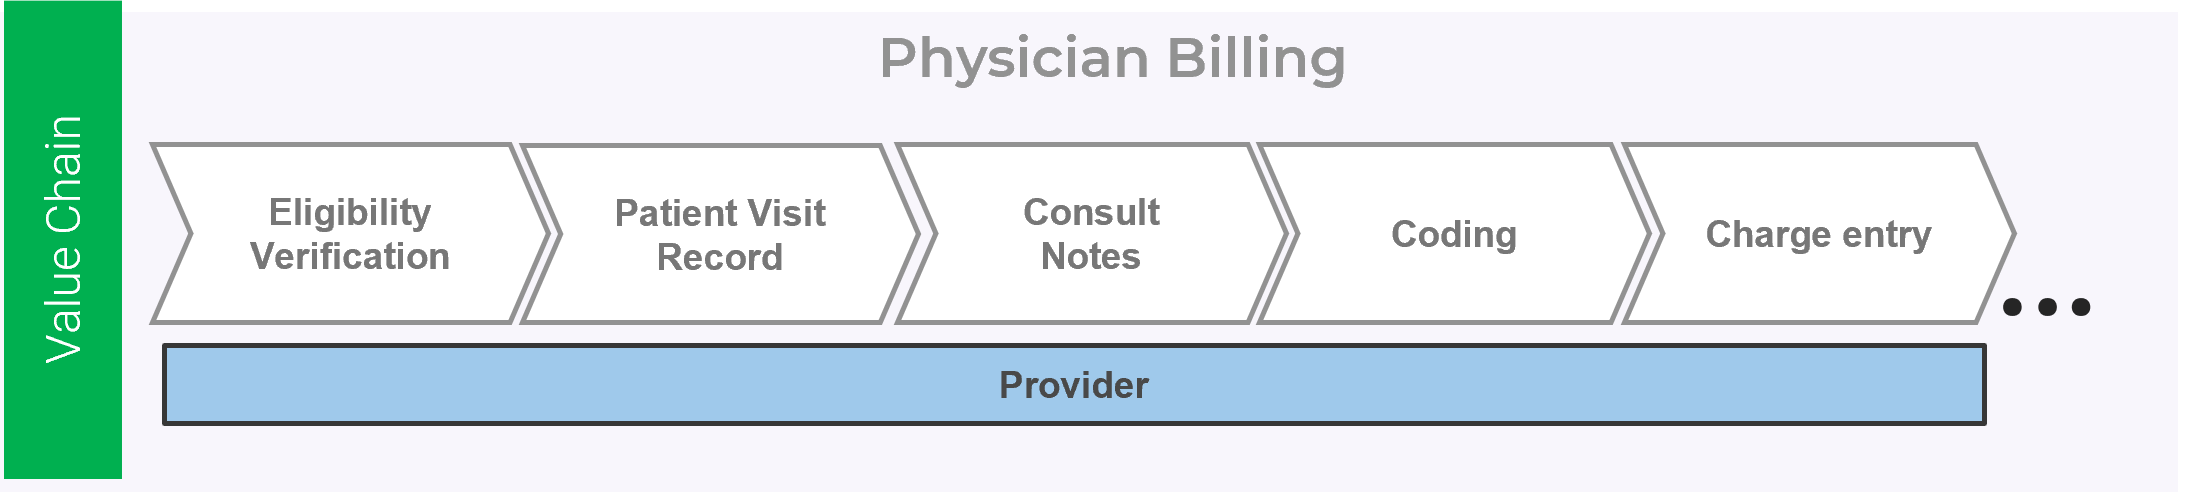
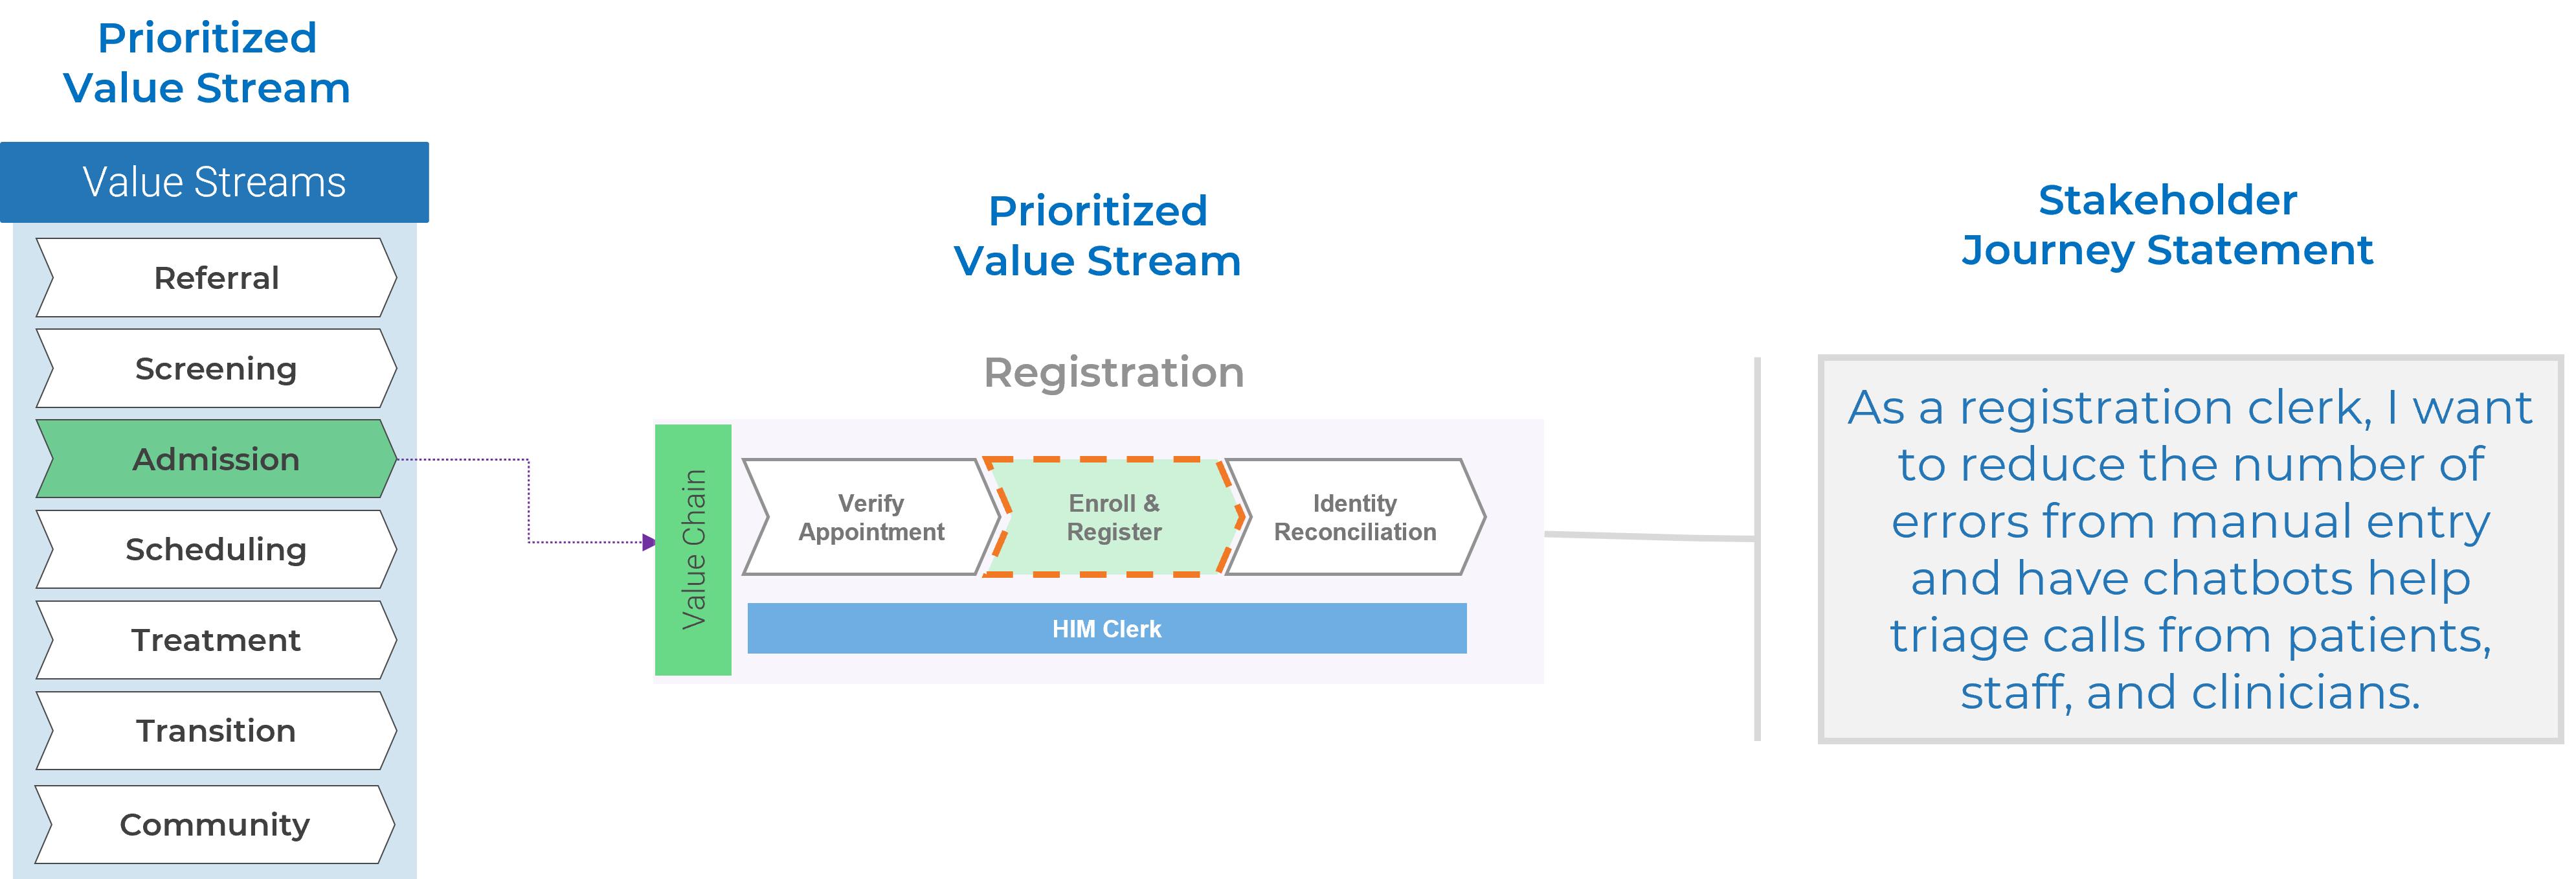
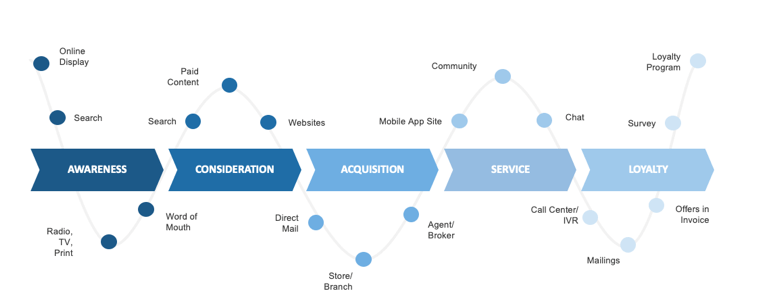
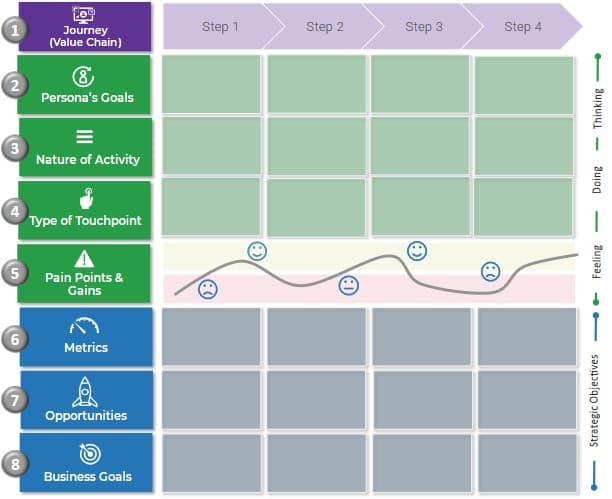
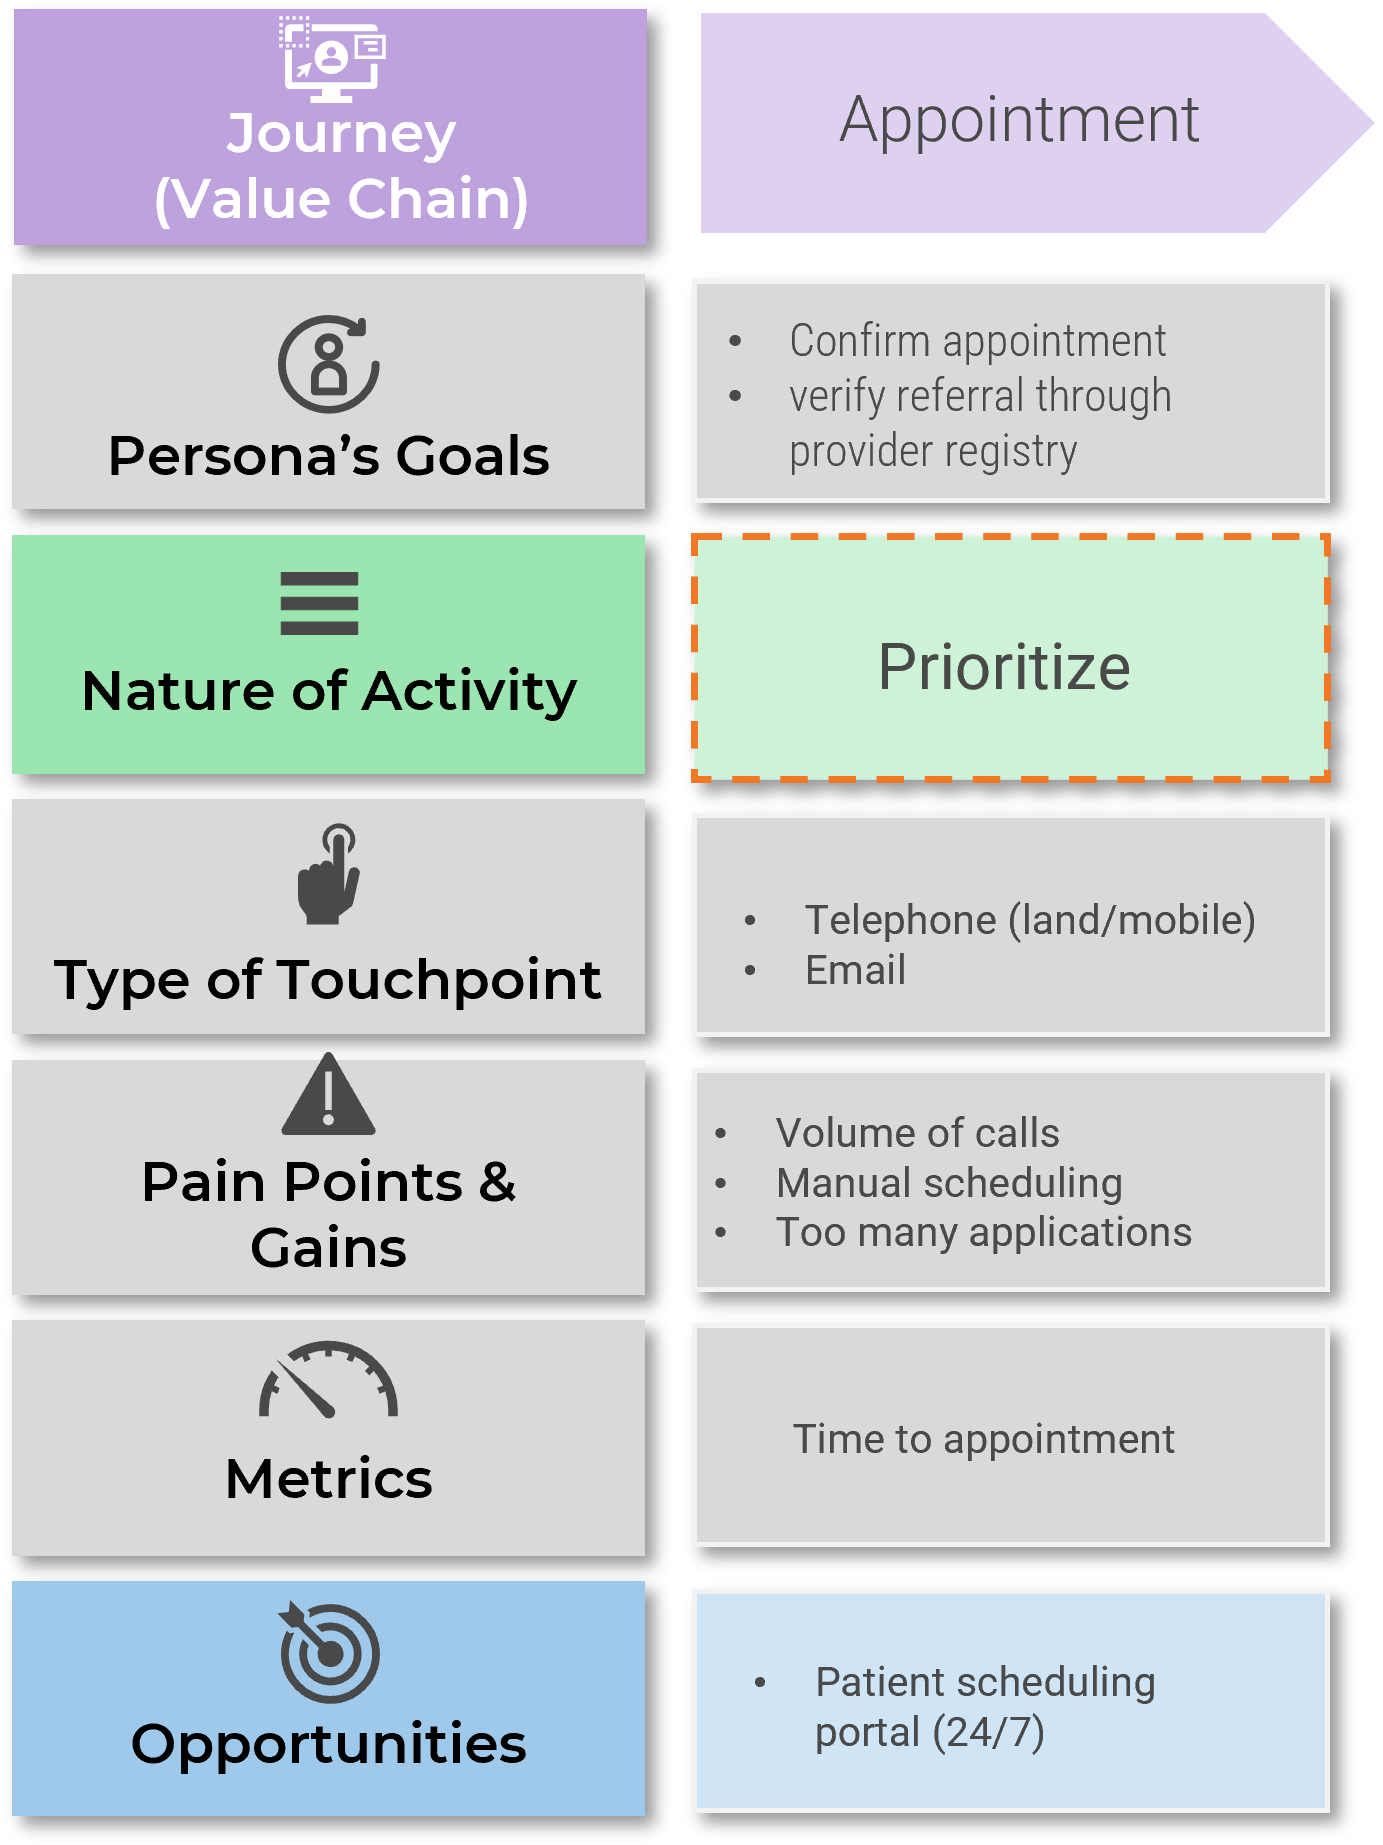
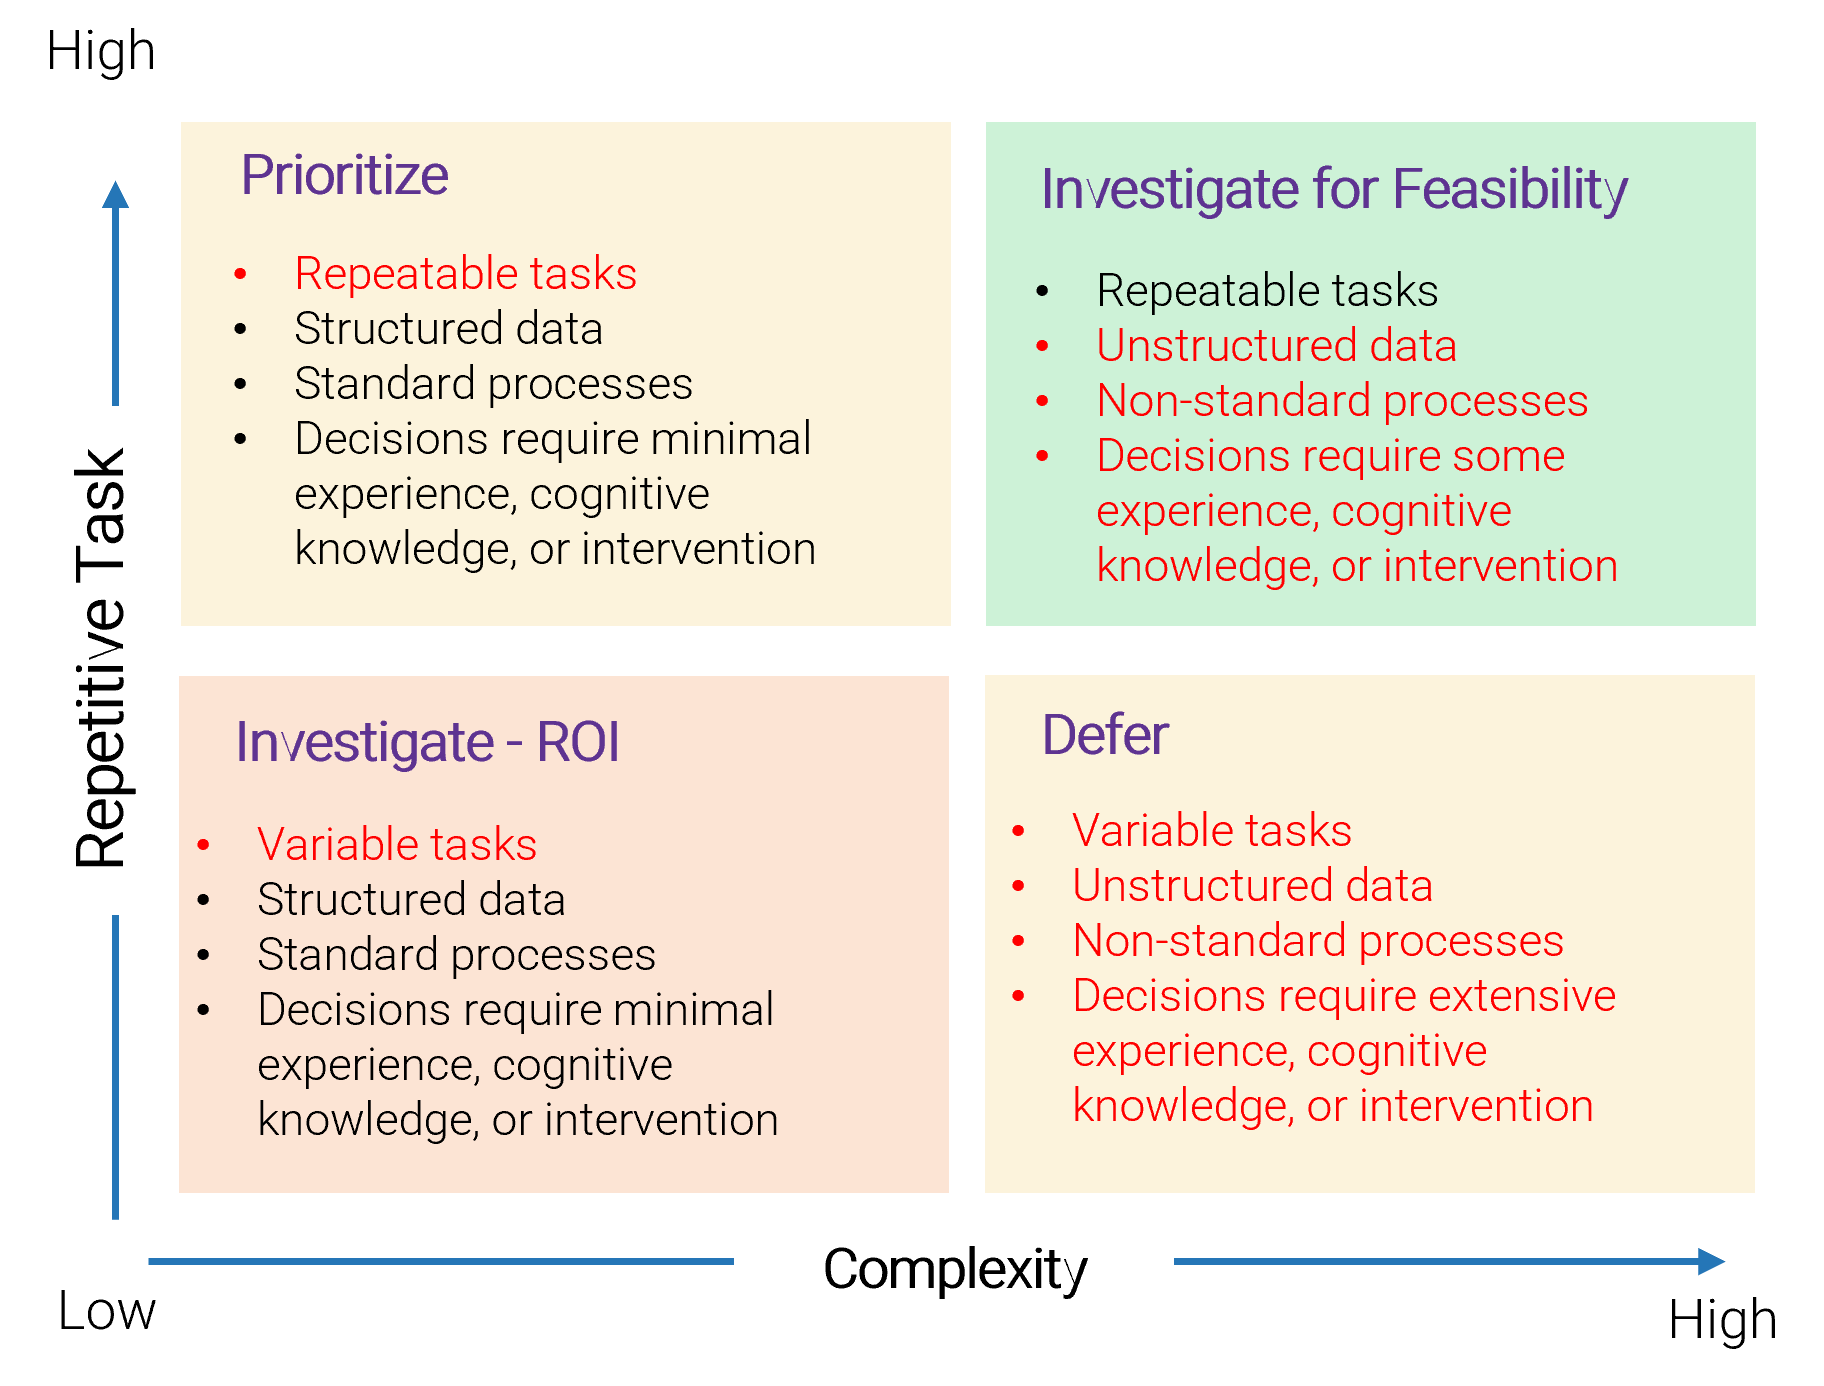
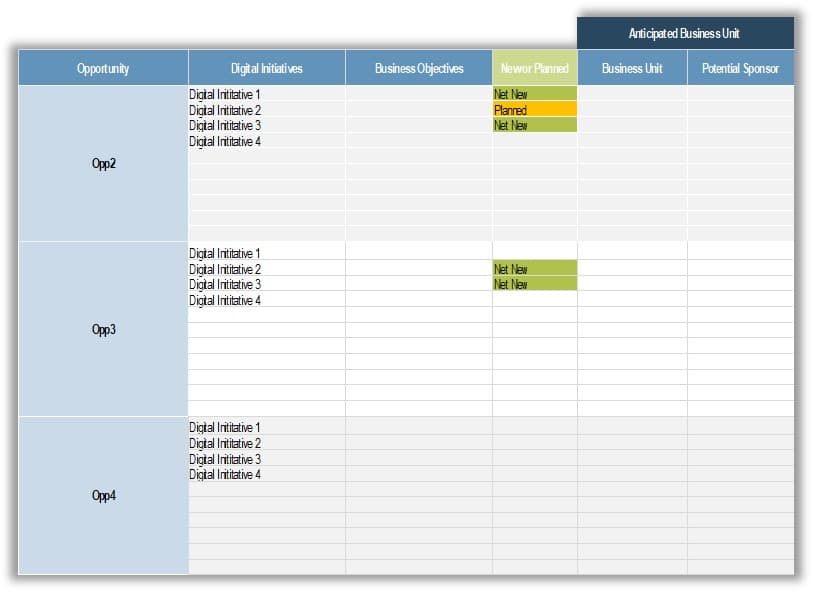
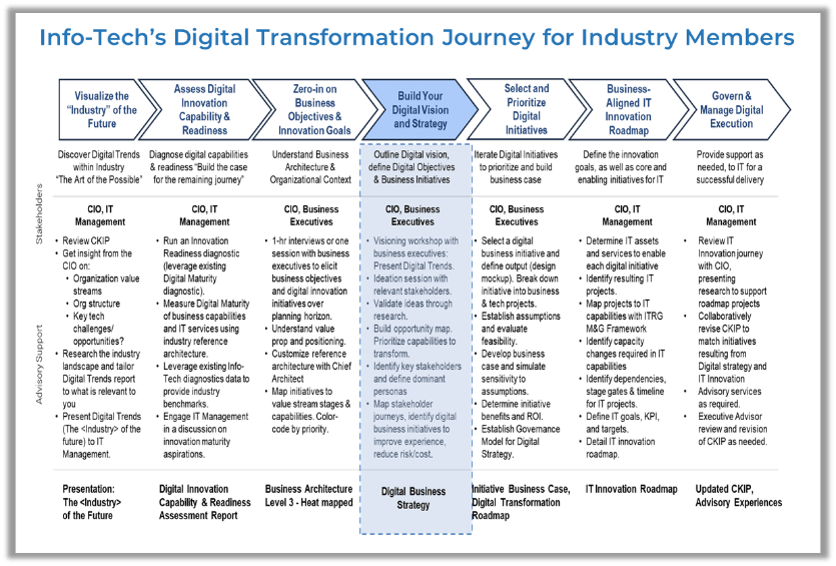


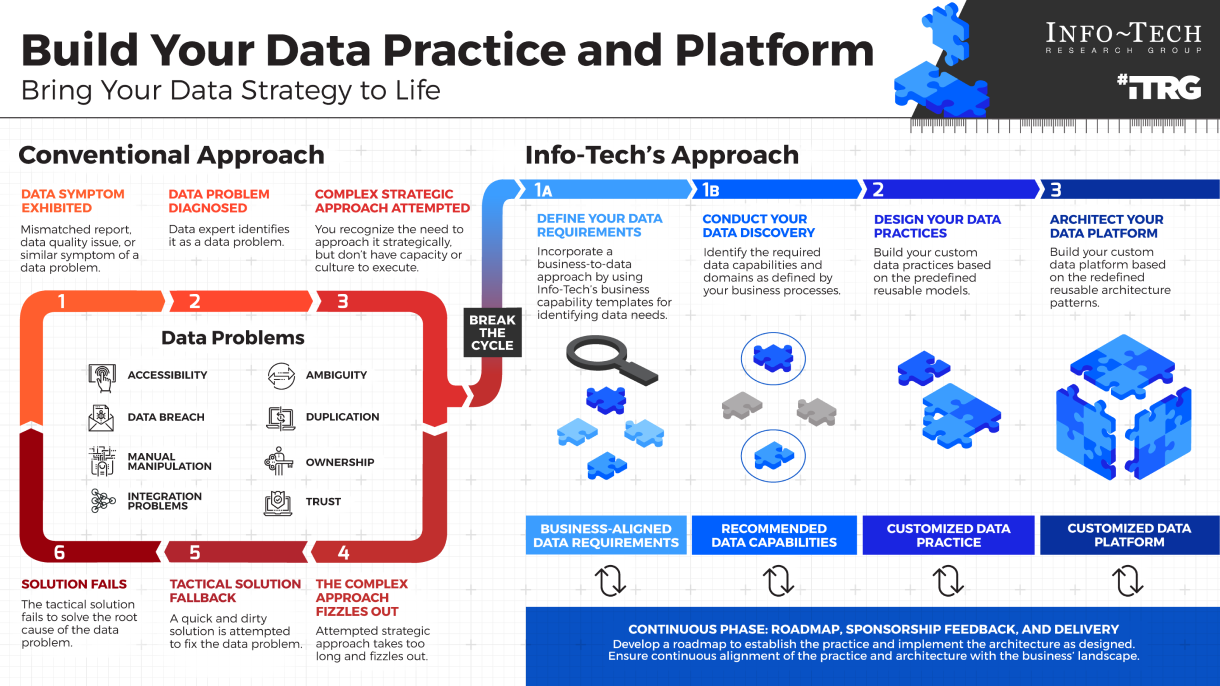


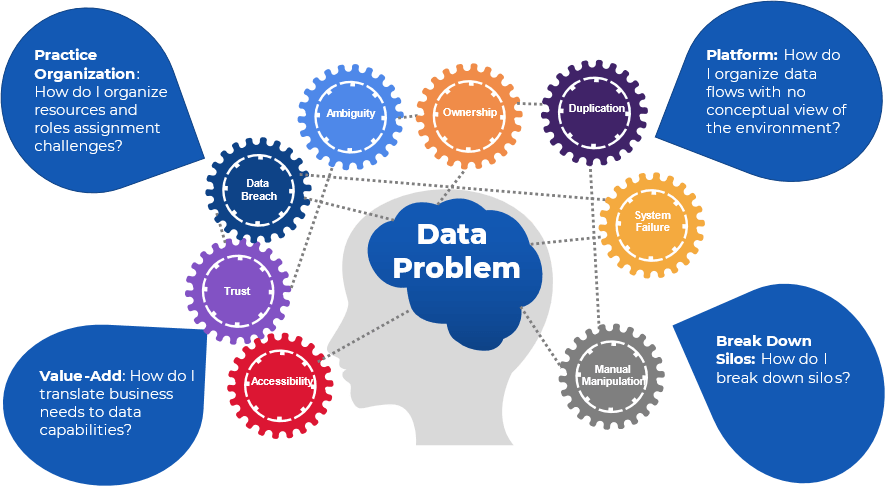
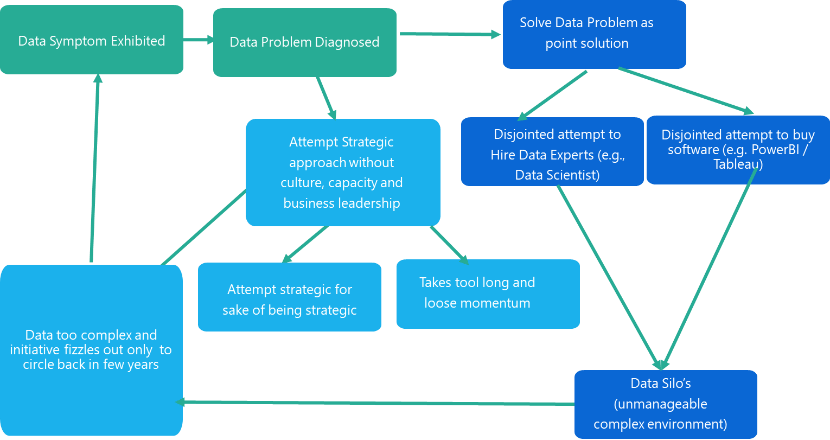
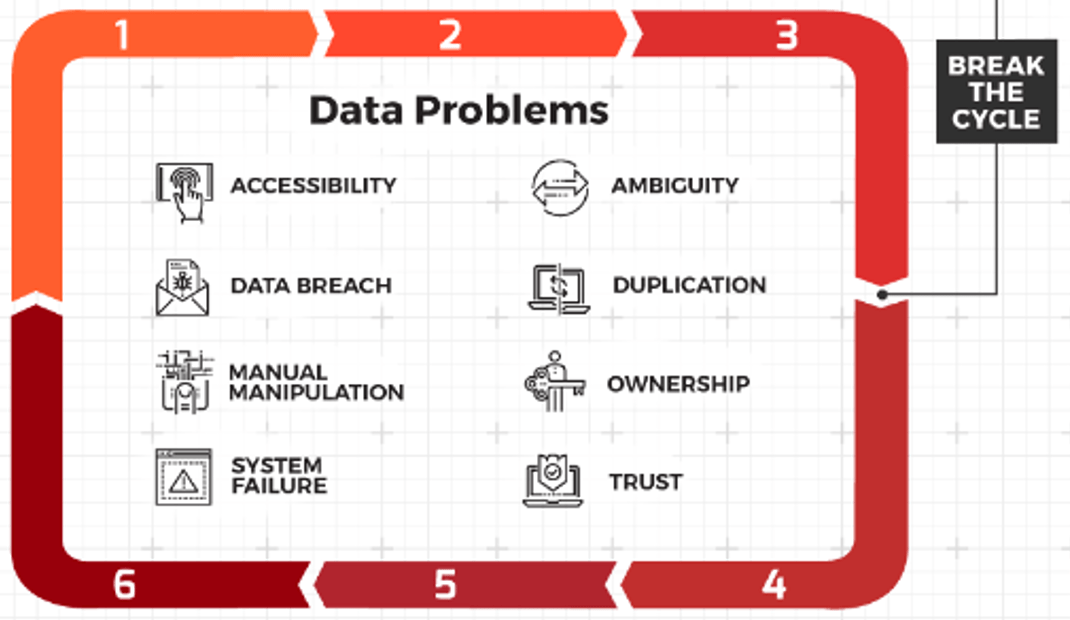
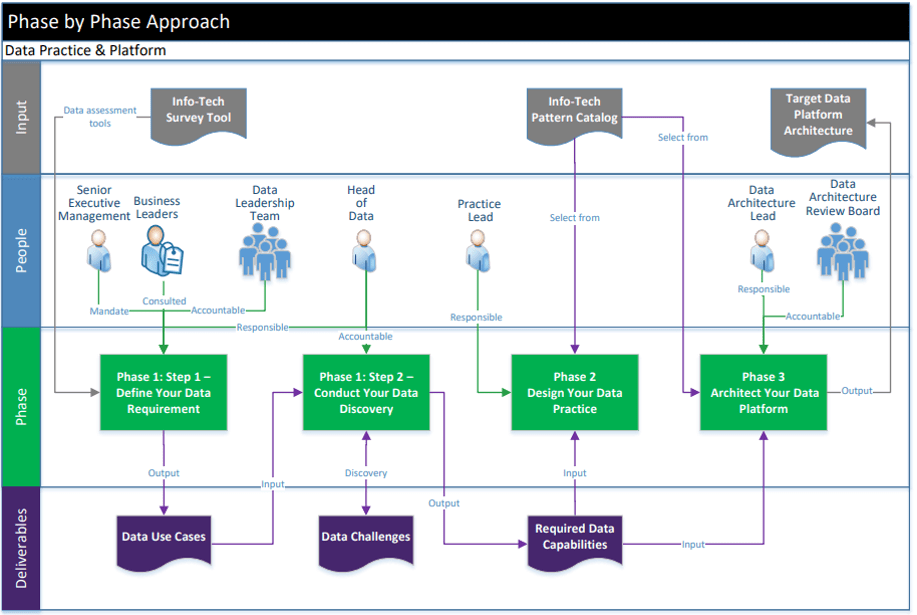
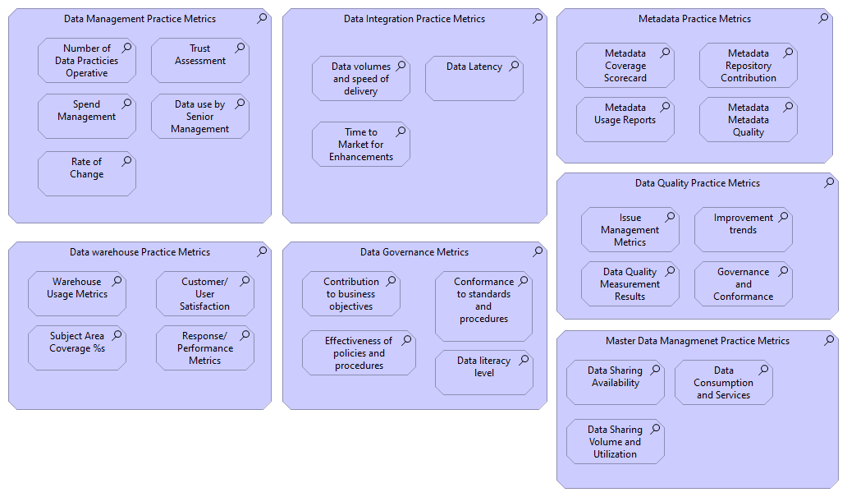


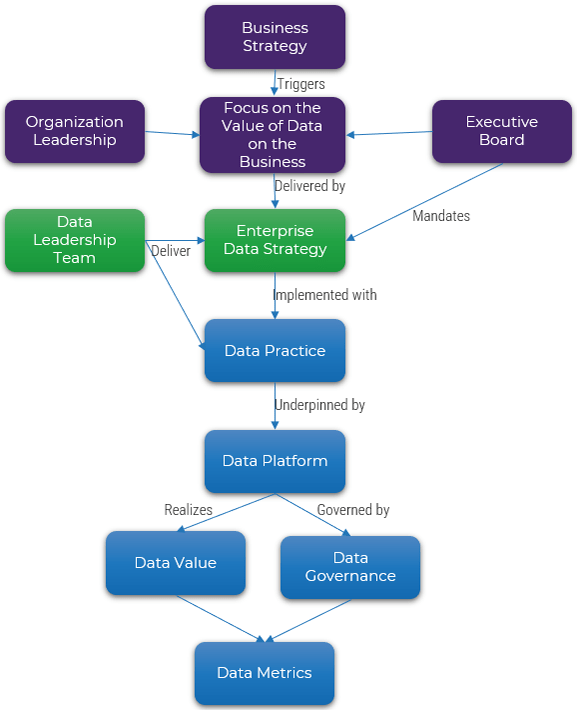
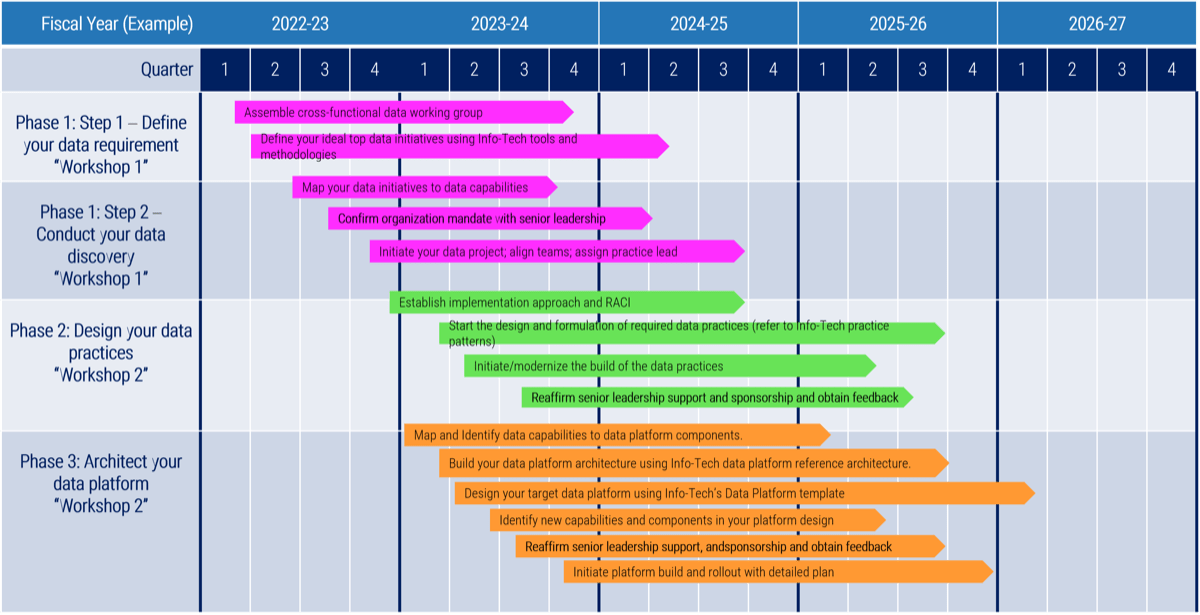
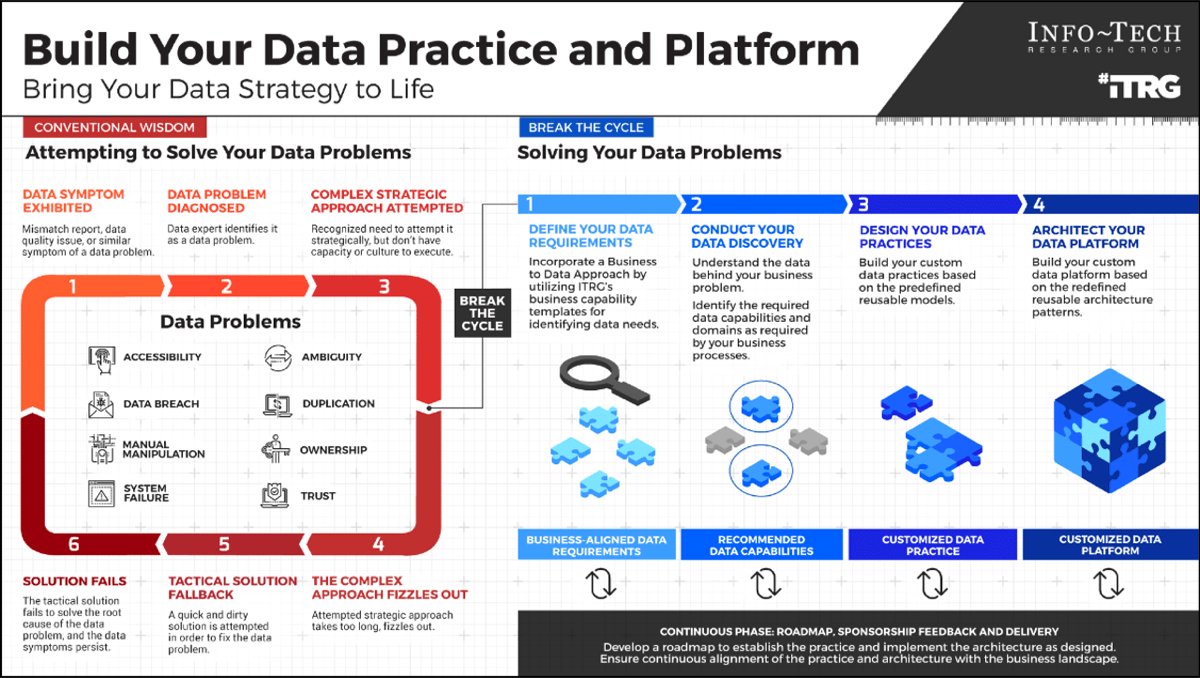

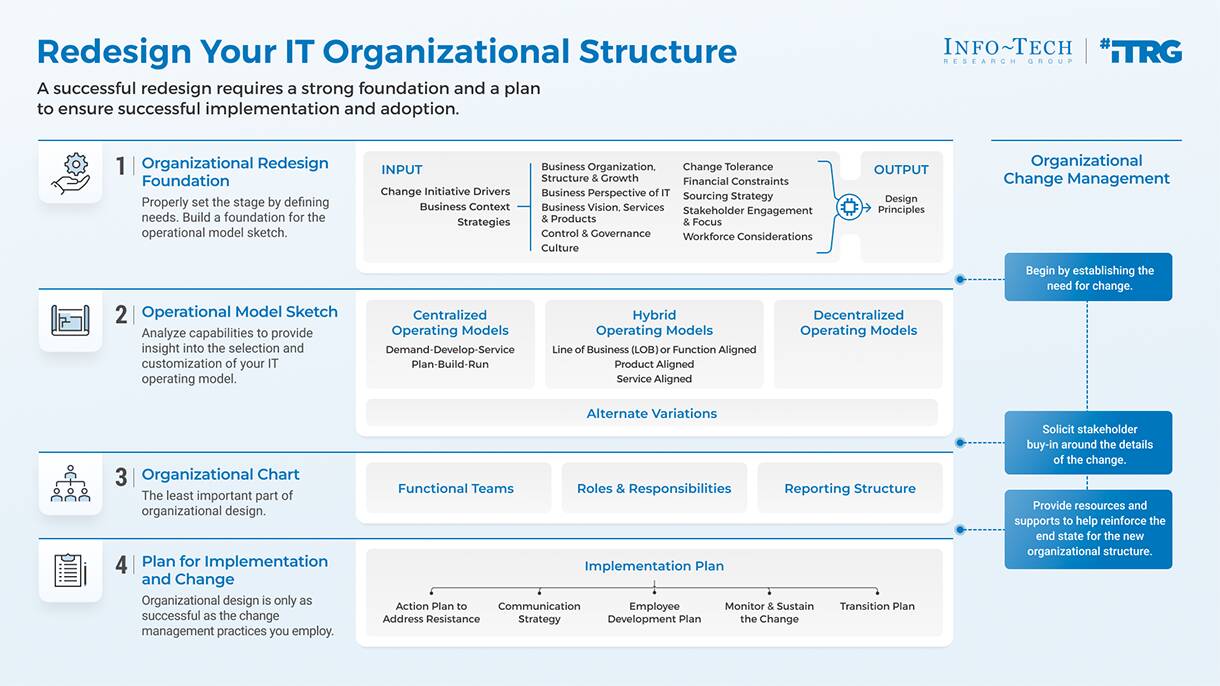


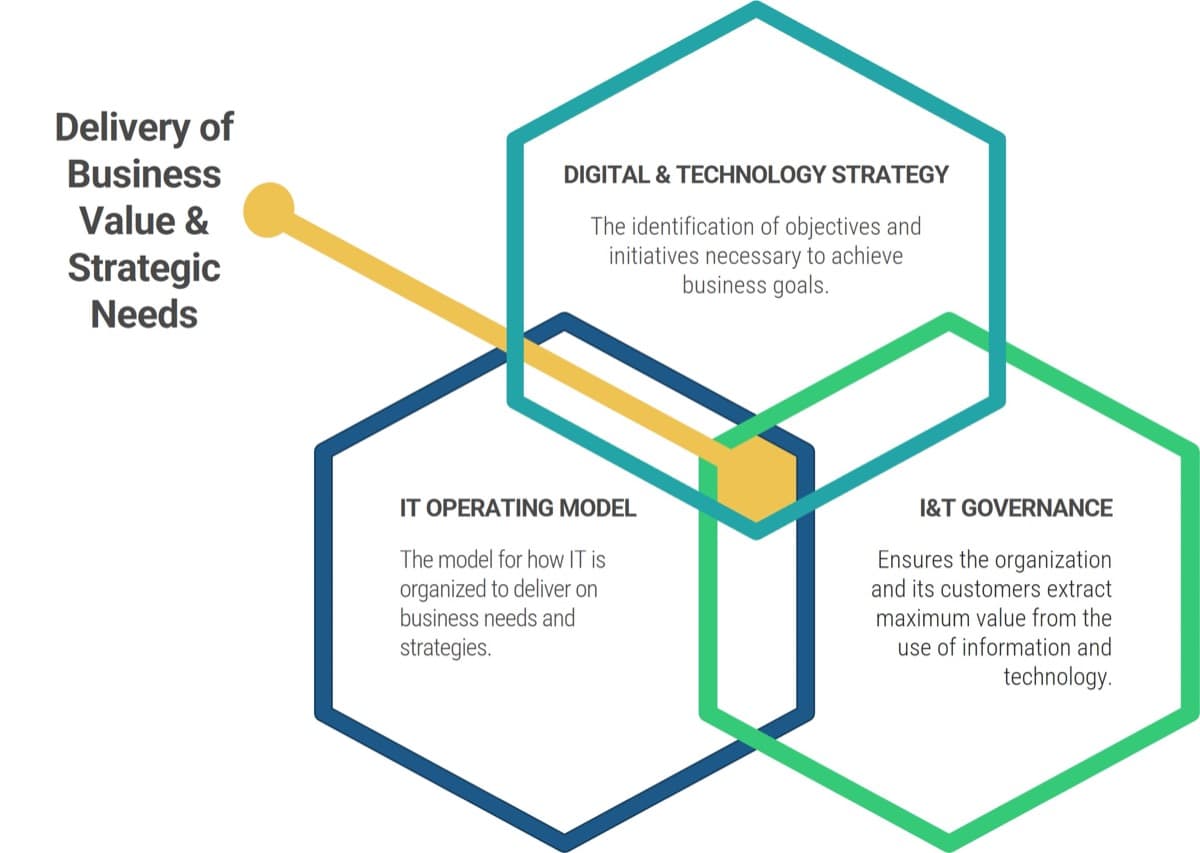
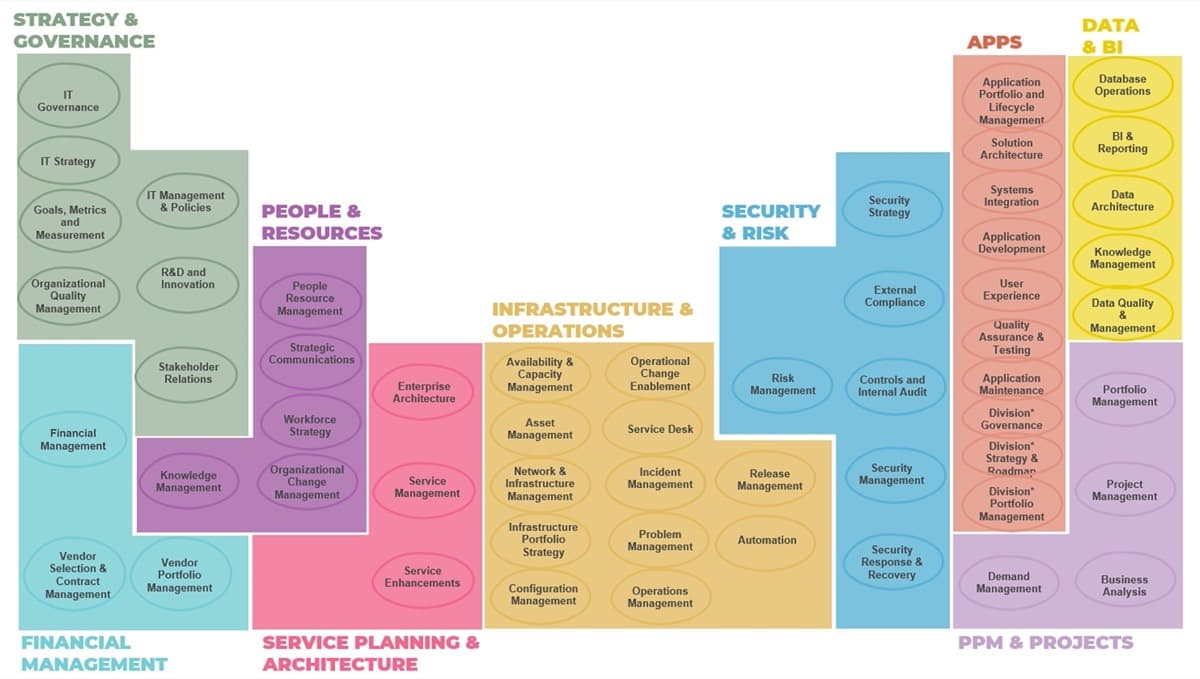
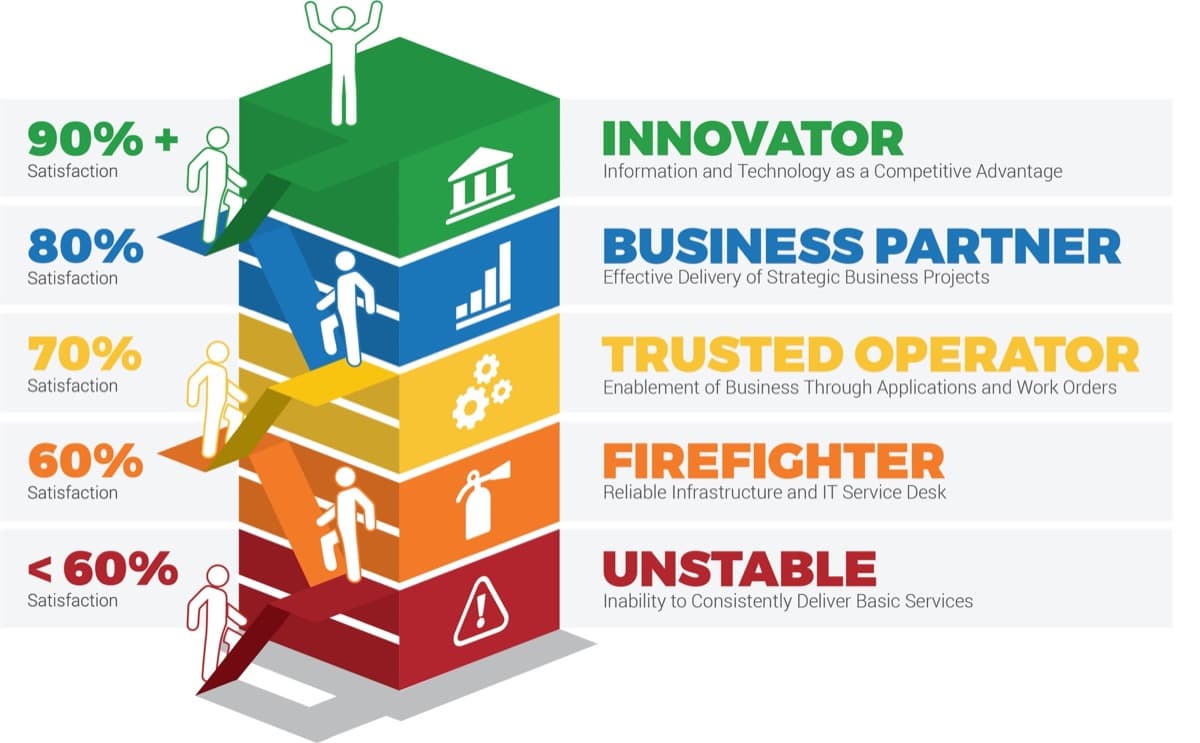
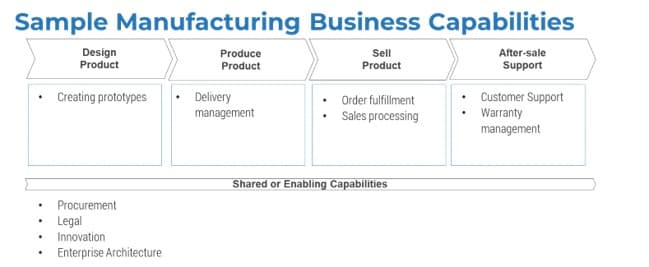
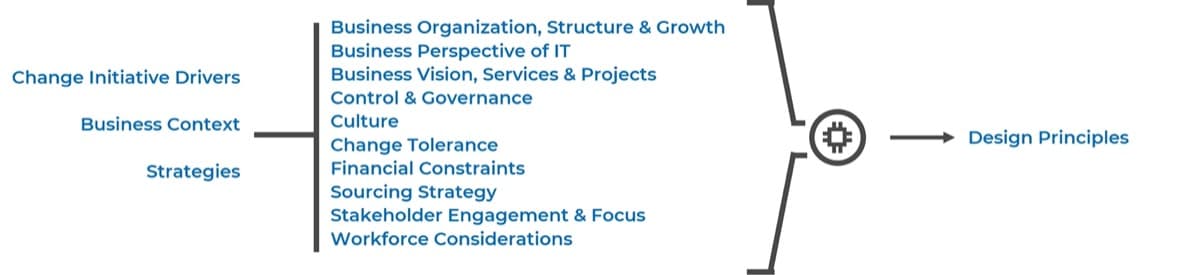
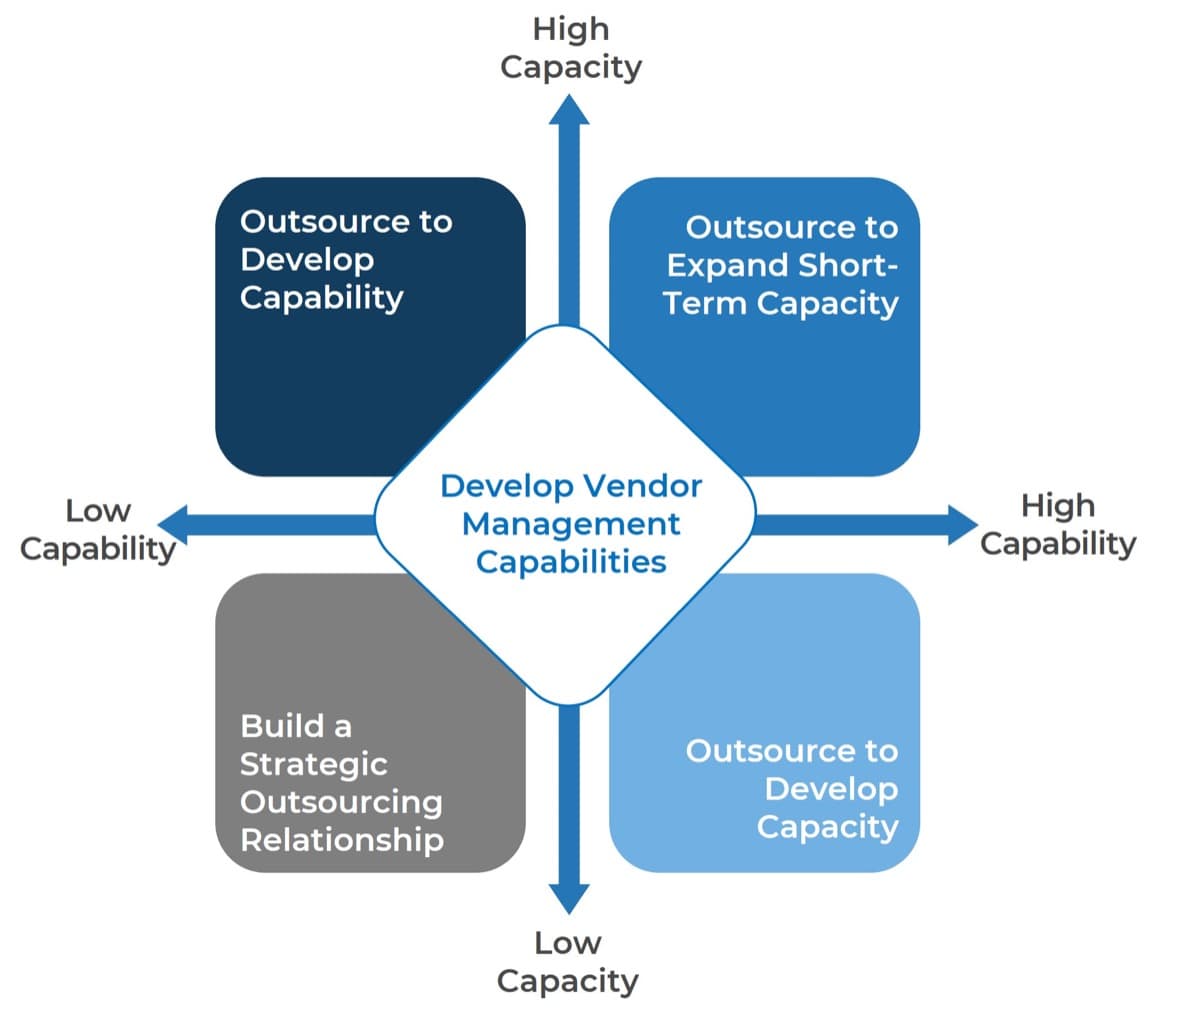
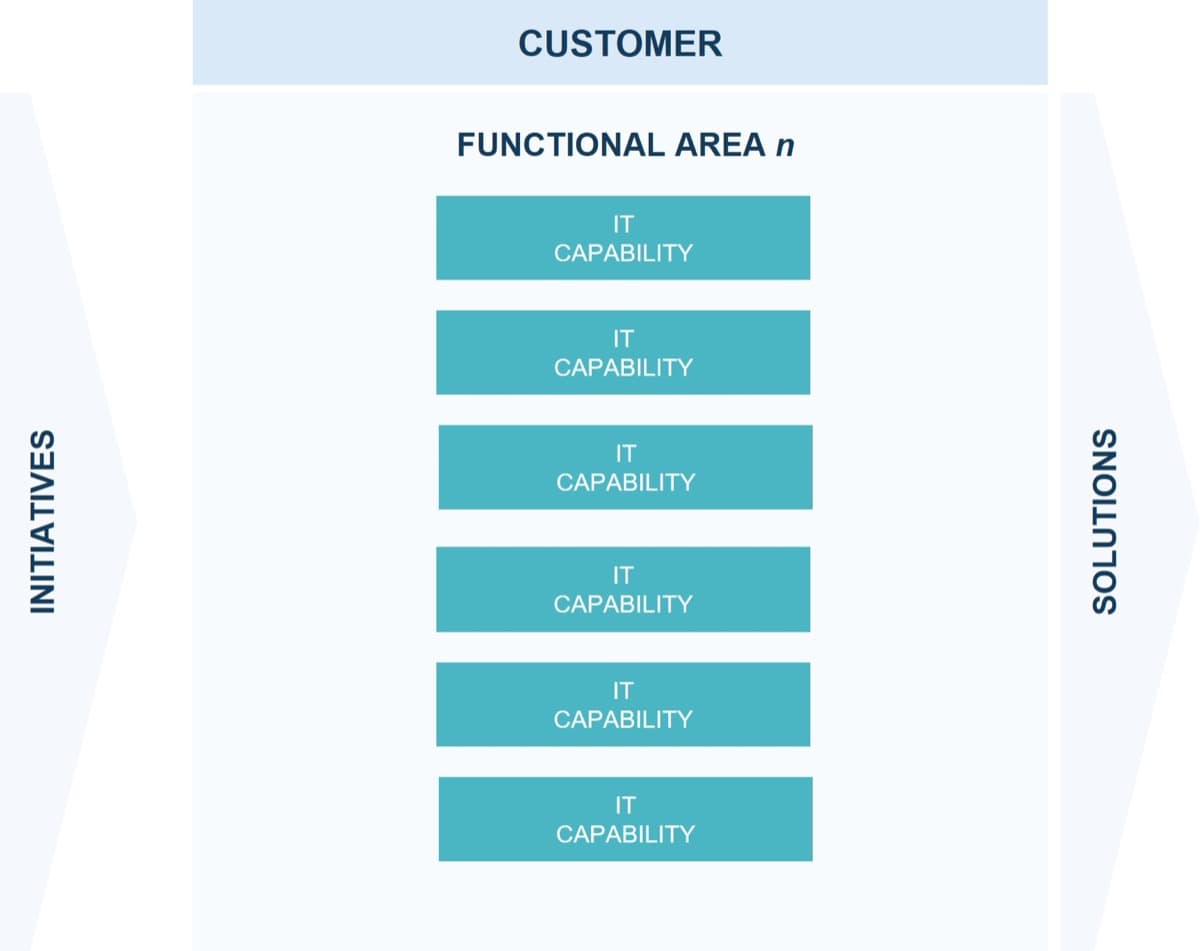
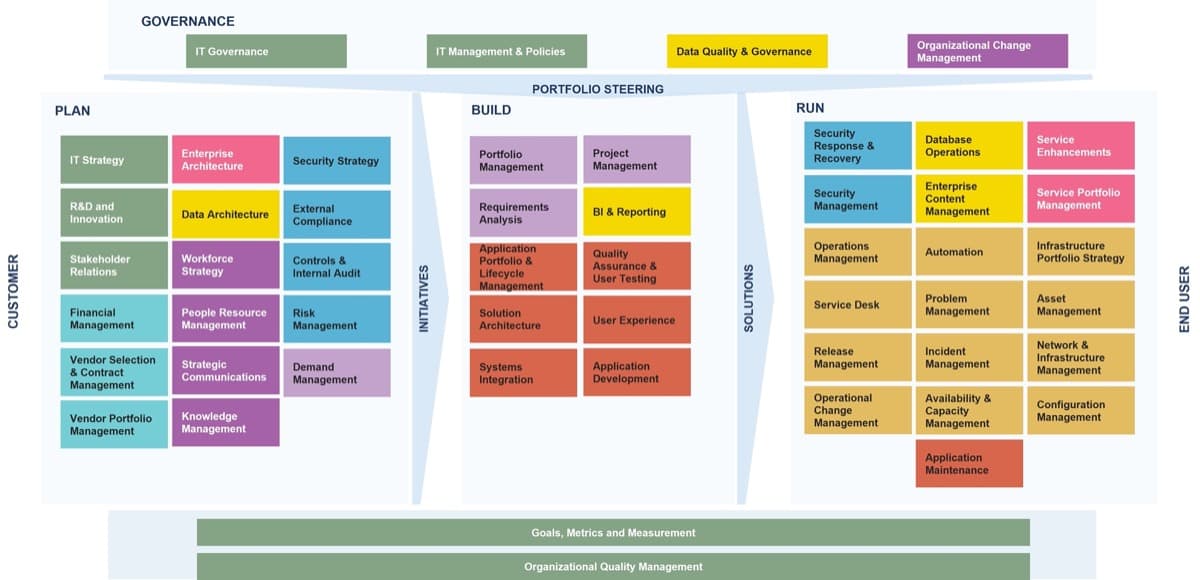
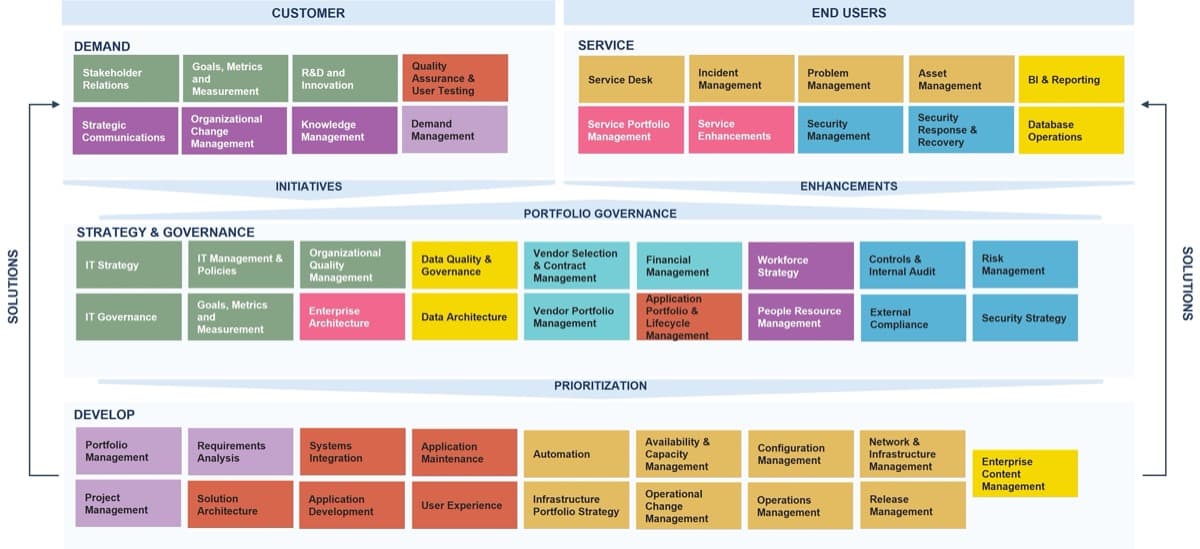
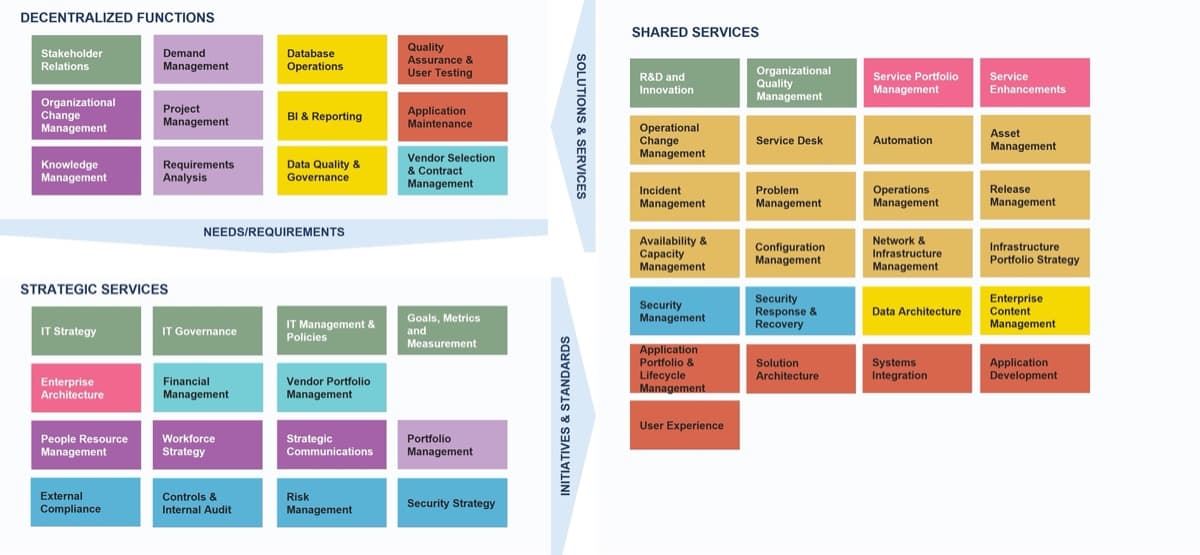
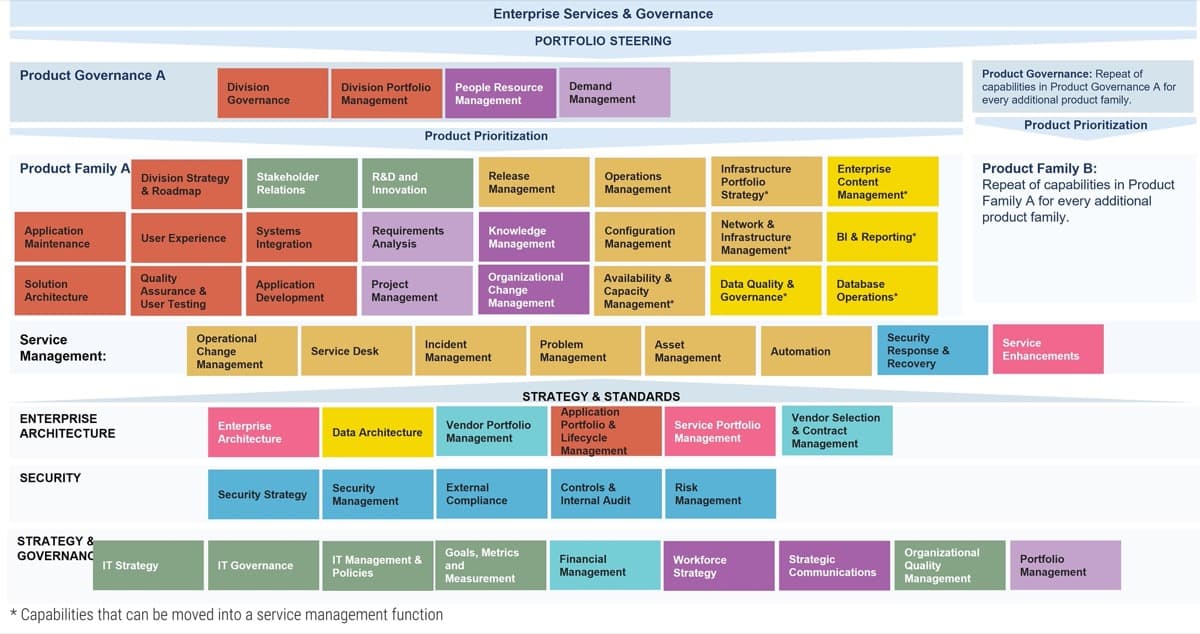
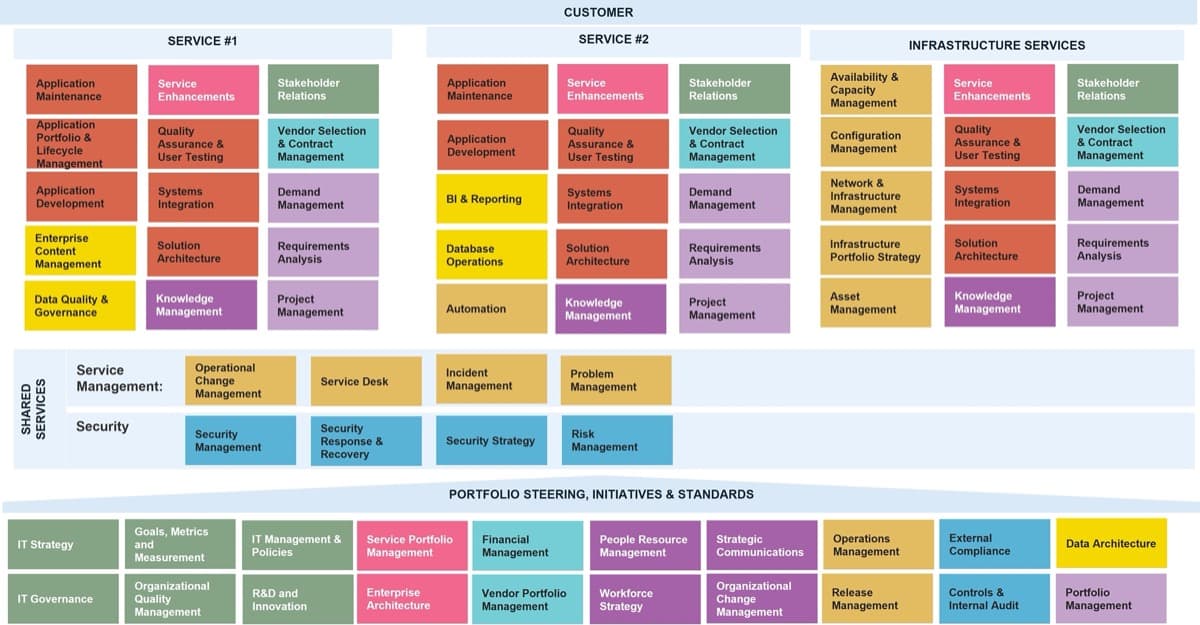
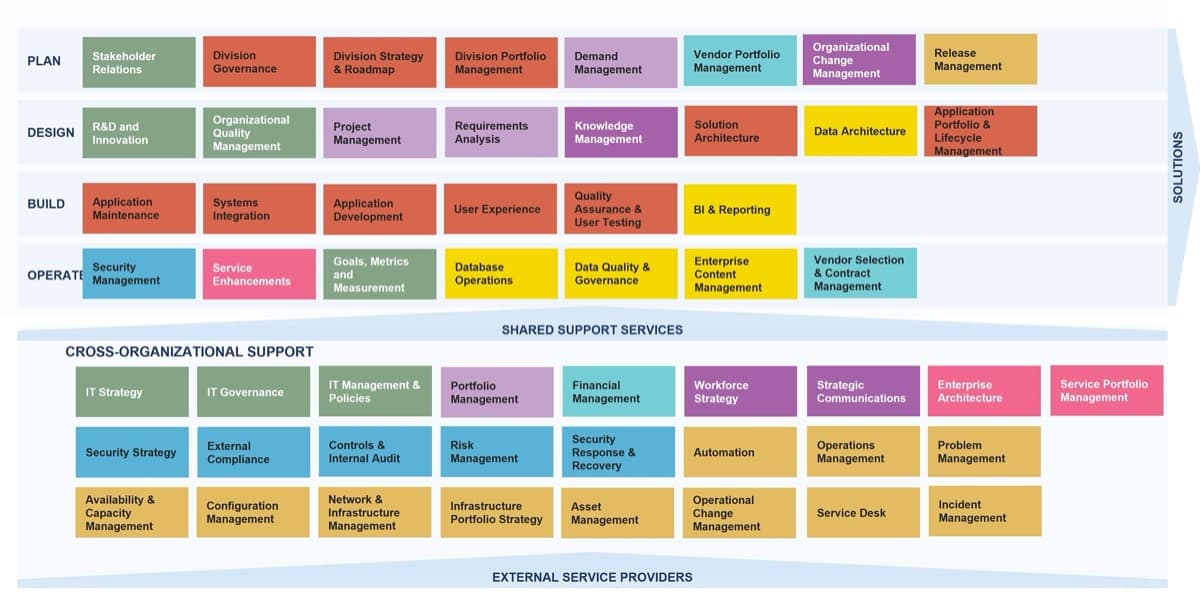
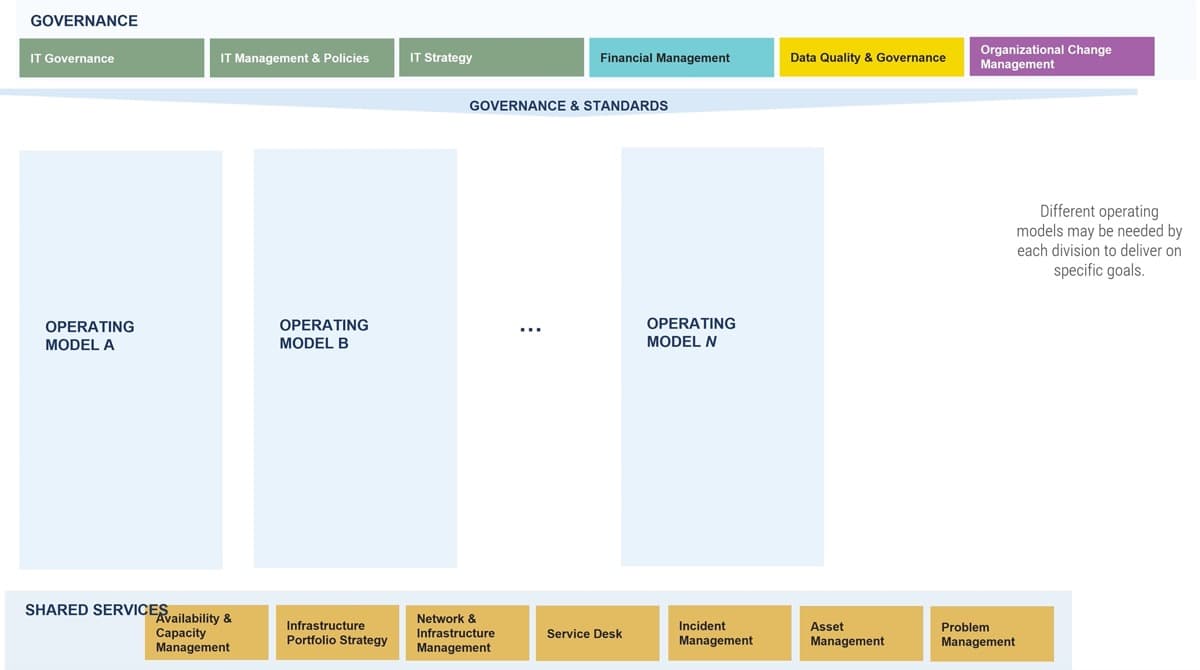
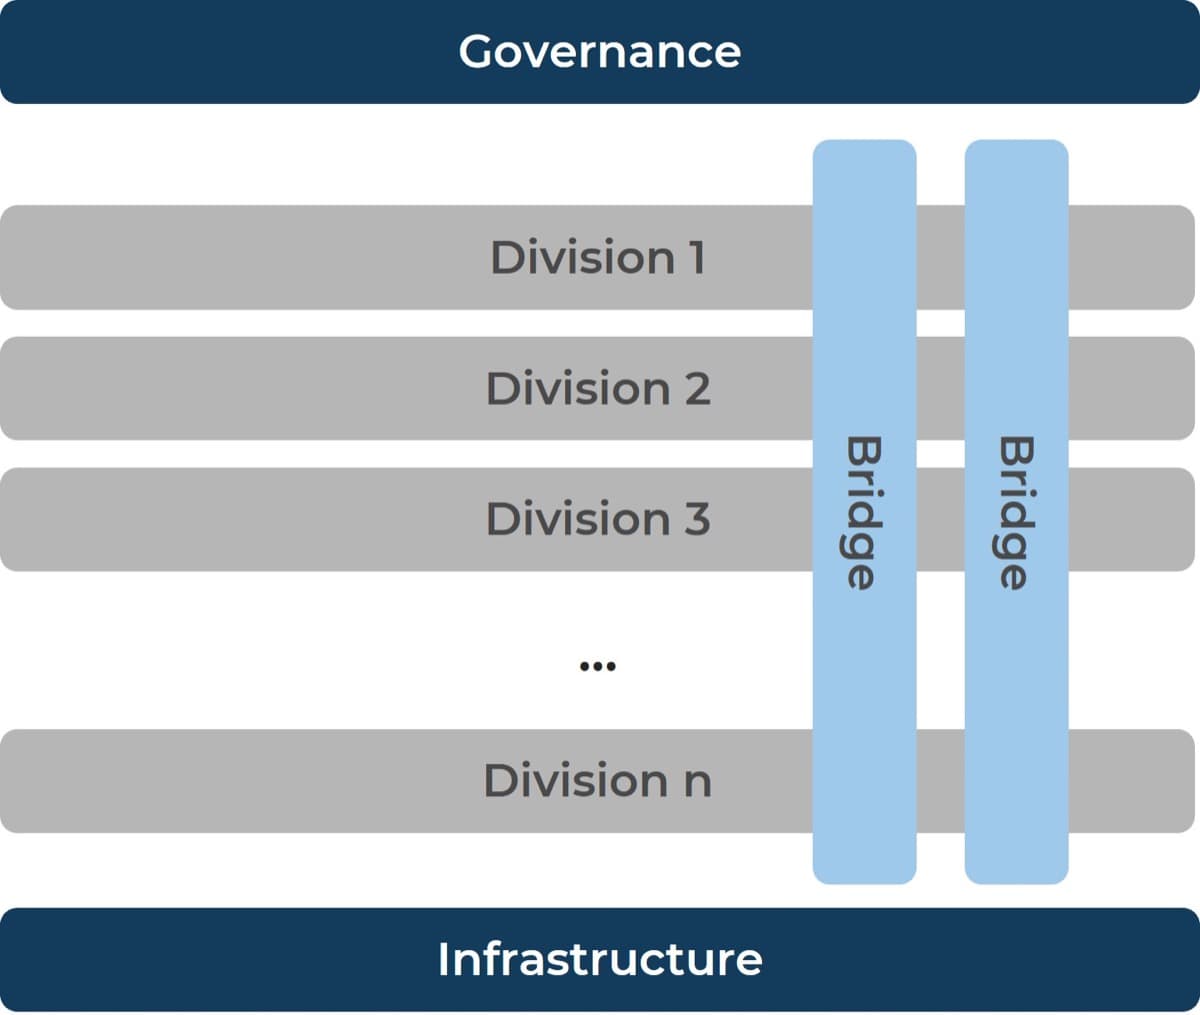
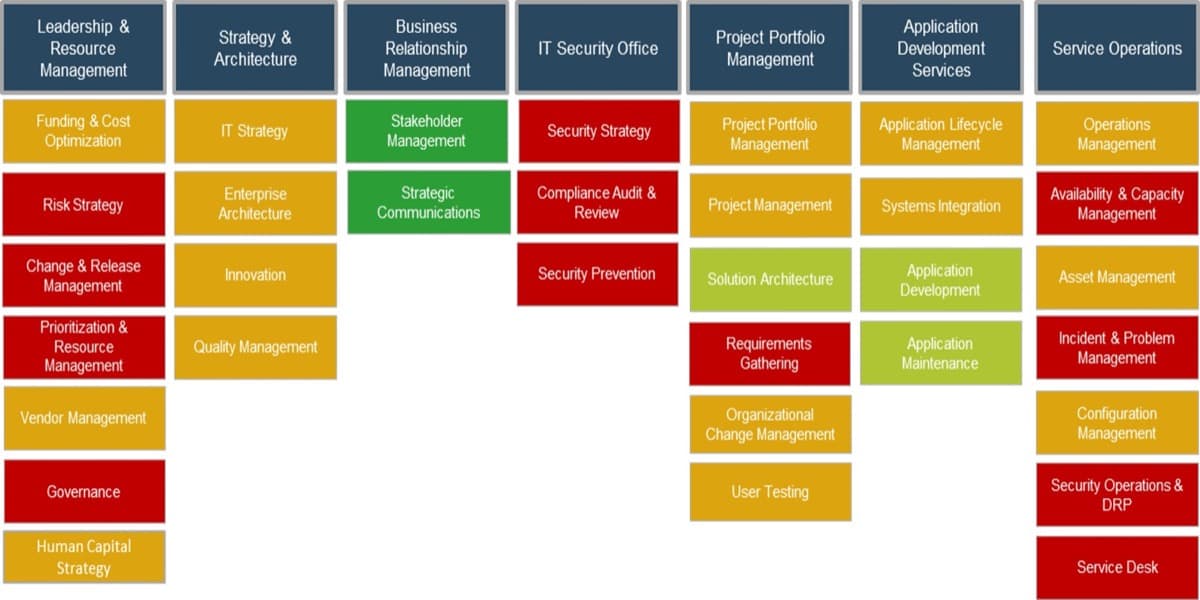
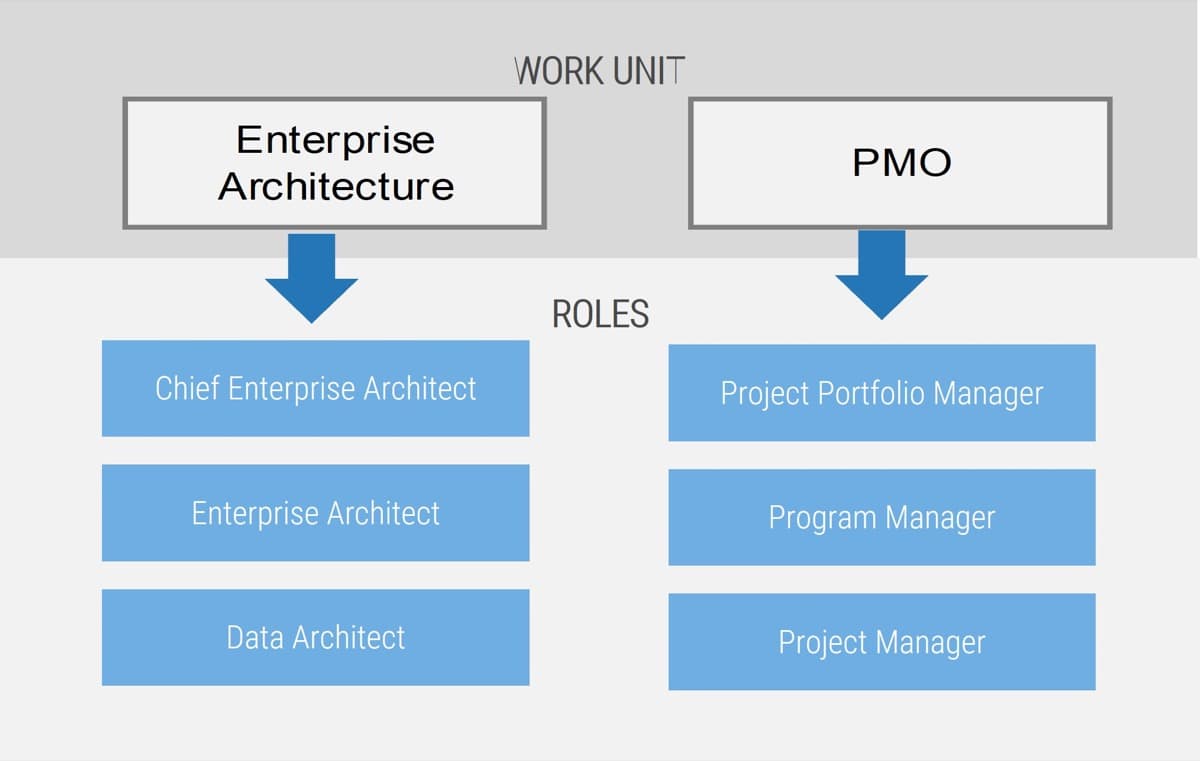
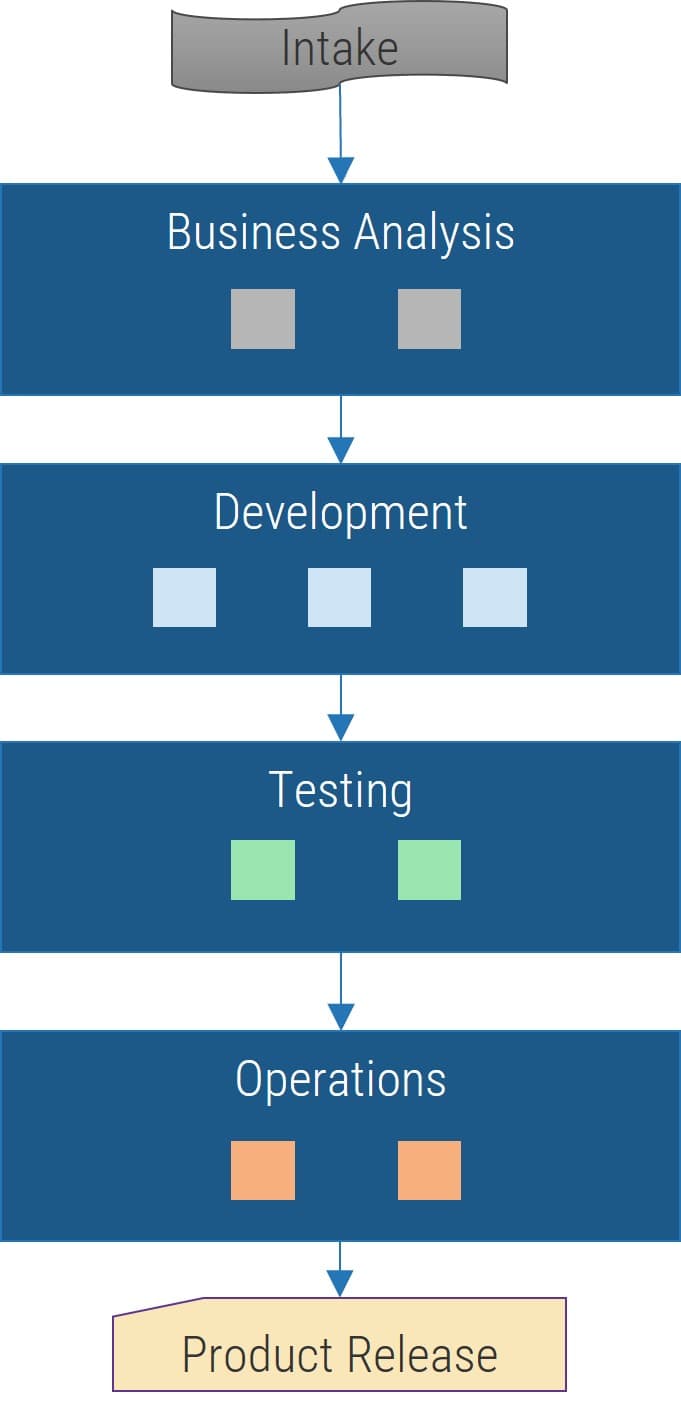
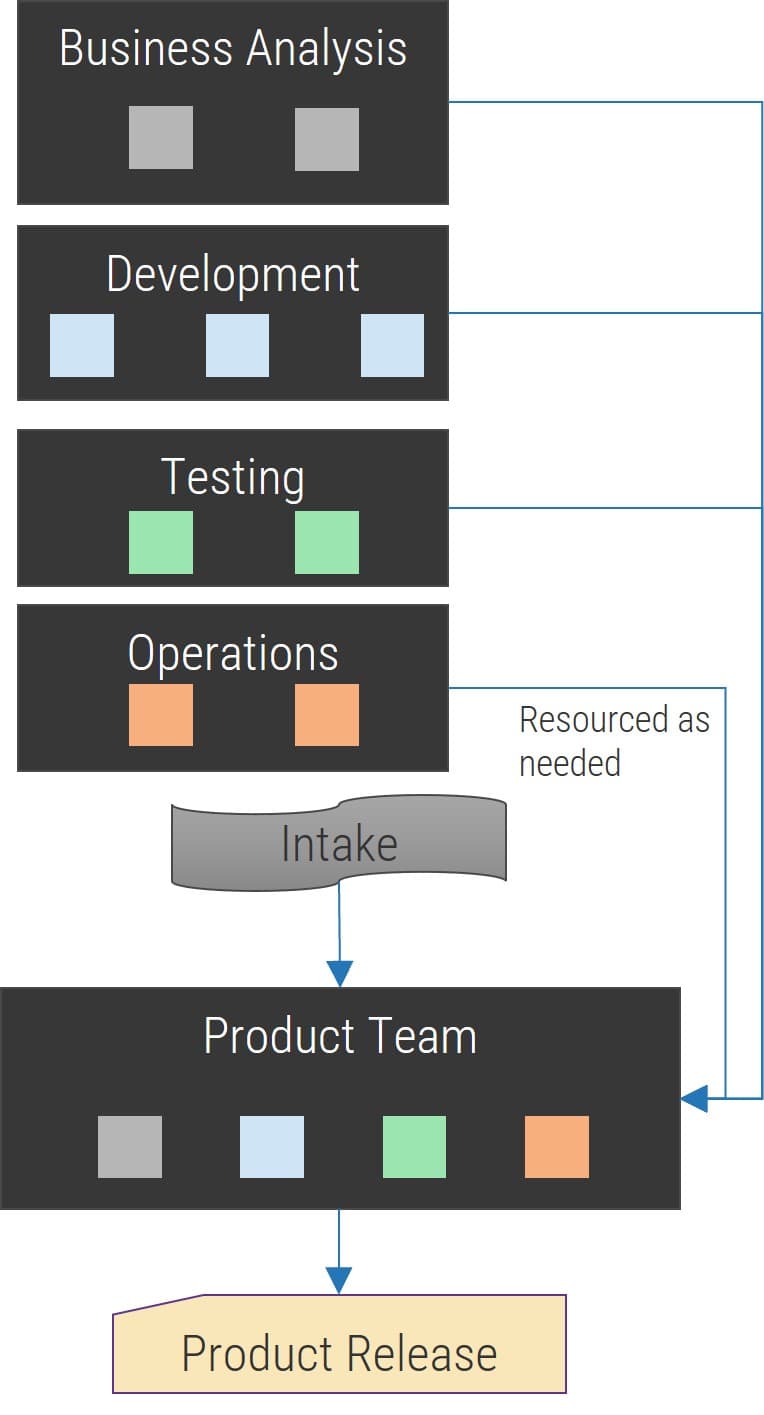
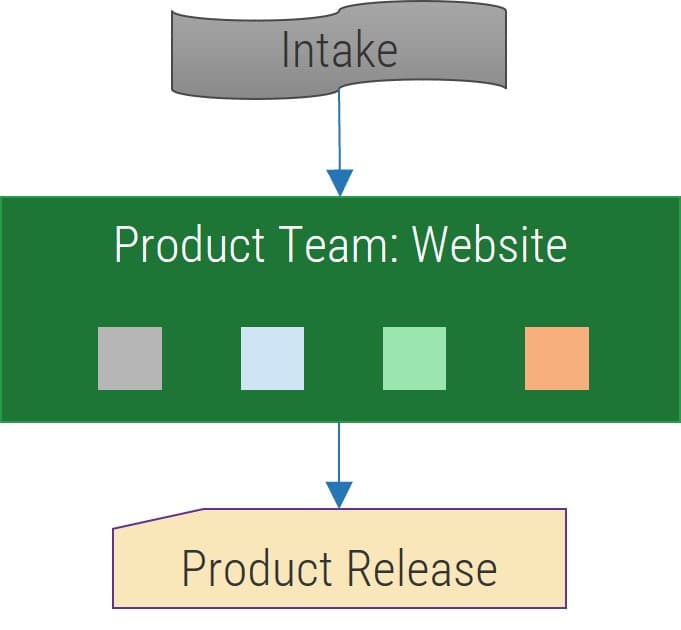
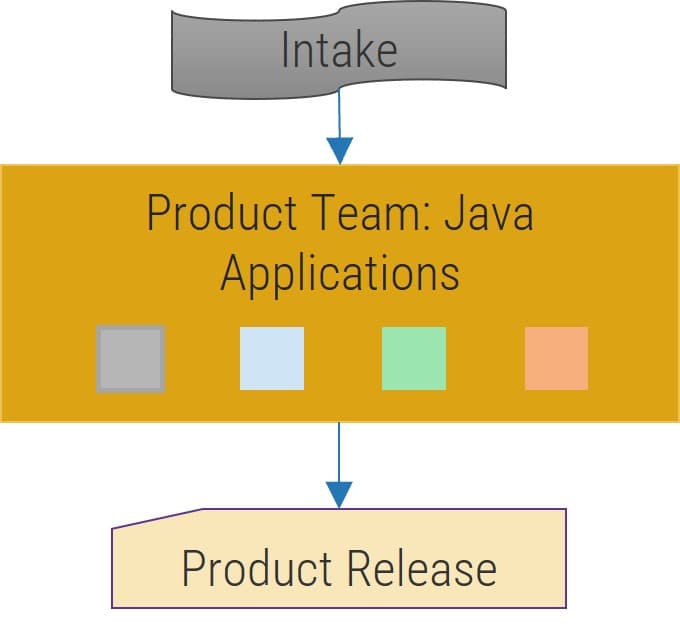
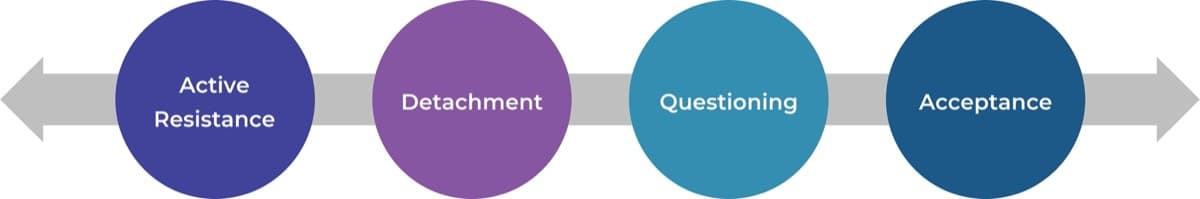


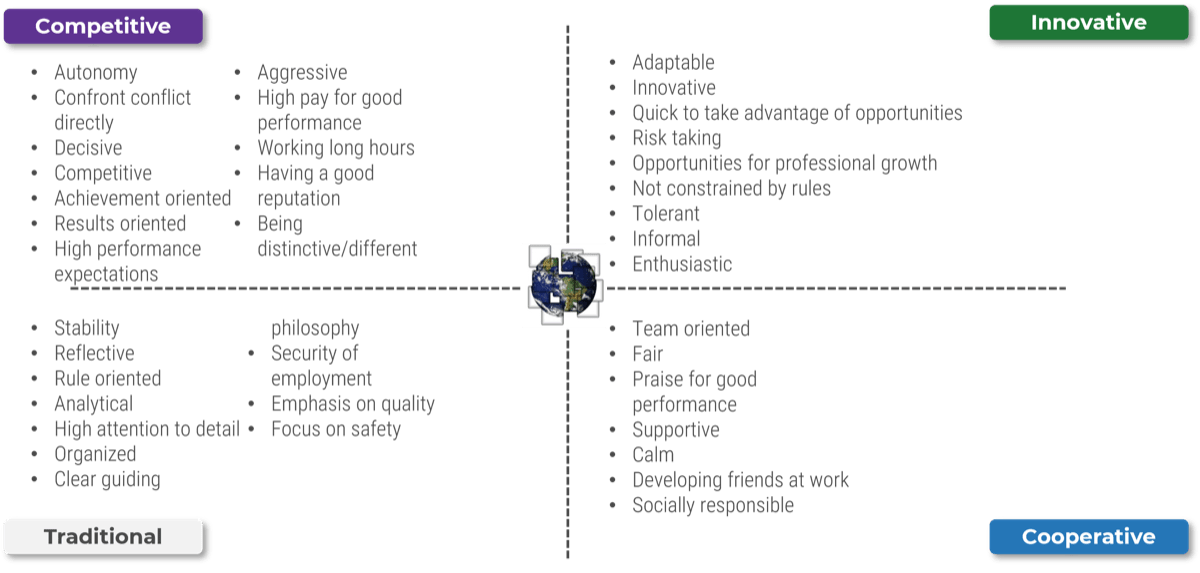

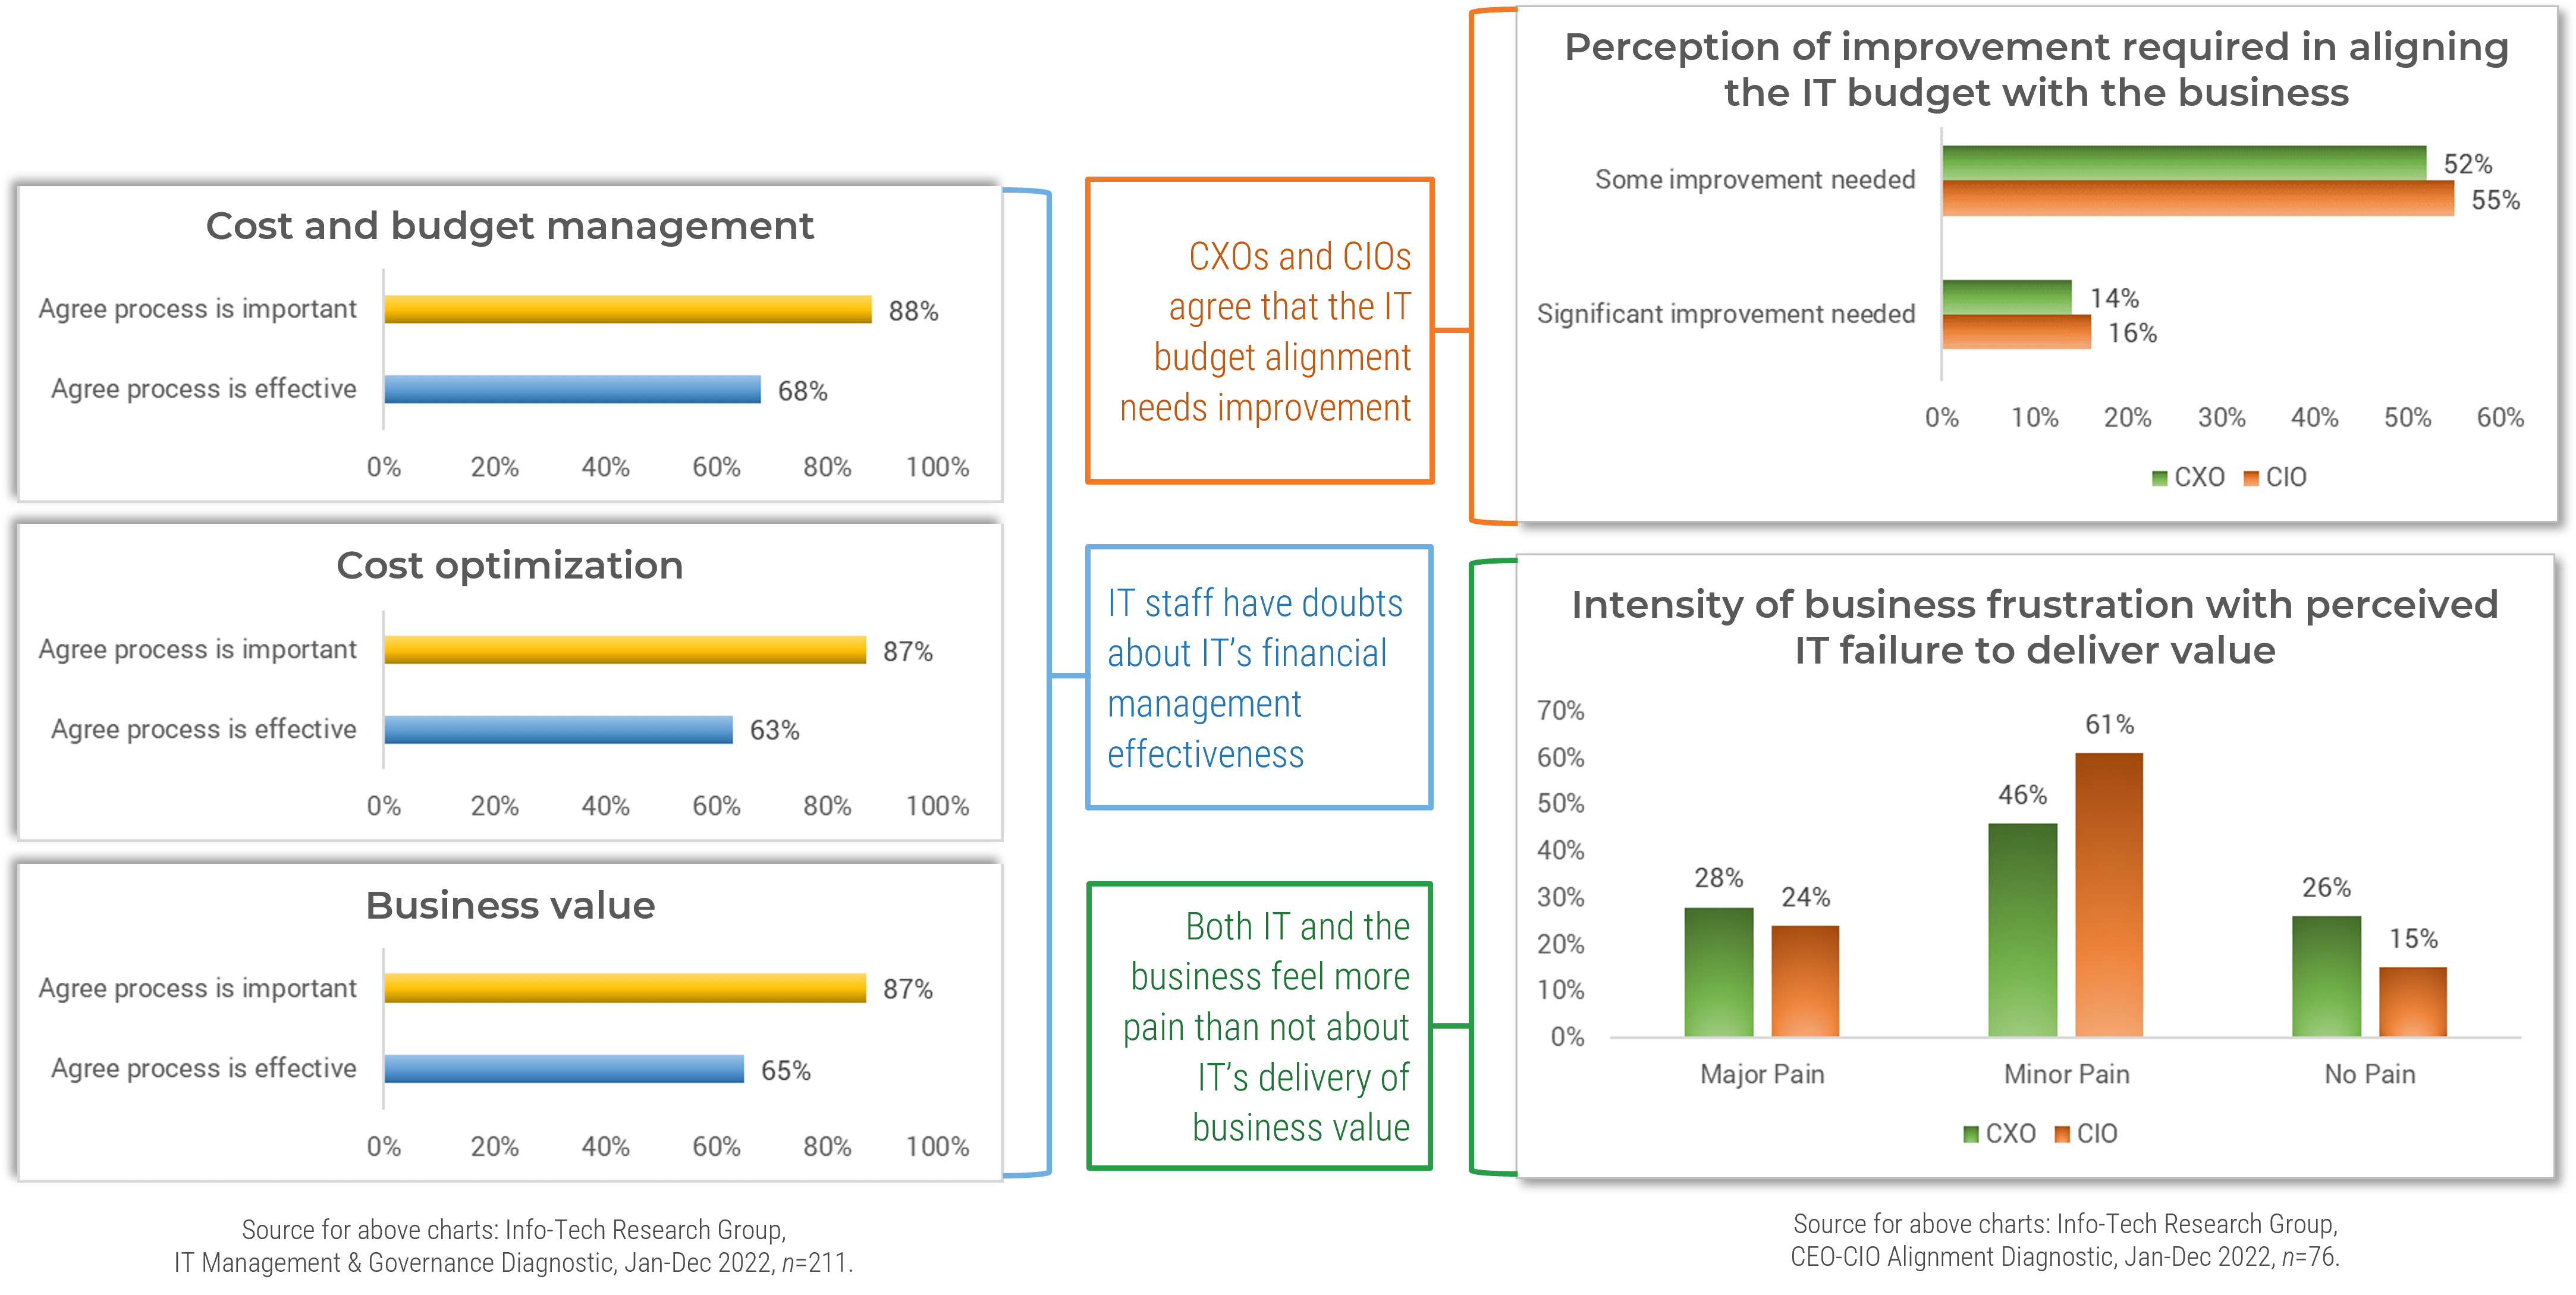
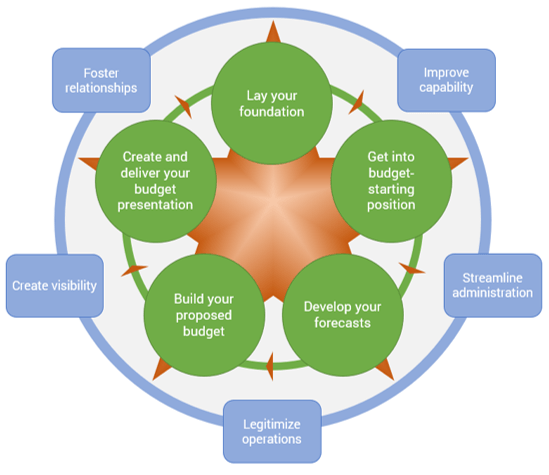
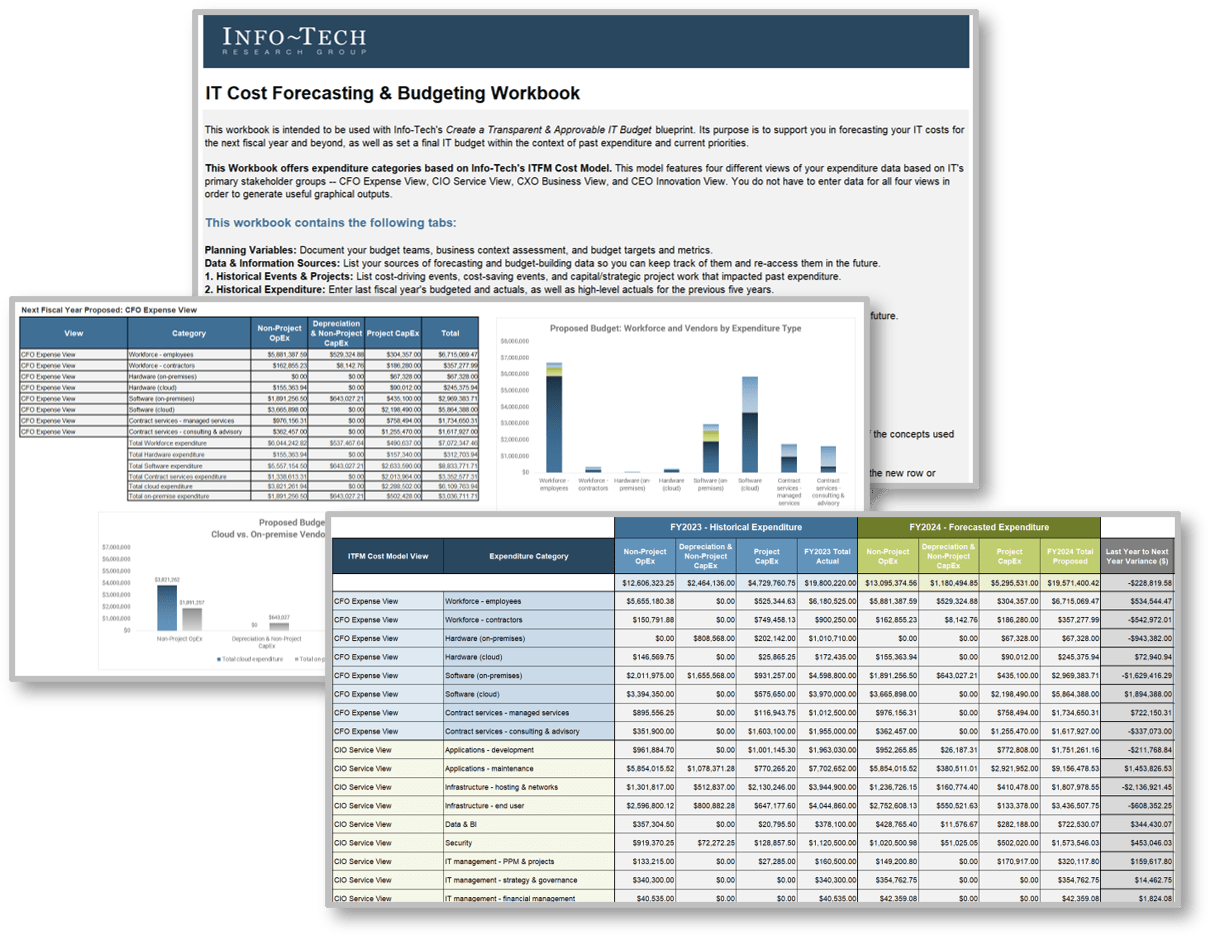
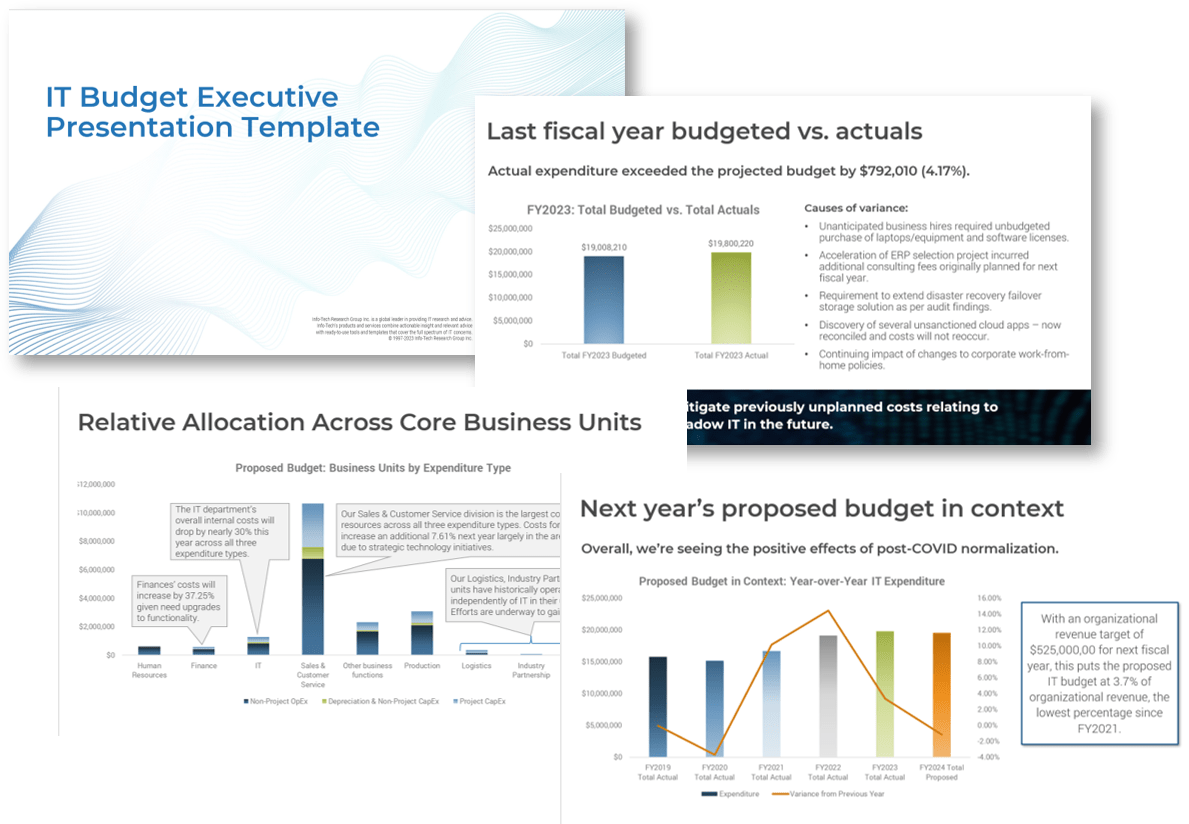
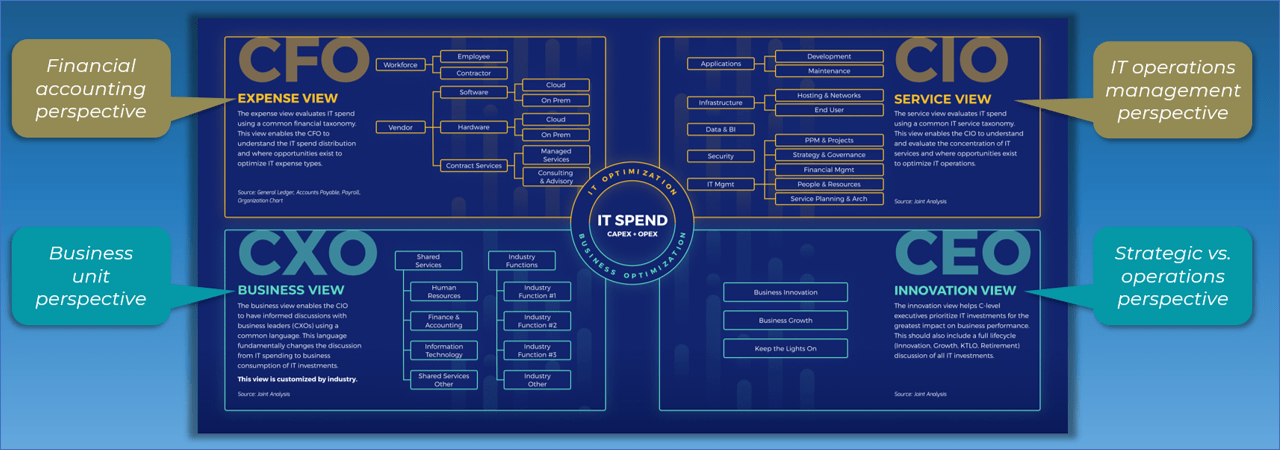
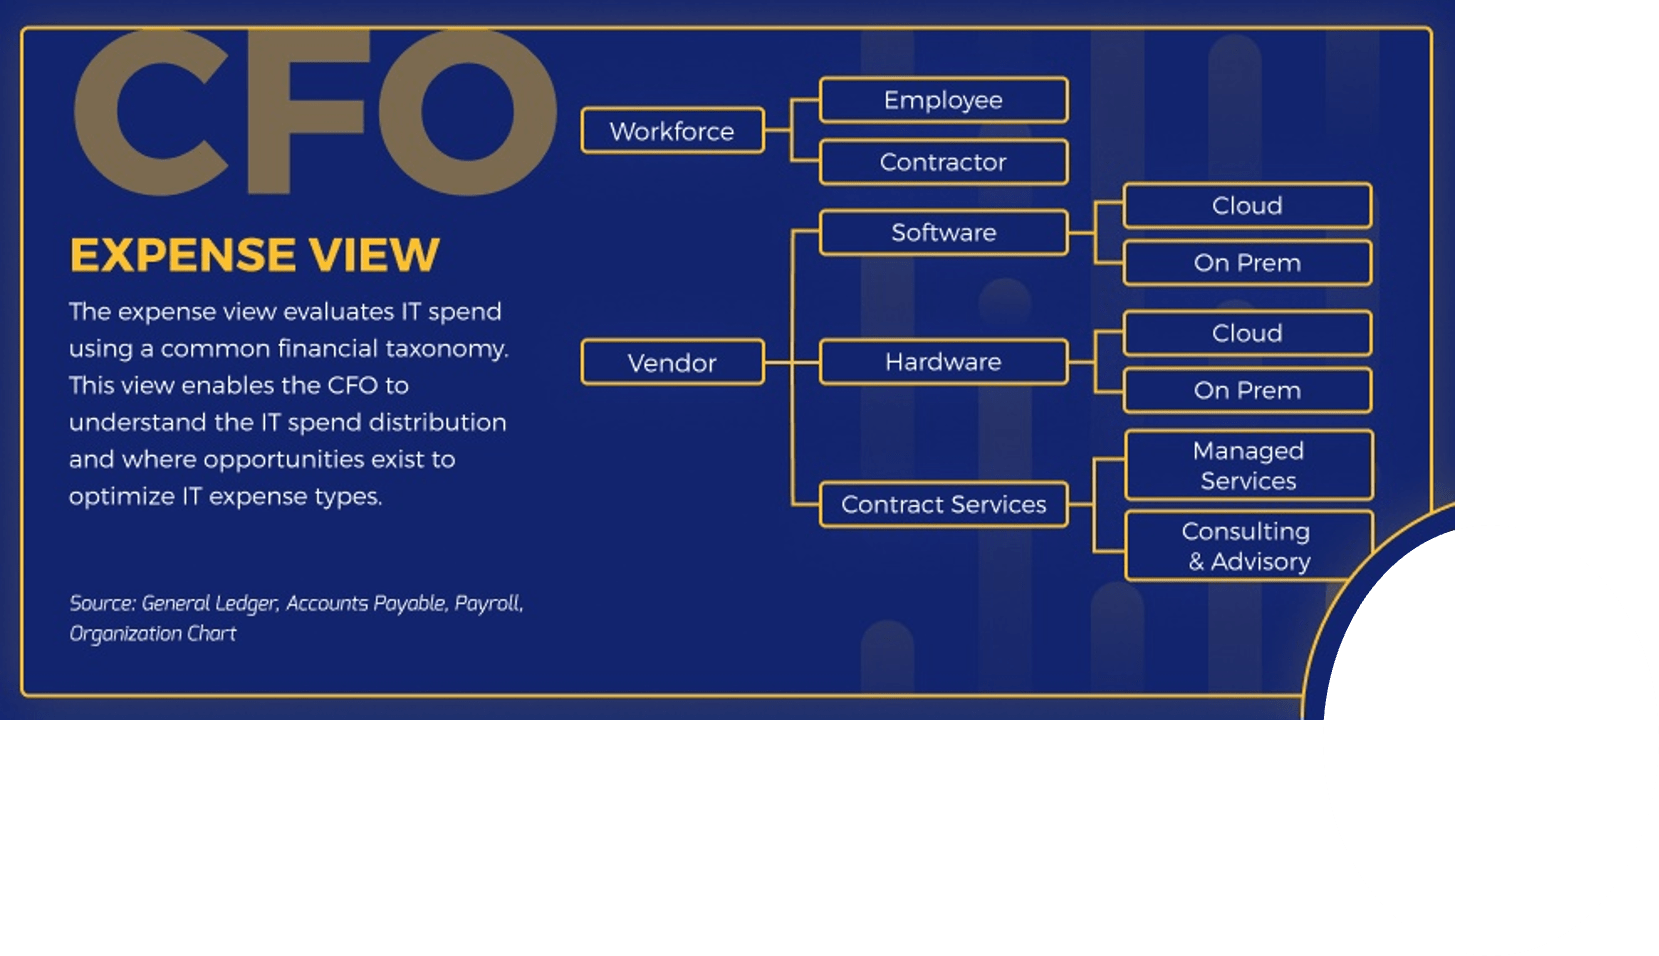
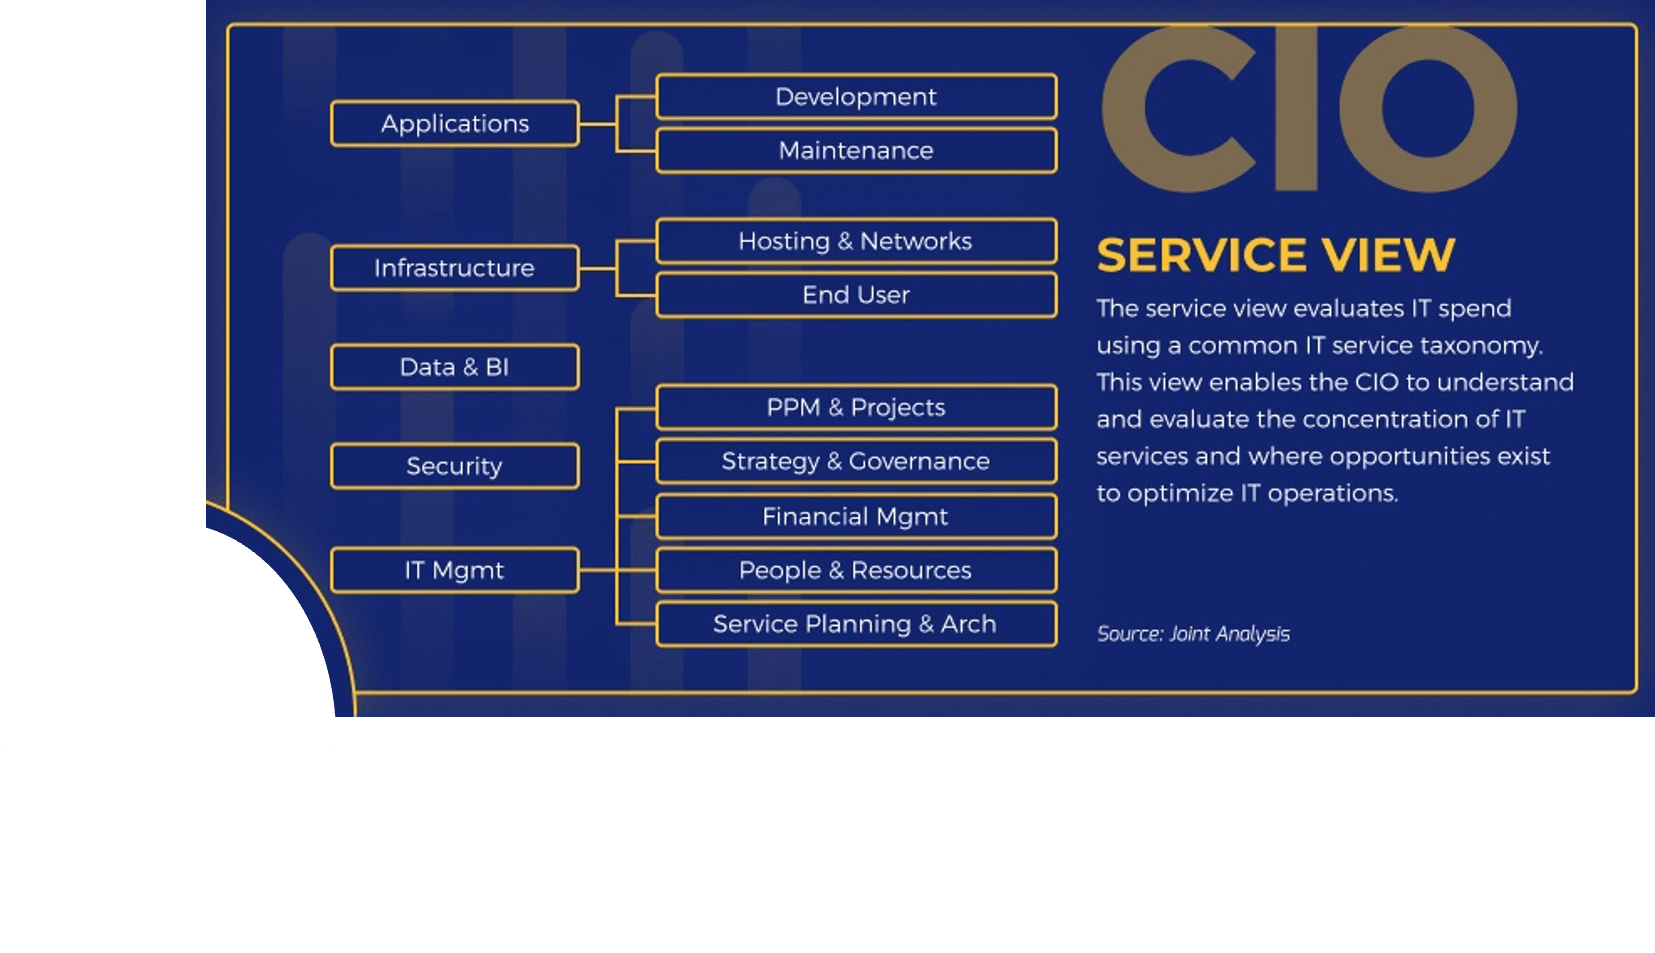
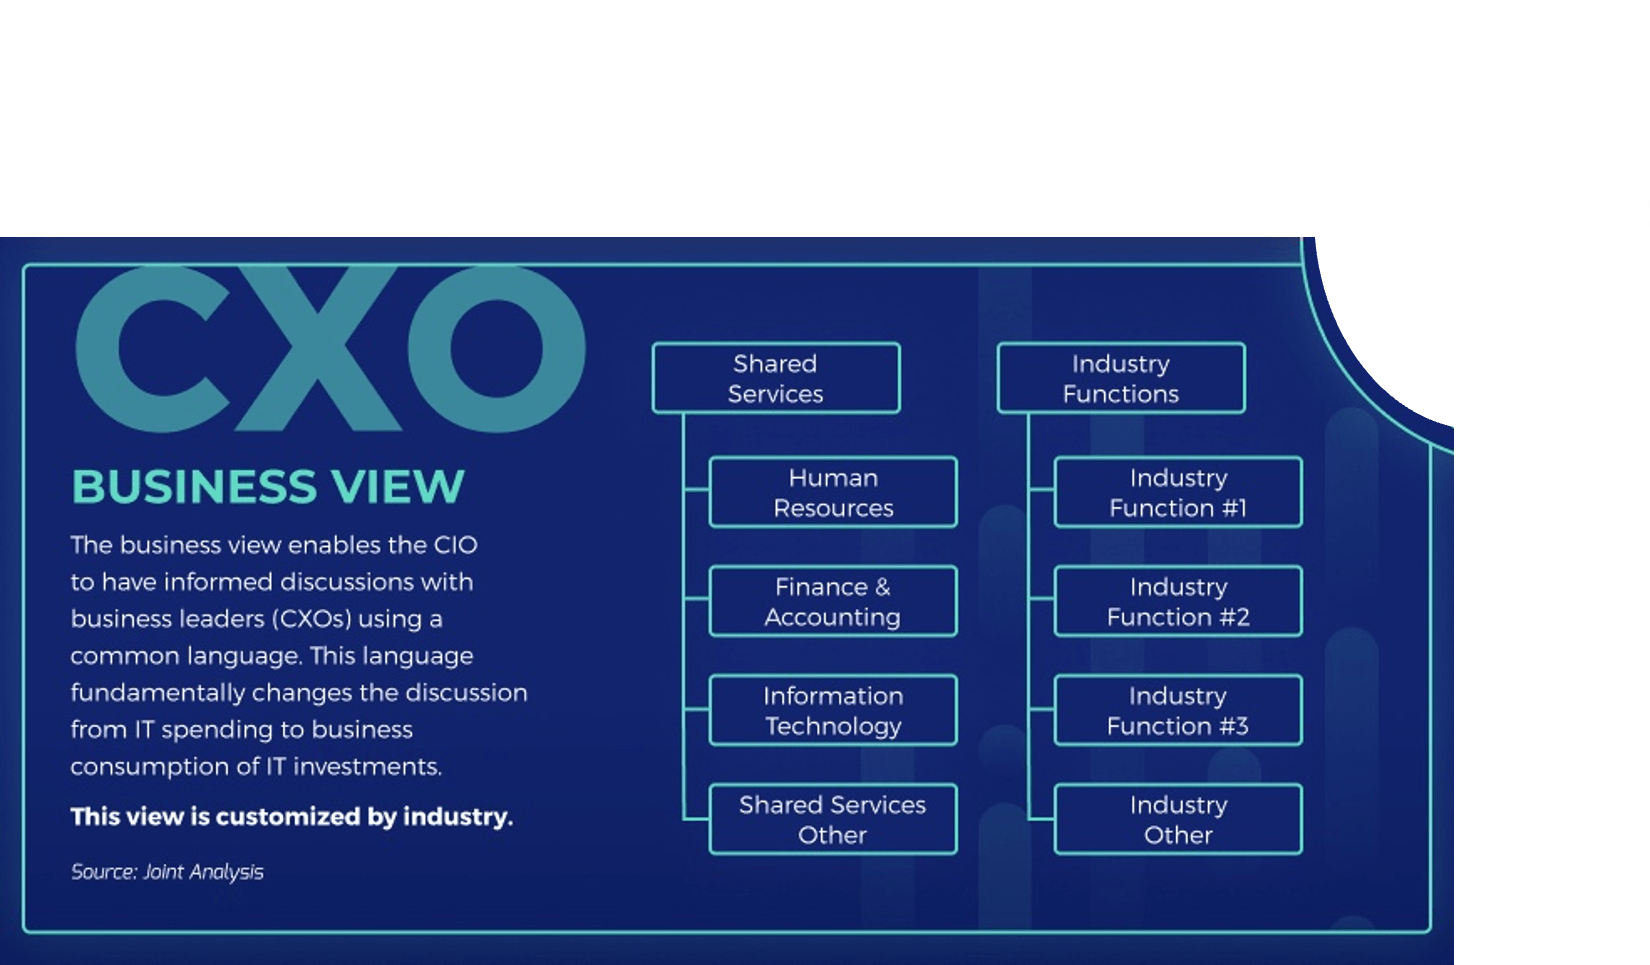
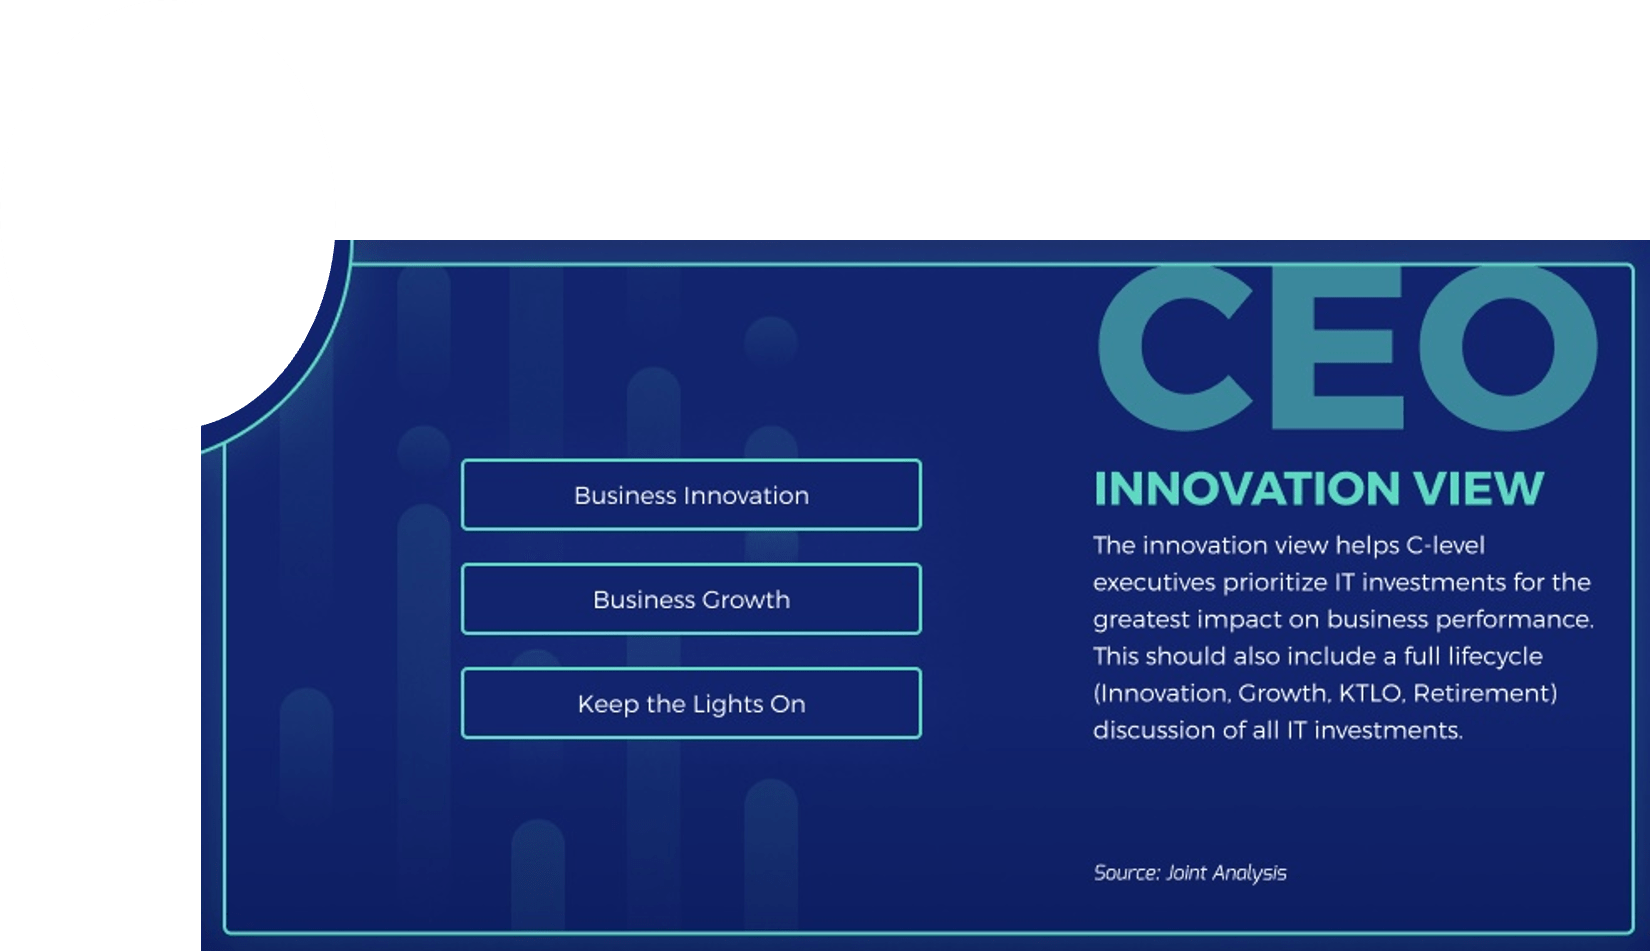
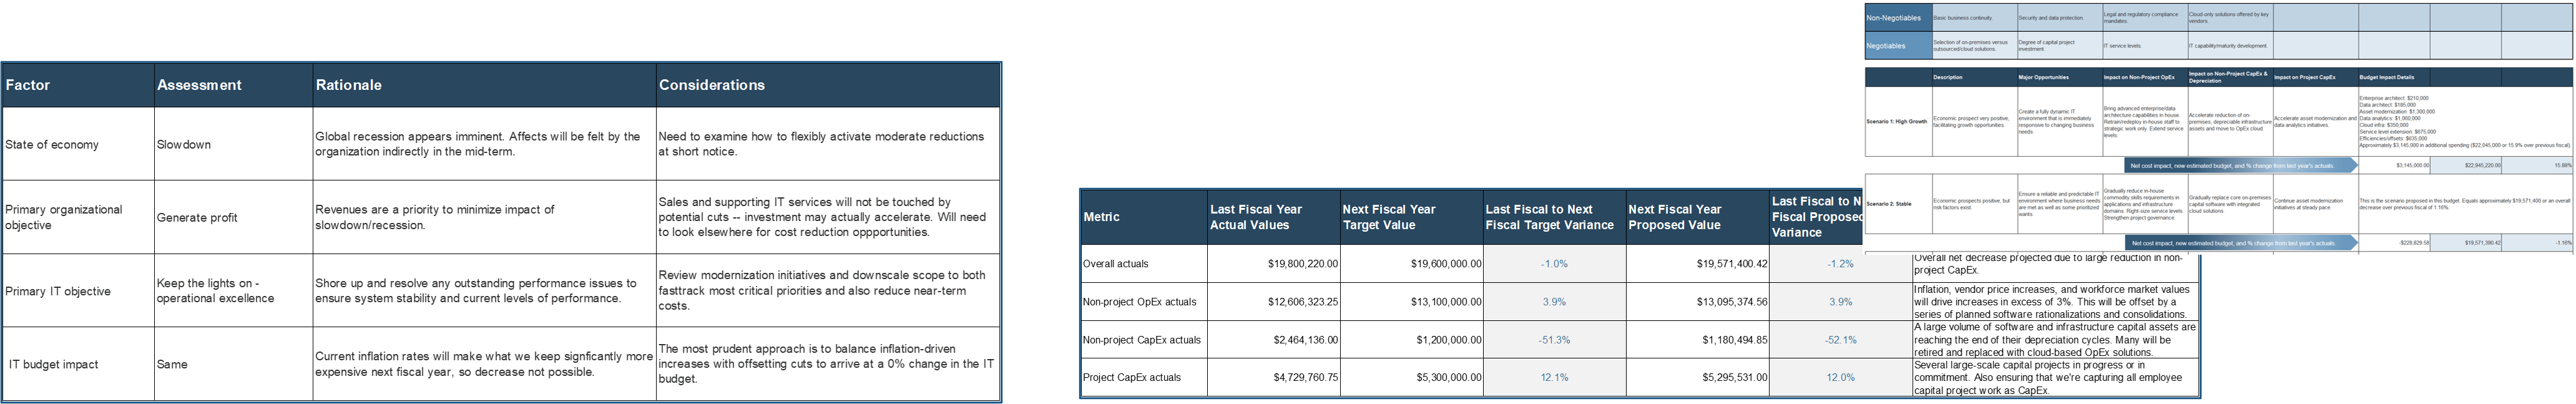
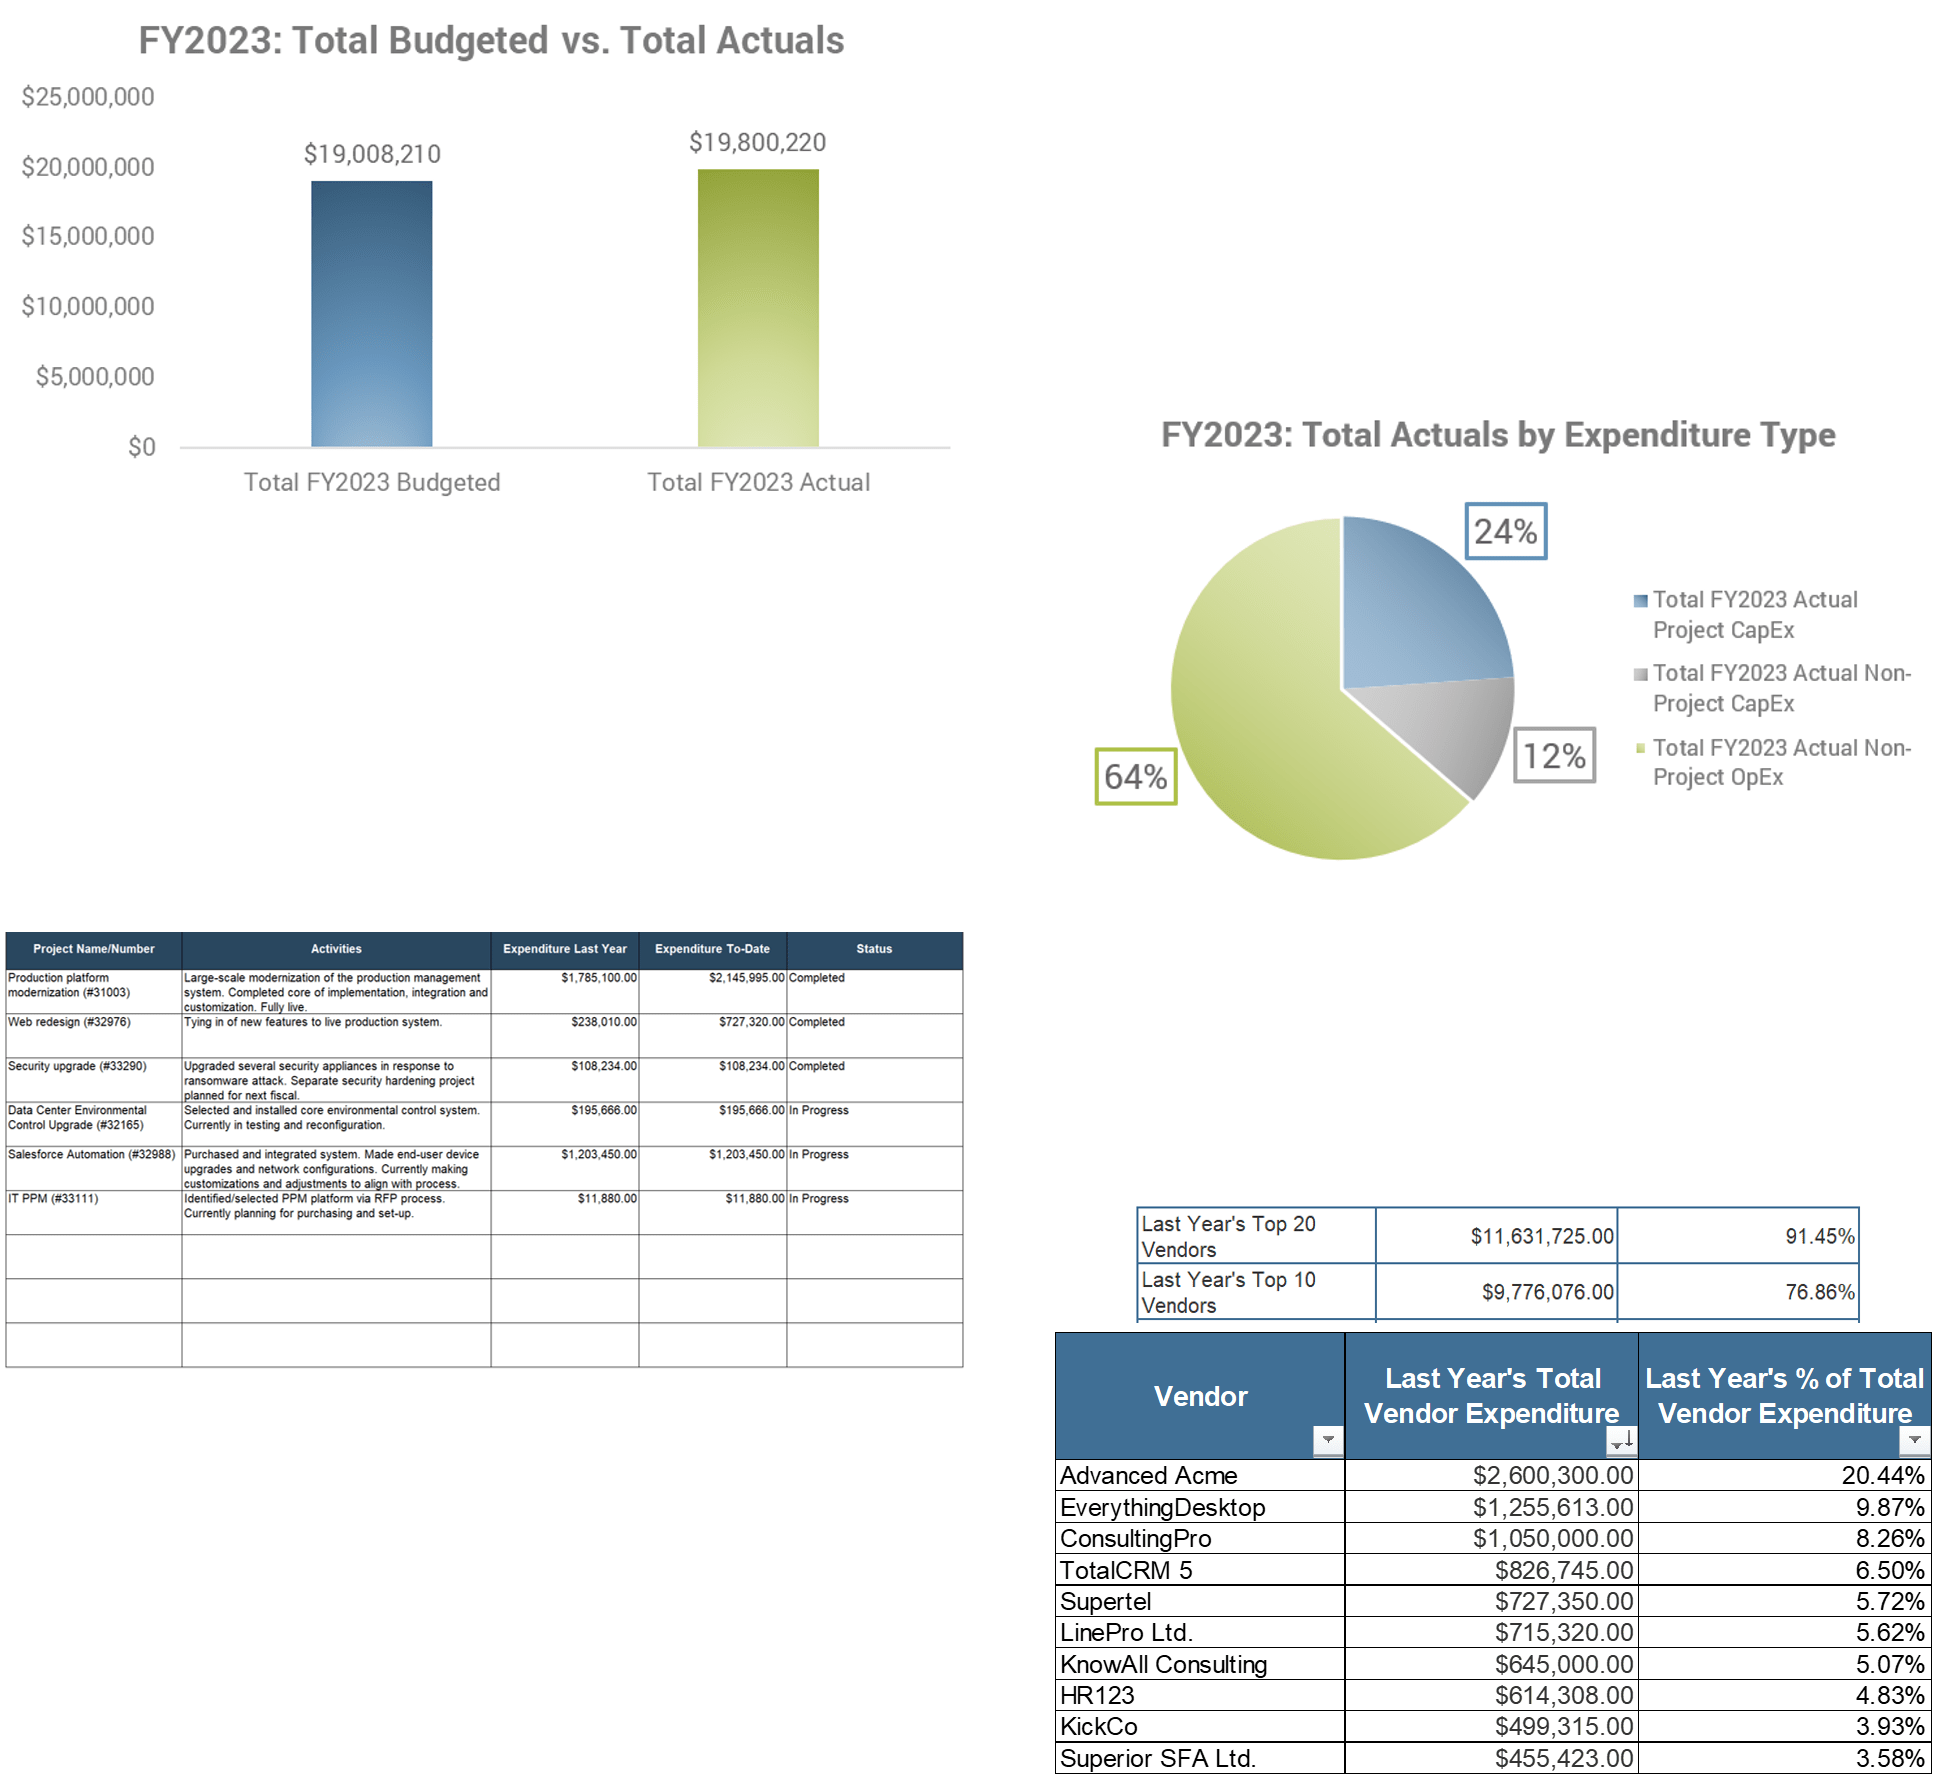
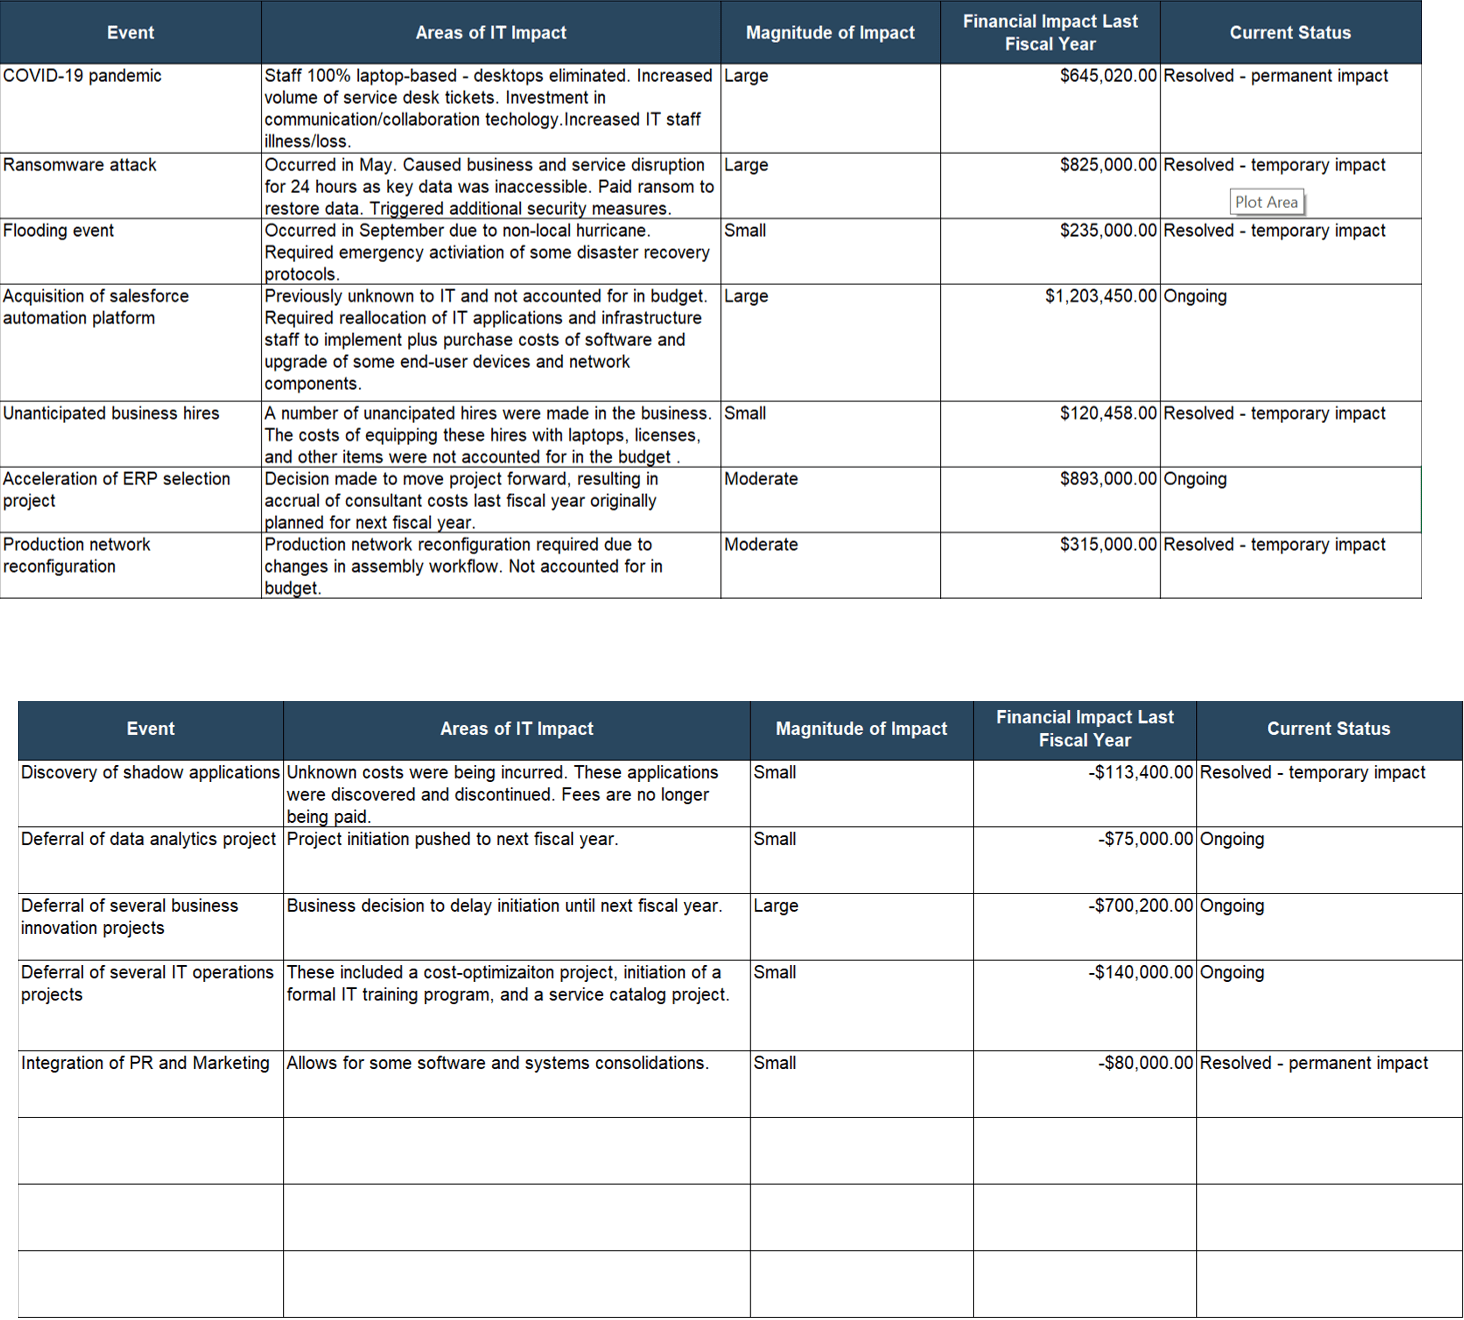
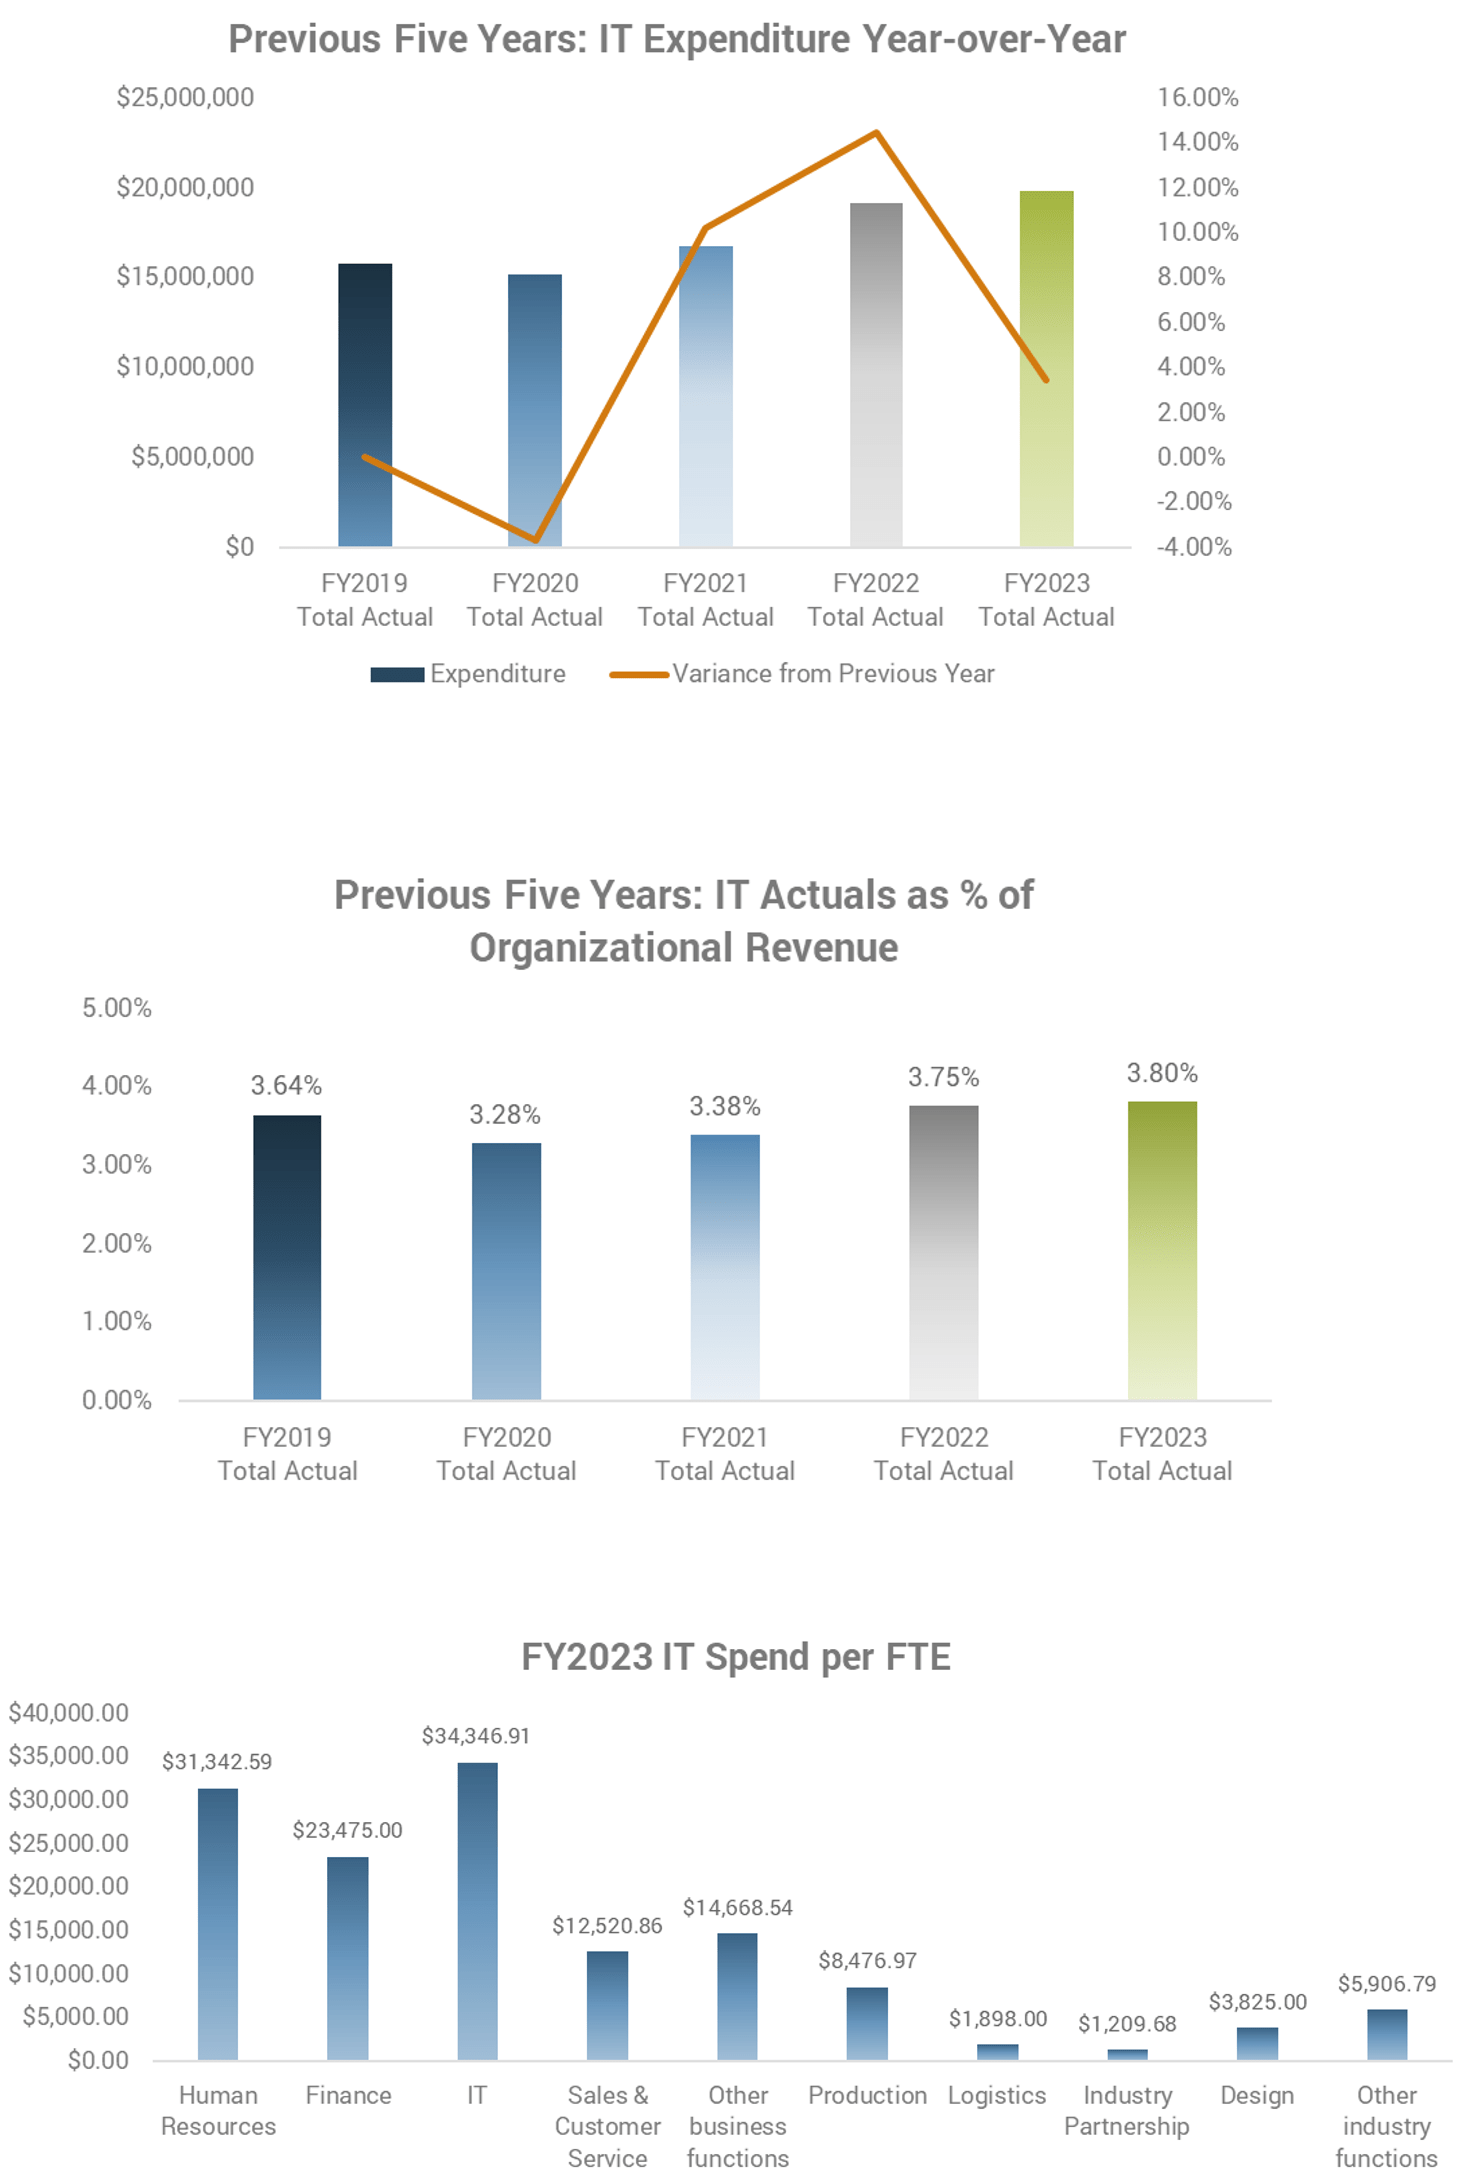
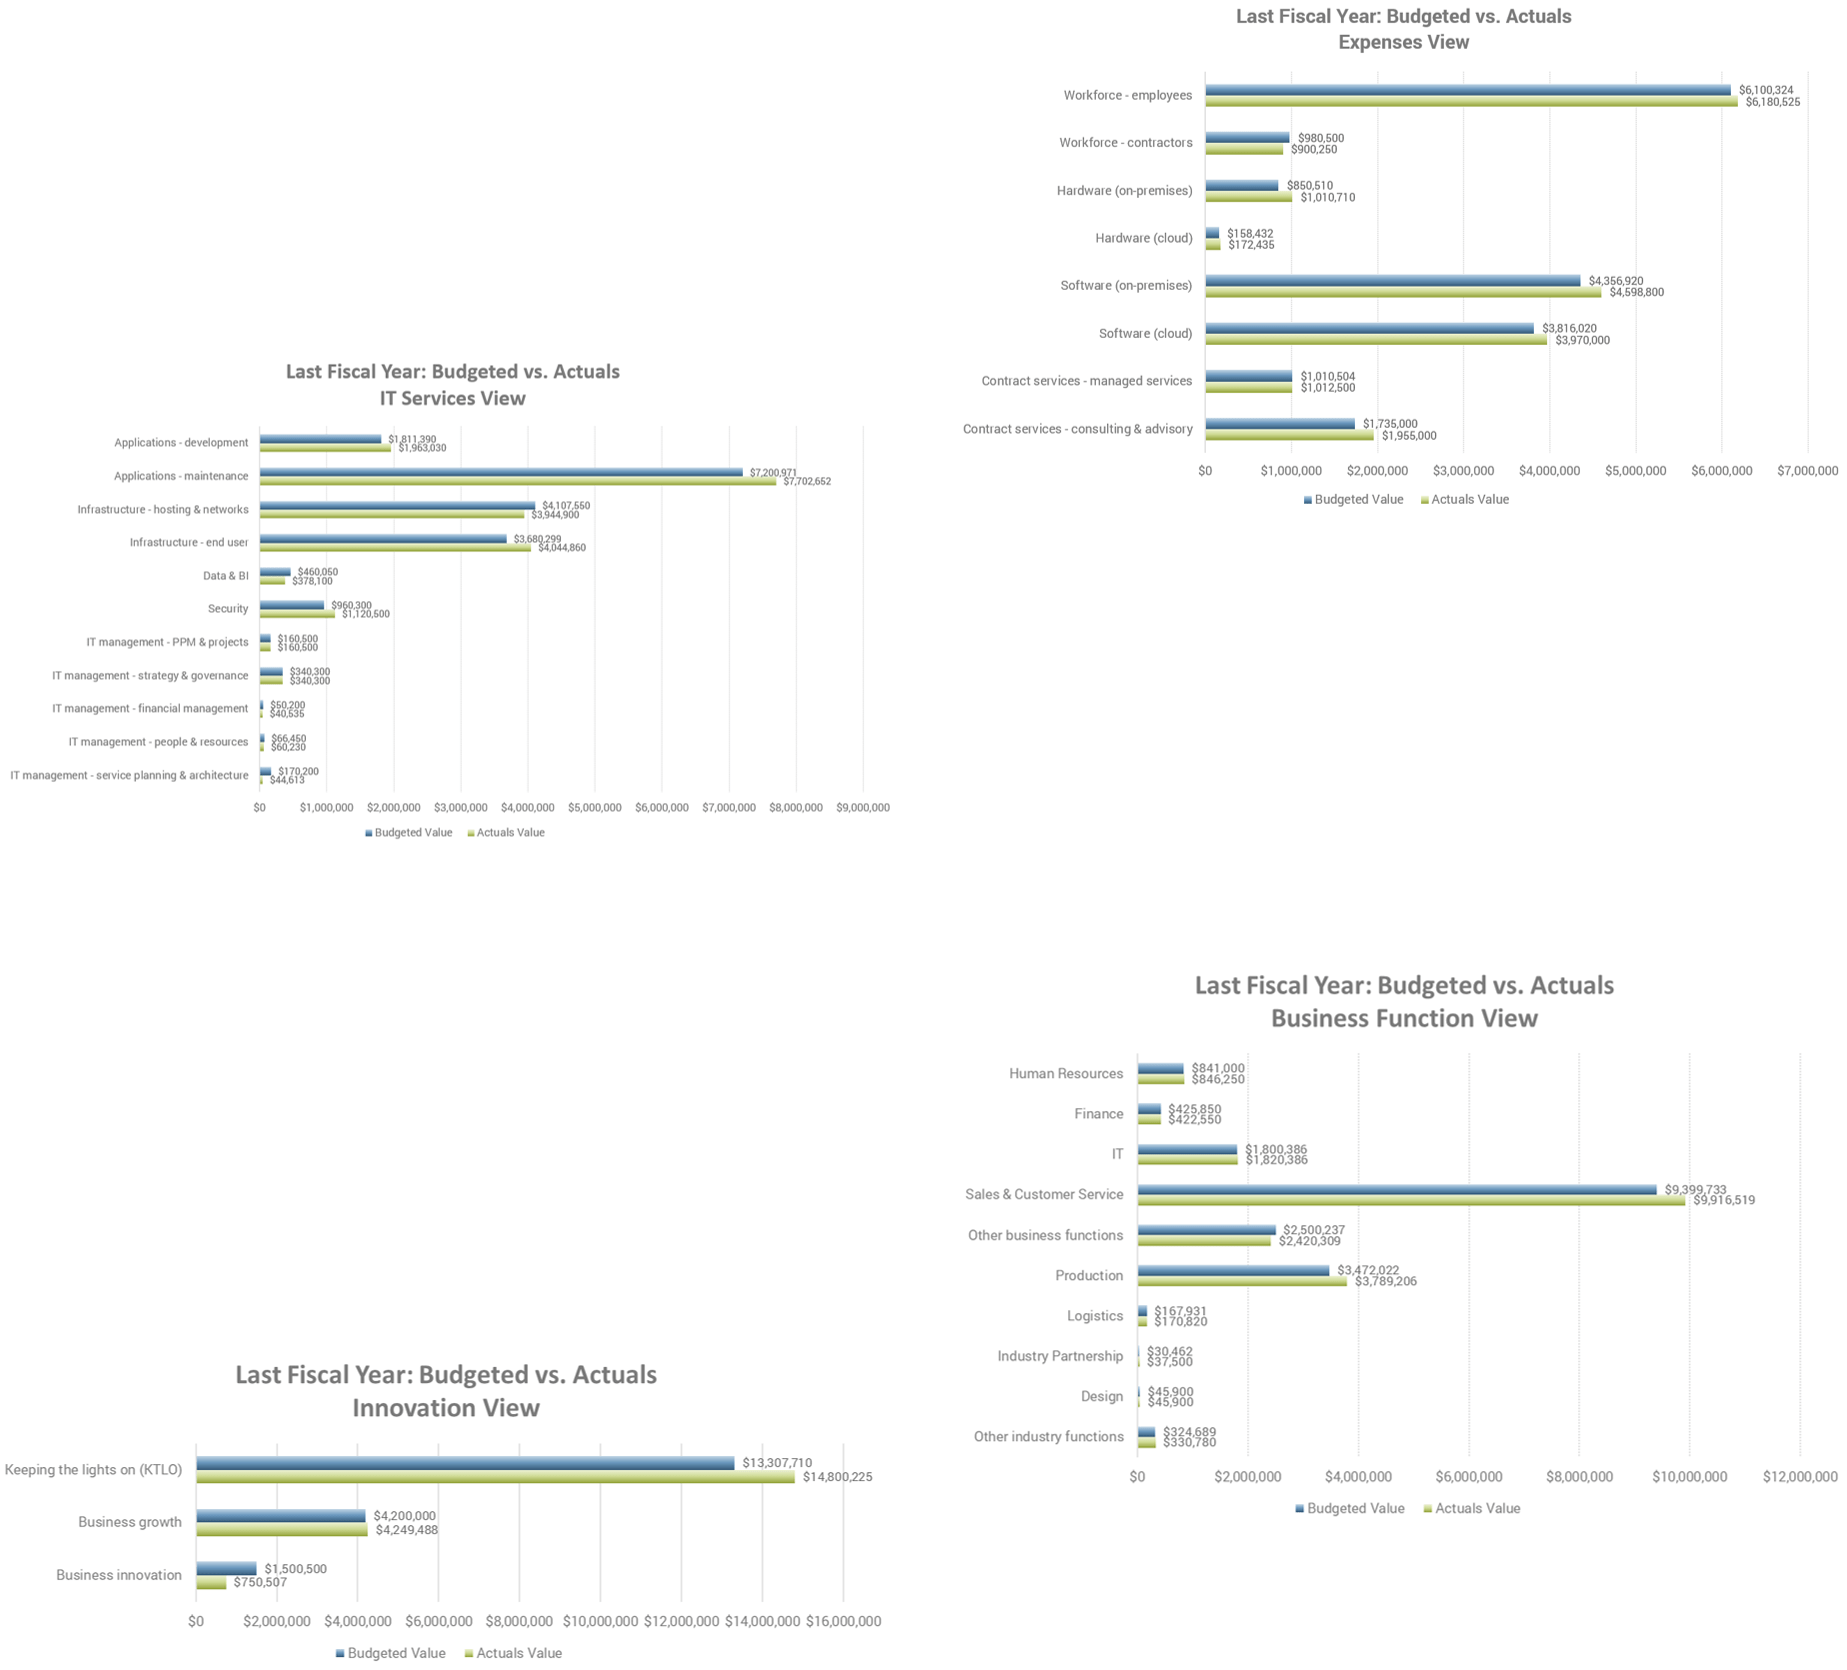
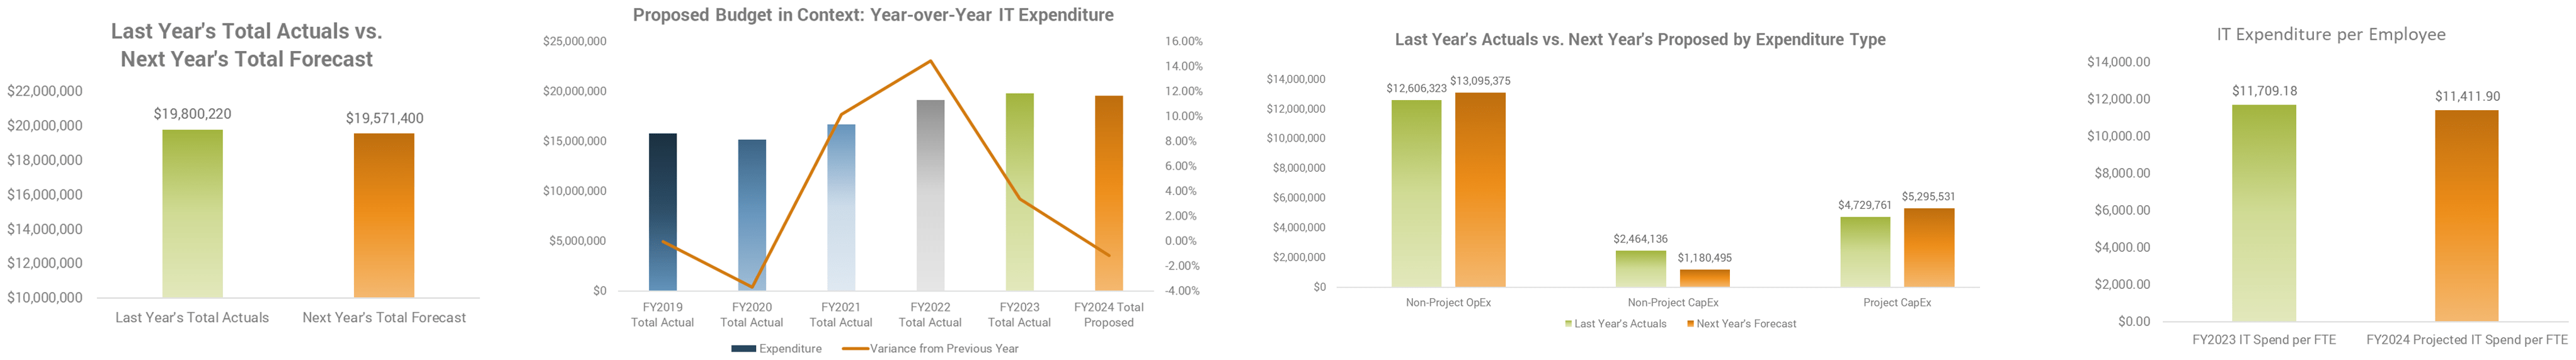
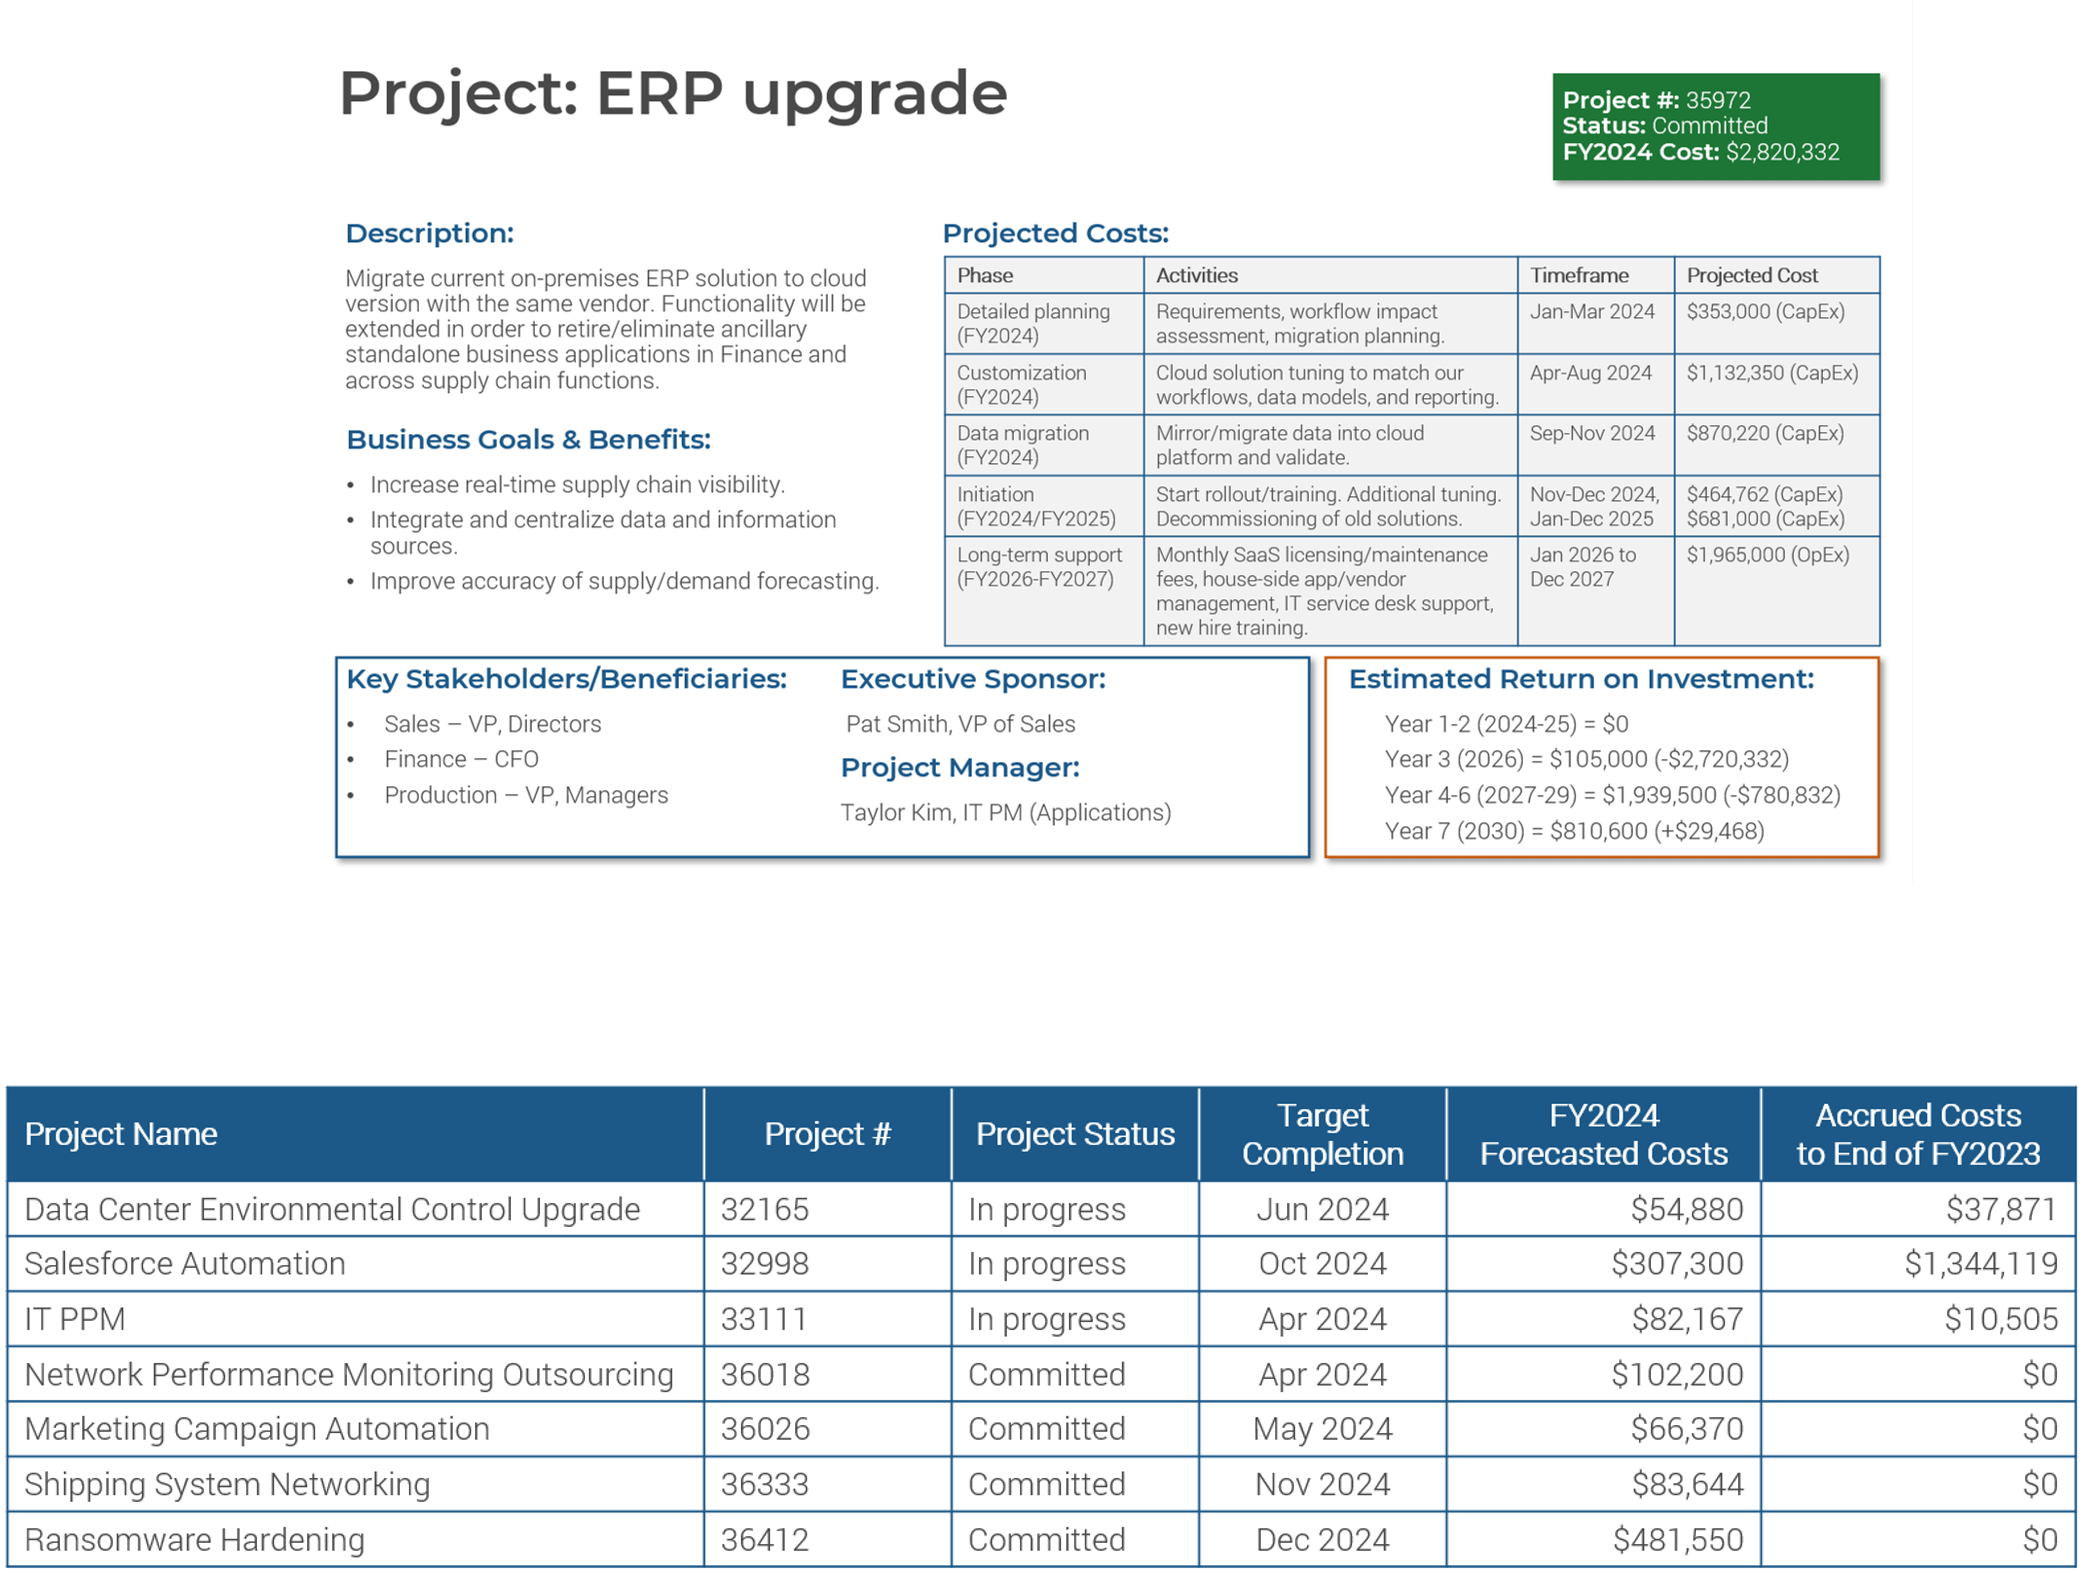
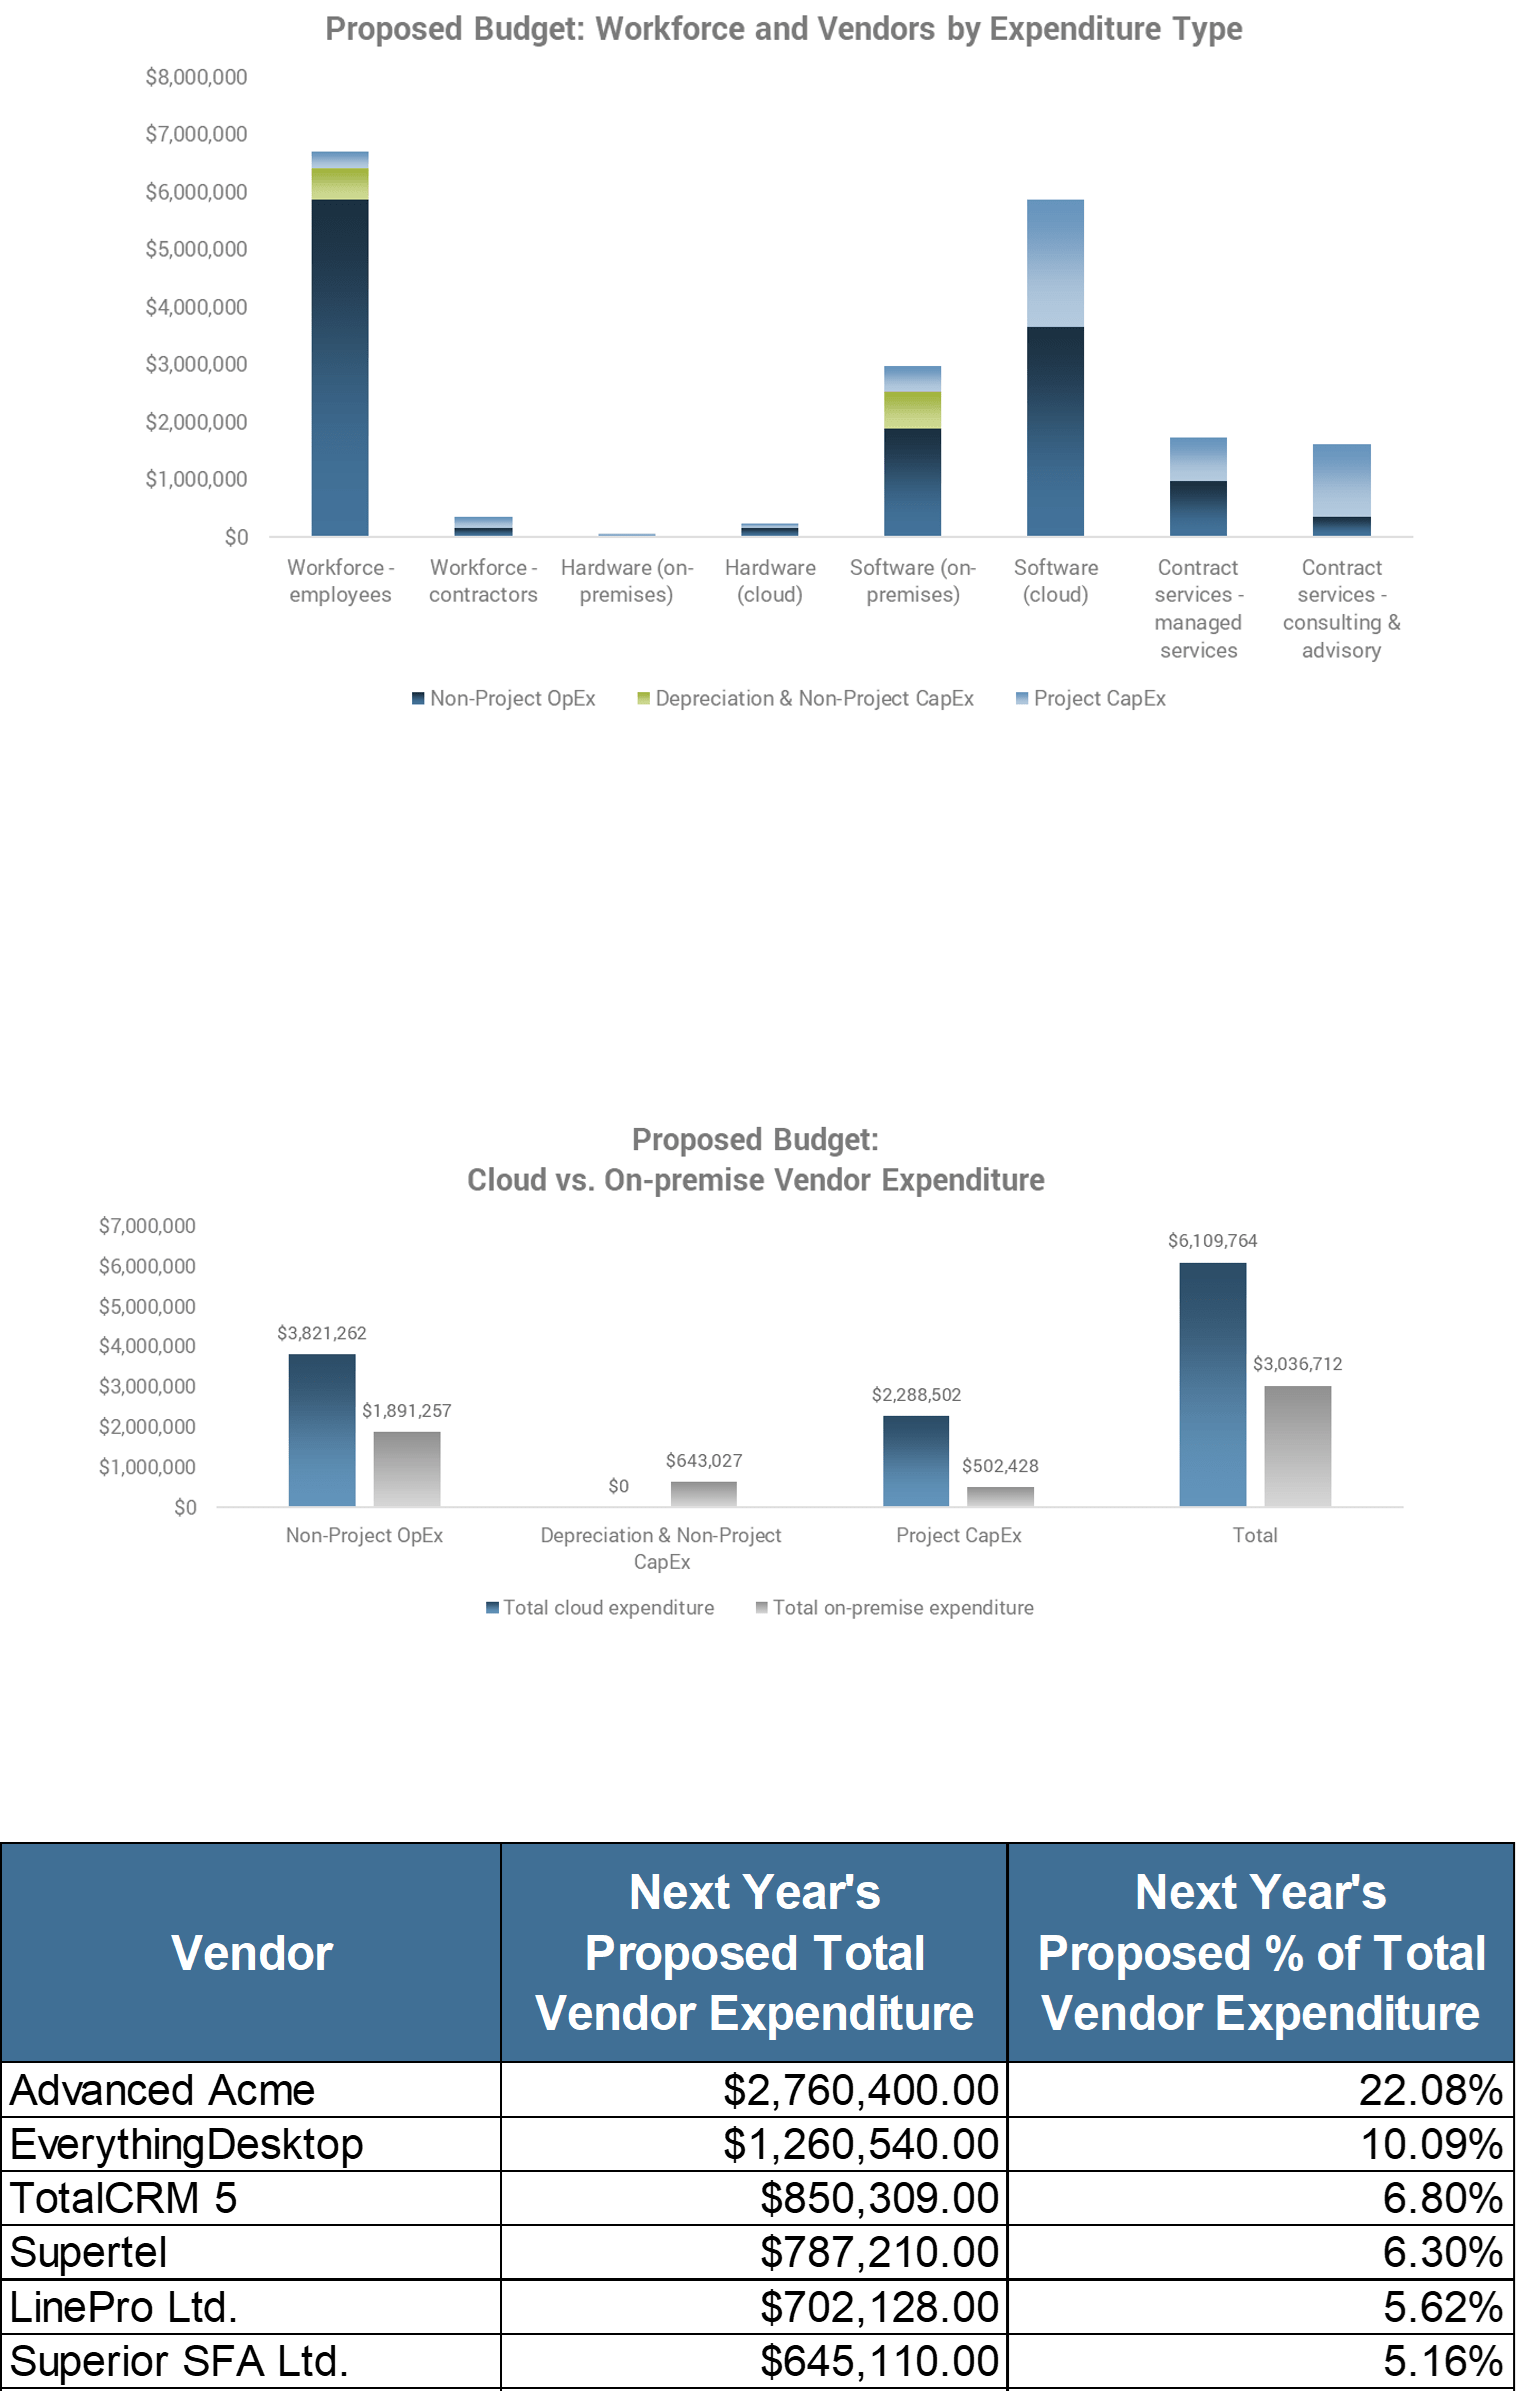
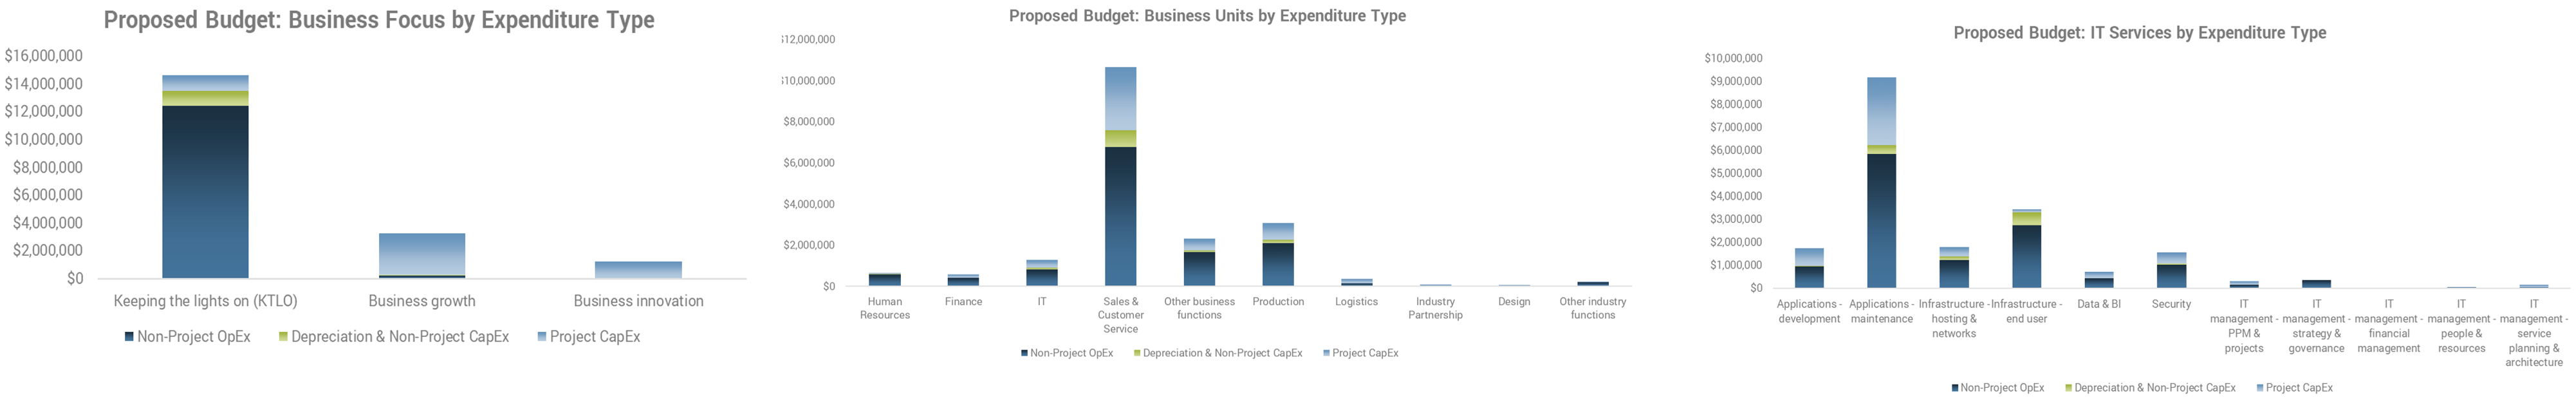

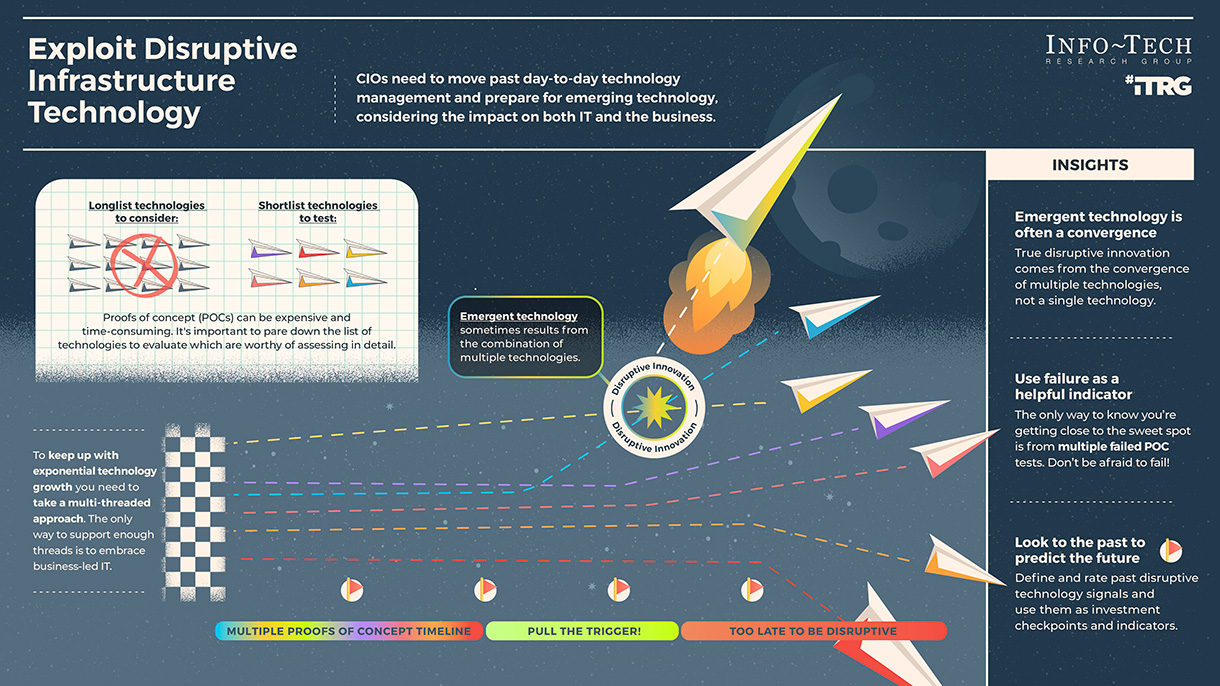

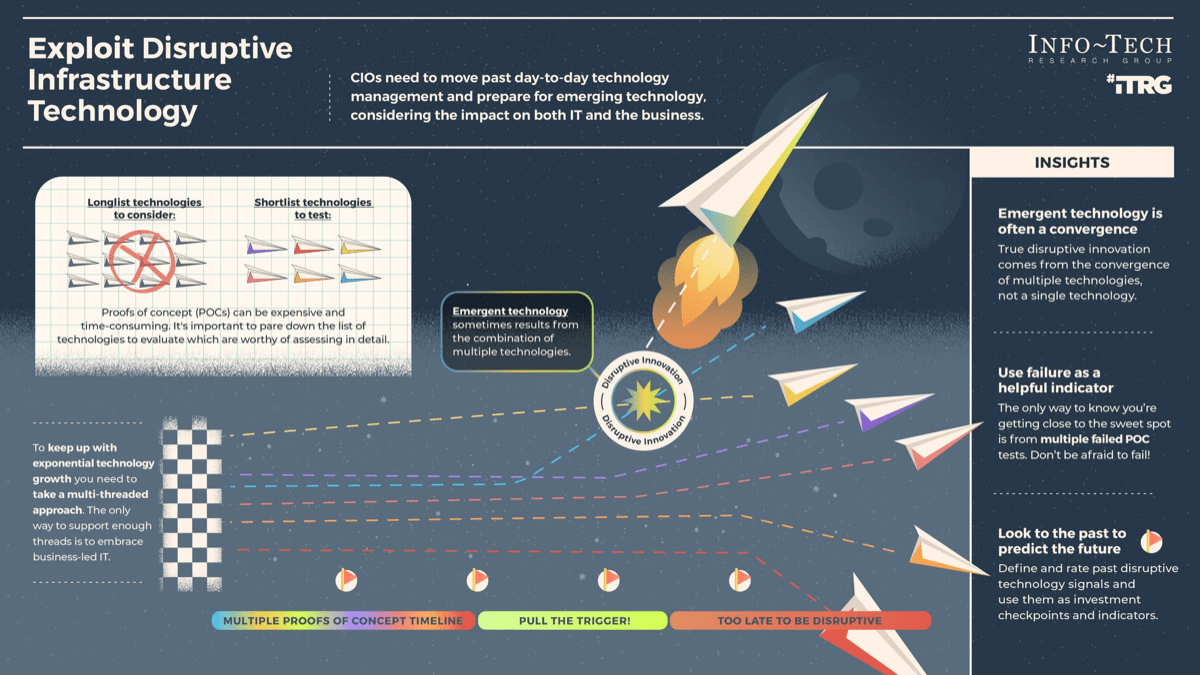
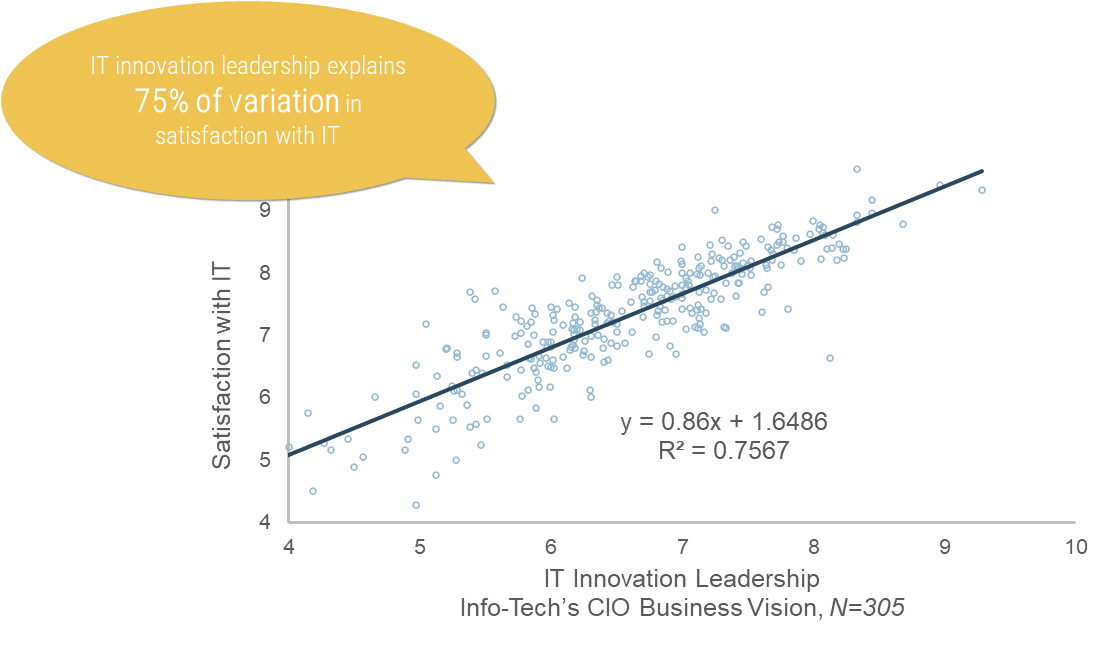

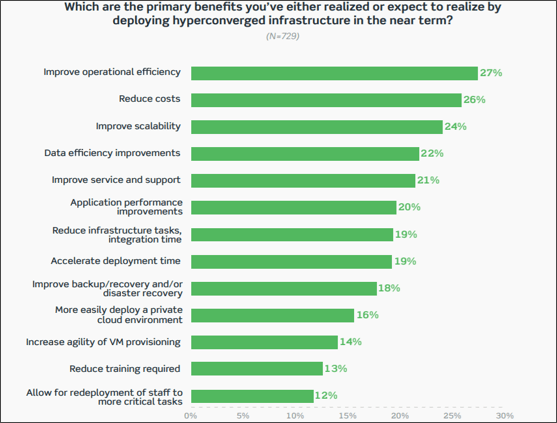
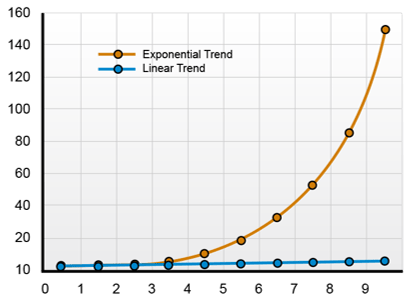
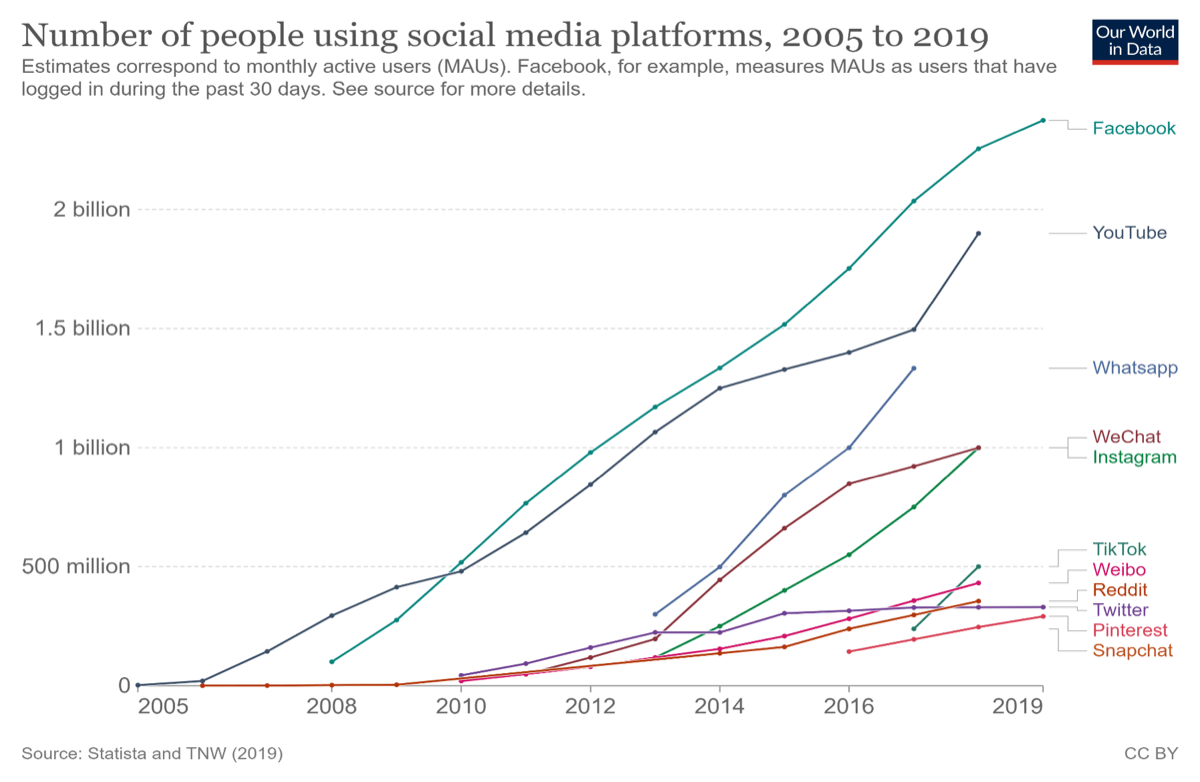
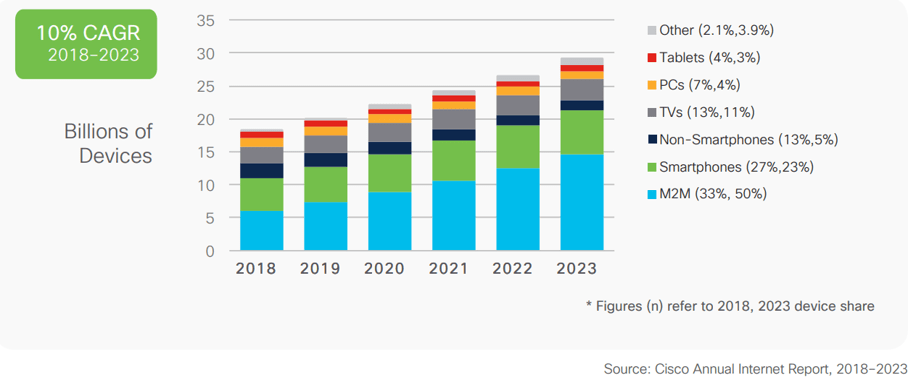
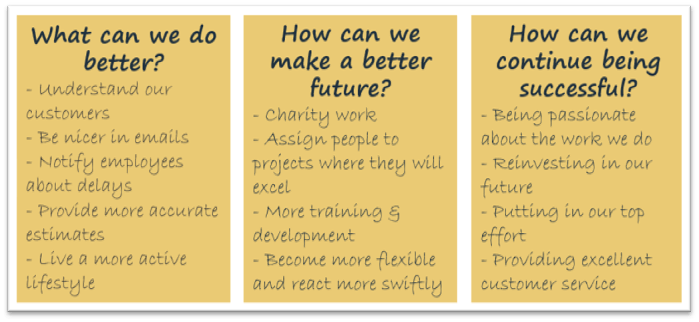
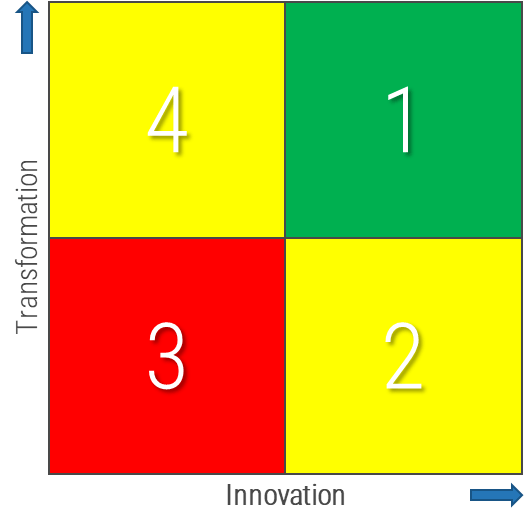
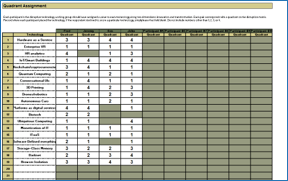
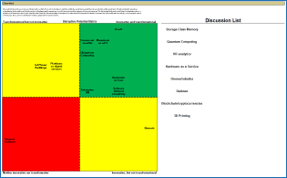
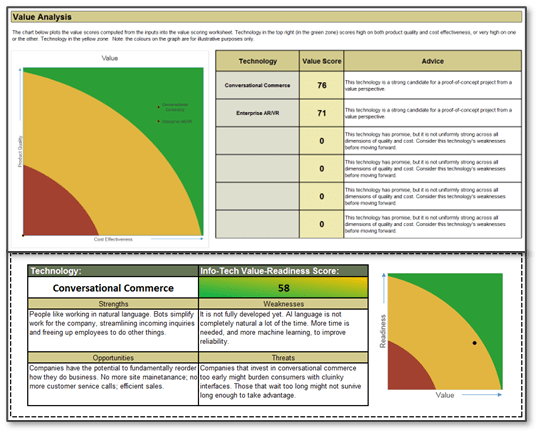
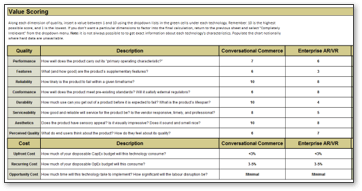
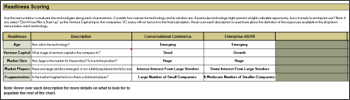
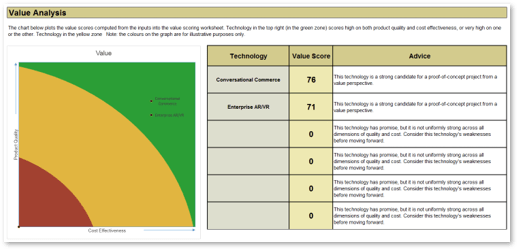
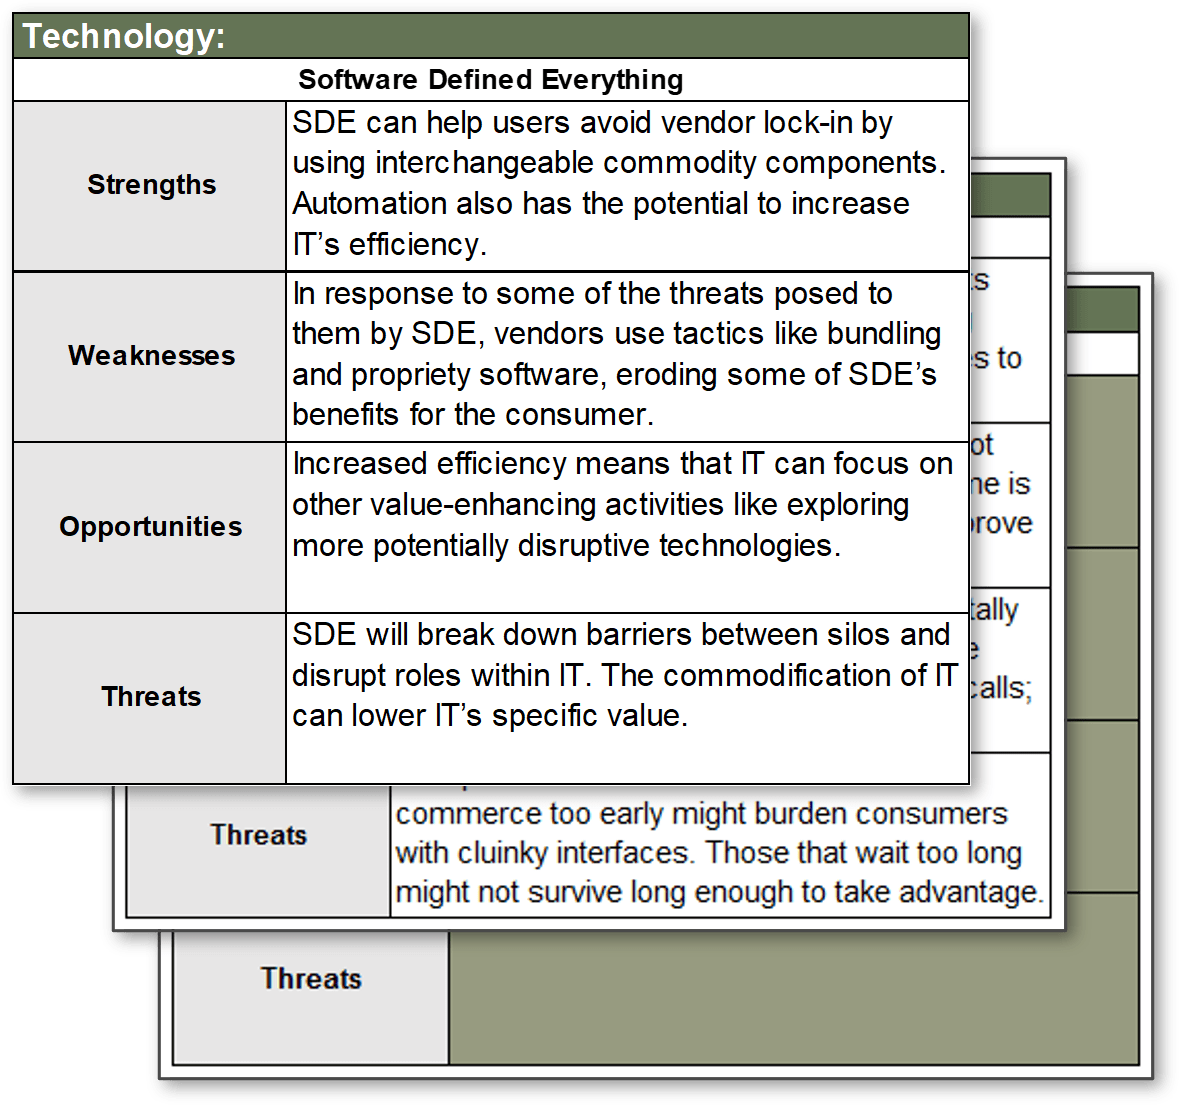
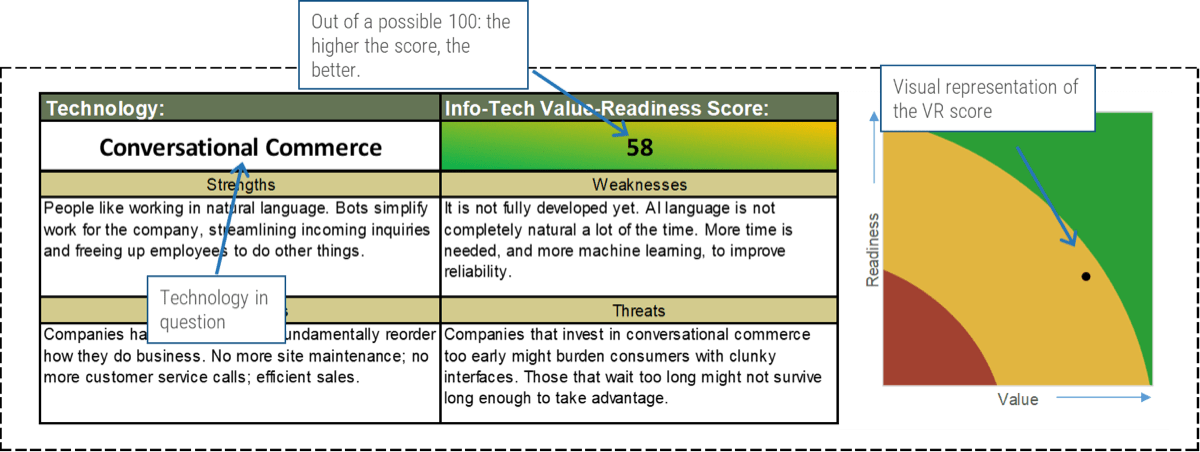
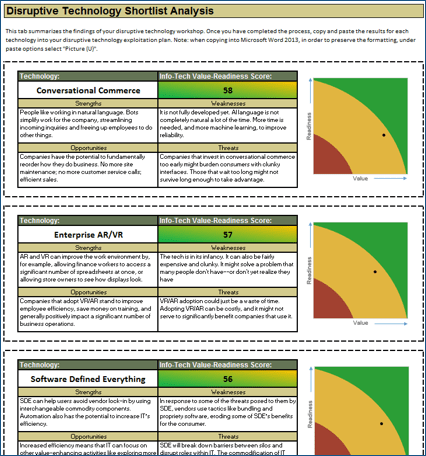
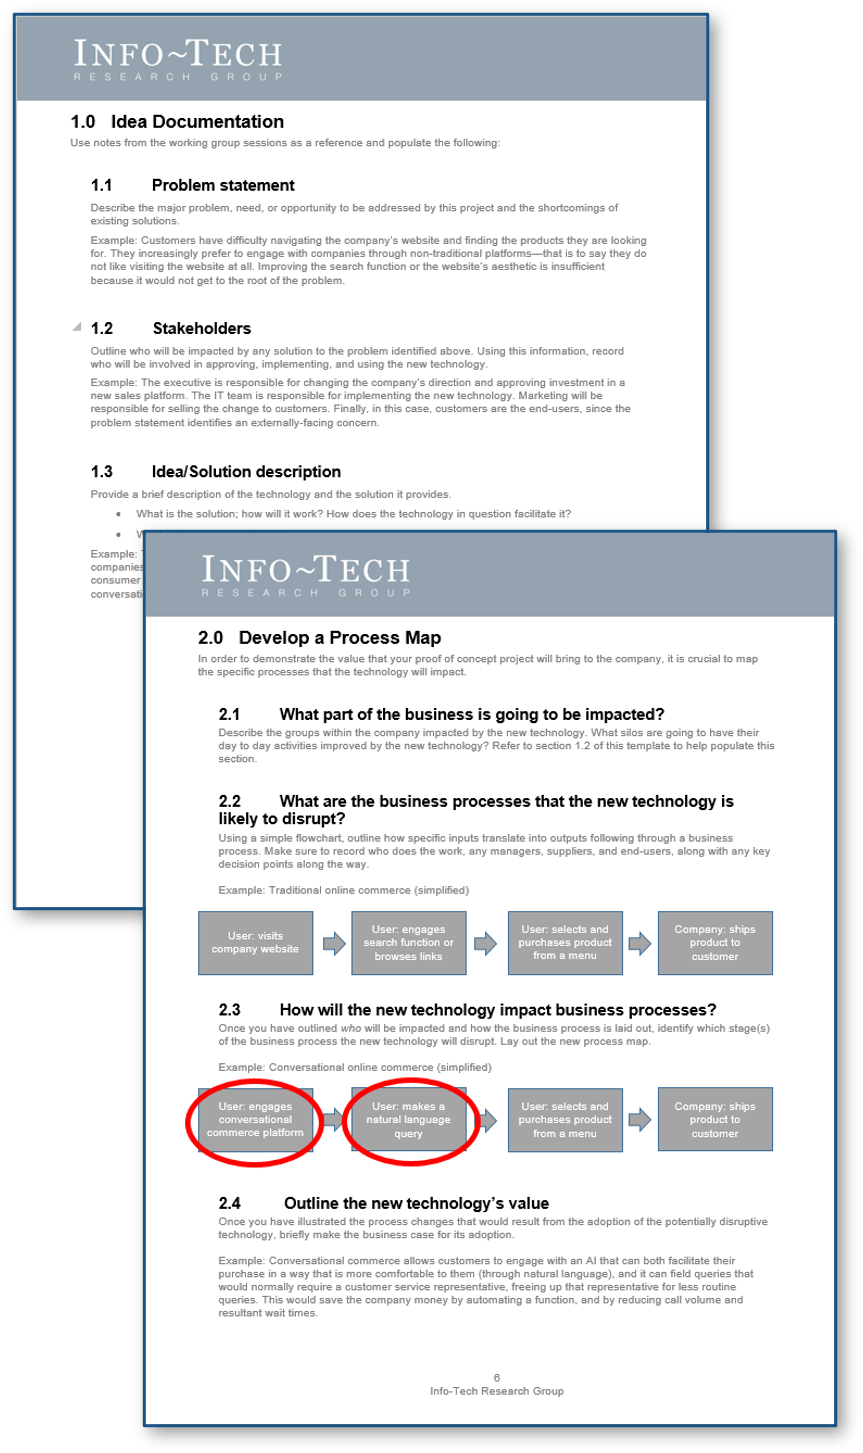
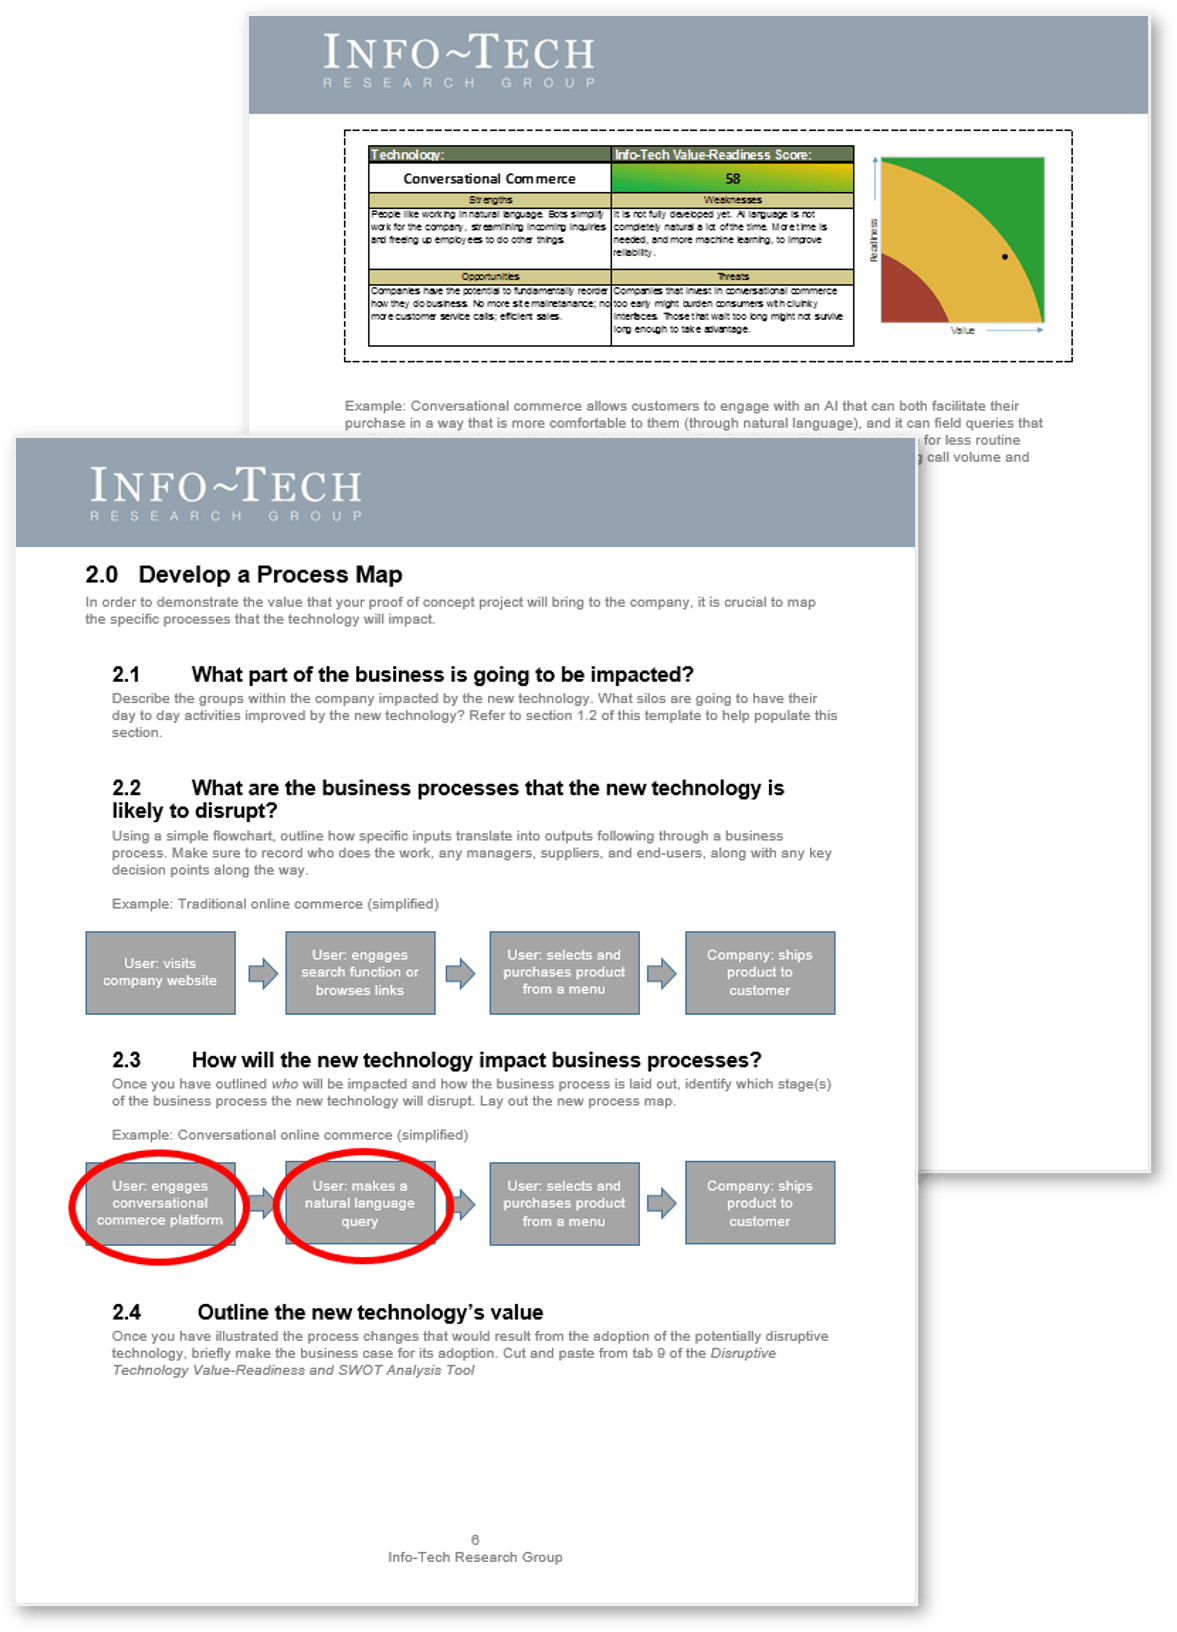
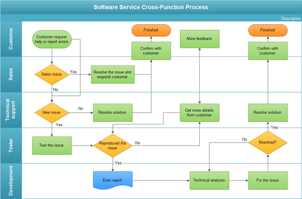
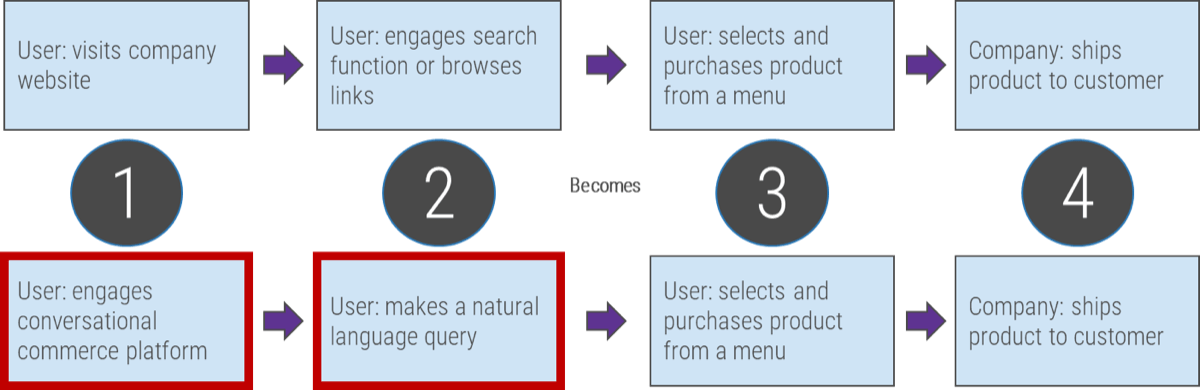
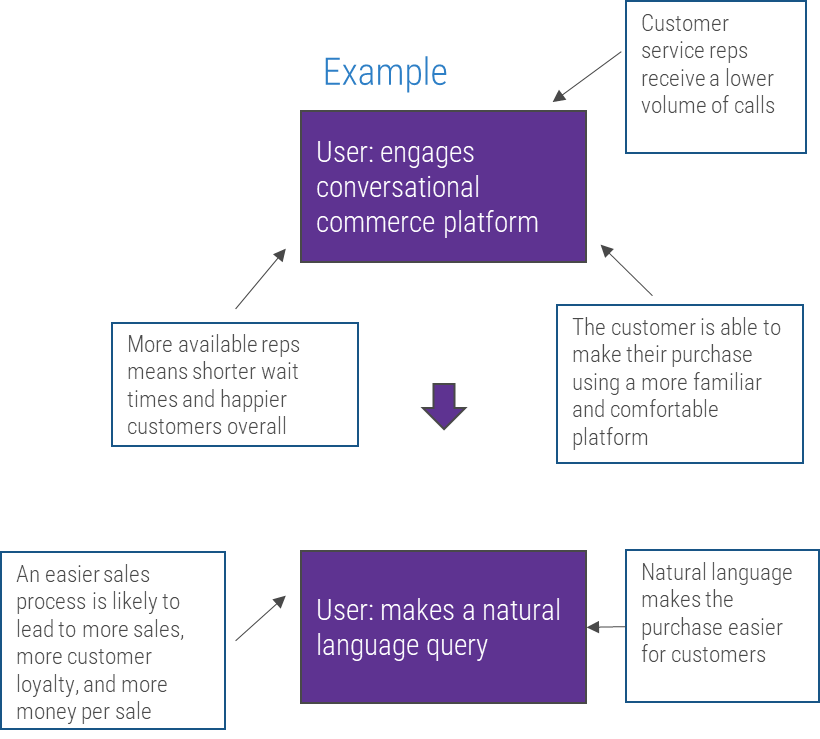
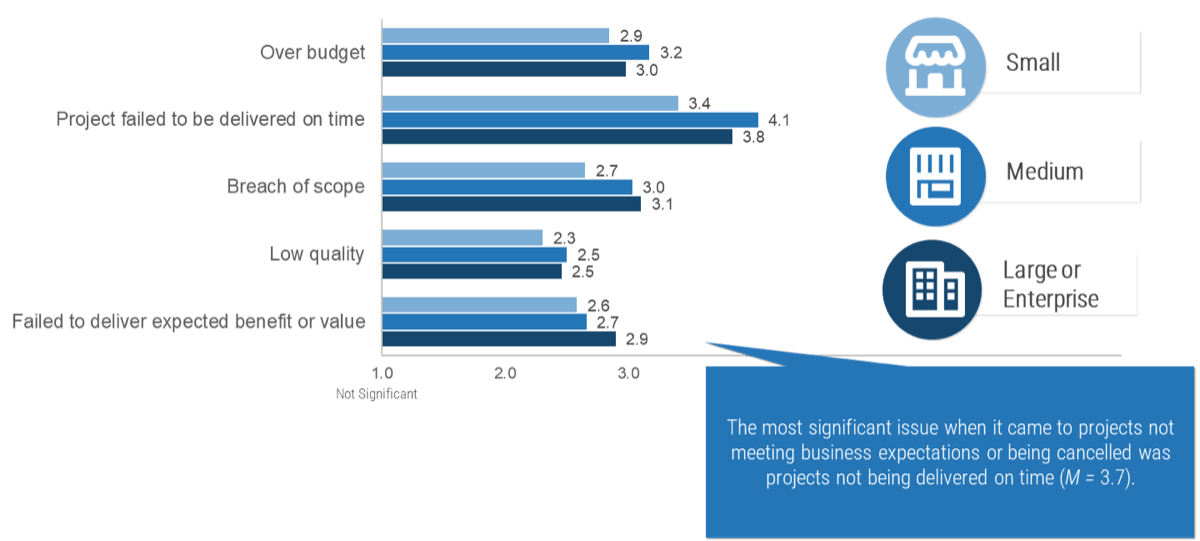


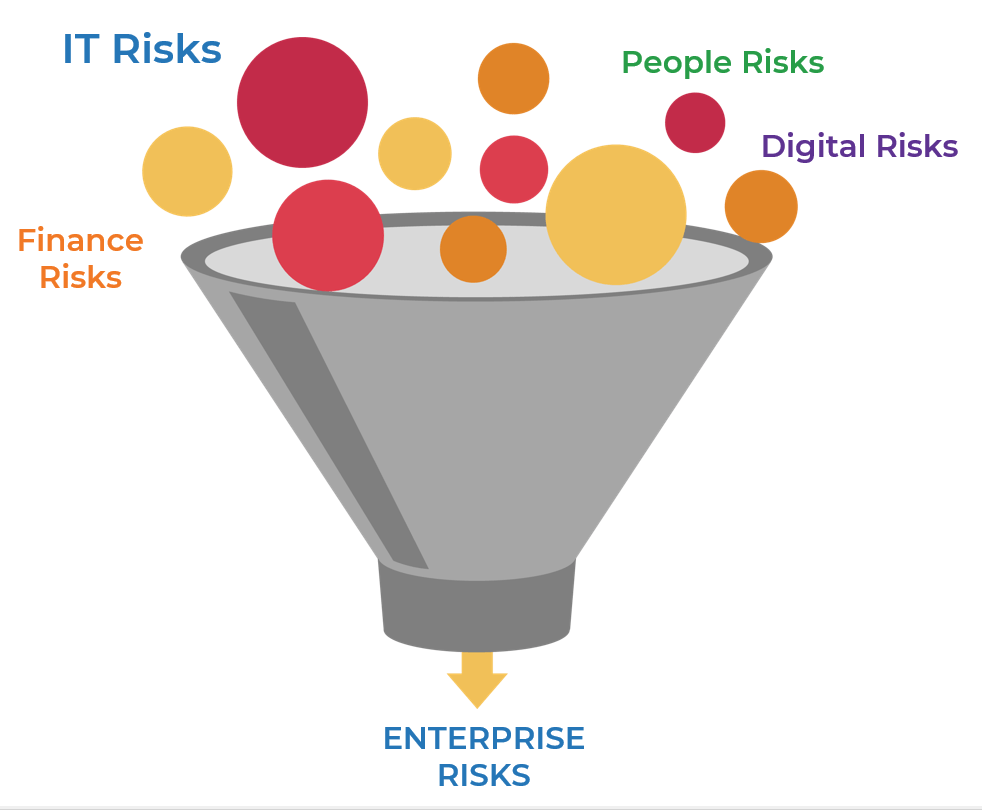
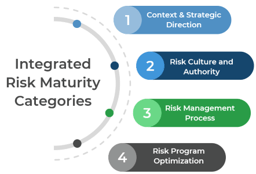

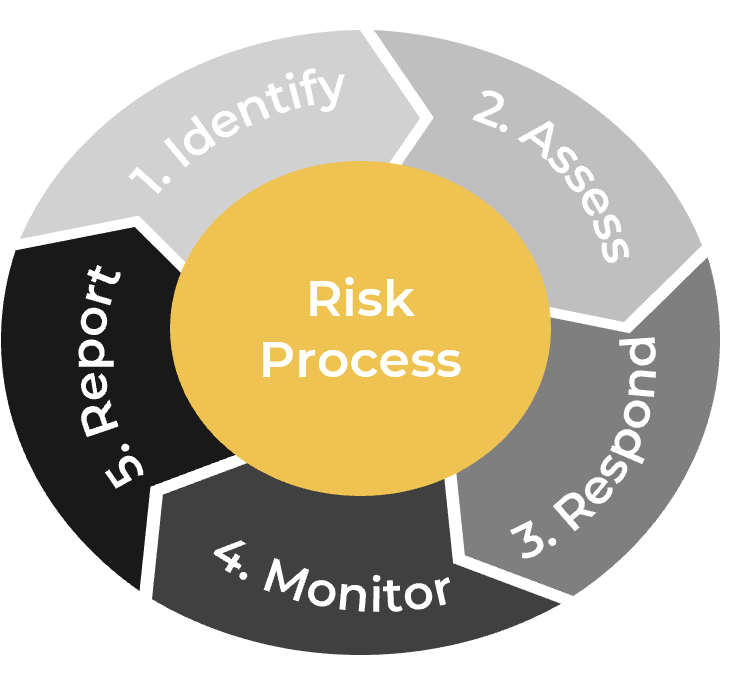
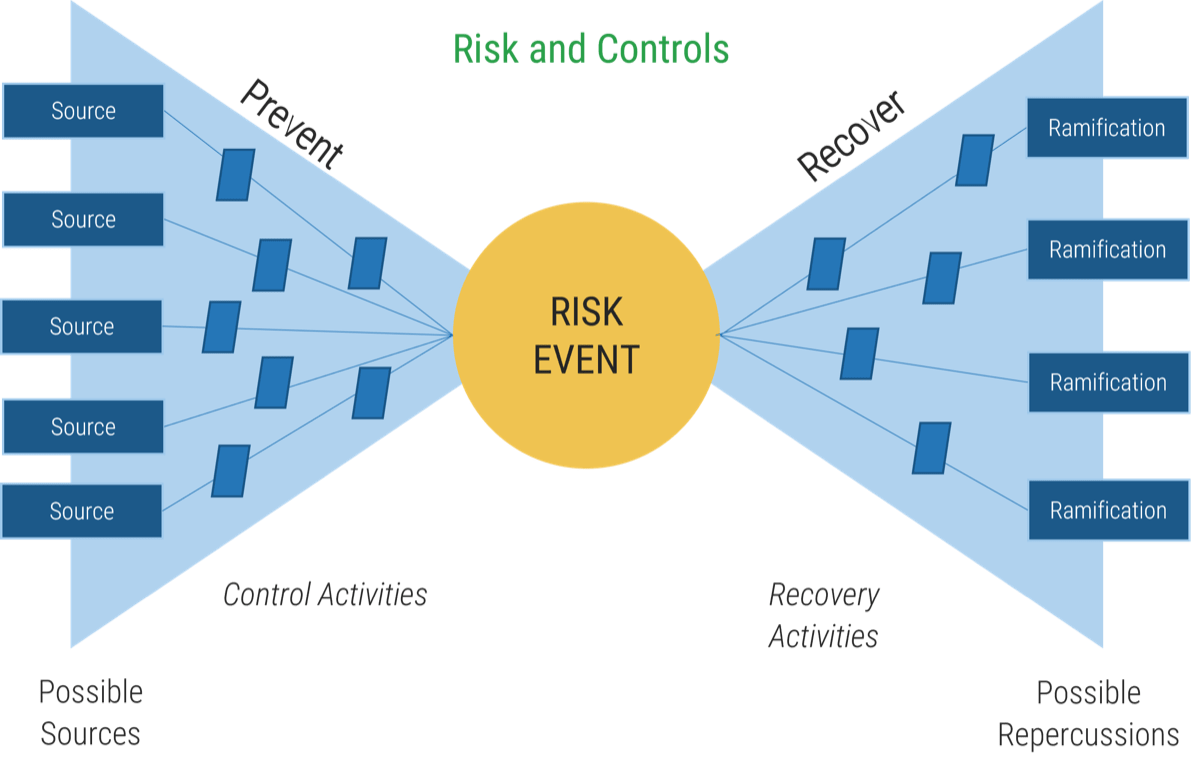
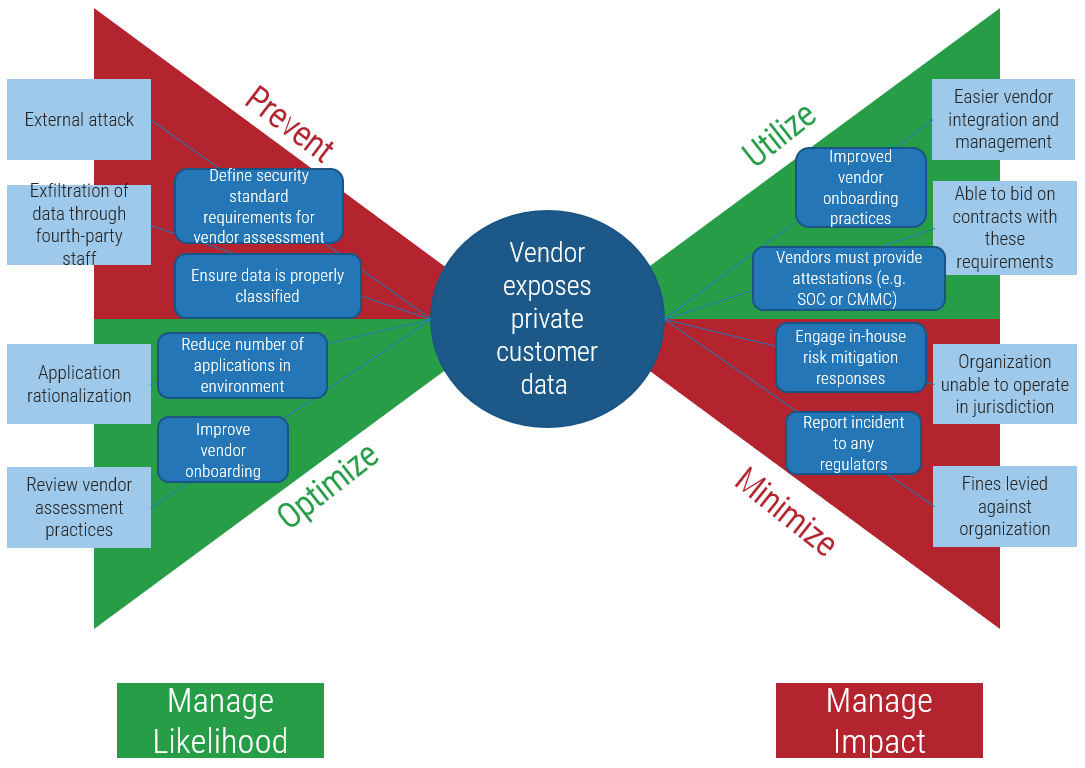
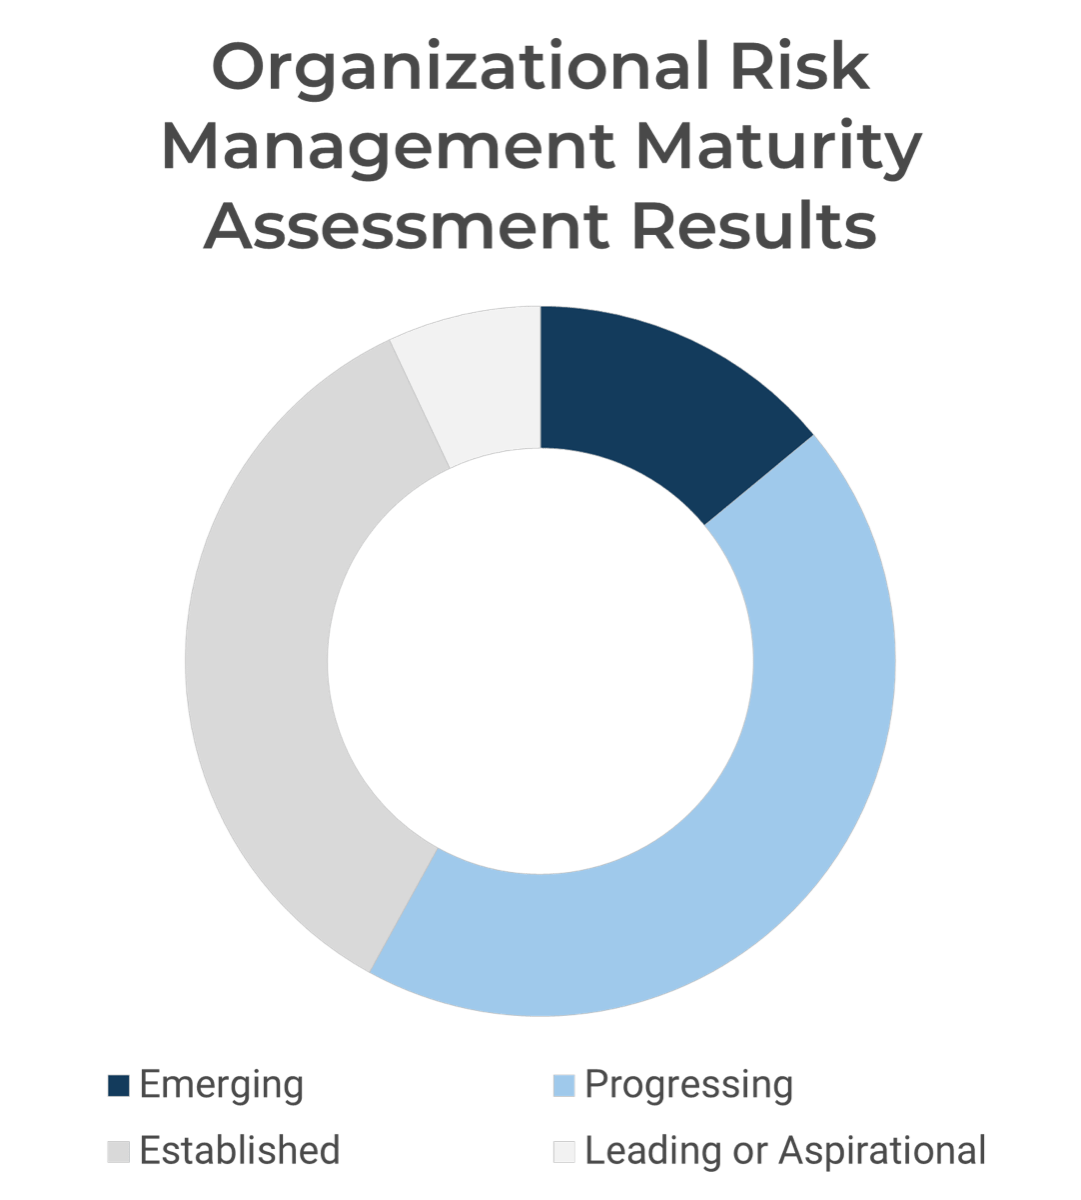
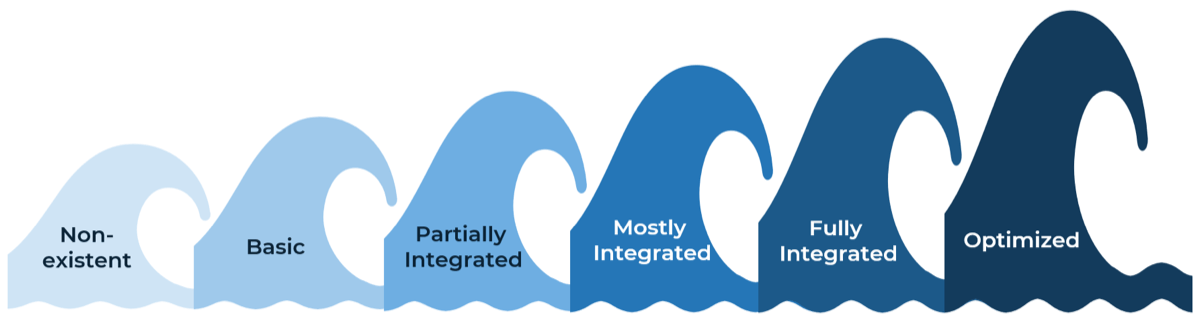
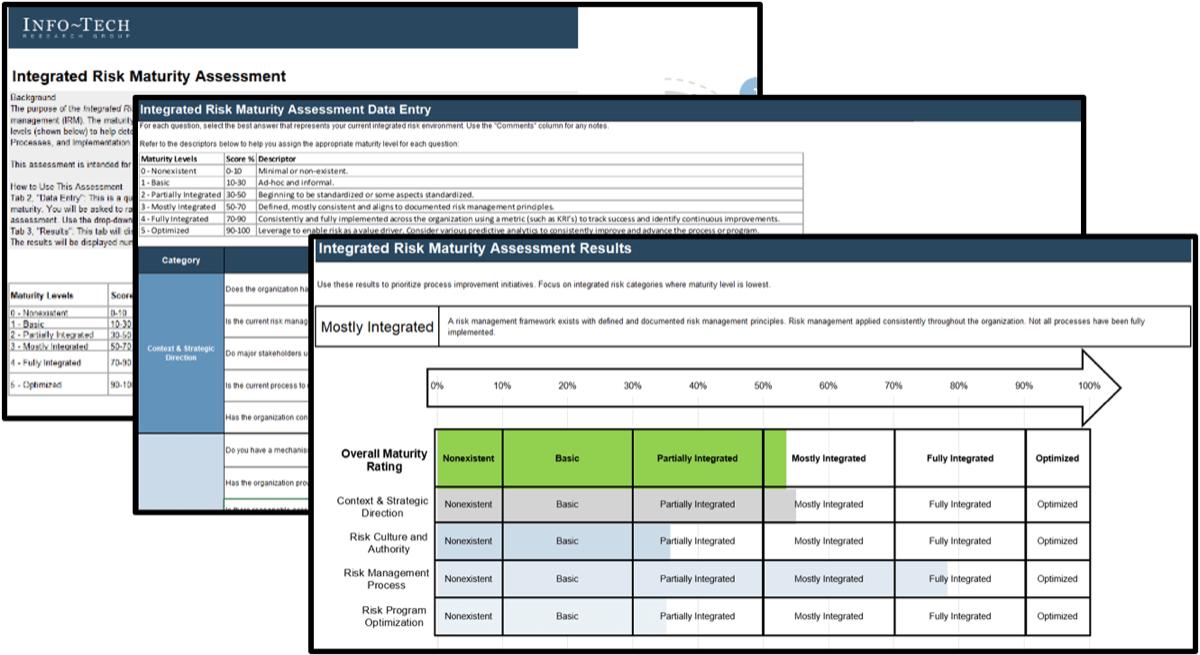


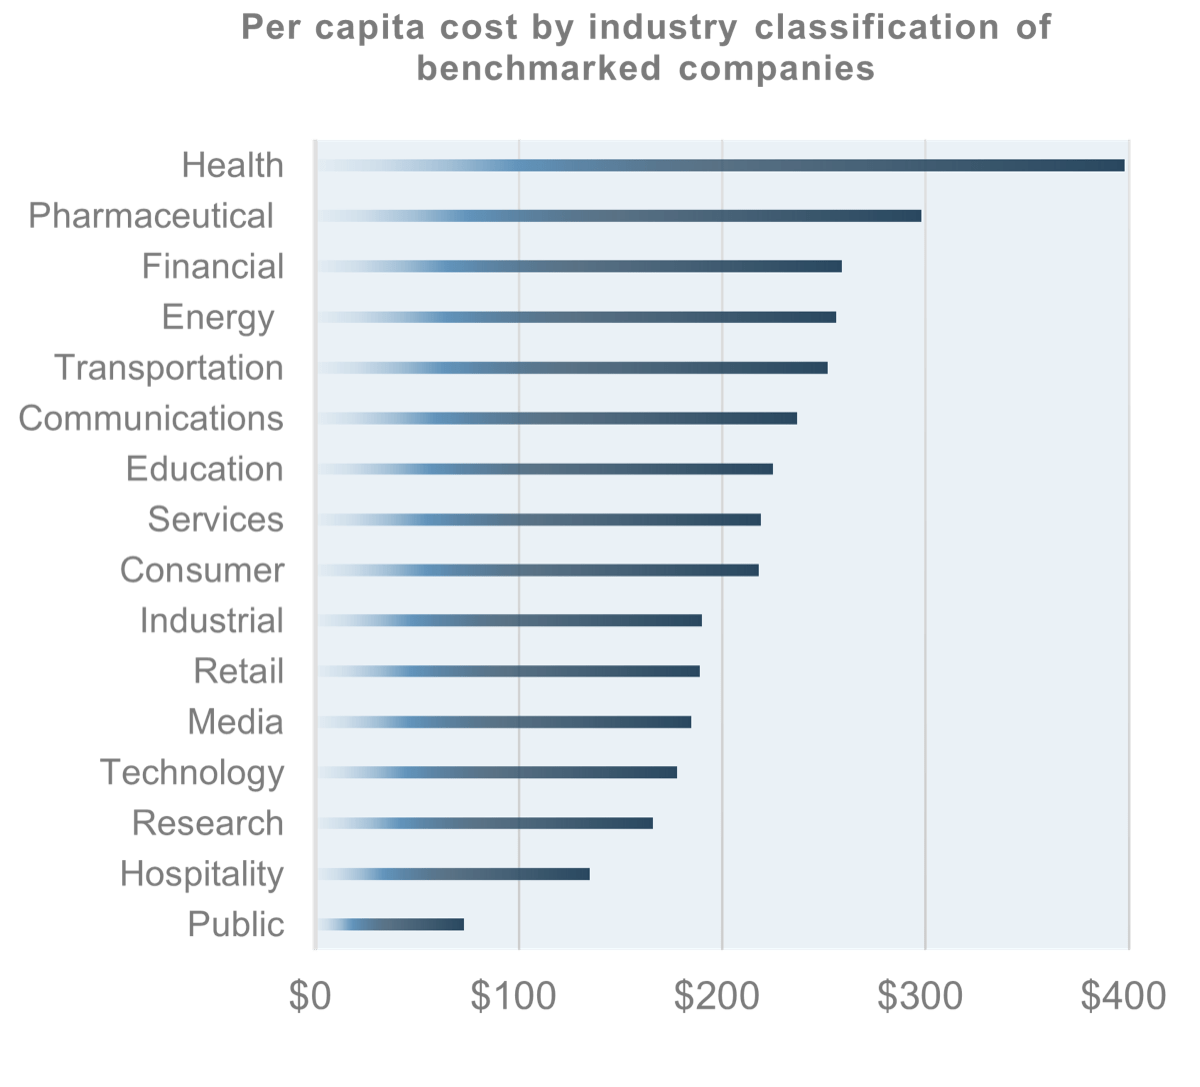
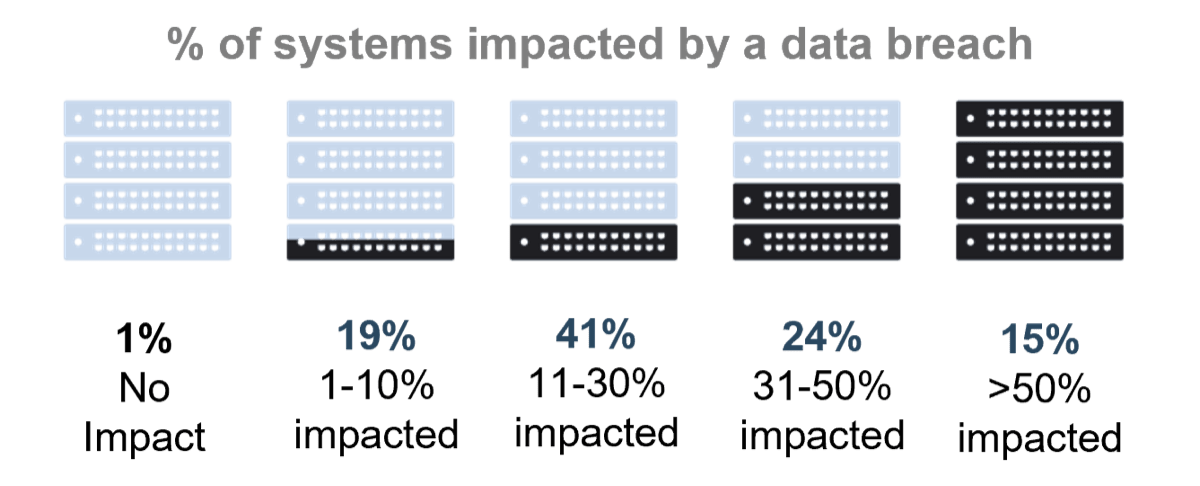

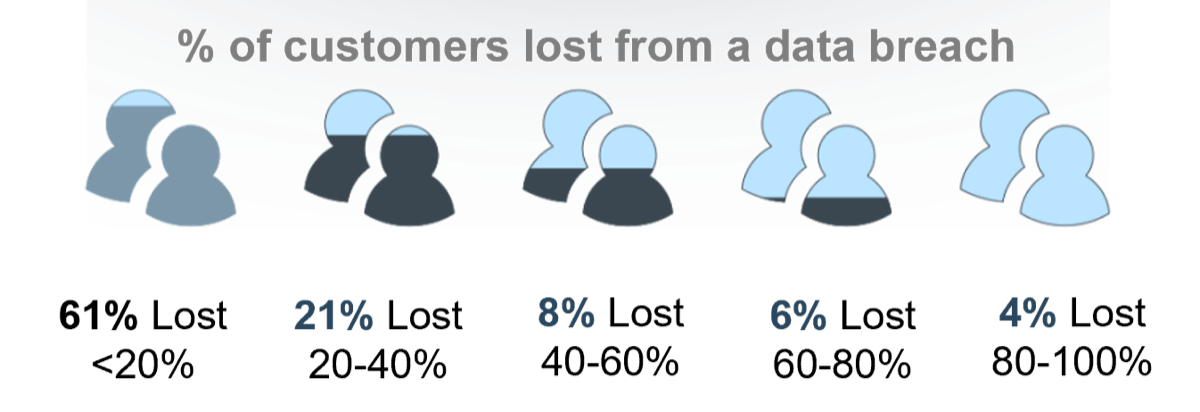
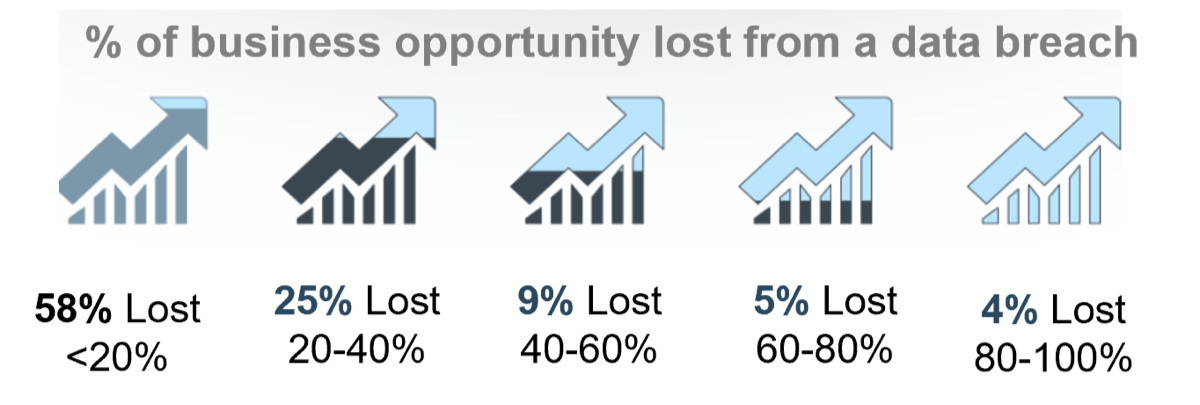
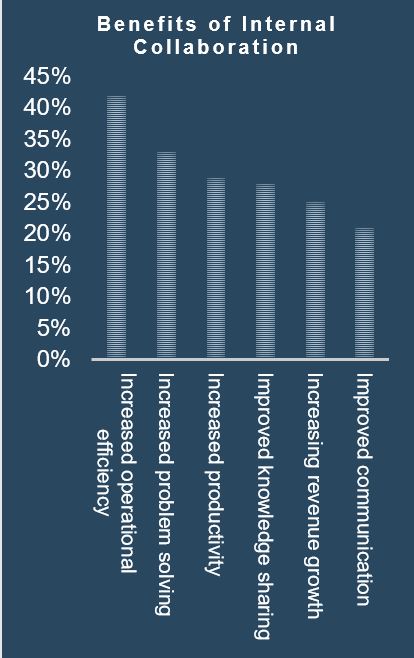
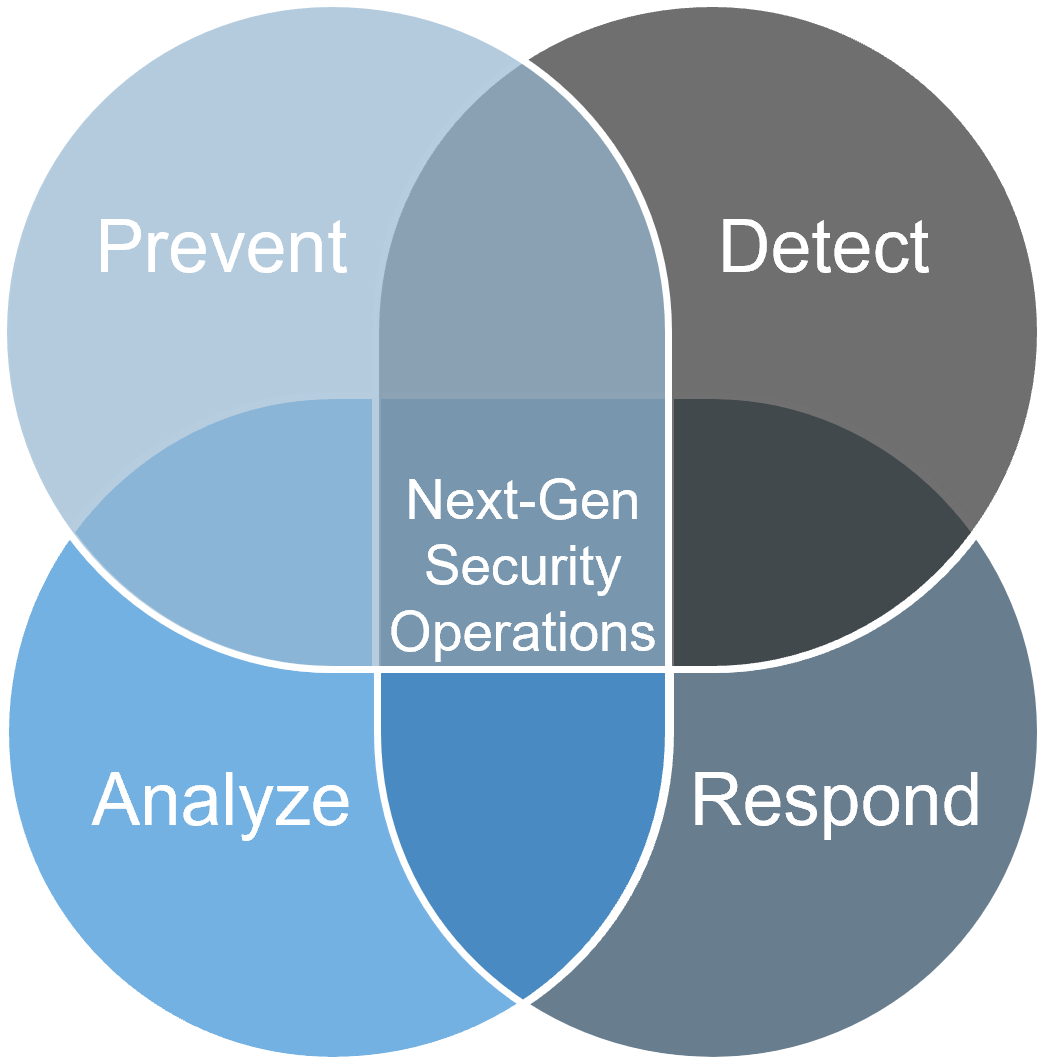


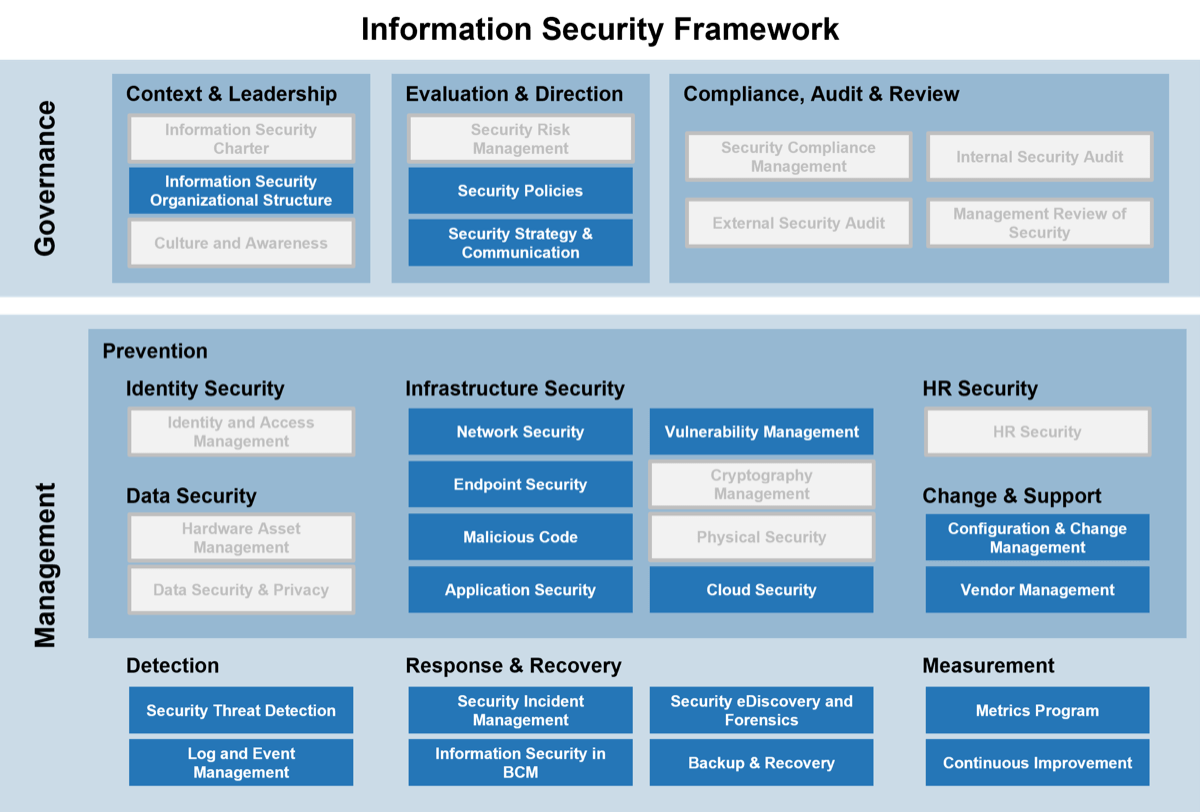
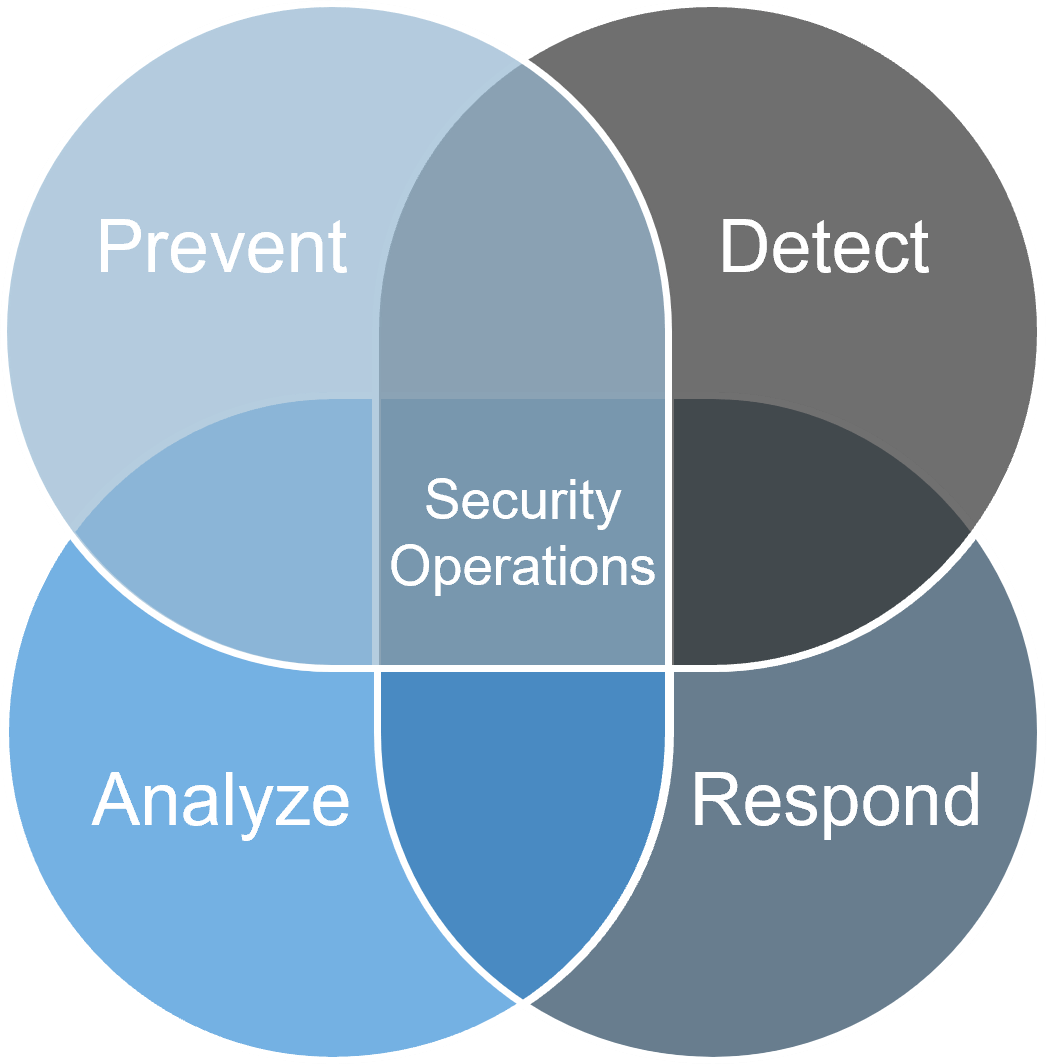

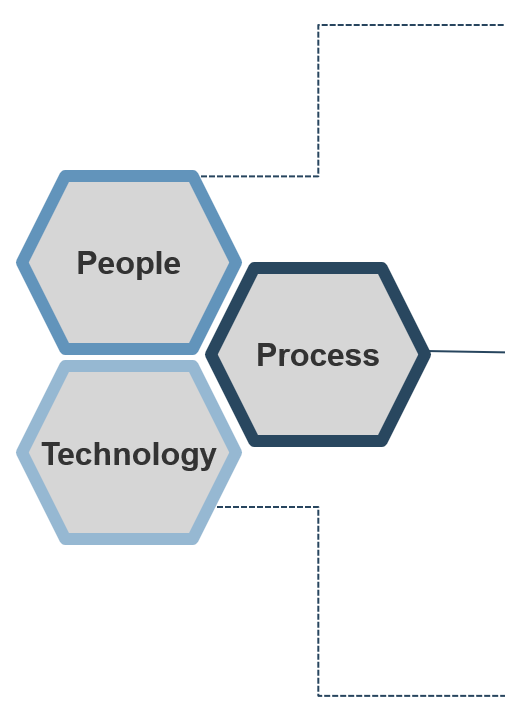
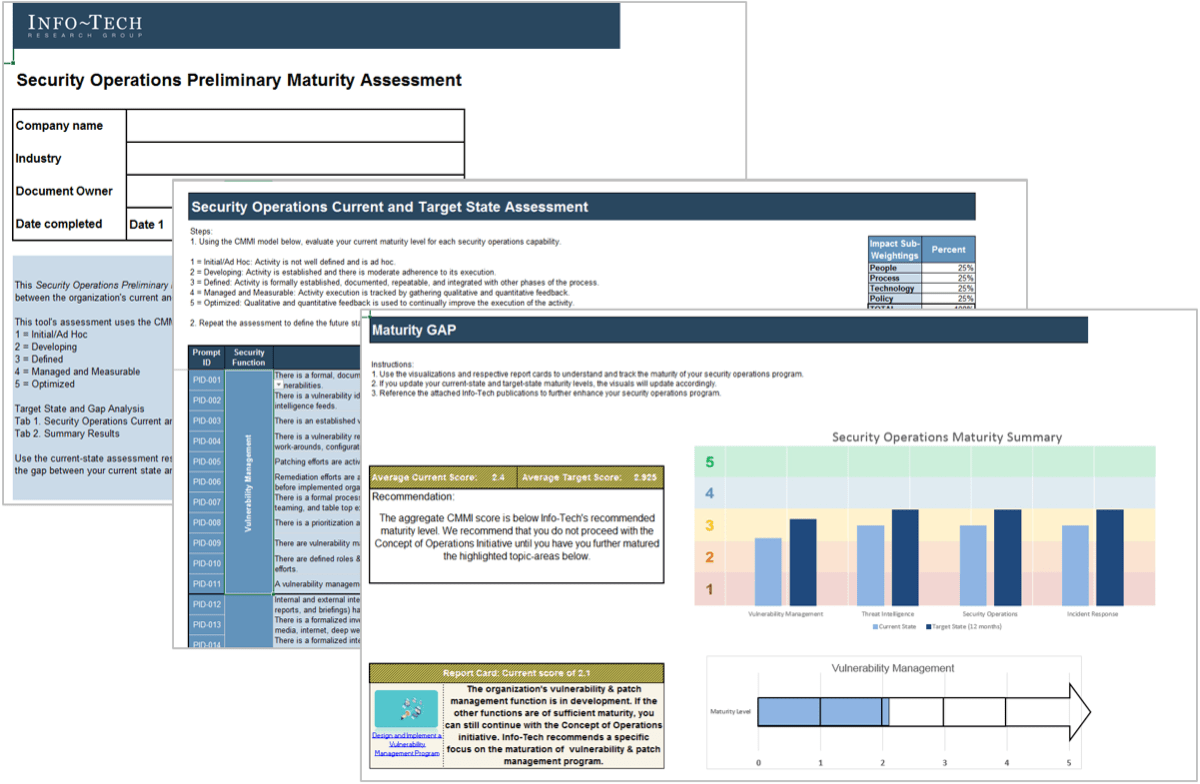
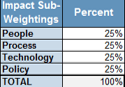
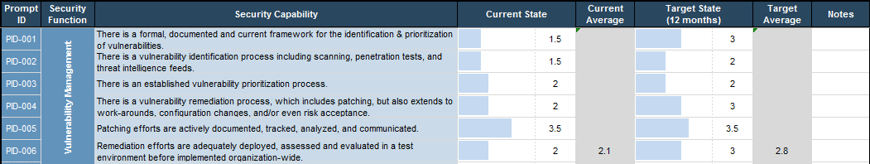
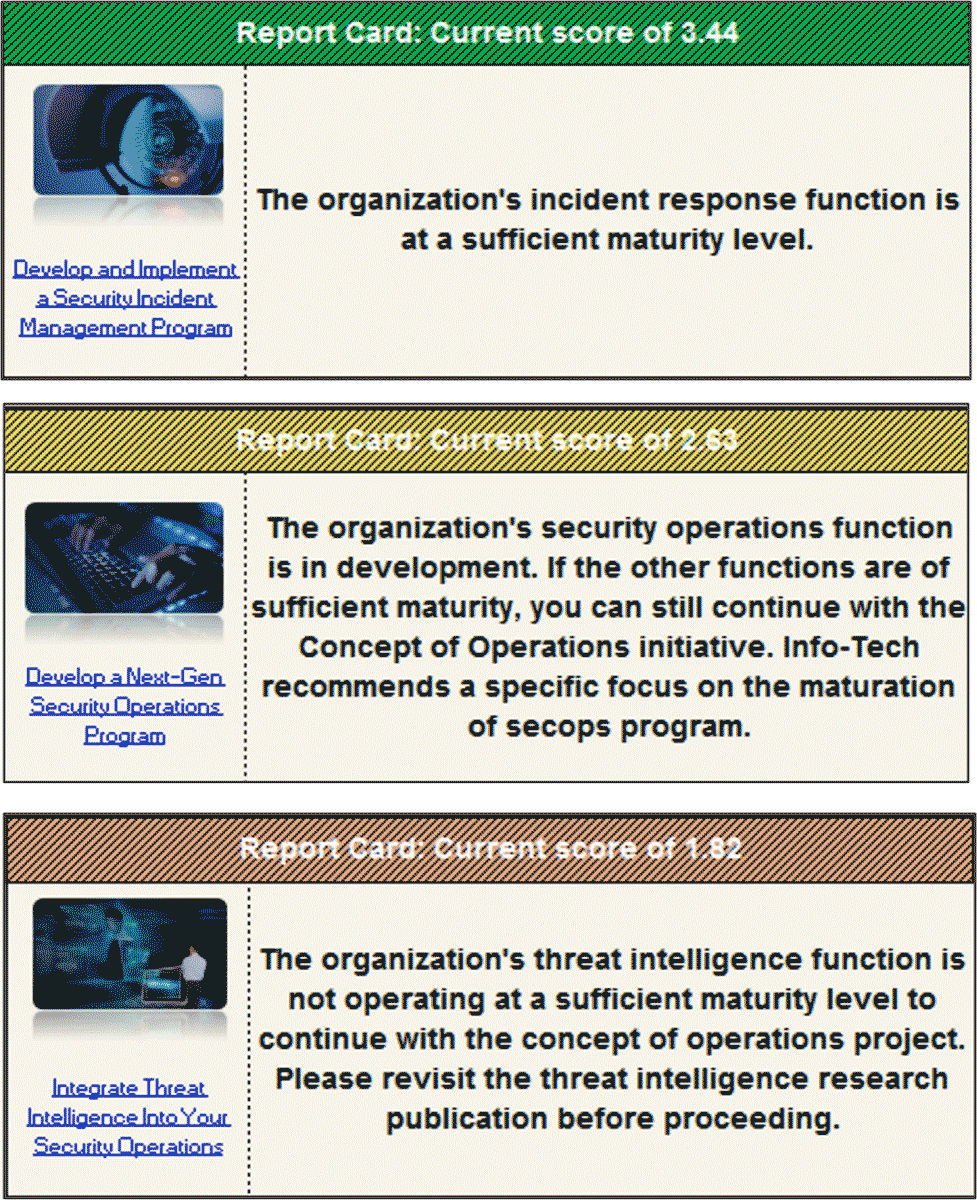
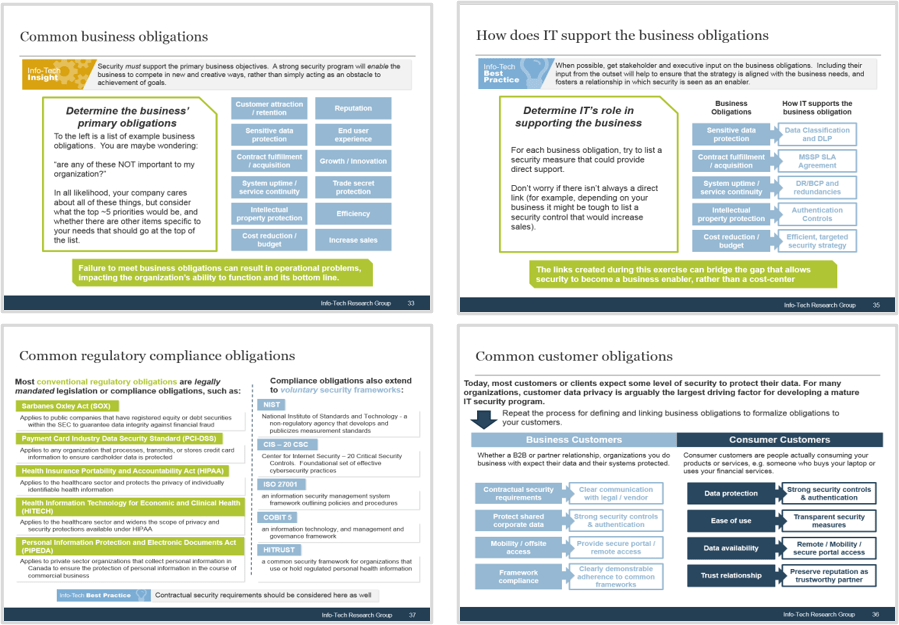
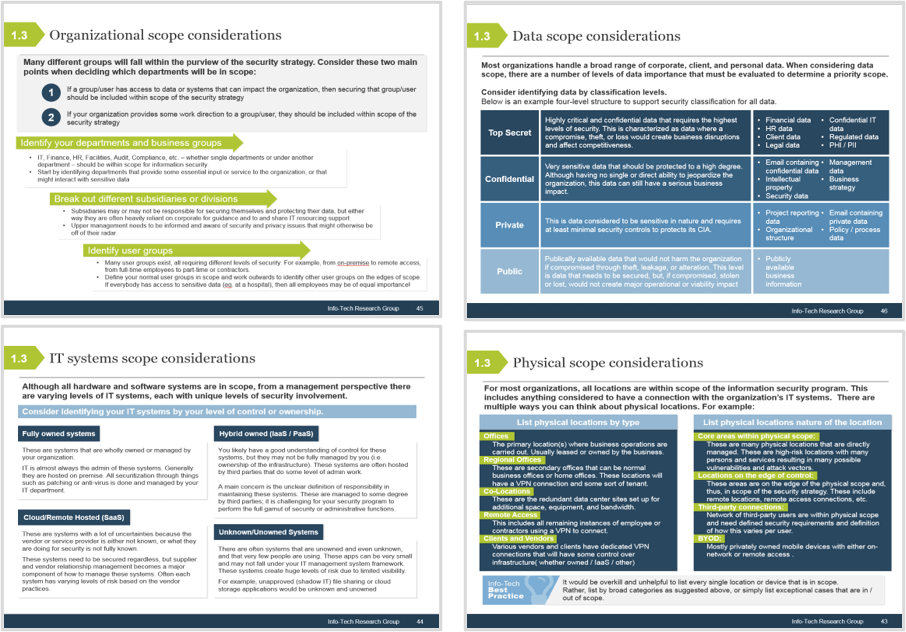
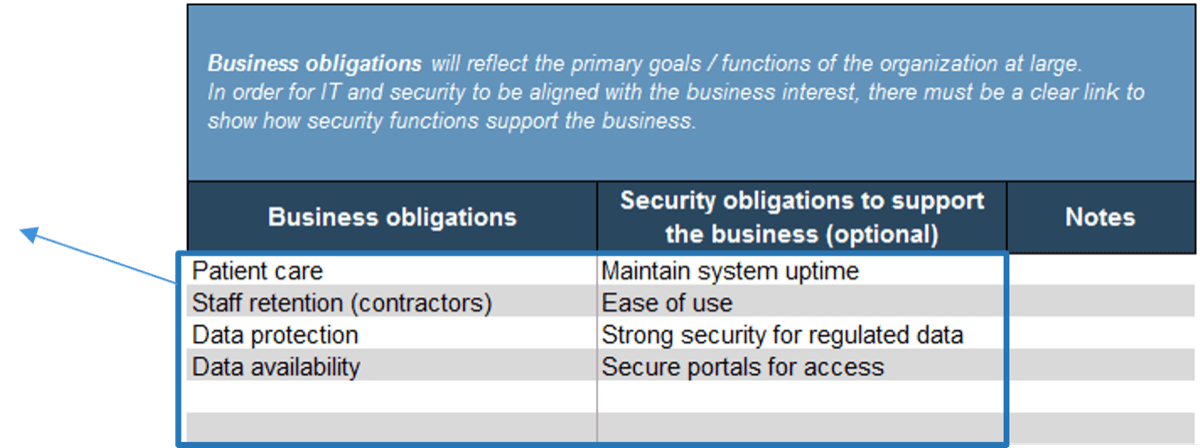
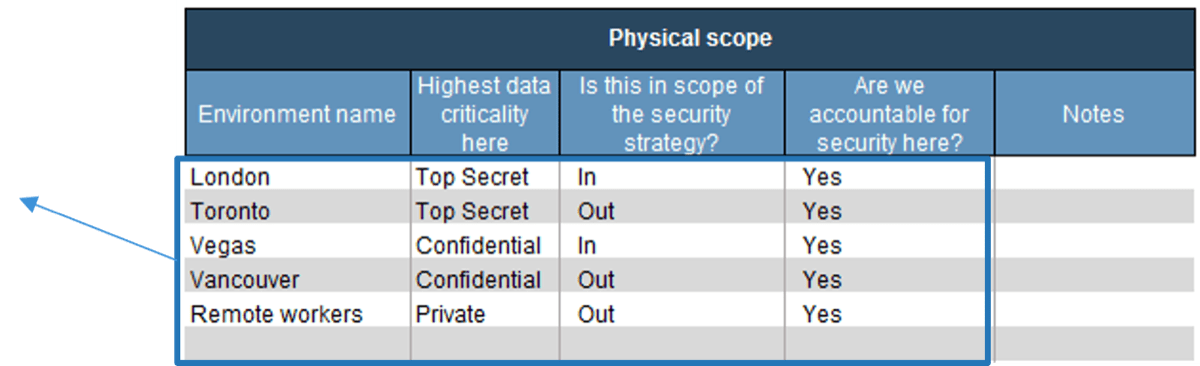
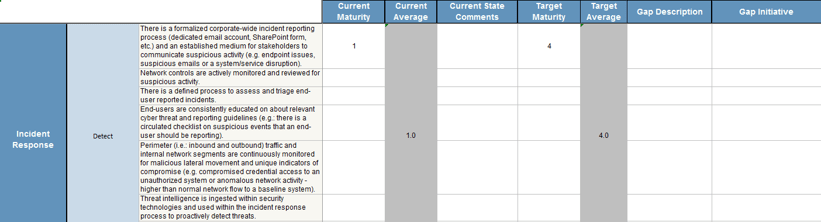
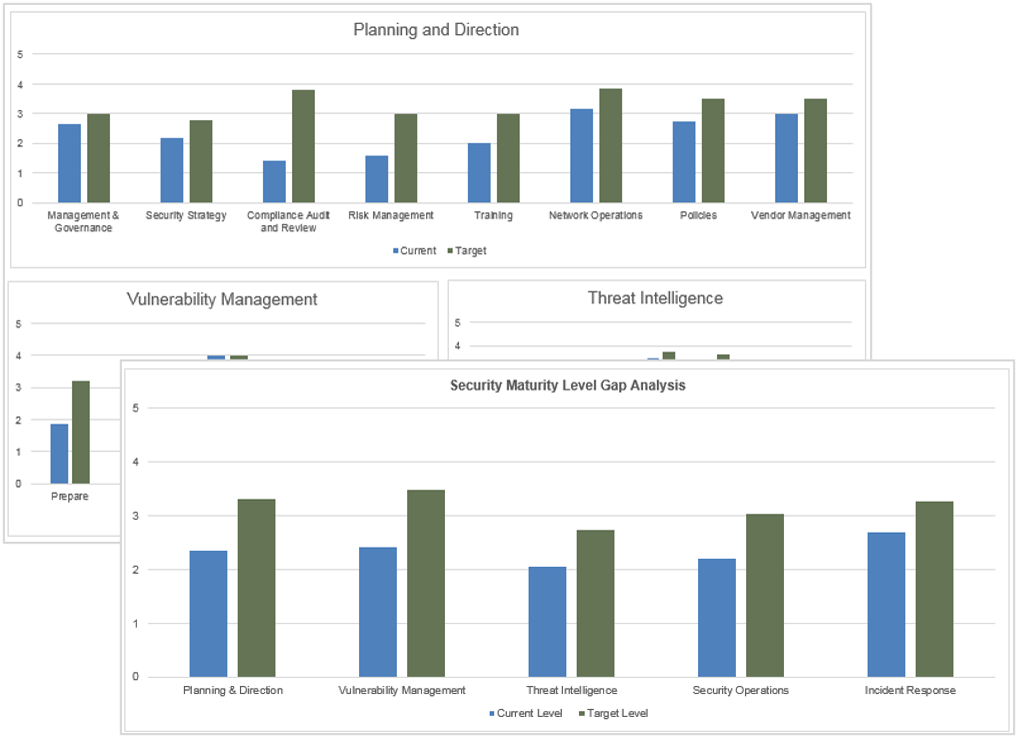
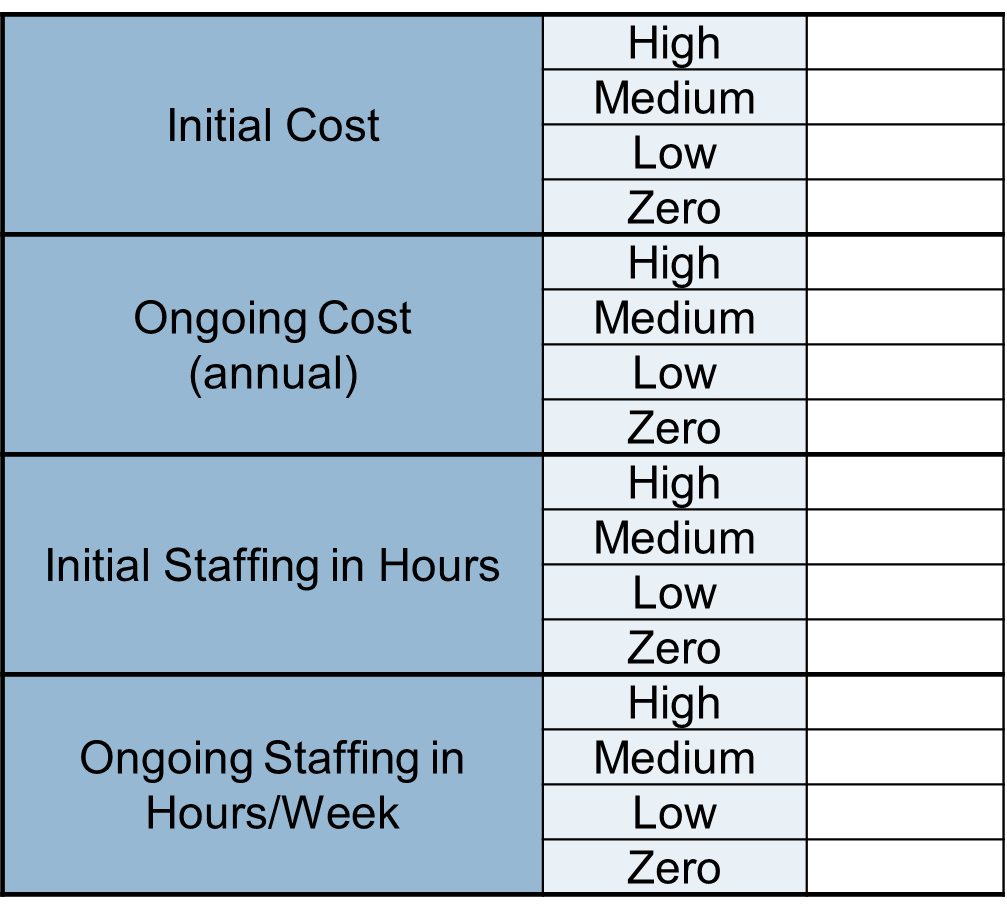
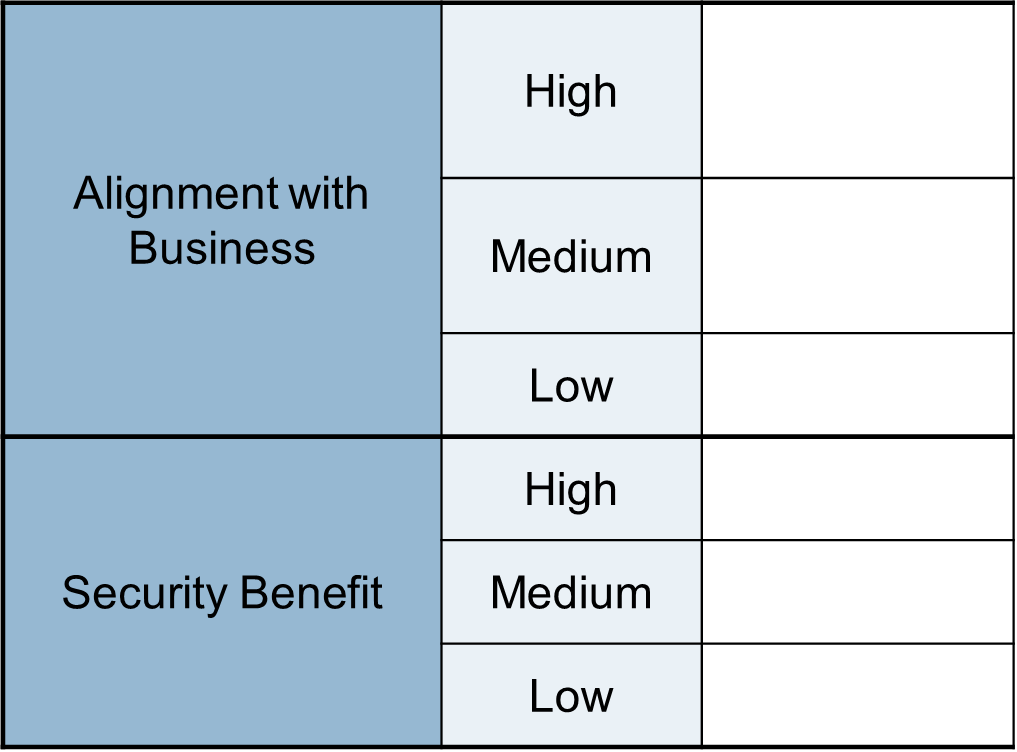
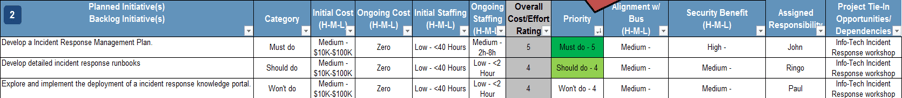
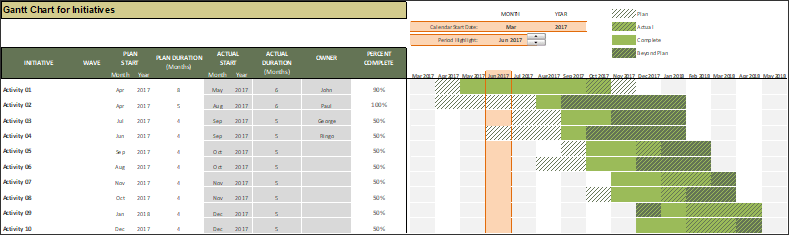


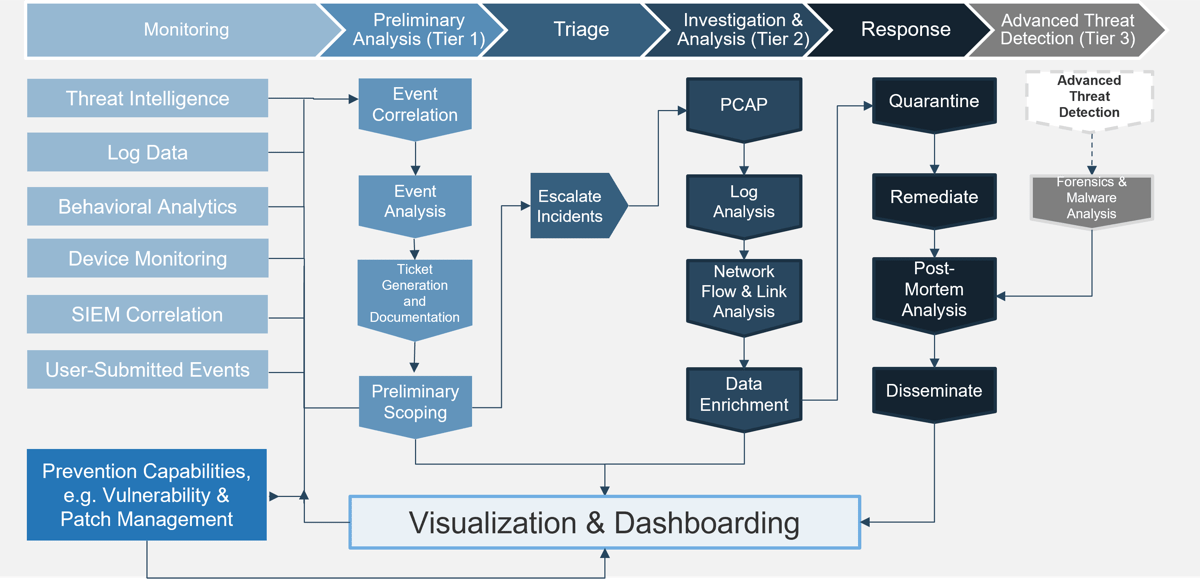
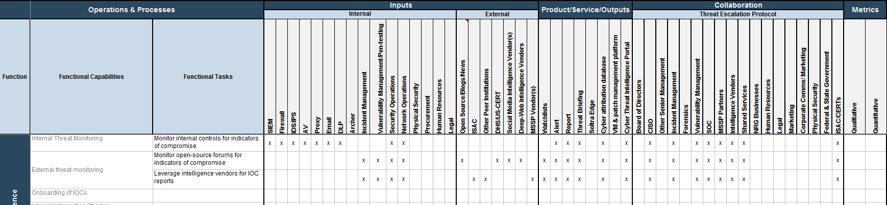
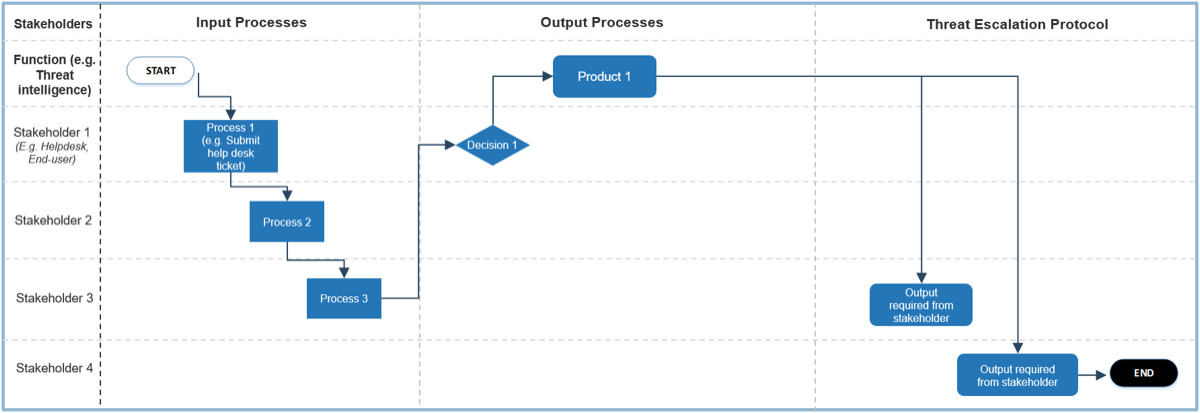
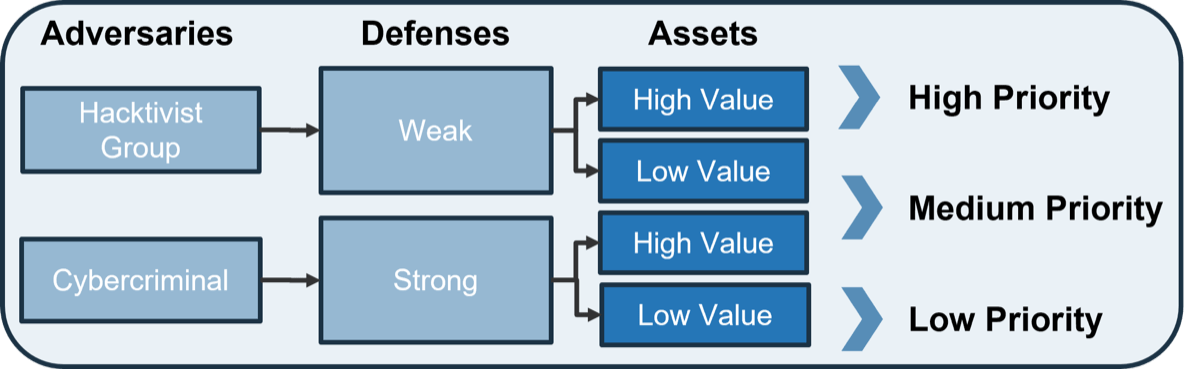
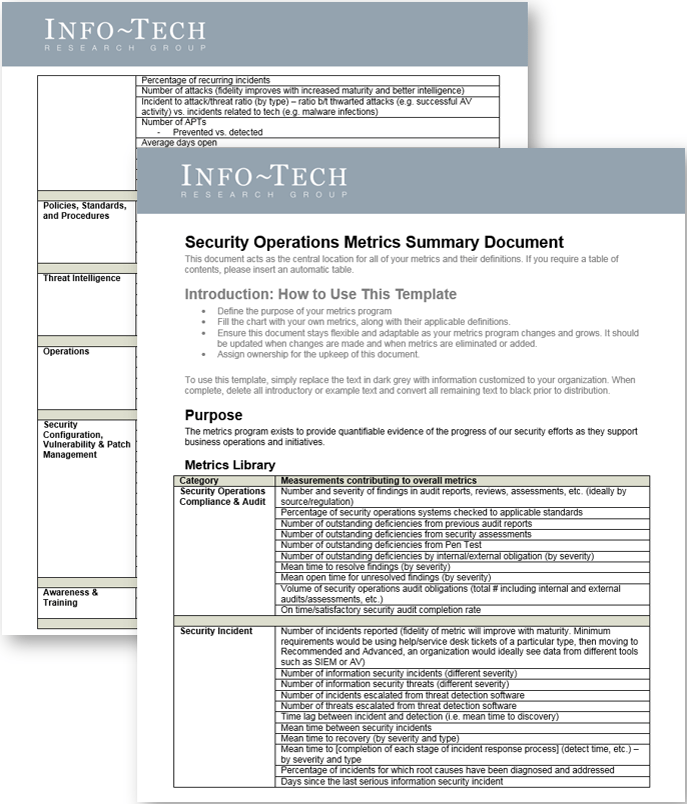
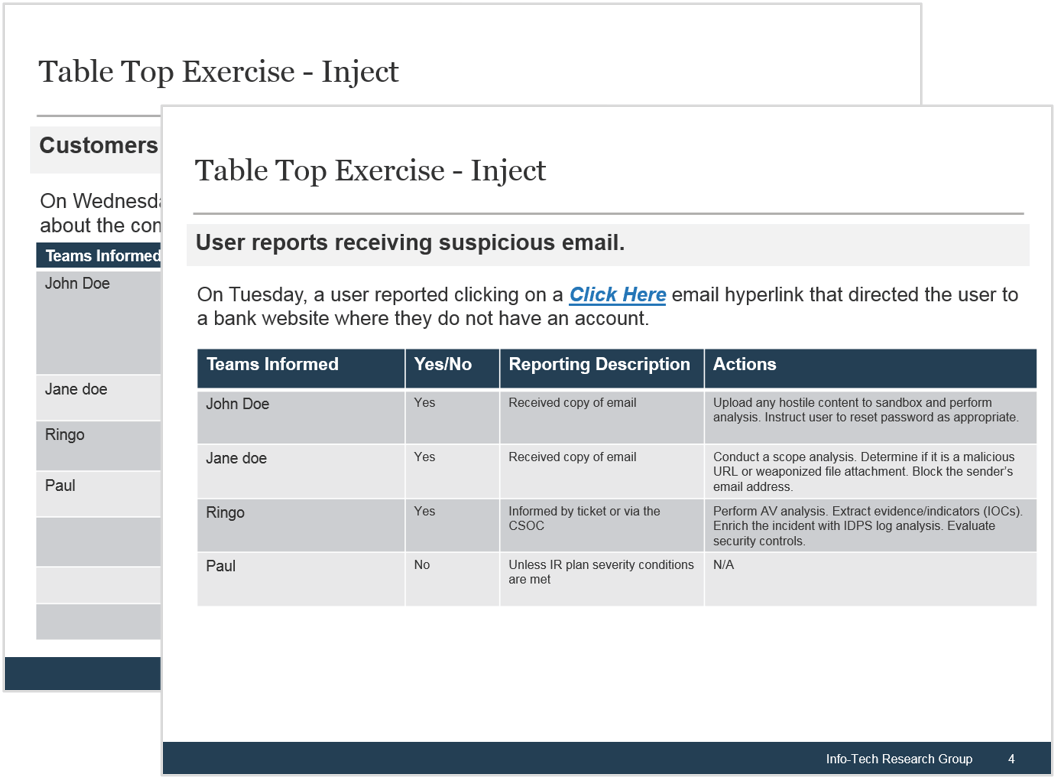


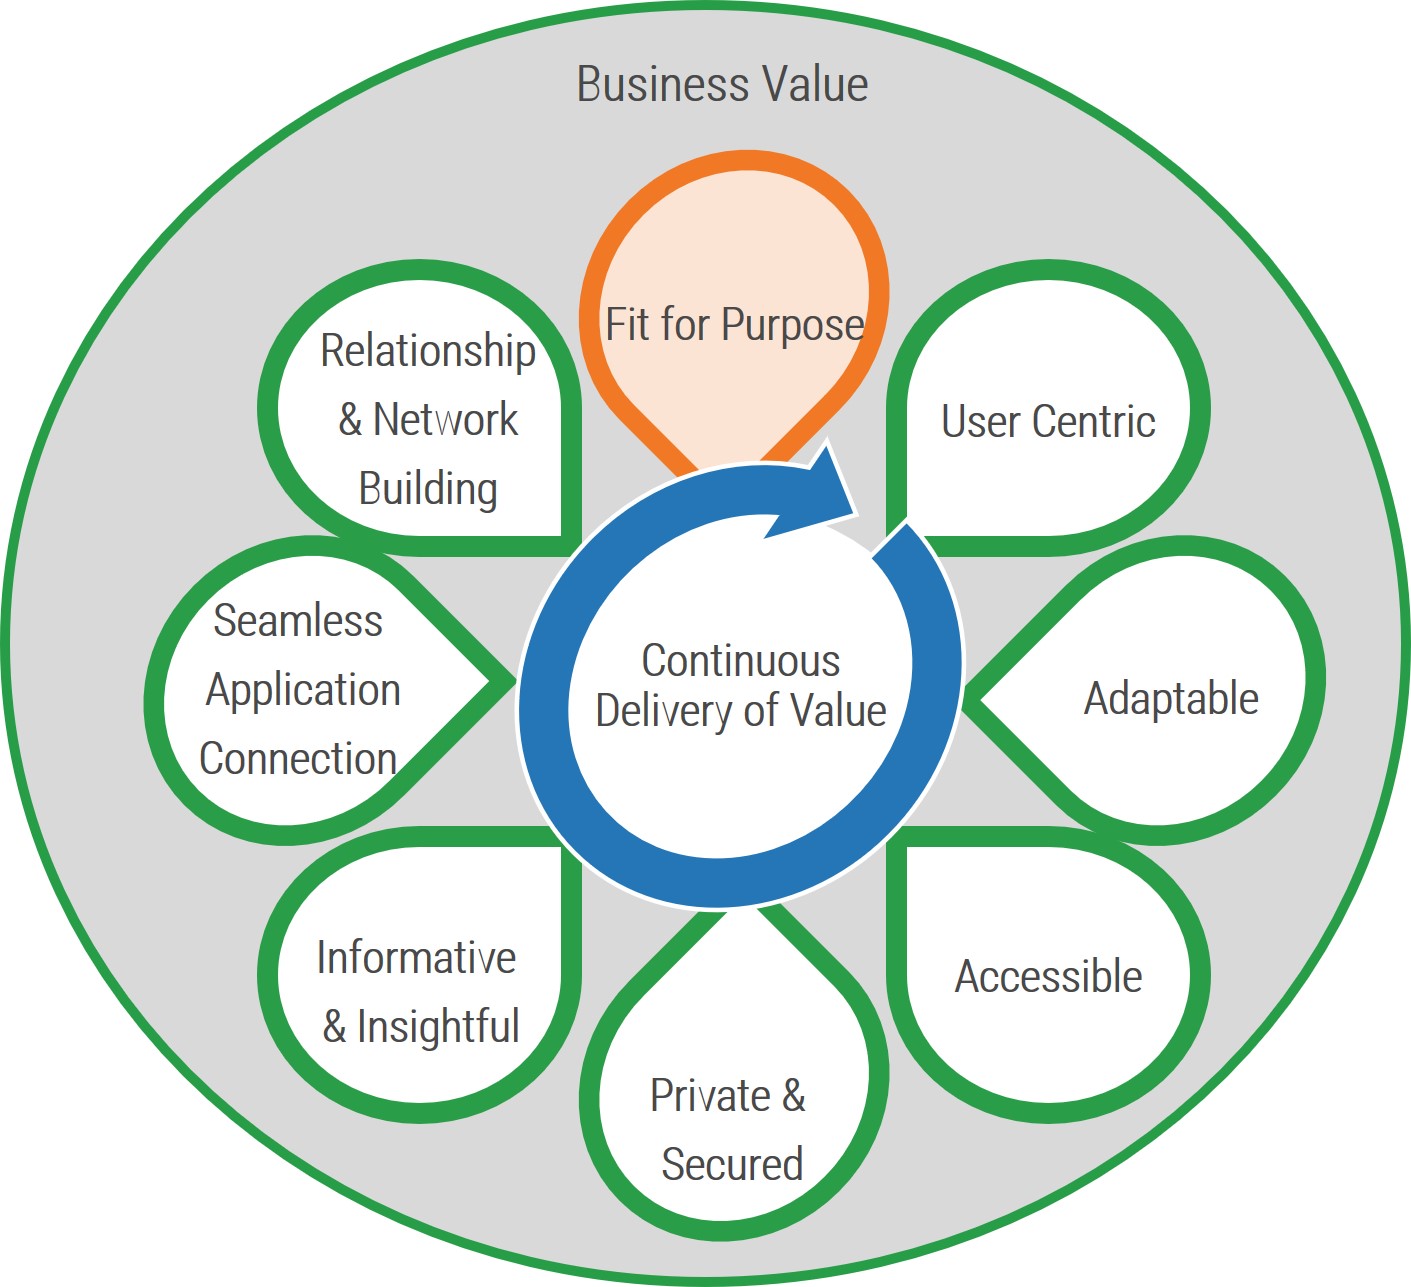


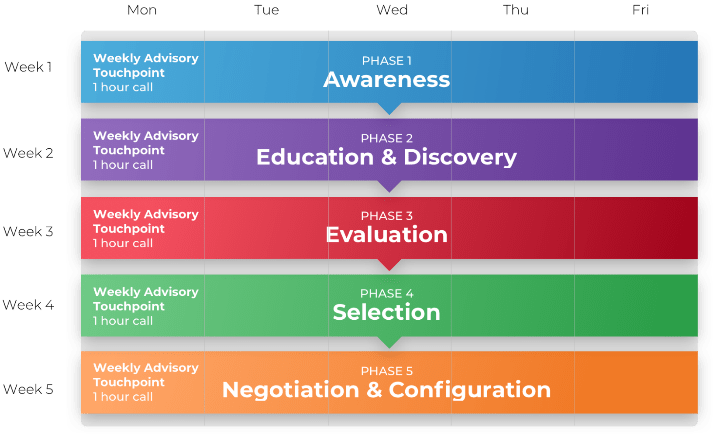
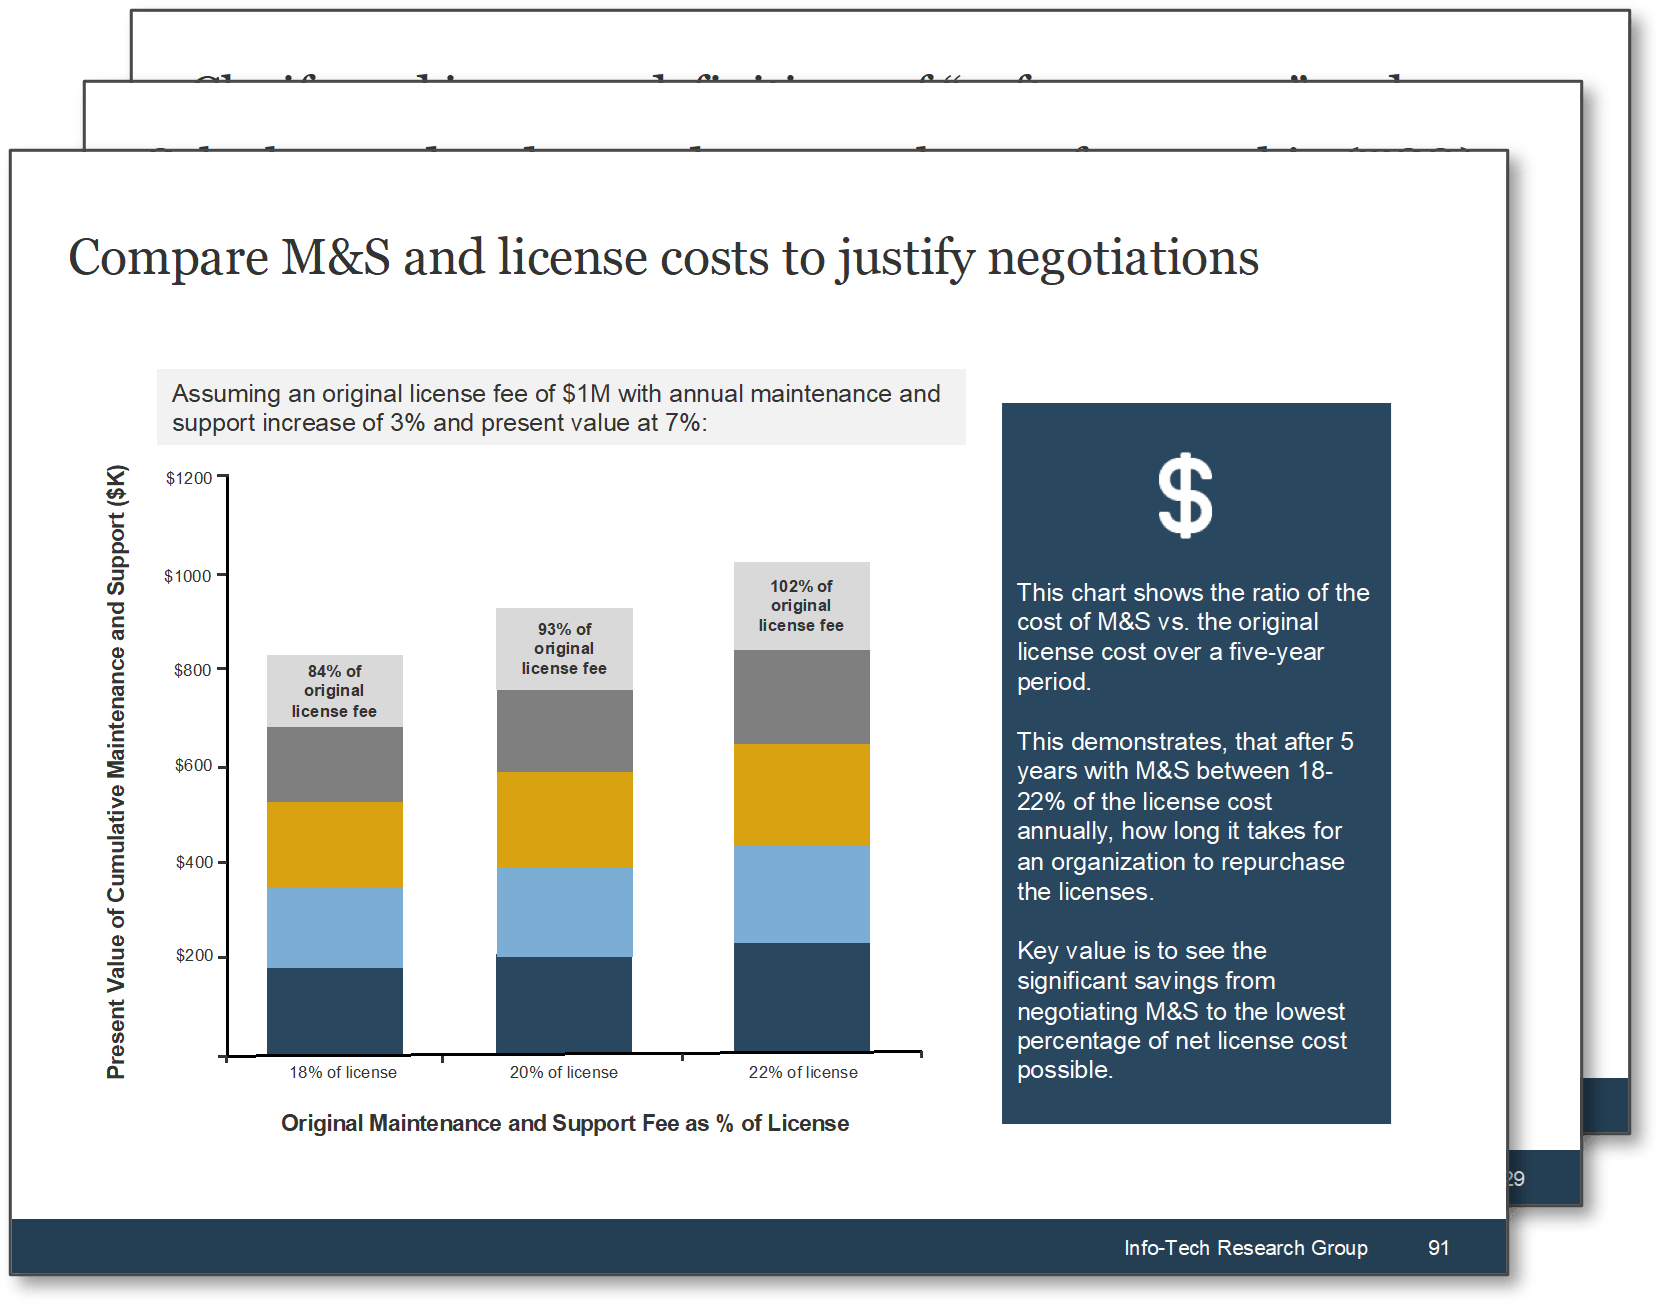


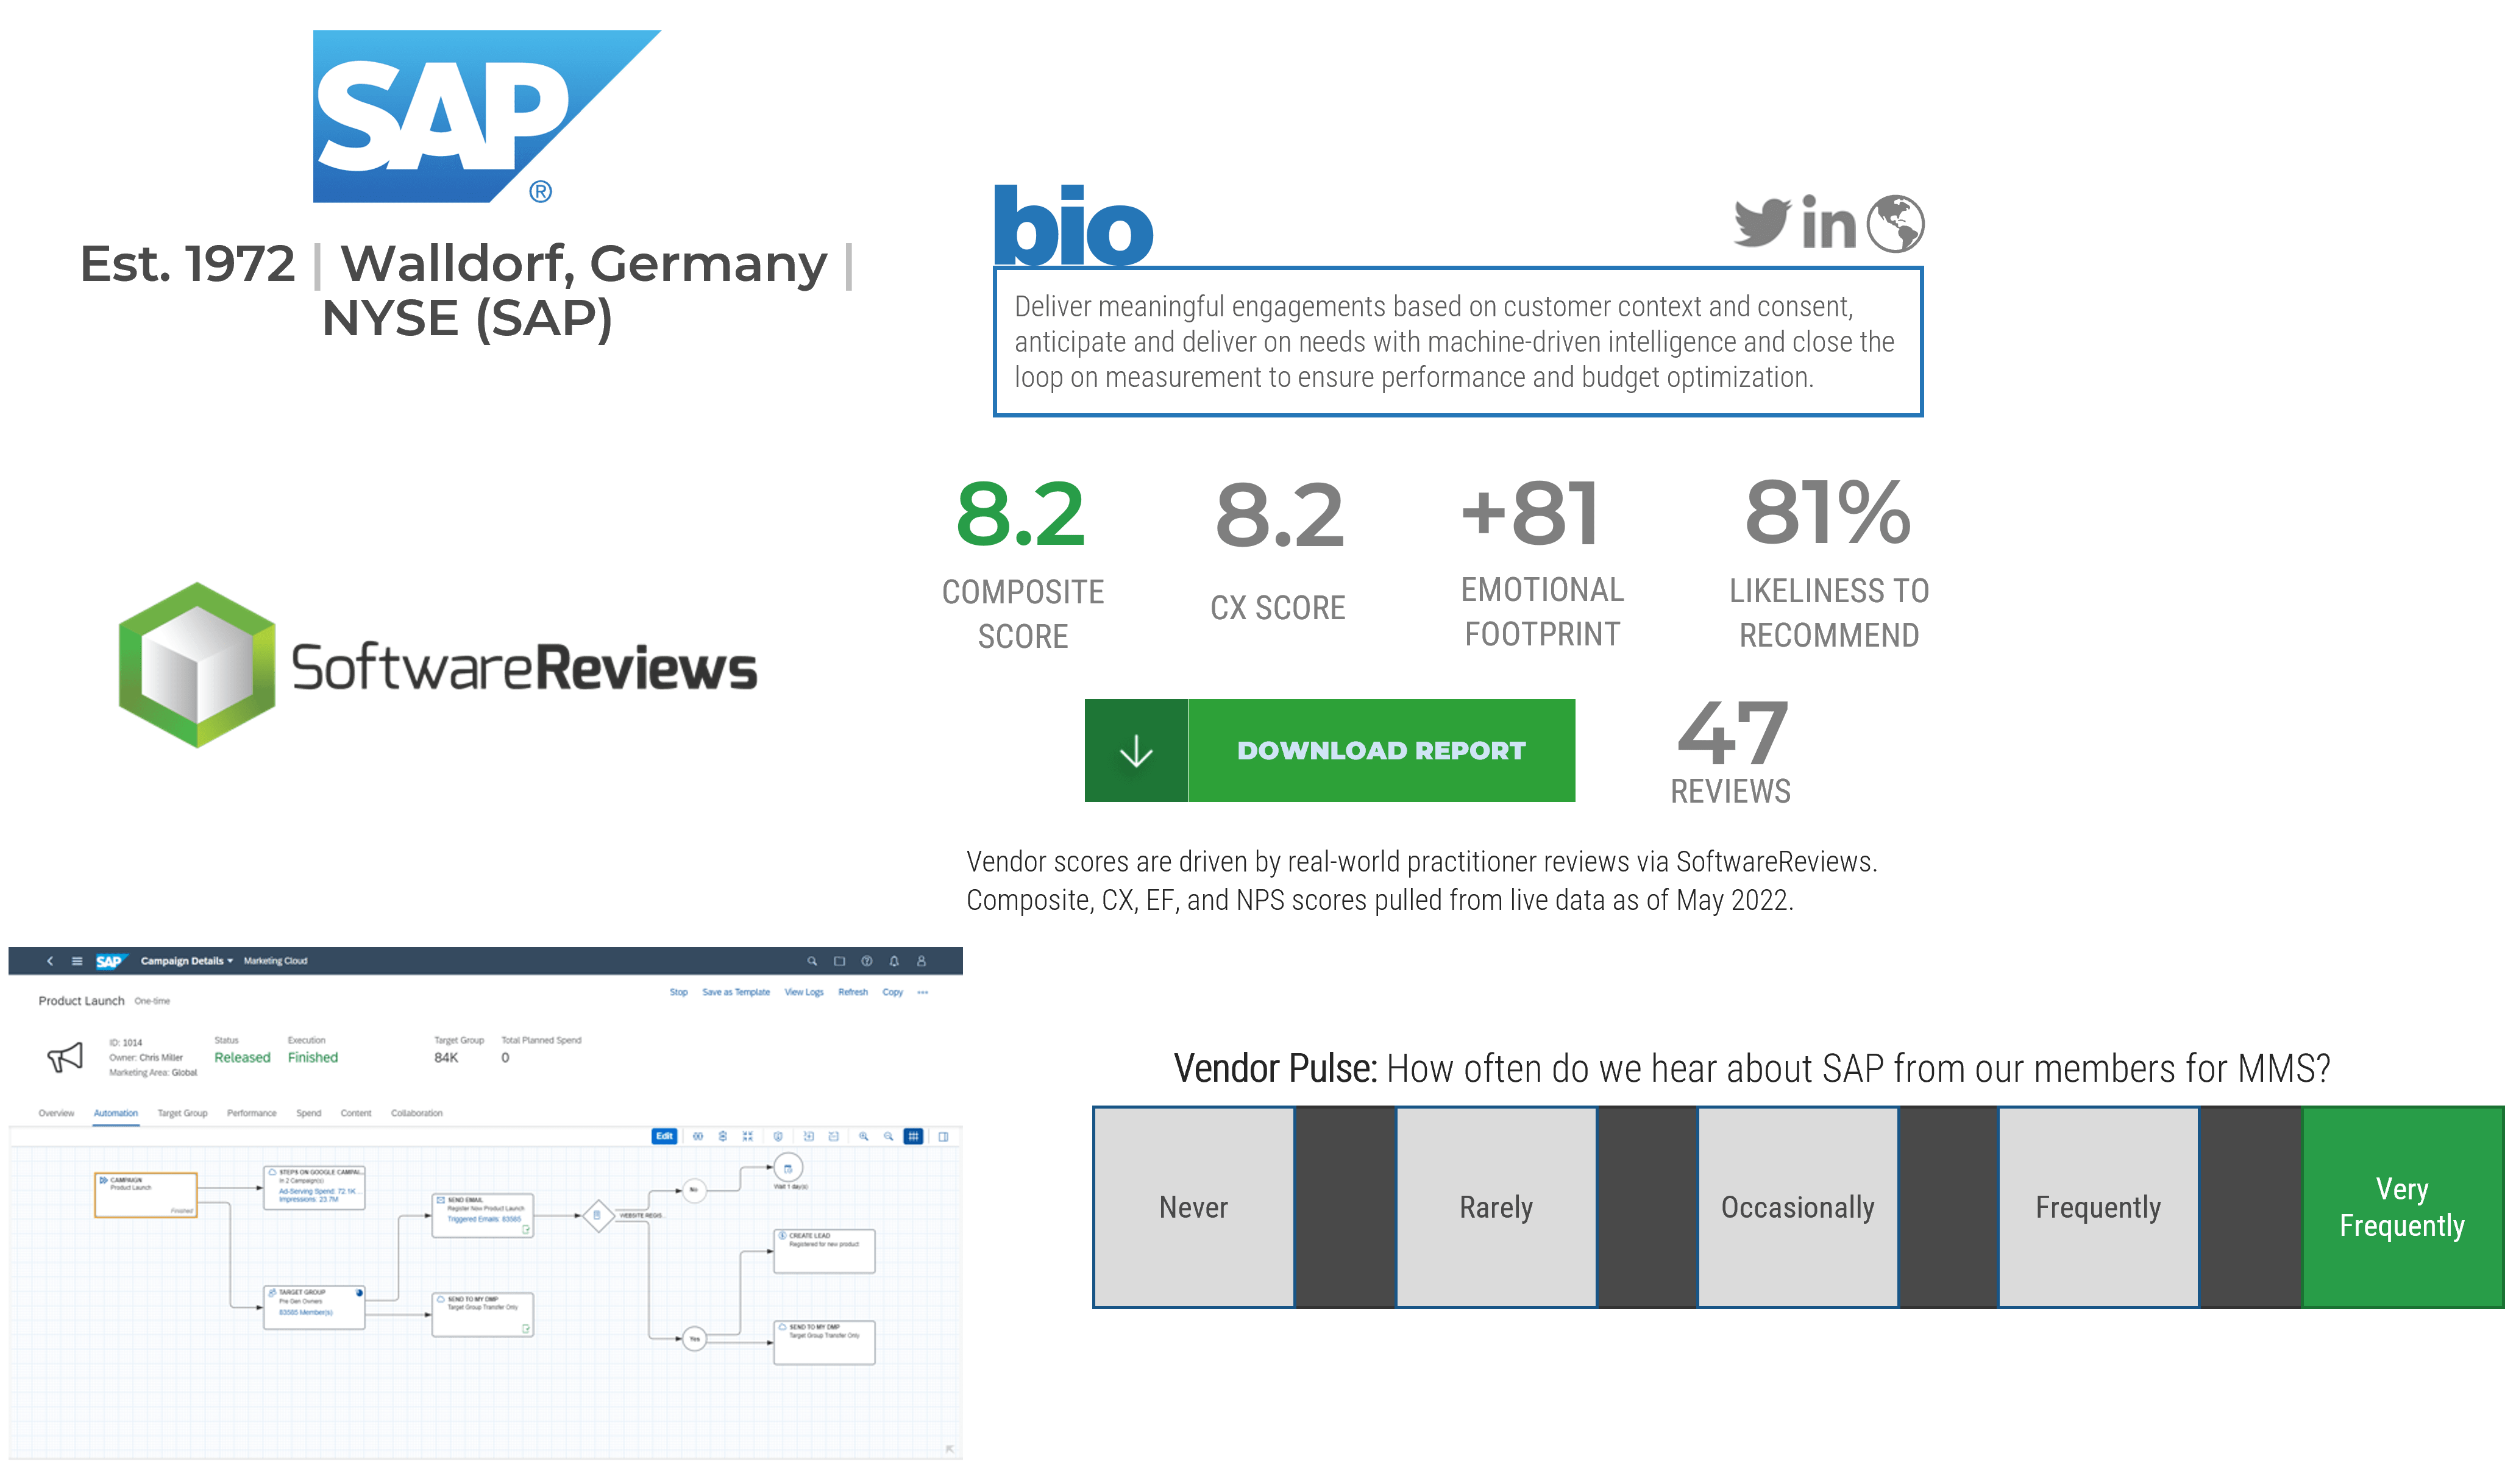


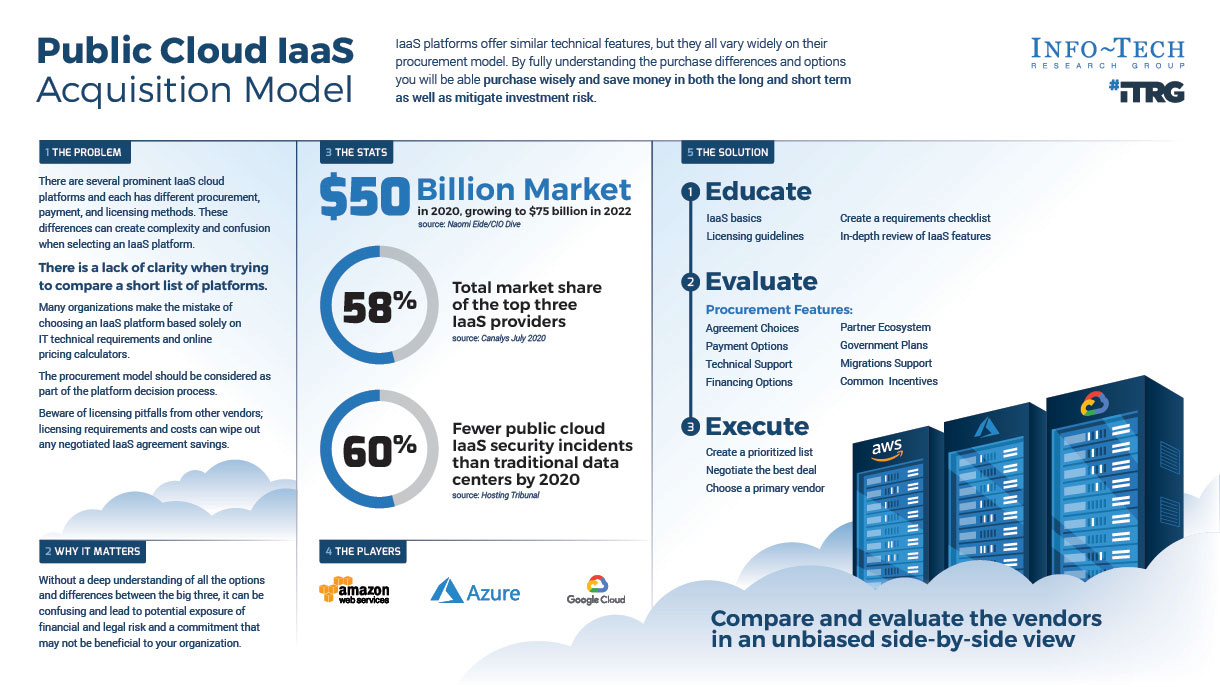


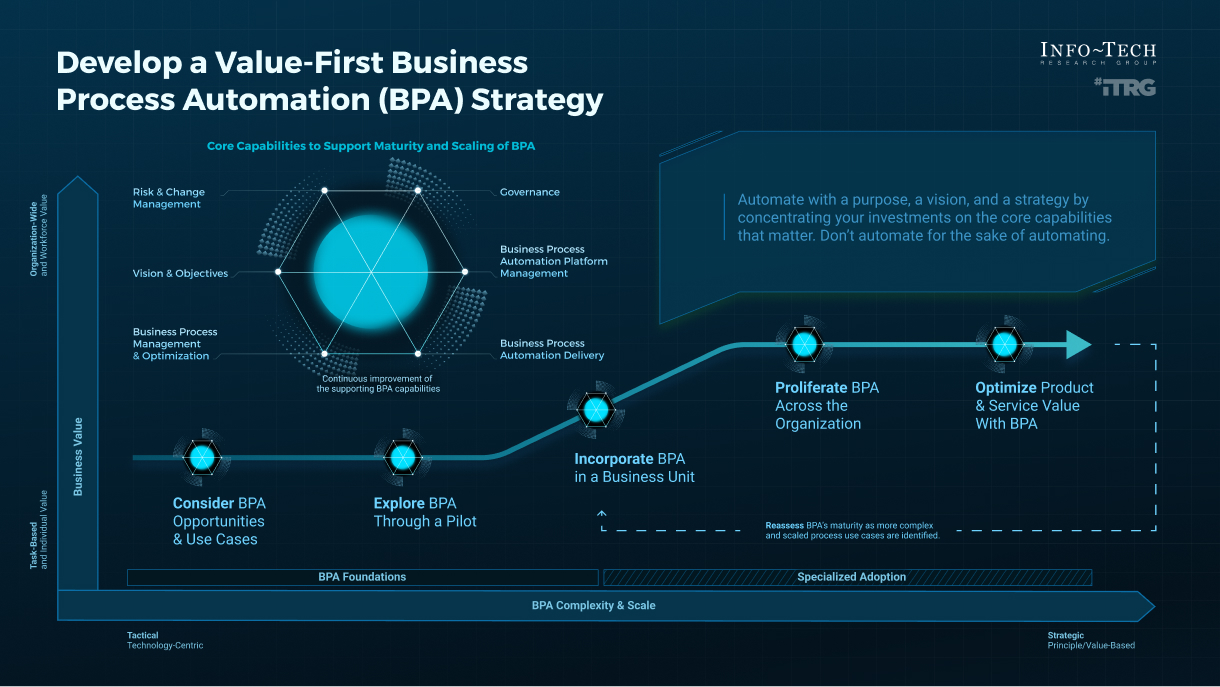

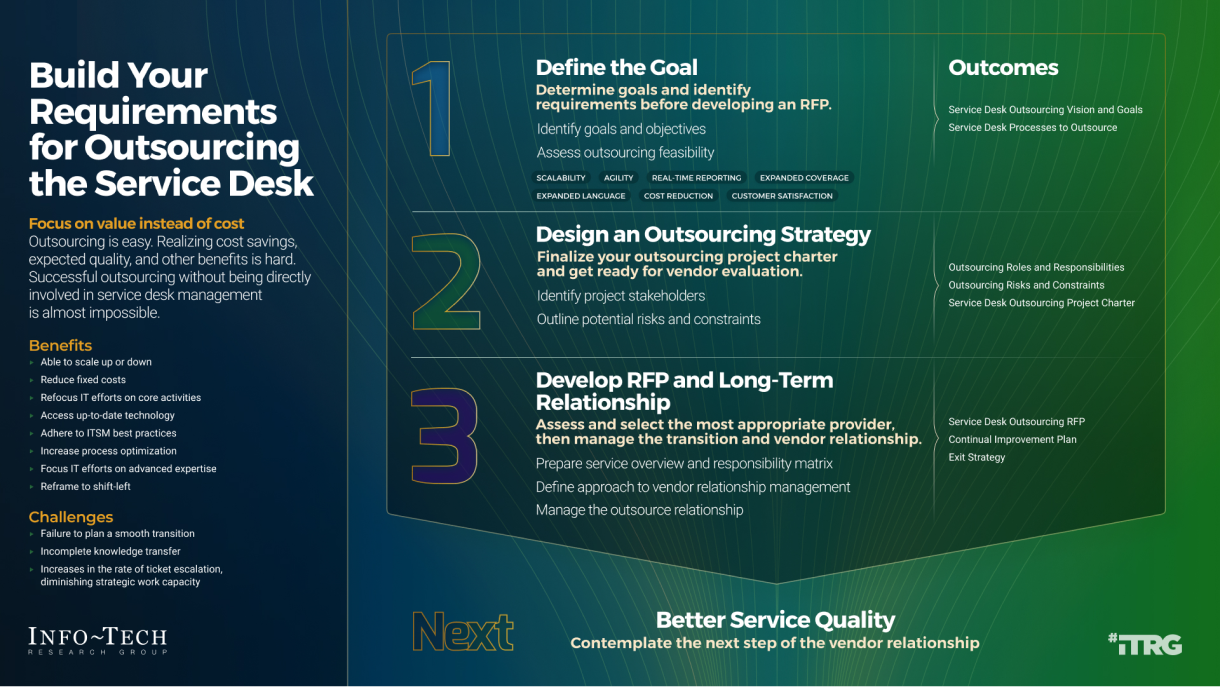

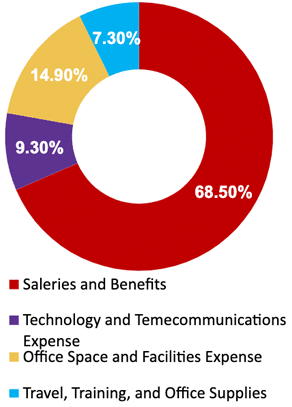
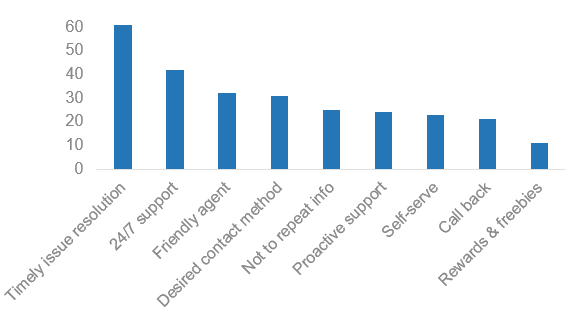
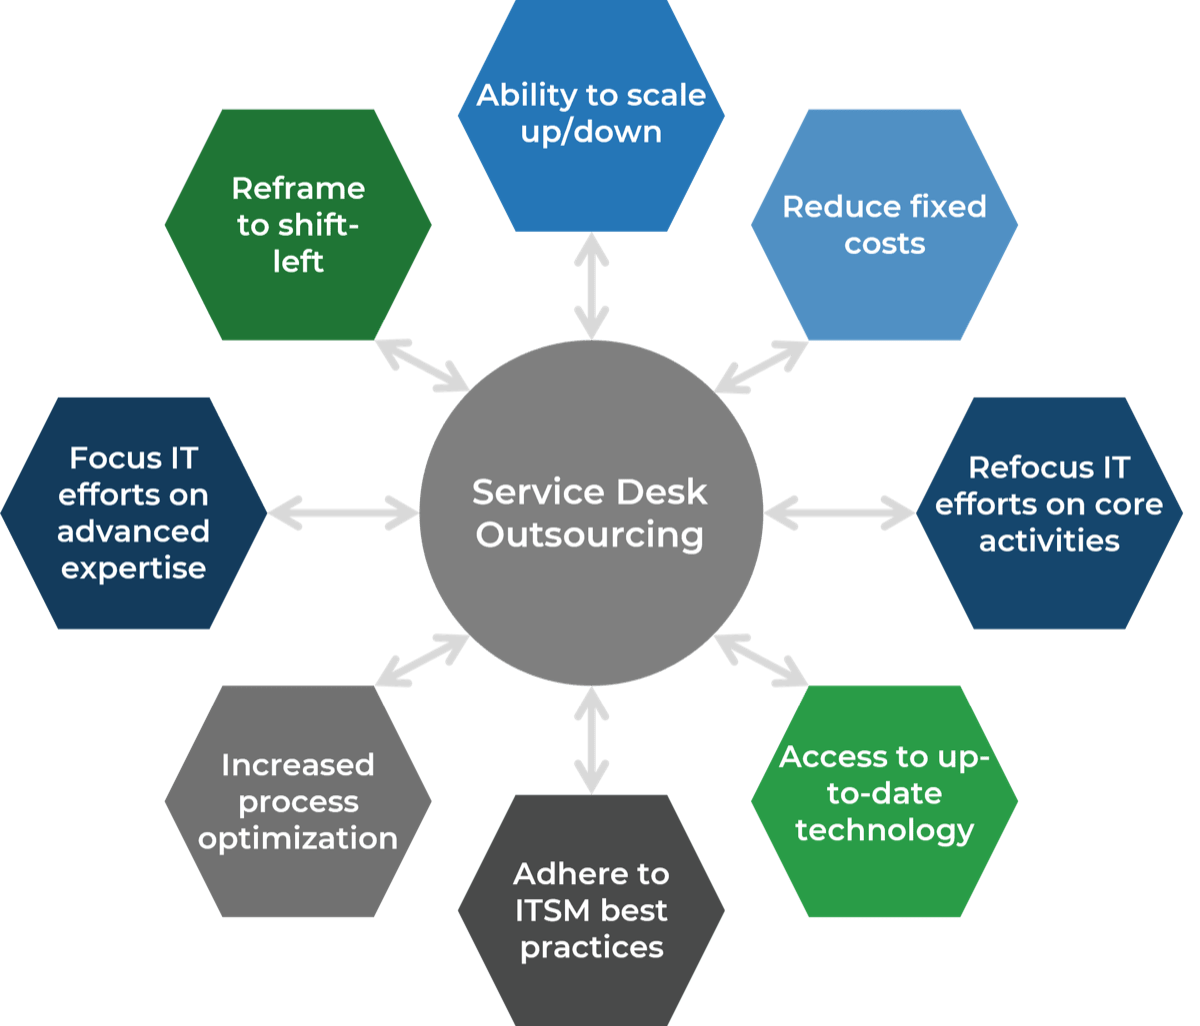
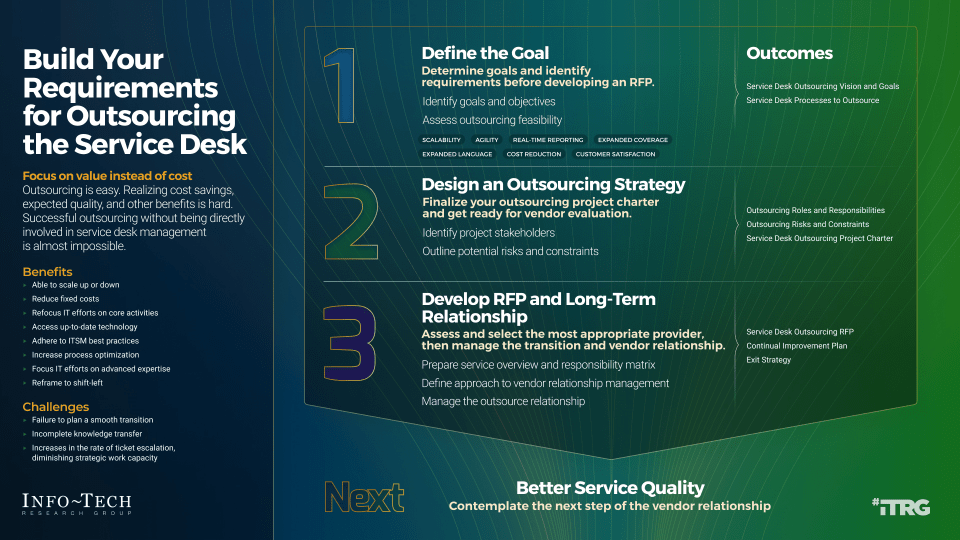
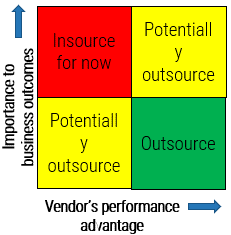
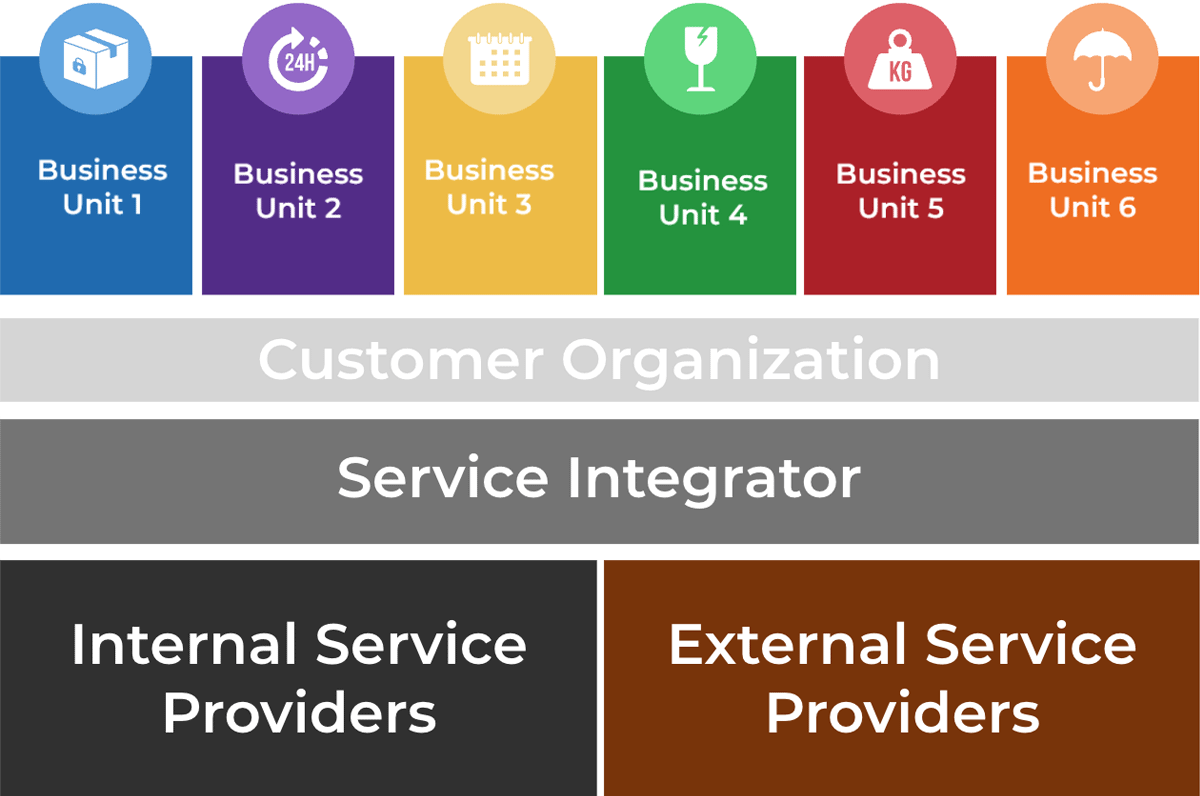
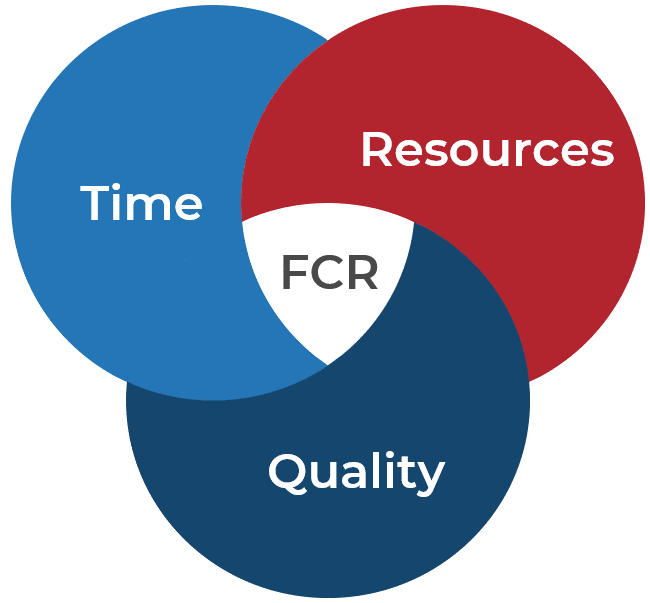
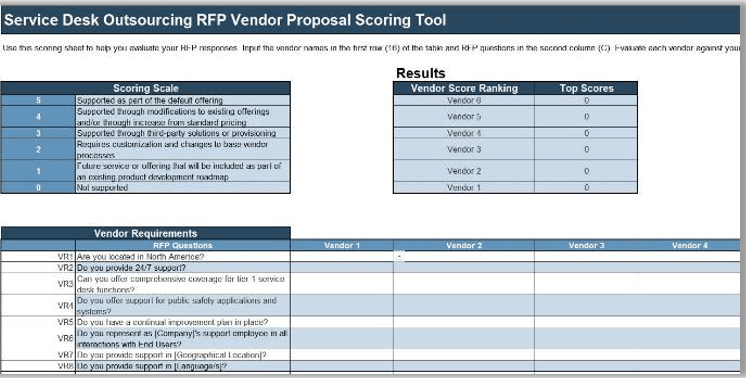
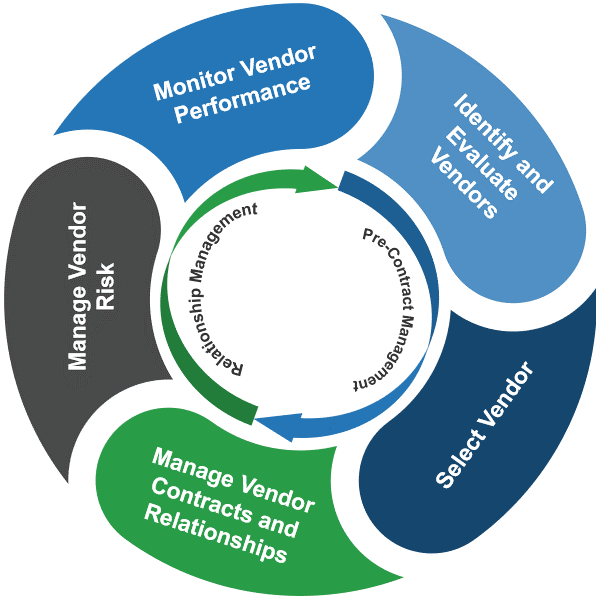
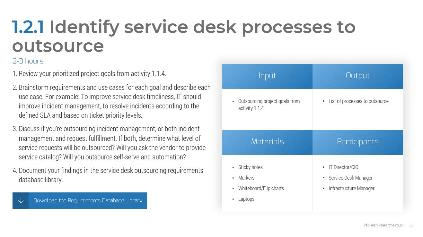
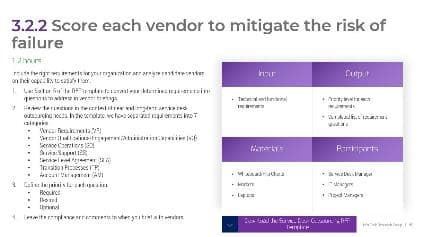


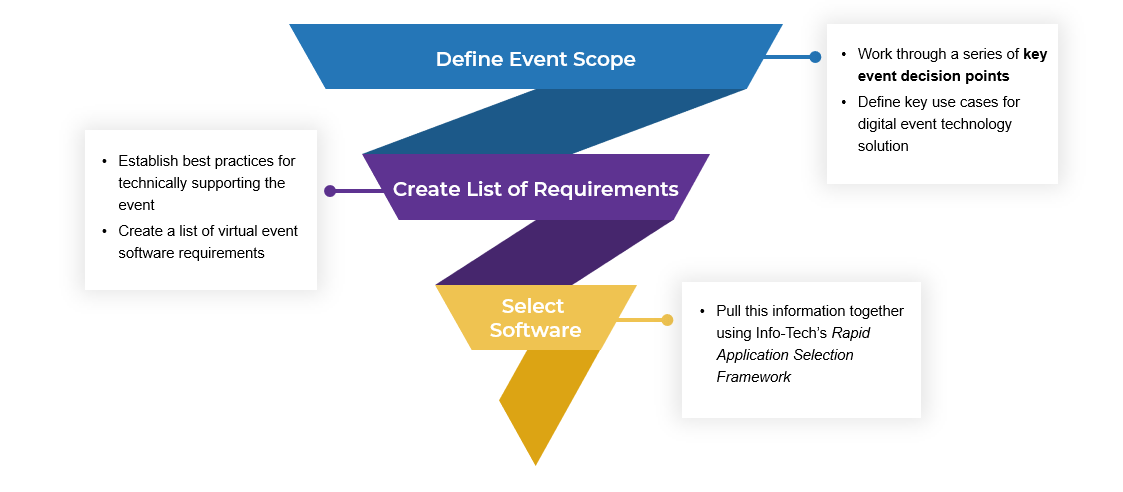
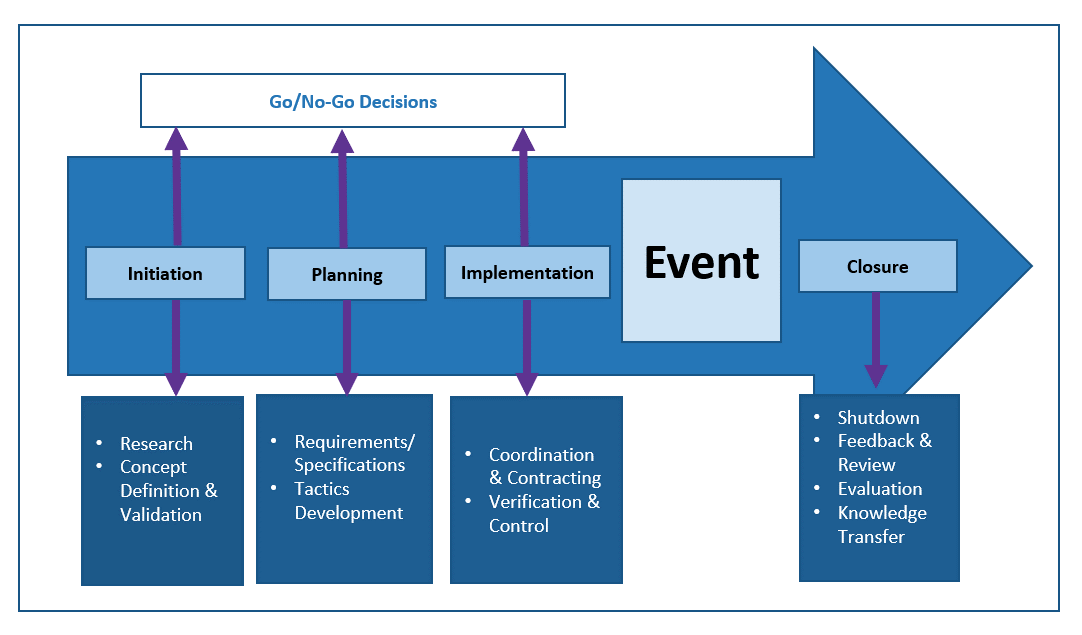
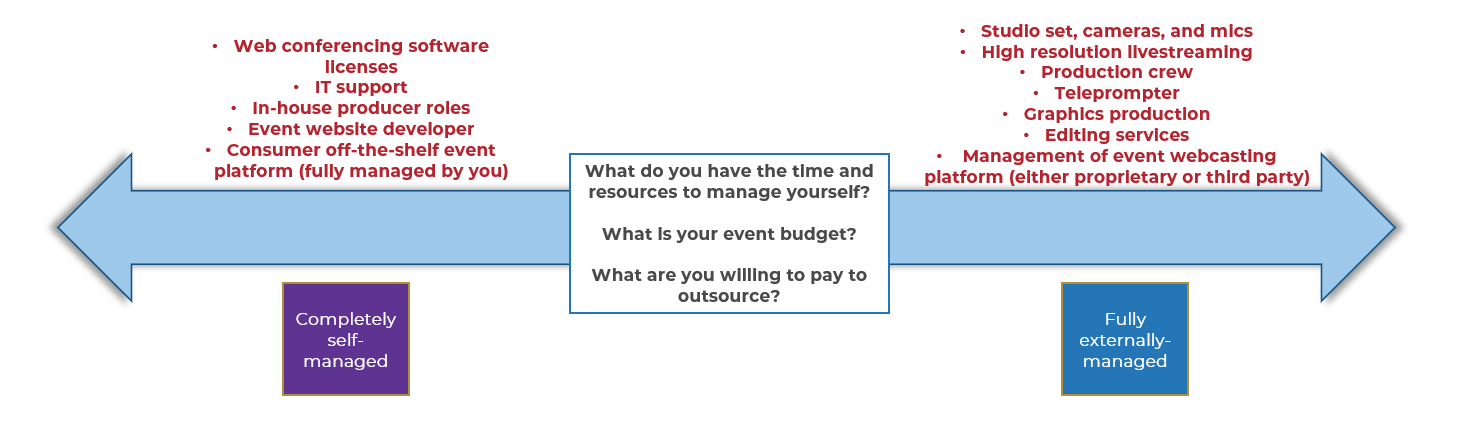
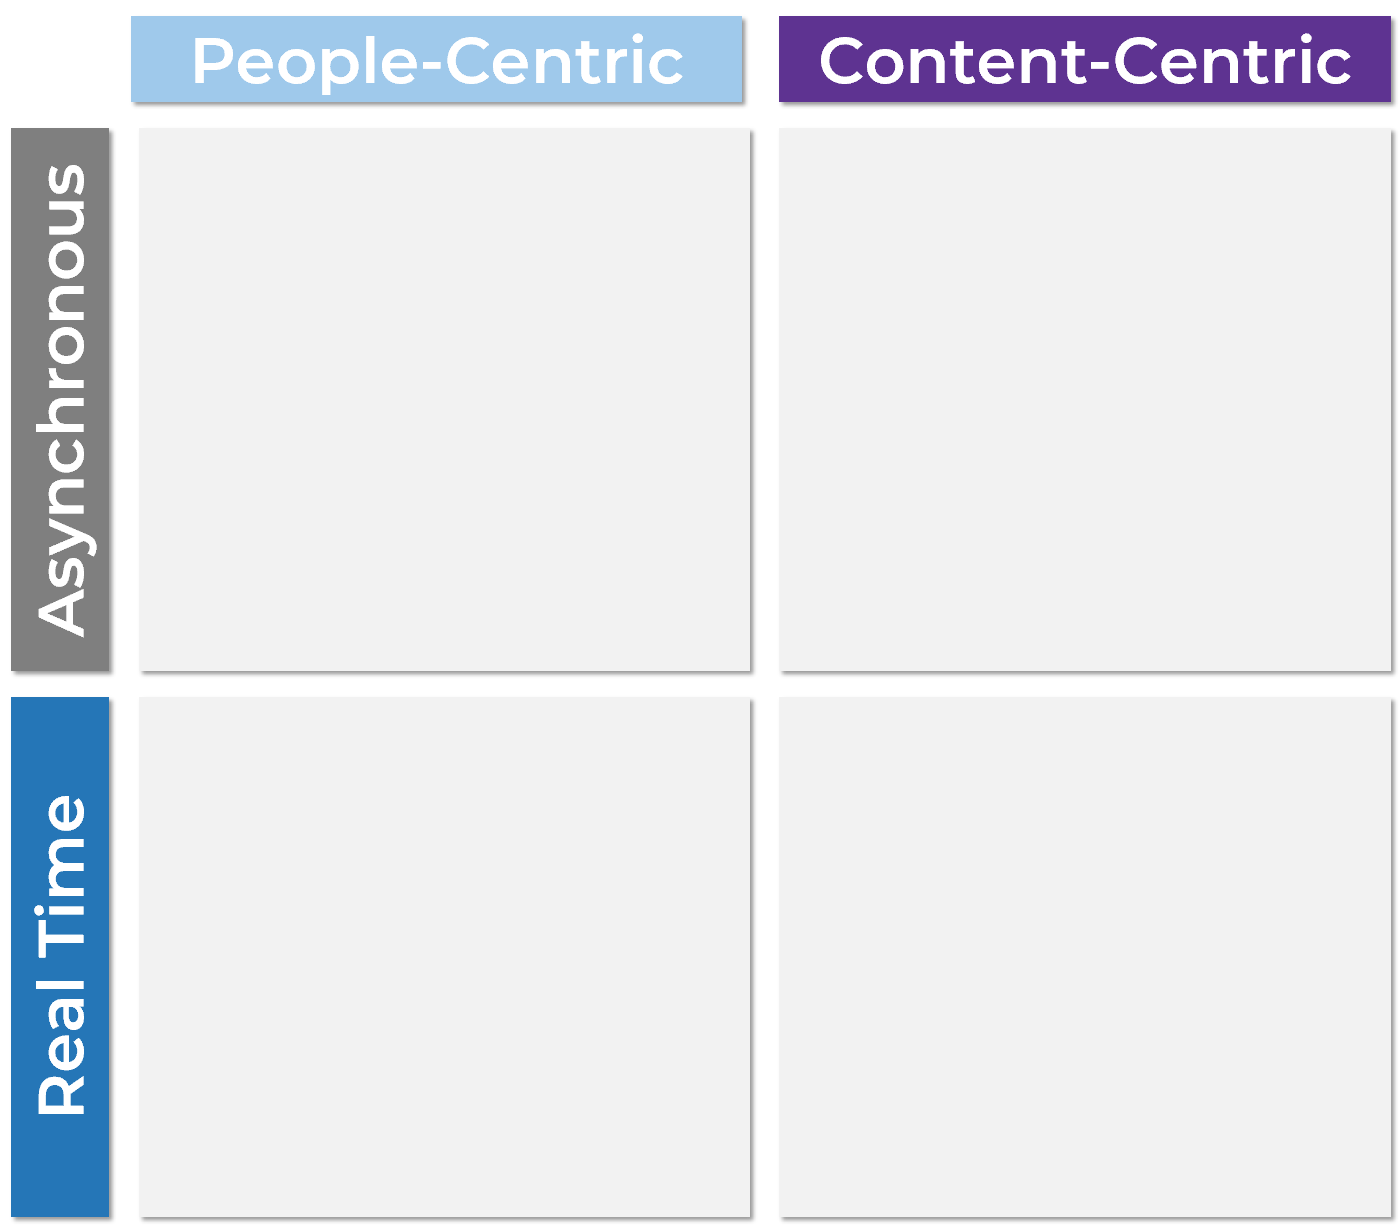
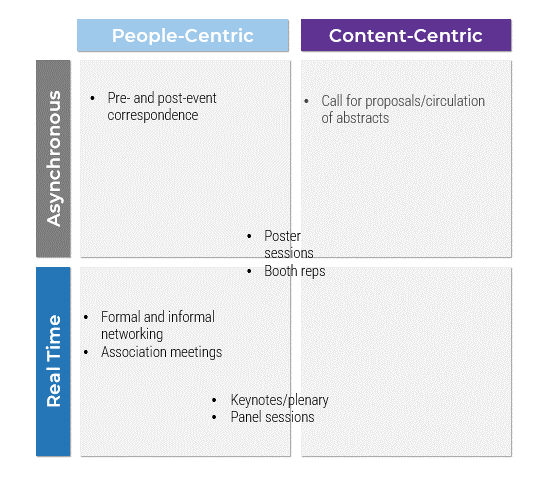
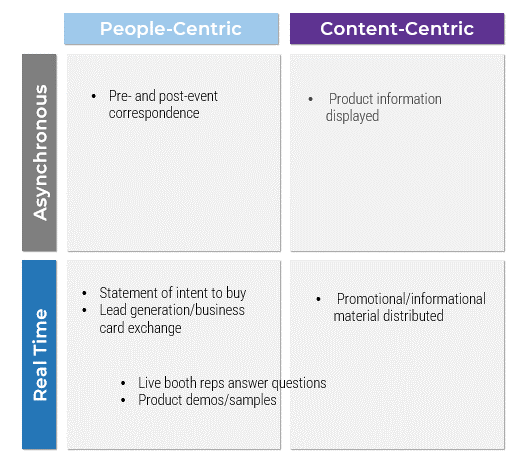
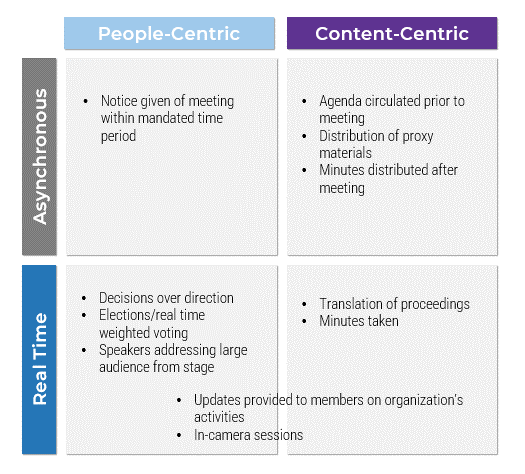
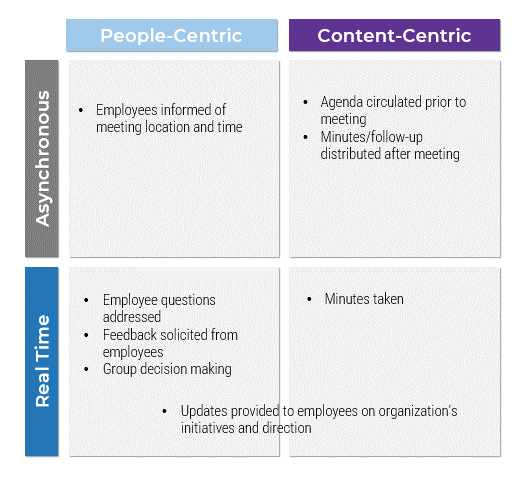
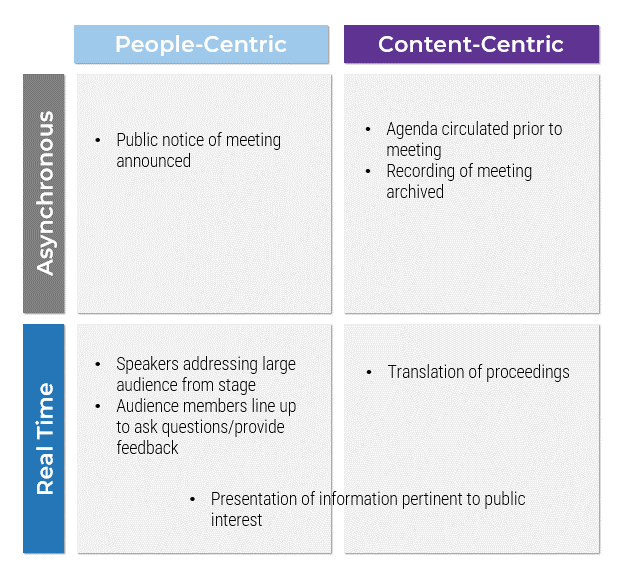
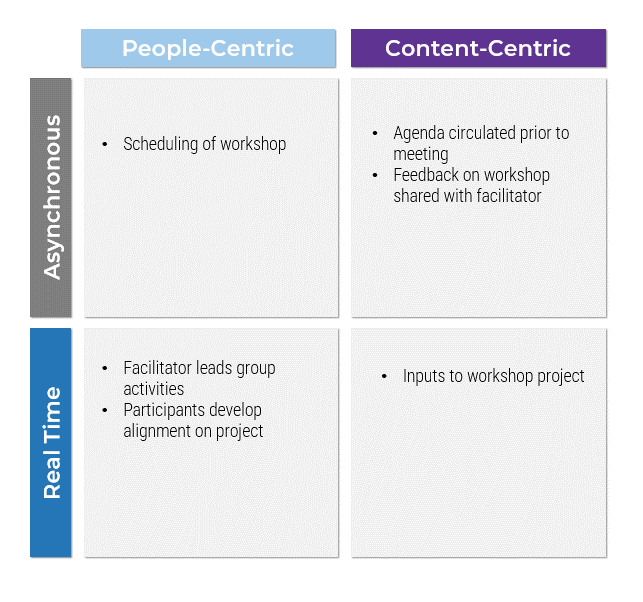
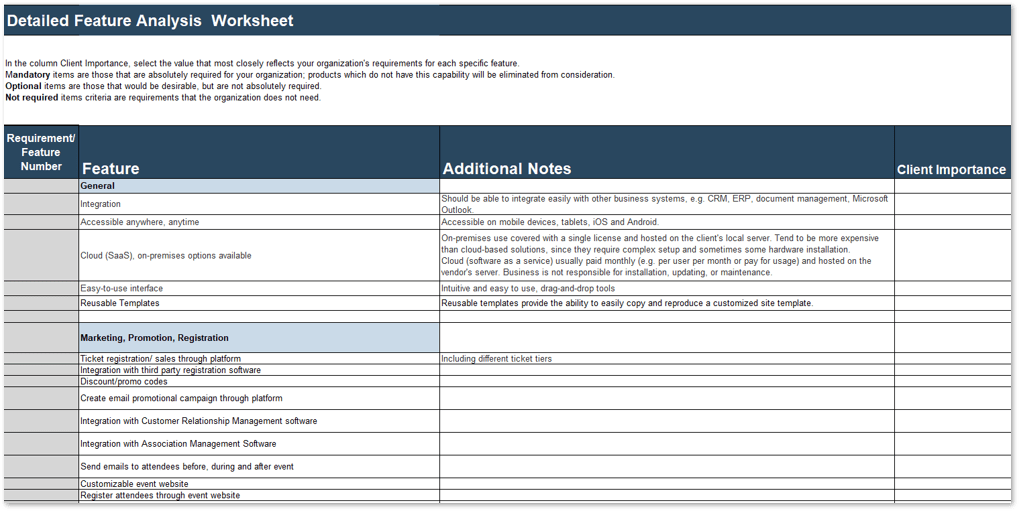


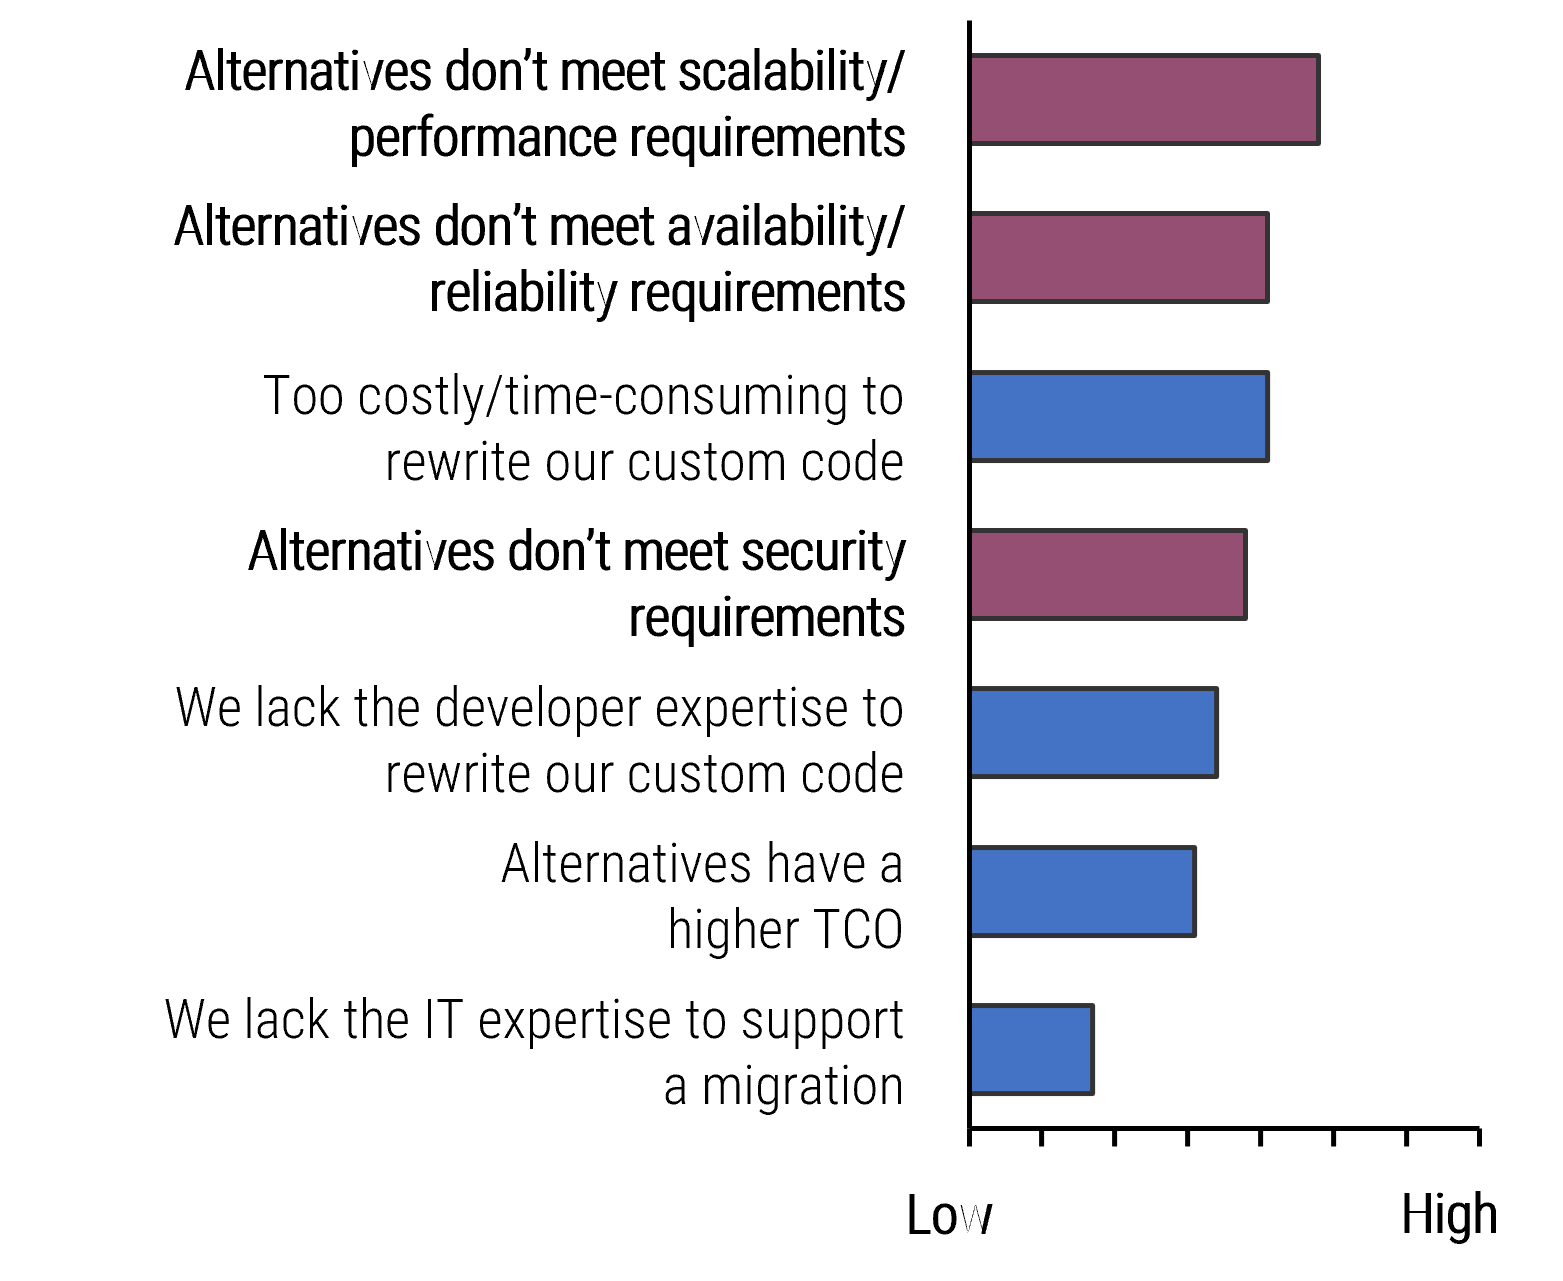
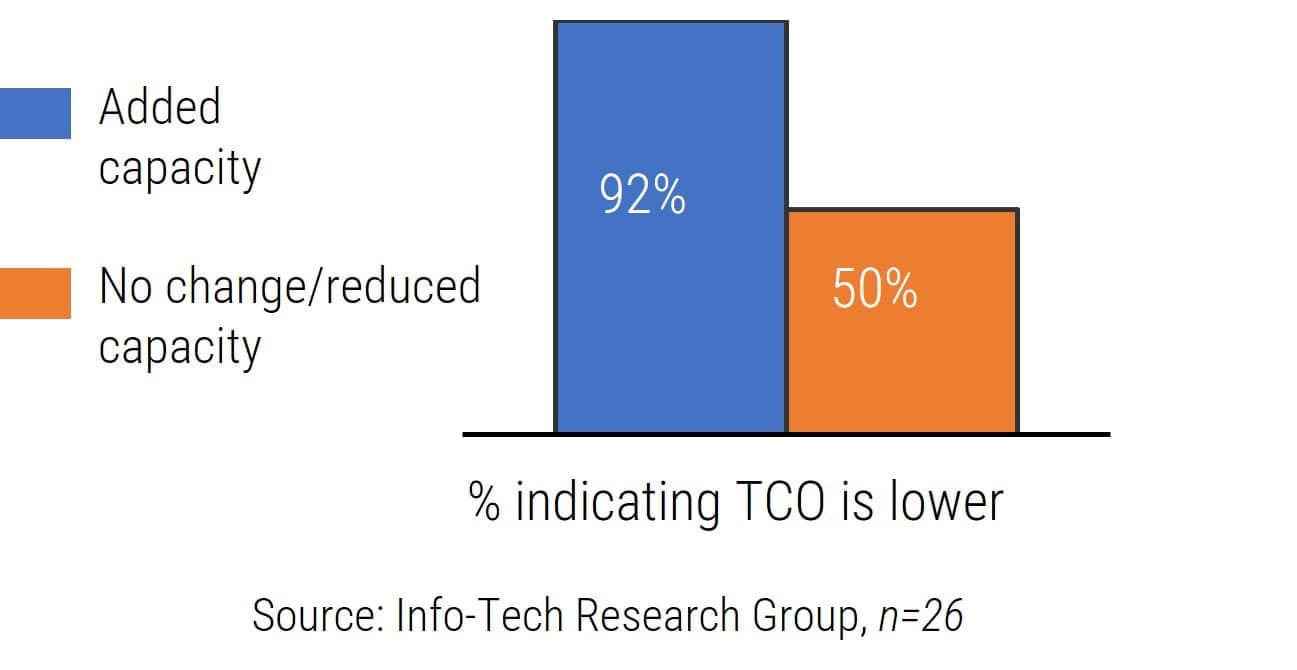
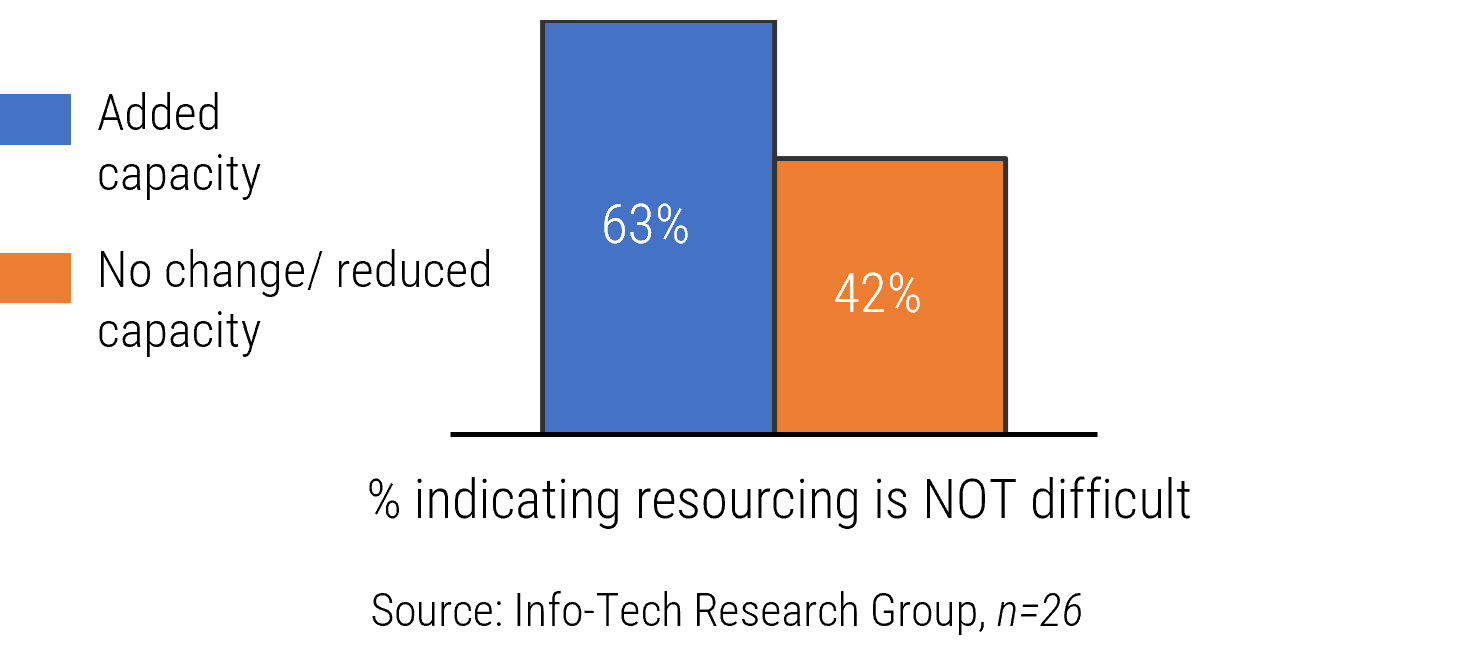
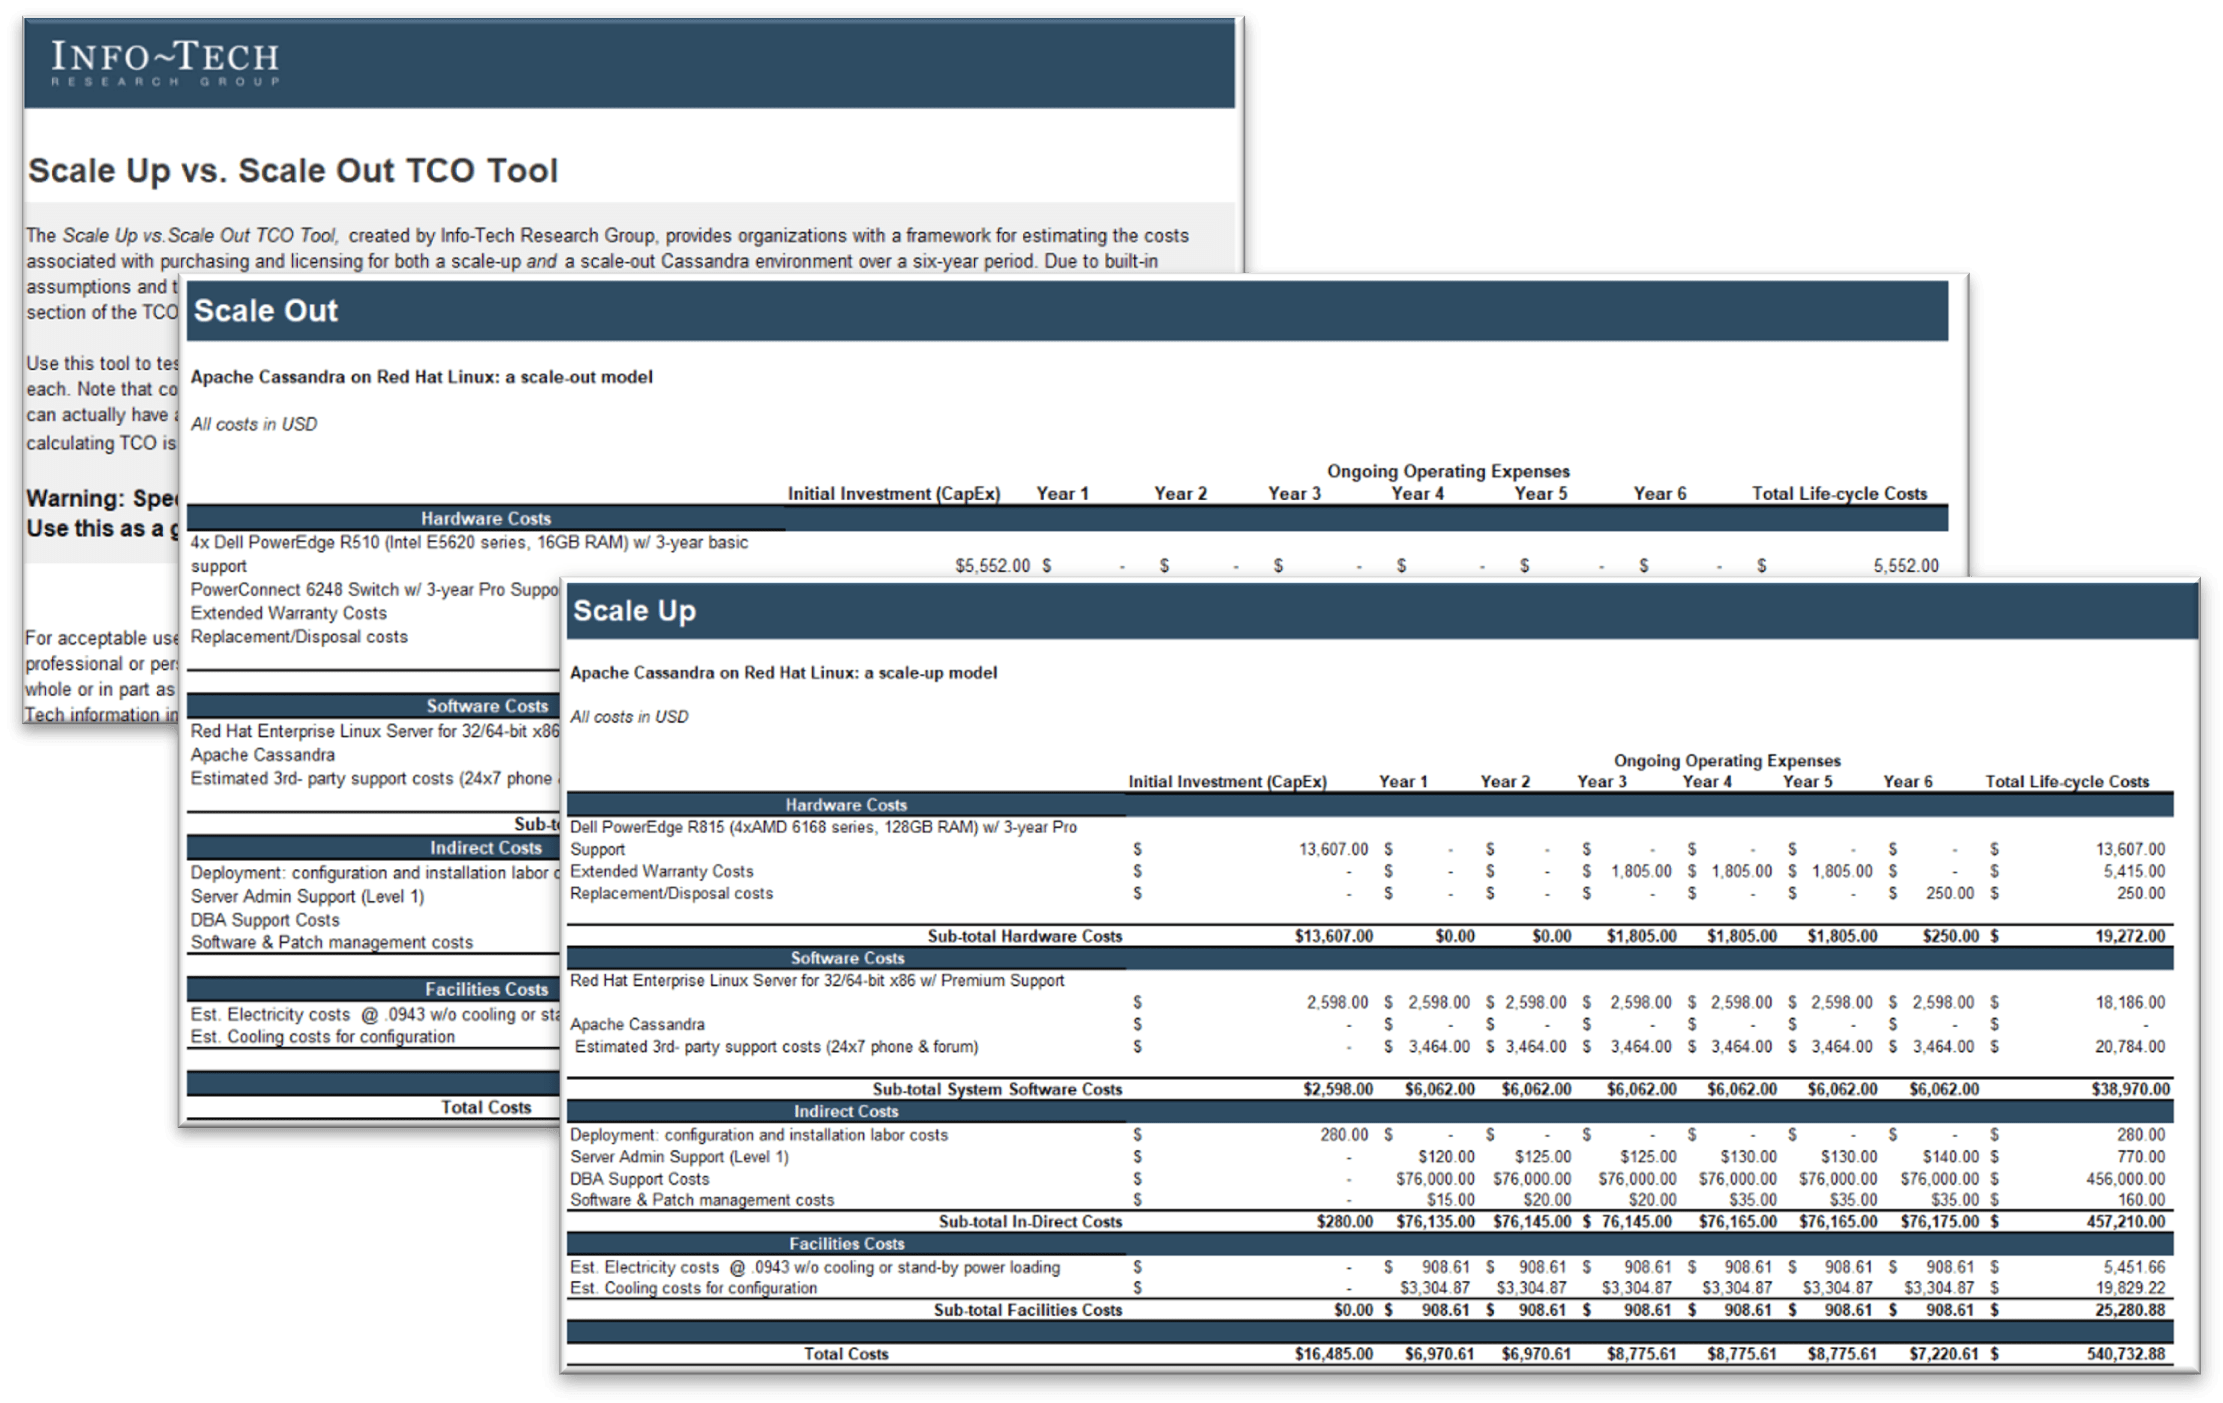


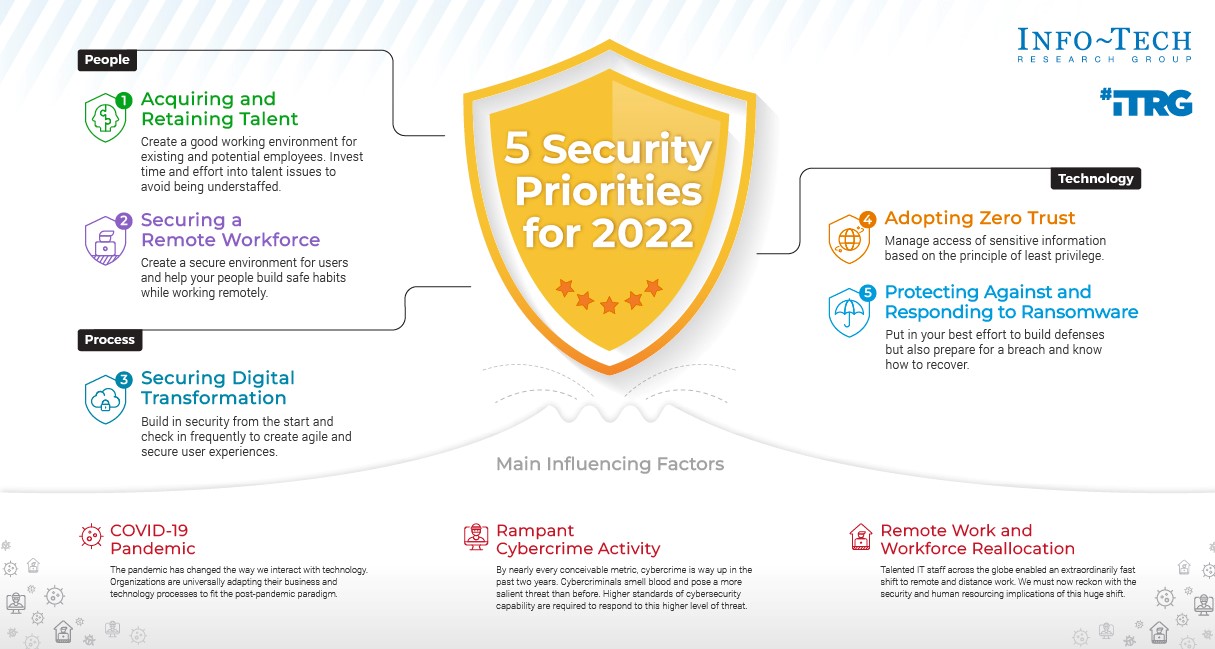
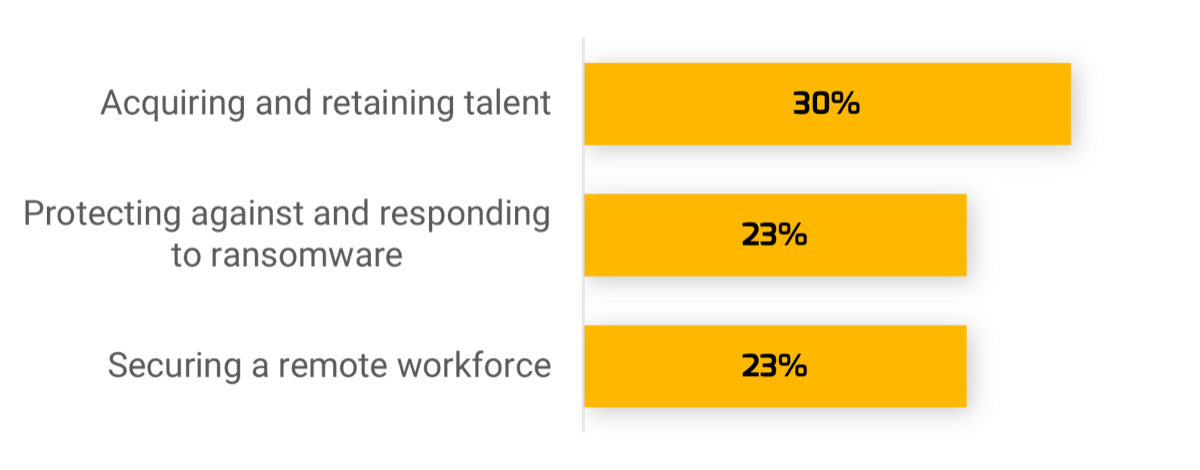
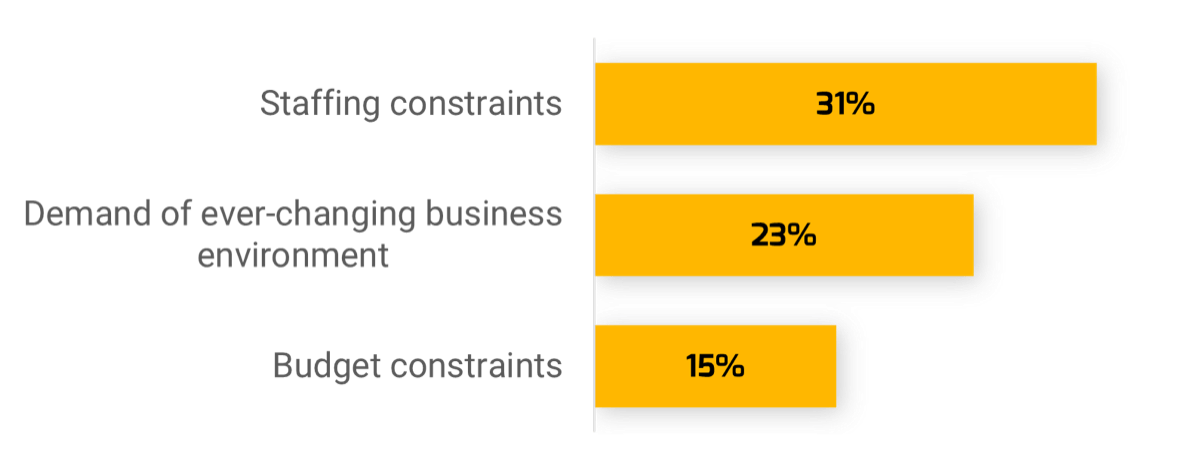
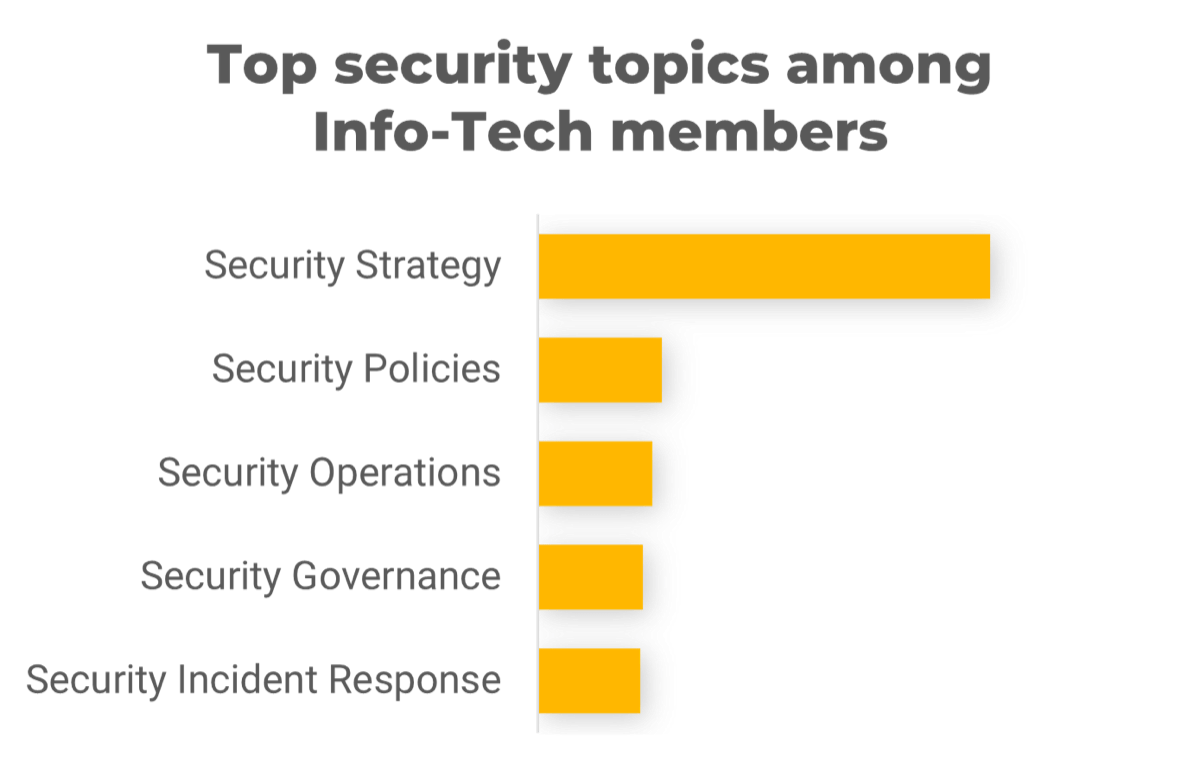
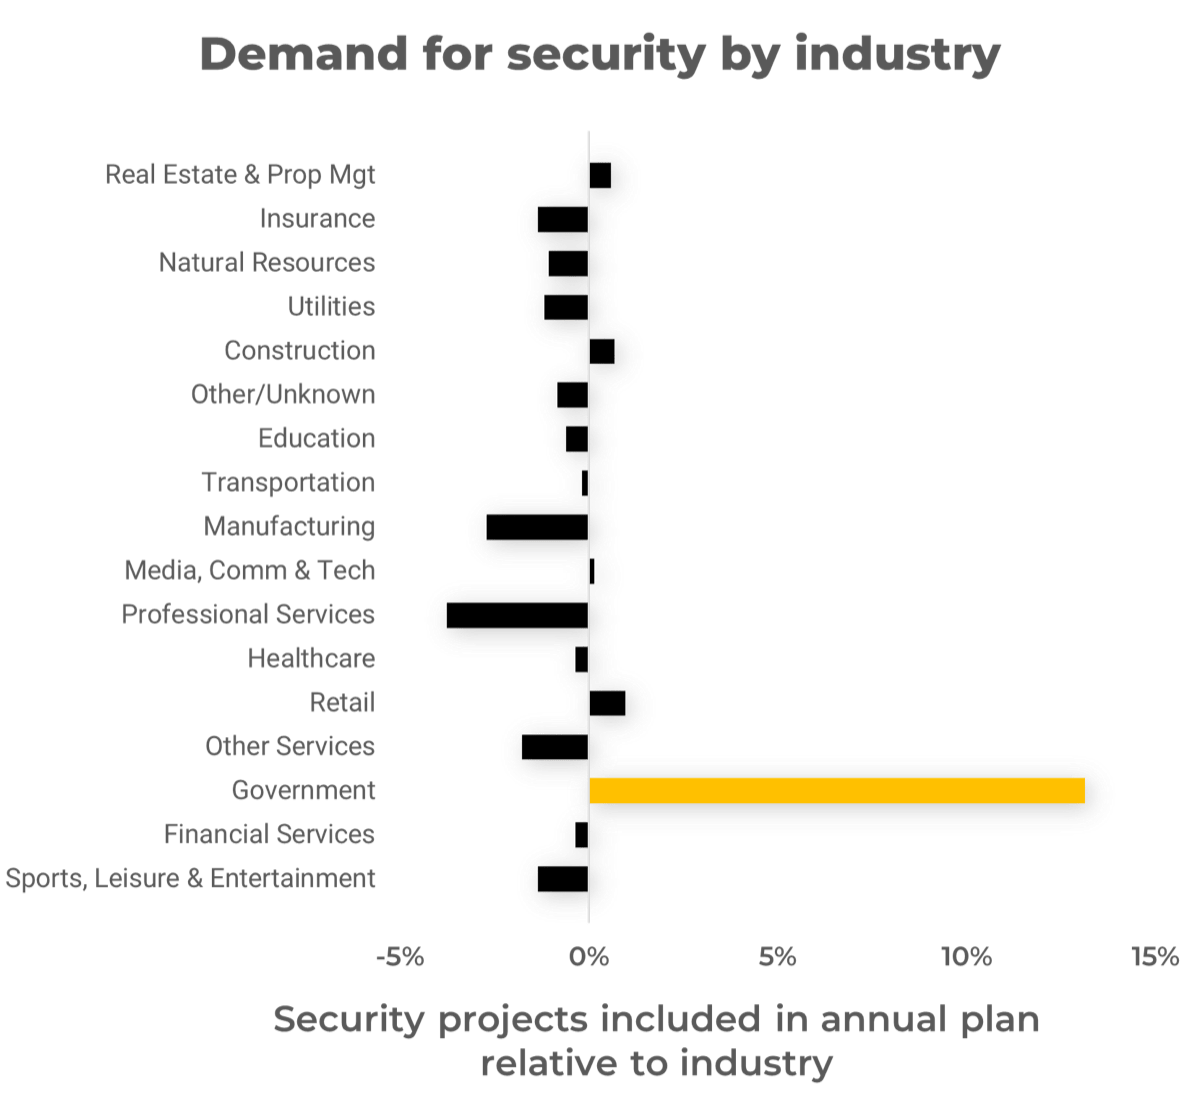

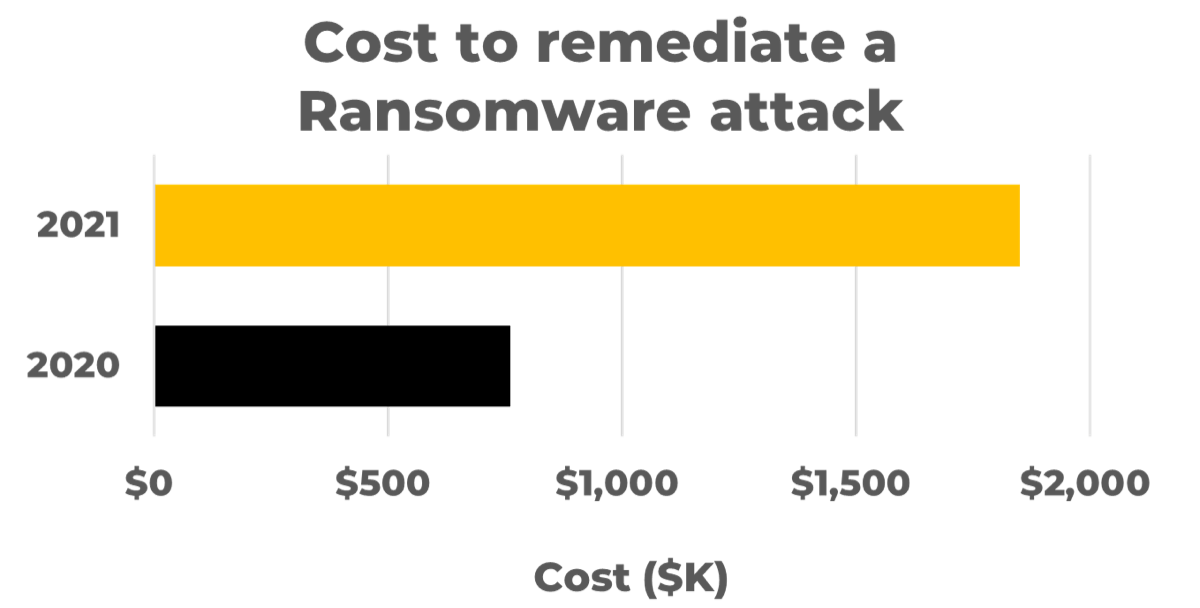


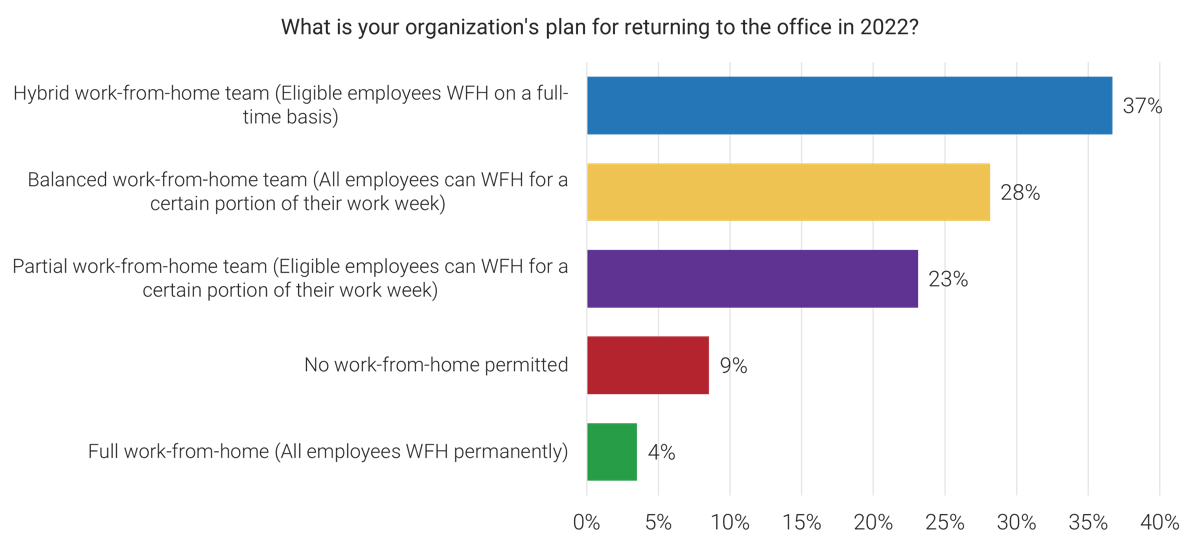
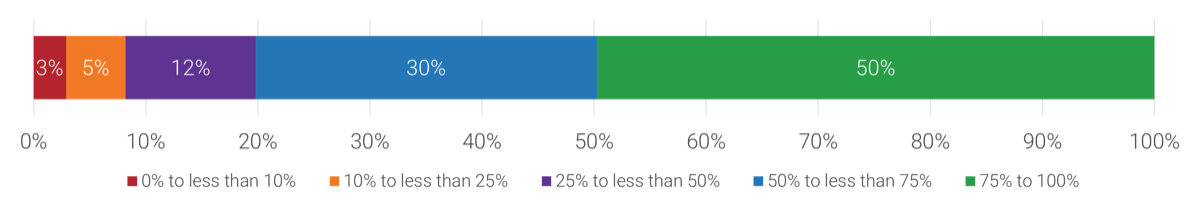
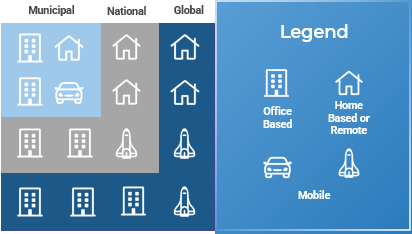
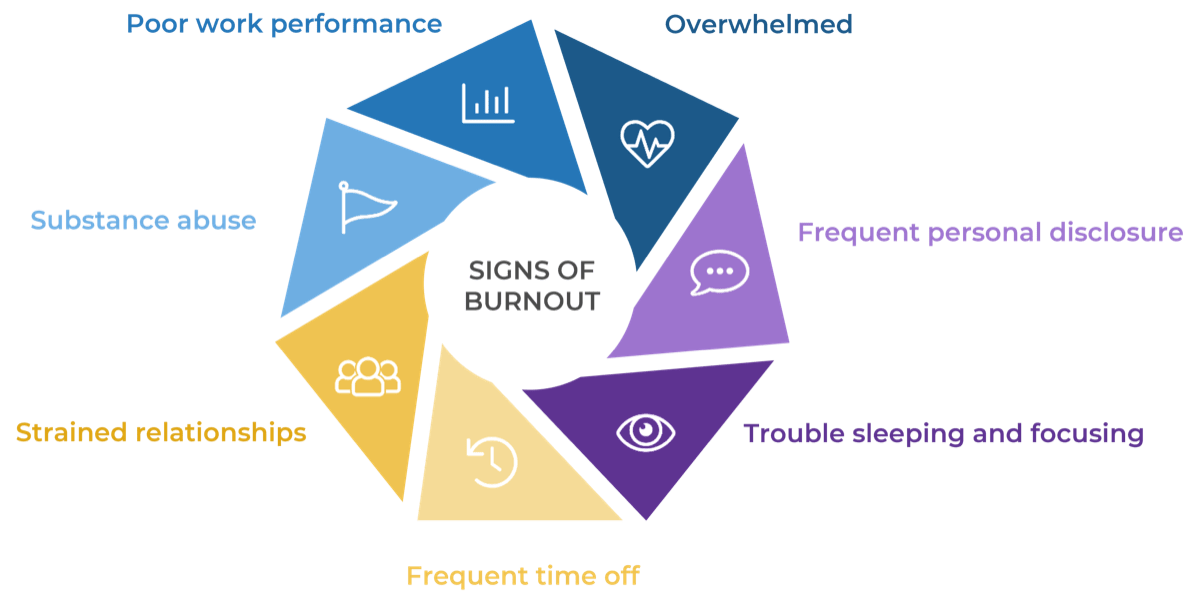
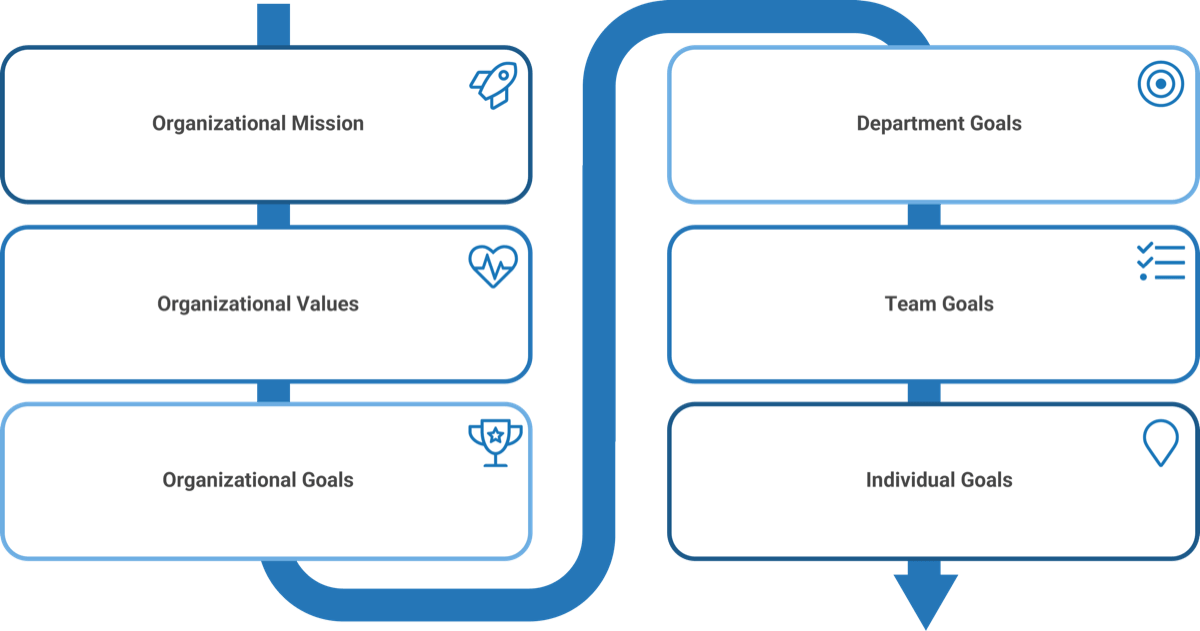
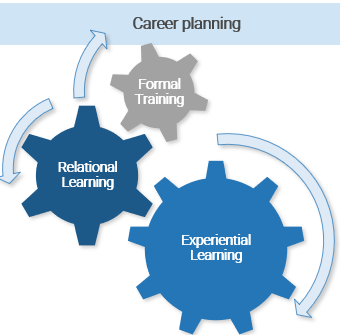


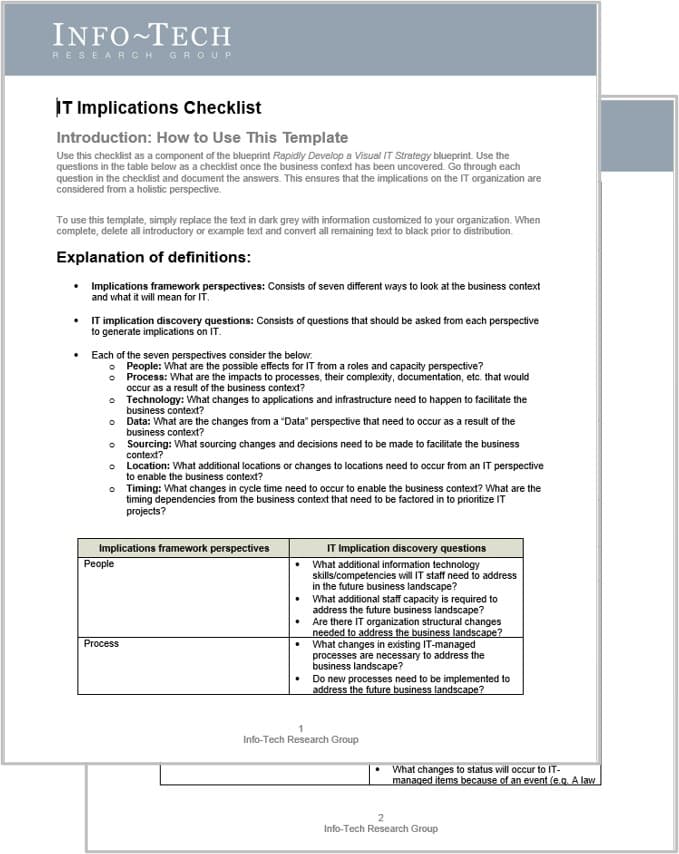
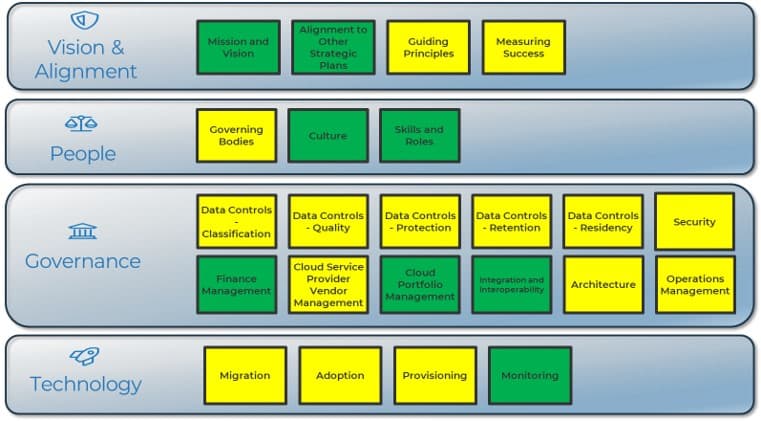

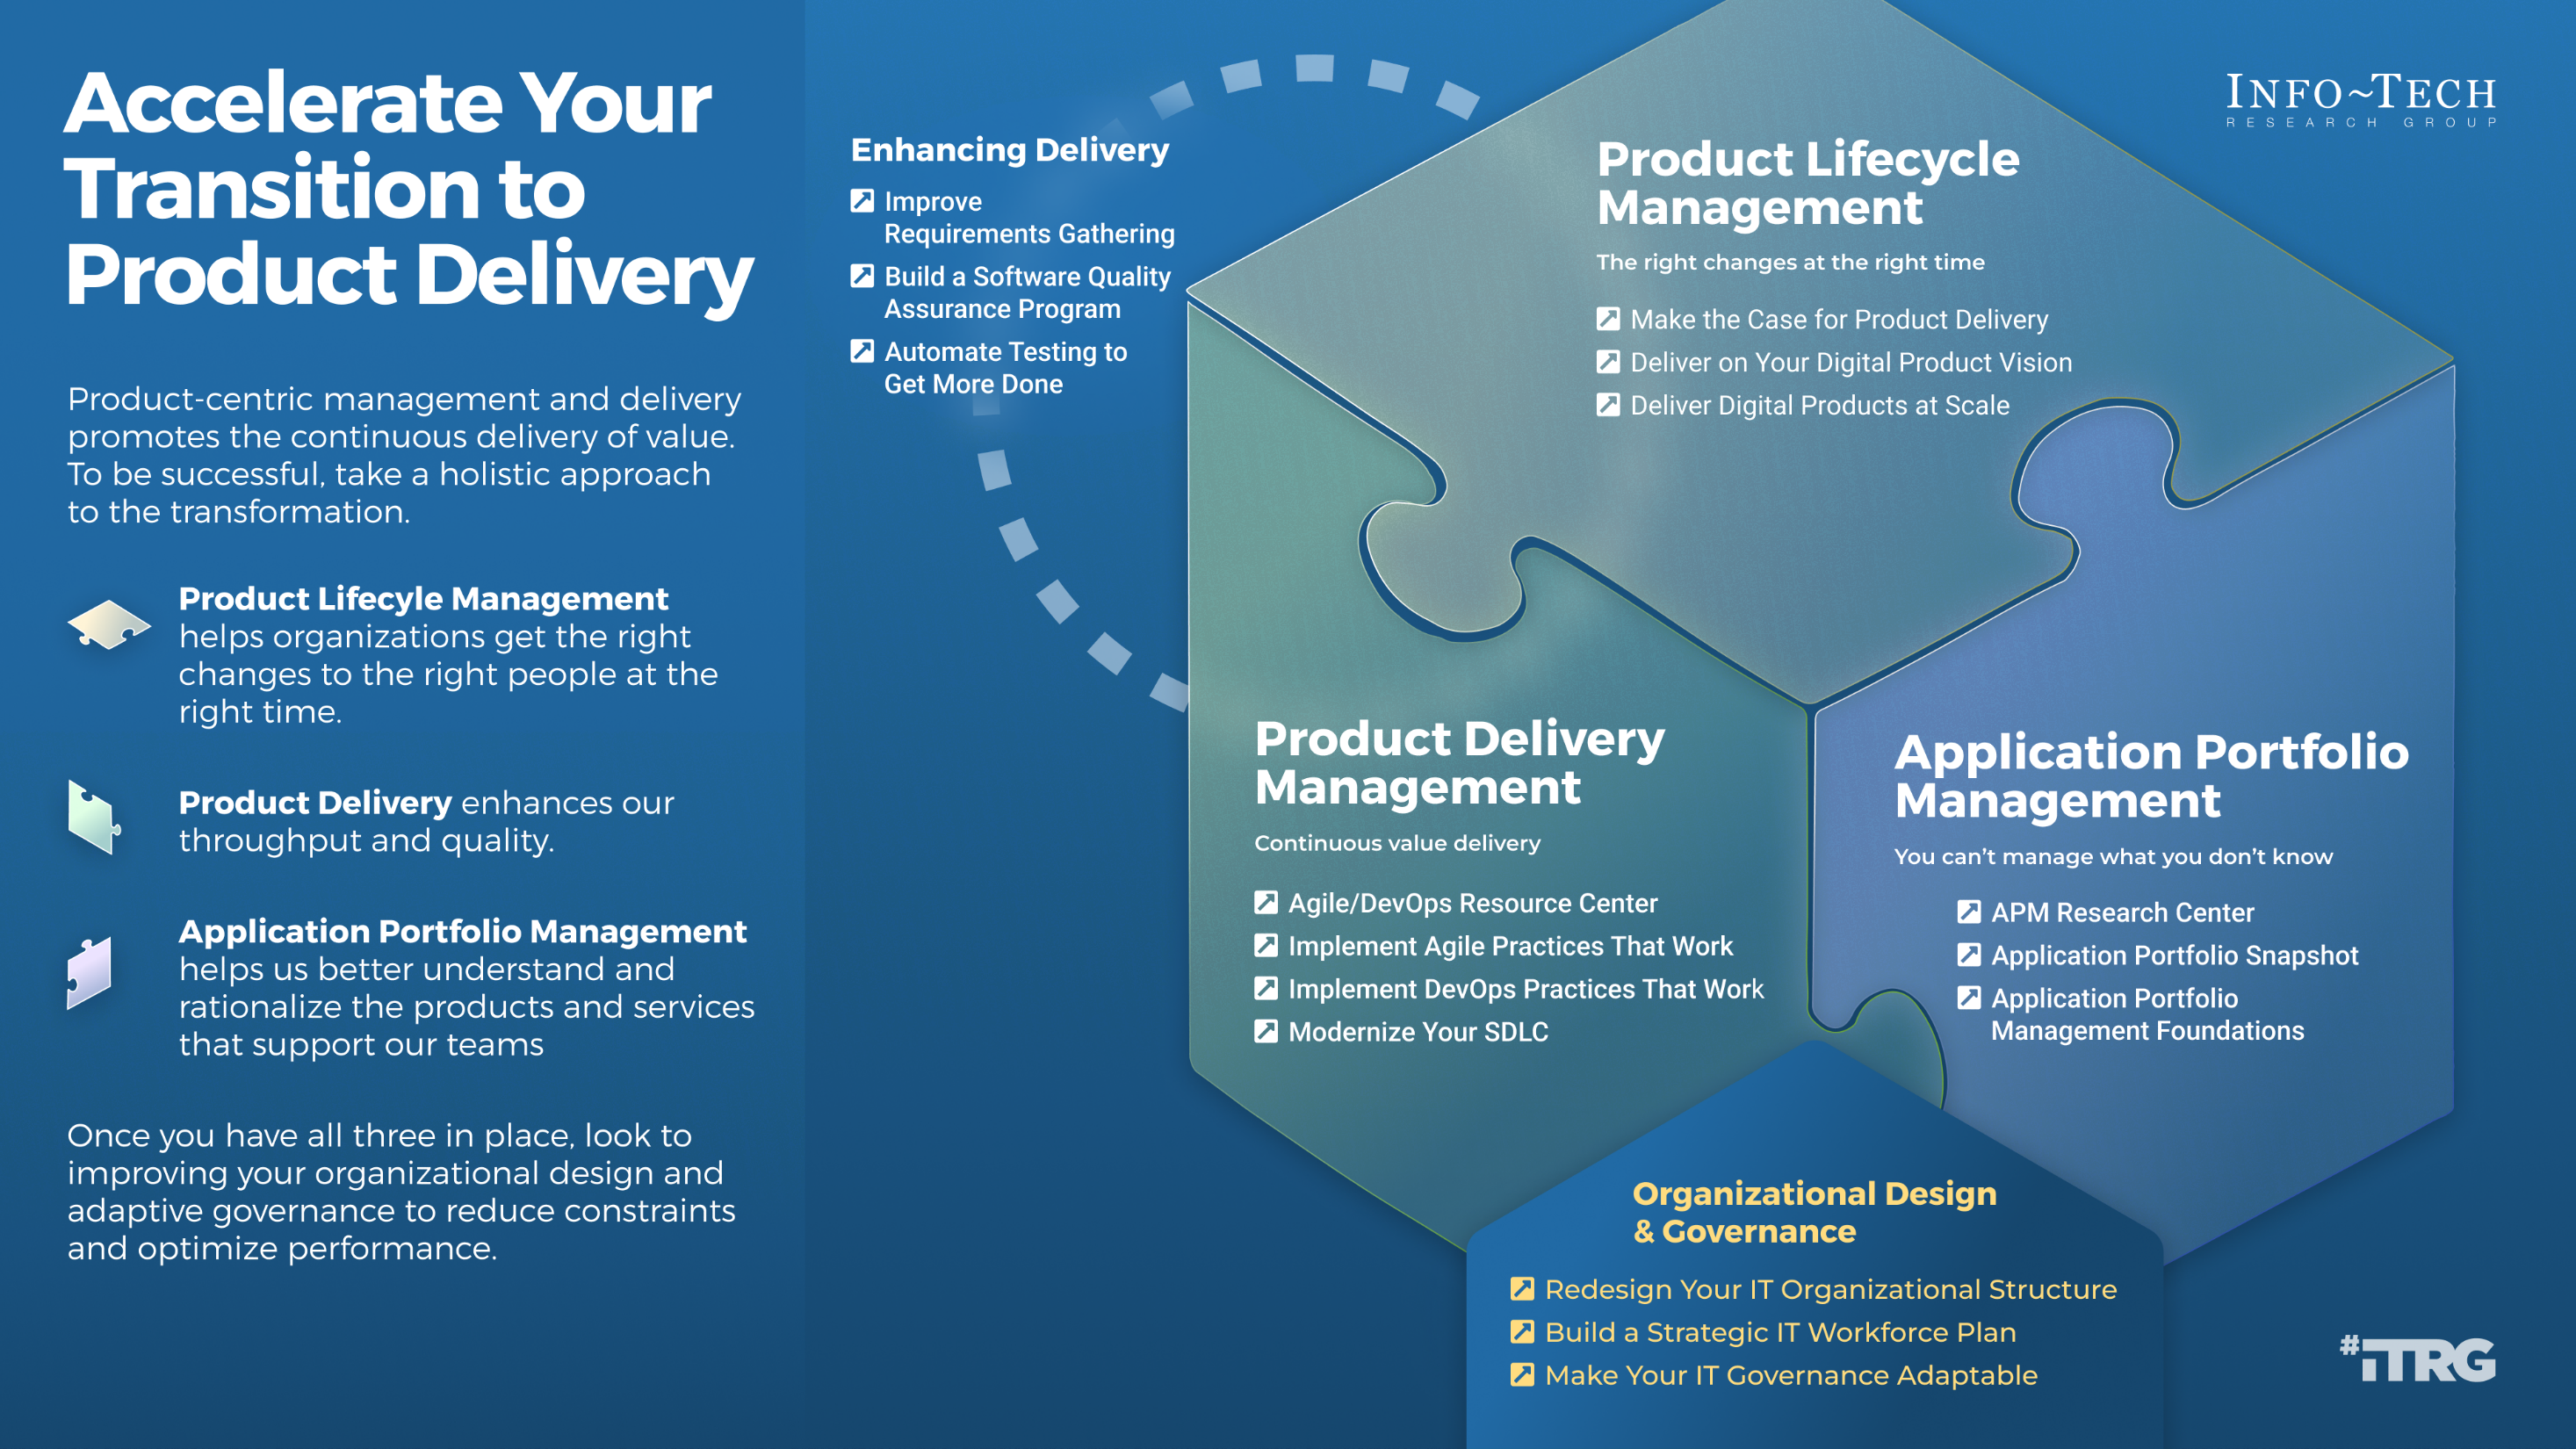
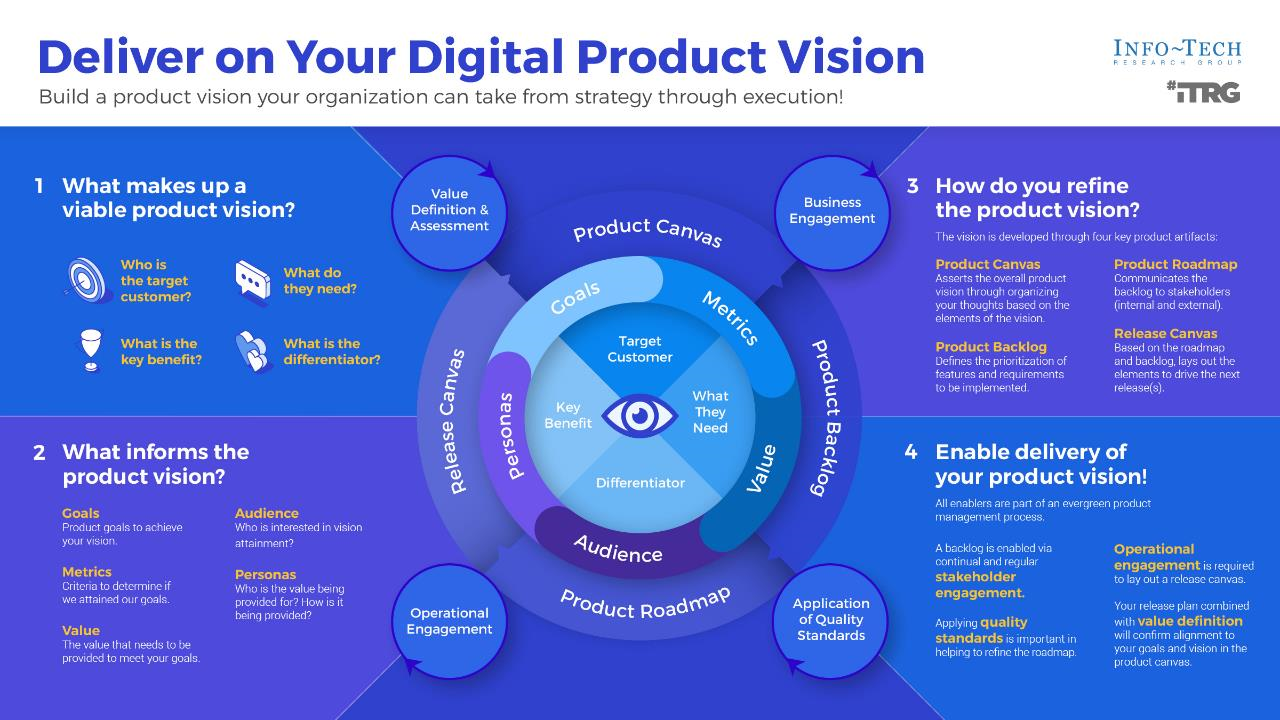

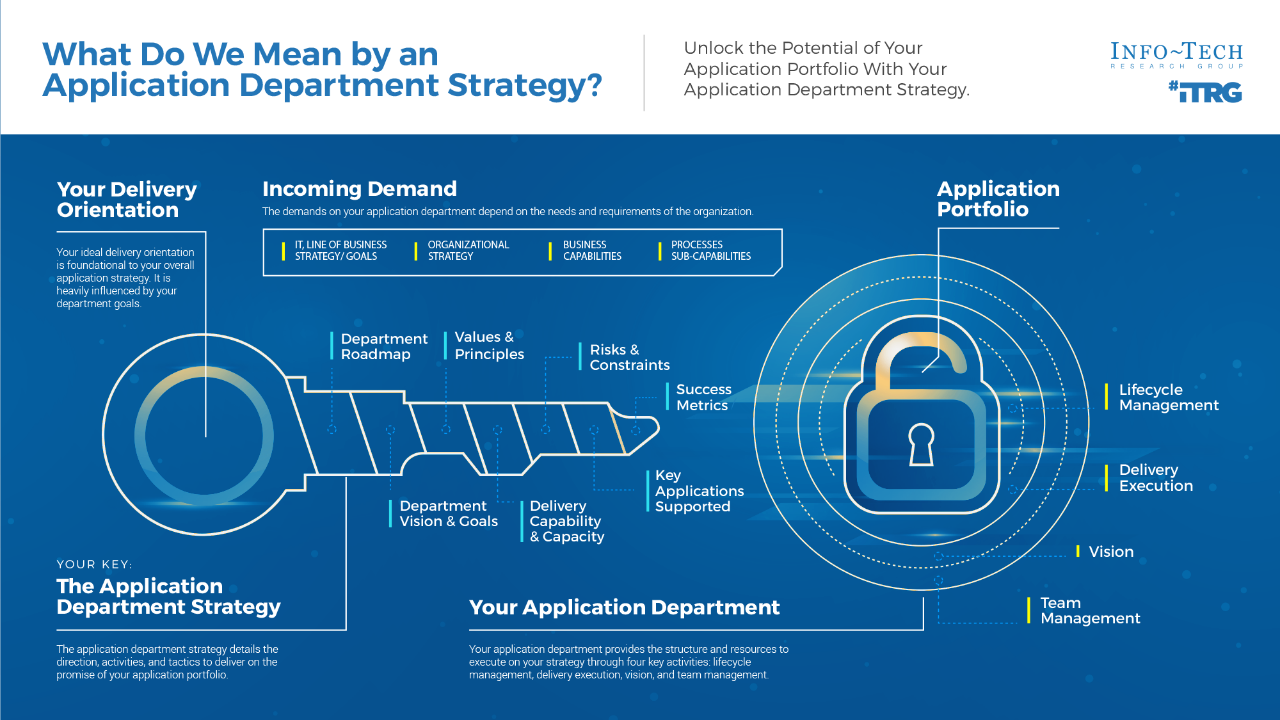
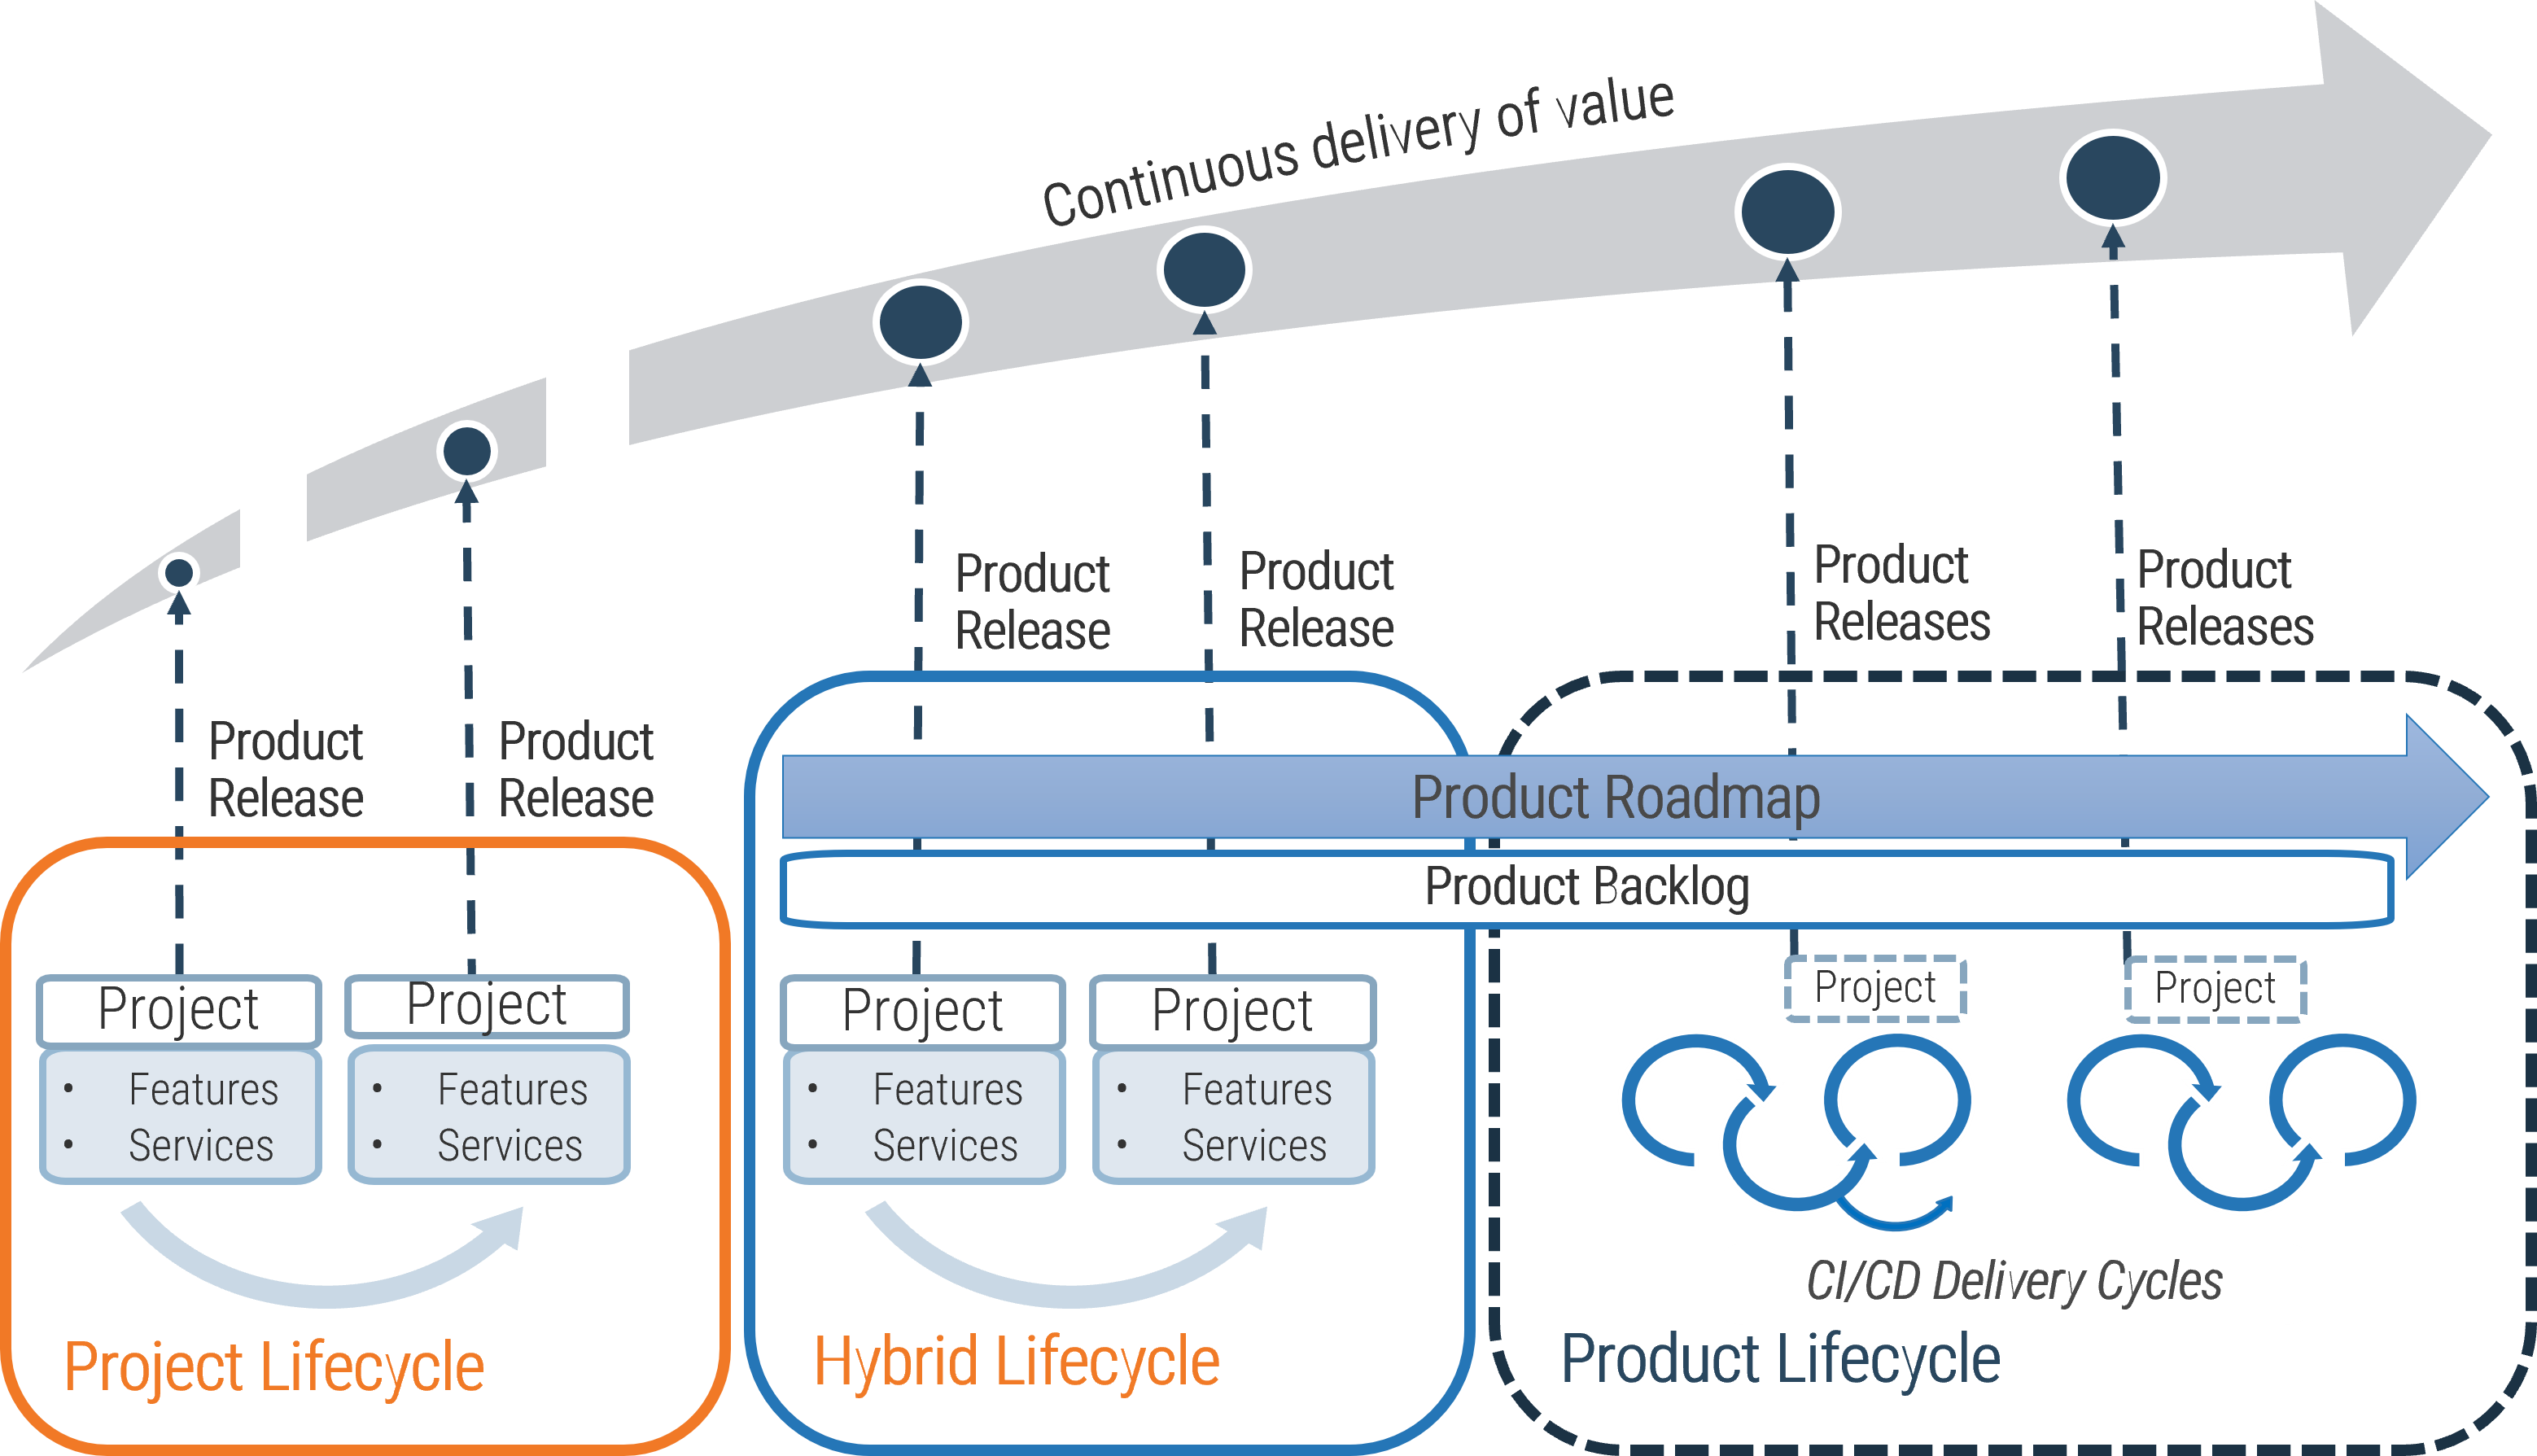
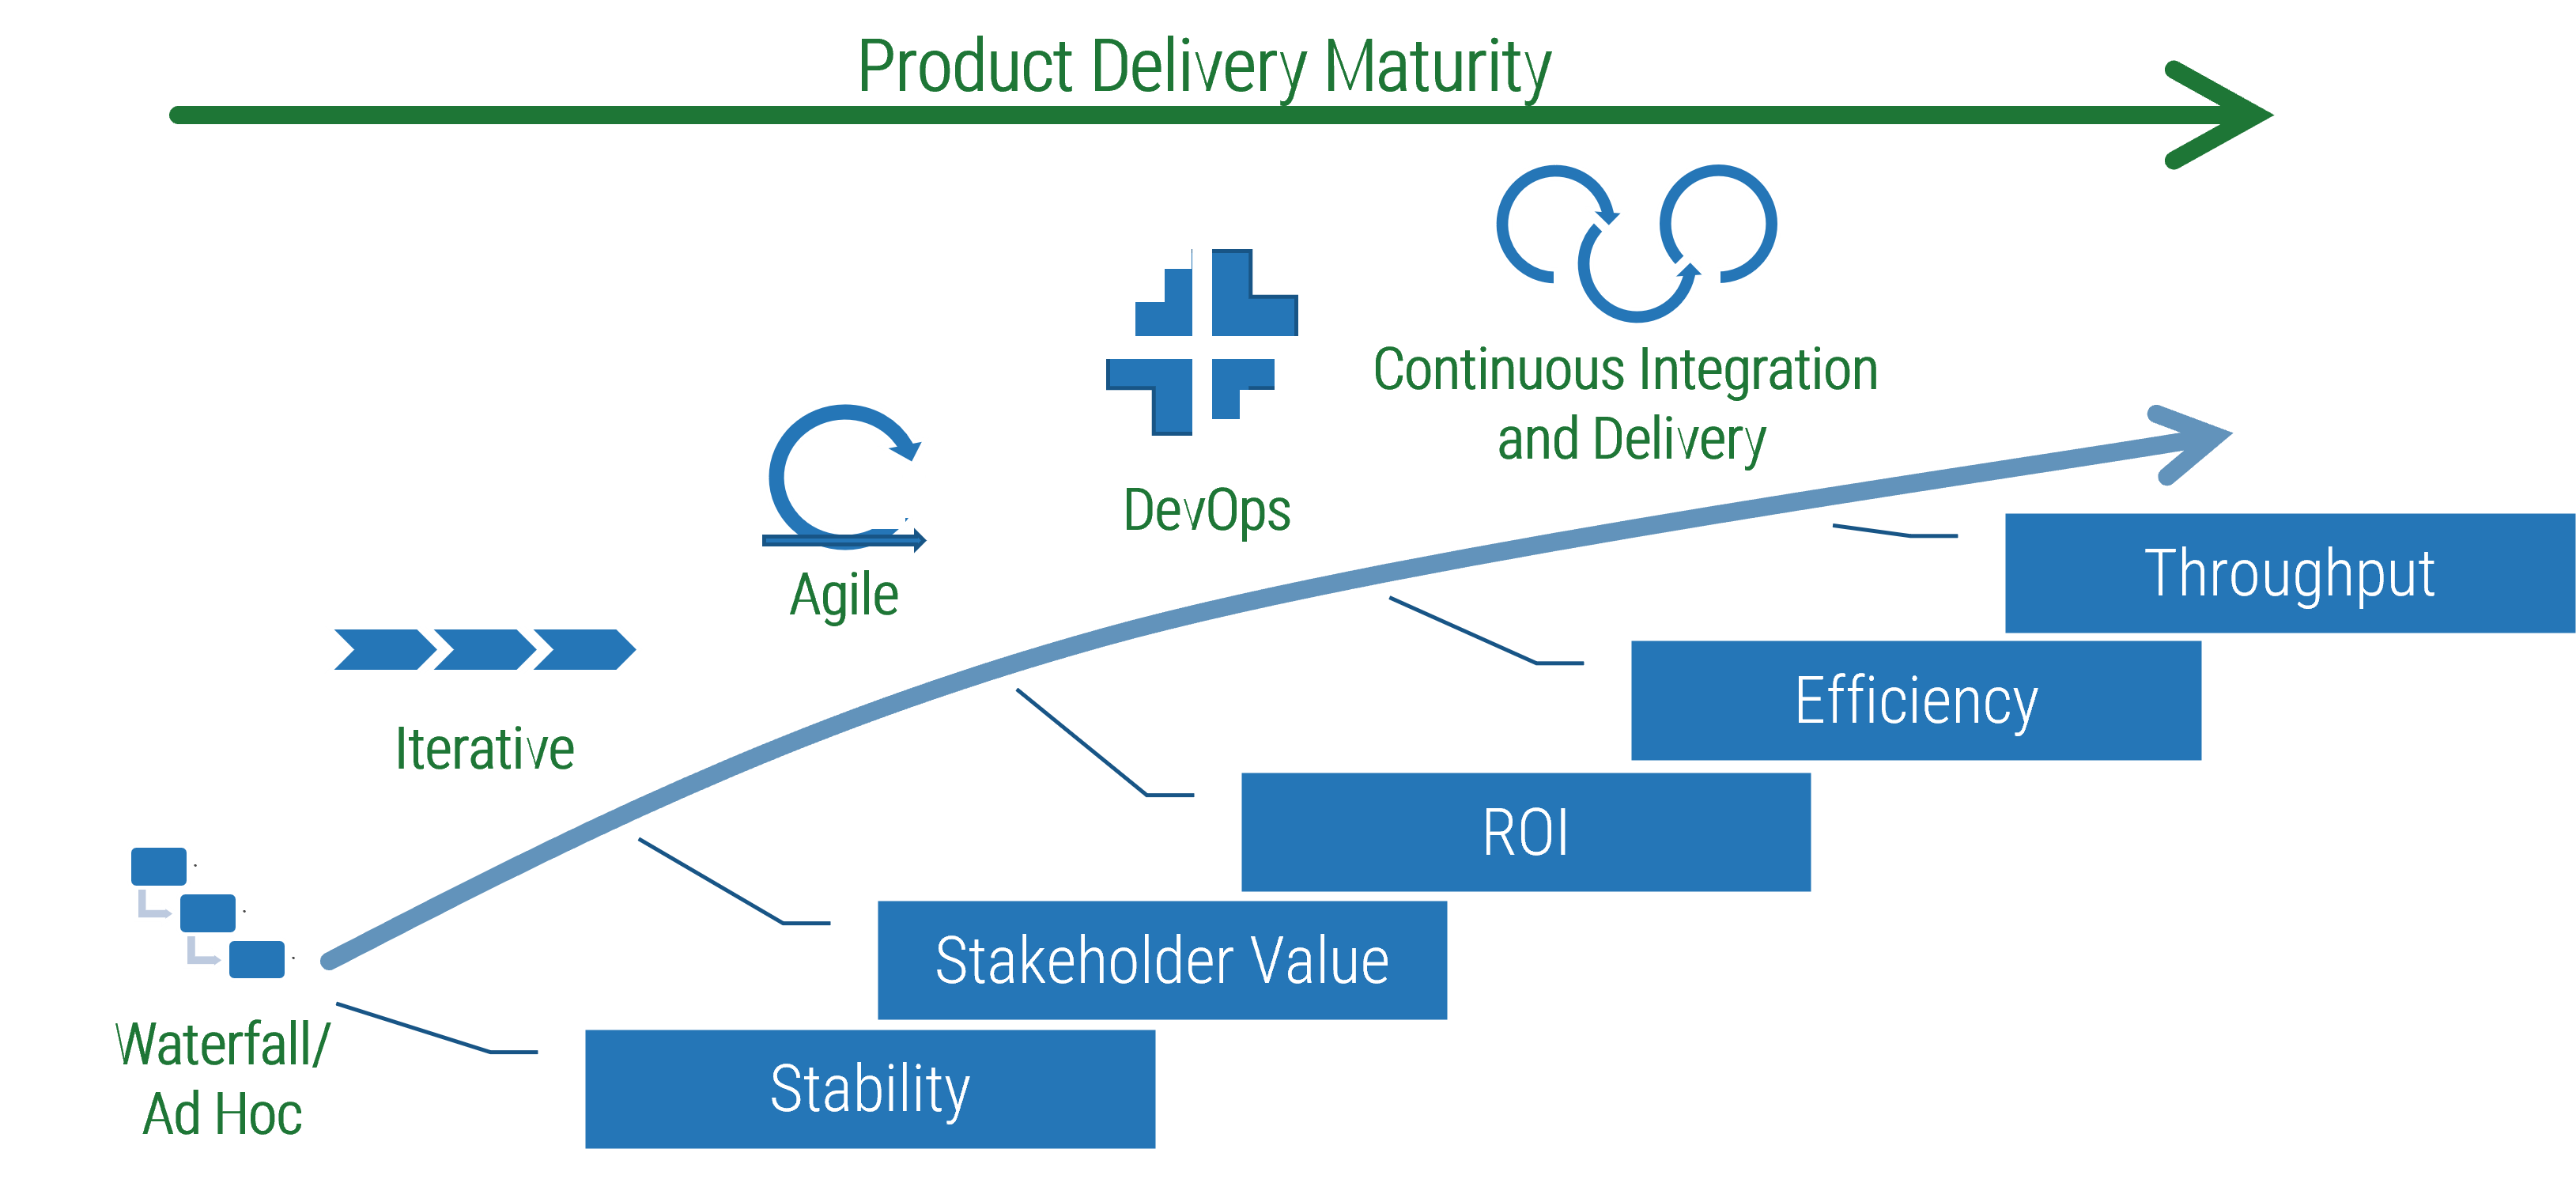
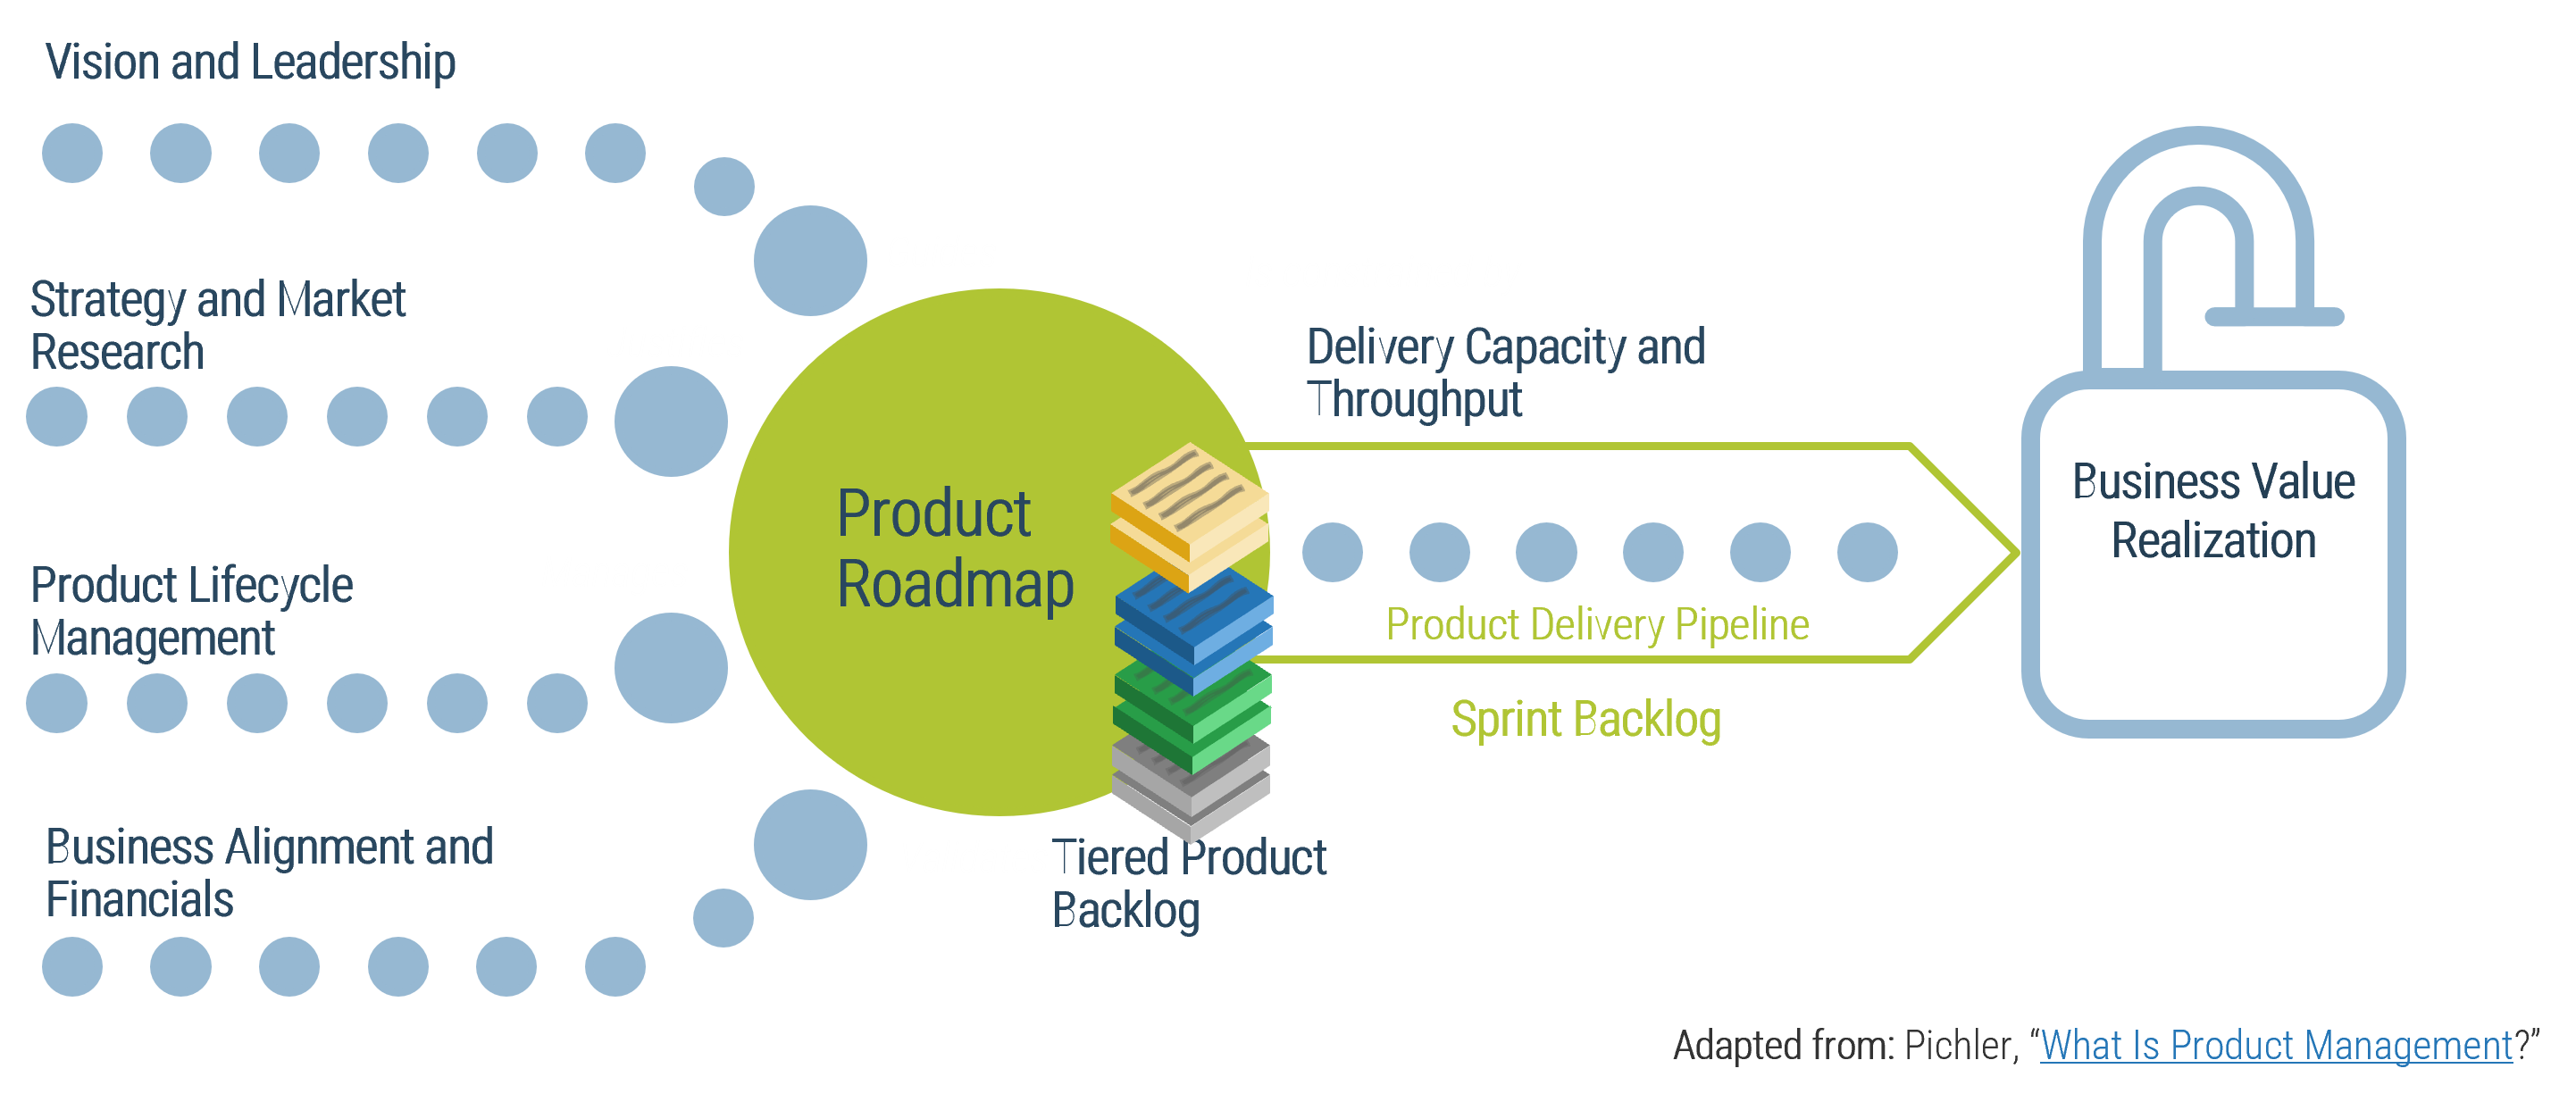


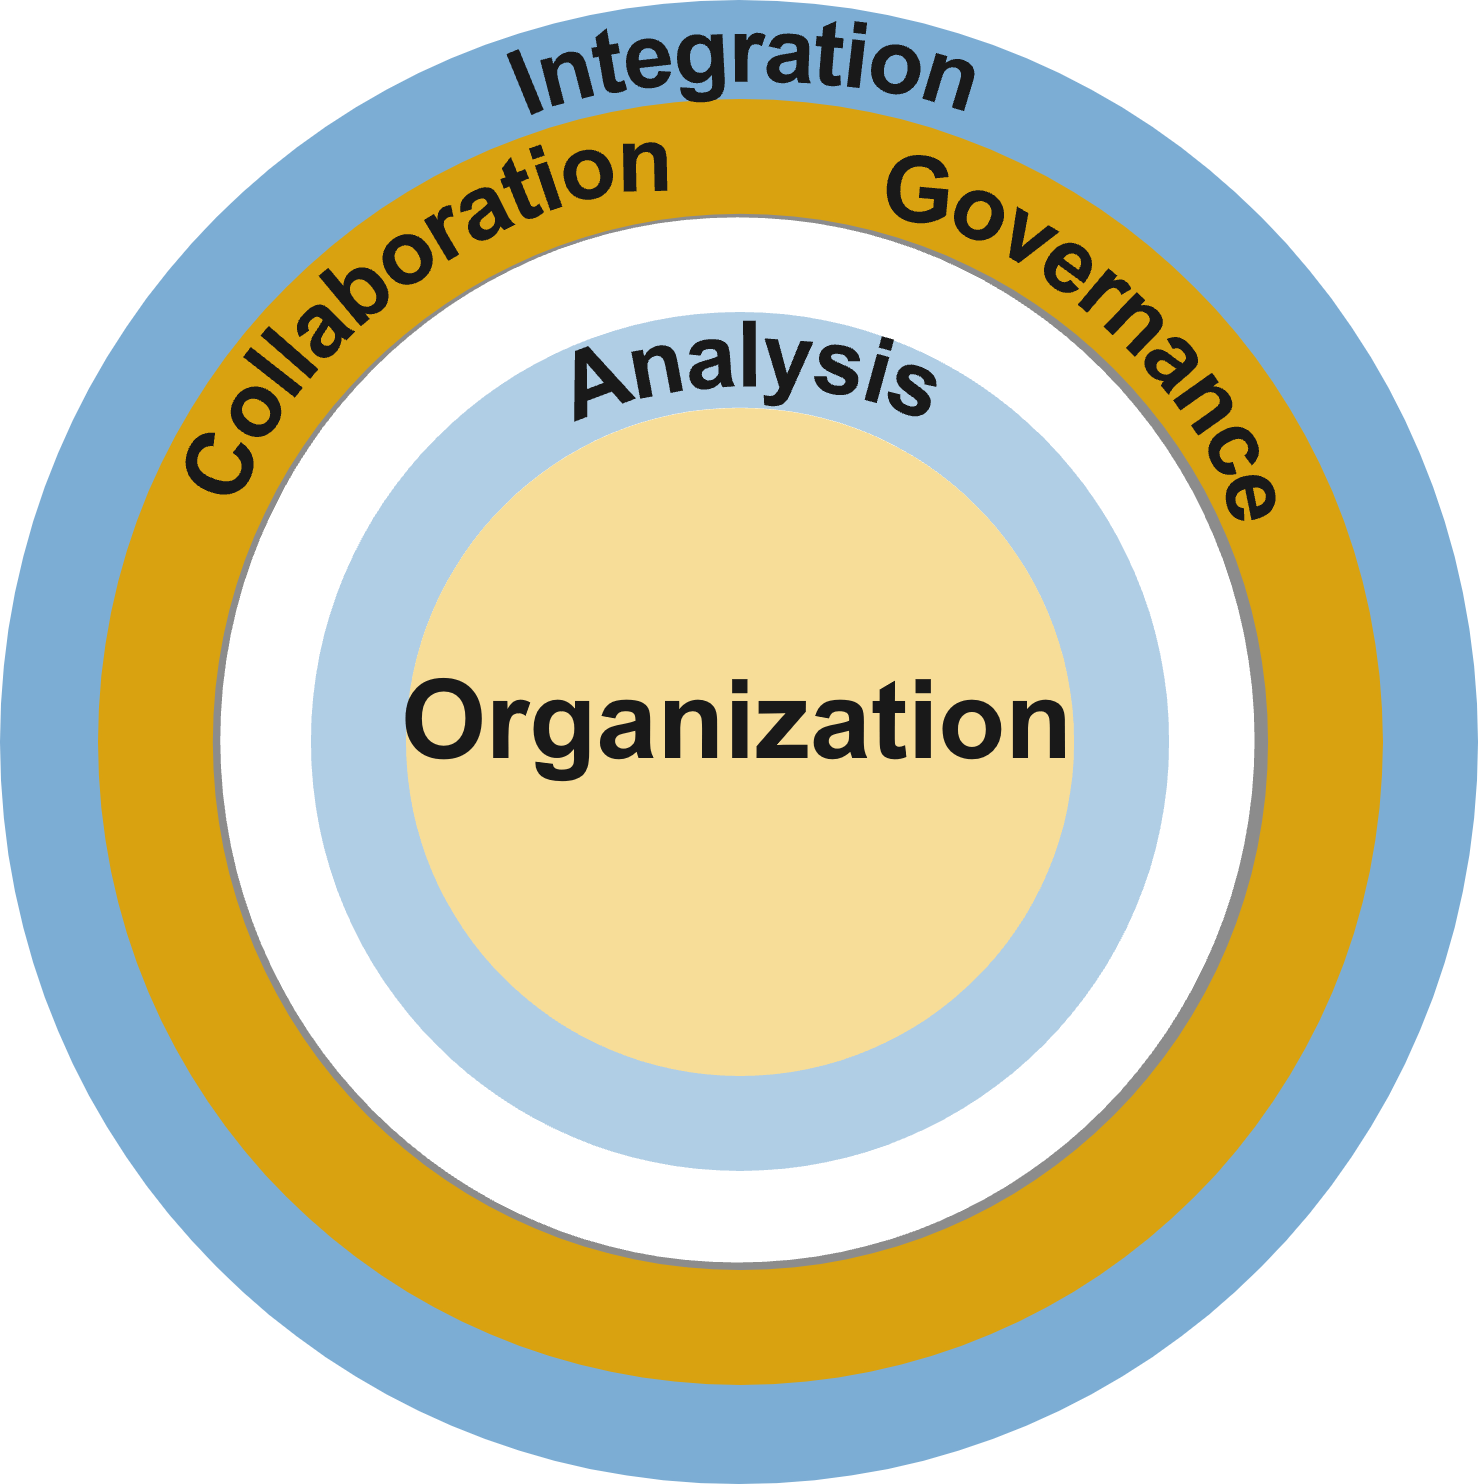
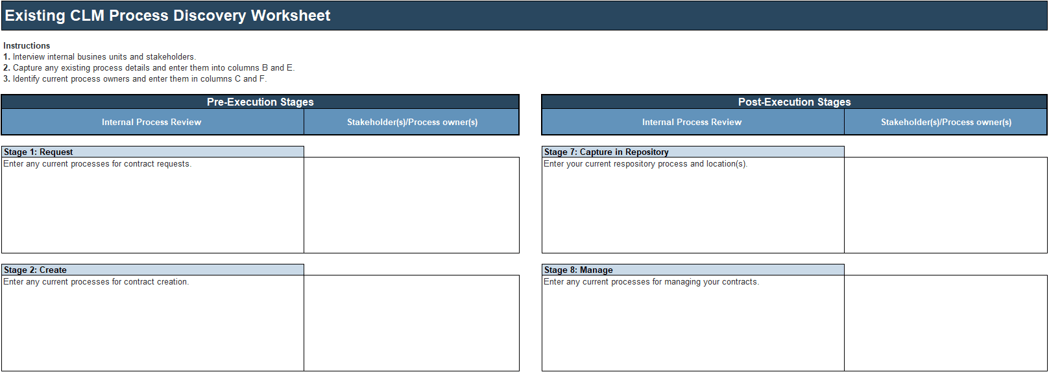
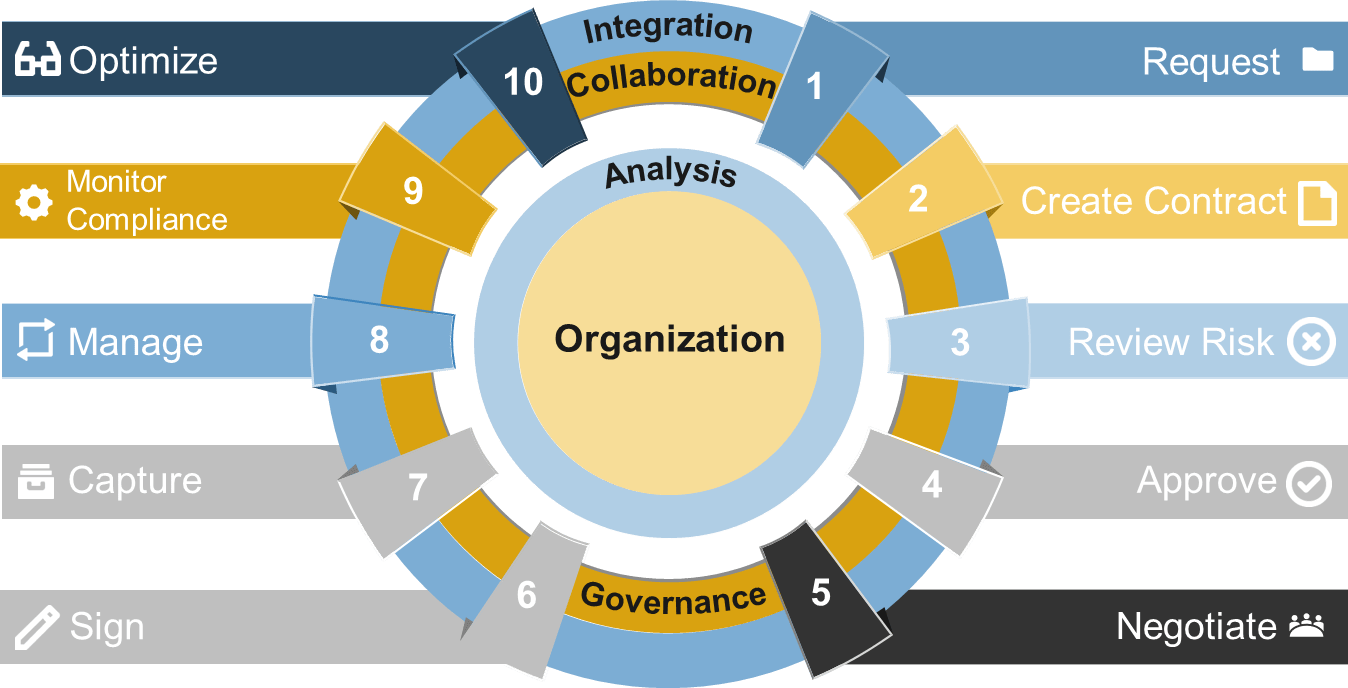
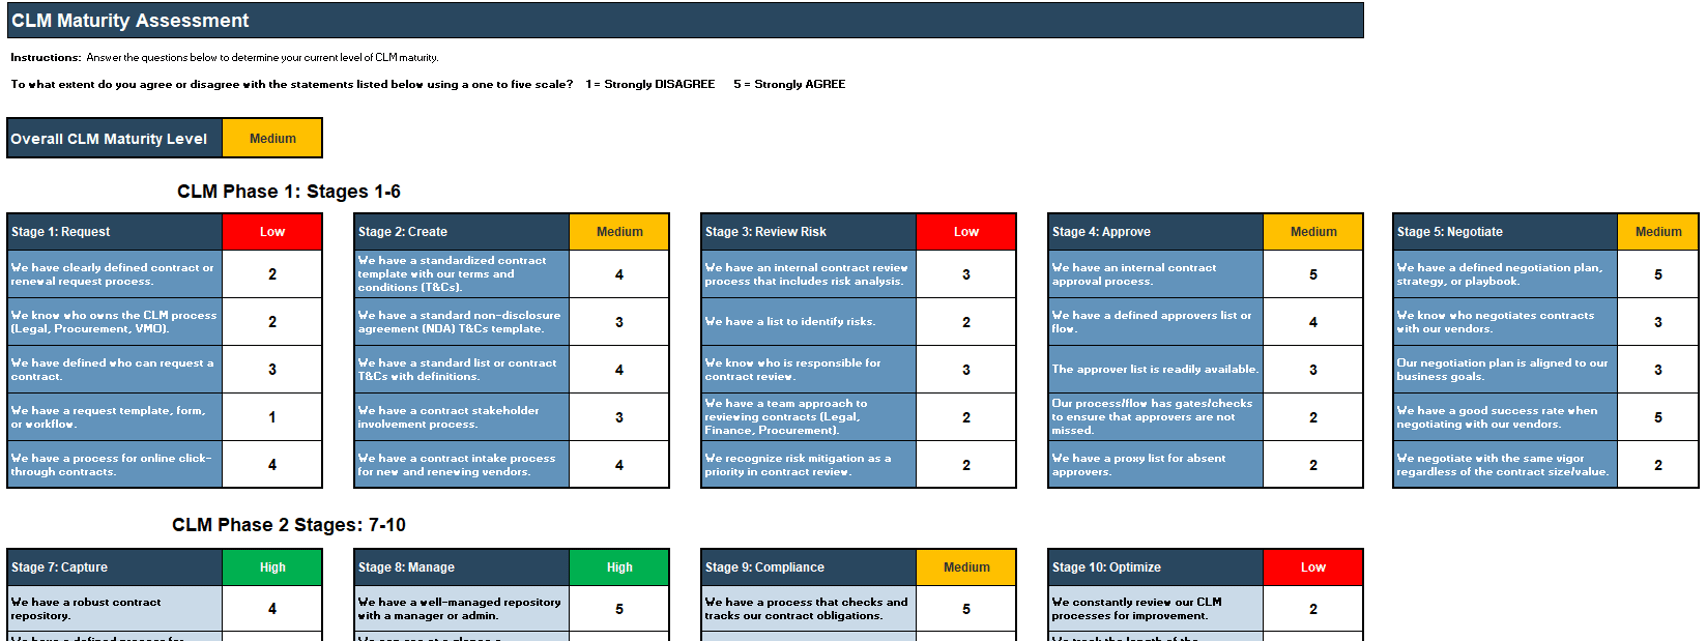
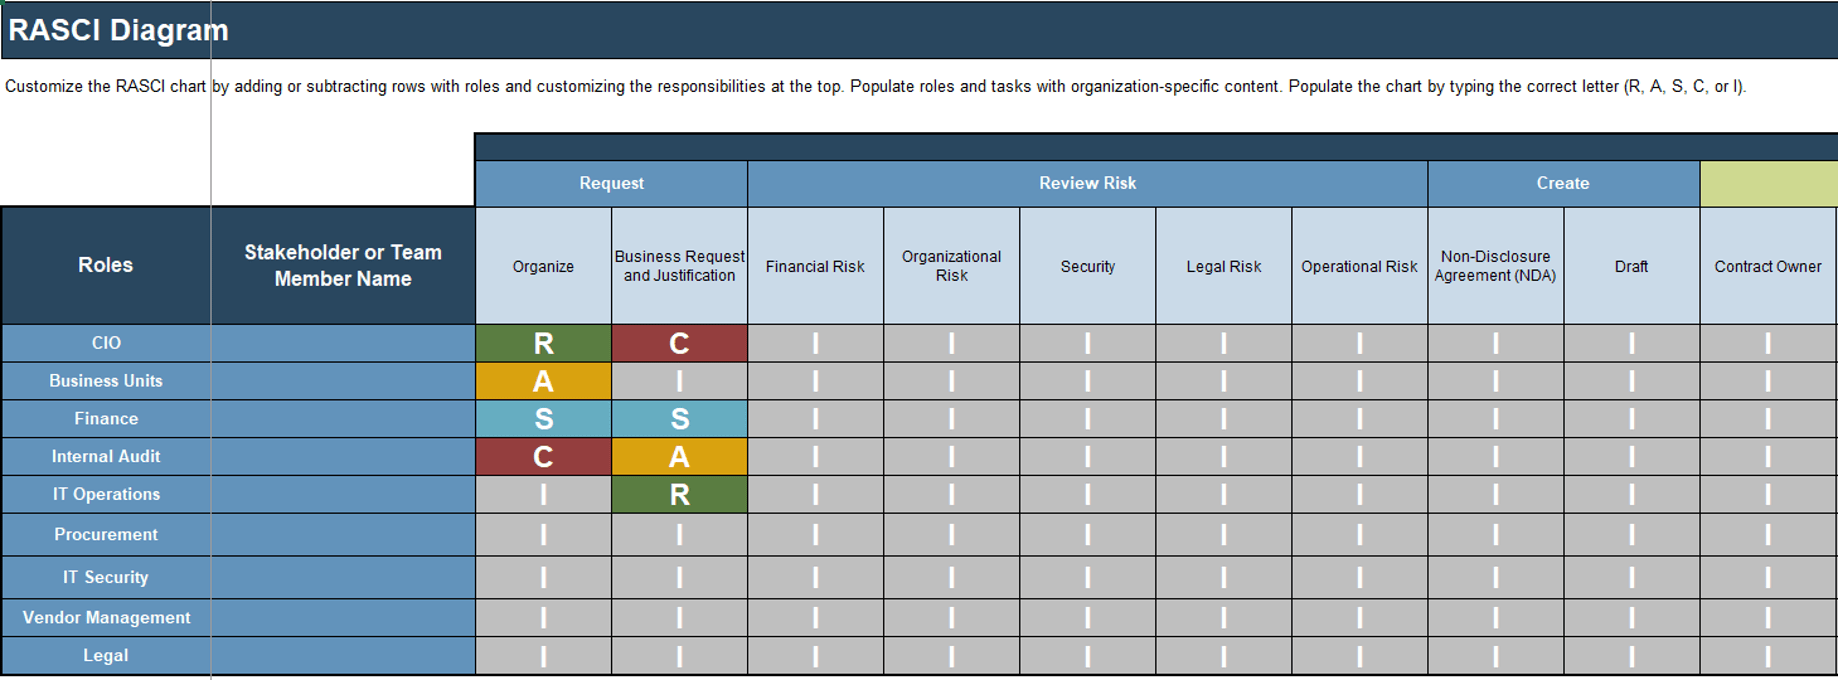


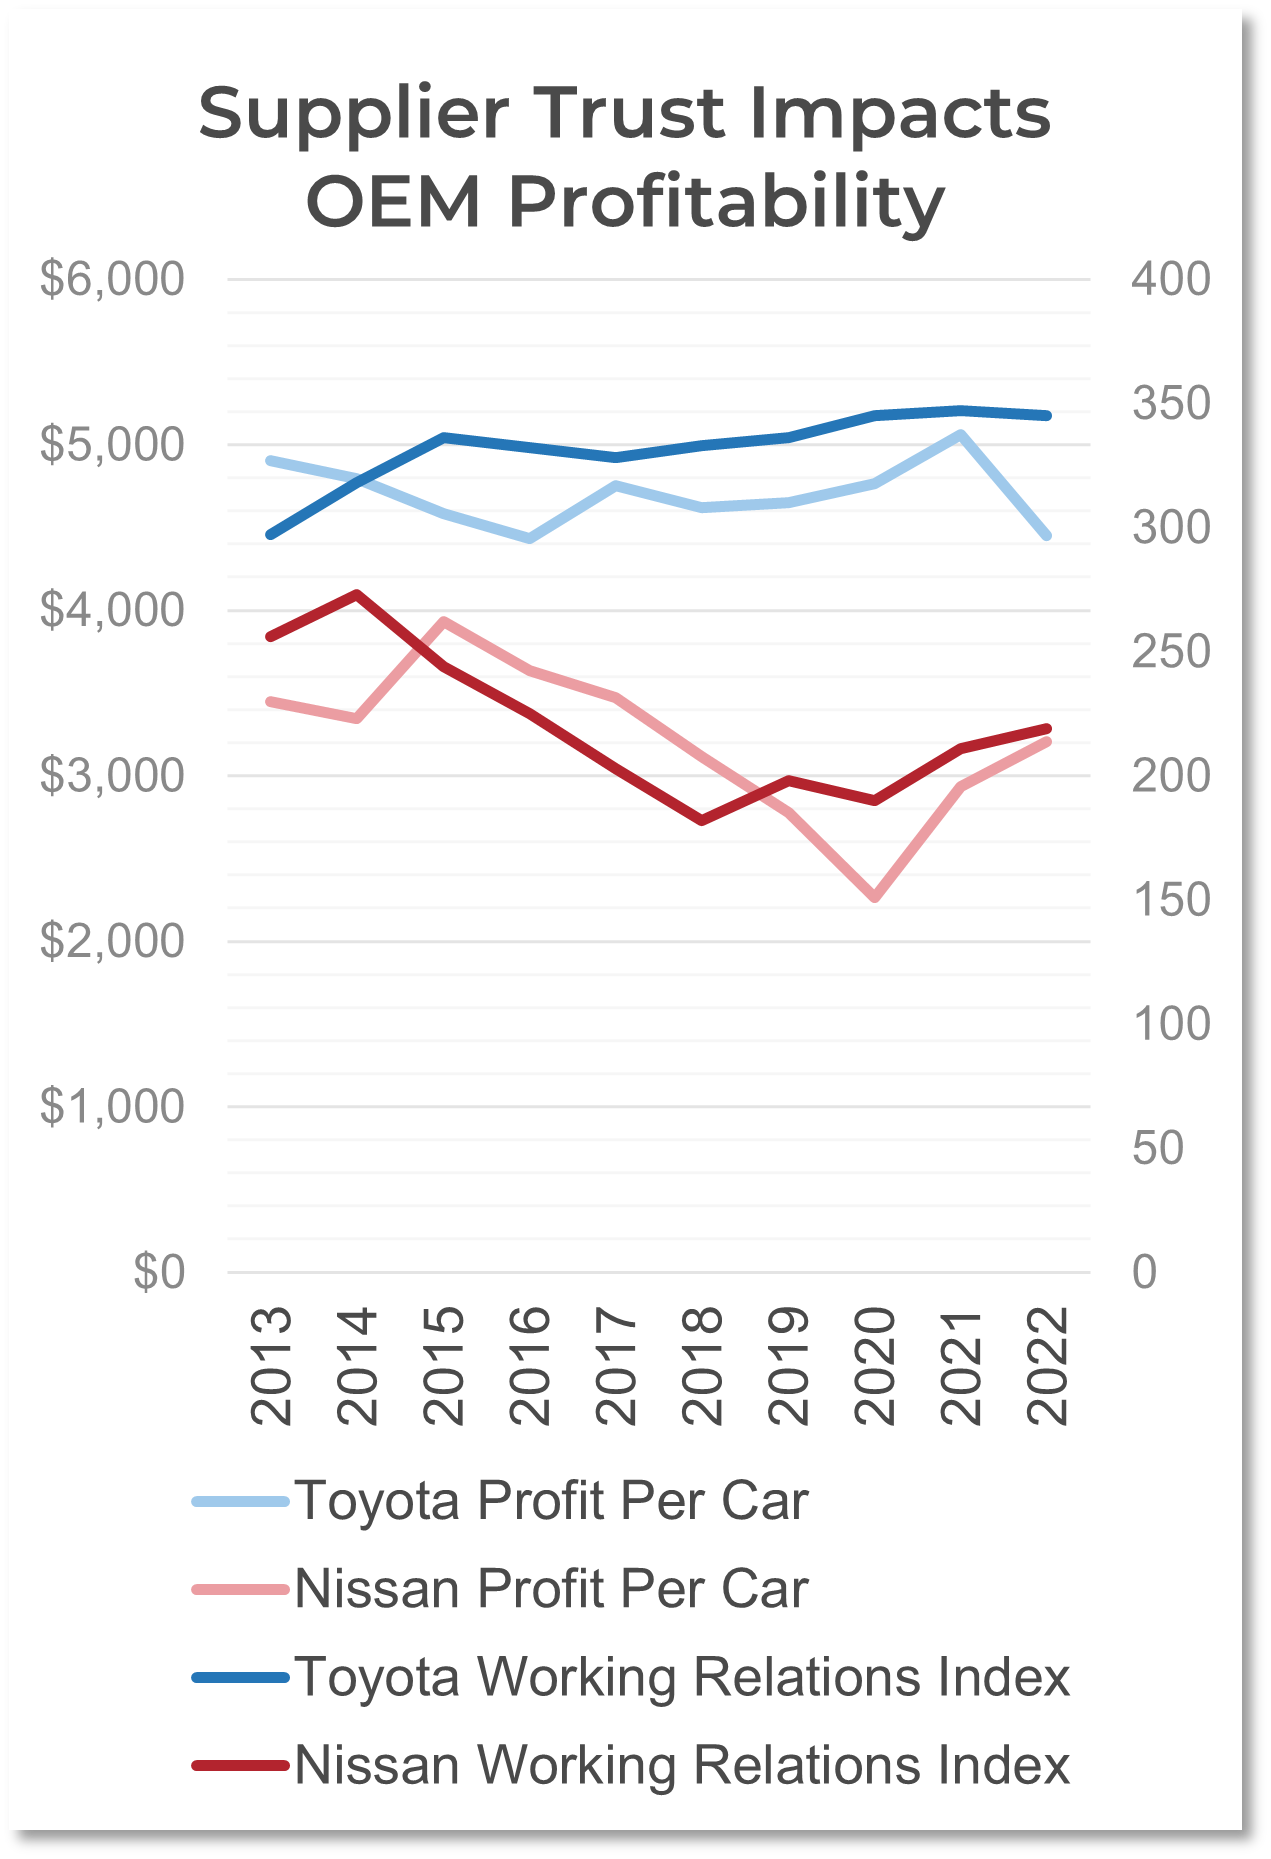
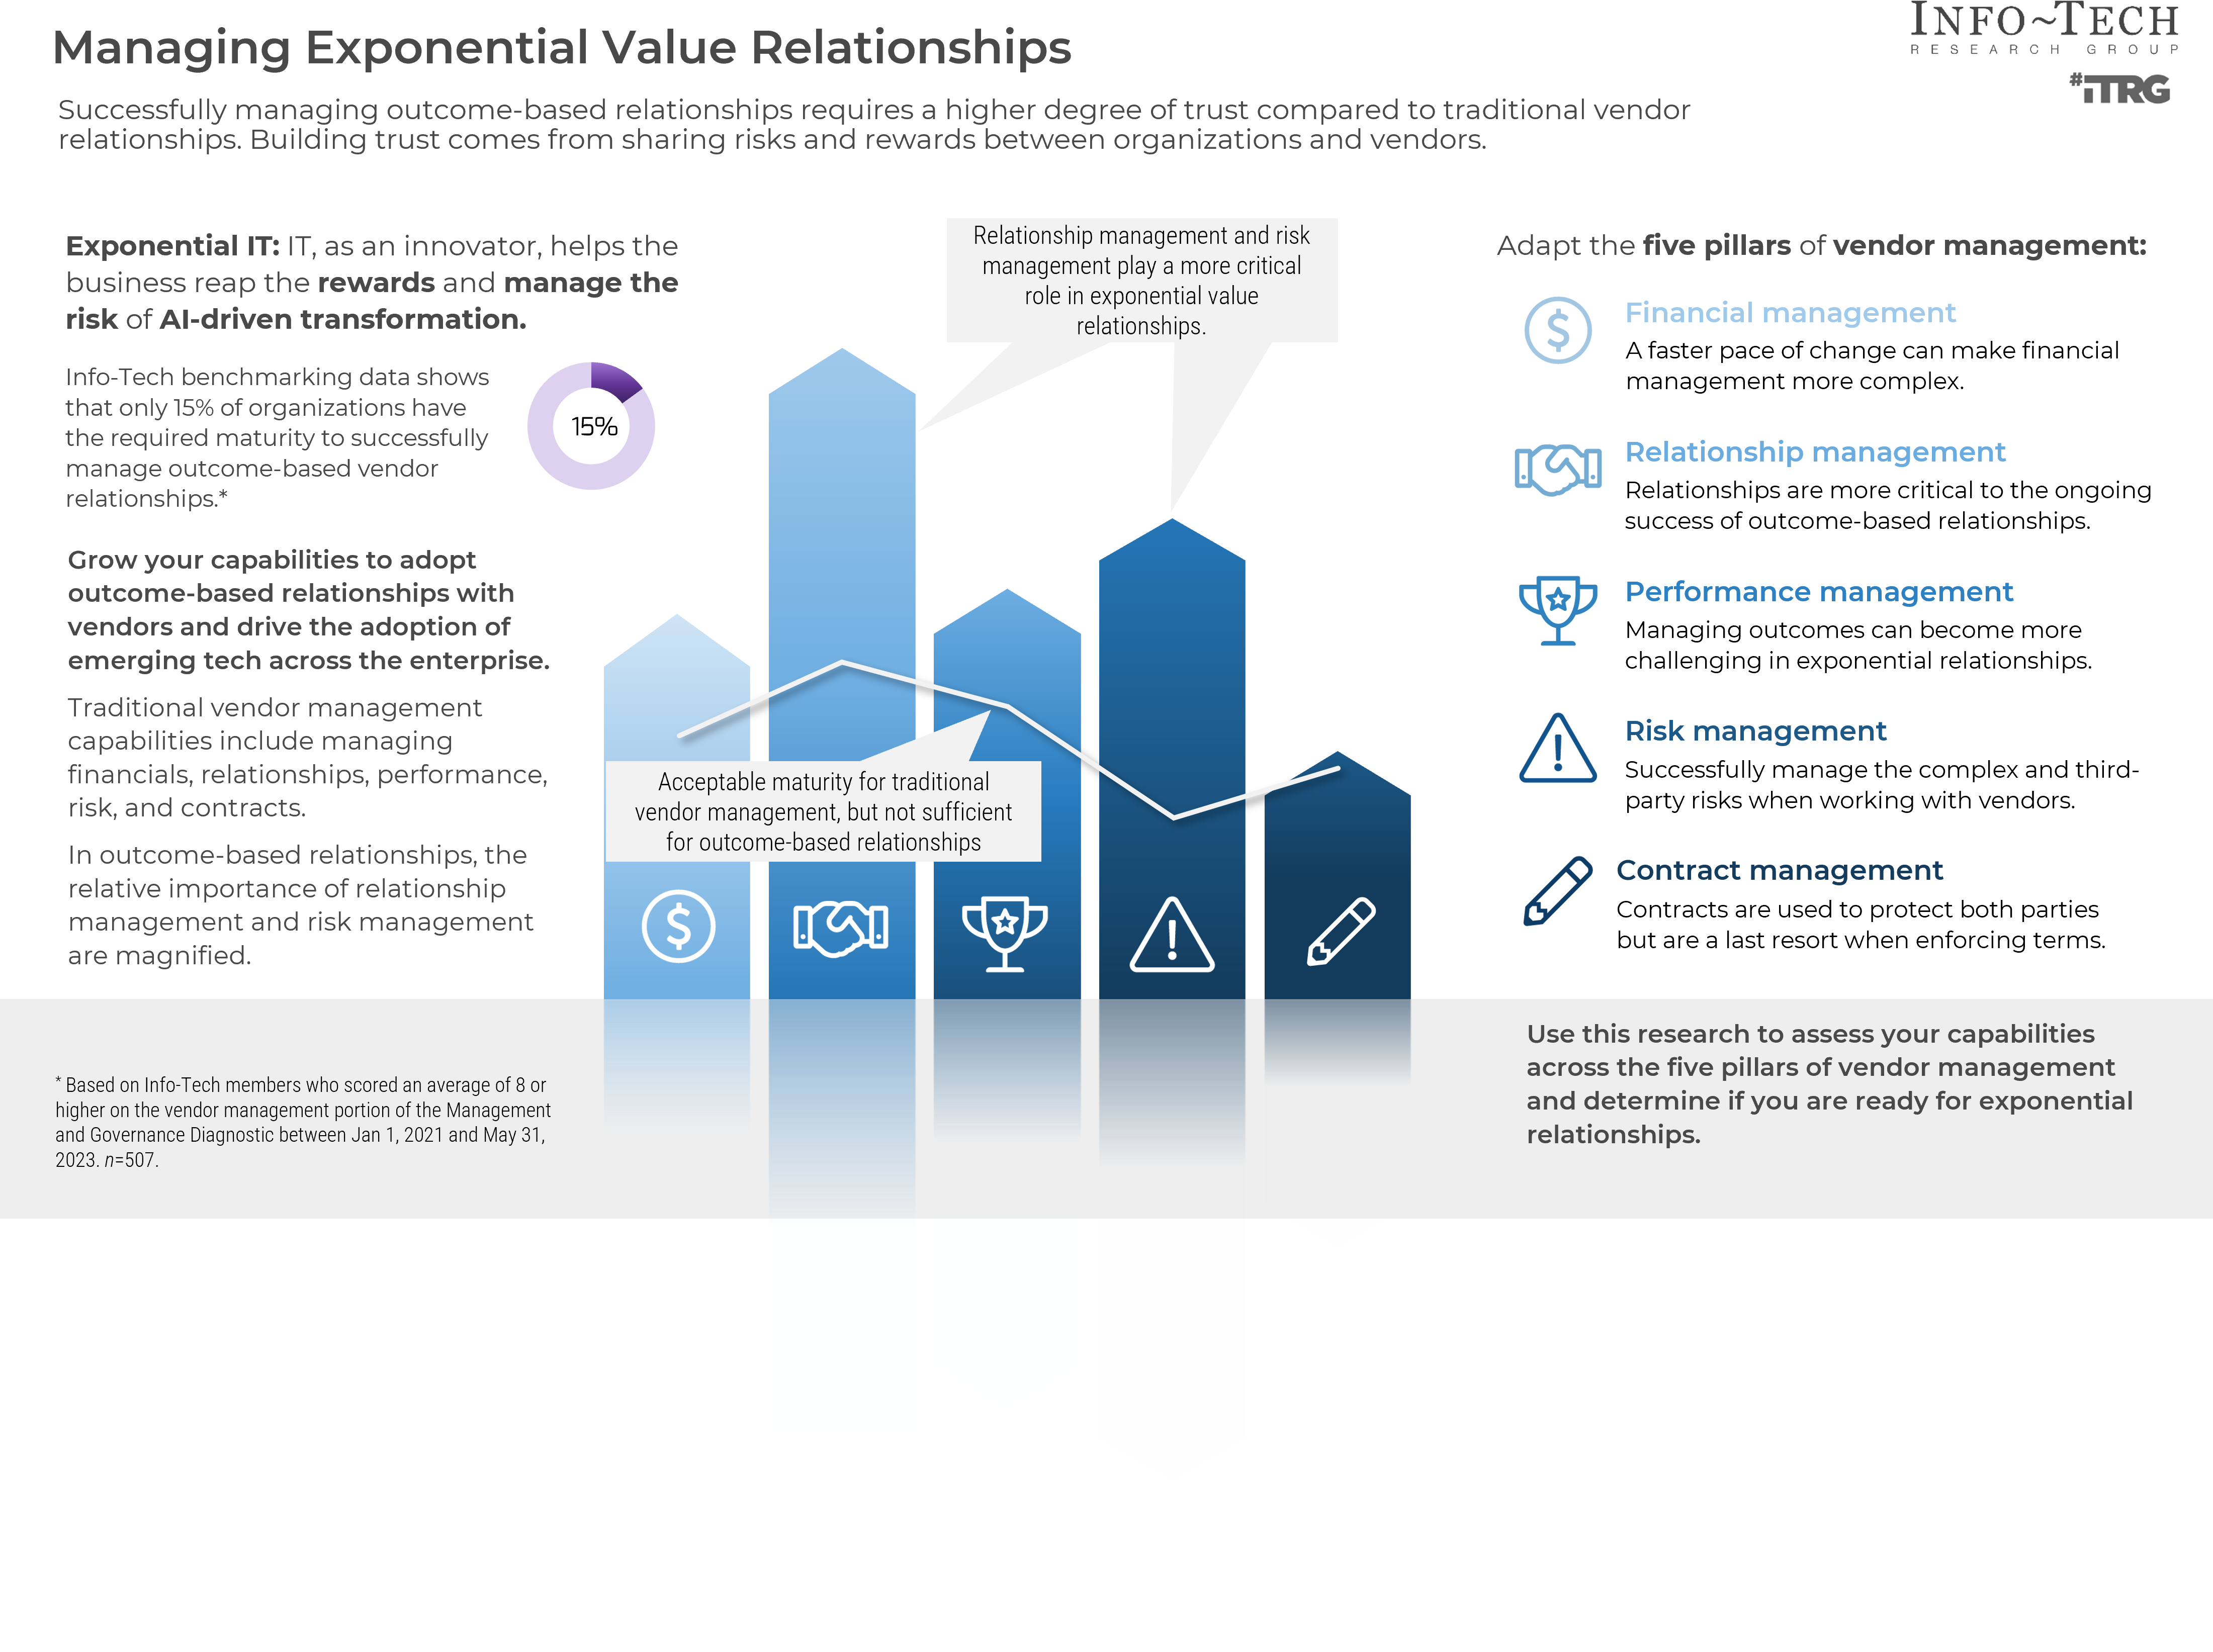
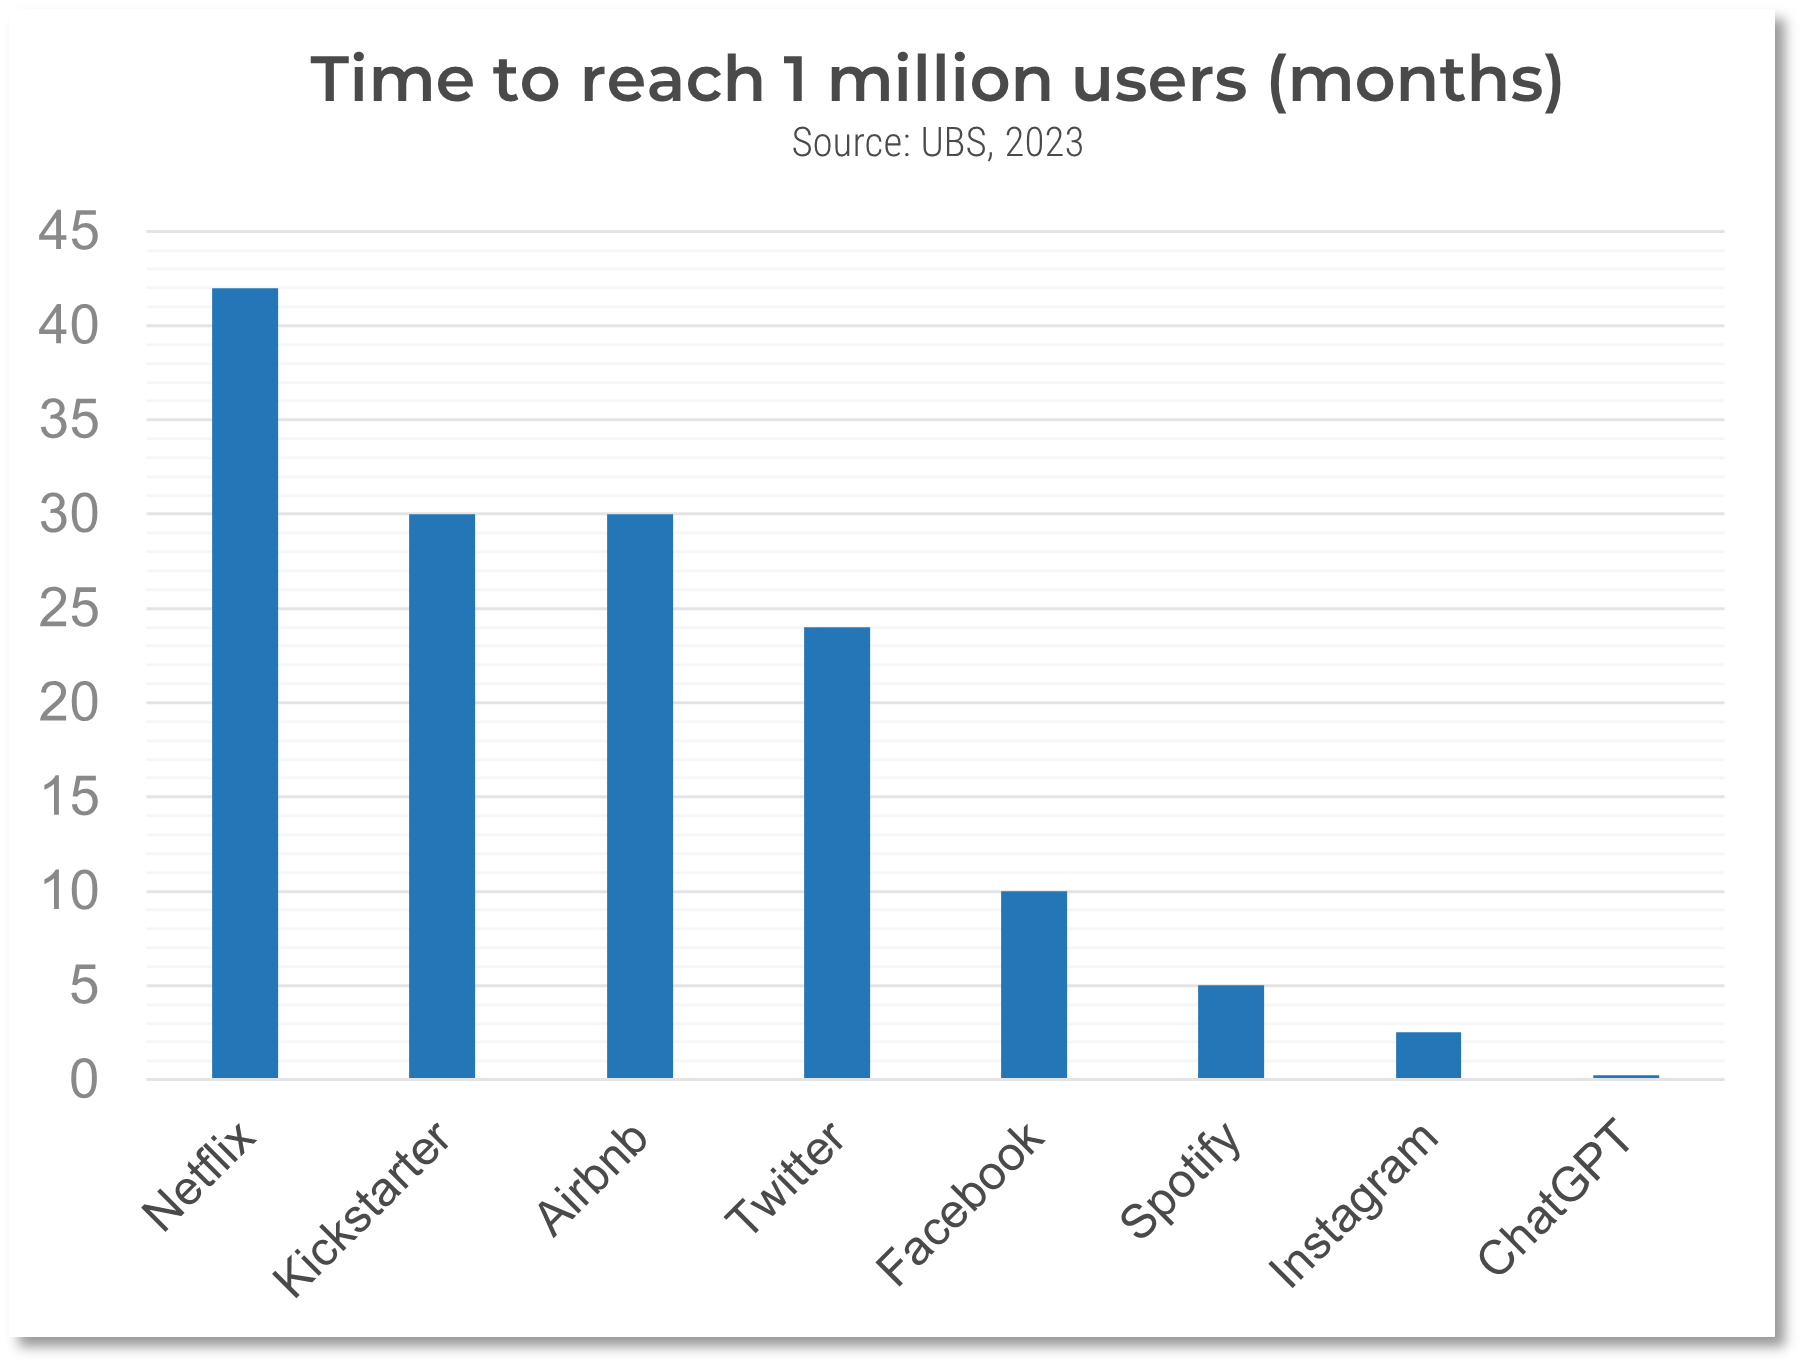
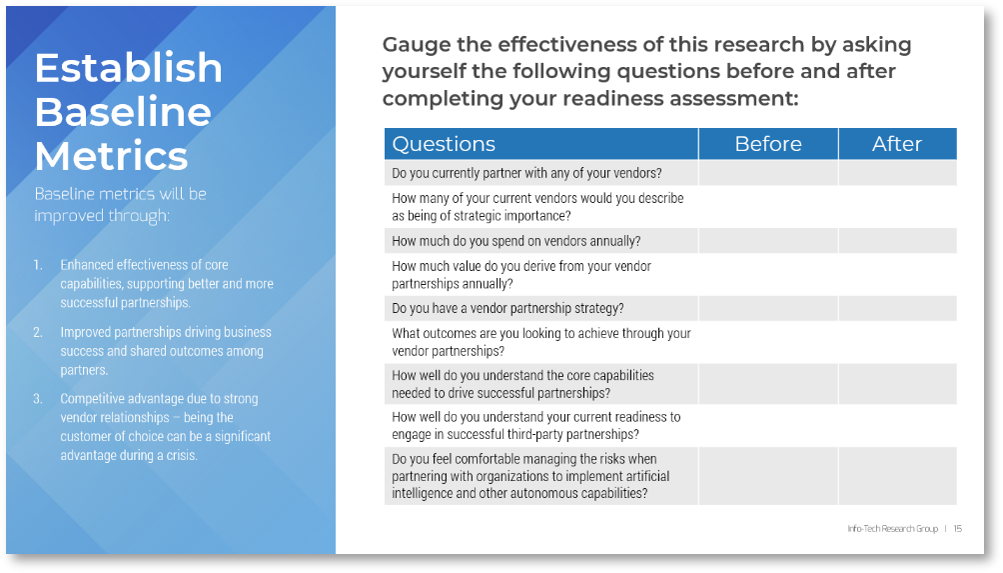
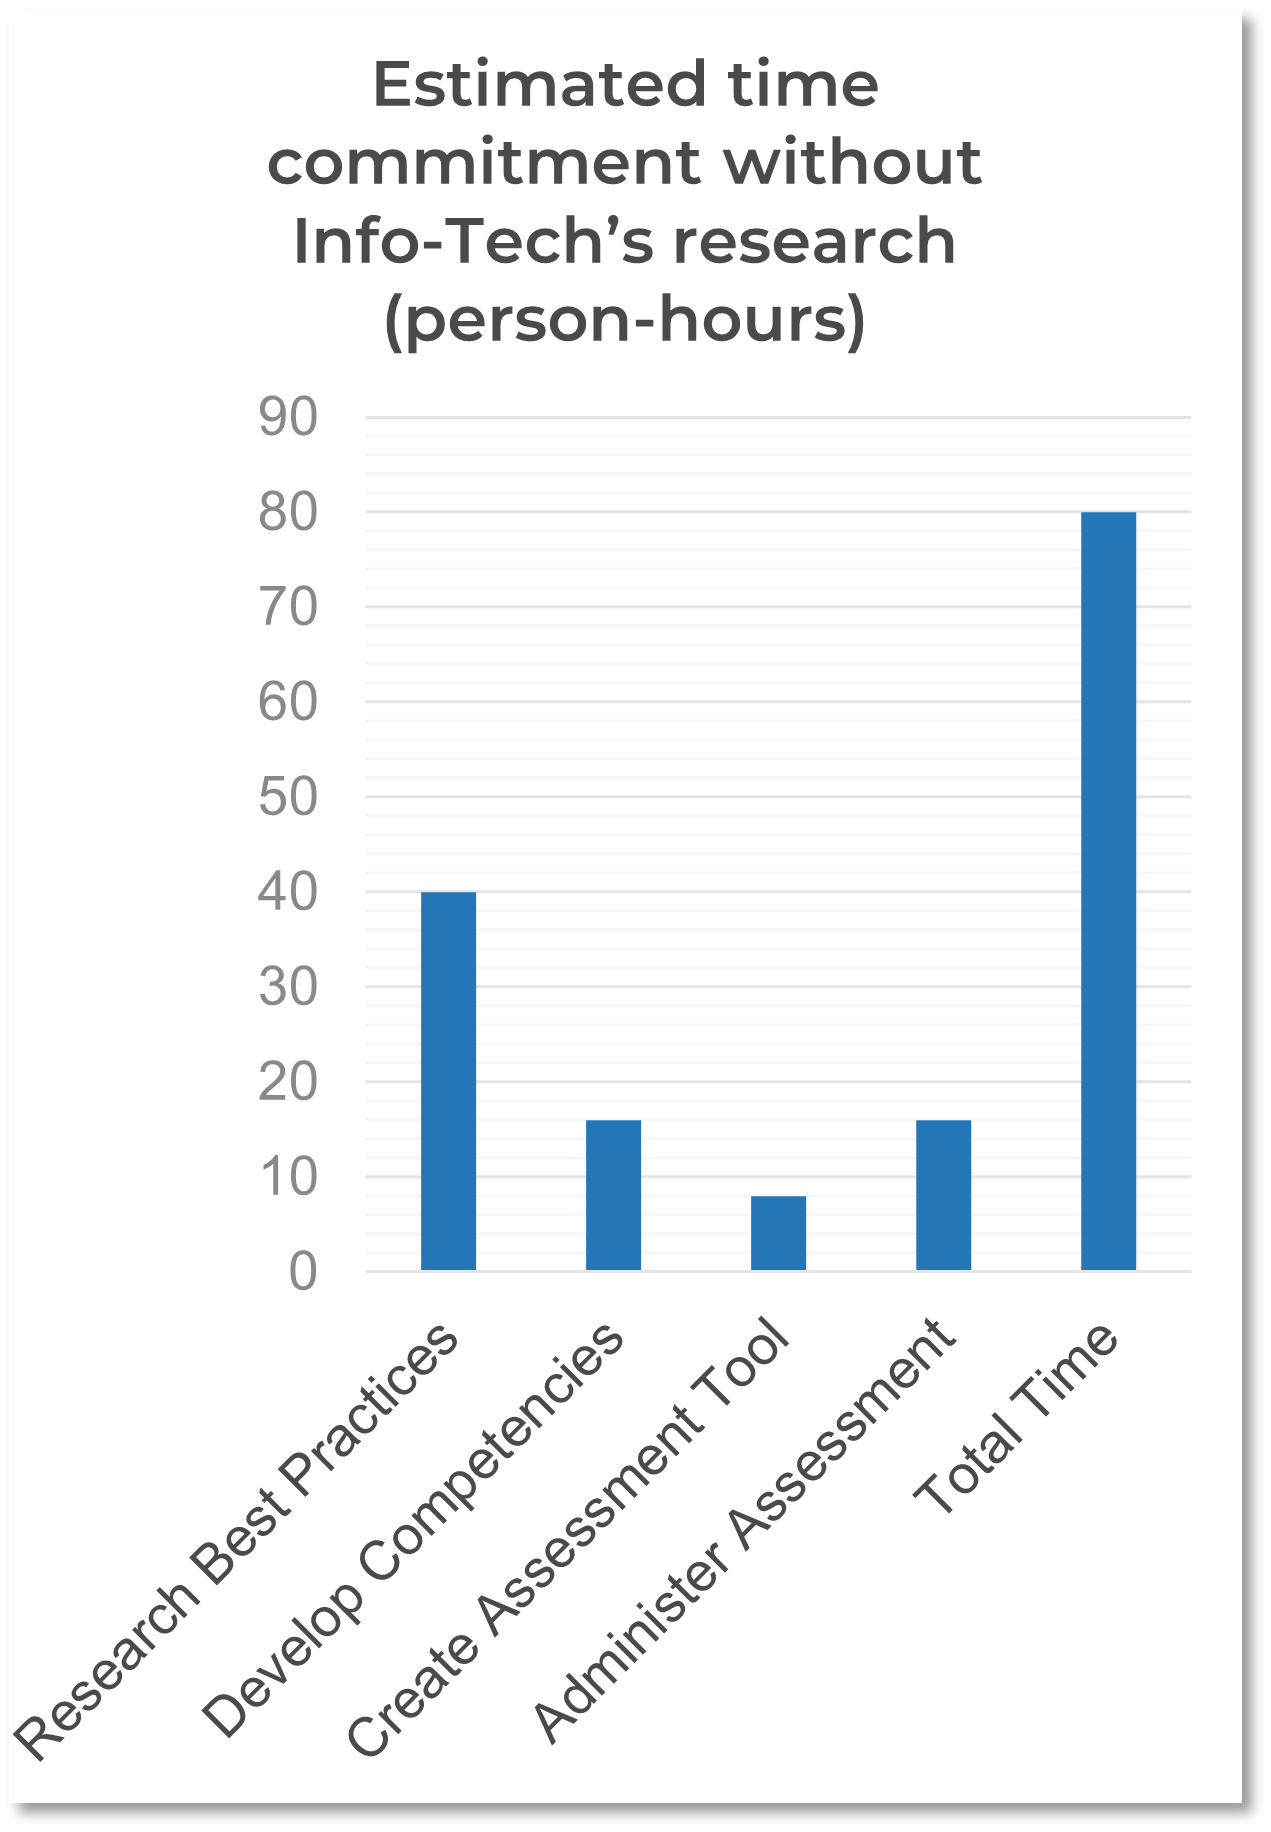
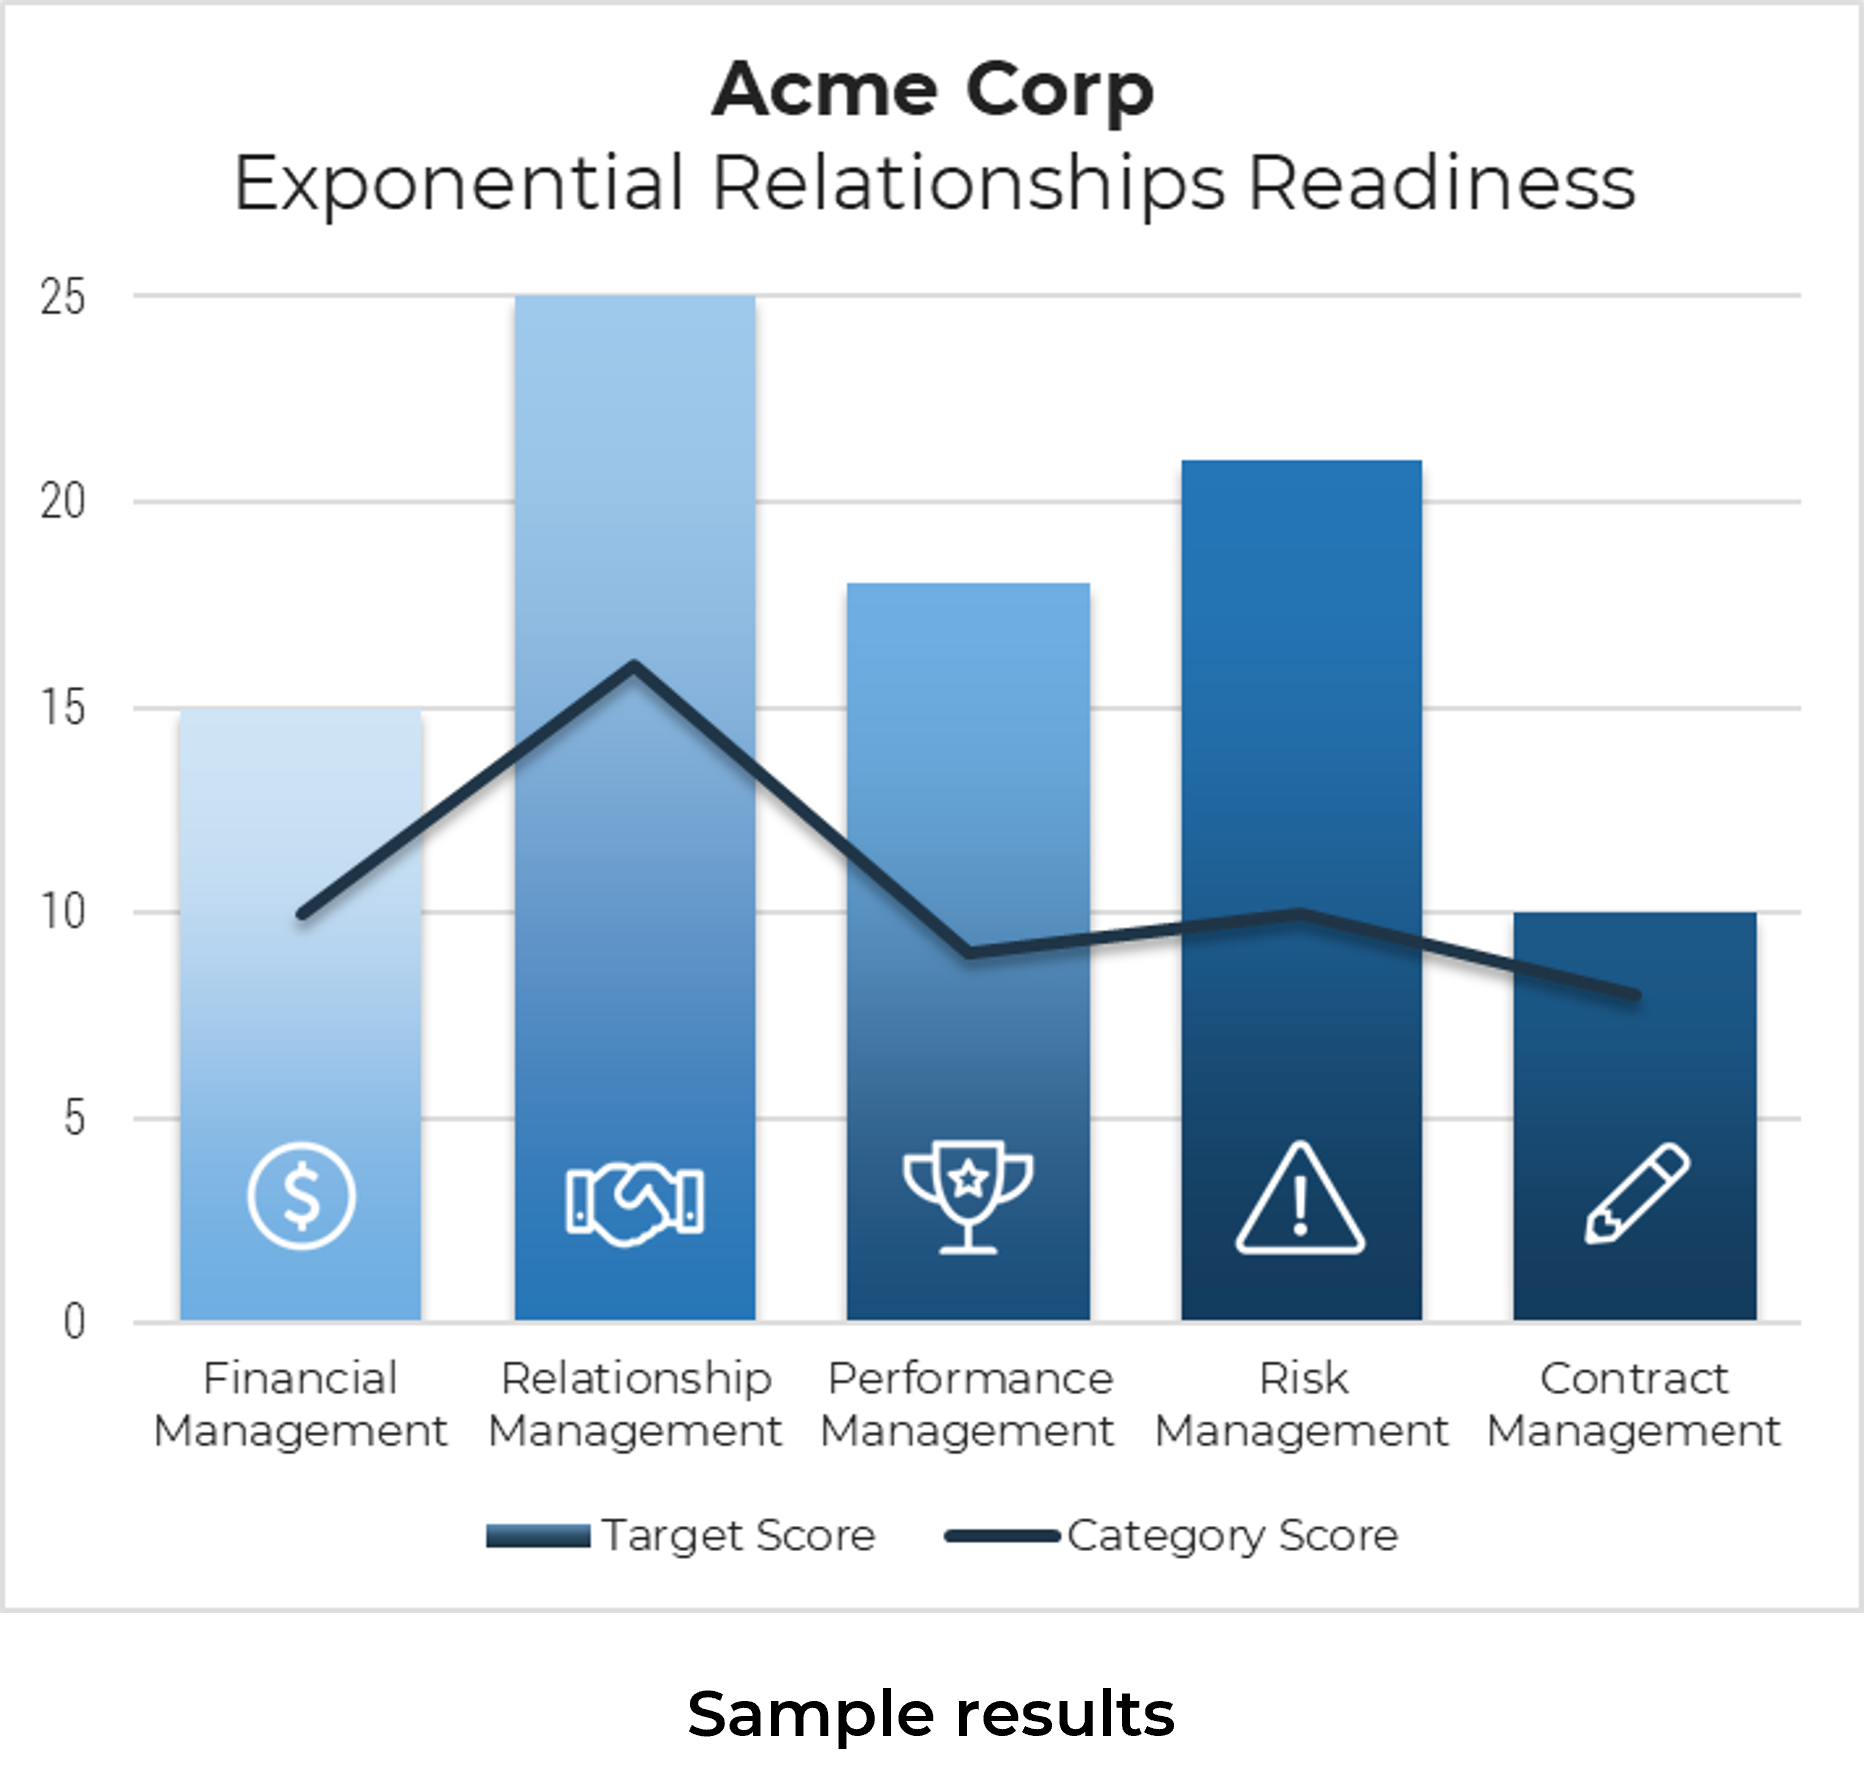


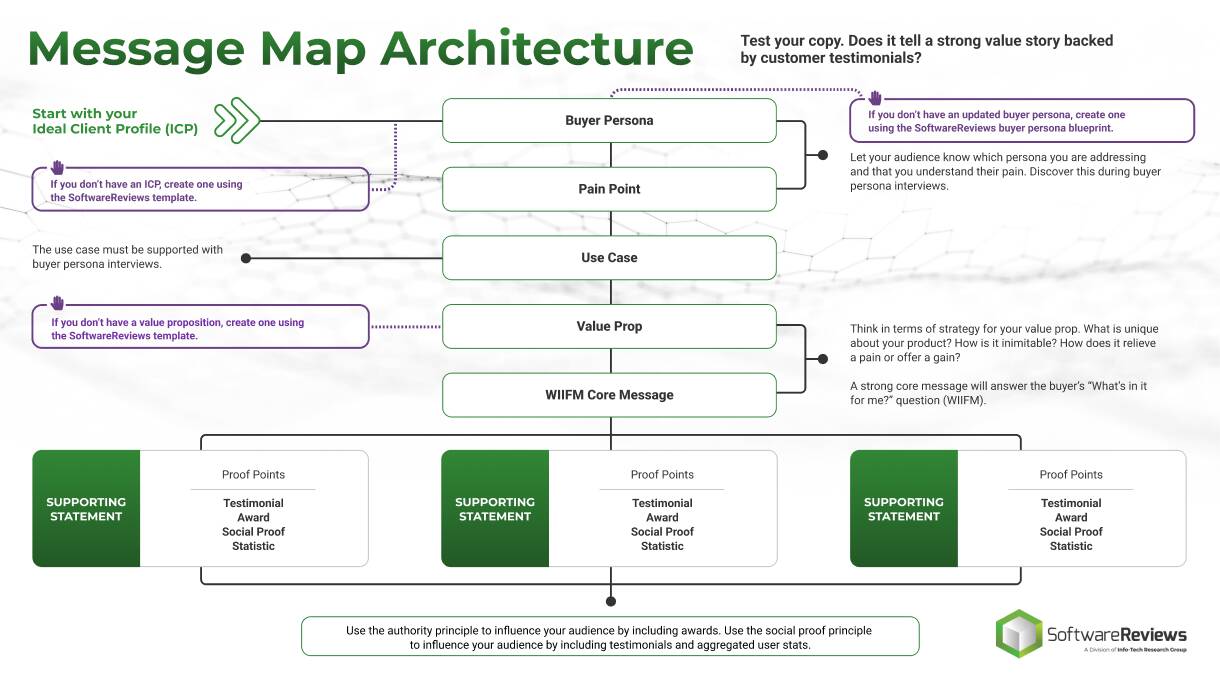

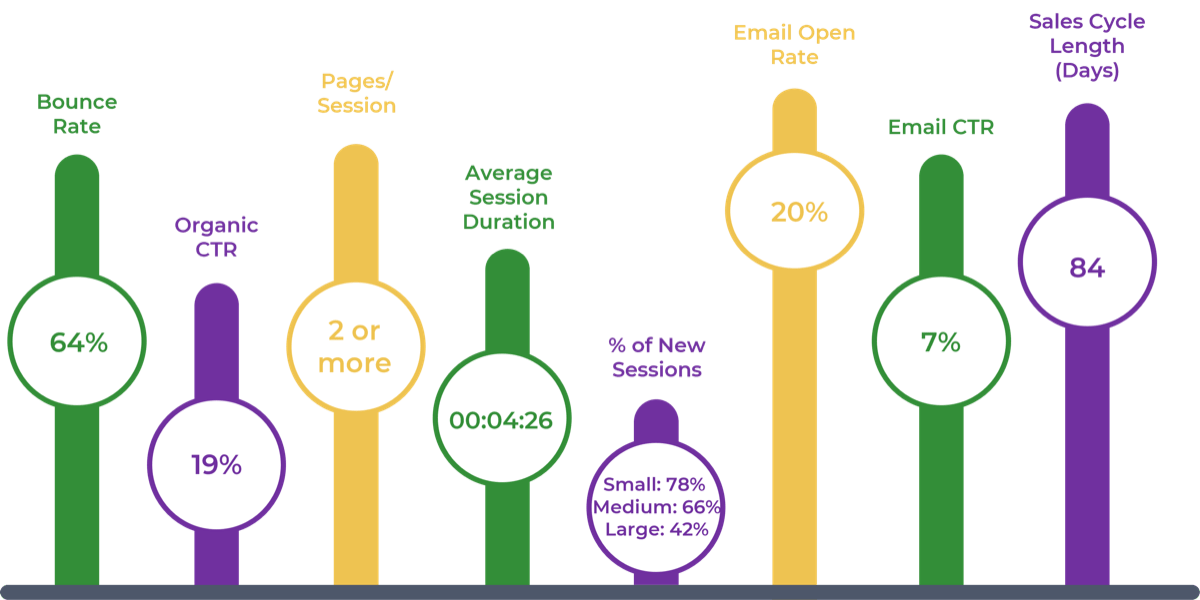
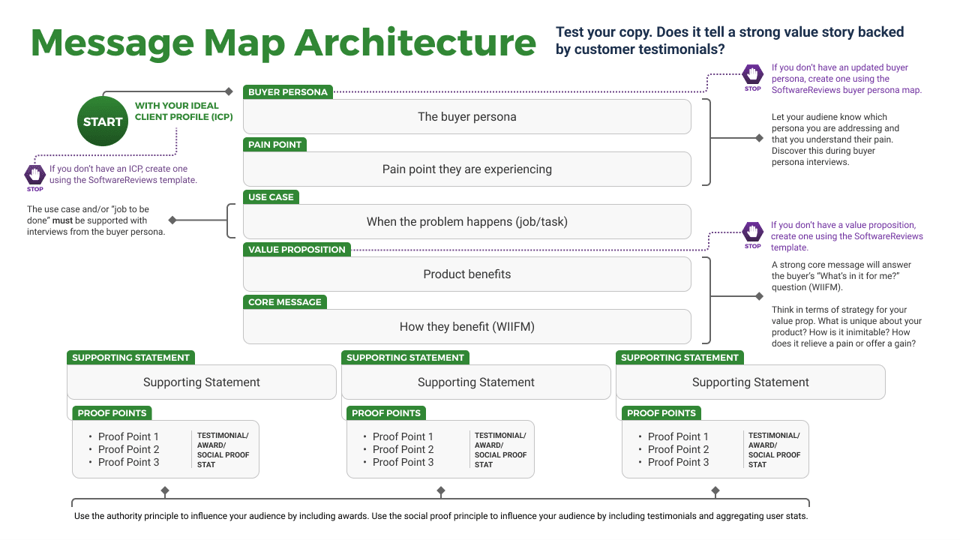
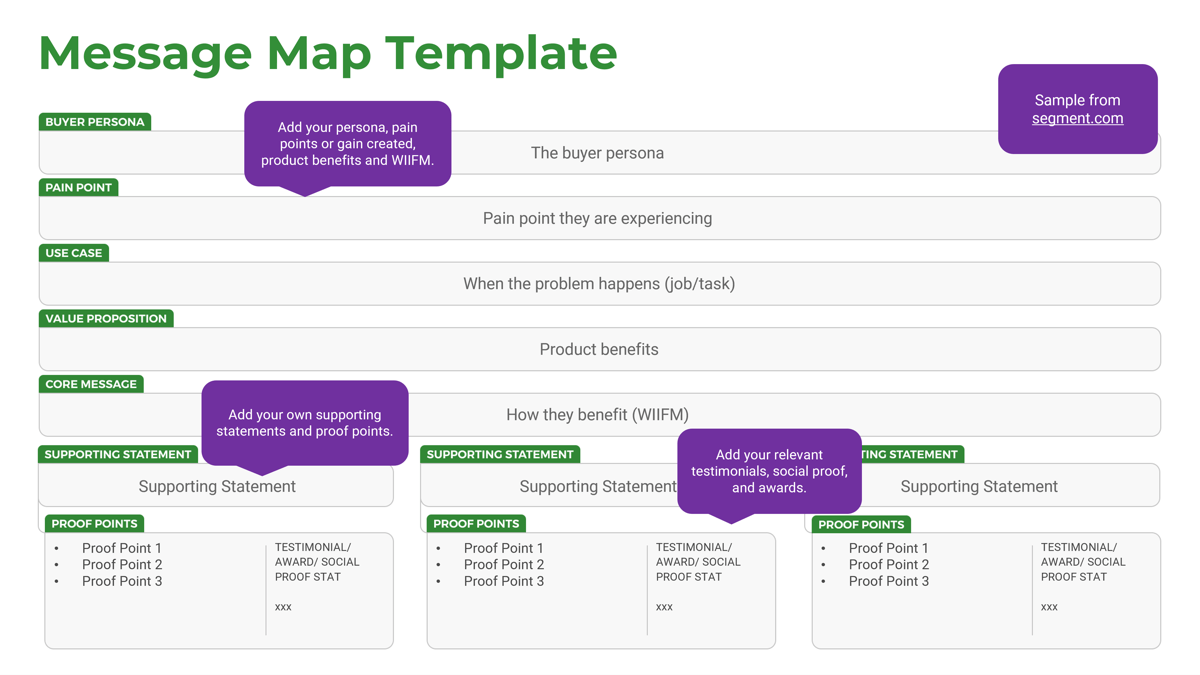
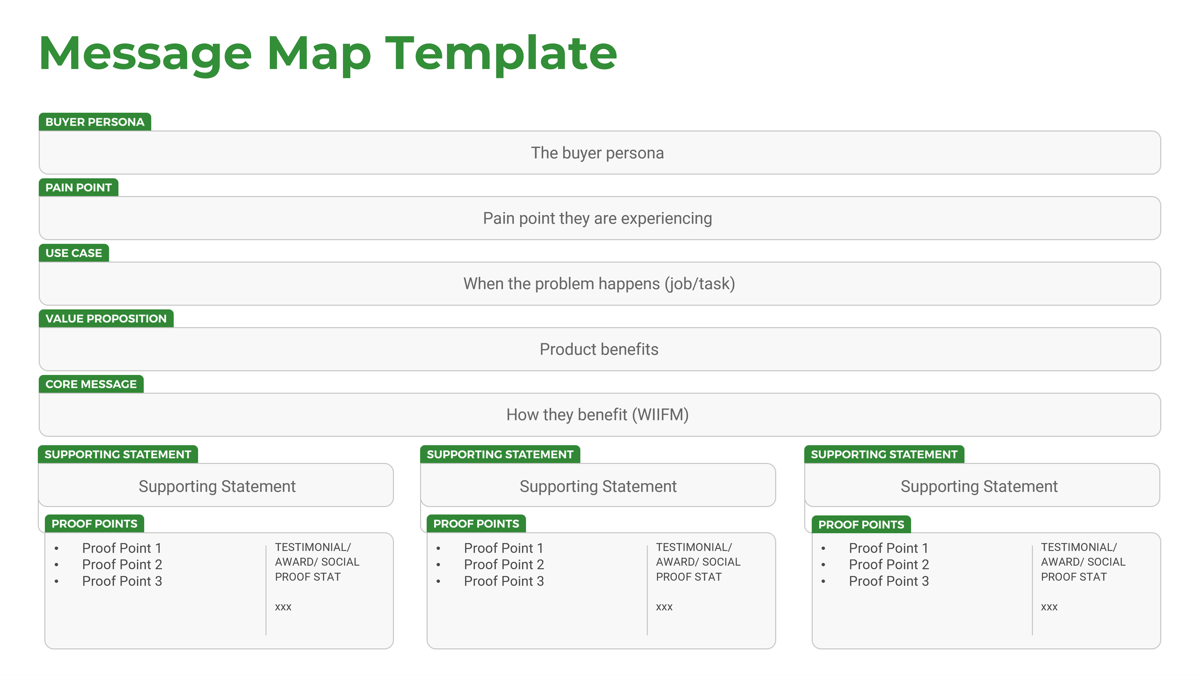
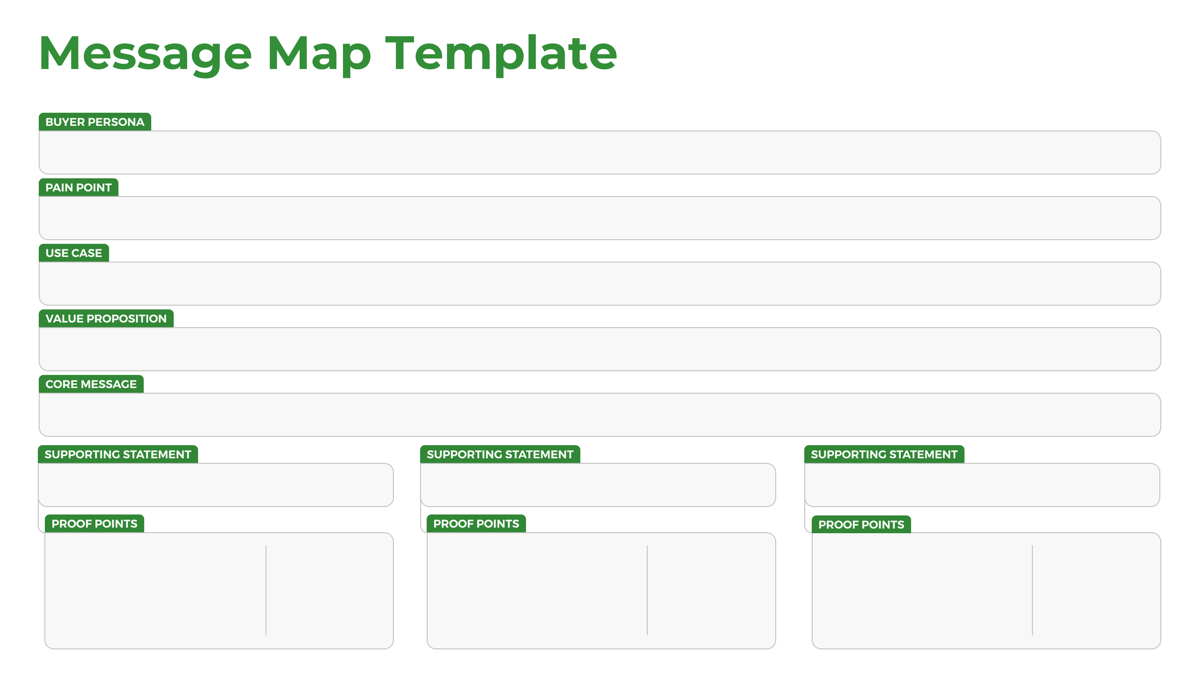
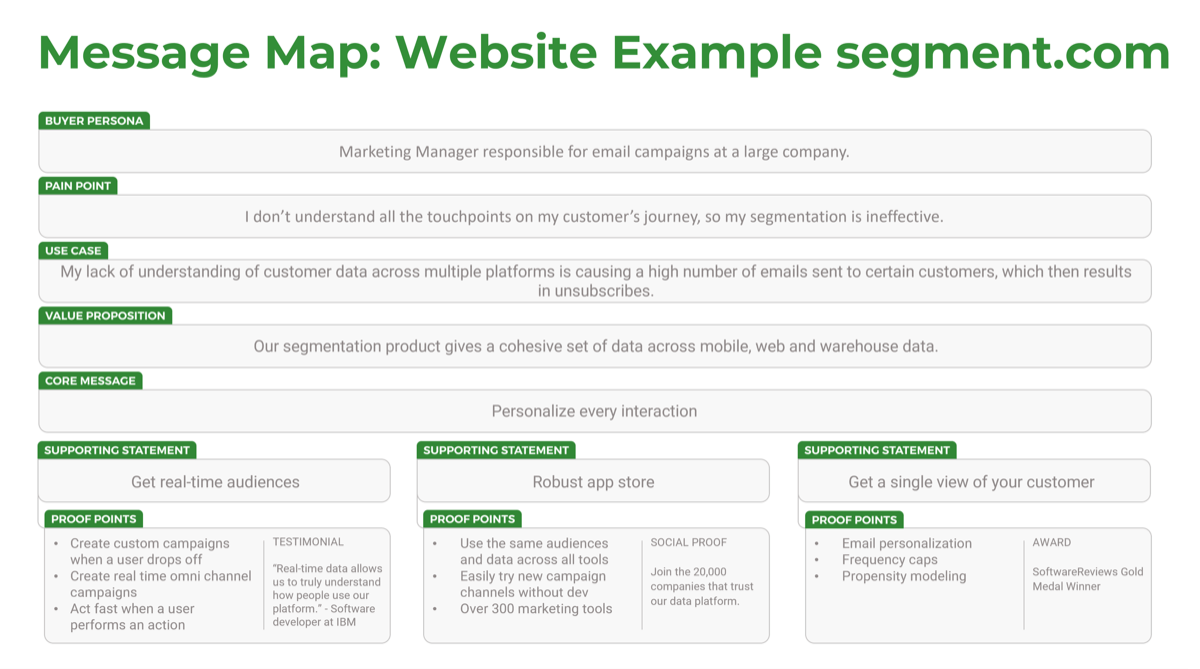
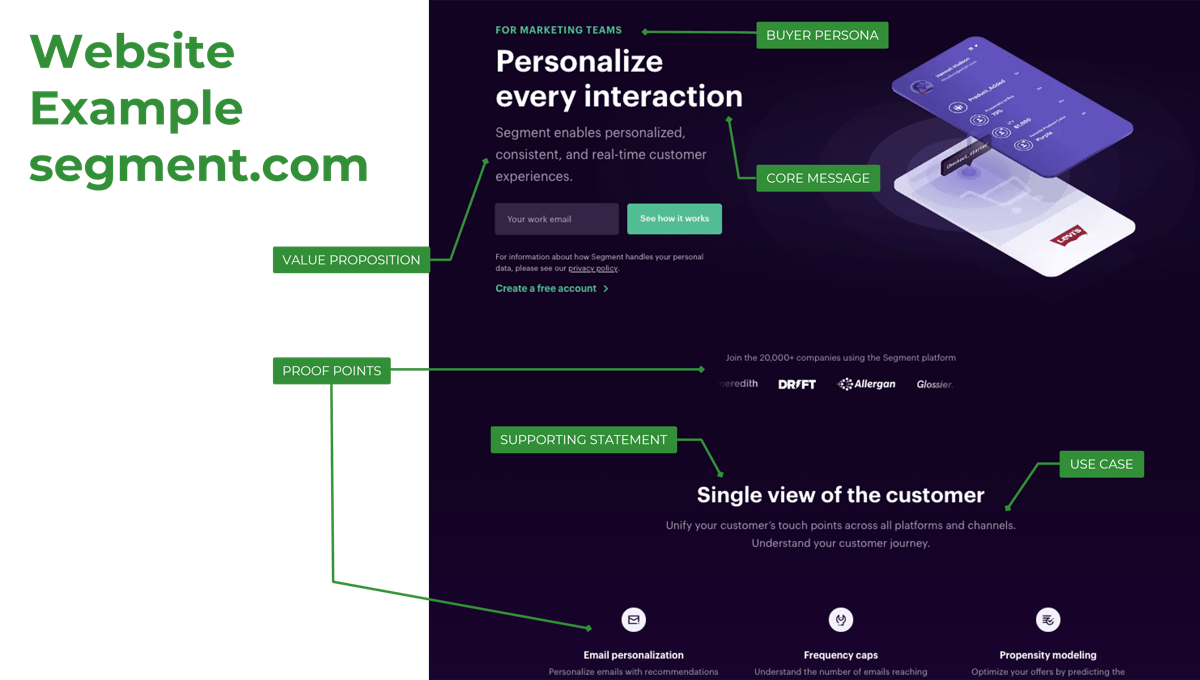
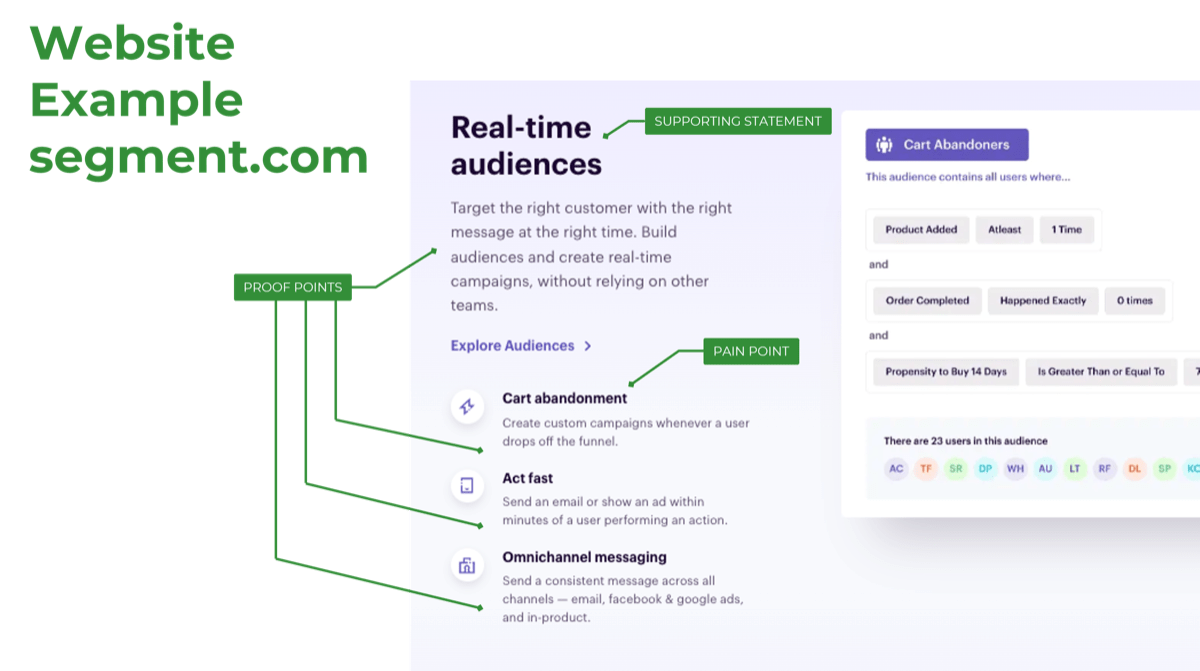
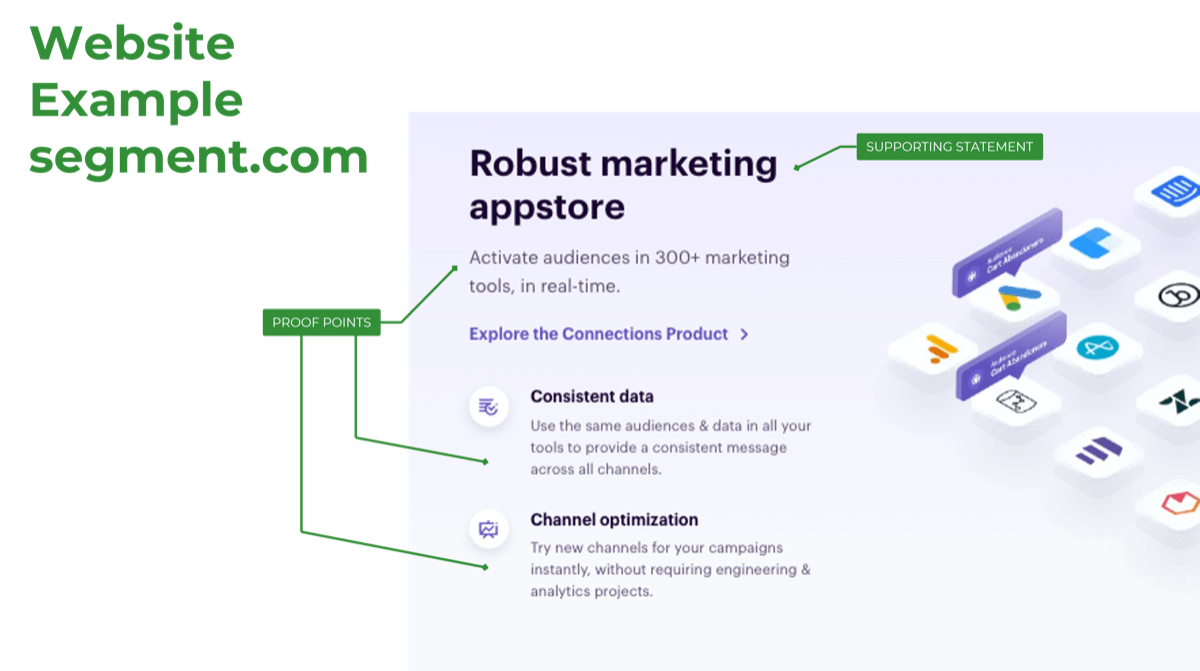
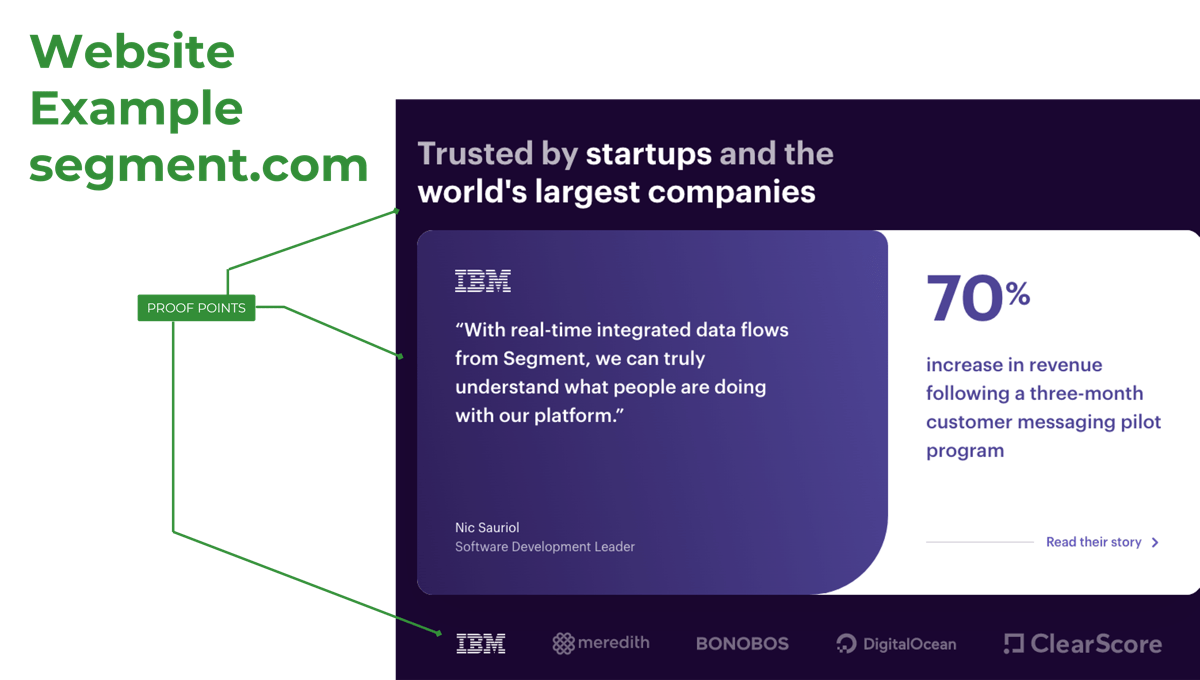
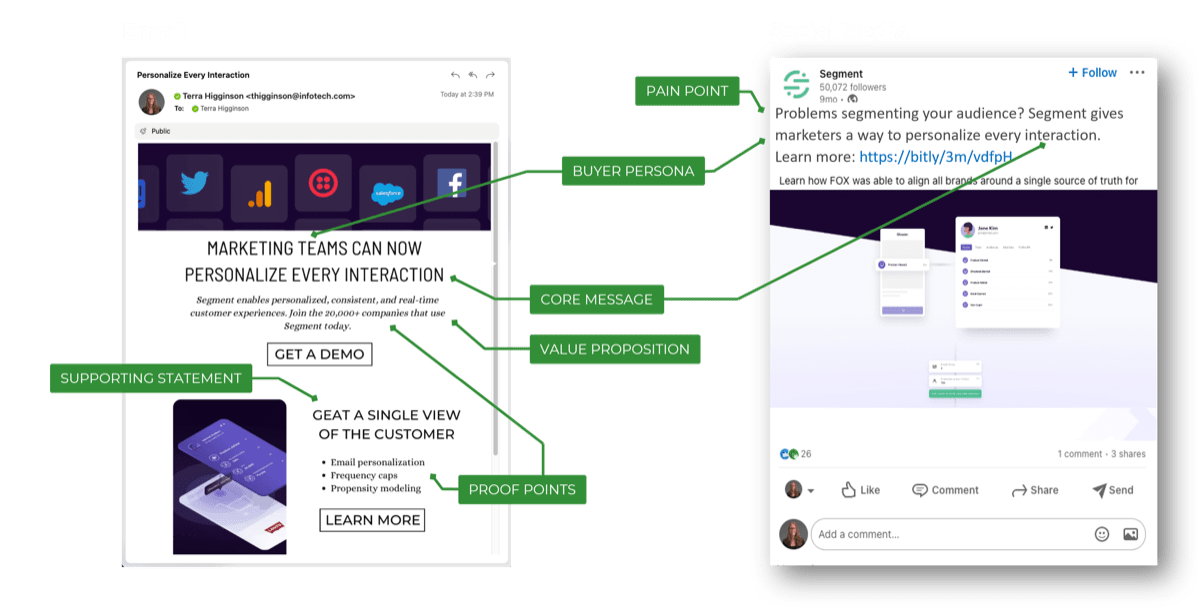


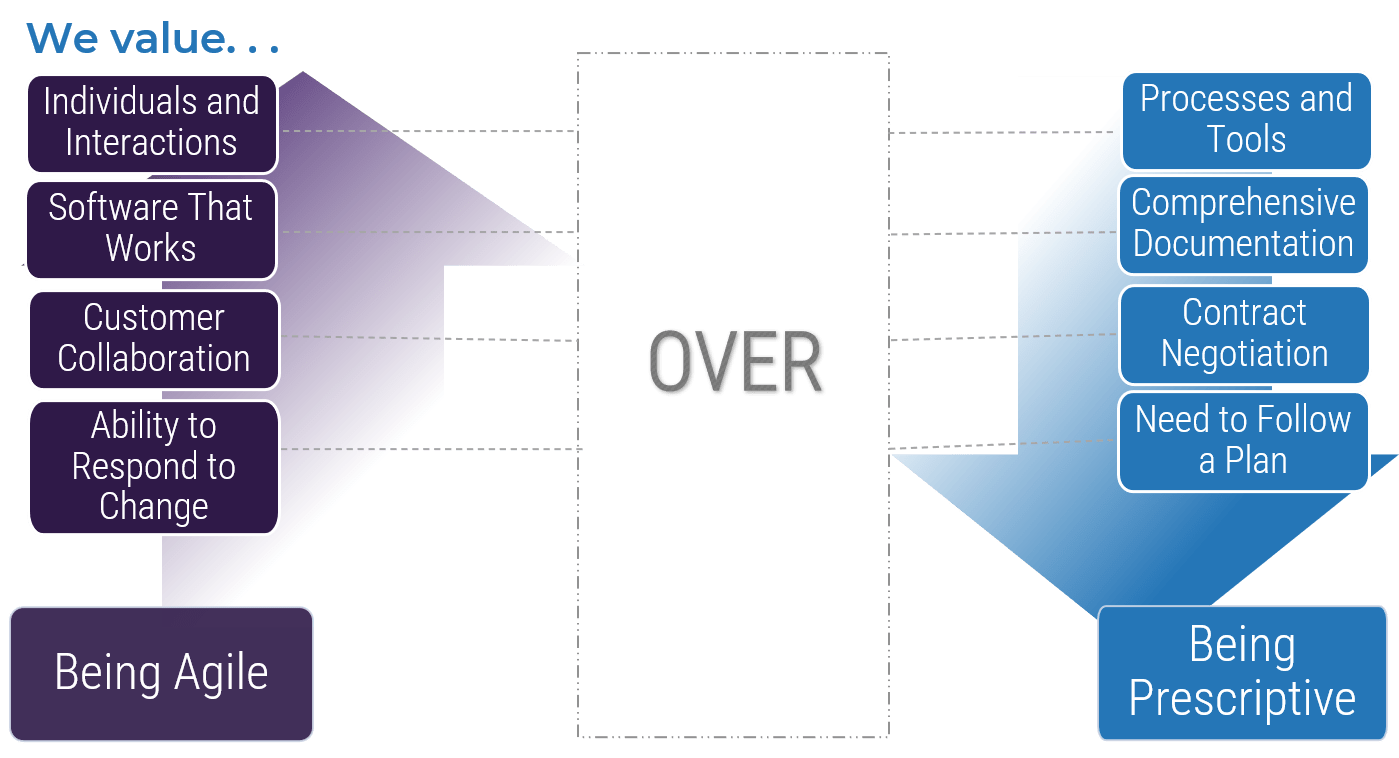
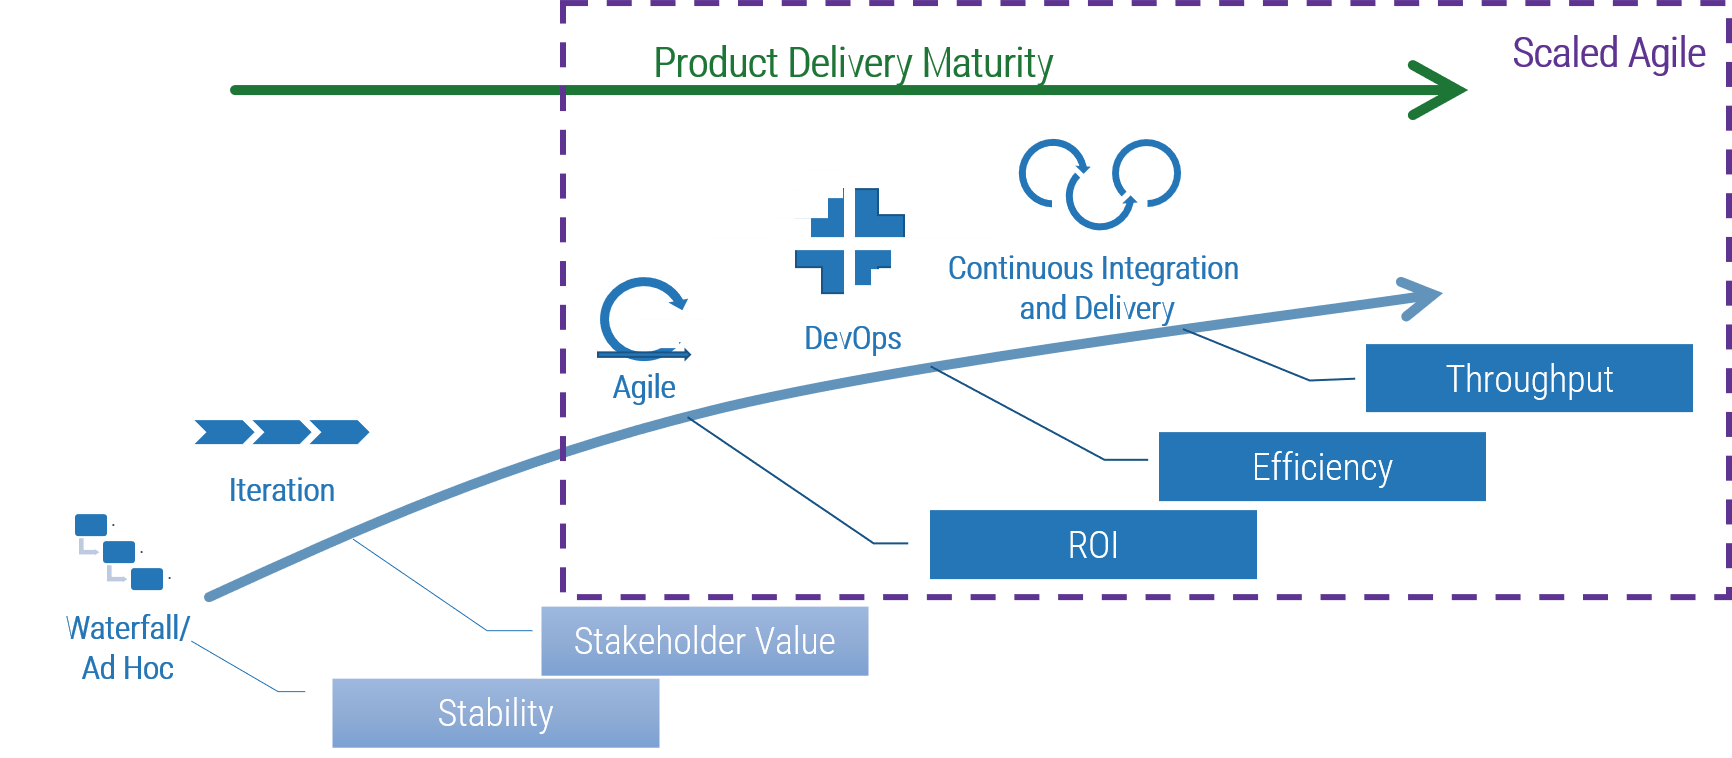


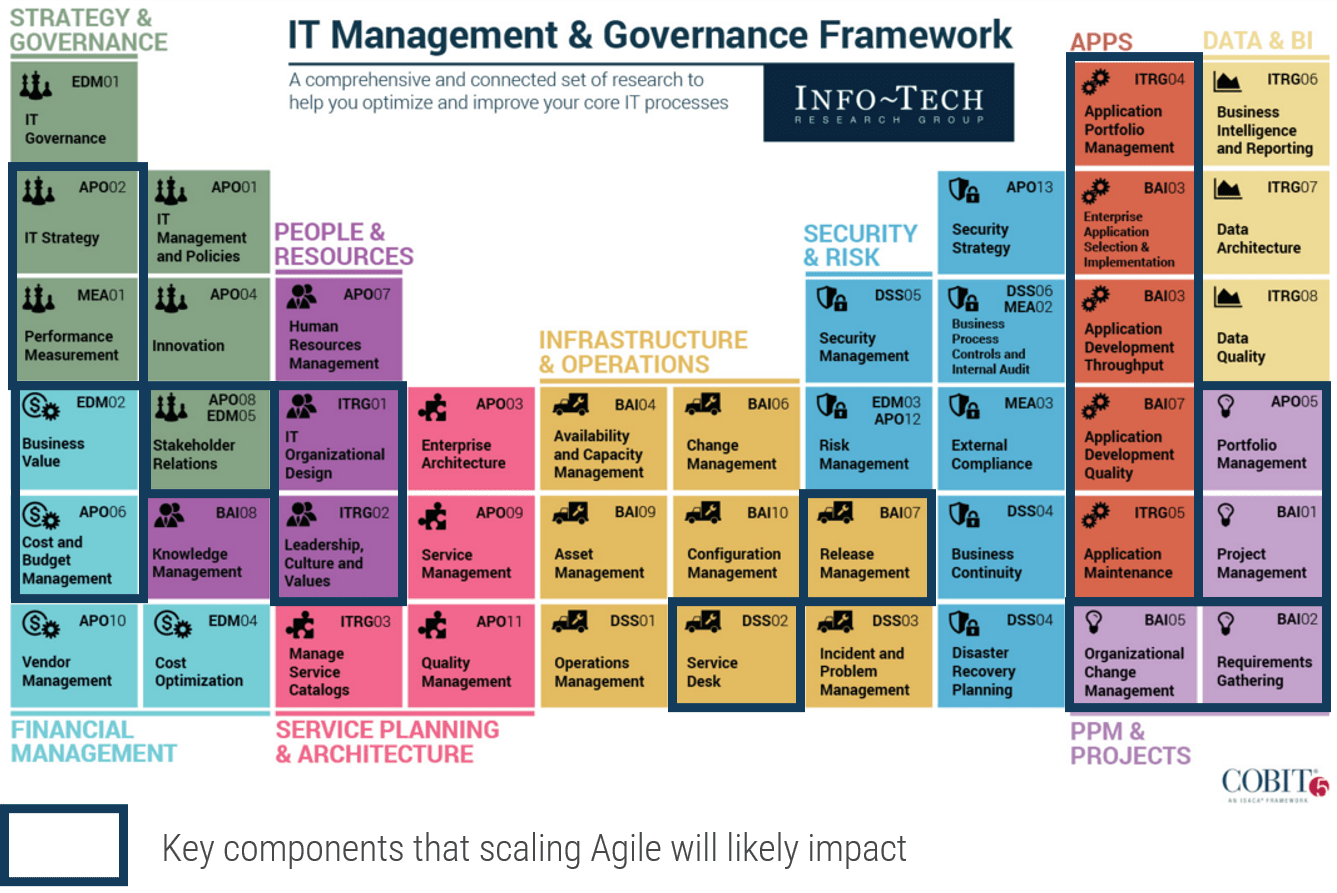
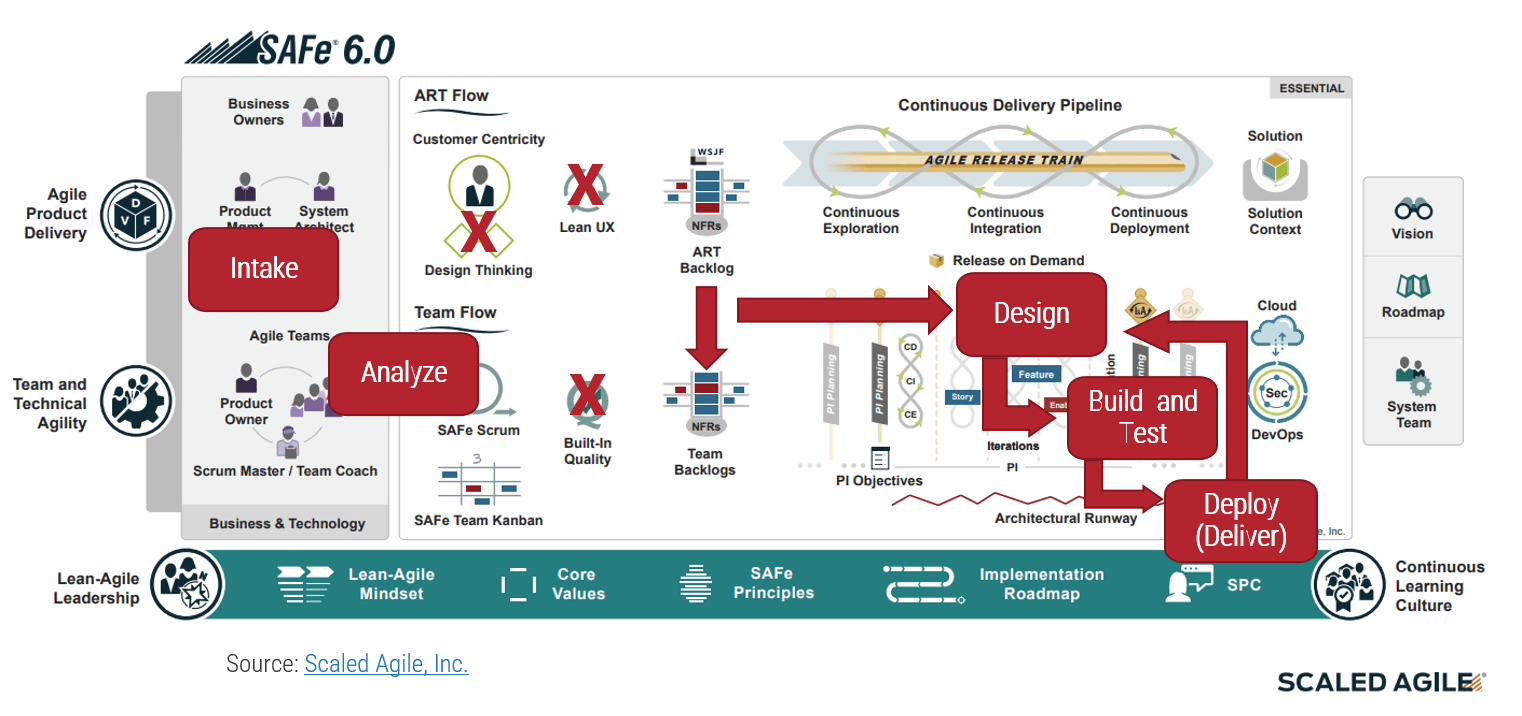


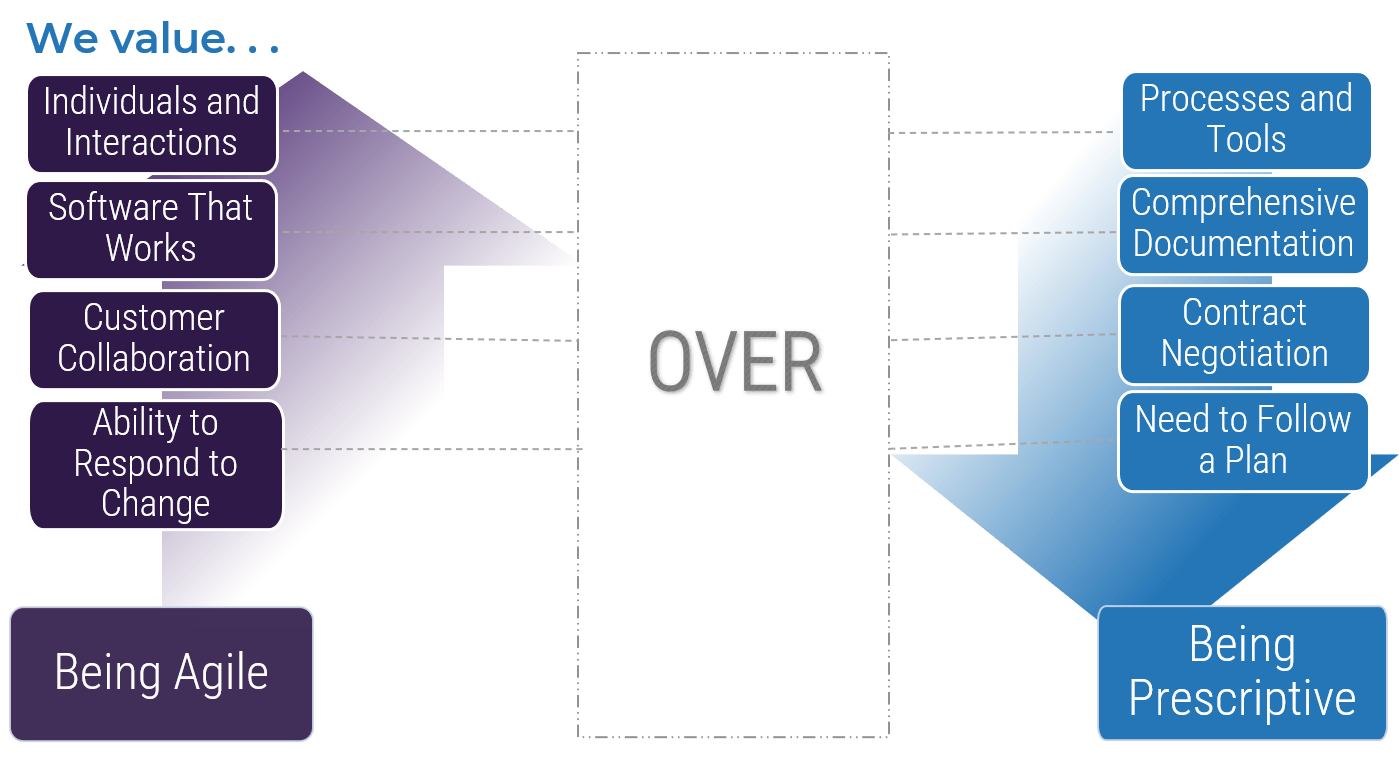
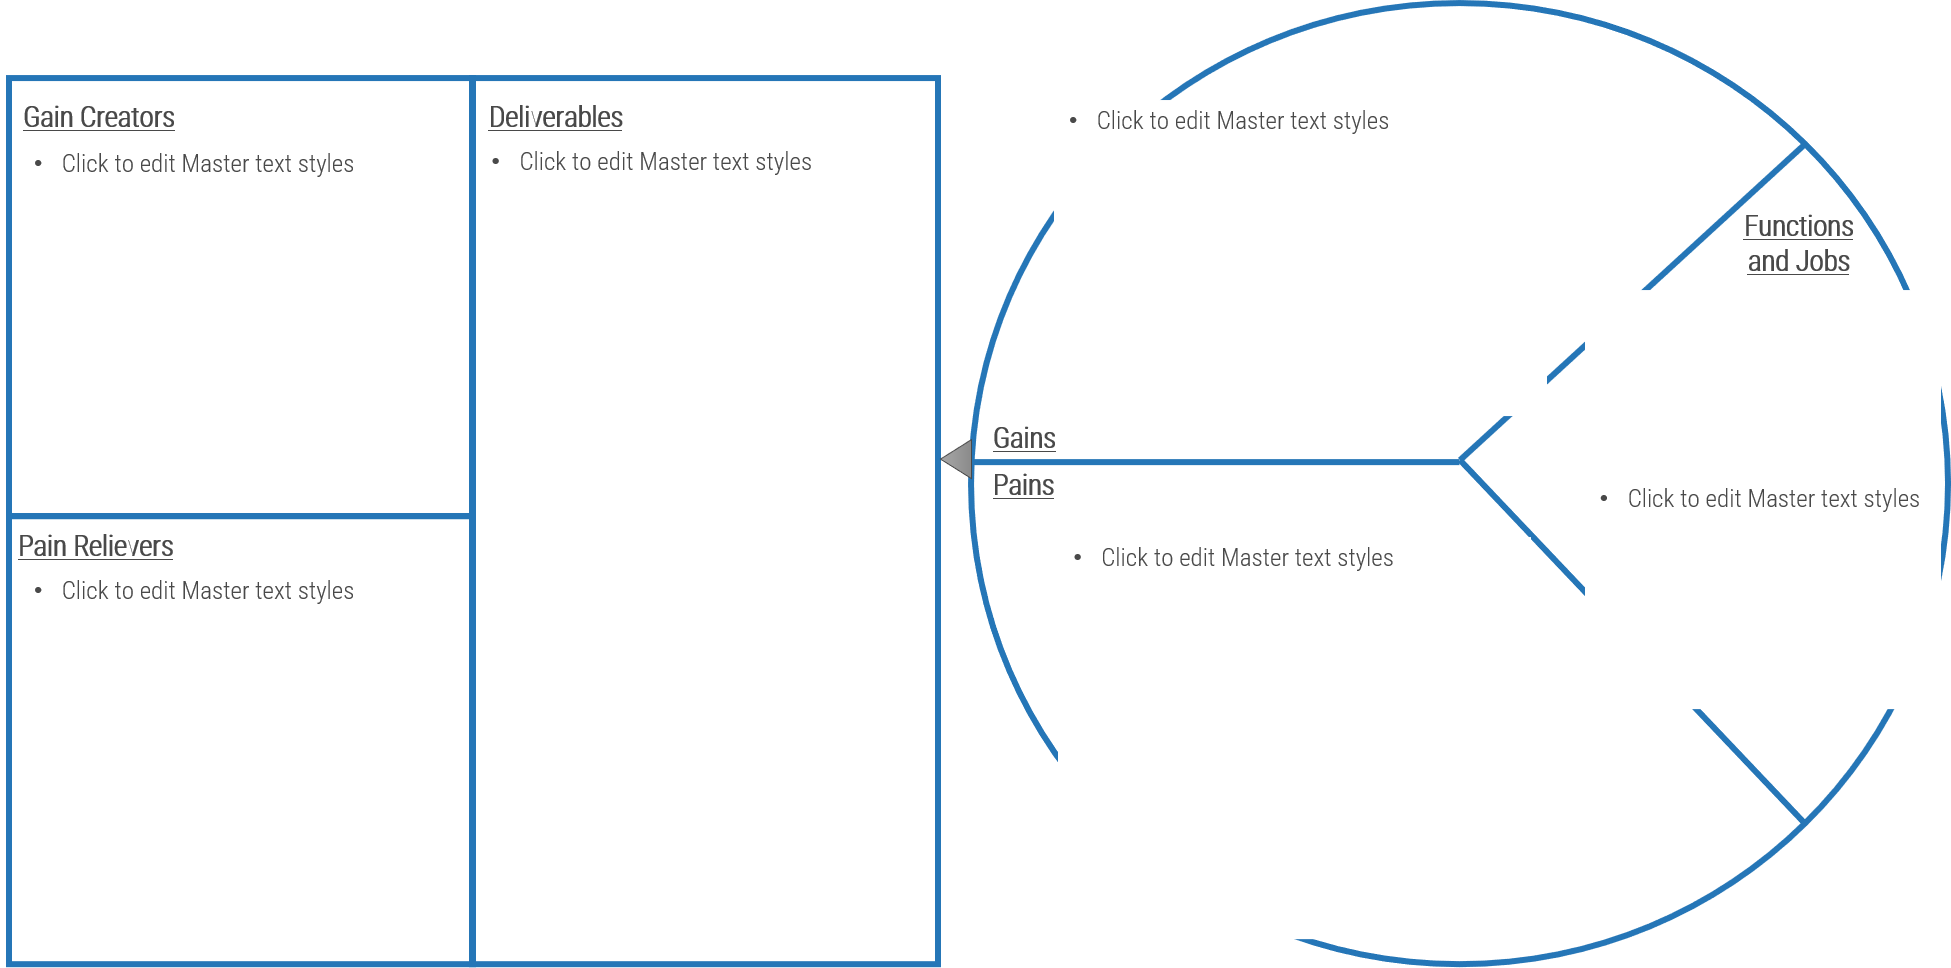
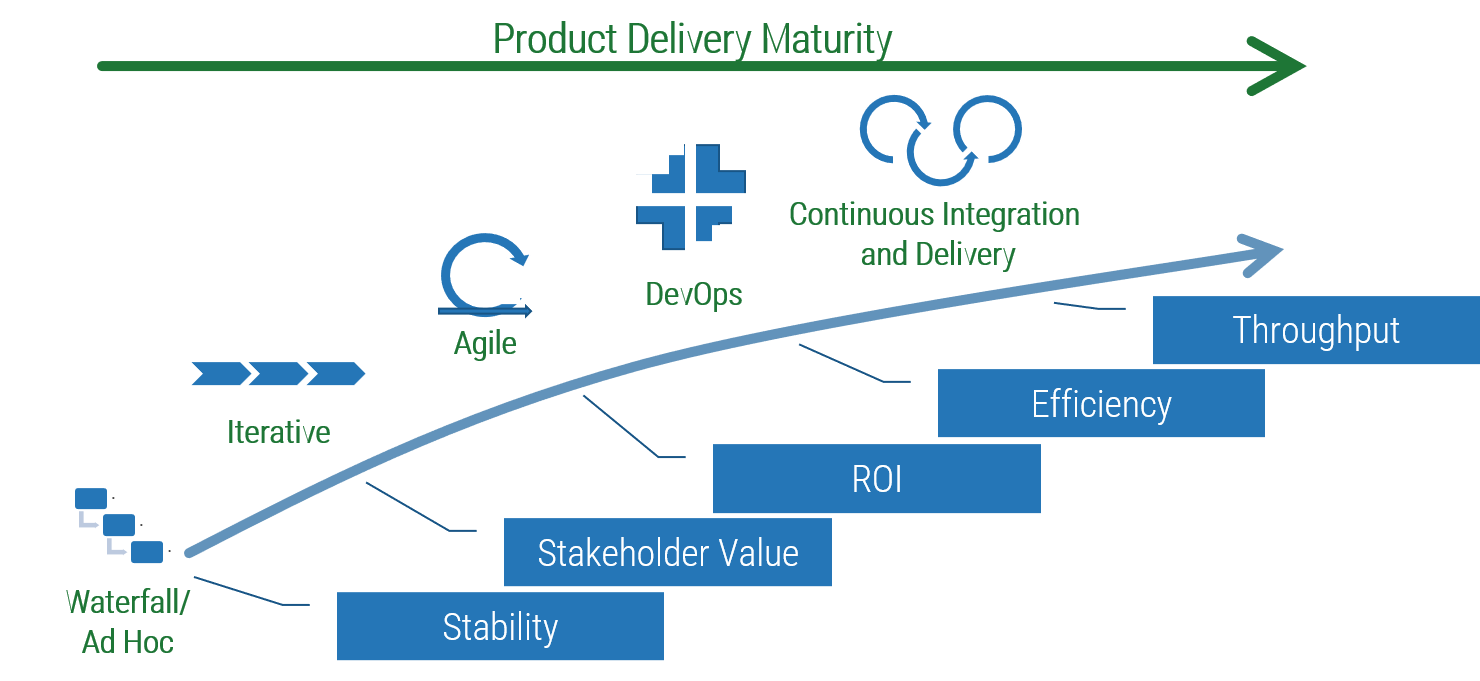
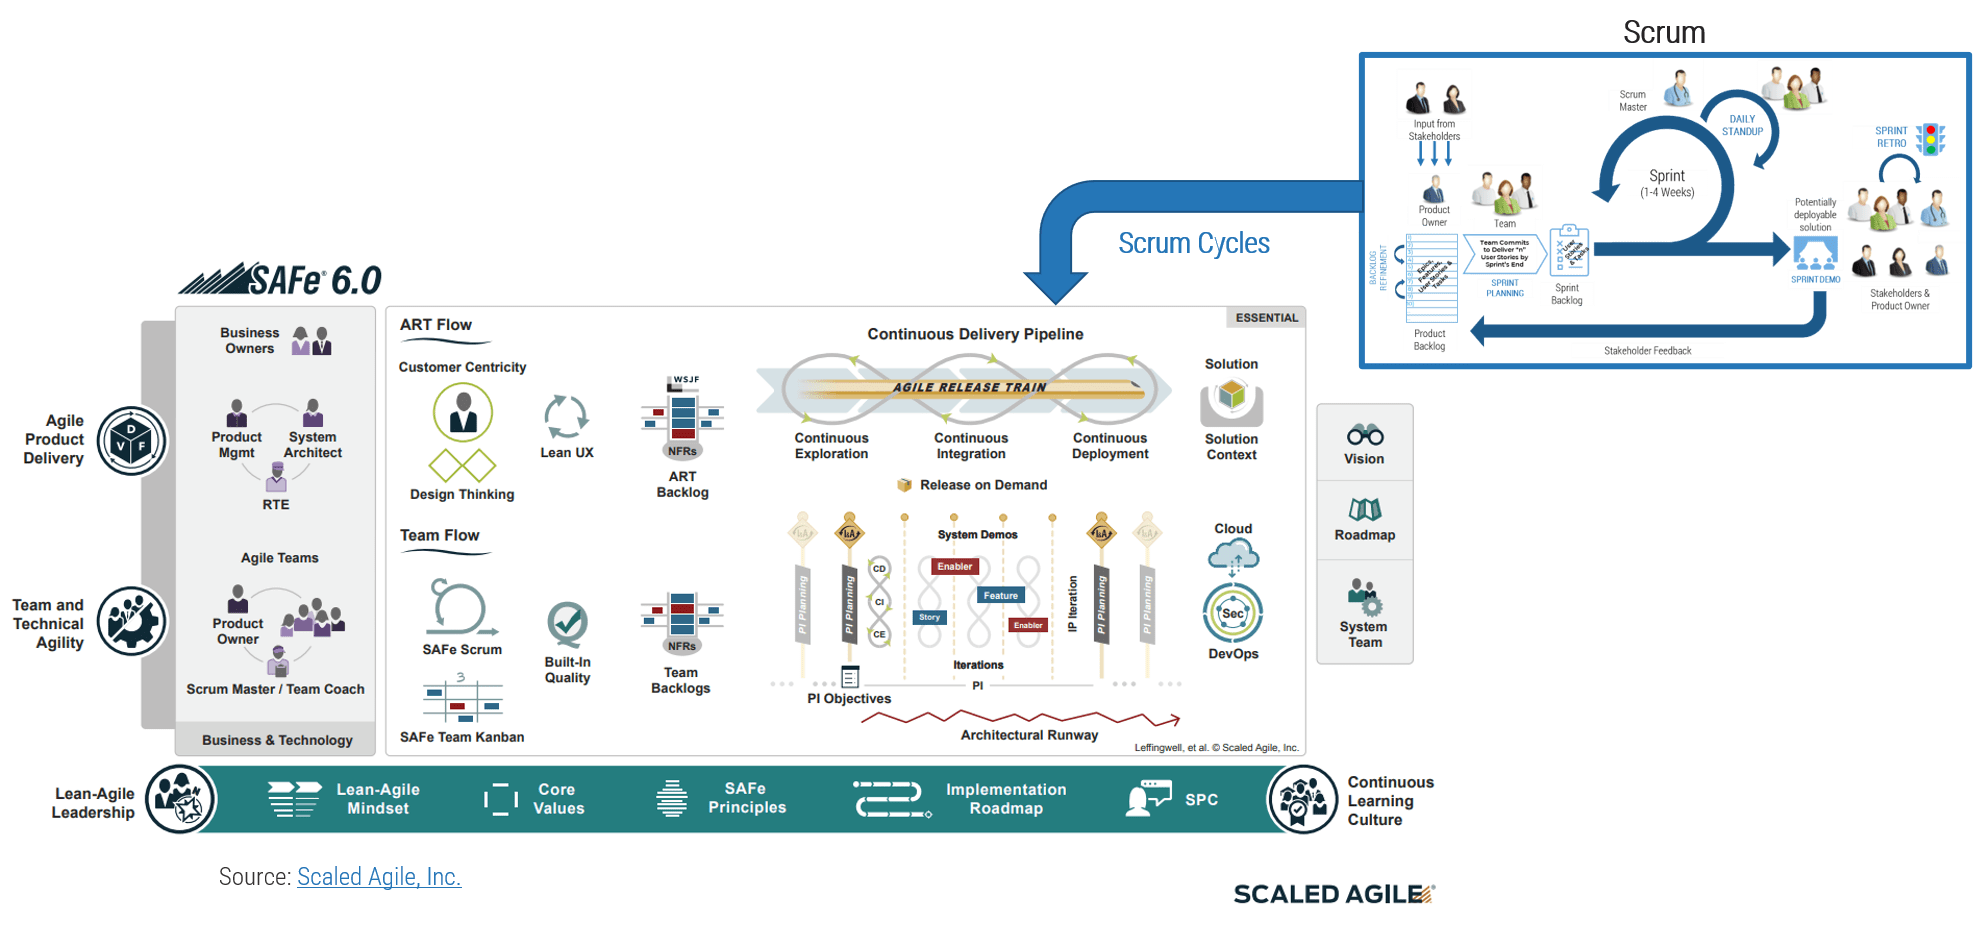
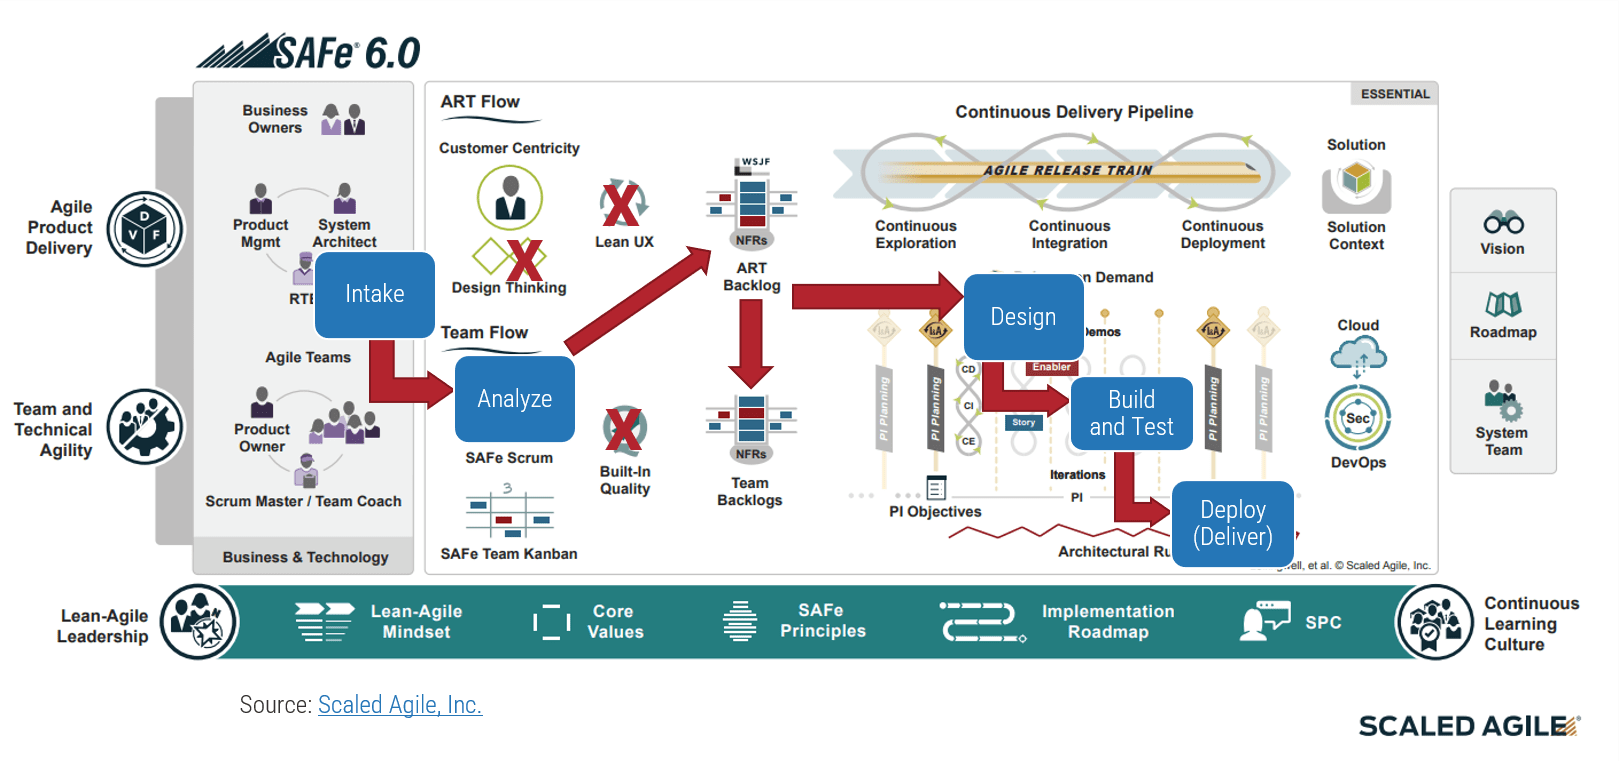
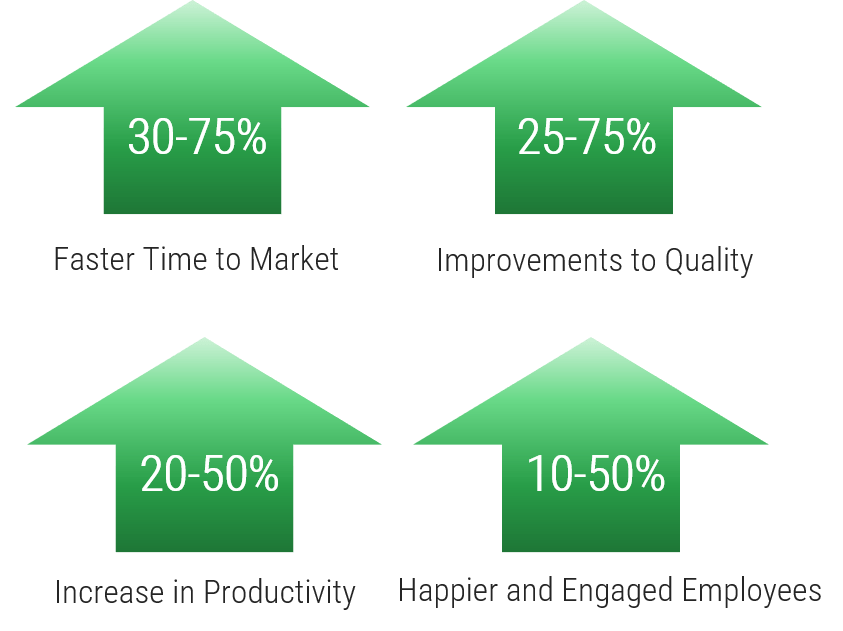
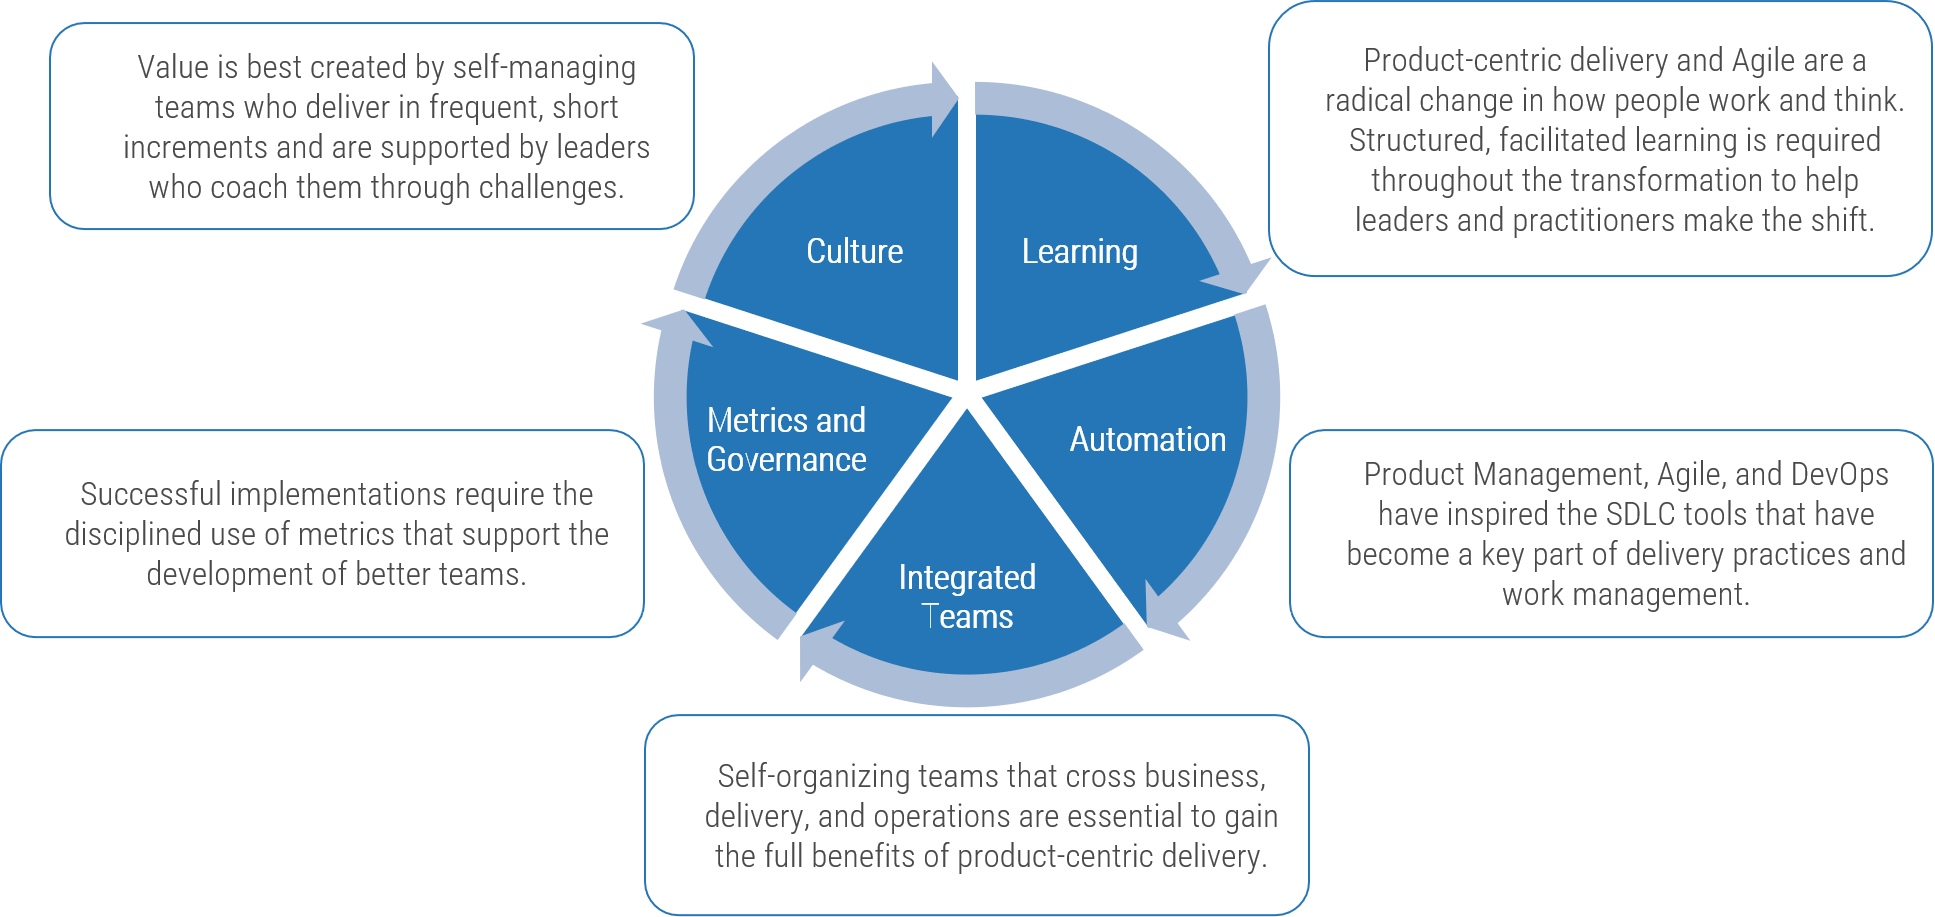
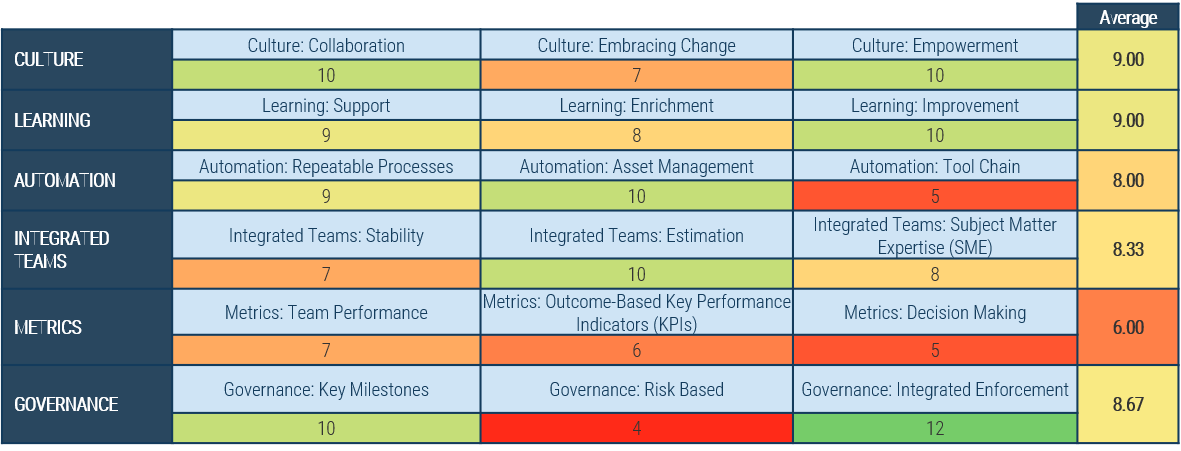
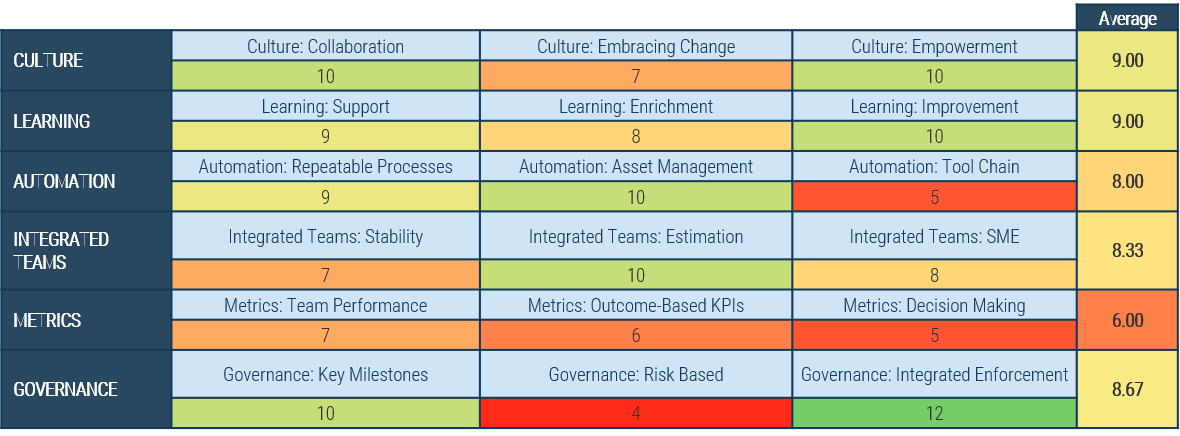
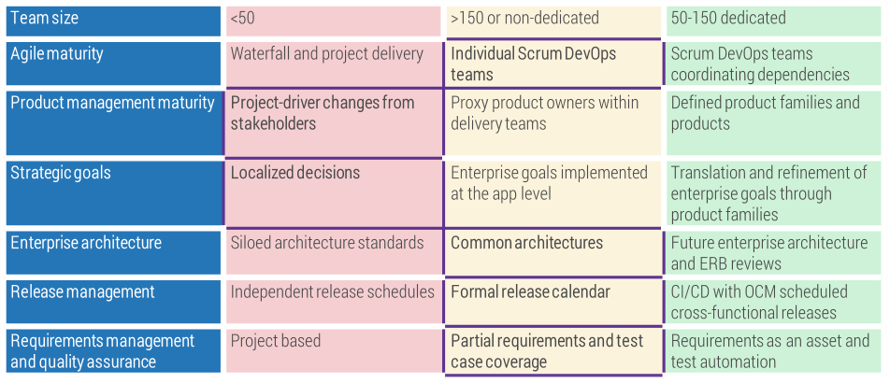
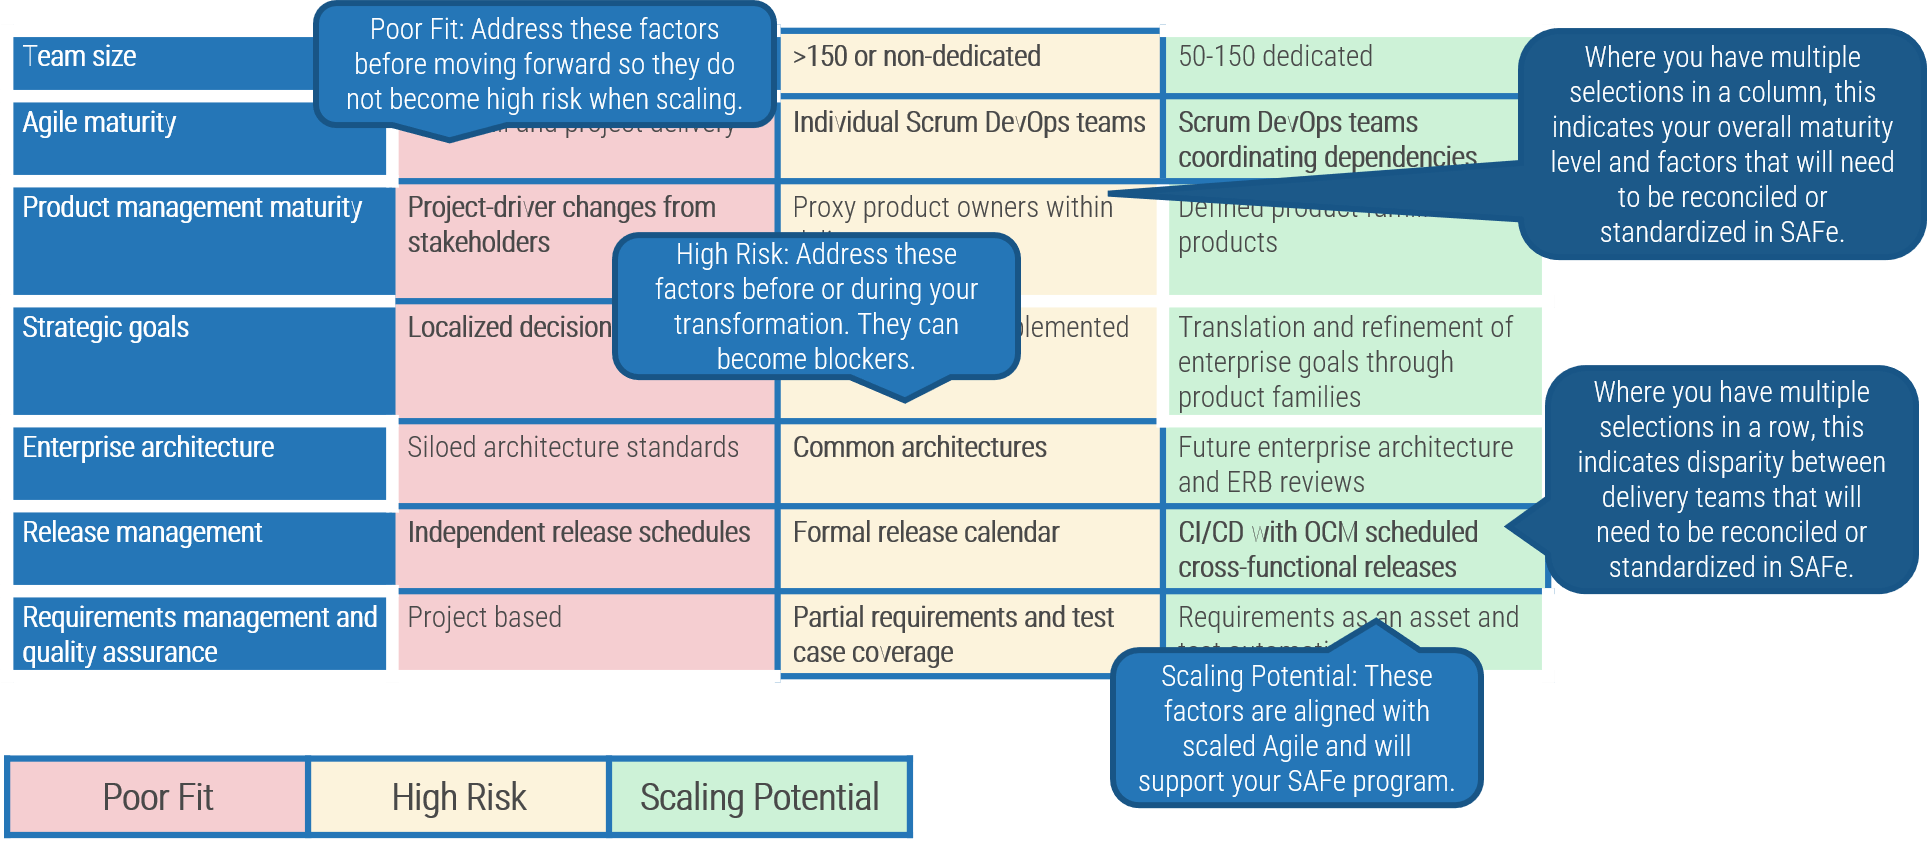
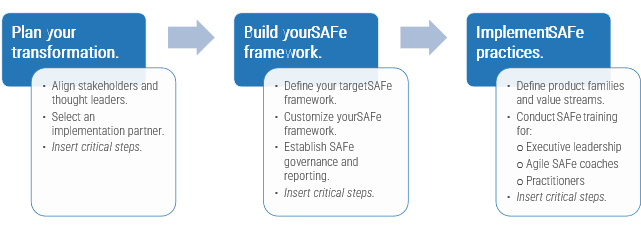
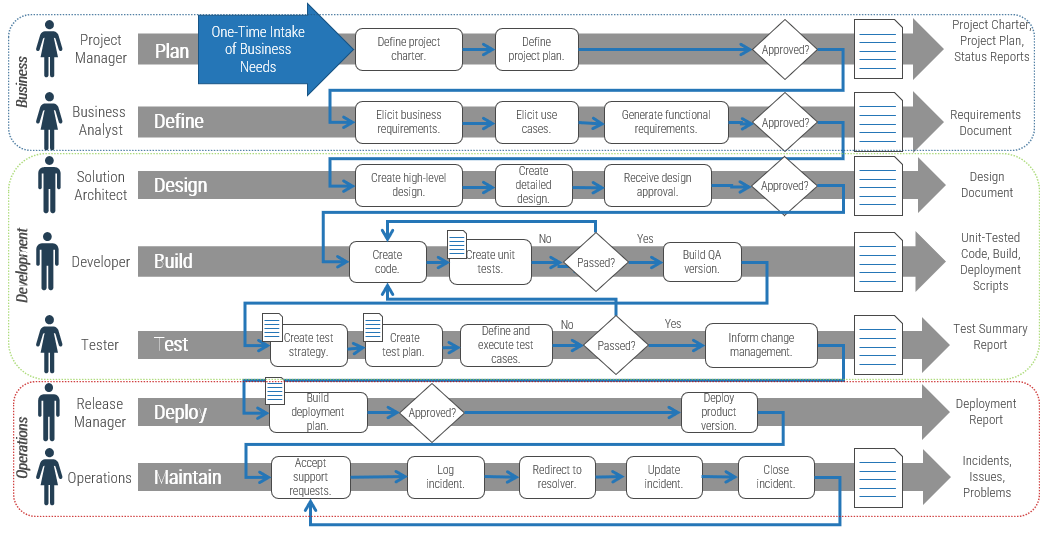
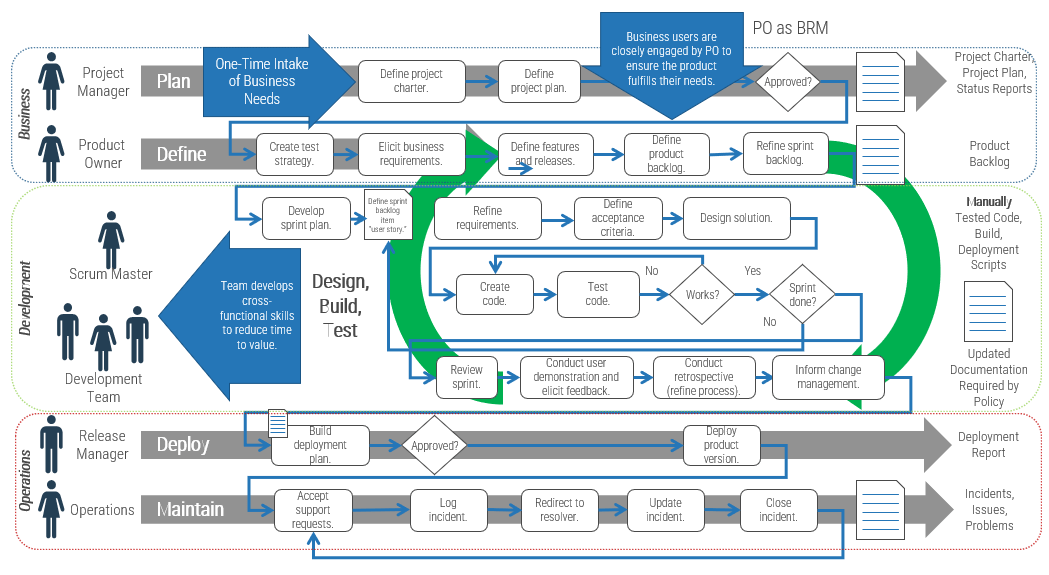
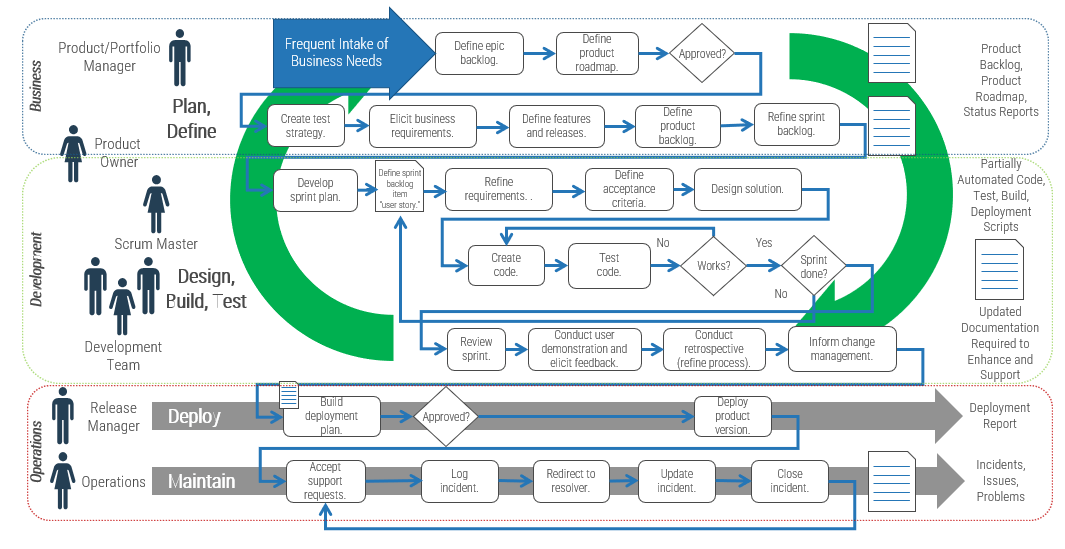
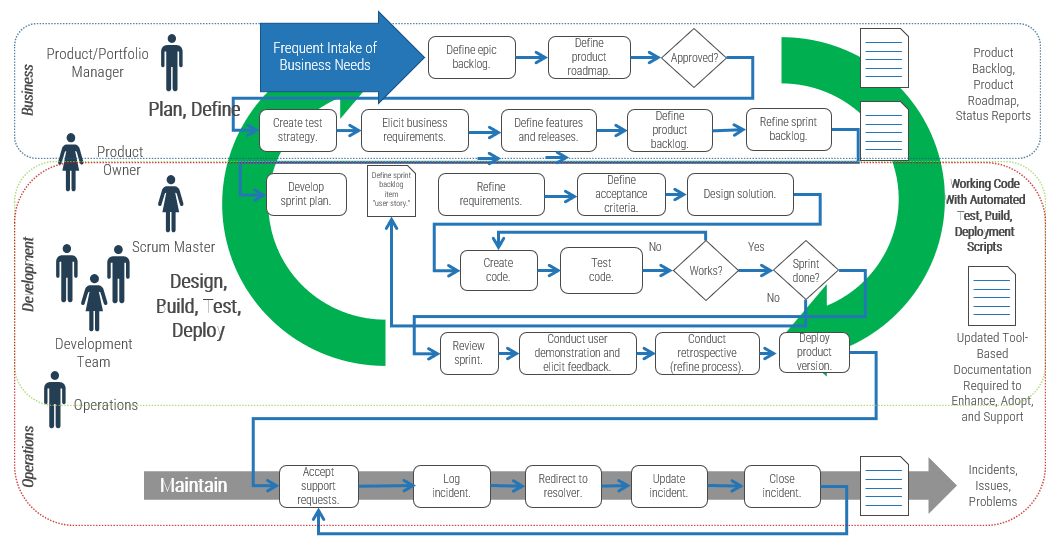
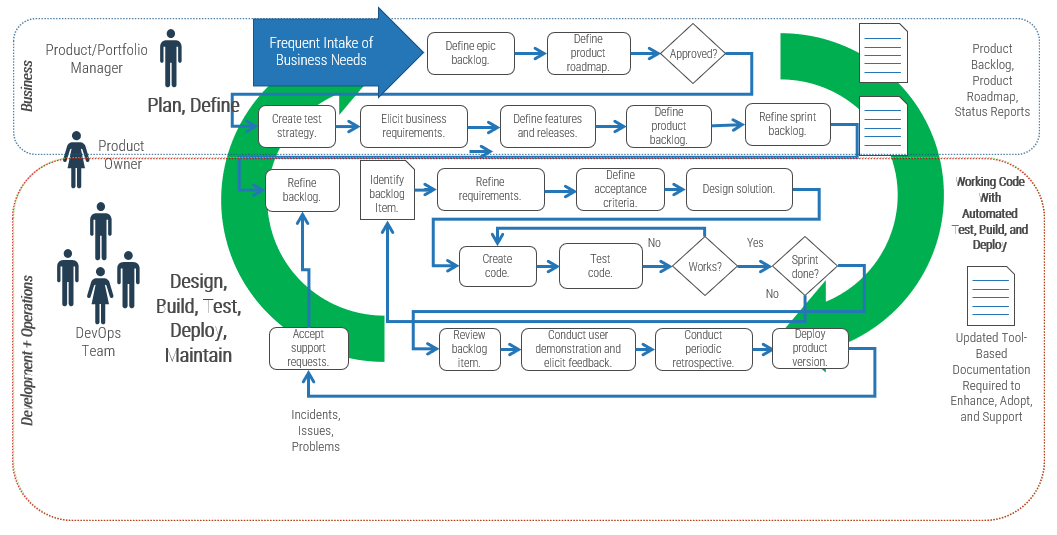
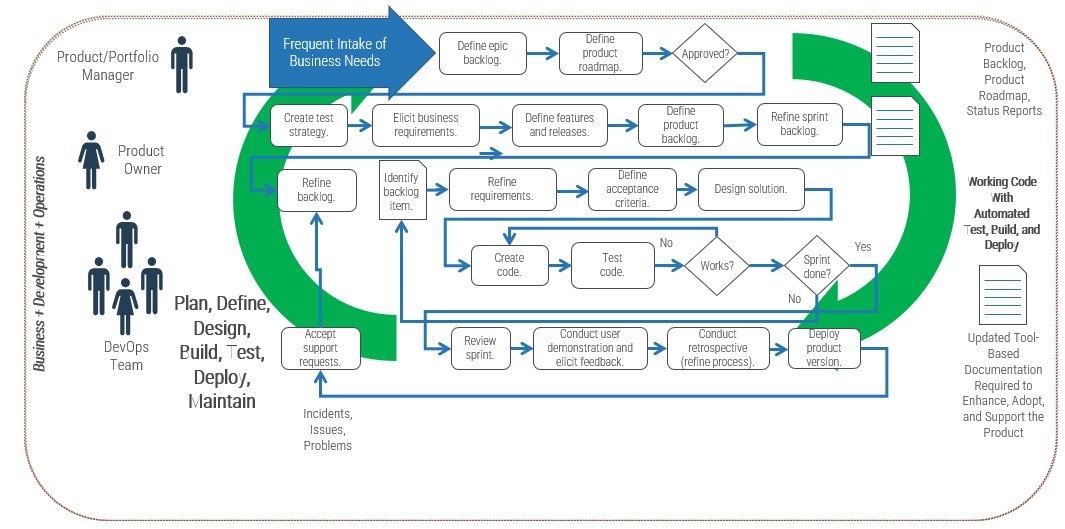
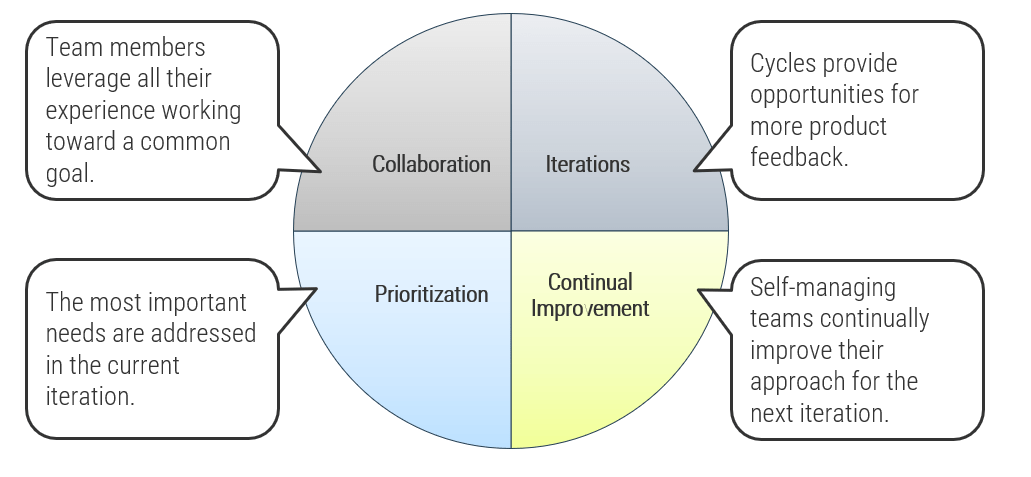
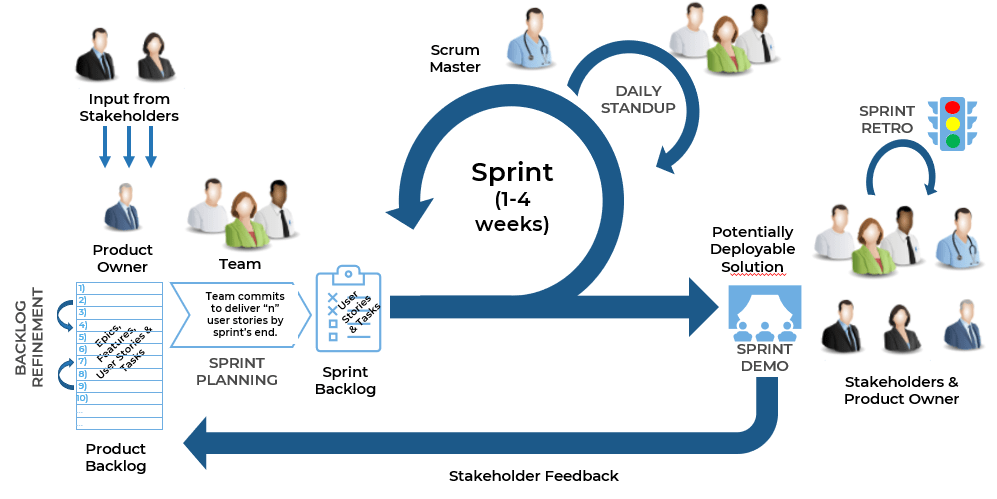
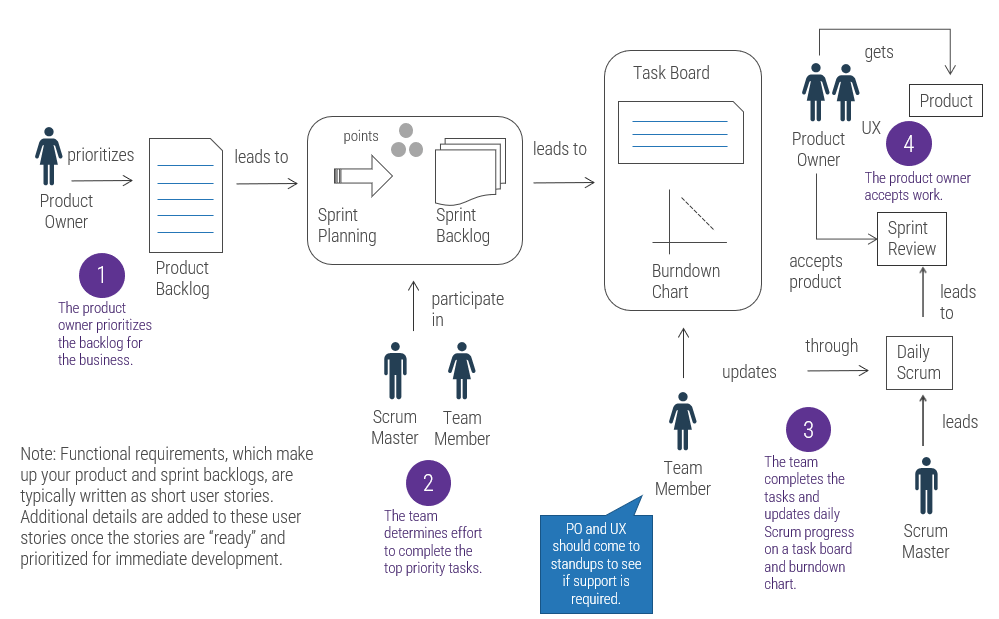
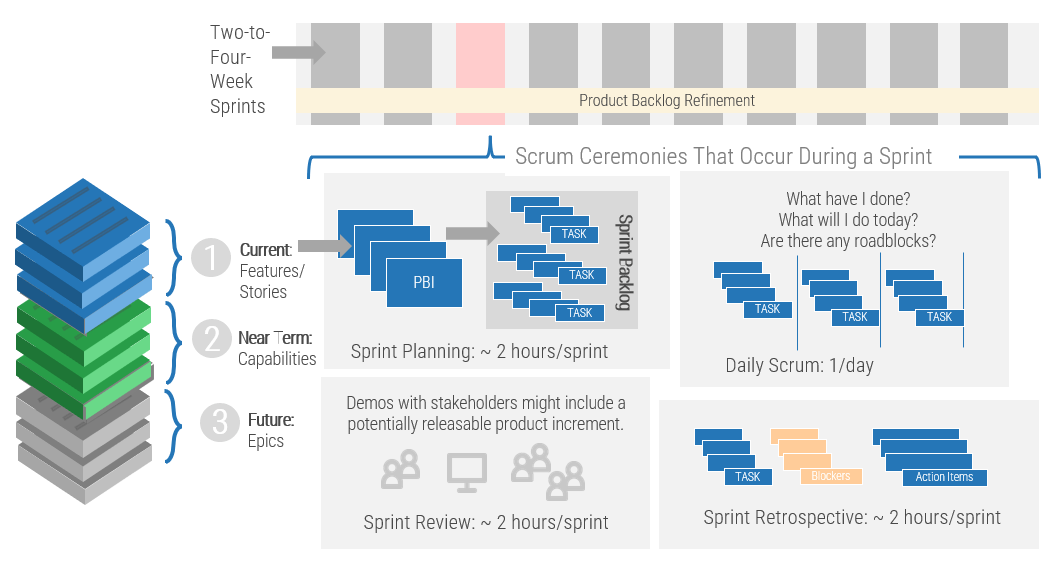
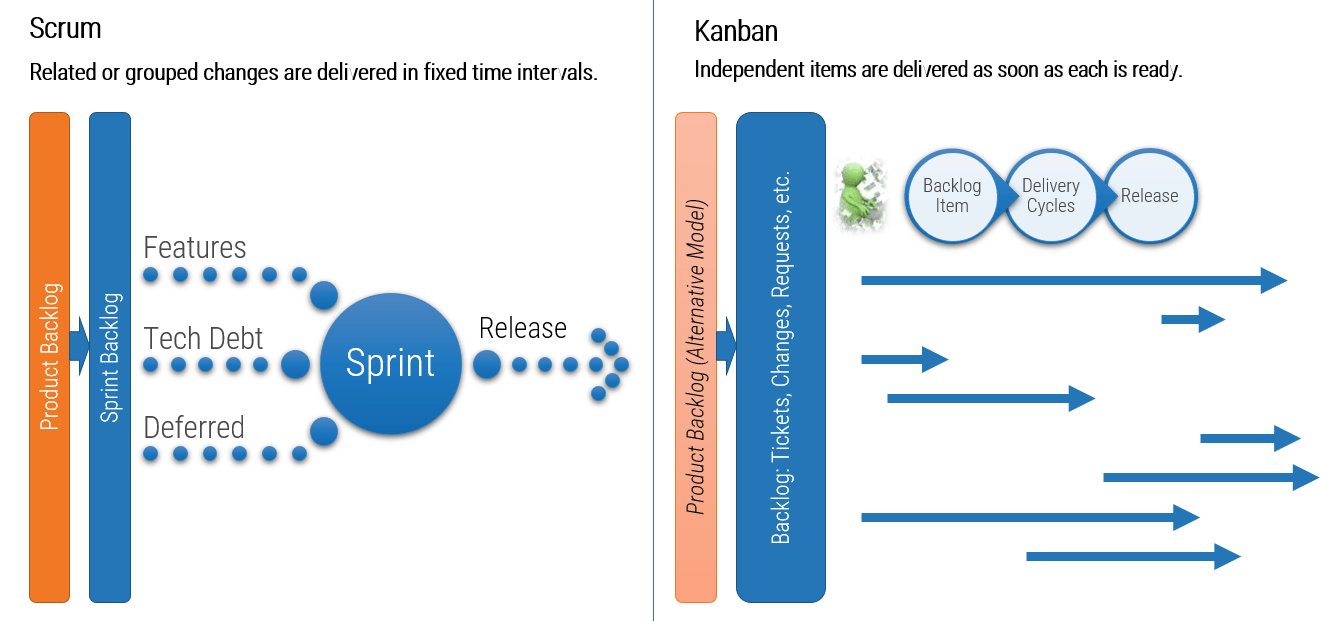
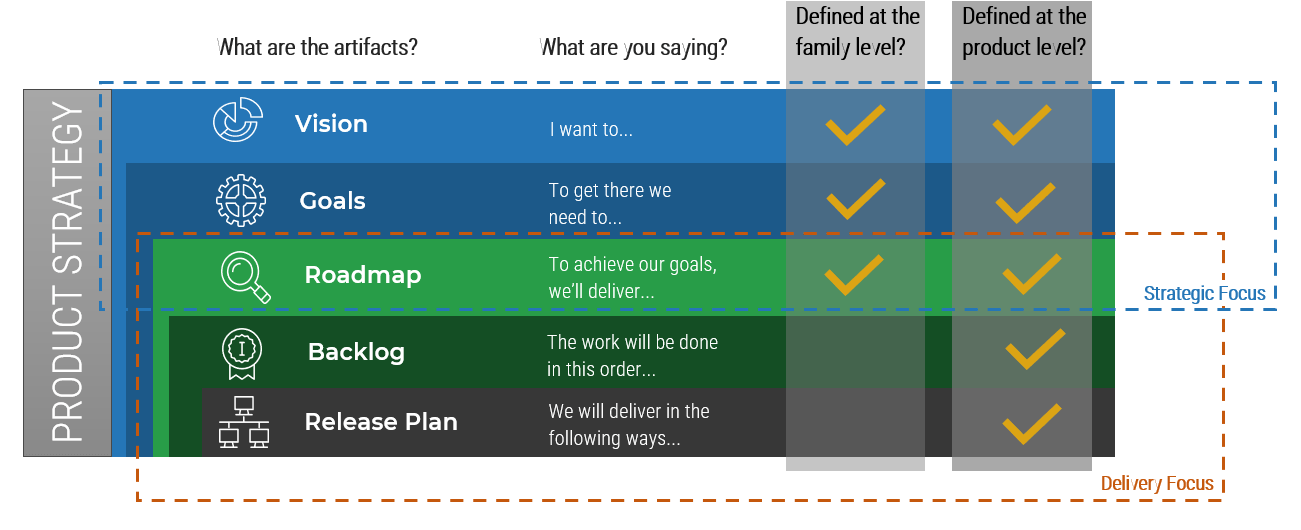
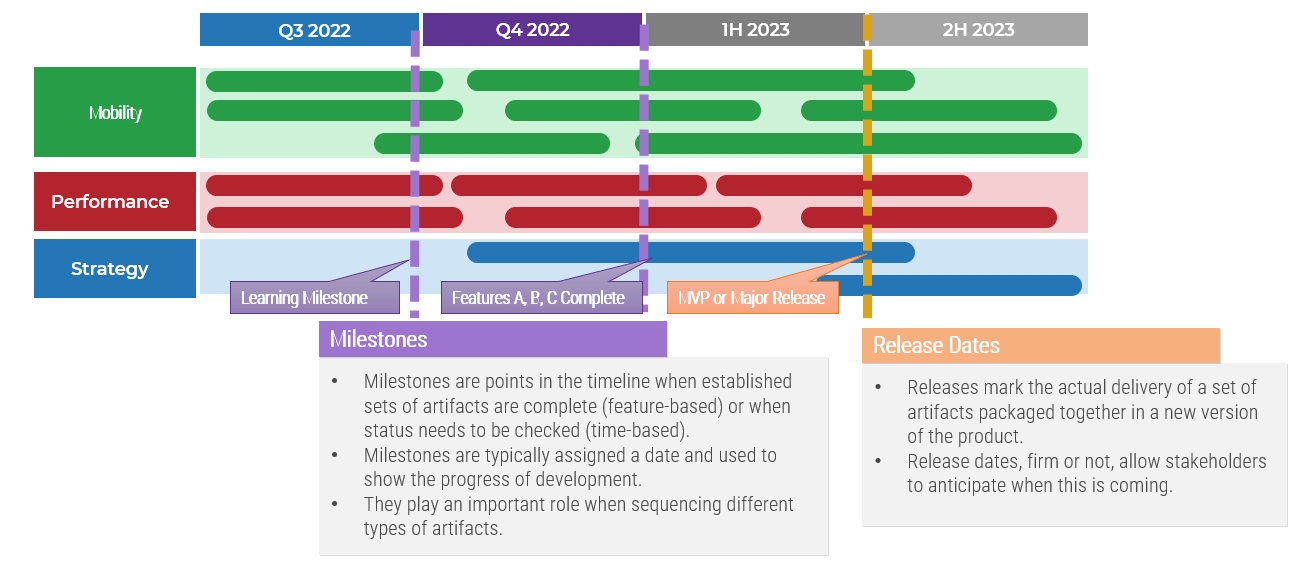
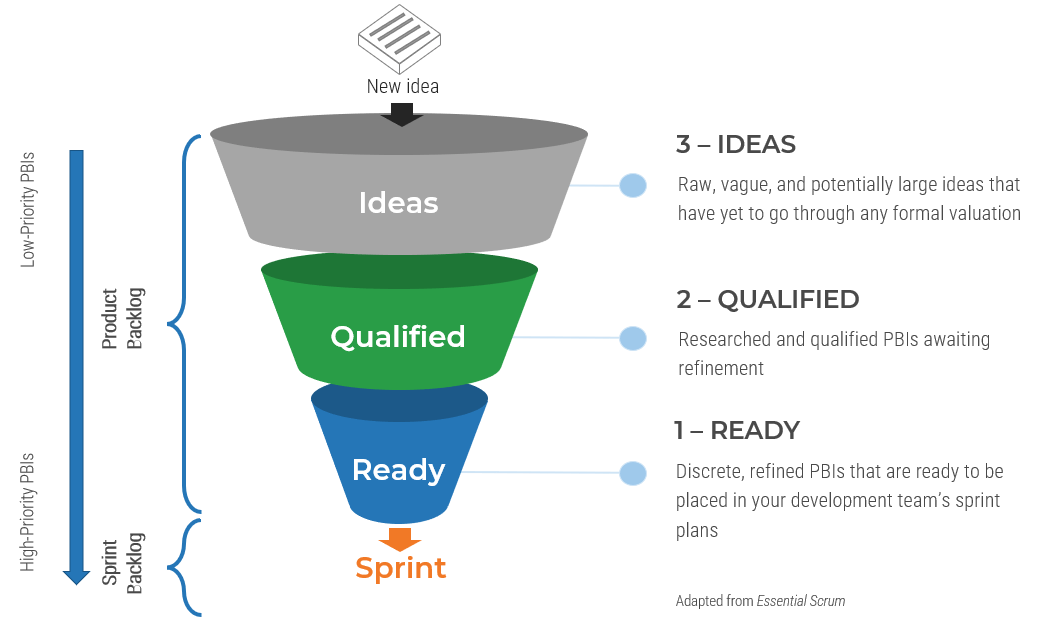
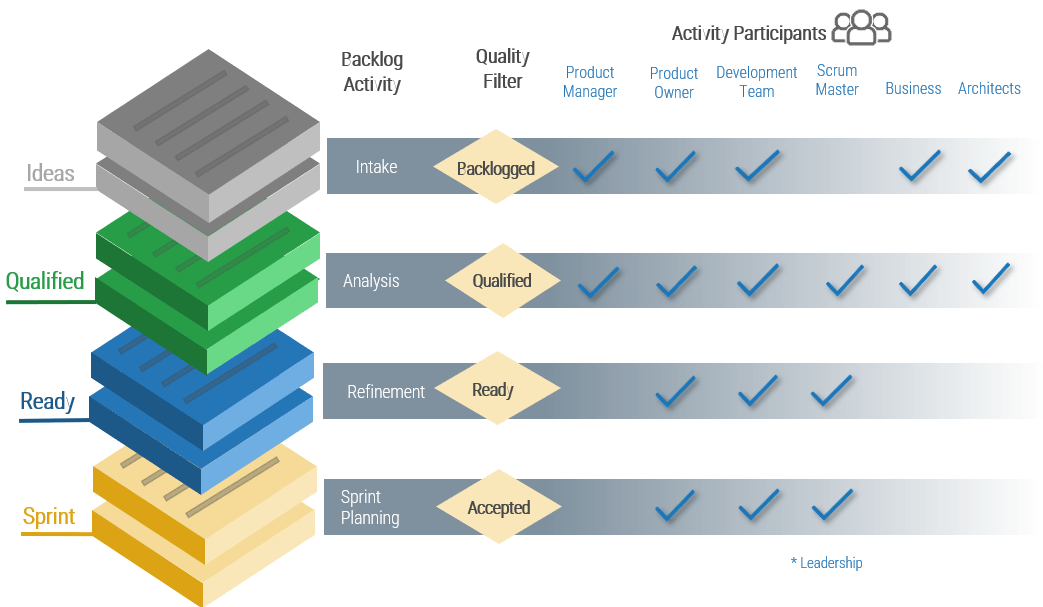
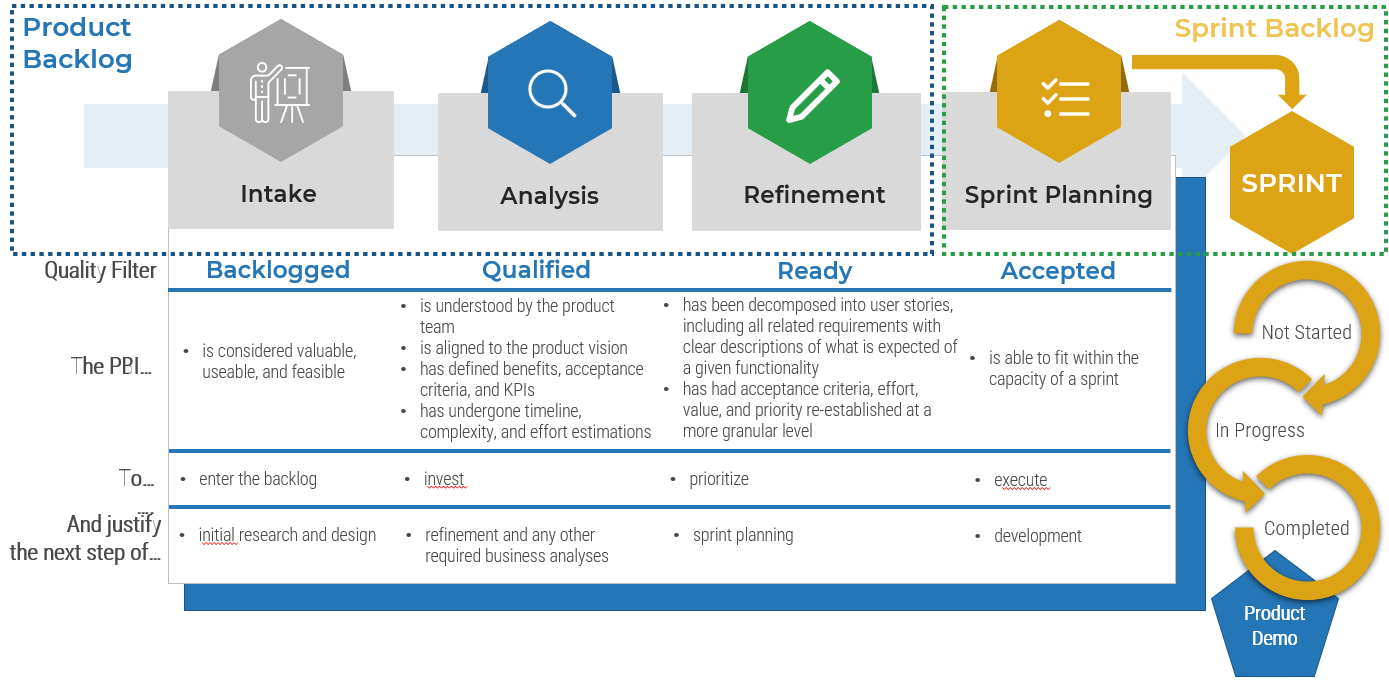
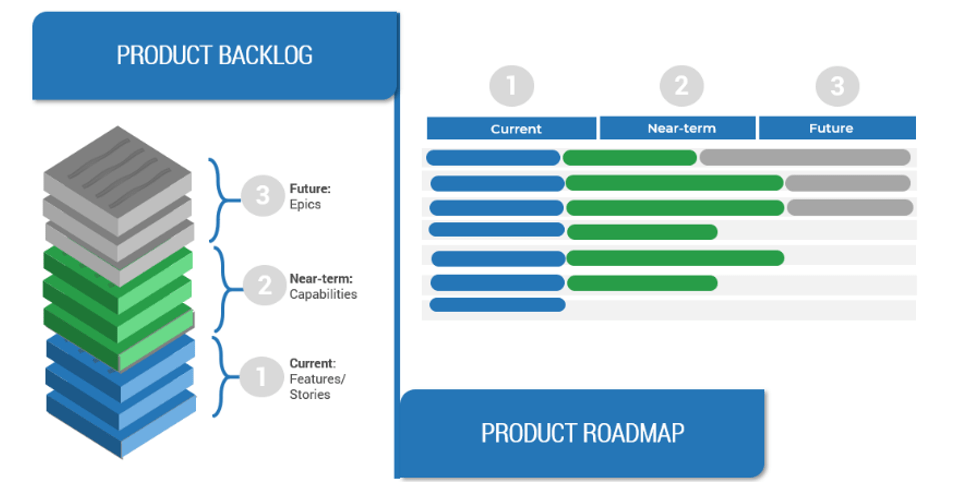
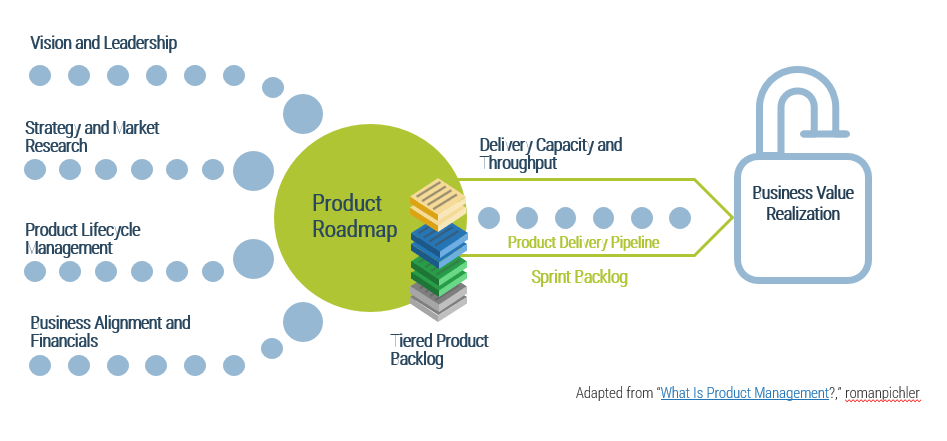
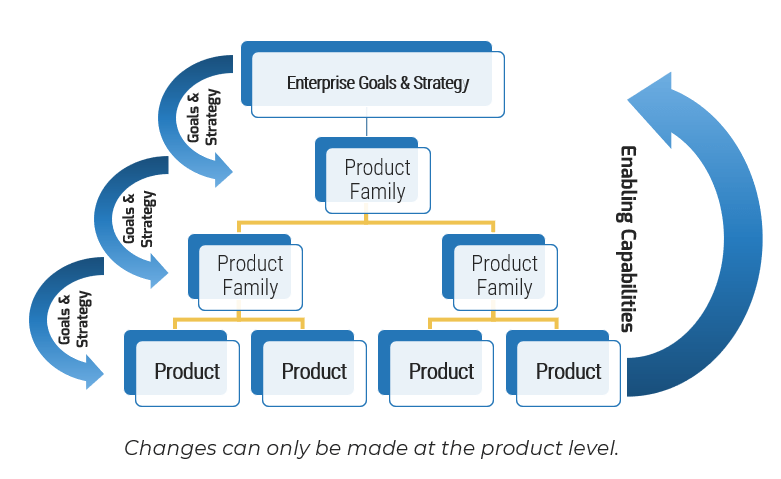


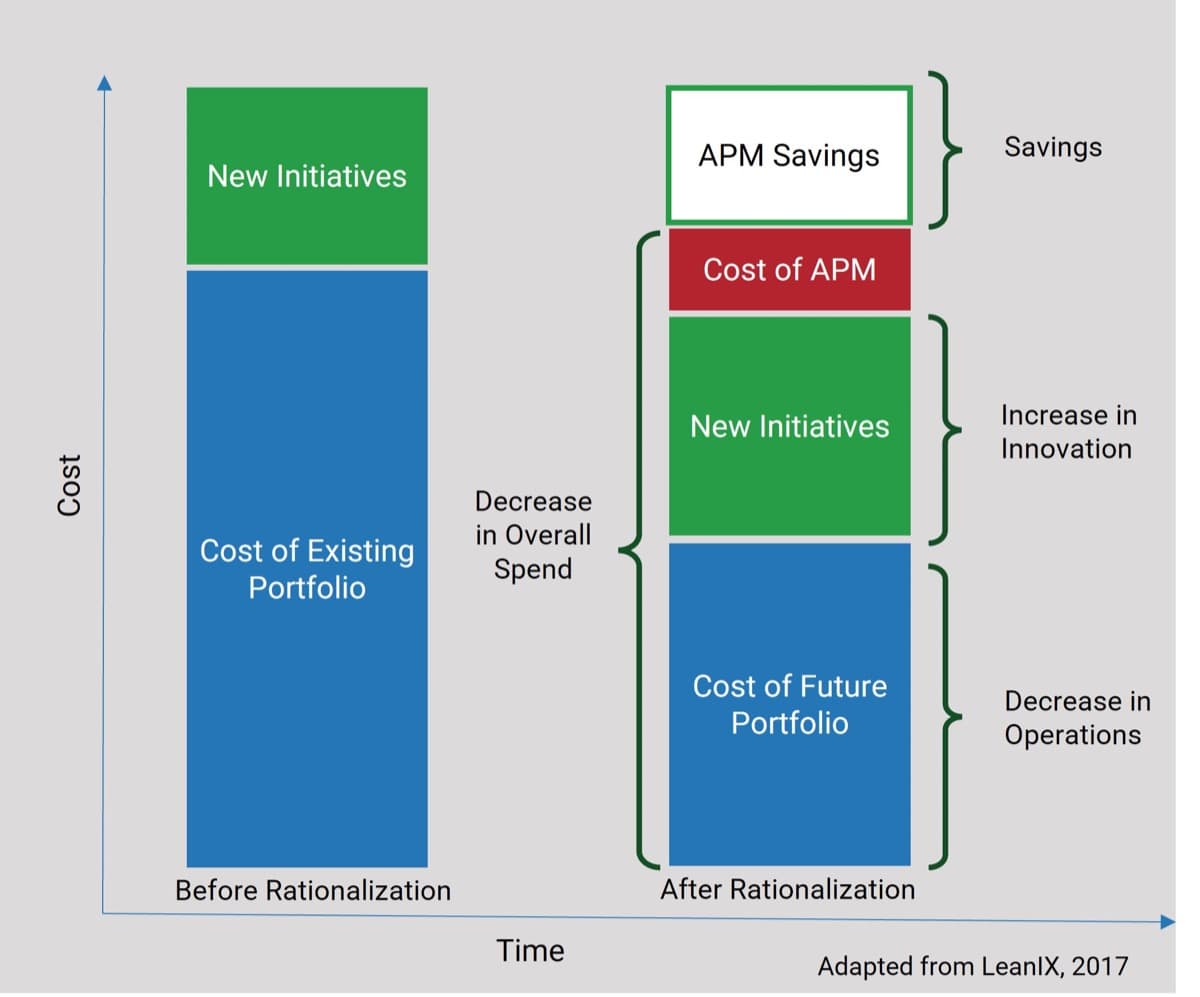
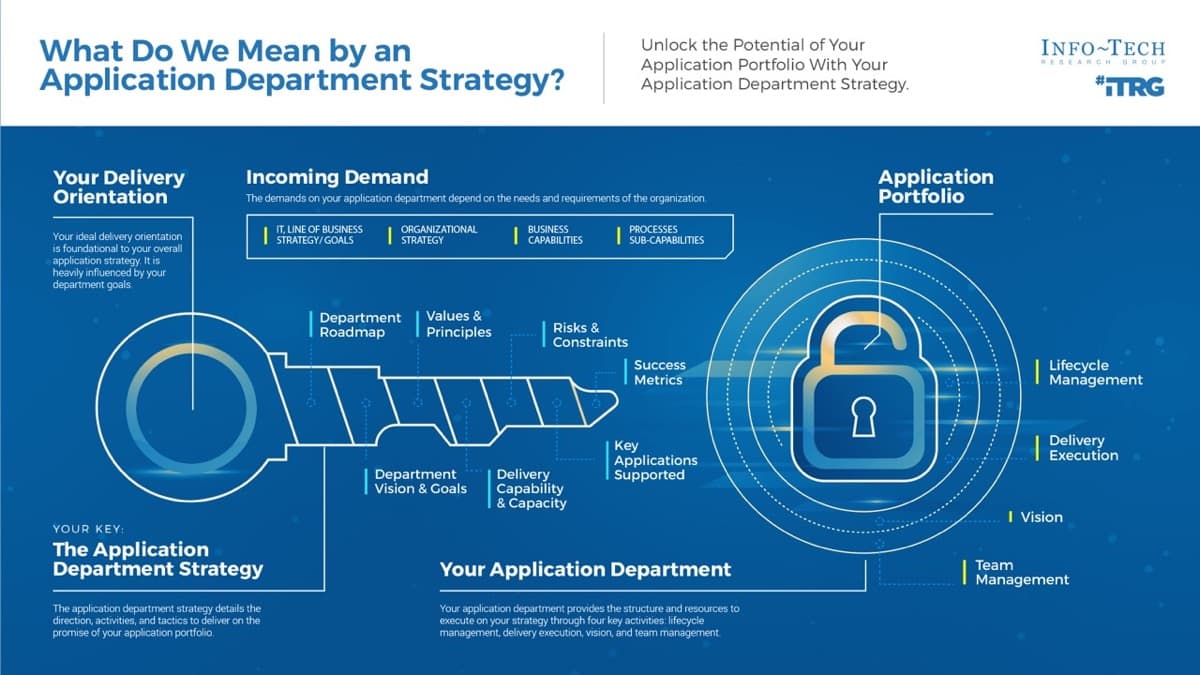
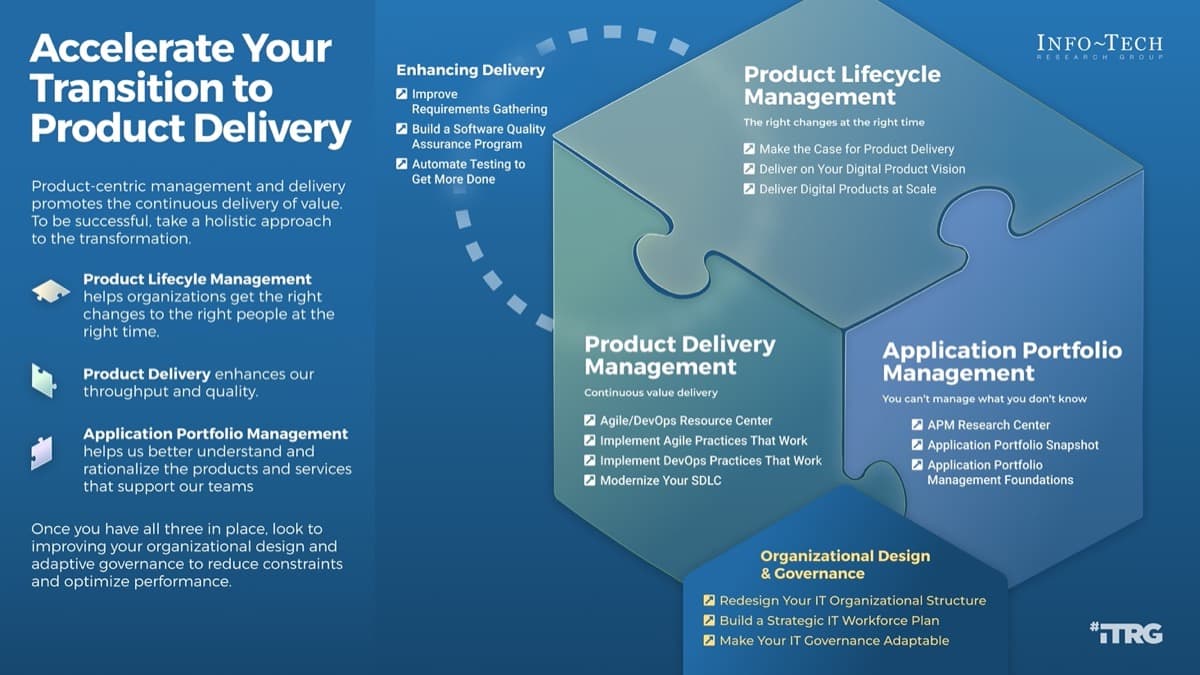
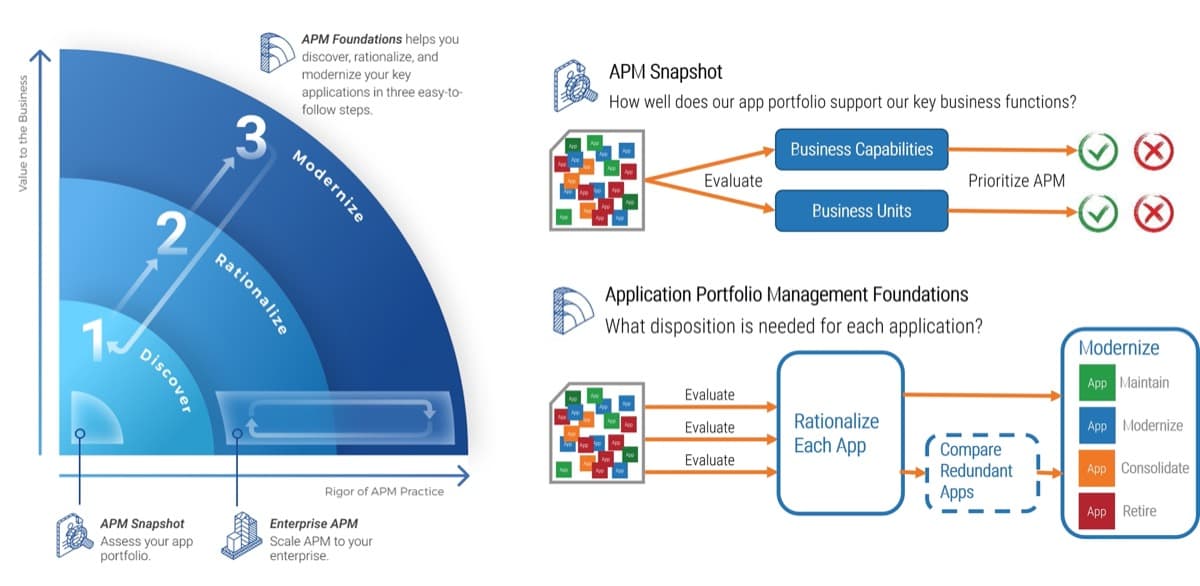
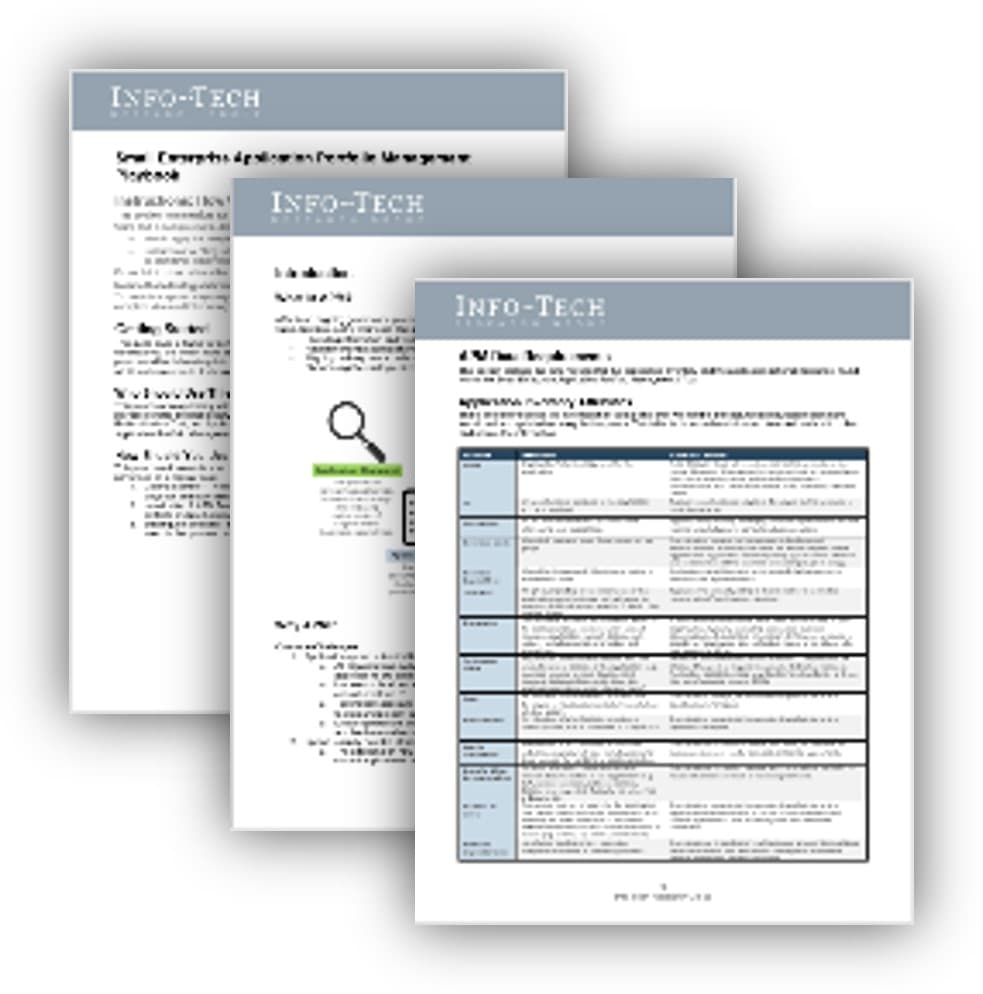
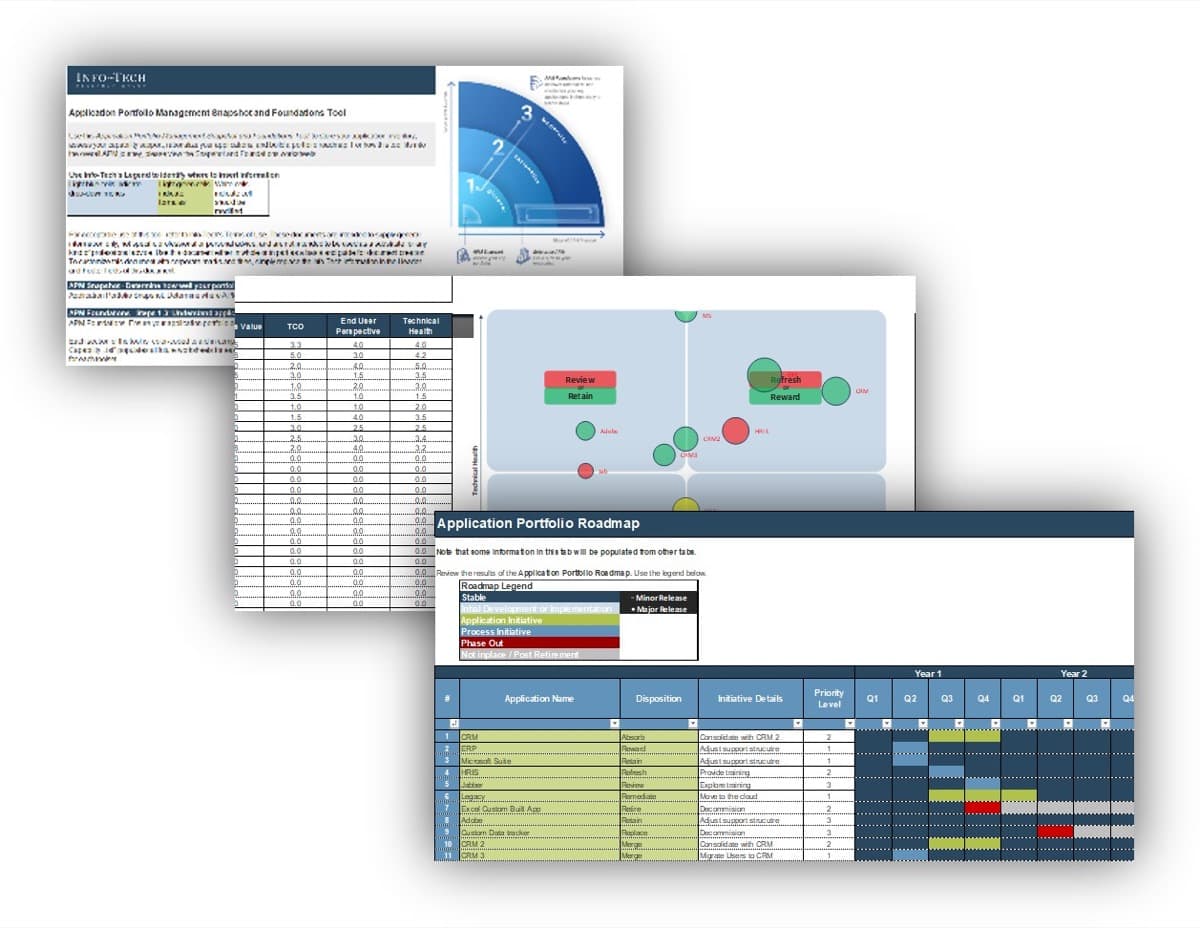
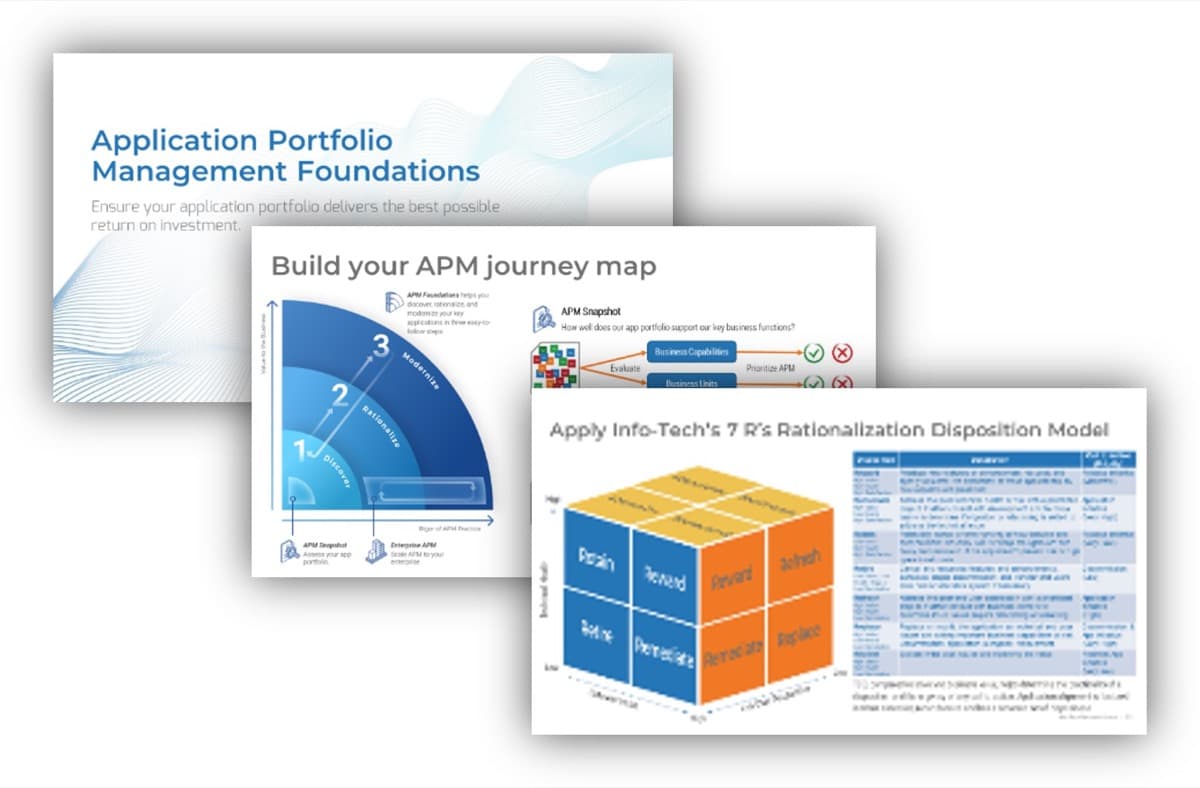
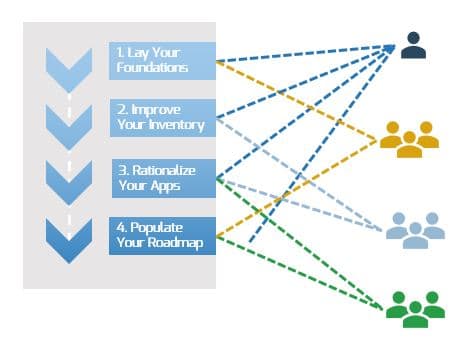
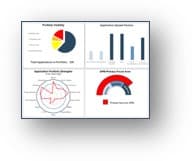
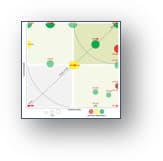
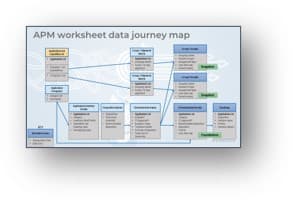
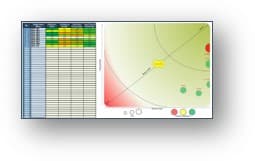
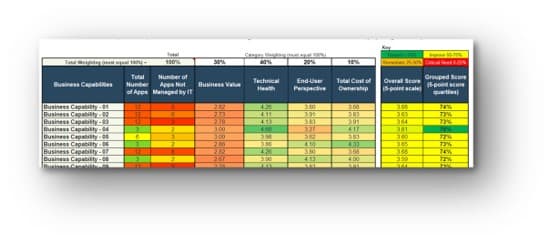
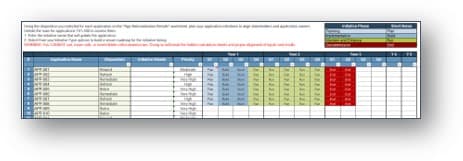
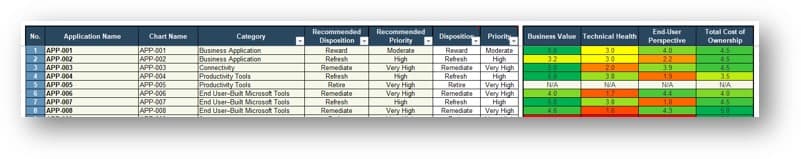
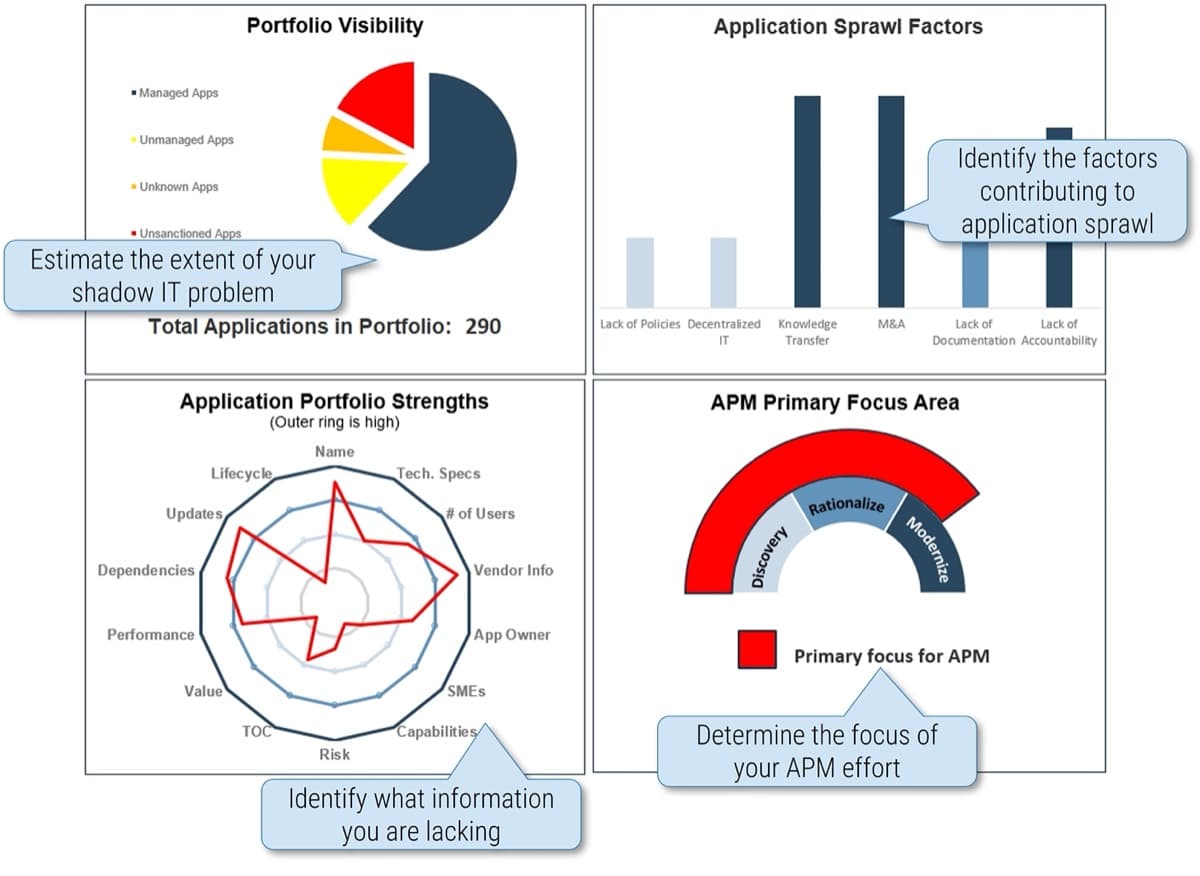
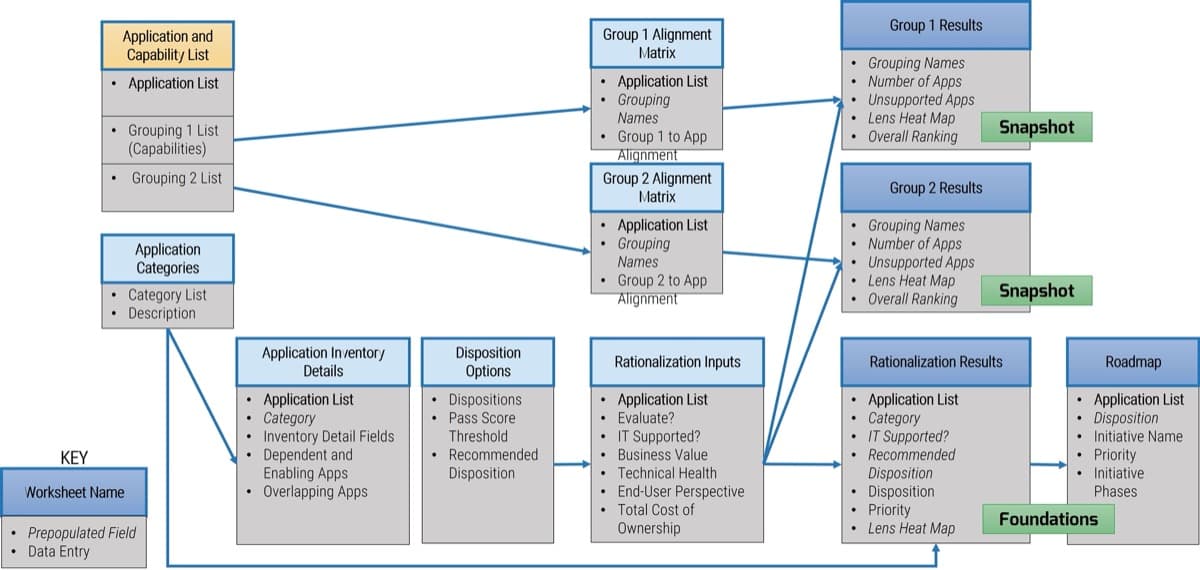
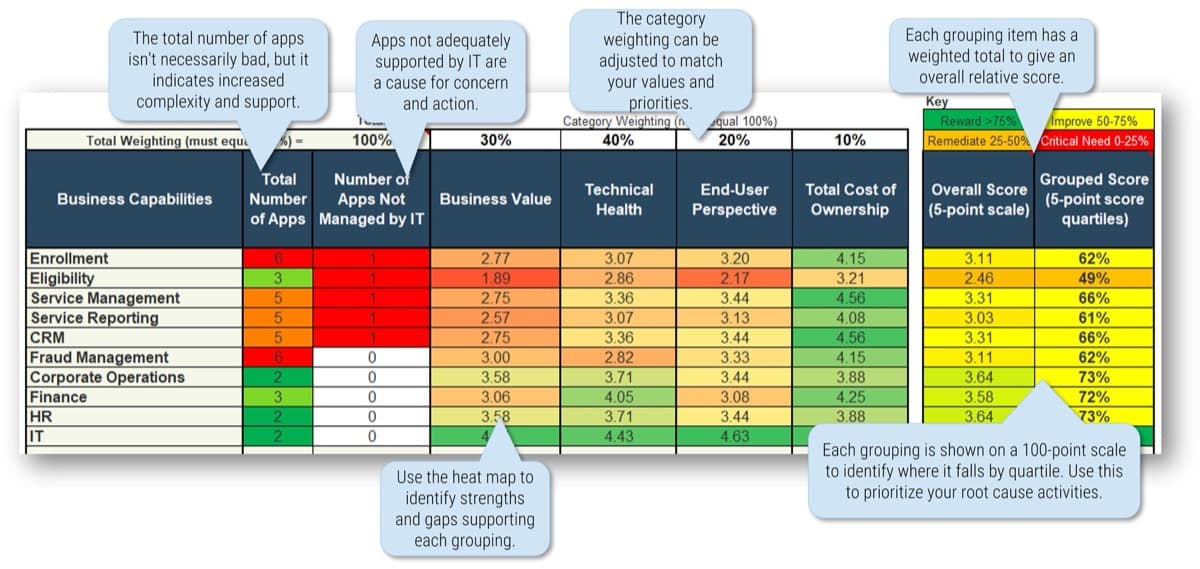
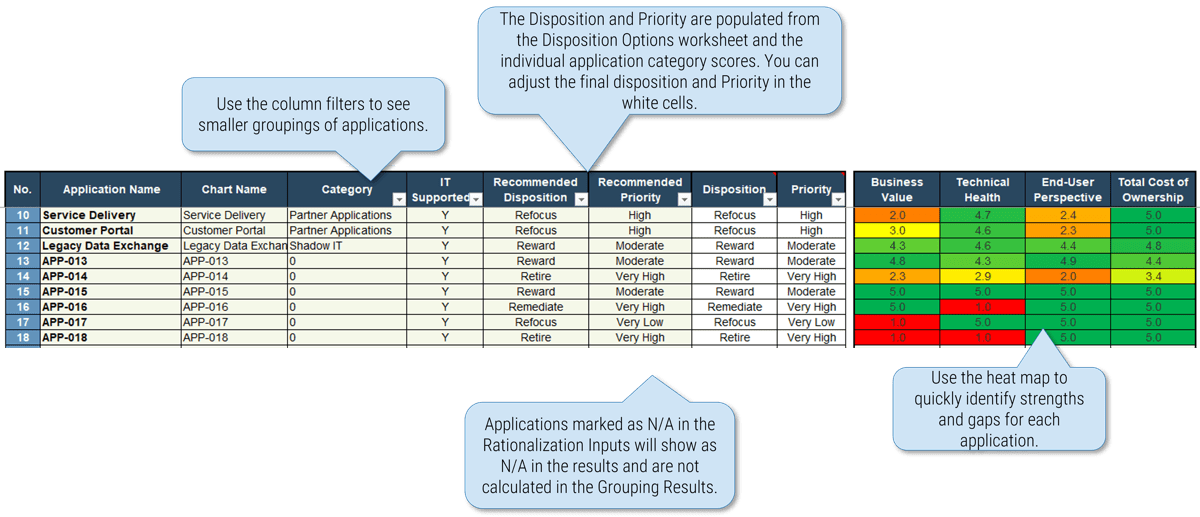
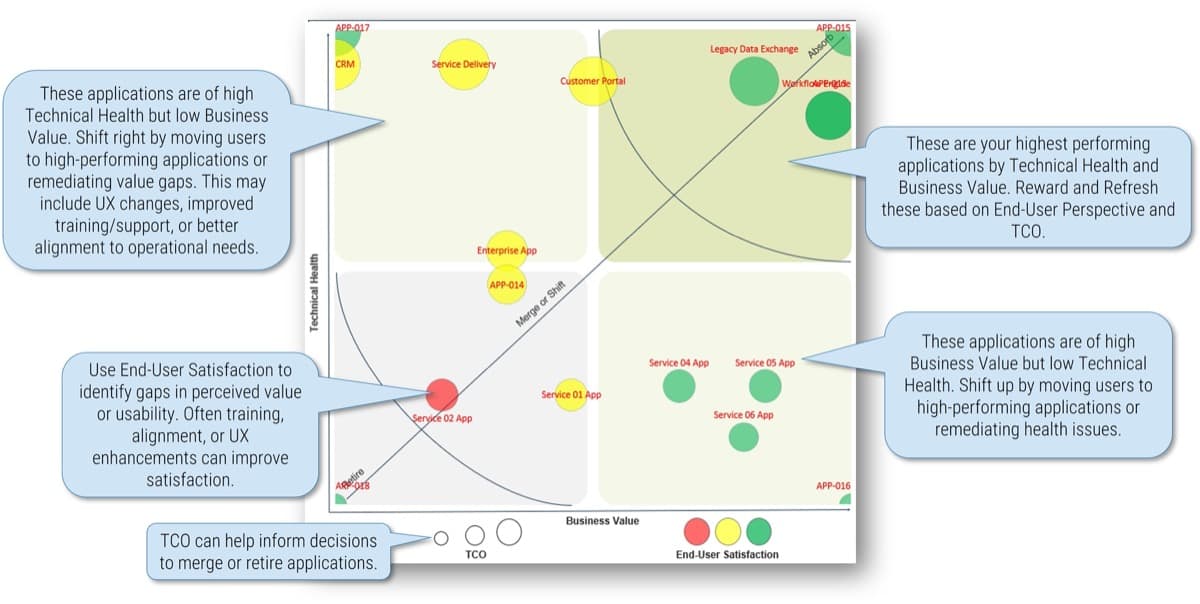
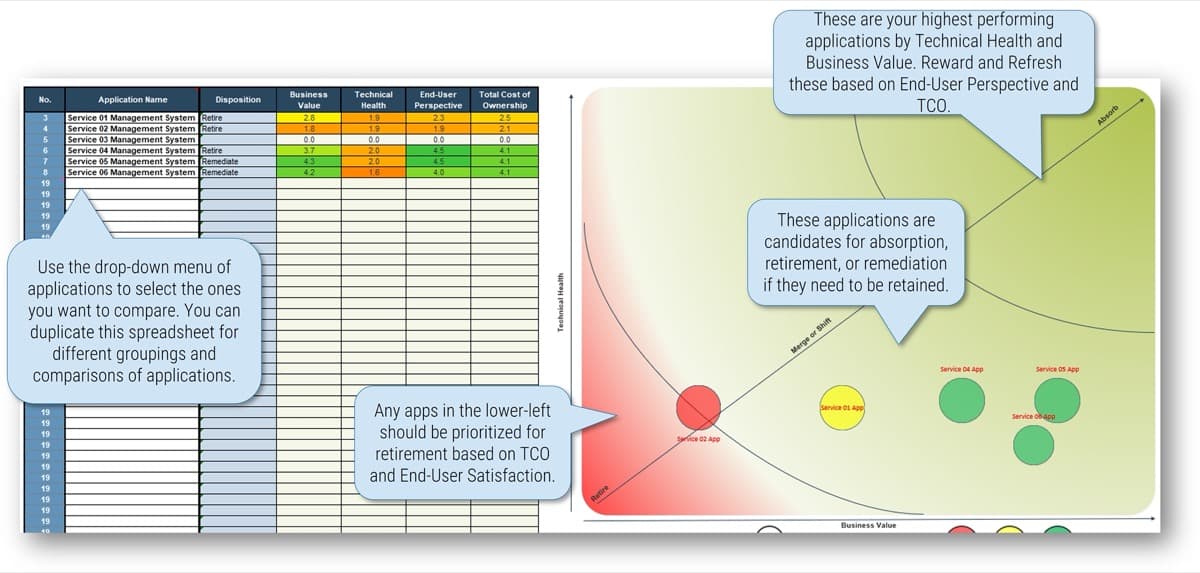
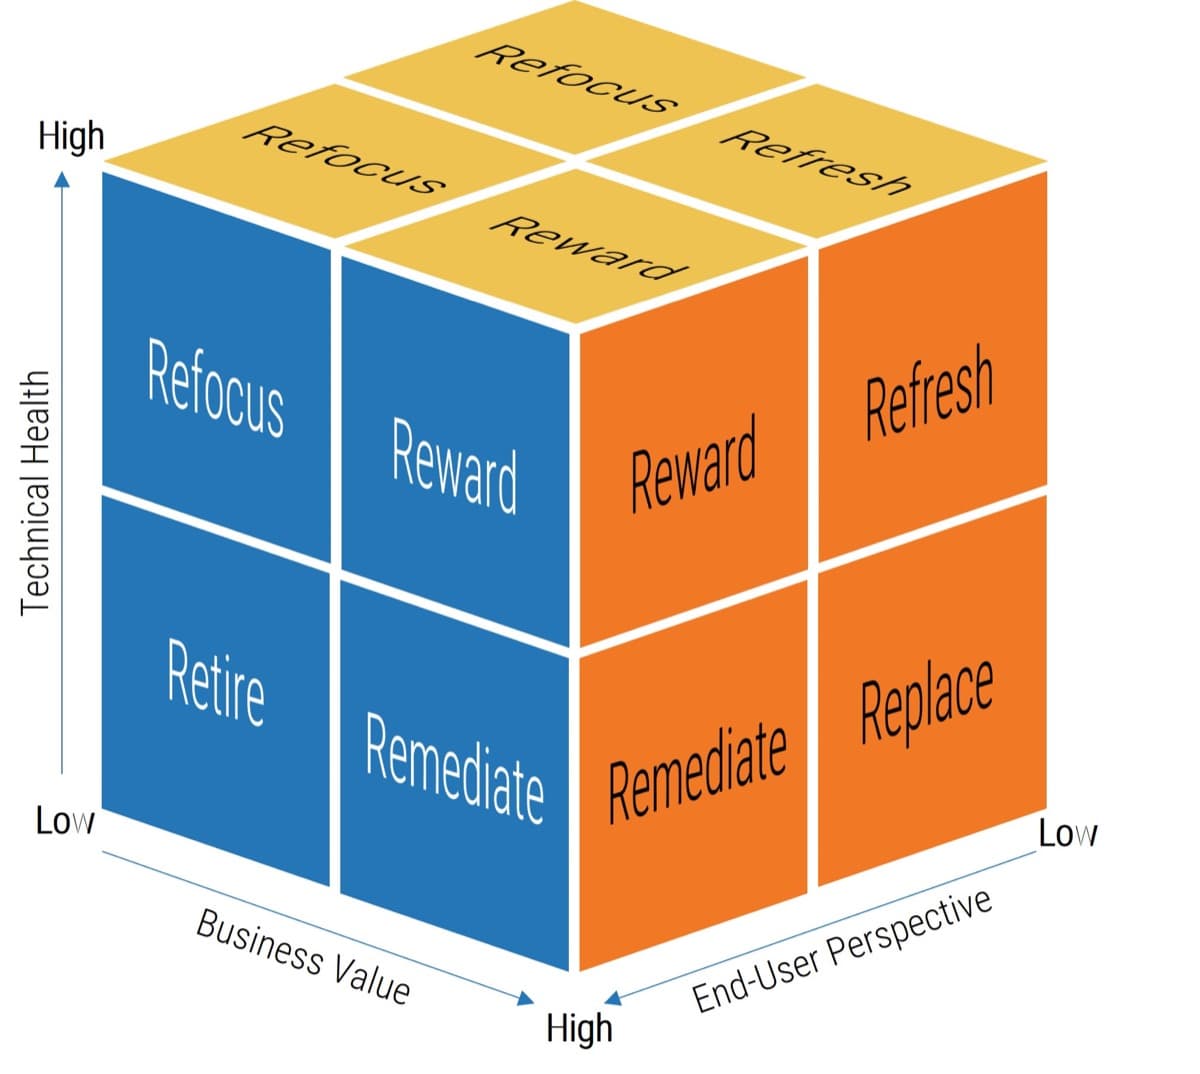
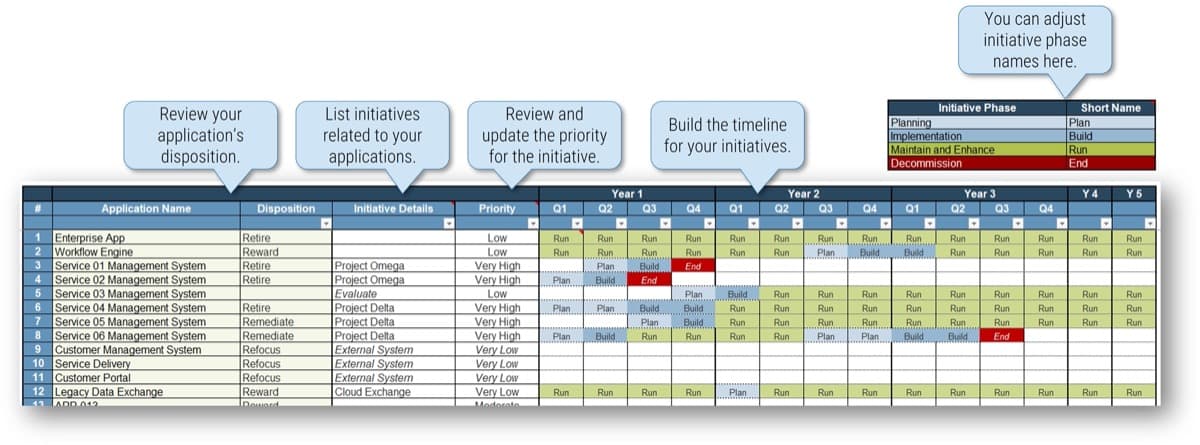
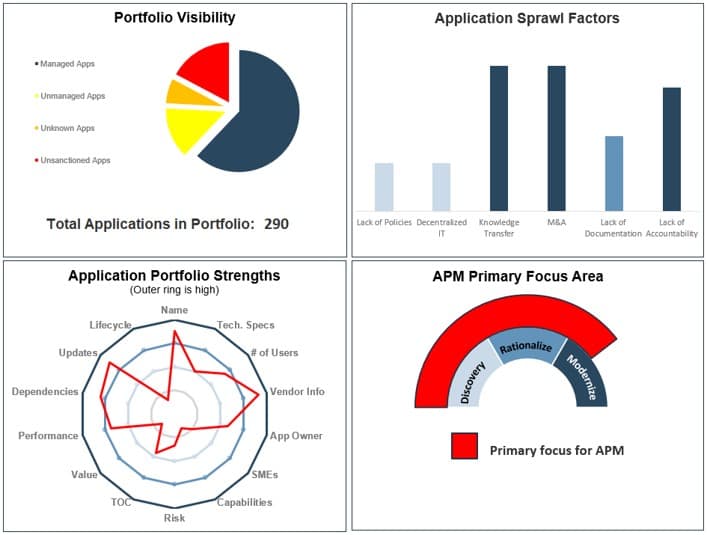

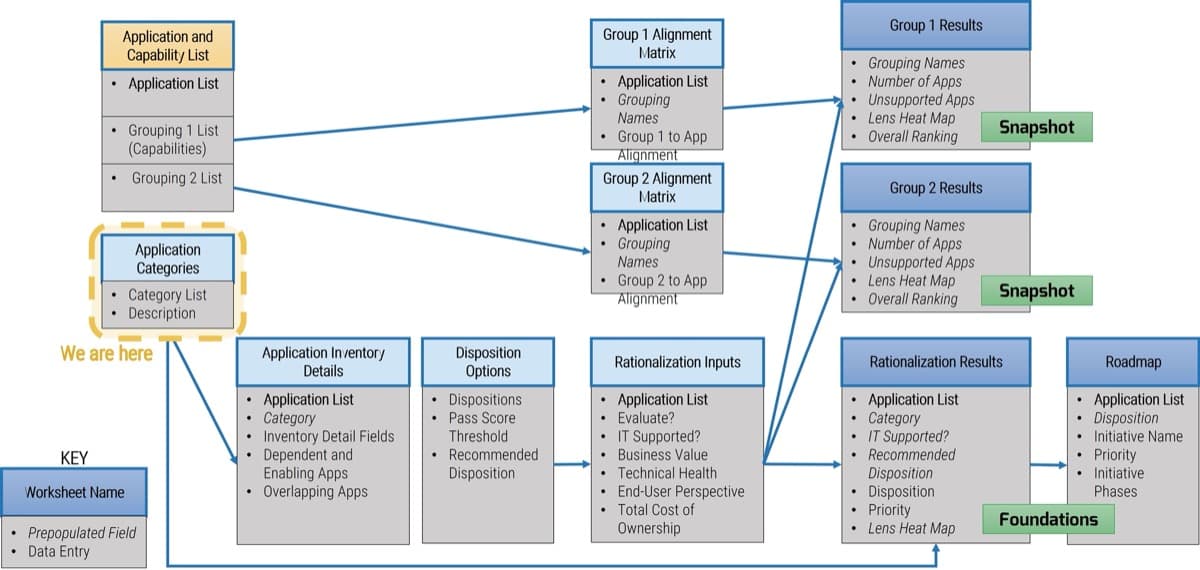
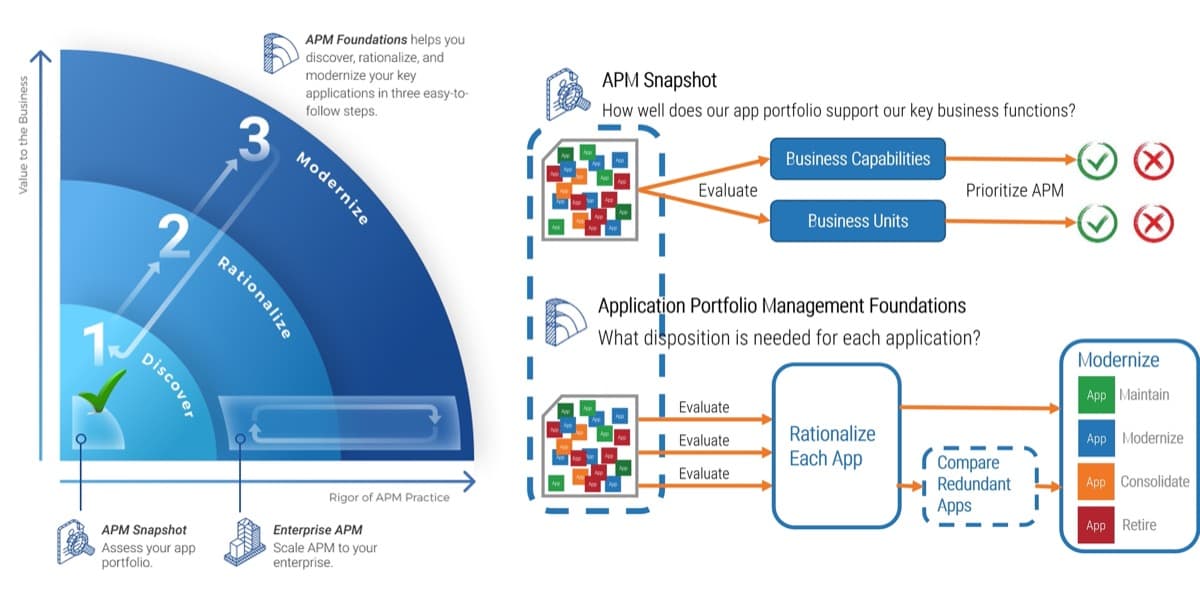
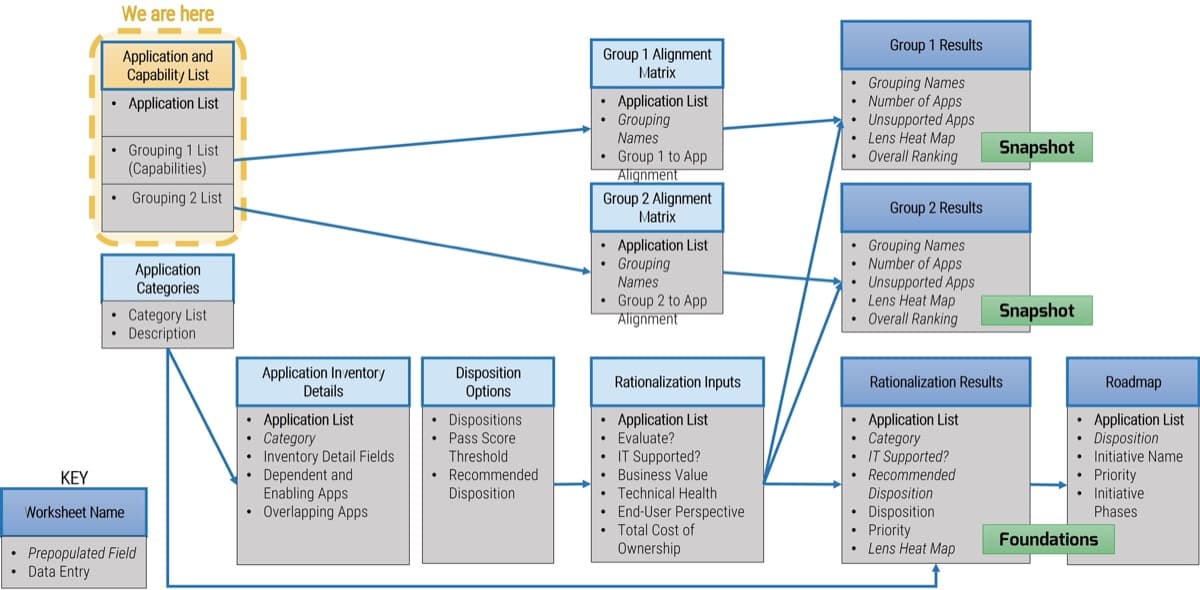
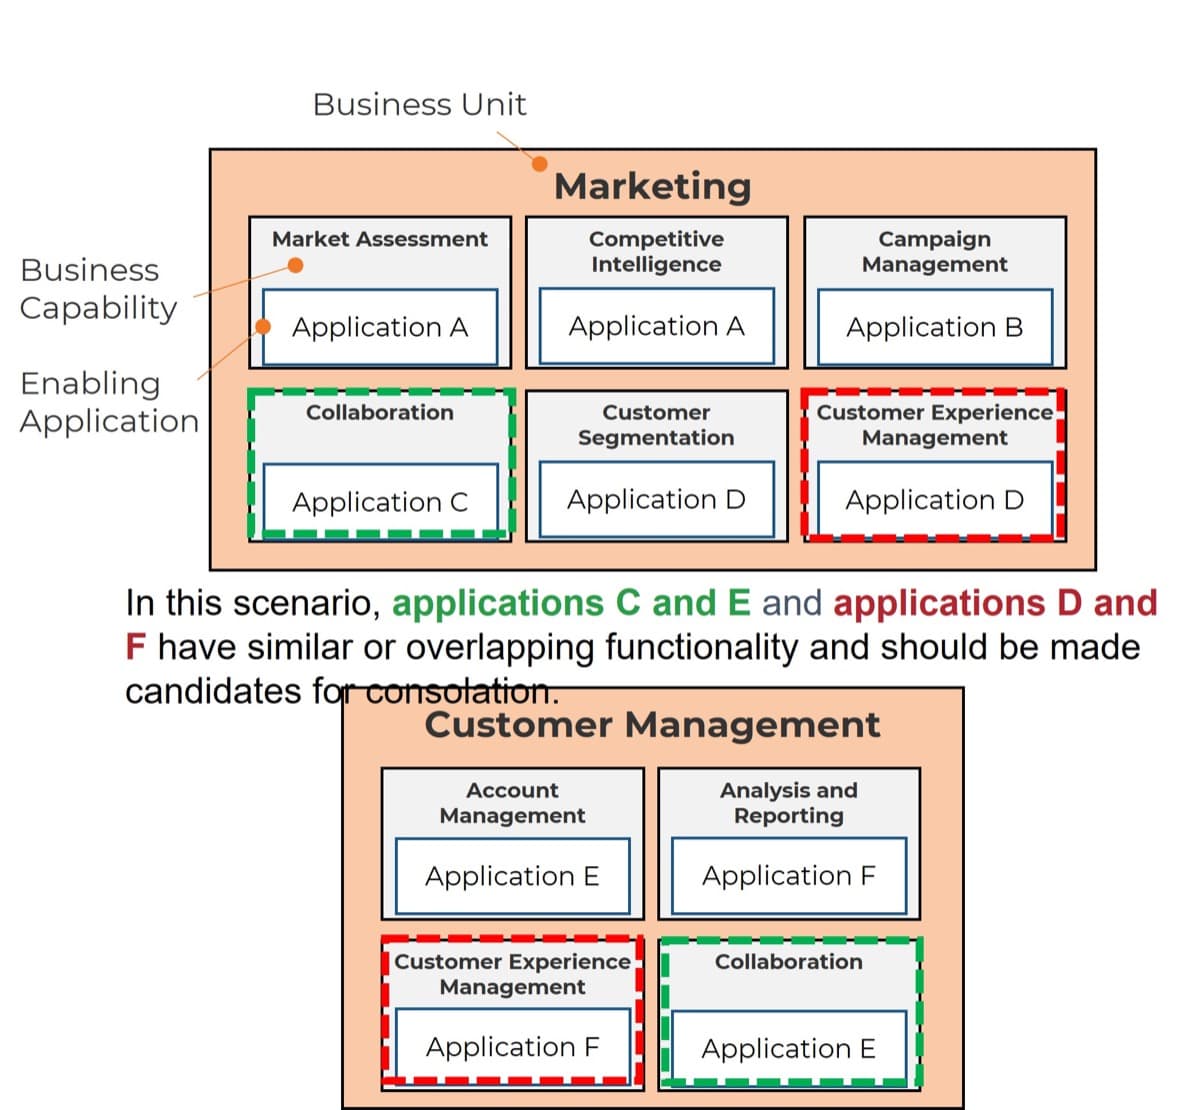
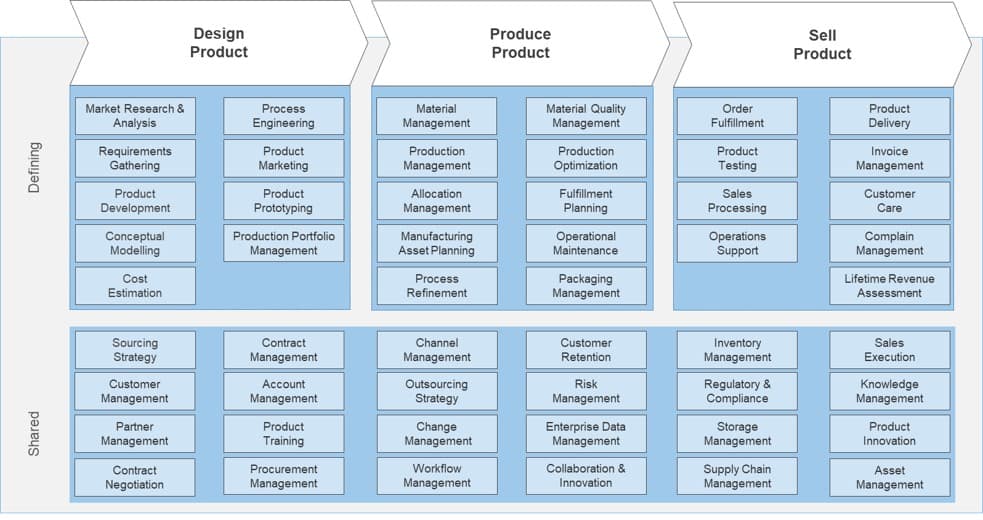
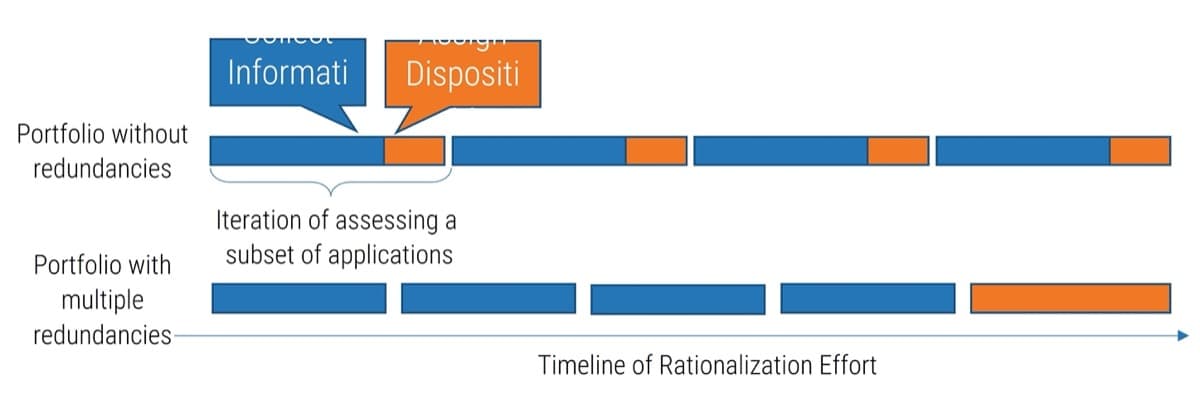
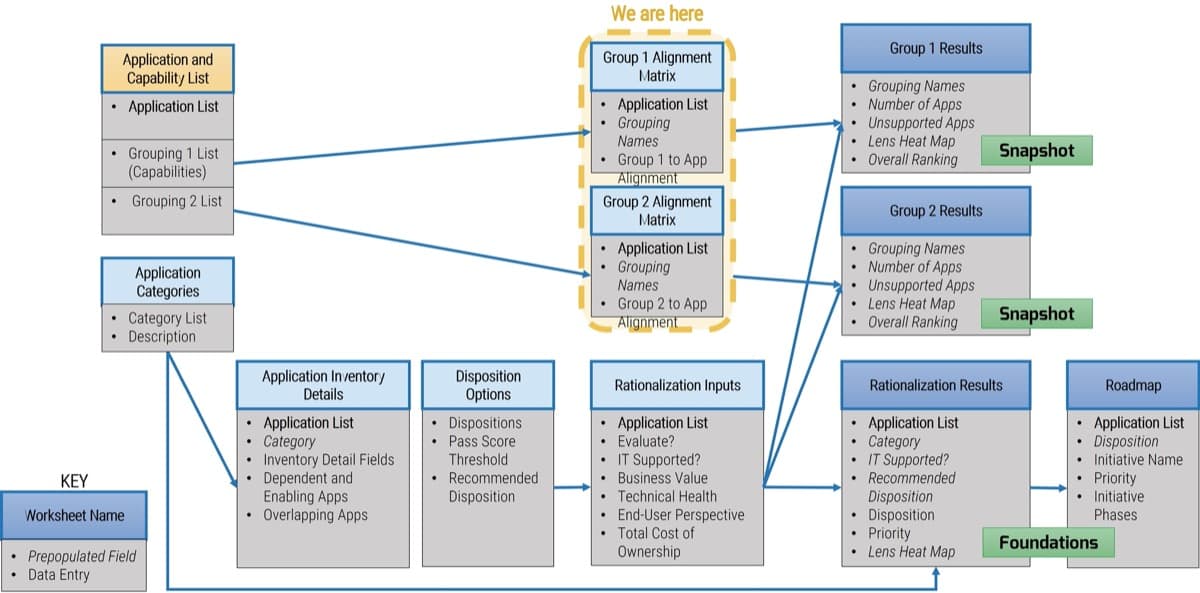
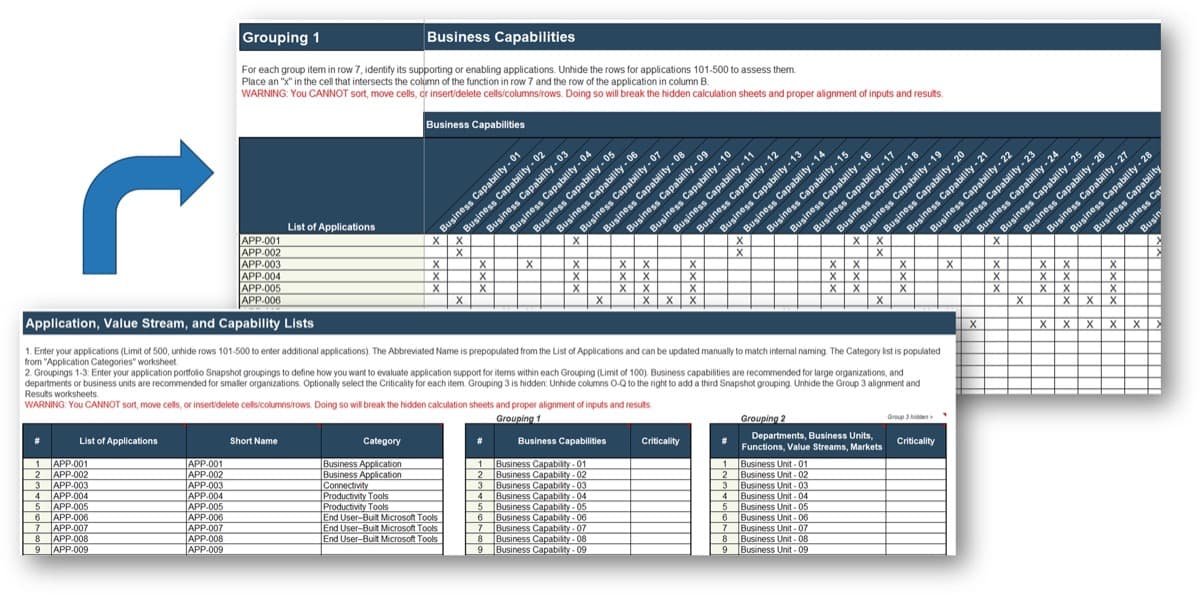
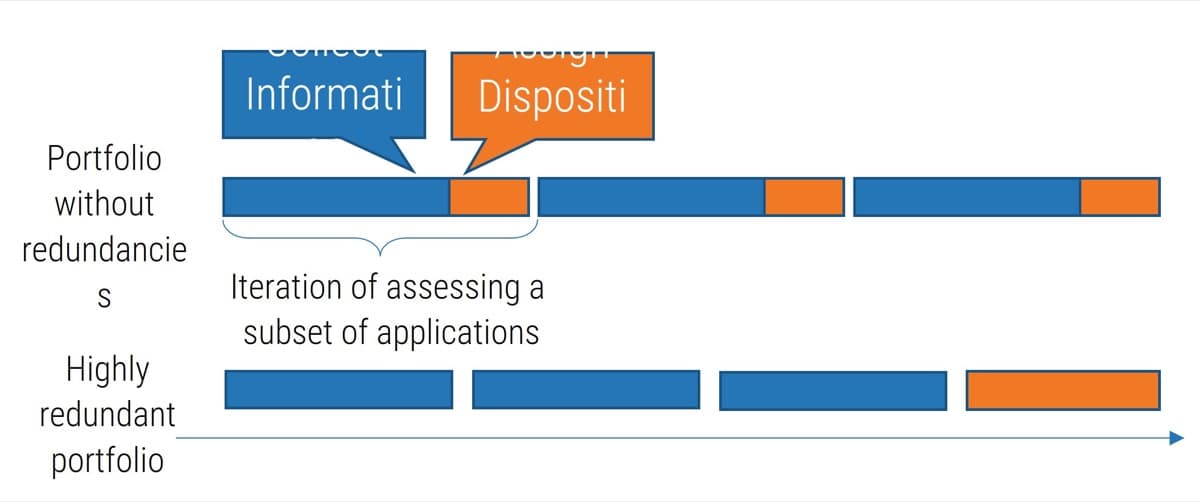
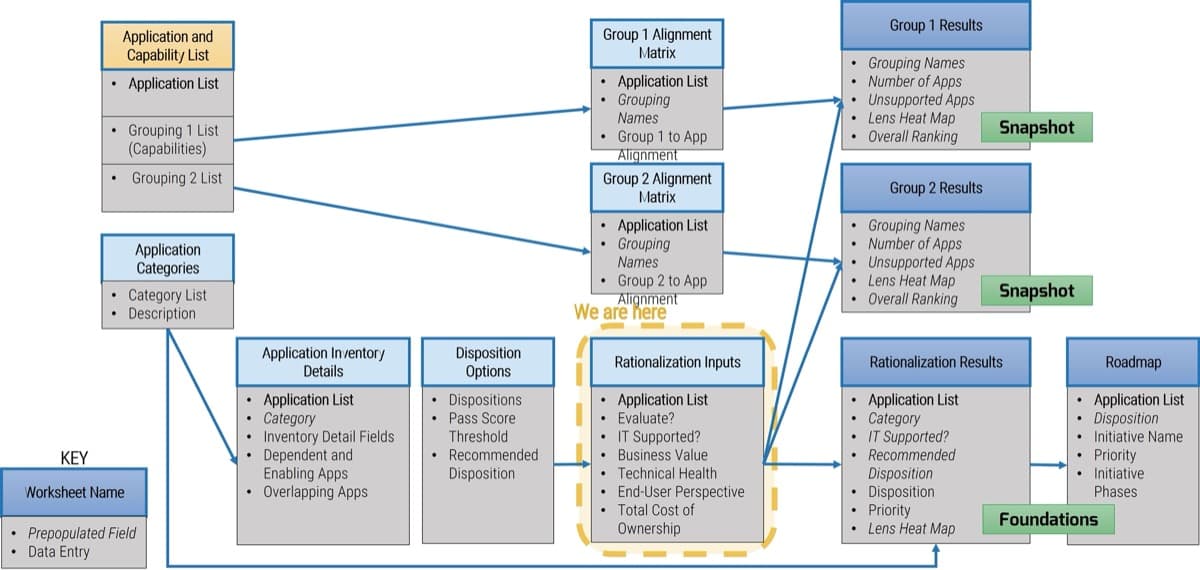
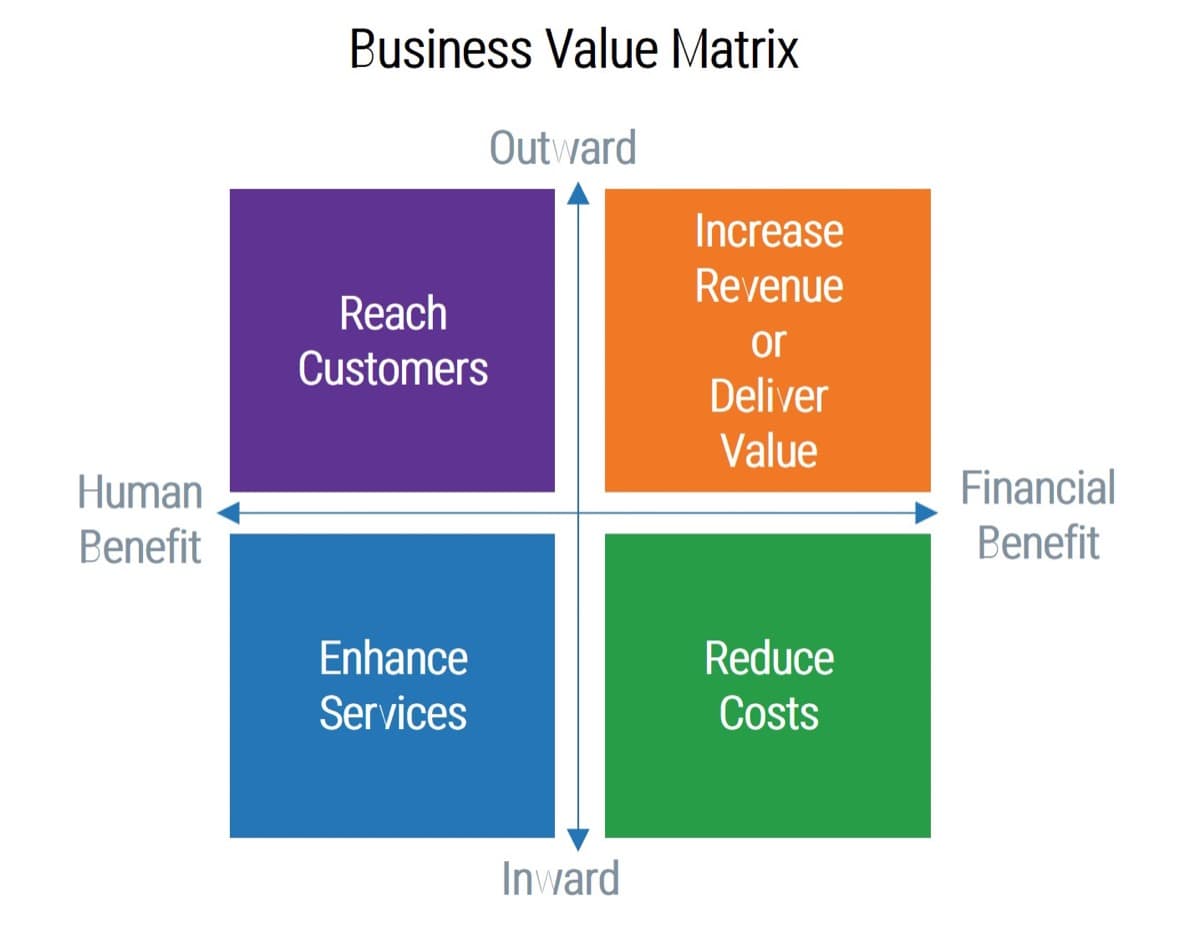
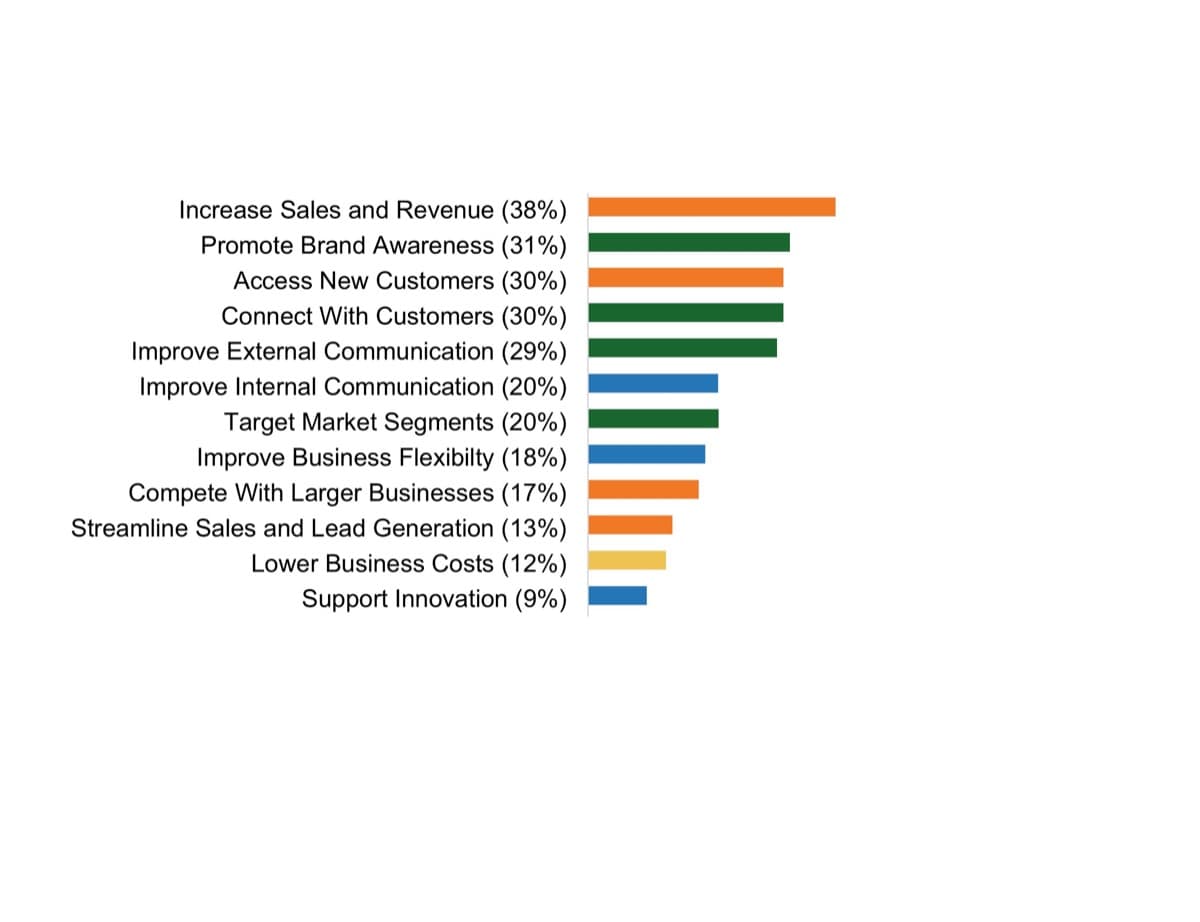
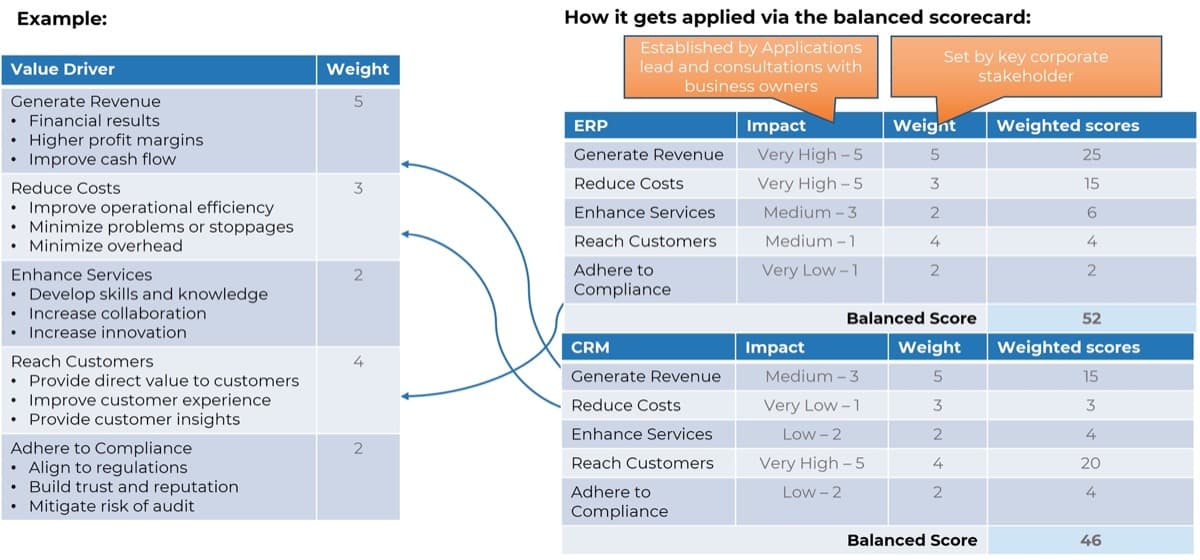
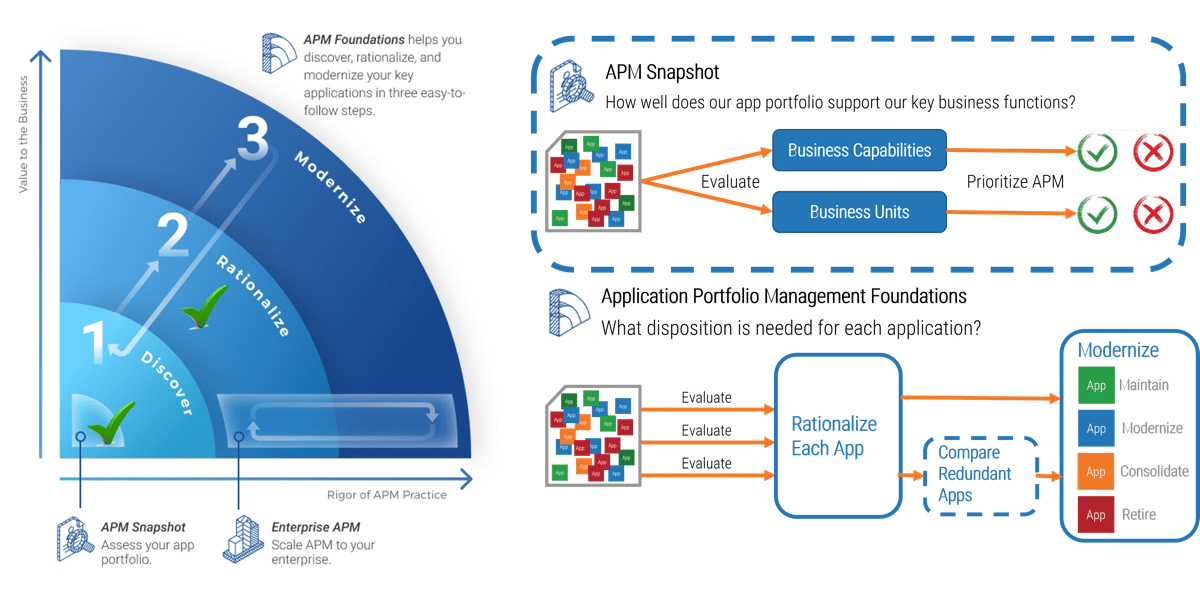
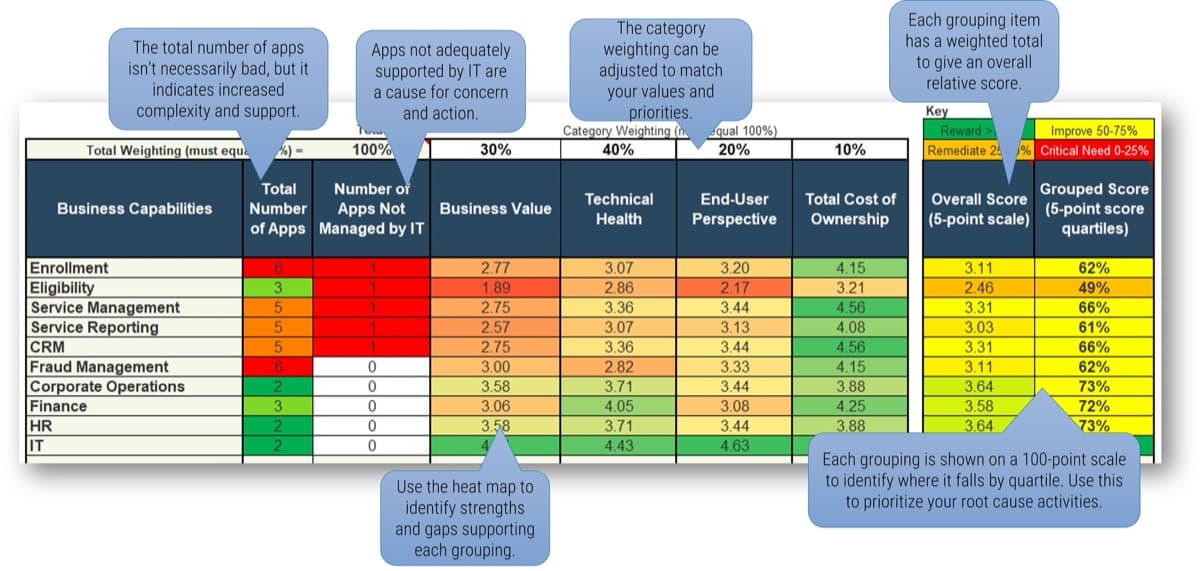
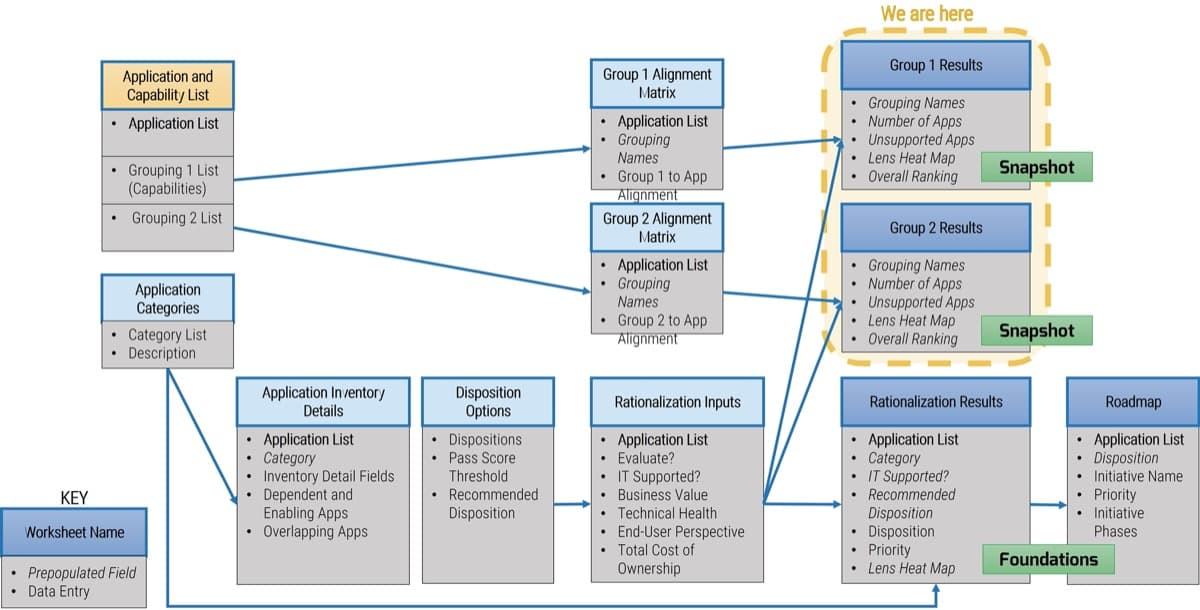
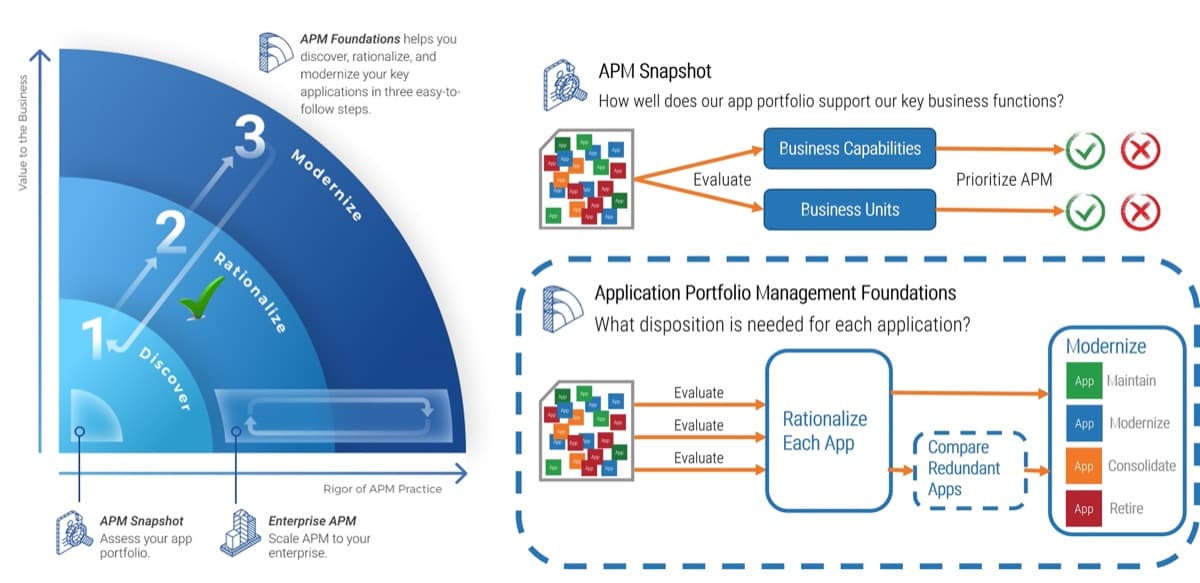
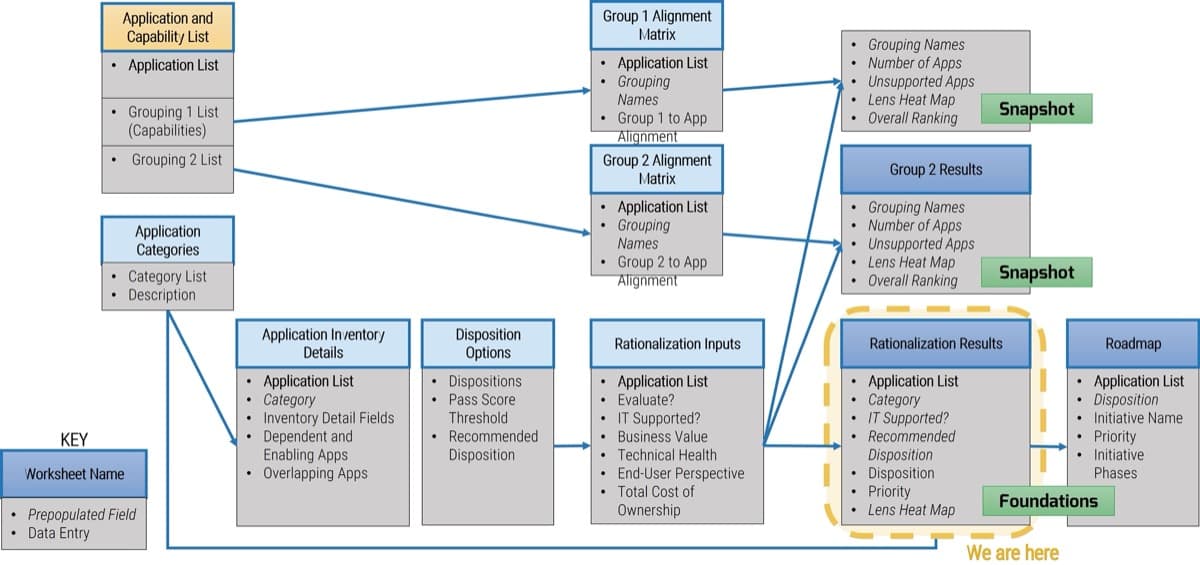
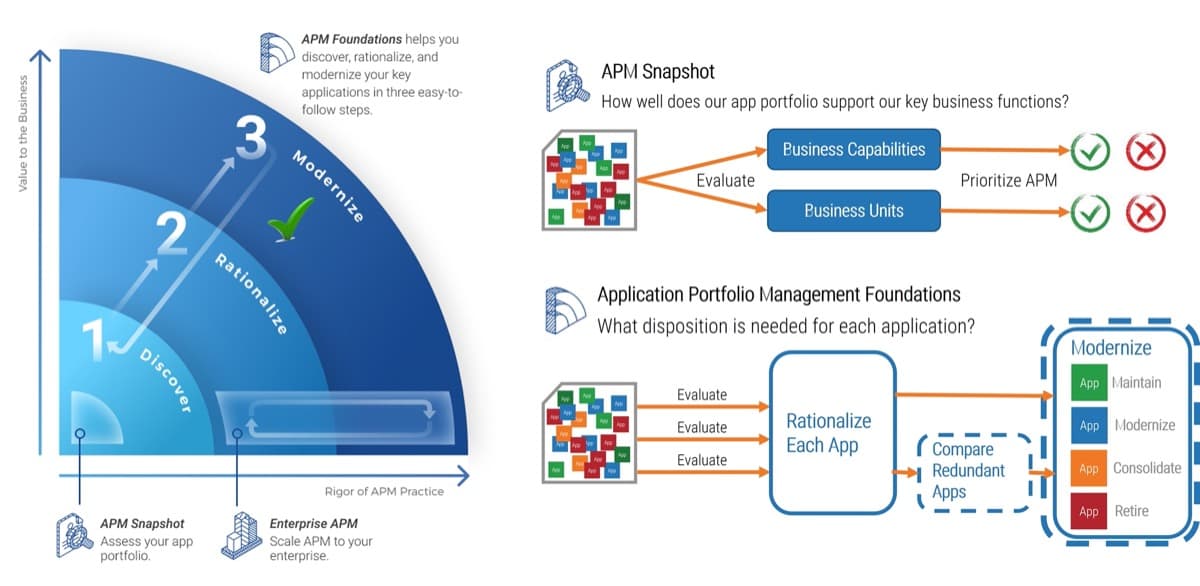
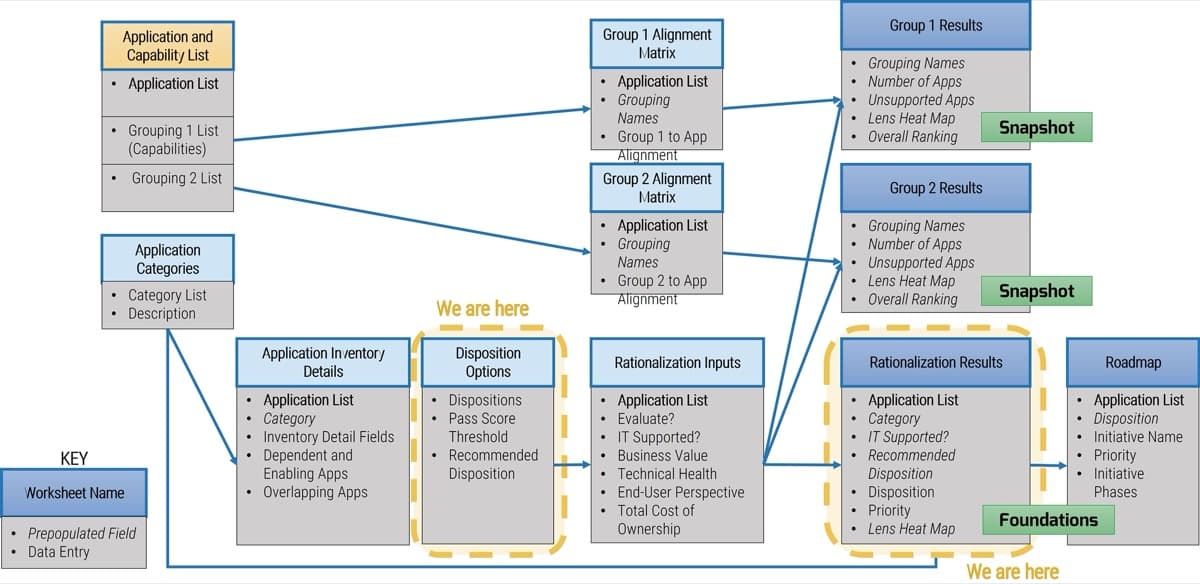

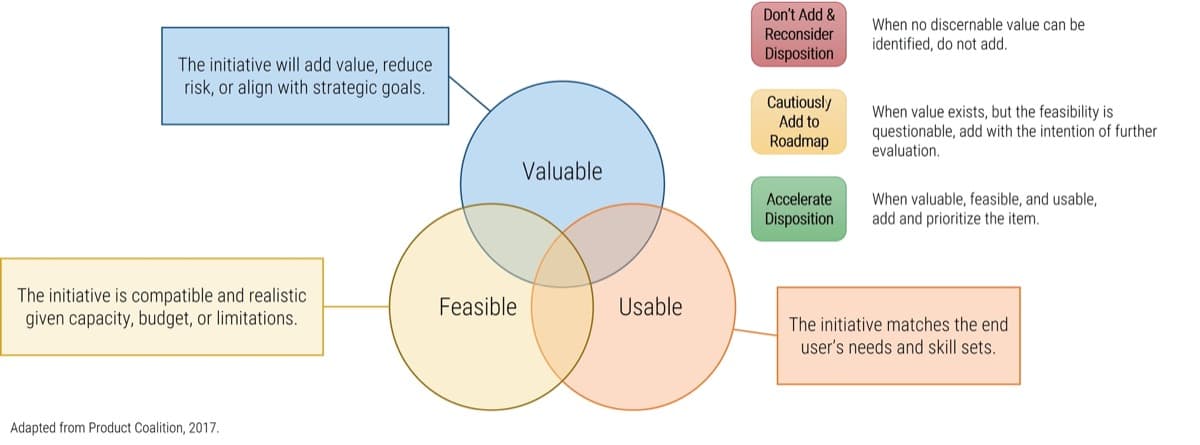
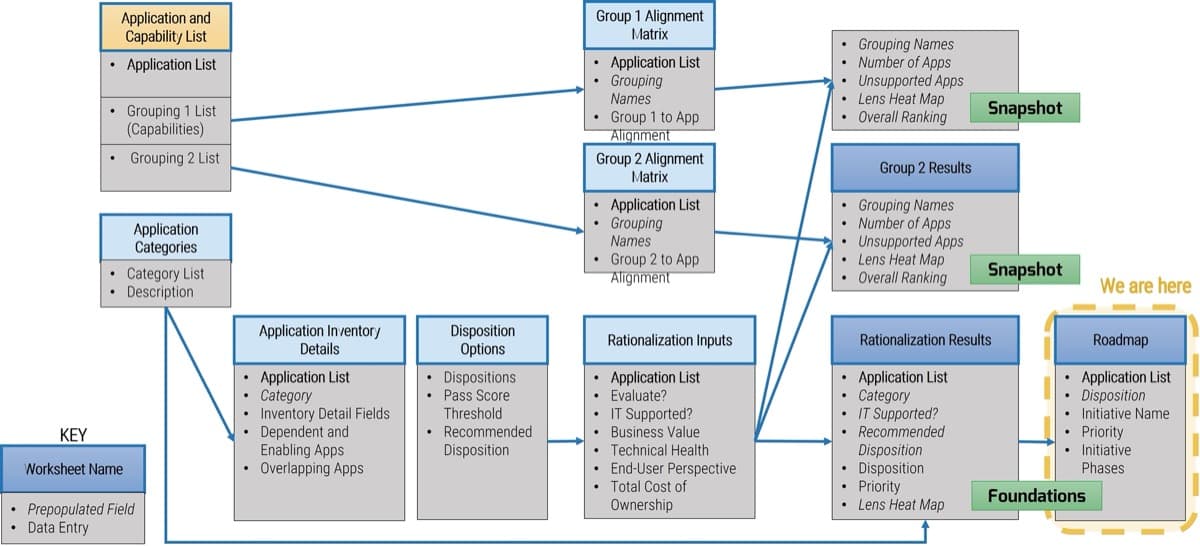
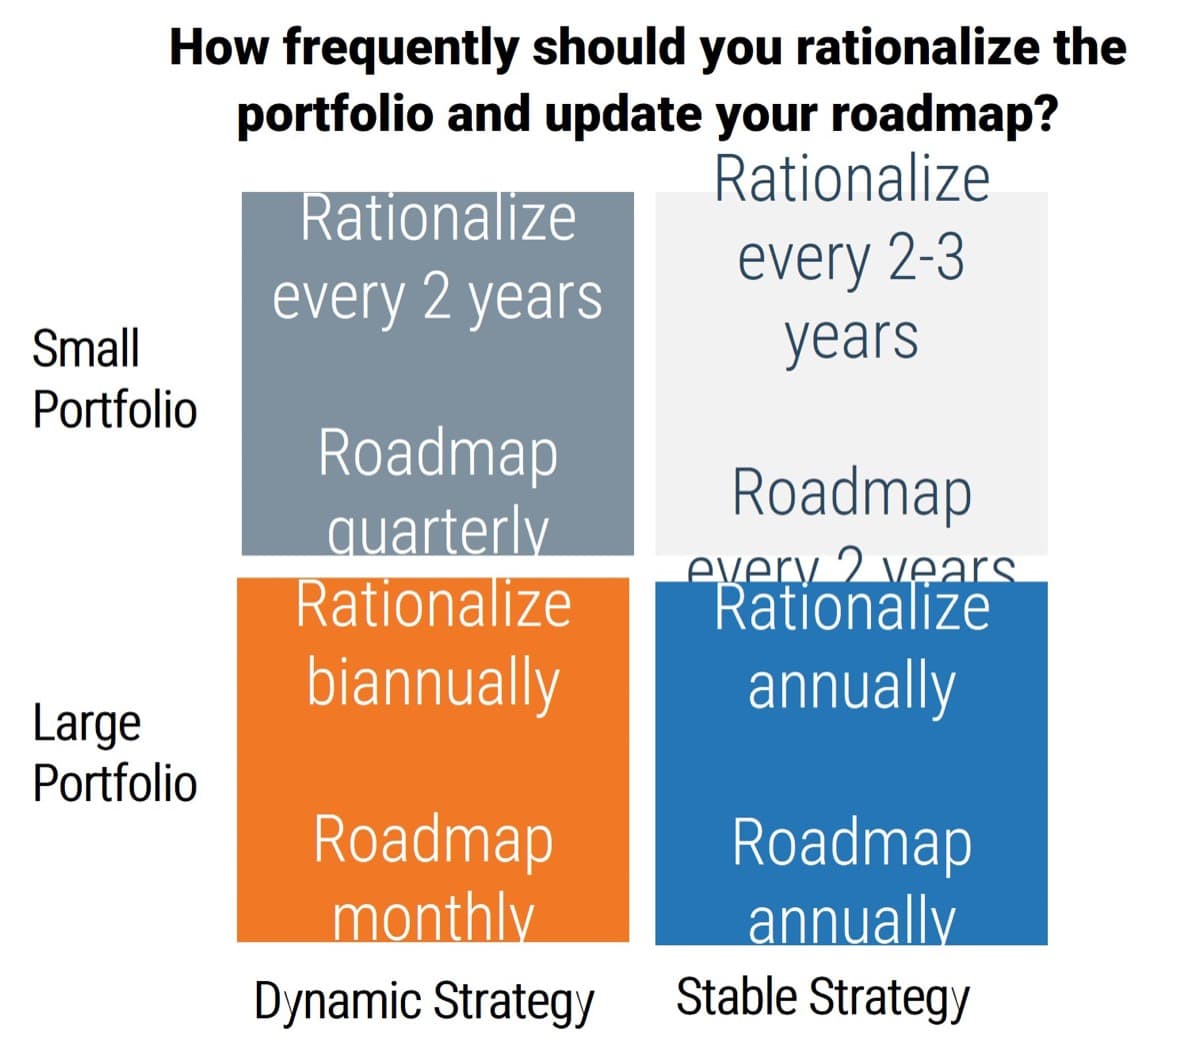
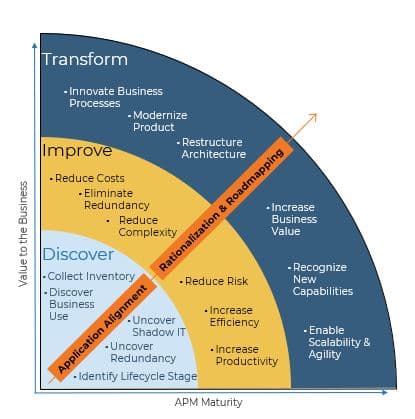


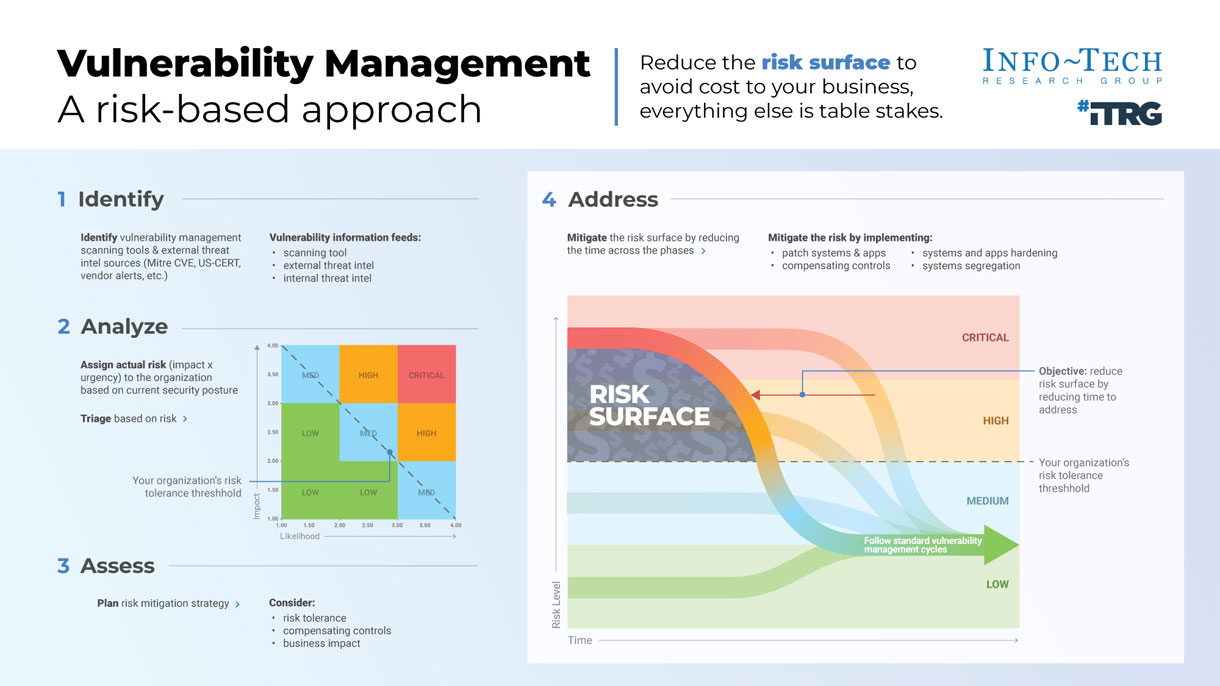

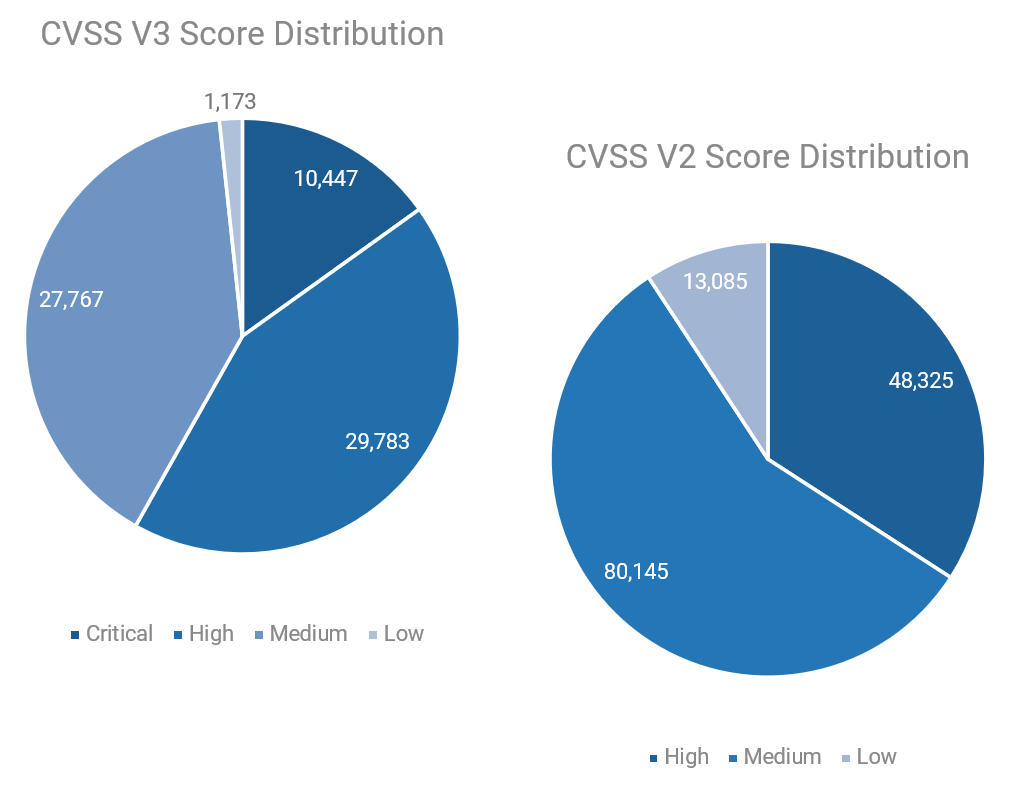
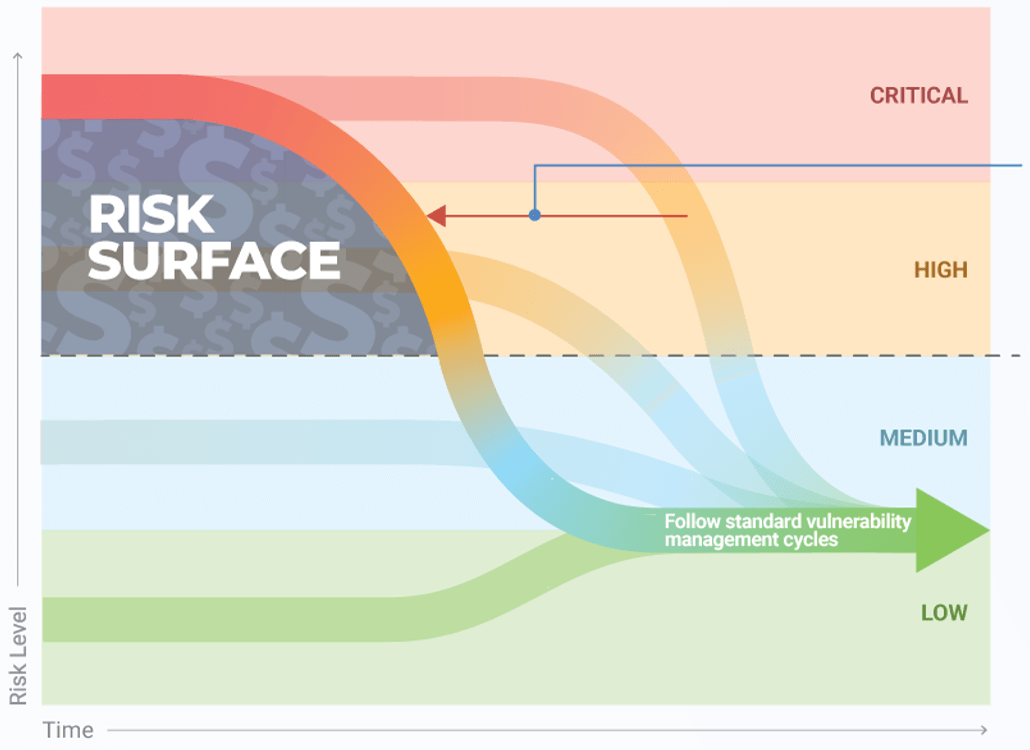
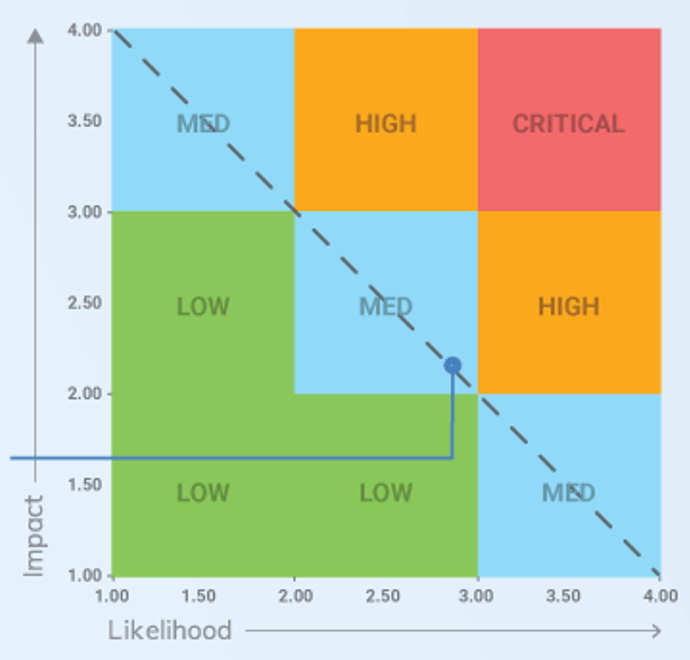
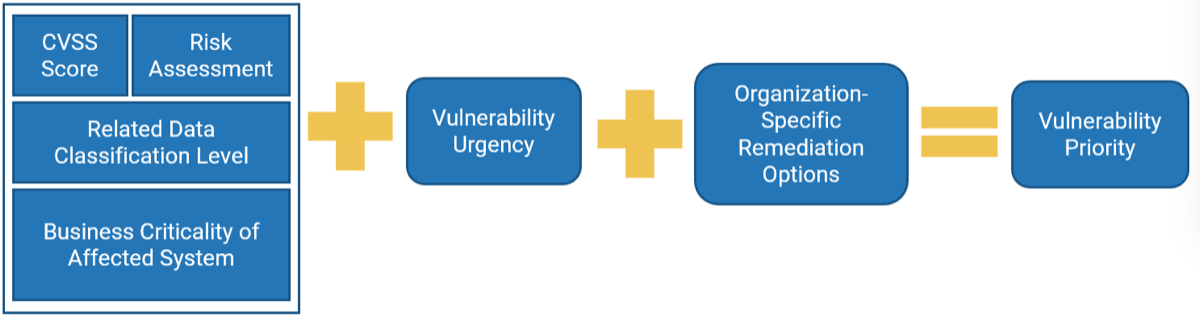
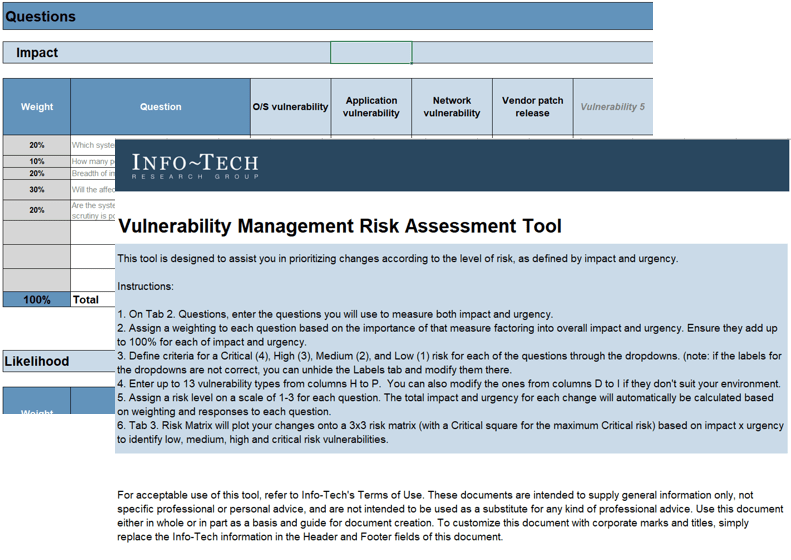

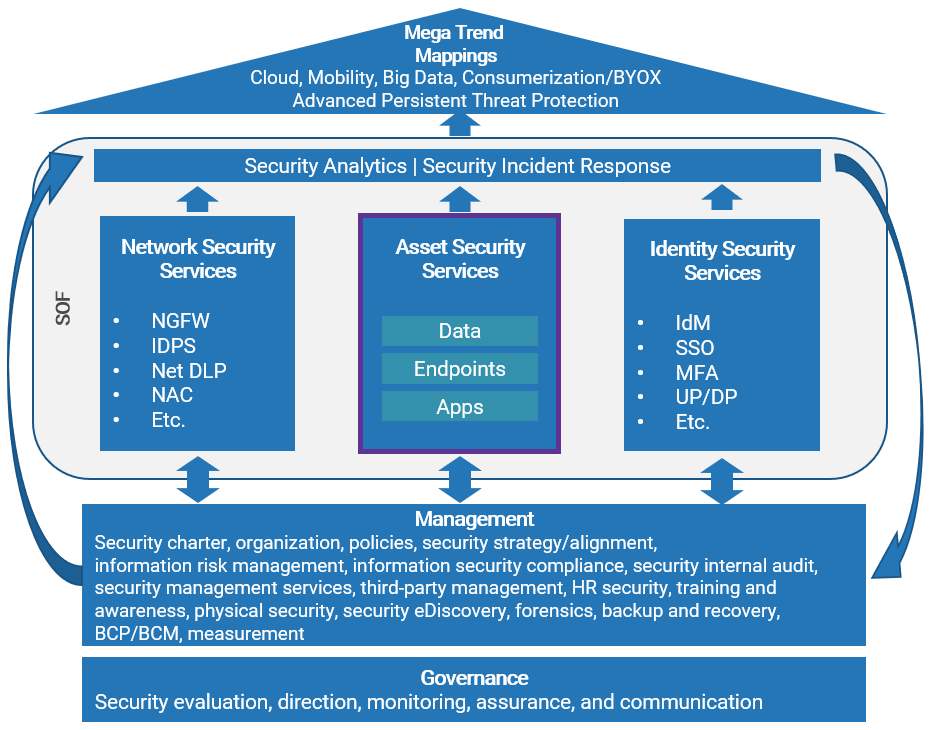
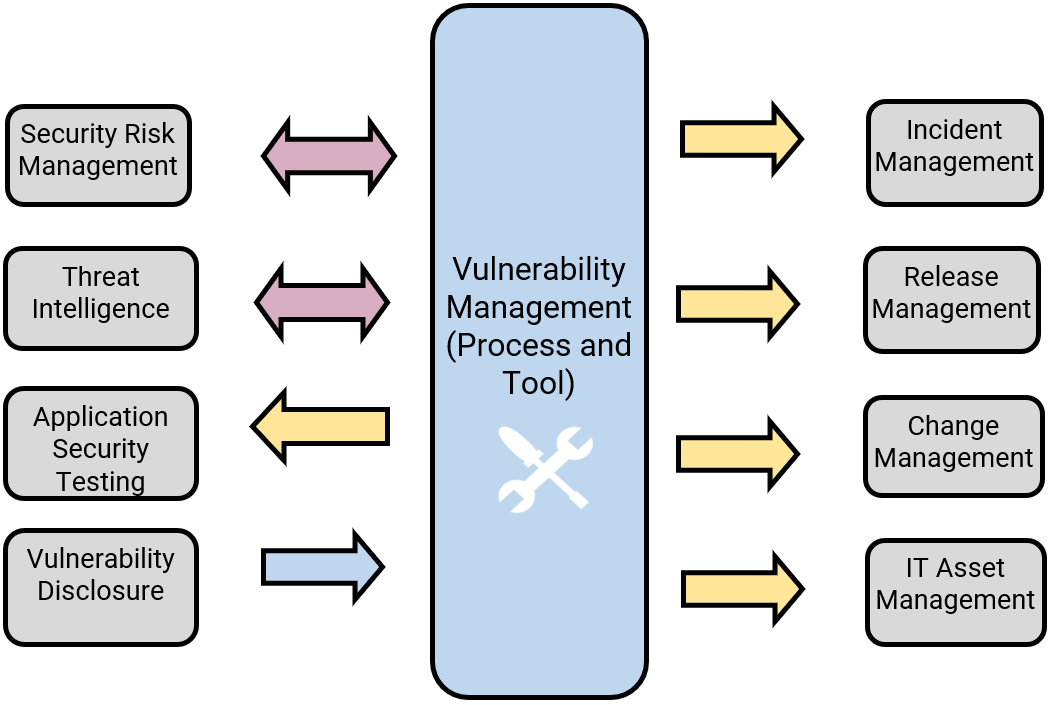
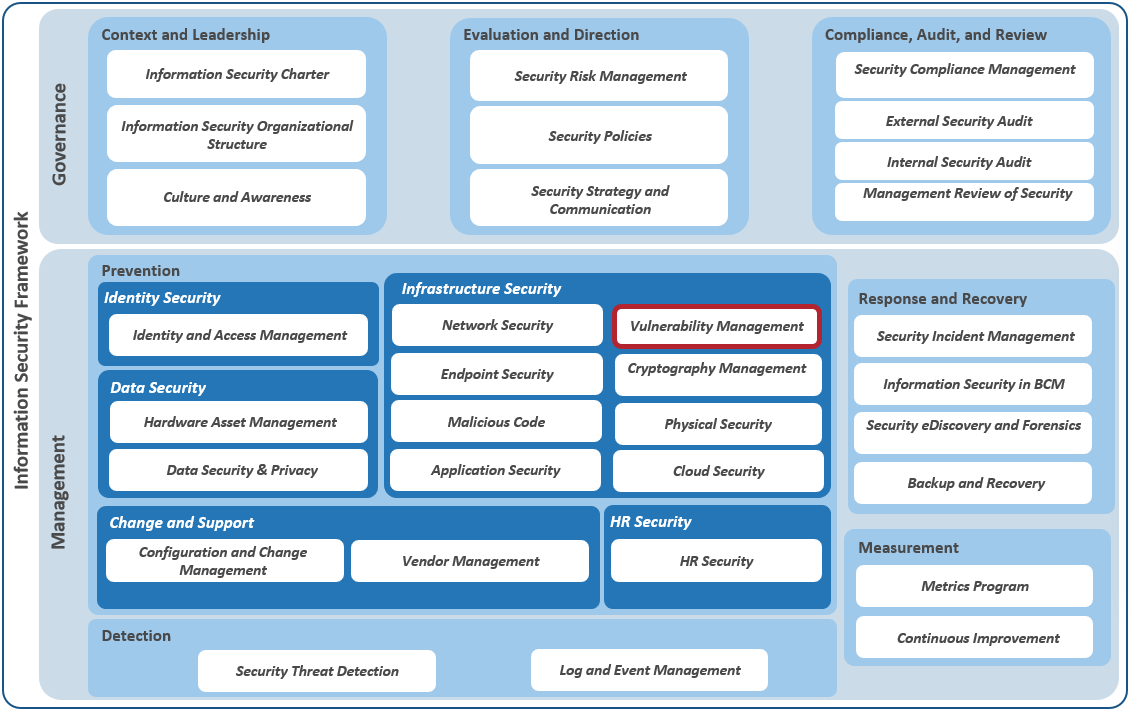
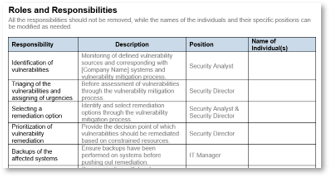
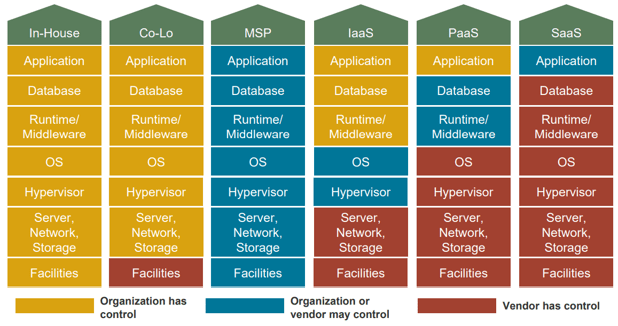


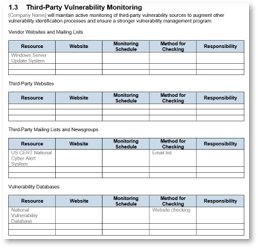
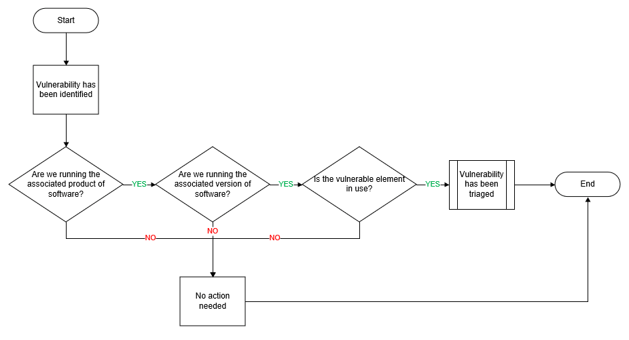
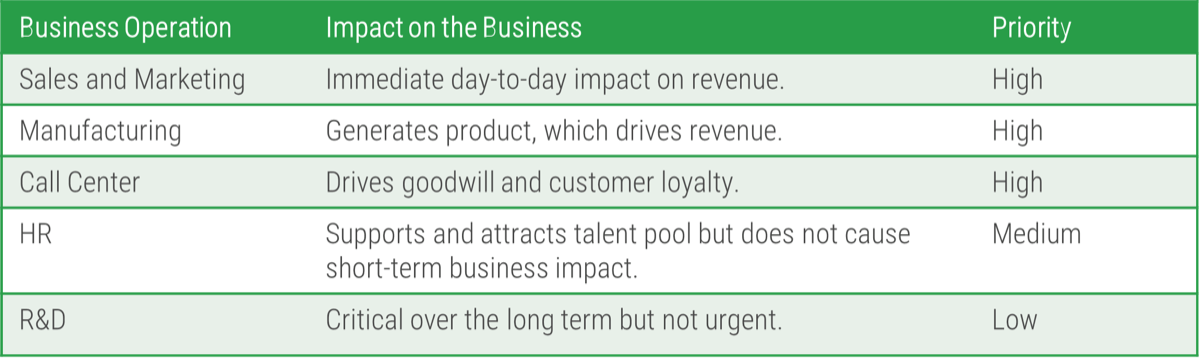
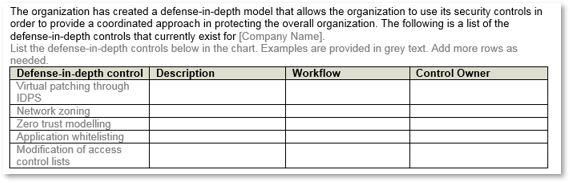
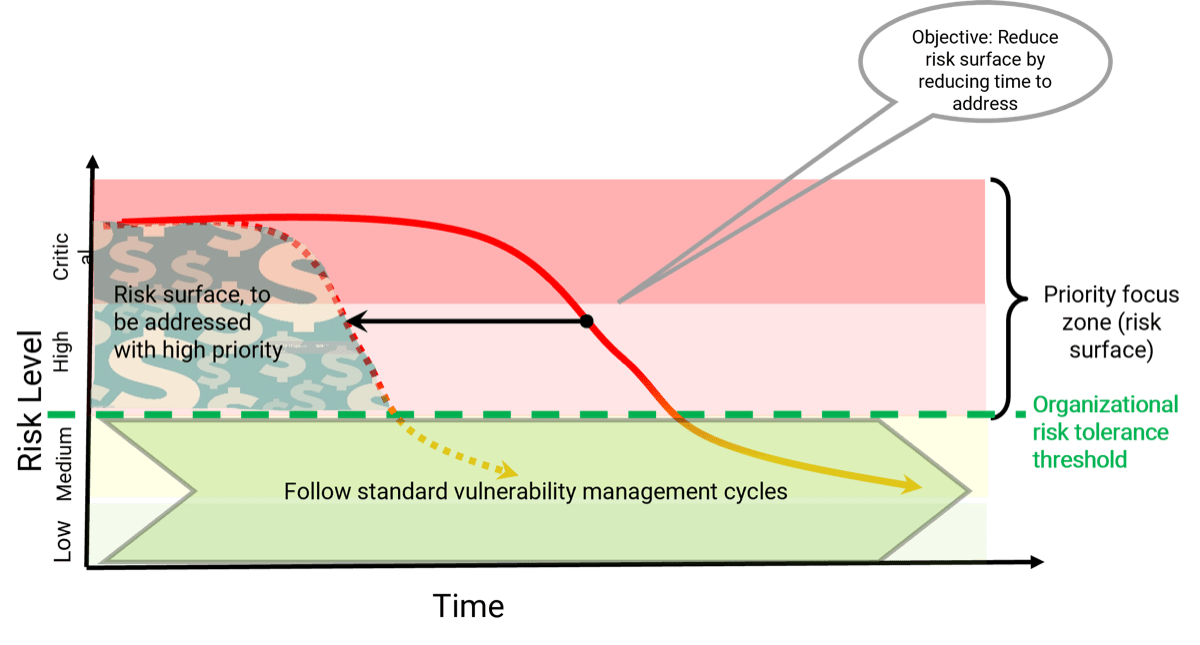
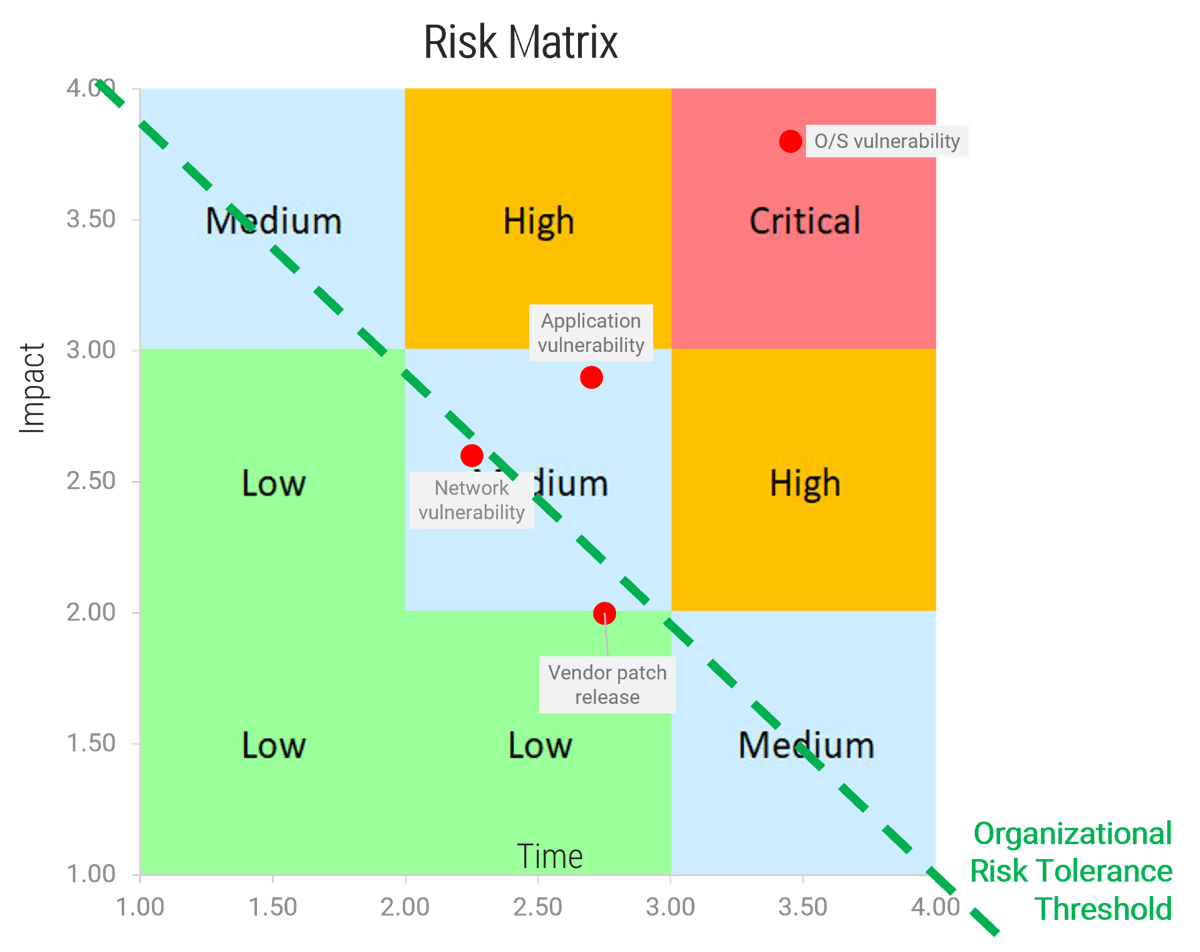
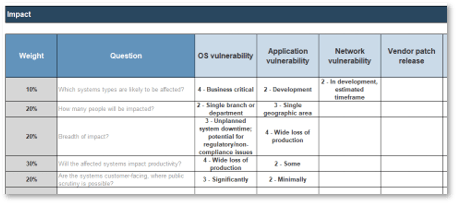
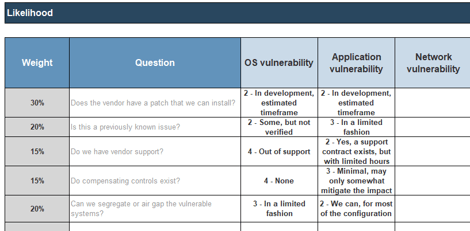


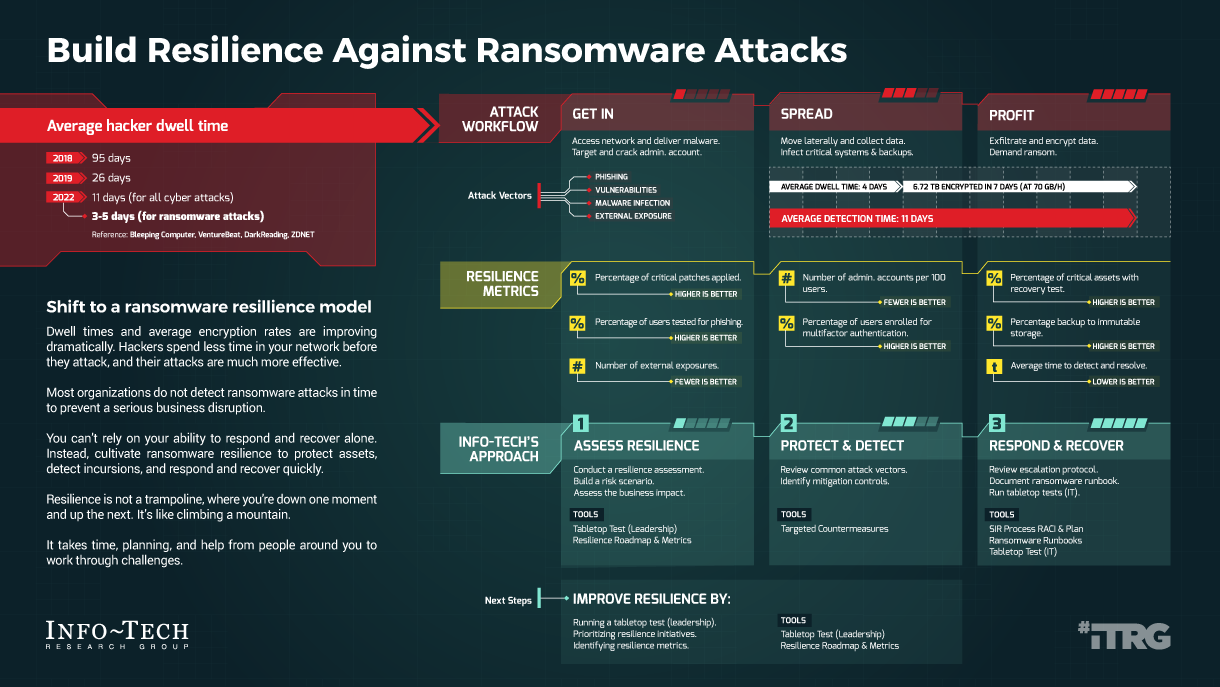

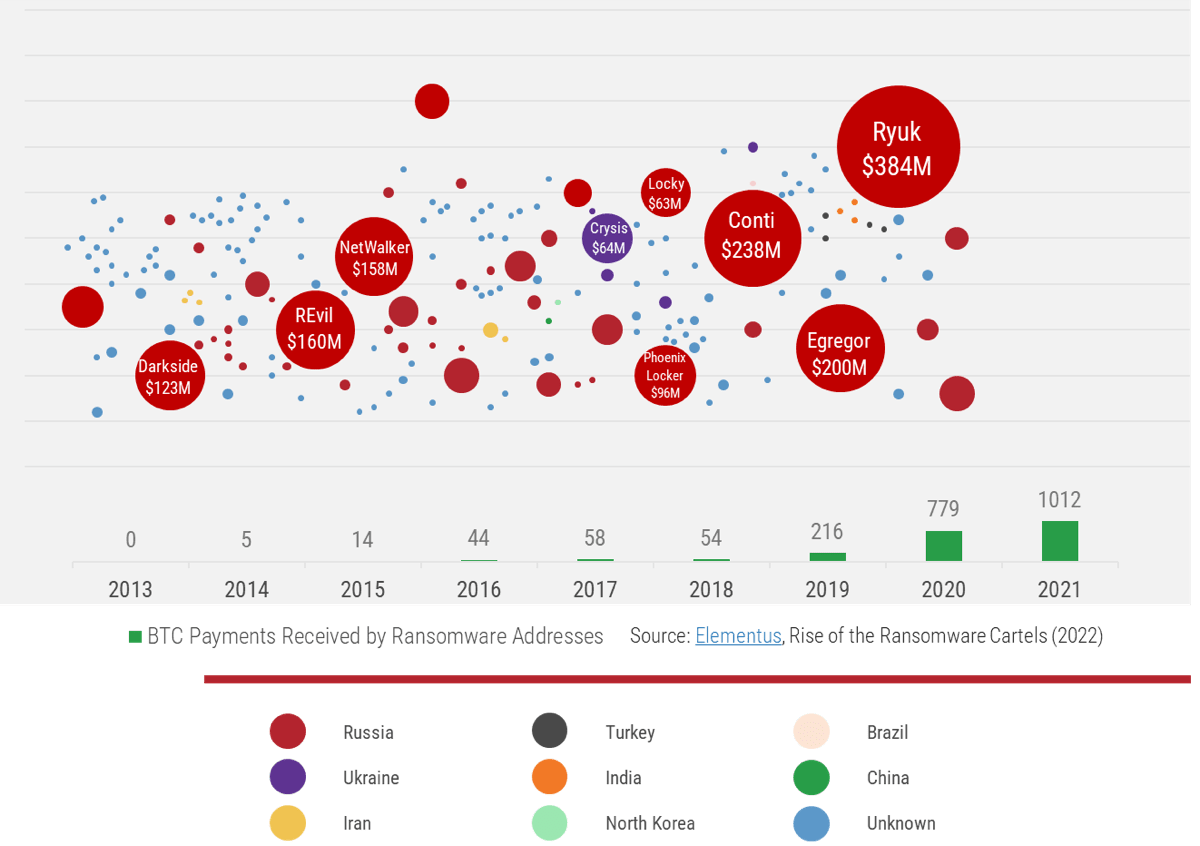
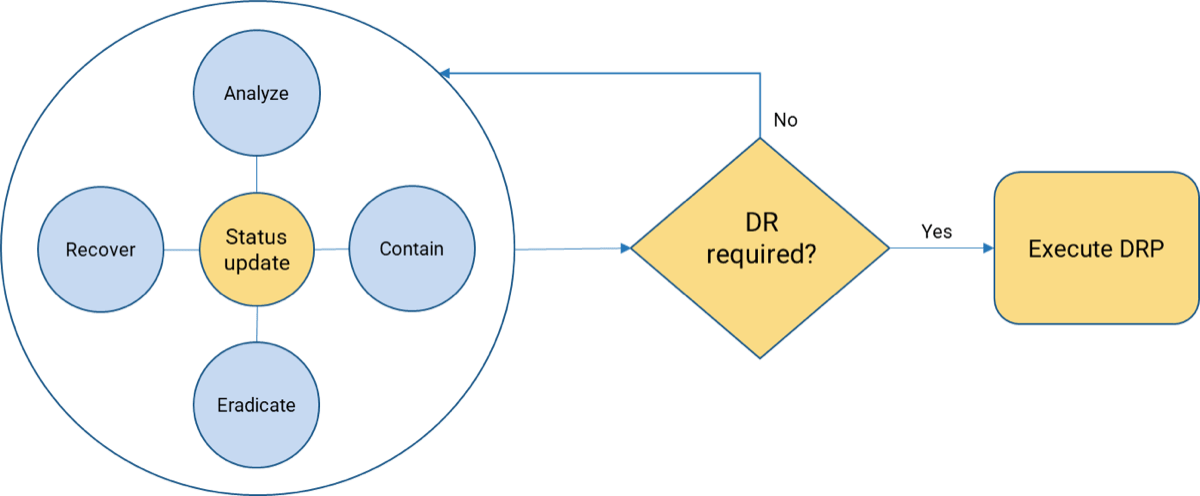
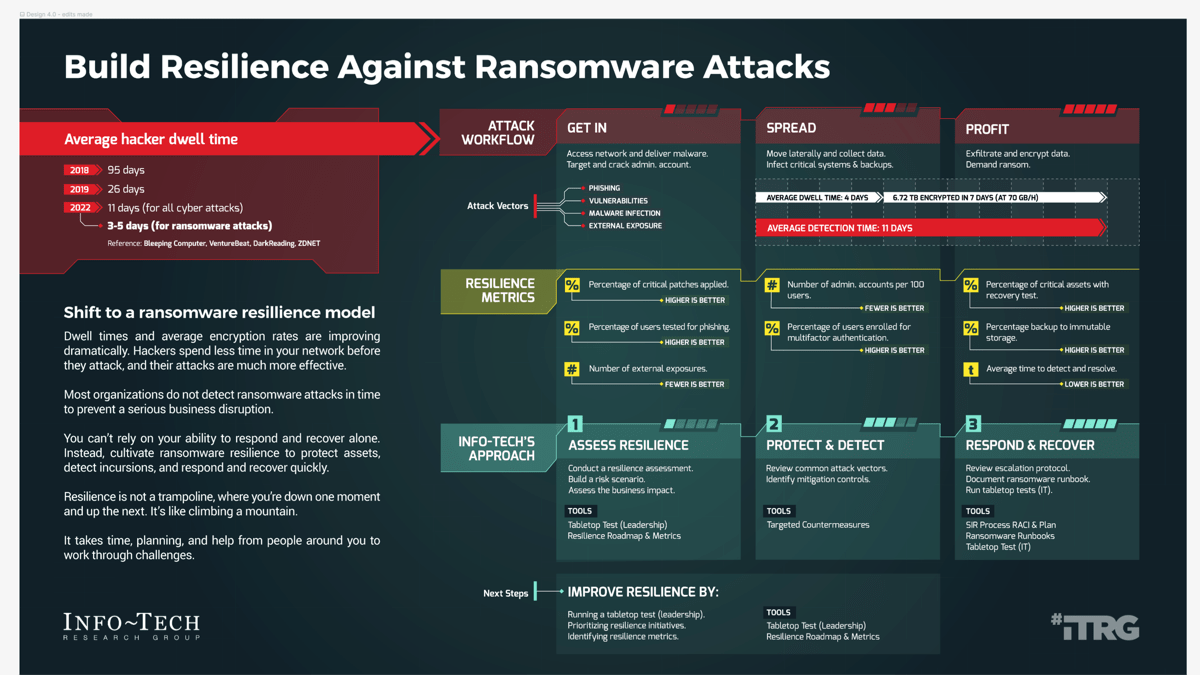
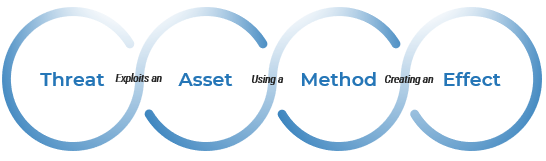
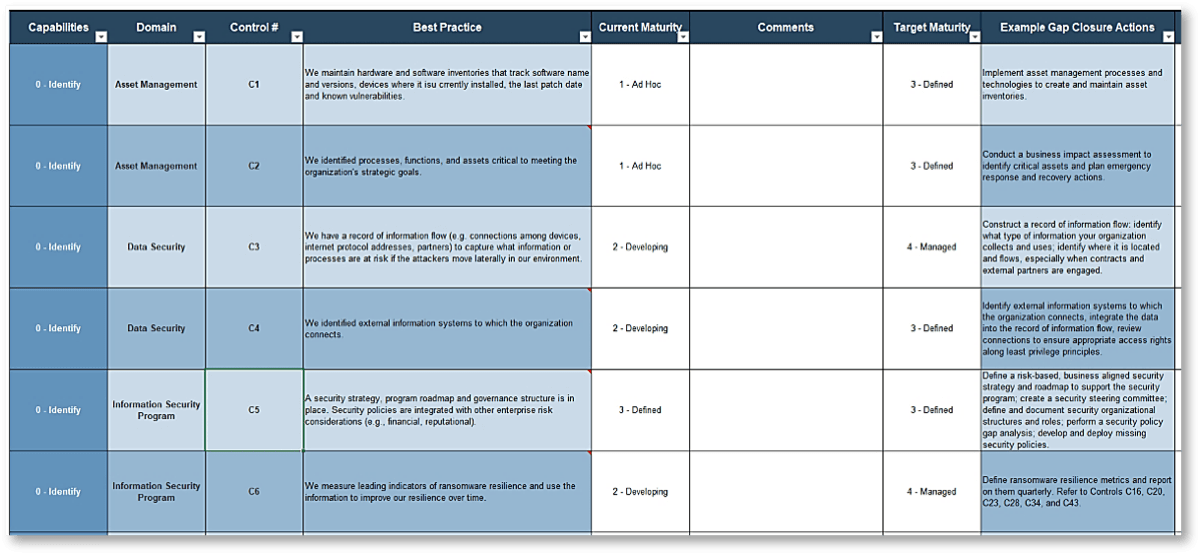
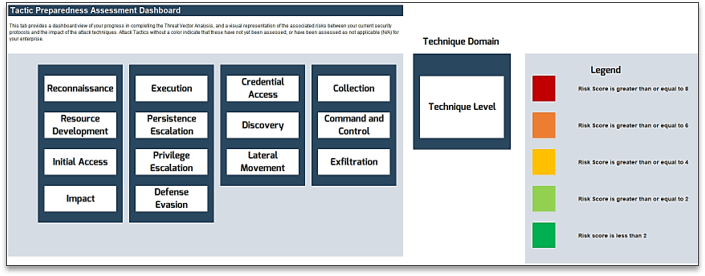
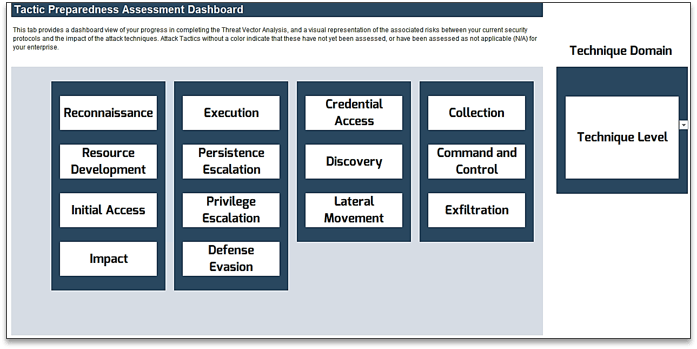
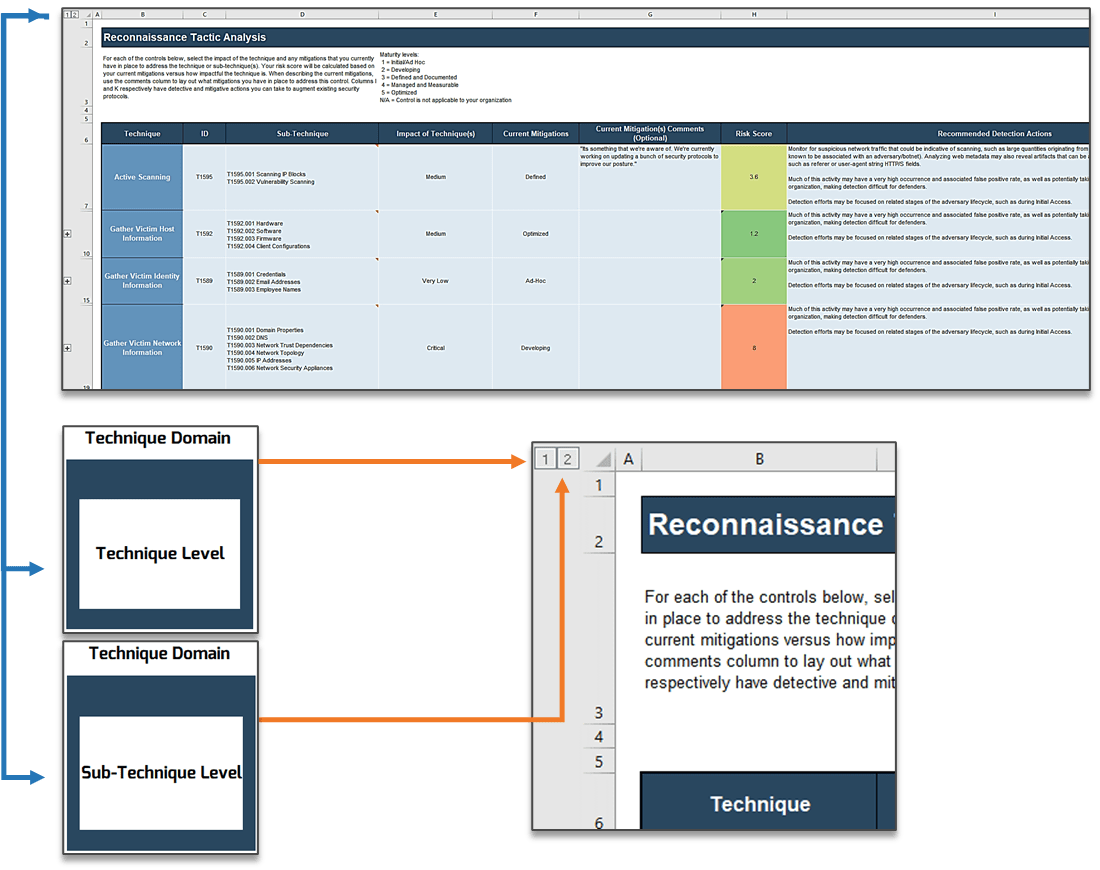
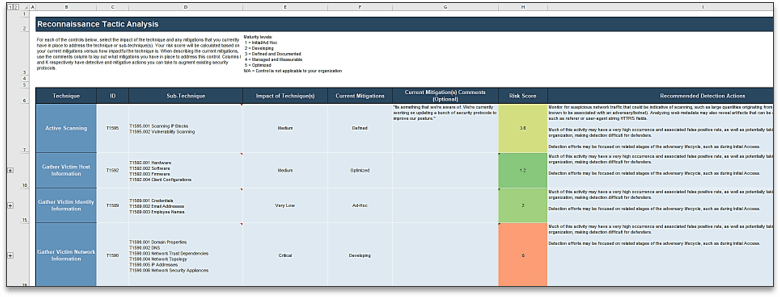
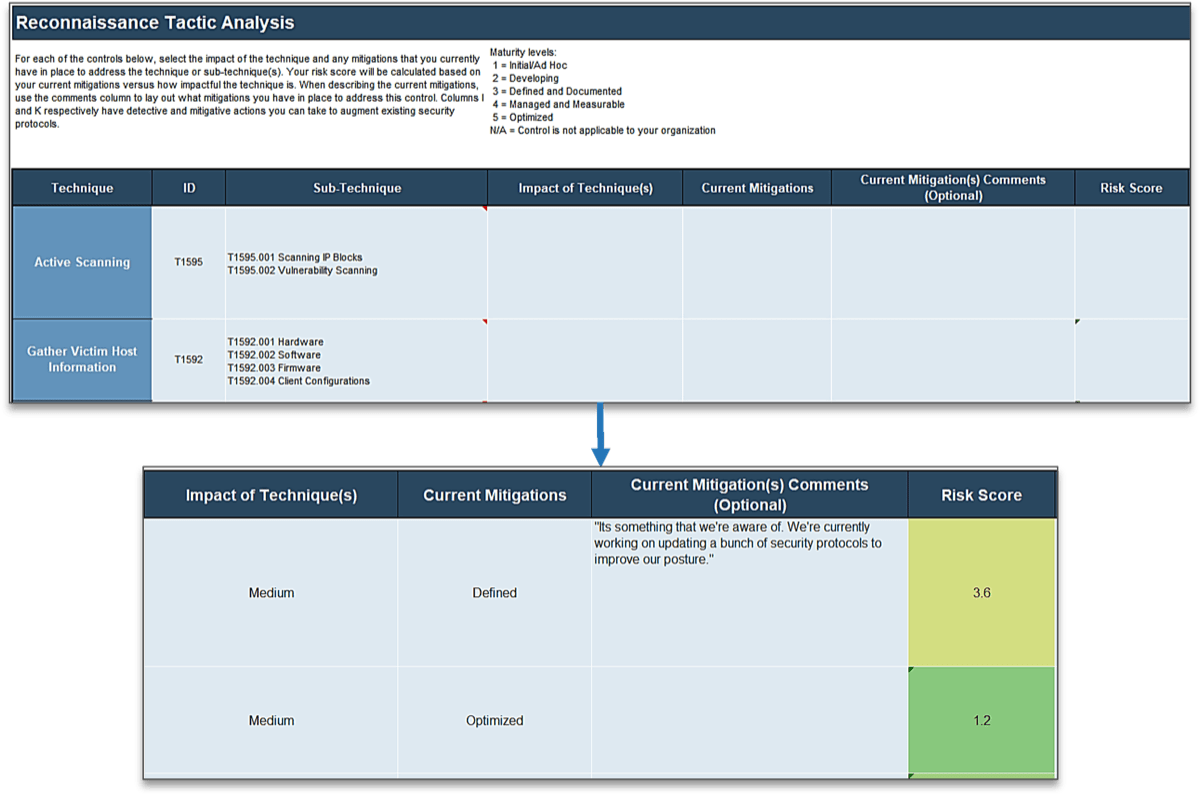
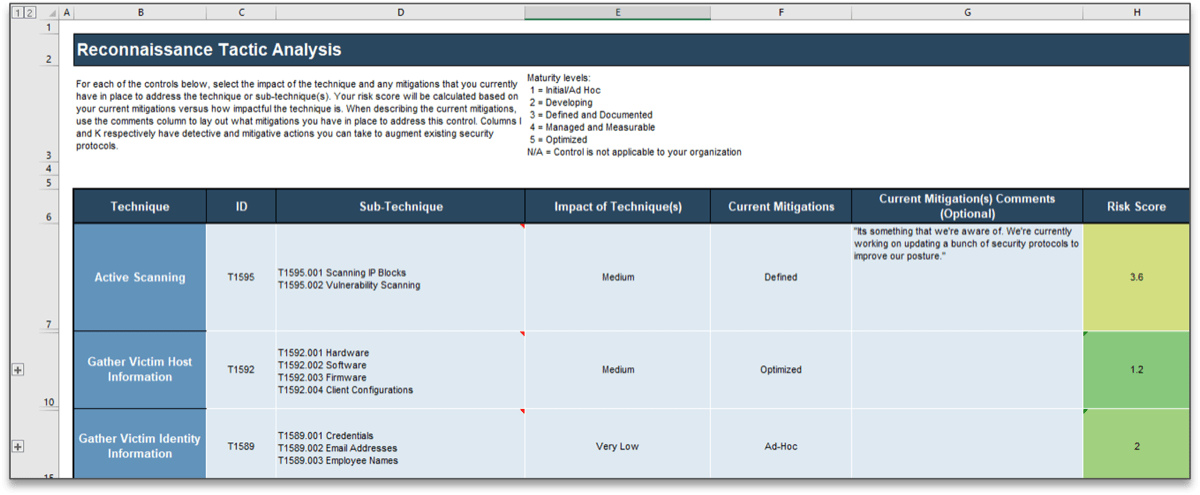
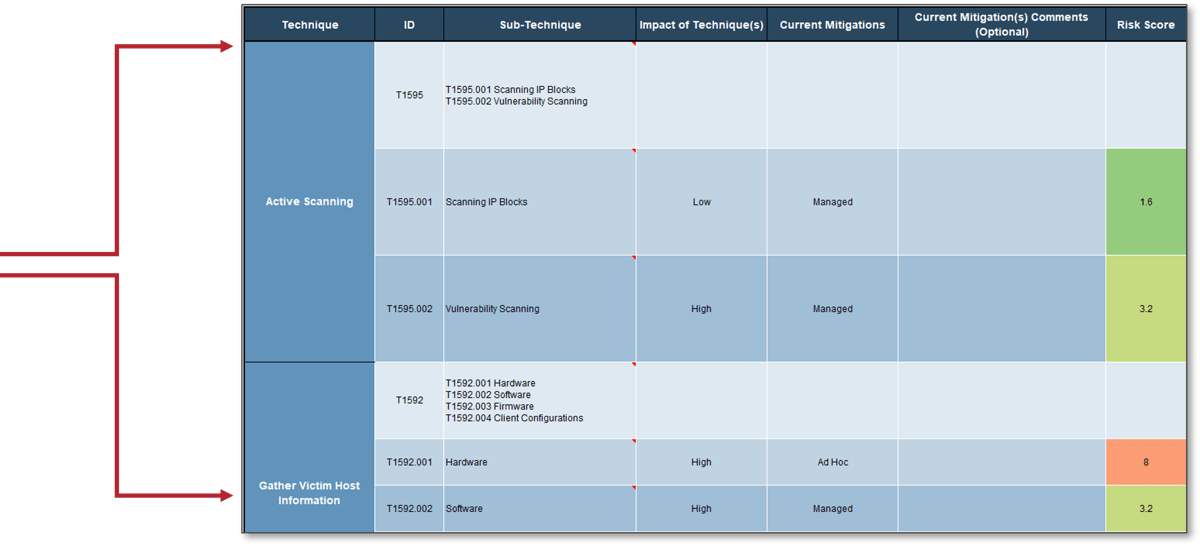
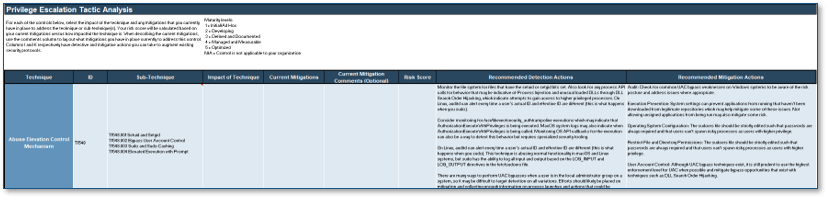
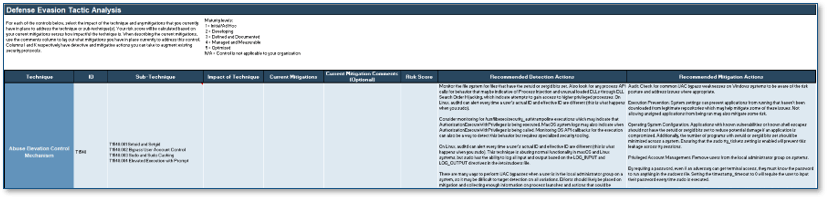
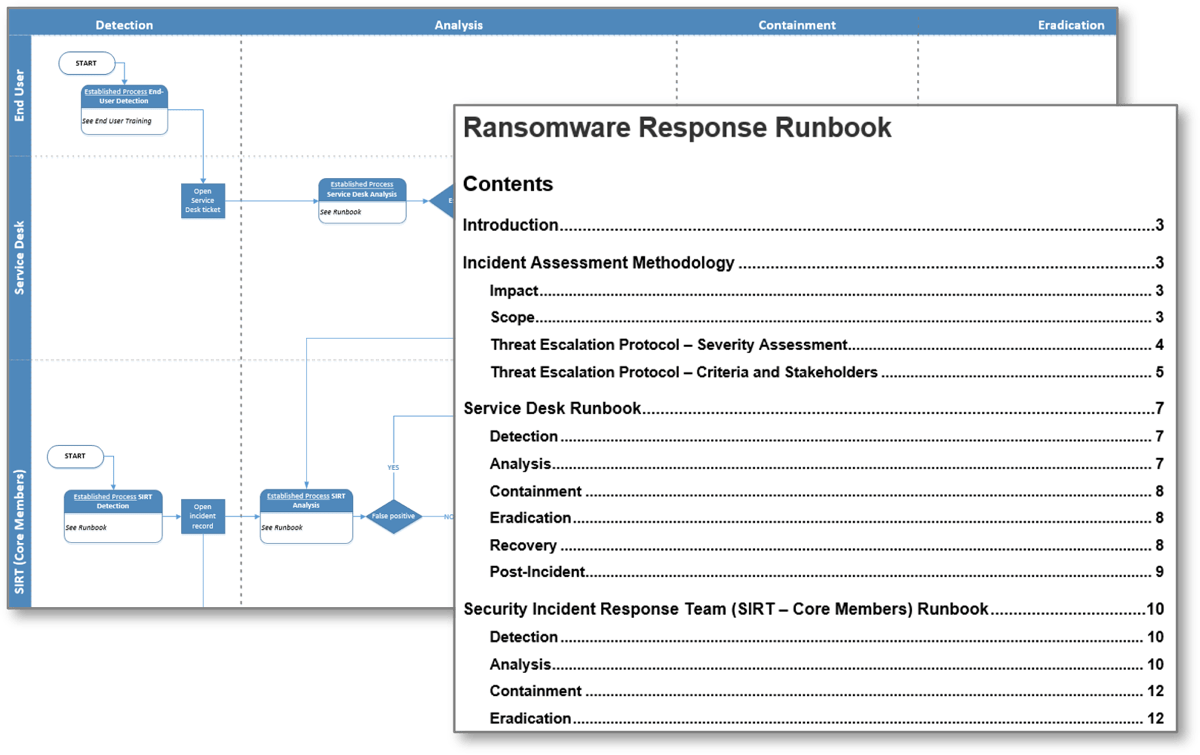
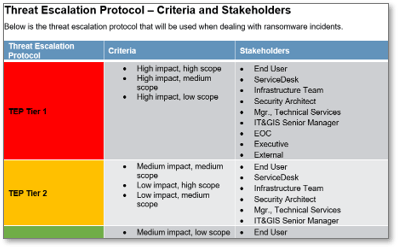
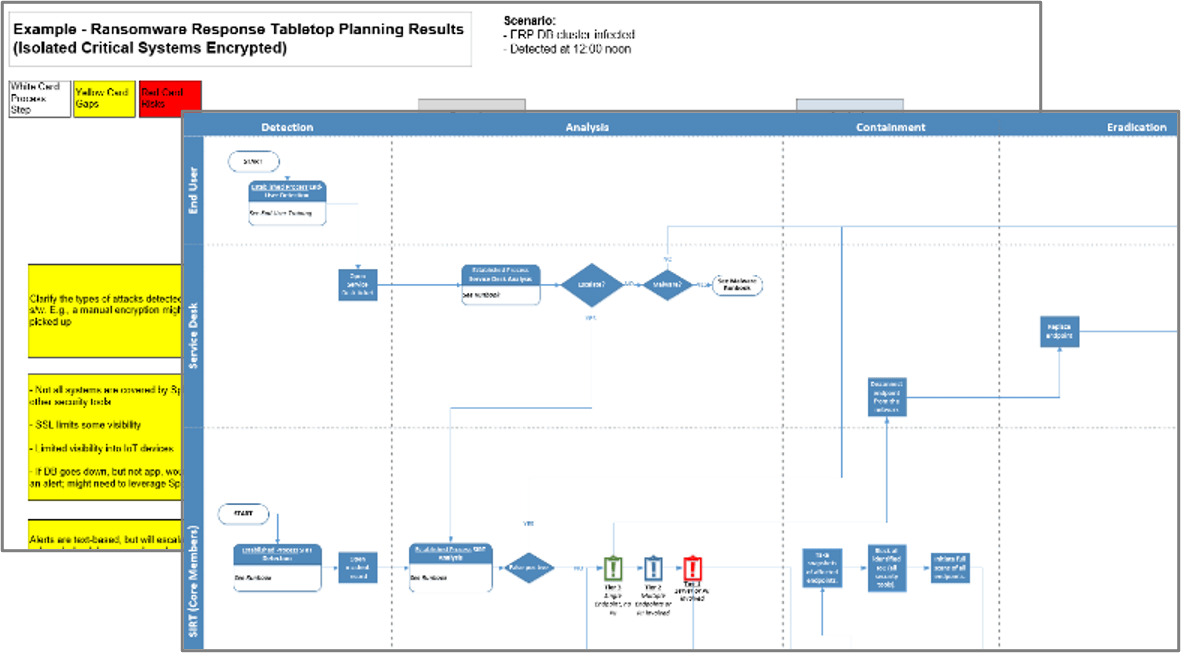
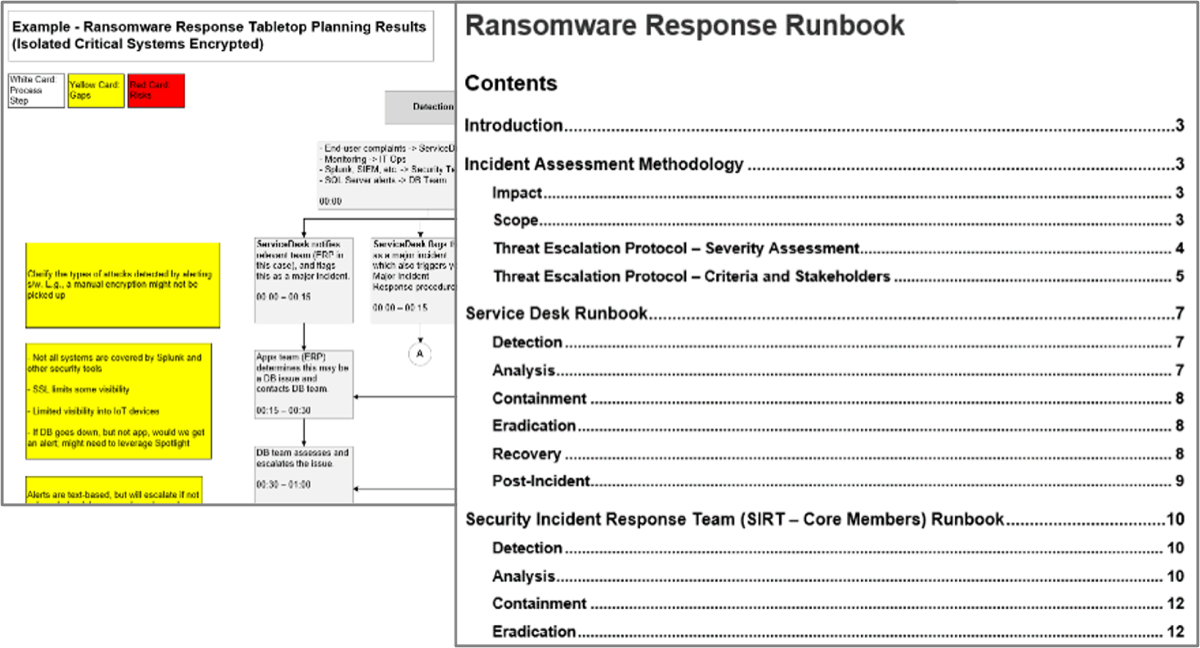
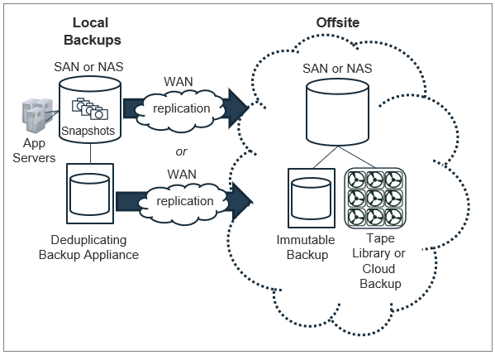
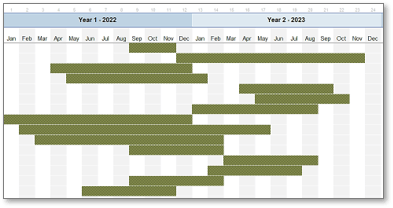
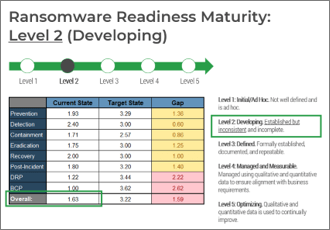


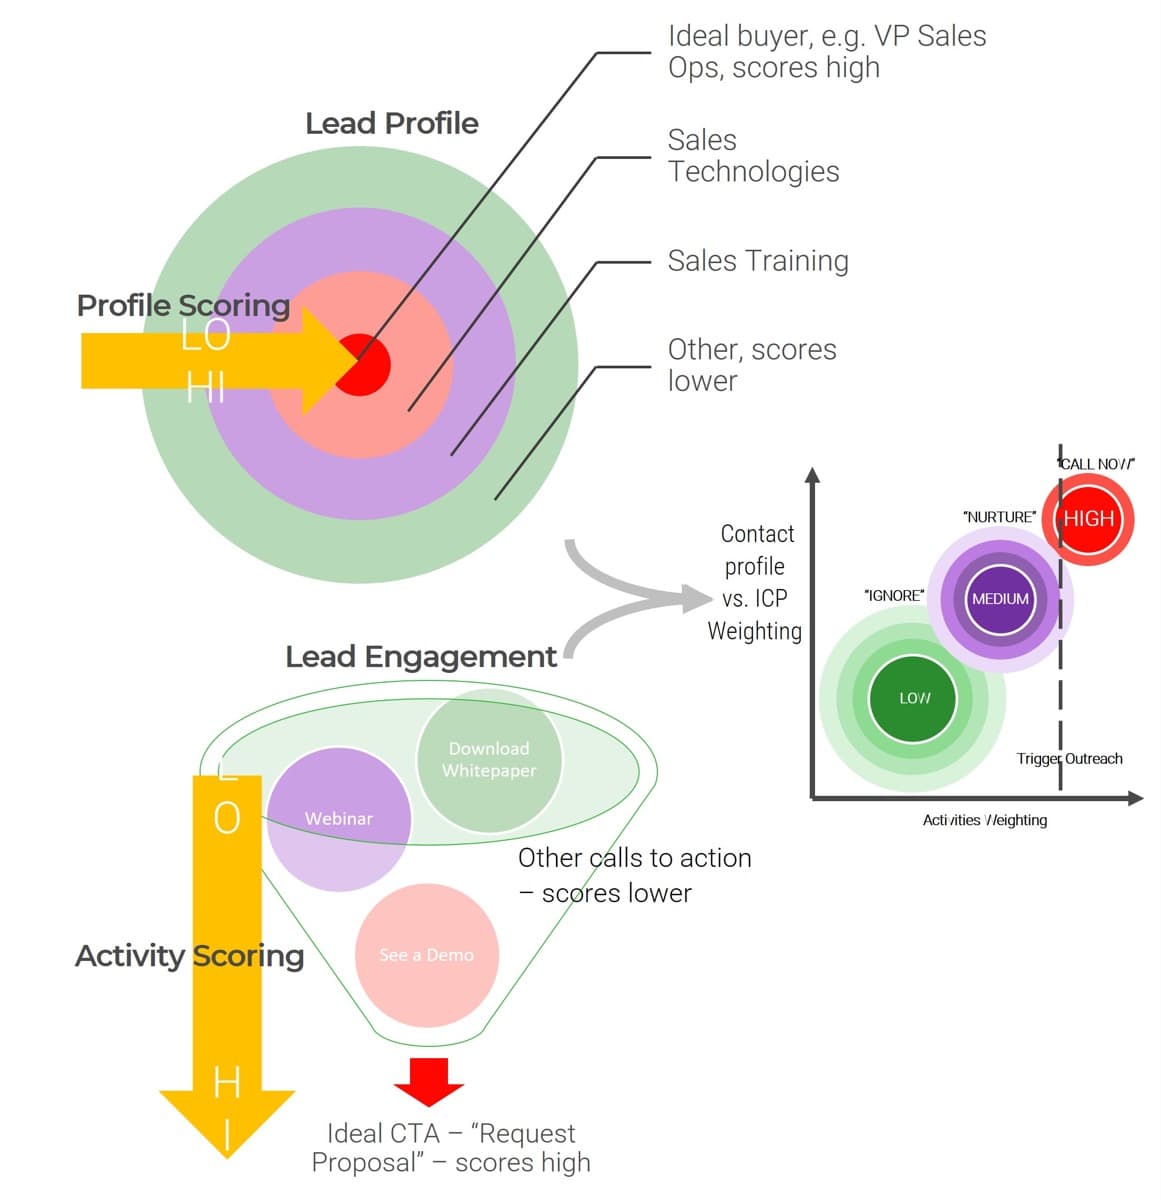
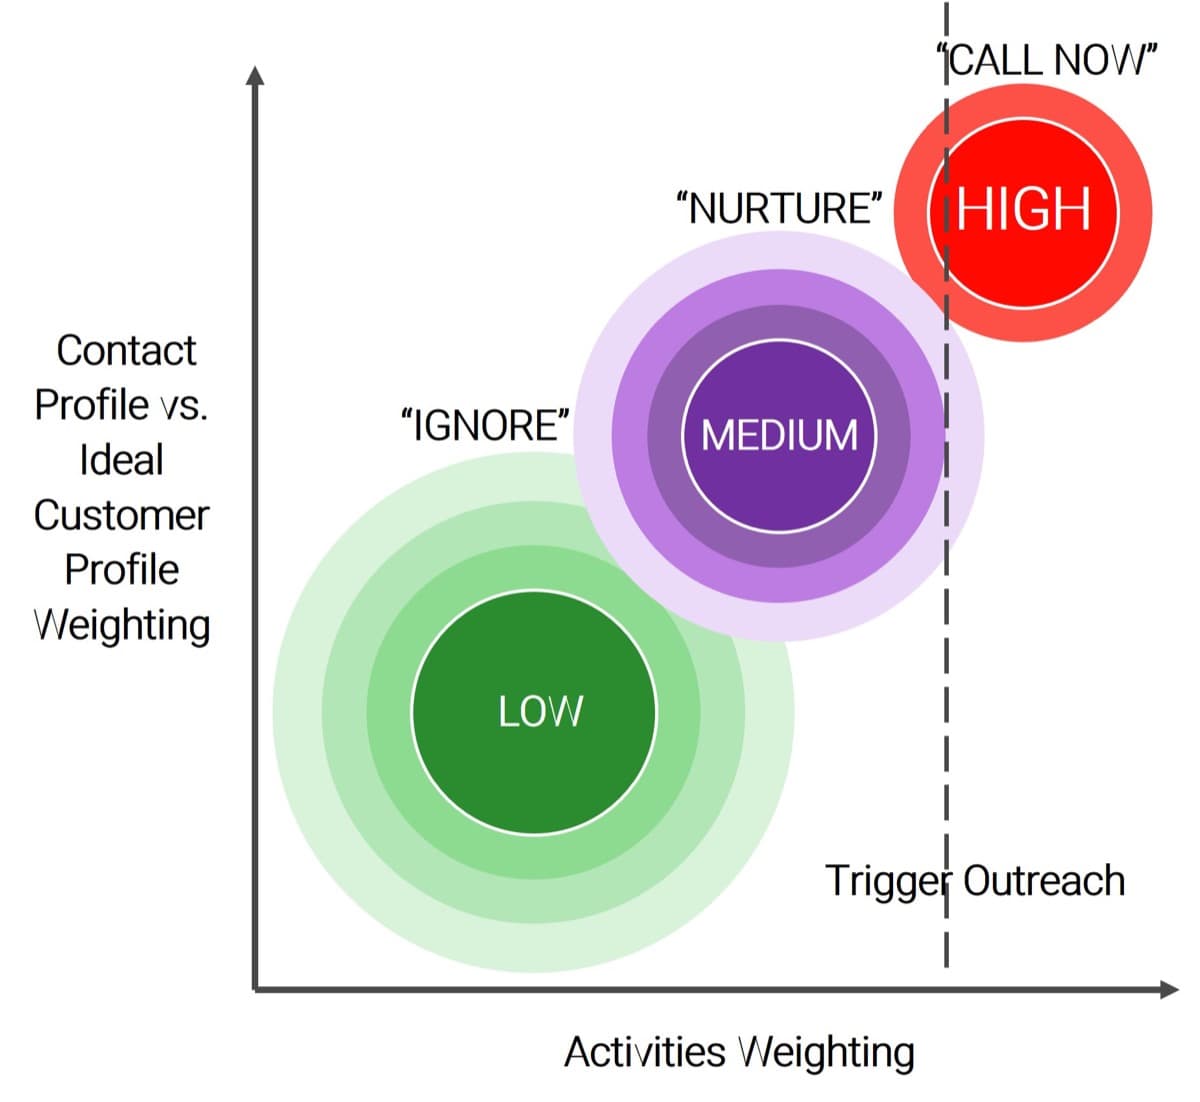
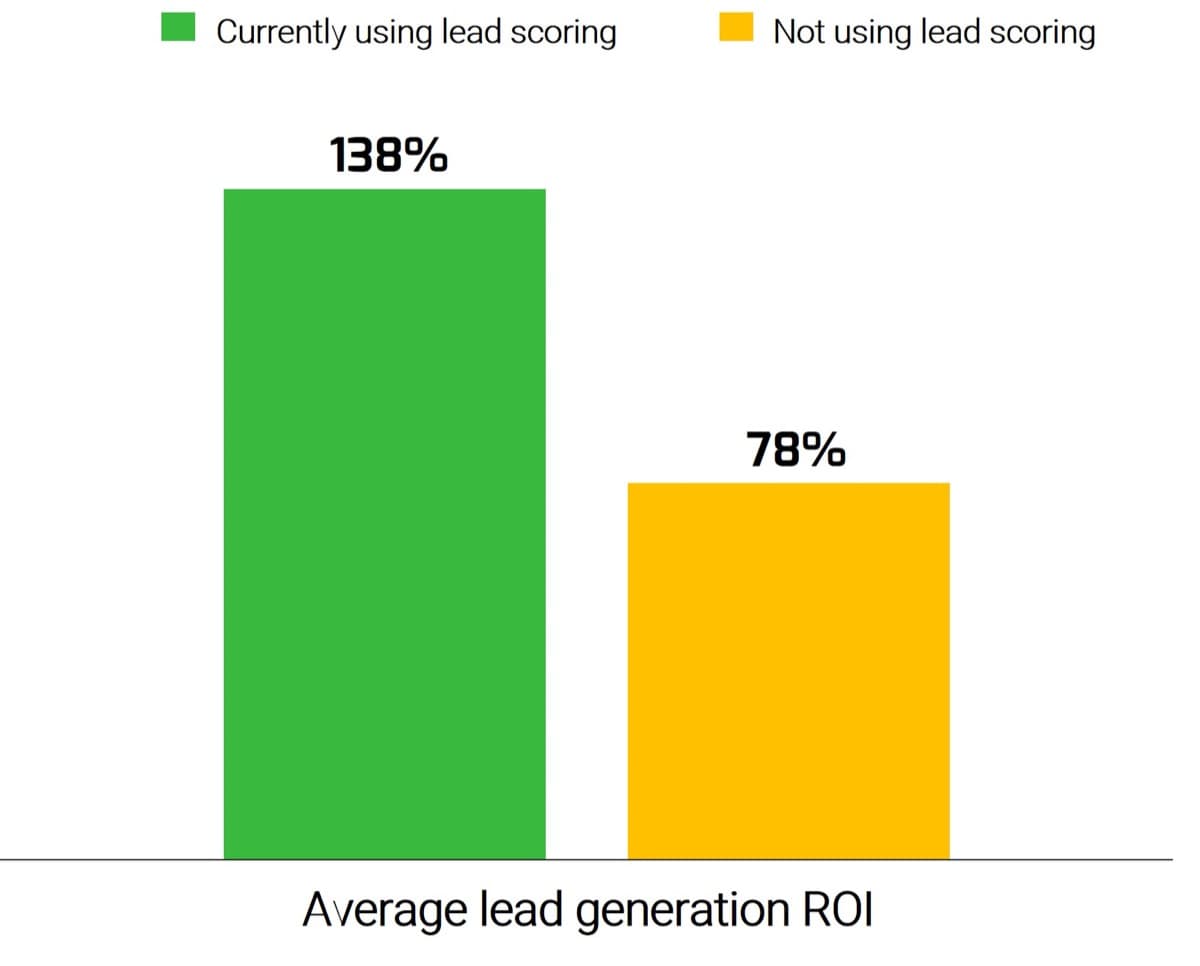
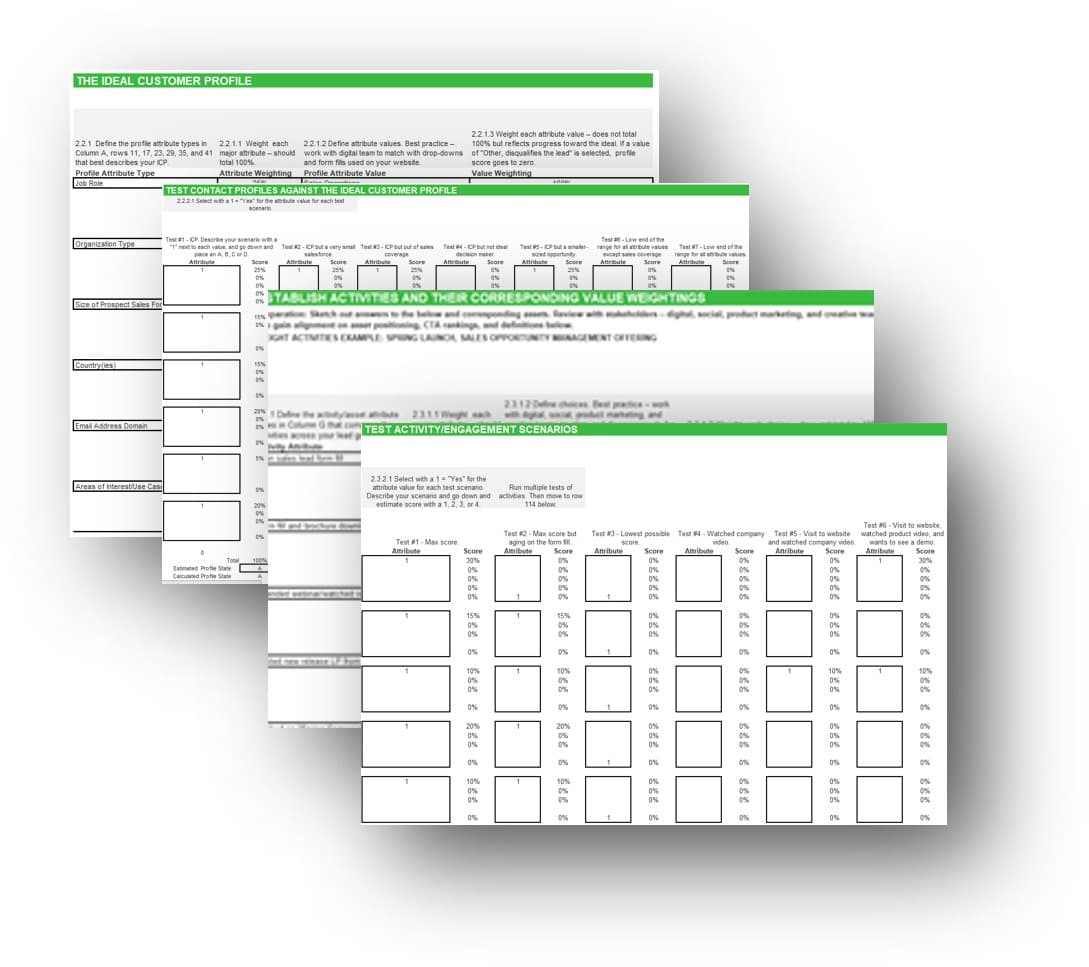
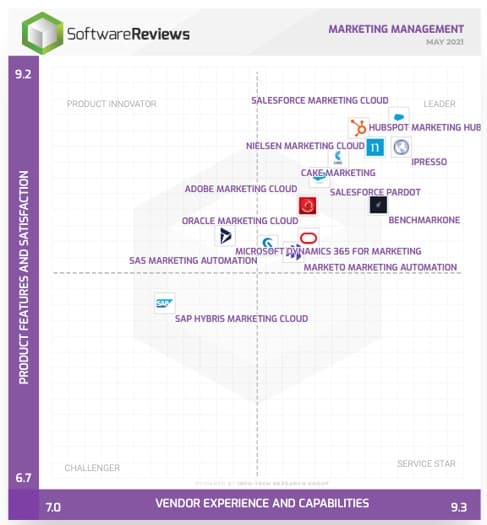
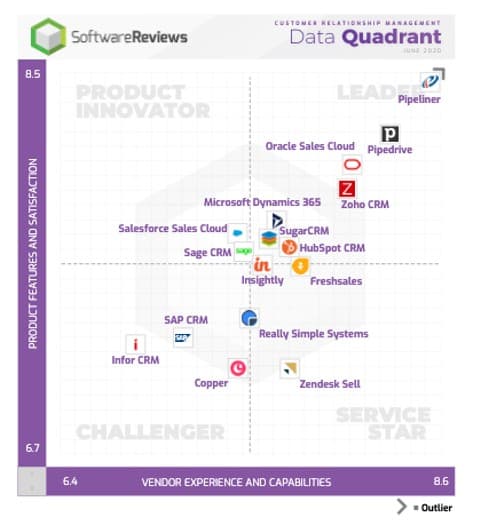
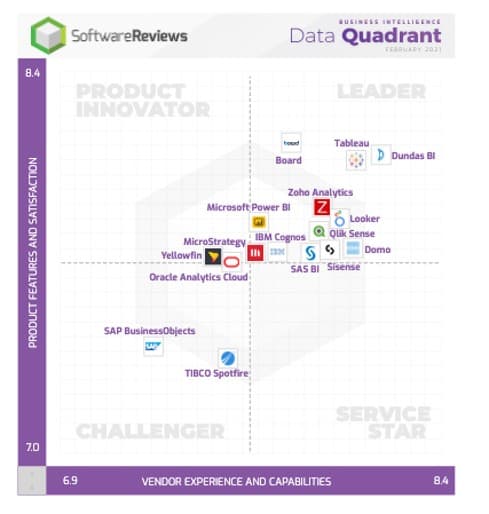
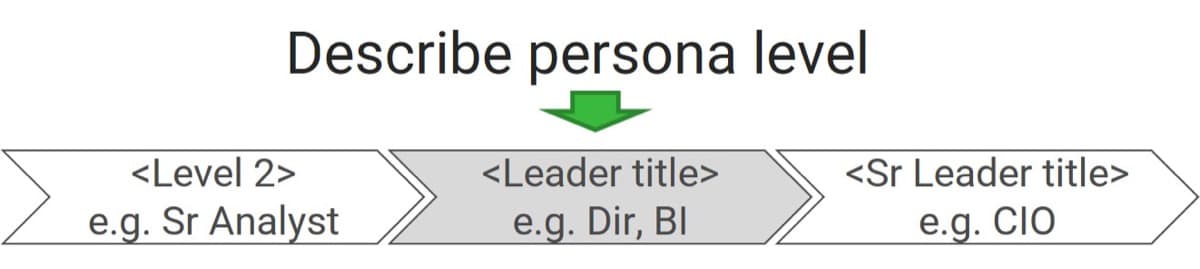
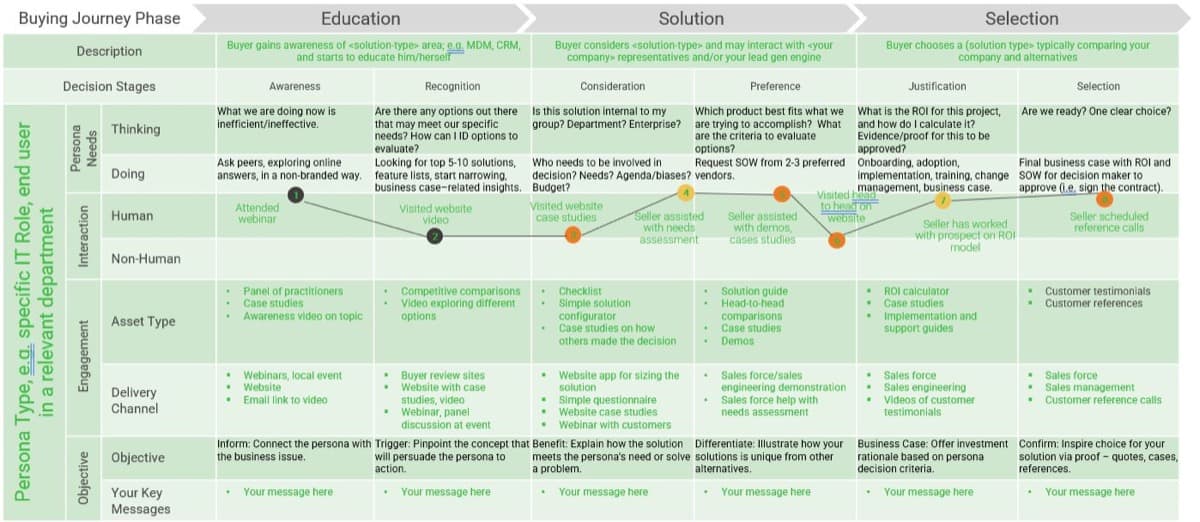
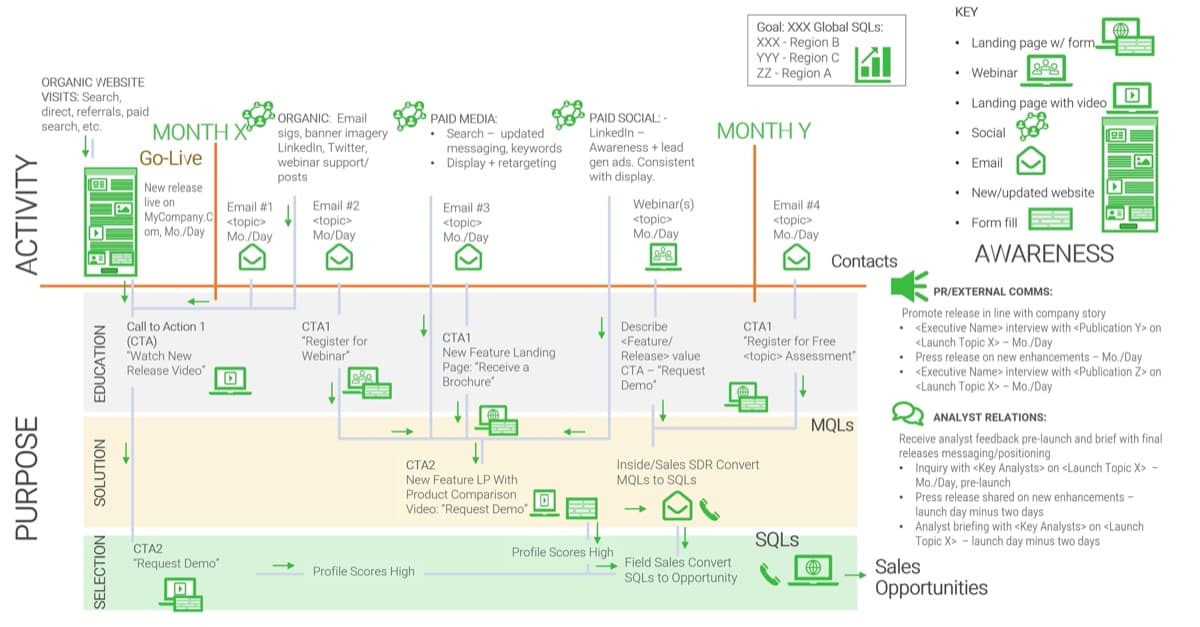
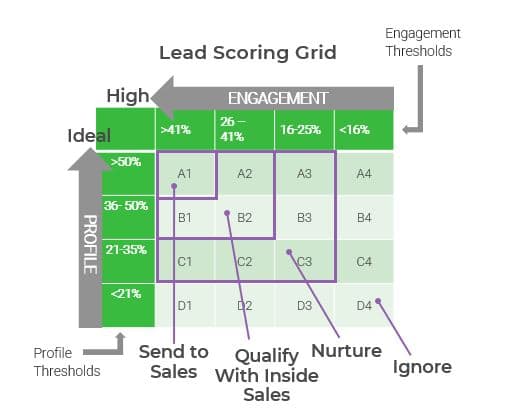
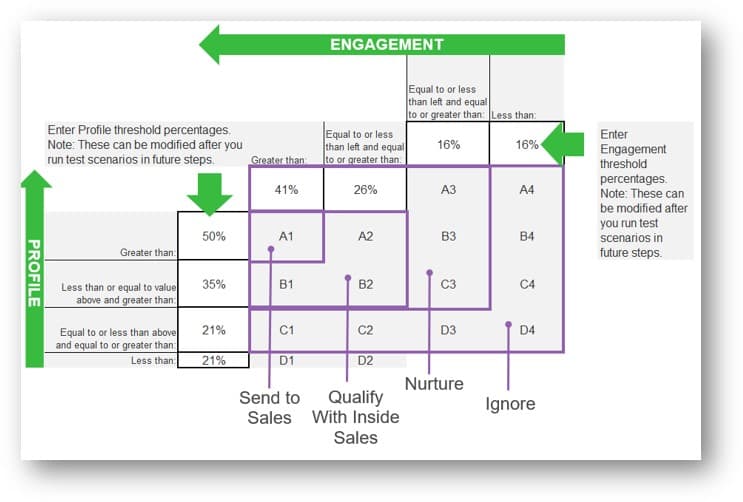
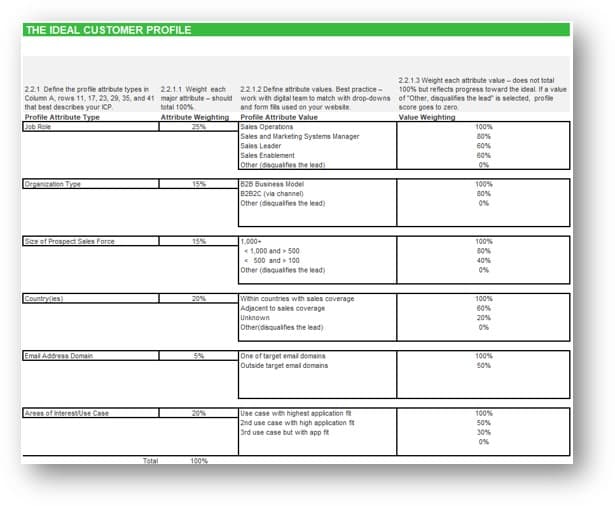
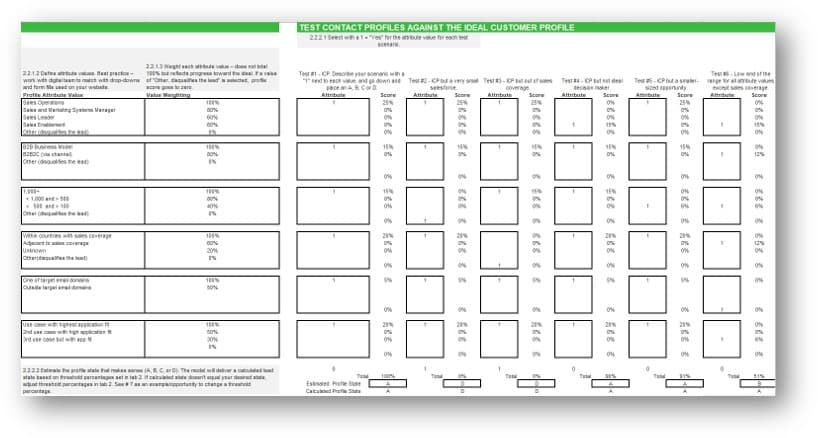
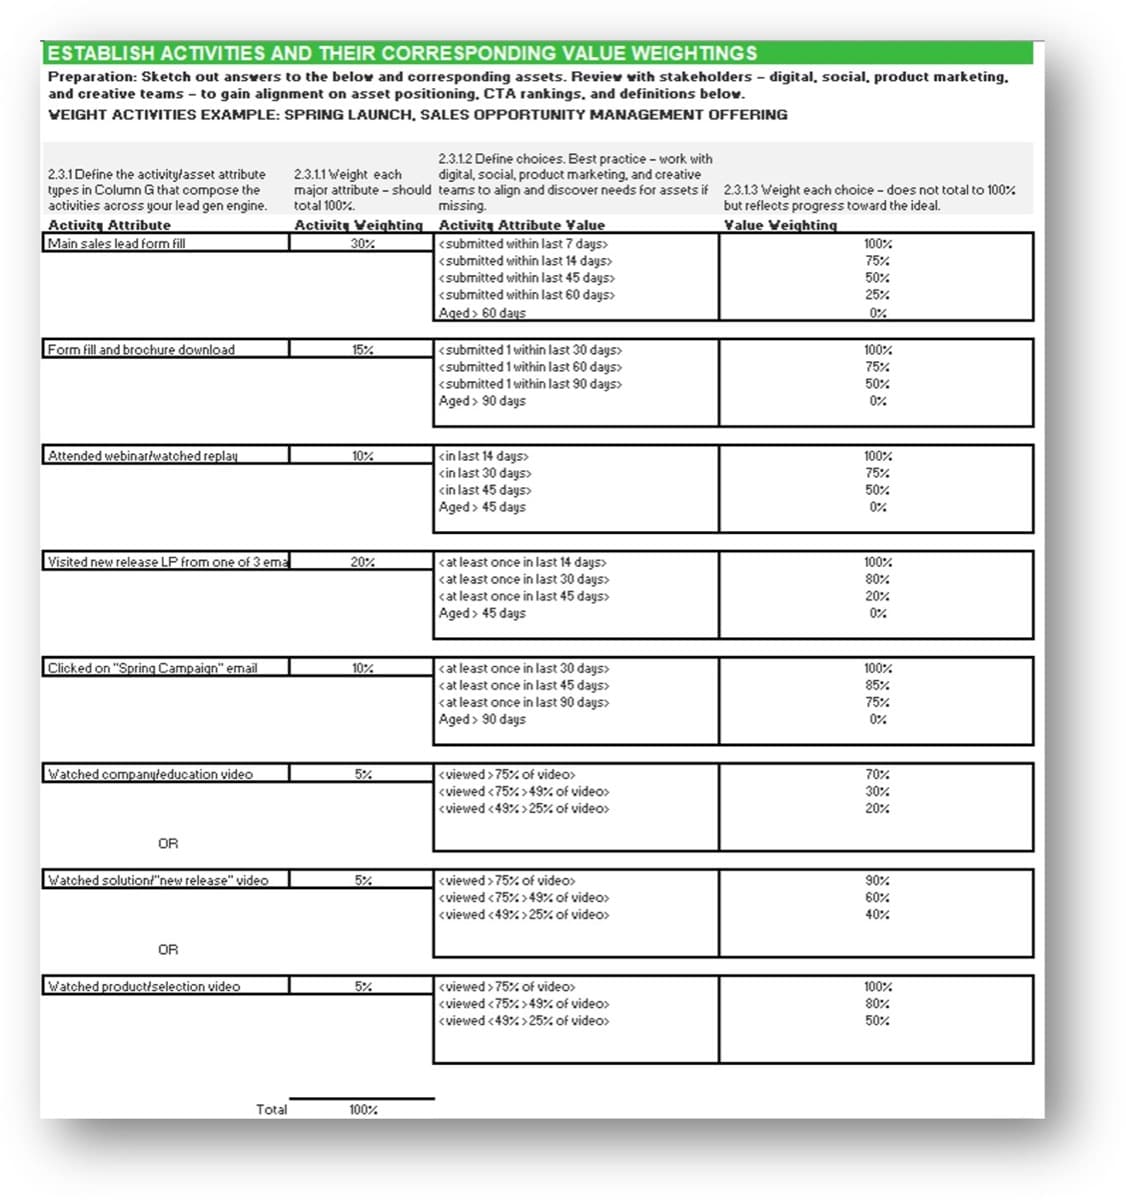
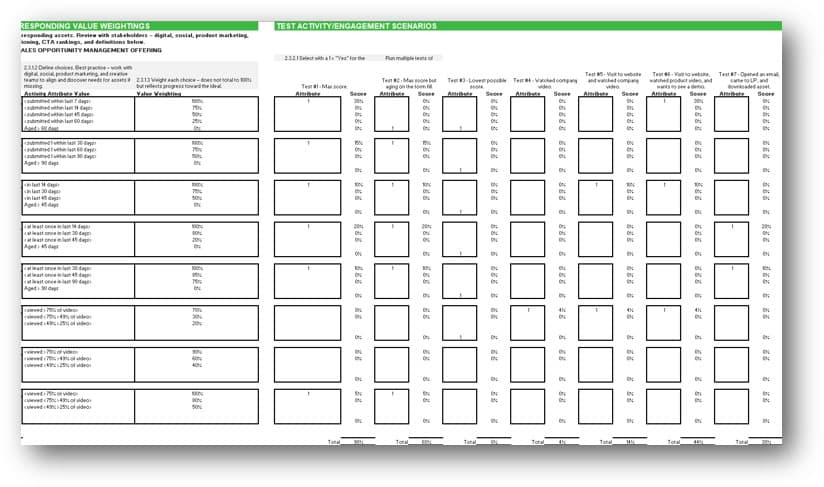
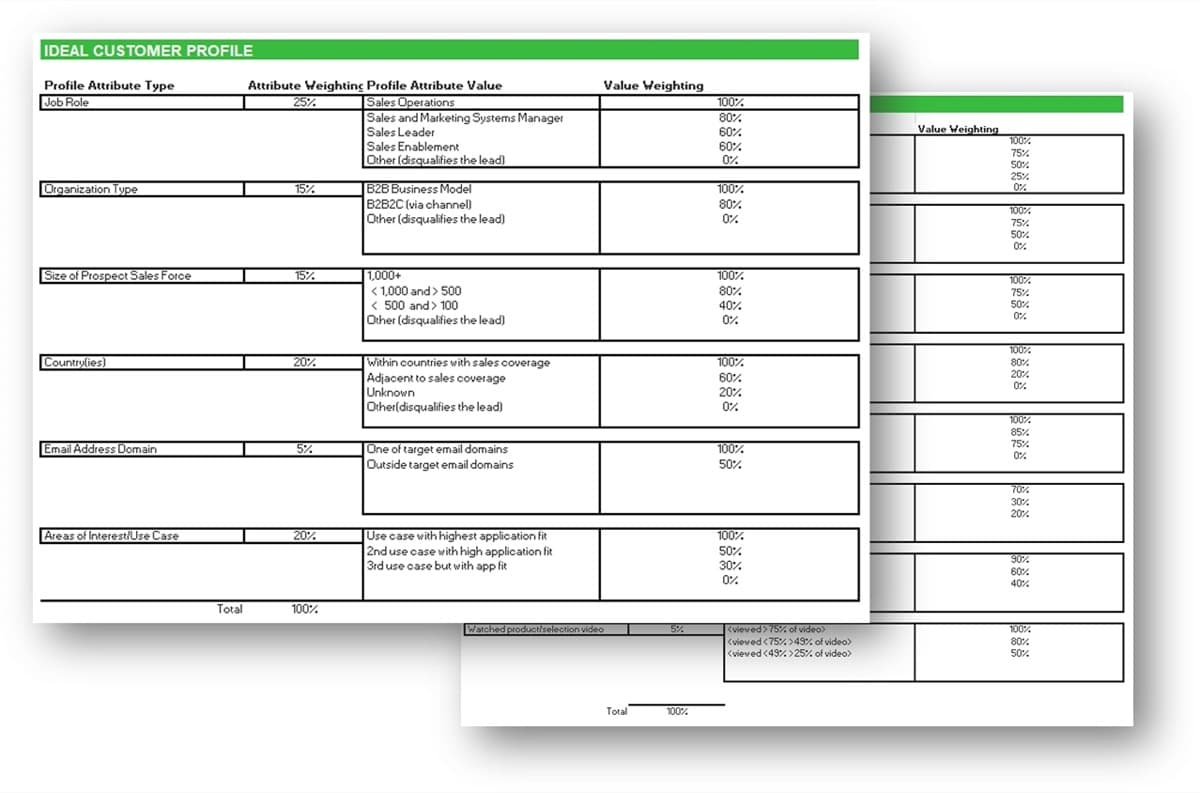
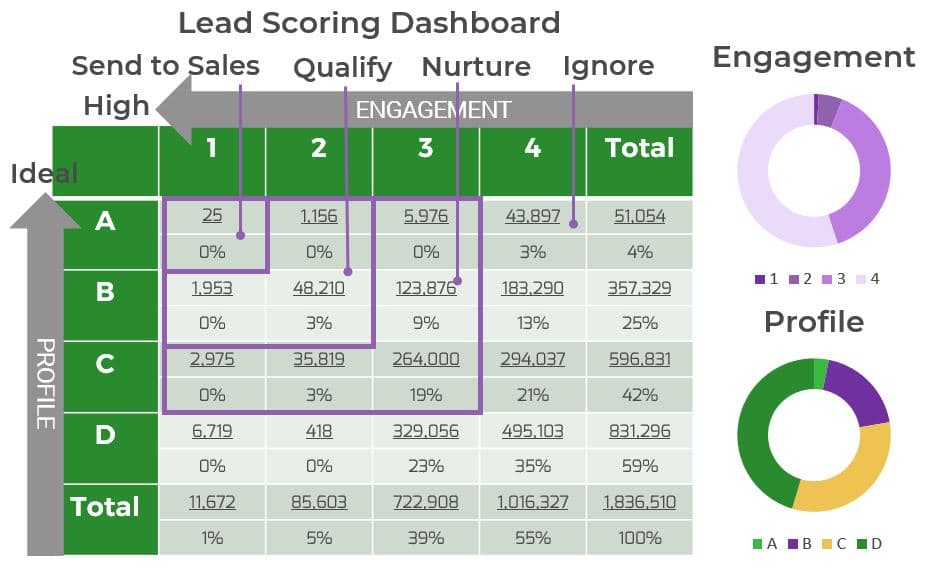
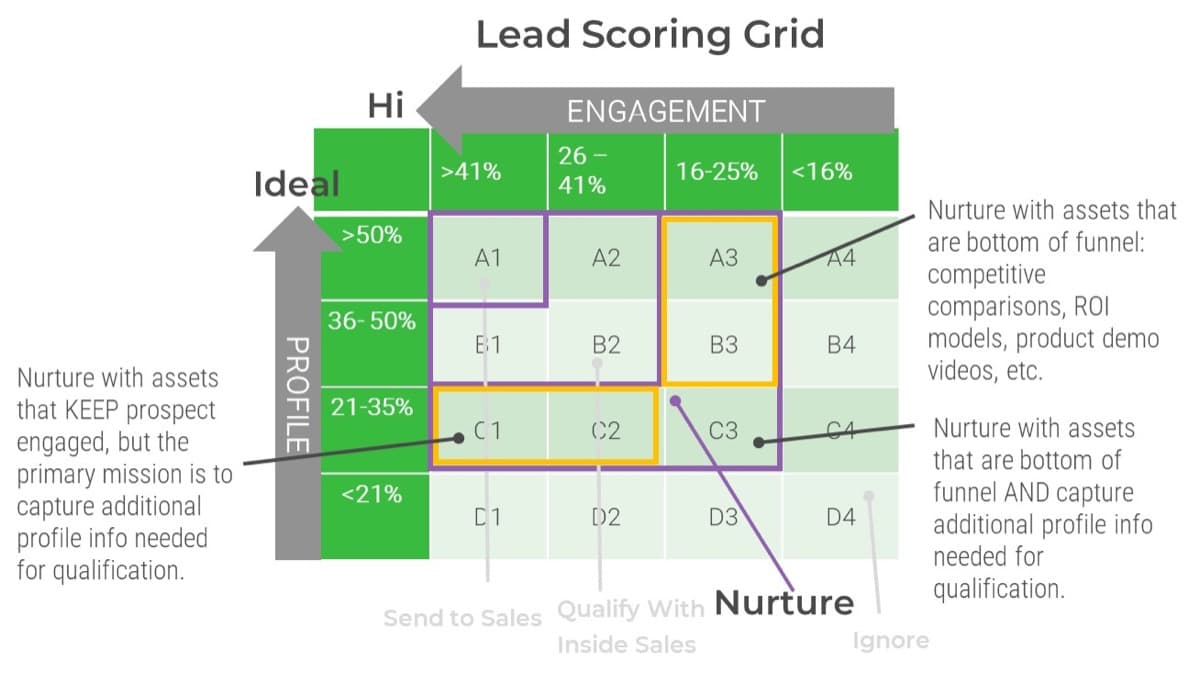
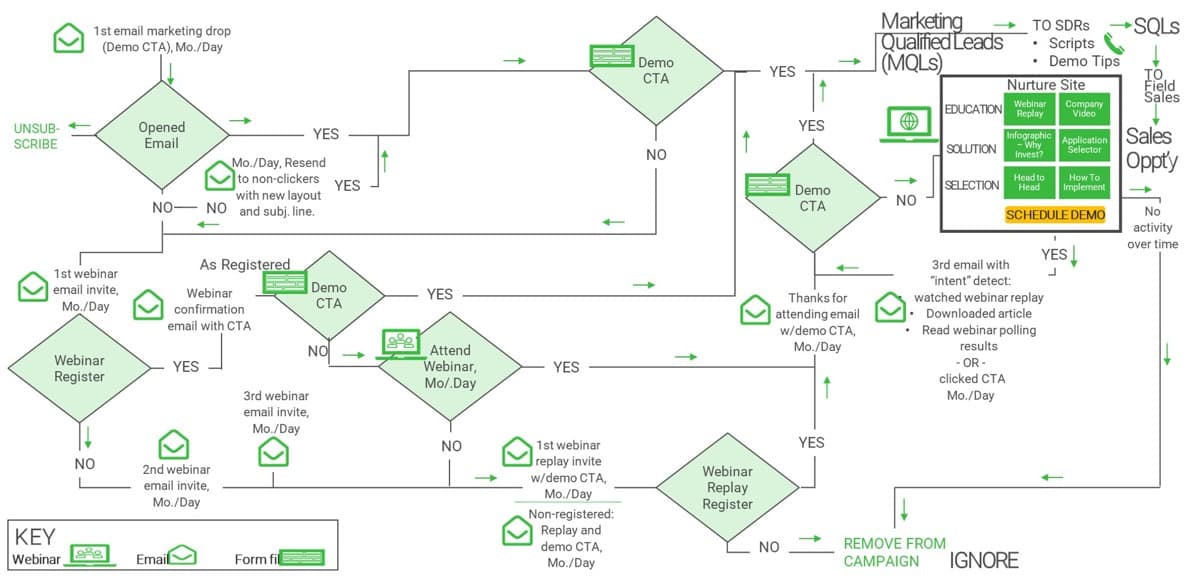


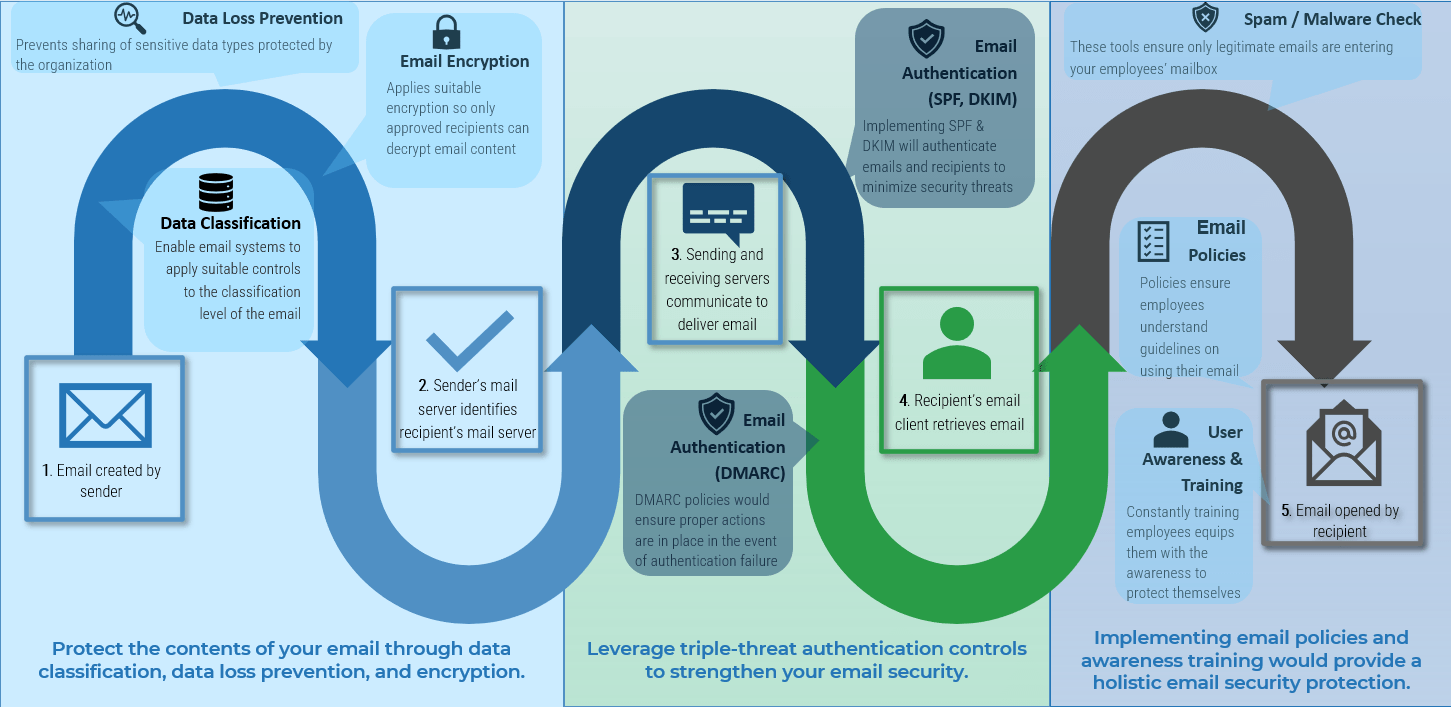
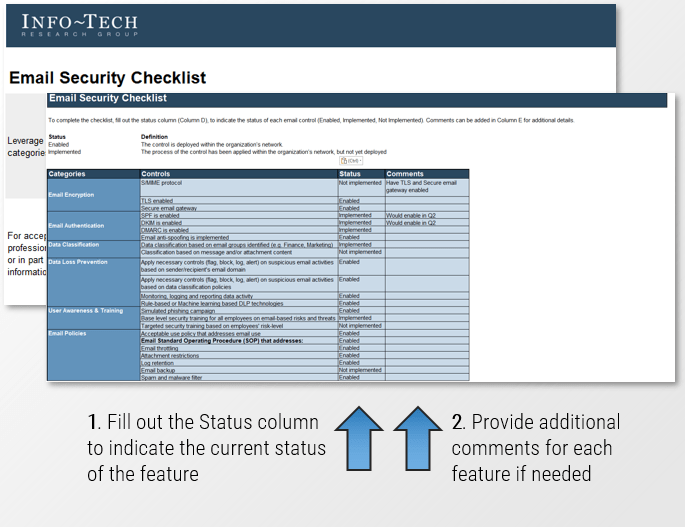

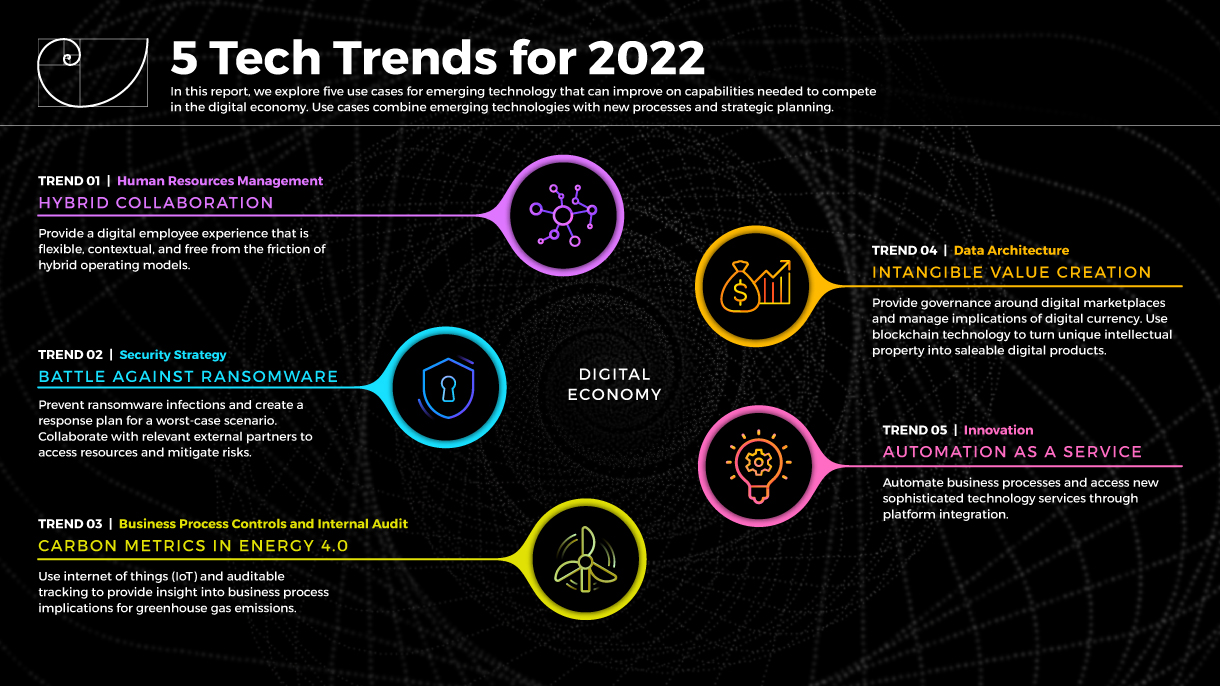
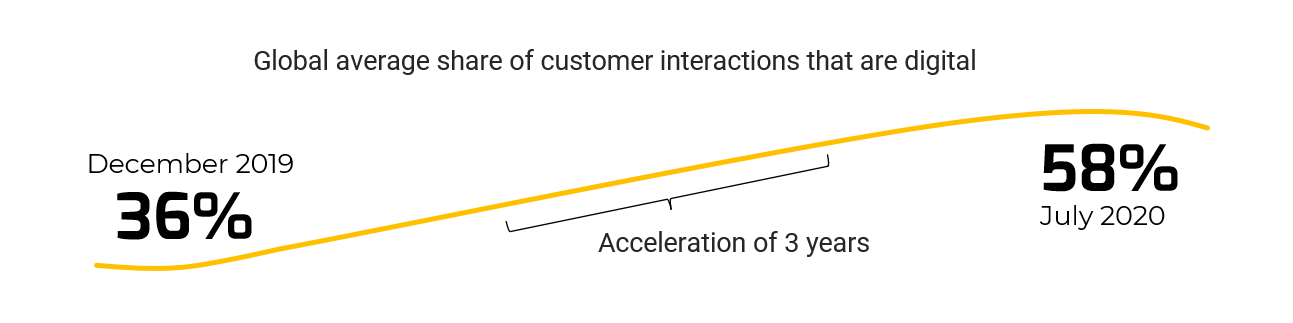
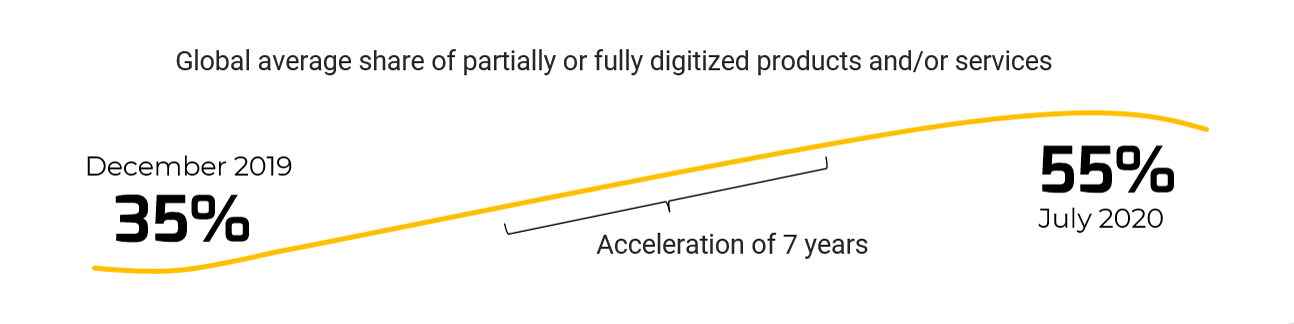 (McKinsey, 2020)
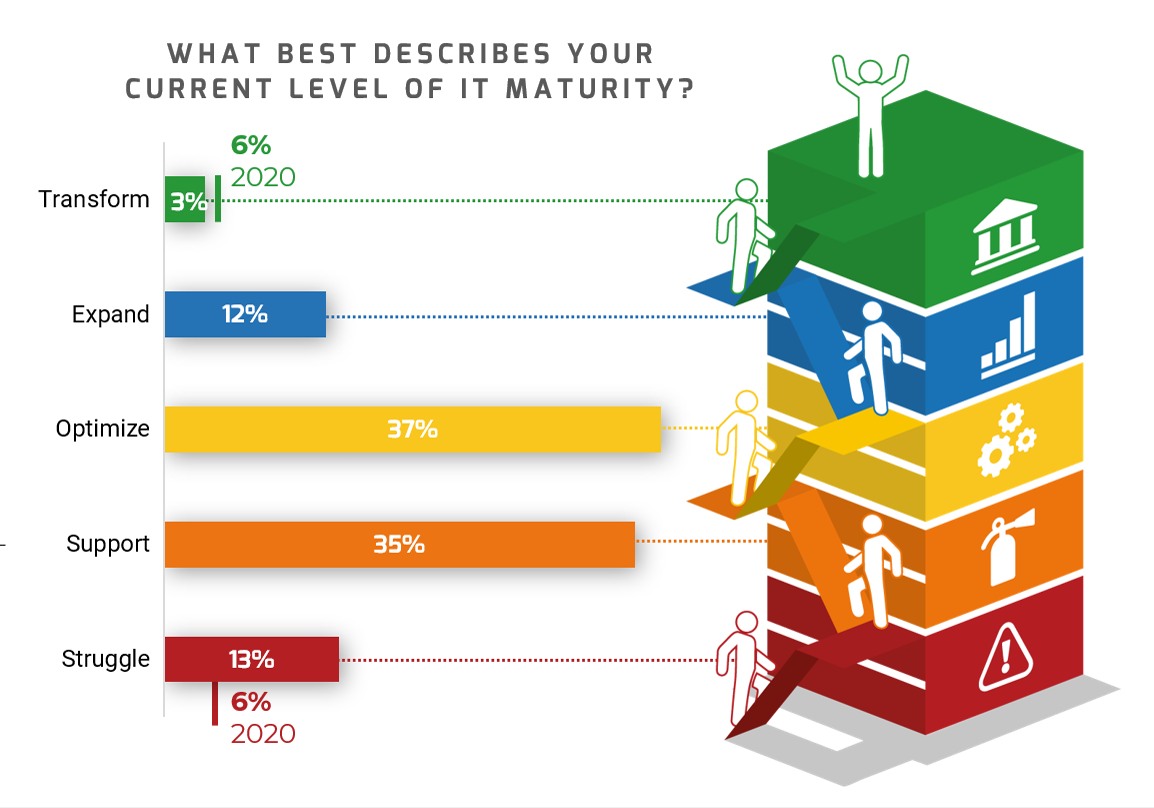
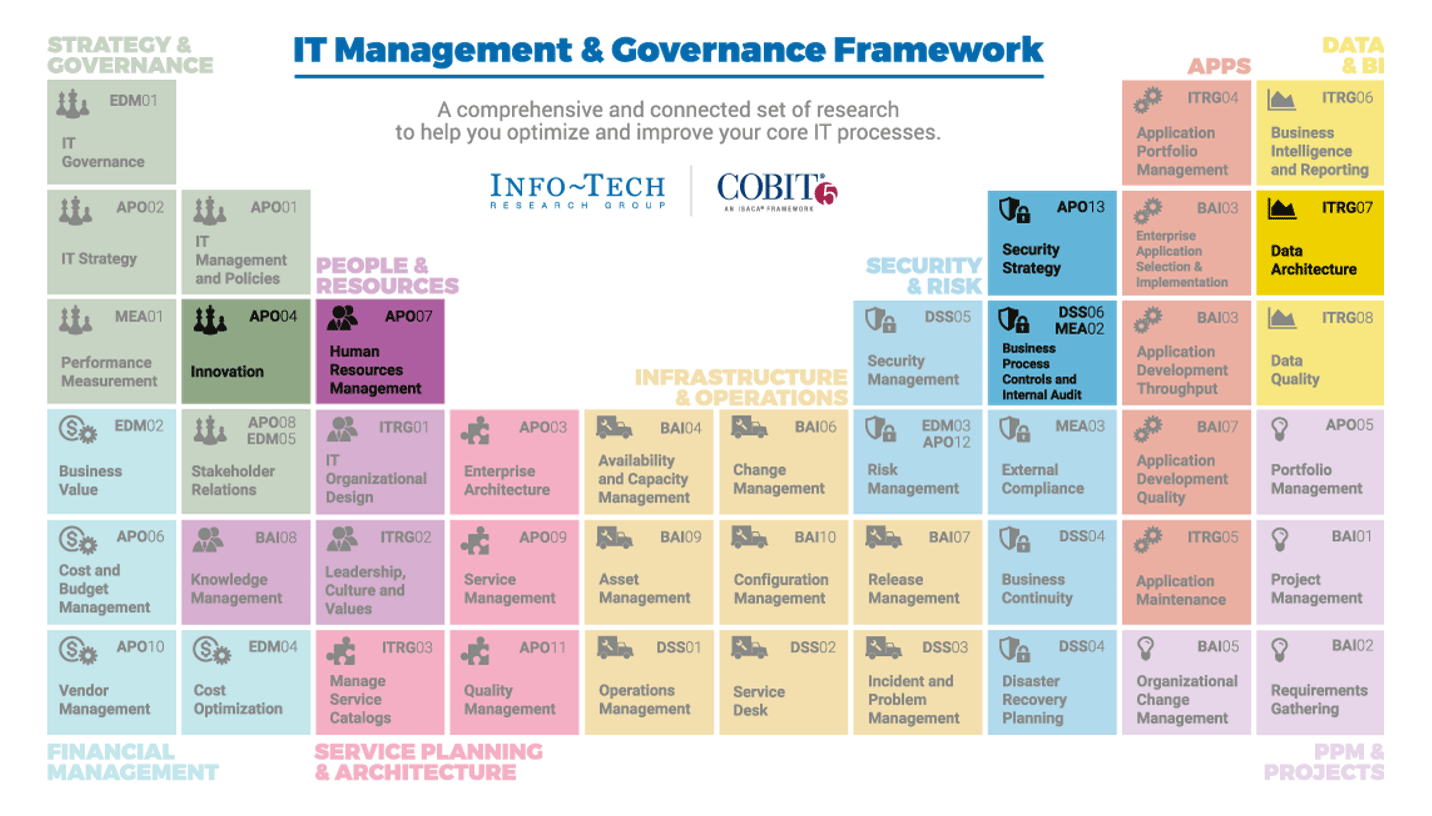


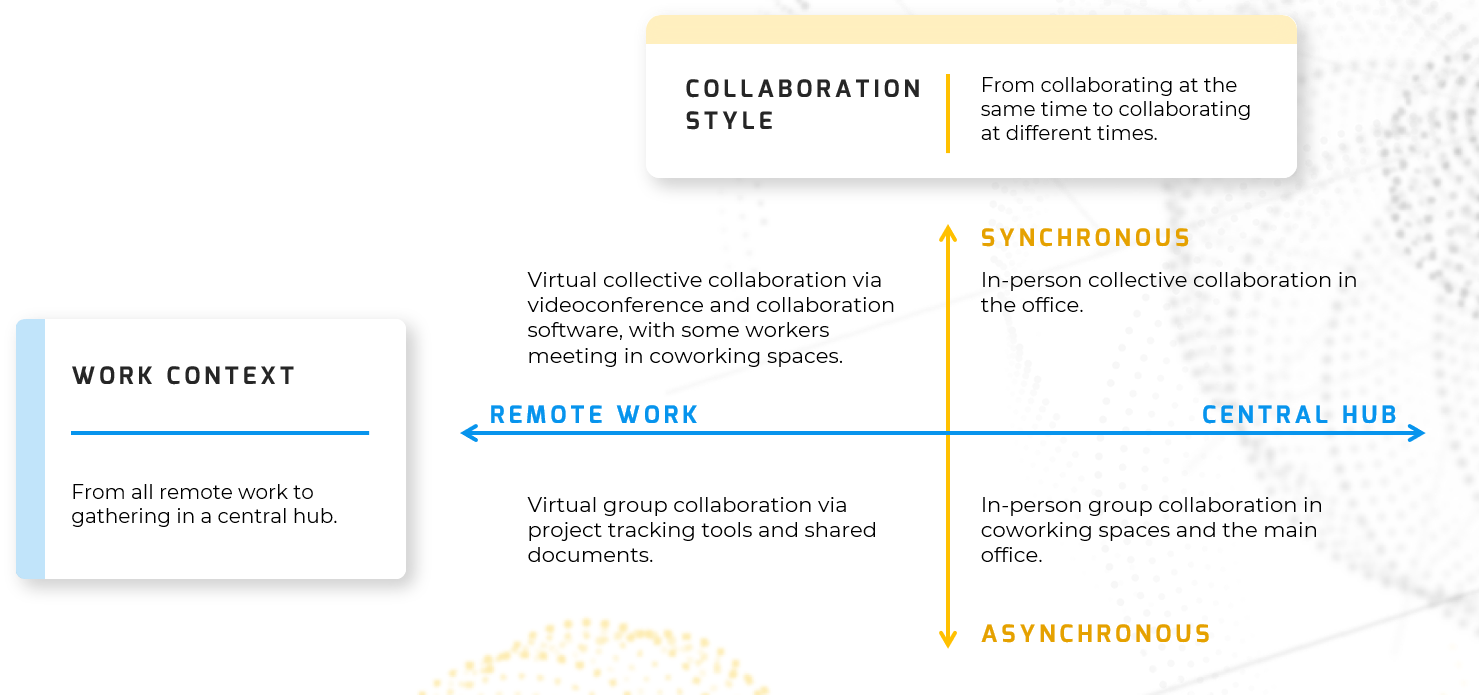

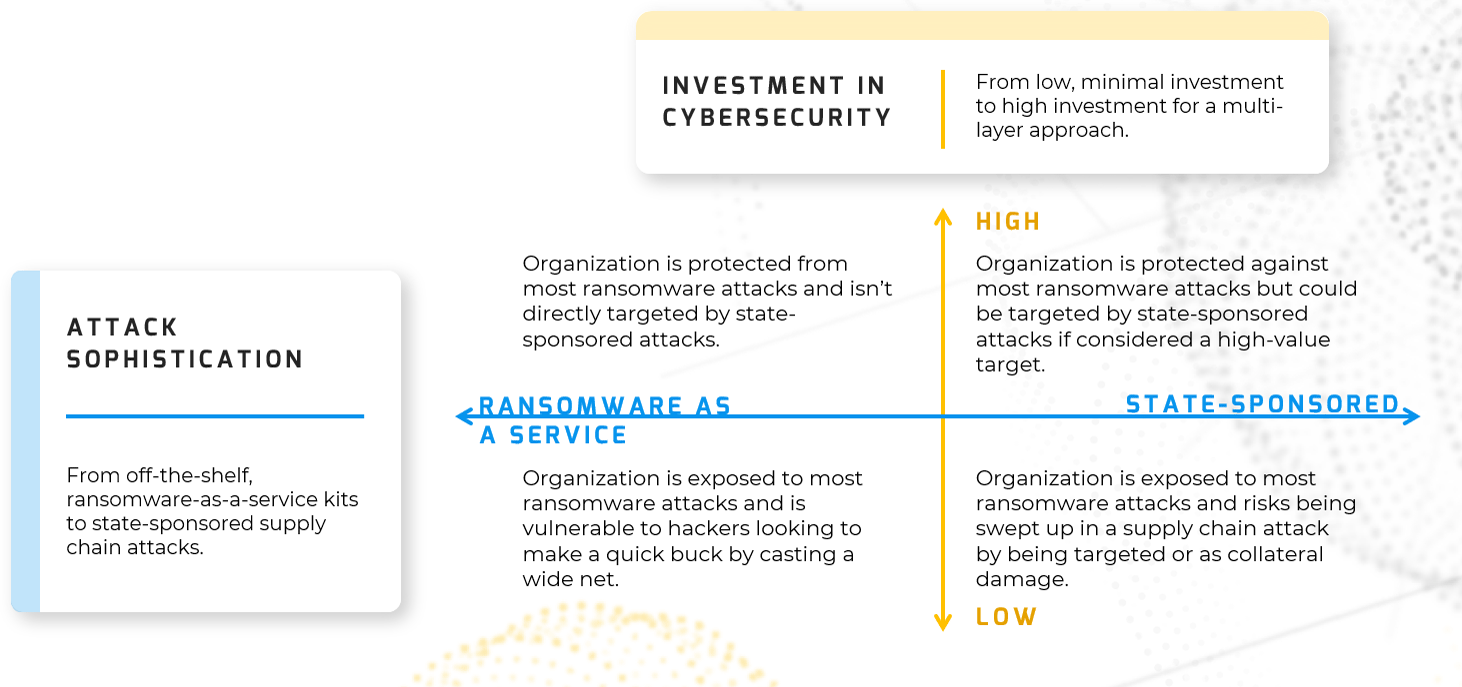

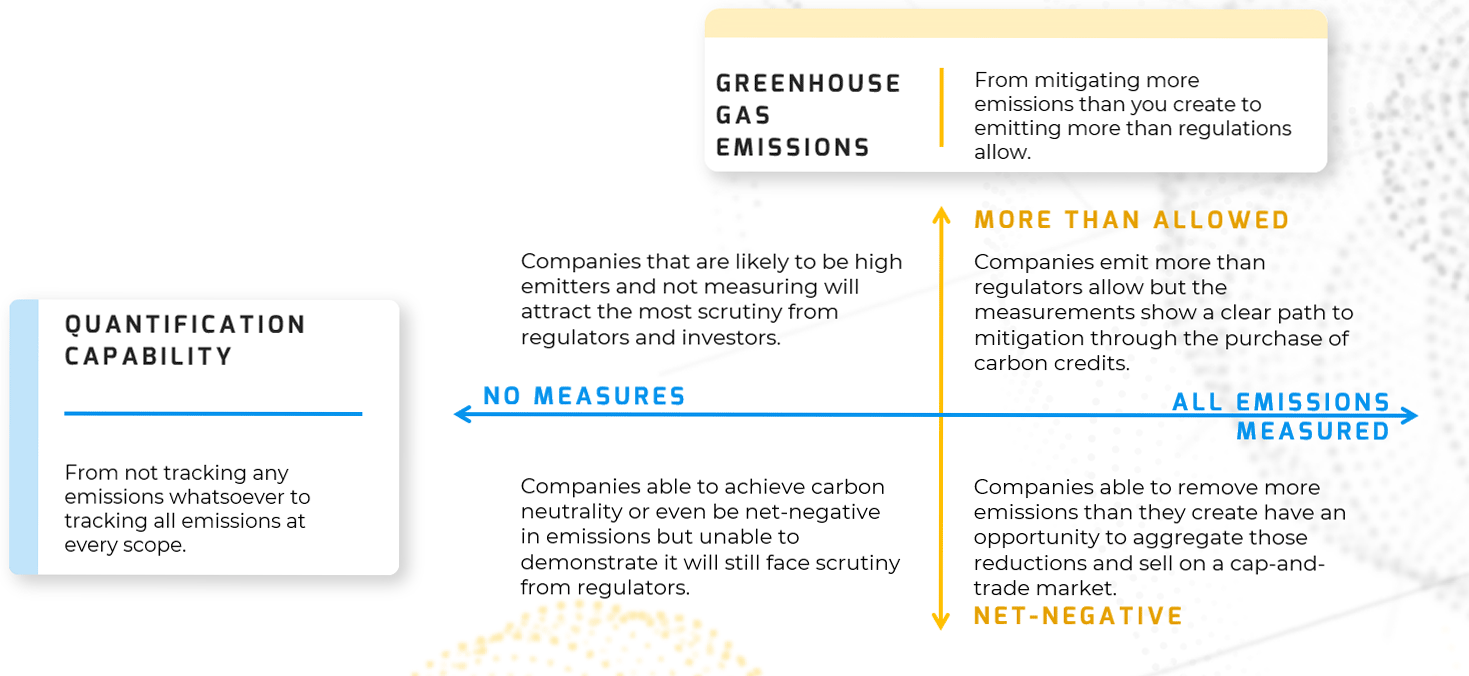

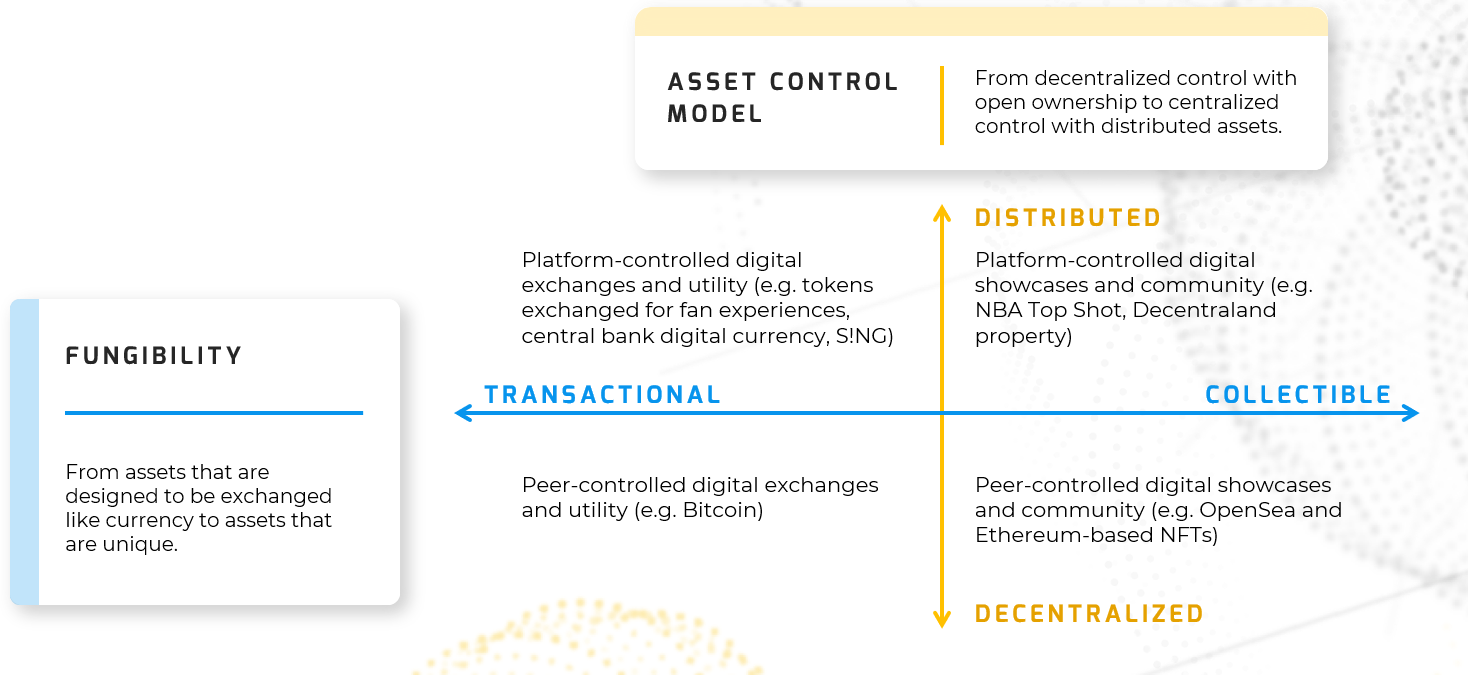
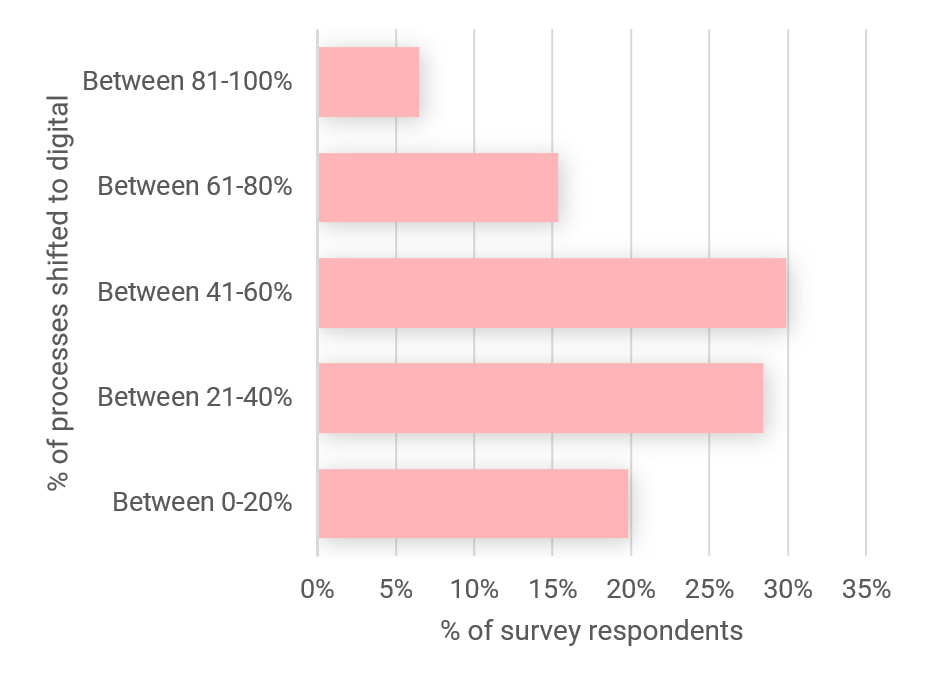

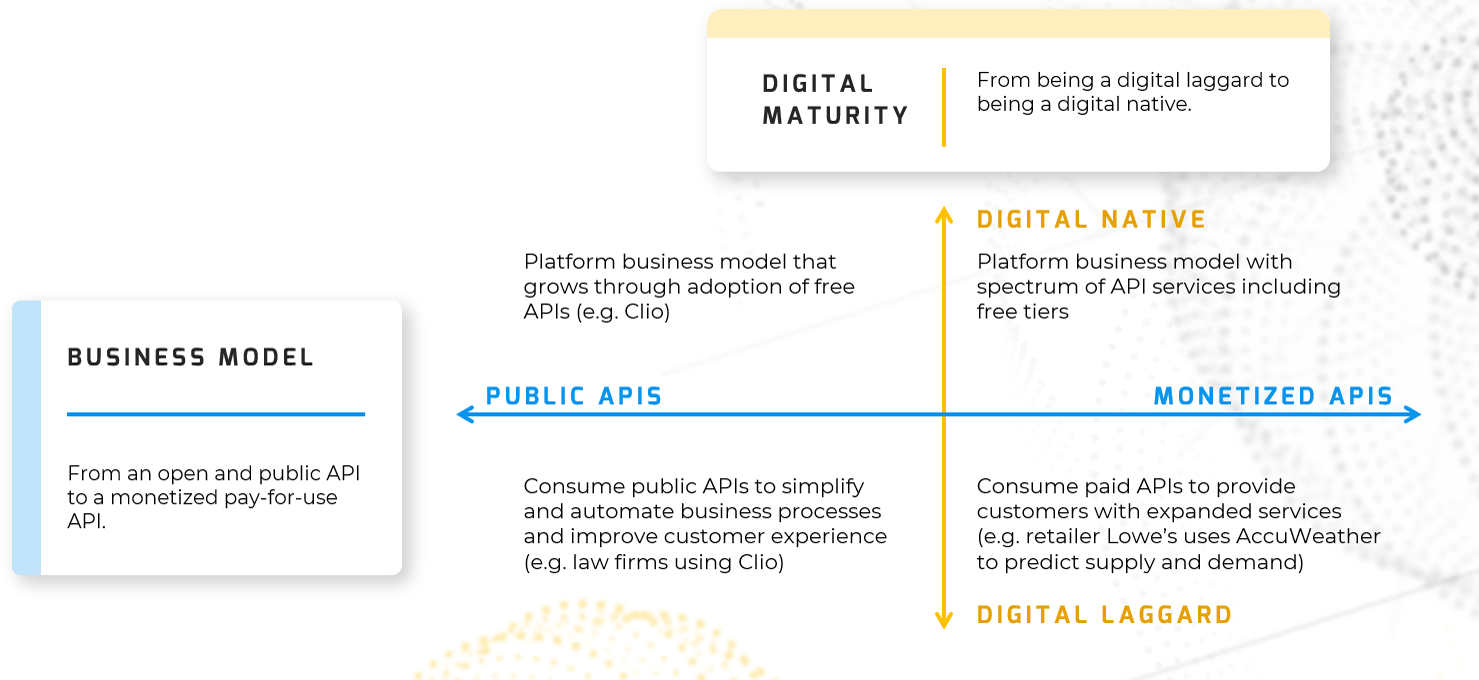


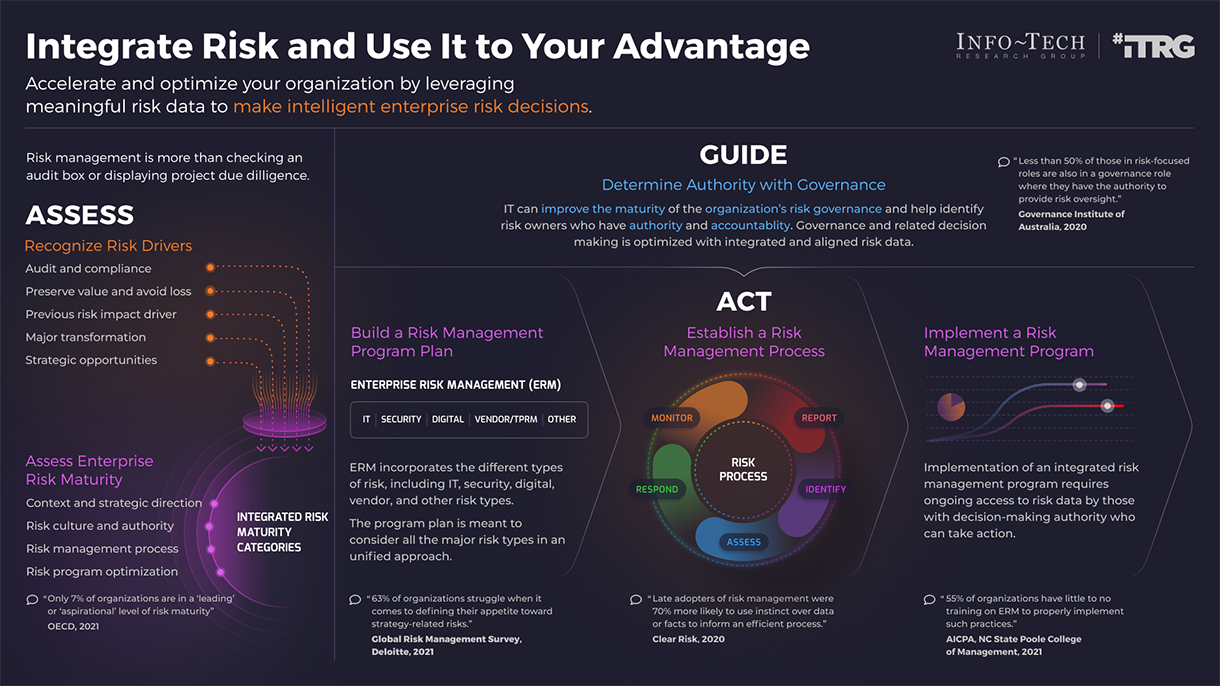


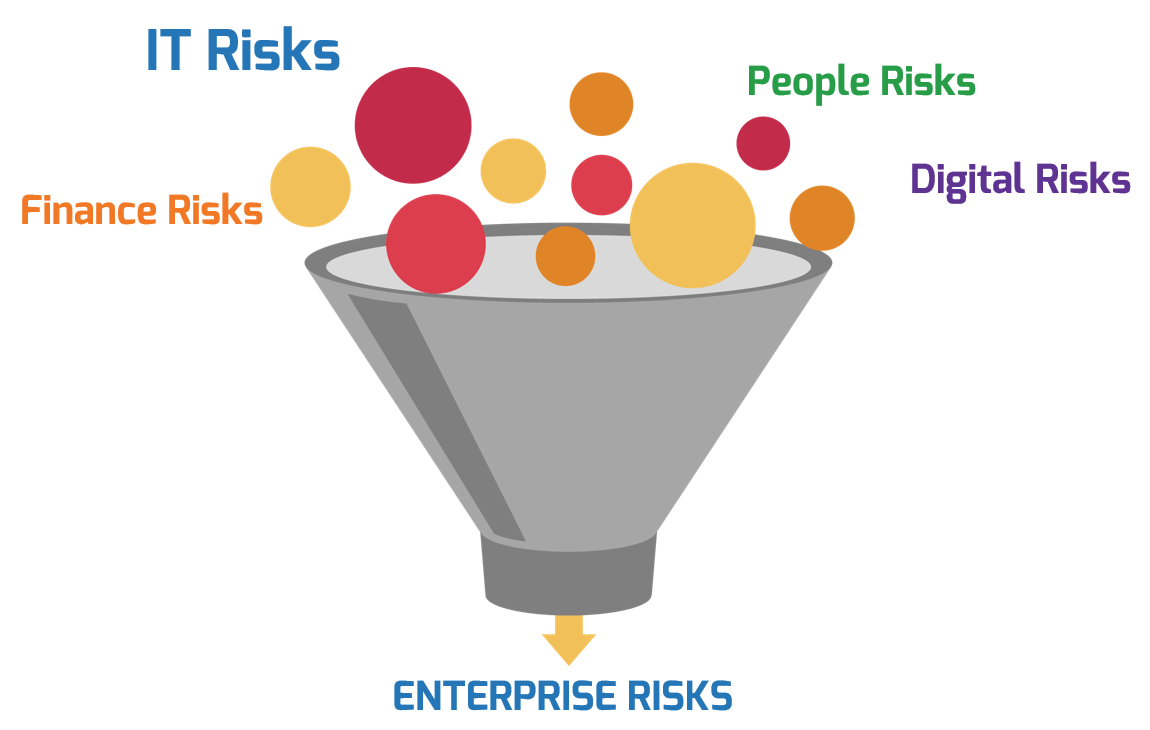
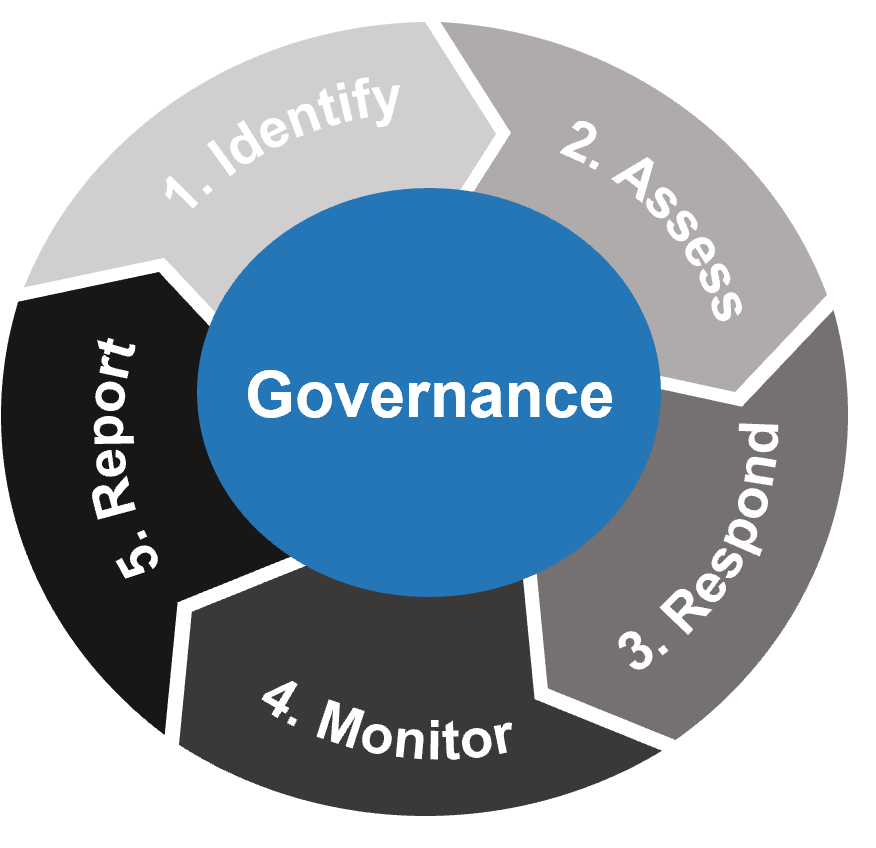

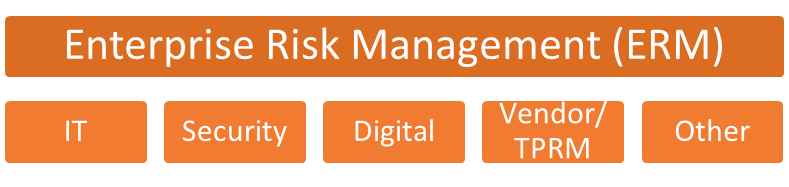

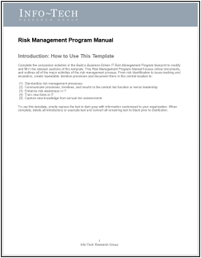
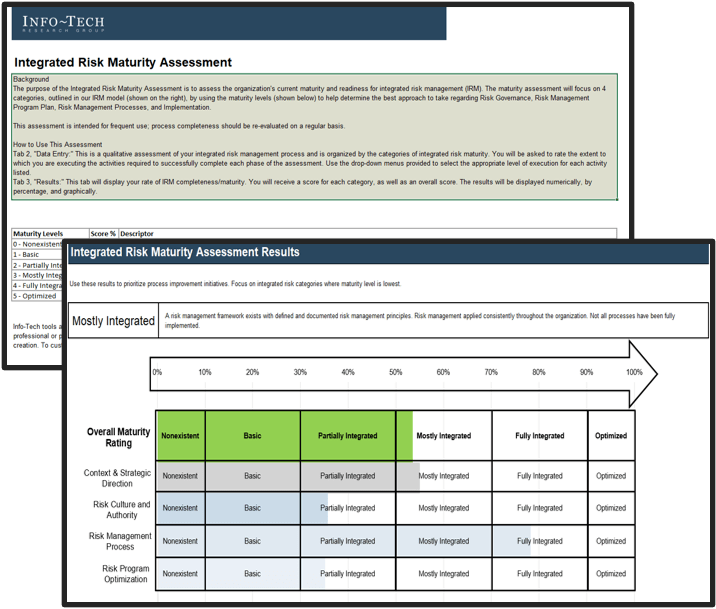
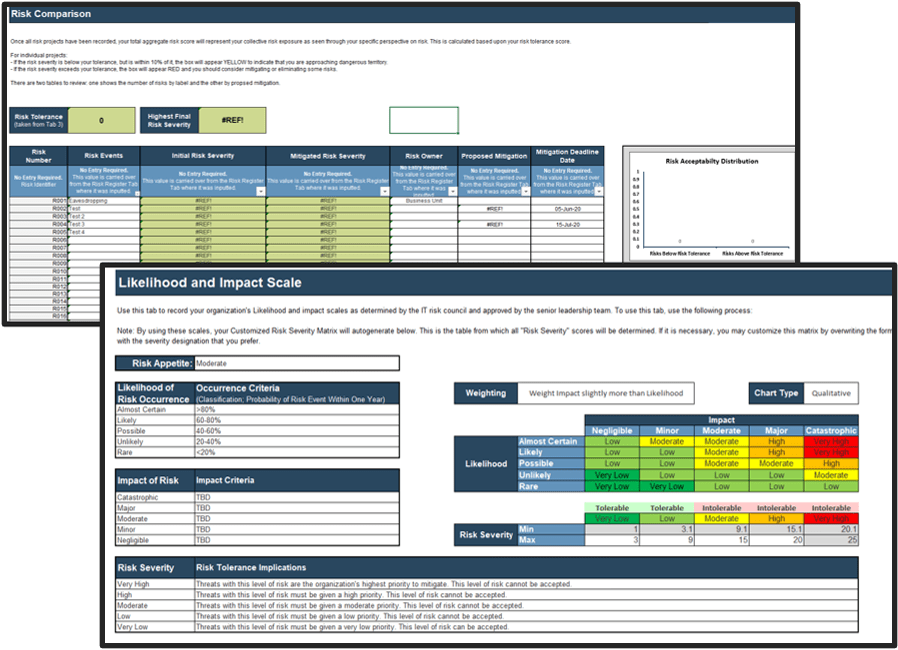
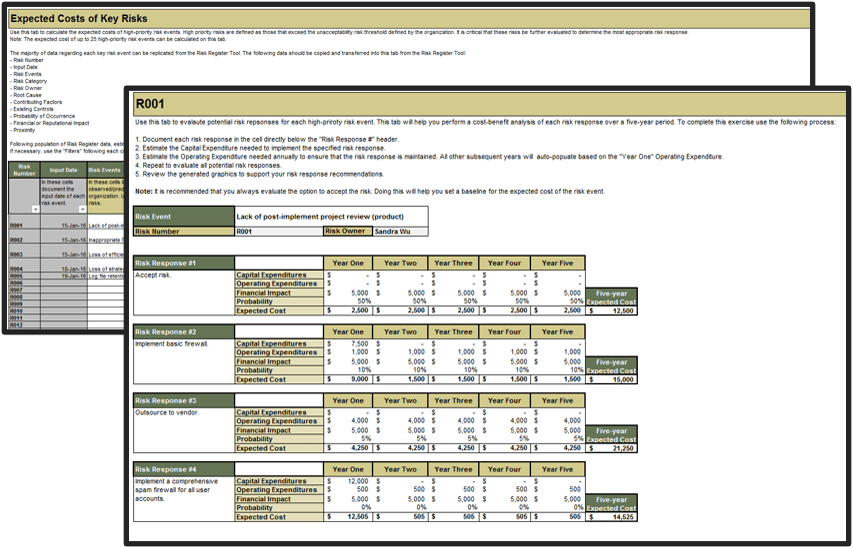
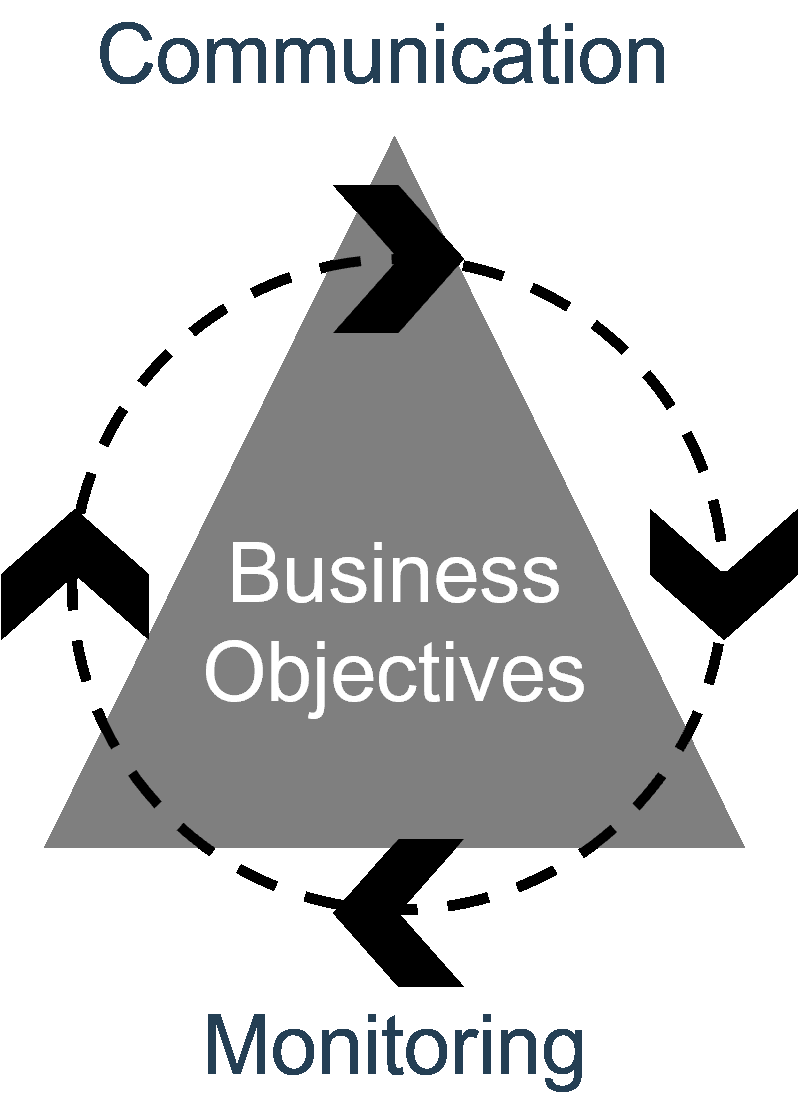
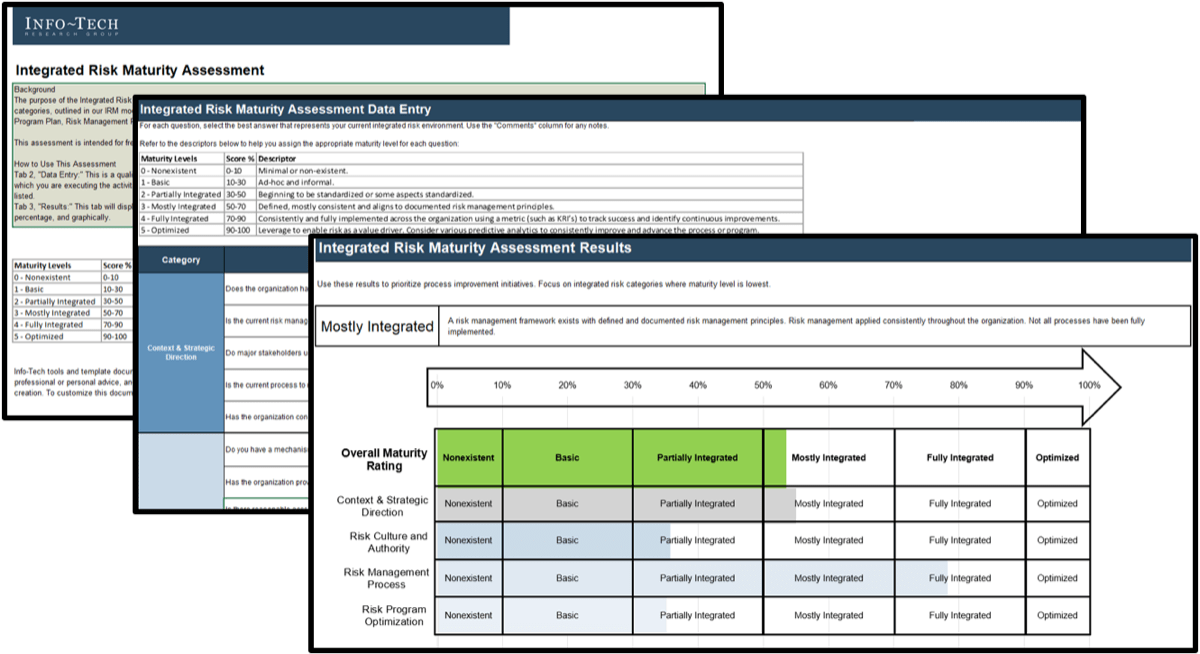

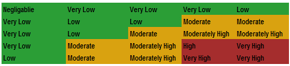
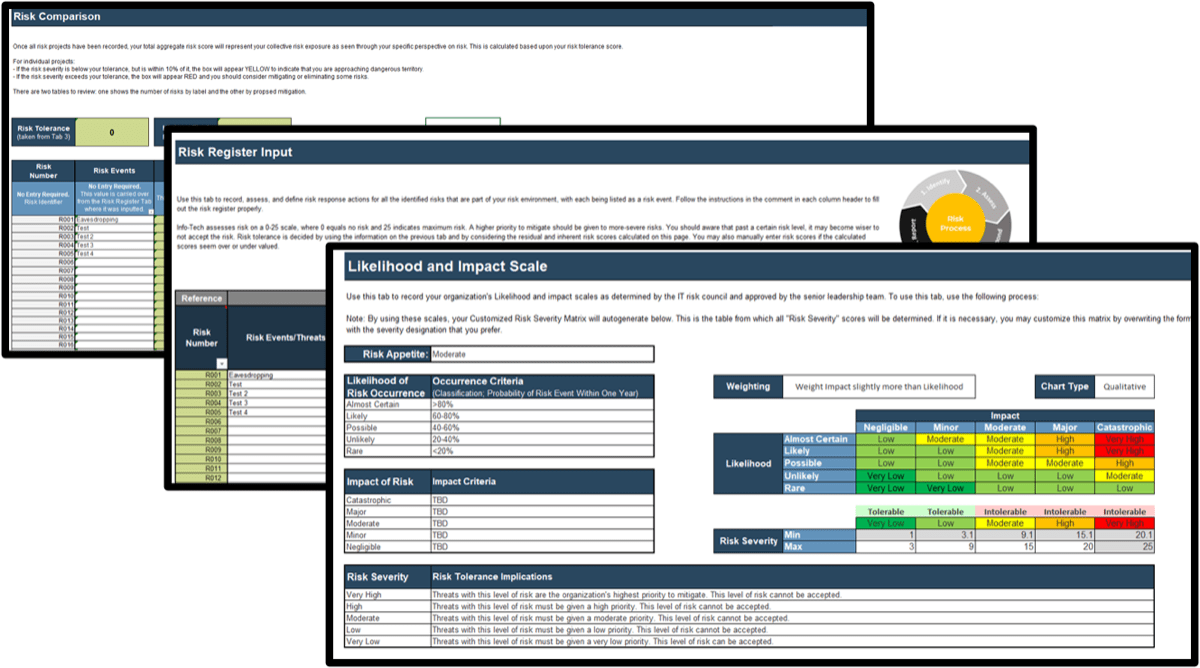
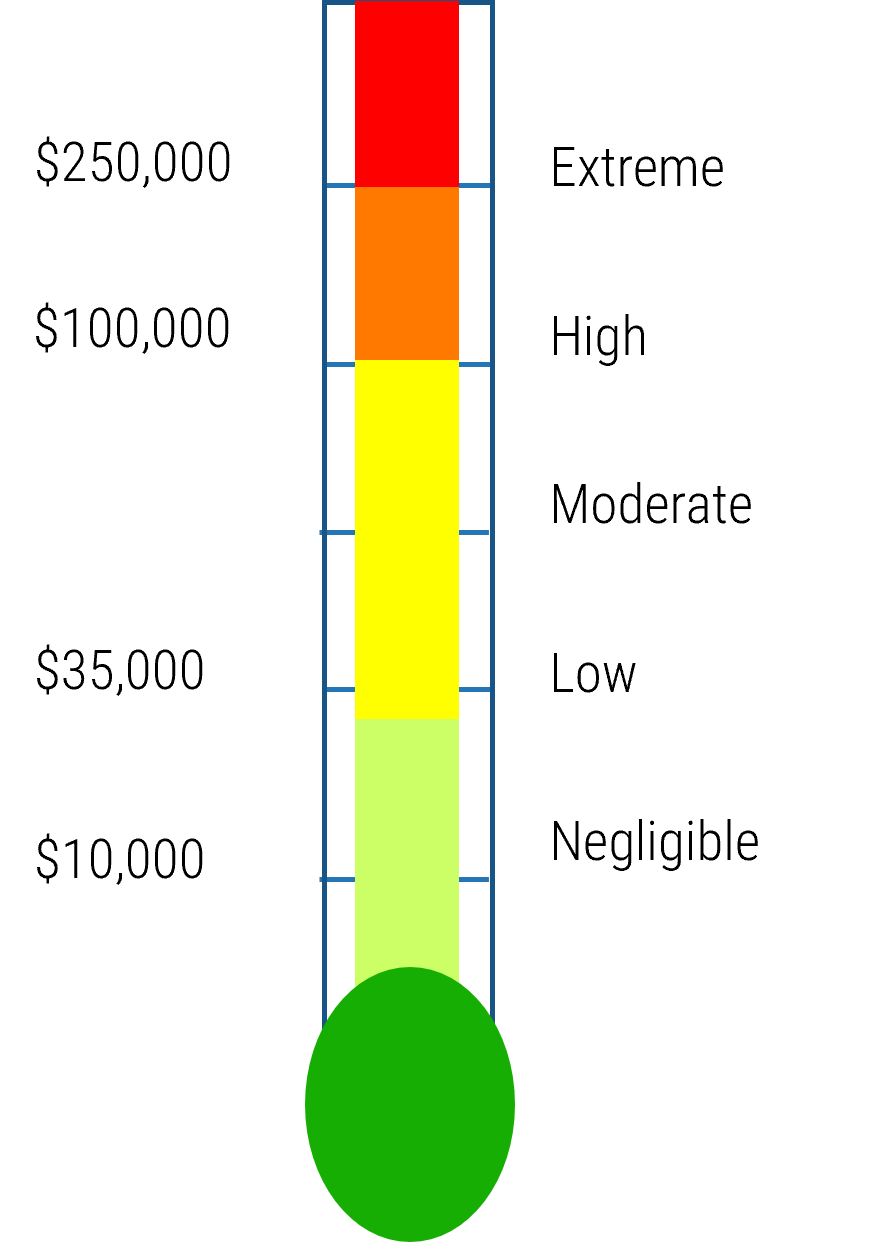
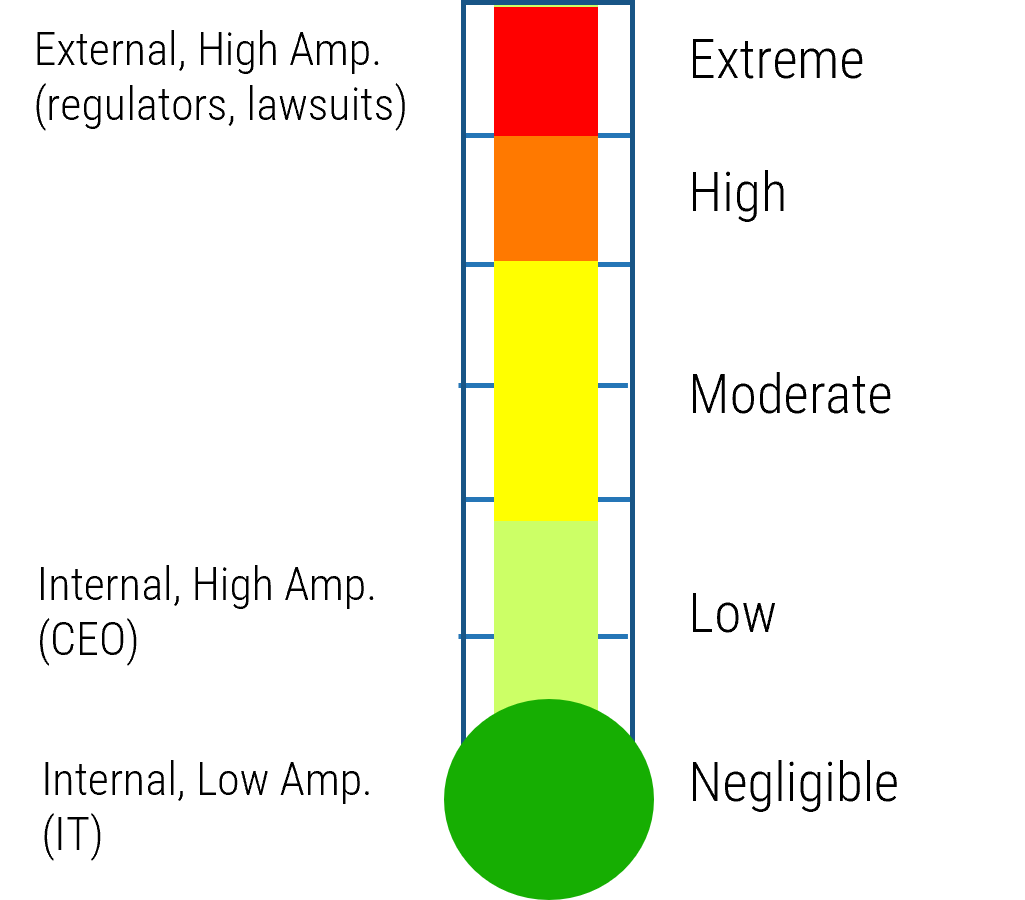
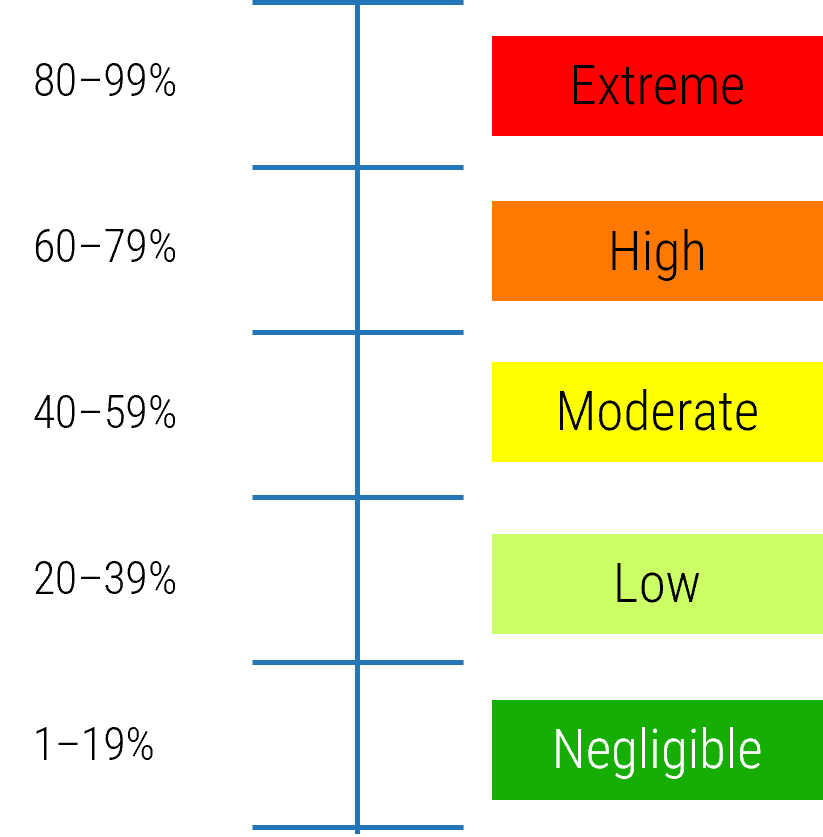
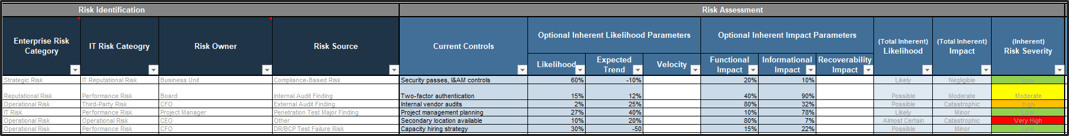
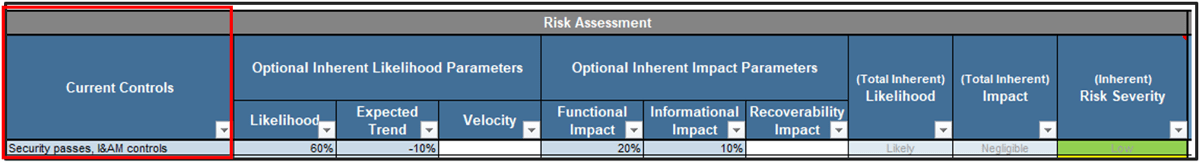
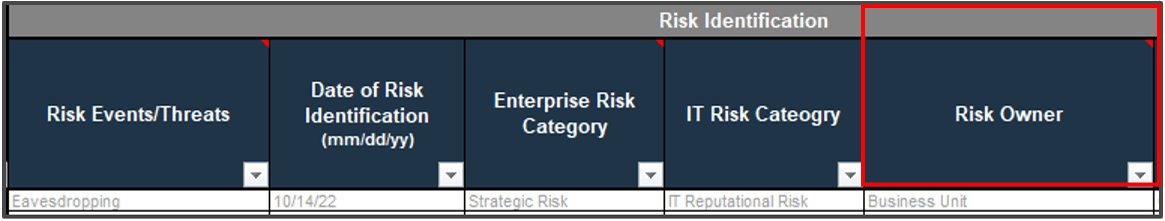
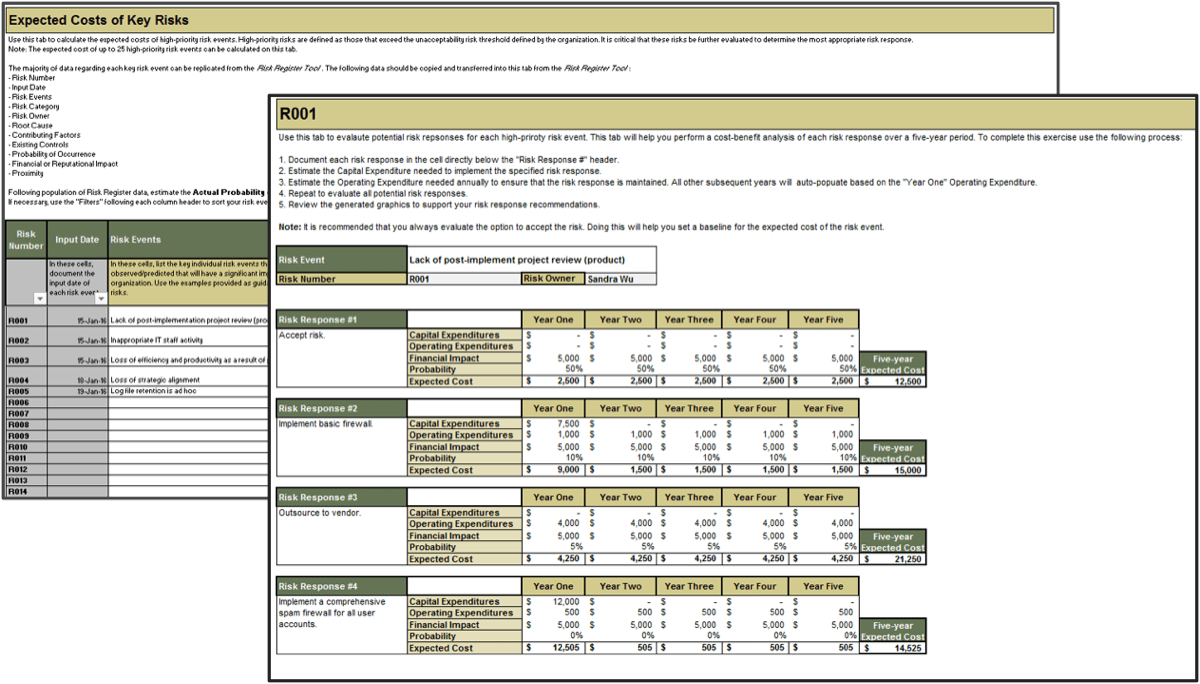
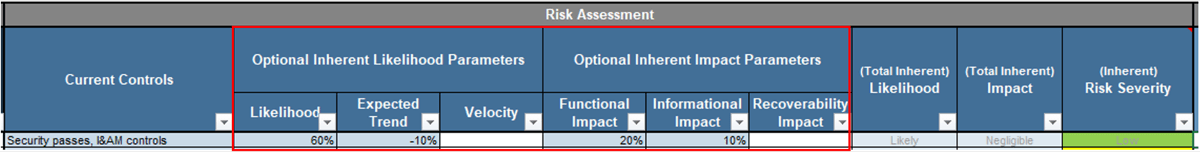
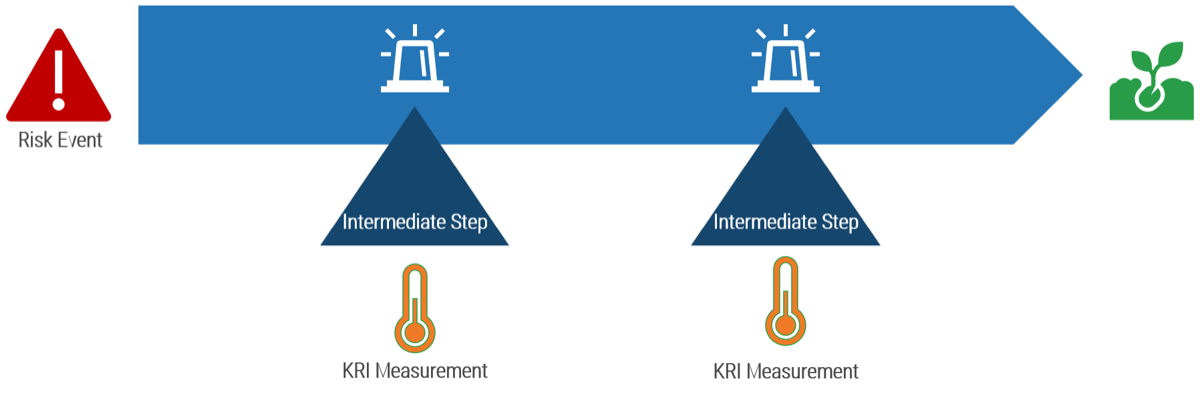
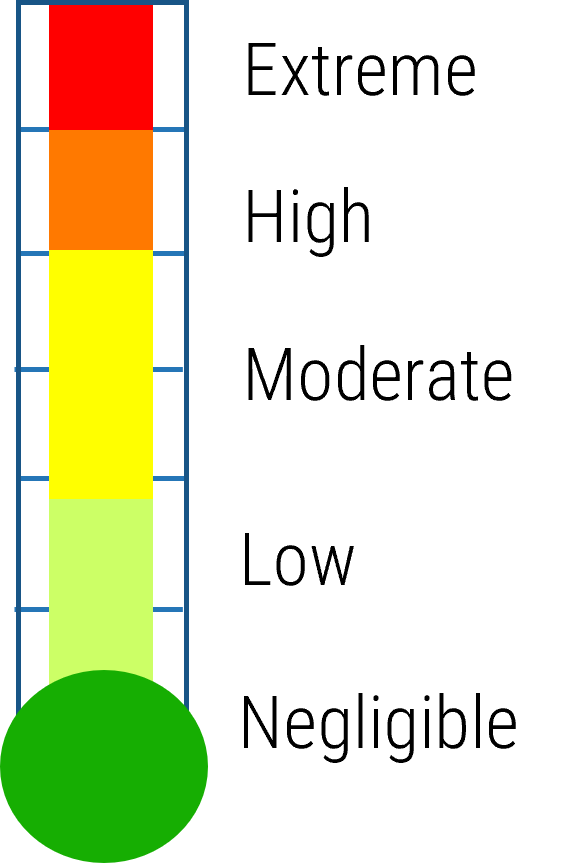
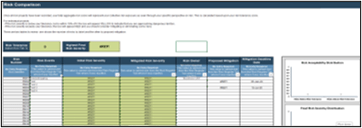
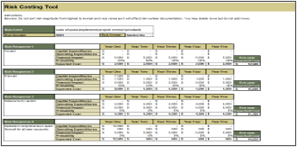
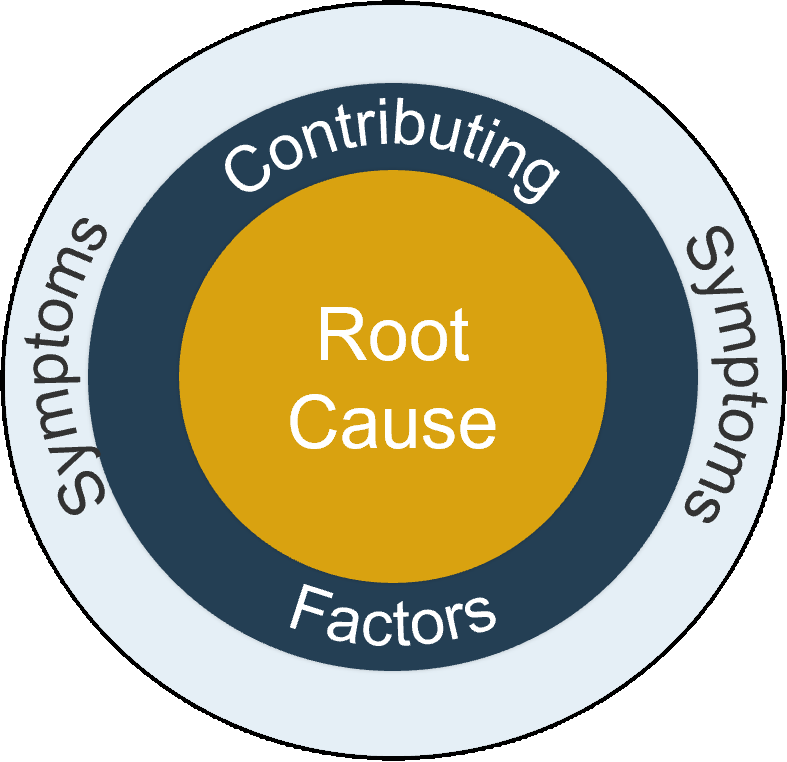
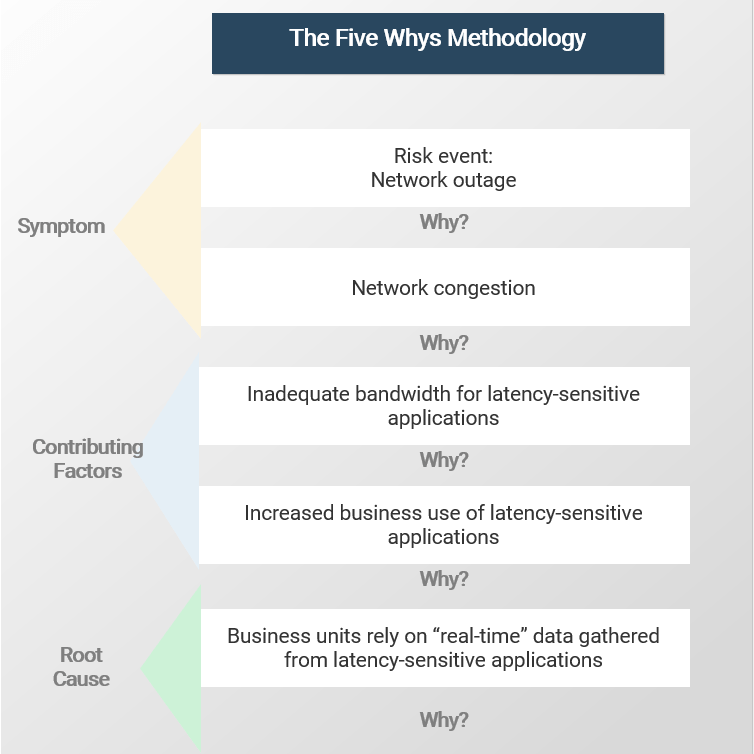

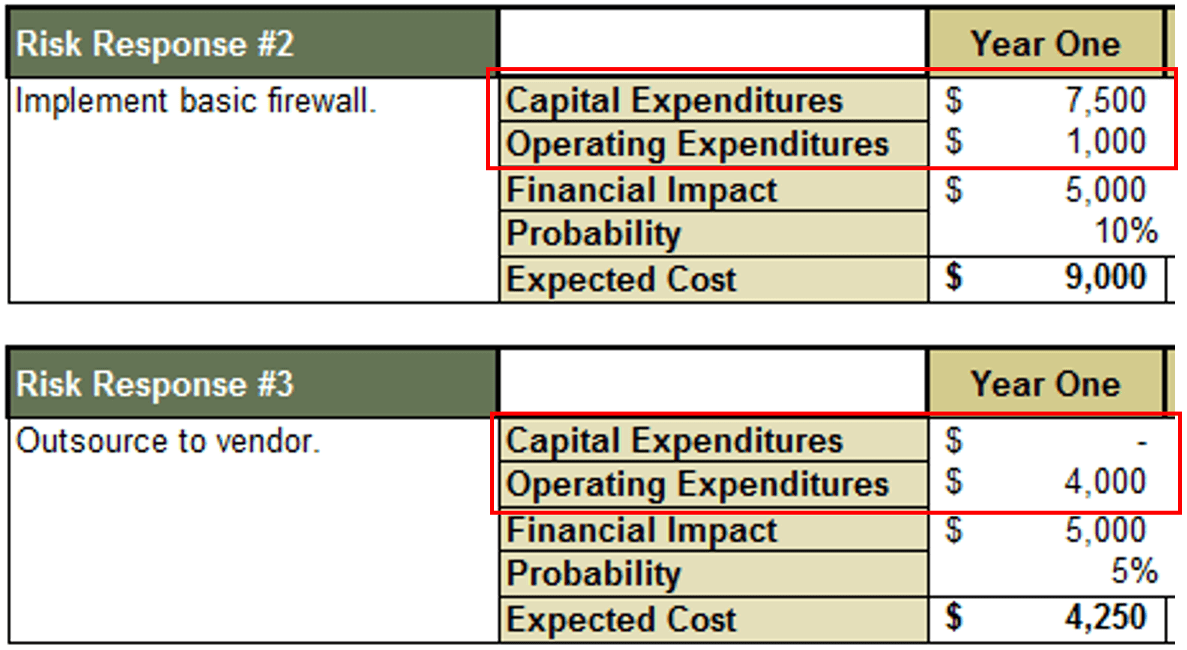
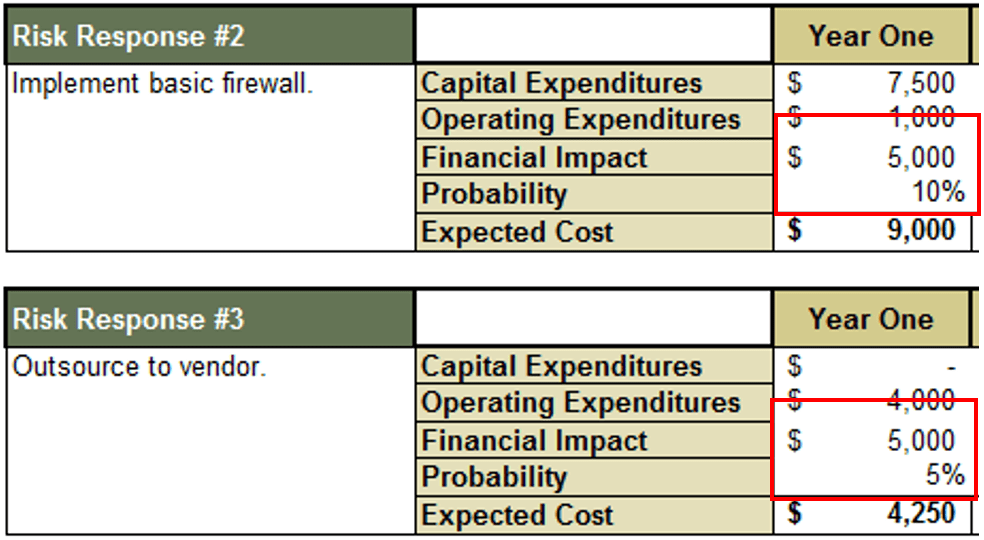
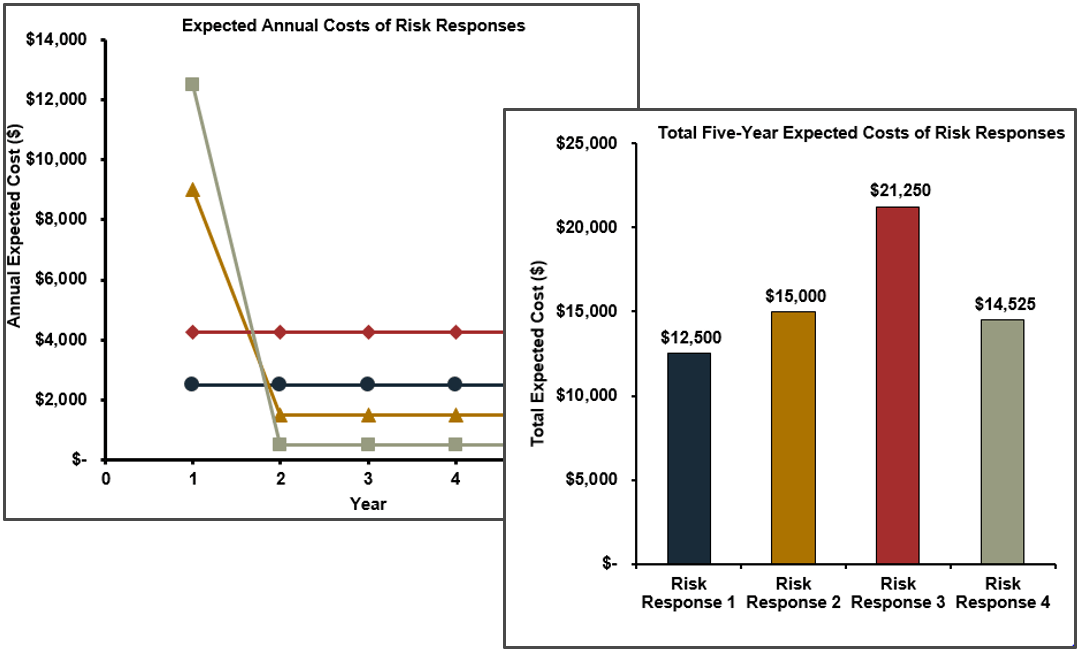
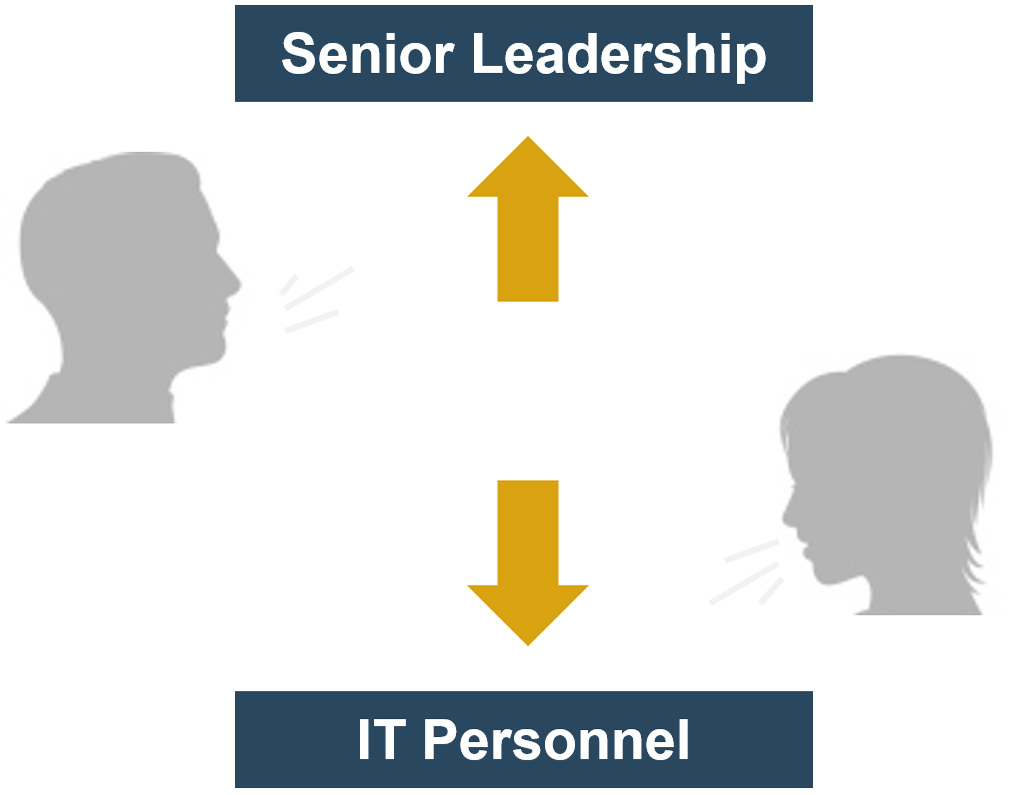
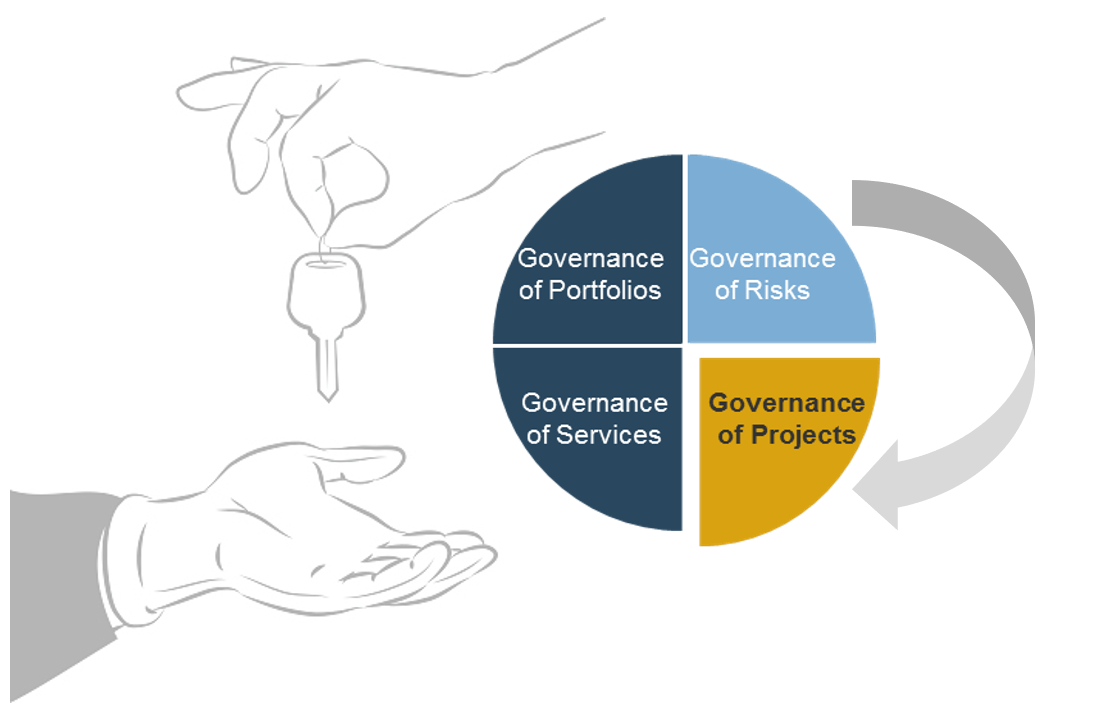
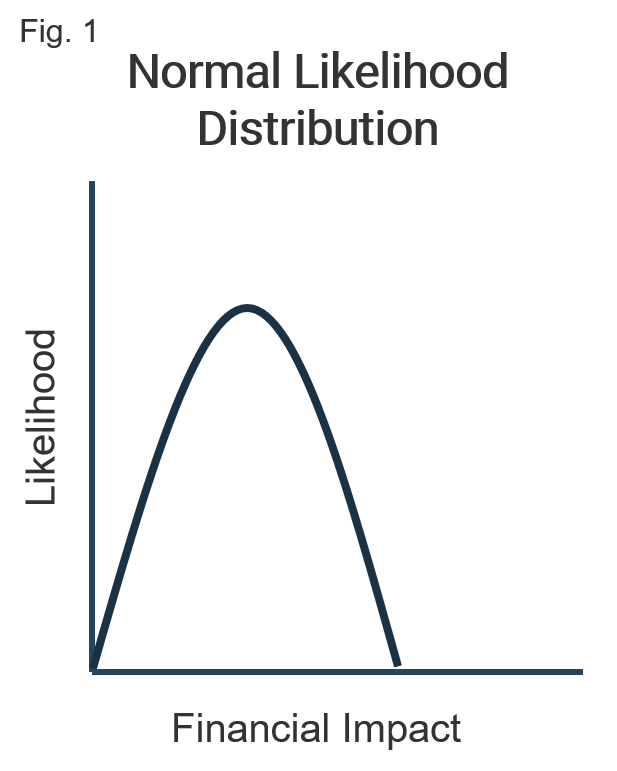
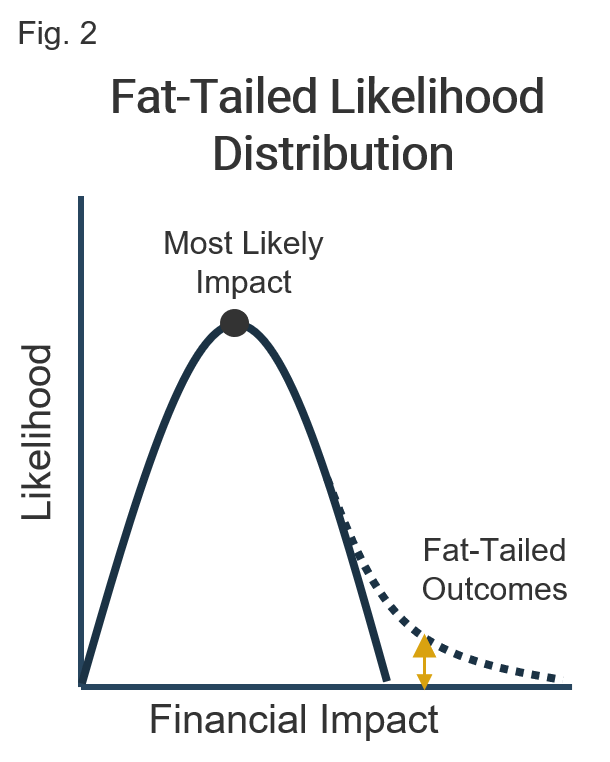


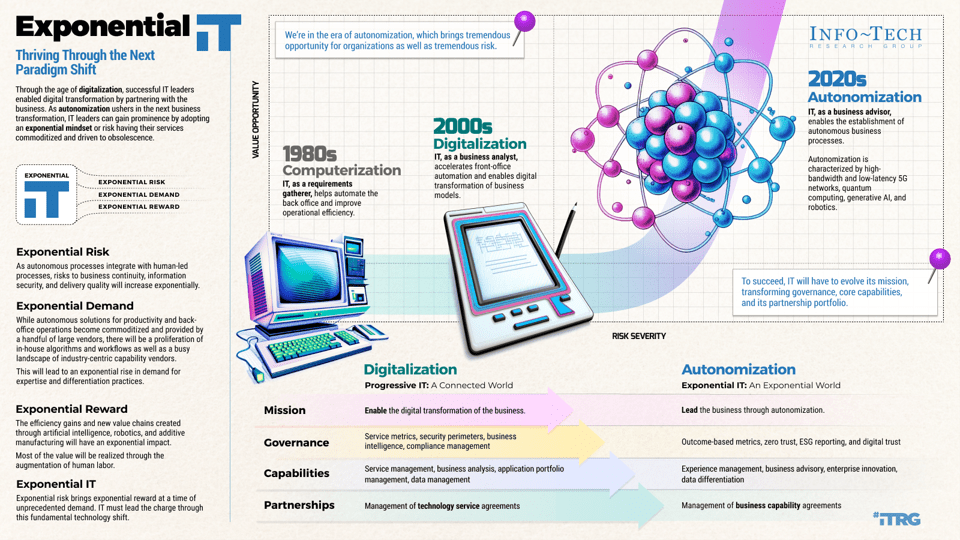

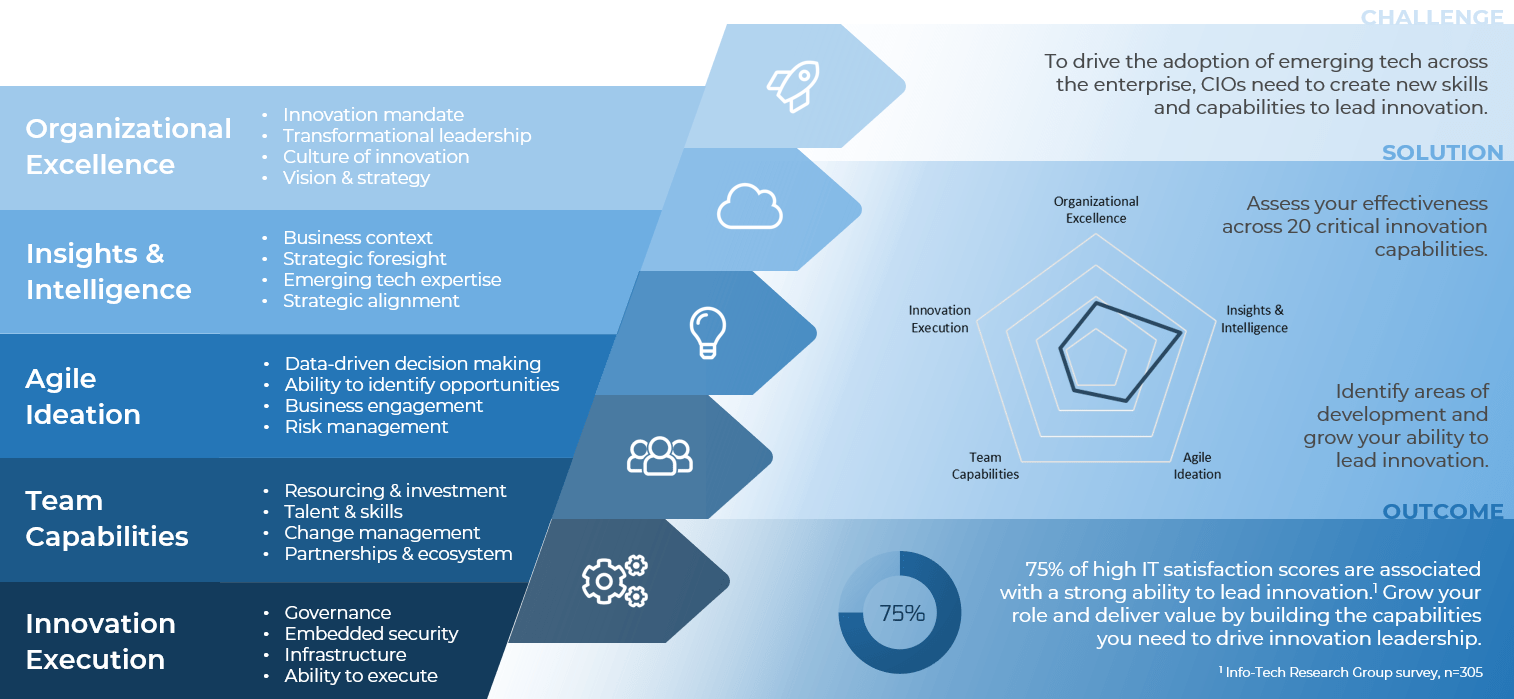
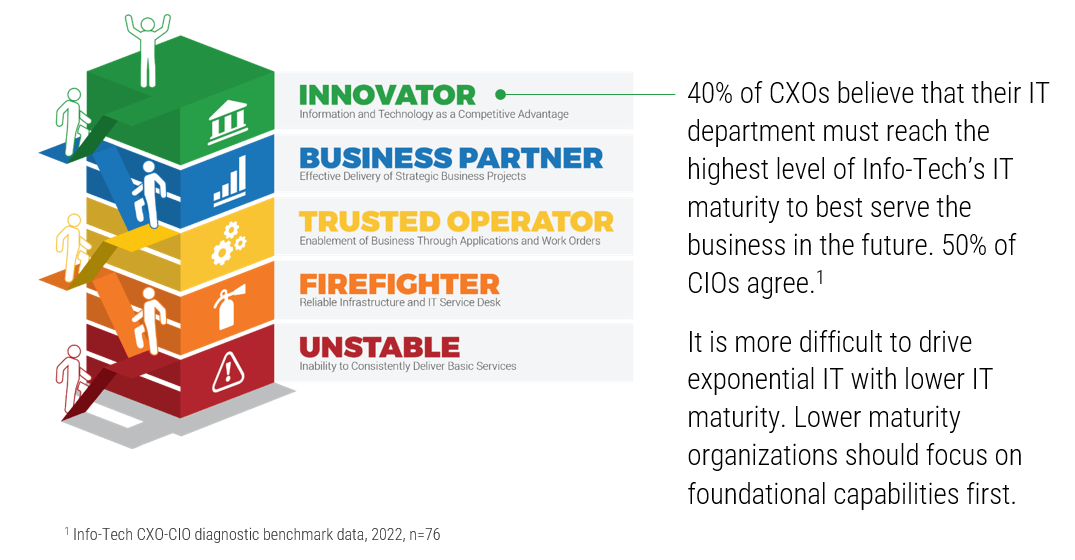
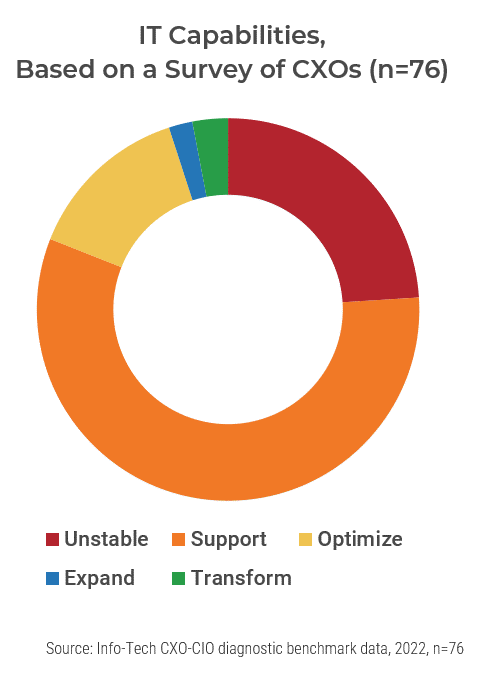
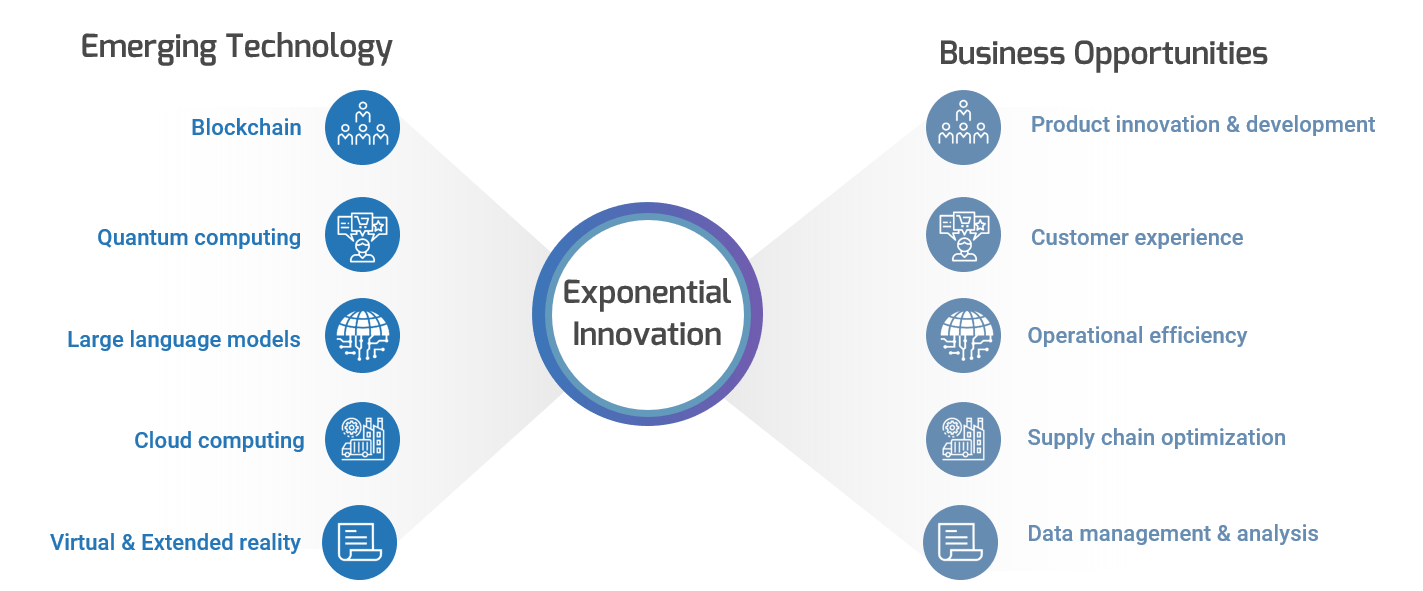
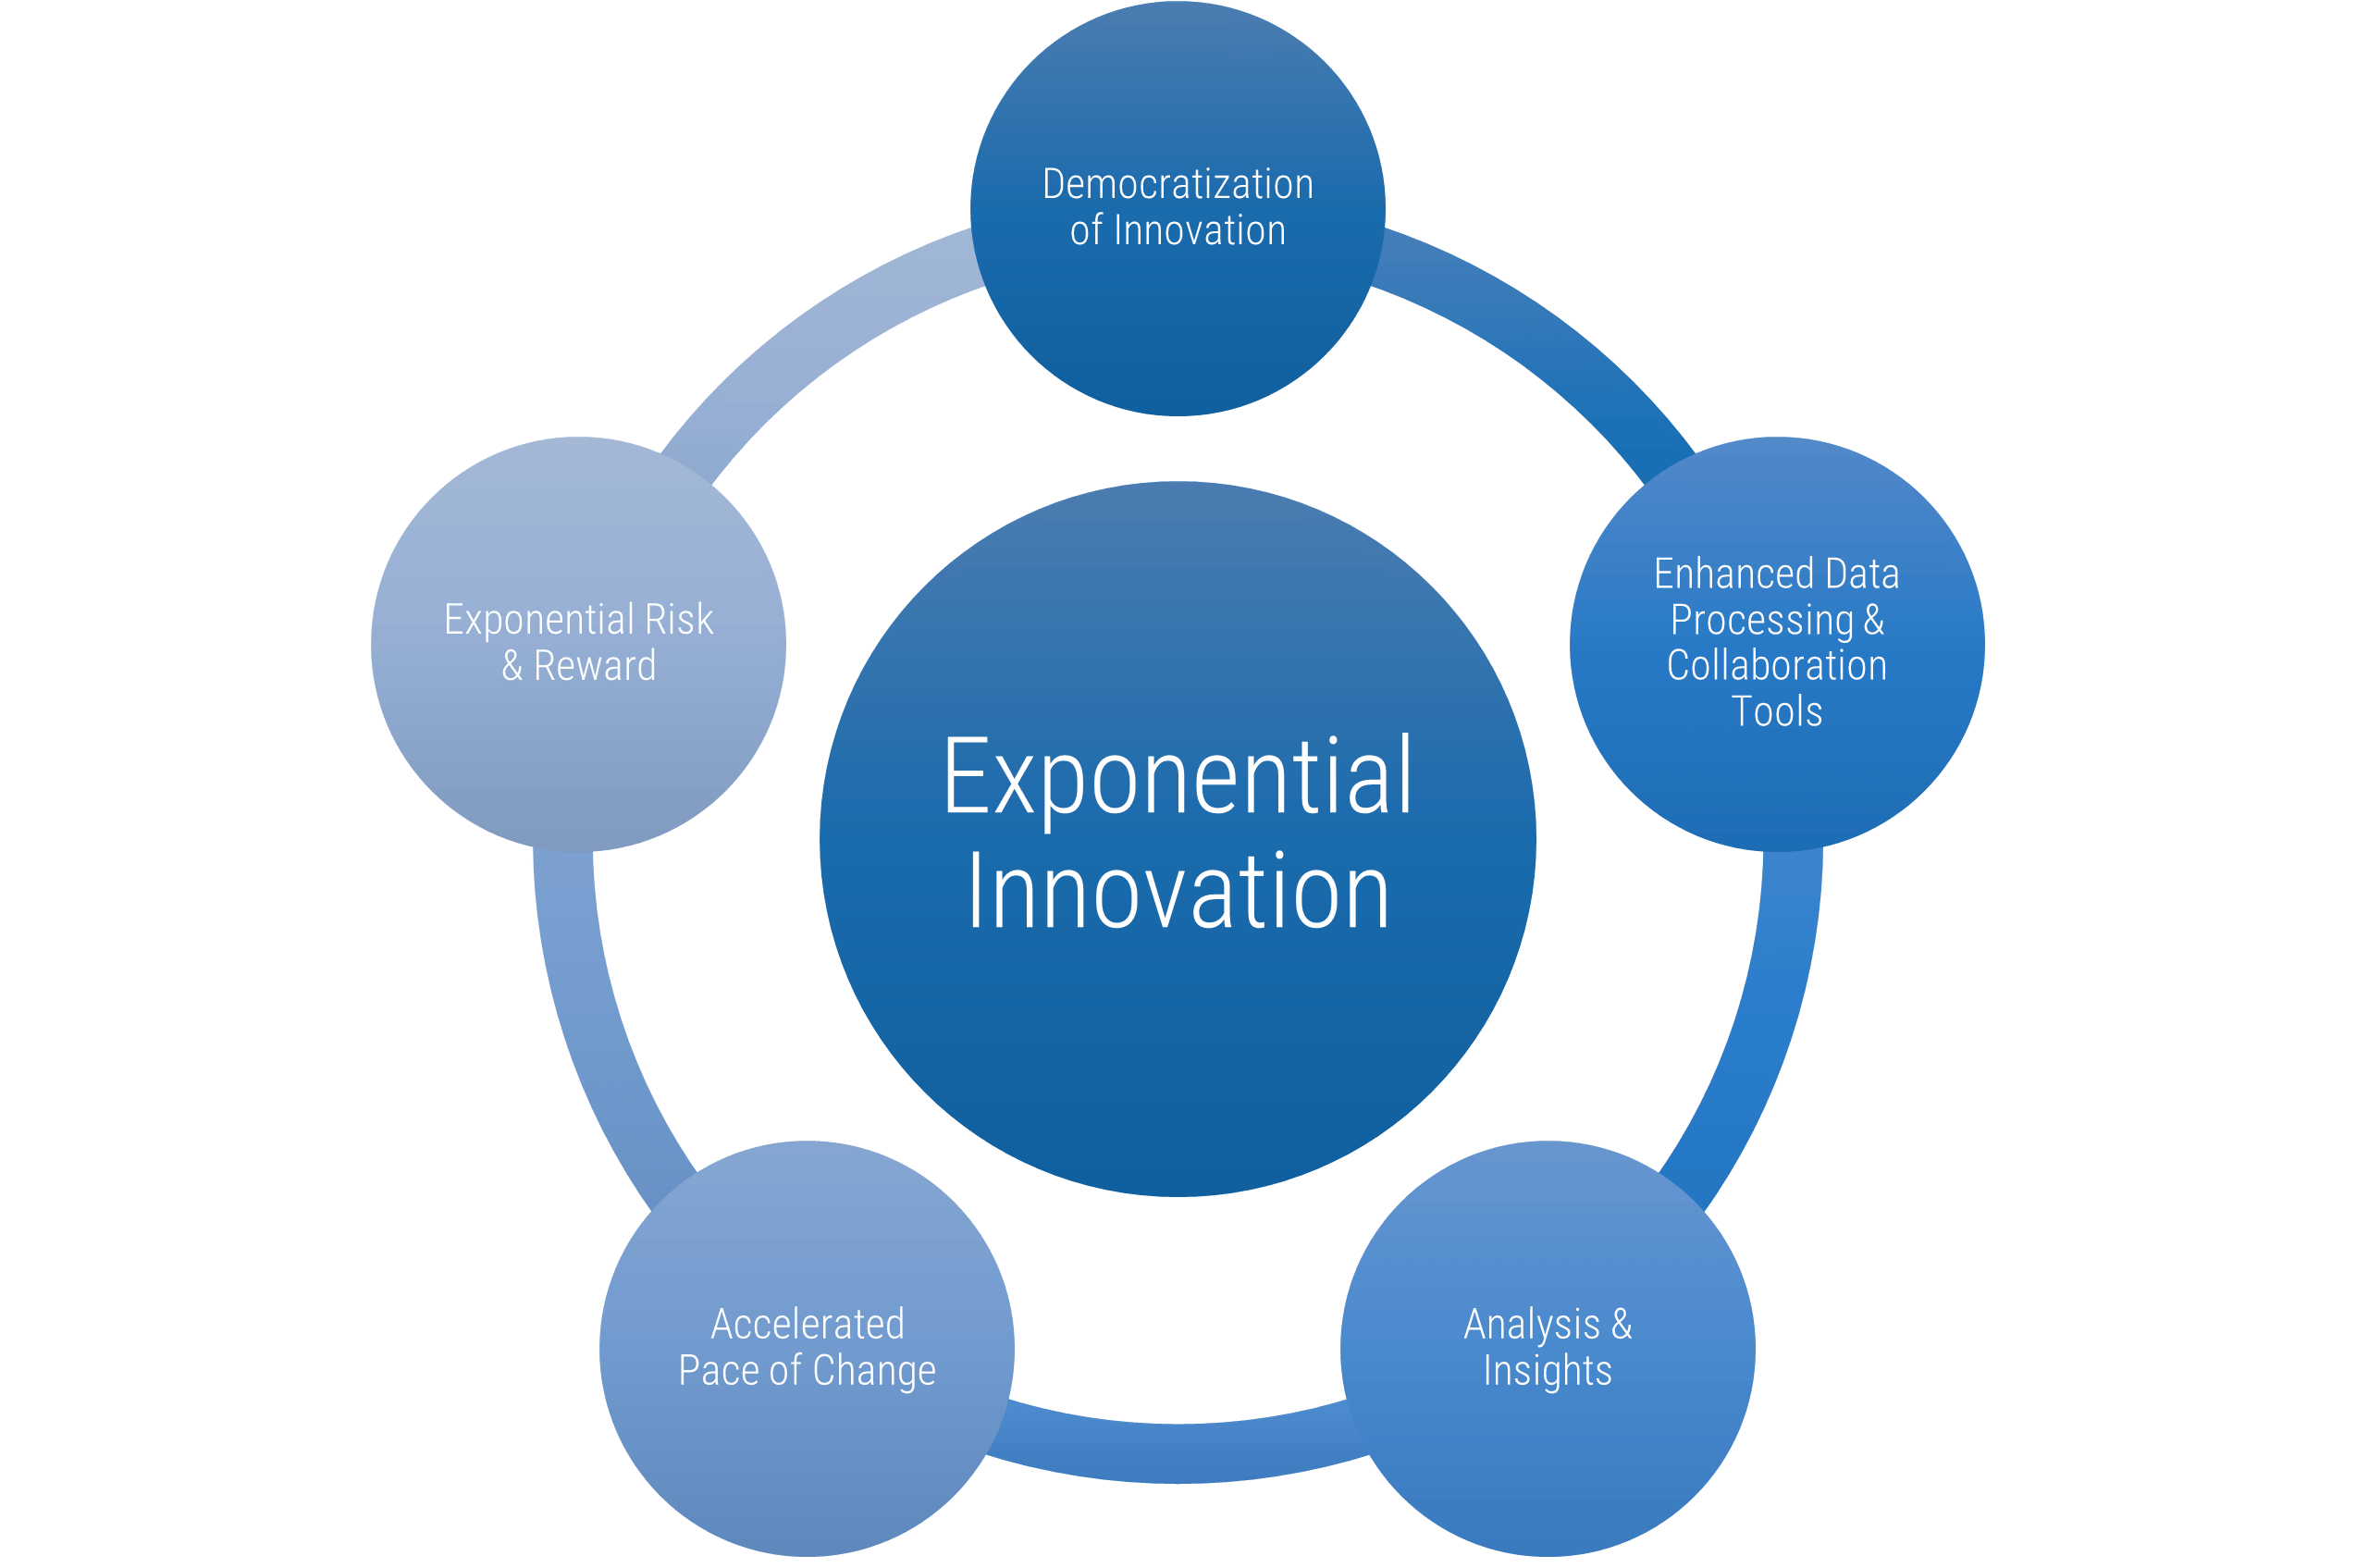
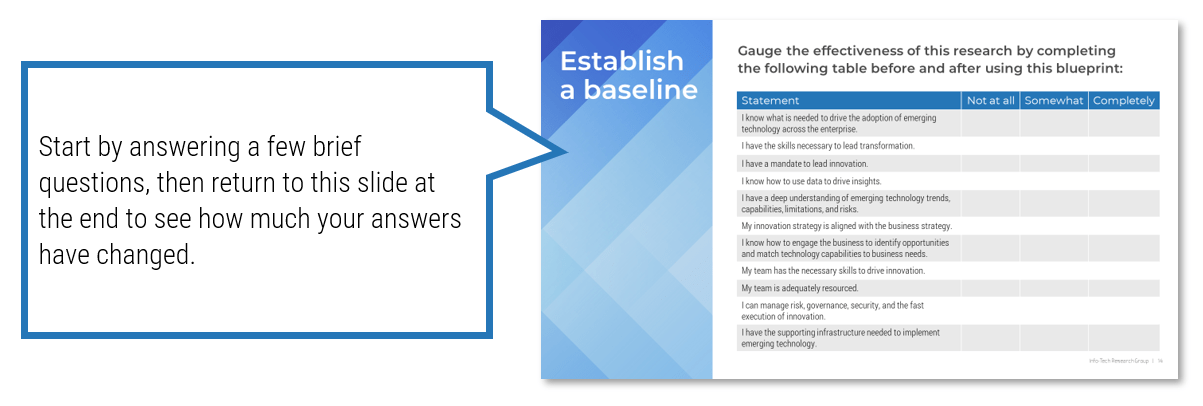
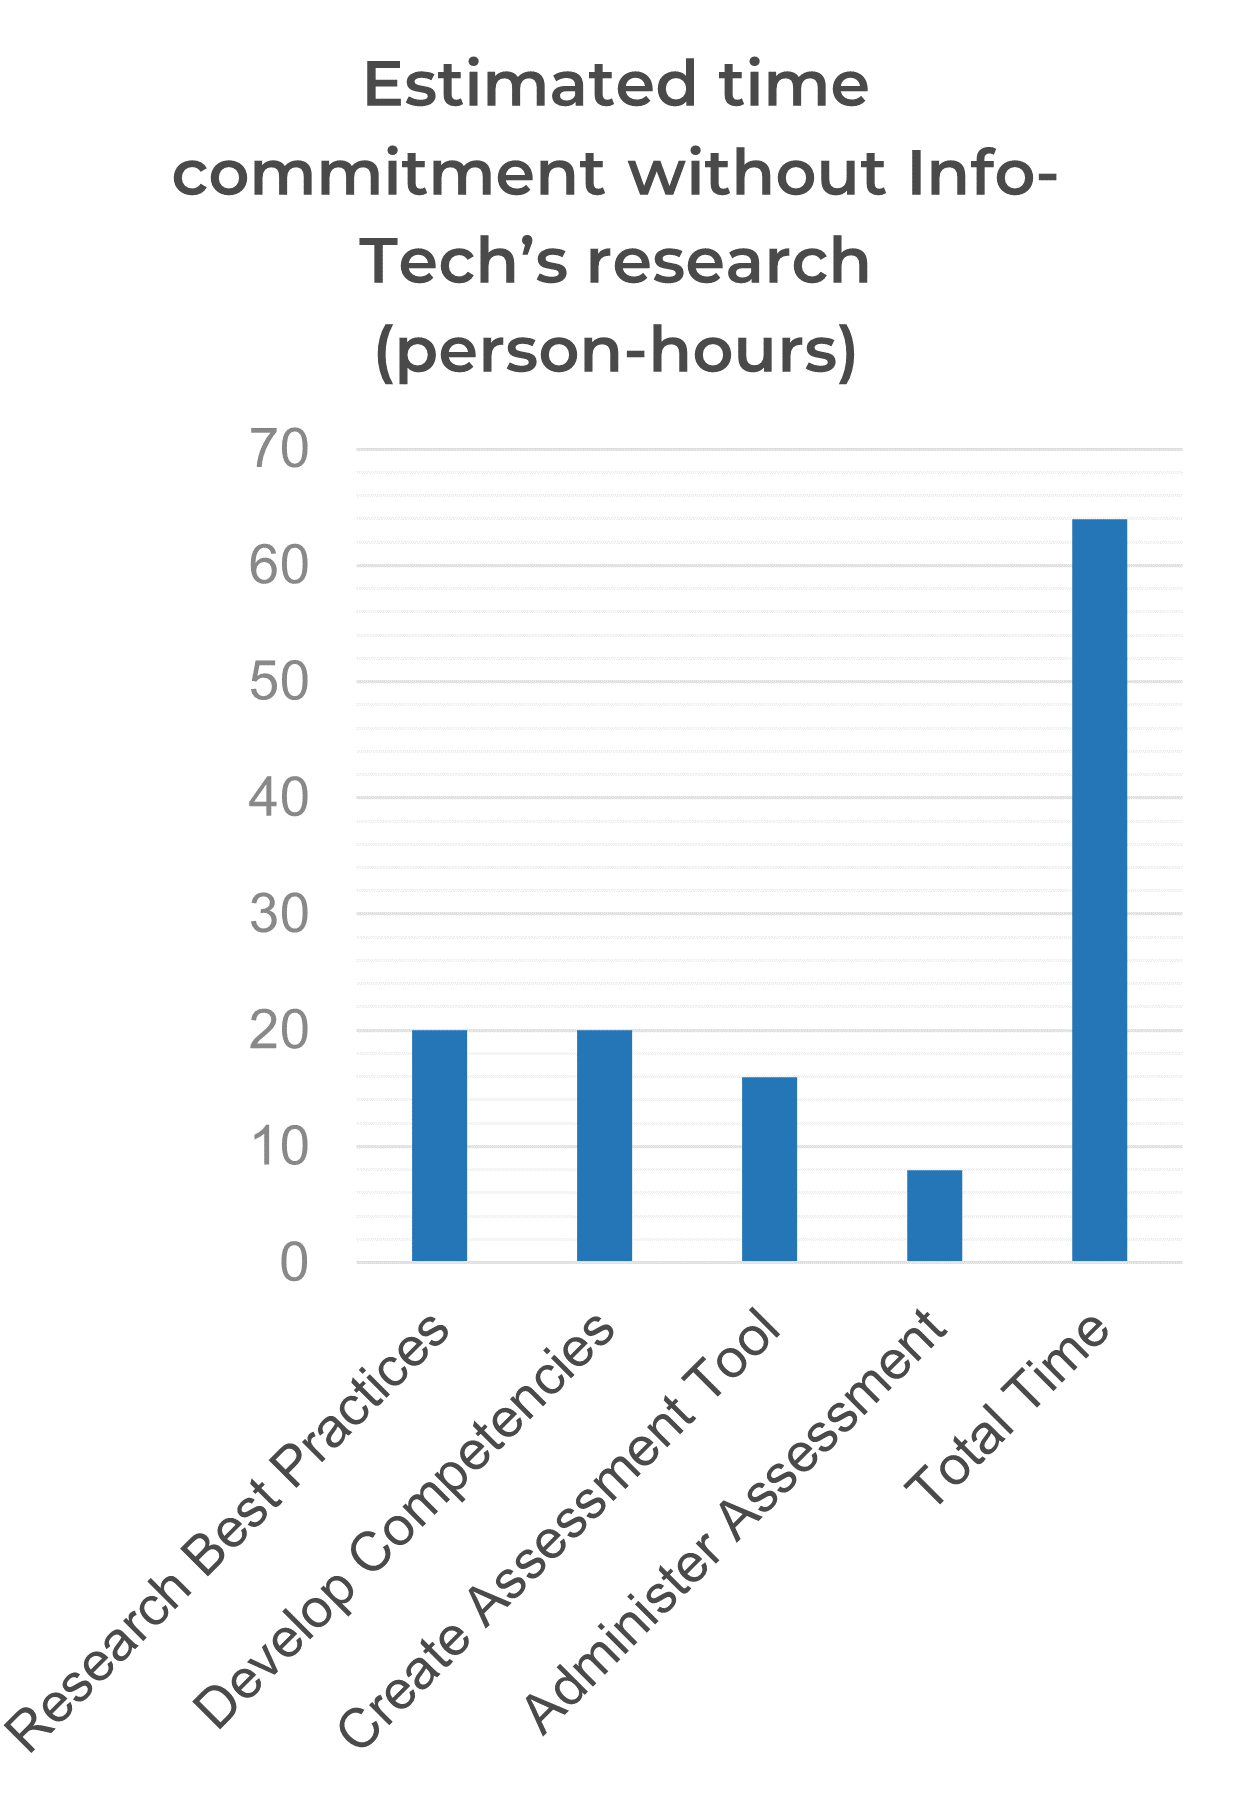
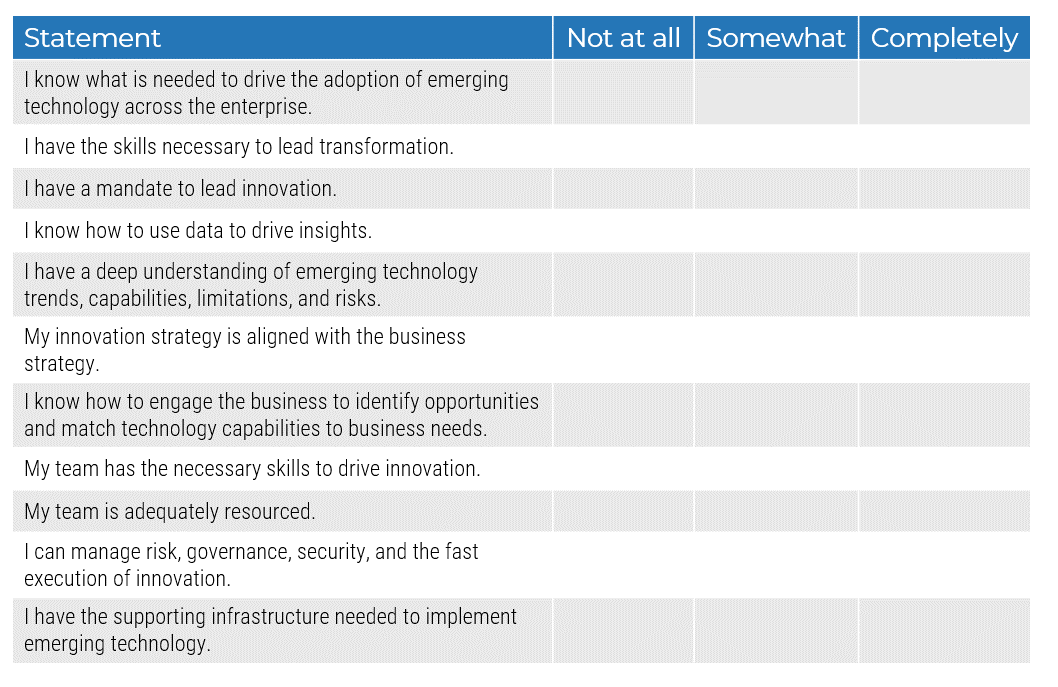
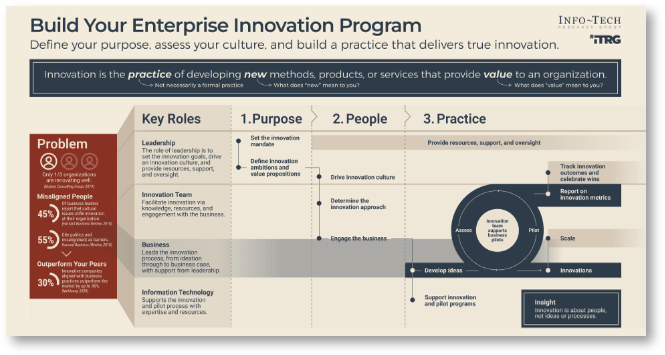
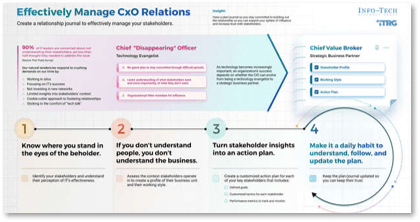


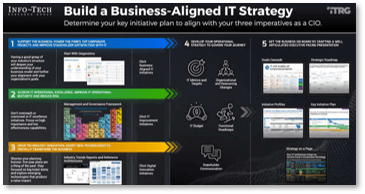
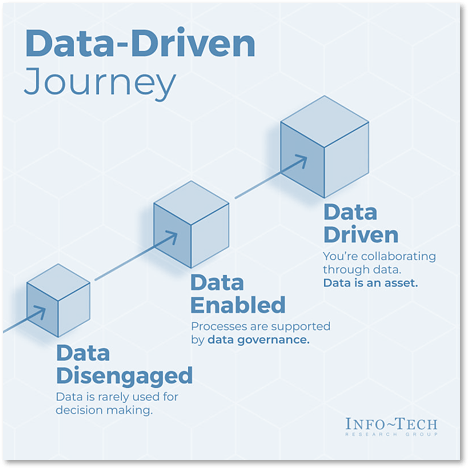
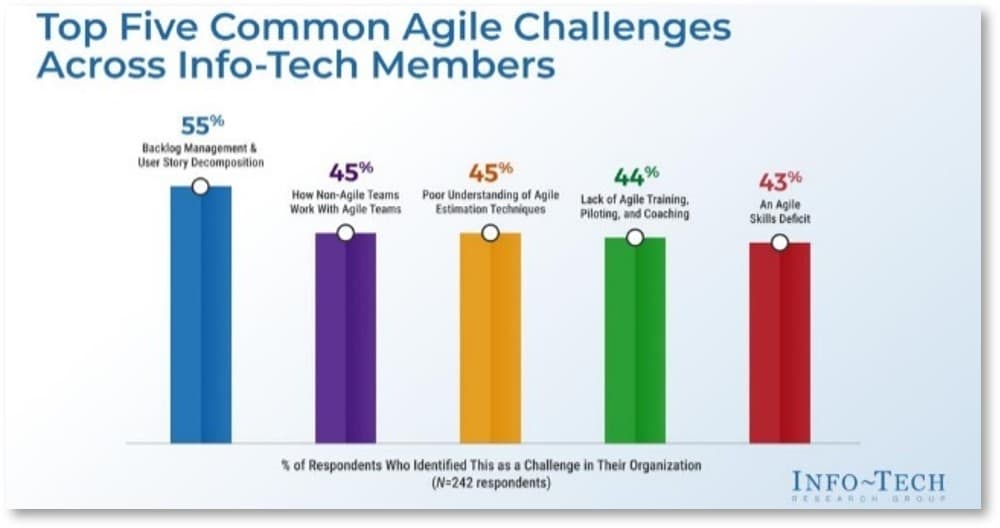
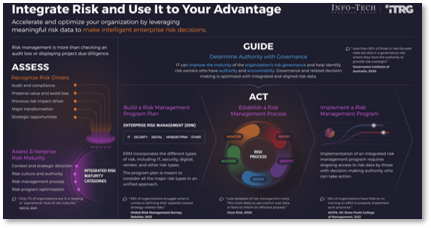
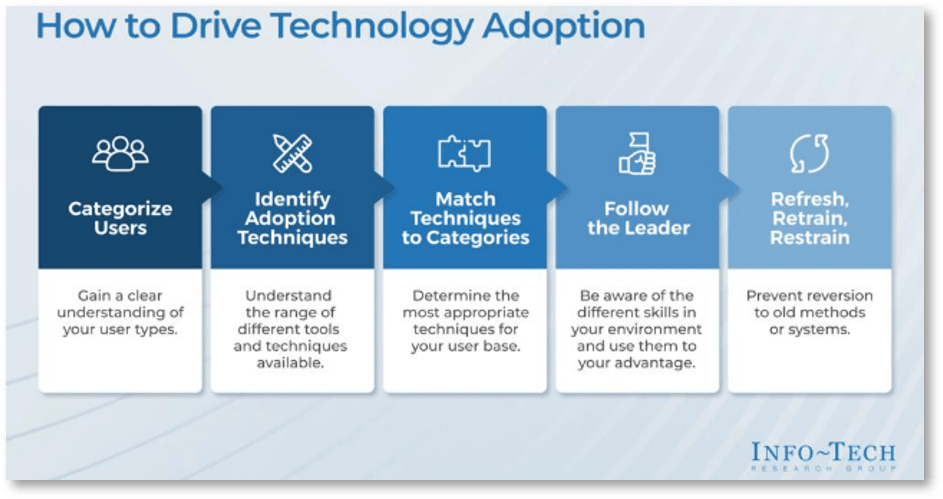

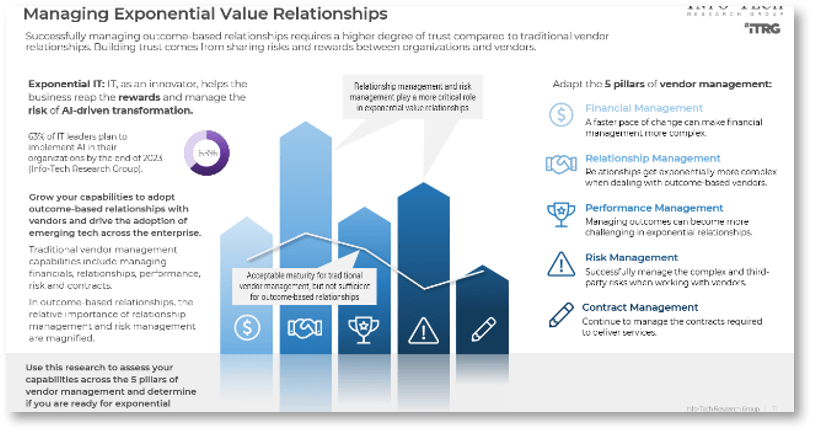
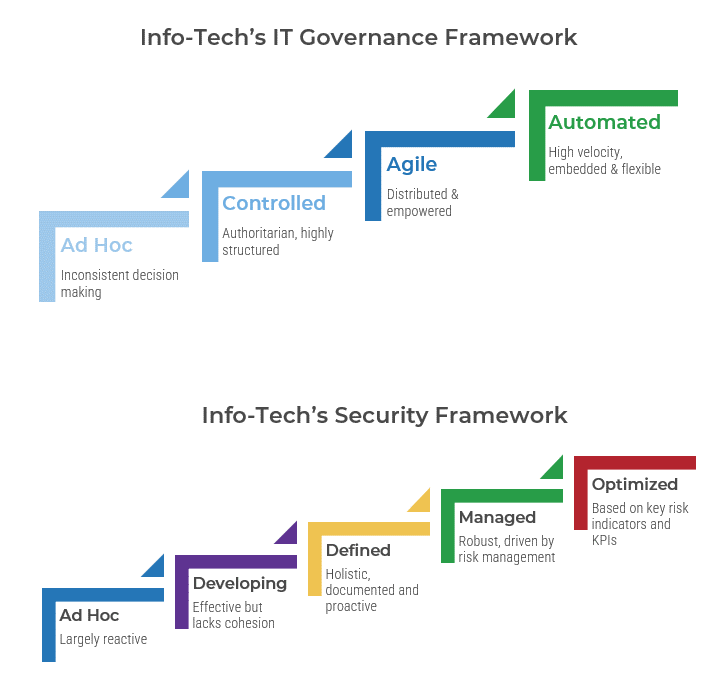
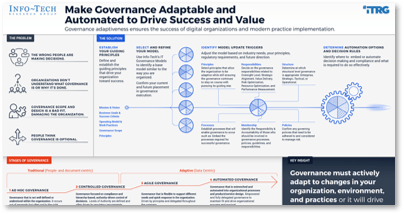
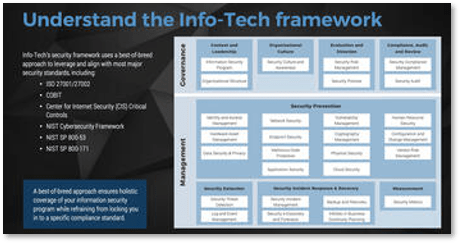
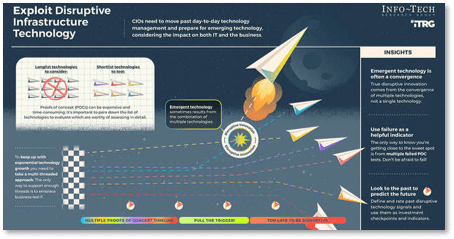
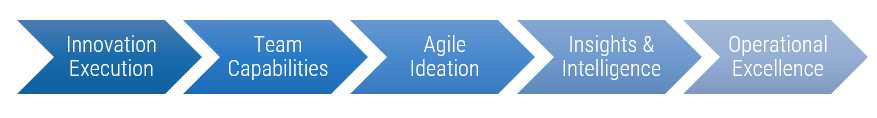
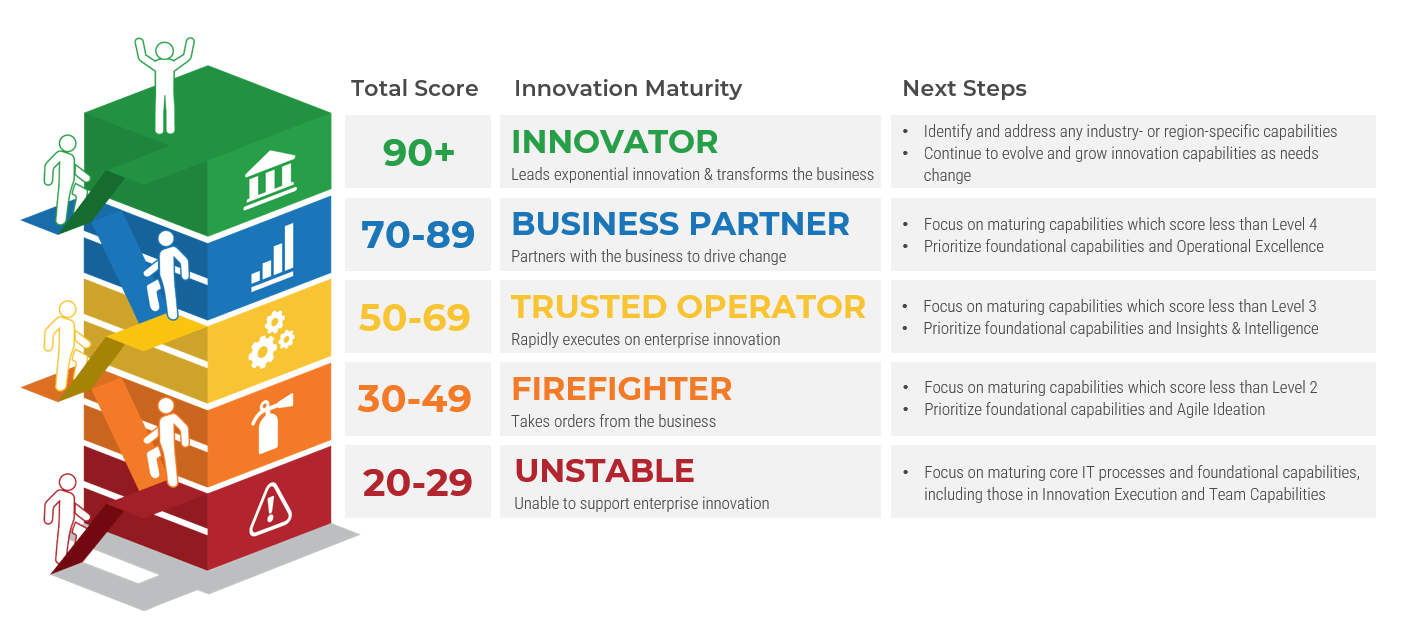


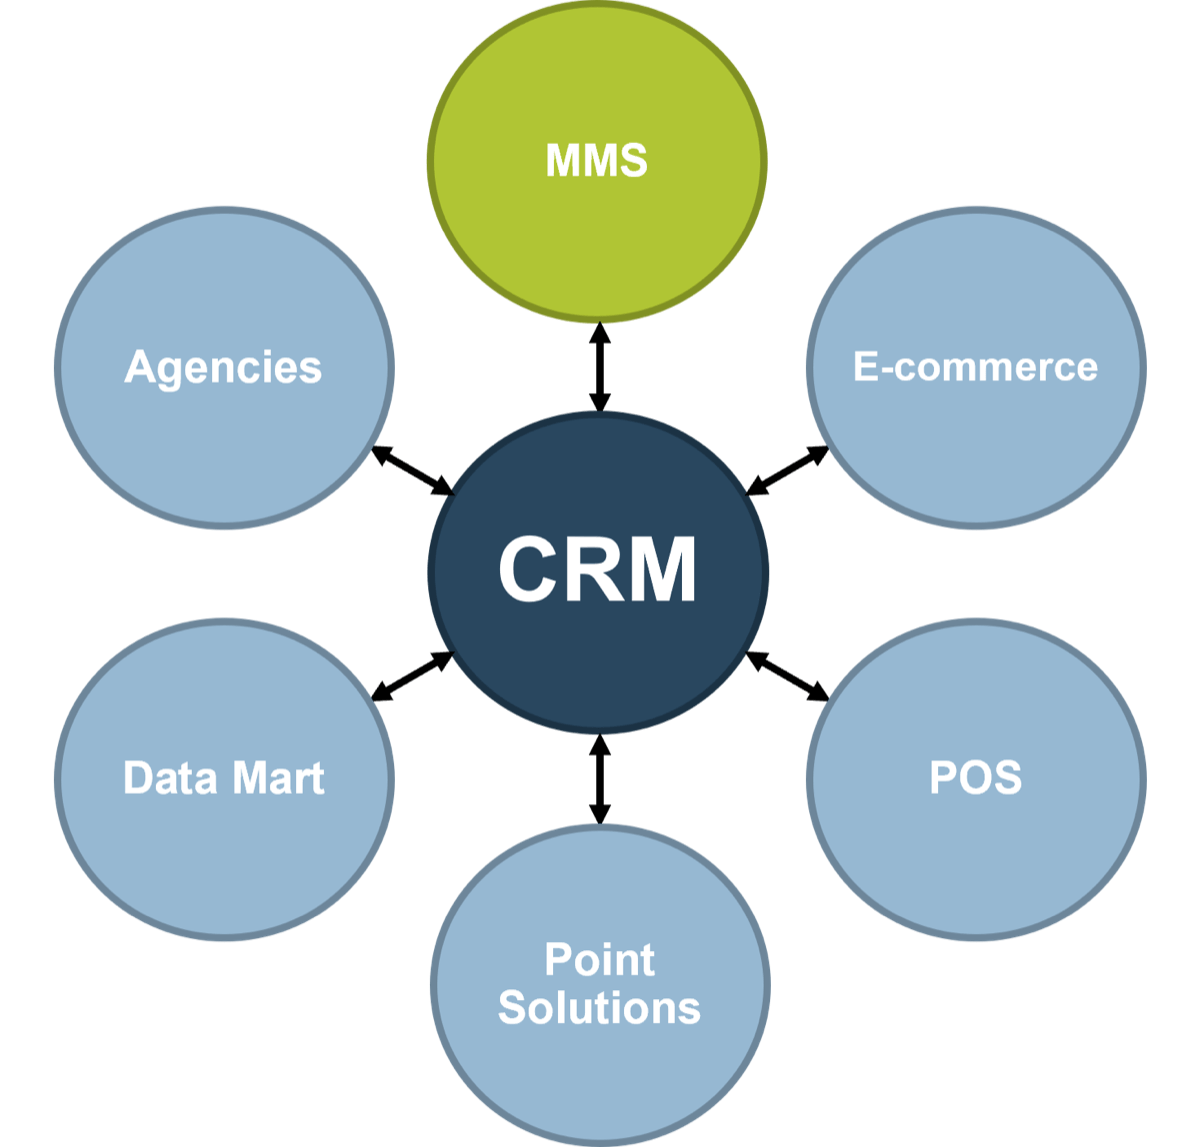


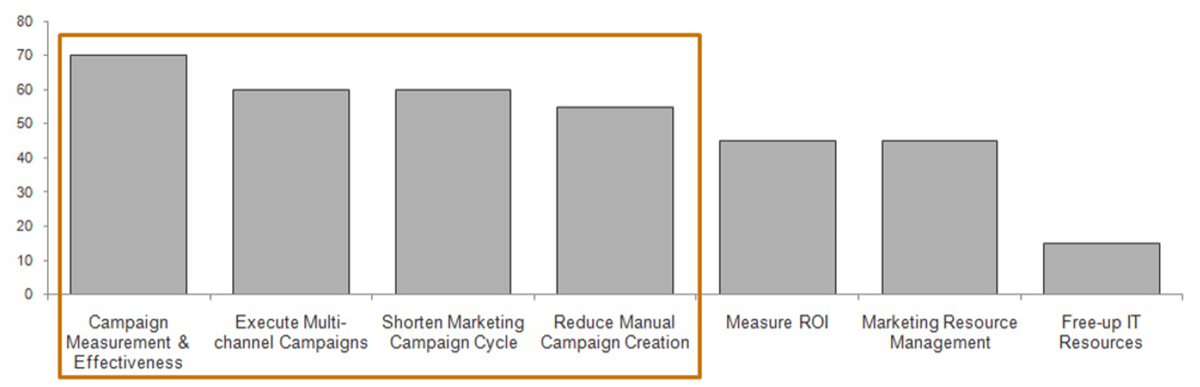
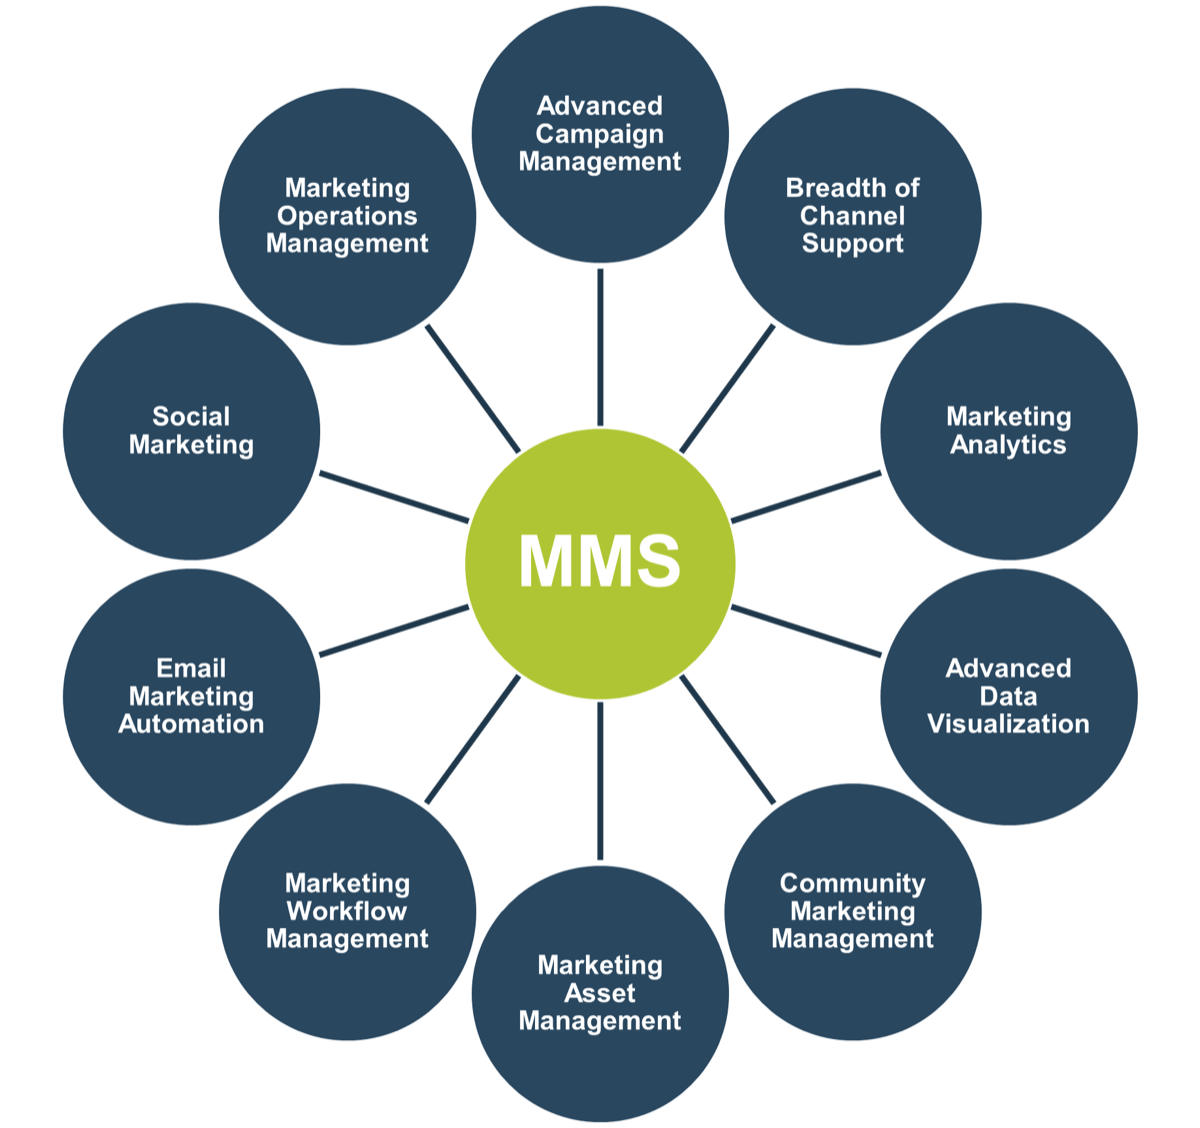
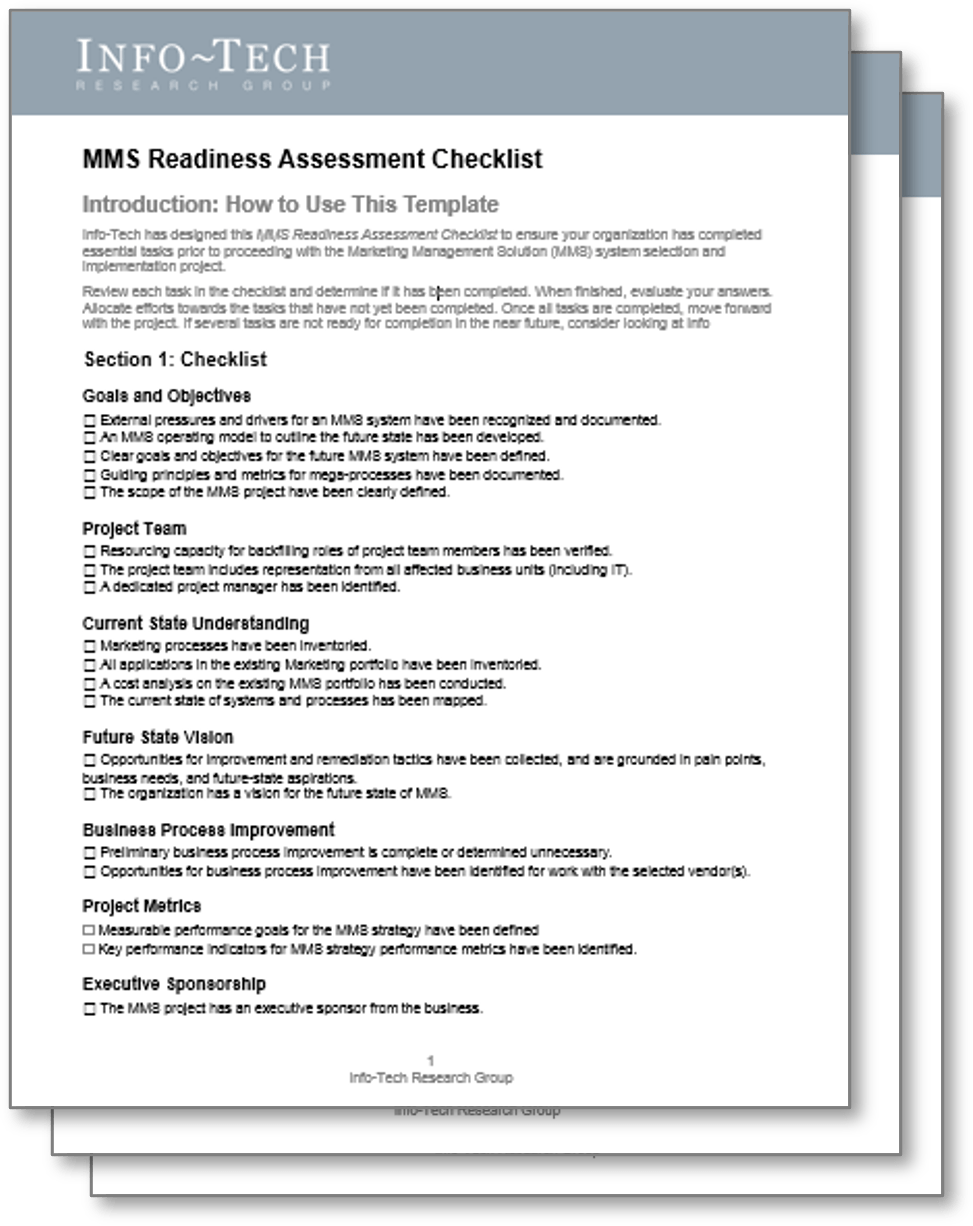

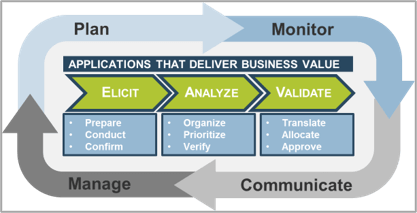
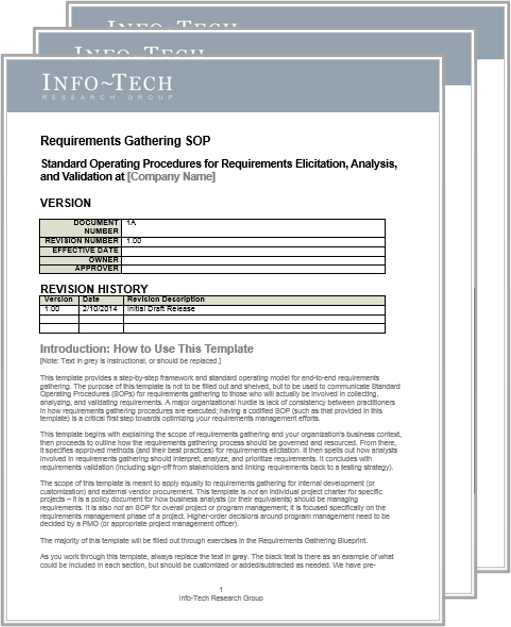
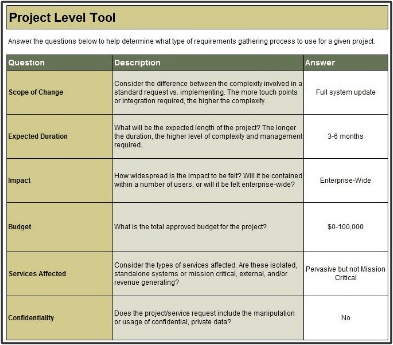


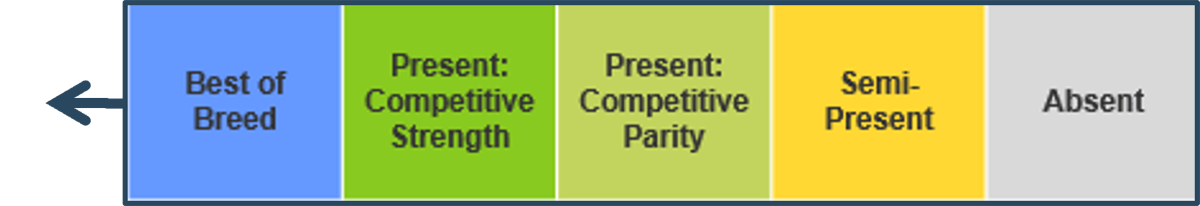
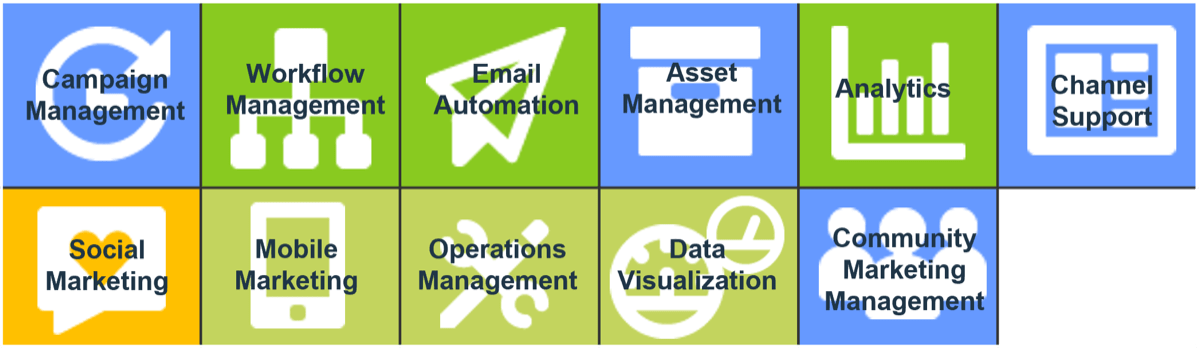
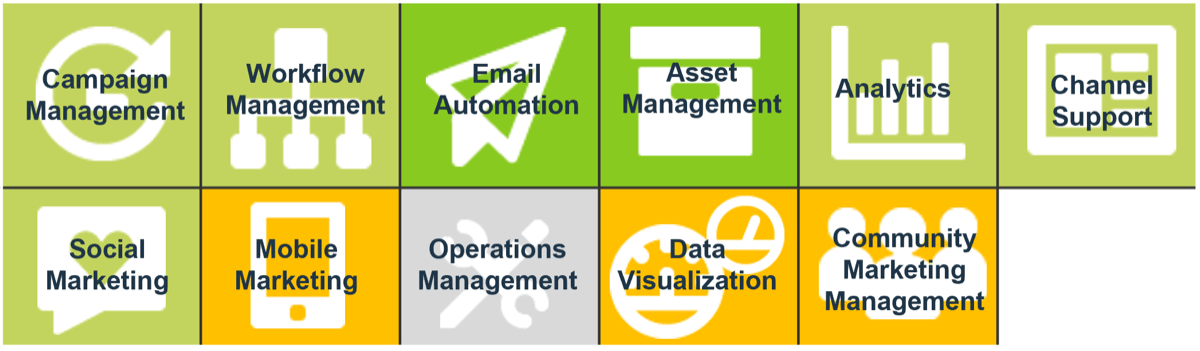
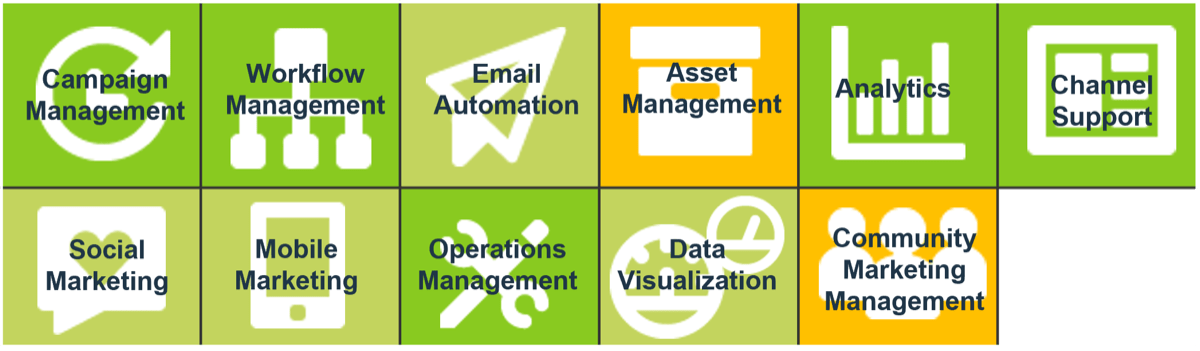
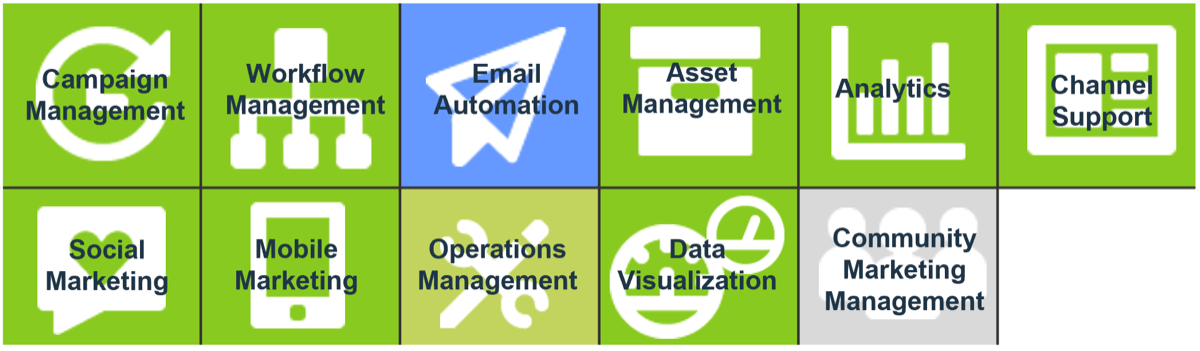
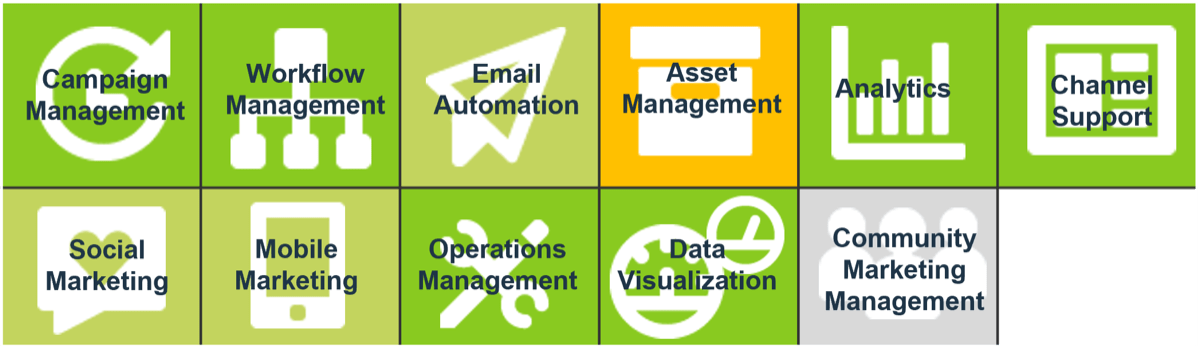


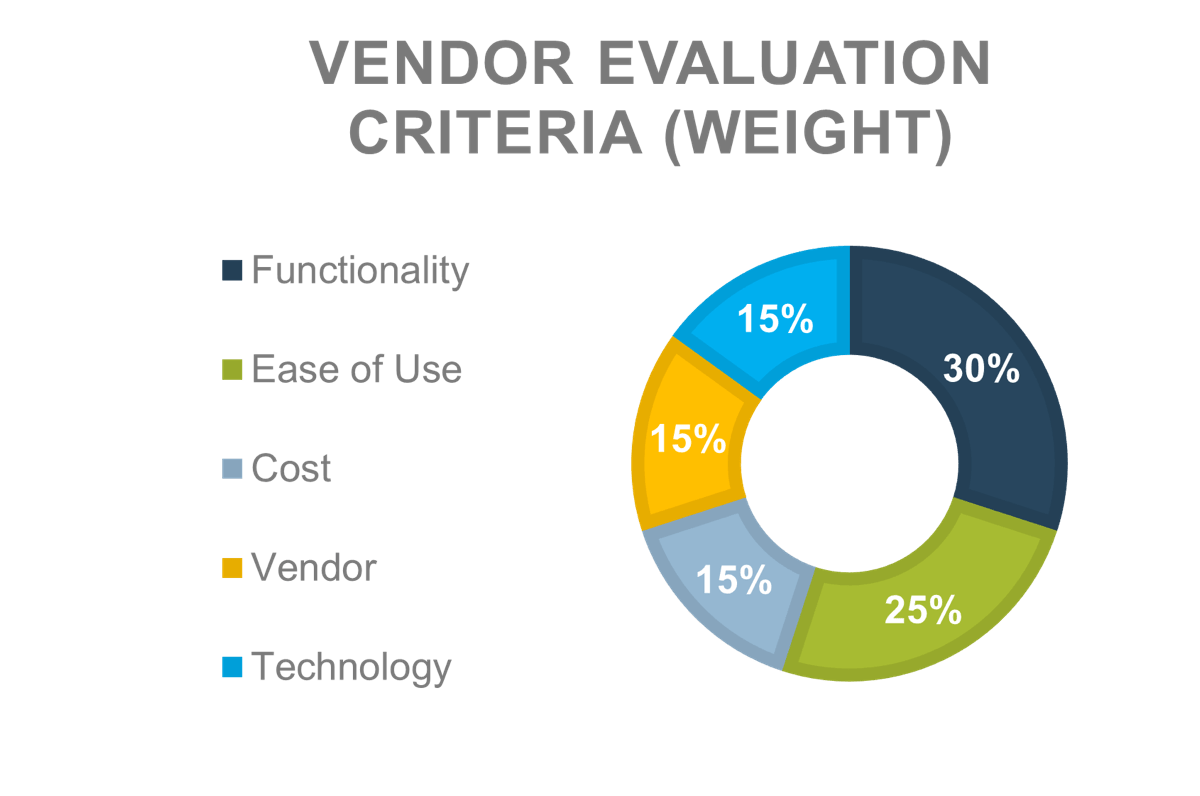
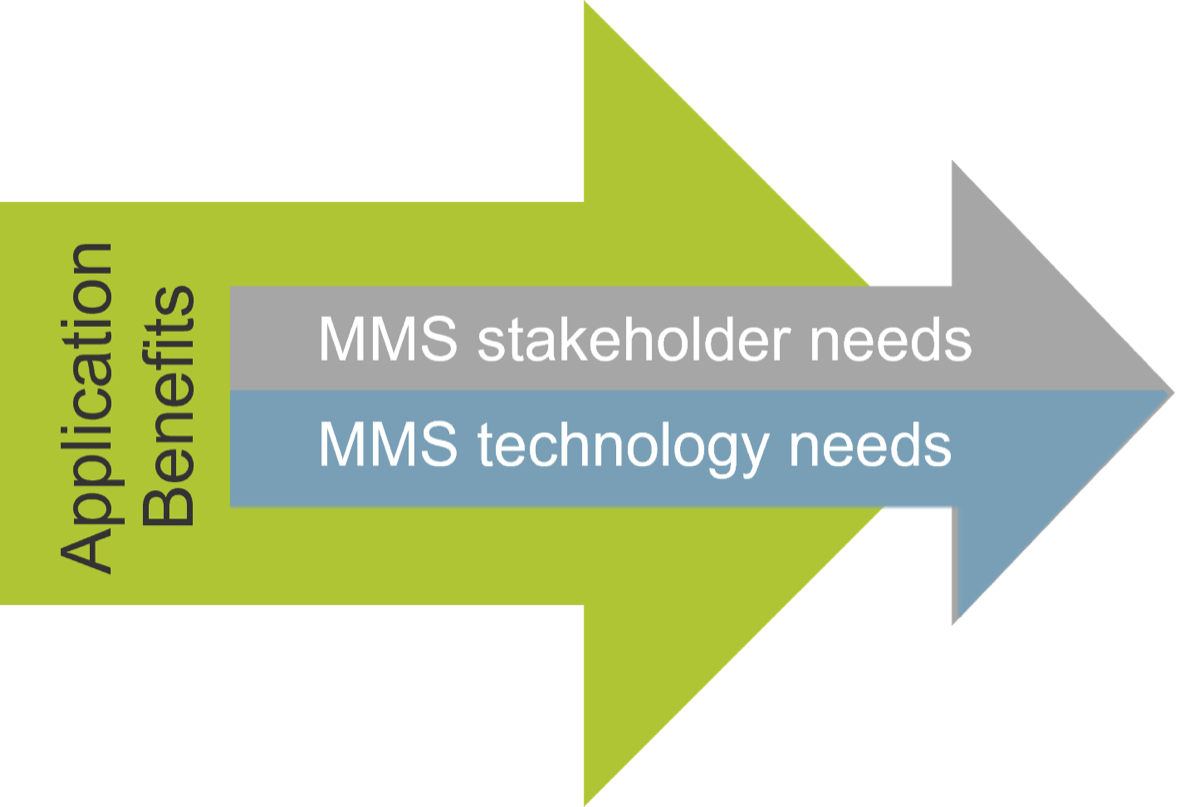

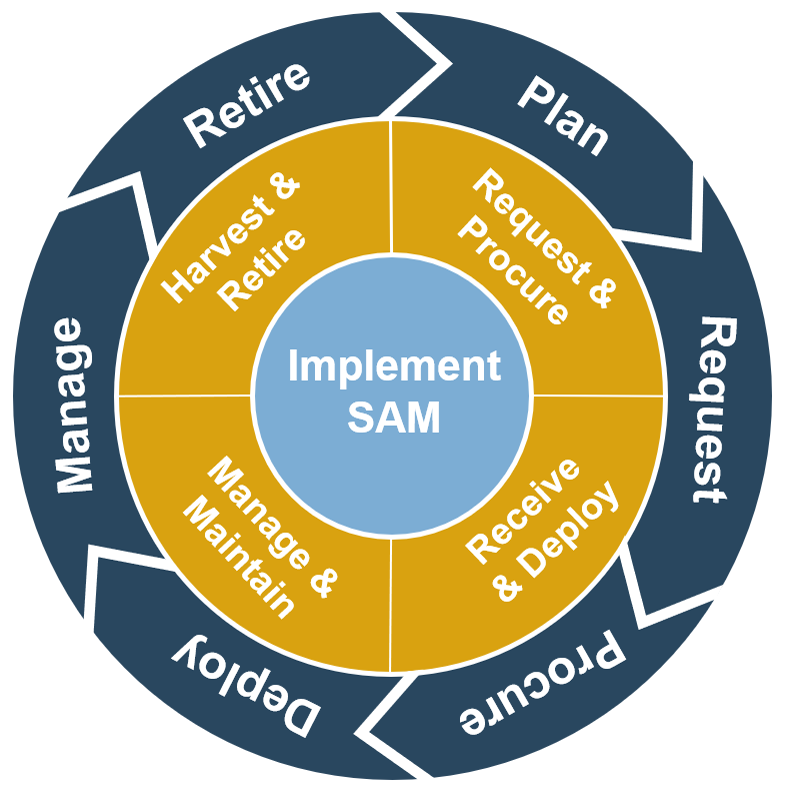
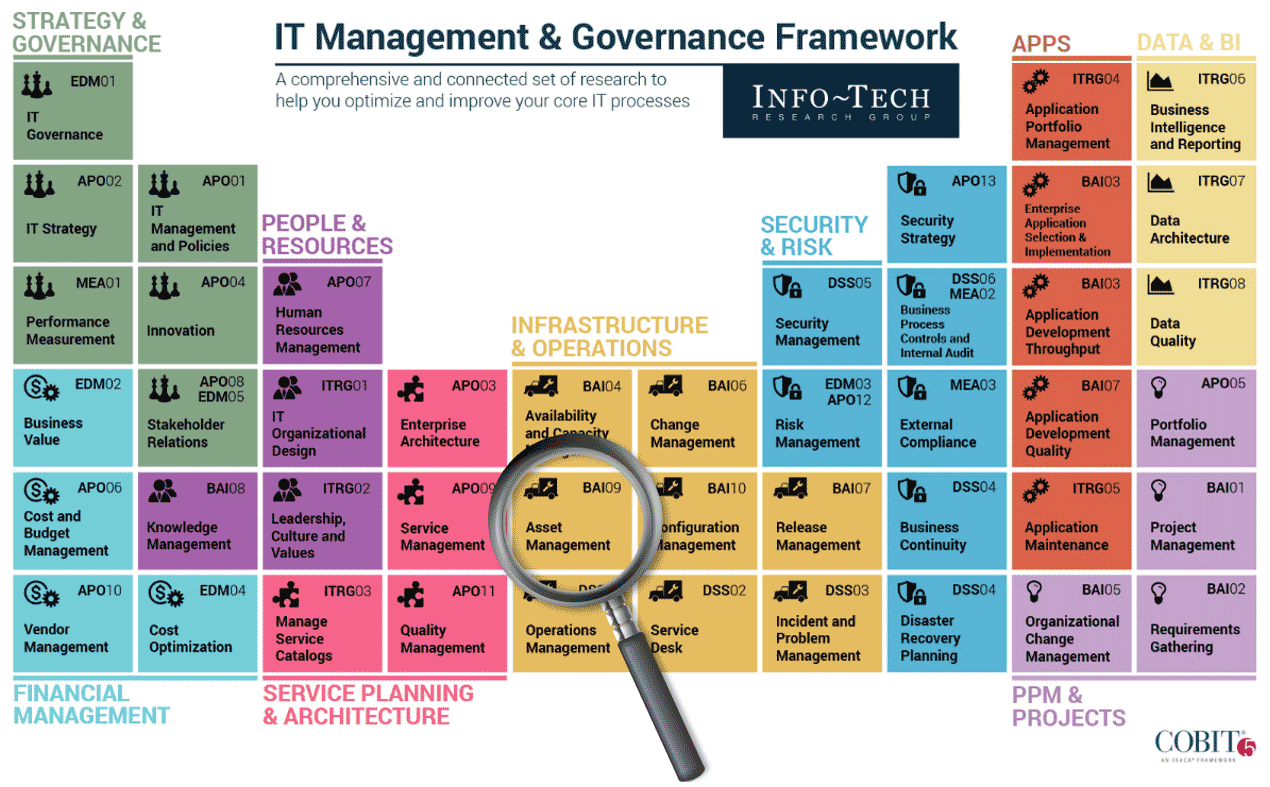
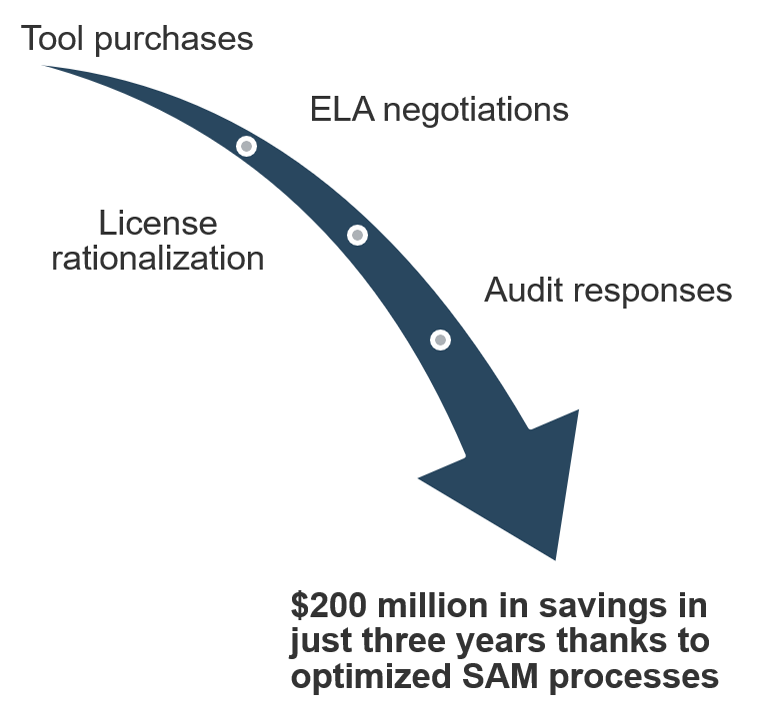
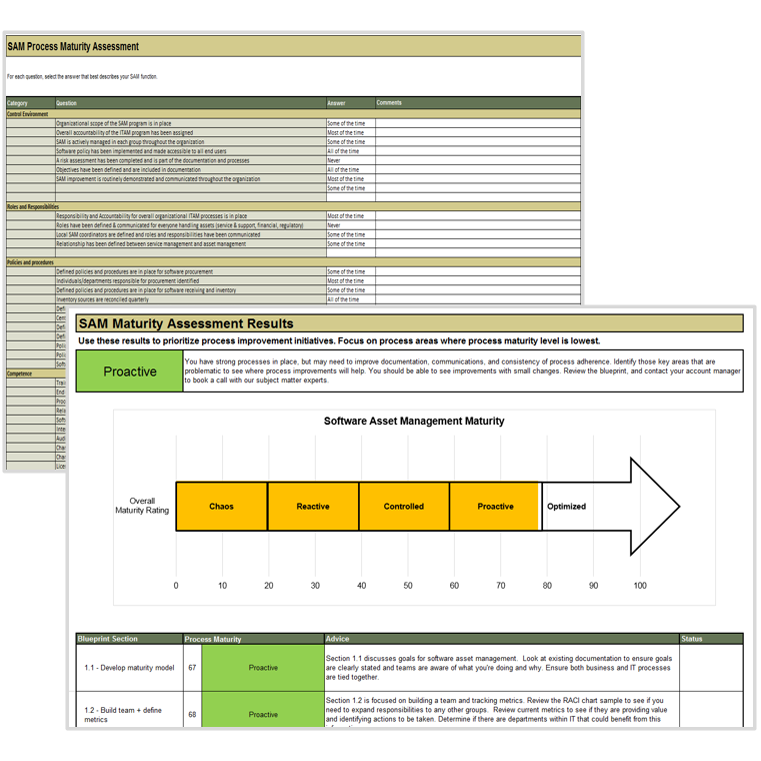
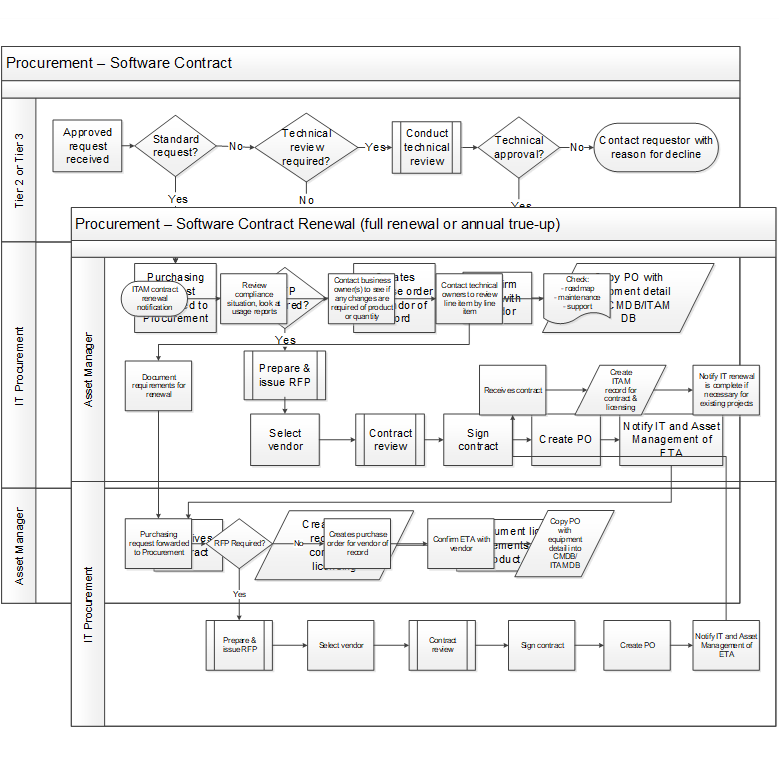
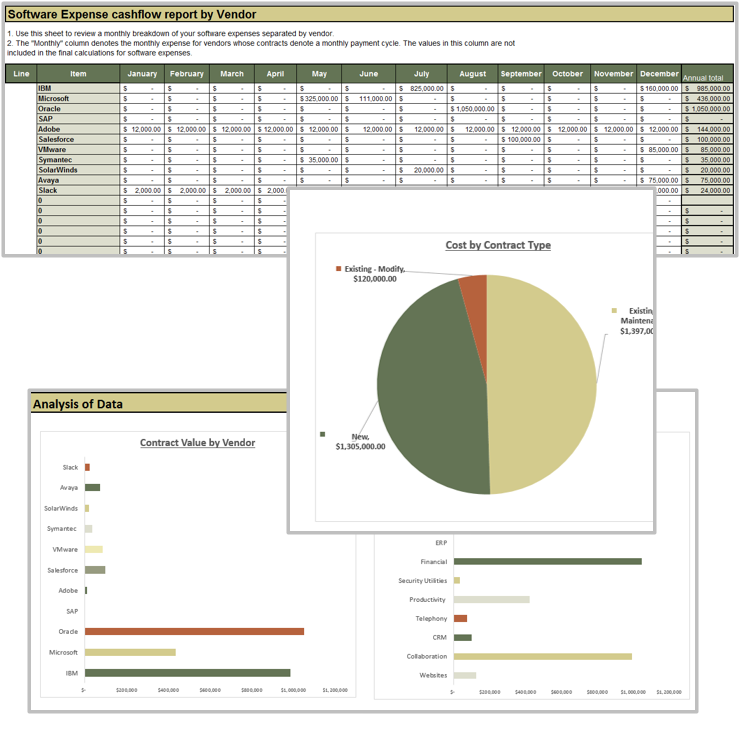
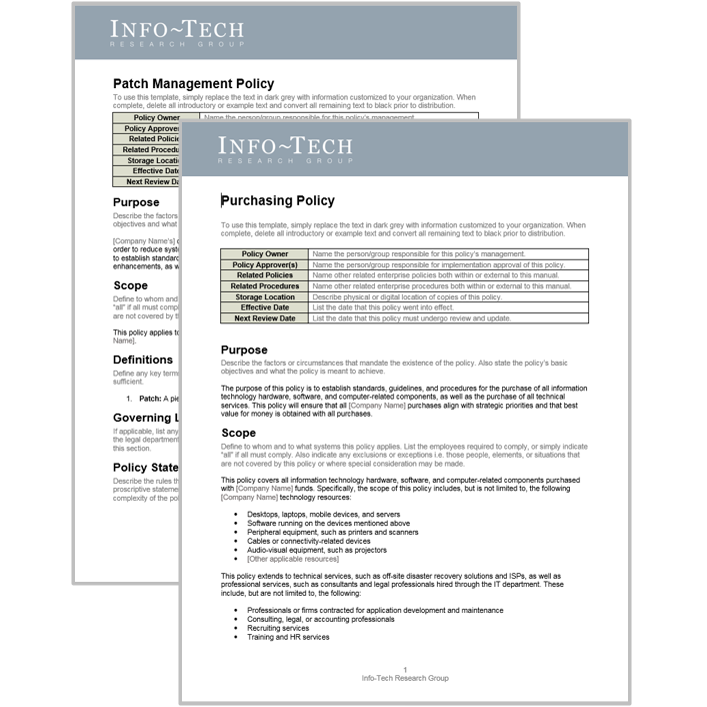
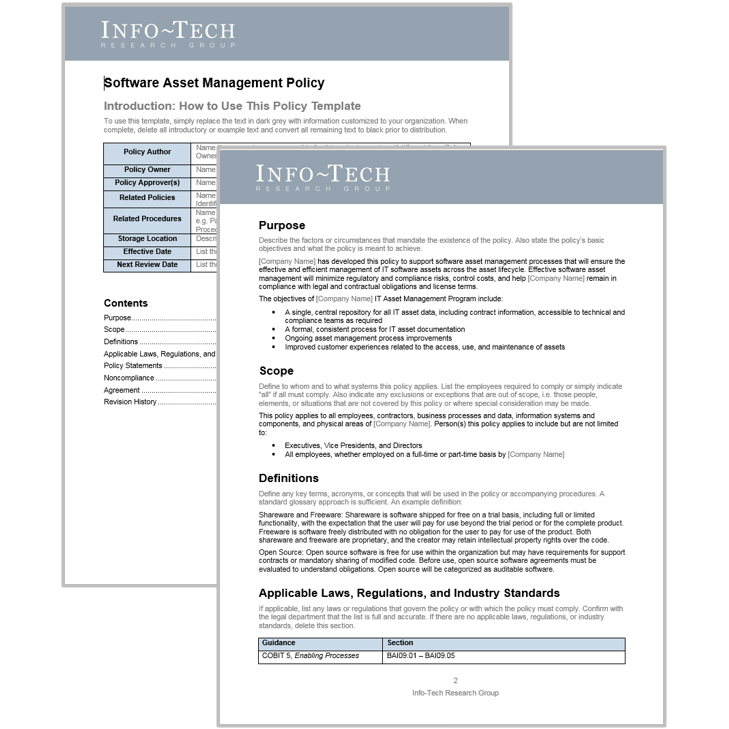
 Best-Practice Toolkit
 Onsite Workshop
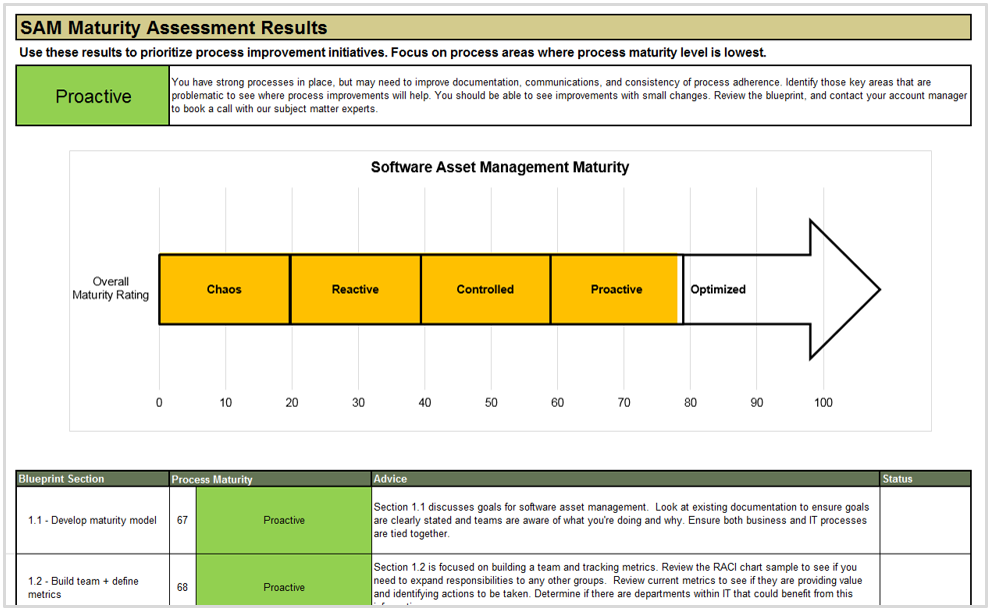
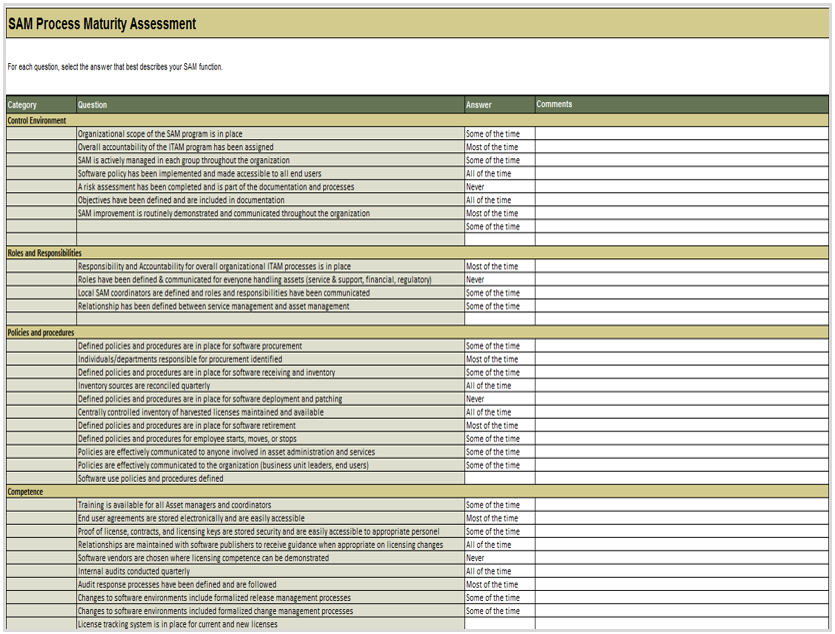
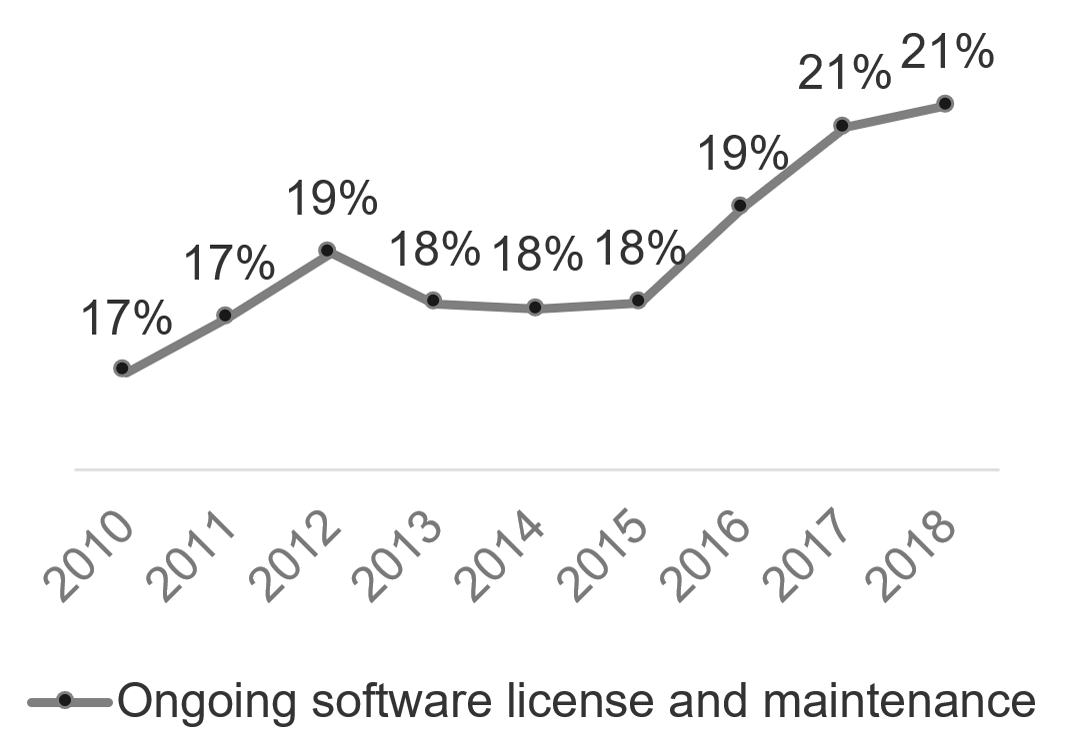
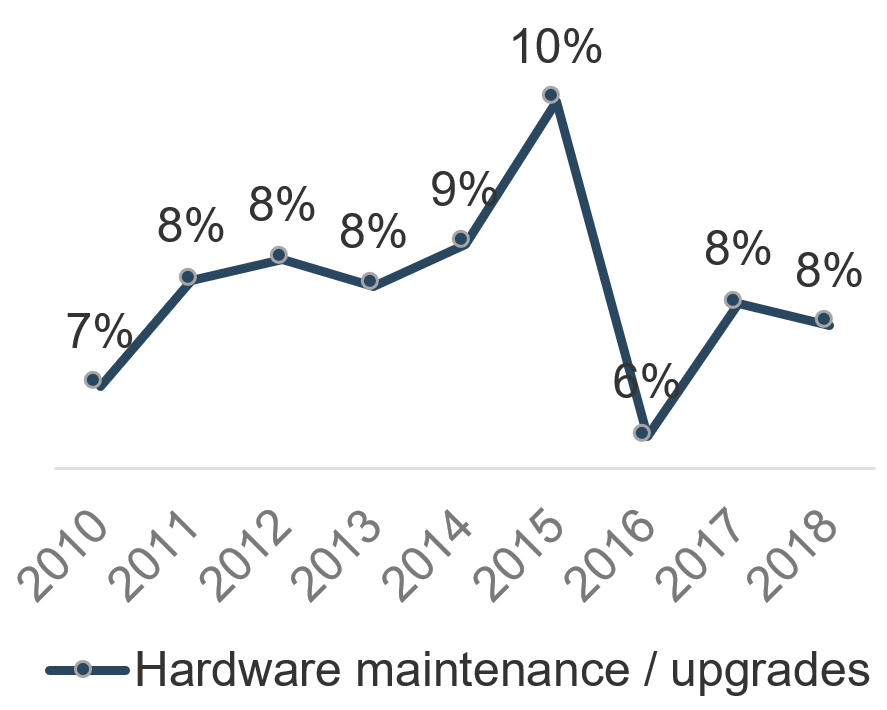
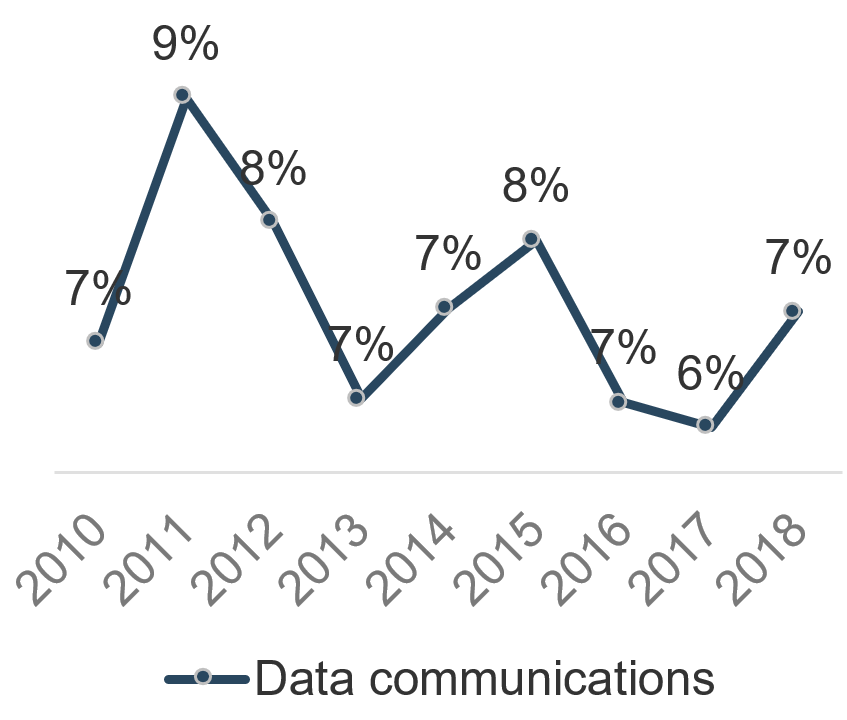
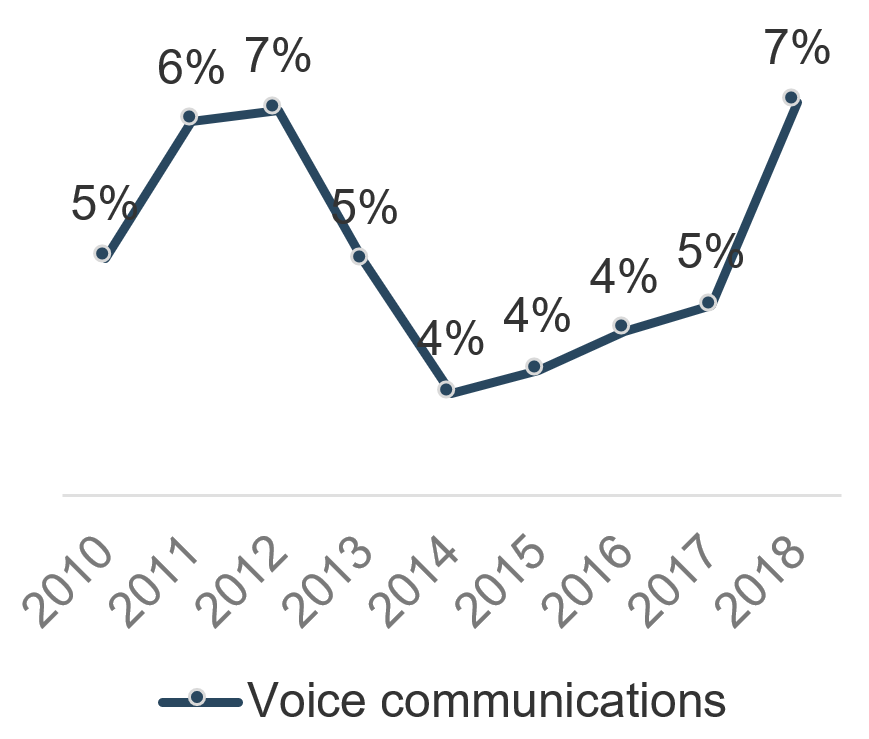
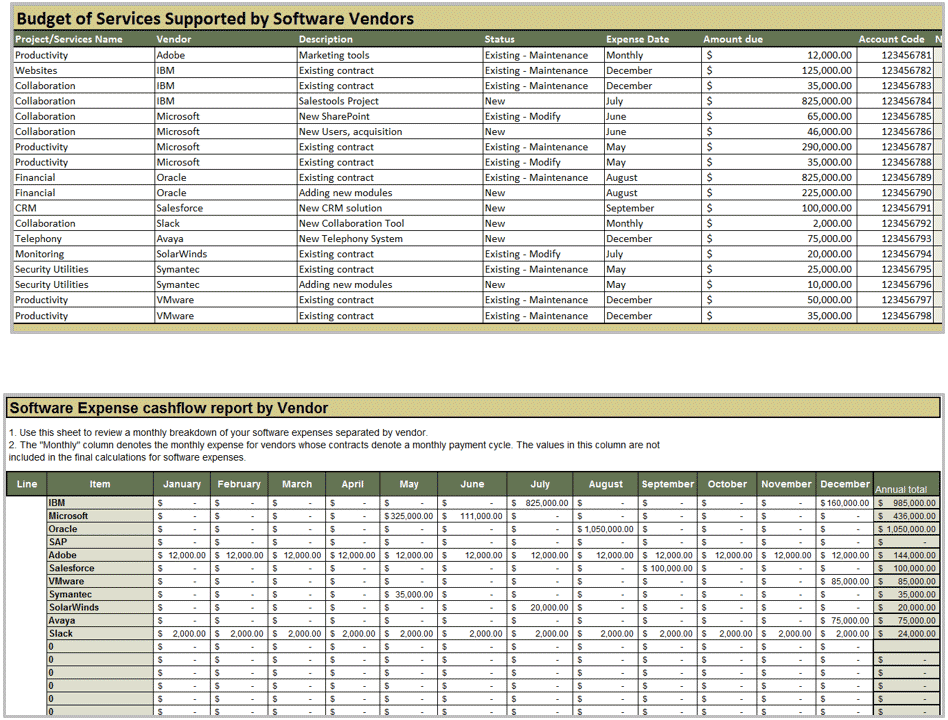
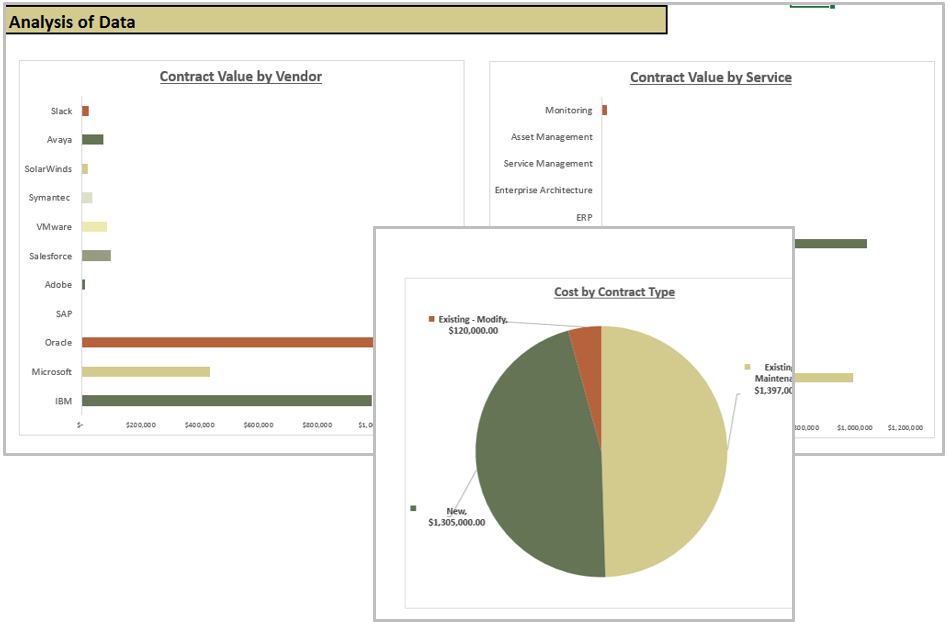

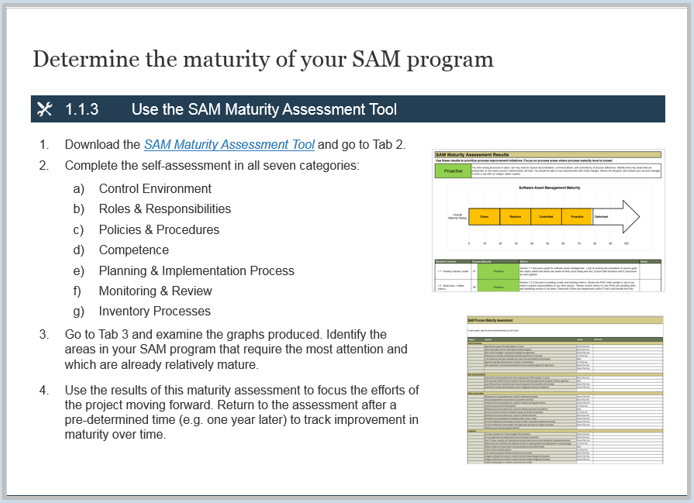
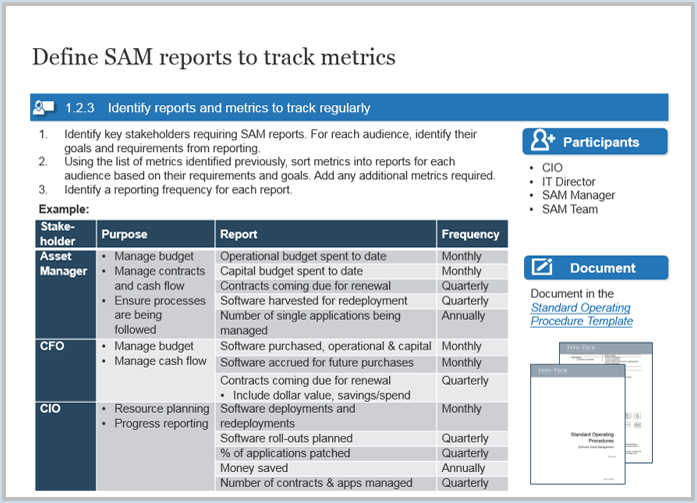

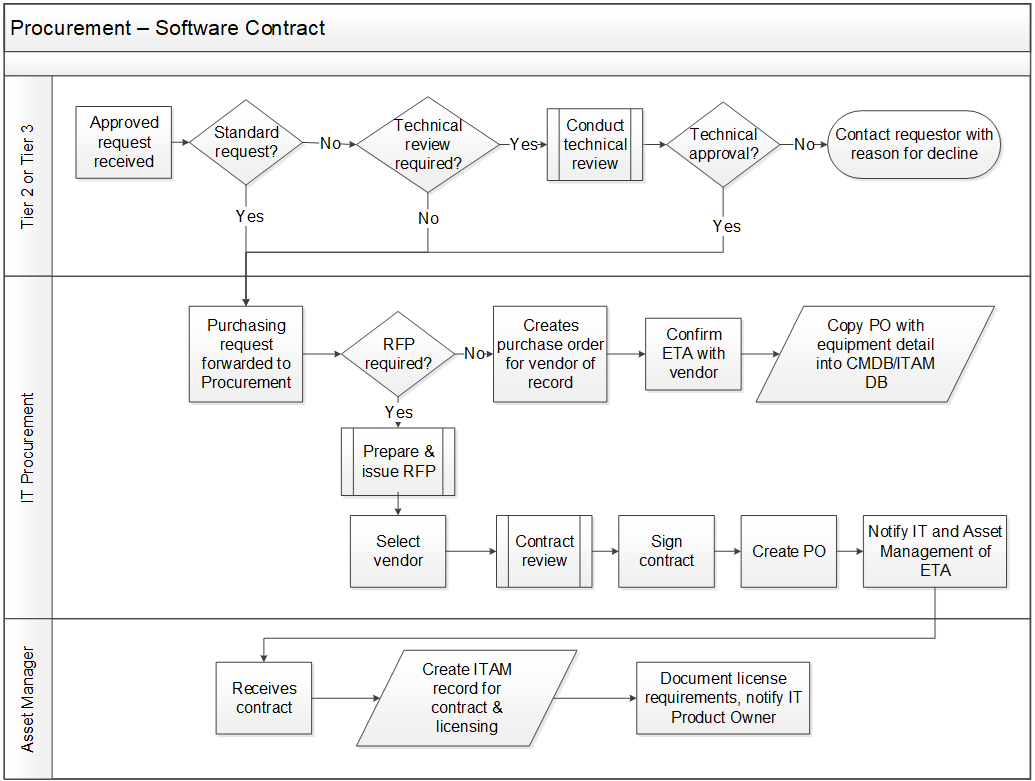
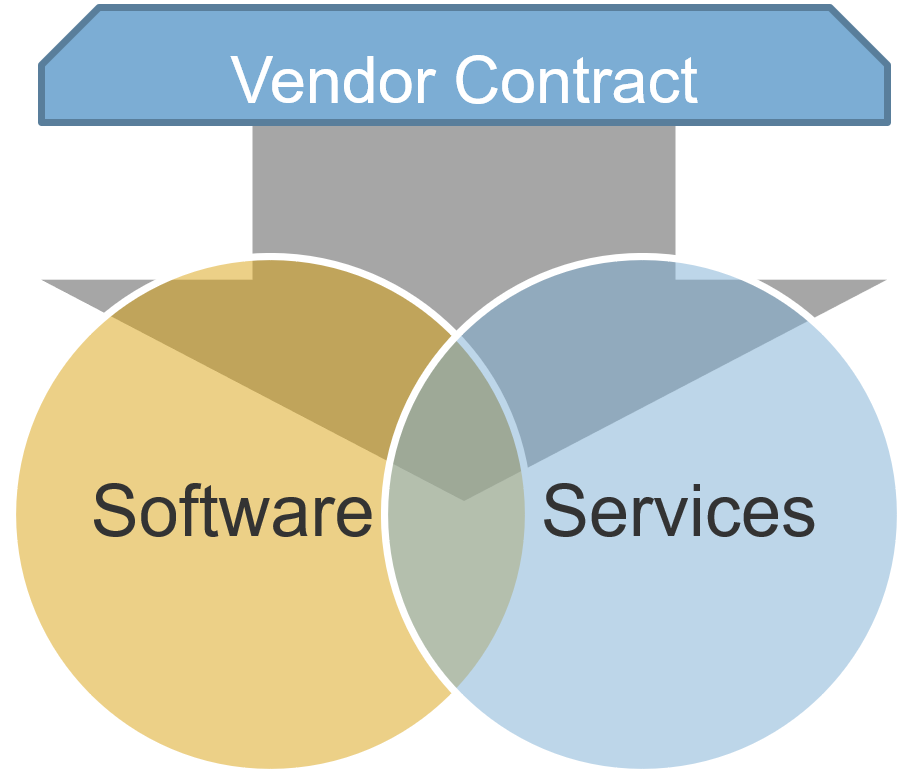
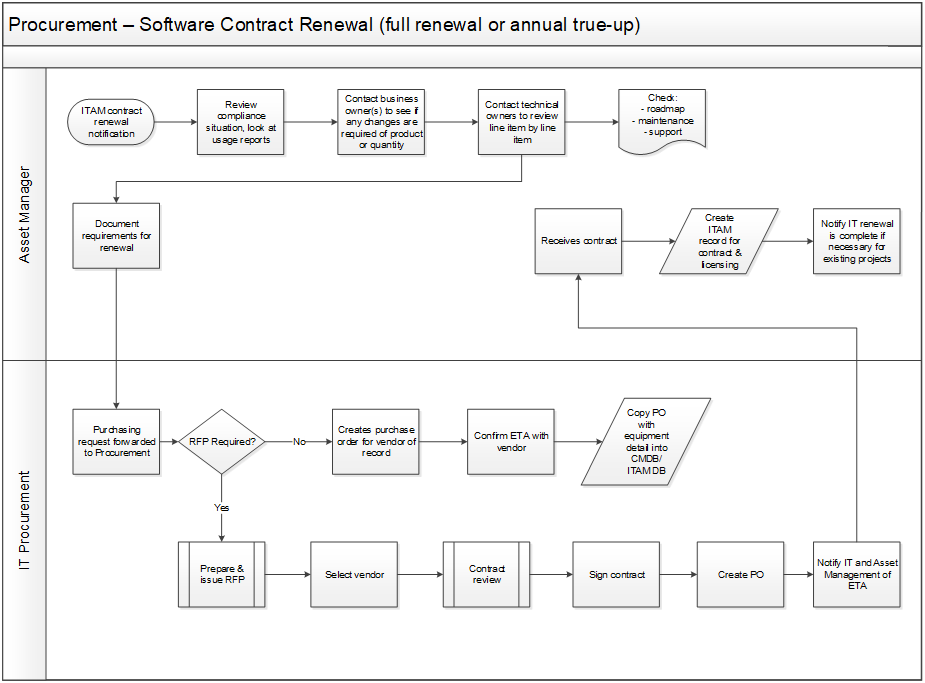
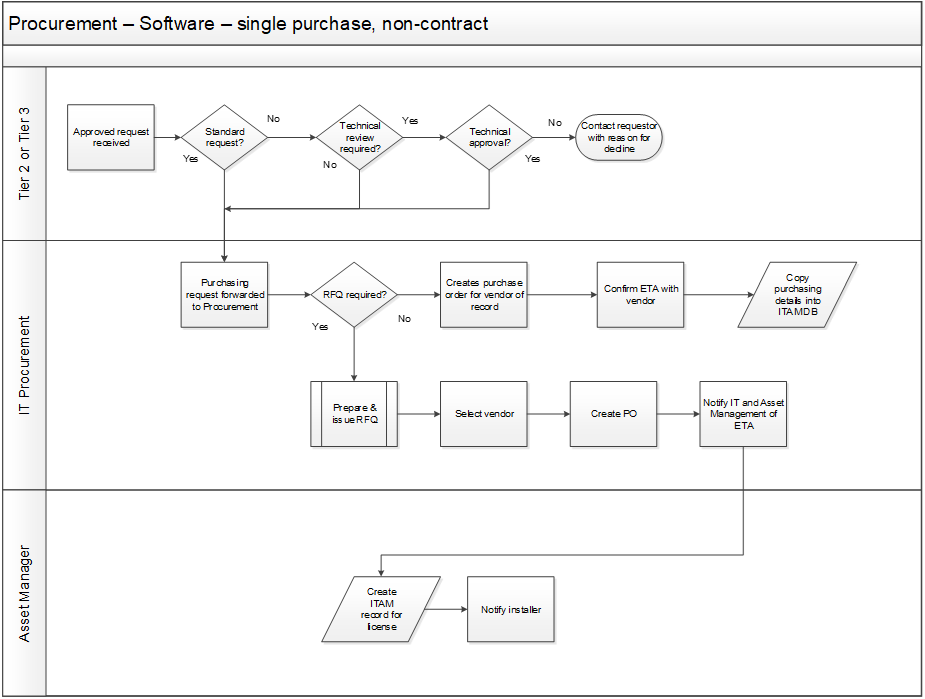
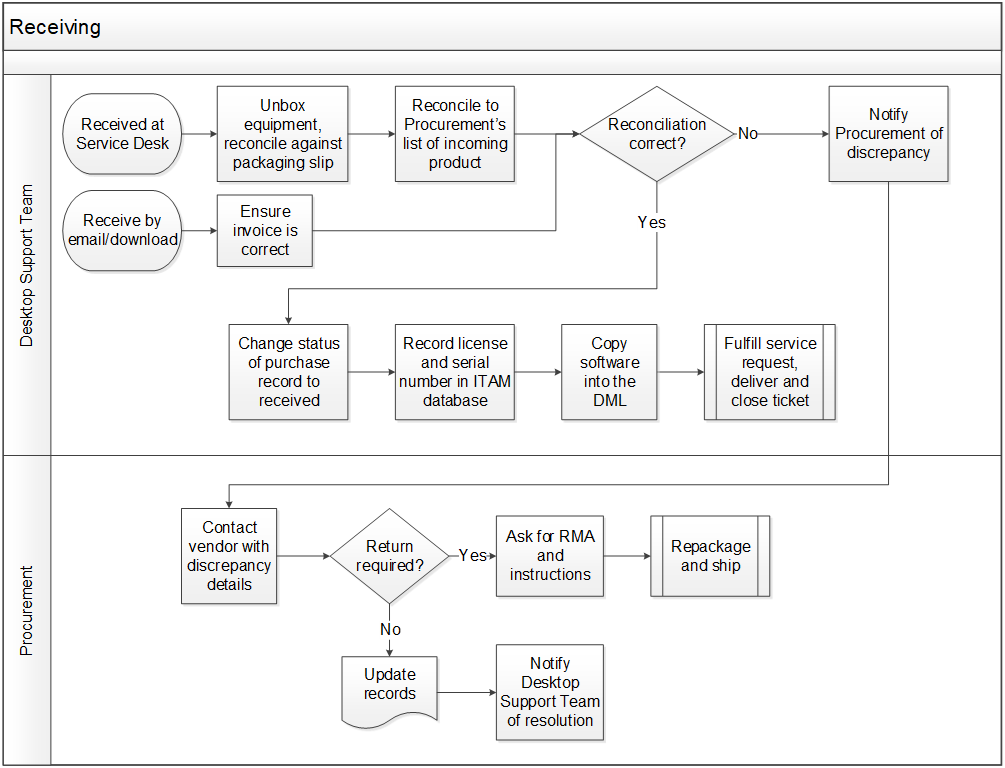
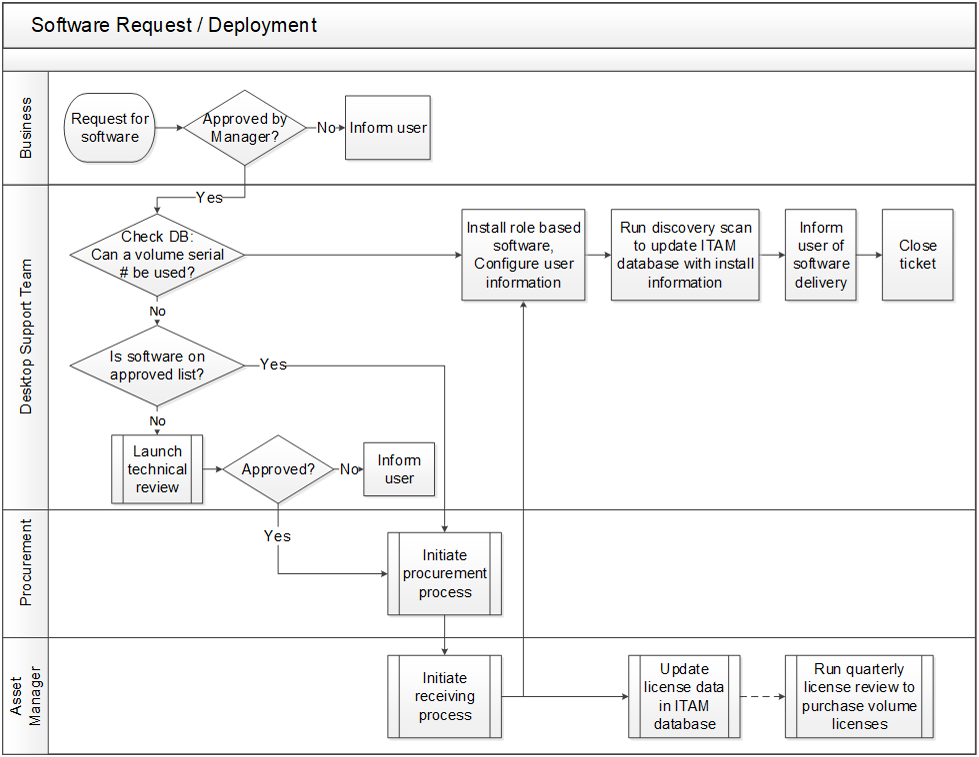
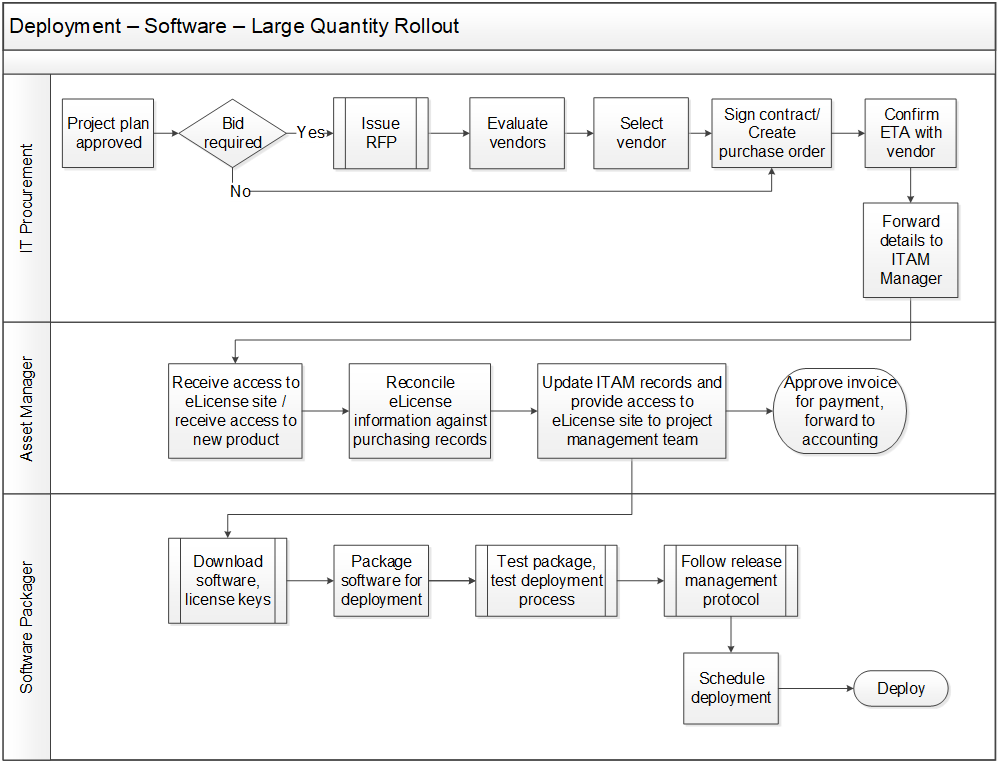
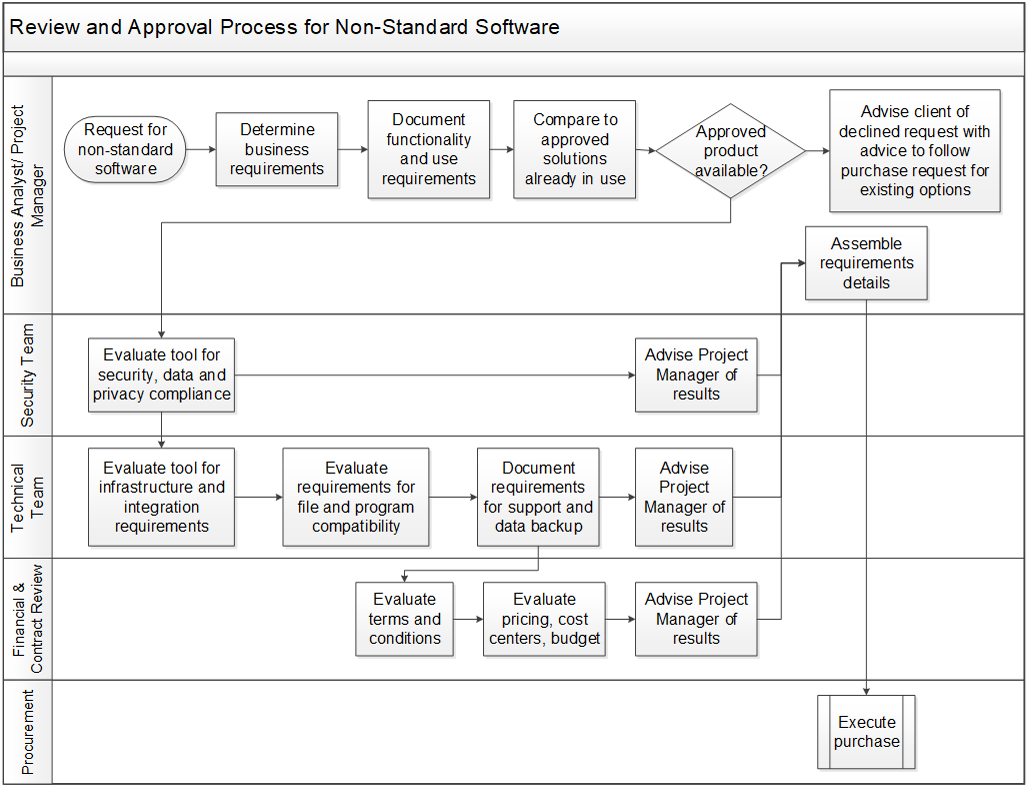
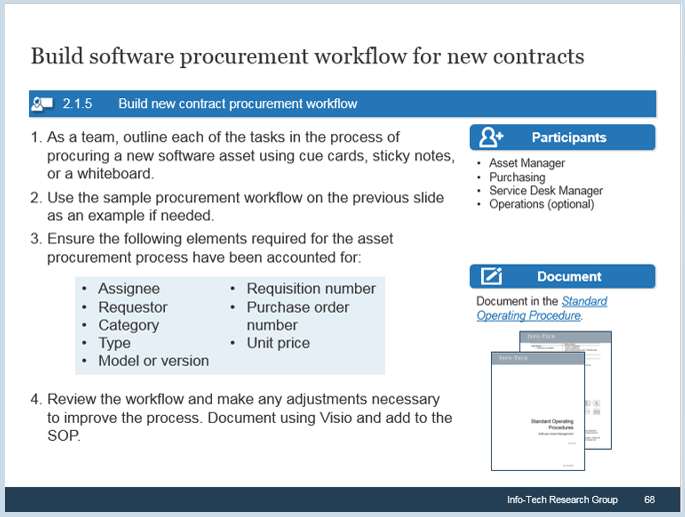
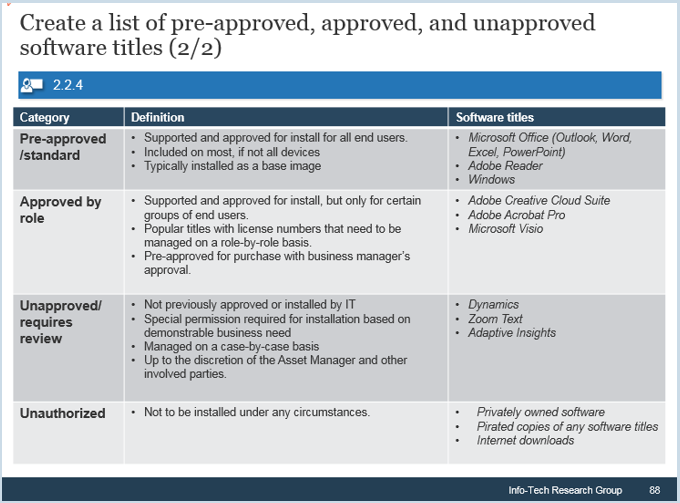
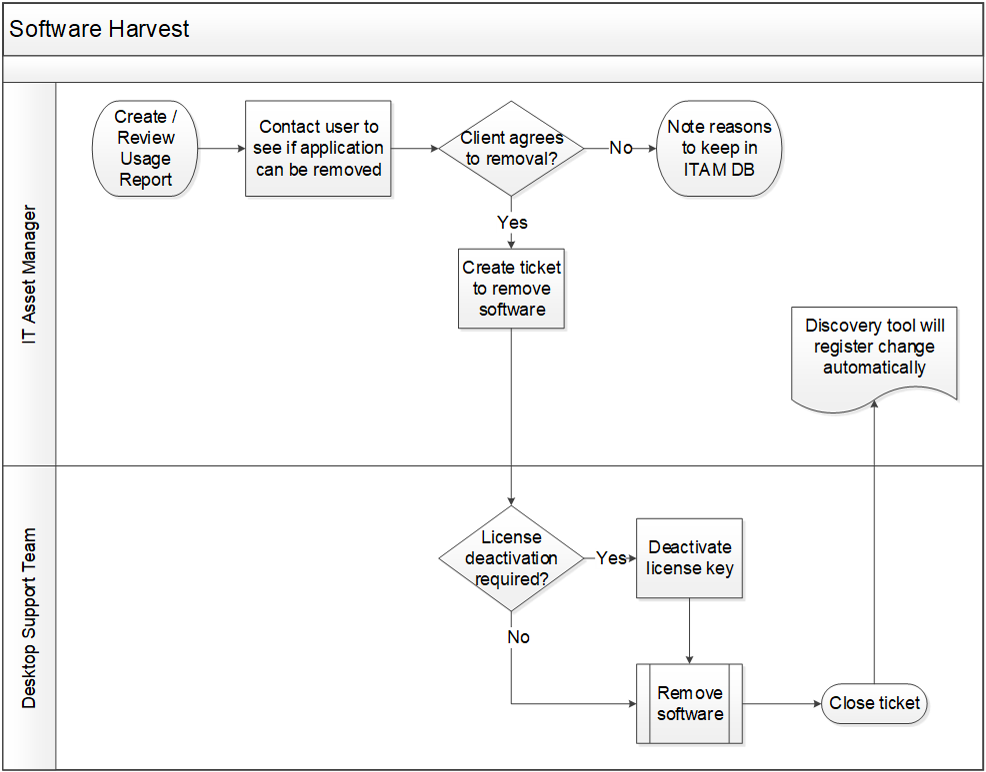
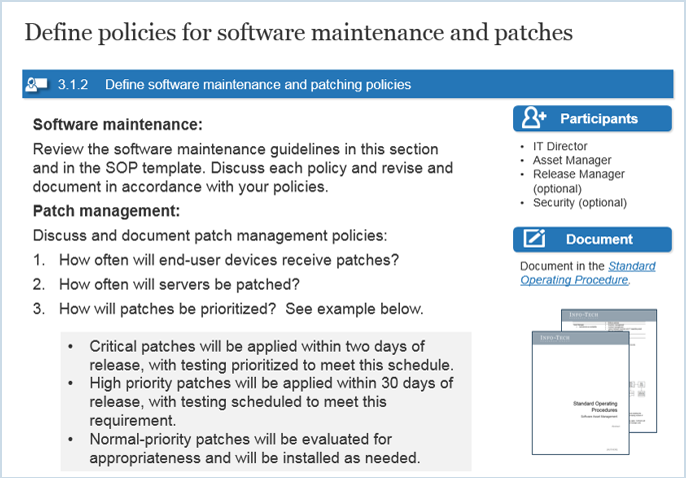
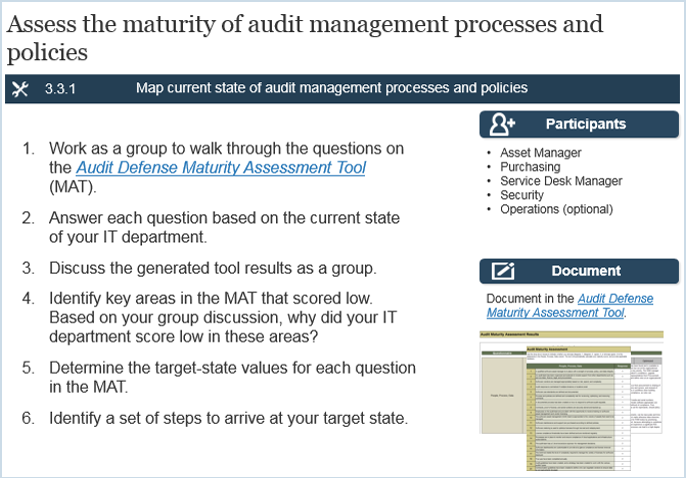
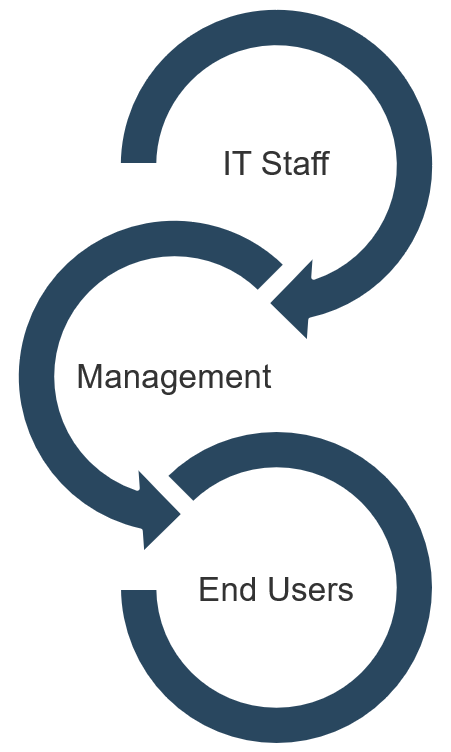
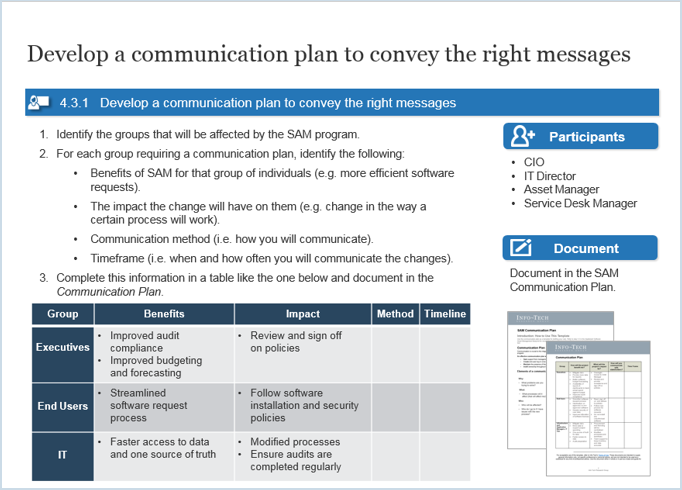
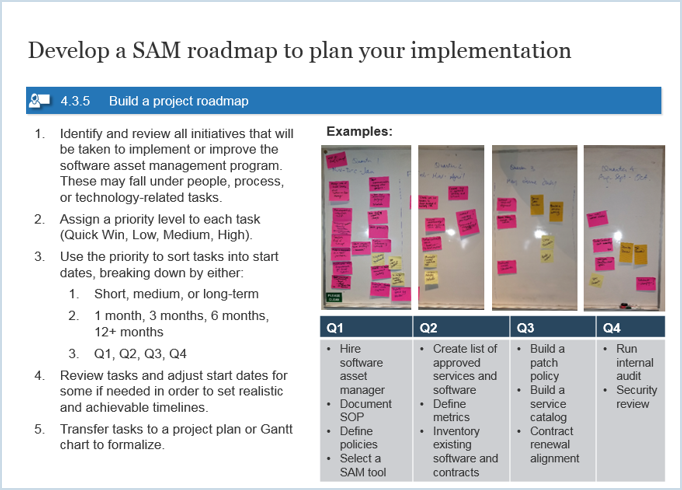


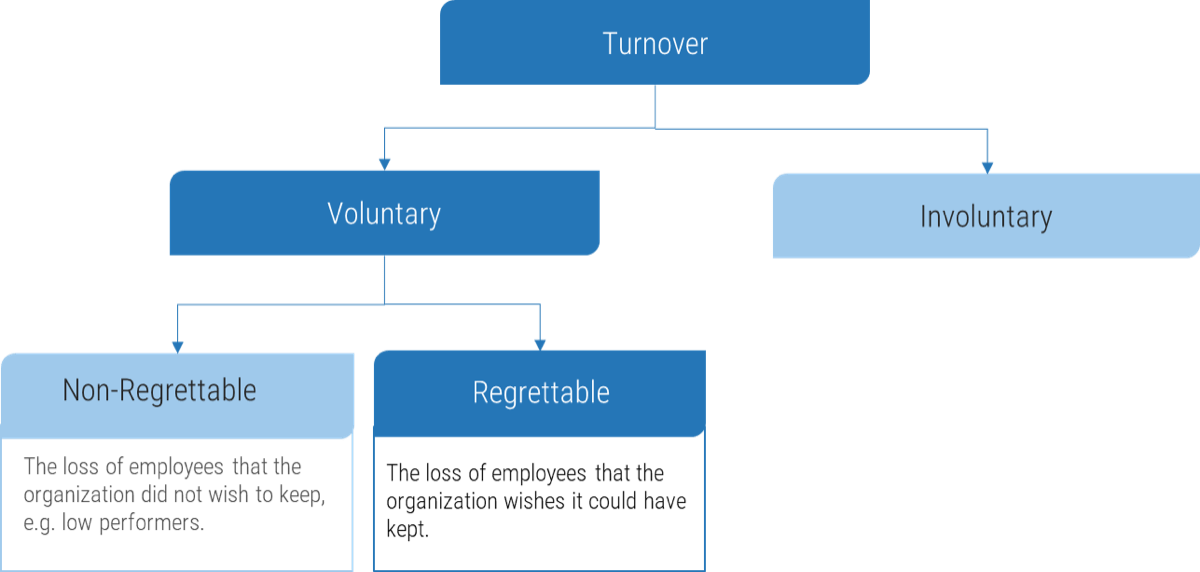
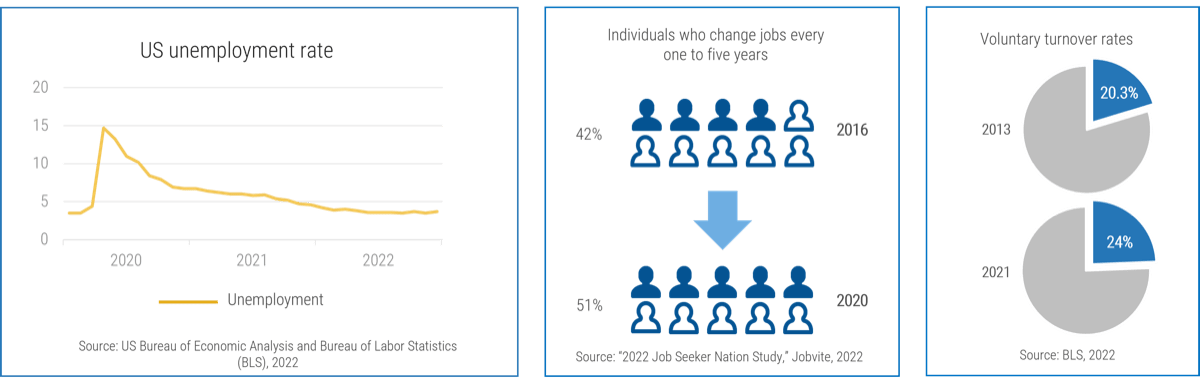
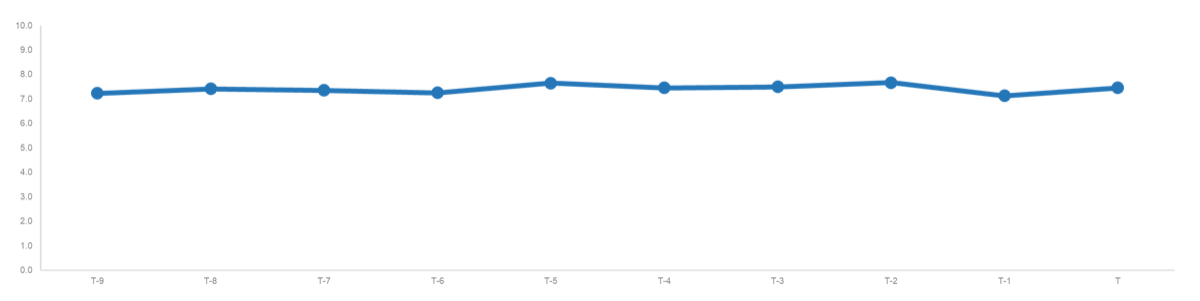
.png)
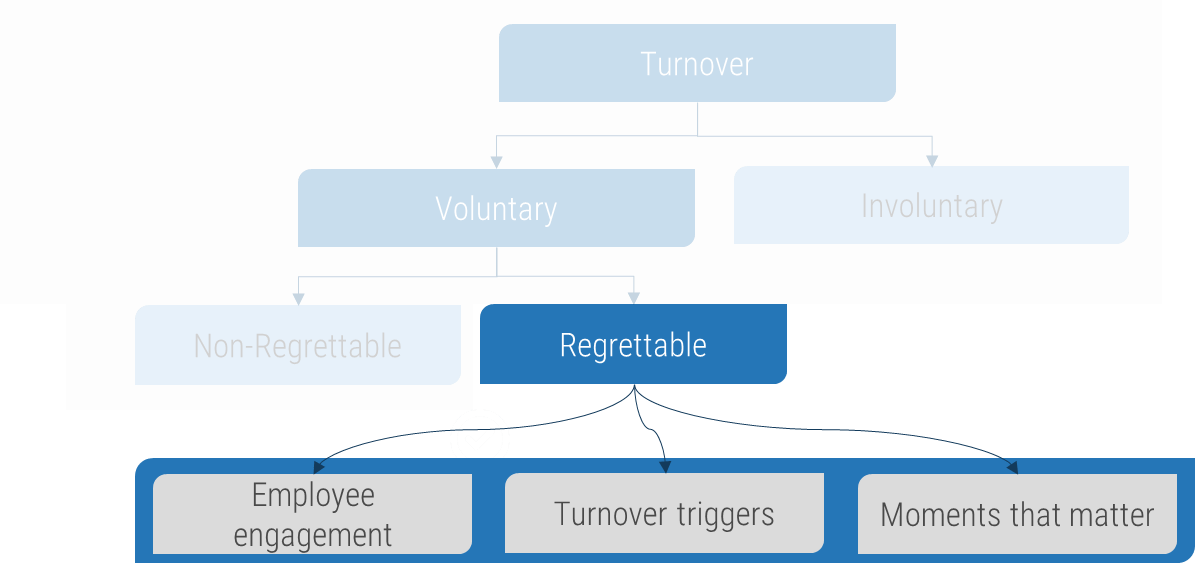


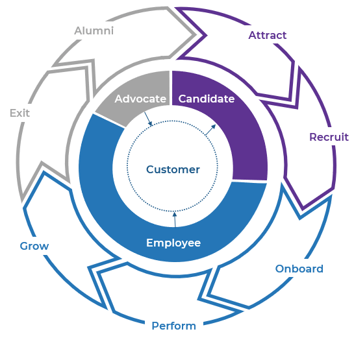
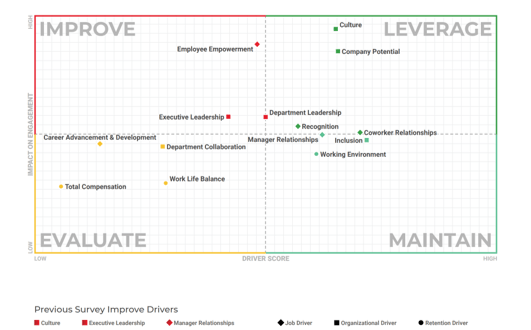
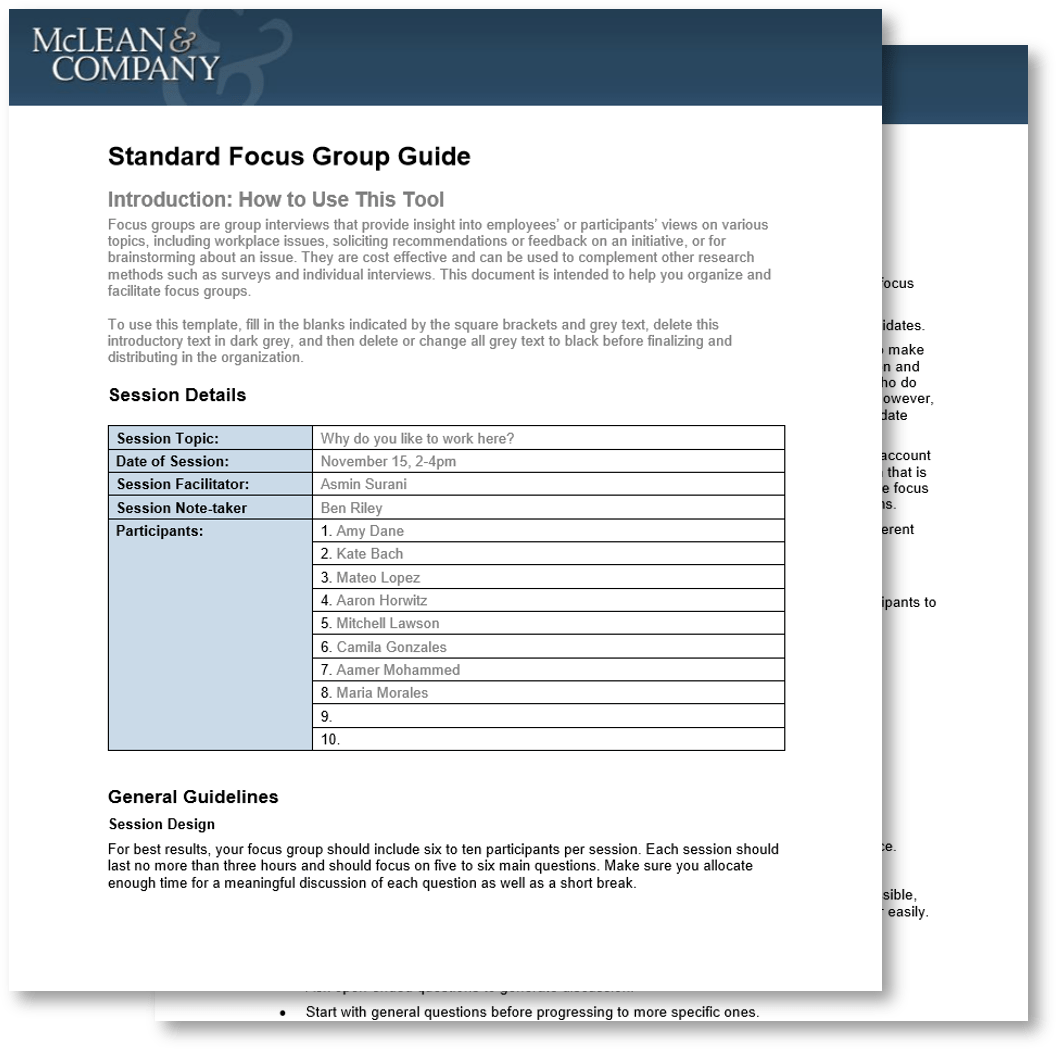
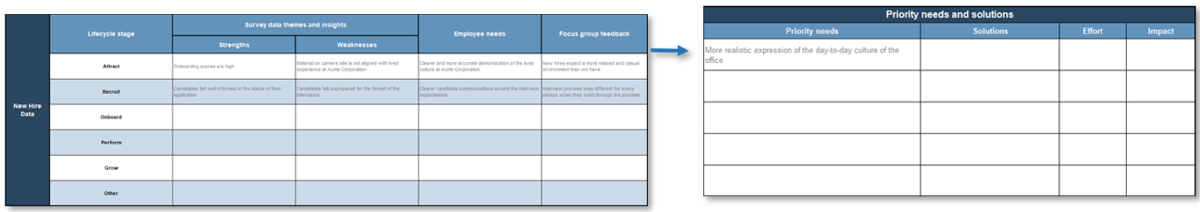


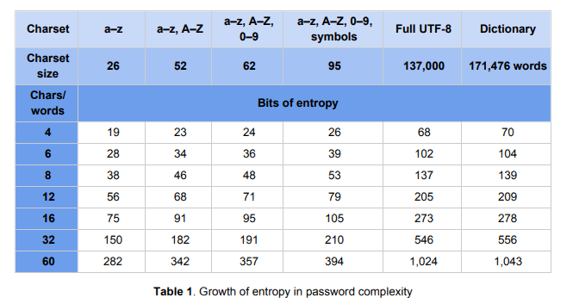
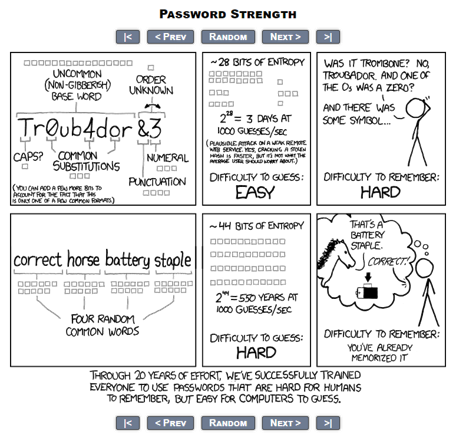
 22B hash/s">