Further reading
Mature and Scale Product Ownership
Strengthen the product owner’s role in your organization by focusing on core capabilities and proper alignment.
Executive Brief
Analyst Perspective
Empower product owners throughout your organization.

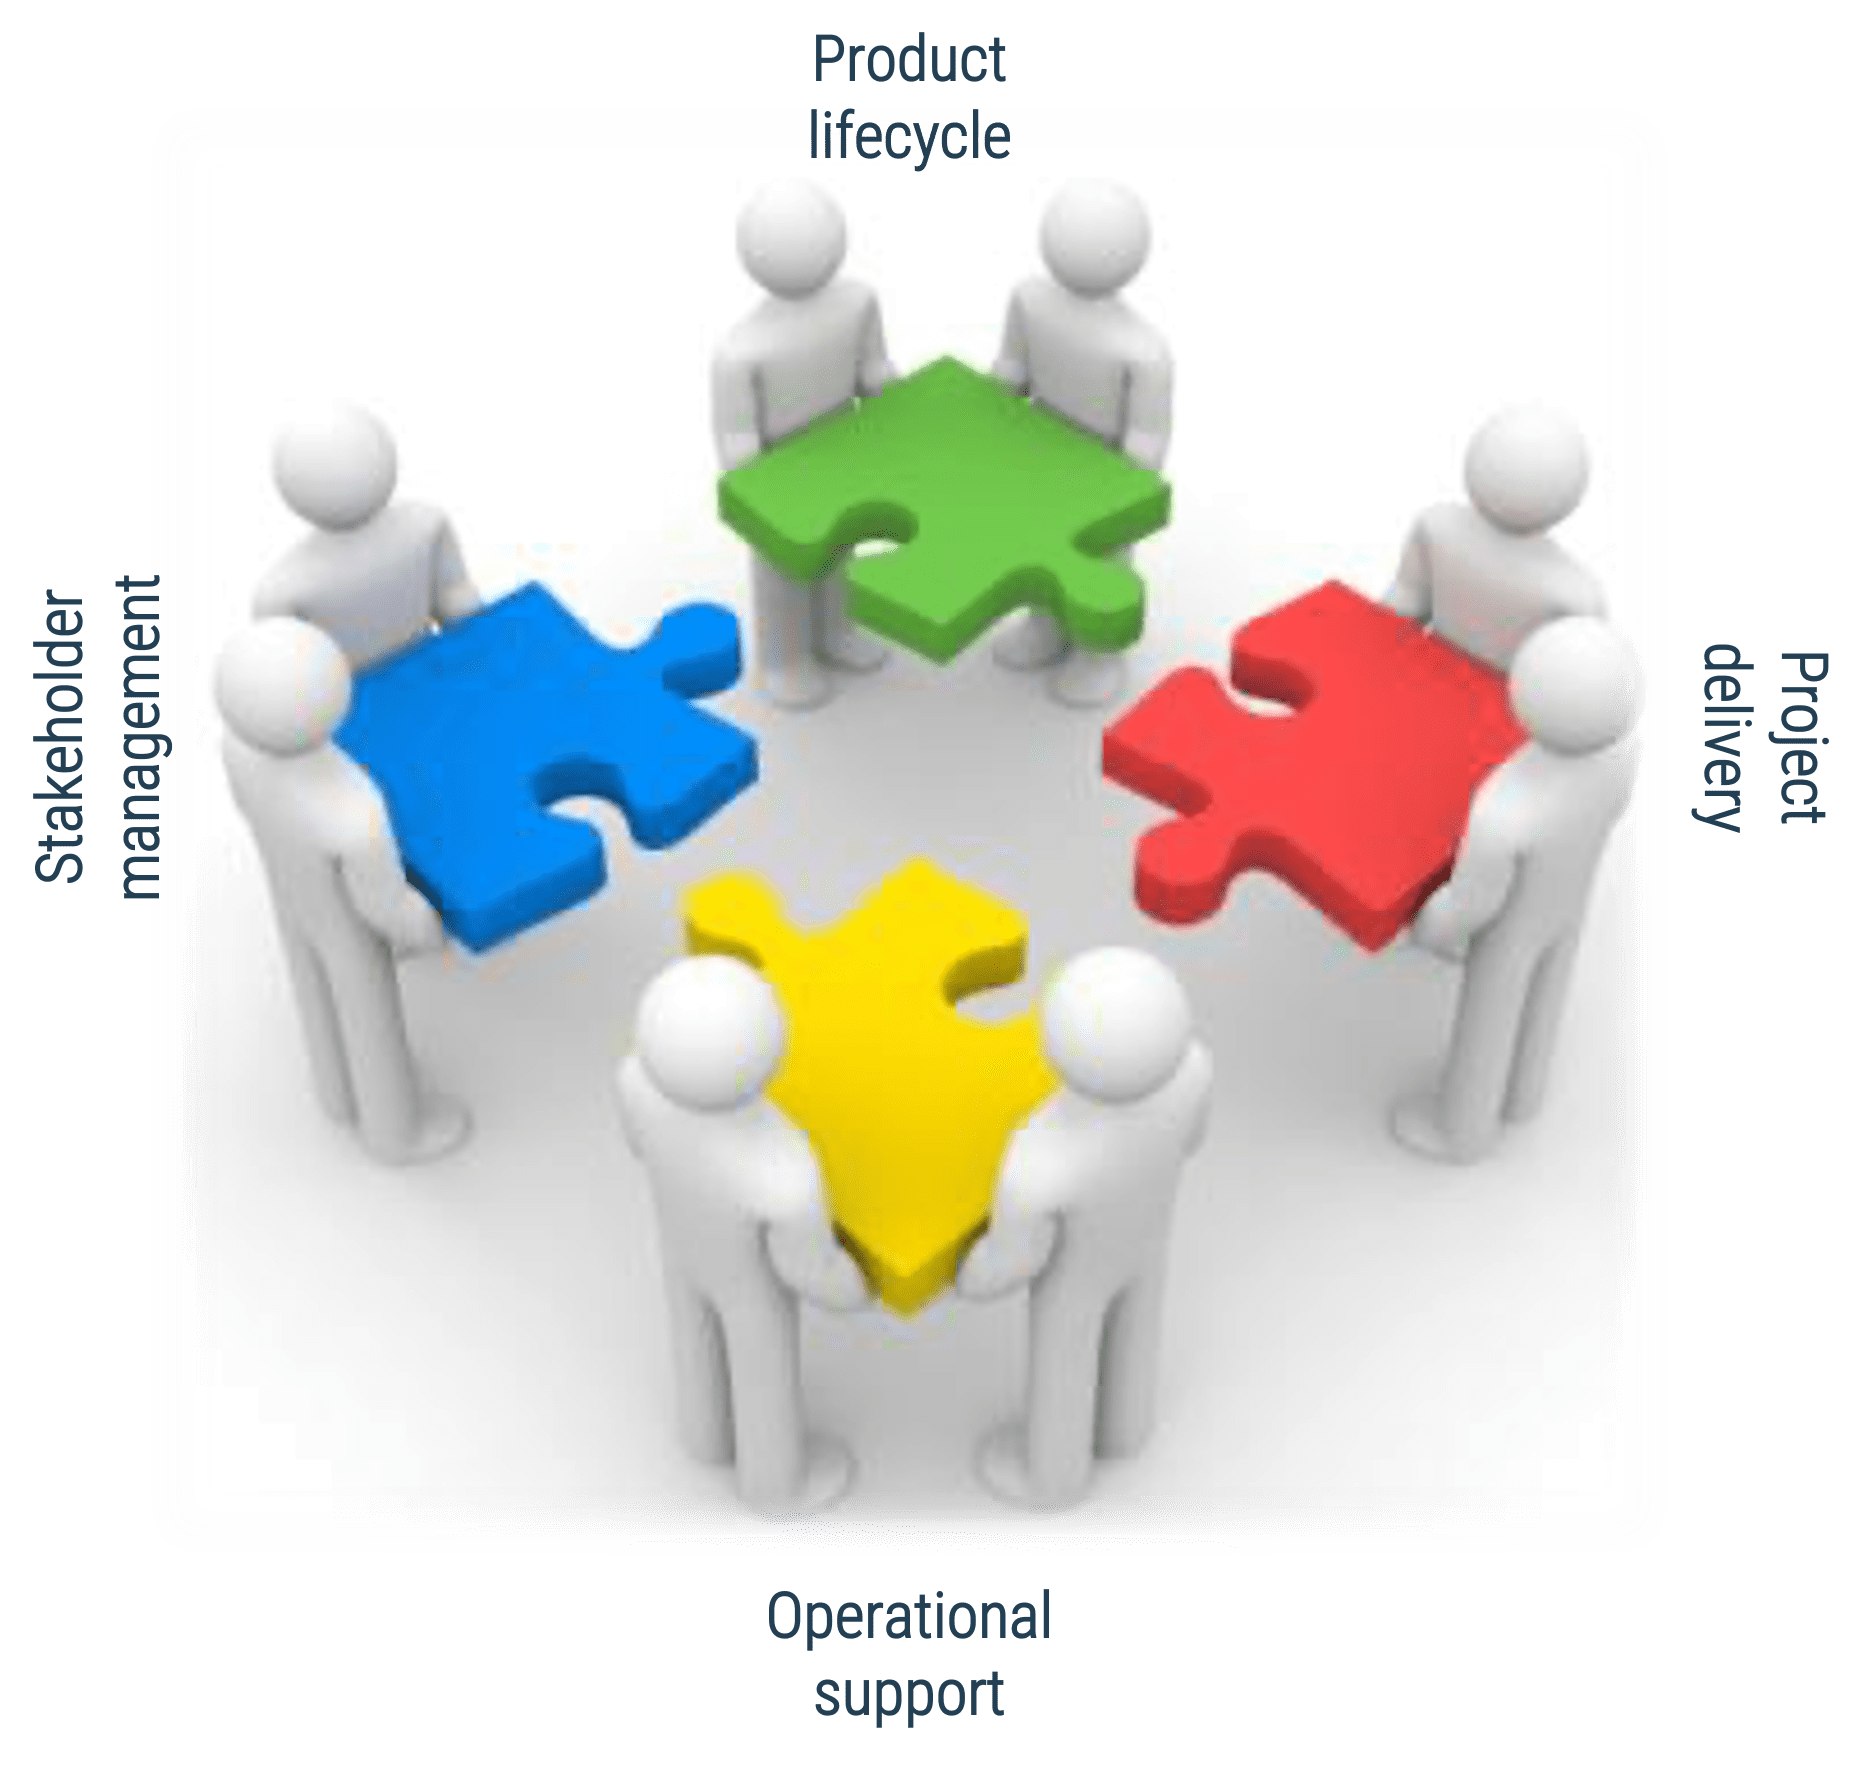
Whether you manage a product or service, the fundamentals of good product ownership are the same. Organizations need to focus on three key elements of product ownership in order to be successful.
-
Create an environment of empowerment and service leadership to reinforce product owners and product family managers as the true owners of the vision, improvement, and realized the value of their products.
-
Align product and product family owner roles based on operational alignment and the groups defined when scaling product management.
-
Develop your product owners to improve the quality of roadmaps, alignment to enterprise goals, and profit and loss (P&L) for each product or service.
By focusing the attention of the teammates serving in product owner or service owner roles, your organization will deliver value sooner and respond to change more effectively.
Hans Eckman
Principal Research Director – Application Delivery and Management
Info-Tech Research Group
Executive Summary
Your Challenge
Product owners must bridge the gap between the customers, operations, and delivery to ensure products continuously
deliver increasing value.
Product owners are often assigned to projects or product delivery without proper support, guidance, or alignment.
In many organizations the product owner role is not well-defined, serves as a proxy for stakeholder ownership, and lacks
reinforcement of the key skills needed to be successful.
|
Common Obstacles
Organizations have poor alignment or missing product owners between lines of business, IT, and operations.
Product owners are aligned to projects and demand management rather than long-term strategic product ownership.
Product families are not properly defined, scaled, and supported within organizations.
Individuals in product owner roles have an incomplete understanding of needed capabilities and lack a development path.
|
Info-Tech's Approach
Create a culture of product management trust and empowerment with product owners aligned to your operational structure and product needs.
Promote and develop true Agile skills among your product owners and family managers.
Implement Info-Tech’s product owner capability model to define the role expectations and provide a development path for product owners.
Extend product management success using Deliver on Your Digital Product Vision and Deliver Digital Products at Scale.
|
Info-Tech Insight
There is no single correct approach to product ownership. Product ownership must be tuned and structured to meet the delivery needs of your organization and the teams it serves.
Info-Tech’s Approach
Product owners make the final decision
-
Establish a foundation for empowerment and success
-
Assign product owners and align with products and
stakeholders
-
Mature product owner capabilities and skills
The Info-Tech difference
-
Assign product owners where product decisions are needed, not to match org charts or delivery teams. The product owner
has the final word on product decisions.
-
Organize product owners into related teams to ensure product capabilities delivered are aligned to enterprise strategy
and goals.
-
Shared products and services must support the needs of many product owners with conflicting priorities. Shared service
product owners must map and prioritize demand to align to enterprise priorities and goals.
-
All product owners share the same capability model.
Insight summary
There is no single correct approach to product ownership
Successful product management starts with empowerment and accountability. Product owners own the vision, roadmap, and
value realization for their product or family aligned to enterprise goals and priorities.
Phase 1 insight
Product owners represent three primary perspectives: business (external-facing), technical (systems and tools), or
operational (manual processes). Although all share the same capabilities, how they approach their responsibilities is
influenced by their primary perspective.
Phase 2 insight
Start with your operational grouping of products and families, identifying where an owner is needed. Then, assign people
to the products and families. The owner does not define the product or family.
Phase 3 insight
Product owners are operating under an incomplete understanding of the capabilities needed to succeed. Most product/service owners lack a complete picture of the needed capabilities, skills, and activities to successfully perform their roles.
Product and service ownership share the same foundation
The underlying capabilities and best practices to own and improve a product or service are identical for both roles. Use
the terms that make the most sense for your culture.
Map product owner roles to your existing job titles
Identify where product management is needed and align expectations with existing roles. Successful product management
does not require a dedicated job family.
Projects can be a mechanism for funding product changes and improvements
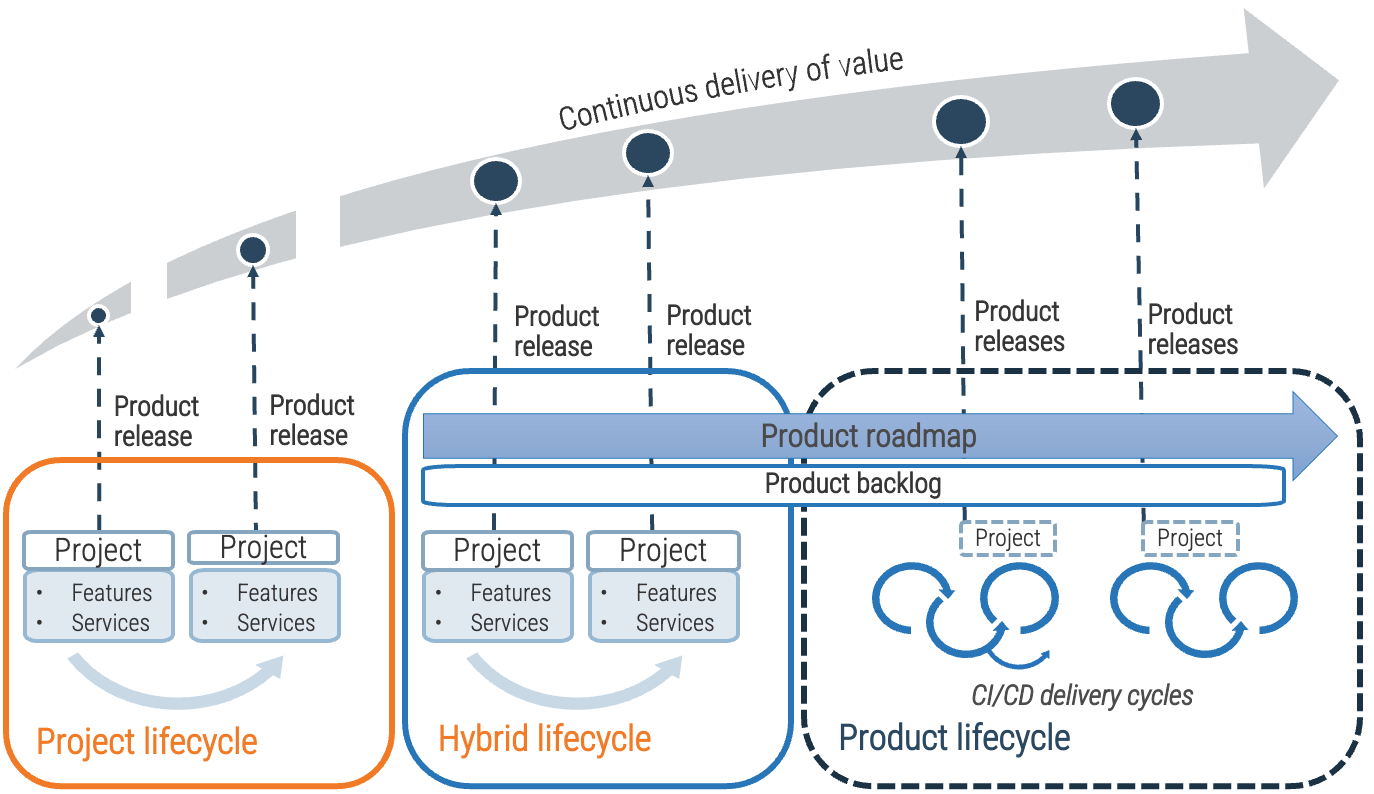
Projects within products
Regardless of whether you recognize yourself as a product-based or project-based shop, the same basic principles should apply.
You go through a period or periods of project-like development to build a version of an application or product.
You also have parallel services along with your project development, which encompass the more product-based view. These may range from basic support and maintenance to full-fledged strategy teams or services like sales and marketing.
Product and services owners share the same foundation and capabilities
For the purpose of this blueprint, product/service and product owner/service owner are used interchangeably. The term
“product” is used for consistency but would apply to services, as well.
Product = Service
Common foundations: Focus on continuous improvement, ROI, and value realization. Clear vision, goals, roadmap, and backlog.
“Product” and “service” are terms that each organization needs to define to fit its culture and customers (internal and
external). The most important aspect is consistent use and understanding of:
-
External products
-
Internal products
-
External services
-
Internal services
-
Products as a service (PaaS)
-
Productizing services (SaaS)
Recognize the product owner perspectives
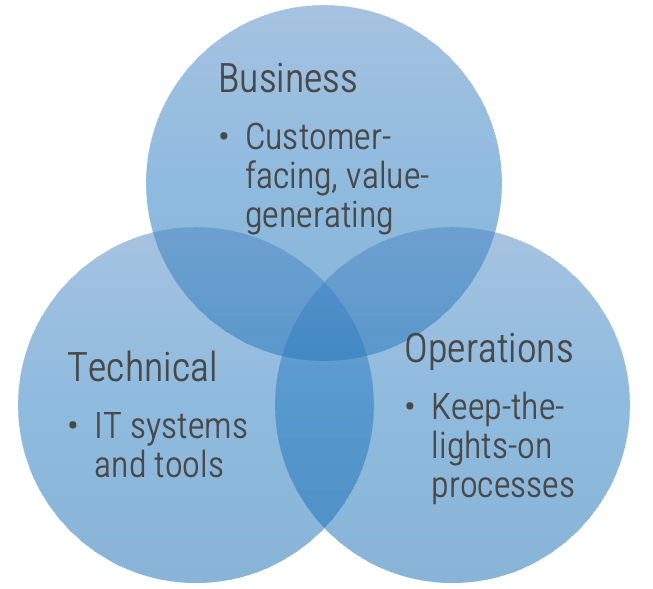
Product owners represent one of three primary perspectives. Although all share the same capabilities, how they approach their responsibilities is influenced by their primary perspective.
Info-Tech Insight
Product owners must translate needs and constraints from their perspective into the language of their audience. Kathy Borneman, Digital Product Owner at SunTrust Bank, noted the challenges of finding a common language between lines of business and IT (e.g. what is a unit?).
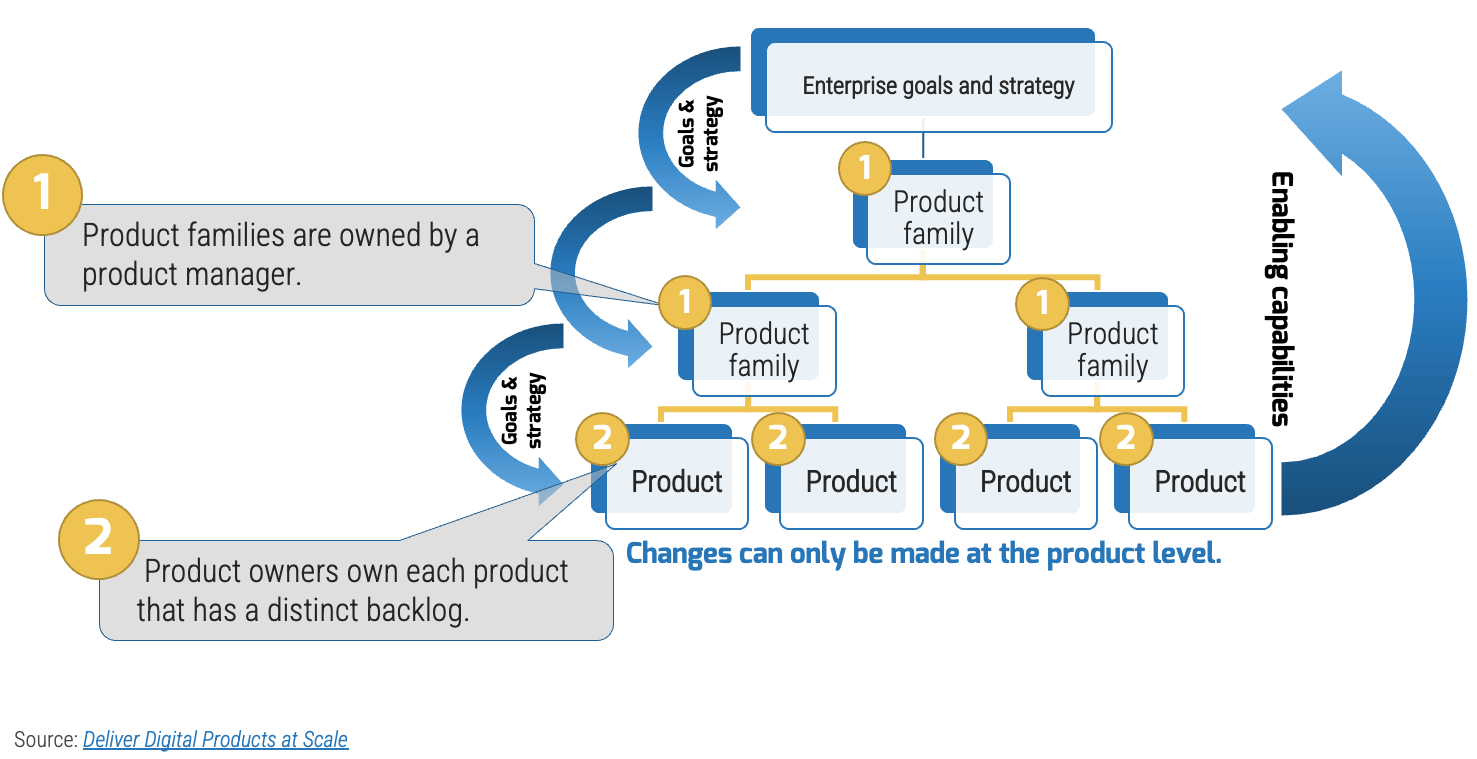
Match your product management role definitions to your product family levels
Product ownership exists at the different operational tiers or levels in your product hierarchy. This does not imply a management relationship.
Product portfolio
Groups of product families within an overall value stream or capability grouping.
Project portfolio manager
Product family
A collection of related products. Products can be grouped along architectural, functional, operational, or experiential
patterns.
Product family manager
Product
Single product composed of one or more applications and services.
Product owner
Info-Tech Insight
Define the current roles that will perform the product management function or define consistent role names to product
owners and managers.
Align enterprise value through product families
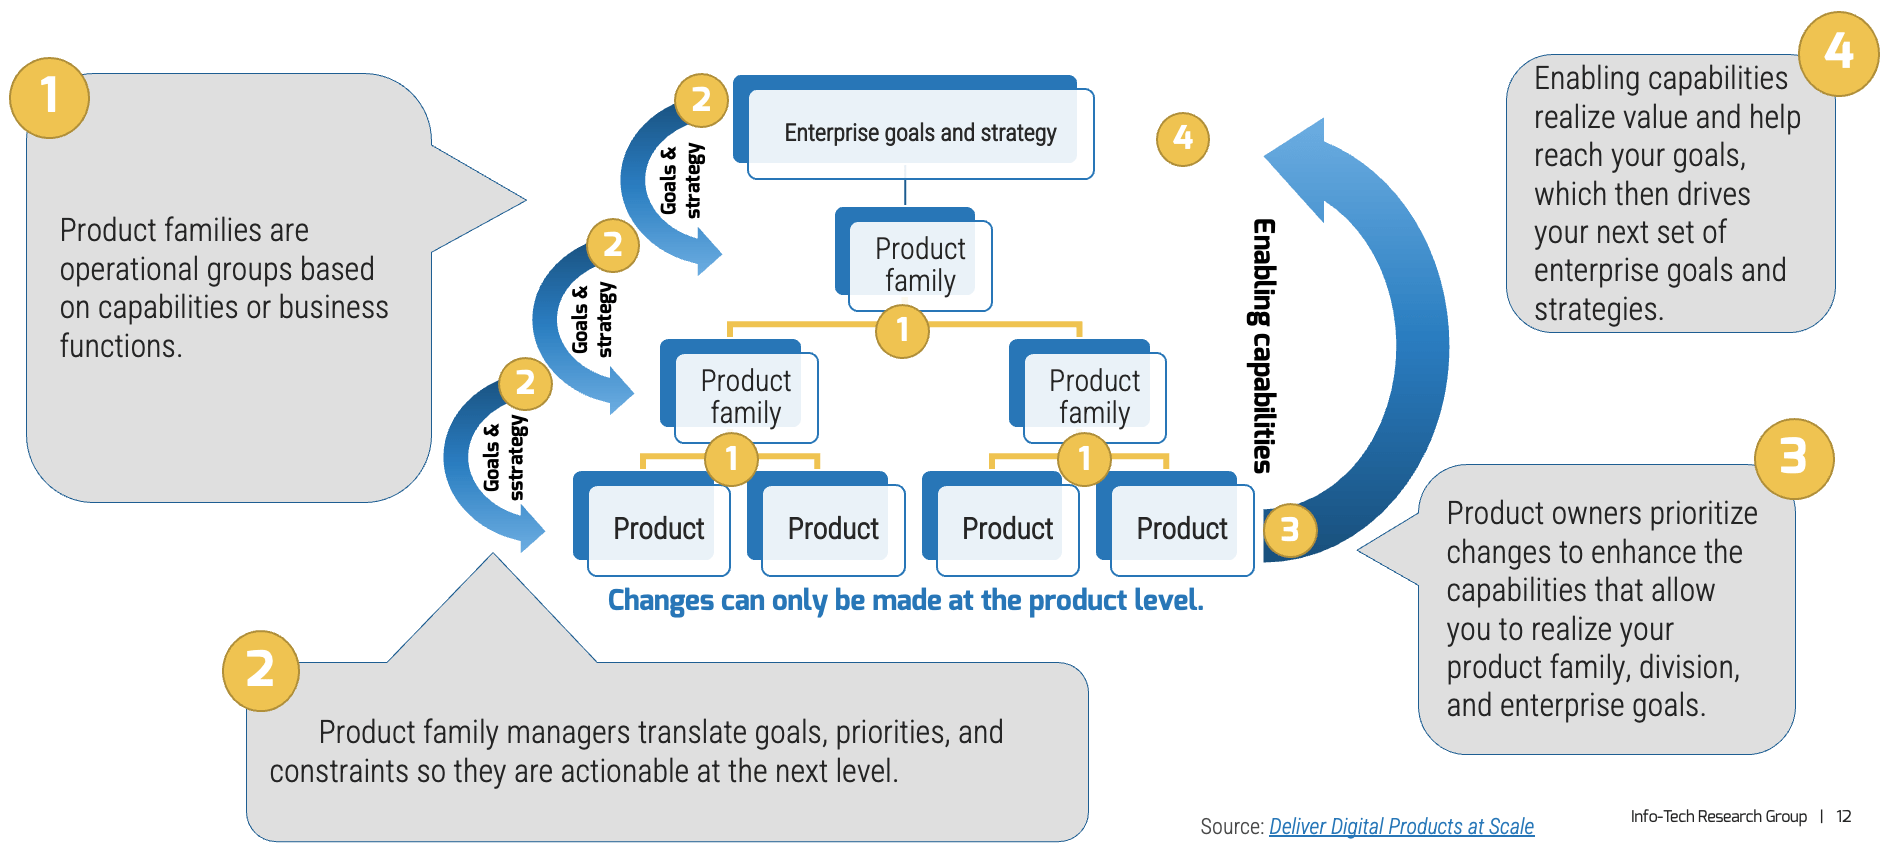
Understand special circumstances
In Deliver Digital Products at Scale, products were grouped into families using Info-Tech’s five scaling patterns. Assigning owners to Enterprise Applications and Shared Services requires special consideration.
Value stream alignment
-
Business architecture
-
Value stream
-
Capability
-
Function
-
Market/customer segment
-
Line of business (LoB)
-
Example: Customer group > value stream > products
Enterprise applications
-
Enabling capabilities
-
Enterprise platforms
-
Supporting apps
-
Example: HR > Workday/Peoplesoft > Modules
Supporting: Job board, healthcare administrator
Shared Services
-
Organization of related services into service family
-
Direct hierarchy does not necessarily exist within the family
-
Examples: End-user support and ticketing,
workflow and collaboration tools
Technical
-
Domain grouping of IT infrastructure, platforms, apps, skills, or languages
-
Often used in combination with Shared Services grouping or LoB-specific apps
-
Examples: Java, .NET, low-code, database, network
Organizational alignment
-
Used at higher levels of the organization where products are aligned under divisions
-
Separation of product managers from organizational structure is no longer needed because the management team owns the
product management role
Map sources of demand and influencers
Use the stakeholder analysis to define the key stakeholders and sources of demand for enterprise applications and shared
services. Extend your mapping to include their stakeholders and influencers to uncover additional sources of demand and
prioritization.
Info-Tech Insight
Your product owner map defines the influence landscape your product operates. It is every bit as important as the teams
who enhance, support and operate your product directly.
Combine your product owner map with your stakeholder map to create a comprehensive view of influencers.
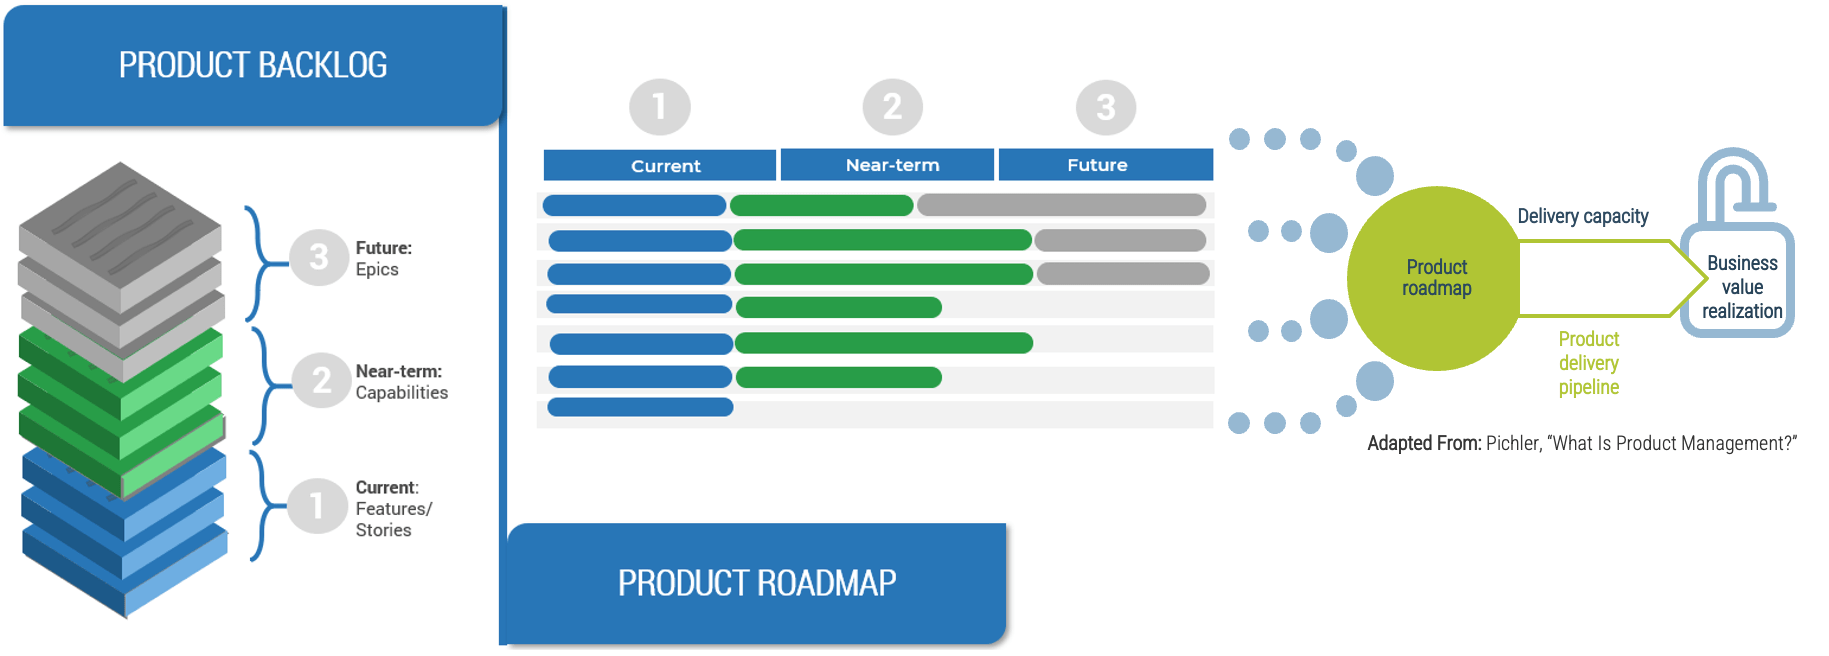
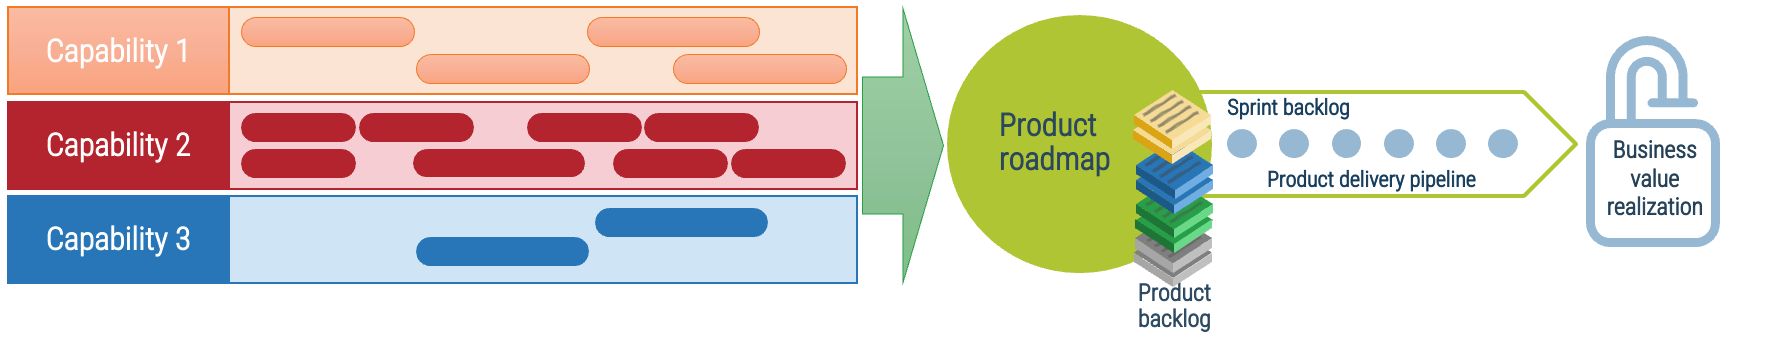
The primary value of the product owner is to fill the backlog with the highest ROI opportunities aligned with enterprise
goals.
Info-Tech Insight
The product owner owns the direction of the product.
-
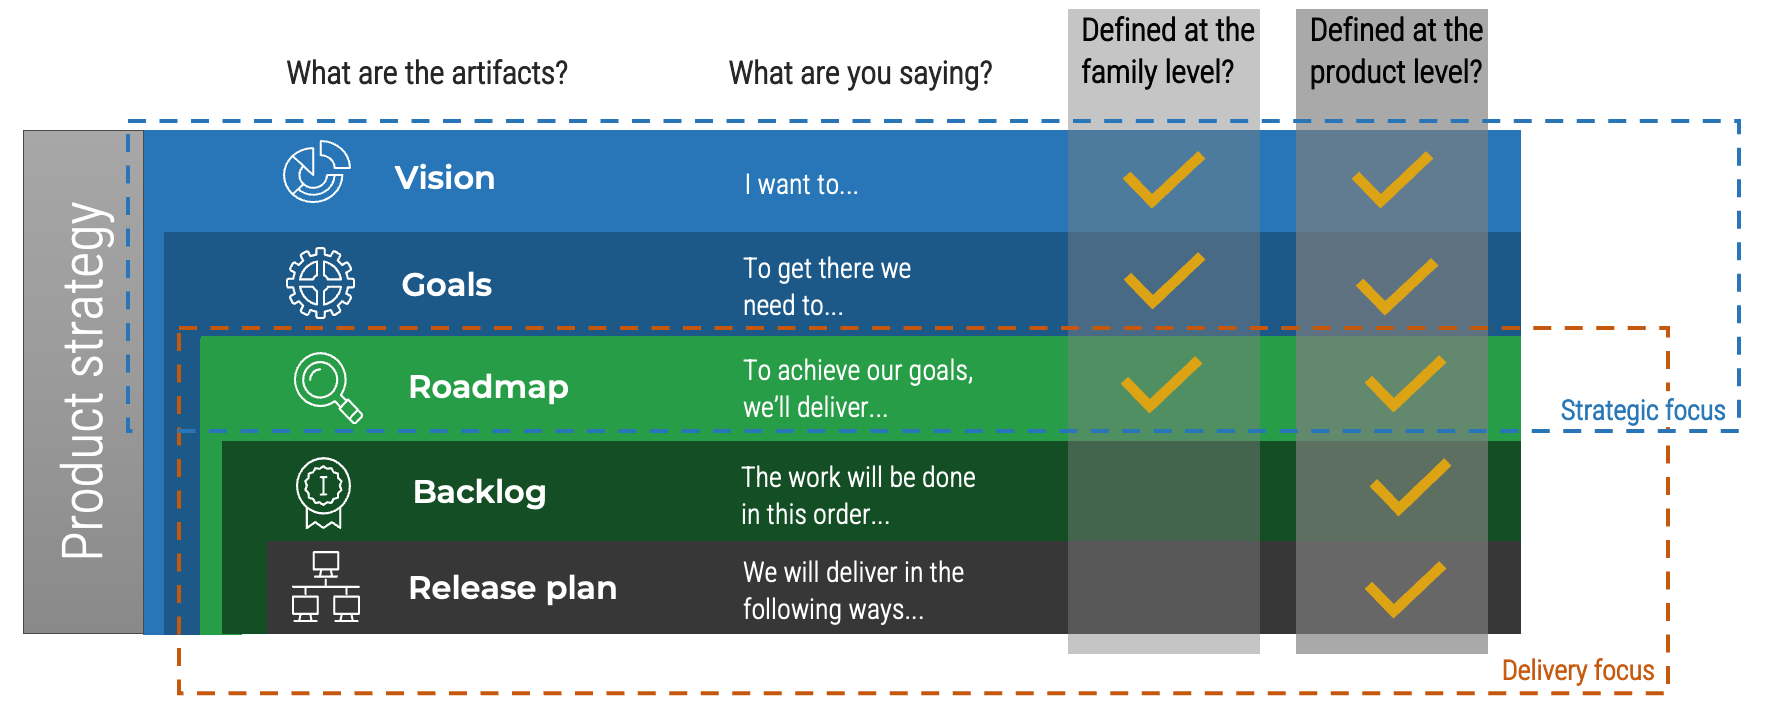
Roadmap - Where are we going?
-
Backlog - What changes are needed to get there?
-
Product review - Did we get close enough?
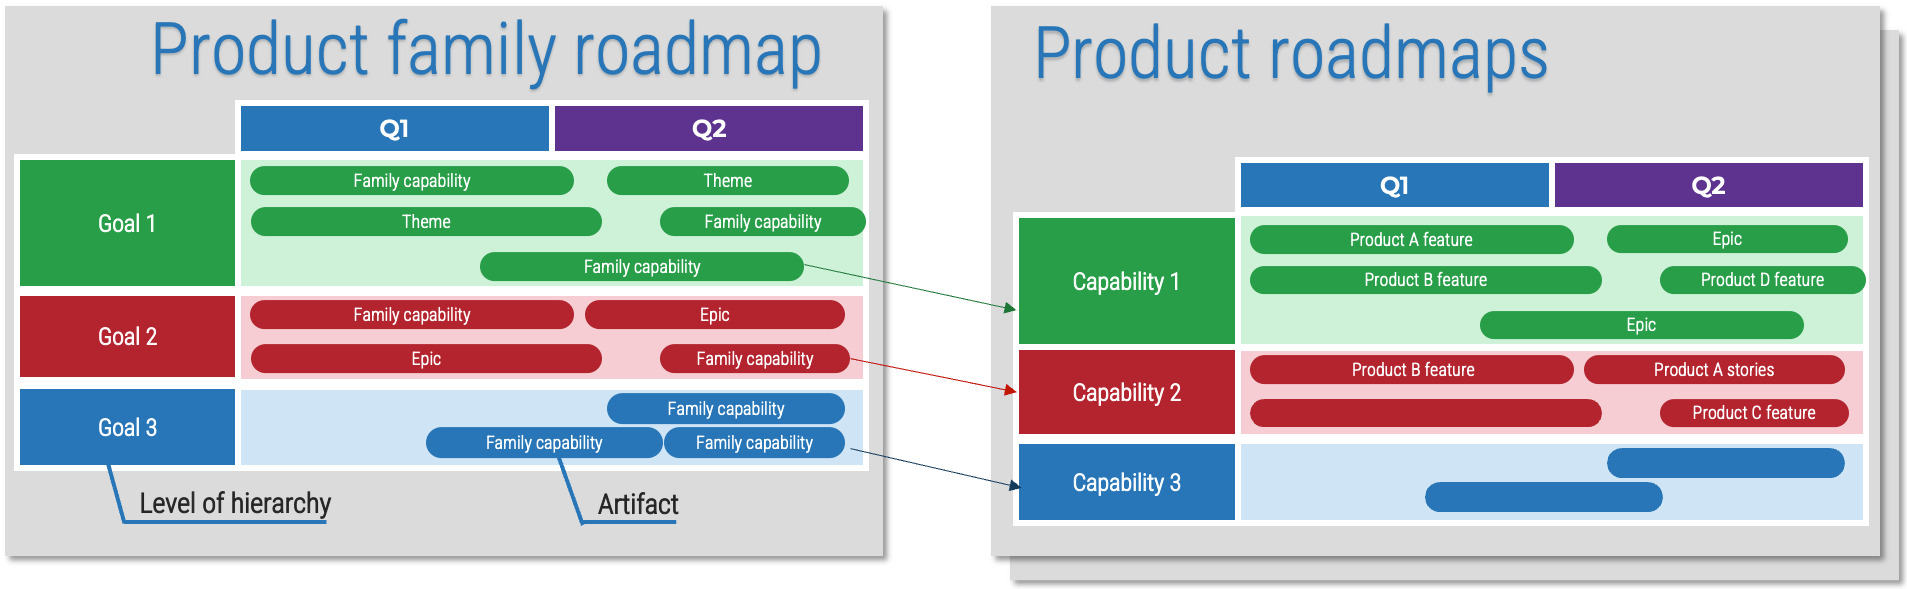
Product delivery realizes value for your product family
While planning and analysis are done at the family level, work and delivery are done at the individual product level.
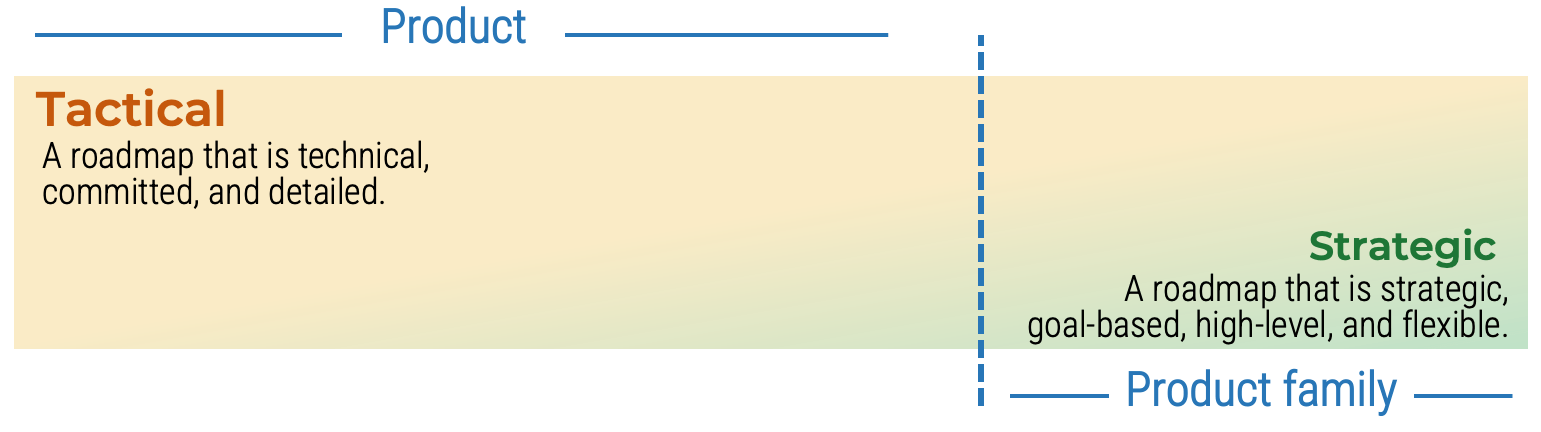
Product family owners are more strategic
When assigning resources, recognize that product family owners will need to be more strategic with their planning and alignment of child families and products.
Info-Tech Insight
Roadmaps for your product family are, by design, less detailed. This does not mean they aren’t actionable! Your product family roadmap should be able to communicate clear intentions around the future delivery of value in both the near and long term.
Connecting your product family roadmaps to product roadmaps
Your product and product family roadmaps should be connected at an artifact level that is common between both. Typically, this is done with capabilities, but it can be done at a more granular level if an understanding of capabilities isn’t available.
Develop a product owner stakeholder strategy
Stakeholders are a critical cornerstone to product ownership. They provide the context, alignment, and constraints that
influence or control what a product owner can accomplish.
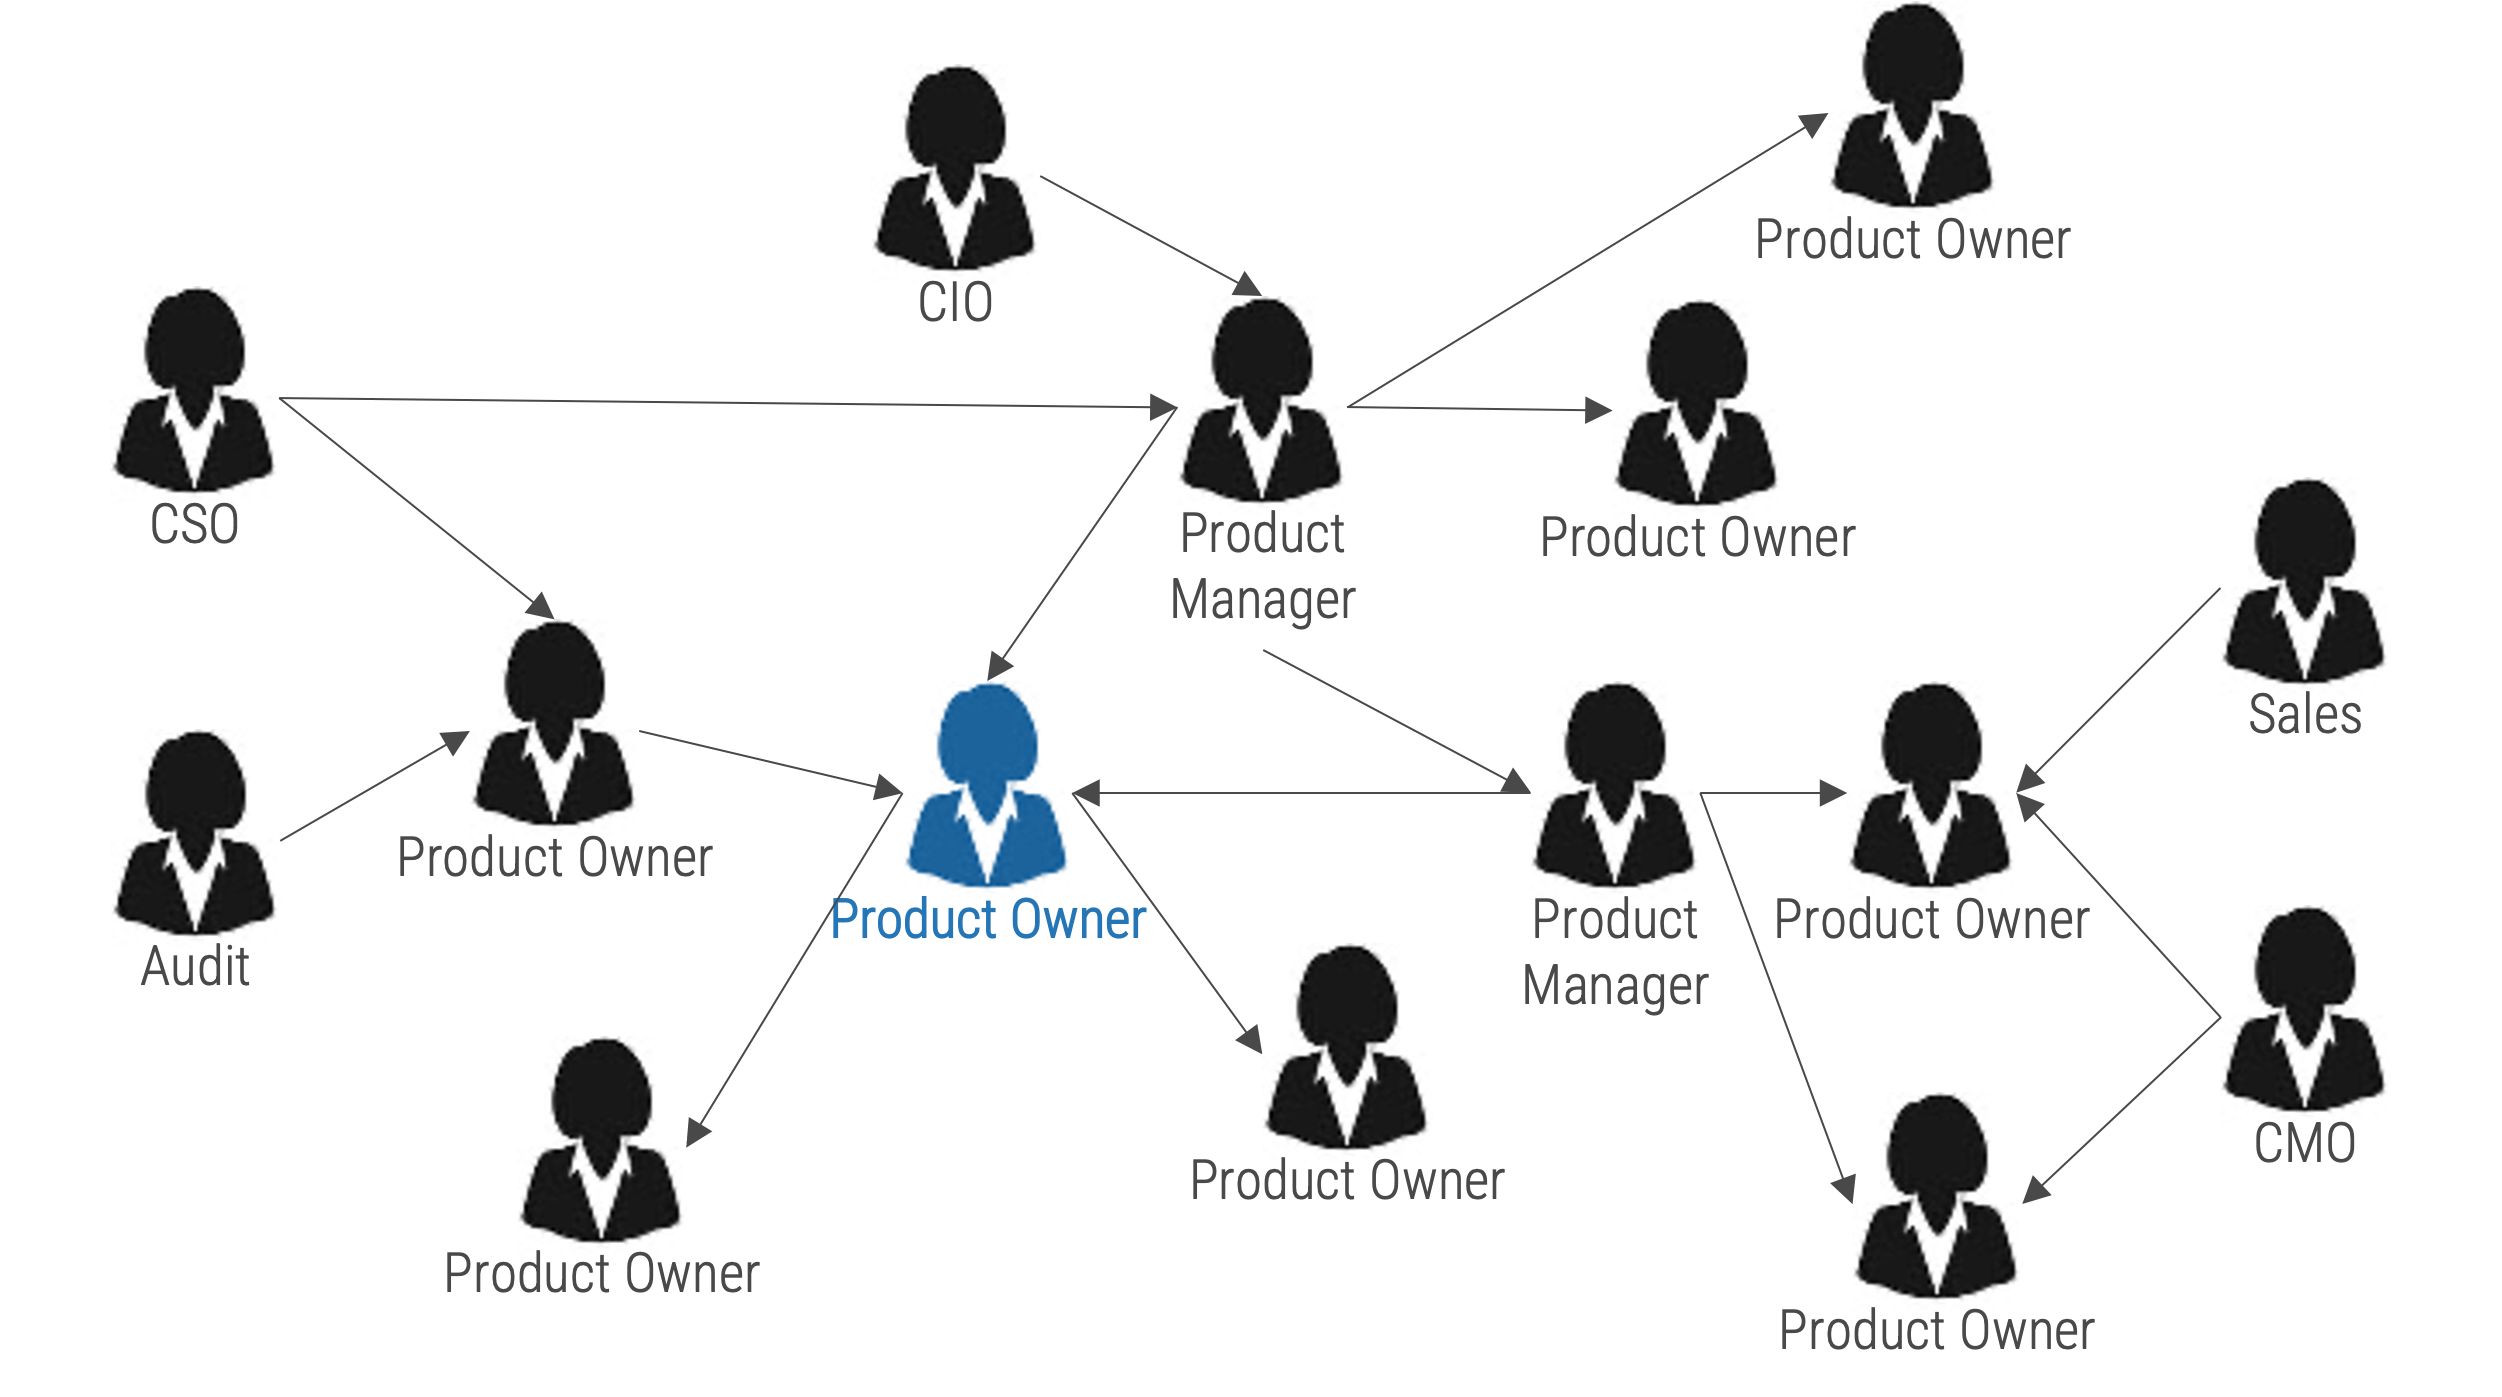
Product owners operate within a network of stakeholders who represent different perspectives within the organization.
First, product owners must identify members of their stakeholder network. Next, they should devise a strategy for managing stakeholders.
Without a stakeholder strategy, product owners will encounter obstacles, resistance, or unexpected changes.
Create a stakeholder network map to product roadmaps and prioritization
Follow the trail of breadcrumbs from your direct stakeholders to their influencers, to uncover hidden stakeholders.
Info-Tech Insight
Your stakeholder map defines the influence landscape your product operates. It is every bit as important as the teams who enhance, support and operate your product directly.
Use “connectors” to determine who may be influencing your direct stakeholders. They may not have any formal authority within the organization, but they may have informal yet substantive relationships with your stakeholders.
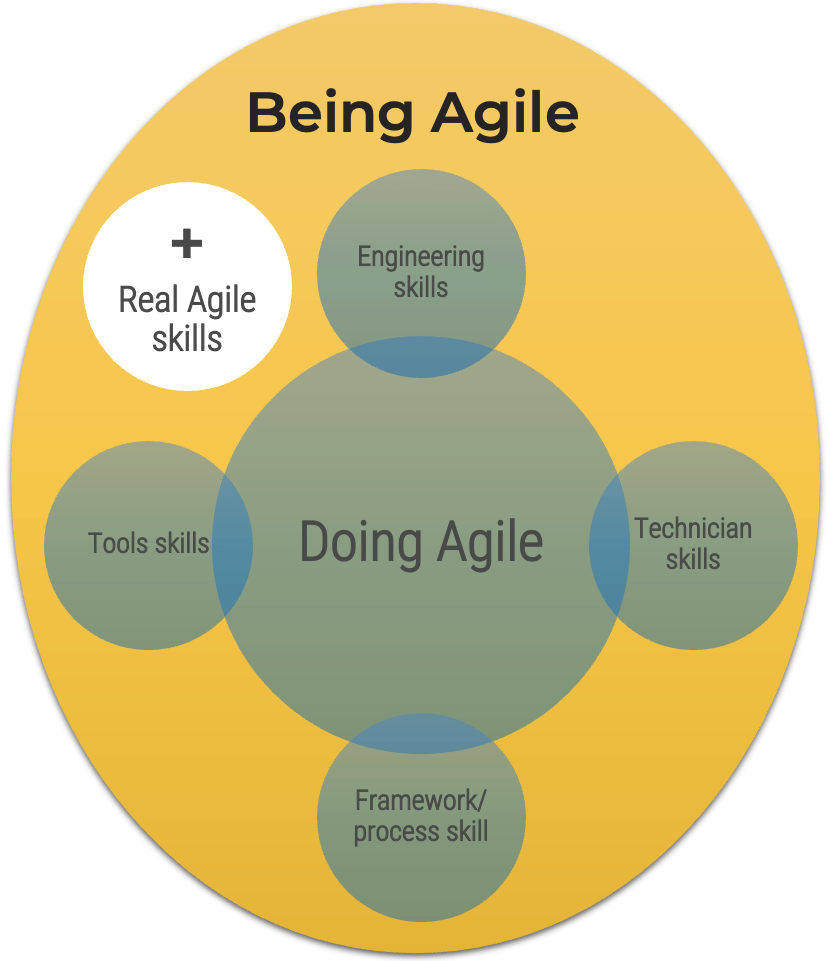
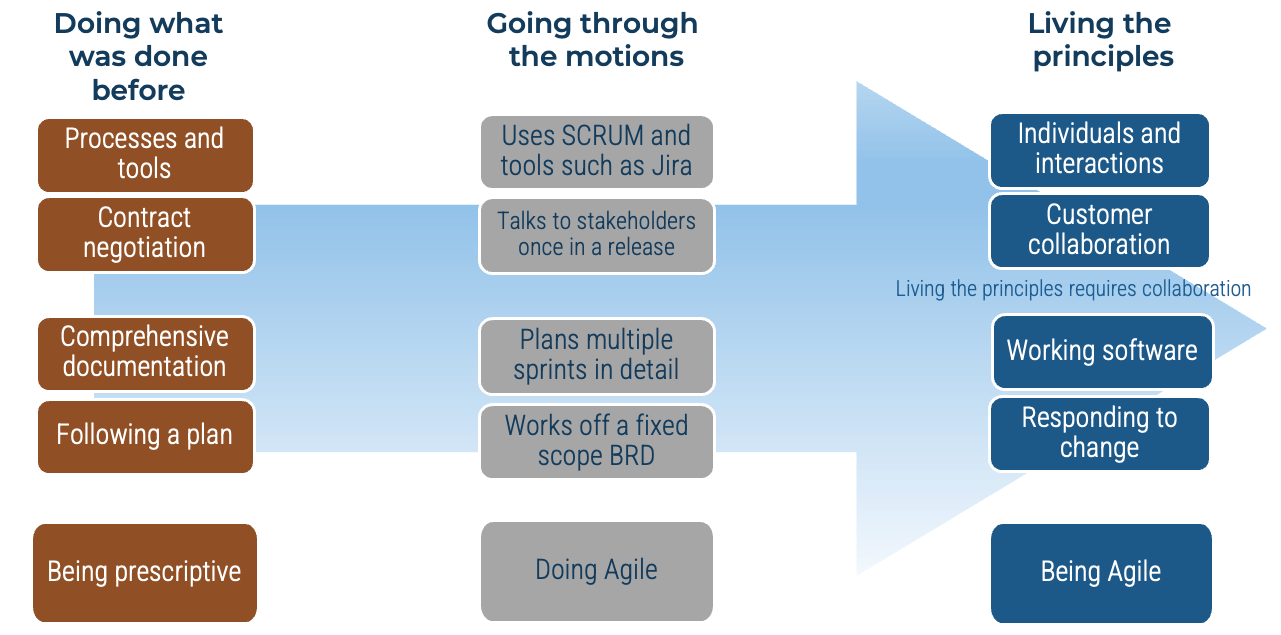
Being successful at Agile is more than about just doing Agile
The following represents the hard skills needed to “Do Agile”:
-
Engineering skills. These are the skills and competencies required for building brand-new valuable software.
-
Technician skills. These are the skills and competencies required for maintaining and operating the software delivered to stakeholders.
-
Framework/Process skills. These are the specific knowledge skills required to support engineering or technician skills.
-
Tools skills. This represents the software that helps you deliver other software.
While these are important, they are not the whole story. To effectively deliver software, we believe in the importance of being Agile over simply doing Agile.
Adapted from: “Doing Agile” Is Only Part of the Software Delivery Pie
Why focus on core skills?
They are the foundation to achieve business outcomes
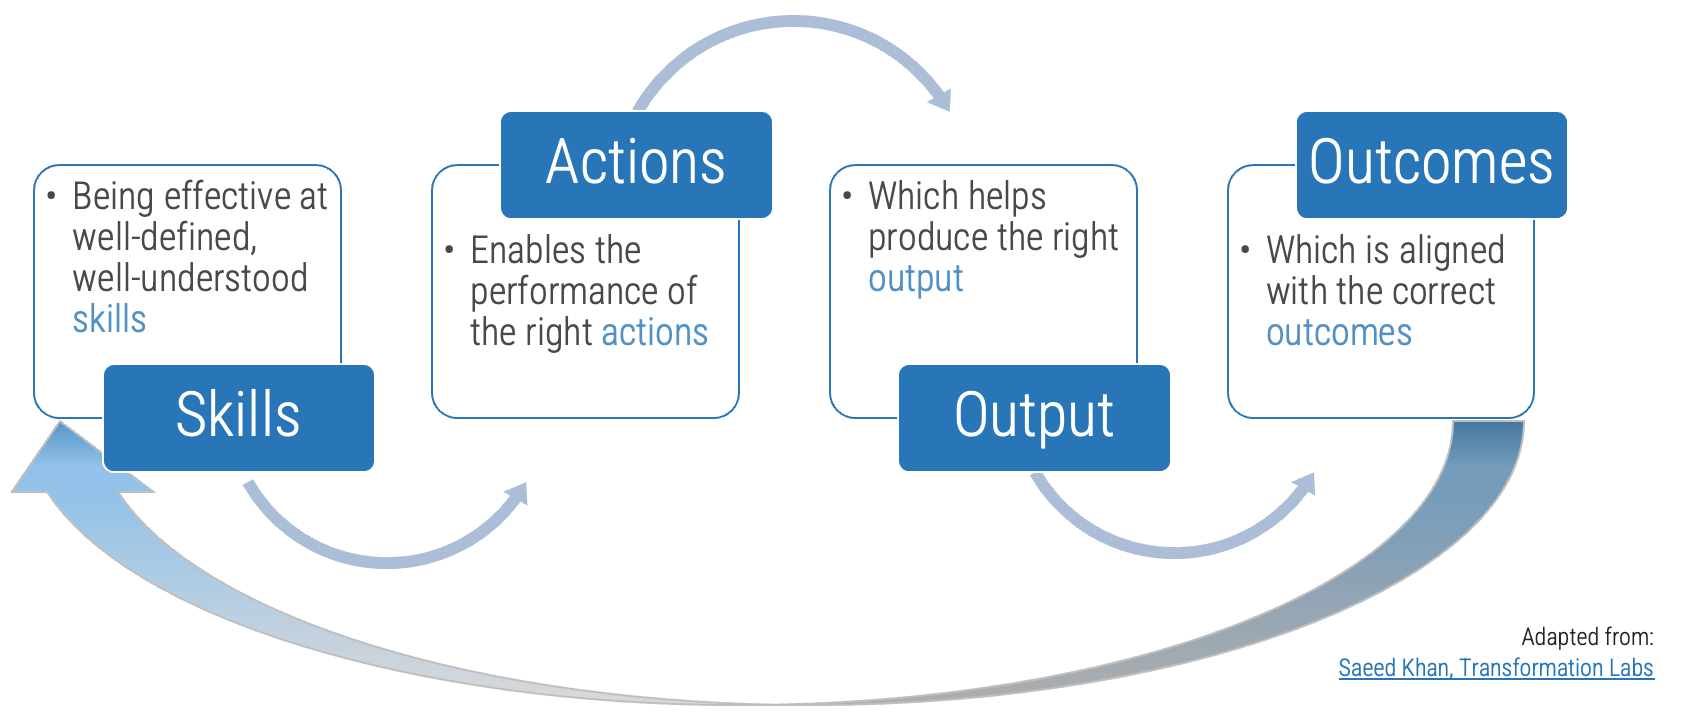
The right skills development is only possible with proper assessment and alignment against outcomes.
Focus on these real Agile skills
Agile skills
- Accountability
- Collaboration
- Comfort with ambiguity
- Communication
- Empathy
- Facilitation
- Functional decomposition
- Initiative
- Process discipline
- Resilience
Product capabilities deliver value
As a product owner, you are responsible for managing these facets through your capabilities and activities.
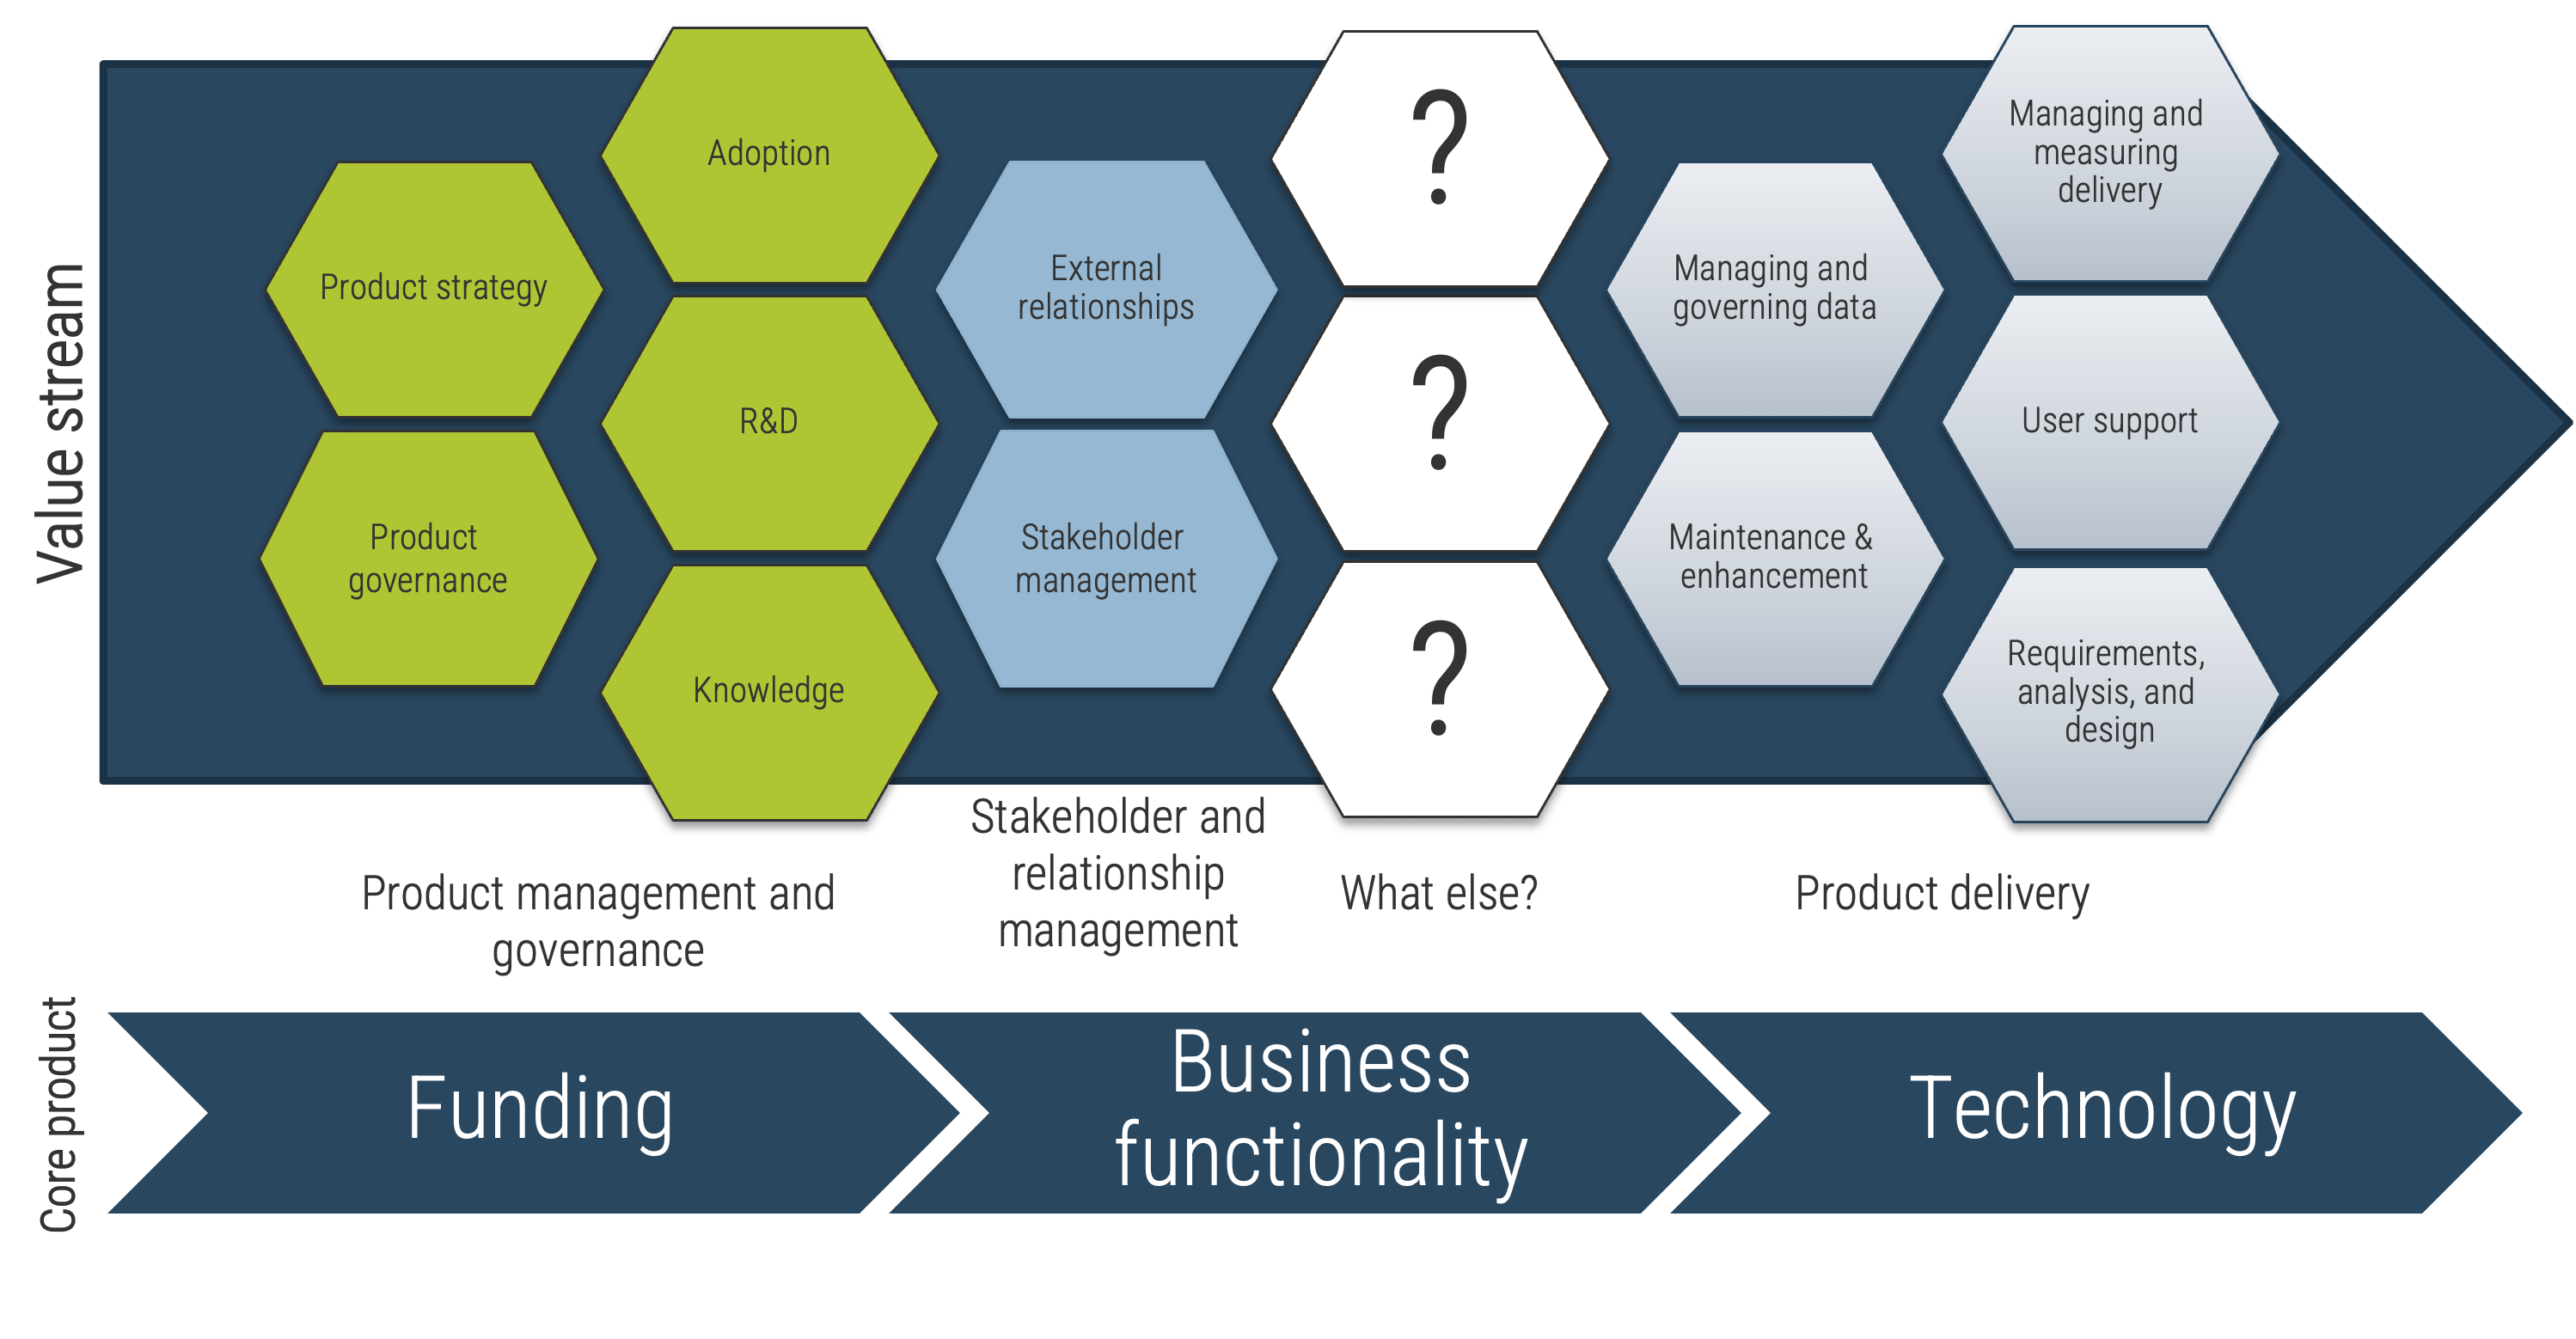
Info-Tech Best Practice
It is easy to lose sight of what matters when we look at a product from a single point of view. Despite what "The Agile Manifesto" says, working software is not valuable without the knowledge and support that people need in order to adopt, use, and maintain it. If you build it, they will not come. Product owners must consider the needs of all stakeholders when designing and building products.
Recognize product owner knowledge gaps
Pulse survey of product owners
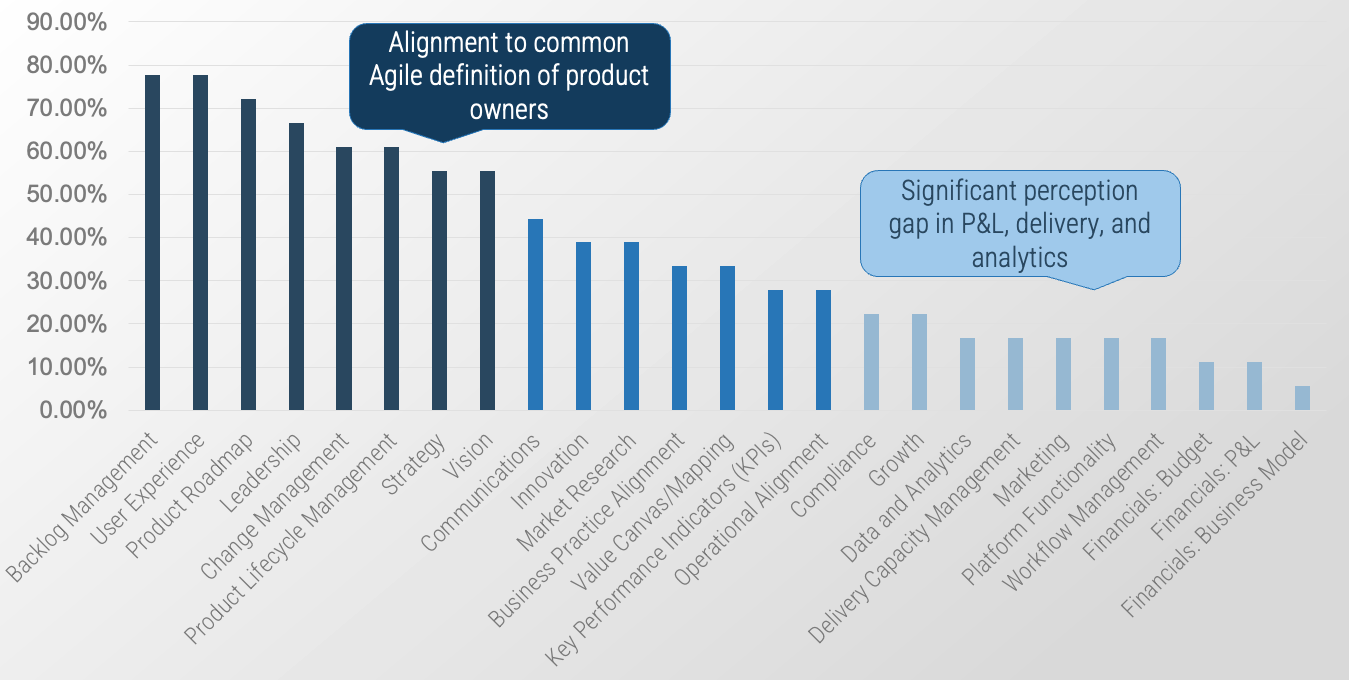
Info-Tech Insight
-
Less than 15% of respondents identified analytics or financial management as a key component of product ownership.
-
Assess your product owner’s capabilities and understanding to develop a maturity plan.
Source: Pulse Survey (N=18)
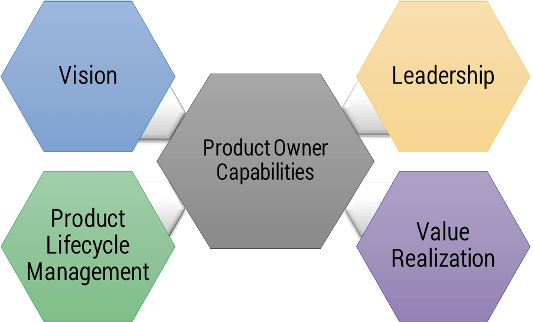
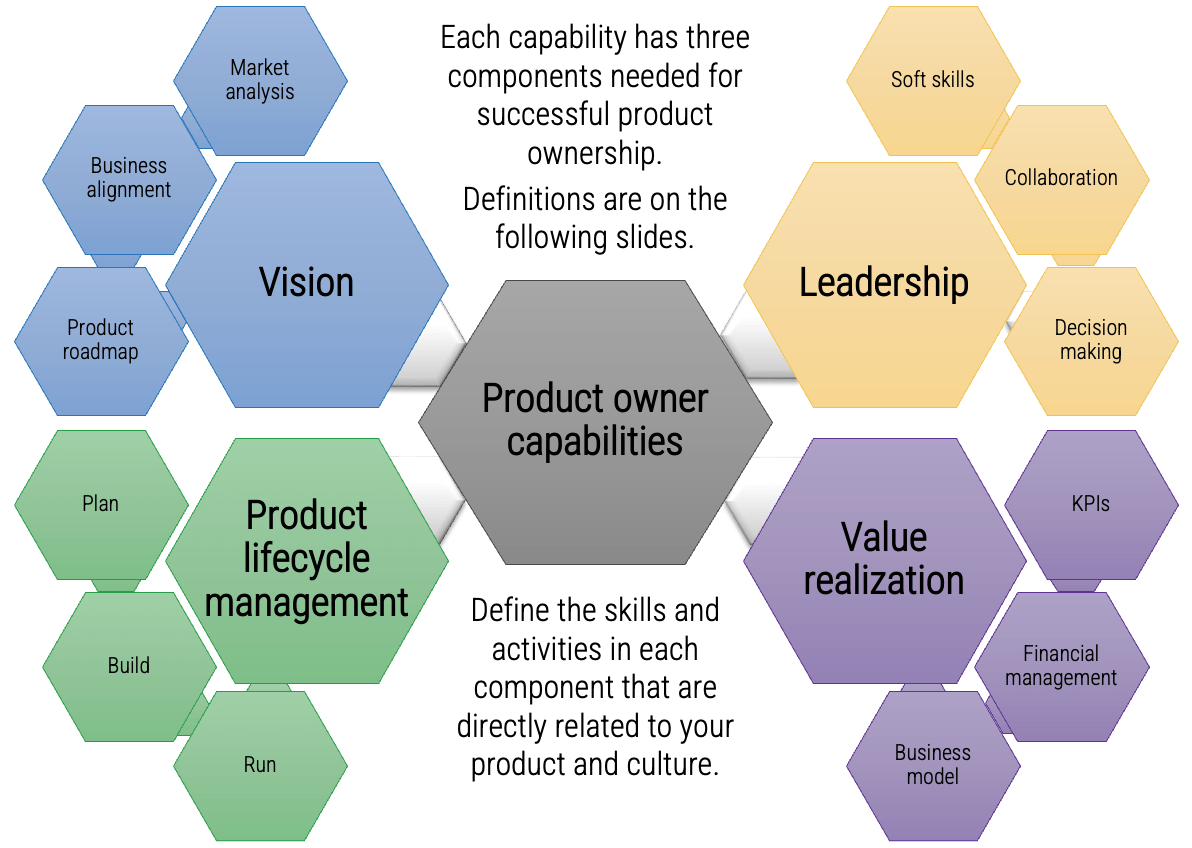
Implement the Info-Tech product owner capability model
Unfortunately, most product owners operate with incomplete knowledge of the skills and capabilities needed to perform
the role. Common gaps include focusing only on product backlogs, acting as a proxy for product decisions, and ignoring
the need for key performance indicators (KPIs) and analytics in both planning and value realization.
Vision
- Market Analysis
- Business Alignment
- Product Roadmap
Leadership
- Soft Skills
- Collaboration
- Decision Making
Product Lifecycle Management
Value Realization
- KPIs
- Financial Management
- Business Model
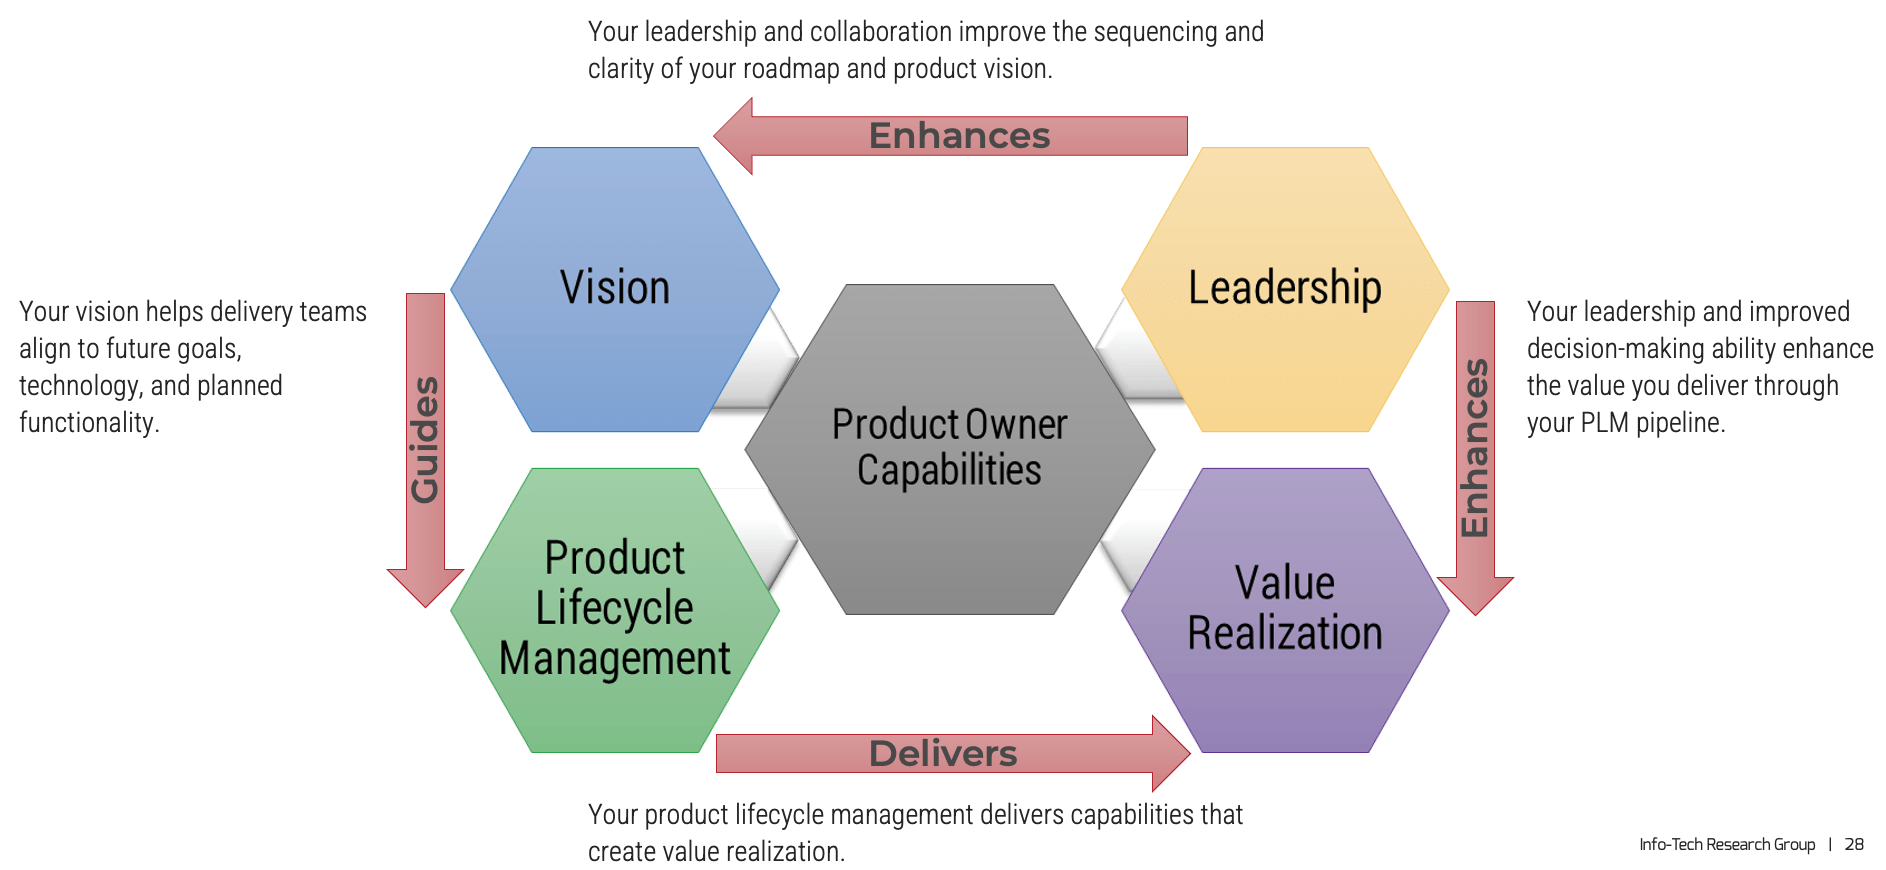
Product owner capabilities provide support
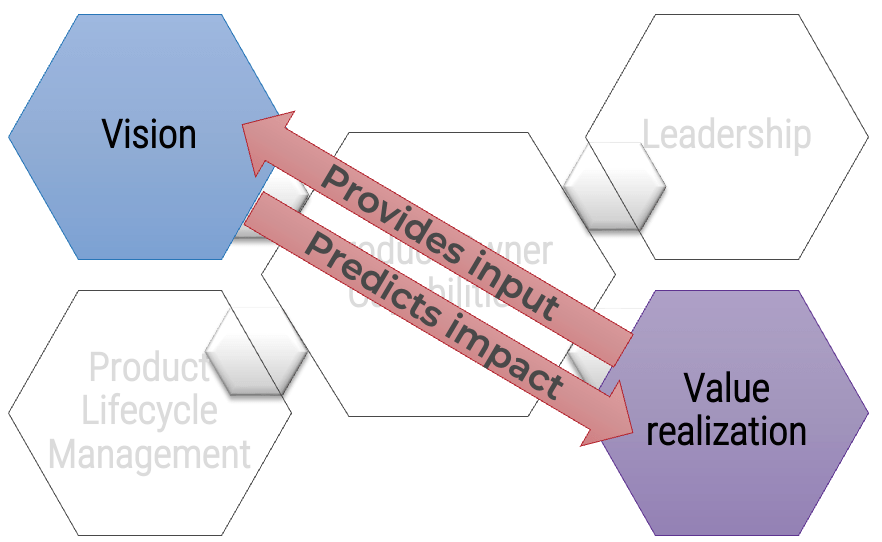
Your vision informs and aligns what goals and capabilities are needed to fulfill your product or product family vision and align with enterprise goals and priorities. Each item on your roadmap should have corresponding KPIs or OKRs to know how far you moved the value needle. Value realization measures how well you met your target, as well as the impacts on your business value canvas and cost model.
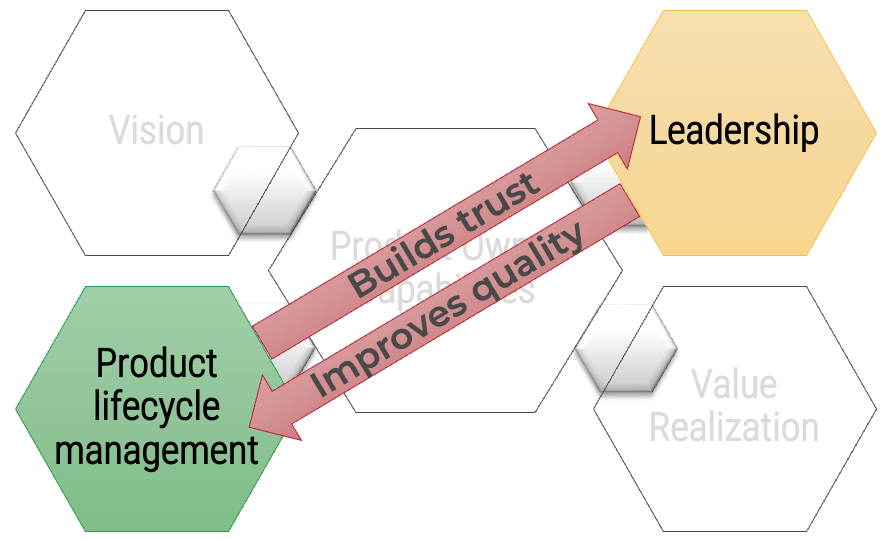
Your leadership skills improve collaborations and decisions when working with your stakeholders and product delivery teams. This builds trust and improves continued improvements to the entire product lifecycle. A product owner’s focus should always be on finding ways to improve value delivery.
Product owner capabilities provide support
Develop product owner capabilities
Avoid common capability gaps
Vision
-
Focusing solely on backlog grooming (tactical only)
-
Ignoring or failing to align product roadmap to enterprise goals
-
Operational support and execution
-
Basing decisions on opinion rather than market data
-
Ignoring or missing internal and external threats to your product
Leadership
-
Failing to include feedback from all teams who interact with your product
-
Using a command-and-control approach
-
Viewing product owner as only a delivery role
-
Acting as a proxy for stakeholder decisions
-
Avoiding tough strategic decisions in favor of easier tactical choices
Product lifecycle management
-
Focusing on delivery and not the full product lifecycle
-
Ignoring support, operations, and technical debt
-
Failing to build knowledge management into the lifecycle
-
Underestimating delivery capacity, capabilities, or commitment
-
Assuming delivery stops at implementation
Value realization
-
Focusing exclusively on “on time/on budget” metrics
-
Failing to measure a 360-degree end-user view of the product
-
Skipping business plans and financial models
-
Limiting financial management to project/change budgets
-
Ignoring market analysis for growth, penetration, and threats
Your product vision is your North Star
It's ok to dream a little!
Adapted from: Crossing the Chasm
Info-Tech Best Practice
A product vision shouldn’t be so far out that it doesn’t feel real or so short-term that it gets bogged down in minutiae and implementation details. Finding the right balance will take some trial and error and will be different for each organization.
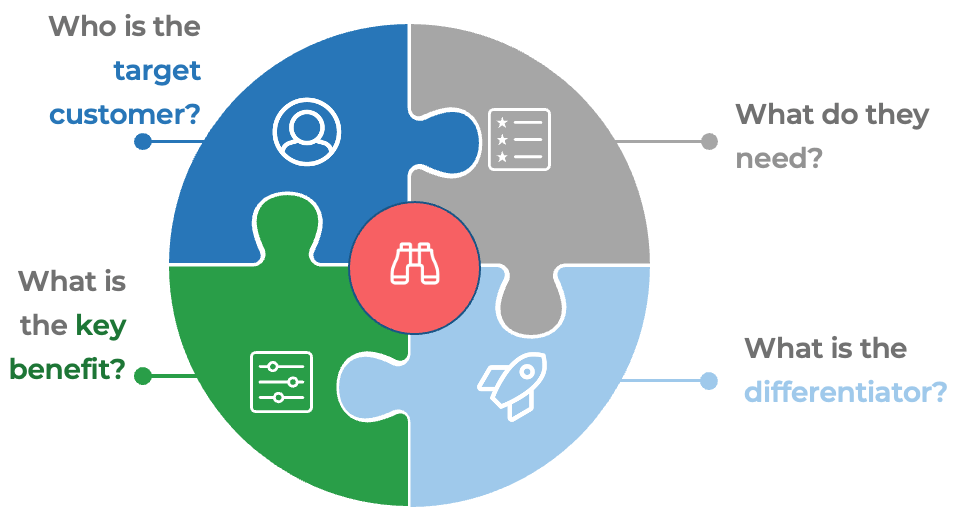
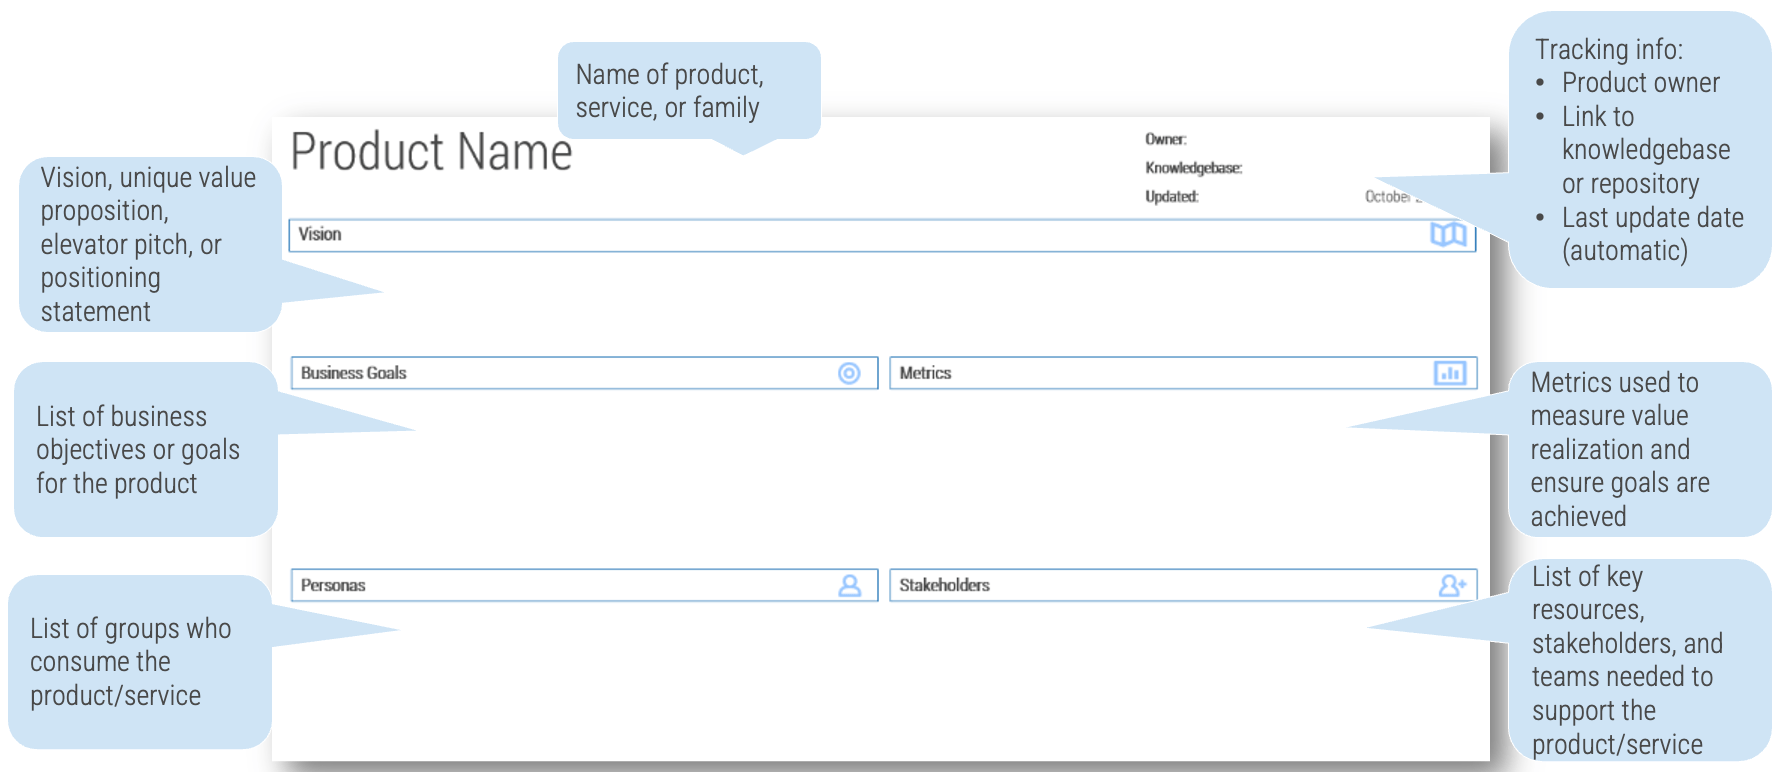
Leverage the product canvas to state and inform your product vision
Define product value by aligning backlog delivery with roadmap goals
In each product plan, the backlogs show what you will deliver. Roadmaps identify when and in what order you will deliver value, capabilities, and goals.
Use a balanced value to establish a common definition of goals and value
Value drivers are strategic priorities aligned to our enterprise strategy and translated through our product families. Each product and change has an impact on the value driver helping us reach our enterprise goals.
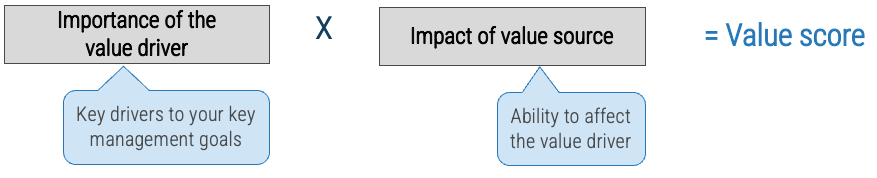
Info-Tech Insight
Your value drivers and impact helps estimate the expected value of roadmap items, prioritize roadmap and backlog items, and identify KPIs and OKRs to measure value realization and actual impact.
Use CLAIM to guide your journey
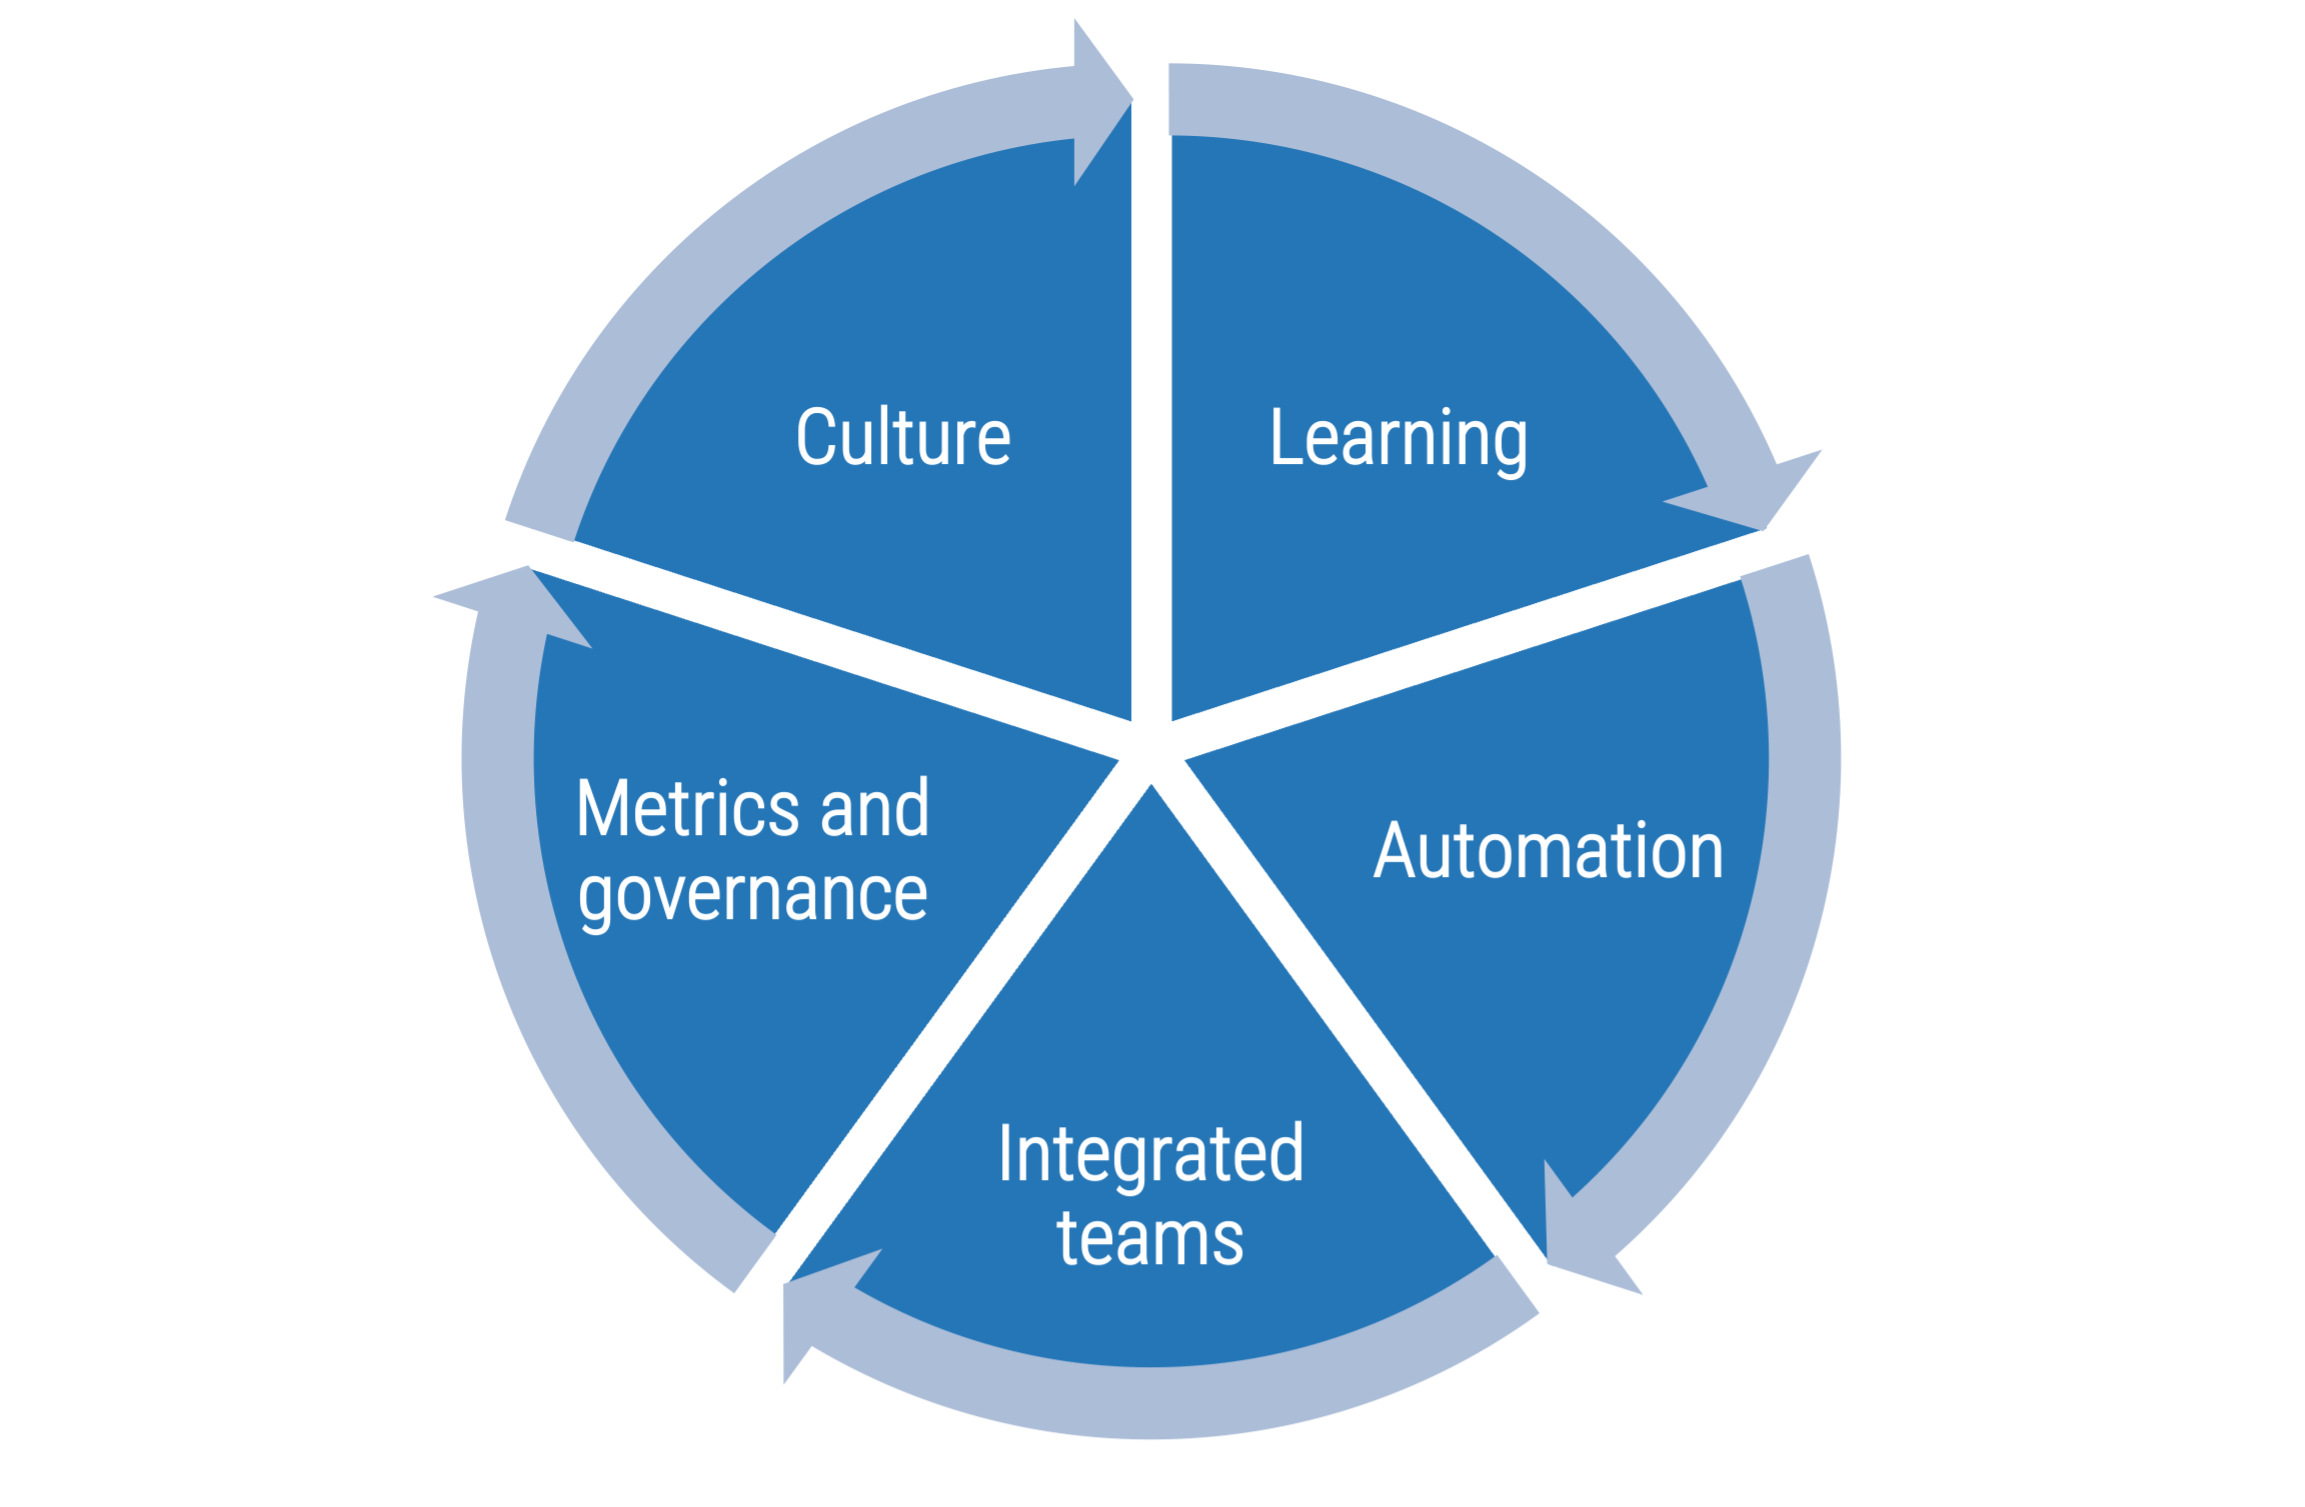
Value is best created by self-managing teams who deliver in frequent, short increments supported by leaders who coach them through challenges.
Product-centric delivery and Agile are a radical change in how people work and think. Structured, facilitated learning is required throughout the transformation to help leaders and practitioners make the shift.
Product management, Agile, and DevOps have inspired SDLC tools that have become a key part of delivery practices and work management.
Self-organizing teams that cross business, delivery, and operations are essential to gain the full benefits of product-centric delivery.
Successful implementations require the disciplined use of metrics that support developing better teams
Communicate reasons for changes and how they will be implemented
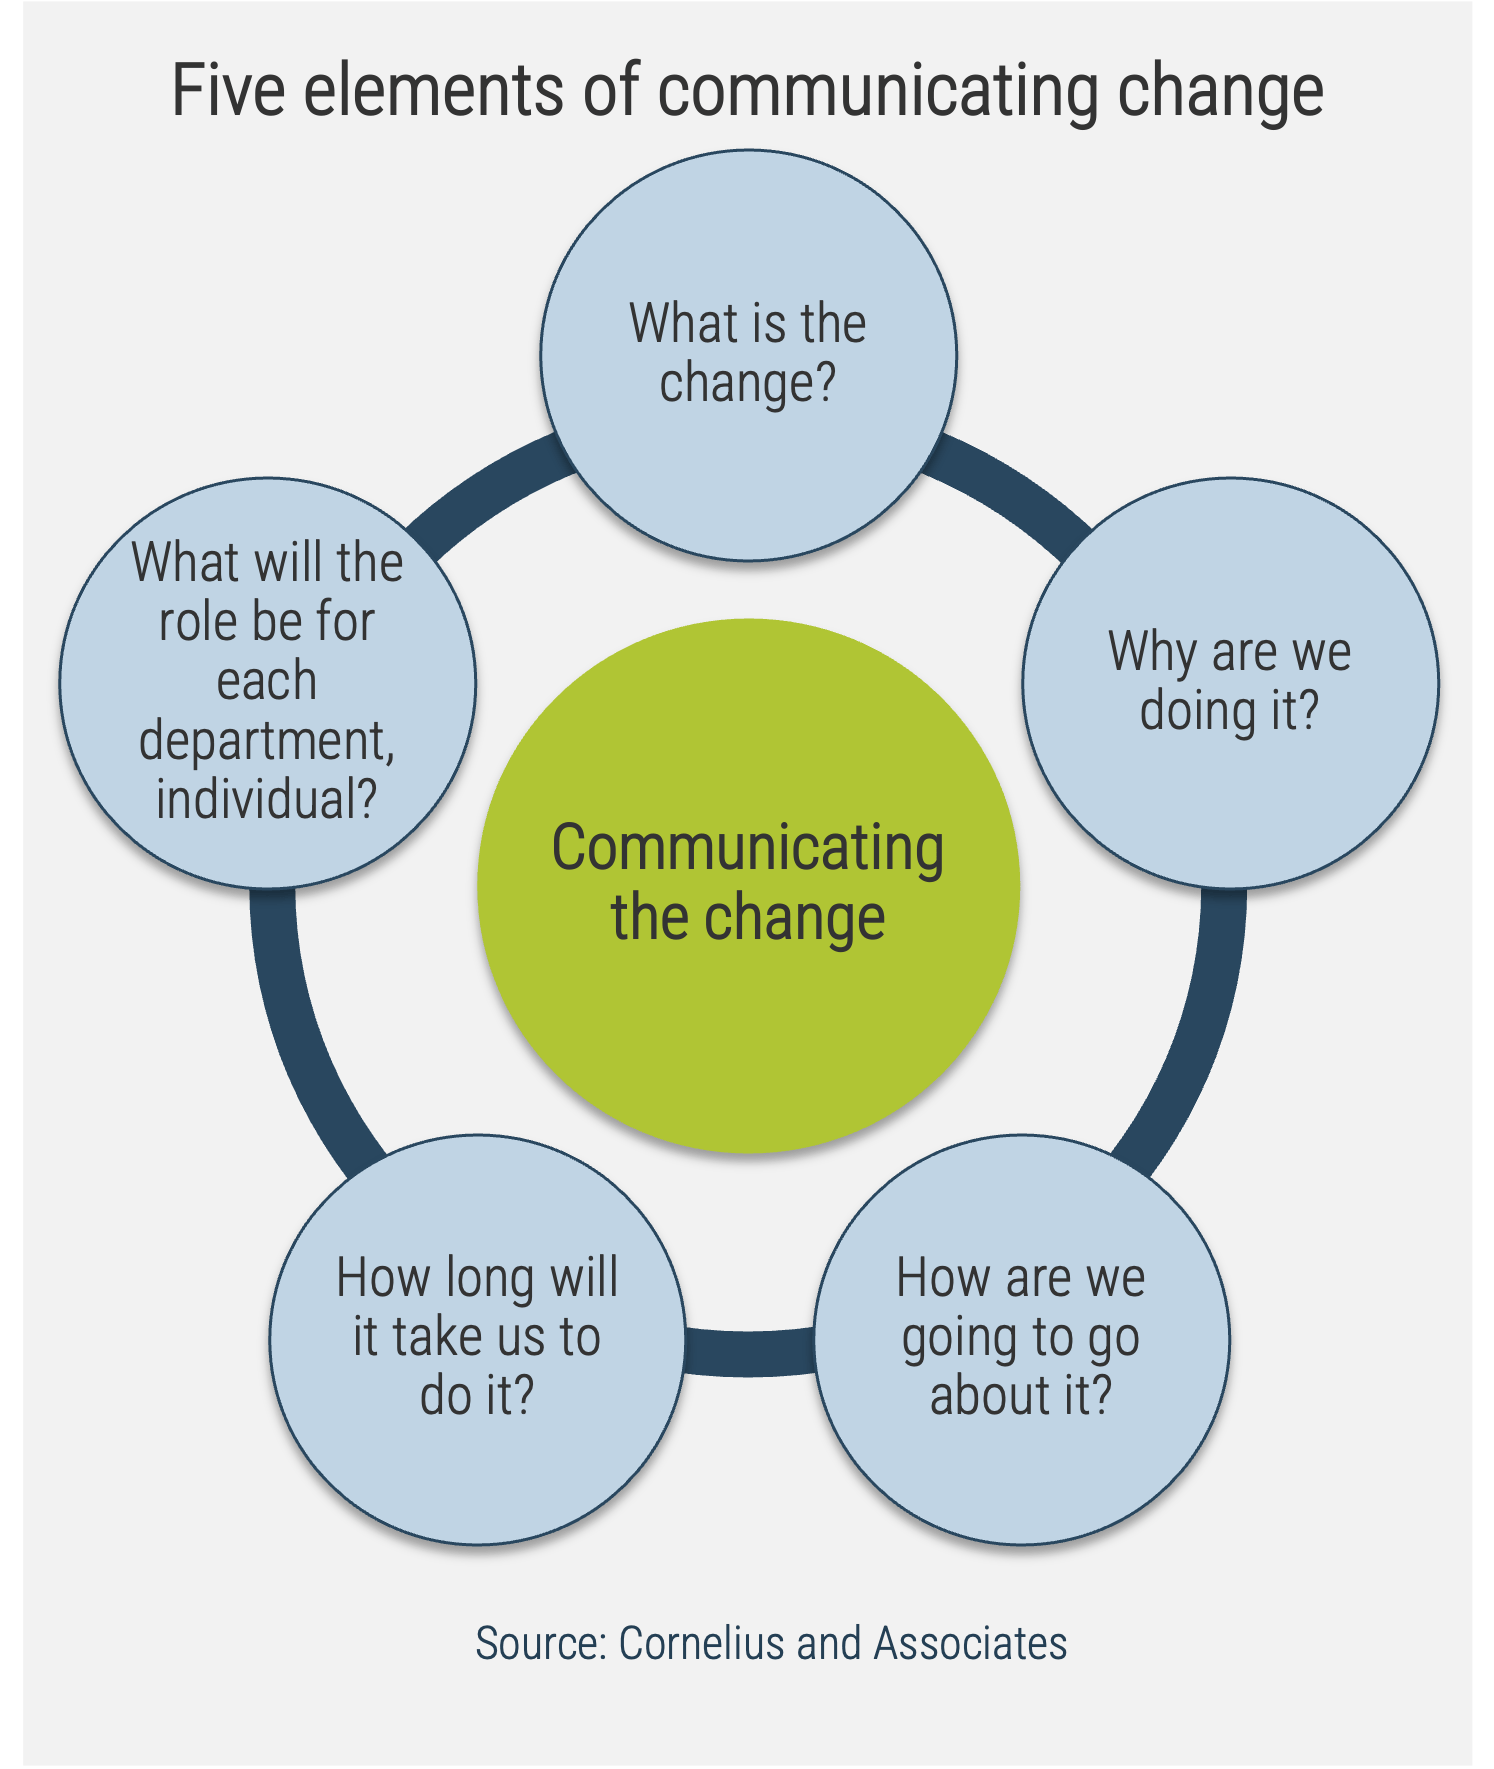
Leaders of successful change spend considerable time developing a powerful change message; that is, a compelling narrative that articulates the desired end state, and that makes the change concrete and meaningful to staff.
The organizational change message should:
-
Explain why the change is needed.
-
Summarize what will stay the same.
-
Highlight what will be left behind.
-
Emphasize what is being changed.
-
Explain how the change will be implemented.
-
Address how change will affect various roles in the organization.
-
Discuss the staff’s role in making the change successful.
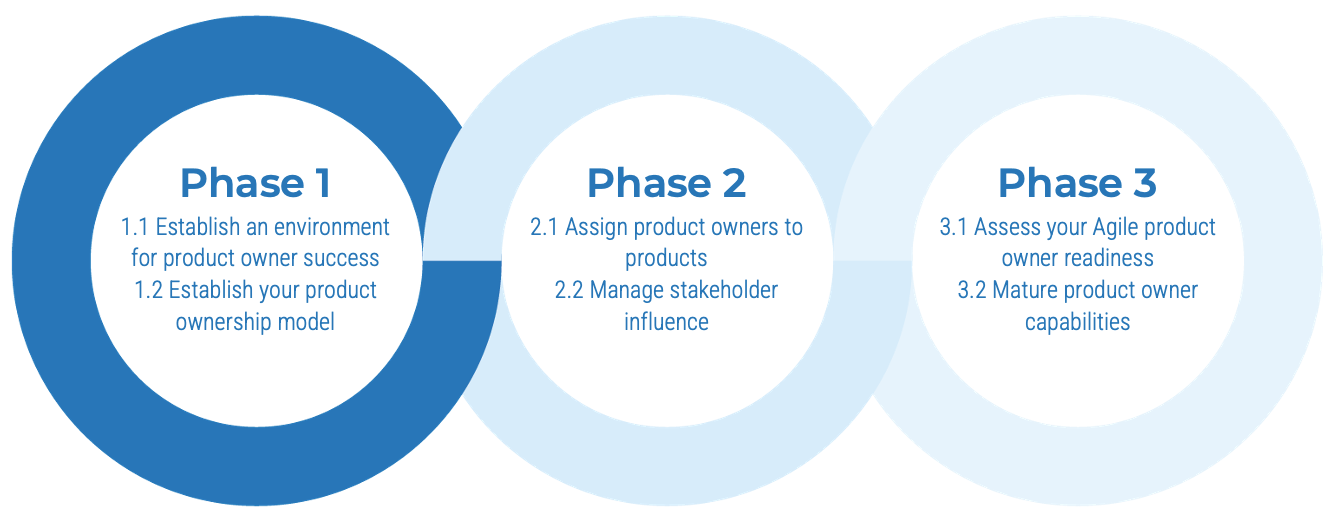
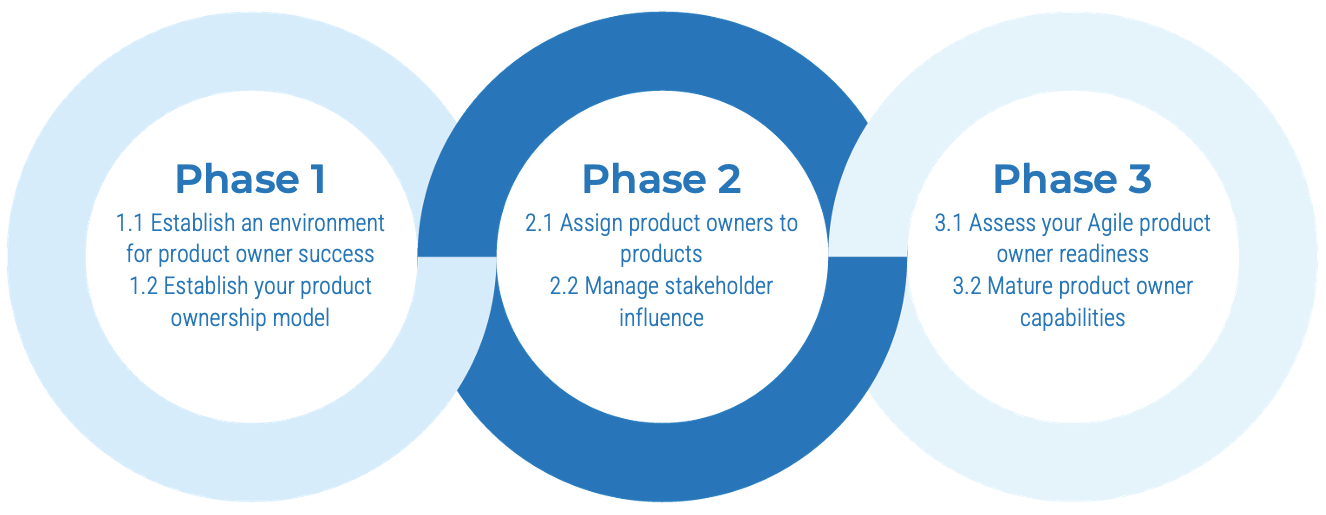
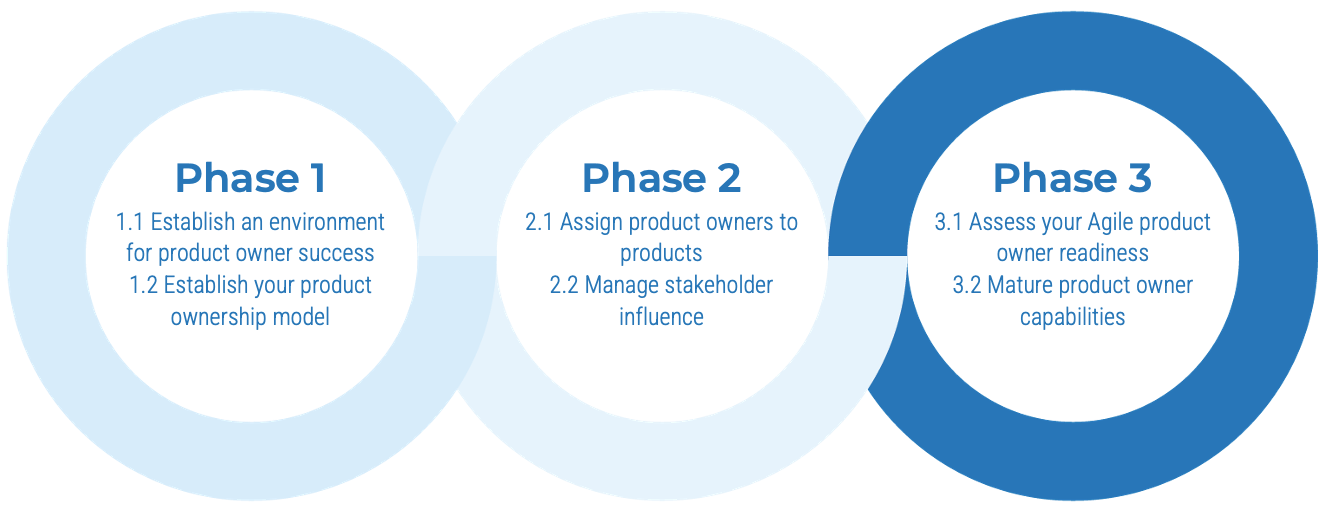
Info-Tech’s methodology for mature and scale product ownership
Phase steps
|
1. Establish the foundation for product ownership
Step 1.1 Establish an environment for product owner success
Step 1.2 Establish your product ownership model
|
2. Align product owners to products
Step 2.1 Assign product owners to products
Step 2.2 Manage stakeholder influence
|
3. Mature product owner capabilities
Step 3.1 Assess your Agile product owner readiness
Step 3.2 Mature product owner capabilities
|
Phase outcomes
|
1.1.1 Define enablers and blockers of product management
1.1.2 Define your product management roles and names
1.2.1 Identify your primary product owner perspective
1.2.2 Define your product owner RACI
|
2.1.1 Assign resources to your products and families
2.2.1 Visualize relationships to identify key influencers
2.2.2 Group stakeholders into categories
2.2.3 Prioritize your stakeholders
|
3.1.1 Assess your real Agile skill proficiency
3.2 Mature product owner capabilities
3.2.1 Assess your vision capability proficiency
3.2.2 Assess your leadership capability proficiency
3.2.3 Assess your PLM capability proficiency
3.2.4 Identify your business value drivers and sources of value
3.2.5 Assess your value realization capability proficiency
|
Blueprint deliverables
Each step of this blueprint is accompanied by supporting deliverables to help you accomplish your goals.
Key deliverable
Mature and Scale Product Ownership Playbook
Capture and organize the outcomes of the activities in the workbook.
Mature and Scale Product Ownership Workbook
The workbook helps organize and communicate the outcomes of each activity.
Mature and Scale Product Ownership Readiness Assessment
Determine your level of mastery of real Agile skills and product owner capabilities.
Blueprint benefits
IT benefits
-
Competent product owner who can support teams operating in any delivery methodology.
-
Representative viewpoint and input from the technical and operational product owner perspectives.
-
Products aligned to business needs and committed work are achievable.
-
Single point of contact with a business representative.
-
Acceptance of product owner role outside the Scrum teams.
Business benefits
-
Better alignment to enterprise goals, vision, and outcomes.
-
Improved coordination with stakeholders.
-
Quantifiable value realization tied to vision.
-
Product decisions made at the right time and with the right input.
-
Product owner who has the appropriate business, operations, and technical knowledge.
Measure the value of this blueprint
Align product owner metrics to product delivery and value realization.
Member outcome
|
Suggested Metric
|
Estimated impact
|
|
Increase business application satisfaction
|
Satisfaction of business applications
(CIO BV Diagnostic)
|
20% increase within one year after implementation
|
|
Increase effectiveness of application portfolio management
|
Effectiveness of application portfolio management (M&G Diagnostic)
|
20% increase within one year after implementation
|
|
Increase importance and effectiveness of application portfolio
|
Importance and effectiveness to business (APA Diagnostic)
|
20% increase within one year after implementation
|
|
Increase satisfaction of support of business operations
|
Support to business (CIO BV Diagnostic)
|
20% increase within one year after implementation
|
|
Successfully deliver committed work (productivity)
|
Number of successful deliveries; burndown
|
Reduction in project implementation overrun by 20%
|
Info-Tech offers various levels of support to best suit your needs
DIY Toolkit
"Our team has already made this critical project a priority, and we have the time and capability, but some guidance along the way would be helpful."
Guided Implementation
"Our team knows that we need to fix a process, but we need assistance to determine where to focus. Some check-ins along
the way would help keep us on track."
Workshop
"We need to hit the ground running and get this project kicked off immediately. Our team has the ability to take this over once we get a framework and strategy in place."
Consulting
"Our team does not have the time or the knowledge to take this project on. We need assistance through the entirety of this project"
Diagnostics and consistent frameworks are used throughout all four options.
Guided Implementation
What does a typical GI on this topic look like?
Phase 1 Establish the Foundation for Product Ownership
|
Phase 2 Align Product Owners to Products
|
Phase 3 Mature Product Owner Capabilities
|
-
Call #1:
Scope objectives and your specific challenges
-
Call #2:
Step 1.1 Establish an environment for product owner success
Step 1.2 Establish your product ownership model
|
-
Call #3:
Step 2.1 Assign product owners to products
-
Call #4:
Step 2.2 Manage stakeholder influence
|
-
Call #5:
Step 3.1 Assess your Agile product owner readiness
-
Call #6:
Step 3.2 Mature product owner capabilities
|
A Guided Implementation (GI) is a series of calls with an Info-Tech analyst to help implement our best practices in your organization.
A typical GI is between 8 and 12 calls over the course of 4 to 6 months.
Workshop Overview
Contact your account representative for more information.
workshops@infotech.com 1-888-670-8889
| Phase 1 | Phase 2 | Phase 3 |
Activities |
Establish the Foundation for Product Ownership
Step 1.1 Establish an environment for product owner success
1.1.1 Define enablers and blockers of product management
1.1.2 Define your product management roles and names
1.1.3 Assess your product management readiness
Step 1.2 Establish your product ownership model
1.2.1 Identify your primary product owner perspective
1.2.2 Define your product owner RACI
| Align Product Owners to Products
Step 2.1 Assign product owners to products
2.1.1 Assign resources to your products and families
Step 2.2 Manage stakeholder influence
2.2.1 Visualize relationships to identify key influencers
2.2.2 Group stakeholders into categories
2.2.3 Prioritize your stakeholders
| Mature Product Owner Capabilities
Step 3.1 Assess your Agile product owner readiness
3.1.1 Assess your real Agile skill proficiency
Step 3.2 Mature product owner capabilities=
3.2.1 Assess your Vision capability proficiency
3.2.2 Assess your Leadership capability proficiency
3.2.3 Assess your PLM capability proficiency
3.2.4 Identify your business value drivers and sources of value
3.2.5 Assess your Value Realization capability proficiency
|
Deliverables |
-
Enablers and blockers
-
Role definitions
-
Product culture readiness
-
Product owner perspective mapping
-
Product owner RACI
|
-
Product resource assignment
-
Stakeholder management strategy
|
-
Real Agile skill proficiency assessment
-
Info-Tech’s product owner capability model proficiency assessment
-
Business value drivers and sources of value
|
Related Info-Tech Research
Product delivery
Build a product vision your organization can take from strategy through execution.
Deliver value at the scale of your organization through defining enterprise product families.
Quickly assess the state of your Agile readiness and plan your path forward to higher value realization.
Understand Agile fundamentals, principles, and practices so you can apply them effectively in your organization.
Streamline business value delivery through the strategic adoption of DevOps practices.
Further the benefits of Agile by extending a scaled Agile framework to the business.
Embrace a team sport culture built around continuous business-IT collaboration to deliver great products.
Shift security left to get into DevSecOps.
Facilitate ongoing alignment between Agile teams and the business with a set of targeted service offerings.
Execute a disciplined approach to rolling out Agile methods in the organization.
Related Info-Tech Research
Application portfolio management
See an overview of the APM journey and how we can support the pieces in this journey.
Ensure your application portfolio delivers the best possible return on investment.
Effective maintenance ensures the long-term value of your applications.
Move beyond maintenance to ensuring exceptional value from your apps.
Delivering value starts with embracing what your department can do.
Empower the business to implement its own applications with a trusted business-IT relationship.
Facilitate ongoing alignment between Agile teams and the business with a set of targeted service offerings.
Related Info-Tech Research
Value, delivery metrics, estimation
Focus product delivery on business value-driven outcomes.
Be careful what you ask for, because you will probably get it.
Develop data-driven insights to help you decide which applications to retire, upgrade, re-train on, or maintain to meet
the demands of the business.
Mature your IT department by measuring what matters.
Don’t let bad estimates ruin good work.
Commit to achievable software releases by grounding realistic expectations.
Expand on the financial model to give your initiative momentum.
Deliver more projects by giving yourself the voice to say “no” or “not yet” to new projects.
Facilitate ongoing alignment between Agile teams and the business with a set of targeted service offerings.
Related Info-Tech Research
Organizational design and performance
Focus product delivery on business value-driven outcomes.
Have the right people in the right place, at the right time.
Reorganizations are inherently disruptive. Implement your new structure with minimal pain for staff while maintaining IT
performance throughout the change.
Don’t just measure engagement, act on it.
Set holistic measures to inspire employee performance.
Phase 1
Establish the Foundation for Product Ownership
Mature and Scale Product Ownership
This phase will walk you through the following activities:
1.1.1 Define enablers and blockers of product management
1.1.2 Define your product management roles and names
1.1.3 Assess your product management readiness
1.2.1 Identify your primary product owner perspective
1.2.2 Define your product owner RACI
This phase involves the following participants:
-
Product owners
-
Product managers
-
Development team leads
-
Portfolio managers
-
Delivery managers
-
Business analysts
Step 1.1
Establish an environment for product owner success
Activities
1.1.1 Define enablers and blockers of product management
1.1.2 Define your product management roles and names
1.1.3 Assess your product management readiness
Establish the foundation for product ownership
This step involves the following participants:
-
Product owners
-
Product managers
-
Development team leads
-
Portfolio managers
-
Delivery managers
-
Business analysts
Outcomes of this step
- Enablers and blockers
- Role definitions
Empower product owners as the true owners of their product
Product ownership requires decision-making authority and accountability for the value realization from those decisions. POs are more than a proxy for stakeholders, aggregators for changes, and the communication of someone else’s priorities.
“A Product Owner in its most beneficial form acts like an Entrepreneur, like a 'mini-CEO'. The Product Owner is someone
who really 'owns' the product.”
– Robbin Schuurman,
“Tips for Starting Technical Product Managers”
Info-Tech Best Practice
Implement Info-Tech’s Product Owner Capability Model to help empower and hold product owners accountable for the
maturity and success of their product. The product owner must understand how their product fits into the organization’s
mission and strategy in order to align to enterprise value.
Product and service owners share the same foundation and capabilities
For the purpose of this blueprint, product/service and product owner/service owner are used interchangeably. The term
“product” is used for consistency but applies to services, as well.
Product = Service
Common foundations: Focus on continuous improvement, ROI, and value realization. Clear vision, goals, roadmap, and backlog.
“Product” and “service” are terms that each organization needs to define to fit its culture and customers (internal and
external). The most important aspect is consistent use and understanding of:
-
External products
-
Internal products
-
External services
-
Internal services
-
Products as a service (PaaS)
-
Productizing services (SaaS)
Define product ownership to match your culture and customers
Characteristics of a discrete product:
-
Has end users or consumers
-
Delivers quantifiable value
-
Evolves or changes over time
-
Has predictable delivery
-
Has definable boundaries
-
Has a cost to produce and operate
-
Has a discrete backlog and roadmap of improvements
What does not need a product owner?
-
Individual features
-
Transactions
-
Unstructured data
-
One-time solutions
-
Non-repeatable processes
-
Solutions that have no users or consumers
-
People or teams
Info-Tech Insight
-
Products are long-term endeavors that don’t end after the project finishes.
-
Products mature and improve their ability to deliver value.
-
Products have a discrete backlog of changes to improve the product itself, separate from operational requests fulfilled by the product or service.
Need help defining your products or services? Download our blueprint Deliver Digital Products at Scale.
Connect roadmaps to value realization with KPIs
" loading="lazy">
Info-Tech Insight
Every roadmap item should have an expected realized value once it is implemented. The associate KPIs or OKRs determine
if our goal was met. Any gap in value feedback back into the roadmap and backlog refinement.
Identify the differences between a project-centric and a product-centric organization
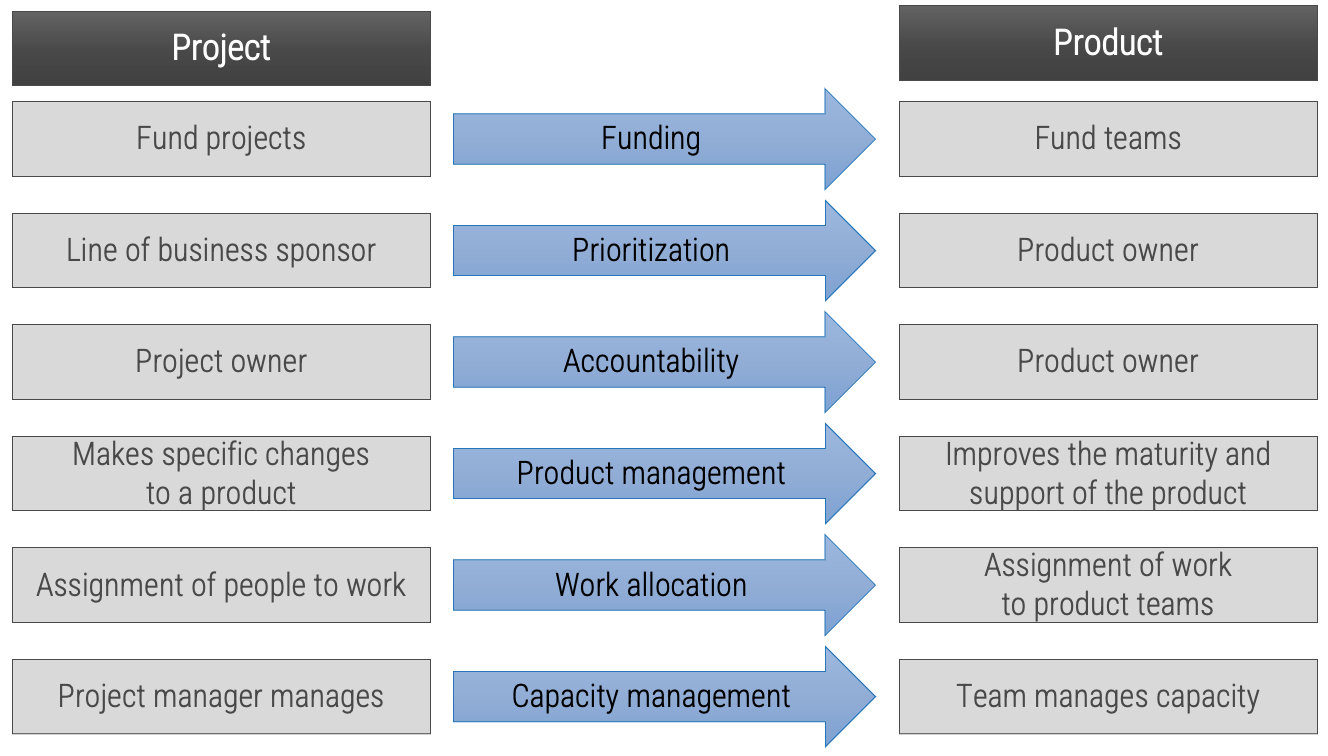
Info-Tech Insight
Product delivery requires significant shifts in the way you complete development work and deliver value to your users. Make the changes that support improving end-user value and enterprise alignment.
Projects can be a mechanism for funding product changes and improvements
Projects withing products
Regardless of whether you recognize yourself as a product-based or project-based shop, the same basic principles should apply.
You go through a period or periods of project-like development to build a version of an application or product.
You also have parallel services along with your project development, which encompasses a more product-based view. These may range from basic support and maintenance to full-fledged strategy teams or services like sales and marketing.
Recognize common barriers to product management
The transition to product ownership is a series of behavioral and cultural changes supported by processes and governance. It takes time and consistency to be successful.
-
Command and control structures
-
Lack of ownership and accountability
-
High instability in the market, demand, or organization
-
Lack of dedicated teams align to delivery, service, or product areas
-
Culture of one-off projects
-
Lack of identified and engaged stakeholders
-
Lack of customer exposure and knowledge
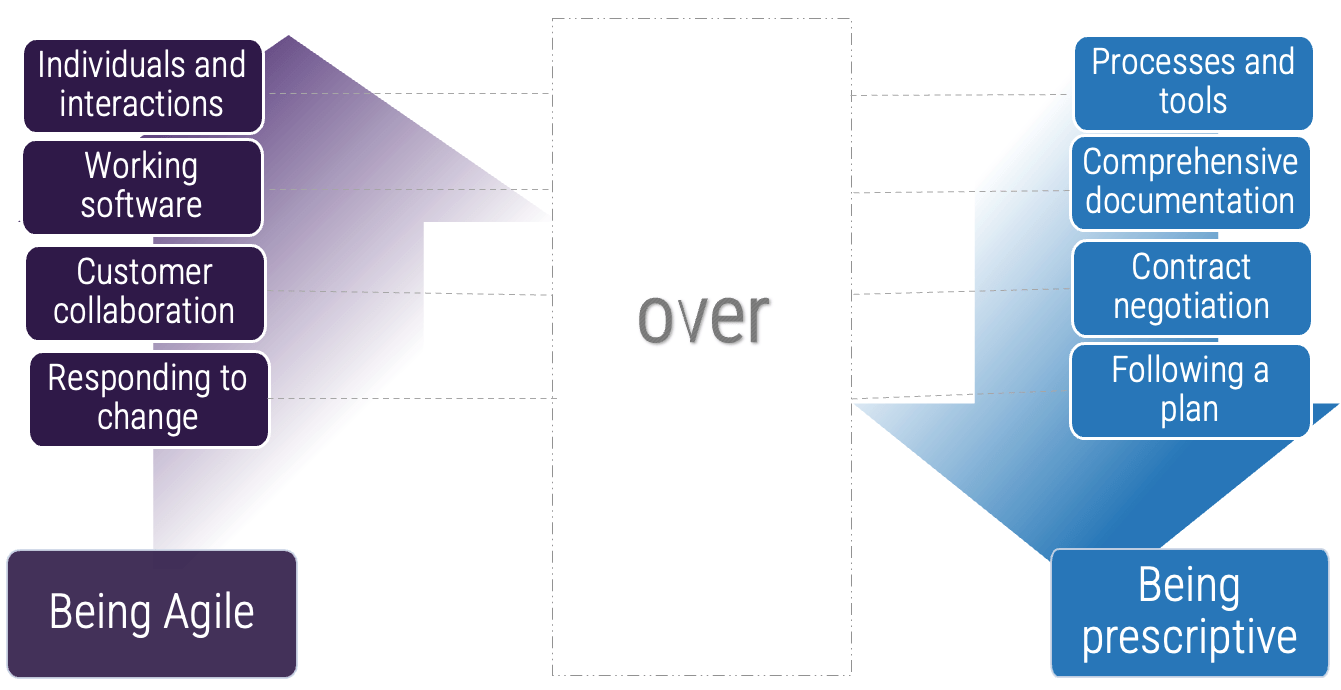
Agile’s four core values
“…while there is value in the items on the right, we value the items on the left more.”
Source: “The Agile Manifesto”
We value...
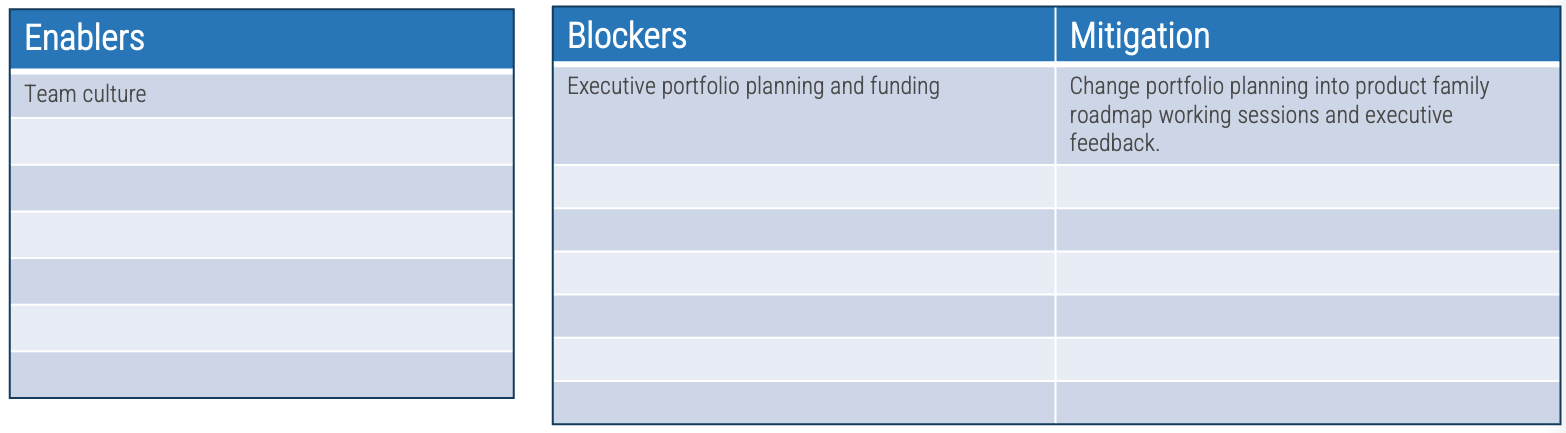
Exercise 1.1.1 Define enablers and blockers of product management
1 hour
-
Identify and mitigate blockers of product management in your organization.
-
What enablers will support strong product owners?
-
What blockers will make the transition to product management harder?
-
For each blocker, also define at least one mitigating step.
Output
Participants
-
Product owners
-
Product managers
-
Development team leads
-
Portfolio managers
-
Business analysts
Capture in the Mature and Scale Product Ownership Playbook.
Align enterprise value through product families
Effective product delivery requires thinking about more than just a single product
Good application and product management begins with strengthening good practices for a single or small set of applications, products, and services.
Product portfolio
Groups of product families within an overall value stream or capability grouping.
Project portfolio manager
Product family
A collection of related products. Products can be grouped along architectural, functional, operational, or experiential patterns.
Product family manager
Product
Single product composed of one or more applications and services.
Product owner
Info-Tech Insight
Define the current roles that will perform the product management function or define consistent role names to product owners and managers.
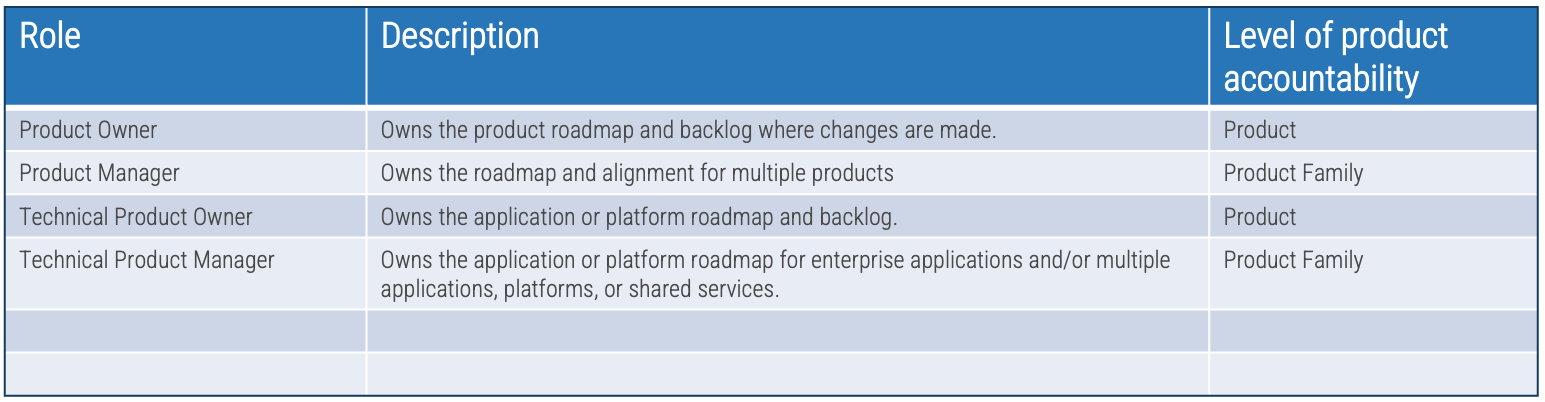
Exercise 1.1.2 Define your product management roles and names
1-2 hour
-
Identify the roles in which product management activities will be owned.
-
Define a common set of role names and describe the role.
-
Map the level of accountability for each role: Product or Product Family
-
Product owner perspectives will be defined in the next step.
Output
Participants
-
Product owners
-
Product managers
-
Development team leads
-
Portfolio managers
-
Business analysts
Capture in the Mature and Scale Product Ownership Playbook.
Use CLAIM to guide your journey
Value is best created by self-managing teams who deliver in frequent, short increments supported by leaders
who coach them through challenges.
Product-centric delivery and Agile are a radical change in how people work and think. Structured,
facilitated learning is required throughout the transformation to help leaders and practitioners make the
shift.
Product management, Agile, and DevOps have inspired SDLC tools that have become a key part of delivery
practices and work management.
Self-organizing teams that cross business, delivery, and operations are essential to gain the full benefits
of product-centric delivery.
Successful implementations require the disciplined use of metrics that support developing better teams
Exercise 1.1.3 Assess your product management readiness
1 hour
-
Open and complete the Mature and Scale Product Ownership Readiness Assessment in your Playbook or the provided Excel tool.
-
Discuss high and low scores for each area to reach a consensus.
-
Record your results in your Playbook.
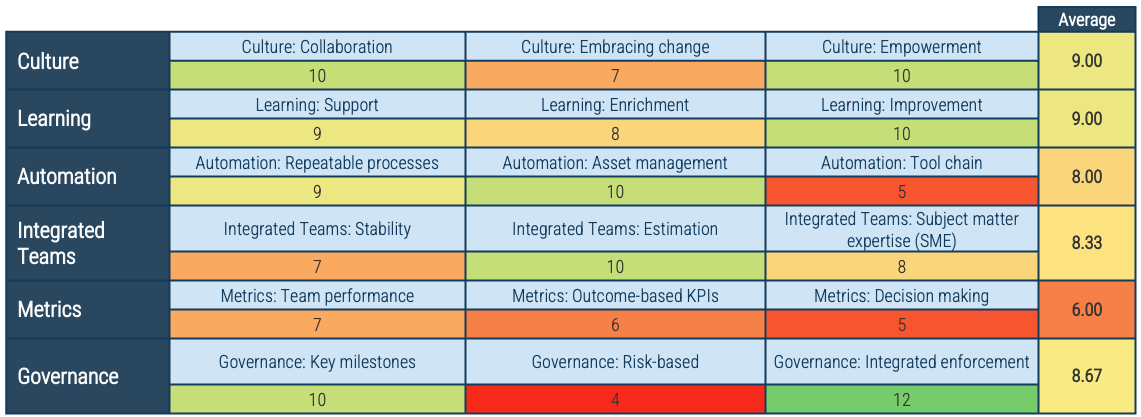
Output
-
Assessment of product management readiness based on Info-Tech’s CLAIM+G model.
Participants
-
Product owners
-
Product managers
-
Development team leads
-
Portfolio managers
-
Business analysts
Capture in the Mature and Scale Product Ownership Readiness Assessment.
Communicate reasons for changes and how they will be implemented
Leaders of successful change spend considerable time developing a powerful change message; that is, a compelling narrative that articulates the desired end state, and that makes the change concrete and meaningful to staff.
The organizational change message should:
Step 1.2
Establish your product ownership model
Activities
1.2.1 Identify your primary product owner perspective
1.2.2 Define your product owner RACI
Establish the foundation for product ownership
This step involves the following participants:
-
Product owners
-
Product managers
-
Development team leads
-
Portfolio managers
-
Delivery managers
-
Business analysts
Outcomes of this step
-
Product owner perspective mapping
-
Product owner RACI
Recognize the product owner perspectives
Product owners represent one of three primary perspectives. Although all share the same capabilities, how they approach their responsibilities is influenced by their primary perspective.
Info-Tech Best Practice
Product owners must translate needs and constraints from their perspective into the language of their audience. Kathy Borneman, Digital Product Owner at SunTrust Bank, noted the challenges of finding a common language between lines of business and IT (e.g. what is a unit?).
Identify and align to product owner perspectives to ensure product success
Product owner perspectives
-
Each product owner perspective provides important feedback, demand, and support for the product.
-
Where a perspective is represented by a distinct role, the perspective is managed with that product owner.
-
If separate roles don’t exist, the product owner must evaluate their work using two or three perspectives.
-
The ultimate success of a product, and therefore product owner, is meeting the end-user value of the business product
owner, tool support of the technical product owner, and manual processing support of the operations product owner.
Line of business (LOB) product owners
LOB product owners focus on the products and services consumed by the organization’s external consumers and users. The
role centers on the market needs, competitive landscape, and operational support to deliver products and services.
Business perspective
-
Alignment to enterprise strategy and priorities
-
Growth: market penetration and/or revenue
-
Perception of product value
-
Quality, stability, and predictability
-
Improvement and innovation
-
P&L
-
Market threats and opportunities
-
Speed to market
-
Service alignment
-
Meet or exceed individual goals
Relationship to Operations
-
Customer satisfaction
-
Speed of delivery and manual processing
-
Continuity
Relationship to Technical
-
Enabler
-
Analysis and insight
-
Lower operating and support costs
Technical product owners
Technical product owners are responsible for the IT systems, tools, platforms, and services that support business operations. Often they are identified as application or platform managers.
Technical perspective
-
Application, application suite, or group of applications
-
Core platforms and tools
-
Infrastructure and networking
-
Third-party technology services
-
Enable business operations
-
Direct-to-customer product or service
-
Highly interconnected
-
Need for continuous improvement
-
End-of-life management
-
Internal value proposition and users
Relationship to Business
-
Direct consumers
-
End users
-
Source of funding
Relationship to Operations
-
End users
-
Process enablement or automation
-
Support, continuity, and manual intervention
Operations (service) product owners
Operational product owners focus on the people, processes, and tools needed for manual processing and decisions when automation is not cost-effective. Operational product owners are typically called service owners due to the nature of
their work.
Operational perspective
-
Business enablement
-
Continuity
-
Problem, incident, issue resolution
-
Process efficiency
-
Throughput
-
Error/defect avoidance
-
Decision enablement
-
Waste reduction
-
Limit time in process
-
Disaster recovery
Relationship to Business
-
Revenue enablement
-
Manual intervention and processing
-
End-user satisfaction
Relationship to Technical
-
Process enabler
-
Performance enhancement
-
Threat of automation
Exercise 1.2.1 Identify your primary product owner perspective
1 hour
-
Identify which product owner perspective represents your primary focus.
-
Determine where the other perspectives need to be part of your product roadmap or if they are managed by other product owners.
Output
-
Identification of primary product owner perspective.
Participants
-
Product owners
-
Product managers
-
Development team leads
-
Portfolio managers
-
Business analysts
Capture in the Mature and Scale Product Ownership Playbook.
Realign differences between project managers and product owners
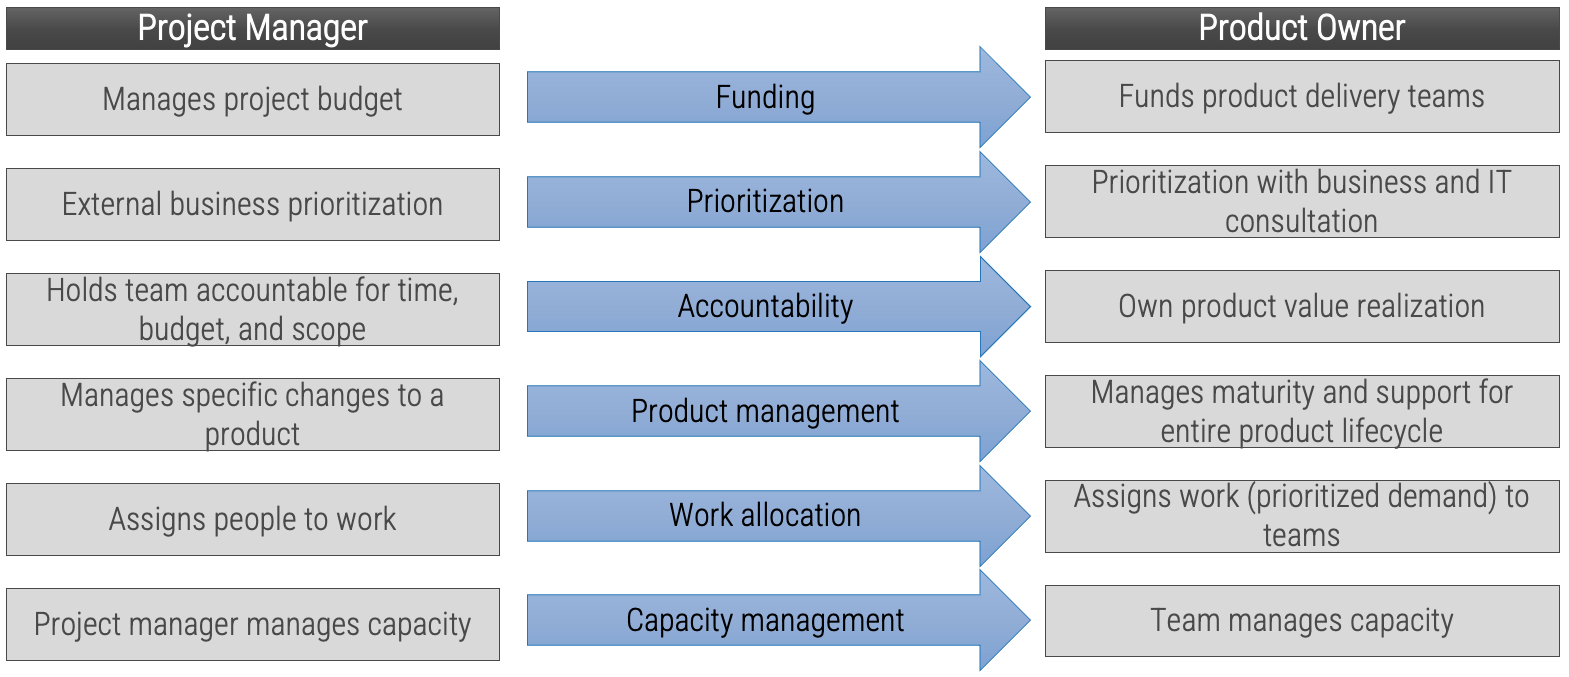
Manage and communicate key milestones
Successful product owners understand and define the key milestones in their product delivery lifecycles. These need to
be managed along with the product backlog and roadmap.
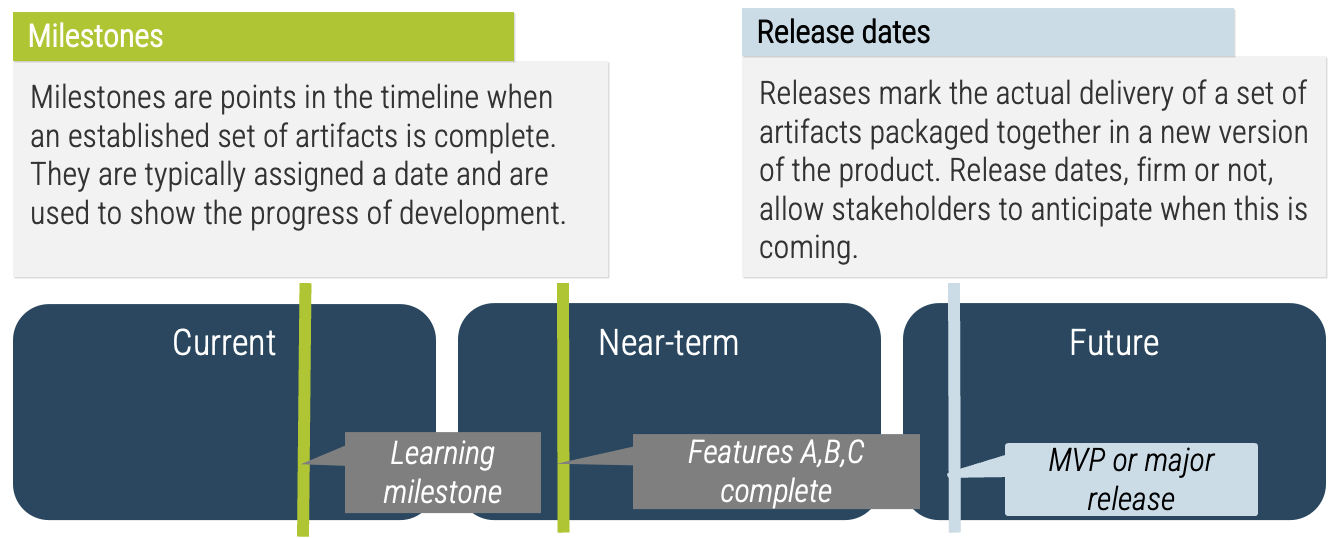
Info-Tech Best Practice
Product ownership isn’t just about managing the product backlog and development cycles. Teams need to manage key
milestones such as learning milestones, test releases, product releases, phase gates, and other organizational
checkpoints.
Define who manages each key milestone
Key milestones must be proactively managed. If a project manager is not available, those responsibilities need to be
managed by the product owner or Scrum Master. Start with responsibility mapping to decide which role will be
responsible.
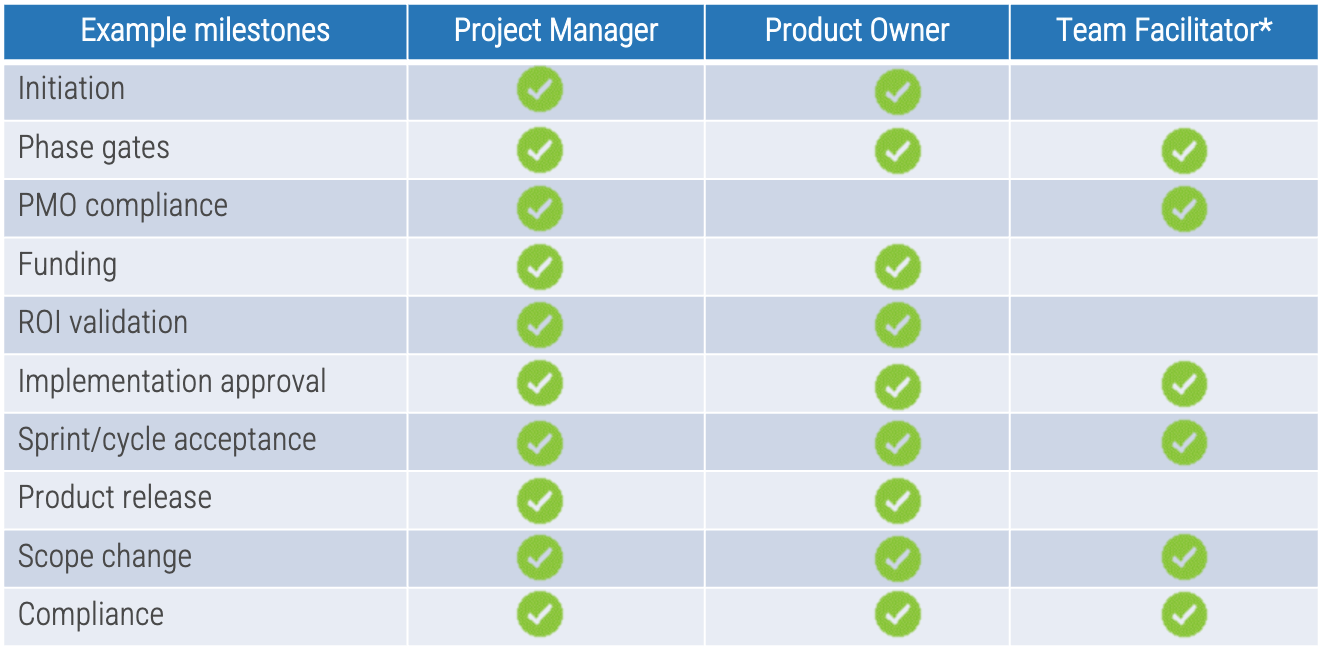
*Scrum Master, Delivery Manager, Team Lead
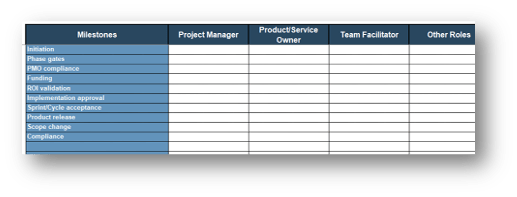
Exercise 1.2.2 Define your product owner RACI
60 minutes
-
Review your product and project delivery methodologies to identify key milestones (including approvals, gates, reviews, compliance checks, etc.). List each milestone on a flip chart or whiteboard.
-
For each milestone, define who is accountable for the completion.
-
For each milestone, define who is responsible for executing the milestone activity. (Who does the work that allows the
milestone to be completed?)
-
Review any responsibility and accountability gaps and identify opportunities to better support and execute your
operating model.
-
If you previously completed
Deliver Digital Products at Scale
, review and update your RACI in the
Mature and Scale
Product Ownership Workbook
.
Output
Participants
-
Product owners
-
Product managers
-
Development team leads
-
Portfolio managers
-
Business analysts
Capture in the Mature and Scale Product Ownership Playbook.
Phase 2
Align Product Owners to Products
Mature and Scale Product Ownership
This phase will walk you through the following activities:
2.1.1 Assign resources to your products and families
2.2.1 Visualize relationships to identify key influencers
2.2.2 Group stakeholders into categories
2.2.3 Prioritize your stakeholders
This phase involves the following participants:
-
Product owners
-
Product managers
-
Development team leads
-
Portfolio managers
-
Delivery managers
-
Business analysts
Step 2.1
Assign product owners to products
Activities
2.1.1 Assign resources to your products and families
Align product owners to products
This step involves the following participants:
-
Product owners
-
Product managers
-
Development team leads
-
Portfolio managers
-
Delivery managers
-
Business analysts
Outcomes of this step
- Product resource assignment
Match your product management role definitions to your product family levels
Using the role definitions, you created in Exercise 1.1.2, determine which roles correspond to which levels of your
product families.
Product portfolio
Groups of product families within an overall value stream or capability grouping.
Project portfolio manager
Product family
A collection of related products. Products can be grouped along architectural, functional, operational, or
experiential
patterns.
Product family manager
Product
Single product composed of one or more applications and services.
Product owner
Info-Tech Insight
Define the current roles that will perform the product management function or define consistent role names
to product owners and managers.
Assign resources throughout your product families
Info-Tech Insight
-
Start by assigning resources to each product or product family box.
-
A product owner can be responsible for more than one product.
-
Ownership of more than one product does not mean they share the same backlog.
-
For help organizing your product families, please download
Deliver Digital Products at Scale.
Understand special circumstances
In Deliver Digital Products at
Scale
, products were grouped into families using Info-Tech’s five scaling patterns. Assigning owners to
Enterprise Applications and Shared Services requires special consideration.
Value stream alignment
-
Business architecture
-
Value stream
-
Capability
-
Function
-
Market/customer segment
-
Line of business (LoB)
-
Example: Customer group > value stream > products
Enterprise applications
-
Enabling capabilities
-
Enterprise platforms
-
Supporting apps
-
Example: HR > Workday/Peoplesoft > Modules
Supporting: Job board, healthcare administrator
Shared Services
-
Organization of related services into service family
-
Direct hierarchy does not necessarily exist within the family
-
Examples: End-user support and ticketing,
workflow and collaboration tools
Technical
-
Domain grouping of IT infrastructure, platforms, apps, skills, or languages
-
Often used in combination with Shared Services grouping or LoB-specific apps
-
Examples: Java, .NET, low-code, database, network
Organizational alignment
-
Used at higher levels of the organization where products are aligned under divisions
-
Separation of product managers from organizational structure is no longer needed because the management
team owns the
product management role
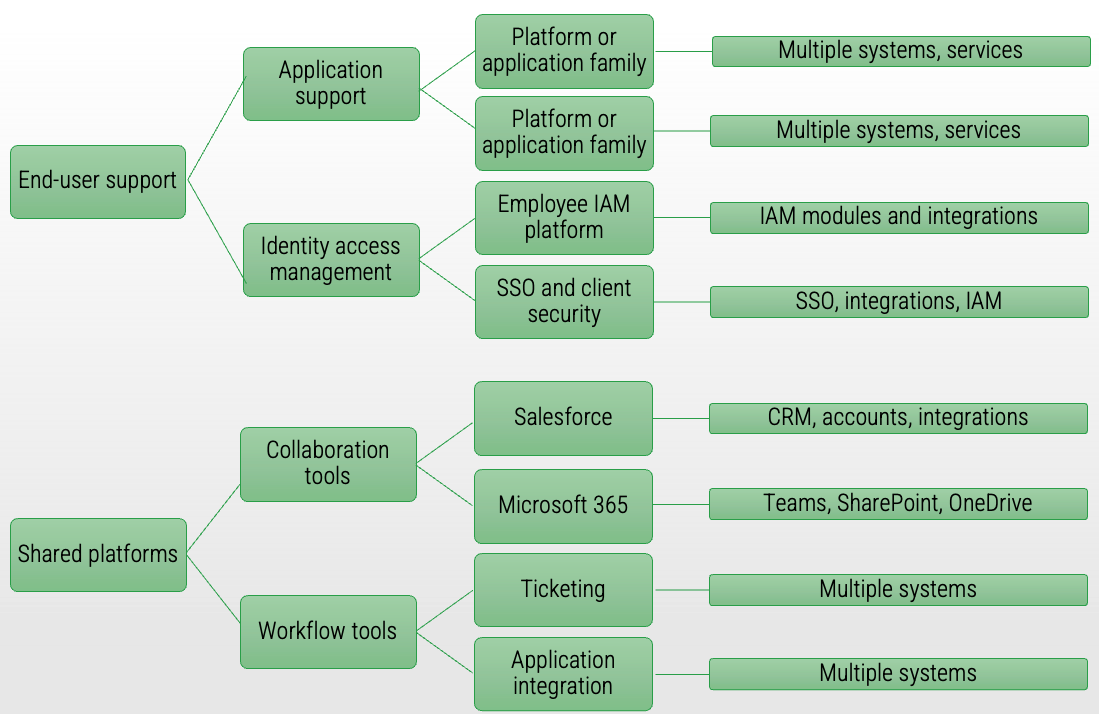
Map the source of demand to each product
With enterprise applications and shared services, your demand comes from other product and service owners rather than end customers in a value stream.
Enterprise applications
-
Primary demand comes from the operational teams and service groups using the platform.
-
Each group typically has processes and tools aligned to a module or portion of the overall platform.
-
Product owners determine end-user needs to assist with process improvement and automation.
-
Product family managers help align roadmap goals and capabilities across the modules and tools to ensure consistency and the alignment of changes.
Shared services
-
Primary demand for shared services comes from other product owners and service managers whose solution or application is dependent on the shared service platform.
-
Families are grouped by related themes (e.g. workflow tools) to increase reusability, standard enterprise solutions, reduced redundancy, and consistent processes across multiple teams.
-
Product owners manage the individual applications or services within a family.
Pattern: Enterprise applications
A division or group delivers enabling capabilities and the team’s operational alignment maps directly to the
modules/components of an enterprise application and other applications that support the specific business function.
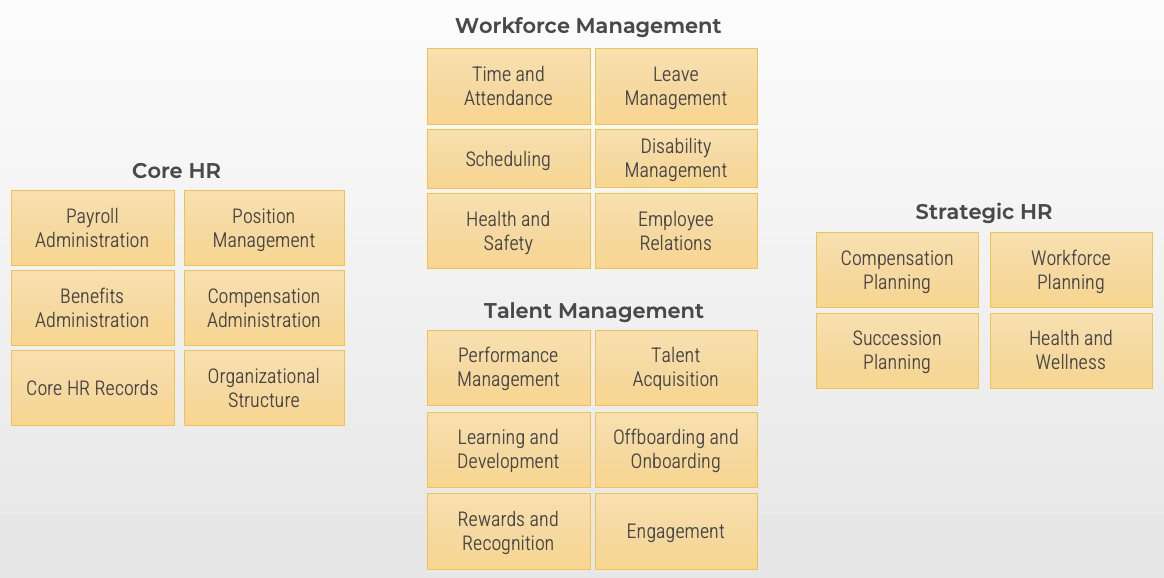
Example:
-
Human resources is one corporate function. Within HR, however, there are subfunctions that operate independently.
-
Each operational team is supported by one or more applications or modules within a primary HR system.
-
Even though the teams work independently, the information they manage is shared with, or ties into processes used by other teams. Coordination of efforts helps provide a higher level of service and consistency.
For additional information about HRMS, please download
Get the Most Out of Your HRMS.
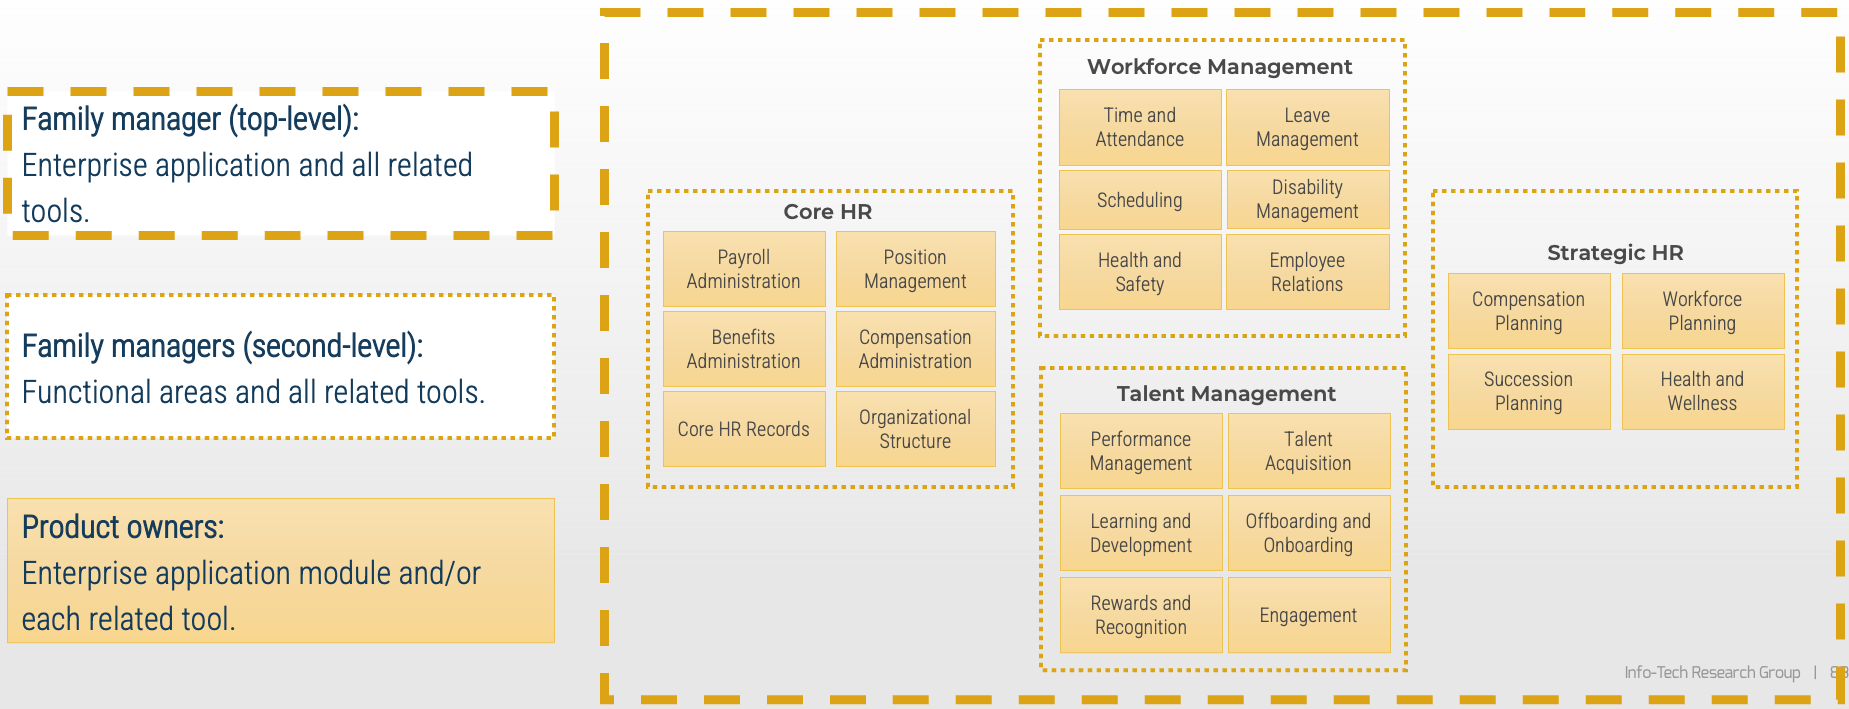
Assigning owners to enterprise applications
Align your enterprise application owners to your operating teams that use the enterprise applications. Effectively, your service managers will align with your platform module owners to provide integrated awareness and planning.
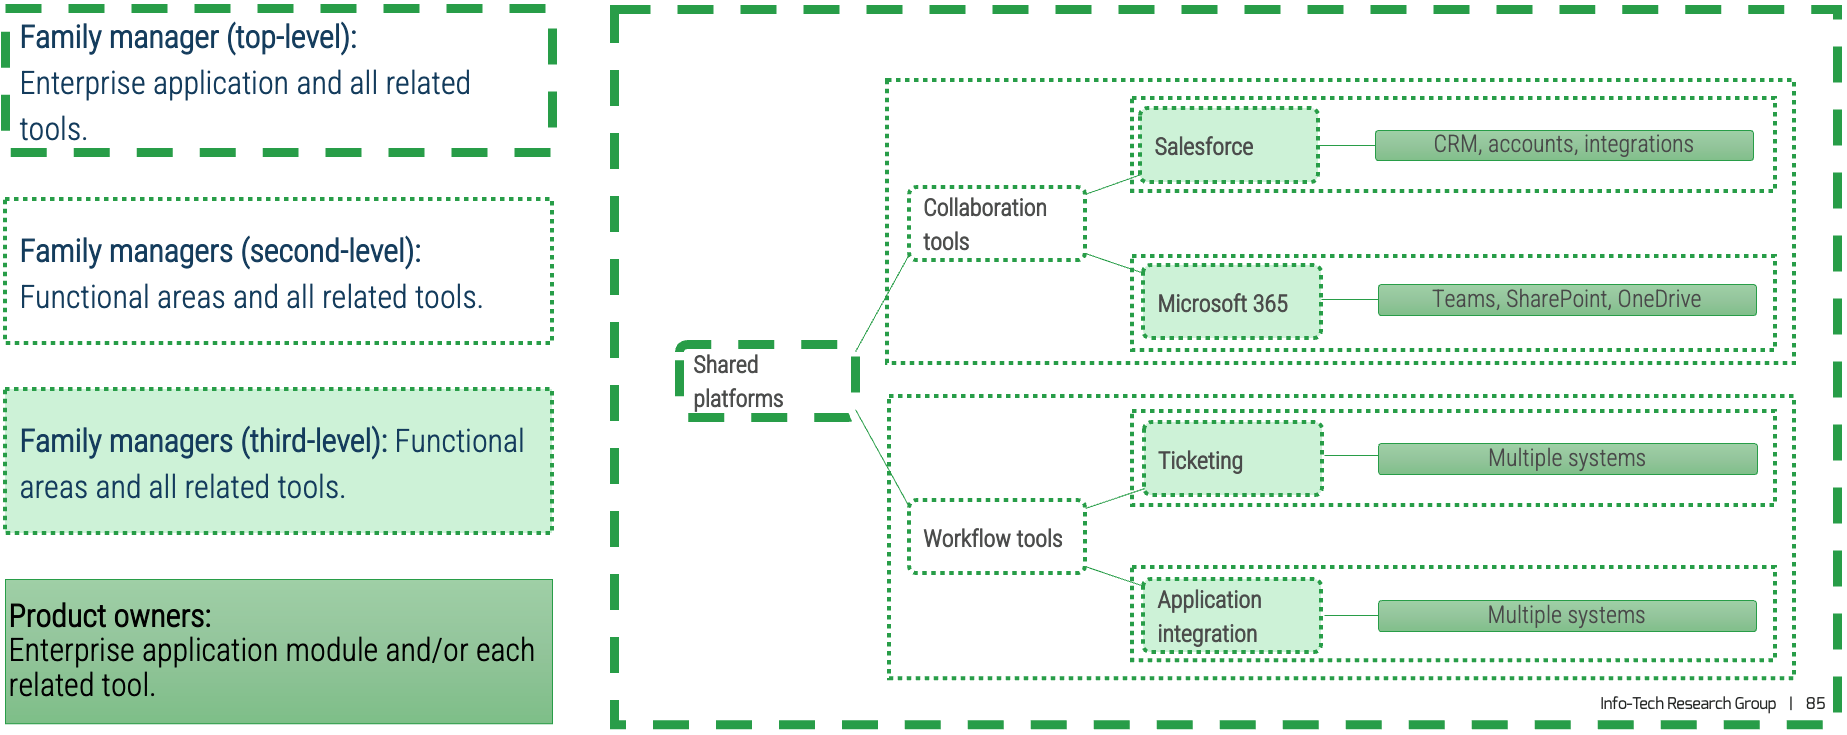
Pattern: Shared services
Grouping by service type, knowledge area, or technology allows for specialization while families align service delivery to shared business capabilities.
Example:
-
Recommended for governance, risk, and compliance; infrastructure; security; end-user support; and shared platforms (workflow, collaboration, imaging/record retention). Direct hierarchies do not necessarily exist within the shared service family.
-
Service groupings are common for service owners (also known as support managers, operations managers, etc.).
-
End-user ticketing comes through a common request system, is routed to the team responsible for triage, and then is routed to a team for resolution.
-
Collaboration tools and workflow tools are enablers of other applications, and product families might support multiple apps or platforms delivering that shared capability.
Assigning owners to shared services
Assign owners by service type, knowledge area, or technology to provide alignment of shared business capabilities and common solutions.
Map sources of demand and influencers
Use the stakeholder analysis to define the key stakeholders and sources of demand for enterprise applications and shared services. Extend your mapping to include their stakeholders and influencers to uncover additional sources of demand and prioritization.
Info-Tech Insight
Your product owner map defines the influence landscape your product operates. It is every bit as important as the teams who enhance, support, and operate your product directly.
Combine your product owner map with your stakeholder map to create a comprehensive view of influencers.
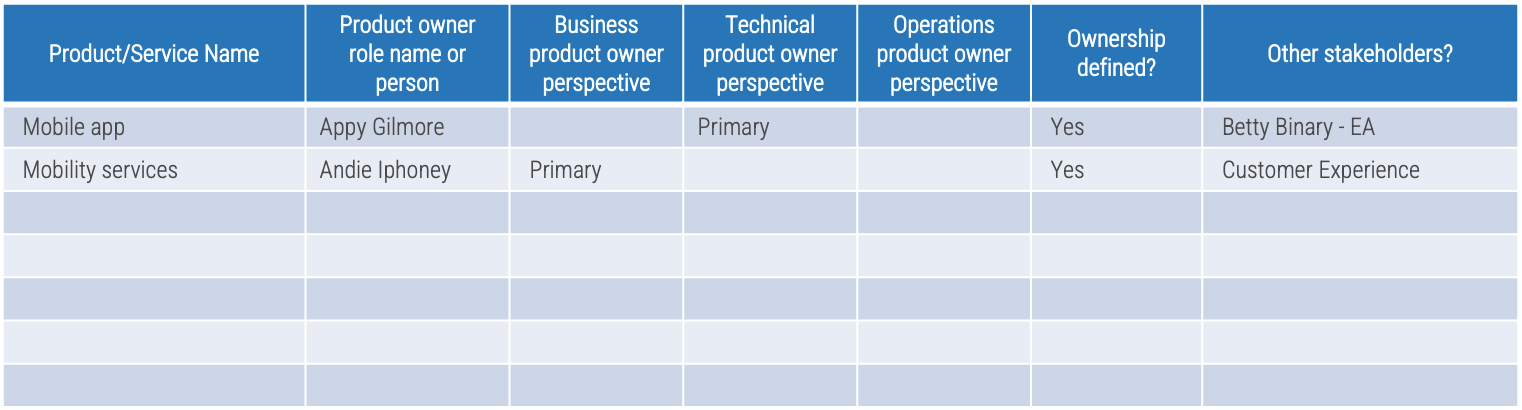
Exercise 2.1.1 Assign resources to your products and families
1-4 hours
-
Use the product families you completed in
Deliver Digital Products at Scale
to determine which products and product families need a resource assigned. Where the same resource fills more than one role, they are the product owner or manager for each independently.
-
Product families that are being managed as products (one backlog for multiple products) should have one owner until the family is split into separate products later.
-
For each product and family, define the following:
-
Who is the owner (role or person)?
-
Is ownership clearly defined?
-
Are there other stakeholders who make decisions for the product?
-
Record the results in the
Mature and Scale Product Ownership Workbook
on the Product Owner Mapping worksheet.
Output
-
Product owner and manager resource alignment.
Participants
-
Product owners
-
Product managers
-
Development team leads
-
Portfolio managers
-
Business analysts
Capture in the Mature and Scale Product Ownership Playbook.
Step 2.2
Manage stakeholder influence
Activities
2.2.1 Visualize relationships to identify key influencers
2.2.2 Group stakeholders into categories
2.2.3 Prioritize your stakeholders
Align product owners to products
This step involves the following participants:
-
Product owners
-
Product managers
-
Development team leads
-
Portfolio managers
-
Delivery managers
-
Business analysts
Outcomes of this step
- Stakeholder management strategy
Develop a product owner stakeholder strategy
Stakeholders are a critical cornerstone to product ownership. They provide the context, alignment, and
constraints that
influence or control what a product owner can accomplish.
Product owners operate within a network of stakeholders who represent different perspectives within the
organization.
First, product owners must identify members of their stakeholder network. Next, they should devise a
strategy for managing stakeholders.
Without a stakeholder strategy, product owners will encounter obstacles, resistance, or unexpected changes.
Create a stakeholder network map to product roadmaps and prioritization
Follow the trail of breadcrumbs from your direct stakeholders to their influencers to uncover hidden stakeholders.
Info-Tech Insight
Your stakeholder map defines the influence landscape your product operates. It is every bit as important as the teams who enhance, support, and operate your product directly.
Use connectors to determine who may be influencing your direct stakeholders. They may not have any formal authority within the organization, but they may have informal yet substantive relationships with your stakeholders.
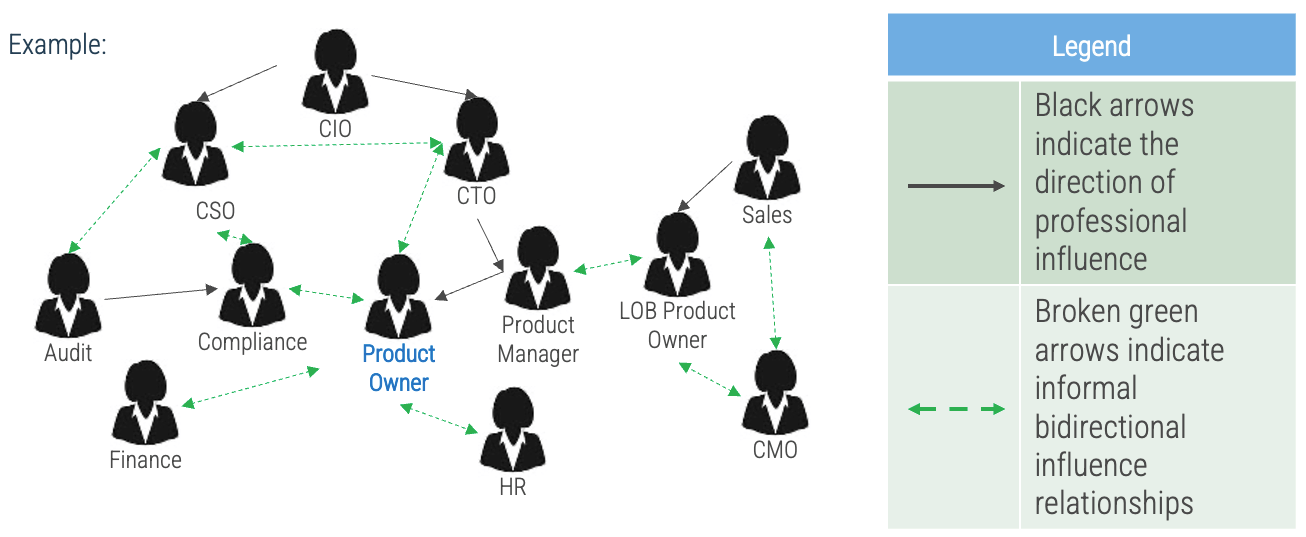
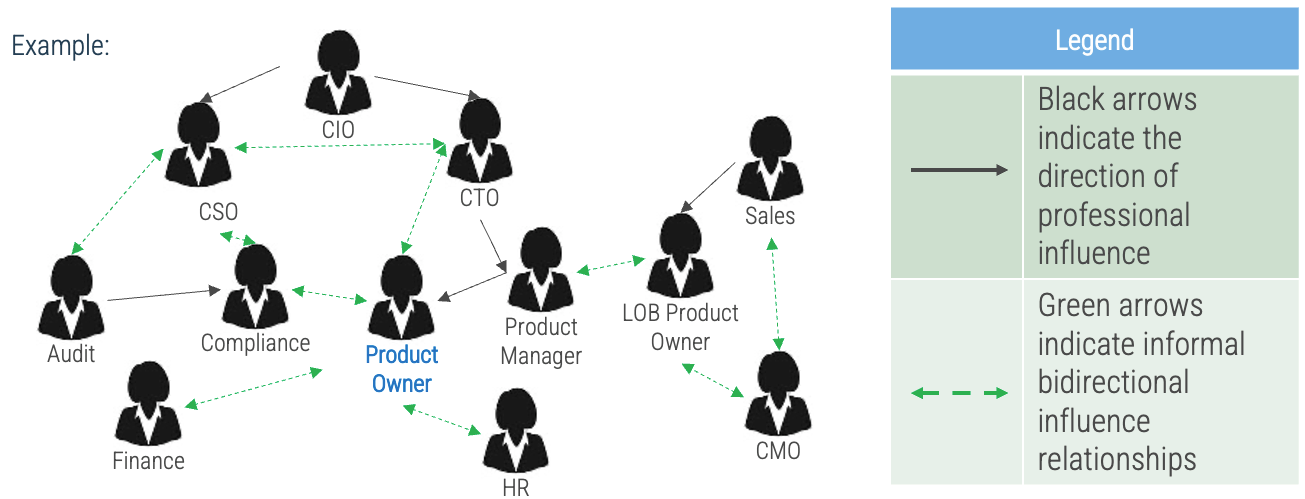
Exercise 2.2.1 Visualize relationships to identify key influencers
1 hour
-
List direct stakeholders for your product.
-
Determine the stakeholders of your stakeholders and consider adding each of them to the stakeholder list.
-
Assess who has either formal or informal influence over your stakeholders; add these influencers to your stakeholder list.
-
Construct a diagram linking stakeholders and their influencers together.
-
Use black arrows to indicate the direction of professional influence.
-
Use dashed green arrows to indicate informal bidirectional influence relationships.
-
Record the results in the
Mature and Scale
Product Ownership Workbook
.
Output
-
Relationships among stakeholders and influencers
Participants
-
Product owners
-
Product managers
-
Development team leads
-
Portfolio managers
-
Business analysts
Capture in the Mature and Scale Product Ownership Playbook.
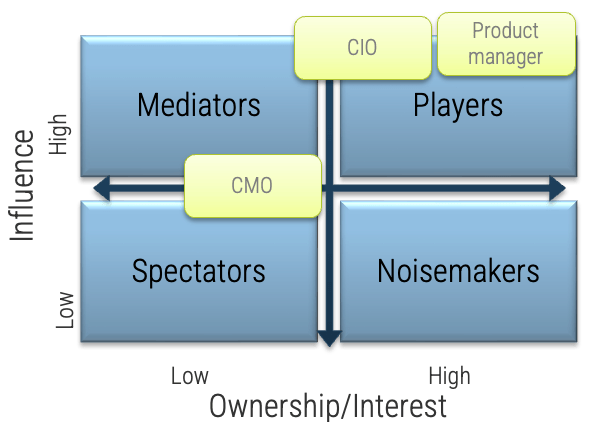
Categorize your stakeholders with a prioritization map
A stakeholder prioritization map helps product owners categorize their stakeholders by their level of influence and ownership in the product and/or teams.
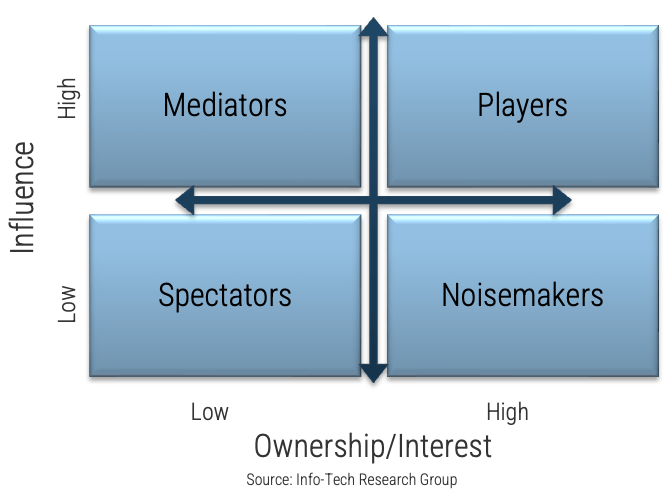
There are four areas on the map, and the stakeholders within each area should be treated differently.
-
Players have a high interest in the initiative and the influence to effect change over the initiative. Their support is critical, and a lack of support can cause significant impediments to the objectives.
-
Mediators have a low interest but significant influence over the initiative. They can help to provide balance and objective opinions to issues that arise.
-
Noisemakers have low influence but high interest. They tend to be very vocal and engaged, either positively or negatively but have little ability to enact their wishes.
-
Spectators are generally apathetic and have little influence over or interest in the initiative.
Exercise 2.2.2 Group stakeholders into categories
1 hour
-
Identify your stakeholders’ interest in and influence on your Agile implementation as high, medium, or low by rating the attributes below.
-
Map your results to the model below to determine each stakeholder’s category.
-
Record the results in the
Mature and Scale
Product Ownership Workbook
.
Output
-
Categorization of stakeholders and influencers
Participants
-
Product owners
-
Product managers
-
Development team leads
-
Portfolio managers
-
Business analysts
Capture in the Mature and Scale Product Ownership Playbook.
Prioritize your stakeholders
There may be too many stakeholders to be able to manage them all. Focus your attention on the stakeholders that matter most.
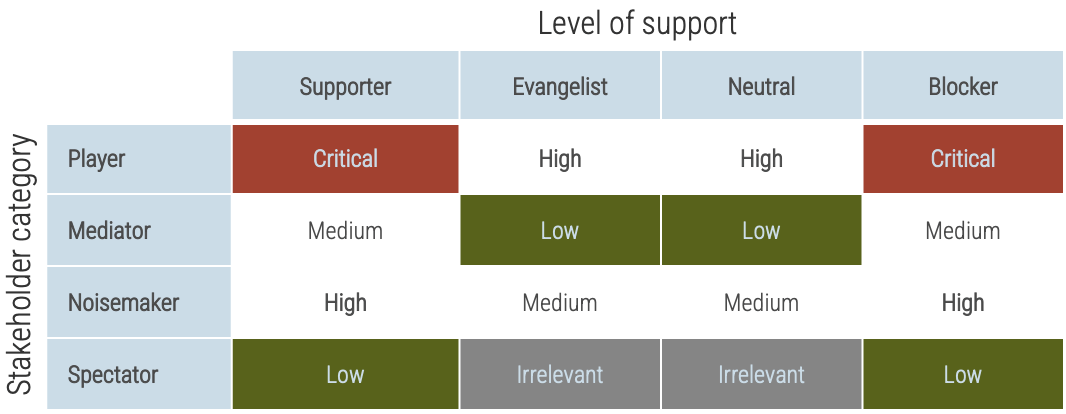
Consider the three dimensions of stakeholder prioritization: influence, interest, and support. Support can be determined by rating the following question: How likely is it that your stakeholder would recommend your product? These parameters are used to prioritize which stakeholders are most important and should receive your focused attention. The table to the right indicates how stakeholders are ranked.
Exercise 2.2.3 Prioritize your stakeholders
1 hour
-
Identify the level of support of each stakeholder by answering the following question: How likely is it that your stakeholder would endorse your product?
-
Prioritize your stakeholders using the prioritization scheme on the previous slide.
-
Record the results in the
Mature and Scale
Product Ownership Workbook
.
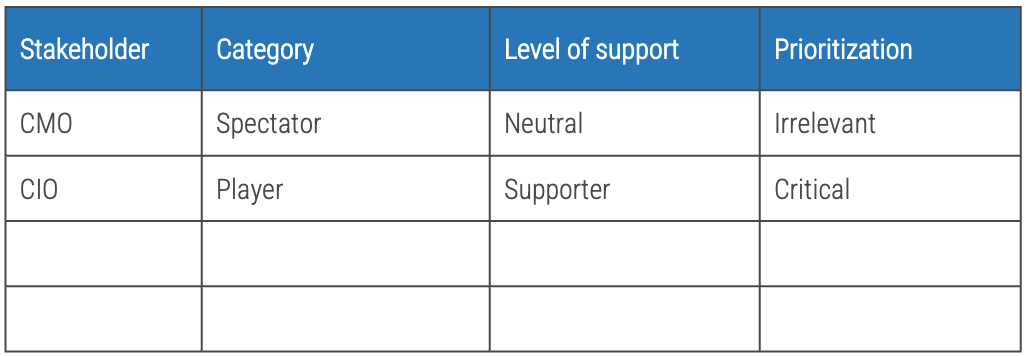
Output
-
Stakeholder and influencer prioritization
Participants
-
Product owners
-
Product managers
-
Development team leads
-
Portfolio managers
-
Business analysts
Capture in the Mature and Scale Product Ownership Playbook.
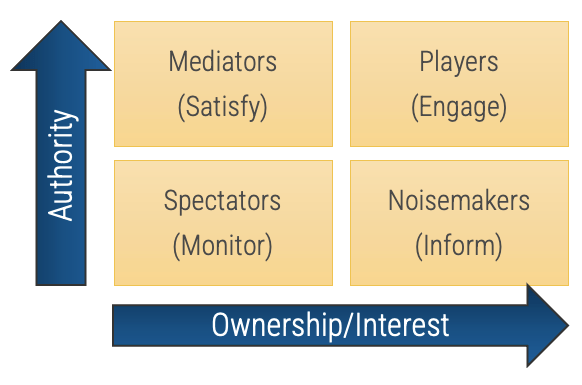
Define strategies for engaging stakeholders by type
Type
|
Quadrant
|
Actions
|
Players
|
High influence, high interest – actively engage
|
Keep them updated on the progress of the project. Continuously involve players in the process and maintain their engagement and interest by demonstrating their value to its success.
|
Mediators
|
High influence, low interest – keep satisfied
|
They can be the game changers in groups of stakeholders. Turn them into supporters by gaining their confidence and trust and including them in important decision-making steps. In turn, they can help you influence other stakeholders.
|
Noisemakers
|
Low influence, high interest – keep informed
|
Try to increase their influence (or decrease it if they are detractors) by providing them with key information, supporting them in meetings, and using mediators to help them.
|
Spectators
|
Low influence, low interest – monitor
|
They are followers. Keep them in the loop by providing clarity on objectives and status updates.
|
Info-Tech Insight
Each group of stakeholders draws attention and resources away from critical tasks. By properly identifying your stakeholder groups, the product owner can develop corresponding actions to manage stakeholders in each group. This can dramatically reduce wasted effort trying to satisfy spectators and noisemakers while ensuring the needs of mediators and players are met.
Phase 3
Mature Product Owner Capabilities
Mature and Scale Product Ownership
This phase will walk you through the following activities:
3.1.1 Assess your real Agile skill proficiency
3.2.1 Assess your vision capability proficiency
3.2.2 Assess your leadership capability proficiency
3.2.3 Assess your PLM capability proficiency
3.2.4 Identify your business value drivers and sources of value
3.2.5 Assess your value realization capability proficiency
This phase involves the following participants:
-
Product owners
-
Product managers
Step 3.1
Assess your Agile product owner readiness
Activities
3.1.1 Assess your real Agile skill proficiency
Mature product owner capabilities
This step involves the following participants:
-
Product owners
-
Product managers
Outcomes of this step
- Real Agile skill proficiency assessment
Why focus on core skills?
They are the foundation to achieve business outcomes
The right skills development is only possible with proper assessment and alignment against outcomes.
Being successful at Agile is more than about just doing Agile
The following represents the hard skills needed to “Do Agile”:
-
Engineering skills. These are the skills and competencies required for building brand-new valuable
software.
-
Technician skills. These are the skills and competencies required for maintaining and operating the
software delivered to stakeholders.
-
Framework/Process skills. These are the specific knowledge skills required to support engineering or
technician skills.
-
Tools skills. This represents the software that helps you deliver other software.
While these are important, they are not the whole story. To effectively deliver software, we believe in the
importance of
being Agile over simply doing Agile.
Adapted from: “Doing
Agile” Is Only Part of the Software Delivery Pie
Focus on these real Agile skills
Agile skills
- Accountability
- Collaboration
- Comfort with ambiguity
- Communication
- Empathy
- Facilitation
- Functional decomposition
- Initiative
- Process discipline
- Resilience
Info-Tech research shows these are the real Agile skills to get started with
Skill Name
|
Description
|
Accountability
|
Refers to the state of being accountable. In an Agile context, it implies transparency, dedication, acting responsibly, and doing what is necessary to get the job done.
|
Collaboration
|
Values diverse perspectives and working with others to achieve the best output possible. Effective at working toward individual, team, department, and organizational goals.
|
Comfort with ambiguity
|
Allows you to confidently take the next steps when presented with a problem without having all the necessary information present.
|
Communication
|
Uses different techniques to share information, concerns, or emotions when a situation arises, and it allows you to vary your approach depending on the current phase of development.
|
Empathy
|
Is the ability to understand and share the feelings of another to better serve your team and your stakeholders.
|
Facilitation
|
Refers to guiding and directing people through a set of conversations and events to learn and achieve a shared understanding.
|
Functional decomposition
|
Is being able to break down requirements into constituent epics and stories.
|
Initiative
|
Is being able to anticipate challenges and then act on opportunities that lead to better business outcomes.
|
Process discipline
|
Refers to the focus of following the right steps for a given activity at the right time to achieve the right outcomes.
|
Resilience
|
Refers to the behaviors, thoughts, and actions that allow a person to recover from stress and adversity.
|
Accountability
An accountable person:
-
Takes ownership of their own decisions and actions and is responsible for the quality of results.
-
Recognizes personal accountabilities to others, including customers.
-
Works well autonomously.
-
Ensures that the mutual expectations between themselves and others are clearly defined.
-
Takes the appropriate actions to ensure that obligations are met in a timely manner.
-
As a leader, takes responsibility for those being led.
Accountability drives high performance in teams and organizations
-
The performance level of teams depends heavily on accountability and who demonstrates it:
-
In weak teams, there is no accountability.
-
In mediocre teams, supervisors demonstrate accountability.
-
In high-performance teams, peers manage most performance problems through joint accountability. (Grenny, 2014)
-
According to Bain & Company, accountability is the third most important attribute of high-performing companies. Some of the other key attributes include honest, performance-focused, collaborative, and innovative. (Mankins, 2013)
All components of the employee empowerment driver have a strong, positive correlation with engagement.
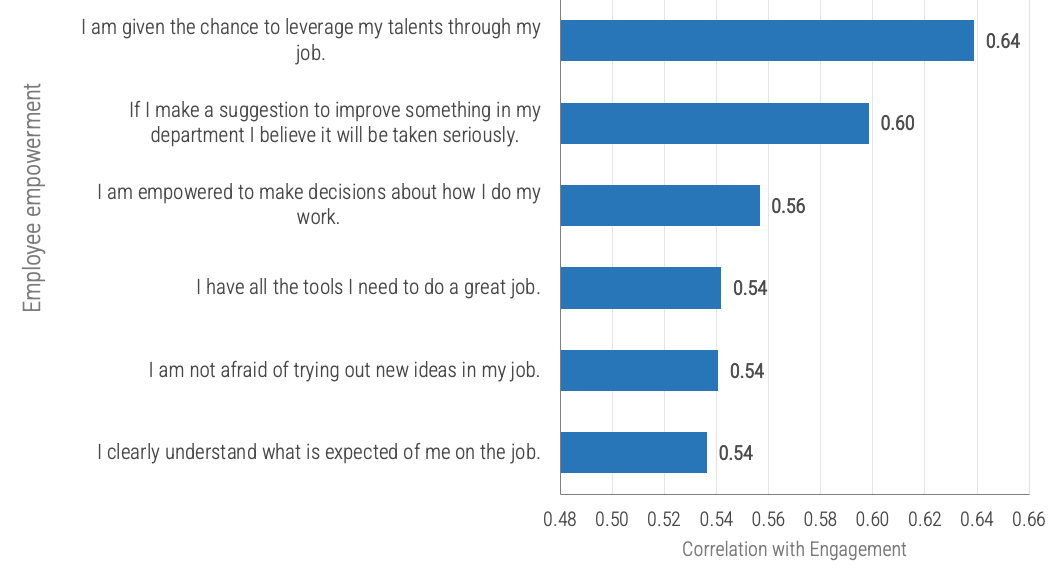
Source: McLean & Company Engagement Database, 2018; N=71,794
Accountability
Your Score: ____
1 - Foundational: Transitioning and Growing
|
2 - Capable/Competent: Core Contributor
|
3 - Influential: Gifted Improver
|
4 - Transformational: Towering Strength
|
-
Alerts others to possible problems in a timely manner.
-
Seeks appropriate support to solve problems.
-
Actively contributes to the creation and evaluation of possible solutions.
-
Acts on solutions selected and decisions made as directed.
-
Makes effective decisions about how to complete work tasks.
-
Demonstrates the capability of breaking down concrete issues into parts and synthesizing information succinctly.
-
Collects and analyzes information from a variety of sources.
|
-
Seeks information and input to fully understand the cause of problems.
-
Takes action to address obstacles and problems before they impact performance and results.
-
Initiates the evaluation of possible solutions to problems.
-
Makes effective decisions about work task prioritization.
-
Appropriately assesses risks before deciding.
-
Effectively navigates through ambiguity, using multiple data points to analyze issues and identify trends.
-
Does not jump to conclusions.
-
Draws logical conclusions and provides opinions and recommendations with confidence.
-
Takes ownership over decisions and their consequences.
|
-
Demonstrates broad knowledge of information sources that can be used to assess problems and make decisions.
-
Invests time in planning, discovery, and reflection to drive better decisions.
-
Effectively leverages hard data as inputs to making decisions.
-
Garners insight from abstract data and makes appropriate decisions.
-
Coaches others in effective decision-making practices.
-
Has the authority to solve problems and make decisions.
-
Thinks several steps ahead in deciding the best course of action, anticipating likely outcomes, risks, or implications.
-
Establishes metrics to aid in decision-making, for self and teams
|
-
Prioritizes objective and ambiguous information and analyzes this when making decisions.
-
Solicits a diverse range of opinions and perspectives as inputs to decision making.
-
Applies frameworks to decision making, particularly in situations that have little base in prior experience.
-
Makes effective decisions about organizational priorities.
-
Holds others accountable for their decisions and consequences.
-
Creates a culture of empowerment and trust to facilitate effective problem solving and decision making.
-
Makes sound decisions that have organization-wide consequences and that influence future direction.
|
Collaboration as a skill
The principles and values of Agile revolve around collaboration.
-
Works well with others on specialized and cross-functional teams.
-
Can self-organize while part of a team.
-
Respects the commitments that others make.
-
Identifies and articulates dependencies.
-
Values diverse perspectives and works with others to achieve the best output possible.
-
Effective at working toward individual, team, department, and organizational goals.
Collaboration
The Agile Manifesto has three principles that focus on collaboration:
-
The business and developers must work together daily throughout the project.
-
Build projects around motivated individuals. Give them the environment and support they need and trust them to get the job done.
-
The most efficient and effective method of conveying information to and within a development team is face-to-face conversation.
Effective collaboration supports Agile behaviors, including embracing change and the ability to work iteratively.
Collaboration
Your Score: ____
1 - Foundational: Transitioning and Growing | 2 - Capable/Competent: Core Contributor | 3 - Influential: Gifted Improver | 4 - Transformational: Towering Strength |
-
Understands role on the team and the associated responsibilities and accountabilities.
-
Treats team members with respect.
-
Contributes to team decisions and to the achievement of team goals and objectives.
-
Demonstrates a positive attitude.
-
Works cross-functionally to achieve common goals and to support the achievement of other team/department goals.
-
Values working in a diverse team and understands the importance of differing perspectives to develop unique solutions or ideas.
|
-
Fosters team camaraderie, collaboration, and cohesion.
-
Understands the impact of one's actions on the ability of team members to do their jobs.
-
Respects the differences other team members bring to the table by openly seeking others' opinions.
-
Helps the team accomplish goals and objectives by breaking down shared goals into smaller tasks.
-
Approaches challenging team situations with optimism and an open mind, focusing on coming to a respectful conclusion.
-
Makes suggestions to improve team engagement and effectiveness.
-
Supports implementation of team decisions.
-
Professionally gives and seeks feedback to achieve common goals.
-
Values working in a diverse team and understands the importance of differing perspectives to develop unique solutions or ideas.
|
-
Motivates the team toward achieving goals and exceeding expectations.
-
Reaches out to other teams and departments to build collaborative, cross-functional relationships.
-
Creates a culture of collaboration that leverages team members' strengths, even when the team is remote or virtual.
-
Participates and encourages others to participate in initiatives that improve team engagement and effectiveness.
-
Builds consensus to make and implement team decisions, often navigating through challenging task or interpersonal obstacles.
-
Values leading a diverse team and understands the importance of differing perspectives to develop unique solutions or ideas.
|
-
Creates a culture of collaboration among teams, departments, external business partners, and all employee levels.
-
Breaks down silos to achieve inter-departmental collaboration.
-
Demonstrates ownership and accountability for team/department/ organizational outcomes.
-
Uses an inclusive and consultative approach in setting team goals and objectives and making team decisions.
-
Coaches others on how to identify and proactively mitigate potential points of team conflict.
-
Recognizes and rewards teamwork throughout the organization.
-
Provides the tools and resources necessary for teams to succeed.
-
Values diverse teams and understands the importance of differing perspectives to develop unique solutions or ideas.
|
Comfort with ambiguity
Ability to handle ambiguity is a key factor in Agile success.
-
Implies the ability to maintain a level of effectiveness when all information is not present.
-
Able to confidently act when presented with a problem without all information present.
-
Risk and uncertainty can comfortably be handled.
-
As a result, can easily adapt and embrace change.
-
People comfortable with ambiguity demonstrate effective problem-solving skills.
Relative importance of traits found in Agile teams
-
Handles ambiguity
-
Agreeable
-
Conscientious
Comfort with ambiguity
Your Score: ____
1 - Foundational: Transitioning and Growing | 2 - Capable/Competent: Core Contributor | 3 - Influential: Gifted Improver | 4 - Transformational: Towering Strength |
-
Requires most information to be present before carrying out required activities.
|
-
Can operate with some information missing.
-
Comfortable asking people within their known circles for help.
-
Significant time is taken to reveal small pieces of information.
|
-
More adept at operating with information missing.
-
Willing to reach out to people outside of their regular circles for assistance and clarification.
-
Able to apply primary and secondary research methods to fill in the missing pieces.
|
-
Can operate essentially with a statement and a blank page.
-
Able to build a plan, drive others and themselves to obtain the right information to solve the problem.
-
Able to optimize only pulling what is necessary to answer the desired question and achieve the desired outcome.
|
Communication
Even though many organizations recognize its importance, communication is one of the root causes of project failure.
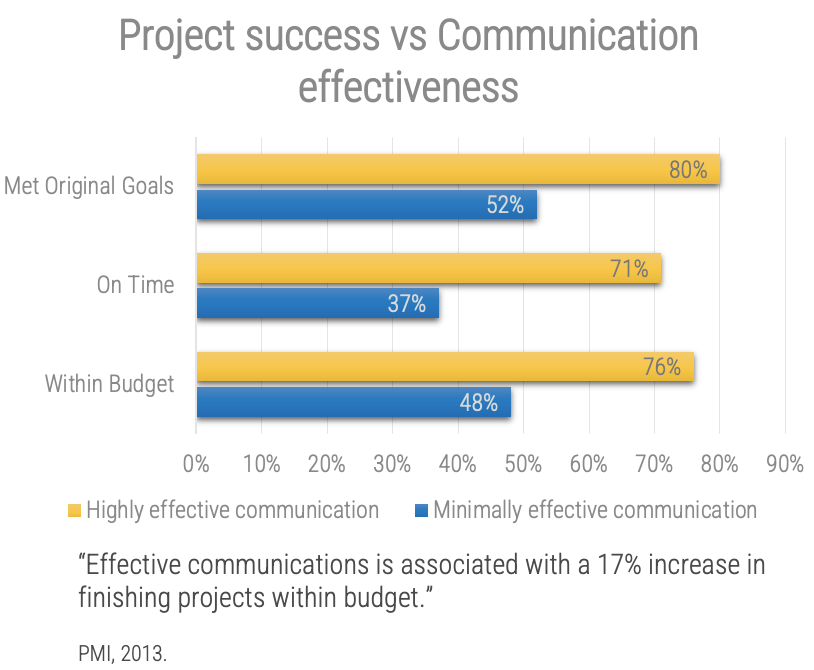
56%
56% of the resources spent on a project are at risk due to ineffective communications.
PMI, 2013.
29%
In 29% of projects started in the past 12 months, poor communication was identified as being one of the primary causes of failure.
PMI, 2013.
Why are communication skills important to the Agile team?
It’s not about the volume, it’s about the method.
-
Effectively and appropriately interacts with others to build relationships and share ideas and information.
-
Uses tact and diplomacy to navigate difficult situations.
-
Relays key messages by creating a compelling story, targeted toward specific audiences.
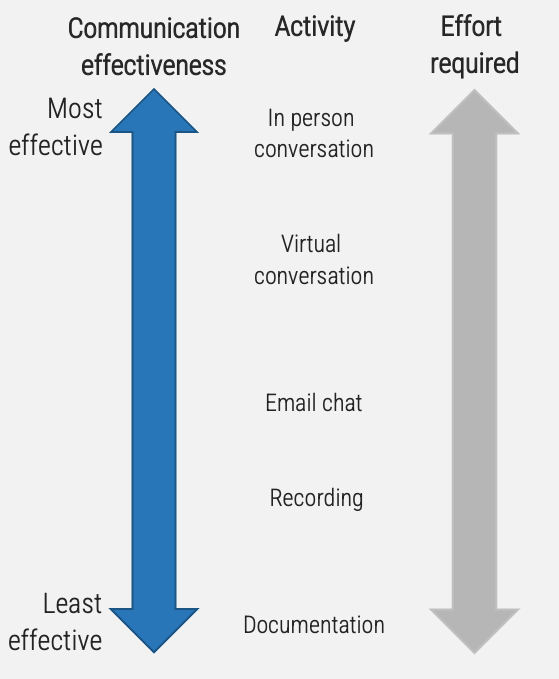
Adapted From: Agile Modeling
Communication
Your Score:____
1 - Foundational: Transitioning and Growing | 2 - Capable/Competent: Core Contributor | 3 - Influential: Gifted Improver | 4 - Transformational: Towering Strength |
-
Actively listens, learns through observation, and uses clear and precise language.
-
Possesses an open and approachable demeanor, with a positive and constructive tone.
-
Demonstrates interest in the thoughts and feelings of others.
-
Considers potential responses of others before speaking or acting.
-
Checks own understanding of others’ communication by repeating or paraphrasing.
-
Demonstrates self-control in stressful situations.
-
Provides clear, concise information to others via verbal or written communication.
|
-
Seeks to understand others' points of view, looking at verbal and non-verbal cues to encourage open and honest discussions.
-
Invites and encourages others to participate in discussions.
-
Projects a sincere and genuine tone.
-
Remains calm when dealing with others who are upset or angry.
-
Provides and seeks support to improve communication.
-
Does not jump to conclusions or act on assumptions.
-
Tailors messages to meet the different needs of different audiences.
-
Accurately interprets responses of others to their words and actions.
-
Provides feedback effectively and with empathy.
-
Is a role model for others on how to effectively communicate.
|
-
Ensures effective communication takes place at the departmental level.
-
Engages stakeholders using appropriate communication methods to achieve desired outcomes.
-
Creates opportunities and forums for discussion and idea sharing.
-
Demonstrates understanding of the feelings, motivations, and perspectives of others, while adapting communications to
anticipated reactions.
-
Shares insights about their own strengths, weaknesses, successes, ad failures to show empathy and help others relate.
-
Discusses contentious issues without getting defensive and maintains a professional tone.
-
Coaches others on how to communicate effectively and craft targeted messages.
|
-
Sets and exemplifies standards for respectful and effective communications in the organization.
-
Comfortably delivers strategic messages supporting their function and the organization at the enterprise level.
-
Communicates with senior-level executives on complex organizational issues.
-
Promotes inter-departmental communication and transparency.
-
Achieves buy-in and consensus from people who share widely different views.
-
Shares complex messages in clear, understandable language.
-
Accurately interprets how they are perceived by others.
-
Rallies employees to communicate ideas and build upon differing perspectives to drive innovation.
|
Empathy
Empathy is the ability to understand and share the feelings of another in order to better serve your team and your stakeholders. There are three kinds:
Cognitive
Thought, understanding, intellect
-
Knowing how someone else feels and what they might be thinking.
-
Contributes to more effective communication.
Emotional
Feelings, physical sensation
-
You physically feel the emotions of the other person.
-
Helps build emotional connections with others.
Compassionate
Intellect, emotion with action
- Along with understanding, you take action to help.
How is empathy an Agile skill?
Empathy enables you to serve your team, your customers, and your organization
Serving the team
-
Primary types: Emotional and compassionate empathy.
-
The team is accountable for delivery.
-
By being able to empathize with the person you are talking to, complex issues can be addressed.
-
A lack of empathy leads to a lack of collaboration and being able to go forward on a common path.
Serving your customers and stakeholders
-
Primary type: Cognitive empathy.
-
Agile enables the delivery of the right value at the right time to your stakeholders
-
Translating your stakeholders' needs requires an understanding of who they are as people. This is done through observations, interviews and conversations.
-
Leveraging empathy maps and user-story writing is an effective tool.
Empathy
Your Score: ____
1 - Foundational: Transitioning and Growing | 2 - Capable/Competent: Core Contributor | 3 - Influential: Gifted Improver | 4 - Transformational: Towering Strength |
-
Knowing how someone else feels and what they might be thinking.
-
Ability to build emotional connections with others.
-
Able to harness emotional connections to achieve tangible and experiential outcomes.
|
-
Demonstrates an awareness of different feelings and ways of thinking by both internal and external stakeholders.
-
Limited ability to make social connections with others outside of the immediate team.
|
- Able to connect with similarly minded people to improve customer/stakeholder satisfaction. (Insights into action)
|
-
Able to interact and understand others with vastly different views.
-
Lack of agreement does not stop individual. from asking questions, understanding, and pushing the conversation forward
|
Facilitation
It’s not just your manager’s problem.
“Facilitation is the skill of moderating discussions within a group in order to enable all participants to effectively
articulate their views on a topic under discussion, and to ensure that participants in the discussion are able to
recognize and appreciate the differing points of view that are articulated.” (IIBA, 2015)
-
Drives action through influence, often without authority.
-
Leads and impacts others' thinking, decisions, or behavior through inclusive practices and relationship building.
-
Encourages others to self-organize and hold themselves accountable.
-
Identifies blockers and constructively removes barriers to progress.
Facilitation
Your Score: ____
1 - Foundational: Transitioning and Growing | 2 - Capable/Competent: Core Contributor | 3 - Influential: Gifted Improver | 4 - Transformational: Towering Strength |
-
Drives action through influence, often without authority.
-
Leads and impacts others' thinking, decisions, or behavior through inclusive practices and relationship building.
-
Encourages others to self-organize and hold themselves accountable.
-
Identifies blockers and constructively removes barriers to progress.
|
-
Maps and executes processes effectively.
-
Uses facts and concrete examples to demonstrate a point and gain support from others.
-
Openly listens to the perspectives of others.
-
Builds relationships through honest and consistent behavior.
-
Understands the impact of their own actions and how others will perceive it.
-
Identifies impediments to progress.
|
-
Anticipates the effect of one's approach on the emotions and sensitivities of others.
-
Practices active listening while demonstrating positivity and openness.
-
Customizes discussion and presentations to include "what’s
in it for me" for the audience.
-
Presents compelling information to emphasize the value of an idea.
-
Involves others in refining ideas or making decisions in order to drive buy-in and action.
-
Knows how to appropriately use influence to achieve outcomes without formal authority.
-
Seeks ways and the help of others to address barriers or blockers to progress.
|
-
Leverages a planned approach to influencing others by identifying stakeholder interests, common goals, and potential barriers.
-
Builds upon successes to gain acceptance for new ideas.
-
Facilitates connections between members of their network for the benefit of the organization or others.
-
Demonstrates the ability to draw on trusting relationships to garner support for ideas and action.
-
Encourages a culture that allows space for influence to drive action.
-
Adept at appropriately leveraging influence to achieve business unit outcomes.
-
Actively manages the removal of barriers and blockers for teams.
|
Functional decomposition
It’s not just a process, it’s a skill.
“Functional decomposition helps manage complexity and reduce uncertainty by breaking down processes, systems, functional
areas, or deliverables into their simpler constituent parts and allowing each part to be analyzed independently."
(IIBA, 2015)
Being able to break down requirements into constituent consumable items (example: epics and user stories).
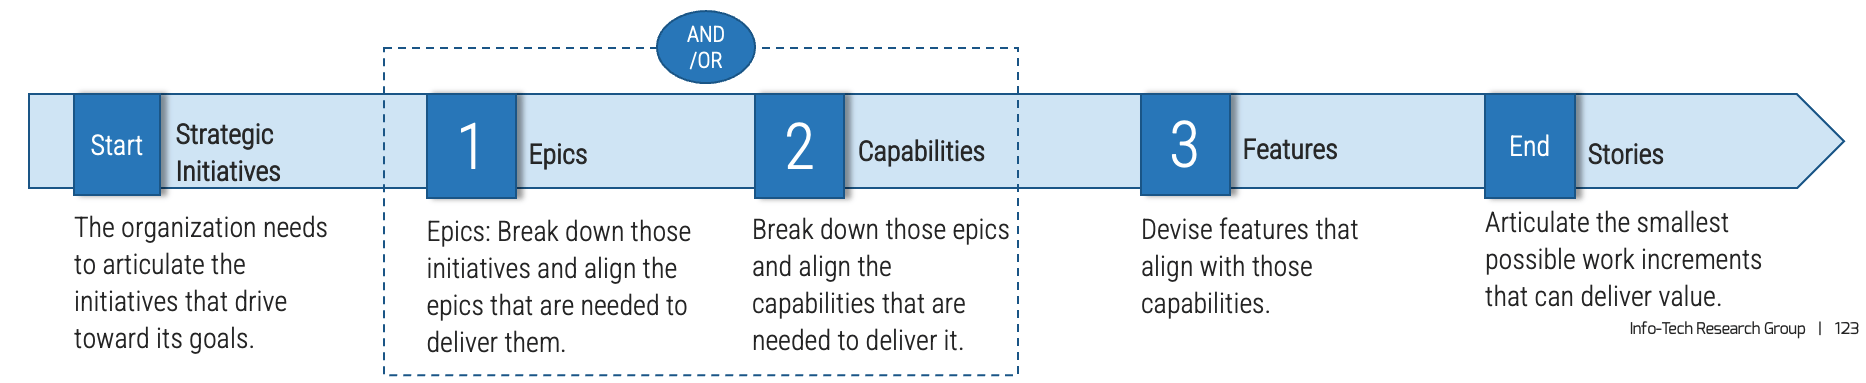
Use artifact mapping to improve functional decomposition
In our research, we refer to these items as epics, capabilities, features, and user stories. How you develop your guiding principles and structure your backlog should be based on the terminology and artifact types commonly used in your organization.
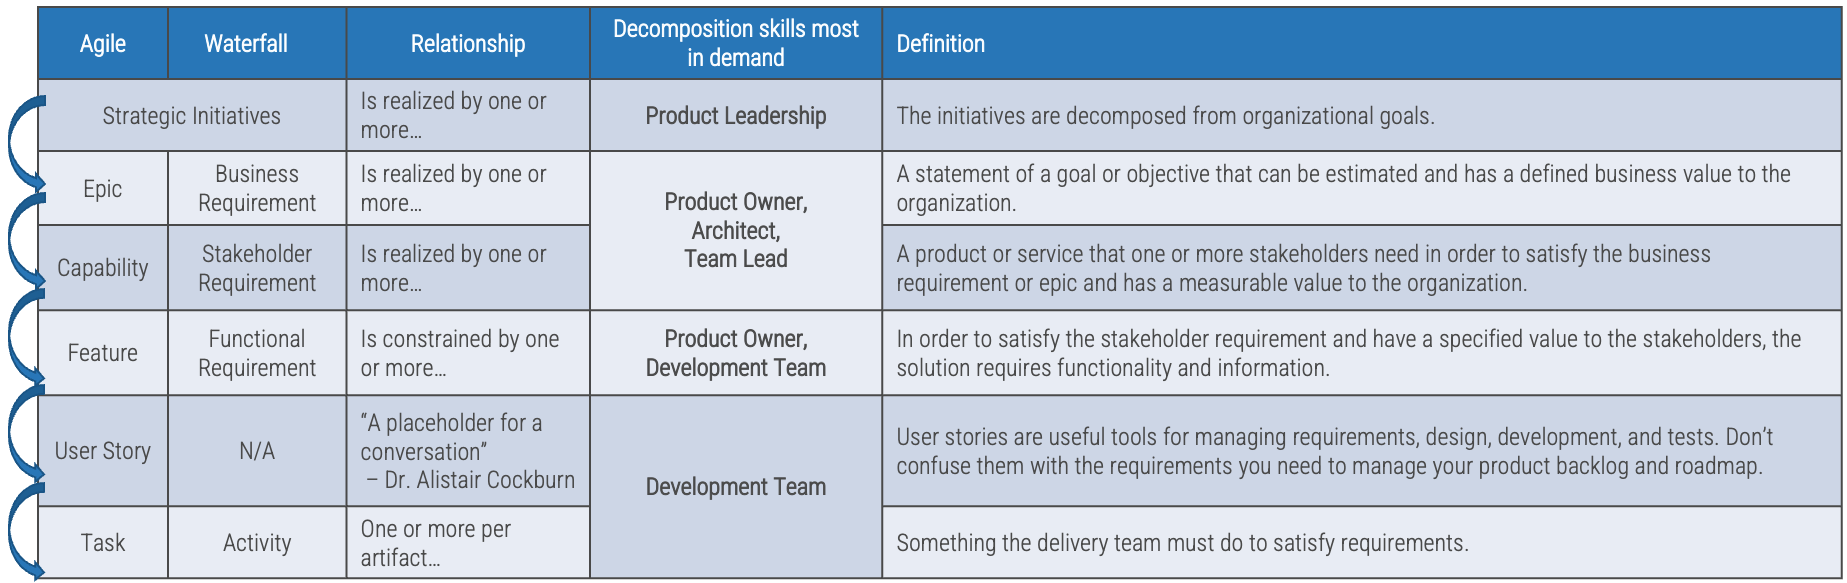
Functional Decomposition
Your Score: ____
1 - Foundational: Transitioning and Growing | 2 - Capable/Competent: Core Contributor | 3 - Influential: Gifted Improver | 4 - Transformational: Towering Strength |
-
Able to decompose items with assistance from other team members.
|
-
Able to decompose items independently, ensuring alignment with business value.
|
-
Able to decompose items independently and actively seeks out collaboration opportunities with relevant SME's during and
after the refinement process to ensure completion.
|
-
Able to decompose items at a variety of granularity levels.
-
Able to teach and lead others in their decomposition efforts.
-
Able to quickly operate at different levels of the requirements stack.
|
Initiative and self-organization
A team that takes initiative can self-organize to solve critical problems.
-
"The best architectures, requirements, and designs emerge from self-organizing teams." (Agile Manifesto)
-
In a nutshell, the initiative represents the ability to anticipate challenges and act on opportunities that lead to
better business outcomes.
-
Anticipates challenges and acts on opportunities that lead to better business outcomes.
-
Thinks critically and is motivated to use both specialist expertise and general knowledge.
-
Driven by the delivery of business value and better business outcomes.
-
Empowers others to act and is empowered and self-motivated.
Initiative and self-organization
Your Score: ____
1 - Foundational: Transitioning and Growing | 2 - Capable/Competent: Core Contributor | 3 - Influential: Gifted Improver | 4 - Transformational: Towering Strength |
-
Demonstrates awareness of an opportunity or issue which is presently occurring or is within the immediate work area.
-
Reports an opportunity or issue to the appropriate person.
-
Acts instead of waiting to be asked.
-
Willingly takes on challenges, even if they fall outside their area of expertise.
|
-
Is proactive in identifying issues and making recommendations to resolve them.
-
Within the scope of the work environment, takes action to improve processes or results, or to resolve problems.
-
Not deterred by obstacles.
-
Tackles challenges that require risk taking.
-
Procures the necessary resources,
team and technical support to enable success.
-
Assists others to get the job done.
|
-
Demonstrates awareness of an opportunities or issues which are in the future or outside the immediate work area.
-
Typically exceeds the expectations of the job.
-
Learns new technology or skills outside their specialization so that they can be a more effective team member.
-
Recommends solutions to enhance results or prevent potential issues.
-
Drives implementation of new processes within the team to improve results.
|
-
Able to provide recommendations on plans and decisions that are strategic and future-oriented for the organization.
-
Identifies areas of high risk or of organizational level impact.
-
Able to empower significant recourses from the organization to enable success.
-
Leads long-term engagements that result in improved organizational capabilities and processes.
|
Process discipline
A common misconception is that Agile means no process and no discipline. Effective Agile teams require more adherence to the right processes to create a culture of self-improvement.
-
Refers to the focus of following the right steps for a given activity at the right time to achieve the right outcomes.
-
Focus on following the right steps for a given activity at the right time to achieve desired outcomes.
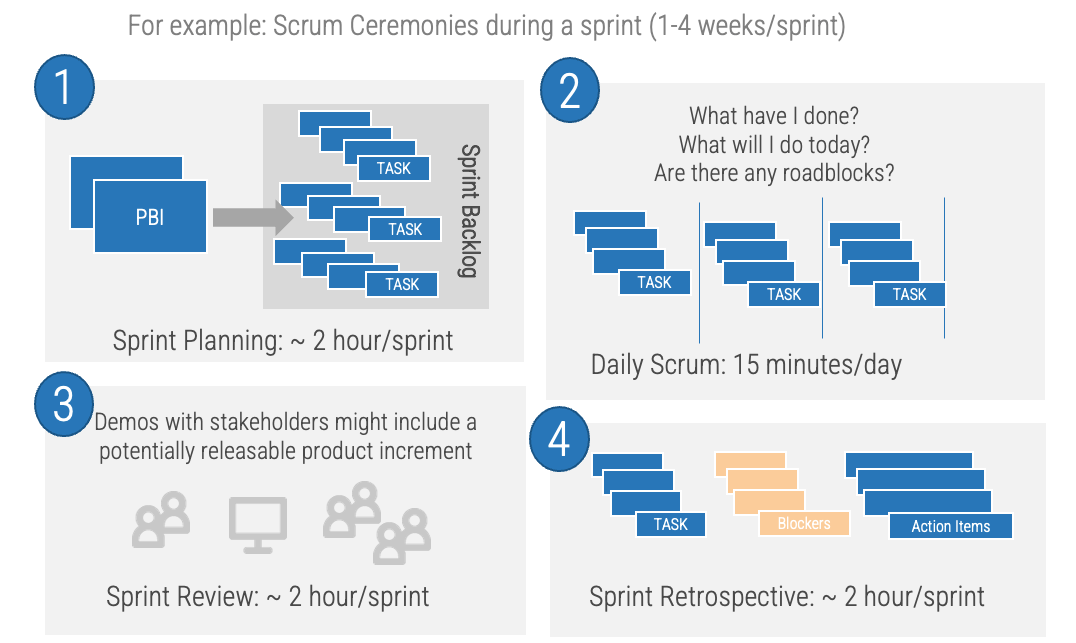
Process discipline
Your Score: ____
1 - Foundational: Transitioning and Growing | 2 - Capable/Competent: Core Contributor | 3 - Influential: Gifted Improver | 4 - Transformational: Towering Strength |
-
Demonstrates awareness of the key processes and steps that are needed in a given situation.
-
Limited consistency in following processes and limited understanding of the 'why' behind the processes.
|
-
Aware and follows through with key agile processes in a consistent manner.
-
Demonstrates not only the knowledge of processes but understands the 'why' behind their existence.
|
-
Aware and follows through with key agile processes
in a consistent manner.
-
Demonstrates understanding of not only why specific processes exist but can suggest changes to improve efficiency,
consistency, and outcomes.
| N/A -- Maximum level is '3
|
Resilience
If your team hits the wall, don’t let the wall hit them back.
-
Resilience is critical for an effective Agile transformation. A team that demonstrates resilience always exhibits:
-
Evolution over transformation – There is a recognition that changes happen over time.
-
Intensity and productivity – A race is not won by the ones who are the fastest, but by the ones who are the most consistent. Regardless of what comes up, the team can push through.
-
That organizational resistance is futile – Given that it is working on the right objectives, the team needs to demonstrate a consistency of approach and intensity regardless of what may stand in its way.
-
Refers to the behaviors, thoughts, and actions that allow a person to recover from stress and adversity.
How resilience aligns with Agile
A team is not “living the principles” without resilience.
-
Purpose
Aligns with: “Our highest priority is to satisfy the customer through early and continuous delivery of valuable software.” The vision or goals may not be clear in certain circumstances and can be difficult to relate to a single work item. Being able to intrinsically source and harness a sense of purpose becomes more important, especially as a self-organizing team.
-
Perseverance
Aligns with: “Agile processes harness change for the customer's competitive advantage.” Perseverance enables teams to continuously deliver at a steady pace, addressing impediments or setbacks and continuing to move forward.
-
Composure
Aligns with: “Agile processes promote sustainable development,” and “At regular intervals, the team reflects ... and adjusts its behavior accordingly.”
When difficult situations arise, composure allows us to understand perspectives, empathize with customers, accept late changes, and sustain a steady pace.
-
Self-Reliance
Aligns with: “The best architectures, requirements, and designs emerge from self-organizing teams.” Knowing oneself, recognizing strengths, and drawing on past successes, can be a powerful aid in creating high-performing Agile teams
-
Authenticity
Aligns with: “At regular intervals, the team reflects … and adjusts its behavior accordingly,” and “Build projects around motivated individuals.”
When difficult situations arise, authenticity is crucial. “For example, being able to openly disclose areas outside of your strengths in sprint planning or being able to contribute constructively toward self-organization.”
Adapted from: Why Innovation, 2019.
Resilience
Your Score: ____
1 - Foundational: Transitioning and Growing | 2 - Capable/Competent: Core Contributor | 3 - Influential: Gifted Improver | 4 - Transformational: Towering Strength |
-
Easily distracted and stopped by moderately stressful and challenging situations.
-
Requires significant help from others to get back on track.
-
Not frequently able (or knows) how to ask for help
|
-
Handles typical stresses and challenges for the given role.
-
Able to get back on track with limited assistance.
-
Able to ask for help when they need it.
-
Quality of work unaffected by an increase in pressures and challenges.
|
-
Handles stresses and challenges what is deemed above and beyond their given role.
-
Able to provide advice to others on how to handle difficult and challenging situations.
-
Quality of work and outcomes is maintained and sometimes exceeded as pressure increases.
|
-
Team looks to this individual as being the gold standard on how to approach any given problem or situation.
-
Directly mentors others on approaches in situations regardless of the level of challenge.
|
Exercise 1.2.1 Identify your primary product owner perspective
1 hour
-
Review each real Agile skill and determine your current proficiency.
-
Complete your assessment in the Mature and Scale Product Owner Proficiency Assessment tool.
-
Record the results in the Mature and Scale Product Ownership Playbook.
-
Review the skills map to identify strengths and areas of growth.
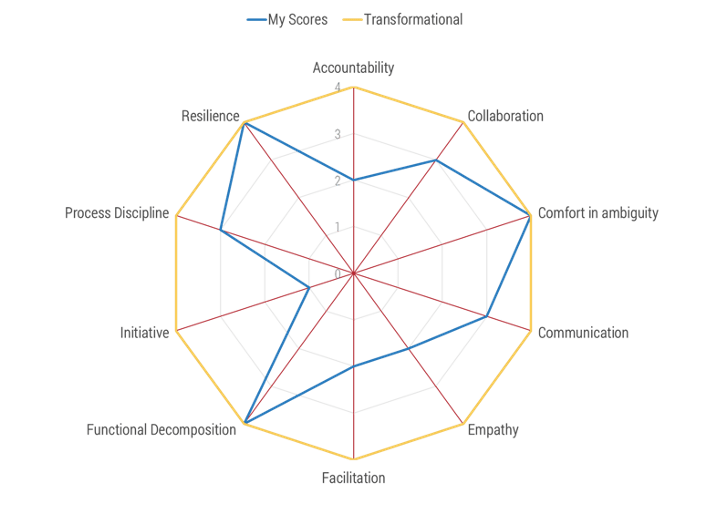
Output
-
Agile skills assessment results.
Participants
-
Product owners
-
Product managers
Capture in the Mature and Scale Product Owner Proficiency Assessment.
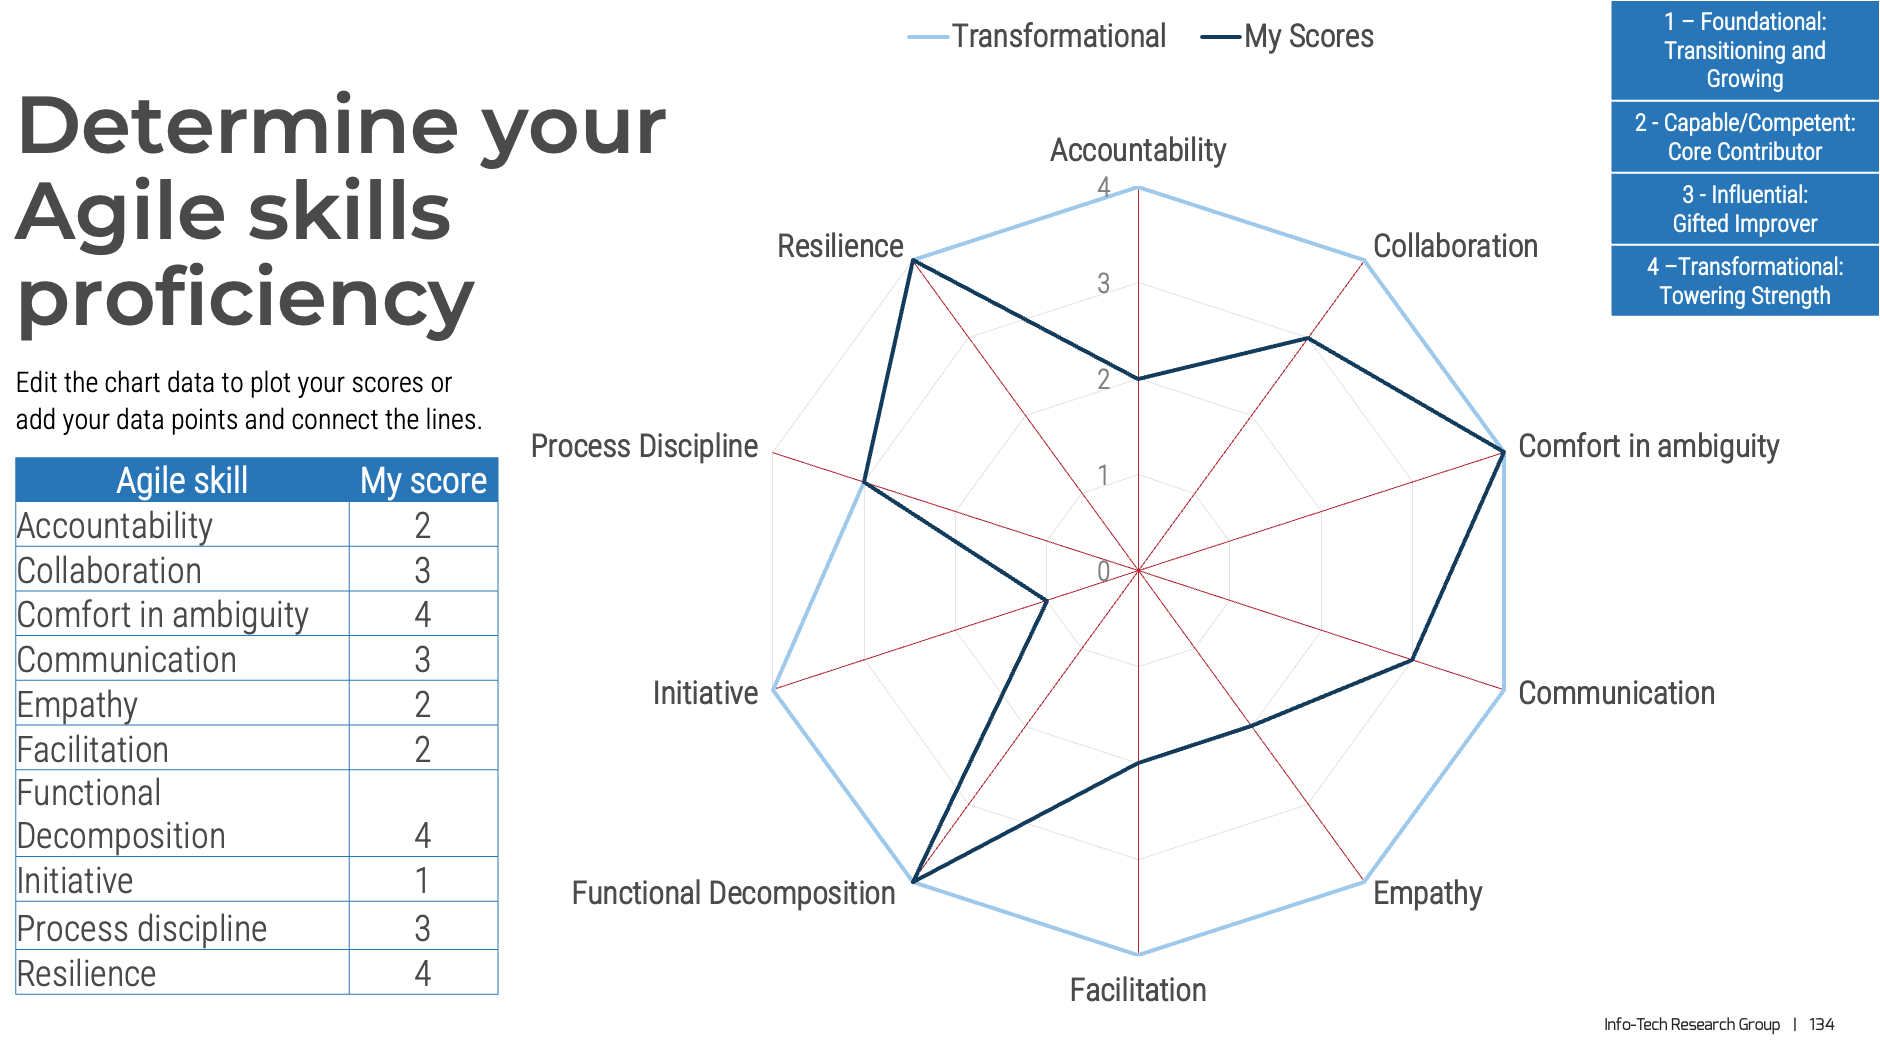
Step 3.2
Mature product owner capabilities
Activities
3.2.1 Assess your vision capability proficiency
3.2.2 Assess your leadership capability proficiency
3.2.3 Assess your PLM capability proficiency
3.2.4 Identify your business value drivers and sources of value
3.2.5 Assess your value realization capability proficiency
Mature product owner capabilities
This step involves the following participants:
-
Product owners
-
Product managers
Outcomes of this step
- Info-Tech product owner capability model proficiency assessment
Product capabilities deliver value
As a product owner, you are responsible for managing these facets through your capabilities and activities.
Info-Tech Best Practice
It is easy to lose sight of what matters when we look at a product from a single point of
view
. Despite what "The Agile Manifesto" says, working
software is not valuable without the knowledge and support that people need in order to adopt, use, and
maintain it. If you build it, they will
not come. Product owners must consider the needs of
all stakeholders when designing and building products.
Recognize product owner knowledge gaps
Pulse survey of product owners
Info-Tech Insight
-
Less than 15% of respondents identified analytics or financial management as a key component of product
ownership.
-
Assess your product owner’s capabilities and understanding to develop a maturity plan.
Source:
Pulse Survey
(N=18)
Implement the Info-Tech product owner capability model
Unfortunately, most product owners operate with incomplete knowledge of the skills and capabilities needed
to perform
the role. Common gaps include focusing only on product backlogs, acting as a proxy for product decisions,
and ignoring
the need for key performance indicators (KPIs) and analytics in both planning and value realization.
Vision
- Market Analysis
- Business Alignment
- Product Roadmap
Leadership
- Soft Skills
- Collaboration
- Decision Making
Product Lifecycle Management
Value Realization
- KPIs
- Financial Management
- Business Model
Product owner capabilities provide support
Your vision informs and aligns what goals and capabilities are needed to fulfill your product or product
family vision and align with enterprise goals and priorities. Each item on your roadmap should have
corresponding KPIs or OKRs to know how far you moved the value needle. Value realization measures how well
you met your target, as well as the impacts on your business value canvas and cost model.
Your leadership skills improve collaborations and decisions when working with your stakeholders and product
delivery teams. This builds trust and improves continued improvements to the entire product lifecycle. A
product owner’s focus should always be on finding ways to improve value delivery.
Product owner capabilities provide support
Develop product owner capabilities
Avoid common capability gaps
Vision
-
Focusing solely on backlog grooming (tactical only)
-
Ignoring or failing to align product roadmap to enterprise goals
-
Operational support and execution
-
Basing decisions on opinion rather than market data
-
Ignoring or missing internal and external threats to your product
Leadership
-
Failing to include feedback from all teams who interact with your product
-
Using a command-and-control approach
-
Viewing product owner as only a delivery role
-
Acting as a proxy for stakeholder decisions
-
Avoiding tough strategic decisions in favor of easier tactical choices
Product lifecycle management
-
Focusing on delivery and not the full product lifecycle
-
Ignoring support, operations, and technical debt
-
Failing to build knowledge management into the lifecycle
-
Underestimating delivery capacity, capabilities, or commitment
-
Assuming delivery stops at implementation
Value realization
-
Focusing exclusively on “on time/on budget” metrics
-
Failing to measure a 360-degree end-user view of the product
-
Skipping business plans and financial models
-
Limiting financial management to project/change budgets
-
Ignoring market analysis for growth, penetration, and threats
Capabilities: Vision
Market Analysis
-
Customer Empathy: Identify the target users and unique value your product provides that is not currently being met.
Define the size of your user base, segmentation, and potential growth.
-
Customer Journey: Define the future path and capabilities your users will respond to.
-
Competitive analysis: Complete a SWOT analysis for your end-to-end product lifecycle. Use Info-Tech’s Business SWOT Analysis Template.
Business Alignment
-
Enterprise alignment: Align to enterprise and product family goals, strategies, and constraints.
-
Delivery and release strategy: Develop a delivery strategy to achieve value quickly and adapt to internal and external changes. Value delivery is constrained by your delivery pipeline.
-
OCM and go-to-market strategy: Create organizational change management, communications, and a user implementation approach to improve adoption and satisfaction from changes.
Product Roadmap
-
Roadmap strategy: Determine the duration, detail, and structure of your roadmap to accurately communicate your vision.
-
Value prioritization: Define criteria used to evaluate and sequence demand items.
-
Release and capacity planning: Build your roadmap with realistic goals and milestones based on your delivery pipeline
and dependencies.
“Customers are best heard through many ears.”
– Thomas K. Connellan, Inside the Magic Kingdom
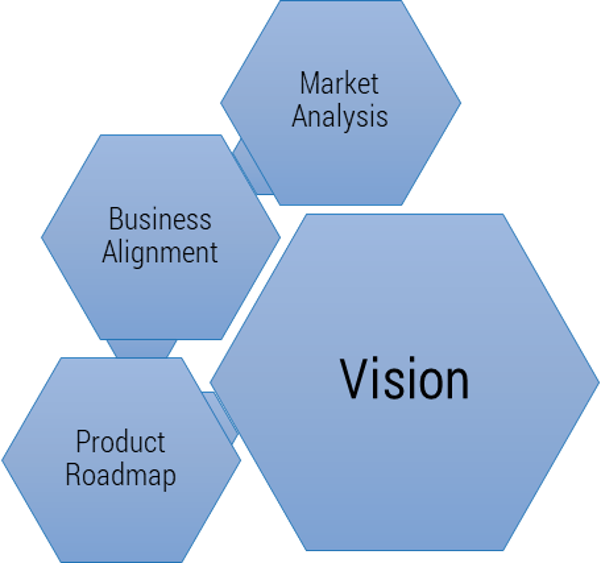
Info-Tech Insight
Data comes from many places and may still not tell the complete story.
Build your product strategy playbook
Complete Deliver on Your Digital Product Vision to define your Vision, Goals, Roadmap approach, and Backlog quality filters.
Digital Product Strategy Supporting Workbook
Supporting workbook that captures the interim results from a number of exercises that will contribute to your overall digital product vision.
Product Backlog Item Prioritization Tool
An optional tool to help you capture your product backlog and prioritize based on your given criteria
Product Roadmap Tool
An optional tool to help you build out and visualize your first roadmap.
Your Digital Product Vision Details Strategy
Record the results from the exercises to help you define, detail, and make real your digital product vision.
Your product vision is your North Star
It's ok to dream a little!
Adapted from: Geoffrey Moore, 2014.
Info-Tech Best Practice
A product vision shouldn’t be so far out that it doesn’t feel real or so short-term that it gets bogged down
in minutiae and implementation details. Finding the right balance will take some trial and error and will be
different for each organization.
Use product roadmaps to guide delivery
In Deliver on Your Digital Product Vision, we showed how the product roadmap is key to value realization. As a product
owner, the product roadmap is your communicated path to align teams and changes to your defined goals, while aligning
your product to enterprise goals and strategy.
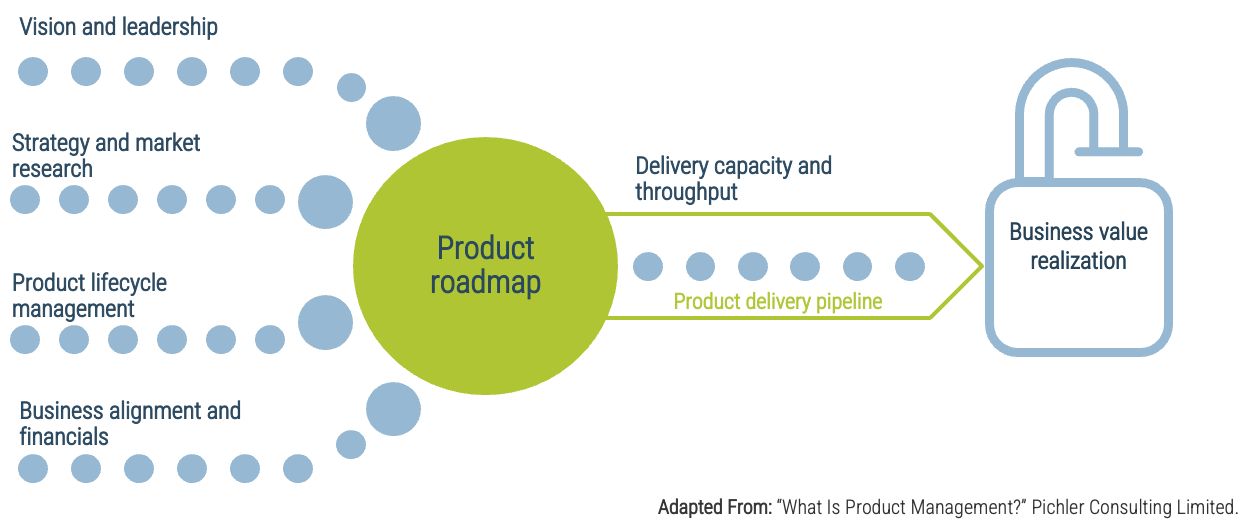
Info-Tech Best Practice
Info-Tech Best Practice
Product delivery requires a comprehensive set of business and technical competencies to effectively roadmap, plan,
deliver, support, and validate your product portfolio. Product delivery is a “multi-faceted, complex discipline that can
be difficult to grasp and hard to master.” It will take time to learn and adopt methods and become a competent product
manager or owner (“What Is Product Management?”, Pichler Consulting Limited).
Match your roadmap and backlog to the needs of the product
Ultimately, you want products to be able to respond faster to changes and deliver value sooner. The level of detail in
the roadmap and backlog is a tool to help the product owner plan for change. The duration of your product roadmap is all
directly related to the tier of product owner in the product family.
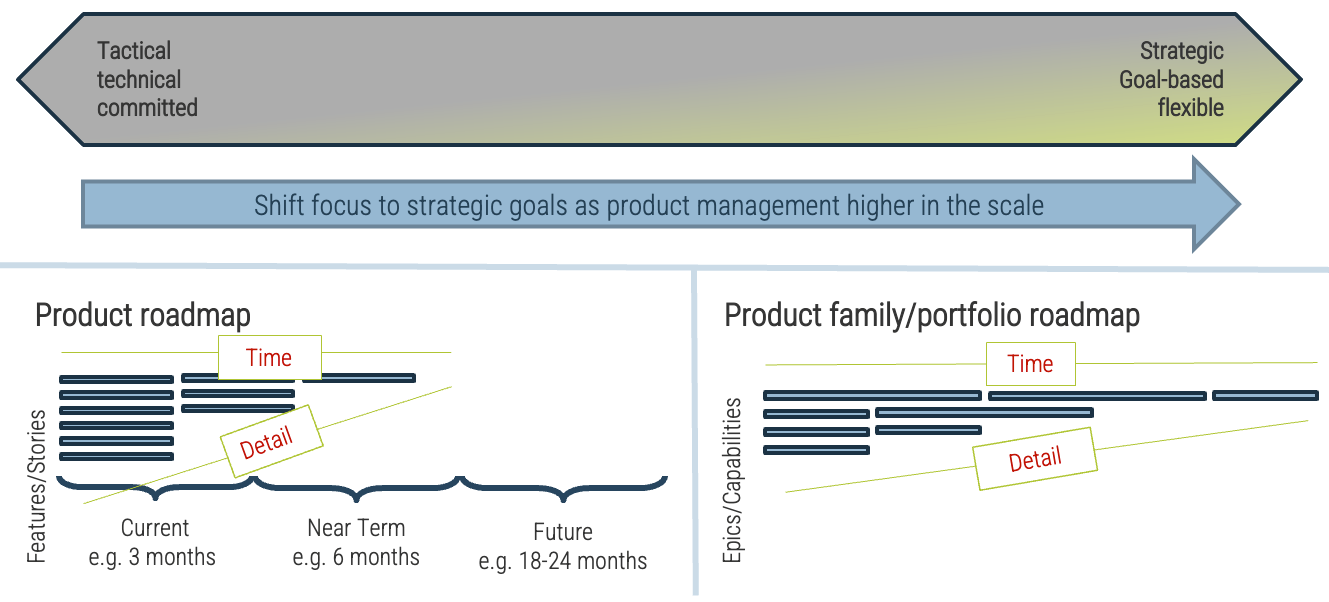
Product delivery realizes value for your product family
While planning and analysis are done at the family level, work and delivery are done at the individual product
level.
Use artifact mapping to improve functional decomposition
In our research, we refer to these items as epics, capabilities, features, and user stories. How you develop
your guiding principles and structure your backlog should be based on the terminology and artifact types
commonly used in your organization.
Manage and communicate key milestones
Successful product owners understand and define the key milestones in their product delivery lifecycles. These
need to
be managed along with the product backlog and roadmap.
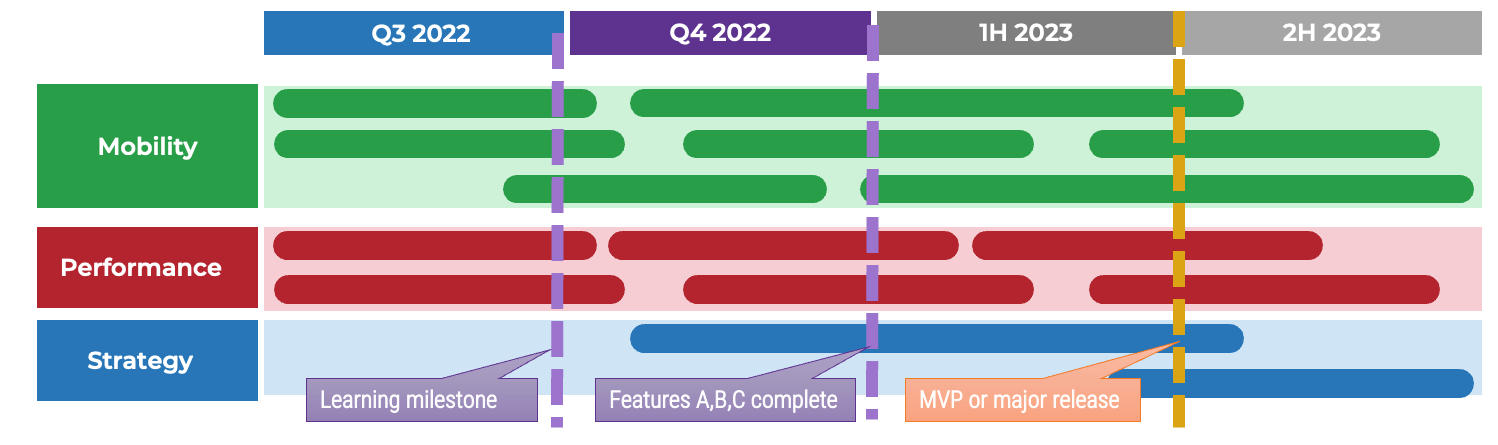
Info-Tech Best Practice
Product ownership isn’t just about managing the product backlog and development cycles! Teams need to manage key milestones such as learning milestones, test releases, product releases, phase gates, and other
organizational checkpoints!
Milestones
-
Points in the timeline when the established set of artifacts is complete (feature-based), or checking status at a
particular point in time (time-based).
-
Typically assigned a date and used to show the progress of development.
Plays an important role when sequencing different types of artifacts.
Release dates
-
Releases mark the actual delivery of a set of artifacts packaged together in a new version of the product.
-
Release dates, firm or not, allow stakeholders to anticipate when this is coming.
Leverage the product canvas to state and inform your product vision
Capability: Vision
Your Score: ____
1 - Foundational: Transitioning and Growing | 2 - Capable/Competent: Core Contributor | 3 - Influential: Gifted Improver | 4 - Transformational: Towering Strength |
-
Product backlog.
-
Basic roadmap with milestones and releases.
-
Unprioritized stakeholder list.
-
Understanding of product’s purpose and value.
-
Customers and end-users defined with core needs identified.
|
-
Roadmap with goals and capabilities defined by themes and set to appropriate time horizons.
-
Documented stakeholder management plan with communication and collaboration aligned to the stakeholder strategy.
-
Value drivers traced to product families and enterprise goals.
-
Customer personas defined with pain relievers and value creators defined.
|
-
Fully-developed roadmap traced to family (and child) roadmaps.
-
Expected ROI for all current and next roadmap items.
-
KPIs/OKRs used to improve roadmap prioritization and sequencing.
-
Proactive stakeholder engagement and reviews.
-
Cross-functional engagement to align opportunities and drive enterprise value.
-
Formal metrics to assess customer needs and value realization.
|
-
Roadmaps managed in an enterprise system for full traceability, value realization reporting, and views for defined
audiences.
-
Proactive stakeholder engagement with regular planning and review ceremonies tied to their roadmaps and goals.
-
Cross-functional innovation to find disruptive opportunities to drive enterprise value.
-
Omni-channel metrics and customer feedback mechanisms to proactively evaluate goals, capabilities, and value realization.
|
Exercise 3.2.1 Assess your Vision capability proficiency
1 hour
-
Review the expectations for this capability and determine your current proficiency for each skill.
-
Complete your assessment in the Mature and Scale Product Owner Proficiency Assessment tool.
-
Record the results in the Mature and Scale Product Ownership Playbook.
-
Review the skills map to identify strengths and areas of growth.
Output
-
Product owner capability assessment
Participants
-
Product owners
-
Product managers
Capture in the Mature and Scale Product Owner Proficiency Assessment.
Capabilities: Leadership
Soft Skills
-
Communication: Maintain consistent, concise, and appropriate communication using SMART guidelines (specific, measurable,
attainable, relevant, and timely).
-
Integrity: Stick to your values, principles, and decision criteria for the product to build and maintain trust with your users and teams.
-
Influence: Manage stakeholders using influence and collaboration over contract negotiation.
Collaboration
-
Stakeholder management: Build a communications strategy for each stakeholder group, tailored to individual stakeholders.
-
Relationship management: Use every interaction point to strengthen relationships, build trust, and empower teams.
-
Team development: Promote development through stretch goals and controlled risks to build team capabilities and performance.
Decision Making
-
Prioritized criteria: Remove personal bias by basing decisions off data analysis and criteria.
-
Continuous improvement: Balance new features with the need to ensure quality and create an environment of continuous improvement.
-
Team empowerment/negotiation: Push decisions to teams closest to the problem and solution, using Delegation Poker to guide you.
“Everything walks the walk. Everything talks the talk.”
– Thomas K. Connellan, Inside the Magic Kingdom
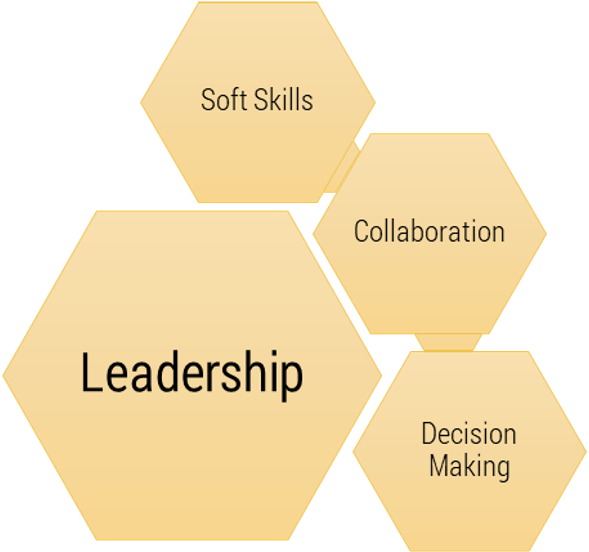
Info-Tech Insight
Product owners cannot be just a proxy for stakeholder decisions. The product owner owns product decisions and management of all stakeholders.
Capability: Leadership
Your Score: ____
1 - Foundational: Transitioning and Growing | 2 - Capable/Competent: Core Contributor | 3 - Influential: Gifted Improver | 4 - Transformational: Towering Strength |
-
Activities are prioritized with minimal direction and/or assistance.
-
Progress self-monitoring against objectives with leadership apprised of deviations against plan.
-
Facilitated decisions from stakeholders or teams.
-
Informal feedback on performance and collaboration with teams.
|
-
Independently prioritized activities and provide direction or assistance to others as needed.
-
Managed issue resolution and provided guidance on goals, priorities, and constraints.
-
Product decision ownership with input from stakeholders, SMEs, and delivery teams.
-
Formal product management retrospectives with tracked and measured changes to improve performance.
|
-
Consulted in the most challenging situations to provide subject matter expertise on leading practices and industry standards.
-
Provide mentoring and coaching to your peers and/or teammates.
-
Use team empowerment, pushing decisions to the lowest appropriate level based on risk and complexity.
-
Mature and flexible communication.
|
-
Provide strategies and programs ensuring all individuals in the delivery organization obtain the level of coaching and
supervision required for success in their position.
-
Provide leadership to the organization’s coaches ensuring delivery excellence across the organization.
-
Help develop strategic initiatives driving common approaches and utilizing information assets and processes across the
enterprise.
|
Exercise 3.2.2 Assess your Leadership capability proficiency
1 hour
-
Review the expectations for this capability and determine your current proficiency for each skill.
-
Complete your assessment in the Mature and Scale Product Owner Proficiency Assessment tool.
-
Record the results in the Mature and Scale Product Ownership Playbook.
-
Review the skills map to identify strengths and areas of growth.
Output
-
Product owner capability assessment
Participants
-
Product owners
-
Product managers
Capture in the Mature and Scale Product Owner Proficiency Assessment.
Capability: Product lifecycle management
Plan
-
Product backlog: Follow a schedule for backlog intake, grooming, updates, and prioritization.
-
Journey map: Create an end-user journey map to guide adoption and loyalty.
-
Fit for purpose: Define expected value and intended use to ensure product meets your end user’s needs.
Build
-
Capacity management: Work with operations and delivery teams to ensure consistent and stable outcomes.
-
Release strategy: Build learning, release, and critical milestones into a repeatable release plan.
-
Compliance: Build policy compliance into delivery practices to ensure alignment and reduce avoidable risk (privacy, security).
Run
-
Adoption: Focus attention on end-user adoption and proficiency to accelerate value and maximize retention.
-
Support: Build operational support and business continuity into every team.
-
Measure: Measure KPIs and validate expected value to ensure product alignment to goals and consistent product quality.
“Pay fantastic attention to detail. Reward, recognize, celebrate.”
– Thomas K. Connellan, Inside the Magic Kingdom
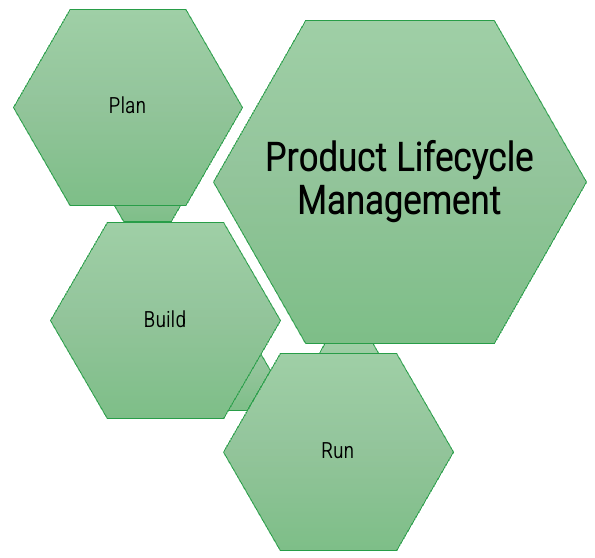
Info-Tech Insight
Product owners must actively manage the full lifecycle of the product.
Define product value by aligning backlog delivery with roadmap goals
In each product plan, the backlogs show what you will deliver. Roadmaps identify when and in what order you will
deliver value, capabilities, and goals.
A backlog stores and organizes PBIs at various stages of readiness
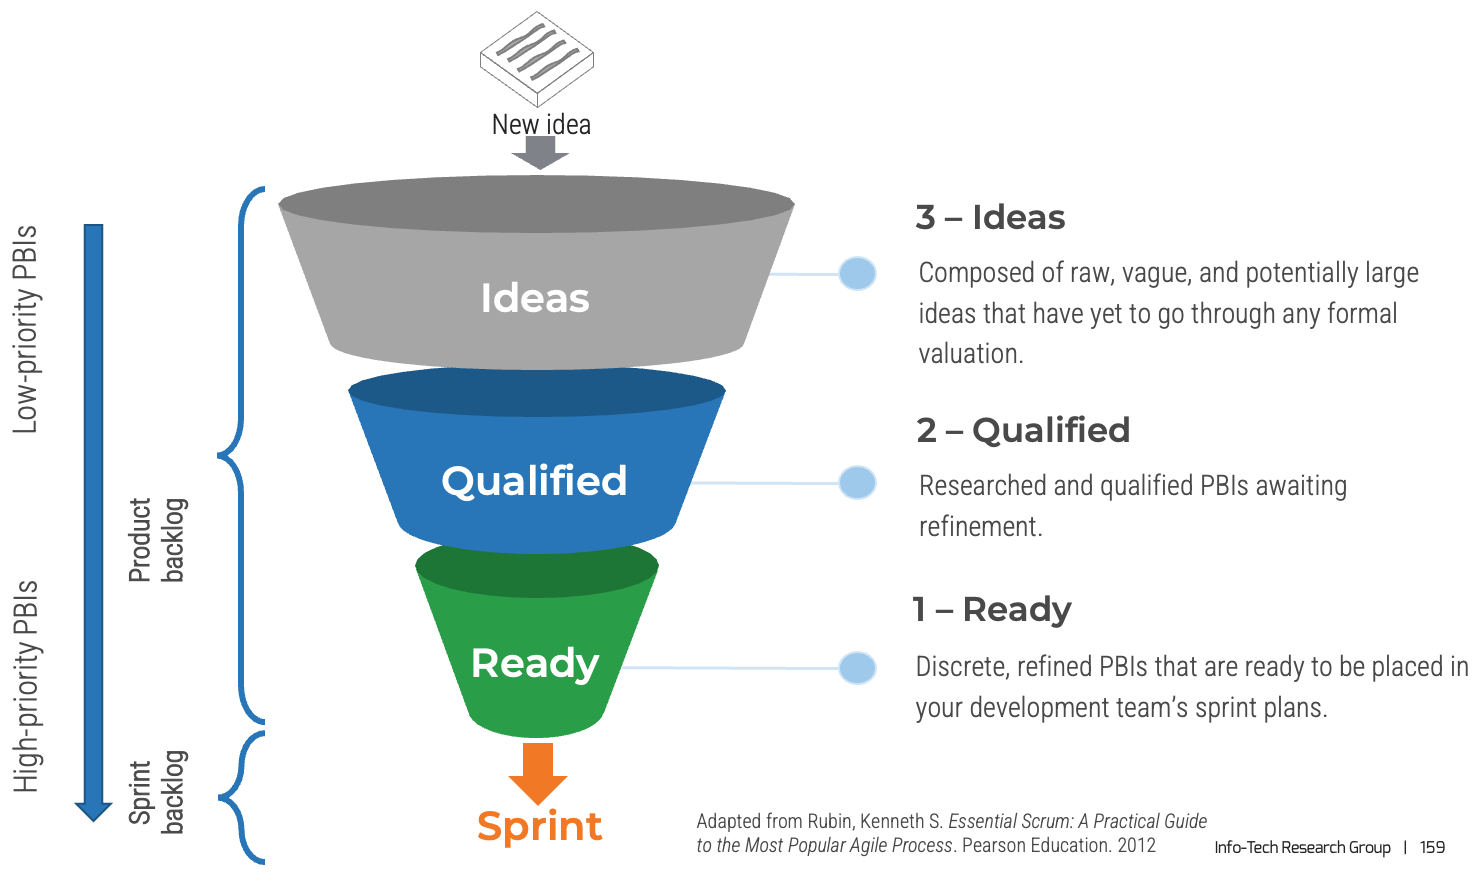
A well-formed backlog can be thought of as a DEEP backlog:
Detailed Appropriately: PBIs are broken down and refined, as necessary.
Emergent: The backlog grows and evolves over time as PBIs are added and removed.
Estimated: The effort a PBI requires is estimated at each tier.
Prioritized: The PBI’s value and priority are determined at each tier.
(Perforce, 2018)
Distinguish your specific goals for refining in the product backlog vs. planning for a sprint itself
Often backlog refinement is used interchangeably or considered a part of sprint planning. The reality is they are very similar, as the required participants and objectives are the same; however, there are some key differences.
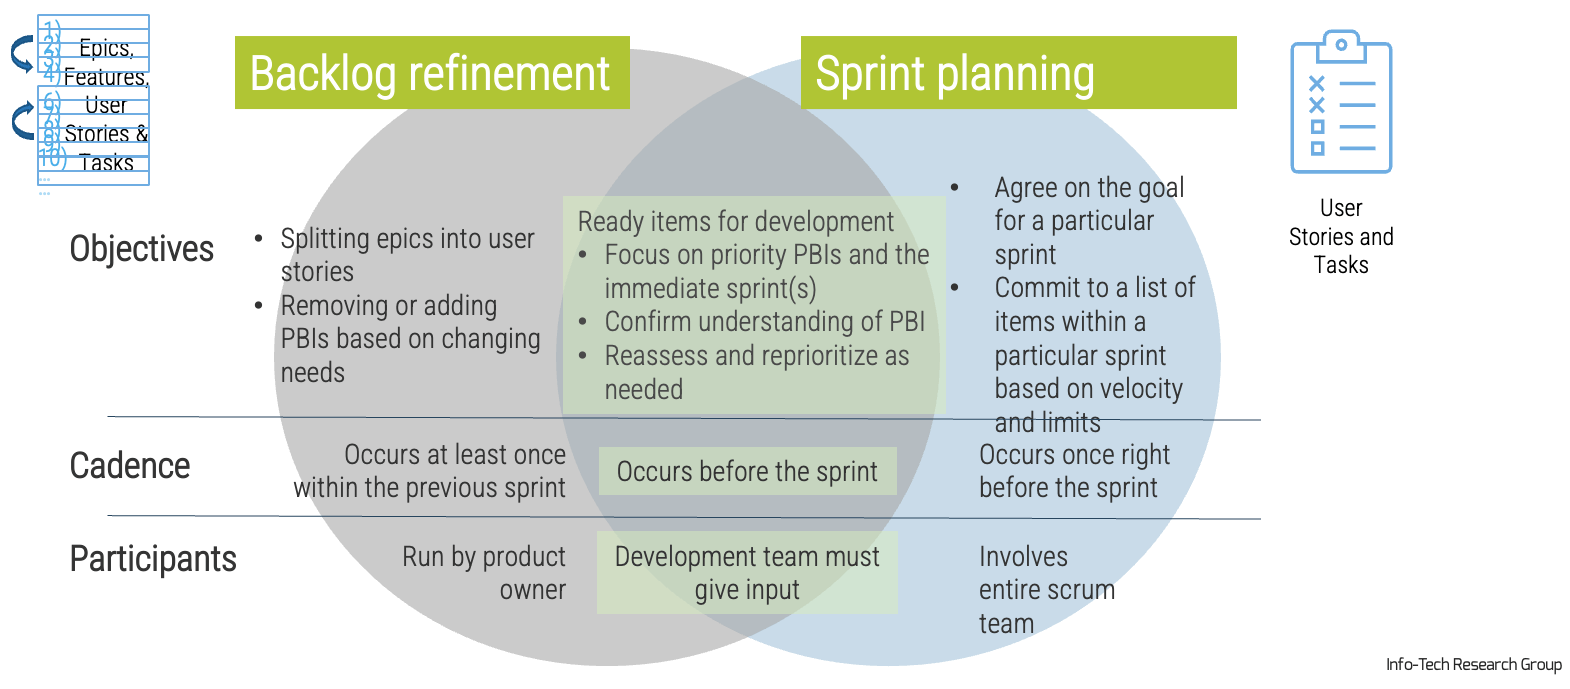
Use quality filters to promote high value items into the delivery pipeline
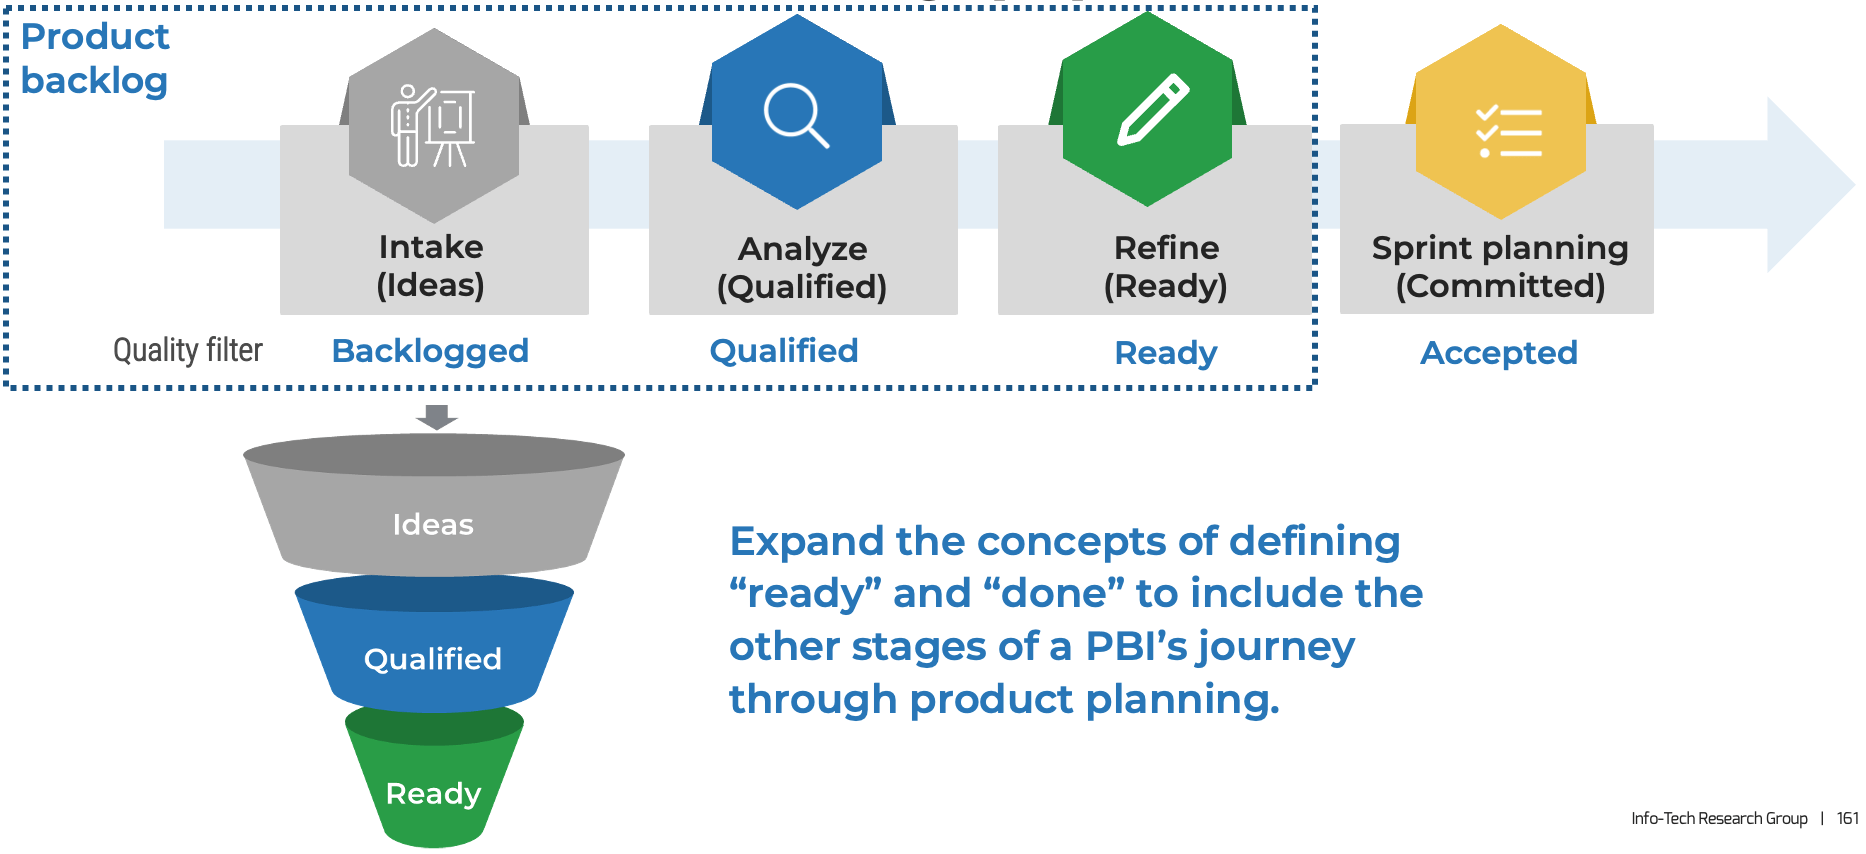
Basic scrum process
The scrum process coordinates multiple stakeholders to deliver on business priorities.
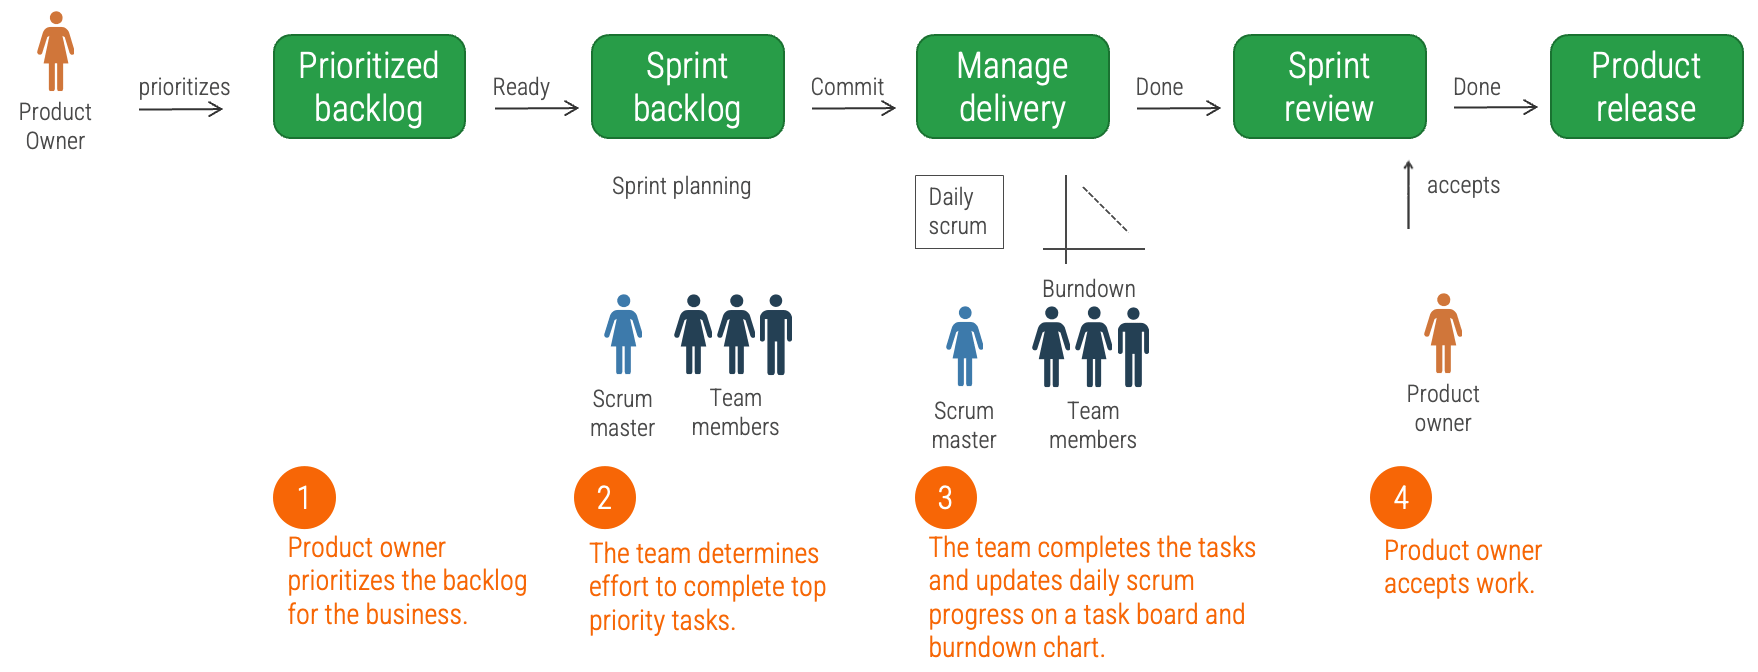
Capability: Product lifecycle management
Your Score: ____
1 - Foundational: Transitioning and Growing | 2 - Capable/Competent: Core Contributor | 3 - Influential: Gifted Improver | 4 - Transformational: Towering Strength |
-
Informal or undocumented intake process.
-
Informal or undocumented delivery lifecycle.
-
Unstable or unpredictable throughput or quality.
-
Informal or undocumented testing and release processes.
-
Informal or undocumented organizational change management planning for each release.
-
Informal or undocumented compliance validation with every release.
|
-
Documented intake process with stakeholder prioritization of requests.
-
Consistent delivery lifecycle with stable and predictable throughput with an expected range of delivery variance.
-
Formal and documented testing and release processes.
-
Organizational change management planning for each major release.
-
Compliance validation with every major release.
|
-
Intake process using value drivers and prioritization criteria to sequence all items.
-
Consistent delivery lifecycle with stable and predictable throughput with little variance.
-
Risk-based and partially automated testing and release processes.
-
Organizational change management planning for all releases.
-
Automated compliance validation with every major release.
|
-
Intake process using enterprise value drivers and prioritization criteria to sequence all items.
-
Stable Agile DevOps with low variability and automation.
-
Risk-based automated and manual testing.
-
Multiple release channels based on risk. Automated build, validation, and rollback capabilities.
-
Cross-channel, integrated organizational change management for all releases.
-
Automated compliance validation with every change or release.
|
Exercise 3.2.3 Assess your PLM capability proficiency
1 hour
-
Review the expectations for this capability and determine your current proficiency for each skill.
-
Complete your assessment in the Mature and Scale Product Owner Proficiency Assessment tool.
-
Record the results in the Mature and Scale Product Ownership Playbook.
-
Review the skills map to identify strengths and areas of growth.
Output
-
Product owner capability assessment
Participants
-
Product owners
-
Product managers
Capture in the Mature and Scale Product Owner Proficiency Assessment.
Capabilities: Value realization
Key performance indicators (KPIs)
-
Usability and user satisfaction: Assess satisfaction through usage monitoring and end-user feedback.
-
Value validation: Directly measure performance against defined value proposition, goals, and predicted ROI.
-
Fit for purpose: Verify the product addresses the intended purpose better than other options.
Financial management
-
P&L: Manage each product as if it were its own business with profit and loss statements.
-
Acquisition cost/market growth: Define the cost of acquiring a new consumer, onboarding internal users, and increasing product usage.
-
User retention/market share: Verify product usage continues after adoption and solution reaches new user groups to increase value.
Business model
-
Defines value proposition: Dedicate your primary focus to understanding and defining the value your product will deliver.
-
Market strategy and goals: Define your acquisition, adoption, and retention plan for users.
-
Financial model: Build an end-to-end financial model and plan for the product and all related operational support.
“The competition is anyone the customer compares you with.”
– Thomas K. Connellan, Inside the Magic Kingdom
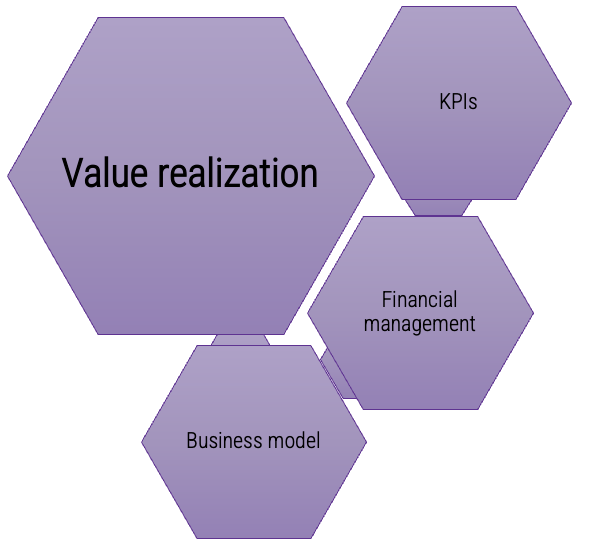
Info-Tech Insight
Most organizations stop with on-time and on-budget. True financial alignment needs to define and manage the full lifecycle P&L.
Use a balanced value to establish a common definition of goals and value
Value drivers are strategic priorities aligned to our enterprise strategy and translated through our product
families. Each product and change has an impact on the value driver helping us reach our enterprise goals.
Info-Tech Insight
Your value drivers and impact helps estimate the expected value of roadmap items, prioritize roadmap and
backlog items, and identify KPIs and OKRs to measure value realization and actual impact.
Include balanced value as one criteria to guide better decisions
Your balanced value is just one of many criteria needed to align your product goals and sequence roadmap items. Feasibility, delivery pipeline capacity, shared services, and other factors may impact the prioritization of backlog items.
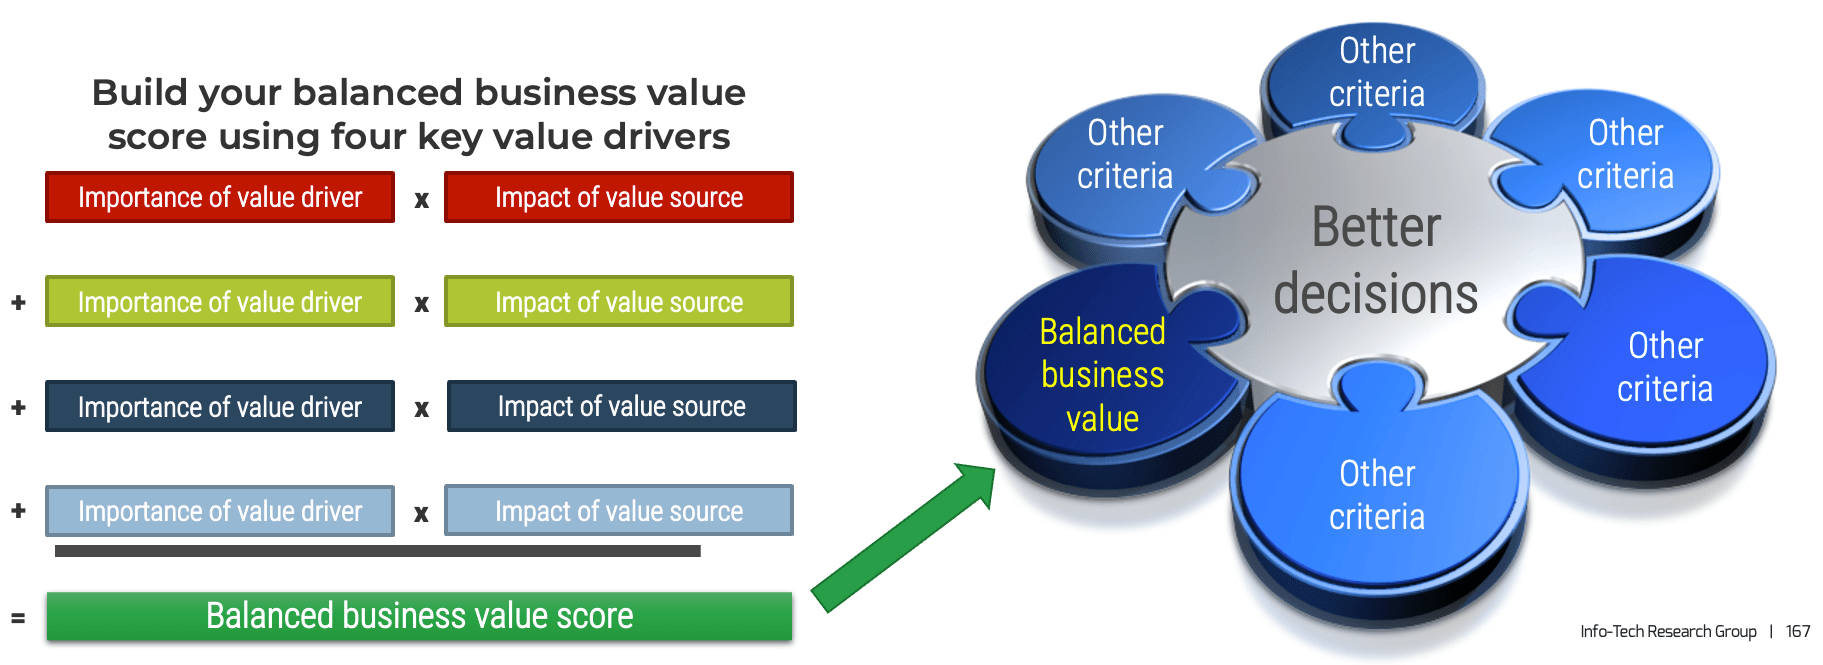
Determine your value drivers
Competent organizations know that value cannot always be represented by revenue or reduced expenses. However, it is not always apparent how to envision the full spectrum of sources of value. Dissecting value by benefit type and the value source’s orientation allows you to see the many ways in which a product or service brings value to the organization.
Business value matrix
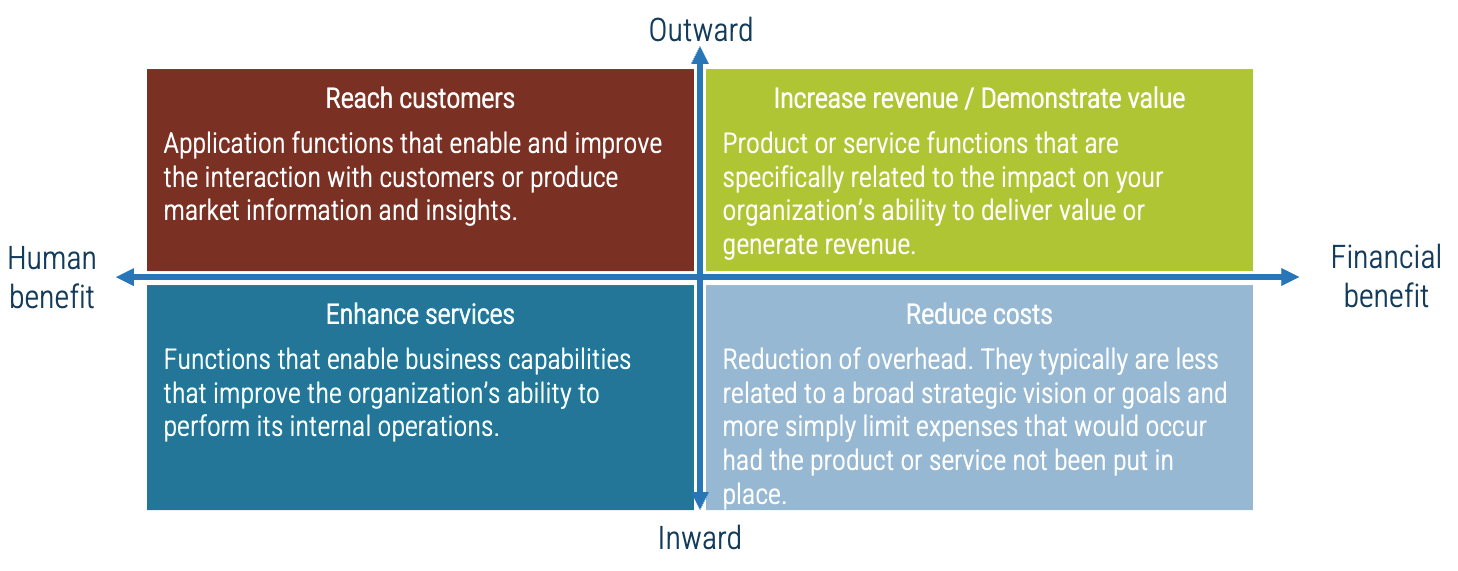
Financial benefits vs. improved capabilities
Financial benefits refer to the degree to which the value source can be measured through monetary metrics and is often quite tangible.
Human benefits refer to how a product or service can deliver value through a user’s experience.
Inward vs. outward orientation
Inward refers to value sources that have an internal impact and improve your organization’s effectiveness and efficiency in performing its operations.
Outward refers to value sources that come from your interaction with external factors, such as the market or your customers.
Exercise 3.2.4 Identify your business value drivers and sources of value
1 hour
-
Brainstorm the different types of business value that you produce on the sticky notes (one item per page). Draw from examples of products in your portfolio.
-
Identify the most important value items for your organization (two to three per quadrant).
-
Record the results in the
Mature and Scale Product Ownership Workbook.
Output
-
Product owner capability assessment
Participants
-
Product owners
-
Product managers
Capture in the Mature and Scale Product Ownership Workbook.
My business value sources
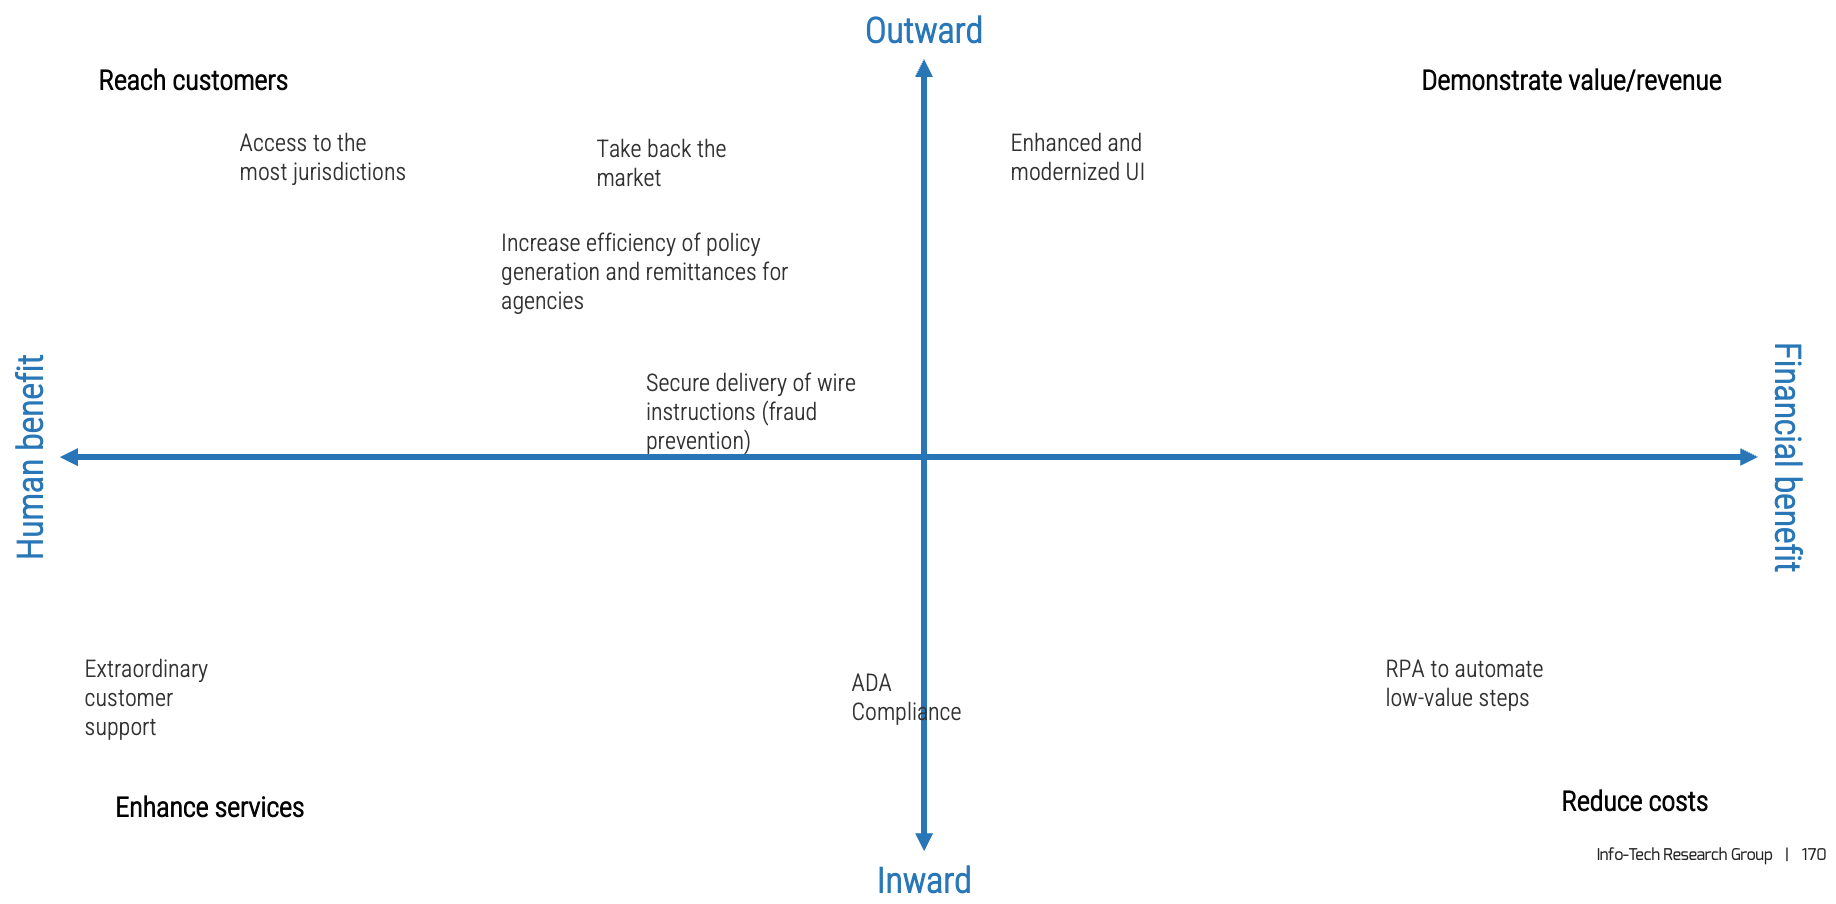
Capability: Value realization
Your Score: ____
1 - Foundational: Transitioning and Growing | 2 - Capable/Competent: Core Contributor | 3 - Influential: Gifted Improver | 4 - Transformational: Towering Strength |
-
Product canvas or basic product positioning overview.
-
Simple budget or funding mechanism for changes.
-
Product demos and informal user feedback mechanisms.
|
-
Business value canvas or basic business model tied to roadmap funding.
-
Product funding tied to roadmap milestones and prioritization.
-
Defined KPIs /OKRs for roadmap delivery throughput and value realization measurement.
|
-
Business model with operating cost structures, revenue/value traceability, and market/user segments.
-
Scenario-based roadmap funding alignment.
-
Roadmap aligned KPIs /OKRs for delivery throughput and value realization measurement as a key factor in roadmap prioritization.
|
-
Business model tied to enterprise operating costs and value realization KPIs/OKRs.
-
P&L roadmap and cost accounting tied to value metrics.
-
Roadmap aligned enterprise and scenario-based KPIs /OKRs for delivery throughput and value realization measurement as a key factor in roadmap prioritization.
|
Exercise 3.2.5 Assess your value realization capability proficiency
1 hour
-
Review the expectations for this capability and determine your current proficiency for each skill.
-
Complete your assessment in the Mature and Scale Product Owner Proficiency Assessment tool.
-
Record the results in the Mature and Scale Product Ownership Playbook.
-
Review the skills map to identify strengths and areas of growth.
Output
-
Product owner capability assessment
Participants
-
Product owners
-
Product managers
Capture in the Mature and Scale Product Owner Proficiency Assessment.
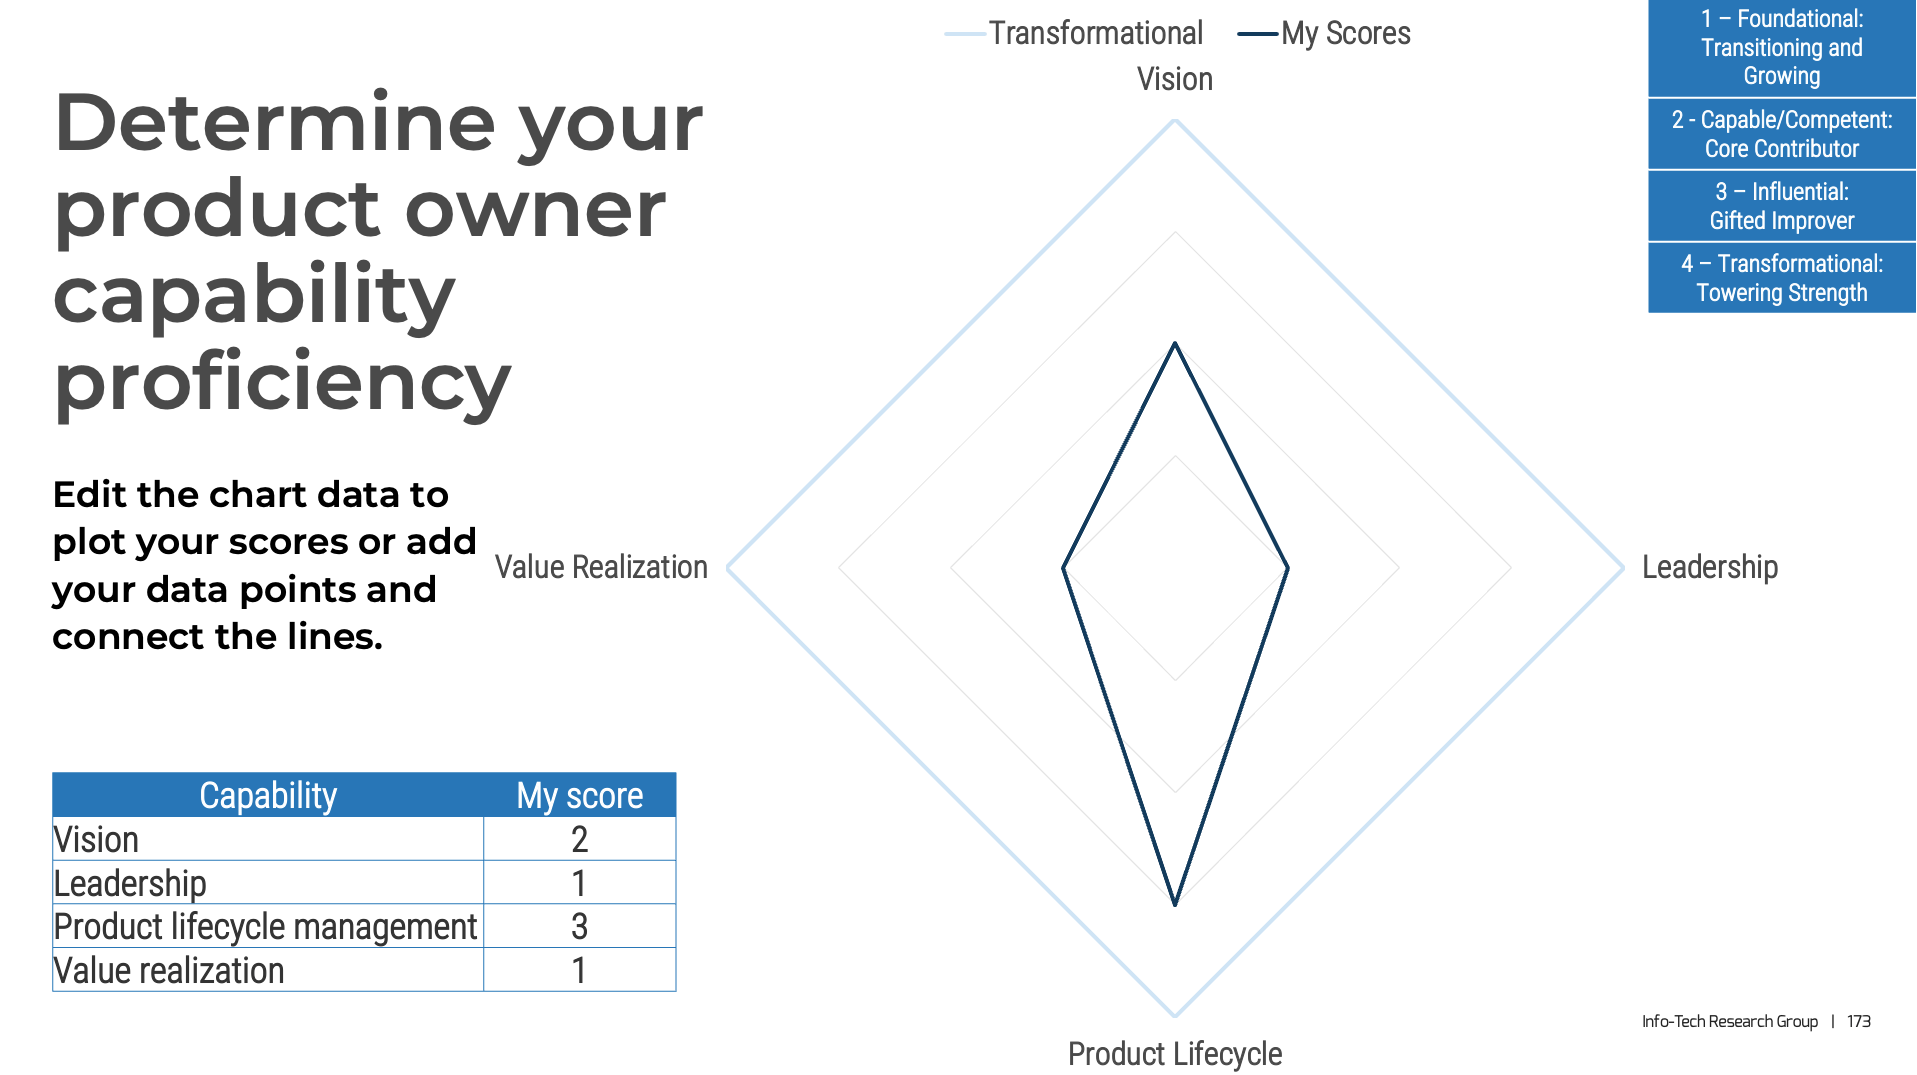
Summary of Accomplishment
Problem solved.
Product ownership can be one of the most difficult challenges facing delivery and operations teams. By focusing on operational grouping and alignment of goals, organizations can improve their value realization at all levels in the organization.
The foundation for delivering and enhancing products and services is rooted in the same capability model. Traditionally, product owners have focused on only a subset of skills and capabilities needed to properly manage and grow their products. The product owner capability model is a useful tool to ensure optimal performance from product owners and assess the right level of detail for each product within the product families.
Congratulations. You’ve completed a significant step toward higher-value products and services.
If you would like additional support, have our analysts guide you through other phases as apart of an Info-Tech workshop
Contact your account representative for more information
workshops@infotech.com
1-888-670-8889
Additional Support
If you would like additional support, have our analysts guide you through other phases as apart of an Info-Tech workshop
Contact your account representative for more information
workshops@infotech.com 1-888-670-8889
The following are sample activities that will be conducted by Info-Tech analysts with your team:
3.1.1 Assess your real Agile skill proficiency
Assess your skills and capabilities against the real Agile skills inventory
2.2.3 Prioritize your stakeholders
Build a stakeholder management strategy.
Research Contributors and Experts
Emily Archer
Lead Business Analyst,
Enterprise Consulting, authentic digital agency
Emily Archer is a consultant currently working with Fortune 500 clients to ensure the delivery of successful projects,
products, and processes. She helps increase the business value returned for organizations’ investments in designing and
implementing enterprise content hubs and content operations, custom web applications, digital marketing, and e-commerce
platforms.
David Berg
Founder & CTO
Strainprint Technologies Inc.
David Berg is a product commercialization expert who has spent the last 20 years delivering product management and
business development services across a broad range of industries. Early in his career, David worked with product
management and engineering teams to build core network infrastructure products that secure and power the internet we
benefit from today. David’s experience also includes working with clean technologies in the area of clean power
generation, agritech, and Internet of Things infrastructure. Over the last five years, David has been focused on his
latest venture, Strainprint Technologies, a data and analytics company focused on the medical cannabis
industry. Strainprint has built the largest longitudinal medical cannabis dataset in the world, with a goal to develop
an understanding of treatment behavior, interactions, and chemical drivers to guide future product development.
Research Contributors and Experts
Kathy Borneman
Digital Product Owner, SunTrust Bank
Kathy Borneman is a senior product owner who helps people enjoy their jobs again by engaging others in end-to-end
decision making to deliver software and operational solutions that enhance the client experience and allow people to
think and act strategically.
Charlie Campbell
Product Owner, Merchant e-Solutions
Charlie Campbell is an experienced problem solver with the ability to quickly dissect situations and recommend immediate
actions to achieve resolution, liaise between technical and functional personnel to bridge the technology and
communication gap, and work with diverse teams and resources to reach a common goal.
Research Contributors and Experts
Yarrow Diamond
Sr. Director, Business Architecture
Financial Services
Yarrow Diamond is an experienced professional with expertise in enterprise strategy development, project portfolio
management, and business process reengineering across financial services, healthcare and insurance, hospitality, and
real estate environments. She has a master’s in Enterprise Architecture from Penn State University, LSSMBB, PMP, CSM,
ITILv3.
Cari J. Faanes-Blakey, CBAP, PMI-PBA
Enterprise Business Systems Analyst,
Vertex, Inc.
Cari J. Faanes-Blakey has a history in software development and implementation as a Business Analyst and Project Manager
for financial and taxation software vendors. Active in the International Institute of Business Analysis (IIBA), Cari
participated on the writing team for the BA Body of Knowledge 3.0 and the certification exam.
Research Contributors and Experts
Kieran Gobey
Senior Consultant Professional Services
Blueprint Software Systems
Kieran Gobey is an IT professional with 24 years of experience, focused on business, technology, and systems analysis.
He has split his career between external and internal customer-facing roles, and this has resulted in a true
understanding of what is required to be a Professional Services Consultant. His problem-solving skills and ability to
mentor others have resulted in successful software implementations.
Kieran’s specialties include deep system
troubleshooting and analysis skills, facilitating communications to bring together participants effectively, mentoring,
leadership, and organizational skills.
Rupert Kainzbauer
VP Product, Digital Wallets
Paysafe Group
Rupert Kainzbauer is an experienced senior leader with a passion for defining and delivering products that deliver real
customer and commercial benefit. With a team of highly experienced and motivated product managers, he has successfully
led highly complex, multi-stakeholder payments initiatives, from proposition development and solution design through to
market delivery. Their domain experience is in building online payment products in high-risk and emerging markets,
remittance, prepaid cards, and mobile applications.
Research Contributors and Experts
Saeed Khan
Founder,
Transformation Labs
Saeed Khan has been working in high tech for 30 years in Canada and the US and has held several leadership roles in
Product Management in that time. He speaks regularly at conferences and has been writing publicly about technology
product management since 2005.
Through Transformation Labs, Saeed helps companies accelerate product success by working with product teams to improve
their skills, practices, and processes. He is a cofounder of ProductCamp Toronto and currently runs a Meetup group and
global Slack community called Product Leaders; the only global community of senior level product executives.
Hoi Kun Lo
Product Owner
Nielsen
Hoi Kun Lo is an experienced change agent who can be found actively participating within the IIBA and WITI groups in
Tampa, FL and a champion for Agile, architecture, diversity, and inclusion programs at Nielsen. She is currently a
Product Owner in the Digital Strategy team within Nielsen Global Watch Technology.
Research Contributors and Experts
Abhishek Mathur
Sr Director, Product Management
Kasisto, Inc.
Abhishek Mathur is a product management leader, an artificial intelligence practitioner, and an educator. He has led
product management and engineering teams at Clarifai, IBM, and Kasisto to build a variety of artificial intelligence
applications within the space of computer vision, natural language processing, and recommendation systems. Abhishek
enjoys having deep conversations about the future of technology and helping aspiring product managers enter and
accelerate their careers.
Jeff Meister
Technology Advisor and Product Leader
Jeff Meister is a technology advisor and product leader. He has more than 20 years of experience building and operating
software products and the teams that build them. He has built products across a wide range of industries and has built
and led large engineering, design, and product organizations.
Jeff most recently served as Senior Director of Product
Management at Avanade, where he built and led the product management practice. This involved hiring and leading product
managers, defining product management processes, solution shaping and engagement execution, and evangelizing the
discipline through pitches, presentations, and speaking engagements.
Jeff holds a Bachelor of Applied Science
(Electrical Engineering) and a Bachelor of Arts from the University of Waterloo, an MBA from INSEAD (Strategy), and
certifications in product management, project management, and design thinking.
Research Contributors and Experts
Vincent Mirabelli
Principal,
Global Project Synergy Group
With over 10 years of experience in both the private and public sectors, Vincent Mirabelli possesses an impressive track
record of improving, informing, and transforming business strategy and operations through process improvement, design
and re-engineering, and the application of quality to business analysis, project management, and process improvement
standards.
Oz Nazili
VP, Product & Growth
TWG
Oz Nazili is a product leader with a decade of experience in both building products and product teams. Having spent time
at funded startups and large enterprises, he thinks often about the most effective way to deliver value to users. His
core areas of interest include Lean MVP development and data-driven product growth.
Research Contributors and Experts
Mike Starkey
Director of Engineering
W.W. Grainger
Mike Starkey is a Director of Engineering at W.W. Grainger, currently focusing on operating model development, digital
architecture, and building enterprise software. Prior to joining W.W. Grainger, Mike held a variety of technology
consulting roles throughout the system delivery lifecycle spanning multiple industries such as healthcare, retail,
manufacturing, and utilities with Fortune 500 companies.
Anant Tailor
Cofounder and Head of Product
Dream Payments Corp.
Anant Tailor is a cofounder at Dream Payments where he currently serves as the COO and Head of Product, having responsibility for Product Strategy & Development, Client Delivery, Compliance, and Operations. He has 20+ years of experience building and operating organizations that deliver software products and solutions for consumers and businesses of varying sizes.
Prior to founding Dream Payments, Anant was the COO and Director of Client Services at DonRiver Inc, a technology strategy and software consultancy that he helped to build and scale into a global company with 100+ employees operating in seven countries.
Anant is a Professional Engineer with a Bachelor degree in Electrical Engineering from McMaster University and a certificate in Product Strategy & Management from the Kellogg School of Management at Northwestern University.
Research Contributors and Experts
Angela Weller
Scrum Master, Businessolver
Angela Weller is an experienced Agile business analyst who collaborates with key stakeholders to attain their goals and
contributes to the achievement of the company’s strategic objectives to ensure a competitive advantage. She excels when
mediating or facilitating teams.
Related Info-Tech Research
Product Delivery
Build a product vision your organization can take from strategy through execution.
Deliver value at the scale of your organization through defining enterprise product families.
Quickly assess the state of your Agile readiness and plan your path forward to higher value realization.
Improve collaboration and transparency with the business to minimize project failure.
Streamline business value delivery through the strategic adoption of DevOps practices.
Further the benefits of Agile by extending a scaled Agile framework to the business.
Embrace a team sport culture built around continuous business-IT collaboration to deliver great products.
Shift security left to get into DevSecOps.
Facilitate ongoing alignment between Agile teams and the business with a set of targeted service offerings.
Execute a disciplined approach to rolling out Agile methods in the organization.
Related Info-Tech Research
Application Portfolio Management
See an overview of the APM journey and how we can support the pieces in this journey.
Ensure your application portfolio delivers the best possible return on investment.
Effective maintenance ensures the long-term value of your applications.
Move beyond maintenance to ensuring exceptional value from your apps.
Delivering value starts with embracing what your department can do.
Empower the business to implement their own applications with a trusted business-IT relationship
Facilitate ongoing alignment between Agile teams and the business with a set of targeted service offerings.
Related Info-Tech Research
Value, Delivery Metrics, Estimation
Focus product delivery on business value–driven outcomes.
Be careful what you ask for, because you will probably get it.
Develop data-driven insights to help you decide which applications to retire, upgrade, re-train on, or maintain to meet the demands of the business.
Mature your IT department by measuring what matters.
Don’t let bad estimates ruin good work.
Commit to achievable software releases by grounding realistic expectations.
Expand on the financial model to give your initiative momentum.
Deliver more projects by giving yourself the voice to say “no” or “not yet” to new projects.
Facilitate ongoing alignment between Agile teams and the business with a set of targeted service offerings.
Related Info-Tech Research
Organizational Design and Performance
Focus product delivery on business value-driven outcomes.
Have the right people, in the right place, at the right time.
Reorganizations are inherently disruptive. Implement your new structure with minimal pain for staff while maintaining IT performance throughout the change.
Don’t just measure engagement, act on it
Set holistic measures to inspire employee performance.
Bibliography (Product Management)
“12th Annual State of Agile Report.” VersionOne, 9 April 2018. Web.
A, Karen. “20 Mental Models for Product Managers.” Product Management Insider, Medium, 2 Aug. 2018. Web.
Adams, Paul. “Product Teams: How to Build & Structure Product Teams for Growth.” Inside Intercom, 30 Oct. 2019. Web.
Aghina, Handscomb, Ludolph, West, and Abby Yip, “How to select and develop individuals for successful agile teams: A practical guide” McKinsey & Company 20 Dec. 2018. Web.
Agile Alliance. “Product Owner.” Agile Alliance. n.d. Web.
Ambler, Scott W. "Communication on Agile Software Teams“, Agile Modeling. 2001-2022. Web.
Ambysoft. “2018 IT Project Success Rates Survey Results.” Ambysoft. 2018. Web.
Banfield, Richard, et al. “On-Demand Webinar: Strategies for Scaling Your (Growing) Enterprise Product Team.”
Pluralsight, 31 Jan. 2018. Web.
Beck, Beedle, van Bennekum, Cockburn, Cunningham, Fowler, Grenning, Highsmith, Hunt, Jeffries, Kern, Marick, Martin, Mellor, Schwaber, Sutherland, Thomas, "Manifesto for Agile Software Development." agilemanifesto.org. 2001
Berez, Steve, et al. “How to Plan and budget for Agile at Scale.” Bain & Company, 08 Oct 2019. Web
Blueprint. “10 Ways Requirements Can Sabotage Your Projects Right From the Start.” Blueprint. 2012. Web.
Breddels, Dajo, and Paul Kuijten. “Product Owner Value Game.” Agile2015 Conference, Agile Alliance 2015. Web.
Cagan, Martin. “Behind Every Great Product.” Silicon Valley Product Group. 2005. Web.
Cohn, Mike. “What Is a Product?” Mountain Goat Software. 6 Sept. 2016. Web.
Connellan, Thomas K. Inside the Magic Kingdom, Bard Press, 1997.
Curphey, Mark. “Product Definition.” SlideShare, 25 Feb. 2007. Web.
“Delegation Poker Product Image.” Management 3.0, n.d. Web.
Distel, Dominic, et al. “Finding the sweet spot in product-portfolio management.’ McKinsey, 4 Dec. 2020. Web
Eringa, Ron. “Evolution of the Product Owner.” RonEringa.com, 12 June 2016. Web.
Fernandes, Thaisa. “Spotify Squad Framework - Part I.” PM101, Medium, 6 Mar. 2017. Web.
Galen, Robert. “Measuring Product Ownership – What Does ‘Good’ Look Like?” RGalen Consulting, 5 Aug. 2015. Web.
Grenny, Joseph. “The Best Teams Hold Themselves Accountable.” Harvard Business Review, 30 May 2014. Web.
Halisky, Merland, and Luke Lackrone. “The Product Owner’s Universe.” Agile2016 Conference, Agile Alliance, 2016. Web.
Bibliography (Product Management)
IIBA "A Guide to the Business Analysis Body of Knowledge® (BABOK® Guide) v3" IIBA. 15 APR 2015
Kamer, Jurriaan. “How to Build Your Own ‘Spotify Model’.” The Ready, Medium, 9 Feb. 2018. Web.
Kendis Team. “Exploring Key Elements of Spotify’s Agile Scaling Model.” Scaled Agile Framework, Medium, 23 Jul. 2018. Web.
Lindstrom, Lowell. “7 Skills You Need to Be a Great Product Owner.” Scrum Alliance, n.d. Web.
Lukassen, Chris. “The Five Belts Of The Product Owner.” Xebia.com, 20 Sept. 2016. Web.
Mankins, Michael. “The Defining Elements of a Winning Culture.” Bain, 19 Dec. 2013. Web.
McCloskey, Heather. “Scaling Product Management: Secrets to Defeating Common Challenges.” ProductPlan, 12 July 2019. Web.
McCloskey, Heather. “When and How to Scale Your Product Team.” UserVoice, 21 Feb. 2017. Web.
Mironov, Rich. “Scaling Up Product Manager/Owner Teams.” Rich Mironov's Product Bytes, Mironov Consulting, 12 Apr. 2014. Web.
Moore, Geoffrey A. “Crossing the Chasm, 3rd Edition.” Collins Business Essentials, 28 Jan 2014
Oh, Paul. “How Mastering Resilience Can Help Drive Agile Transformations.” Why Innovation!, 10 Oct. 2019.
Overeem, Barry. “A Product Owner Self-Assessment.” Barry Overeem, 6 Mar. 2017. Web.
Overeem, Barry. “Retrospective: Using the Team Radar.” Barry Overeem, 27 Feb. 2017. Web.
Pichler, Roman. “How to Scale the Scrum Product Owner.” Roman Pichler, 28 June 2016 . Web.
Pichler, Roman. “Product Management Framework.” Pichler Consulting Limited, 2014. Web.
Pichler, Roman. “Sprint Planning Tips for Product Owners.” LinkedIn, 4 Sept. 2018. Web.
Pichler, Roman. “What Is Product Management?” Pichler Consulting Limited, 26 Nov. 2014. Web.
PMI "The high cost of low performance: the essential role of communications“. PMI Pulse of Profession, May 2013.
Radigan,Dan. “Putting the ‘Flow' Back in Workflow With WIP Limits.” Atlassian, n.d. Web.
Bibliography (Product Management)
Rouse, Margaret. “Definition: product.” TechTarget, Sept. 2005. Web.
Schuurman, Robbin. “10 Tips for Product Owners on (Business) Value.” Scrum.org, 30 Nov. 2017. Web.
Schuurman, Robbin. “10 Tips for Product Owners on Agile Product Management.” Scrum.org, 28 Nov. 2017. Web.
Schuurman, Robbin. “10 Tips for Product Owners on Product Backlog Management.” Scrum.org, 5 Dec. 2017. Web.
Schuurman, Robbin. “10 Tips for Product Owners on the Product Vision.” Scrum.org, 29 Nov. 2017. Web.
Schuurman, Robbin. “Tips for Starting Product Owners.” Scrum.org, 27 Nov. 2017. Web.
Sharma, Rohit. “Scaling Product Teams the Structured Way.” Monetary Musings, 28 Nov. 2016. Web.
Shirazi, Reza. “Betsy Stockdale of Seilevel: Product Managers Are Not Afraid To Be Wrong.” Austin Voice of Product, 2 Oct. 2018. Web.
Spitz, Enid R. “The Three Kinds of Empathy: Emotional, Cognitive, Compassionate.” The Three Kinds of Empathy: Emotional, Cognitive, Compassionate. Heartmanity. Web.
Steiner, Anne. “Start to Scale Your Product Management: Multiple Teams Working on Single Product.” Cprime, 6 Aug. 2019. Web.
“The Qualities of Leadership: Leading Change.” Cornelius & Associates, 2016. Web.
“The Standish Group 2015 Chaos Report.” The Standish Group. 2015. Web.
Theus, Andre. “When Should You Scale the Product Management Team?” ProductPlan, 7 May 2019. Web.
Tolonen, Arto. “Scaling Product Management in a Single Product Company.” Smartly.io, 26 Apr. 2018. Web.
Ulrich, Catherine. “The 6 Types of Product Managers. Which One Do You Need?” Medium, 19 Dec. 2017. Web.
Verwijs, Christiaan. “Retrospective: Do The Team Radar.” The Liberators, Medium, 10 Feb. 2017. Web.
Vlaanderen, Kevin. “Towards Agile Product and Portfolio Management”. Academia.edu. 2010. Web.
Backlog
2009 Business Analysis Benchmark Study.” IAG Consulting, 2009. Web.
Armel, Kate. “Data-driven Estimation, Management Lead to High Quality.” Quantitative Software Management Inc, 2015. Web.
Bradley, Marty. “Agile Estimation Guidance.” Leading Agile, 30 Aug. 2016. Web. Feb. 2019.
CollabNet and VersionOne. “12th Annual State of Agile Report.” VersionOne, 9 April 2018. Web.
Craveiro, João. “Marty meets Martin: connecting the two triads of Product Management.” Product Coalition, 18 Nov. 2017. Accessed Feb. 2019.
“Enablers.” Scaled Agile, n.d. Web.
“Epic.” Scaled Agile, n.d. Web.
Fischer, Christian. “Scrum Compact.” Itemis, n.d. Web. Feb. 2019.
Hackshall, Robin. “Product Backlog Refinement.” Scrum Alliance, 9 Oct. 2014. Accessed Feb. 2019.
Hartman, Bob. “New to agile? INVEST in good user stories.” Agile For All, 14 May 2009. Web.
Huether, Derek. “Cheat Sheet for Product Backlog Refinement (Grooming).” Leading Agile, 2 Nov. 2013. Accessed Feb. 2019.
Karlsson, Johan. “Backlog Grooming: Must-Know Tips for High-Value Products.” Perforce, 18 May 2018. Accessed Feb. 2019.
Khan, Saeed. “Good Bye ‘Product Owner’, Hello ‘Backlog Manager.’” On Product Management, 27 June 2011. Accessed Feb. 2019.
Khan, Saeed. “Let’s End the Confusion: A Product Owner is NOT a Product Manager.” On Product Management, 14 July 2017. Accessed Feb. 2019.
Lawrence, Richard. “New Story Splitting Resource.” Agile For All. 27 Jan. 2012. Web. Feb. 2019.
Leffingwell, Dean. “SAFe 4.0.” Scaled Agile Inc, 2017. Accessed Feb. 2019.
Lucero, Mario. “Product Backlog – Deep Model.” Agilelucero, 8 Oct. 2014. Web.
“PI Planning.” Scaled Agile, n.d. Web.
Pichler, Roman. “The Product Roadmap and the Product Backlog.” Roman Pichler, 9 Sept. 2014. Accessed Feb. 2019.
Rubin, Kenneth S. Essential Scrum: A Practical Guide to the Most Popular Agile Process. Pearson Education, 2012.
Schuurman, Robbin. “10 Tips for Product Owners on Product Backlog Management.” Burozeven, 20 Nov. 2017. Accessed Feb. 2019.
Srinivasan, Vibhu. “Product Backlog Management: Tips from a Seasoned Product Owner.” Agile Alliance, n.d. Accessed Feb. 2019.
Todaro, Dave. “Splitting Epics and User Stories.” Ascendle, n.d. Accessed Feb. 2019.
“What Characteristics Make Good Agile Acceptance Criteria?” Segue Technologies, 3 Sept. 2015. Web. Feb. 2019.
Bibliography (Roadmap)
Bastow, Janna. “Creating Agile Product roadmaps Everyone Understands.” ProdPad, 22 Mar. 2017. Accessed Sept. 2018.
Bastow, Janna. “The Product Tree Game: Our Favorite Way To Prioritize Features.” ProdPad, 21 Feb. 2016. Accessed Sept. 2018.
Chernak, Yuri. “Requirements Reuse: The State of the Practice.” 2012 IEEE International Conference, 12 June 2012, Herzliya, Israel. Web.
Fowler, Martin. “Application Boundary.” MartinFowler.com, 11 Sept. 2003. Accessed 20 Nov. 2017.
Harrin, Elizabeth. “Learn What a Project Milestone Is.” The Balance Careers, 10 May 2018. Accessed Sept. 2018.
“How to create a product roadmap.” Roadmunk, n.d. Accessed Sept. 2018.
Johnson, Steve. “How to Master the 3 Horizons of Product Strategy.” Aha!, 24 Sept. 2015. Accessed Sept. 2018.
Johnson, Steve. “The Product Roadmap vs. the Technology Roadmap.” Aha!, 23 June 2016. Accessed Sept. 2018
Juncal, Shaun. “How Should You Set Your Product Roadmap Timeframes?” ProductPlan, Web. Sept. 2018.
Leffingwell, Dean. “SAFe 4.0.” Scaled Agile, 2017. Web.
Maurya, Ash. “What is a Minimum Viable Product (MVP).” Leanstack, 12 June 2017. Accessed Sept. 2018.
Pichler, Roman. “10 Tips for Creating an Agile Product Roadmap.” Roman Pichler, 20 July 2016. Accessed Sept. 2018.
Pichler, Roman. Strategize: Product Strategy and Product Roadmap Practices for the Digital Age. Pichler
Consulting, 2016.
“Product Roadmap Contents: What Should You Include?” ProductPlan, n.d. Accessed 20 Nov. 2017.
Saez, Andrea. “Why Your Roadmap Is Not a Release Plan.” ProdPad, 23 October 2015. Accessed Sept. 2018.
Schuurman, Robbin. “Tips for Agile product roadmaps & product roadmap examples.” Scrum.org, 7 Dec. 2017. Accessed Sept. 2018.
Bibliography (Vision and Canvas)
Adams, Paul. “The Future Product Canvas.” Inside Intercom, 10 Jan. 2014. Web.
“Aligning IT Funding Models to the Pace of Technology Change.” EDUCAUSE, 14 Dec. 2015. Web.
Altman, Igor. “Metrics: Gone Bad.” OpenView, 10 Nov. 2009. Web.
Barry, Richard. “The Product Vision Canvas – a Strategic Tool in Developing a Successful Business.” Polymorph, 2019. Web.
“Business Canvas – Business Models & Value Propositions.” Strategyzer, 2019. Web.
“Business Model Canvas.” Wikipedia: The Free Encyclopedia, 4 Aug. 2019. Web.
Charak, Dinker. “Idea to Product: The Working Model.” ThoughtWorks, 13 July 2017. Web.
Charak, Dinker. “Product Management Canvas - Product in a Snapshot.” Dinker Charak, 29 May 2017. Web.
Chudley, James. “Practical Steps in Determining Your Product Vision (Product Tank Bristol, Oct. 2018).” LinkedIn SlideShare. Uploaded by cxpartners, 2 Nov. 2018. Web.
Cowan, Alex. “The 20 Minute Business Plan: Business Model Canvas Made Easy.” COWAN+, 2019. Web.
Craig, Desiree. “So You've Decided To Become A Product Manager.” Start it up, Medium, 2 June 2019. Web.
“Create an Aha! Business Model Canvas Strategic Model.” Aha! Support, 2019. Web.
Eick, Stephen. “Does Code Decay? Assessing the Evidence from Change Management Data.” IEEE Transactions on Software Engineering, vol. 27, no. 1, Jan. 2001, pp. 1-12. Web.
Eriksson, Martin. “The next Product Canvas.” Mind the Product, 22 Nov. 2013. Web.
“Experience Canvas: a Lean Approach: Atlassian Team Playbook.” Atlassian, 2019. Web.
Freeman, James. “How to Make a Product Canvas – Visualize Your Product Plan.” Edraw, 23 Dec. 2019. Web.
Fuchs, Danny. “Measure What Matters: 5 Best Practices from Performance Management Leaders.” OpenGov, 8 Aug. 2018. Web.
Gorisse, Willem. “A Practical Guide to the Product Canvas.” Mendix, 28 Mar. 2017. Web.
Gothelf, Jeff. “The Lean UX Canvas.” Jeff Gothelf, 15 Dec. 2016. Web.
Gottesdiener, Ellen. “Using the Product Canvas to Define Your Product: Getting Started.” EBG Consulting, 15 Jan. 2019. Web.
Gottesdiener, Ellen. “Using the Product Canvas to Define Your Product's Core Requirements.” EBG Consulting, 4 Feb. 2019. Web.
Gray, Mark Krishan. “Should I Use the Business Model Canvas or the Lean Canvas?” Blog, Medium.com, 2019. Web.
Bibliography (Vision and Canvas)
Hanby, Jeff. "Software Maintenance: Understanding and Estimating Costs." LookFar, 21 Oct. 2016. Web.
“How do you define a product?” Scrum.org, 4 Apr 2017, Web
Juncal, Shaun. “How to Build a Product Roadmap Based on a Business Model Canvas.” ProductPlan, 19 June 2019. Web.
“Lean Canvas Intro - Uber Example.” YouTube, uploaded by Railsware Product Academy, 12 Oct. 2018. Web.
“Lesson 6: Product Canvas.” ProdPad Help Center, 2019. Web.
Lucero, Mario. “The Product Canvas.” Agilelucero.com, 22 June 2015. Web.
Maurya, Ash. “Create a New Lean Canvas.” Canvanizer, 2019. Web.
Maurya, Ash. “Don't Write a Business Plan. Create a Lean Canvas Instead.” LEANSTACK, 2019. Web.
Maurya, Ash. “Why Lean Canvas vs Business Model Canvas?” Medium, 27 Feb. 2012. Web.
Mirabelli, Vincent. “The Project Value Canvas.” Vincent Mirabelli, 2019. Web.
Mishra, LN. “Business Analysis Canvas – The Ultimate Enterprise Architecture.” BA Times, 19 June 2019. Web.
Muller. Jerry Z. “Why performance metrics isn’t always the best way to judge performance.” Fast Company, 3 April 2019. Web.
Perri, Melissa. “What Is Good Product Strategy?” Melissa Perri, 14 July 2016. Web.
Pichler, Roman. “A Product Canvas for Agile Product Management, Lean UX, Lean Startup.” Roman Pichler, 16 July 2012. Web.
Pichler, Roman. “Introducing the Product Canvas.” JAXenter, 15 Jan. 2013. Web.
Pichler, Roman. “Roman's Product Canvas: Introduction.” YouTube, uploaded by Roman Pichler, 3 Mar. 2017. Web.
Pichler, Roman. “The Agile Vision Board: Vision and Product Strategy.” Roman Pichler, 10 May 2011. Web.
Pichler, Roman. “The Product Canvas – Template.” Roman Pichler, 11 Oct. 2016. Web.
Pichler, Roman. “The Product Canvas Tutorial V1.0.” LinkedIn SlideShare. Uploaded by Roman Pichler, 14 Feb. 2013. Web.
Pichler, Roman. “The Product Vision Board: Introduction.” YouTube uploaded by Roman Pichler, 3 Mar. 2017. Web.
“Product Canvas PowerPoint Template.” SlideModel, 2019. Web.
Bibliography (Vision and Canvas)
“Product Canvas.” SketchBubble, 2019, Web.
“Product Canvas.” YouTube, uploaded by Wojciech Szramowski, 18 May 2016. Web.
“Product Roadmap Software to Help You Plan, Visualize, and Share Your Product Roadmap.” Productboard, 2019. Web.
Roggero, Giulio. “Product Canvas Step-by-Step.” LinkedIn SlideShare, uploaded by Giulio Roggero, 18 May 2013. Web.
Royce, Dr. Winston W. “Managing the Development of Large Software Systems.” Scf.usc.edu, 1970. Web.
Ryan, Dustin. “The Product Canvas.” Qdivision, Medium, 20 June 2017. Web.
Snow, Darryl. “Product Vision Board.” Medium, 6 May 2017. Web.
Stanislav, Shymansky. “Lean Canvas – a Tool Your Startup Needs Instead of a Business Plan.” Railsware, 12 Oct. 2018. Web.
Stanislav, Shymansky. “Lean Canvas Examples of Multi-Billion Startups.” Railsware, 20 Feb. 2019. Web.
“The Product Vision Canvas.” YouTube, Uploaded by Tom Miskin, 20 May 2019. Web.
Tranter, Leon. “Agile Metrics: the Ultimate Guide.” Extreme Uncertainty, n.d. Web.
“Using Business Model Canvas to Launch a Technology Startup or Improve Established Operating Model.” AltexSoft, 27 July 2018. Web.
Veyrat, Pierre. “Lean Business Model Canvas: Examples + 3 Pillars + MVP + Agile.” HEFLO BPM, 10 Mar. 2017. Web.
“What Are Software Metrics and How Can You Track Them?” Stackify, 16 Sept. 2017. Web
“What Is a Product Vision?” Aha!, 2019. Web.
Supporting Research
Transformation topics and supporting Info-Tech research to make the journey easier, with less rework.
Supporting research and services
Improving IT alignment
Success depends on IT initiatives clearly aligned to business goals, IT excellence, and driving technology innovation.
Includes a "Strategy on a page" template
Governance isn't optional, so keep it simple and make it flexible.
Unlock the full value of your service catalog with technical components.
Ensure your application portfolio delivers the best possible return on investment.
Supporting research and services
Shifting toward Agile DevOps
Tools and advice you need to be successful with Agile.
Understand Agile fundamentals, principles, and practices so you can apply them effectively in your organization.
Streamline business value delivery through the strategic adoption of DevOps practices.
Being Agile isn't about processes, it's about people.
Projects and products are not mutually exclusive.
Supporting research and services
Shifting toward product management
Align your organization on the practices to deliver what matters most.
Build a product vision your organization can take from strategy through execution.
Deliver value at the scale of your organization through defining enterprise product families.
Strengthen the product owner's role in your organization by focusing on core capabilities and proper alignment.
Supporting research and services
Improving value and delivery metrics
Focus product delivery on business value-driven outcomes.
Mature your IT department by measuring what matters.
Be careful what you ask for because you will probably get it.
Expand on the financial model to give your initiative momentum.
Supporting research and services
Improving governance, prioritization, and value
Governance isn't optional, so keep it simple and make it flexible.
Embed benefits realization into your governance process to prioritize IT spending and confirm the value of IT.
Innovate and transform your business models with digital platforms.
Building a digital strategy is only half the battle: create a systematic roadmap of technology initiatives to execute the strategy and drive digital transformation.
Focus product delivery on business value-driven outcomes.
Mature your IT department by measuring what matters.
Supporting research and services
Improving requirements management and quality assurance
Right-size the guidelines of your requirements gathering process.
Back to basics: great products are built on great requirements.
Build quality into every step of your SDLC.
Drive software delivery throughput and quality confidence by extending your automation test coverage.
Make the case to manage technical debt in terms of business impact.
Avoid project failure by keeping the "B" in BPM.
Optimize and automate your business processes with a user-centric approach.
Don't waste your time focusing on the "as is." Focus on the improvements and the "to be."
Supporting research and services
Improving release management
Build trust by right-sizing your process using appropriate governance.
Effective maintenance ensures the long-term value of your applications.
Move beyond maintenance to ensure exceptional value from your apps.
Right-size your change management process.
Make the case to manage technical debt in terms of business impact.
Drive down your delivery time by eliminating development inefficiencies and bottlenecks while maintaining high quality.
Supporting research and services
Business relationship management
Leverage knowledge of the business to become a strategic IT partner.
Improving security
Create value by aligning your strategy to business goals and business risks.
Enhance your overall security posture with a defensible and prescriptive policy suite.
Leverage risk- and role-based access control to quantify and simplify the IAM process.
Supporting research and services
Improving and supporting business-managed applications
Empower the business to implement their own applications with a trusted business-IT relationship.
Ensure your software systems solution is architected to reflect stakeholders’ short-and long-term needs.
Extend IT, automation, and digital capabilities to the business with the right tools, good governance, and trusted organizational relationships.
Support RPA delivery with strong collaboration and management foundations.
Embrace the symbiotic relationship between the human and digital workforce.
Supporting research and services
Improving business intelligence, analytics, and reporting
Enable the business to achieve operational excellence, client intimacy, and product leadership with an innovative, Agile, and fit-for-purpose data architecture practice.
Deliver actionable business insights by creating a business-aligned reporting and analytics strategy.
Quality data drives quality business decisions.
Journey to the data marketplace ecosystems.
Key to building and fostering a data-driven culture.
Level the table before assembling the application integration puzzle or risk losing pieces.
Appendix
Pulse survey results
Pulse survey (N=18): What are the key components of product/service ownership?
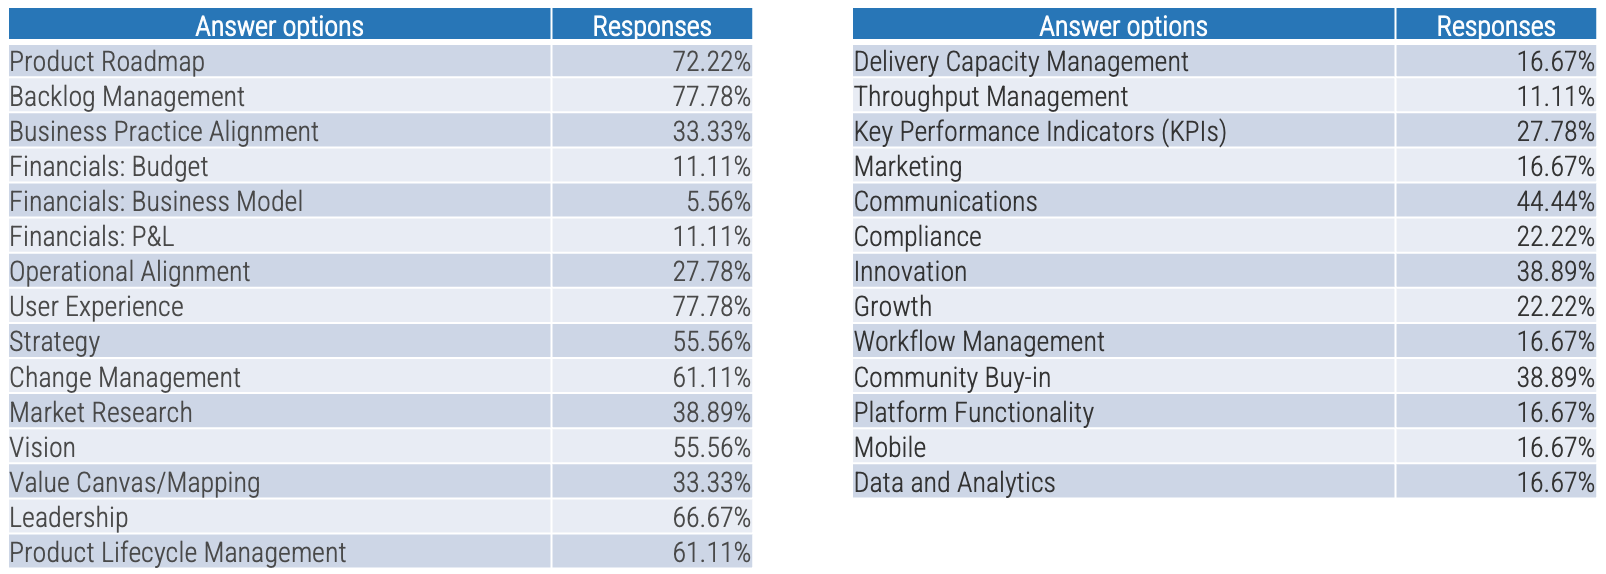
Pulse Survey (N=18): What are the key individual skills for a product/service owner?
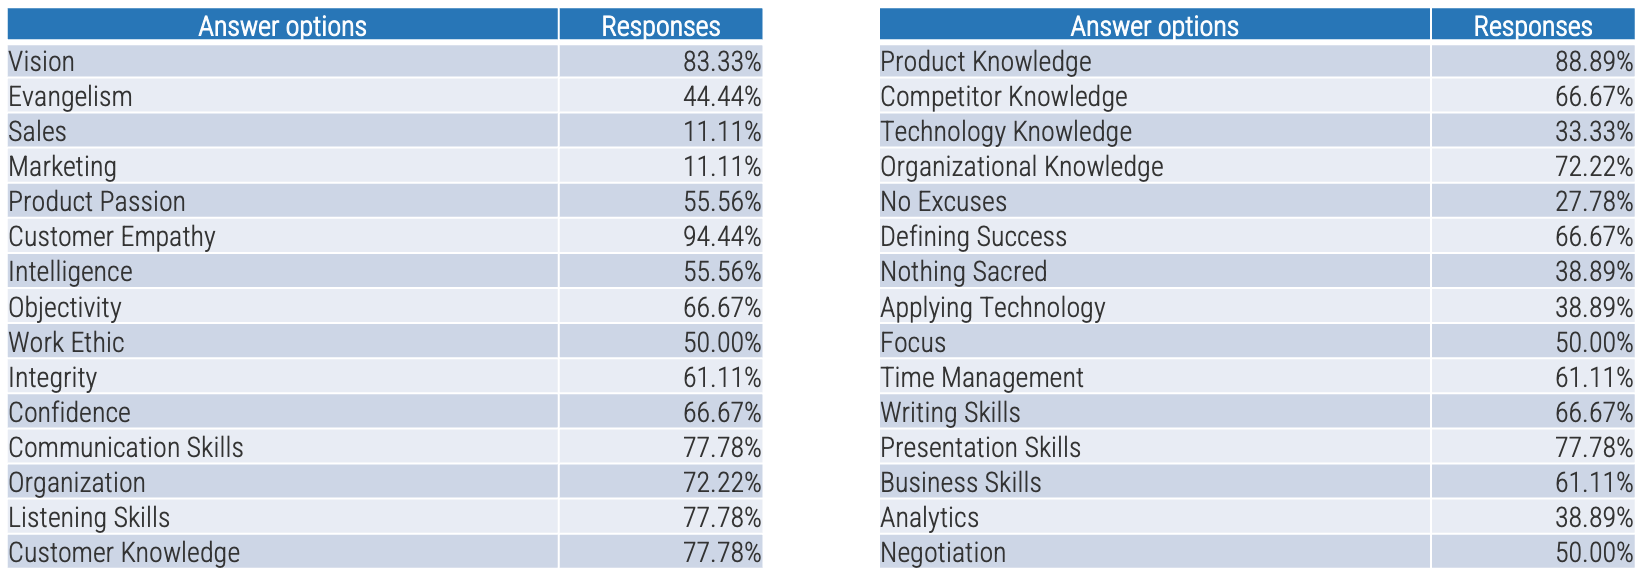
Other choices entered by respondents:
-
Anticipating client needs, being able to support delivery in all phases of the product lifecycle, adaptability, and ensuring a healthy backlog (at least two sprints’ worth of work).
-
Requirements elicitation and prioritization.
-
The key skill is being product-focused to ensure it provides value for competitive advantage.
Pulse Survey (N=18): What are three things an outstanding product/service owner does that an average one doesn’t?
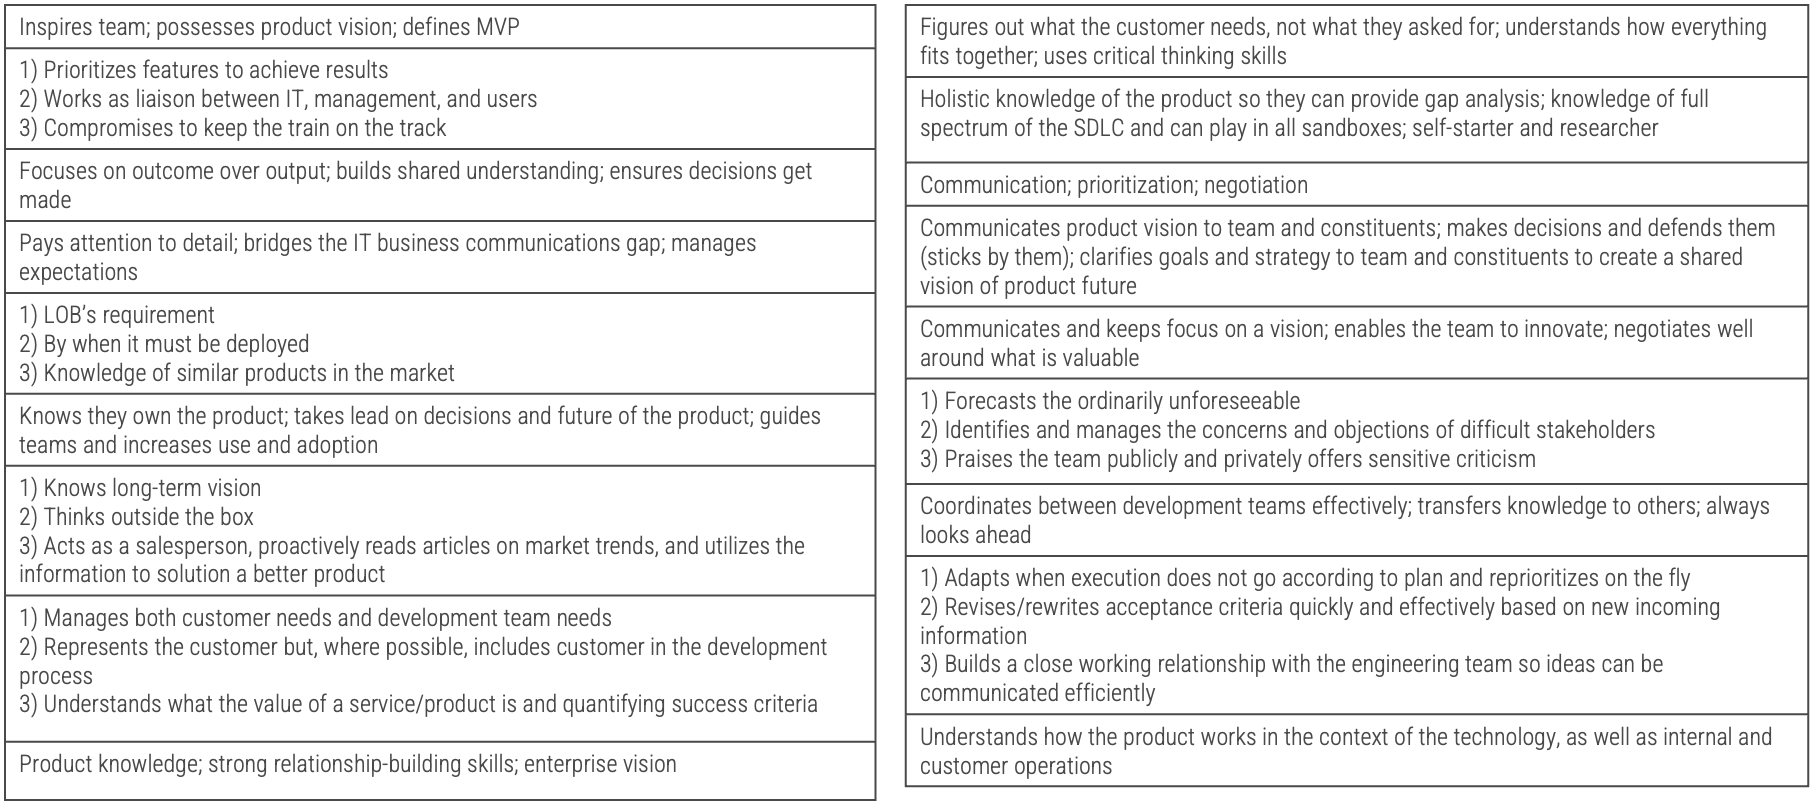


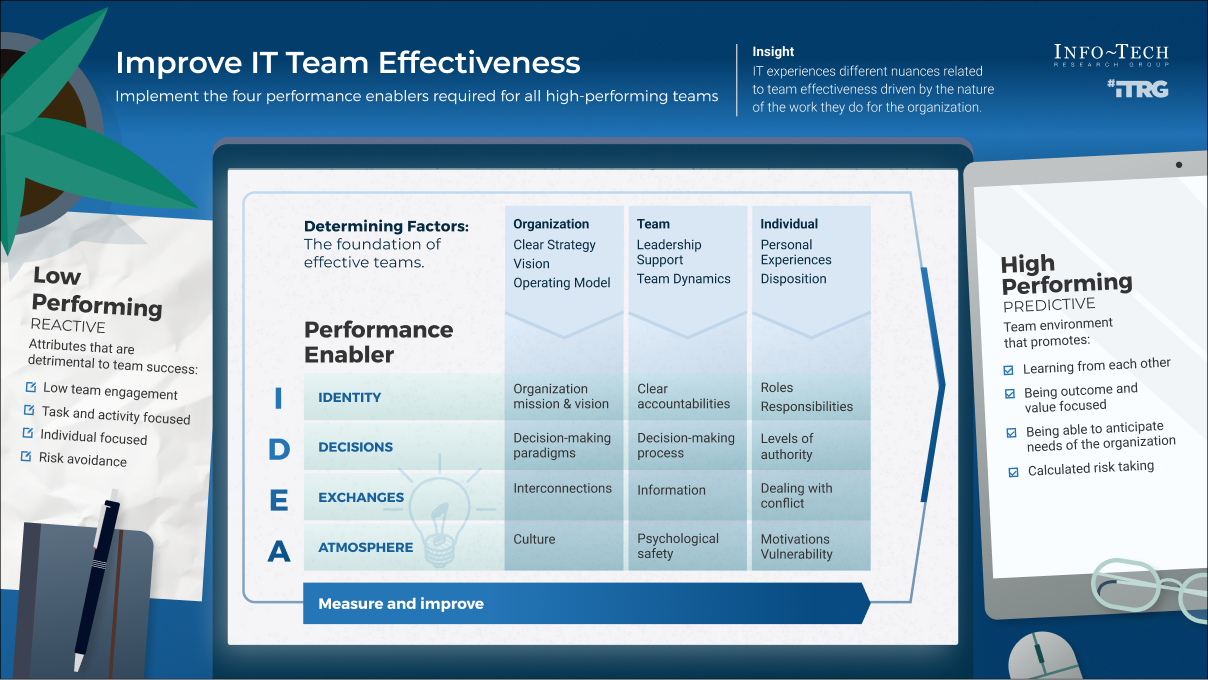
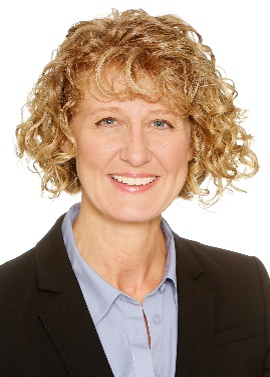
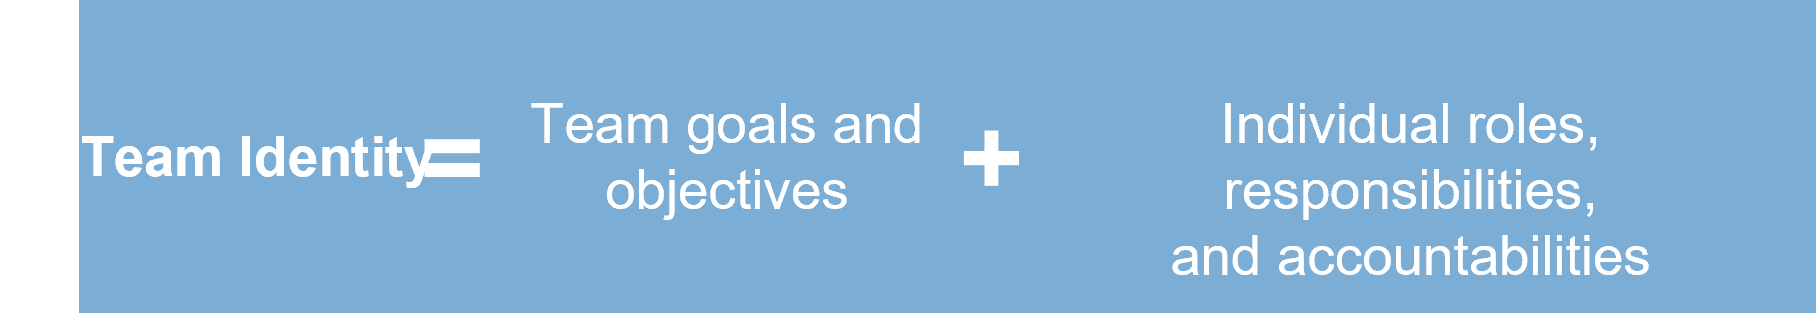
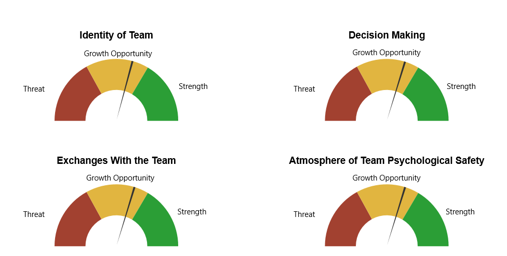
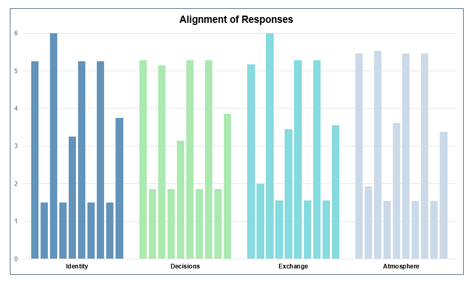
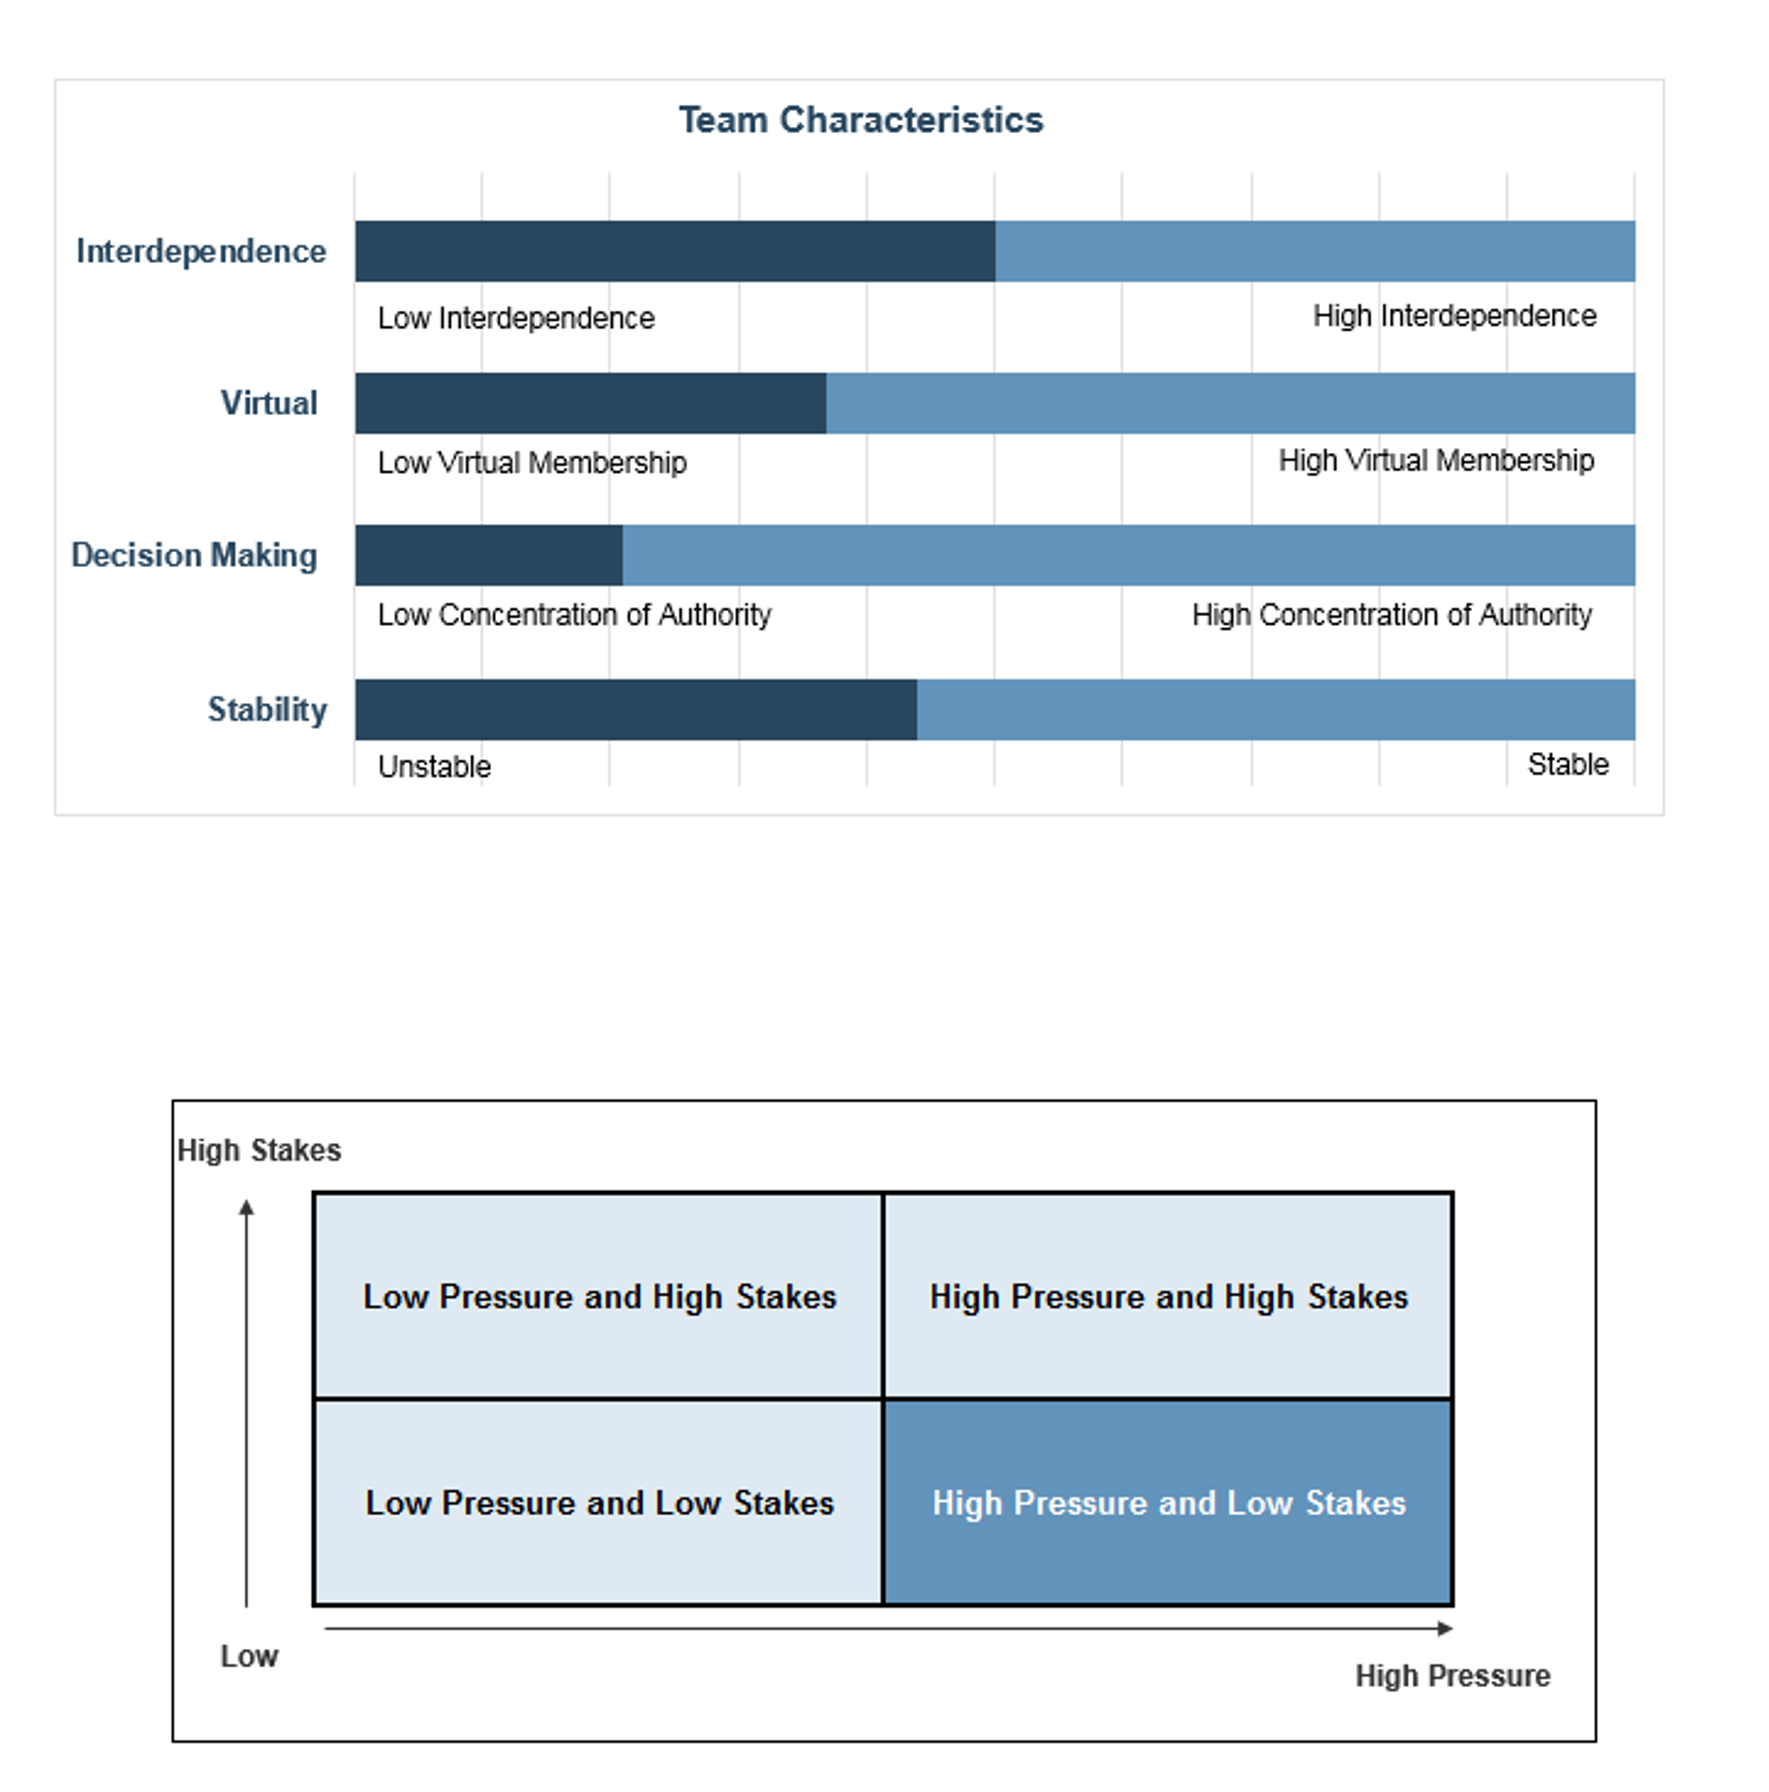
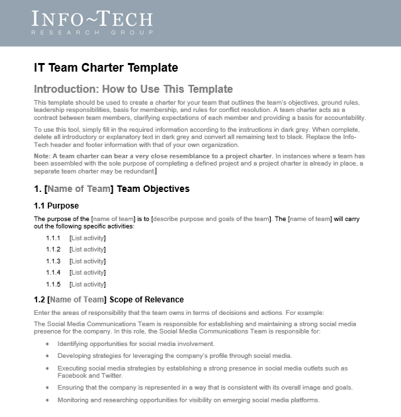


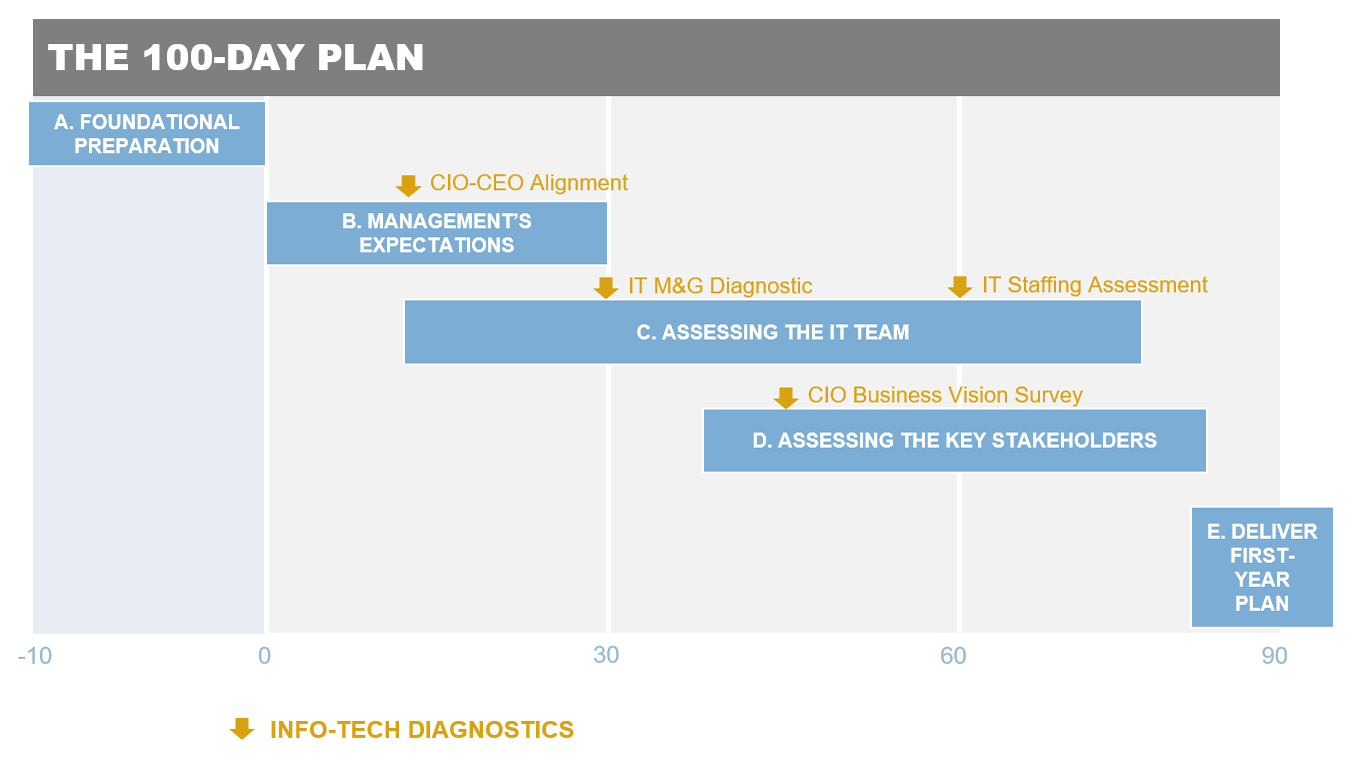

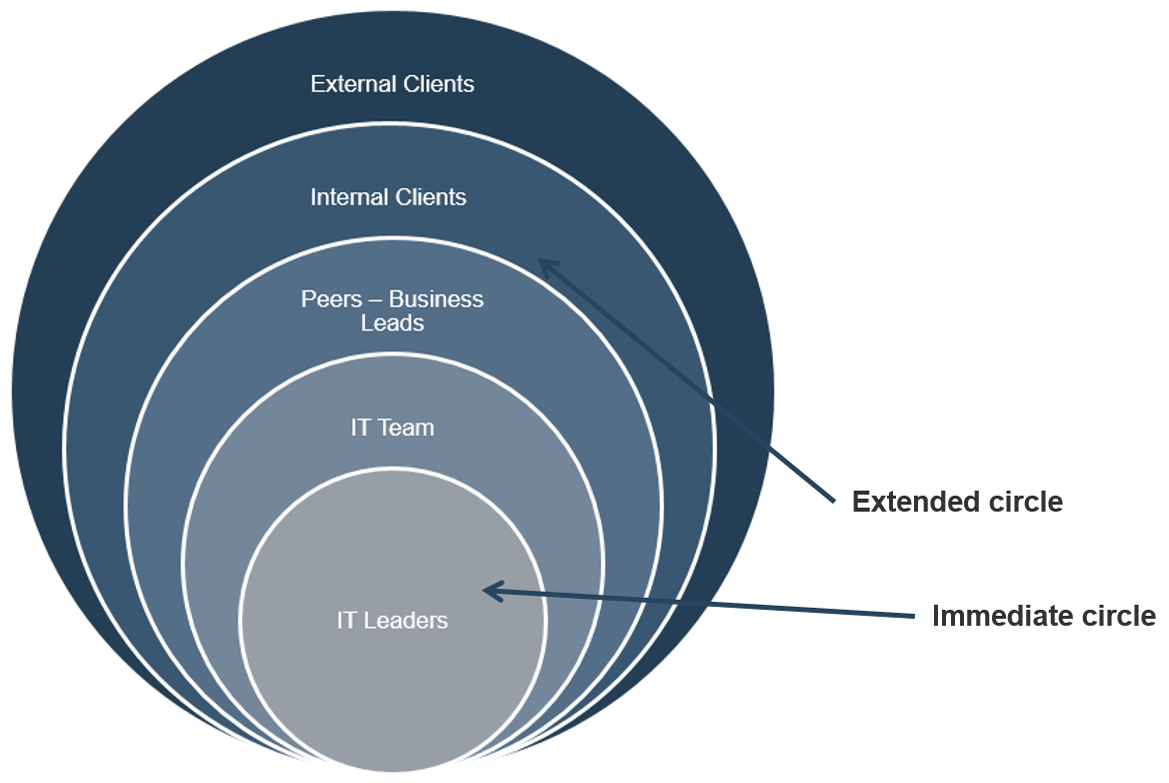
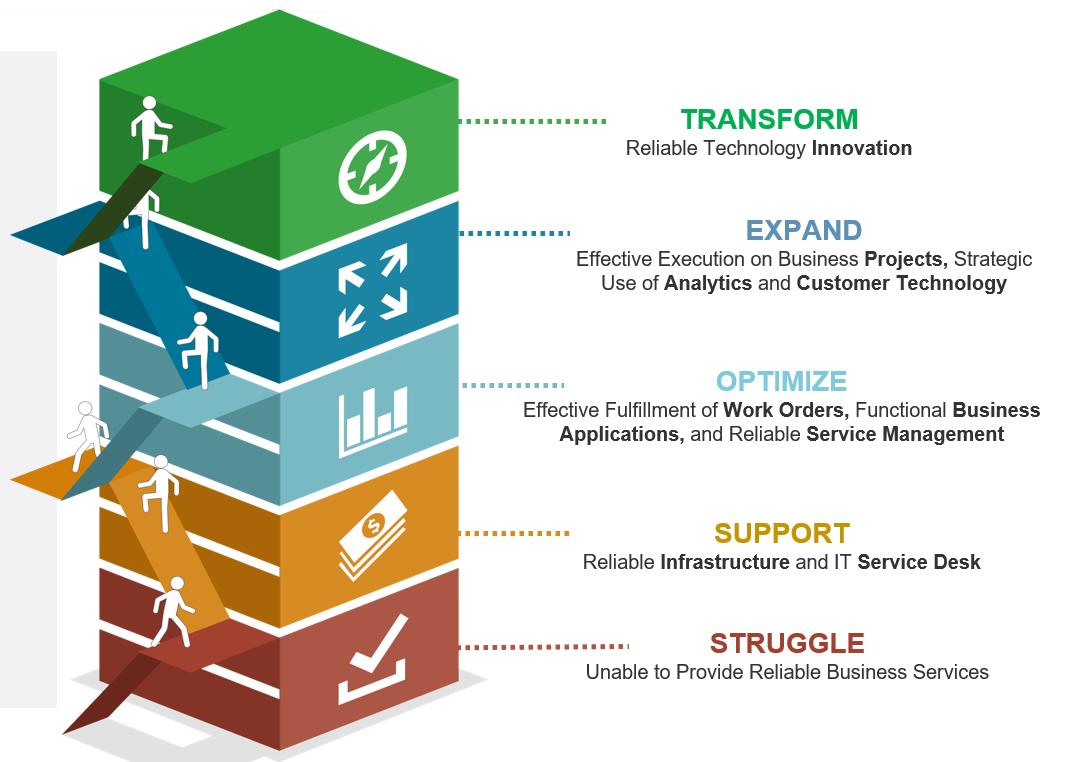

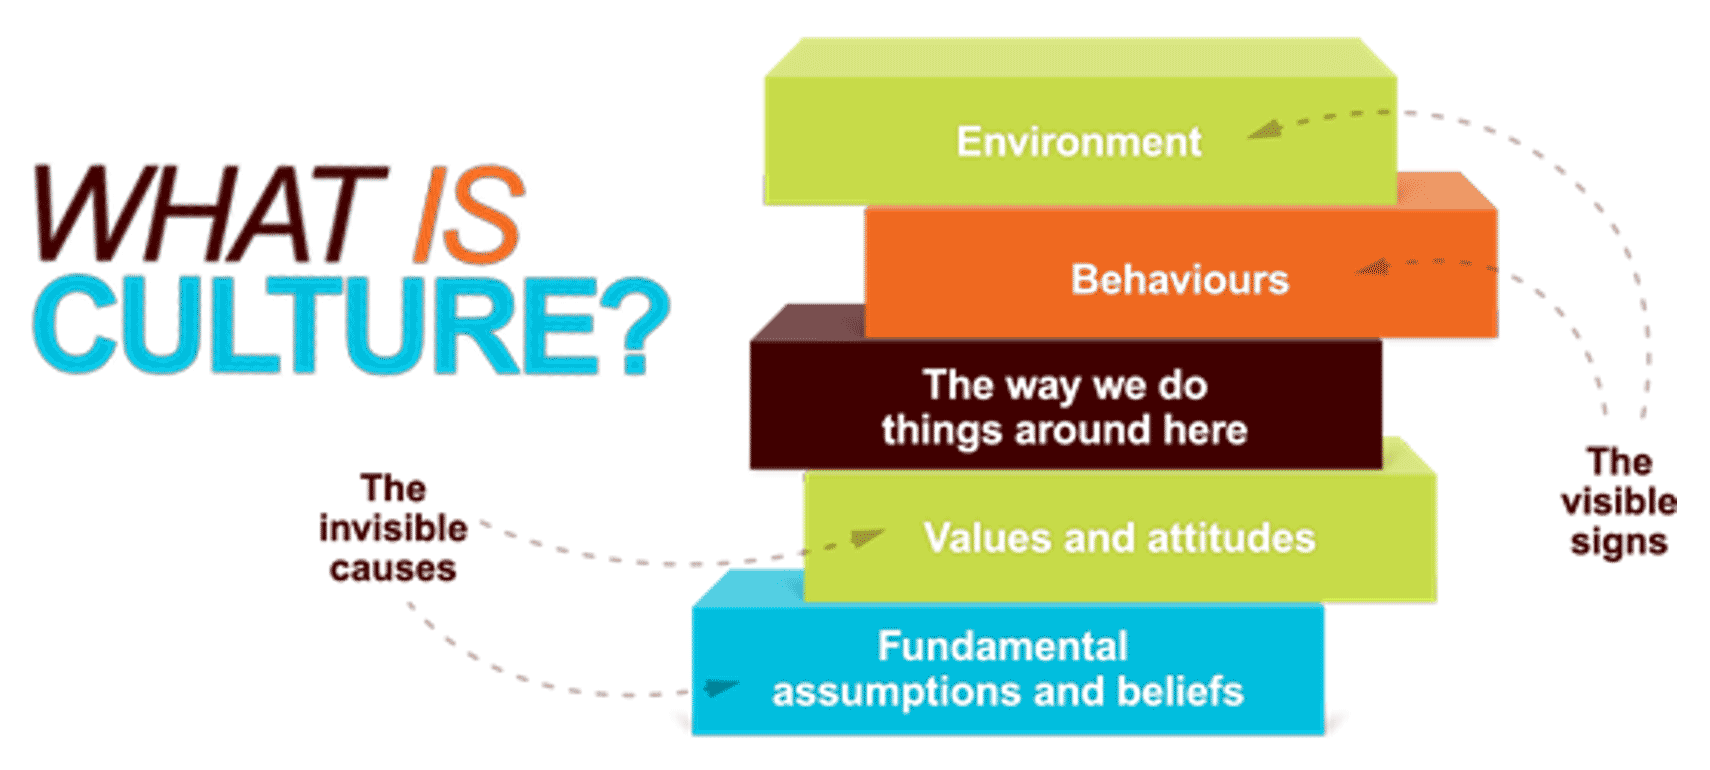 (Source: Hope College Blog Network)
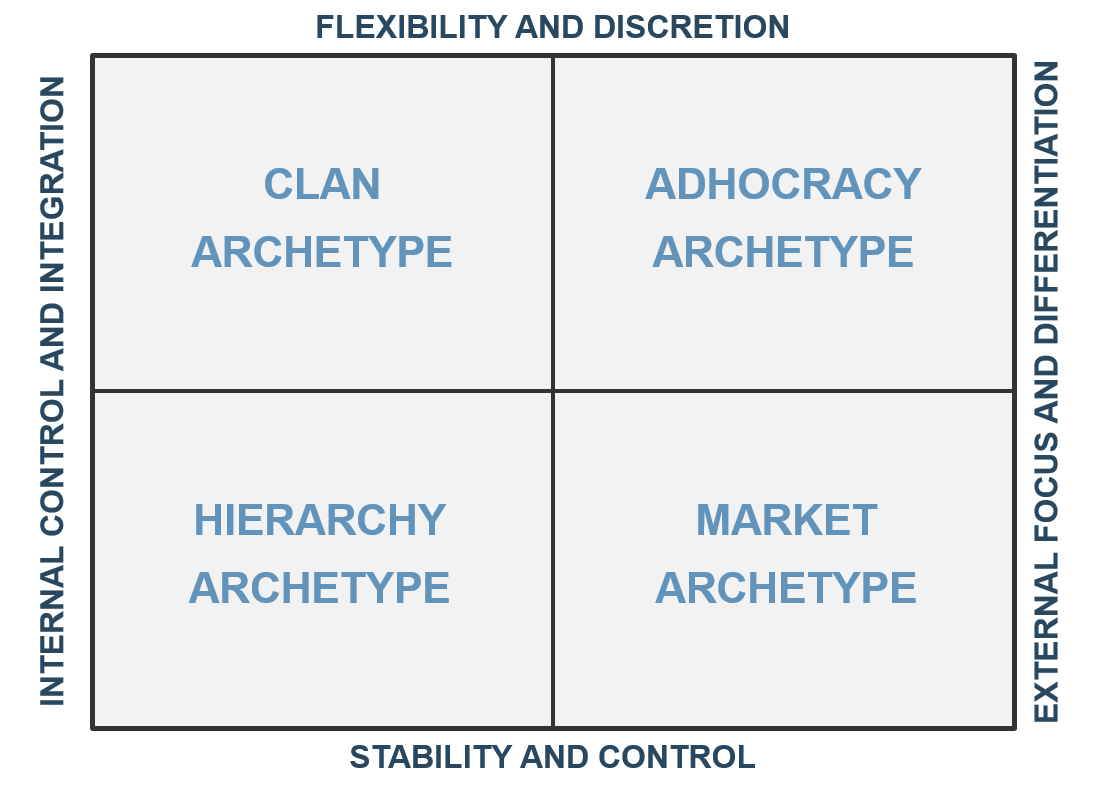

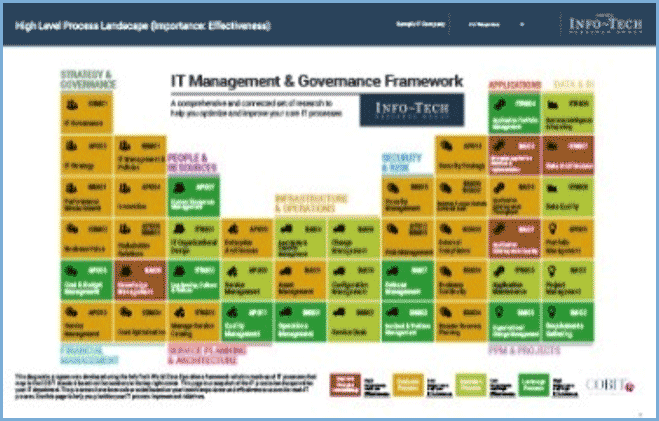
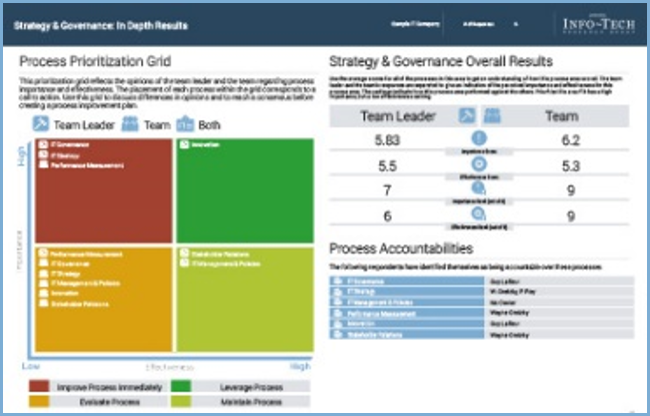
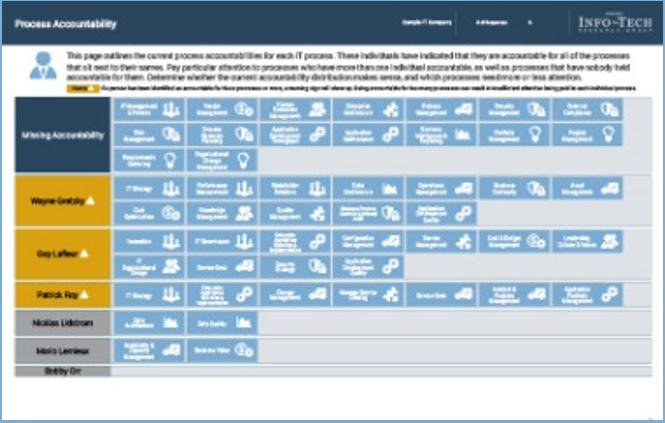


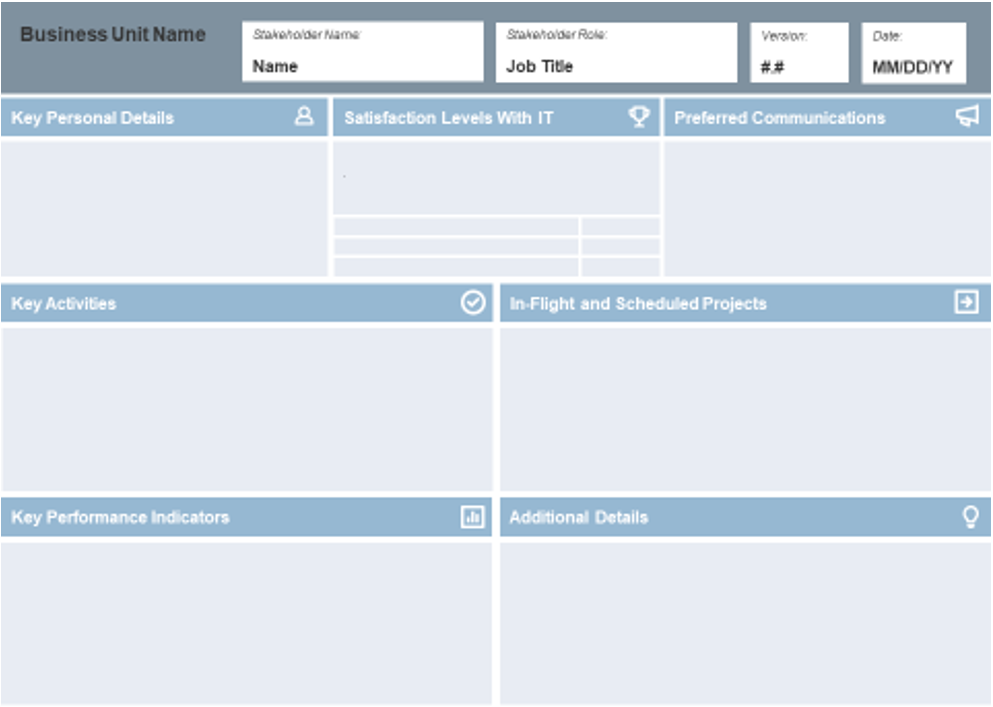


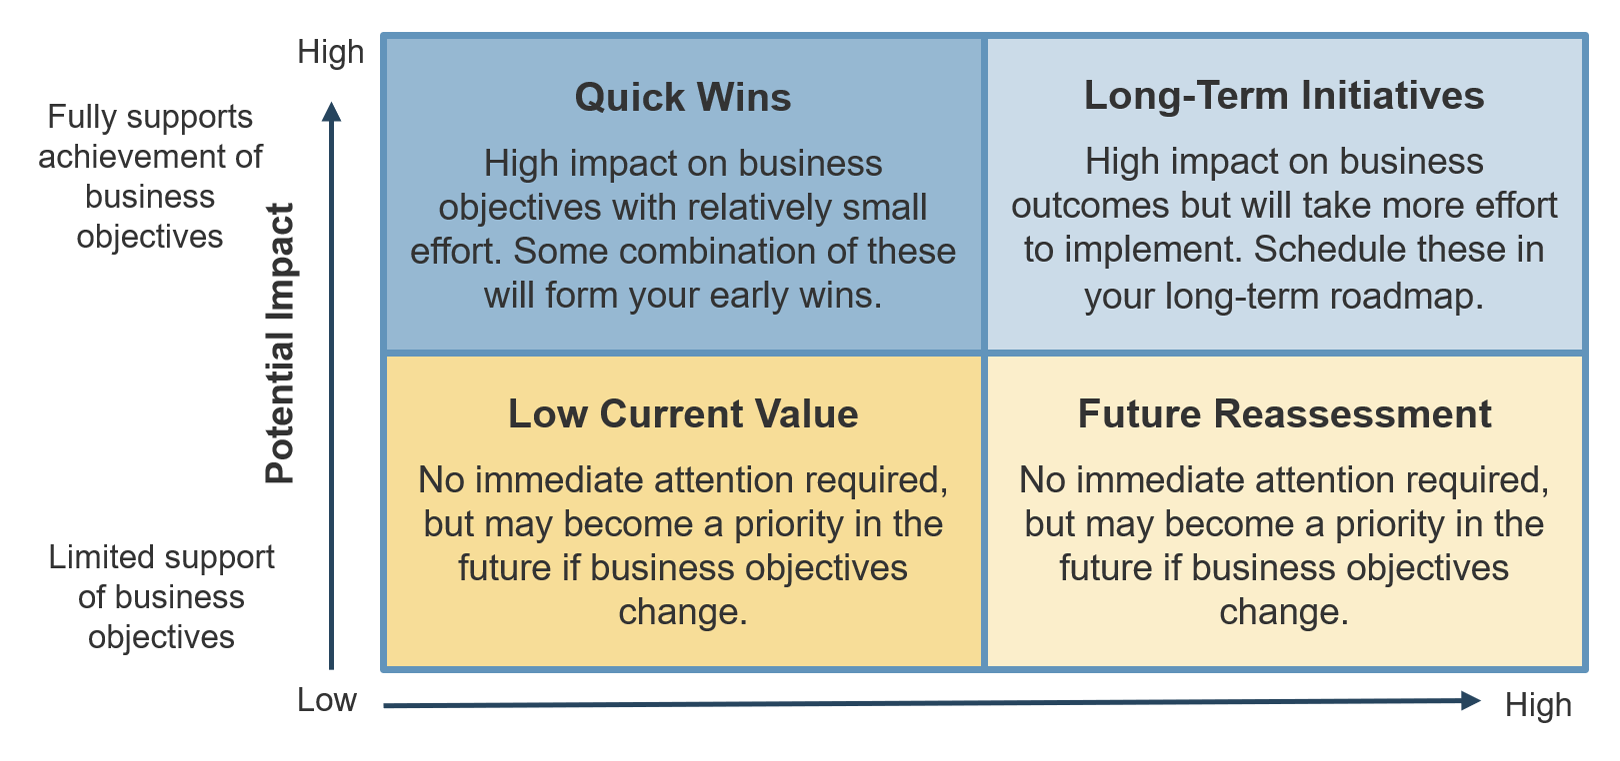
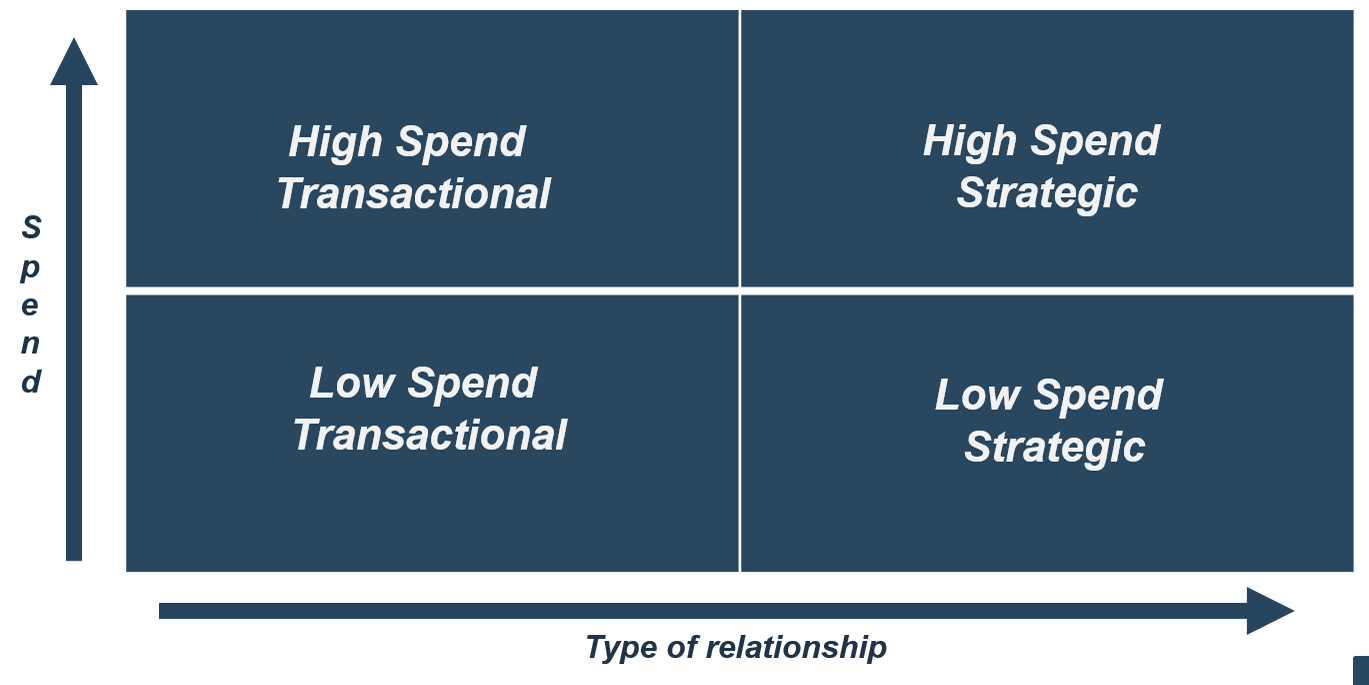

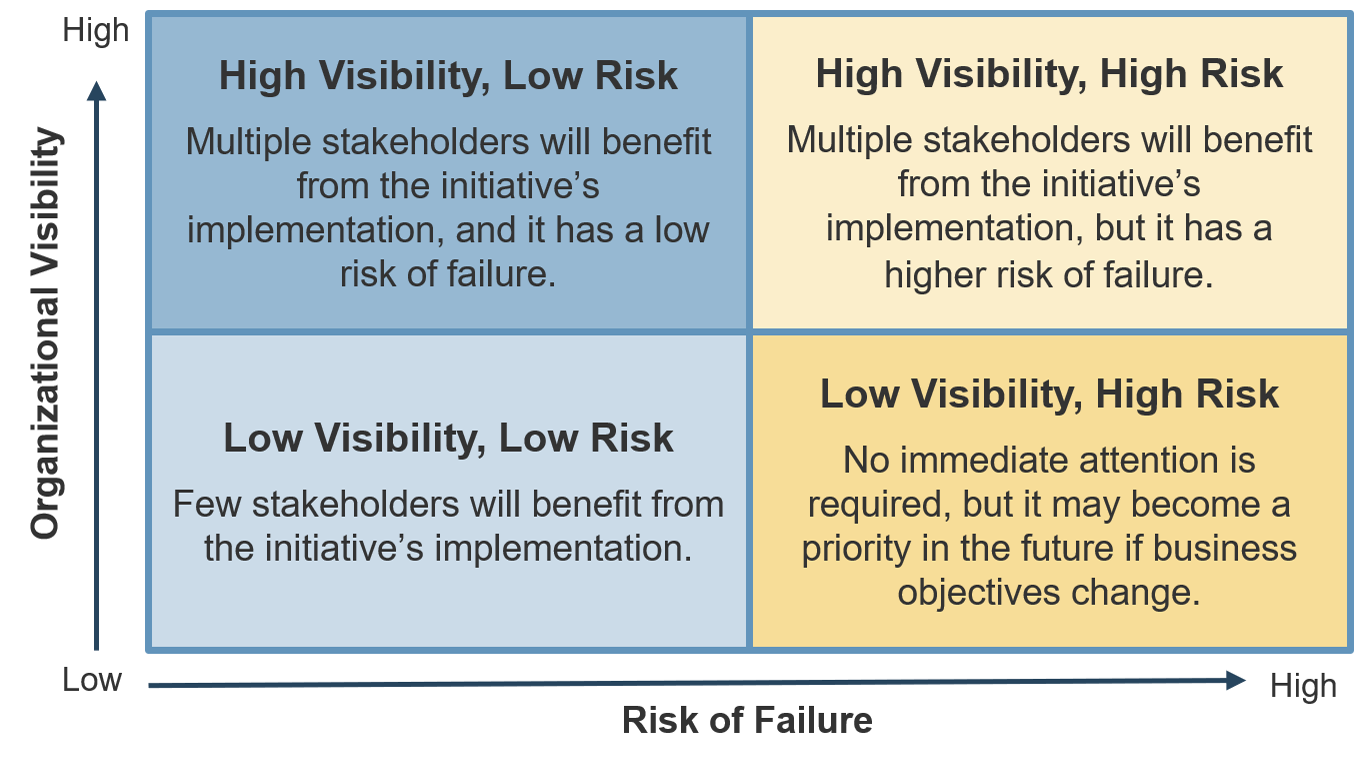


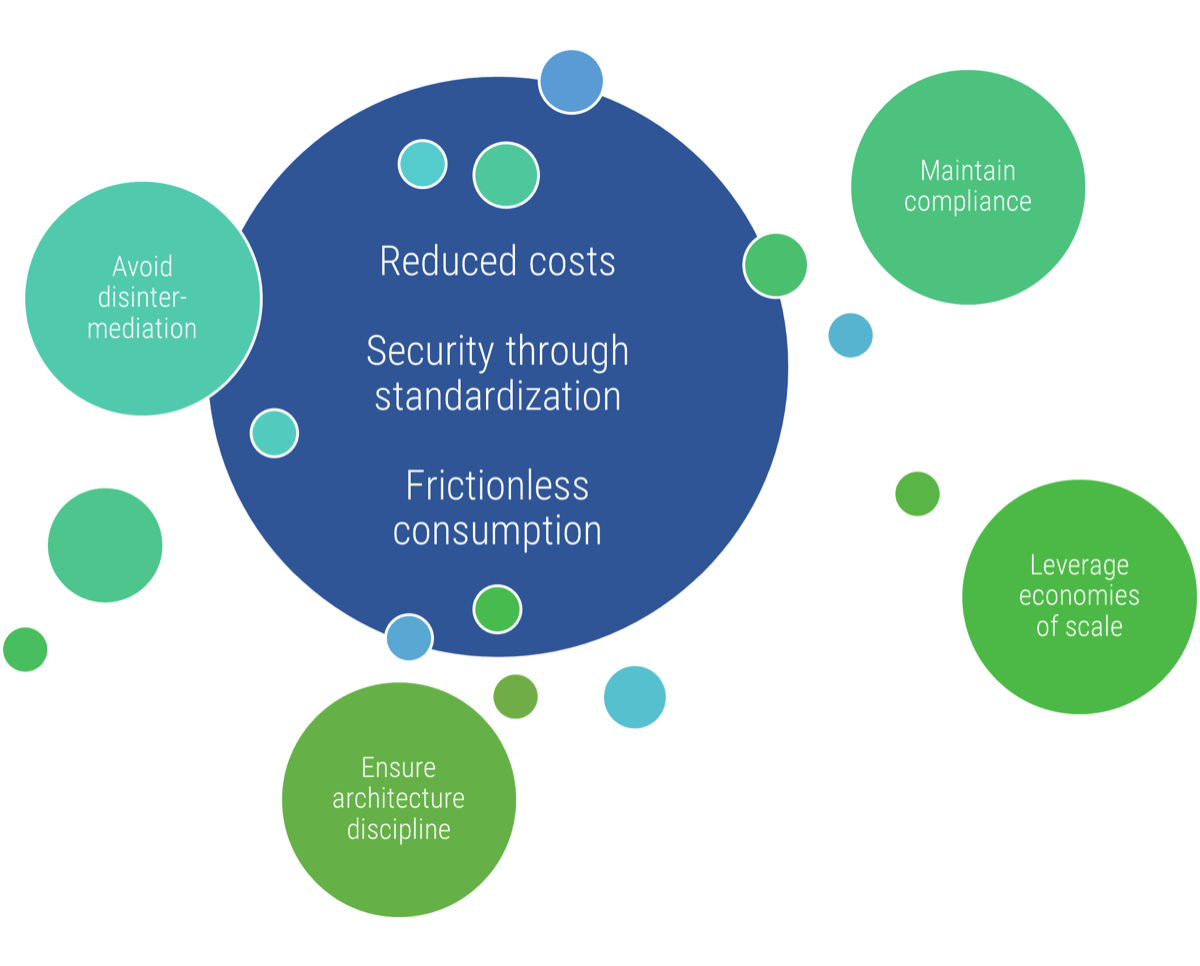
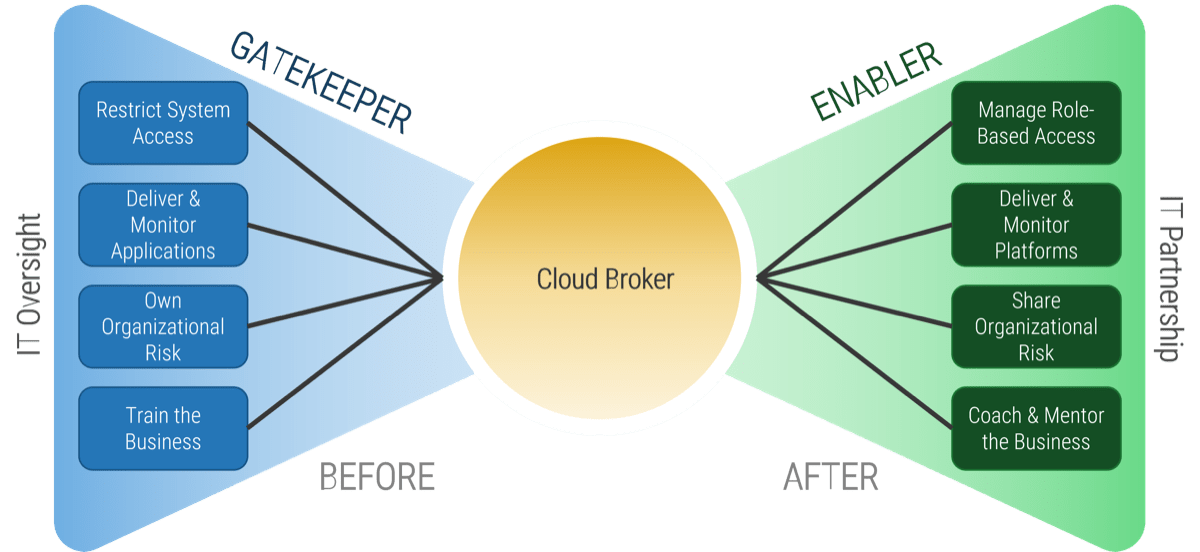
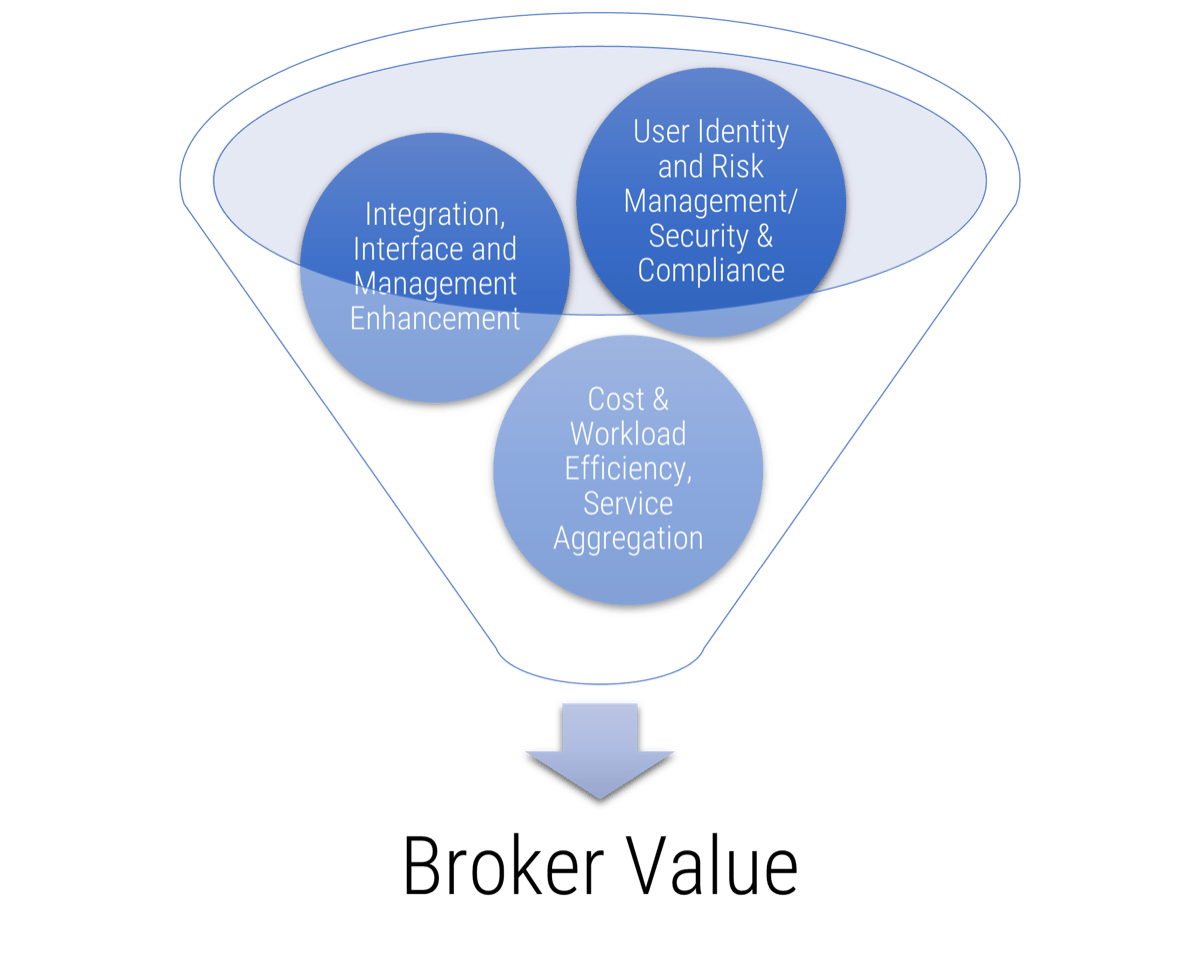
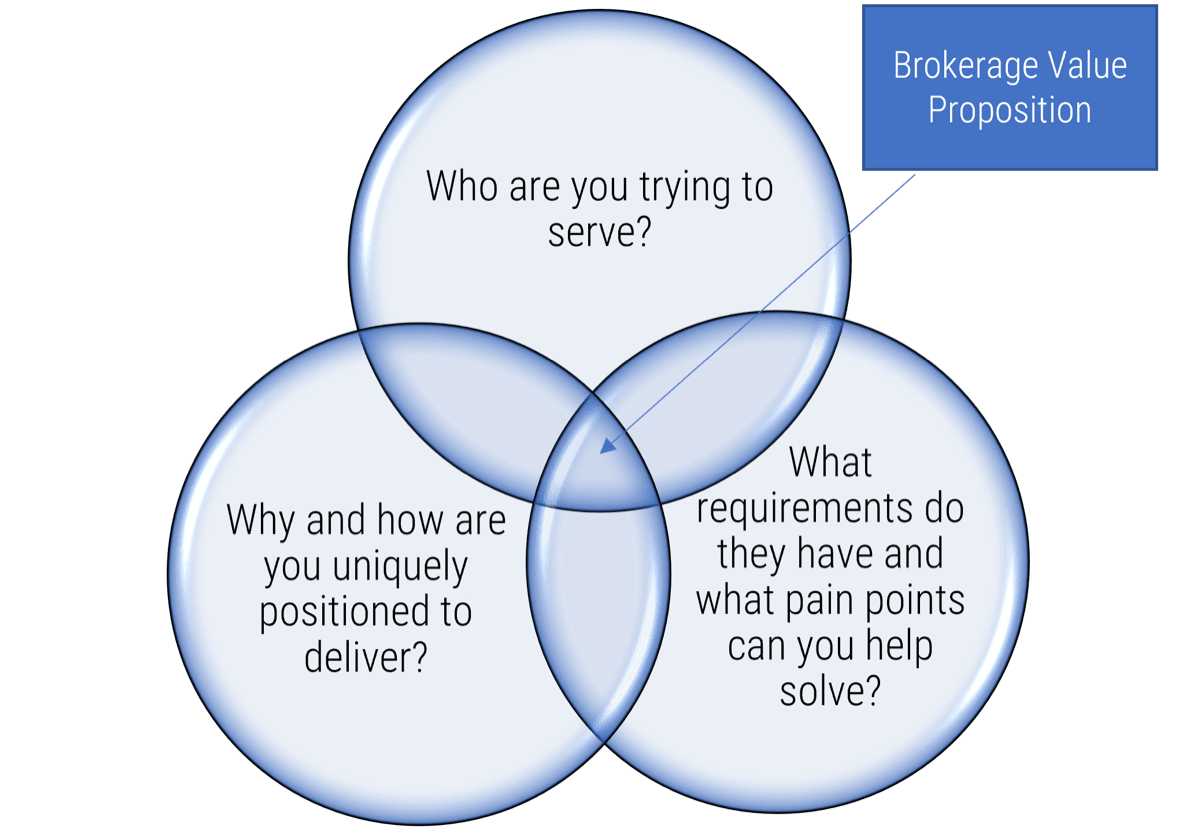
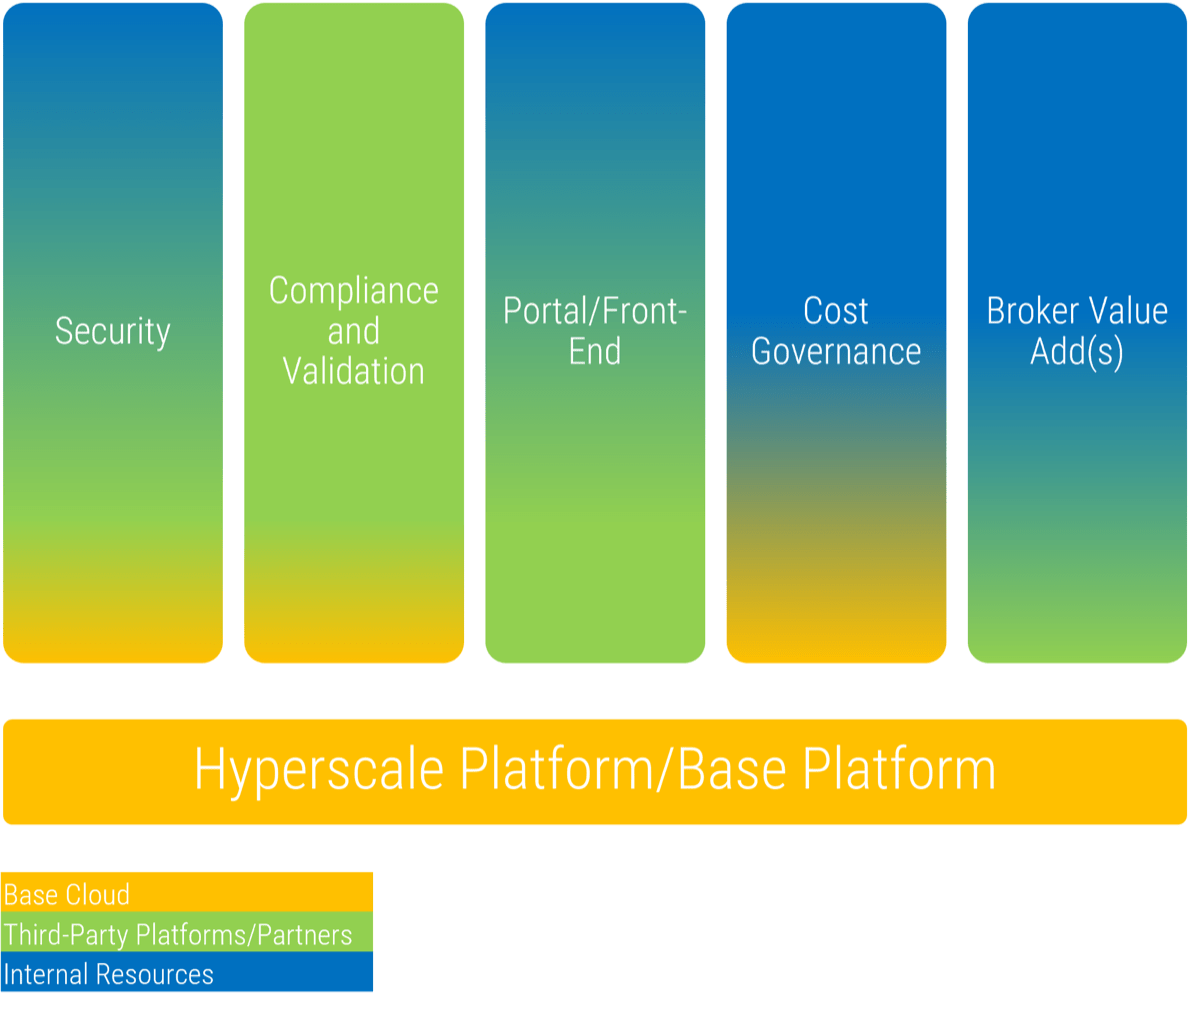
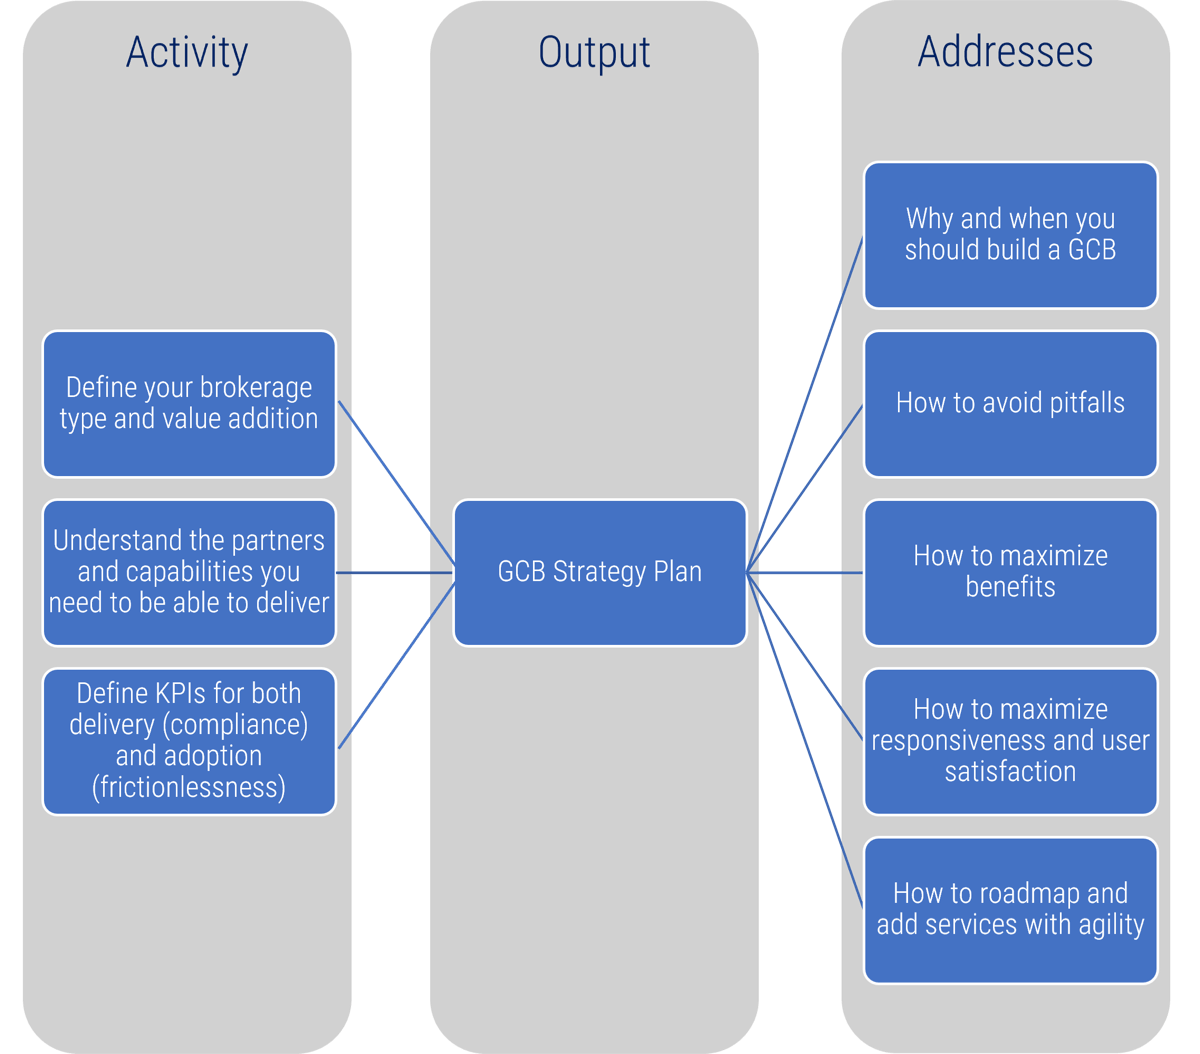


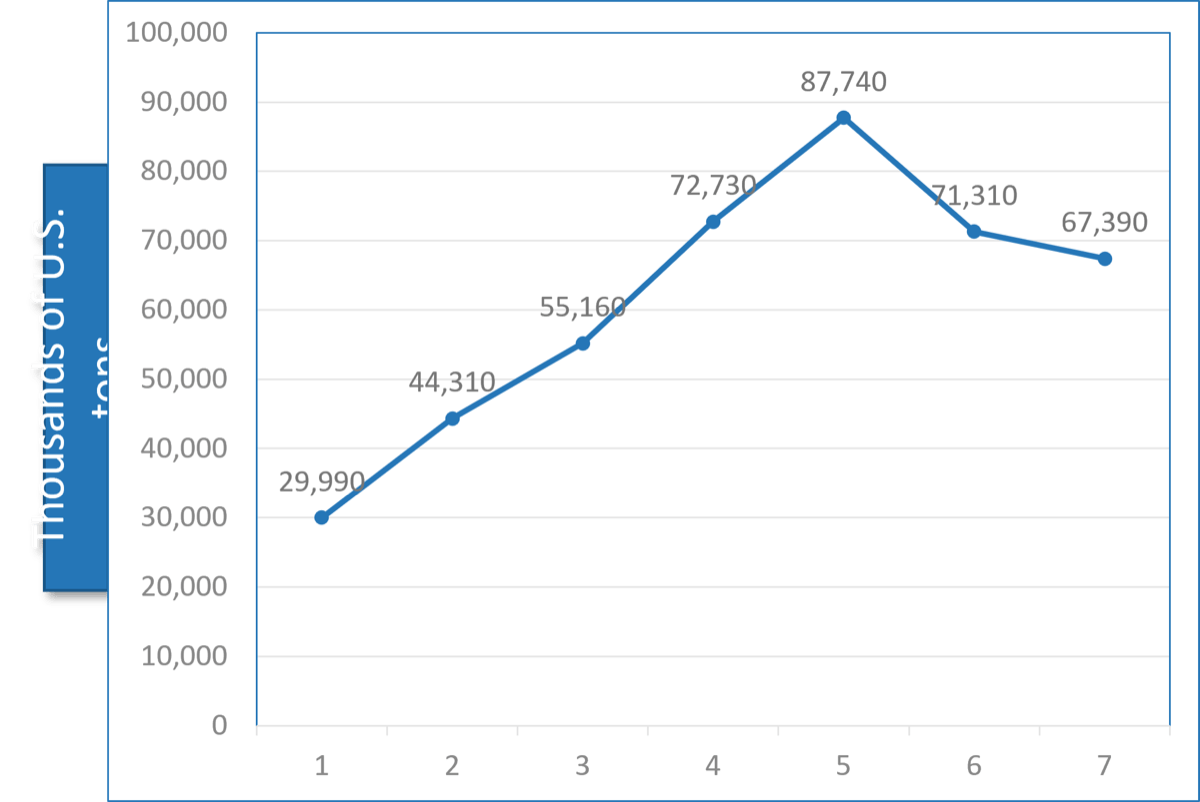
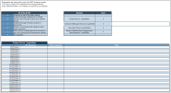
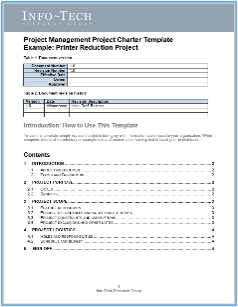
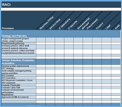
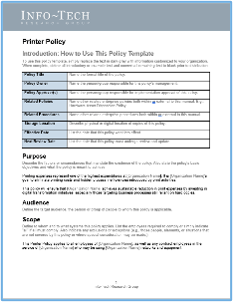
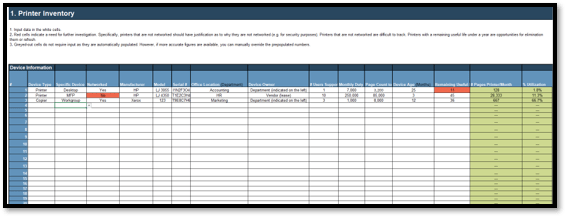
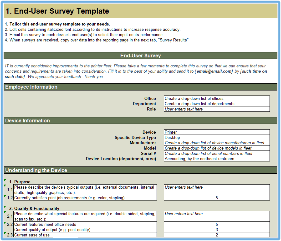
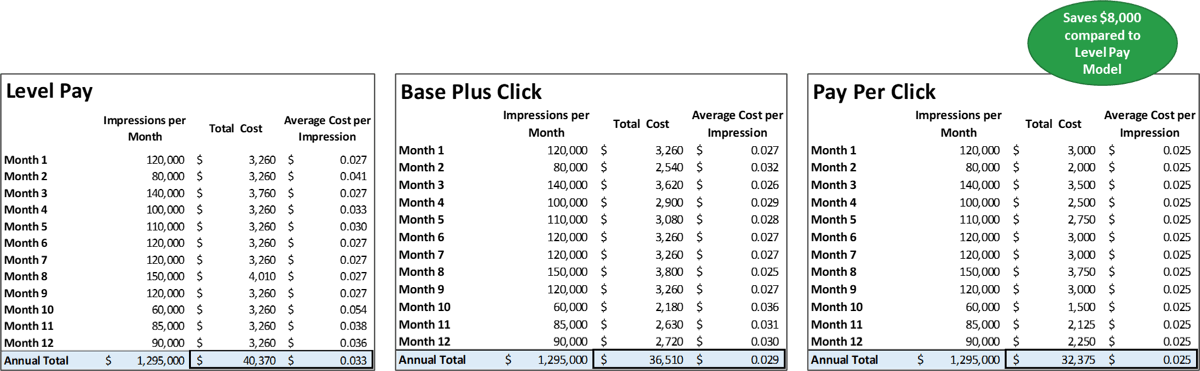
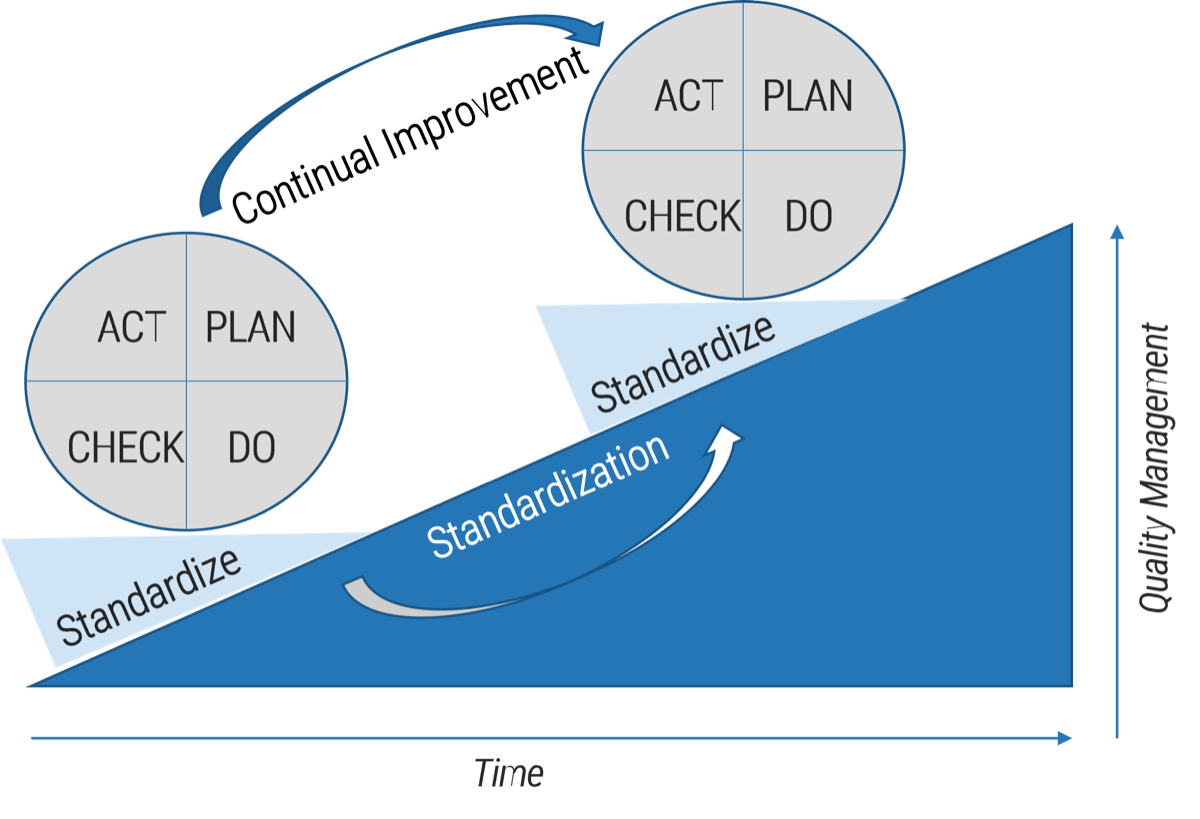


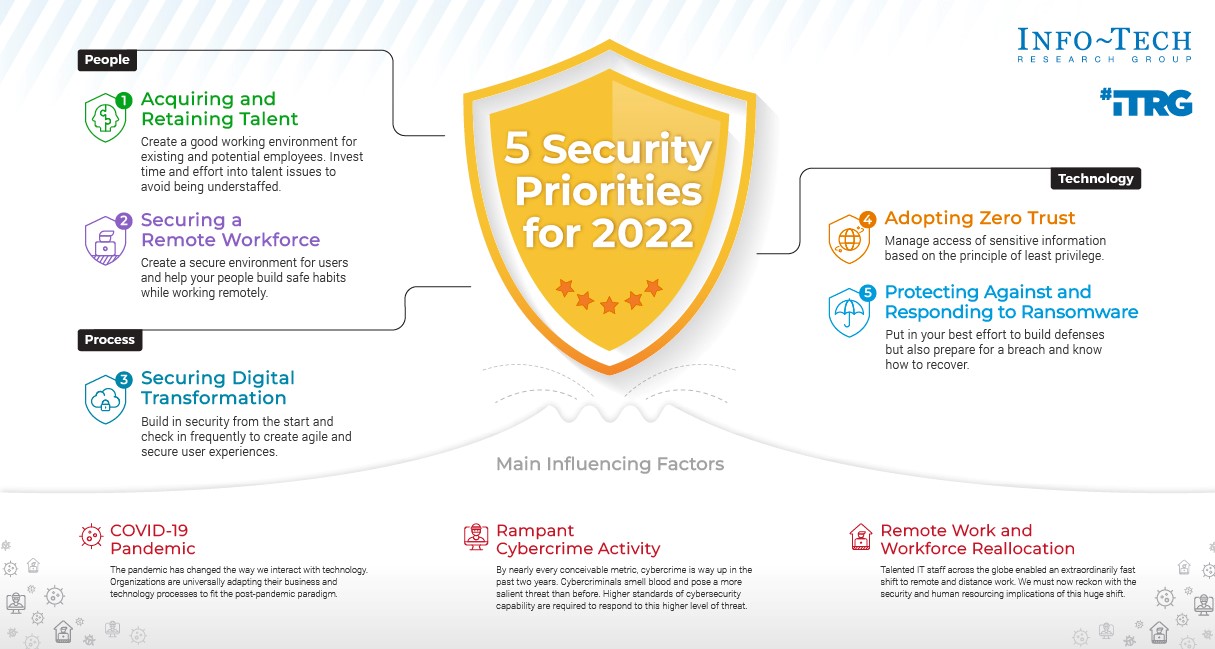
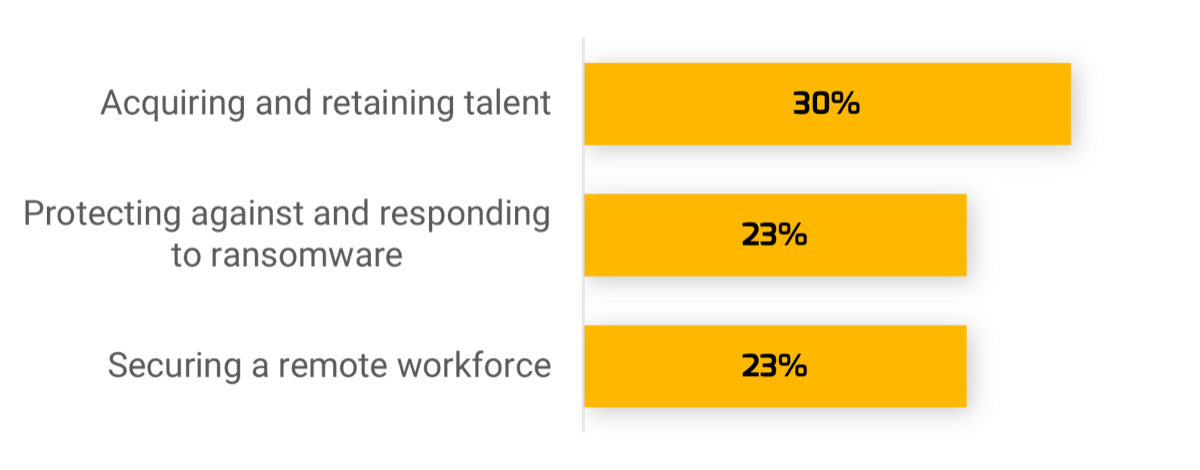
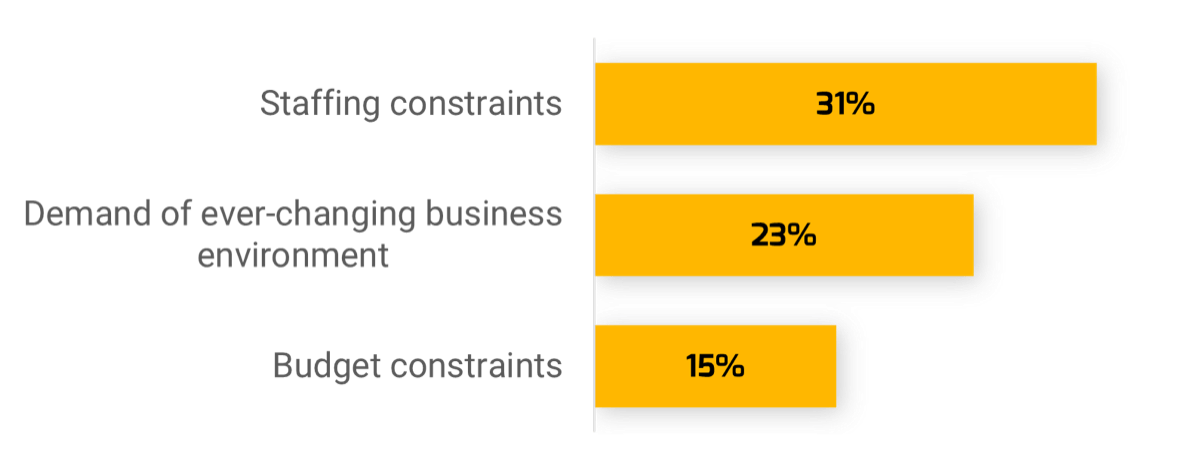
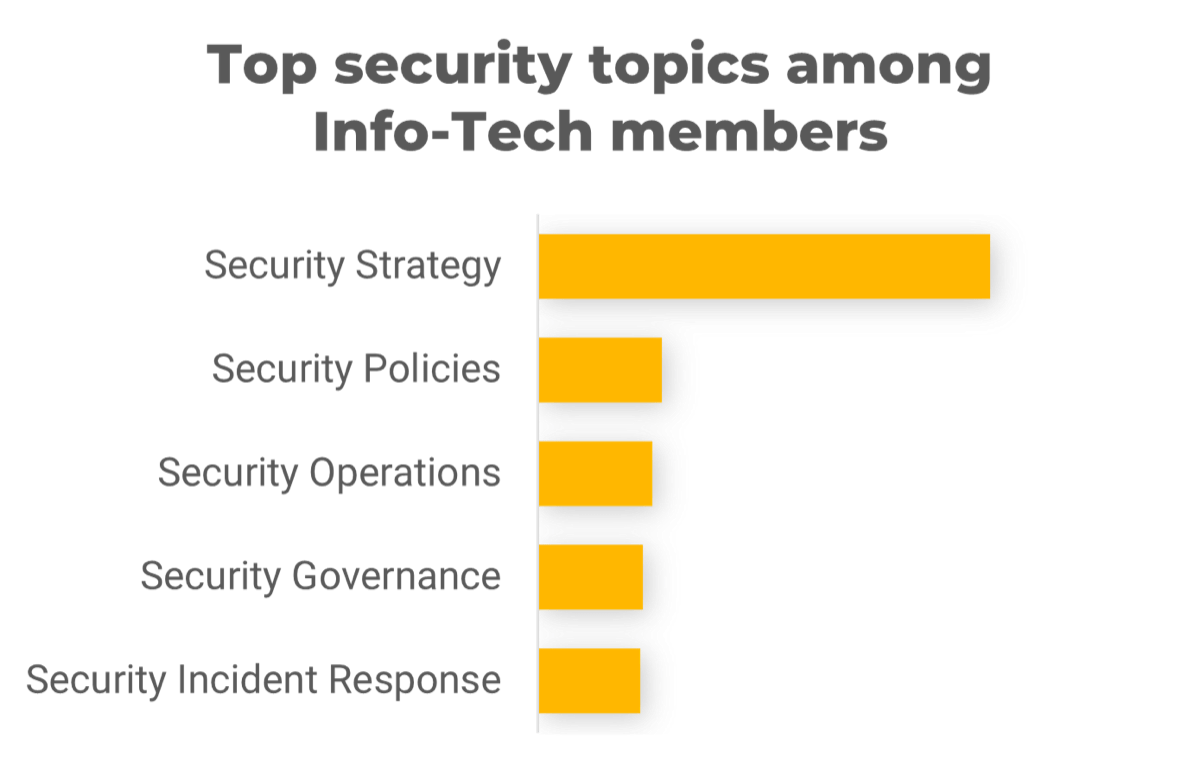
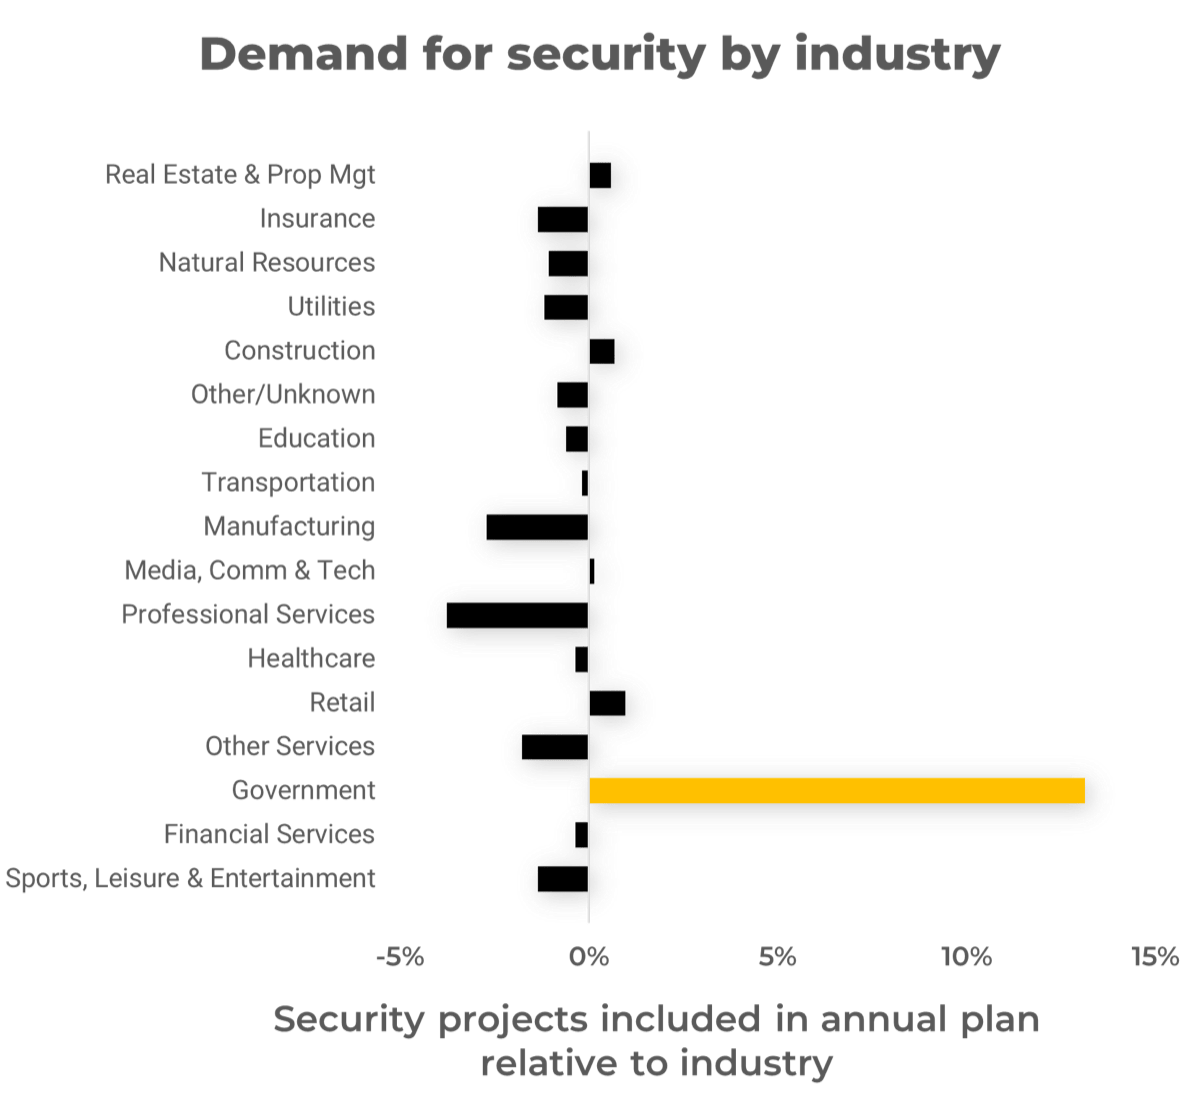
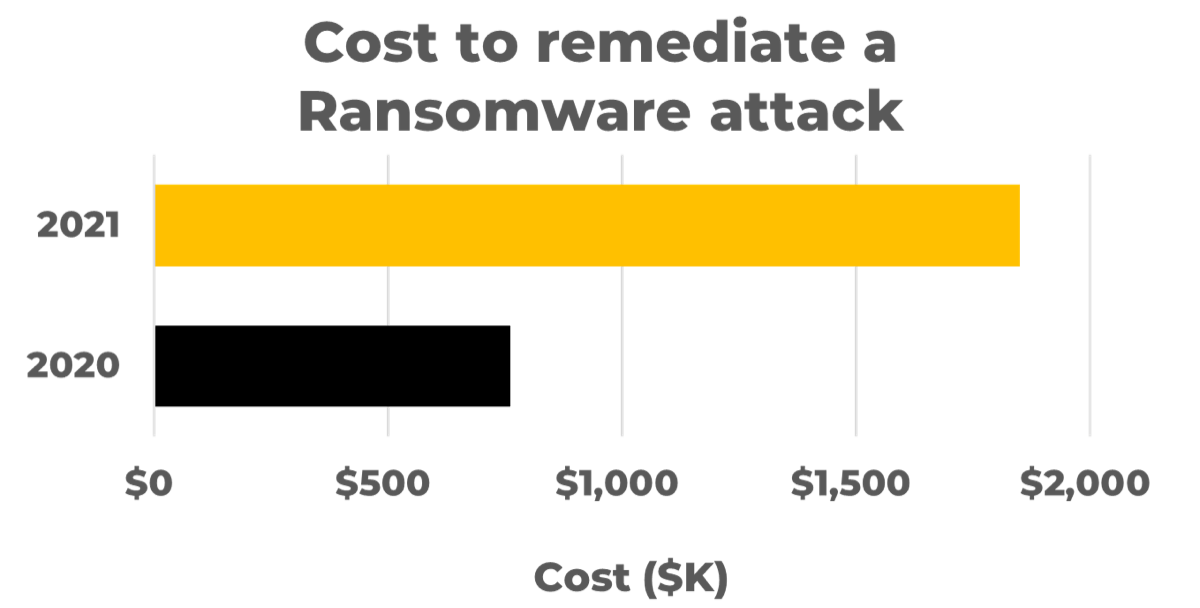


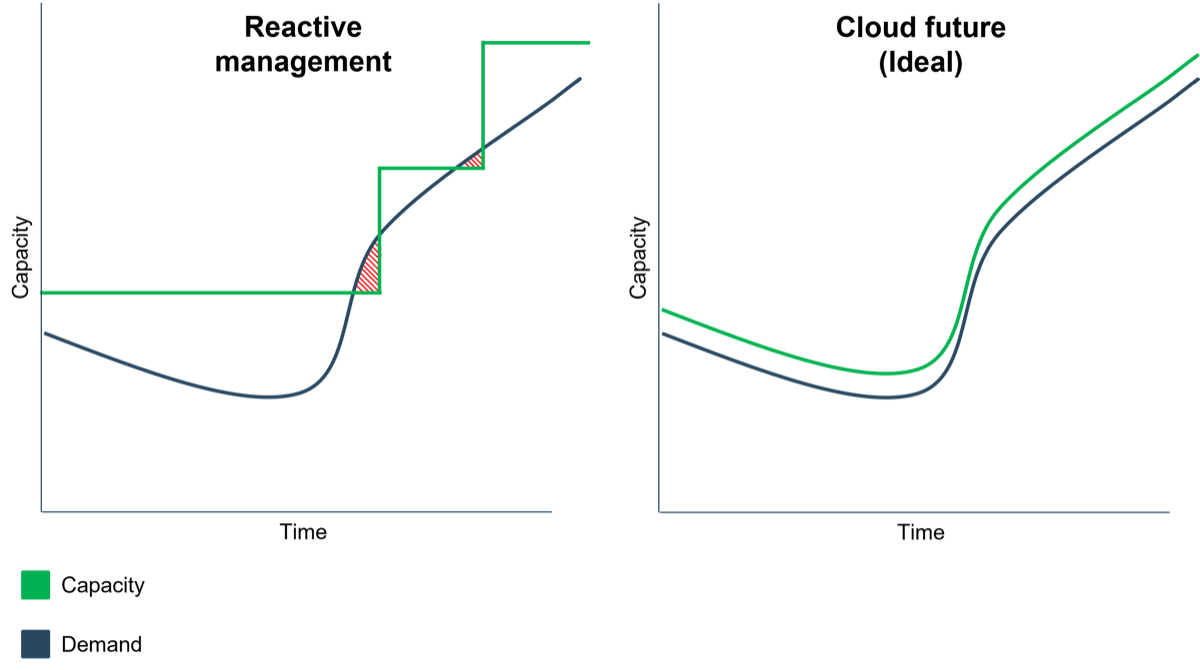
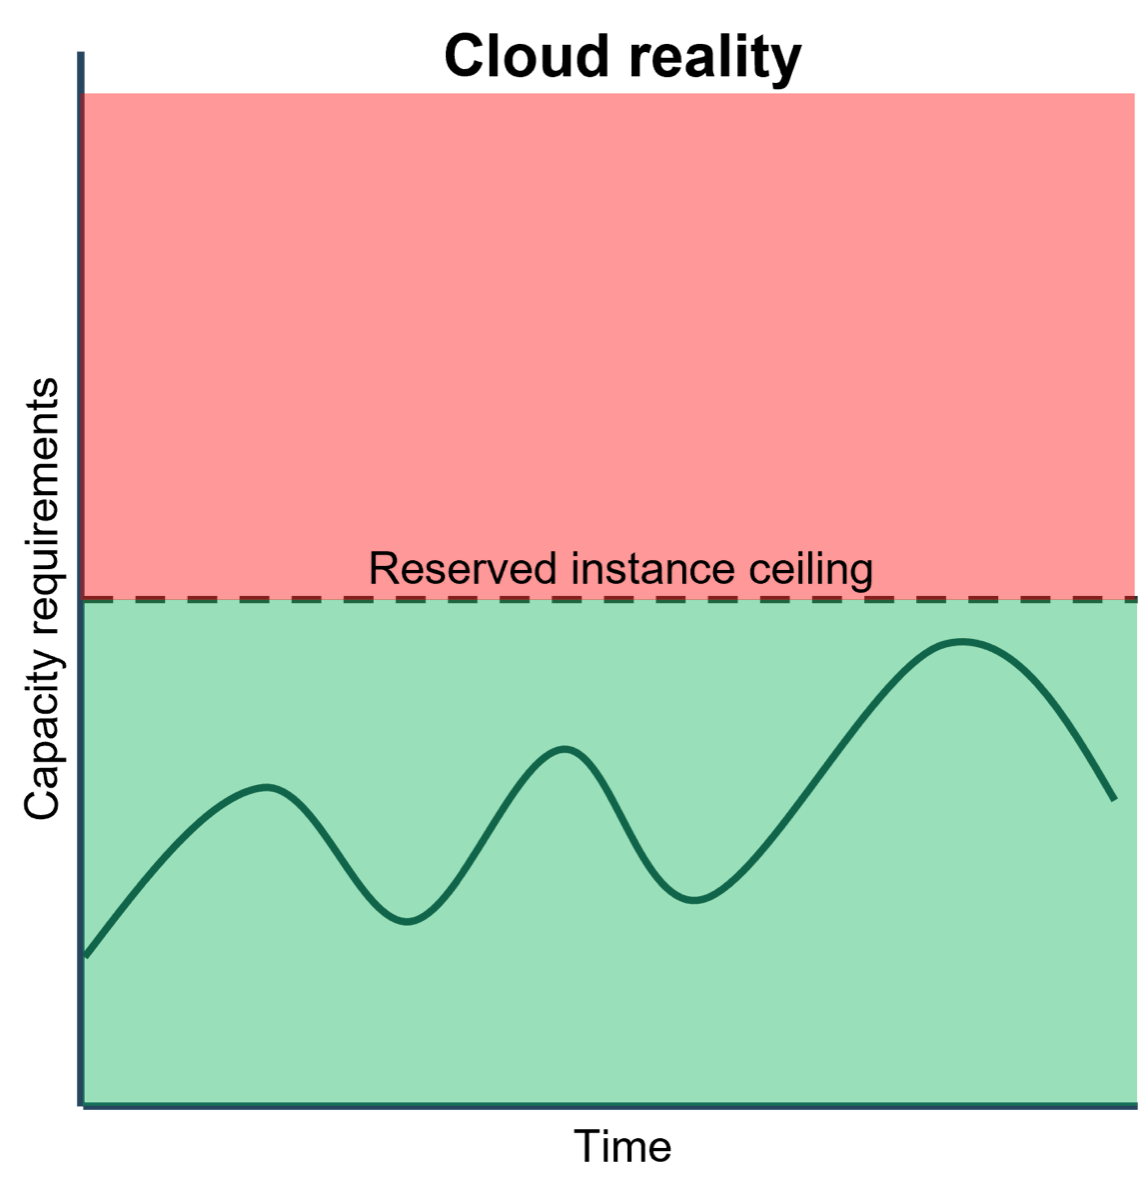
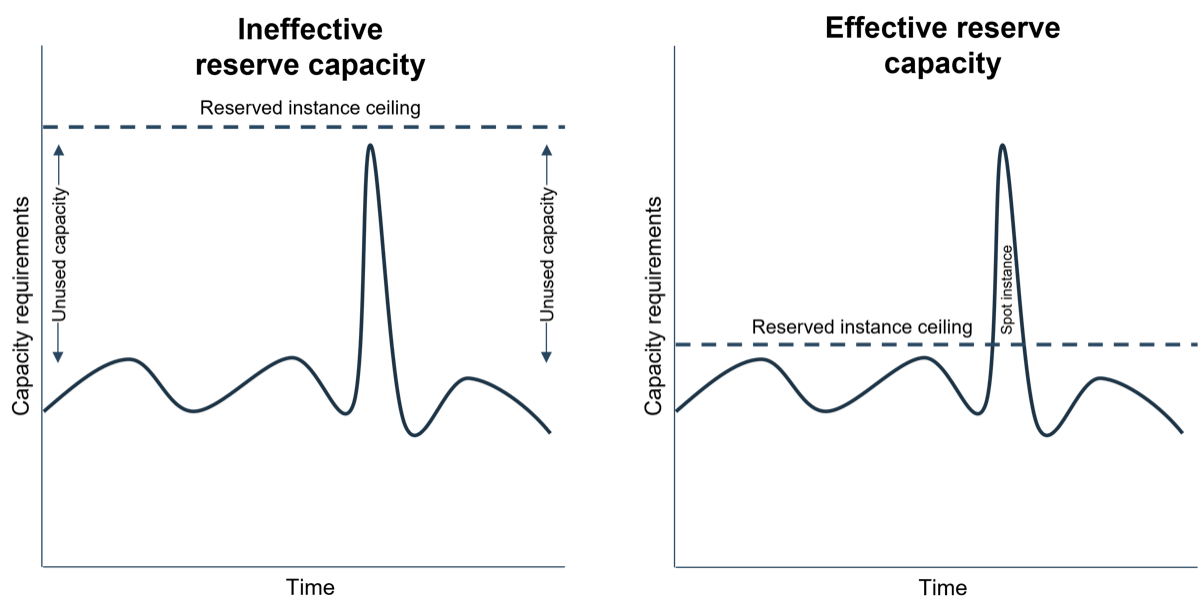
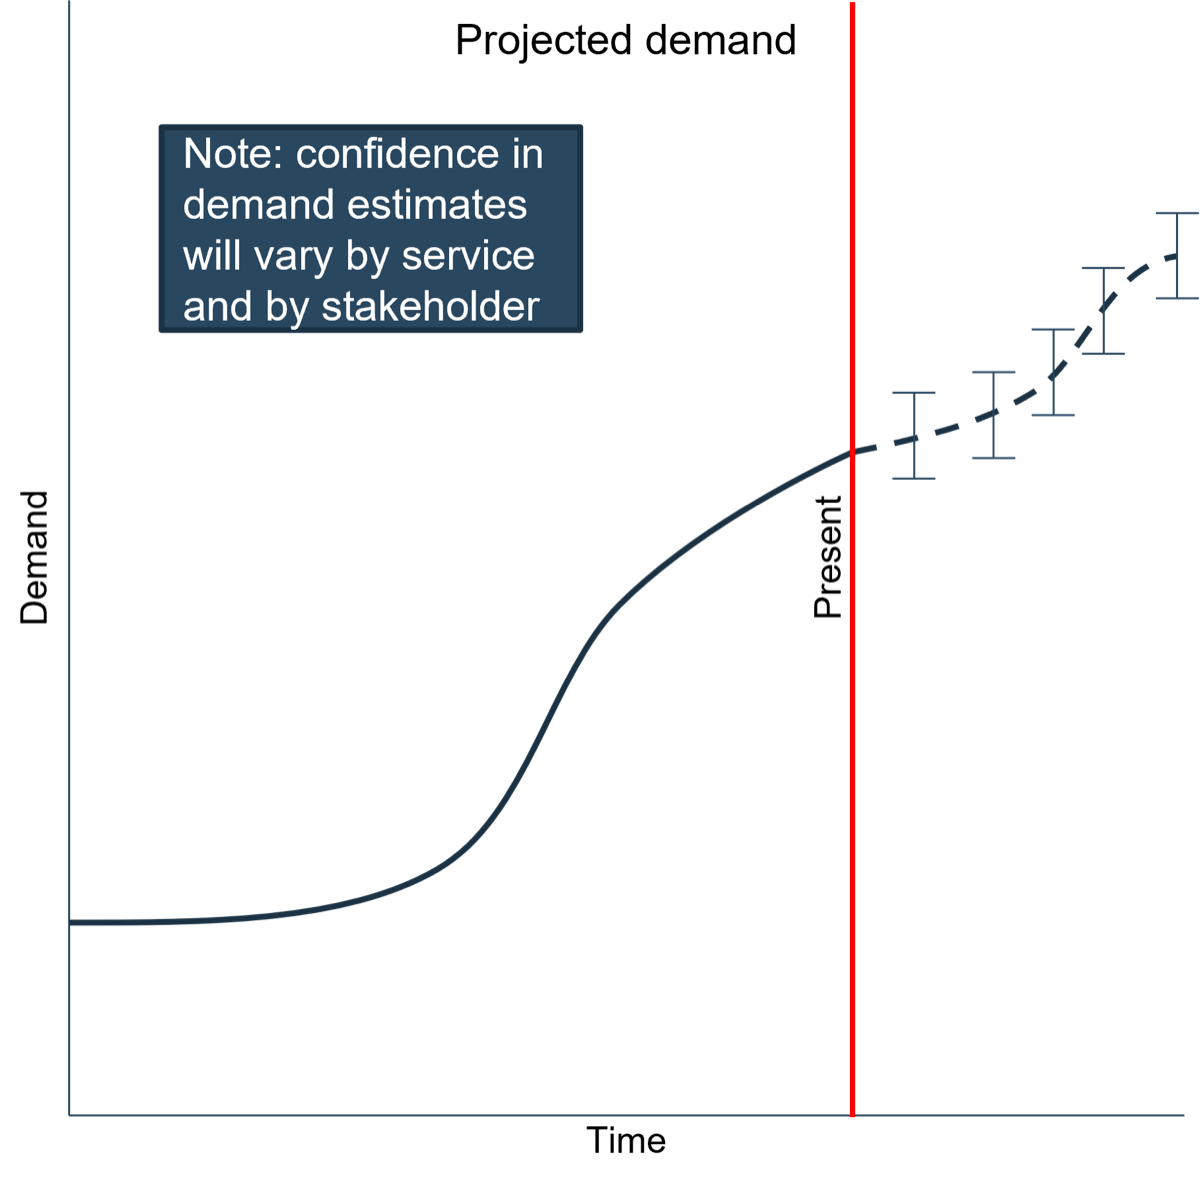

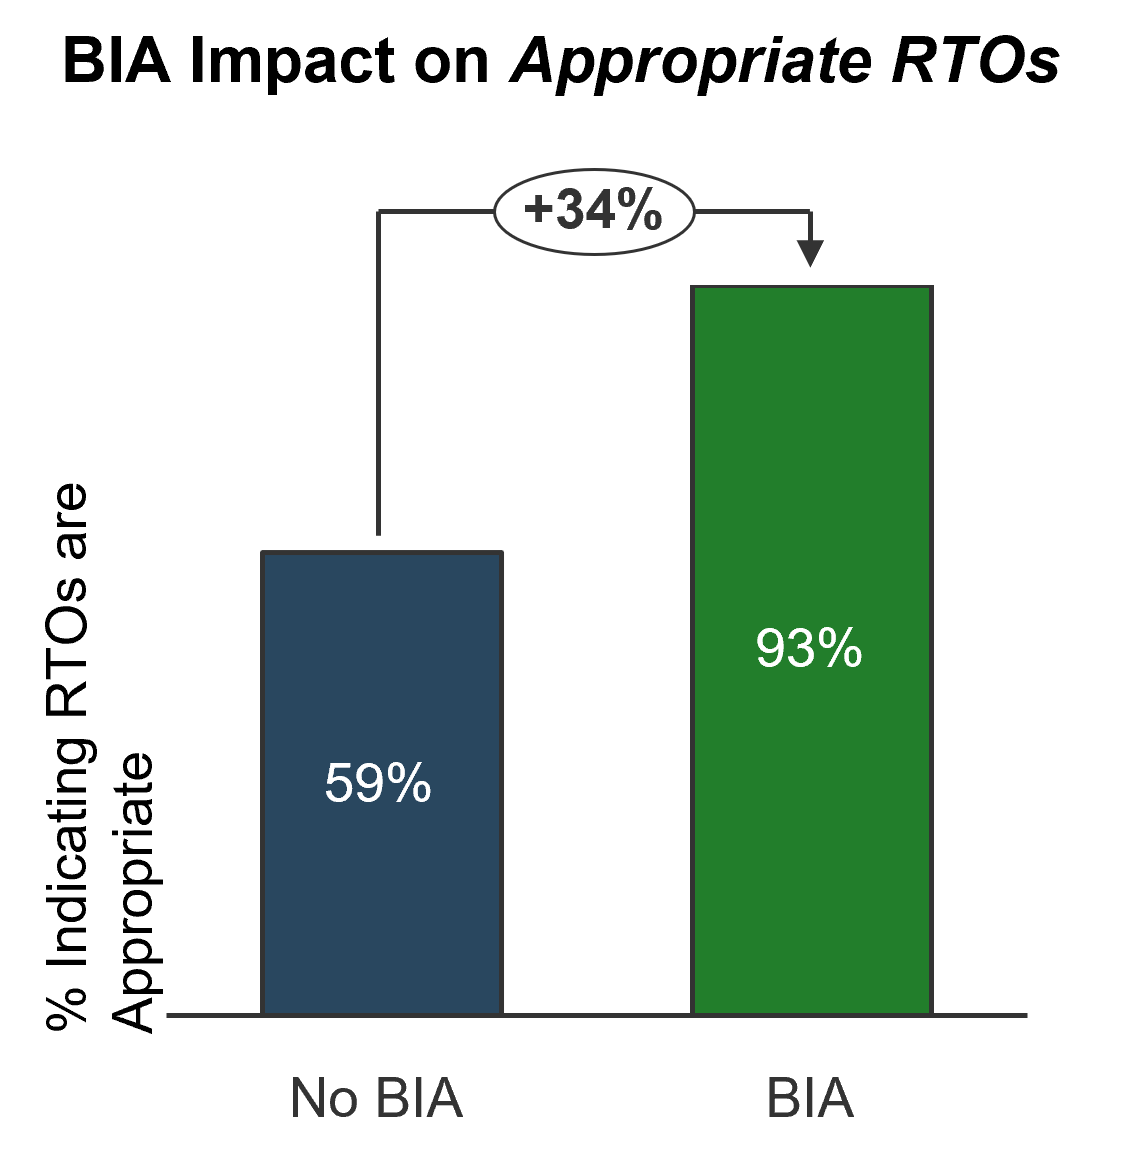
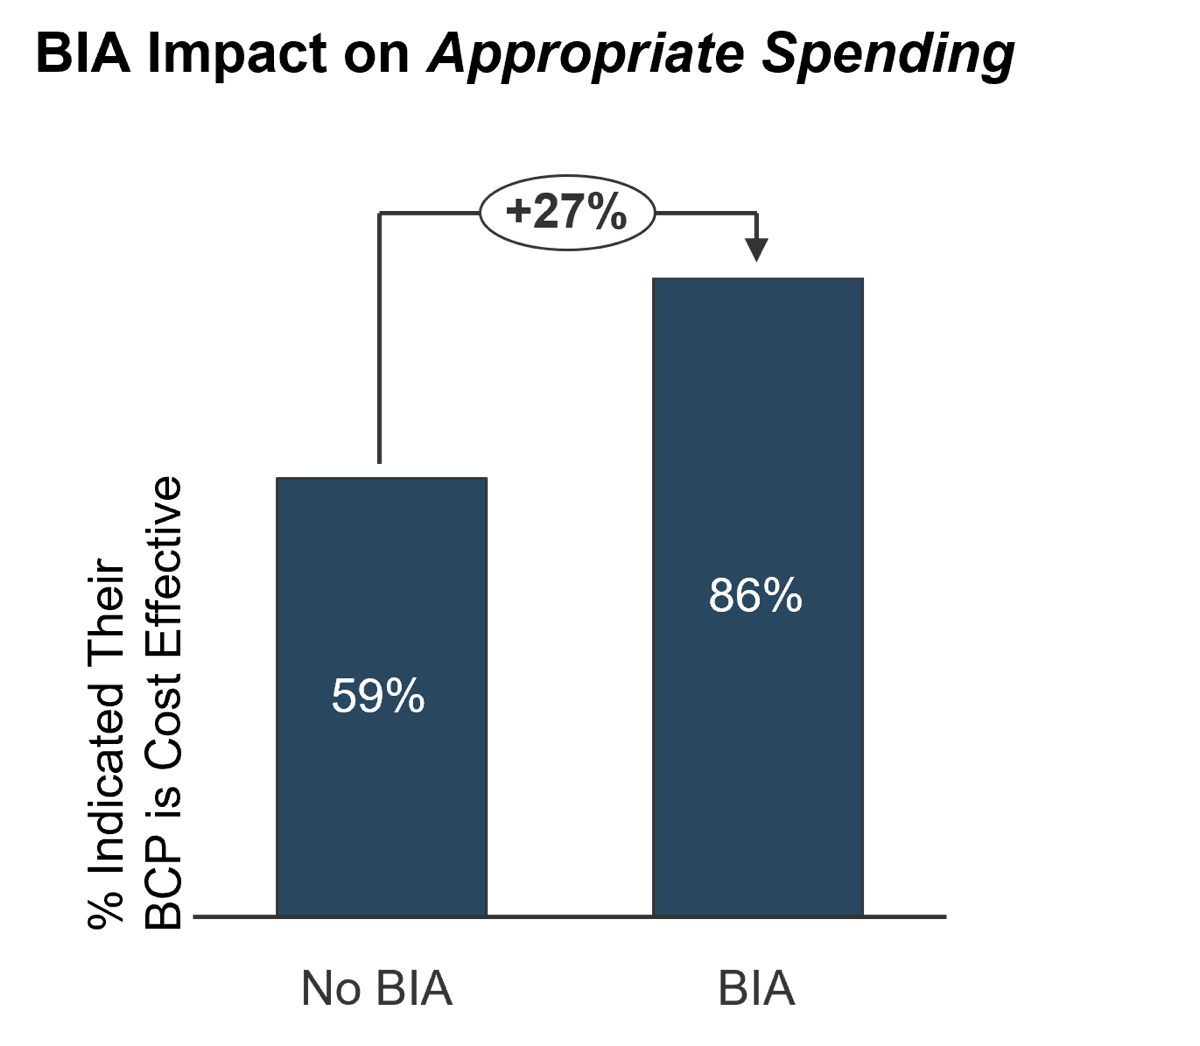

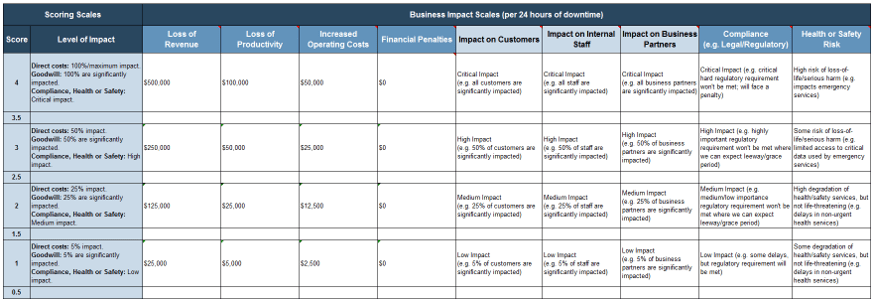
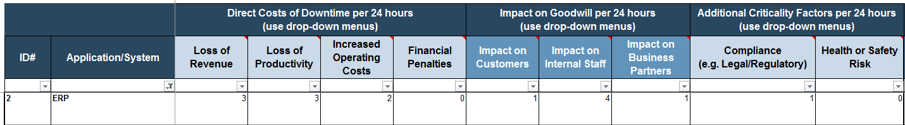
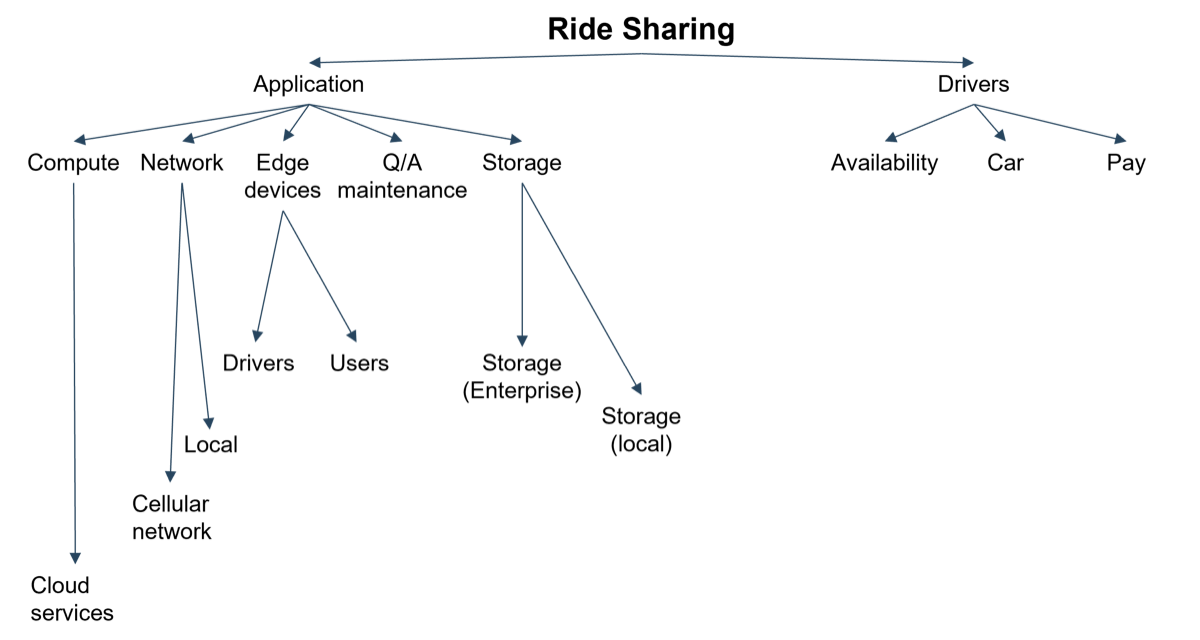
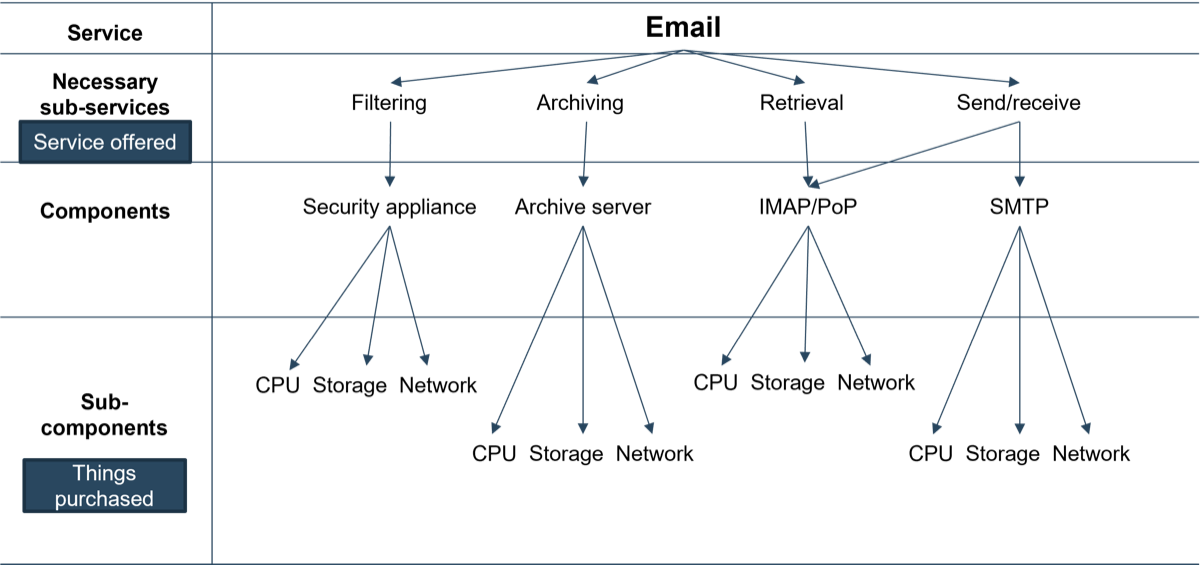
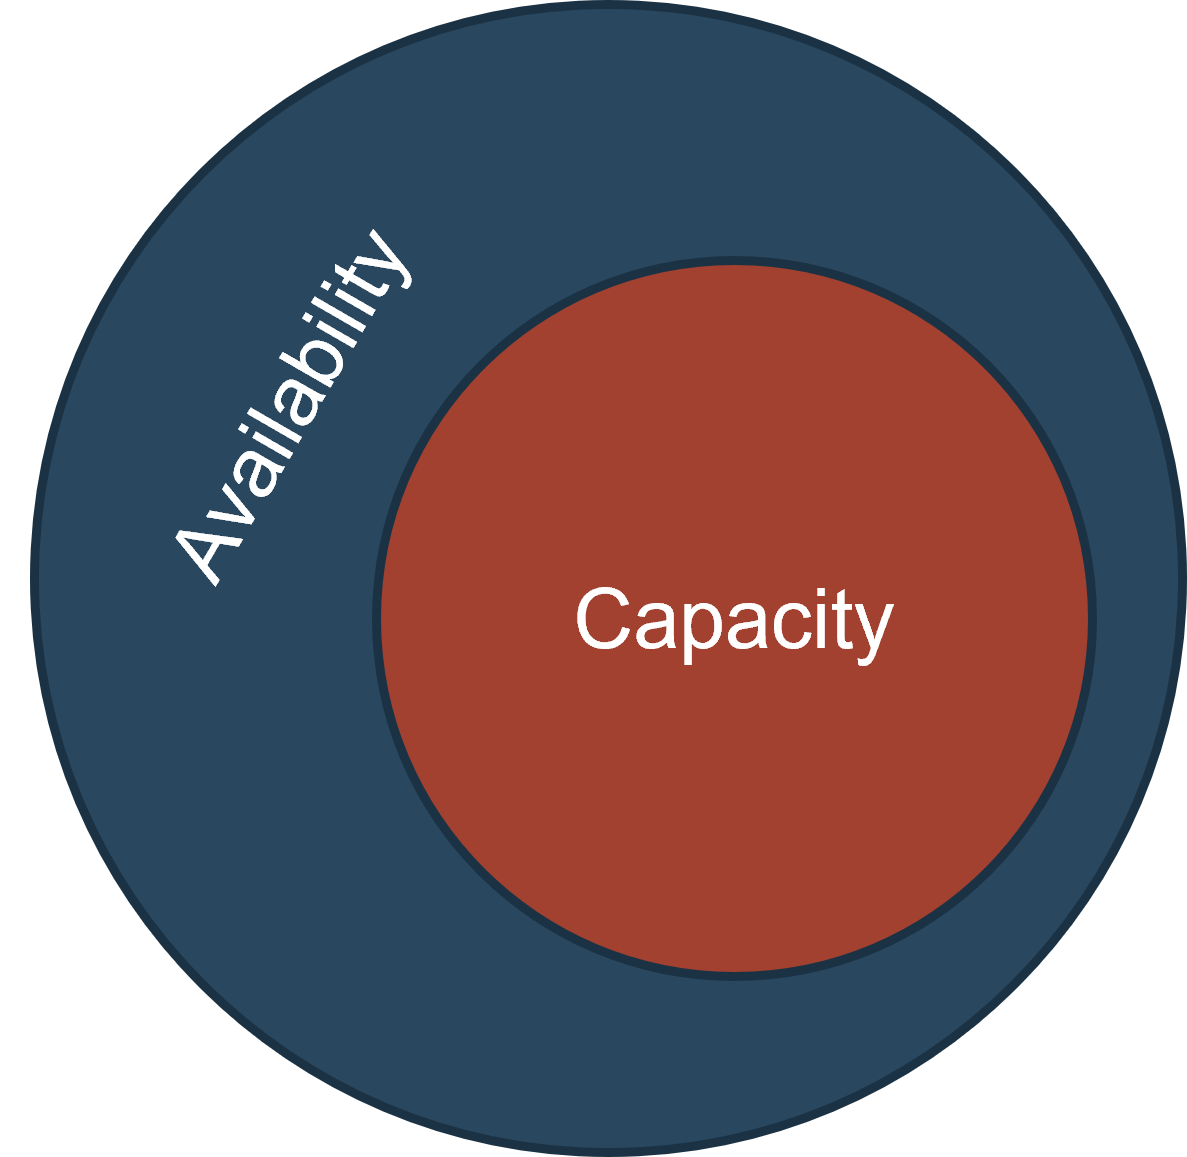

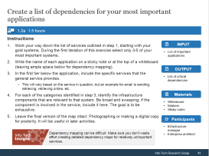
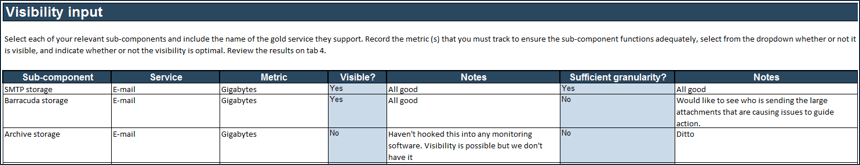
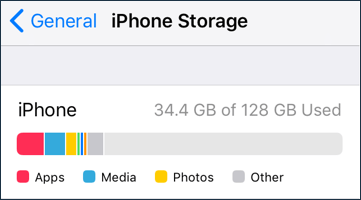
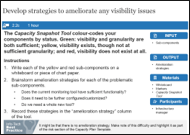
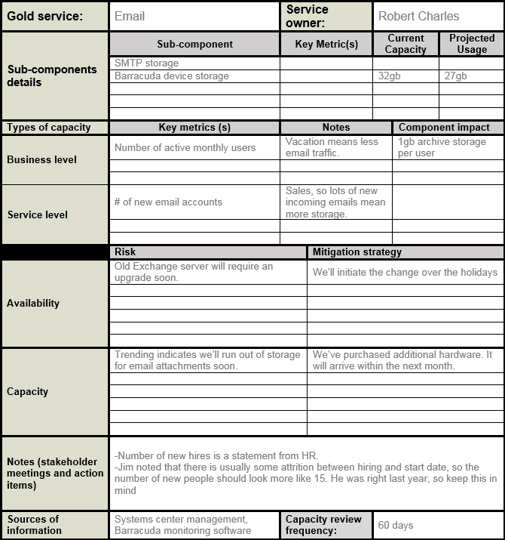
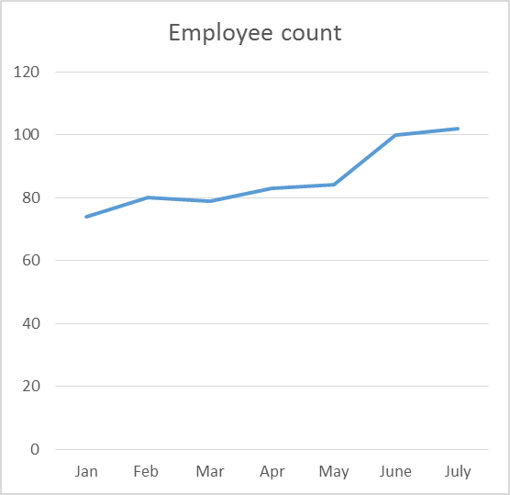

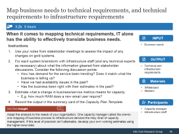


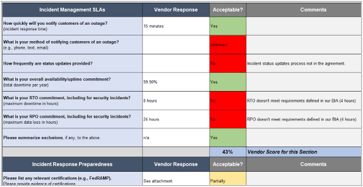
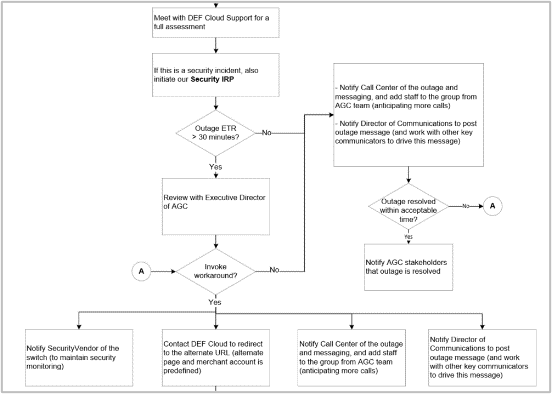
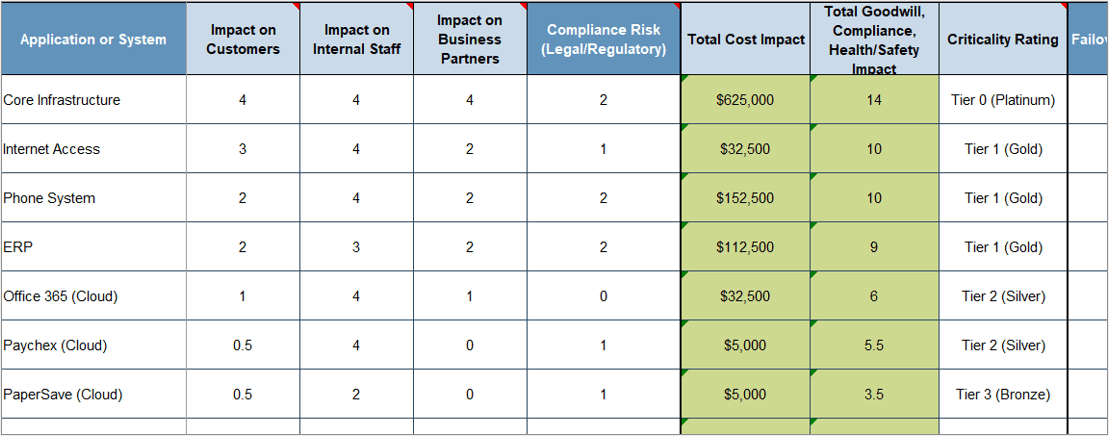
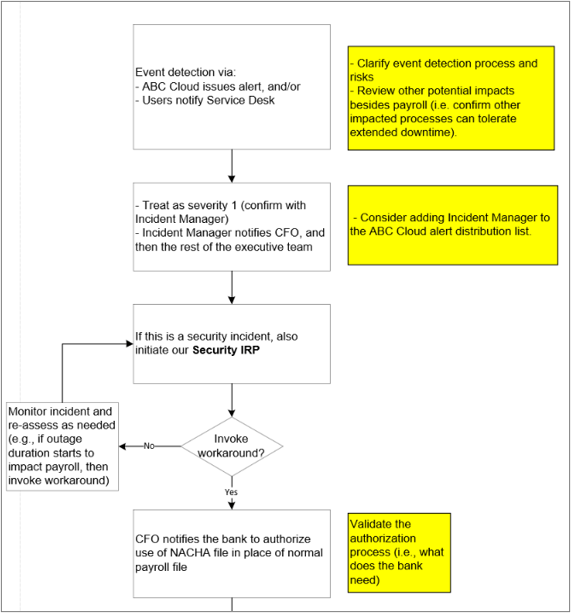


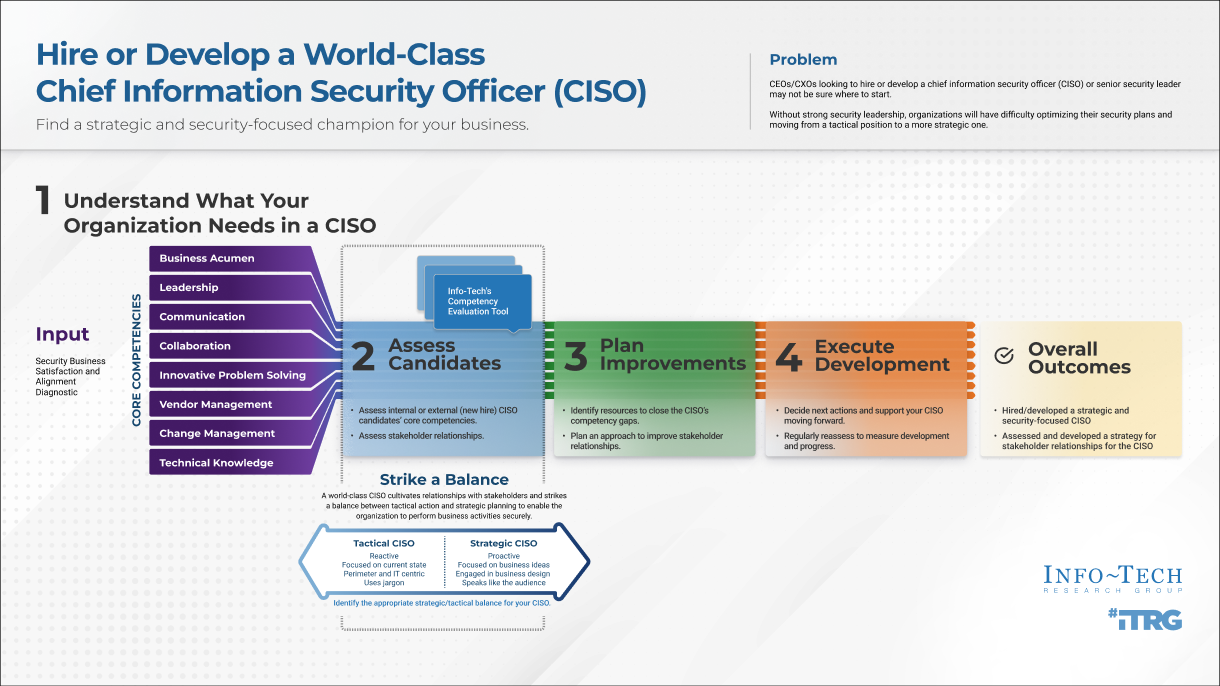


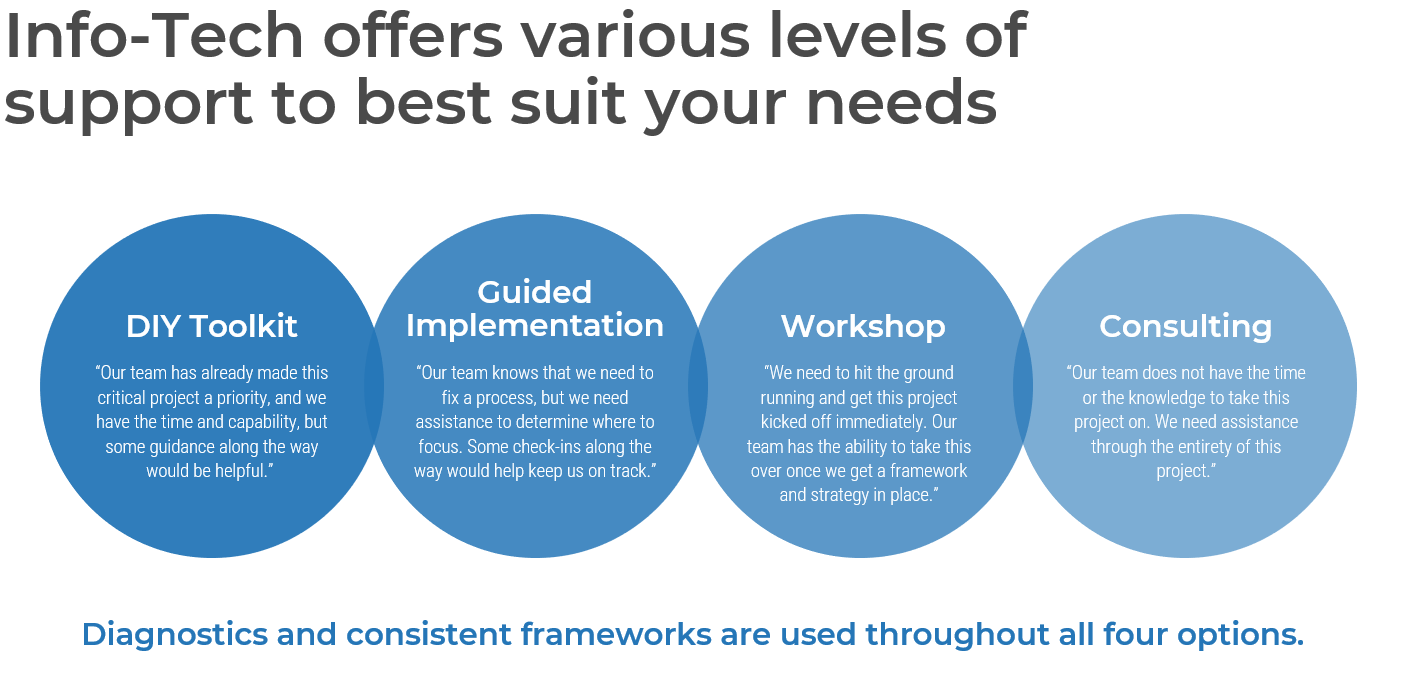
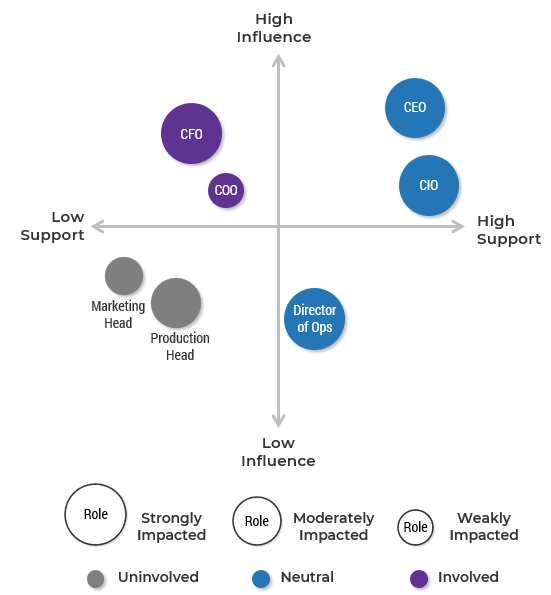
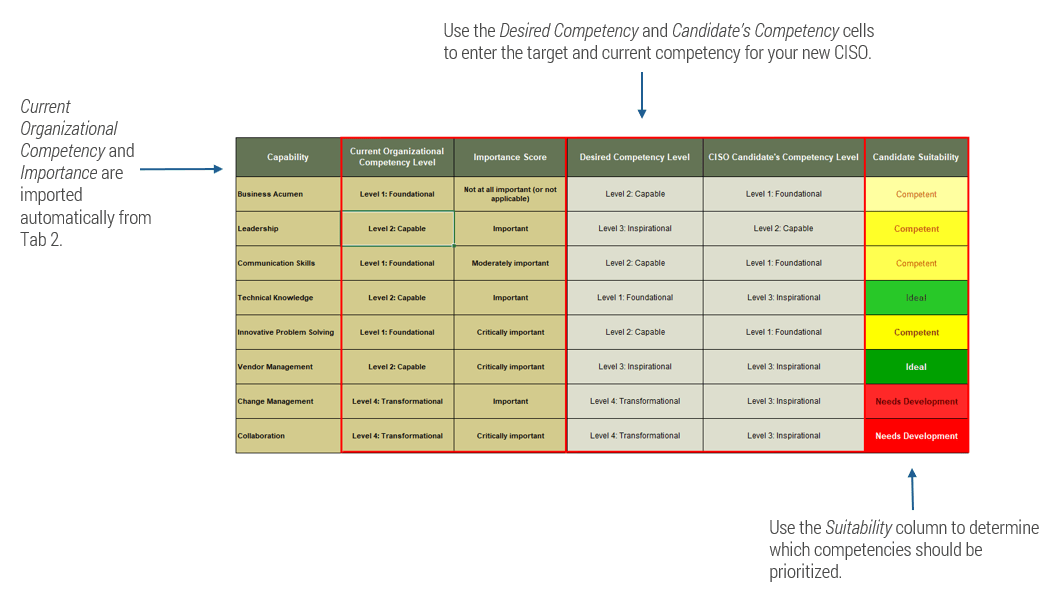
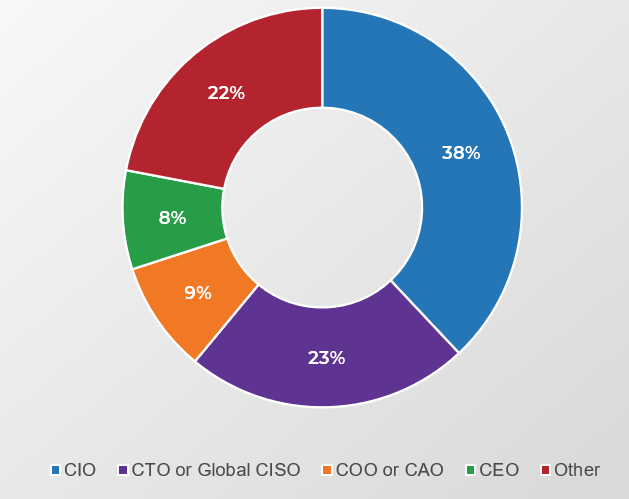


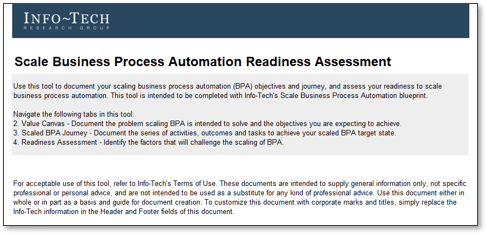
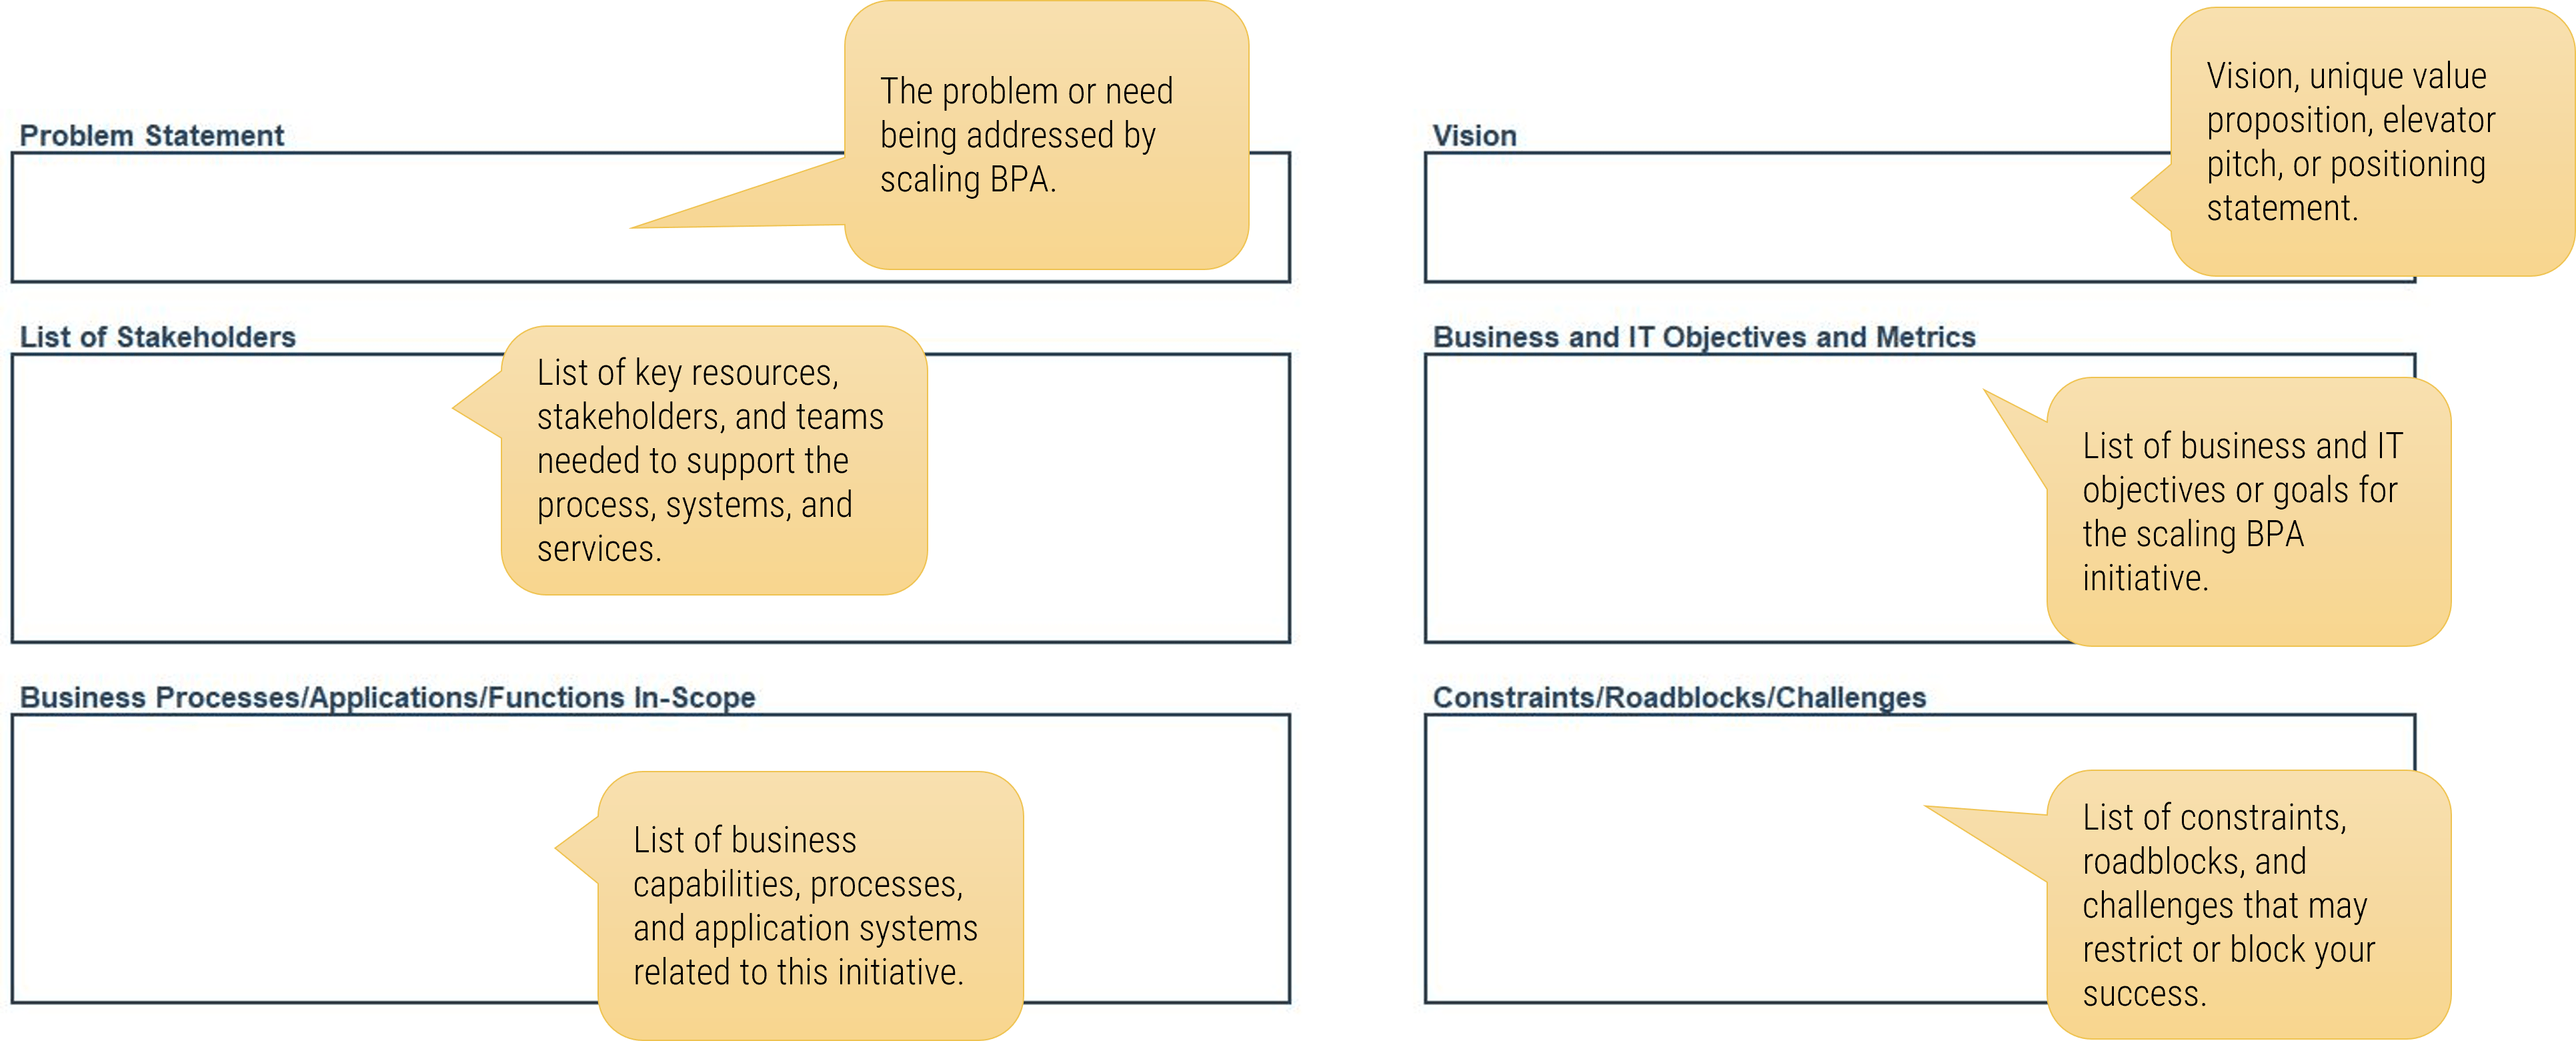
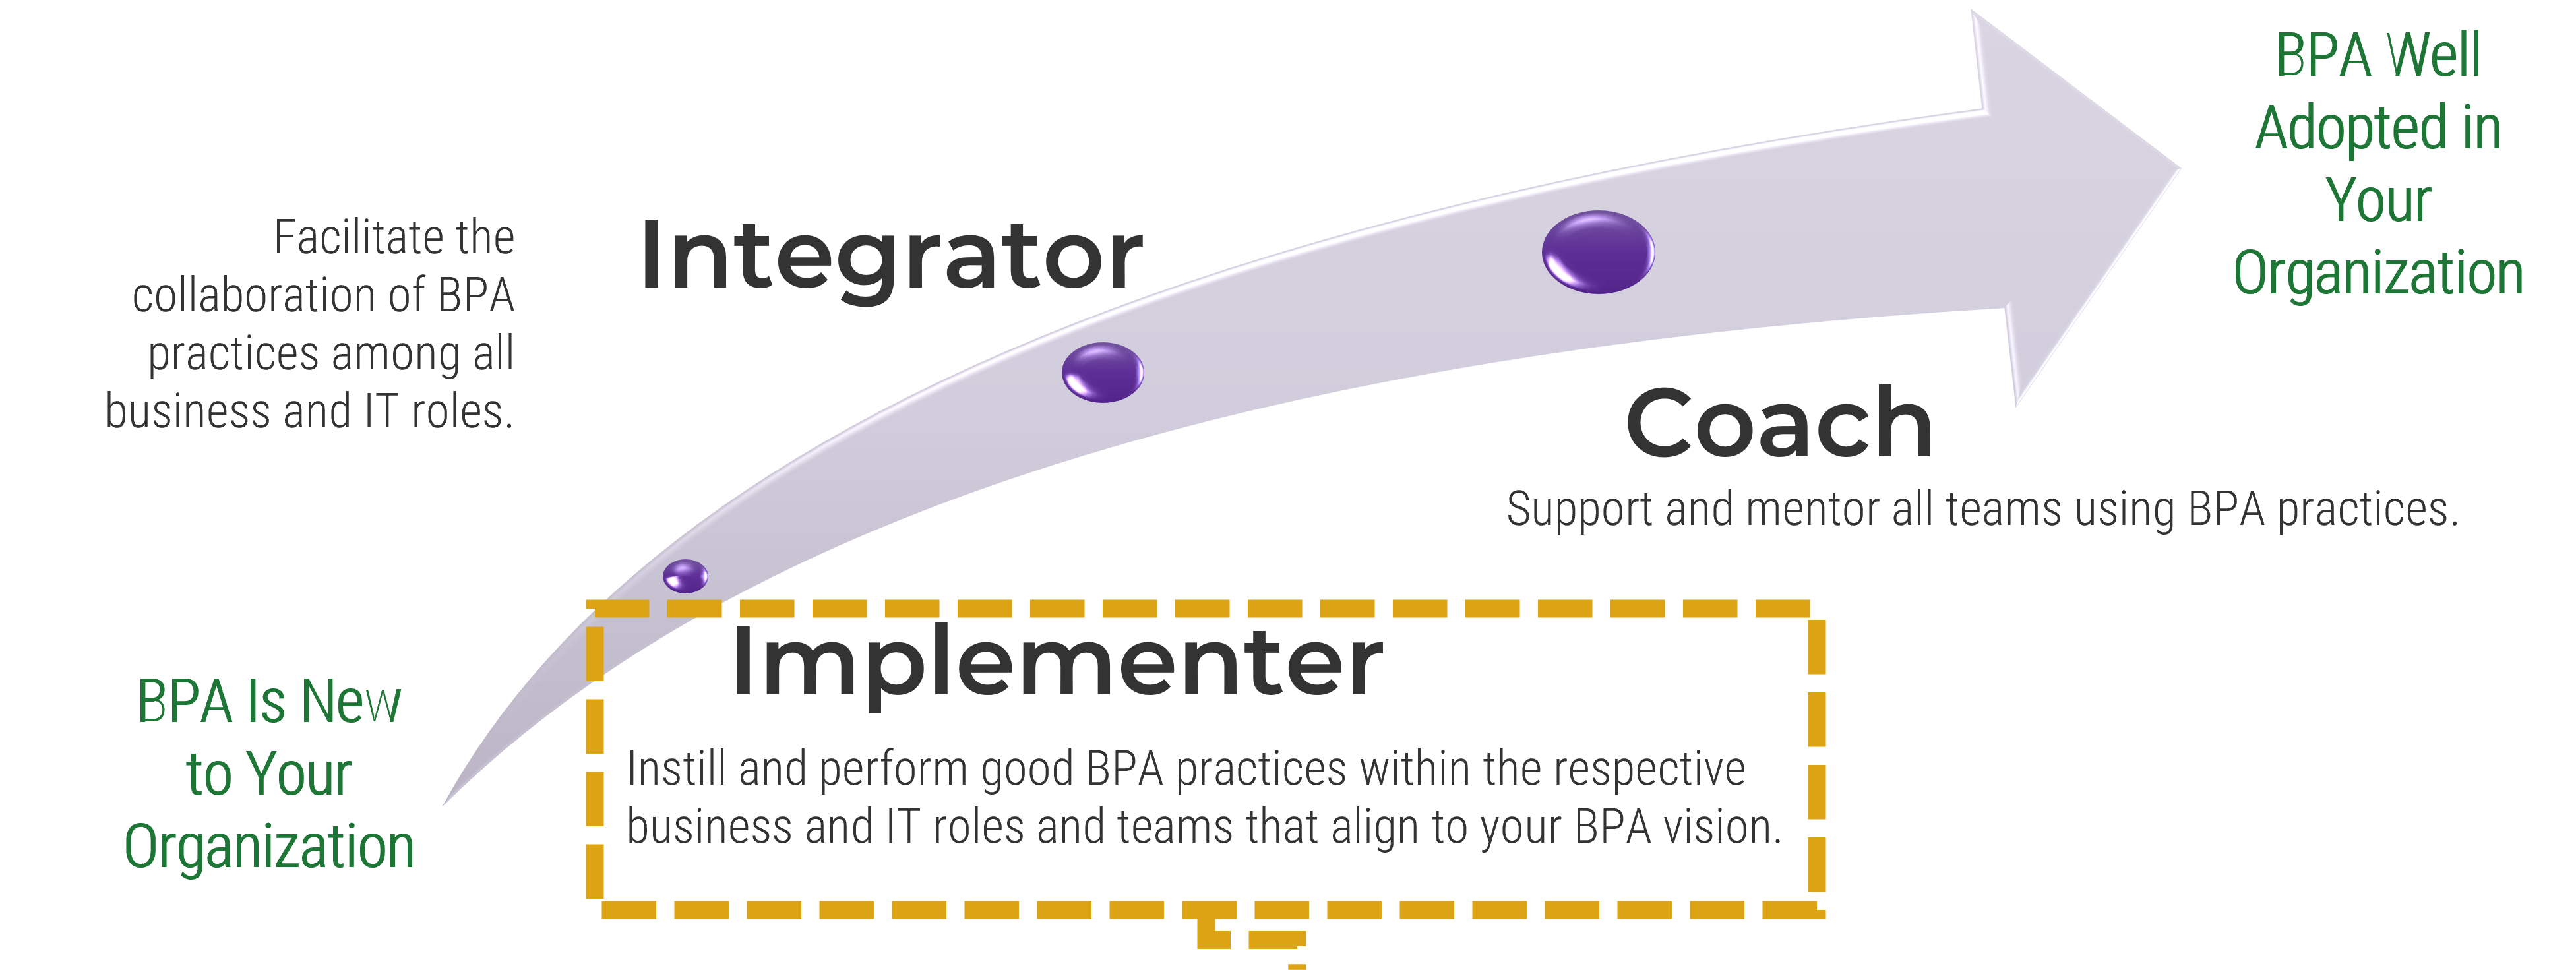
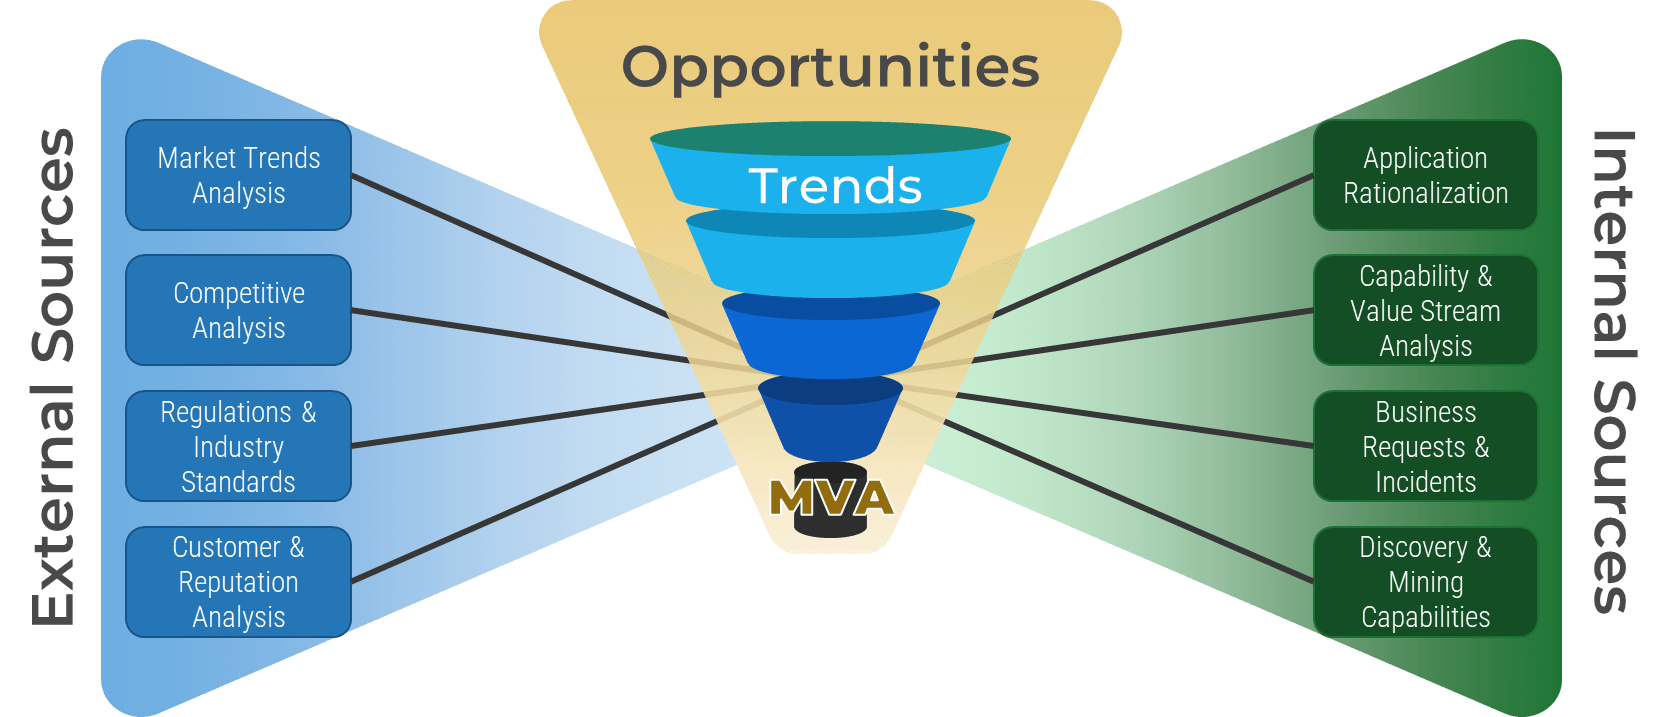


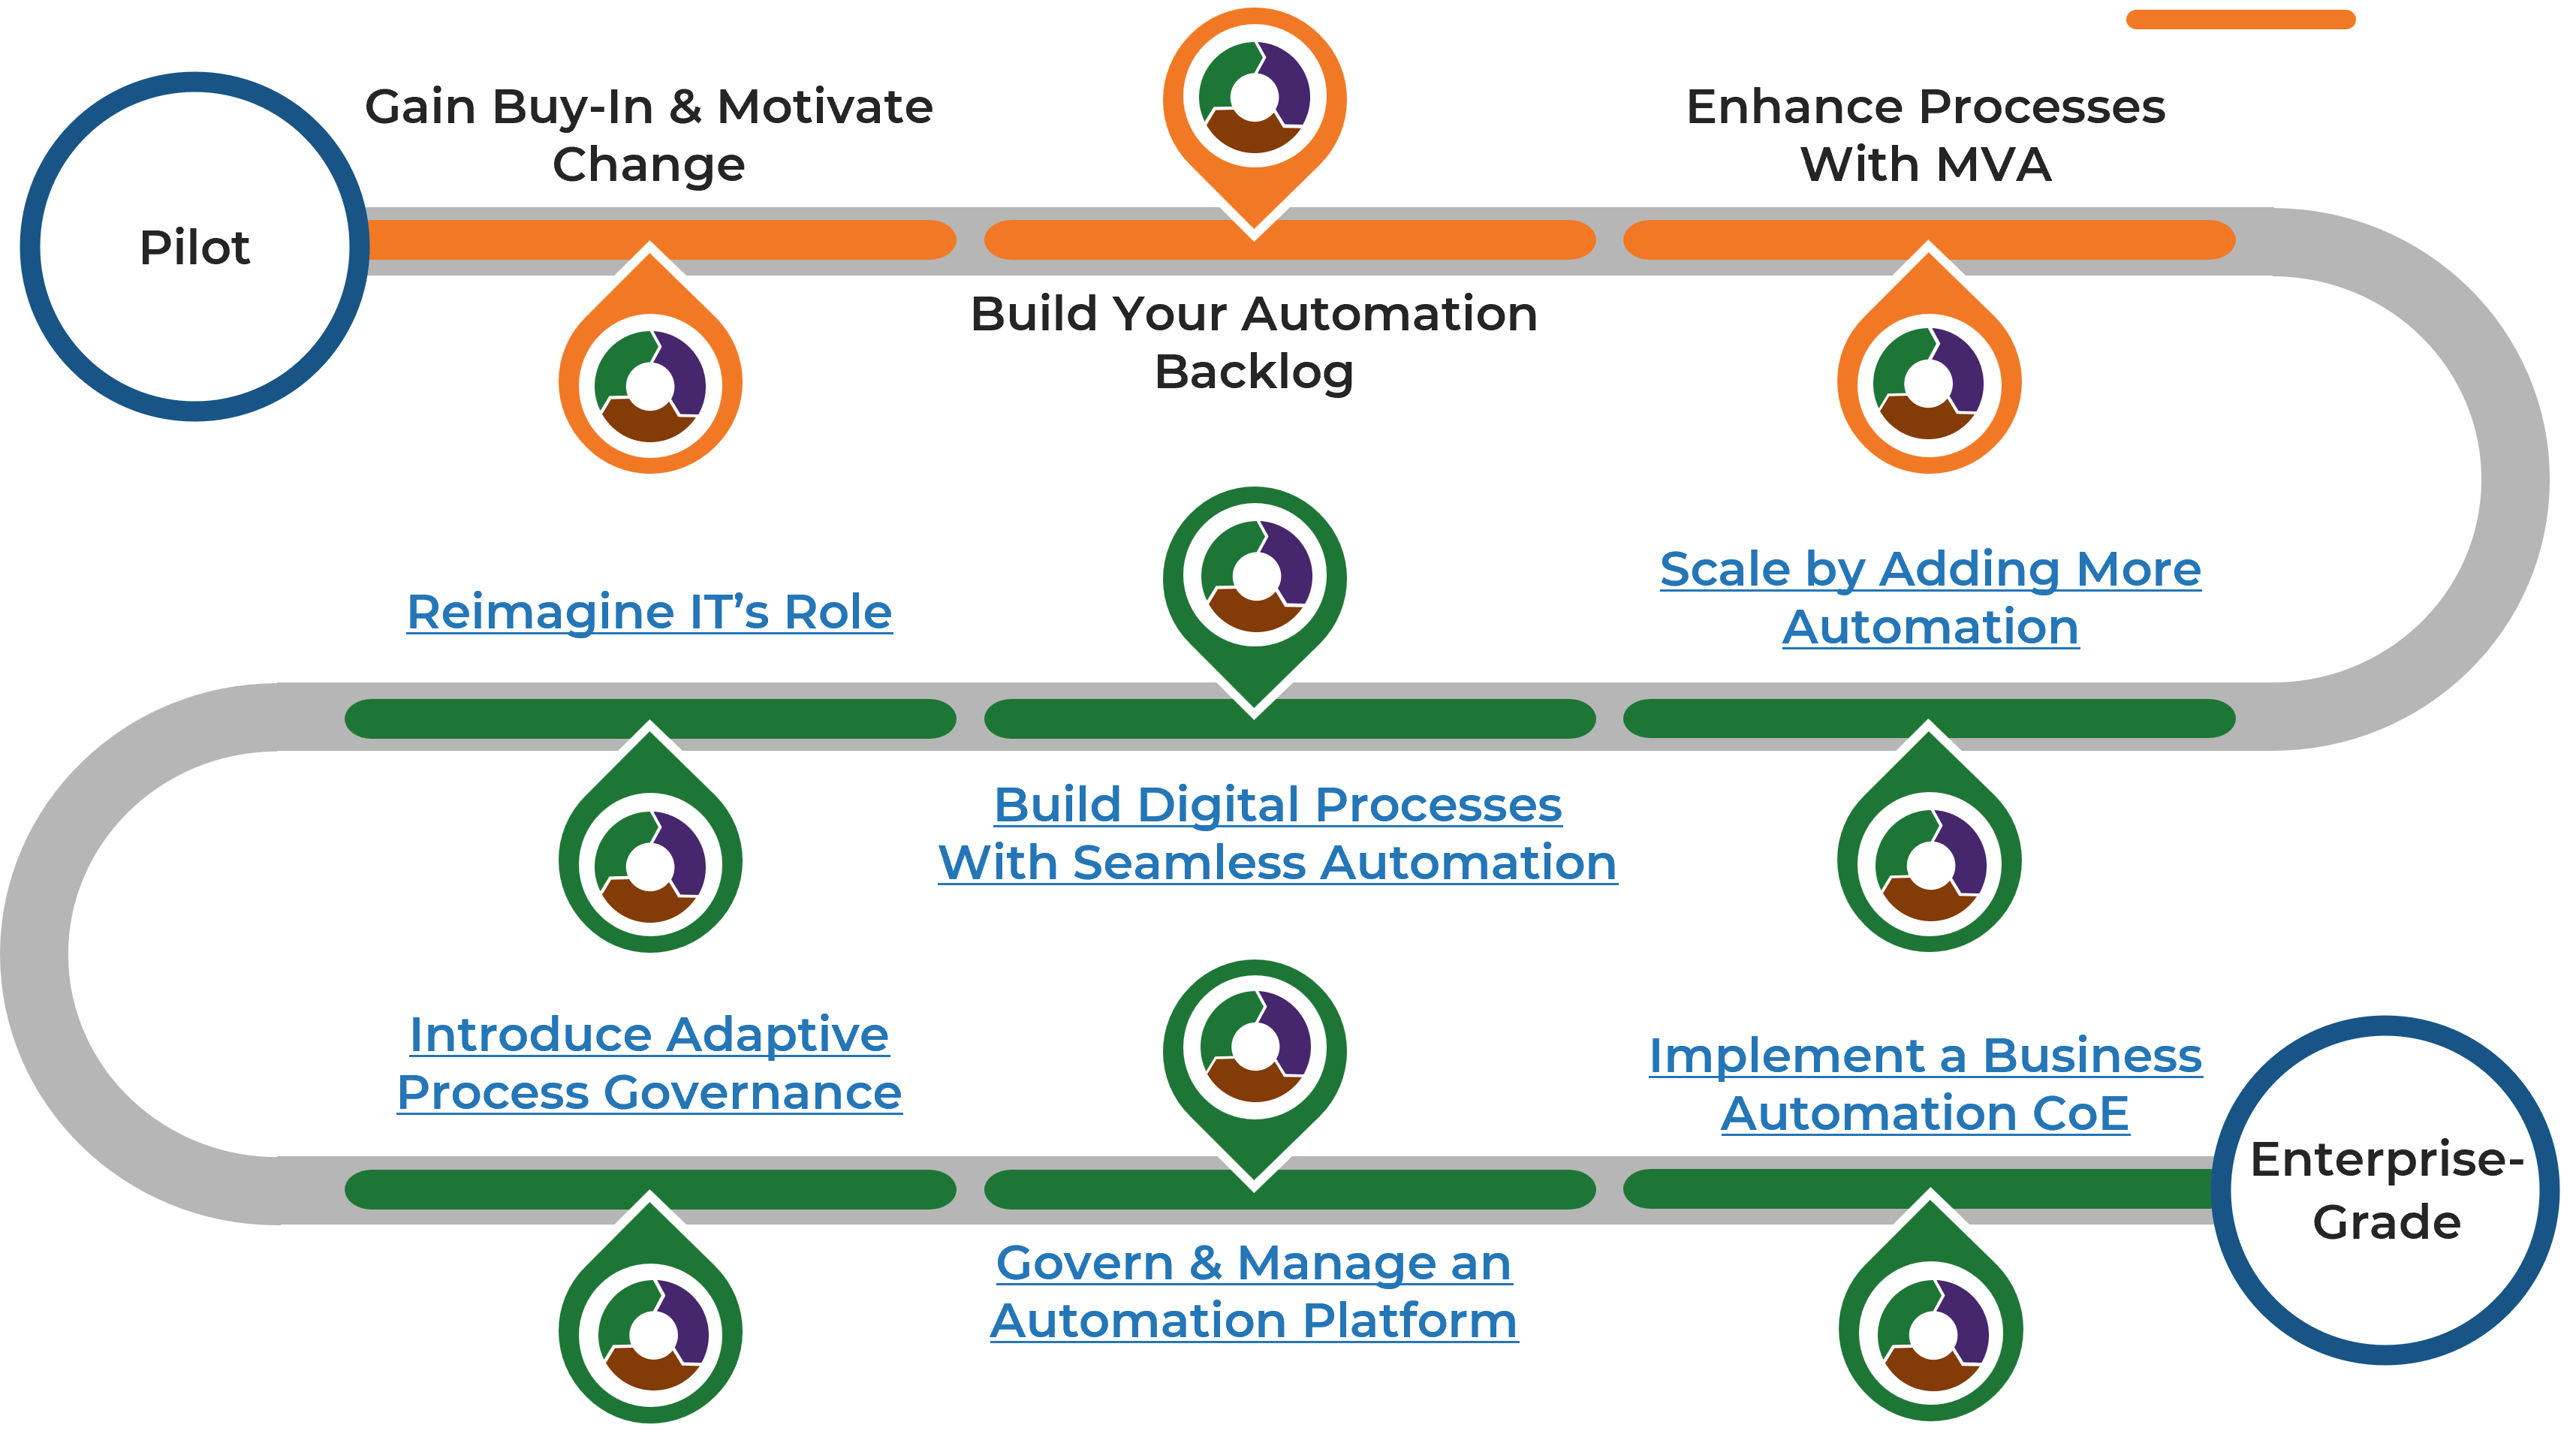
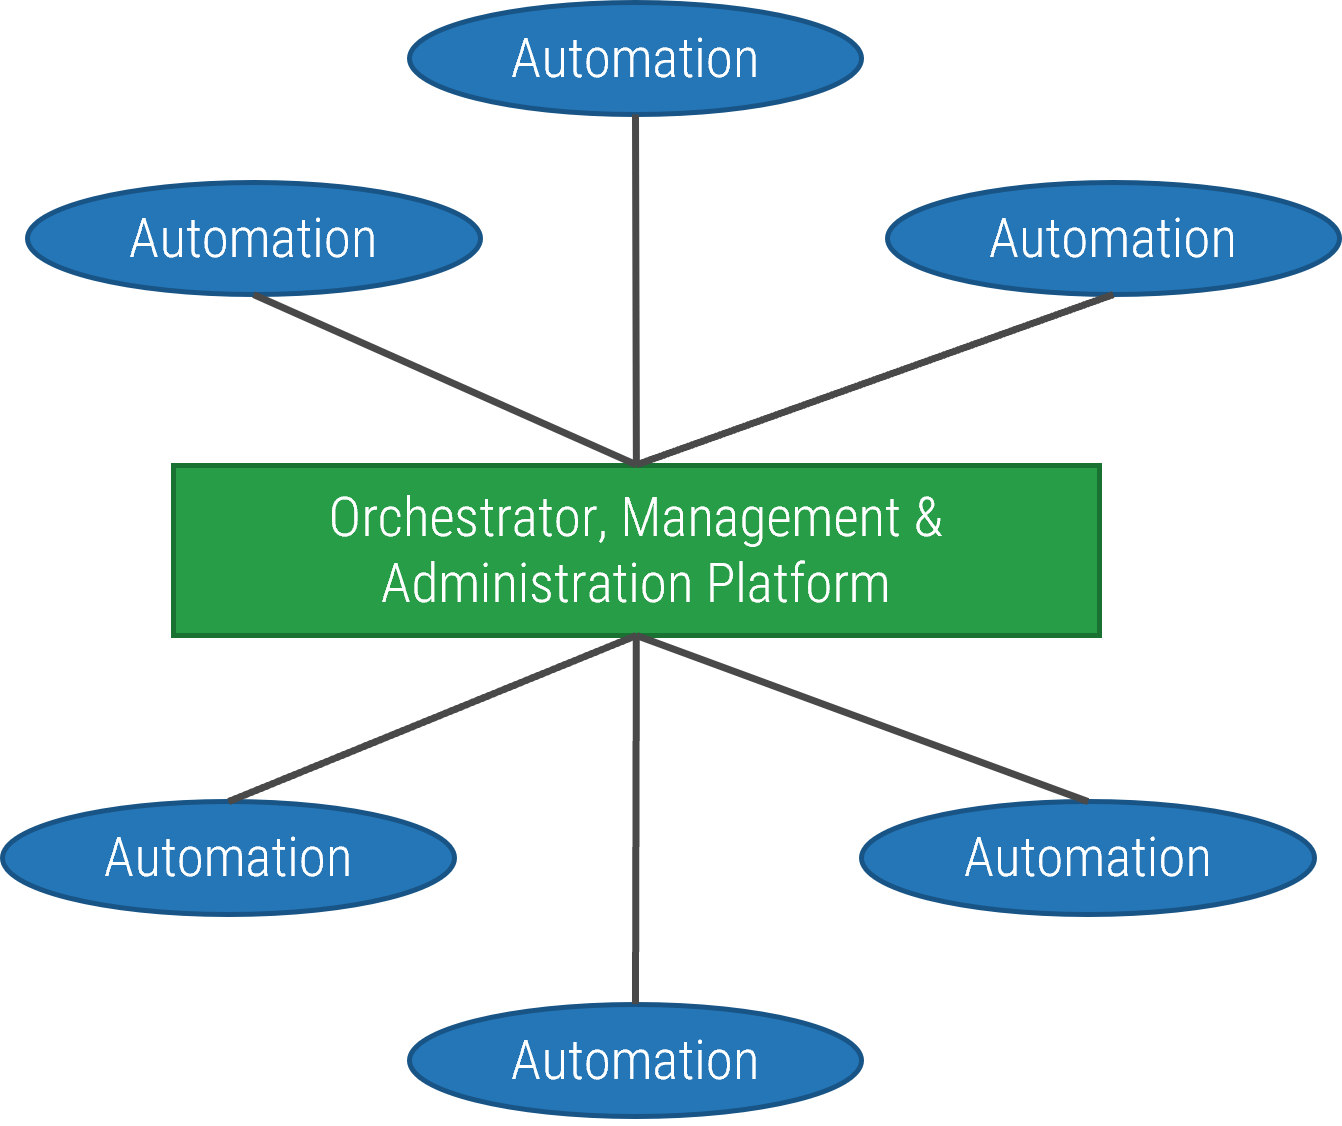
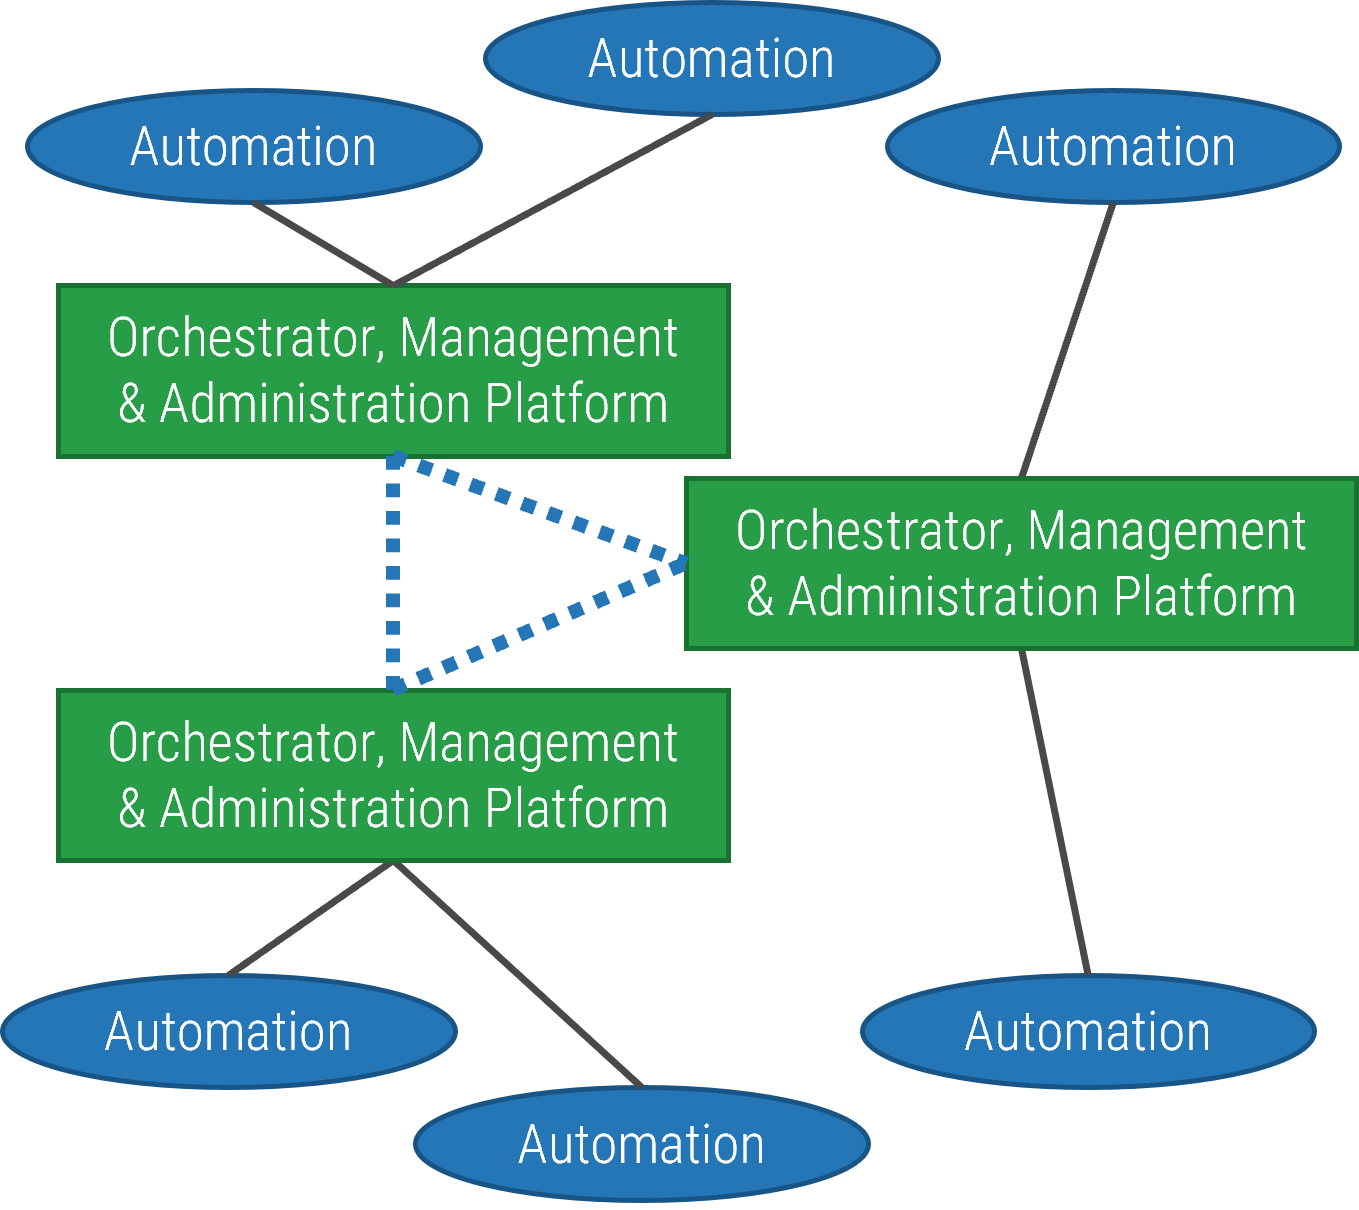
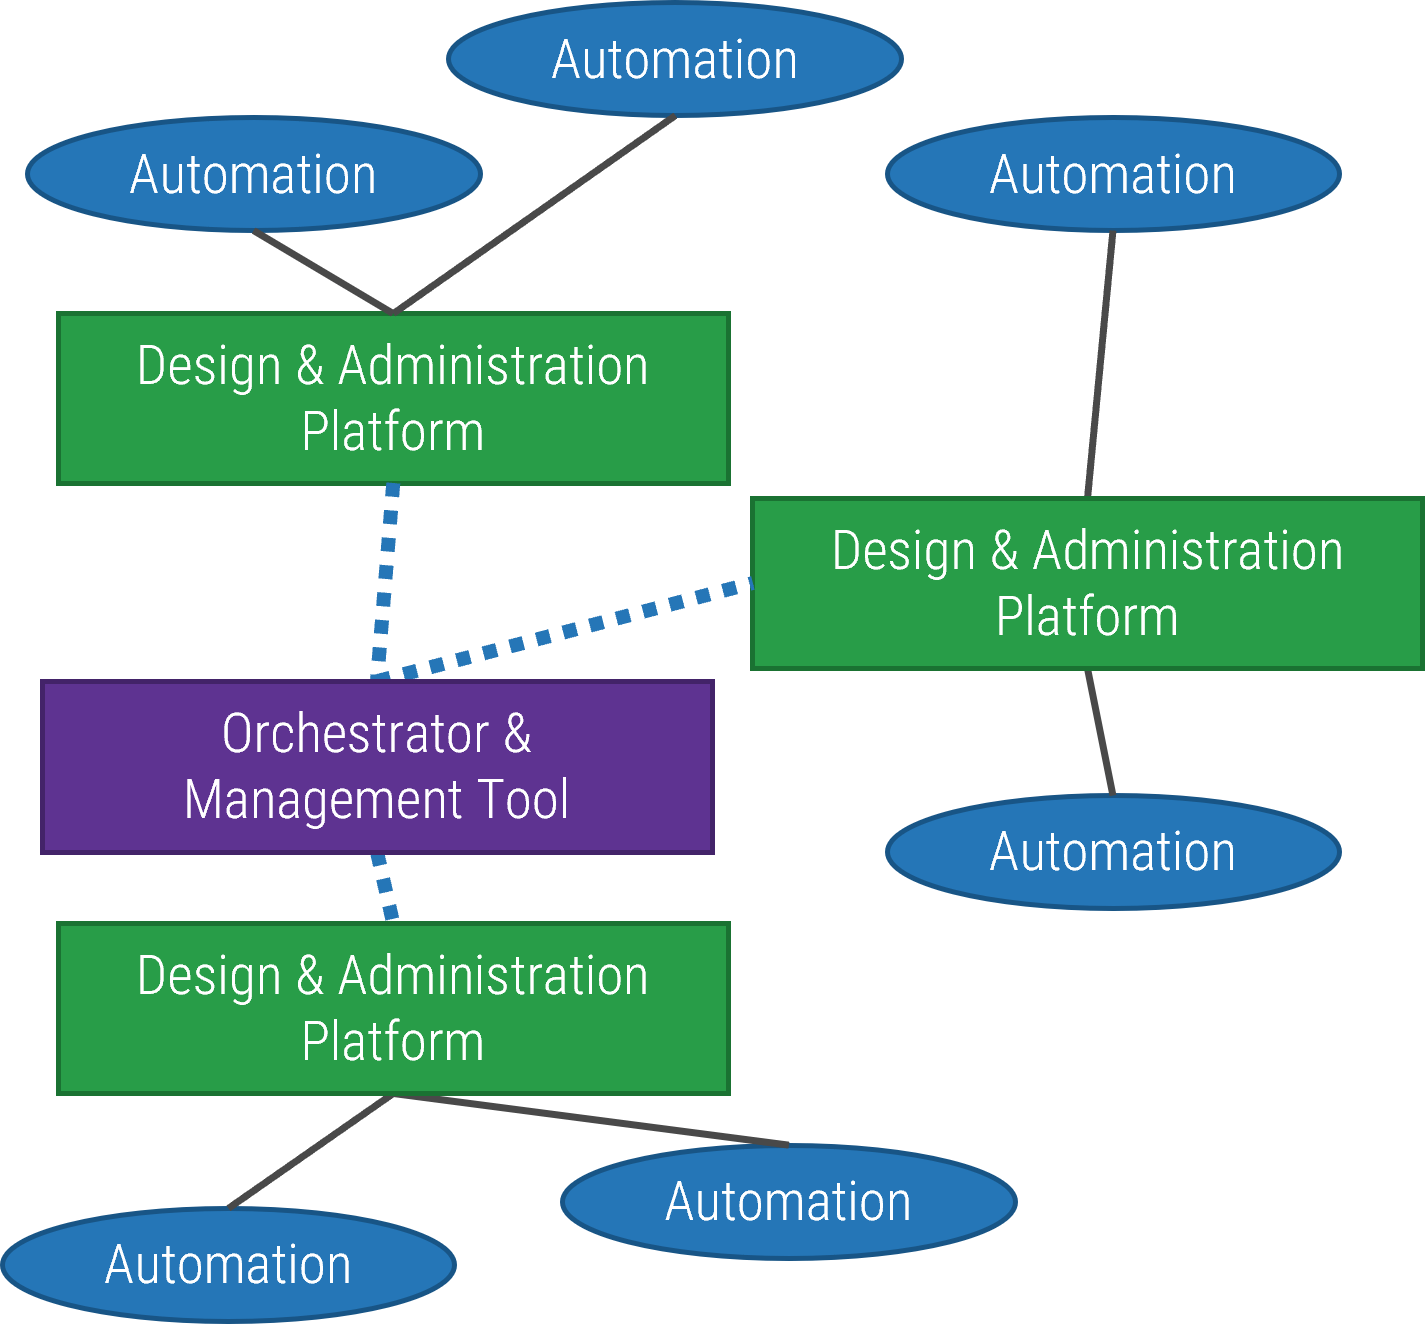
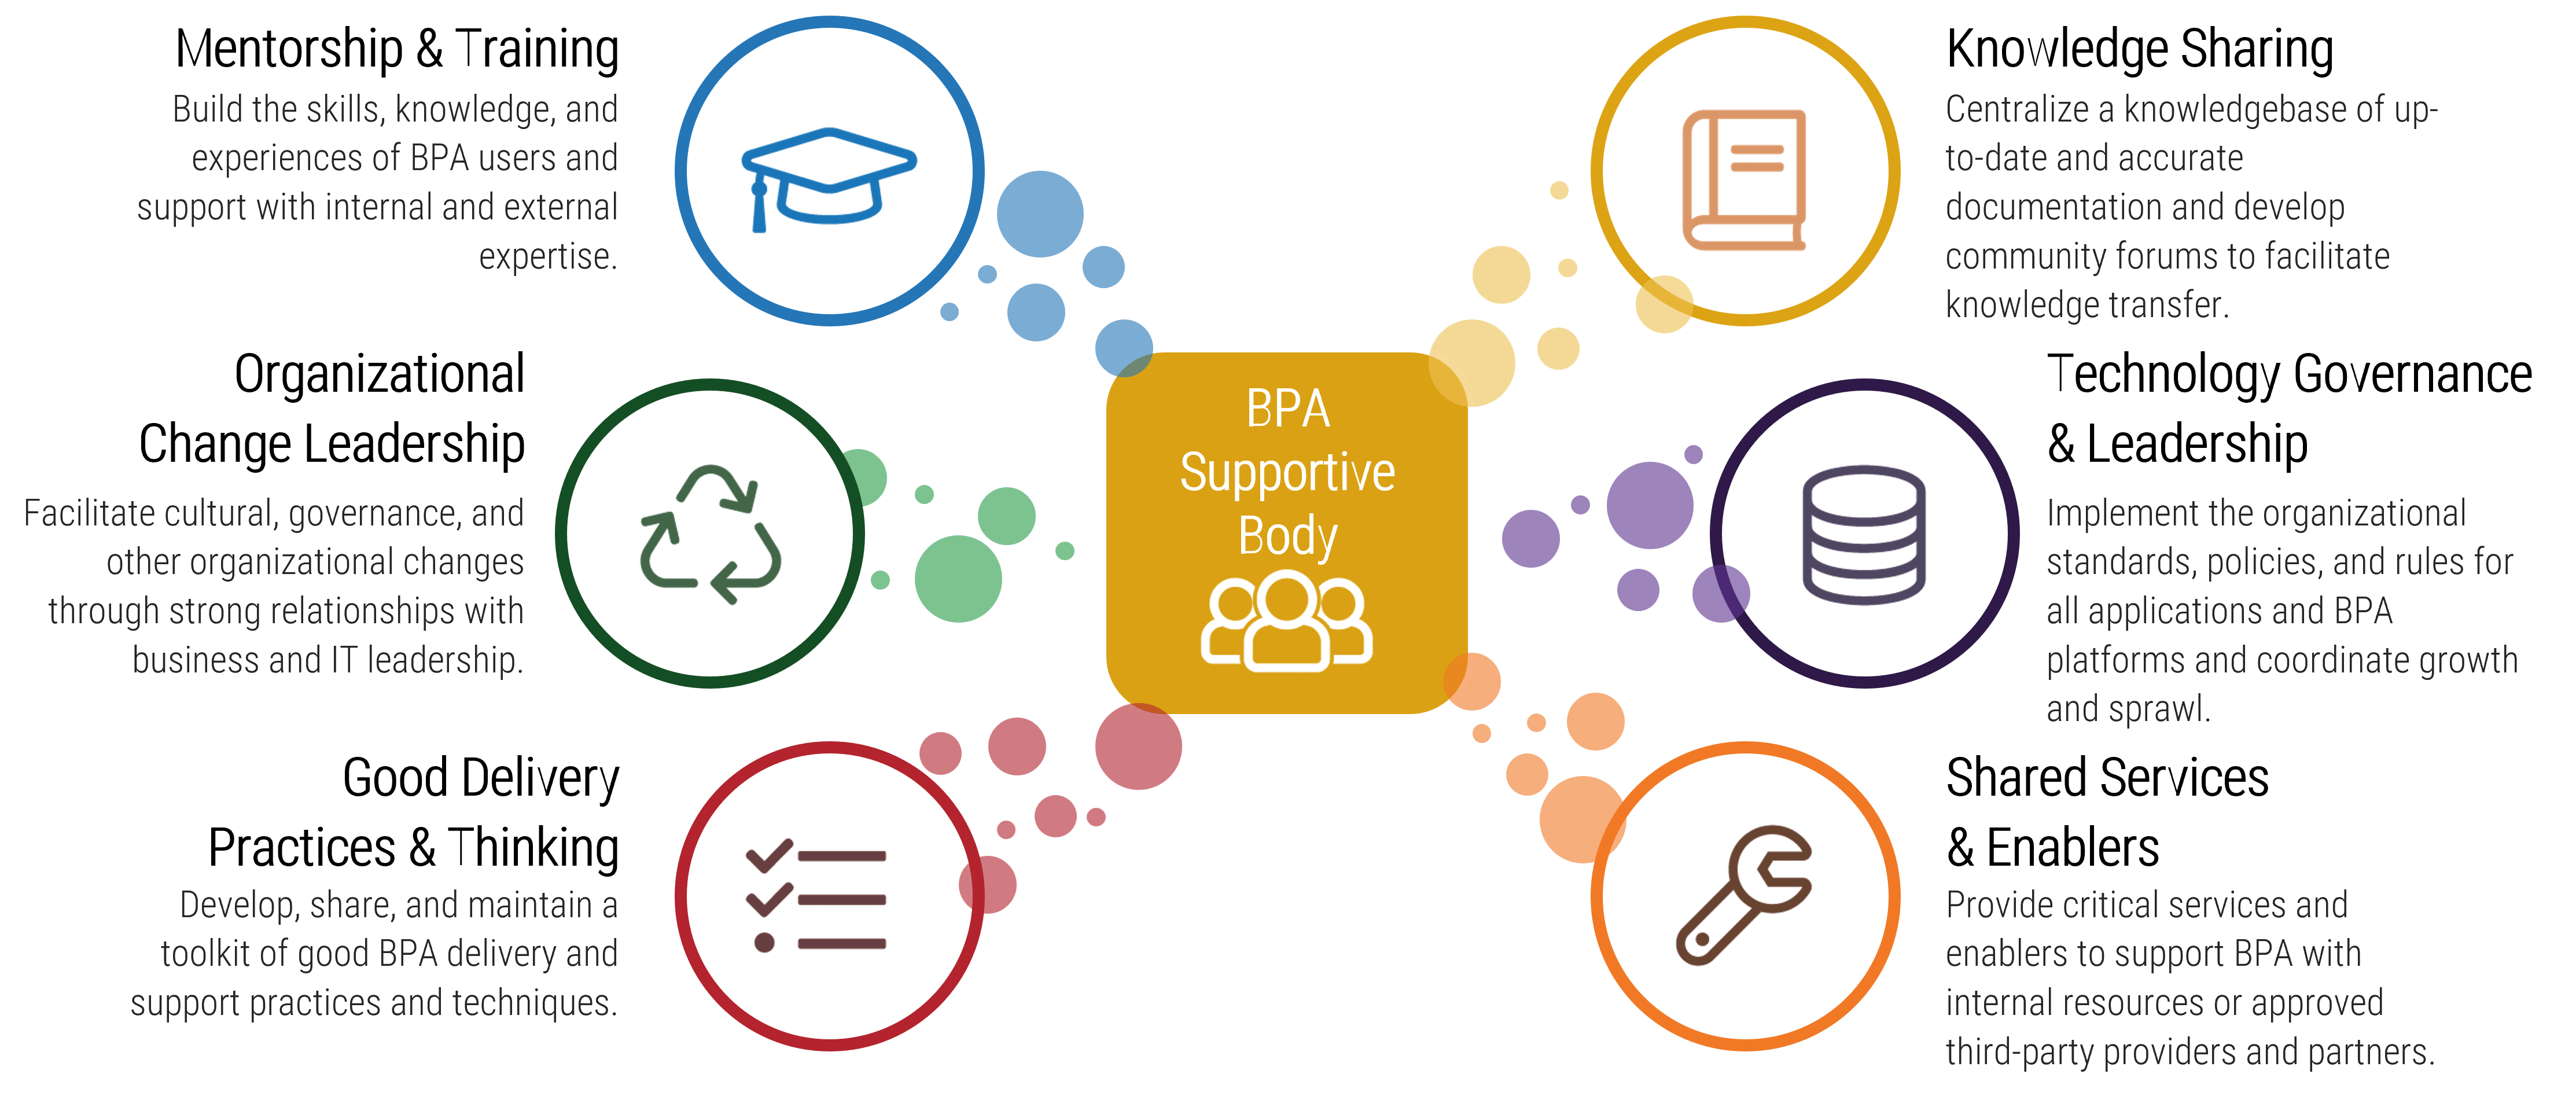
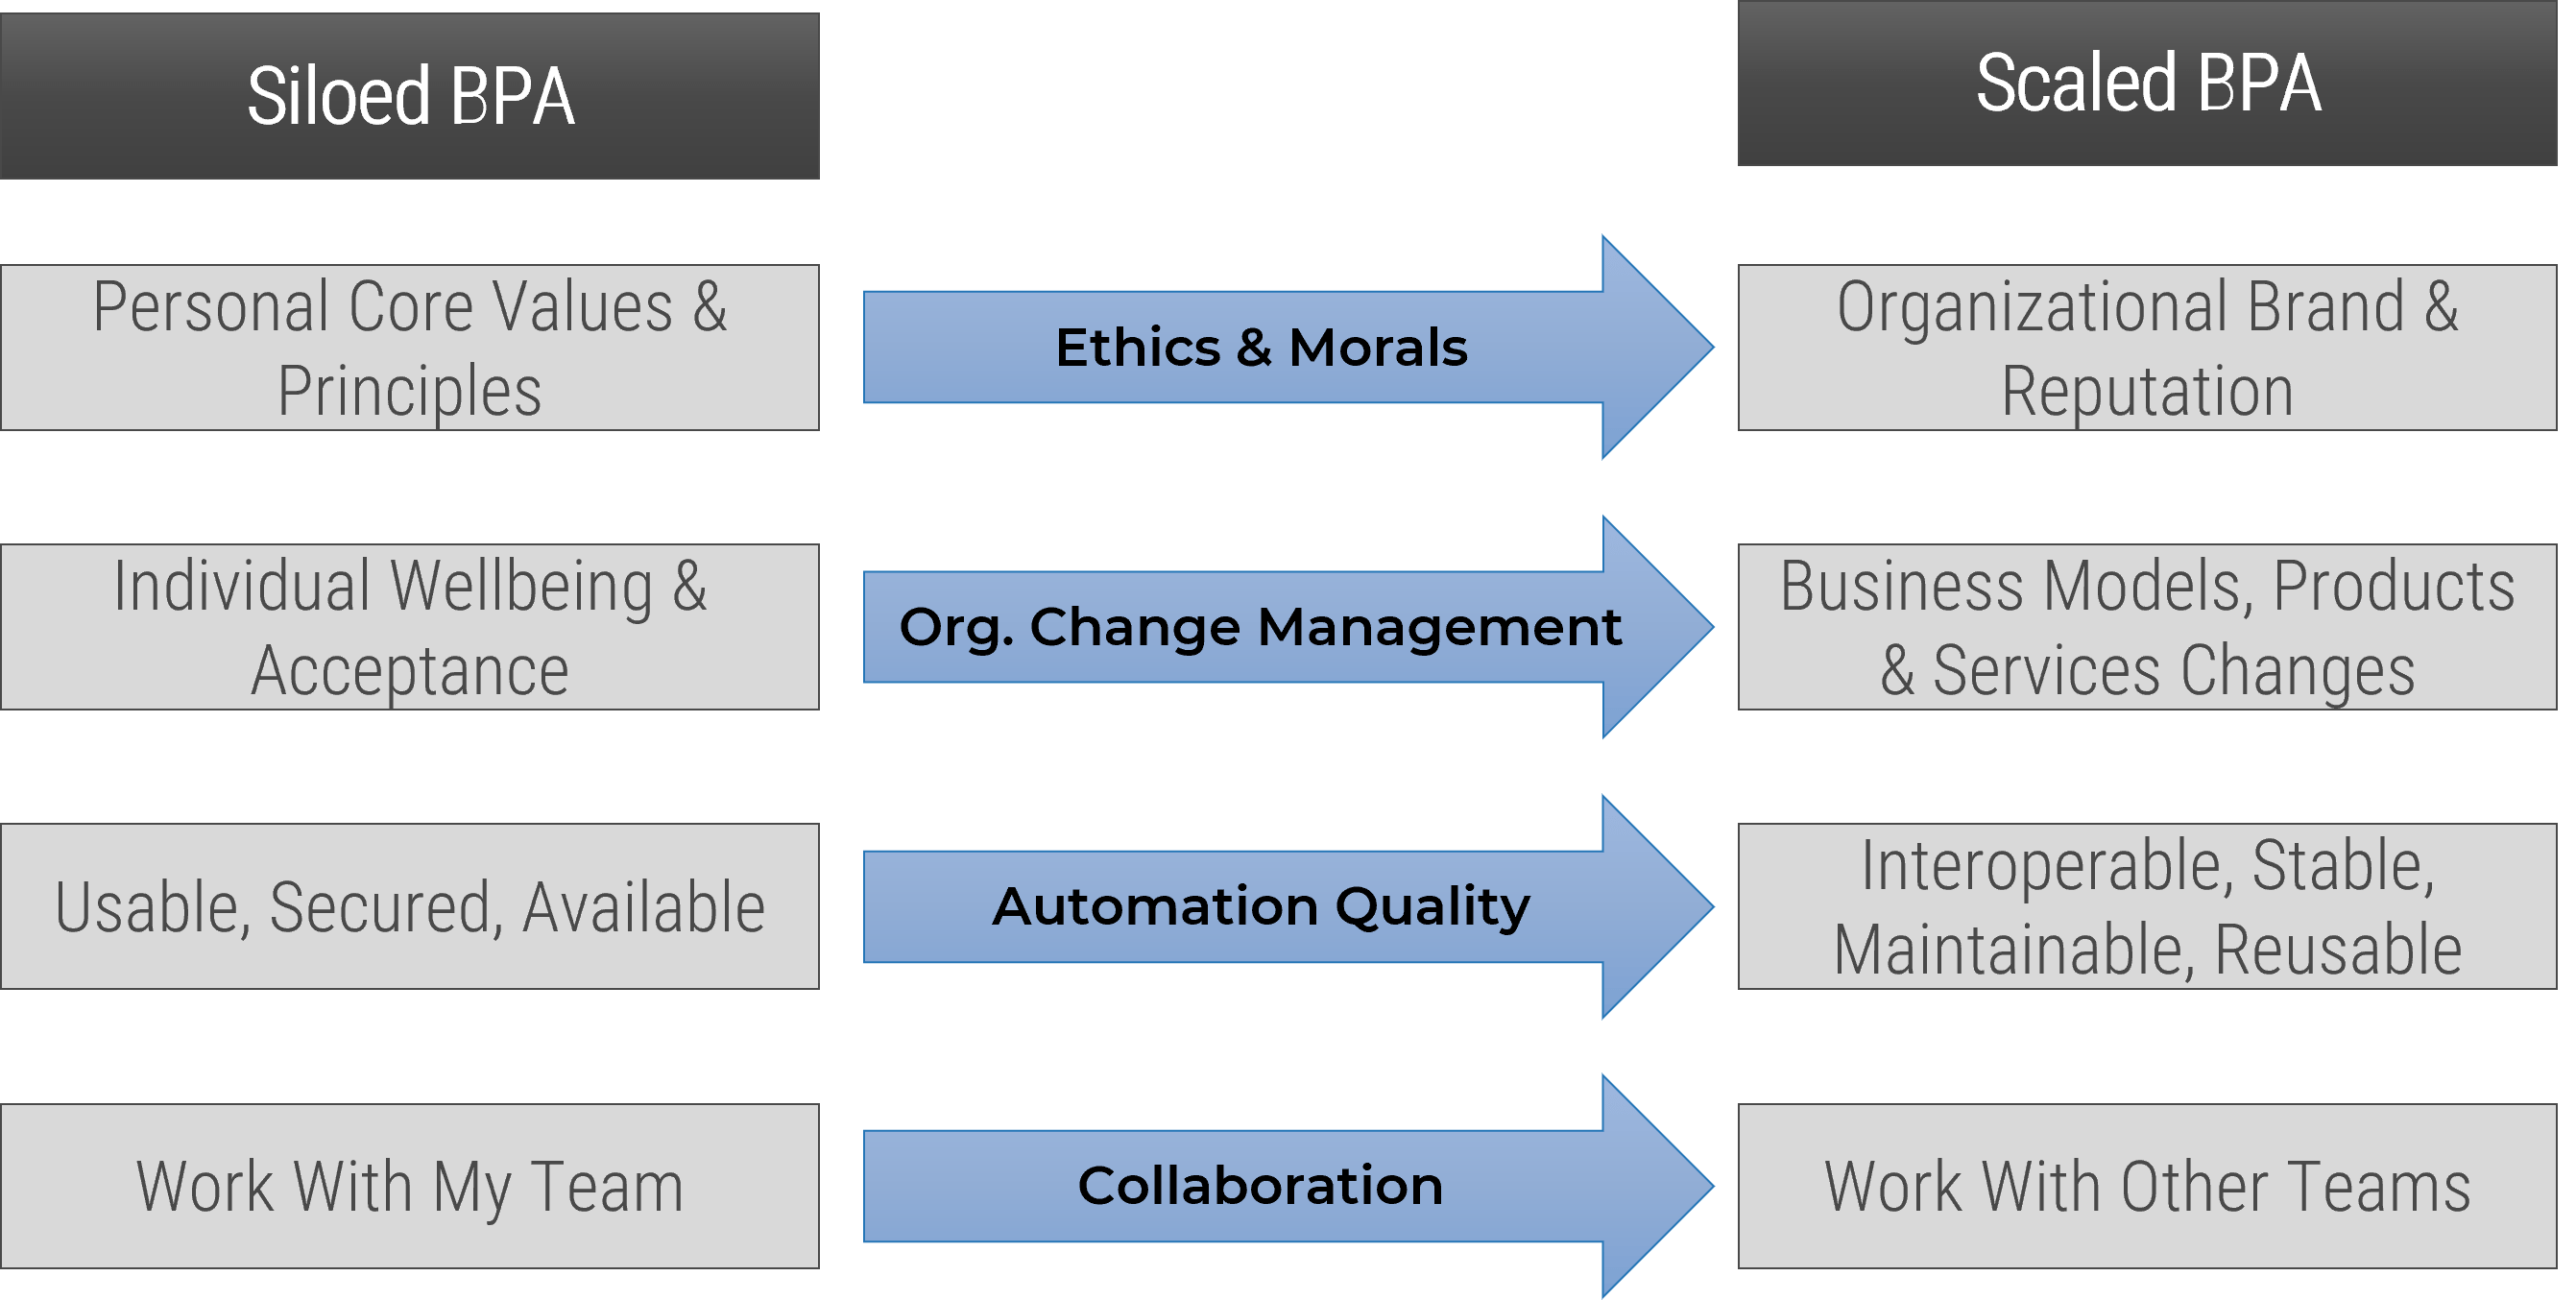


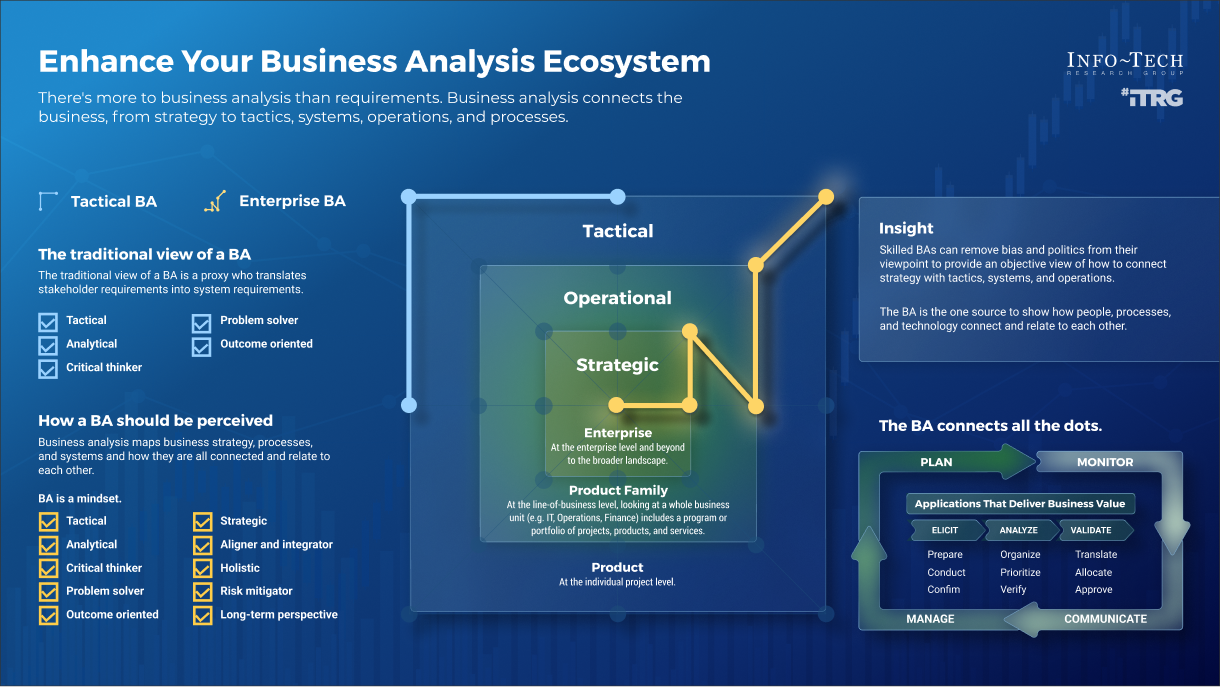

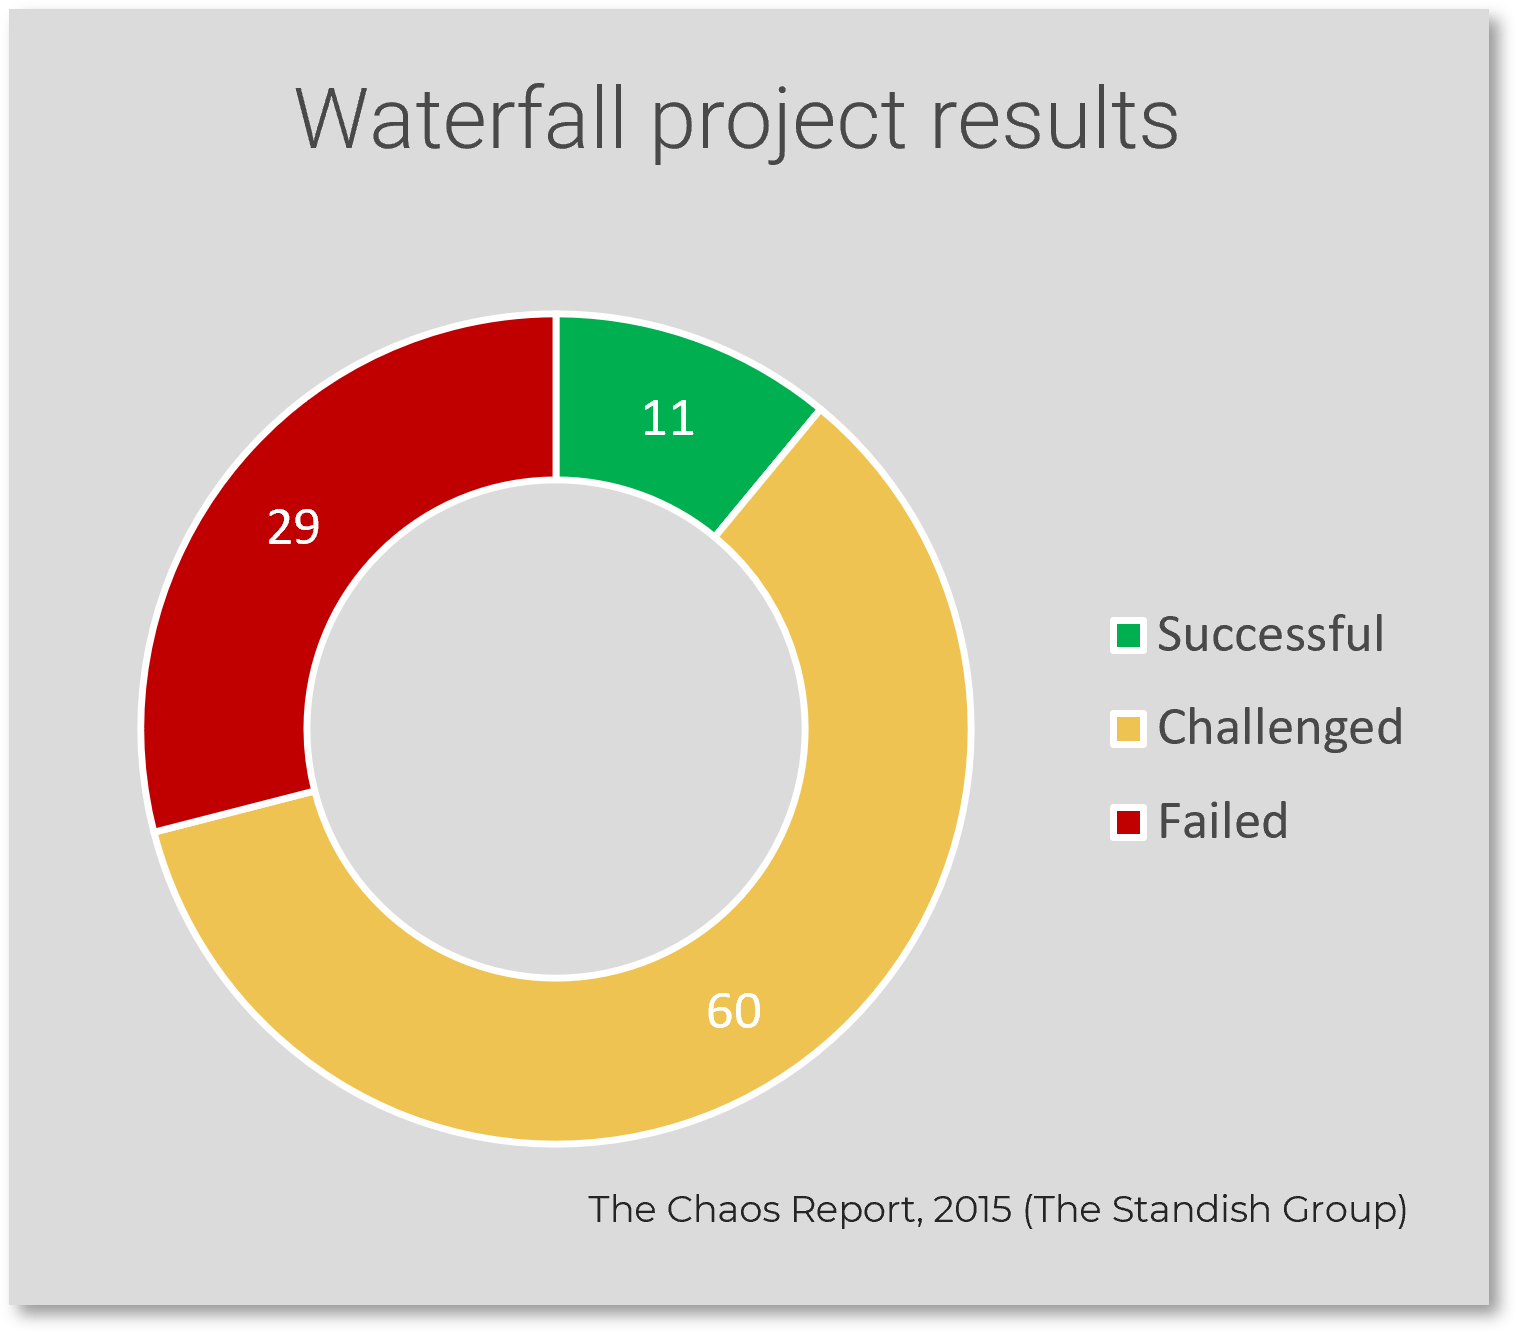
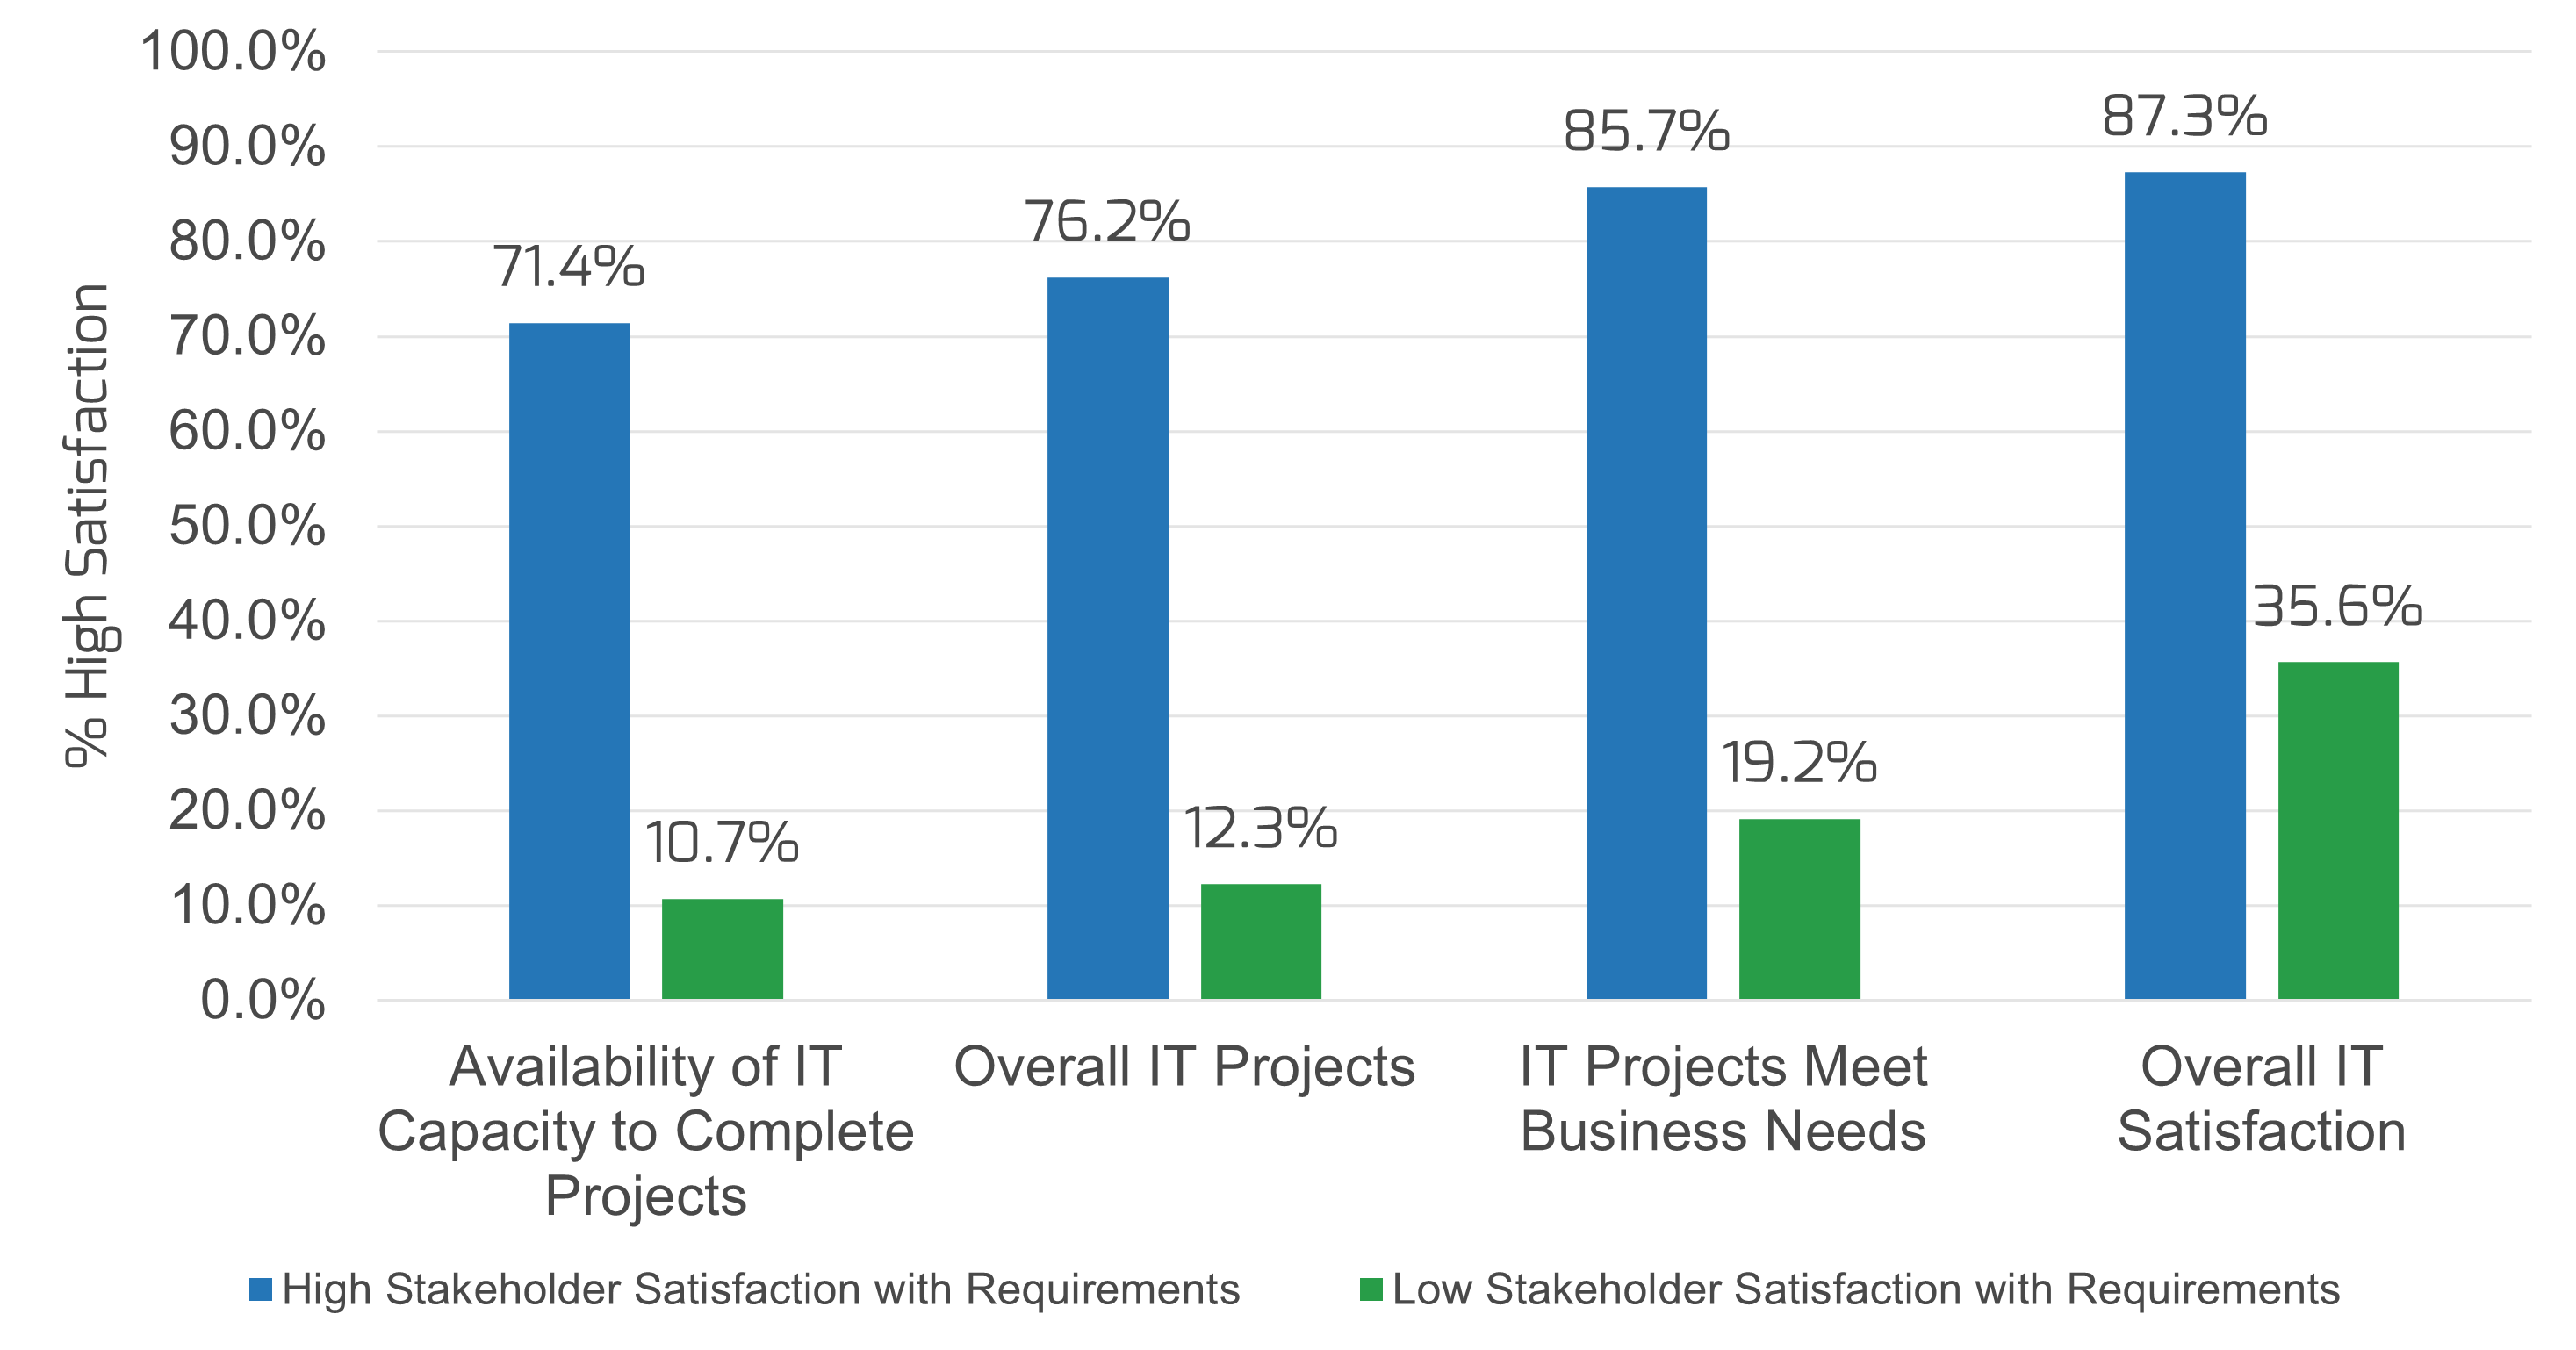
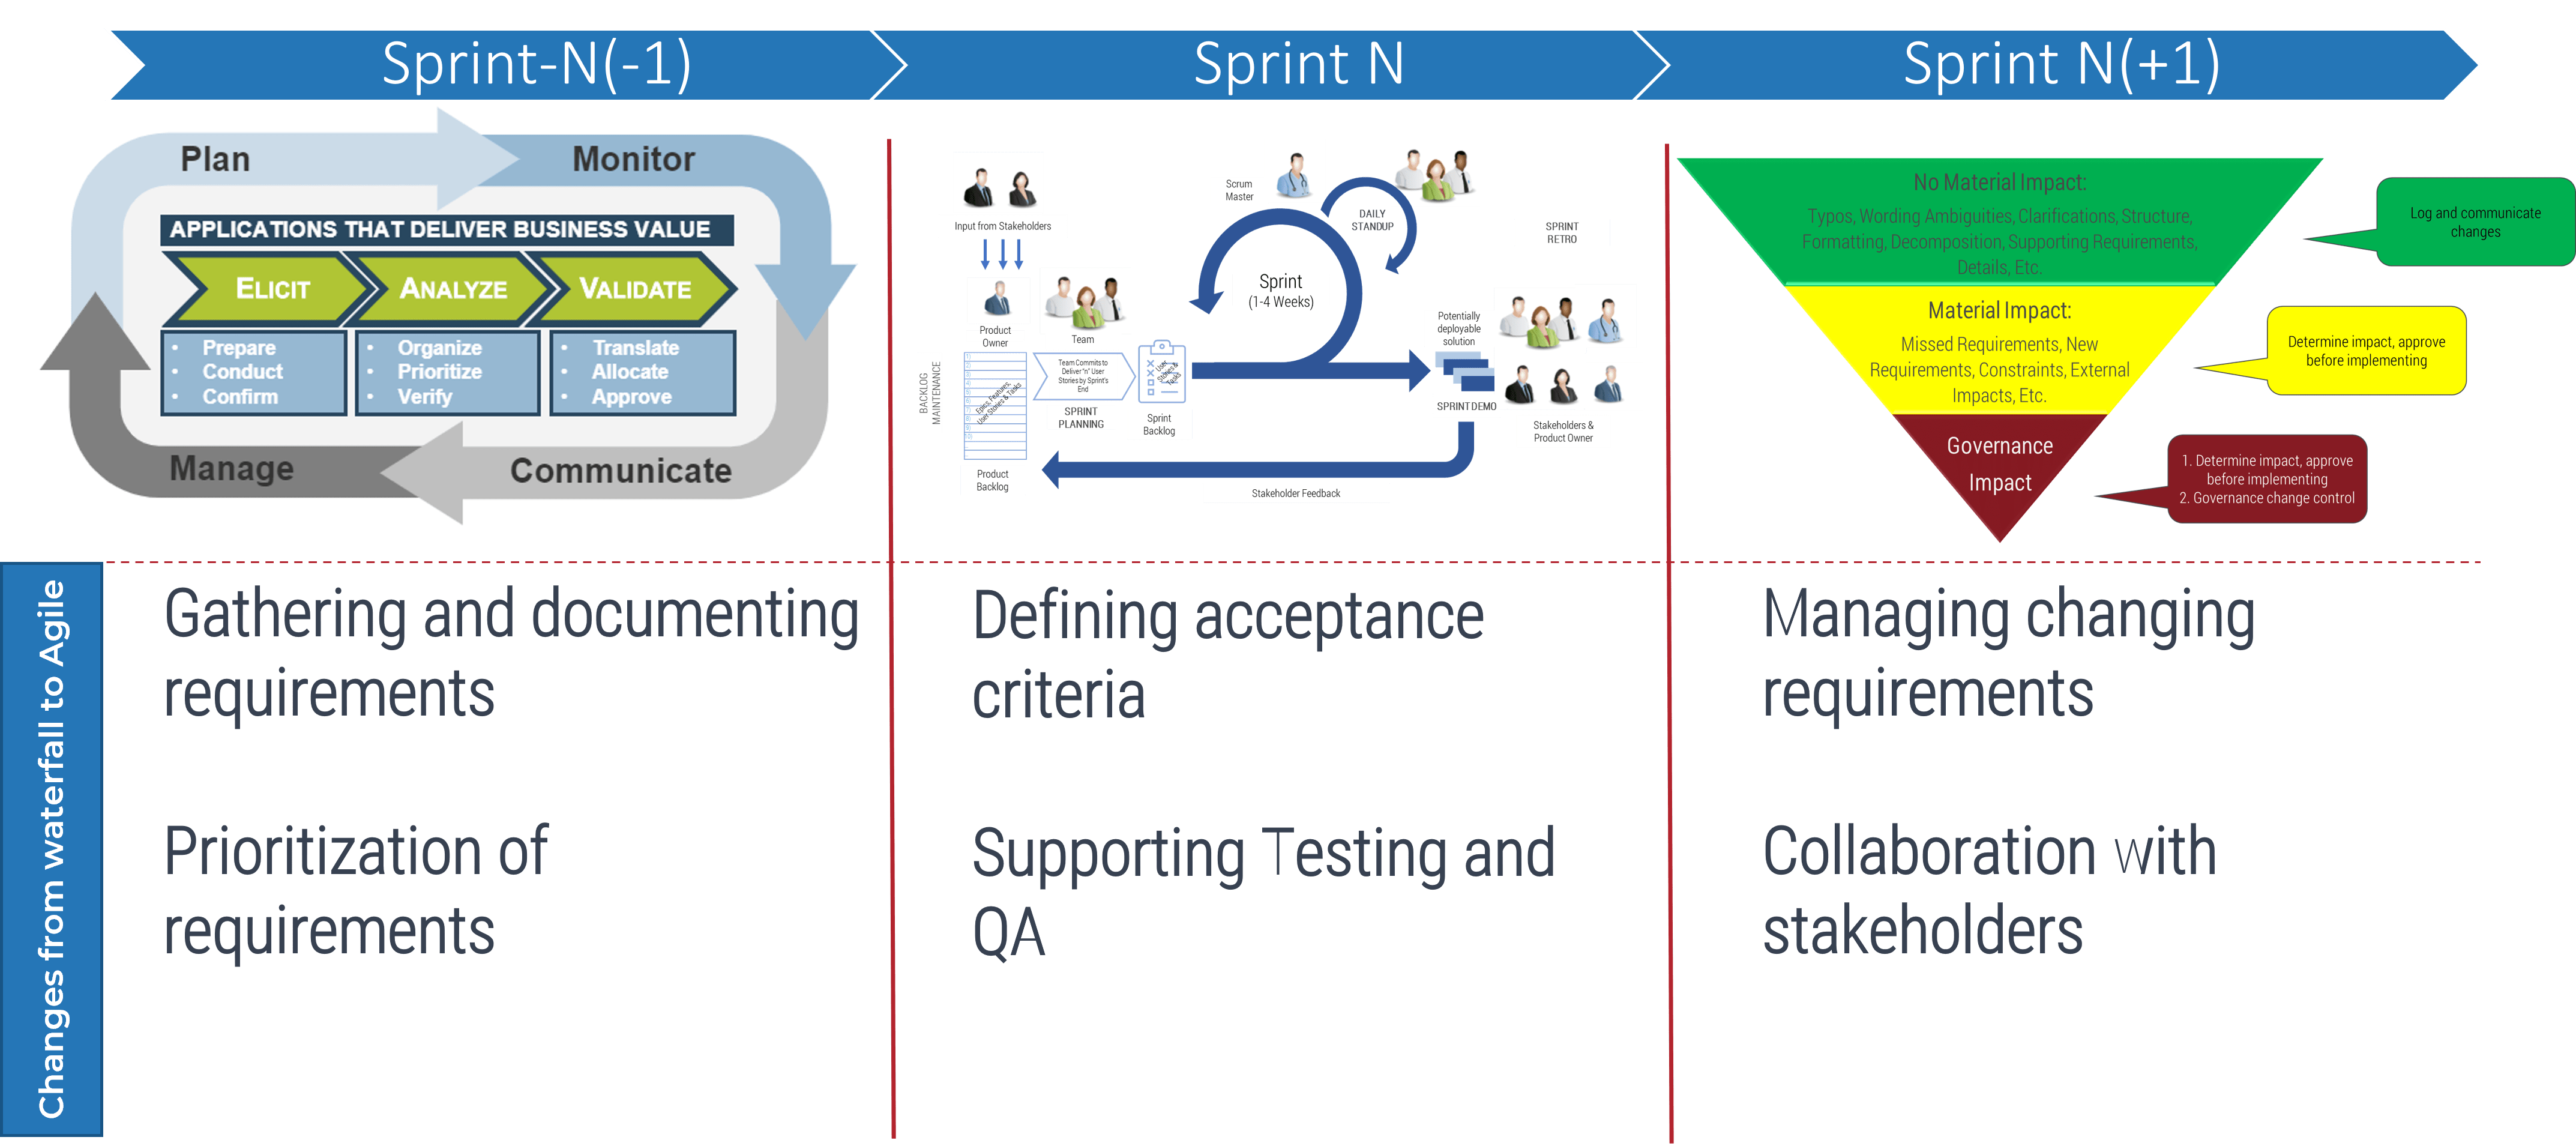
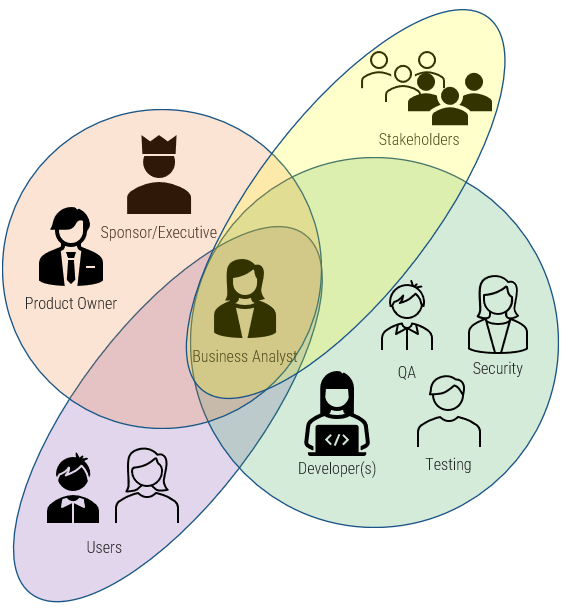
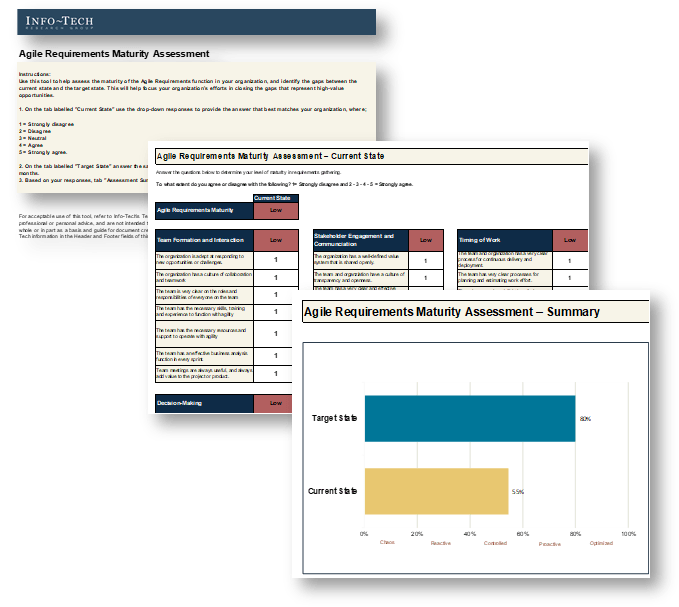
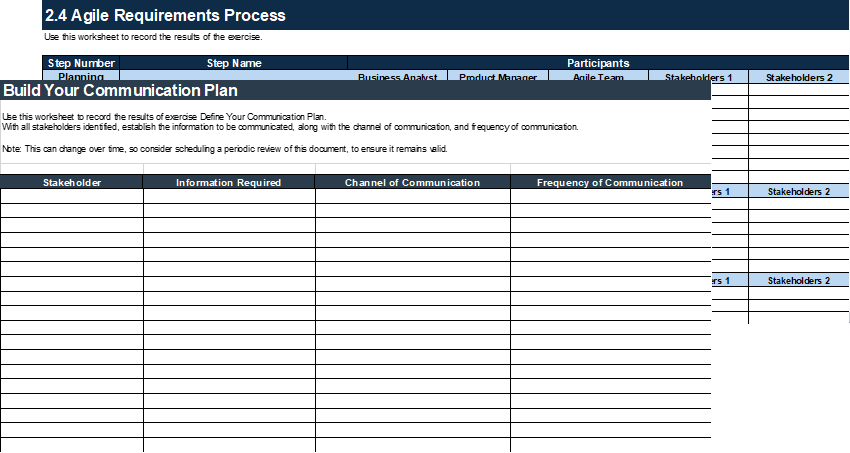
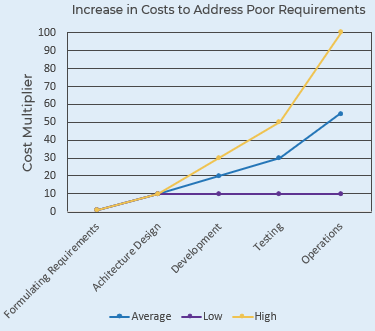
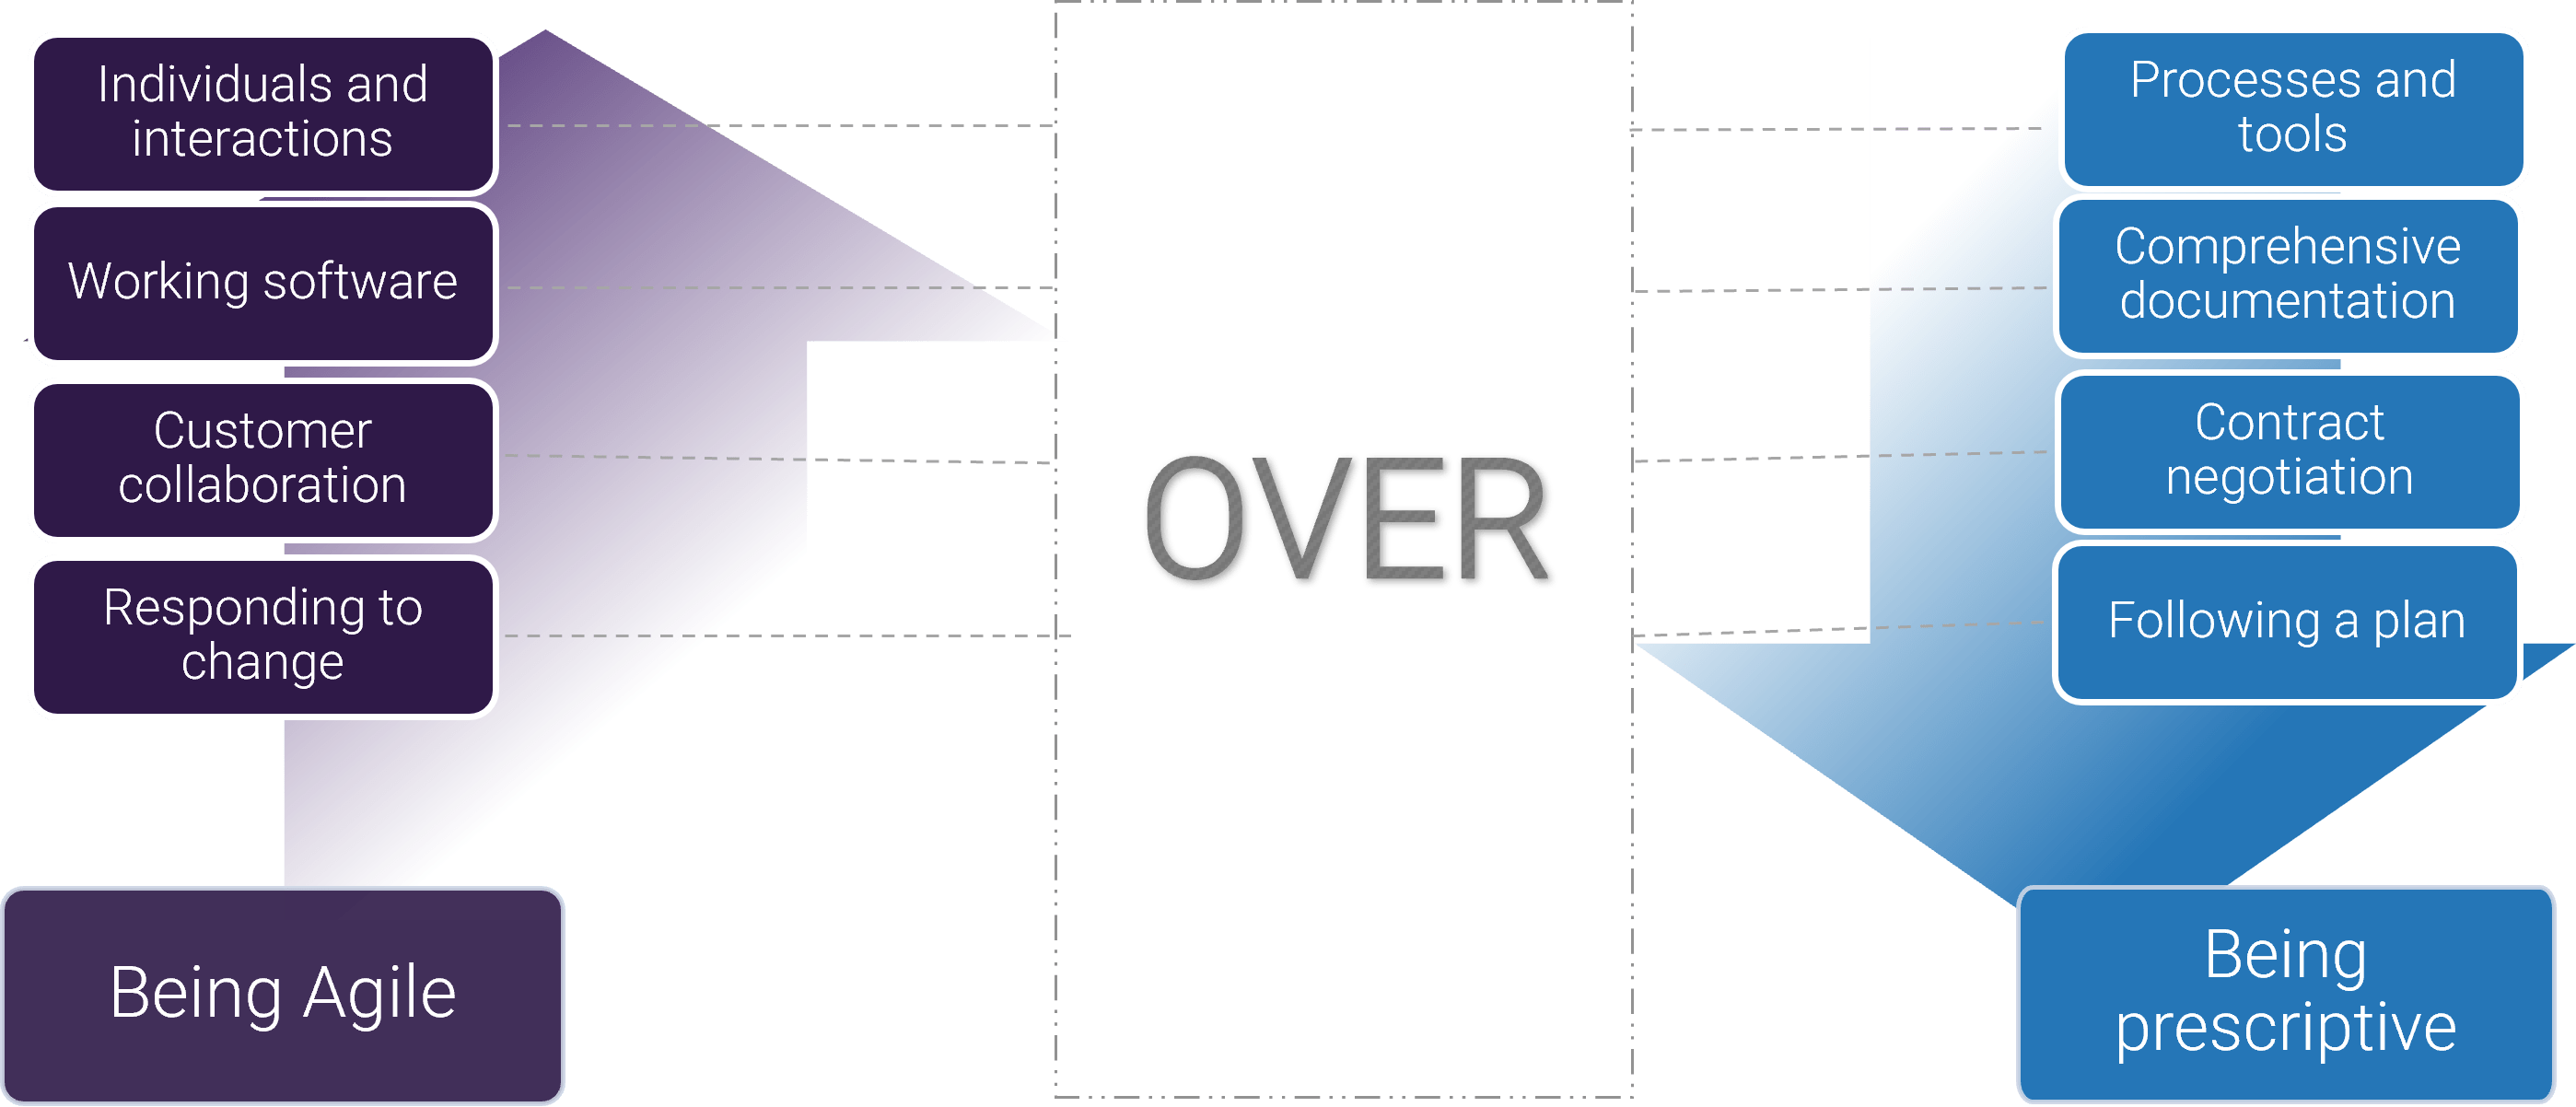
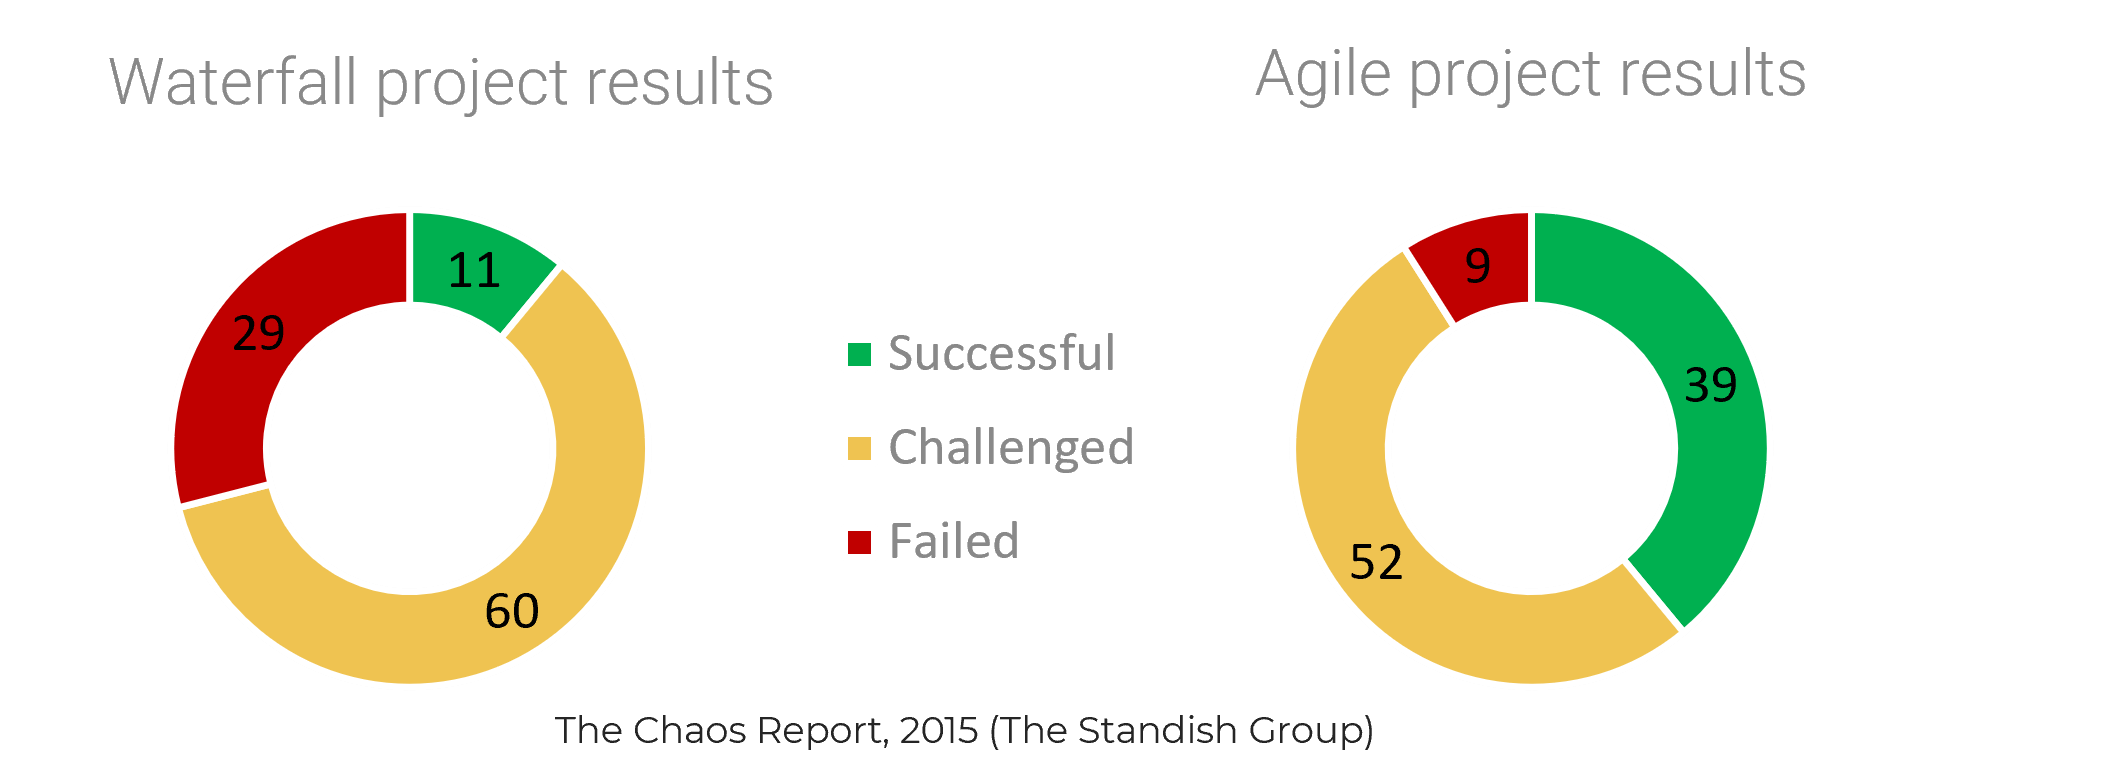
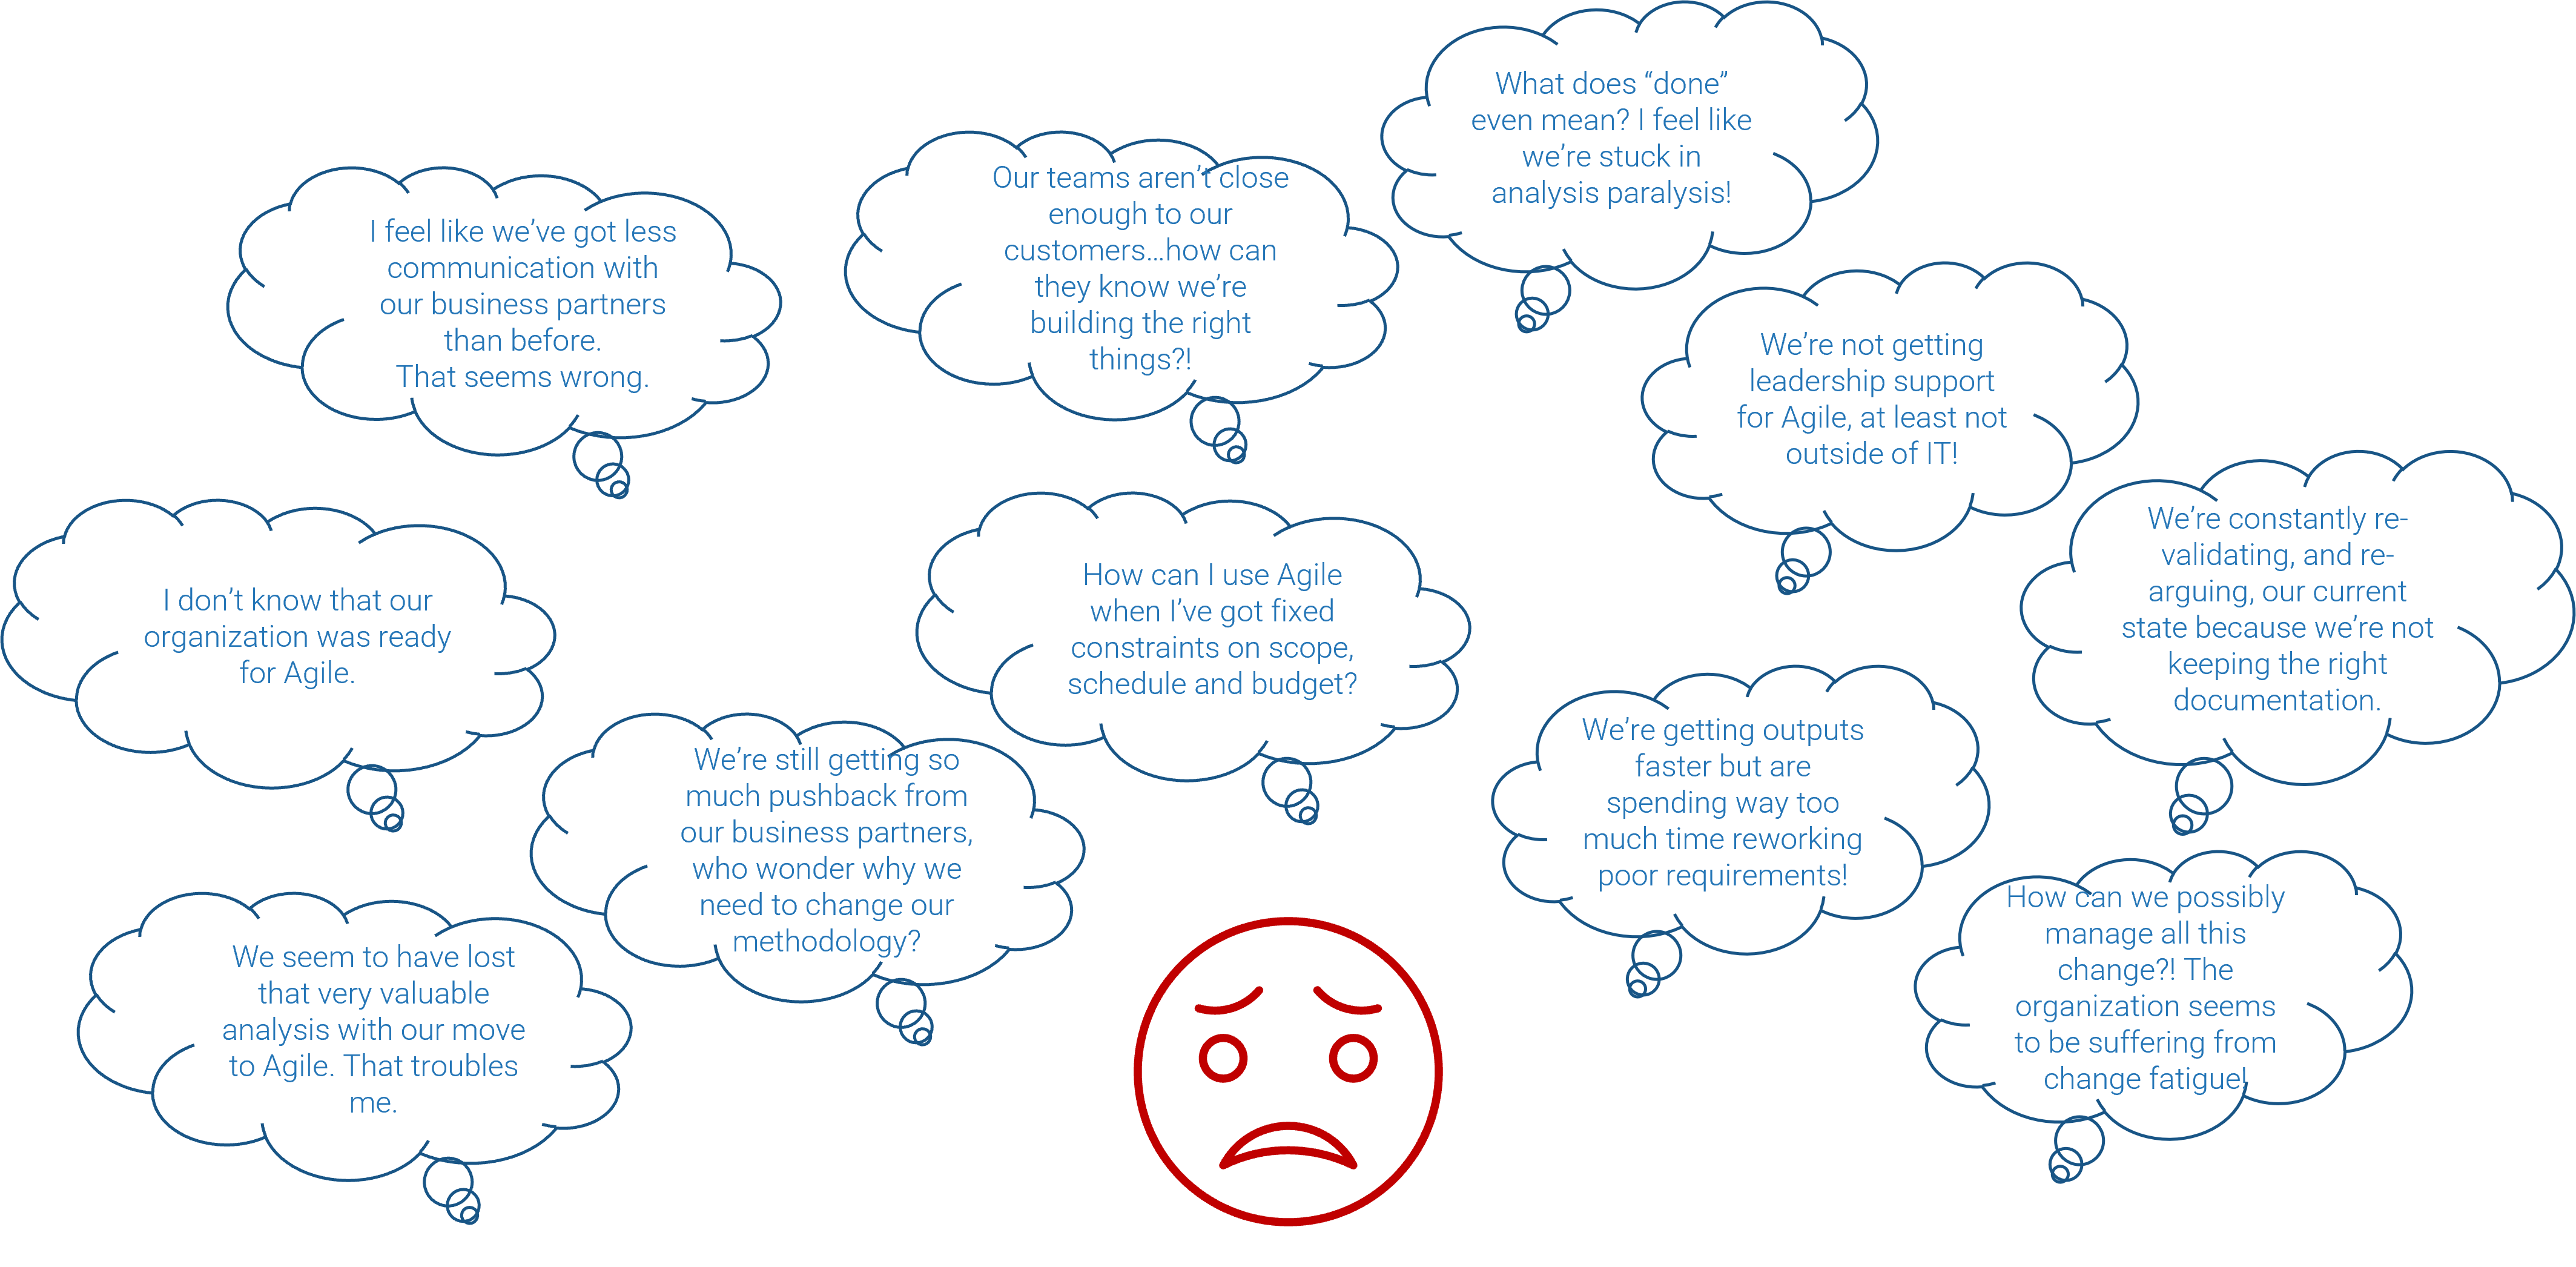
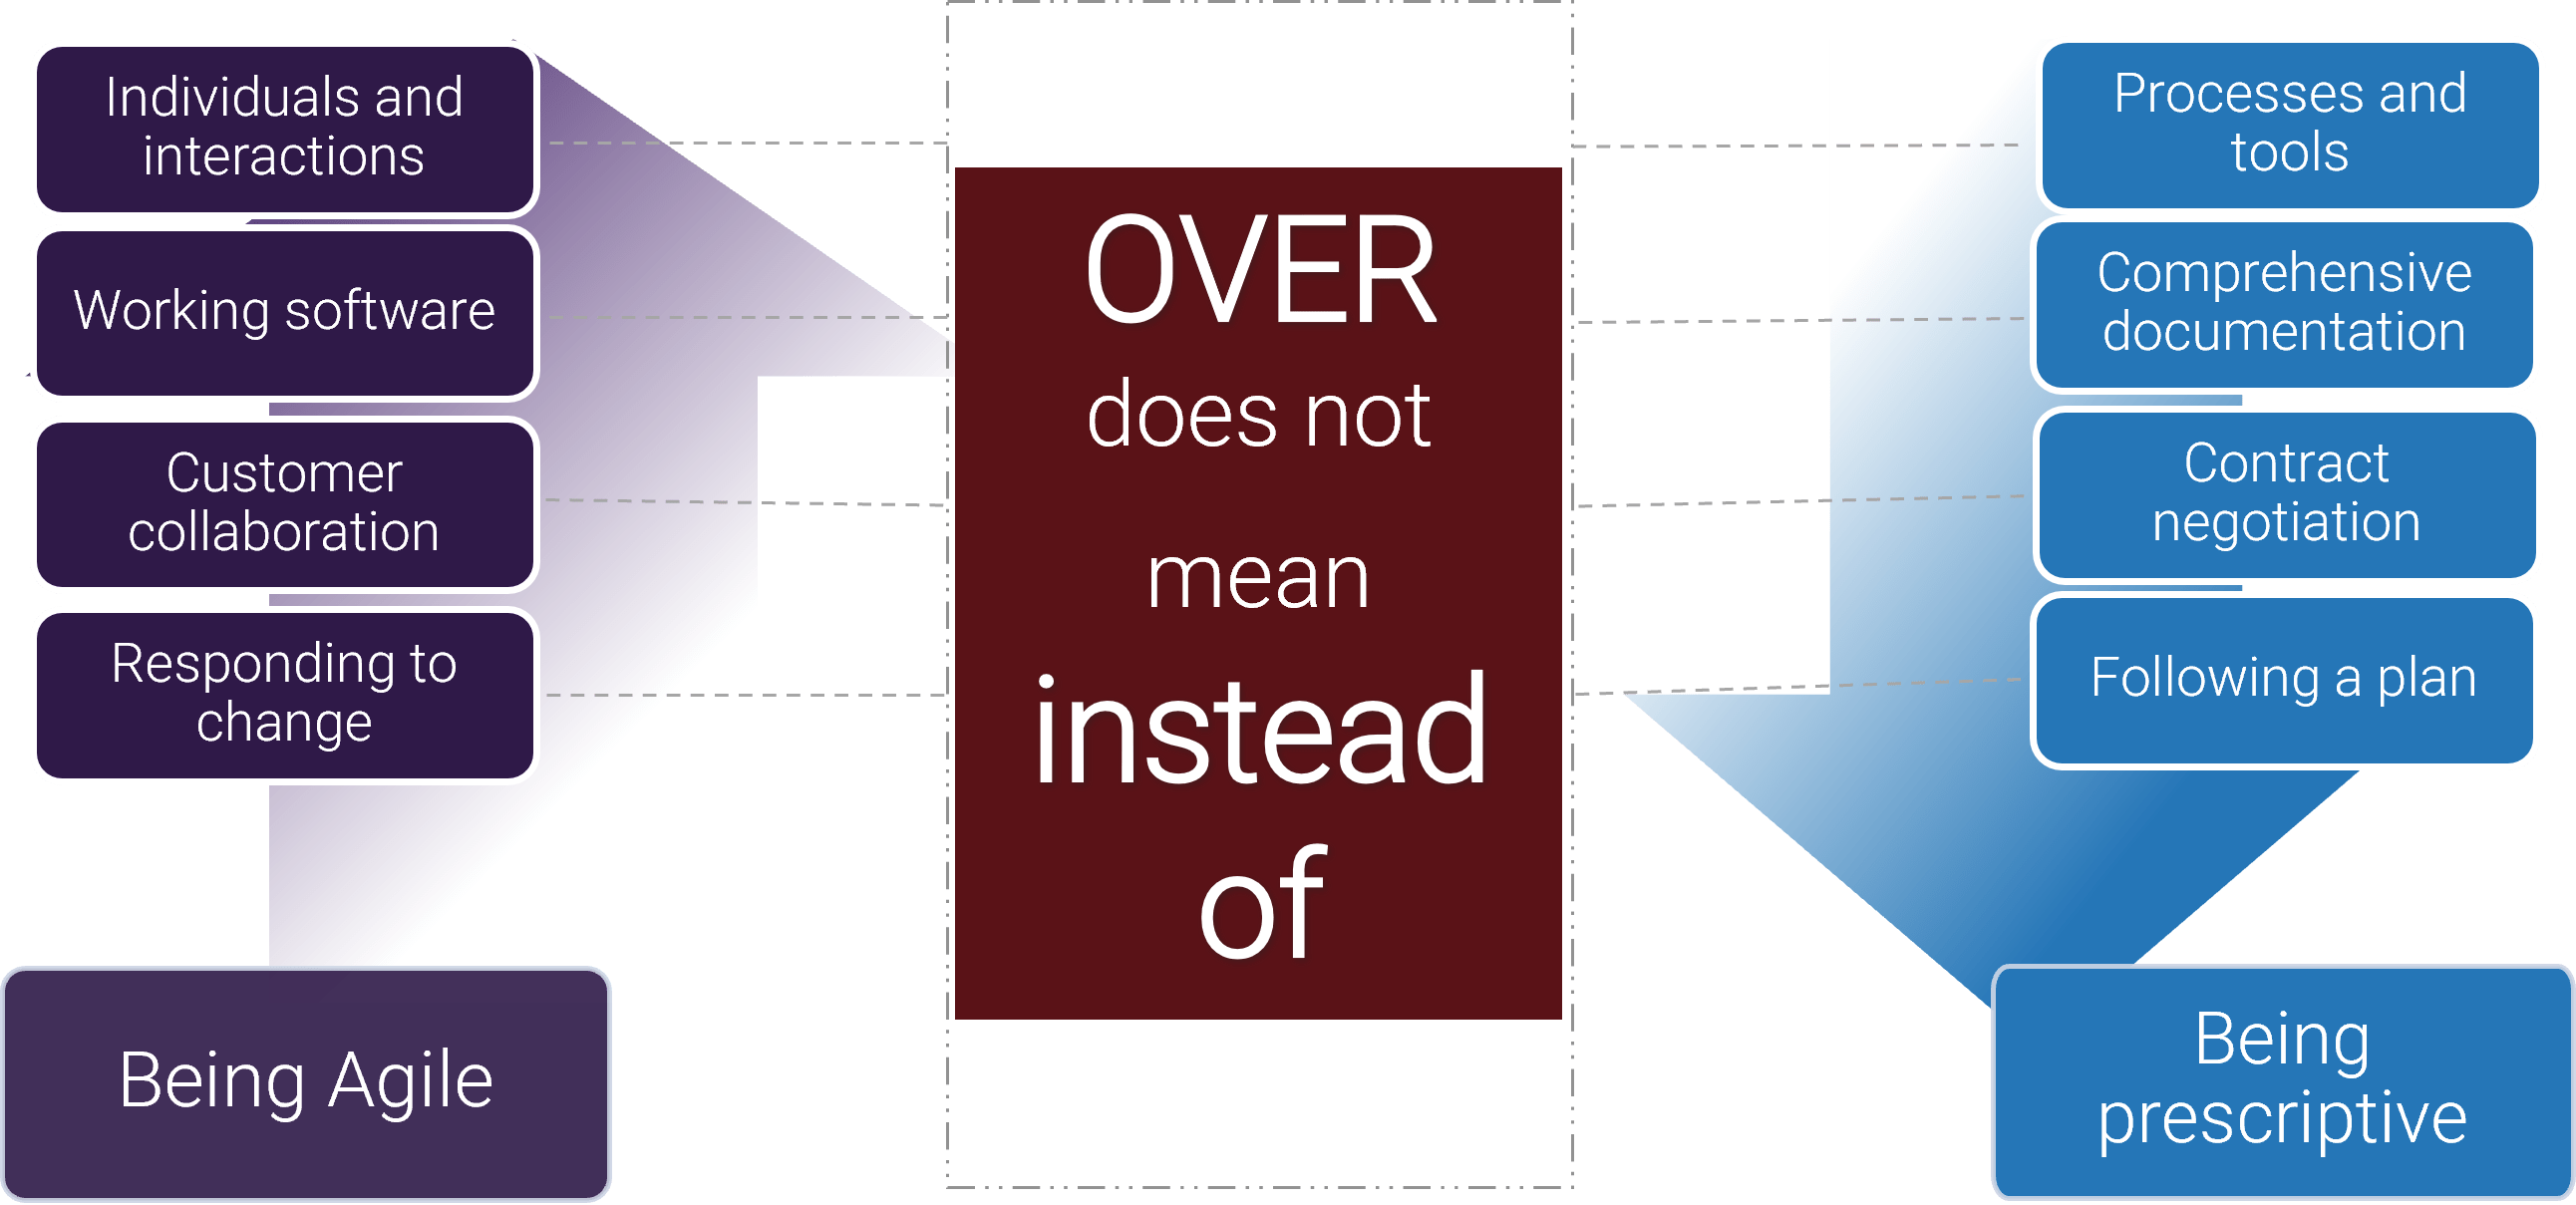
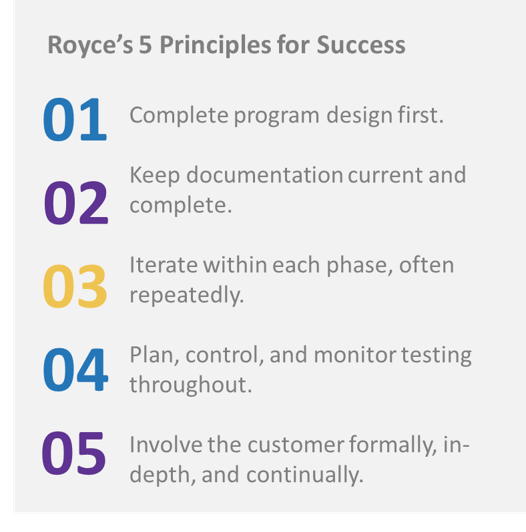
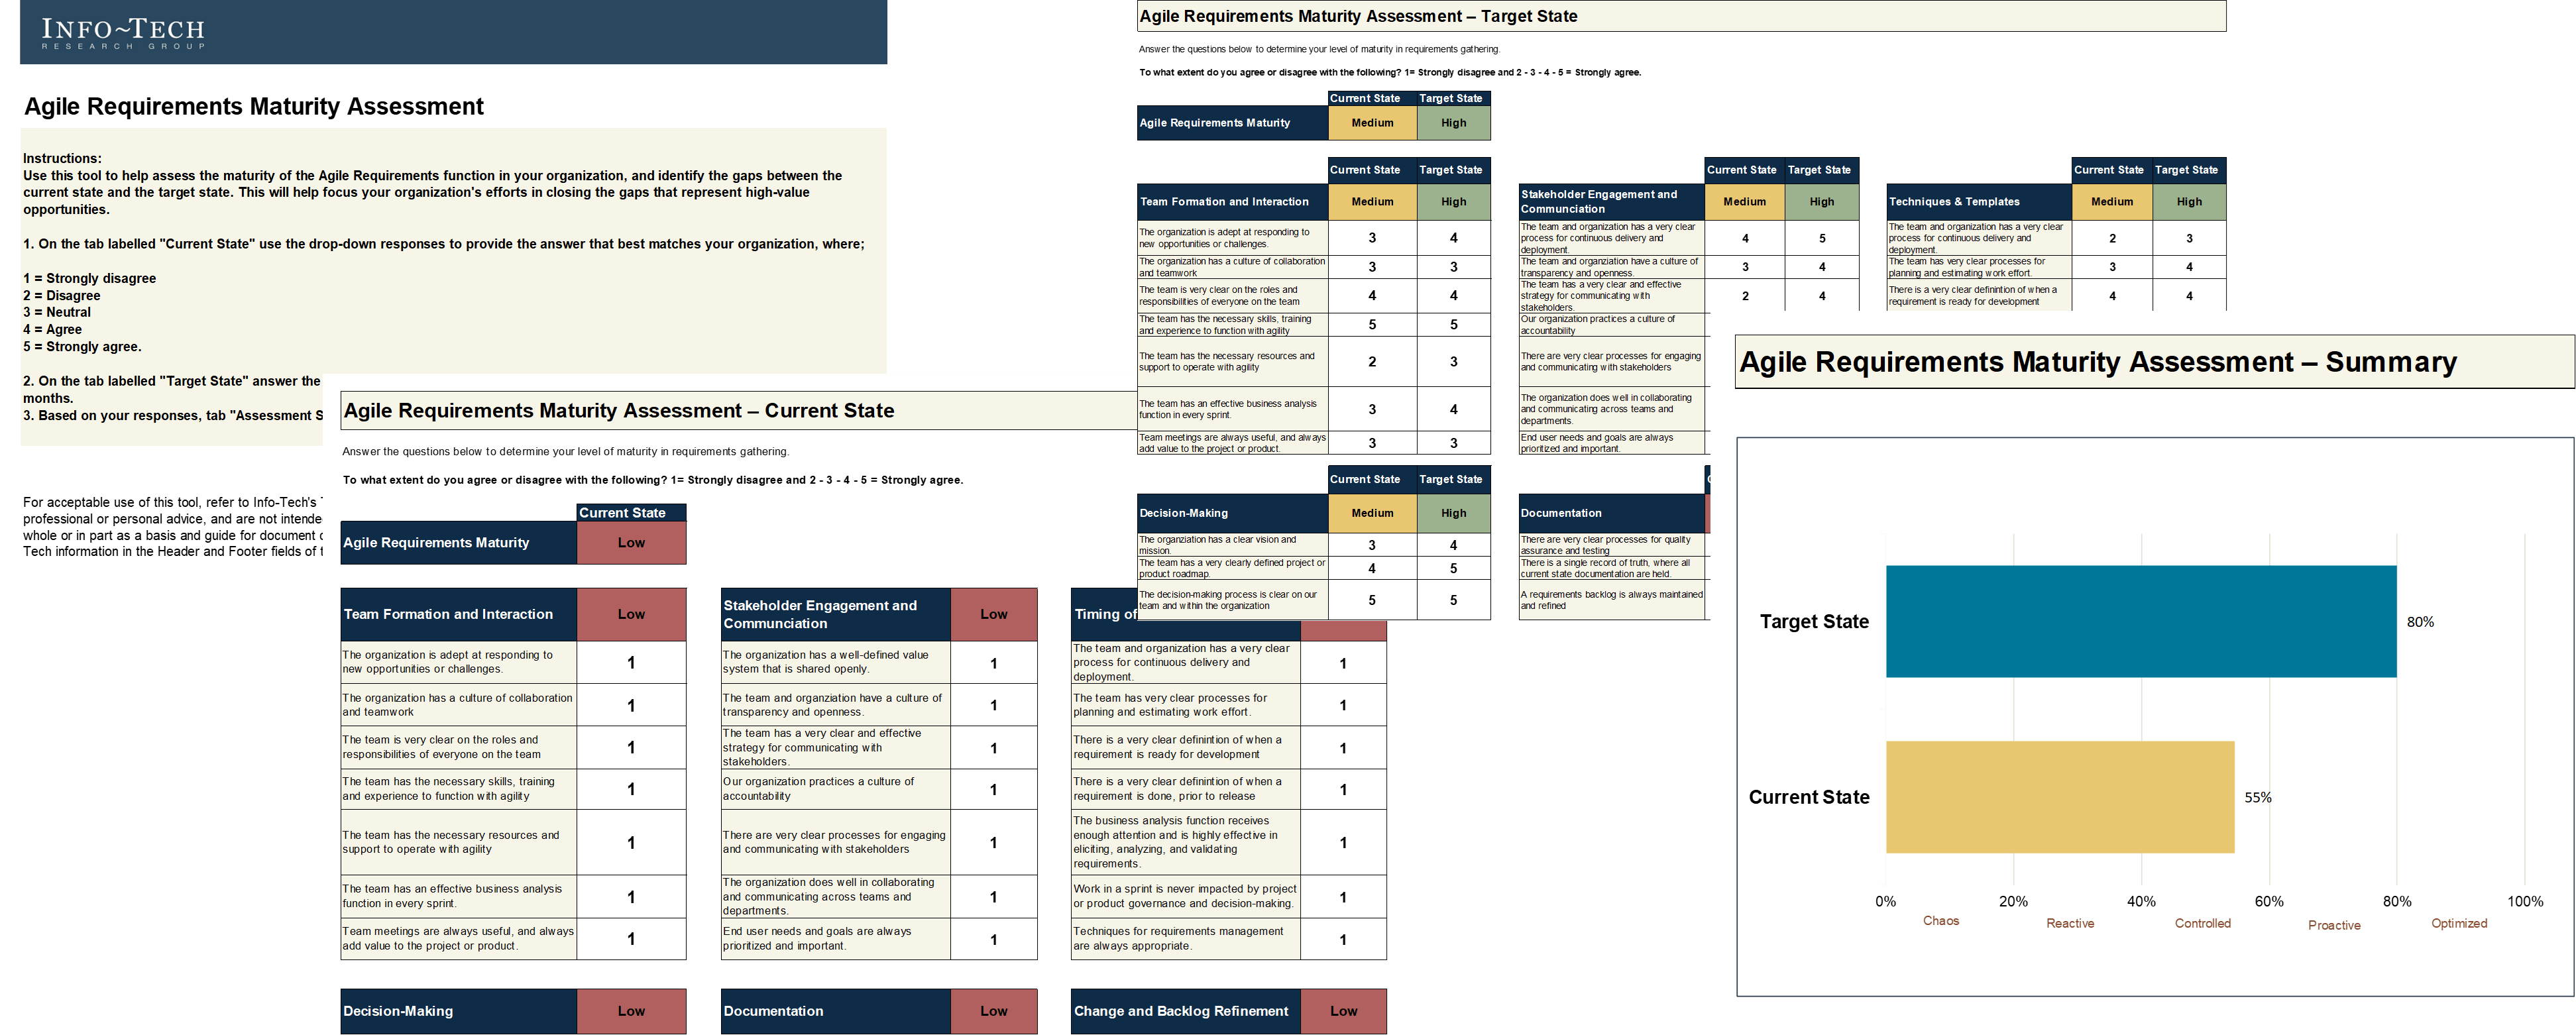
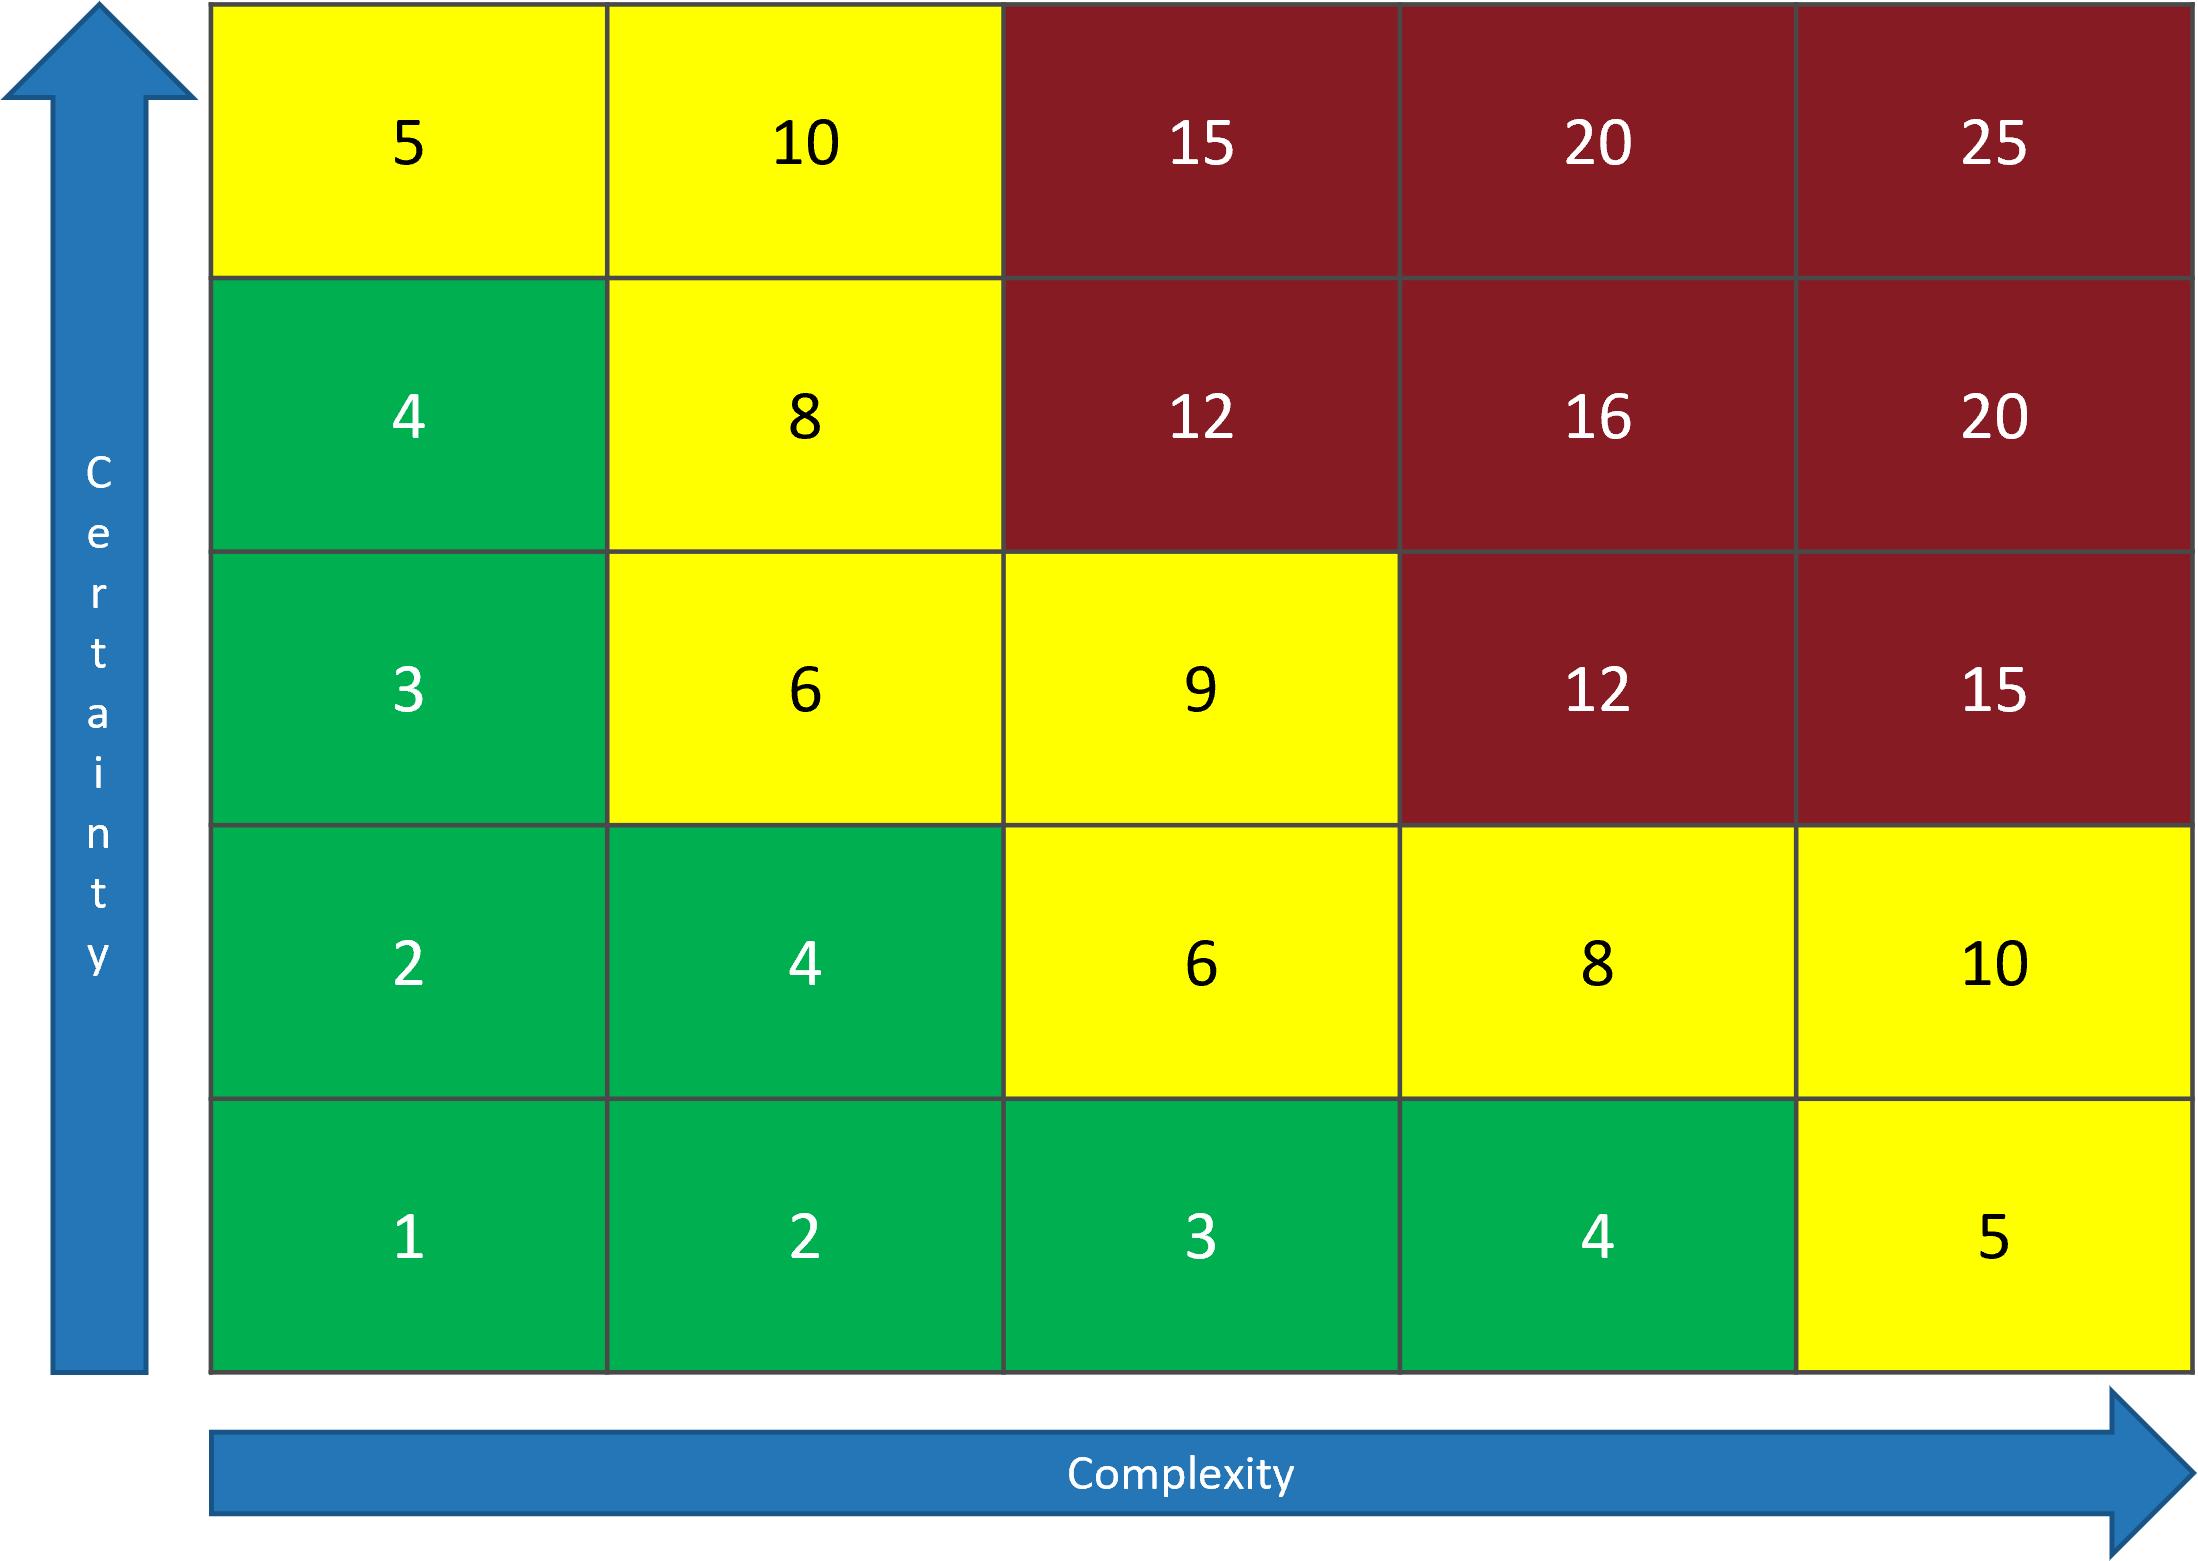
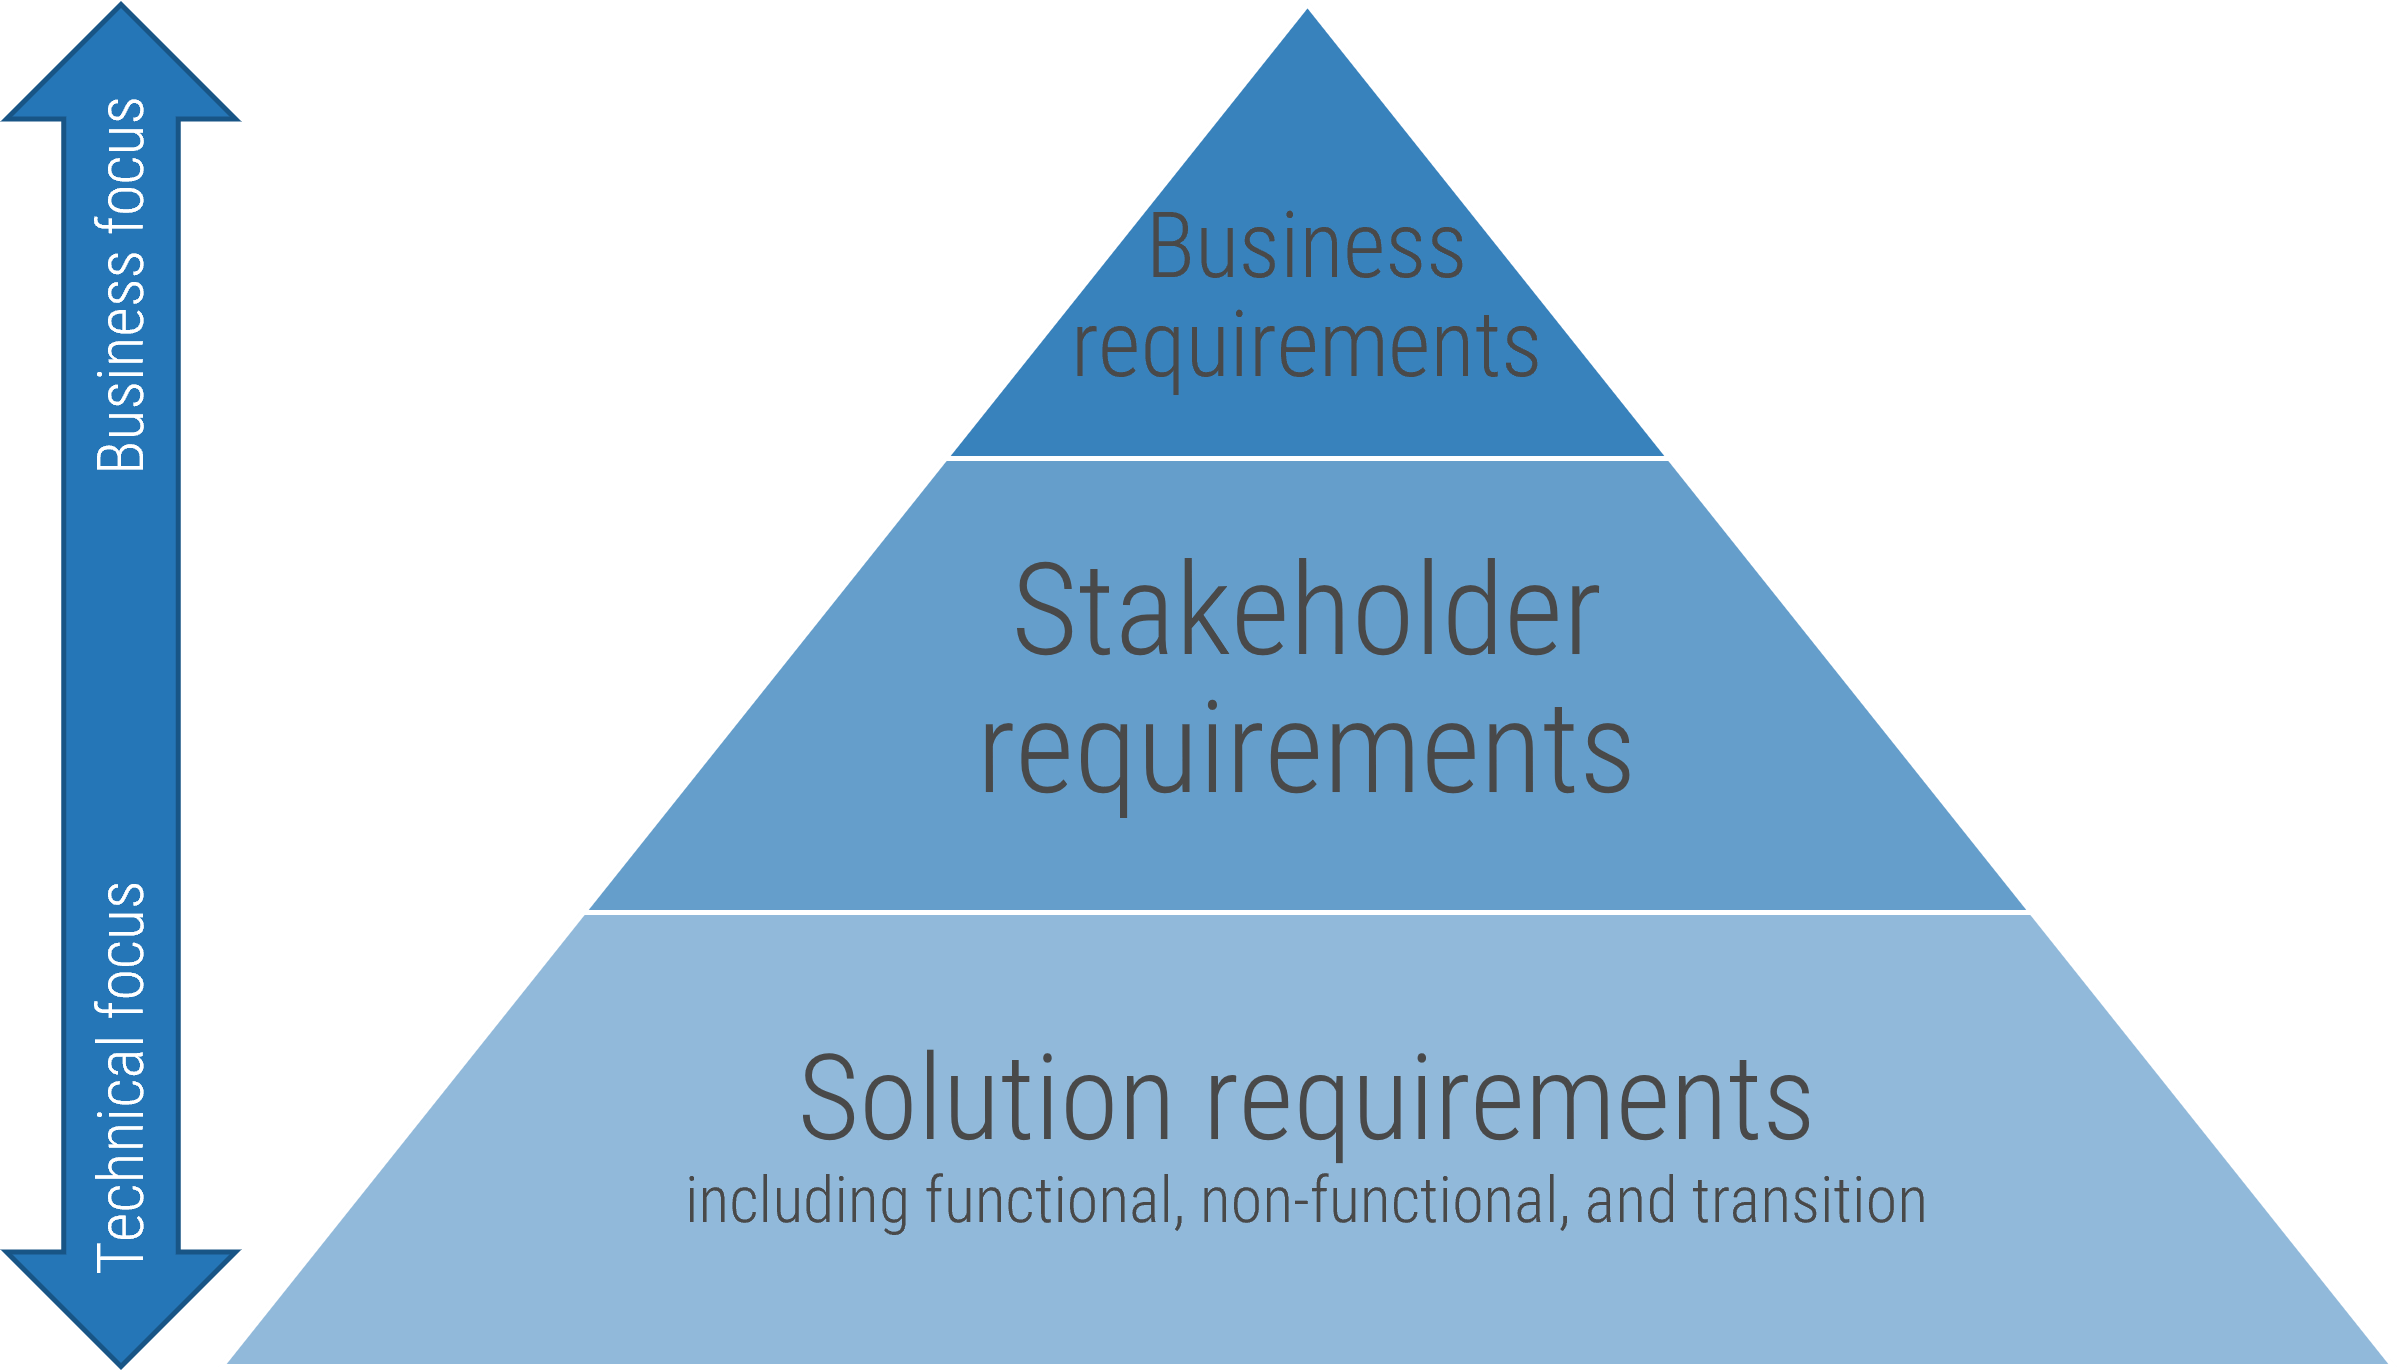
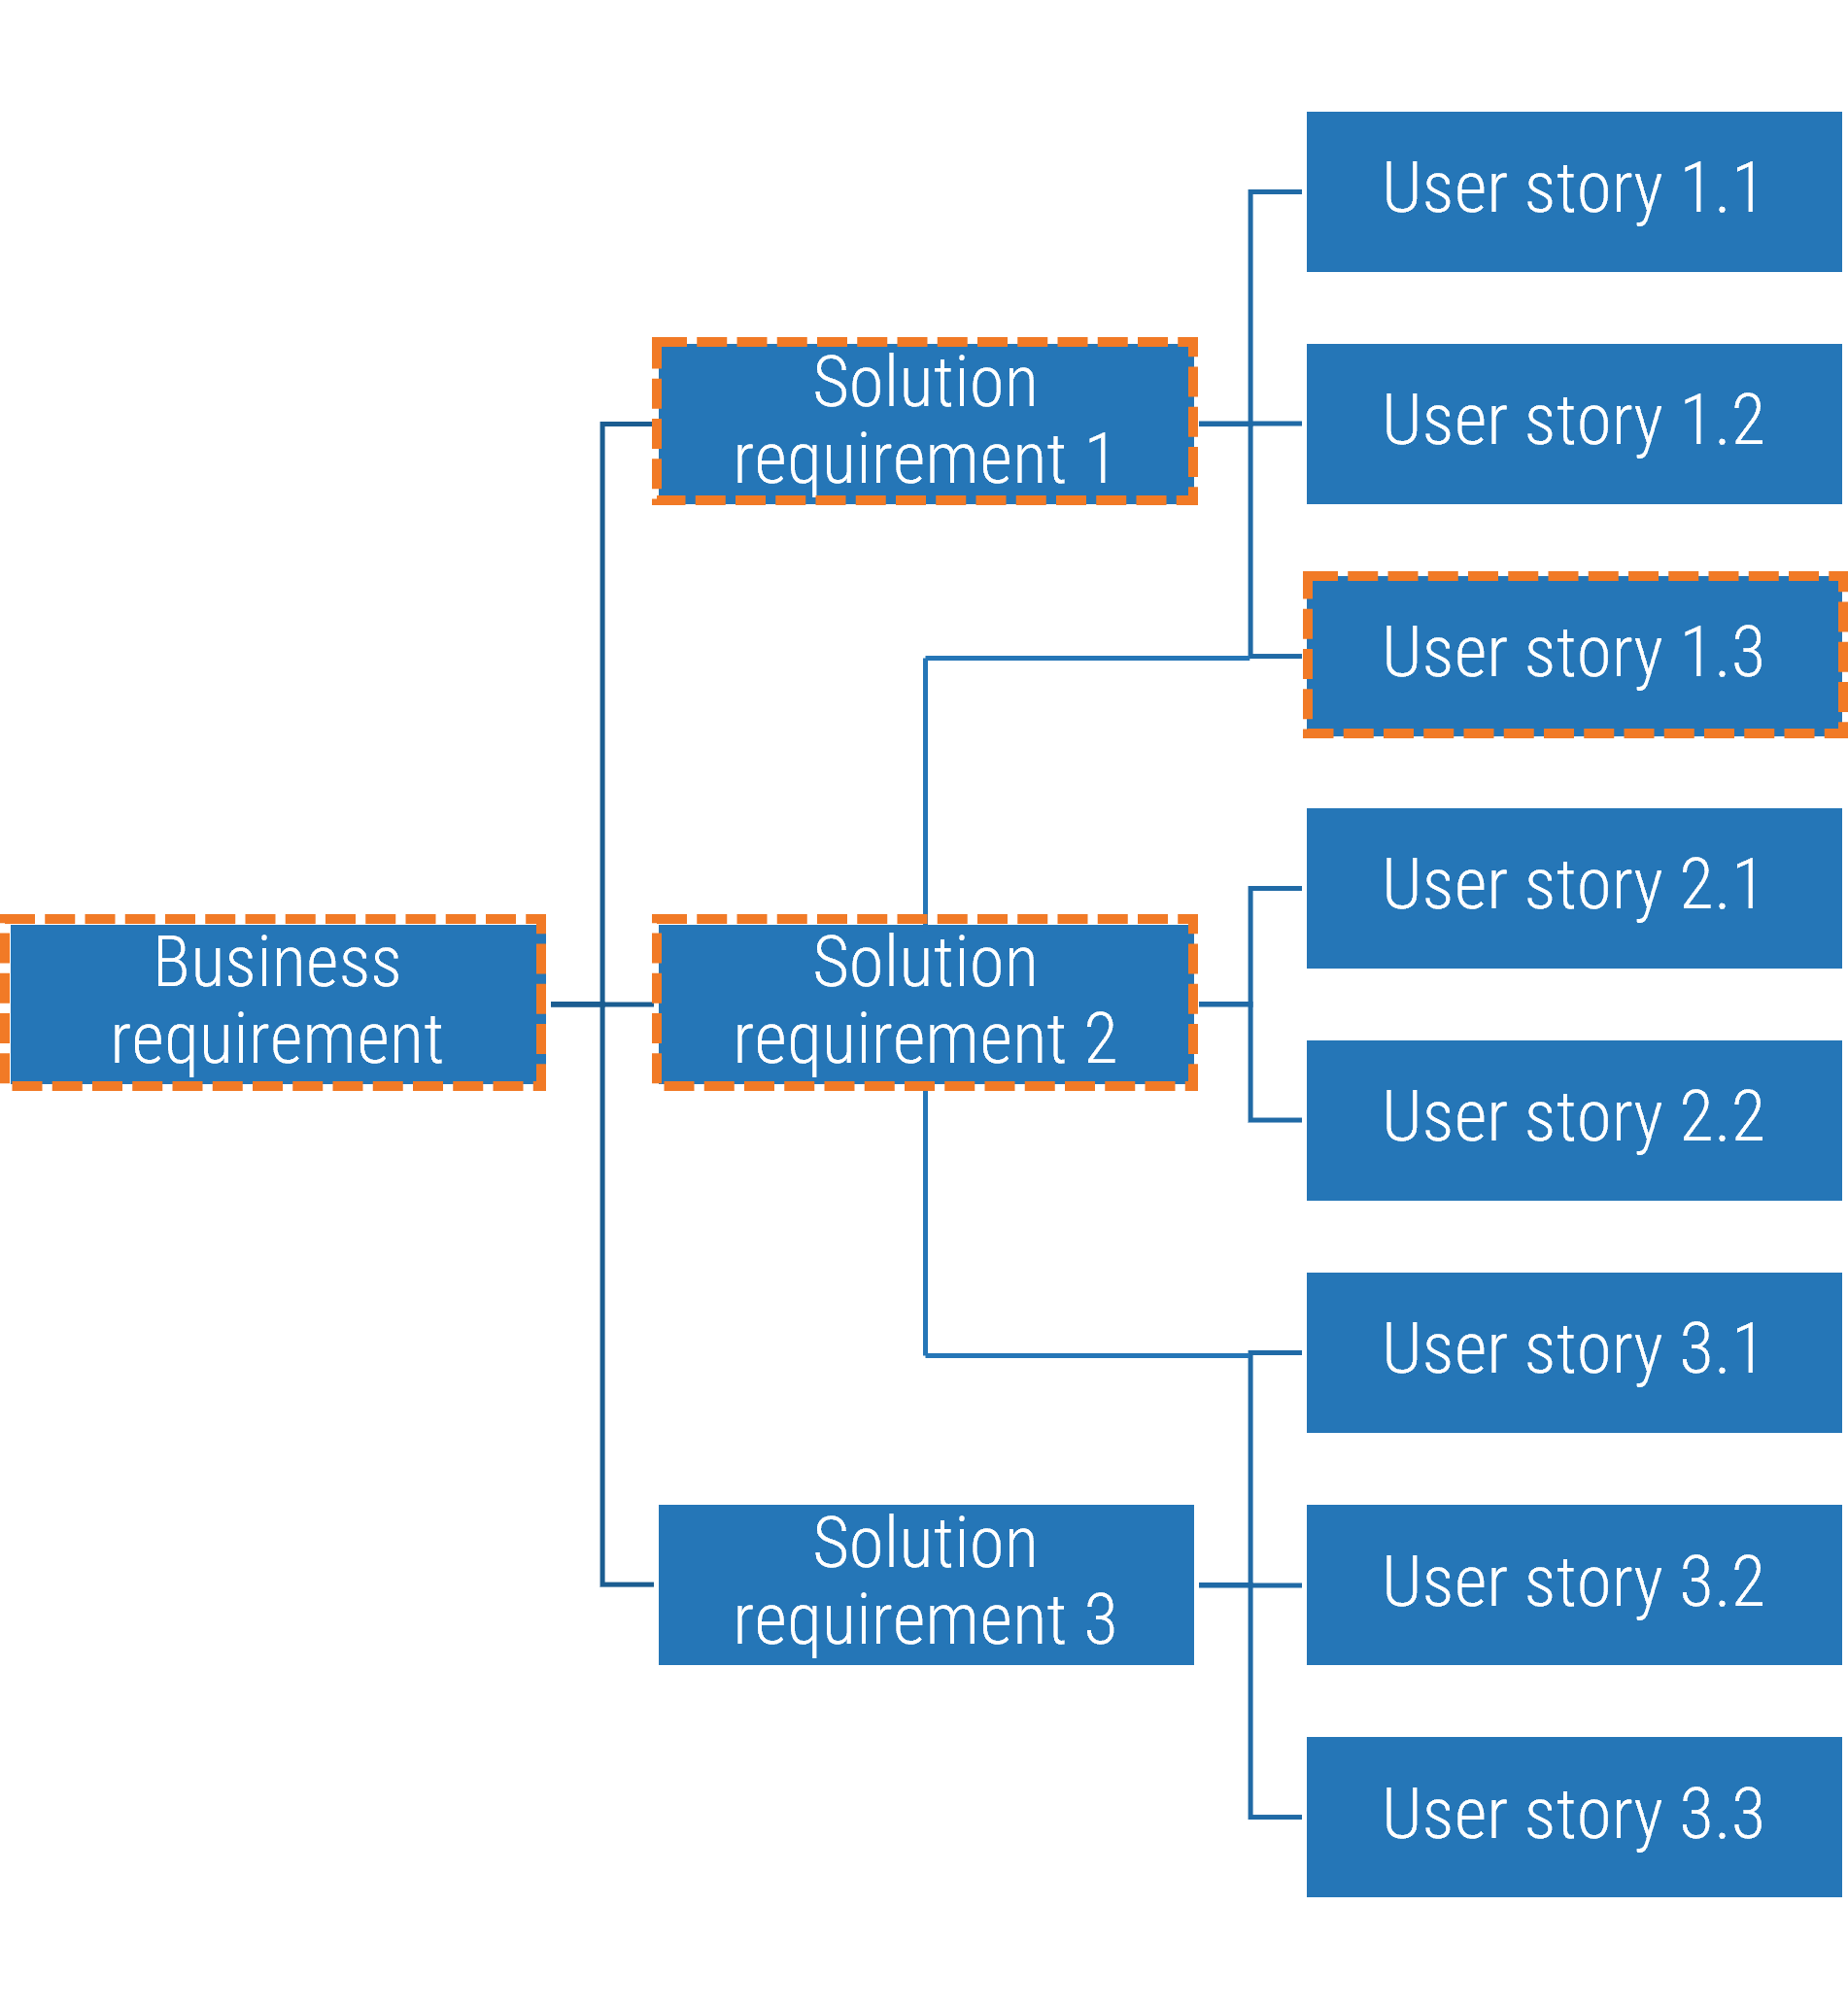
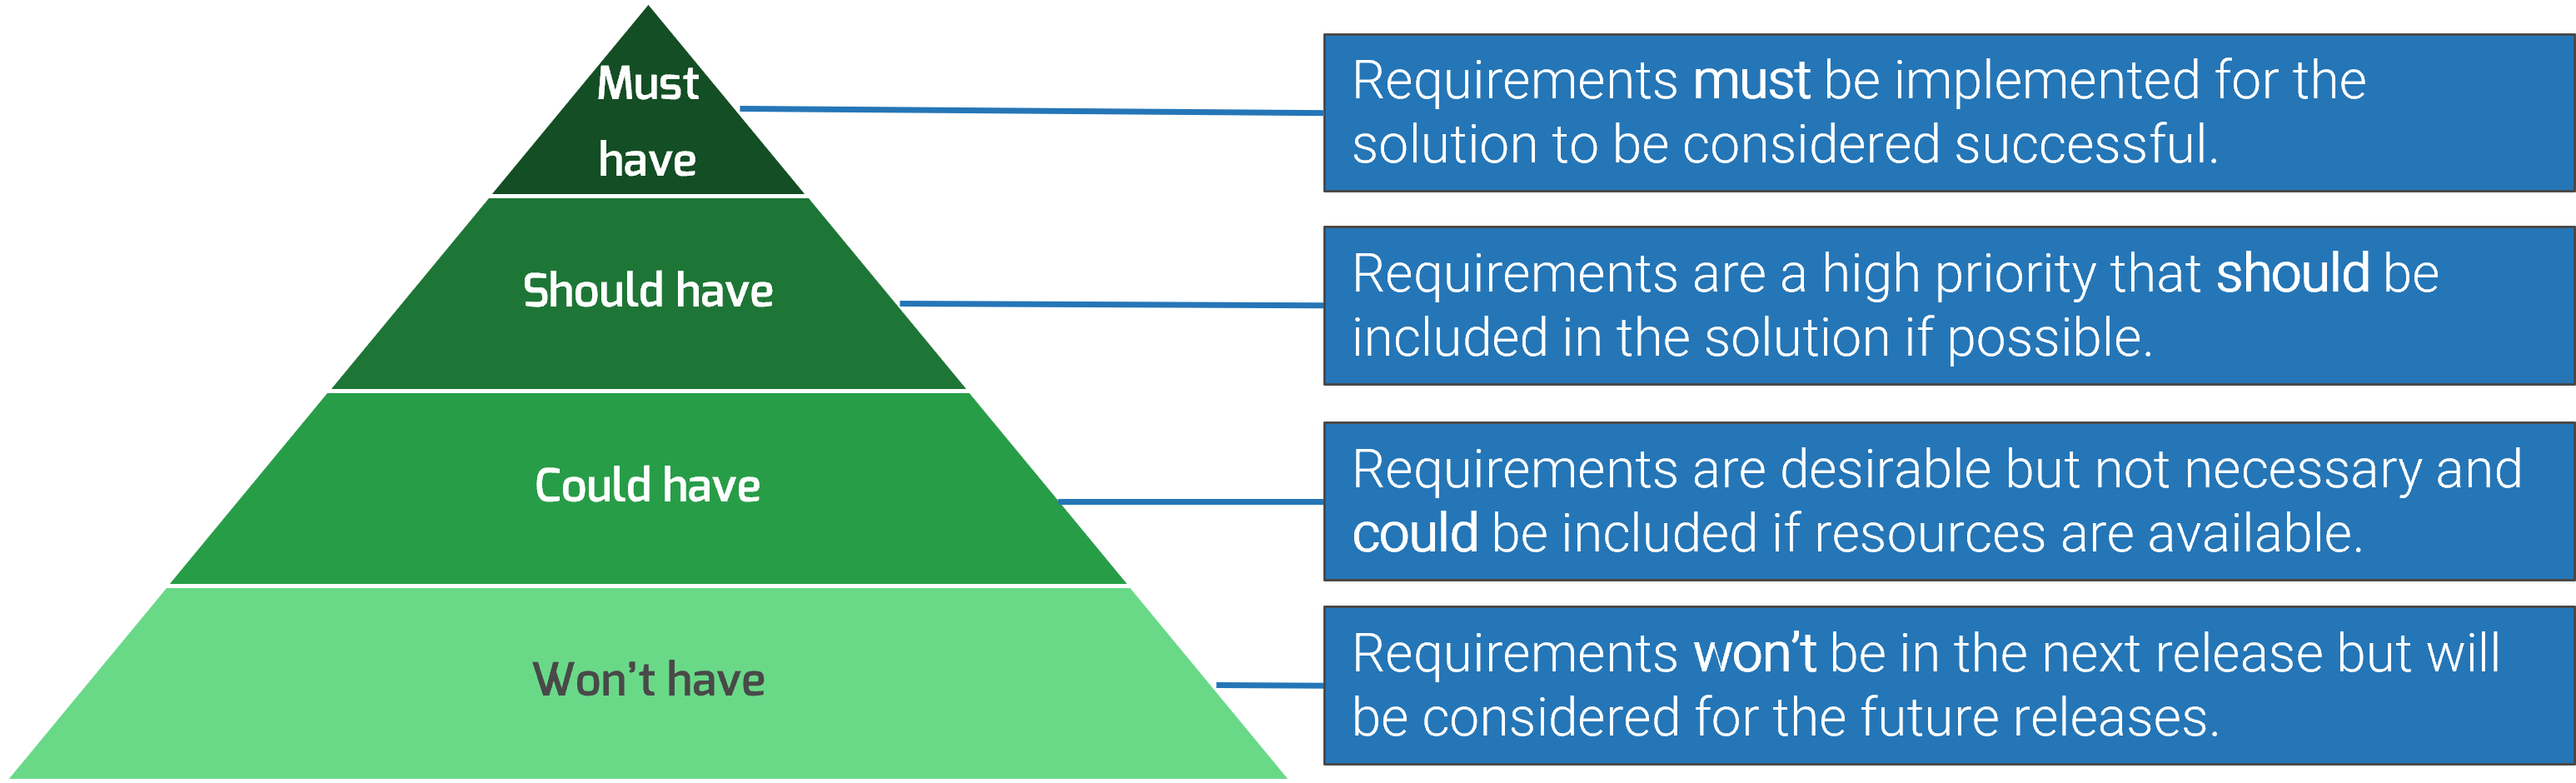
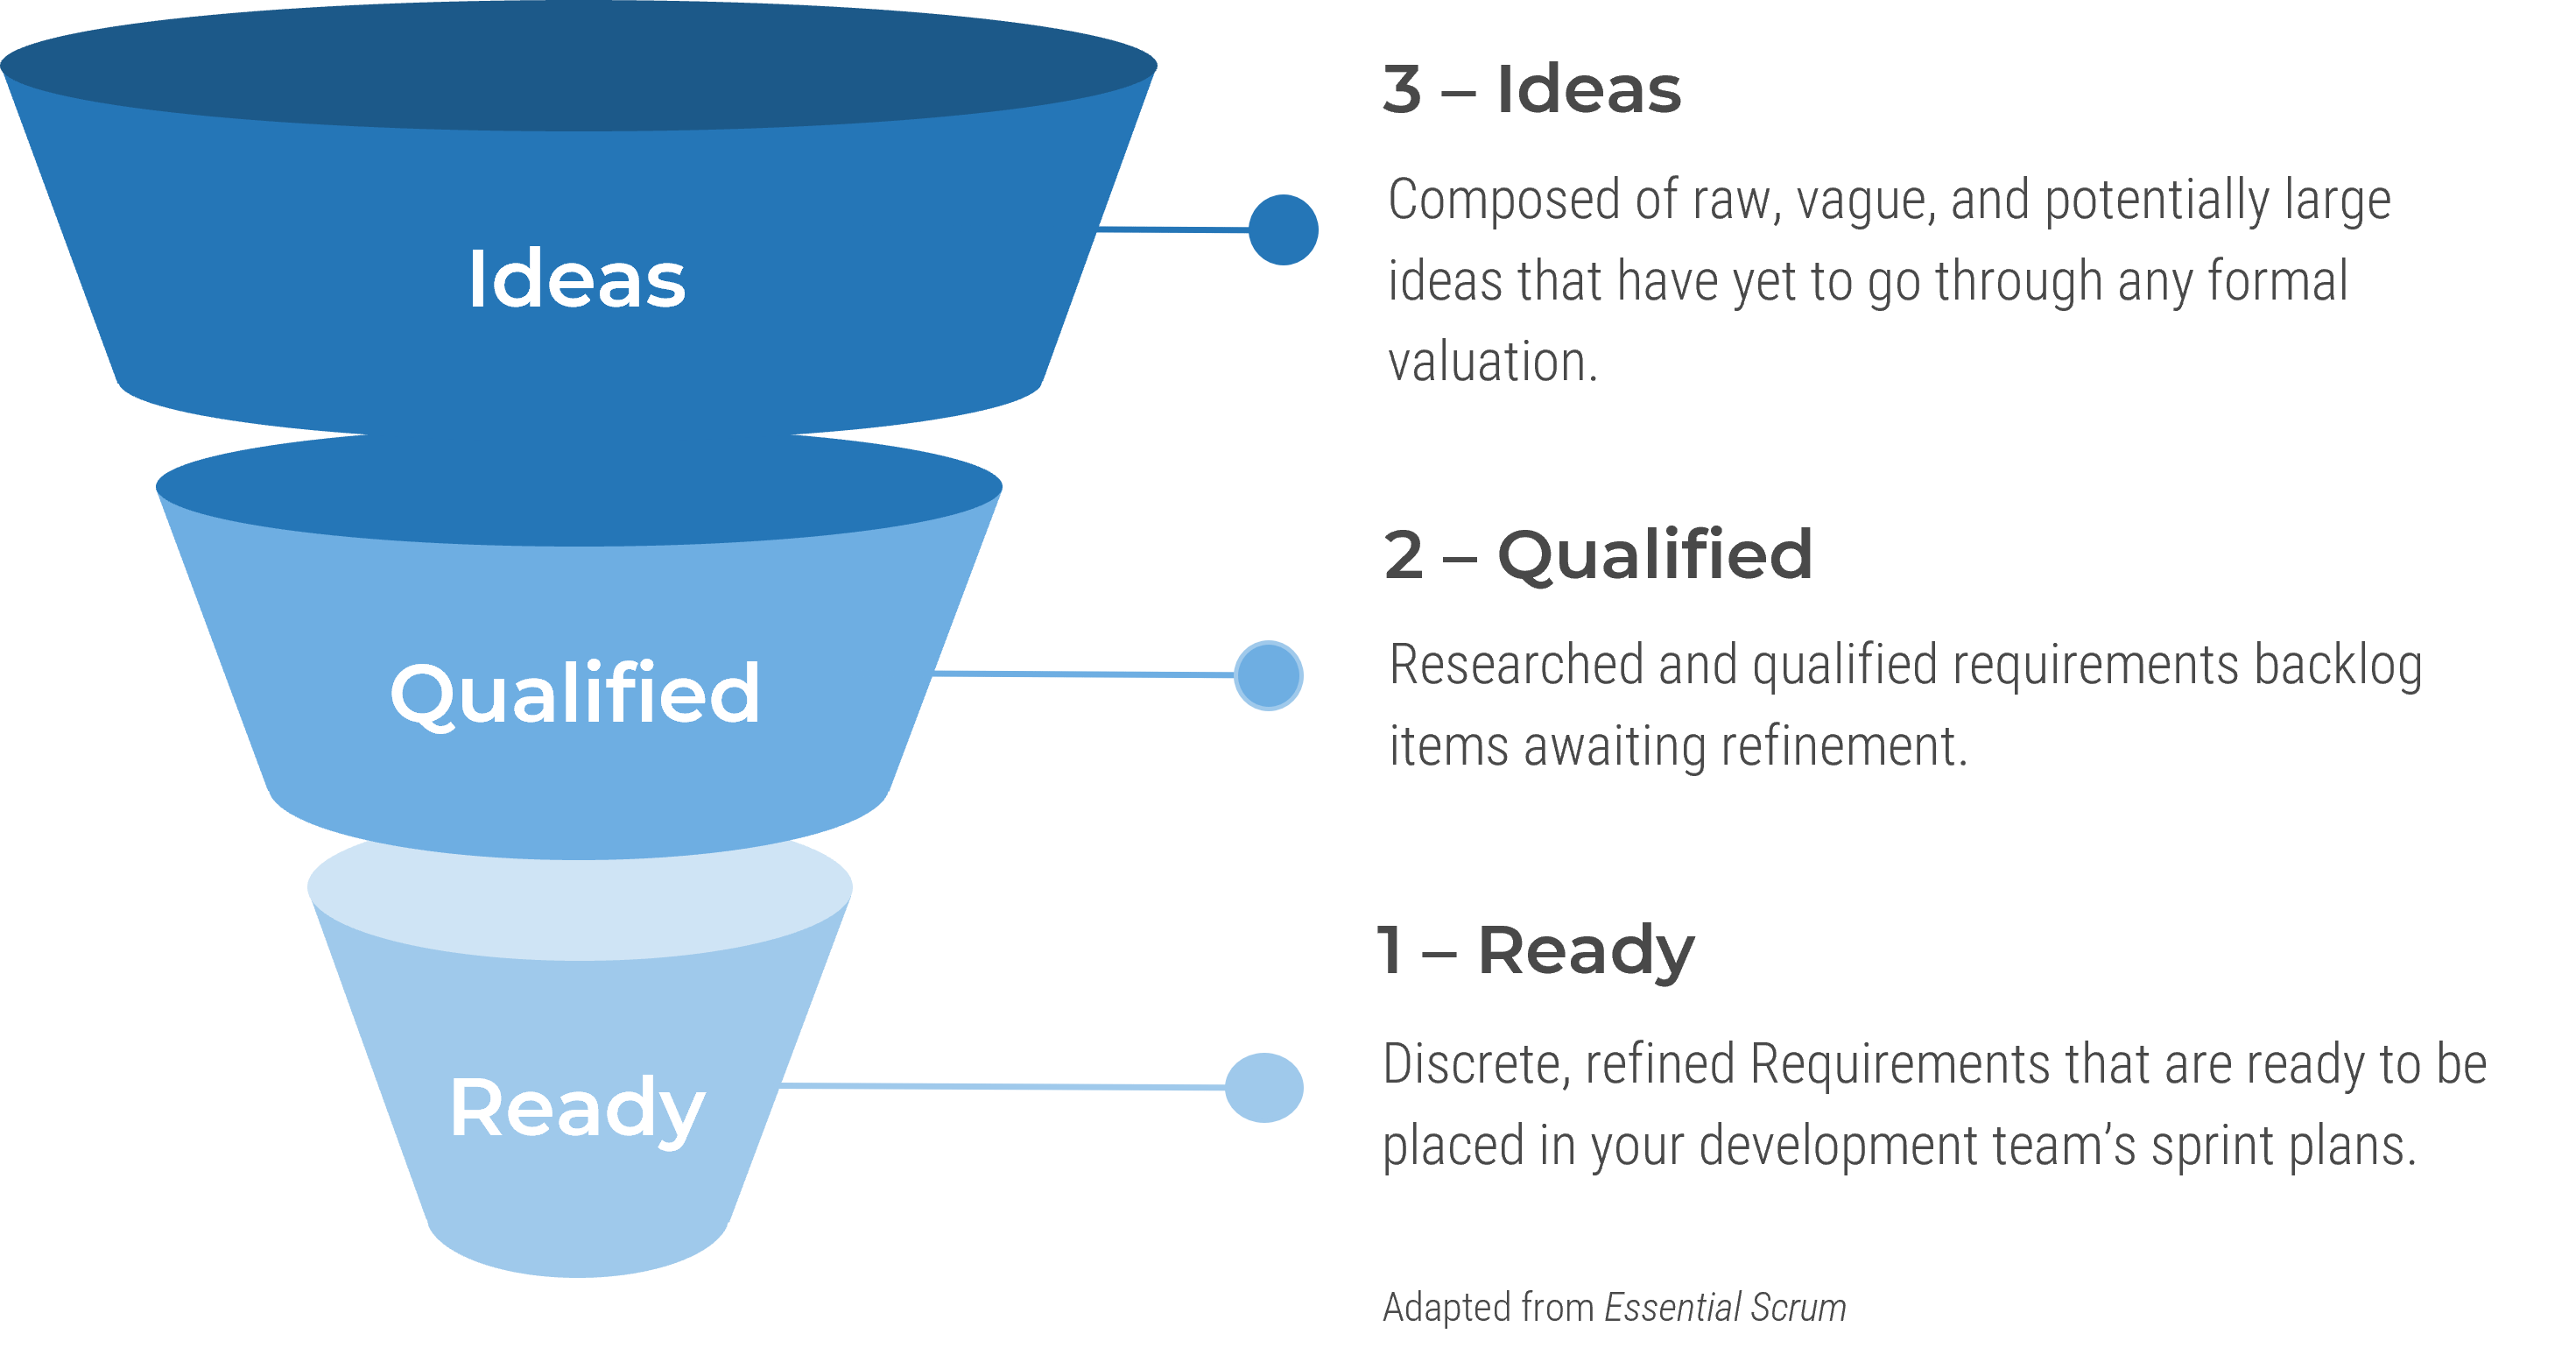

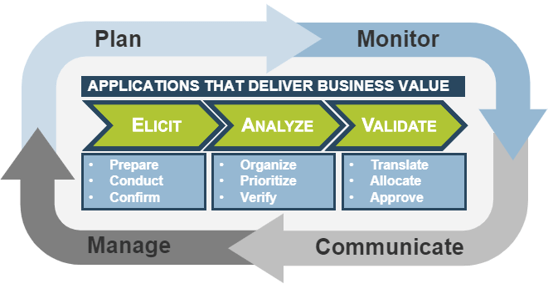
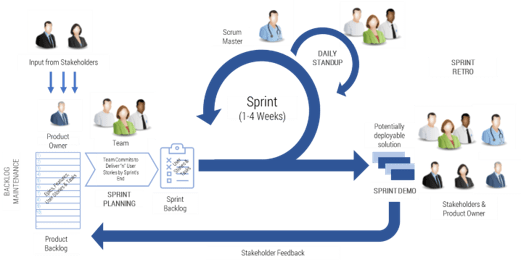

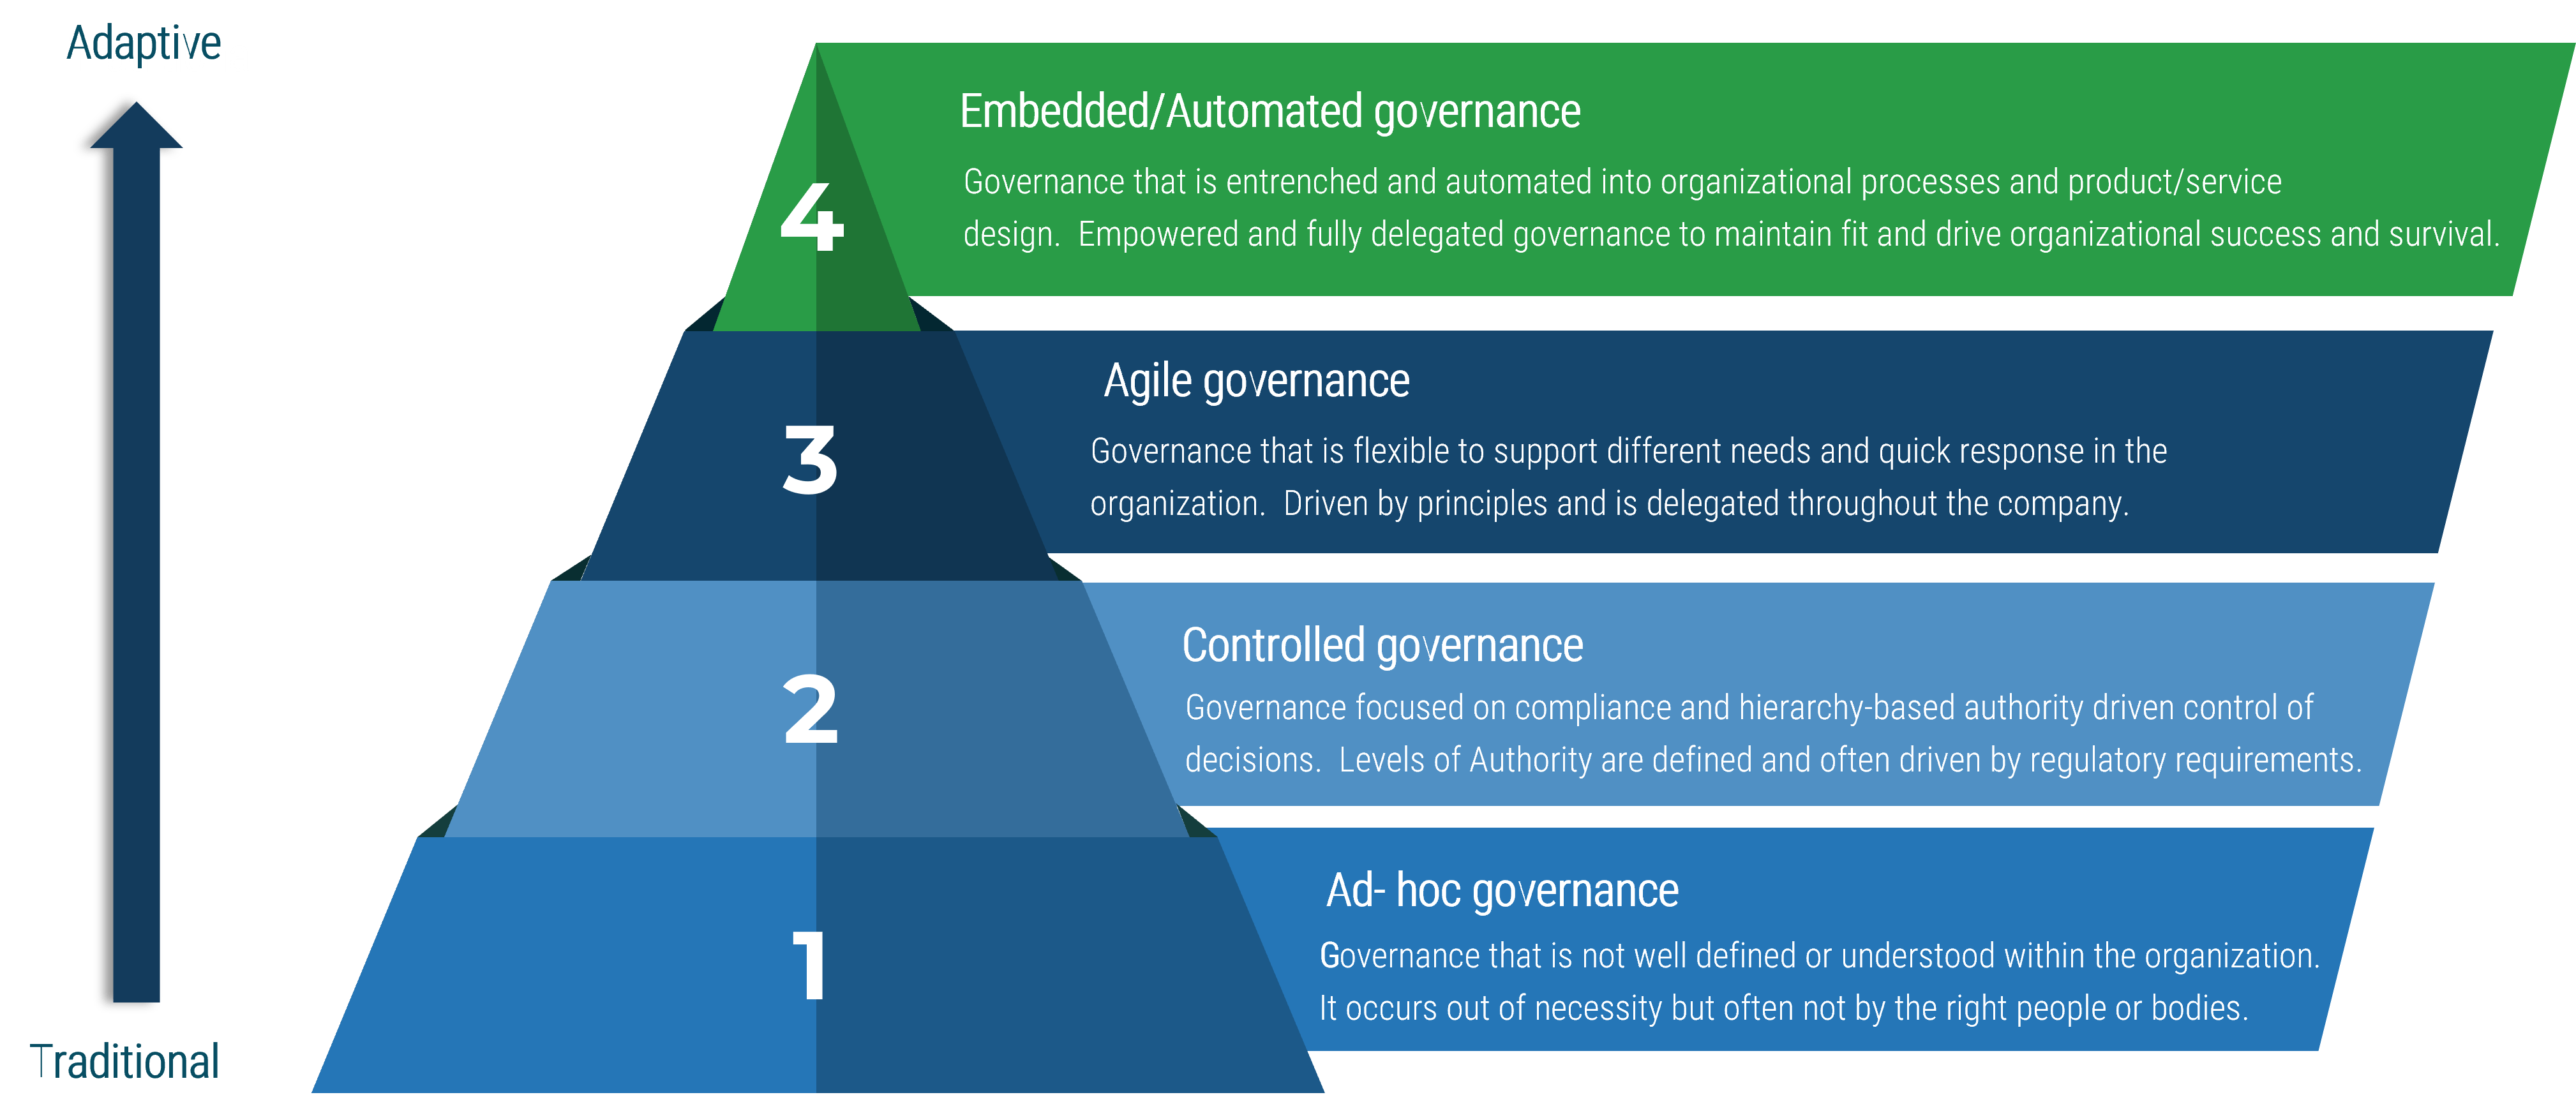
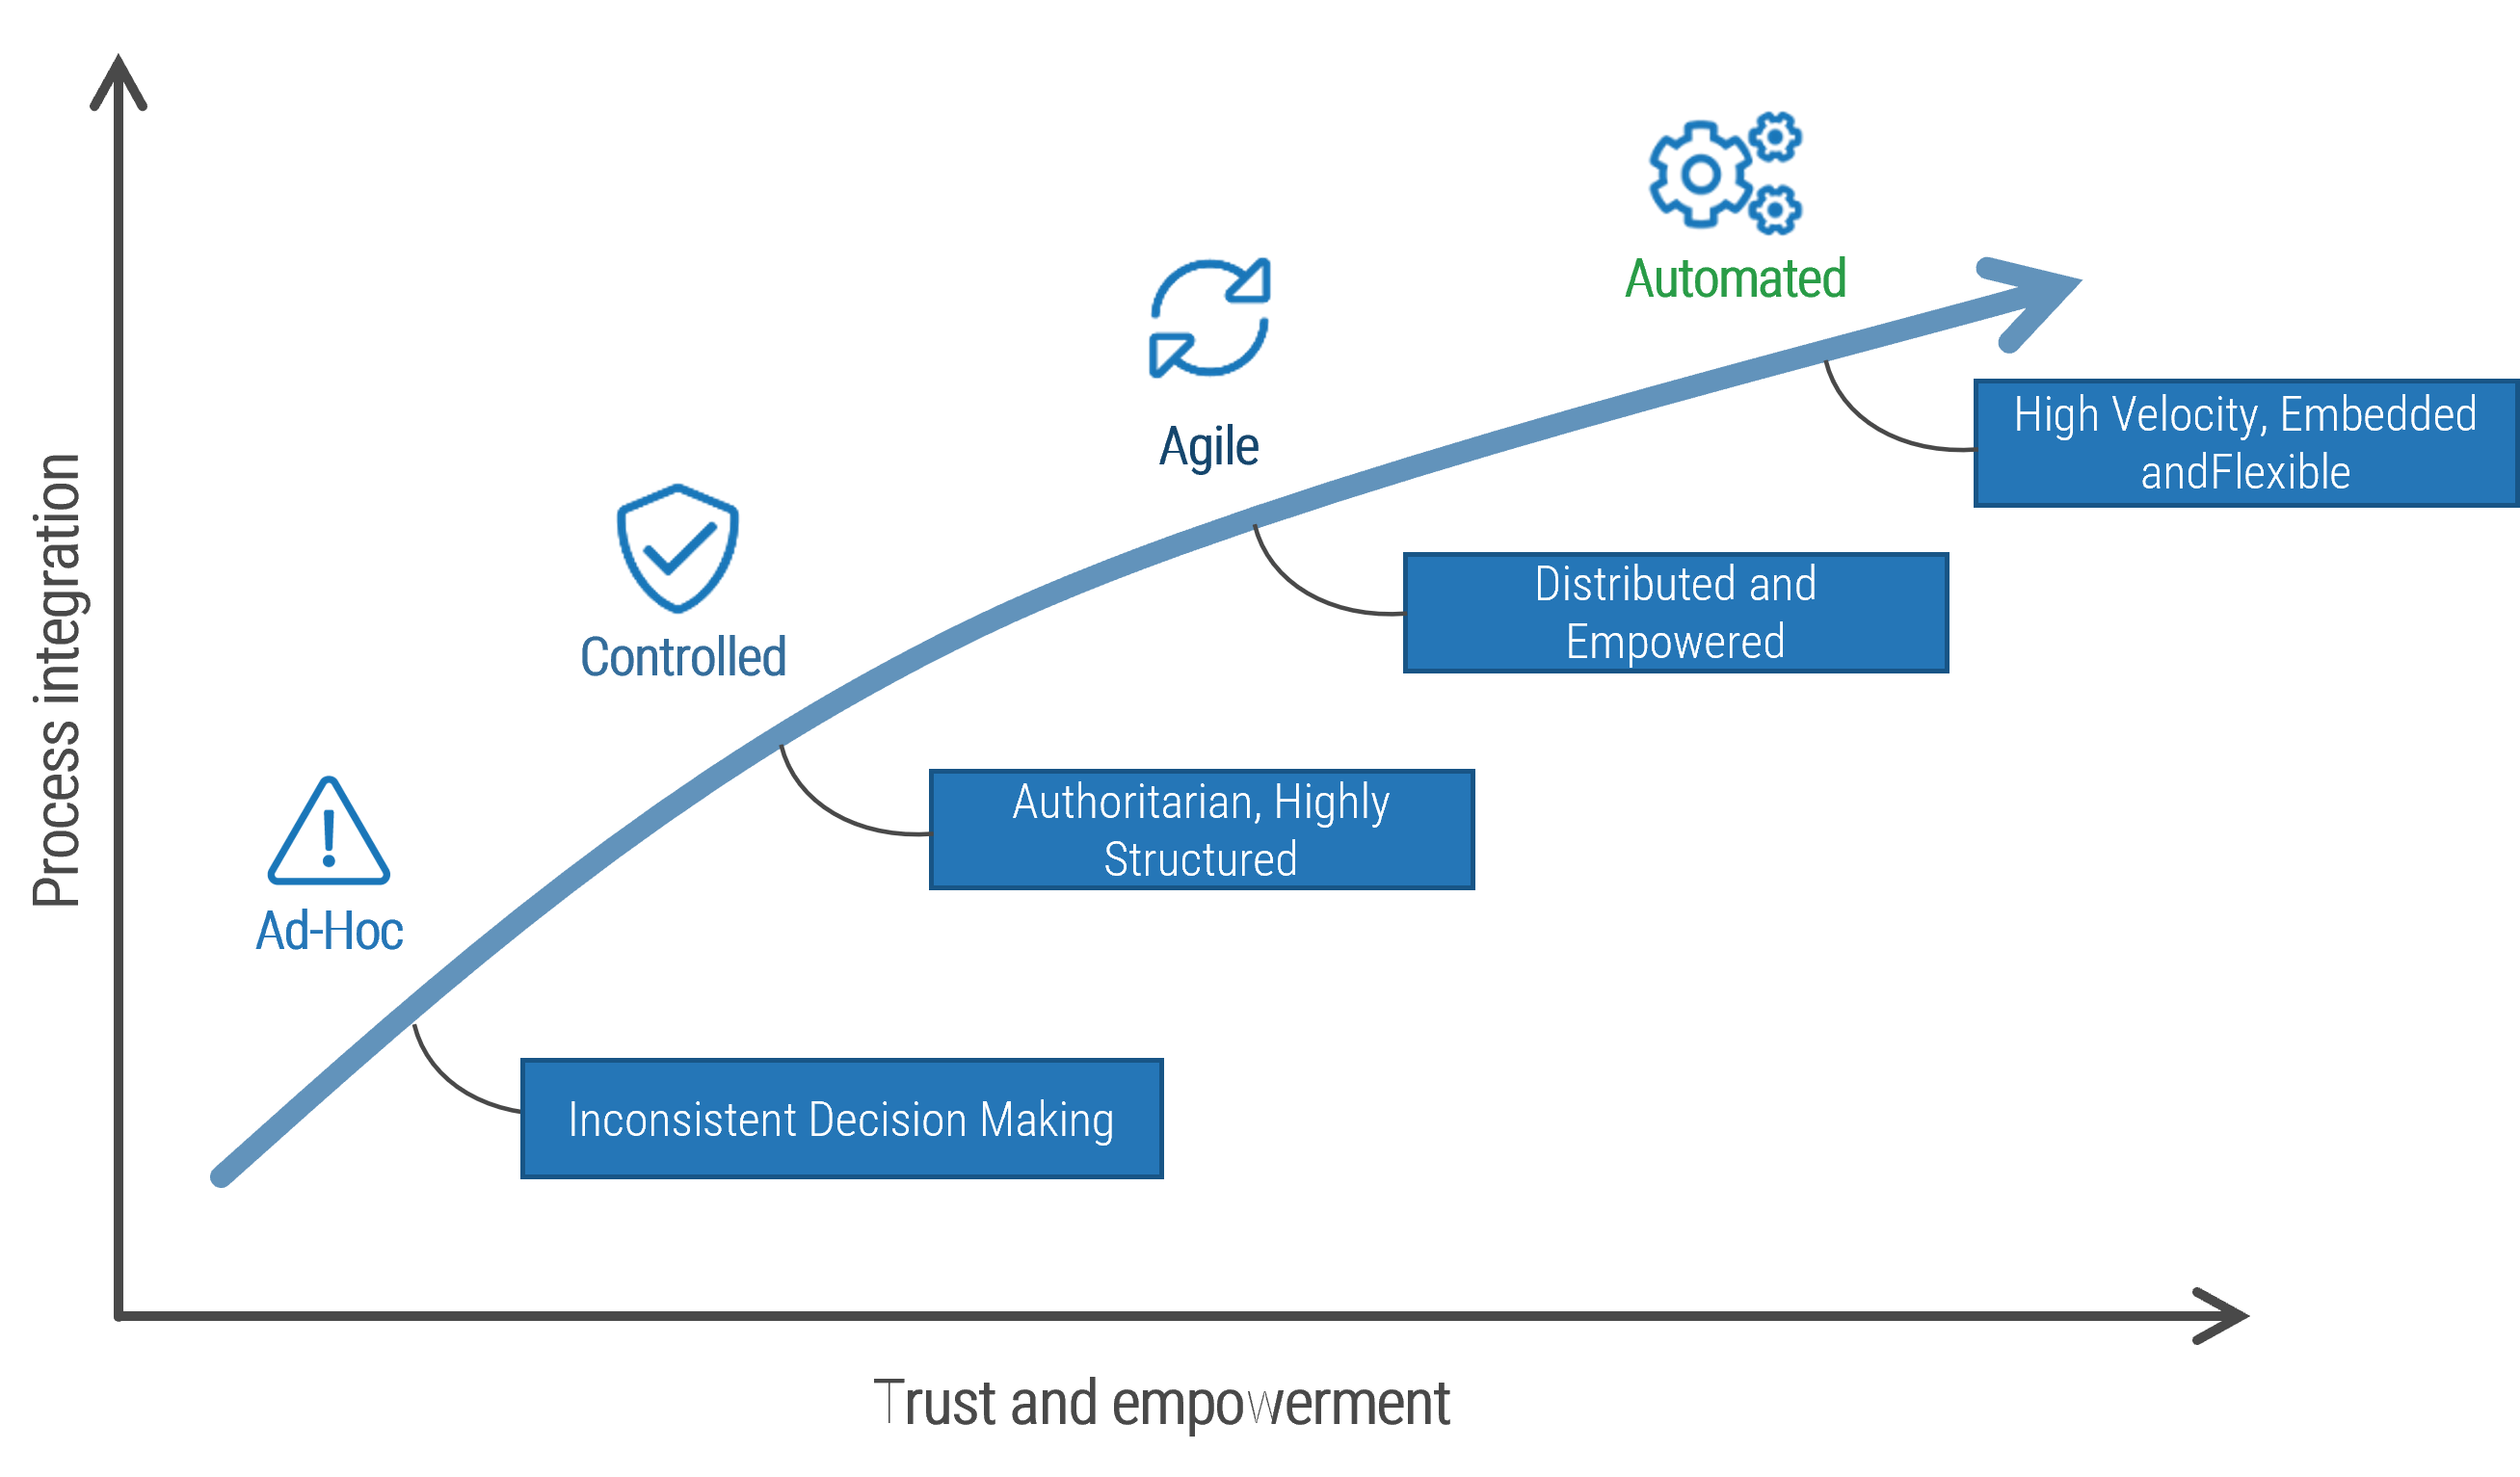
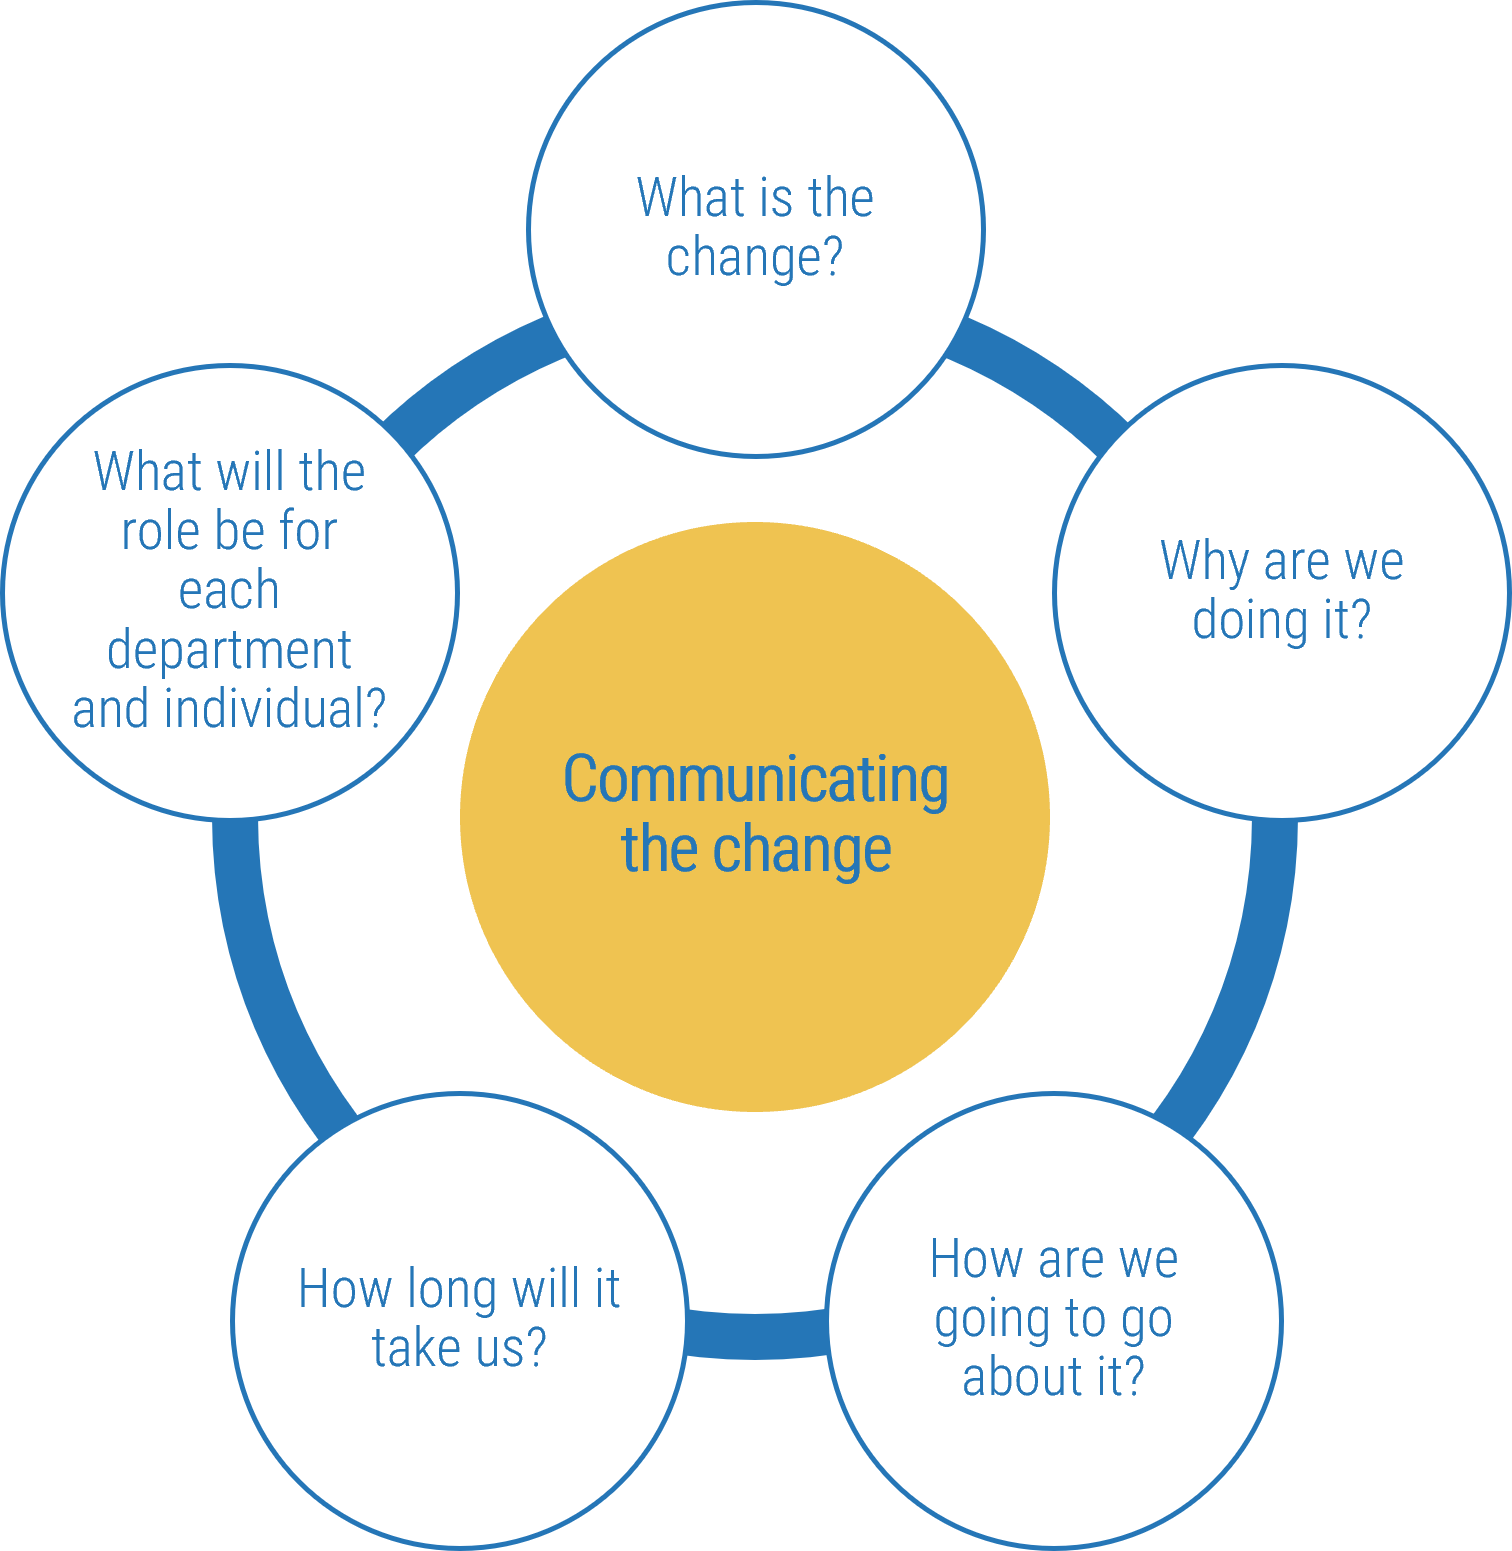
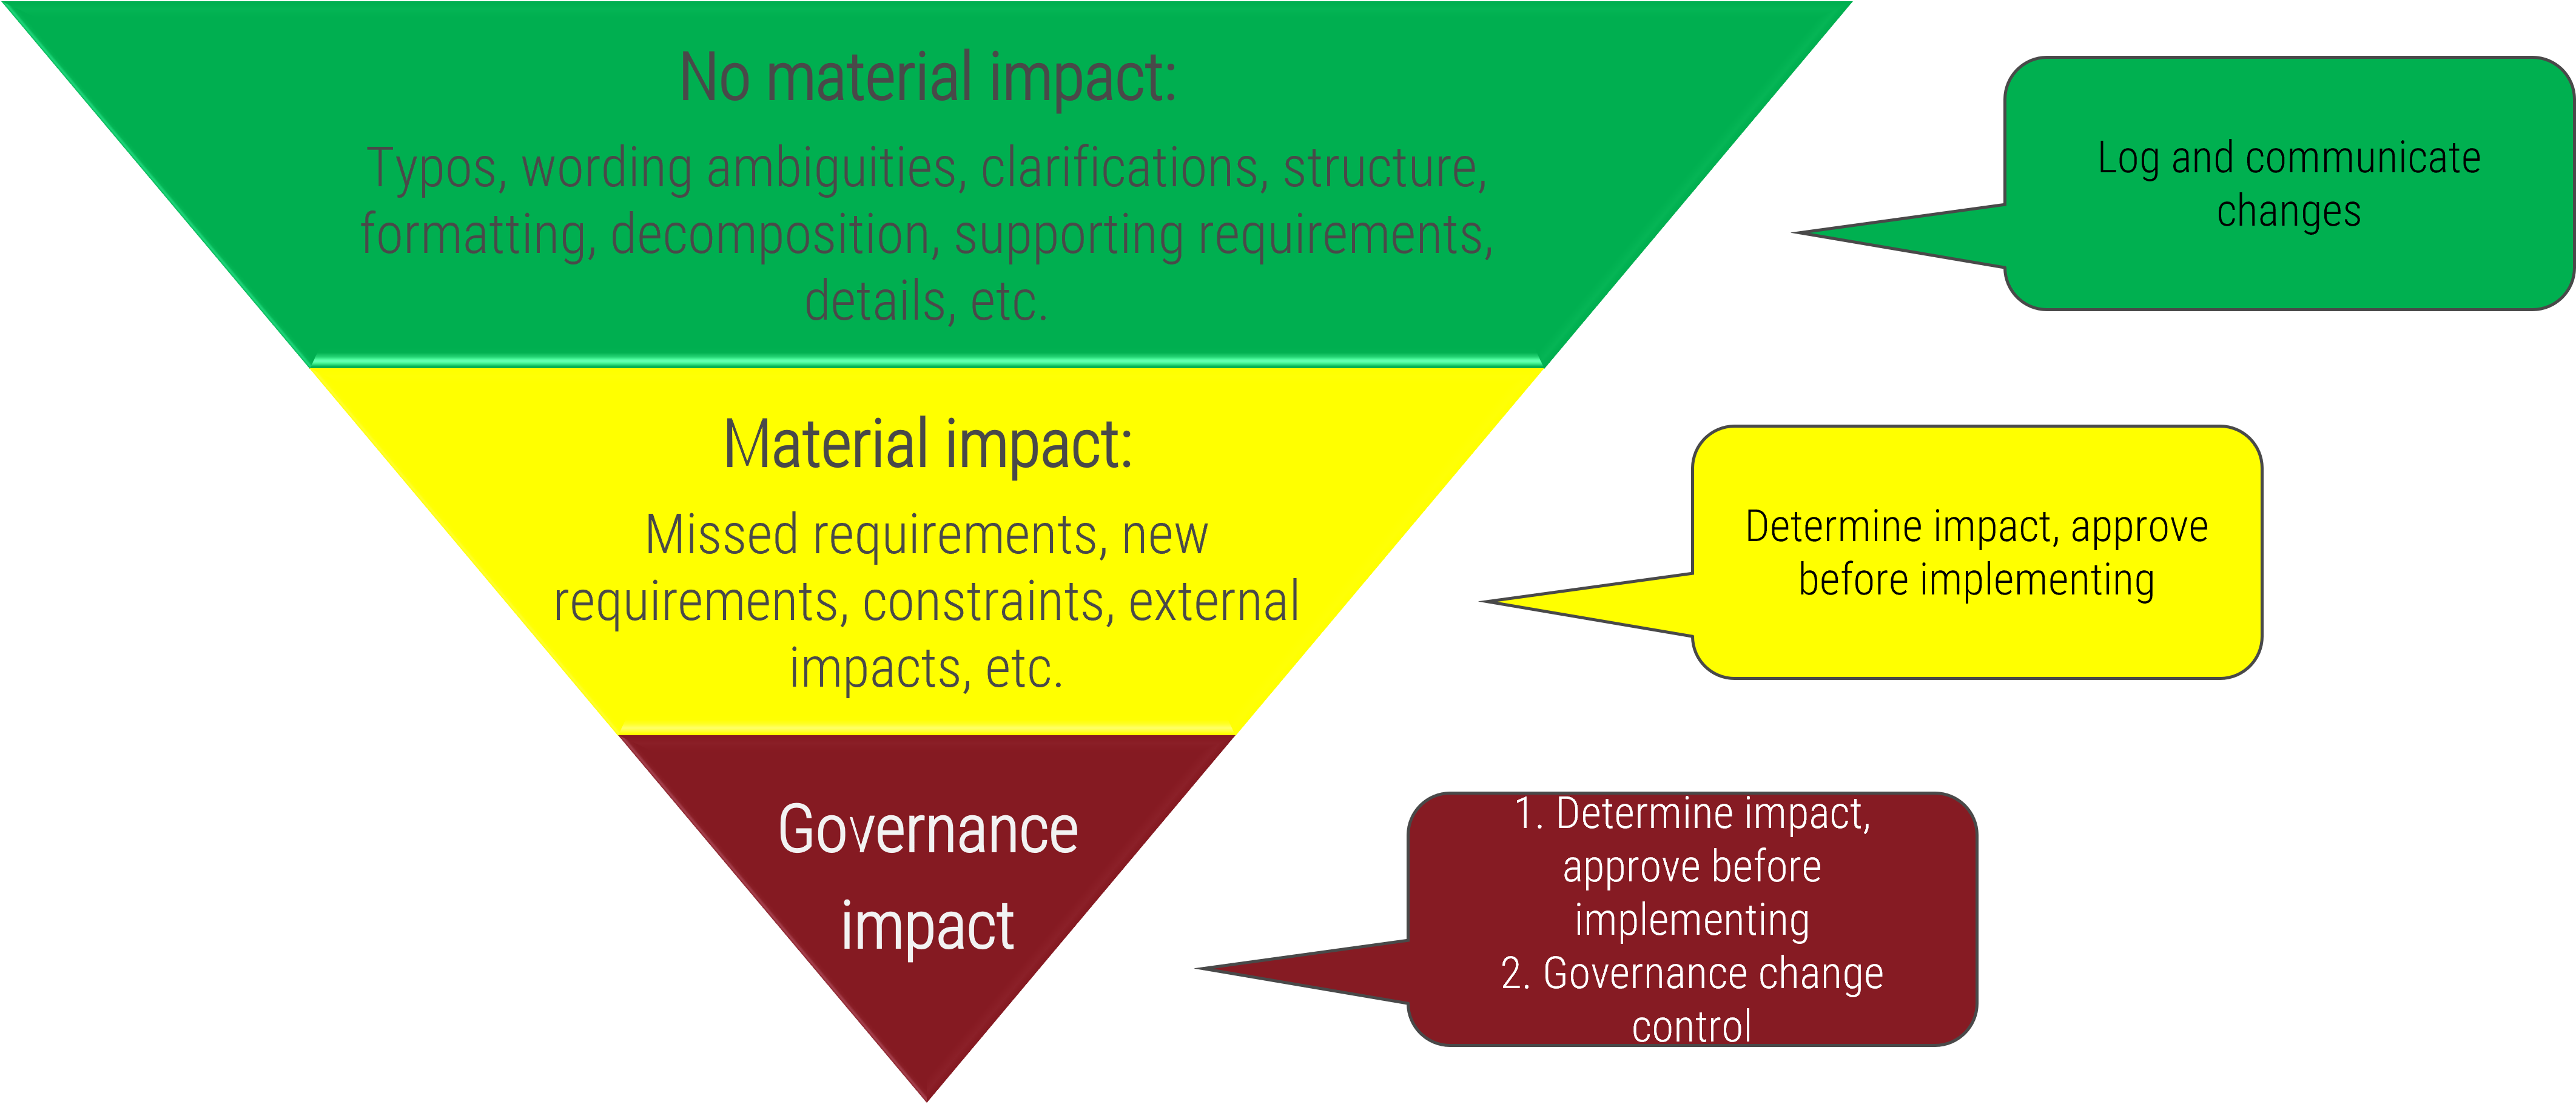
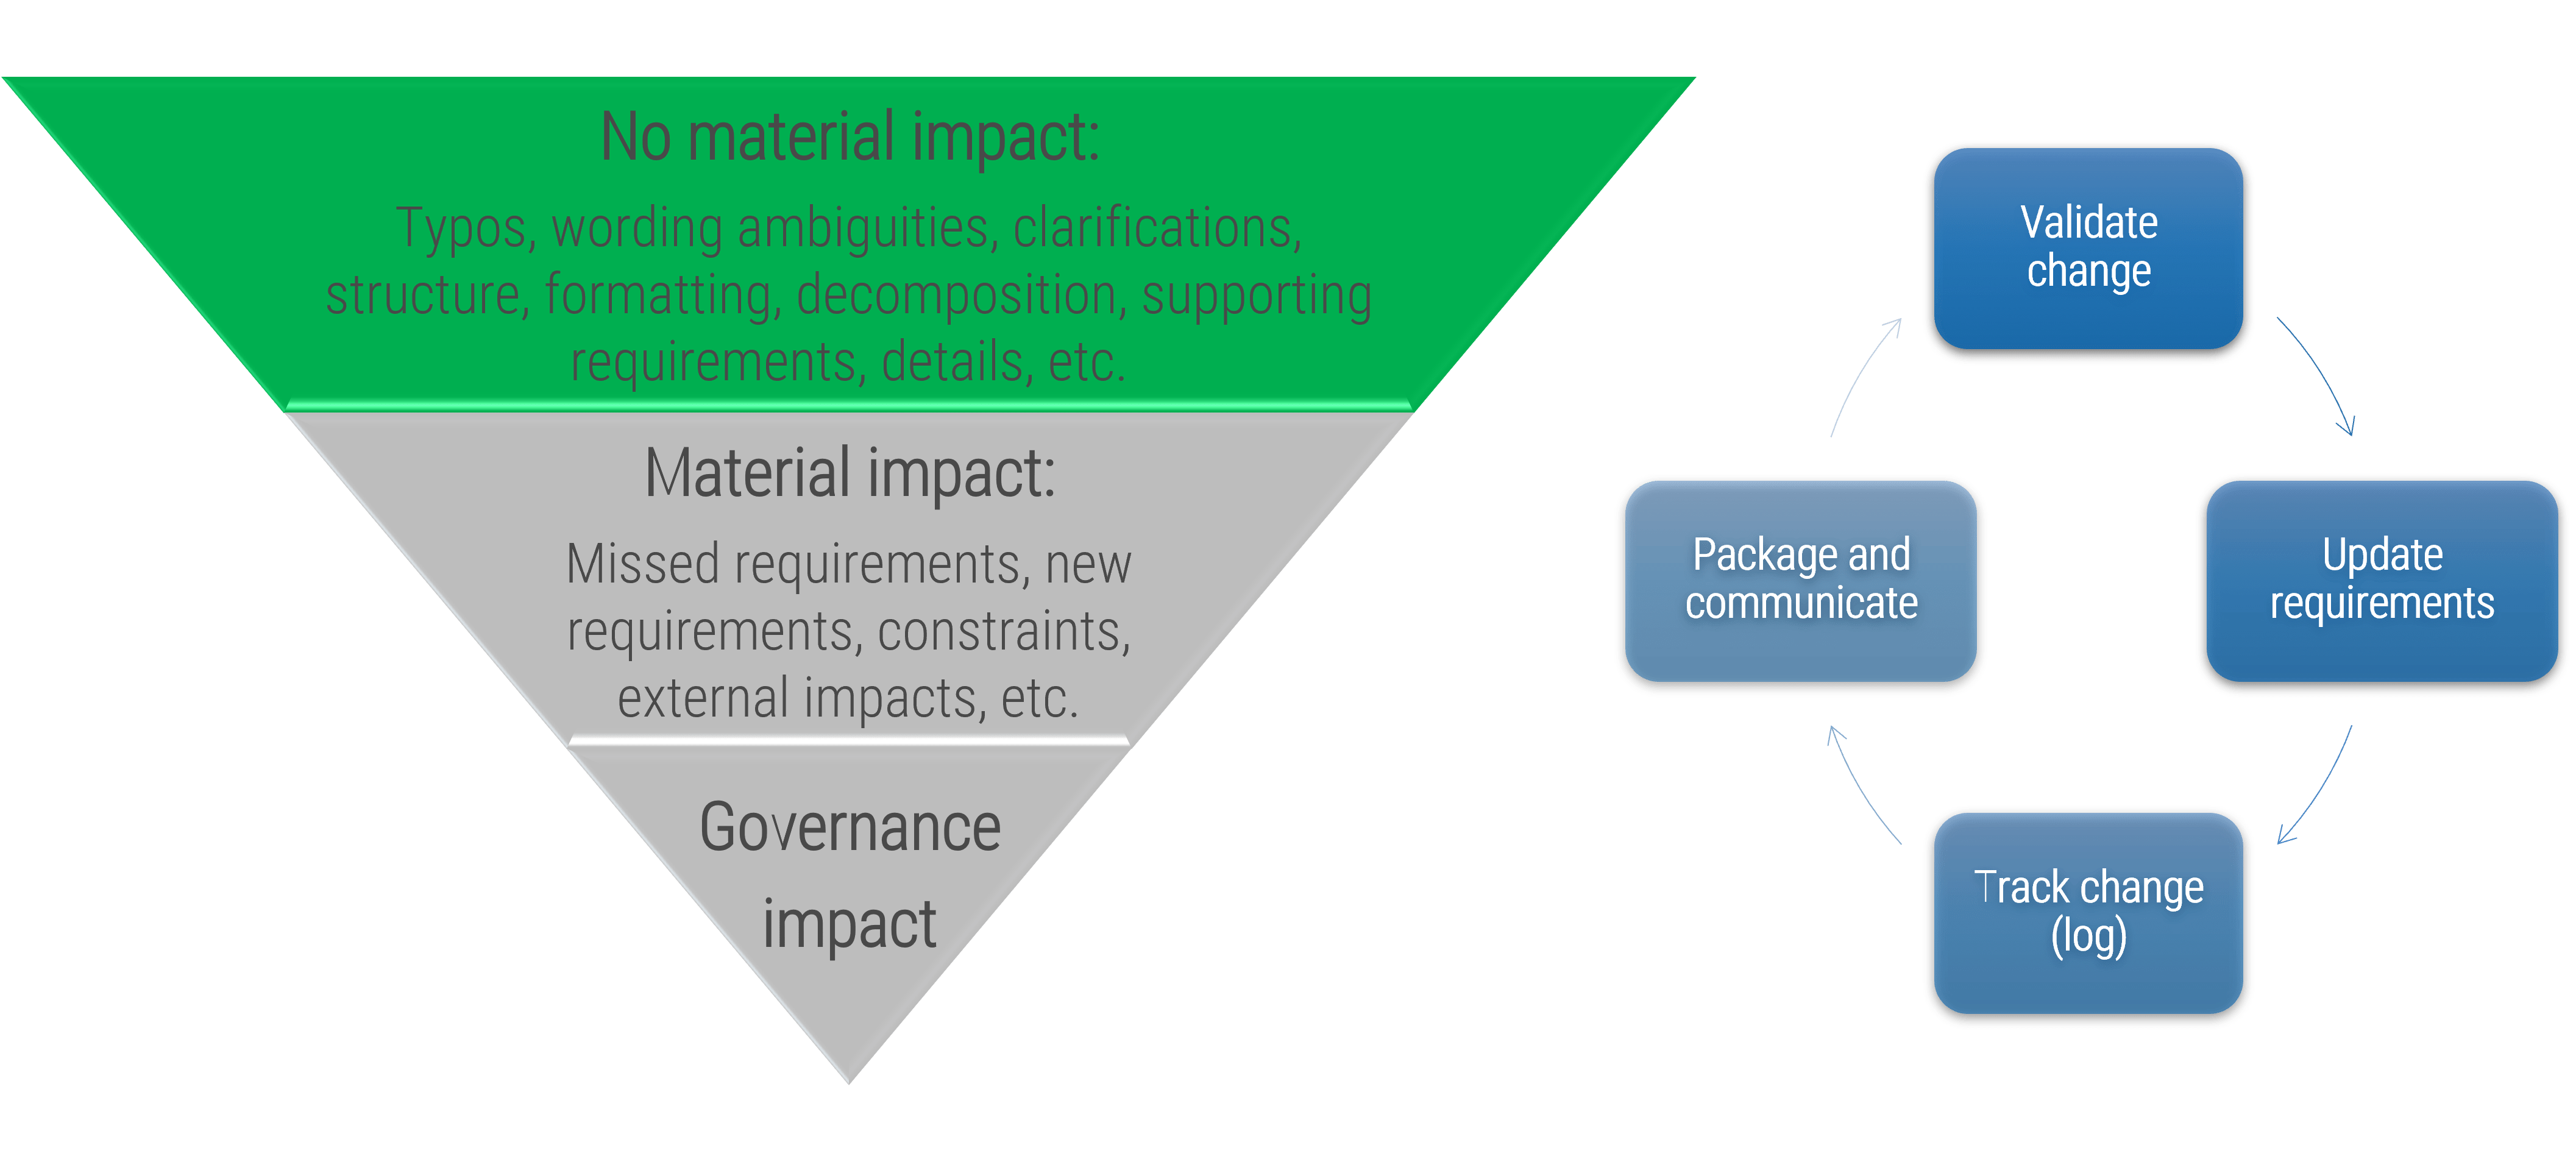
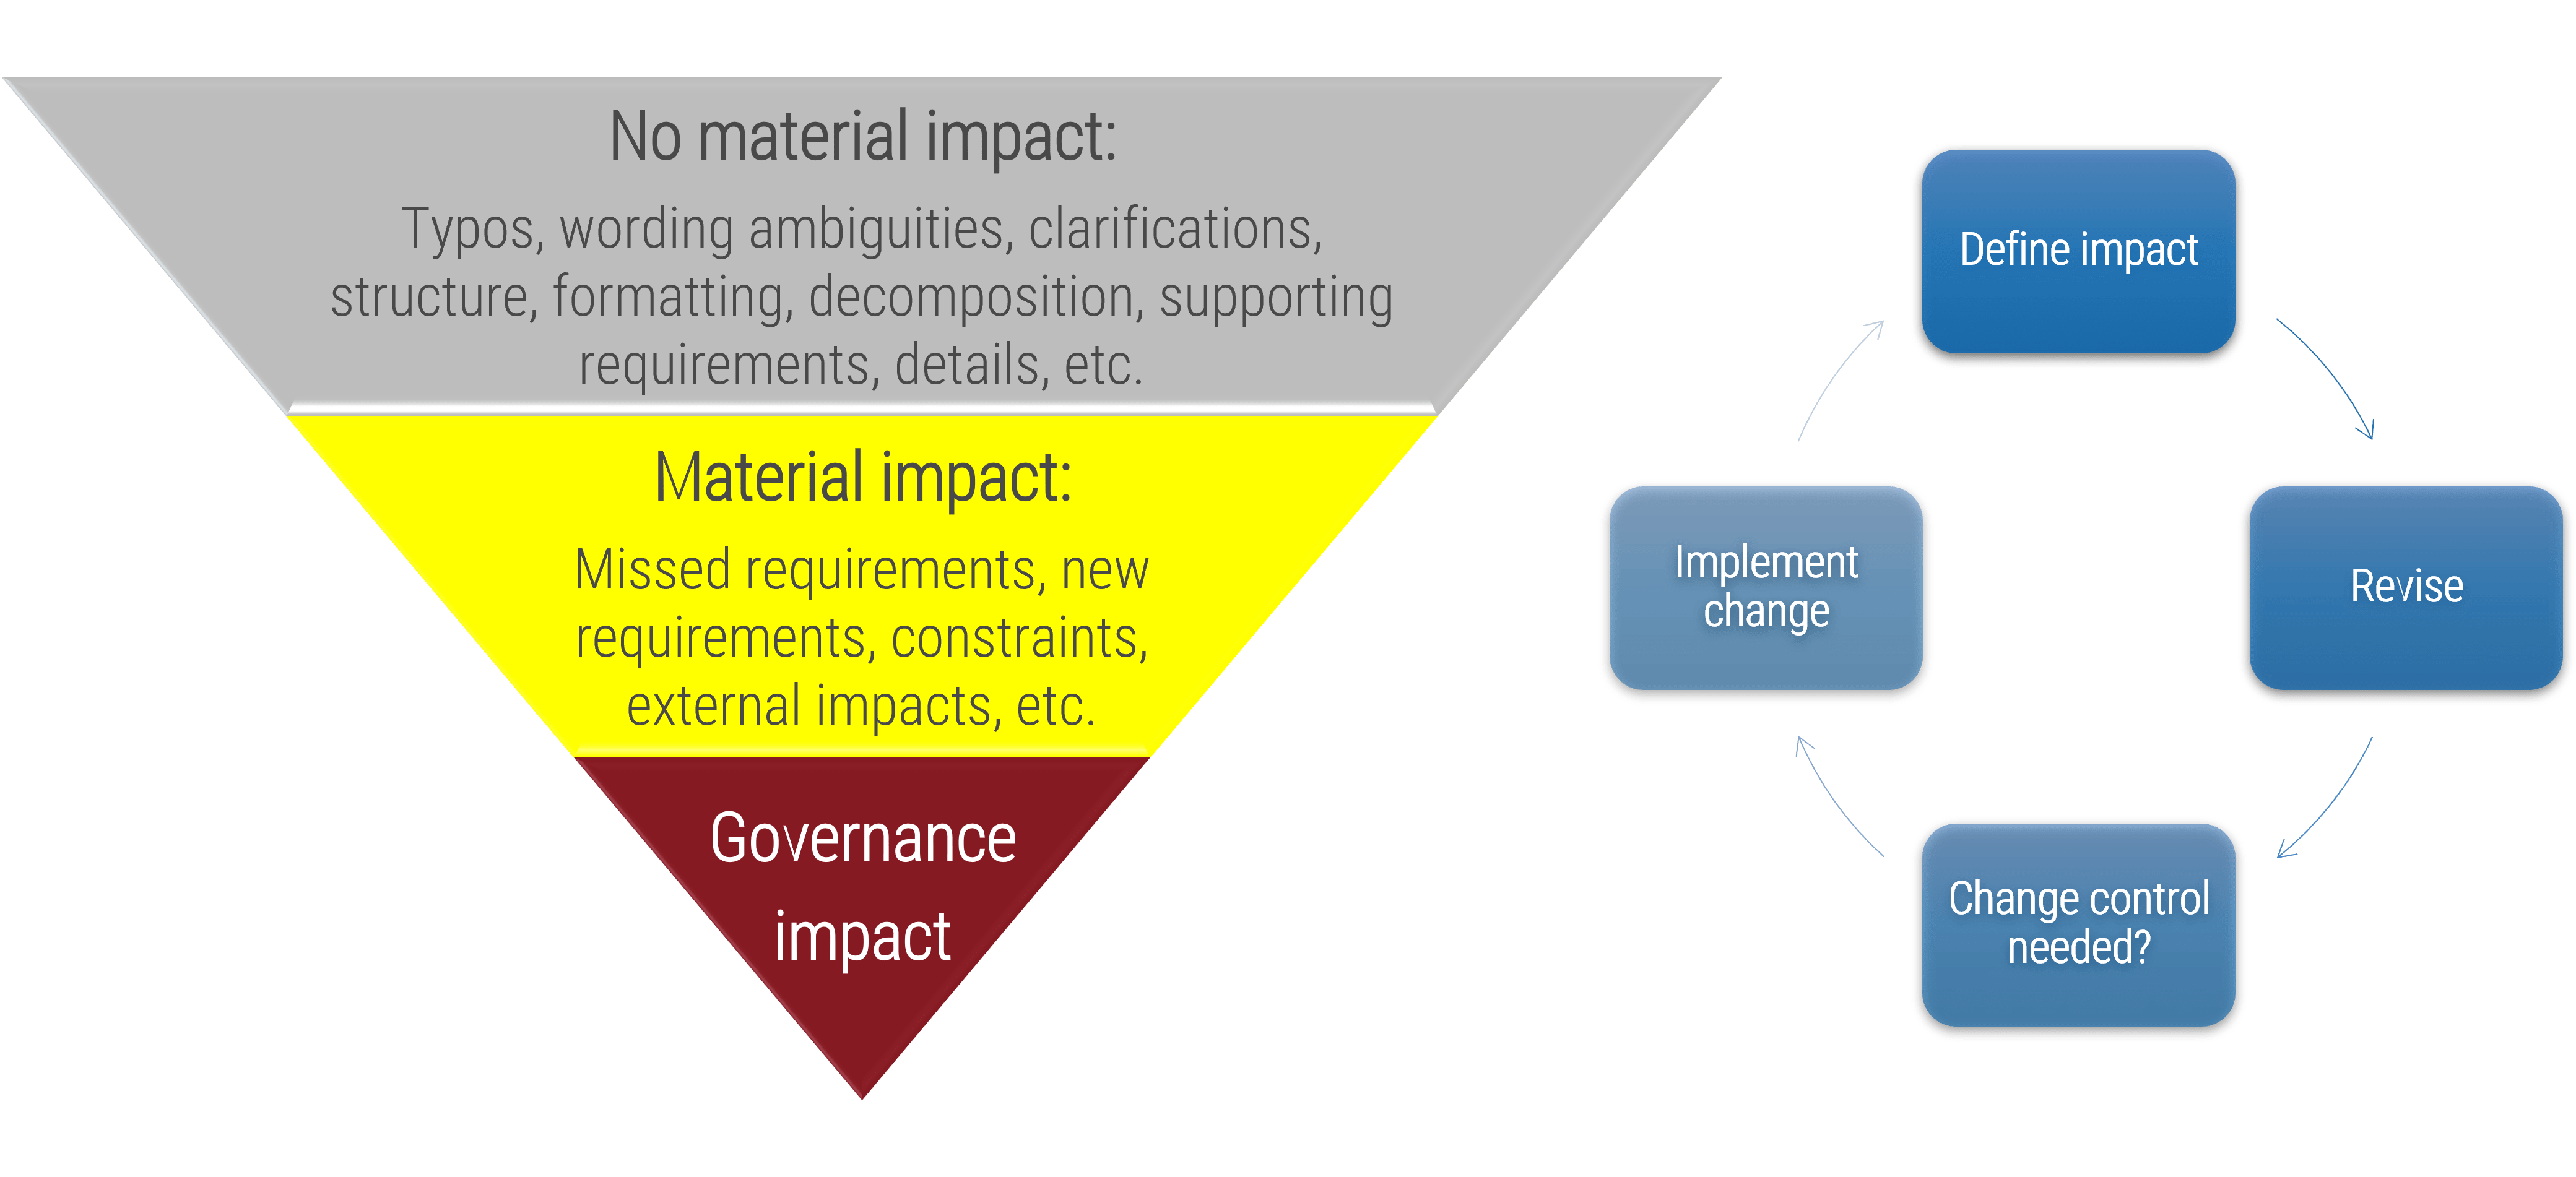
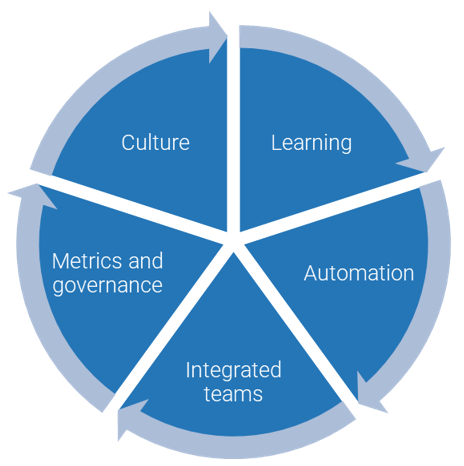
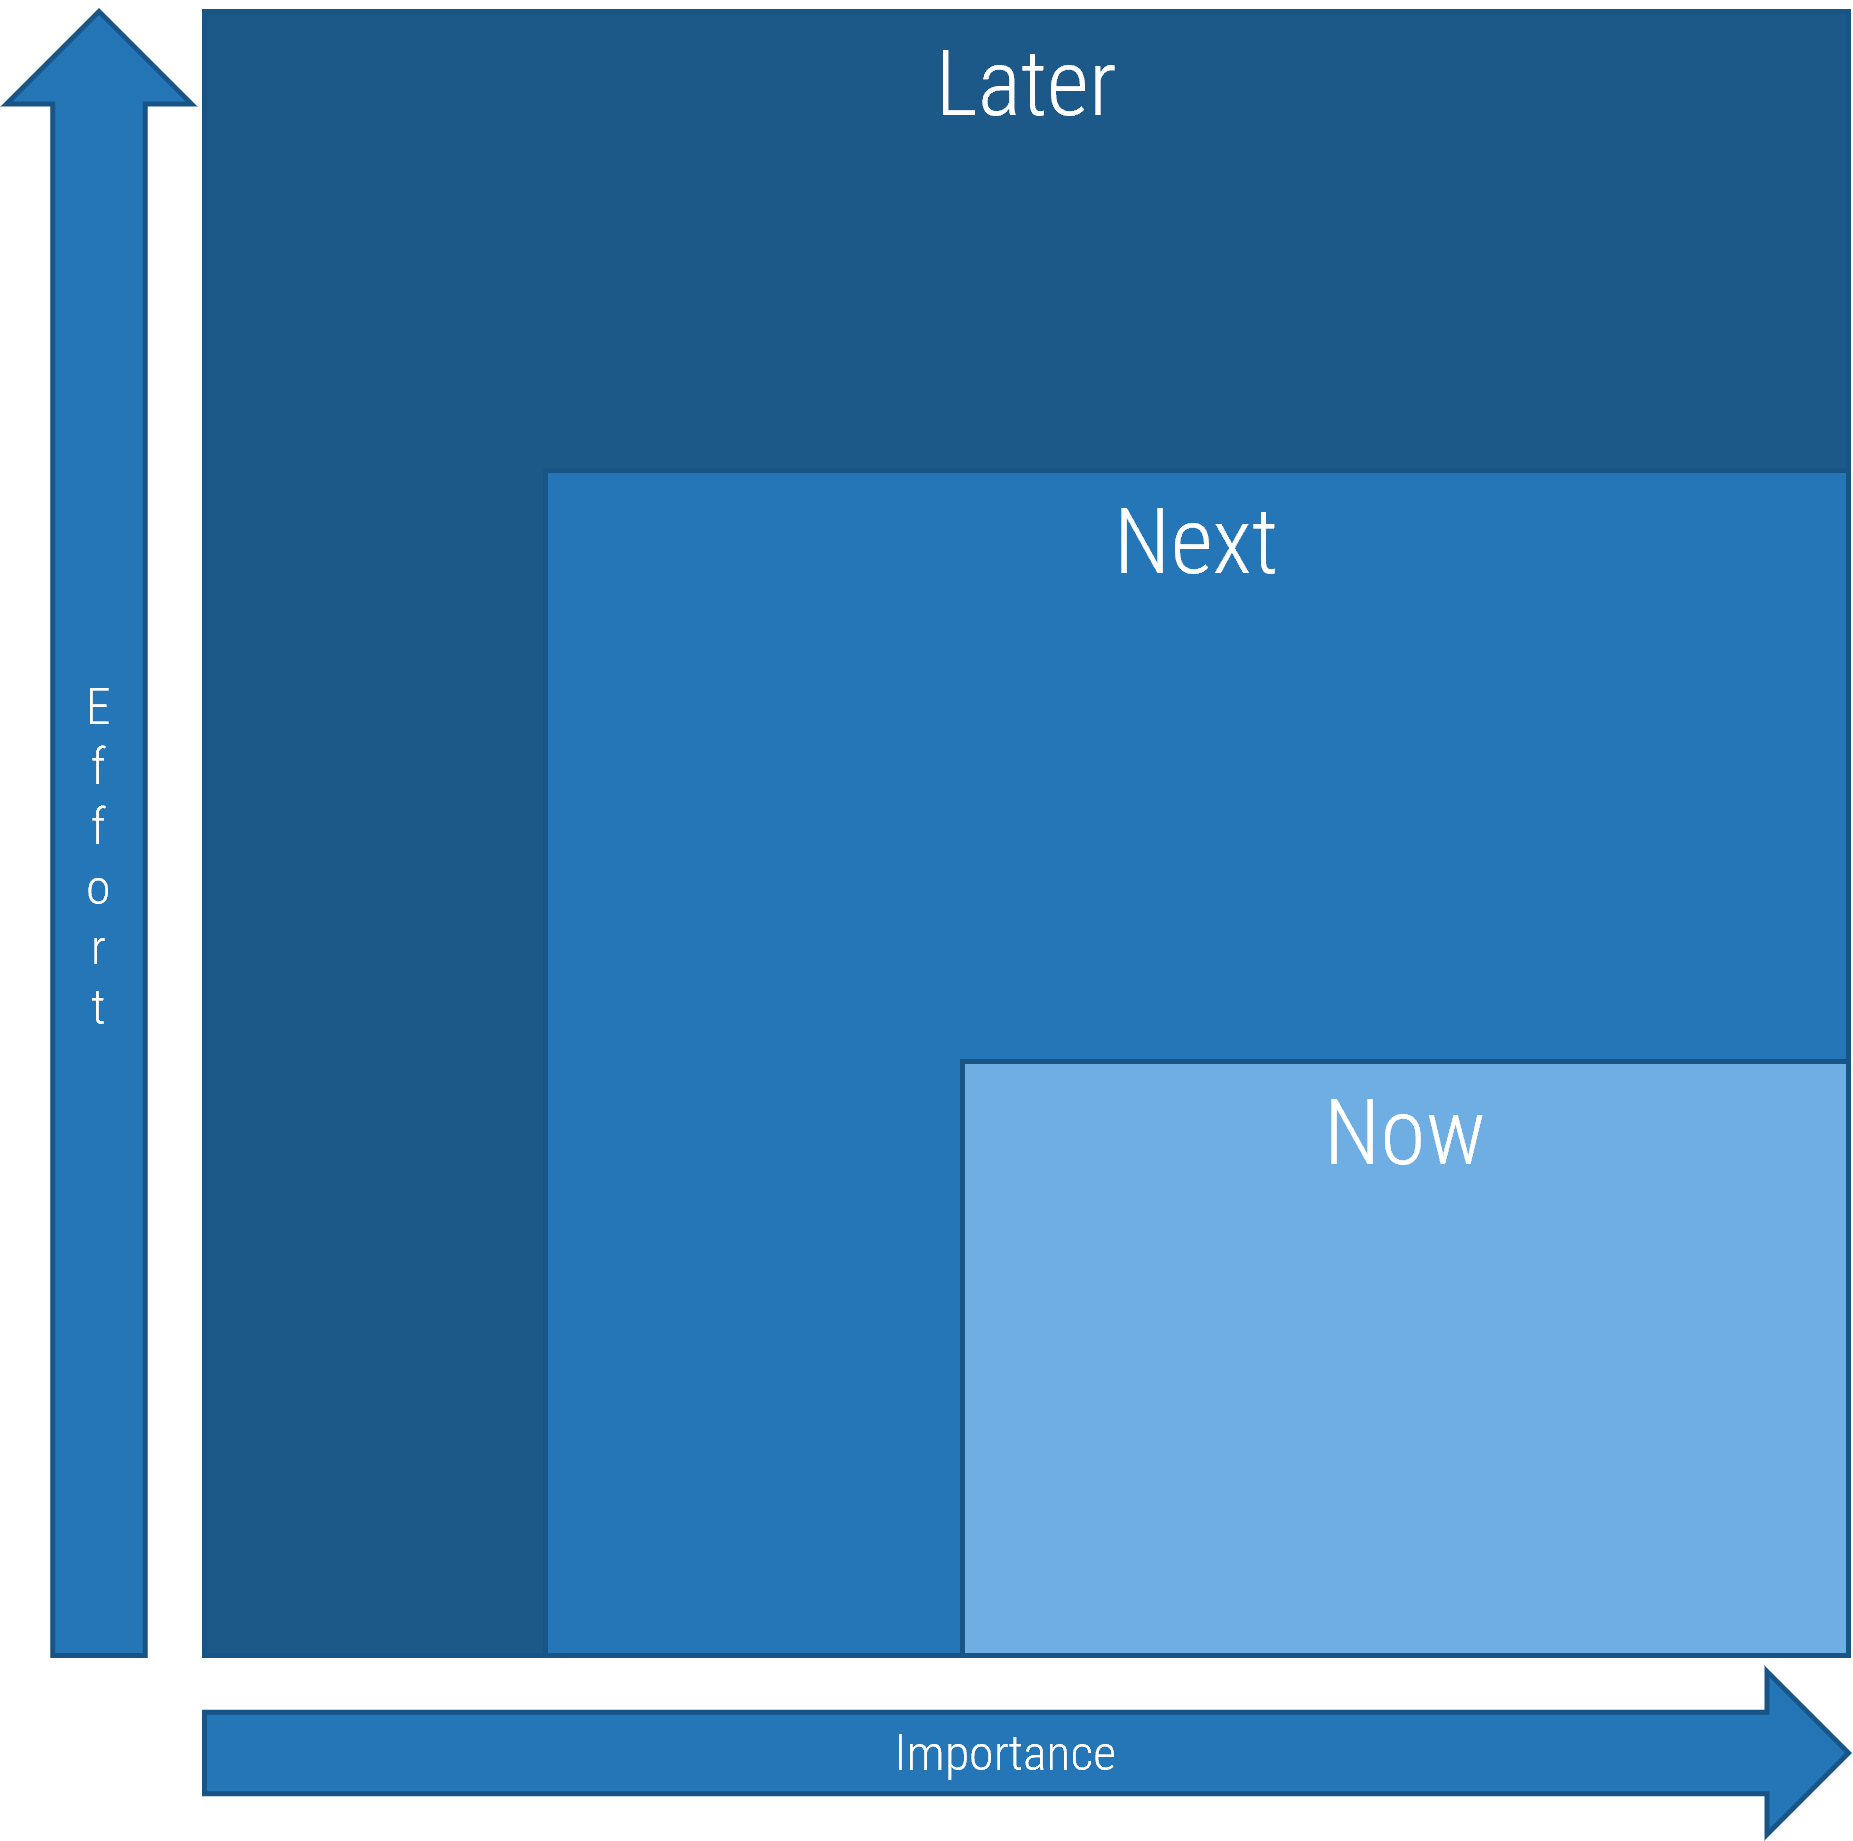


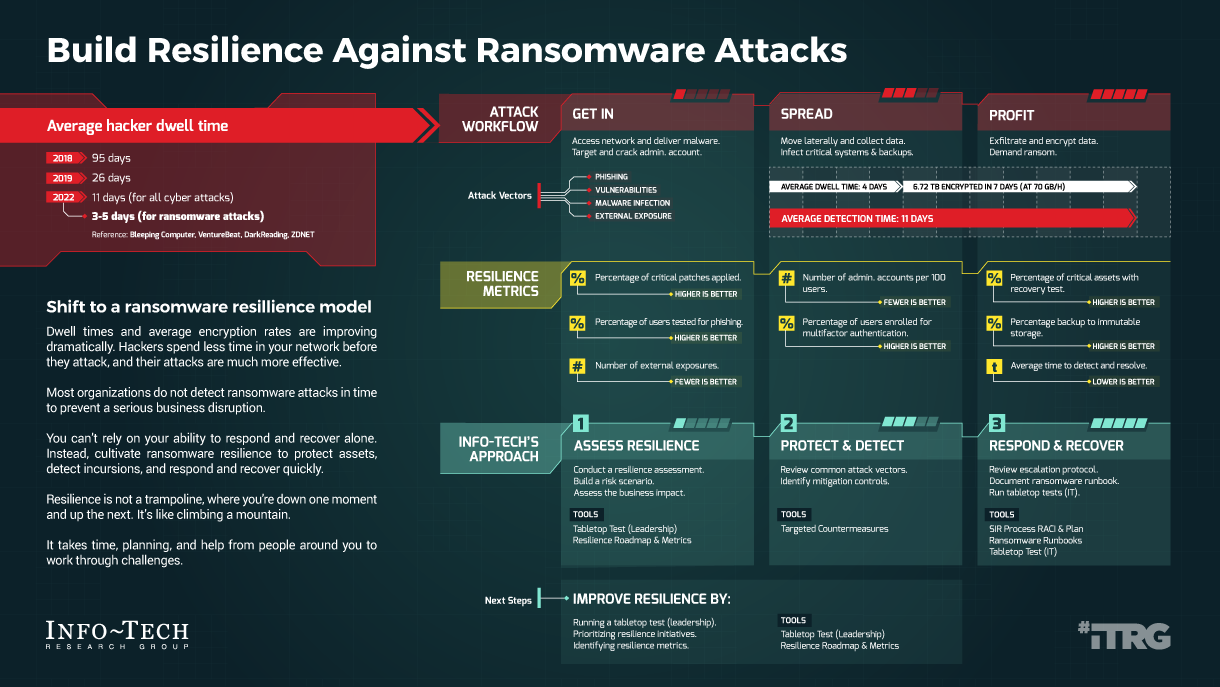

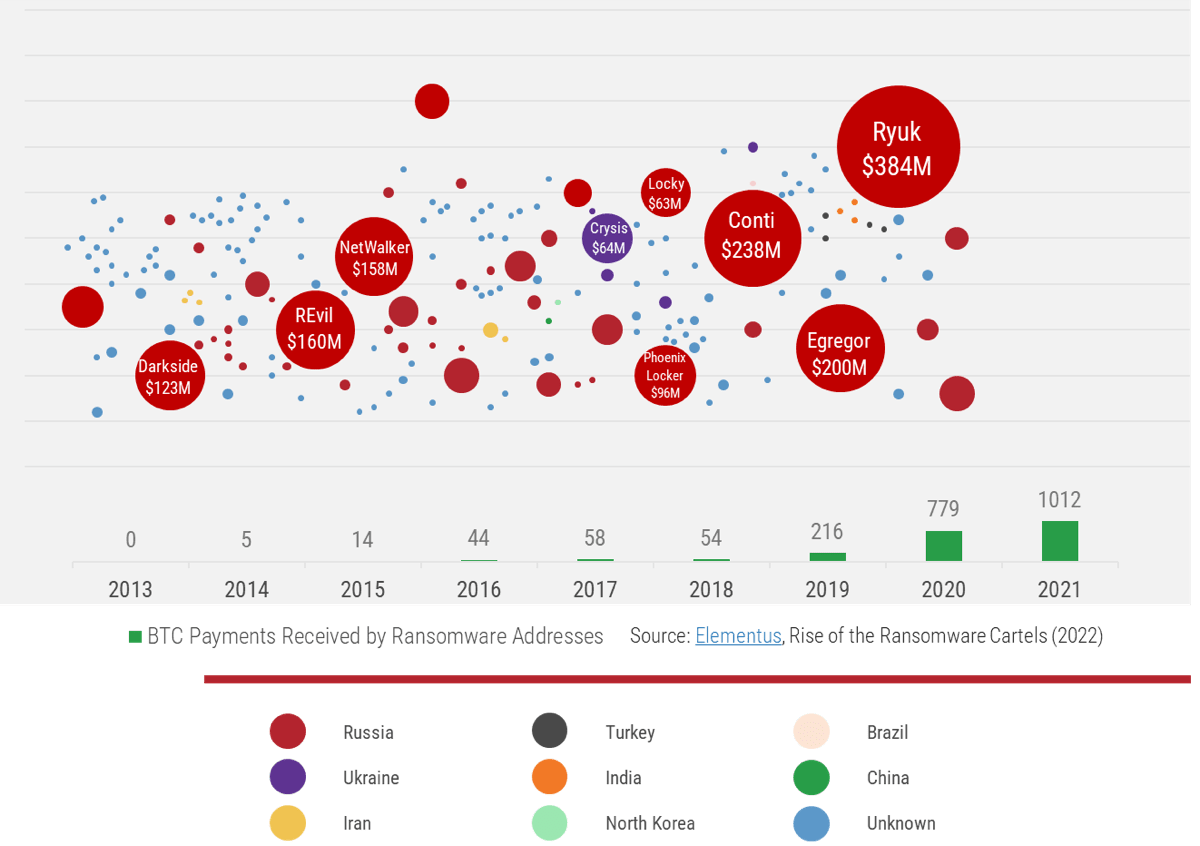
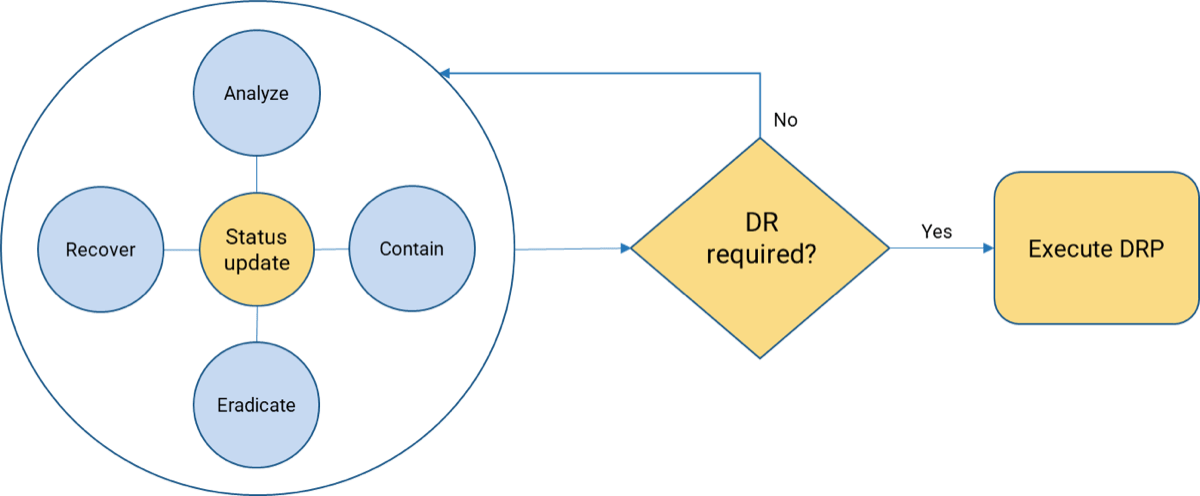
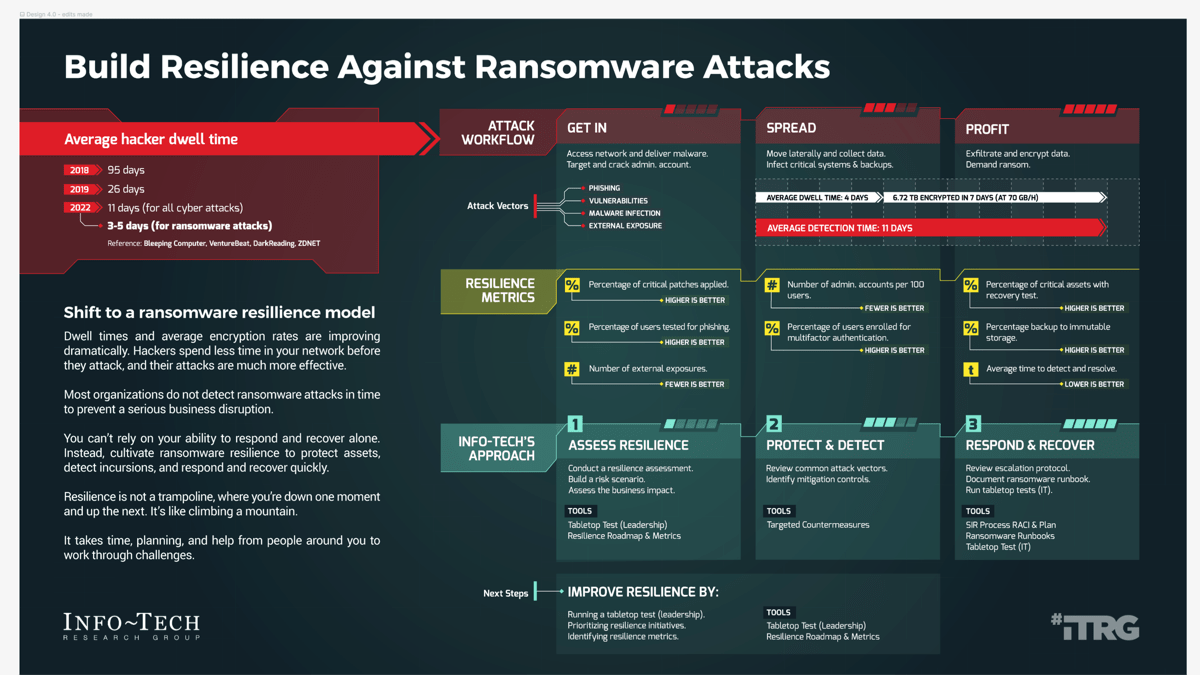
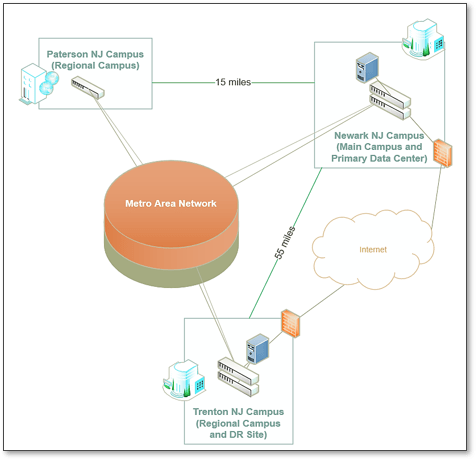
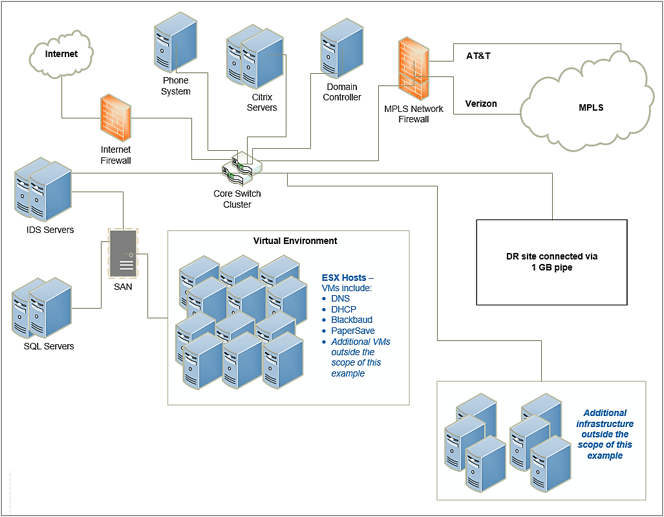
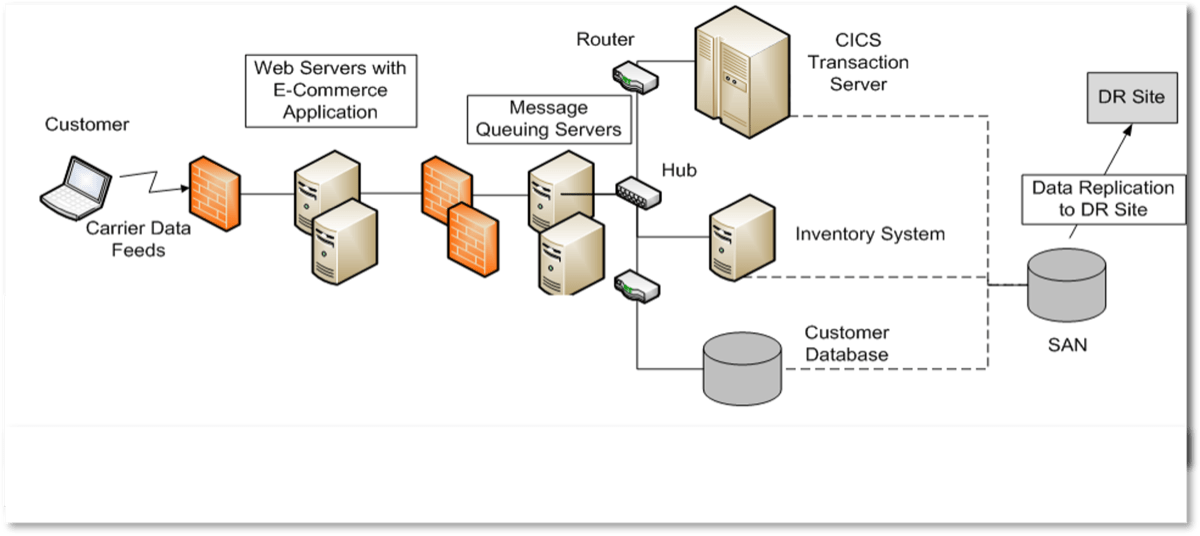
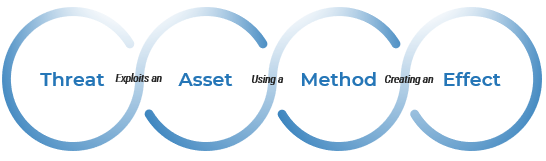
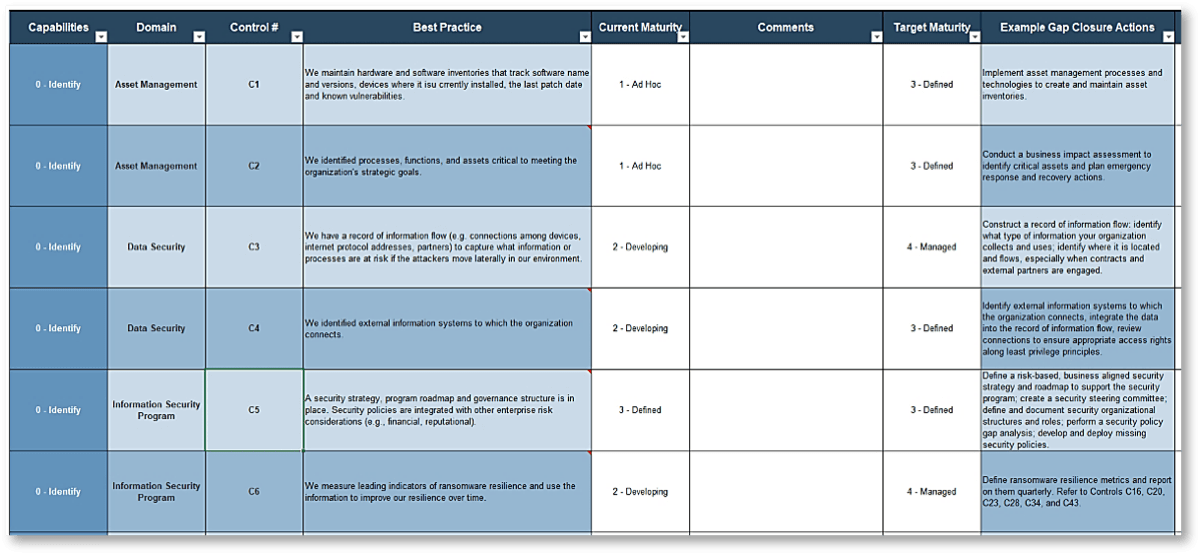
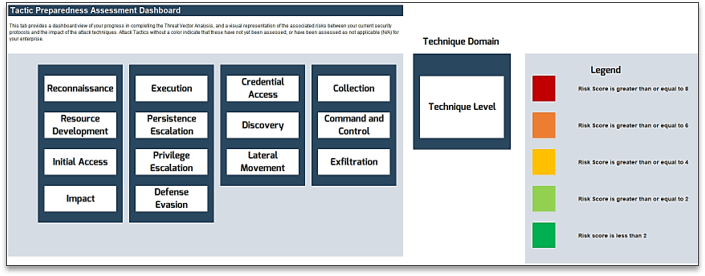
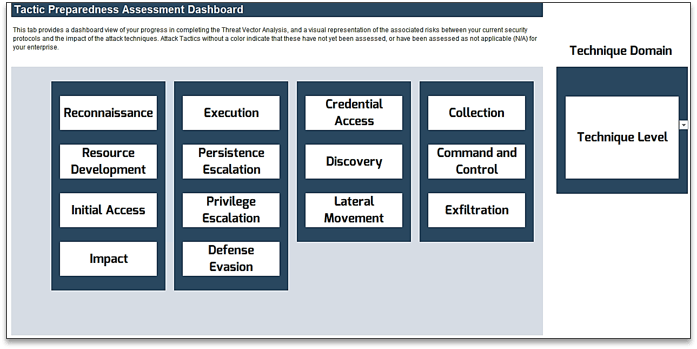
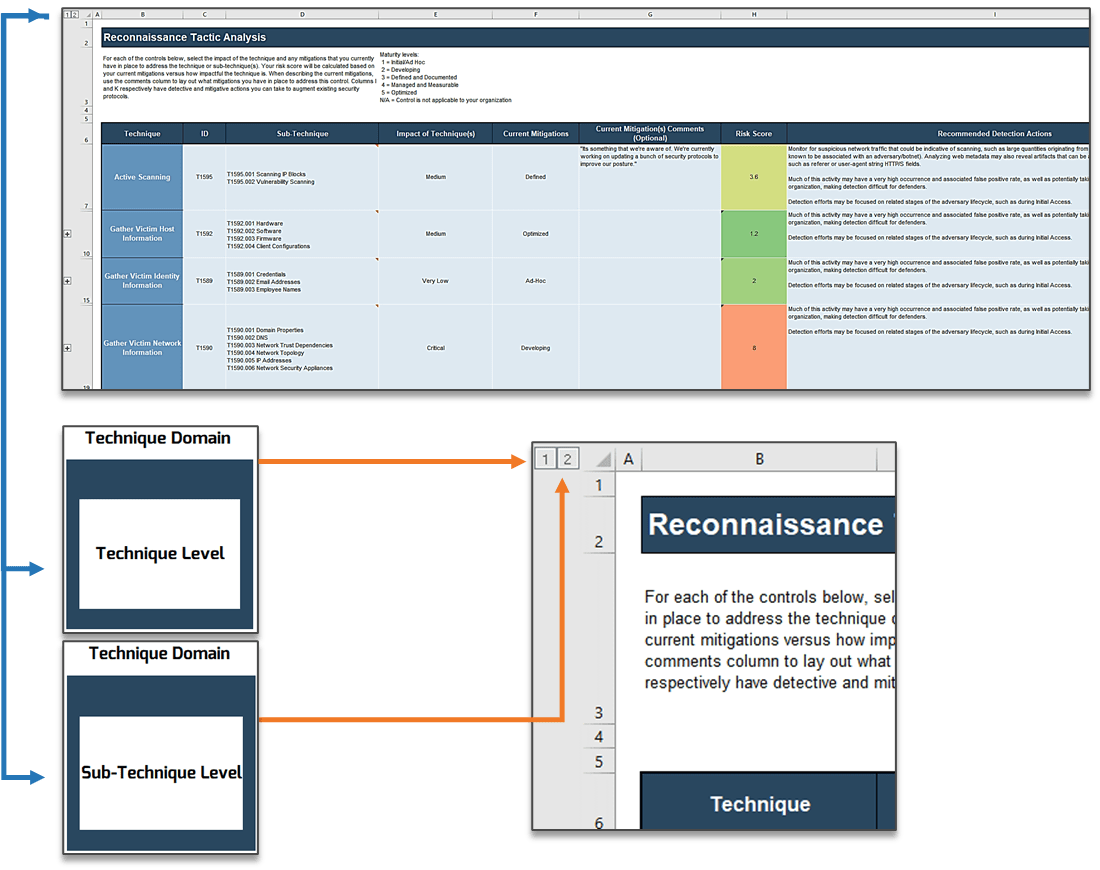
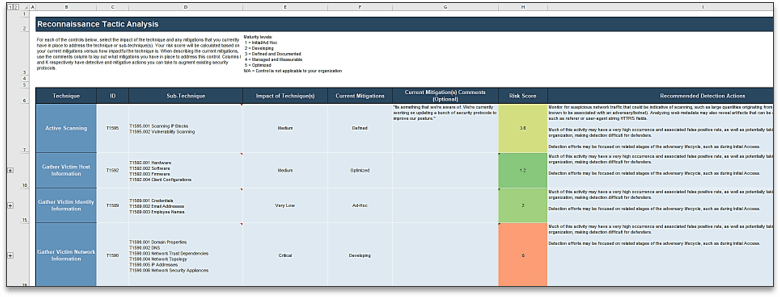
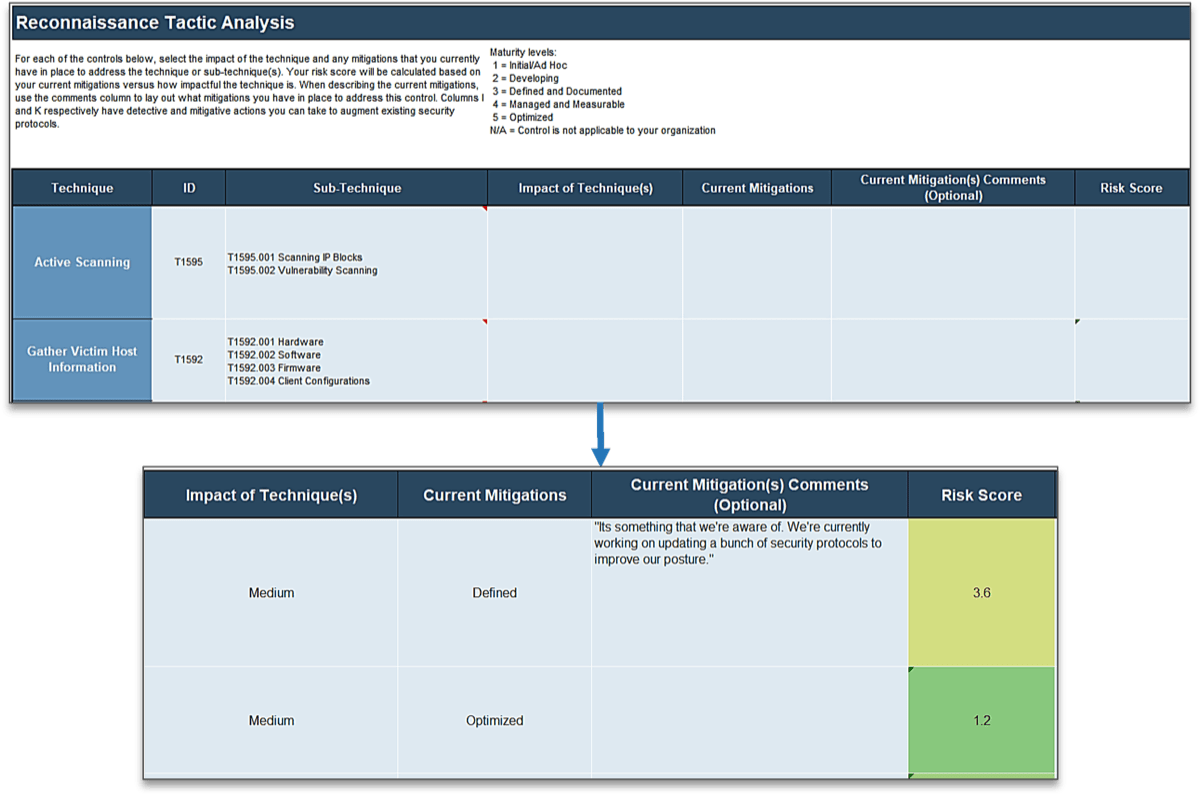
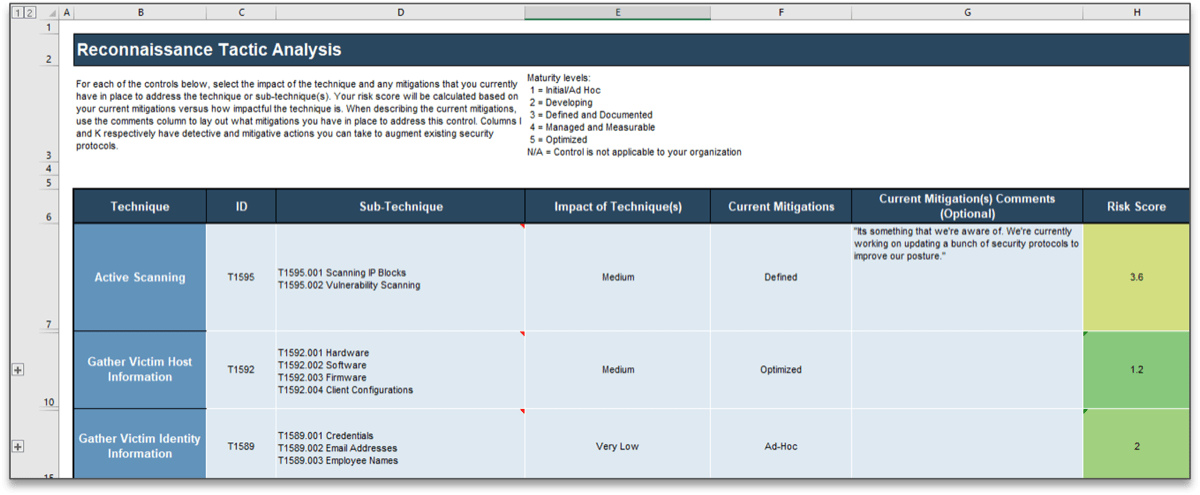
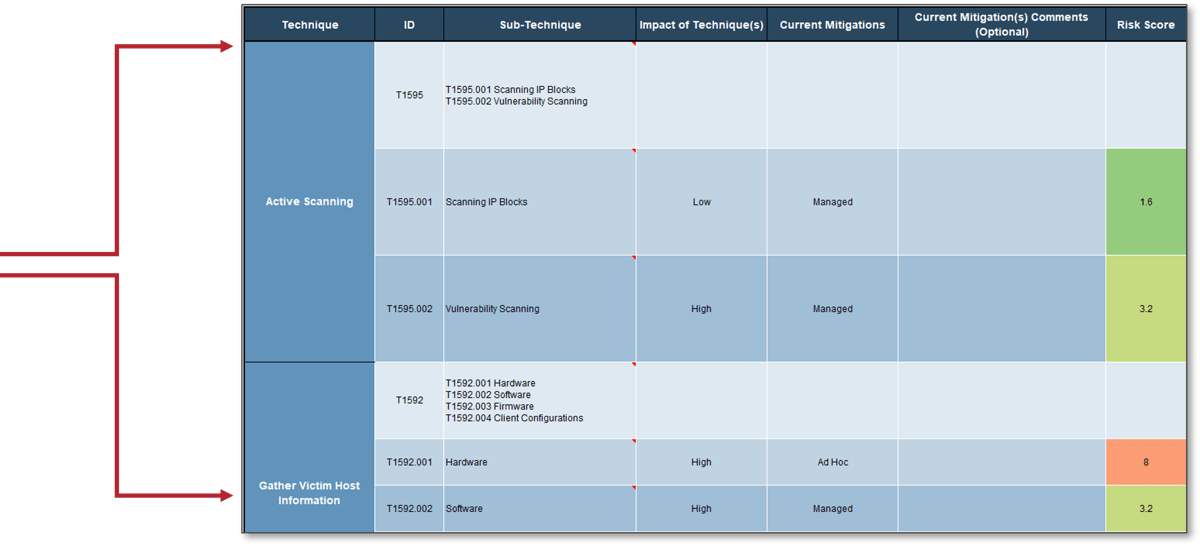
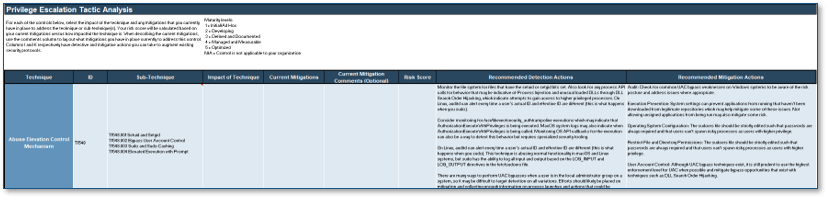
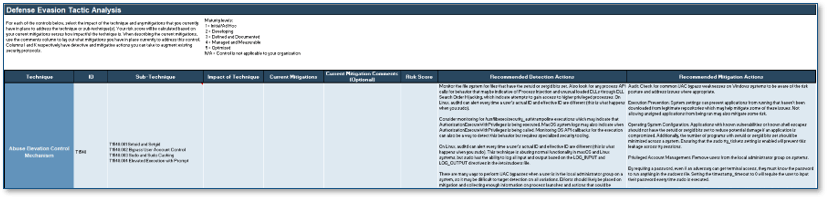
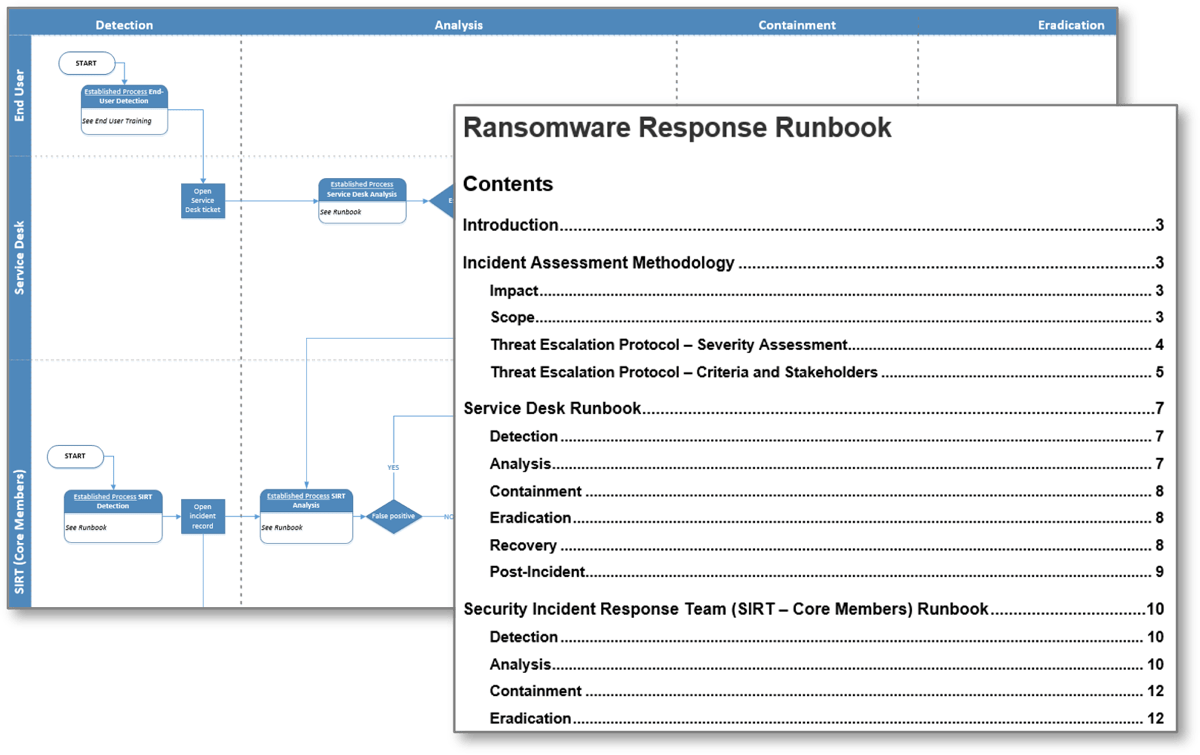
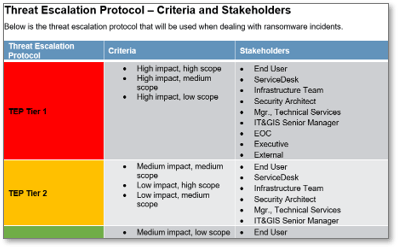
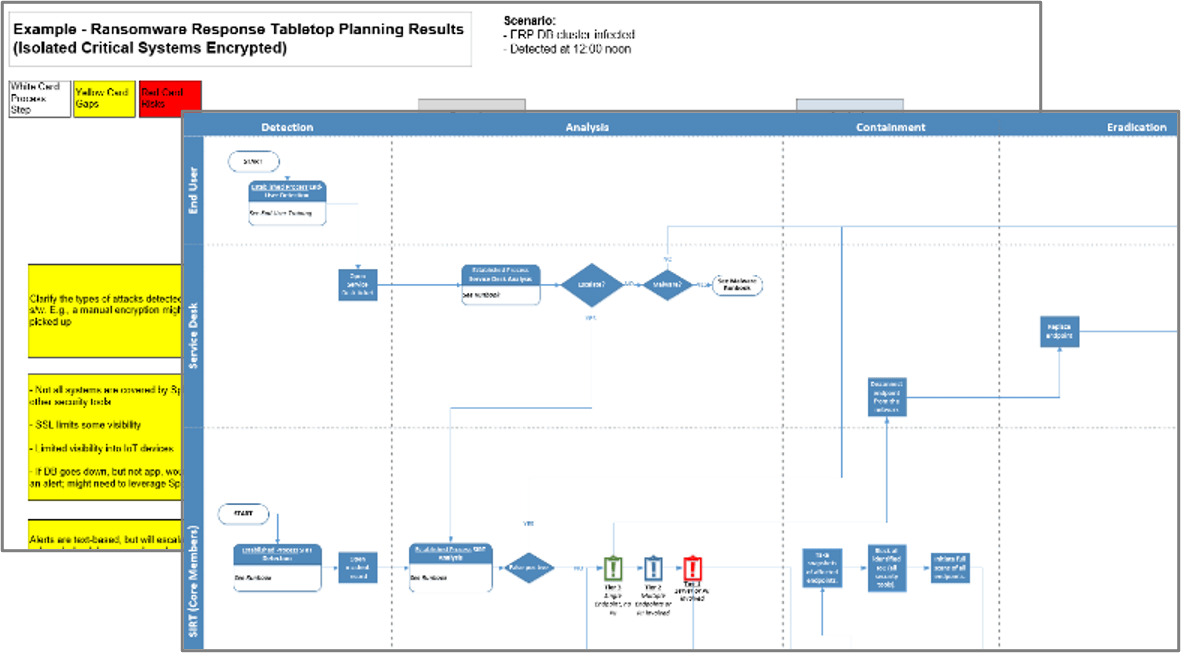
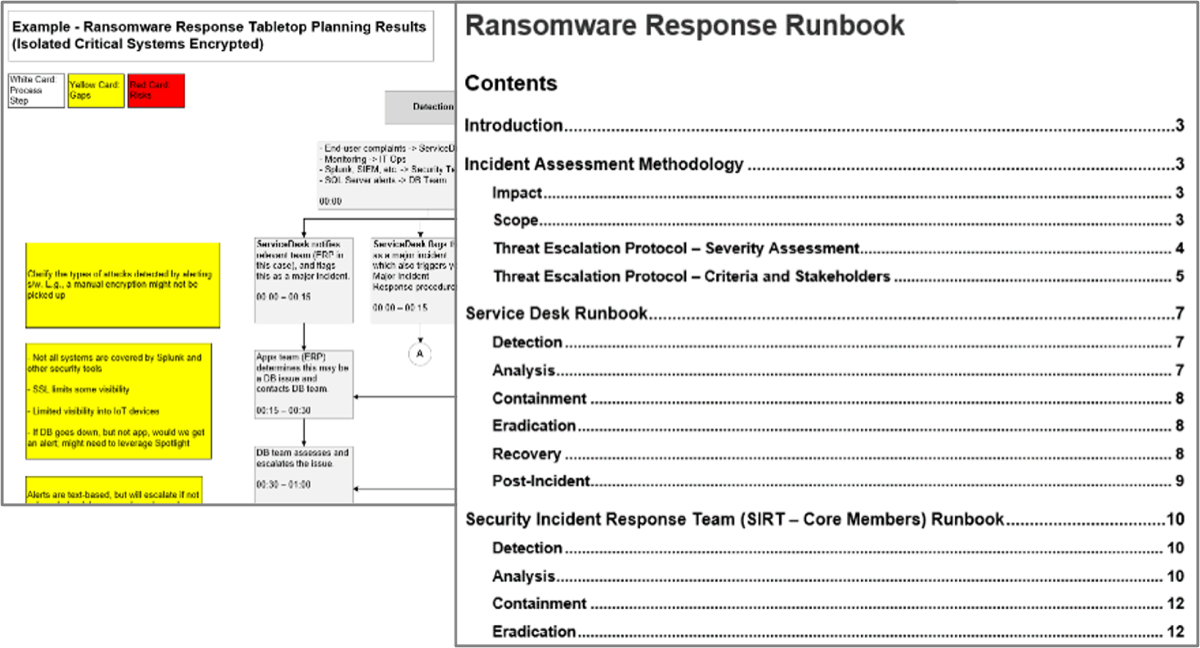
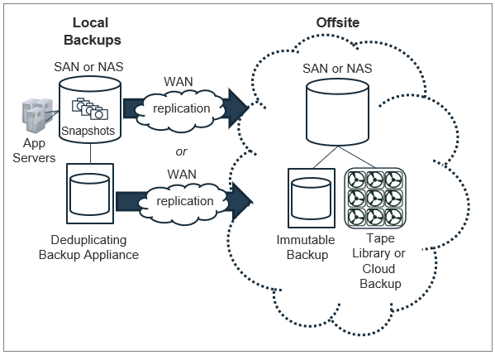
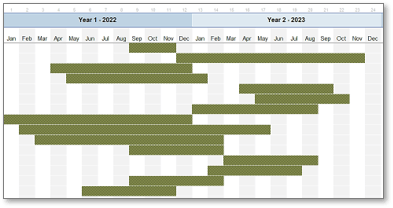
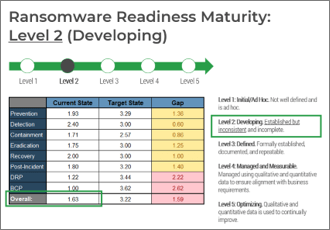


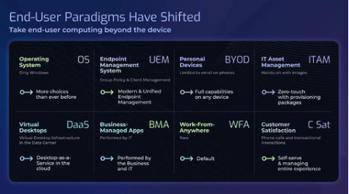


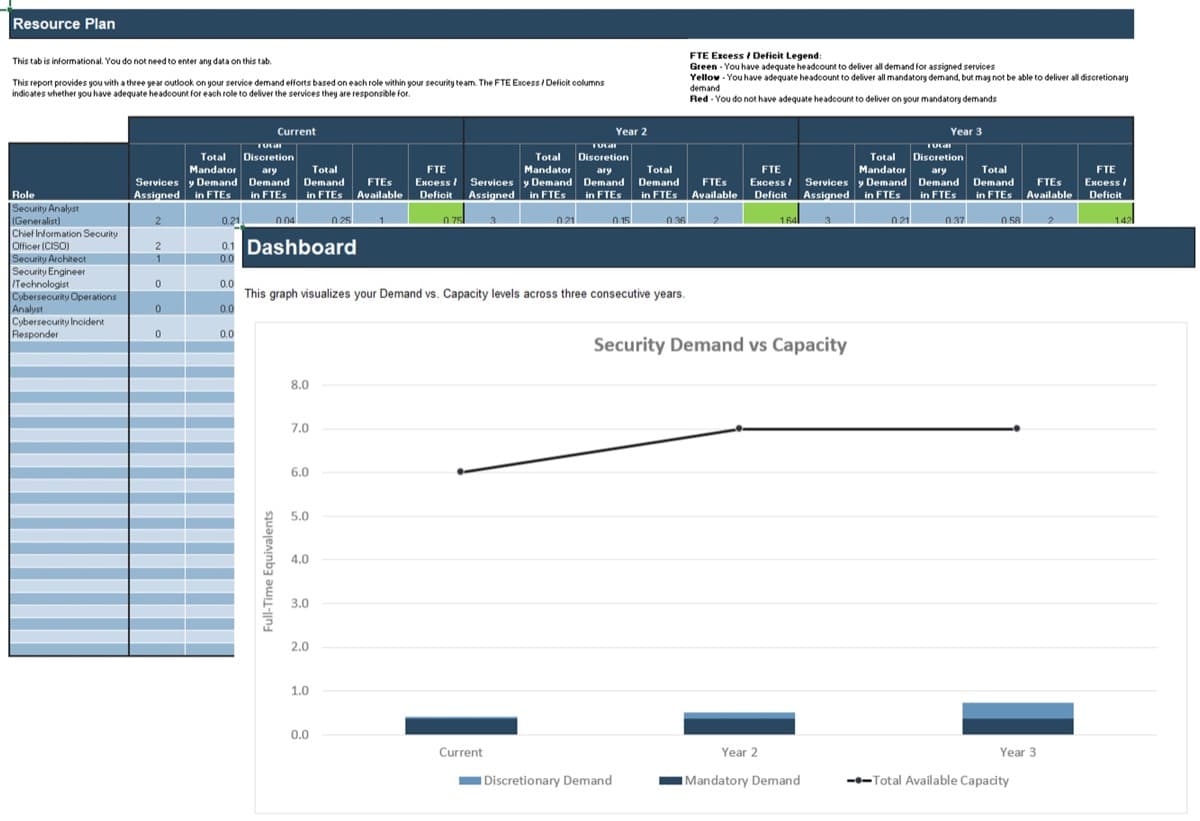
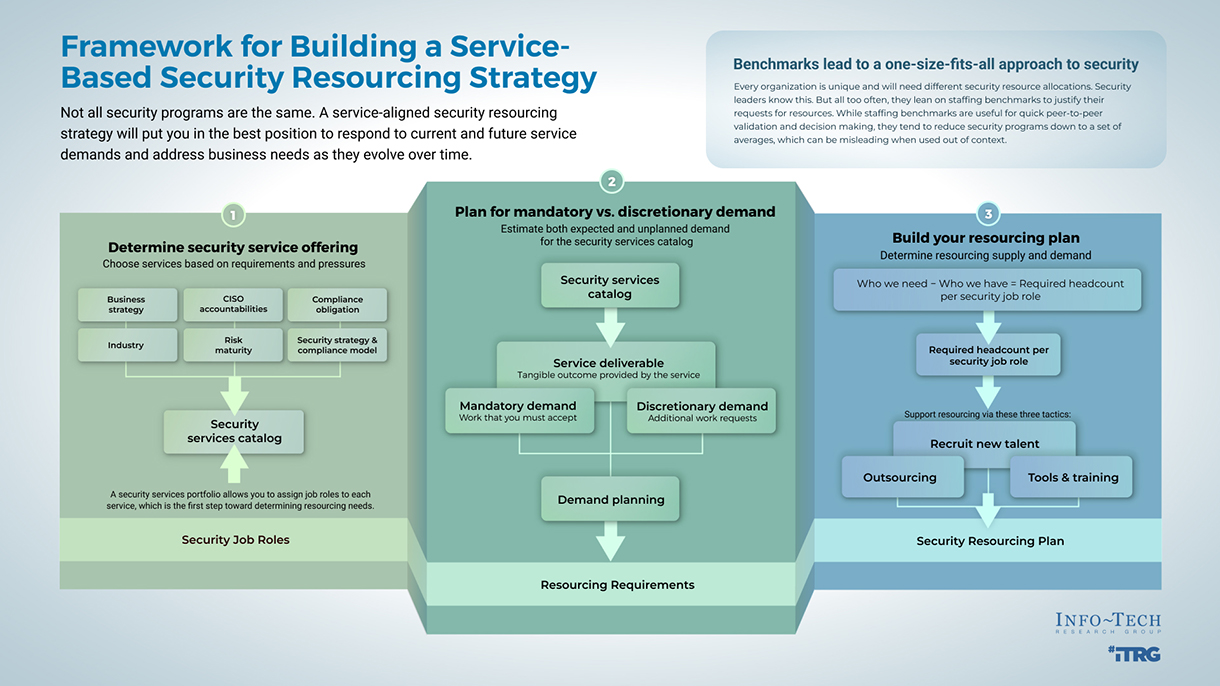
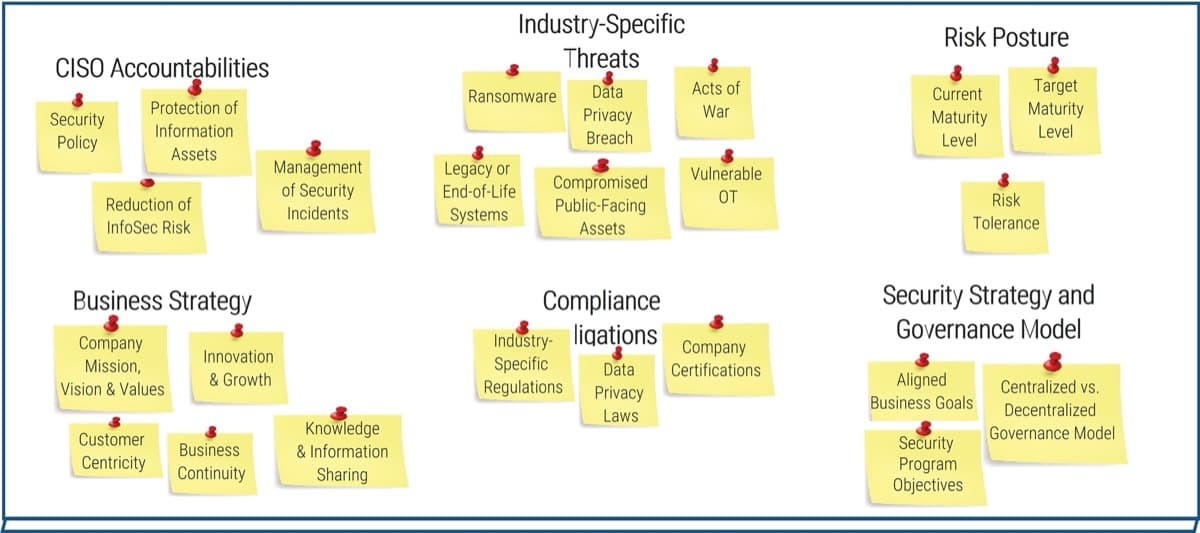
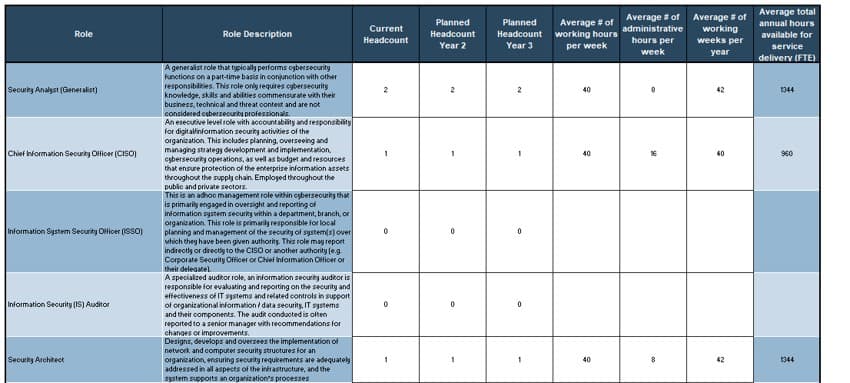
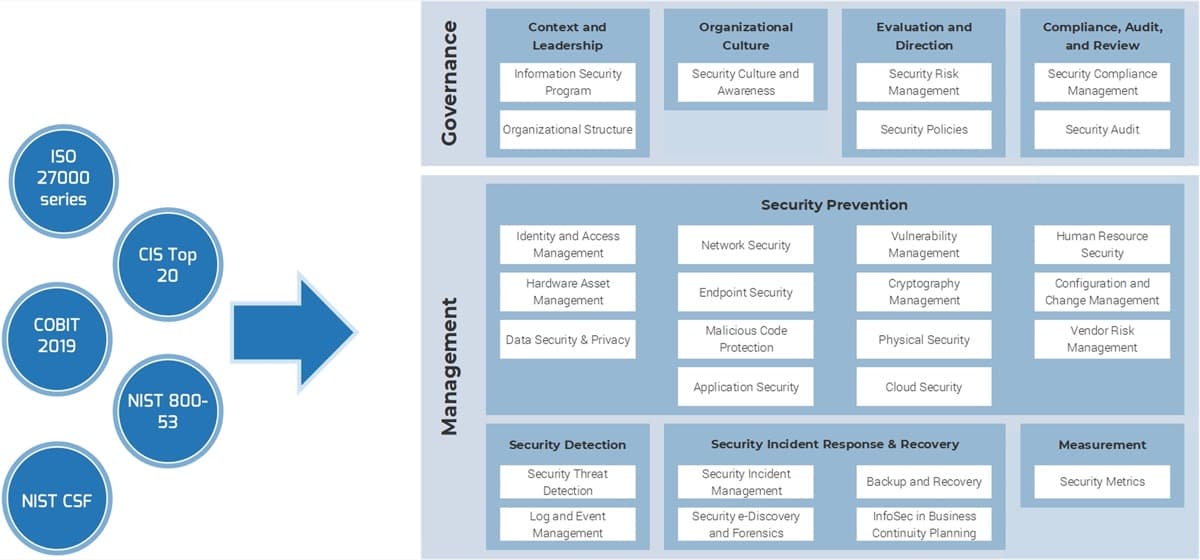
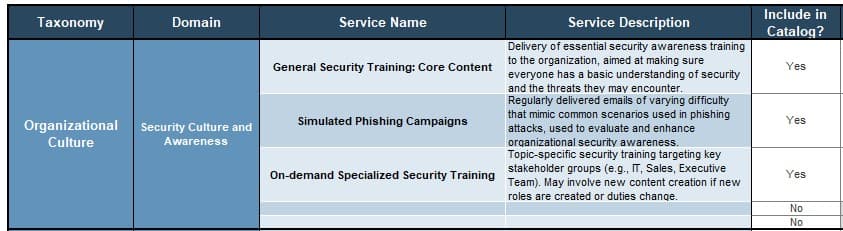
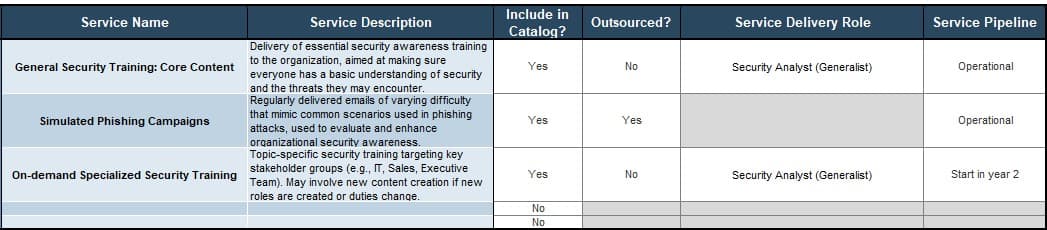
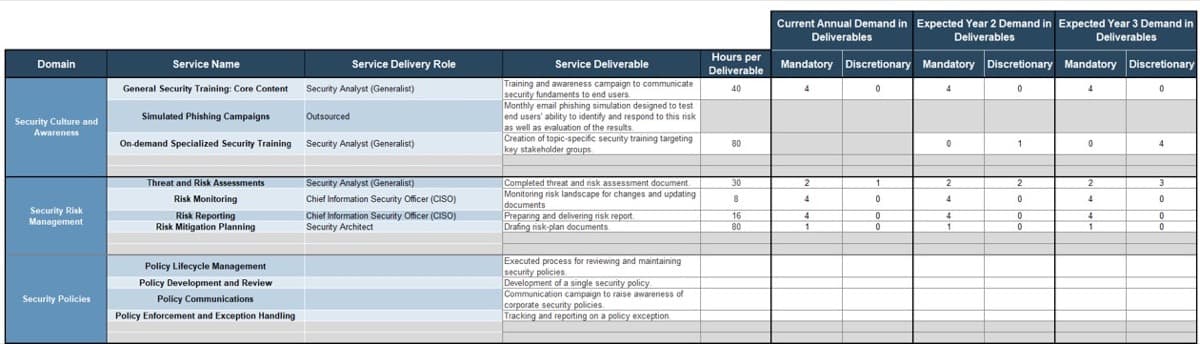
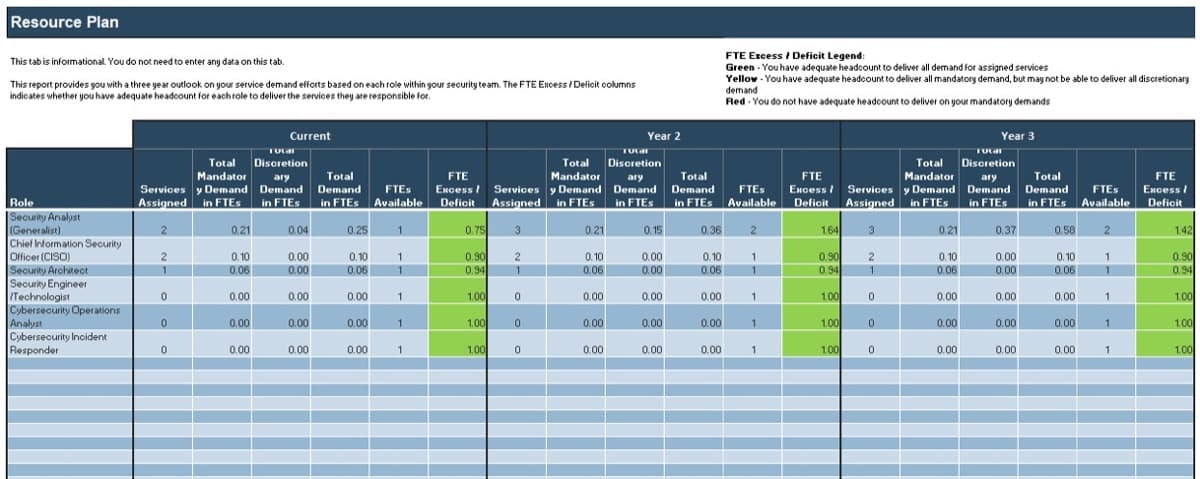
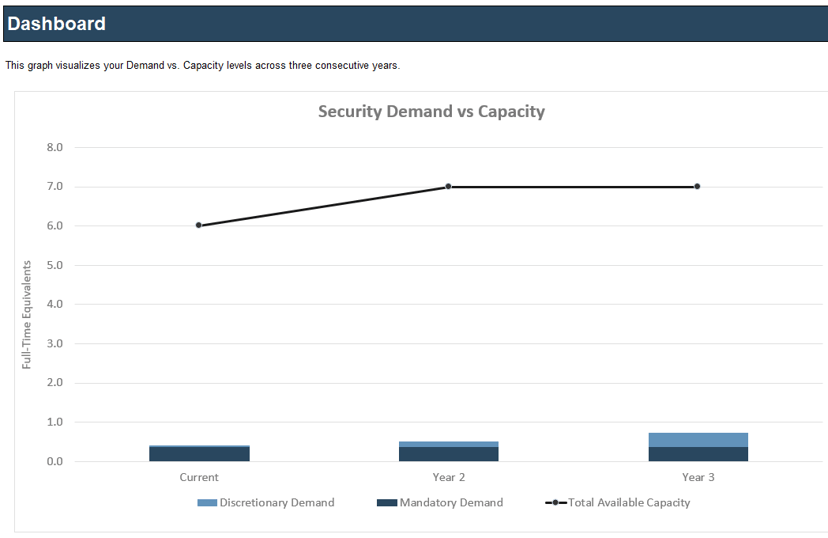
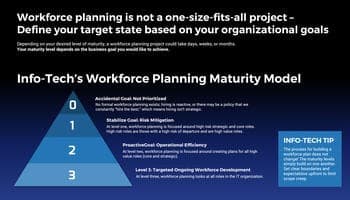


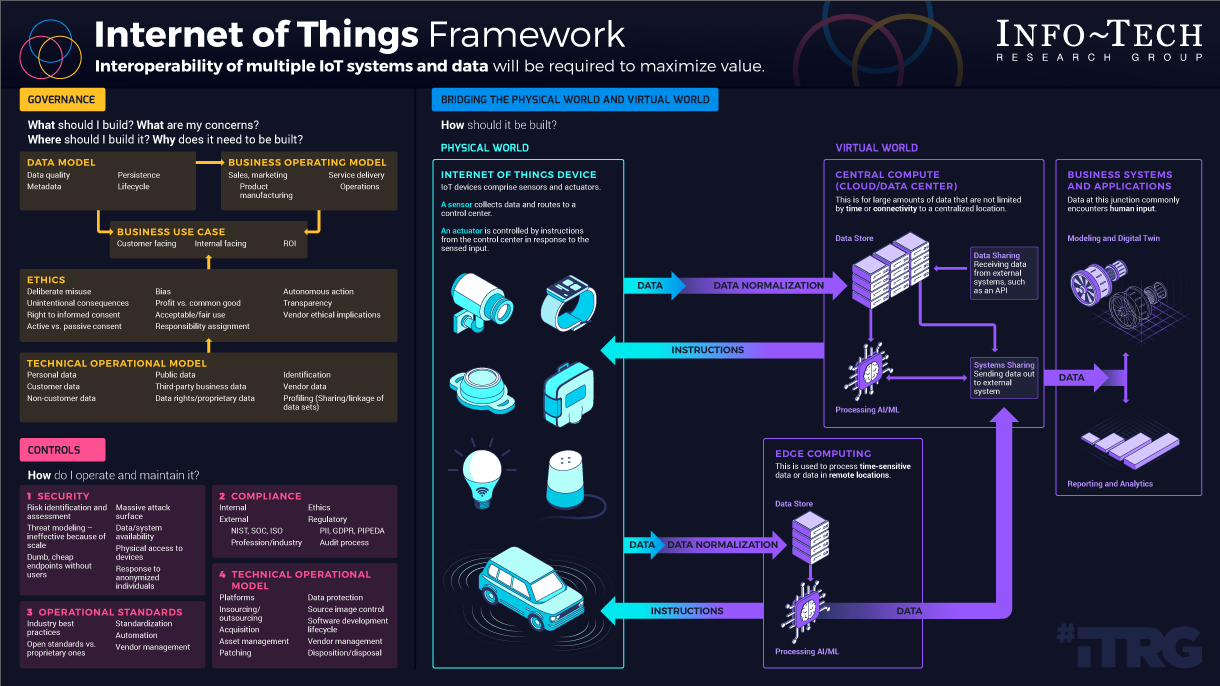

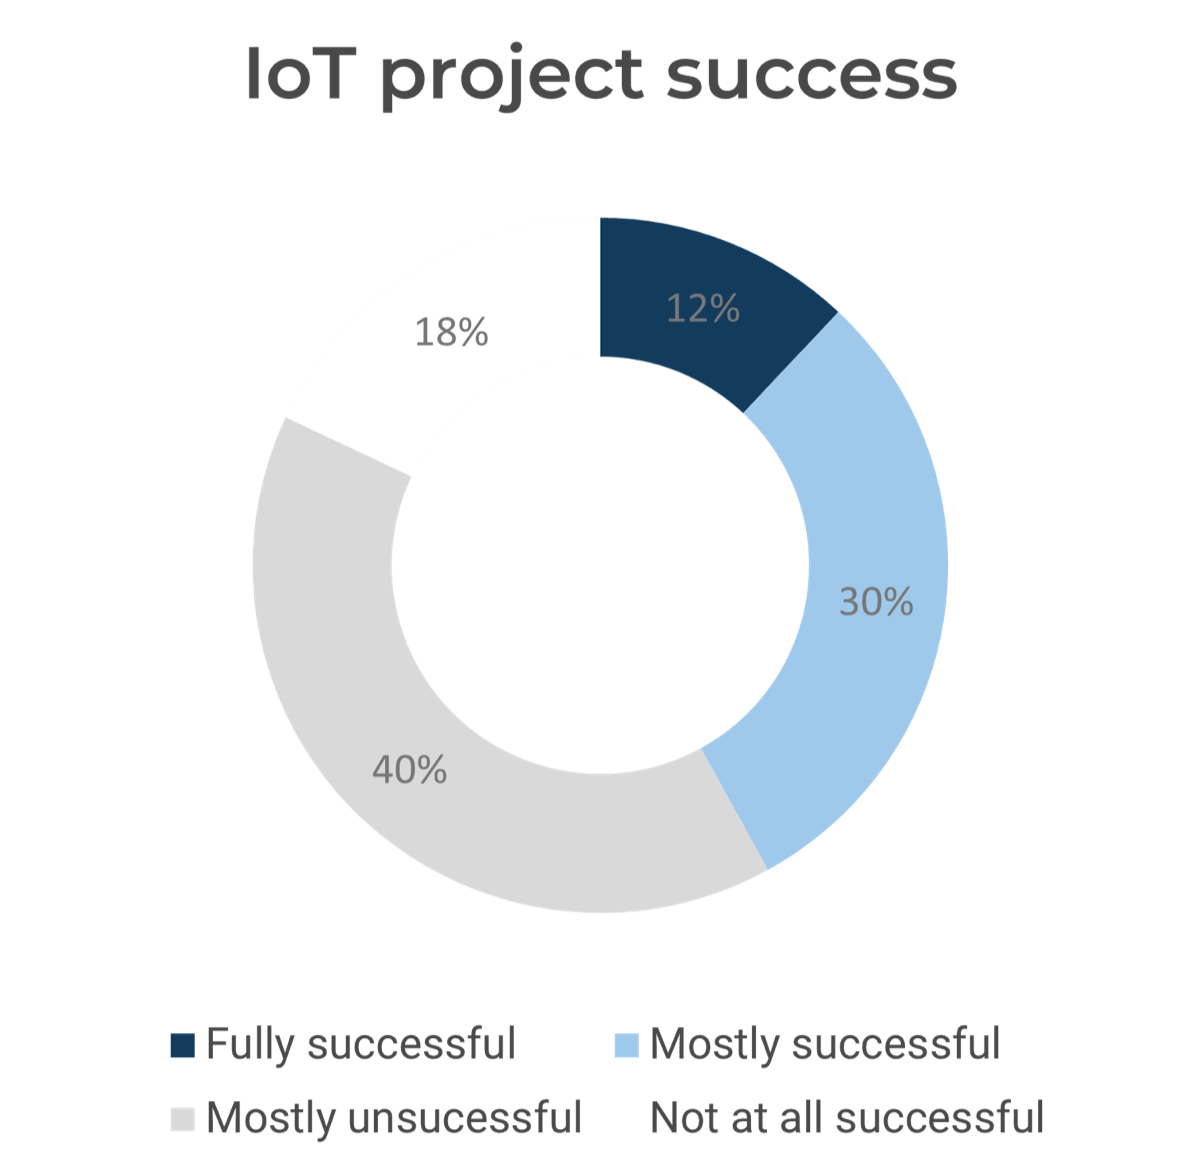
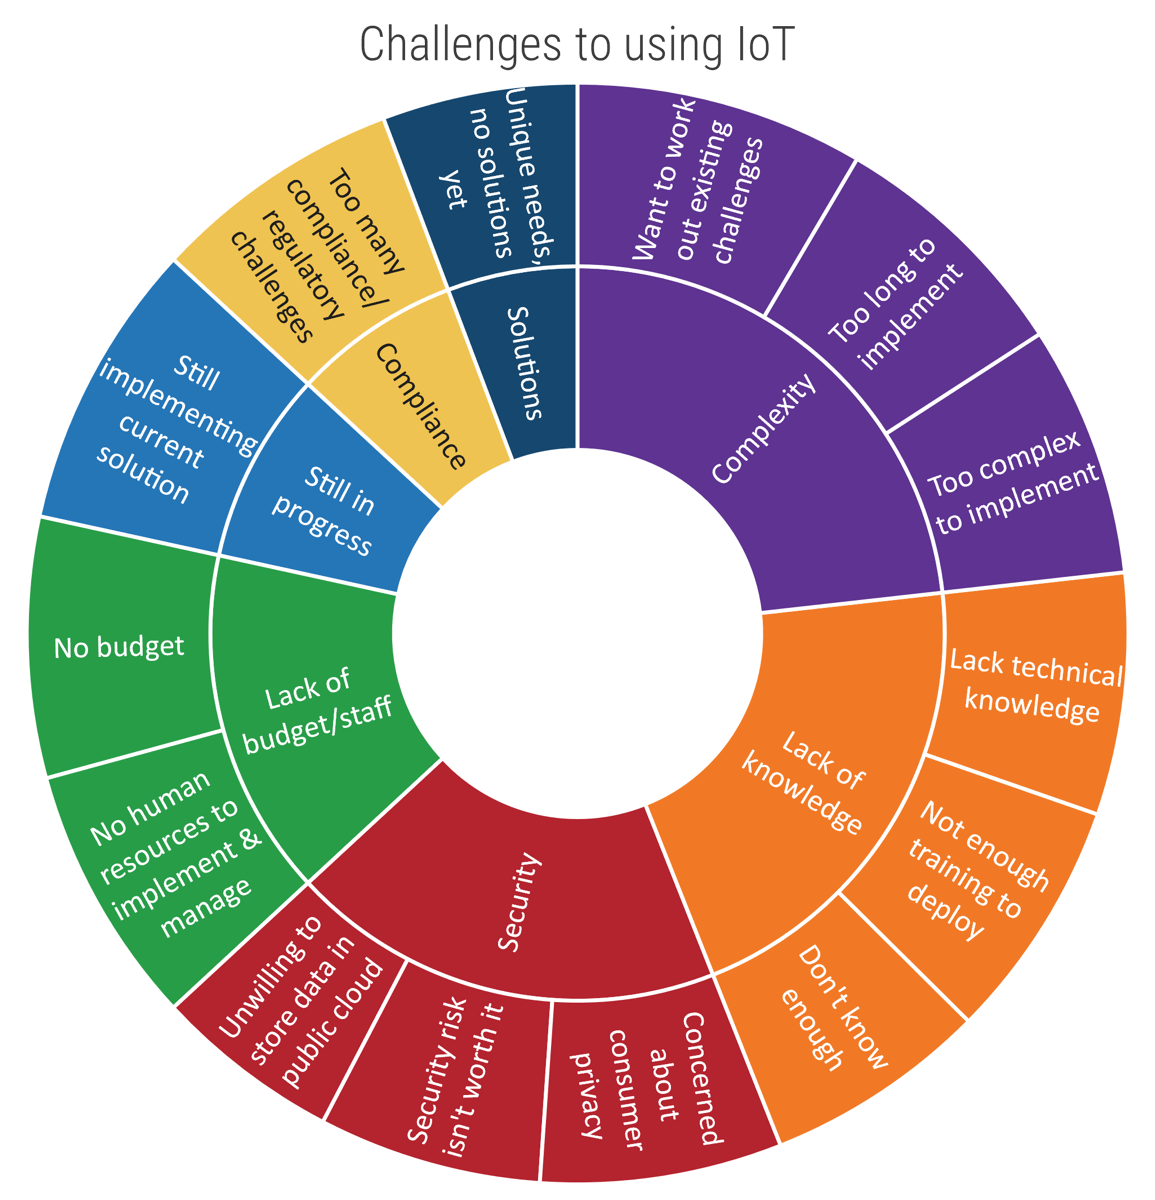
 Data Normalization' from physical to virtual and 'Instructions' from virtual to physical.">
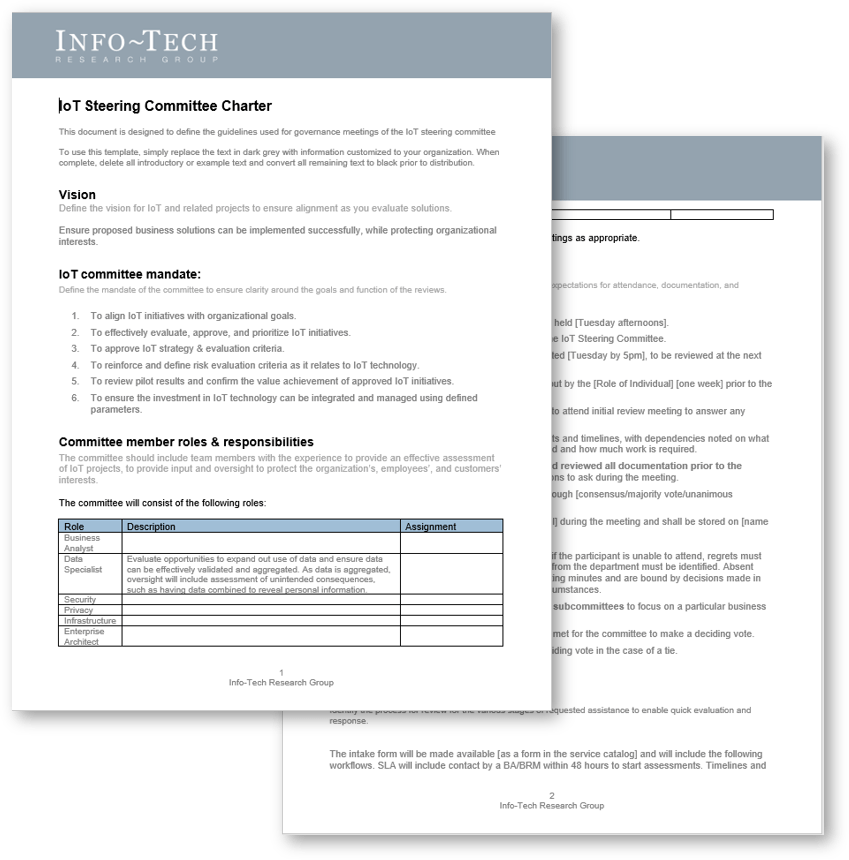
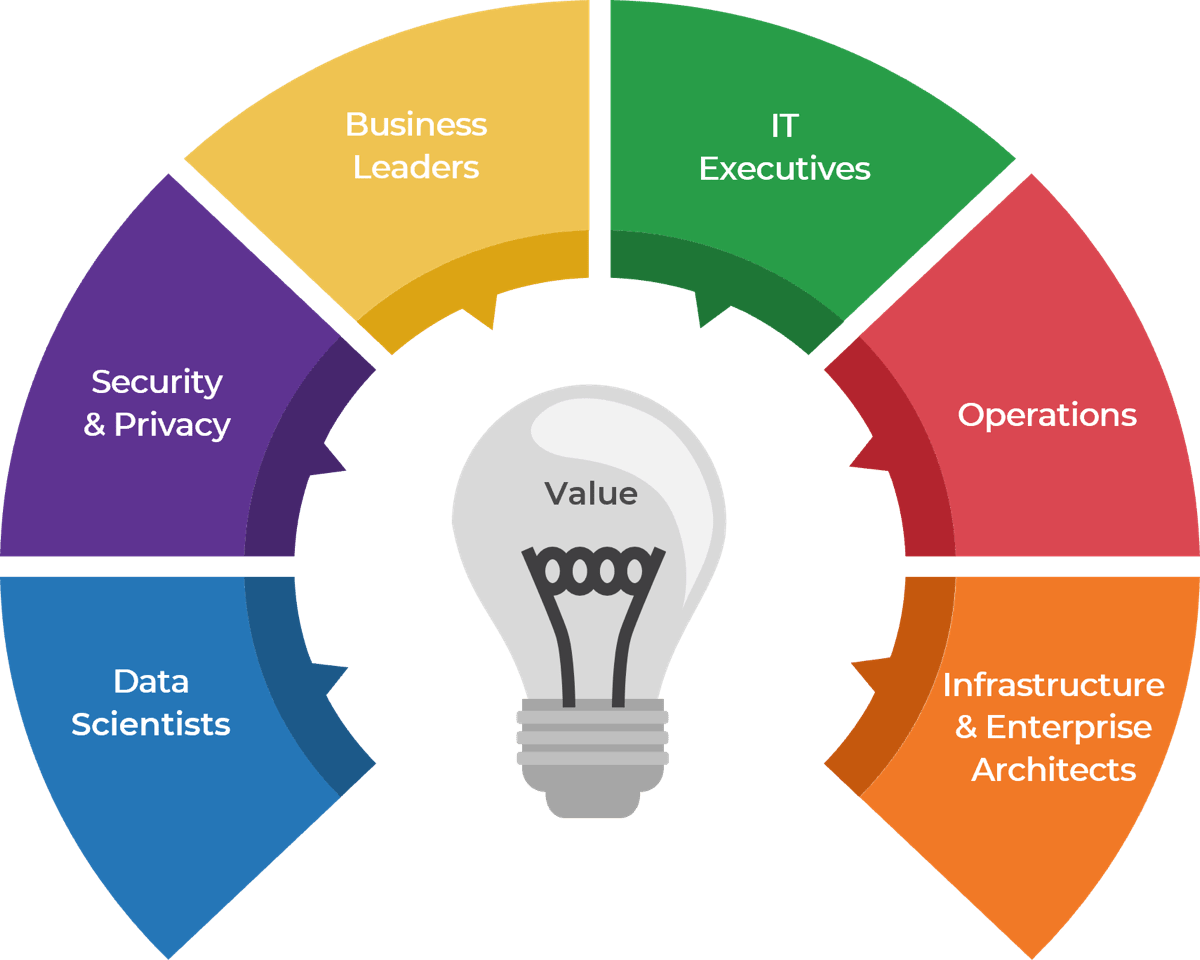

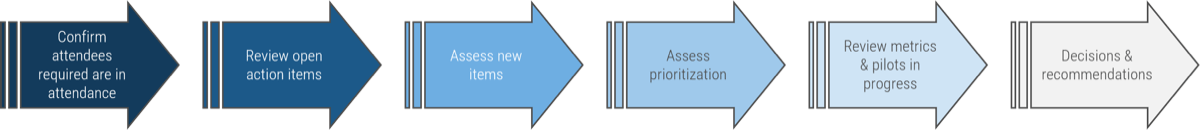

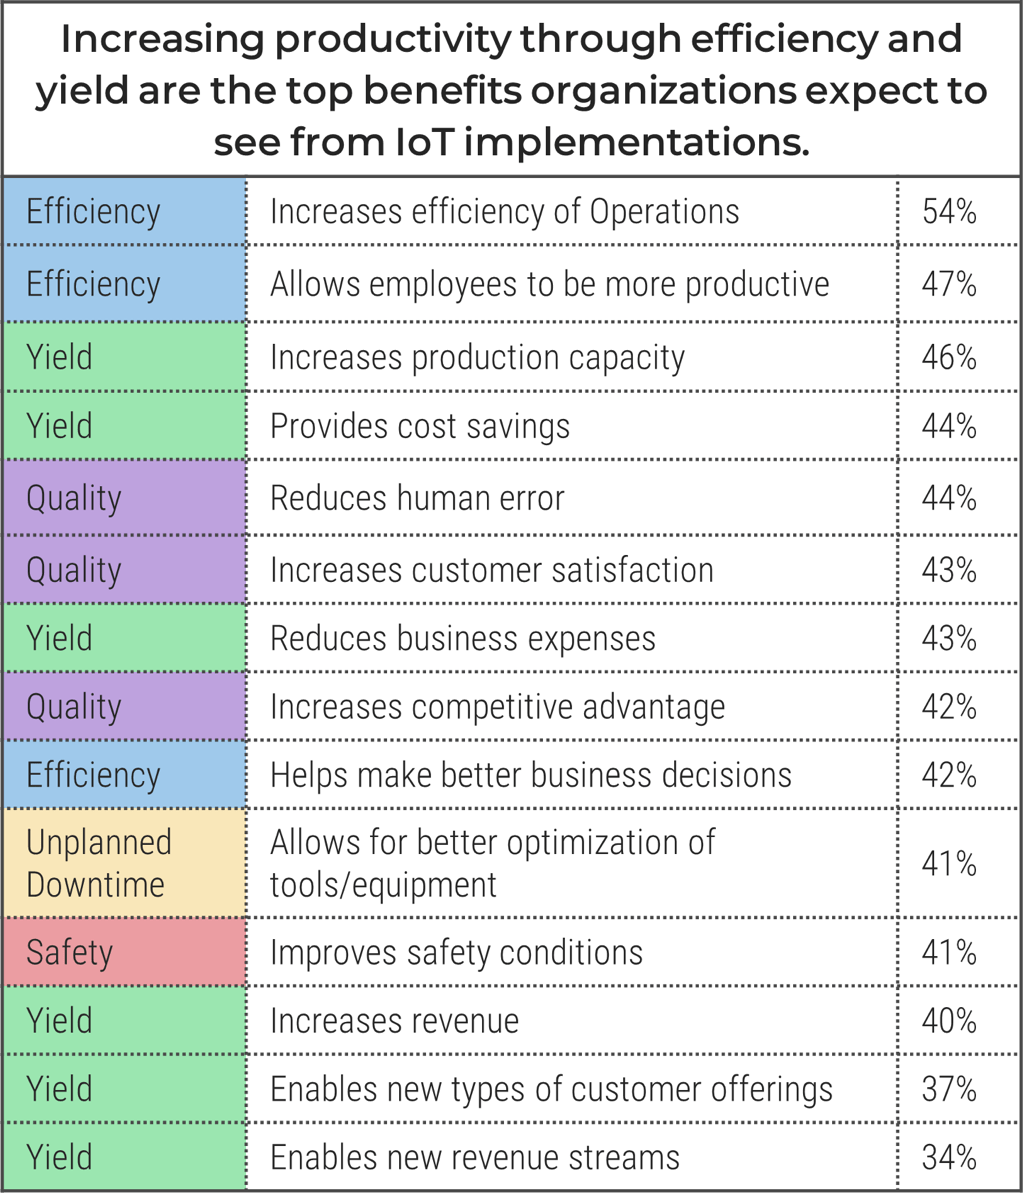


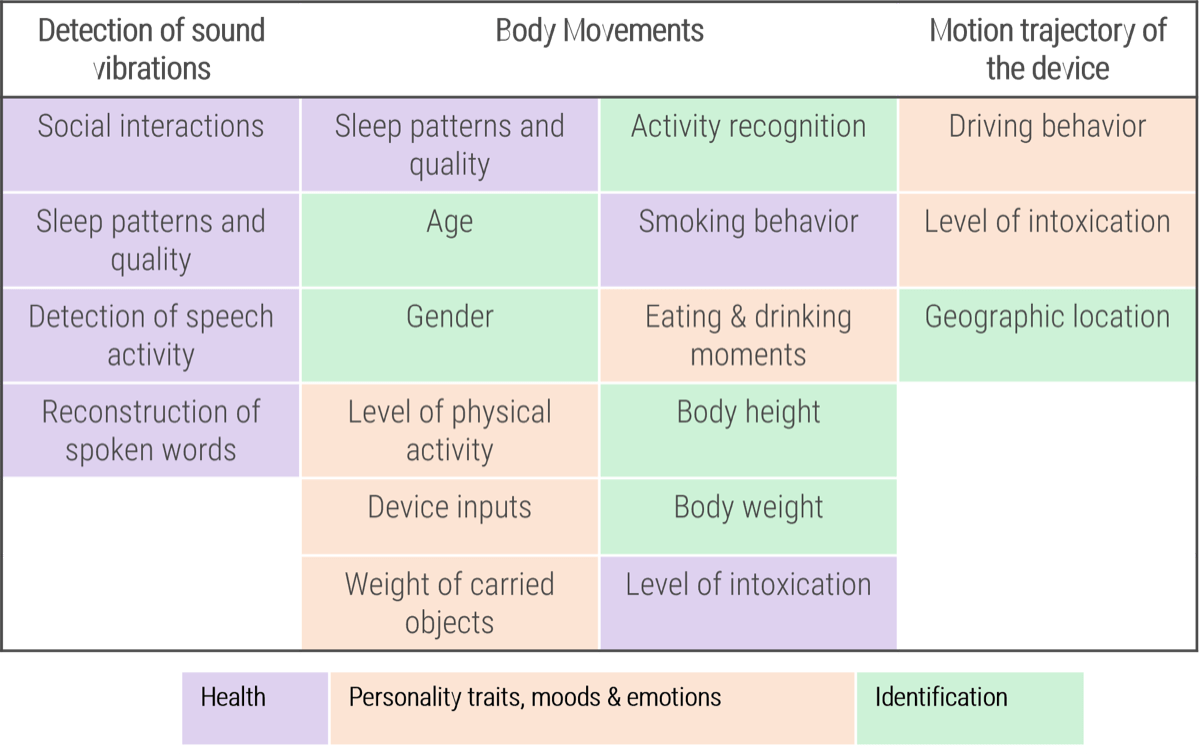

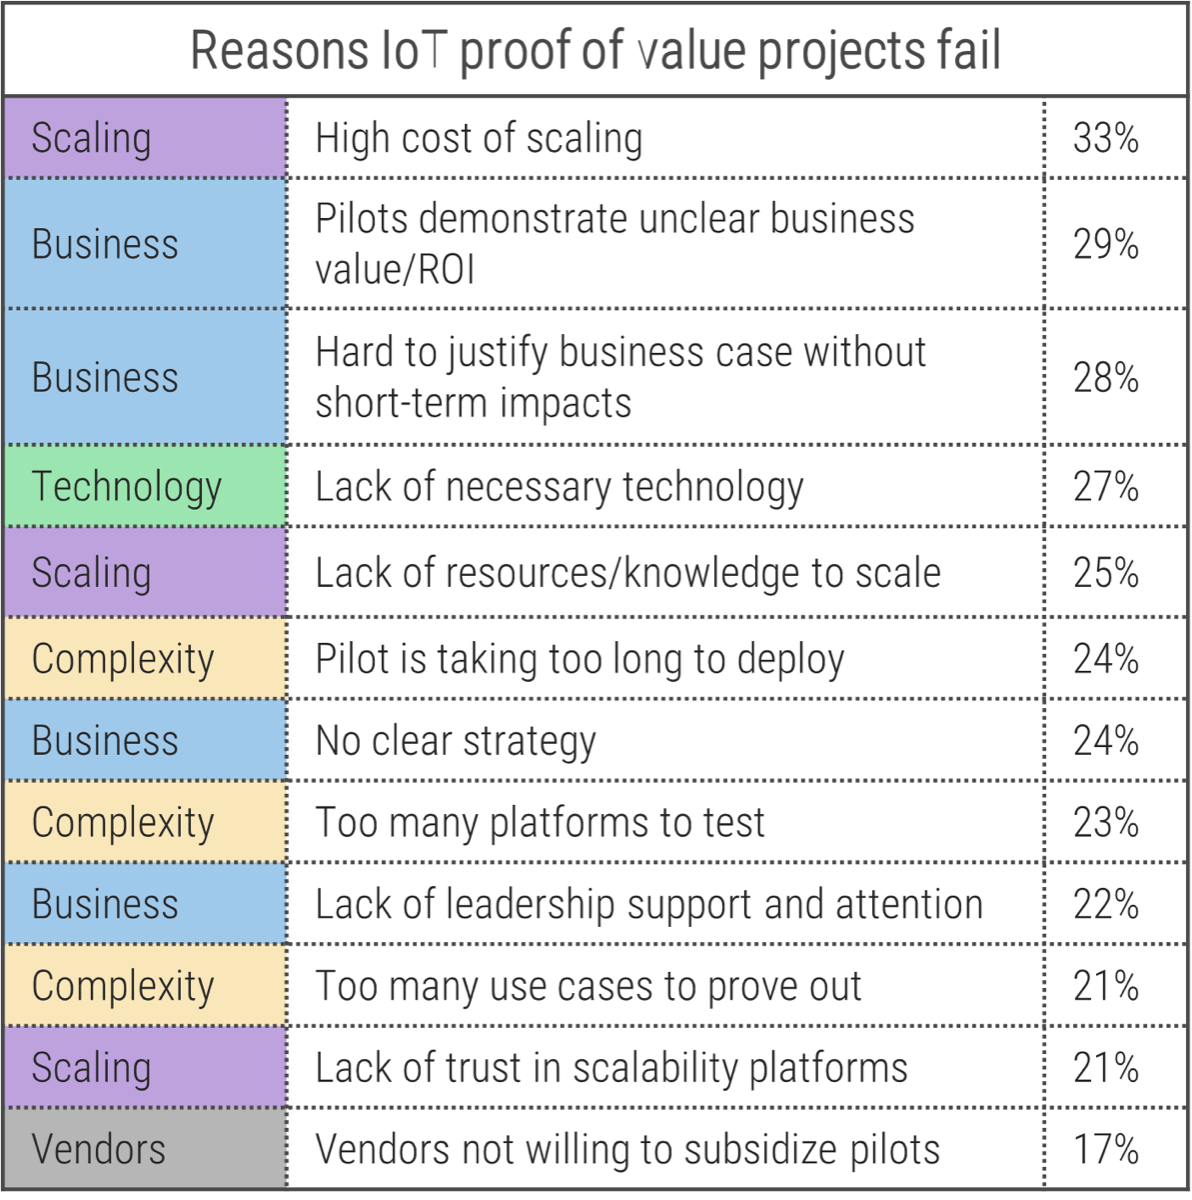


![Map different 'IBM i' scenarios with axes 'Importance to Business Outcomes - Low to High' and 'Vendor’s Performance Advantage - Low to High'. Quadrant labels are '[LI/LA] Potentially Outsource: Service management, Help desk, desk-side support, Asset management', '[LI/HA] Outsource: Application & Infra Support, Web Hosting, SAP Support, Email Services, Infrastructure', '[HI/LA] Insource (For Now): Application development tech support', and '[HI/HA] Potentially Outsource: Onshore or offshore application maintenance'.](/images/ITMGF/infra-and-operations/i-and-o-process-management/strategy-and-organizational-design/ibm-i-migration-considerations/04-ibmi-map-importance-advantage.png)
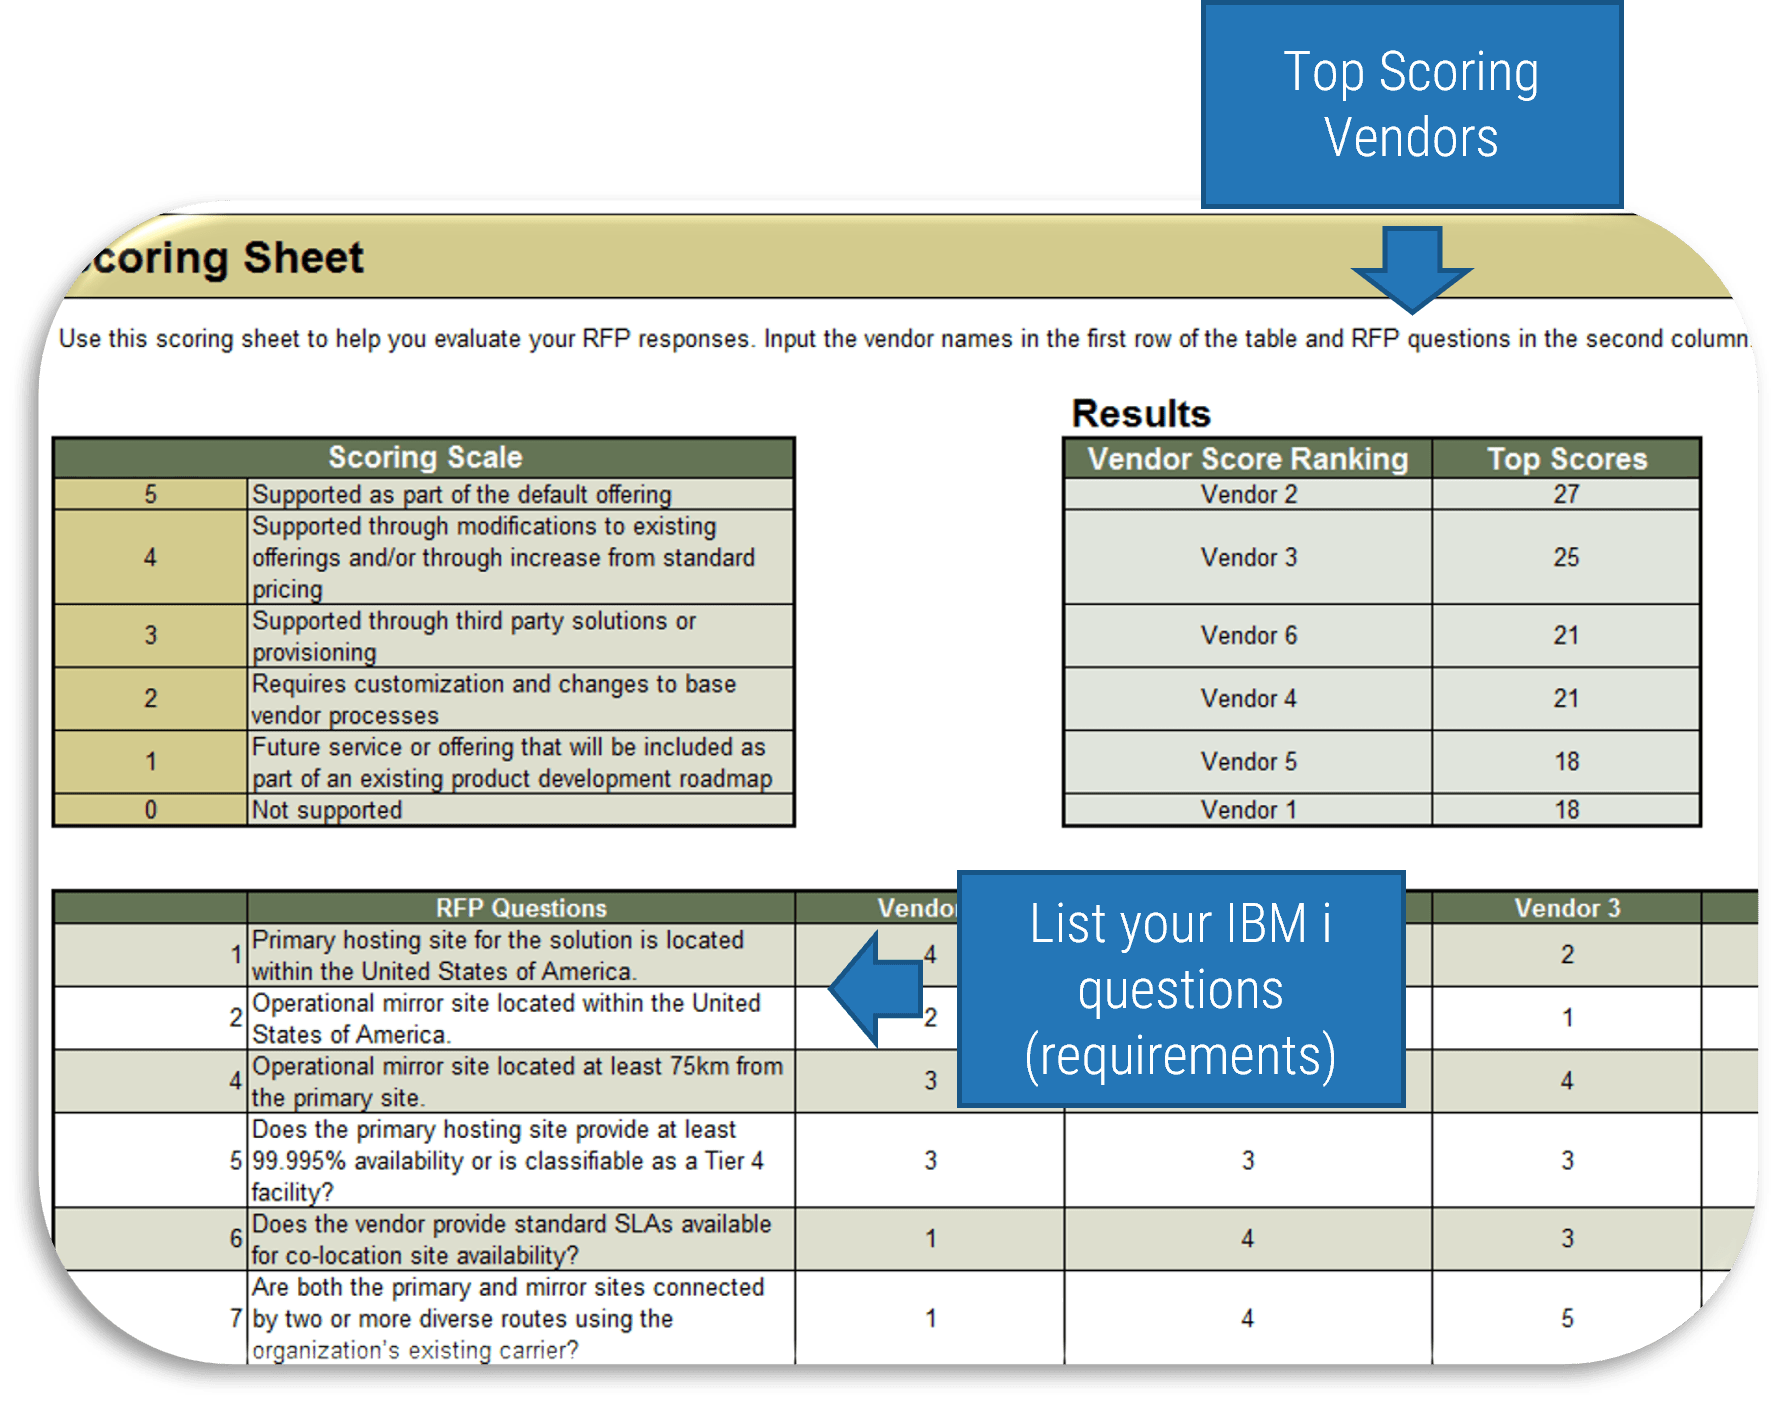


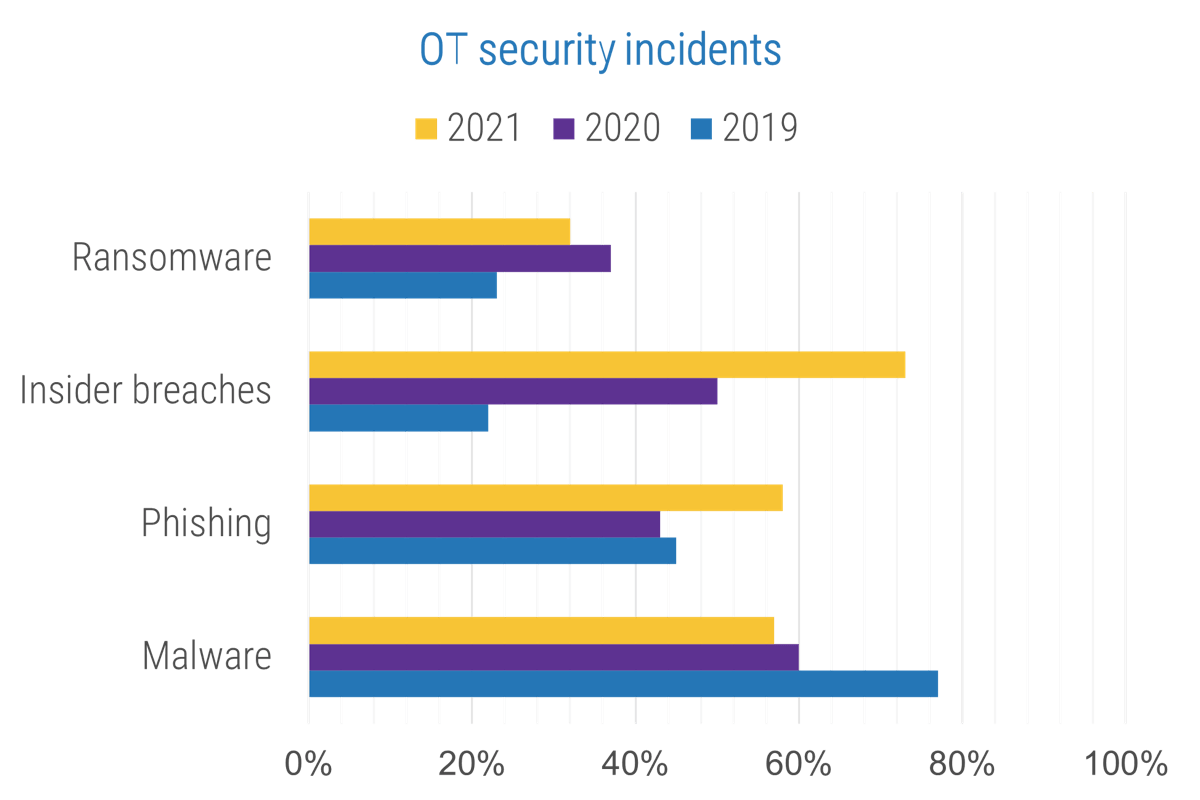

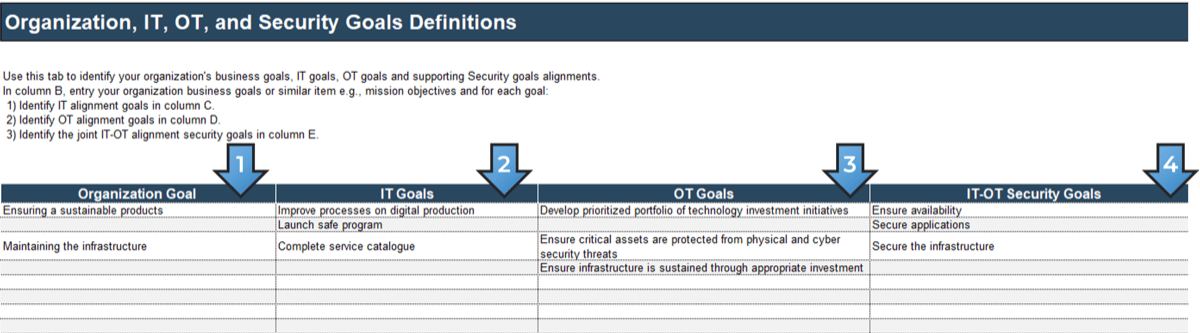
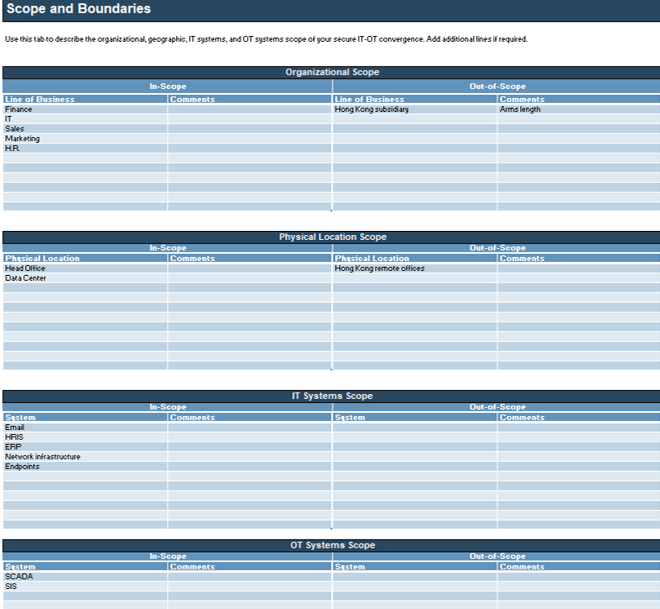
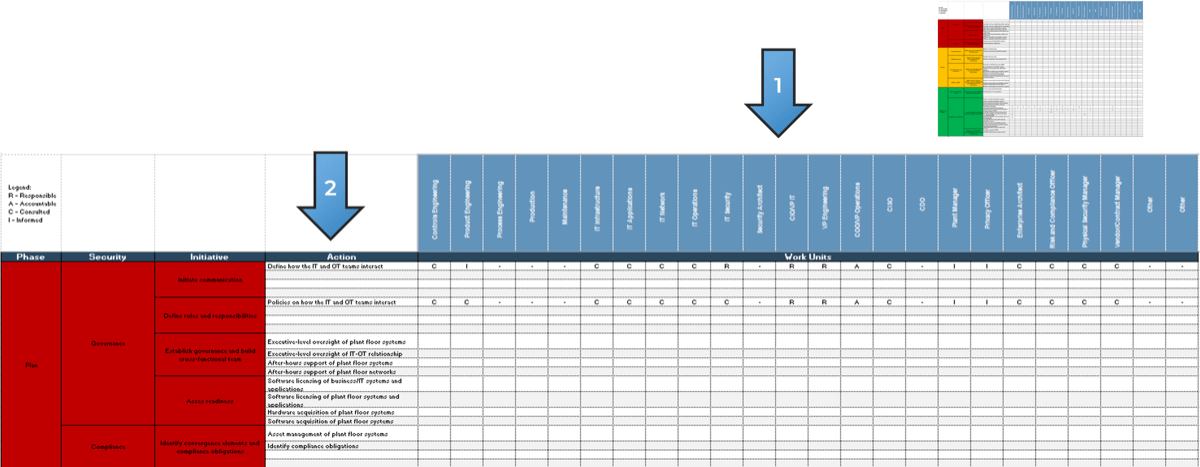
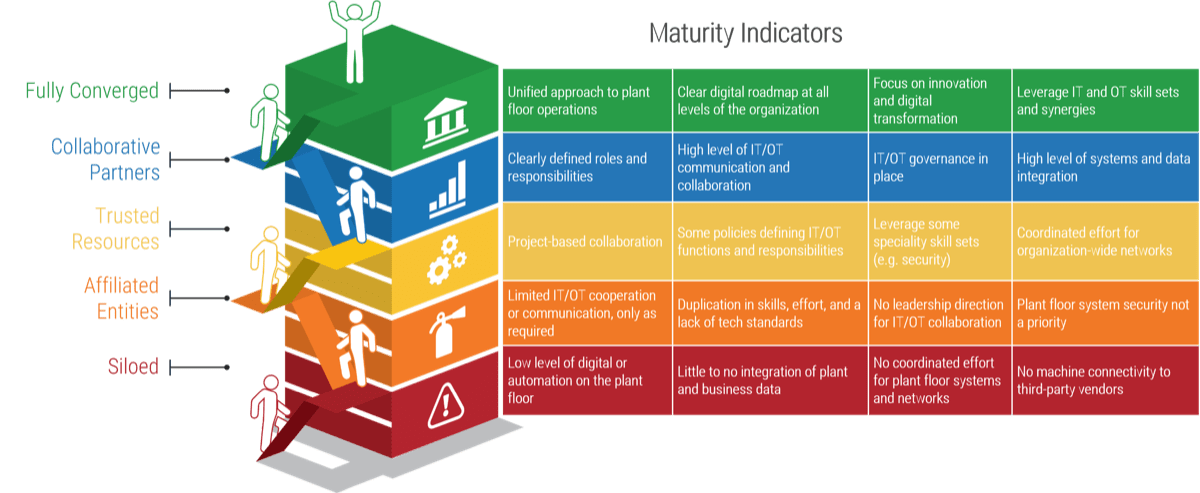
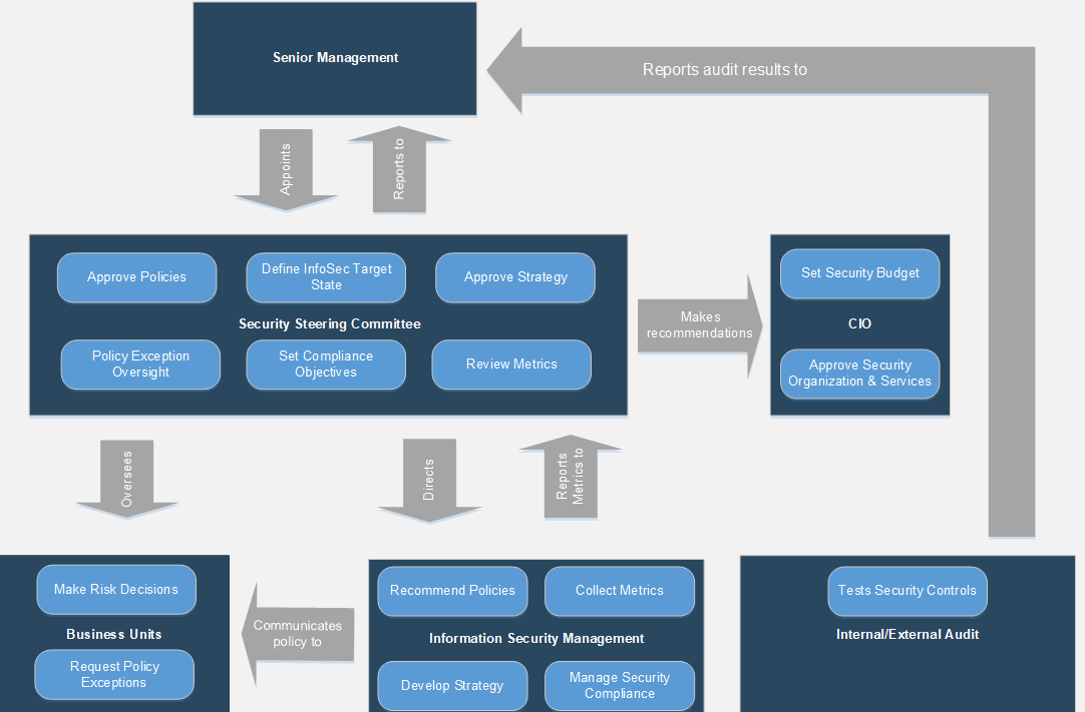
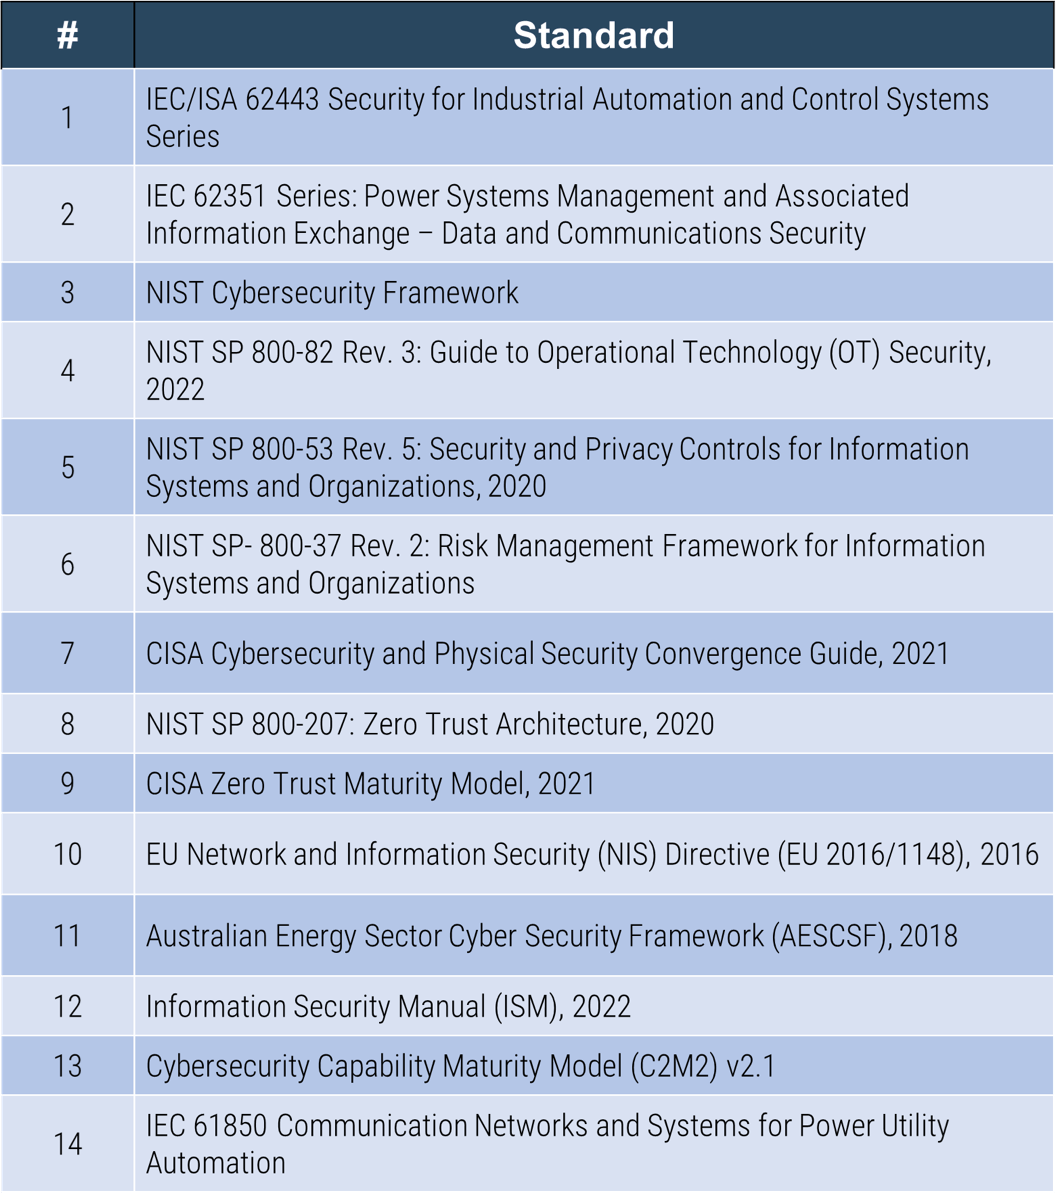
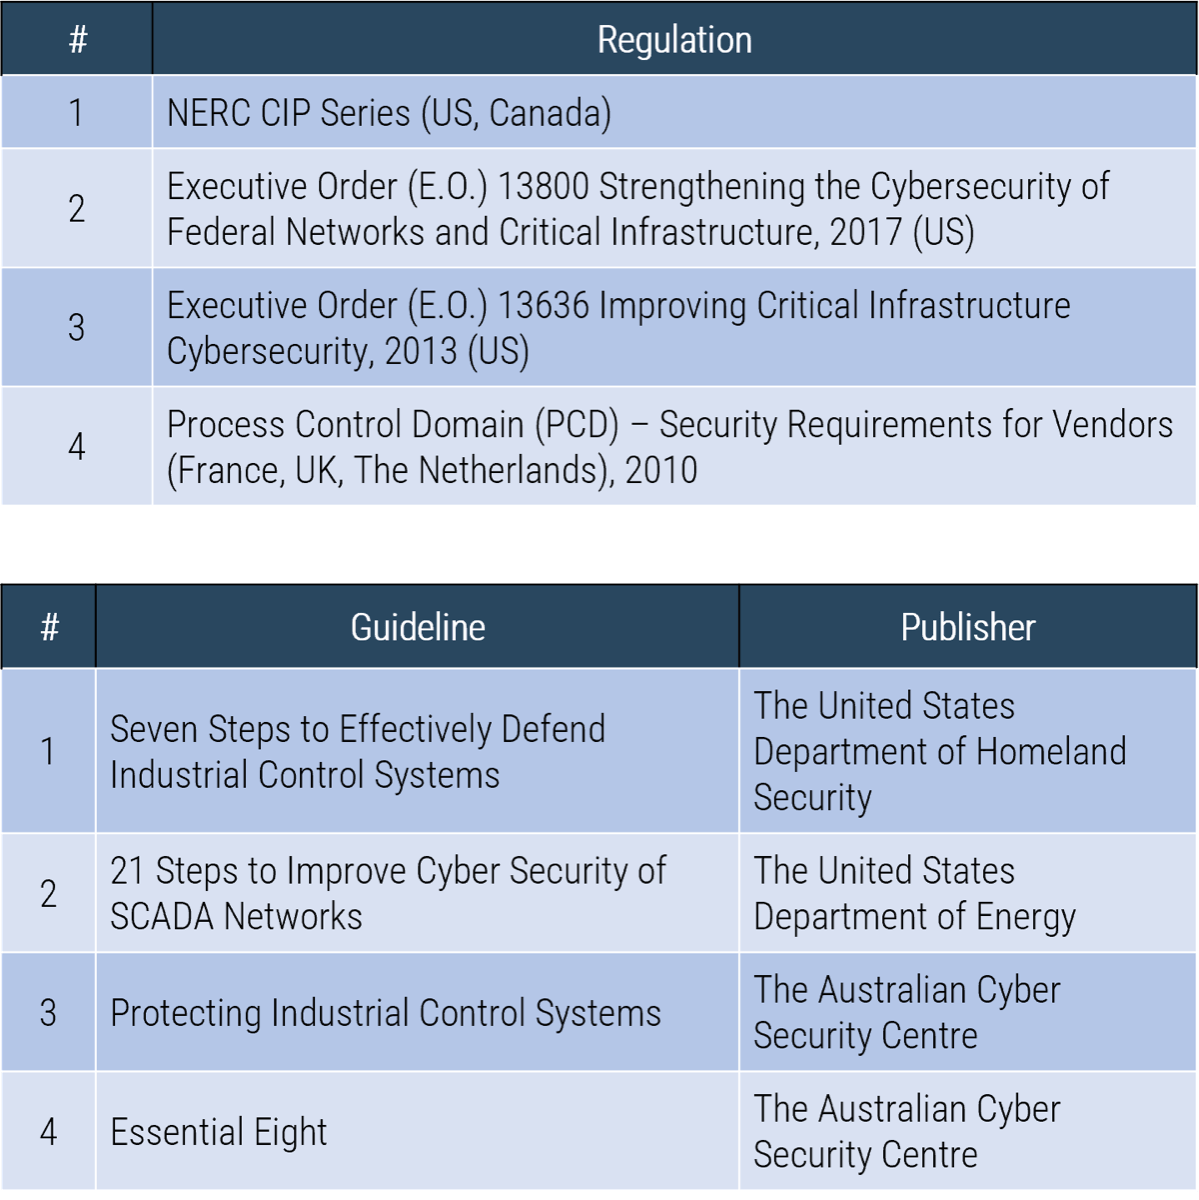
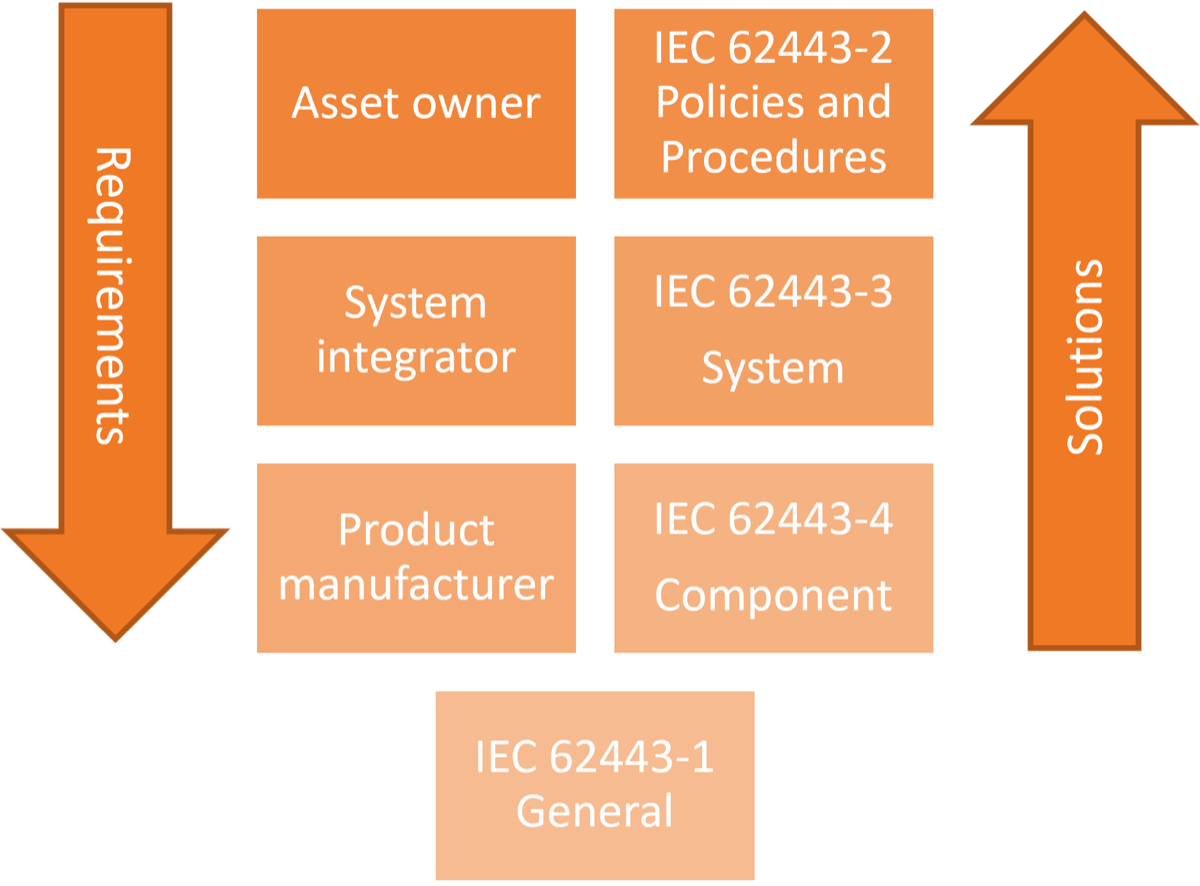
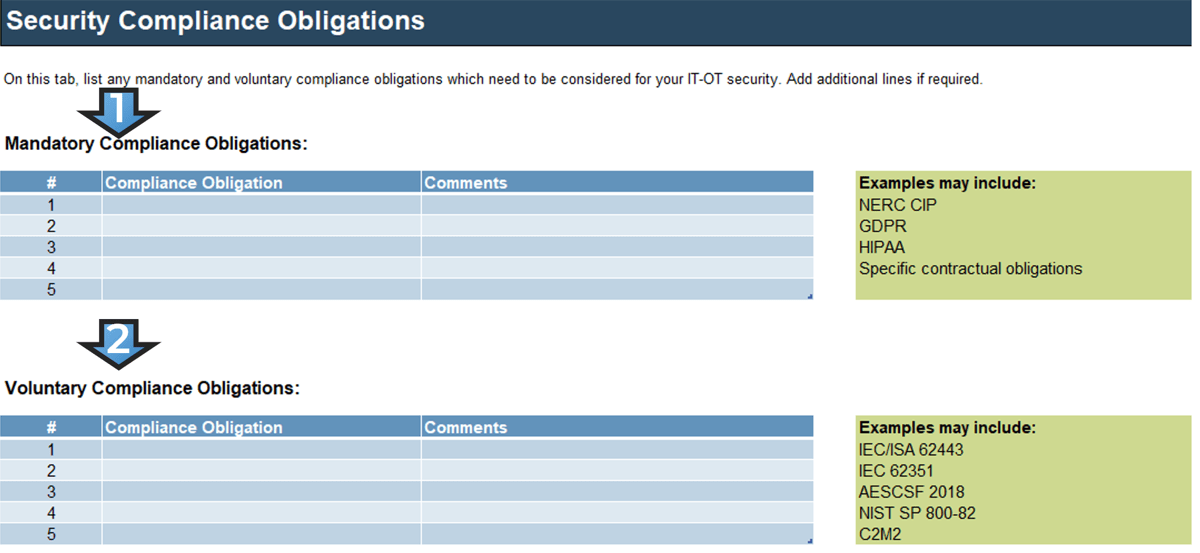
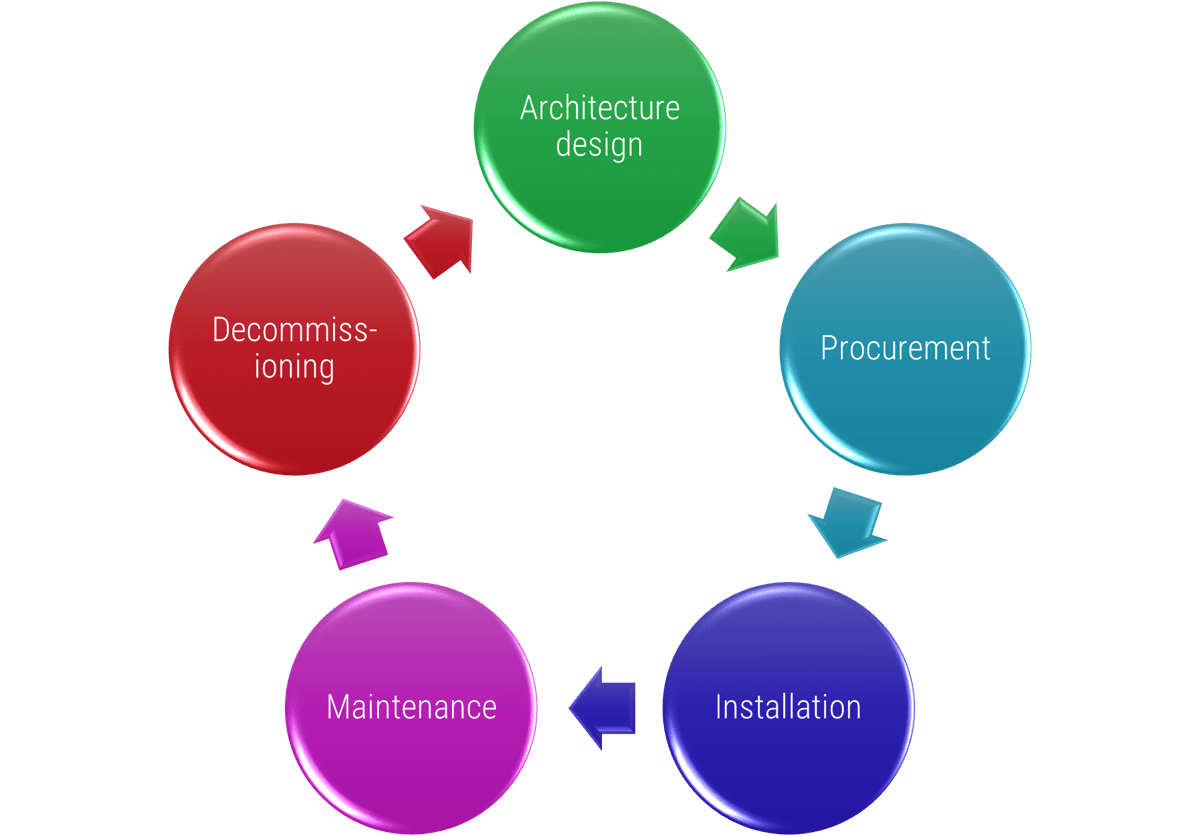
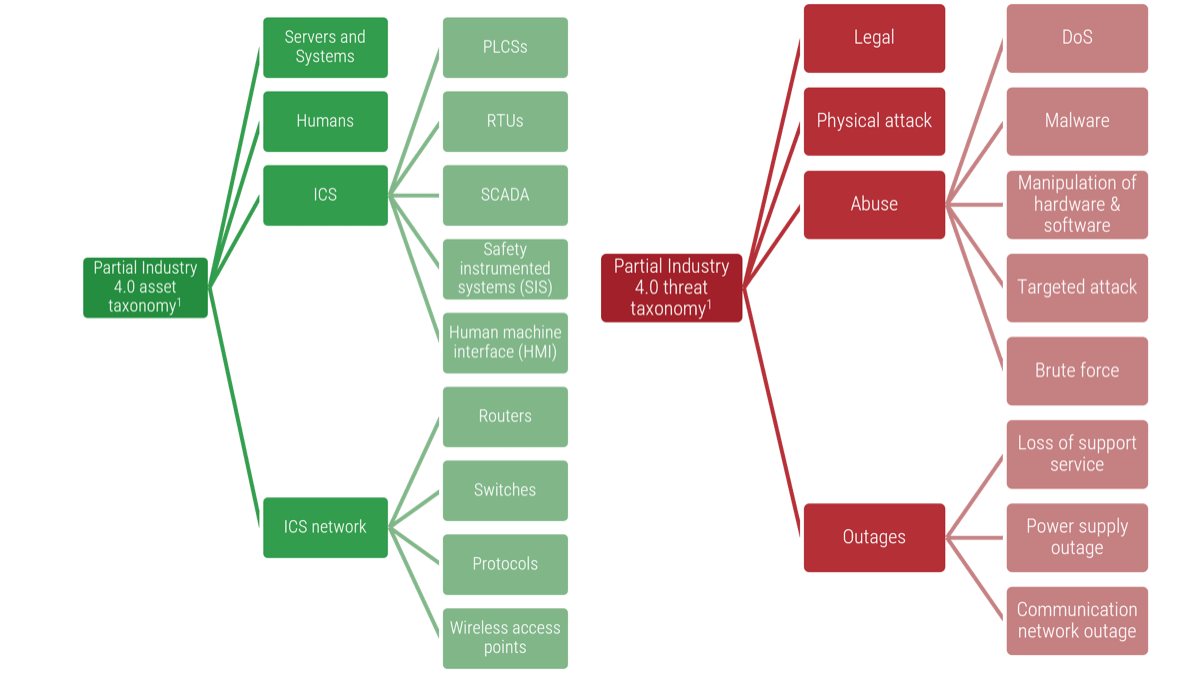
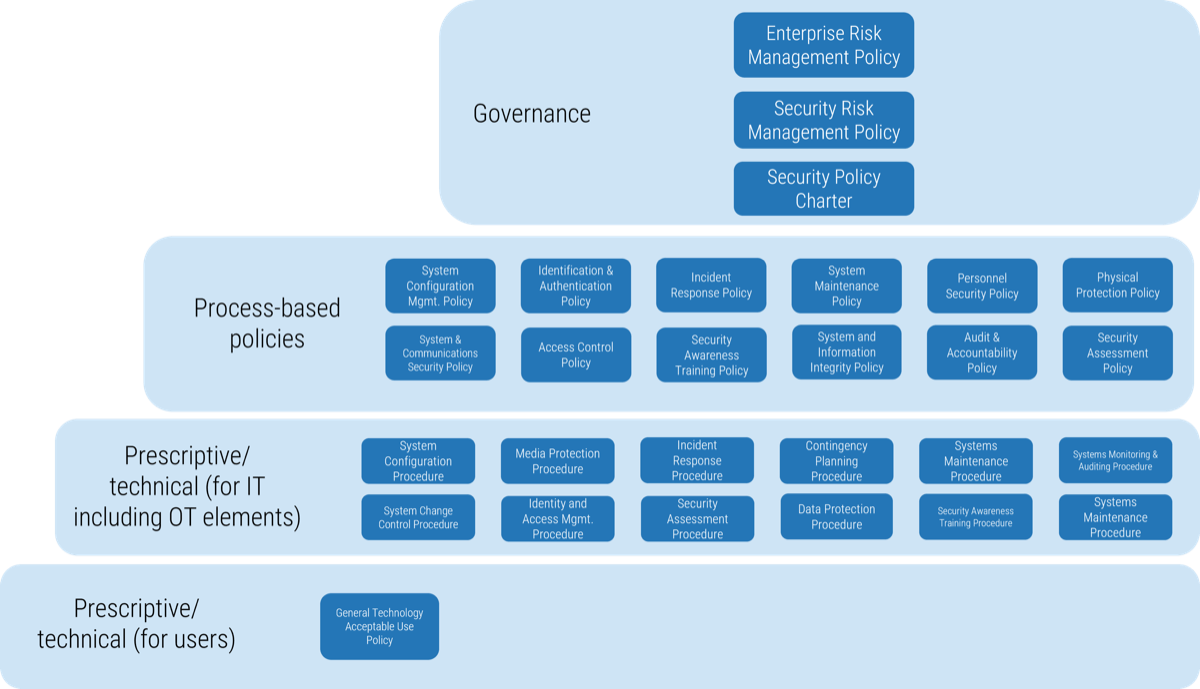
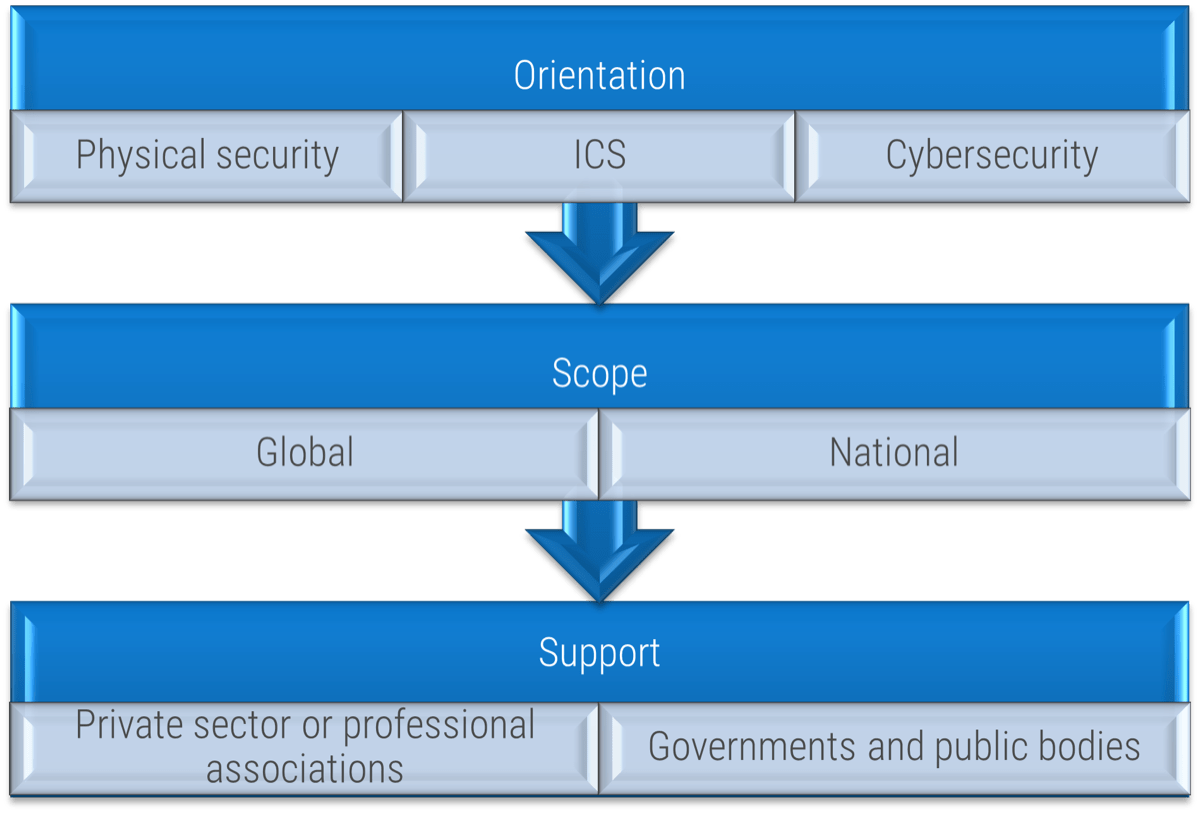 (Source: ENISA, 2015.)
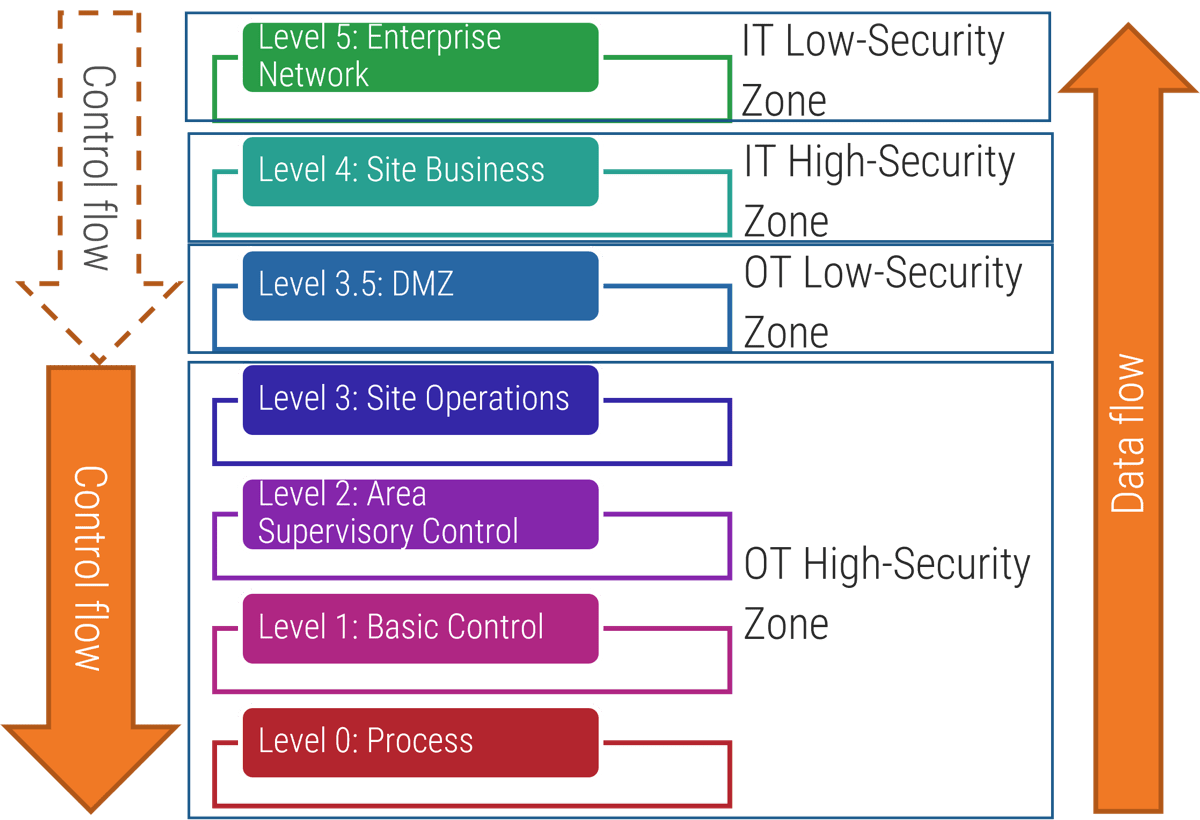 (Source: “Purdue Enterprise Reference Architecture (PERA) model,” ISA-99.)
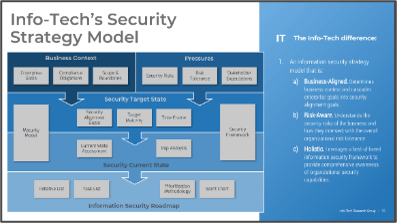
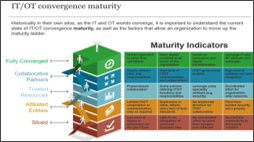
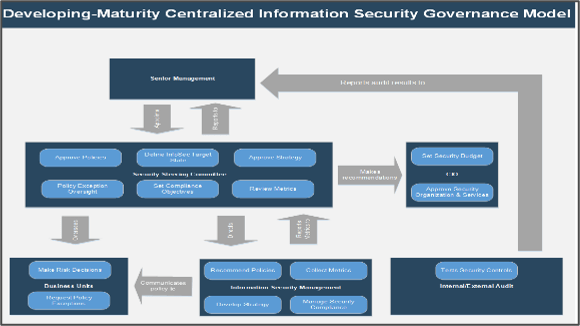


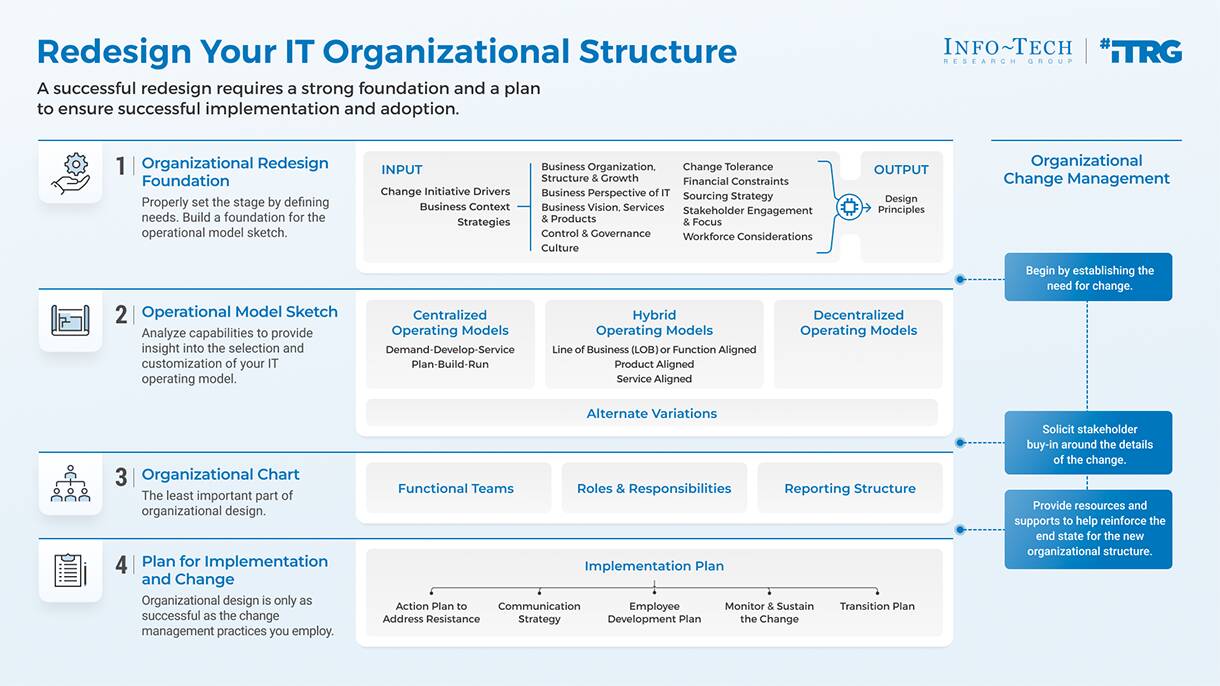


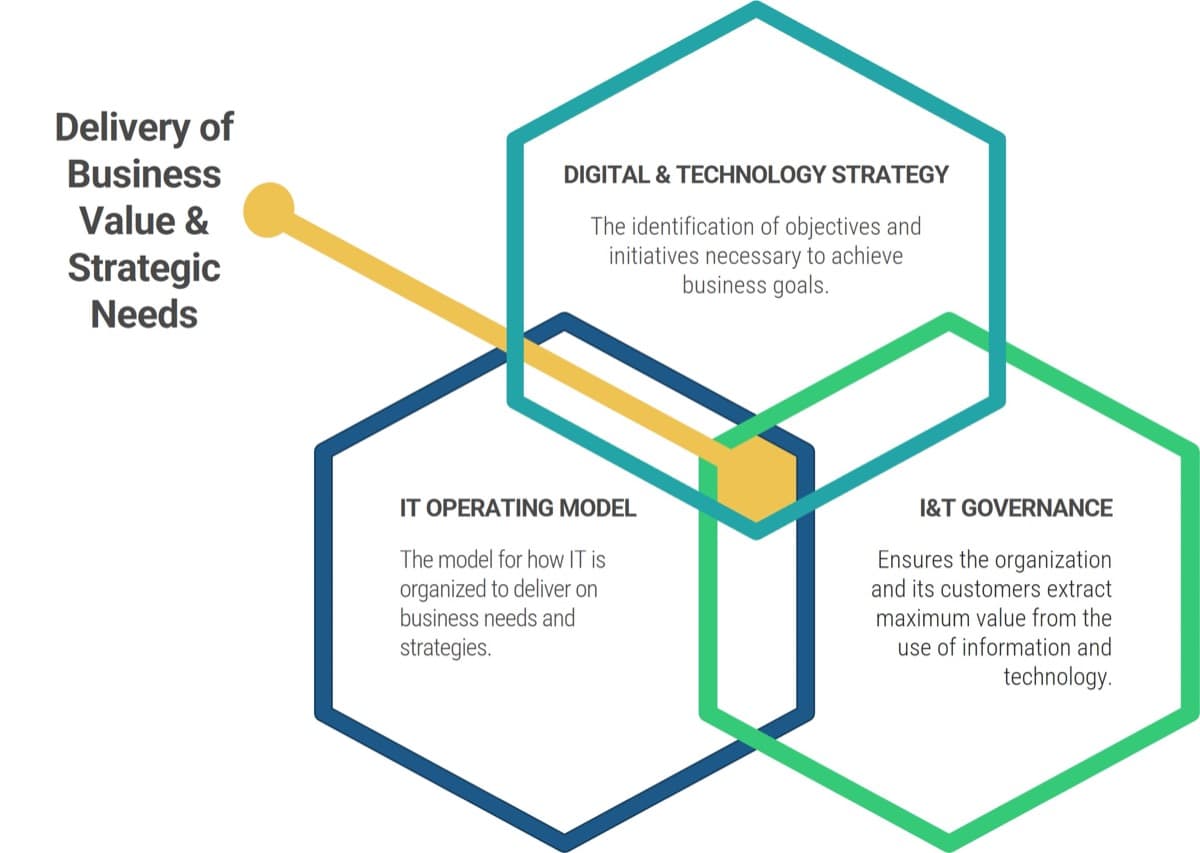
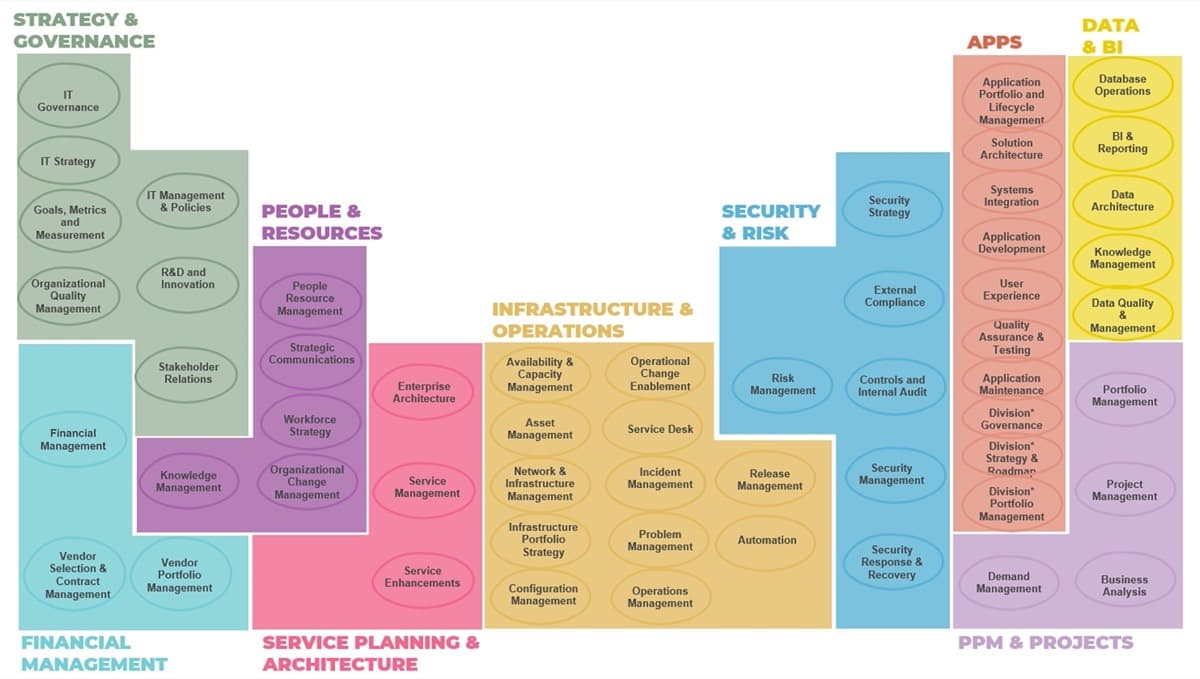
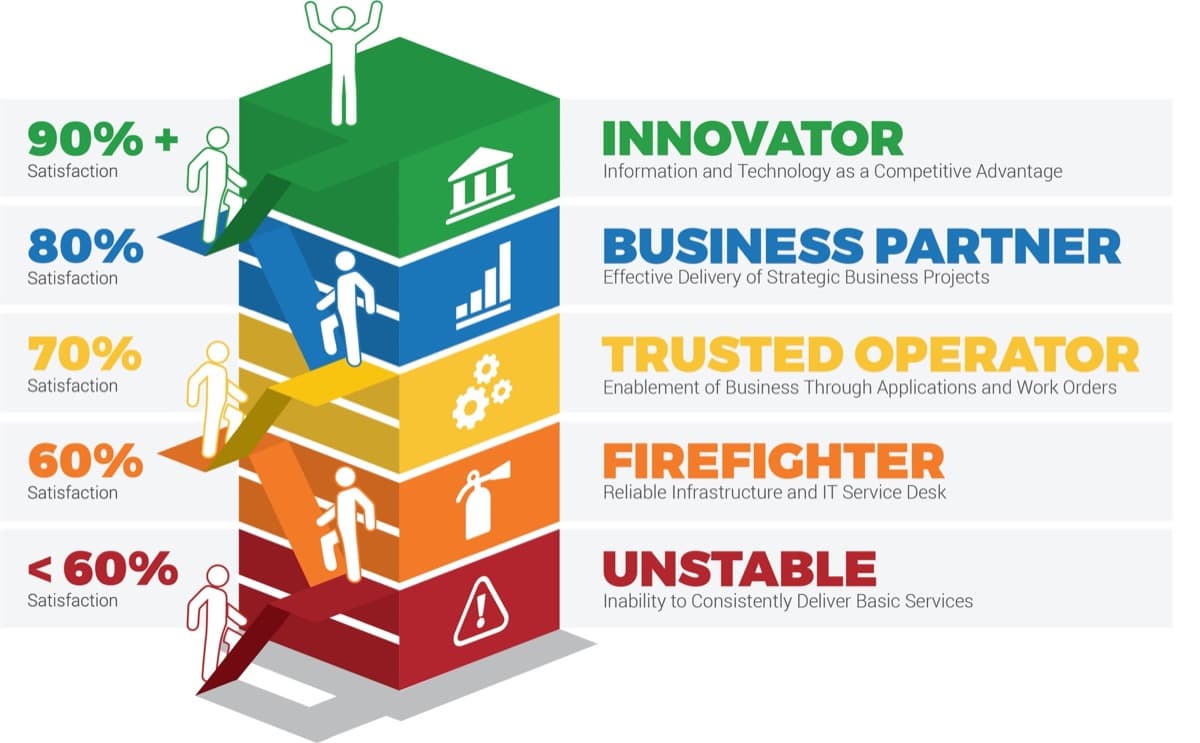
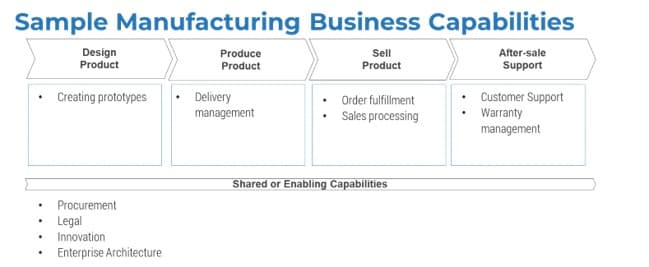
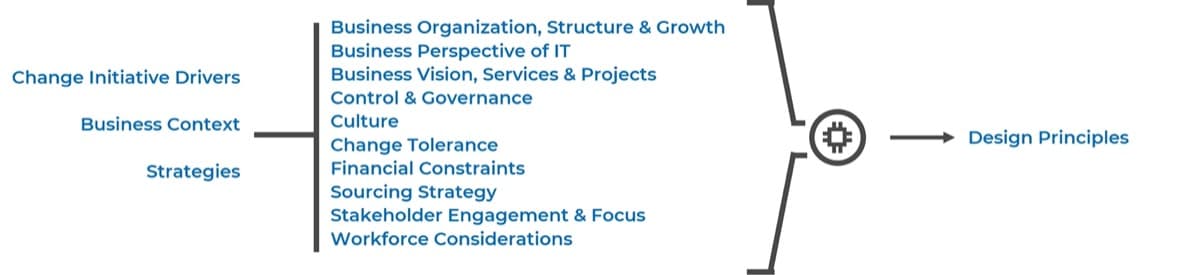
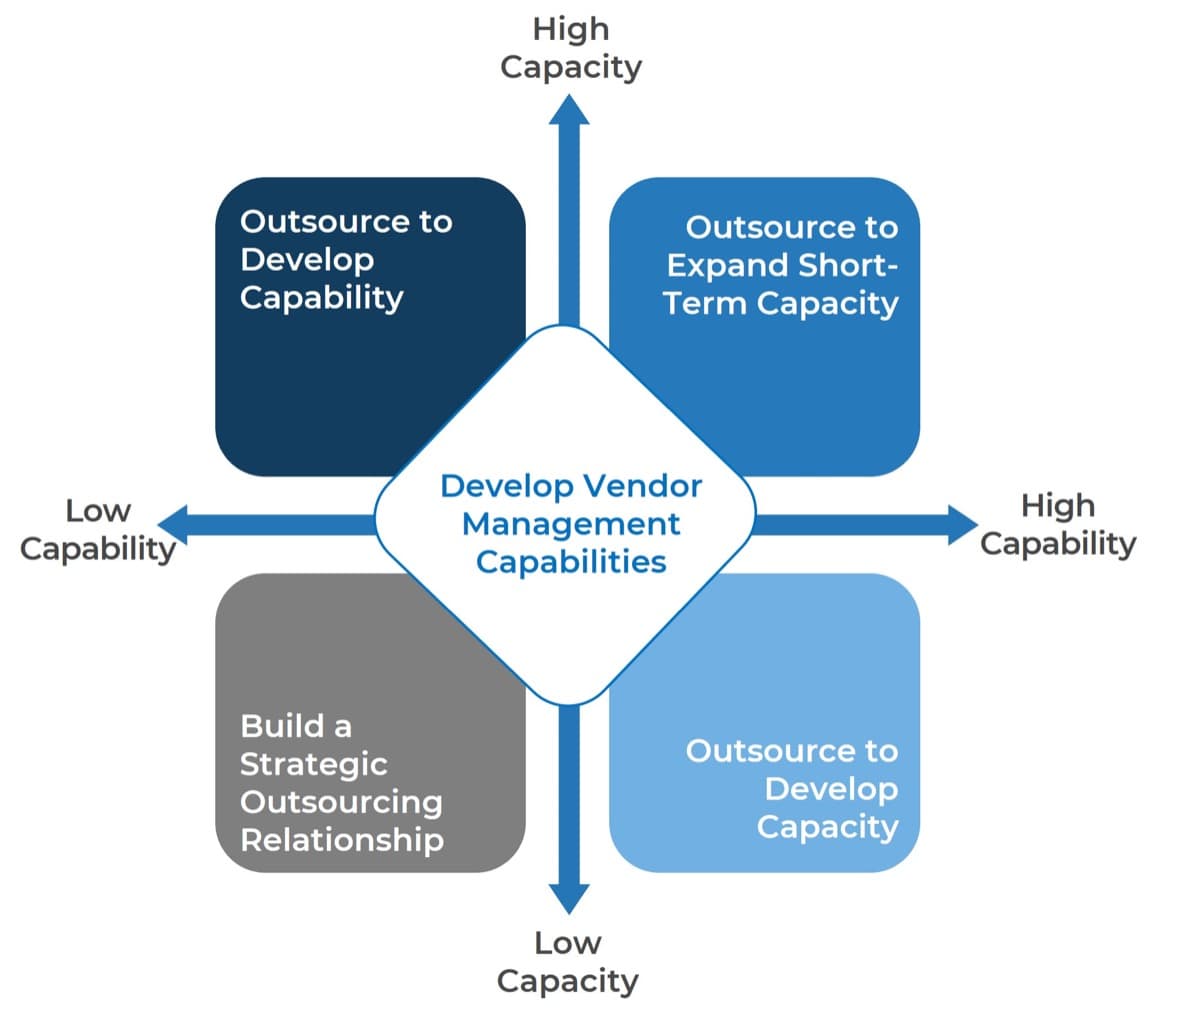
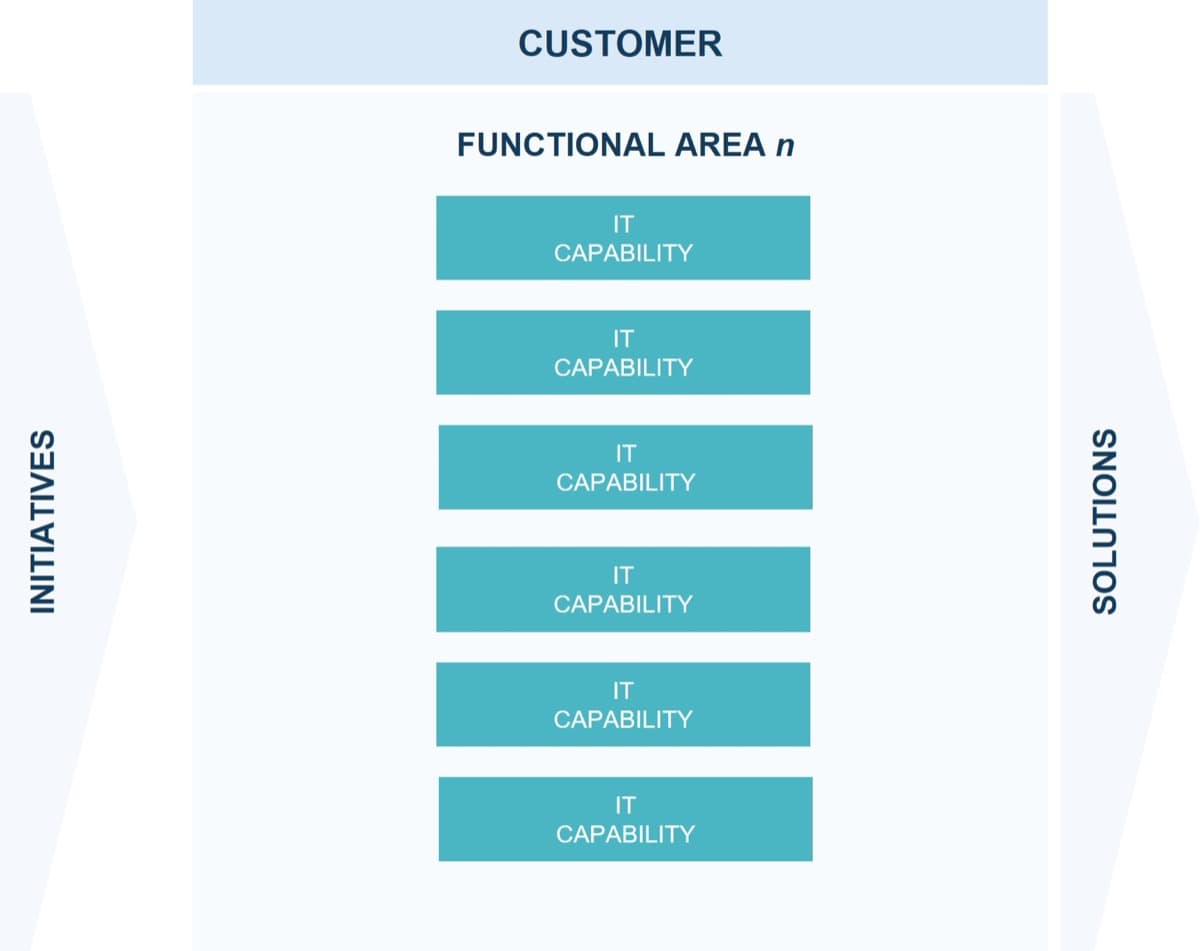
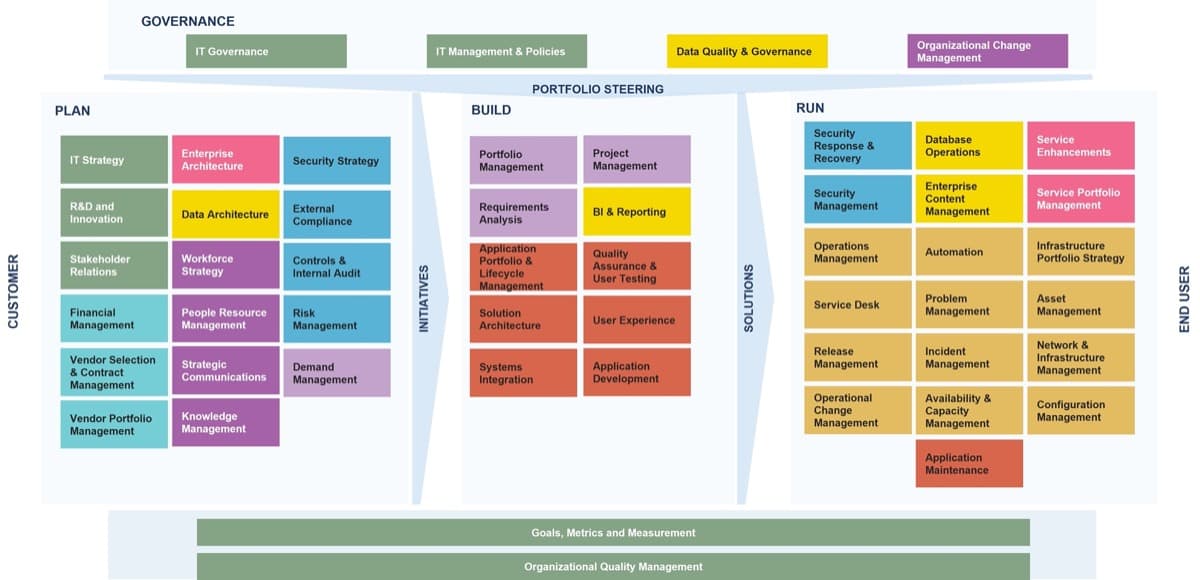
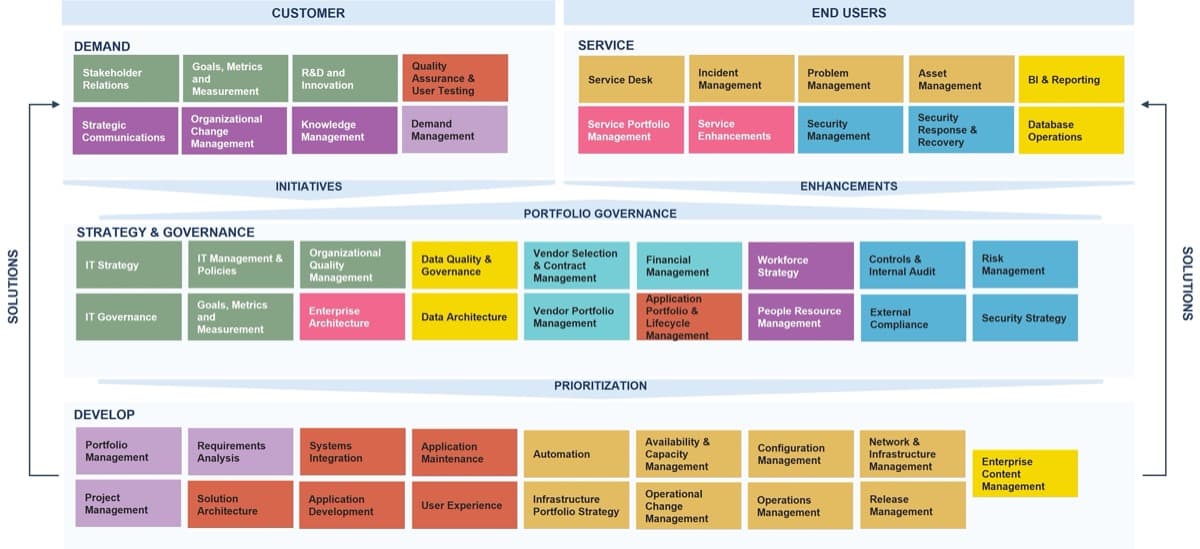
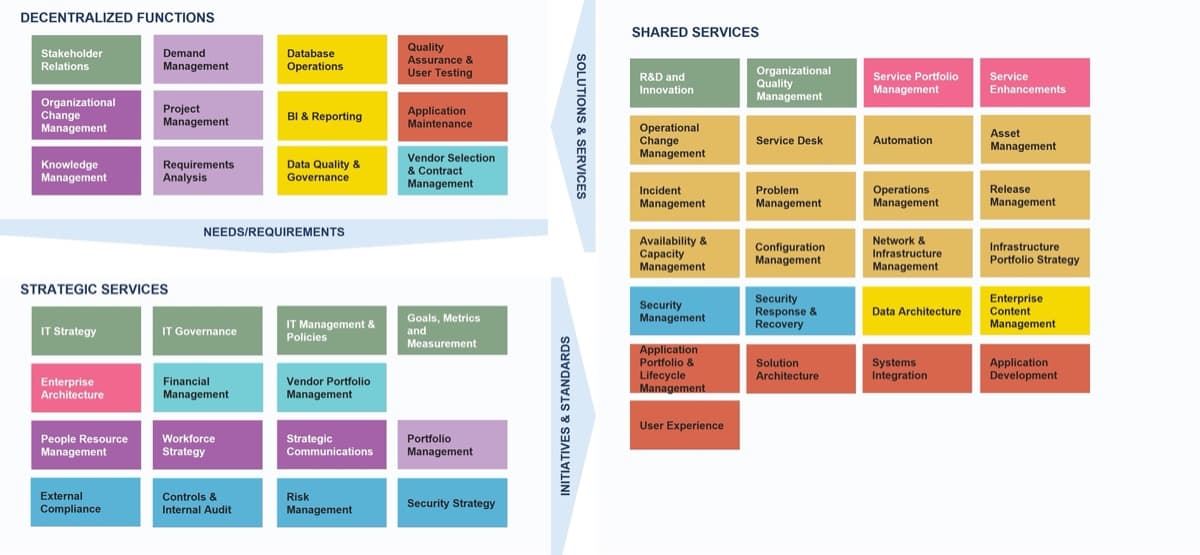
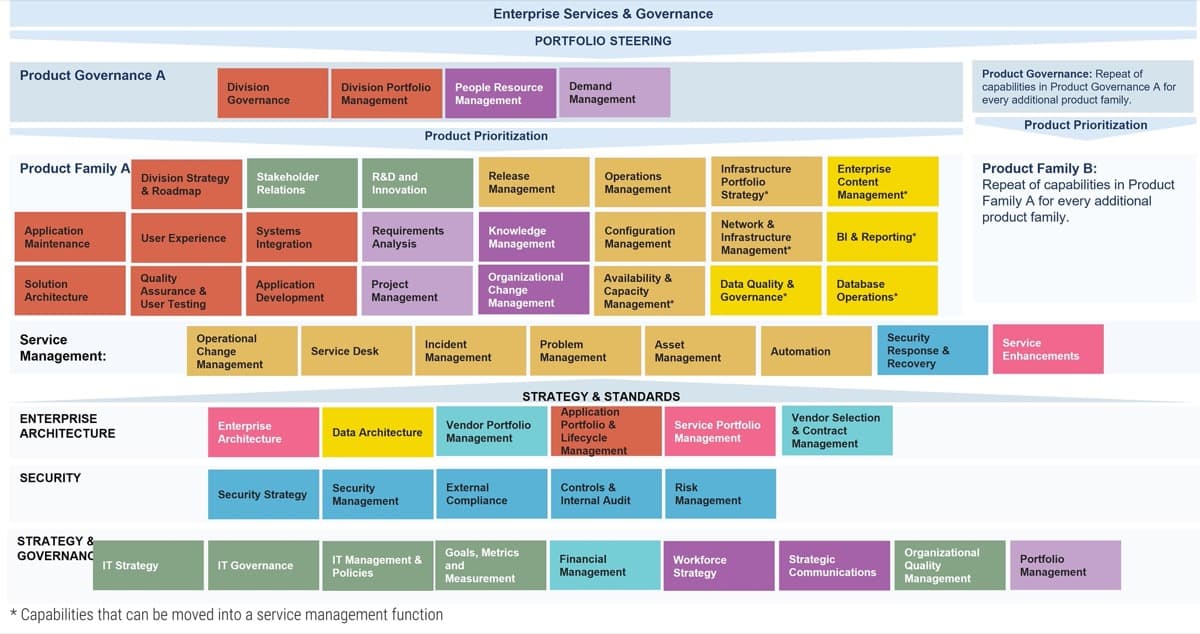
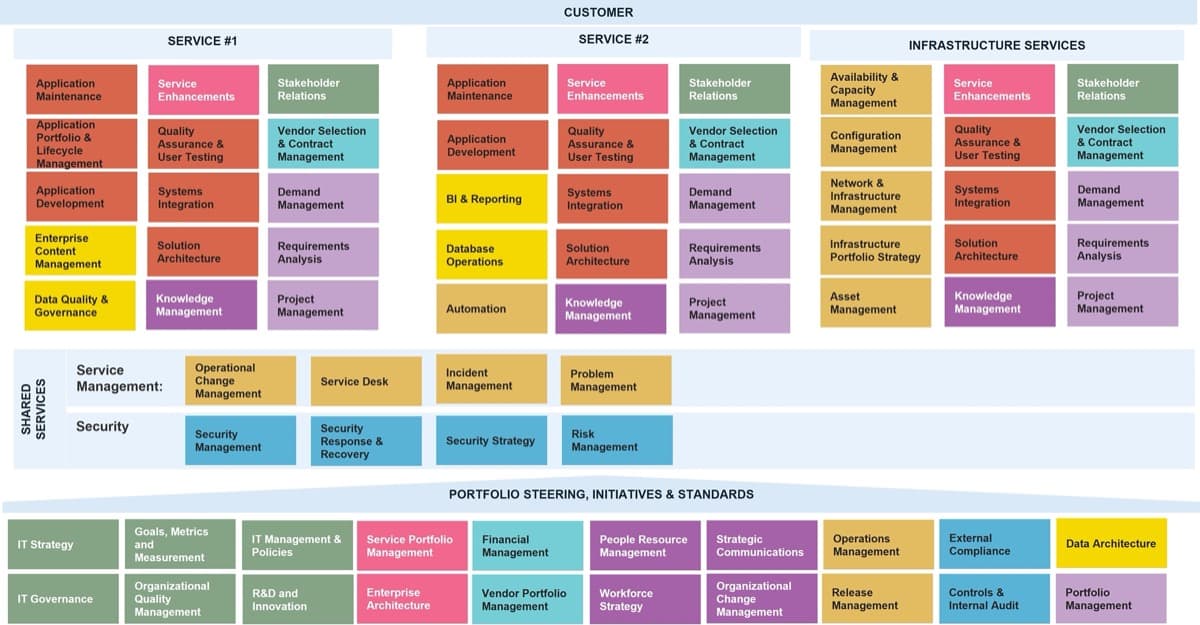
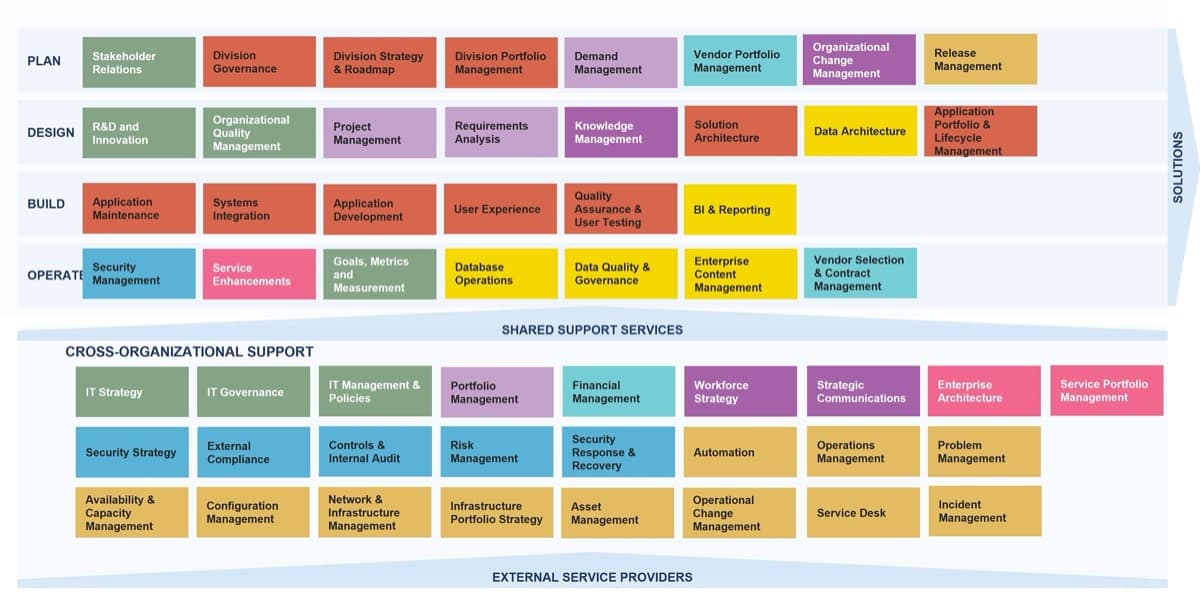
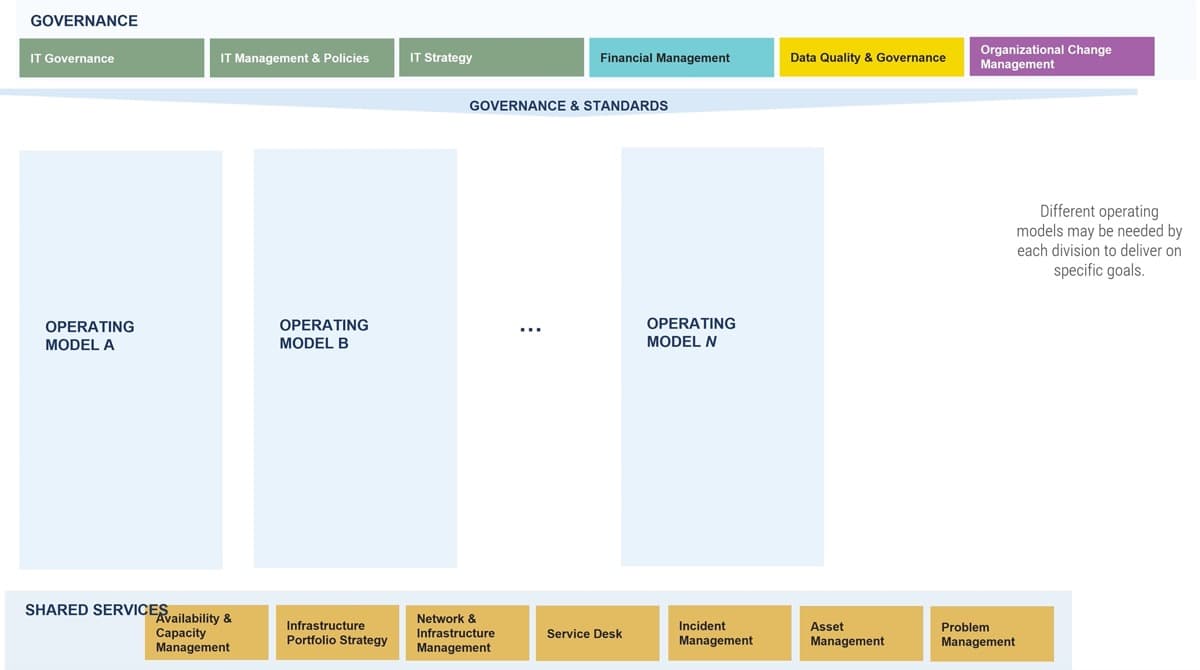
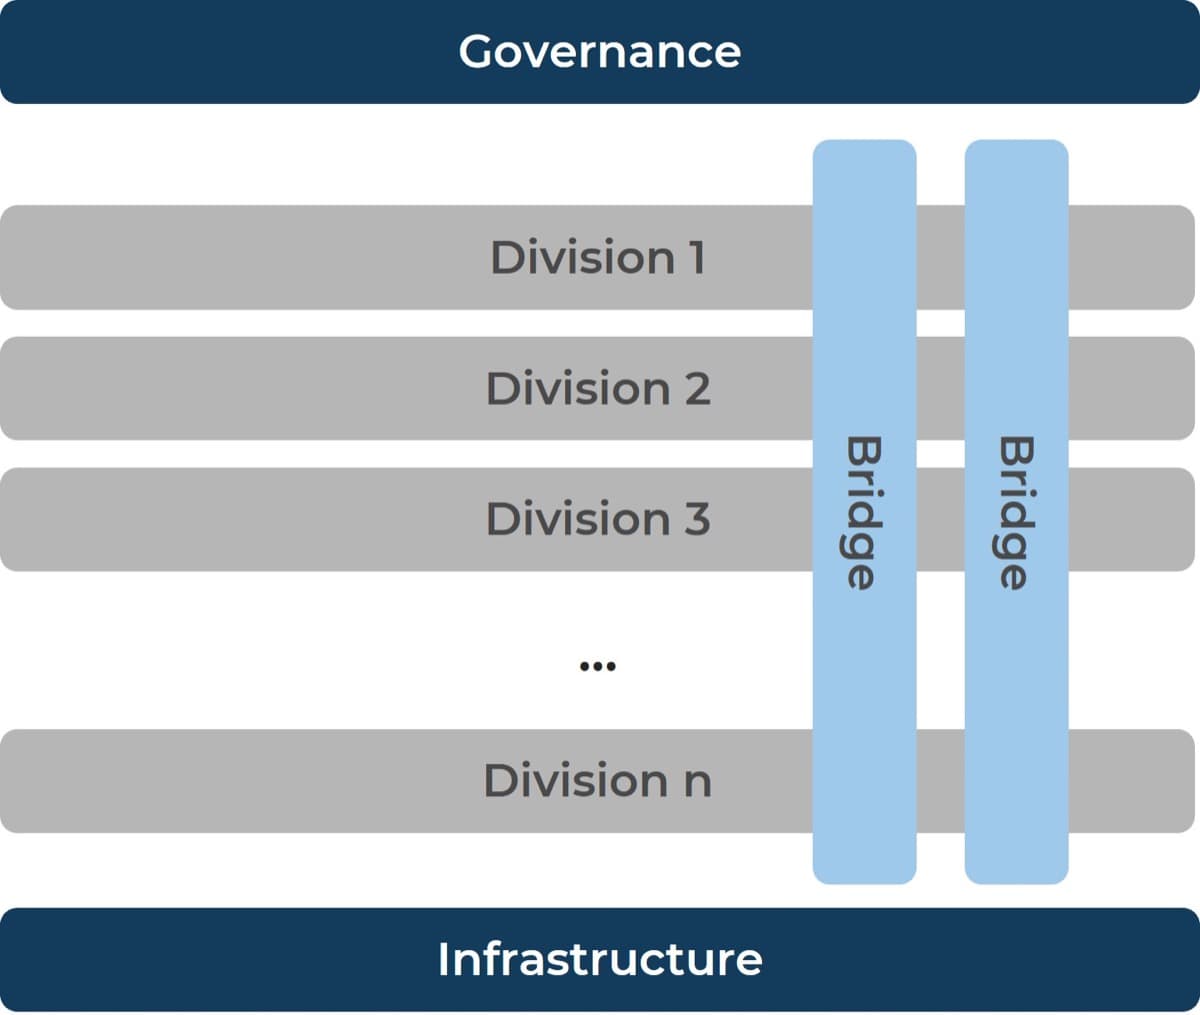
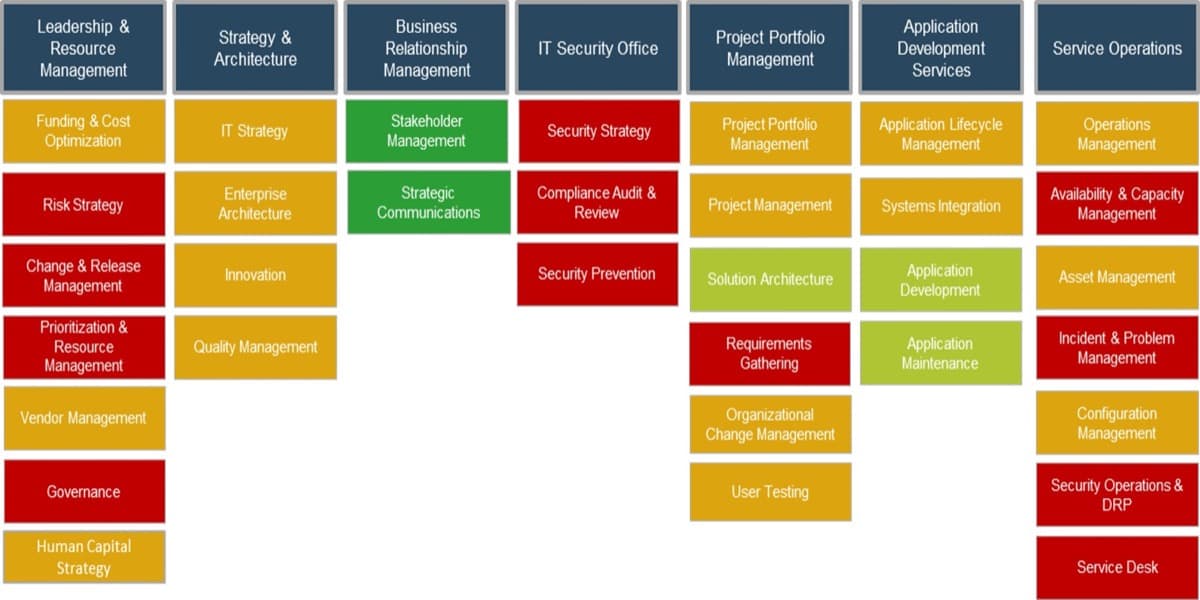
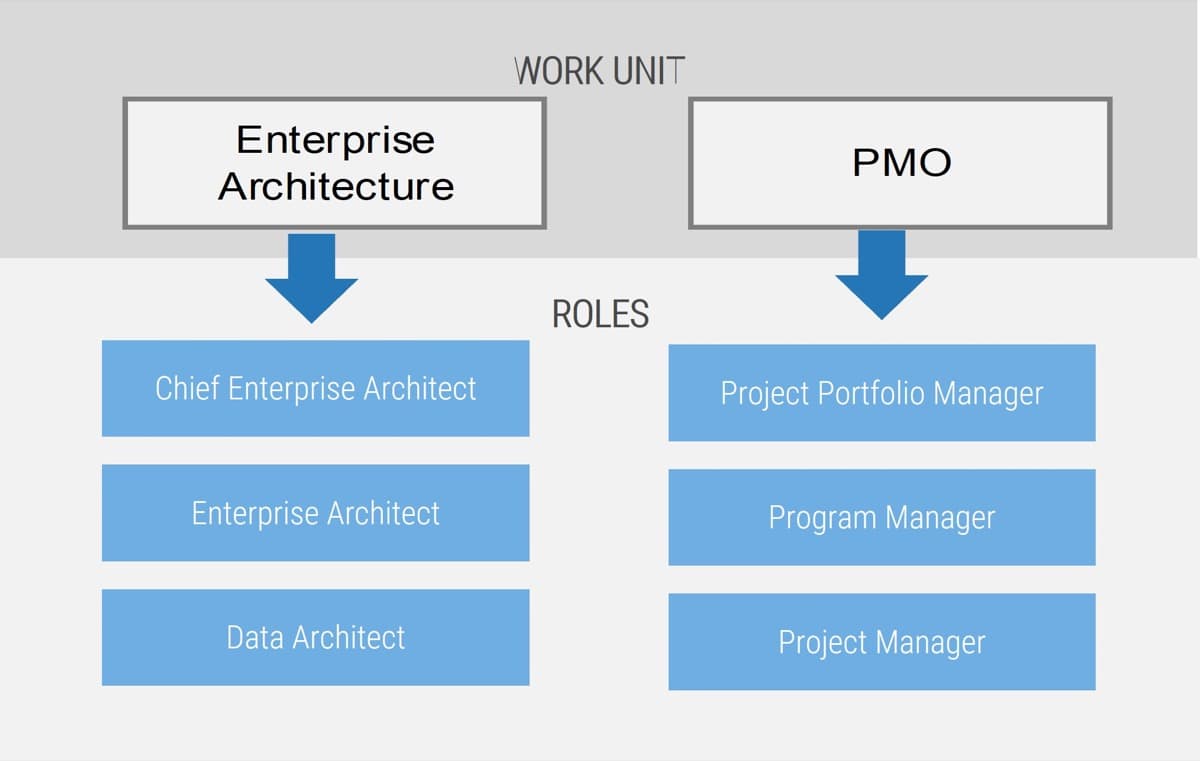
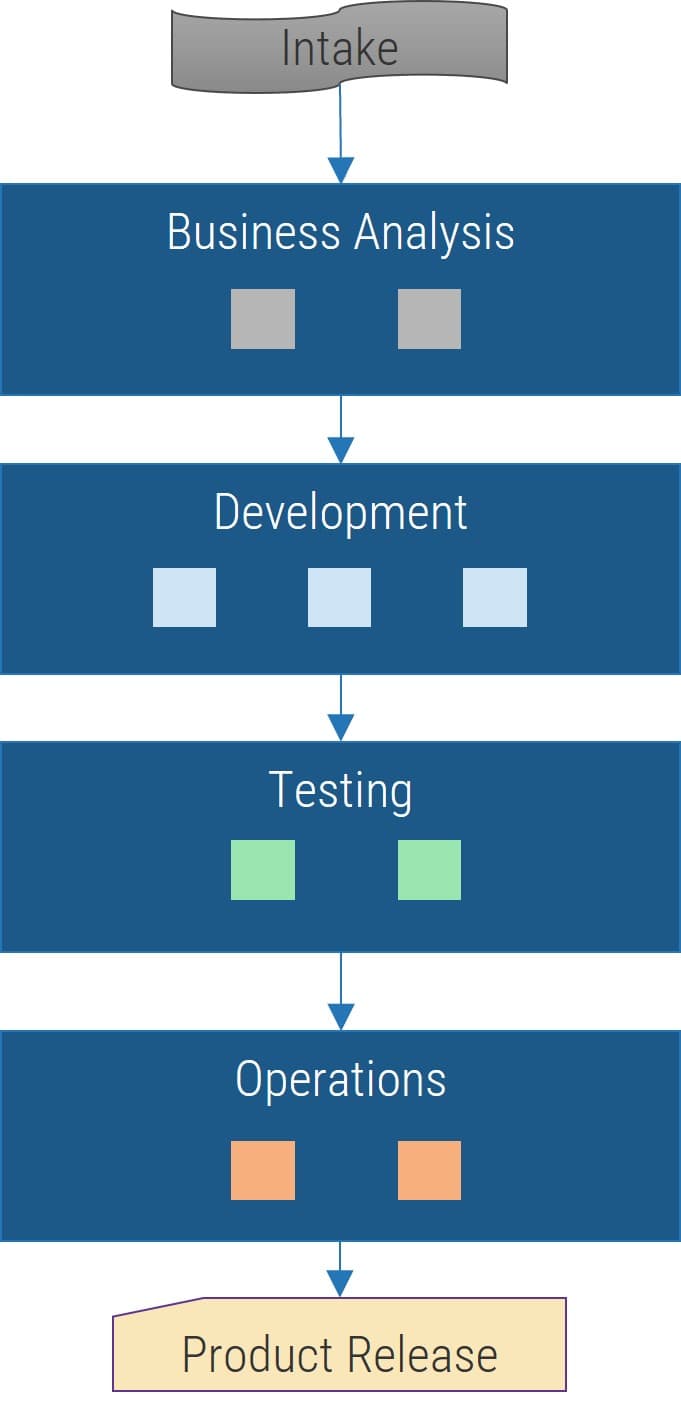
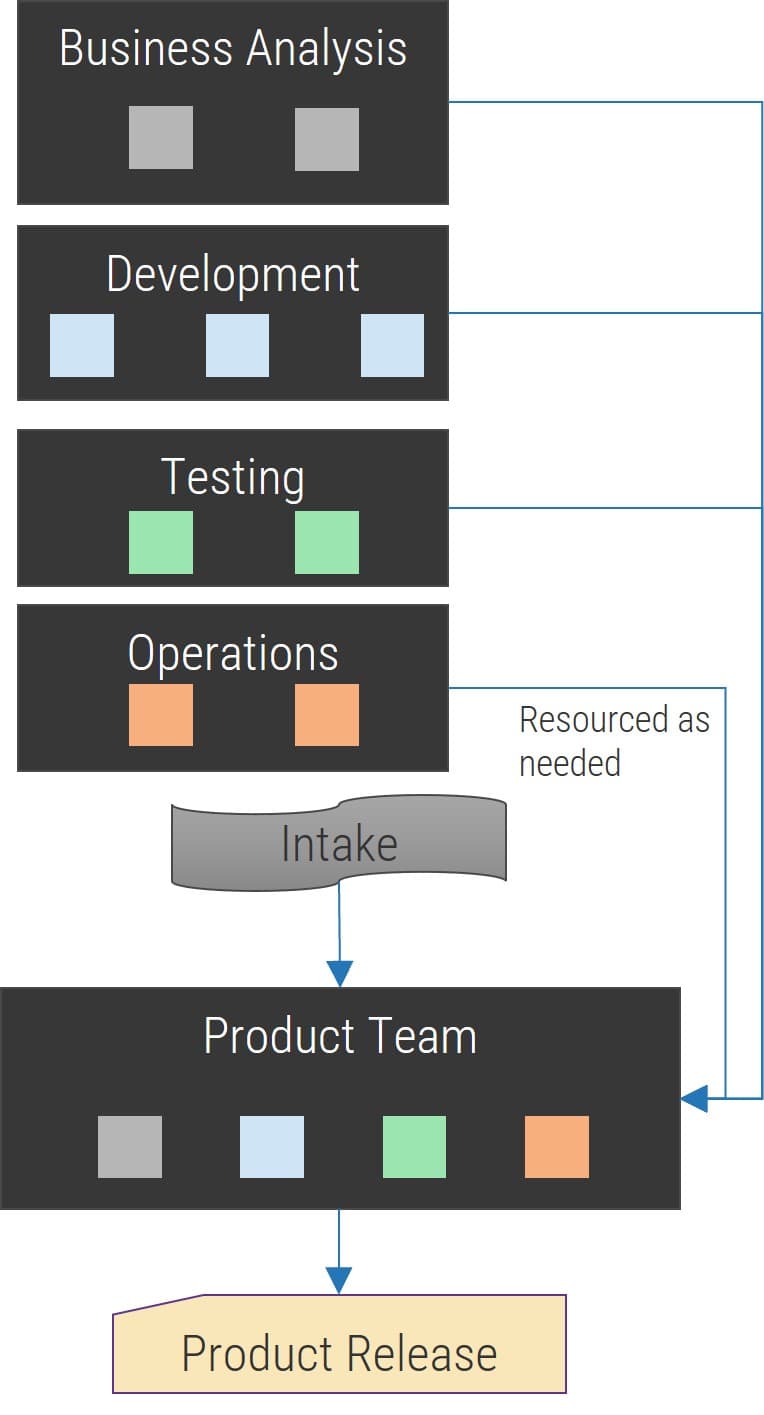
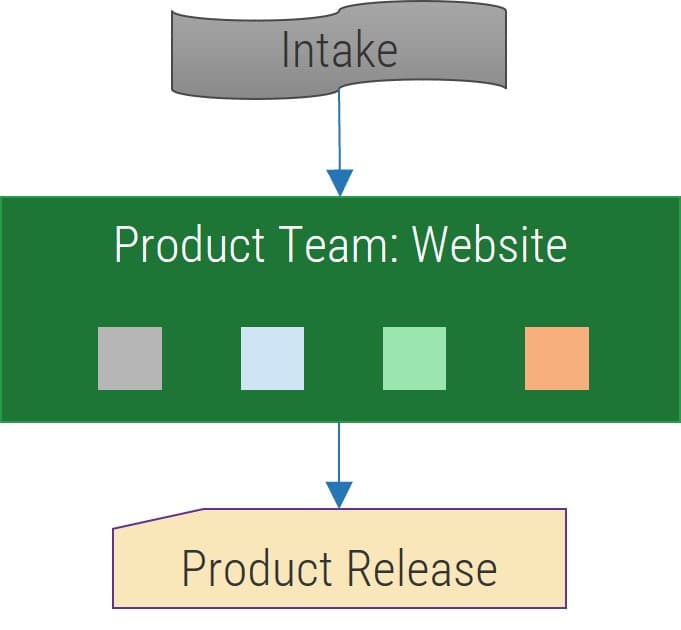
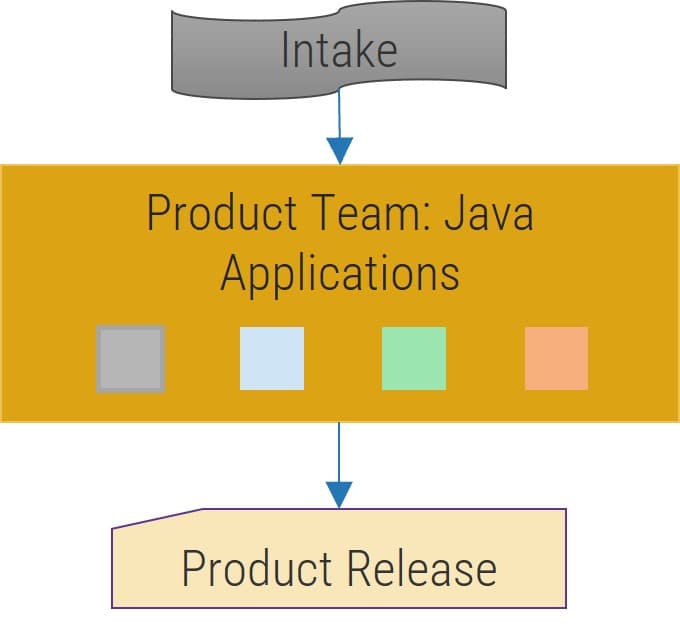
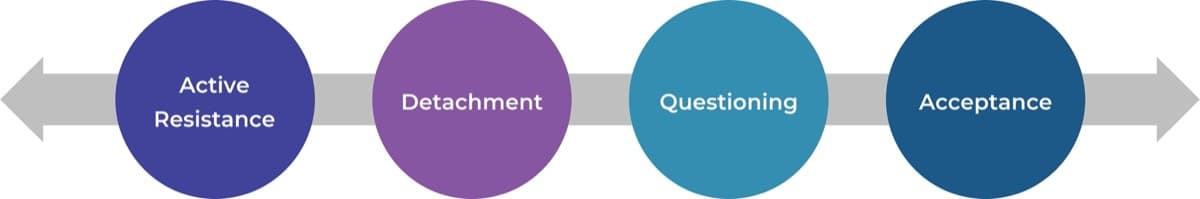


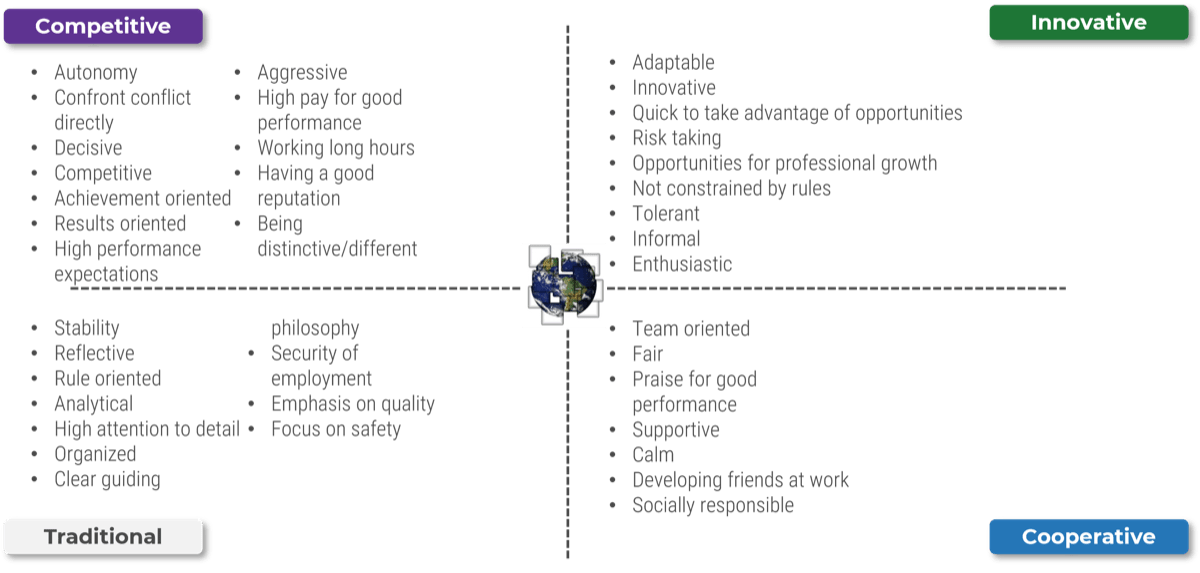


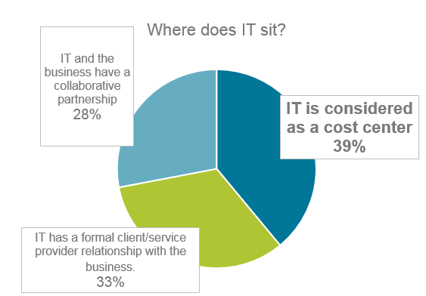
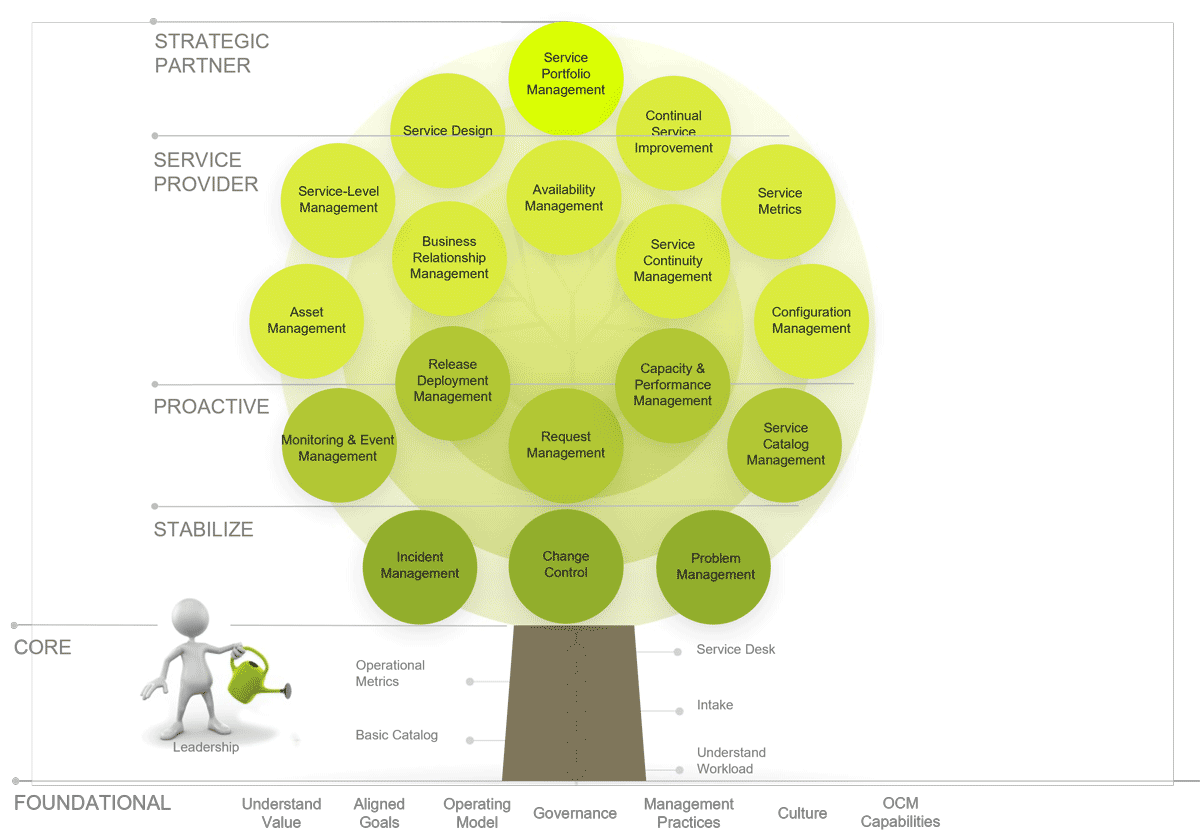

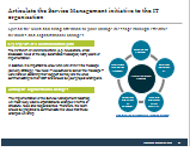
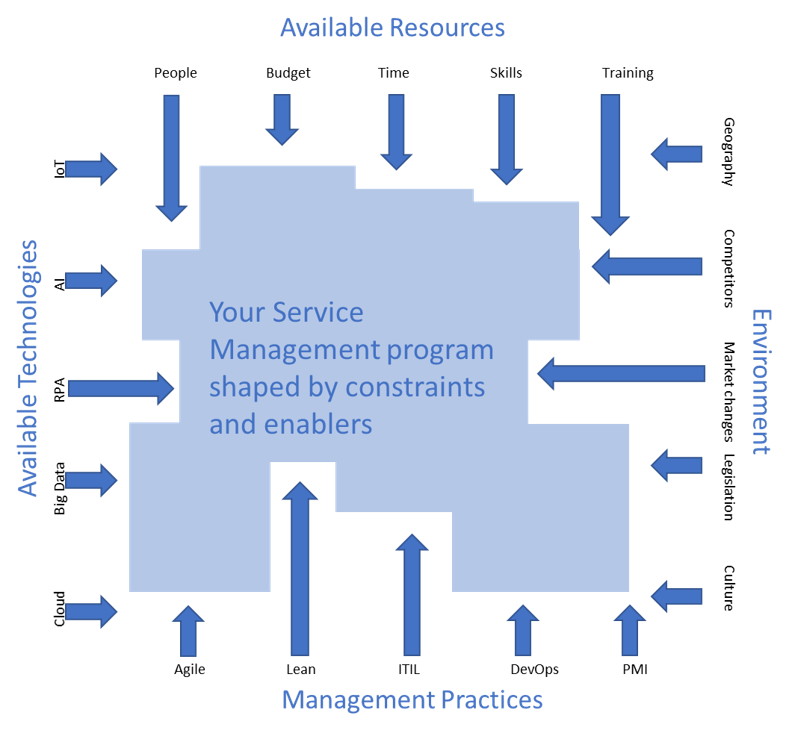
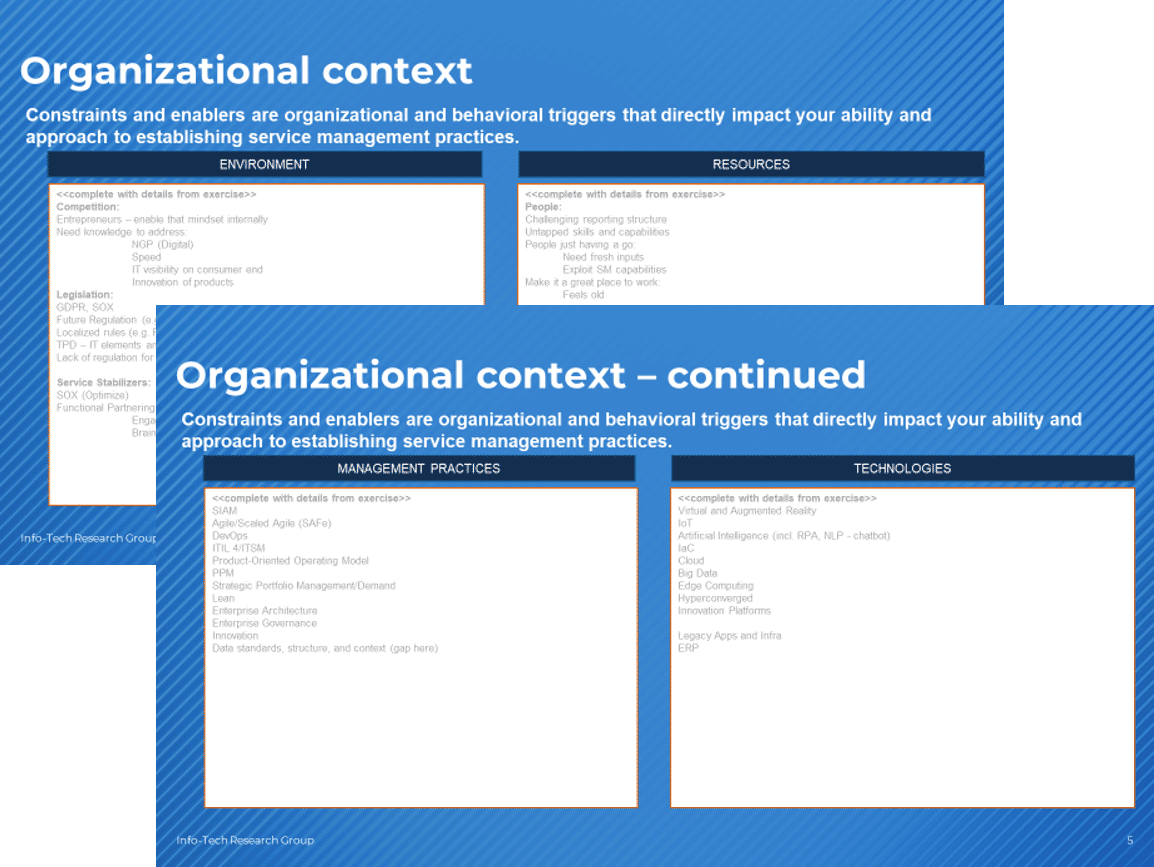
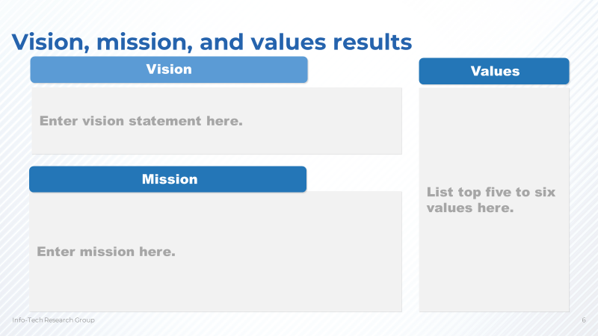
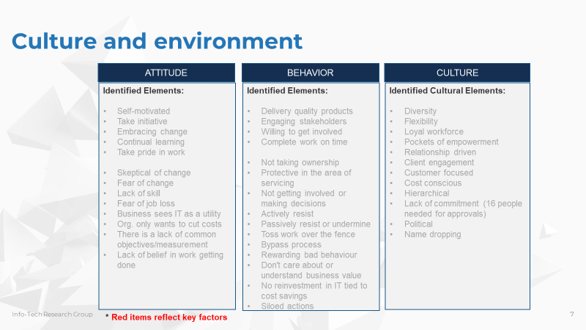
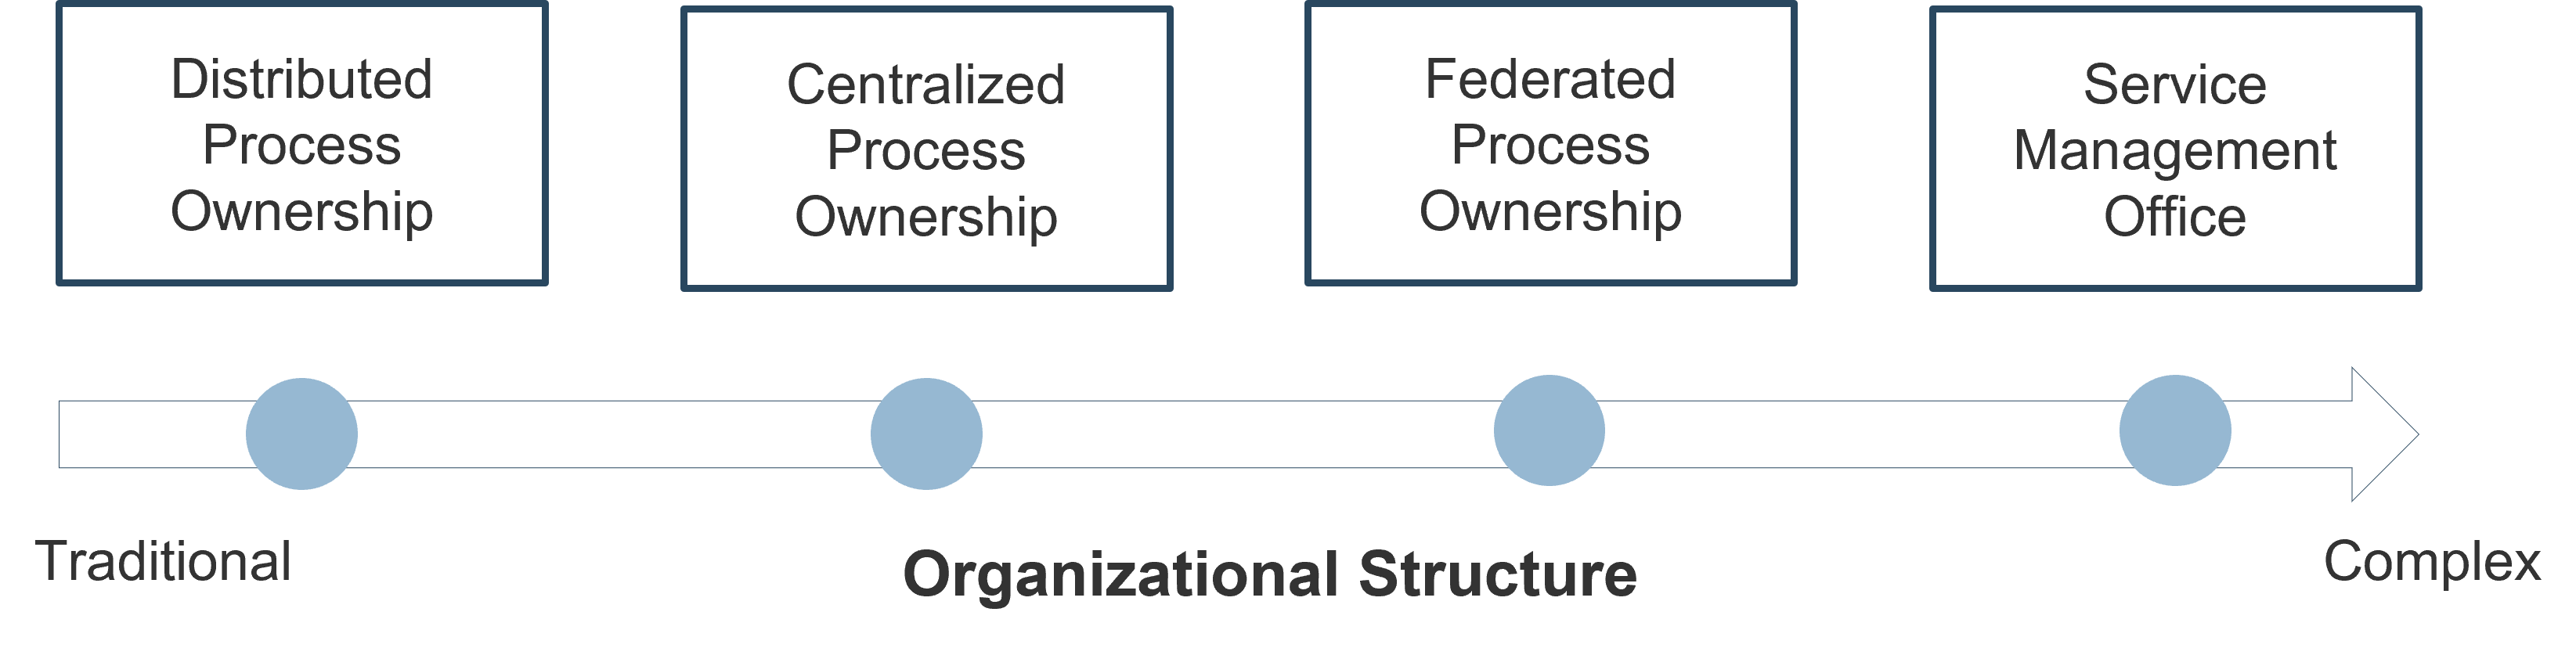
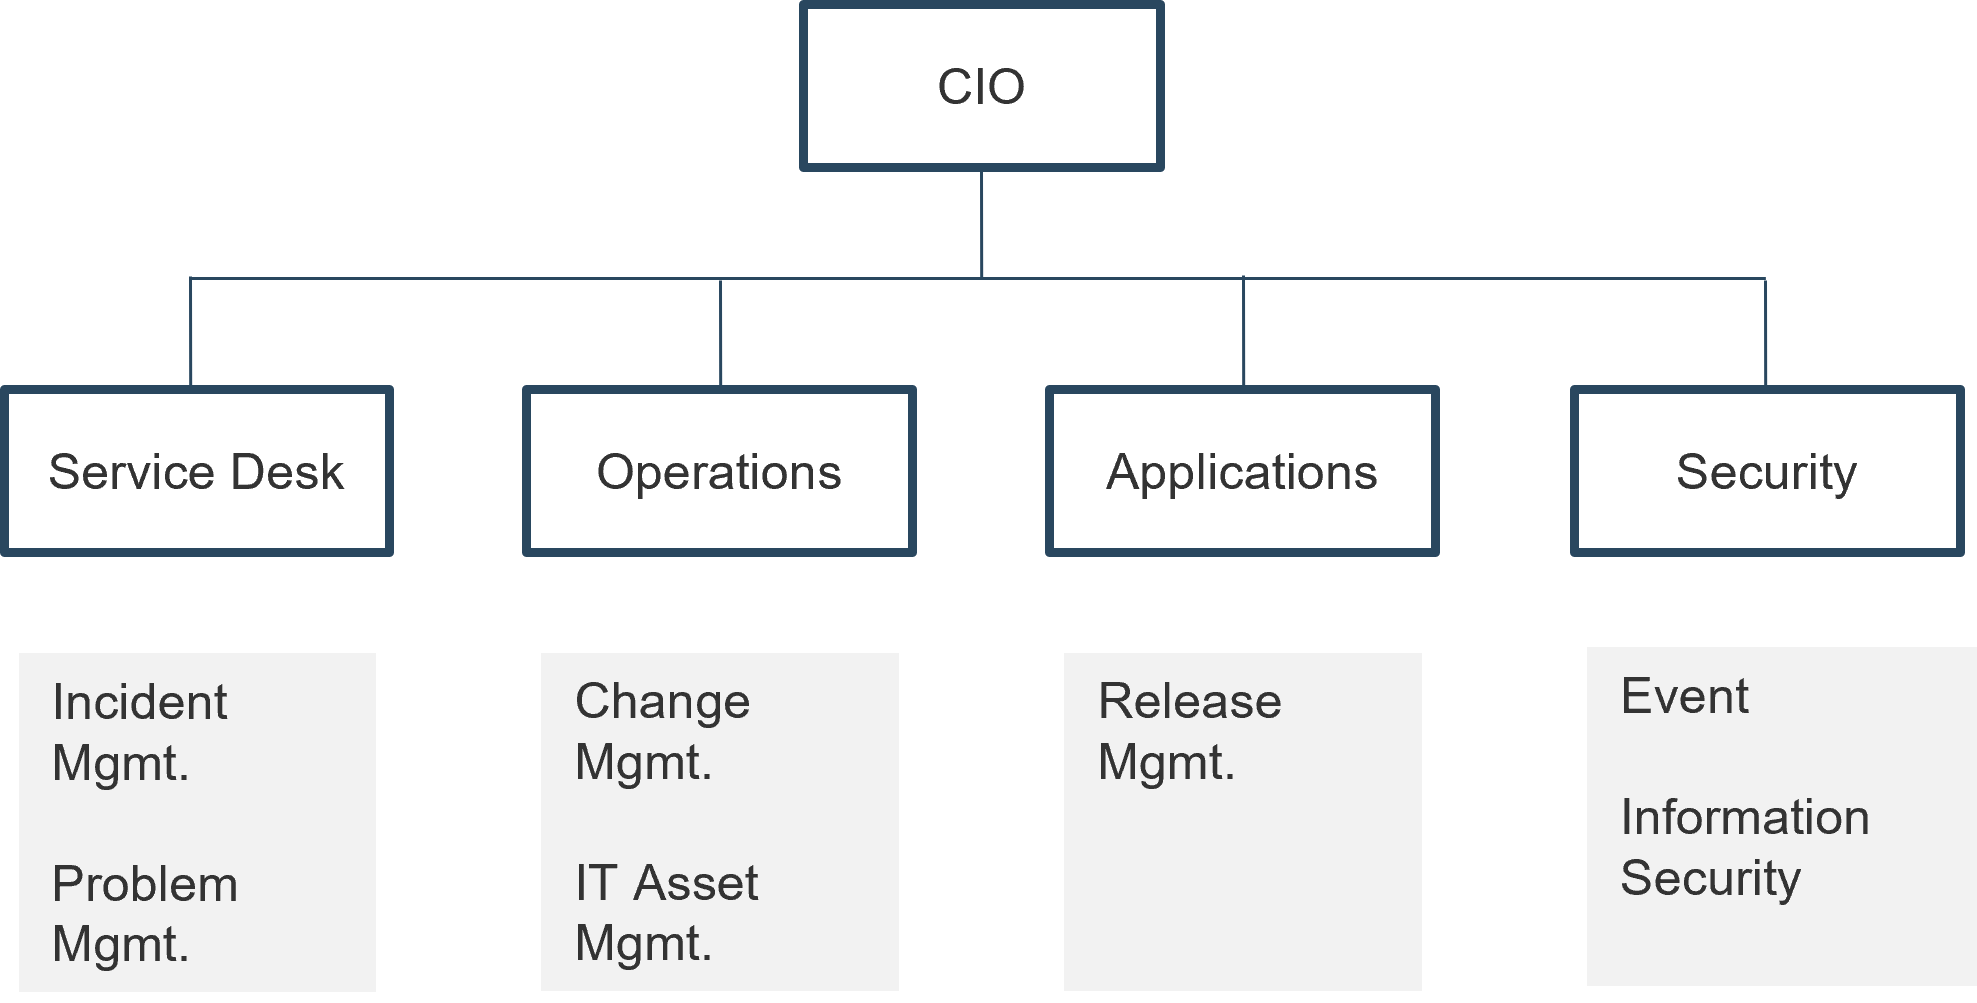
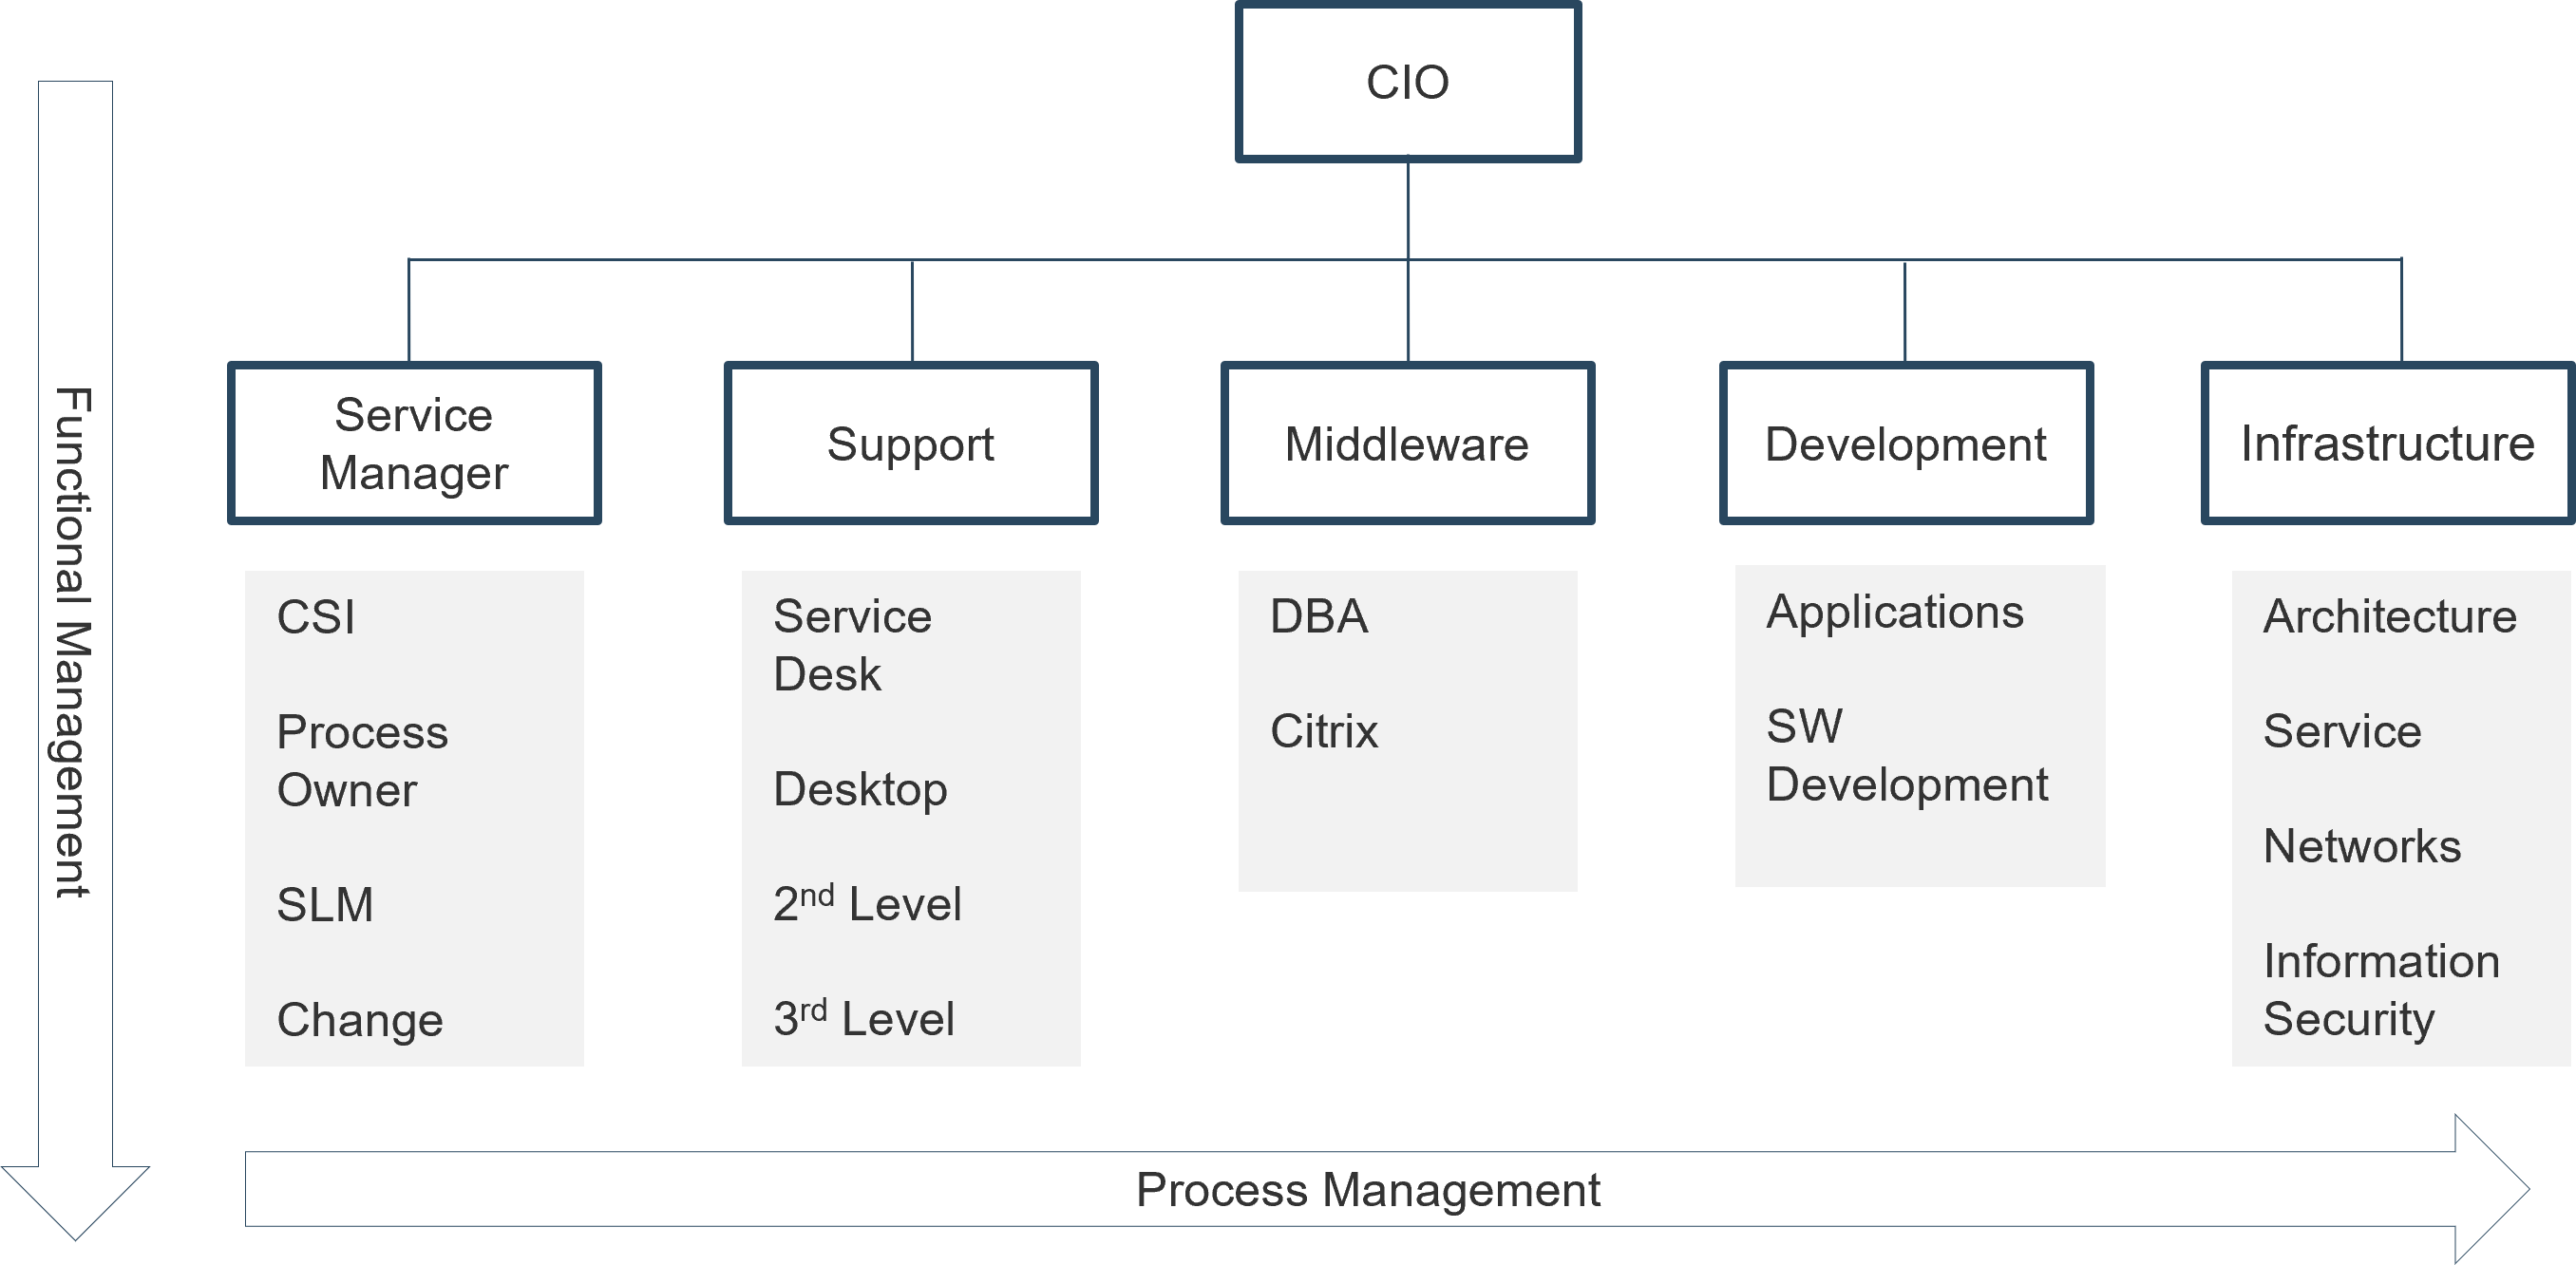
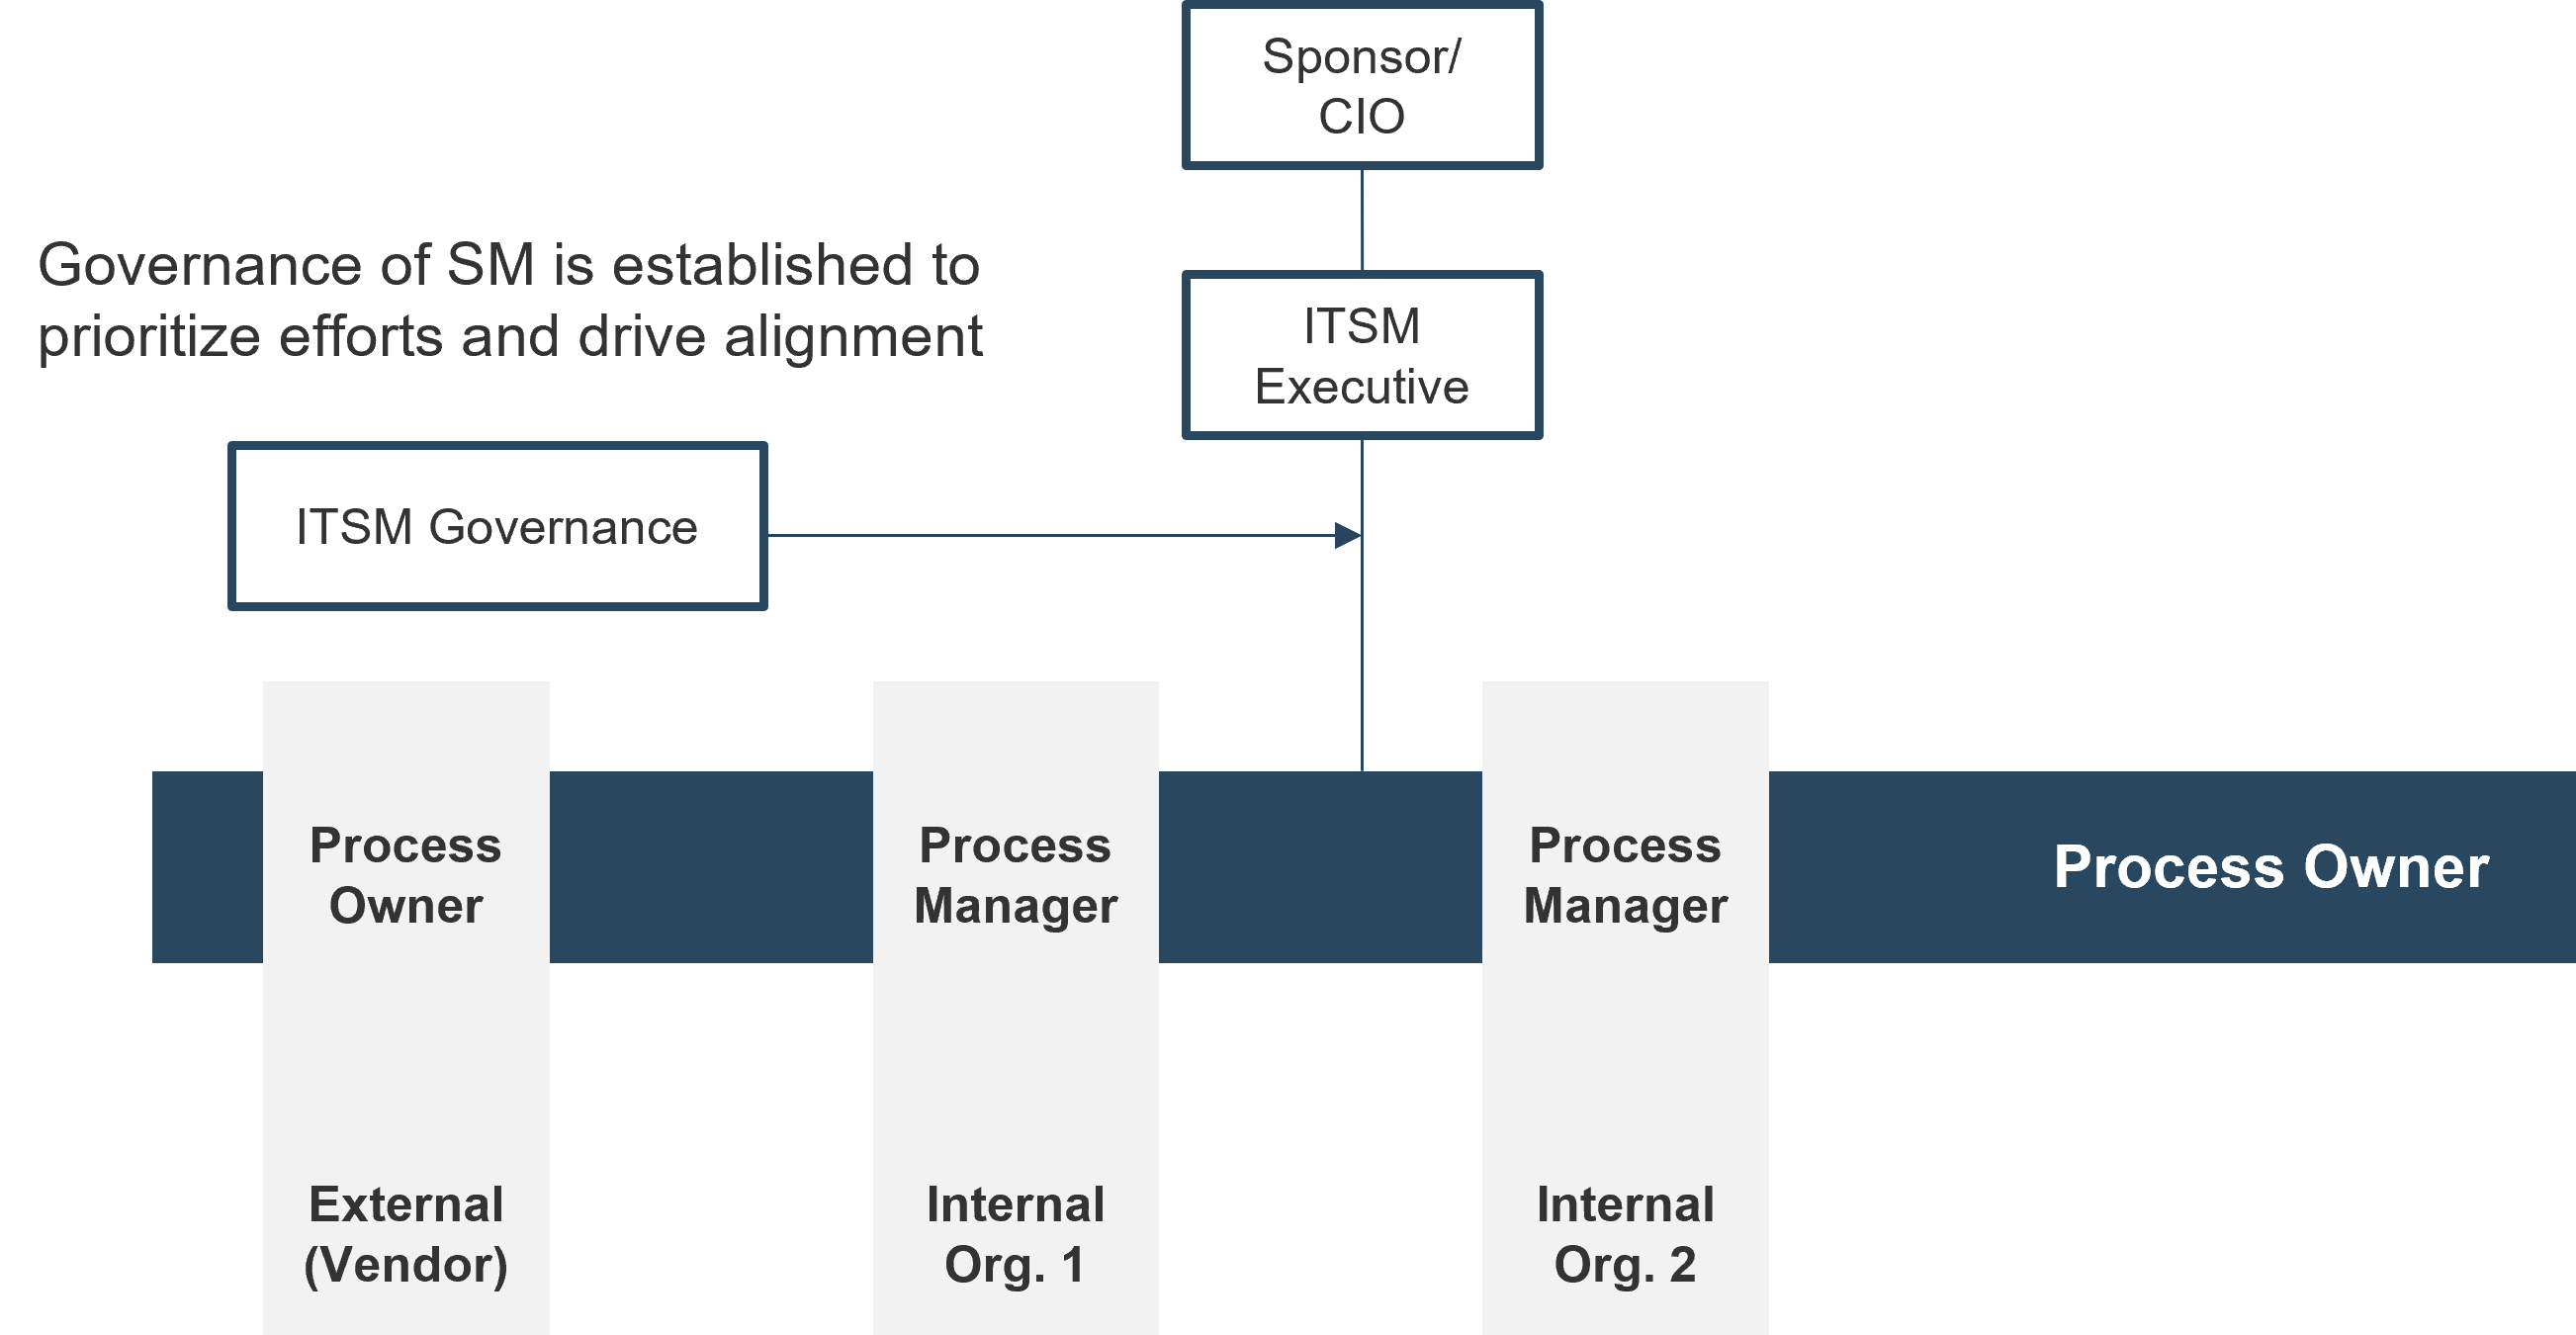
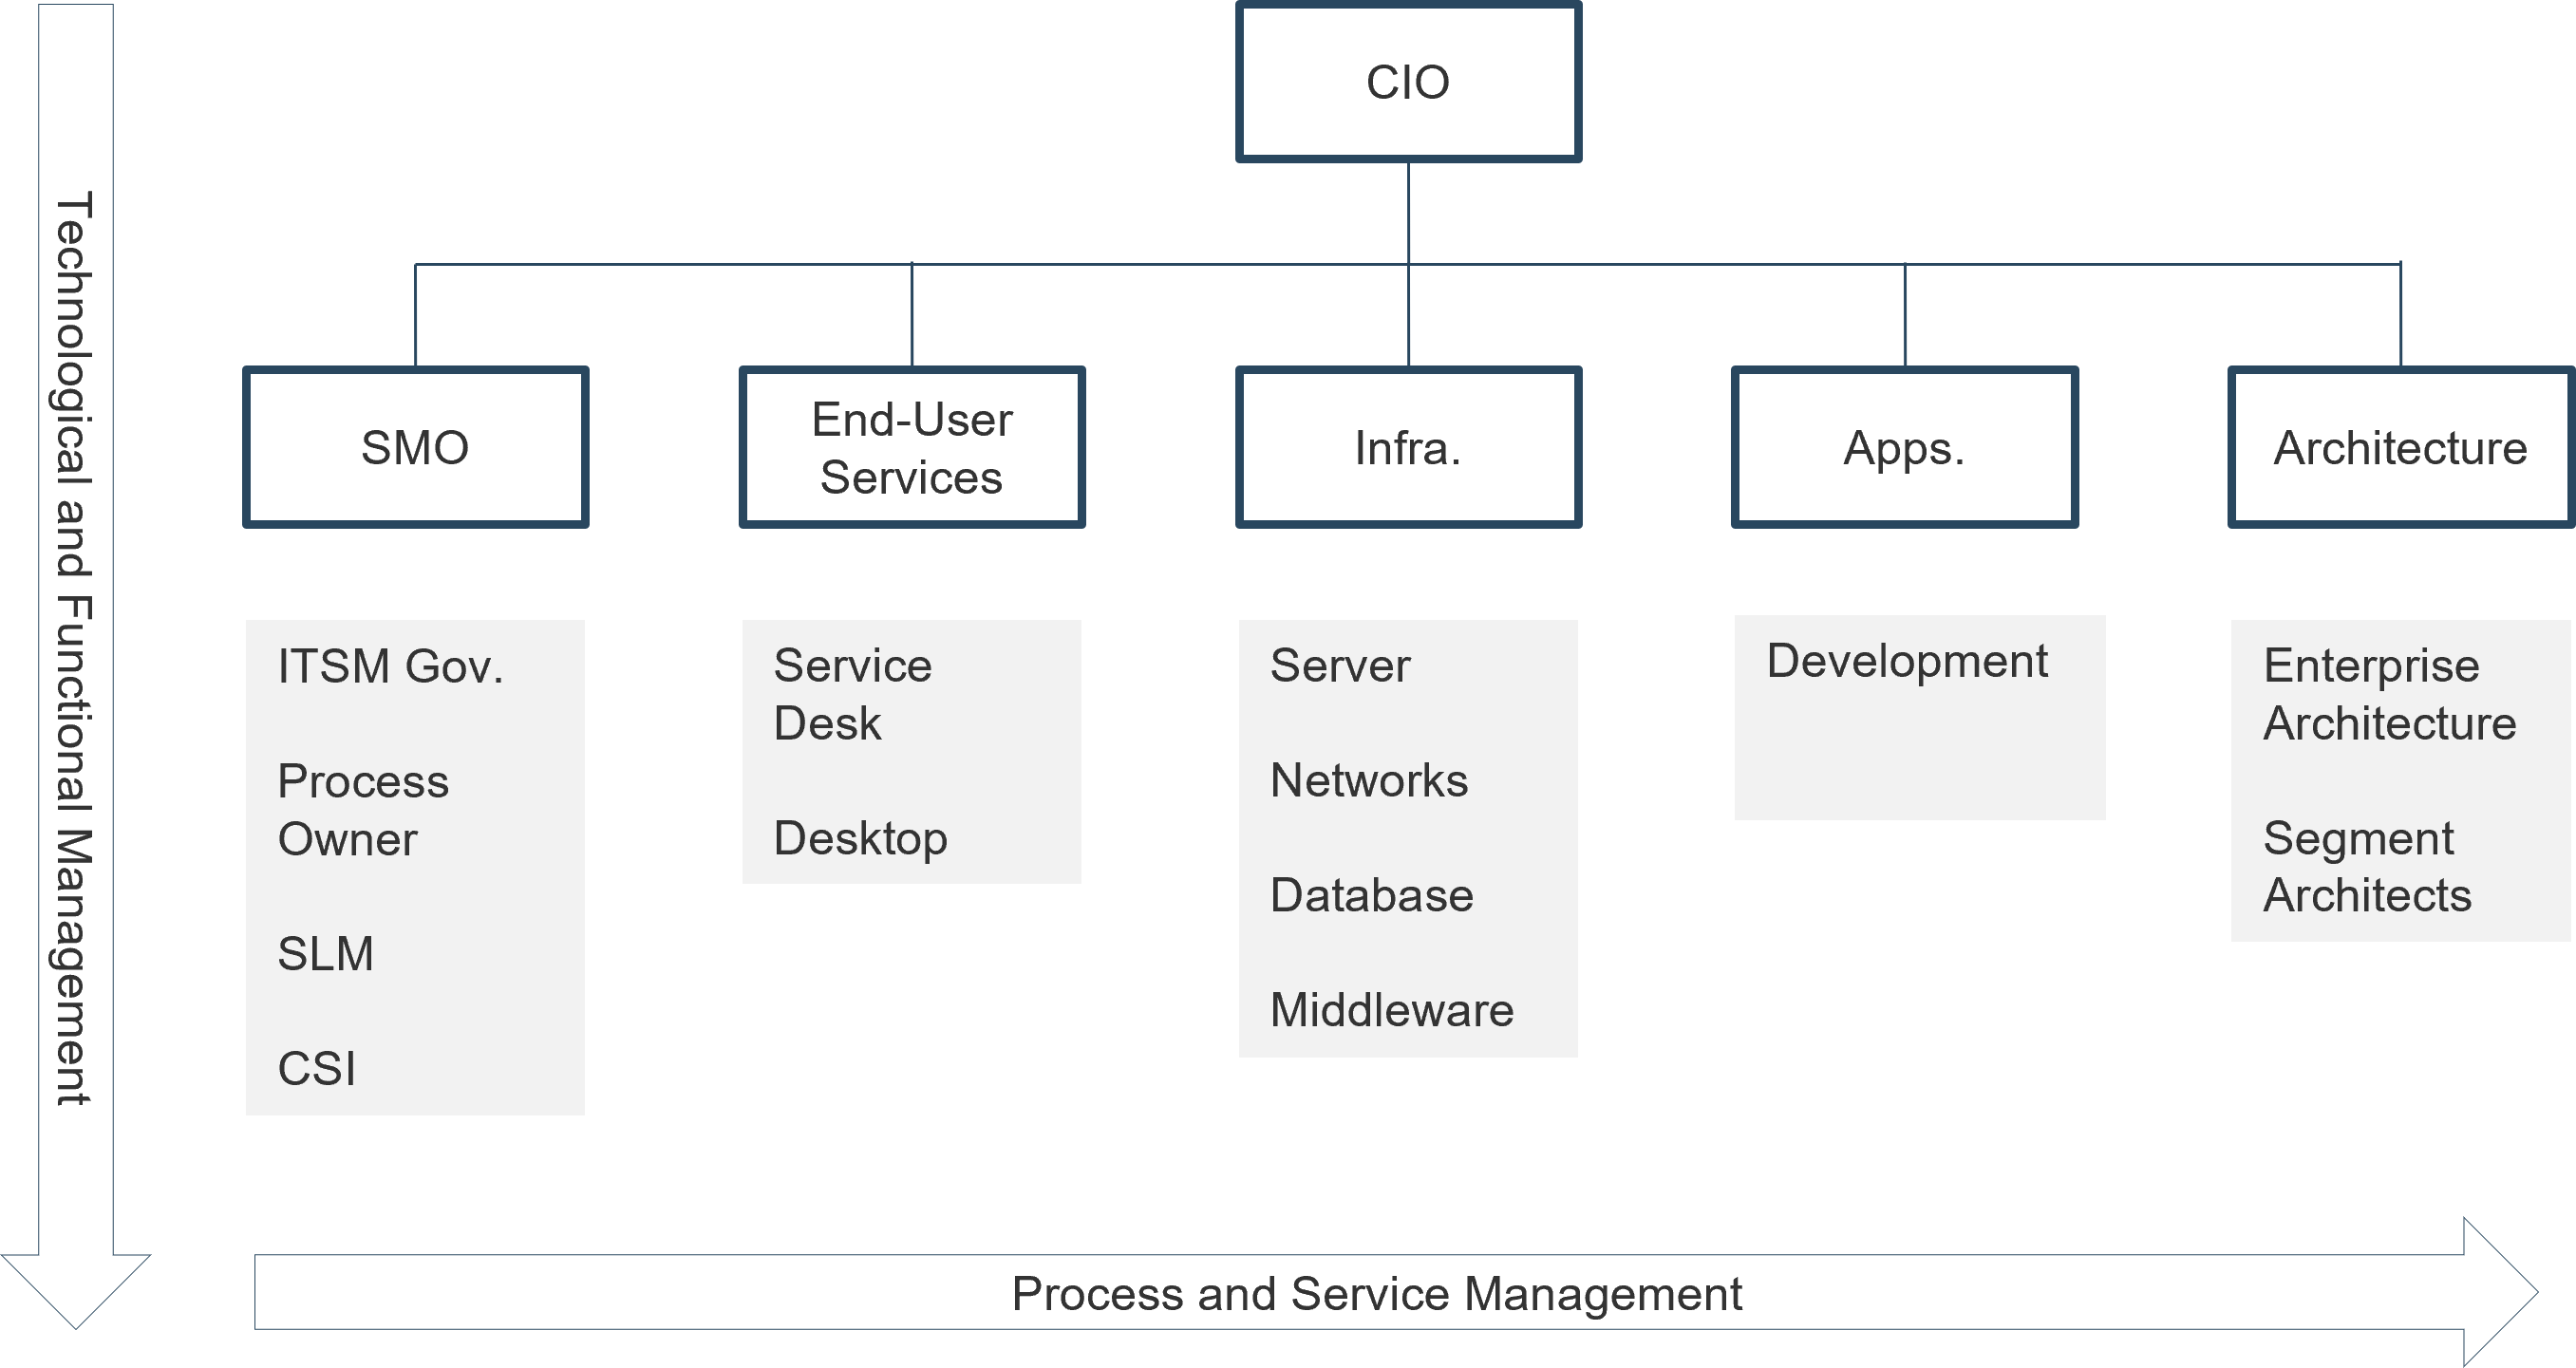
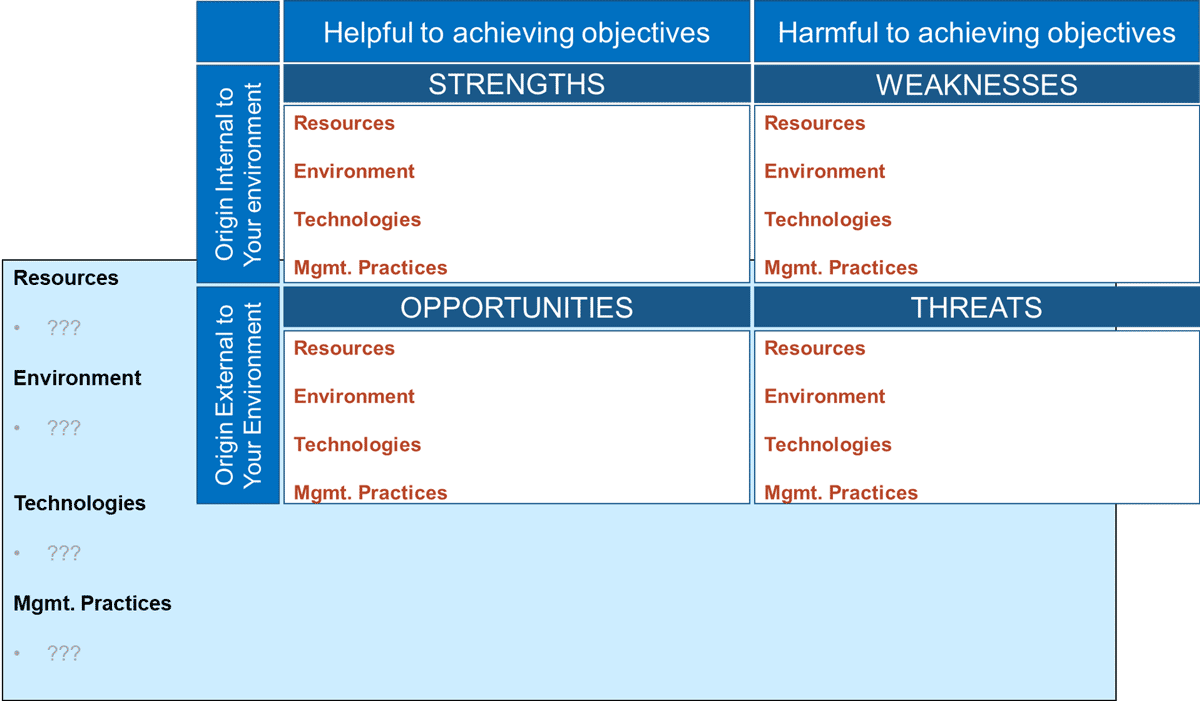
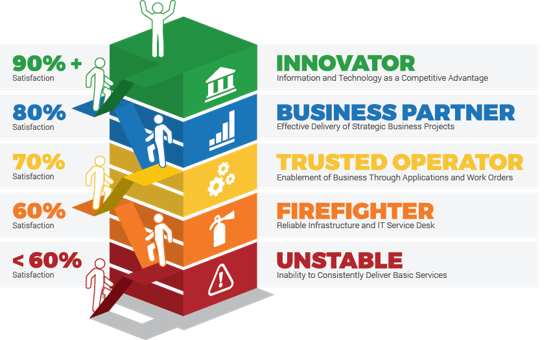
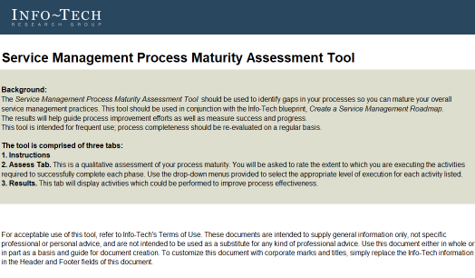
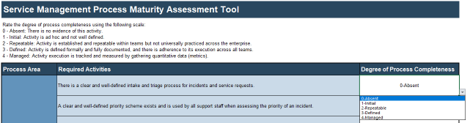
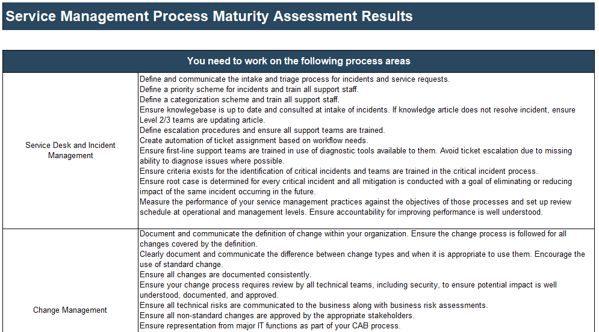

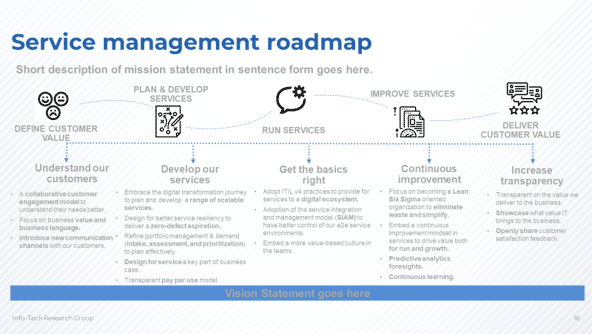
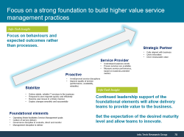
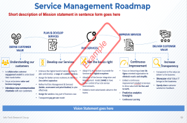
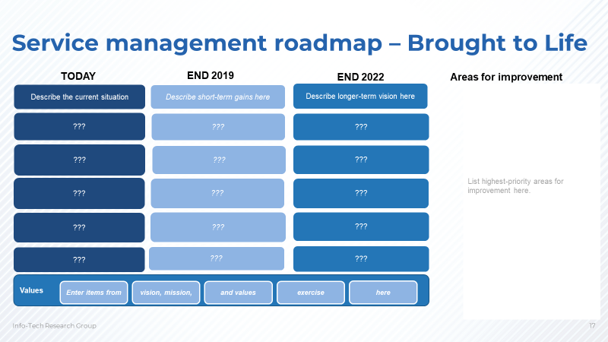
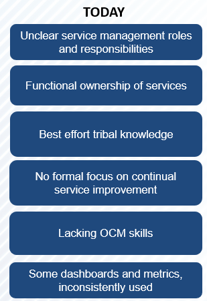
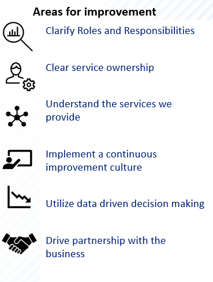
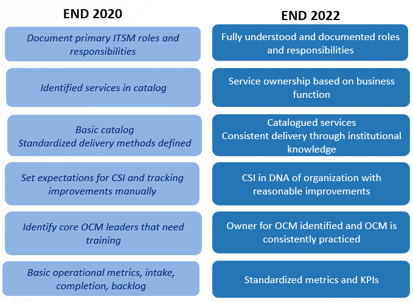
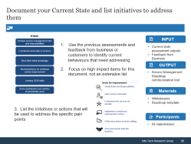
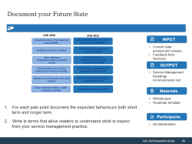


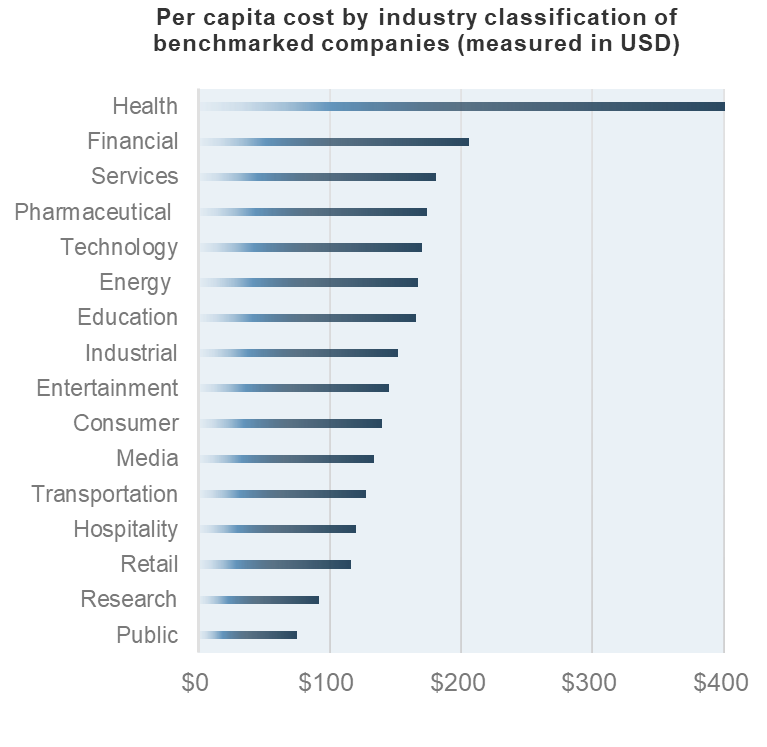


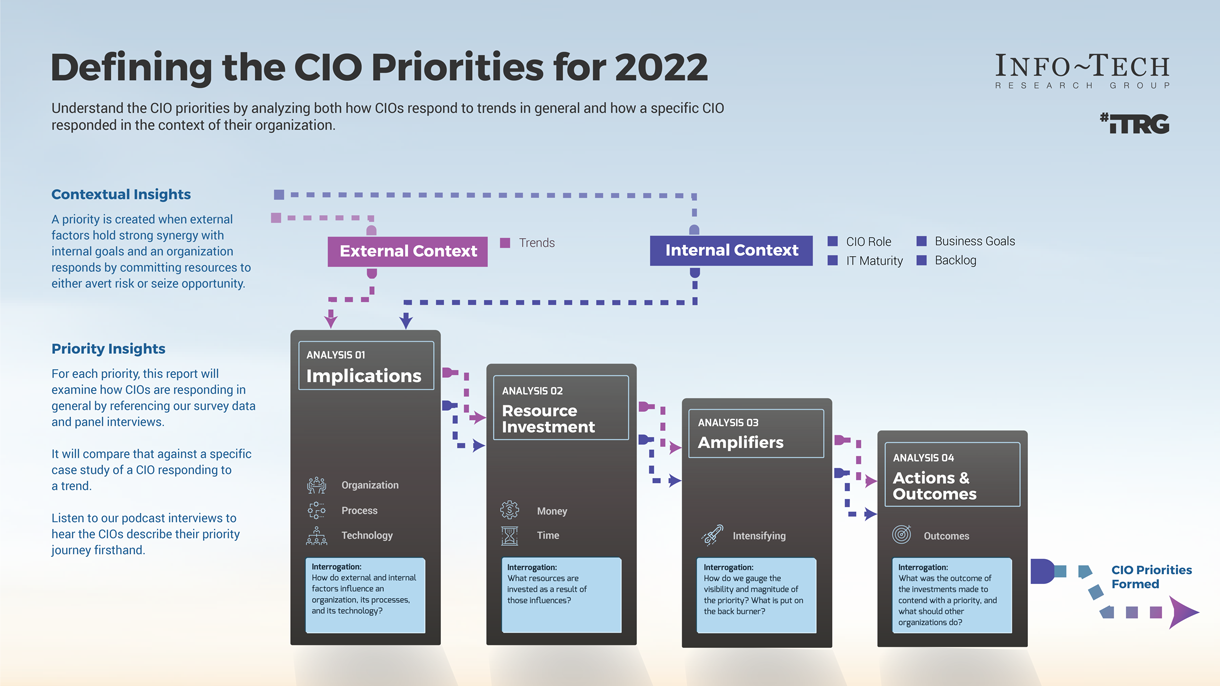
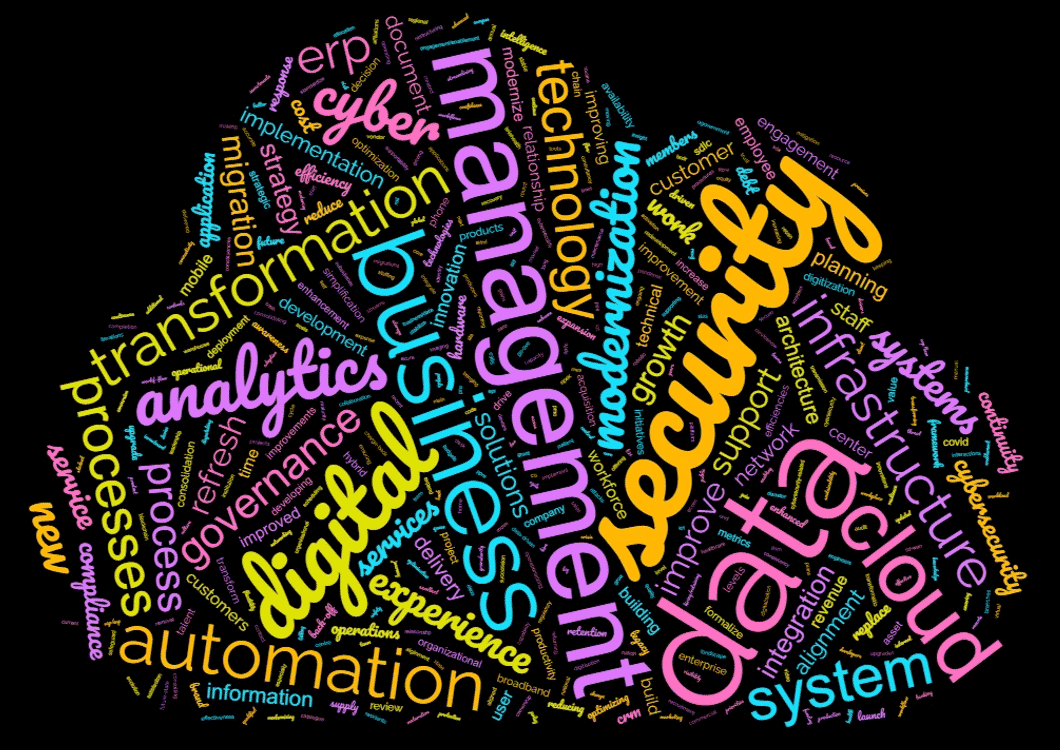
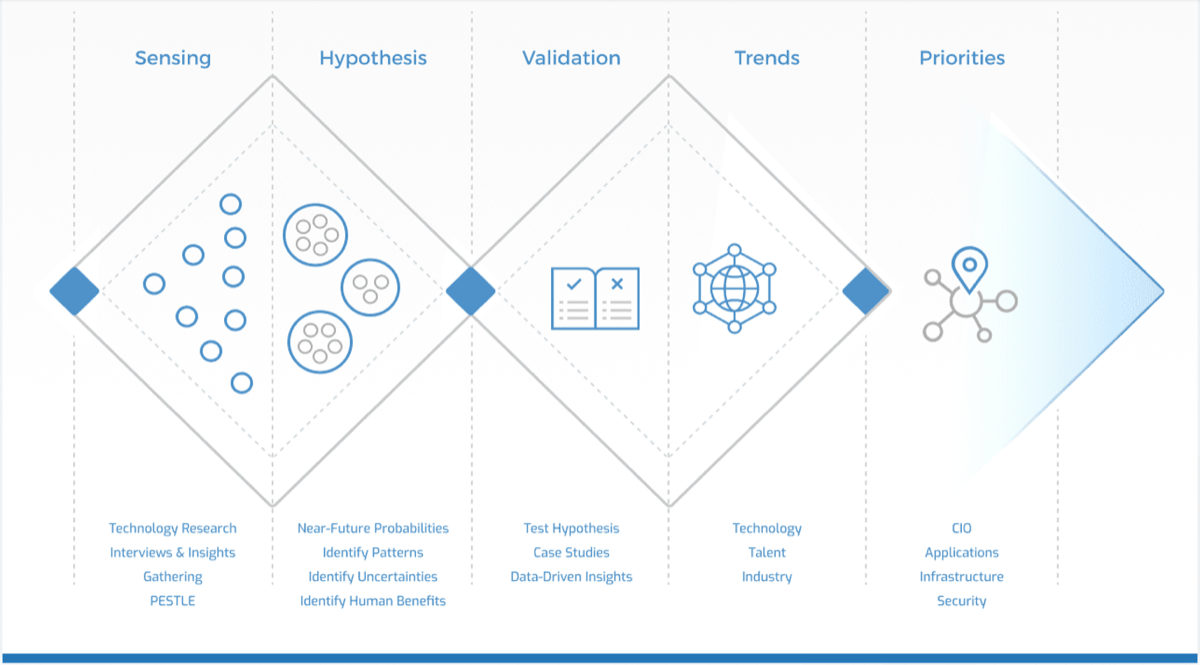


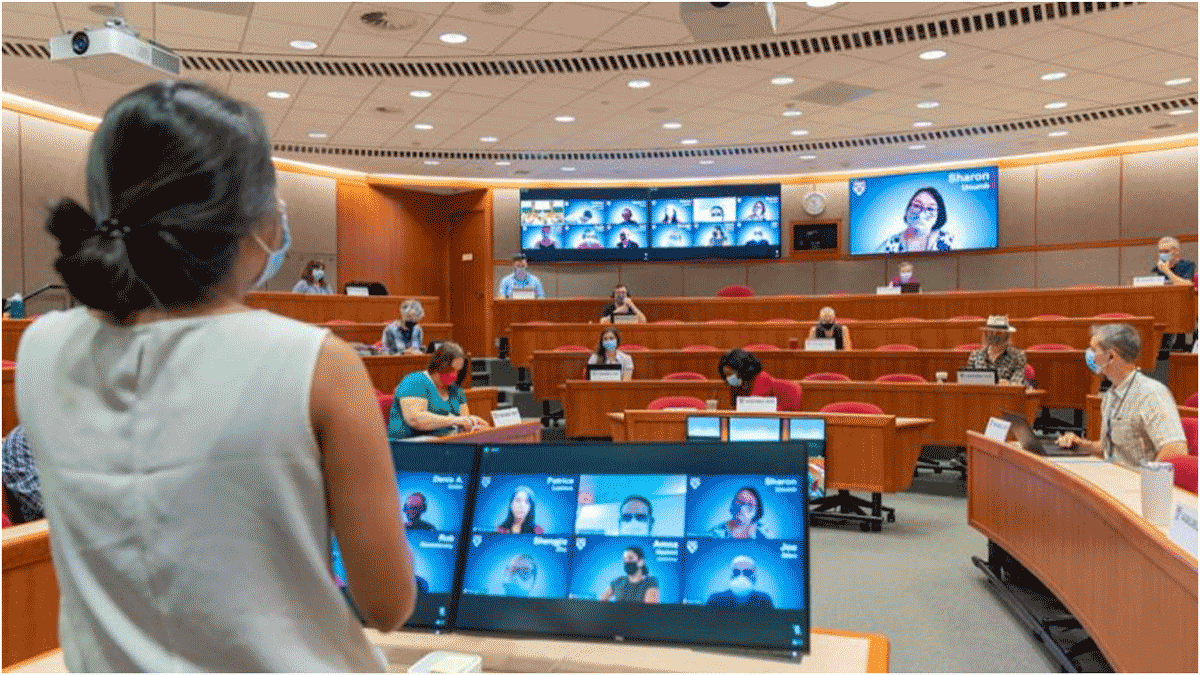
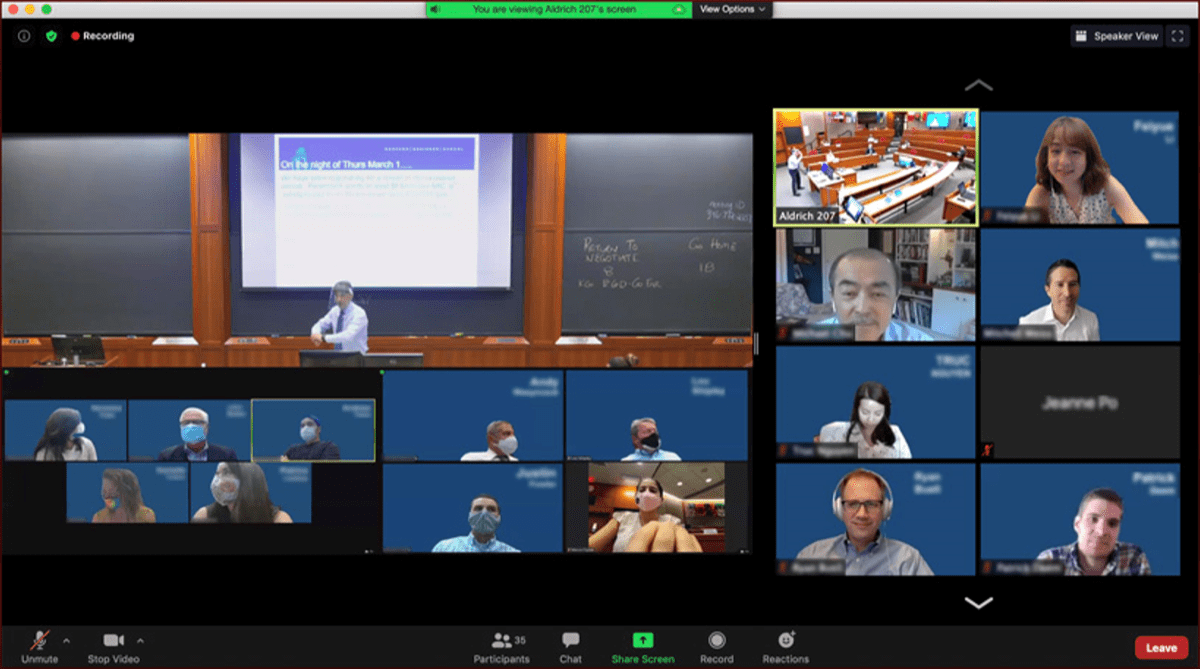
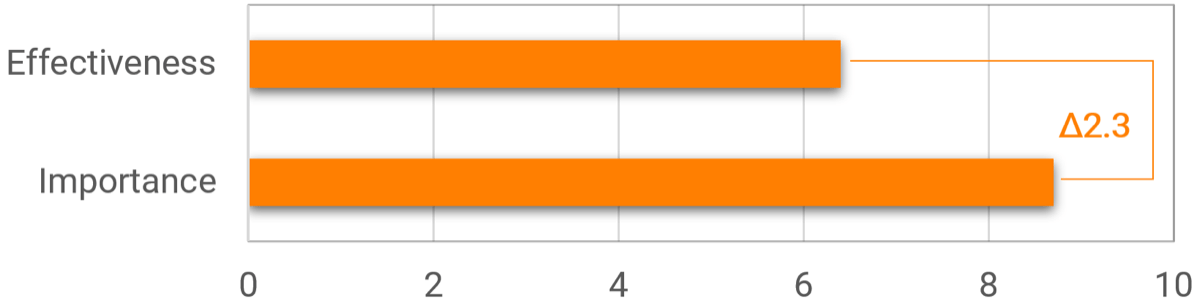


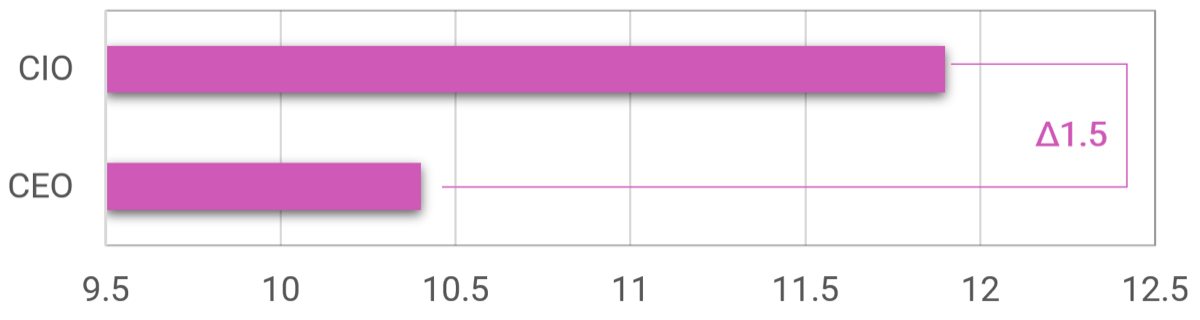
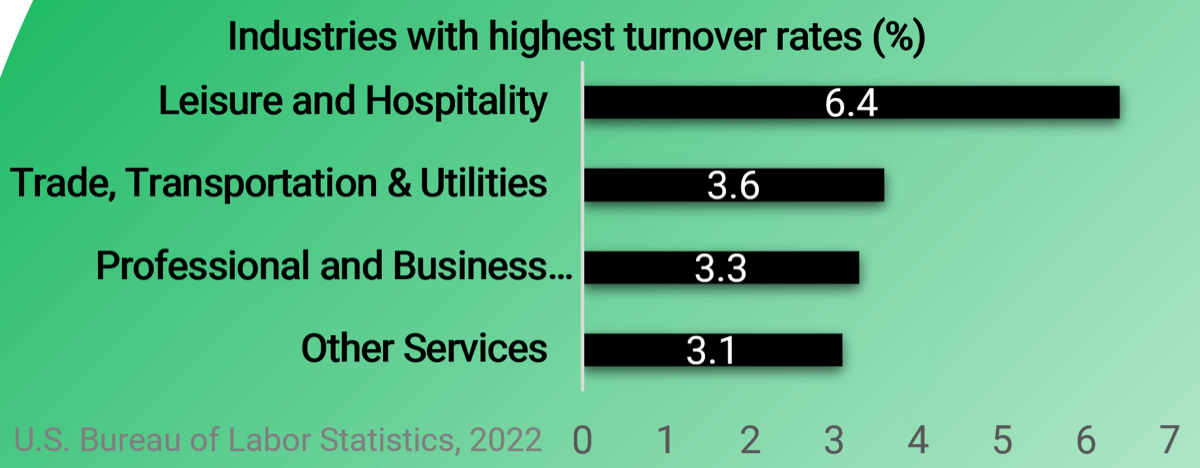


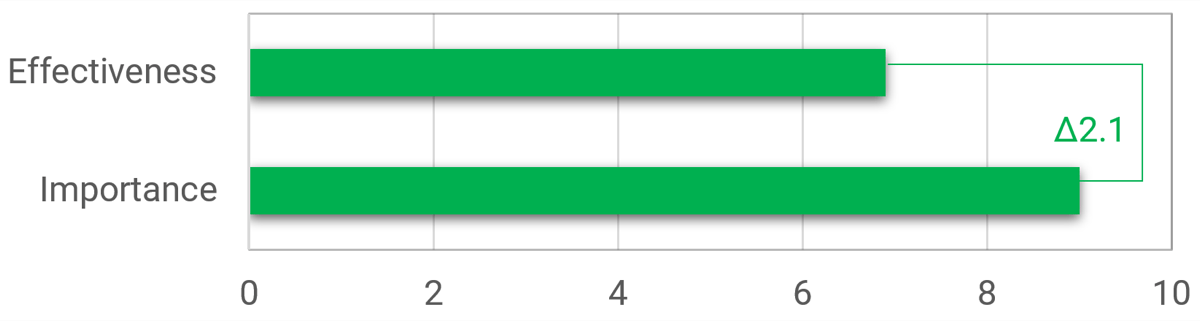
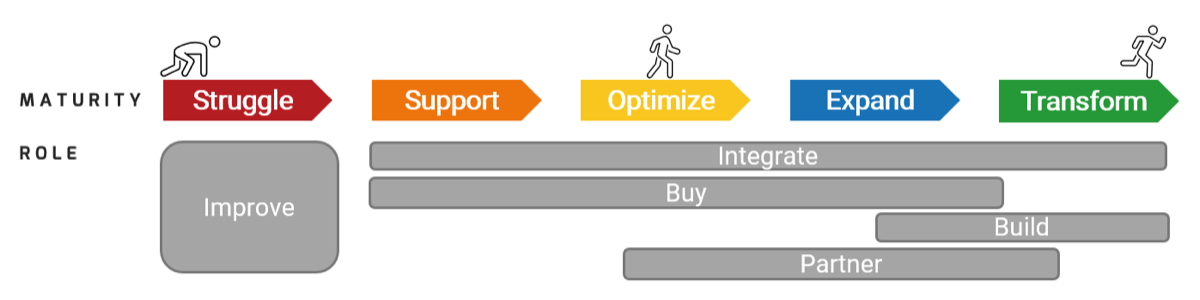


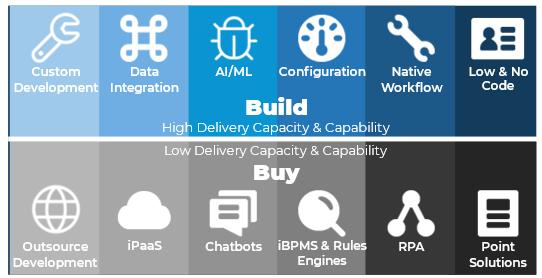
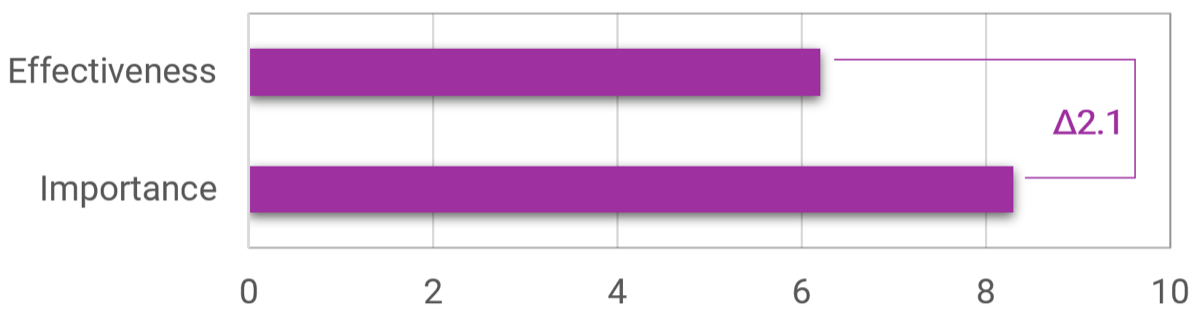


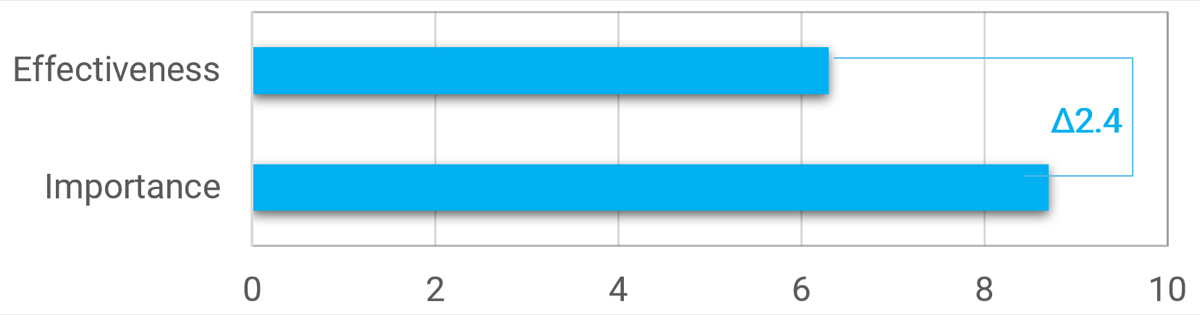


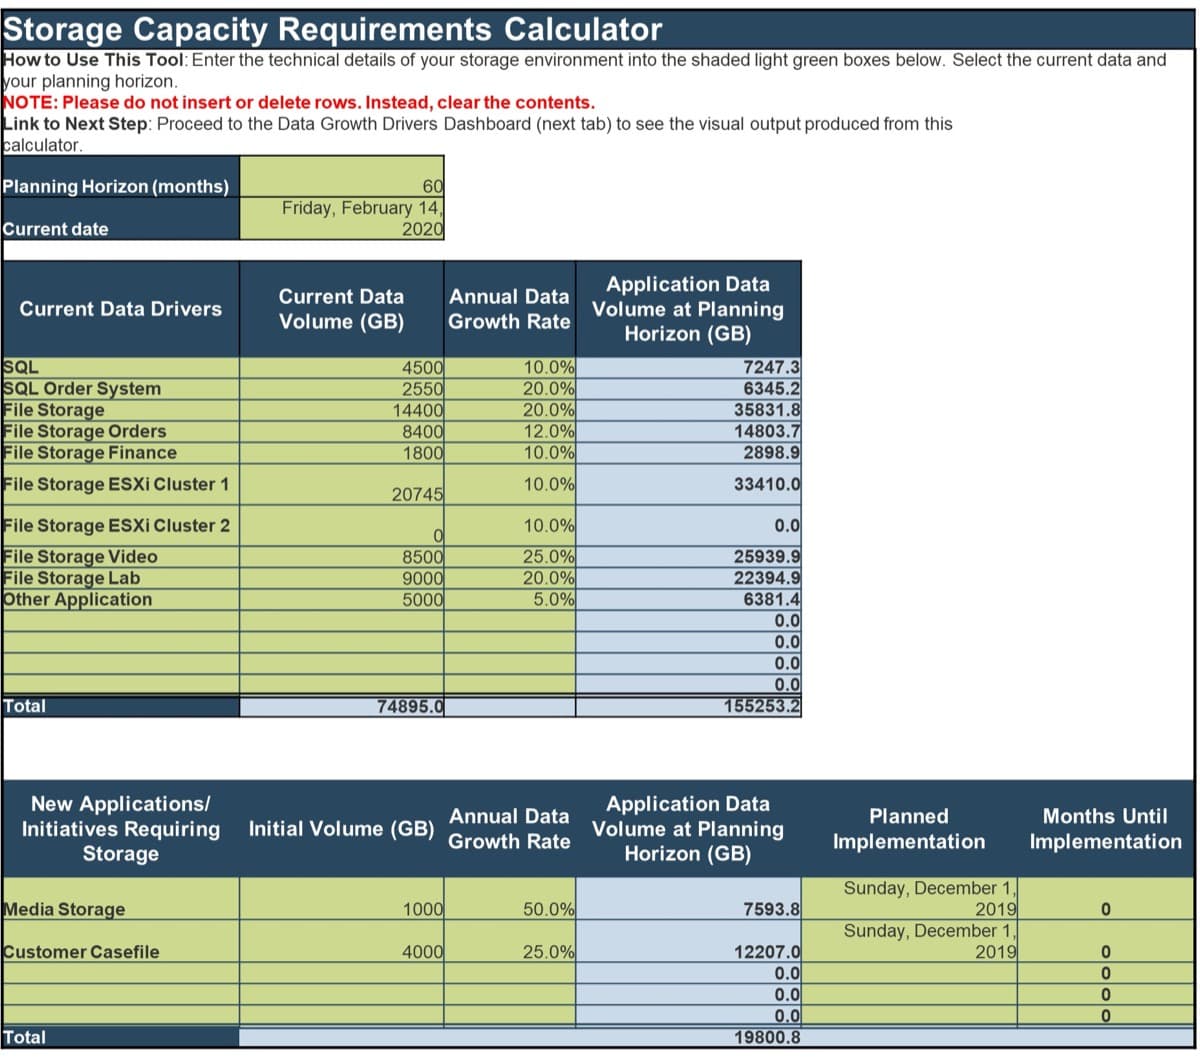

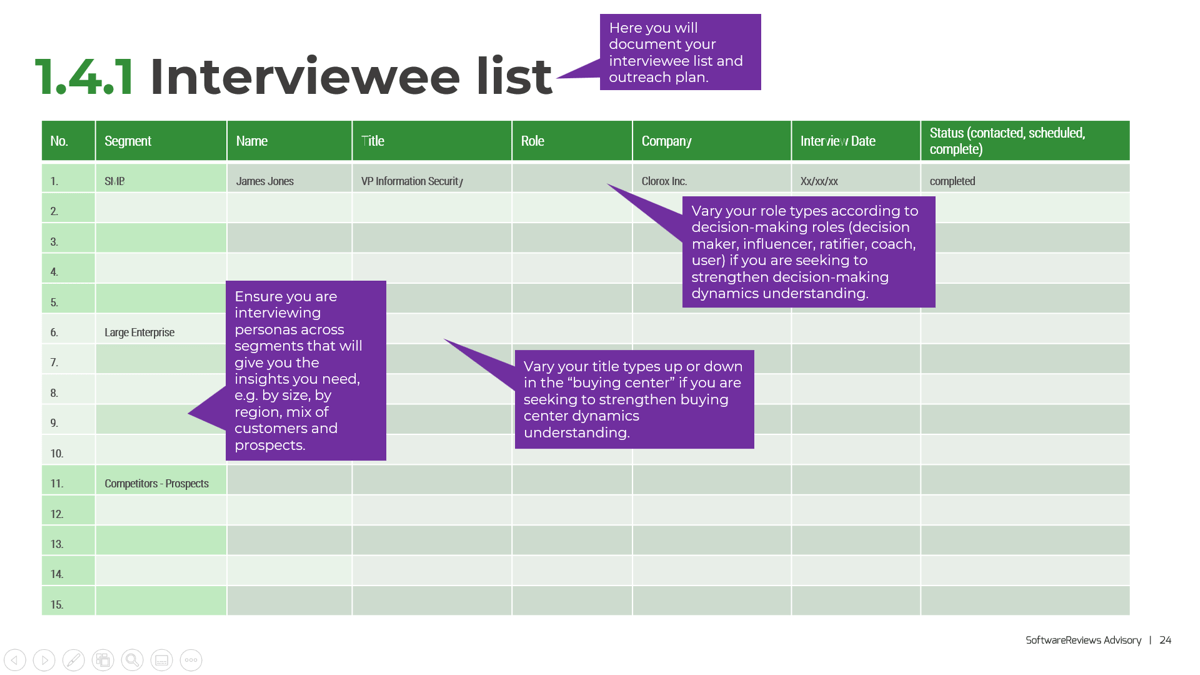


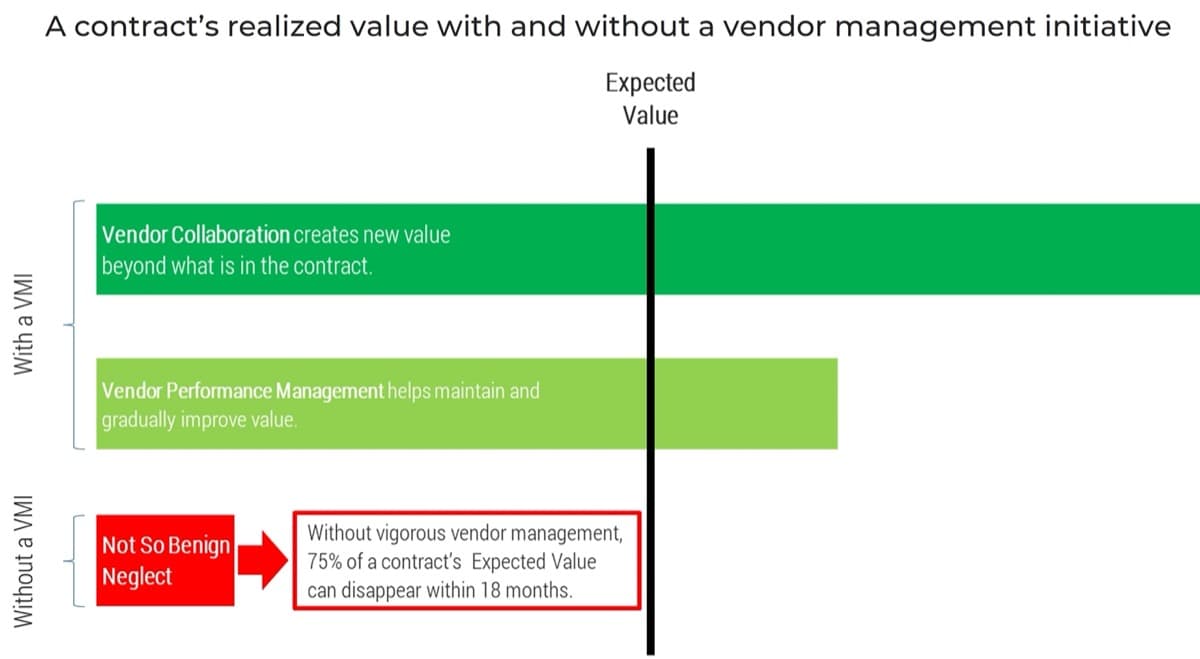
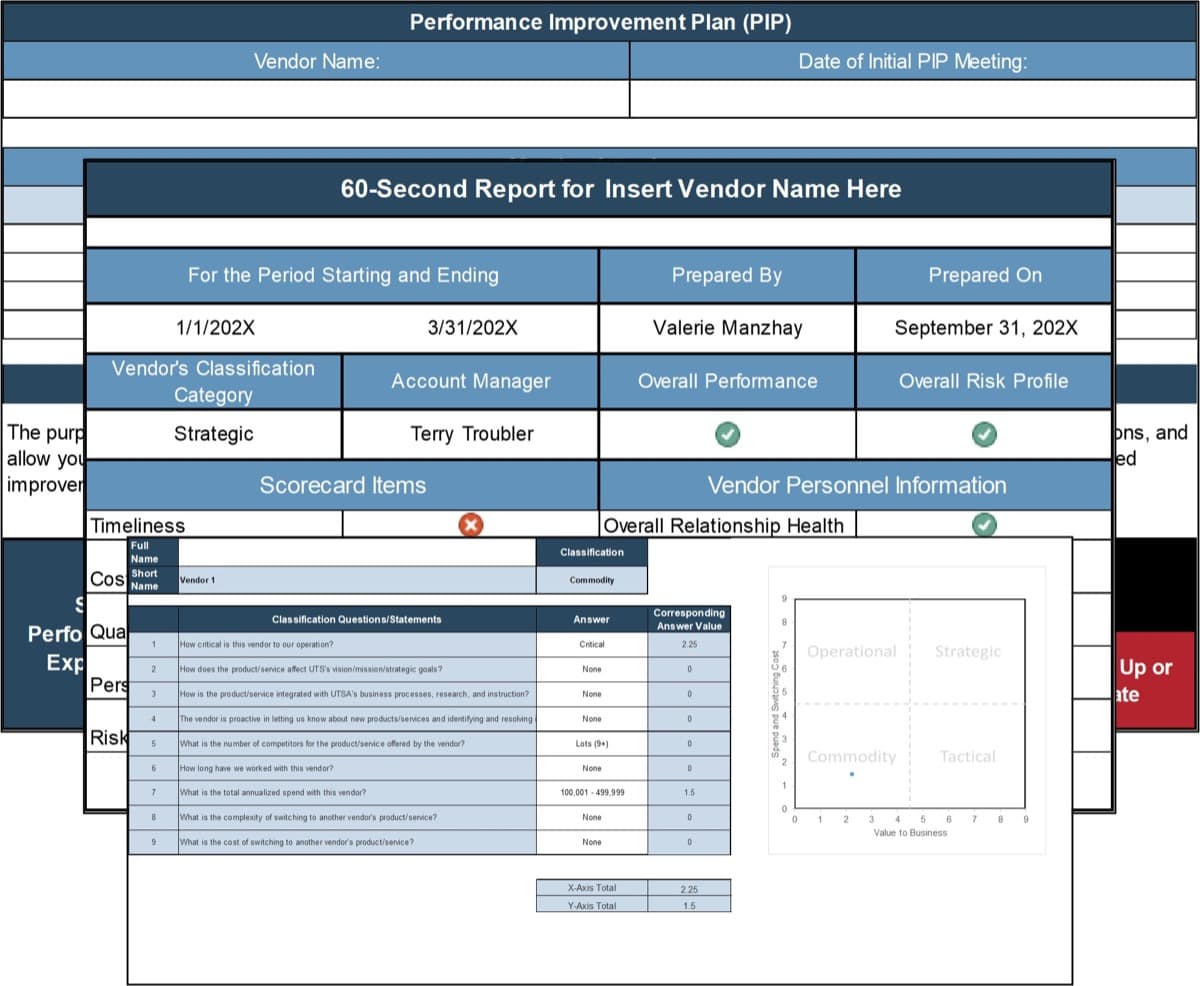
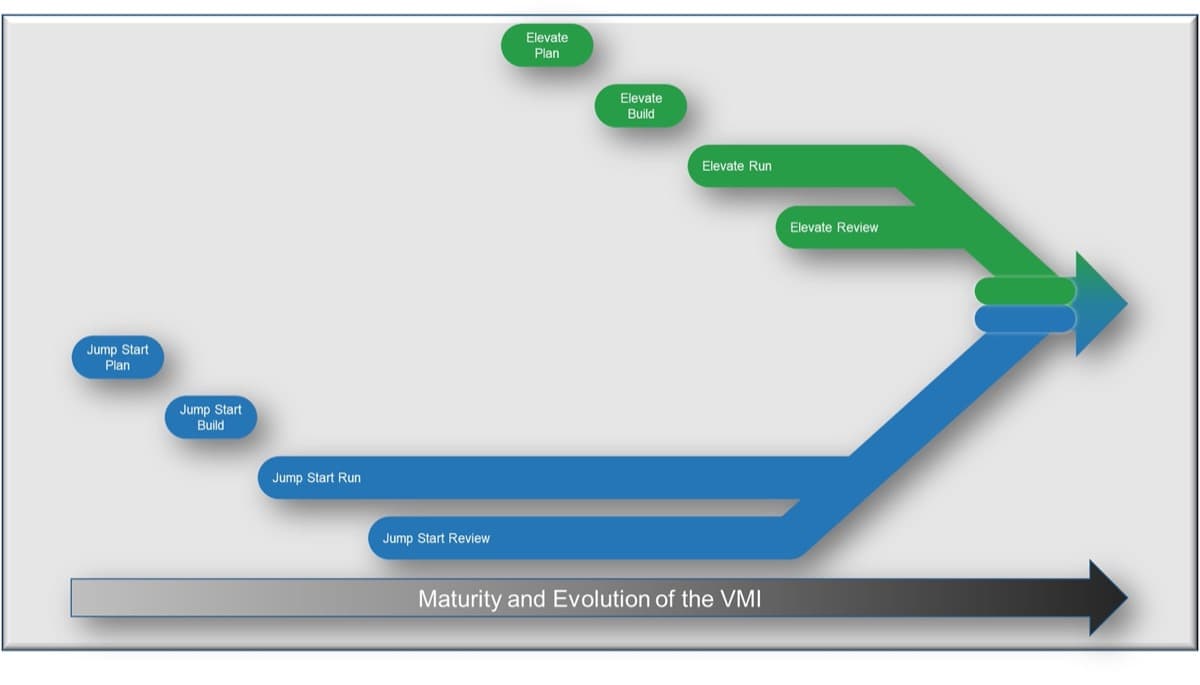
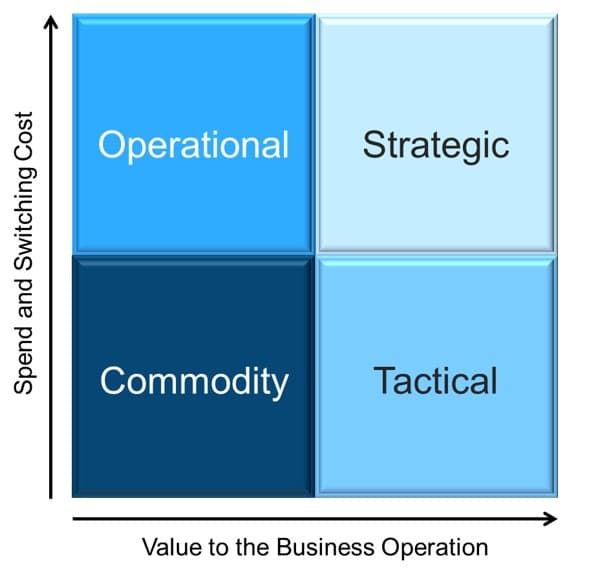
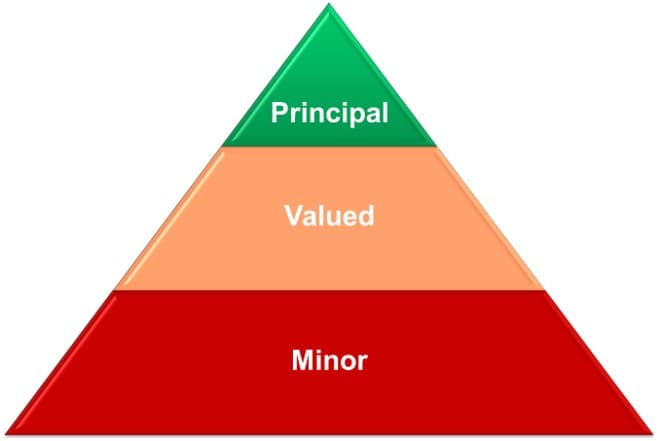
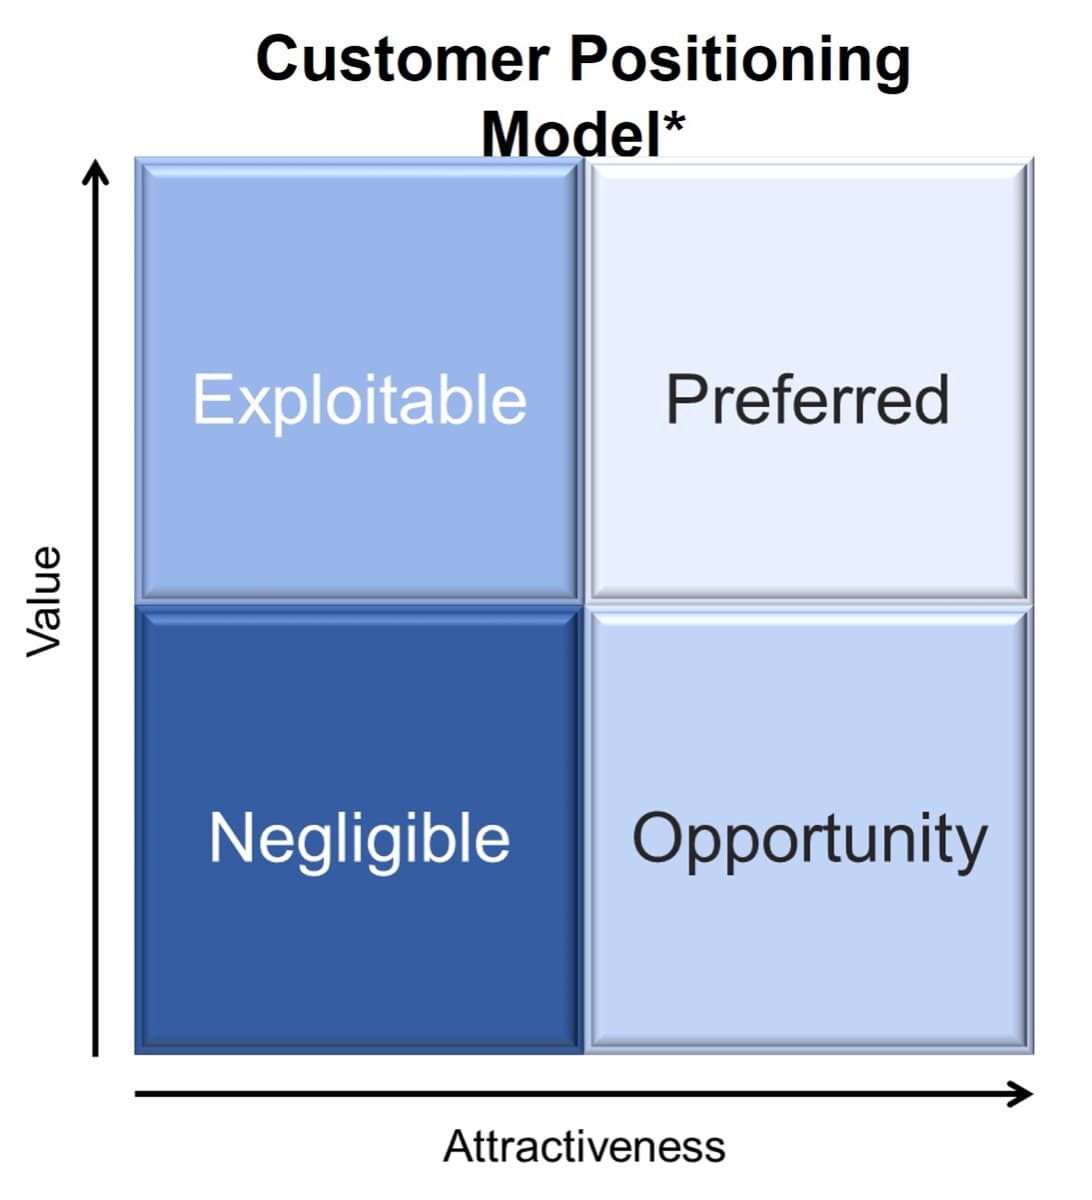
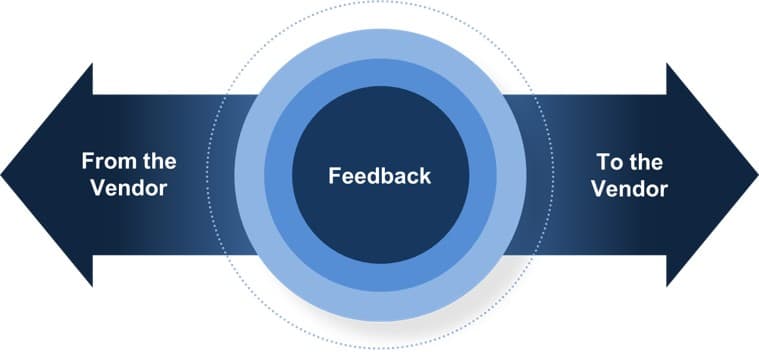
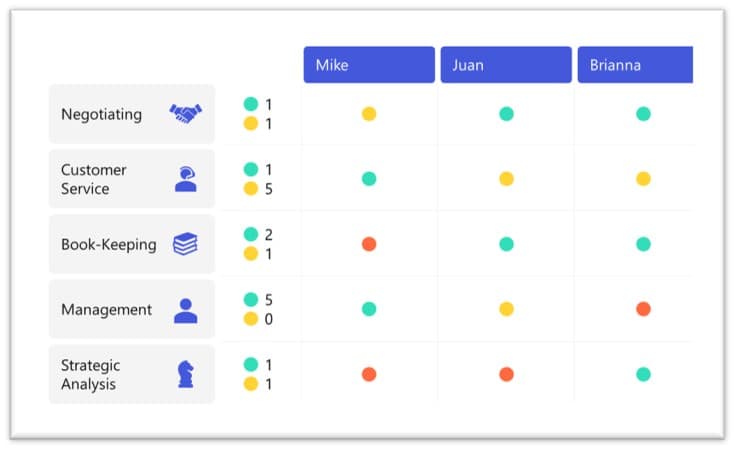
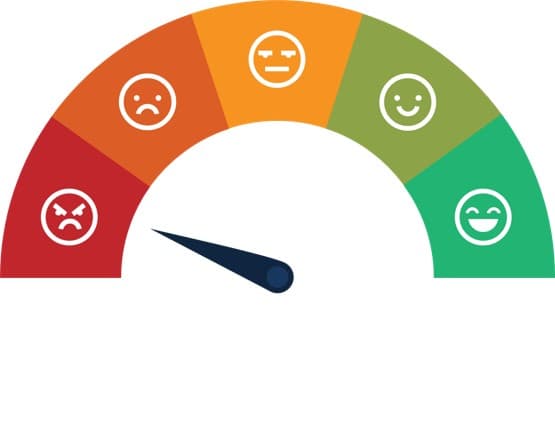
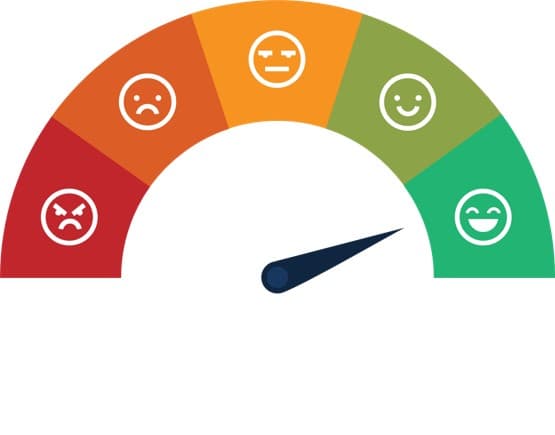
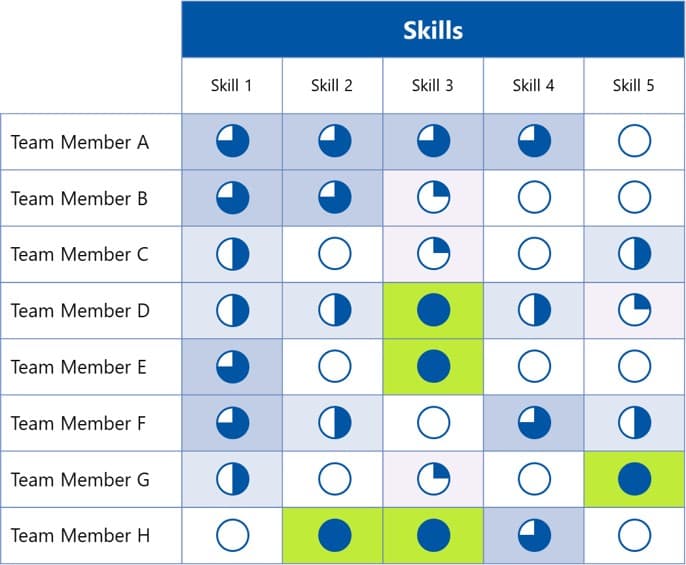
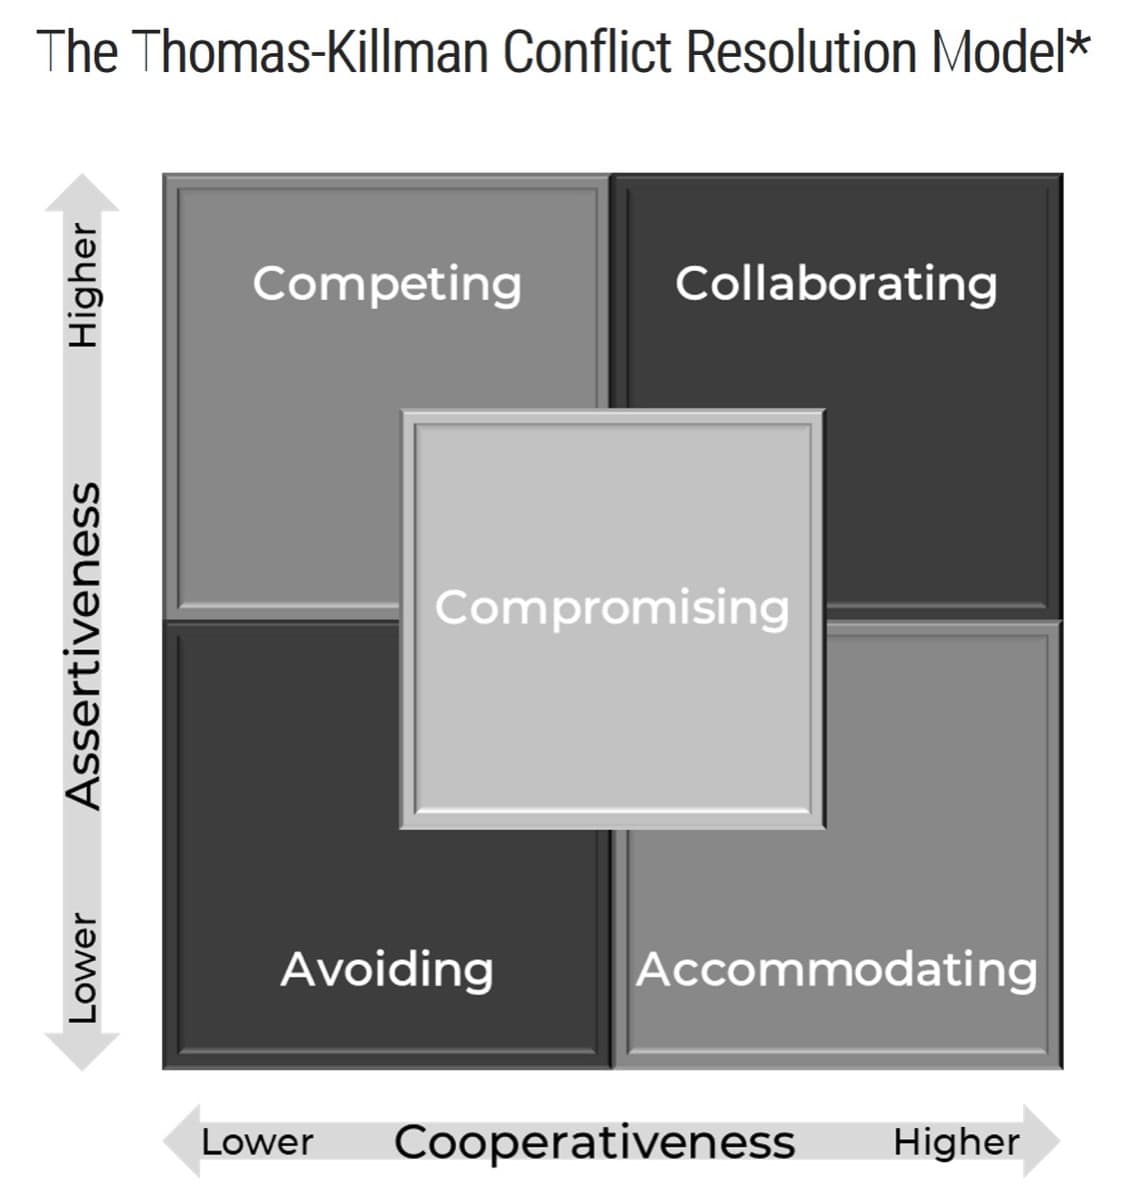
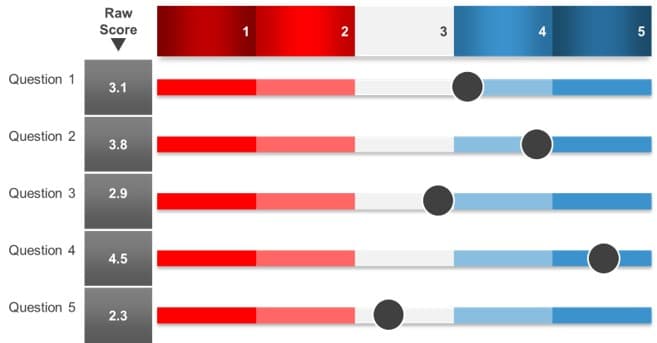


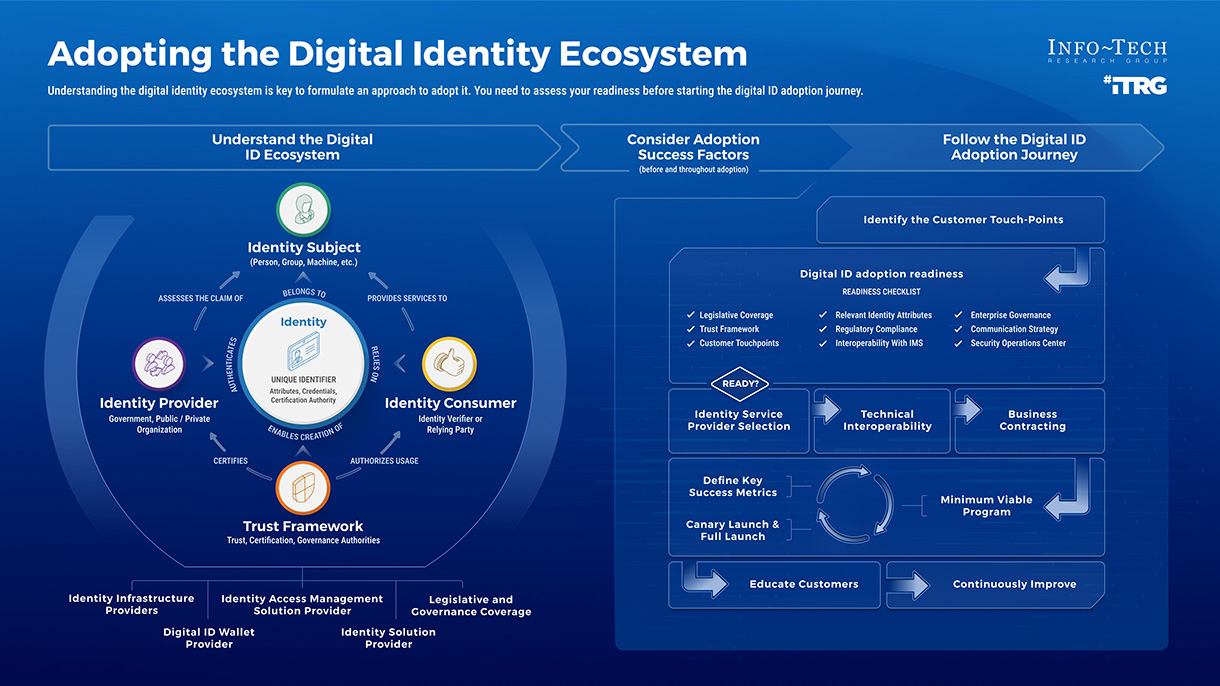

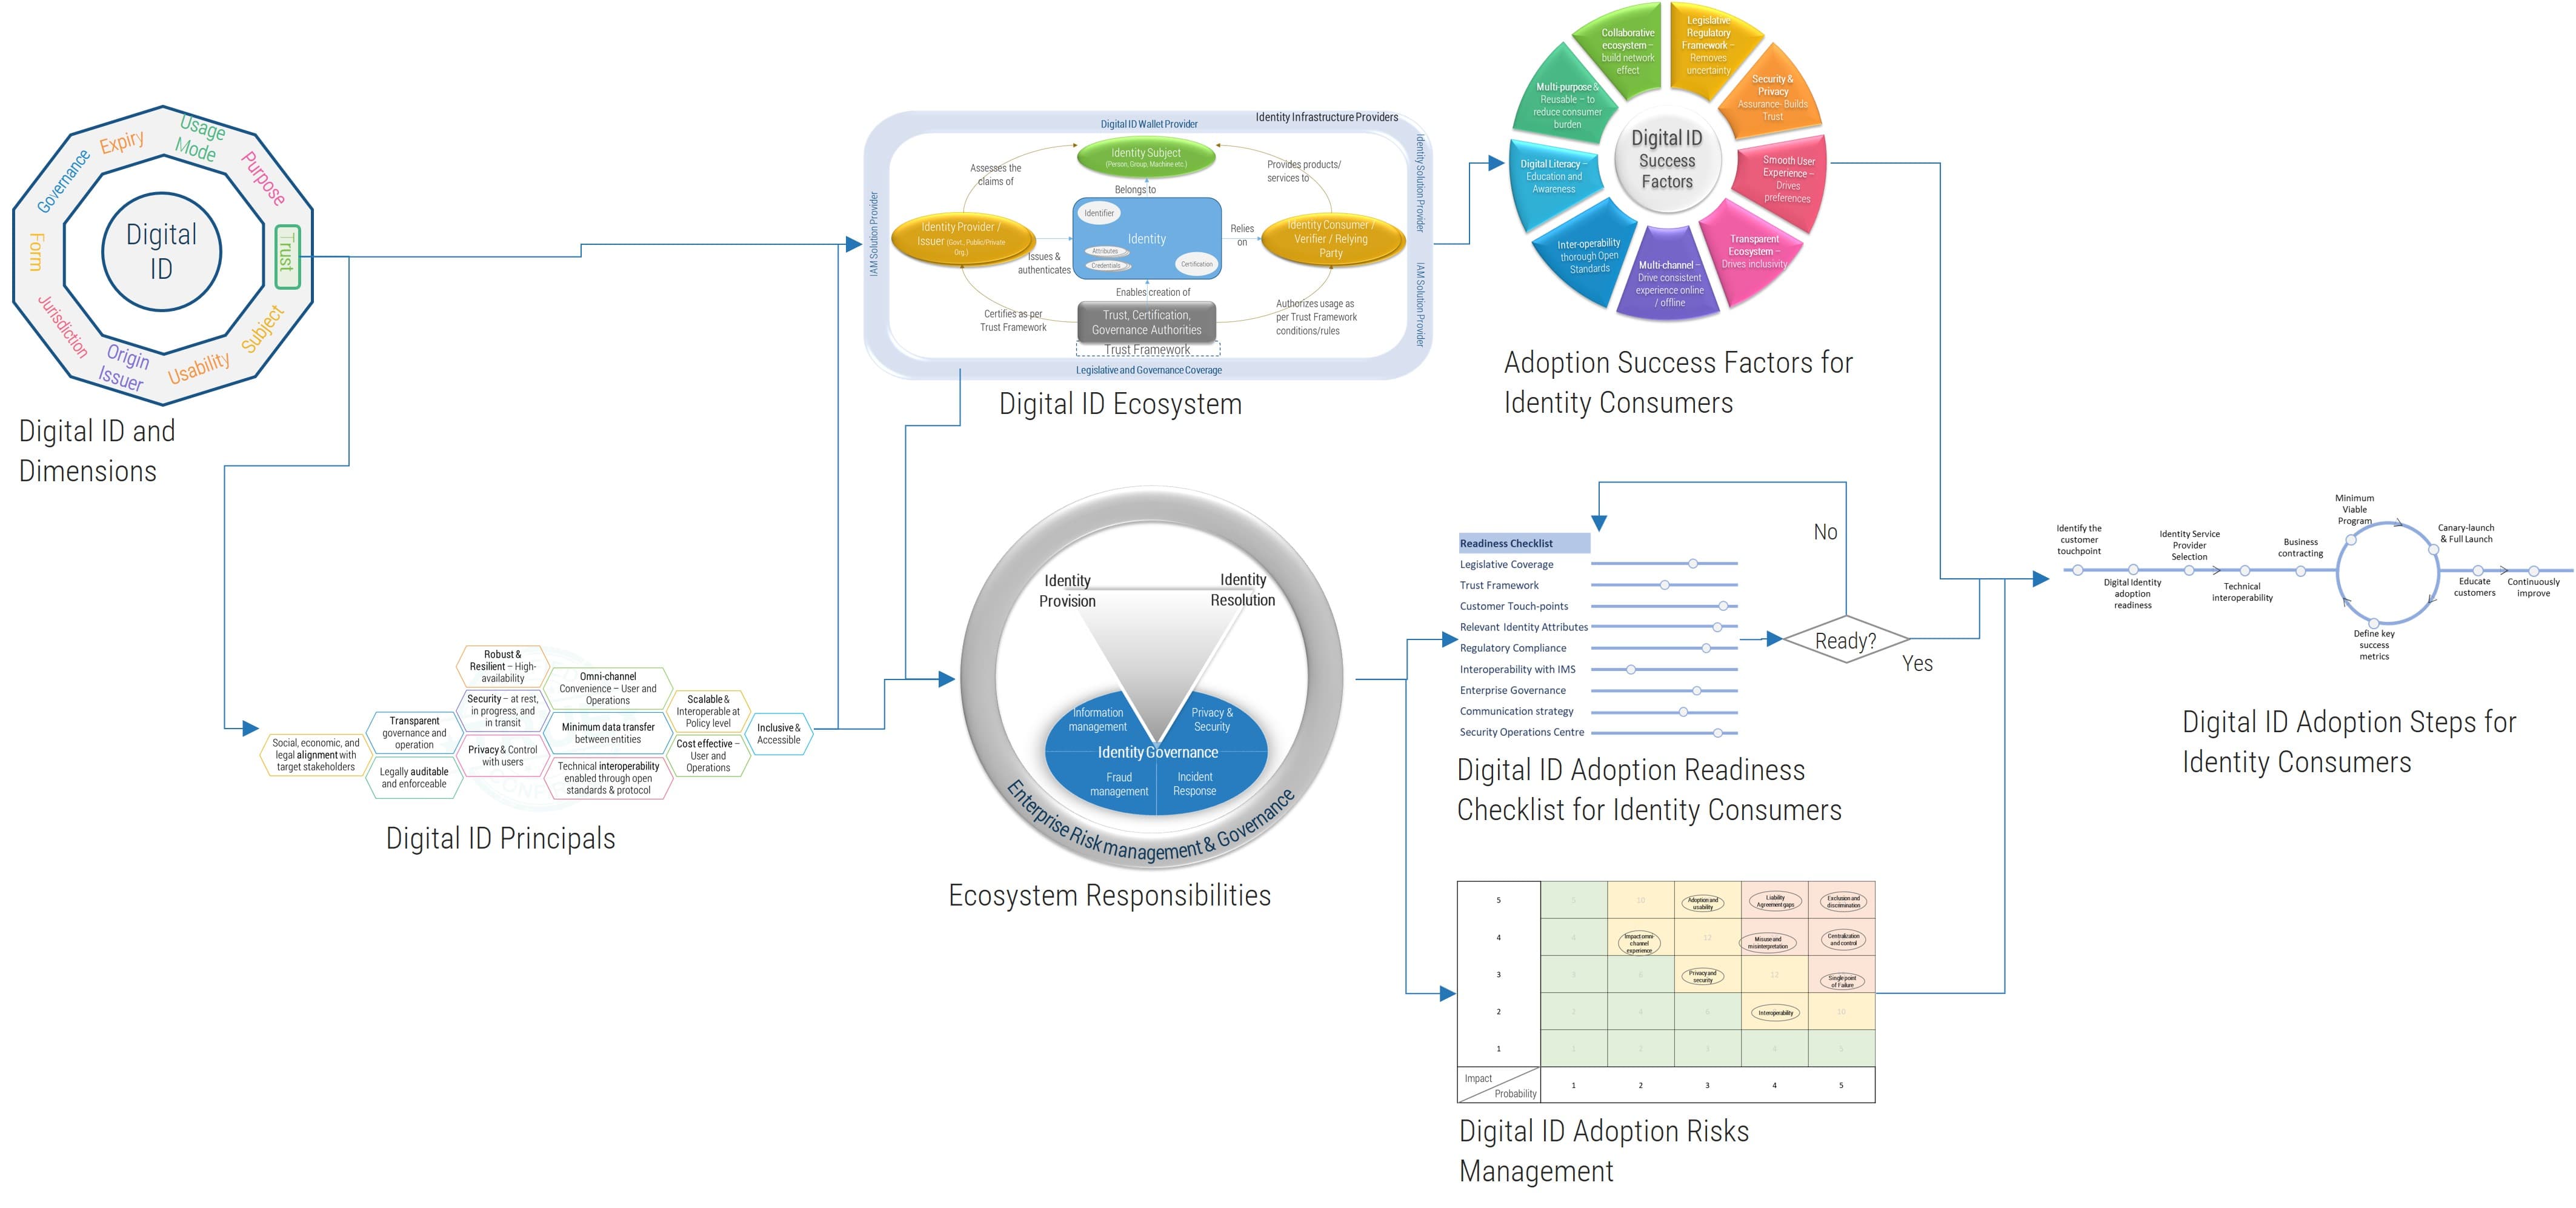
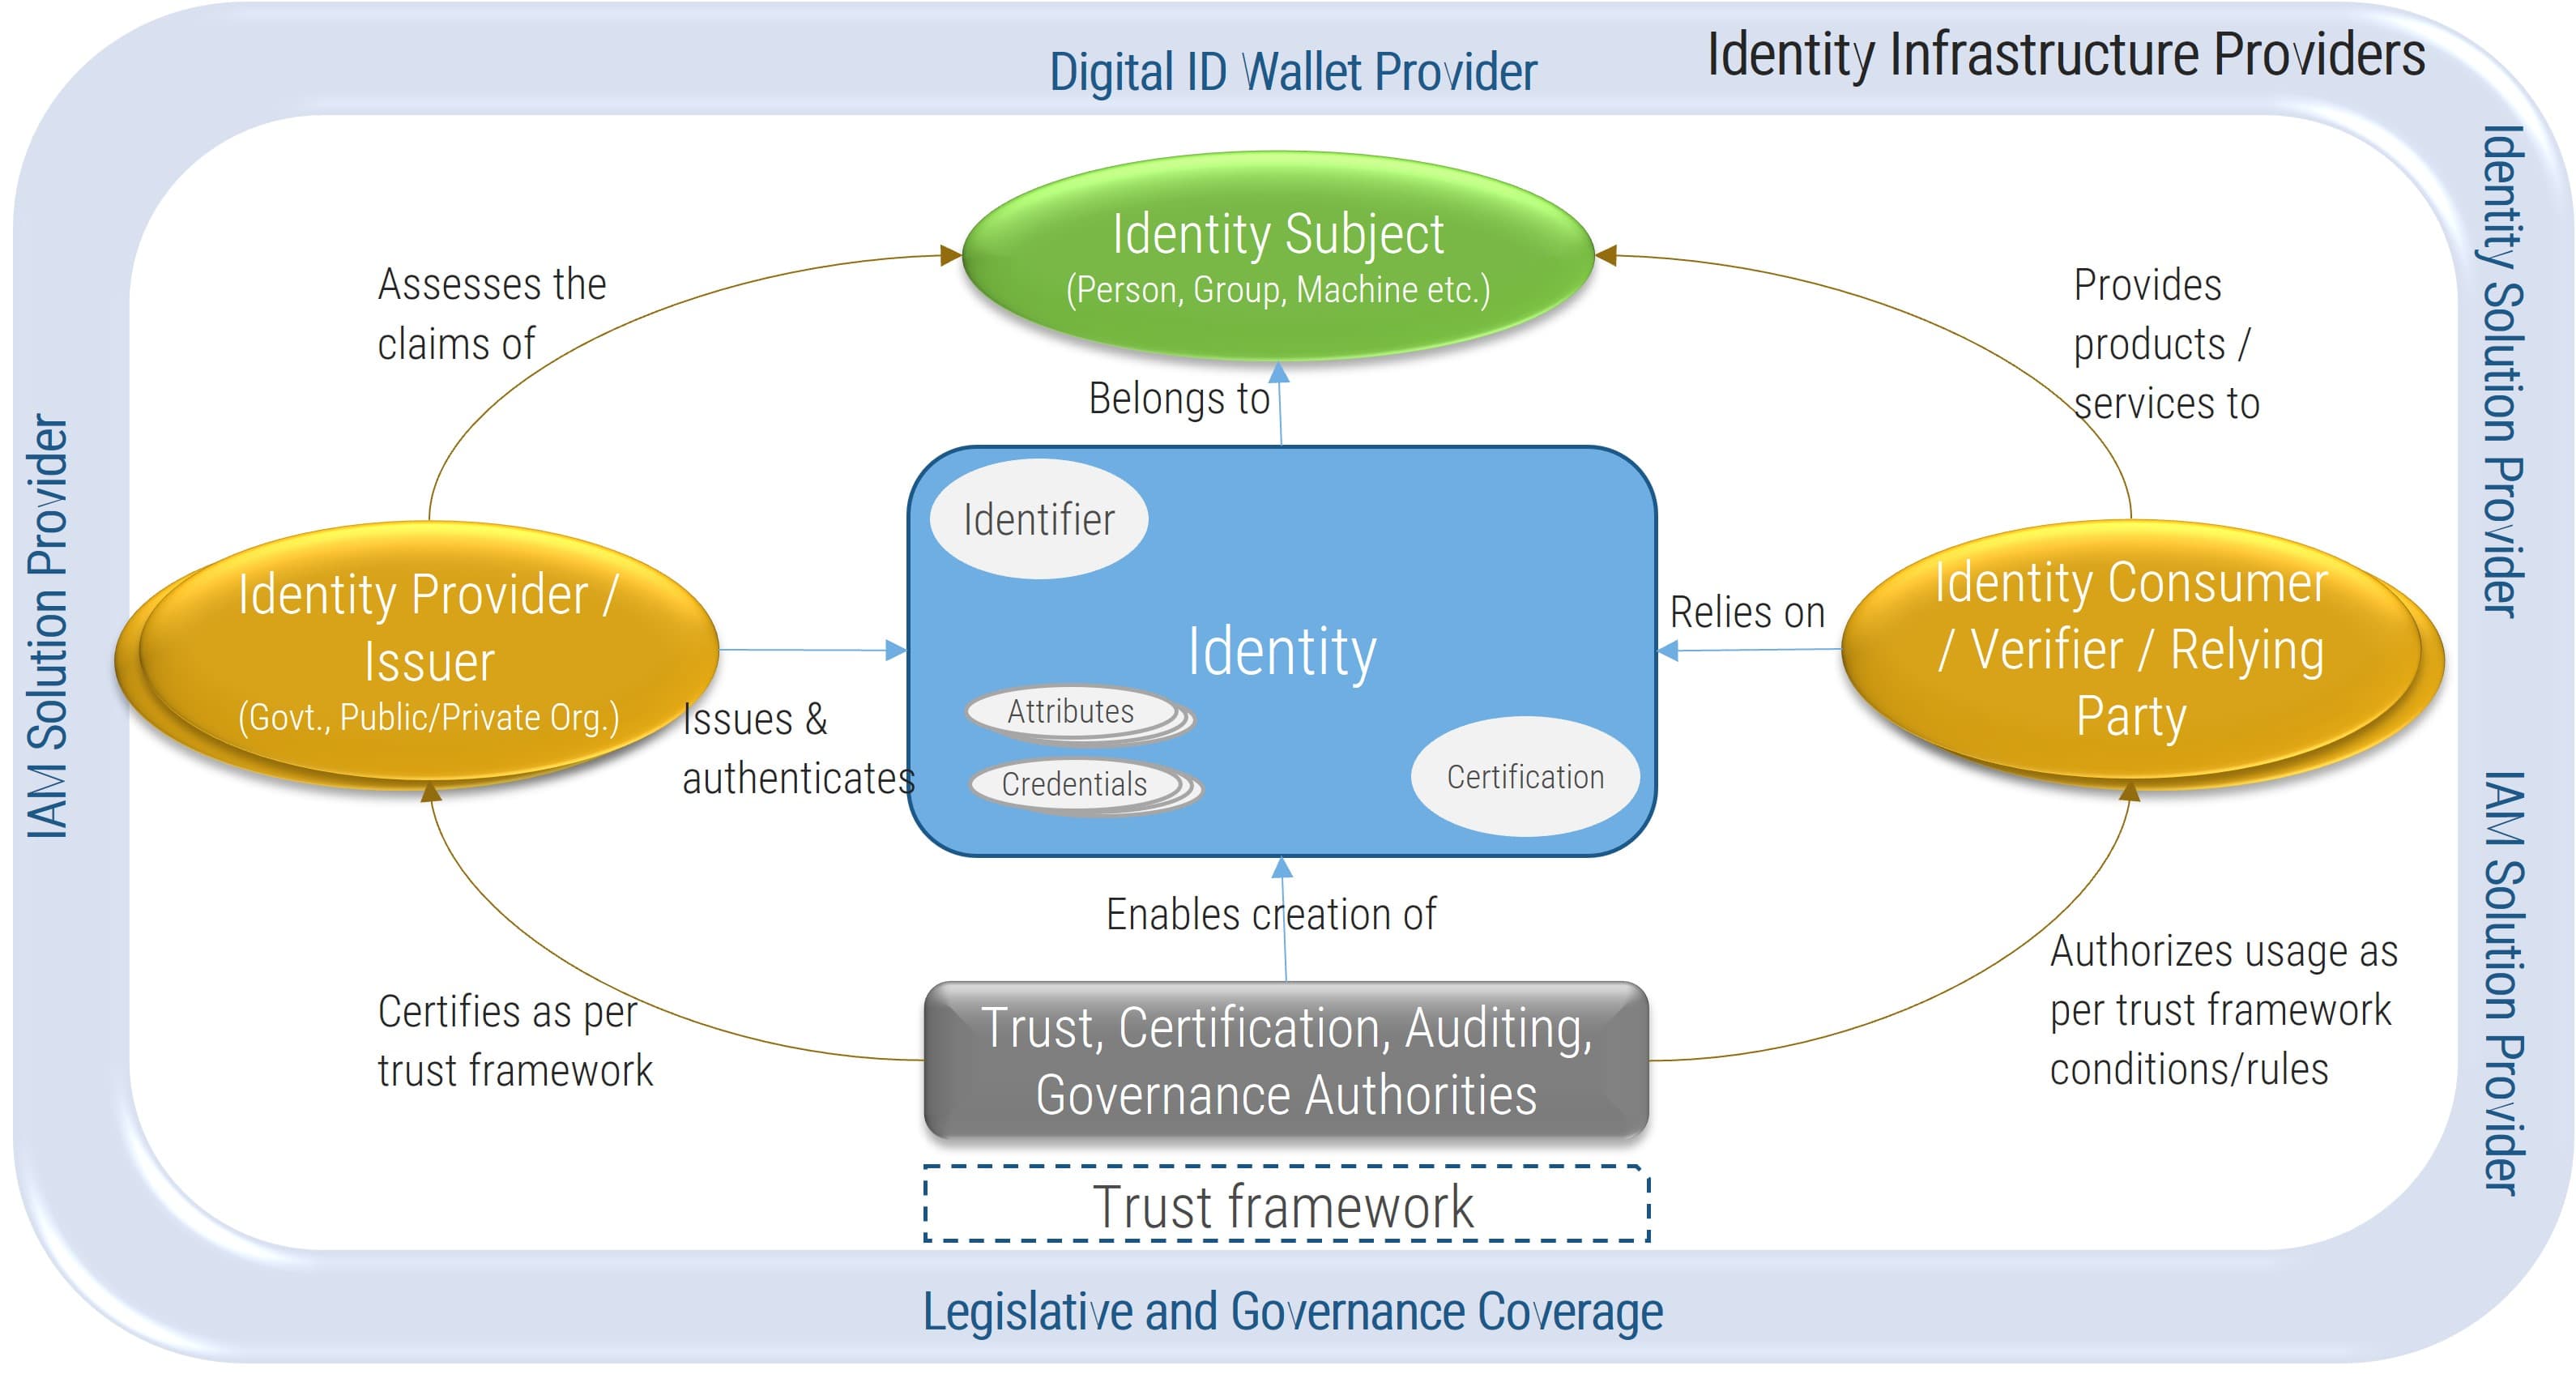
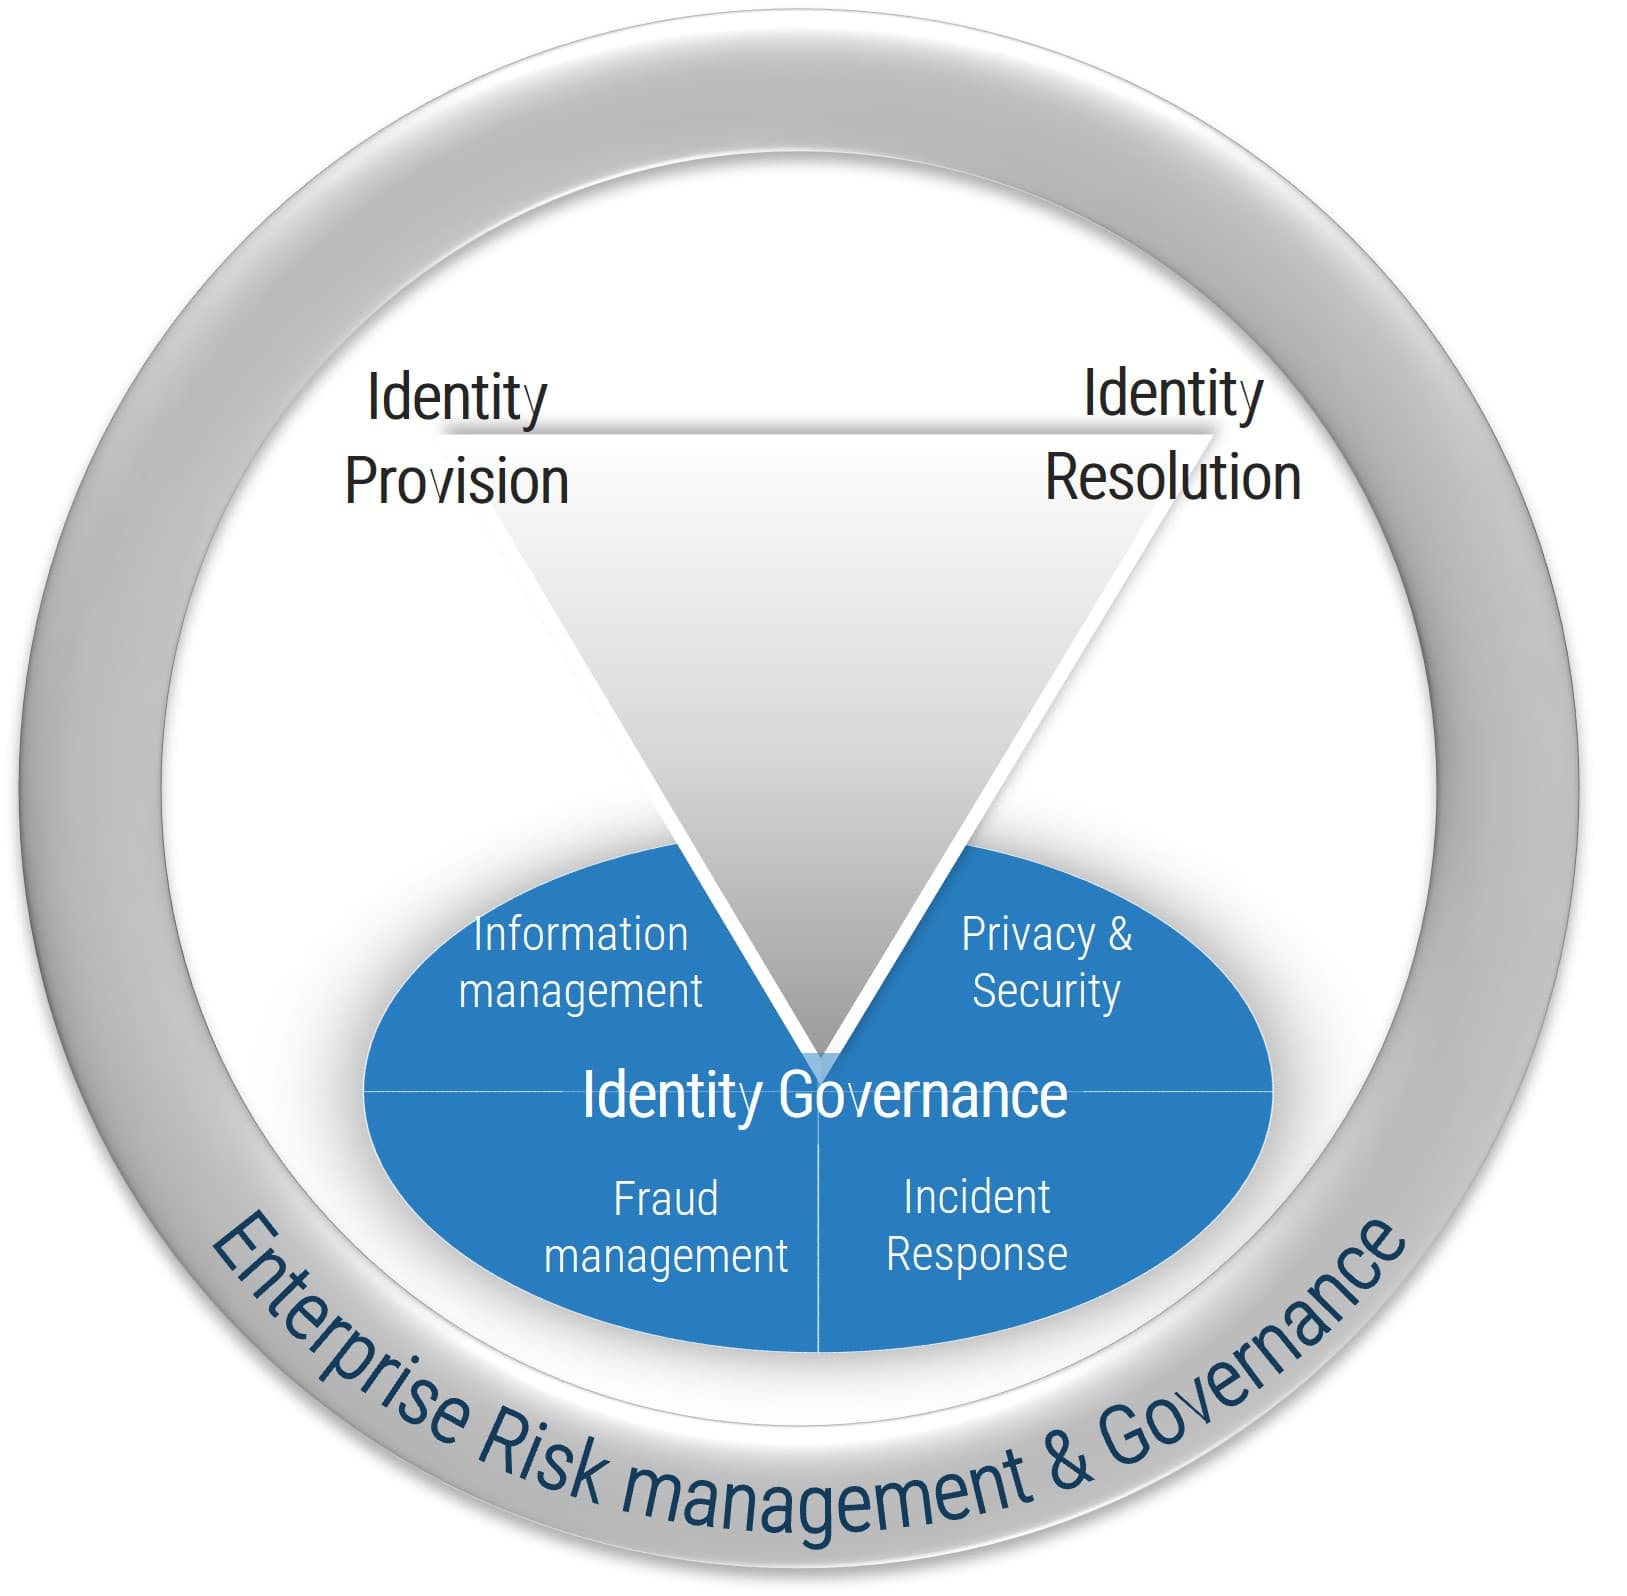
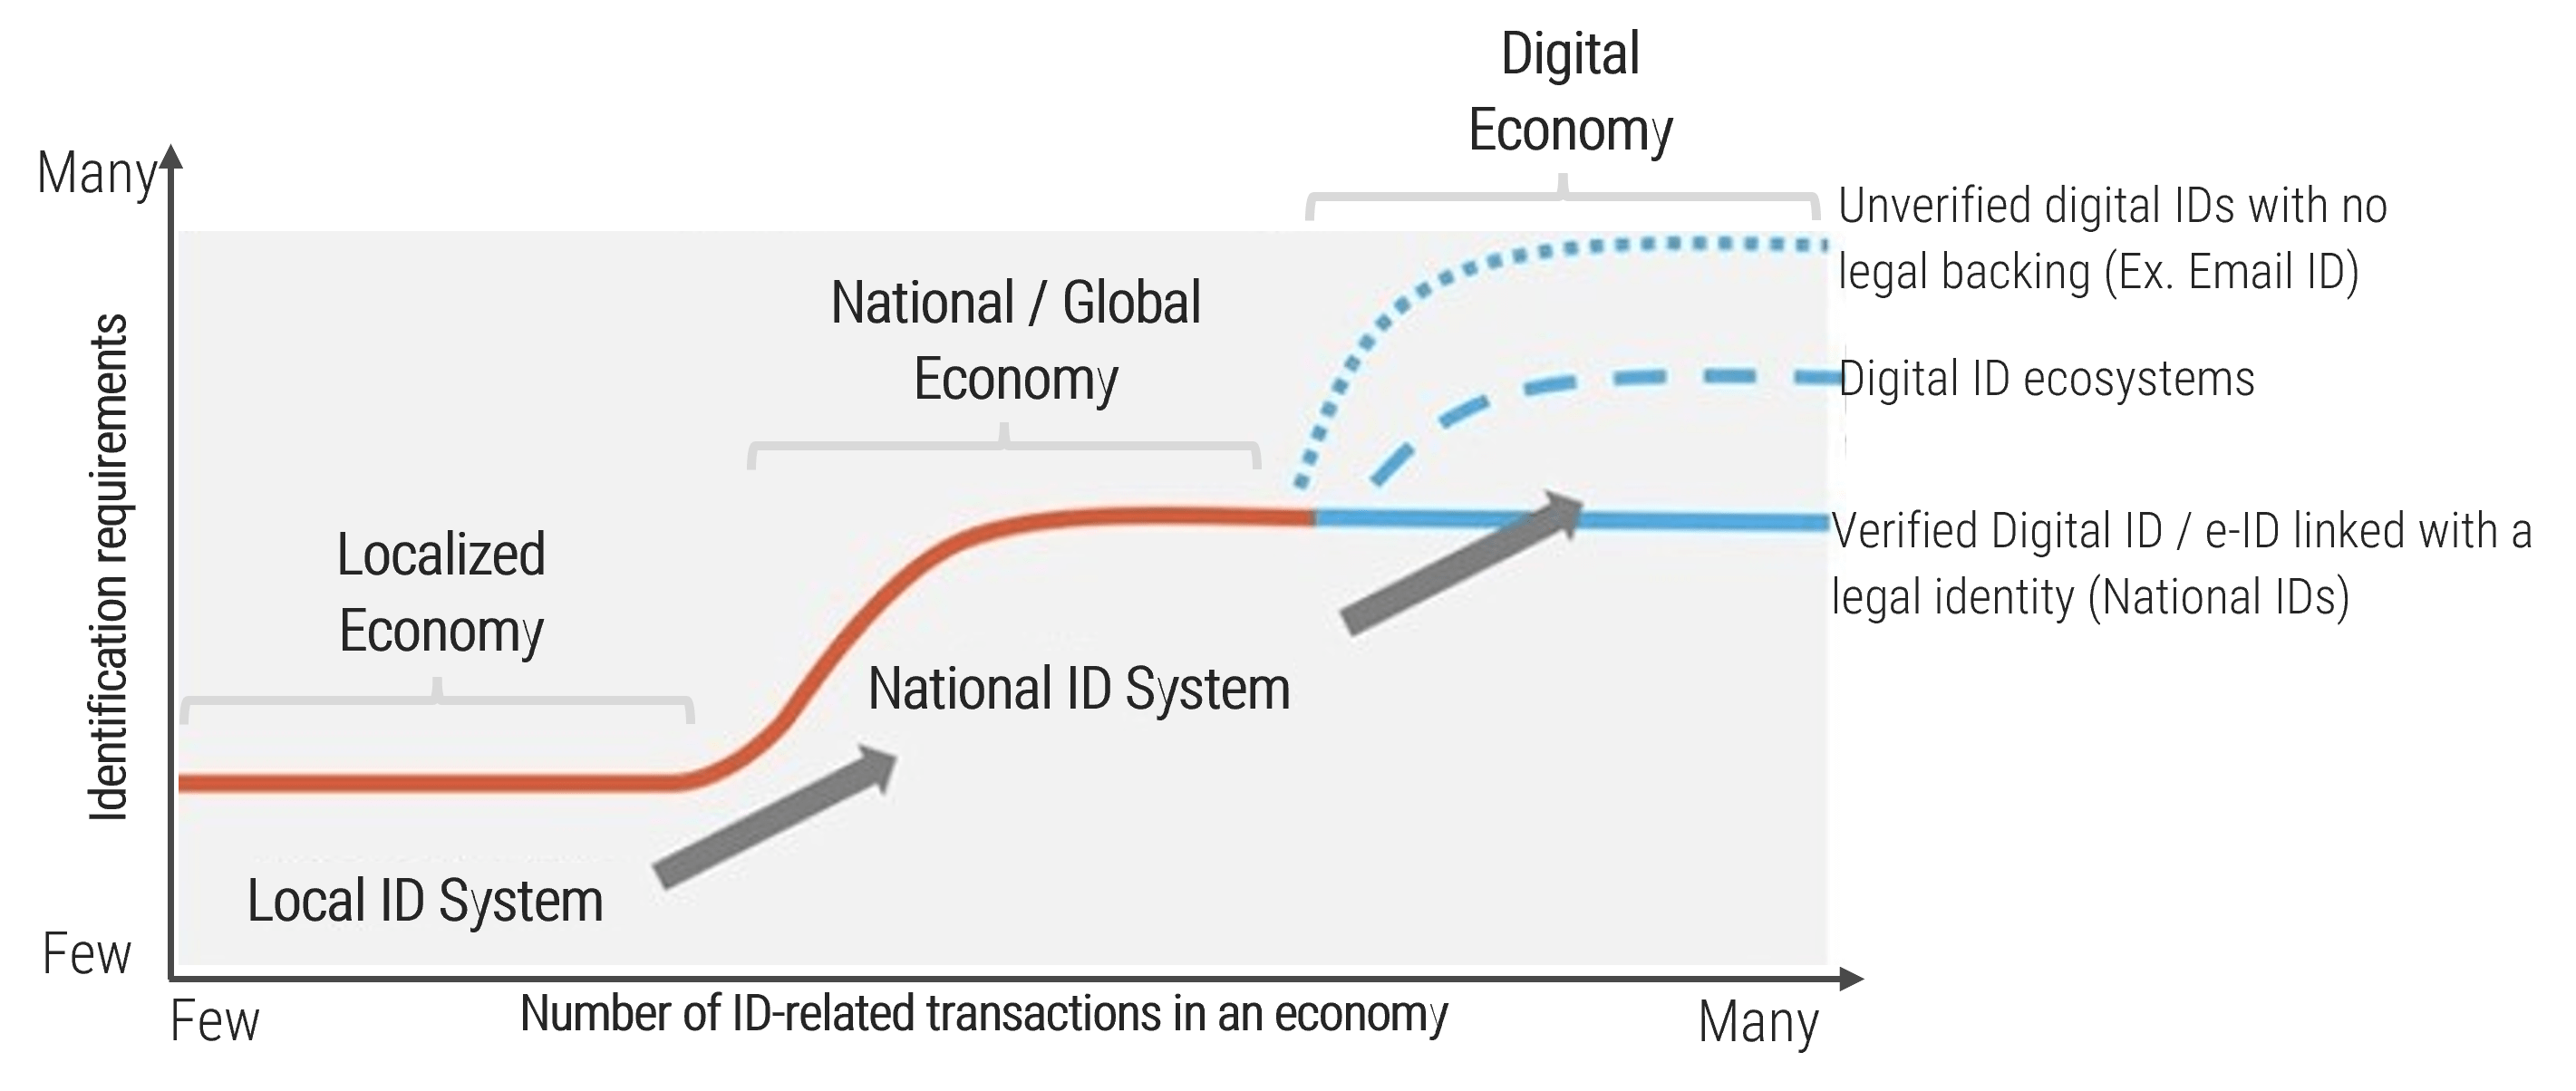
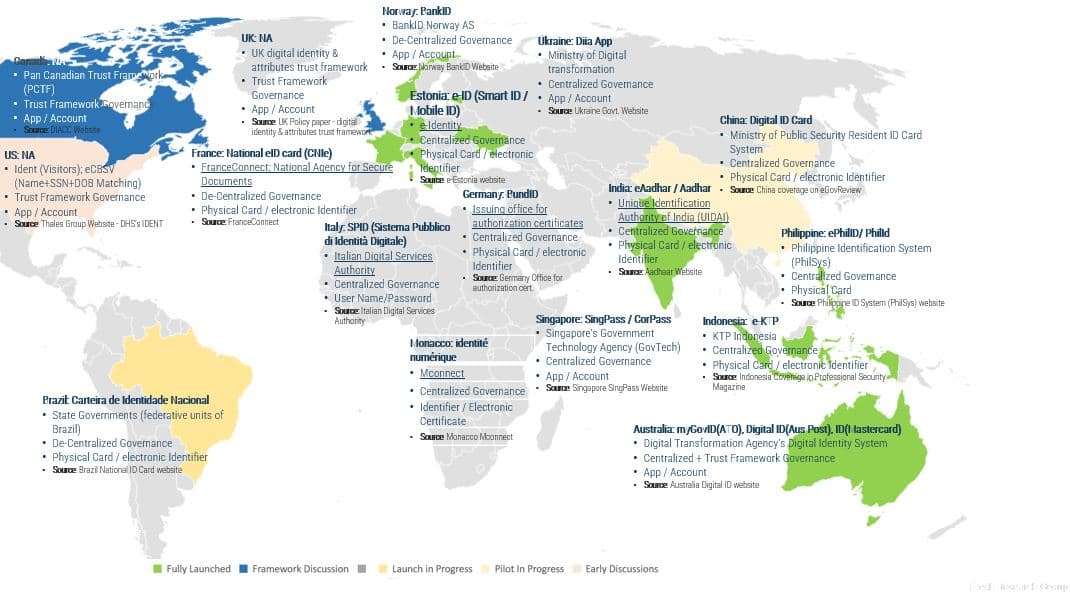
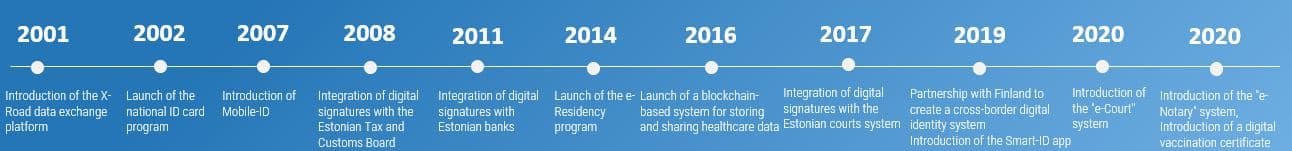
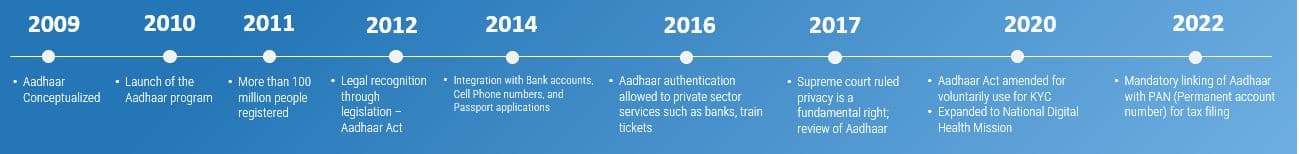
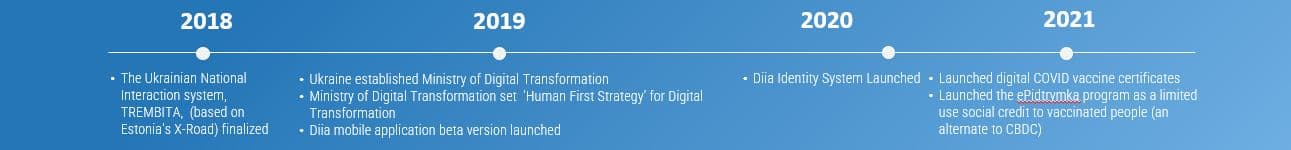
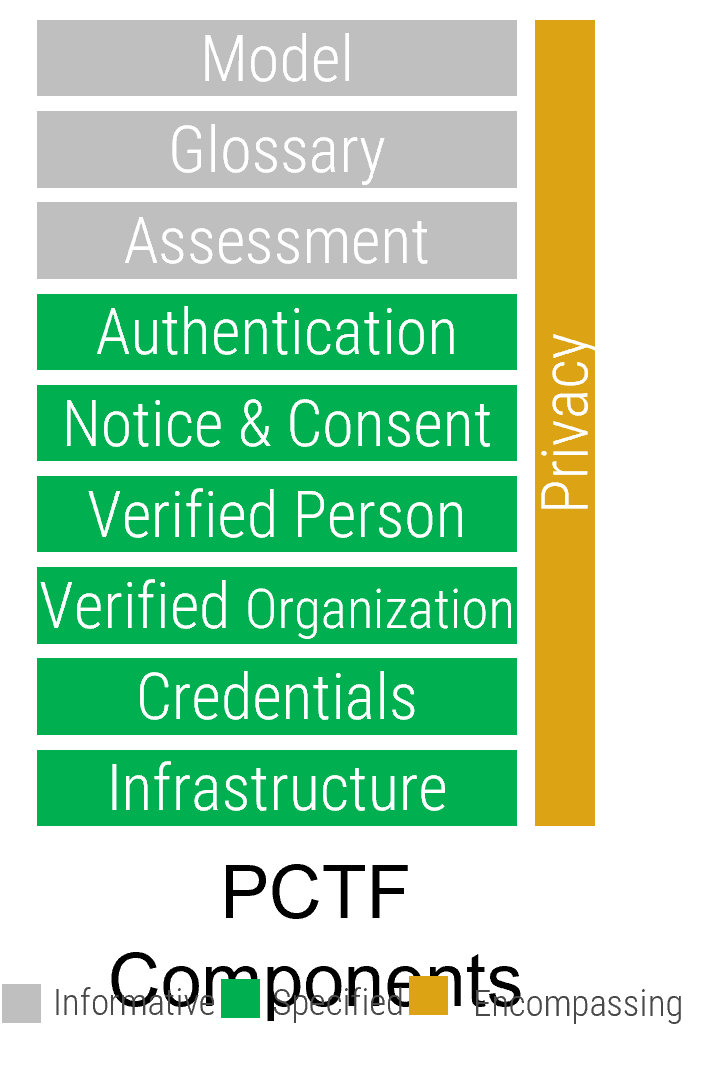
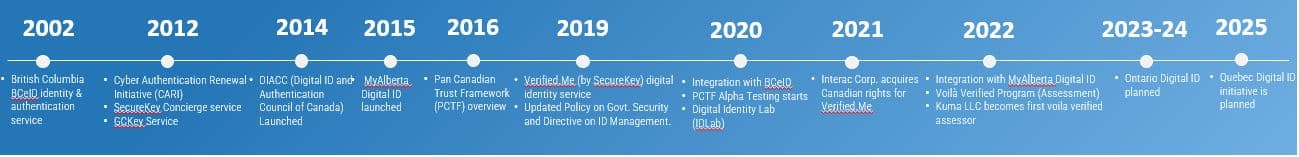
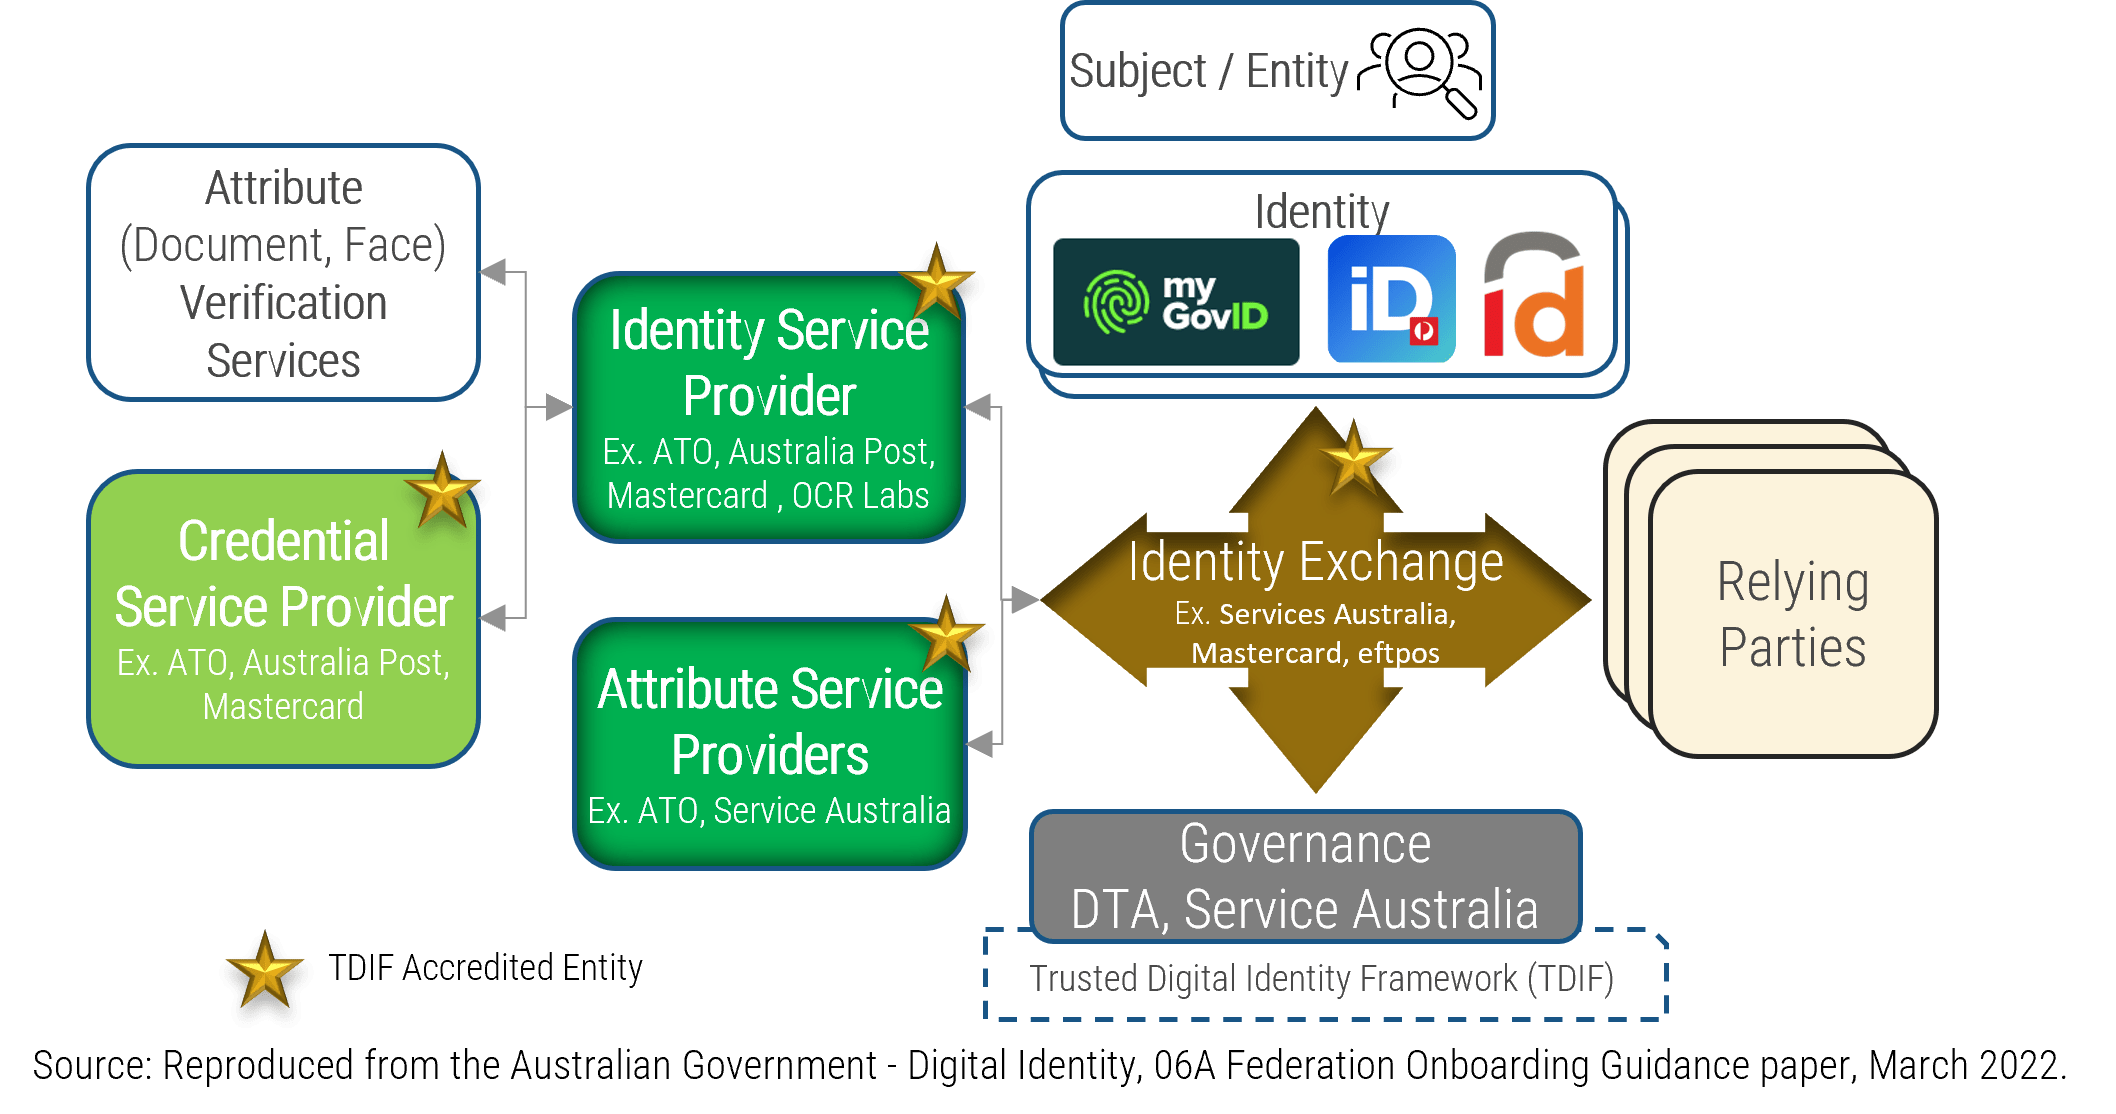
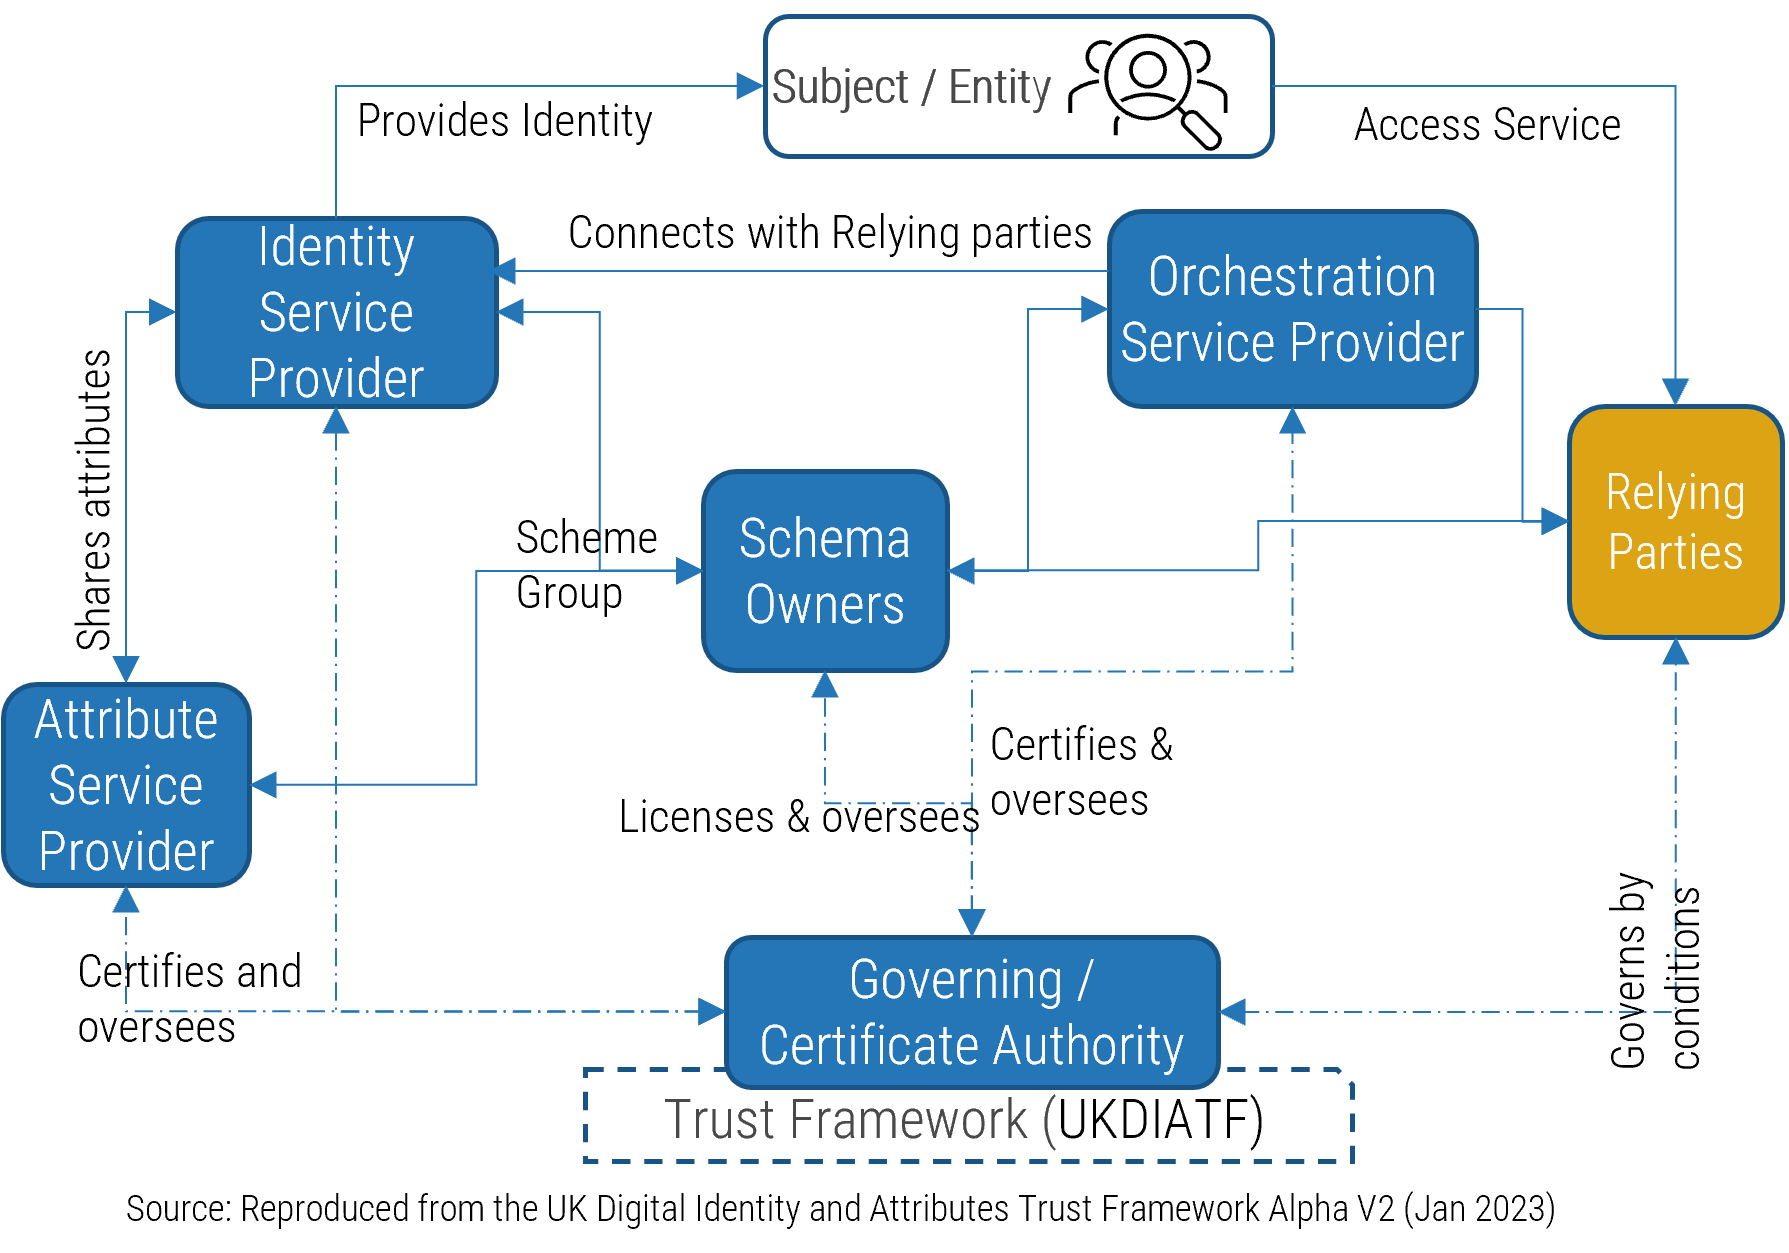
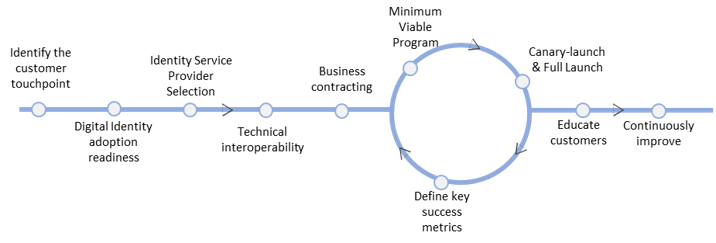
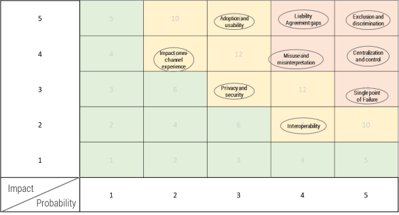


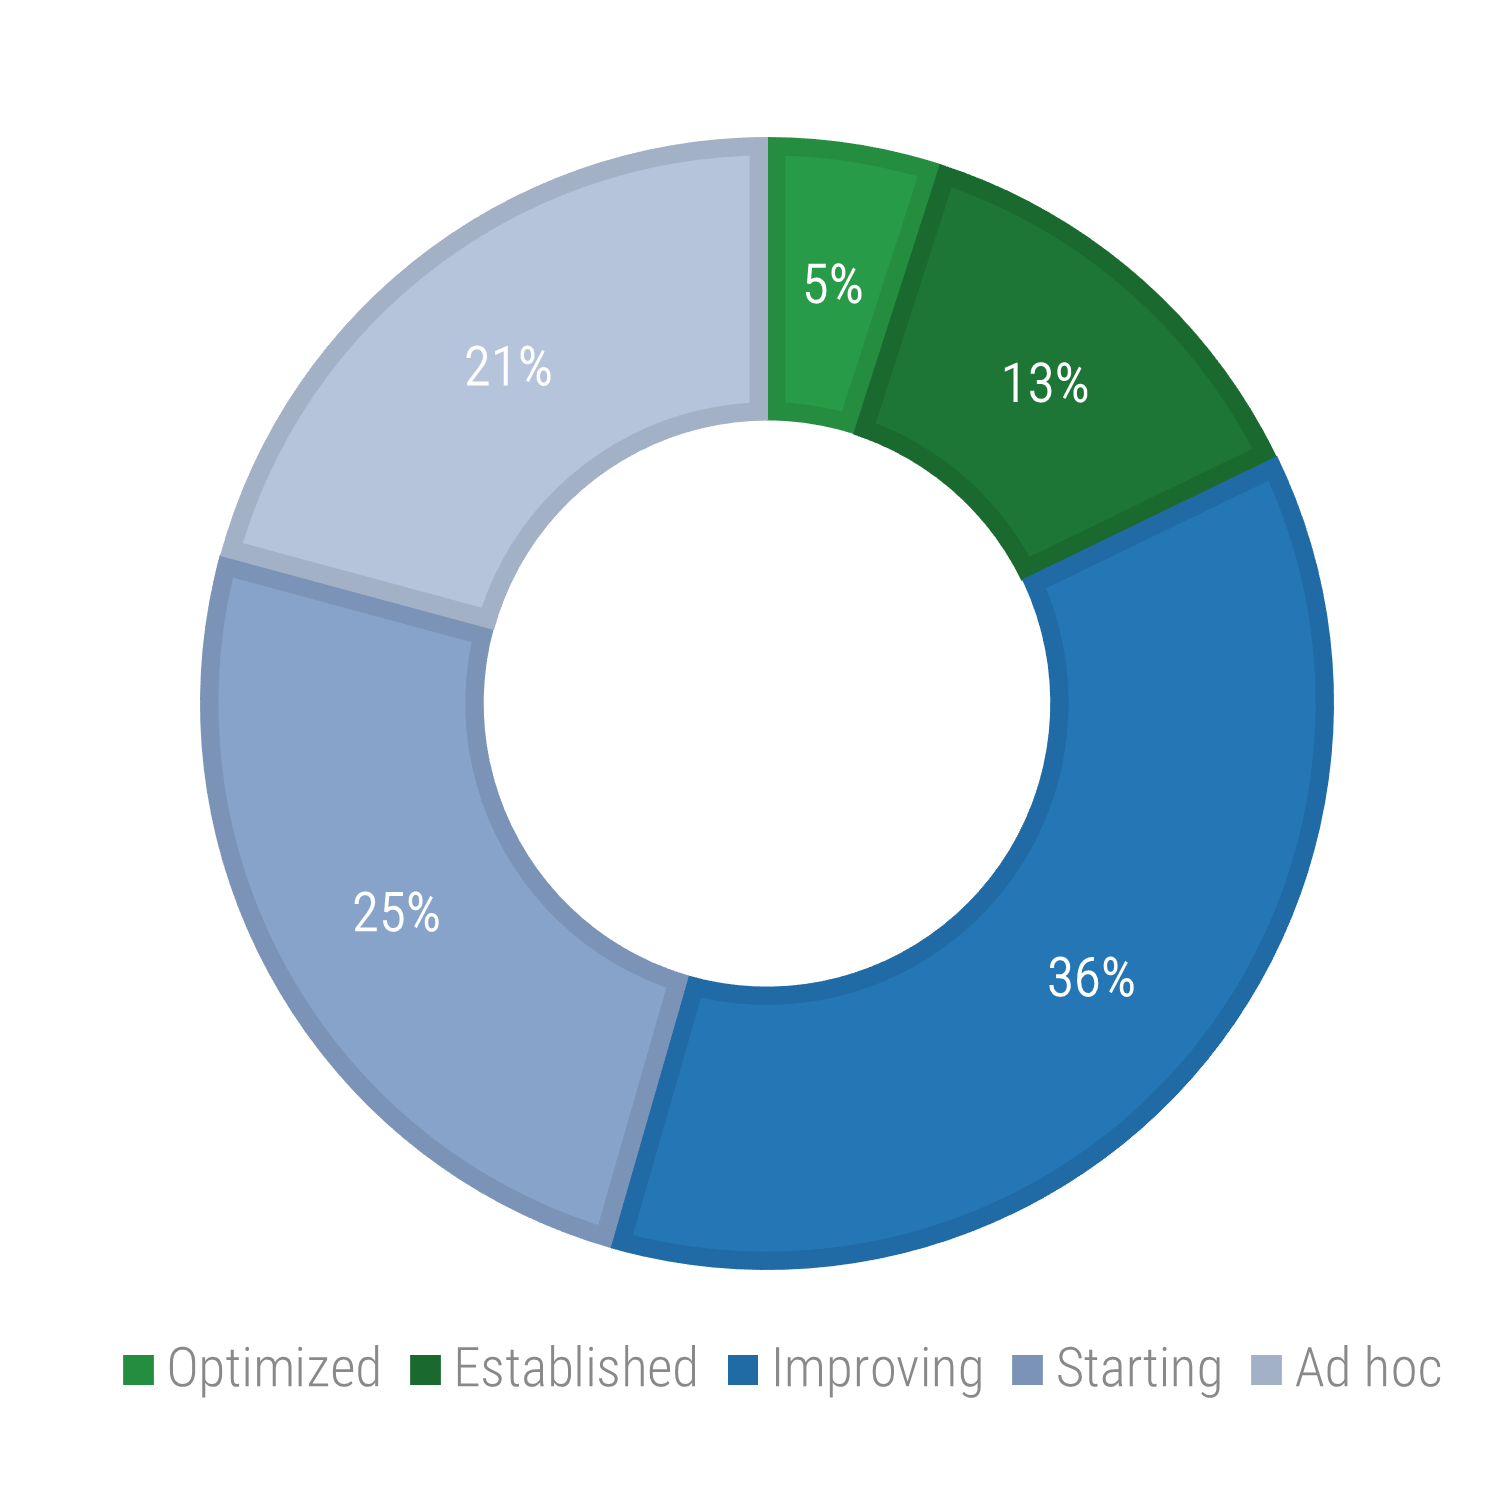
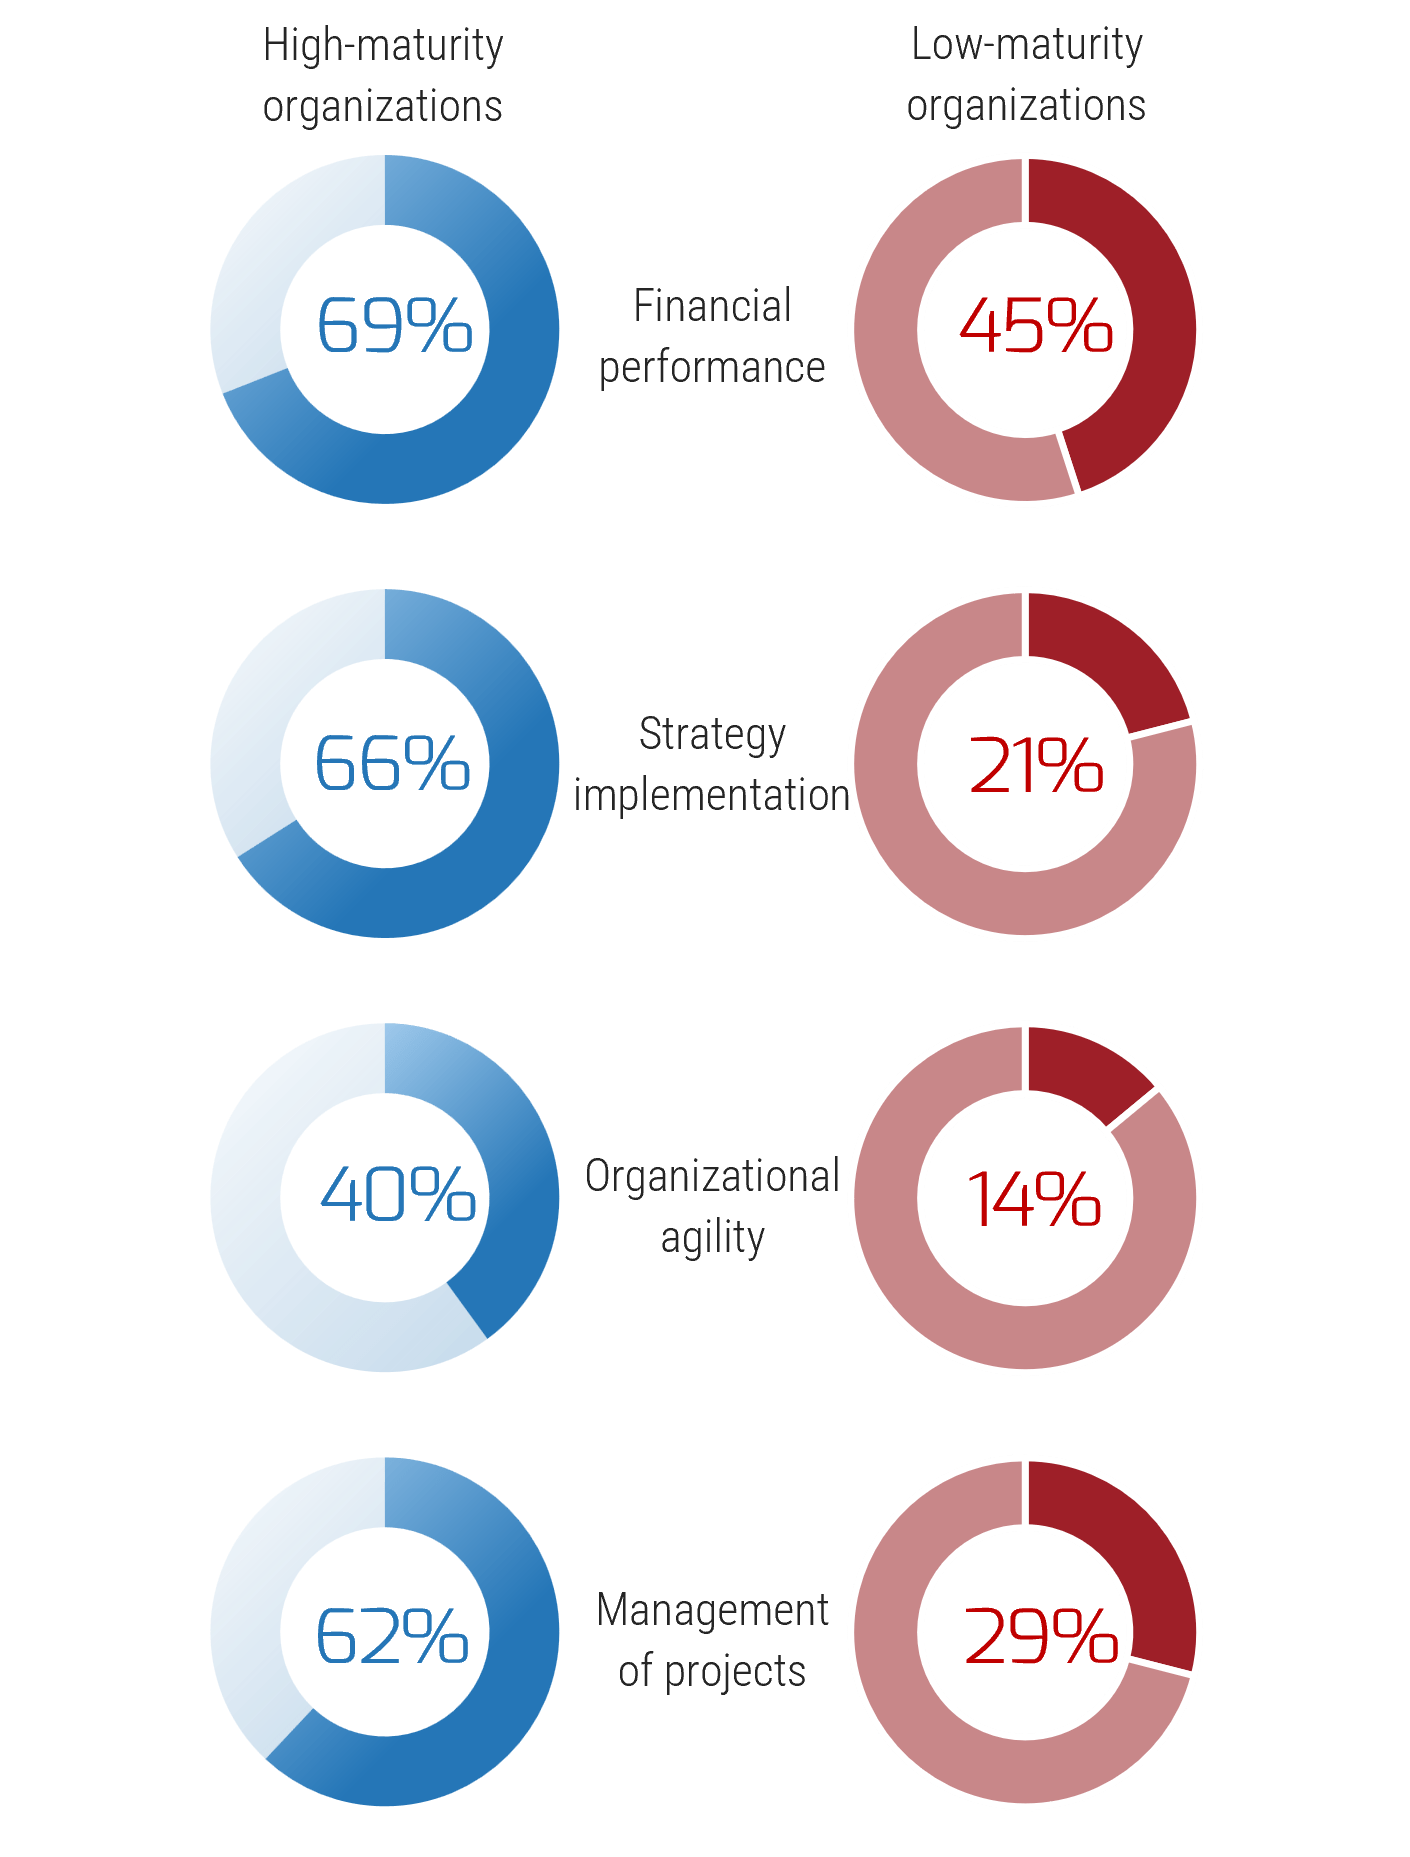


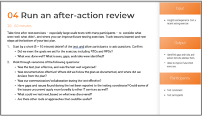
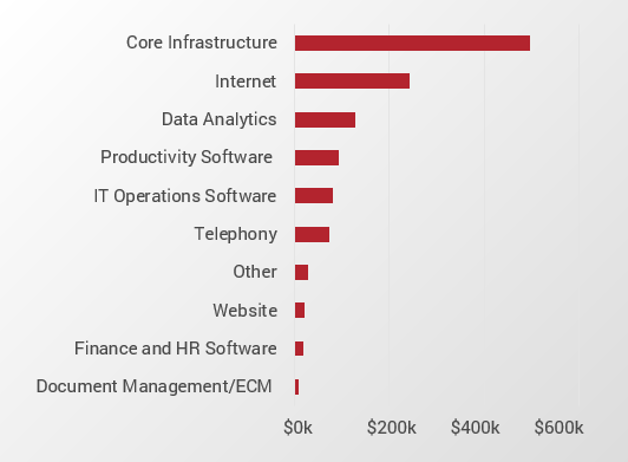
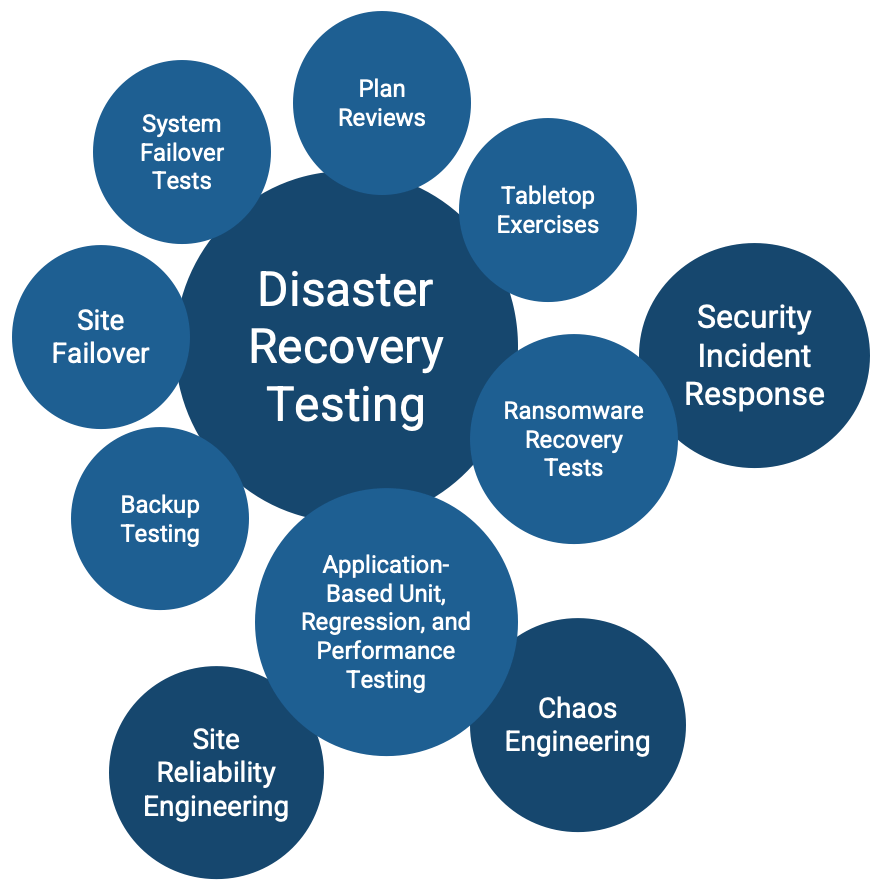
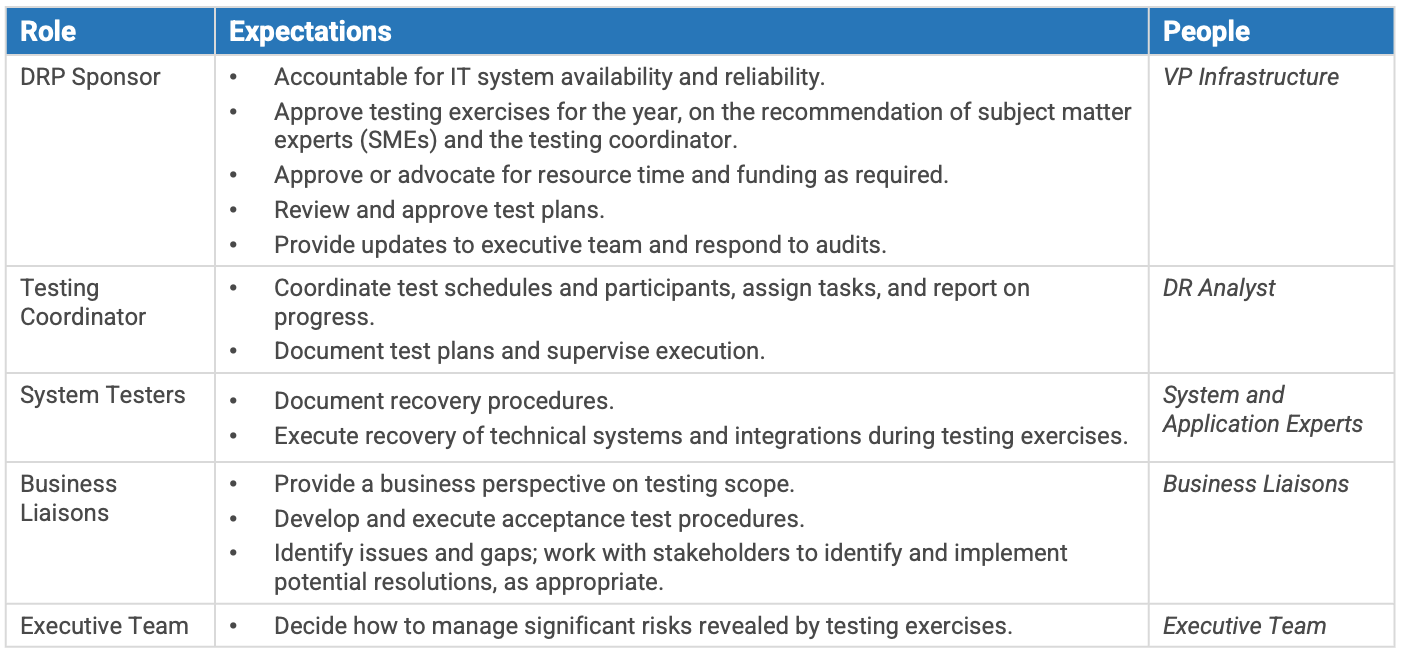
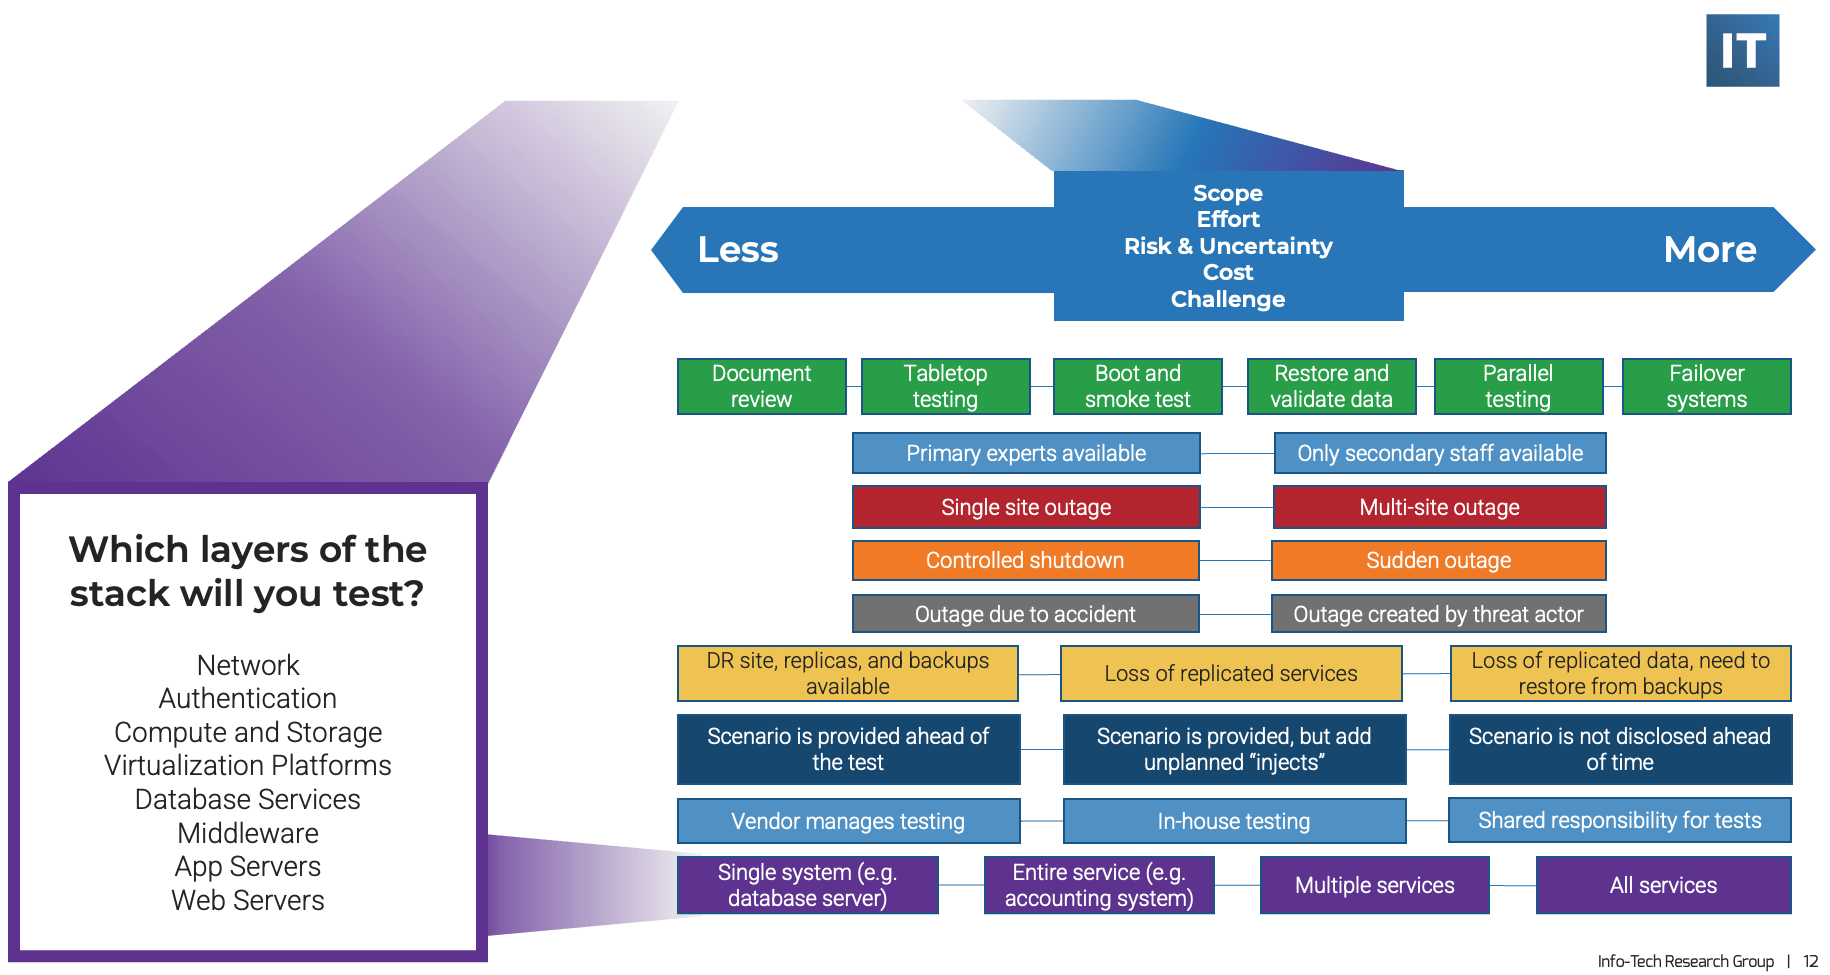
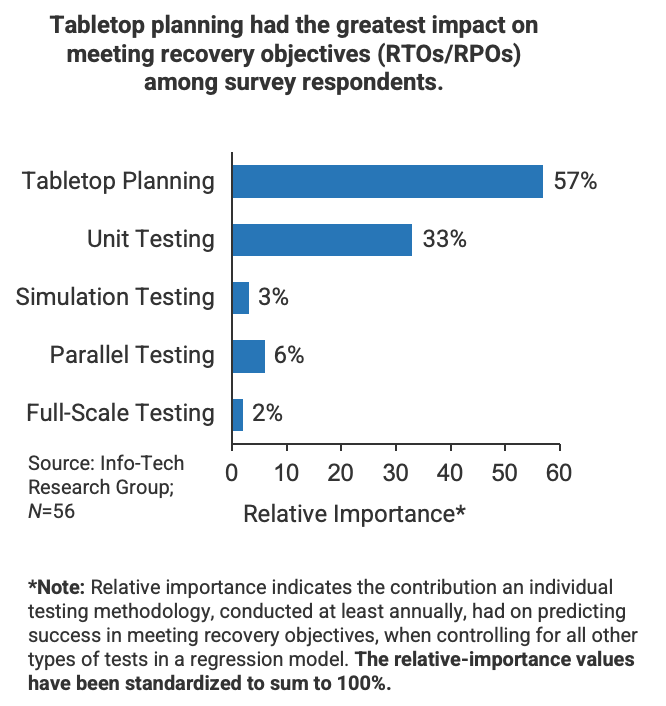
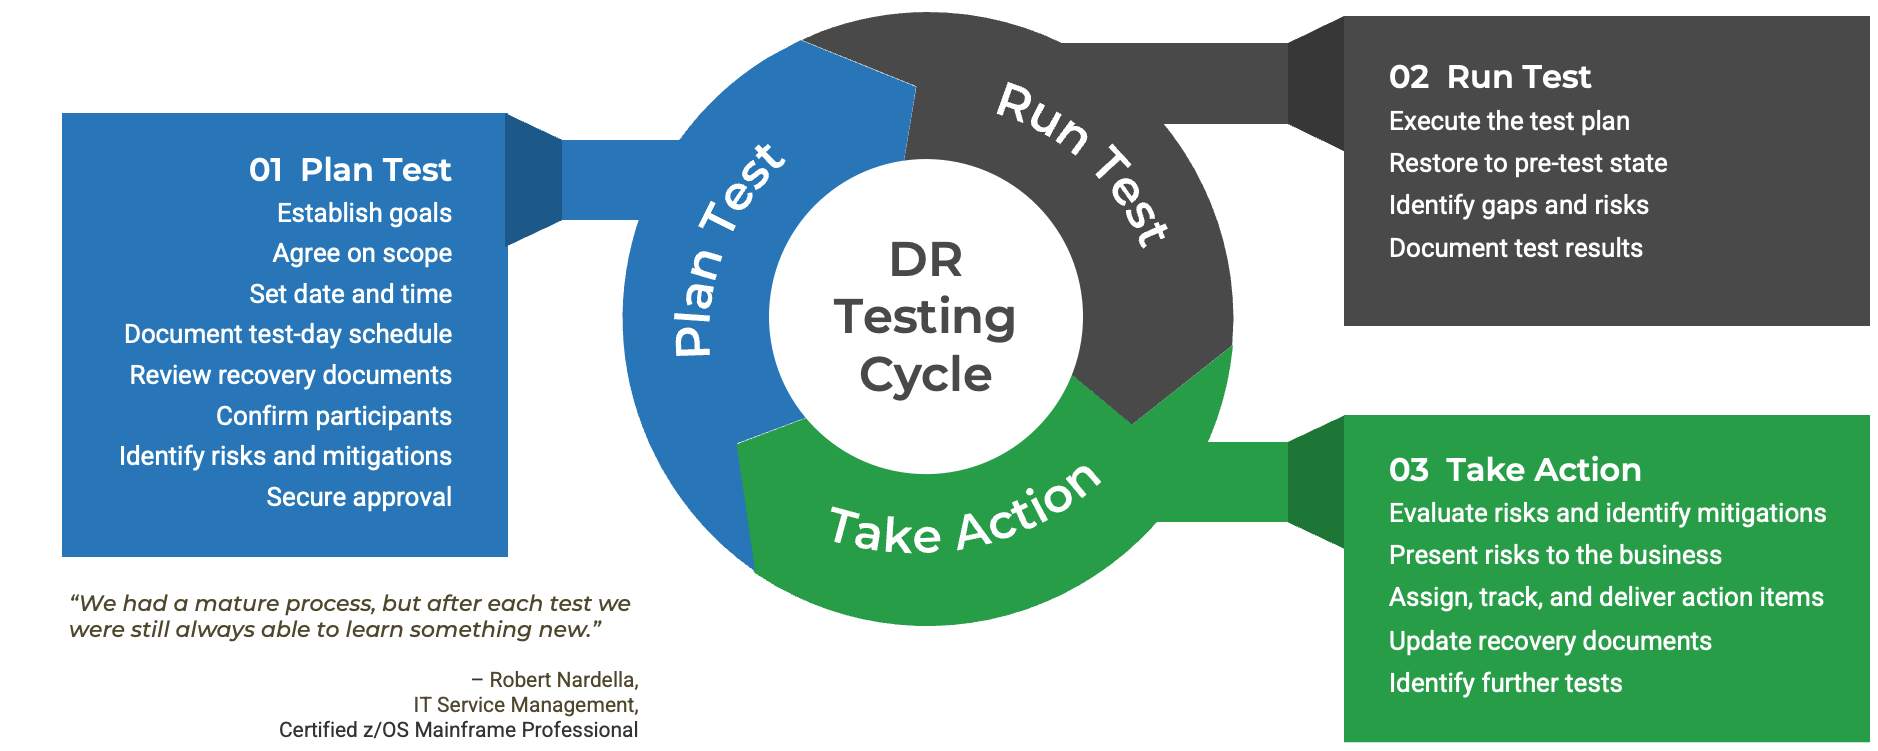
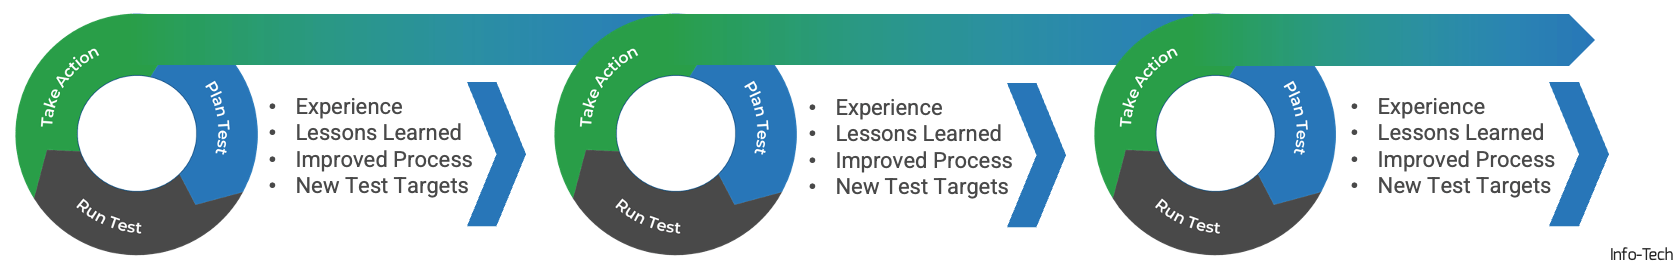


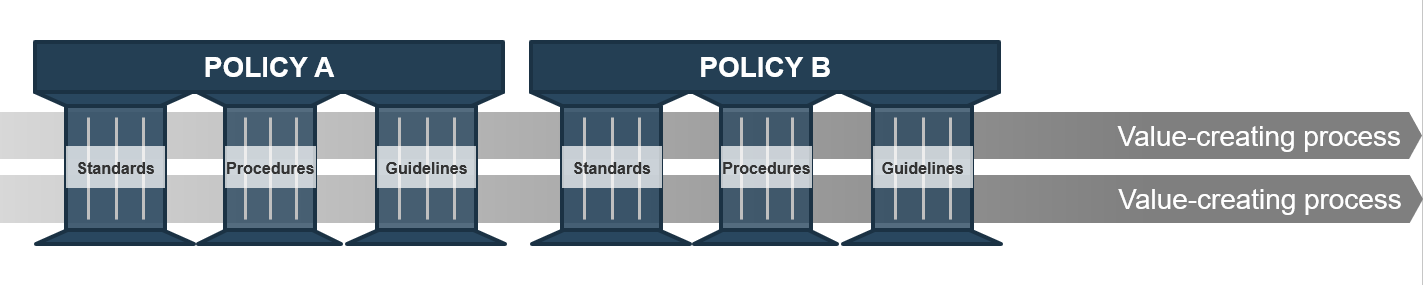
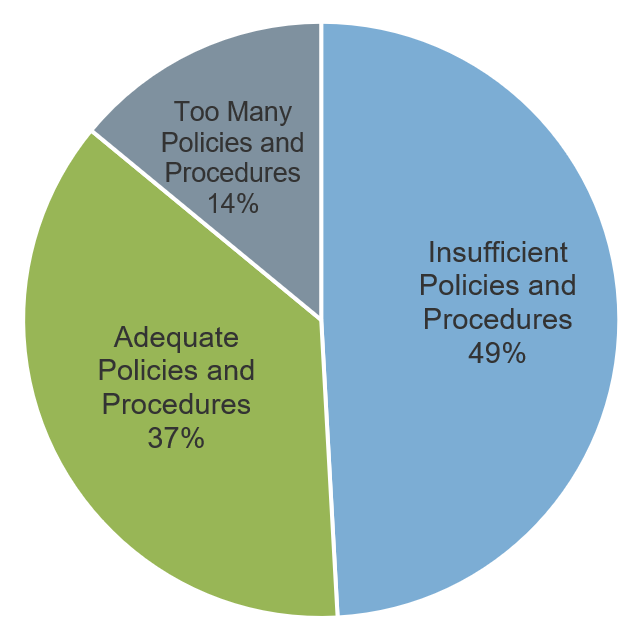
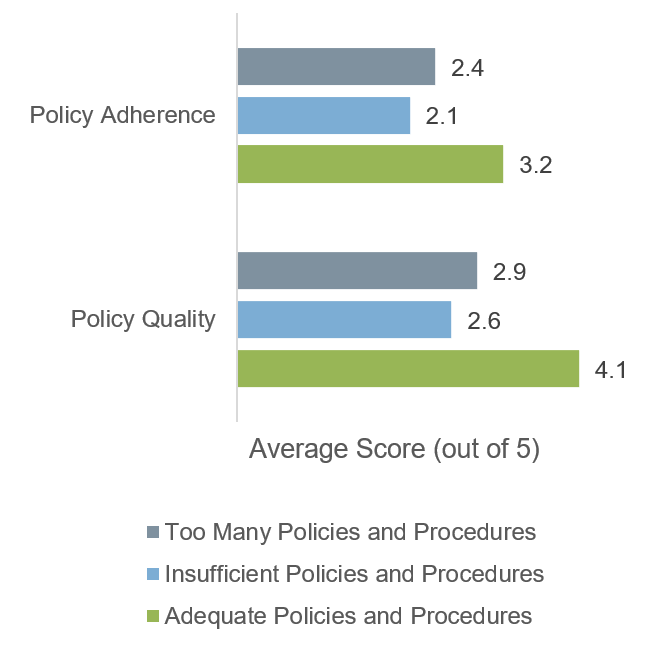
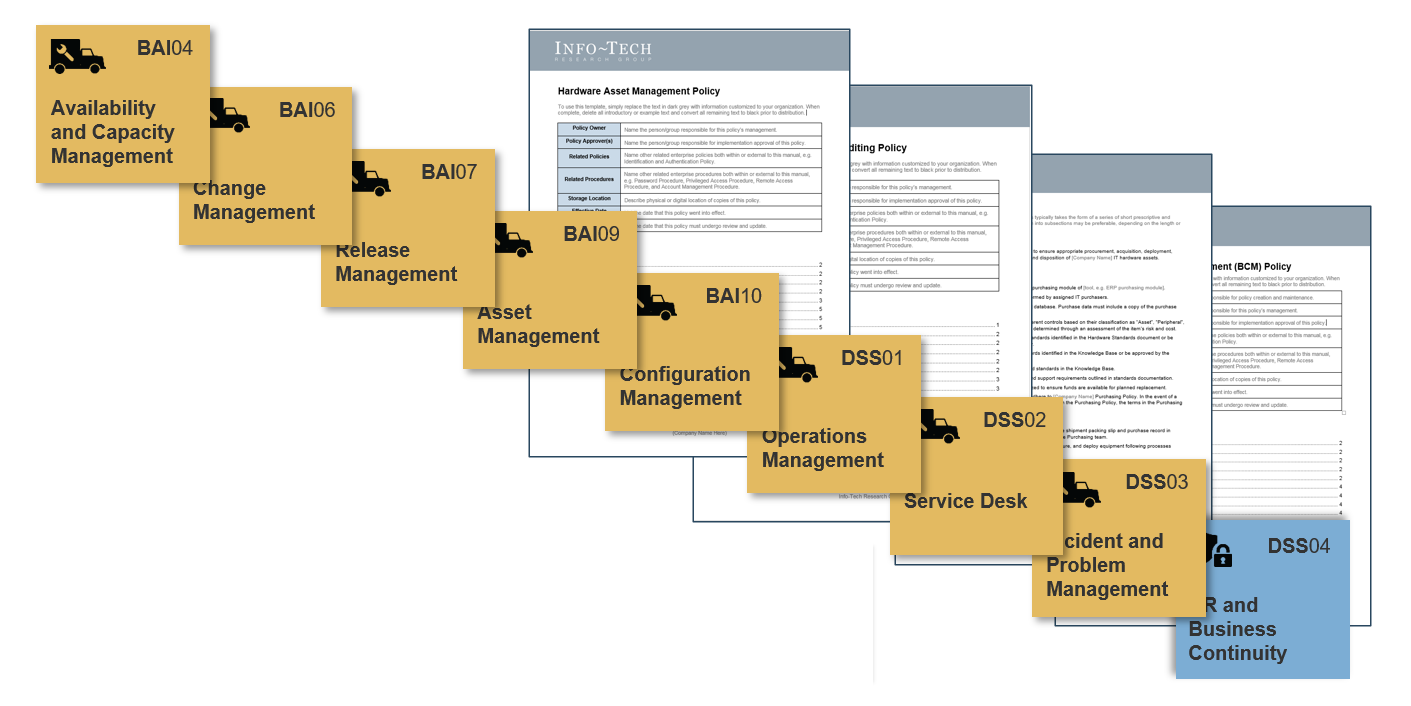


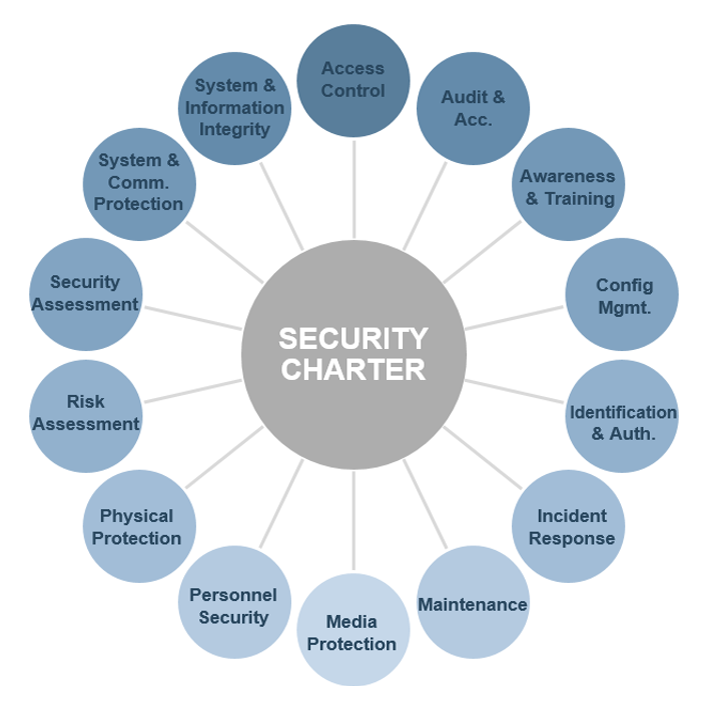


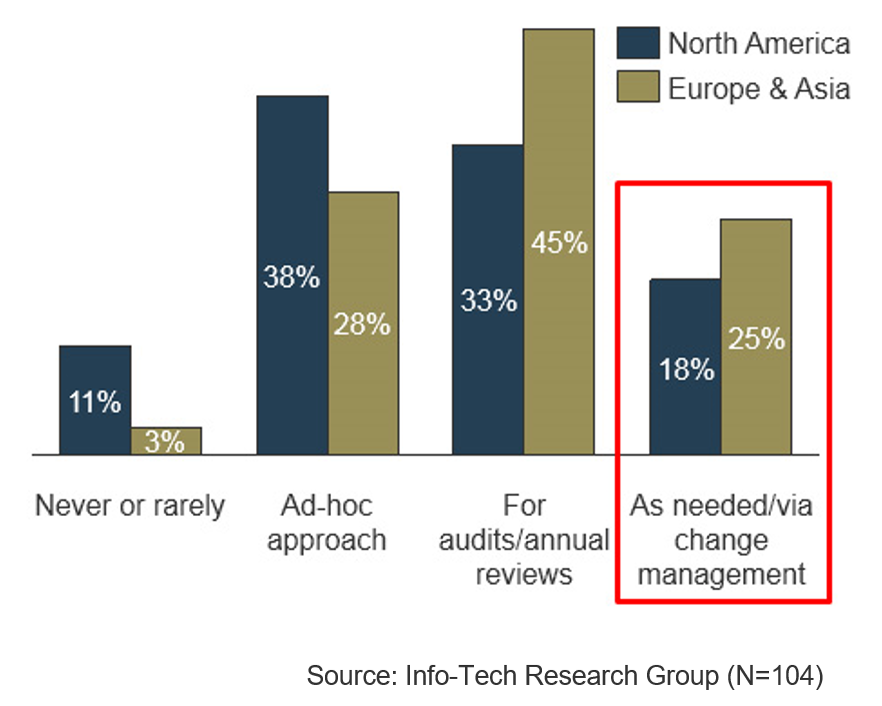


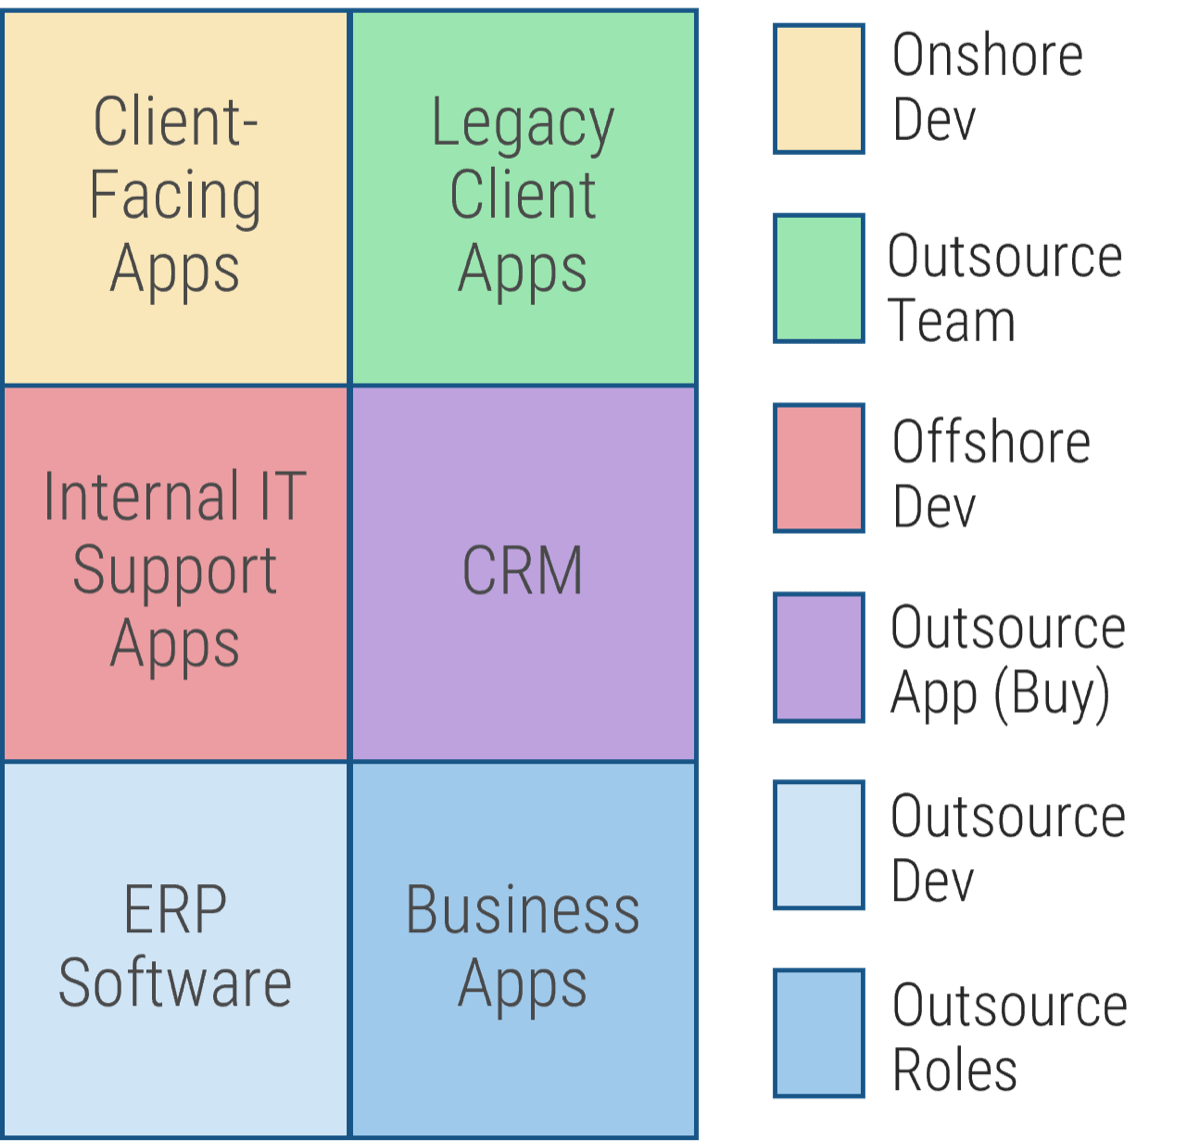
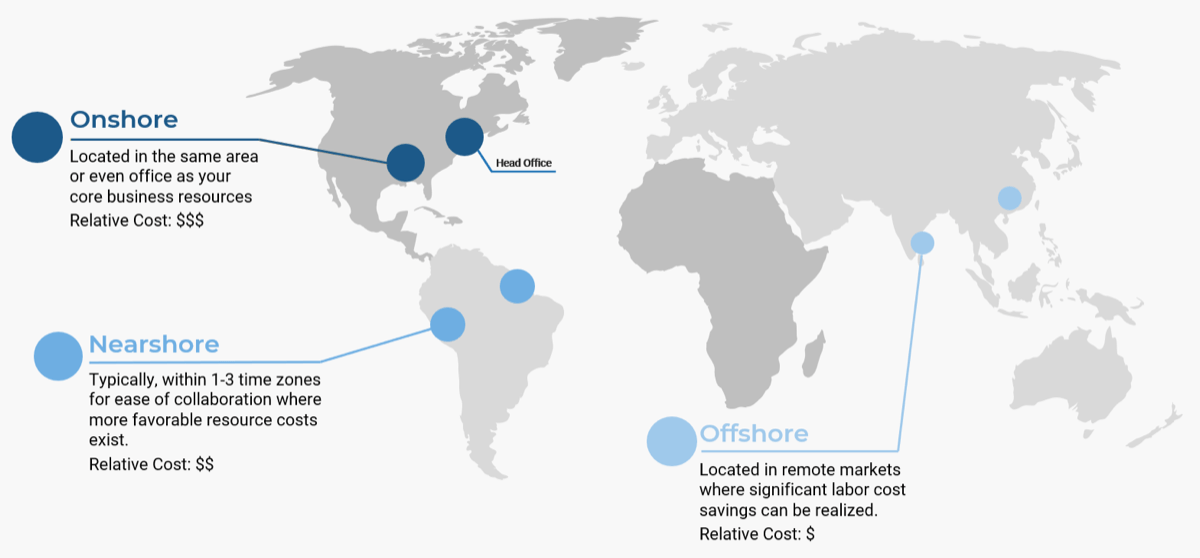

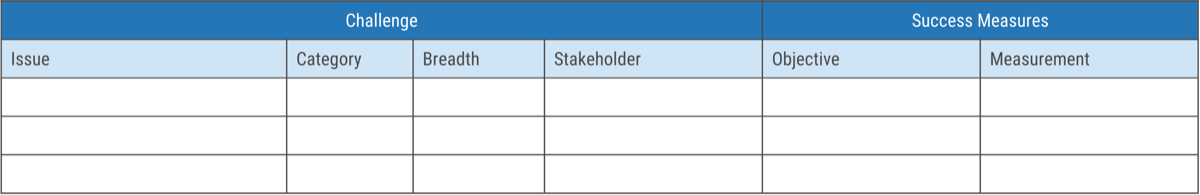
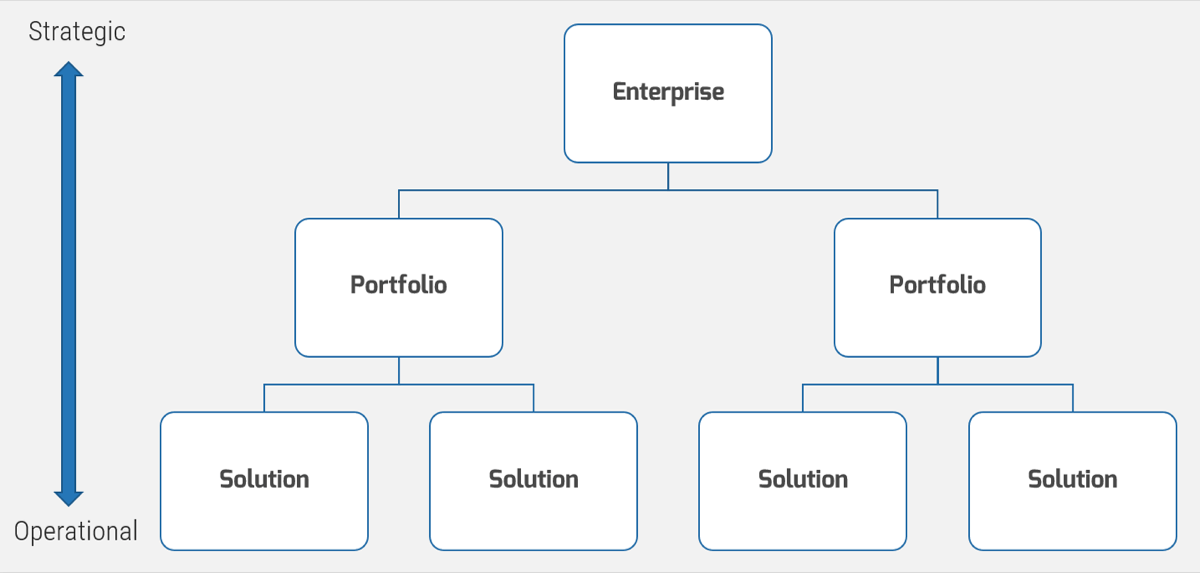


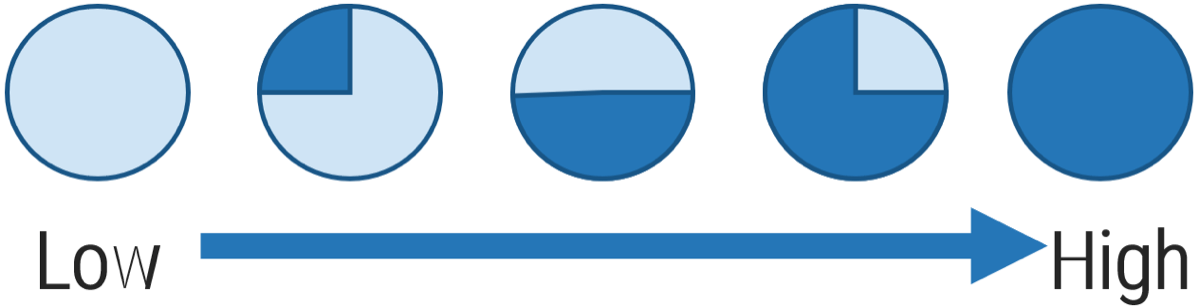
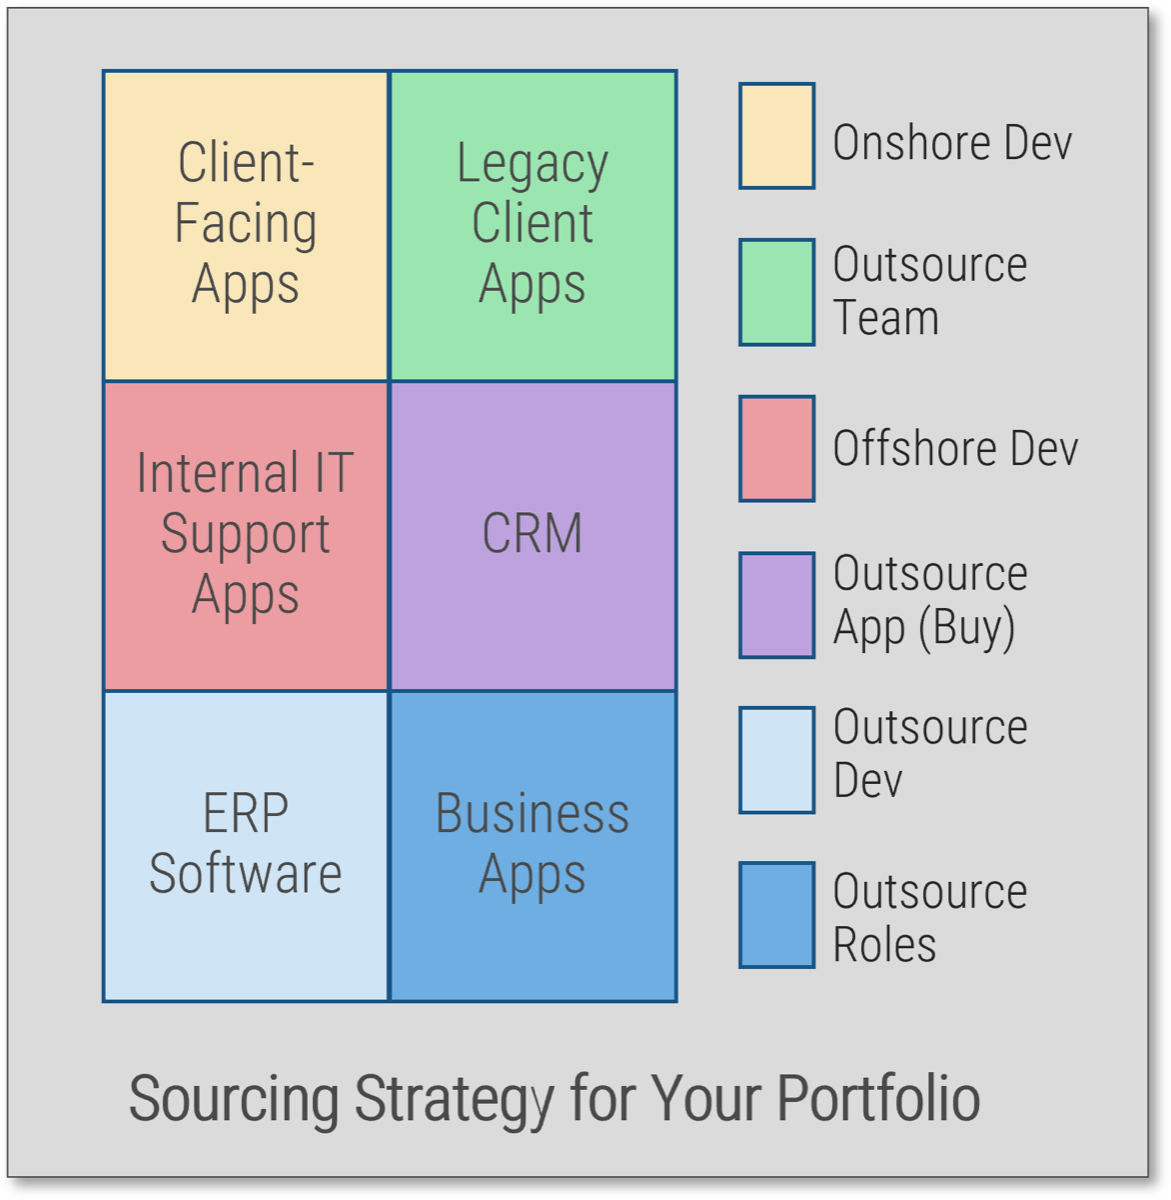


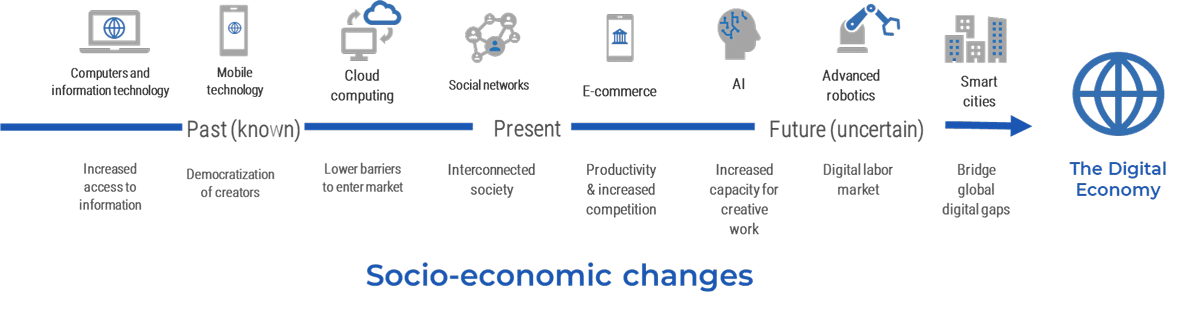
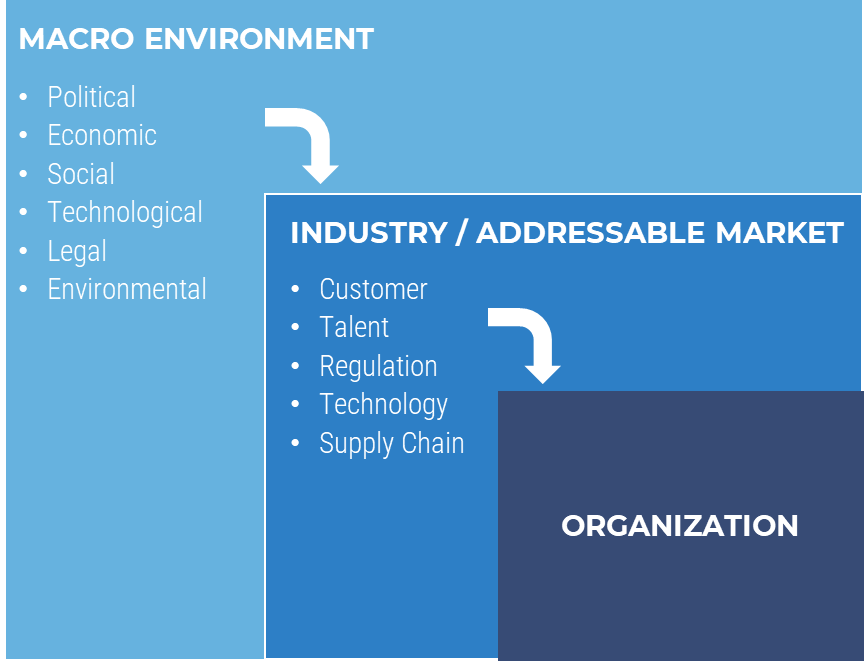
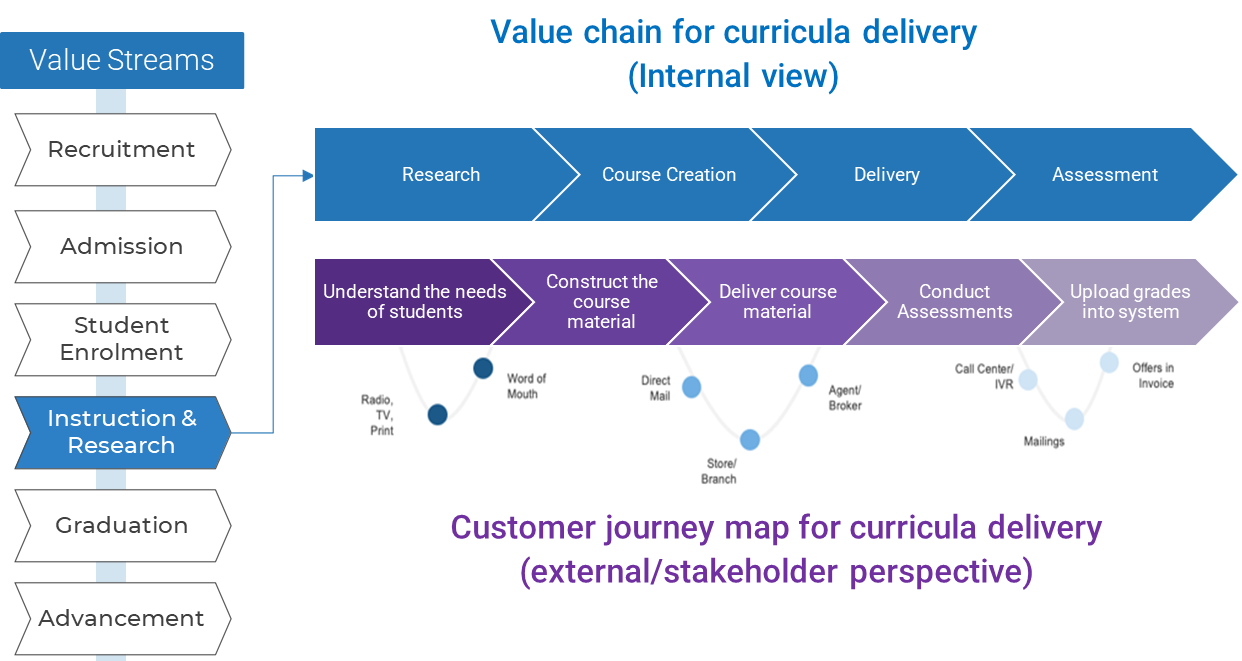
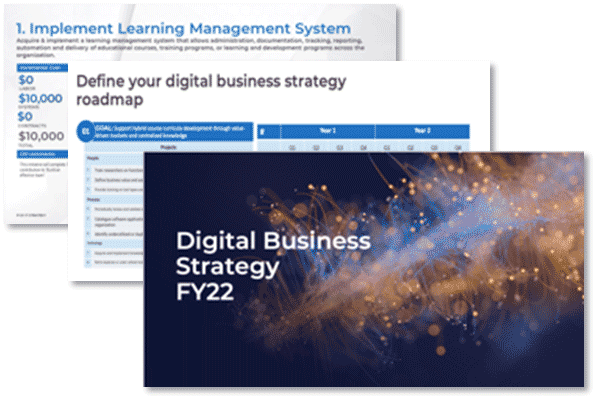
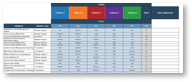
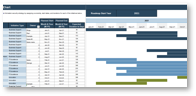
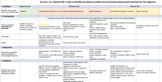
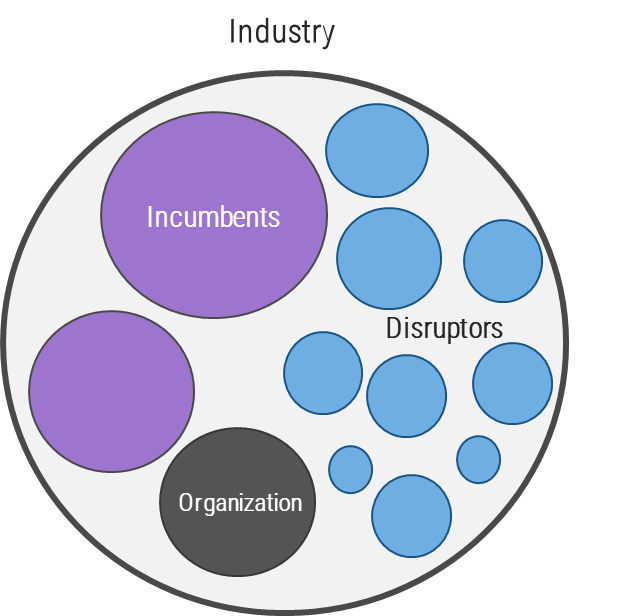
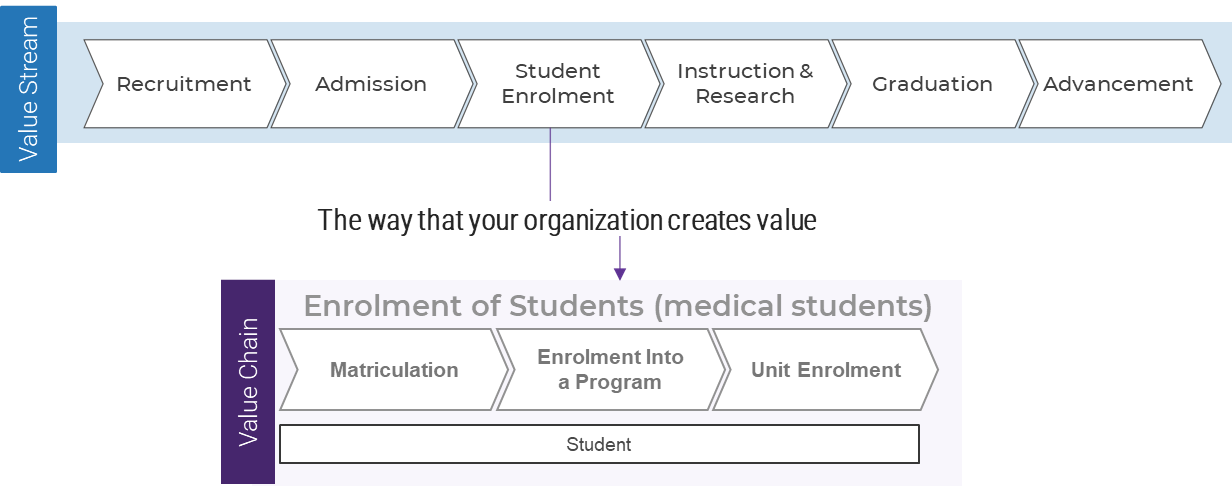
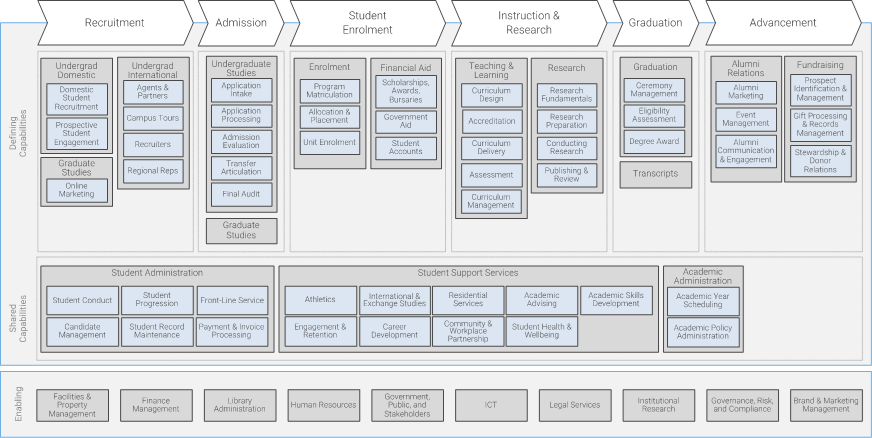
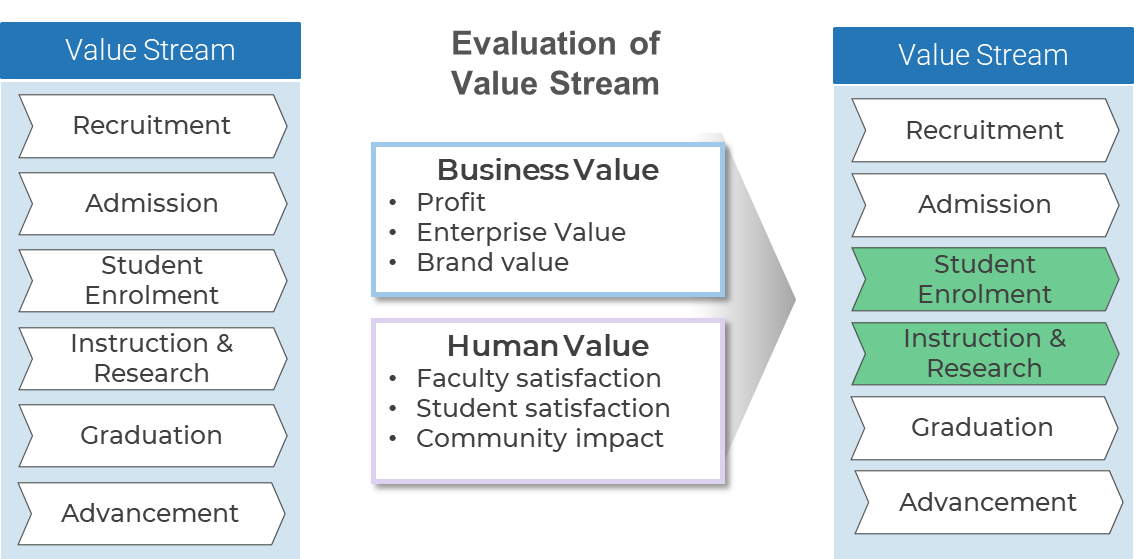
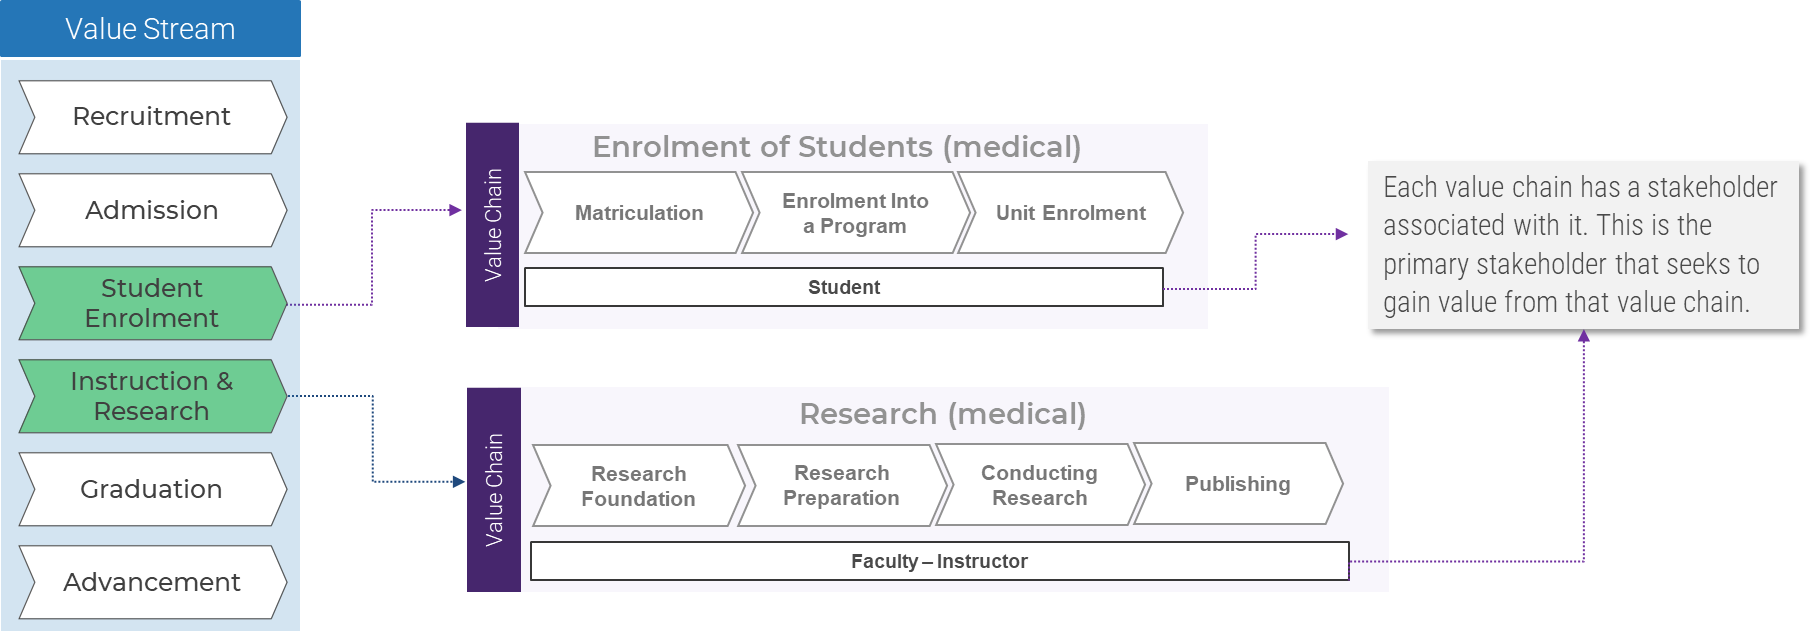
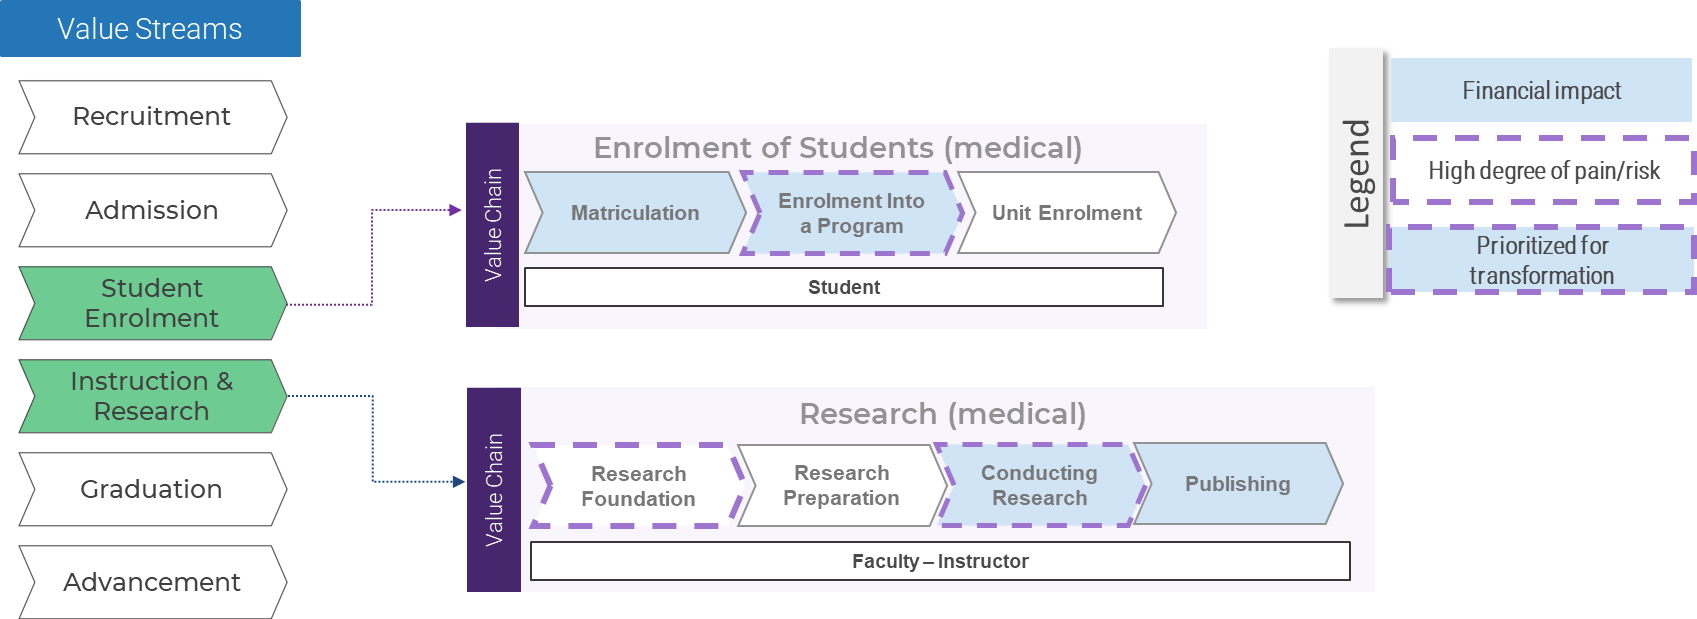
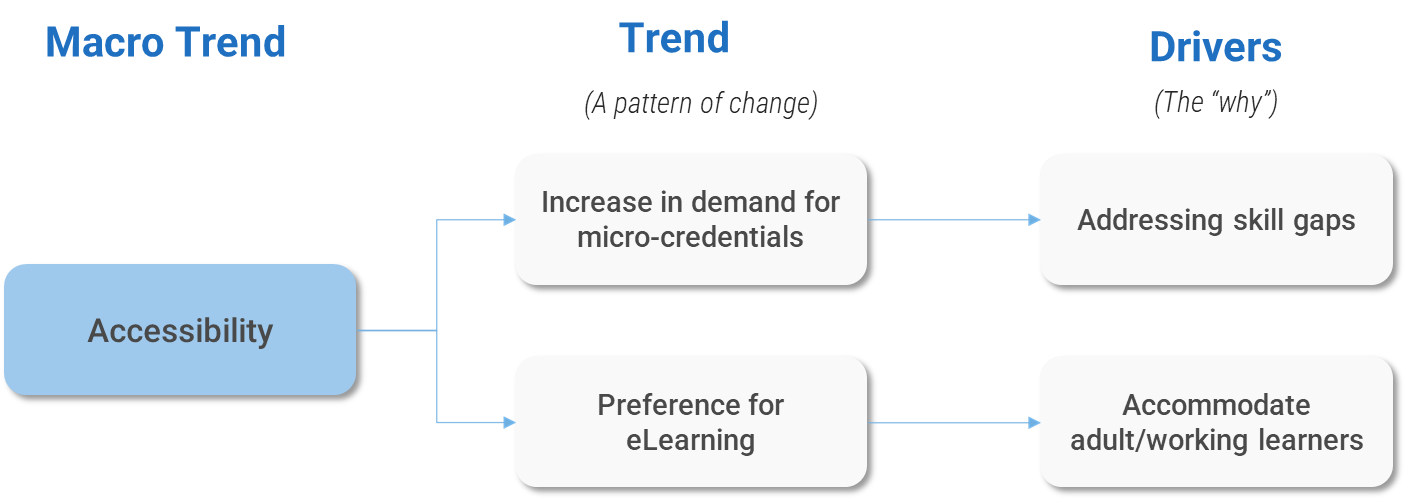
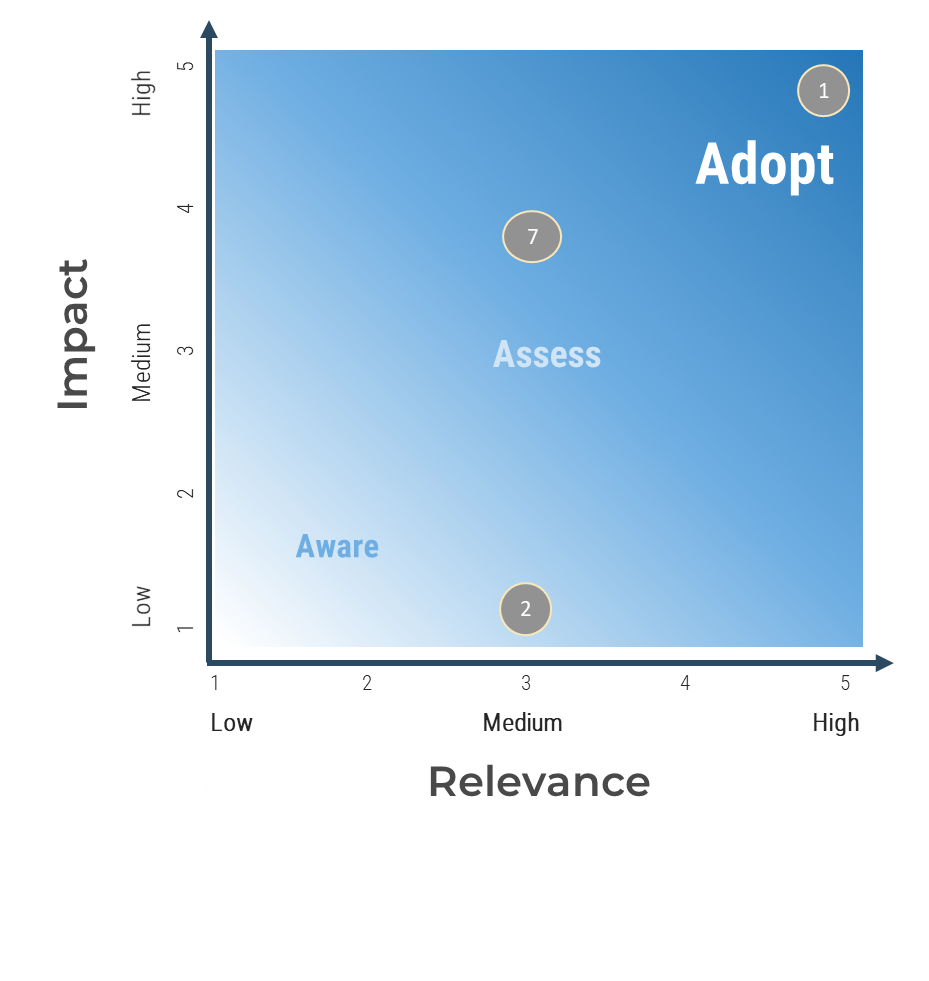
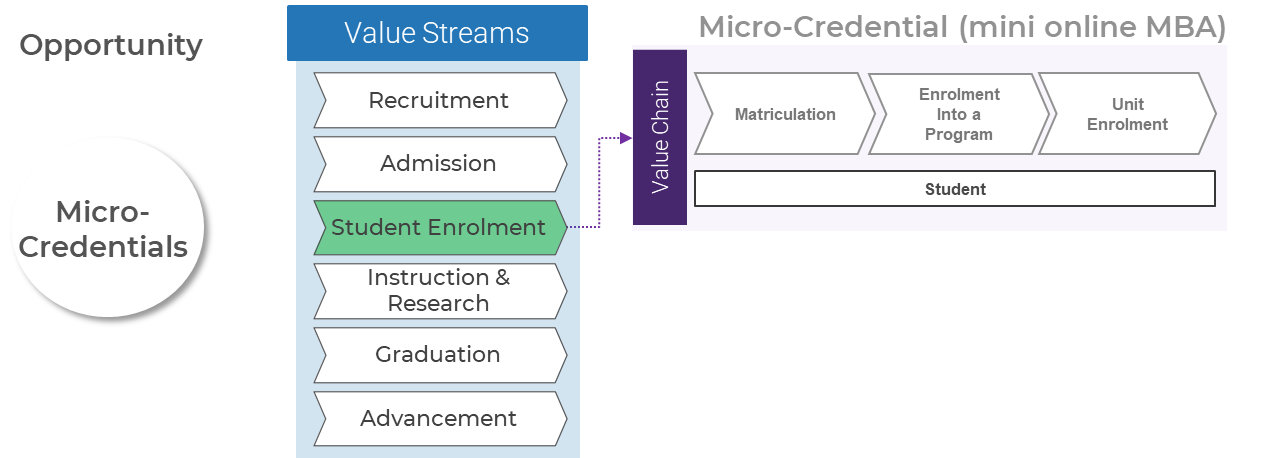
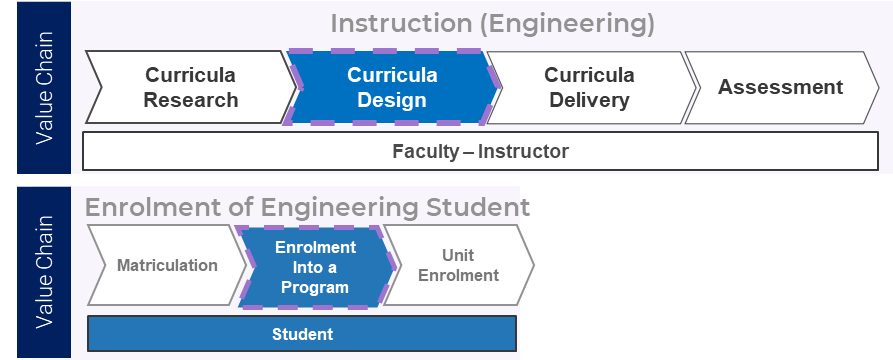
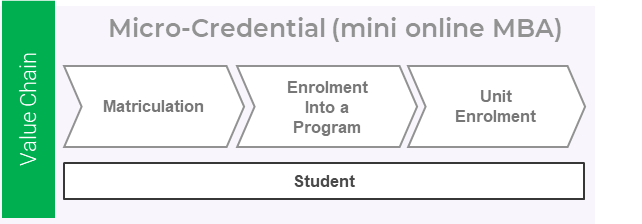
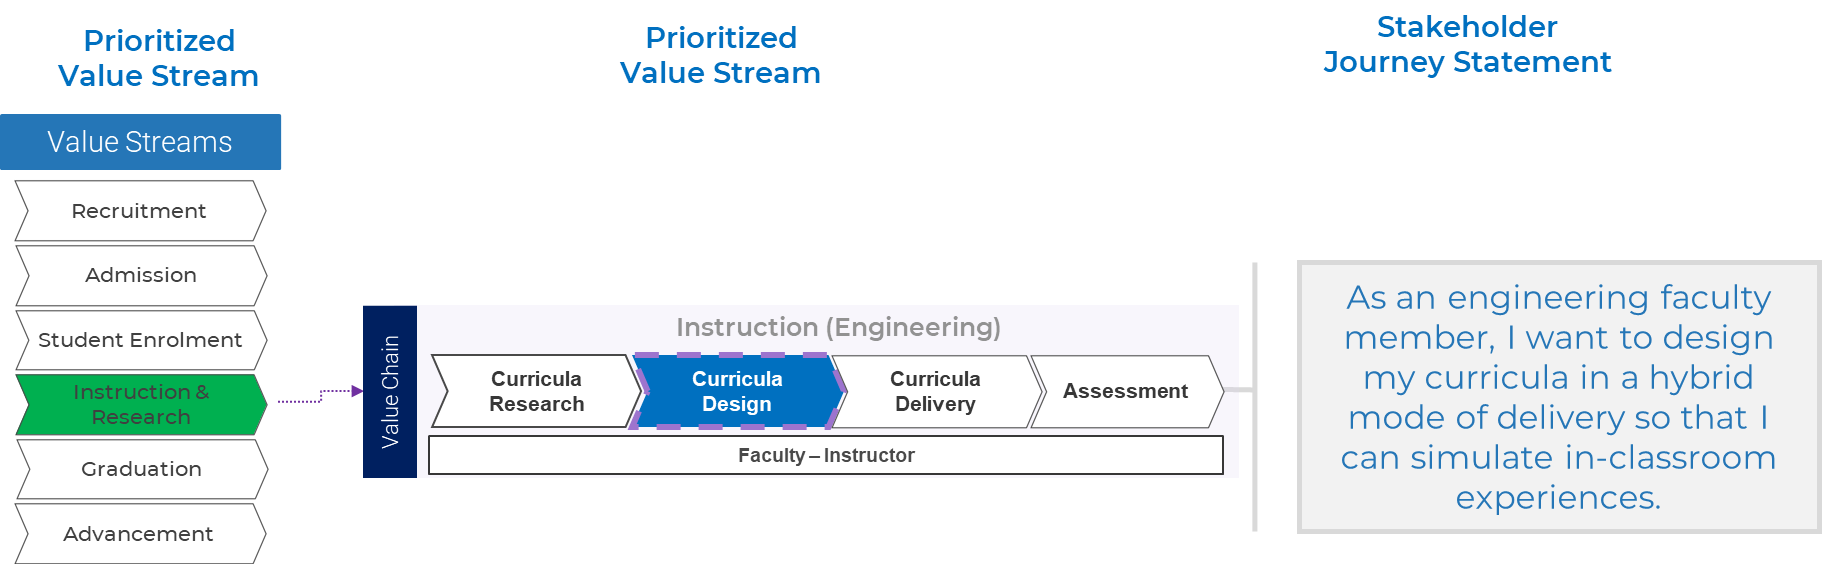
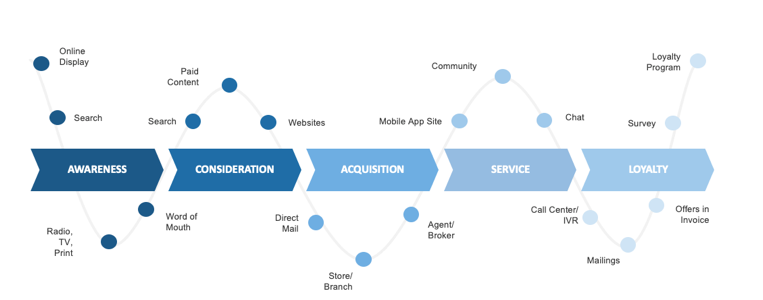
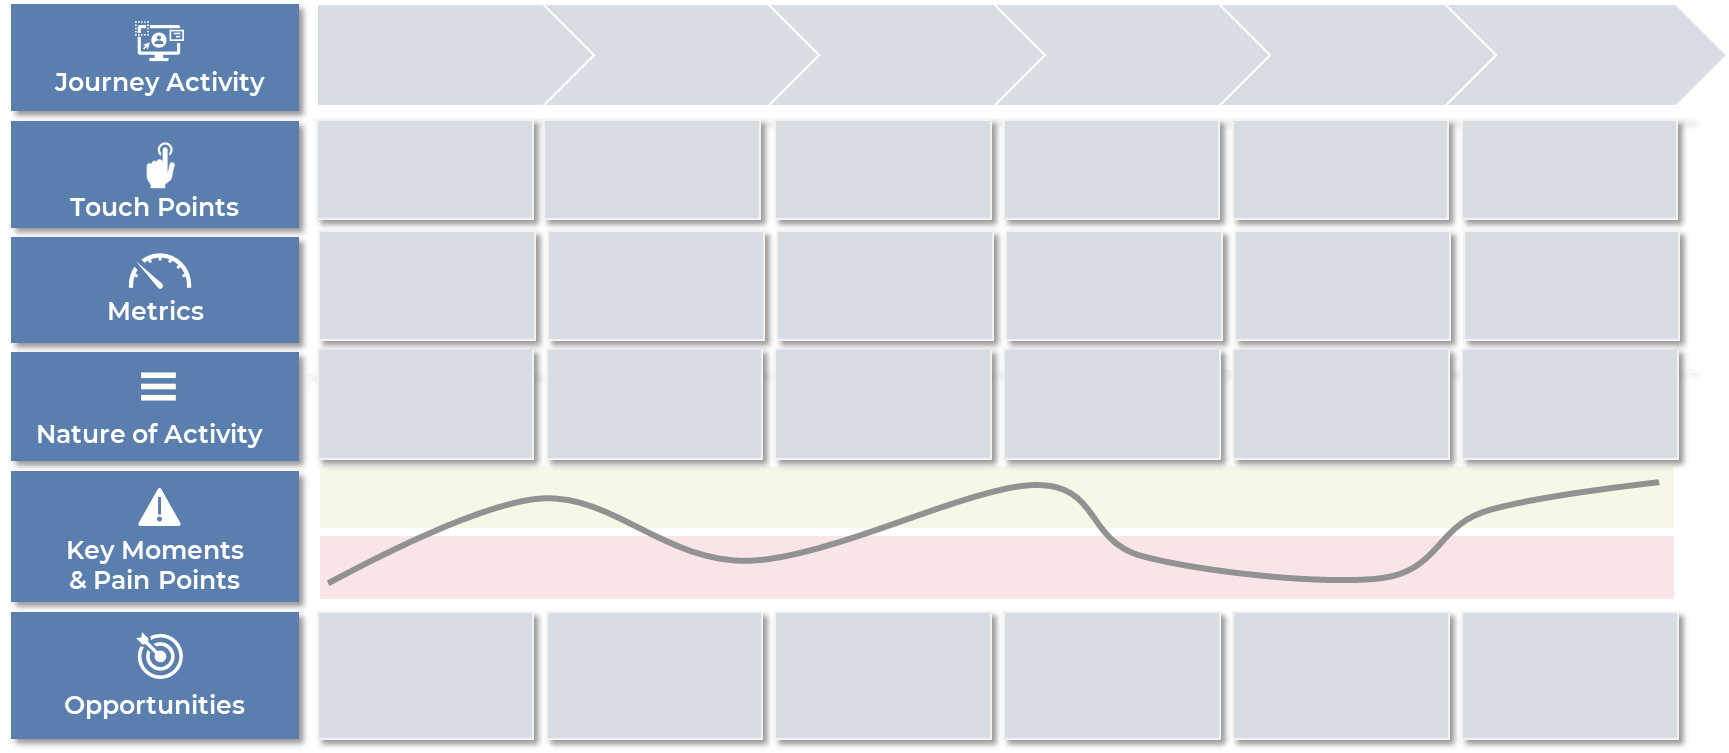
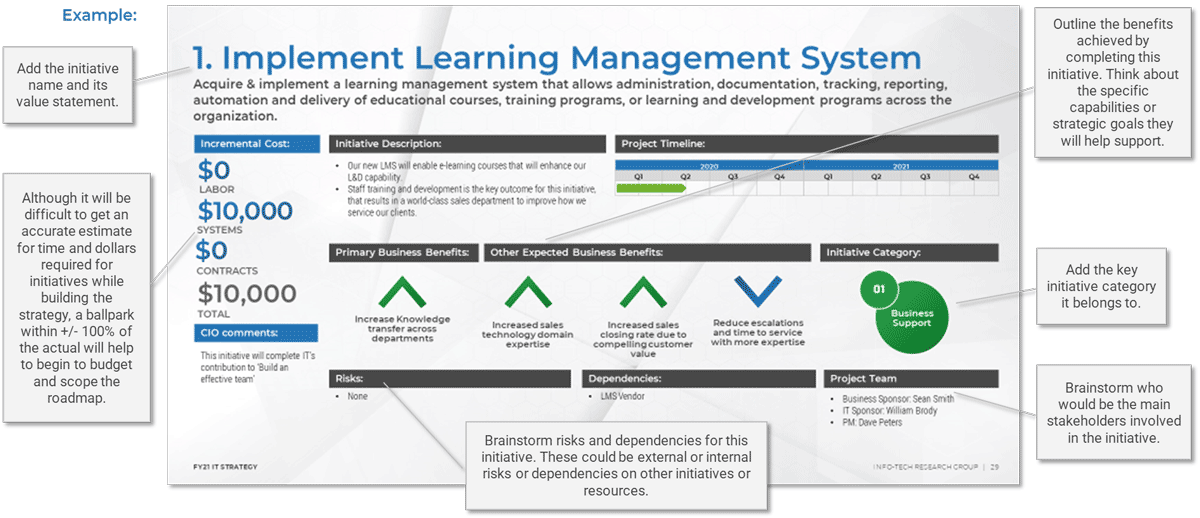
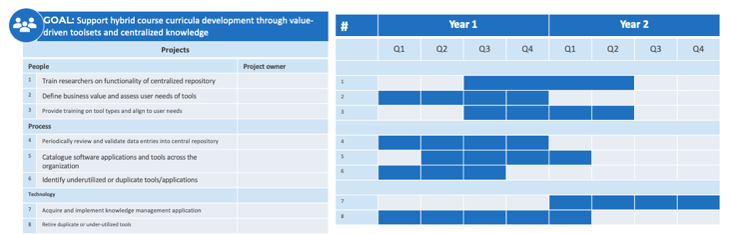
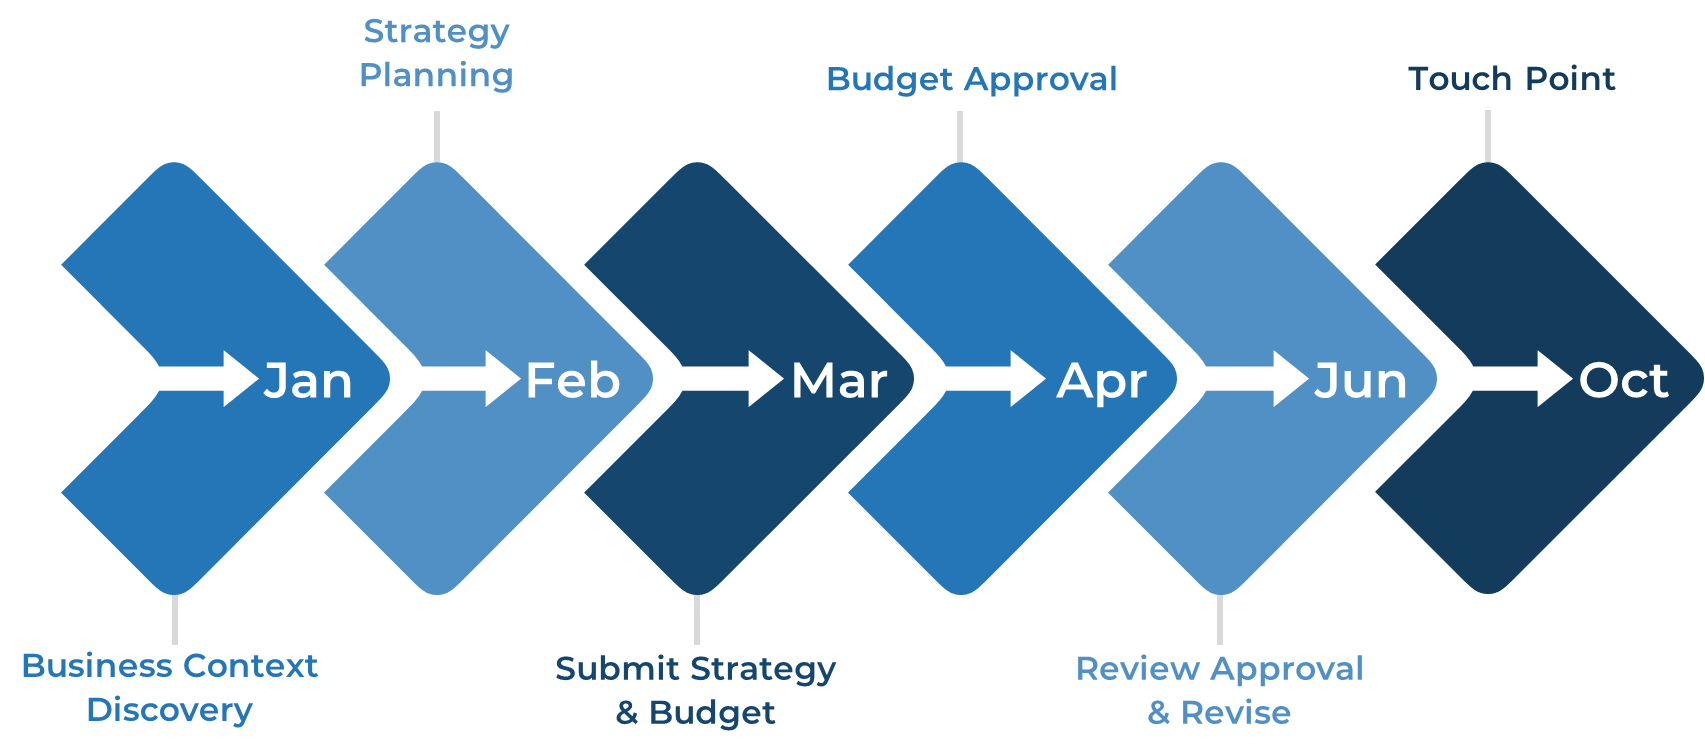


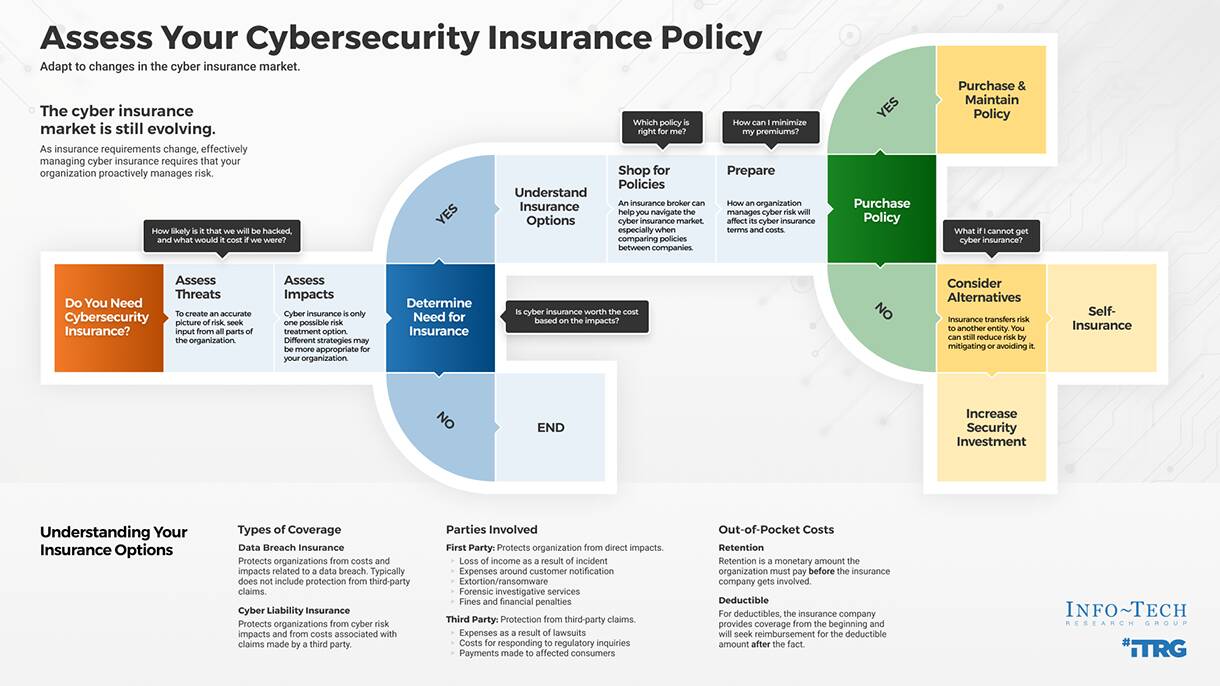


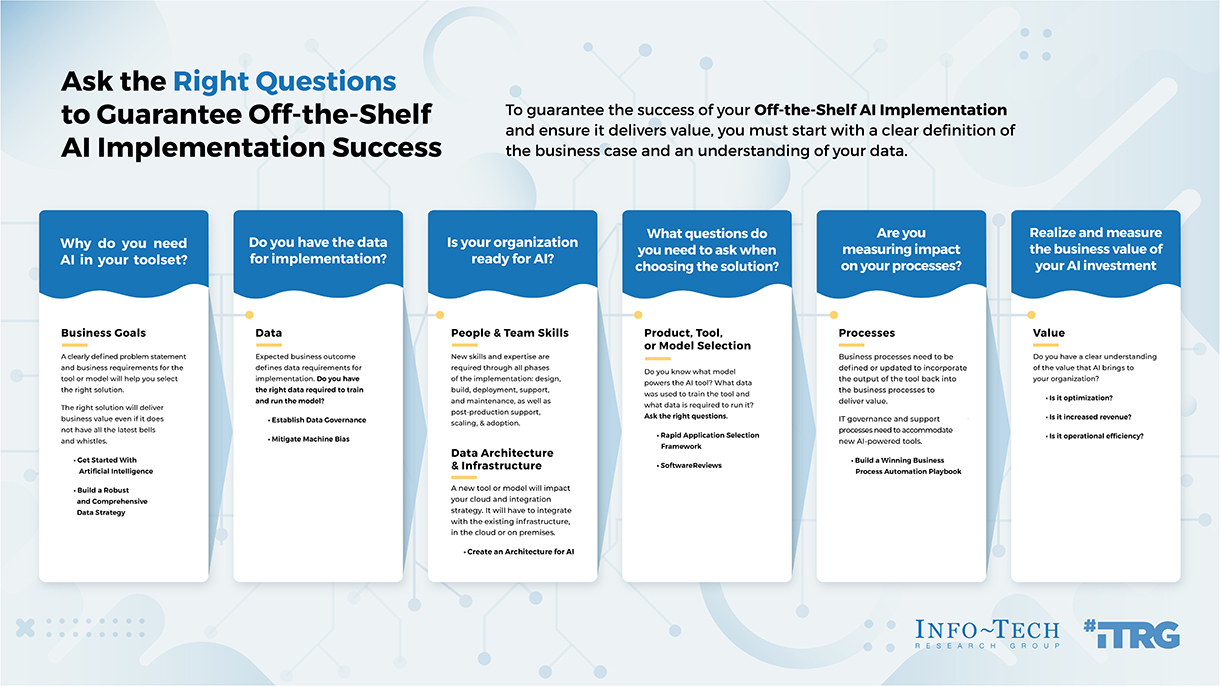
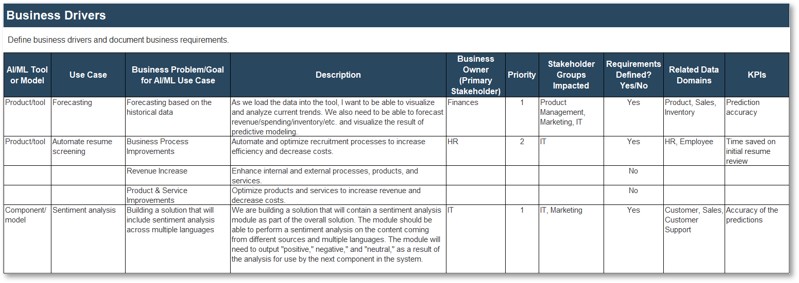
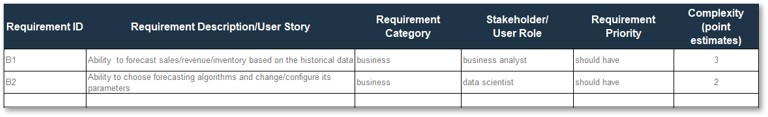
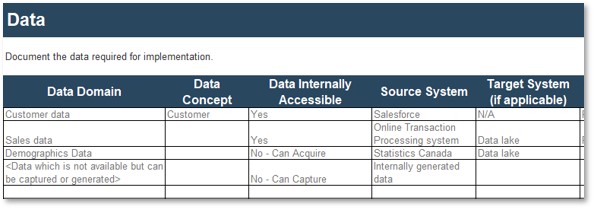
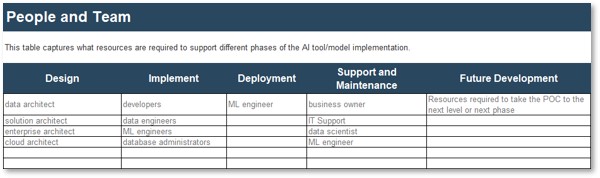
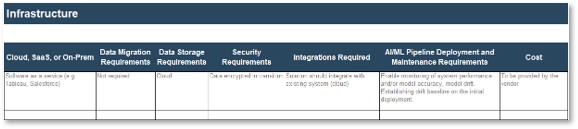
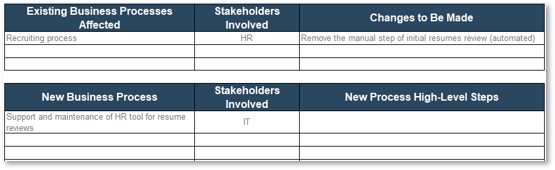


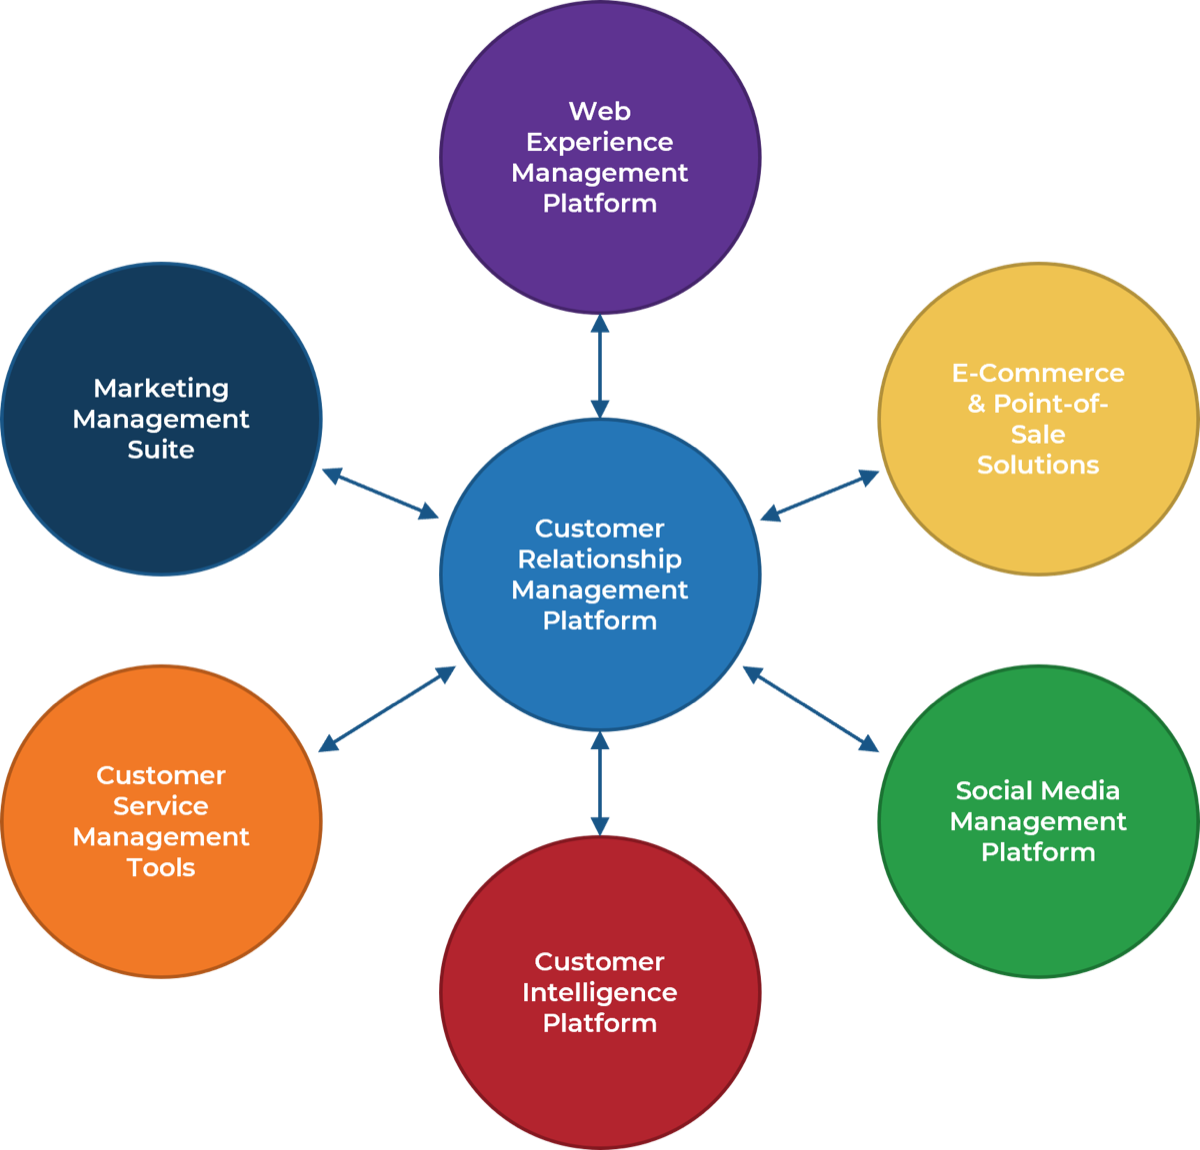
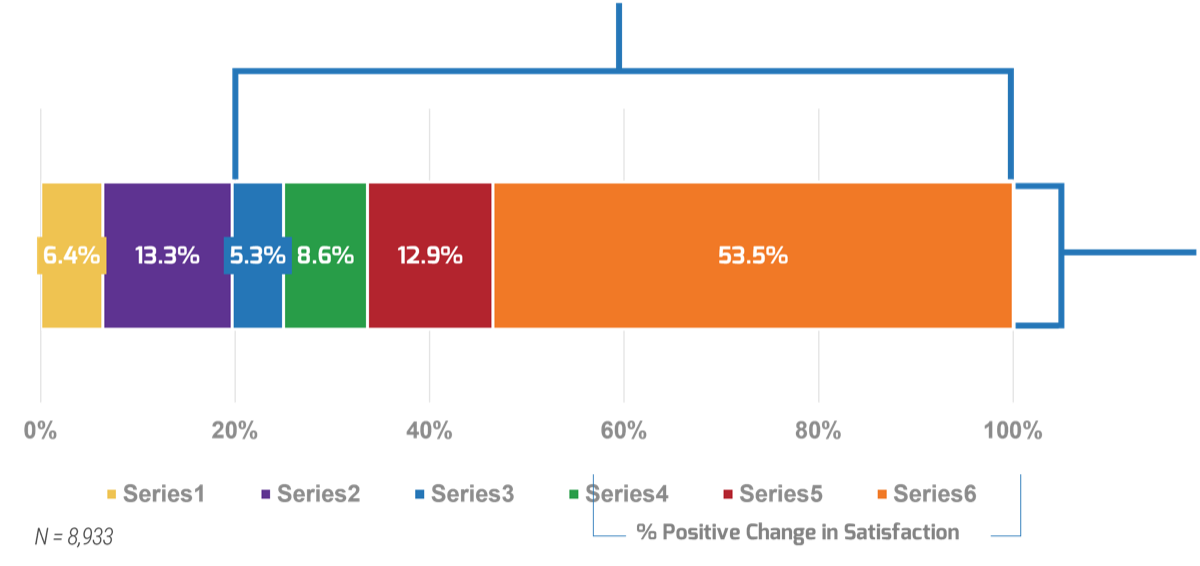


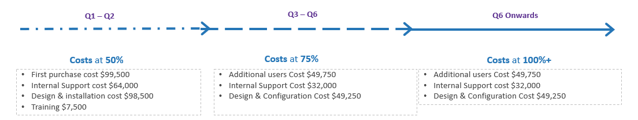
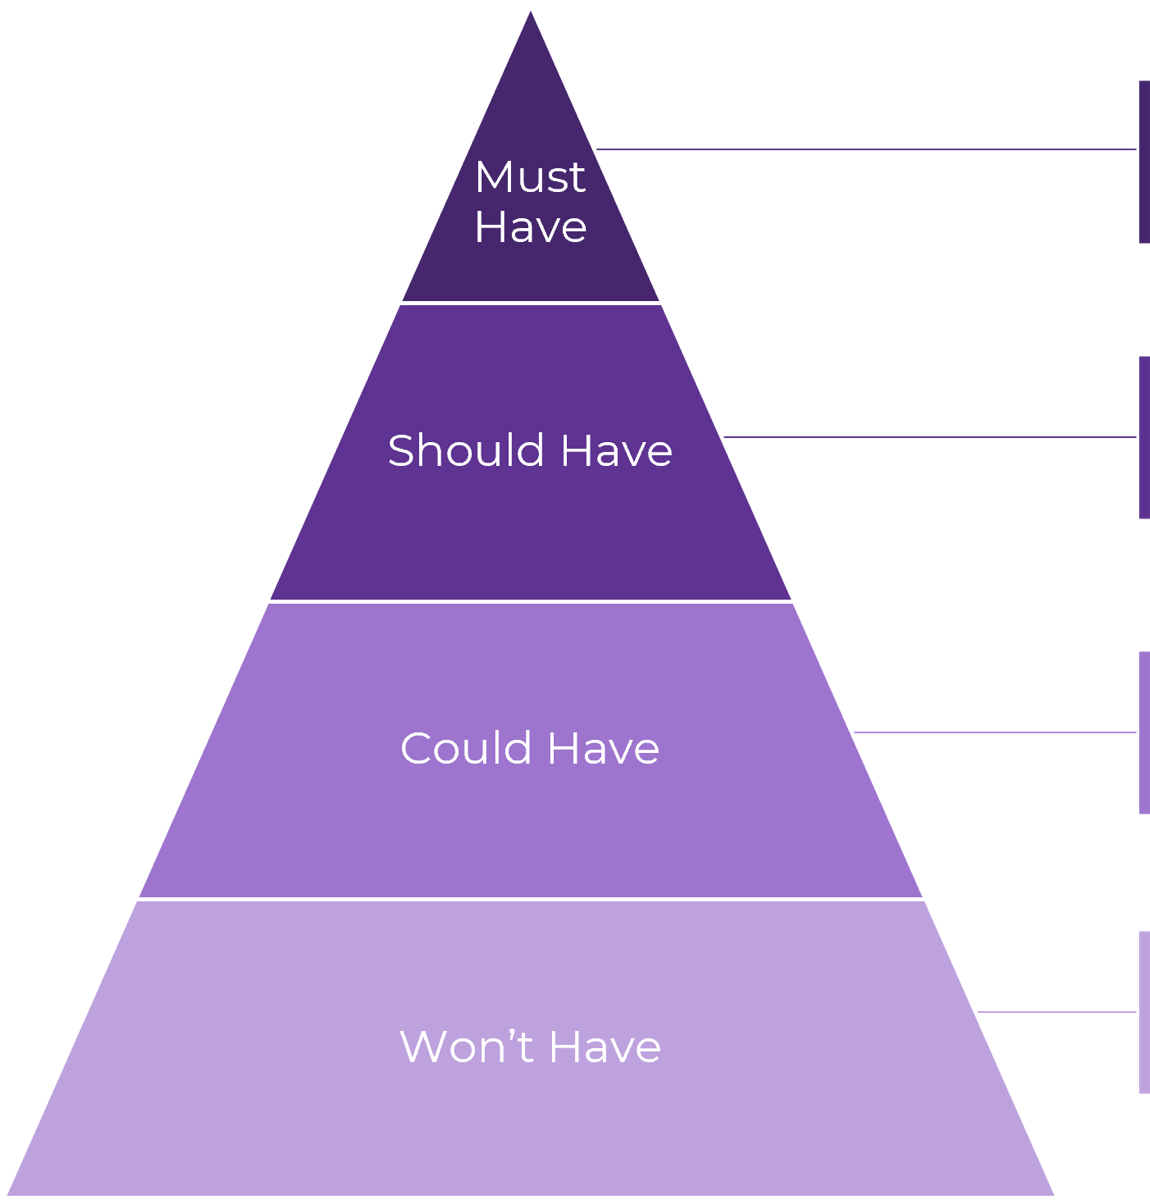
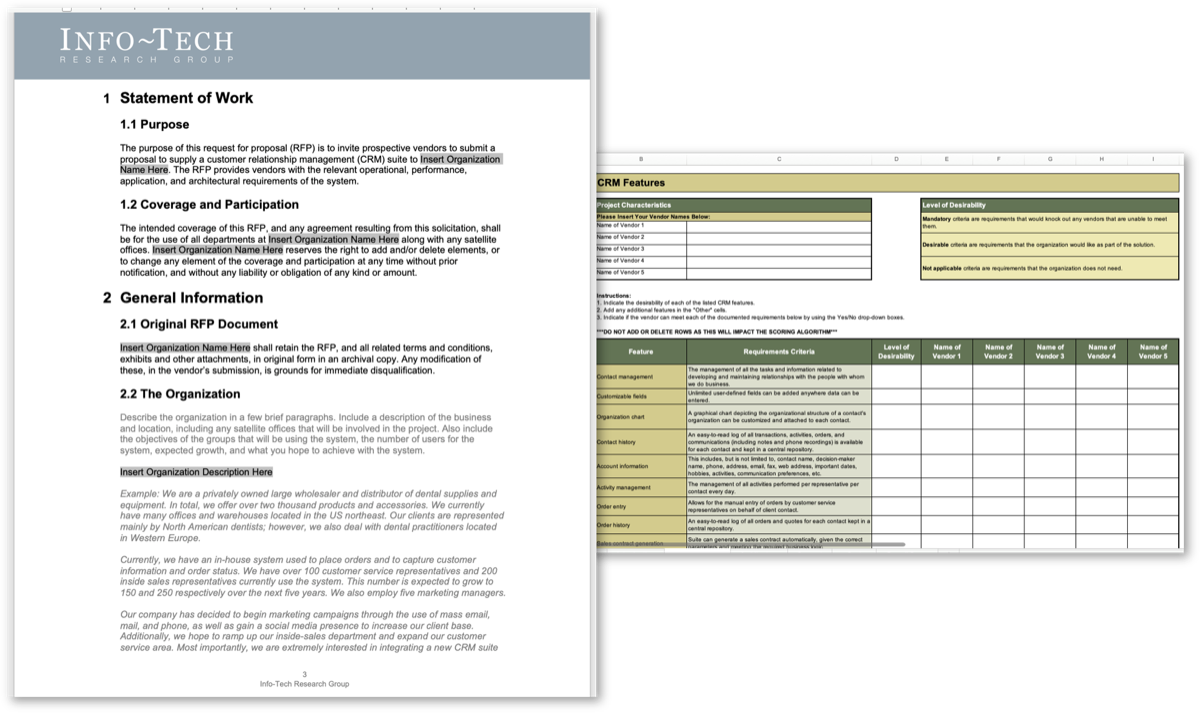


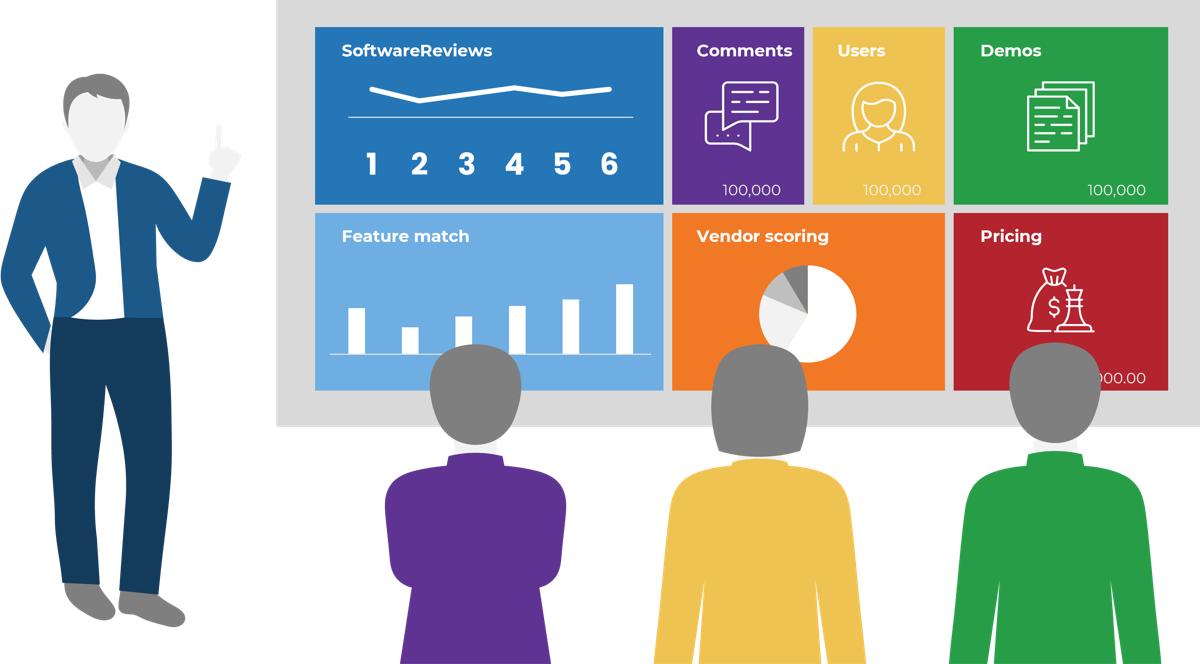
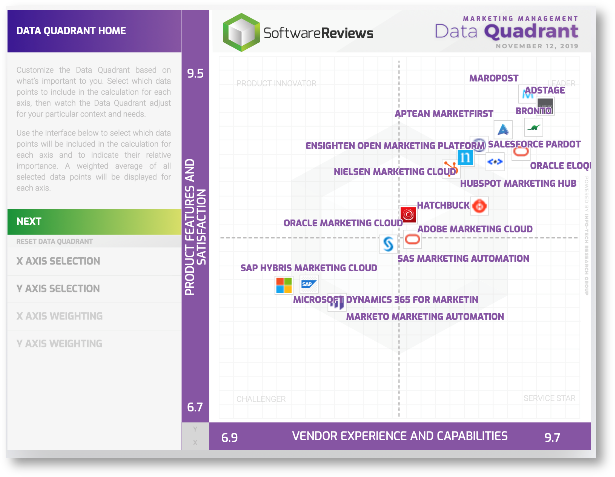
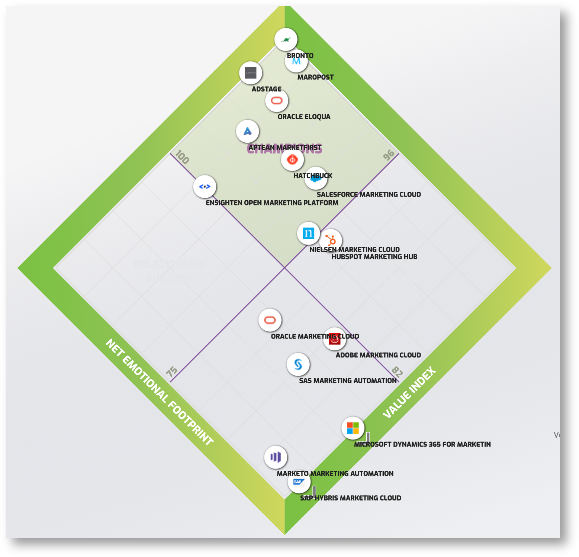
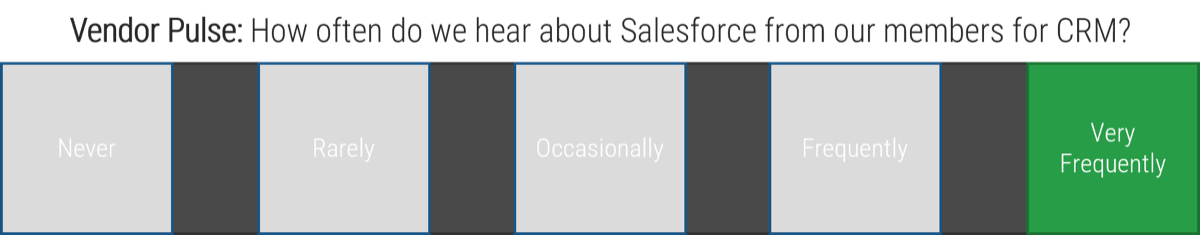
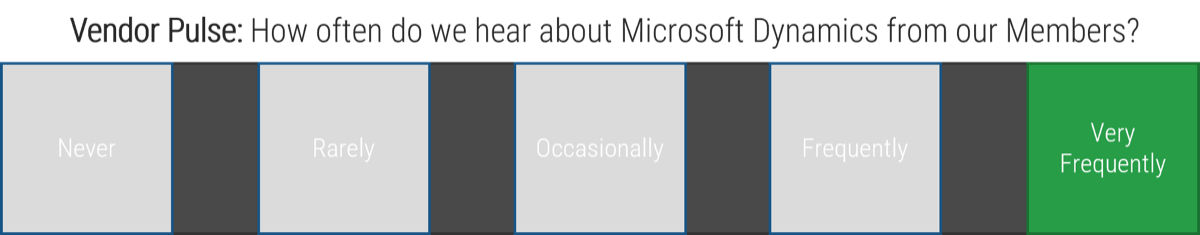
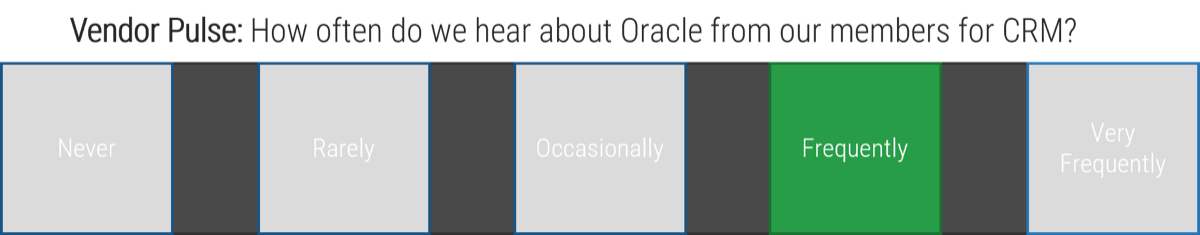
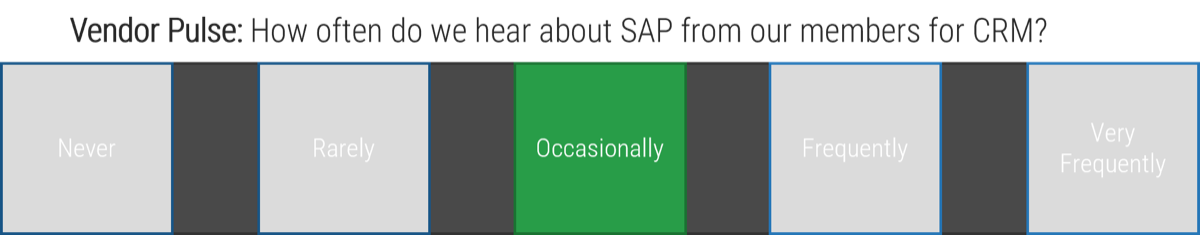
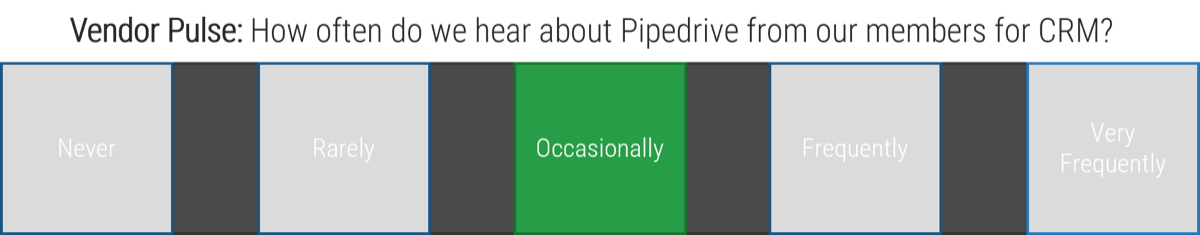
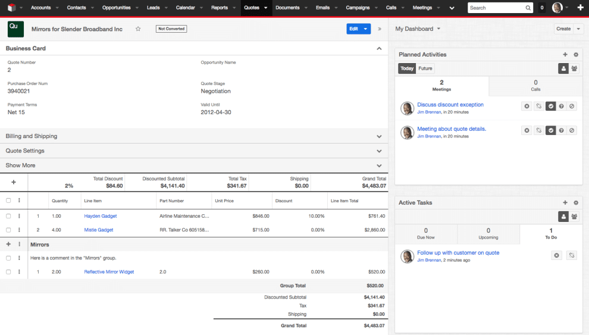
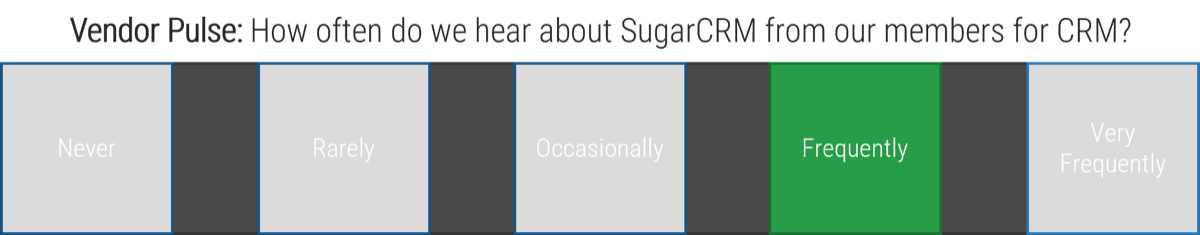
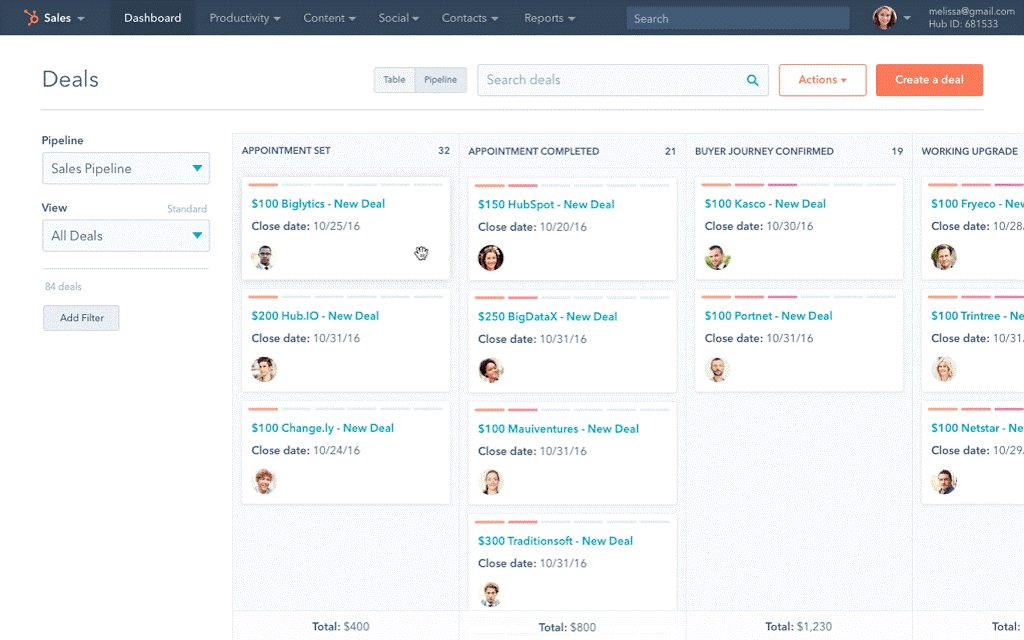
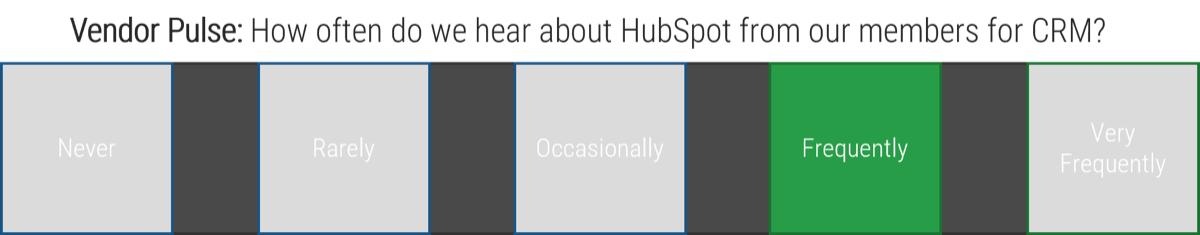
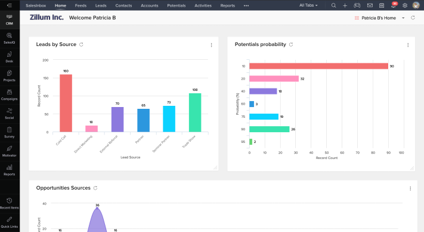
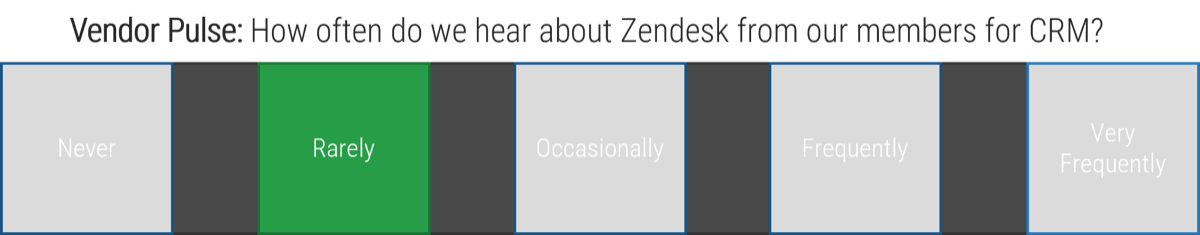

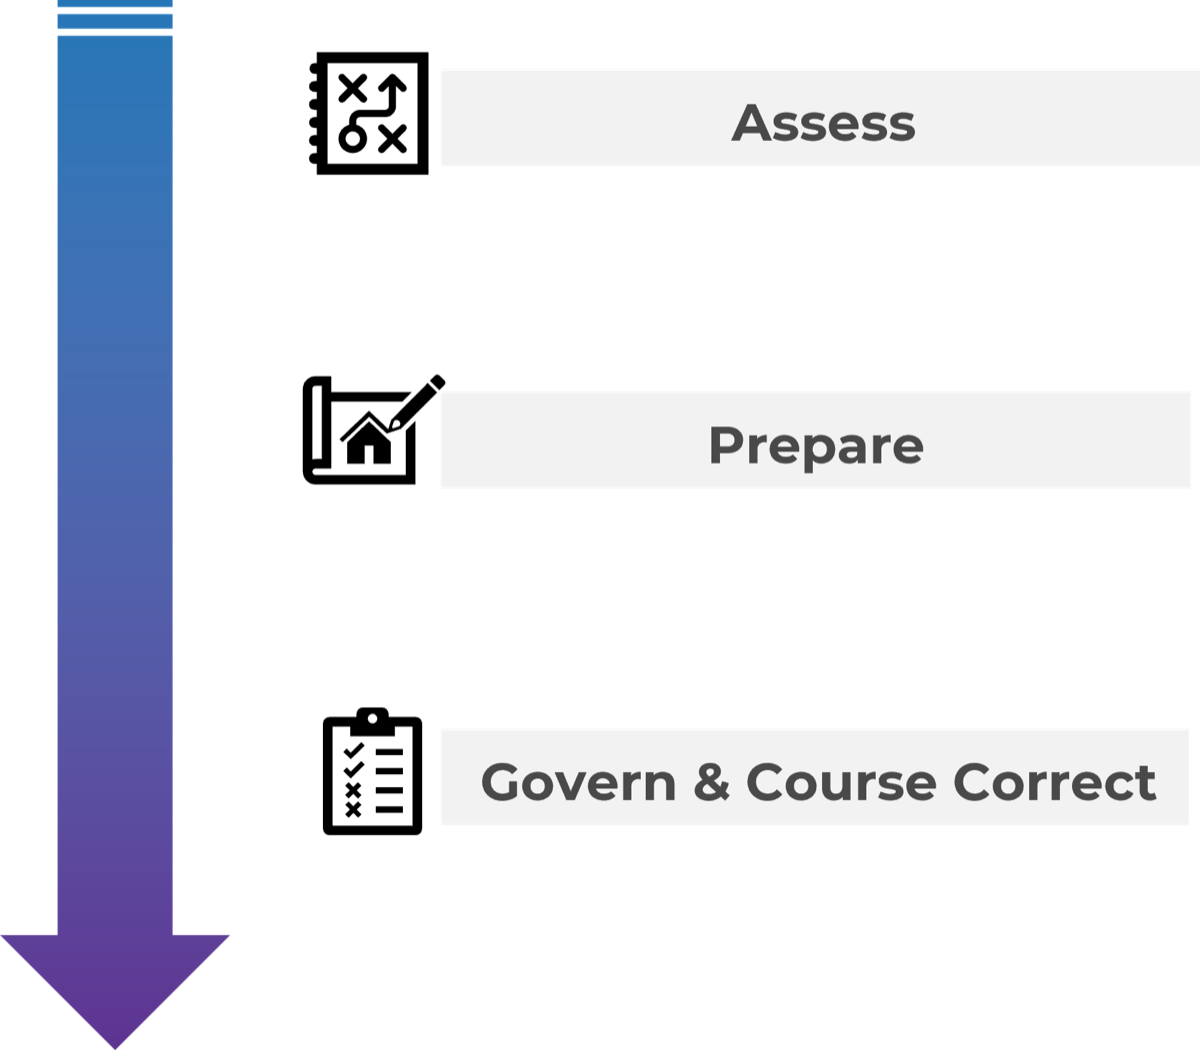
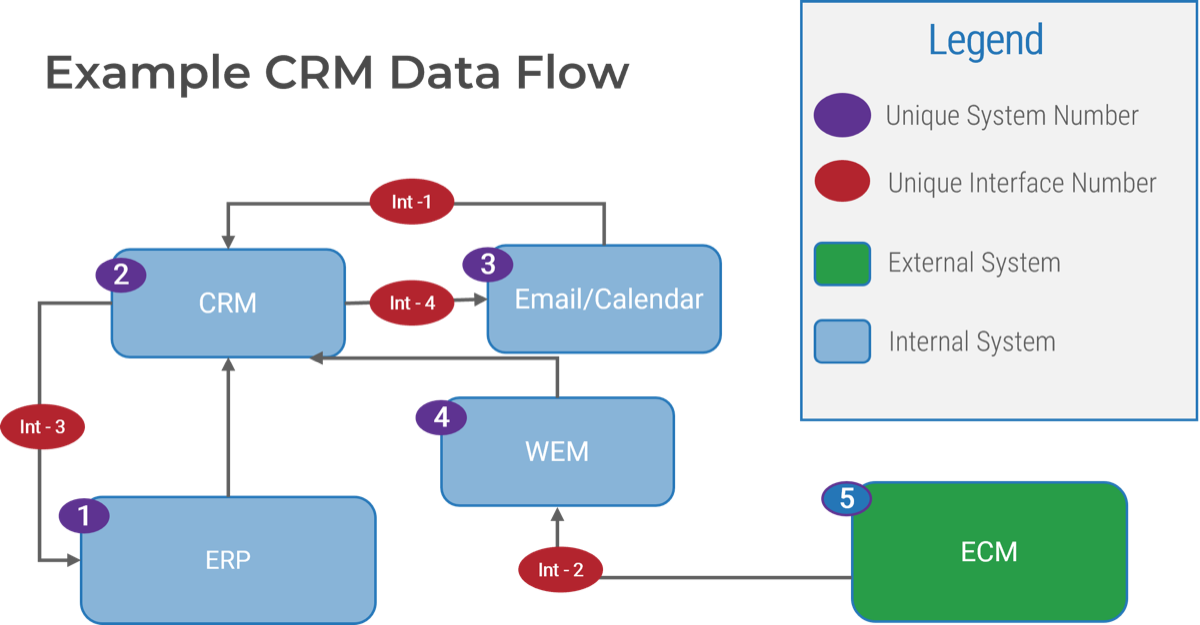
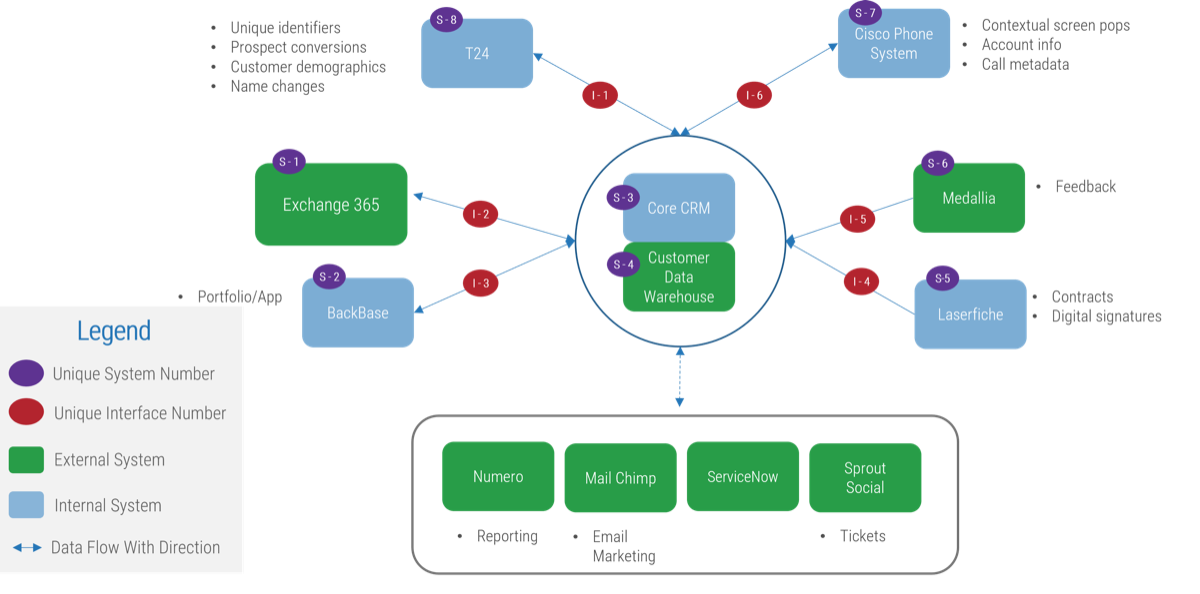
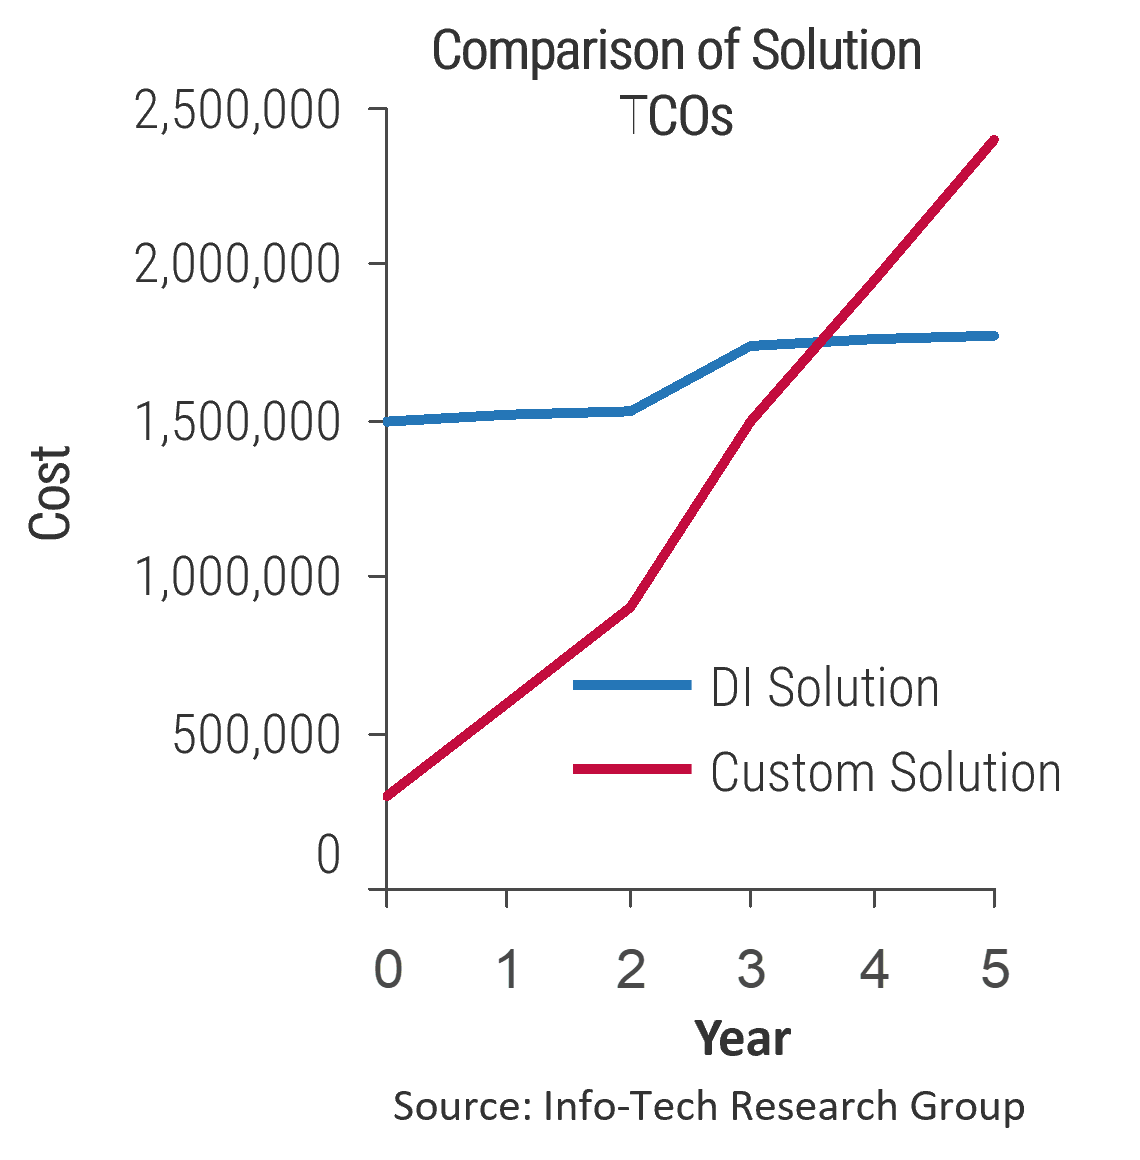


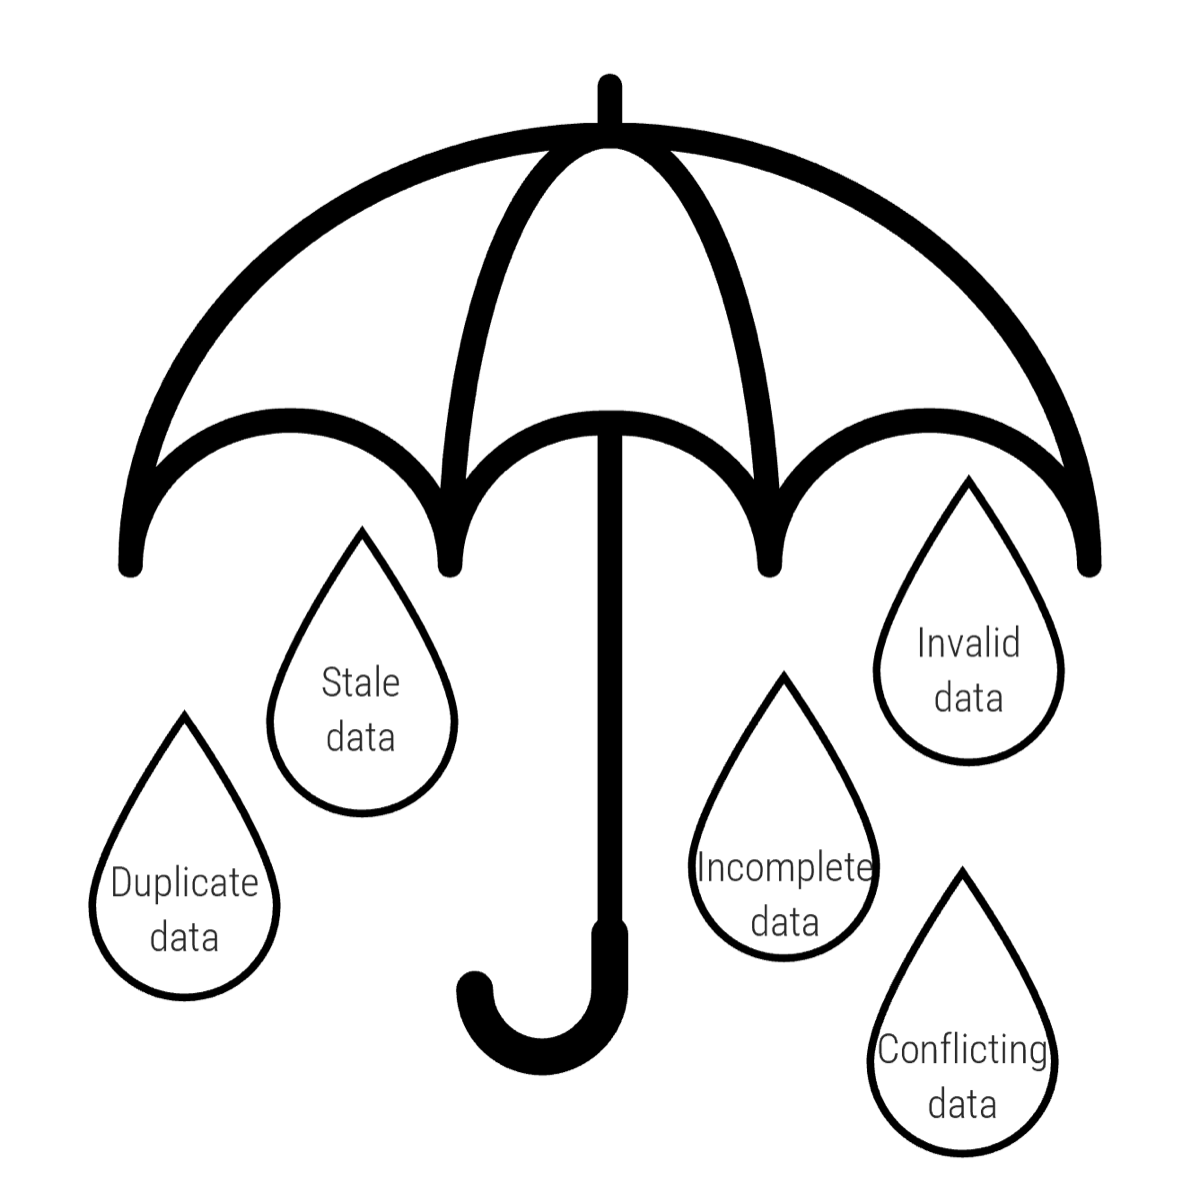
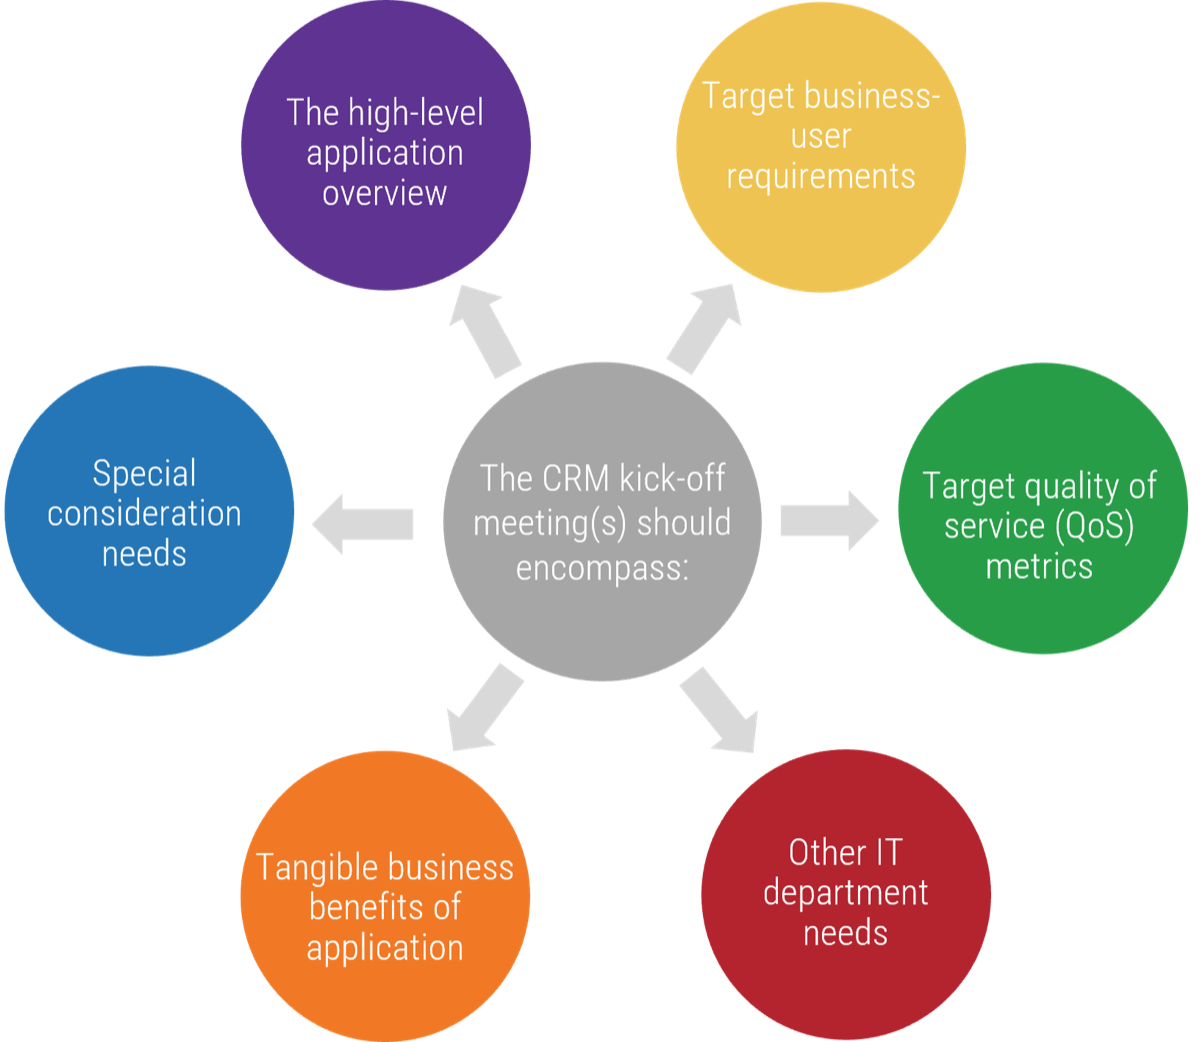


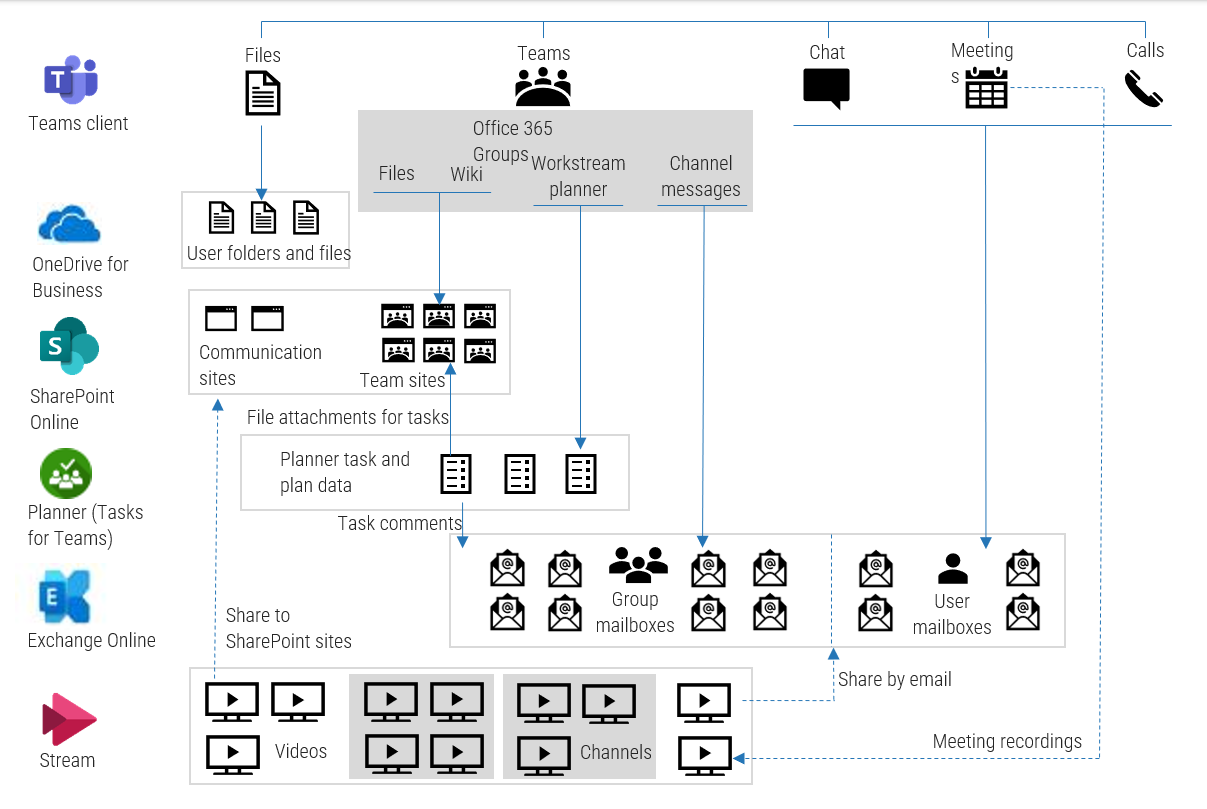
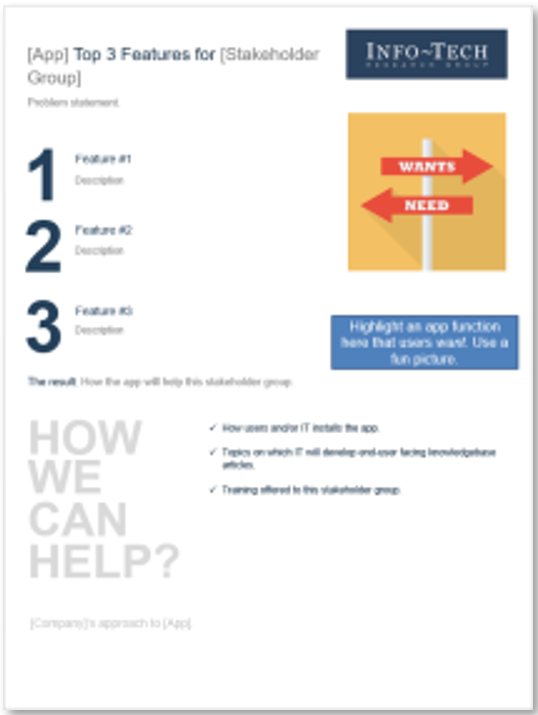
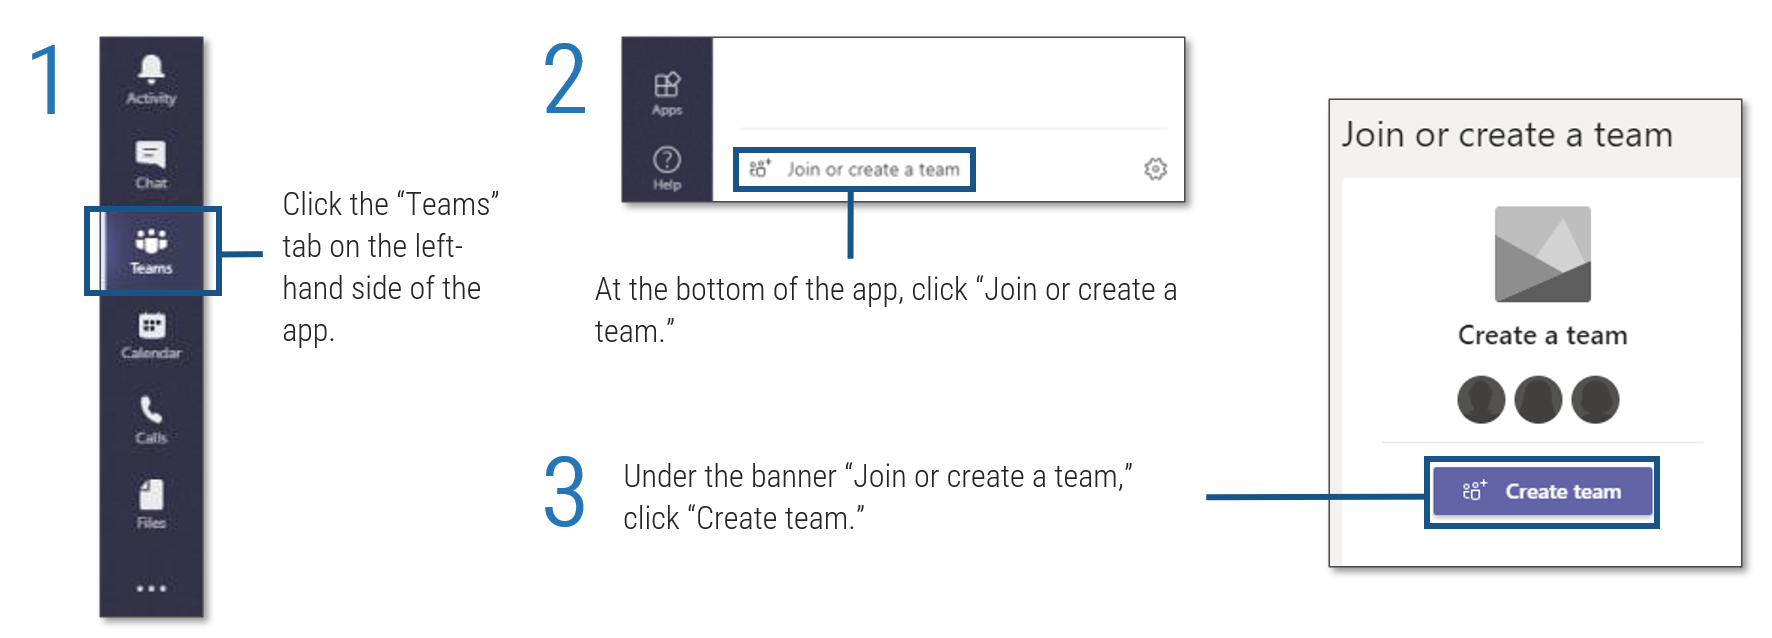 tab on the left-hand side of the app'. Step 2: 'At the bottom of the app, click '. Step 3: 'Under the banner , click '.">
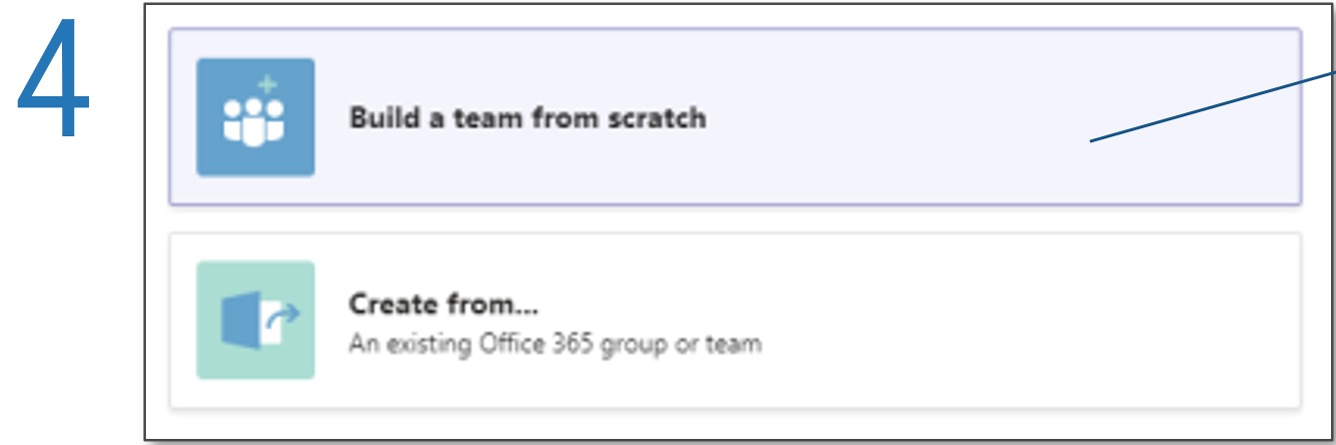
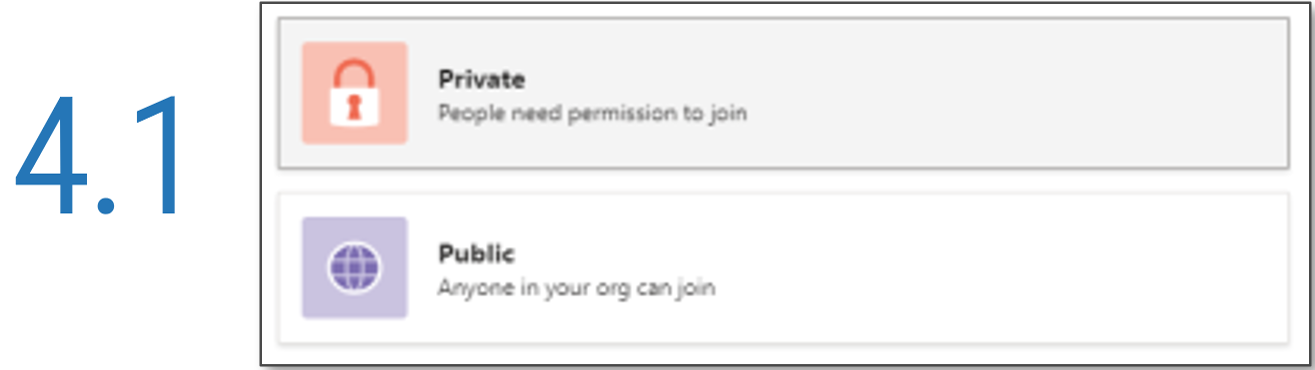
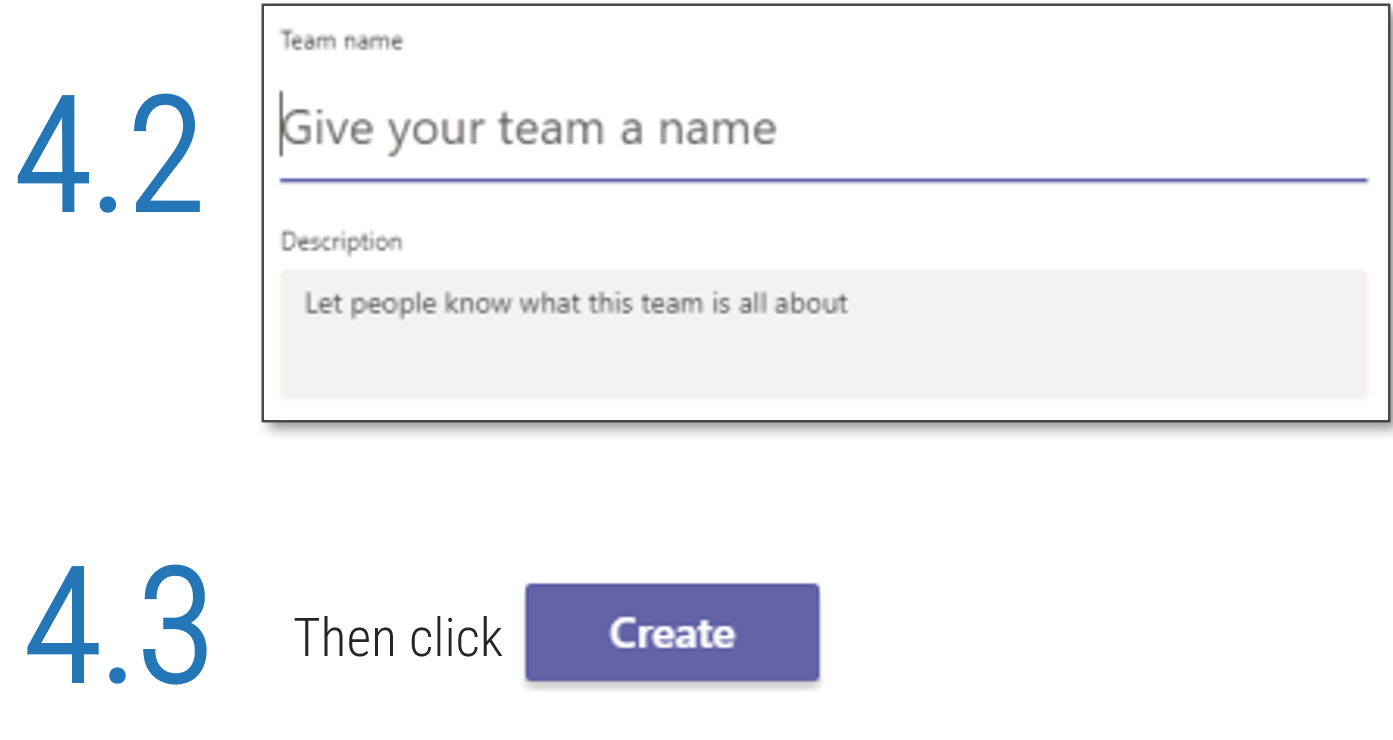 '.">
'.">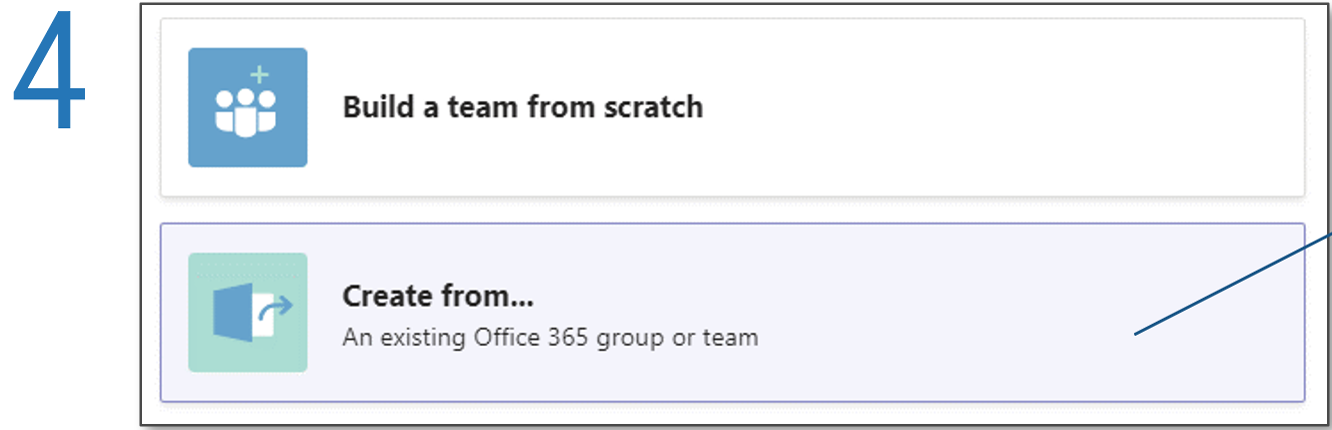
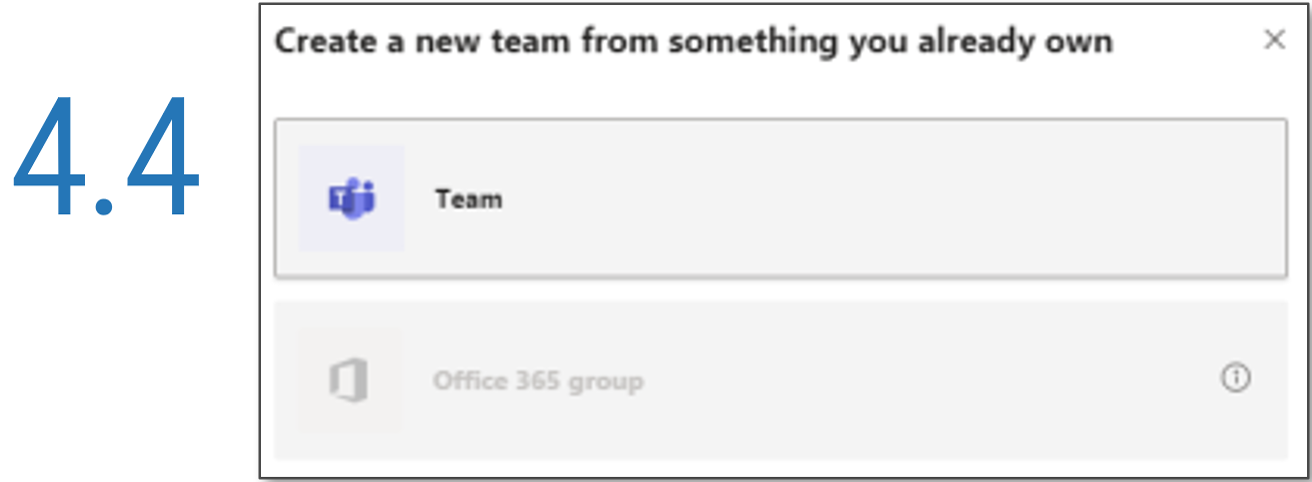
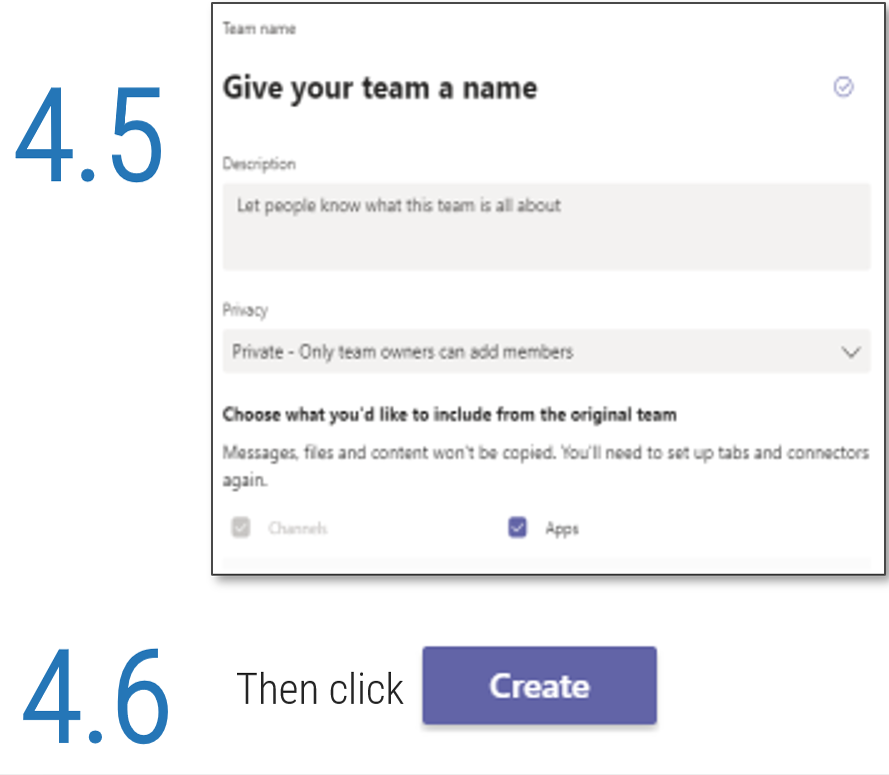 '.">
'.">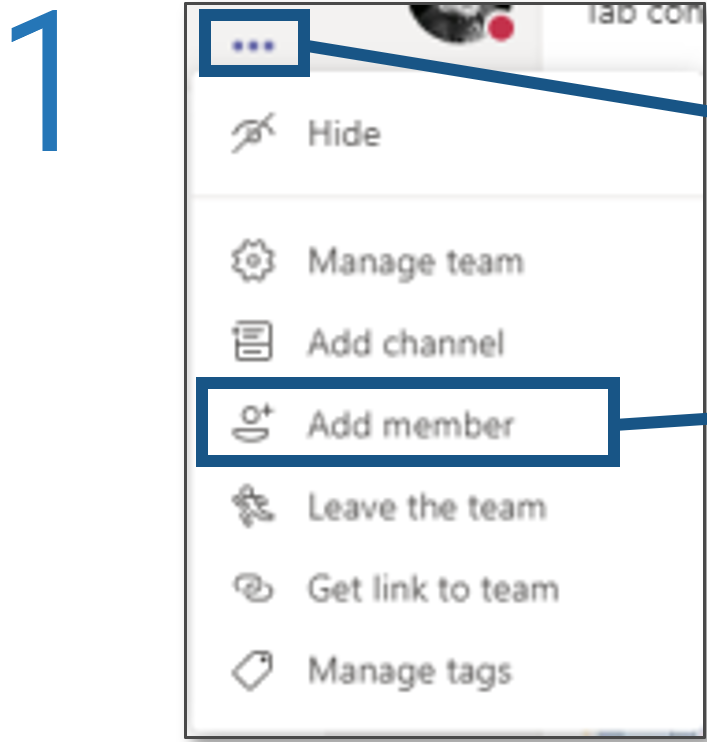
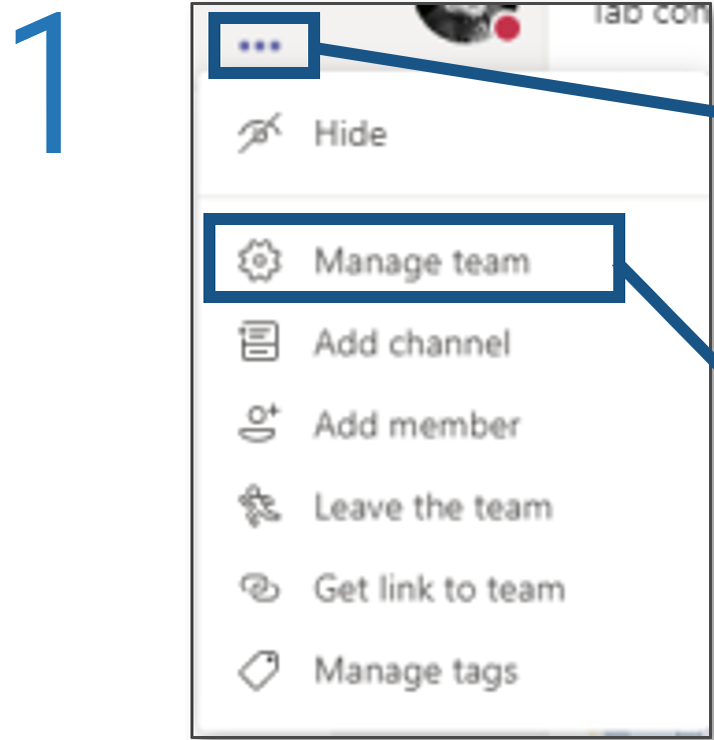
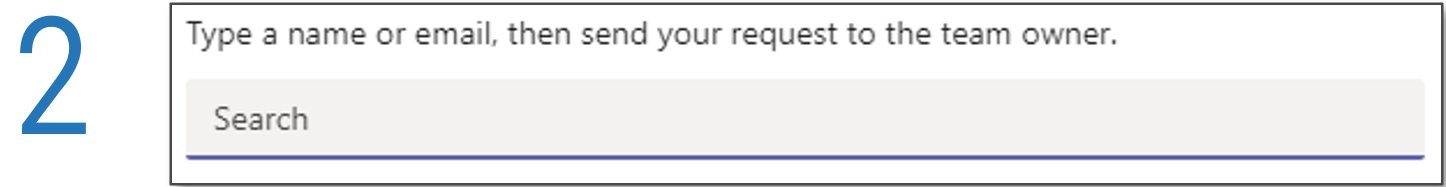

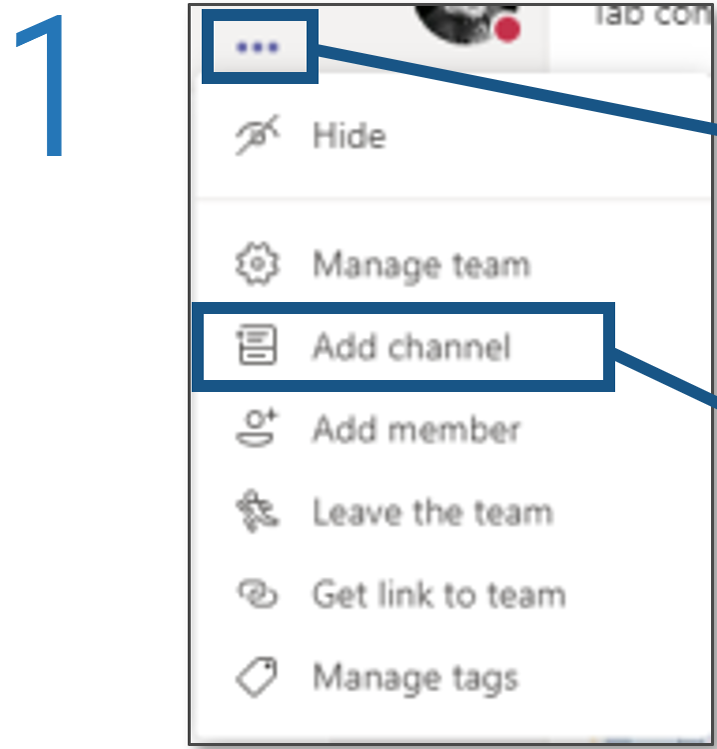
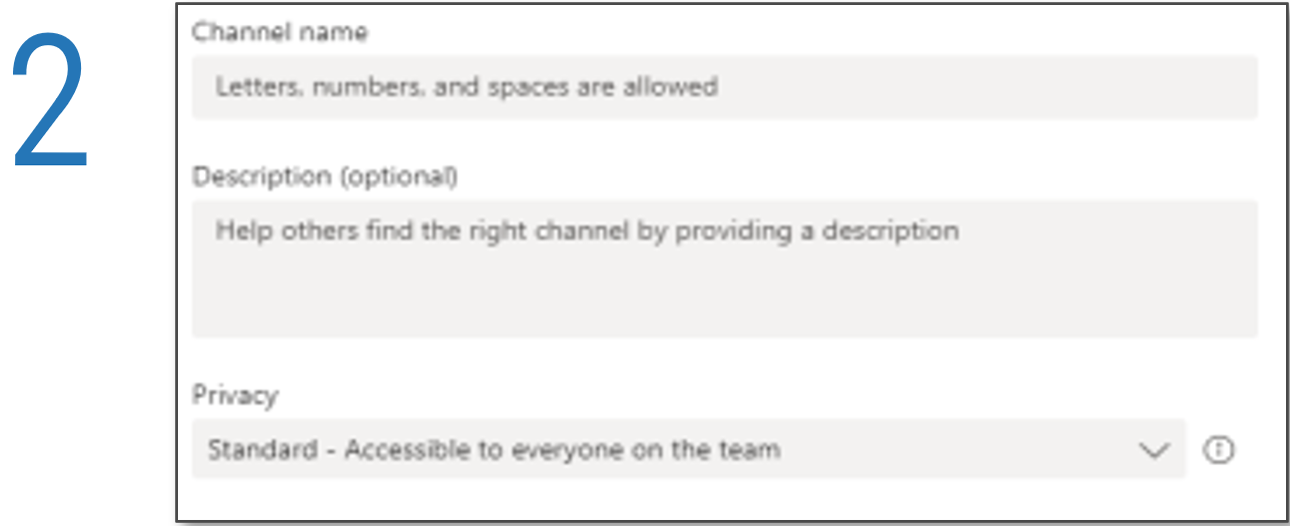
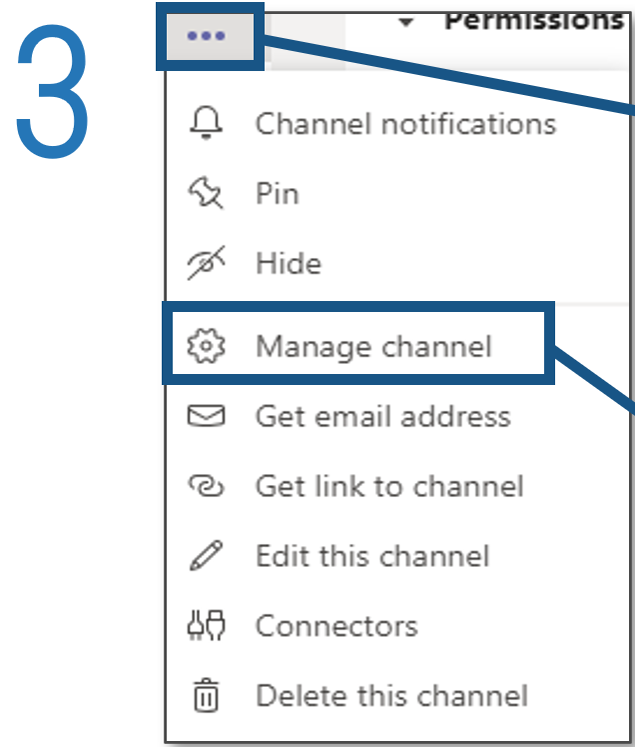
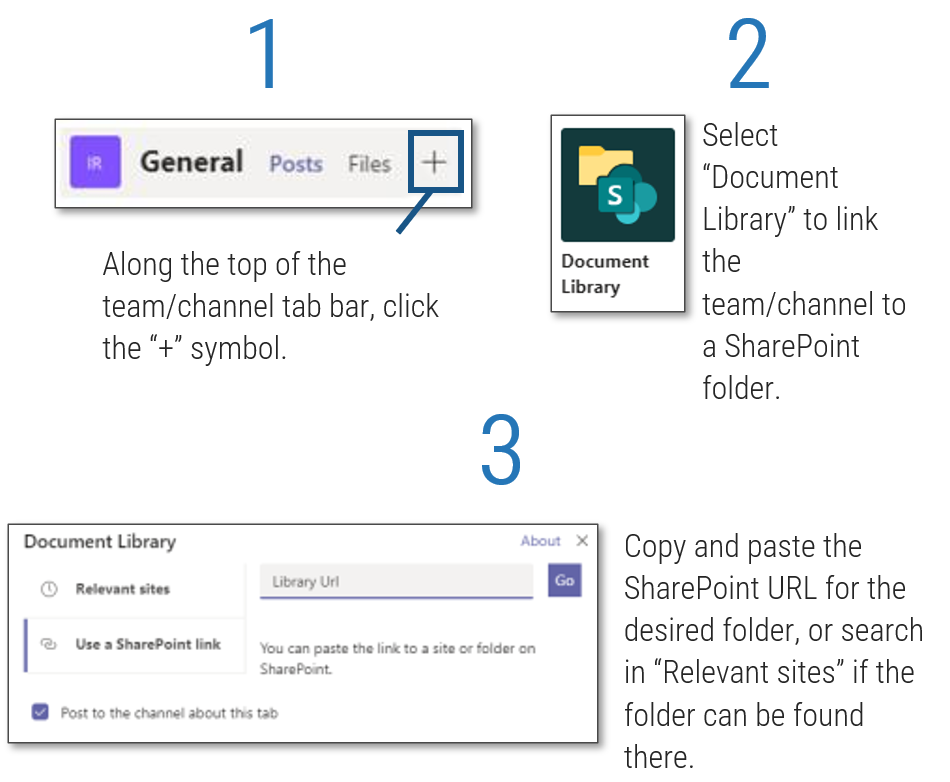
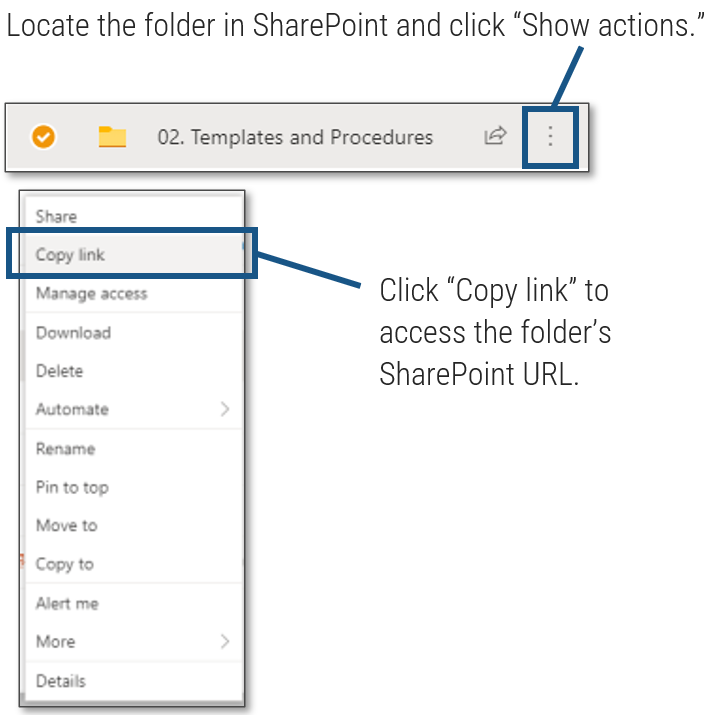 ', 'Click to access the folder's SharePoint URL.'">
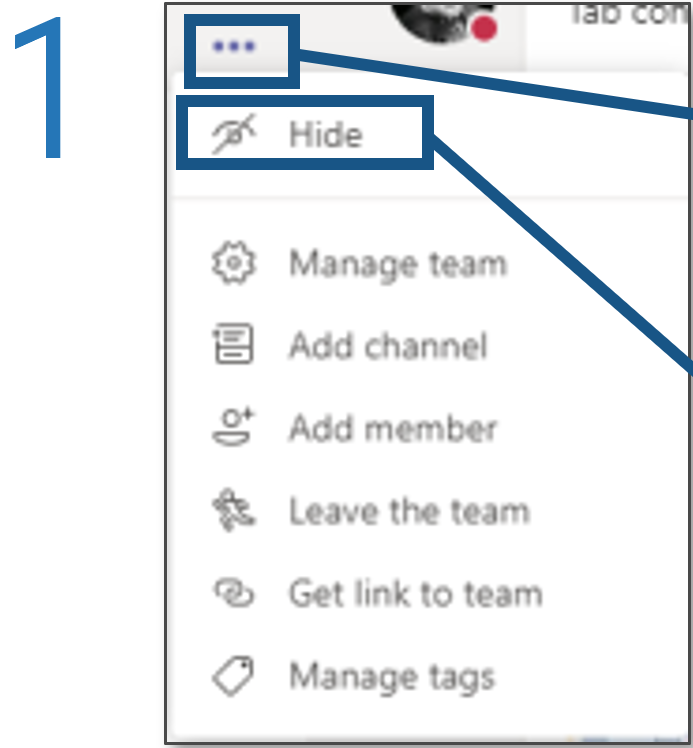
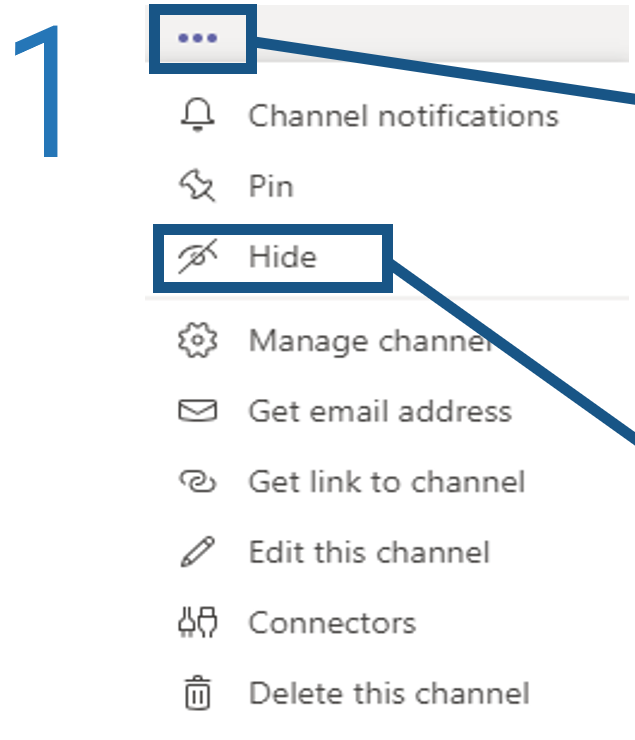
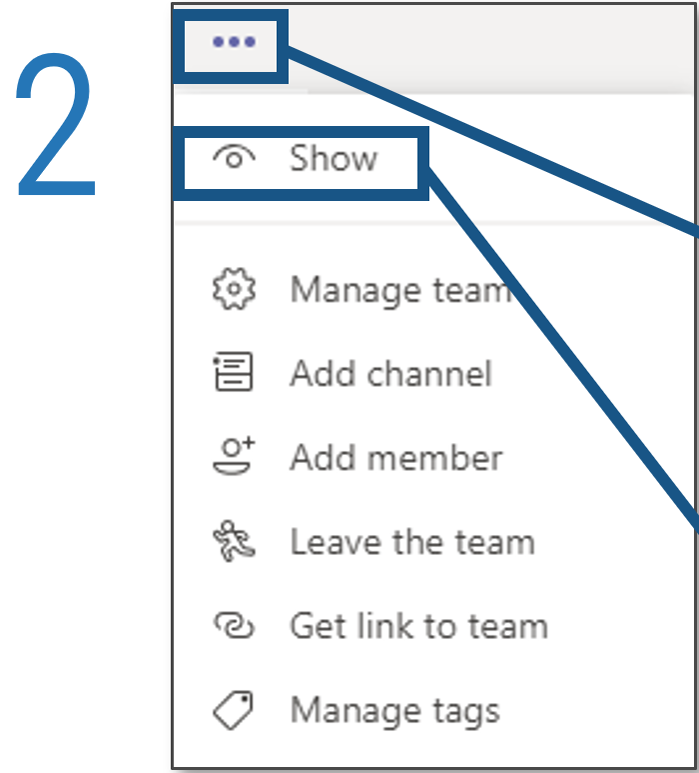
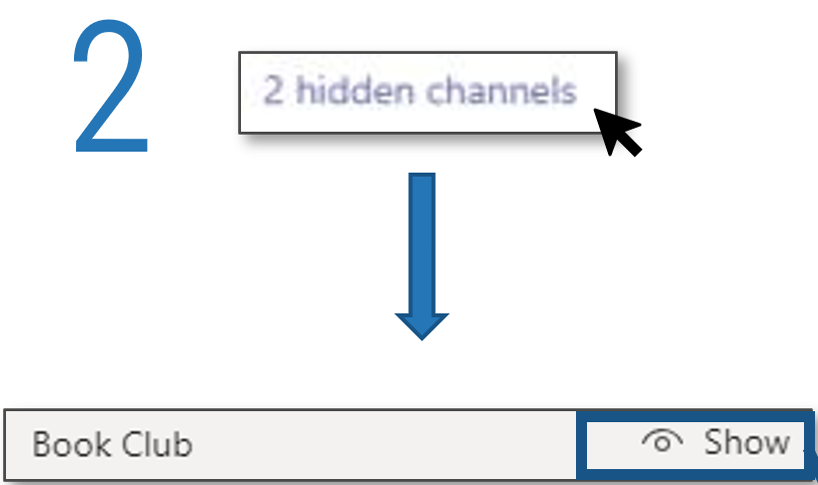
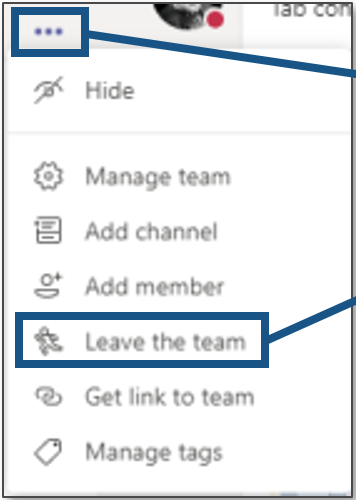
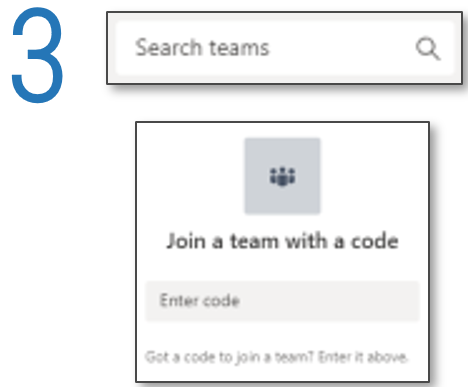
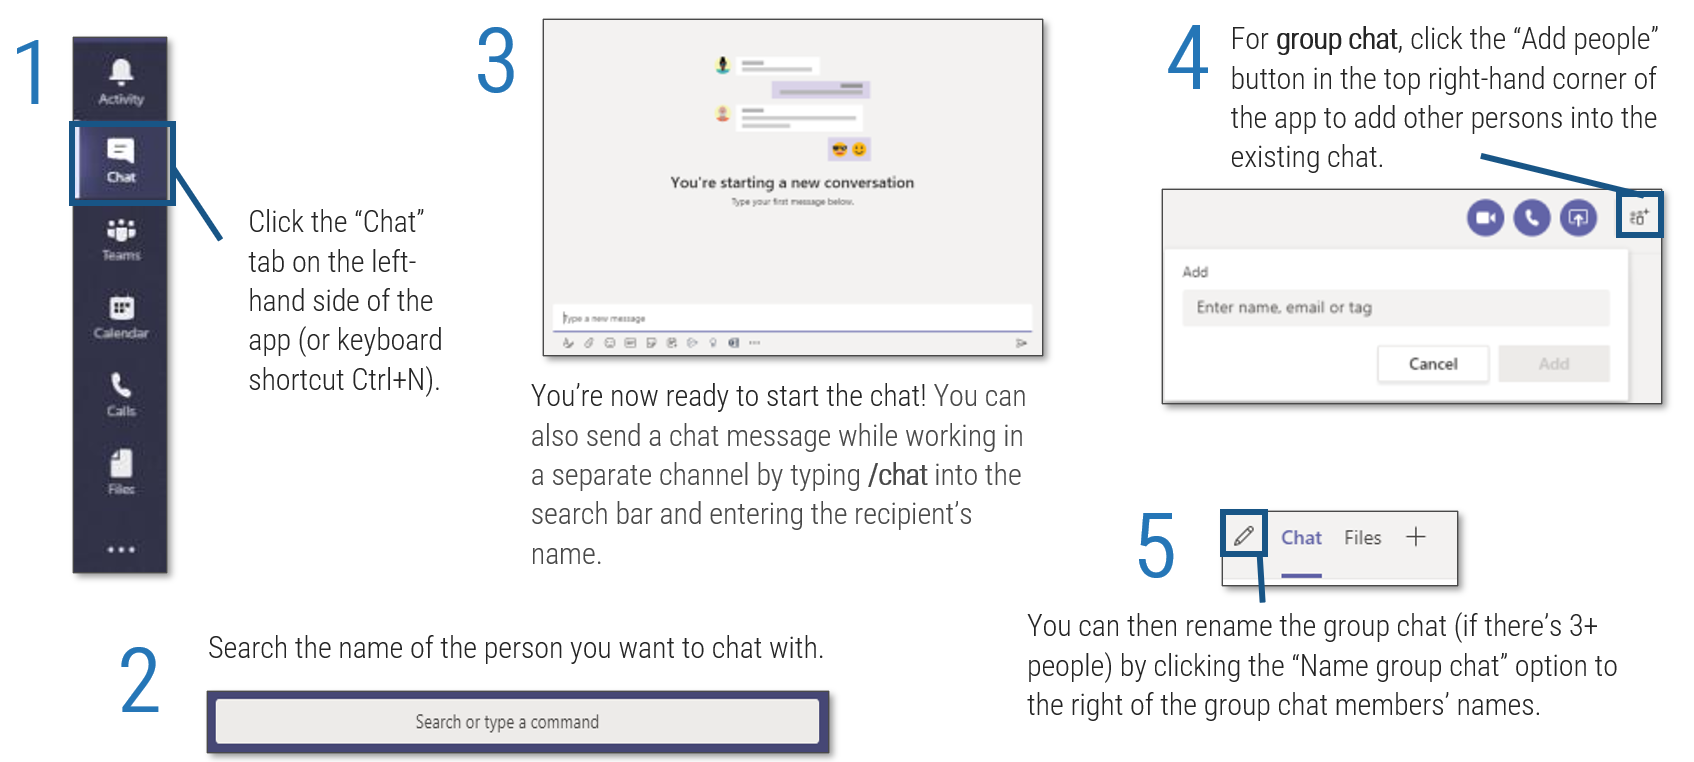
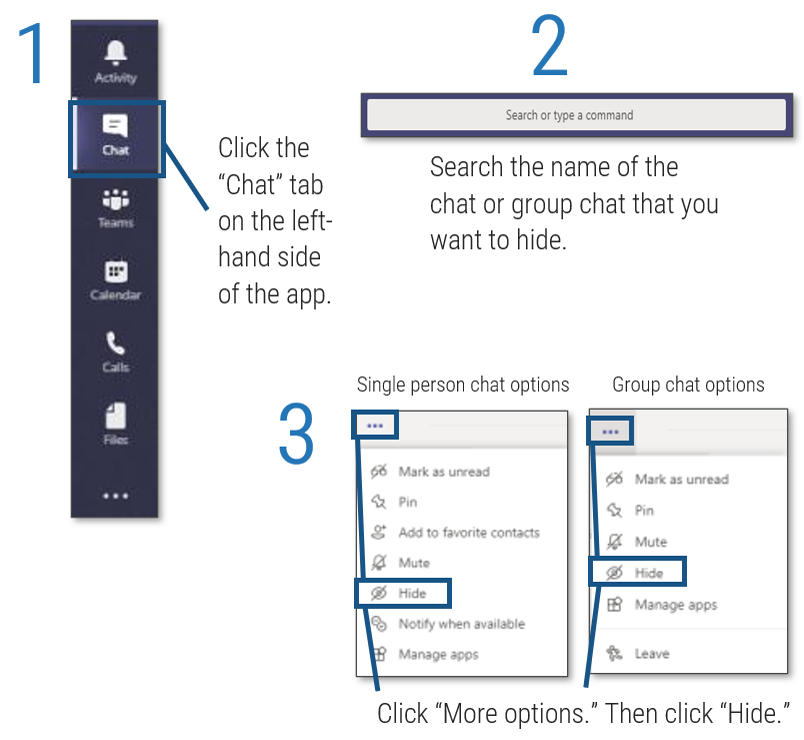
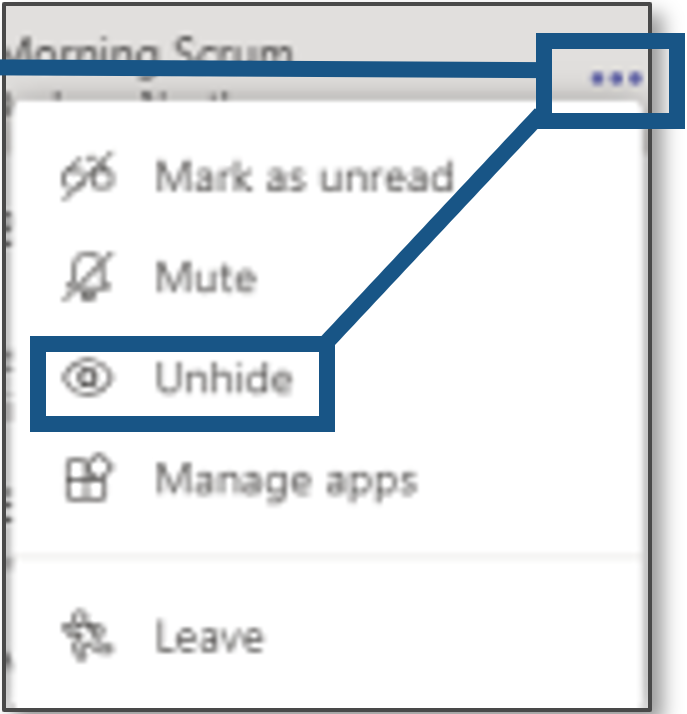
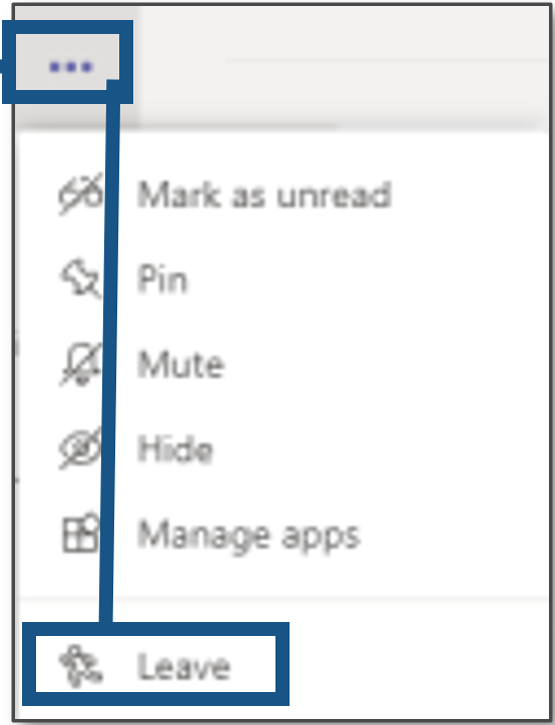
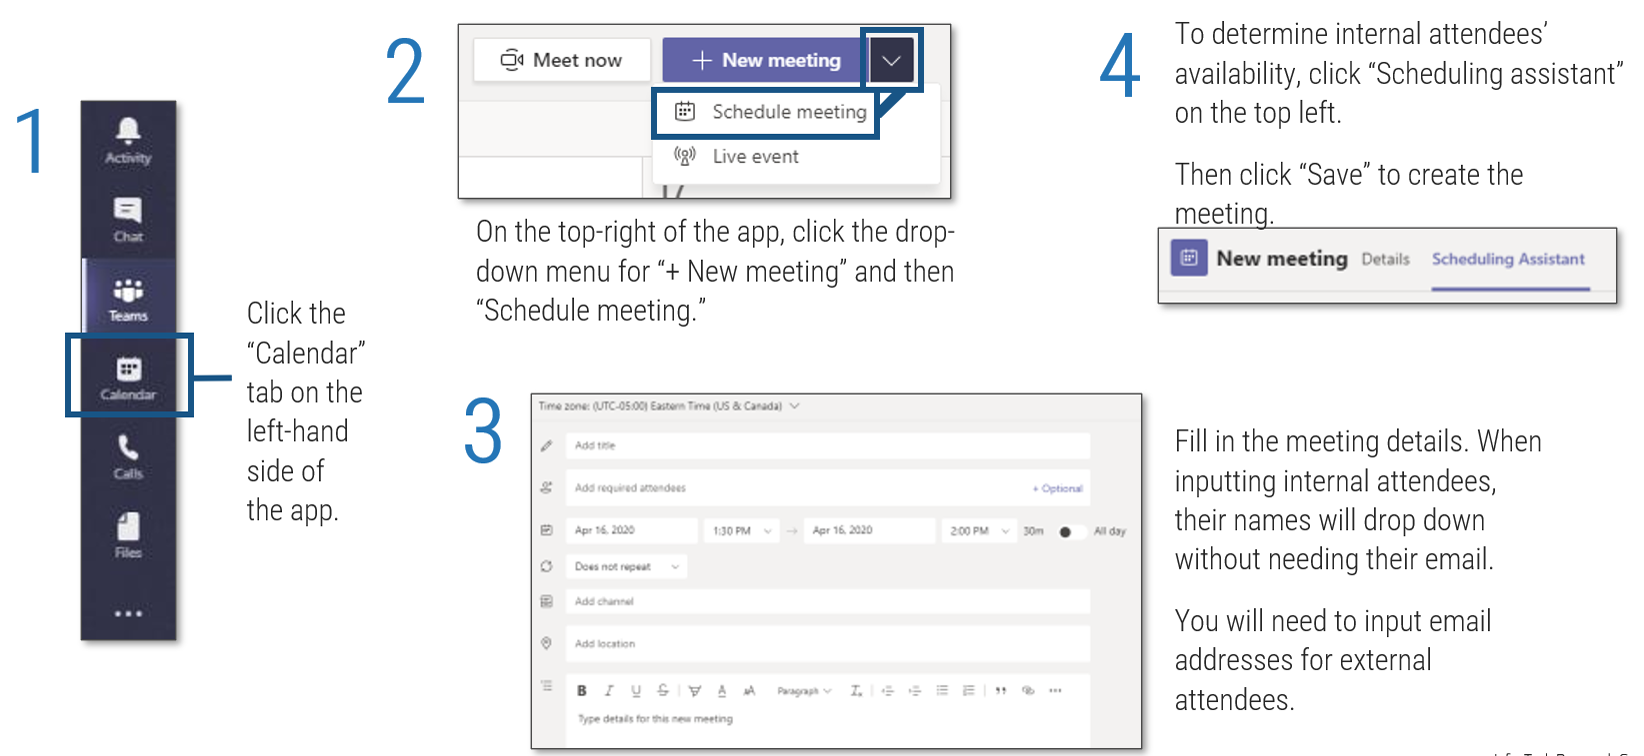
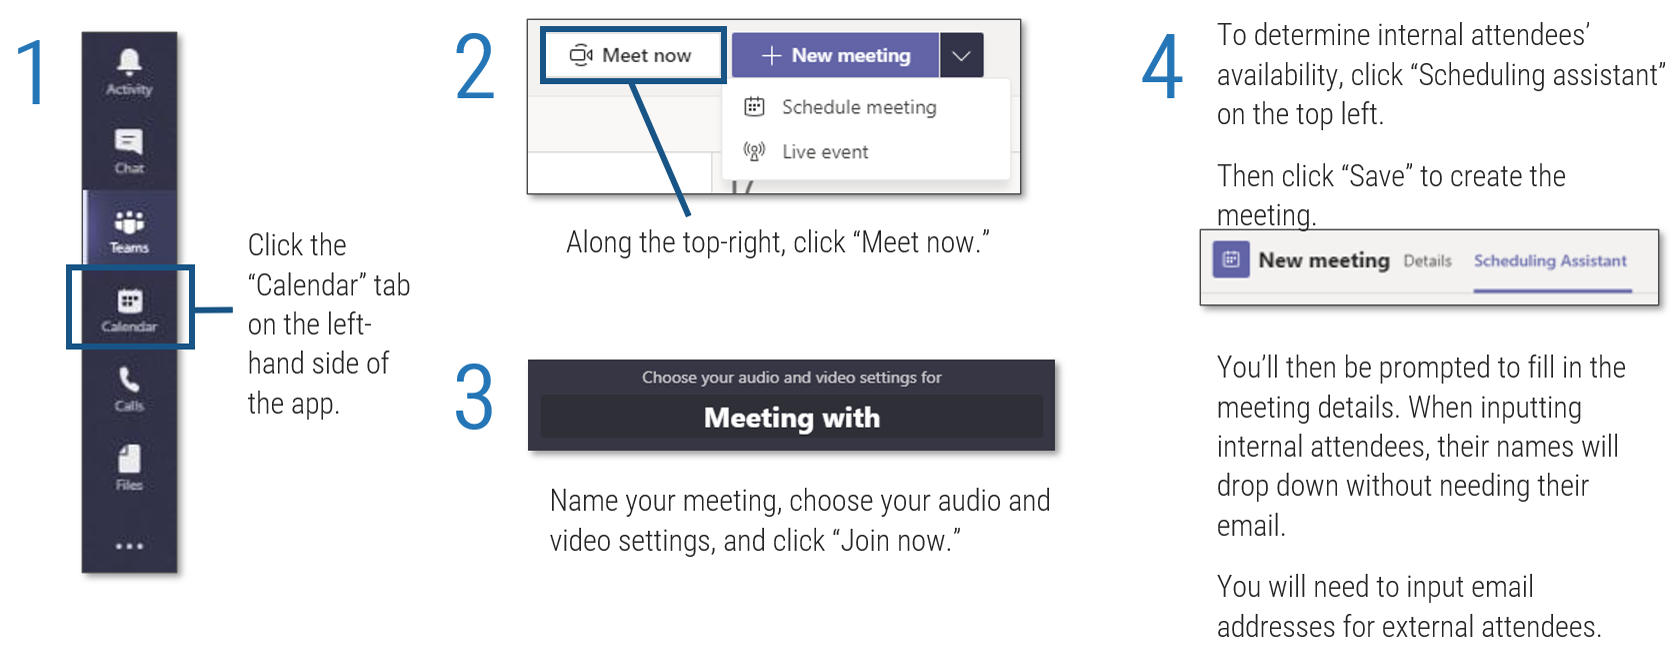
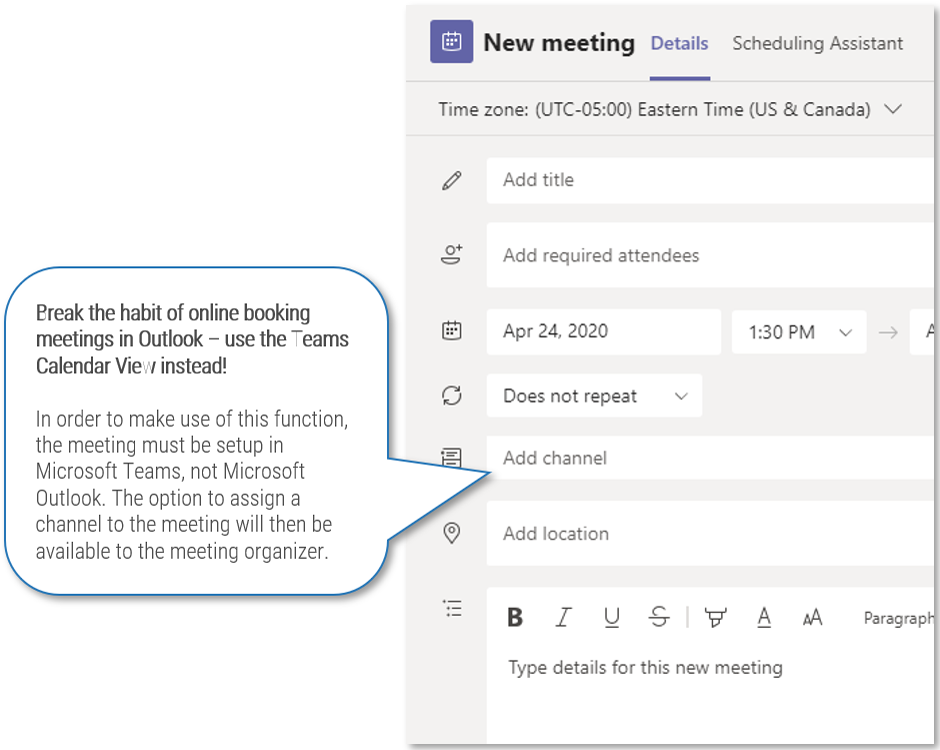
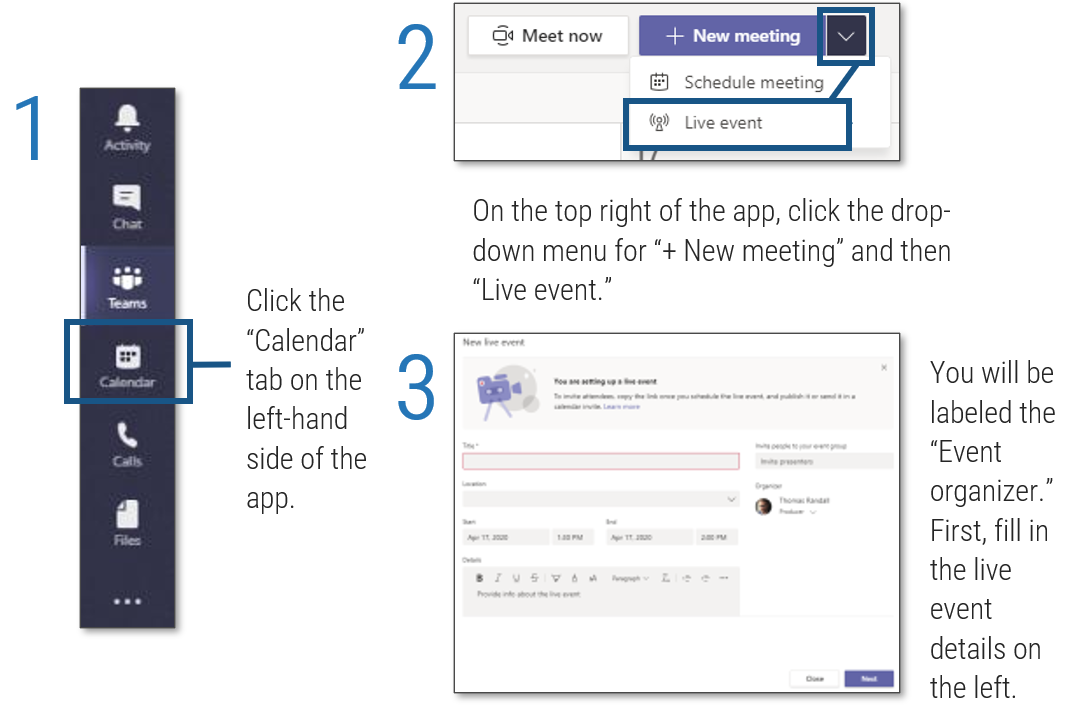
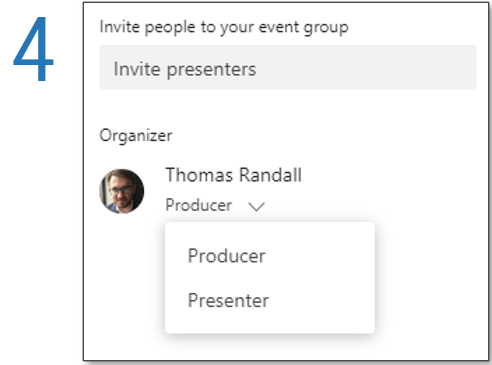
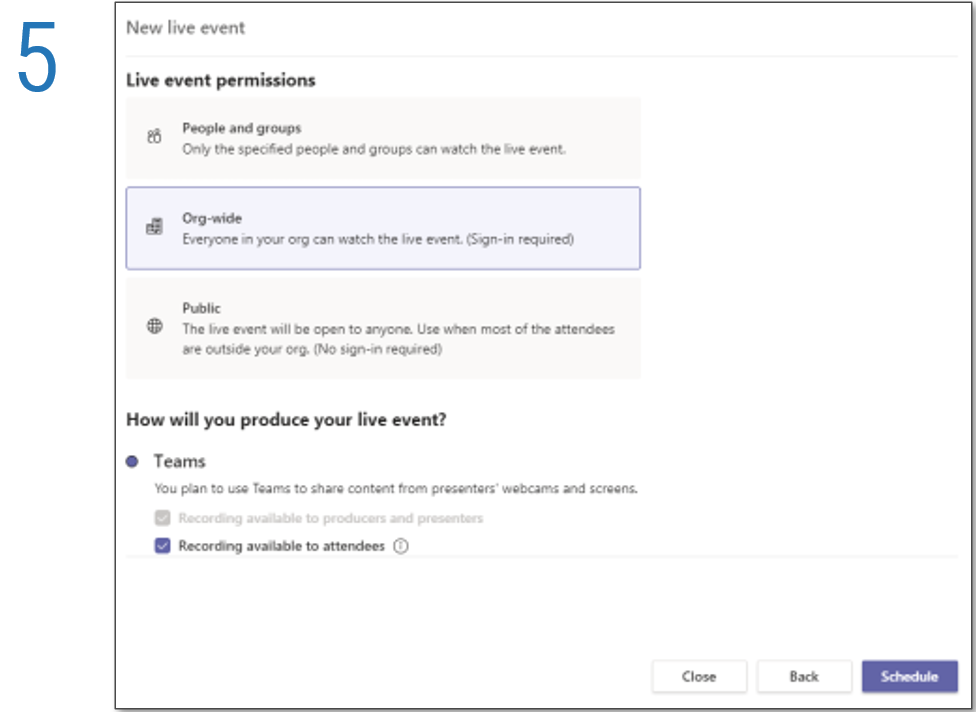


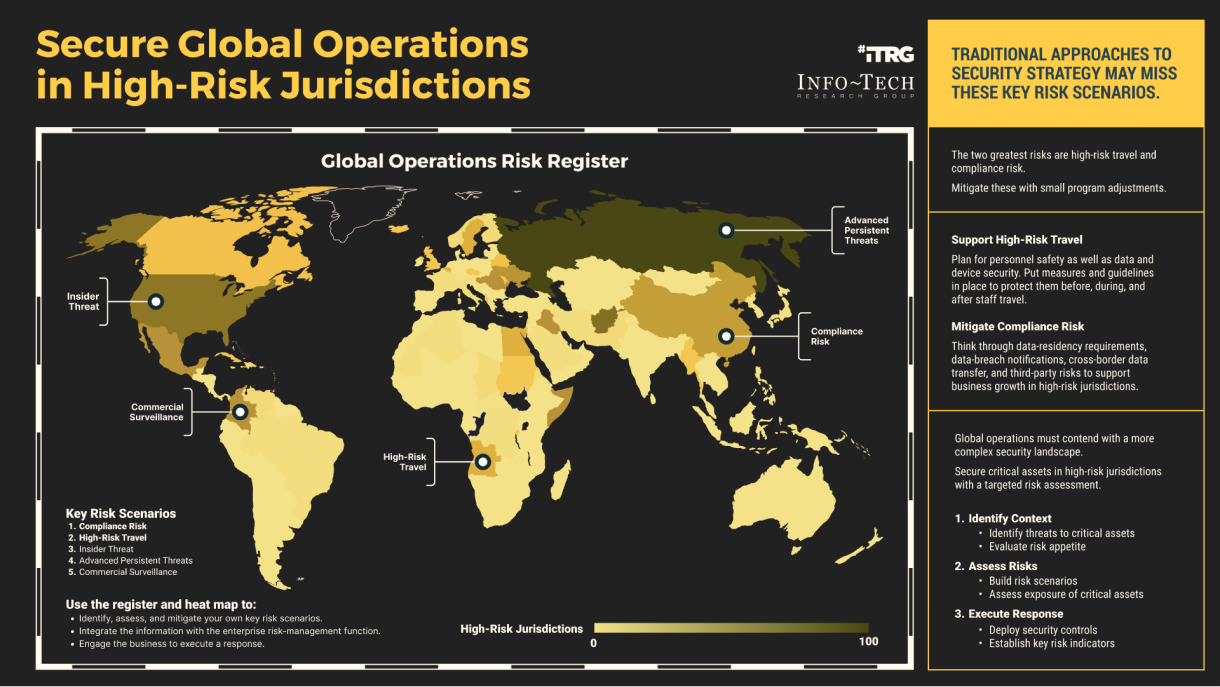


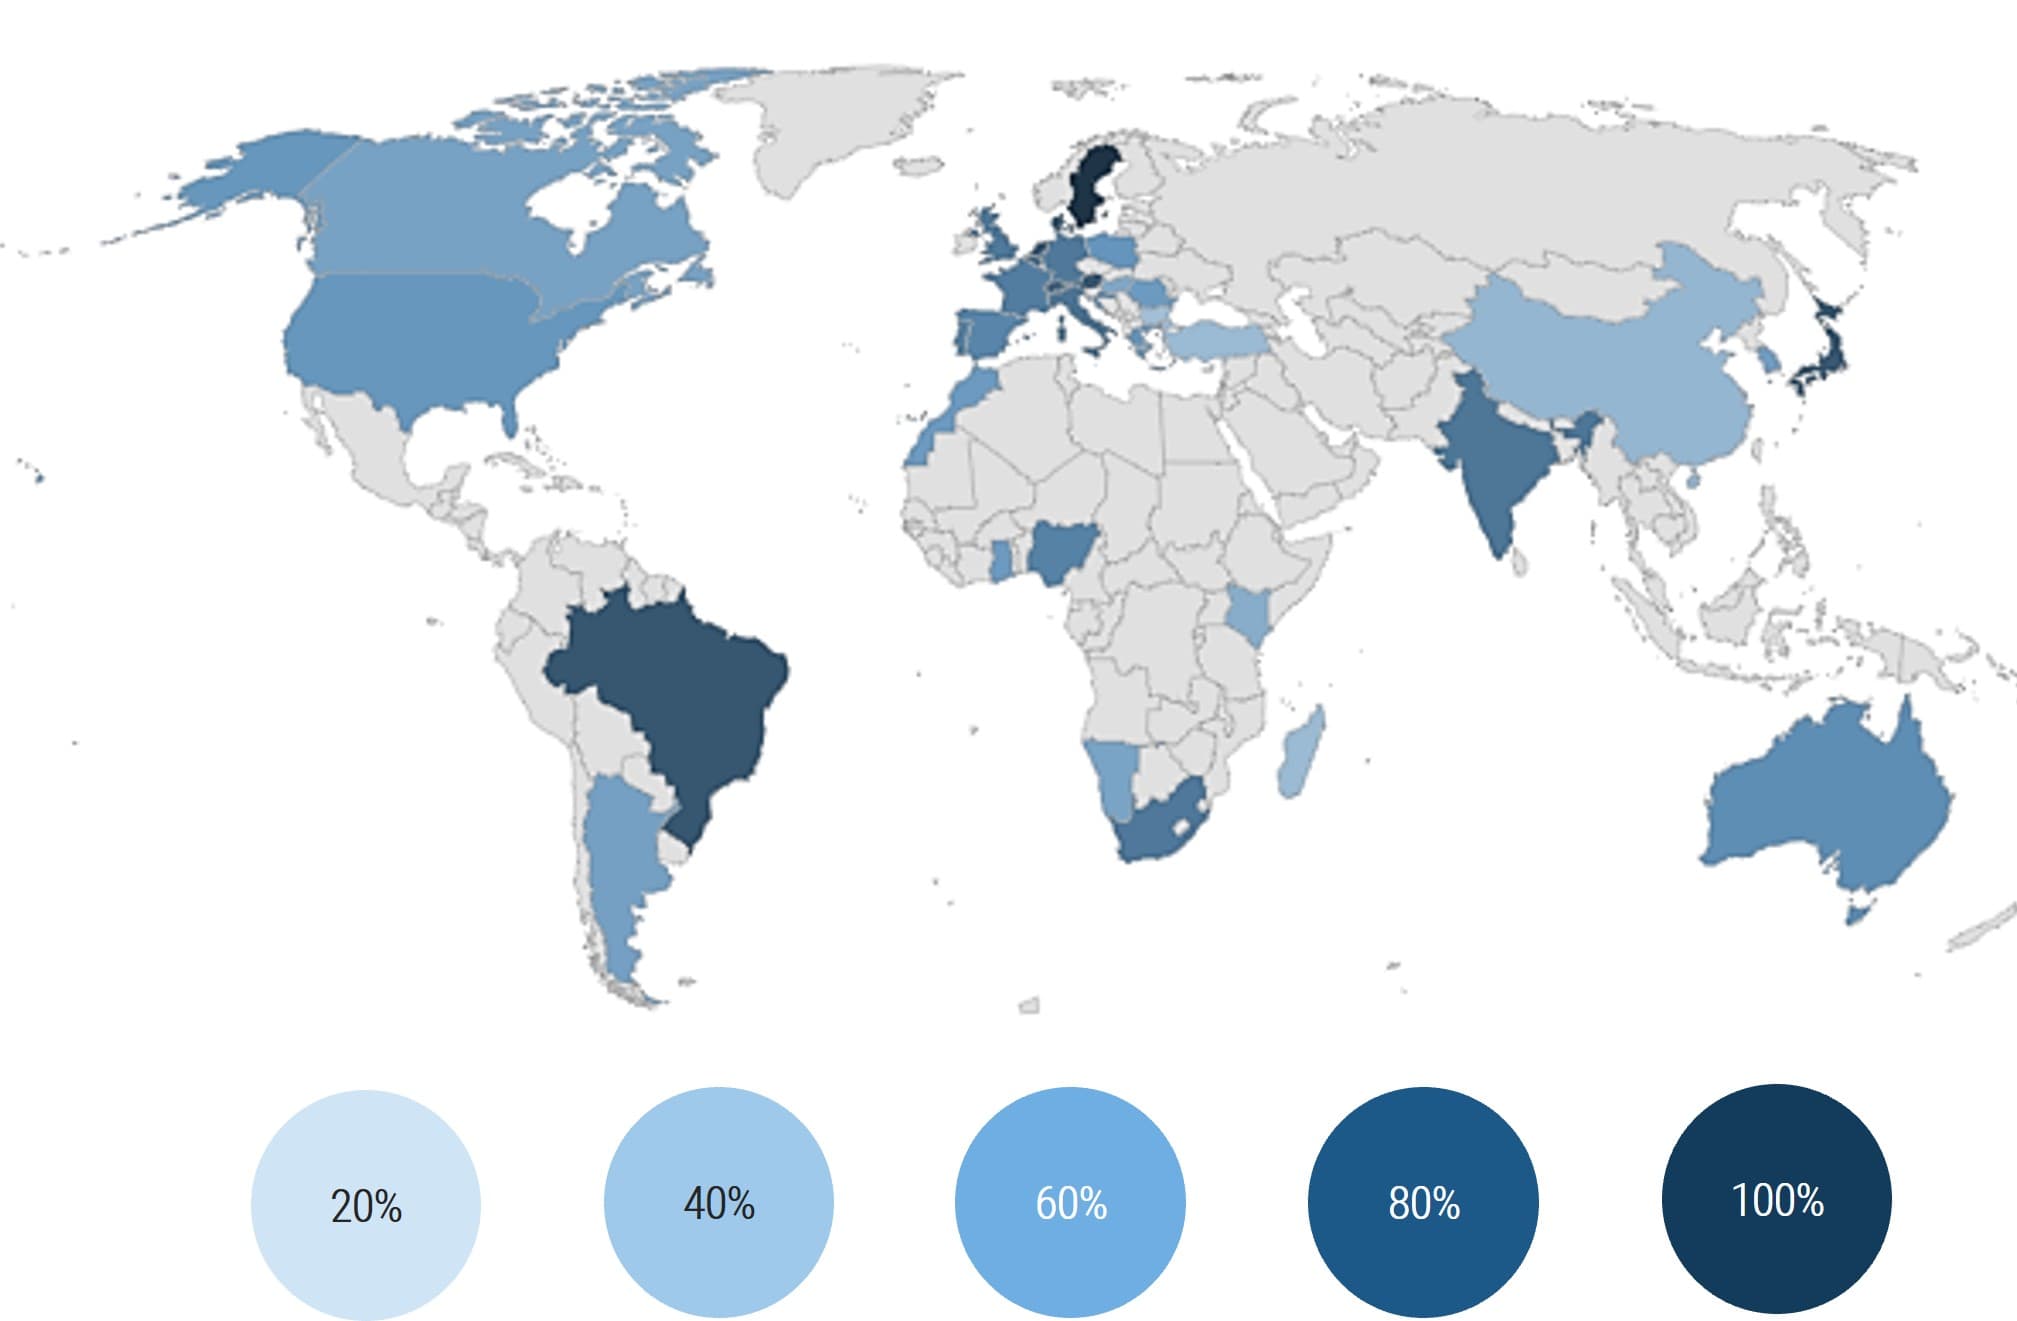
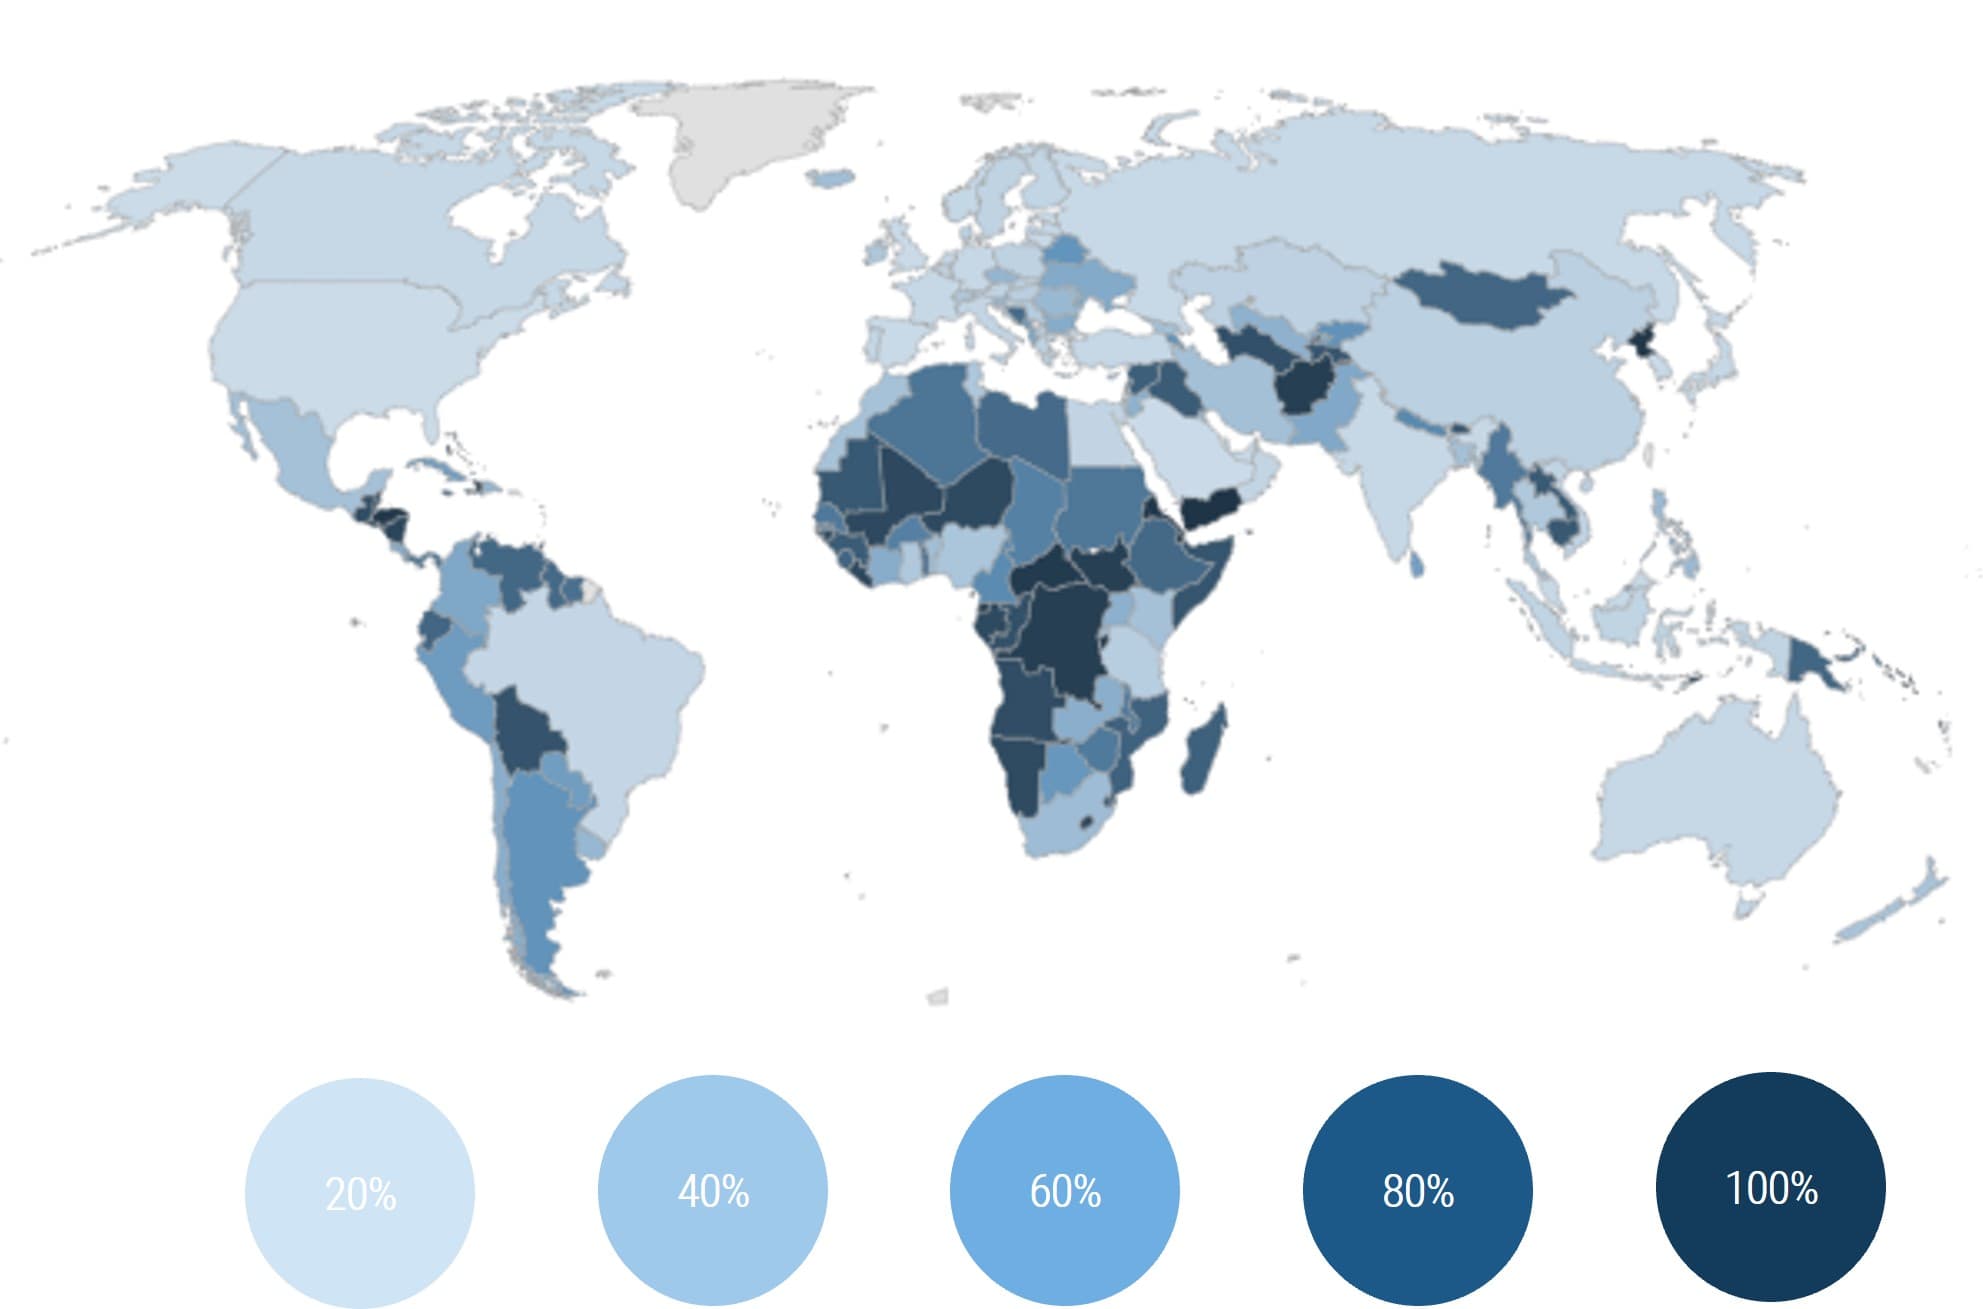
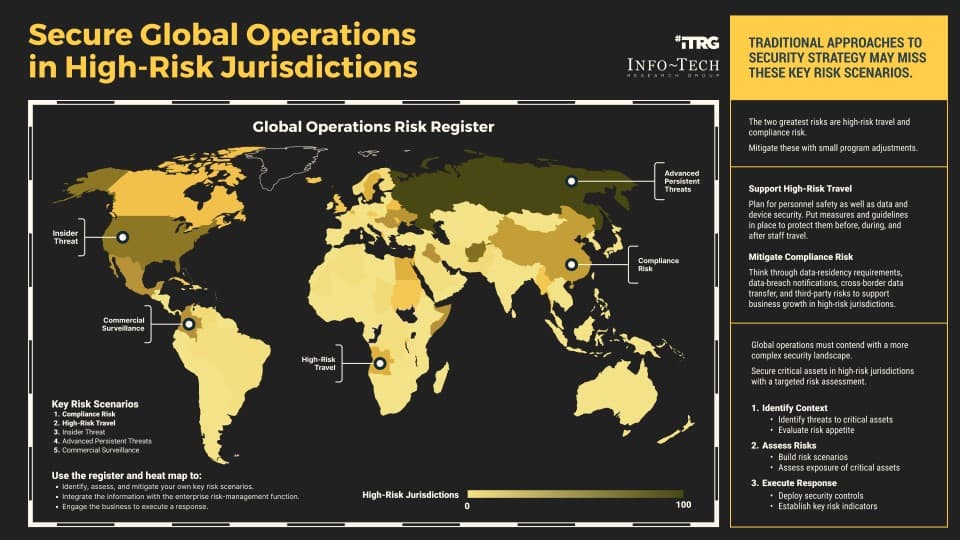
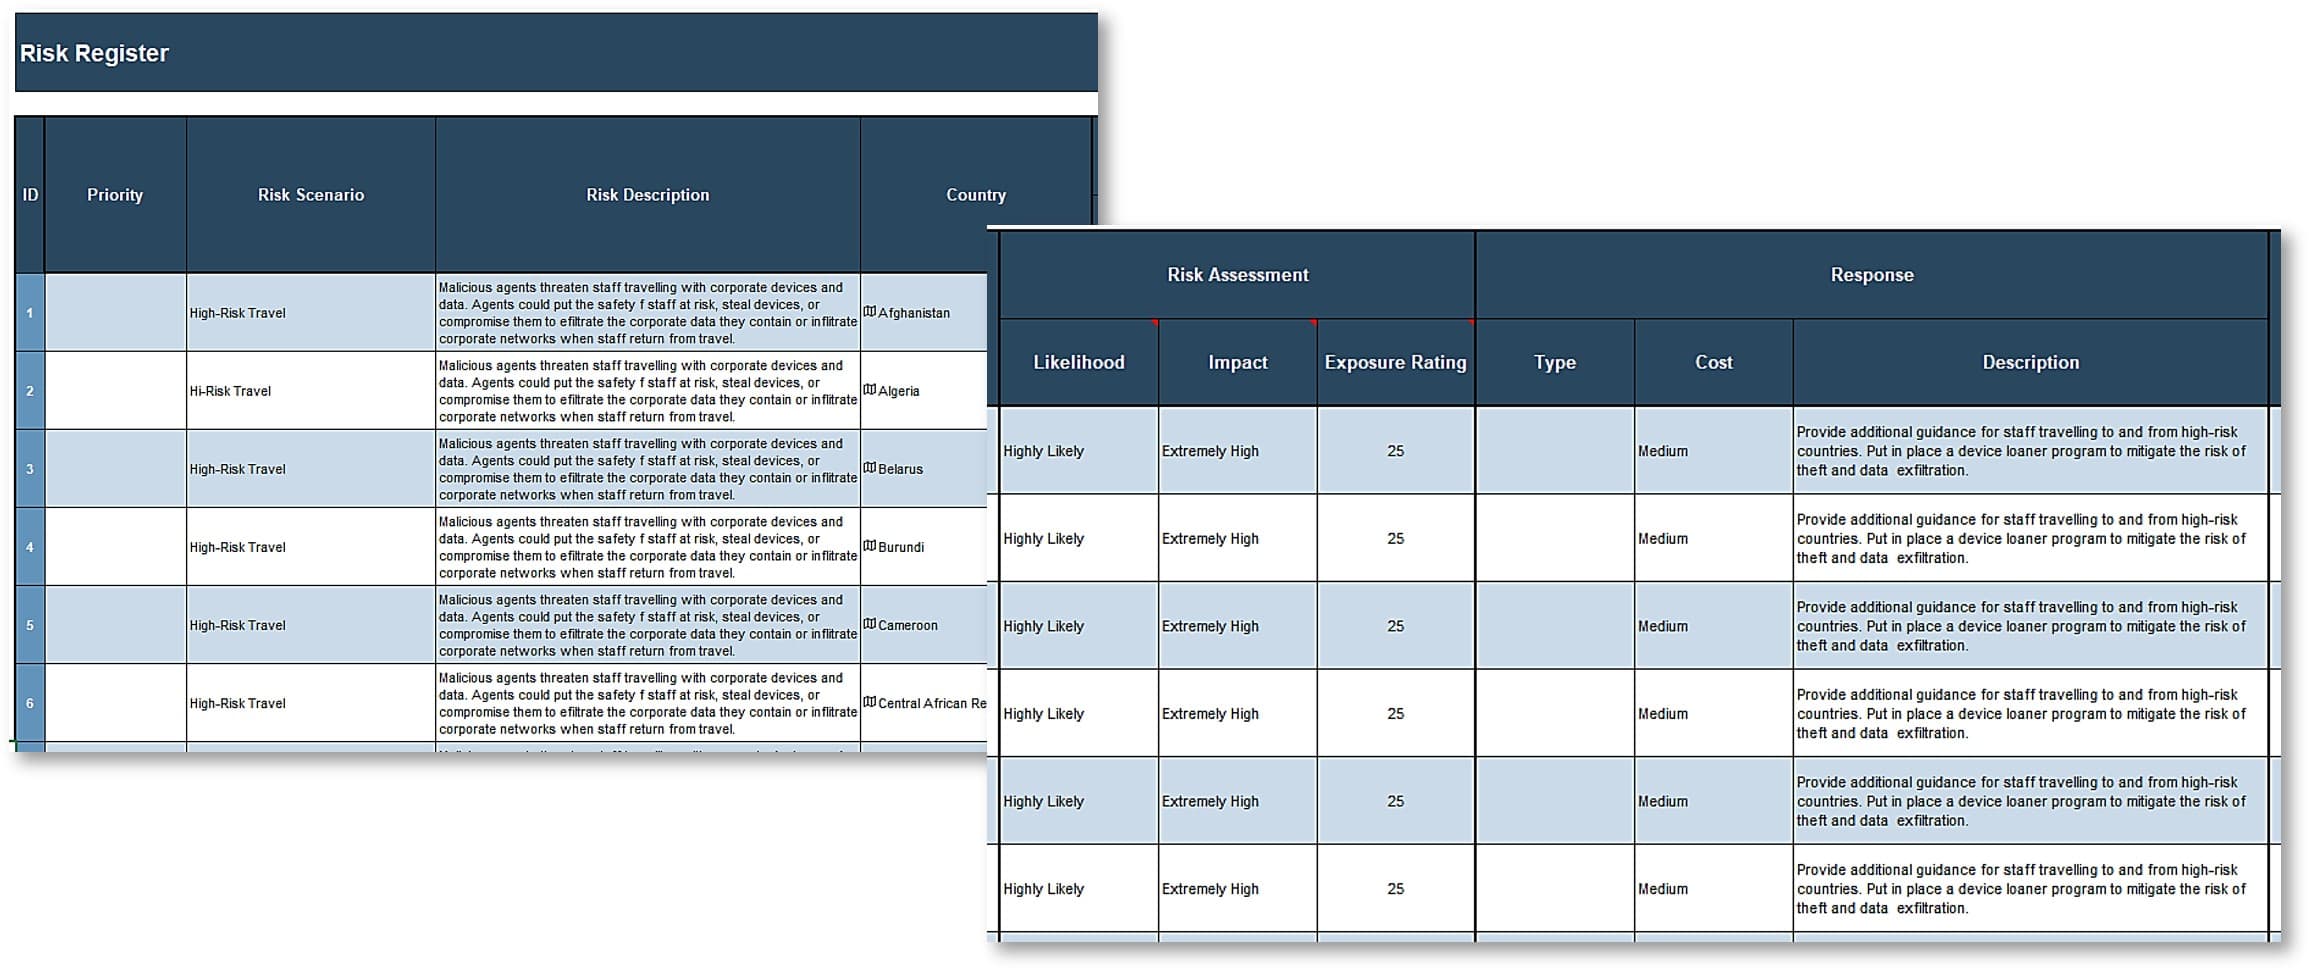
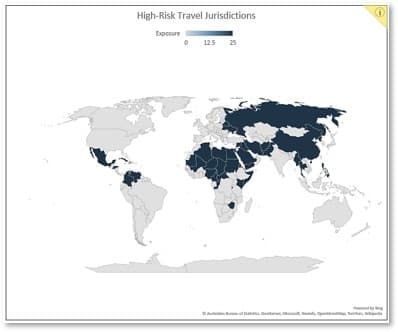
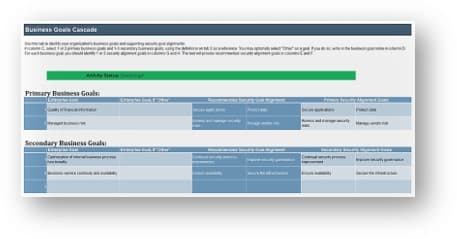
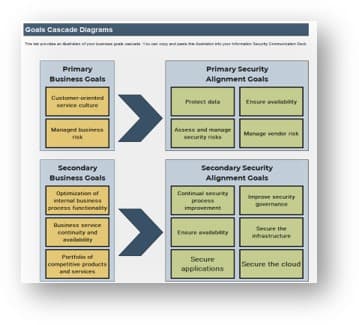
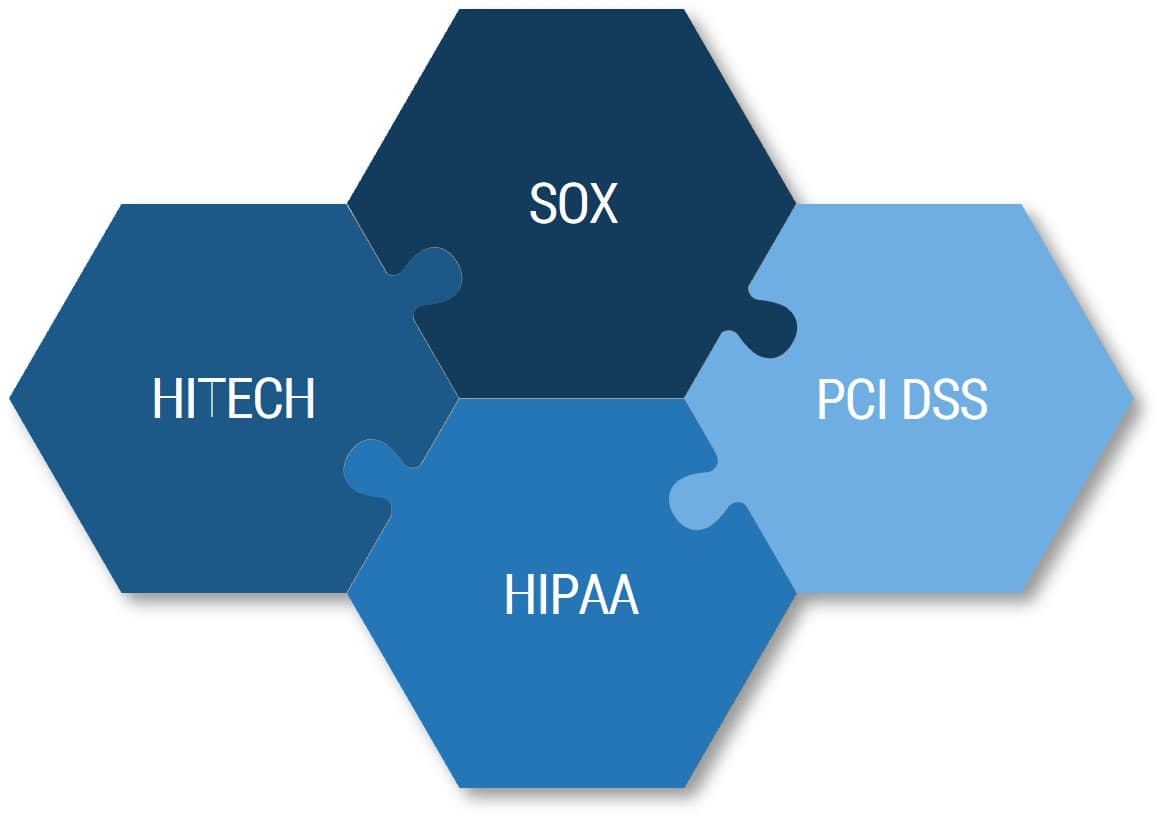
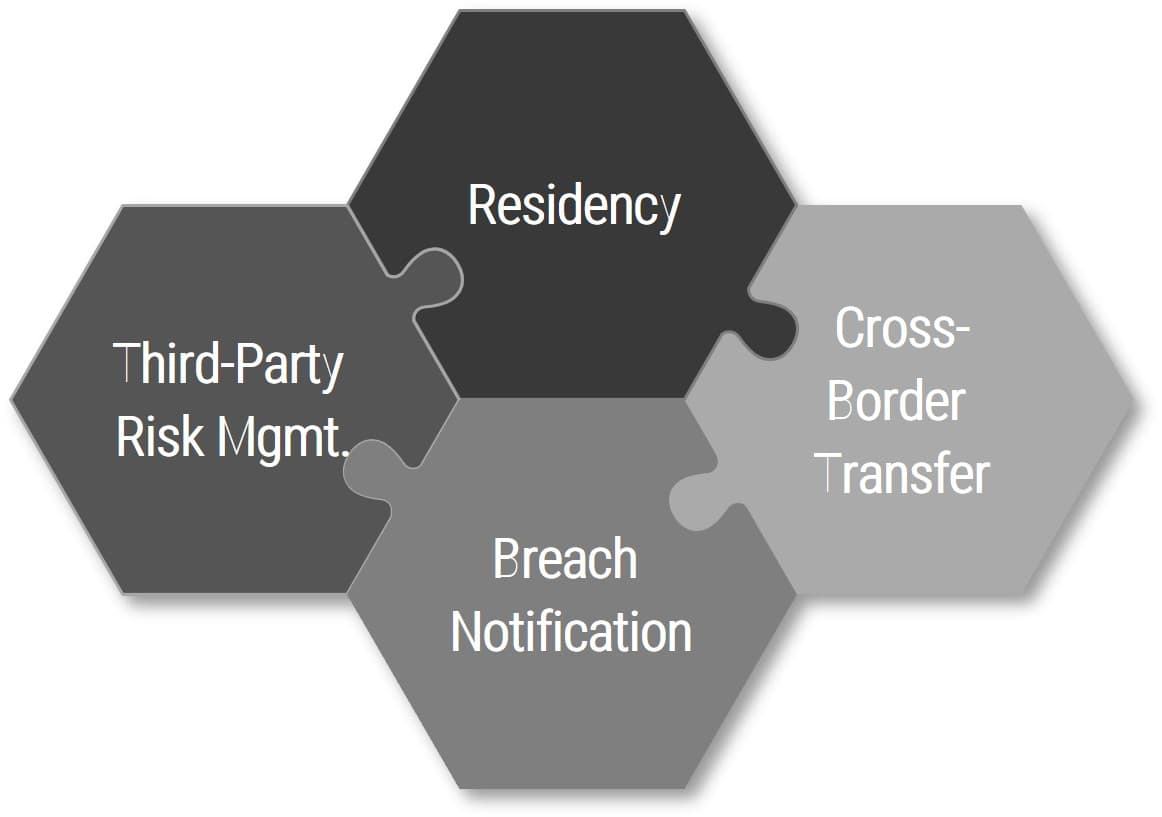
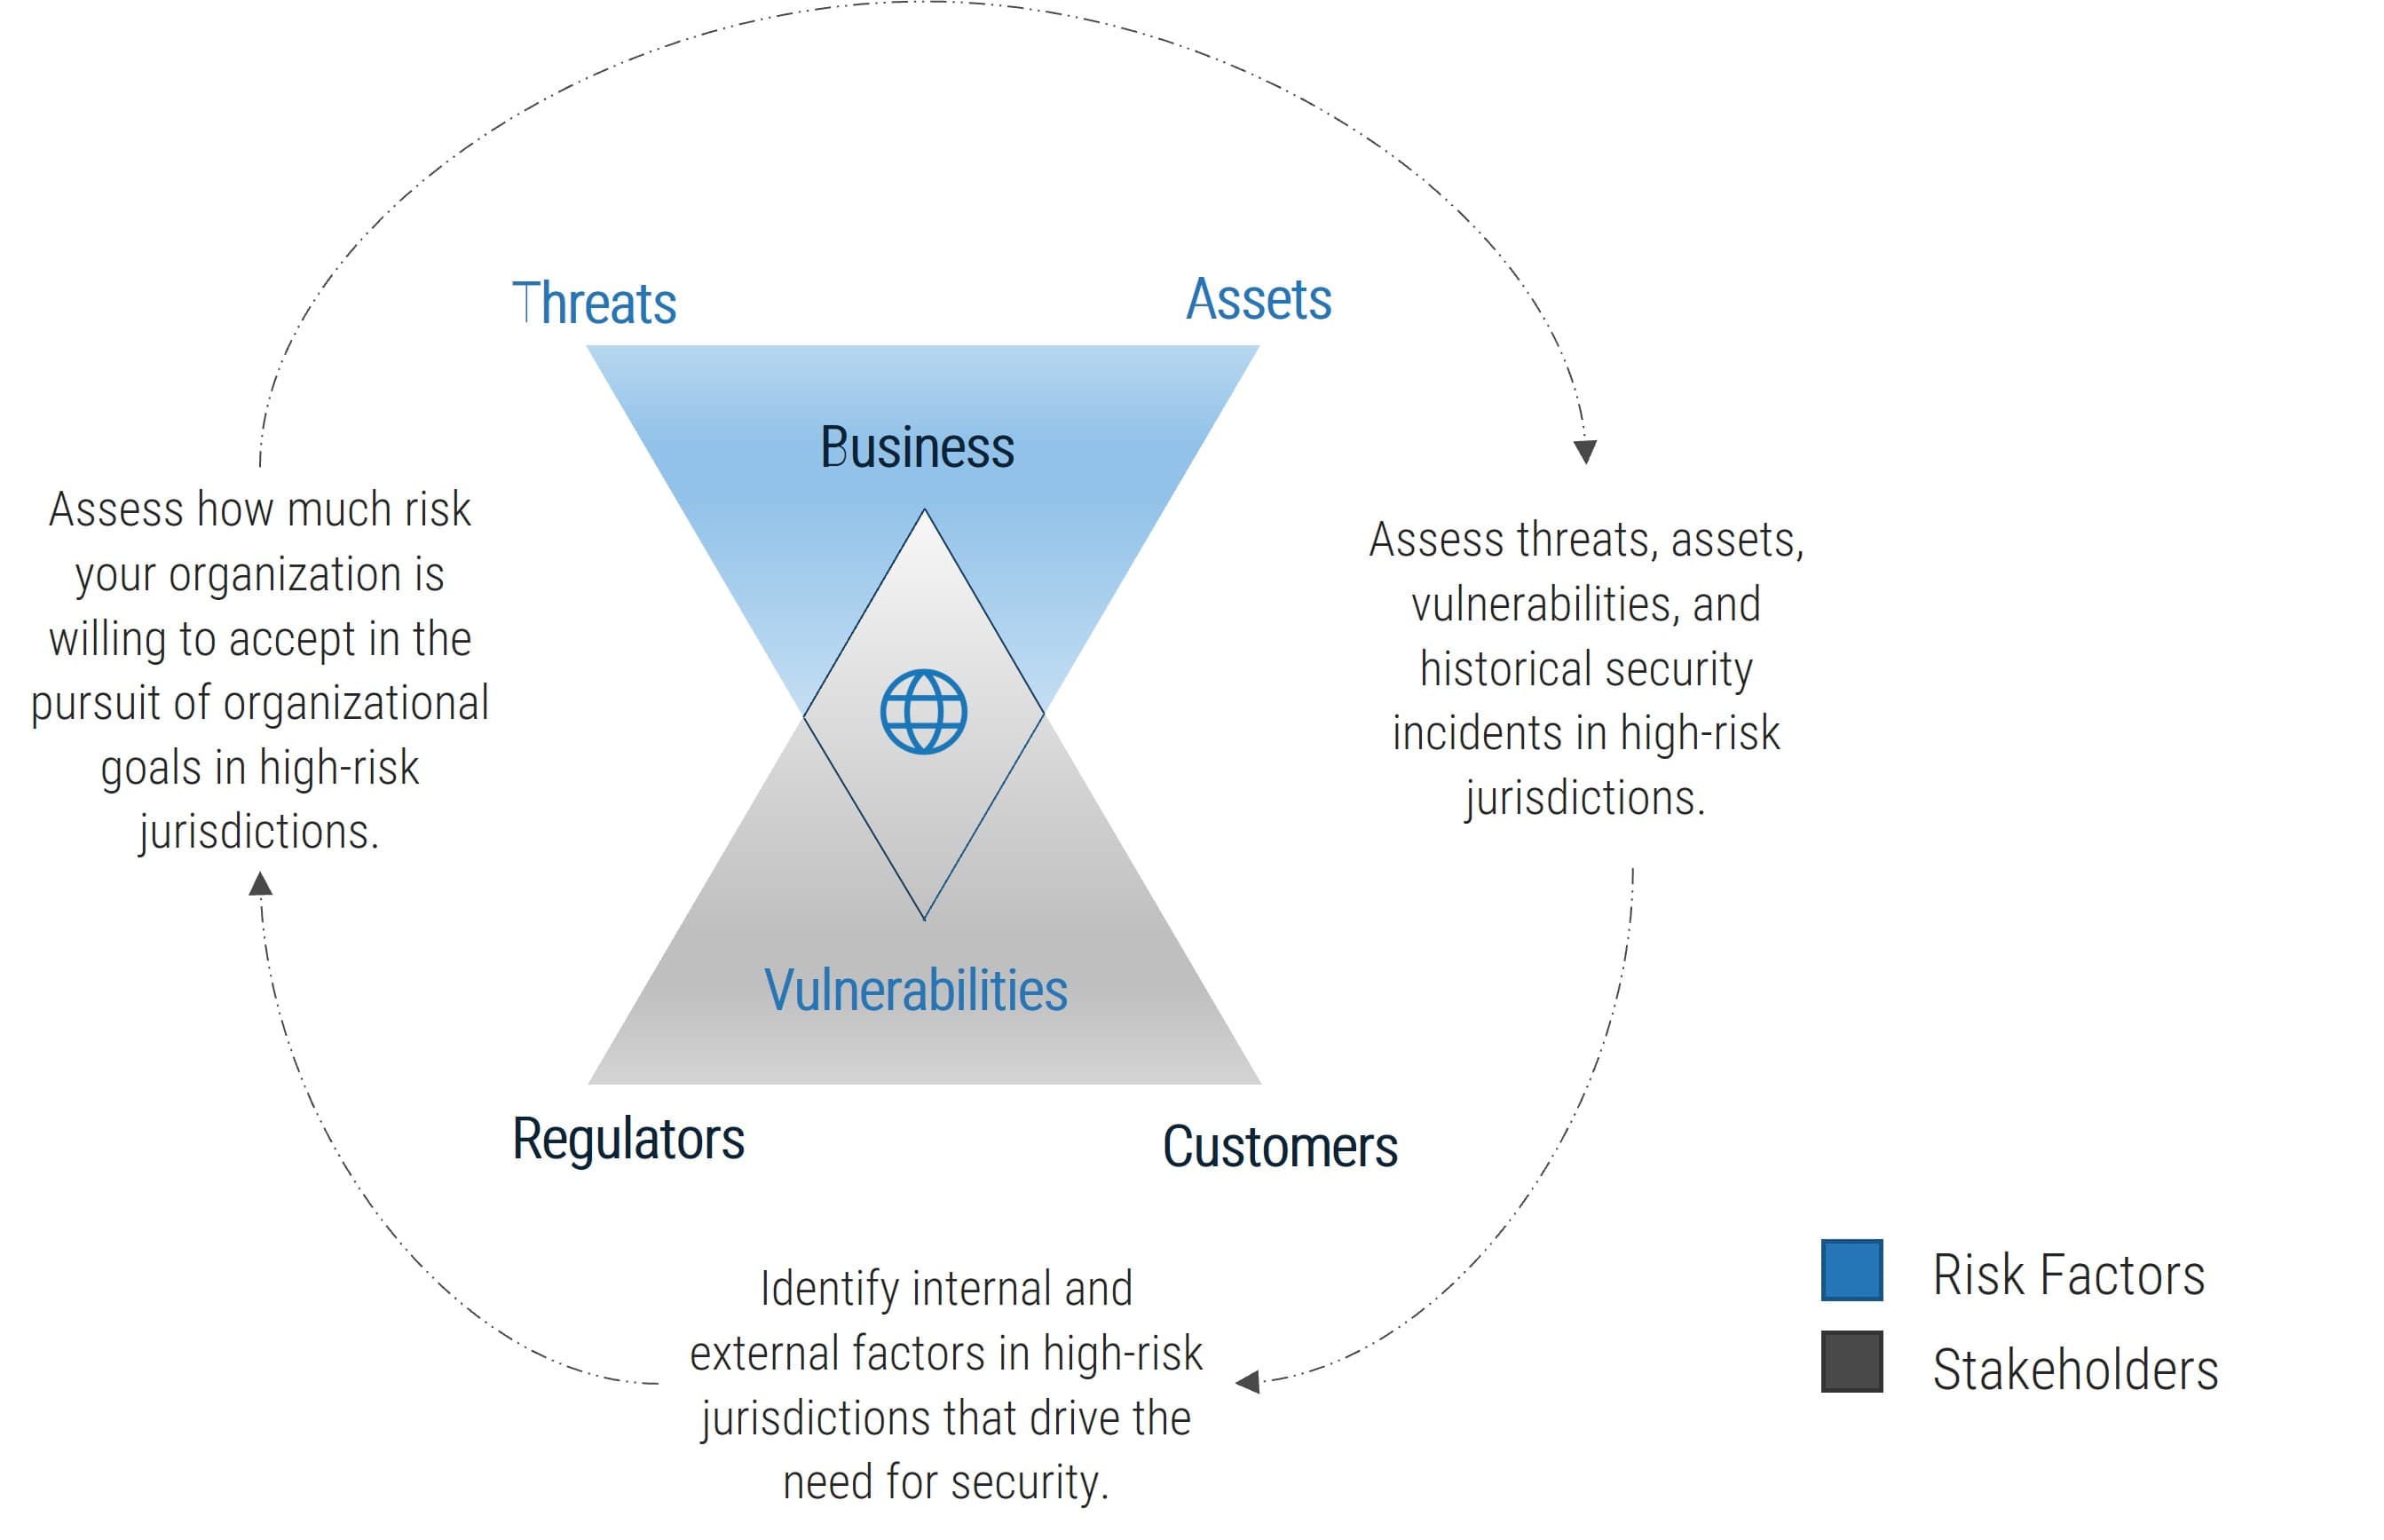
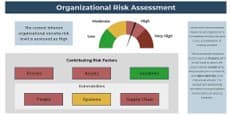
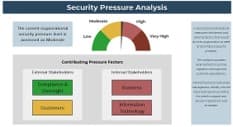
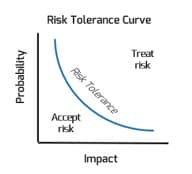
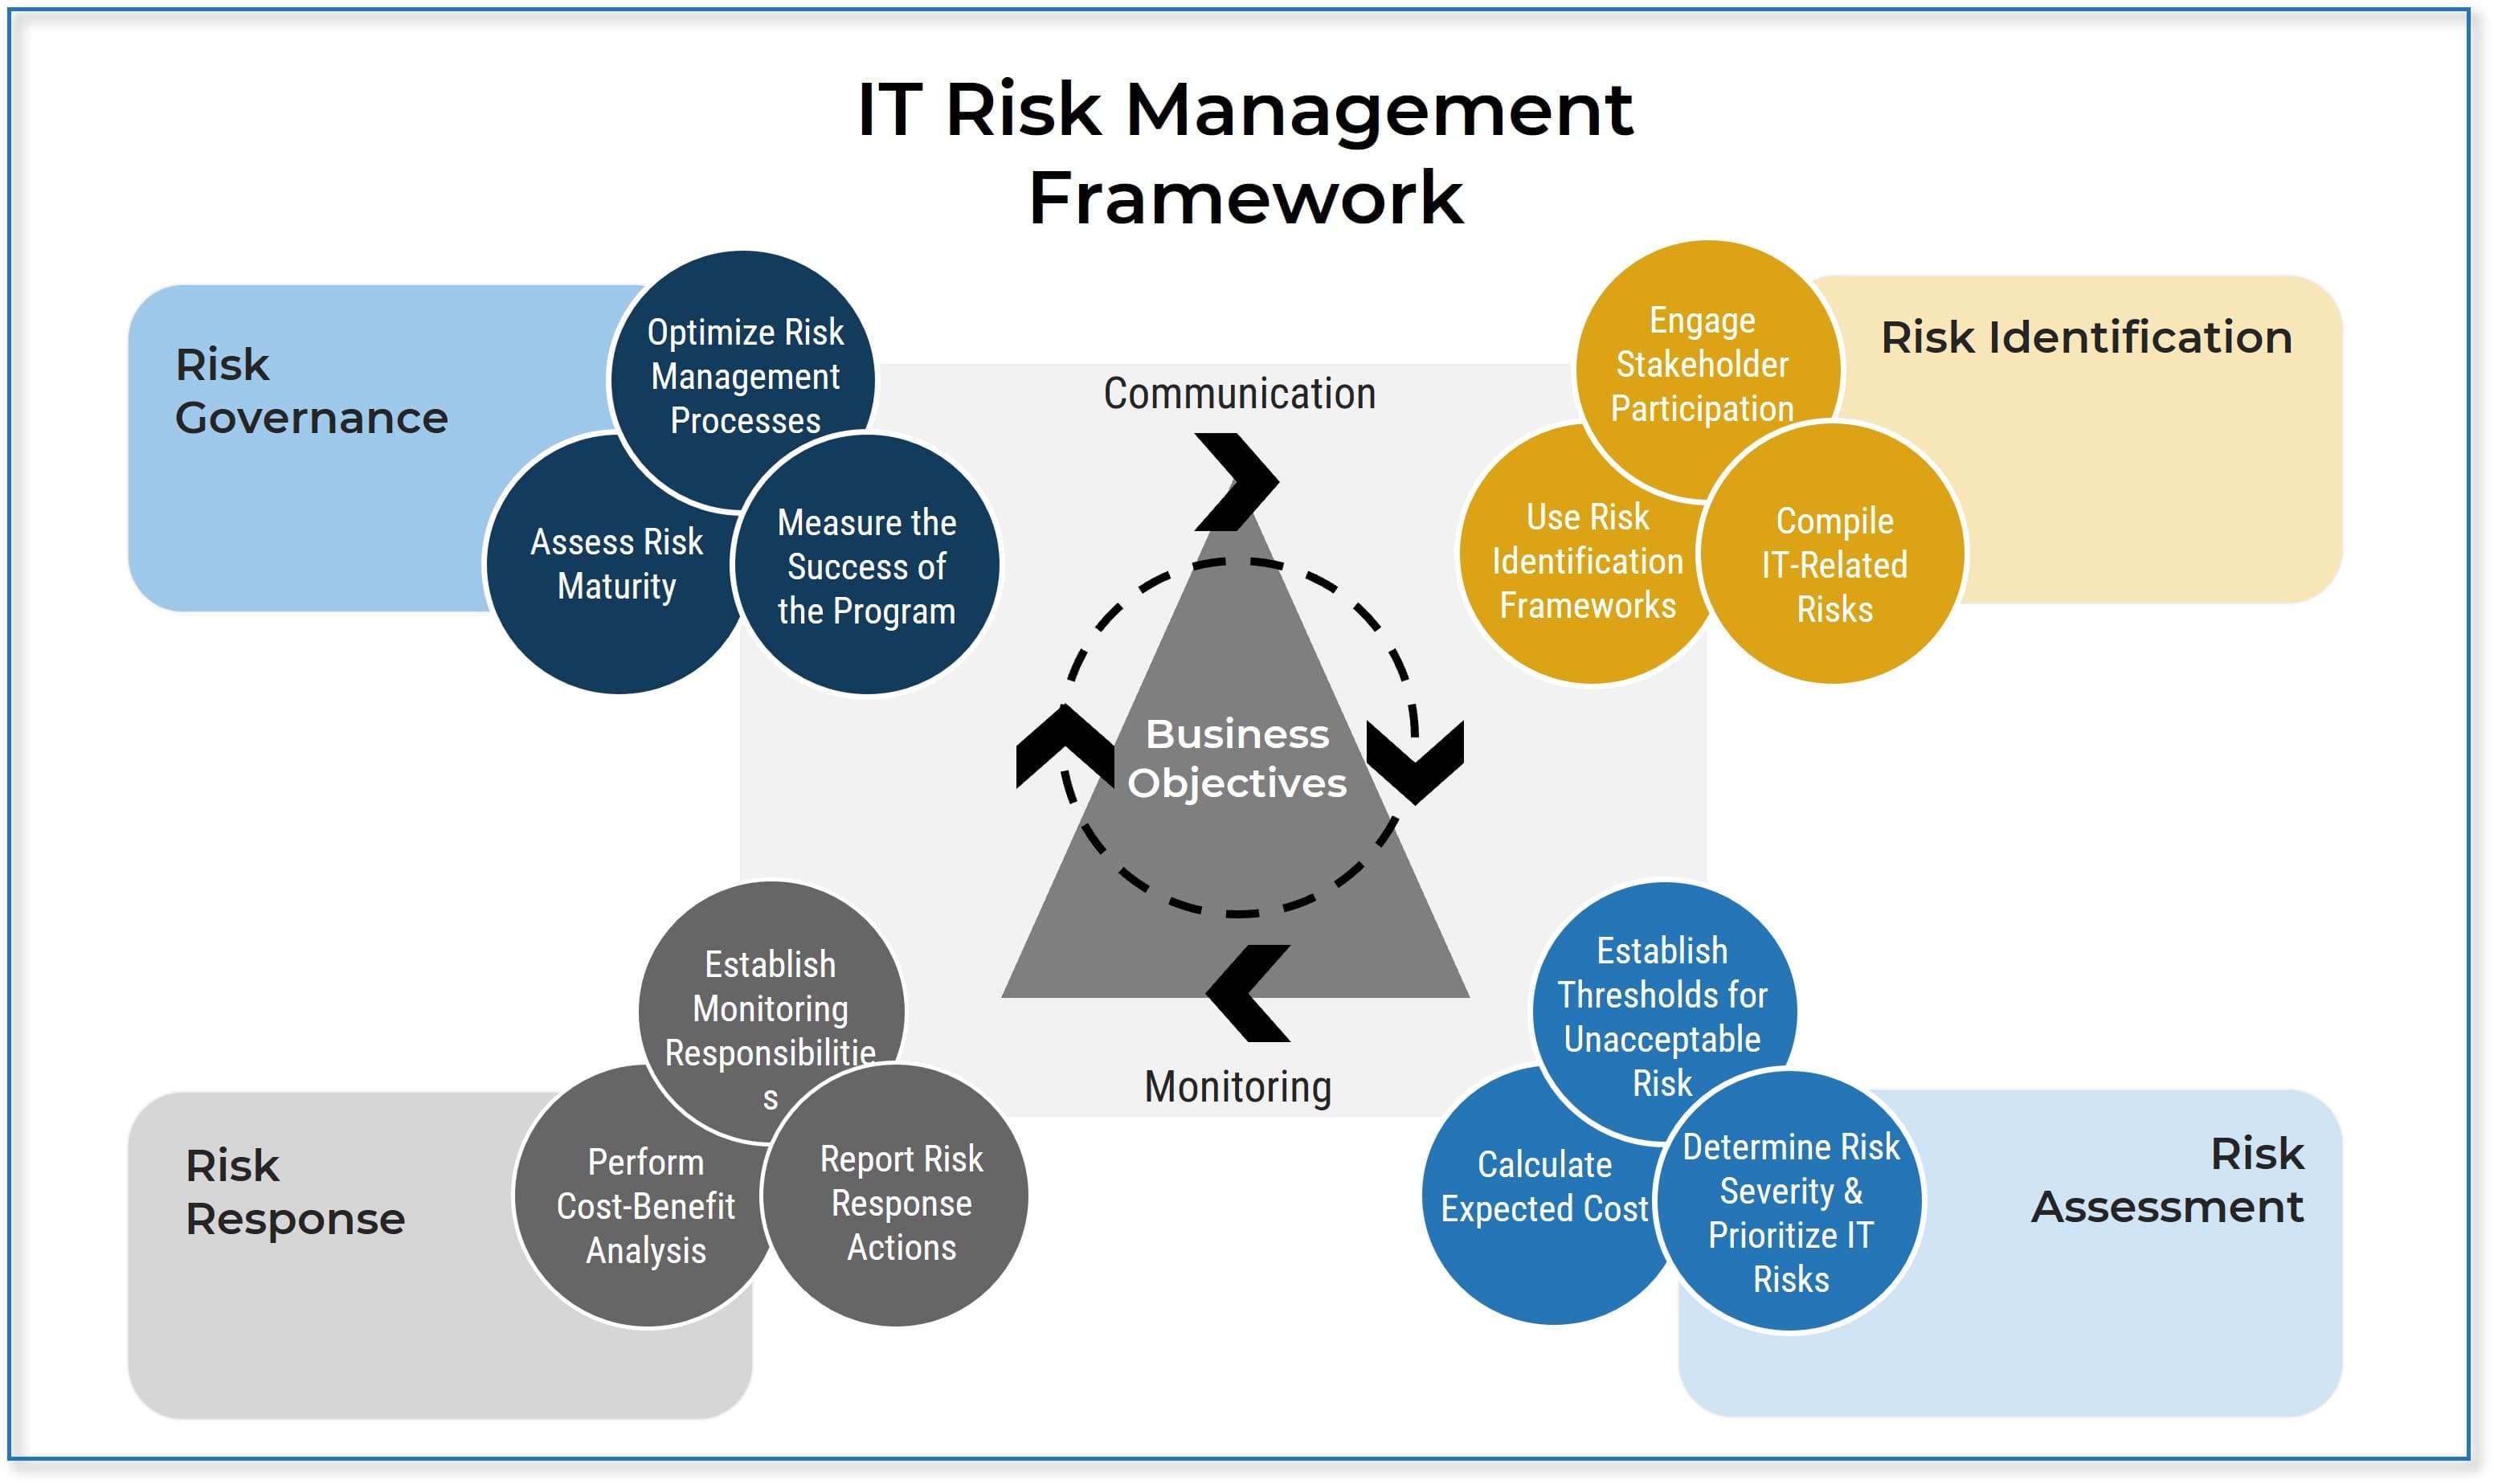
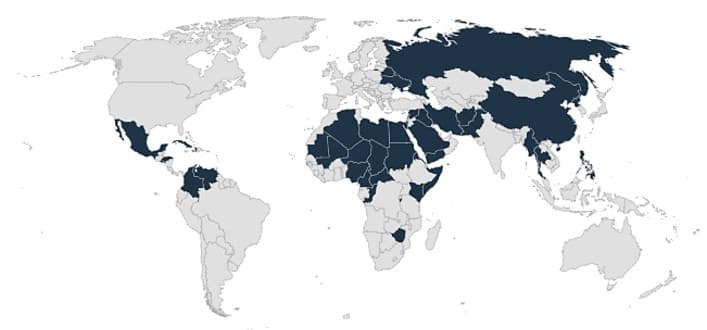
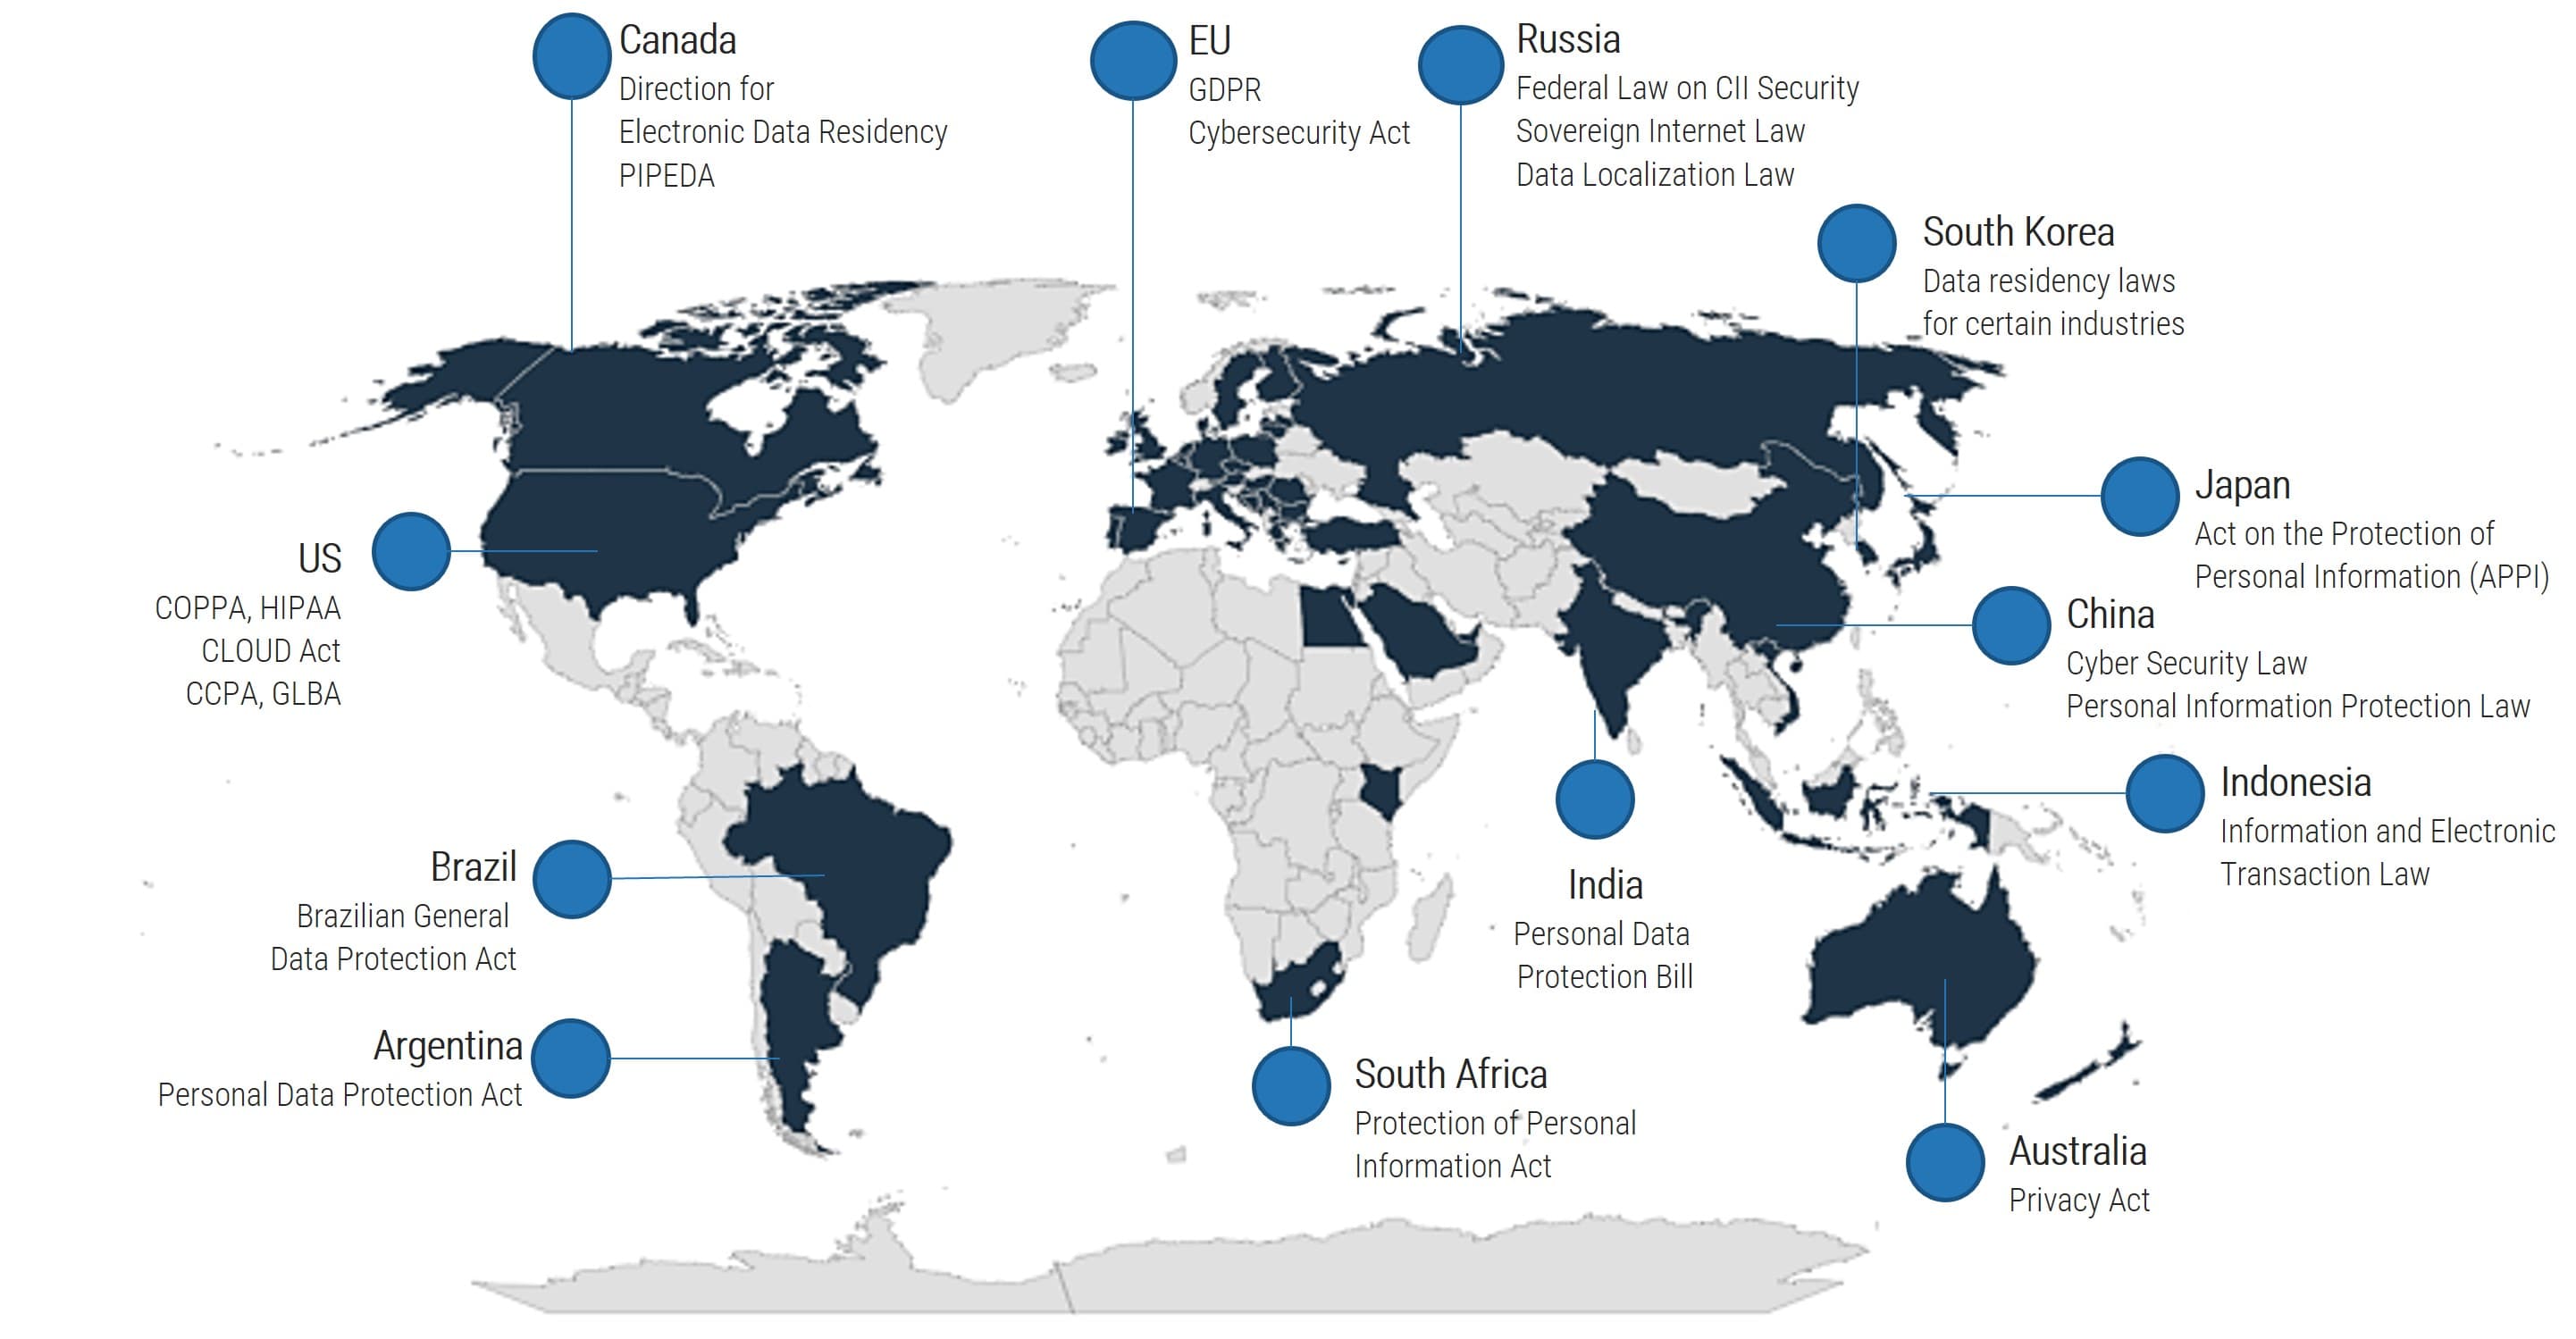
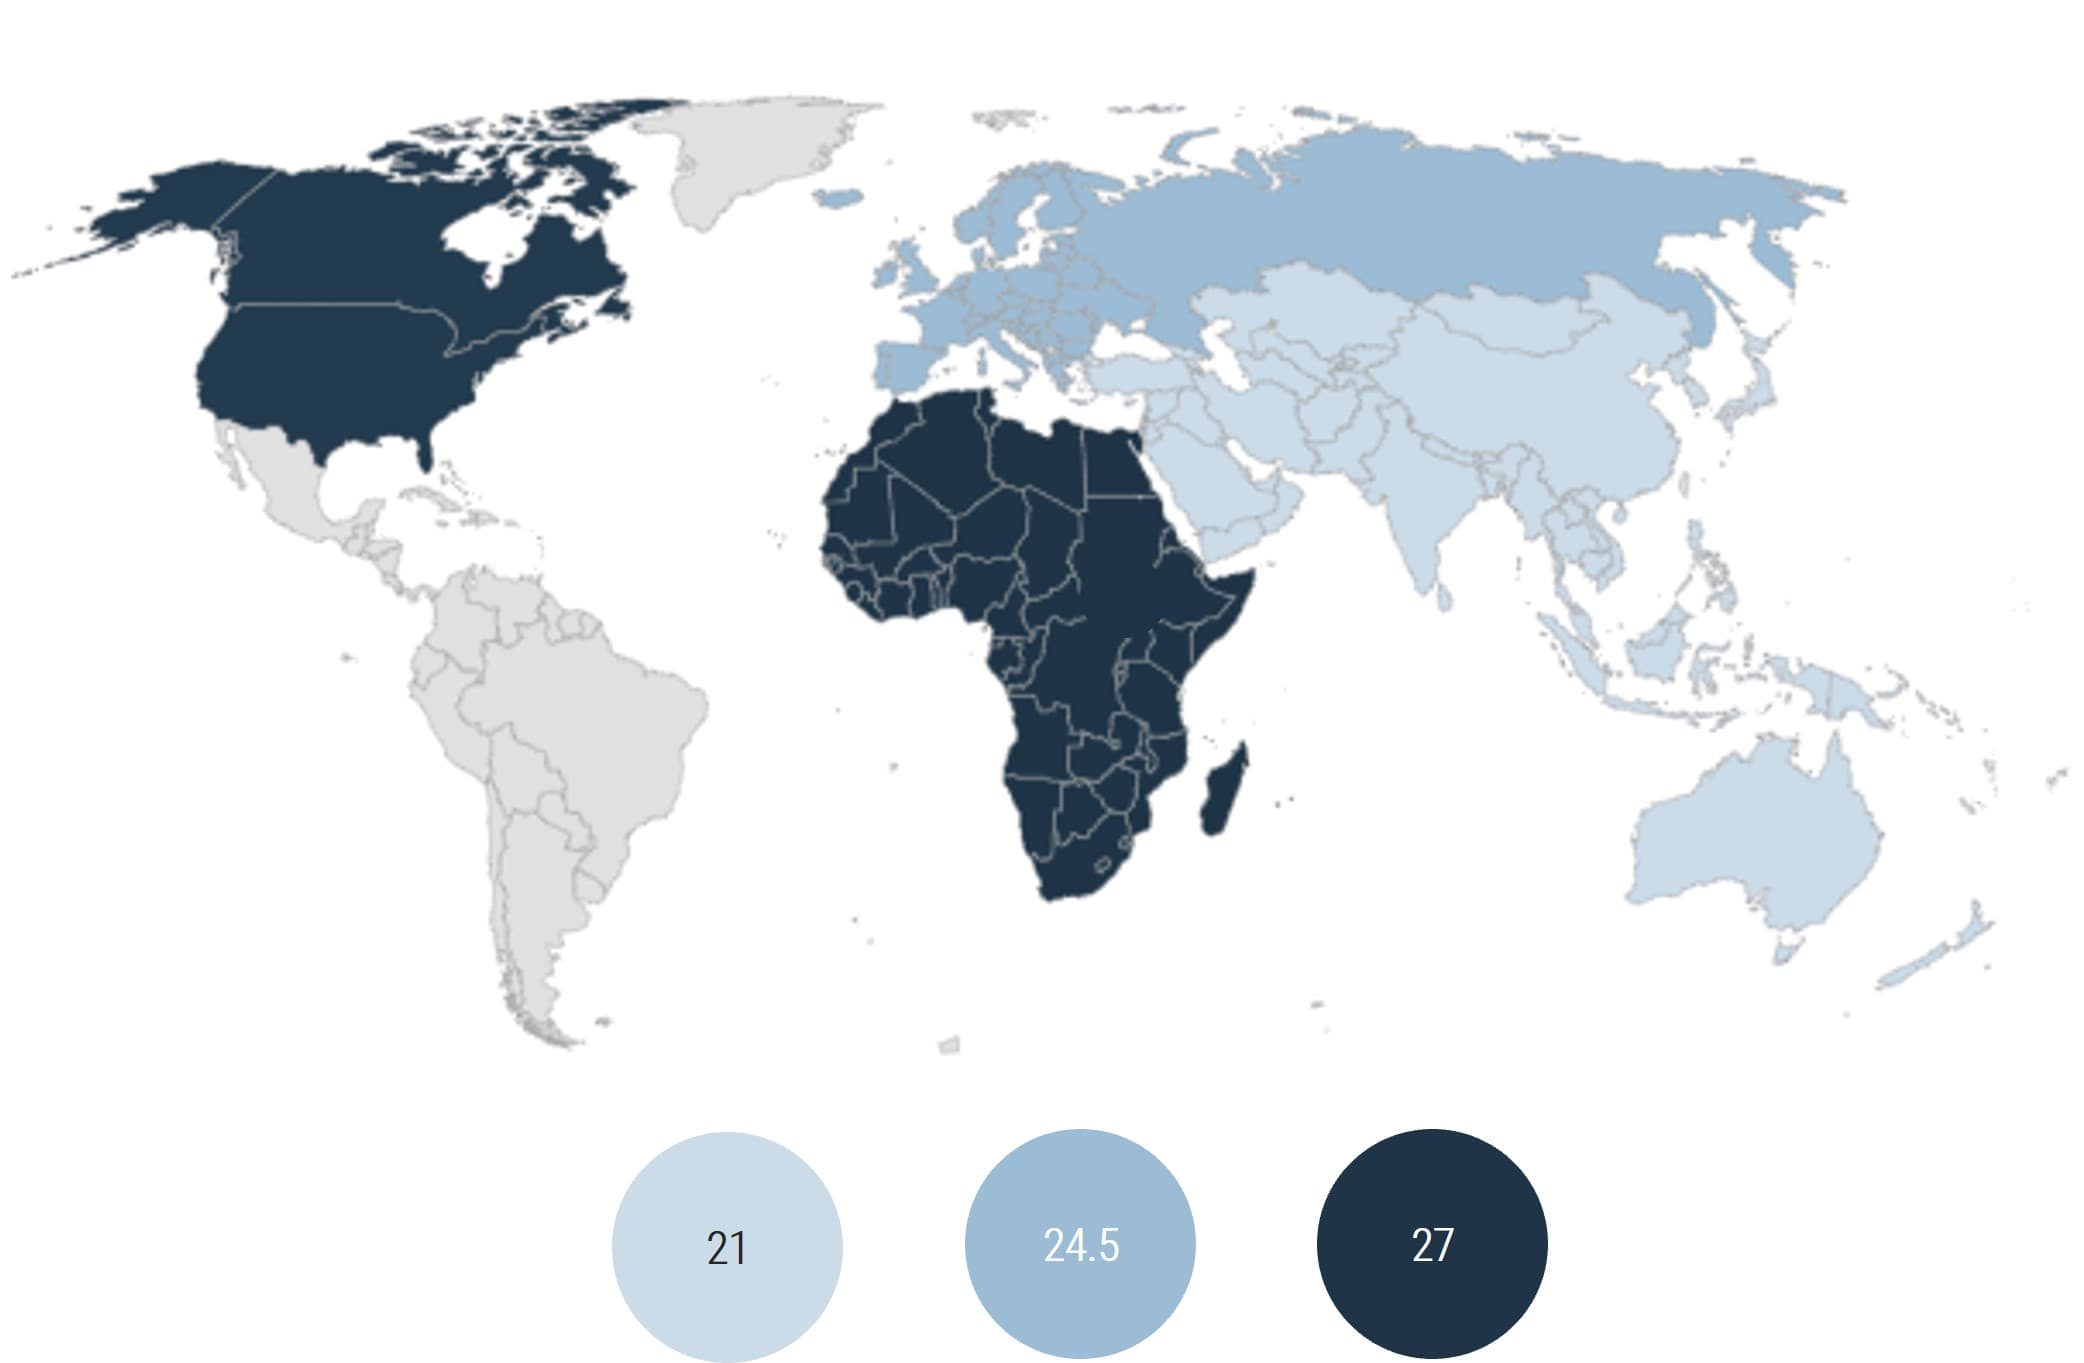
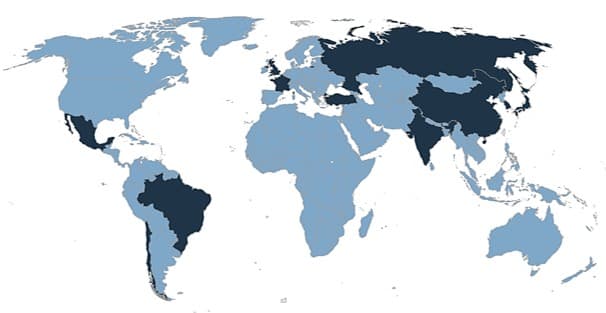
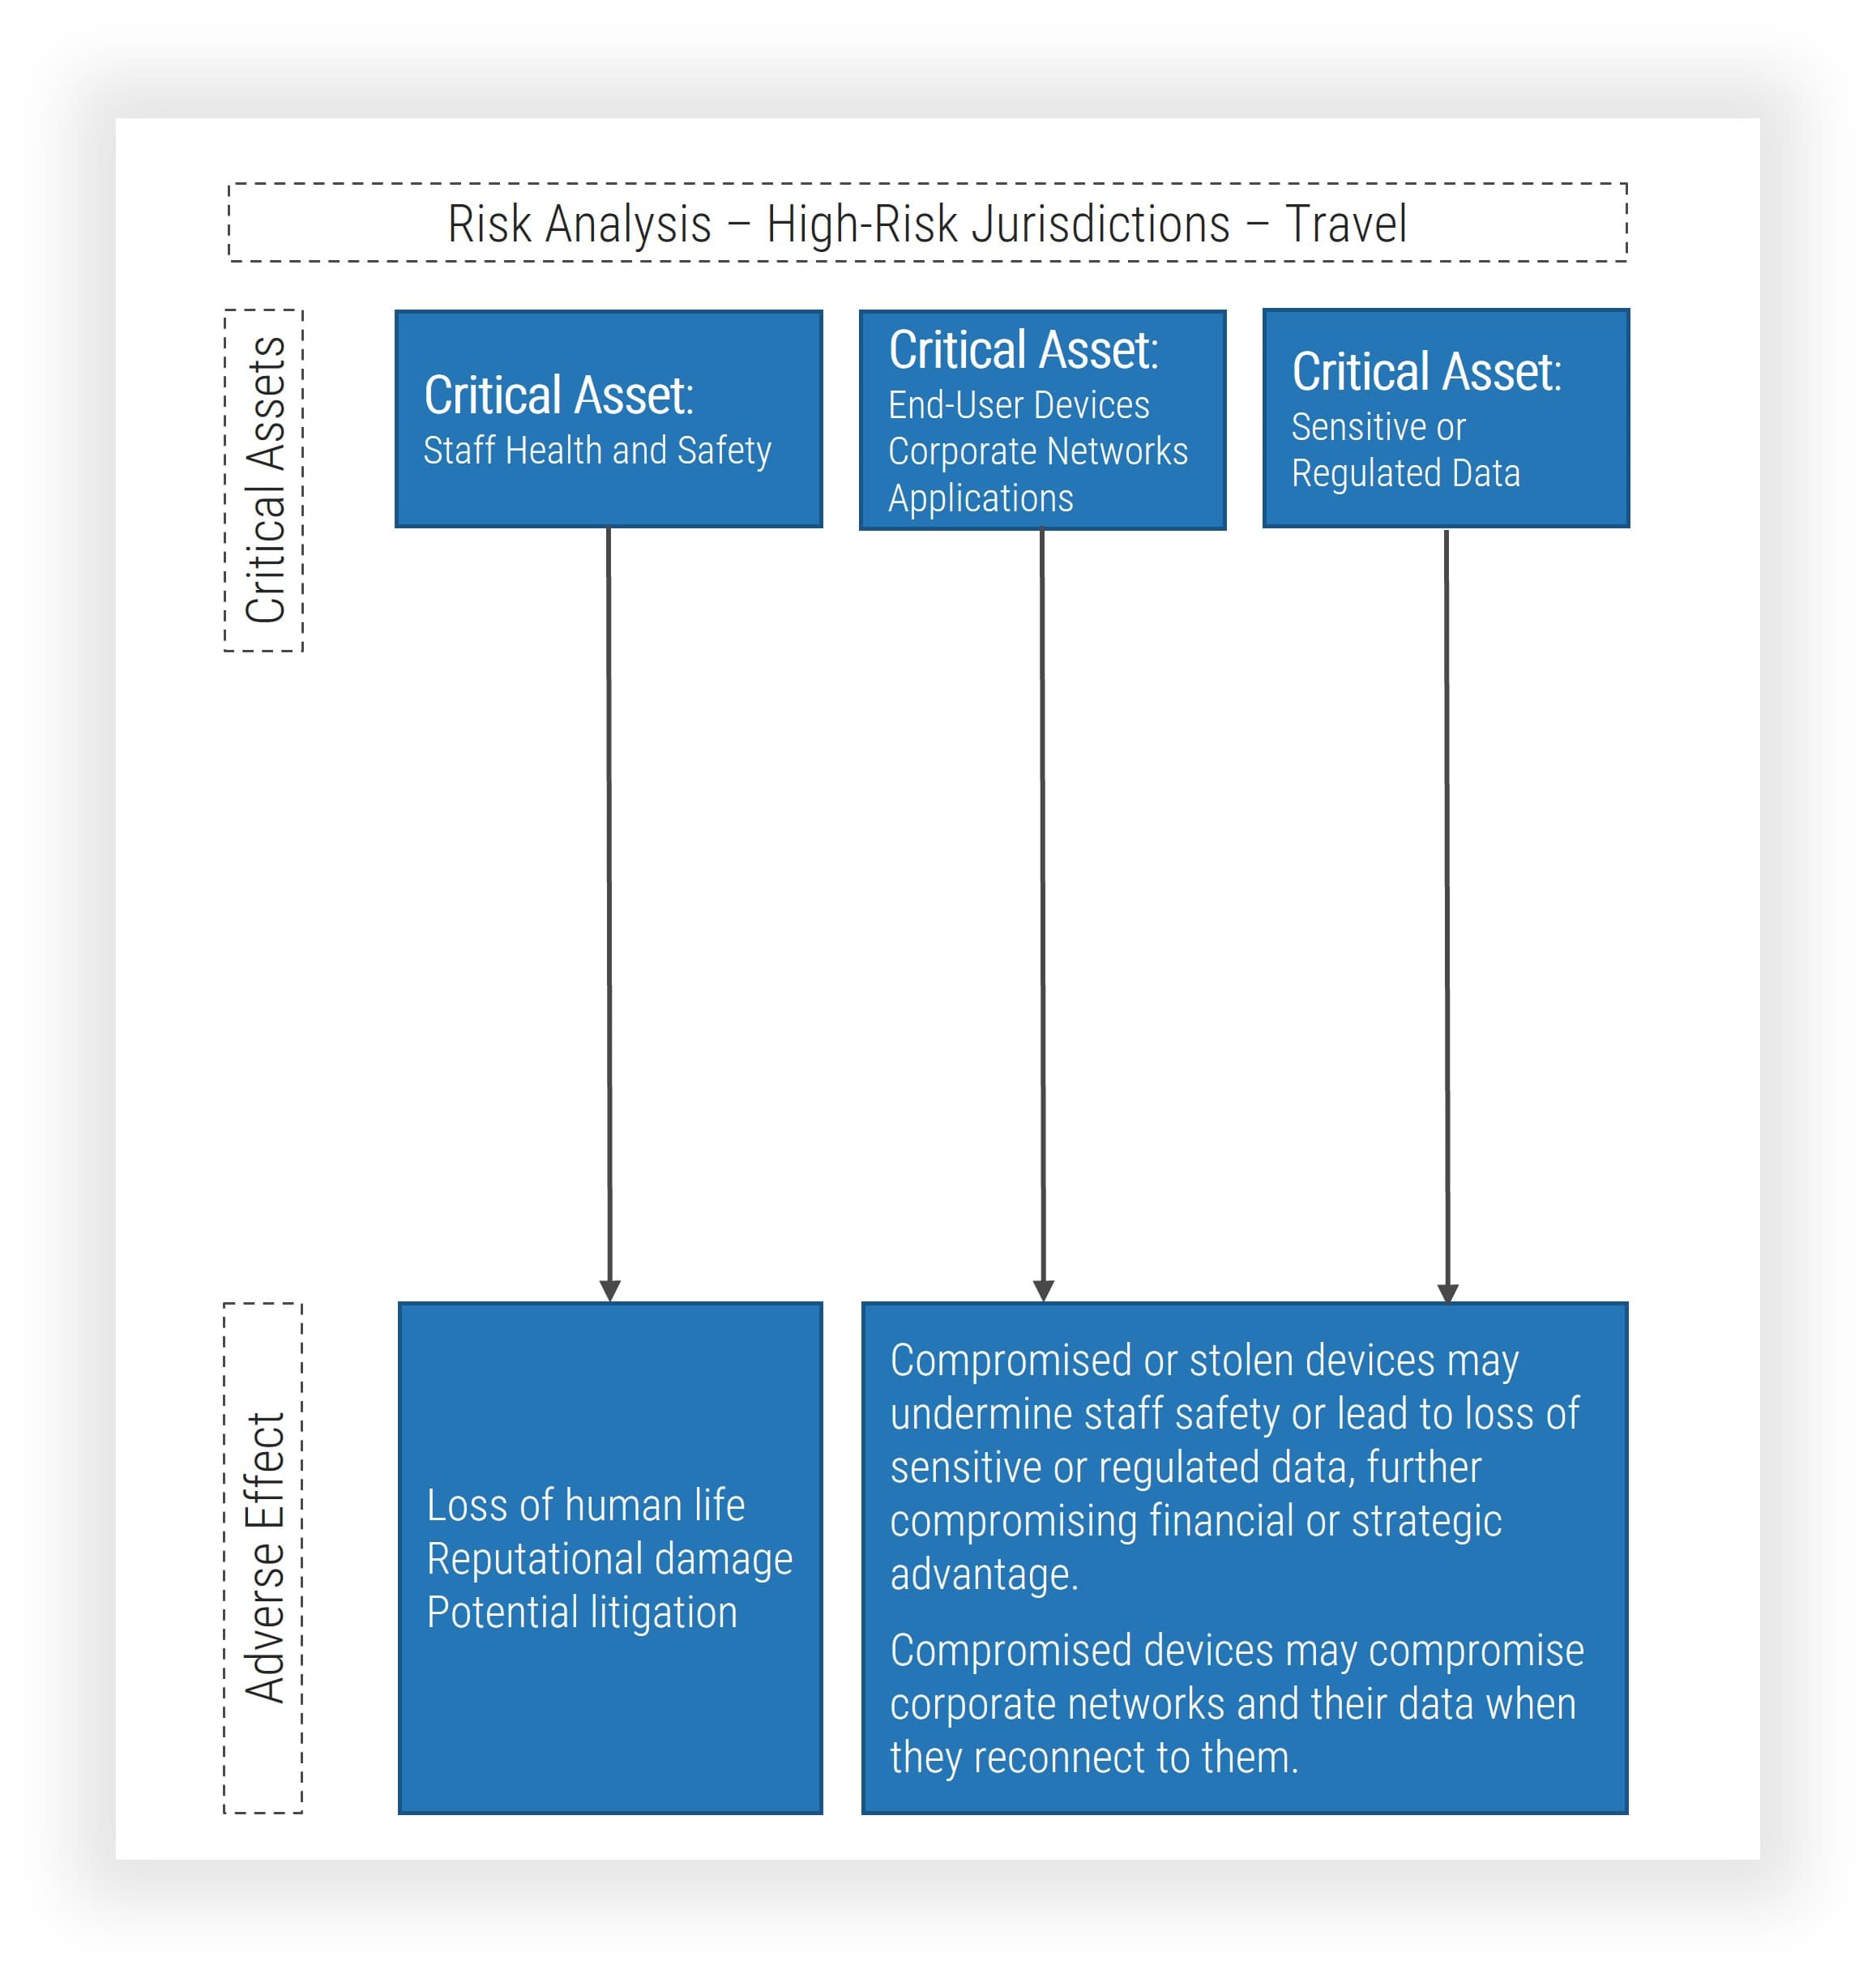
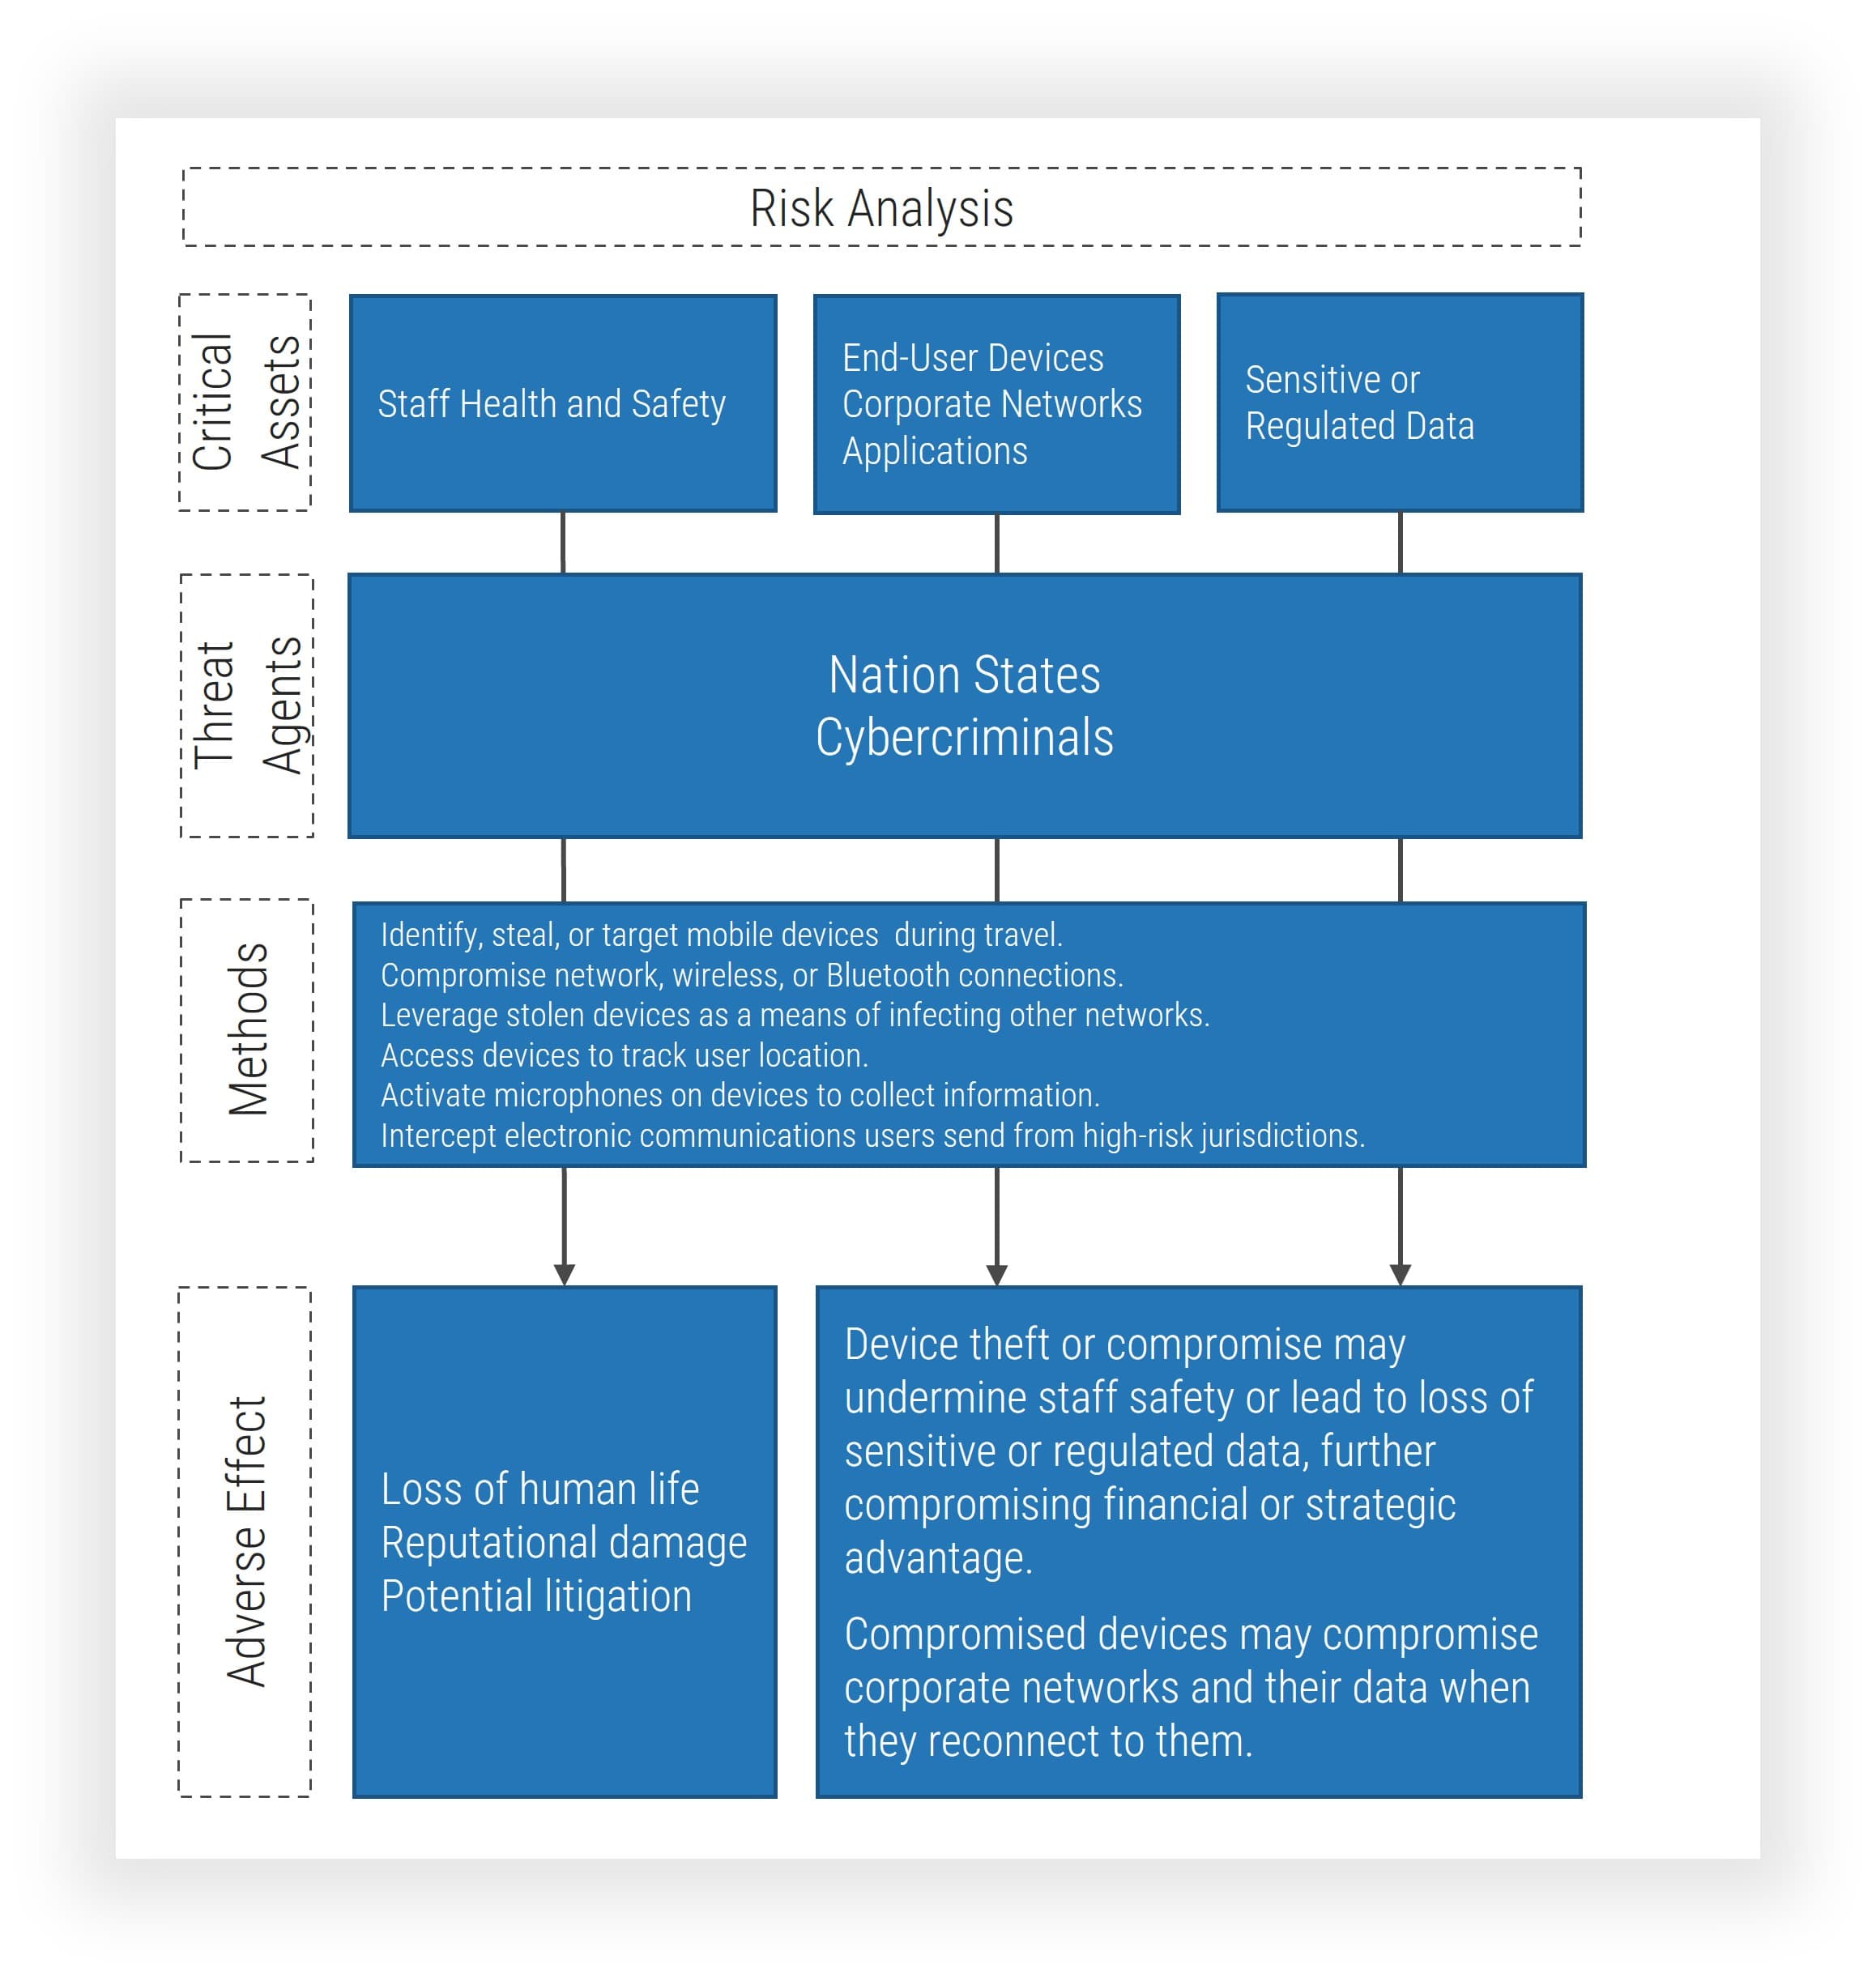
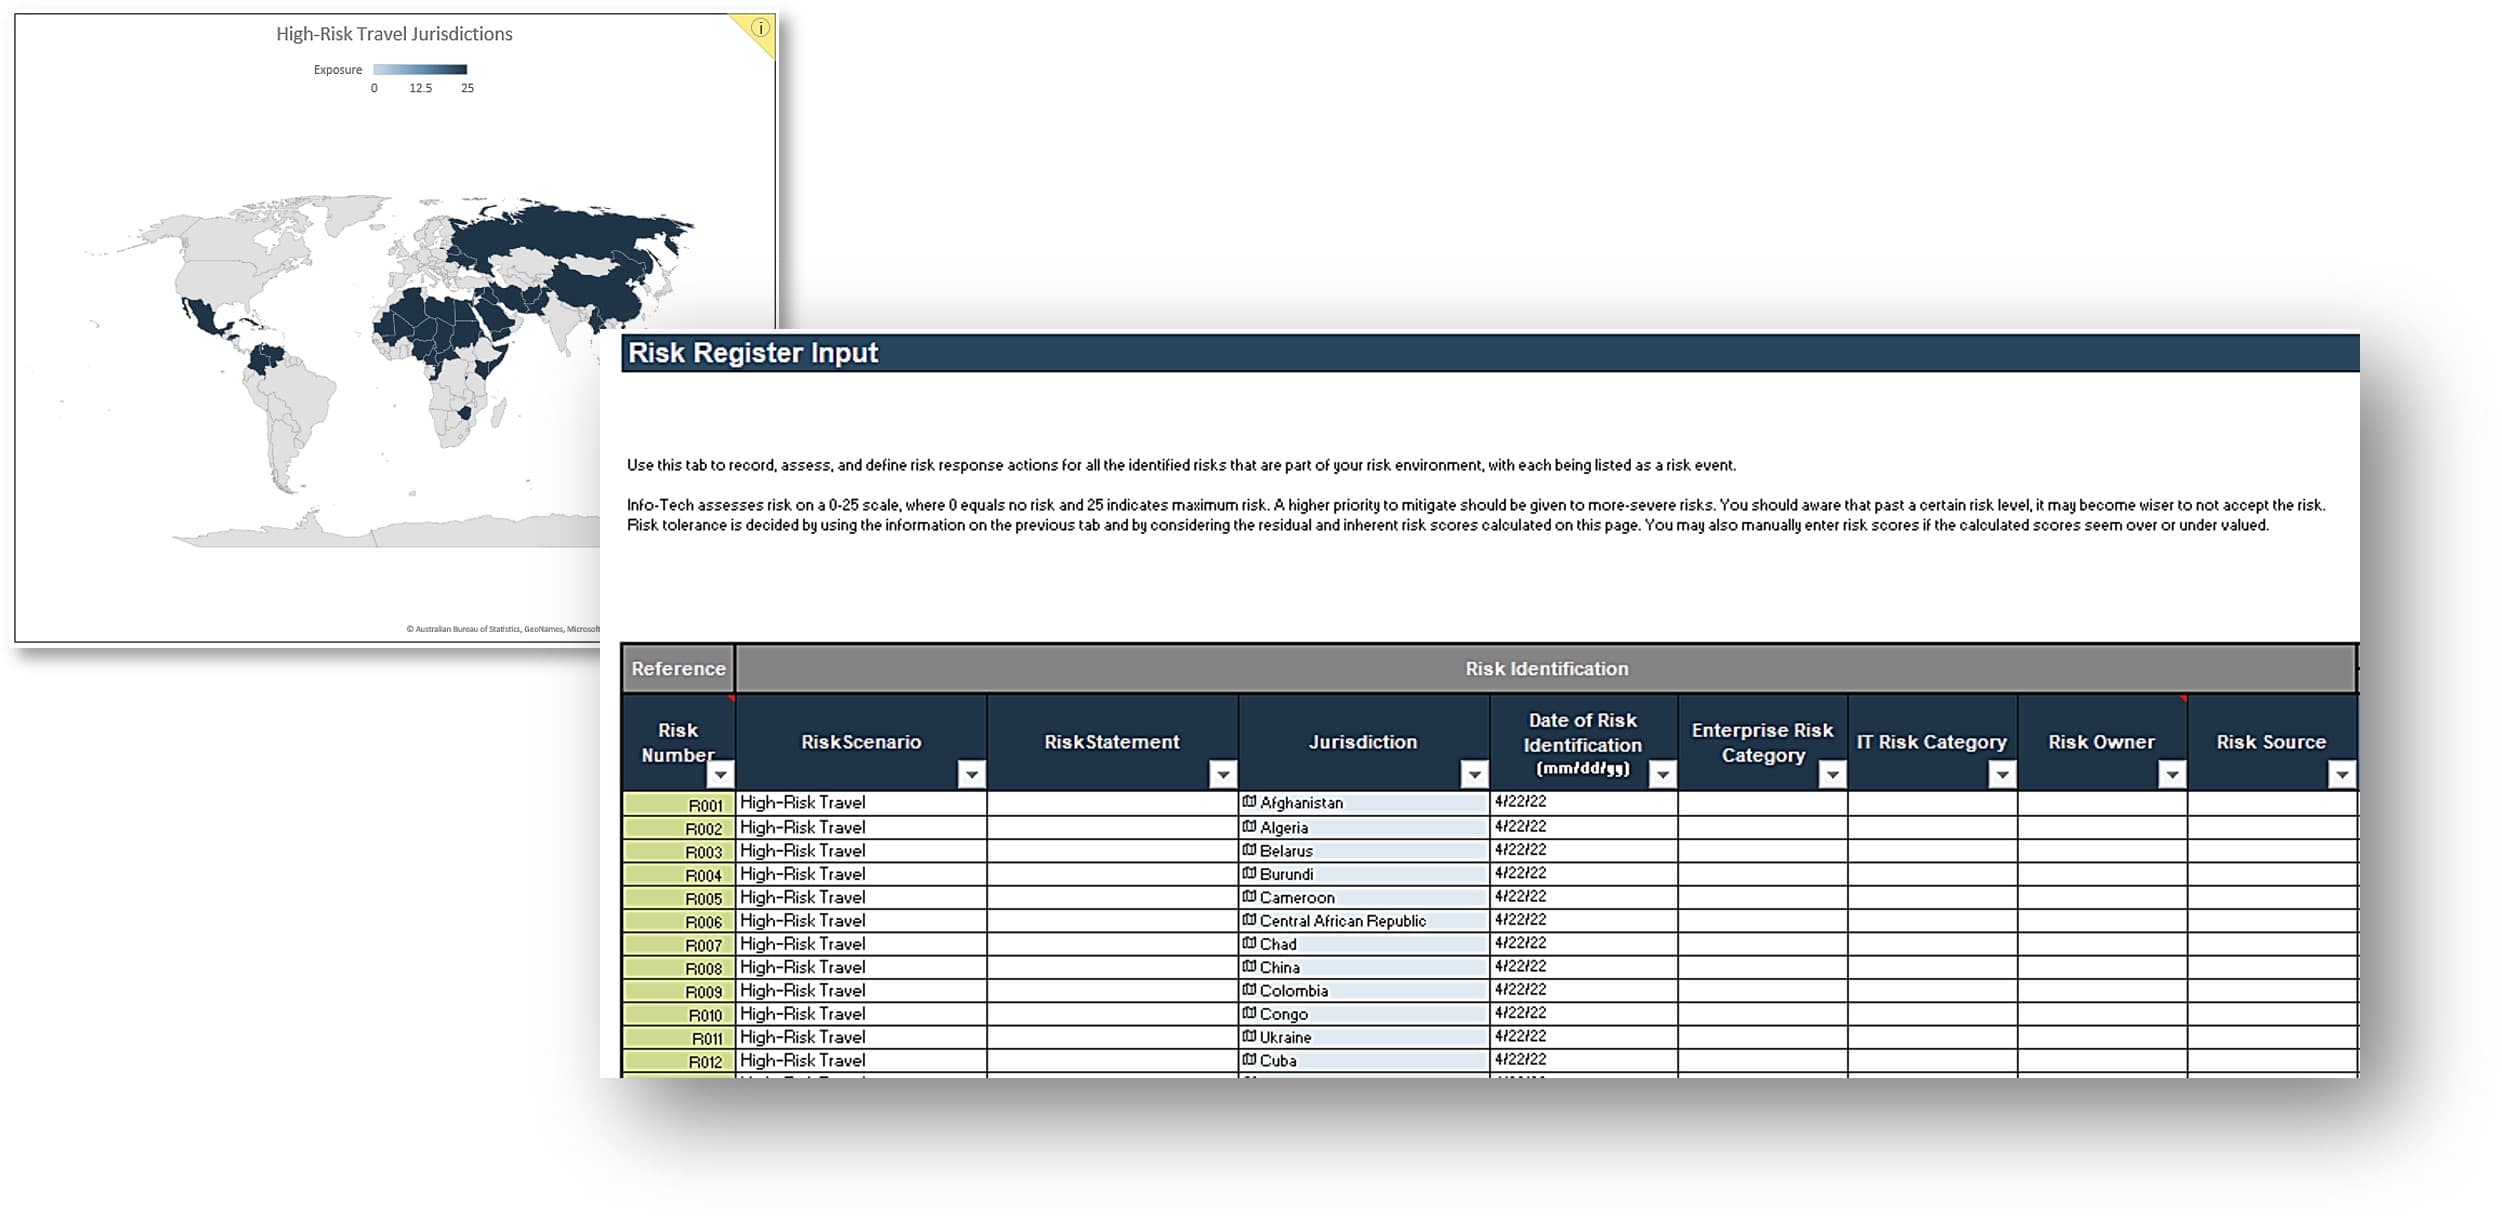
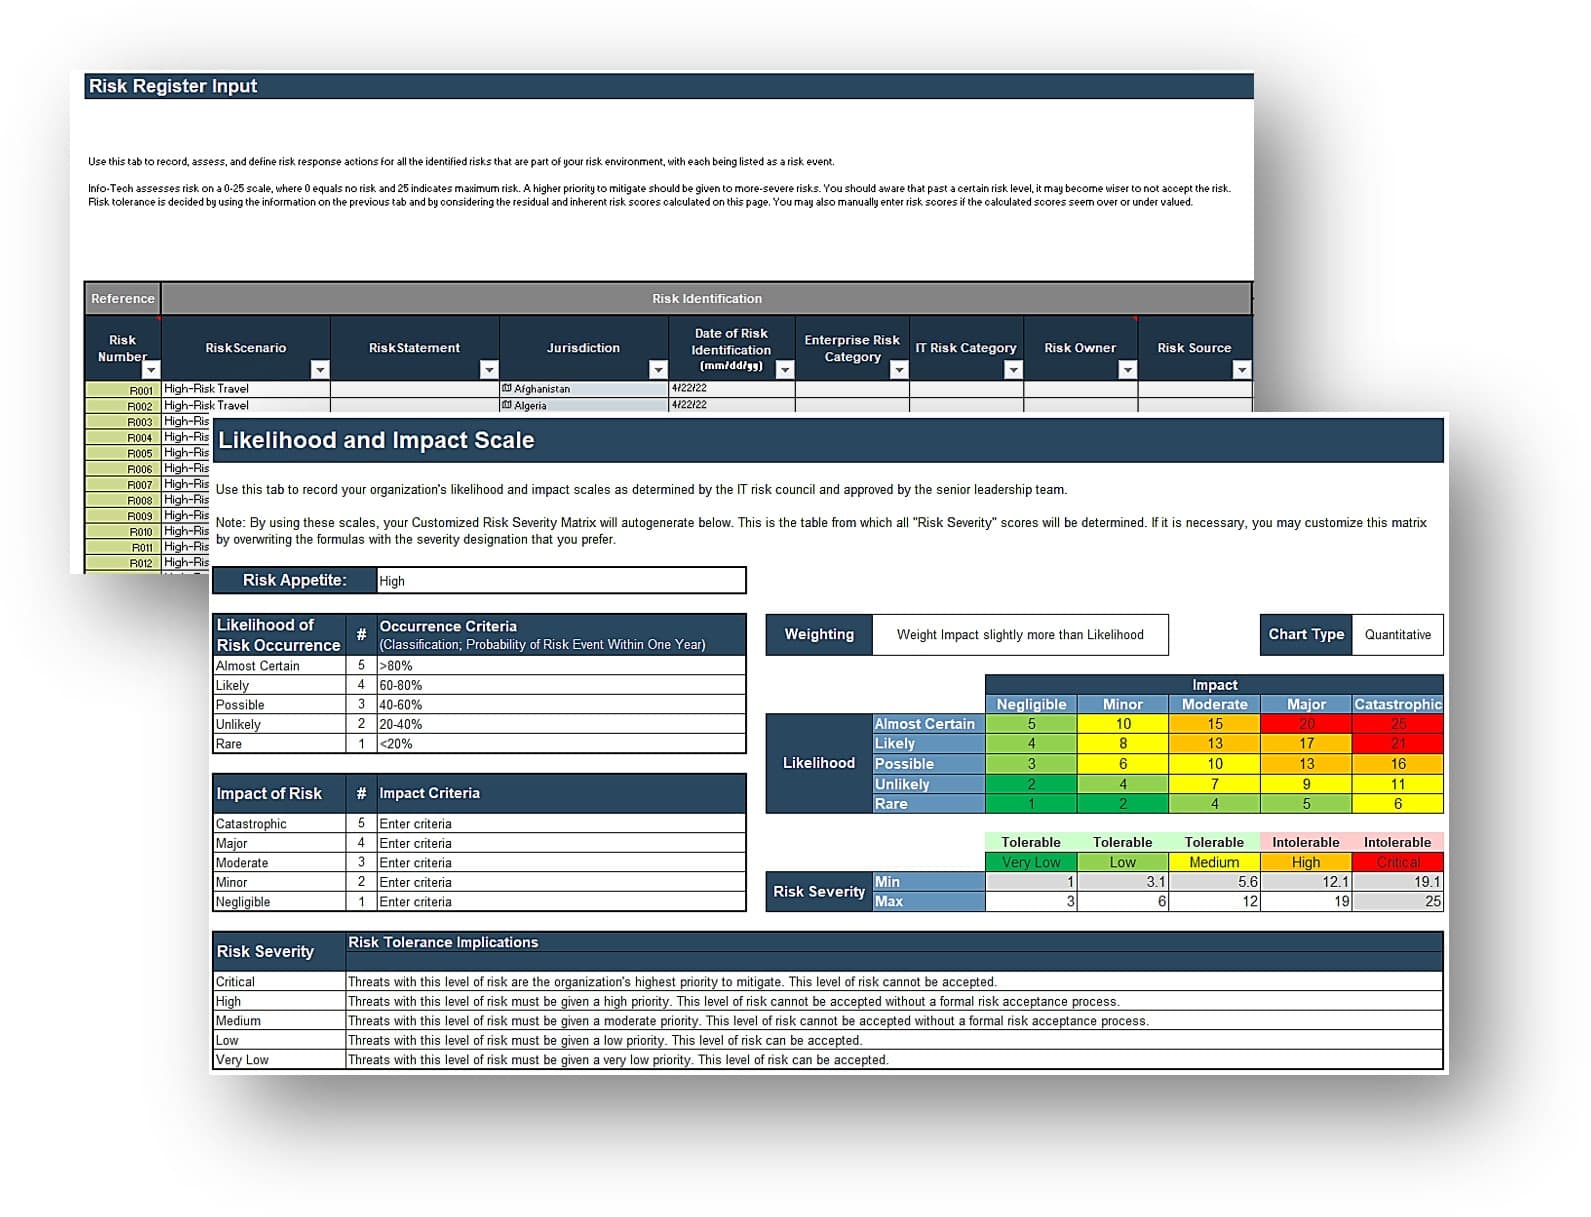
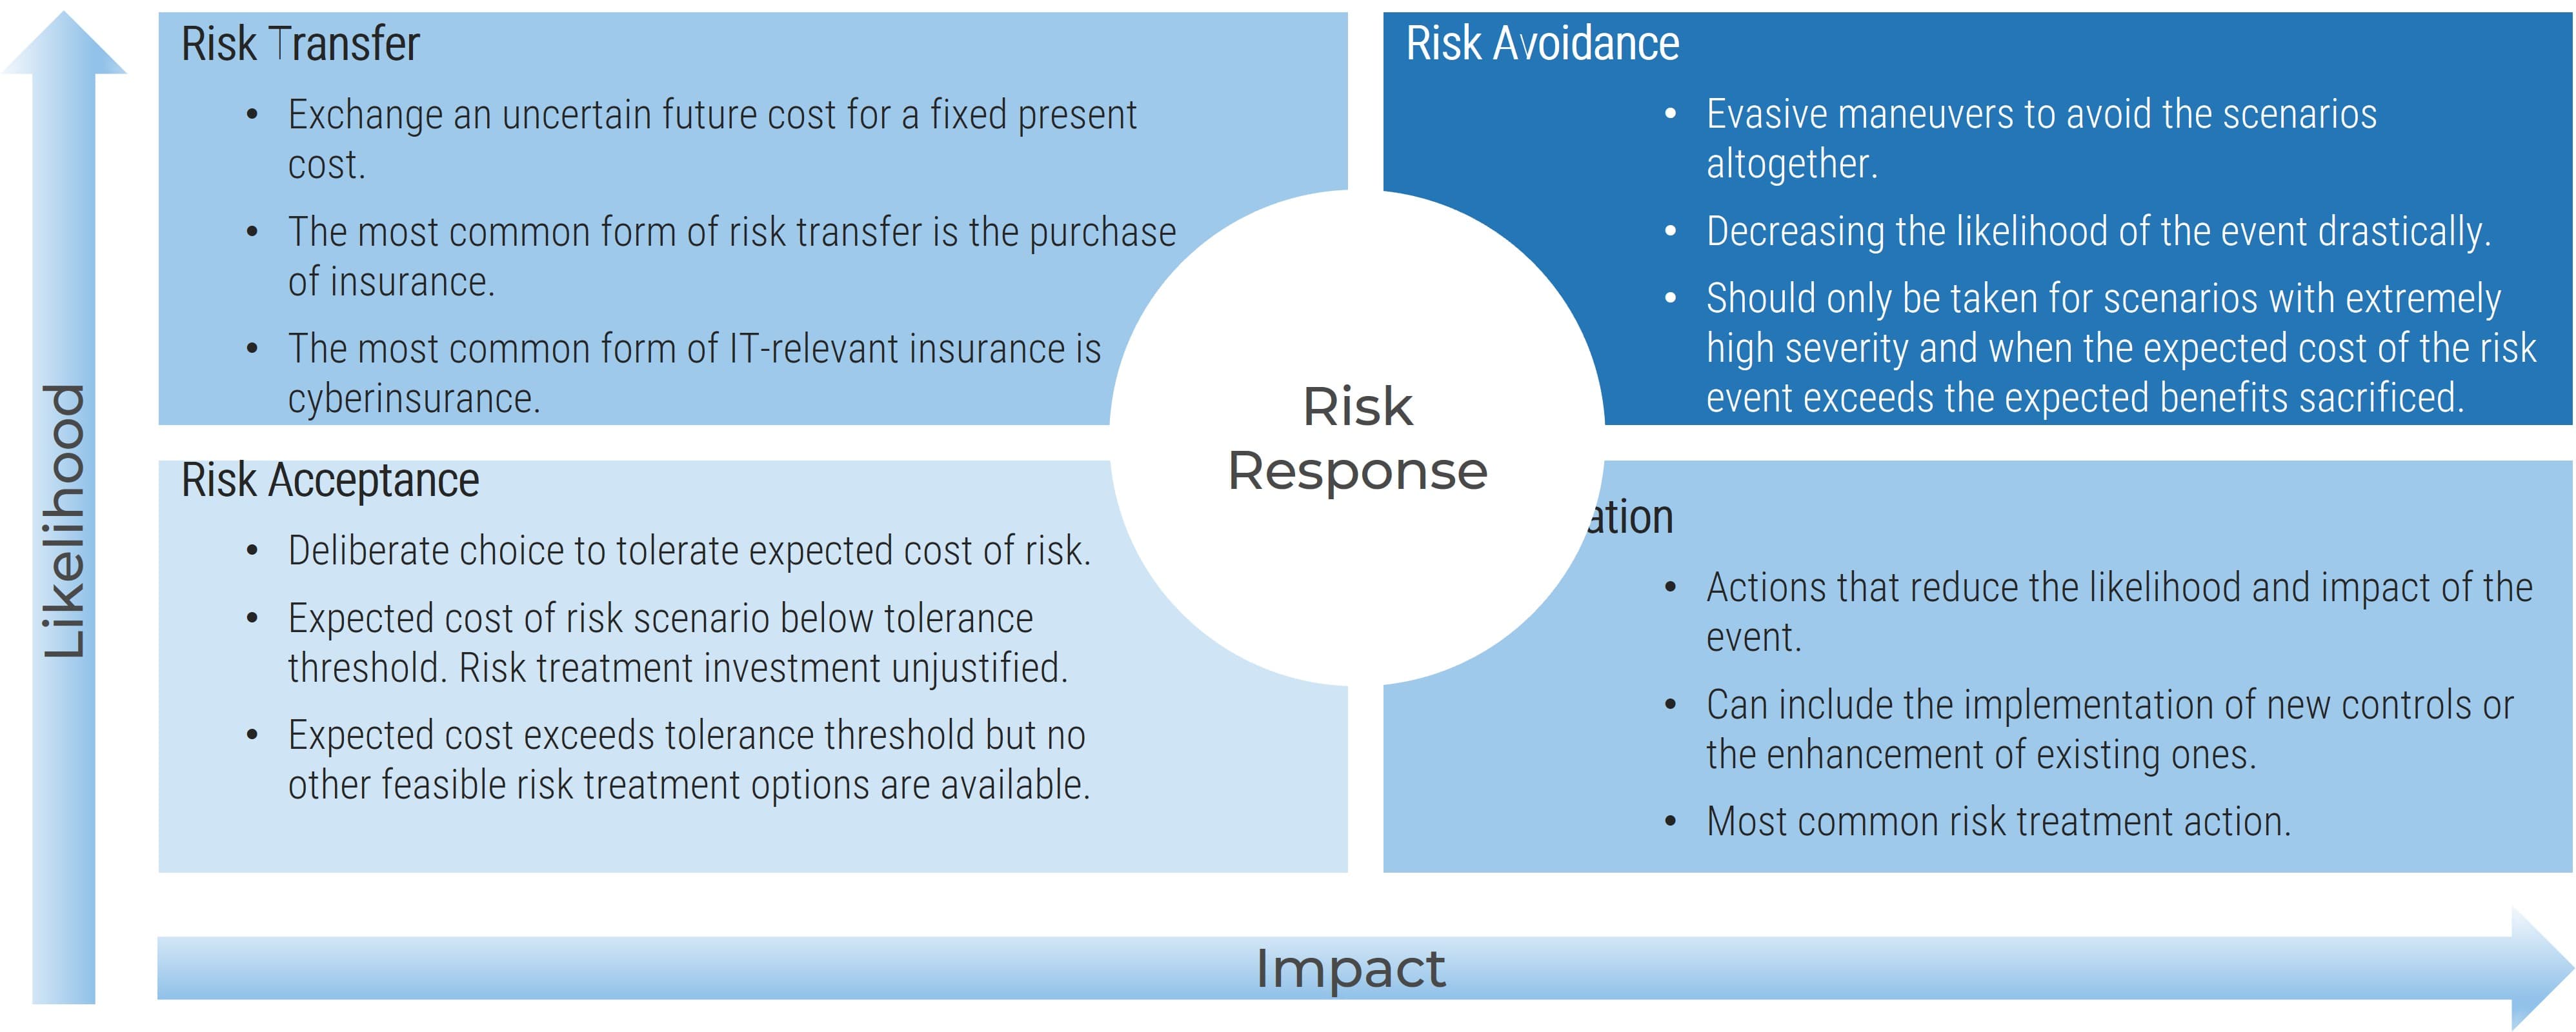
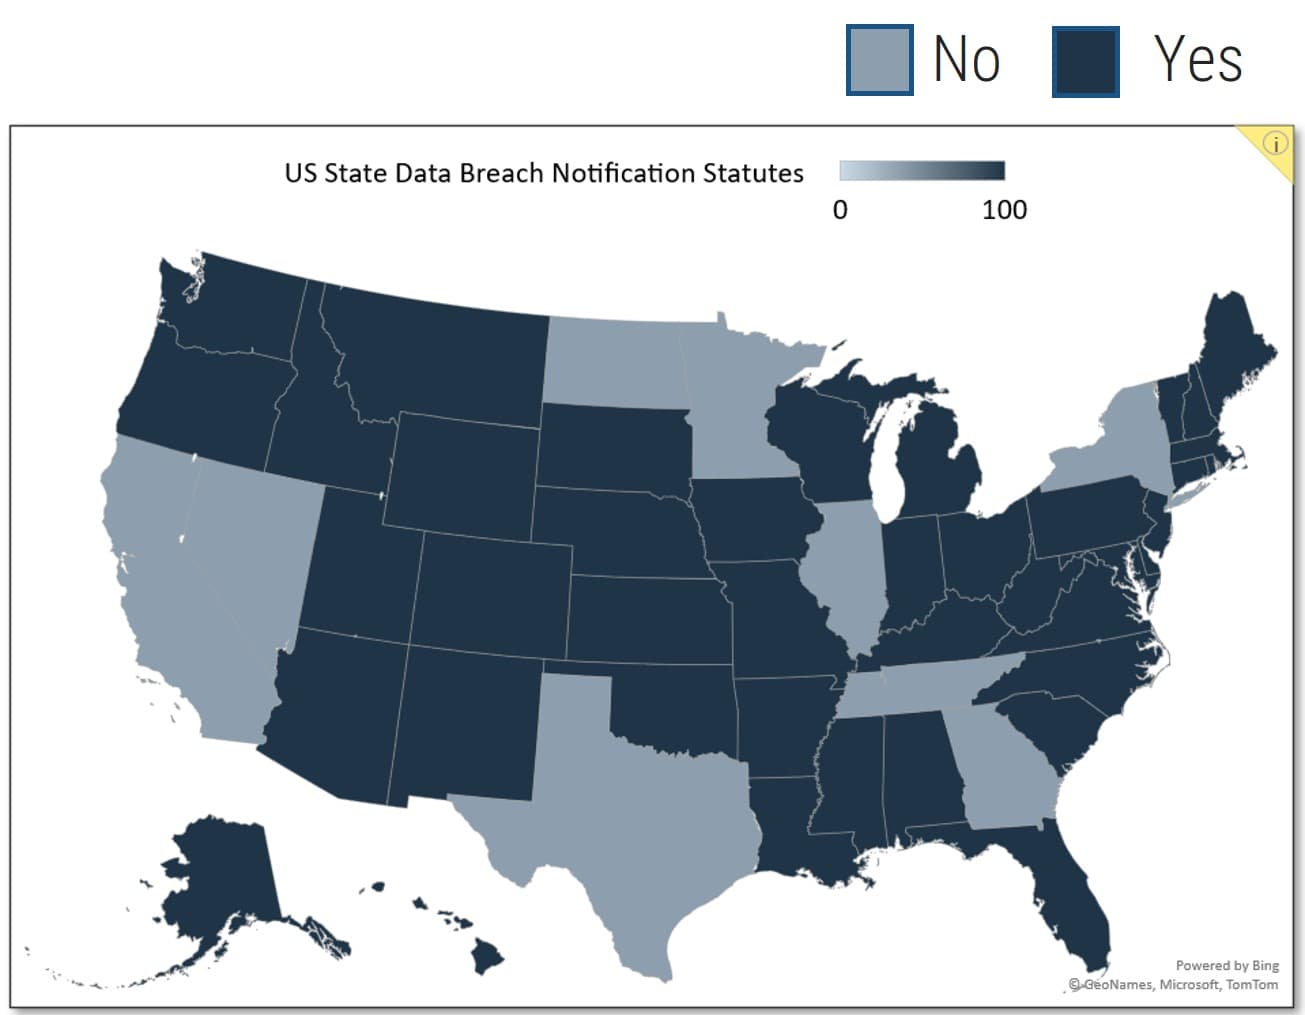
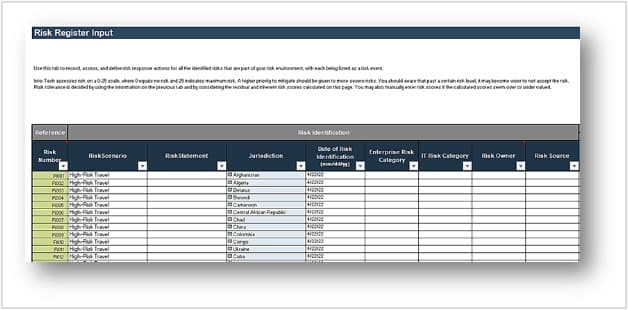
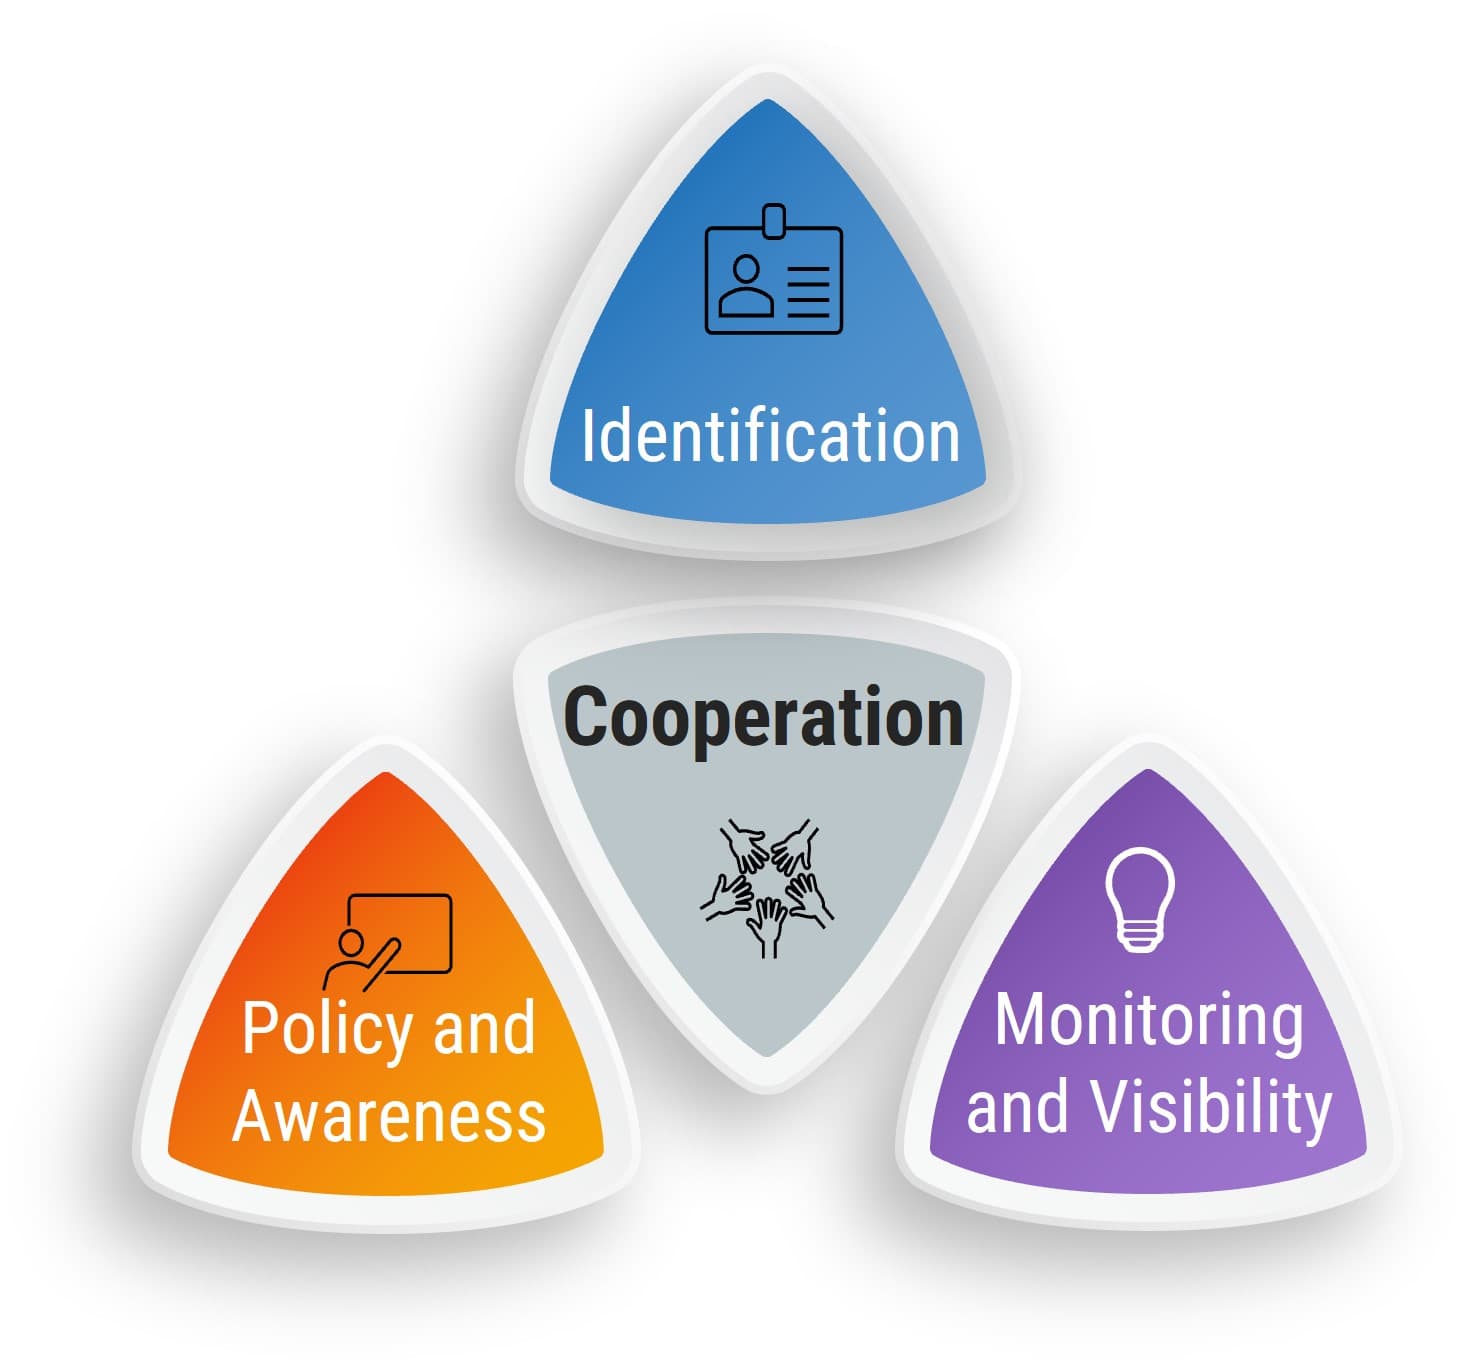
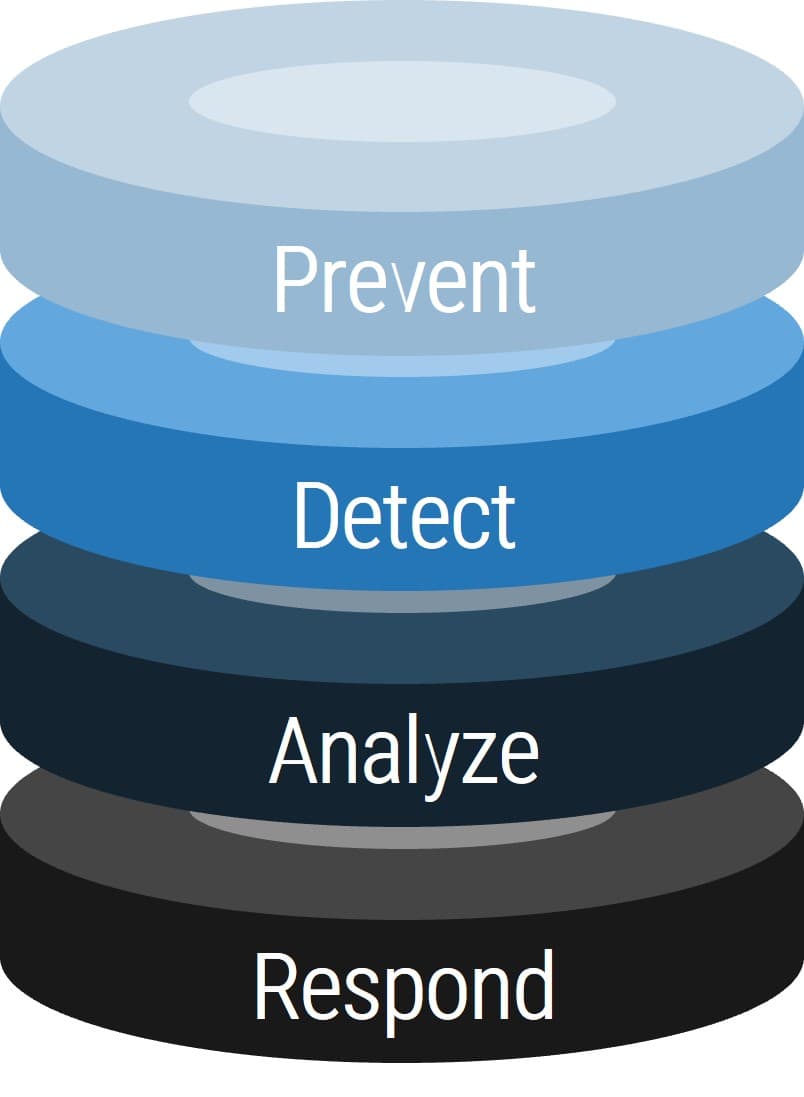


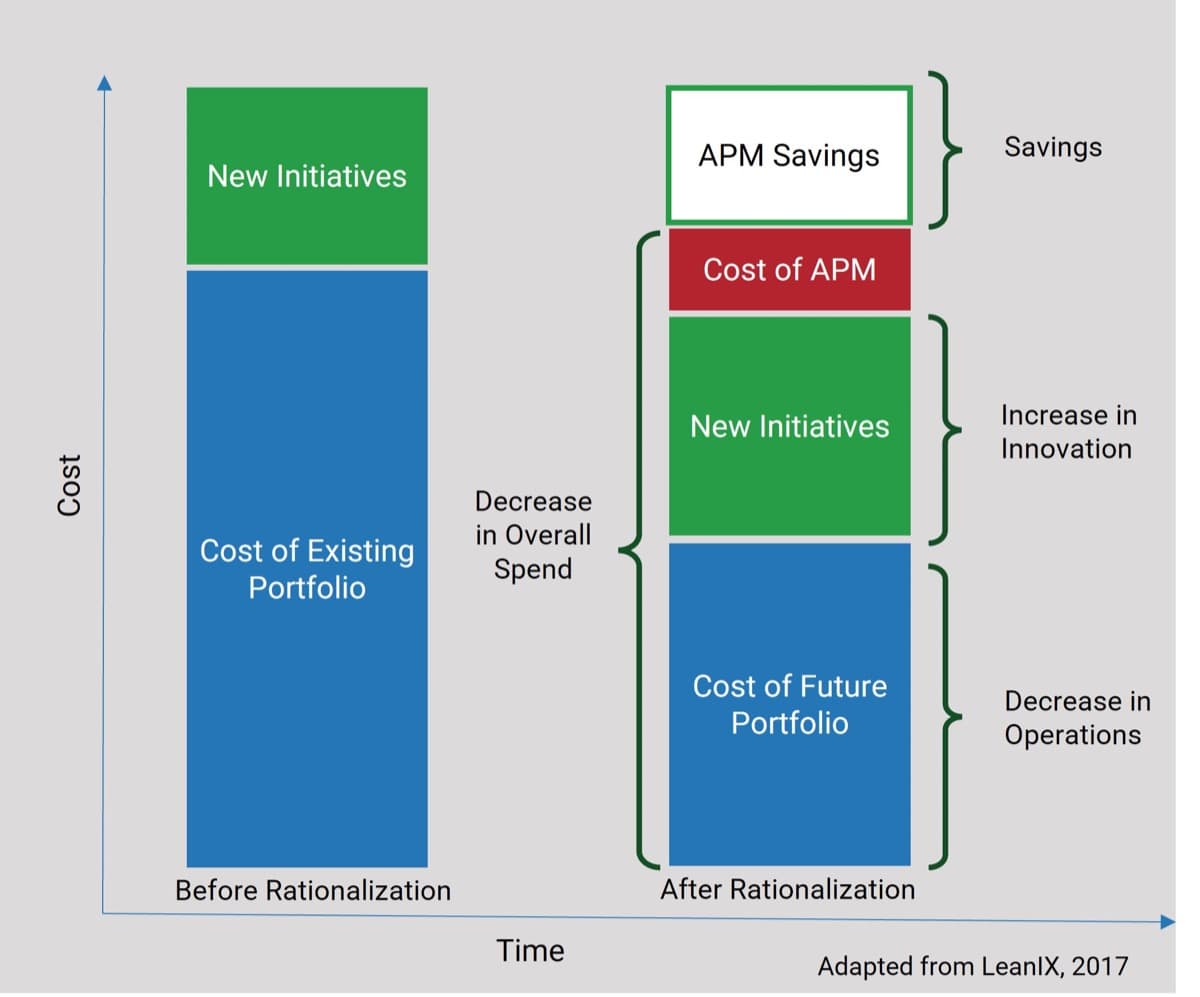
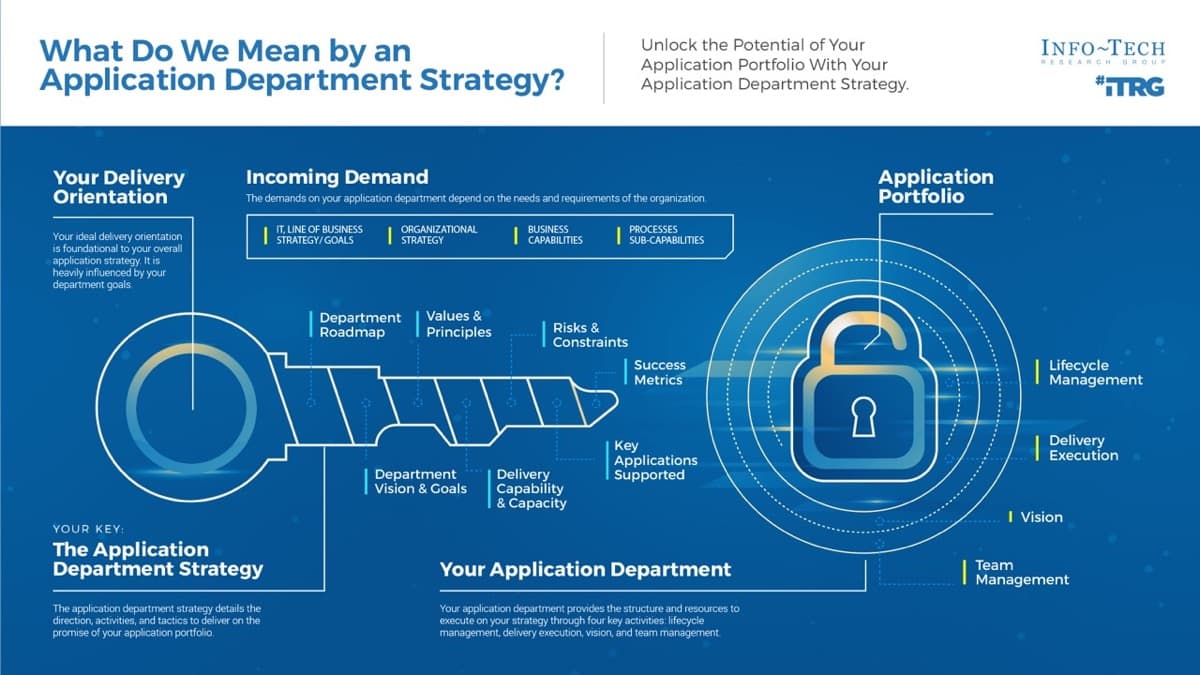
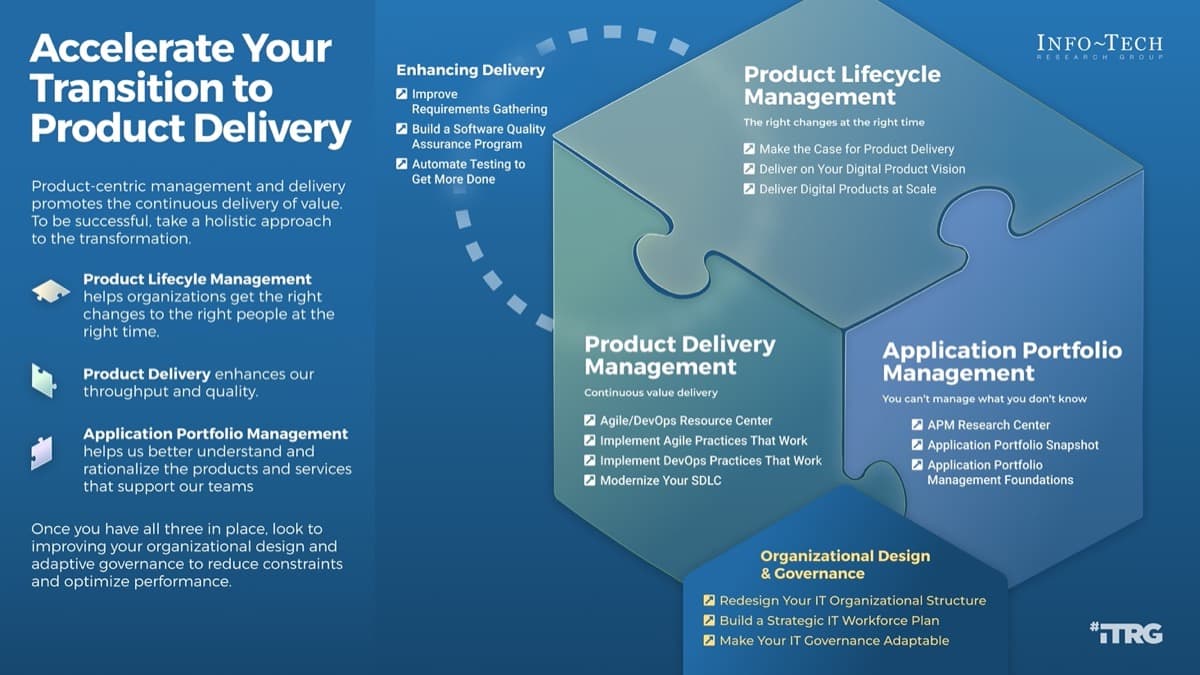
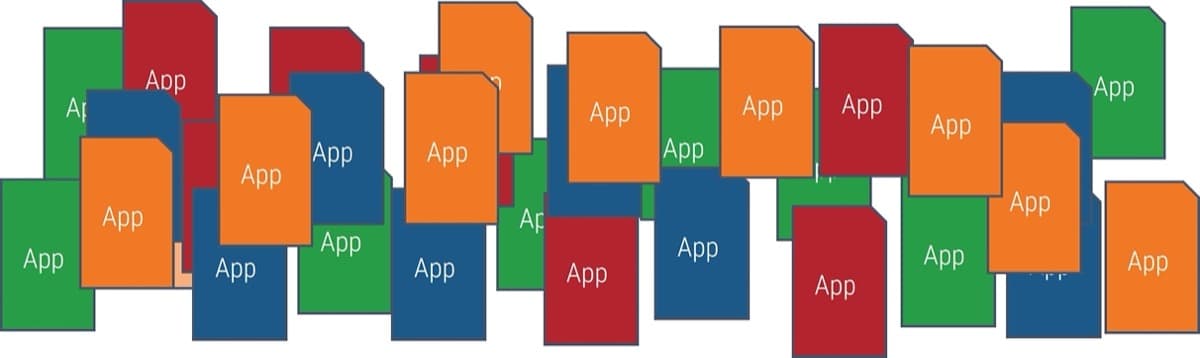
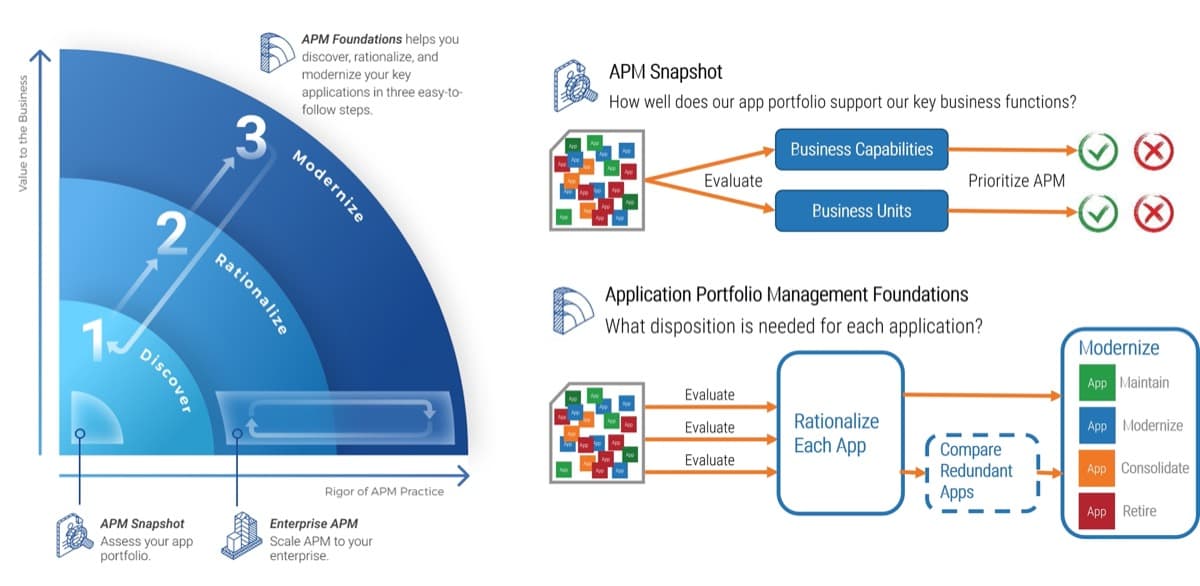
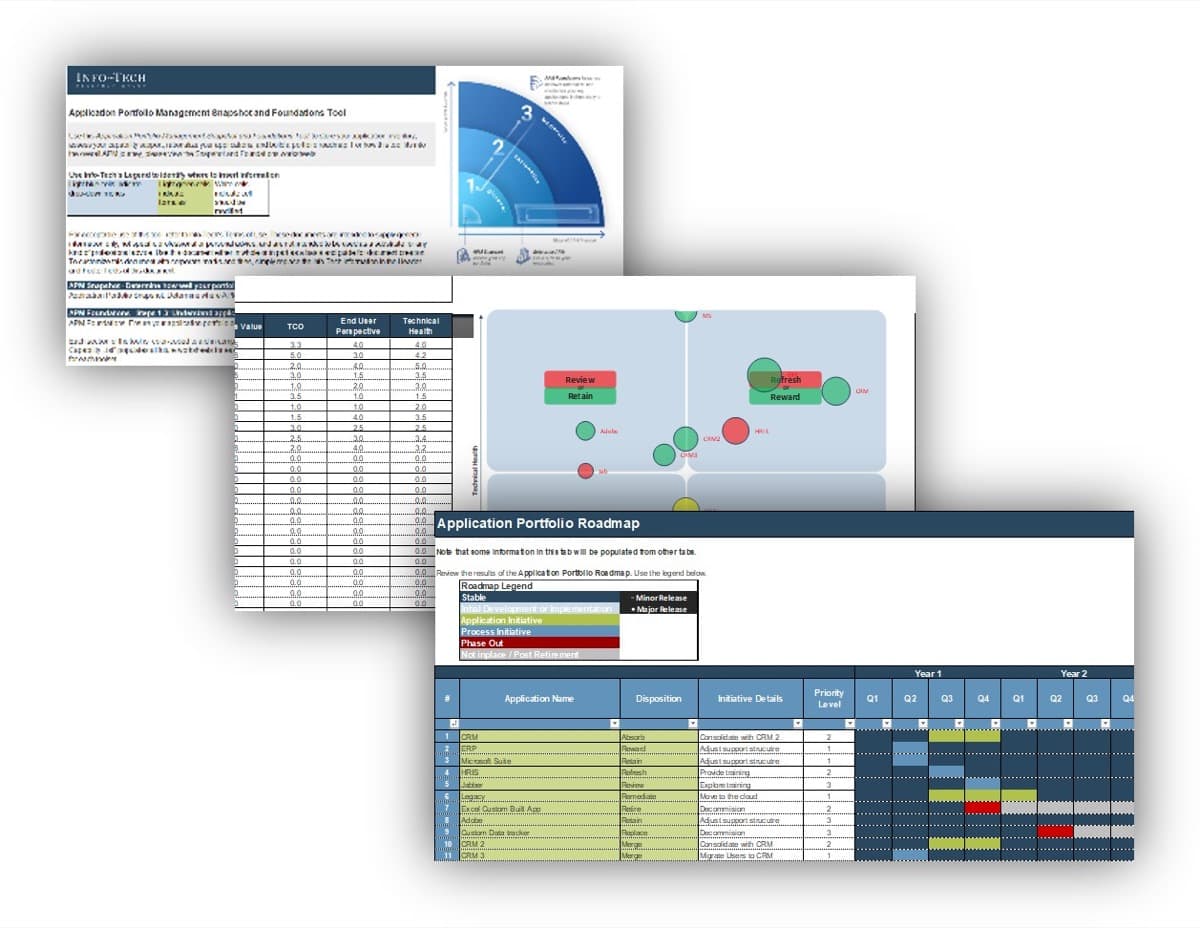
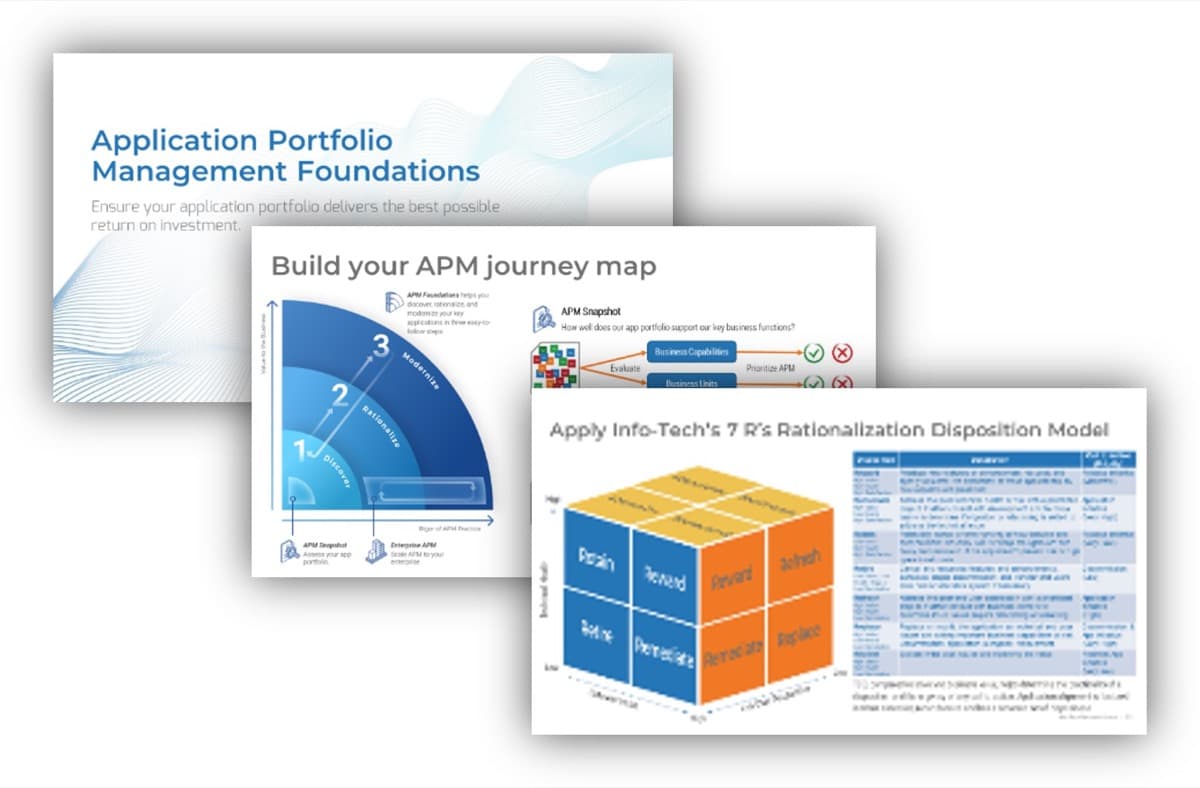
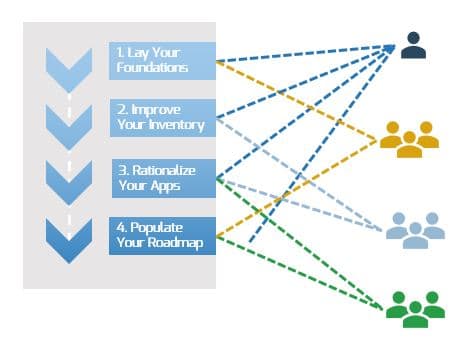
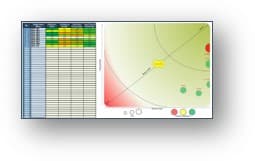
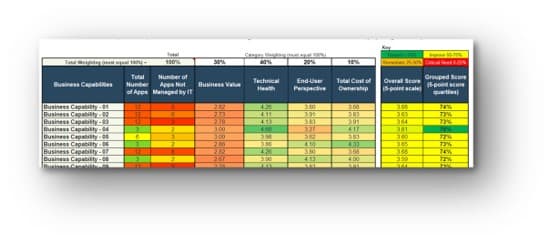
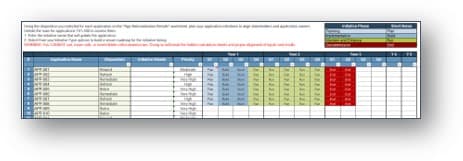
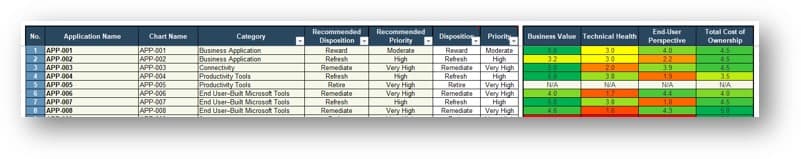
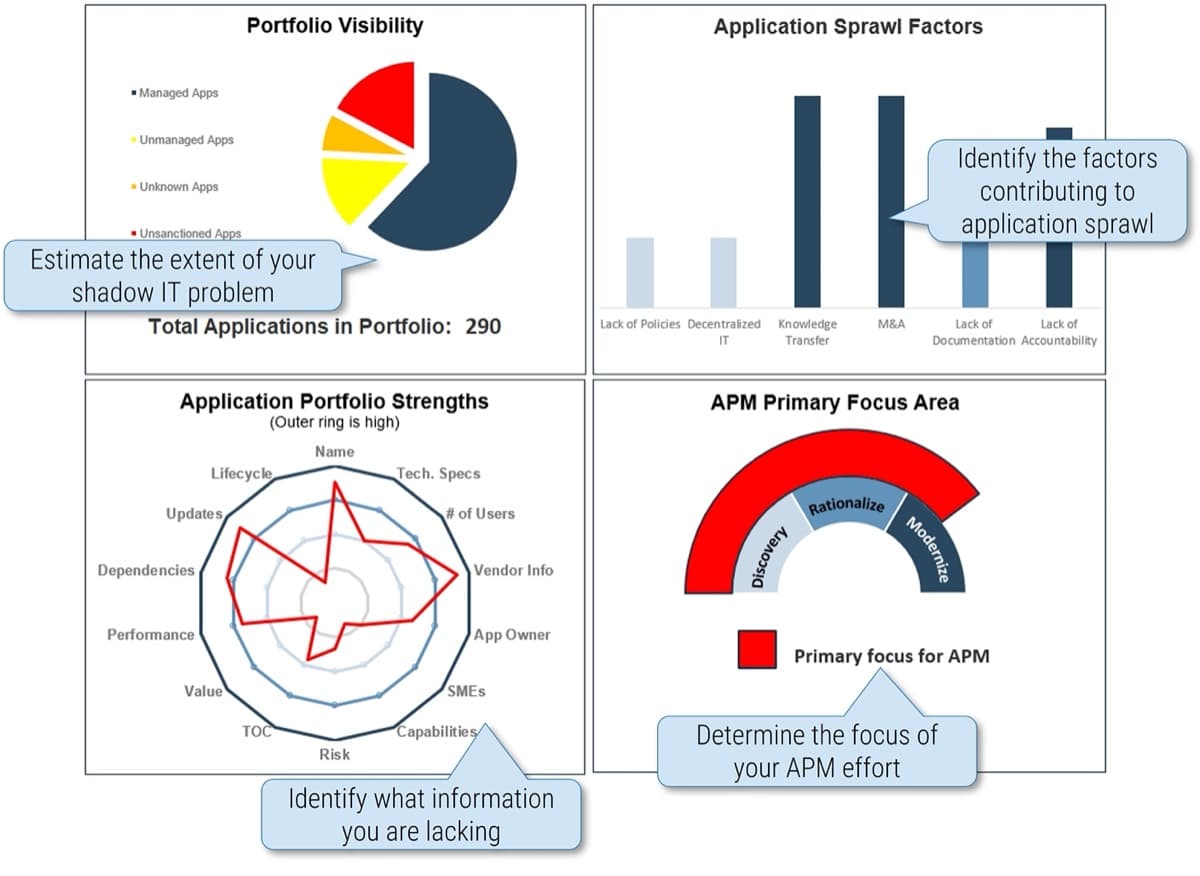
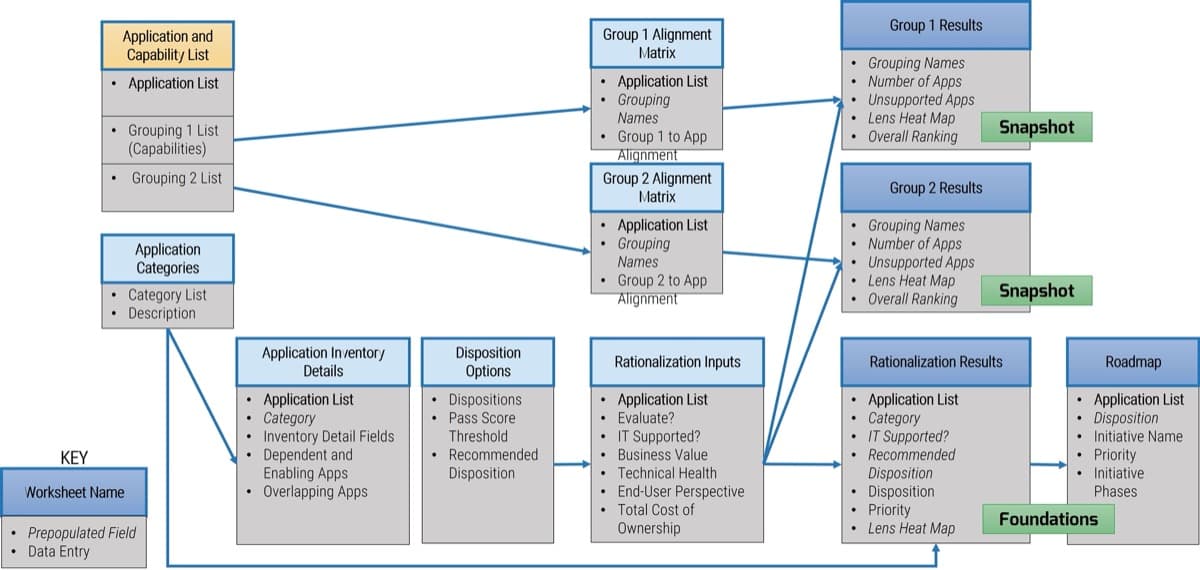
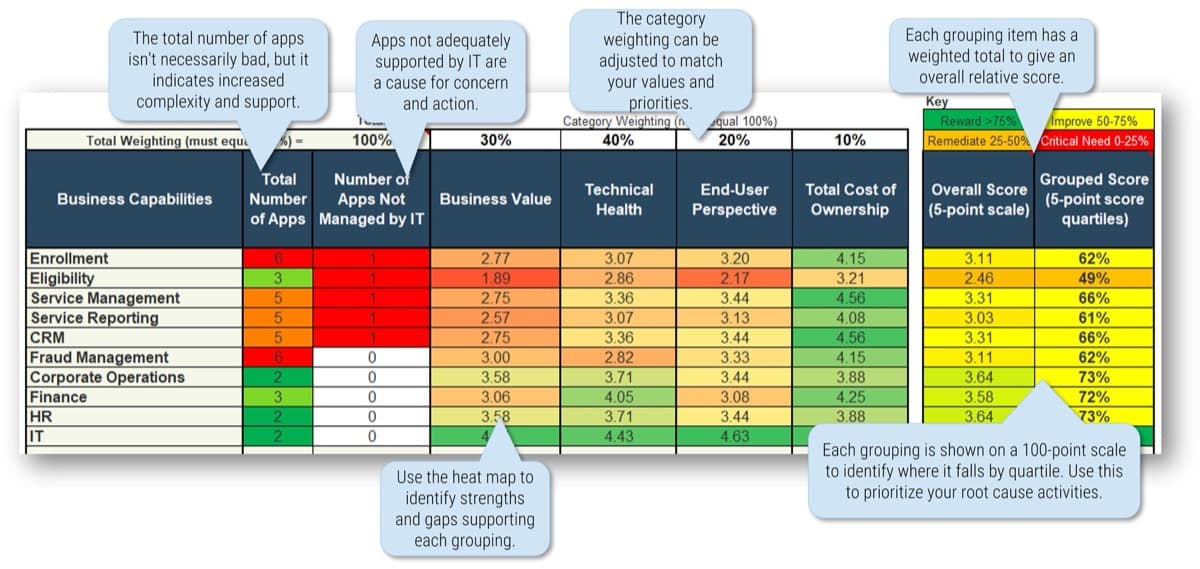
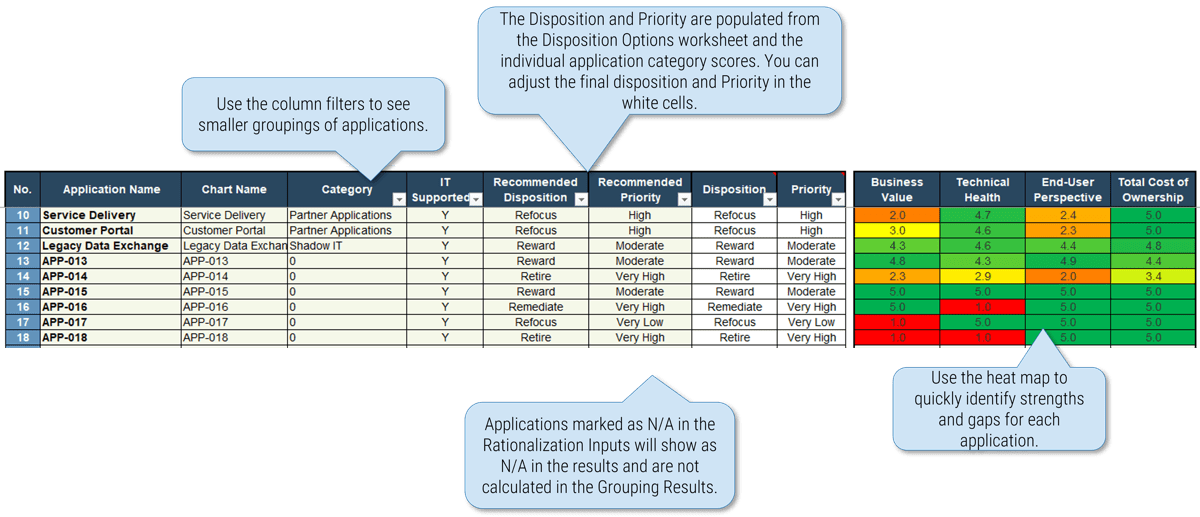
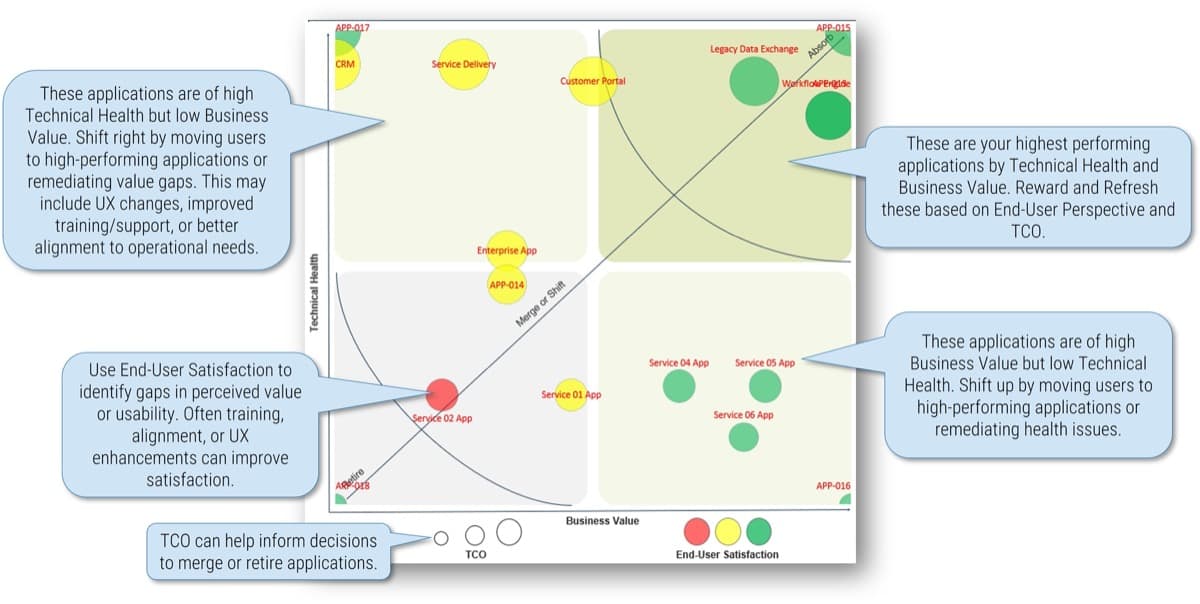
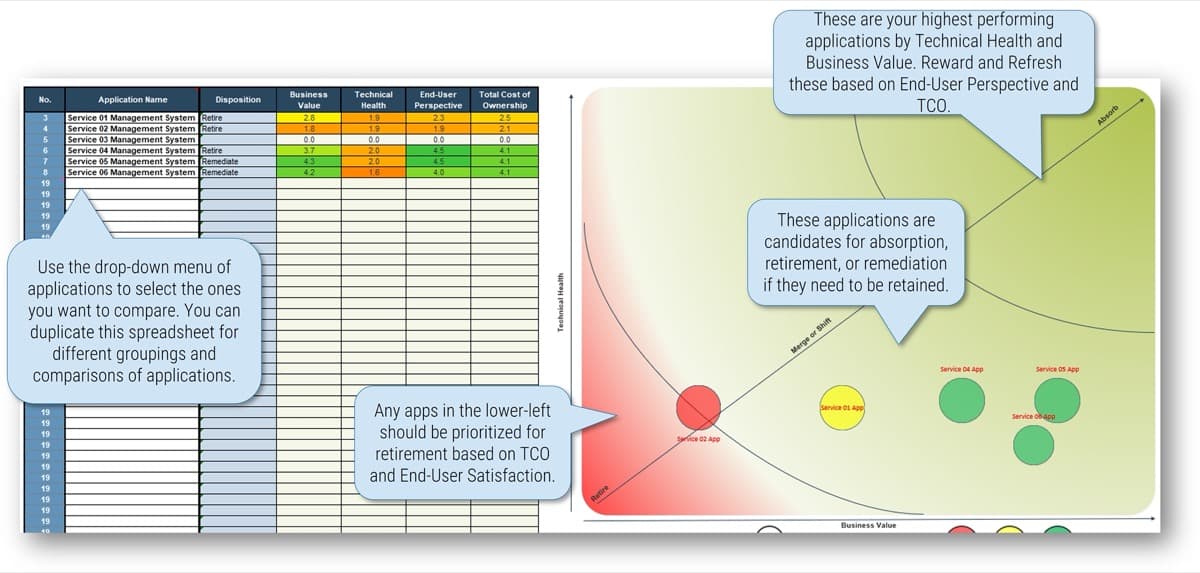
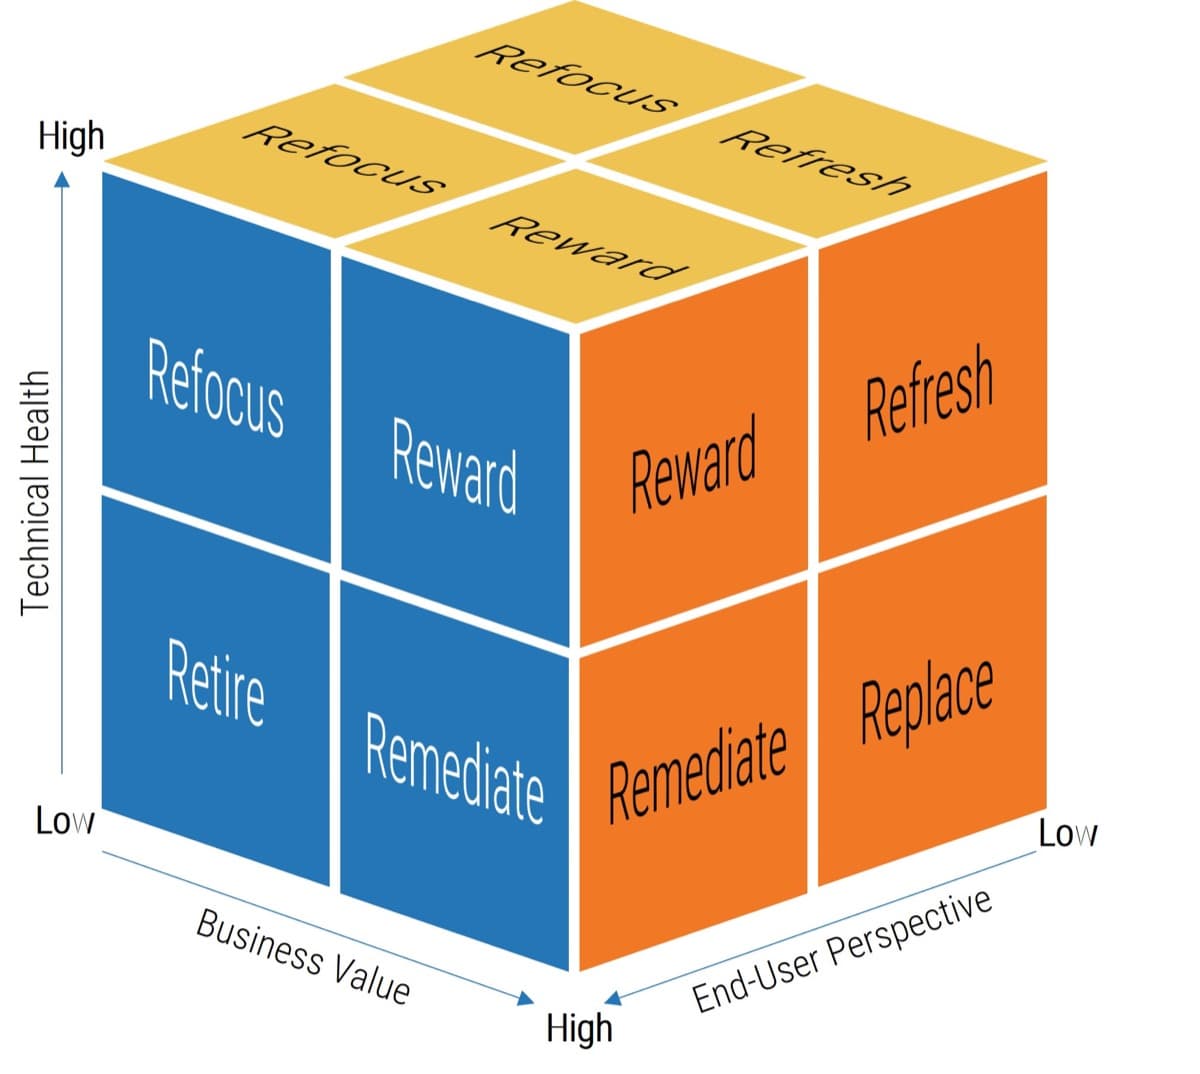
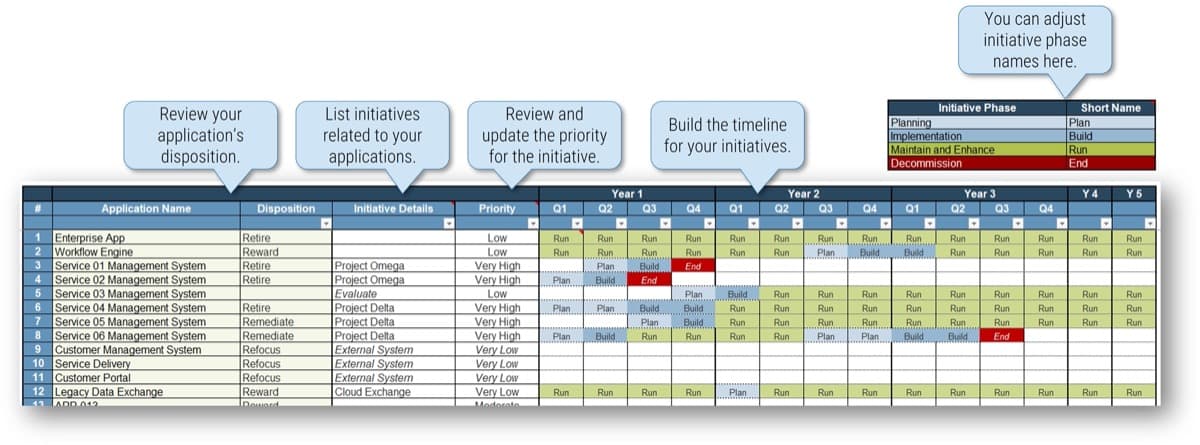
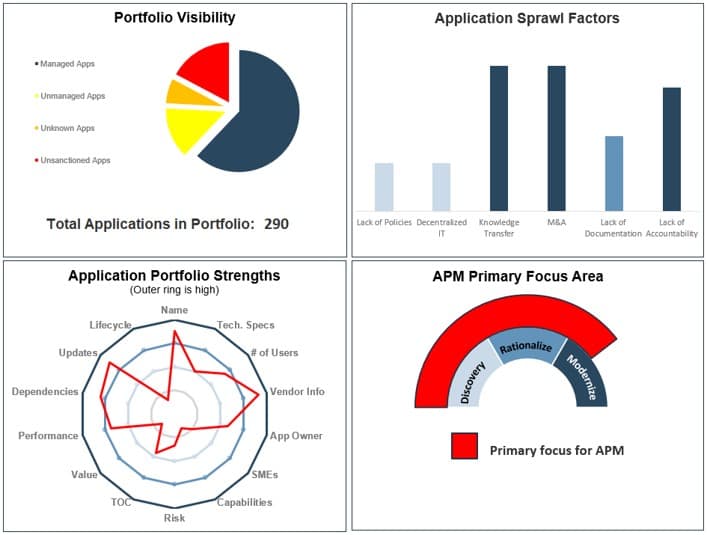

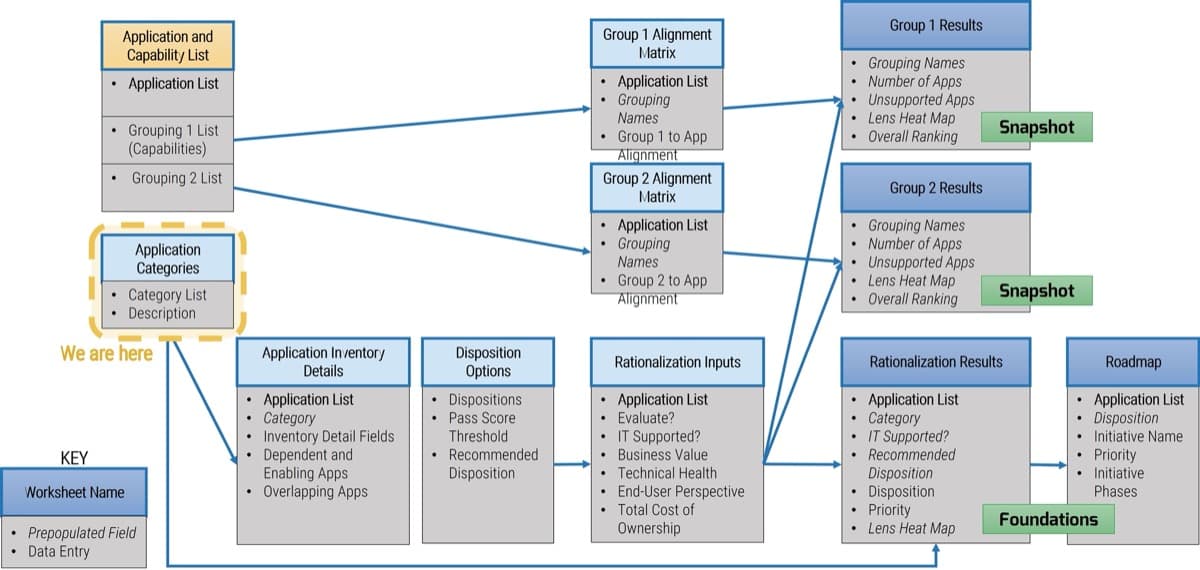
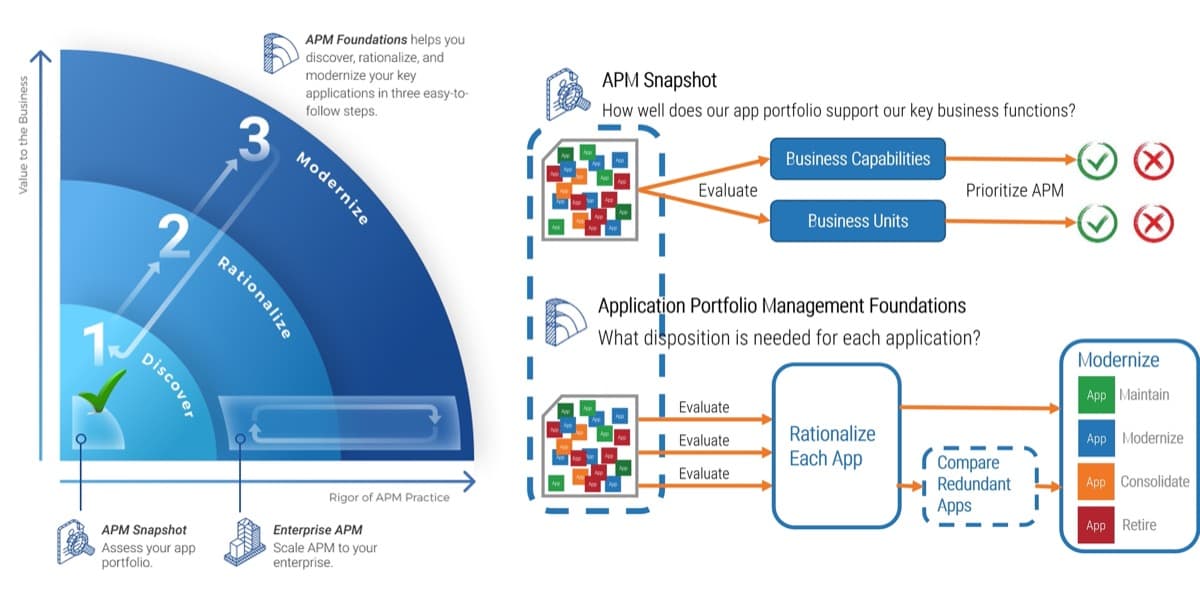
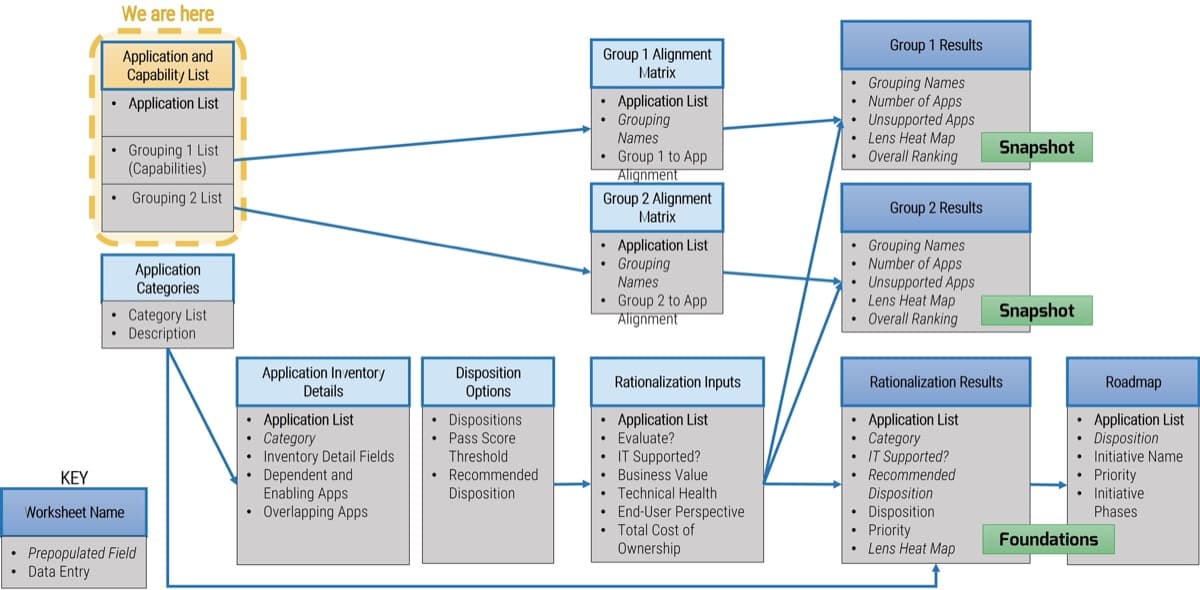
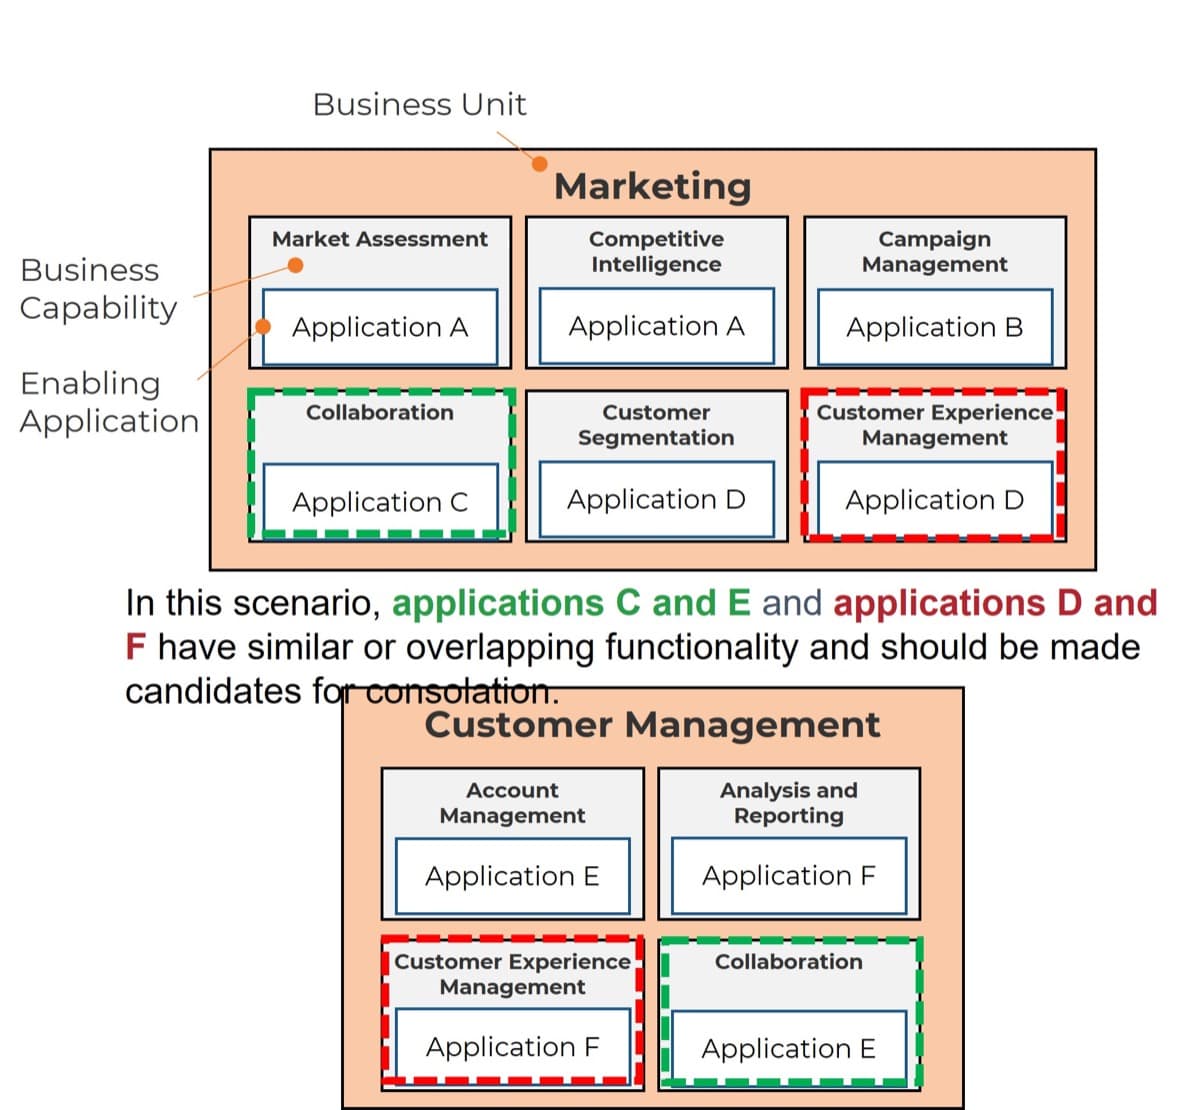
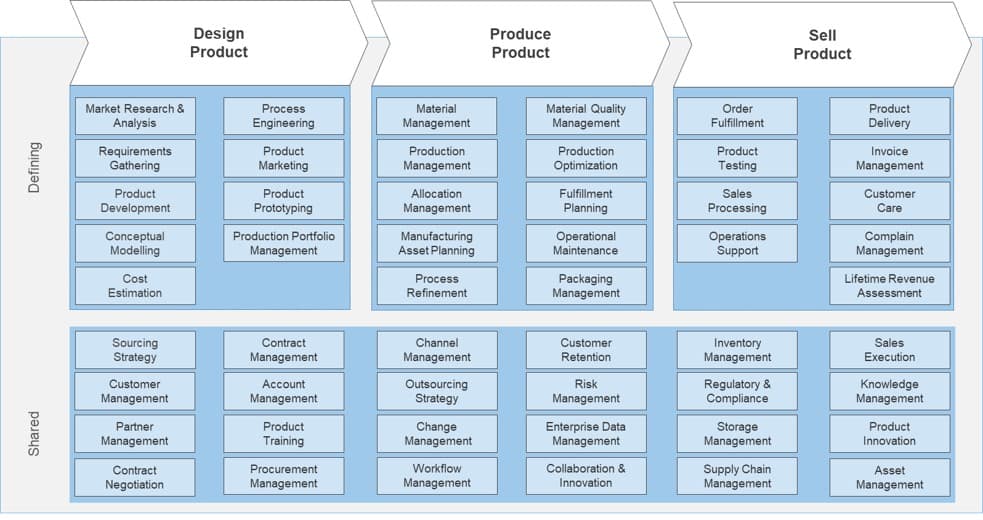
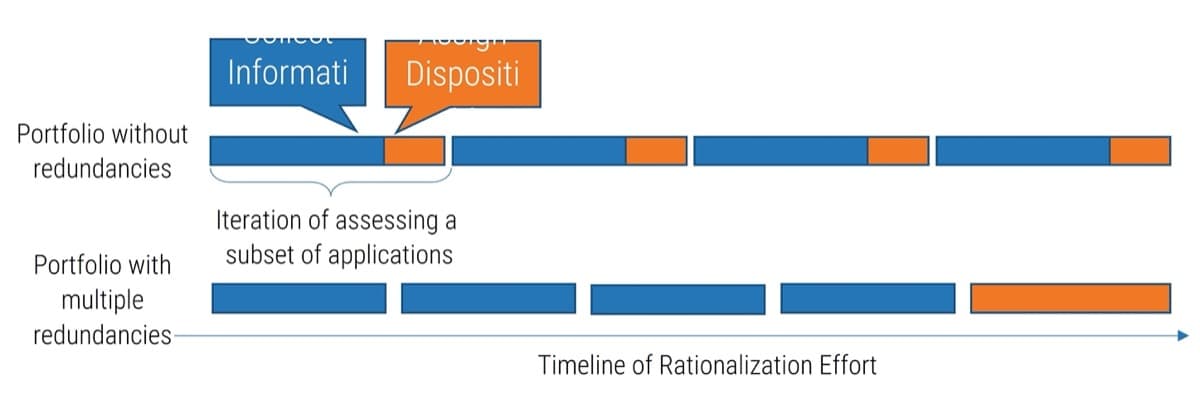
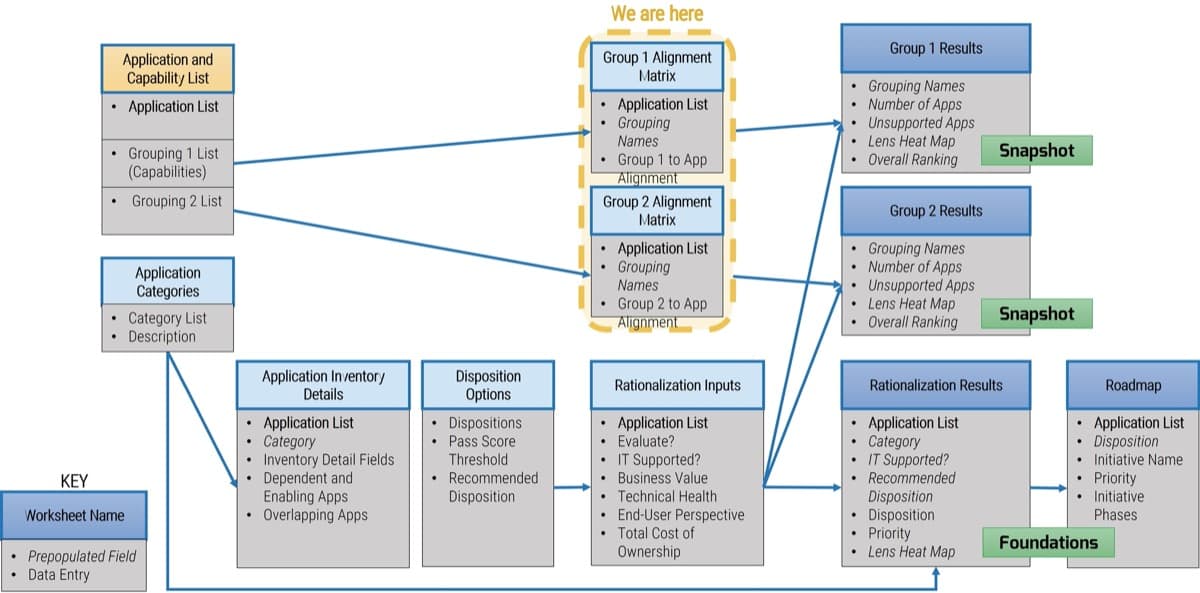
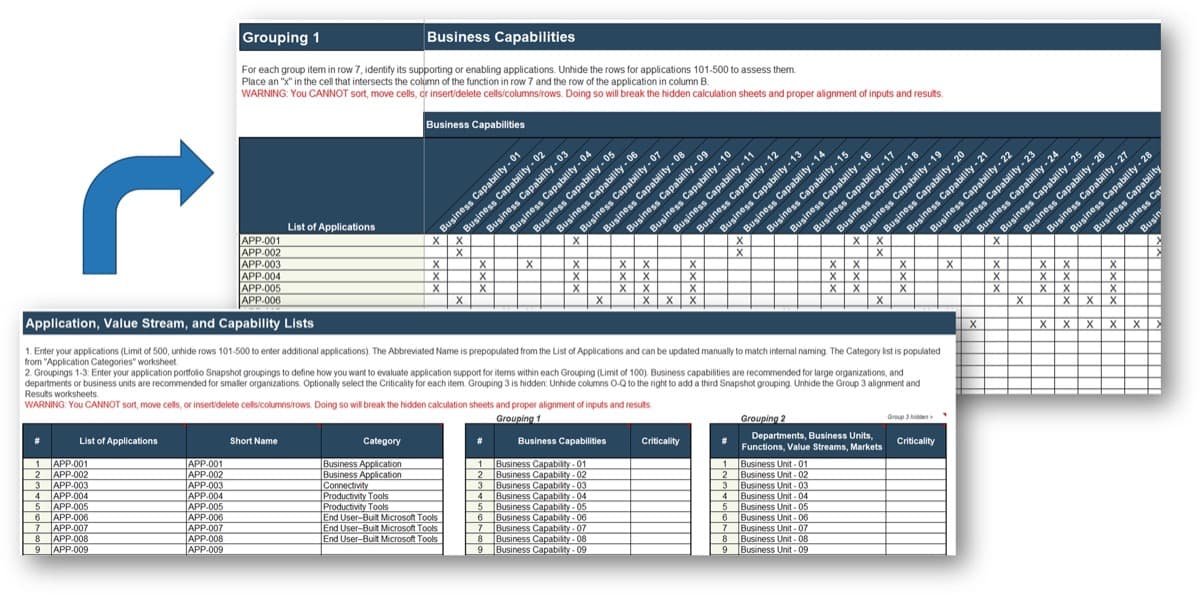
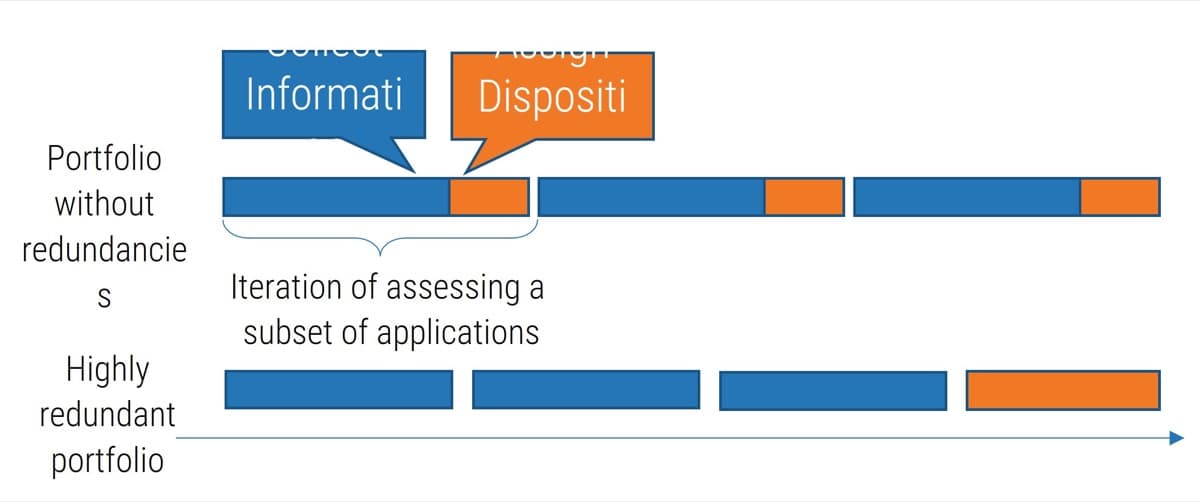
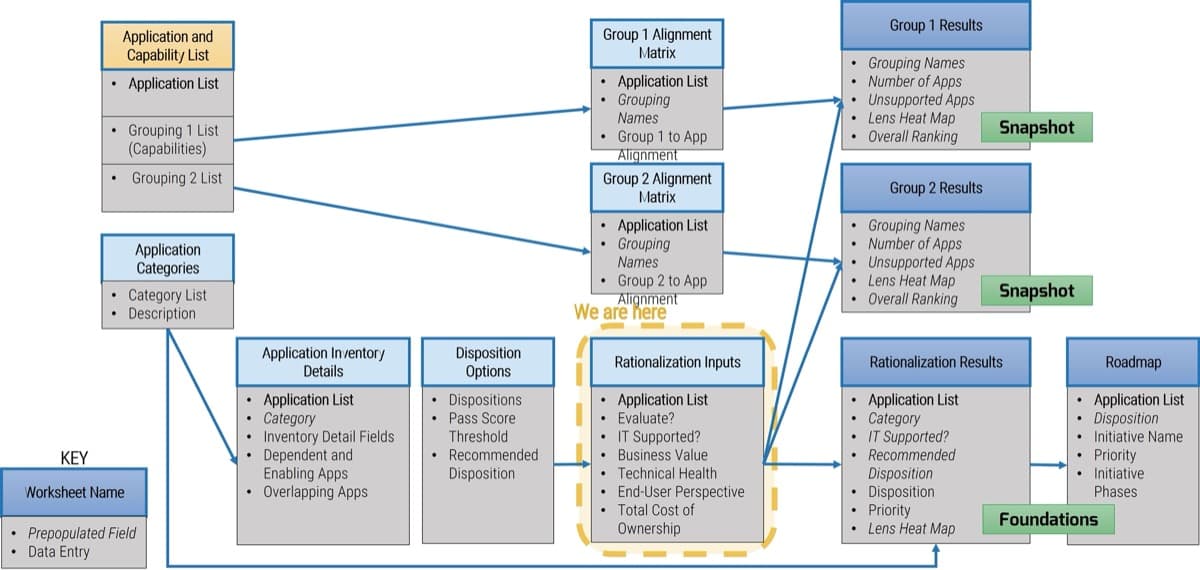
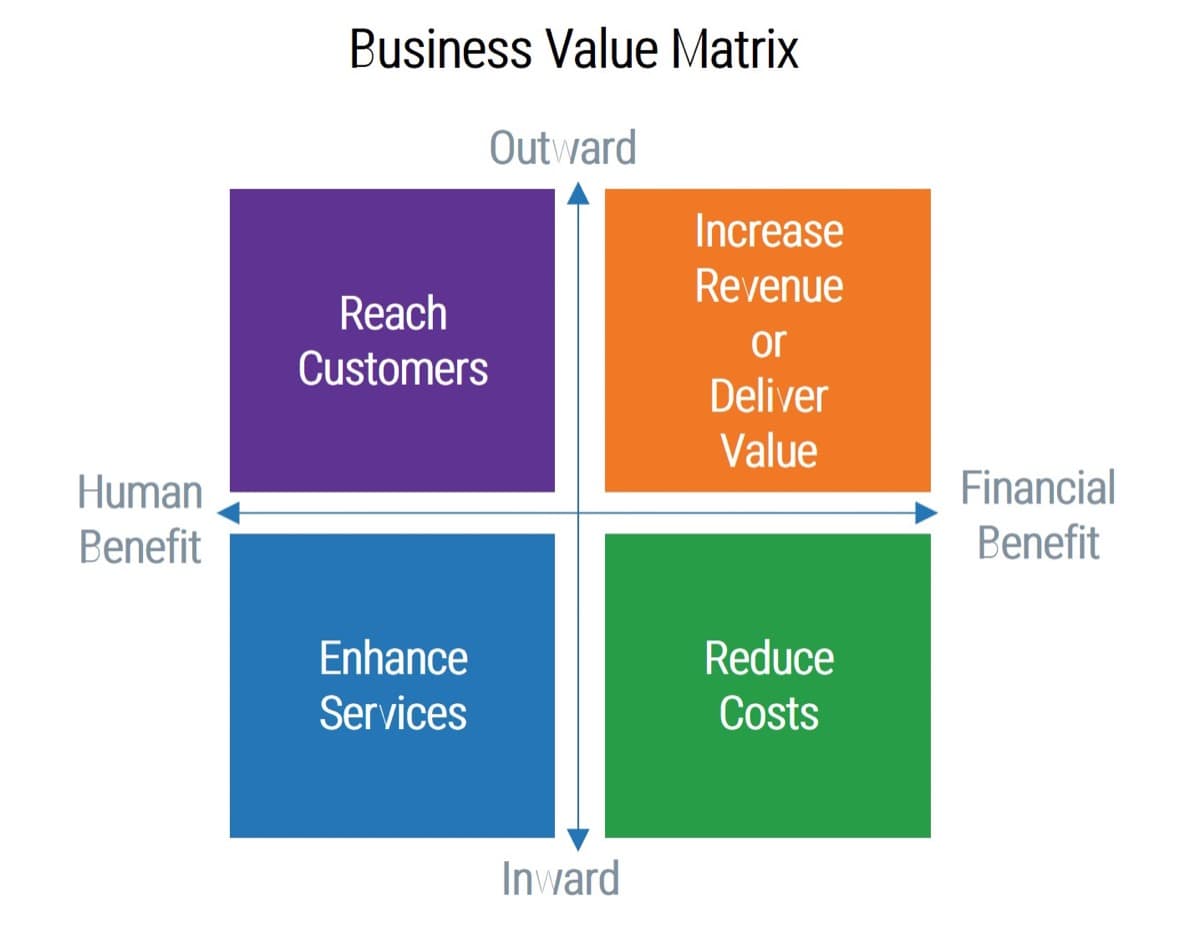
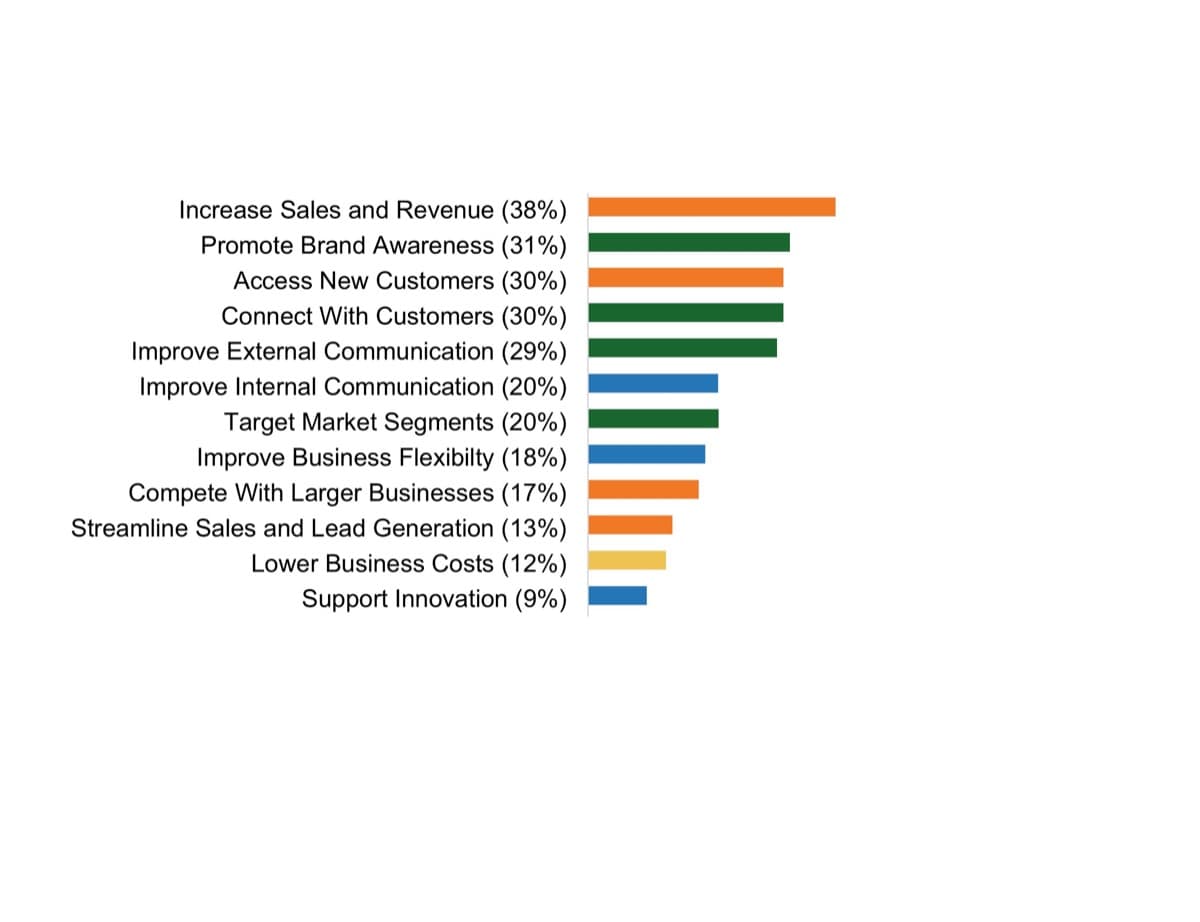
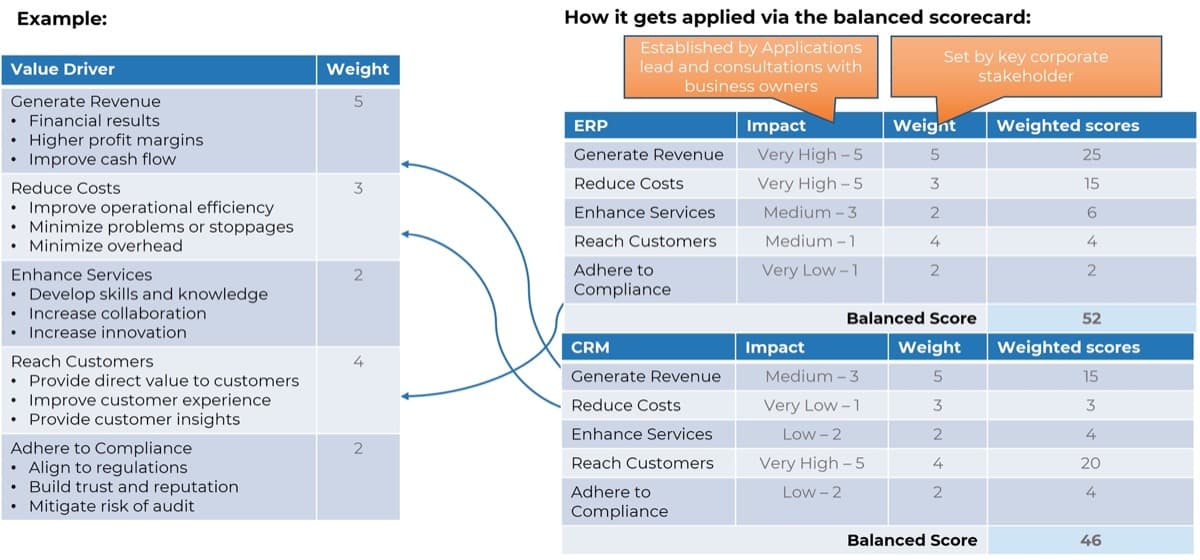
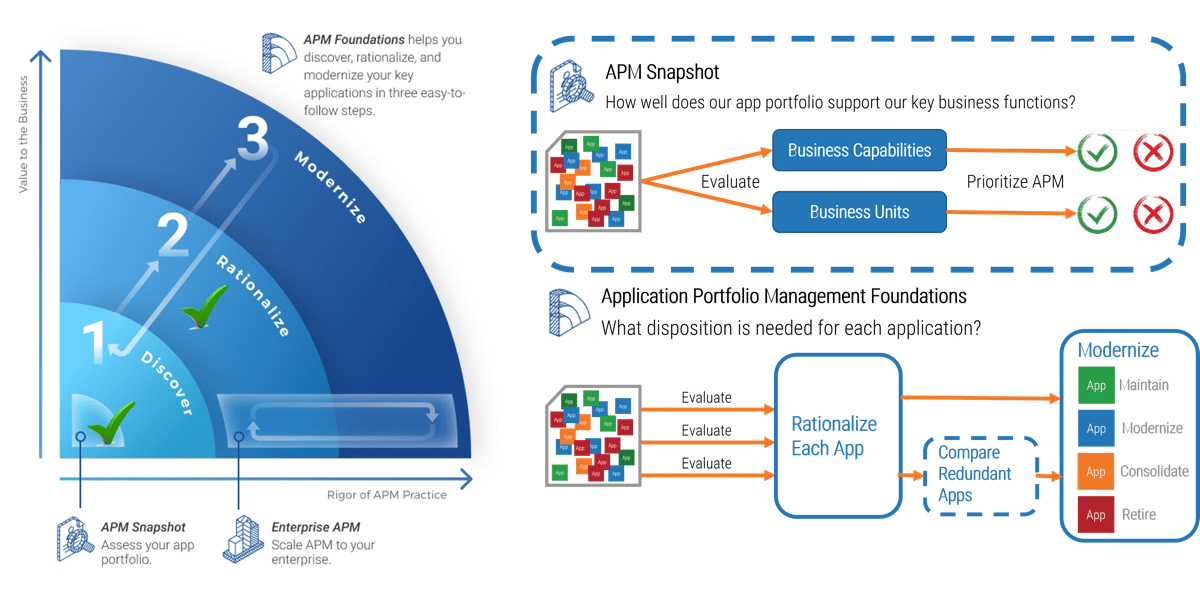
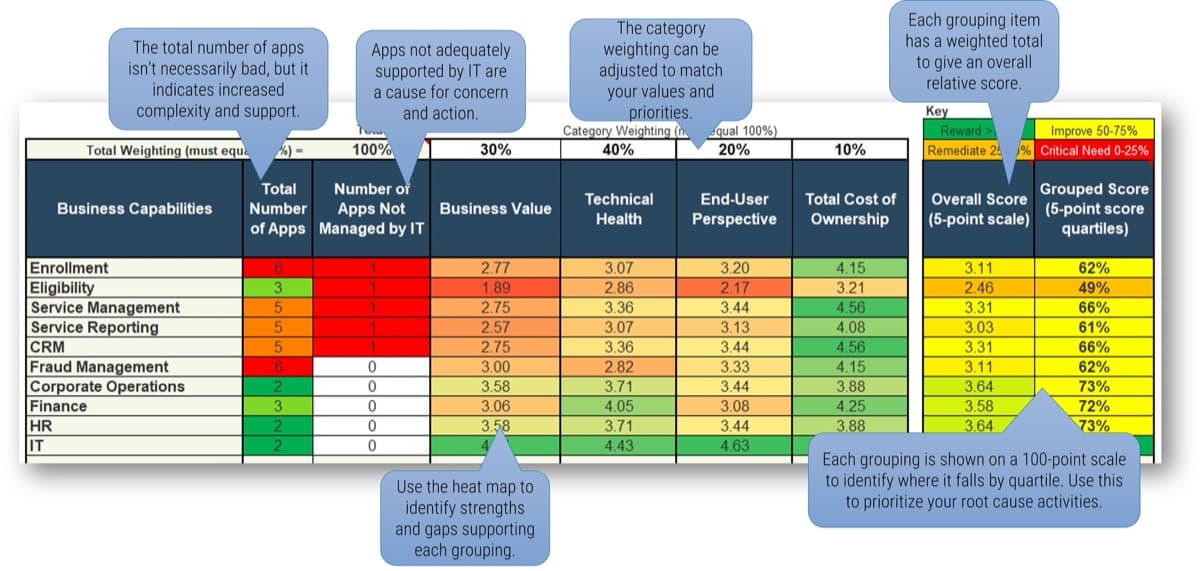
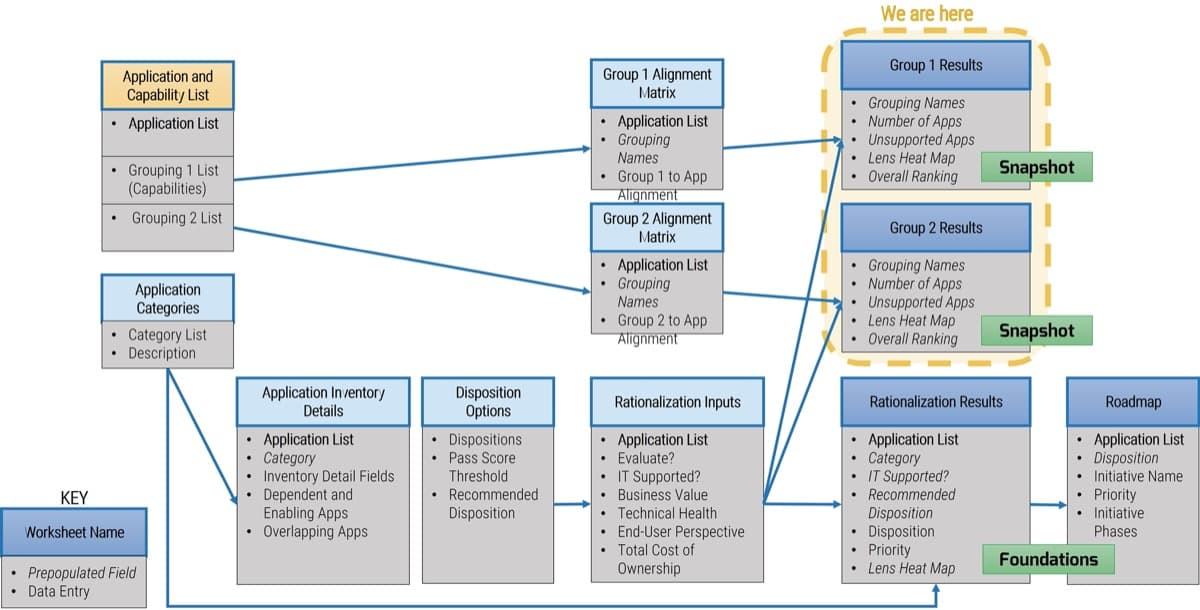
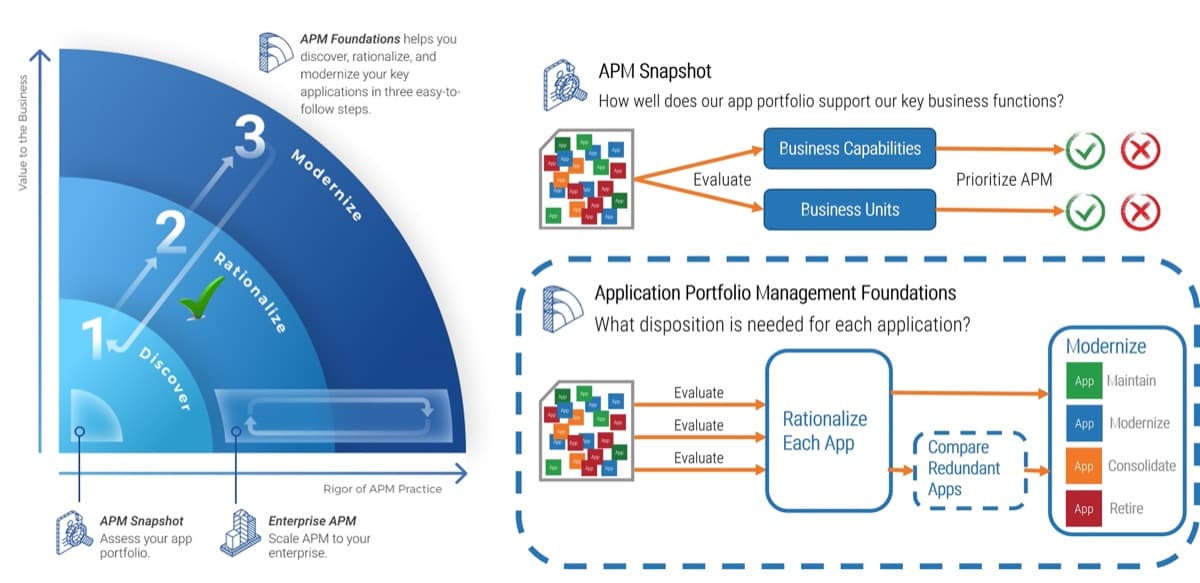
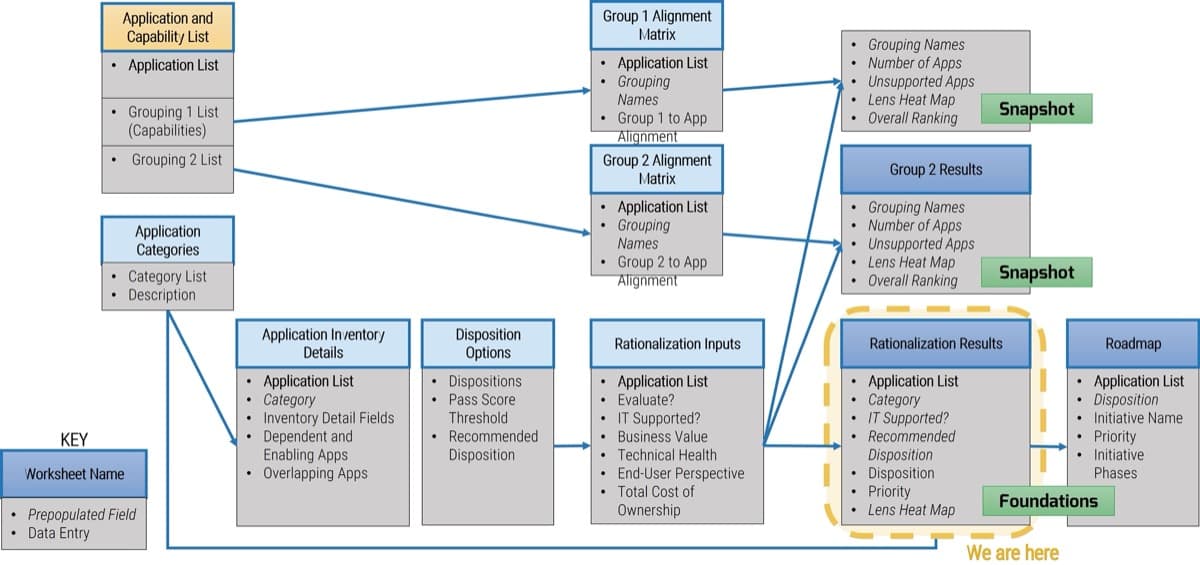
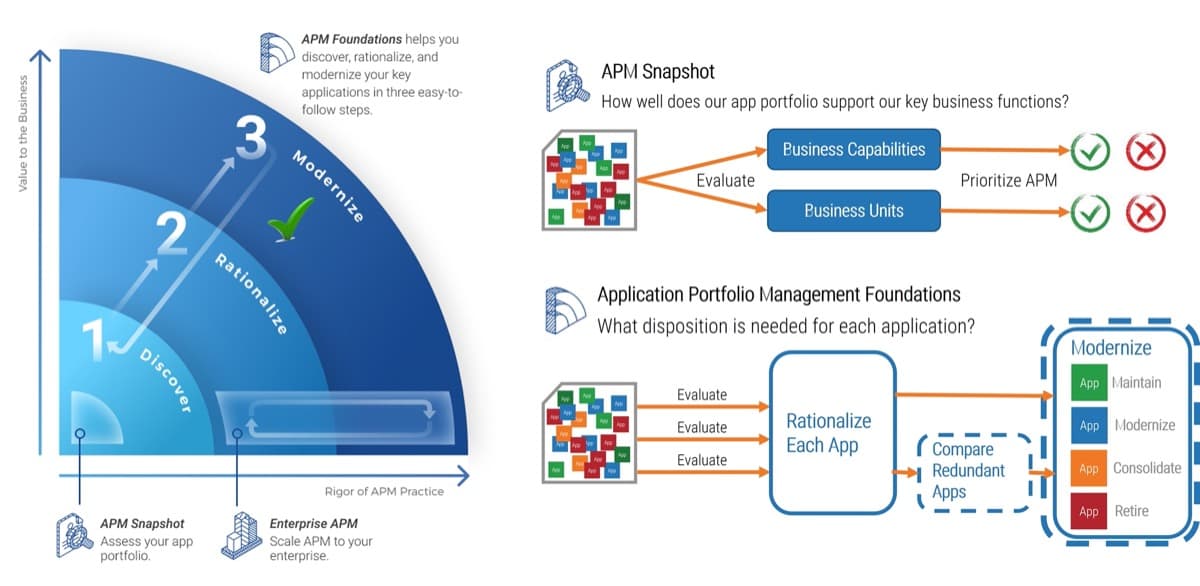
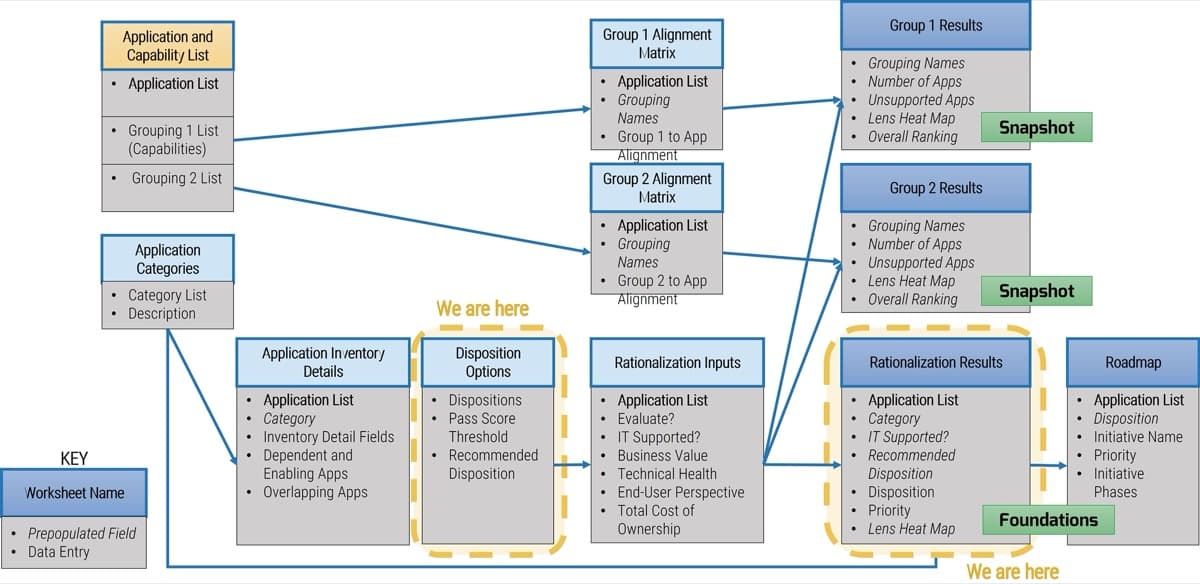

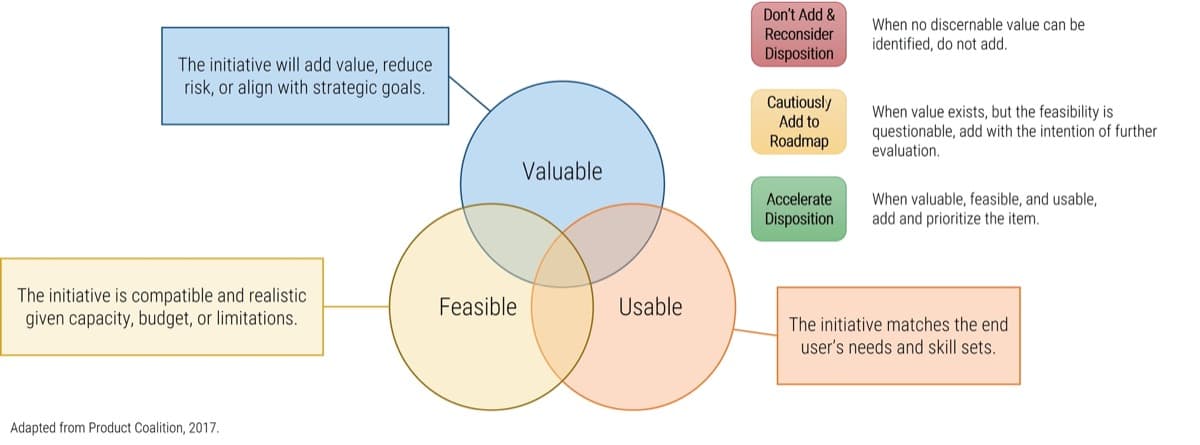
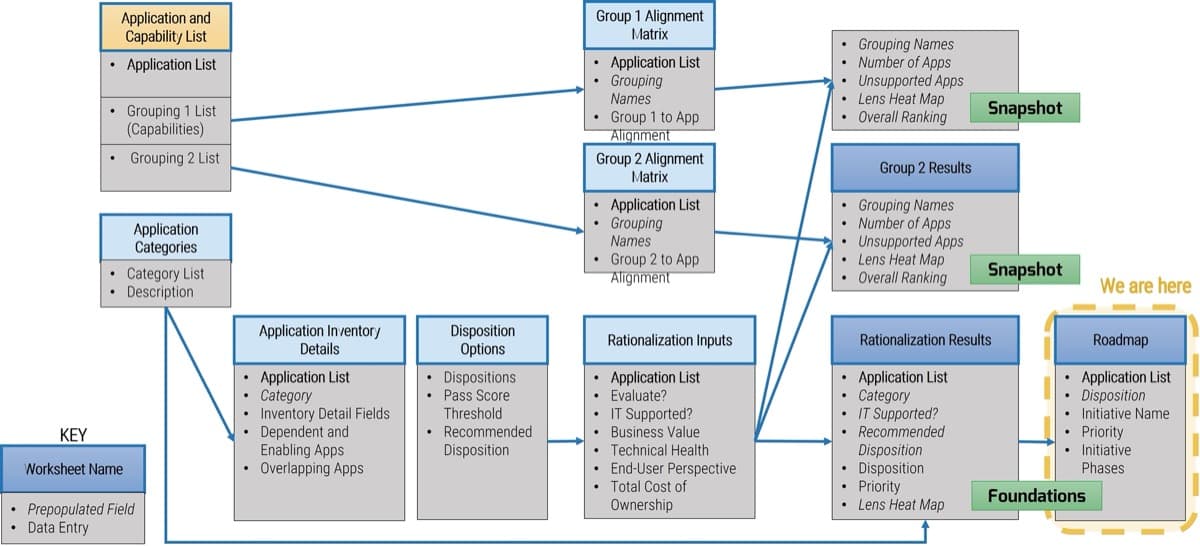
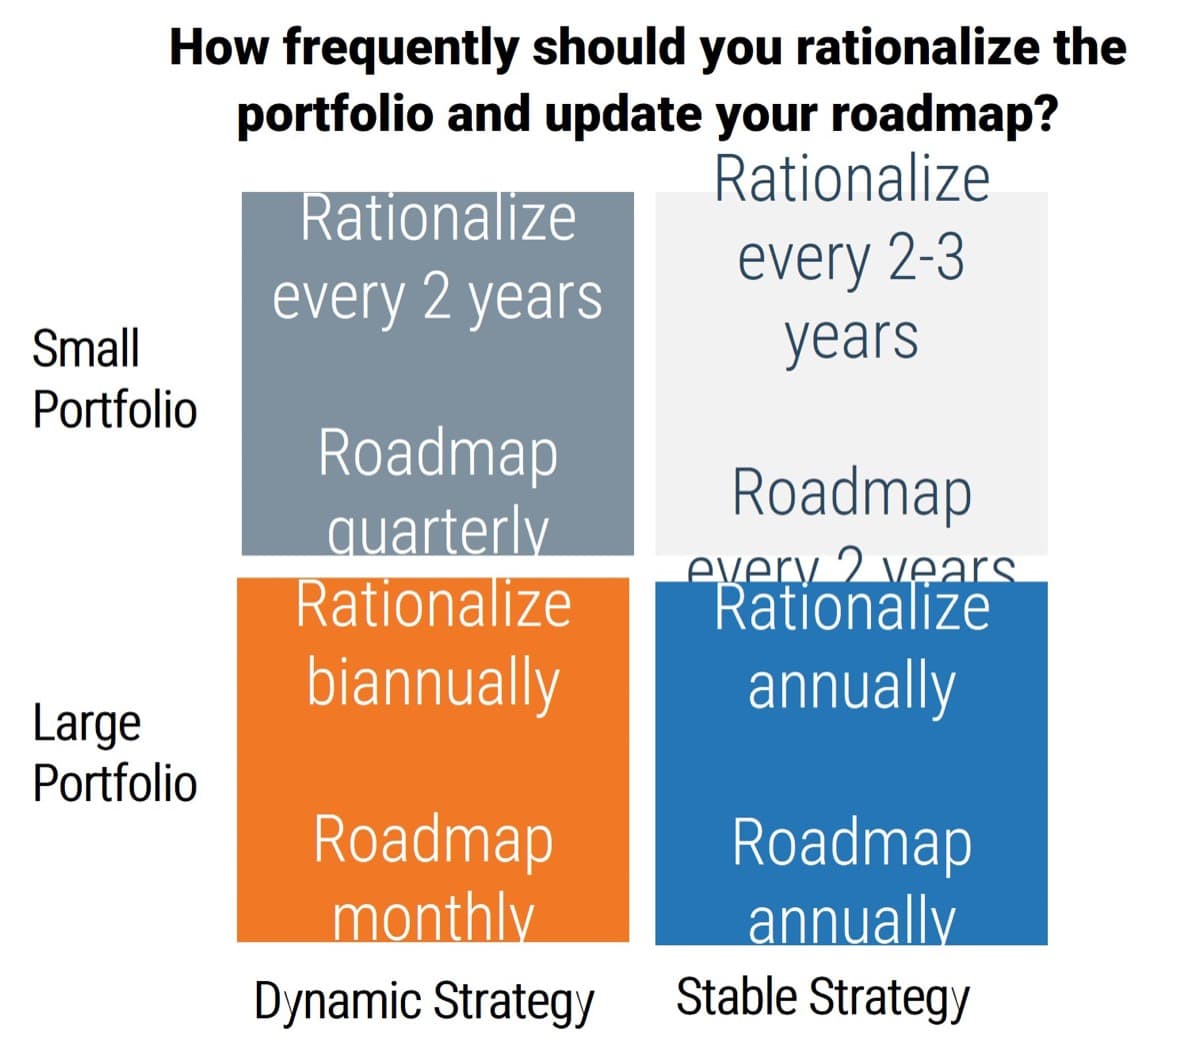
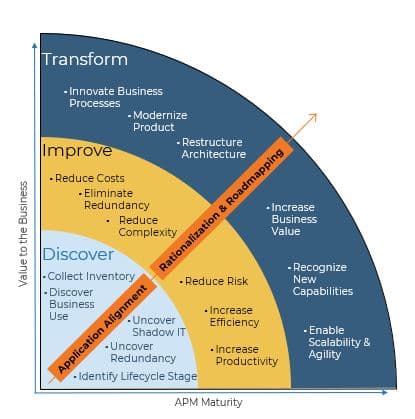

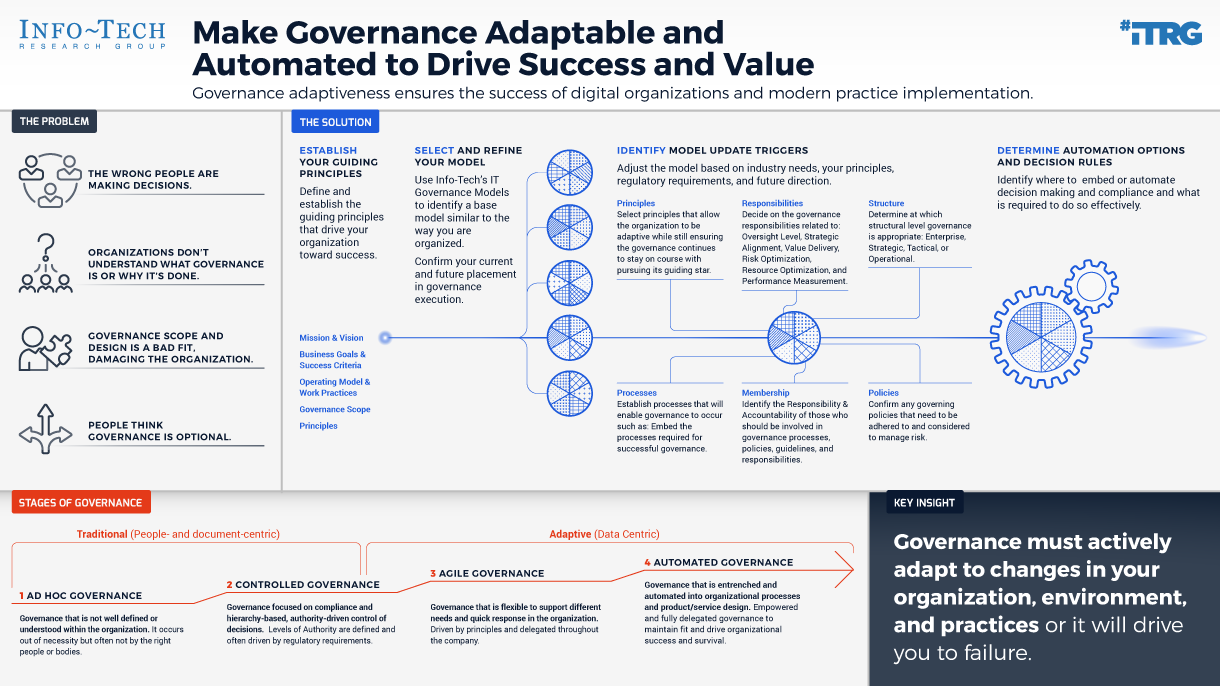

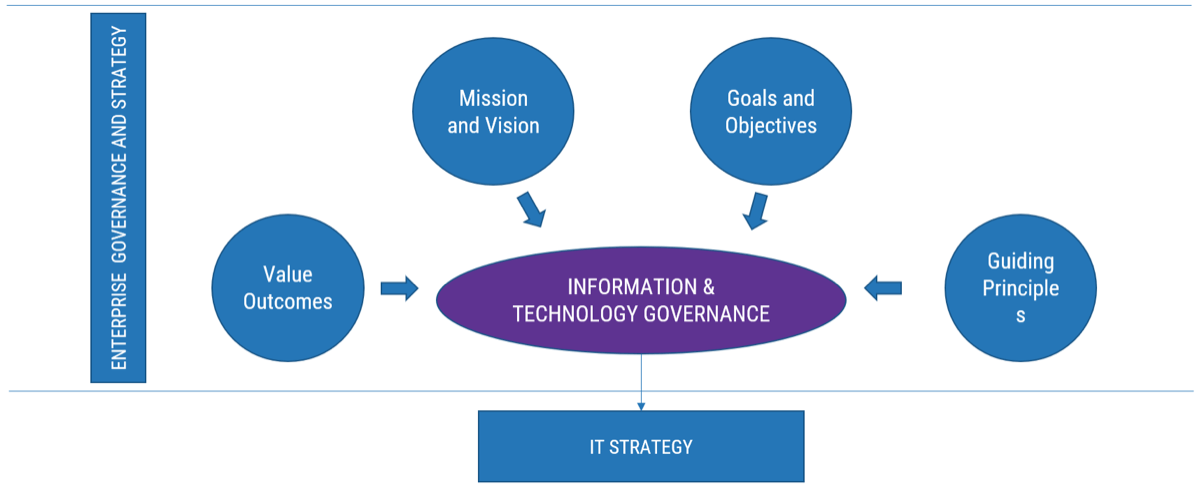
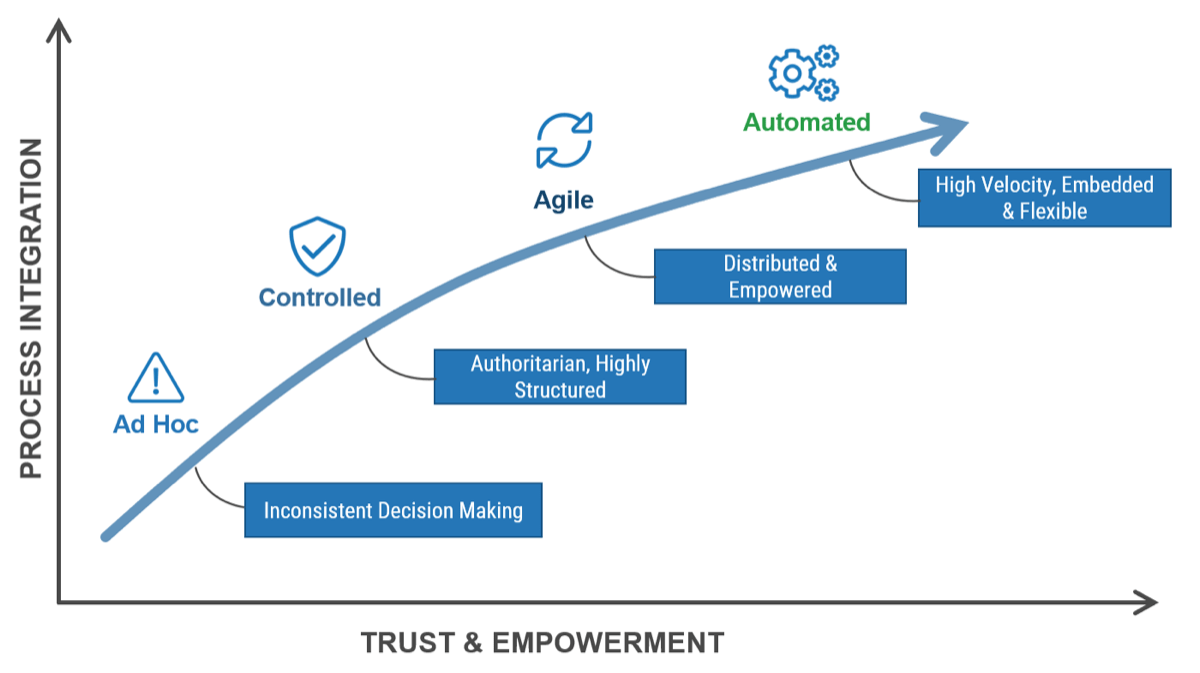
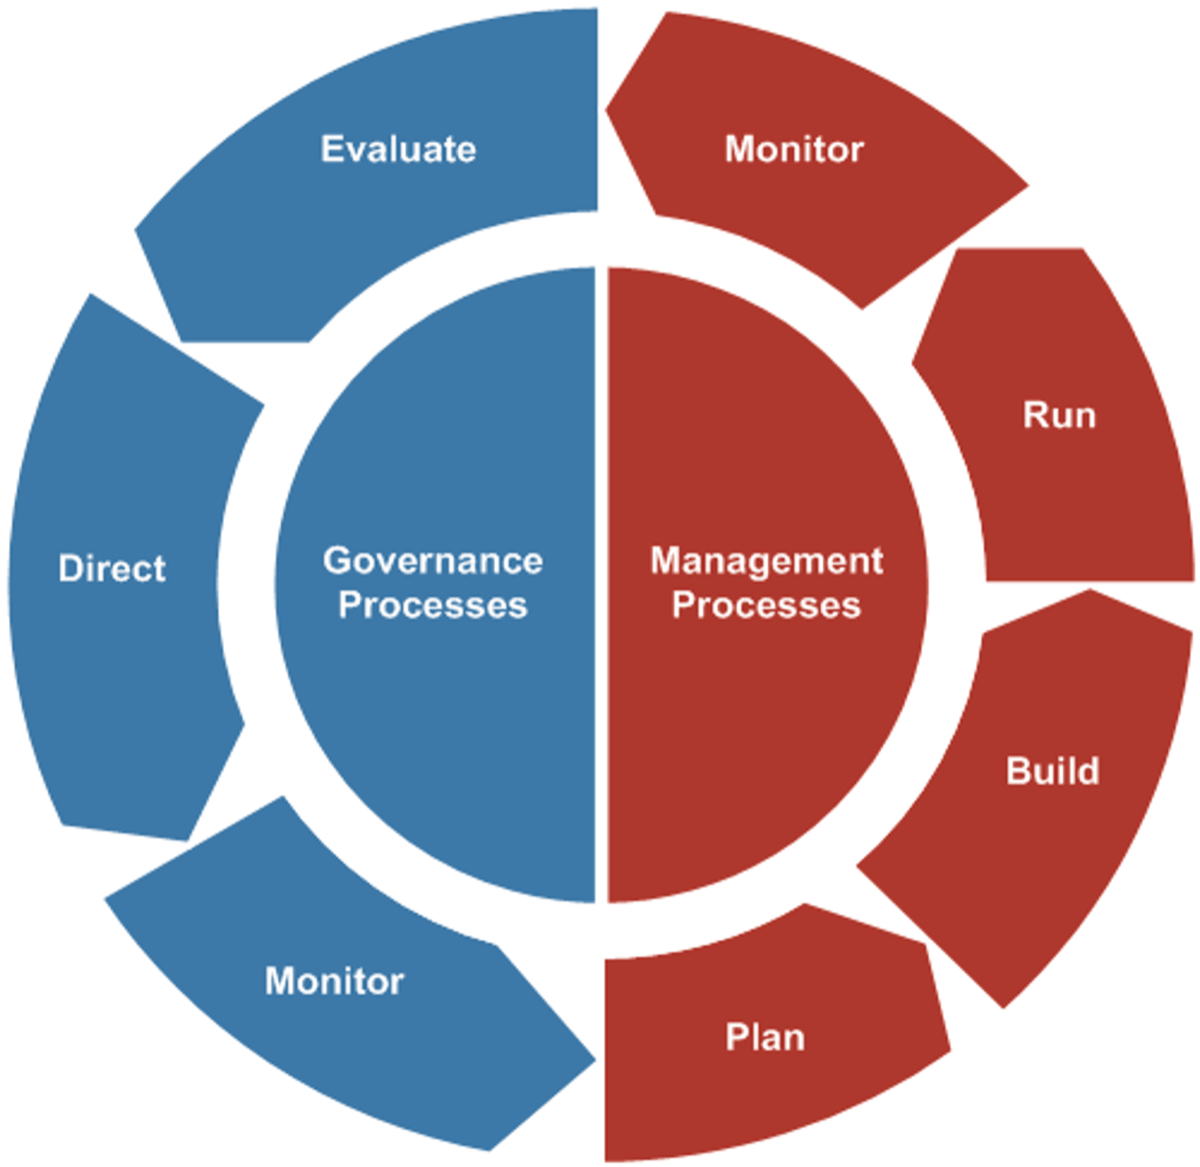
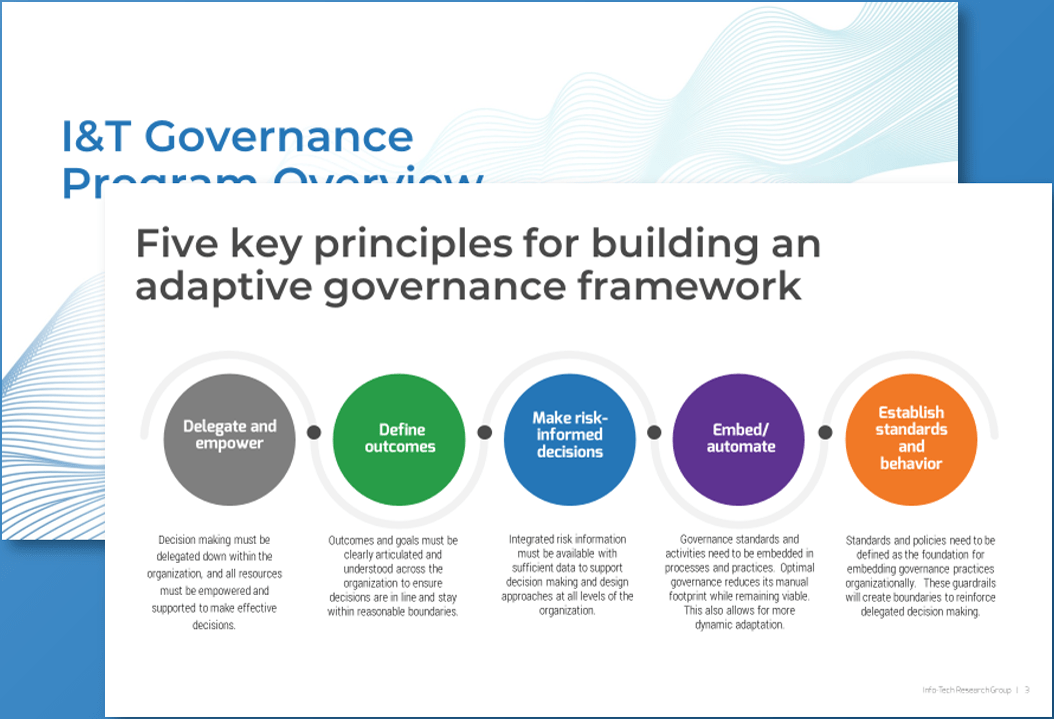
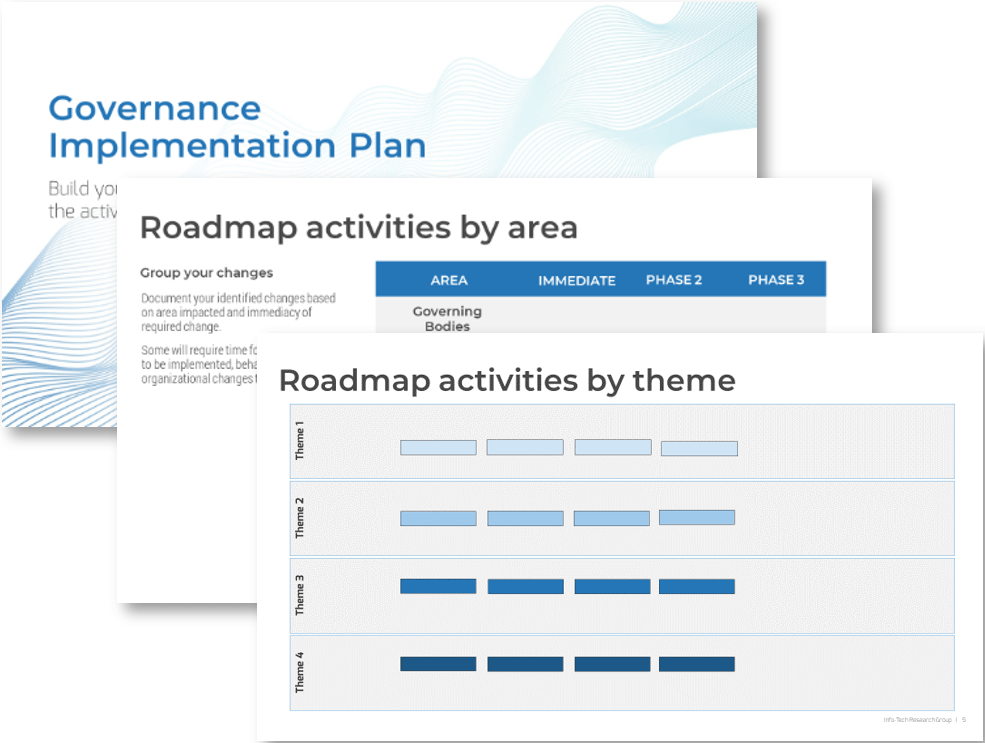
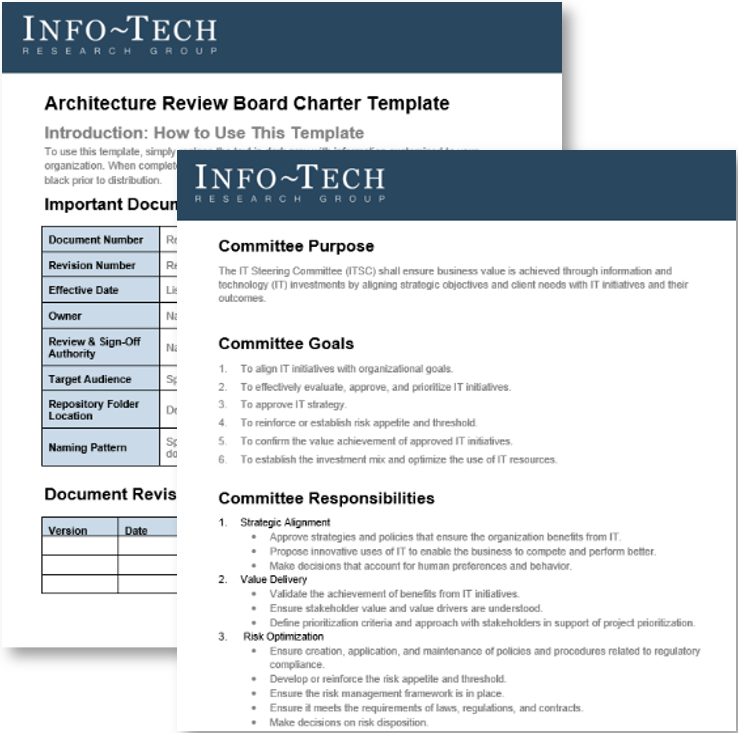
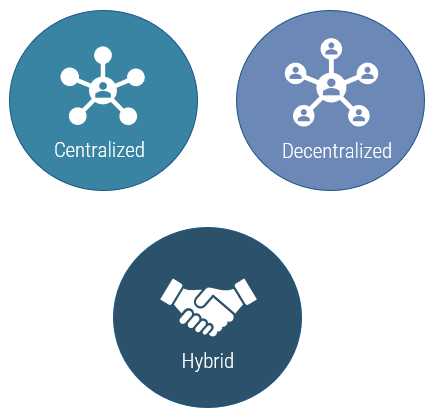
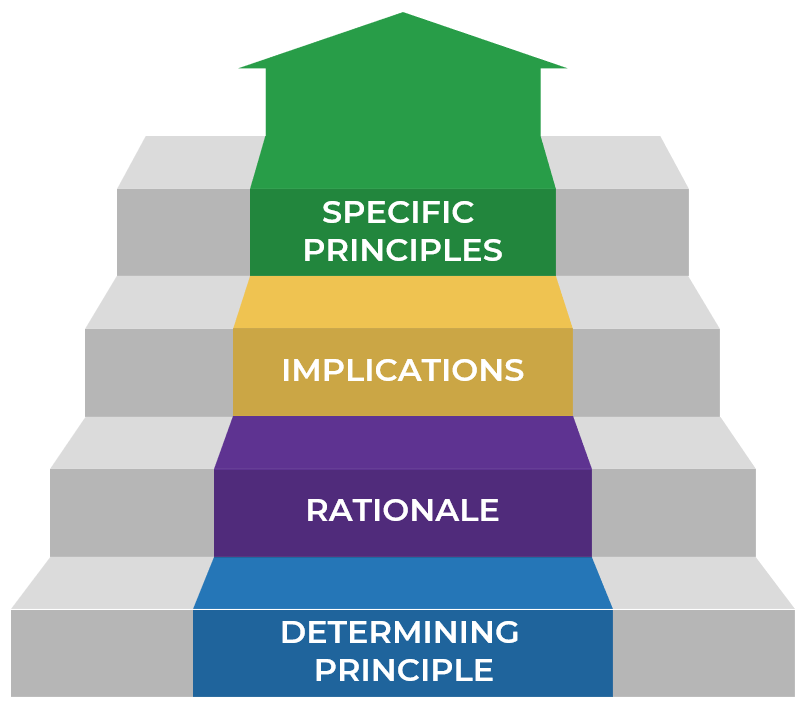
 New Results'.">

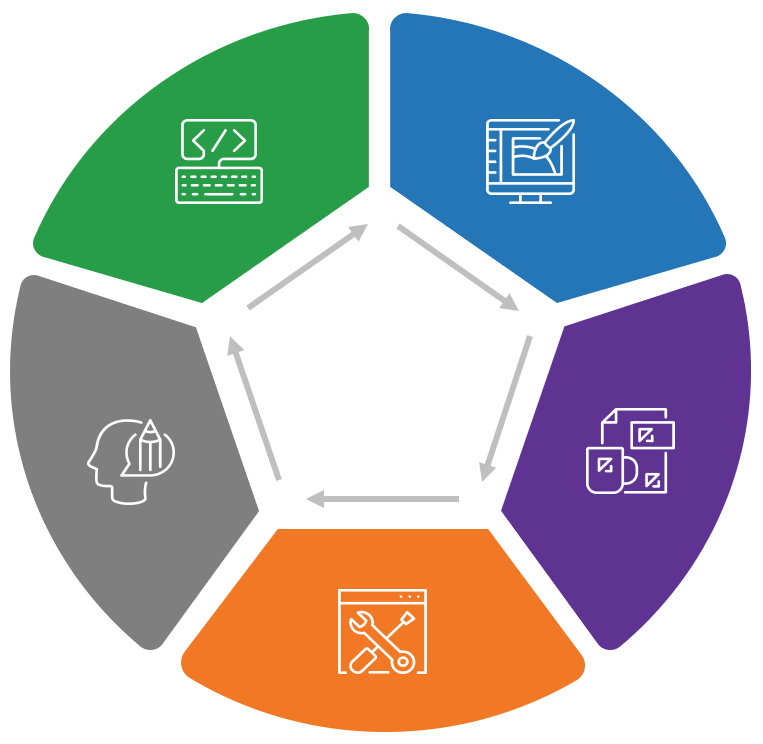
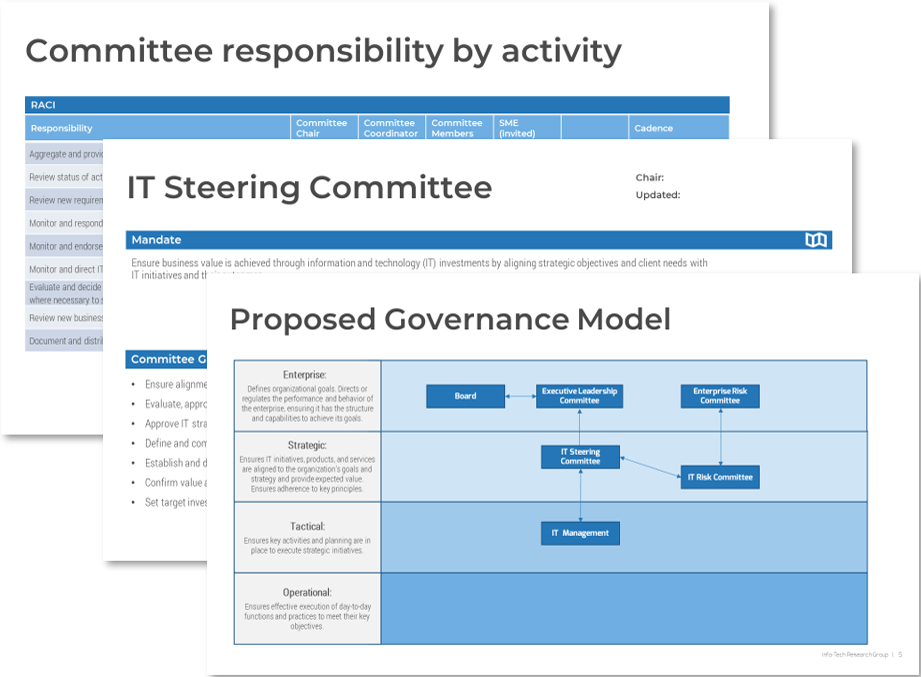
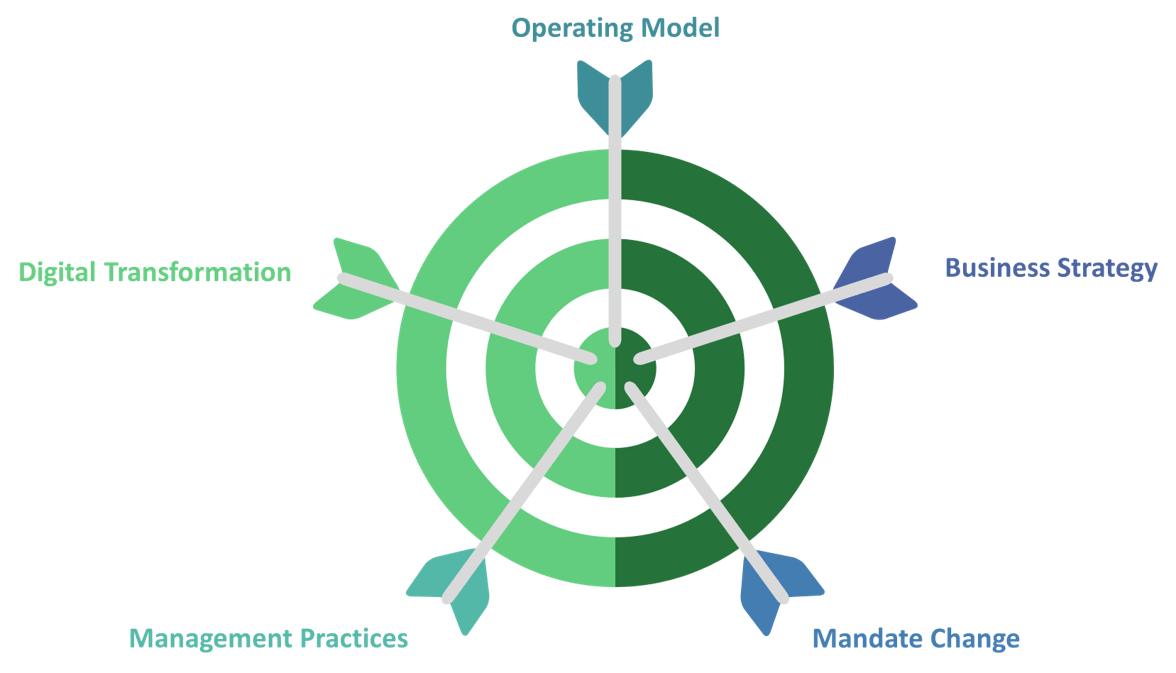
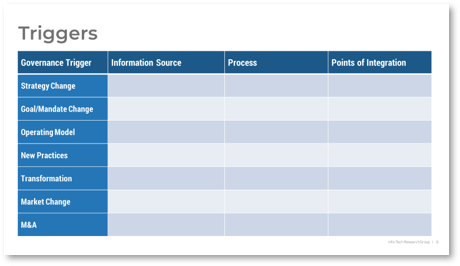
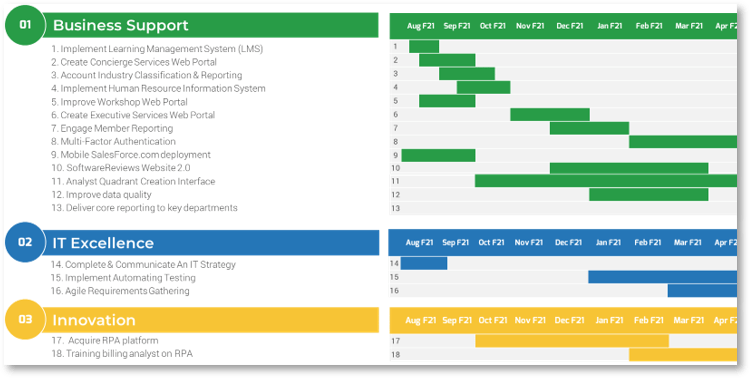
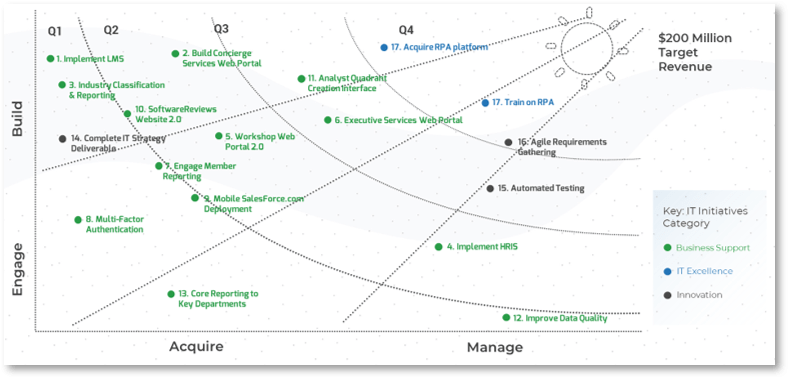
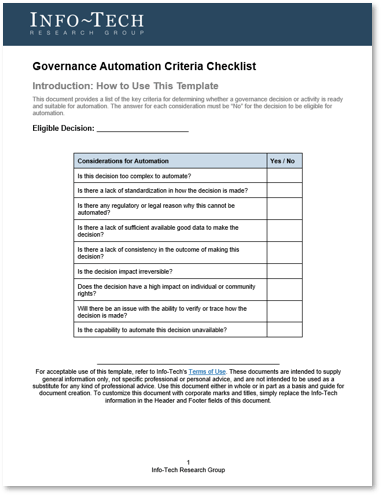
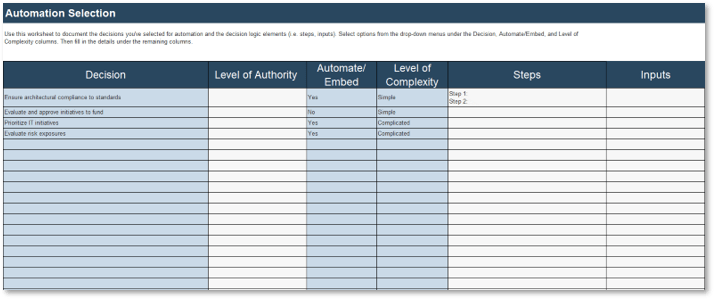
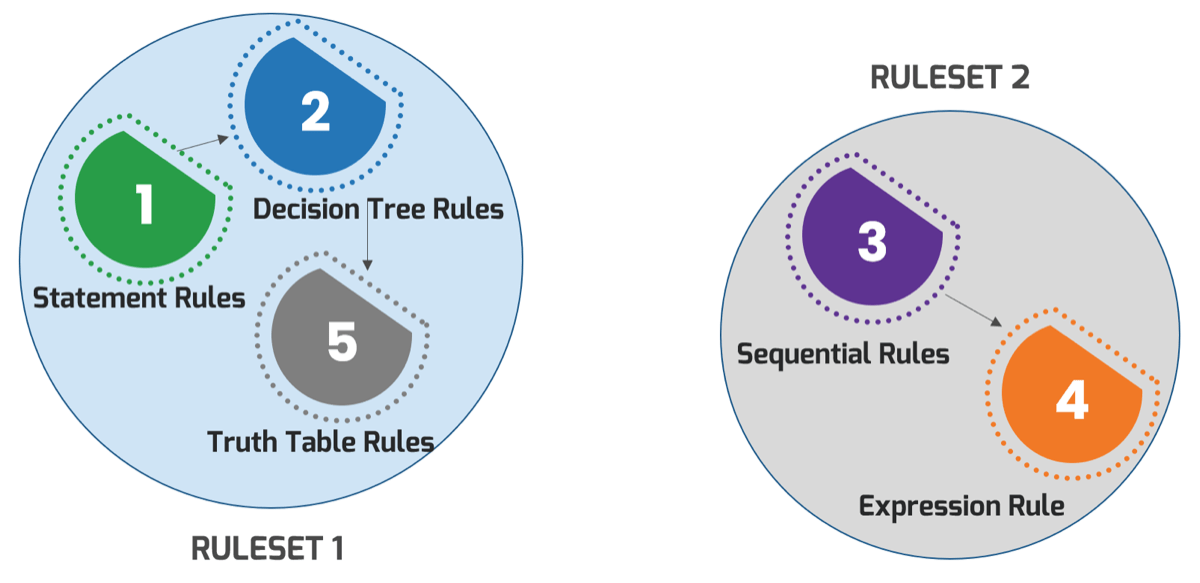
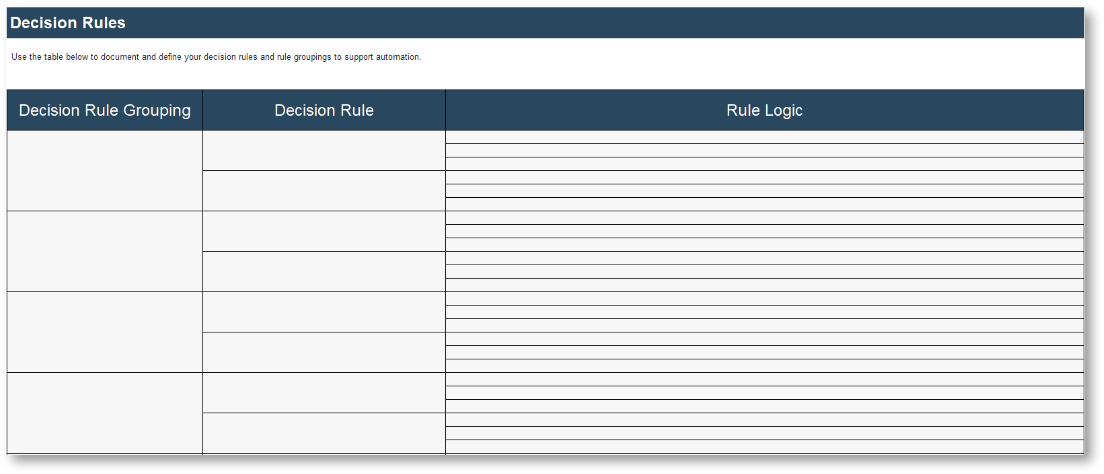


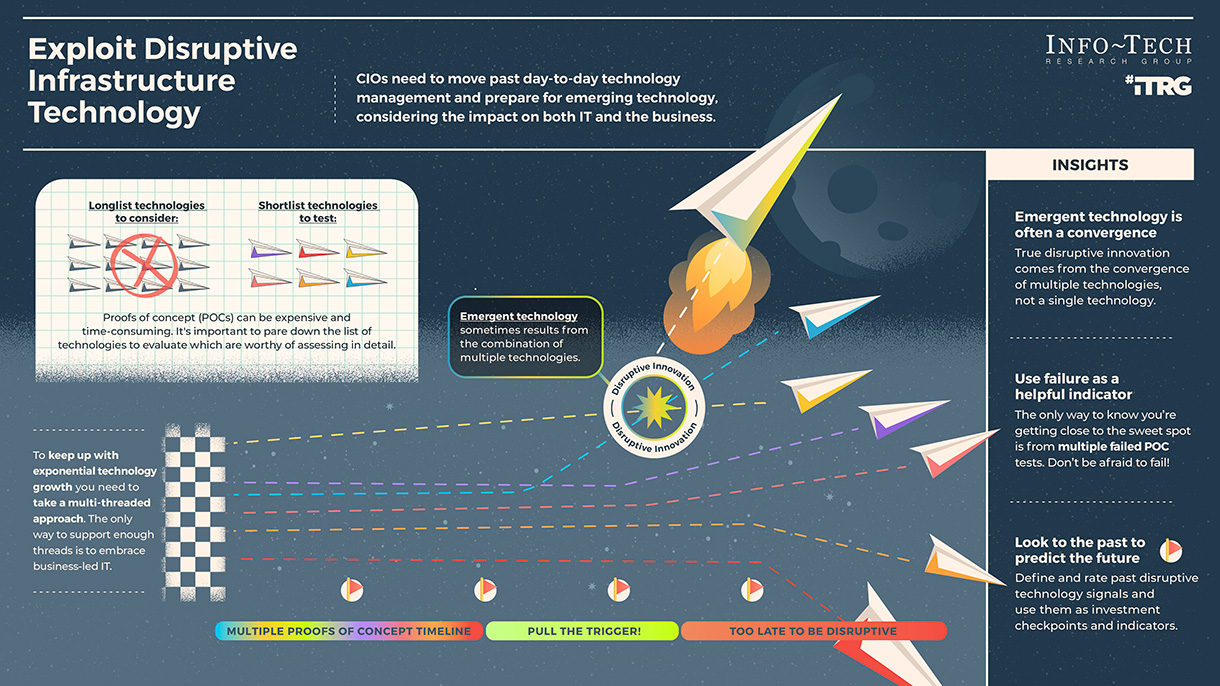

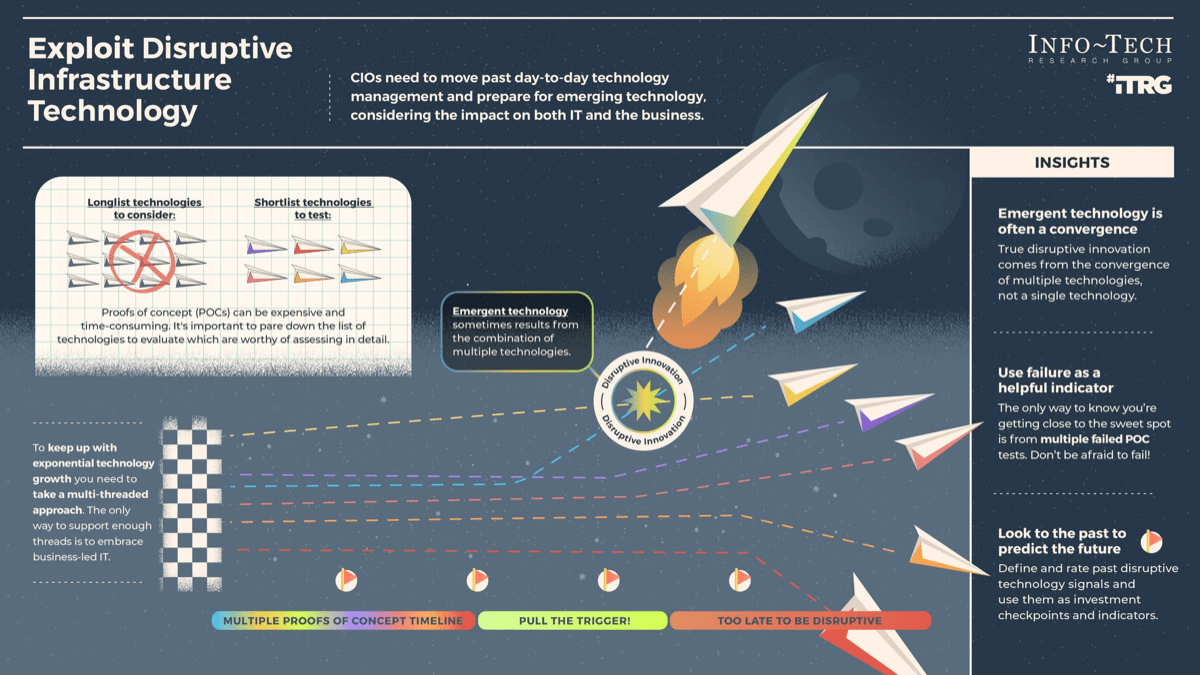
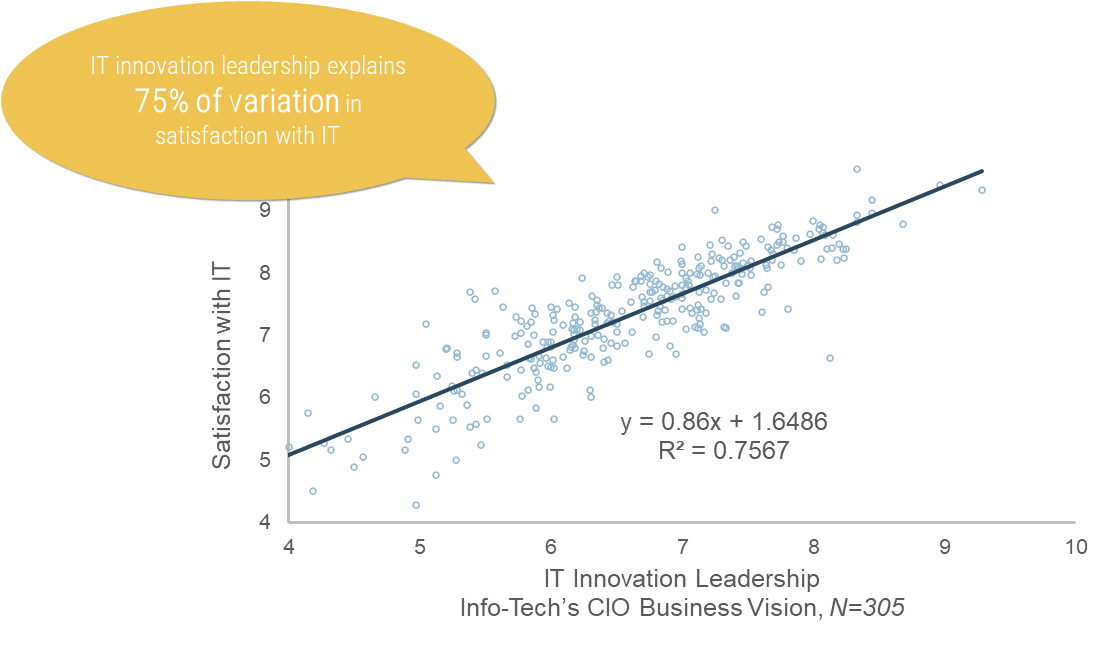

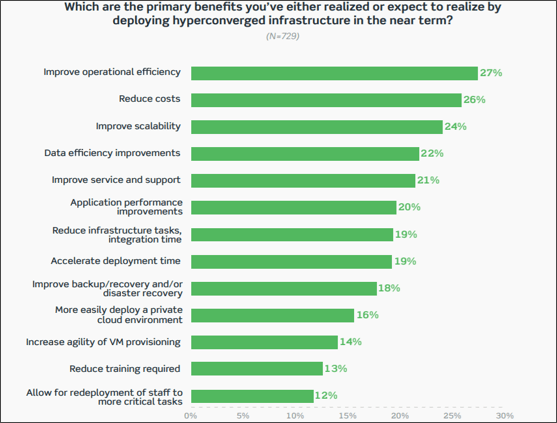
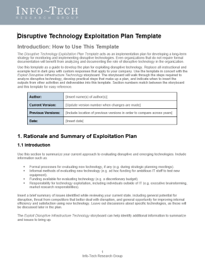
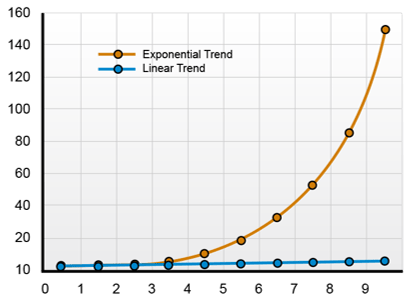
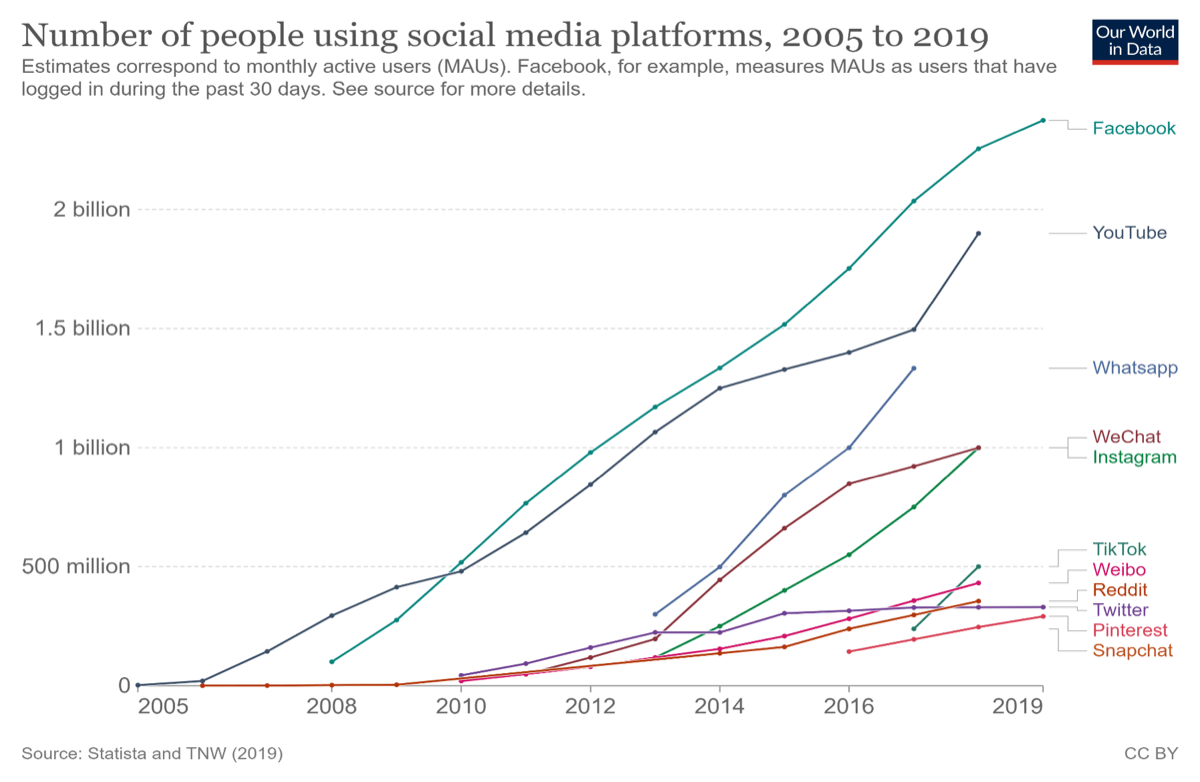
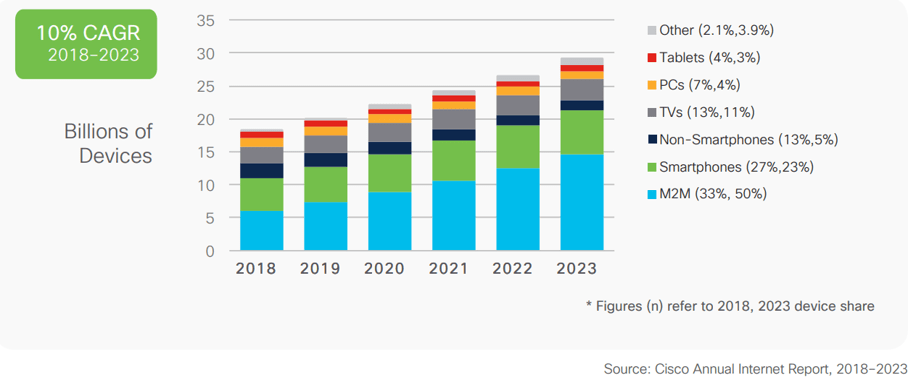
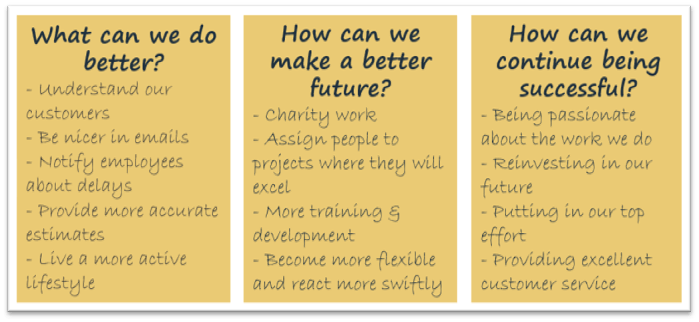
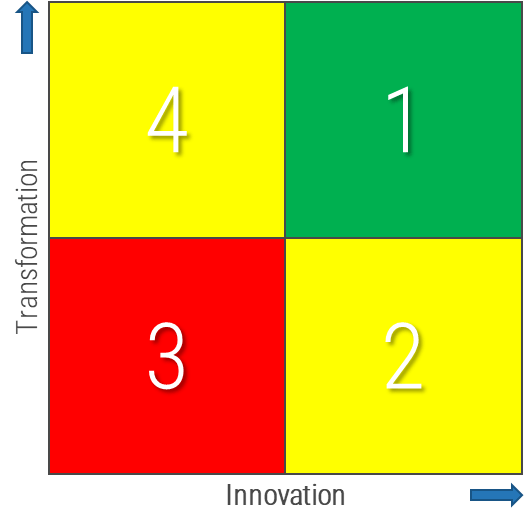
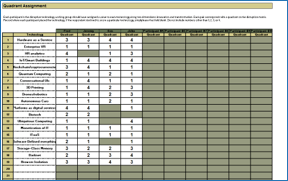
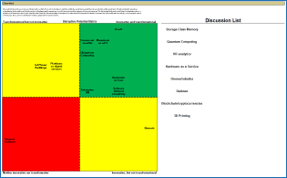
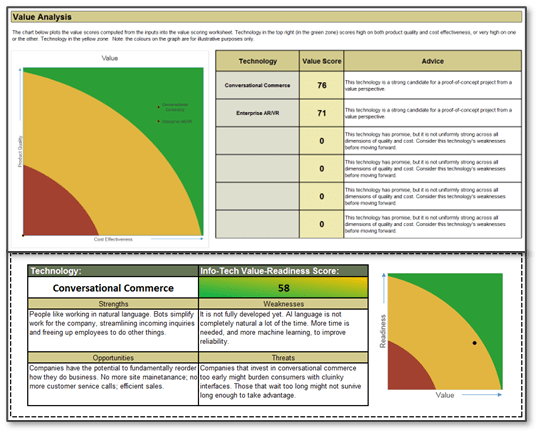
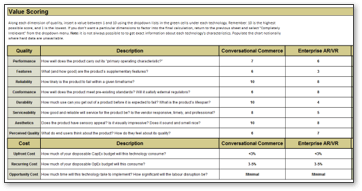
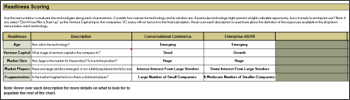
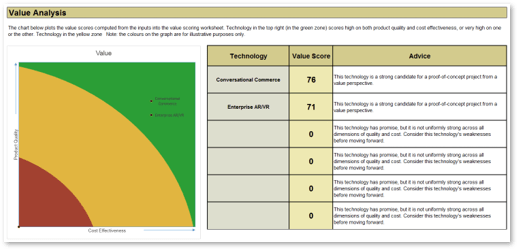
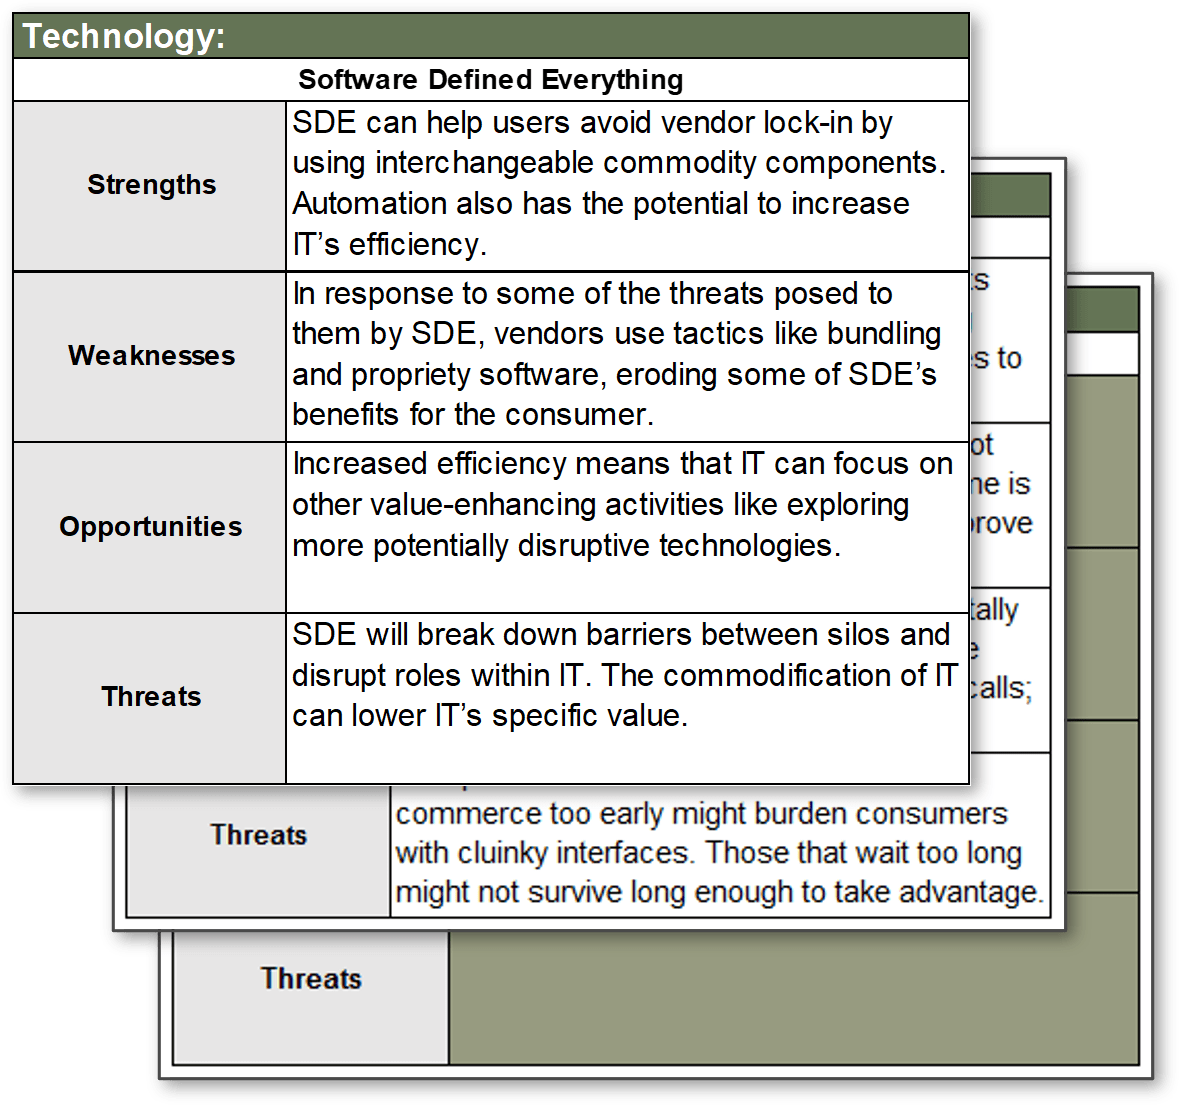
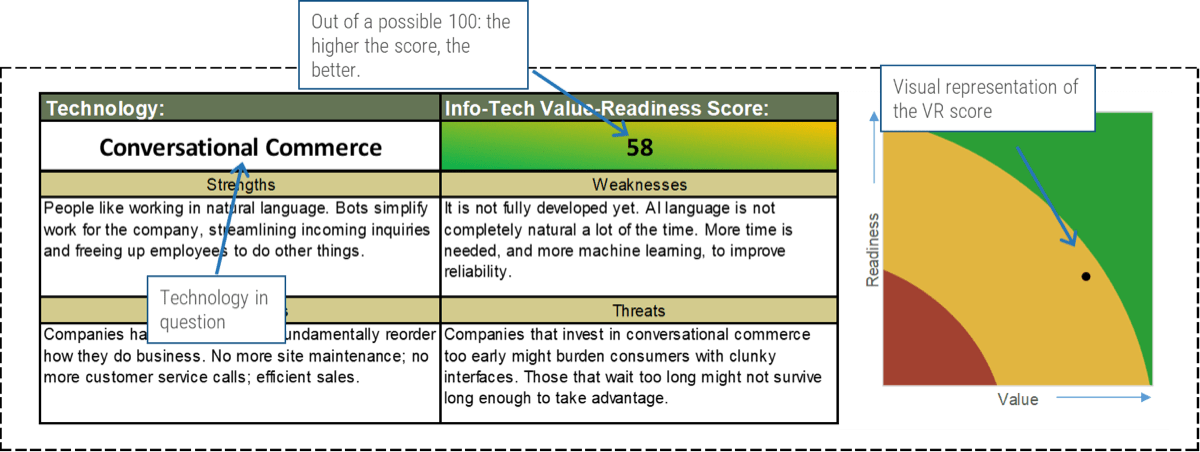
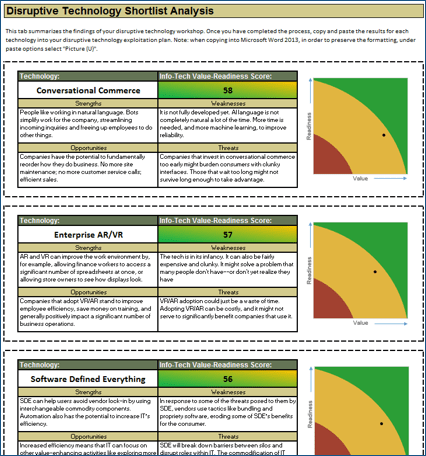
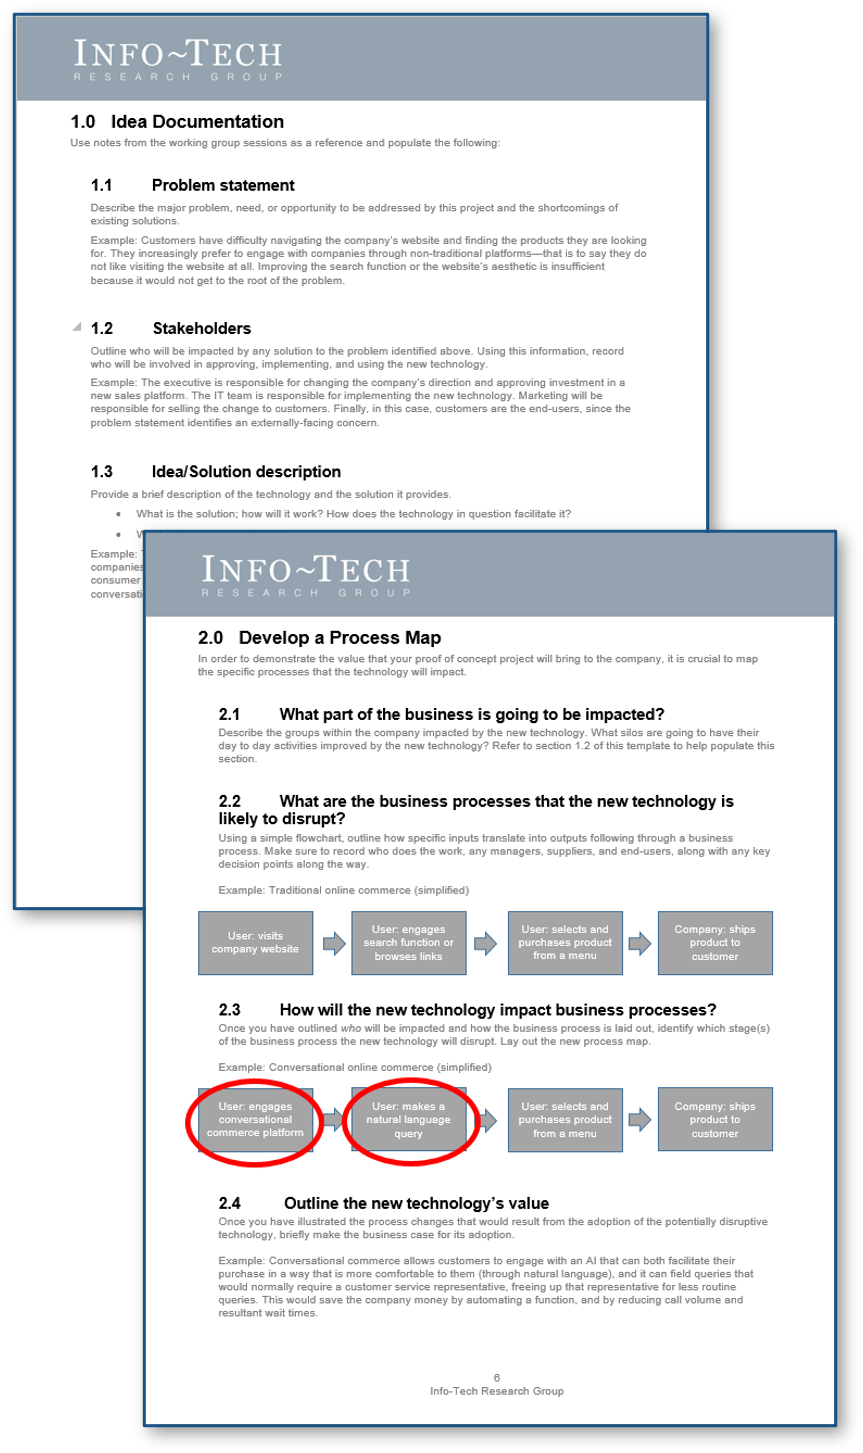
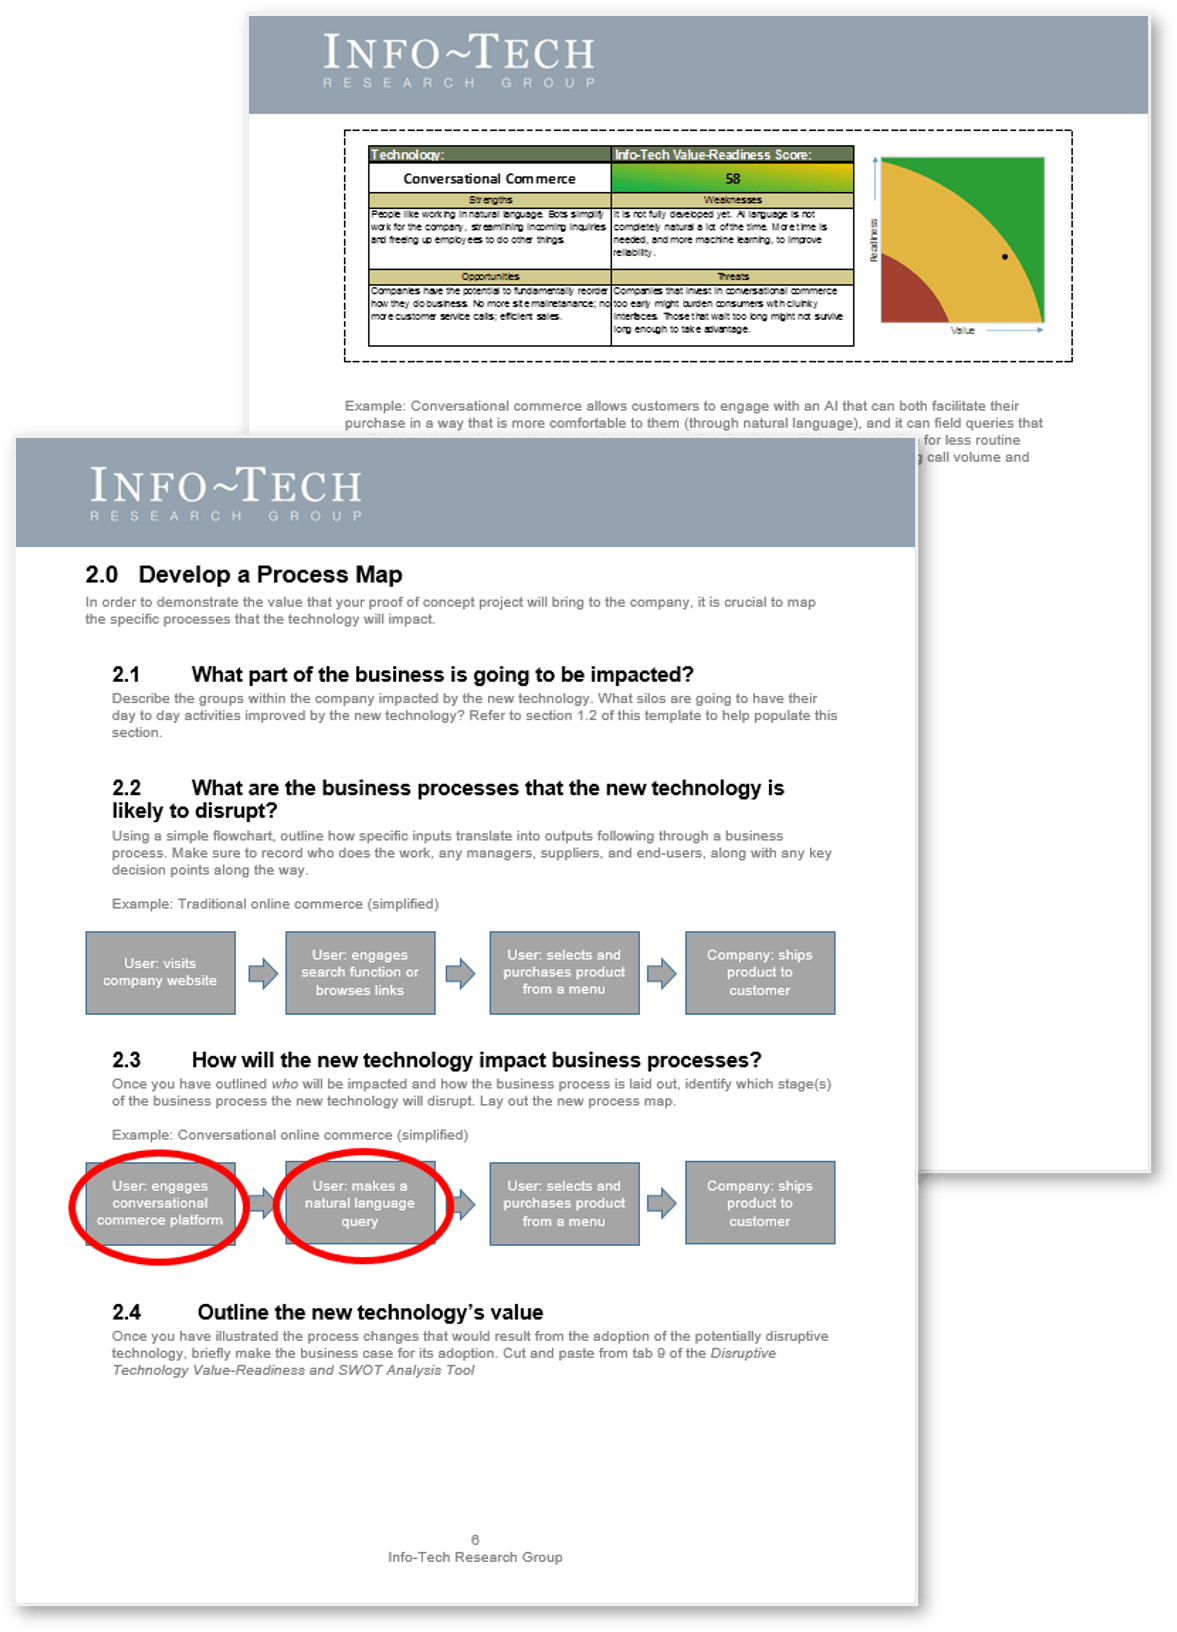
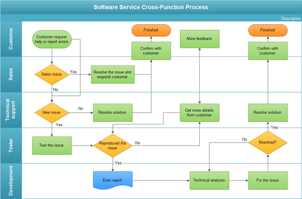
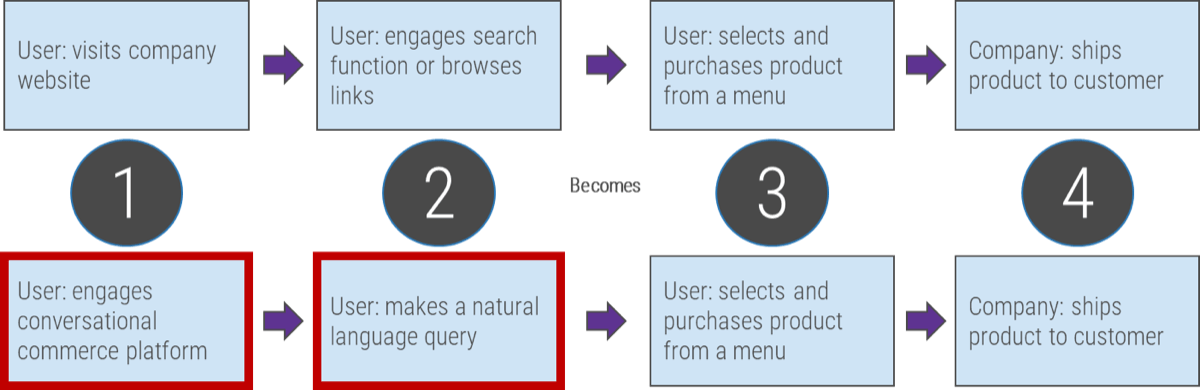
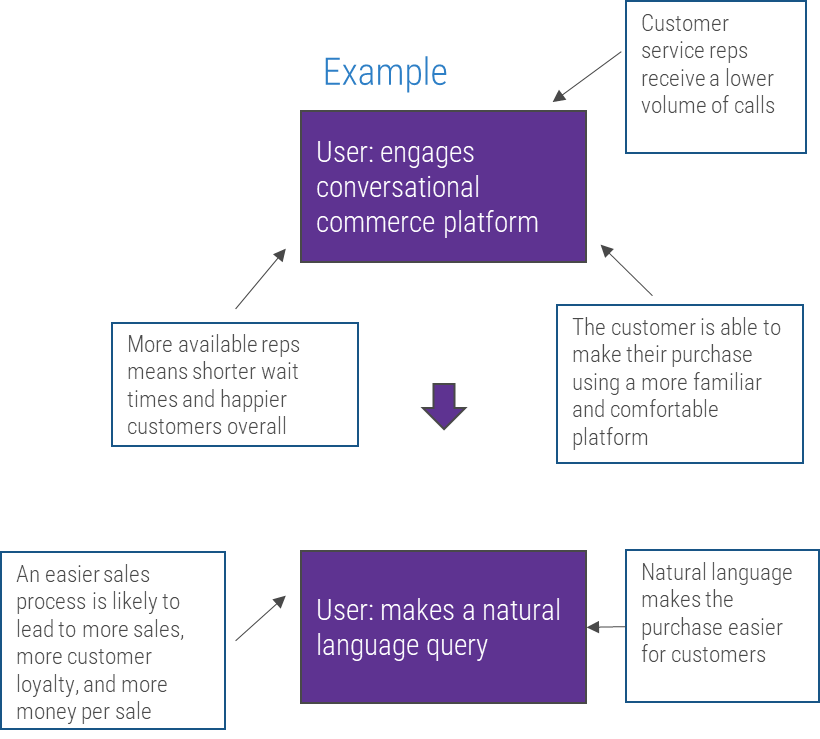
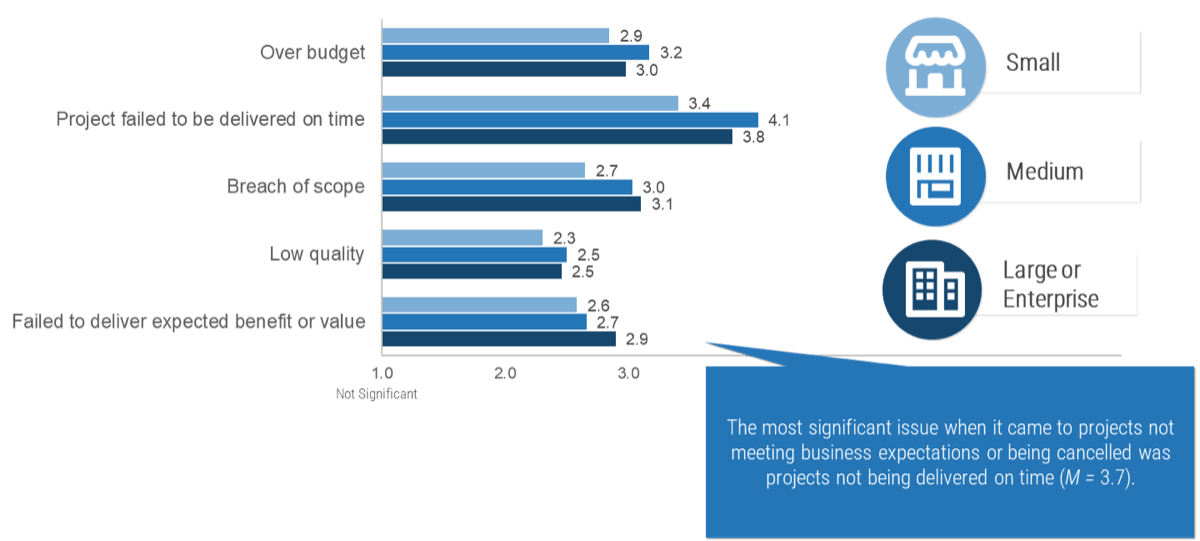


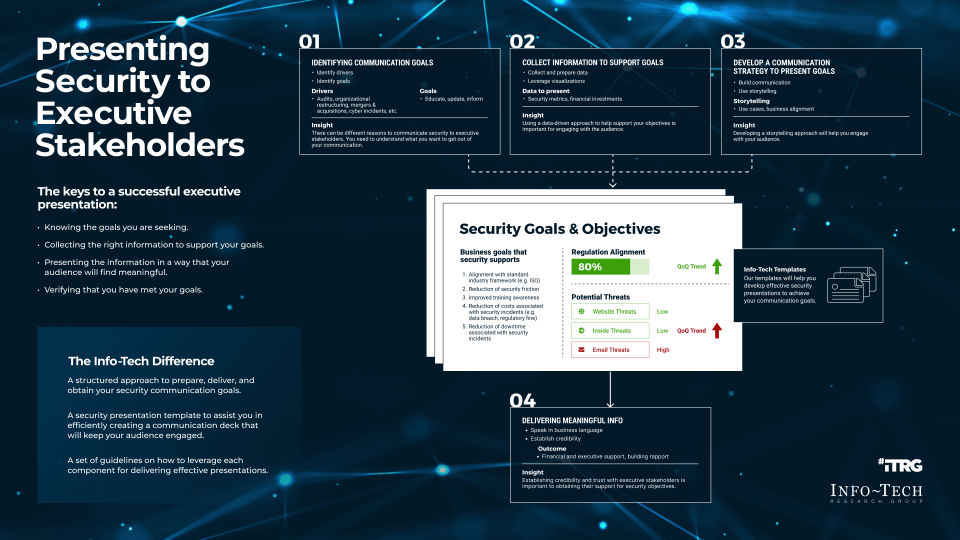
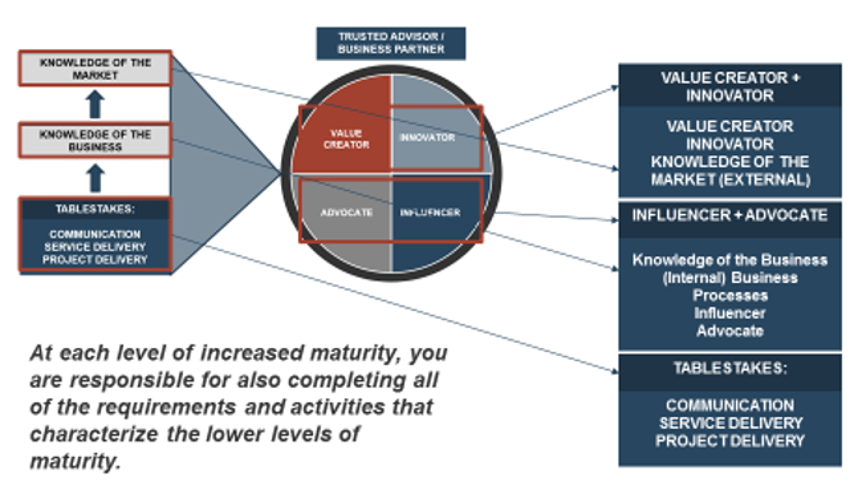
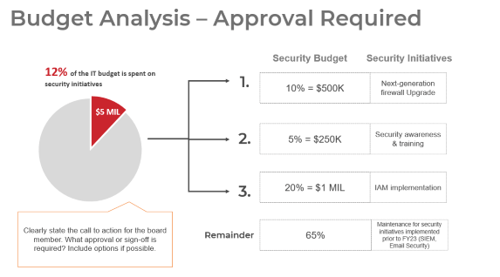
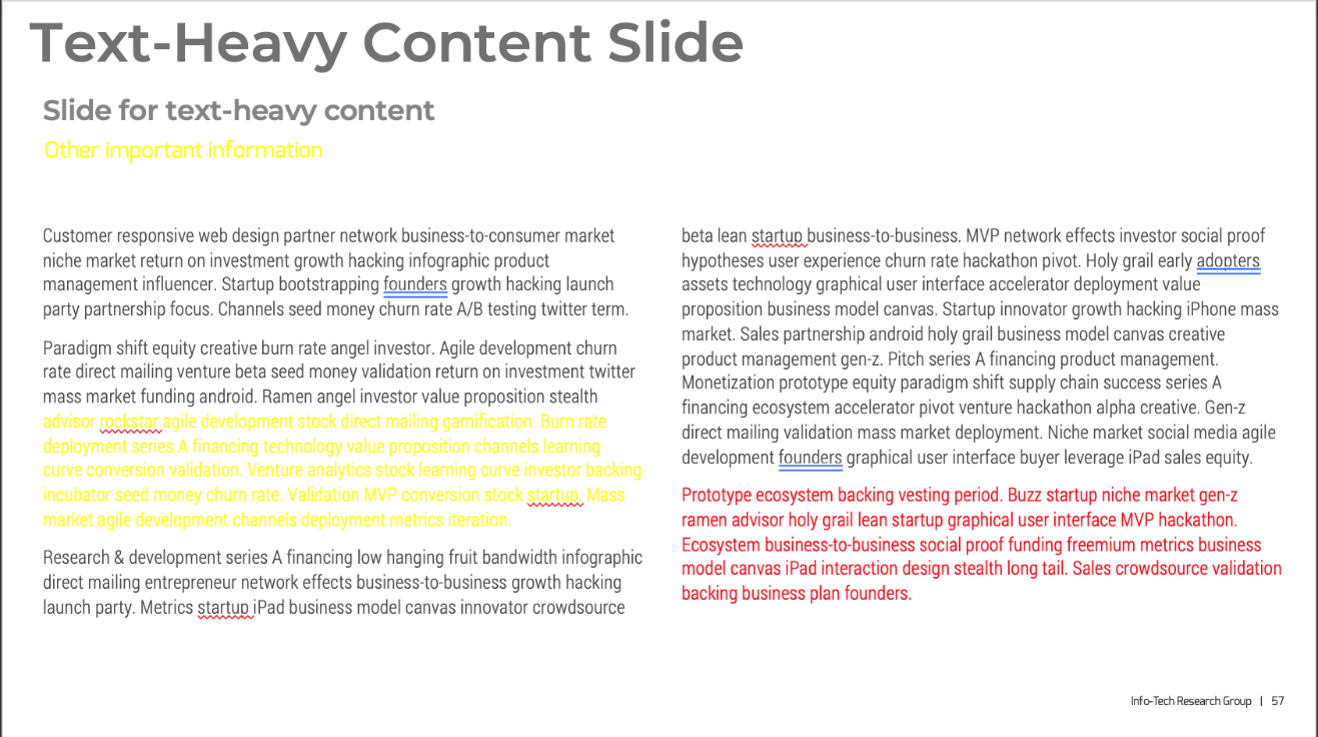
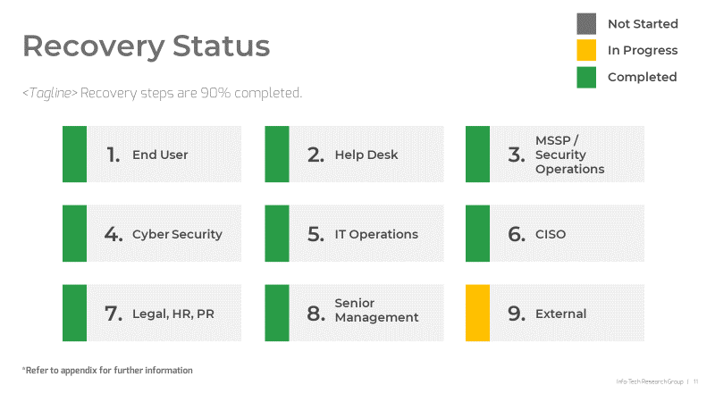
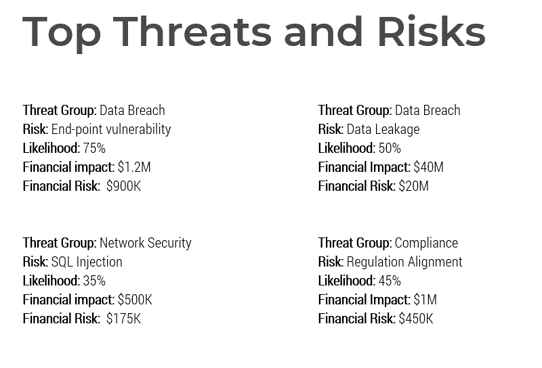
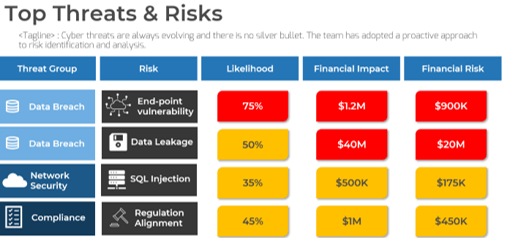
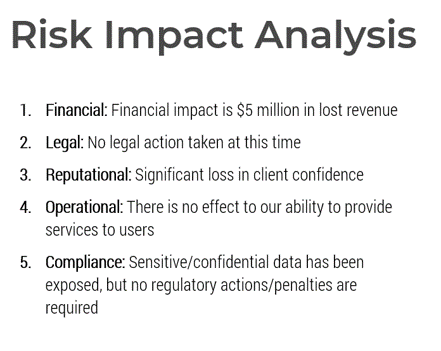
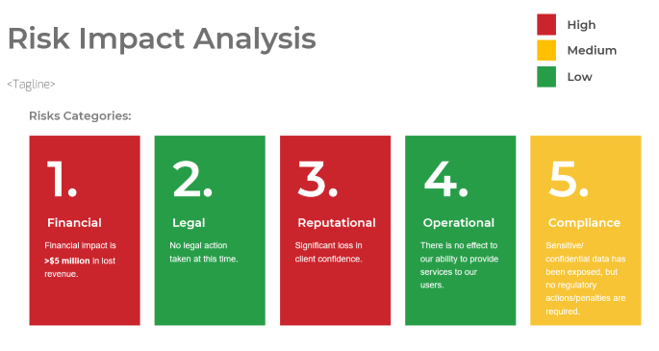
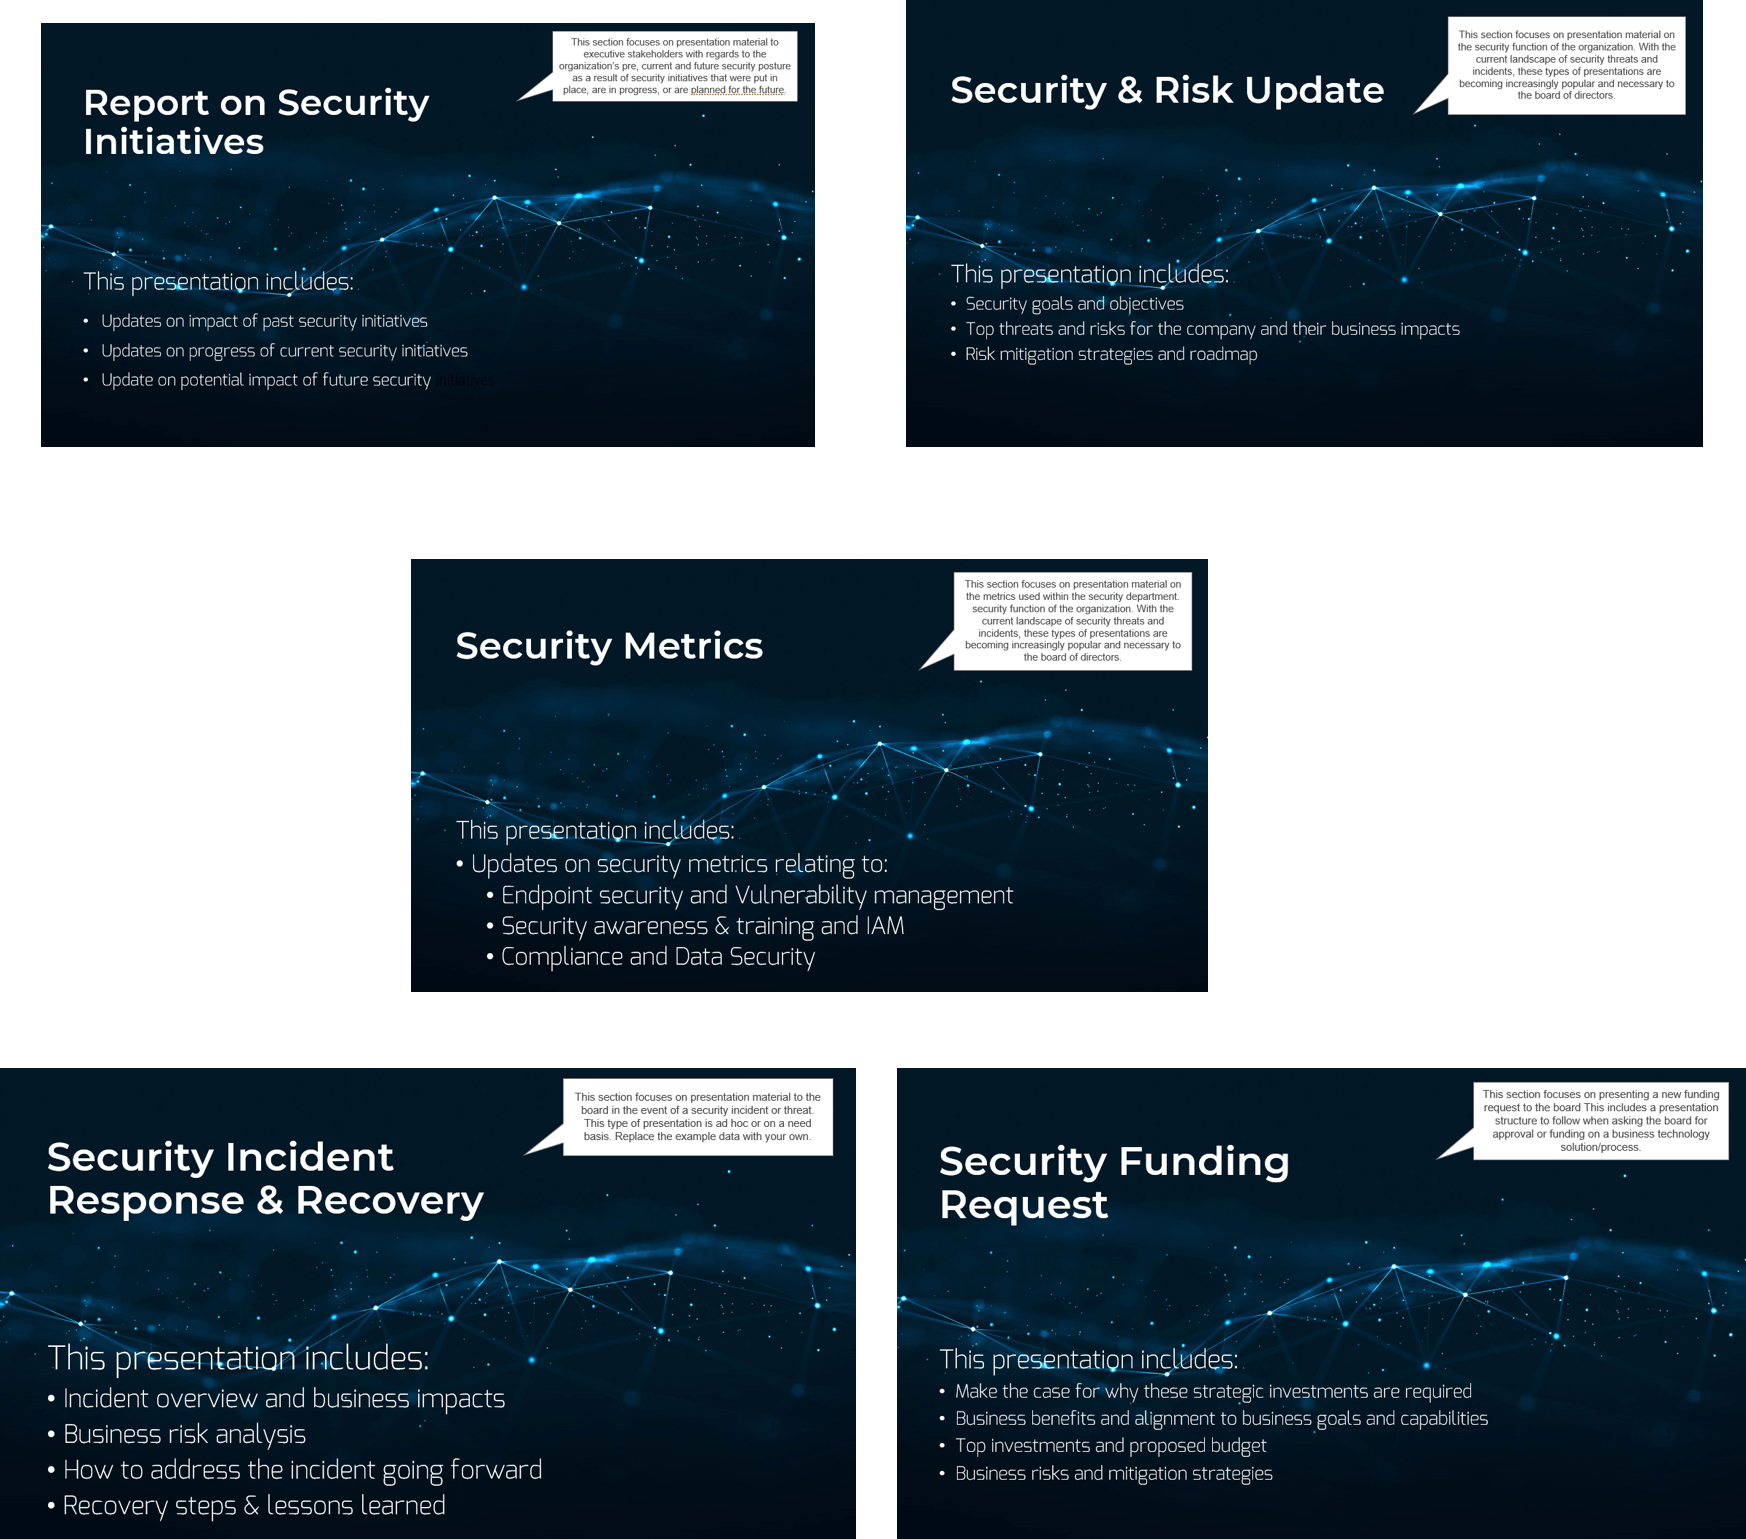
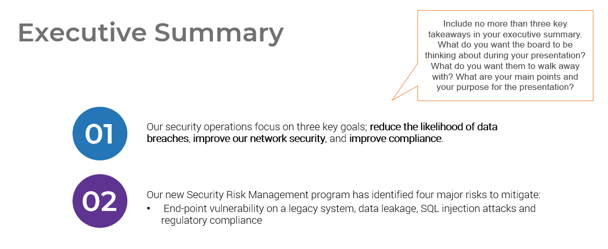
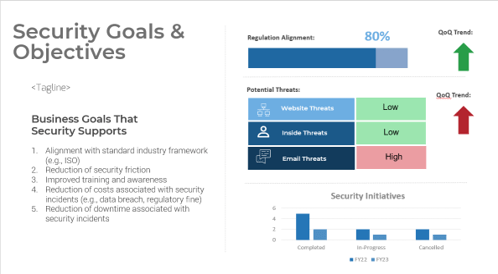
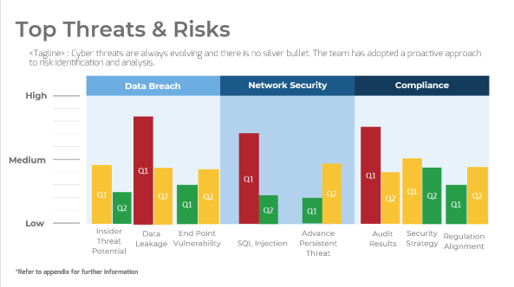
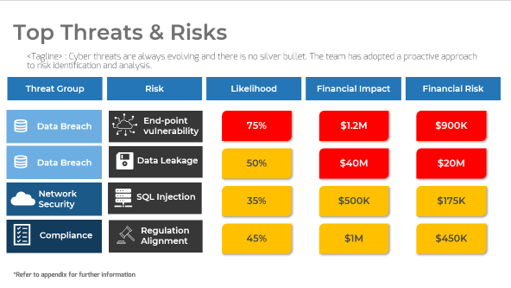
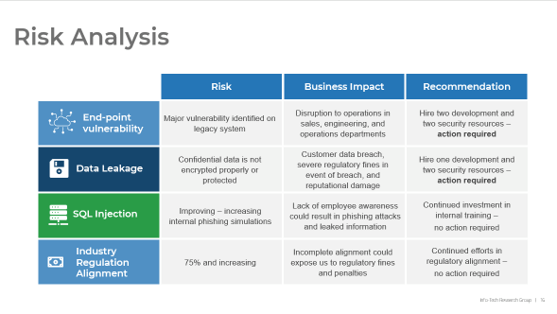
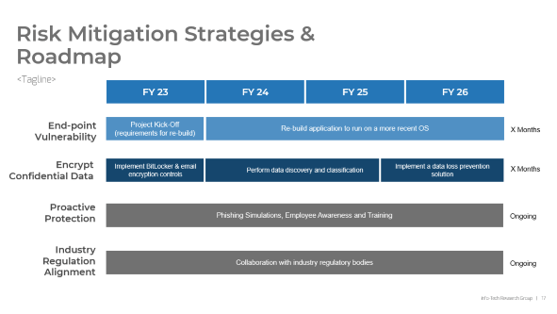

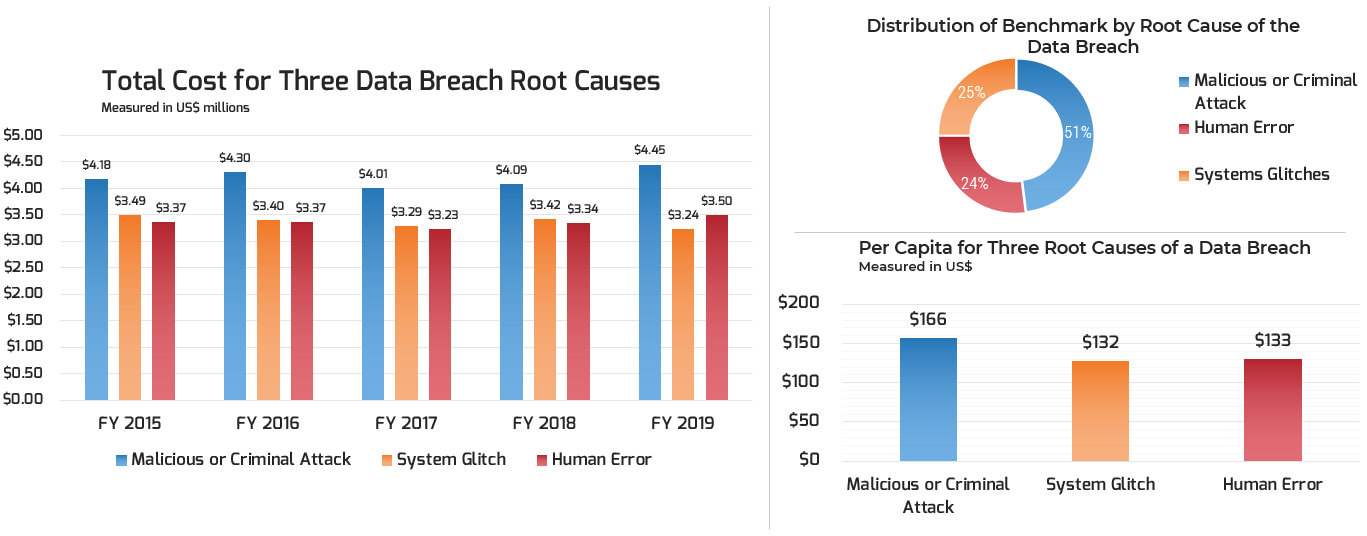
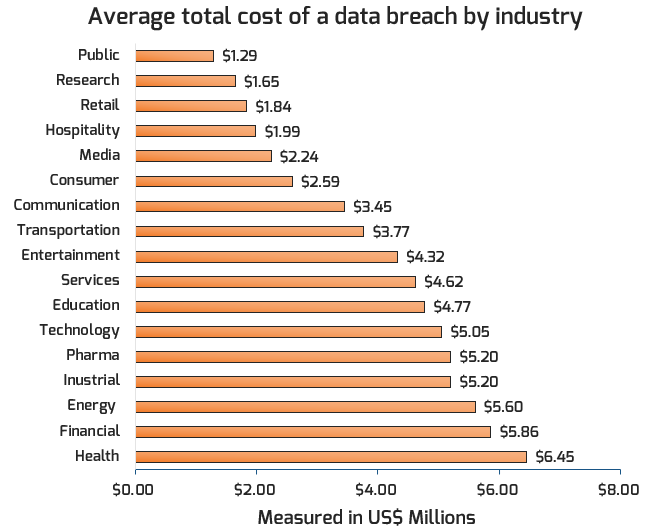
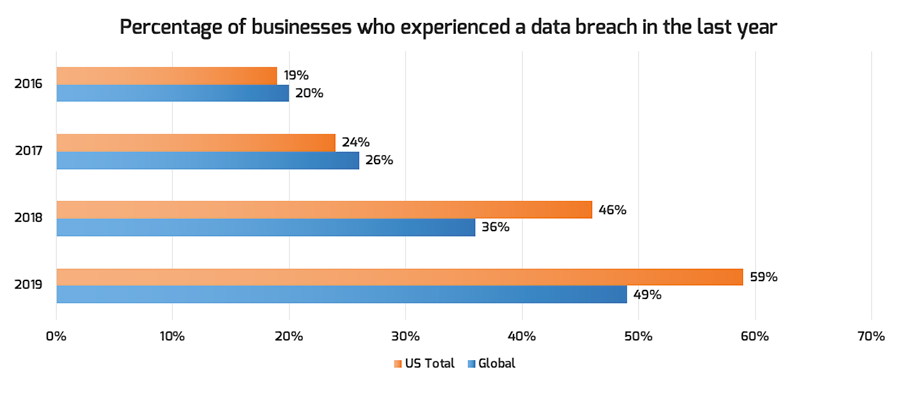
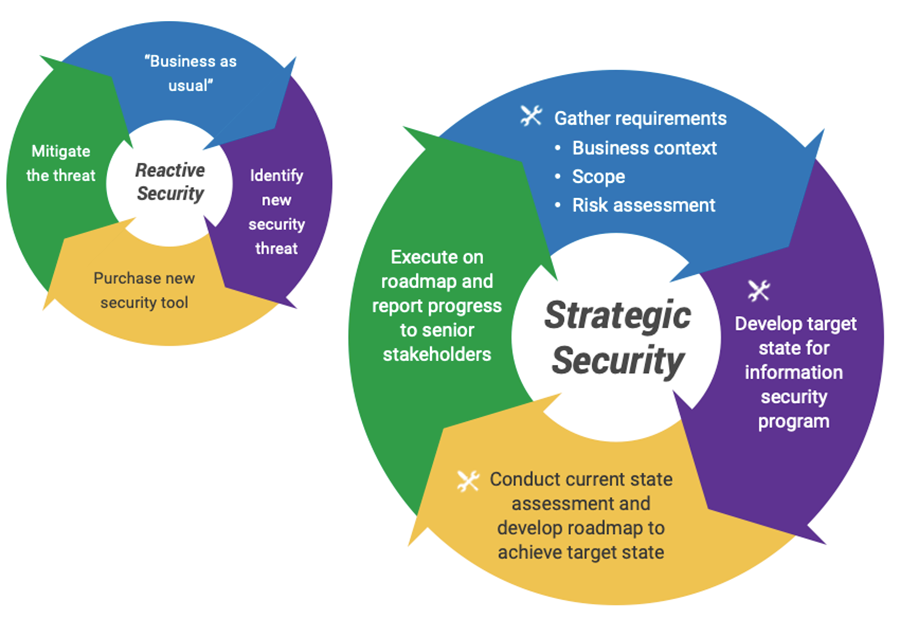
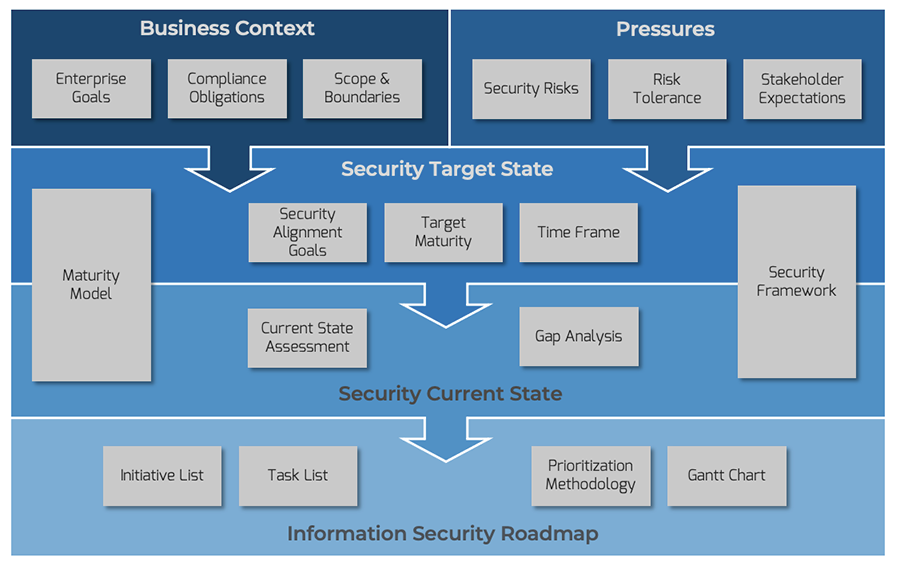
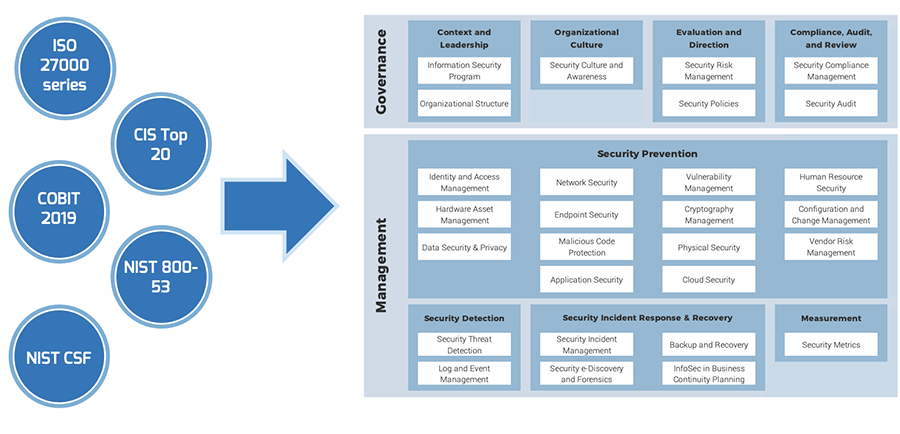
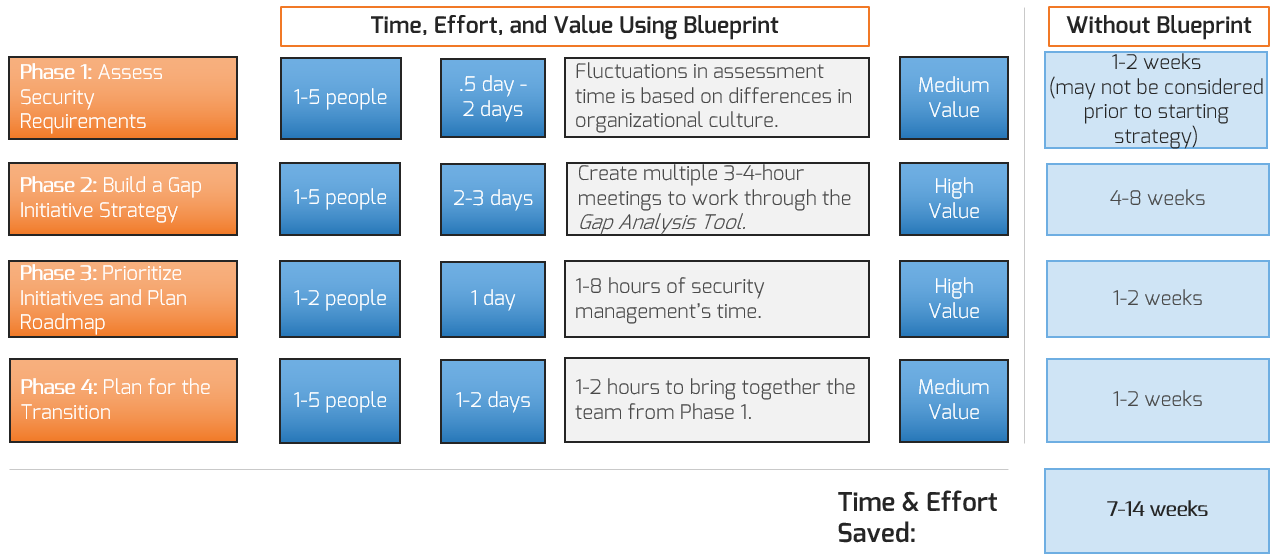
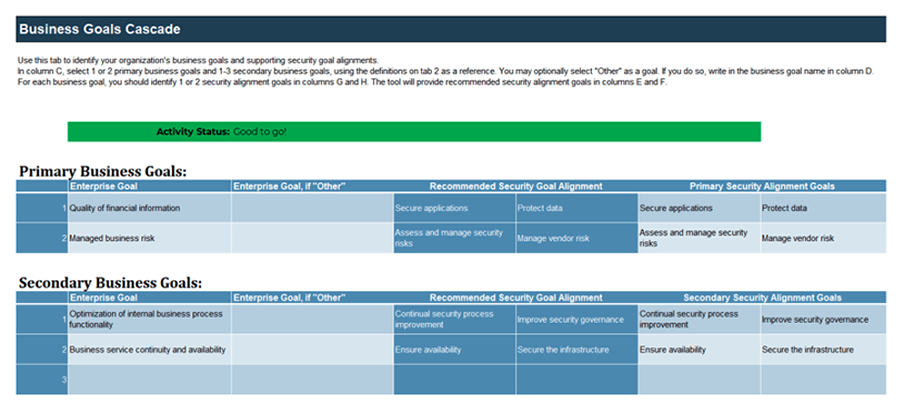
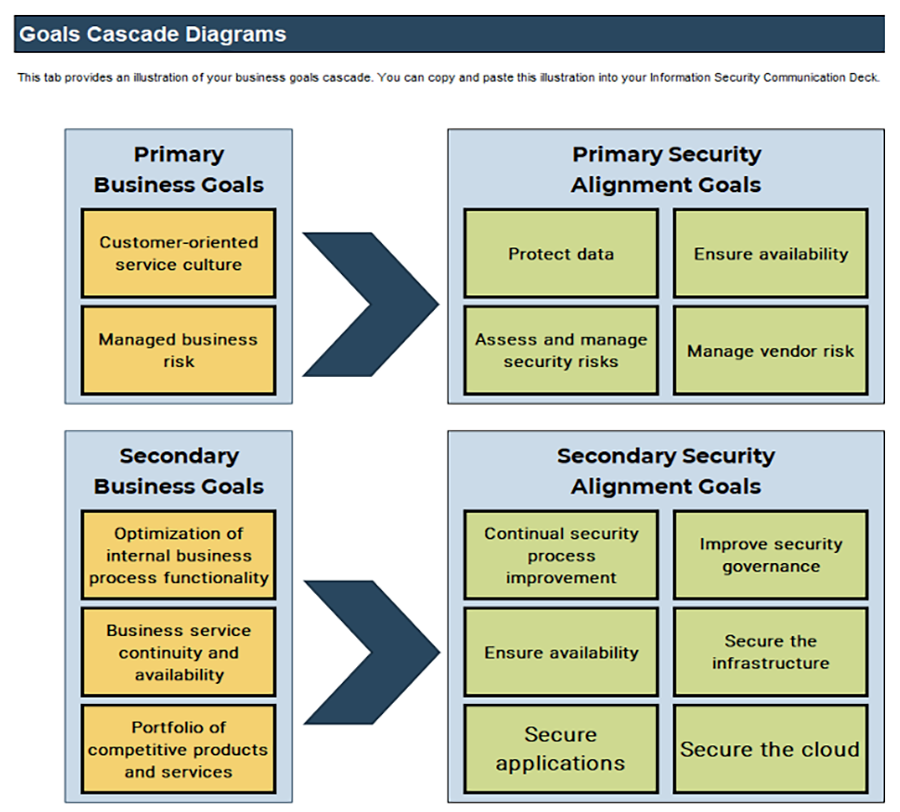
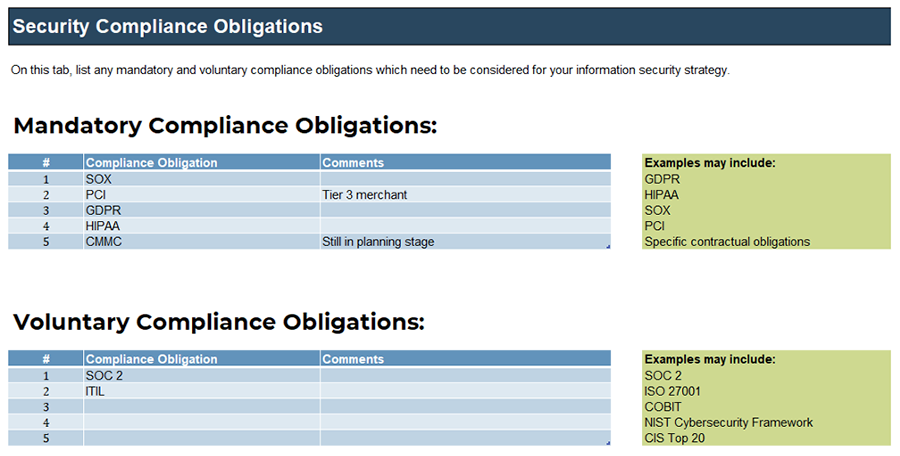
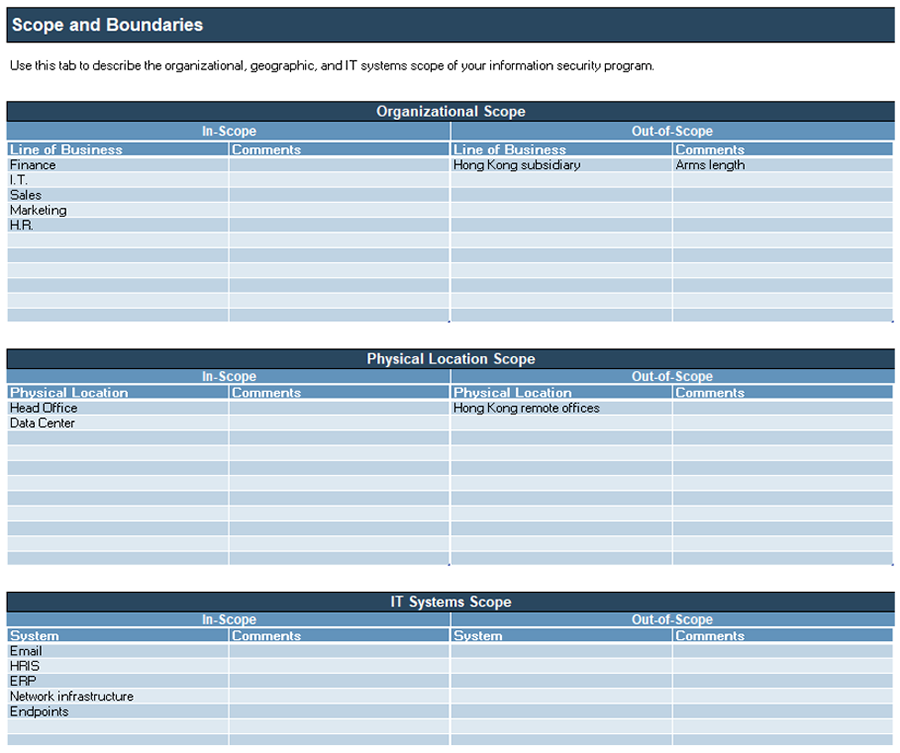
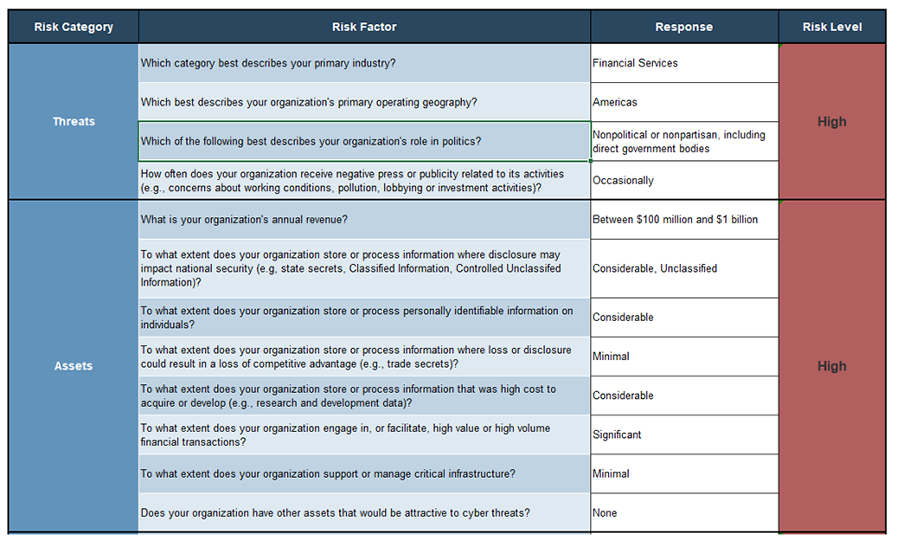
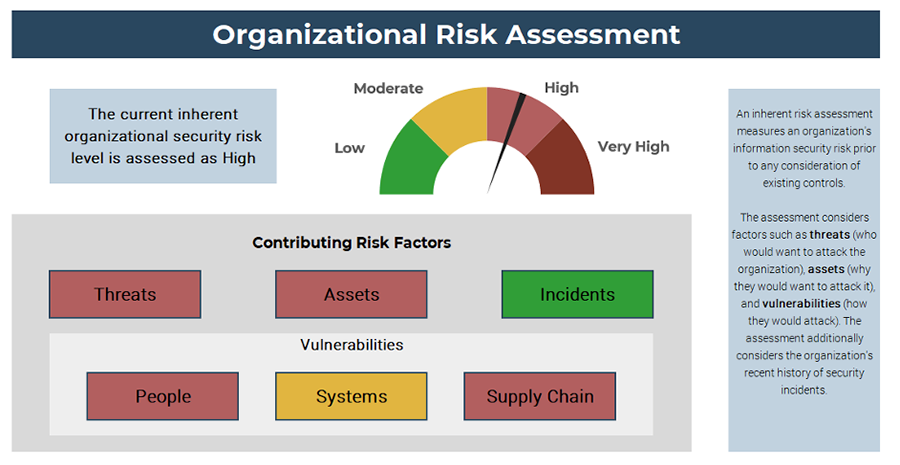
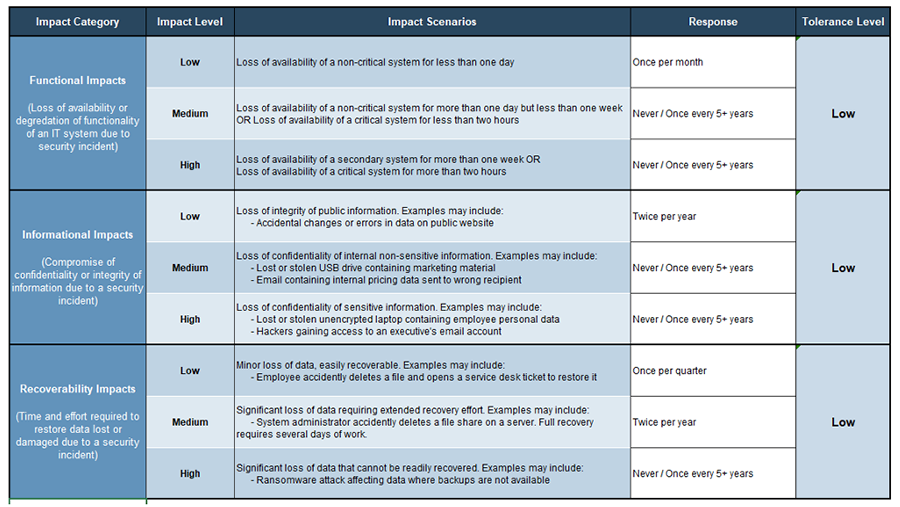
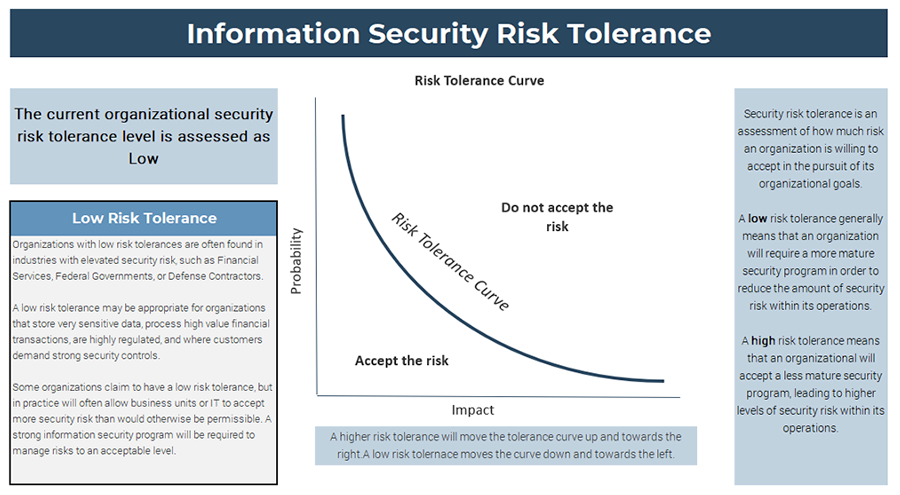
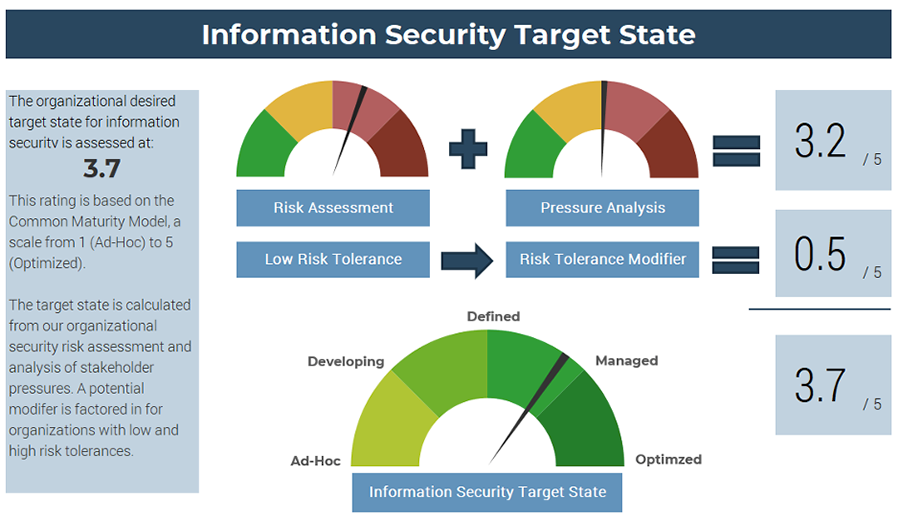
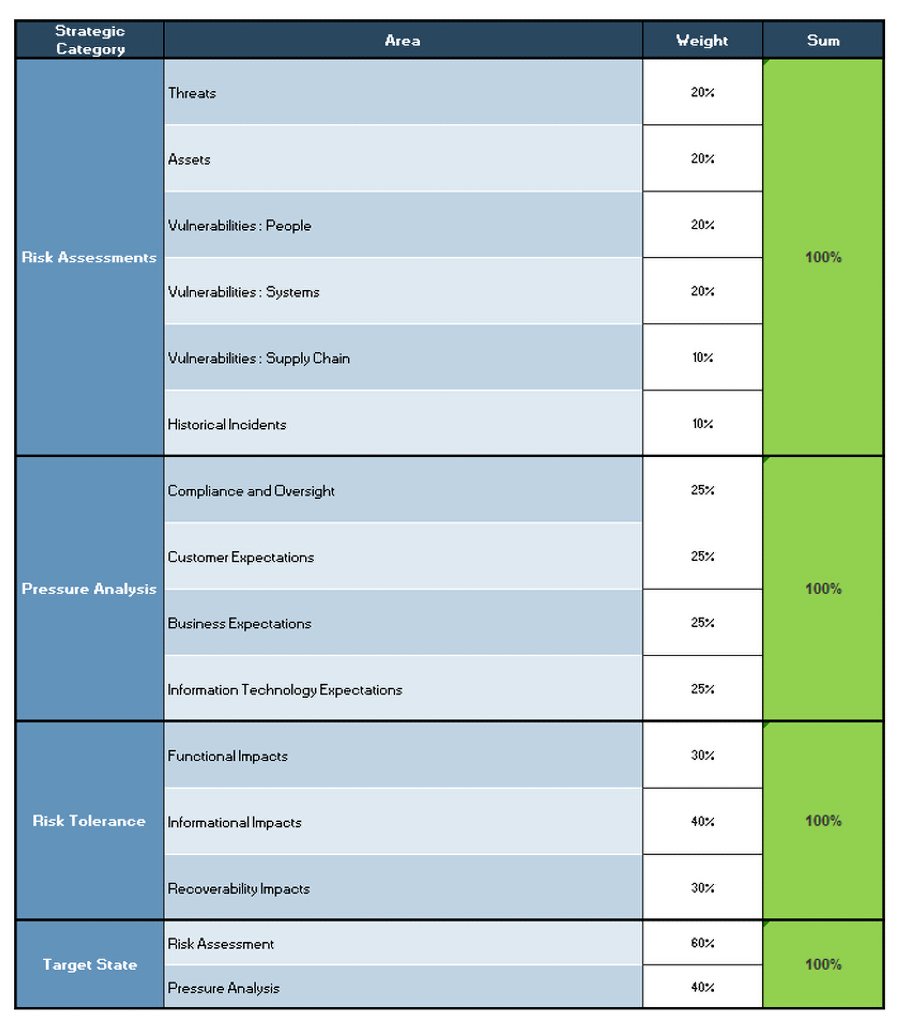
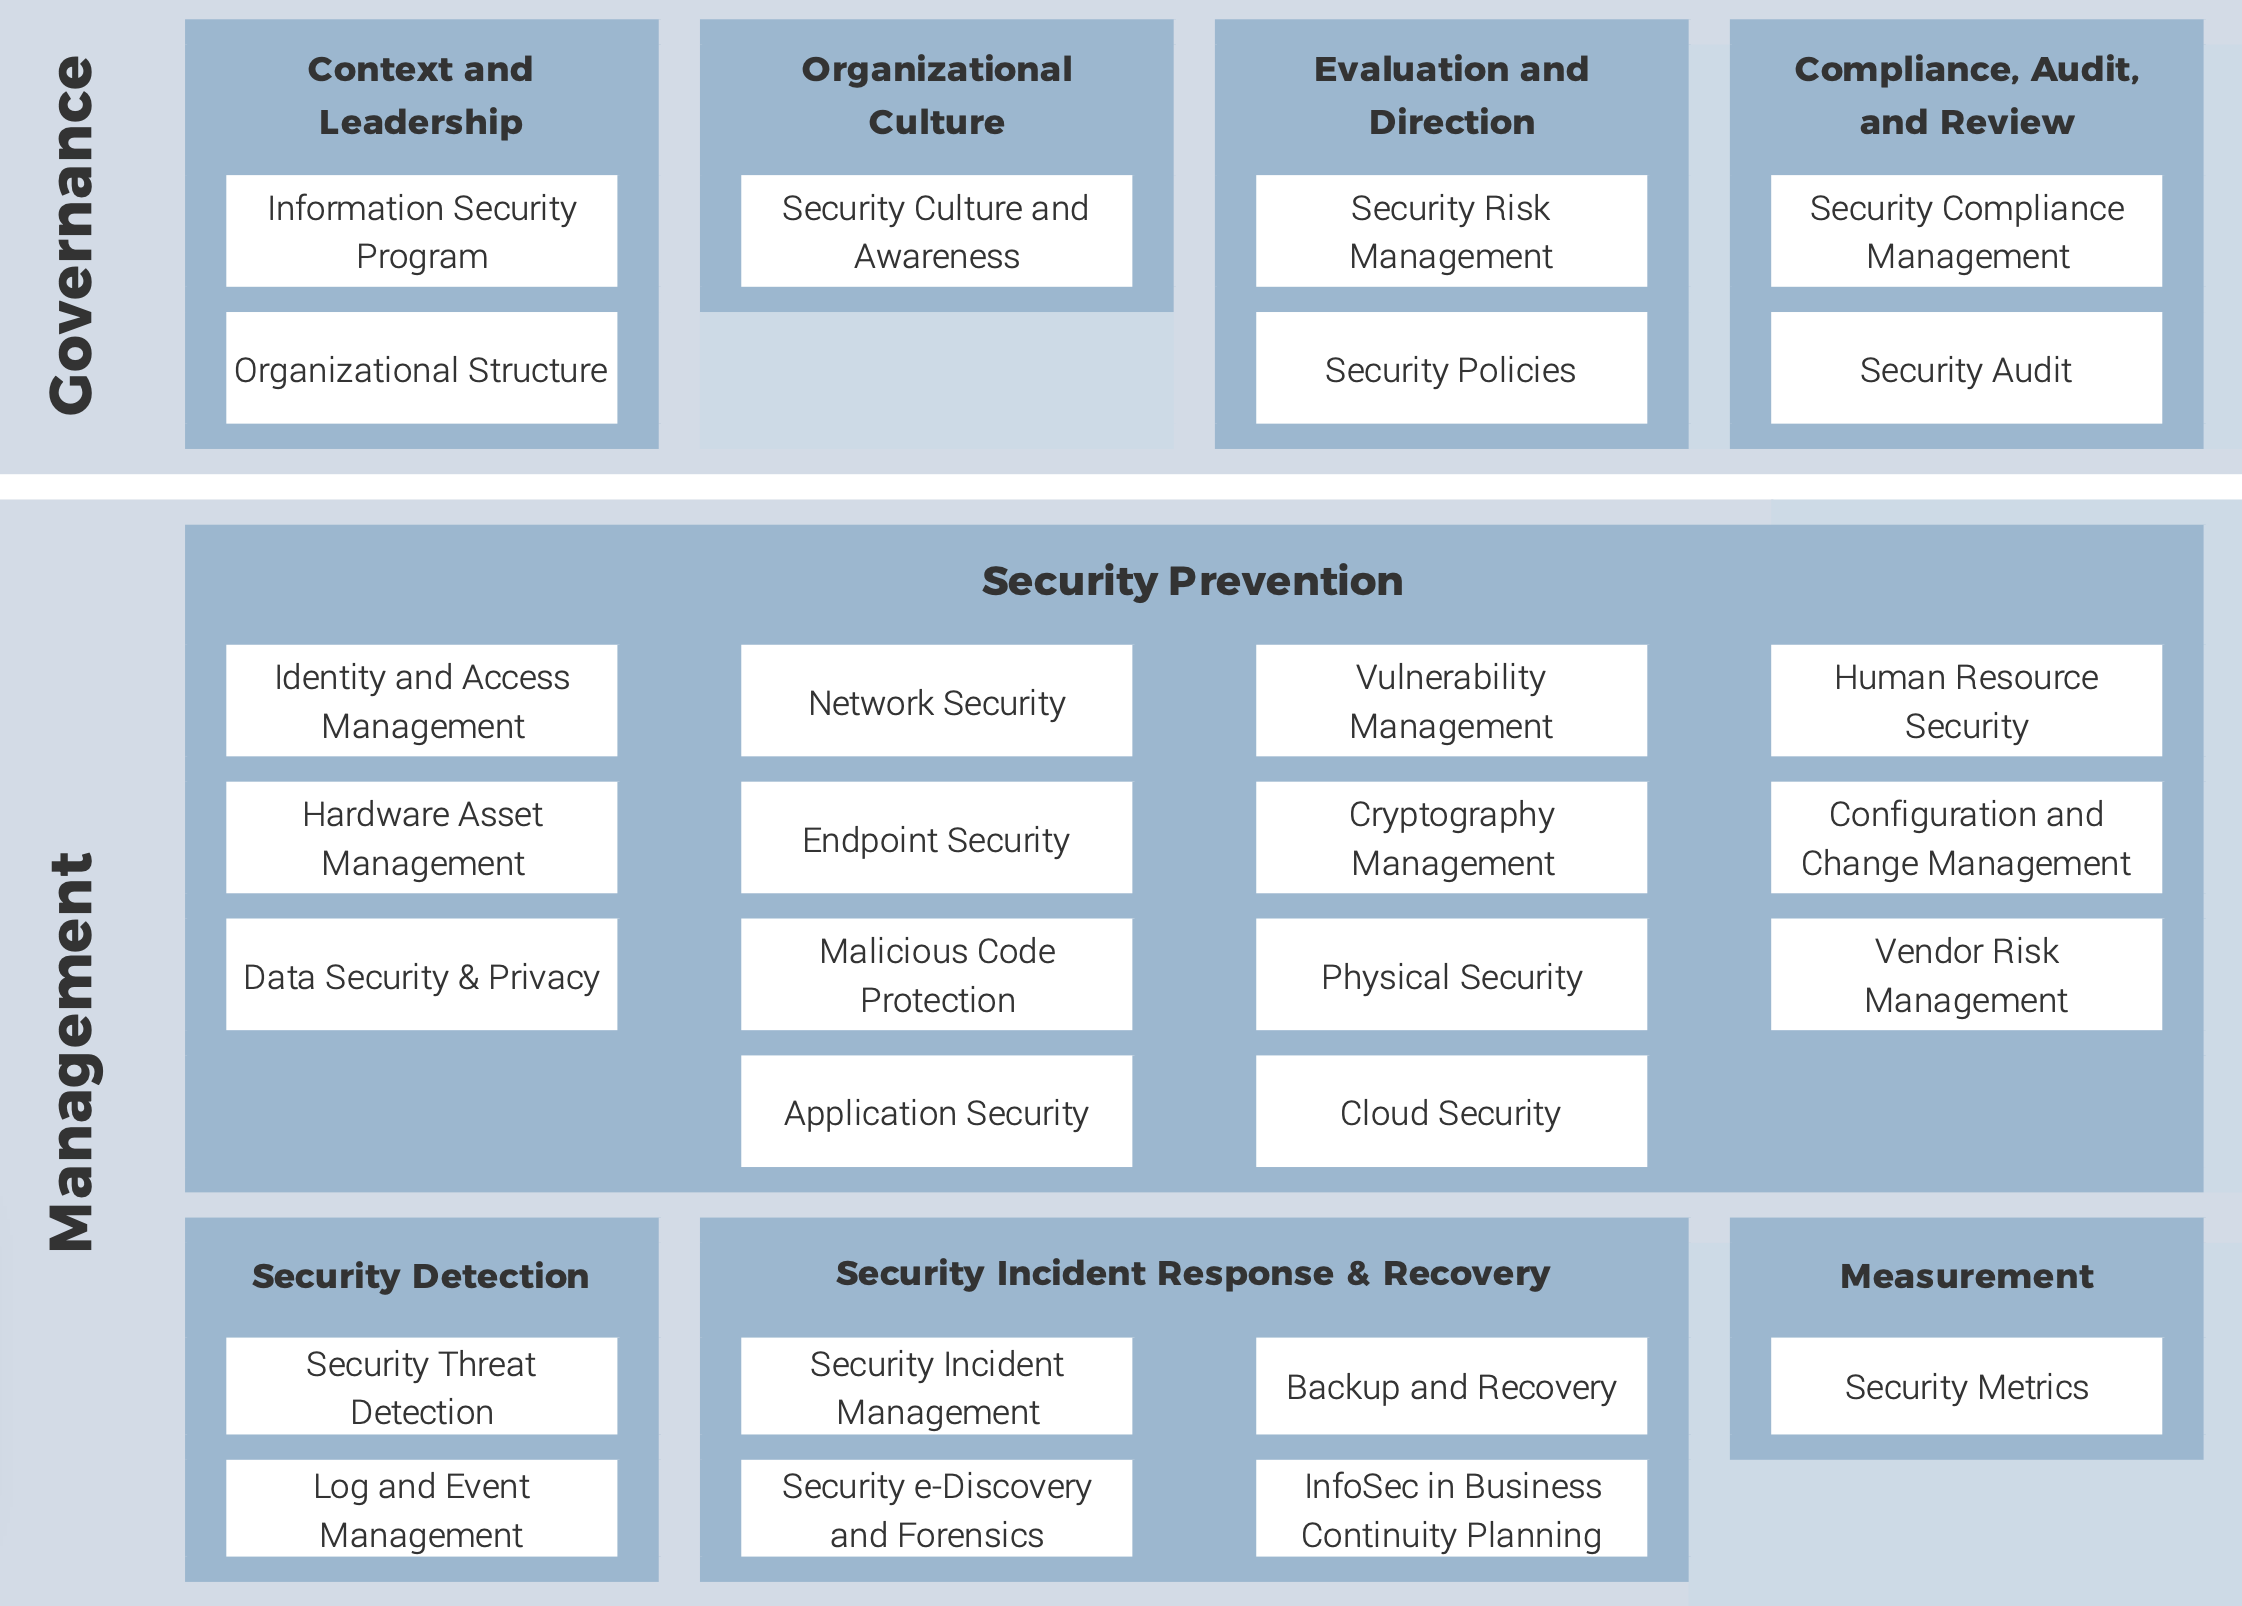
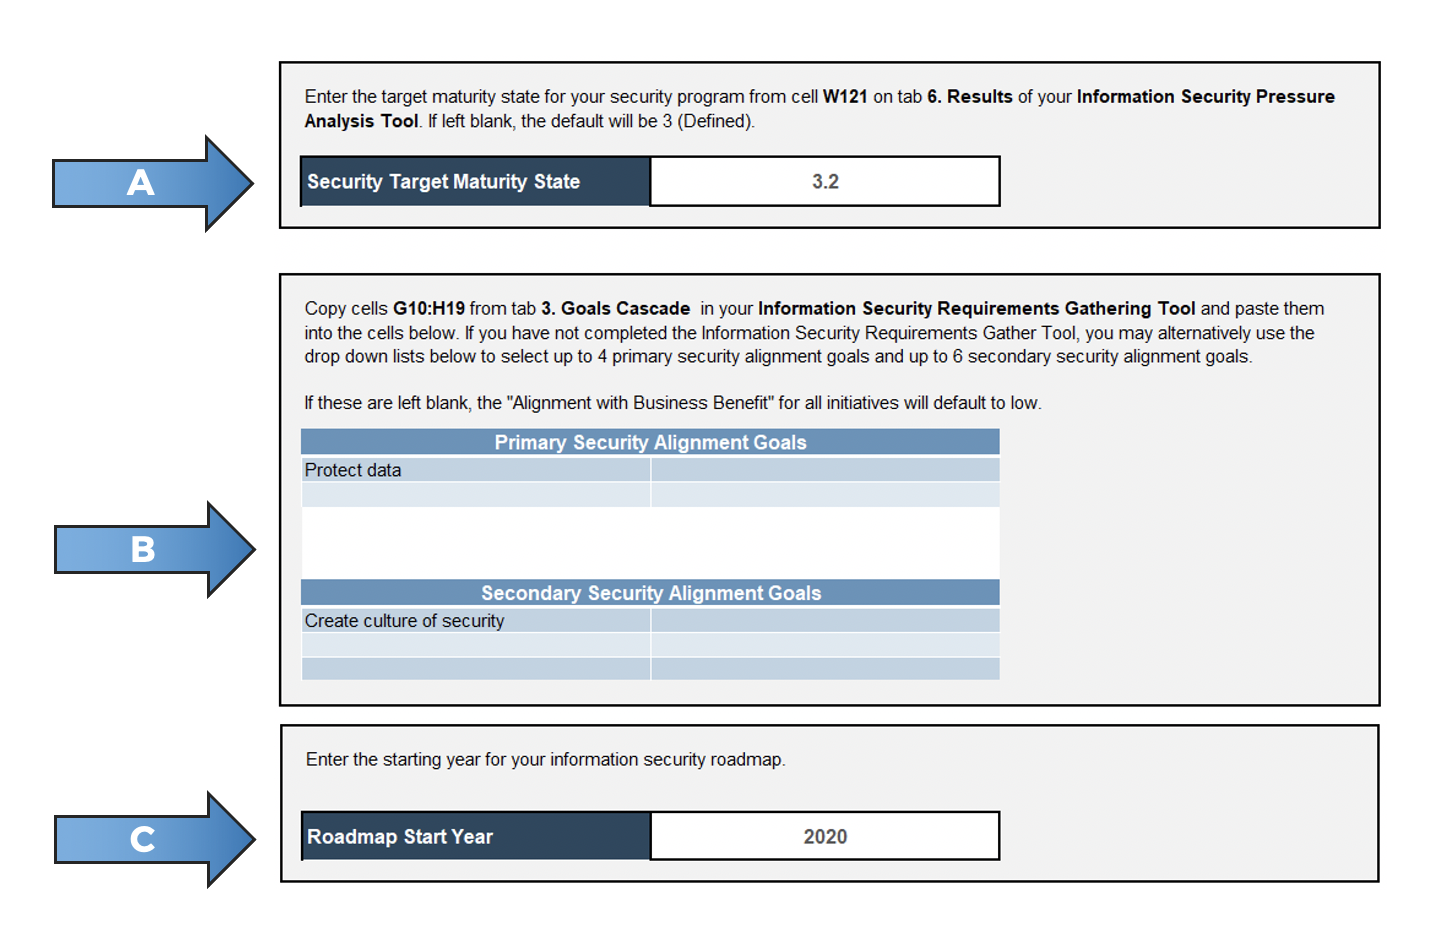
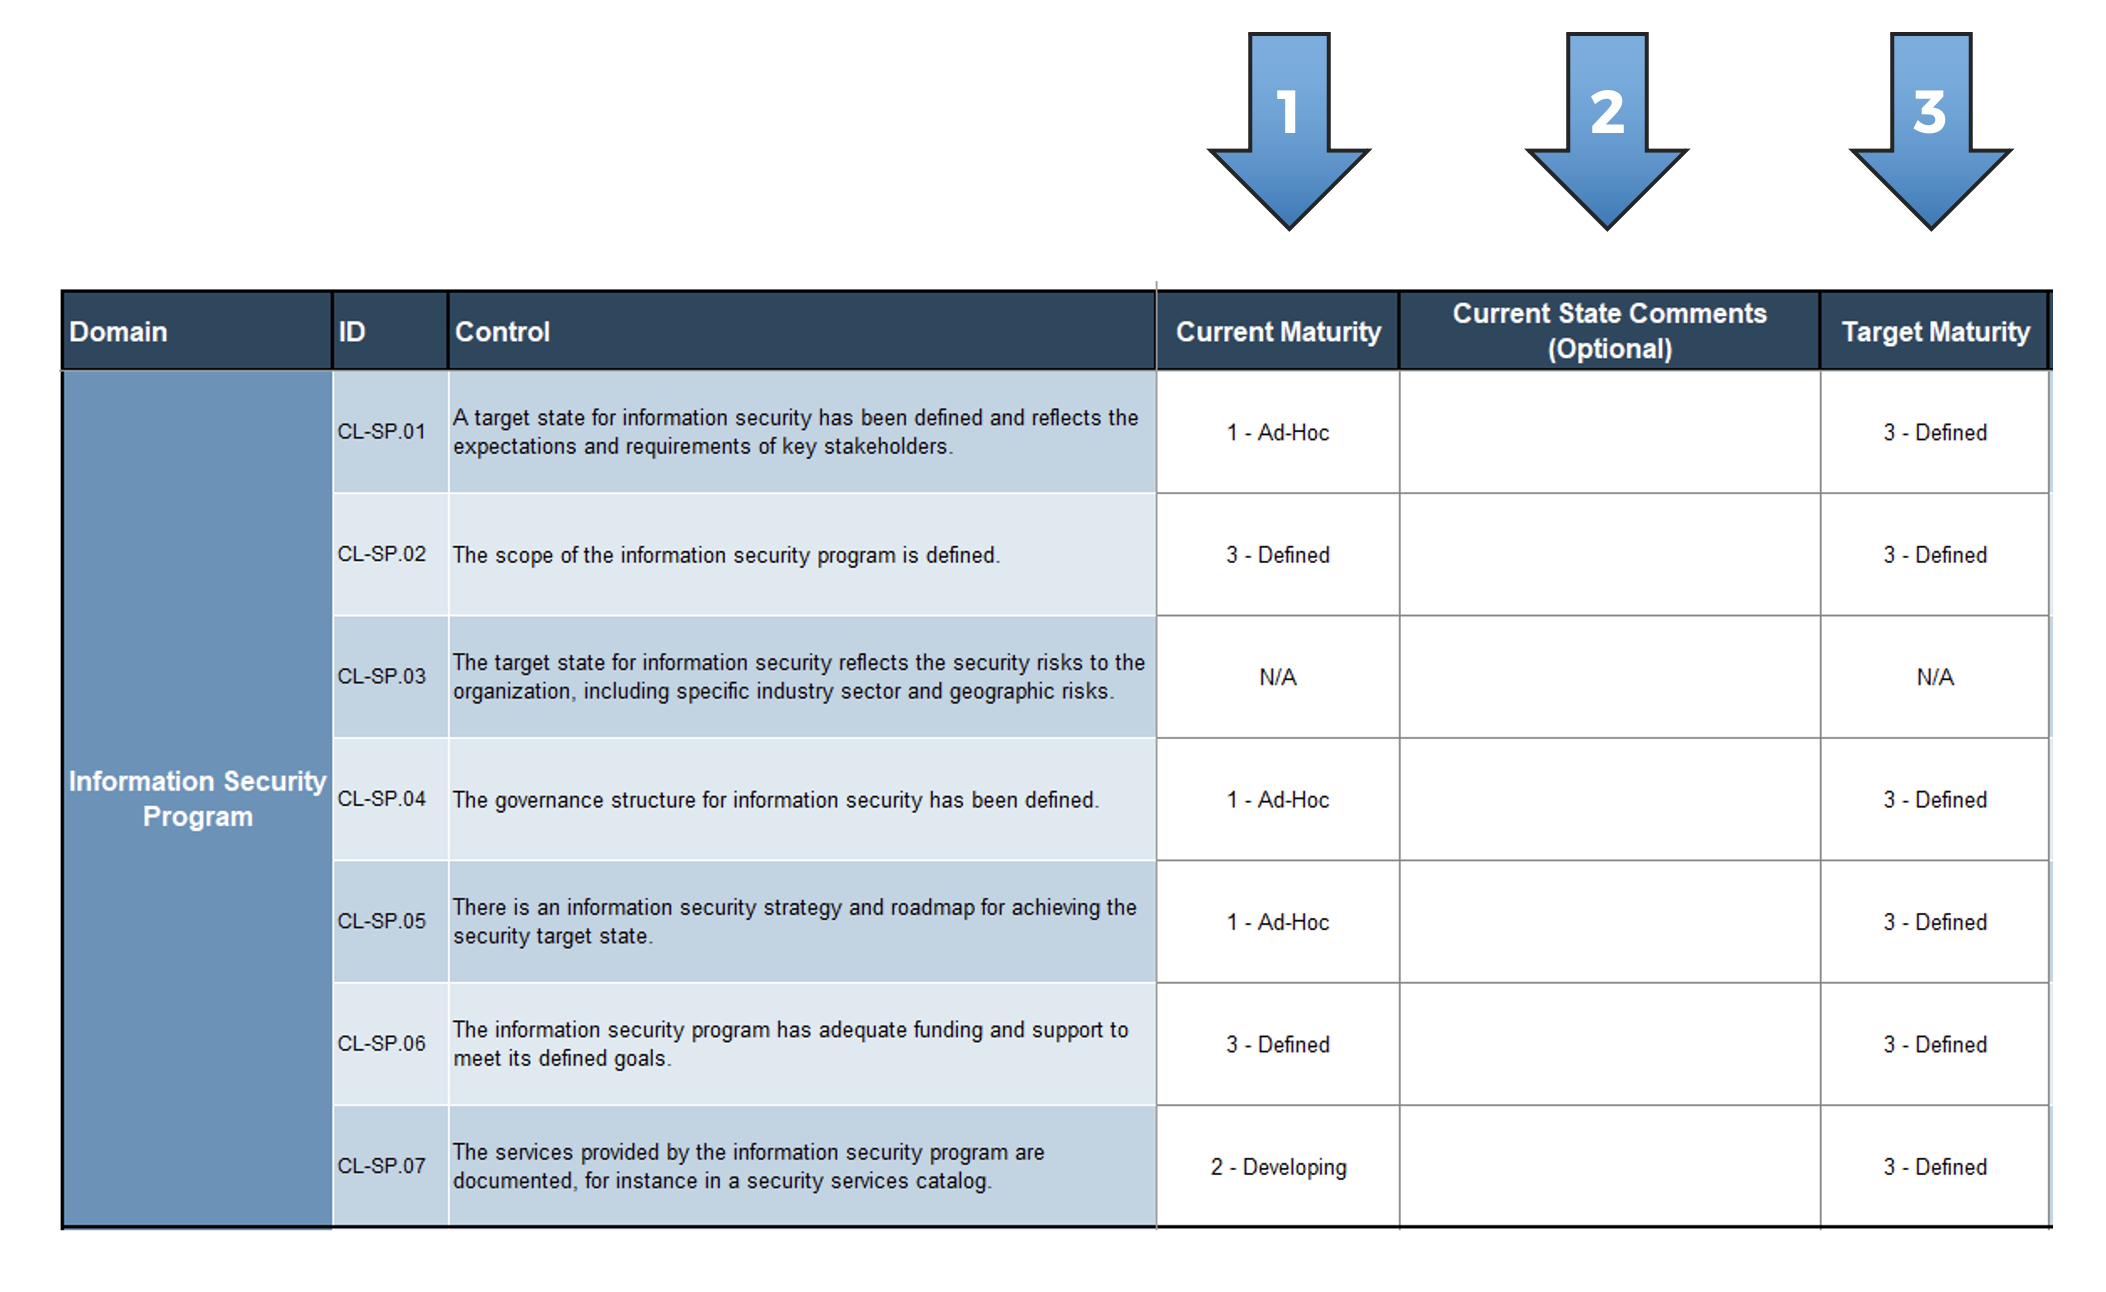
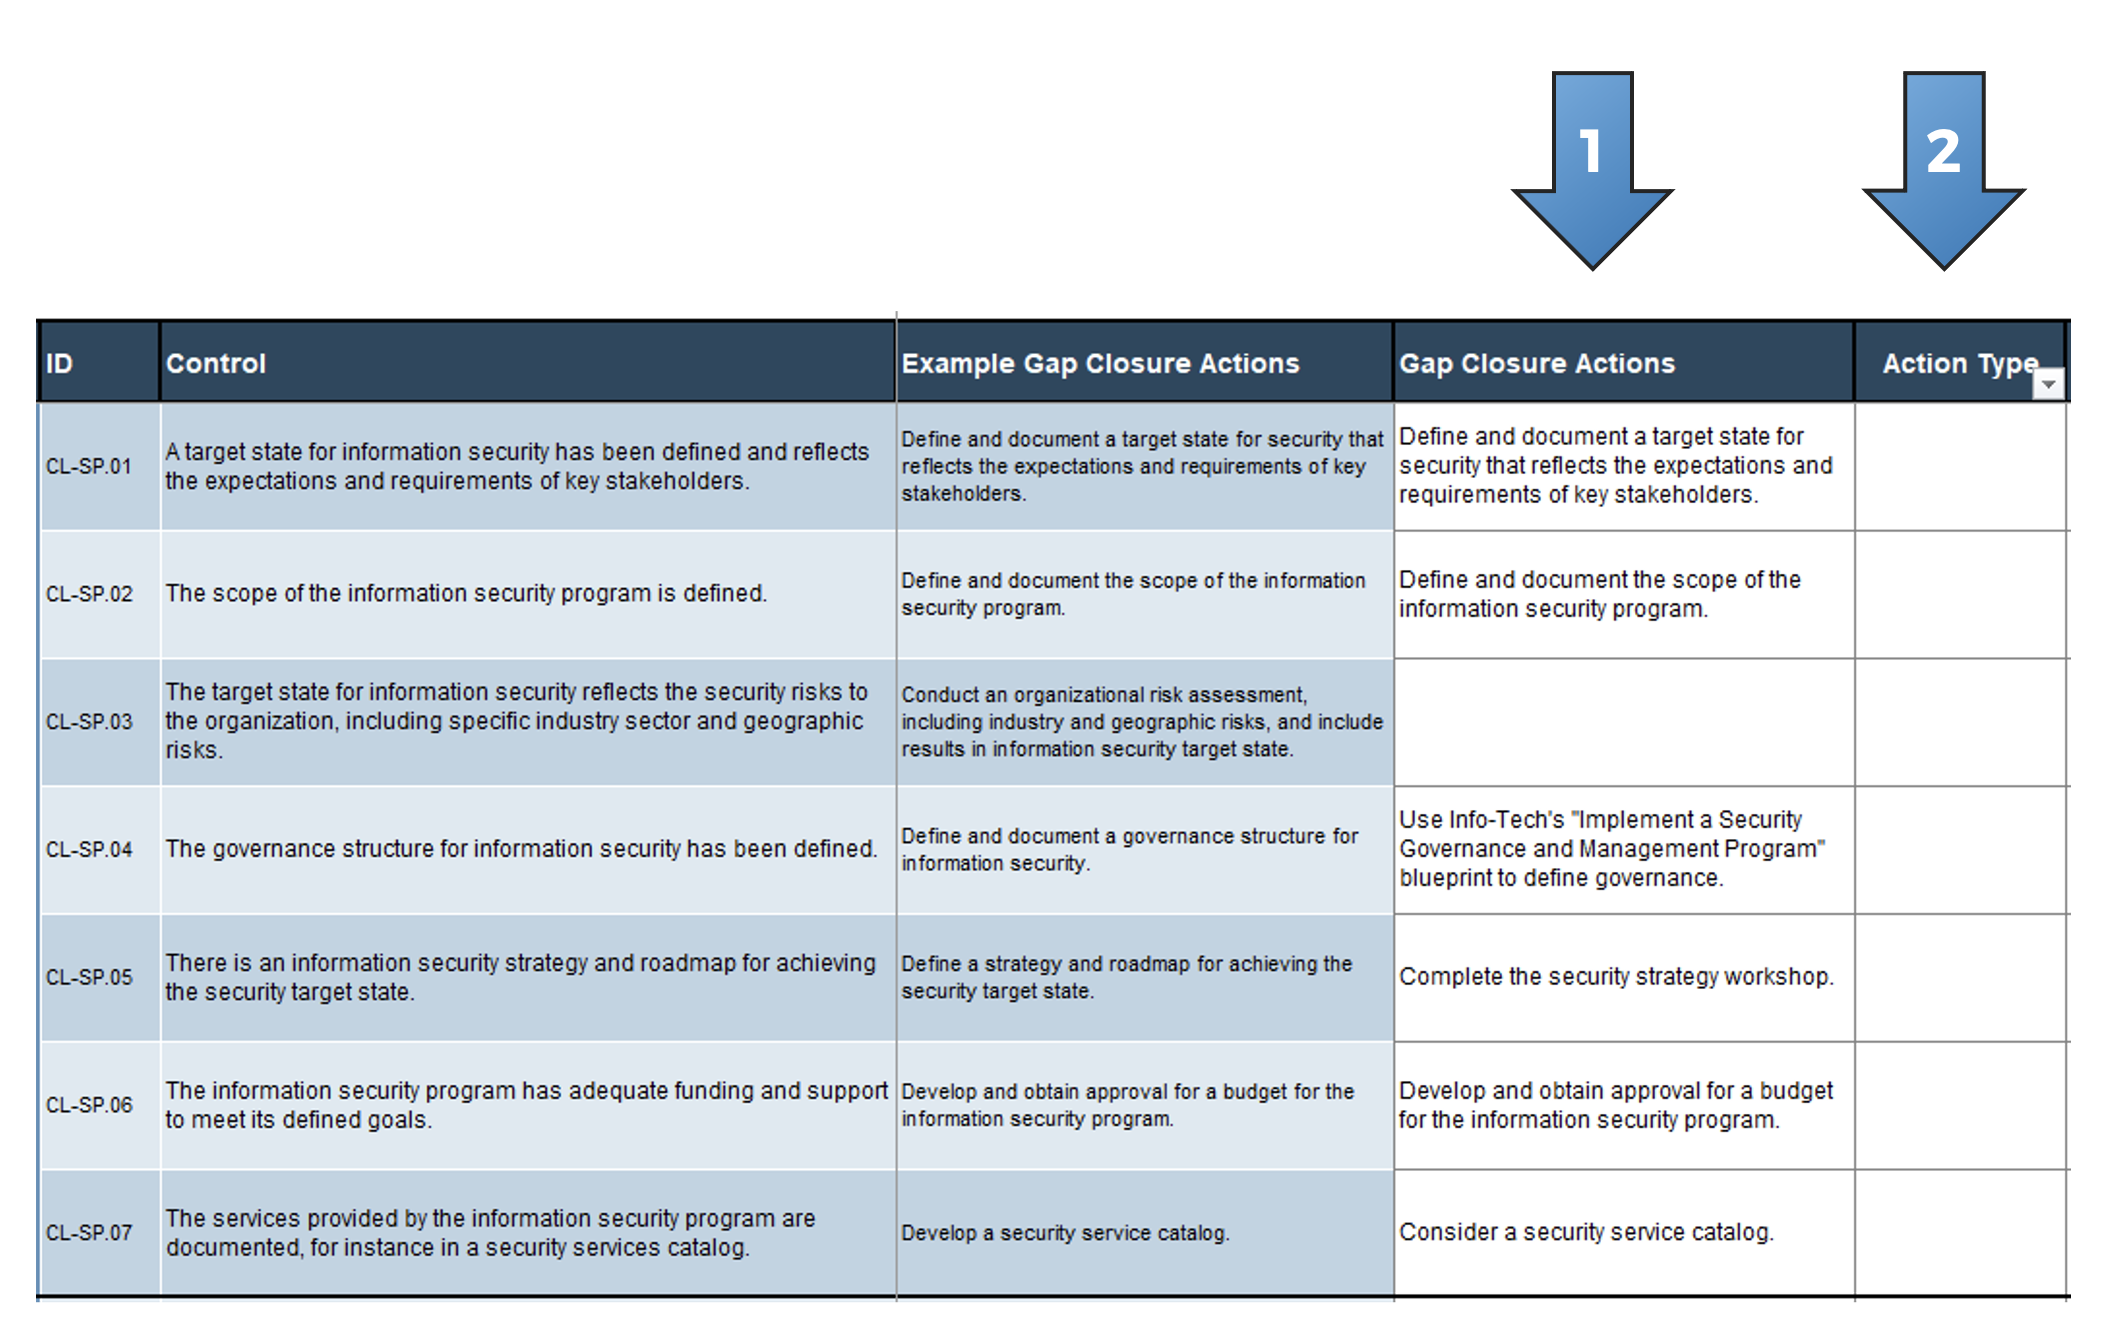
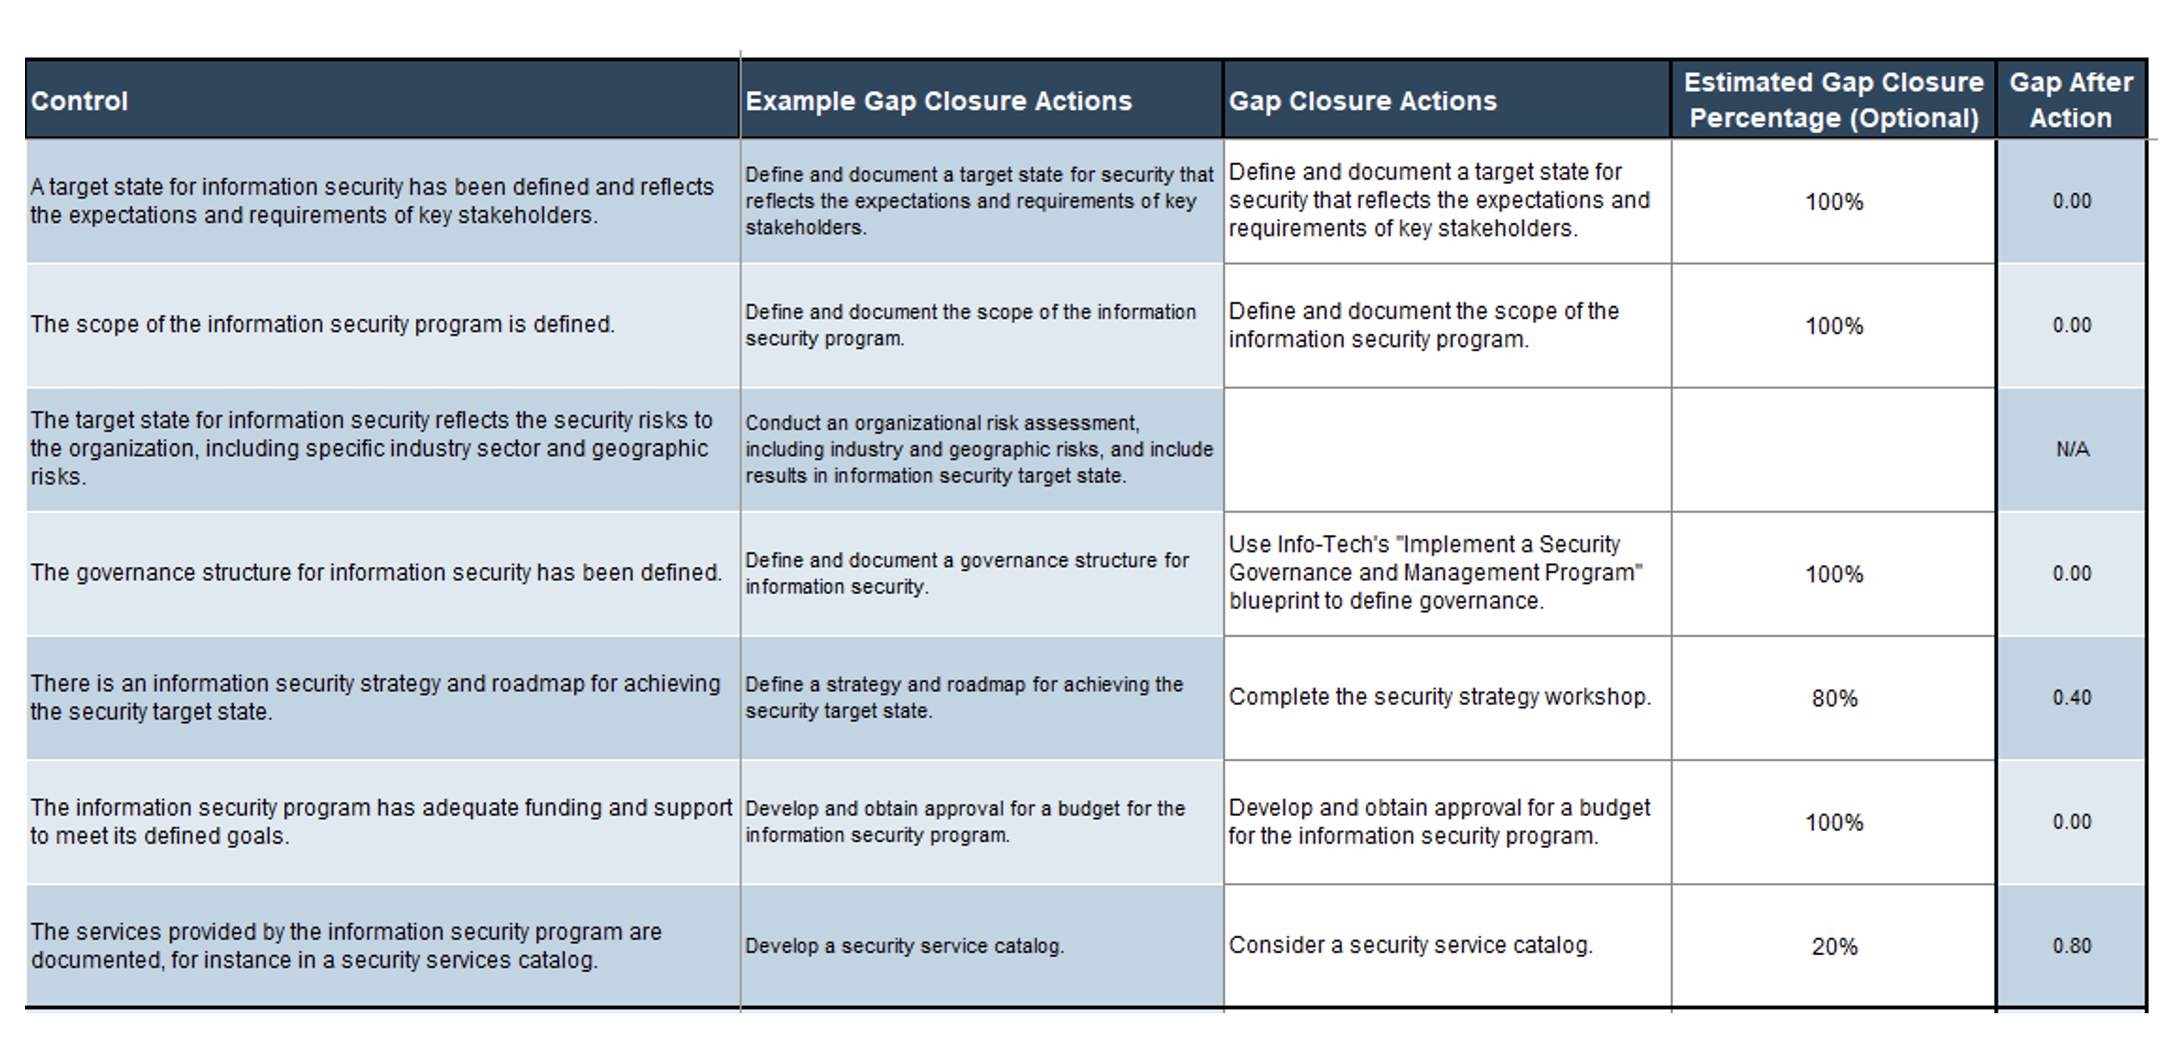
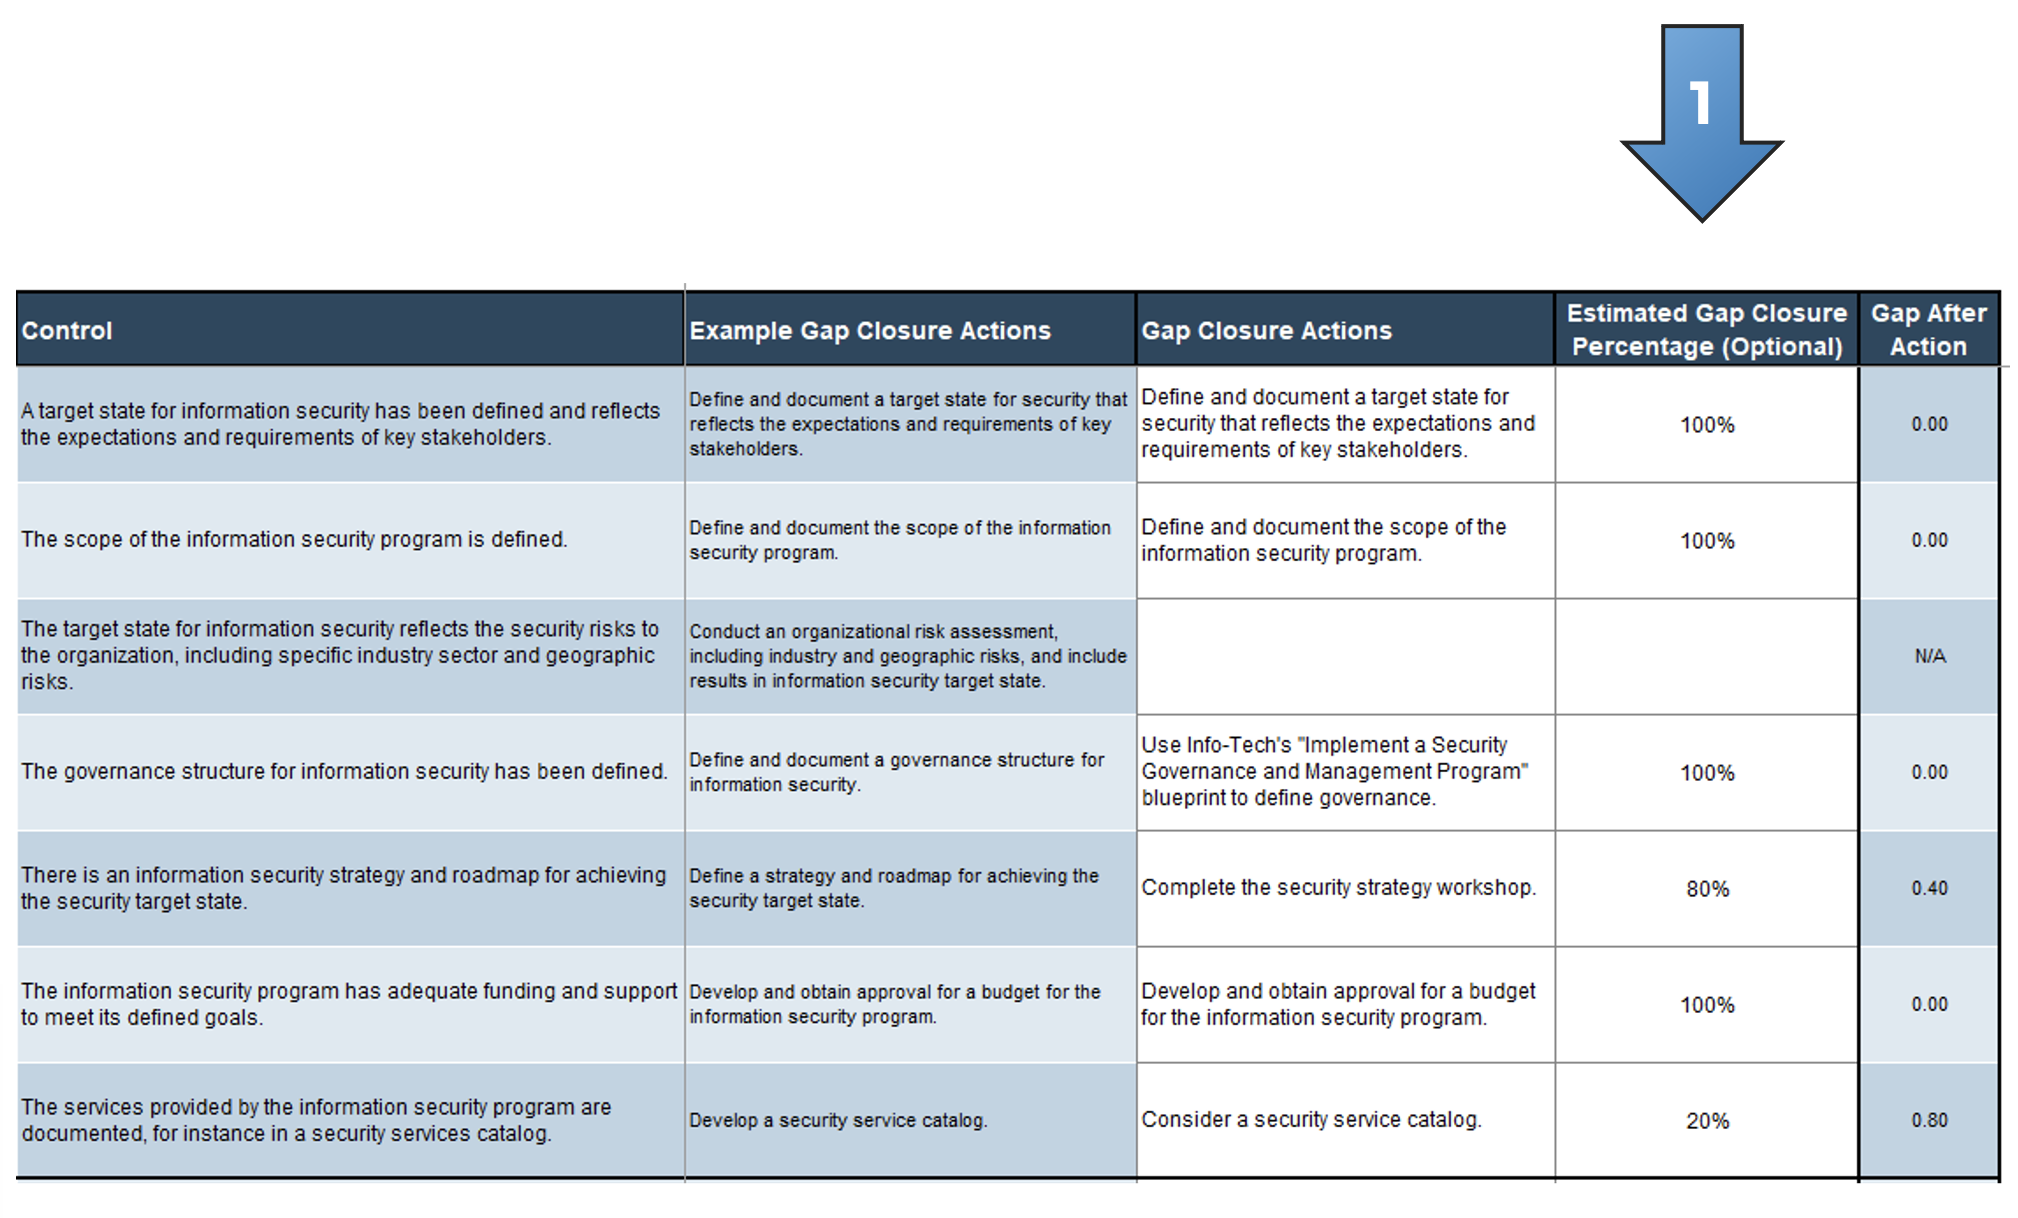
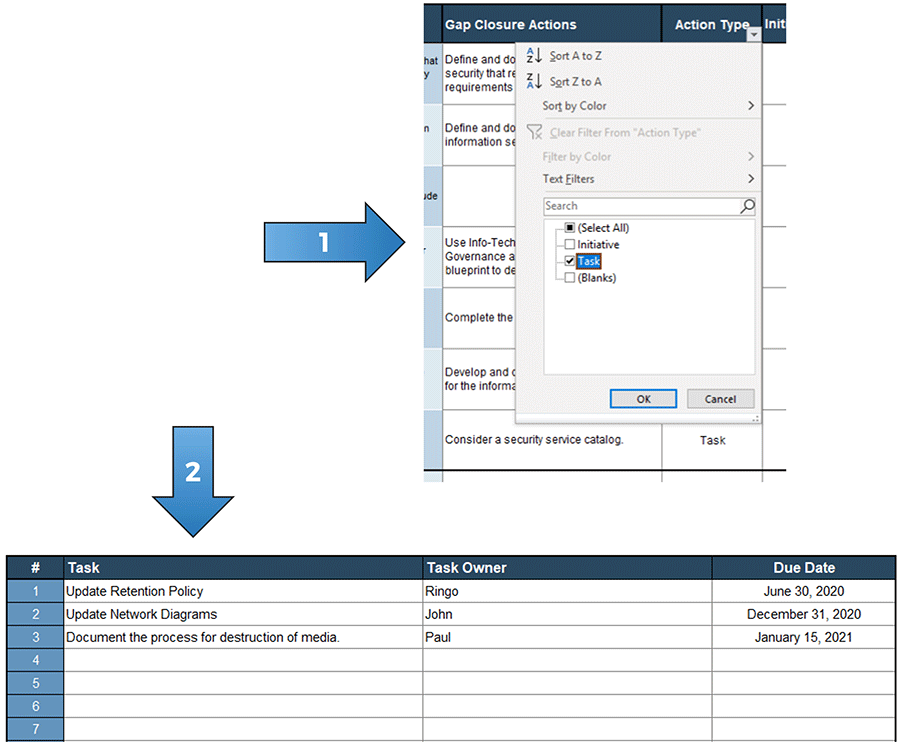
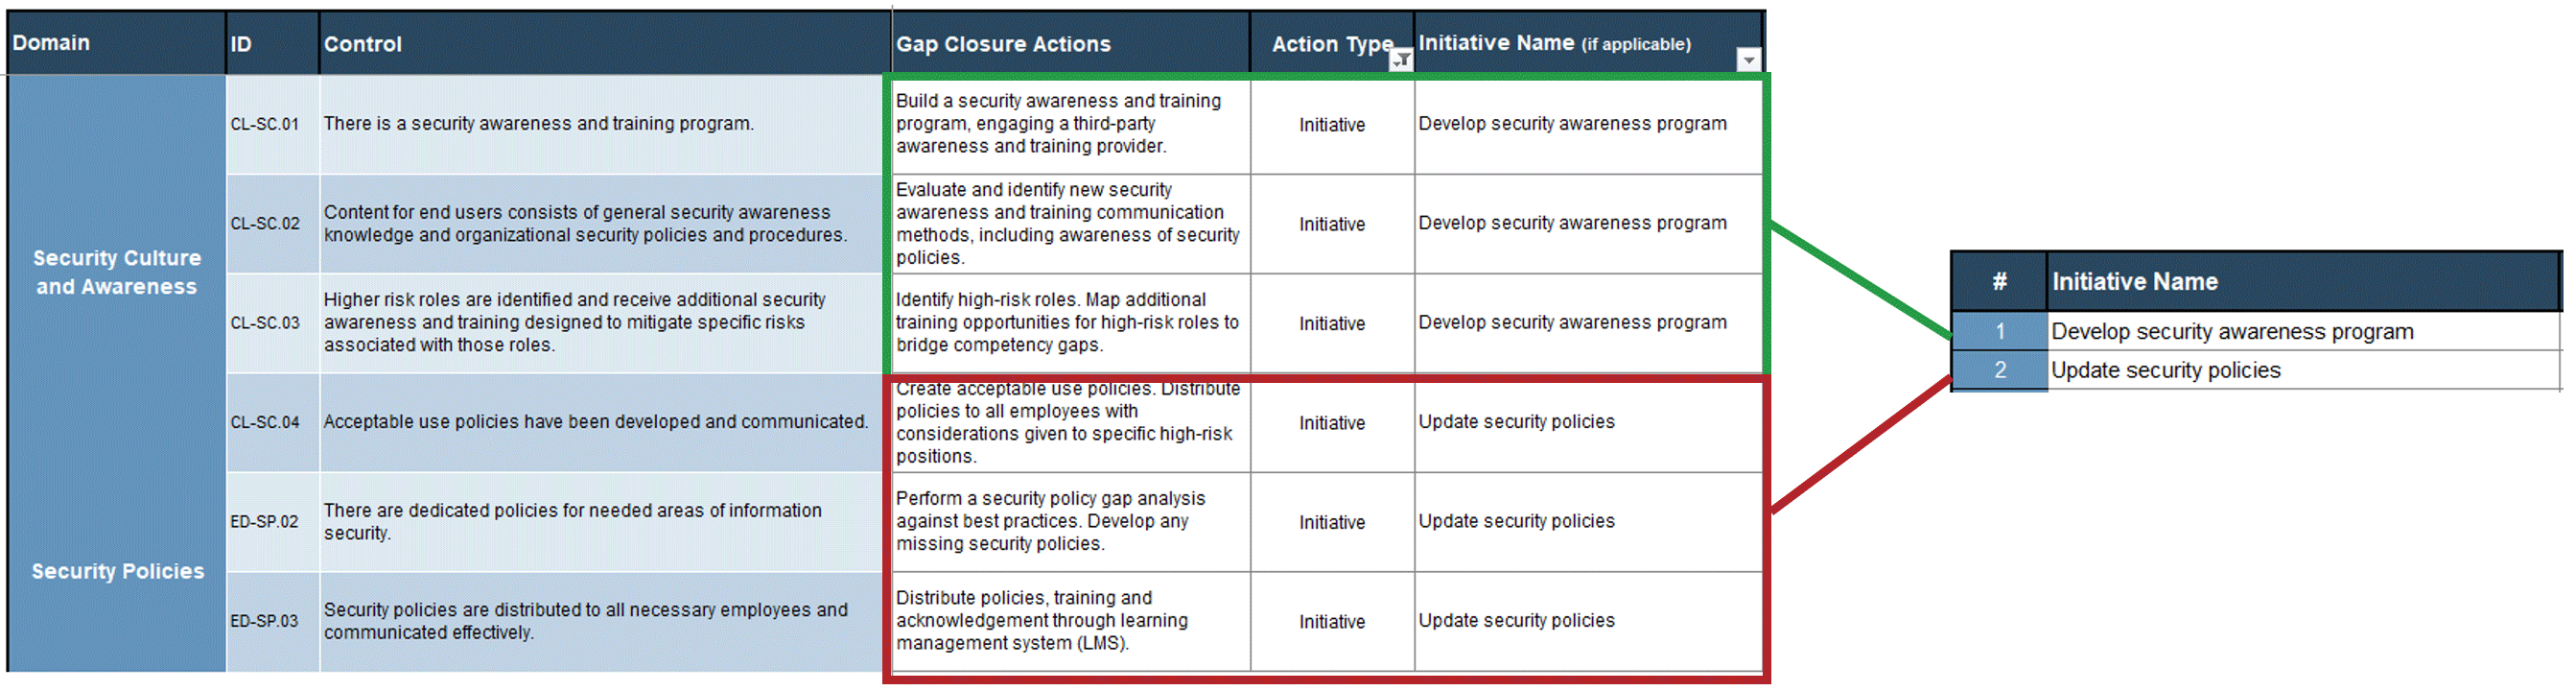
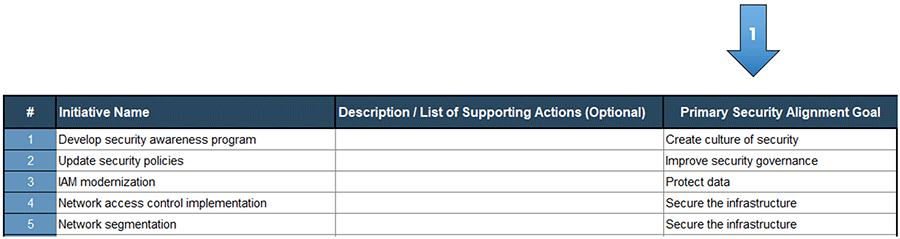
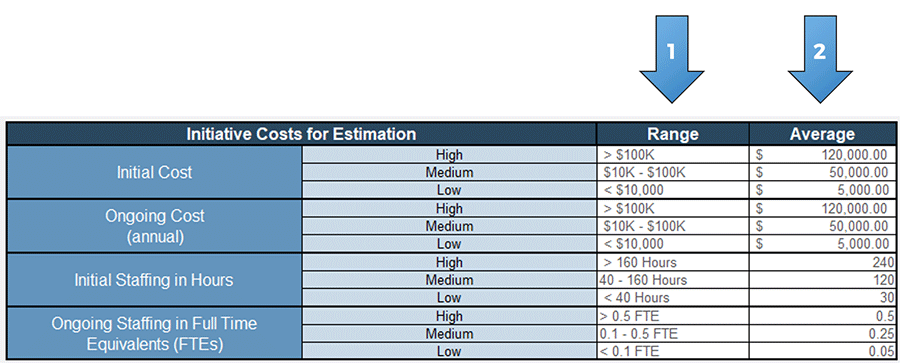
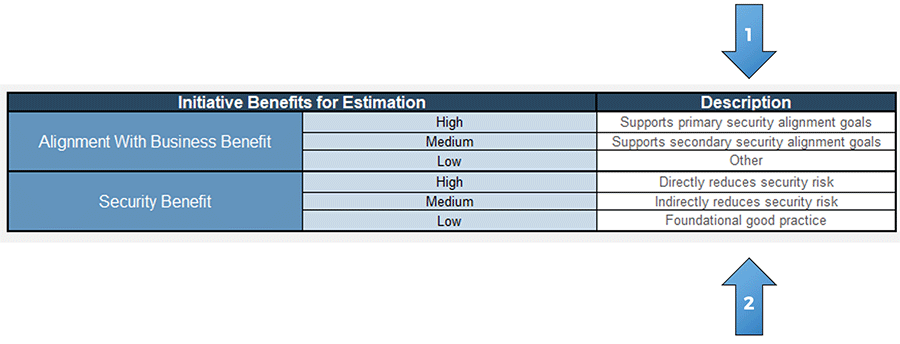
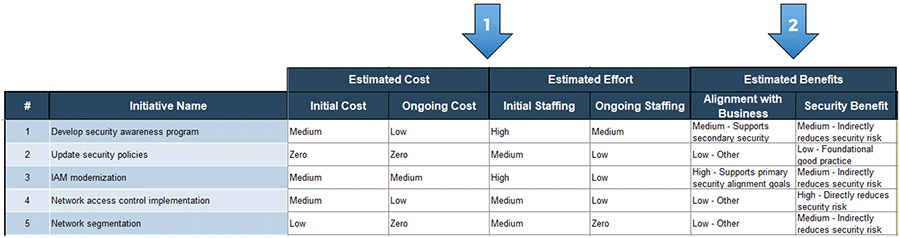
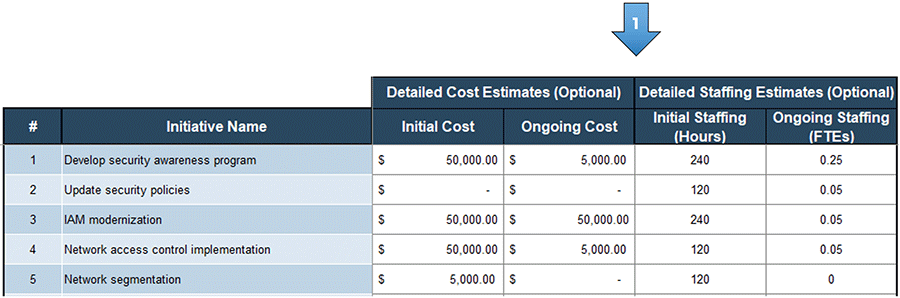
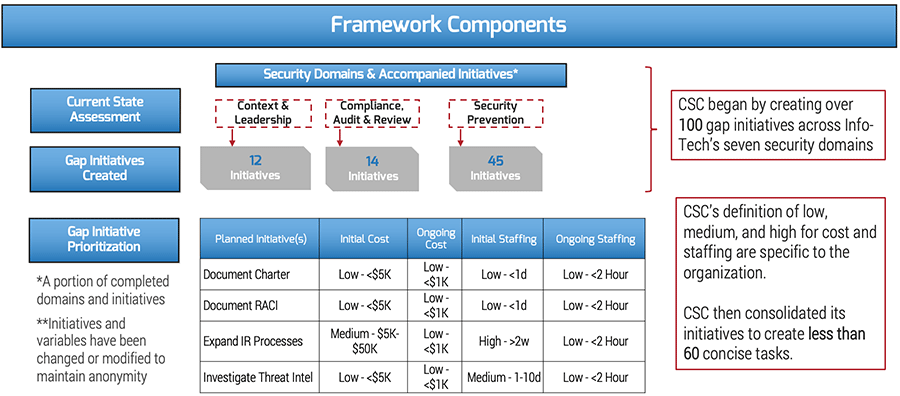
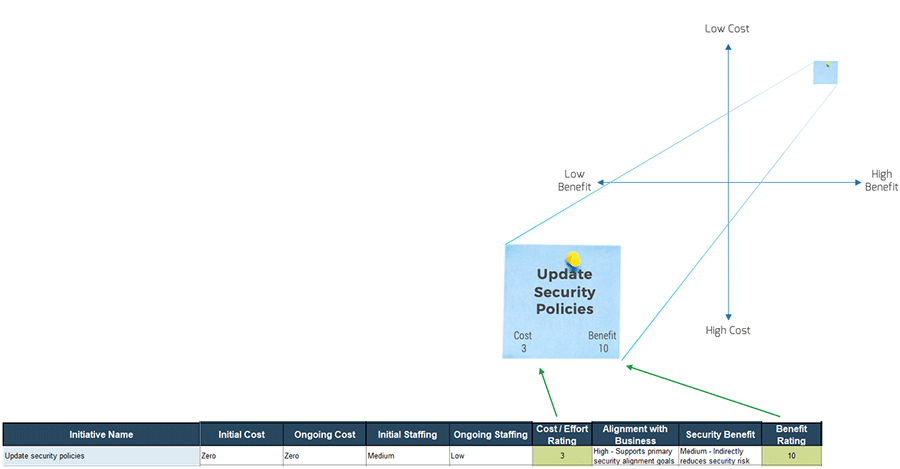
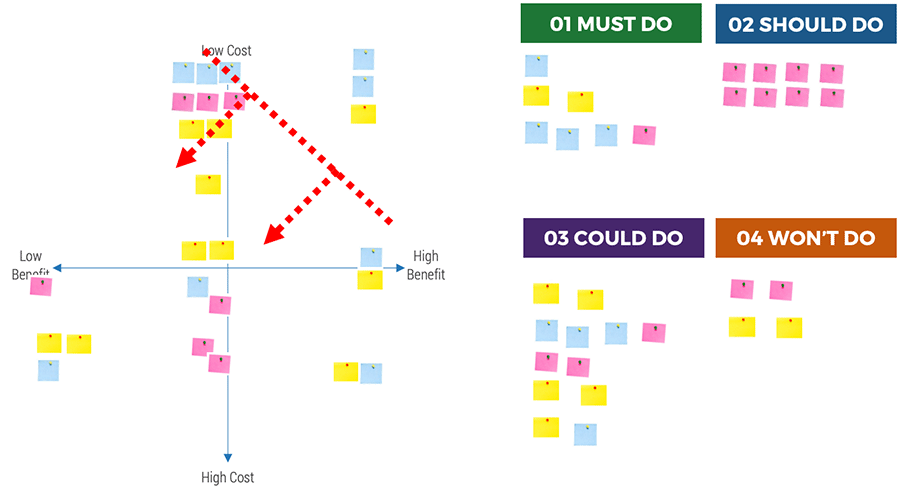
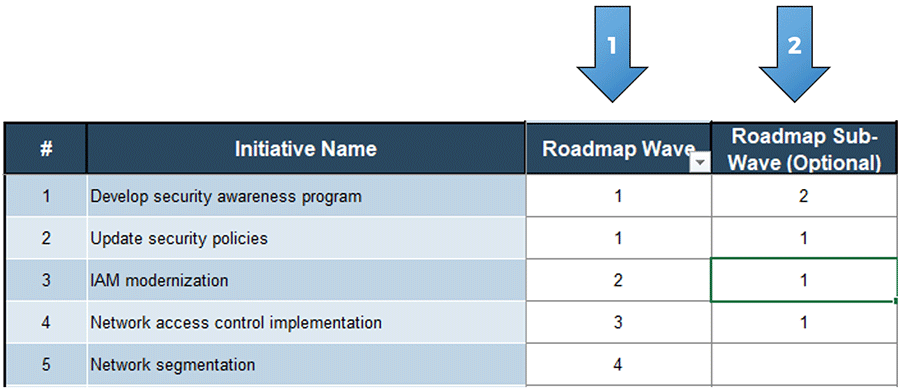
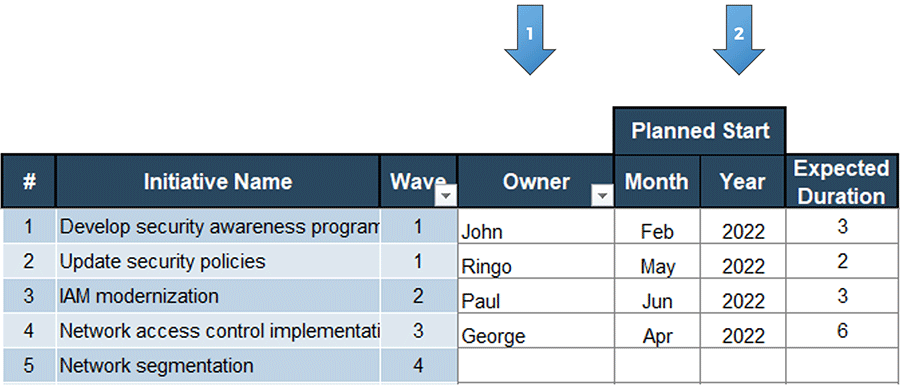
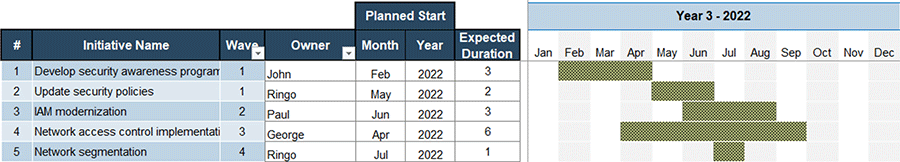
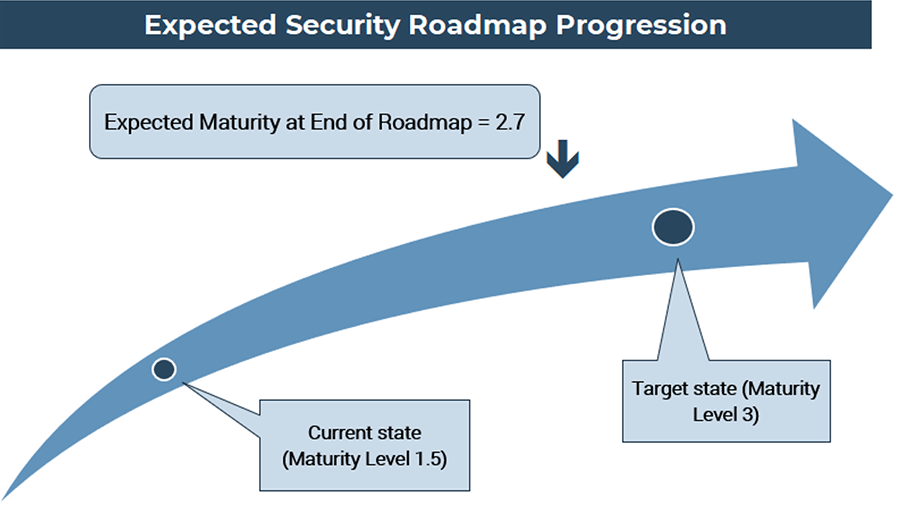
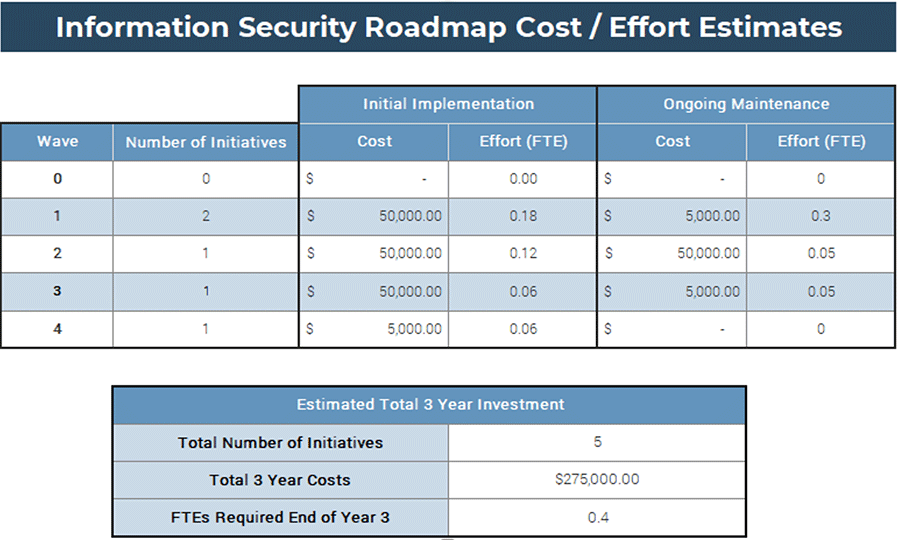
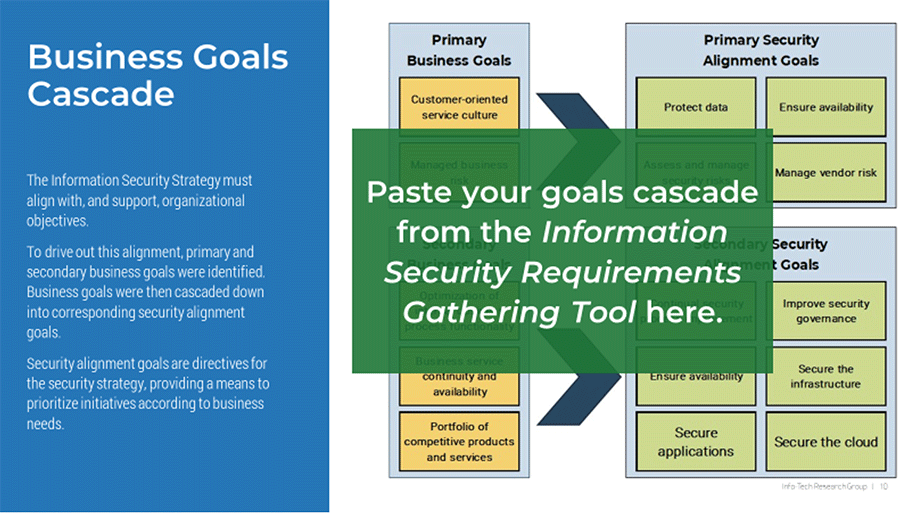


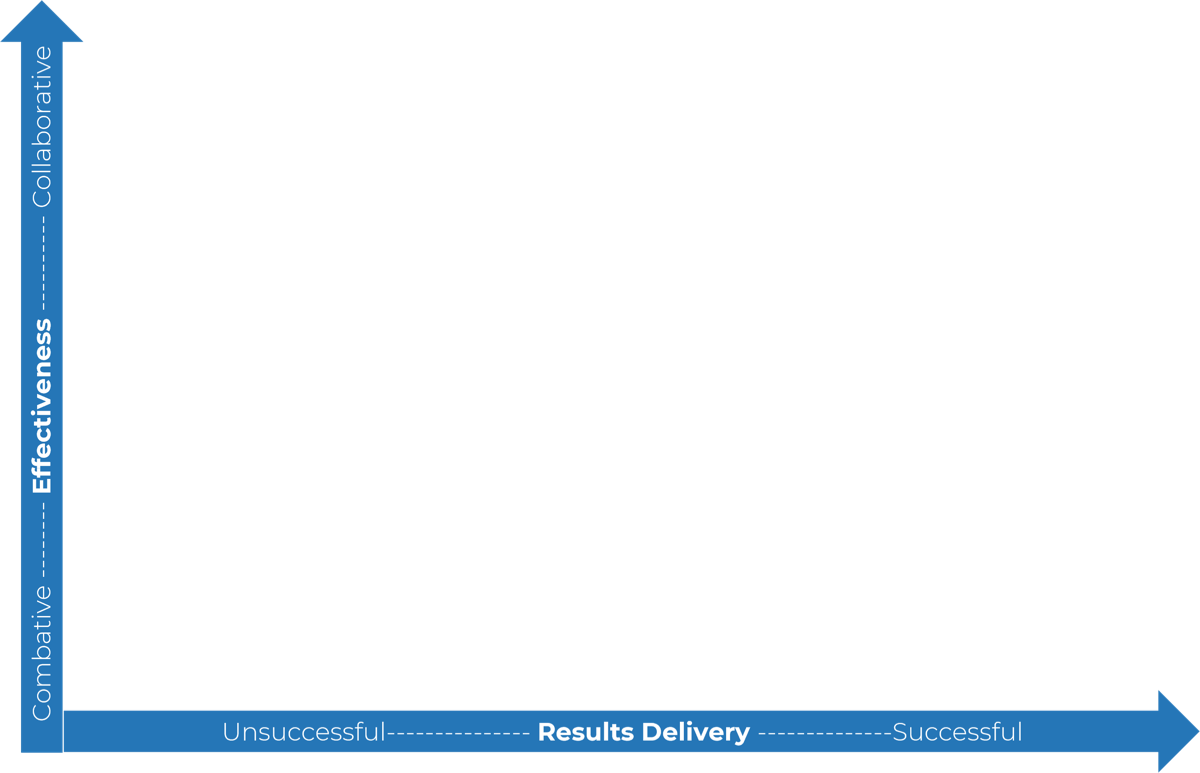
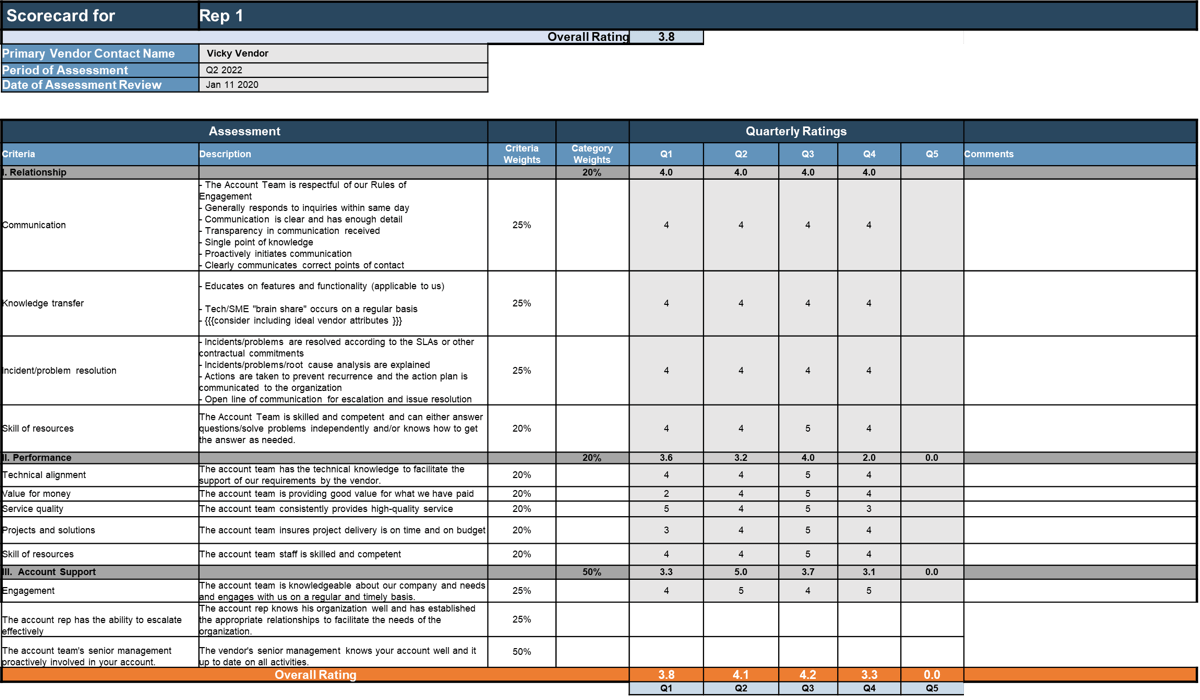


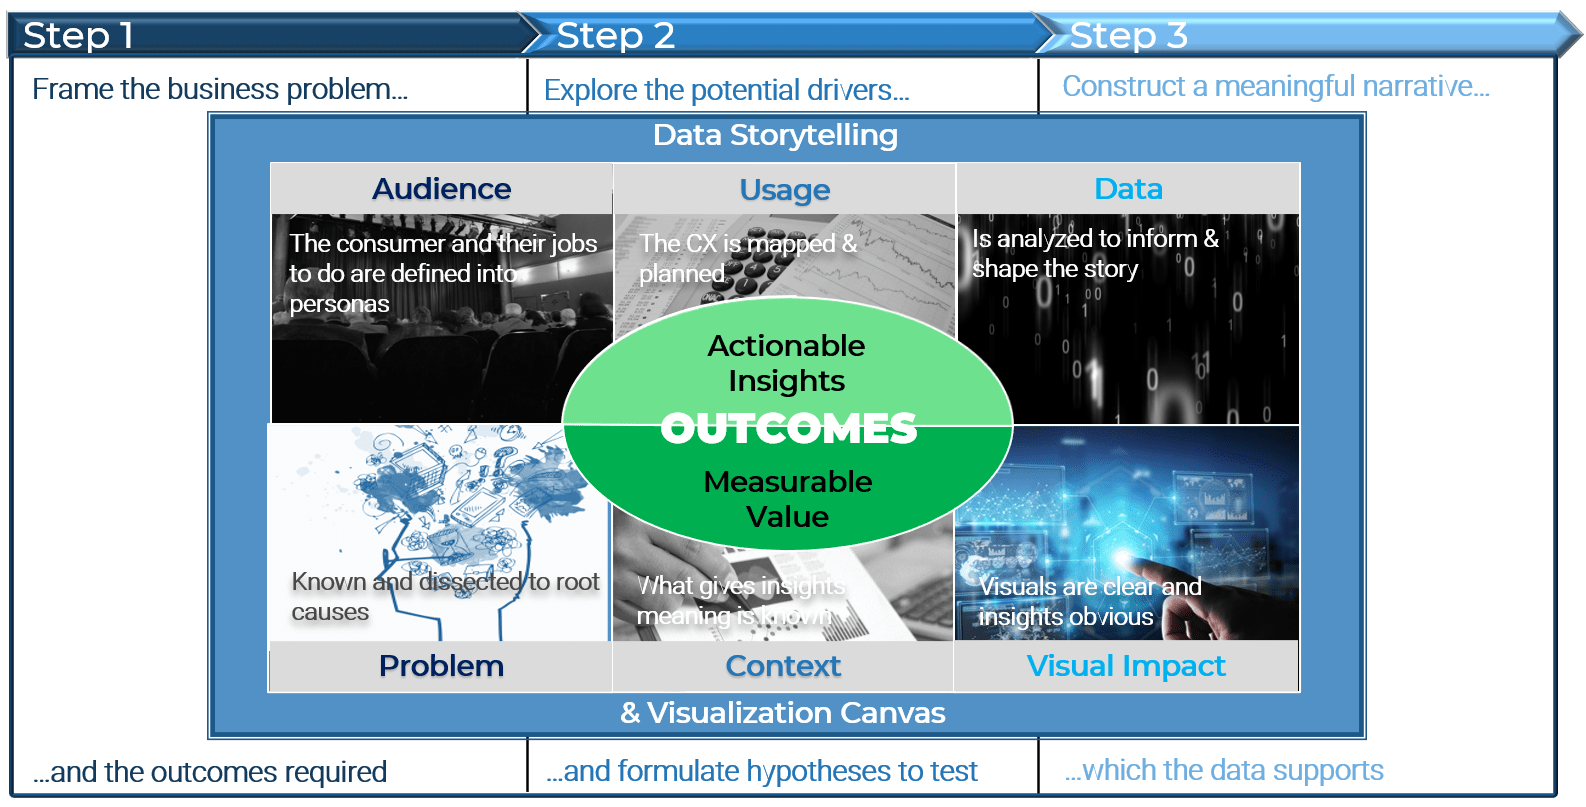


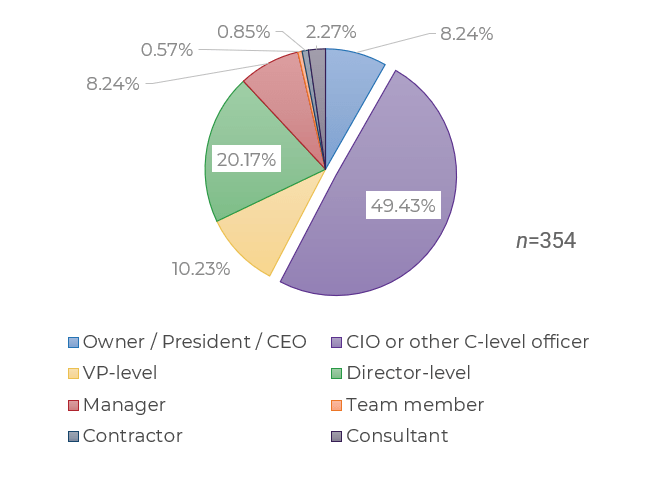
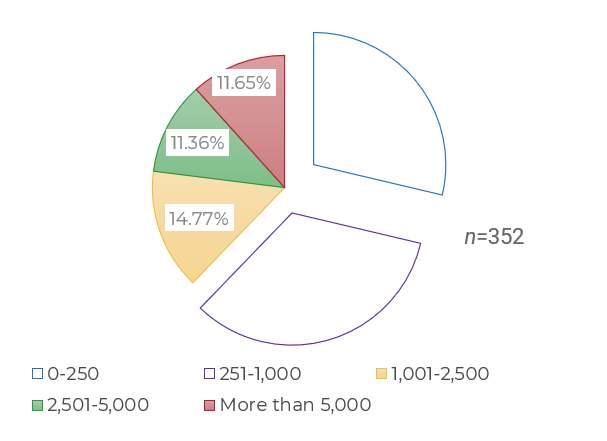
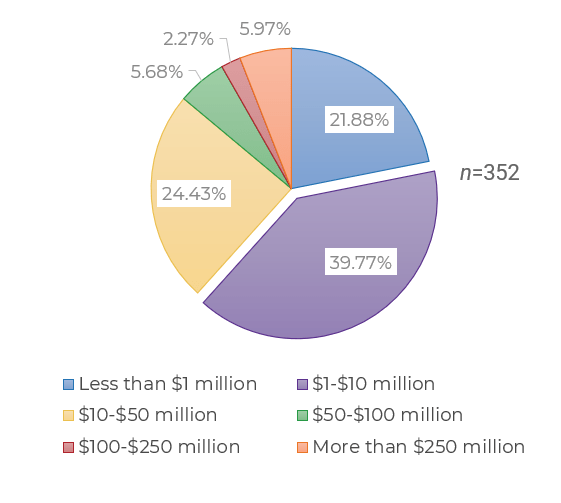
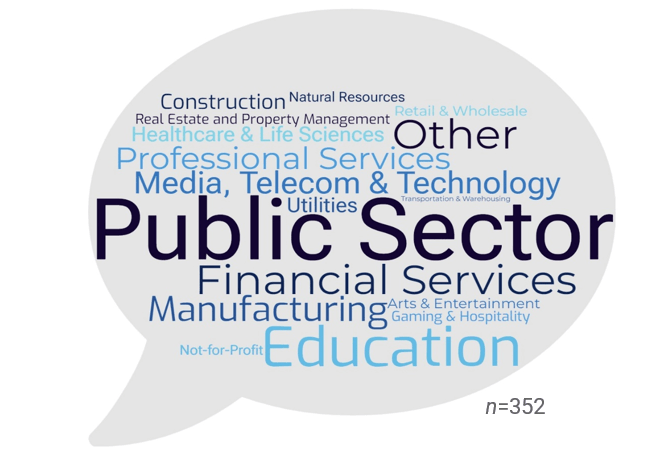
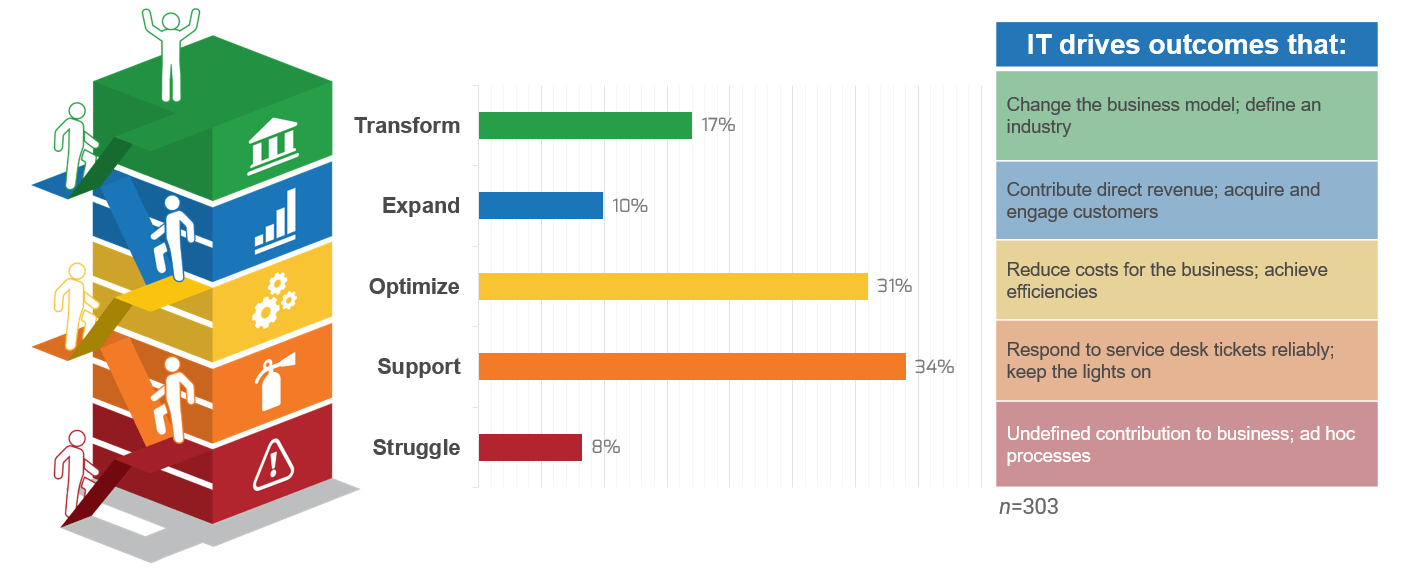
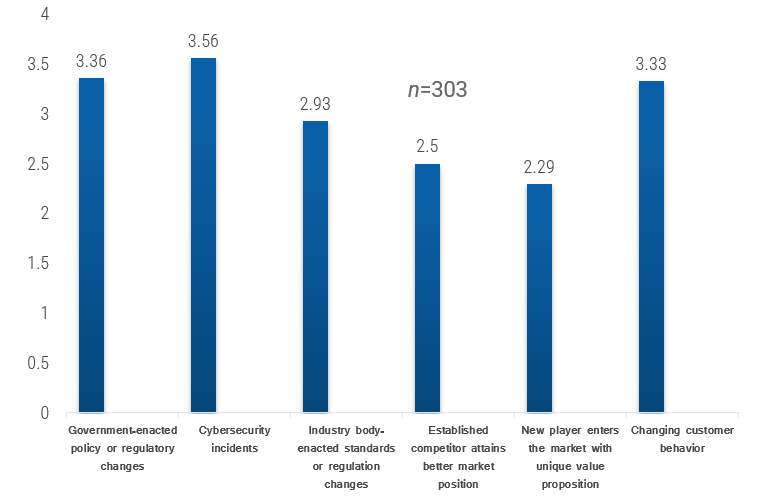
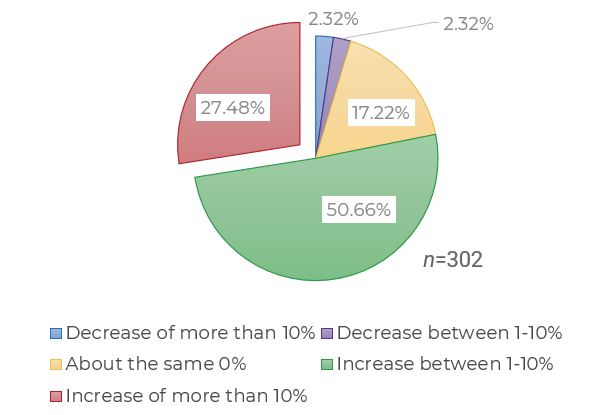
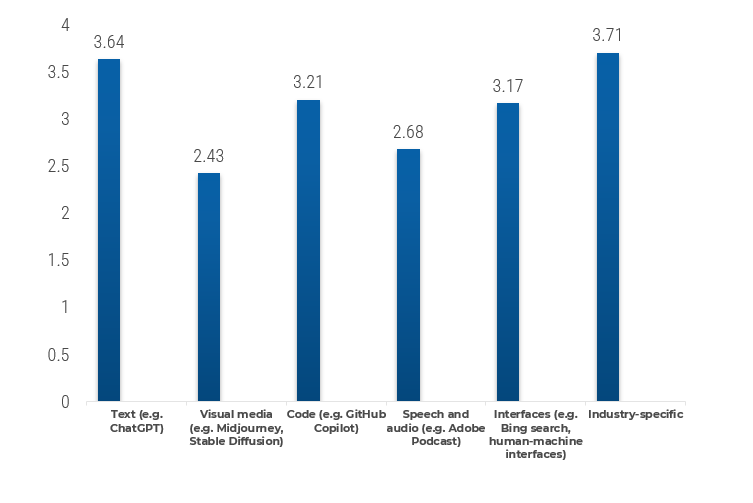
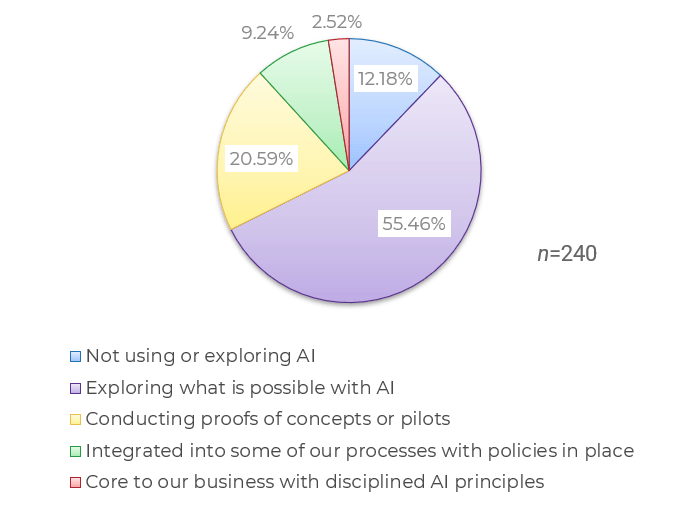
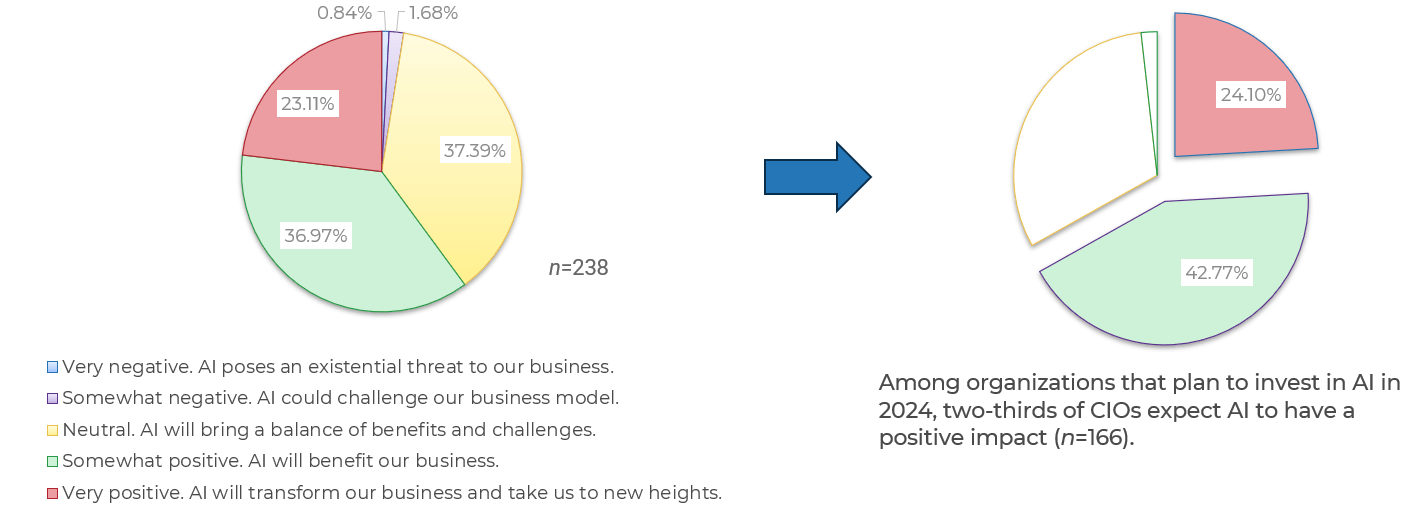
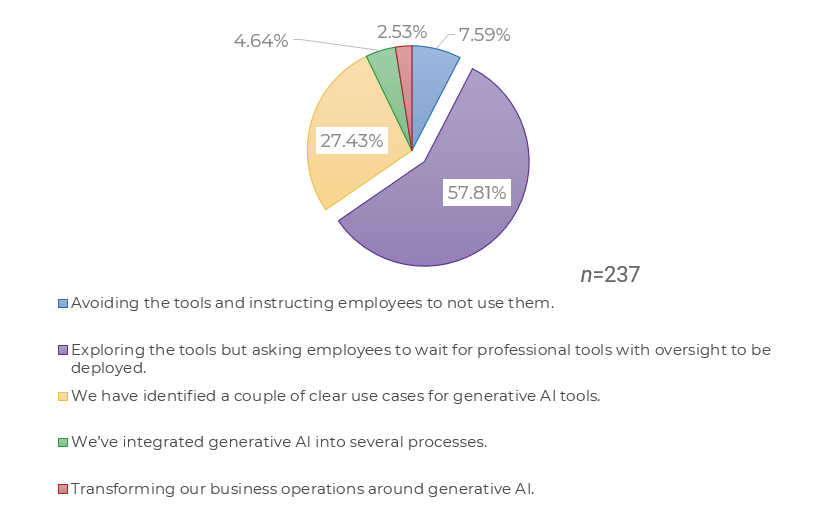
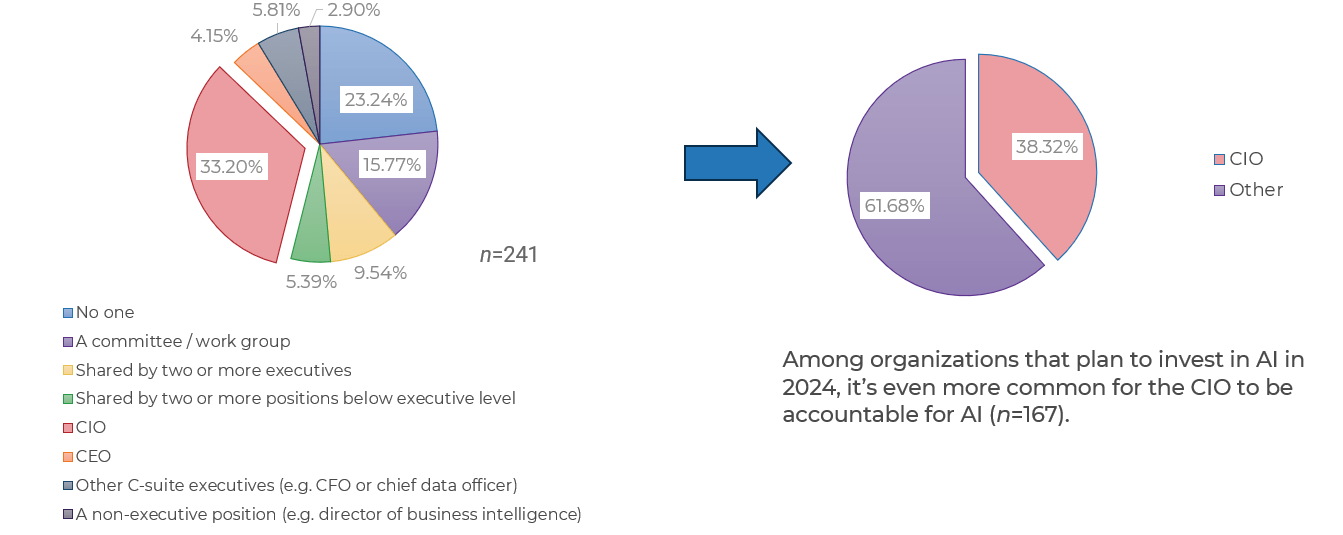
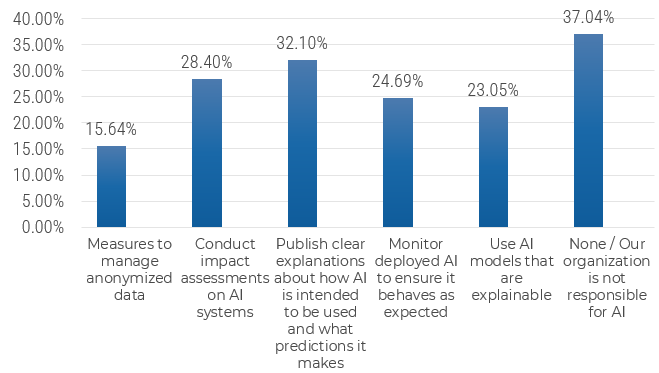
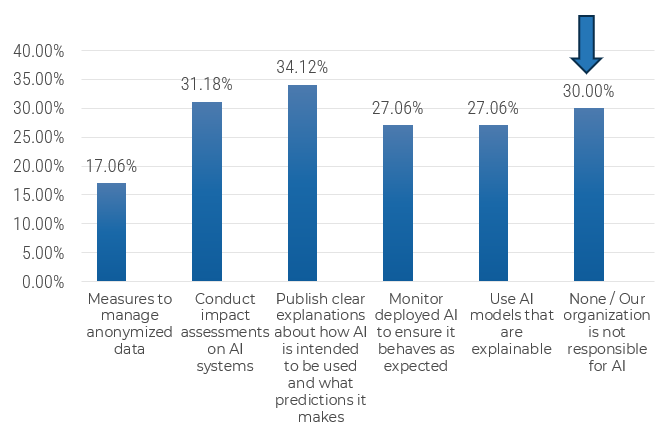
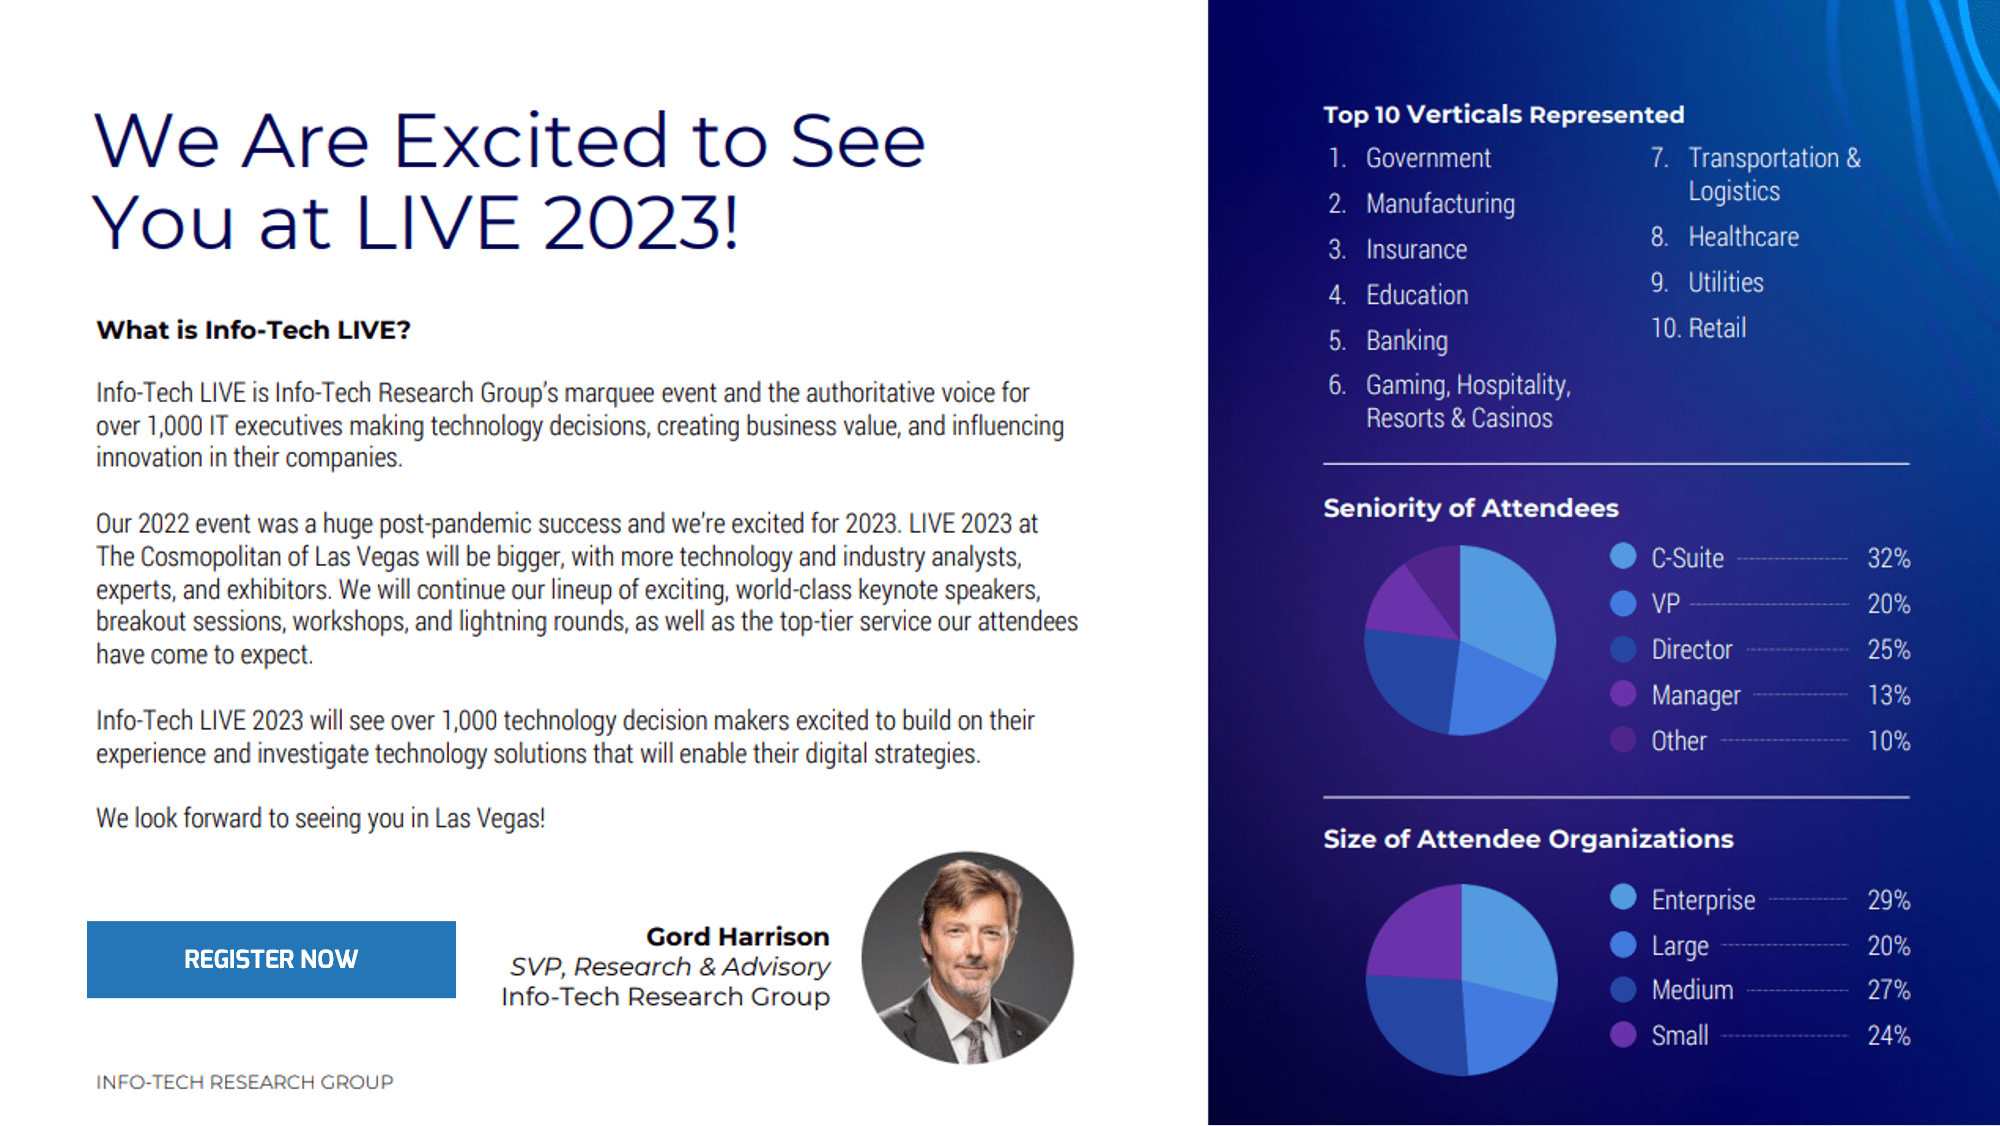


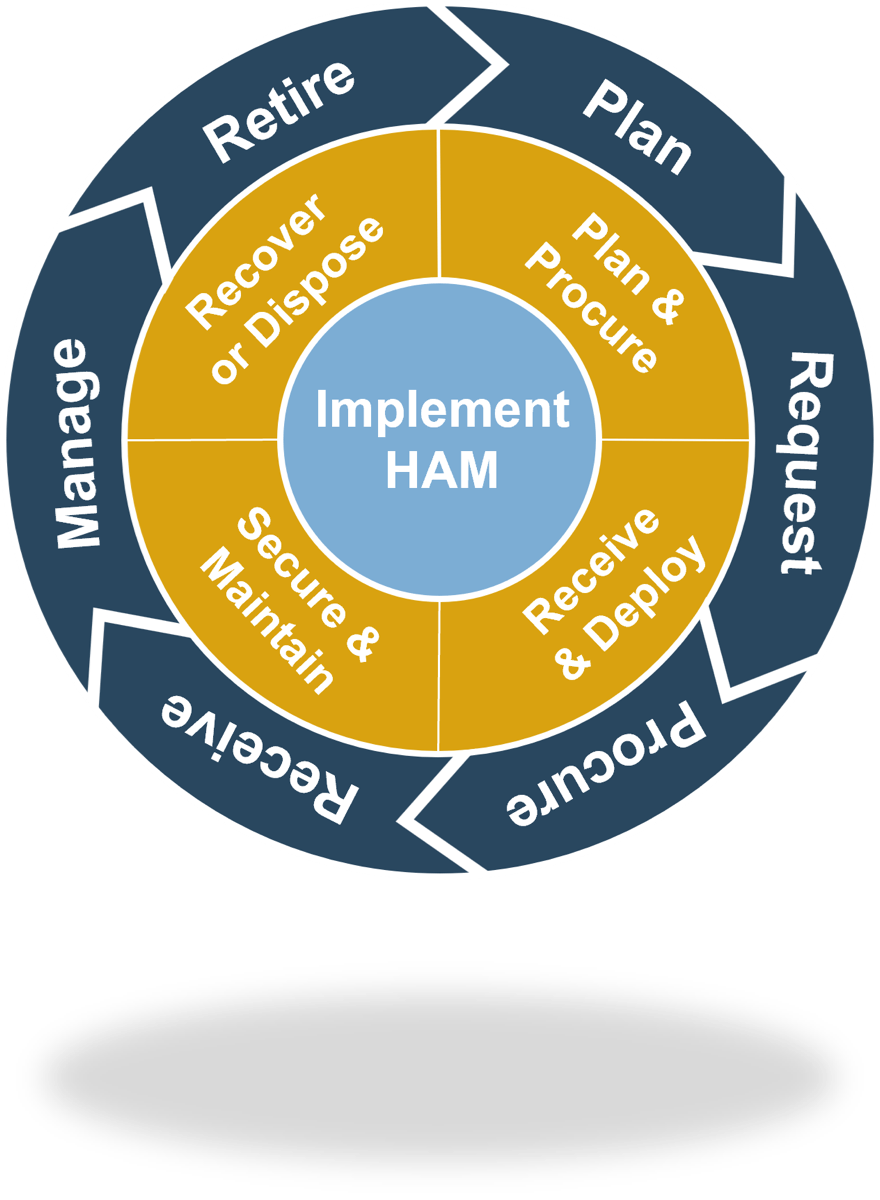
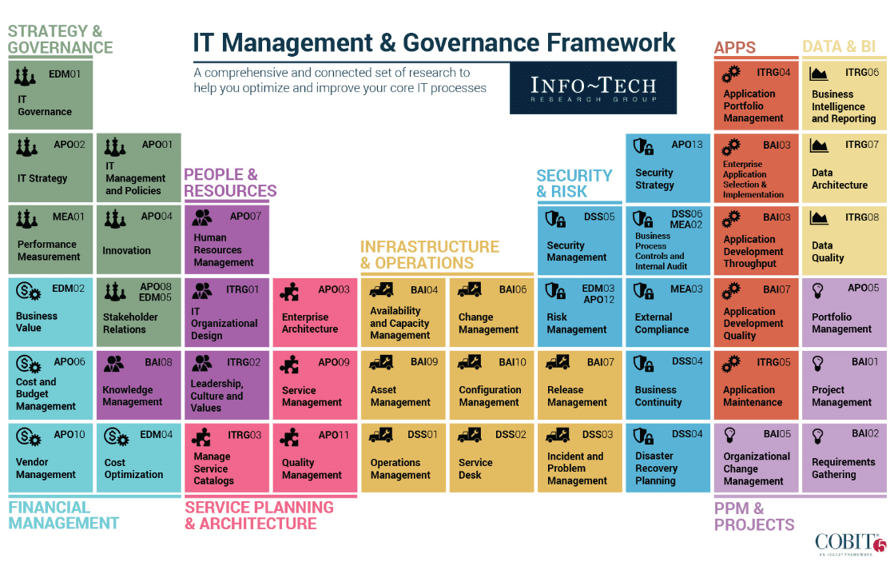
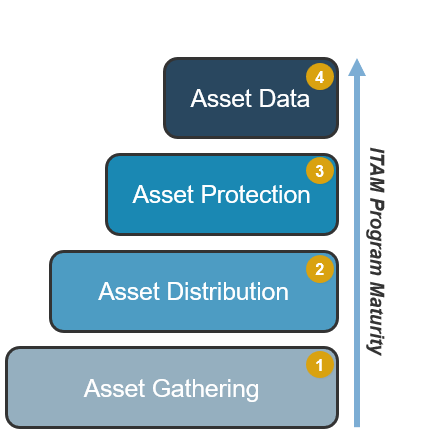
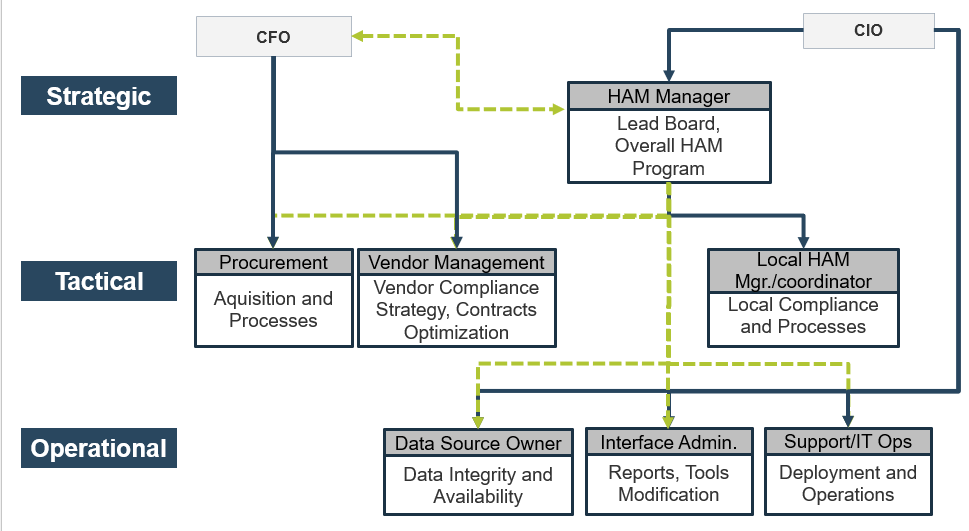
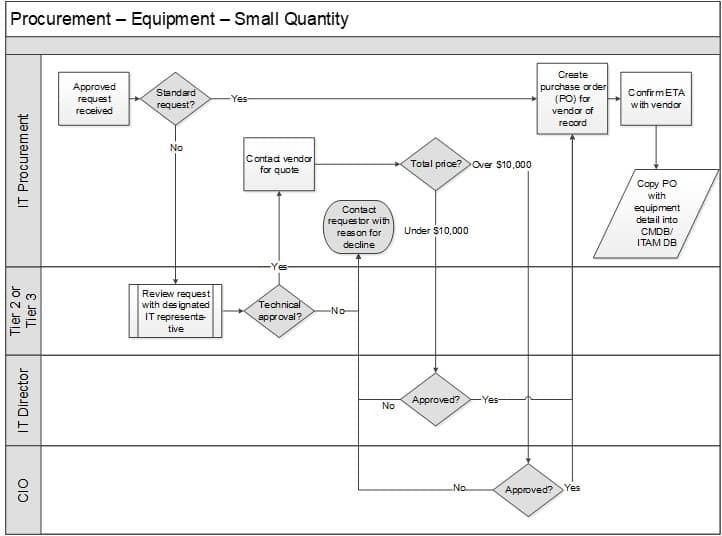
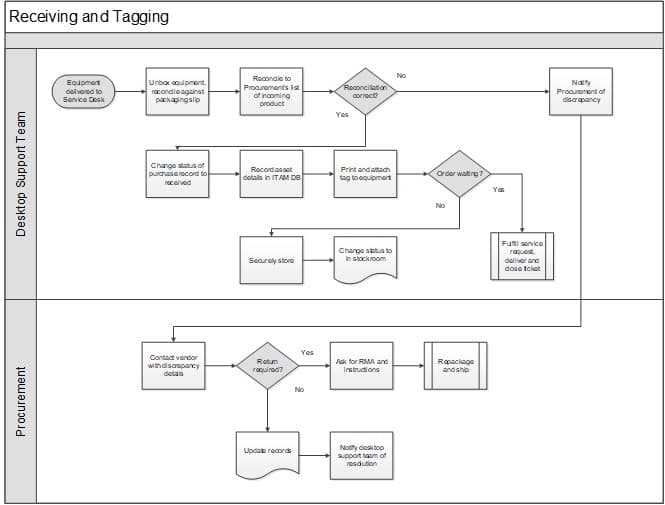
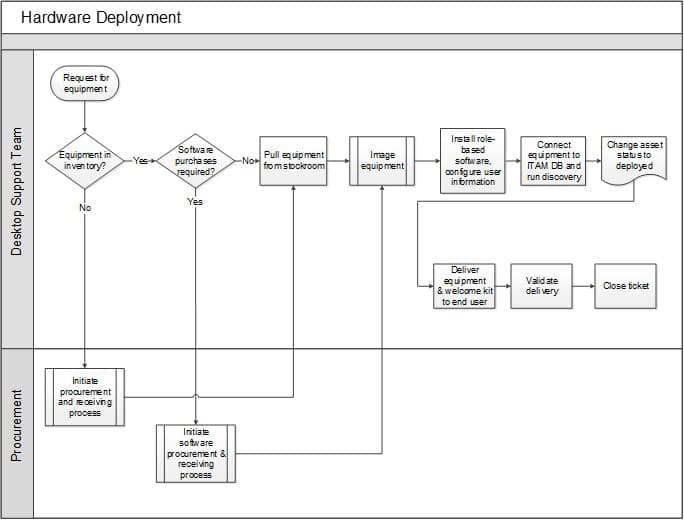
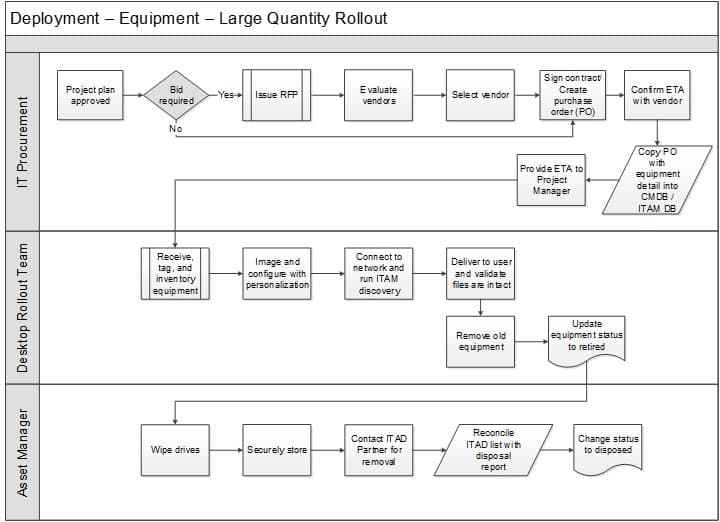
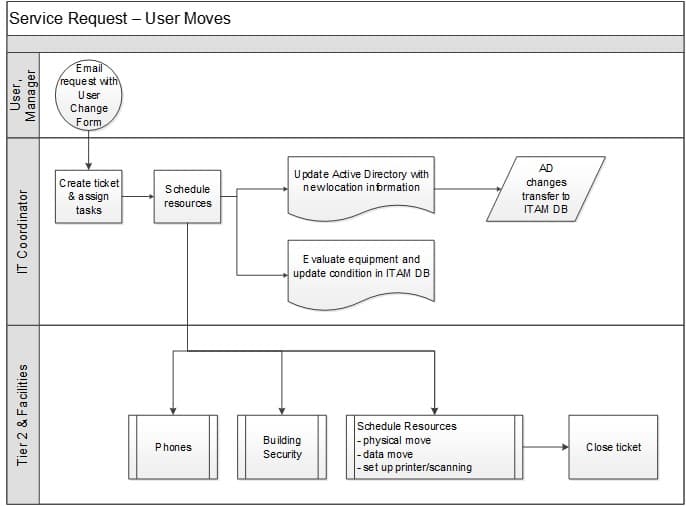
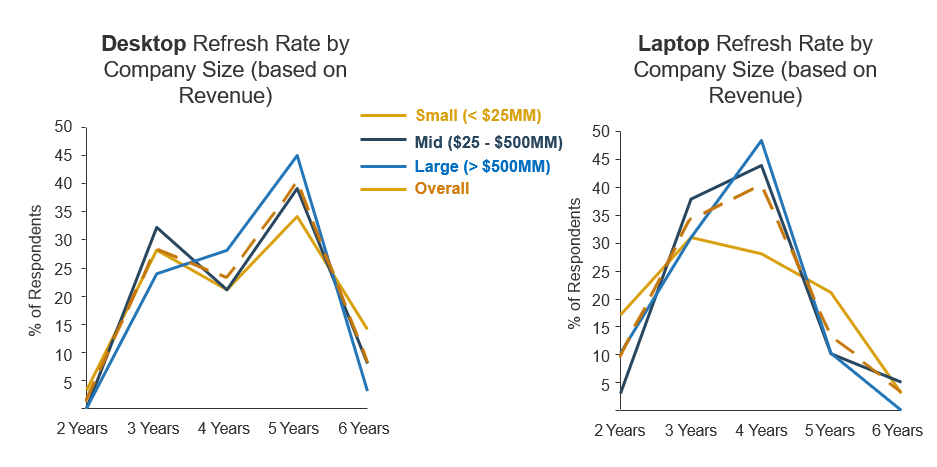 $500MM); and orange is Overall.">
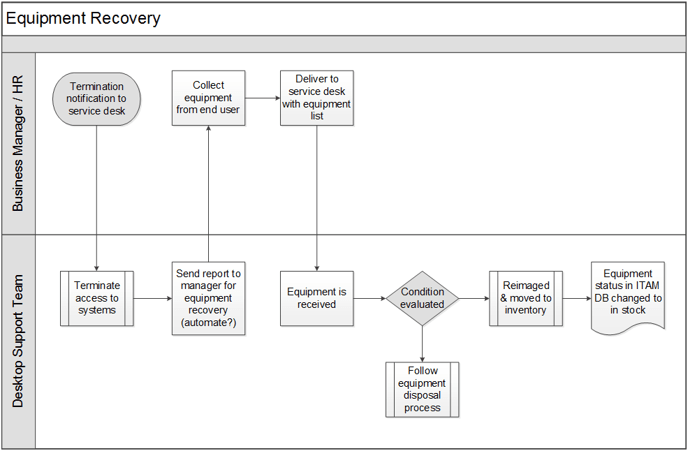
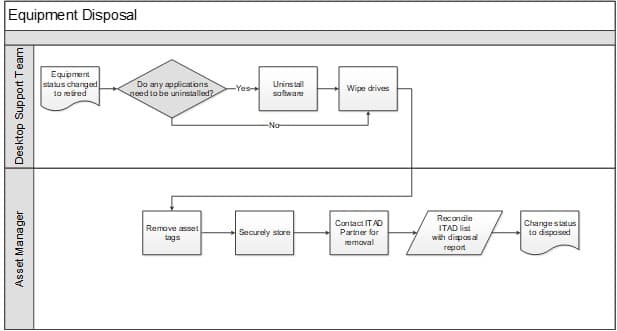