Implement Risk-Based Vulnerability Management

- Buy Link or Shortcode: {j2store}296|cart{/j2store}
- Parent Category Name: Threat Intelligence & Incident Response
- Parent Category Link: /threat-intelligence-incident-response
- Vulnerability scanners, industry alerts, and penetration tests are revealing more and more vulnerabilities, and it is unclear how to manage them.
- Organizations are struggling to prioritize the vulnerabilities for remediation, as there are many factors to consider, including the threat of the vulnerability and the potential remediation option itself.
Our Advice
Critical Insight
- Patches are often seen as the only answer to vulnerabilities, but these are not always the most suitable solution.
- Vulnerability management does not equal patch management. It includes identifying and assessing the risk of the vulnerability, and then selecting a remediation option which goes beyond just patching alone.
- There is more than one way to tackle the problem. Leverage your existing security controls in order to protect the organization.
Impact and Result
- At the conclusion of this blueprint, you will have created a full vulnerability management program that will allow you to take a risk-based approach to vulnerability remediation.
- Assessing a vulnerability’s risk will enable you to properly determine the true urgency of a vulnerability within the context of your organization; this ensures you are not just blindly following what the tool is reporting.
- The risk-based approach will allow you prioritize your discovered vulnerabilities and take immediate action on critical and high vulnerabilities, while allowing your standard remediation cycle to address the medium to low vulnerabilities.
- With your program defined and developed, you now need to configure your vulnerability scanning tool, or acquire one if you don’t already have a tool in place.
- Lastly, while vulnerability management will help address your systems and applications, how do you know if you are secure from external malicious actors? Penetration testing will offer visibility, allowing you to plug those holes and attain an environment with a smaller risk surface.
Implement Risk-Based Vulnerability Management Research & Tools
Start here – read the Executive Brief
Read our concise Executive Brief to find out why you should design and implement a vulnerability management program, review Info-Tech’s methodology, and understand the four ways we can support you in completing this project.Besides the small introduction, subscribers and consulting clients within this management domain have access to:
- Implement Risk-Based Vulnerability Management – Phases 1-4
1. Identify vulnerability sources
Begin the project by creating a vulnerability management team and determine how vulnerabilities will be identified through scanners, penetration tests, third-party sources, and incidents.
- Vulnerability Management SOP Template
2. Triage vulnerabilities and assign priorities
Determine how vulnerabilities will be triaged and evaluated based on intrinsic qualities and how they may compromise business functions and data sensitivity.
- Vulnerability Tracking Tool
- Vulnerability Management Risk Assessment Tool
- Vulnerability Management Workflow (Visio)
- Vulnerability Management Workflow (PDF)
3. Remediate vulnerabilities
Address the vulnerabilities based on
their level of risk. Patching isn't the only risk mitigation action; some
systems simply cannot be patched, but other options are available.
Reduce the risk down to medium/low levels and
engage your regular operational processes to deal with the latter.
4. Measure and formalize
Evolve the program continually by developing metrics and formalizing a policy.
- Vulnerability Management Policy Template
- Vulnerability Scanning Tool RFP Template
- Penetration Test RFP Template
Infographic
Workshop: Implement Risk-Based Vulnerability Management
Workshops offer an easy way to accelerate your project. If you are unable to do the project yourself, and a Guided Implementation isn't enough, we offer low-cost delivery of our project workshops. We take you through every phase of your project and ensure that you have a roadmap in place to complete your project successfully.
1 Identify Vulnerability Sources
The Purpose
Establish a common understanding of vulnerability management, and define the roles, scope, and information sources of vulnerability detection.
Key Benefits Achieved
Attain visibility on all of the vulnerability information sources, and a common understanding of vulnerability management and its scope.
Activities
1.1 Define the scope & boundary of your organization’s security program.
1.2 Assign responsibility for vulnerability identification and remediation.
1.3 Develop a monitoring and review process of third-party vulnerability sources.
1.4 Review incident management and vulnerability management
Outputs
Defined scope and boundaries of the IT security program
Roles and responsibilities defined for member groups
Process for review of third-party vulnerability sources
Alignment of vulnerability management program with existing incident management processes
2 Triage and Prioritize
The Purpose
We will examine the elements that you will use to triage and analyze vulnerabilities, prioritizing using a risk-based approach and prepare for remediation options.
Key Benefits Achieved
A consistent, documented process for the evaluation of vulnerabilities in your environment.
Activities
2.1 Evaluate your identified vulnerabilities.
2.2 Determine high-level business criticality.
2.3 Determine your high-level data classifications.
2.4 Document your defense-in-depth controls.
2.5 Build a classification scheme to consistently assess impact.
2.6 Build a classification scheme to consistently assess likelihood.
Outputs
Adjusted workflow to reflect your current processes
List of business operations and their criticality and impact to the business
Adjusted workflow to reflect your current processes
List of defense-in-depth controls
Vulnerability Management Risk Assessment tool formatted to your organization
Vulnerability Management Risk Assessment tool formatted to your organization
3 Remediate Vulnerabilities
The Purpose
Identifying potential remediation options.
Developing criteria for each option in regard to when to use and when to avoid.
Establishing exception procedure for testing and remediation.
Documenting the implementation of remediation and verification.
Key Benefits Achieved
Identifying and selecting the remediation option to be used
Determining what to do when a patch or update is not available
Scheduling and executing the remediation activity
Planning continuous improvement
Activities
3.1 Develop risk and remediation action.
Outputs
List of remediation options sorted into “when to use” and “when to avoid” lists
4 Measure and Formalize
The Purpose
You will determine what ought to be measured to track the success of your vulnerability management program.
If you lack a scanning tool this phase will help you determine tool selection.
Lastly, penetration testing is a good next step to consider once you have your vulnerability management program well underway.
Key Benefits Achieved
Outline of metrics that you can then configure your vulnerability scanning tool to report on.
Development of an inaugural policy covering vulnerability management.
The provisions needed for you to create and deploy an RFP for a vulnerability management tool.
An understanding of penetration testing, and guidance on how to get started if there is interest to do so.
Activities
4.1 Measure your program with metrics, KPIs, and CSFs.
4.2 Update the vulnerability management policy.
4.3 Create an RFP for vulnerability scanning tools.
4.4 Create an RFP for penetration tests.
Outputs
List of relevant metrics to track, and the KPIs, CSFs, and business goals for.
Completed Vulnerability Management Policy
Completed Request for Proposal (RFP) document that can be distributed to vendor proponents
Completed Request for Proposal (RFP) document that can be distributed to vendor proponents
Further reading
Implement Risk-Based Vulnerability Management
Get off the patching merry-go-round and start mitigating risk!
Table of Contents
4 Analyst Perspective 5 Executive Summary 6 Common Obstacles 8 Risk-based approach to vulnerability management 16 Step 1.1: Vulnerability management defined 24 Step 1.2: Defining scope and roles 34 Step 1.3: Cloud considerations for vulnerability management | 33 Step 1.4: Vulnerability detection 46 Step 2.1: Triage vulnerabilities 51 Step 2.2: Determine high-level business criticality 56 Step 2.3: Consider current security posture 61 Step 2.4: Risk assessment of vulnerabilities 71 Step 3.1: Assessing remediation options |
Table of Contents
80 Step 3.2: Scheduling and executing remediation 85 Step 3.3: Continuous improvement 89 Step 4.1: Metrics, KPIs, and CSFs 94 Step 4.2: Vulnerability management policy 97 Step 4.3: Select & implement a scanning tool 107 Step 4.4: Penetration testing 118 Summary of accomplishment | 119 Additional Support 120 Bibliography |
Analyst Perspective
Vulnerabilities will always be present. Know the unknowns!
In this age of discovery, technology changes at such a rapid pace. New things are discovered, both in new technology and in old. The pace of change can often be very confusing as to where to start and what to do.
The ever-changing nature of technology means that vulnerabilities will always be present. Taking measures to address these completely will consume all your department’s time and resources. That, and your efforts will quickly become stale as new vulnerabilities are uncovered. Besides, what about the systems that simply can’t be patched? The key is to understand the vulnerabilities and the levels of risk they pose to your organization, to prioritize effectively and to look beyond patching.
A risk-based approach to vulnerability management will ensure you are prioritizing appropriately and protecting the business. Reduce the risk surface!
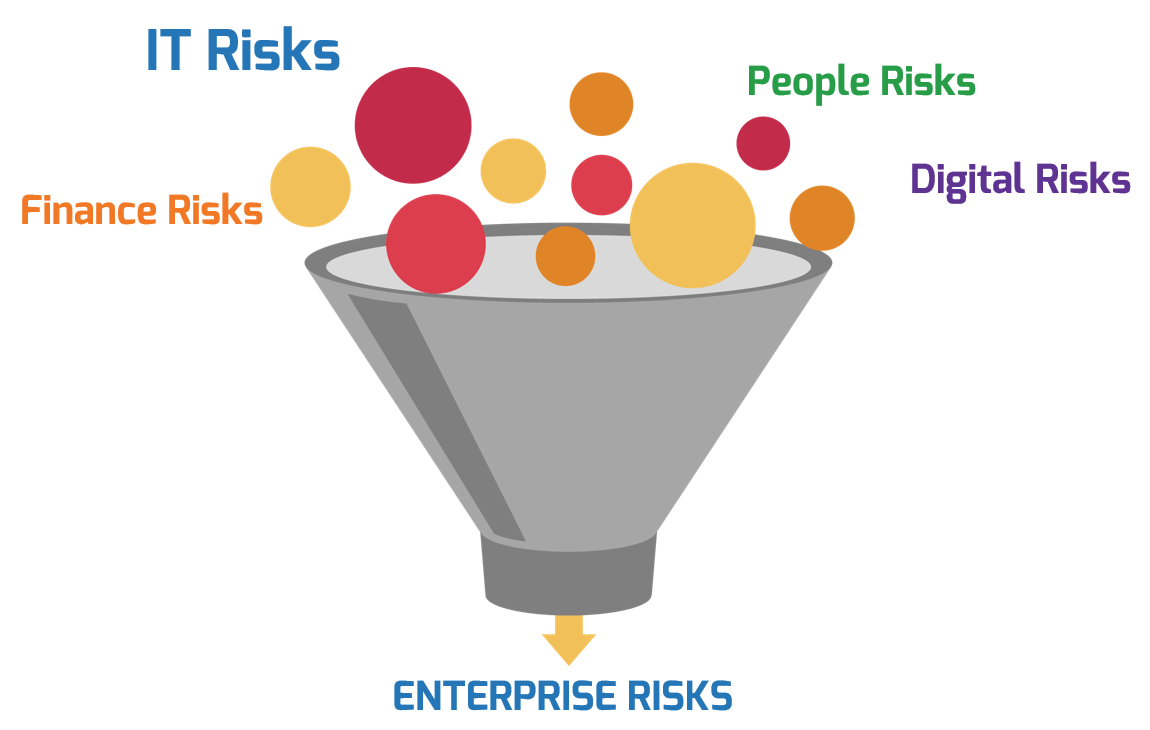
Vulnerability management is more than just systems and application patching. It is a full process that includes patching, compensating controls, segmentation, segregation, and heightened diligence in security monitoring.
 | Jimmy Tom Research Advisor – Security, Privacy, Risk, and Compliance Info-Tech Research Group |
Executive Summary
| Your Challenge Vulnerability scanners, industry alerts, and penetration tests are revealing more and more vulnerabilities, and it is unclear how to manage them. Organizations are struggling to prioritize the vulnerabilities for remediation, as there are many factors to consider, including the threat of the vulnerability and the potential remediation option. | Common Obstacles Patches are often seen as the answer to vulnerabilities, but these are not always the most suitable solution. Some systems deemed vulnerable simply cannot be patched or easily replaced. Companies are unaware of the risk implications that come from leaving the vulnerability open and from the remediation option itself. | Info-Tech’s Approach Design and implement a vulnerability management program that identifies, prioritizes, and remediates vulnerabilities. Understand what needs to be considered when implementing remediation options, including patches, configuration changes, and defense-in-depth controls. Build a process that is easy to understand and allows vulnerabilities to be remediated proactively, instead of in an ad hoc fashion. |
Info-Tech Insight
Vulnerability management does not always equal patch management. There is more than one way to tackle the problem, particularly if a system cannot be easily patched or replaced. If a vulnerability cannot be completely remediated, steps to reduce the risk to a tolerable level must be taken.
Common obstacles
These barriers make vulnerability management difficult to address for many organizations:
| CVSS Score Distribution From the National Vulnerability Database: 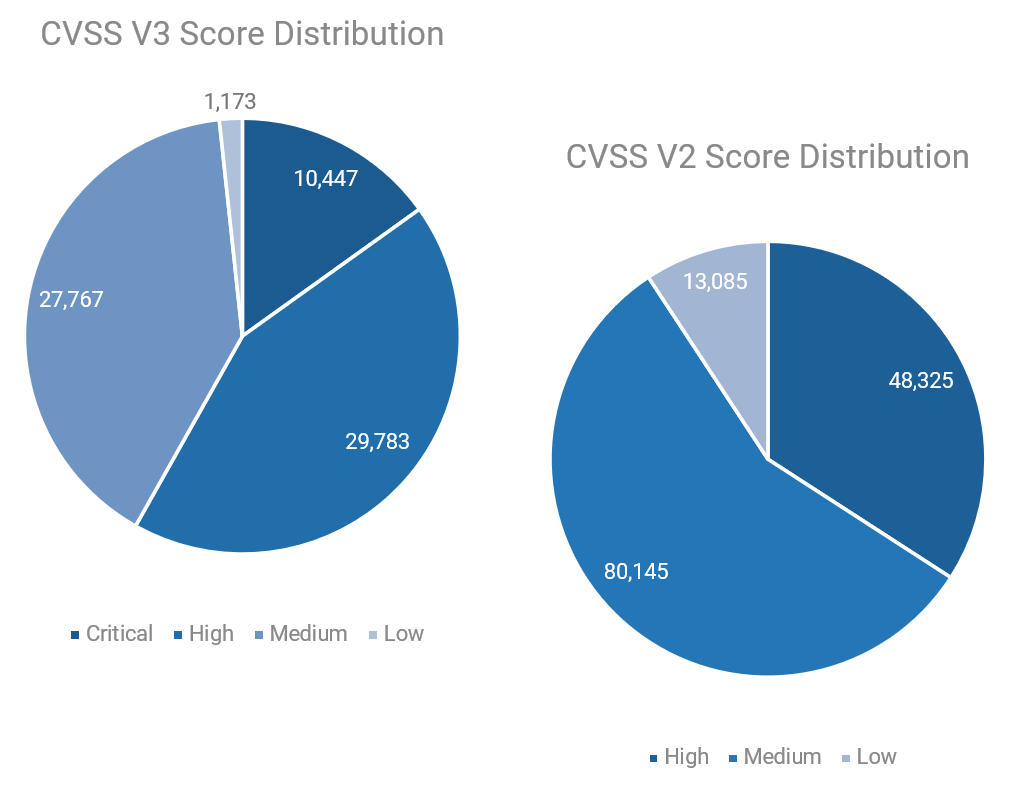 (Source: NIST National Vulnerability Database Dashboard) |
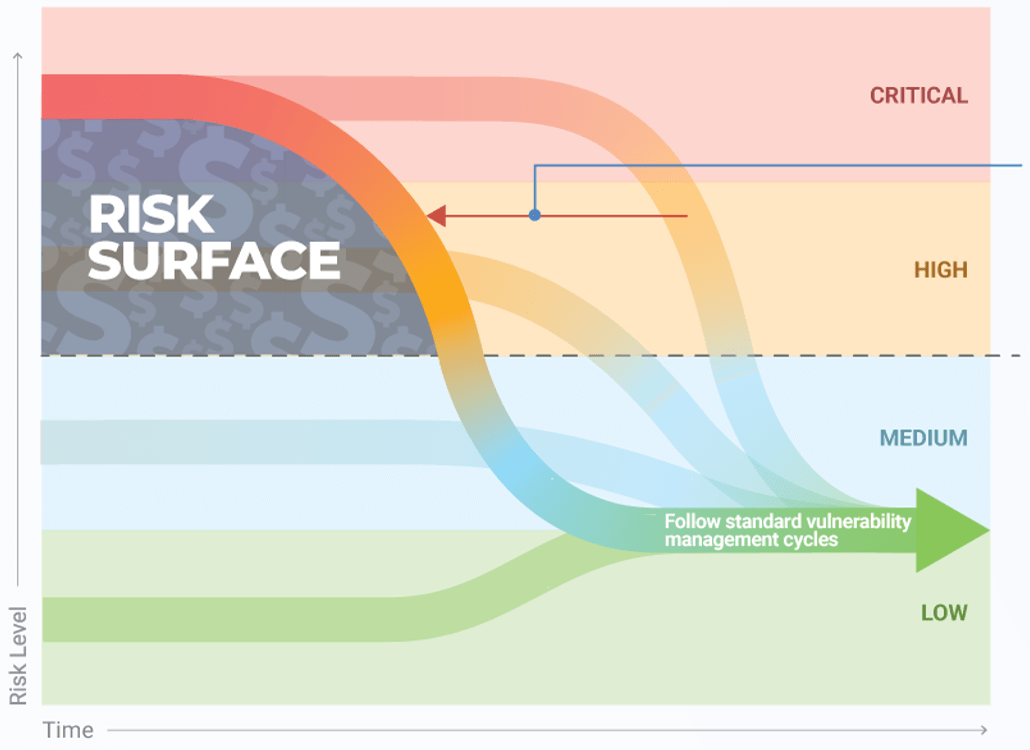
Leverage risk to sort, triage, and prioritize vulnerabilities
Reduce your risk surface to avoid cost to your business; everything else is table stakes.
Reduce the critical and high vulnerabilities below the risk threshold and operationalize the remediation of medium/low vulnerabilities by following your effective vulnerability management program cycles.
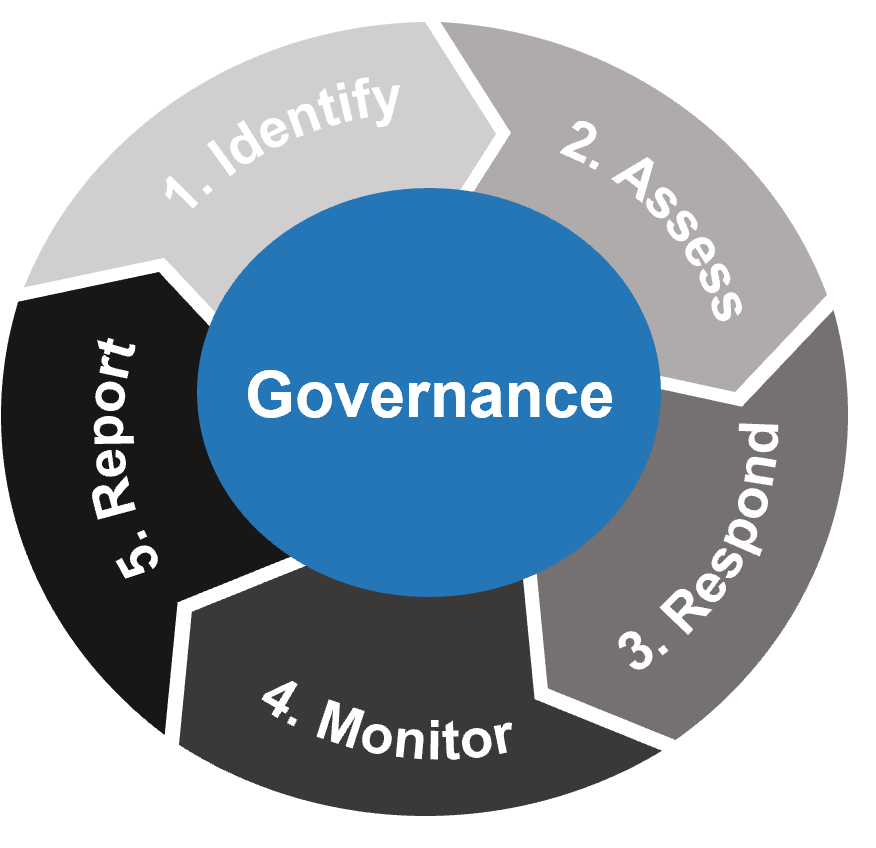
Identify vulnerability sources
An inventory of your scanning tool and vulnerability threat intelligence data sources will help you determine a viable strategy for addressing vulnerabilities. Defining roles and responsibilities ahead of time will ensure you are not left scrambling when dealing with vulnerabilities.
Triage and prioritize
Bring the vulnerabilities into context by assessing vulnerabilities based on your security posture and mechanisms and not just what your data sources report. This will allow you to gauge the true urgency of the vulnerabilities based on risk and determine an effective mitigation plan.
Remediate vulnerabilities
Address the vulnerabilities based on their level of risk. Patching isn't the only risk mitigation action; some systems simply cannot be patched, but other options are available.
Reduce the risk down to medium/low levels and engage your regular operational processes to deal with the latter.
Measure and formalize
Upon implementation of the program, measure with metrics to ensure that the program is successful. Improve the program with each iteration of vulnerability mitigation to ensure continuous improvement.
Tactical Insight 1
All actions to address vulnerabilities should be based on risk and the organization’s established risk tolerance.
Tactical Insight 2
Reduce the risk surface down below the risk threshold.
The industry has shifted to a risk-based approach
Traditional vulnerability management is no longer viable.
“For those of us in the vulnerability management space, ensuring that money, resources, and time are strategically spent is both imperative and difficult. Resources are dwindling fast, but the vulnerability problem sure isn’t.” (Kenna Security)
“Using vulnerability scanners to identify unpatched software is no longer enough. Keeping devices, networks, and digital assets safe takes a much broader, risk-based vulnerability management strategy – one that includes vulnerability assessment and mitigation actions that touch the entire ecosystem.” (Balbix)
“Unlike legacy vulnerability management, risk-based vulnerability management goes beyond just discovering vulnerabilities. It helps you understand vulnerability risks with threat context and insight into potential business impact.” (Tenable)
“A common mistake when prioritizing patching is equating a vulnerability’s Common Vulnerability Scoring System (CVSS) score with risk. Although CVSS scores can provide useful insight into the anatomy of a vulnerability and how it might behave if weaponized, they are standardized and thus don’t reflect either of the highly situational variables — namely, weaponization likelihood and potential impact — that factor into the risk the vulnerability poses to an organization.” (SecurityWeek)
Why a take risk-based approach?
Vulnerabilities, by the numbers
60% — In 2019, 60% of breaches were due to unpatched vulnerabilities.
74% — In the same survey, 74% of survey responses said they cannot take down critical applications and systems to patch them quickly. (Source: SecurityBoulevard, 2019)
Info-Tech Insight
Taking a risk-based approach will allow you to focus on mitigating risk, rather than “just patching” your environment.
The average cost of a breach in 2020 is $3.86 million, and “…the price tag was much less for mature companies and industries and far higher for firms that had lackluster security automation and incident response processes.” (Dark Reading)
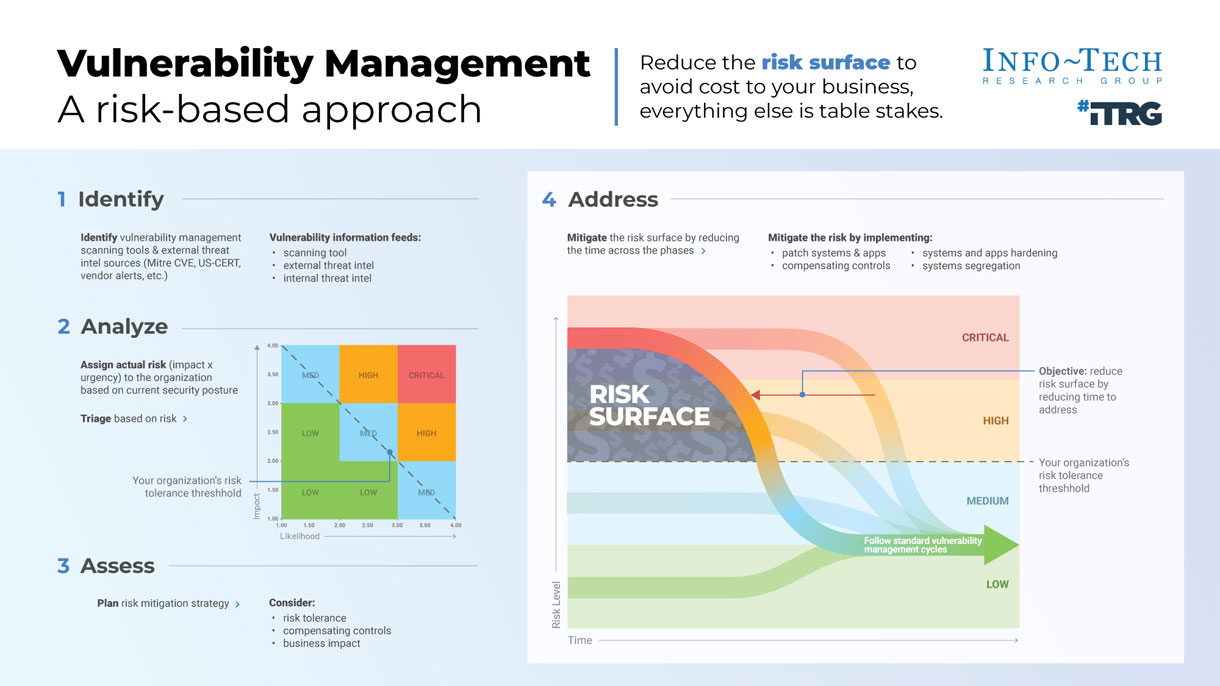
Vulnerability ManagementA risk-based approach | Reduce the risk surface to avoid cost to your business, everything else is table stakes |
1 | Identify |
| ||||||||||||||||
| Identify vulnerability management scanning tools & external threat intel sources (Mitre CVE, US-CERT, vendor alerts, etc.) | Vulnerability information feeds:
| |||||||||||||||||
2 | Analyze | |||||||||||||||||
| Assign actual risk (impact x urgency) to the organization based on current security posture
Triage based on risk › Your organization's risk tolerance threshold | 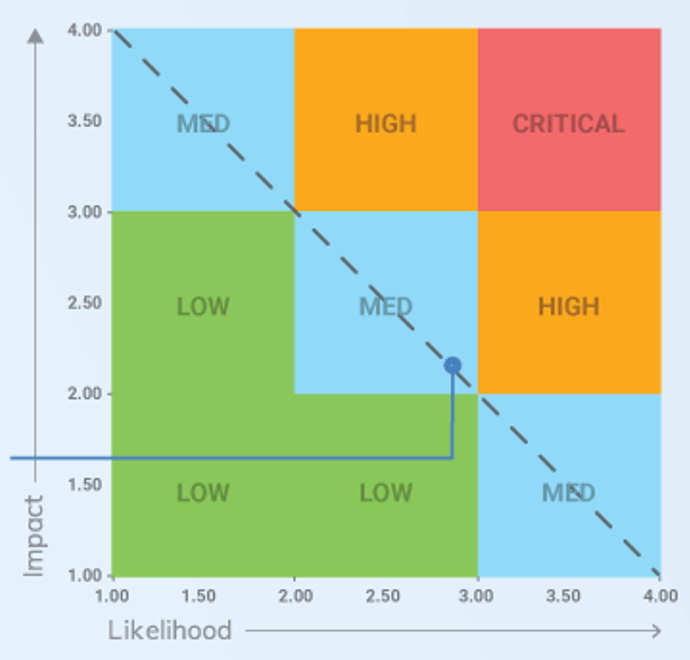 | |||||||||||||||||
3 | Assess | |||||||||||||||||
| Plan risk mitigation strategy › | Consider:
| |||||||||||||||||
Info-Tech’s vulnerability management methodology
Focus on developing the most efficient processes.
Vulnerability management isn’t “old school.”
The vulnerability management market is relatively mature; however, vulnerability management remains a very relevant and challenging topic.
Security practitioners are inundated with the advice they need to prioritize their vulnerabilities. Every vulnerability scanning vendor will proclaim their ability to prioritize the identified vulnerabilities.
Third-party prioritization methodology can’t be effectively applied across all organizations. Each organization is too unique with different constraints. No tool or service can account for these variables.
When patching is not possible, other options exist: configuration changes (hardening), defense-in-depth, compensating controls, and even elevated security monitoring are possible options.
Info-Tech Insight
Vulnerability management is not only patch management. Patching is only one aspect.
Blueprint deliverables
Each step of this blueprint is accompanied by supporting deliverables to help you accomplish your goals:
Key deliverable:Vulnerability Management SOPThe Standard operating procedure (SOP) will comprise the end-to-end description of the program: roles & responsibilities, data flow, and expected outcomes of the program. 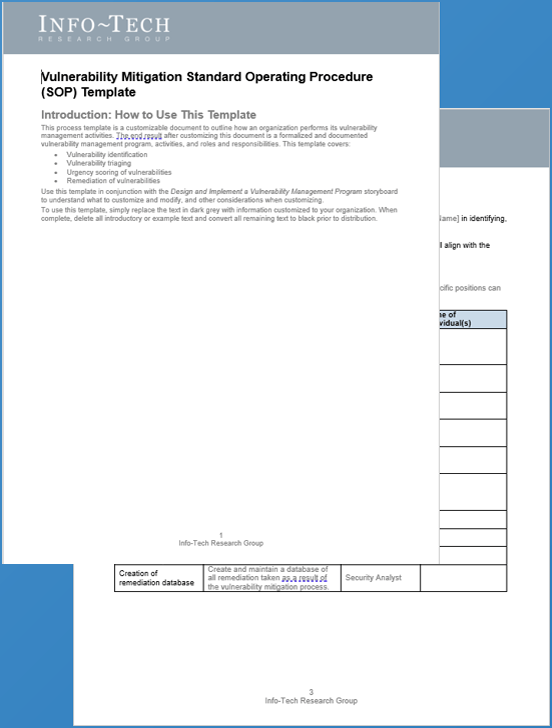 | Vulnerability Management Policy Template for your vulnerability management policy. | 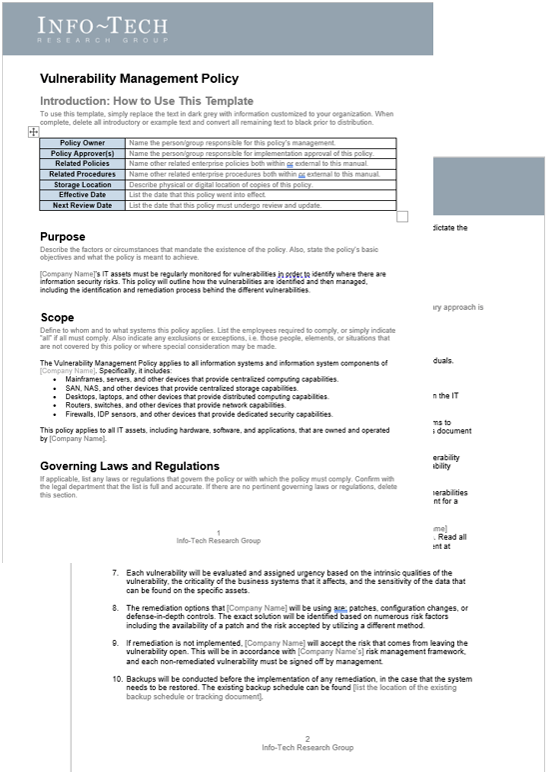 | Vulnerability Tracking Tool This tool offers a template to track vulnerabilities and how they are remedied. | |
| Vulnerability Scanning RFP Template Request for proposal template for the selection of a vulnerability scanning tool. |  | Vulnerability Risk Assessment Tool Methodology to assess vulnerability risk by determining impact and likelihood. | 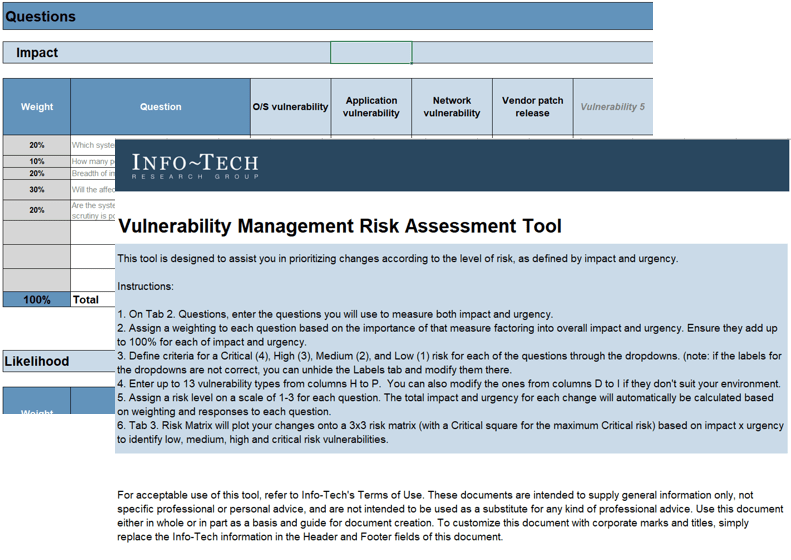 |
Blueprint benefits
IT Benefits
| Business Benefits
|
Info-Tech’s process can save significant financial resources
| Phase | Measured Value |
| Phase 1: Identify vulnerability sources |
|
| Phase 2: Triage vulnerabilities and assign urgencies |
|
| Phase 3: Remediate vulnerabilities |
|
| Phase 4: Continually improve the vulnerability management process |
|
| Potential financial savings from using Info-Tech resources | Phase 1 ($1,600) + Phase 2 ($6,400) + Phase 3 ($10,400) + Phase 4 ($10,400) = $28,800 |
Guided Implementation
A Guided Implementation (GI) is a series of calls with an Info-Tech analyst to help implement our best practices in your organization.
A typical GI is between 8 to 12 calls over the course of 4 to 6 months.
What does a typical GI on this topic look like?
Phase 1 | Phase 2 | Phase 3 | Phase 4 |
| Call #1: Scope requirements, objectives, and your specific challenges. Call #2: Discuss current state and vulnerability sources. | Call #3: Identify triage methods and business criticality. Call #4:Review current defense-in-depth and discuss risk assessment. | Call #5: Discuss remediation options and scheduling. Call #6: Review release and change management and continuous improvement. | Call #7: Identify metrics, KPIs, and CSFs. Call #8: Review vulnerability management policy. |
Workshop Overview
Contact your account representative for more information.
workshops@infotech.com 1-888-670-8889
| Day 1 | Day 2 | Day 3 | Day 4 | Day 5 | |
| Activities | Identify vulnerability sources1.1 What is vulnerability management? 1.2 Define scope and roles 1.3 Cloud considerations for vulnerability management 1.4 Vulnerability detection | Triage and prioritize2.1 Triage vulnerabilities 2.2 Determine high-level business criticality 2.3 Consider current security posture 2.4 Risk assessment of vulnerabilities | Remediate vulnerabilities3.1 Assess remediation options 3.2 Schedule and execute remediation 3.3 Drive continuous improvement | Measure and formalize4.1 Metrics, KPIs & CSFs 4.2 Vulnerability Management Policy 4.3 Select & implement a scanning tool 4.4 Penetration testing | Next Steps and Wrap-Up (offsite)5.1 Complete in-progress deliverables from previous four days 5.2 Set up review time for workshop deliverables and to discuss next steps |
| Deliverables |
|
|
|
|
|
Implement Risk-Based Vulnerability Management
Phase 1
Identify Vulnerability Sources
Phase 11.1 What is vulnerability management? | Phase 22.1 Triage vulnerabilities | ||
Phase 33.1 Assessing remediation options | Phase 44.1 Metrics, KPIs & CSFs |
This phase will walk you through the following activities:
Establish a common understanding of vulnerability management, define the roles, scope, and information sources of vulnerability detection.
This phase involves the following participants:
- Security operations team
- IT Security Manager
- IT Director
- CISO
Step 1.1
Vulnerability Management Defined
Activities
None for this section
This step will walk you through the following activities:
Establish a common understanding of vulnerability management and its place in the IT organization.
This step involves the following participants:
- Security operations team
- IT Security Manager
- IT Director
- CISO
Outcomes of this step
Foundational knowledge of vulnerability management in your organization.
Identify vulnerability sources| Step 1.1 | Step 1.2 | Step 1.3 | Step 1.4 |
What is vulnerability management?
It’s more than just patching.
| “Most organizations do not have a formal process for vulnerability management.” (Morey Haber, VP of Technology, BeyondTrust, 2016) |
Effective vulnerability management
It’s not easy, but it’s much harder without a process in place.
|  You’re not just doing this for yourself. It’s also for your auditors.Many compliance and regulatory obligations require organizations to have thorough documentation of their vulnerability management practices. |
Vulnerability management revolves around your asset security services
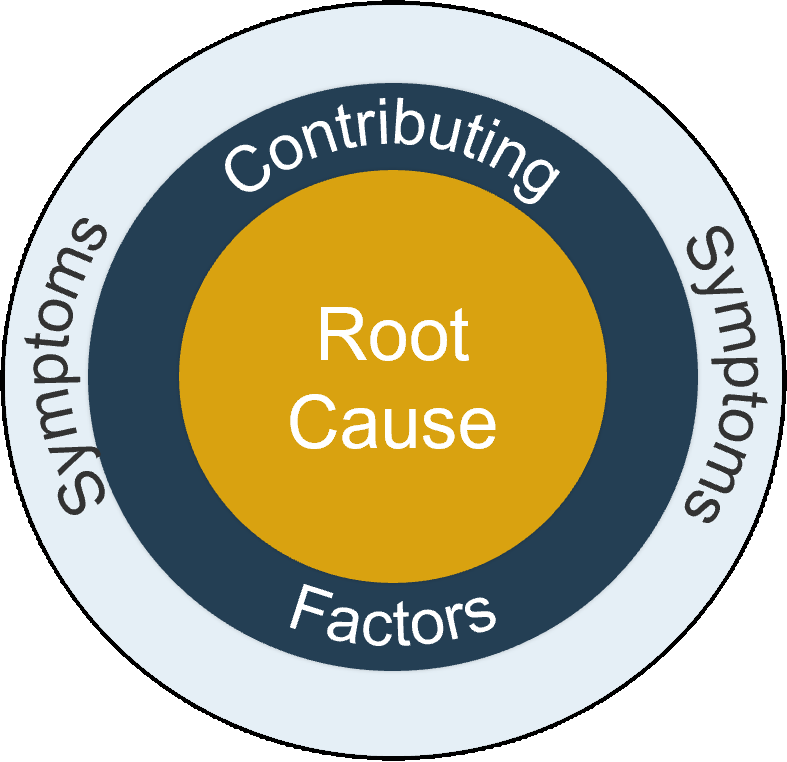
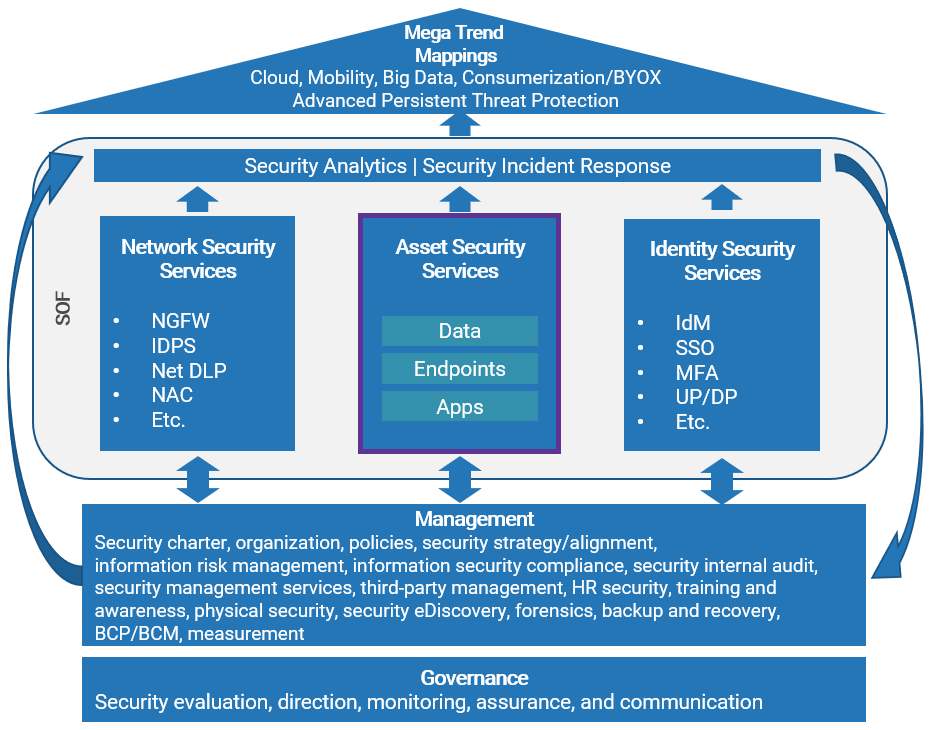 | Vulnerabilities can be found primarily within your assets but also connect to your information risk management. These must be effectively managed as part of a holistic security program. Without management, vulnerabilities left unattended can be easy for attackers to exploit. It becomes difficult to identify the correct remediation option to mitigate against the vulnerabilities. |
Vulnerability management works in tandem with SecOps and ITOps
Vulnerability Management Process Inputs/Outputs: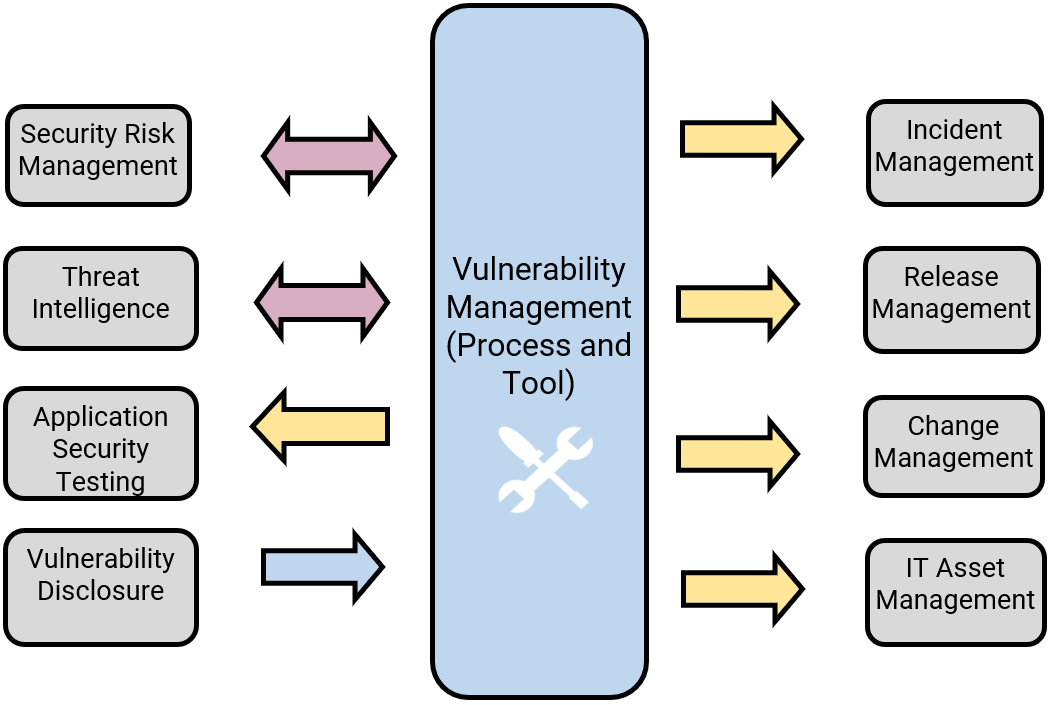 Arrows denote direction of information feed | Vulnerability management serves as the input into a number of processes for remediation, including:
A two-way data flow exists between vulnerability management and:
|
For additional information please refer to Info-Tech’s research for each area:
|
|
Info-Tech’s Information Security Program Framework
Vulnerability management is a component of the Infrastructure Security section of Security Management
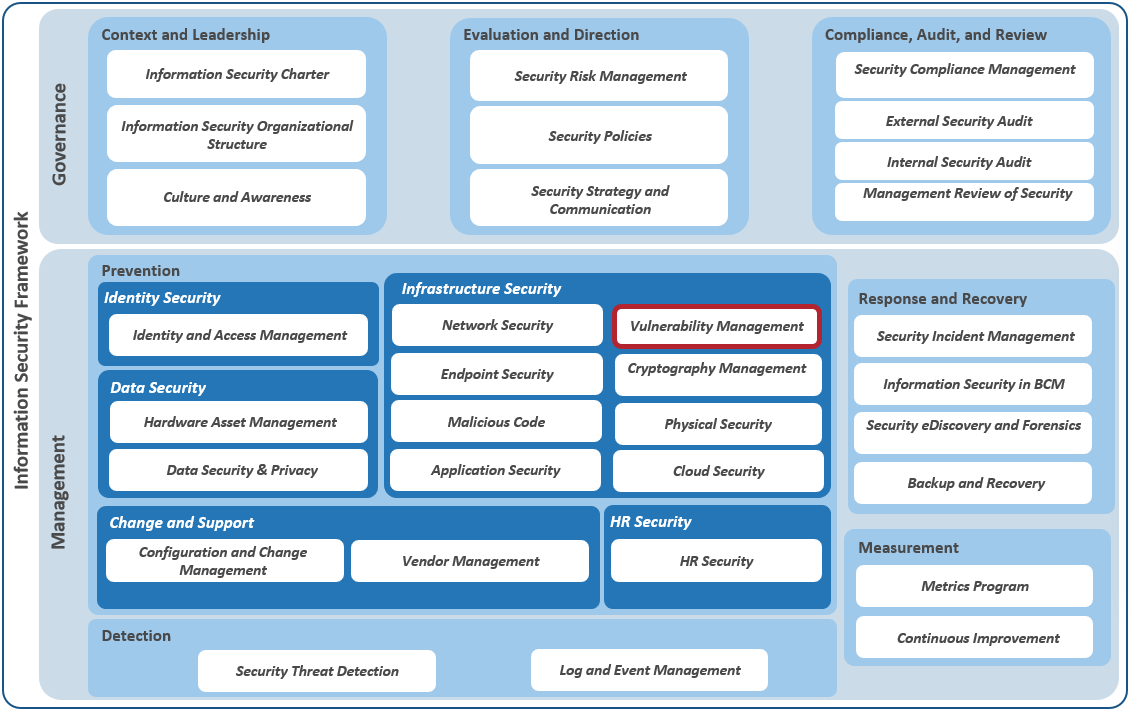 | For more information, review our Build an Information Security Strategy blueprint, or speak to one of our analysts.Info-Tech InsightVulnerability management is but one piece of the information security puzzle. Ensure that you have all the pieces! |
Case Study | INDUSTRY: Manufacturing |
One organization is seeing immediate benefits by formalizing its vulnerability management program.
| Challenge Cimpress was dealing with many challenges in regards to vulnerability management. Vulnerability scanning tools were used, but the reports that were generated often gave multiple vulnerabilities that were seen as critical or high and required many resources to help address them. Scanning was done primarily in an attempt to adhere to PCI compliance rather than to effectively enable security. After re-running some scans, Cimpress saw that some vulnerabilities had existed for an extended time period but were deemed acceptable. | Solution The Director of Information Security realized that there was a need to greatly improve this current process. Guidelines and policies were formalized that communicated when scans should occur and what the expectations for remediations should be. Cimpress also built a tiered approach to prioritize vulnerabilities for remediation that is specific to Cimpress instead of relying on scanning tool reports. | Results Cimpress found better management of the vulnerabilities within its system. There was no pushback to the adoption of the policies, and across the worldwide offices, business units have been proactively trying to understand if there are vulnerabilities. Vulnerability management has been expanded to vendors and is taken into consideration when doing any mergers and acquisitions. Cimpress continues to expand its program for vulnerability management to include application development and vulnerabilities within any existing legacy systems. |
Step 1.2
Defining the scope and roles
Activities
- 1.2.1 Define the scope and boundary of your organization’s security program
- 1.2.2 Assign responsibility for vulnerability identification and remediation
This step will walk you through the following activities:
Define and understand the scope and boundary of the security program. For example, does it include OT? Define roles and responsibilities for vulnerability identification and remediation
This step involves the following participants:
- Security operations team
- IT Security Manager
- IT Director
- CISO
Outcomes of this step
Understand how far vulnerability management extends and what role each person in IT plays in the remediation of vulnerabilities
Identify vulnerability sources| Step 1.1 | Step 1.2 | Step 1.3 | Step 1.4 |
Determine the scope of your security program
This will help you adjust the depth and breadth of your vulnerability management program.
|  |
1.2.1 Define the scope and boundary of your organization’s security program
60 minutesInput: List of Data Scope, Physical Scope, Organization Scope, and IT Scope
Output: Defined scope and boundaries of the IT security program
Materials: Whiteboard/Flip Charts, Sticky Notes, Markers, Vulnerability Management SOP Template
Participants: Business stakeholders, IT leaders, Security team members
- On a whiteboard, write the headers: Data Scope, Physical Scope, Organizational Scope, and IT Scope.
- Give each group member a handful of sticky notes. Ask them to write down as many items as possible for the organization that could fall under one of the four scope buckets.
- In a group, discuss the sticky notes and the rationale for including them. Discuss your security-related locations, data, people, and technologies, and define their scope and boundaries.
The goal is to identify what your vulnerability management program is responsible for and document it.
Consider the following:
How is data being categorized and classified? How are business units engaged with security initiatives? How are IT systems connected to each other? How are physical locations functioning in terms of information security management?
Download the Vulnerability Management SOP Template
Assets are part of the scope definition
An inventory of IT assets is necessary if there is to be effective vulnerability management.
| If you need assistance building your asset inventory, review Info-Tech’s Implement Hardware Asset Management and Implement Software Asset Management blueprints.Info-Tech InsightCreate a formal IT asset inventory before continuing with the rest of this project. Otherwise, you risk being at the mercy of a weak vulnerability management program. |
Assign responsibility for vulnerability identification and remediation
Determine who is critical to effectively detecting and managing vulnerabilities.
|  |
1.2.2 Assign responsibility for vulnerability identification and remediation
60 minutesInput: Sample list of vulnerabilities and requisite actions from each group, High-level organizational chart with area functions
Output: Defined set of roles and responsibilities for member groups
Materials: Vulnerability Management SOP Template
Participants: CIO, CISO, IT Management representatives for each area of IT
- Display the table of responsibilities that need to be assigned.
- List all the positions within the IT security team.
- Map these to the positions that require IT security team members.
- List all positions that are part of the IT team.
- Map these to the positions that require IT team members.
If your organization does not have a dedicated IT security team, you can perform this exercise by mapping the relevant IT staff to the different positions shown on the right.
| Download the Vulnerability Management SOP Template | 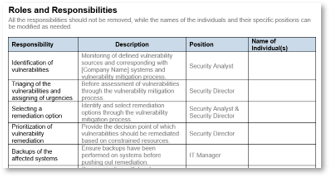 |
Step 1.3
Cloud considerations for vulnerability management
Activities
None for this section.
This step will walk you through the following activities:
Review cloud considerations for vulnerability management
This step involves the following participants:
- Security operations team
- IT Security Manager
- IT Director
- CISO
Outcomes of this step
Understand the various types of cloud offerings and the implications (and limitations) of vulnerability management in a cloud environment.
Identify vulnerability sources| Step 1.1 | Step 1.2 | Step 1.3 | Step 1.4 |
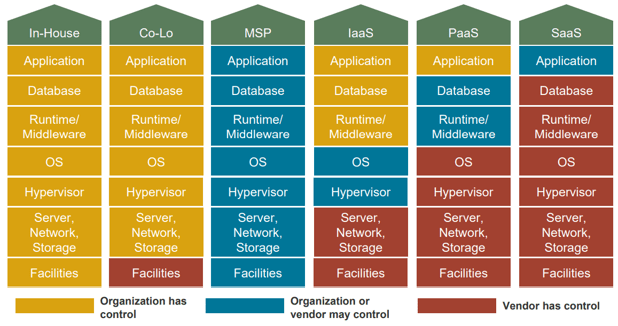
Cloud considerations
Cloud will change your approach to vulnerability management.
|  For more information, see Info-Tech Research Group’s Document Your Cloud Strategy blueprint. |
Cloud environment scanning
Cloud scanning is becoming a more common necessity but still requires special consideration.
An organization’s cloud environment is just an extension of its own environment. As such, cloud environments need to be scanned for vulnerabilities.
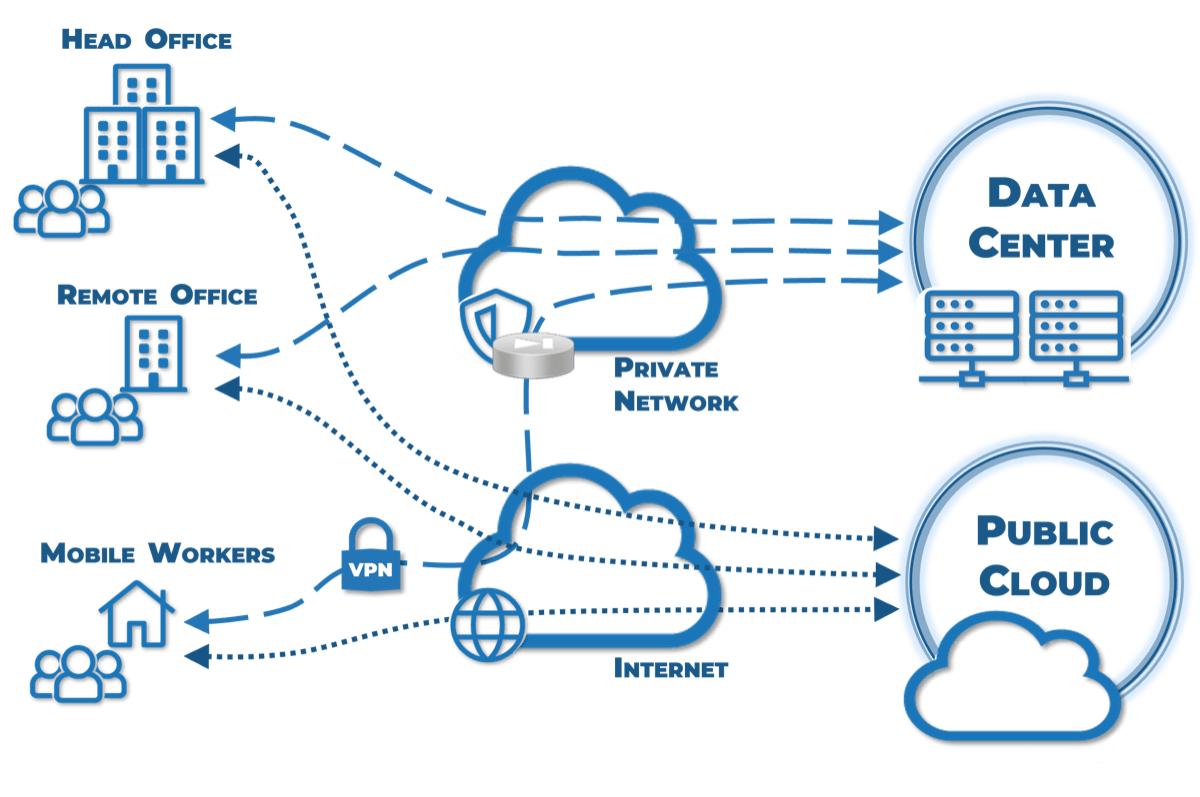
| Private Cloud | |
| If your organization owns a private cloud, these environments can be tested normally. | |
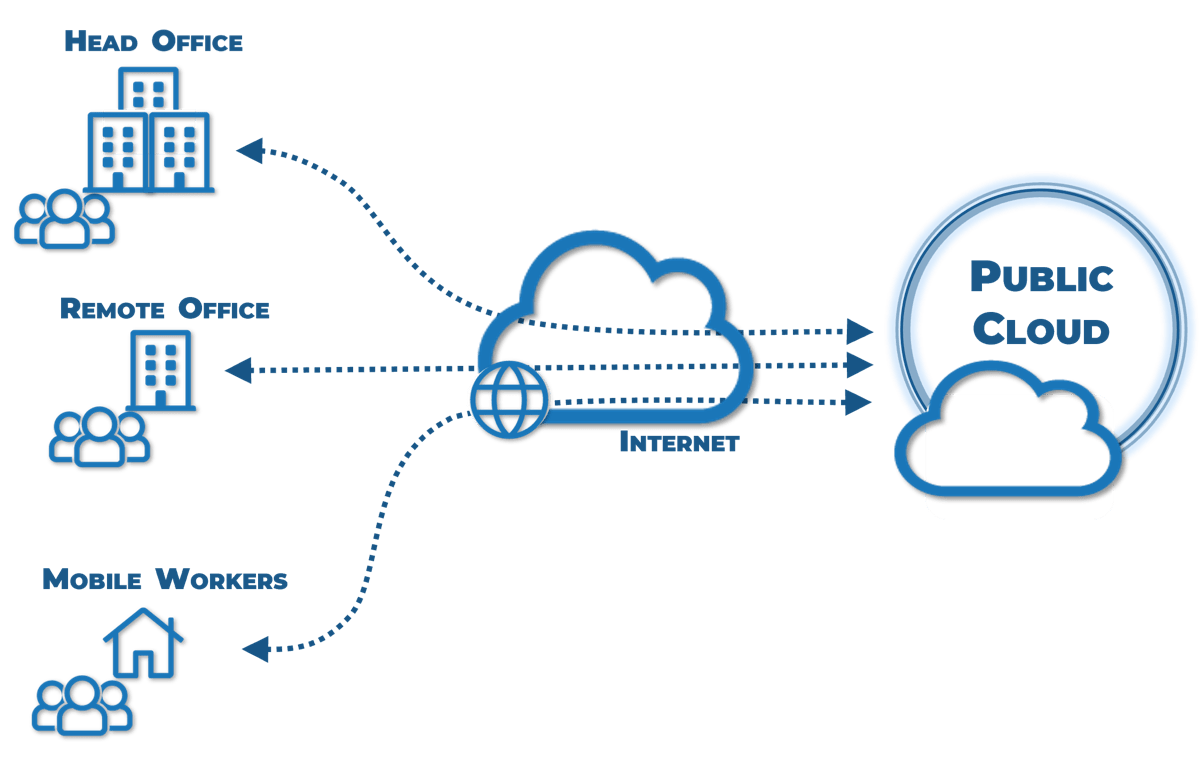
| Public Cloud | |
| Performing vulnerability testing against public, third-party cloud environments is an area experiencing rapid growth and general acceptance, although customer visibility will still be limited. In many cases, a customer must rely on the vendor’s assurance that vulnerabilities are being addressed in a sufficient manner. Security standards’ compliance requirements are driving the need for cloud suppliers to validate and assure that they are appropriately scanning for and remediating vulnerabilities. | Infrastructure- or Platform-as-a-Service (IaaS or PaaS) Environments
Certain testing (e.g. DoS or load testing) will be very limited by your cloud vendor. Cloud vendors won’t open themselves to testing that would possibly impact their operations. |
Step 1.4
Vulnerability detection
Activities
- 1.4.1 Develop a monitoring and review process of third-party vulnerability sources
- 1.4.2 Incident management and vulnerability management
This step will walk you through the following activities:
Create an inventory of your vulnerability monitoring capability and third-party vulnerability information sources.
Determine how incident management and vulnerability management interoperate.
This step involves the following participants:
- Security operations team
- IT Security Manager
- IT Director
- CISO
Outcomes of this step
Catalog of vulnerability information data sources. Understanding of the intersection of incident management and vulnerability management.
Identify vulnerability sources| Step 1.1 | Step 1.2 | Step 1.3 | Step 1.4 |
Vulnerability detection
Vulnerabilities can be identified through numerous mediums.
Info-Tech has determined the following to be the four most common ways to identify vulnerabilities.
Vulnerability Assessment and Scanning Tools
| Penetration Tests
|
Open Source Monitoring
| Security Incidents
|
Automate with a vulnerability scanning tool
Vulnerabilities are too numerous for manual scanning and detection.
| Automation requires oversight.
For guidance on tool selectionRefer to section 4.3 Selecting and Implement a Scanning Tool in this blueprint. |
Vulnerability scanning tool considerations
Select a vulnerability scanning tool with the features you need to be effective.
|  For guidance on tool vendorsVisit SoftwareReviews for information on vulnerability management tools and vendors. |
Vulnerability scanning tool best practices
How often should scans be performed?
One-off scans provide snapshots in time. Repeated scans over time provide tracking for how systems are changing and how well patches are being applied and software is being updated.
The results of a scan (asset inventory, configuration data, and vulnerability data) are basic information needed to understand your security posture. This data needs to be as up to date as possible.
ANALYST PERSPECTIVE: Organizations should look for continuous scanning
Continuous scanning is the concept of providing continual scanning of your systems so any asset, configuration, or vulnerability information is up to date. Most vendors will advertise continuous scanning but you need to be skeptical of how this feature is met.
Continuous Scanning Methods
| Continuous agent scanning Real-time scanning that is completed through agent-based scanning. Provides real-time understanding of system changes. | On-demand scanning Cyclical scanning is the method where once you’re done scanning an area, you start it again. This is usually done because doing some scans on some areas of your network take time. How long the scan takes depends on the scan itself. How often you perform a scan depends on how long a scan takes. For example, if a scan takes a day, you perform a daily scan. | Cloud-based scanning Cloud-scanning-as-a-Service can provide hands-free continuous monitoring of your systems. This is usually priced as a subscription model. |
Vulnerability scanning tool best practices
Where to perform a scan.
| What should be scanned | How to point a scanner |
The general idea is that you want to scan pretty much everything. Here are considerations for three environments:Mobile DevicesYou need to scan mobile devices for vulnerabilities, but the problem is these can be hard to scan and often come and go on your network. There are always going to be some devices that aren’t on the network when scanning occurs. Several ways to scan mobile devices:
Virtualization
Cloud Environments
|
|
Vulnerability scanning tool best practices
Communication and measurementPre-Scan Communication With Users
- It is always important to inform owners and users of systems that a scan will be happening.
- Although it is unlikely any performance issues will arise, it is important to notify end users of potential impact.
- Local admins or system owners may have controls in place that stop vulnerability scans and you need to inform the owners so that they can safelist the scanner you will be using.
Vulnerability Scanning Tool Tracking Metrics
- Vulnerability score by operating system, application, or organization division.
- This provides a look at the widely accepted severity of the vulnerability as it relates across the organization’s systems.
- Most vulnerable applications and application version.
- This provides insight into how outdated applications are creating risk exposure for an organization.
- This will also provide metrics on the effectiveness of your patching program.
- Number of assets scanned within the last number of days.
- This provides visibility into how often your assets are being scanned and thus protected.
- Number of unowned devices or unapproved applications.
- This metric will track how many unowned devices or unapproved applications may be on your network. Unowned devices may be rogue devices or just consultant/contractor devices.
Third-party vulnerability information sources
IT security forums and mailing lists are another source of vulnerability information.
Proactively identify new vulnerabilities as they are announced.
By monitoring for vulnerabilities as they are announced through industry alerts and open-source mechanisms, it is possible to identify vulnerabilities beyond your scanning tool’s penetration tests.
Common sources:
|  |
Third-party vulnerability information sources
IT security forums and mailing lists are another source of vulnerability information.
Third-party sources for vulnerabilities
- Open Source Vulnerability Database (OSVDB)
- An open-source database that is run independently of any vendors.
- Common Vulnerabilities and Exposures (CVE)
- Free, international dictionary of publicly known information security vulnerabilities and exposures.
- National Vulnerability Database (NVD)
- Through NIST, the NVD is the US government’s repository of vulnerabilities and includes product names, flaws, and any impact metrics.
- The National Checklist Repository Program (NCRP), also provided by NIST, provides security checklists for configurations of operating systems and applications.
- The Center for Internet Security, a separate entity unrelated to NIST, provides configuration benchmarks that are often referenced by the NCRP.
- Open Web Application Security Project (OWASP)
- OWASP is another free project helping to expose vulnerabilities within software.
- US-CERT National Cyber Alert System (US-CERT Alerts)
- Cybersecurity Alerts – Provide timely information about current security issues, vulnerabilities, and exploits.
- Cybersecurity Tips – Provide advice about common security issues for the general public.
- Cybersecurity Bulletins – Provide weekly summaries of new vulnerabilities. Patch information is provided when available.
- US-CERT Vulnerability Notes Database (US-CERT Vulnerability Notes)
- Database of searchable security vulnerabilities that were deemed not critical enough to be covered under US-CERT Alerts. Note that the NVD covers both US-CERT Alerts and US-CERT Notes.
- Open Vulnerability Assessment Language (OVAL)
- Coding language for security professionals to discuss vulnerability checking and configuration issues. Vulnerabilities are identified using tests that are disseminated in OVAL definitions (XML executables that can be used by end users).
1.4.1 Develop a monitoring and review process for third-party vulnerability sources
60 minutesInput: Third-party resources list
Output: Process for review of third-party vulnerability sources
Materials: Whiteboard, Whiteboard markers, Vulnerability Management SOP Template
Participants: IT Security Manager, SecOps team members, ITOps team members, CISO
- Identify what third-party resources are useful and relevant.
- Shortlist your third-party sources.
- Identify what is the best way to receive information from a third party.
- Document the method to receive or check information from the third-party source.
- Identify who is responsible for maintaining third-party vulnerability information sources
- Capture this information in the Vulnerability Management SOP Template.
| Download the Vulnerability Management SOP Template | 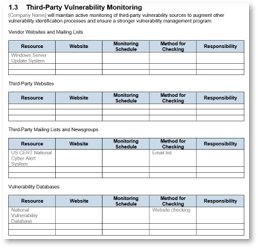 |
Incidents and vulnerability management
Incidents can also be a sources of vulnerabilities.
When any incident occurs, for example:
- A security incident, such as malware detected on a machine
- An IT incident, such as an application becomes unresponsive
- A crisis occurs, like a worker accident
There can be underlying vulnerabilities that need to be processed.
Three Types of IT Incidents exist:
Note: You need to have developed your various incident response plans to develop information feeds to the vulnerability mitigation process. | Info-Tech Related Resources: | |
| If you do not have a formalized information security incident management program, take a look at Info-Tech’s blueprint Develop and Implement a Security Incident Management Program. If you do not have a formalized problem management process, take a look at Info-Tech’s blueprint Incident and Problem Management. | If you do not have a formalized IT incident management process, take a look at Info-Tech’s blueprint Develop and Implement a Security Incident Management Program. If you do not have formalized crisis management, take a look at Info-Tech’s blueprint Implement Crisis Management Best Practices. | |
1.4.2 Incident management and vulnerability management
60 minutesInput: Existing incident response processes, Existing crisis communications plans
Output: Alignment of vulnerability management program with existing incident management processes
Materials: Whiteboard, Whiteboard markers, Vulnerability Management SOP Template
Participants: IT Security Manager, SecOps team members, ITOps team members, including tiers 1, 2, and 3, CISO, CIO
- Inventory what incident response plans the organization has. These include:
- Information Security Incident Response Plan
- IT Incident Plan
- Problem Management Plan
- Crisis Management Plan
- Identify what part of those plans contains the post-response recap or final analysis.
- Formalize a communication process between the incident response plan and the vulnerability mitigation process.
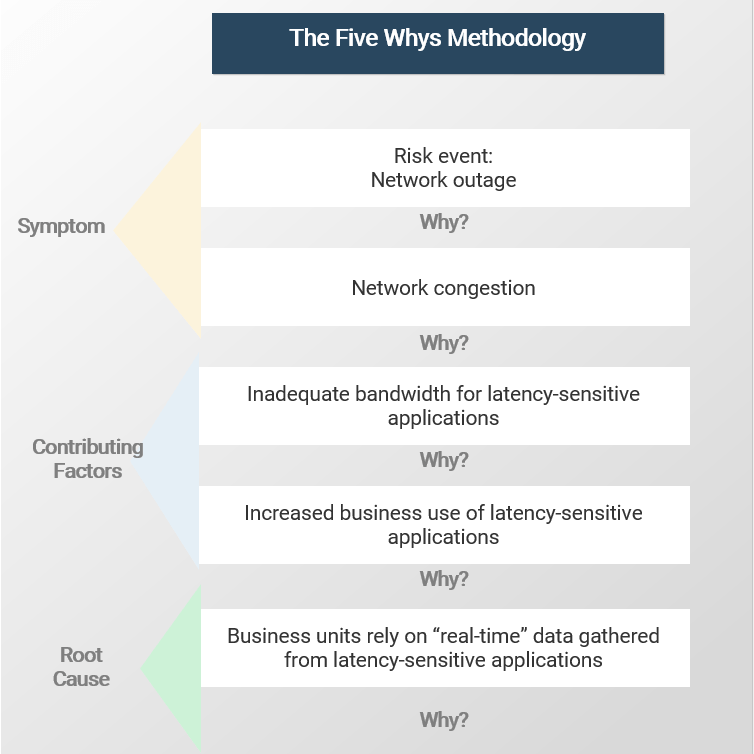
Note: Most incident processes will cover some sort of root cause analysis and investigation of the incident. If a vulnerability of any kind is detected within this analysis it needs to be reported on and treated as a detected vulnerability, thus warranting the full vulnerability mitigation process.
Download the Vulnerability Management SOP Template
Implement Risk-Based Vulnerability Management
Phase 2
Triage & prioritize
Phase 11.1 What is vulnerability management? | Phase 22.1 Triage vulnerabilities | ||
Phase 33.1 Assessing remediation options | Phase 44.1 Metrics, KPIs & CSFs |
This phase will walk you through the following activities:
Examine the elements that you will use to triage and analyze vulnerabilities, prioritizing using a risk-based approach, and prepare for remediation options.
This phase involves the following participants:
- IT Security Manager
- SecOps team members
- ITOps team members, including tiers 1, 2, and 3
- CISO
- CIO
Step 2.1
Triage vulnerabilities
Activities
- 2.1.1 Evaluate your identified vulnerabilities
This step will walk you through the following activities:
Review your vulnerability information sources and determine a methodology that will be used to consistently evaluate vulnerabilities as your scanning tool alerts you to them.
This step involves the following participants:
- IT Security Manager
- SecOps team members
- ITOps team members, including tiers 1, 2, and 3
- CISO
- CIO
Outcomes of this step
A consistent, documented process for the evaluation of vulnerabilities in your environment.
Triage & prioritize| Step 2.1 | Step 2.2 | Step 2.3 | Step 2.4 |
Triaging vulnerabilities
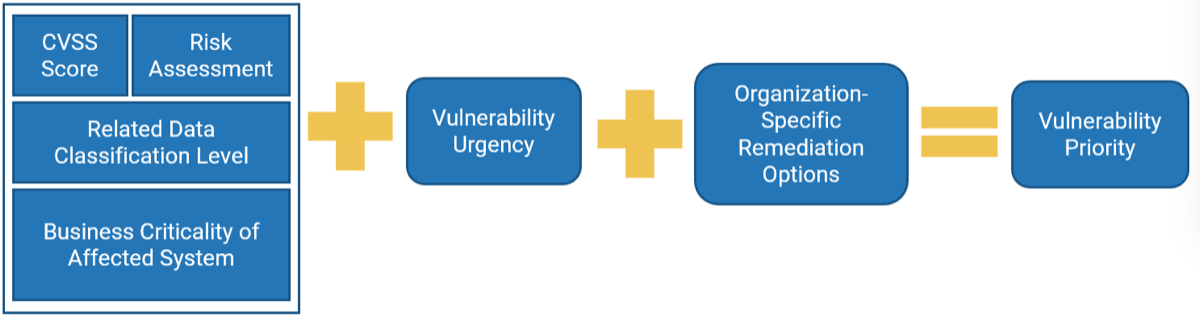
Use Info-Tech’s methodology to allocate urgencies to your vulnerabilities to assign the appropriate resources to each one.
When evaluating numerous vulnerabilities, use the following three factors to help determine the urgency of vulnerabilities:
- The intrinsic qualities of the vulnerability
- The business criticality of the affected asset
- The sensitivity of the data stored on the affected asset
Intrinsic qualities of the vulnerability — Vulnerabilities need to be examined for the inherent risk they pose specifically to the organization, which includes if an exploit has been identified or if the industry views this as a serious and likely threat.
Business criticality of the affected asset — Assets with vulnerabilities need to be assessed for their criticality to the business. Vulnerabilities on systems that are critical to business operations or customer interactions are usually top of mind.
Sensitivity of the data of the affected asset — Beyond just the criticality of the business, there must be consideration of the sensitivity of the data that may be compromised or modified as a result of any vulnerabilities.
Info-Tech Insight
This methodology allows you to determine urgency of vulnerabilities, but your remediation approach needs to be risk-based, within the context of your organization.
Triage your vulnerabilities, filter out the noise
| Triaging enables your vulnerability management program to focus on what it should focus on. Use the Info-Tech Vulnerability Mitigation Process Template to define how to triage vulnerabilities as they first appear. Triaging is an important step in vulnerability management, whether you are facing ten to tens of thousands of vulnerability notifications.
| The Info-Tech methodology for initial triaging of vulnerabilities: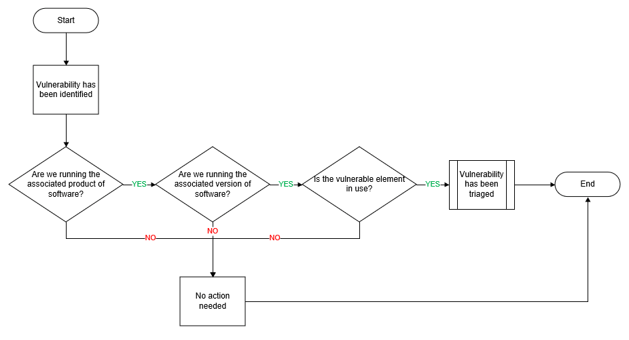 Even if neither of these use cases apply to your organization, triaging still addresses the issues of false positives. Triaging provides a quick way to determine if vulnerabilities are relevant. |
After eliminating the noise, evaluate your vulnerabilities to determine urgency
Consider the intrinsic risk to the organization.
Is there an associated, verified exploit?- For a vulnerability to become a true threat to the organization, it must be exploited to cause damage. In today’s threat landscape, exploit kits are sold online that allow individuals with low technical knowledge to exploit a vulnerability.
- Not all vulnerabilities have an associated exploit, but this does not mean that these vulnerabilities can be left alone. In many cases, it is just a matter of time before an exploit is created.
- Another point to consider is that while exploits can exist theoretically, they may not be verified. Vulnerabilities always pose some level of risk, but if there are no known verified exploits, there is less risk attached.
- Common Vulnerability Scoring System (CVSS) is an open-source industry scoring method to assess the potential severity of vulnerabilities.
- CVSS takes into account: attack vector, complexity, privileges required, user interaction, scope, confidentiality impact, integrity impact, and availability impact.
- Vulnerabilities that have a score of 4.0 or lower are classified as low vulnerabilities, while scores between 4.0 and 6.9 are put in the medium category. Scores of 7 or higher are in the high and critical categories. As we will review in the Risk Assessment section, you will want to immediately deal with high and critical vulnerabilities.
- Even though a vulnerability may appear to be part of an inconsequential asset, it is important to consider whether it can be leveraged to gain access to other areas of the network or system by an attacker.
- Another consideration should be whether the vulnerability can be exploited by remote or local access. Remote exploits pose a greater risk as this can mean that attackers can perform an exploit from any location. Local exploits carry less risk, although the risk of insider threats should be considered here as well.
2.1.1 Evaluate your identified vulnerabilities
60 minutesInput: Visio workflow of Info-Tech’s vulnerability management process
Output: Adjusted workflow to reflect your current processes, Vulnerability Tracking Tool
Materials: Whiteboard, Whiteboard markers, Vulnerability Management SOP Template
Participants: IT Security Manager, SecOps team members, ITOps team members, including tiers 1, 2, and 3, CISO, CIO
Using the criteria from the previous slide, Info-Tech has created a methodology to evaluate your vulnerabilities by examining their intrinsic qualities.
The methodology categorizes the vulnerabilities into high, medium, and low risk importance categorizations, before assigning final urgency scores in the later steps.
- Review the evaluation process in the Vulnerability Management Workflow library.
- Determine if this process makes sense for the organization; otherwise, change the flow to include any other considerations of process flows.
- As this process is used to evaluate vulnerabilities, document vulnerabilities to an importance category. This can be done in the Vulnerability Tracking Tool or using a similar internal vulnerability tracking document, if one exists.
Download the Vulnerability Management SOP Template
Step 2.2
Determine high-level business criticality
Activities
- 2.2.1 Determine high-level business criticality
- 2.2.2 Determine your high-level data classifications
This step will walk you through the following activities:
Determining high-level business criticality and data classifications will help ensure that IT security is aligned with what is critical to the business. This will be very important when decisions are made around vulnerability risk and the urgency of remediation action.
This step involves the following participants:
- IT Security Manager
- SecOps team members
- CISO
Outcomes of this step
Understanding and consistency in how business criticality and business data is assessed by IT in the vulnerability management process.
Triage & prioritize| Step 2.1 | Step 2.2 | Step 2.3 | Step 2.4 |
Understanding business criticality is key to determining vulnerability urgency
Prioritize operations that are truly critical to the operation of the business, and understand how they would be impacted by an exploited vulnerability.
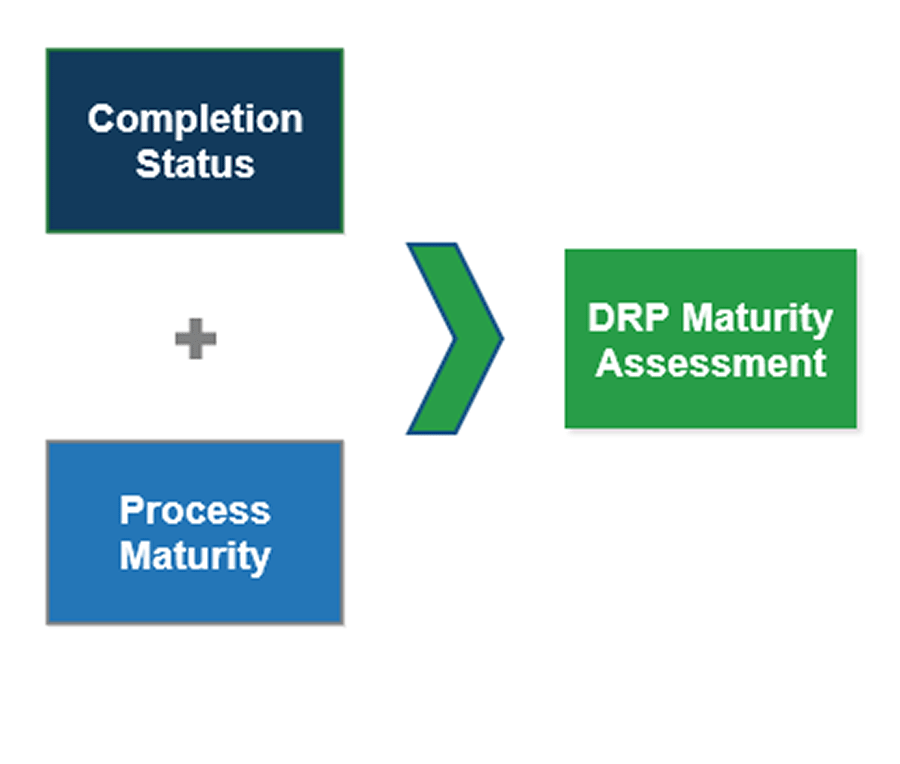
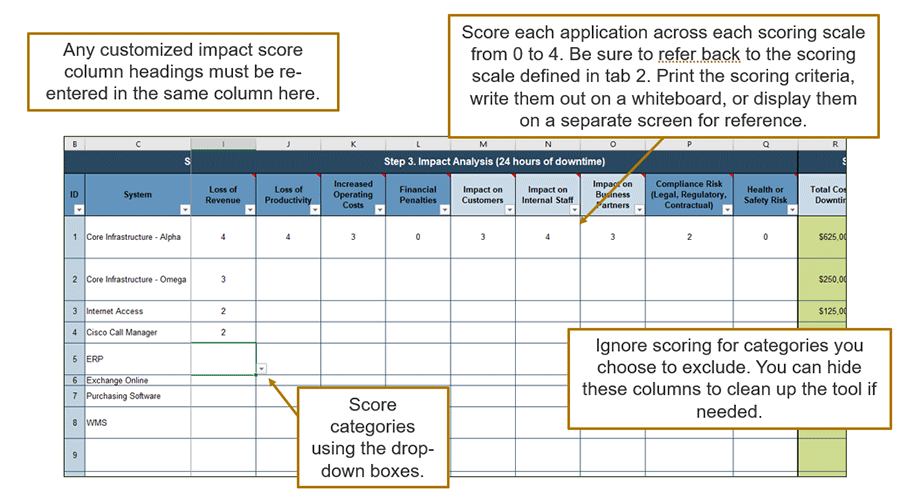
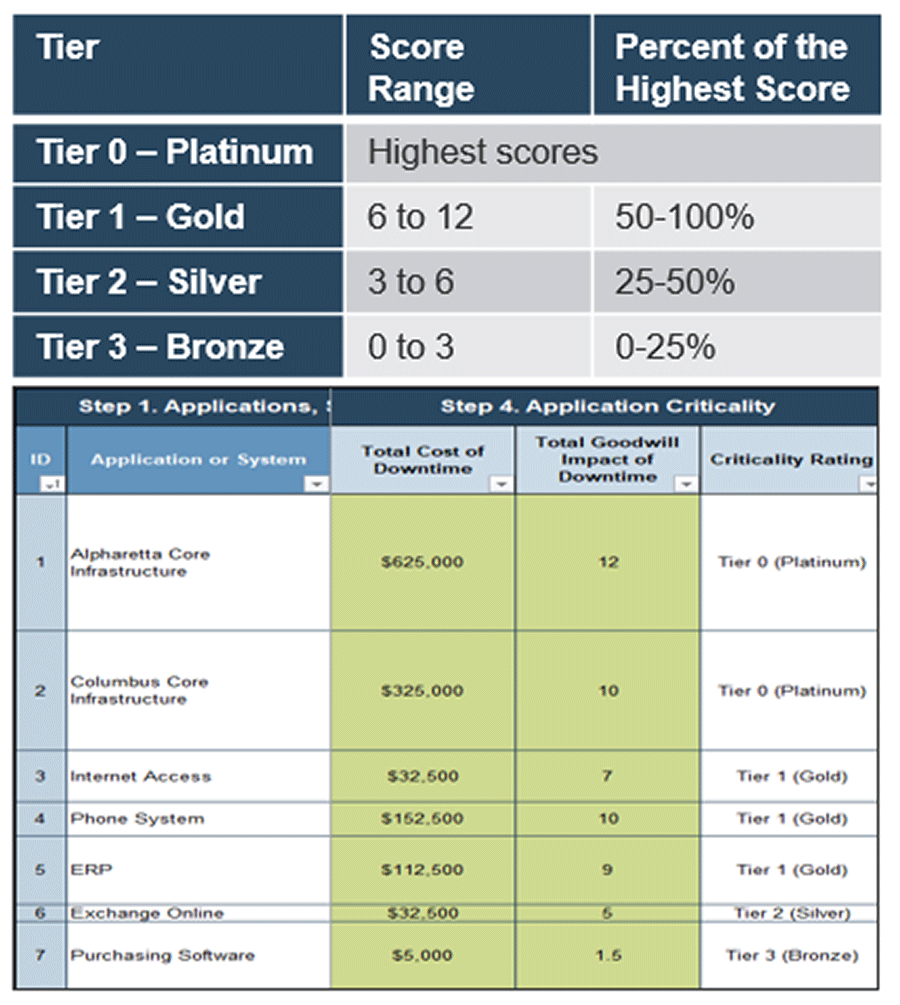
| Use the questions below to help assess which operations are critical for the business to continue functioning. For example, email is often thought of as a business-critical operation when this is not always the case. It is important to the business, but as regular operations can continue for some time without it, it would not be considered extremely business critical.
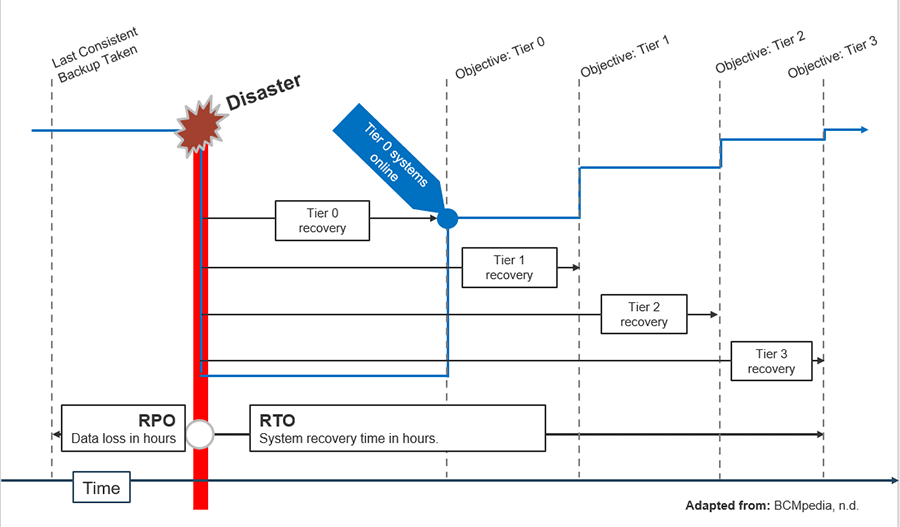
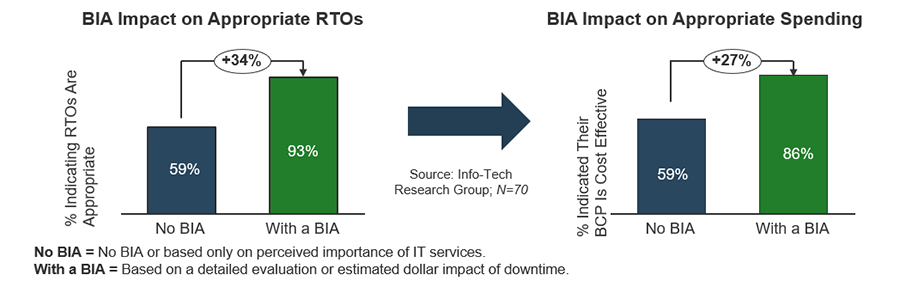
| Don’t start from scratch – your disaster recovery plan (DRP) may have a business impact analysis (BIA) that can provide insight into which applications and operations are considered business critical.Analyst PerspectiveWhen assessing the criticality of business operations, most core business applications may be deemed business critical over the long term. Consider instead what the impact is over the first 24 or 48 hours of downtime. |
2.2.1 Determine high-level business criticality
120 minutes; less time if a Disaster recovery plan business impact analysis existsInput: List of business operations, Insight into business operations impacts to the business
Output: List of business operations and their criticality and impact to the business
Materials: Vulnerability Management SOP Template
Participants: Participants from the business, IT Security Manager, CISO, CIO
- List your core business operations at a high level.
- Use a High, Medium, or Low ranking to prioritize the business operations based on mission-critical criteria and the impact of the vulnerability.
- When using the process flow, consider if the vulnerability directly affects any of these business operations and move through the process flow based on the corresponding High, Medium, or Low ranking.
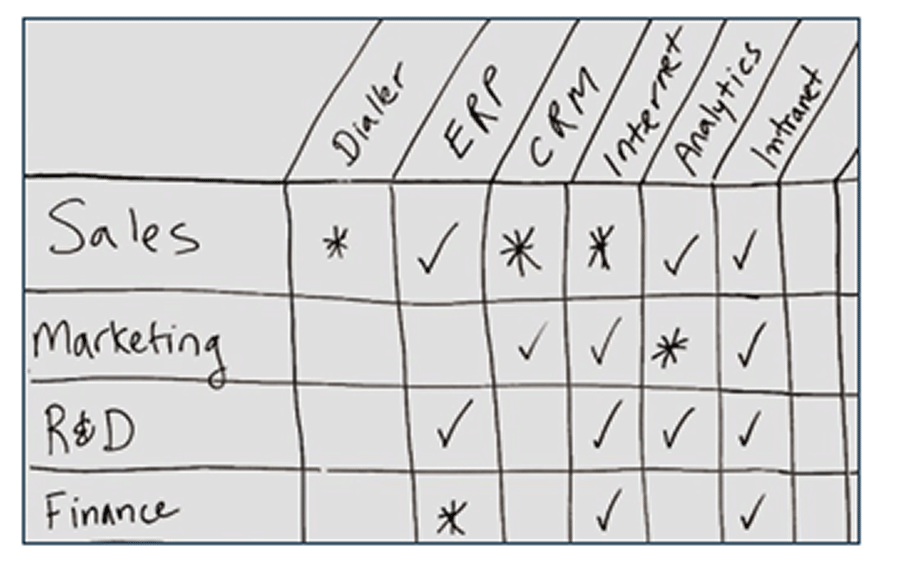
| Example prioritization of business operations for a manufacturing company: | 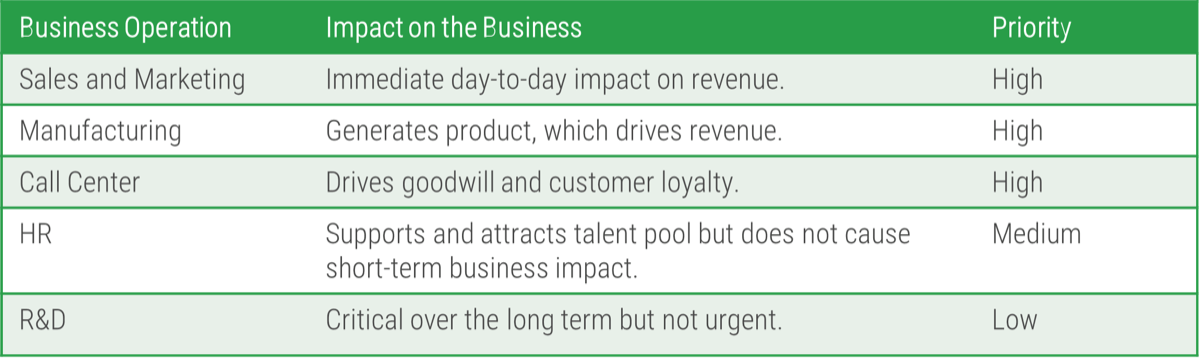 | Questions to ask:
|
Download the Vulnerability Management SOP Template
Determine vulnerability urgency by its data classification
Consider how to classify your data based on if the Confidentiality, Integrity, or Availability (CIA) is compromised.
To properly classify your data, consider how the confidentiality, integrity, and availability of that data would be affected if it were to be exploited by a vulnerability. Review the table below for an explanation for each objective.
If you wish to build a whole data classification methodology, refer to our Discover and Classify Your Data blueprint. | How to determine data classification when CIA differs: The overall ranking of the data will be impacted by the highest objective’s ranking. For example, if confidentiality and availability are low, but integrity is high, the overall impact is high. This process was developed in part by Federal Information Processing Standards Publication 199. |
2.2.2 Determine your high-level data classifications
120 minutes, less time if data classification already existsInput: Knowledge of data use and sensitivity
Output: Adjusted workflow to reflect your current processes, Vulnerability Tracking Tool
Materials: Whiteboard, Whiteboard markers, Vulnerability Management SOP Template
Participants: IT Security Manager, CISO, CIO
If your organization has formal data classification in place, it should be leveraged to determine the high, medium, and low rankings necessary for the process flows. However, if there is no formal data classification in place, the process below can be followed:
- List common assets or applications that are prone to vulnerabilities.
- Consider the data that is on these devices and provide a high (severe or catastrophic adverse effect), medium (serious adverse effect), or low (limited adverse effect) ranking based on confidentiality, availability, and integrity.
- Use the table on the previous slide to assist in providing the ranking.
- Remember that it is the highest ranking that dictates the overall ranking of the data.
- Document which data belongs in each of the categories to provide contextual evidence.
Download the Vulnerability Management SOP Template
This process should be part of your larger data classification program. If you need assistance in building this out, review the Info-Tech research, Discover and Classify Your Data.
Step 2.3
Consider current security posture
Activities
- 2.3.1 Document your defense-in-depth controls
This step will walk you through the following activities:
Your defense-in-depth controls are the existing layers of security technology that protects your environment. These are relevant when considering the urgency and risk of vulnerabilities in your environment, as they will mitigate some of the risk.
This step involves the following participants:
- IT Security Manager
- SecOps team members
- ITOps team members, including tiers 1, 2, and 3
- CISO
- CIO
Outcomes of this step
Understanding and documentation of your current defense-in-depth controls.
Triage & prioritize| Step 2.1 | Step 2.2 | Step 2.3 | Step 2.4 |
Review your current security posture
What you have today matters.
|  |
Enterprise architecture considerations
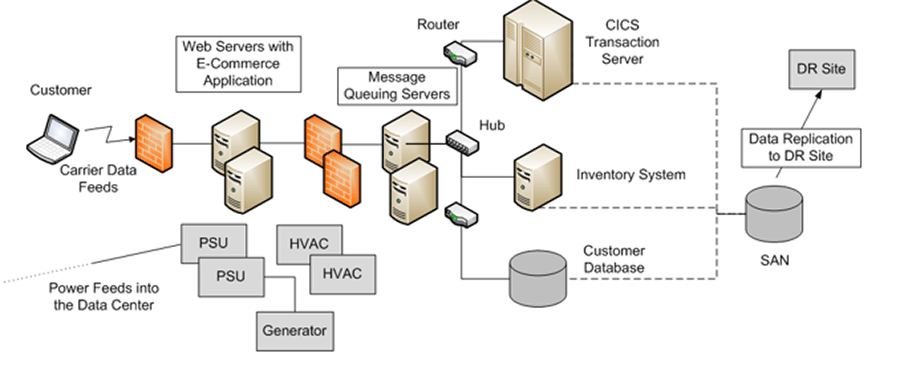
What does your network look like?
| What’s the relevance to vulnerability management? For a vulnerability to be exploited, a malicious actor must find a way to access the vulnerable system to make use of the vulnerability in question. Any enterprise architecture characteristics that you have in place may lessen the probability of a successful vulnerability exploit. This may potentially “buy time” for SecOps to address and remediate the vulnerability. |
Defense-in-depth
Defense-in-depth provides extra layers of protection to the organization.
Note: Defense-in-depth controls do not entirely mitigate vulnerability risk. They provide a way in which the vulnerability cannot be exploited, but it continues to exist on the application. This must be kept in mind as the controls or applications themselves change, as it can re-open the vulnerability and cause potential problems. | Examples of defense-in-depth controls can consist of any of the following:
|
2.3.1 Document your defense-in-depth controls
2 hours, less time if a security services catalog existsInput: List of technologies within your environment, List of IT security controls that are in place
Output: List of defense-in-depth controls
Materials: Whiteboard/flip charts, Vulnerability Management SOP Template
Participants: IT Security Manager, Infrastructure Manager, IT Director, CISO
- Document the existing defense-in-depth controls within your system.
- Review the initial list that has been provided and see if these are controls that currently exist.
- Indicate any other controls that are being used by the organization. This may already exist if you have a security services catalog.
- Indicate who the owners of the different controls are.
- Track the information in the Vulnerability Management SOP Template.
Download the Vulnerability Management SOP Template | 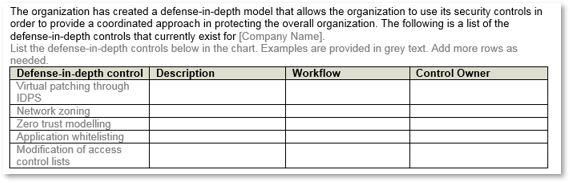 |
Step 2.4
Risk assessment of vulnerabilities
Activities
- 2.4.1 Build a classification scheme to consistently assess impact
- 2.4.2 Build a classification scheme to consistently assess likelihood
This step will walk you through the following activities:
Assessing risk will be the cornerstone of how you evaluate vulnerabilities and what priority you place on remediation. This is actual risk to the organization and not simply what the tool reports without the context of your defense-in-depth controls.
This step involves the following participants:
- IT Security Manager
- IT Operations Management
- CISO
- CIO
Outcomes of this step
A risk matrix tailored to your organization, based on impact and likelihood. This will provide a consistent, unambiguous way to assess risk across the vulnerability types that is reported by your scanning tool.
Triage & prioritize| Step 2.1 | Step 2.2 | Step 2.3 | Step 2.4 |
Vulnerabilities and risk
Vulnerabilities must be addressed to mitigate risk to the business.
|  Info-Tech InsightRisk to the organization is business language that everyone can understand. This is particularly true when the risk is to productivity or to the company’s bottom line. |
A risk-based approach to vulnerability management
CVSS scores are just the starting point!
Vulnerabilities are constant.
|
Info-Tech InsightVulnerability scanning is a valuable function, but it does not tell the full picture. You must determine how urgent a vulnerability truly is, based on your specific environment. |

Prioritize remediation by levels of risk
Address critical and high risk with high immediacy.
| Mitigate the risk surface by reducing the time across the phases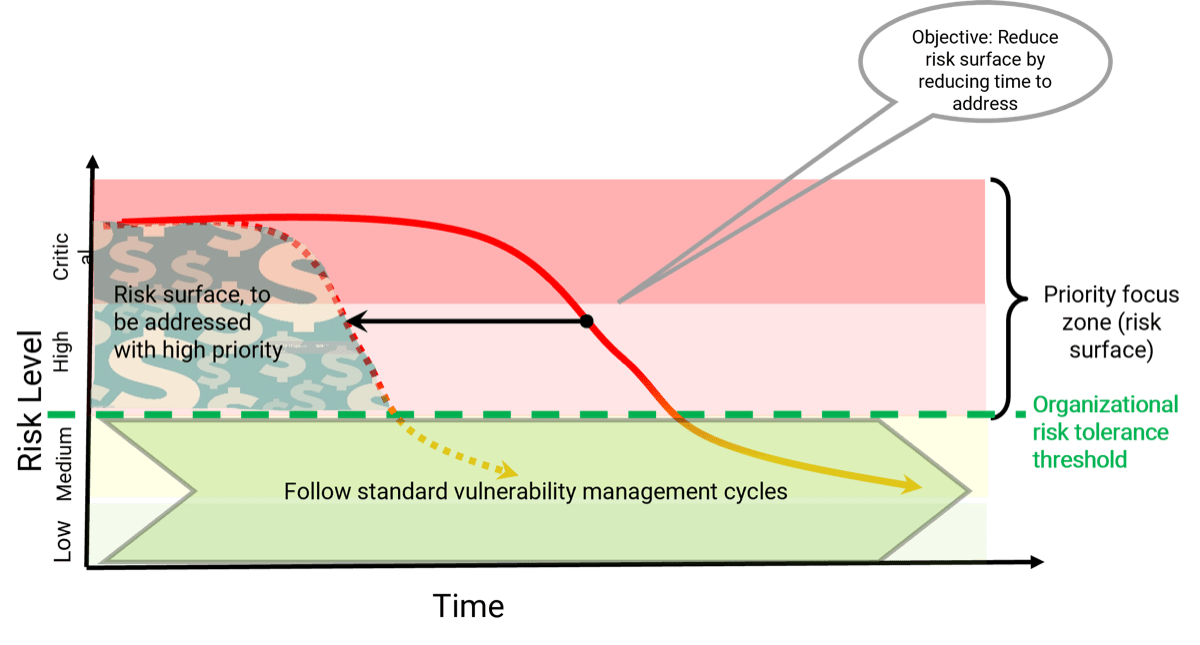 |
Risk matrix
Risk = Impact x Likelihood
Info-Tech InsightRisk determination should be done within the context of your current environment and not simply based on what your vulnerability tool is reporting. | A risk matrix is useful in calculating a risk rating for vulnerabilities. 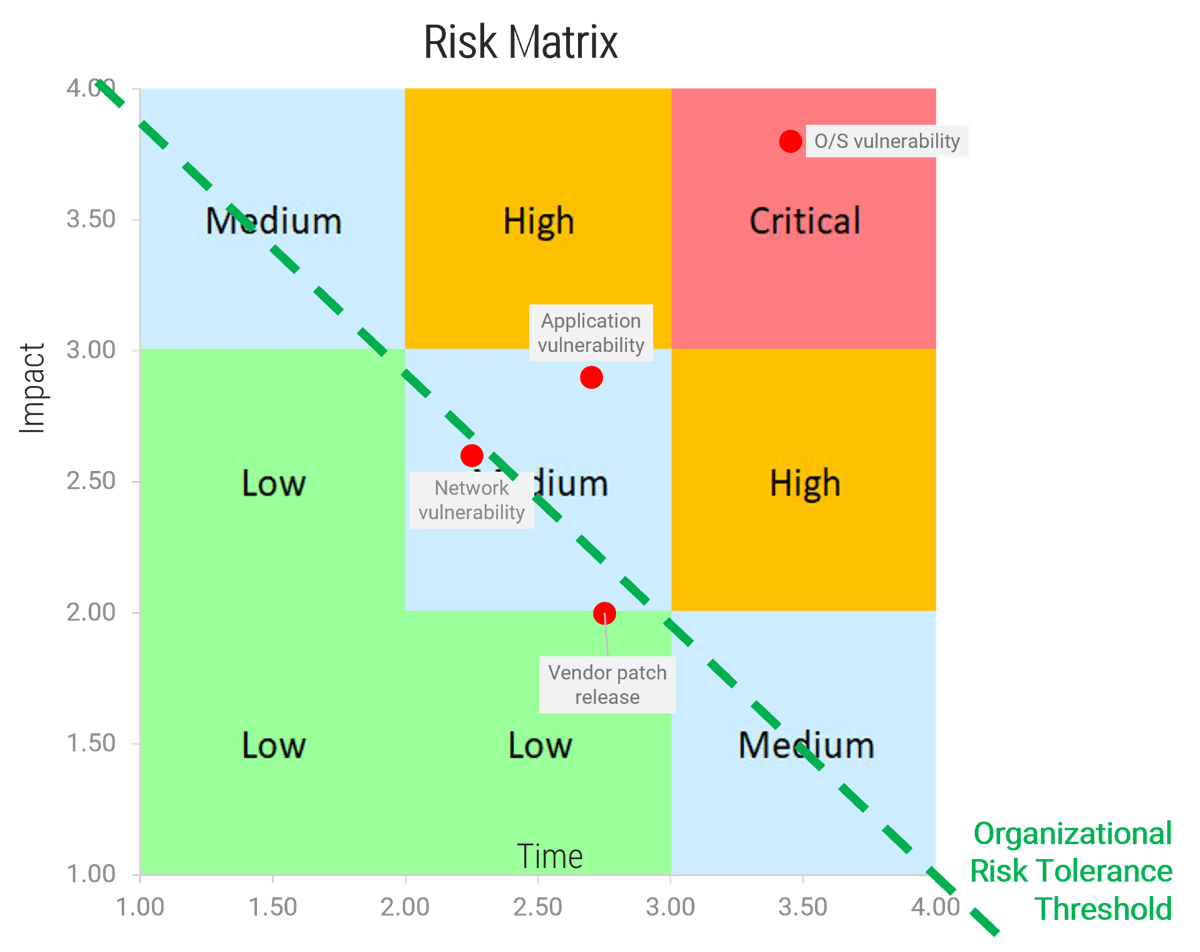 |
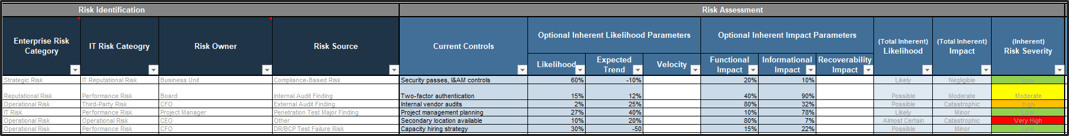
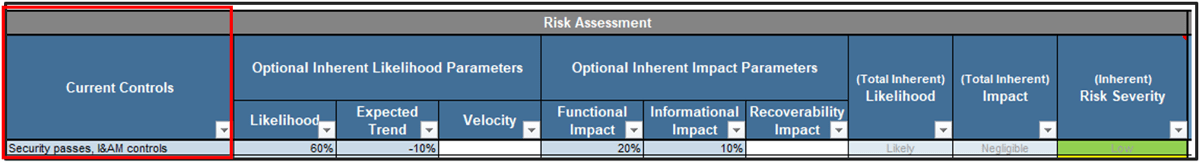
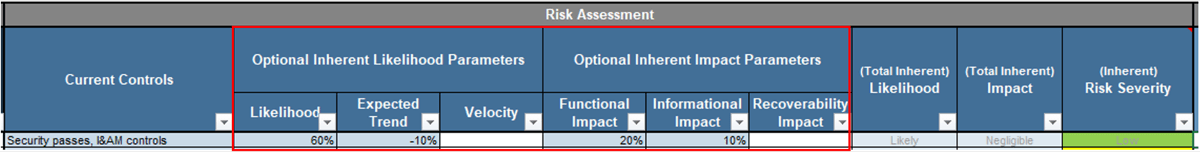
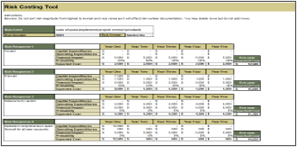
2.4.1 Build a classification scheme to consistently assess impact
60 minutesInput: Knowledge of IT environment, Knowledge of business impact for each IT component or service
Output: Vulnerability Management Risk Assessment Tool formatted to your organization
Materials: Vulnerability Management Risk Assessment Tool
Participants: Functional Area Managers, IT Security Manager, CISO
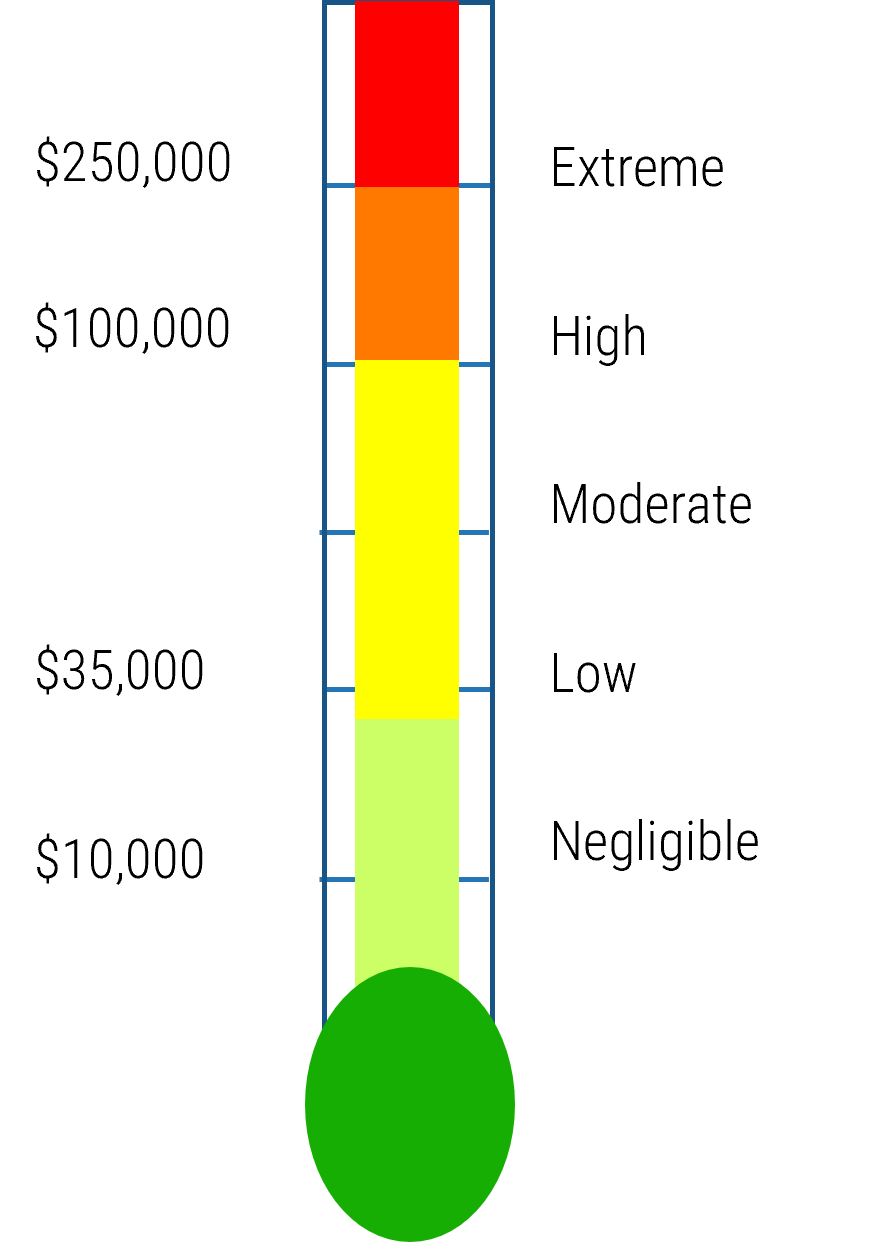
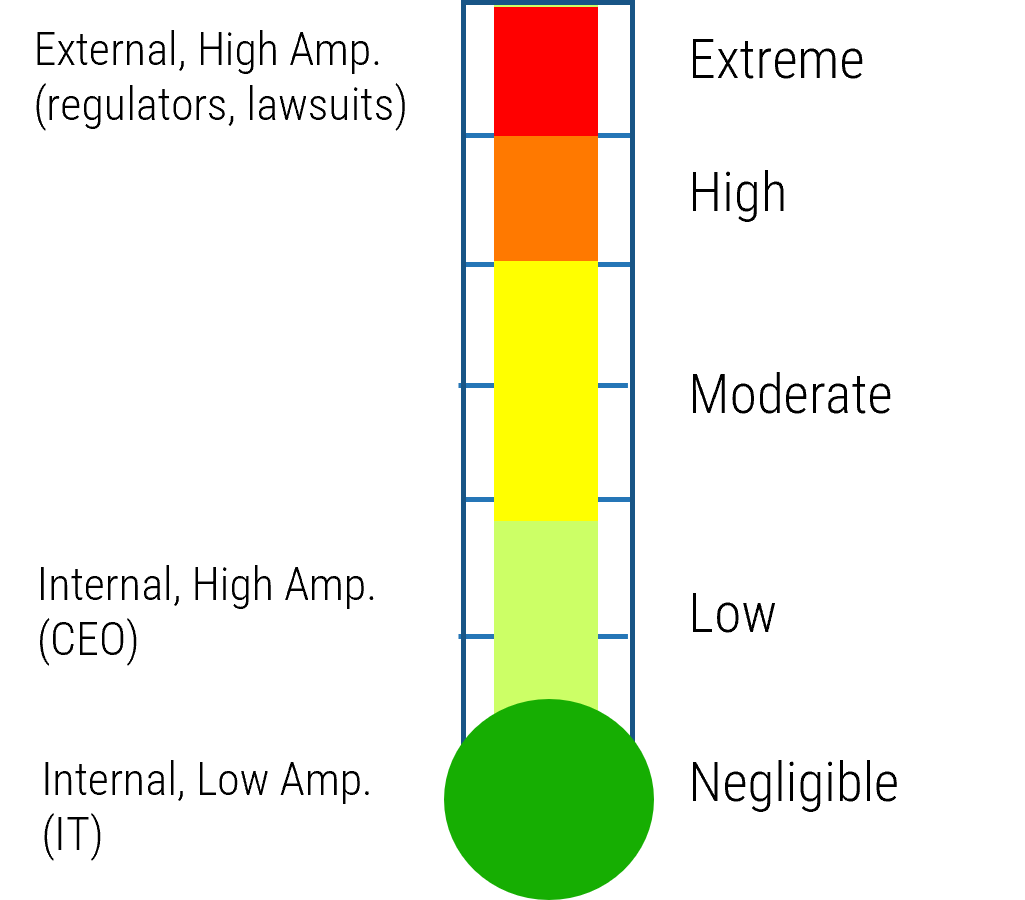
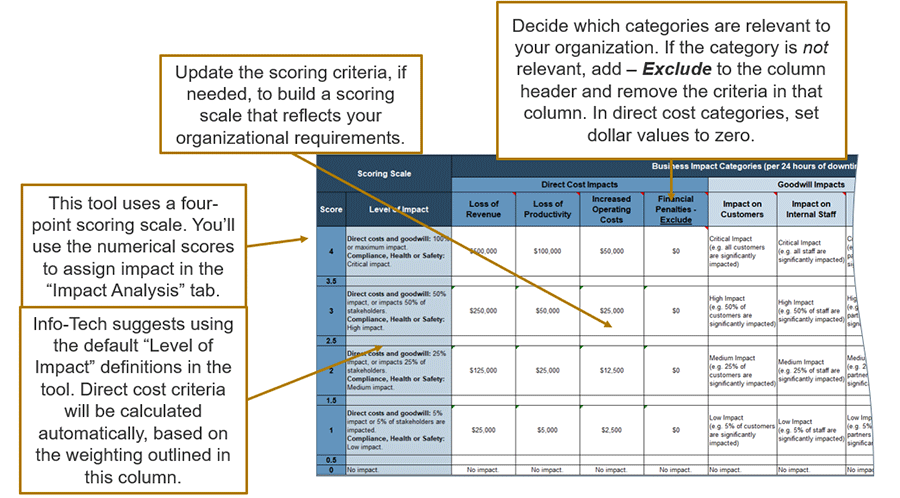
Risk always has a negative impact, but the size of the impact can vary considerably in terms of cost, number of people or sites affected, and the severity of the impact. Impact questions tend to be more objective and quantifiable than likelihood questions.
- Define a set of questions to measure risk impact or edit existing questions in the tool.
- For each question, assign a weight that should be placed on that factor.
- Define criteria for each question that would categorize the risk. The drop-down box content can be modified in the hidden Labels tab.
Note that you are looking to baseline vulnerability types, rather than categorizing every single vulnerability your scanning tool reports. The volume of vulnerabilities will be high, but vulnerabilities can be categorized into types on a regular basis.
Download the Vulnerability Management Risk Assessment Tool | 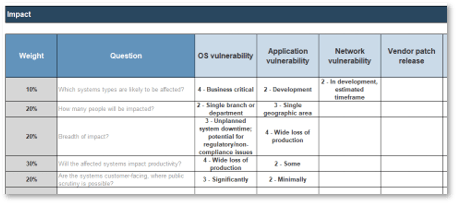 |
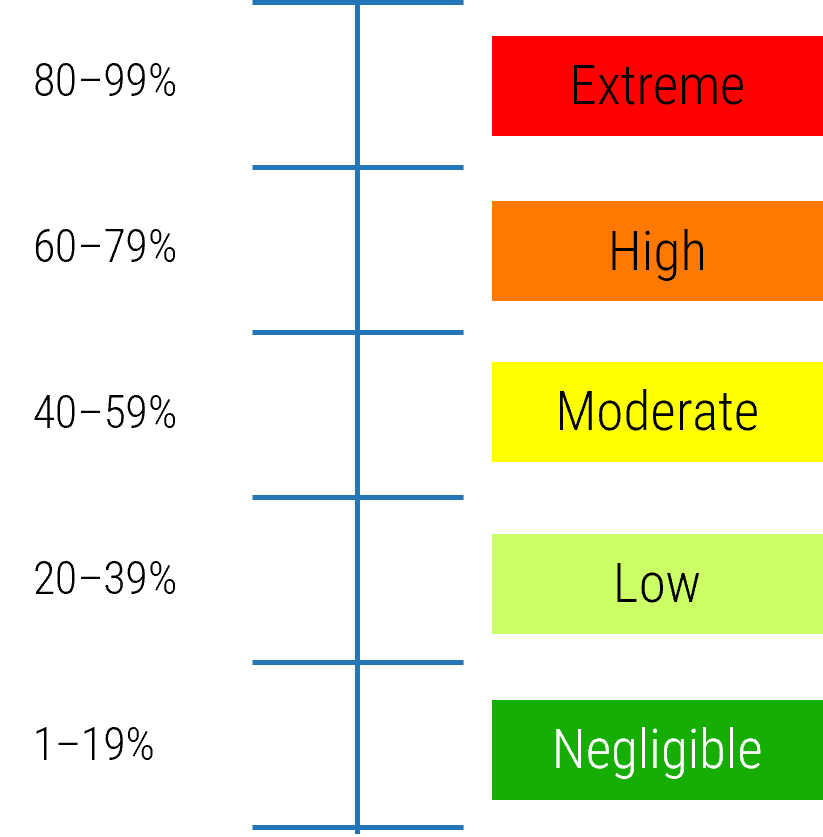
2.4.2 Build a classification scheme to consistently assess likelihood
60 minutesInput: Knowledge of IT environment, Knowledge of business impact for each IT component or service
Output: Vulnerability Management Risk Assessment Tool formatted to your organization
Materials: Vulnerability Management Risk Assessment Tool
Participants: Functional Area Managers, IT Security Manager, CISO
Risk always has a negative impact, but the size of the impact can vary considerably in terms of cost, number of people or sites affected, and the severity of the impact. Impact questions tend to be more objective and quantifiable than likelihood questions.
- Define a set of questions to measure risk impact or edit existing questions in the tool.
- For each question, assign a weight that should be placed on that factor.
- Define criteria for each question that would categorize the risk. The drop-down box content can be modified in the hidden Labels tab.
Note that you are looking to baseline vulnerability types, rather than categorizing every single vulnerability that your scanning tool reports. The volume of vulnerabilities will be high, but vulnerabilities can be categorized into types on a regular basis.
Download the Vulnerability Management Risk Assessment Tool | 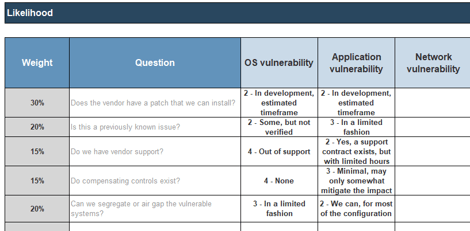 |
Prioritize based on risk
| Select the best remediation option to minimize risk. Through the combination of the identified risk and remediation steps in this phase, the prioritization for vulnerabilities will become clear. Vulnerabilities will be assigned a priority once their intrinsic qualities and threat potential to business function and data have been identified.
| Prioritization
Remediation plays an incredibly important role in the entire program. It plays a large part in wider risk management when you must consider the risk of the vulnerability, the risk of the remediation option, and the risk associated with the overall process. |
Implement Risk-Based Vulnerability Management
Phase 3
Remediate vulnerabilities
Phase 11.1 What is vulnerability management? | Phase 22.1 Triage vulnerabilities | ||
Phase 33.1 Assessing remediation options | Phase 44.1 Metrics, KPIs & CSFs |
This phase will walk you through the following activities:
- Identifying potential remediation options.
- Developing criteria for each option with regards to when to use and when to avoid.
- Establishing exception procedure for testing and remediation.
- Documenting the implementation of remediations and verification.
This phase involves the following participants:
- CISO, or equivalent
- Security Manager/Analyst
- Network, Administrator, System, Database Manager
- Other members of the vulnerability management team
- Risk managers for the risk-related steps
Determining how to remediate
Patching is only one option.
This phase will allow organizations to build out the specific processes for remediating vulnerabilities. The overall process will be the same but what will be critical is the identification of the correct material. This includes building the processes around:
Each remediation option carries a different level of risk that the organization needs to consider and accept by building out this program. | It is necessary to be prepared to do this in real time. Careful documentation is needed when dealing with vulnerabilities. Use the Vulnerability Tracking Tool to assist with documentation in real time. This is separate from using the process template but can assist in the documentation of vulnerabilities. |
Step 3.1
Assessing remediation options
Activities
- 3.1.1 Develop risk and remediation action
This step will walk you through the following activities:
With the risk assessment from the previous activity, we can now examine remediation options and make a decision. This activity will guide us through that.
This step involves the following participants:
- IT Security Manager
- SecOps team members
- ITOps team members, including tiers 1, 2, and 3
- CISO
- CIO
Outcomes of this step
List of remediation options and criteria on when to consider each.
Remediate vulnerabilities| Step 3.1 | Step 3.2 | Step 3.3 |
Identify remediation options
There are four options when it comes to vulnerability remediation.
| Patches and Updates Patches are software or pieces of code that are meant to close vulnerabilities or provide fixes to any bugs within existing software. These are typically provided by the vendor to ensure that any deployed software is properly protected after vulnerabilities have been detected. | Configuration Changes Configuration changes involve administrators making significant changes to the system or network to remediate against the vulnerability. This can include disabling the vulnerable application or specific element and can even extend to removing the application altogether. |
Remediation | |
| Compensating Controls By leveraging security controls, such as your IDS/IPS, firewalls, or access control, organizations can have an added layer of protection against vulnerabilities beyond the typical patches and configuration changes. This can be used as a measure while waiting to implement another option (if one exists) to reduce the risk of the vulnerability in the short or long term. | Risk Acceptance Whenever a vulnerability is not remediated, either indefinitely or for a short period of time, the organization is accepting the associated risk. Segregation of the vulnerable system can occur in this instance. This can occur in cases where a system or application cannot be updated without detrimental effect to the business. |
Patches and updates
Patches are often the easiest and most common method of remediation.
Patches are usually the most desirable remediation solution when it comes to vulnerability management. They are typically provided by the vendor of the vulnerable application or system and are meant to eliminate the existing vulnerability.When to use
| When to avoid
|
When to consider other remediation options
| |
Compensating controls
Compensating controls can decrease the risk of vulnerabilities that cannot be (immediately) remediated.
| Examples of compensating controls
|
Configuration changes
Configuration changes involve making changes directly to the application or system in which there is a vulnerability. This can vary from disabling or removing the vulnerable element or, in the case of applications built in-house, changing the coding of the application itself. These are commonly used in network vulnerabilities such as open ports.When to use
| When to avoid
|
When to consider other remediation options
| Info-Tech InsightRemember your existing processes: configuration changes may need to be approved and orchestrated through your organization’s configuration and change management processes. |
Case StudyRemediation options do not have to be used separately. Use the Shellshock 2014 case as an example. | INDUSTRY: All |
| Challenge Bashdoor, more commonly known as Shellshock, was announced on September 24, 2014. This bug involved the Bash shell, which normally executes user commands, but this vulnerability meant that malicious attackers could exploit it. This was rated a 10/10 by CVSS – the highest possible score. Within hours of the announcement, hackers began to exploit this vulnerability across many organizations. | Solution Organizations had to react quickly and multiple remediation options were identified:
| Results Companies began to protect themselves against these vulnerabilities. While many organizations installed patches as quickly as possible, some also wished to test the patch and leveraged defense-in-depth controls in the interim. However, even today, many still have the Shellshock vulnerability and exploits continue to occur. |
Accept the risk and do nothing
By choosing not to remediate vulnerabilities, you must accept the associated risk. This should be your very last option.
Every time that a vulnerability is not remediated, it continues to pose a risk to the organization. While it may seem that every vulnerability needs to be remediated, this is simply not possible due to limited resources. Further, it can take away resources from other security initiatives as opposed to low-priority vulnerabilities that are extremely unlikely to be exploited.
Common criteria for vulnerabilities that are not remediated:
Risk acceptance is not uncommon…
| Enterprise risk managementWhile these are common criteria, they must be aligned to the enterprise risk management framework and approved by management.Don’t forget the variables that were assessed in Phase 2. This includes the risk from potential lateral movement or if there is an existing exploit. |
Risk considerations
When determining if risk acceptance is appropriate, consider the cost of not mitigating vulnerabilities.
Don’t accept the risk because it seems easy. Consider the financial impact of leaving vulnerabilities open.
With risk acceptance, it is important to review the financial impact of a security incident resulting from that vulnerability. There is always the possibility of exploitation for vulnerabilities. A simple metric taken from NIST SP800-40 to use for this is:Cost not to mitigate = W * T * RWhere (W) is the number of work stations, (T) is the time spent fixing systems or lost in productivity, and (R) is the hourly rate of the time spent. | |
| As an example provided by NIST SP800-40 Version 2.0, Creating a Patch and Vulnerability Management Program: “For an organization where there are 1,000 computers to be fixed, each taking an average of 8 hours of down time (4 hours for one worker to rebuild a system, plus 4 hours the computer owner is without a computer to do work) at a rate of $70/hour for wages and benefits: 1,000 computers * 8 hours * $70/hour = $560,000” | Info-Tech InsightAlways consider the financial impact that can occur from an exploited vulnerability that was not remediated. |
3.1.1 Develop risk and remediation action
90 minutesInput: List of remediation options
Output: List of remediation options sorted into “when to use” and “when to avoid” lists
Materials: Whiteboard/flip charts, Vulnerability Management SOP Template
Participants: IT Security Manager, IT Infrastructure Manager, IT Operations Manager, Corporate Risk Officer, CISO
It is important to define and document your organization-specific criteria for when a remediation option is appropriate and inappropriate.
- List each remediation option on a flip chart and create two headings: “When to use” and “When to avoid.”
- Each person will list “when to use” criteria on a green sticky note and “when to avoid” criteria on a red one for each option; these will be placed on the appropriate flip chart.
- Discuss as a group which criteria are appropriate and which should be removed.
- Move on to the next remediation option when completed.
- Ensure to include when there are remediation options that will be connected. For example, the risk may be accepted until the next available change window, or a defense-in-depth control is used before a patch can be fully installed.
- Once the criteria has been established, document this in the Vulnerability Management SOP Template.
When to use:
| When to avoid:
|
Download the Vulnerability Management SOP Template
Step 3.2
Scheduling and executing remediation
Activities
None for this section.
This step will walk you through the following activities:
Although there are no specific activities for this section, it will walk you through your existing processes configuration and change management to ensure that you are leveraging those activities in your vulnerability remediation actions.
This step involves the following participants:
- IT Security Manager
- SecOps team members
- ITOps team members, including tiers 1, 2, and 3
- CISO
- CIO
Outcomes of this step
Gained understanding of how IT operations processes configuration and change management can be leveraged for the vulnerability remediation process. Don’t reinvent the wheel!
Remediate vulnerabilities| Step 3.1 | Step 3.2 | Step 3.3 |
Implementing the remediation
Vulnerability management converges with your IT operations functions.
|  |
Release Management
Control the quality of deployments and releases of software updates.
For guidance on implementing or improving your release management process, refer to Info-Tech’s Stabilize Release and Deployment Management blueprint or speak to one of our experts. | Info-Tech InsightMany organizations don’t have a separate release team. Rather, whomever is doing the deployment will submit a change request and the testing details are vetted through the organization’s change management process. For guidance on the change management process review our Optimize Change Management blueprint. |
Change Management
Leverage change control, interruption management, approval, and scheduling.
For further guidance on implementing or improving your change management process, refer to Info-Tech’s Optimize Change Management blueprint or speak to one of our experts. | “With no controls in place, IT gets the blame for embarrassing outages. Too much control, and IT is seen as a roadblock to innovation.” (VP IT, Federal Credit Union) |
Post-implementation activities
Vulnerability remediation isn’t a “set it and forget it” activity.
| A scan with your vulnerability management software after remediation can be a way to verify that the overall risk has been reduced, if remediation was done by way of patching/updates.Info-Tech InsightAfter every change completion, whether due to vulnerability remediation or not, it is a good idea to ensure that your infrastructure team increases its monitoring diligence and that your service desk is ready for any sudden influx of end-user calls. |
Step 3.3
Continuous improvement
Activities
None for this section.
This step will walk you through the following activities:
Although this section has no activities, it will review the process by which you may continually improve vulnerability management.
This step involves the following participants:
- IT Security Manager
- SecOps team members
- ITOps team members, including tiers 1, 2, and 3
- CISO
- CIO
Outcomes of this step
An understanding of the importance of ongoing improvements to the vulnerability management program.
Remediate vulnerabilities| Step 3.1 | Step 3.2 | Step 3.3 |
Drive continuous improvement
| “The success rate for continual improvement efforts is less than 60 percent. A major – if not the biggest – factor affecting the deployment of long-term continual improvement initiatives today is the fundamental change taking place in the way companies manage and execute work.” (Industry analyst at a consulting firm, 2014) |
Continuous Improvement
Continuously re-evaluate the vulnerability management process.
As your systems and assets change, your vulnerability management program may need updates in two ways.When new assets and systems are introduced:
Effective systems and asset management are needed to track this. Review Info-Tech’s Implement Systems Management to Improve Availability and Visibility blueprint for more help. Document any changes to the vulnerability management program in the Vulnerability Management SOP Template. | When defense-in-depth capabilities are modified:
To assist in building a defense-in-depth model, review Build an Information Security Strategy. |
Implement Risk-Based Vulnerability Management
Phase 4
Measure and formalize
Phase 11.1 What is vulnerability management? | Phase 22.1 Triage vulnerabilities | ||
Phase 33.1 Assessing remediation options | Phase 44.1 Metrics, KPIs & CSFs |
This phase will walk you through the following activities:
- You will determine what ought to be measured to track the success of your vulnerability management program.
- If you lack a scanning tool this phase will help you determine tool selection.
- Lastly, penetration testing is a good next step to consider once you have your vulnerability management program well underway.
This phase involves the following participants:
- IT Security Manager
- SecOps team members
- Procurement representatives
- CISO
- CIO
Step 4.1
Metrics, Key Performance Indicators (KPIs), and Critical Success Factors (CSFs)
Activities
- 4.1.1 Measure your program with metrics, KPIs, and CSFs
This step will walk you through the following activities:
After a review of the differences between raw metrics, key performance indicators (KPI), and critical success factors (CSF), compile a list of what metrics you will be tracking, why, and the business goals for each.
This step involves the following participants:
- IT Security Manager
- SecOps team members
- CISO
- CIO
Outcomes of this step
Outline of metrics you can configure your vulnerability scanning tool to report on.
Measure and formalize| Step 4.1 | Step 4.2 | Step 4.3 | Step 4.4 |
You can’t manage what you can’t measure
Metrics provides visibility.
|  |
Metrics, KPIs, and CSFs
Tracking the right information and making the information relevant.
| The activity tracker on your wrist is a wealth of metrics, KPIs, and CSFs. If you wear an activity tracker, you are likely already familiar with the differences between metrics, key performance indicators, and critical success factors:
Your security systems can be similarly measured and tracked – transfer this skill! |
Tracking relevant information
Tell the story in the numbers.
Below are a number of suggested metrics to track, and why.Business Goal | Critical Success Factor | Key Performance Indicator | Metric to track |
| Minimize overall risk exposure | Reduction of overall risk due to vulnerabilities | Decrease in vulnerabilities | Track the number of vulnerabilities year after year. |
| Appropriate allocation of time and resources | Proper prioritization of vulnerability mitigation activities | Decrease of critical and high vulnerabilities | Track the number of high-urgency vulnerabilities. |
| Consistent timely remediation of threats to the business | Minimize risk when vulnerabilities are detected | Remediate vulnerabilities more quickly | Mean time to detect: track the average time between the identification to remediation. |
| Track effectiveness of scanning tool | Minimize the ratio, indicating that the tool sees everything | Ratio between known assets and what the scanner tracks | Scanner coverage compared to known assets in the organization. |
| Having effective tools to track and address | Accuracy of the scanning tool | Difference or ratio between reported vulnerabilities and verified ones | Number of critical or high vulnerabilities verified, between the scanning tool’s criticality rating and actual criticality. |
| Reduction of exceptions to ensure minimal exposure | Visibility into persistent vulnerabilities and risk mitigation measures | Number of exceptions granted | Number of vulnerabilities in which little or no remediation action was taken. |
4.1.1 Measure your program with metrics, KPIs, and CSFs
60 minutesInput: List of metrics current being measured by the vulnerability management tool
Output: List of relevant metrics to track, and the KPIs, CSFs, and business goals related to the metric
Materials: Whiteboard/flip charts, Vulnerability Management SOP Template
Participants: IT Security Manager, IT operations management, CISO
Metrics can offer a way to view how the organization is dealing with vulnerabilities and if there is improvement.
- Determine the high-level vulnerability management goals for the organization.
- Even with a formal process in place, the organization should be considering ways it can improve.
- Determine metrics that can help quantify those goals and how they can be measured.
- Metrics should always be easy to measure. If it’s a complex process to find the information required, it means that it is not a metric that should be used.
- Document your list of metrics in the Vulnerability Management SOP Template.
Download the Vulnerability Management SOP Template
Step 4.2
Vulnerability Management Policy
Activities
- 4.2.1 Update the vulnerability management program policy
This step will walk you through the following activities:
If you have a vulnerability management policy, this activity may help augment it. Otherwise, if you don’t have one, this would be a great starting point.
This step involves the following participants:
- IT Security Manager
- CISO
- CIO
- Human resources representative
Outcomes of this step
An inaugural policy covering vulnerability management
Measure and formalize| Step 4.1 | Step 4.2 | Step 4.3 | Step 4.4 |
Vulnerability Management Program Policy
Policies provide governance and enforcement of processes.
|  |
4.2.1 Update the vulnerability management policy
60 minutesInput: Vulnerability Management SOP, HR guidance on policy creation and approval
Output: Completed Vulnerability Management Policy
Materials: Vulnerability Management SOP, Vulnerability Management Policy Template
Participants: IT Security Manager, IT operations management, CISO, Human resources representative
After having built your entire process in this project, formalize it into a vulnerability management policy. This will set the standards and expectations for vulnerability management in the organization, while the process will be around the specific actions that need to be taken around vulnerability management.
This is separate and distinct from the Vulnerability Management SOP Template, which is a process and procedure document.
|  |
Download the Vulnerability Management Policy Template
Step 4.3
Select and implement a scanning tool
Activities
- 4.3.1 Create an RFP for vulnerability scanning tools
This step will walk you through the following activities:
If you need to select a new vulnerability scanning tool, or replace your existing one, this activity will help set up a request for proposal (RFP).
This step involves the following participants:
- IT Security Manager
- SecOps team members
- CISO
Outcomes of this step
The provisions needed for you to create and deploy an RFP for a vulnerability management tool.
Measure and formalize| Step 4.1 | Step 4.2 | Step 4.3 | Step 4.4 |
Vulnerability management and penetration testing
Similar in nature, yet provide different security functions.
| Vulnerability Scanning Tools Scanning tools focus on the network and operating systems. These tools look for items such as missing patches or open ports. They won’t detect specific application vulnerabilities. | Exploitation Tools These tools will look to exploit a detected vulnerability to validate it. | Penetration Tests A penetration test simulates the actions of an external or internal cyber attacker that aims to breach the information security of the organization. (Formal definition of penetration test) | |
| ‹————— What’s the difference again? —————› | |||
| Vulnerability scanning tools are just one type of tool. | When you add an exploitation tool to the mix, you move down the spectrum. | Penetration tests will use scanning tools, exploitation tools, and people. | |
What is the value of each?
| What’s the implication for me?Info-Tech Recommends:
| ||
Vulnerability scanning software
All organizations can benefit from having one.Scanning tools will benefit areas beyond just vulnerability management
Vulnerability Detection Use CaseMost organizations use scanners to identify and assess system vulnerabilities and prioritize efforts. Compliance Use CaseOthers will use scanners just for compliance, auditing, or larger GRC reasons. Asset Discovery Use CaseMany organizations will use scanners to perform active host and application identification. | Scanning Tool Market TrendsVulnerability scanning tools have expanded value from conventional checking for vulnerabilities to supporting configuration checking, asset discovery, inventory management, patch management, SSL certificate validation, and malware detection. Expect to see network and system vulnerability scanners develop larger vulnerability management functions and develop exploitation tool functionality. This will become a table stakes option enabling organizations to provide higher levels of validation of detected vulnerabilities. Some tools already possess these capabilities:
Device proliferation (BYOD, IoT, etc.) is increasing the need for stronger vulnerability management and scanners. This is driving the need for numerous device types and platform support and the development of baseline and configuration norms to support system management. Increased regulatory or compliance controls are also stipulating the need for vulnerability scanning, especially by a trusted third party. Organizations are outsourcing security functions or moving to cloud-based deployment options for any security technology they can. Expect to see massive growth of vulnerability scanning as a service. |
Vulnerability scanning market
There are several technology types or functional differentiators that divide the market up.Vulnerability Exploitation Tools
| Scanning Tool Market Trends
Web Application Scanning ToolsThese tools perform dynamic application security testing (DAST) and static application security testing (SAST). Application Scanning and Testing Tools
|
Vulnerability scanning tool features
Evaluate vulnerability scanning tools on specific features or functions that are the best differentiators.
|
| |||||||||||||||||||||
Common areas people mistake as tool differentiators:
For more information on vulnerability scanning tools and how they rate, review the Vulnerability Management category on SoftwareReviews. | ||||||||||||||||||||||
Vulnerability scanning deployment options
Understand the different deployment options to identify which is best for your security program.Option | Description | Pros | Cons | Use Cases |
| On-Premises | Either an on-premises appliance or an on-premises virtualized machine that performs external and internal scanning. |
|
|
|
| Cloud | Either hosted on a public cloud infrastructure or hosted by a third party and offered “as a service.” |
|
|
|
| Managed | A third party is contracted to manage and maintain your vulnerability scanner so you can dedicate resources elsewhere. |
|
|
|
Vulnerability scanning methods
Understand the different scanning methods to identify which tool best supports your needs.Method | Description | Pros | Cons | Use Cases |
| Agent-Based Scanning | Locally installed software gives the information needed to evaluate the security posture of a device. |
|
|
|
| Authenticated Active Scanning | Tool uses authenticated credentials to log in to a device or application to perform scanning. |
|
|
|
| Unauthenticated Active Scanning | Scanning of devices without any authentication. |
|
|
|
| Passive Scanning | Scanning of network traffic. |
|
|
|
IP Management and IPv6
IP management and the ability to manage IPv6 is a new area for scanning tool evaluation.Scanning on IPv4Scanning tools create databases of systems and devices with IP addresses.
| Current Problem With IP AddressesIP addresses are becoming no longer manageable or even owned by organizations. They are often provided by ISPs or other third parties. Even if it is your range, chances are you don't do static IP ranges today. Info-Tech Recommends:
|
Scanning on IPv6First, you need to know if your organization is moving to IPv6. IPv6 is not strategically routed yet for most organizations. If you are moving to IPv6, Info-Tech recommends the following:
If you are already on IPv6, Info-Tech recommends the following:
| |
4.3.1 Create an RFP for vulnerability scanning tools
2 hoursInput: List of key feature requirements for the new tool, List of intersect points with current software, Network topology and layout of servers and applications
Output: Completed RFP document that can be distributed to vendor proponents
Materials: Whiteboard/flip charts, Vulnerability Scanning Tool RFP Template
Participants: IT Security Manager, IT operations managers, CISO, Procurement department representative
Use a request for proposal (RFP) template to convey your desired scanning tool requirements to vendors and outline the proposal and procurement steps set by your organization.
- Determine what kind of requirements will be needed for your scanning tool RFP, based on people, process, and technology requirements.
- Consider items such as the desired capabilities and the scope of the scanning.
- Conduct interviews with relevant stakeholders to determine the exact requirements needed.
- Use Info-Tech’s Vulnerability Scanning Tool RFP Template. It lists many requirements but can be customized to your organization’s specific needs.
Download the Vulnerability Scanning Tool RFP Template
4.3.1 Create an RFP for vulnerability scanning tools (continued)
Things to Consider:
| Info-Tech RFP Table of Contents:
|
Download the Vulnerability Scanning Tool RFP Template
Step 4.4
Penetration testing
Activities
- 4.1.1 Create an RFP for penetration tests
This step will walk you through the following activities:
We will review penetration testing, its distinction from vulnerability management, and why you may want to engage a penetration testing service.
We provide a request for proposal (RFP) template that we can review if this is an area of interest.
This step involves the following participants:
- IT Security Manager
- SecOps team members
- CISO
- CIO
Outcomes of this step
An understanding of penetration testing, and guidance on how to get started if there is interest to do so.
Measure and formalize| Step 4.1 | Step 4.2 | Step 4.3 | Step 4.4 |
Penetration testing
Penetration tests are critical parts of any strong security program.
| Penetration testing will emulate the methods an attacker would use in the real world to circumvent your security controls and gain access to systems and data. Penetration testing is much more than just running a scanner or other automated tools and then generating a report. Penetration testing performs critical exploit validation to create certainty around your vulnerability. The primary objective of a penetration test is to identify and validate security weaknesses in an organization’s security systems. Reasons to Test:
Regulatory Considerations:
| How and where is the value being generated?Penetration testing is a service provided by trained and tested professionals with years of experience. The person behind the test is the most important part of the test. The person is able to emulate a real-life attacker better than any computer. It is just a vulnerability scan if you use tools or executables alone. “A penetration test is an audit with validation.” (Joel Shapiro, Vice President Sales, Digital Boundary Group) |
Start by considering the spectrum of penetration tests
| Network Penetration Tests Conventional testing of network defences. Testing vectors include:
| Application Penetration Tests Core business functions are now being provided through web applications, either to external customers or to internal end users. Types: Web apps, non-web apps, mobile apps Application penetration and security testing encompasses:
| Human-Centric Testing
|
Info-Tech Insight
Your pen test should use multiple methods. Demonstrating weakness in one area is good but easy to identify. When you blend techniques, you get better success at breaching and it becomes more life-like. Think about prevention, detection, and response testing to provide full insight into your security defenses.
Penetration testing types
Evaluate four variables to determine which type of penetration test is most appropriate for your organization.
Evaluate these dimensions to determine relevant penetration testing.Network, Application, or HumanEvaluate your need to perform different types of penetration testing.Some level of network and application testing is most likely appropriate. The more common decision point is to consider to what degree your organization requires human-centric penetration testing. | External or InternalExternal: Attacking an organization’s perimeter and internet-facing systems. For these, you generally provide some level of information to the tester. The test will begin with publicly available information gathering followed by some kind of network scanning or probing against externally visible servers or devices (DNS server, email server, web server, firewall, etc.) Internal: Carried out within the organization’s network. This emulates an attack originating from an internal point (disgruntled employee, authorized user, etc.). The idea is to see what could happen if the perimeter is breached. |
Transparent, Semi-Transparent, or Opaque BoxOpaque Box: The penetration tester is not provided any information. This emulates a real-life attack. Test team uses publicly available information (corporate website, DNS, USENET, etc.) to start the test. These tests are more time consuming and expensive. They often result in exploitation of the easiest vulnerability. Use cases: full assessment of security controls; testing of attacker traversal capabilities. | Aggressiveness of the TestNot Aggressive: Very slow and careful penetration testing. Usually spread out in terms of packets being sent and number of calls to individuals. It attempts to not set off any alarm bells.Aggressive: A full DoS attack or something similar. These would be DoS attacks that take down systems or full SQL injection attacks all at once versus small injections over time. Testing options cover anything including physical tests, network tests, social engineering, and data extraction and exfiltration. This is more costly and time consuming. Assessing Aggressiveness: How aggressive the test should be is based on the threats you are concerned with. Assess who you are concerned with: random individuals on the internet, state-sponsored attacks, criminals, hacktivists, etc. Who you are concerned with will determine the appropriate aggressiveness of the test. |
Penetration testing scope
Establish the scope of your penetration test before engaging vendors.
Determining the scope of what is being tested is the most important part of a penetration test. Organizations need to be as specific as possible so the vendor can actually respond or ask questions.
Organizations need to define boundaries, objectives, and key success factors.
For scope:
| Boundaries to scope before a test:
| Objectives and key success factors to scope:
|
What would be out of scope?
- Are there systems, IP addresses, or other things you want out of scope? These are things you don’t explicitly want any penetration tester to touch.
- Are there third-party connections to your environment that you don’t want to be tested? These are instances such as cloud providers, supply chain connections, and various services.
- Are there things that would be awkward to test? For example, determine if you include high-level people in a social engineering test. Do you conduct social engineering for the CEO? If you get their credentials, it could be an awkward moment.
Ways to break up a penetration test:
- Location – This is the most common way to break up a penetration test.
- Division – Self-contained business units are often done as separate tests so you can see how each unit does.
- IT systems – For example, you put certain security controls in a firewall and want to test its effectiveness.
- Applications – For example, you are launching a new website or a new portal and you want to test it.
Penetration testing appropriateness
Determine your penetration testing appropriateness.
Usual instances to conduct a penetration test:
Specific timing considerations: Testing should be completed during non-production times of day. Testing should be completed after a backup has been performed. | Assess your threats to determine your appropriate test type: Penetration testing is about what threats you are concerned about. Understand your risk profile, risk tolerance level, and specific threats to see how relevant penetration tests are.
ANALYST PERSPECTIVE: Do a test only after you take a first pass. |
4.4.1 Create an RFP for penetration tests
2 hoursInput: List of criteria and scope for the penetration test, Systems and application information if white box
Output: Completed RFP document that can be distributed to vendor proponents
Materials: Whiteboard/flip charts, Penetration Test RFP Template
Participants: IT Security Manager, IT operations managers, CISO, Procurement department representative
Use an RFP template to convey your desired penetration test requirements to vendors and outline the proposal and procurement steps set by your organization.
- Determine what kind of requirements will be needed for your penetration test RFP based on people, process, and technology requirements.
- Consider items such as your technology environment and the scope of the penetration tests.
- Conduct an interview with relevant stakeholders to determine the exact requirements needed.
- Use Info-Tech’s Penetration Test RFP Template, which lists many requirements but can be customized to your organization’s specific needs.
Download the Penetration Test RFP Template
4.4.1 Create an RFP for penetration tests (continued)
Steps of a penetration test:
| Info-Tech RFP Table of Contents:
|
Download the Penetration Test RFP Template
Penetration testing considerations – service providers
Consider what type of penetration testing service provider is best for your organization
Professional Service Providers
Professional Services Firms. These firms will often provide a myriad of professional services across auditing, financial, and consulting services. If they offer security-related consulting services, they will most likely offer some level of penetration testing.
Security Service Firms. These are dedicated security consulting or advisory firms that will offer a wide spectrum of security-related services. Penetration testing may be one aspect of larger security assessments and strategy development services.
Dedicated Penetration Testing Firms. These are service providers that will often offer the full gamut of penetration testing services.
Integrators
Managed Security Service Providers. These providers will offer penetration testing. For example, Dell SecureWorks offers numerous services including penetration testing. For organizations like this, you need to be skeptical of ulterior motives. For example, expect recommendations around outsourcing from Dell SecureWorks.
Regional or Small Integrators. These are service providers that provide security services of some kind. For example, they would help in the implementation of a firewall and offer penetration testing services as well.
Info-Tech Recommends:
- Always be conscientious of who is conducting the testing and what else they offer. Even if you get another party to test rather than your technology provider, they will try to obtain you as a client. Remember that for larger technology vendors, security testing is a small revenue stream for them and it’s a way to find technology clients. They may offer penetration testing for free to obtain other business.
- Most of the penetration testers were systems administrators (for network testing) or application developers (for application testing) at some point before becoming penetration testers. Remember this when evaluating providers and evaluating remediation recommendations.
- Evaluate what kind of open-source tools, commercial tools, and proprietary tools are being used. In general, you don’t want to rely on an open-source scanner. For open source, they will have more outdated vulnerability databases, system identification can also be limited compared to commercial, and reporting is often lacking.
- Above all else, ensure your testers are legally capable, experienced, and abide by non-disclosure agreements.
Penetration testing best practices – communications
Communication With Service Provider
| Communication With Internal StaffDo you tell your internal staff that this is happening?This is sometimes called a “double blind test” when you don’t let your IT team know of the test occurring. Pros to notifying:
|
Penetration testing best practices – results and remediation
What to expect from penetration test results report:
A final results report will state all findings including what was done by the testers, what vulnerabilities or exploitations were detected, how they were compromised, the related risk, and related remediation recommendations.
Expect four major sections:- Introduction. An overview of the penetration test methodology including rating methodology of vulnerabilities.
- Executive Summary. A management-level description of the test, often including a summary of any recommendations.
- Technical Review. An overview of each item that was looked at and touched. This area breaks down what was done, how it was done, what was found, and any related remediation recommendations. Expect graphs and visuals in this section.
- Detailed Findings. An in-depth breakdown of all testing methods used and results. Each vulnerability will be explained regarding how it was detected, what the risk is, and what the remediation recommendation is.
Prioritization
| Remediation
|
Summary of Accomplishment
Problem Solved
At the conclusion of this blueprint, you will have created a full vulnerability management program that will allow you to take a risk-based approach to vulnerability remediation.
Assessing a vulnerability’s risk will enable you to properly determine the true urgency of a vulnerability within the context of your organization; this ensures you are not just blindly following what the tool is reporting.
The risk-based approach will allow you to prioritize your discovered vulnerabilities and take immediate action on critical and high vulnerabilities while allowing your standard remediation cycle to address the medium to low vulnerabilities.
With your program defined and developed, you now need to configure your vulnerability scanning tool or acquire one if you don’t already have a tool in place.
Lastly, while vulnerability management will help address your systems and applications, how do you know if you are secure from external malicious actors? Penetration testing will offer visibility, allowing you to plug those holes and attain an environment with a smaller risk surface.
If you would like additional support, have our analysts guide you through other phases as part of an Info-Tech workshop.
Contact your account representative for more information.
workshops@infotech.com 1-888-670-8889
Additional Support
If you would like additional support, have our analysts guide you through other phases as part of an Info-Tech workshop.
 | Contact your account representative for more information. workshops@infotech.com 1-888-670-8889 |
To accelerate this project, engage your IT team in an Info-Tech workshop with an Info-Tech analyst team.
Info-Tech analysts will join you and your team at your location or welcome you to Info-Tech’s historic Toronto office to participate in an innovative onsite workshop.
The following are sample activities that will be conducted by Info-Tech analysts with your team:
 Review of the Implement Vulnerability Management storyboard |  Build your vulnerability management SOP |
Contributors
Contributors from 2016 version of this project:
- Morey Haber, Vice President of Technology, BeyondTrust
- Richard Barretto, Manager, Information Privacy and Security, Cimpress
- Joel Shapiro, Vice President Sales, Digital Boundary Group
Contributors from current version of this project:
- 2 anonymous contributors from the manufacturing sector
- 1 anonymous contributor from a US government agency
- 2 anonymous contributors from the financial sector
- 1 anonymous contributor from the medical technology industry
- 2 anonymous contributors from higher education
- 1 anonymous contributor from a Canadian government agency
- 7 anonymous others; information gathered from advisory calls
Bibliography
Arya. “COVID-19 Impact: Vulnerability Management Solution Market | Strategic Industry Evolutionary Analysis Focus on Leading Key Players and Revenue Growth Analysis by Forecast To 2028 – FireMon, Digital Shadows, AlienVault.” Bulletin Line, 6 Aug. 2020. Accessed 6 Aug. 2020.
Campagna, Rich. “The Lean, Mean Vulnerability Management Machine.” Security Boulevard, 31 Mar. 2020. Accessed 15 Aug. 2020.
Constantin, Lucian. “What are vulnerability scanners and how do they work?” CSO Online, 10 Apr. 2020. Accessed 1 Sept. 2020.
“CVE security vulnerabilities published in 2019.” CVE Details. Accessed 22 Sept. 2020.
Garden, Paul, et al. “2019 Year End Report – Vulnerability QuickView.” Risk Based Security, 2020. Accessed 22 Sept. 2020.
Keary, Eoin. “2019 Vulnerability Statistics Report.” Edgescan, Feb. 2019. Accessed 22 Sept. 2020.
Lefkowitz, Josh. ““Risk-Based Vulnerability Management is a Must for Security & Compliance.” SecurityWeek, 1 July 2019. Accessed 1 Nov. 2020.
Mell, Peter, Tiffany Bergeron, and David Henning. “Creating a Patch and Vulnerability Management Program.” Creating a Patch and Vulnerability Management Program. NIST, Nov. 2005. Web.
“National Vulnerability Database.” NIST. Accessed 18 Oct. 2020.
“OpenVAS – Open Vulnerability Assessment Scanner.” OpenVAS. Accessed 14 Sept. 2020.
“OVAL.” OVAL. Accessed 21 Oct. 2020.
Paganini, Pierluigi. “Exploiting and Verifying Shellshock: CVE-2014-6271.” INFOSEC, 27 Sept. 2014. Web.
Pritha. “Top 10 Metrics for your Vulnerability Management Program.” CISO Platform, 28 Nov. 2019. Accessed 25 Oct. 2020.
“Risk-Based Vulnerability Management: Understanding Vulnerability Risk With Threat Context And Business Impact.” Tenable. Accessed 21 Oct. 2020.
Stone, Mark. “Shellshock In-Depth: Why This Old Vulnerability Won’t Go Away.” SecurityIntelligence, 6 Aug. 2020. Web.
“The Role of Threat Intelligence in Vulnerability Management.” NOPSEC, 18 Sept. 2014. Accessed 18 Aug. 2020.
“Top 15 Paid and Free Vulnerability Scanner Tools in 2020.” DNSstuff, 6 Jan. 2020. Accessed 15 Sept. 2020.
Truta, Filip. “60% of Breaches in 2019 Involved Unpatched Vulnerabilities.” Security Boulevard, 31 Oct. 2019. Accessed 2 Nov. 2020.
“Vulnerability Management Program.” Core Security. Accessed 15 Sept. 2020.
“What is Risk-Based Vulnerability Management?” Balbix. Accessed 15 Sept. 2020.
White, Monica. “The Cost Savings of Effective Vulnerability Management (Part 1).” Kenna Security, 23 April 2020. Accessed 20 Sept. 2020.
Wilczek, Marc. “Average Cost of a Data Breach in 2020: $3.86M.” Dark Reading, 24 Aug. 2020. Accessed 5 Nov 2020.

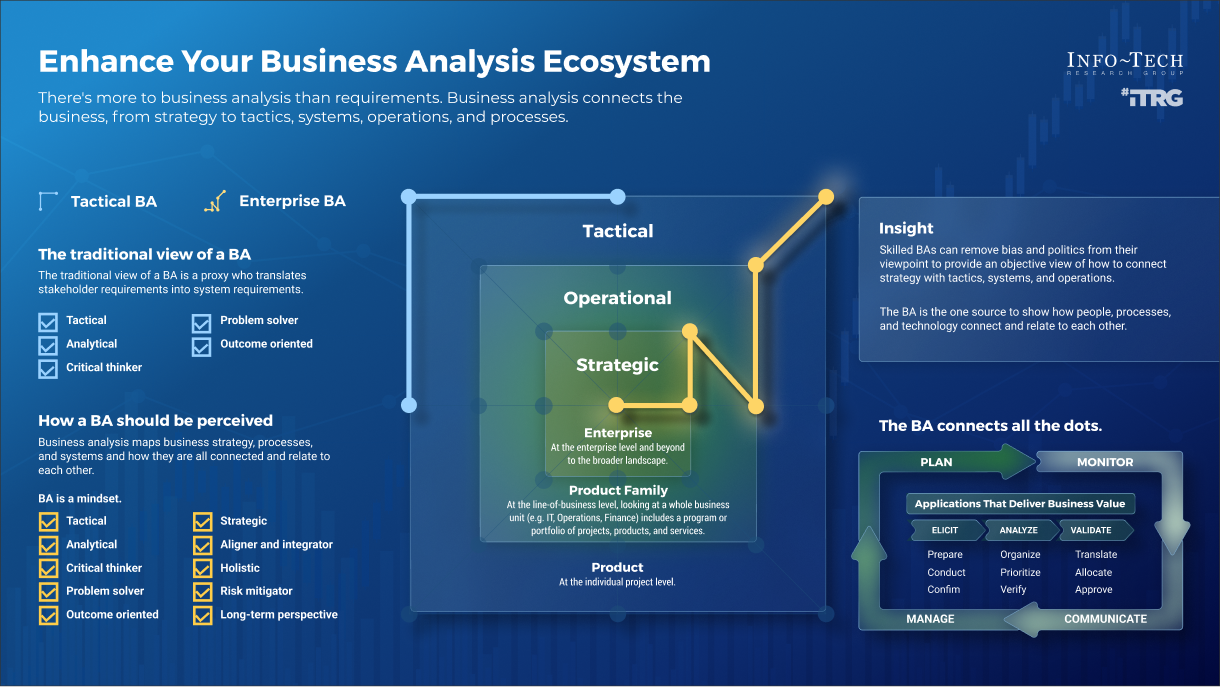

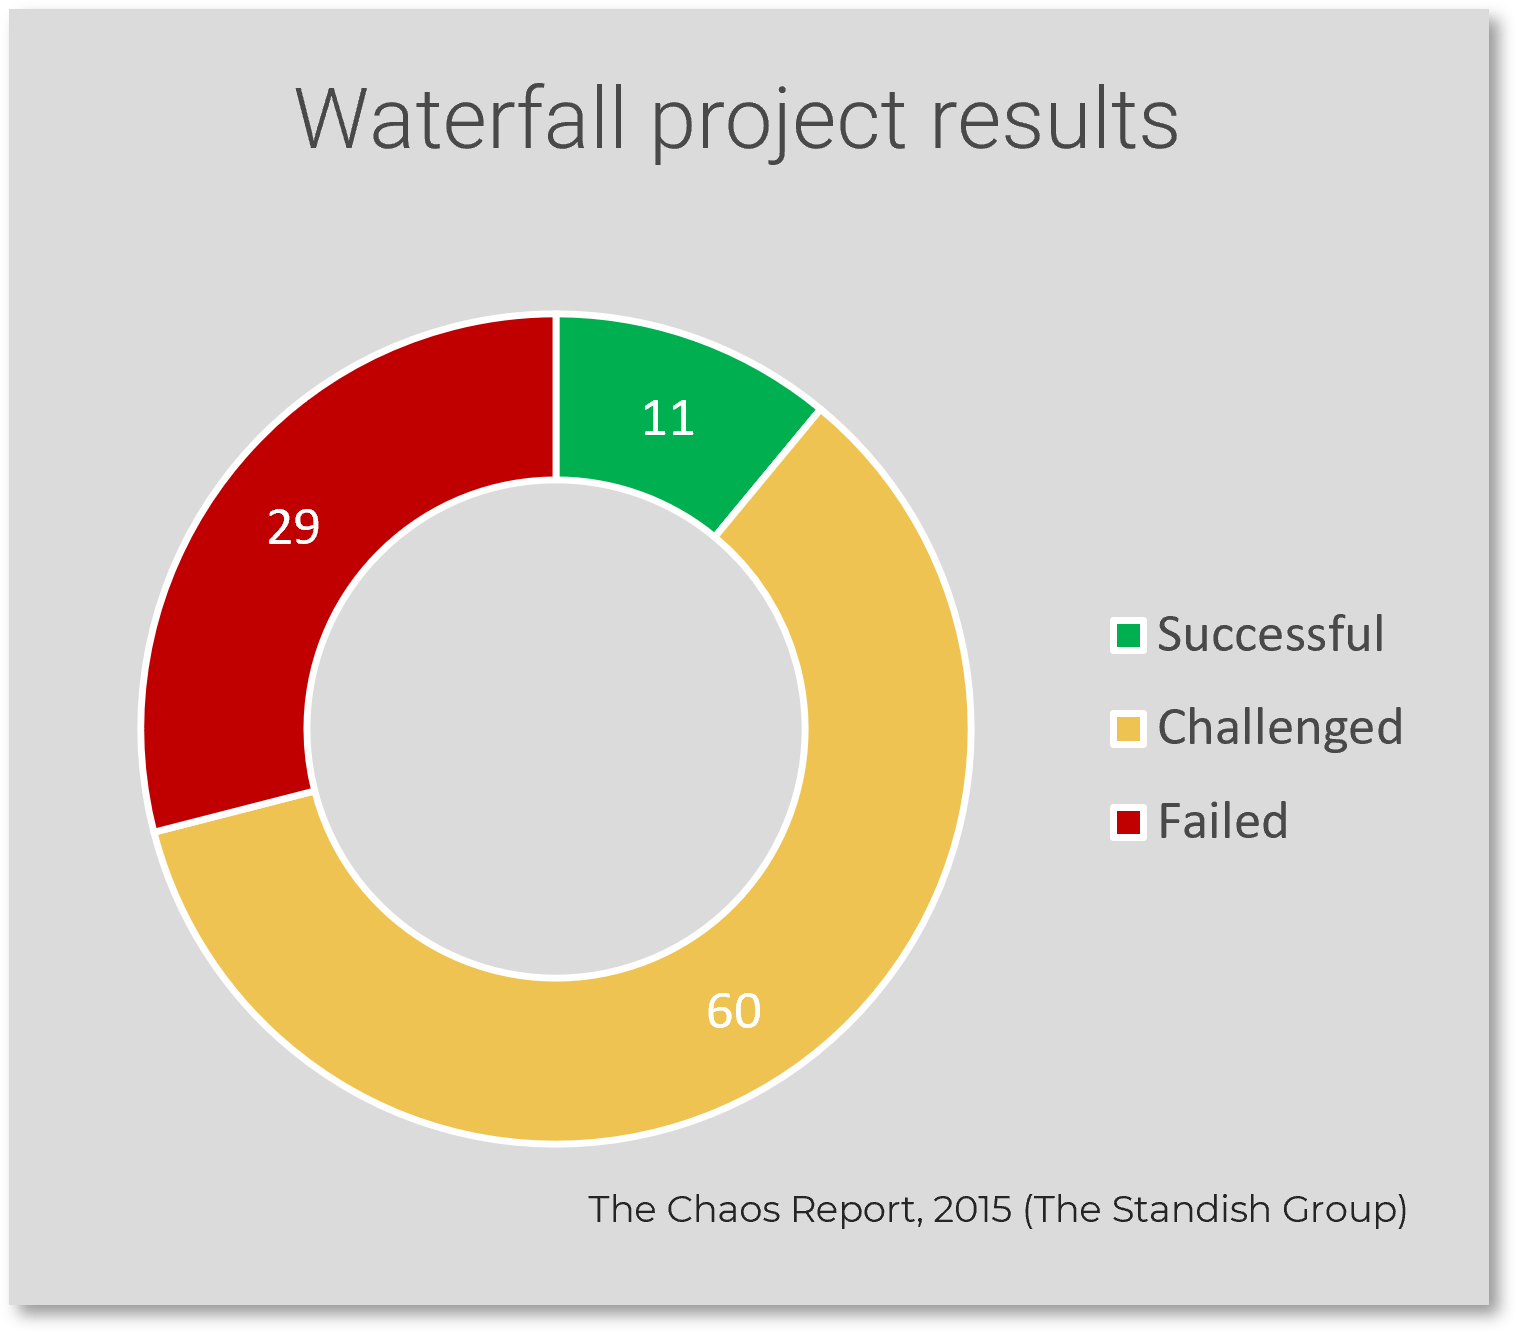
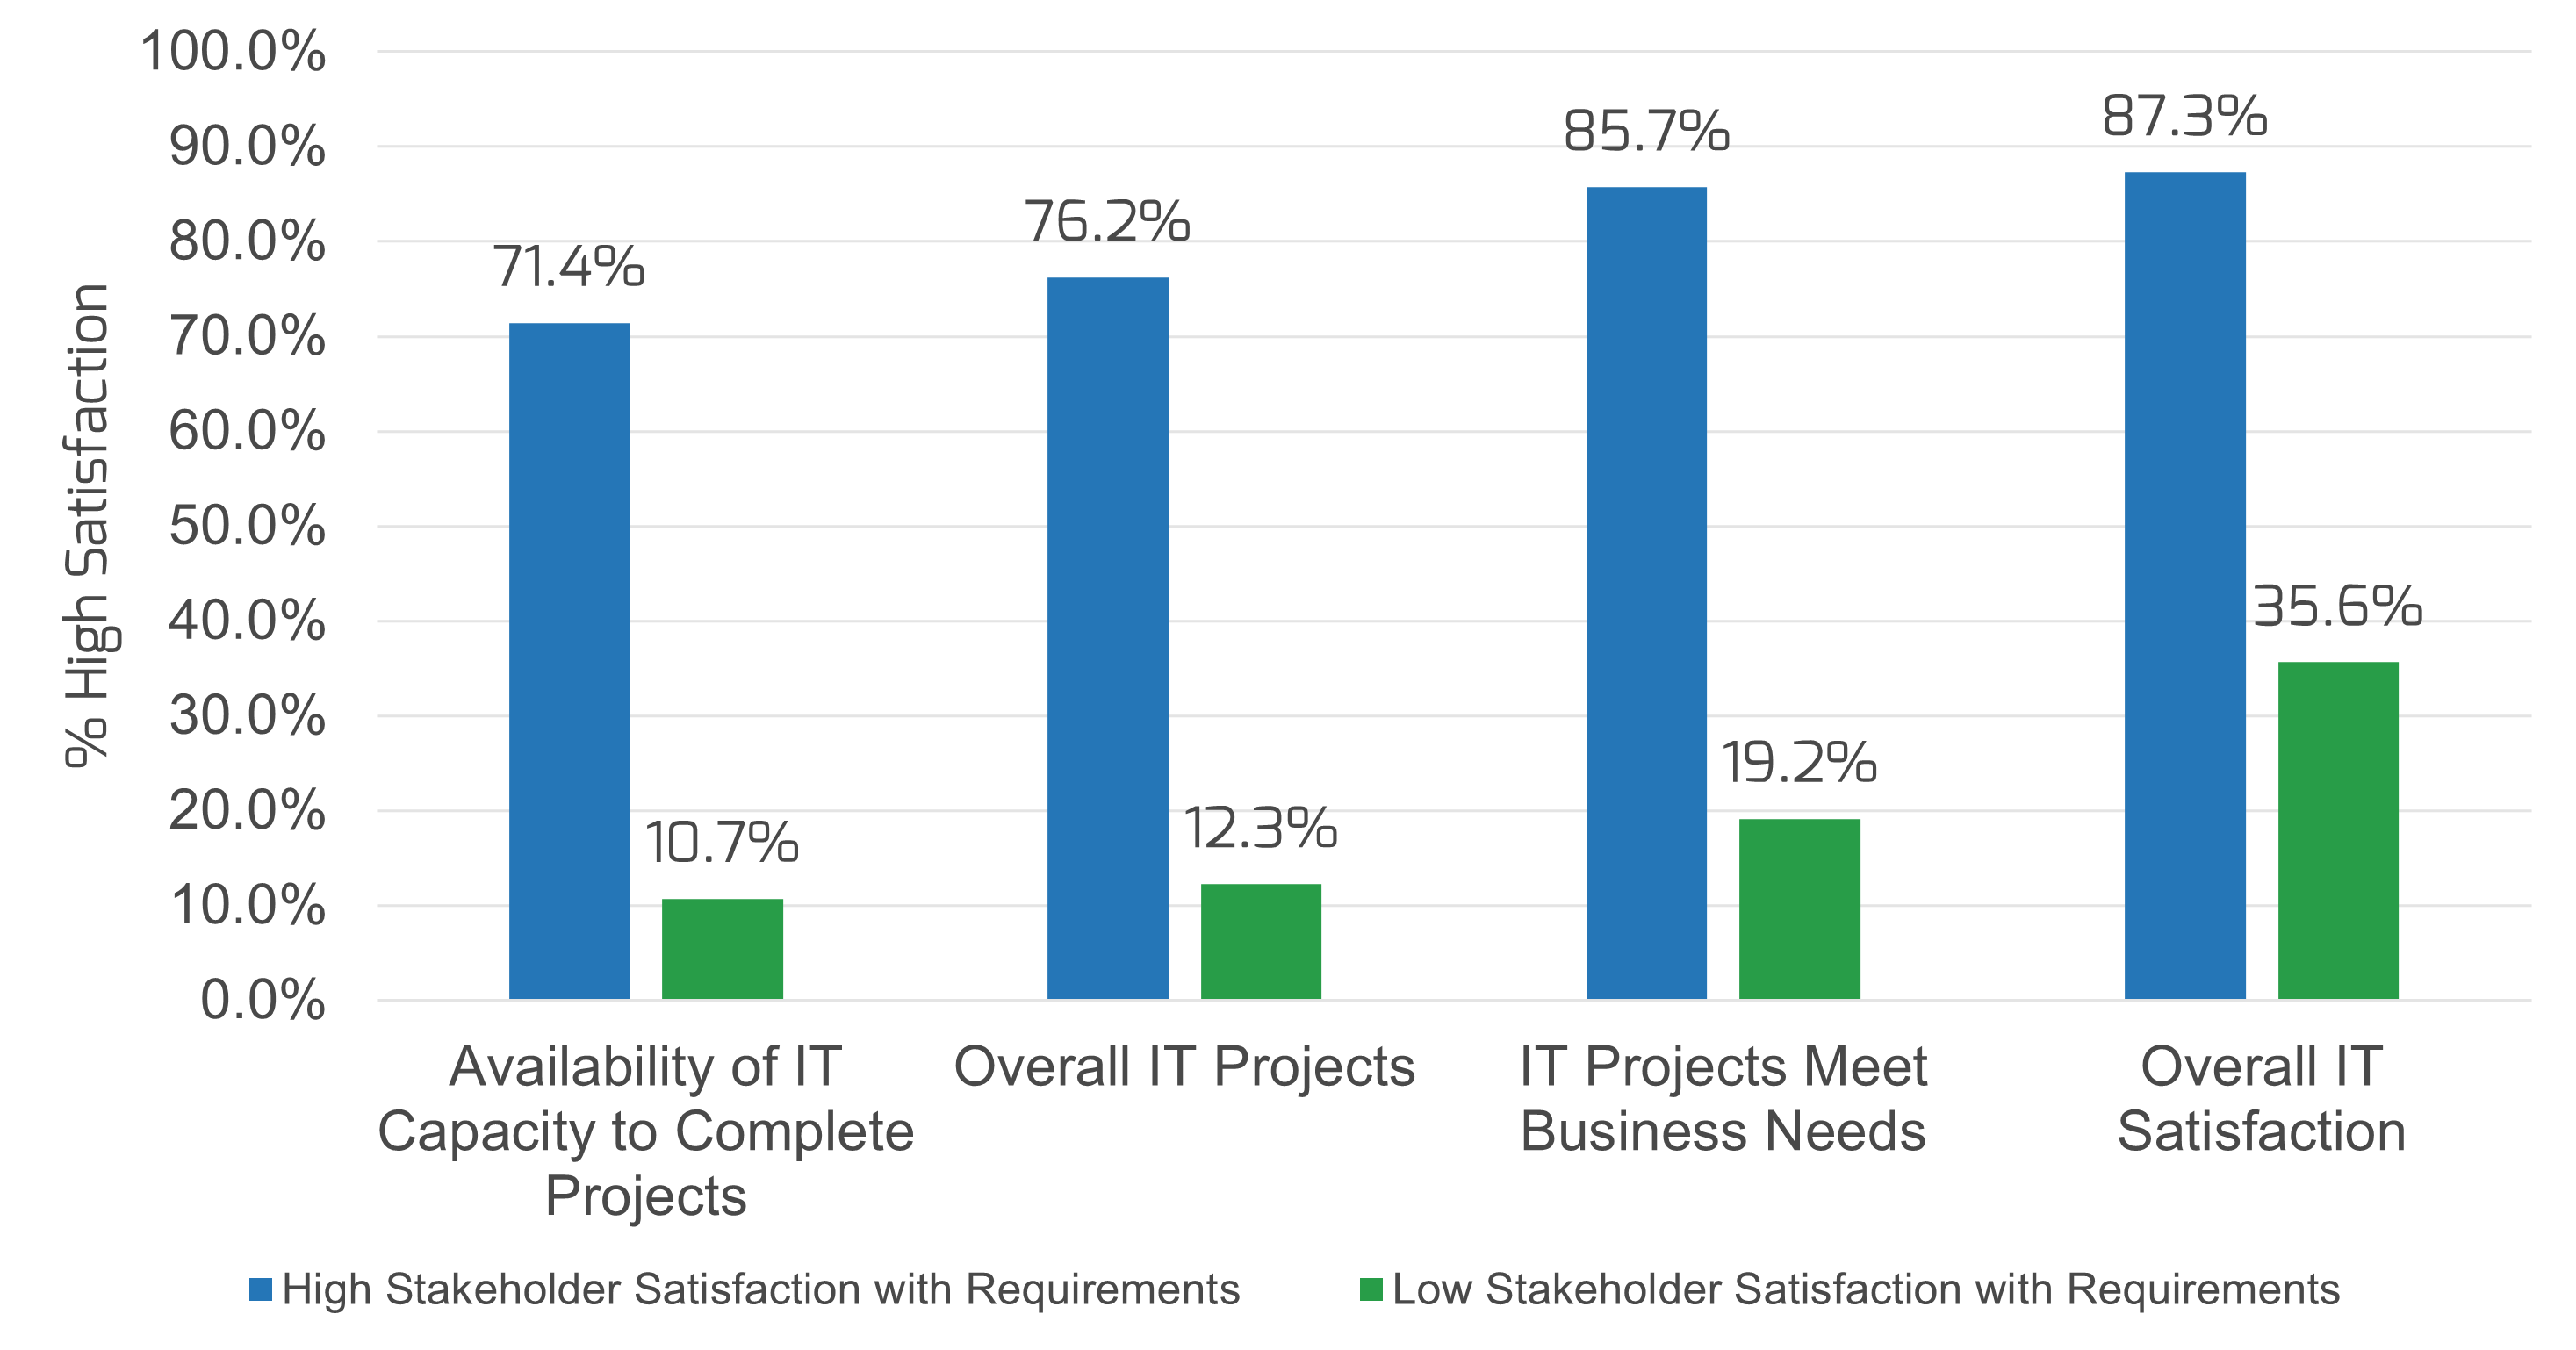
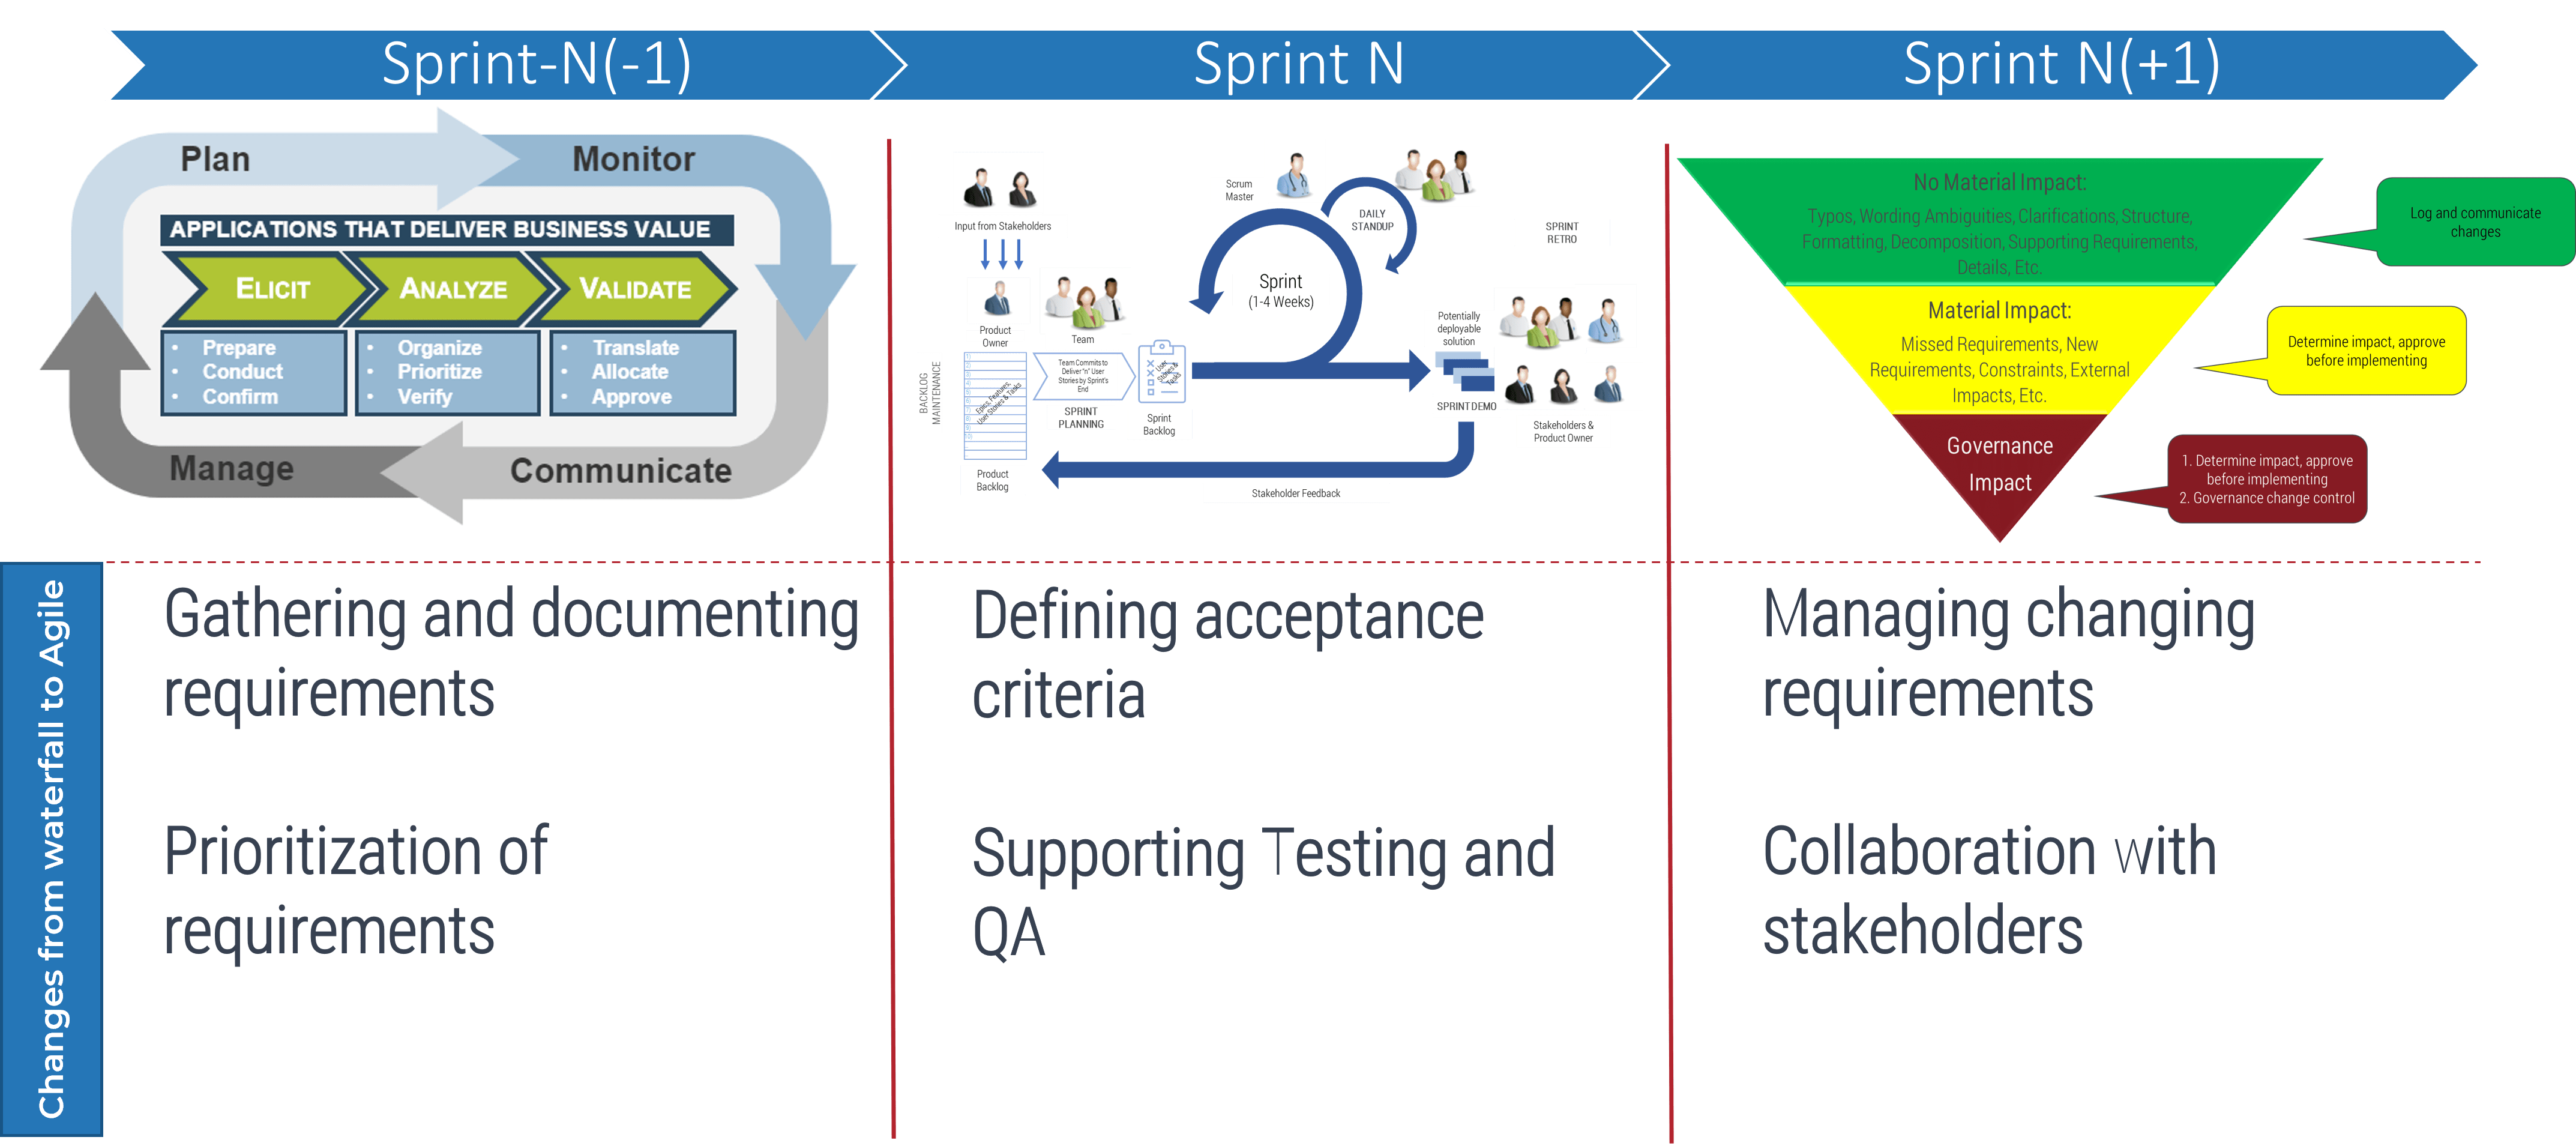
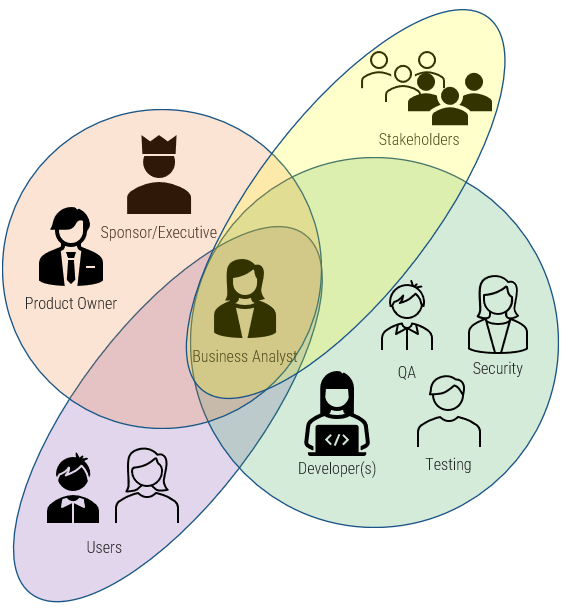
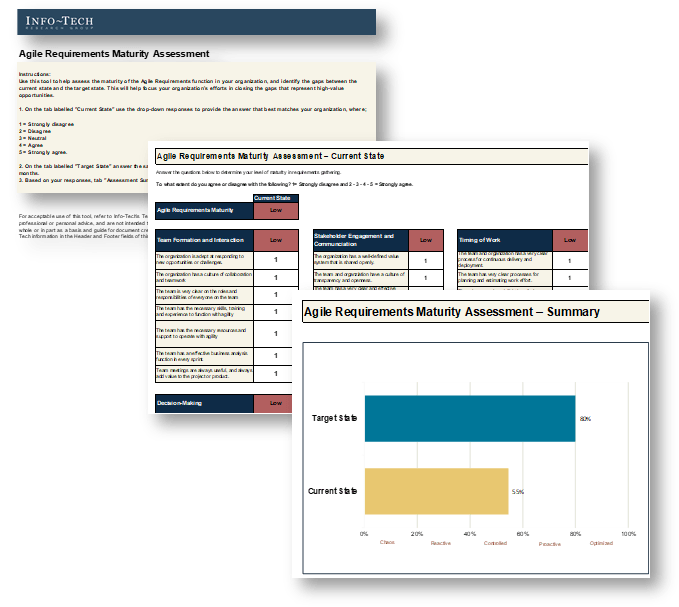
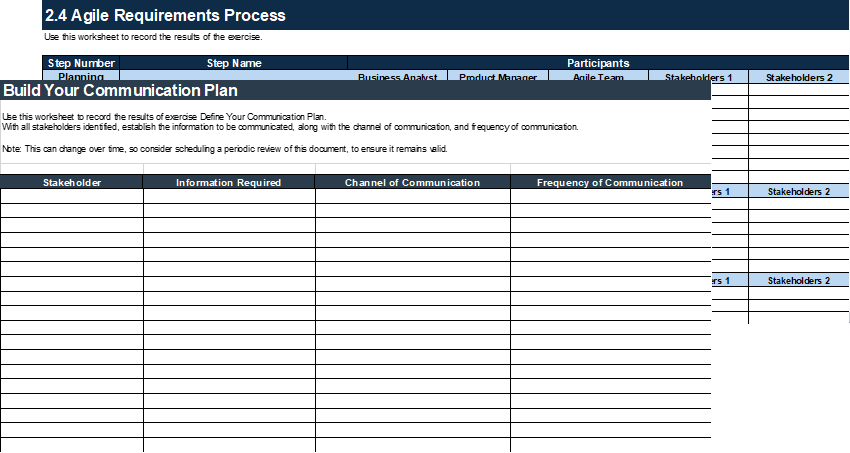
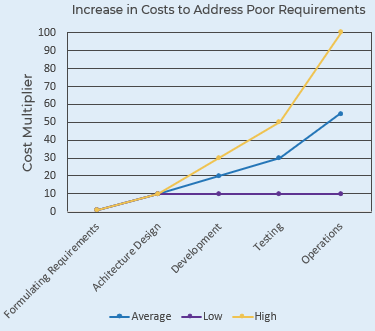
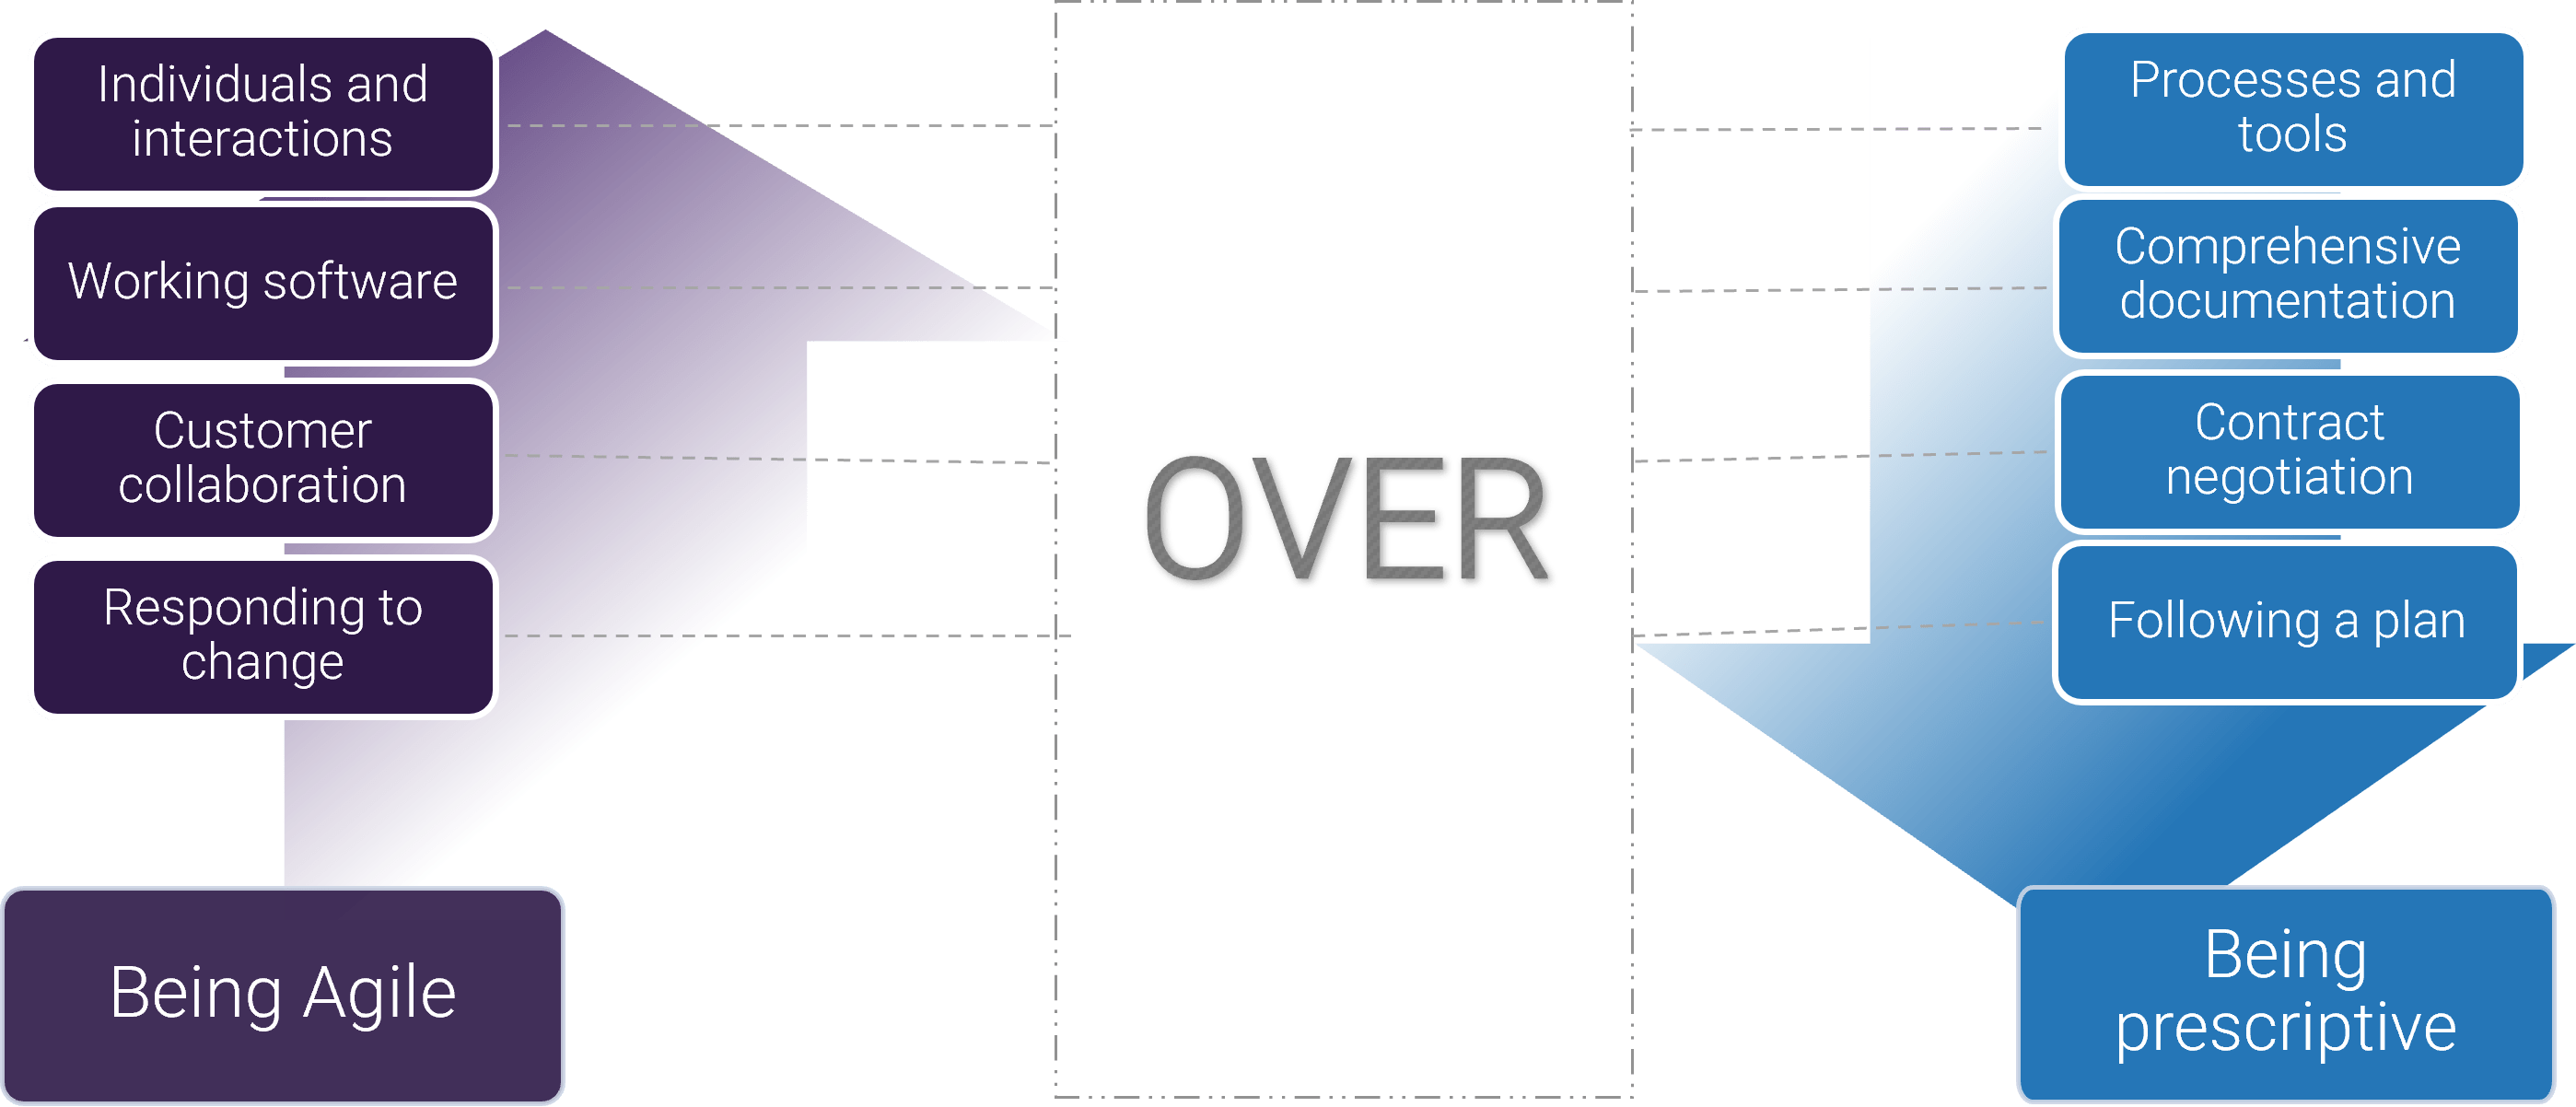
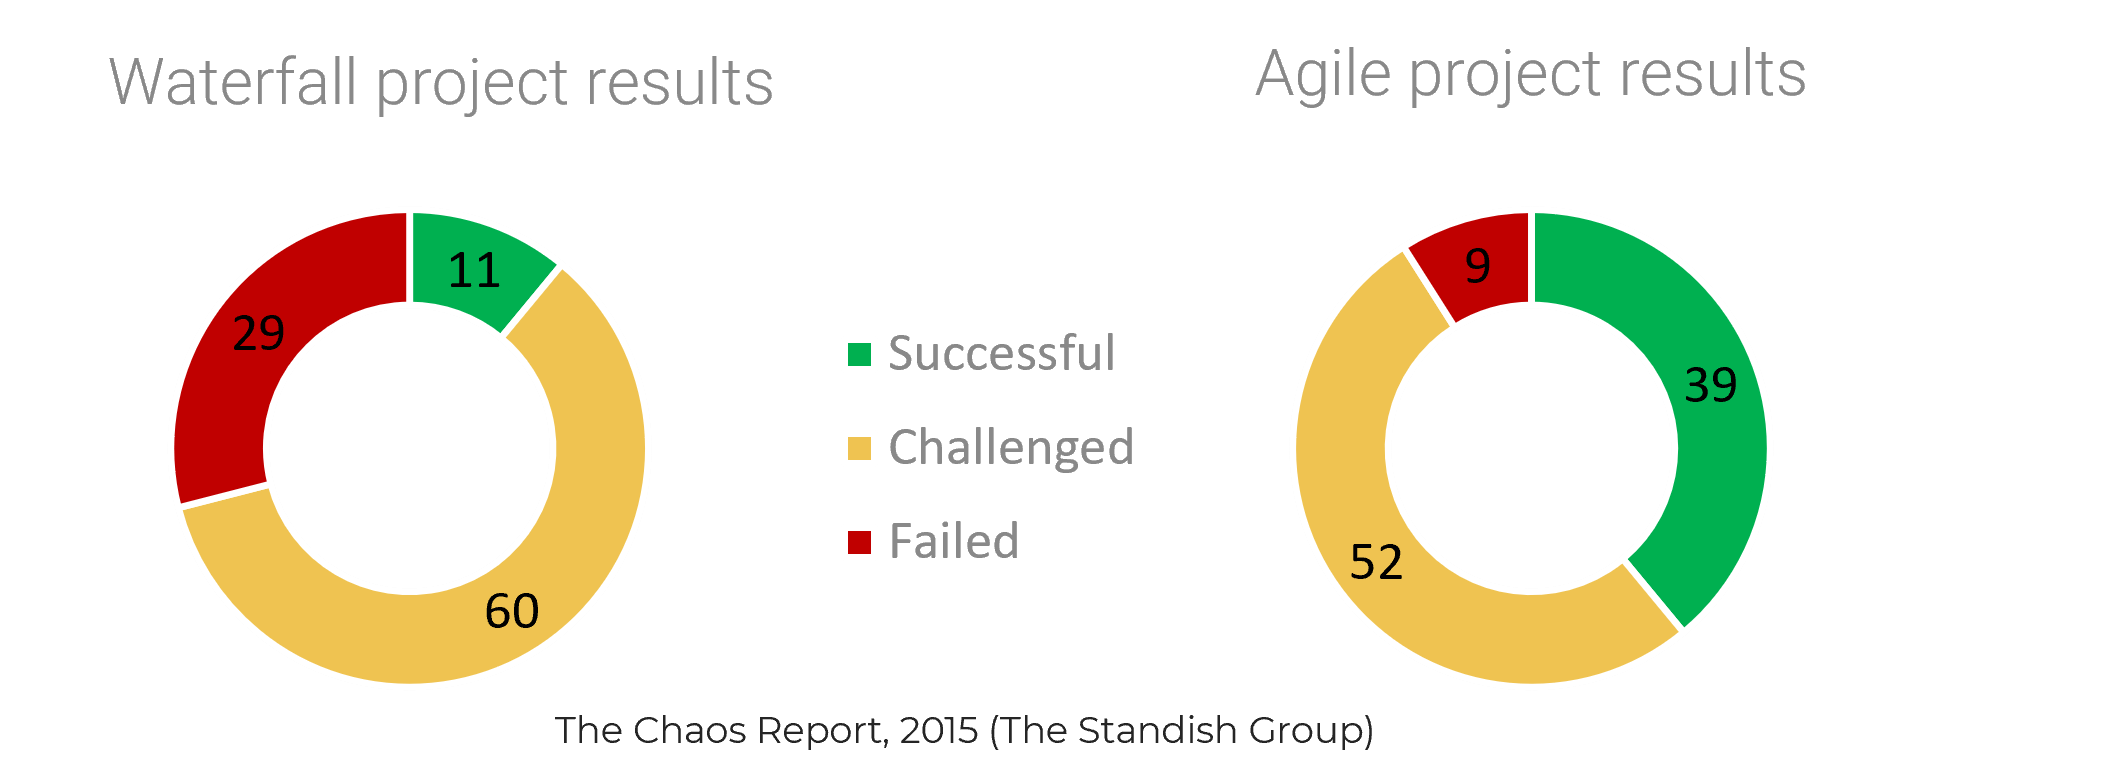
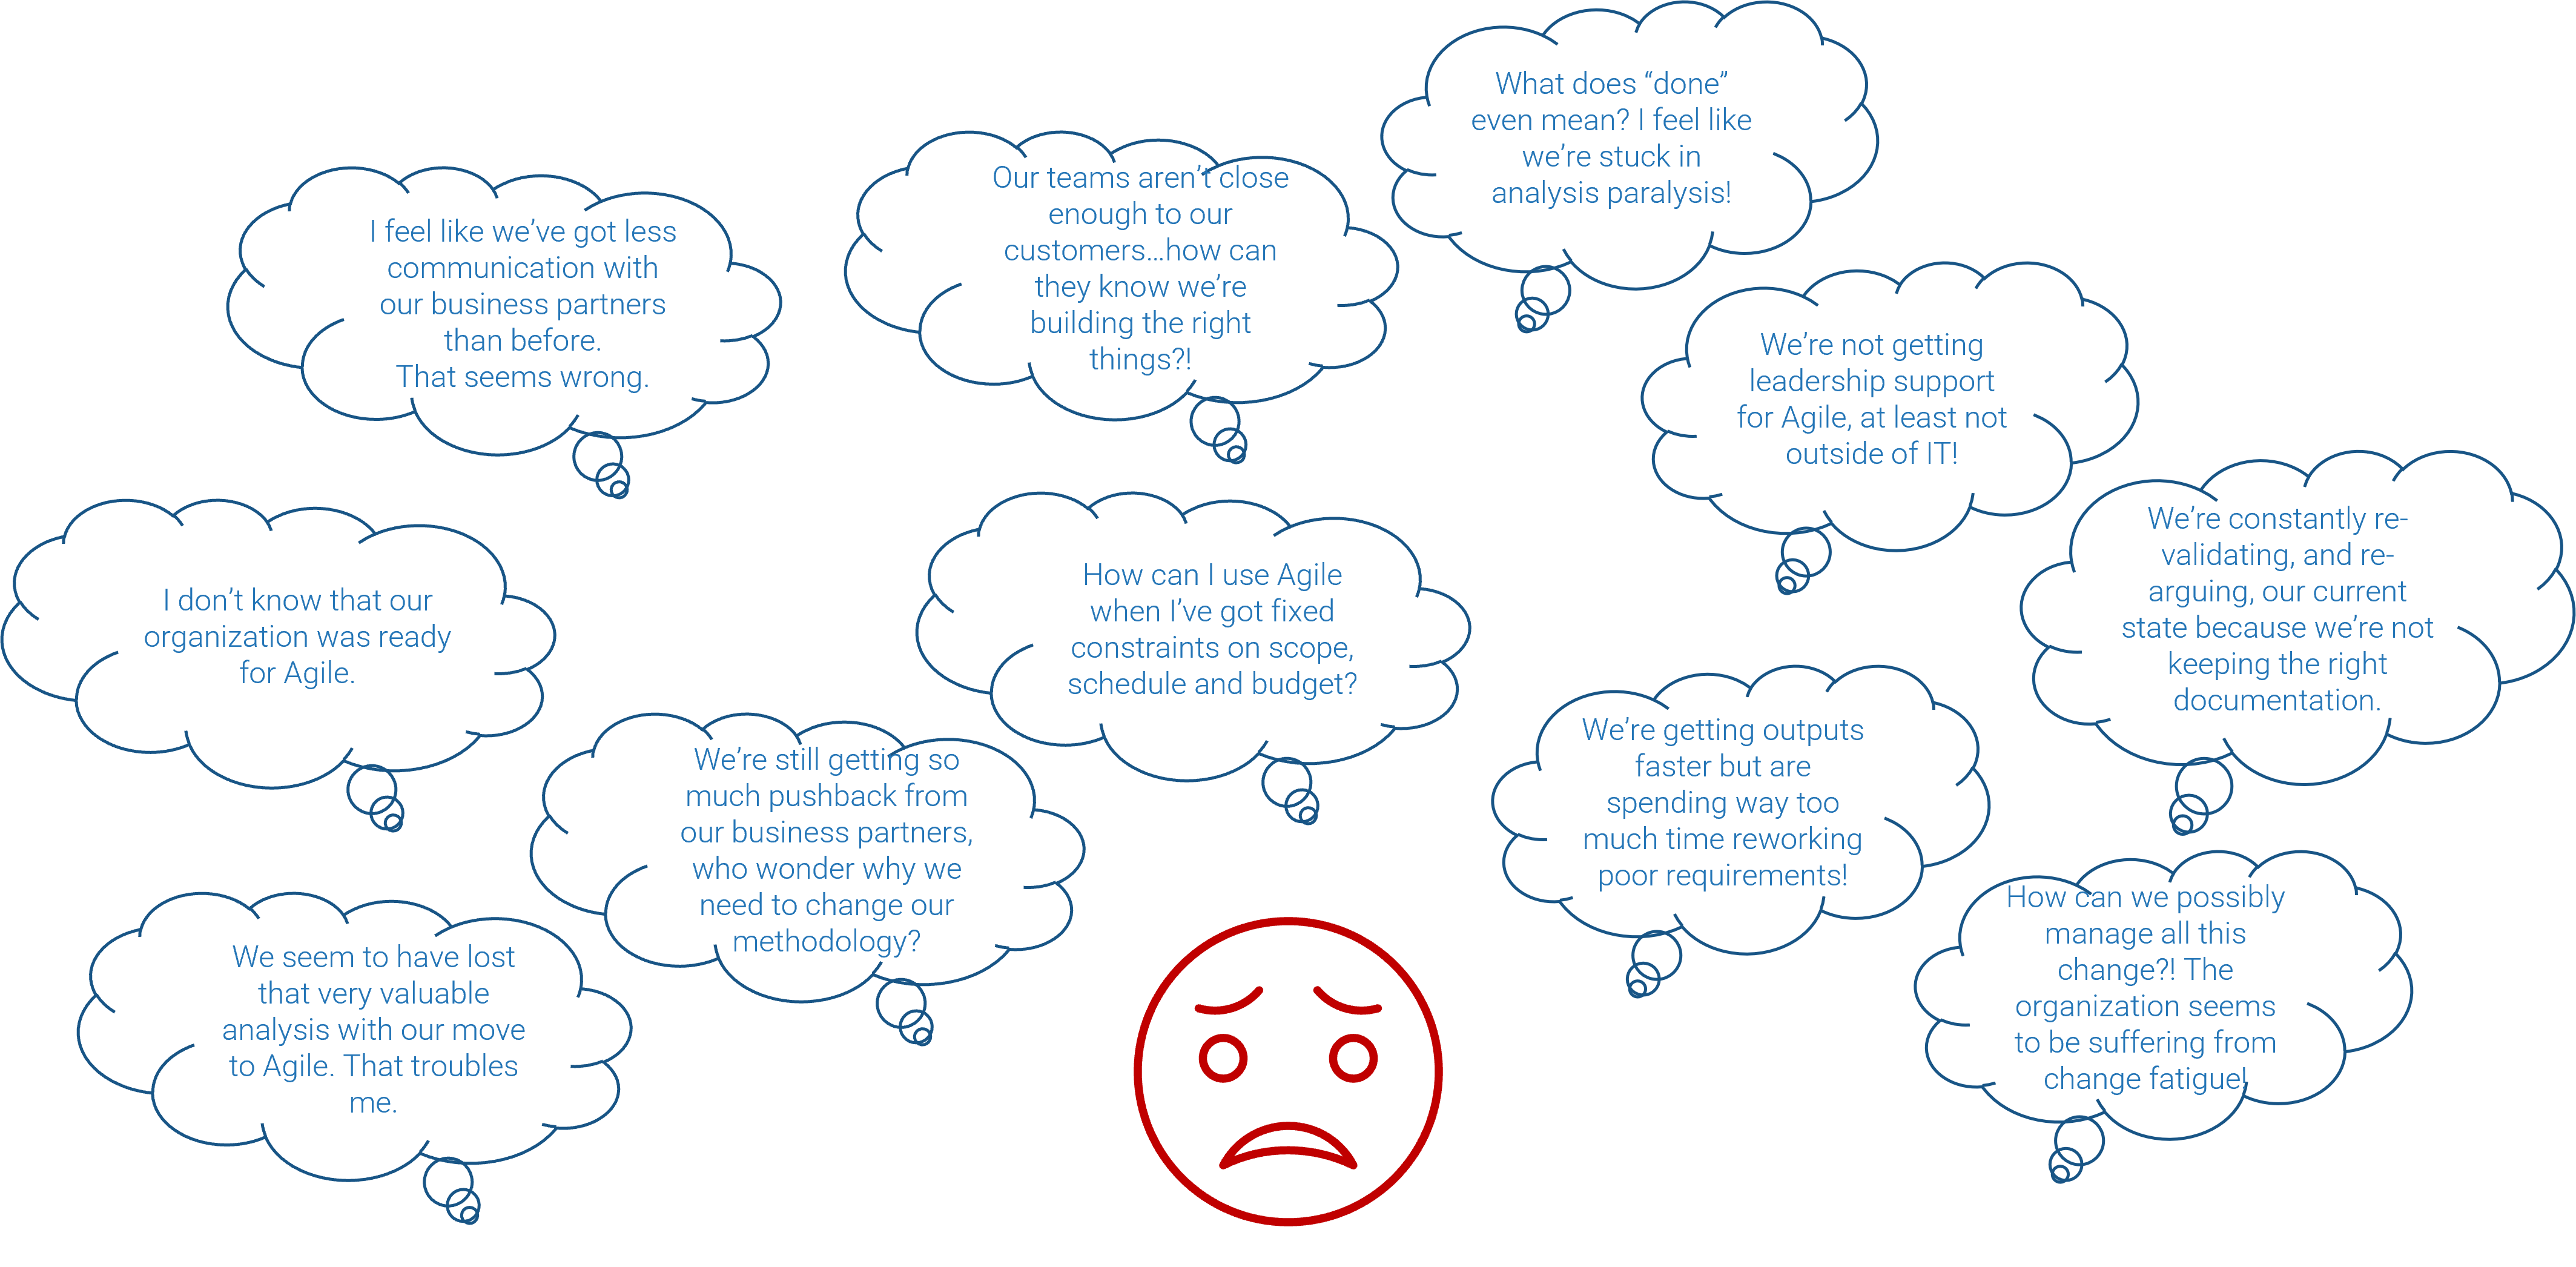
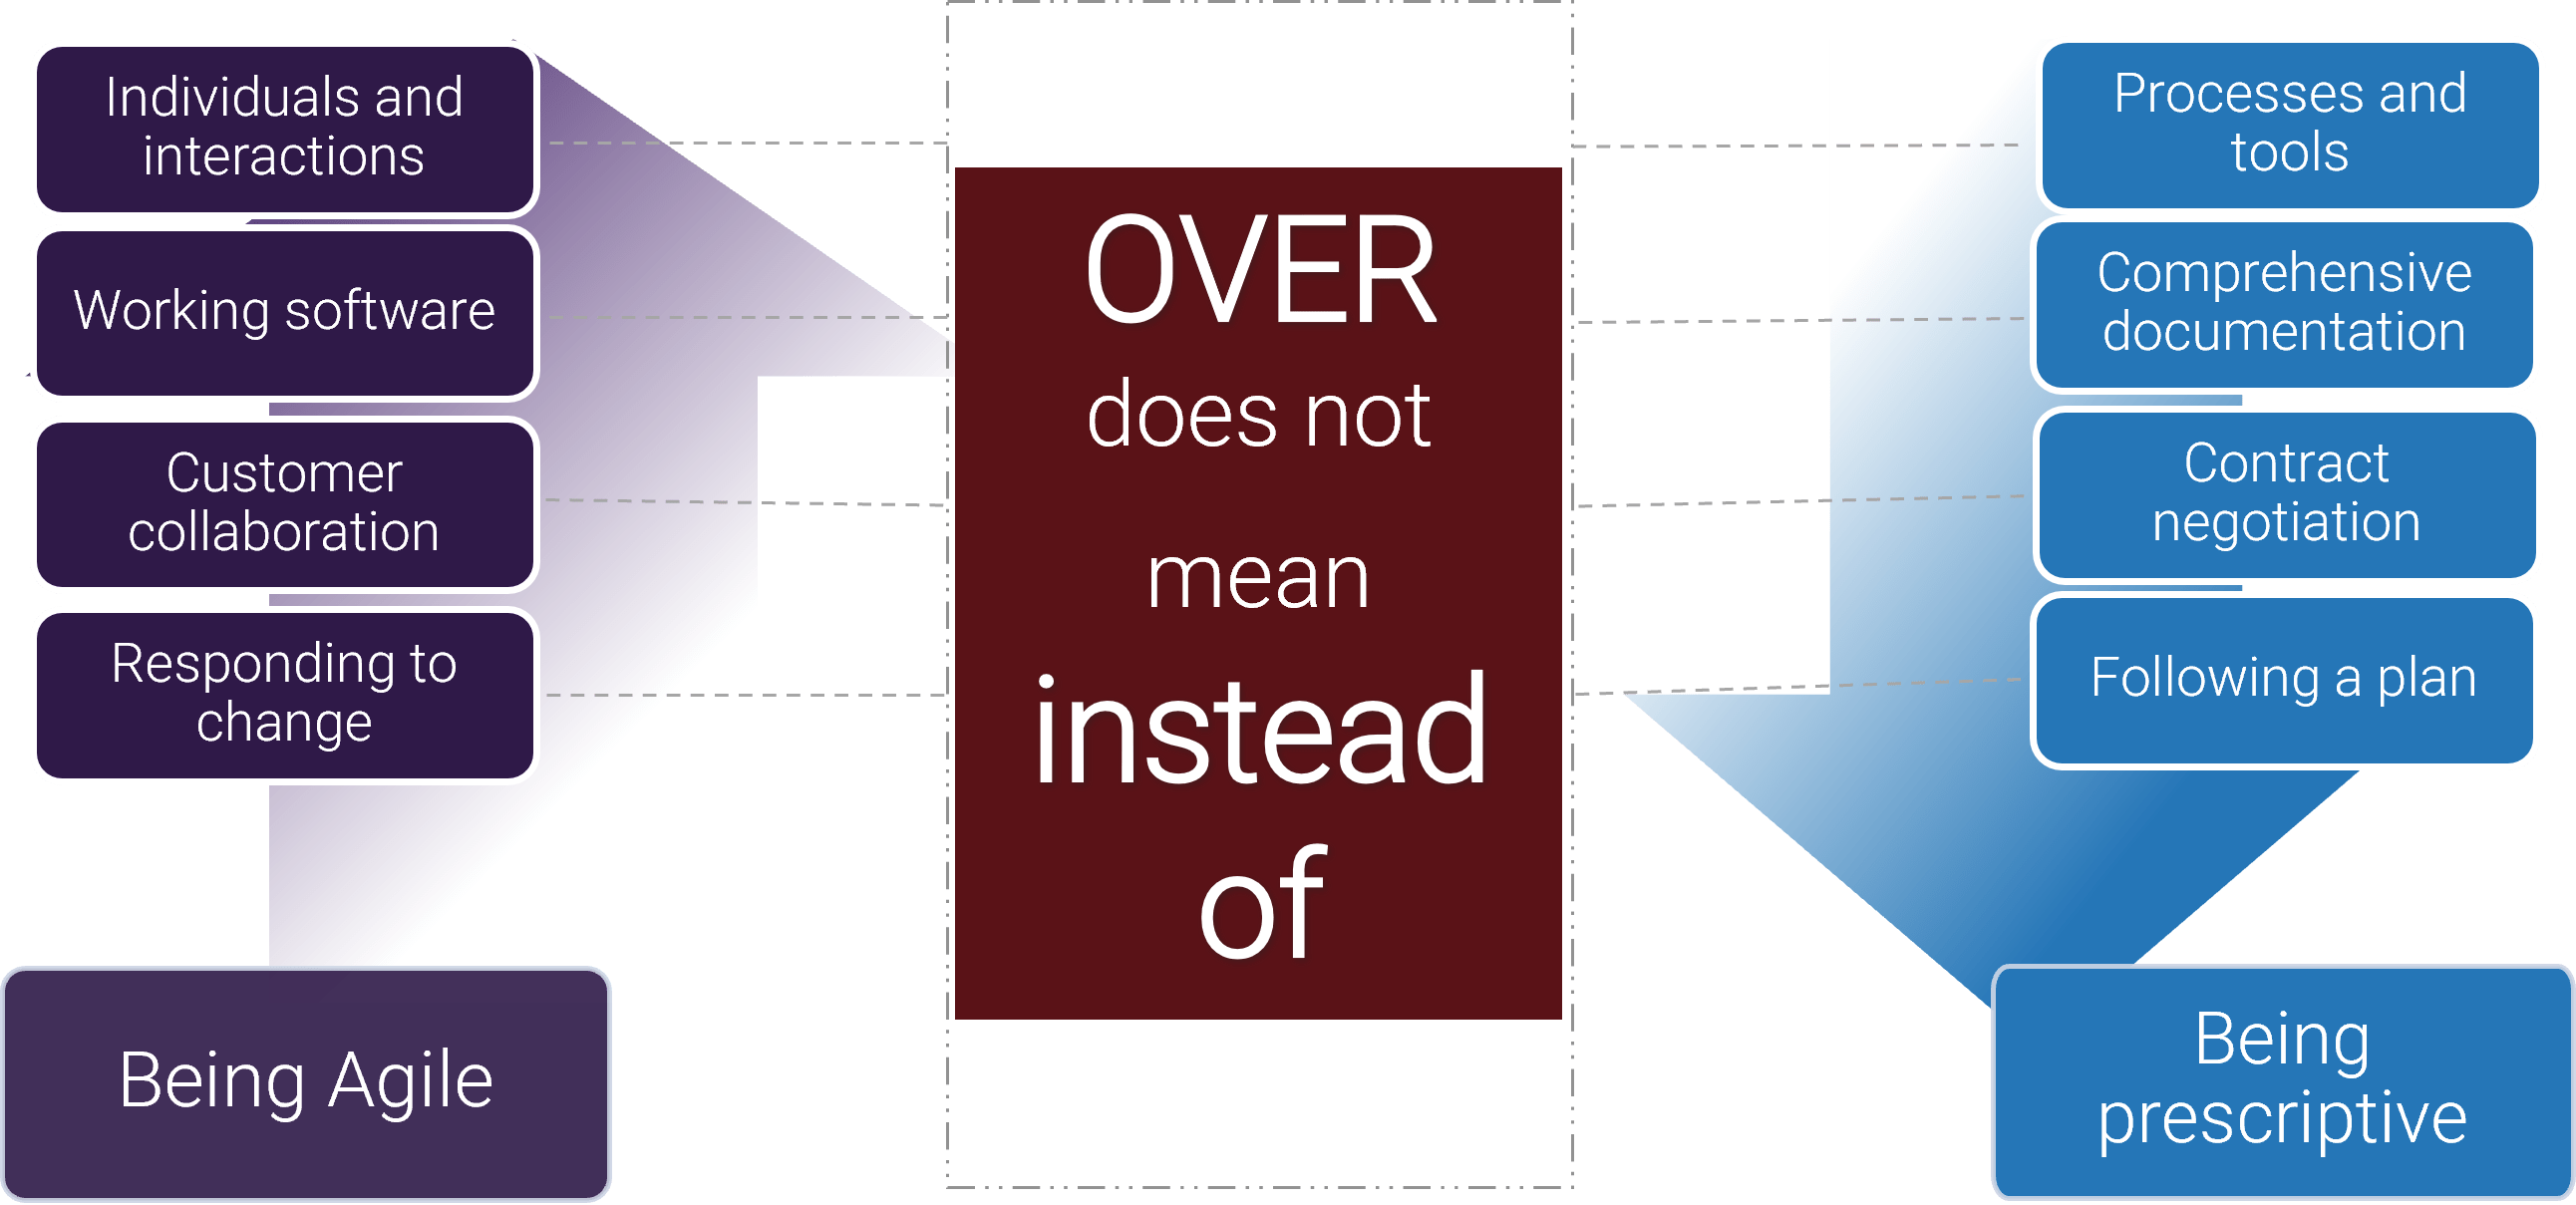
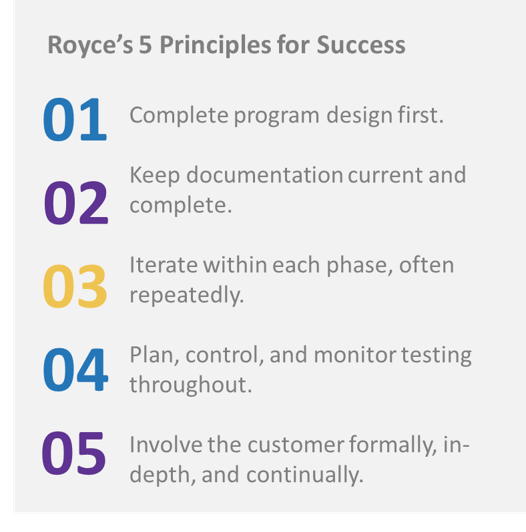
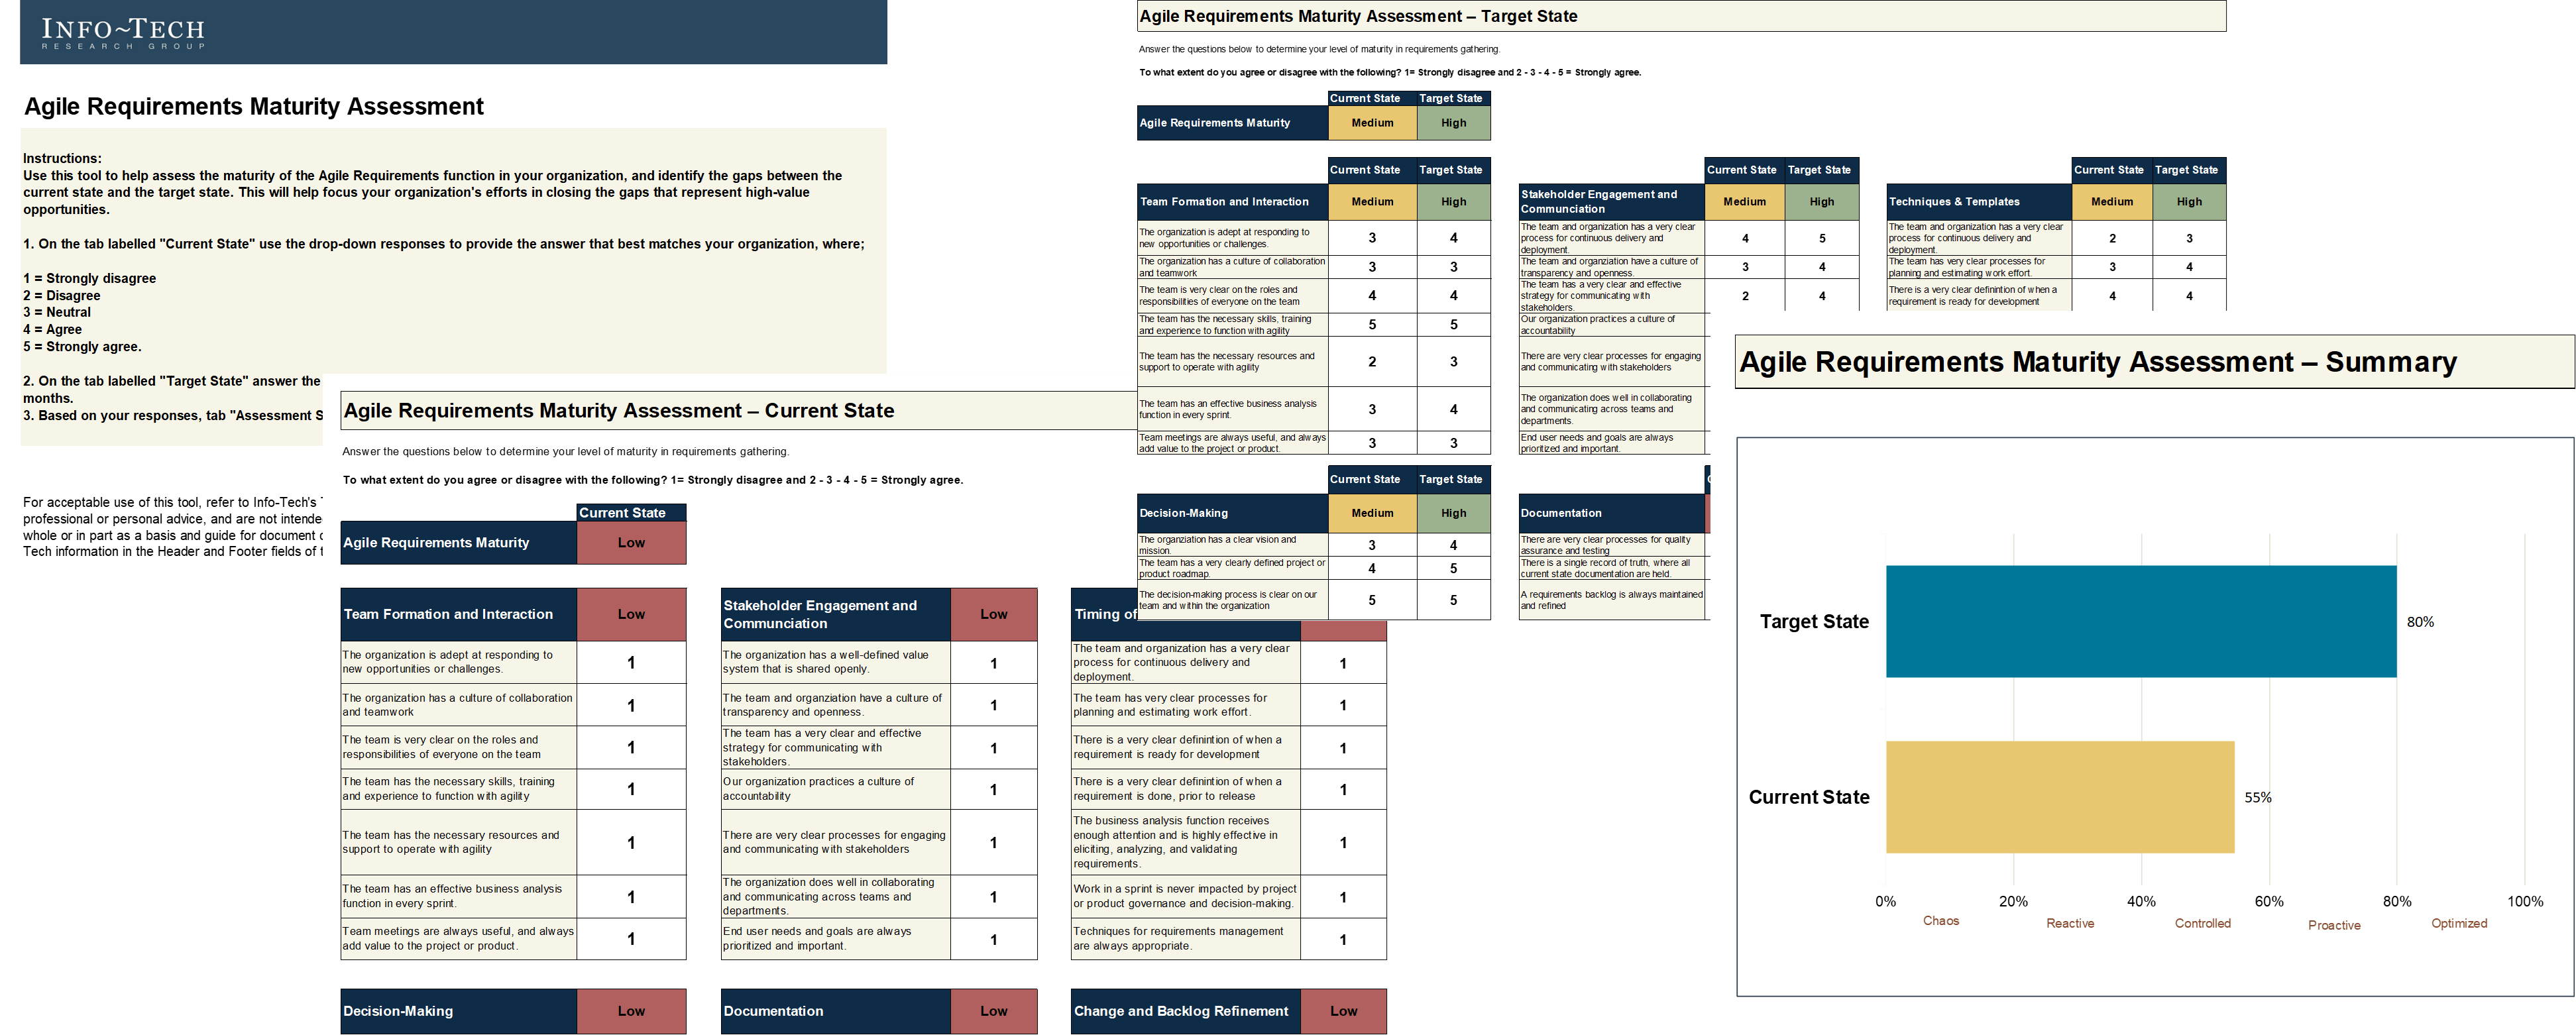
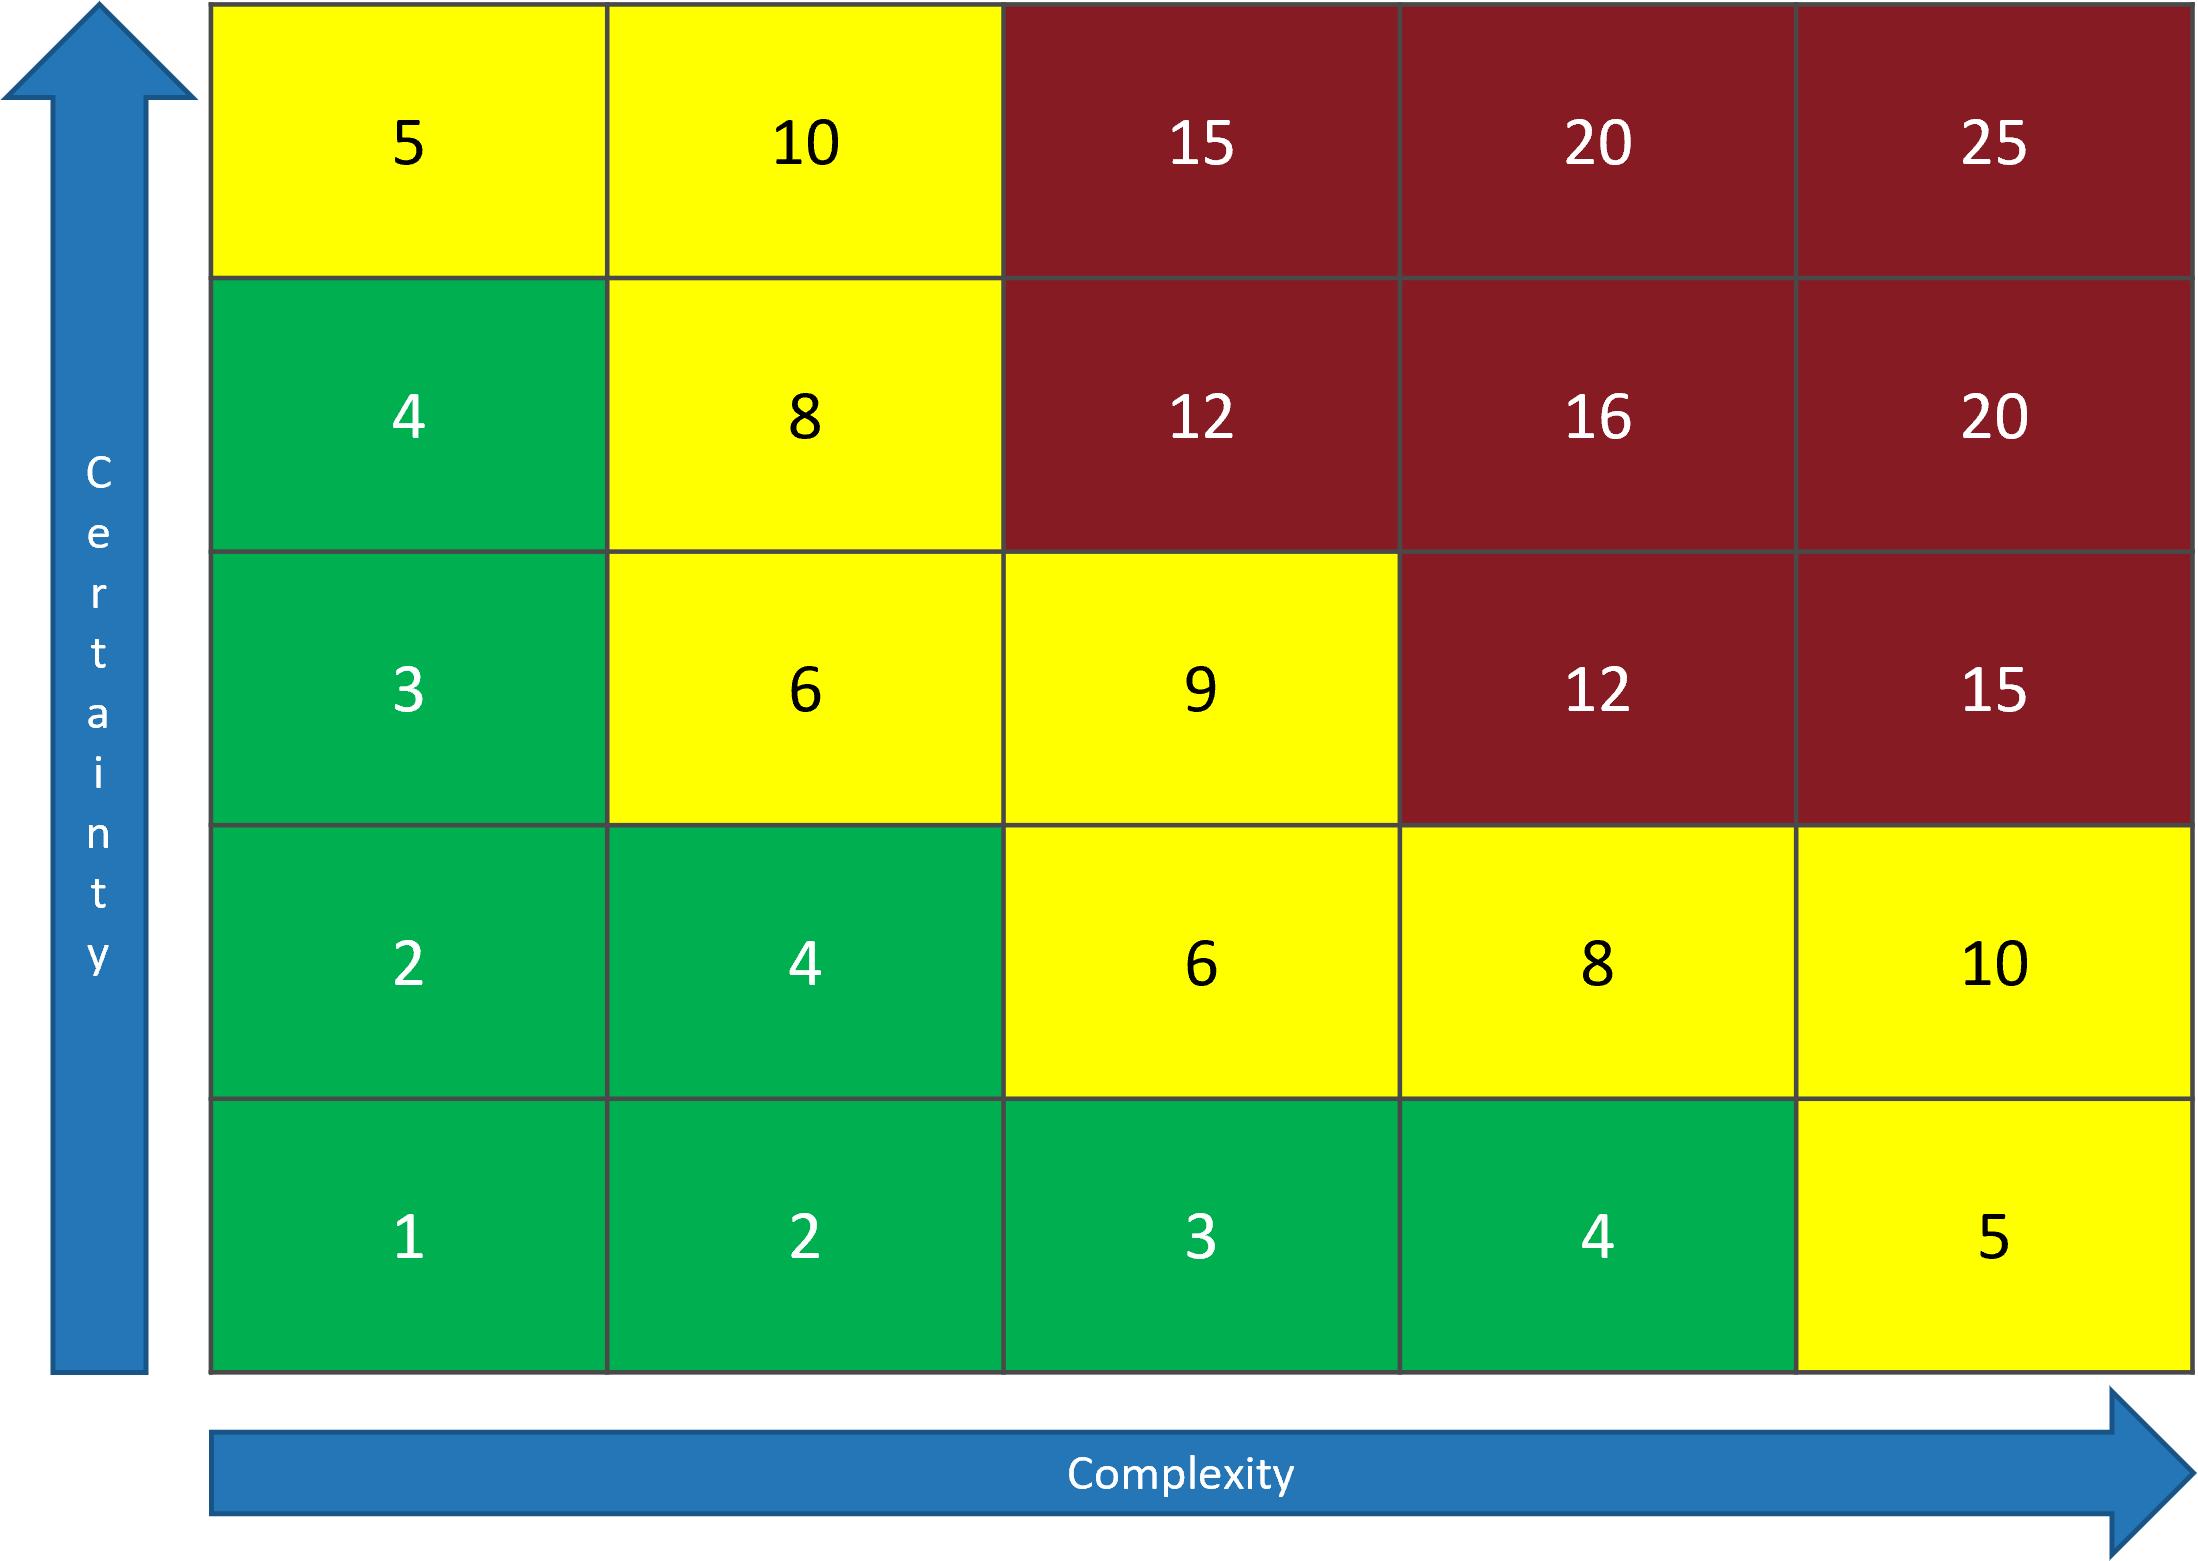
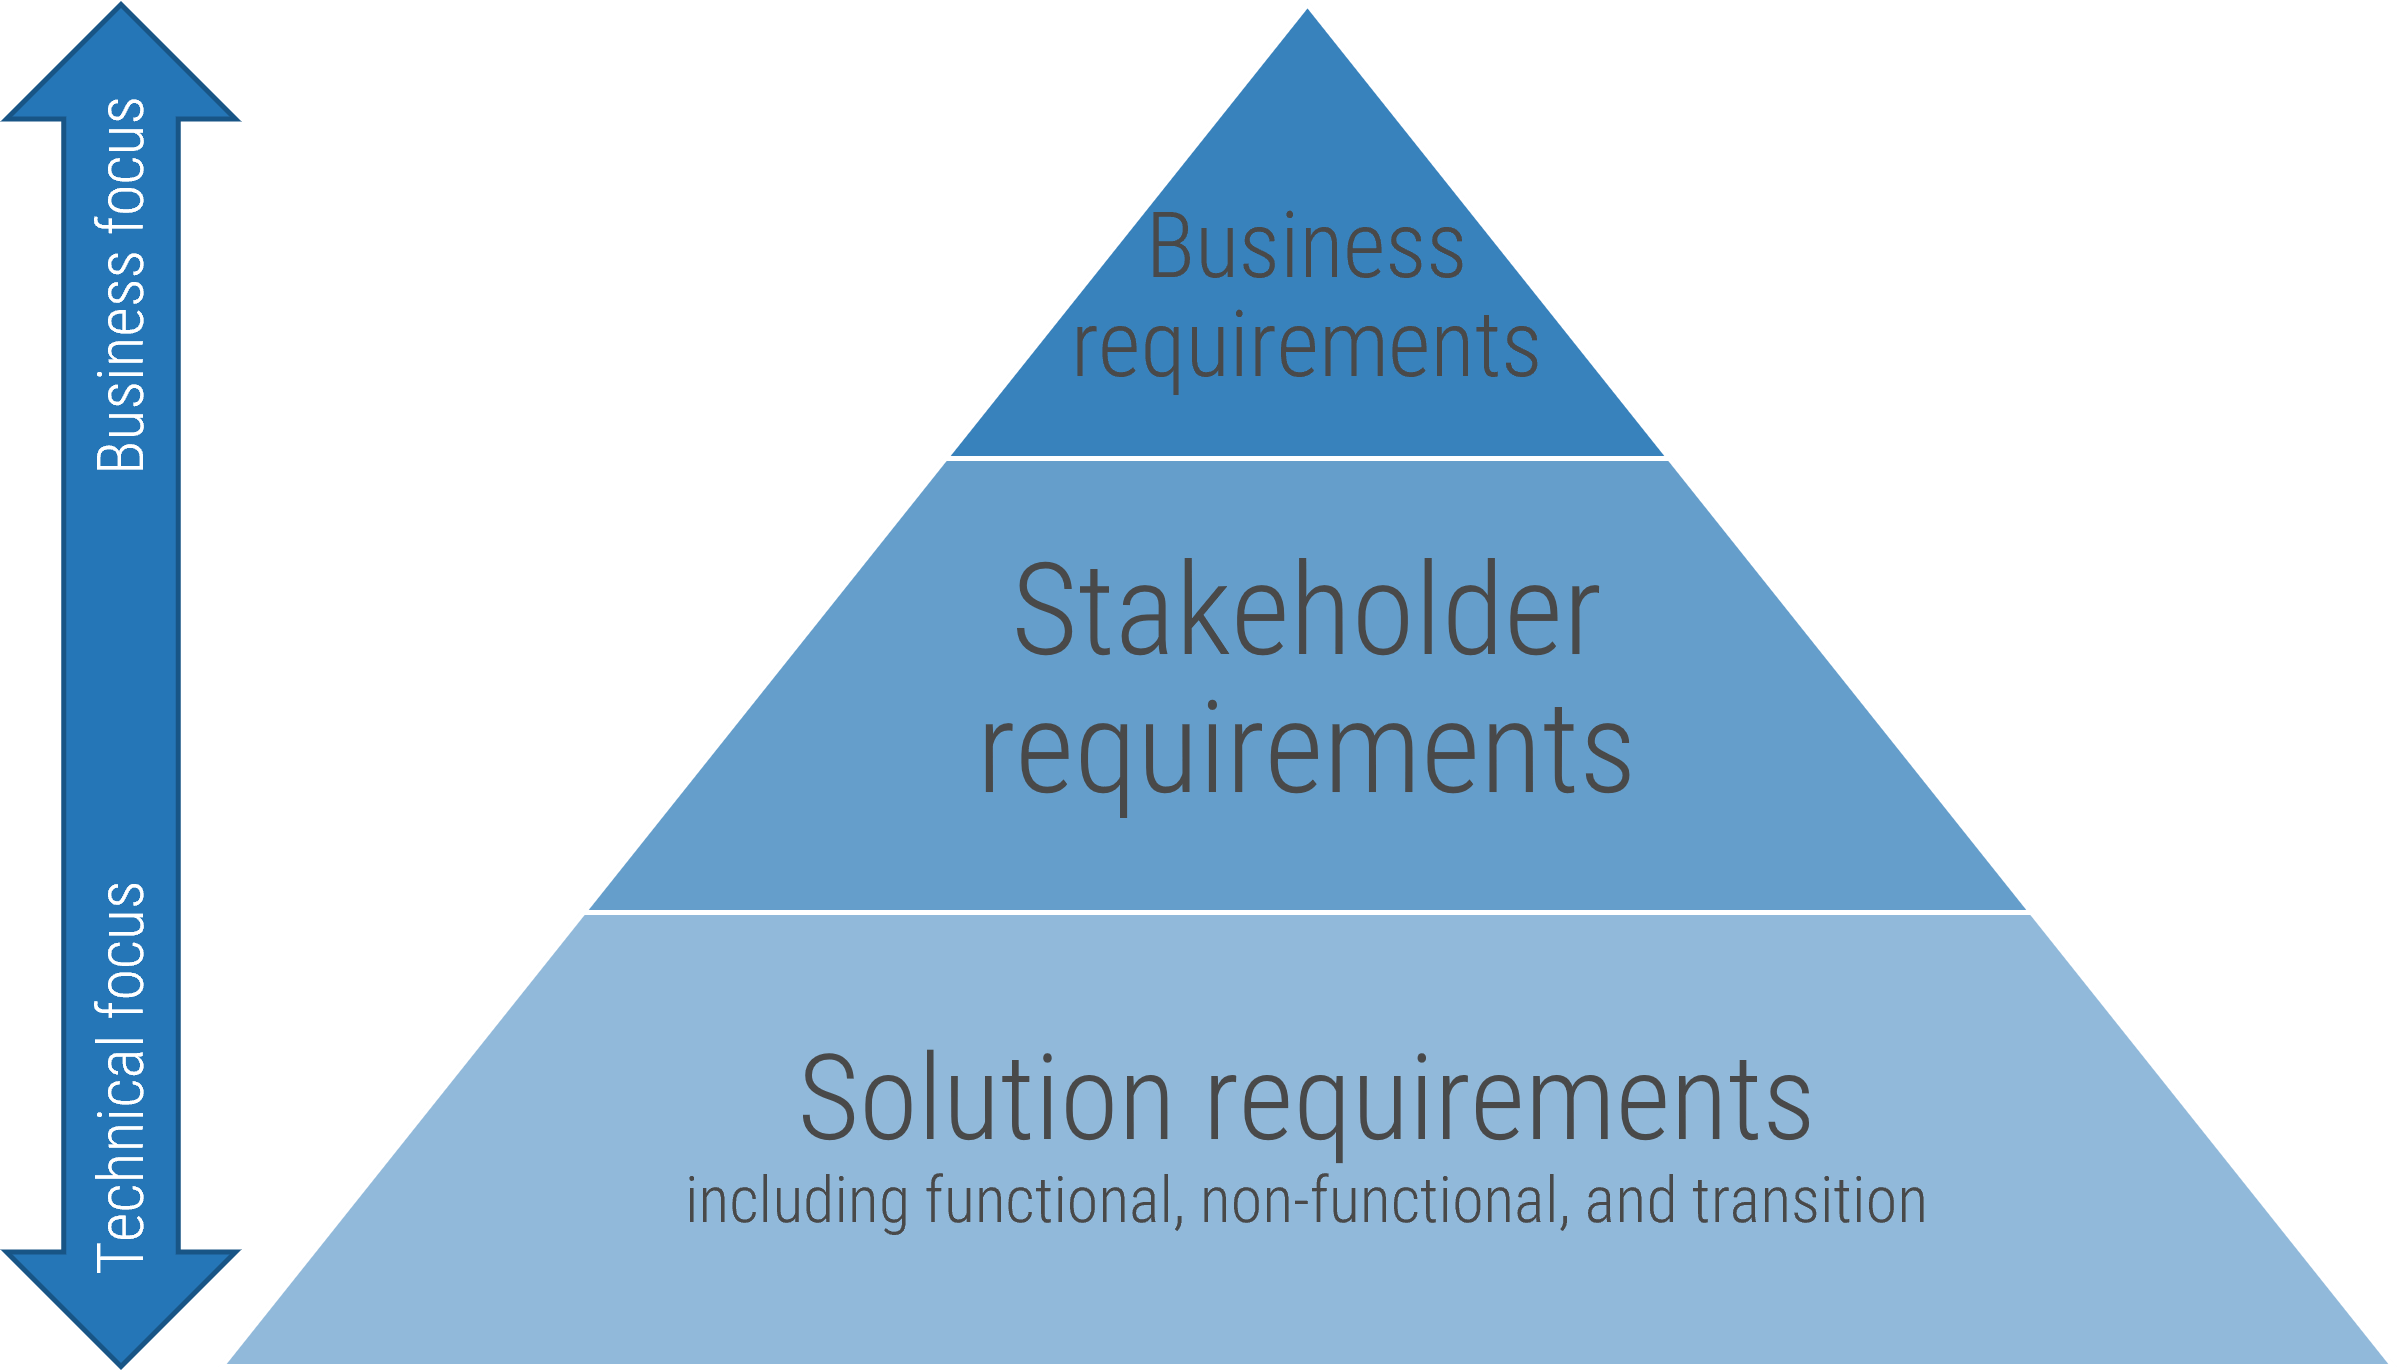
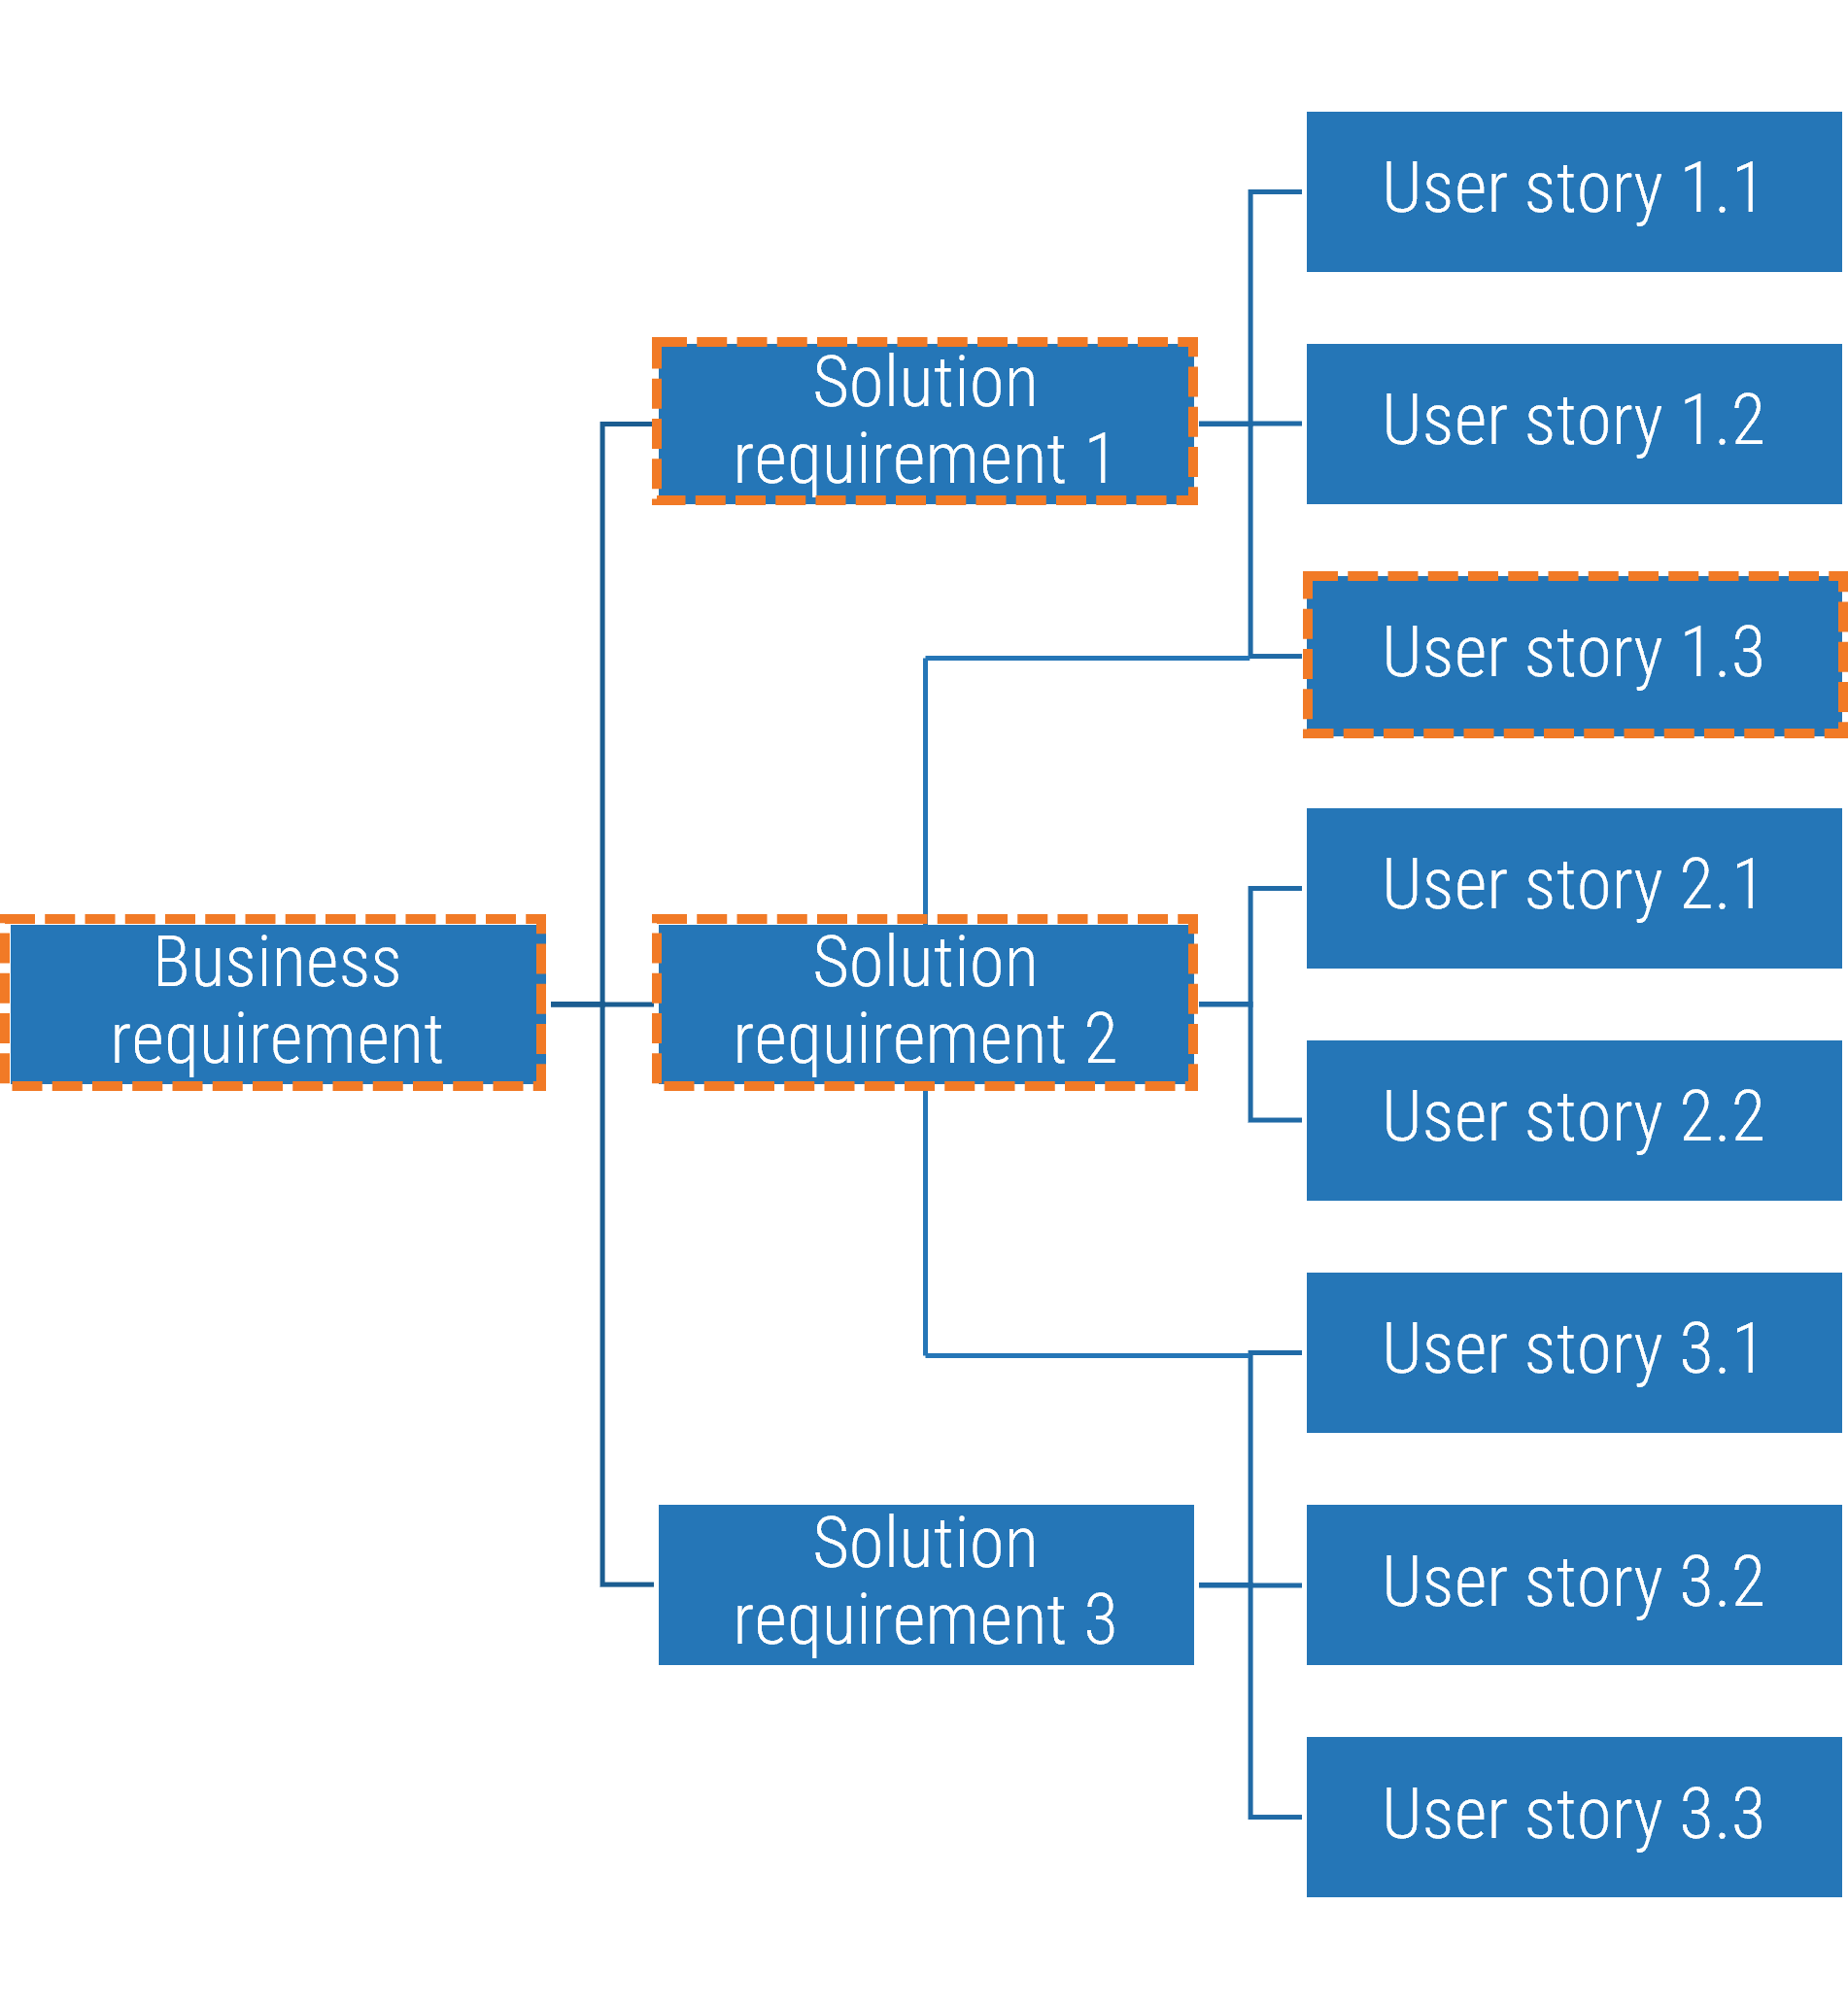
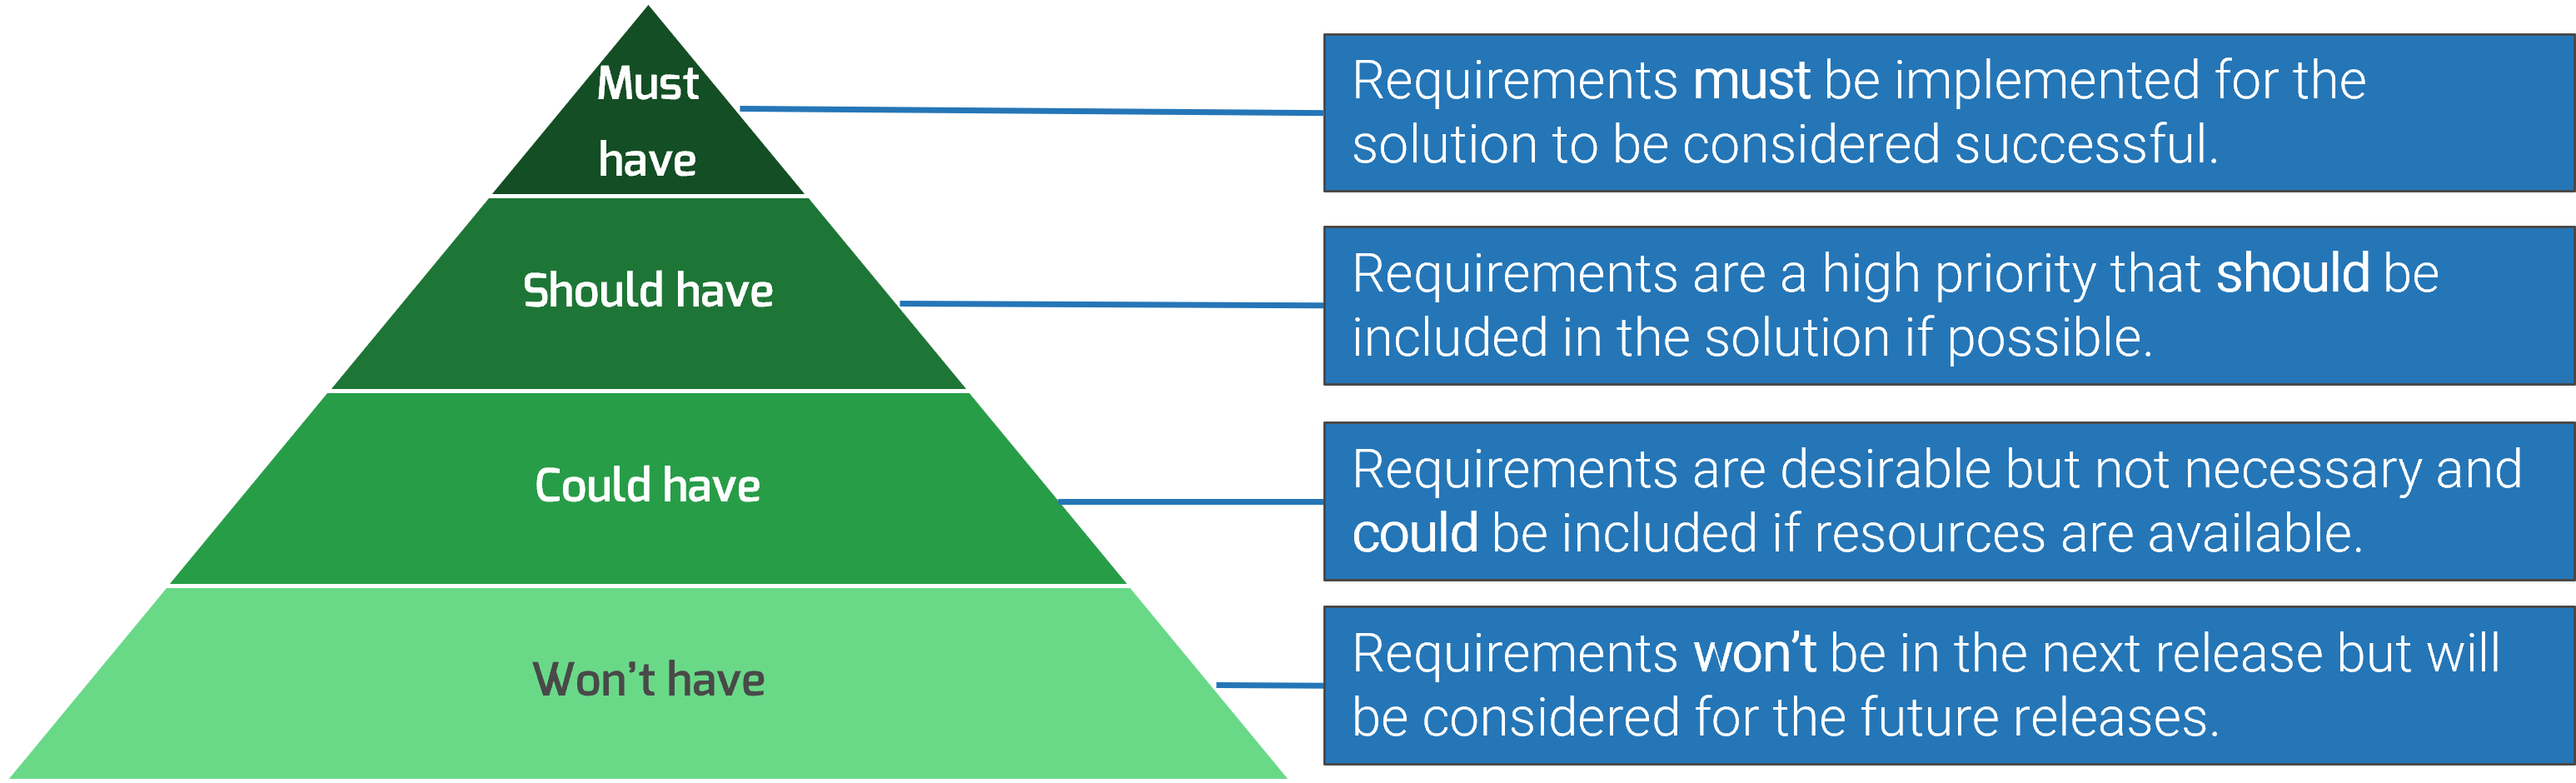
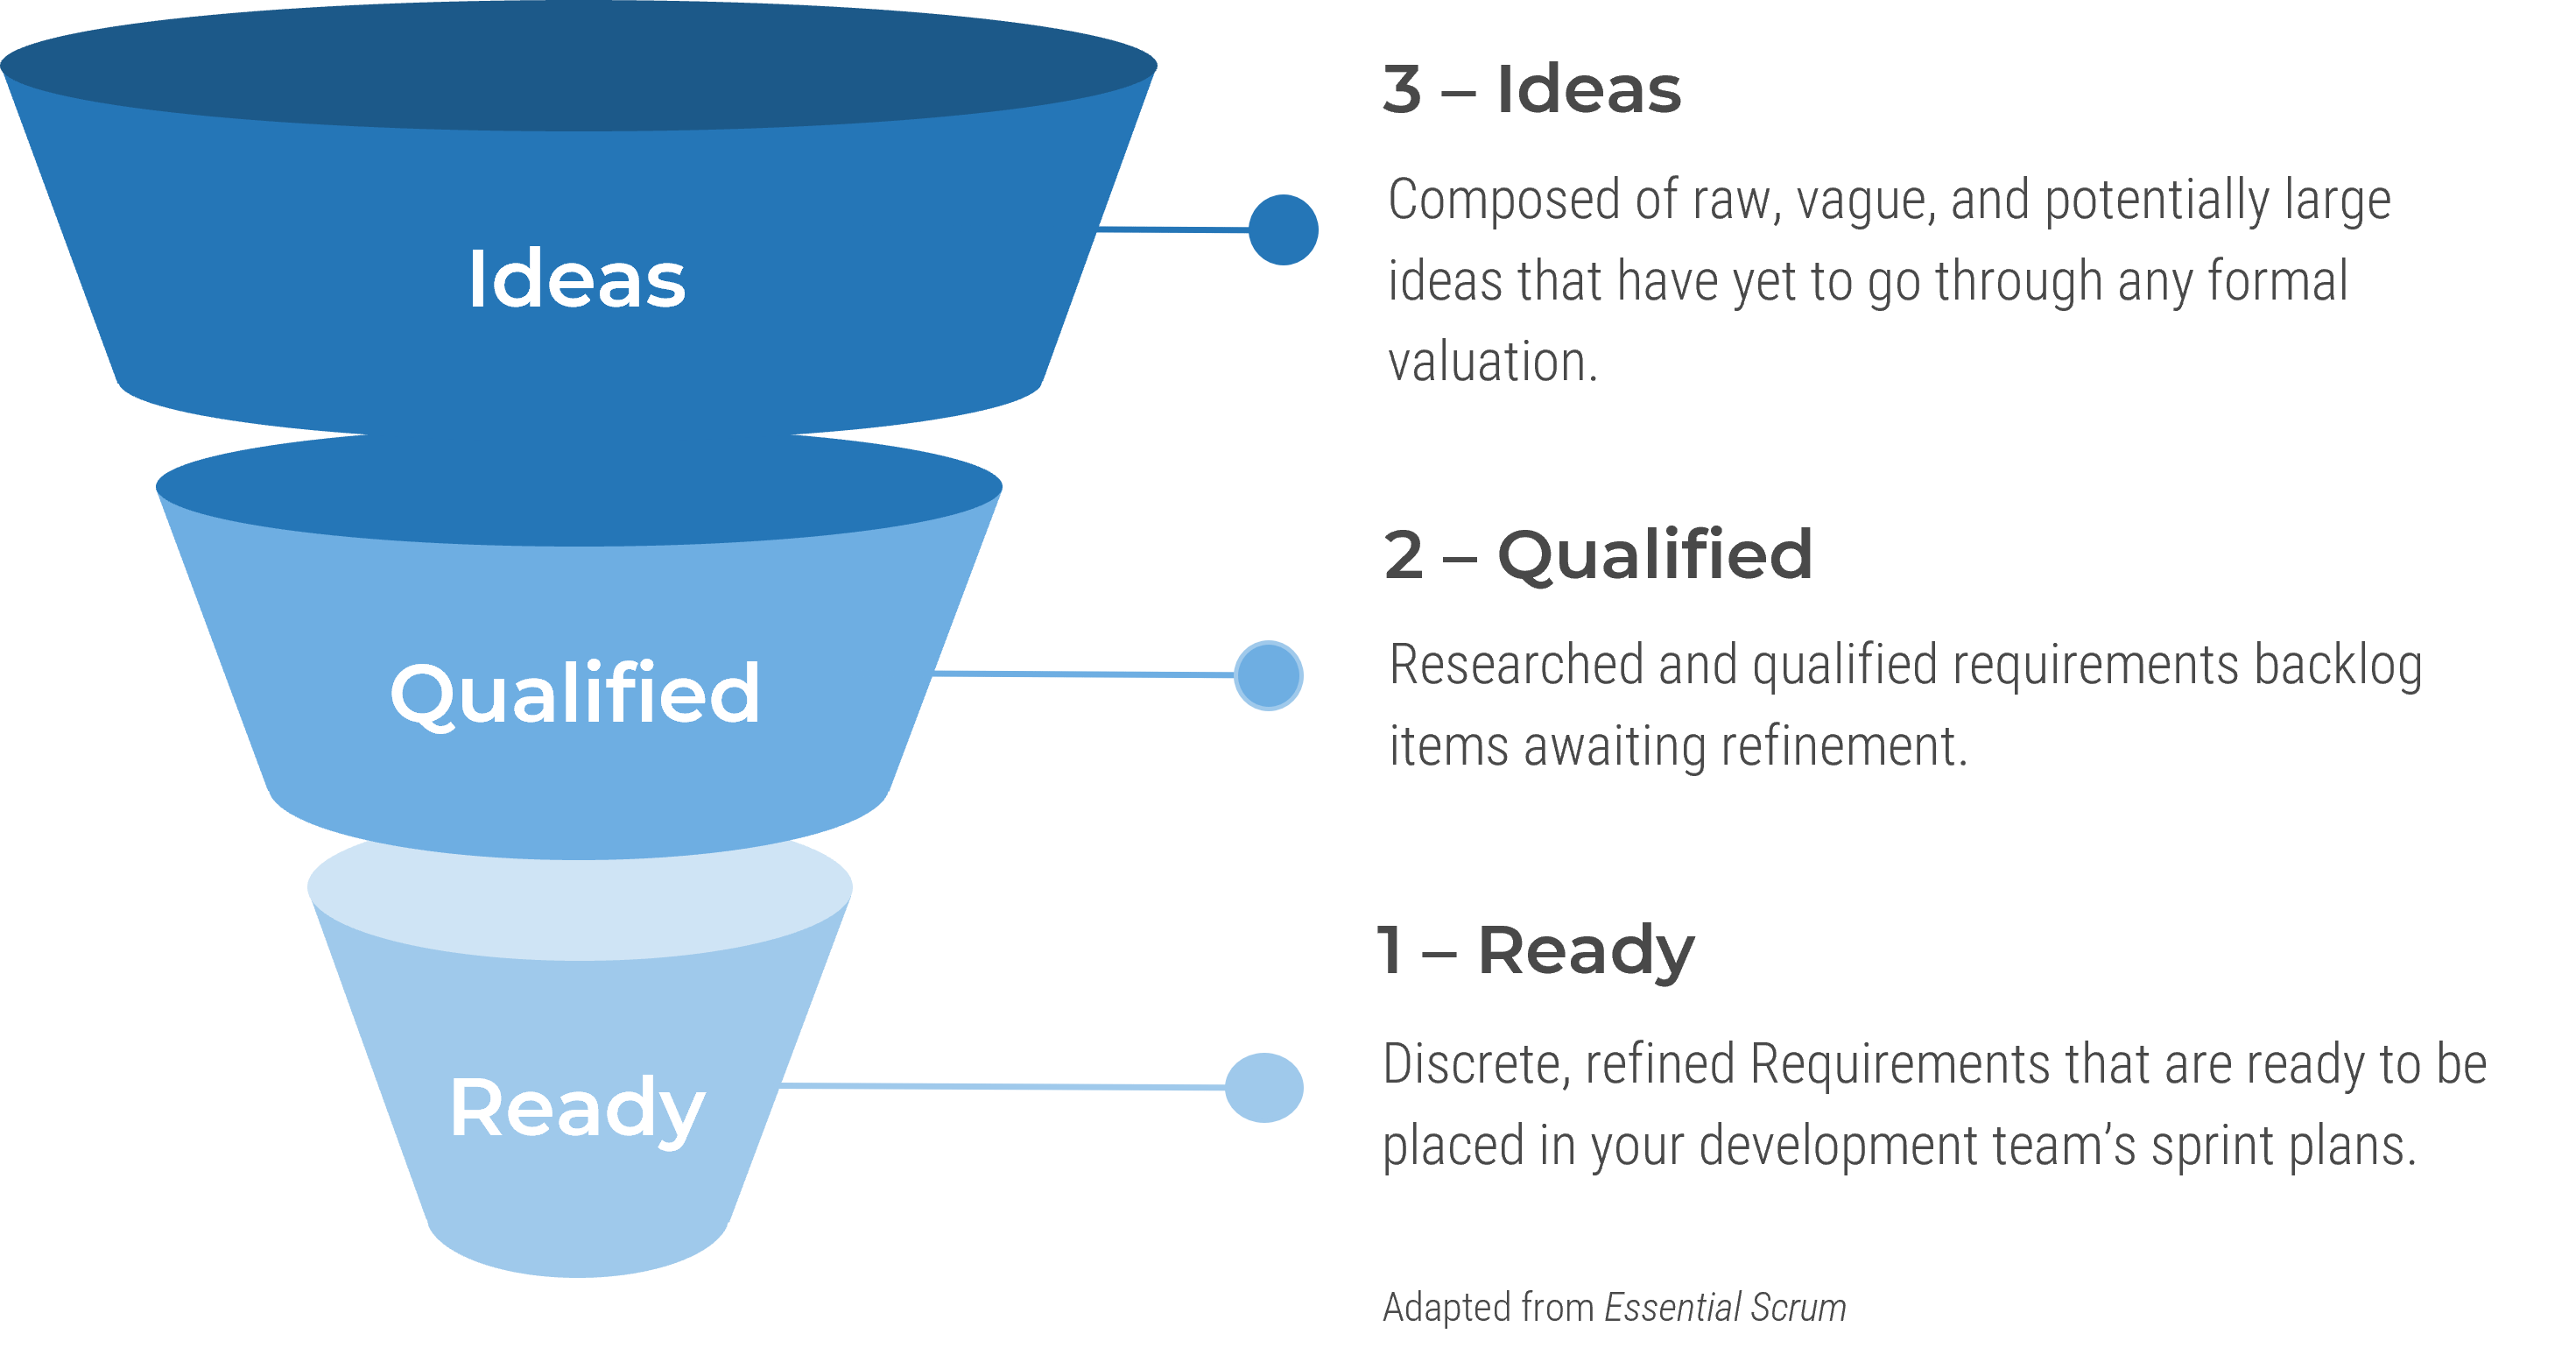

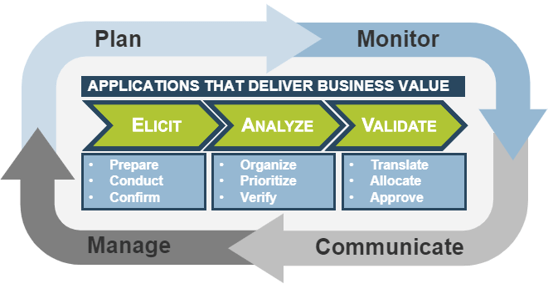
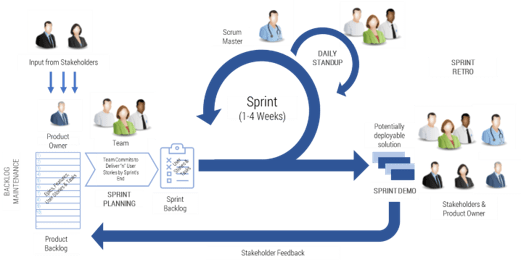

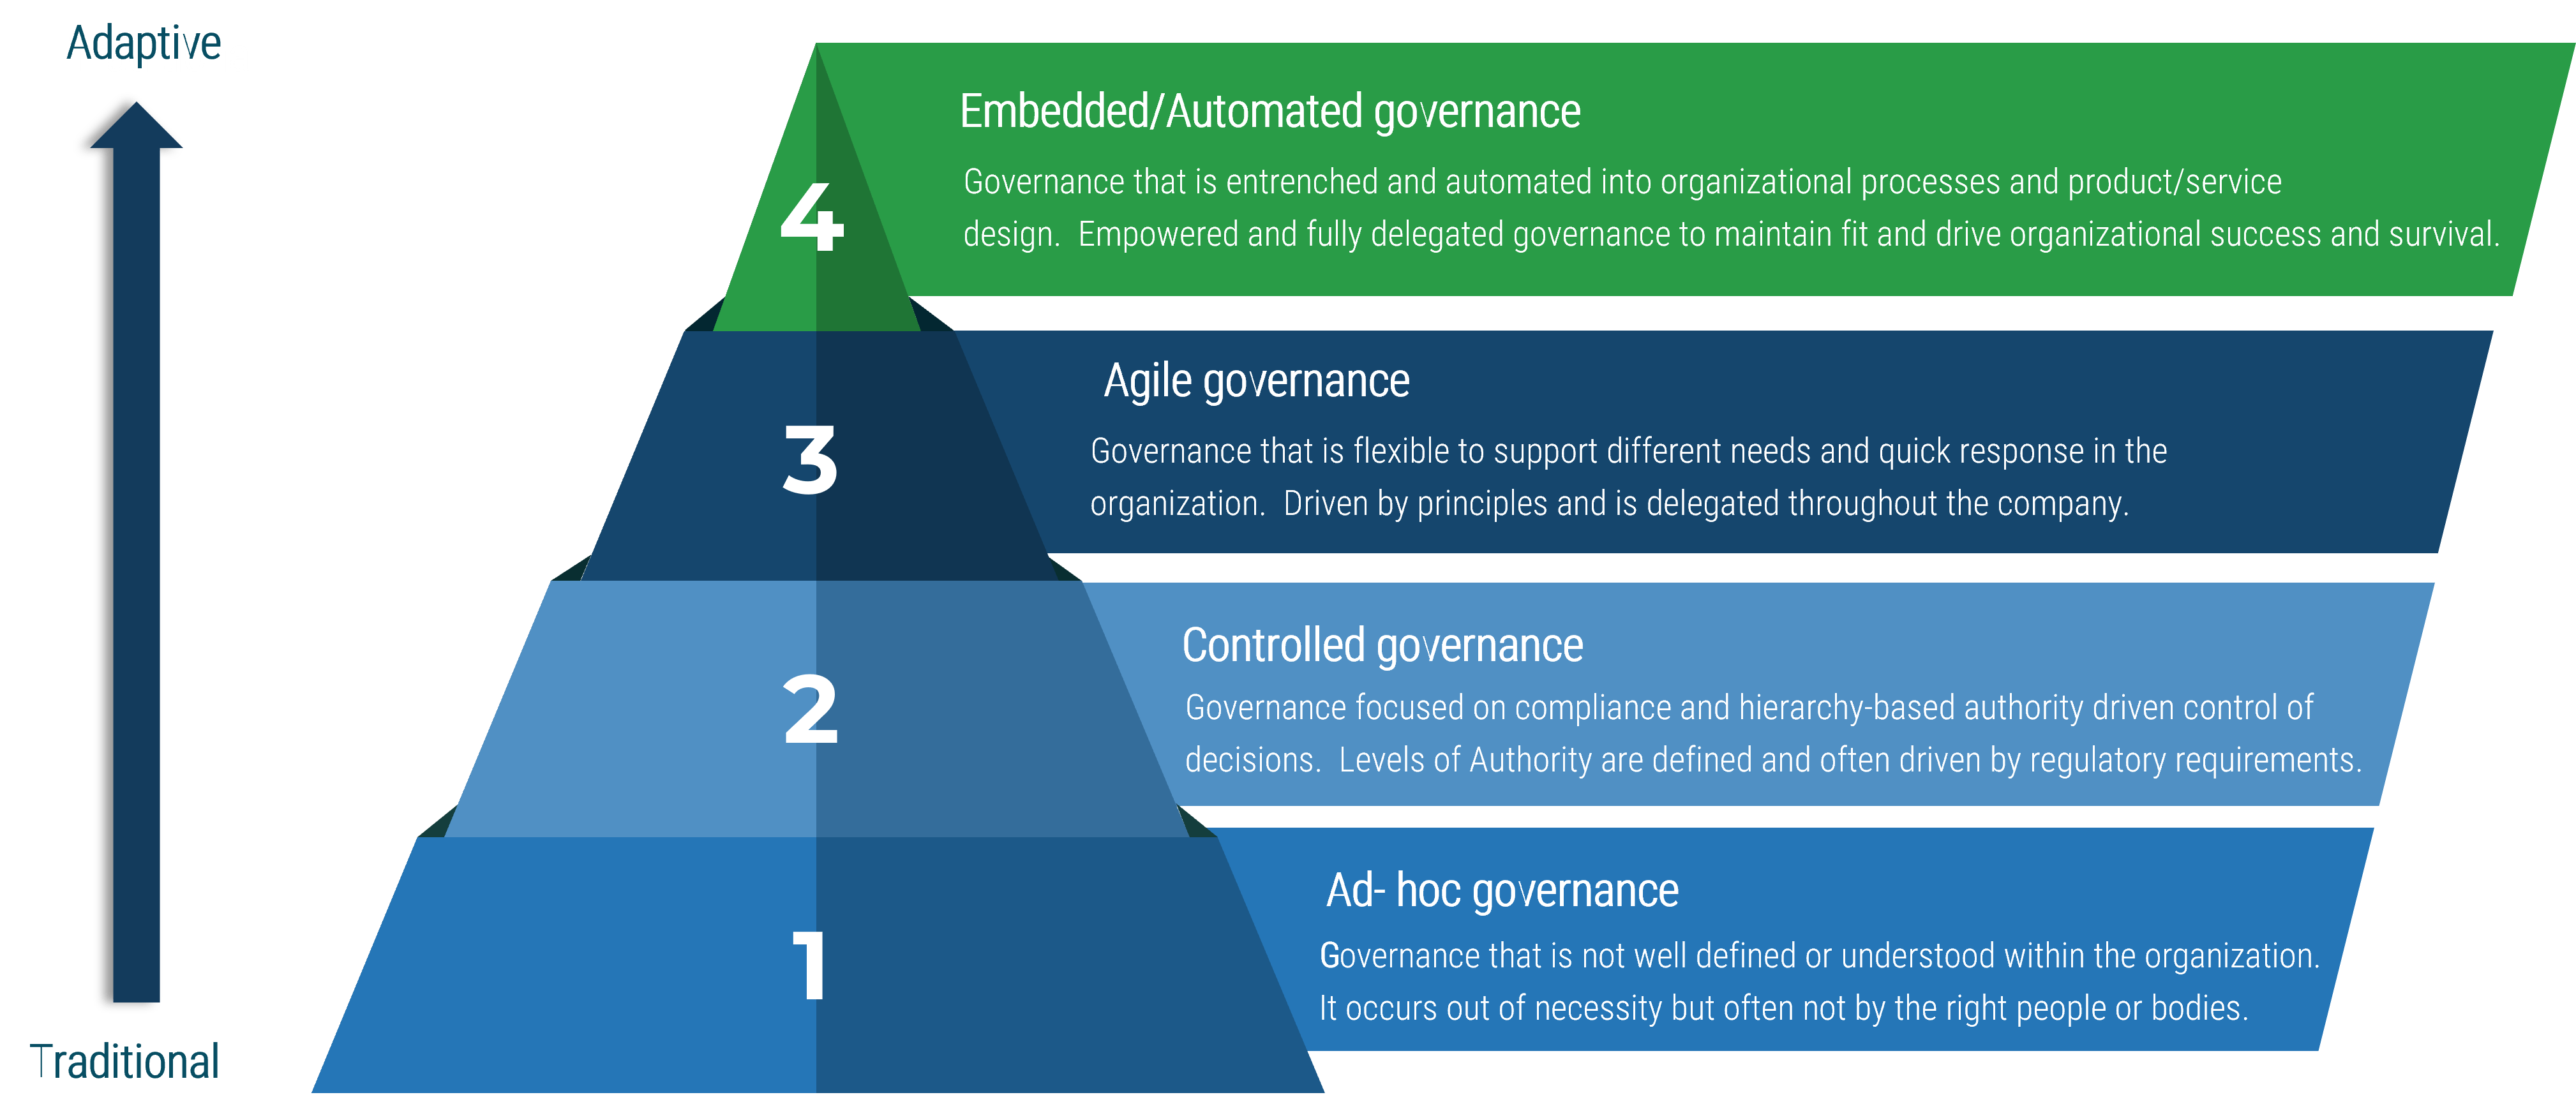
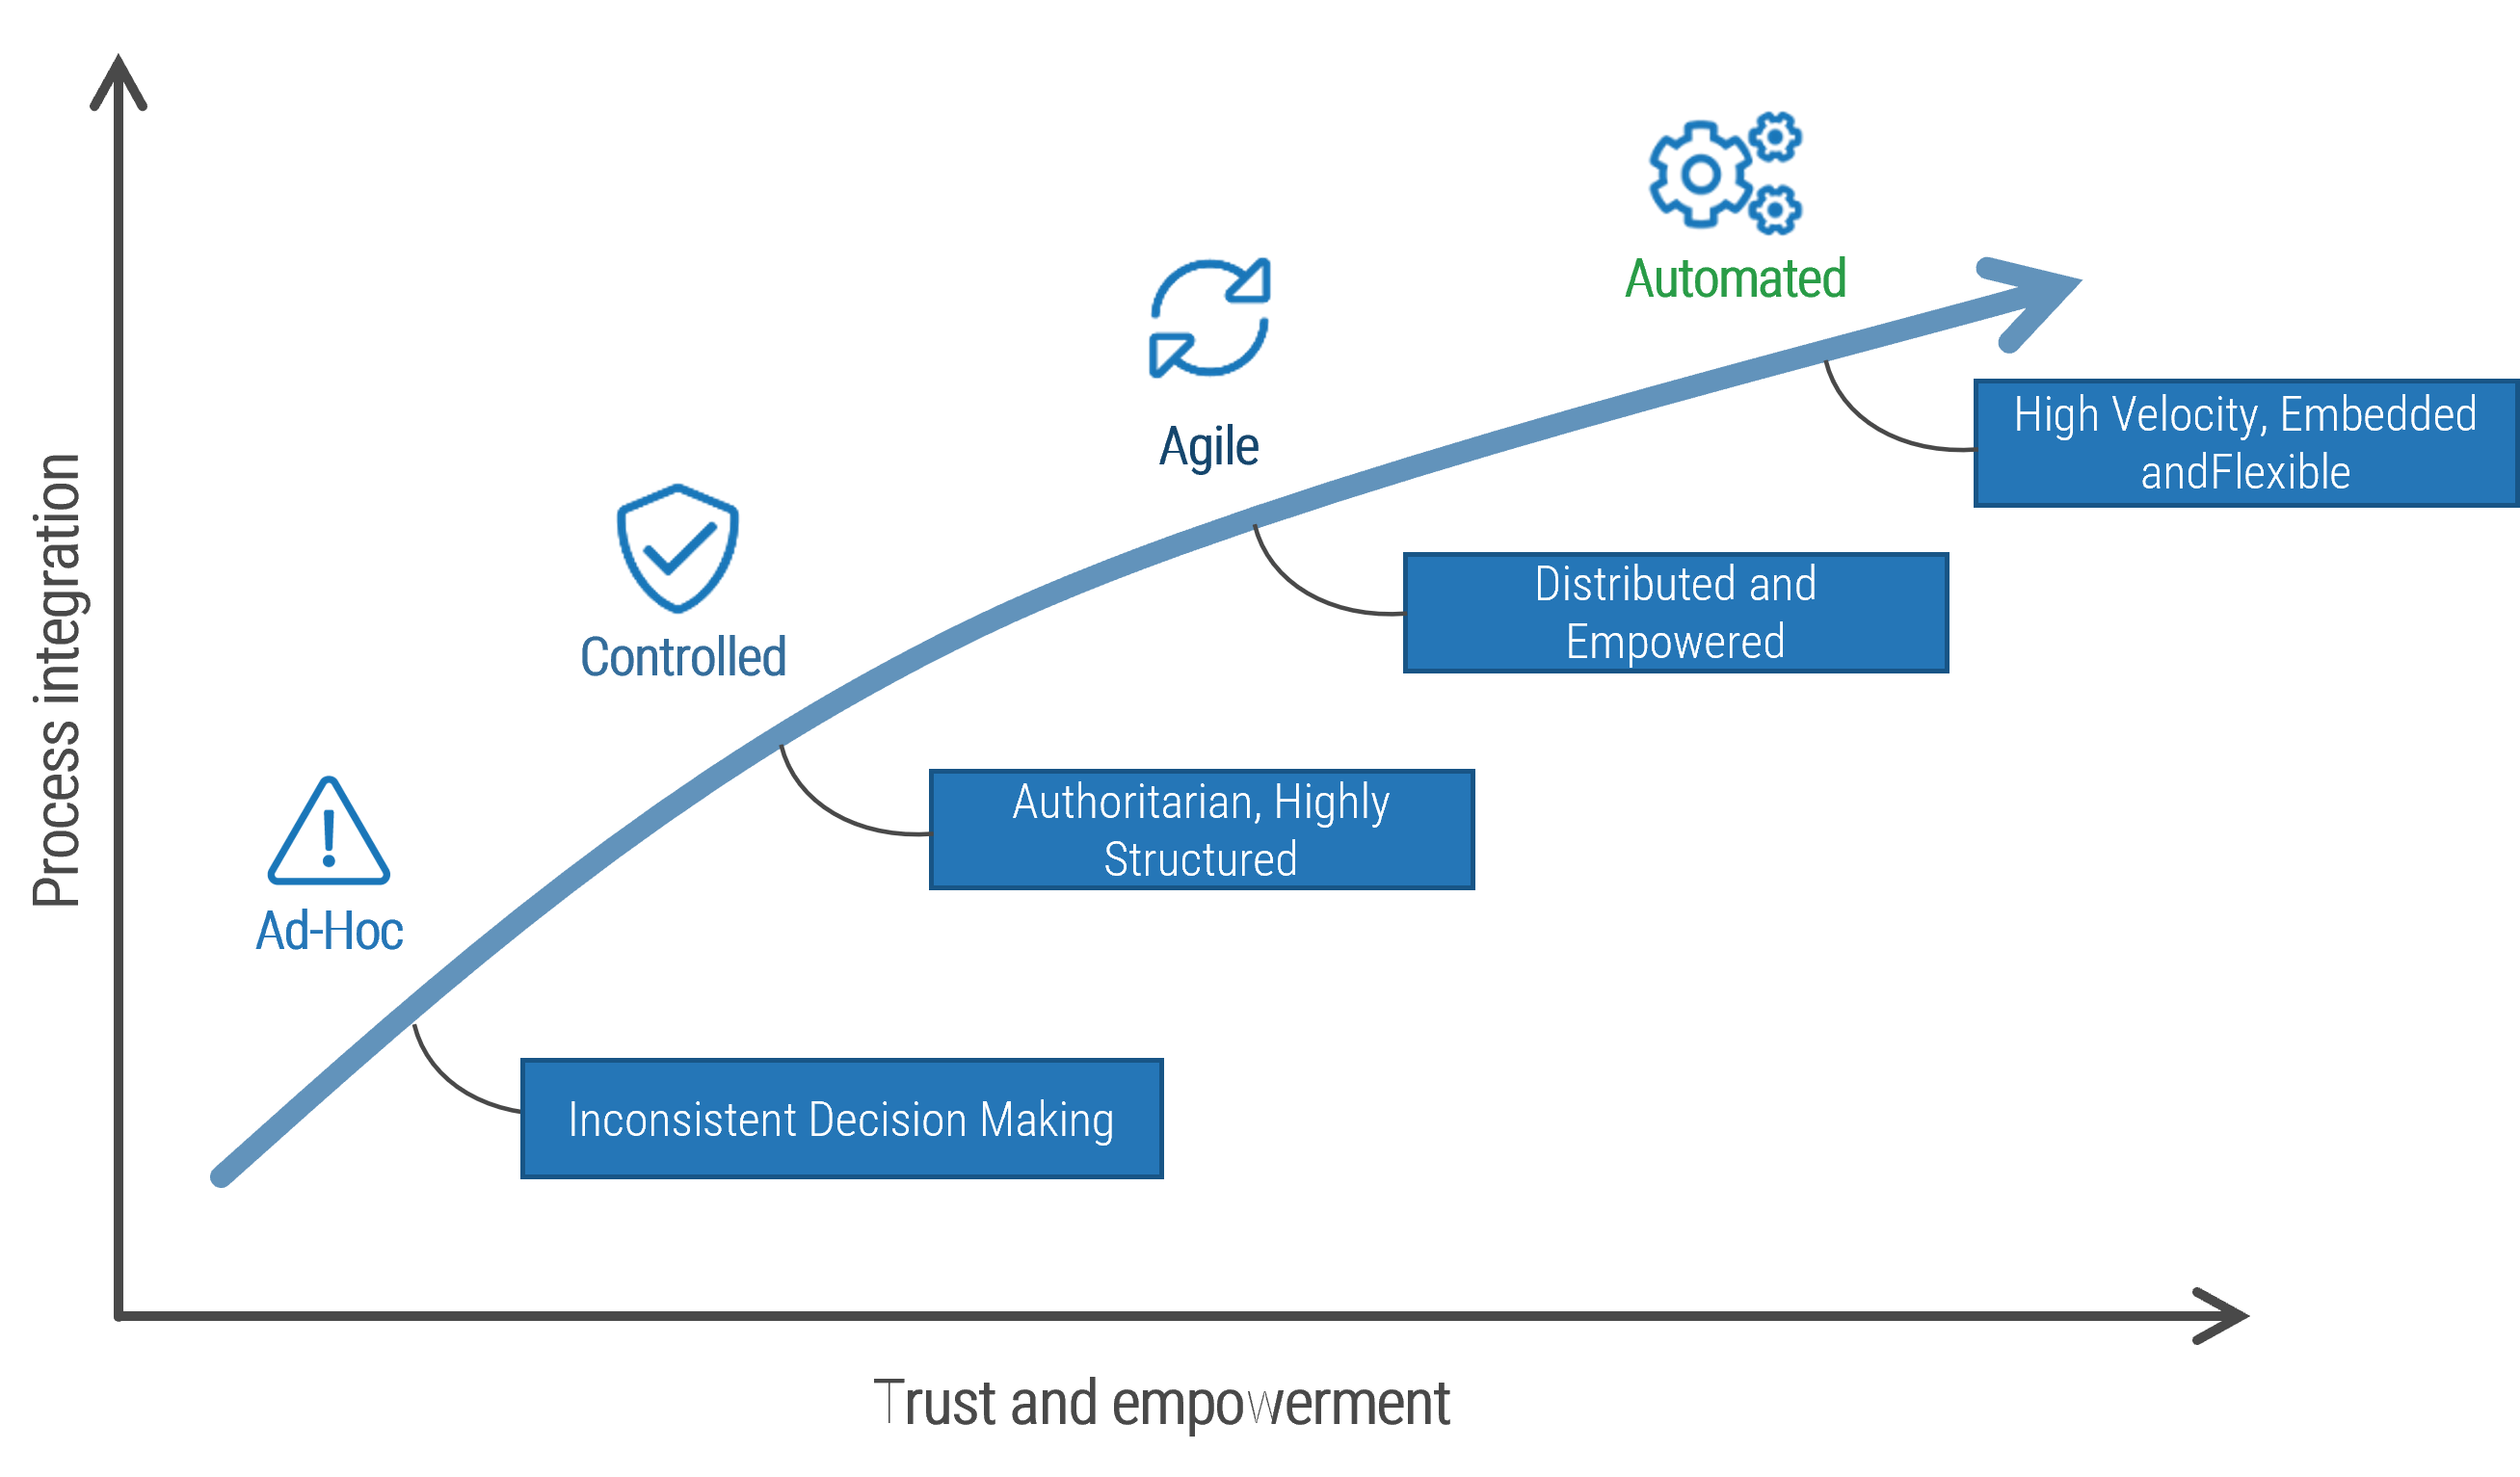
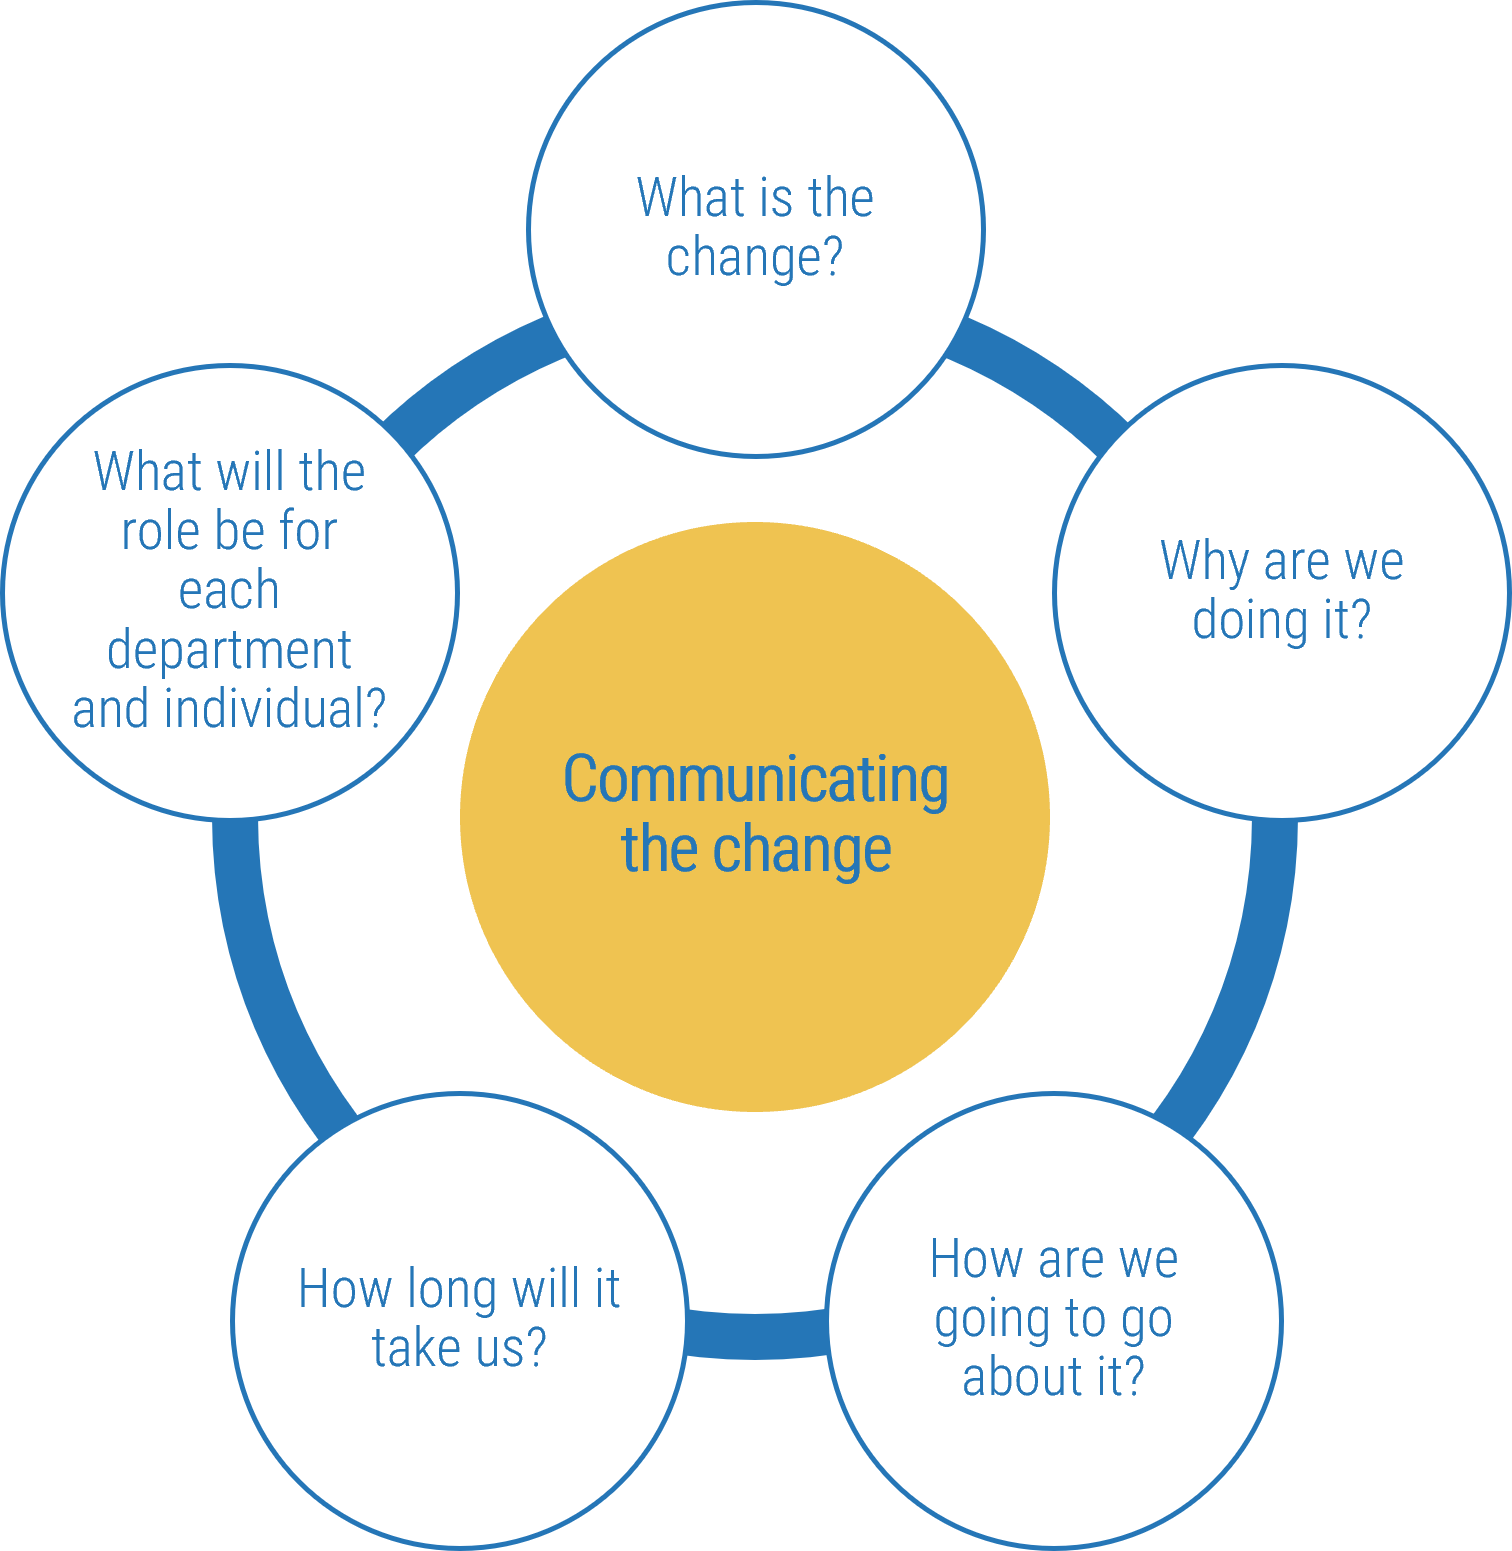
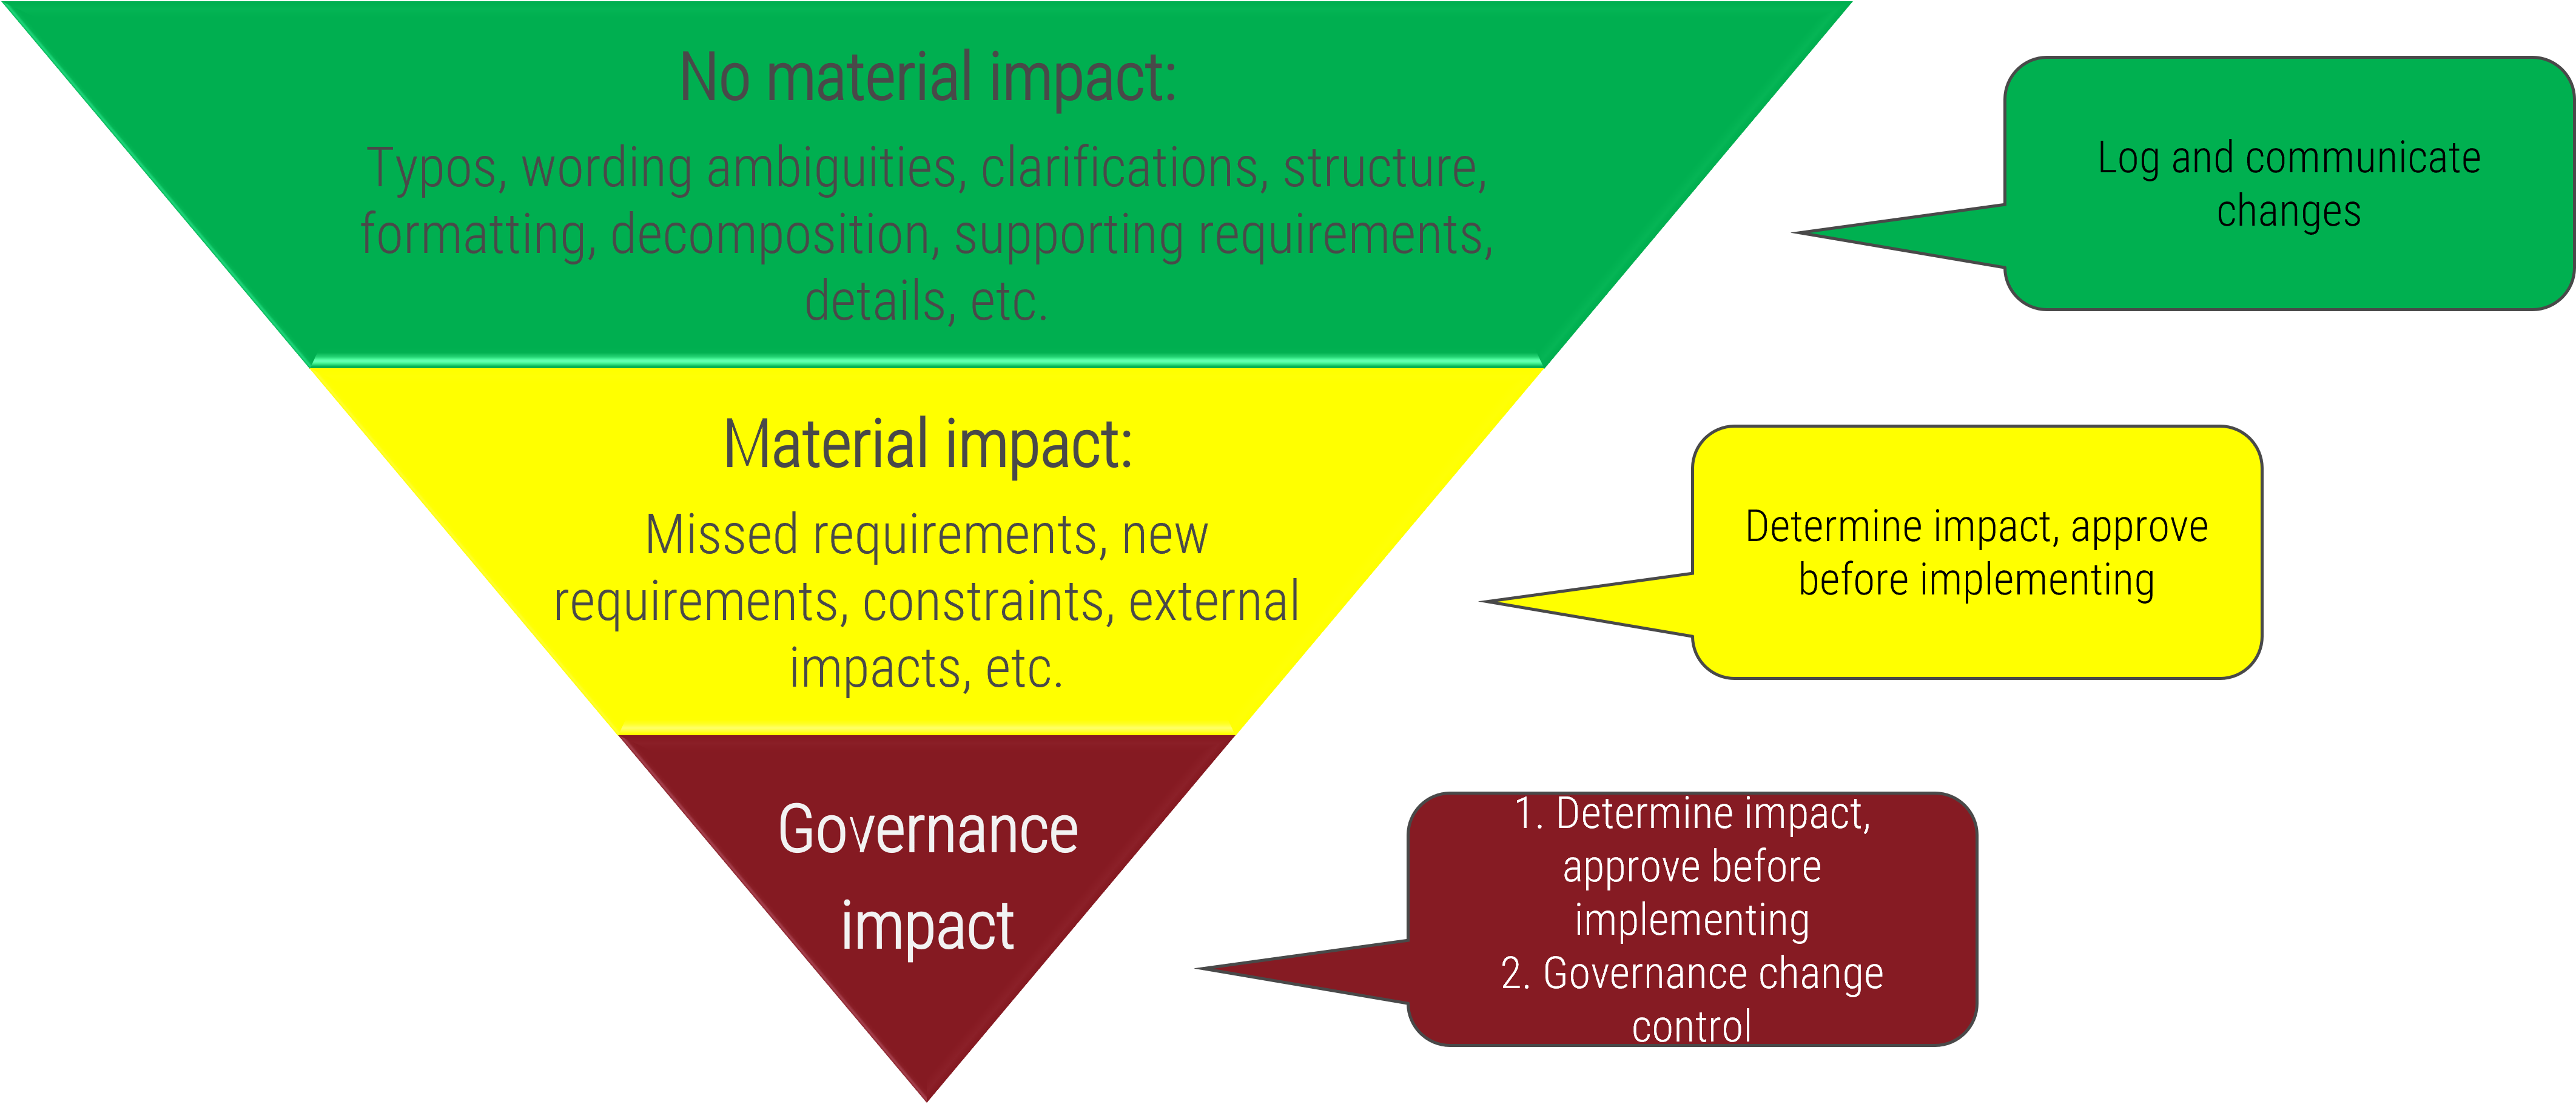
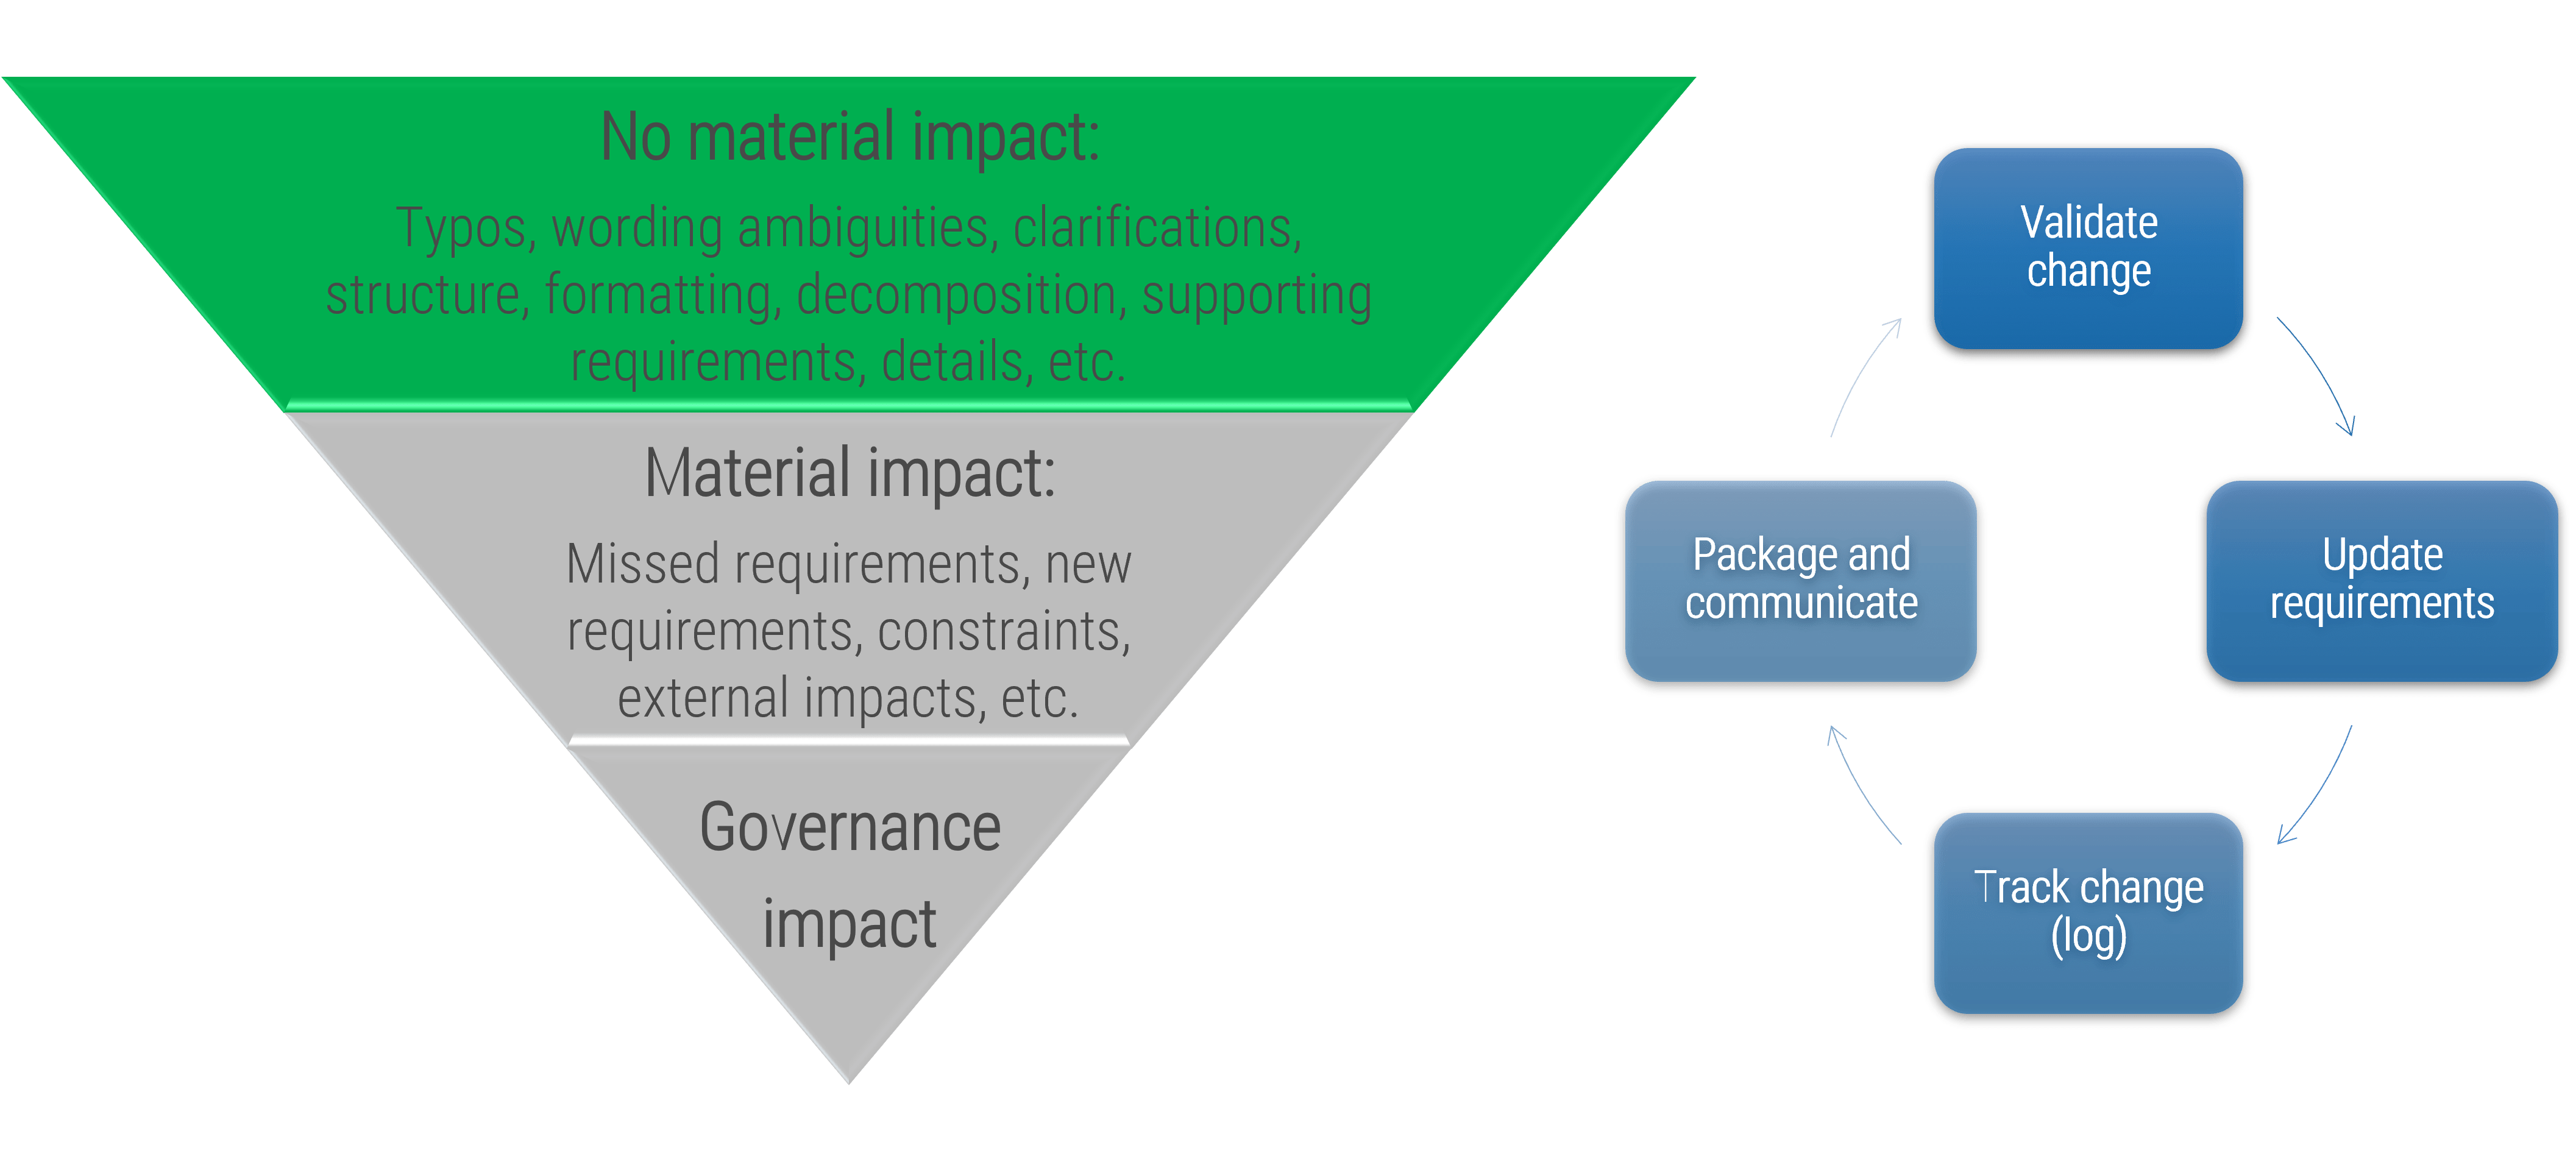
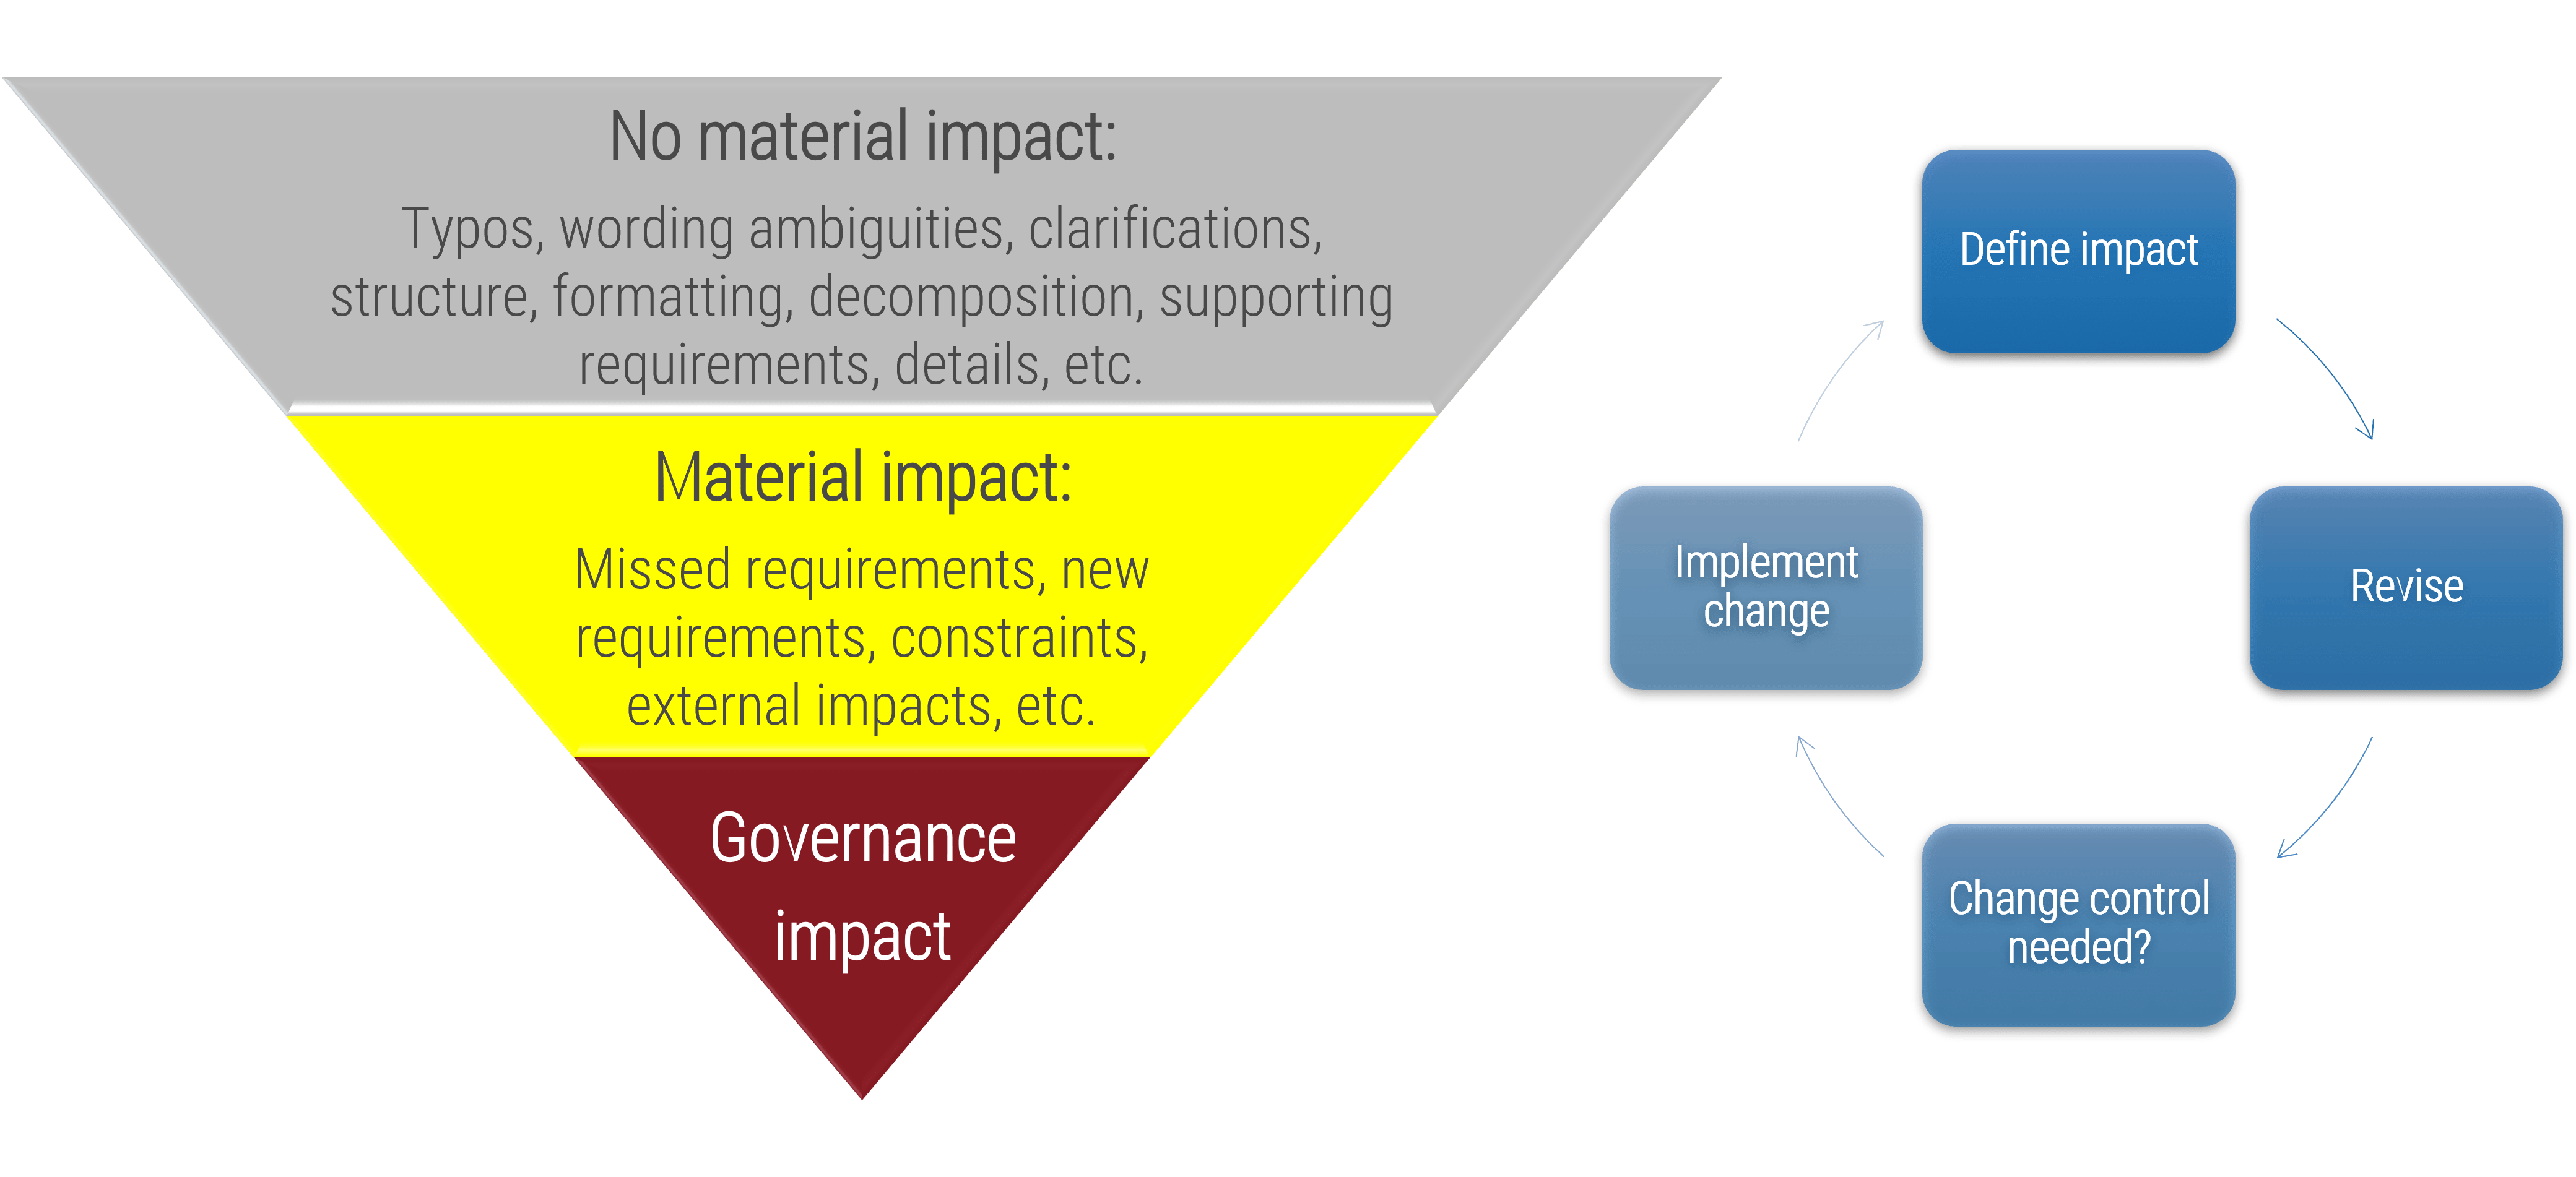
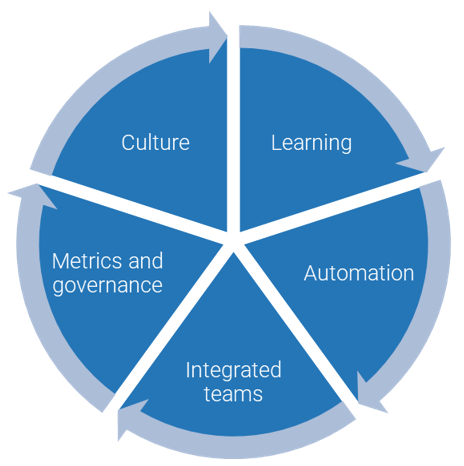
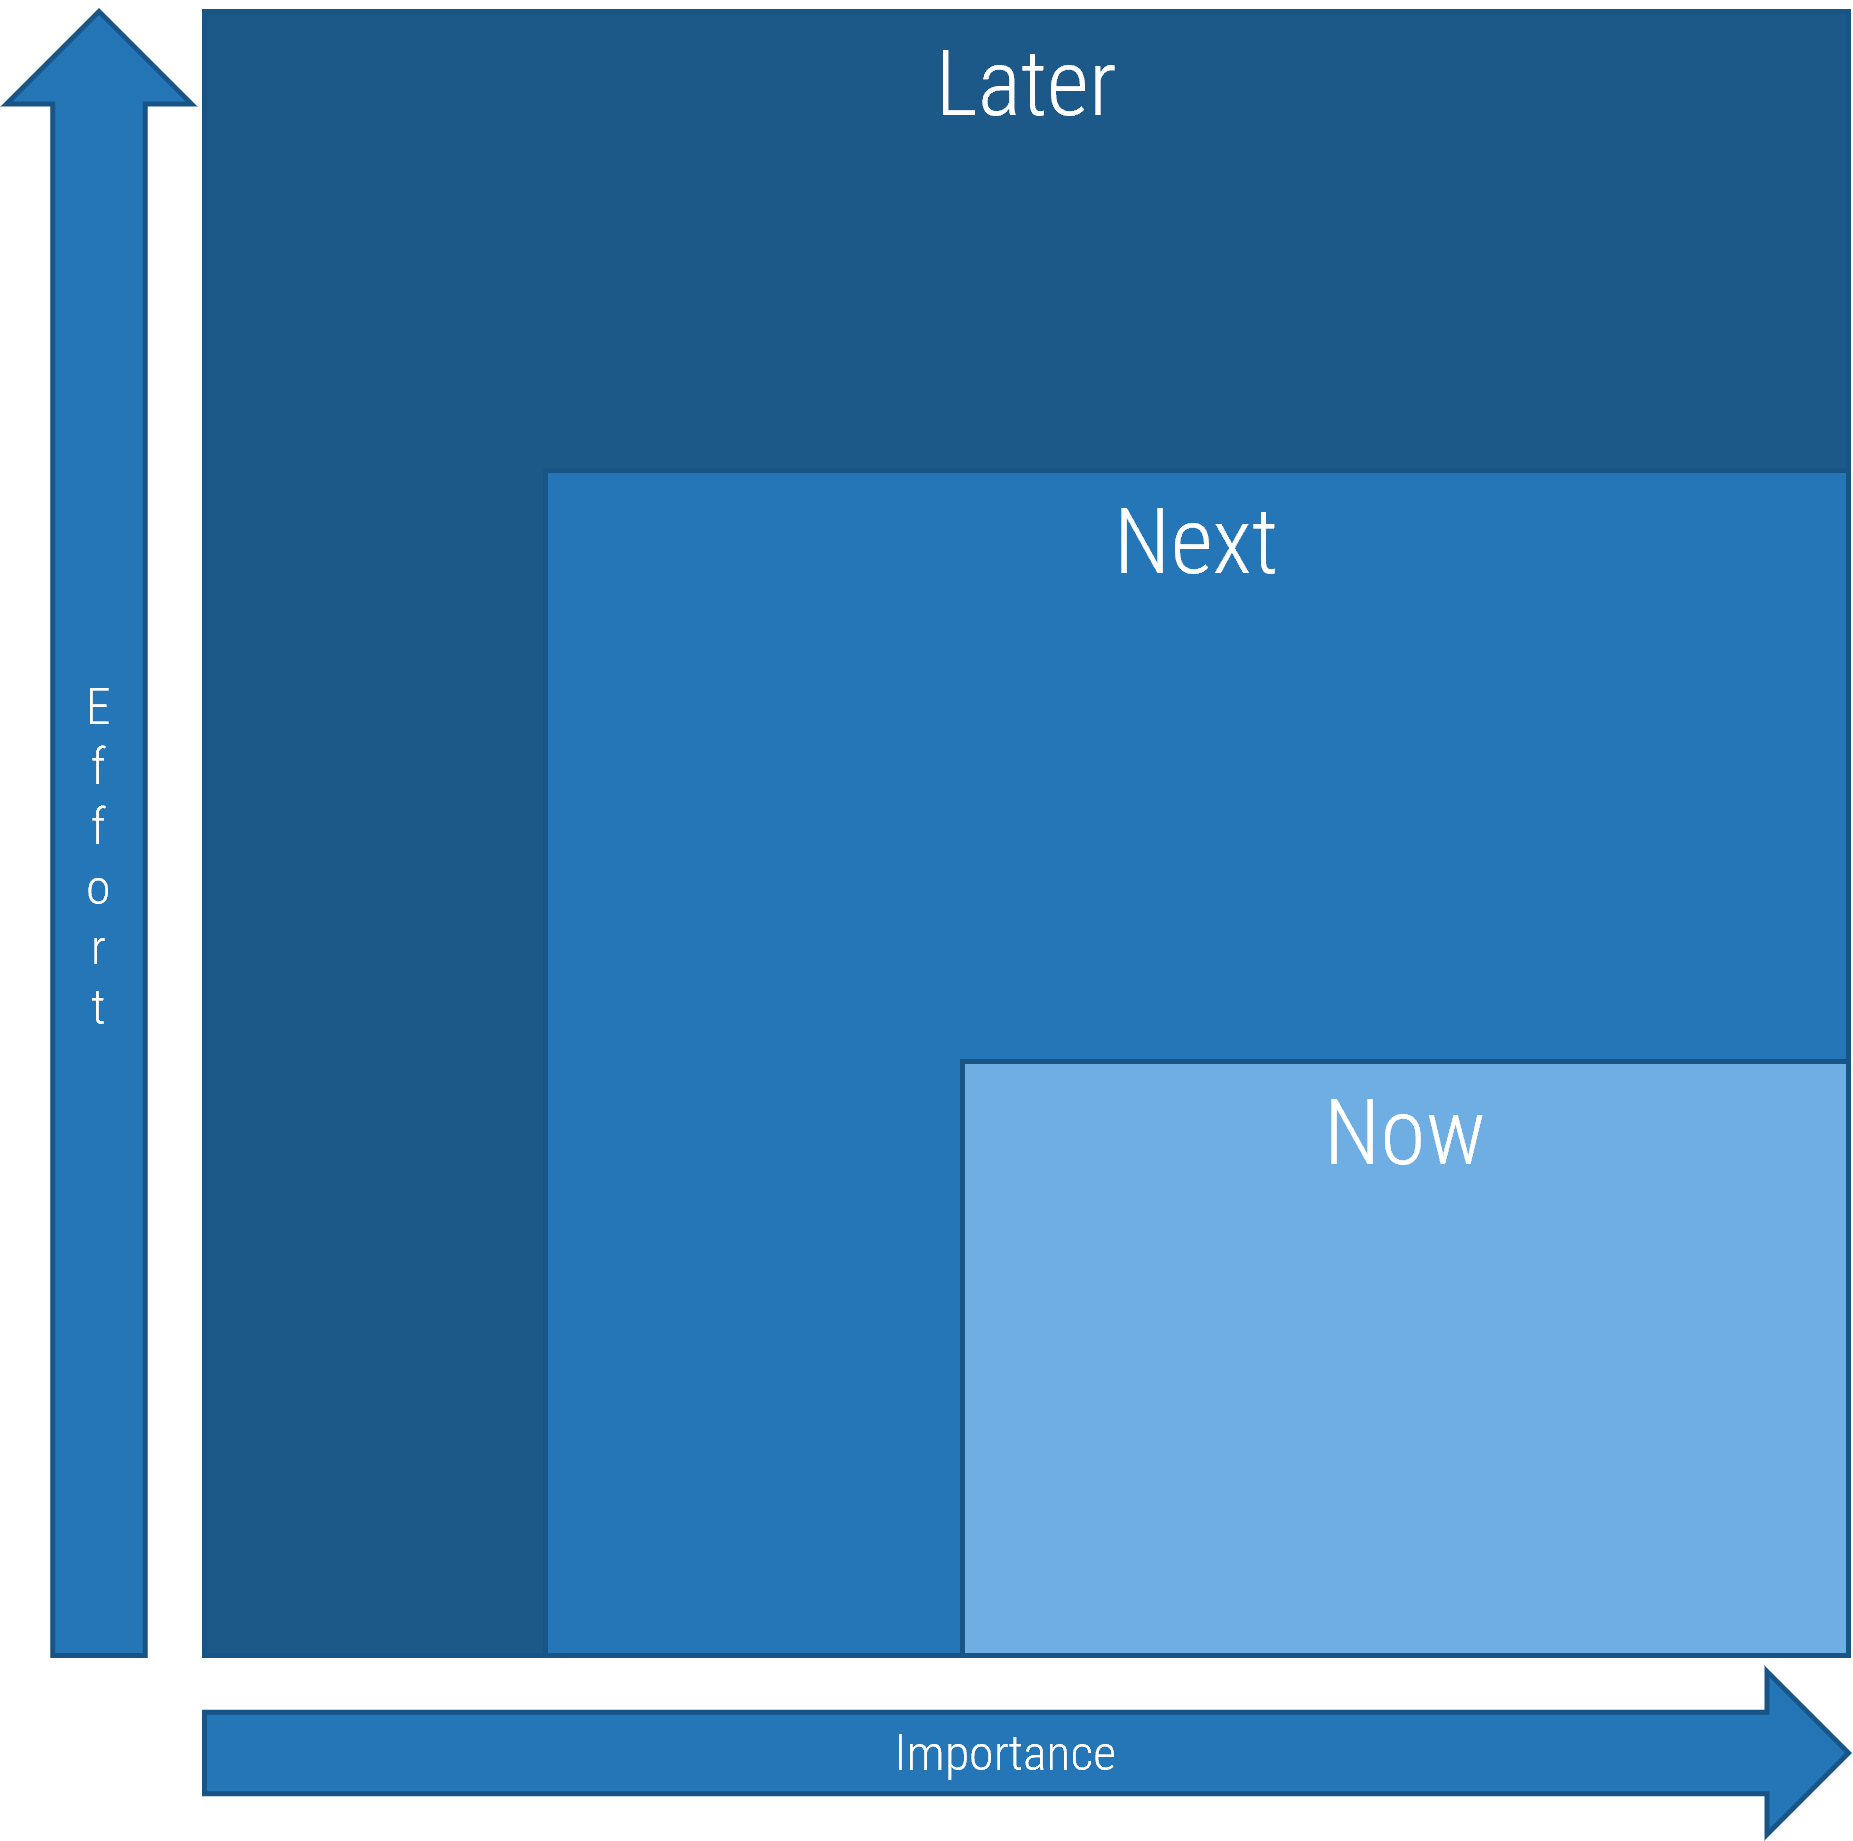


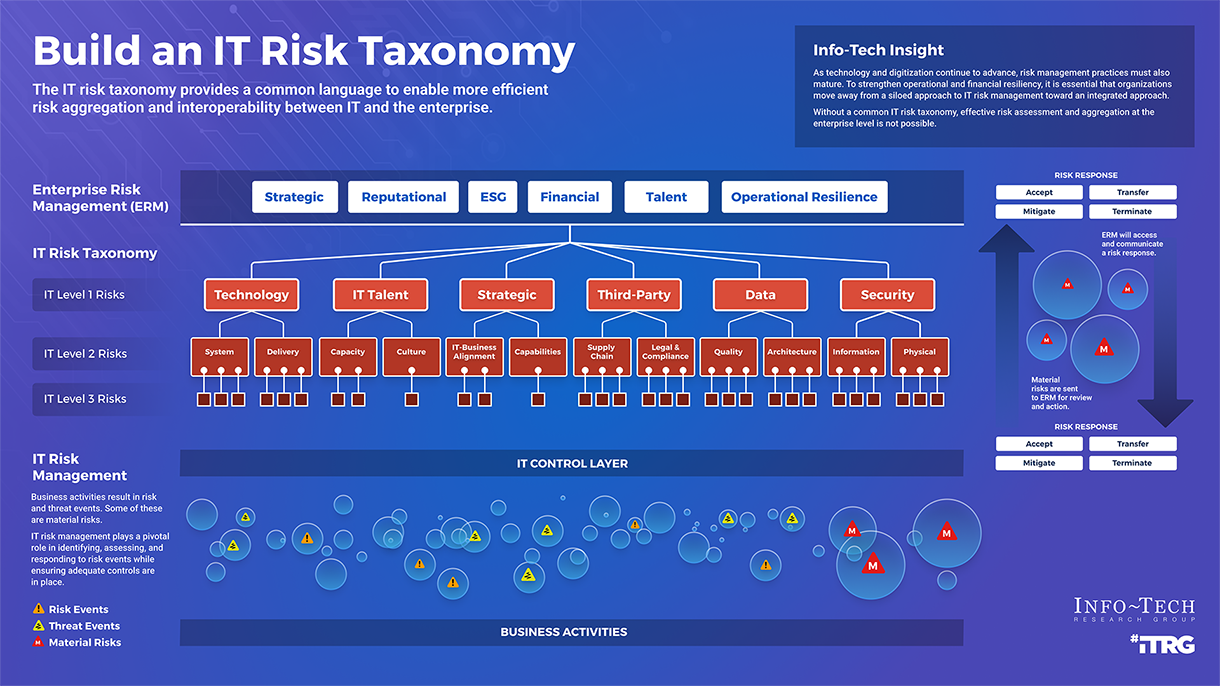


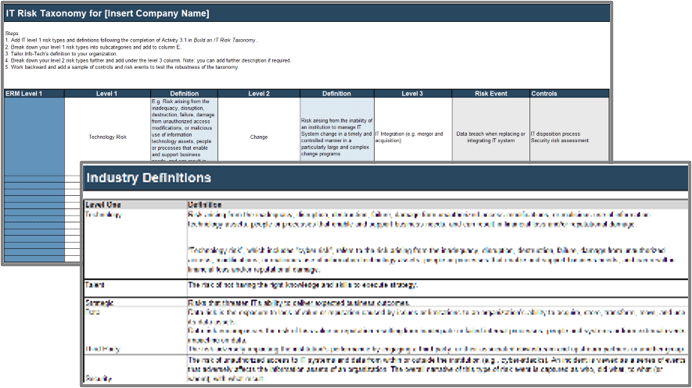
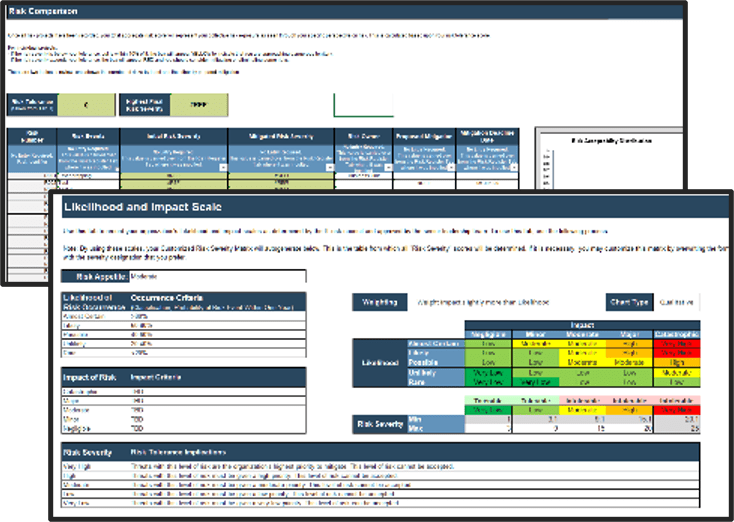
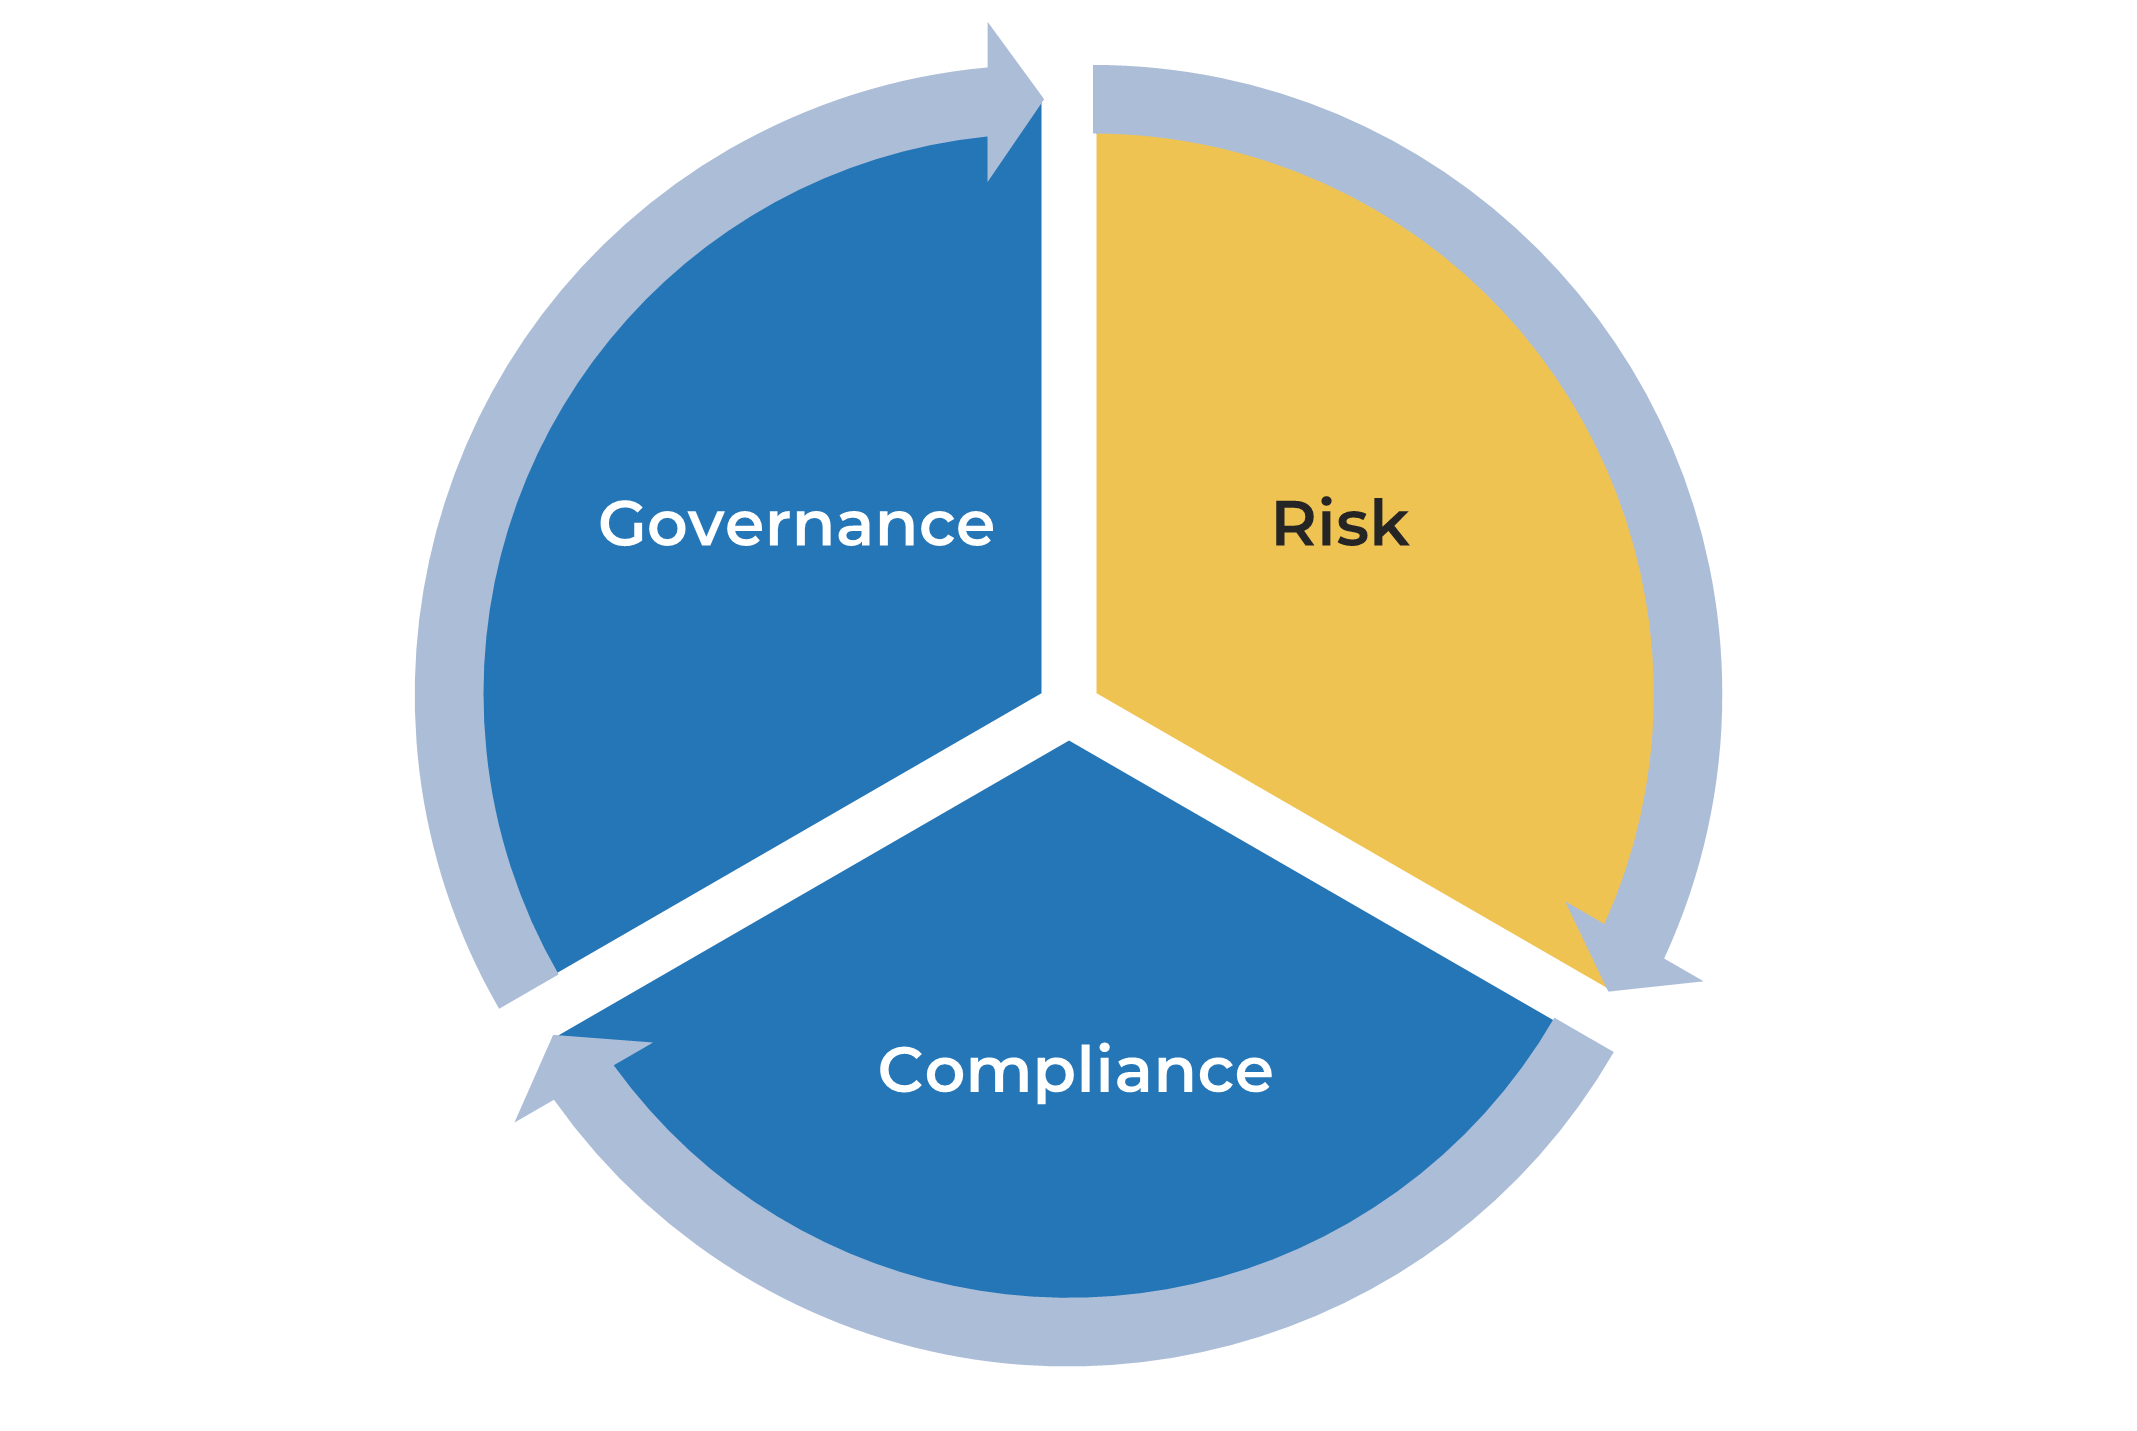
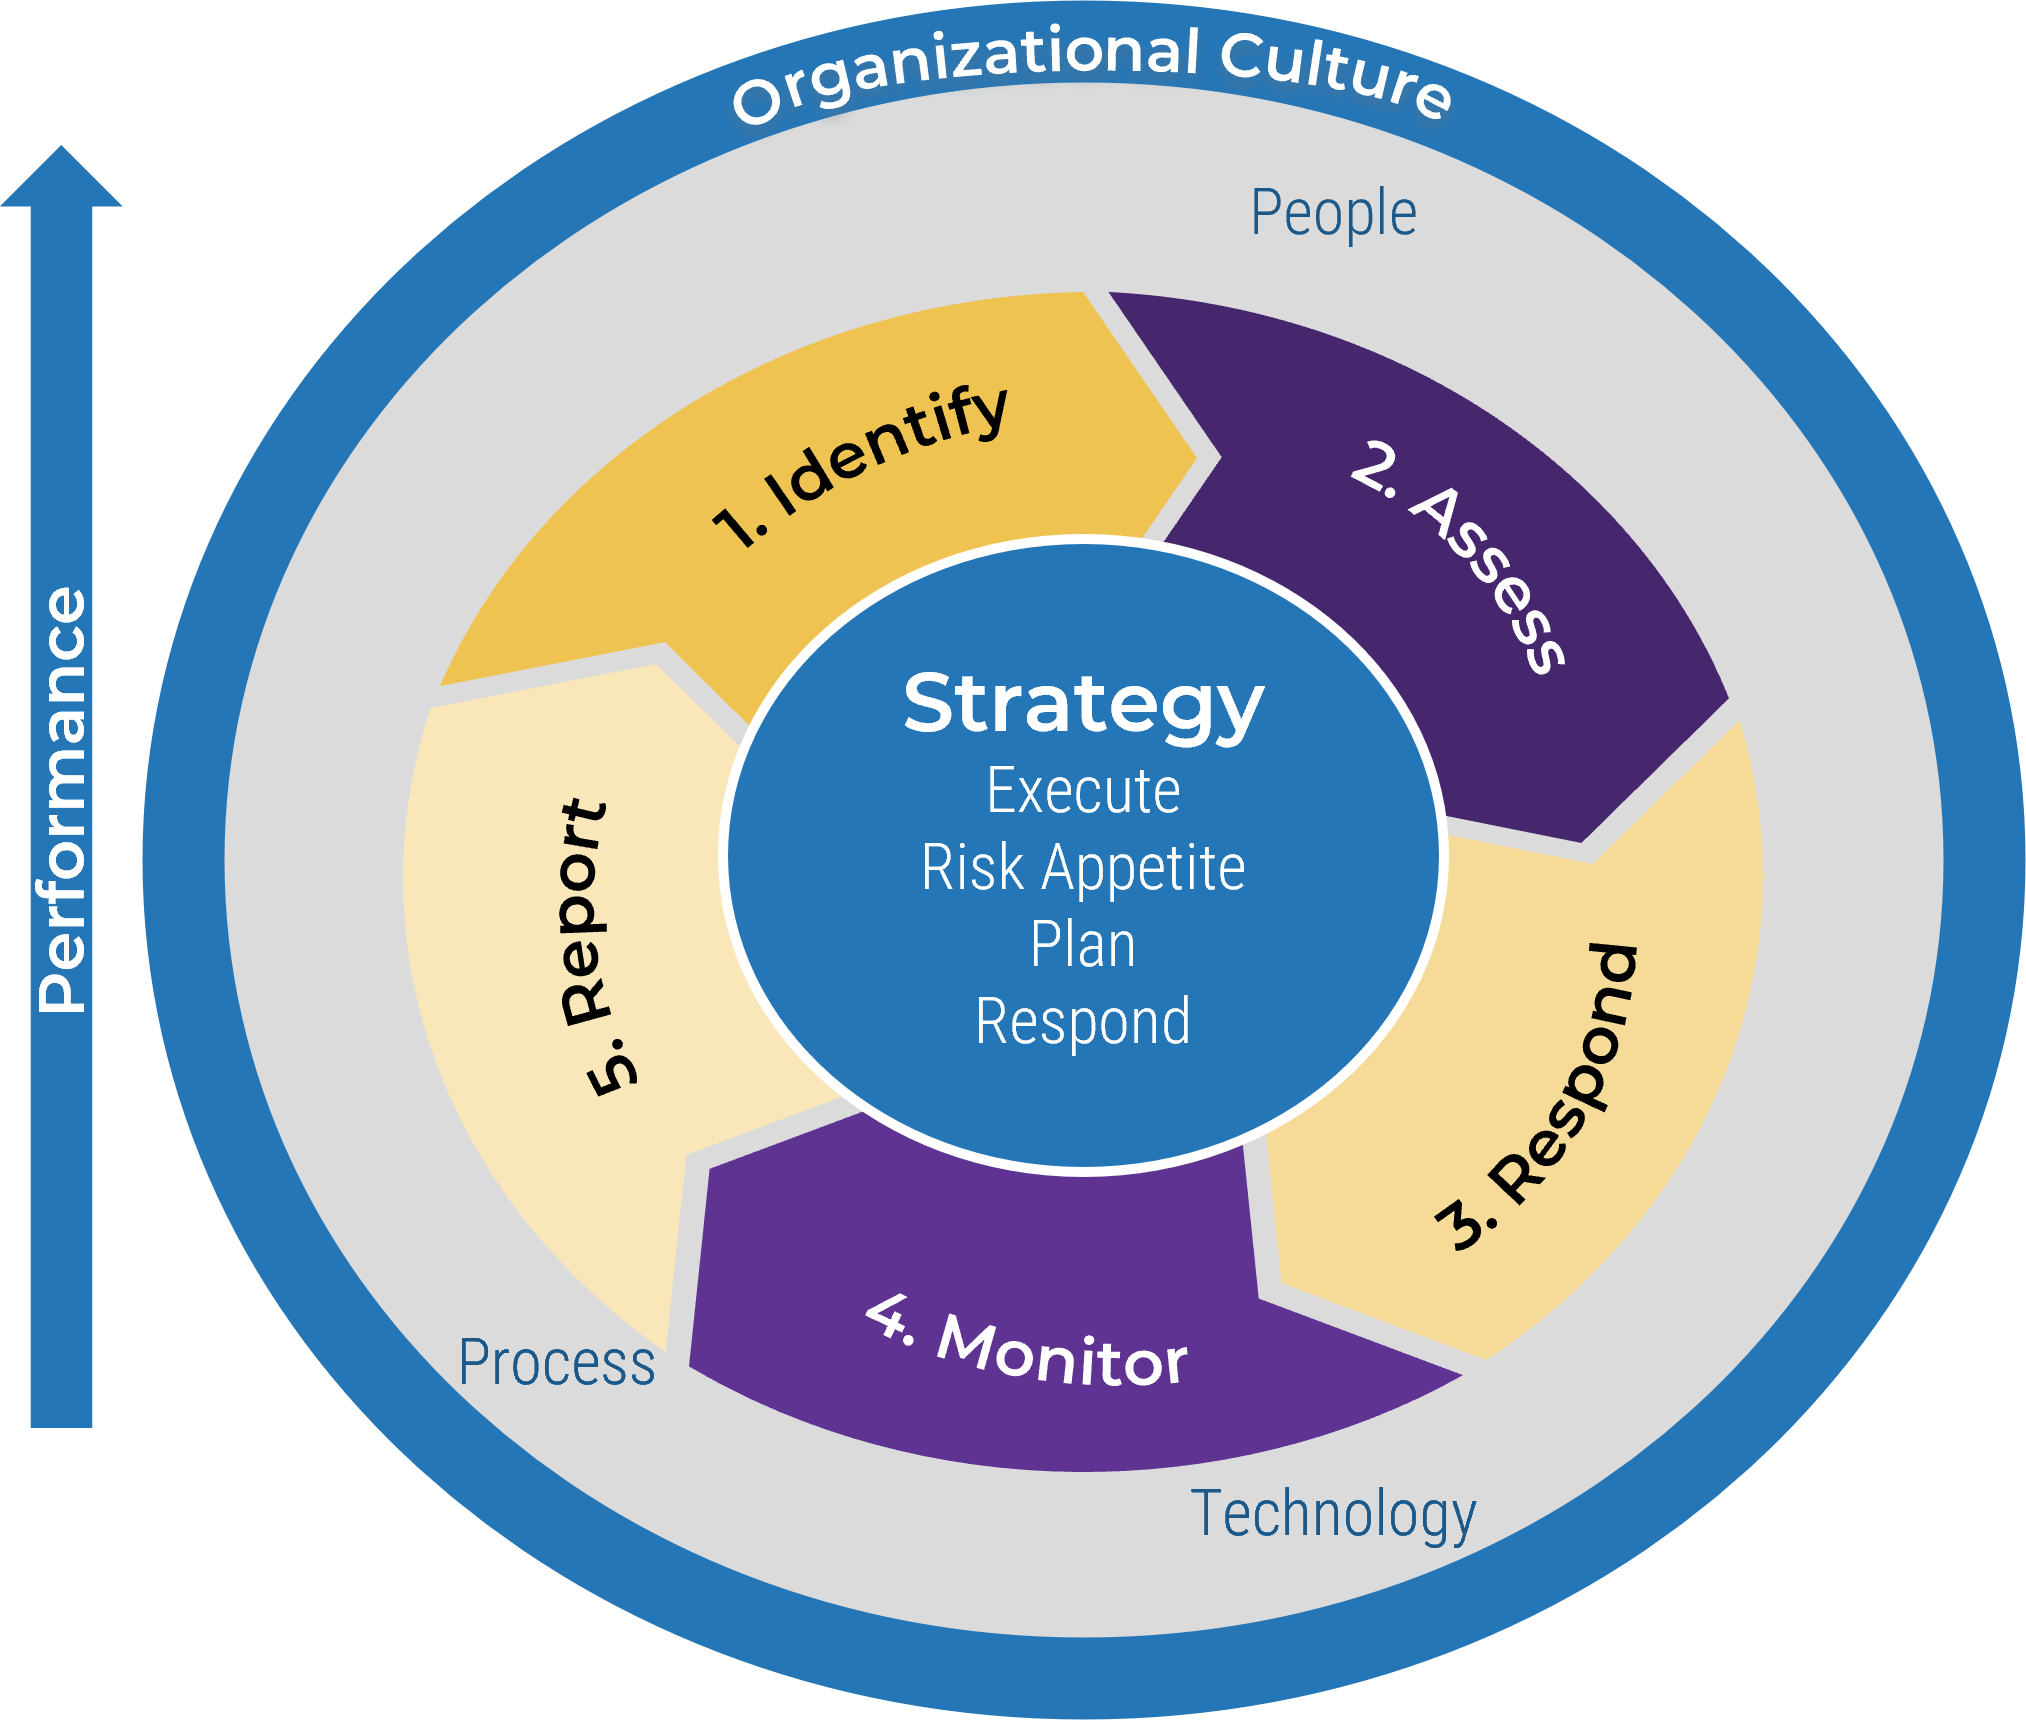
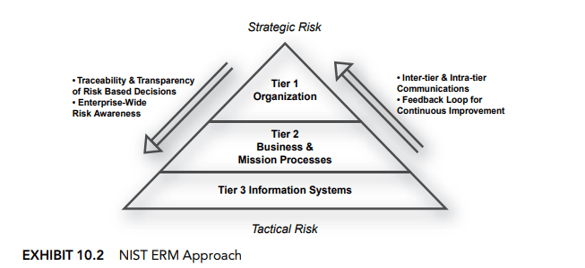
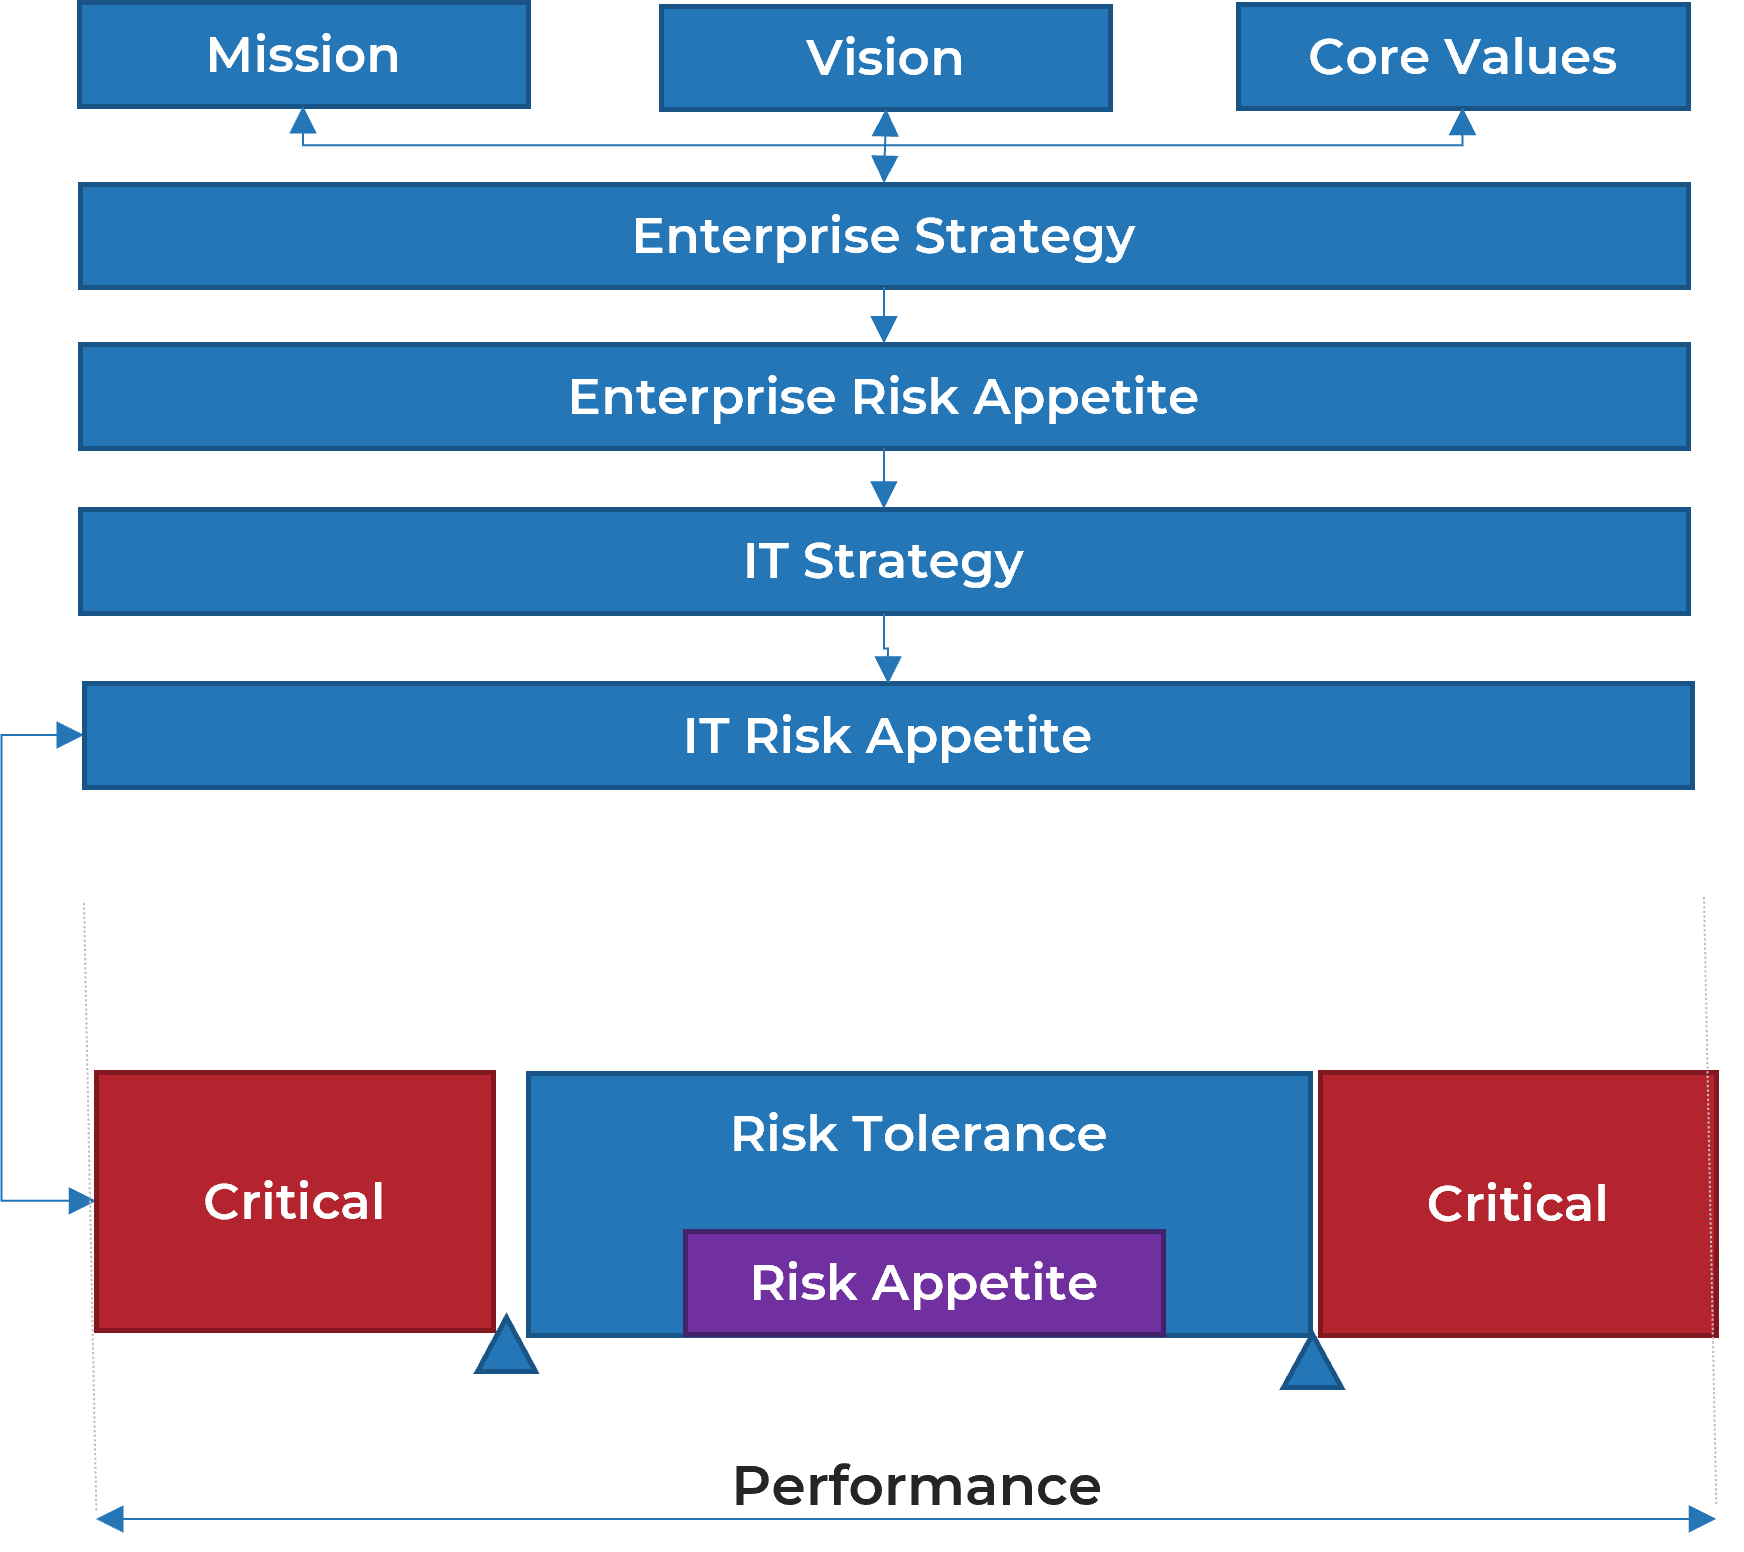
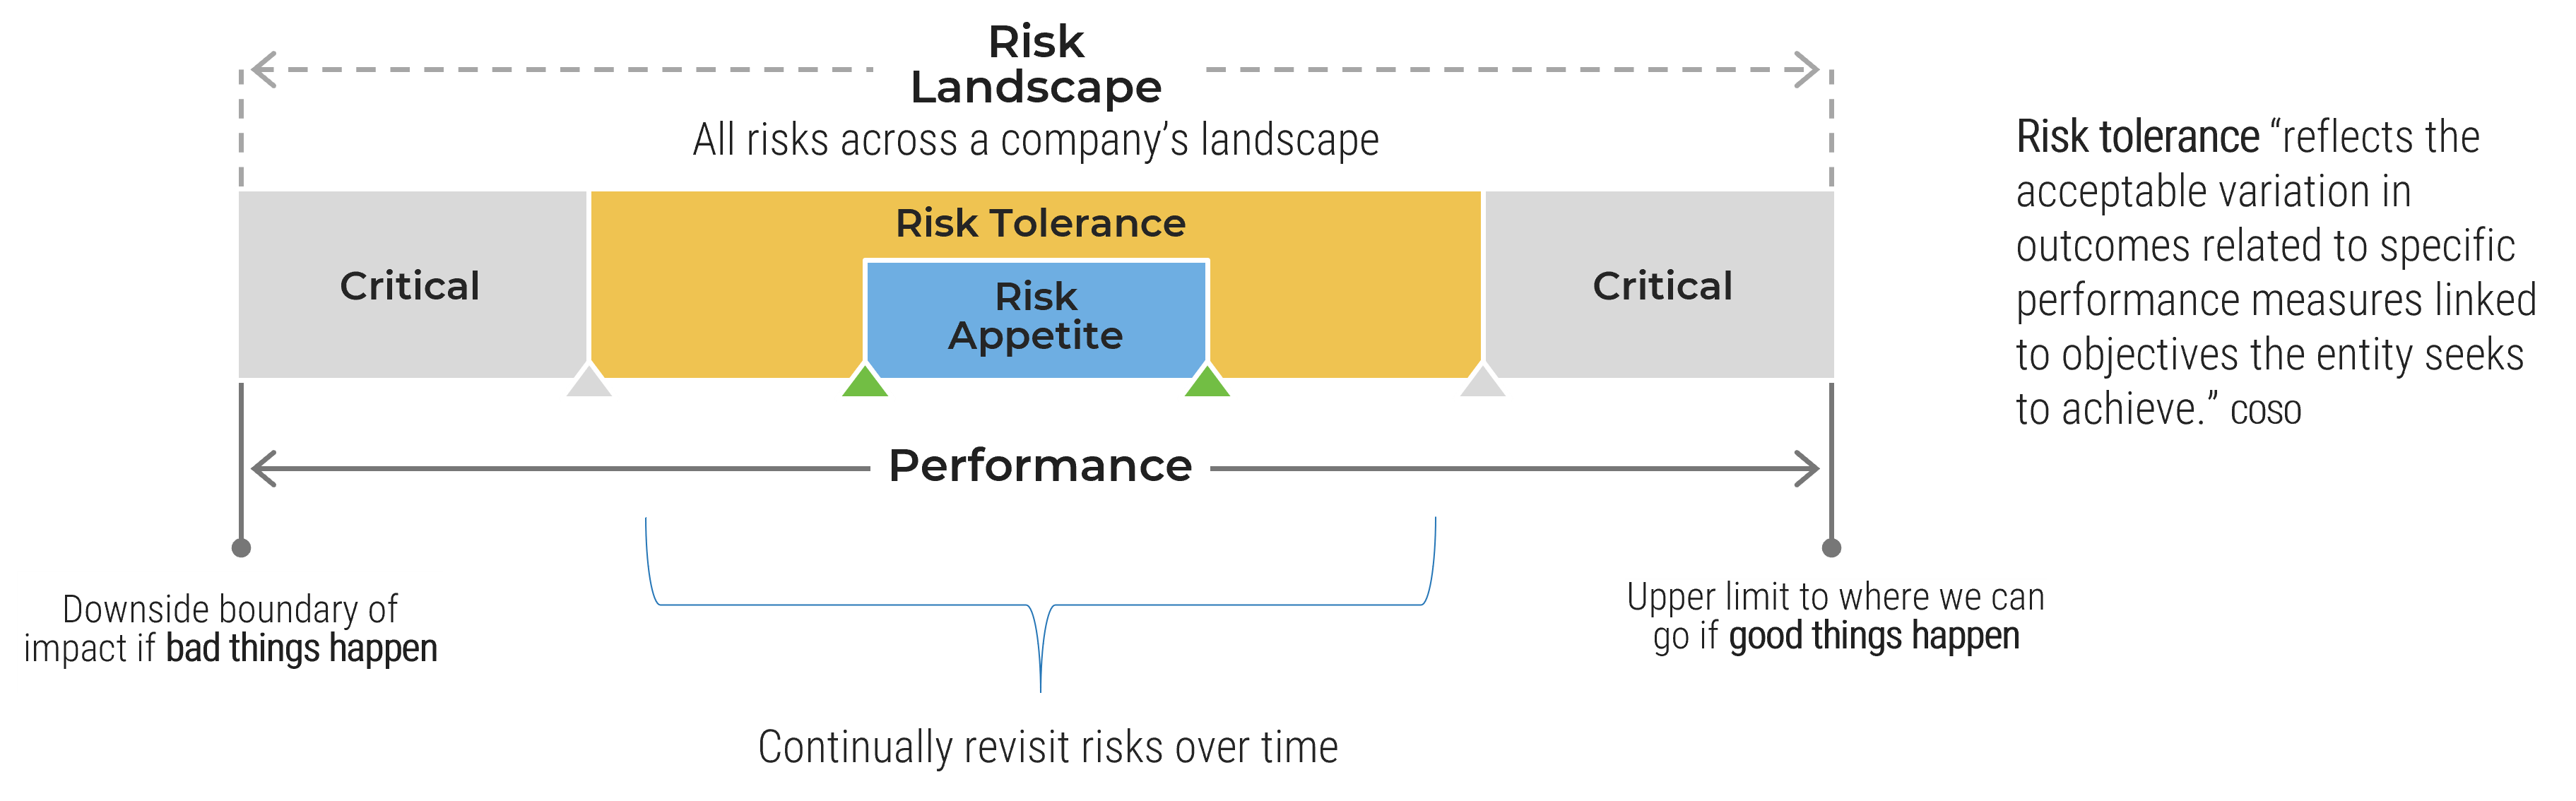
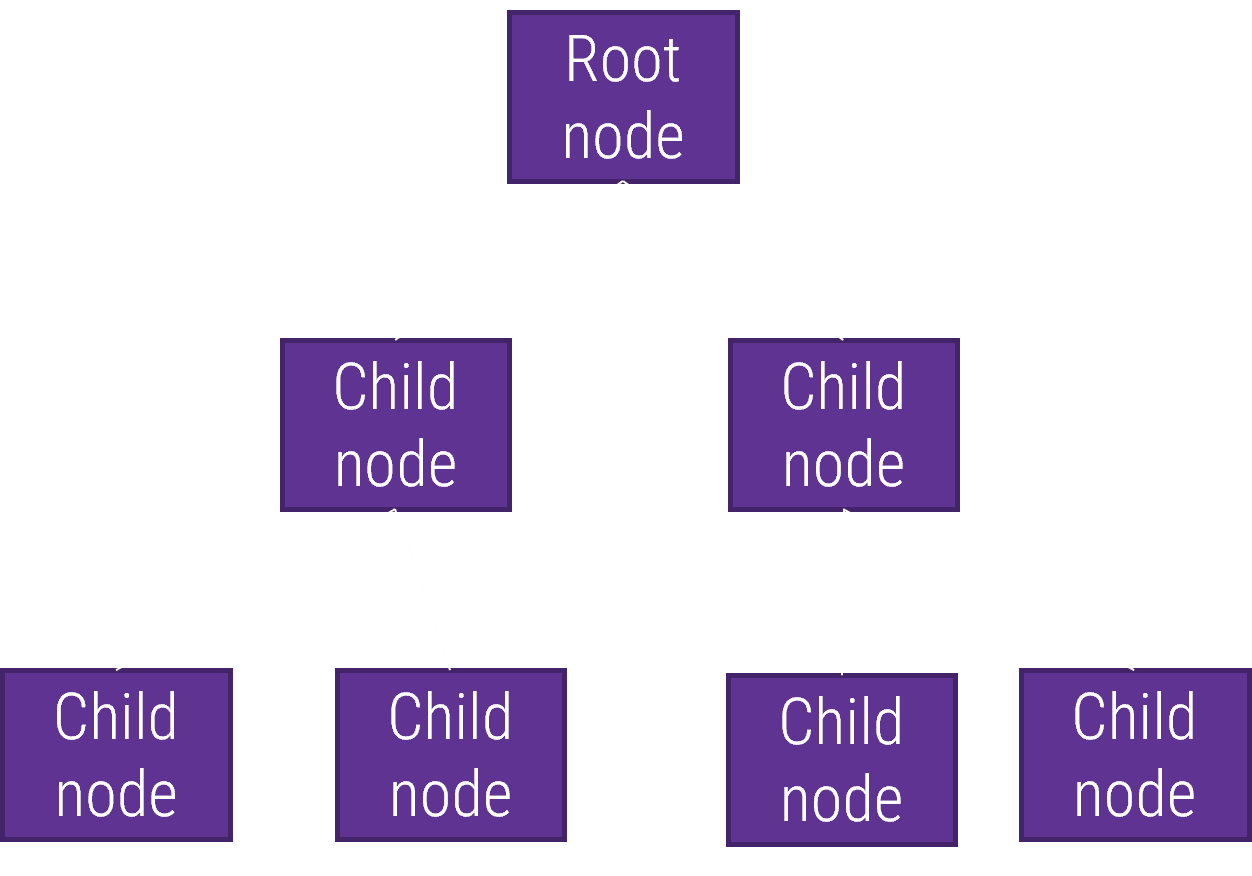
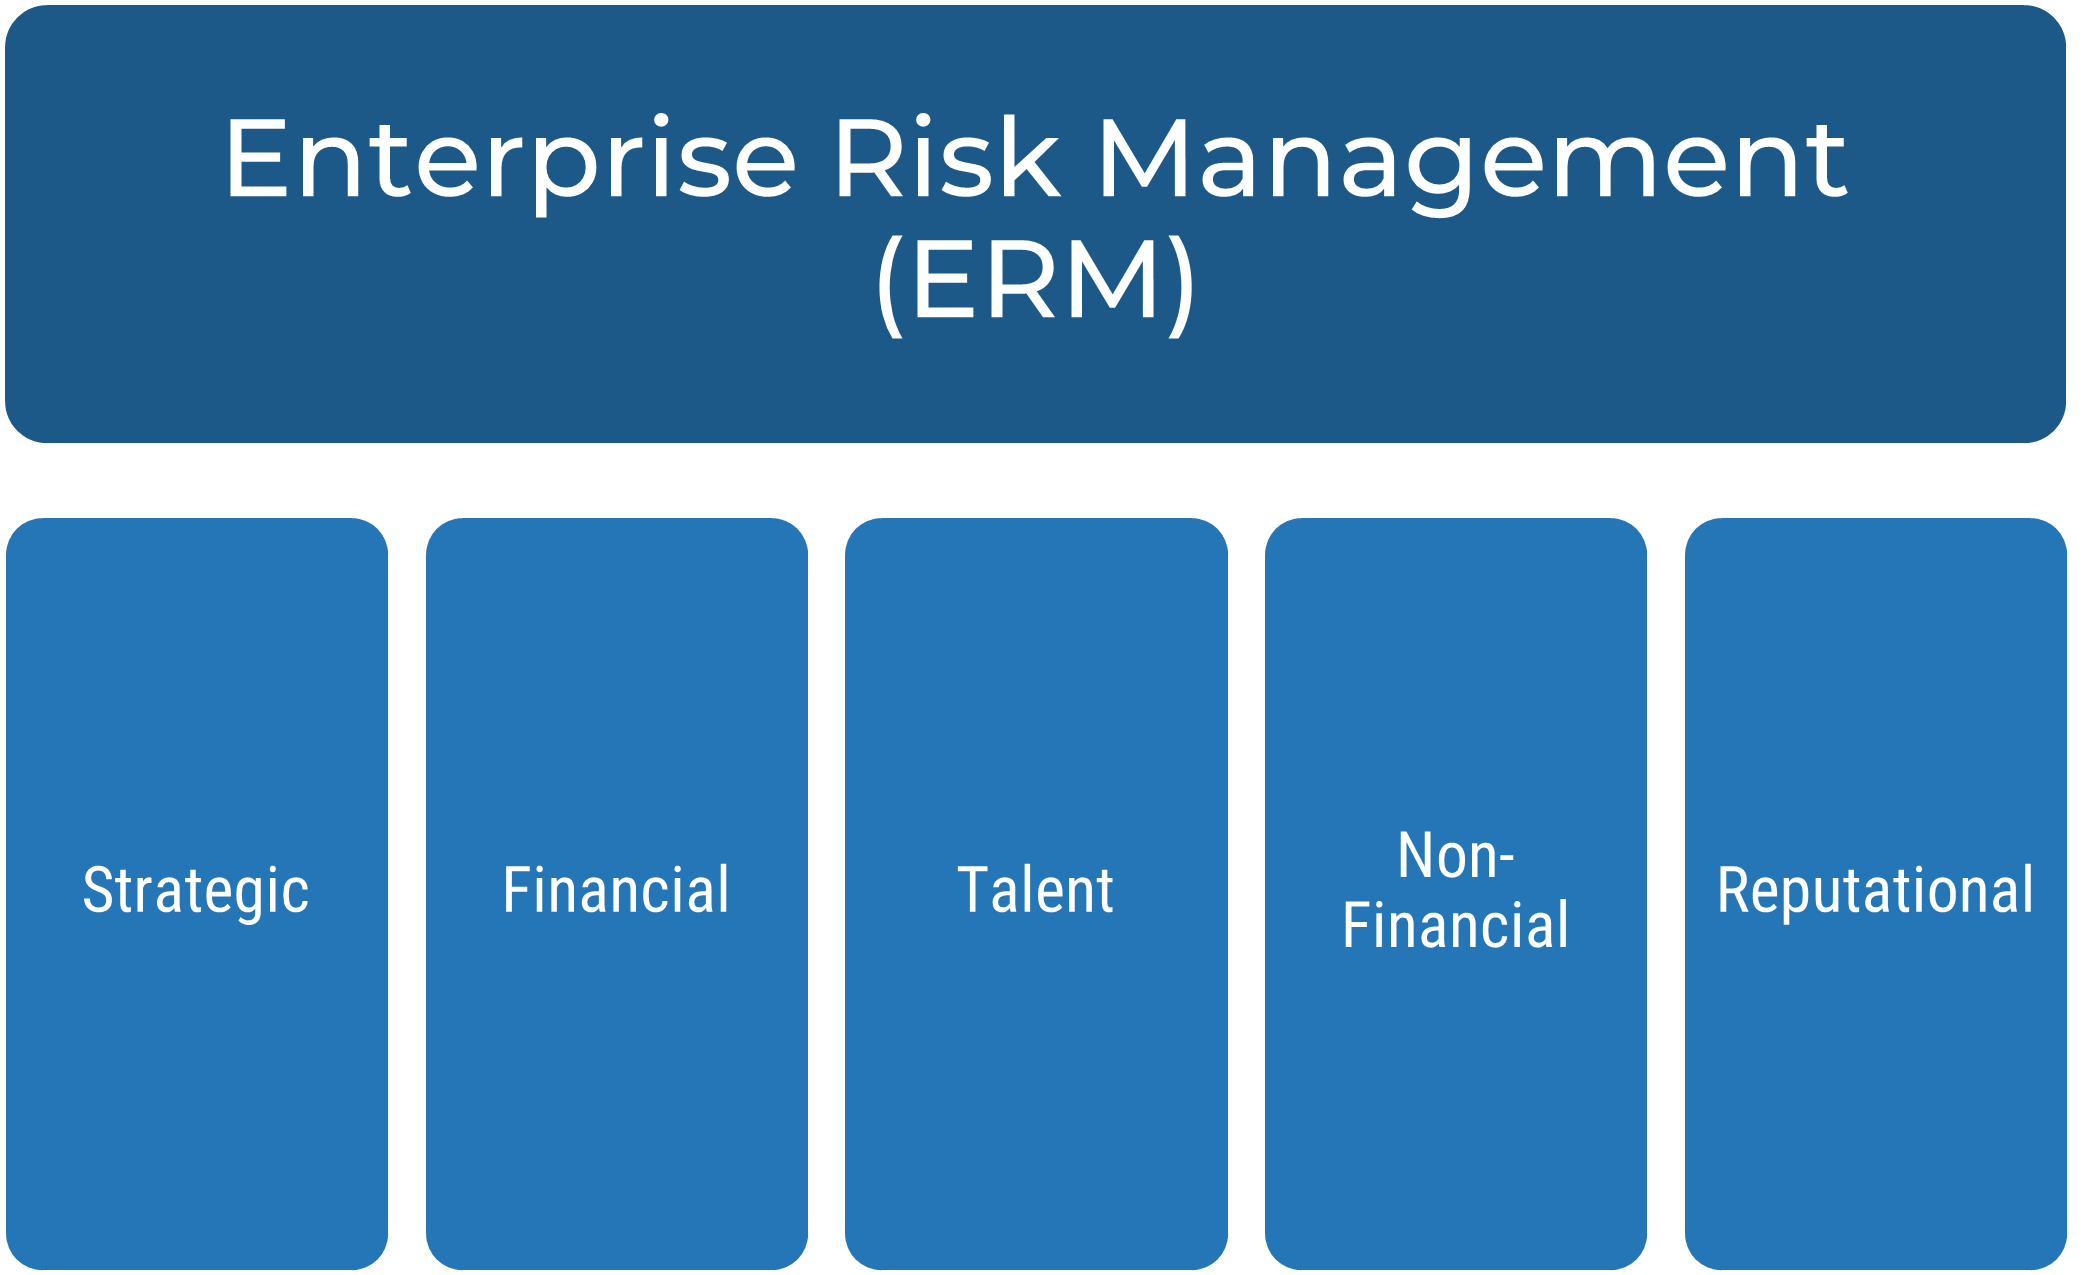
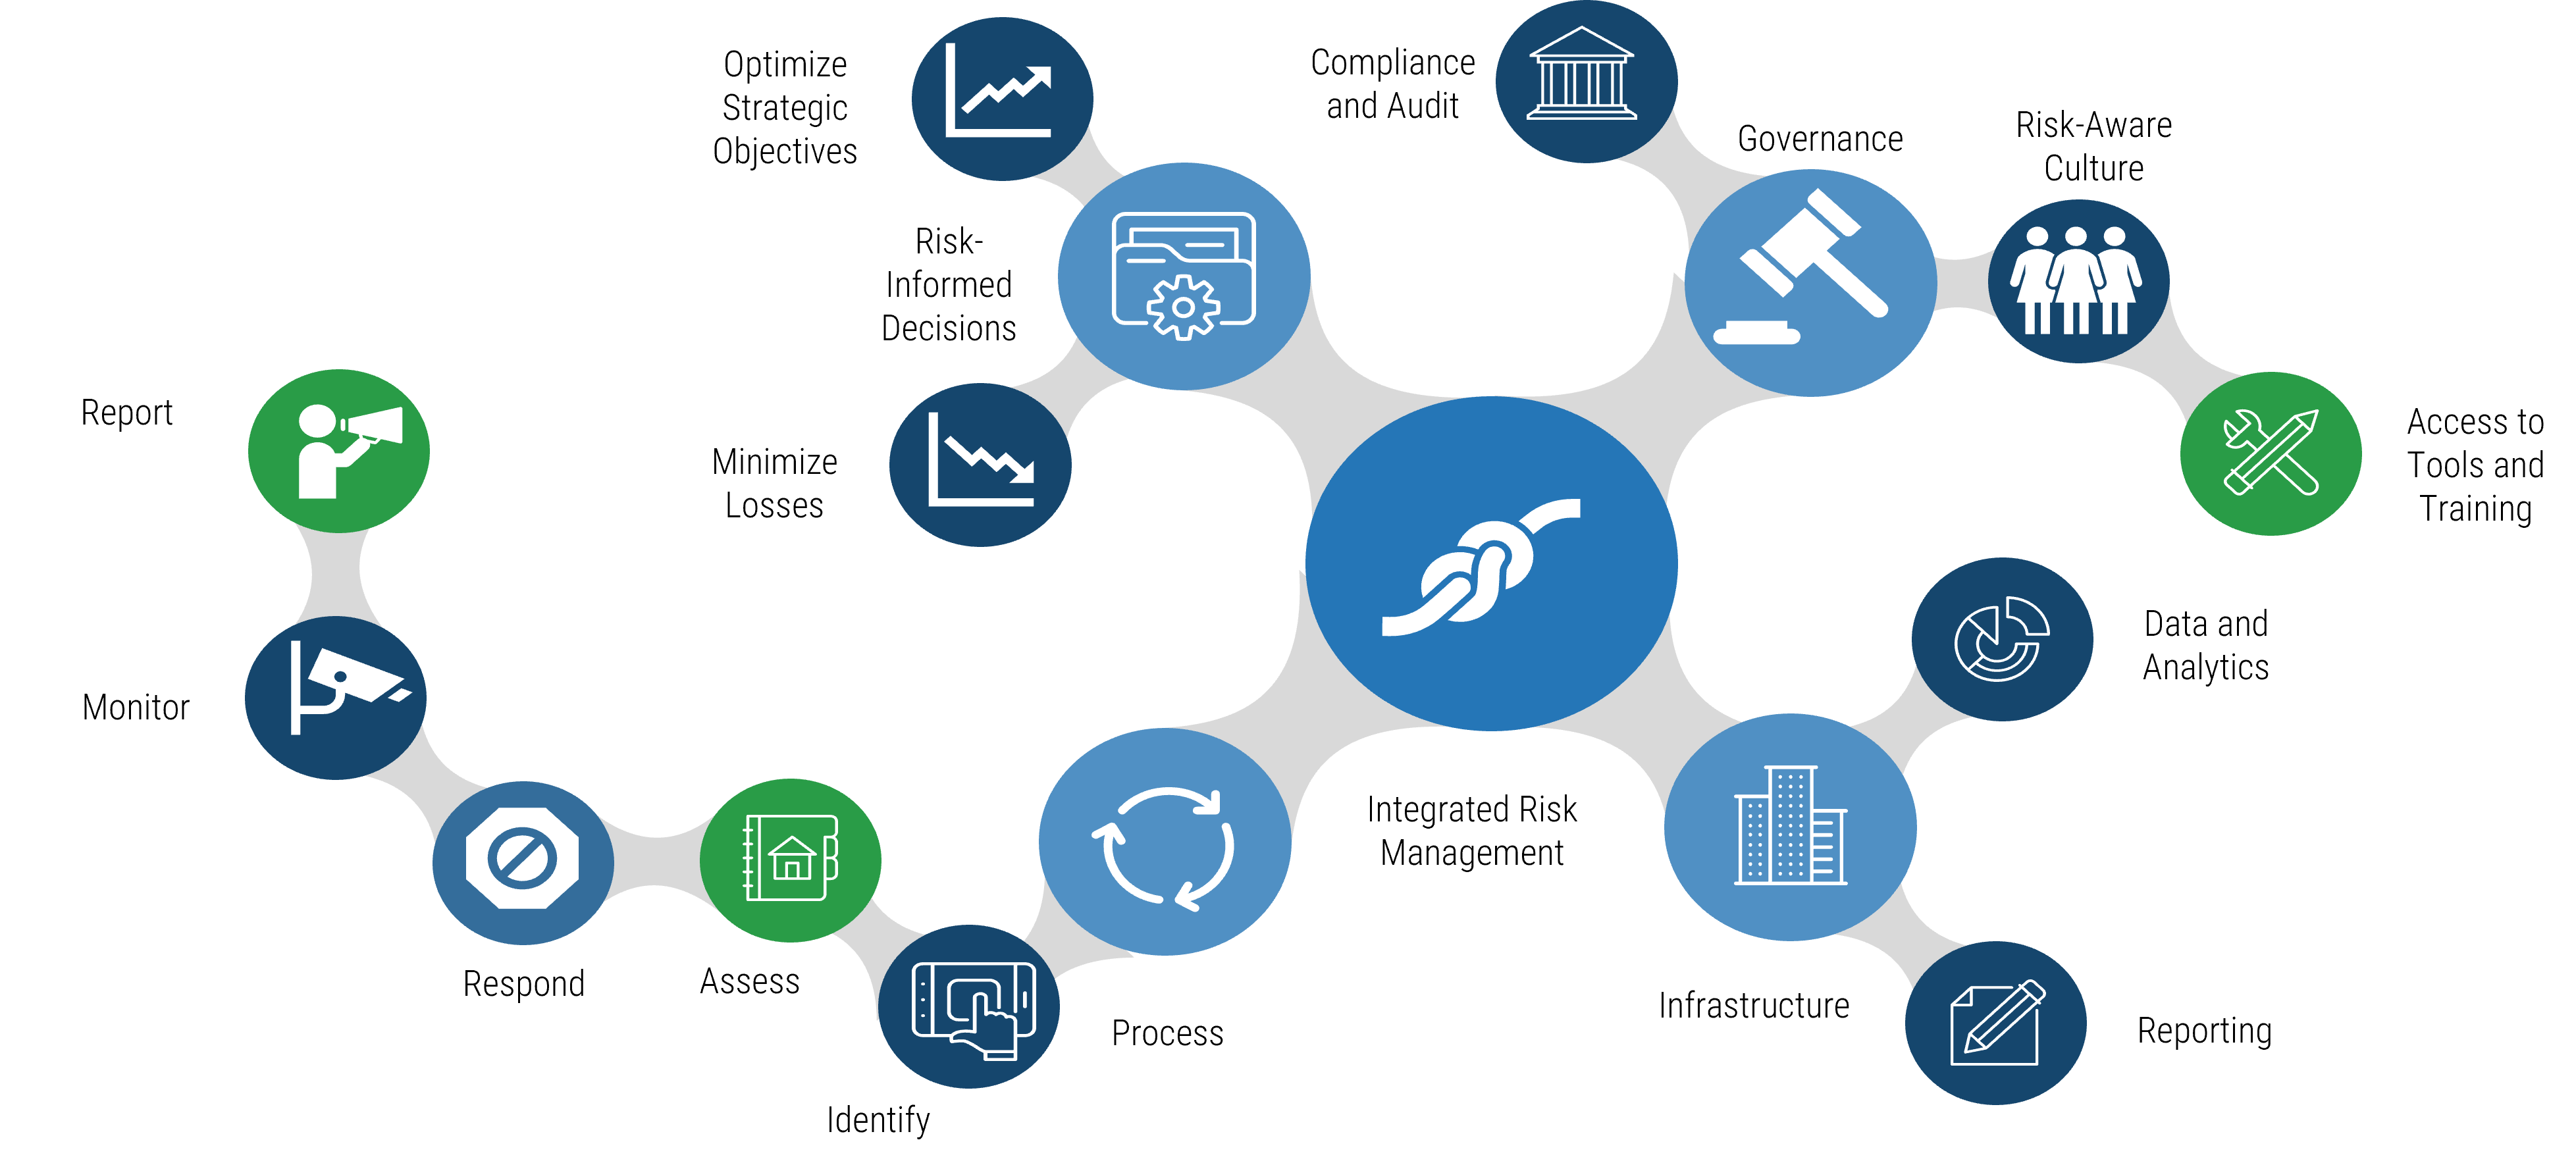
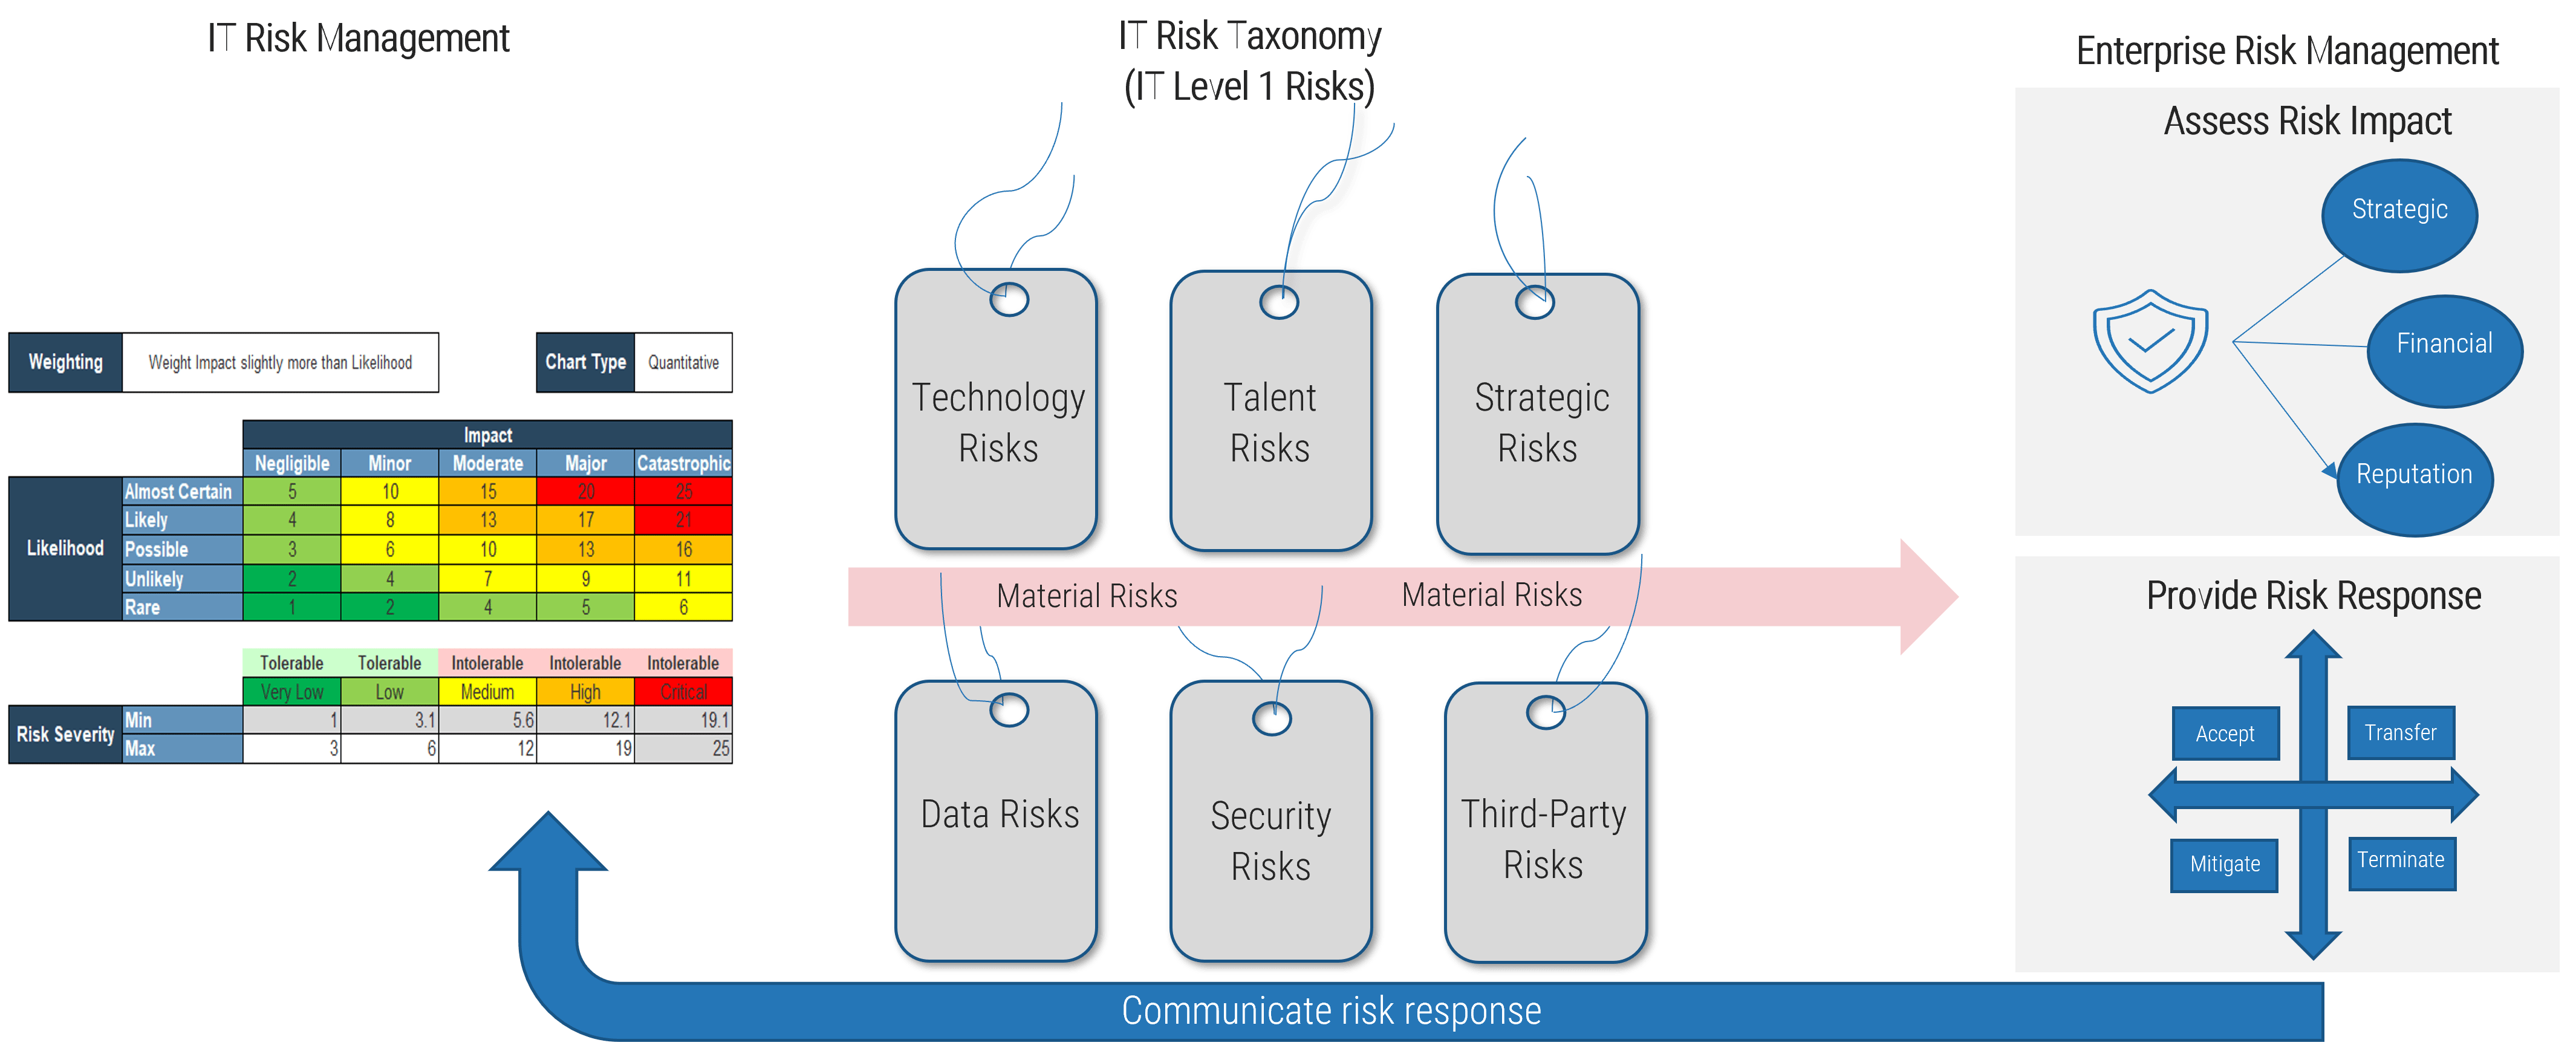
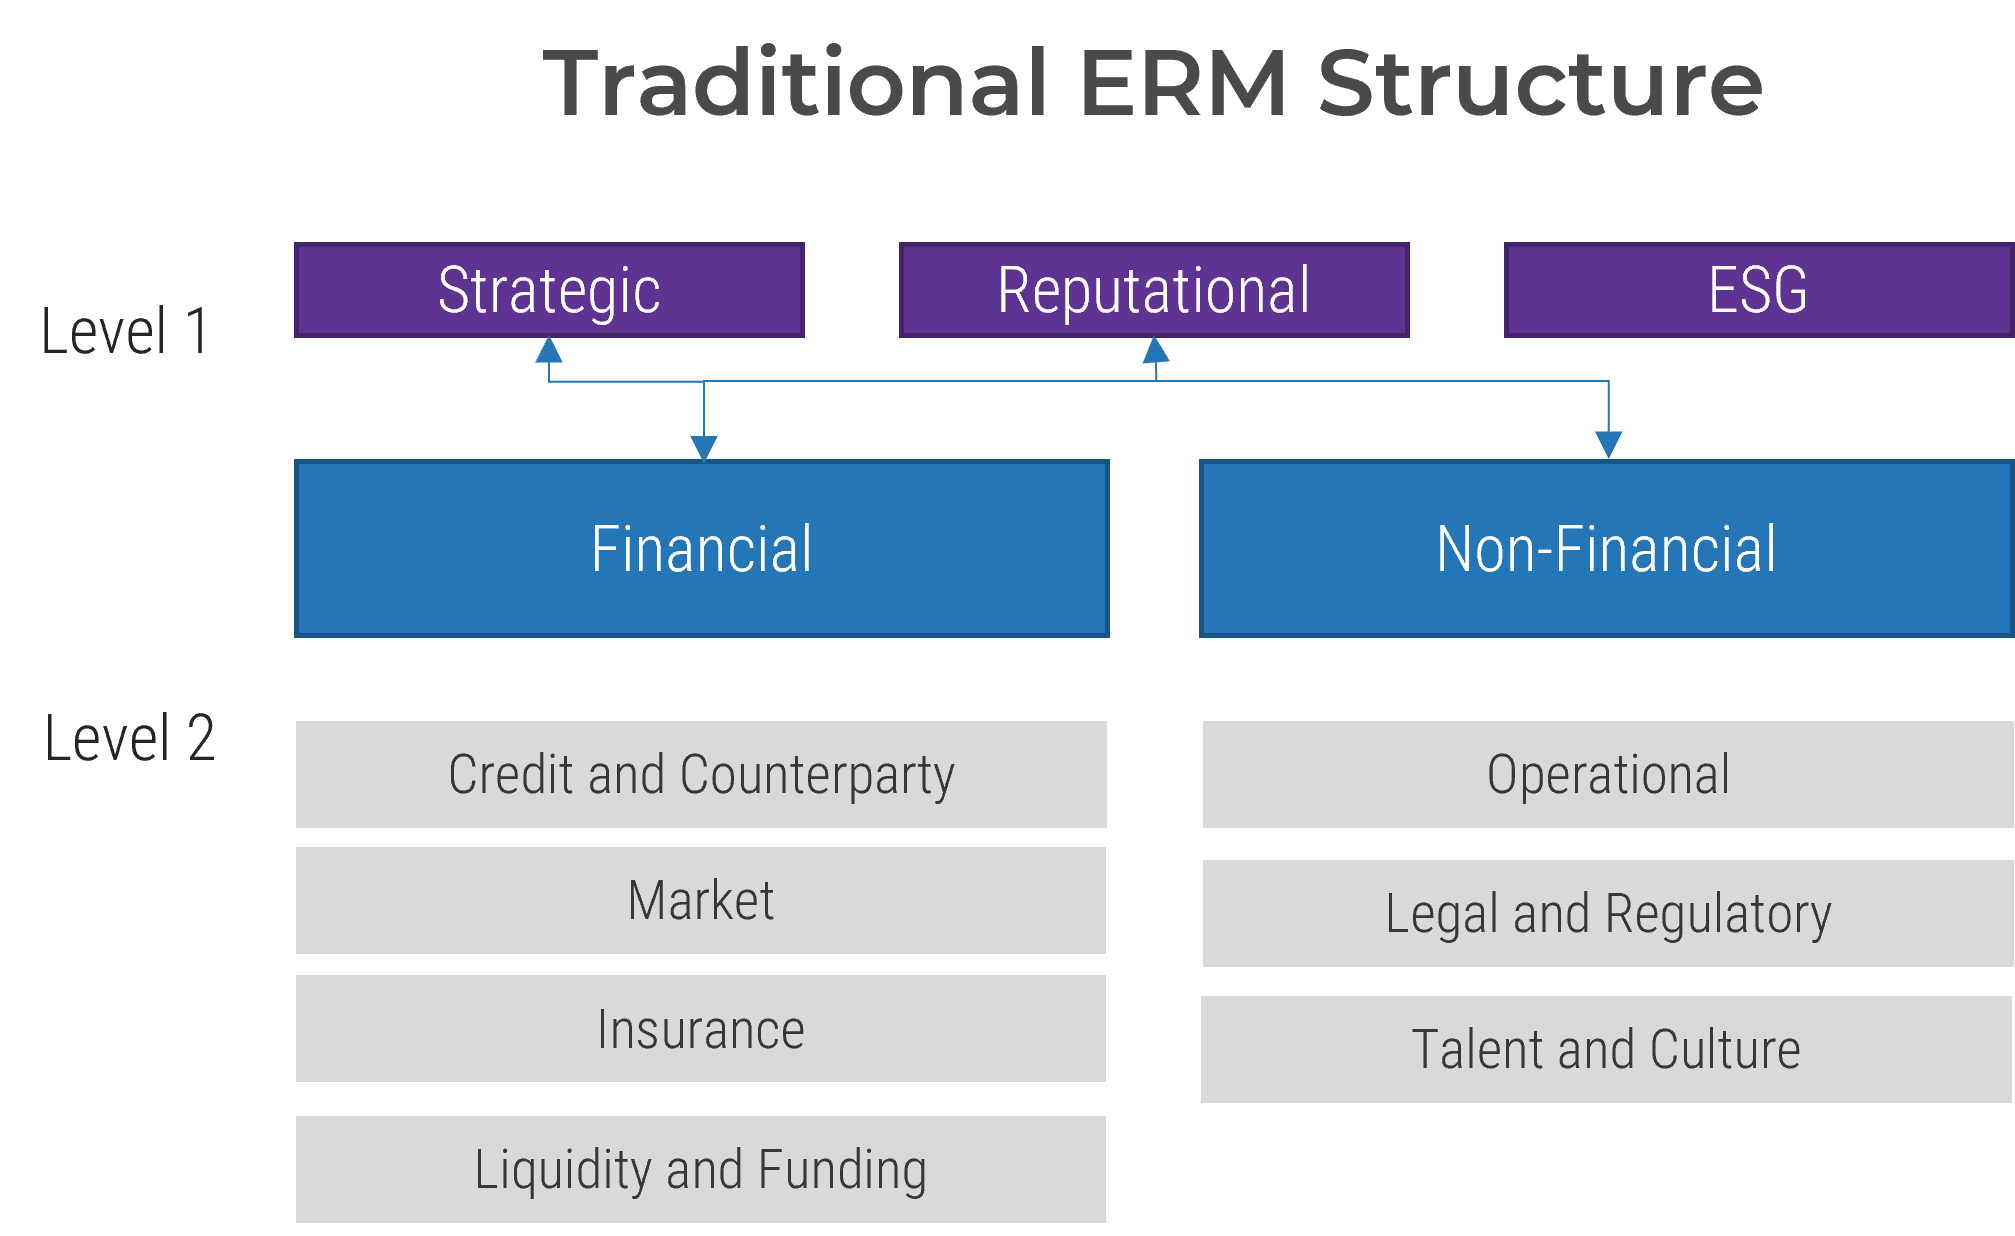
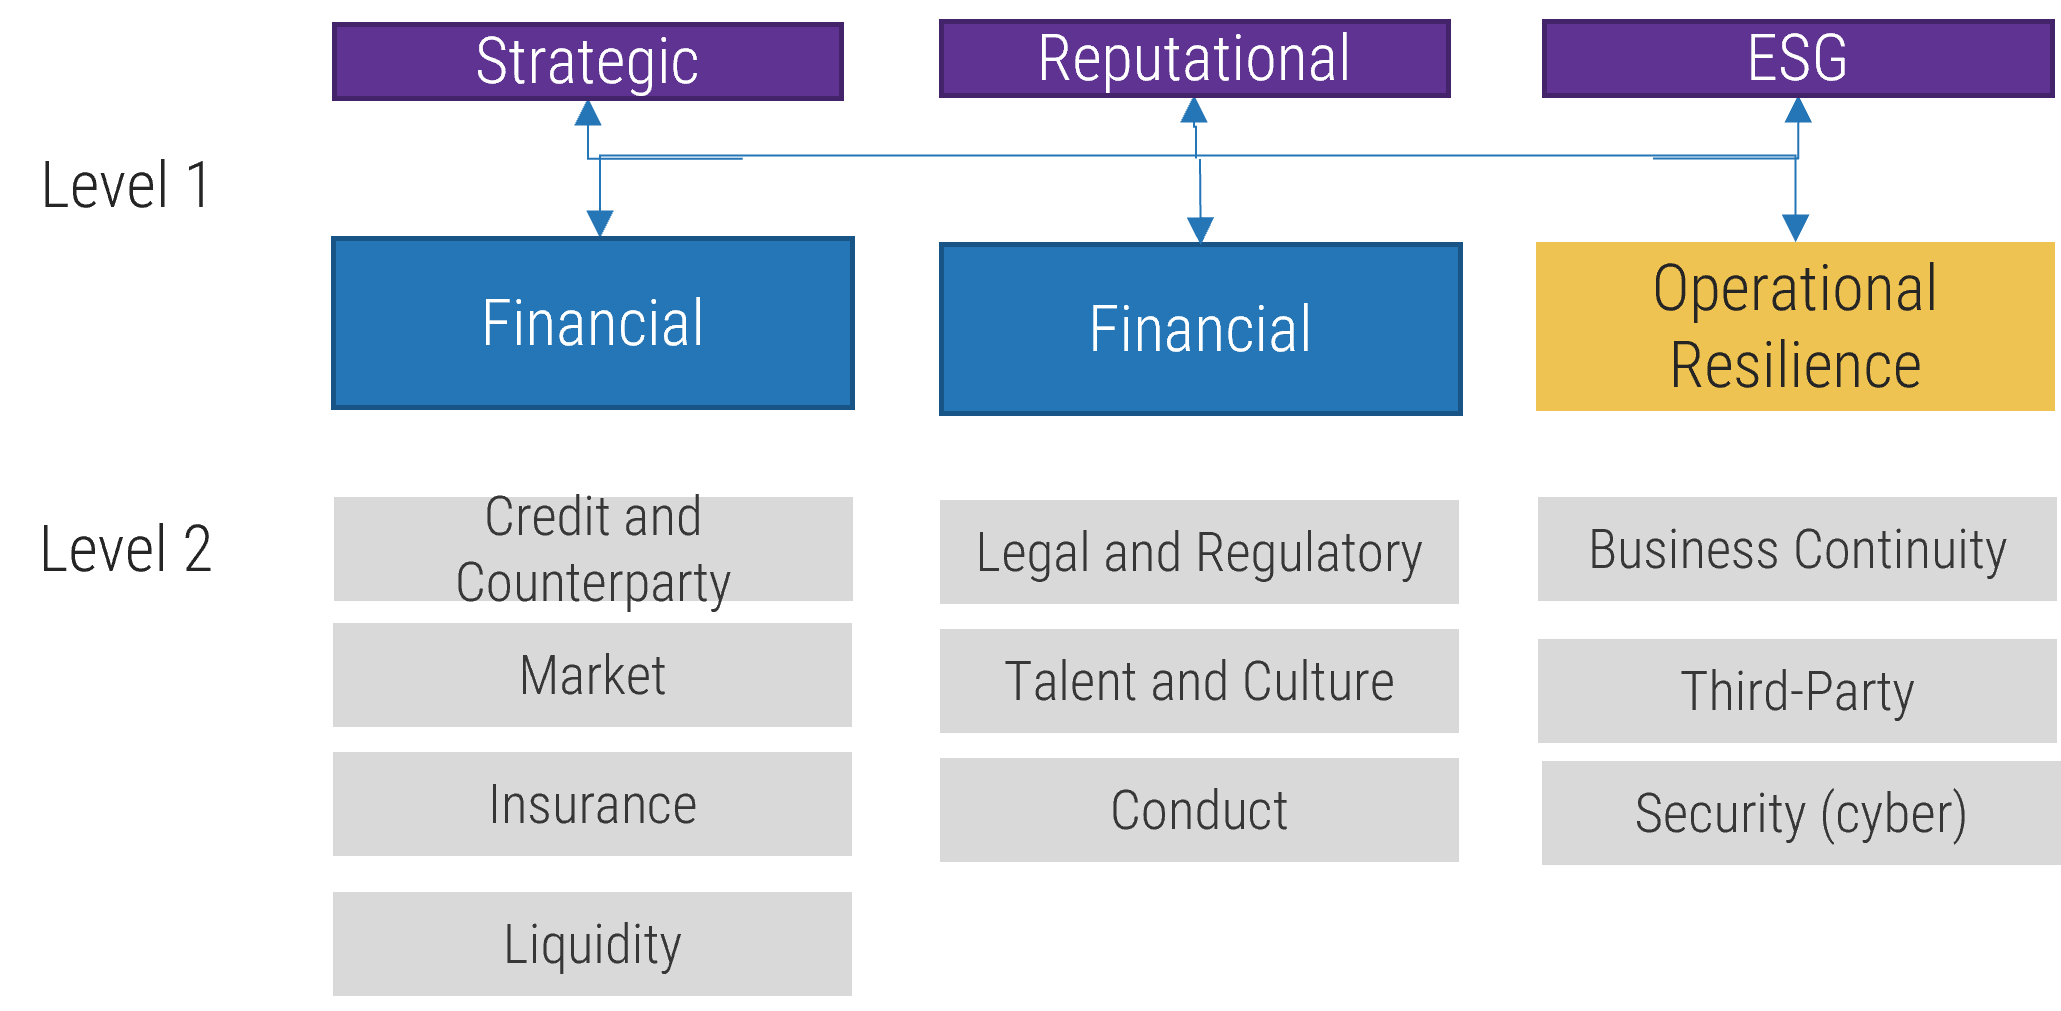
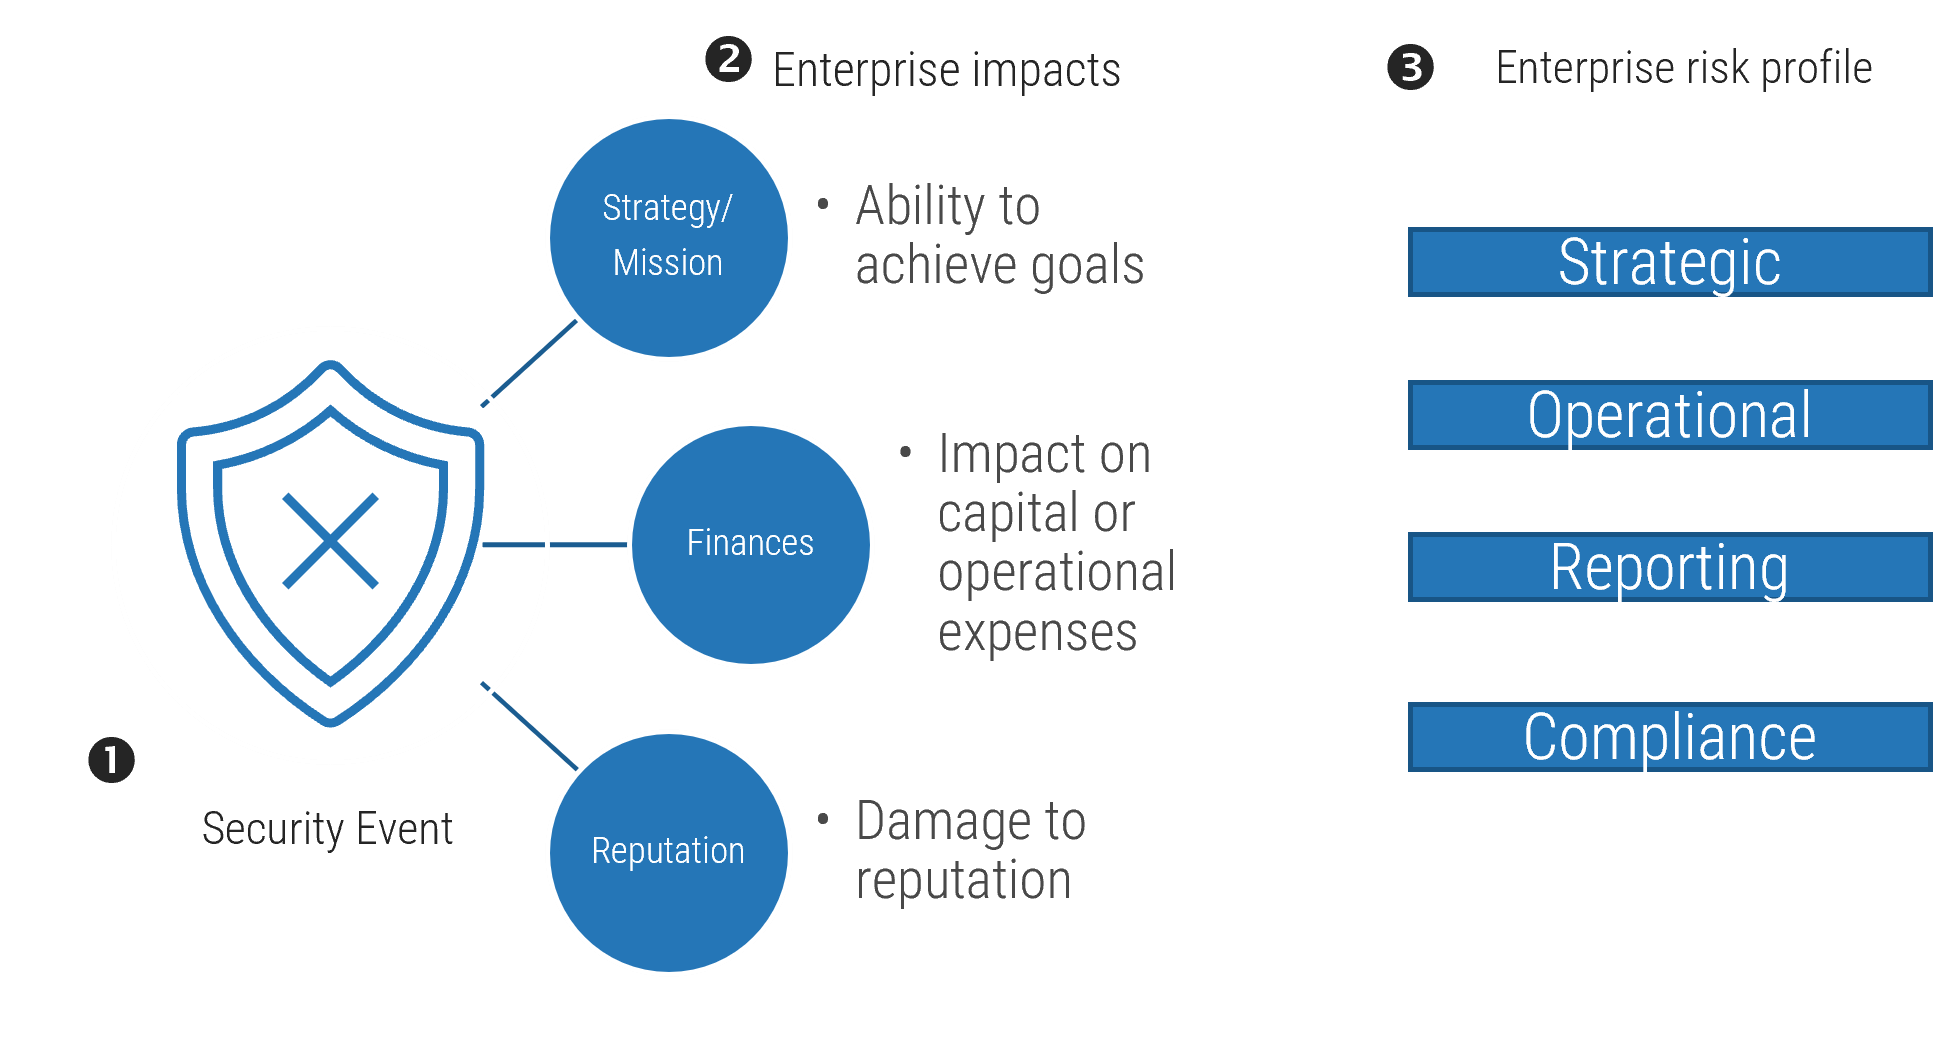
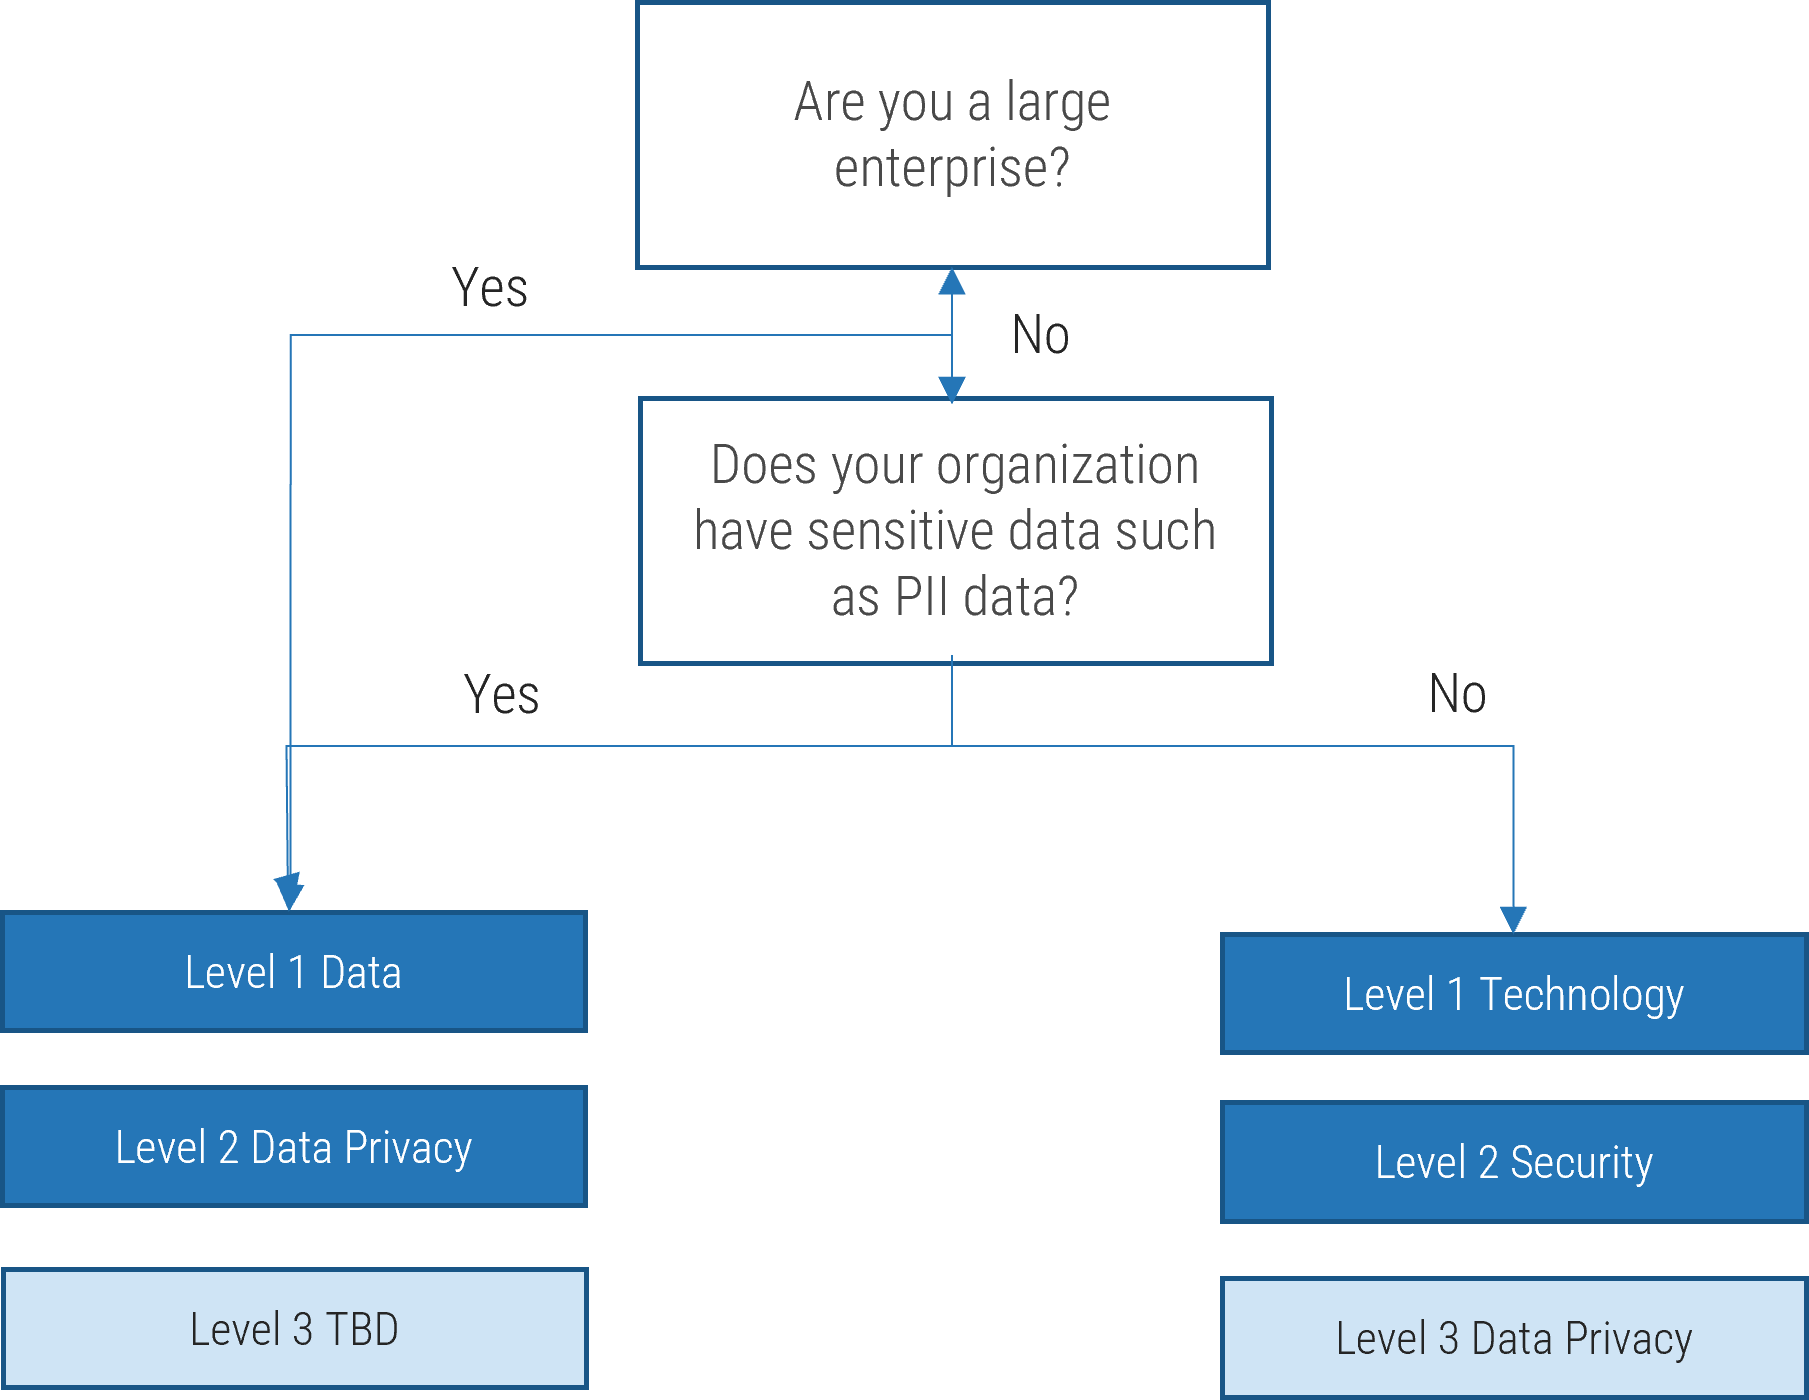
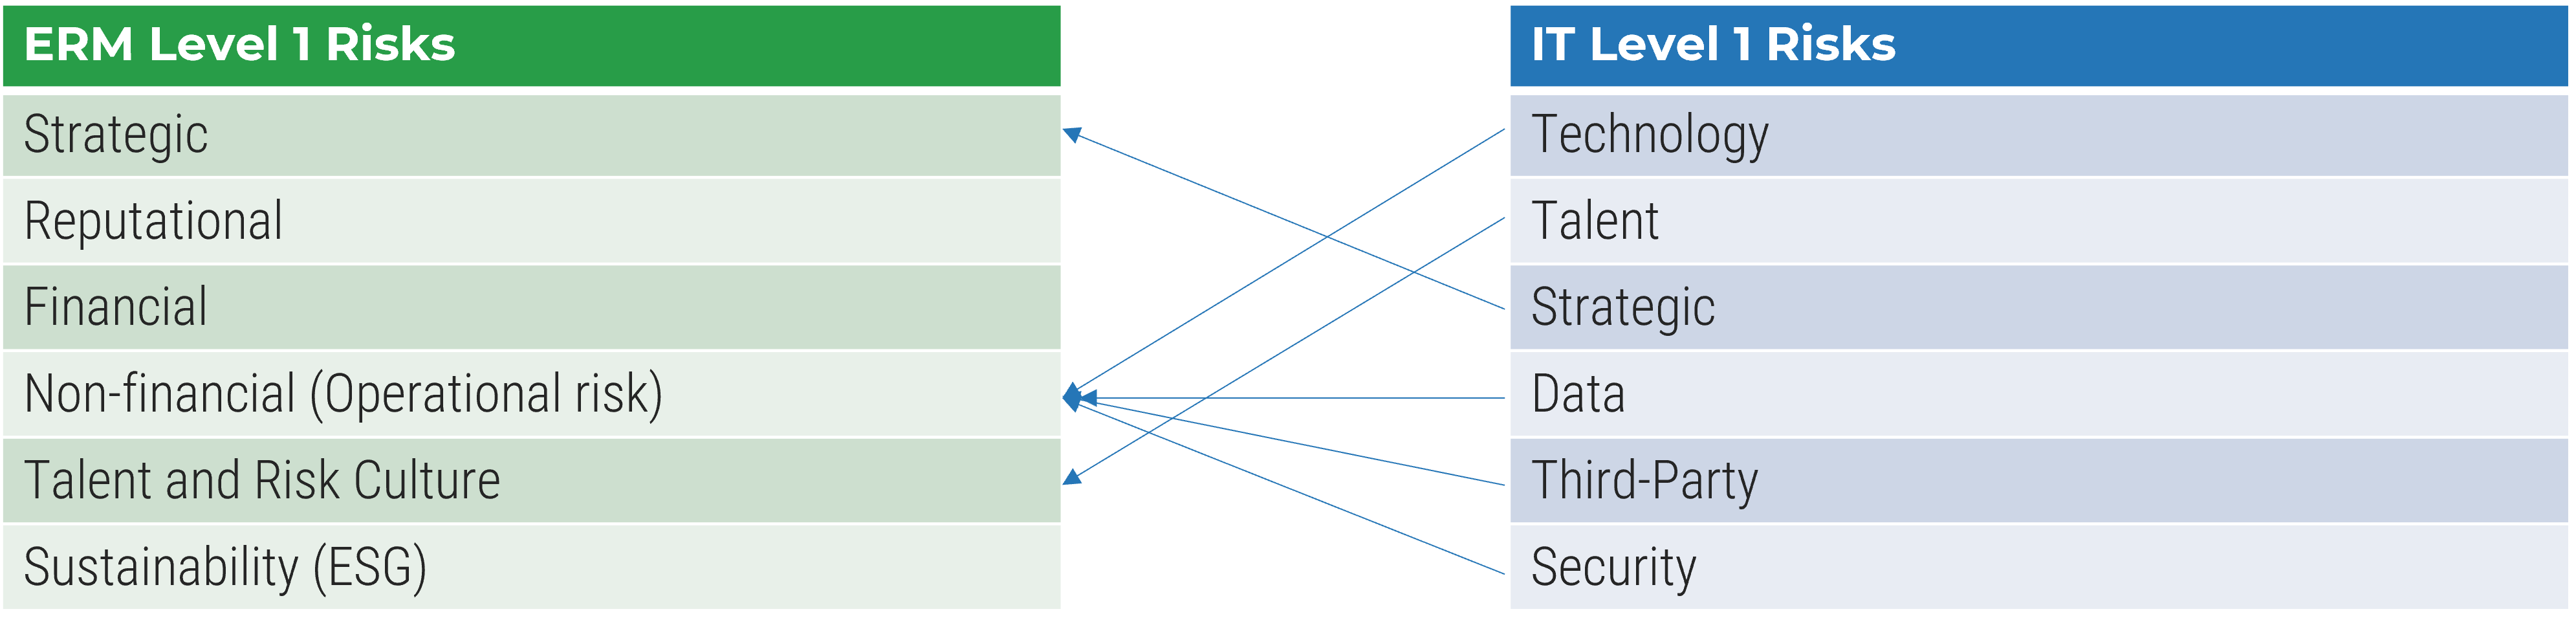


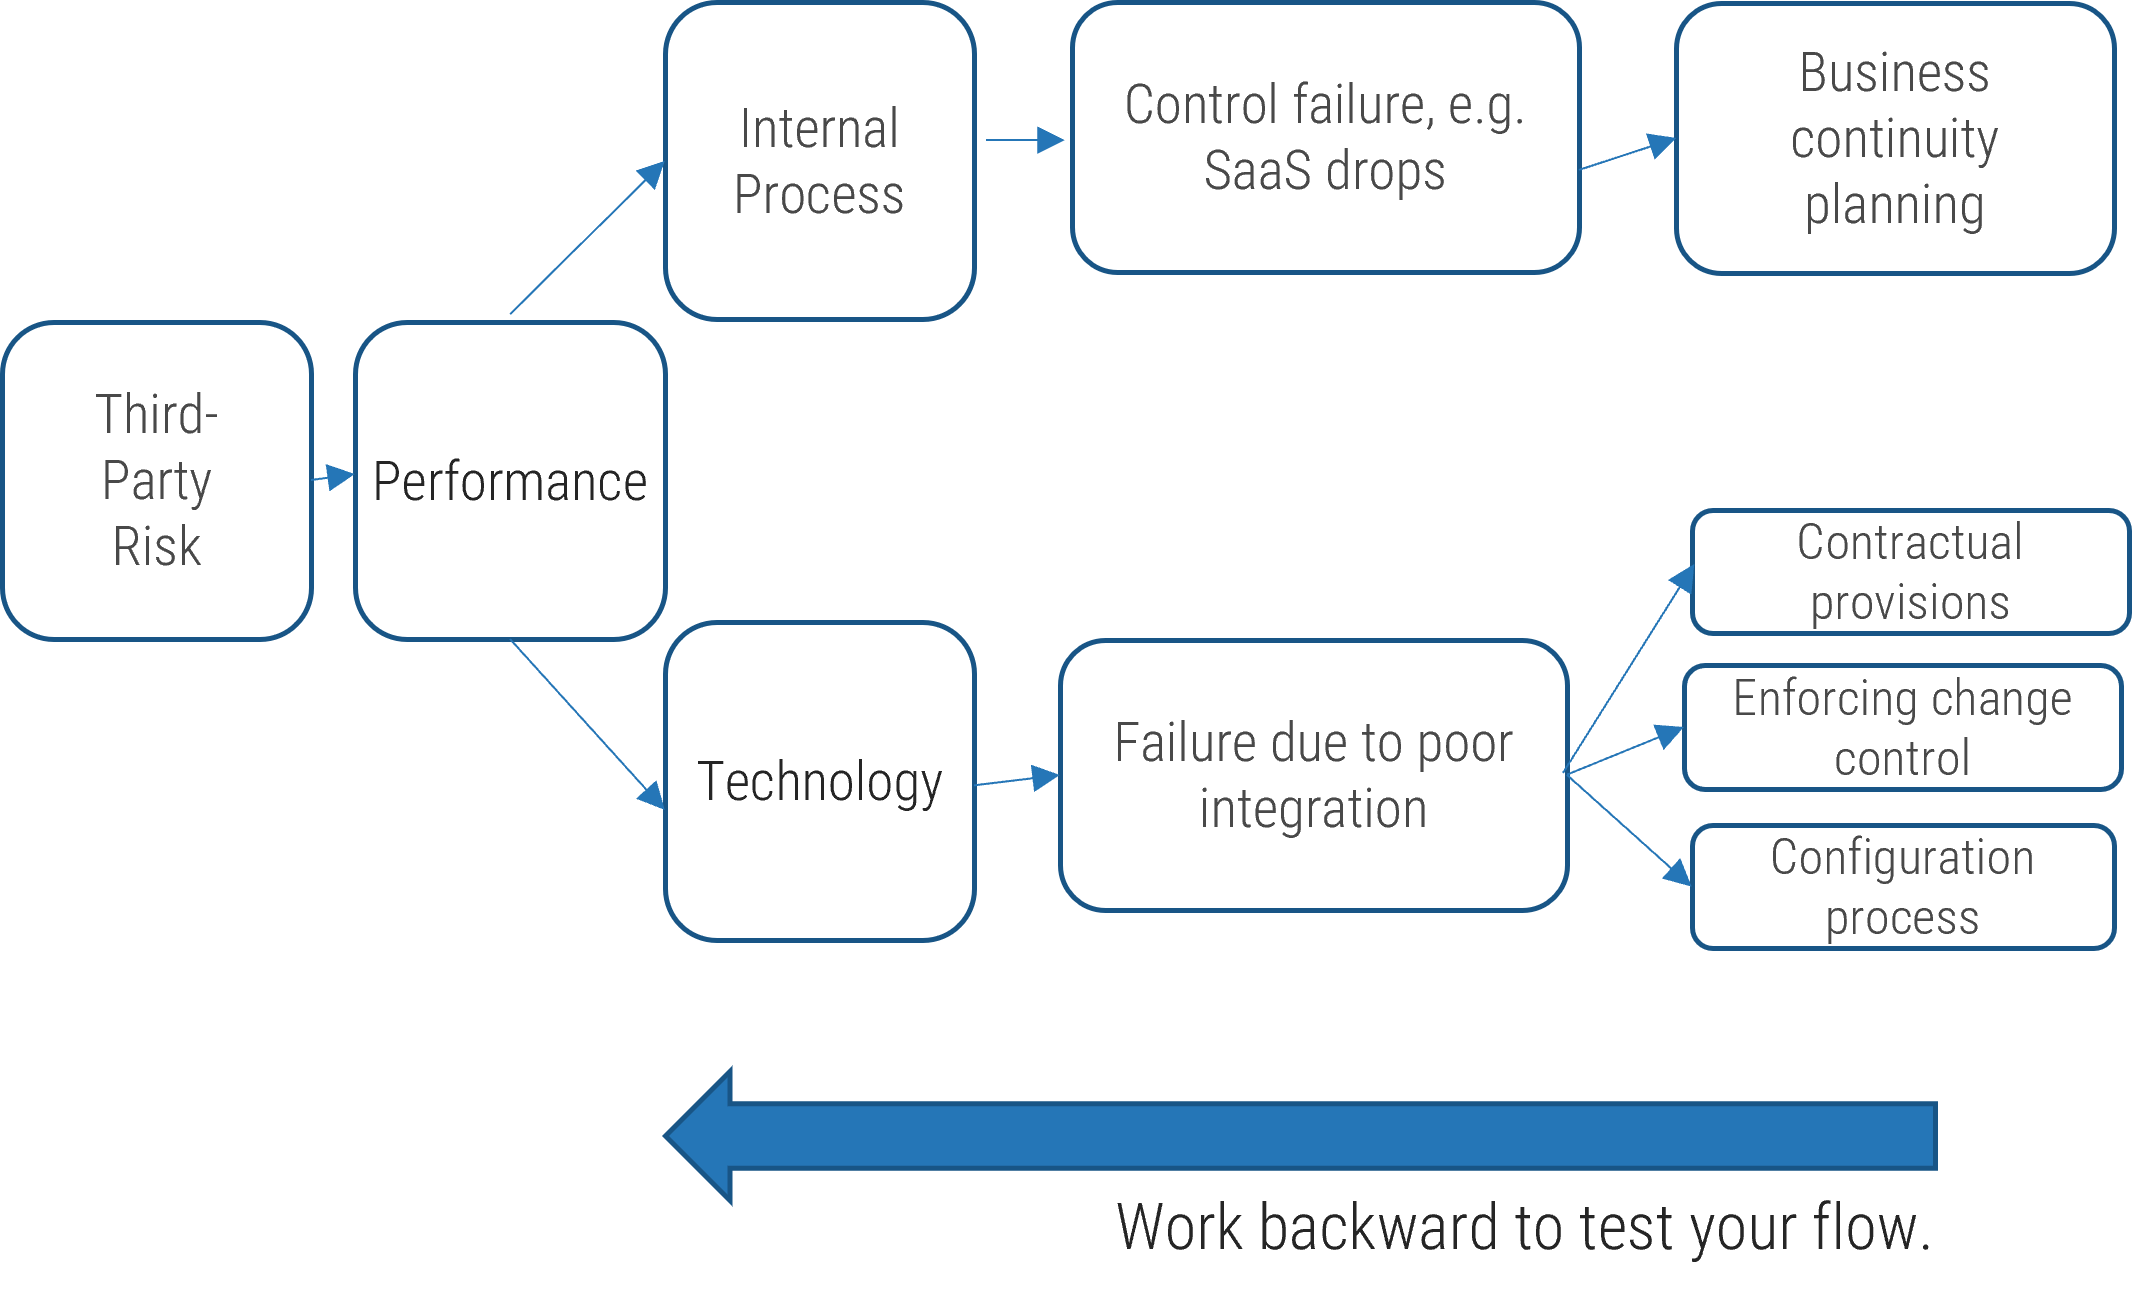


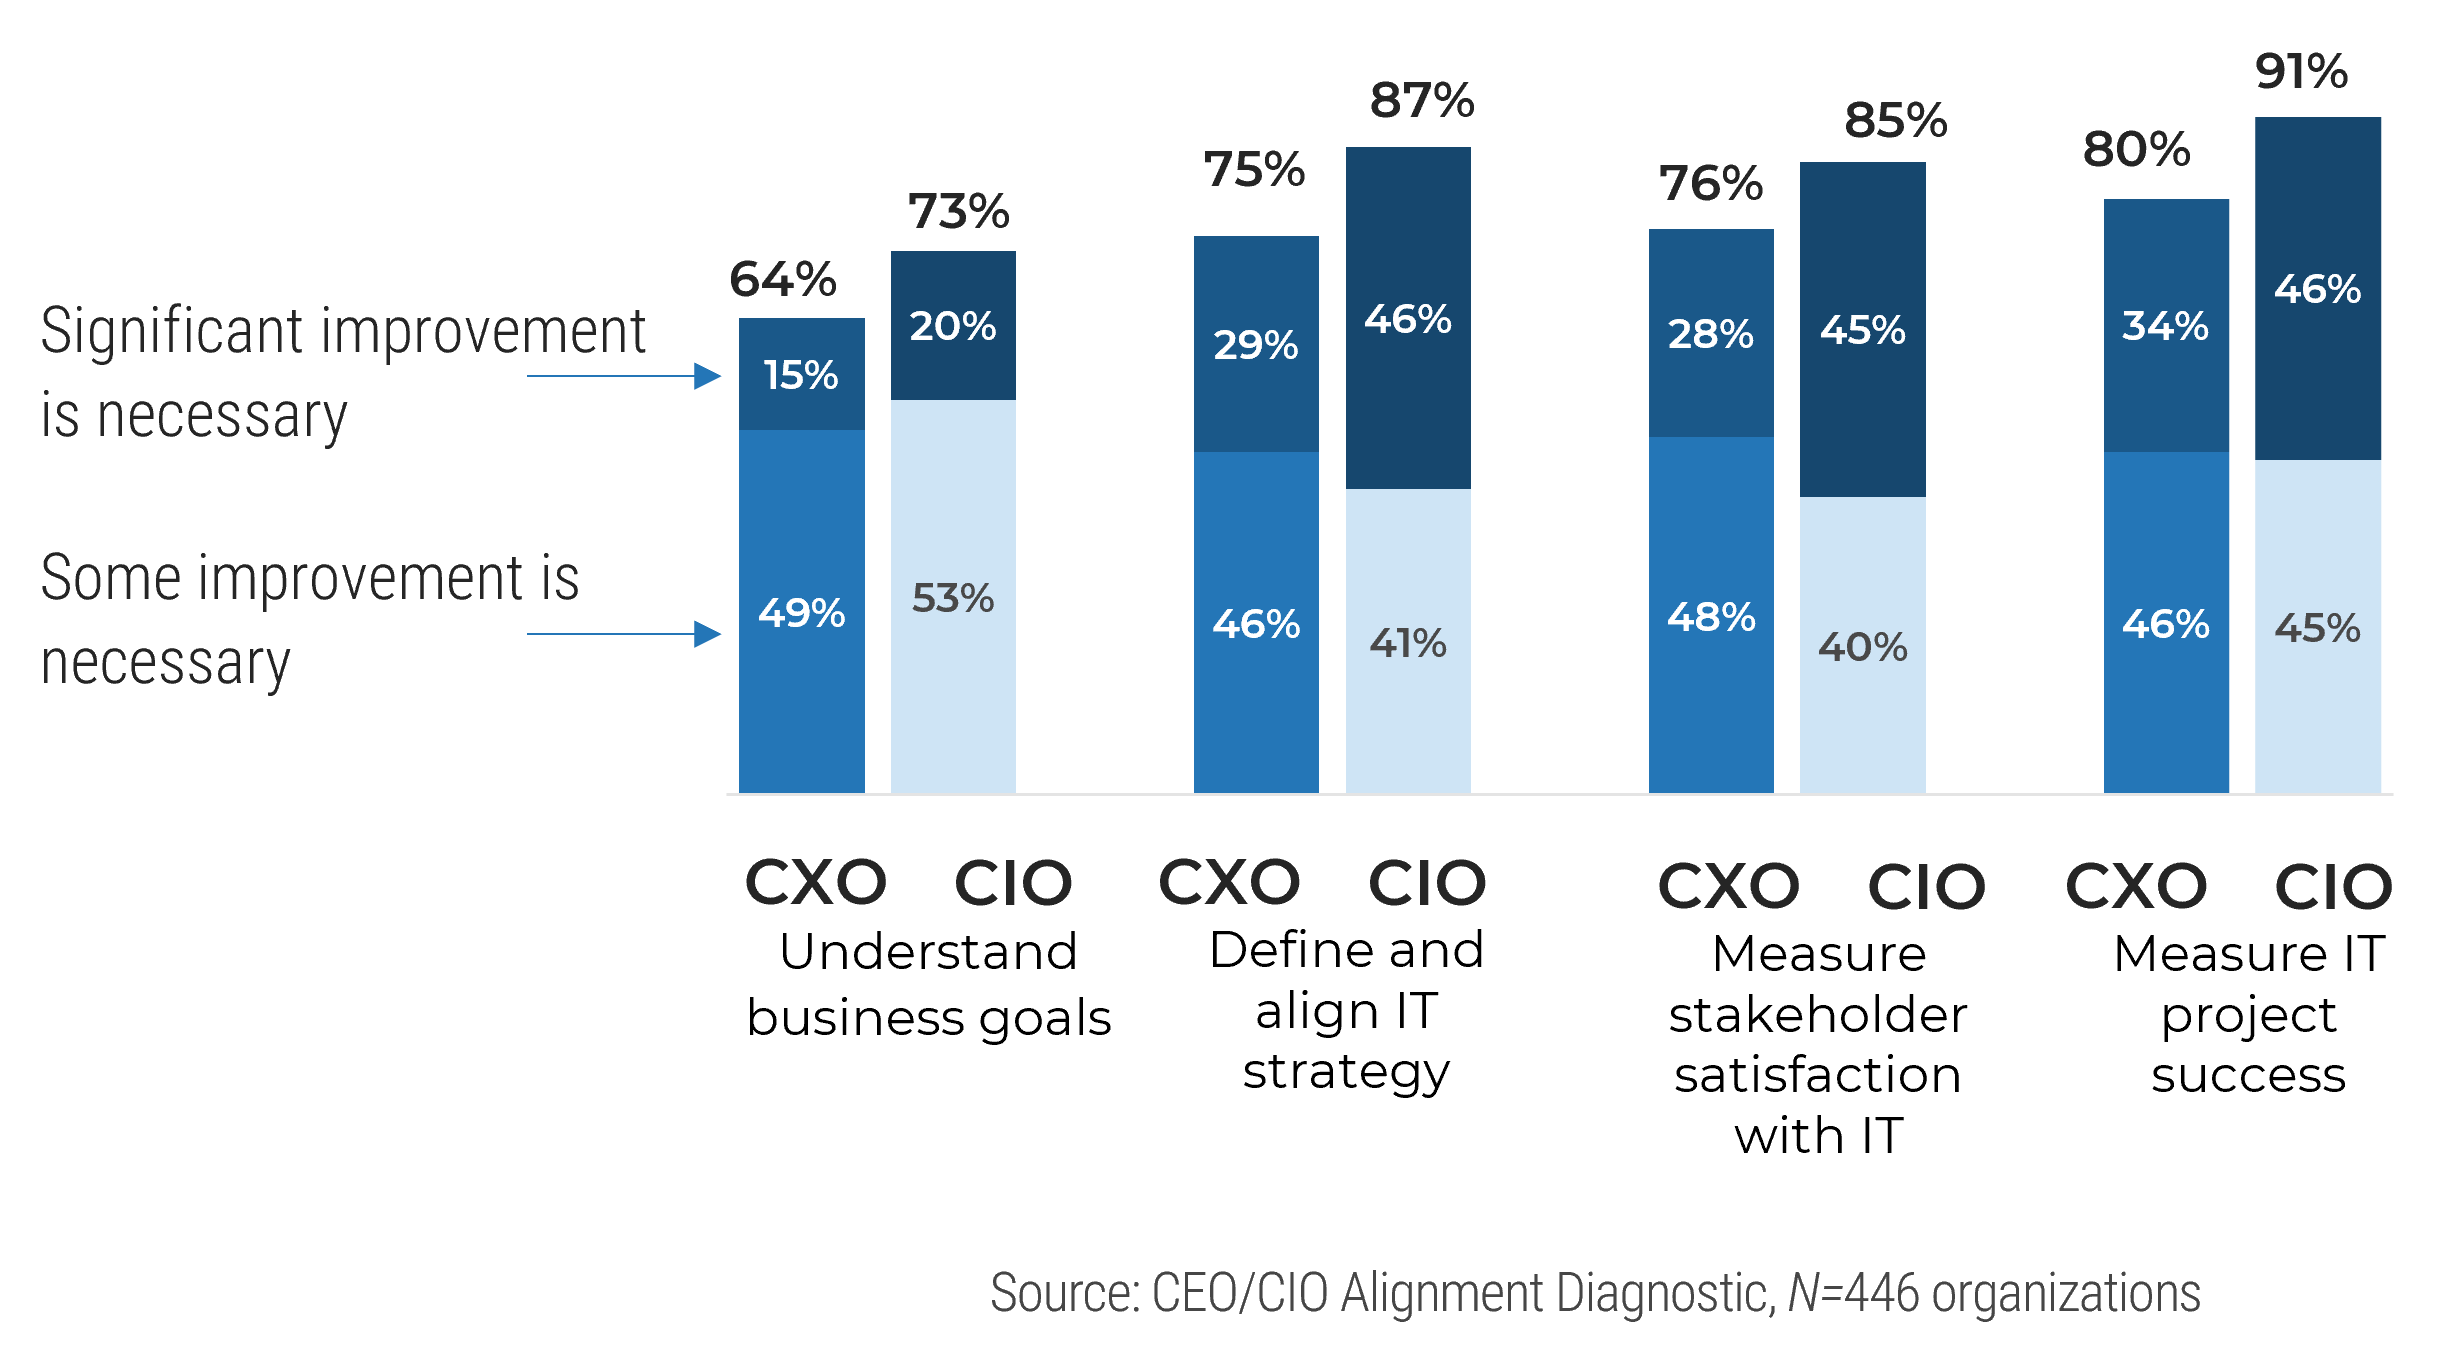

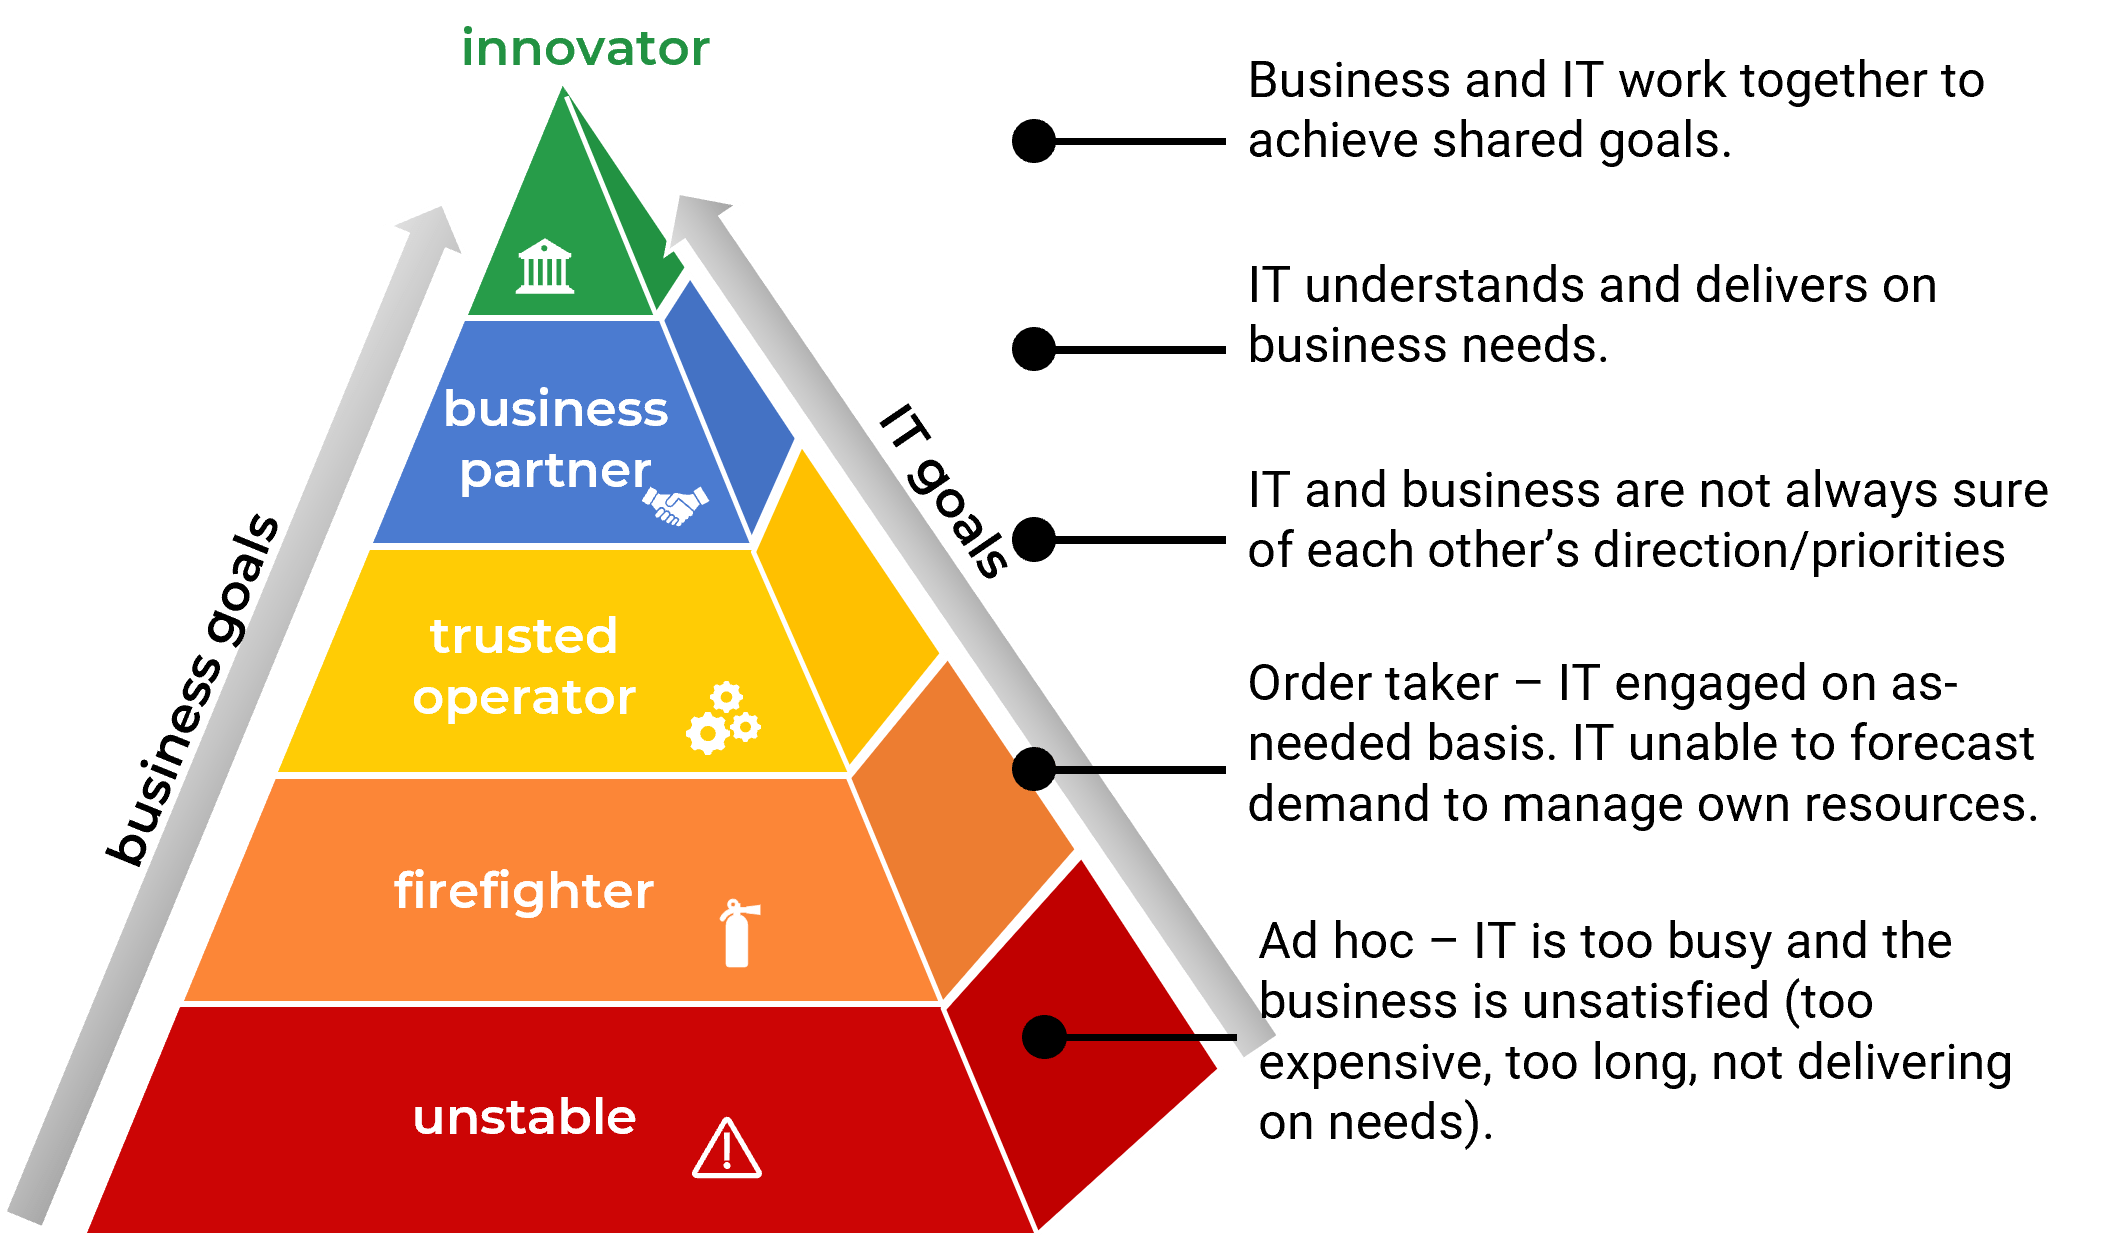
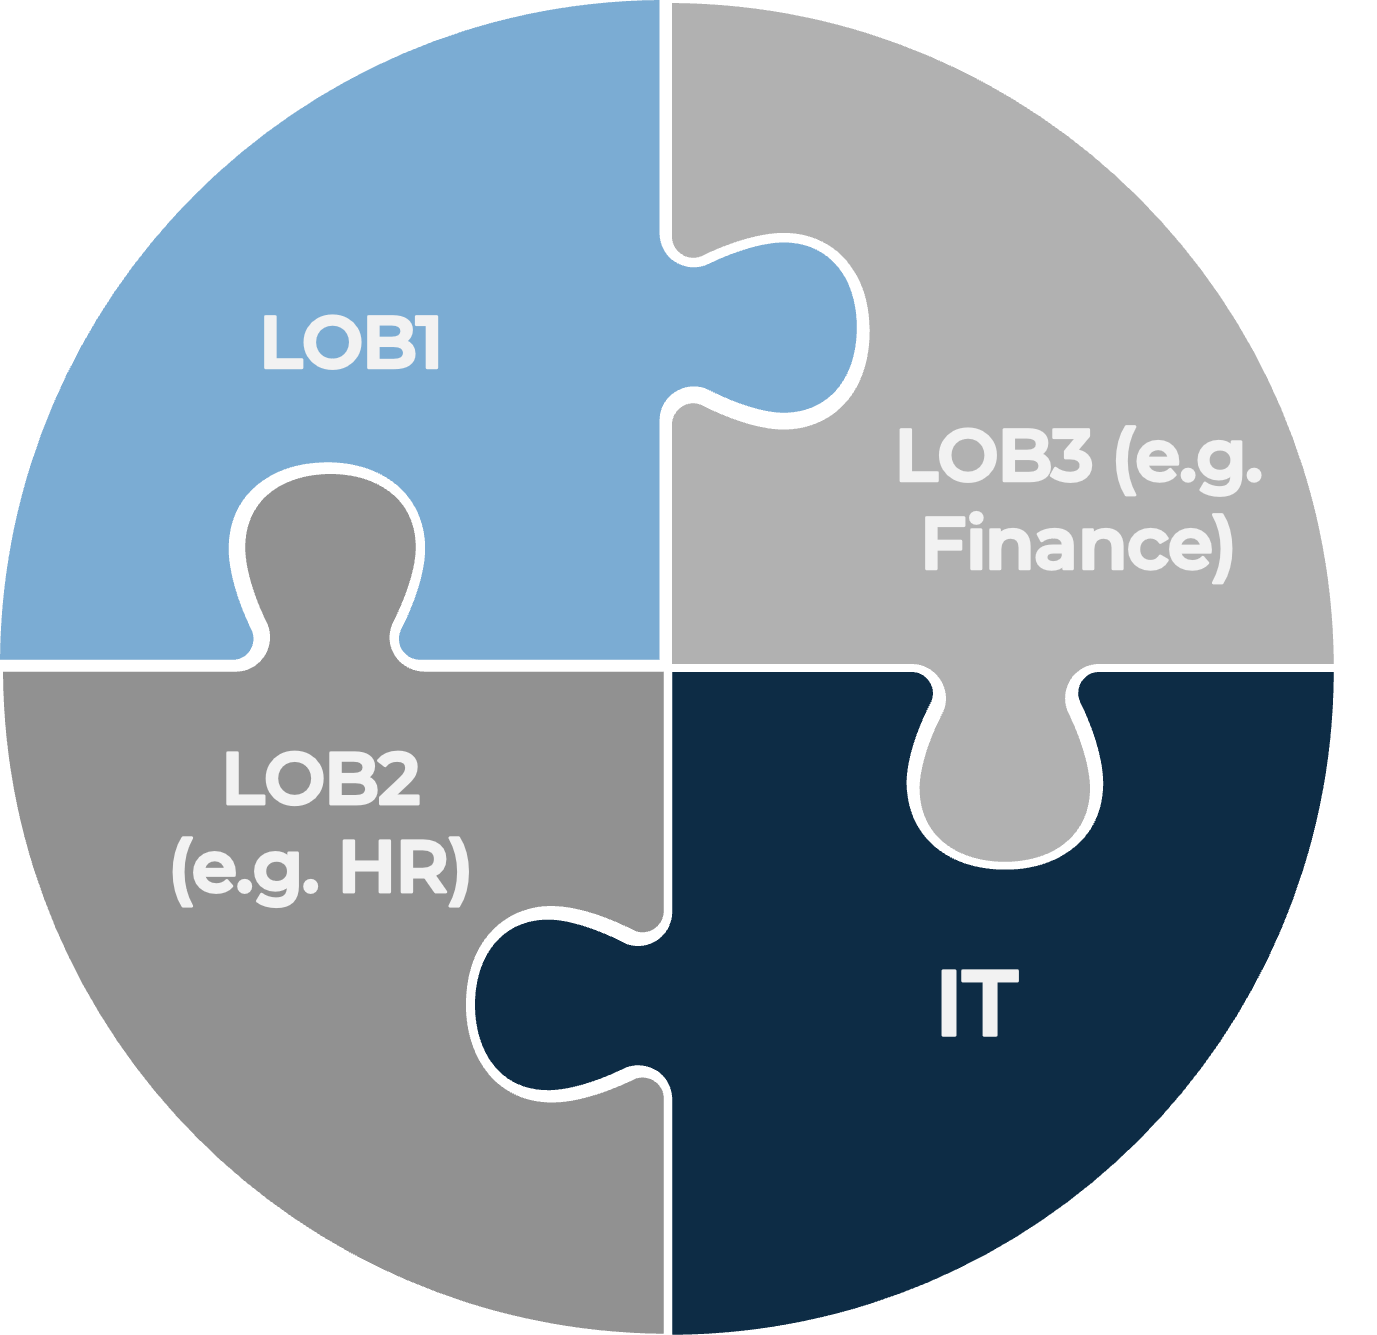


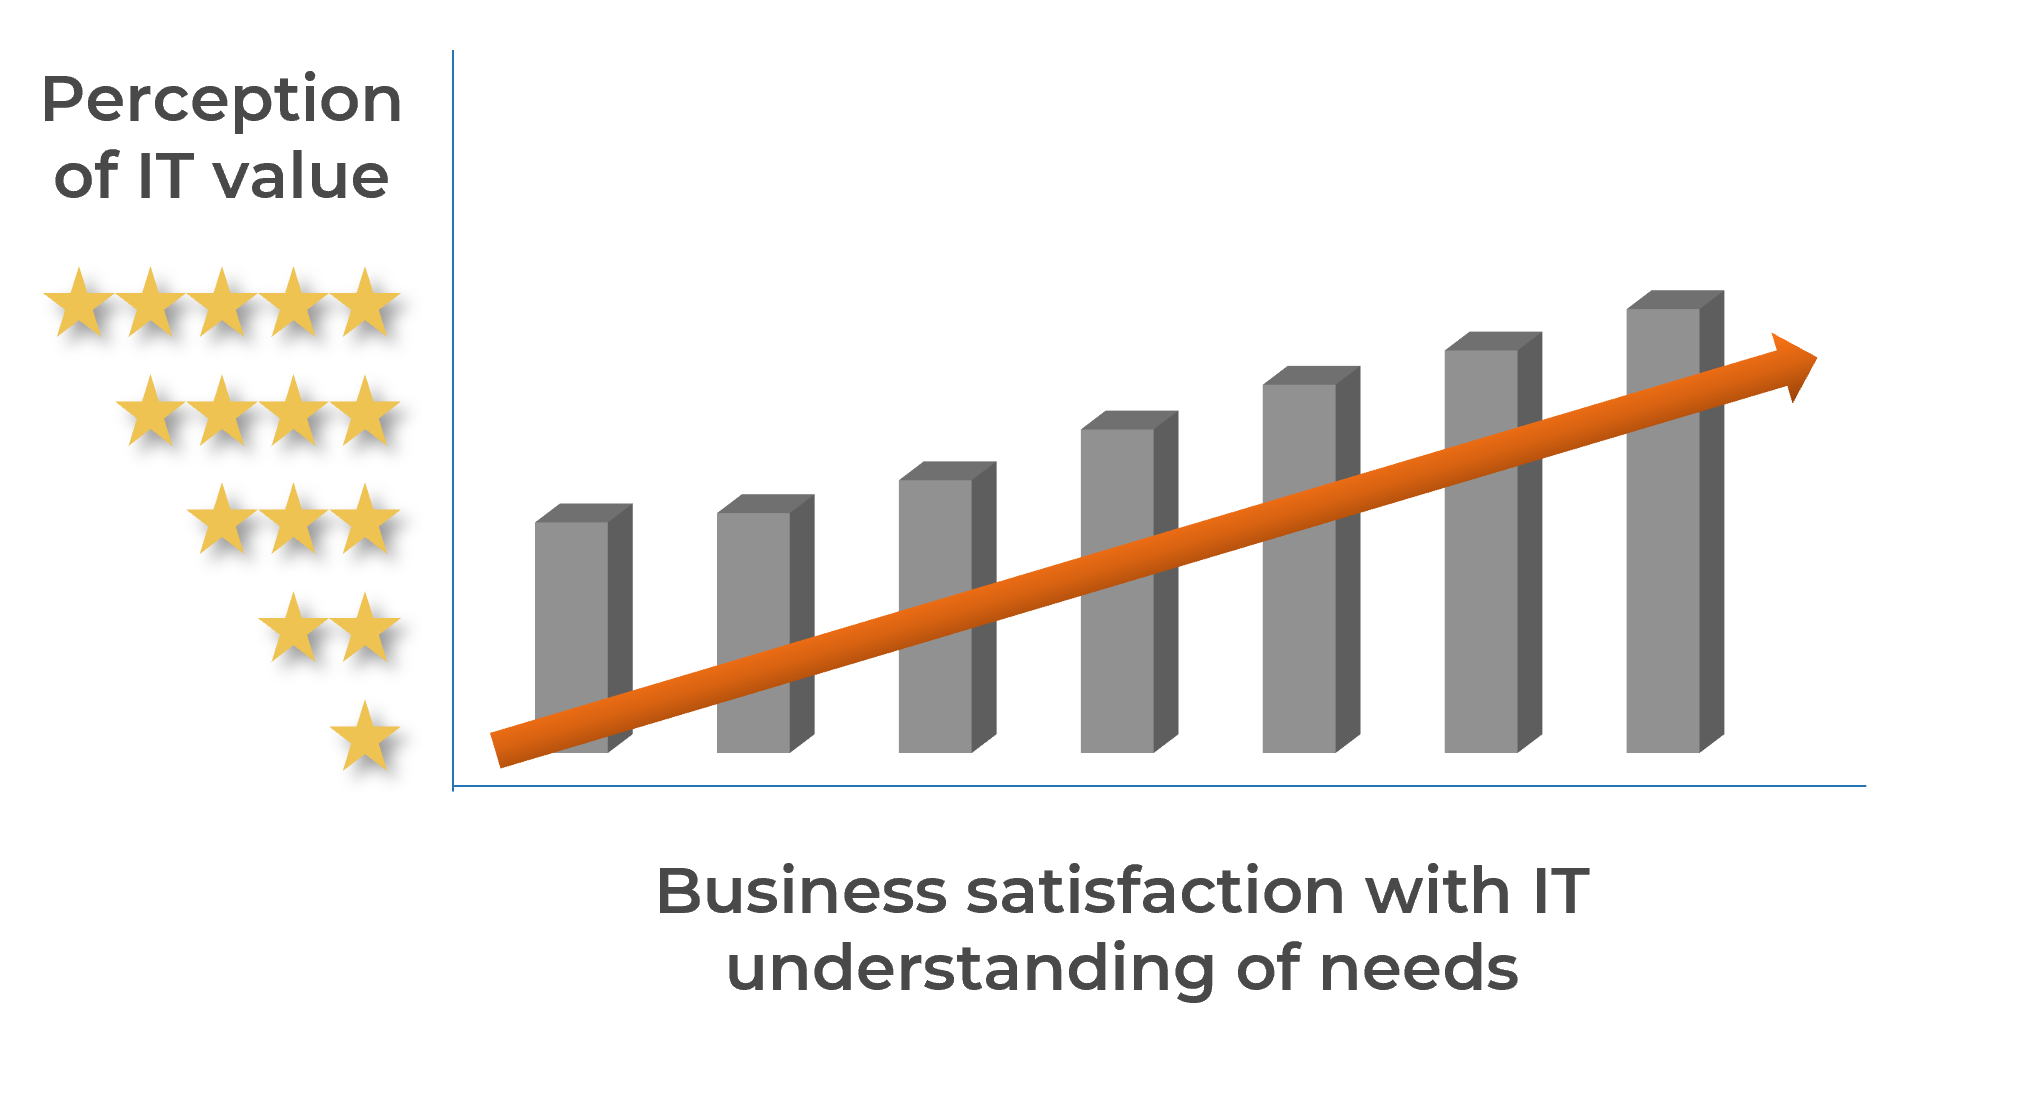


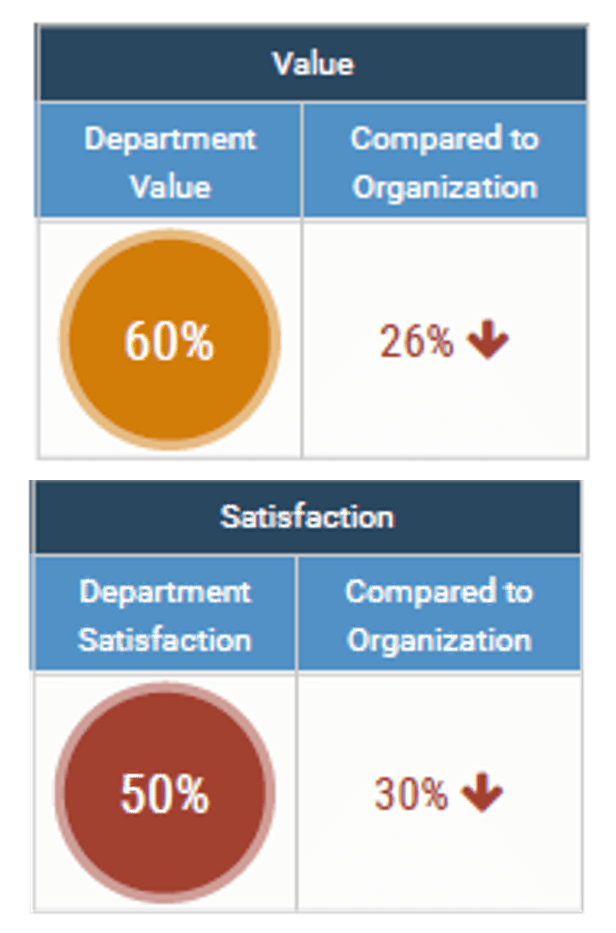
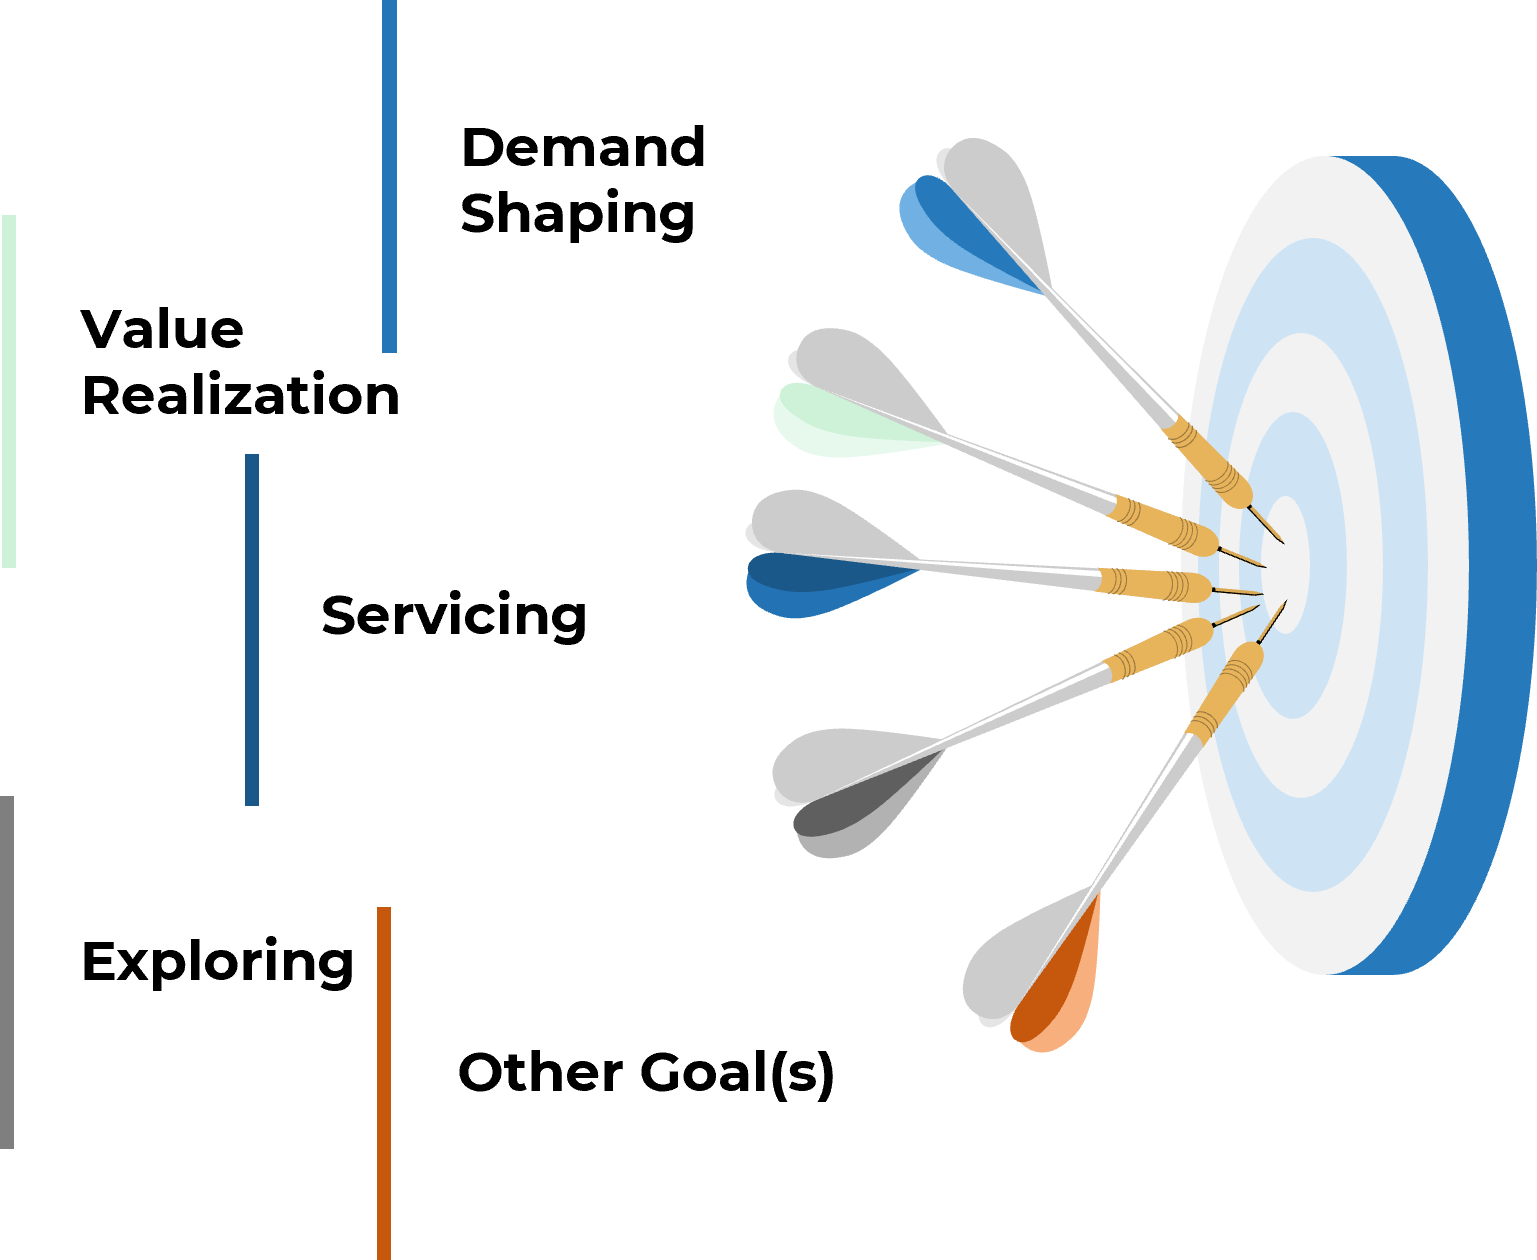
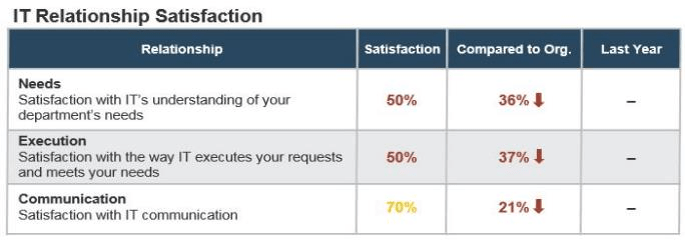

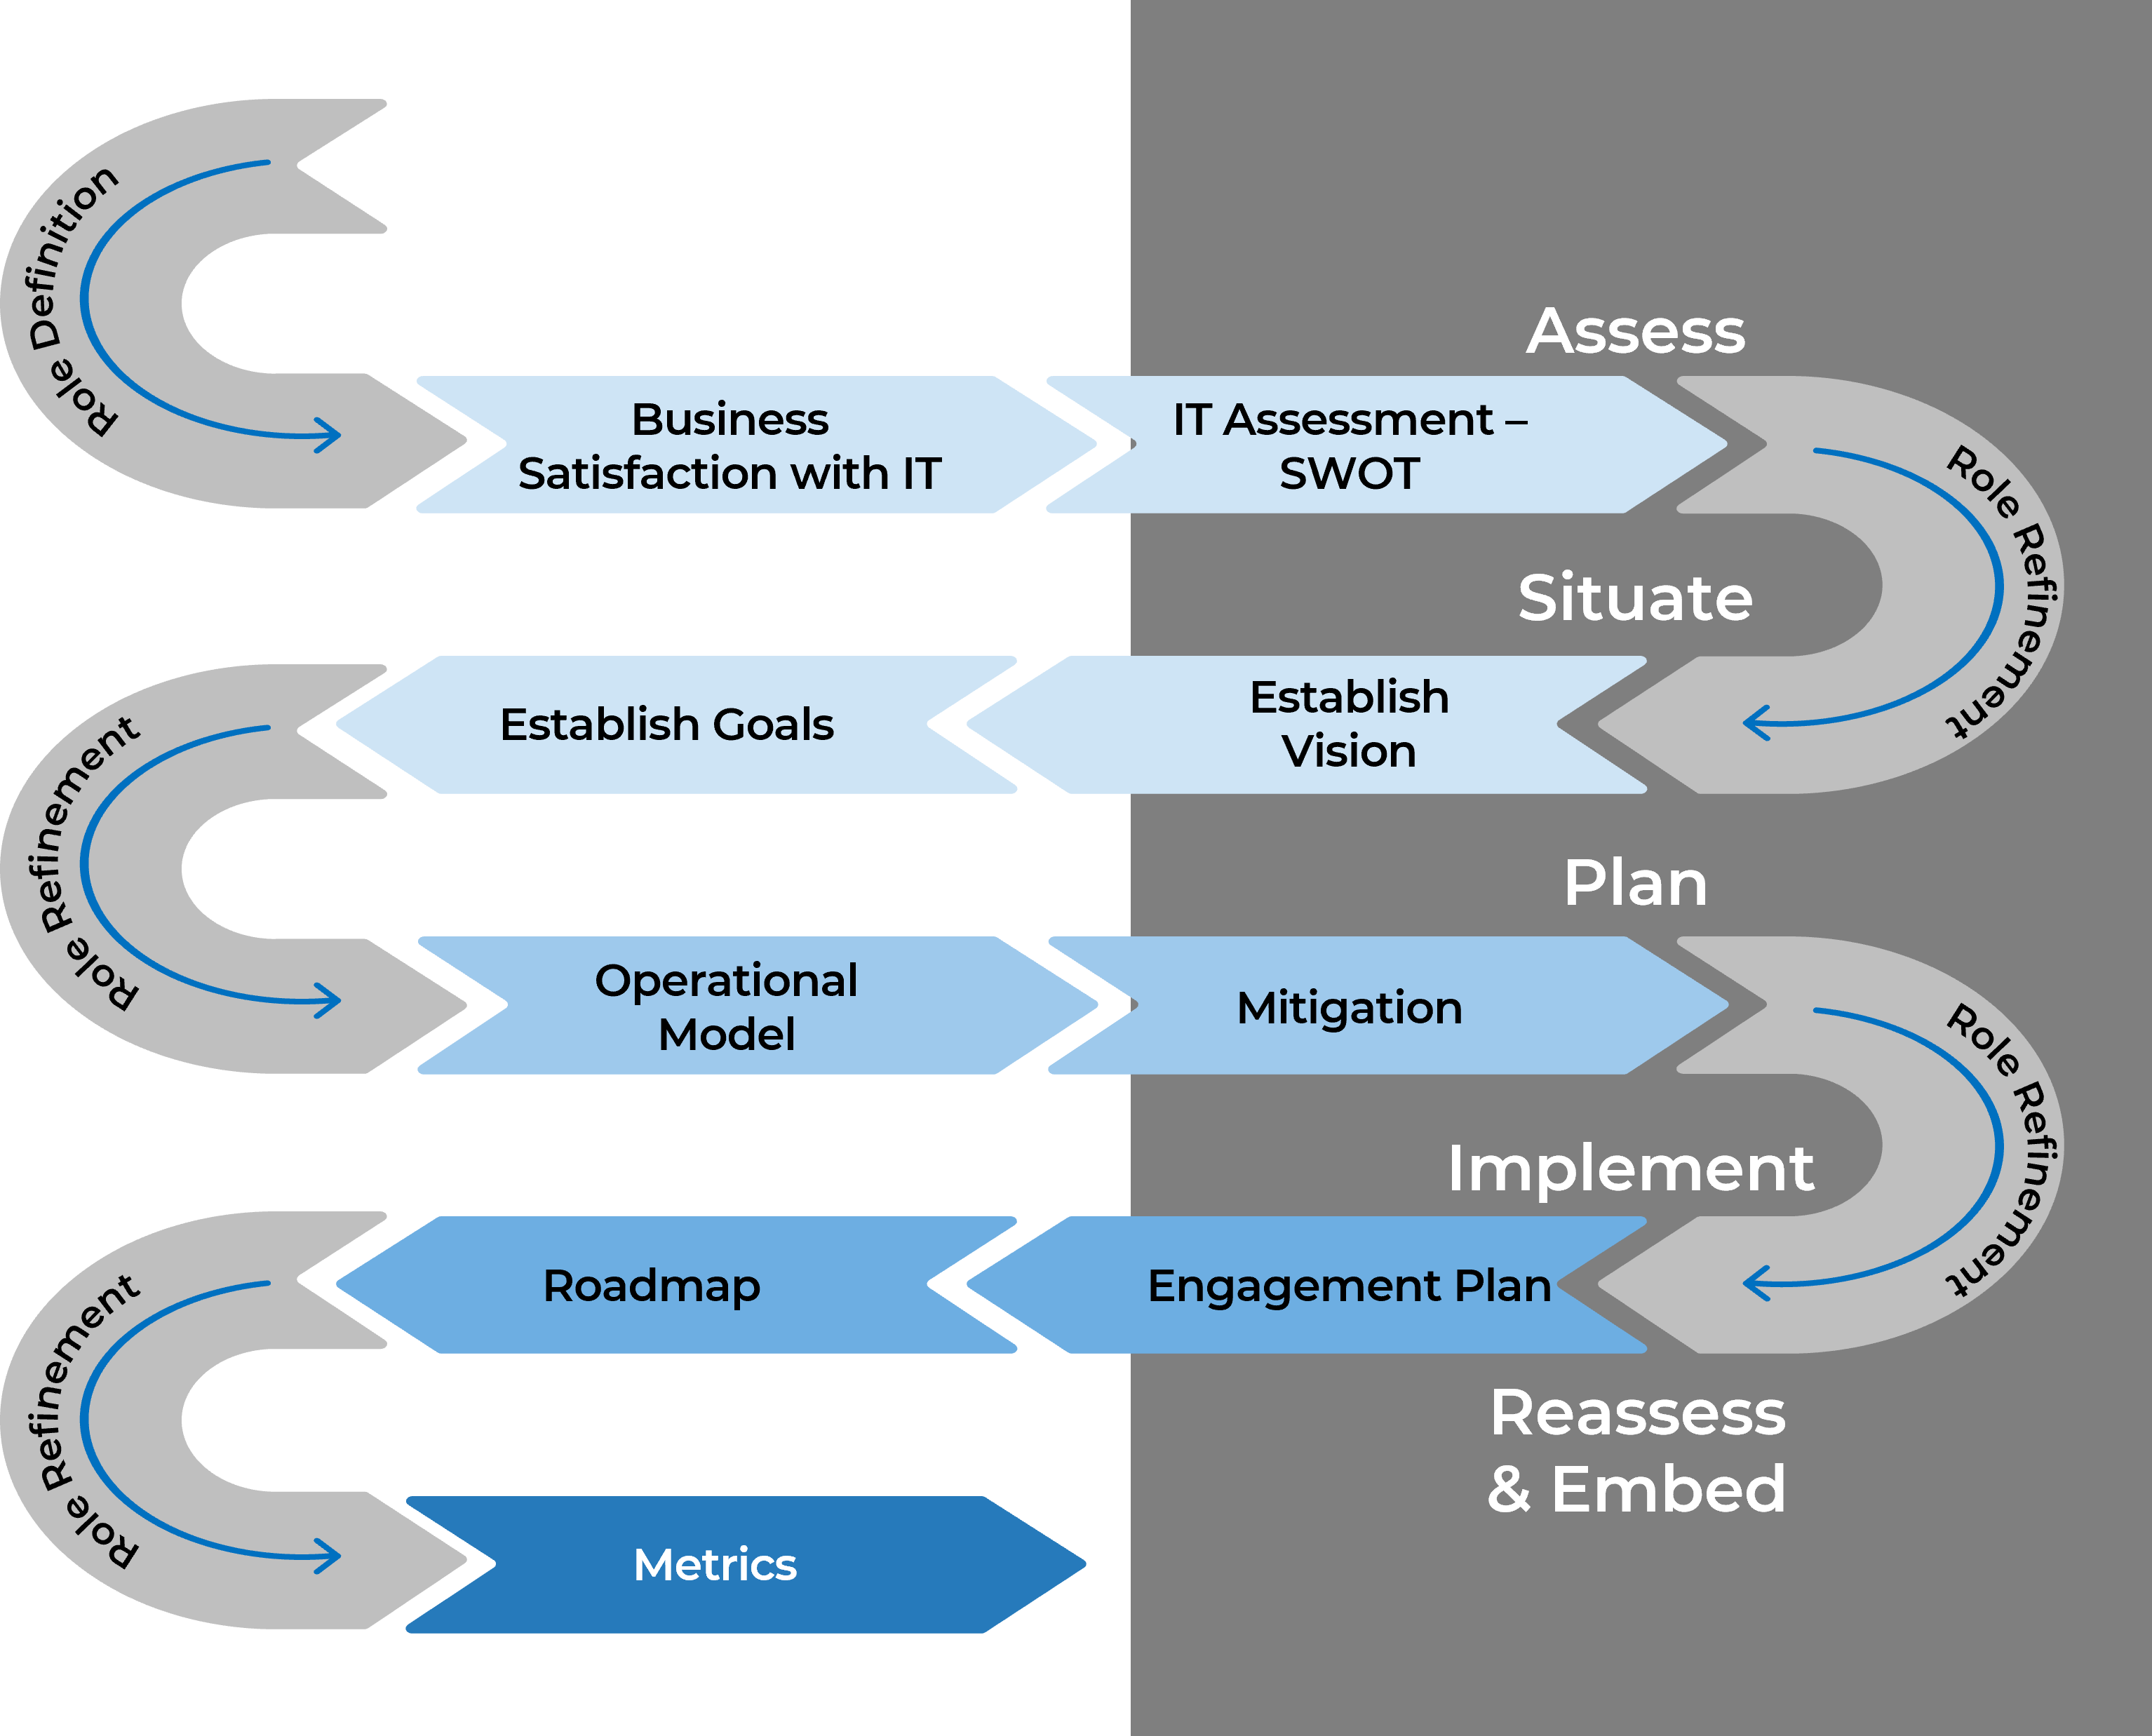

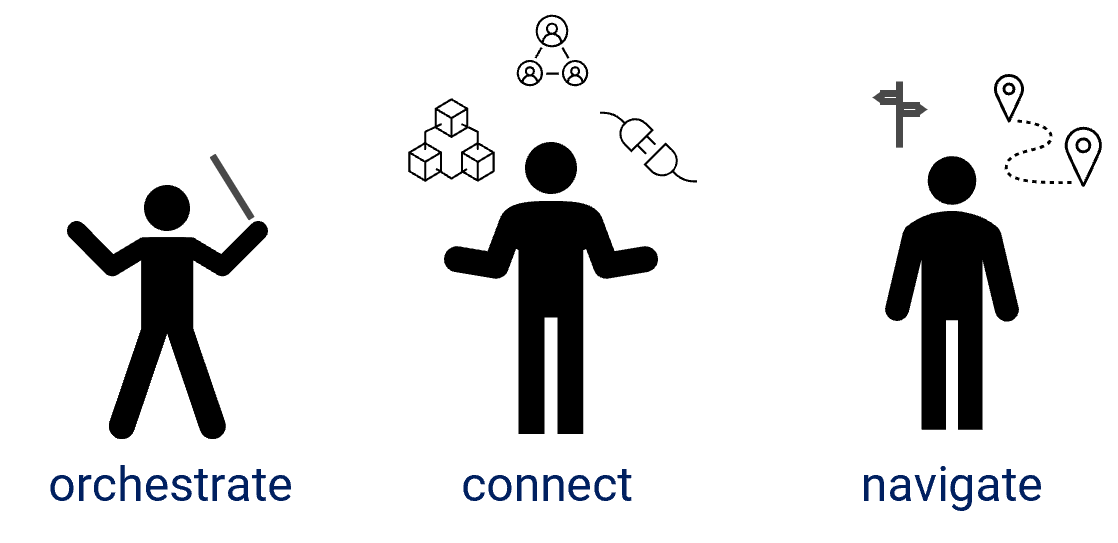
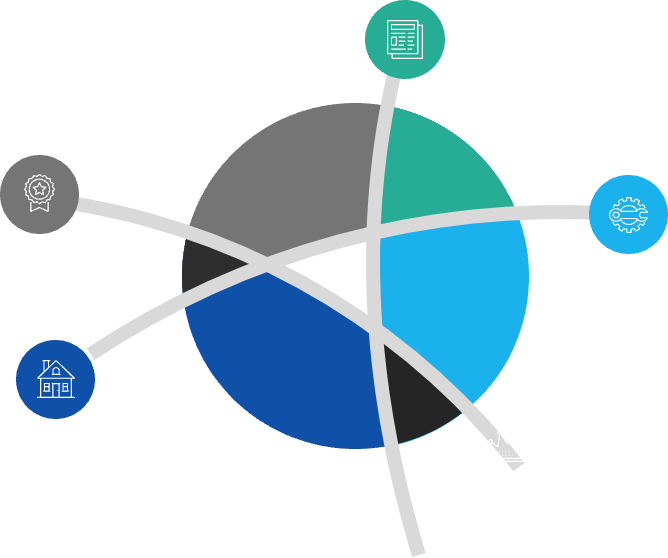
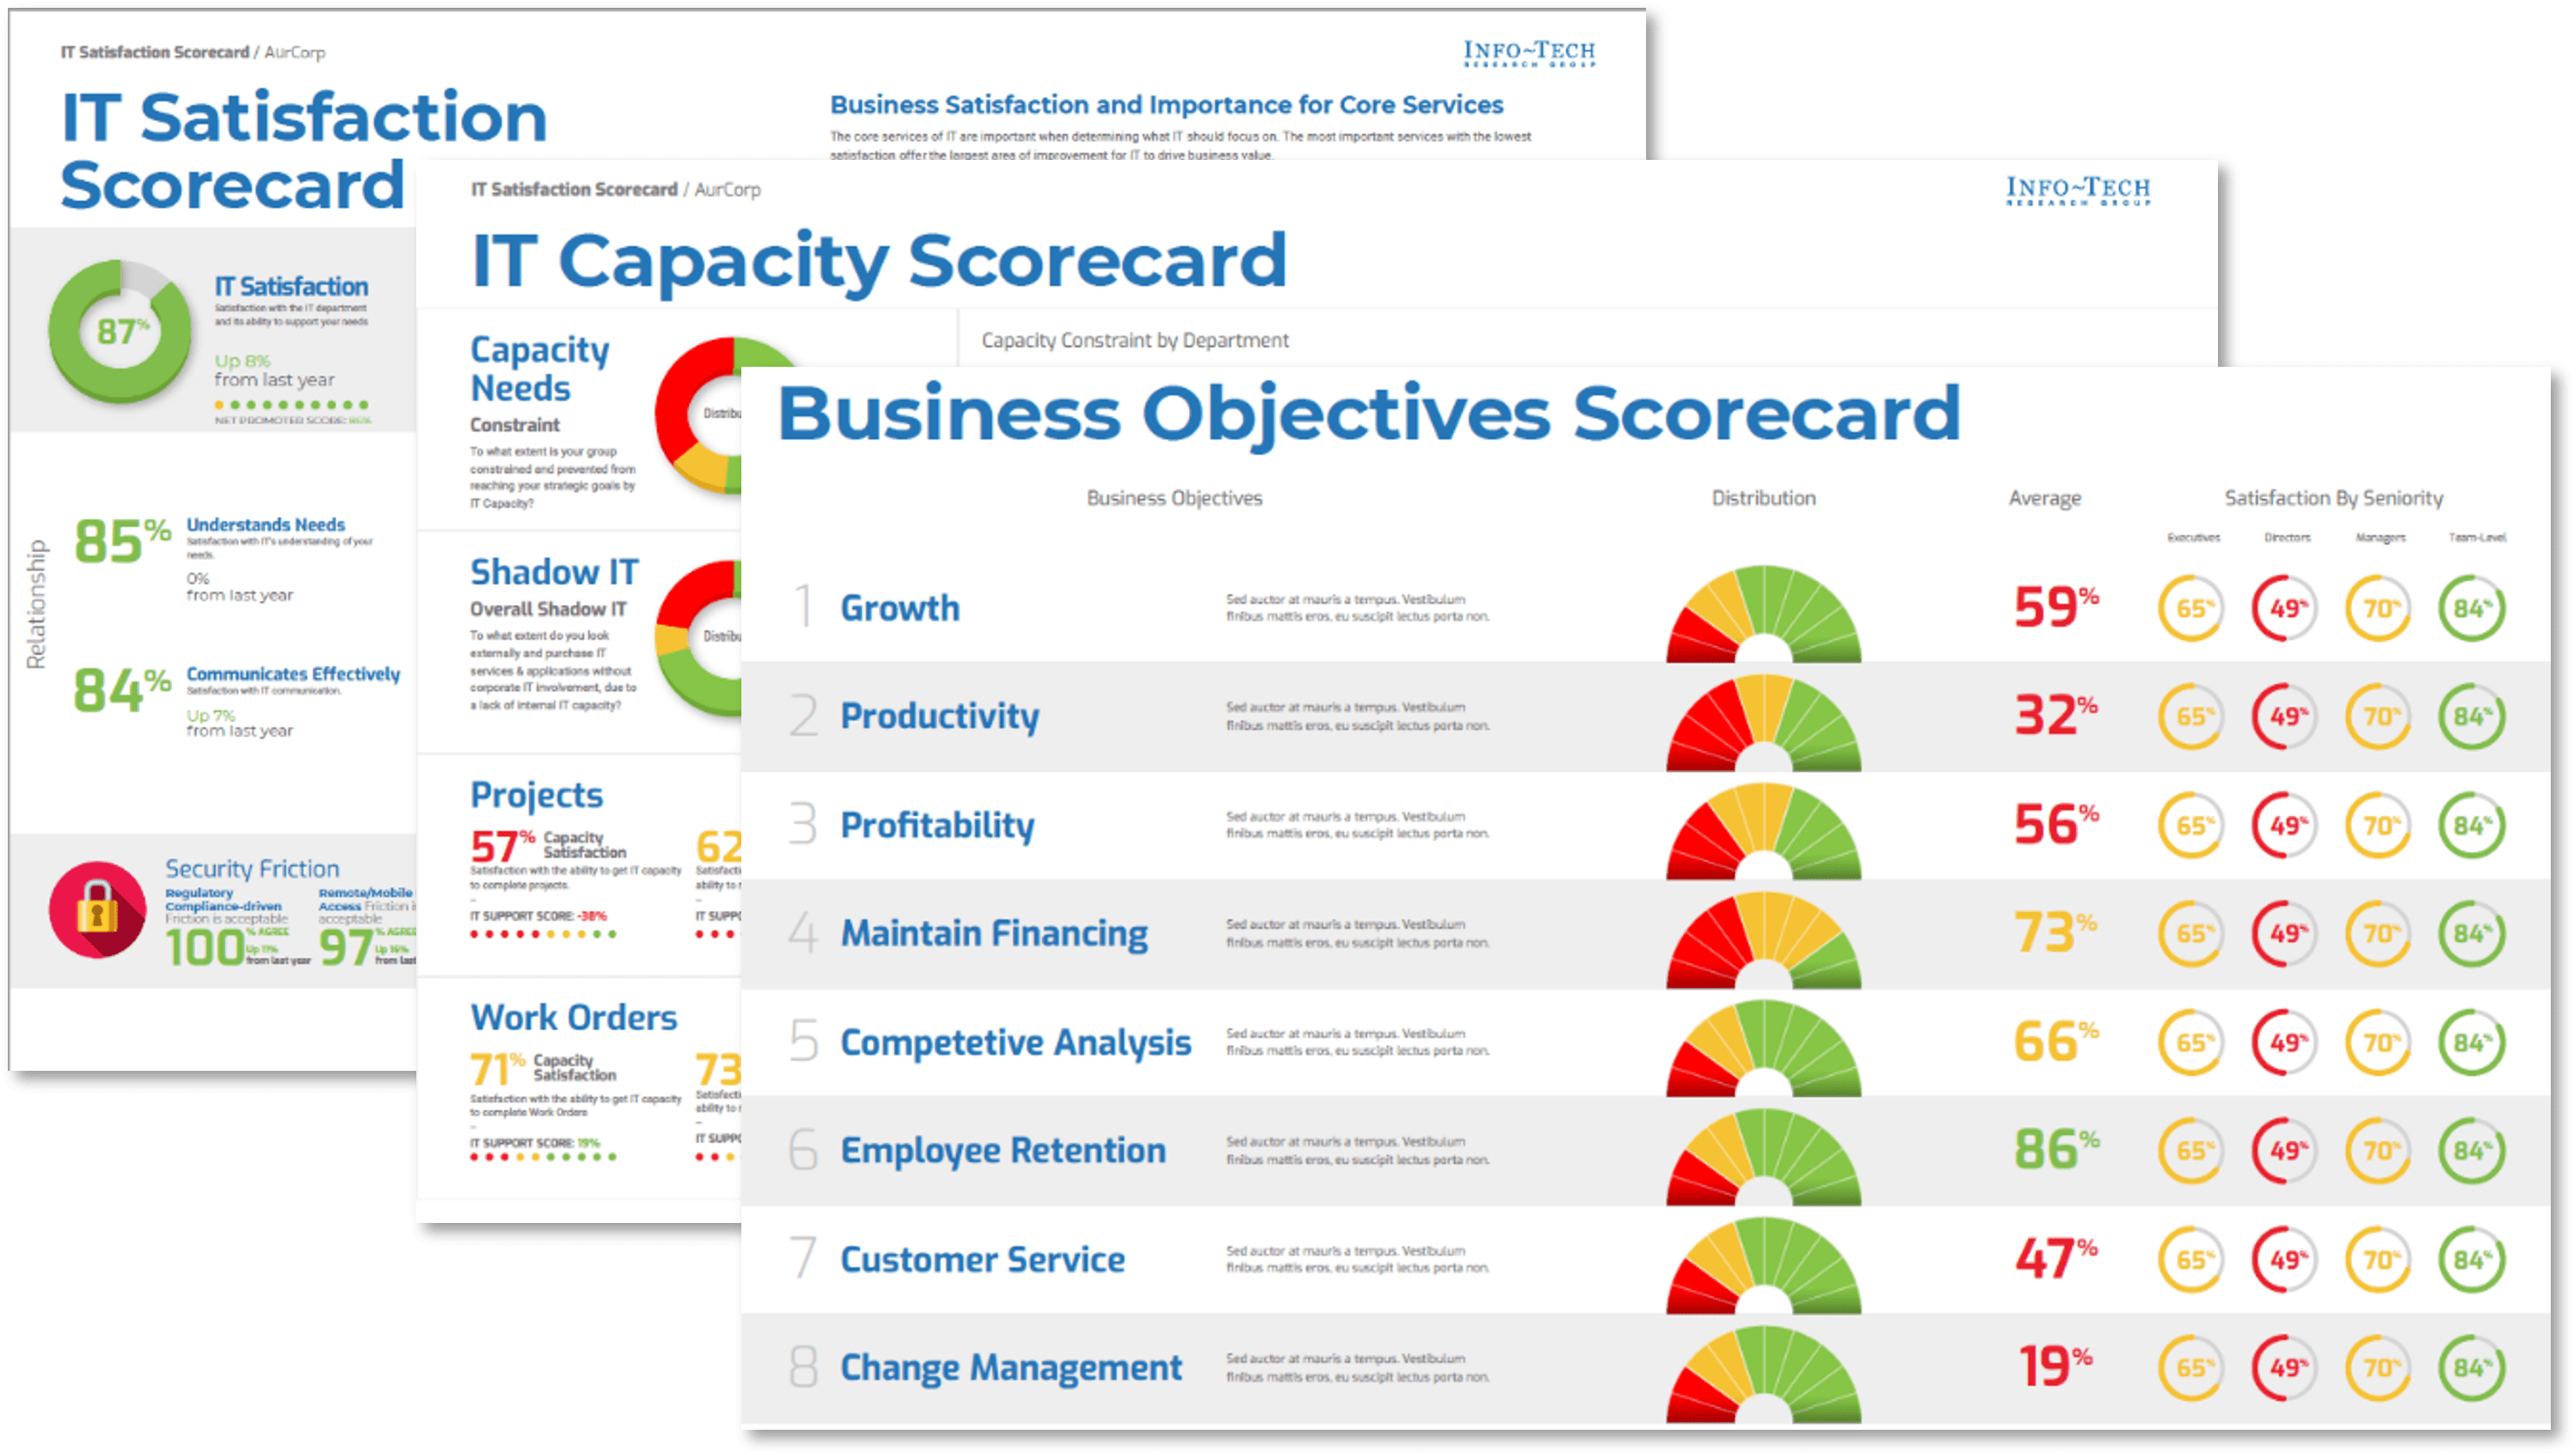


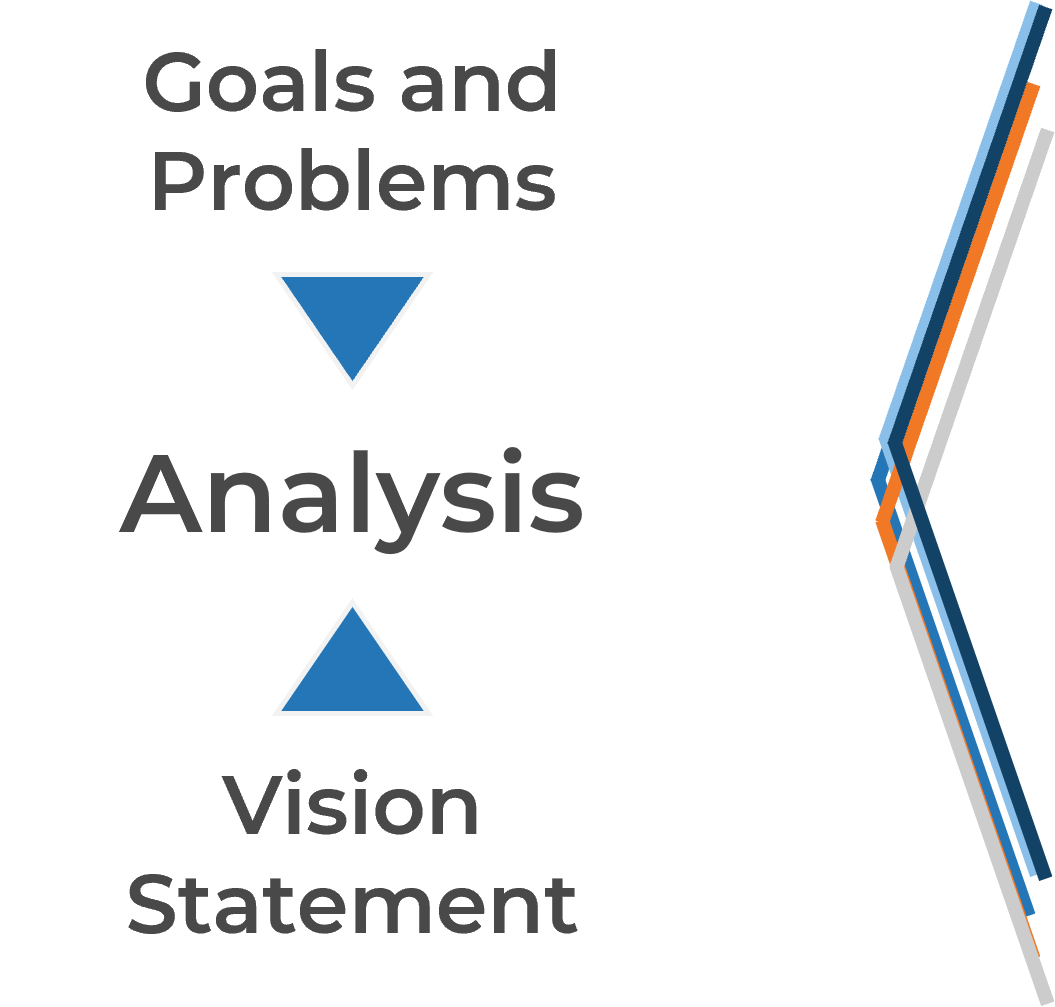

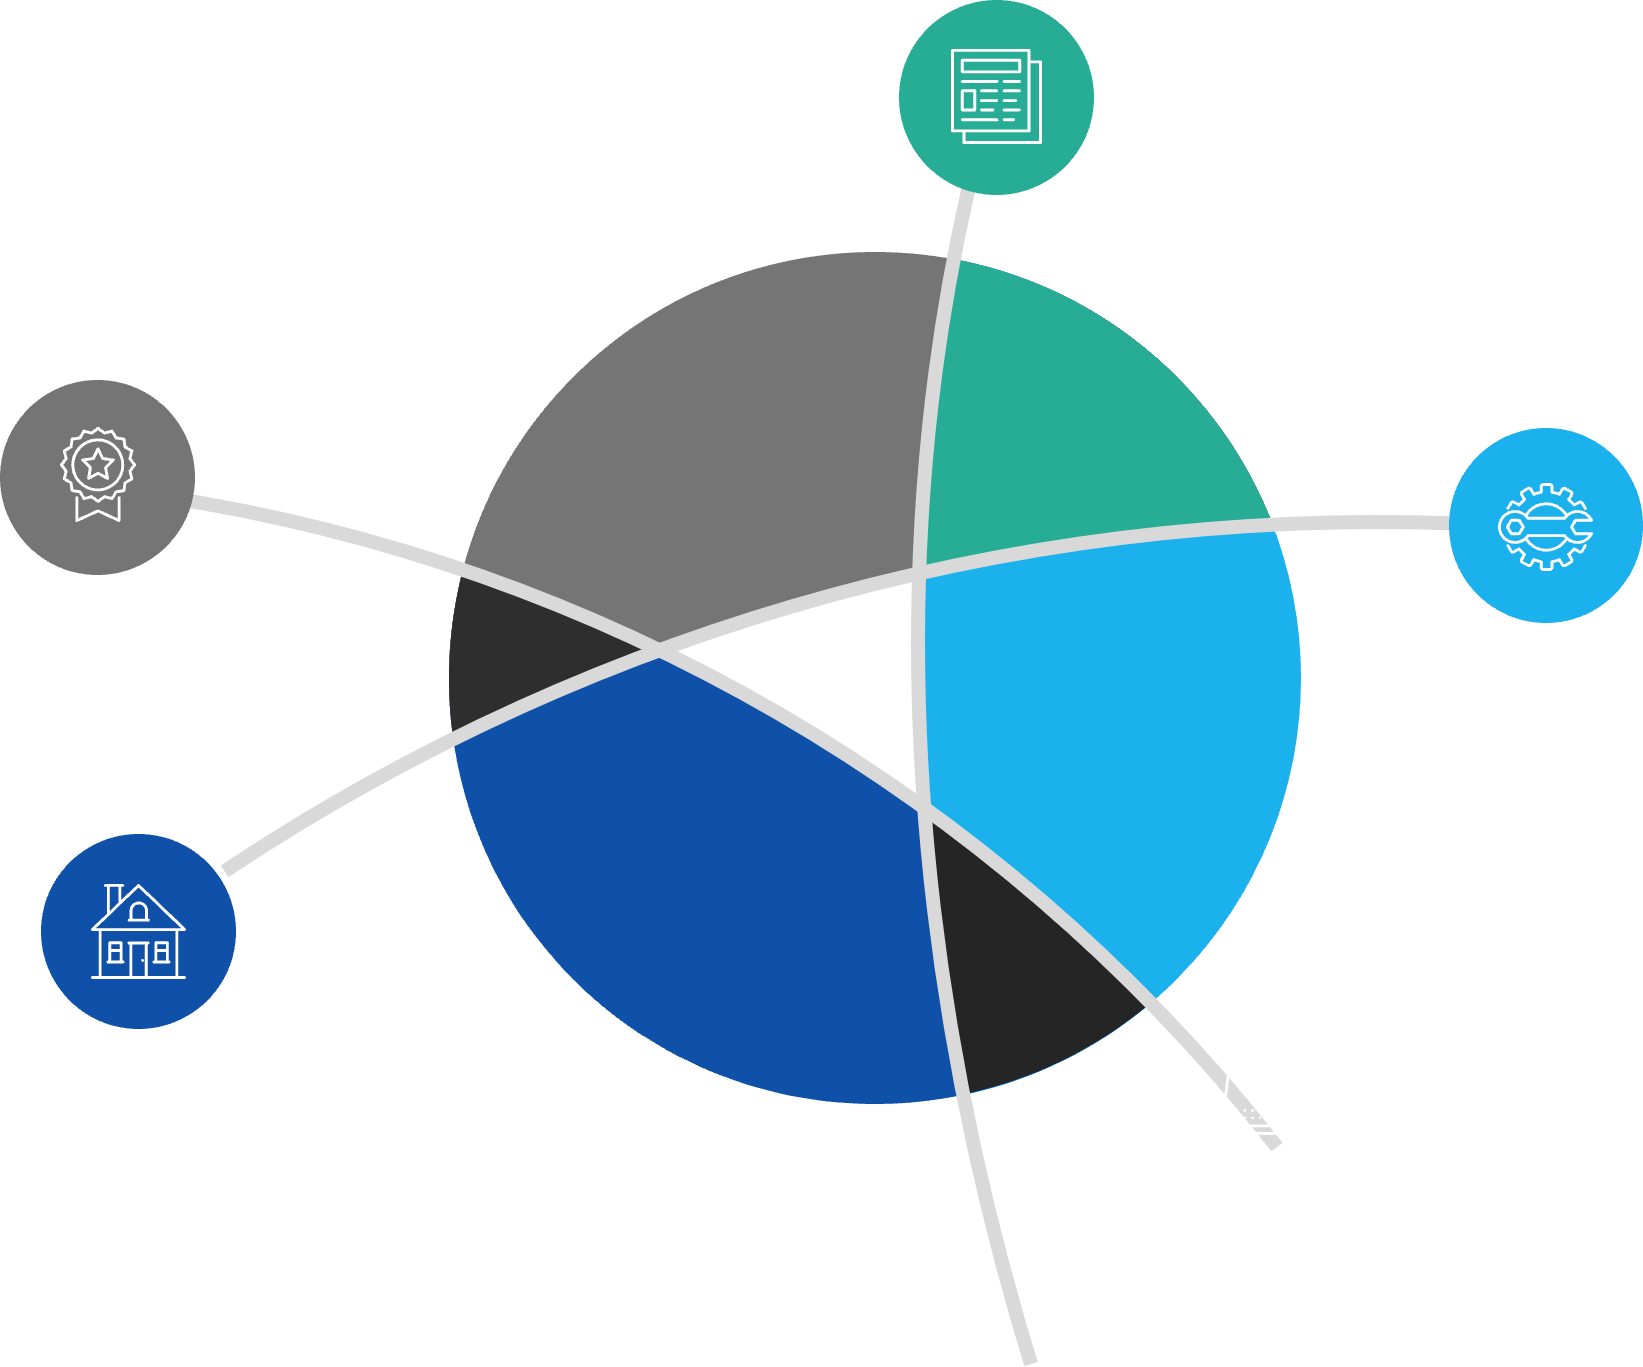
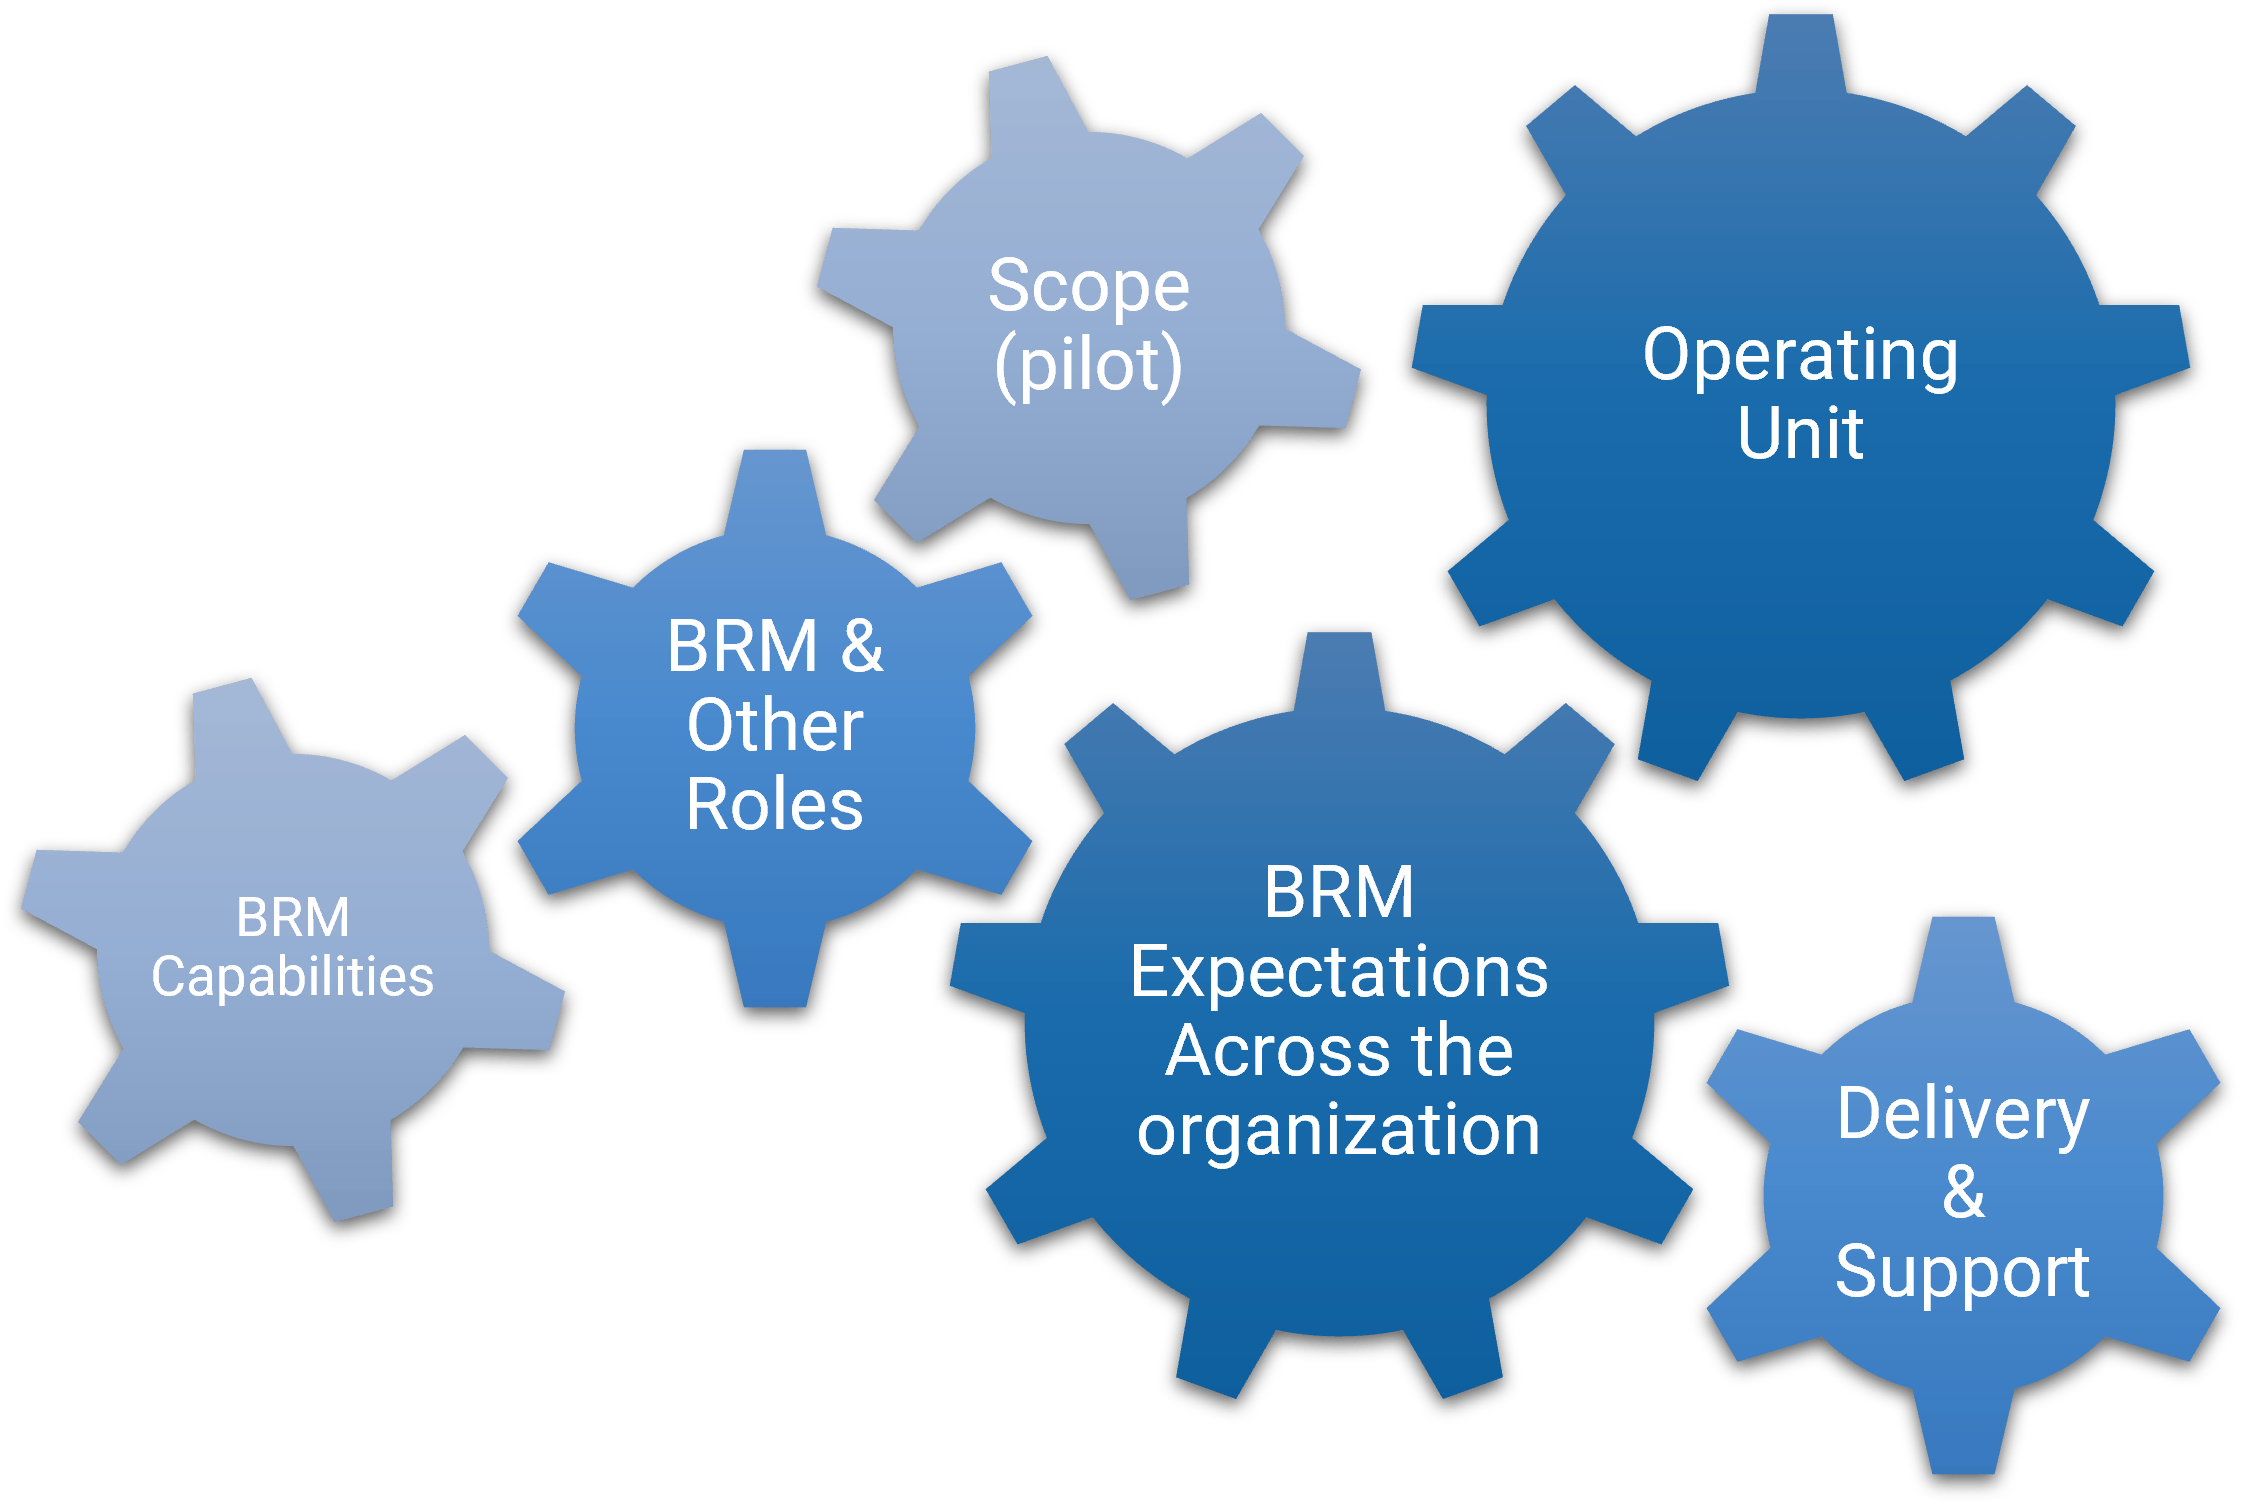
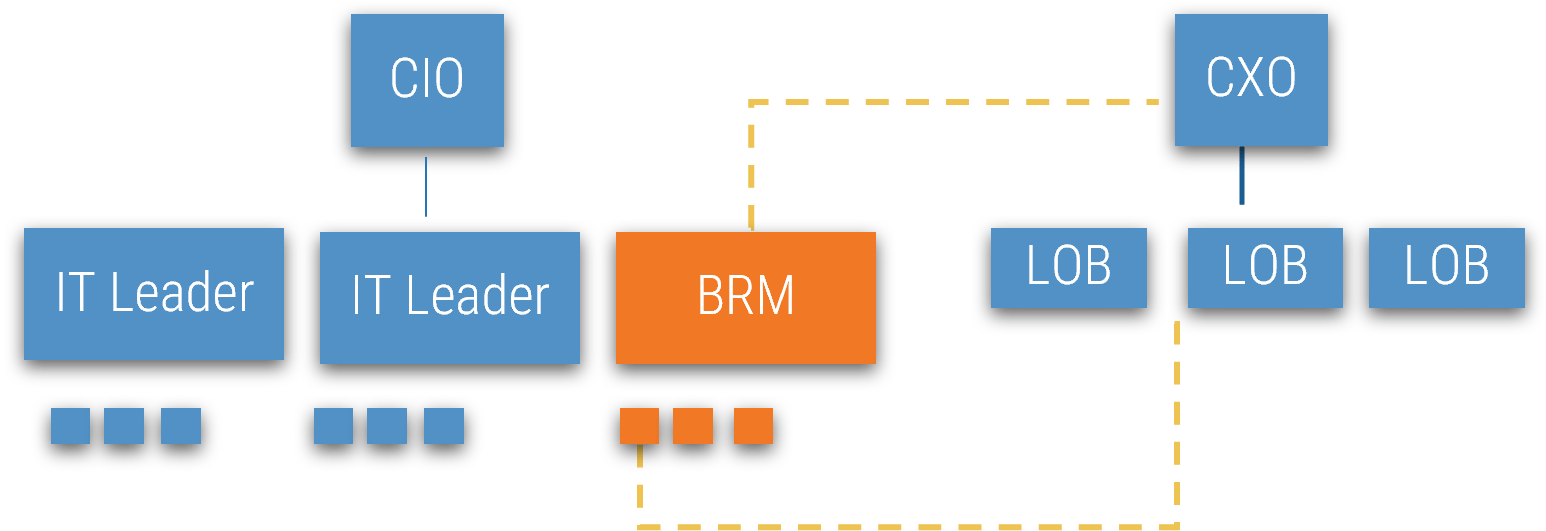
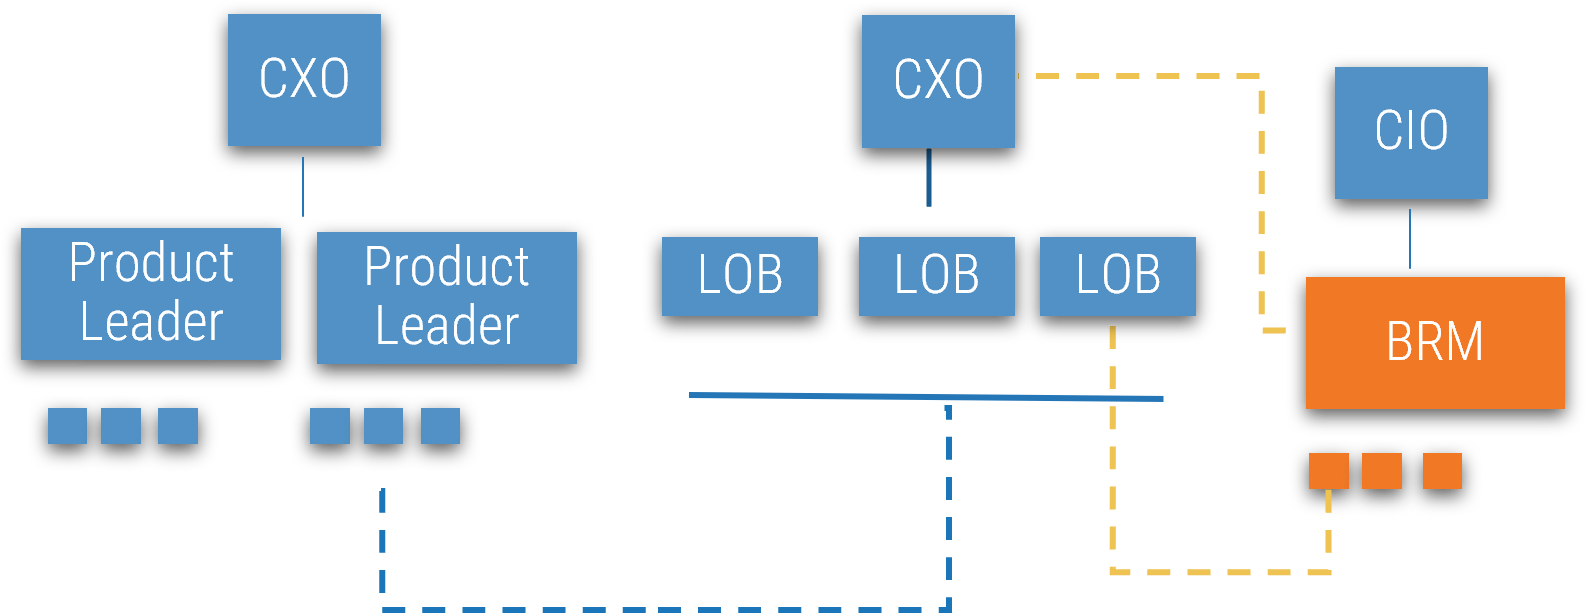
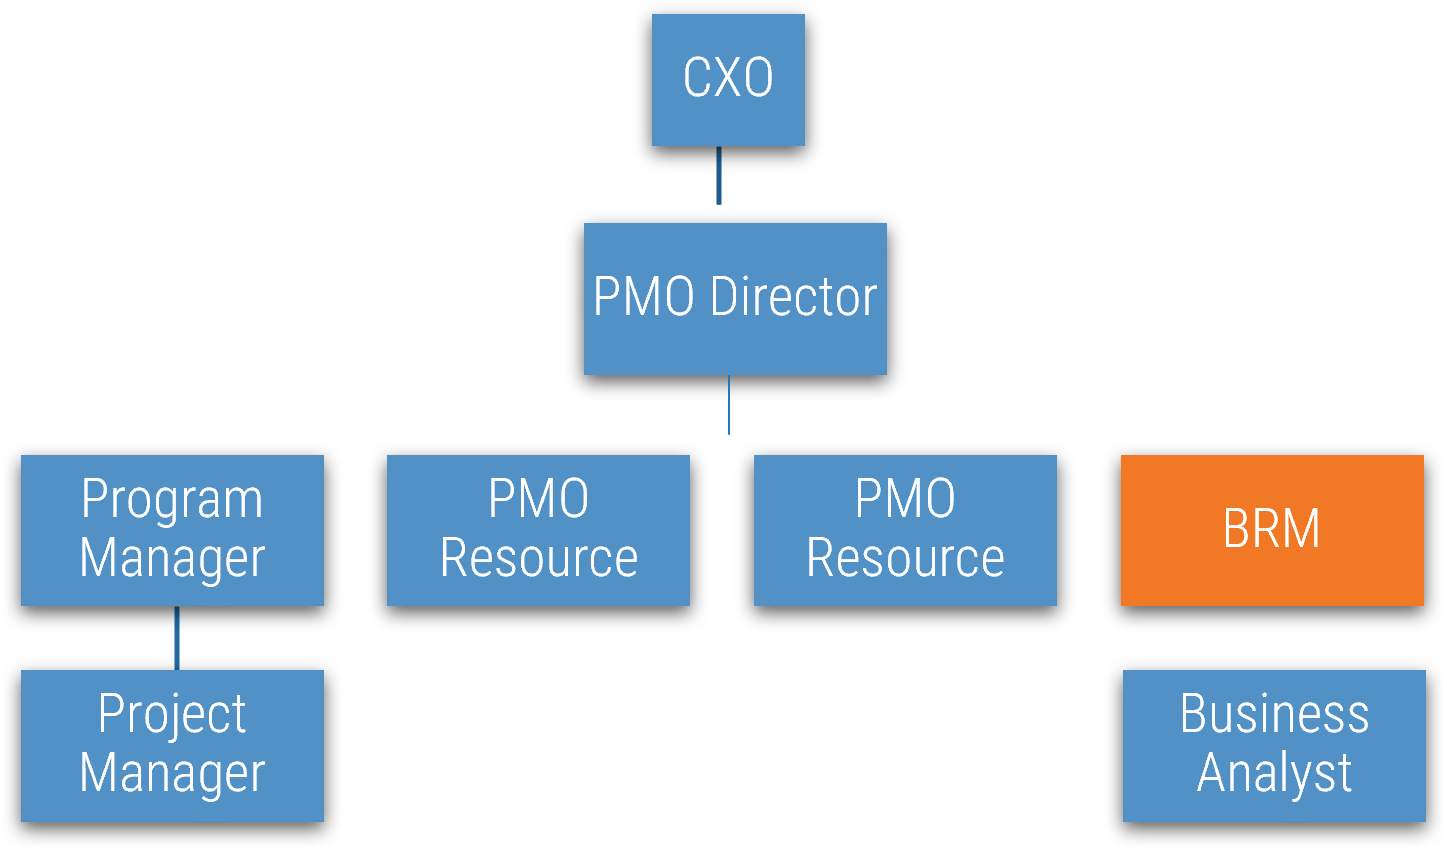

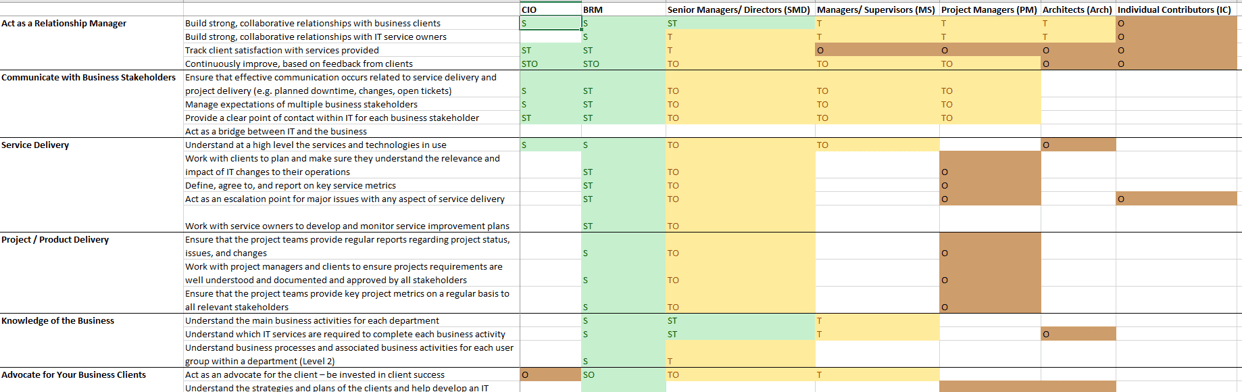
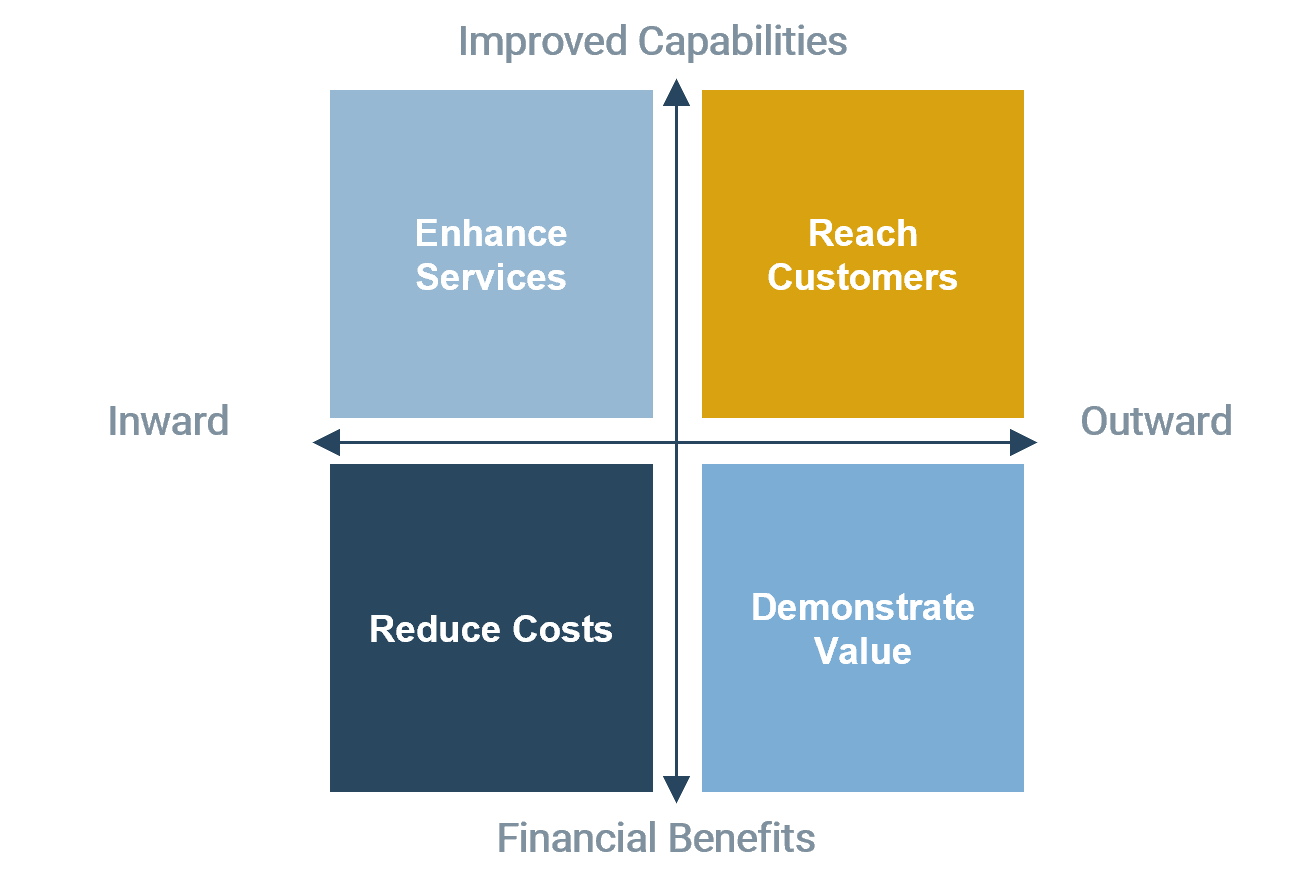
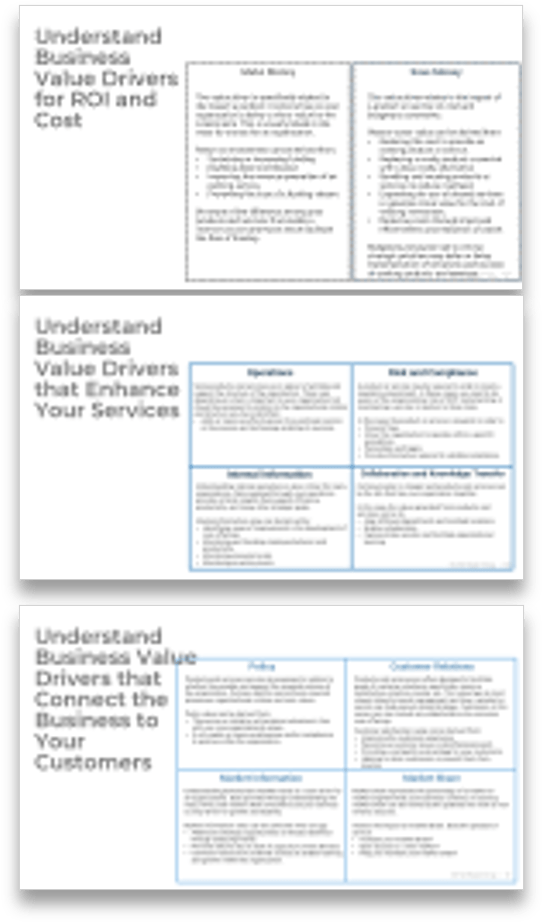

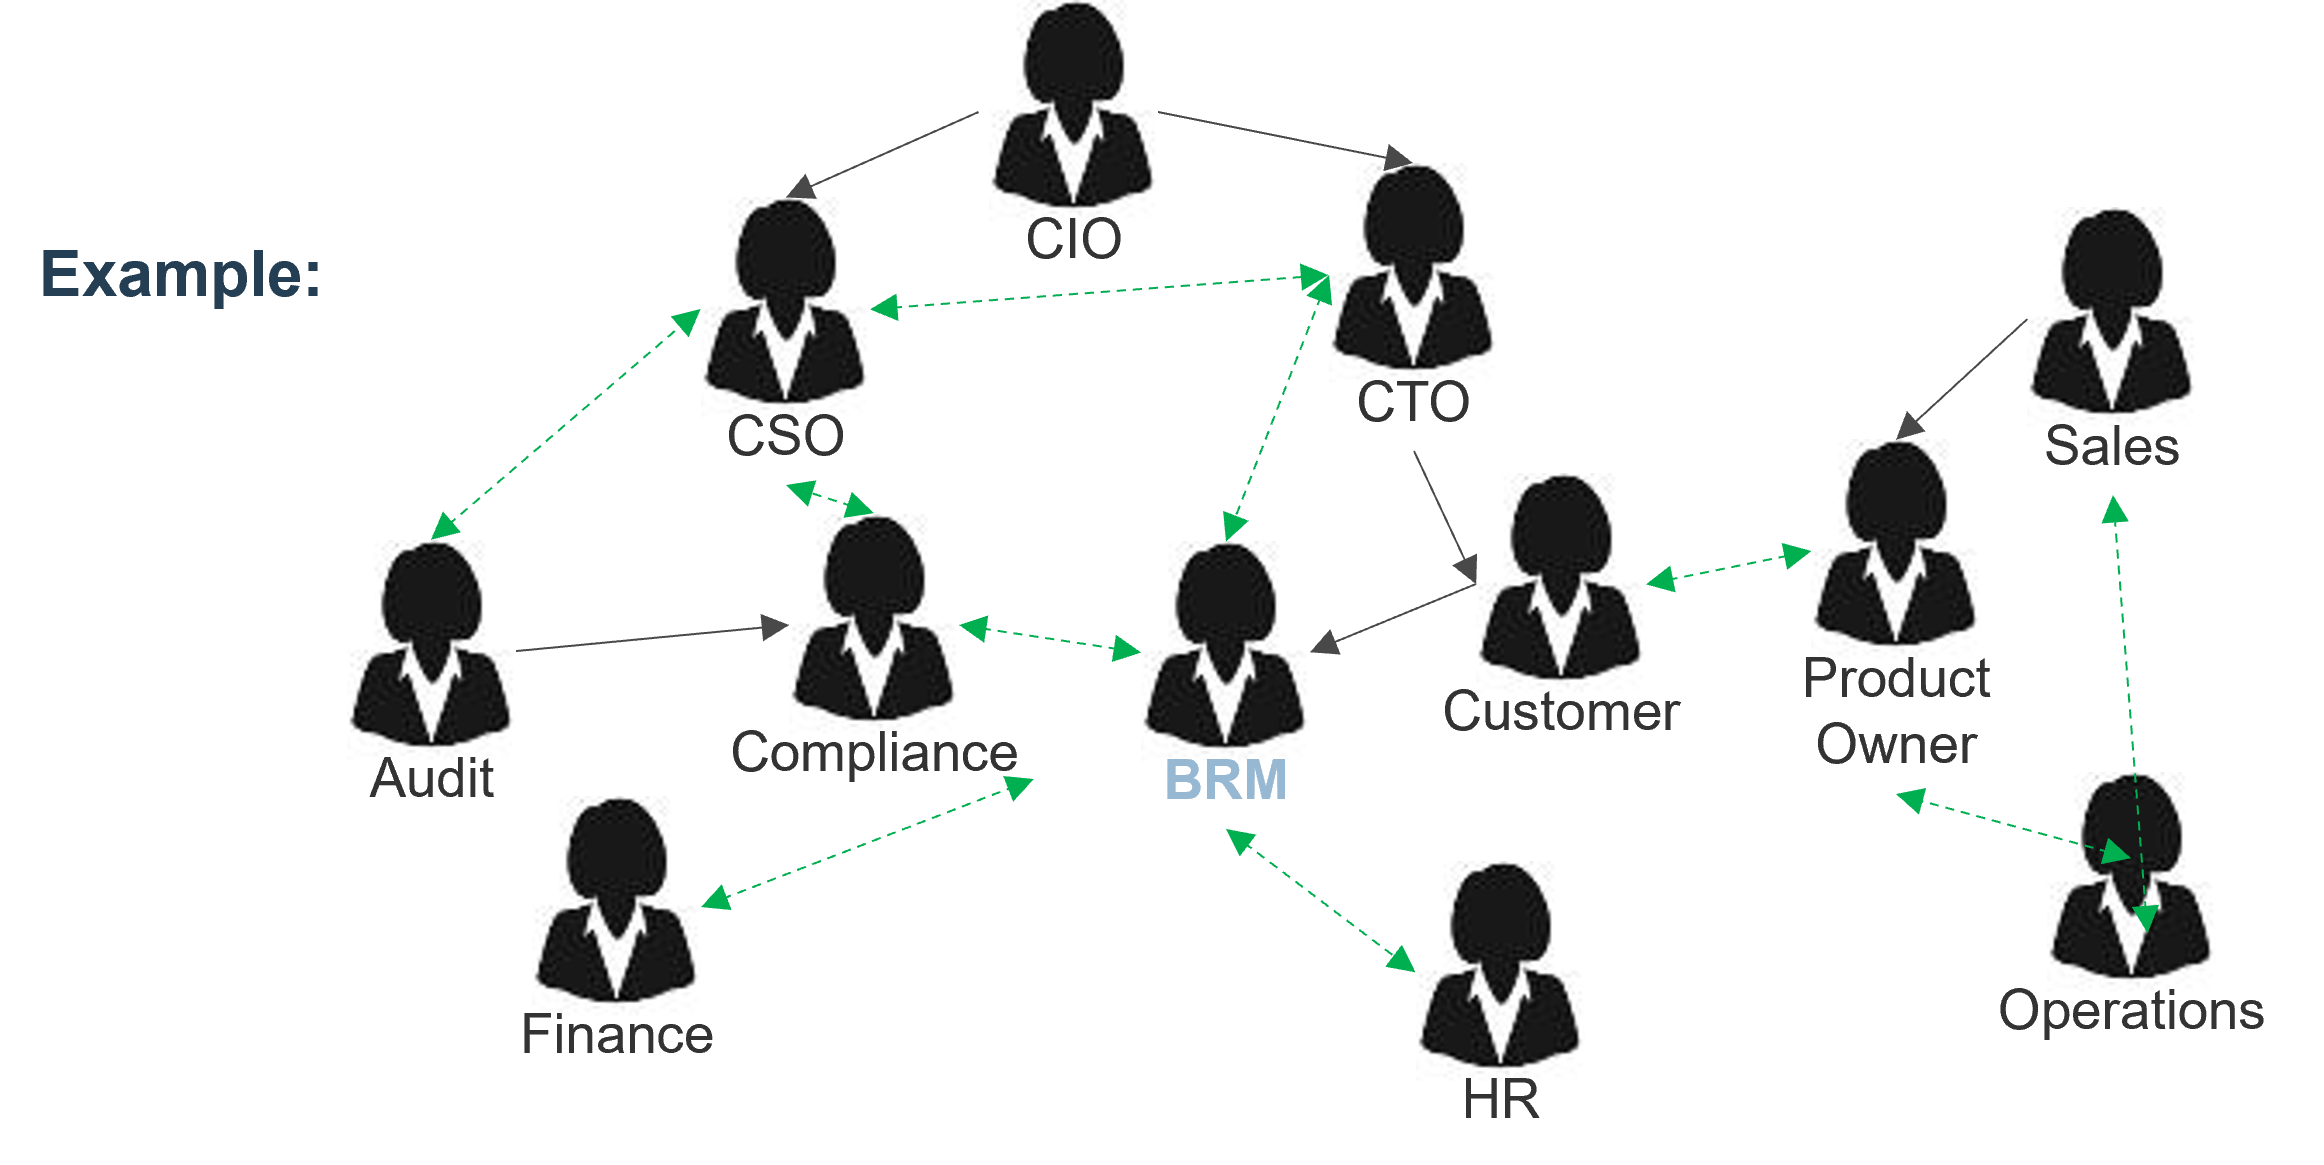
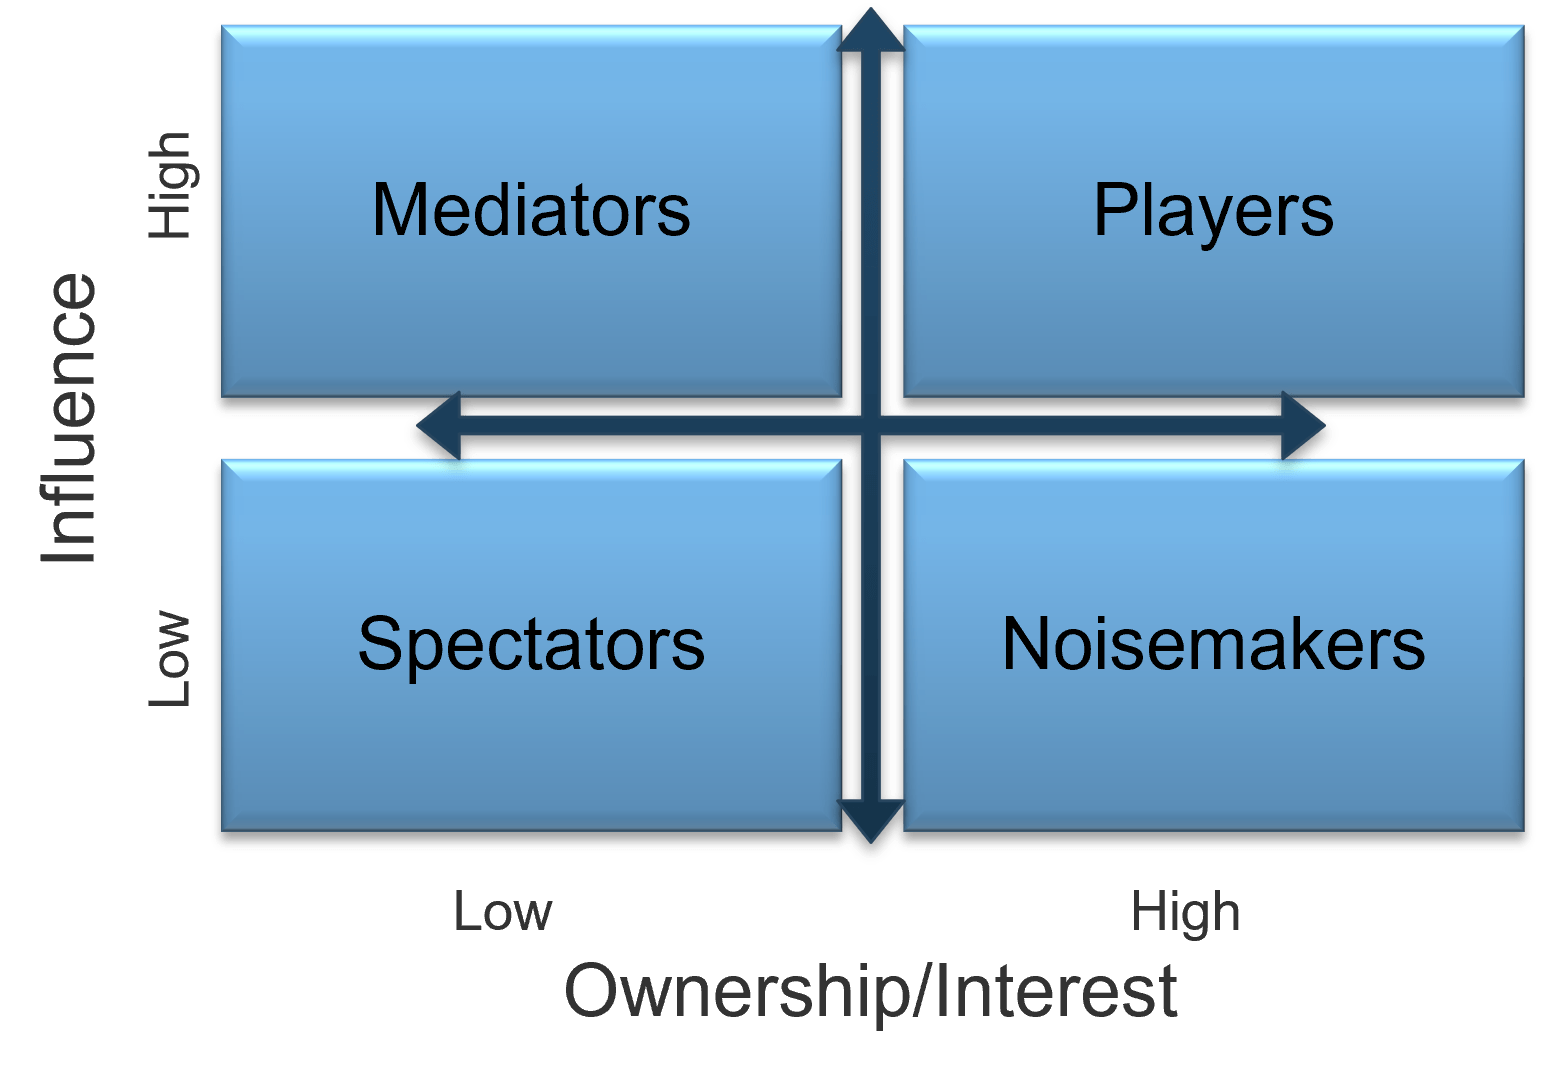
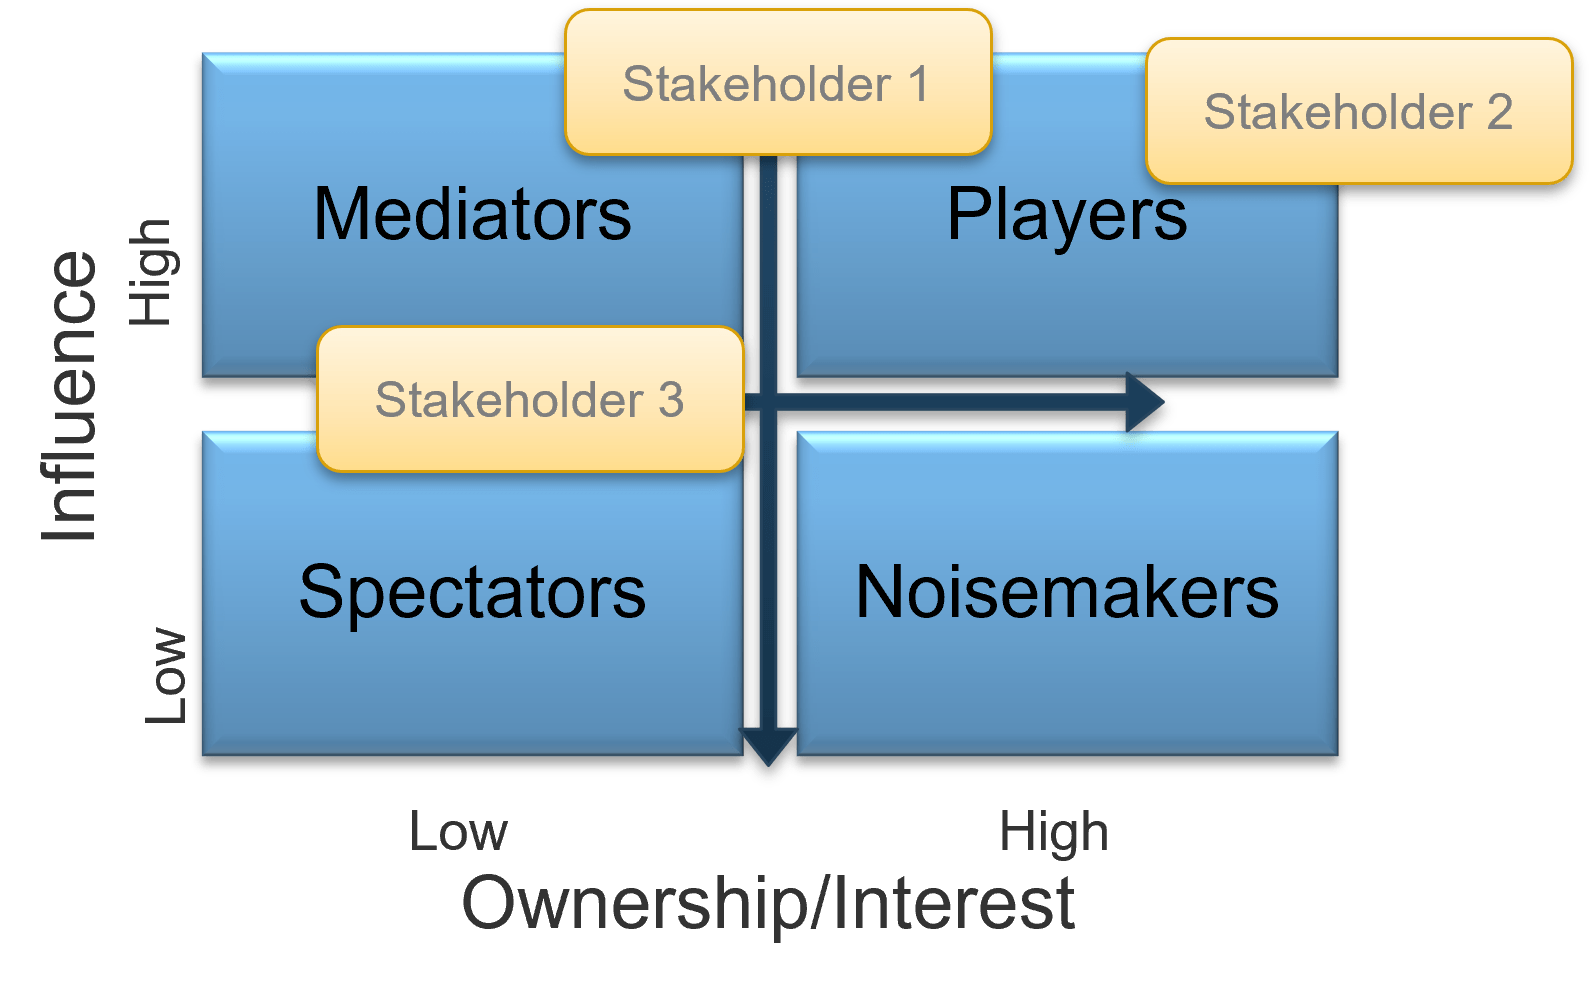
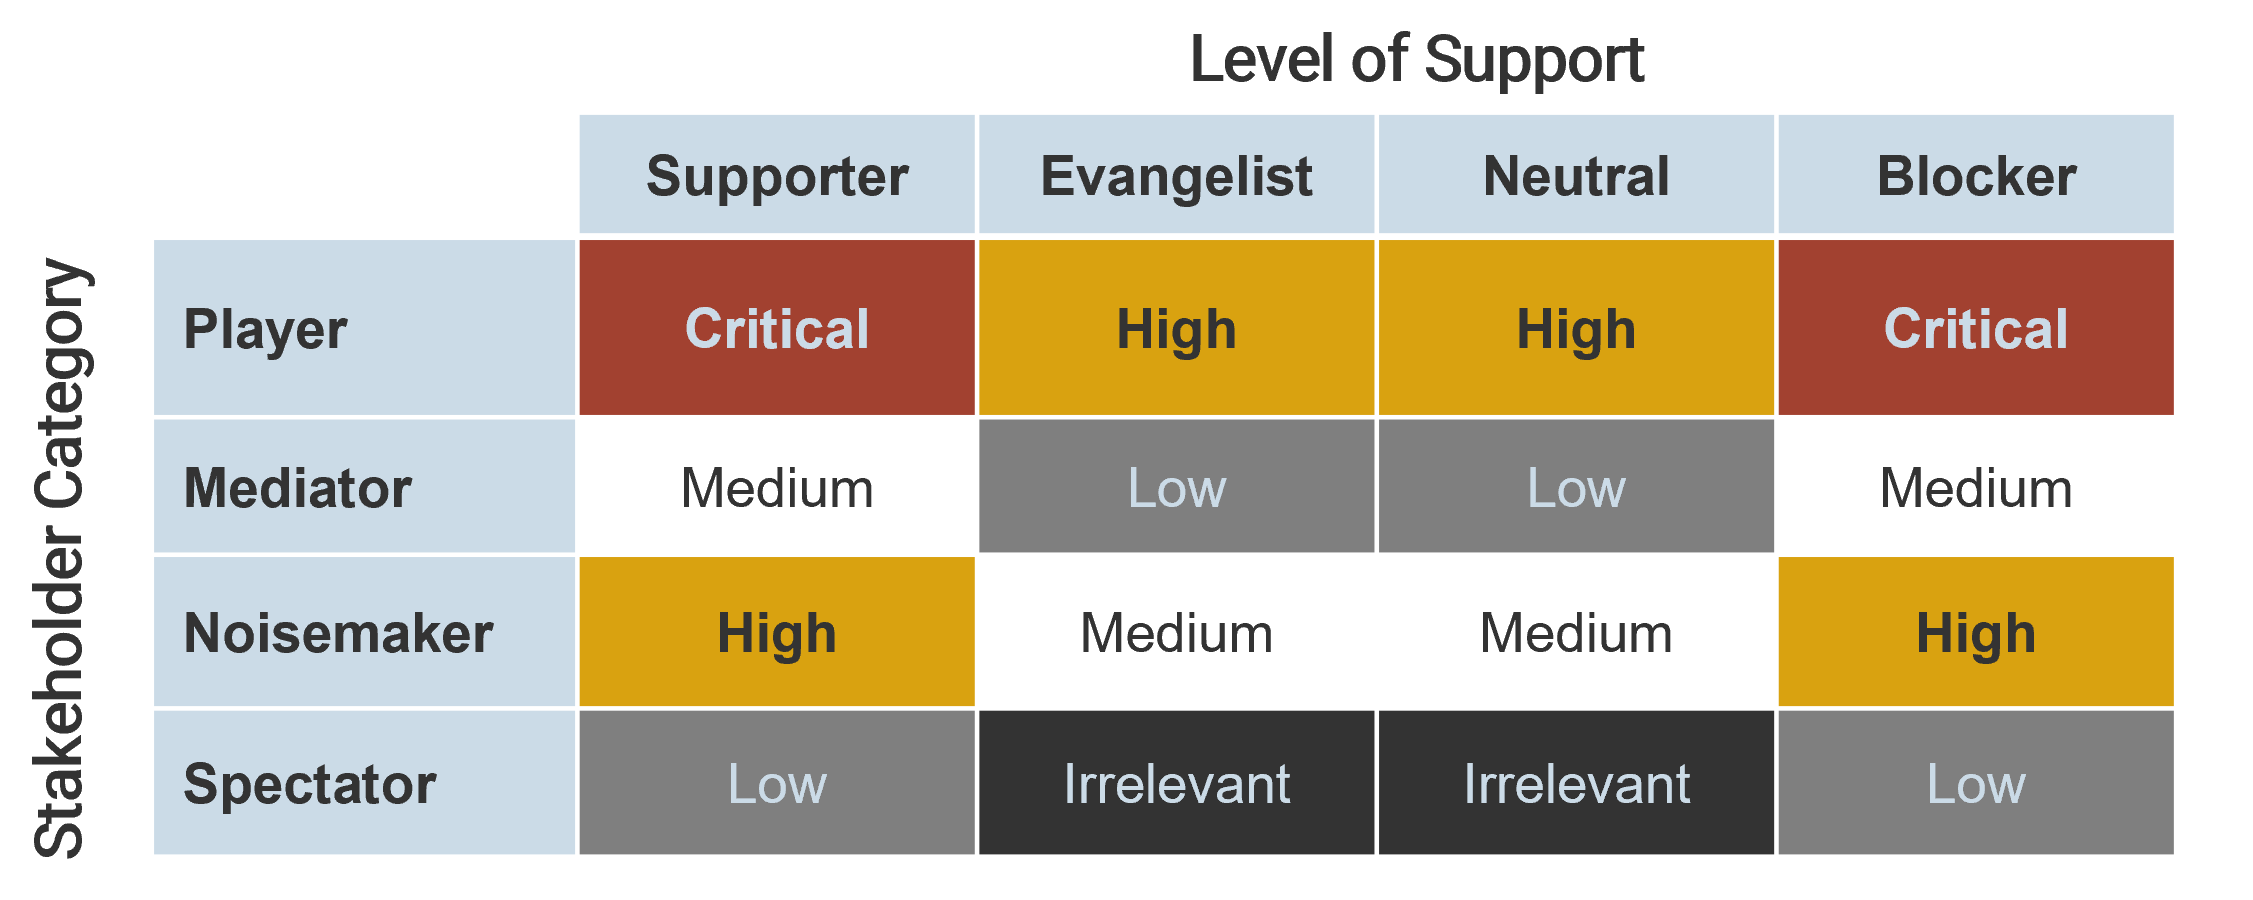
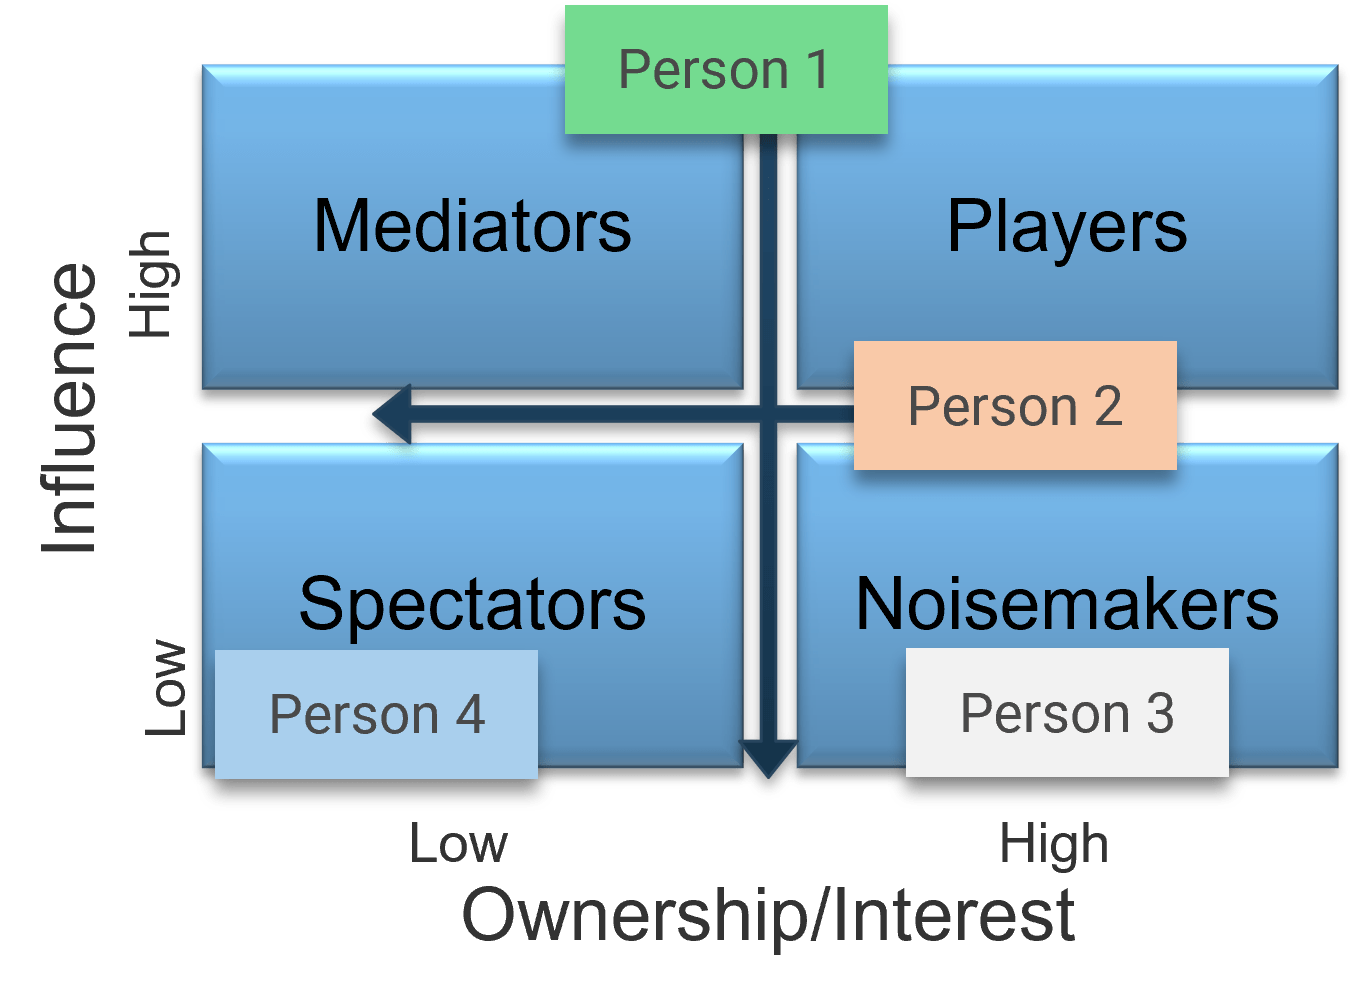


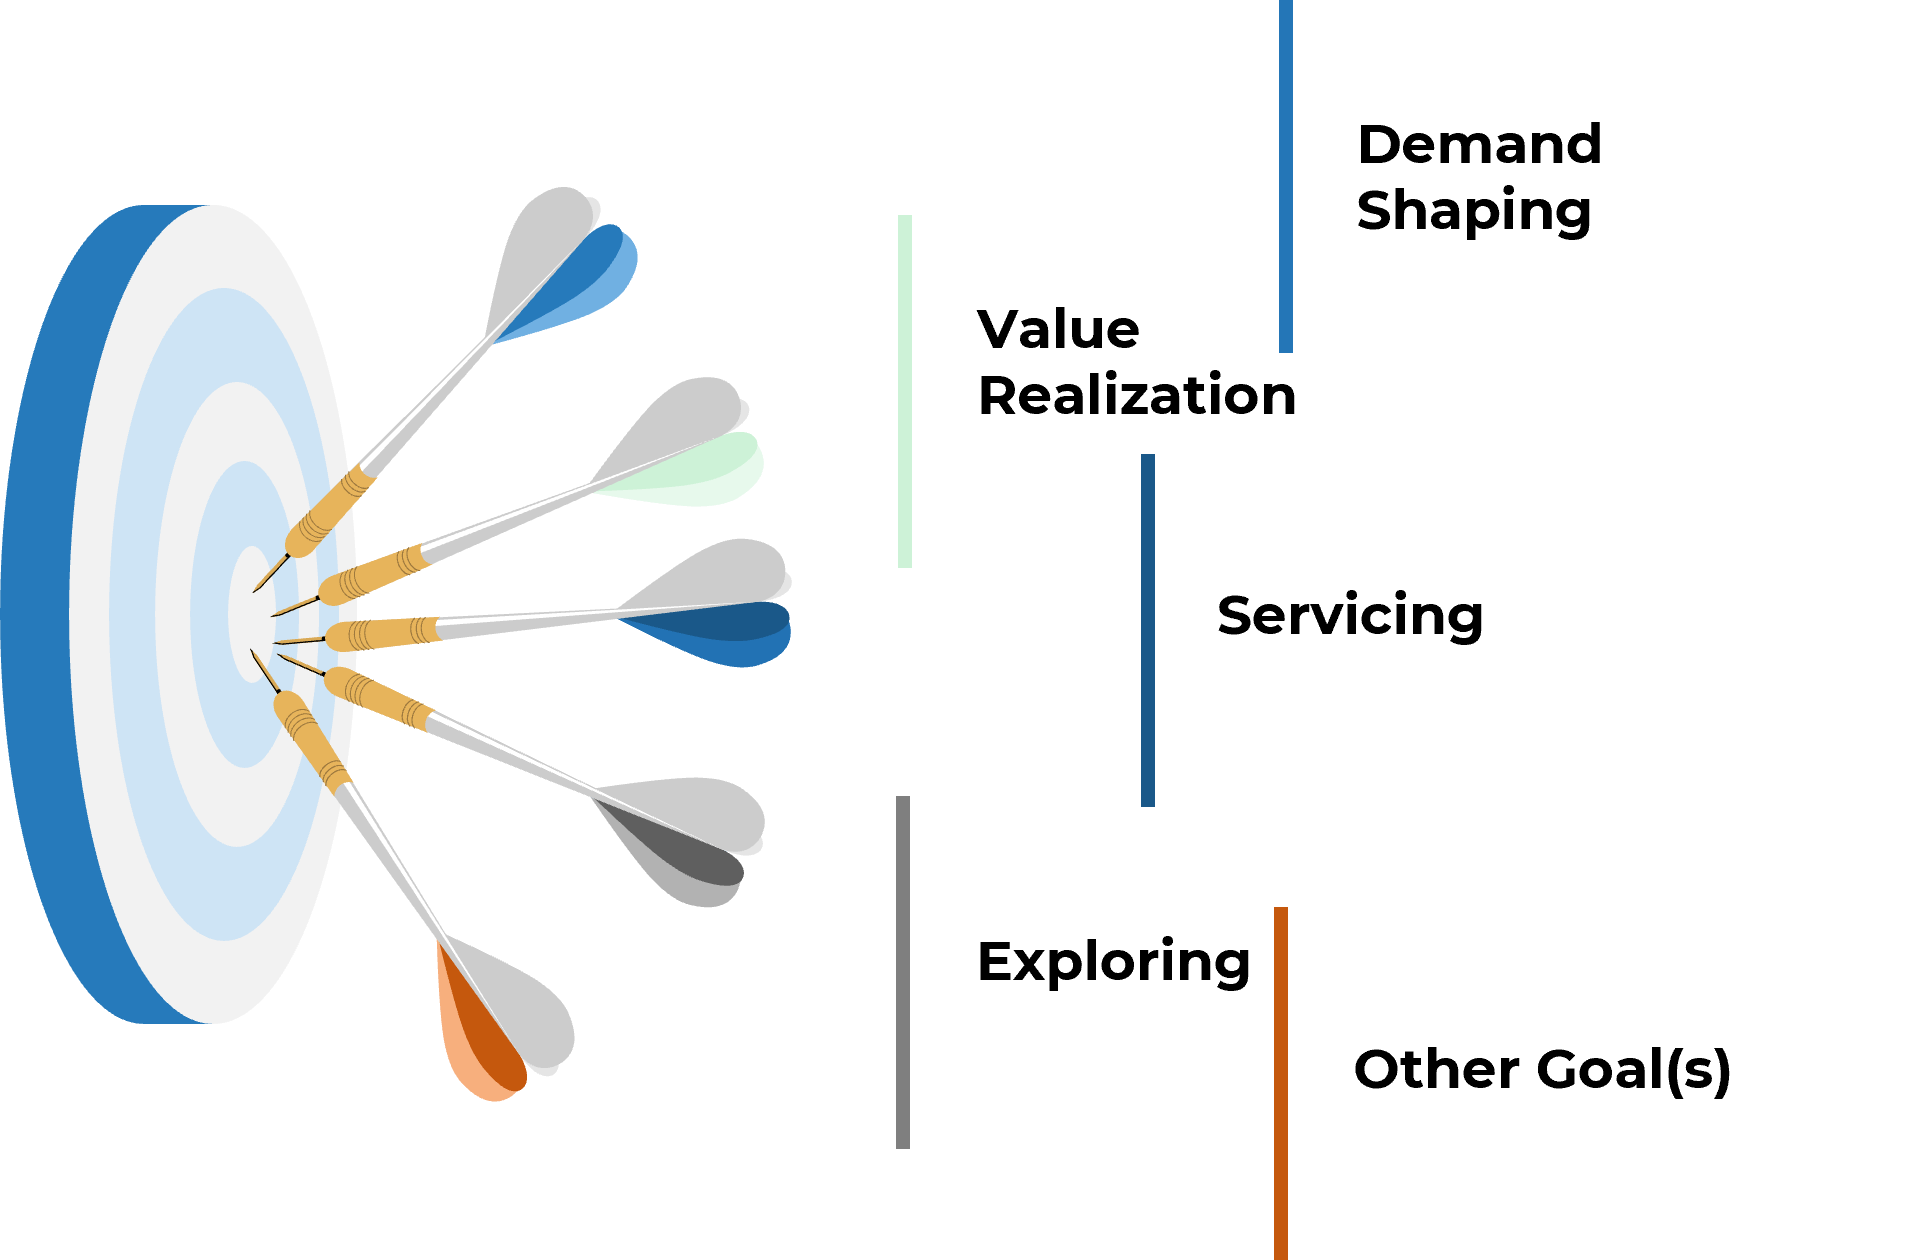
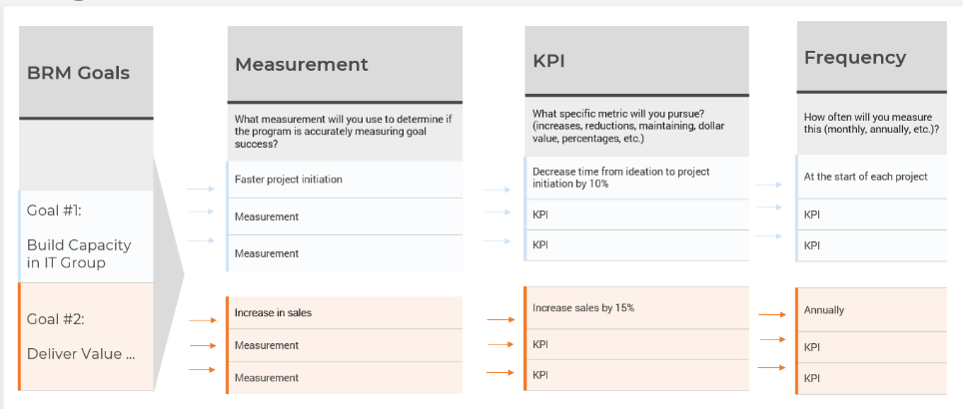


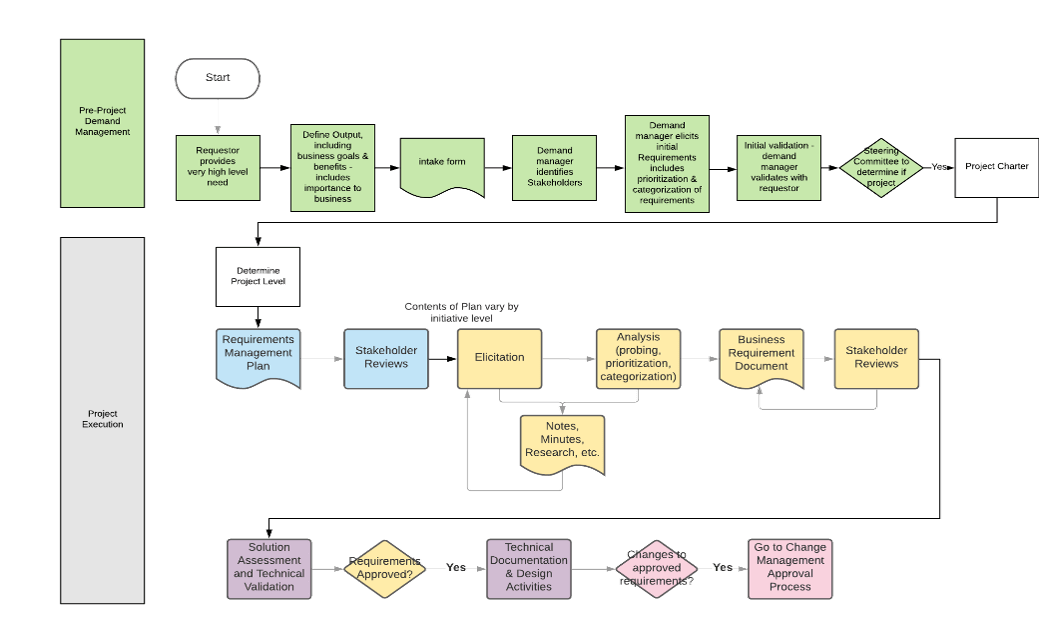
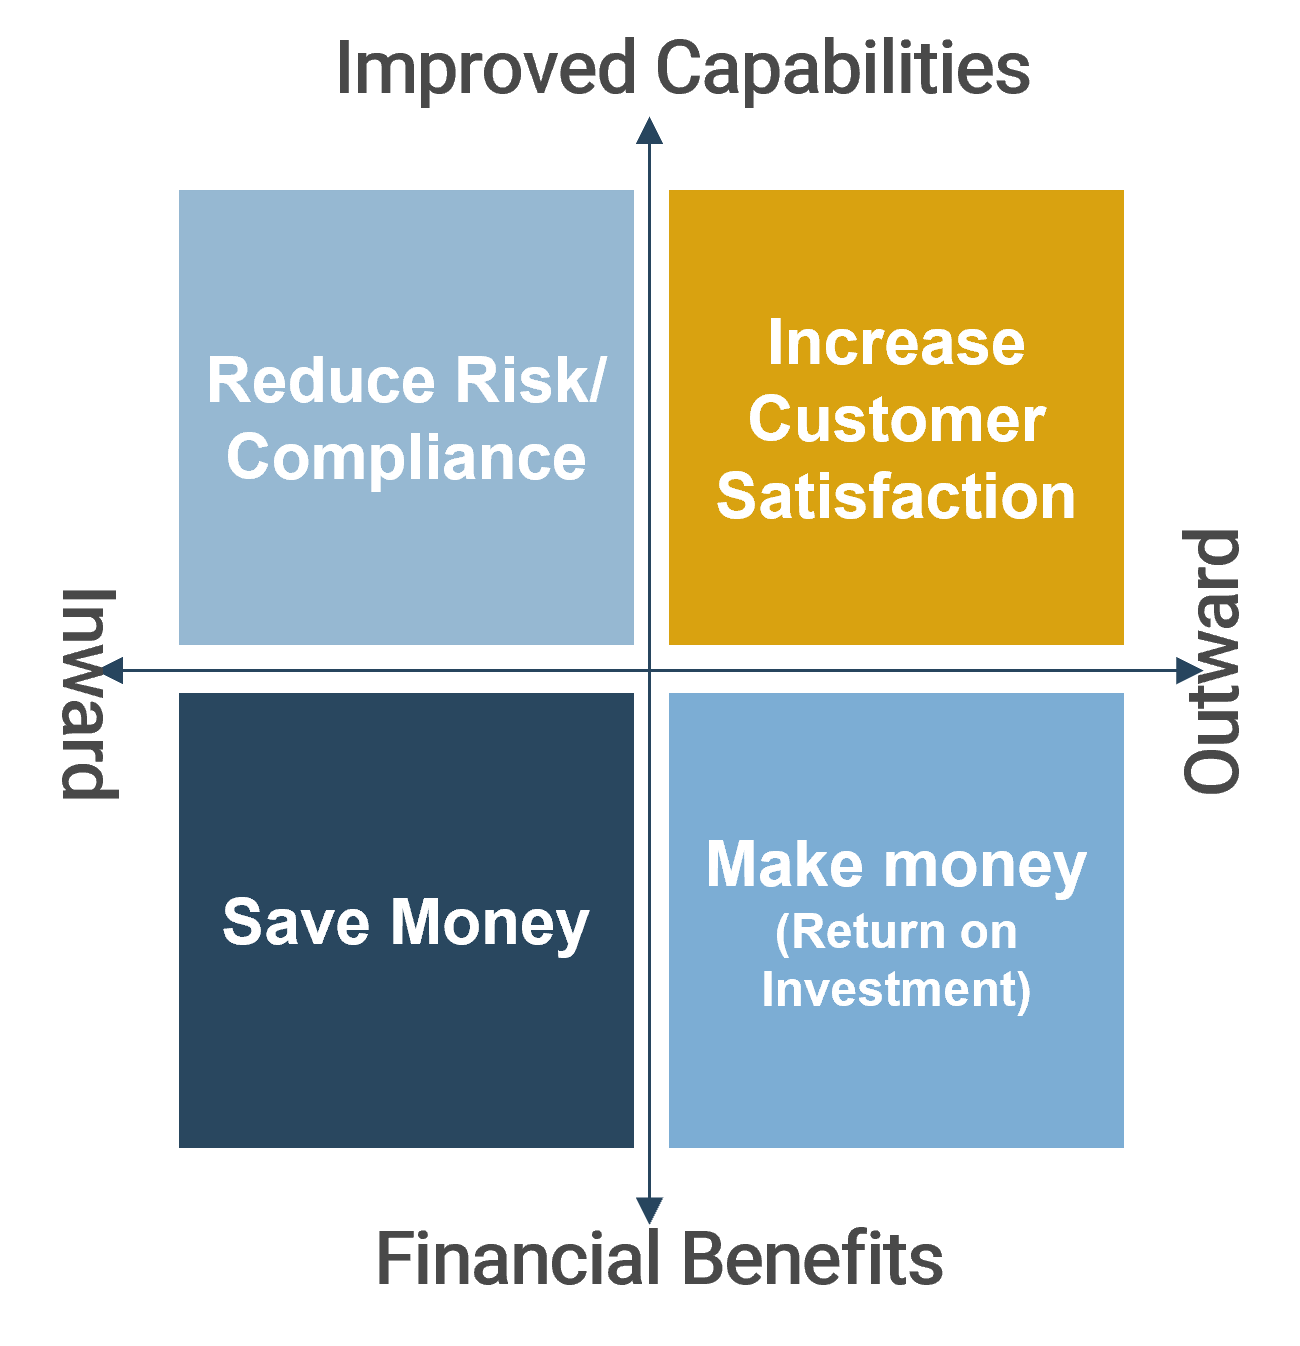
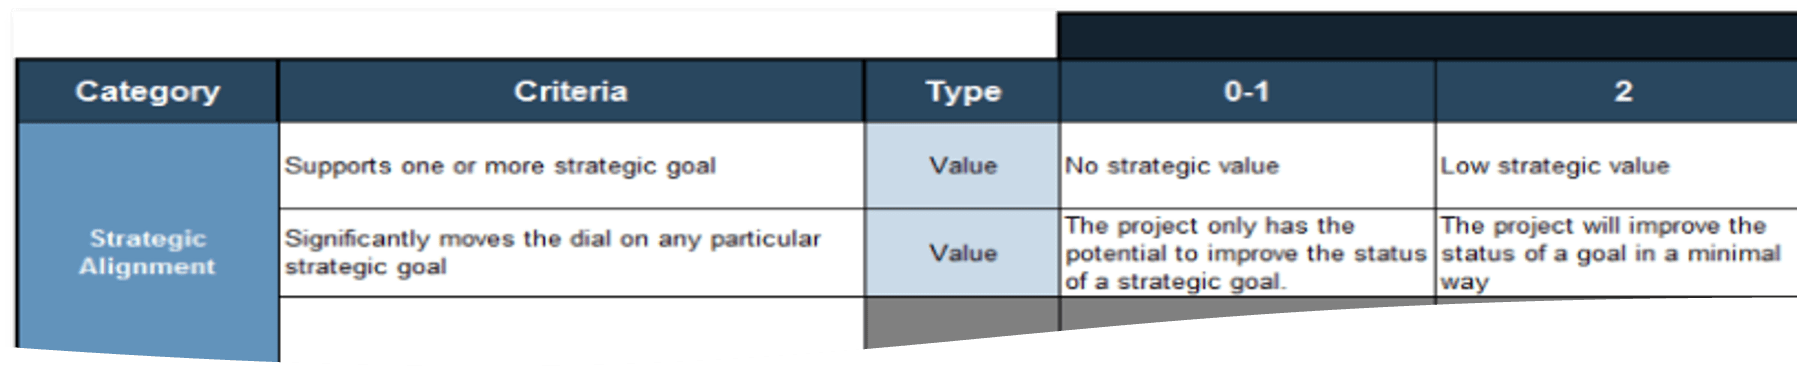
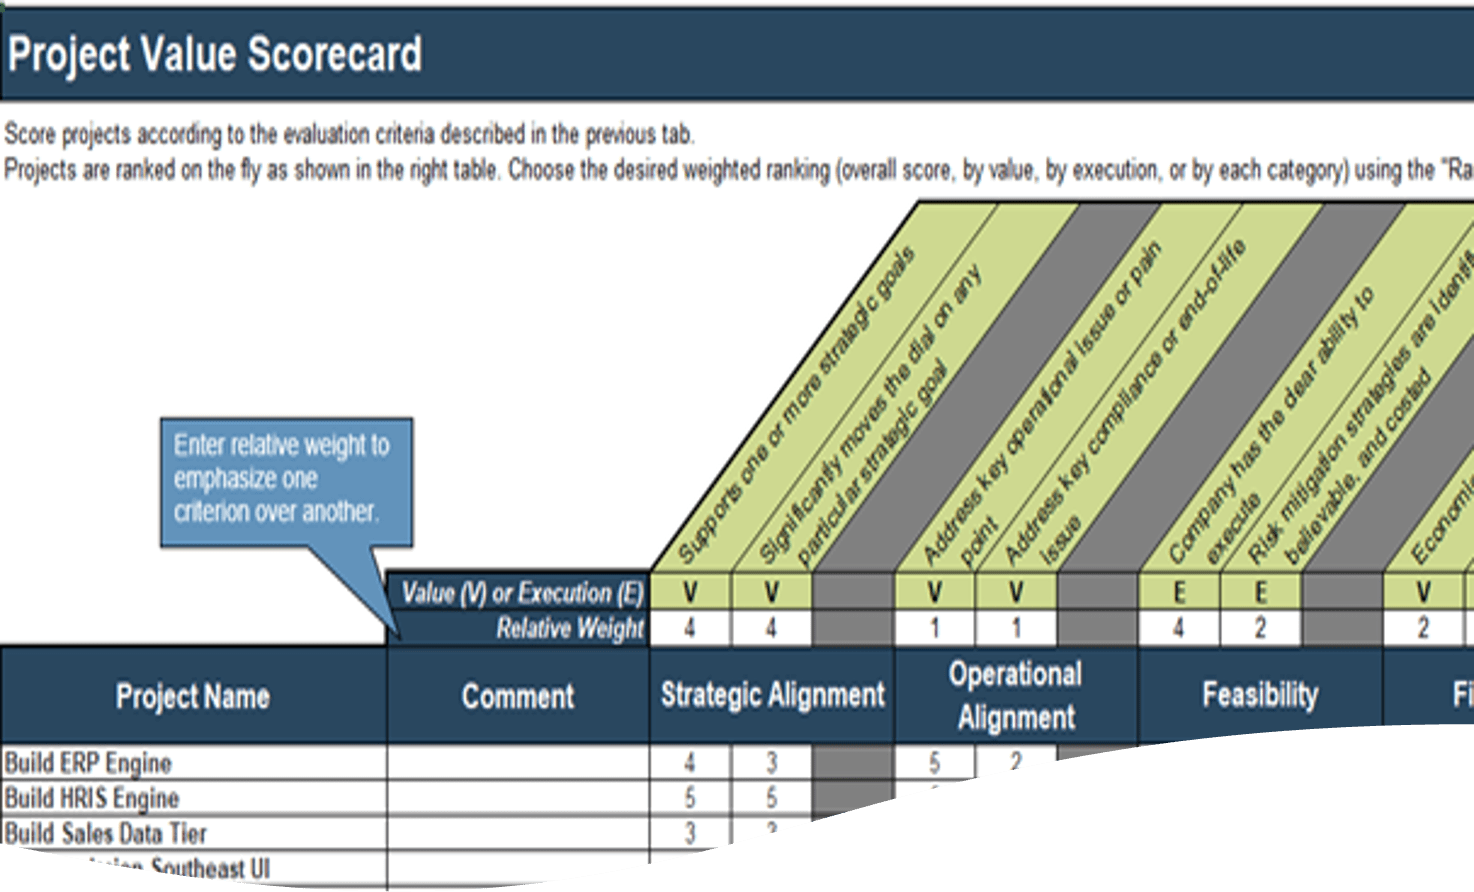
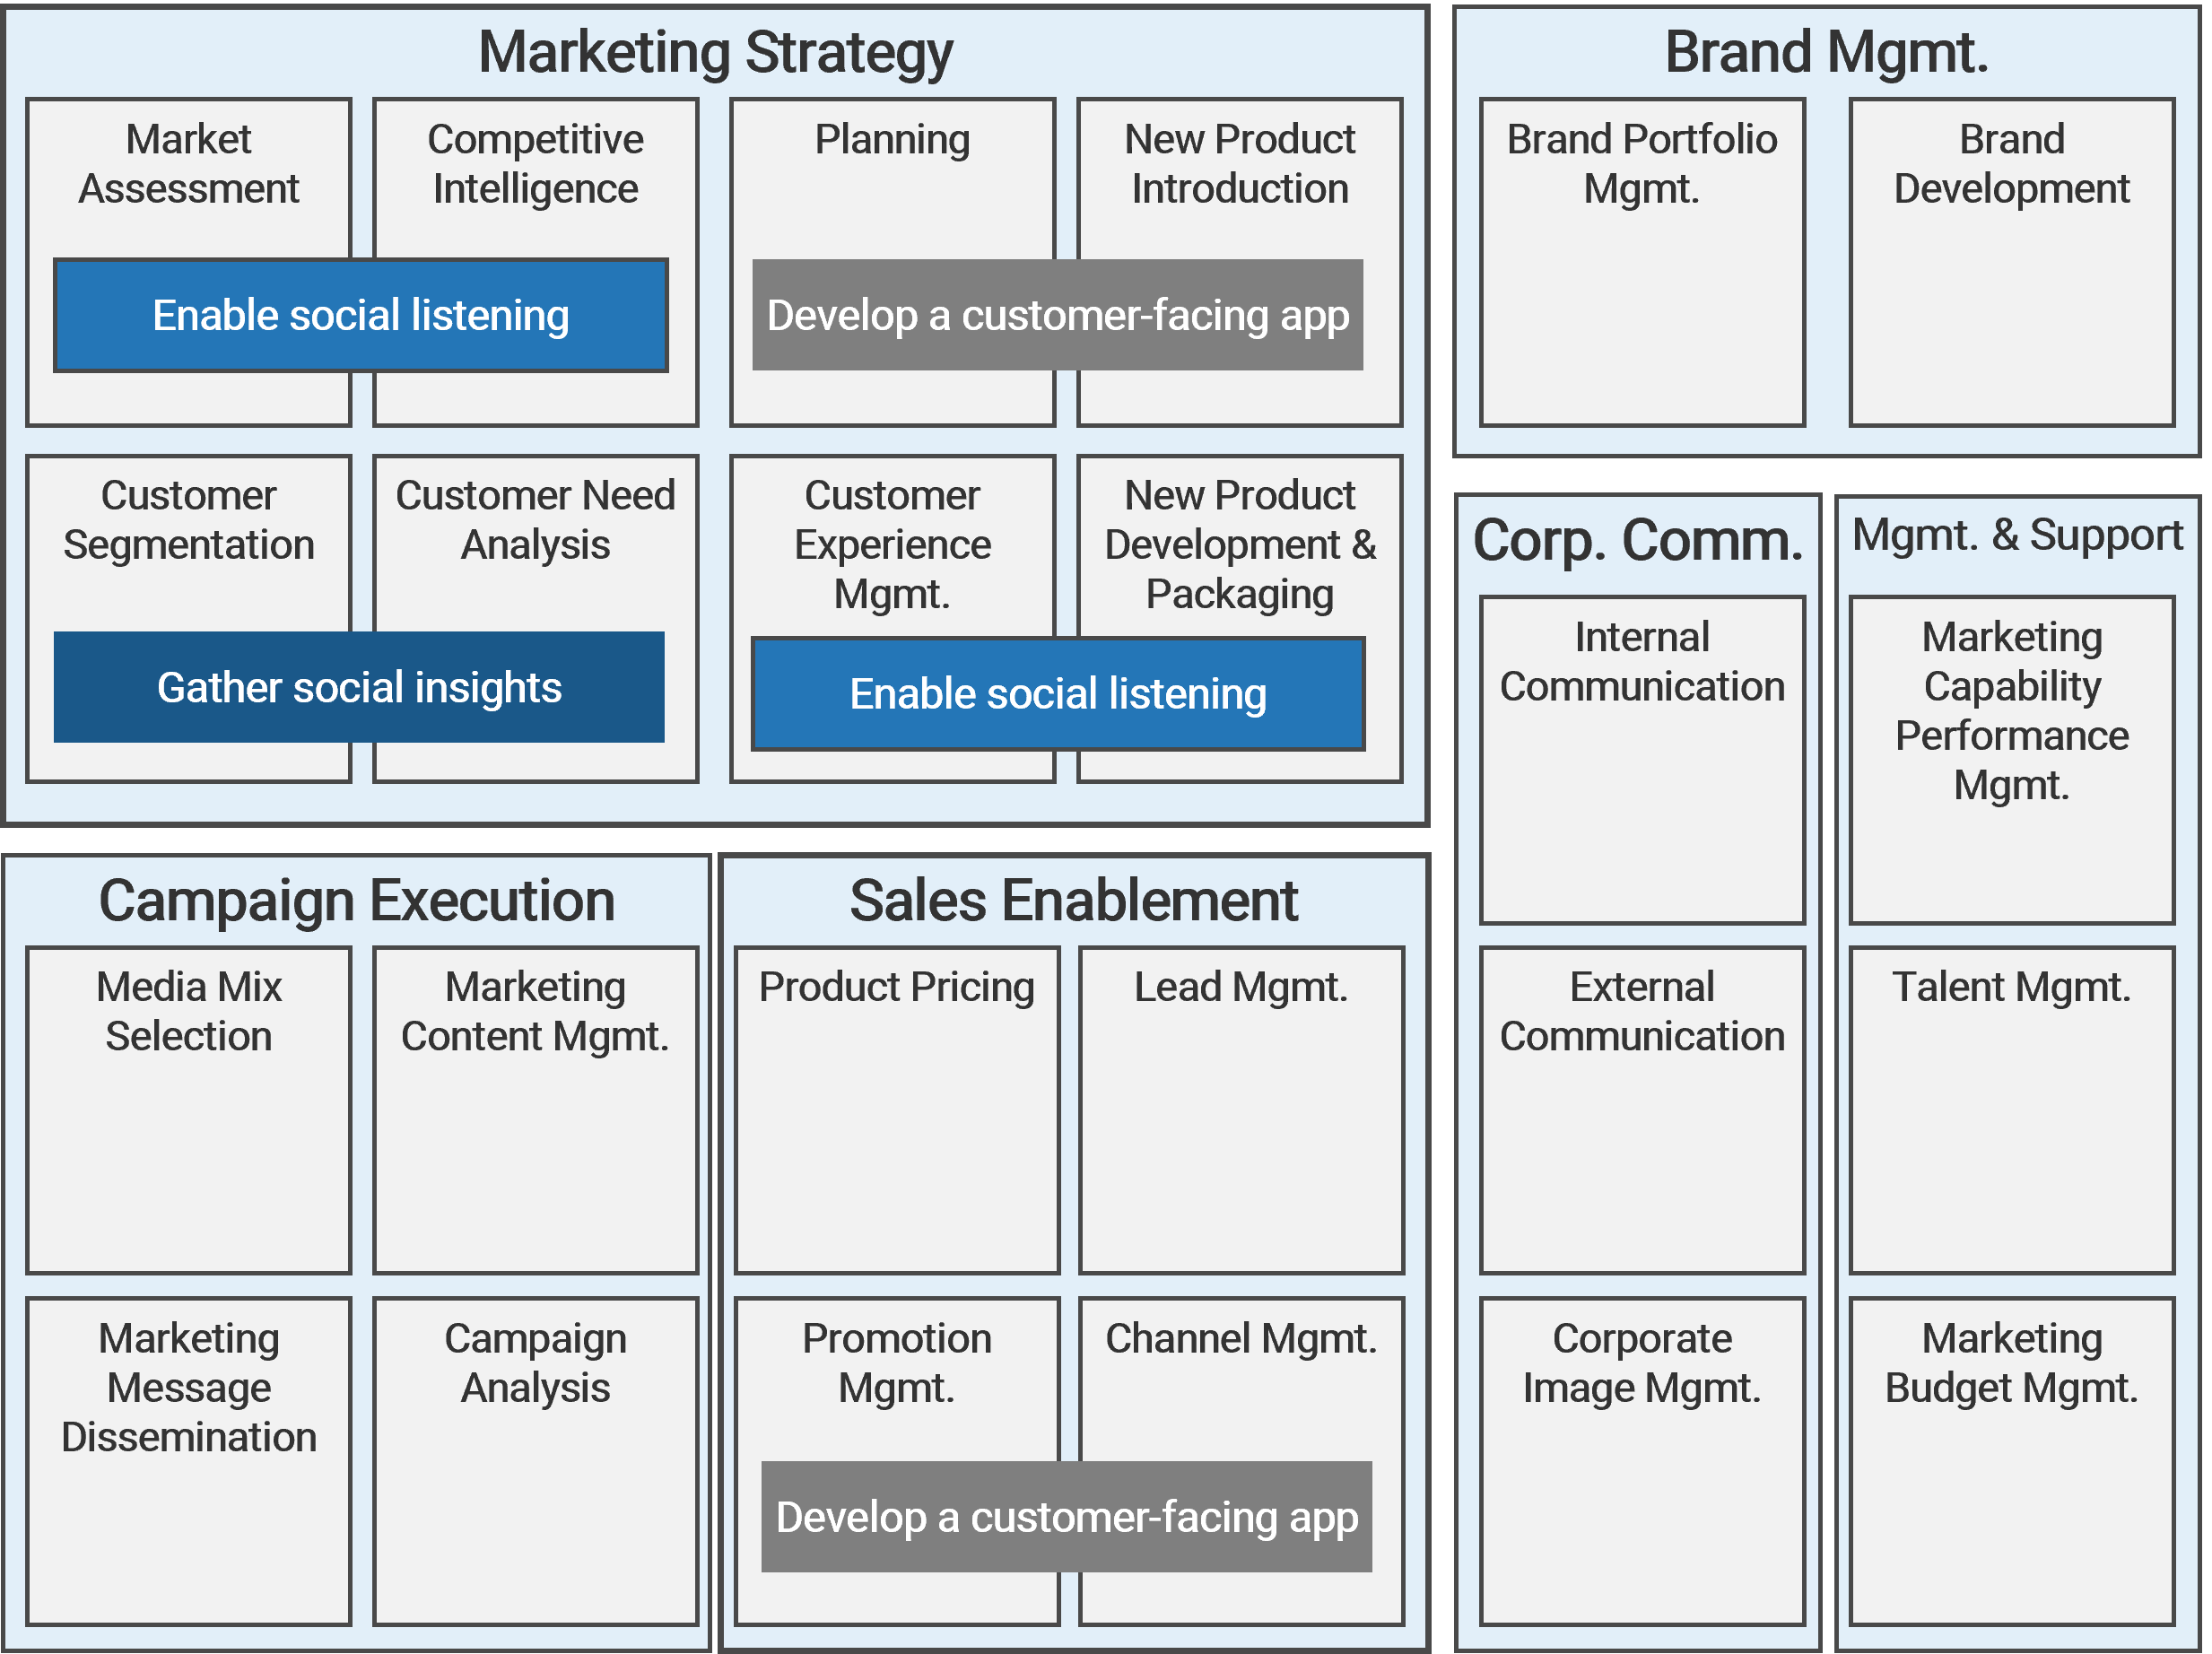
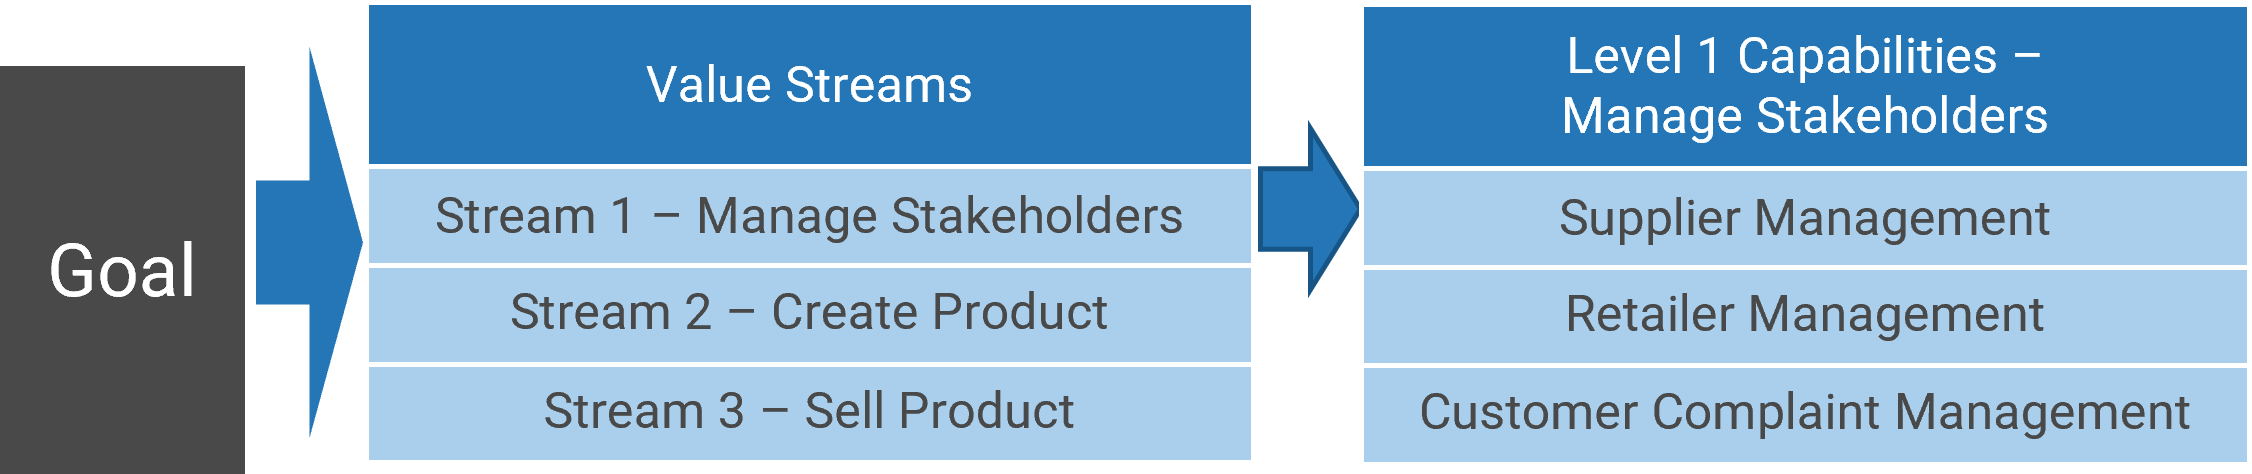

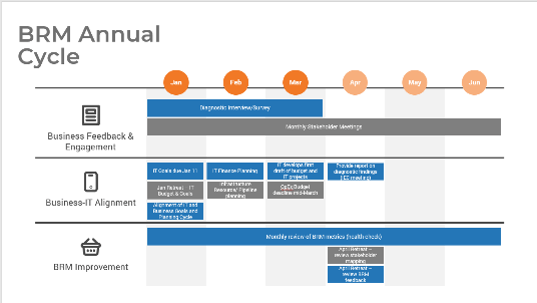
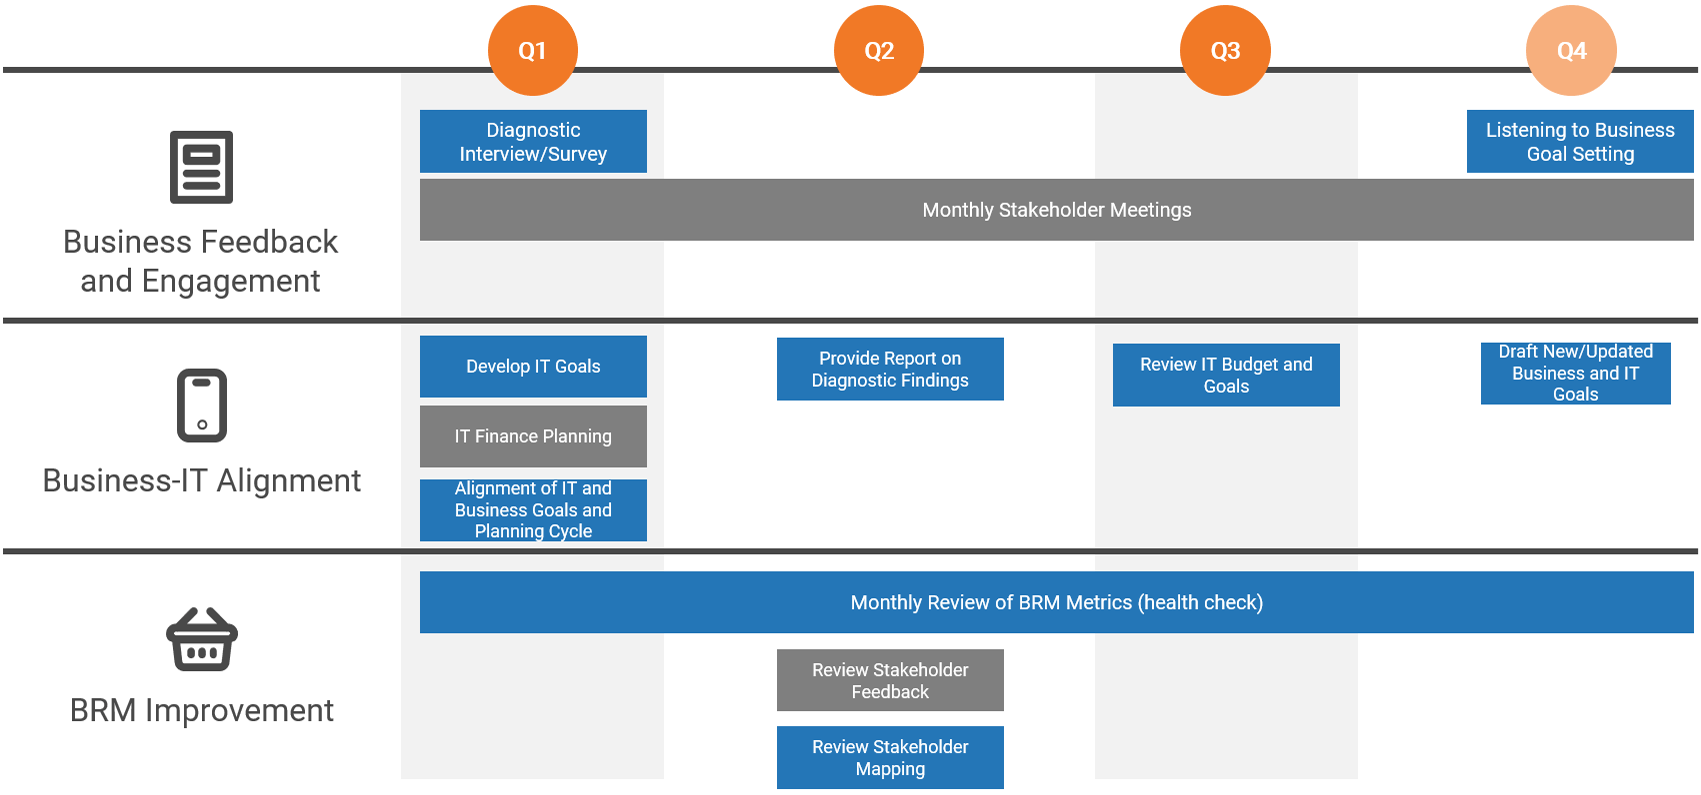
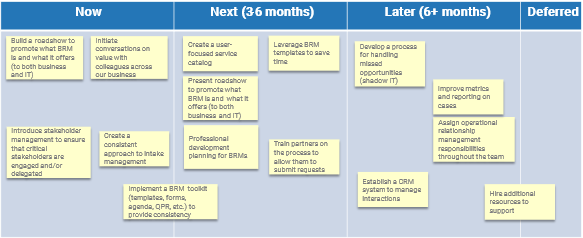
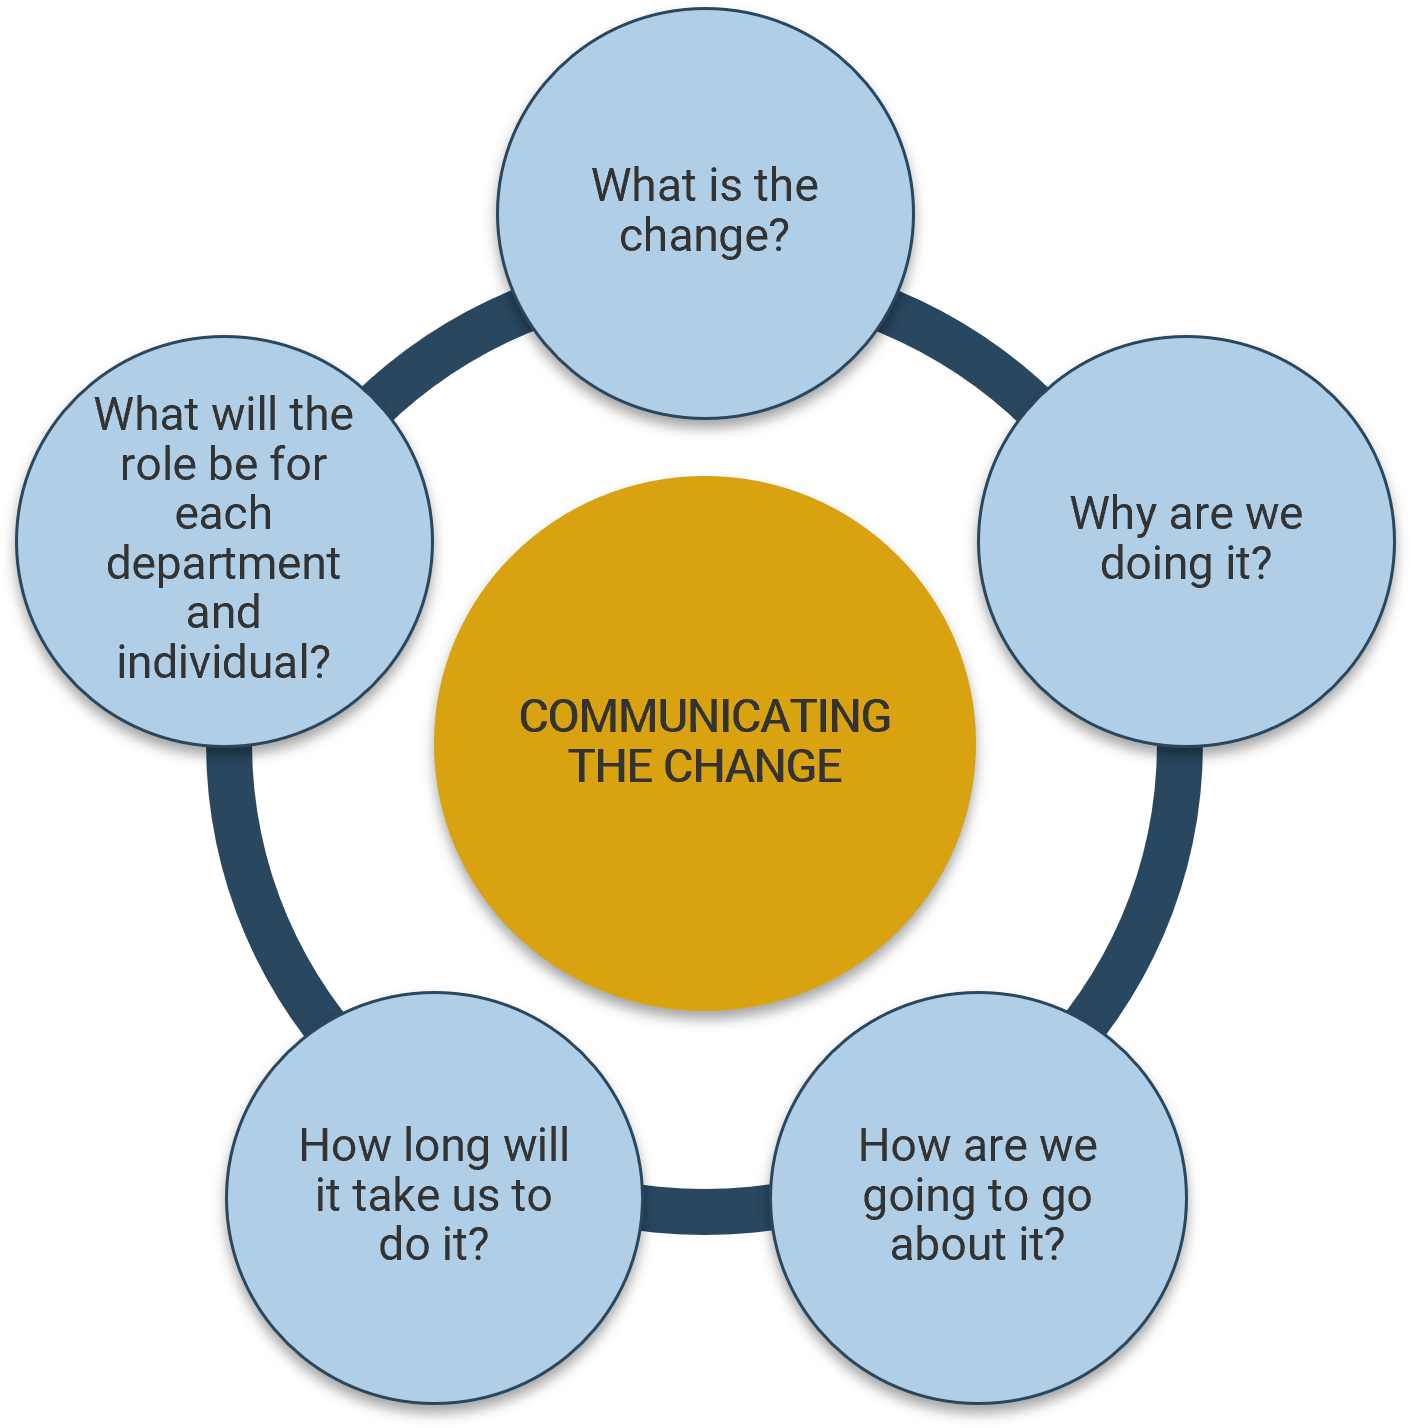

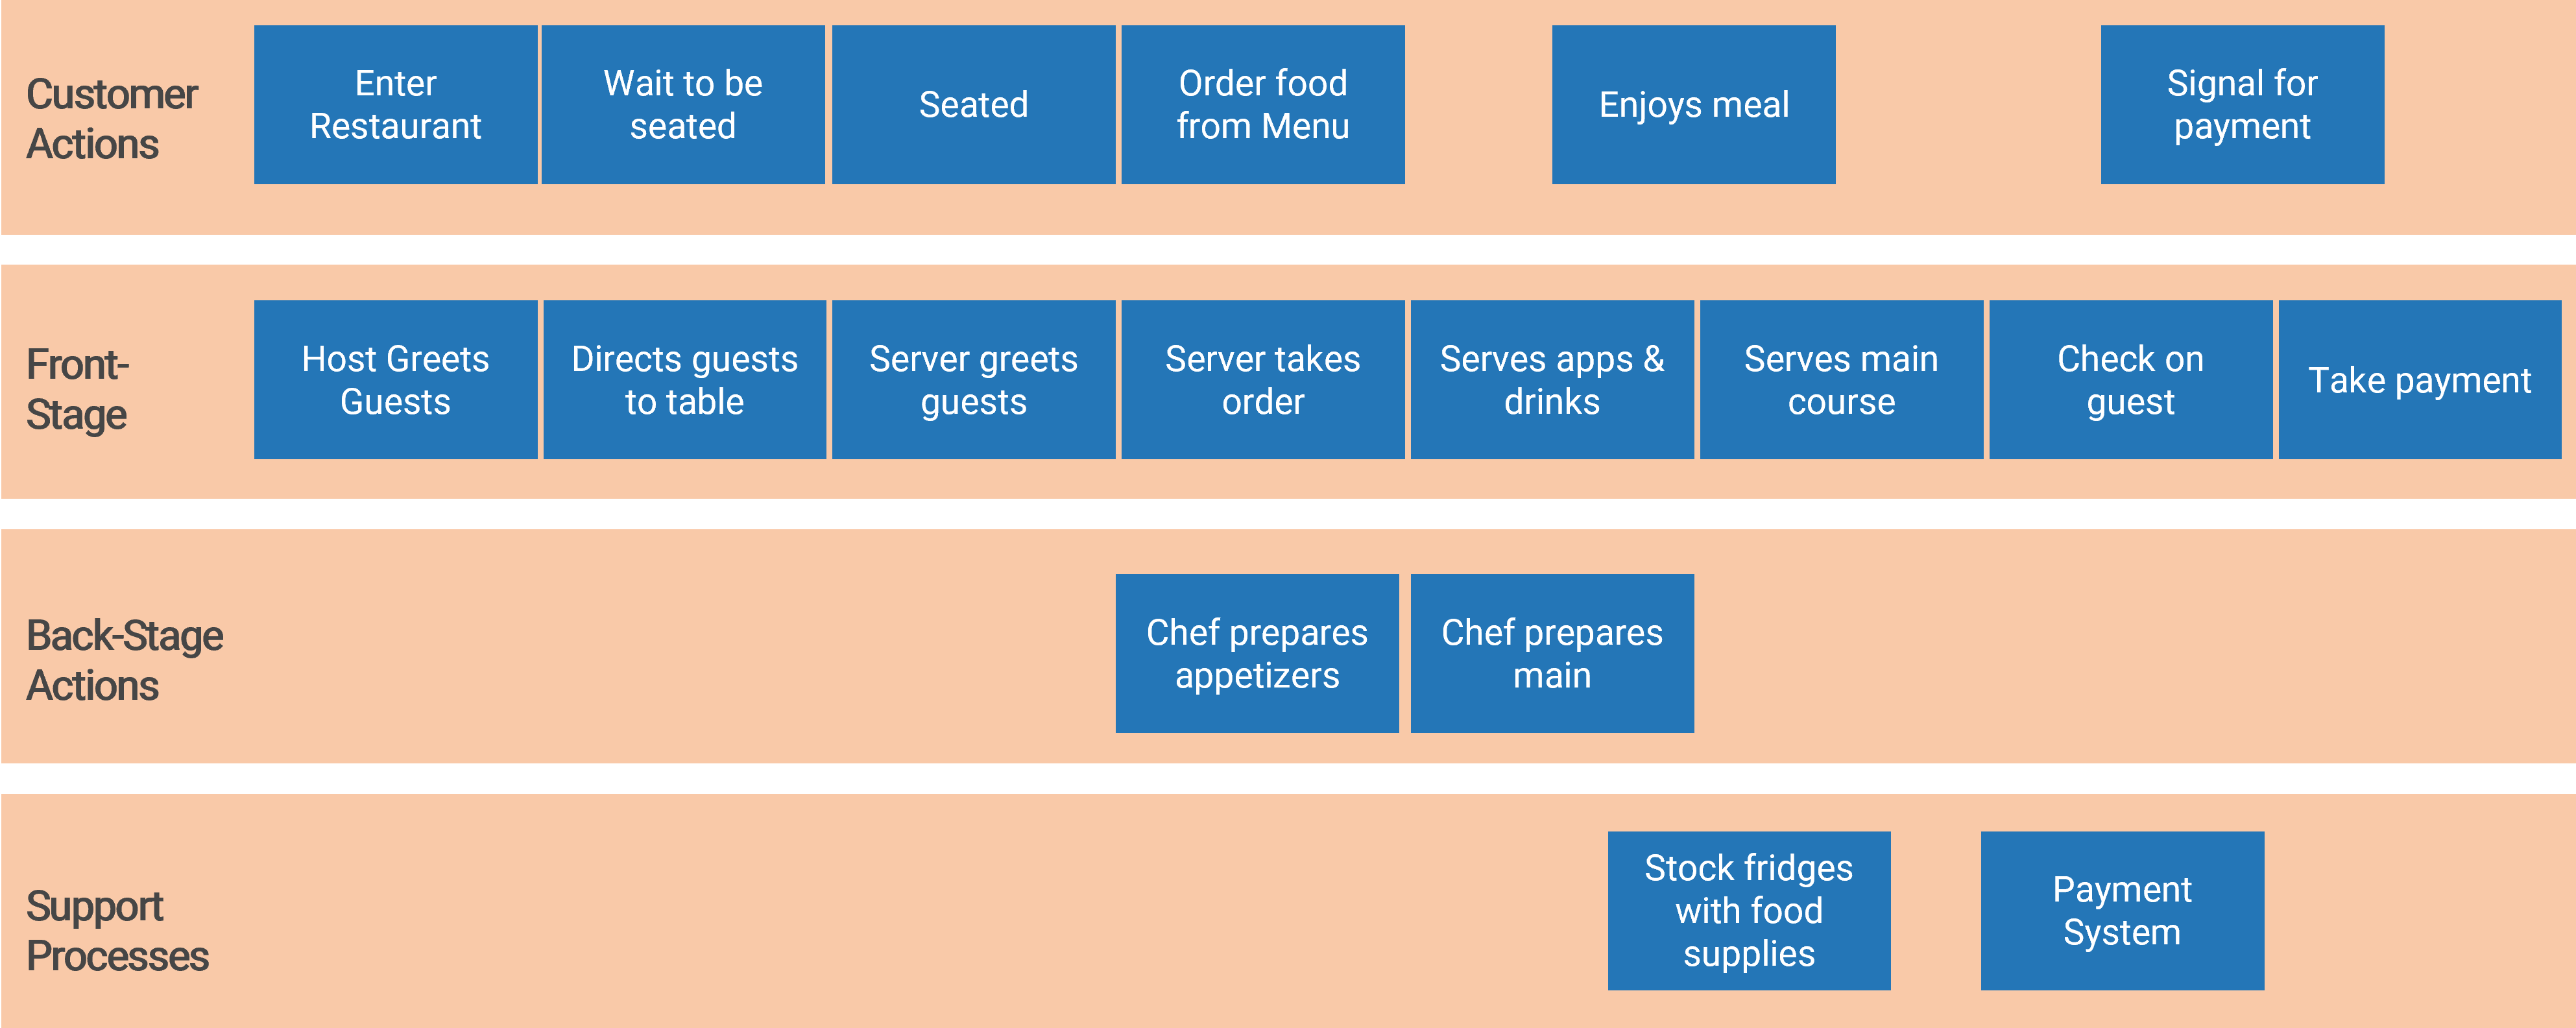
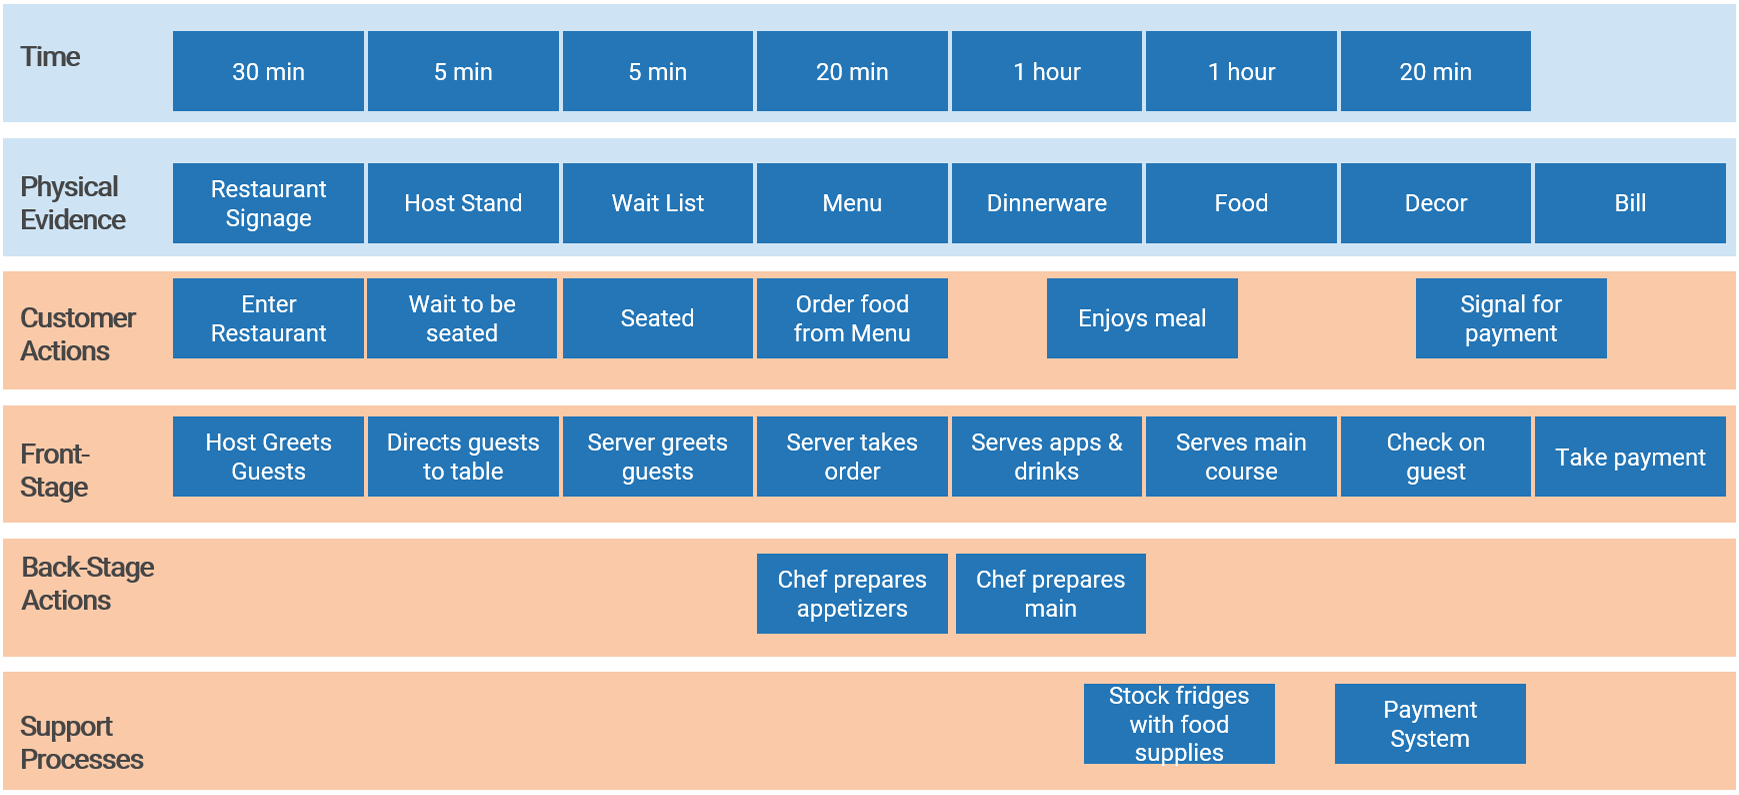


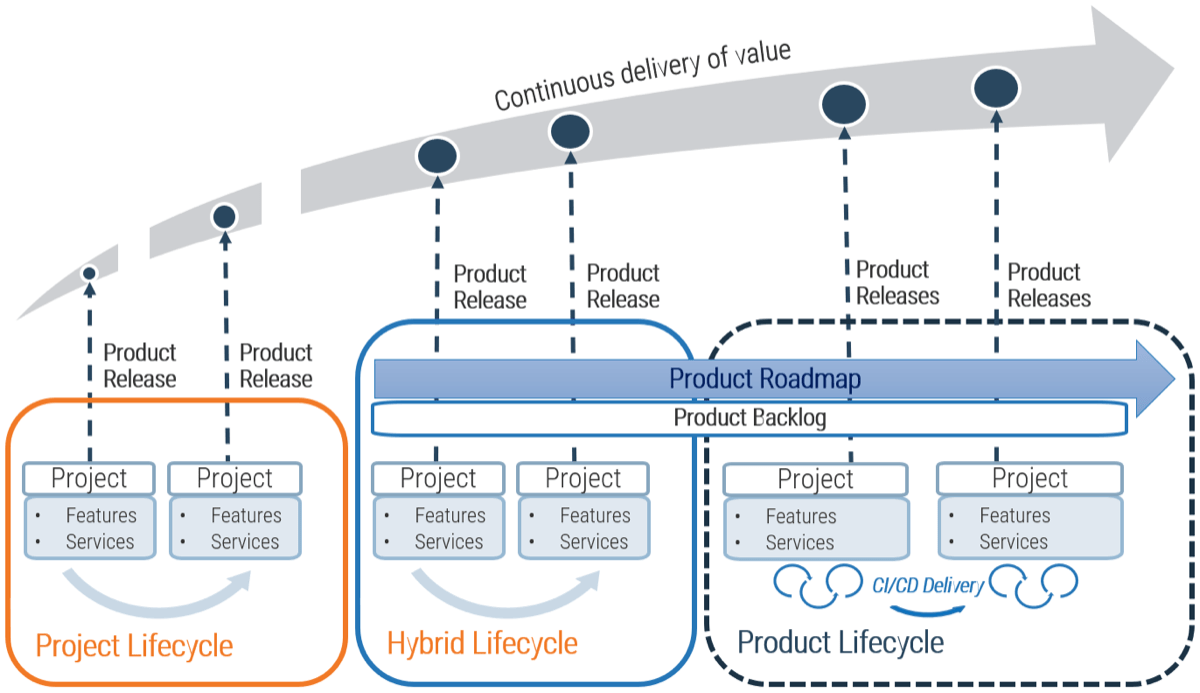

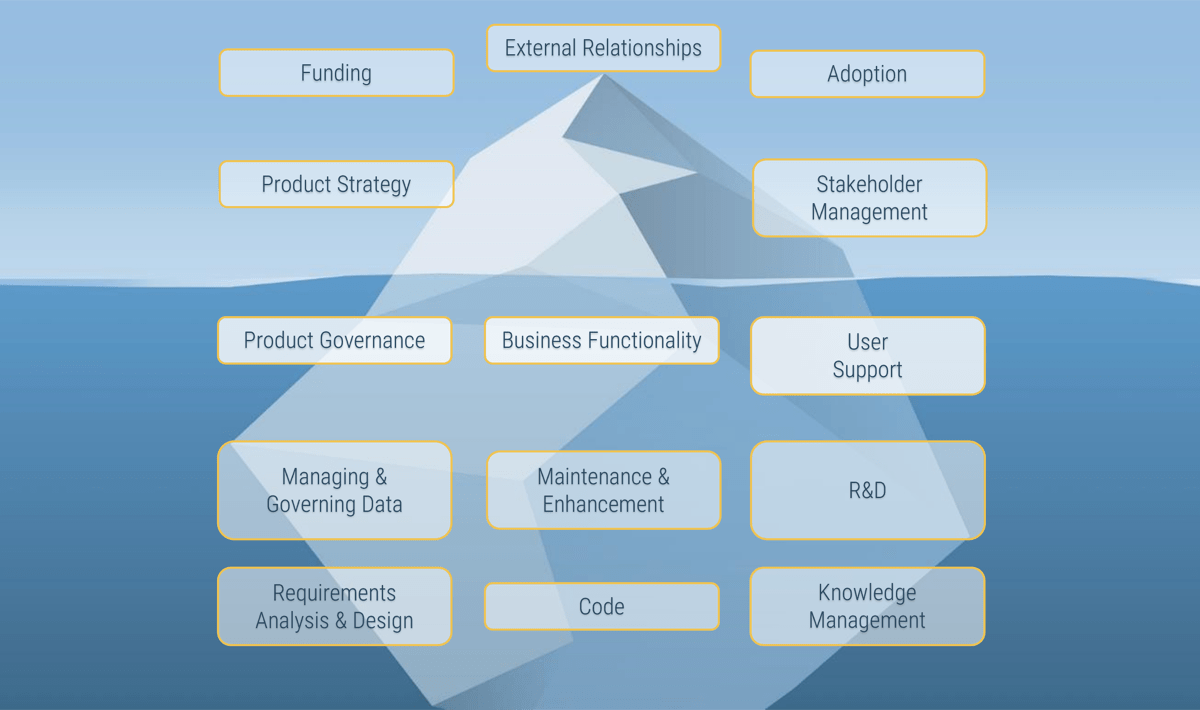
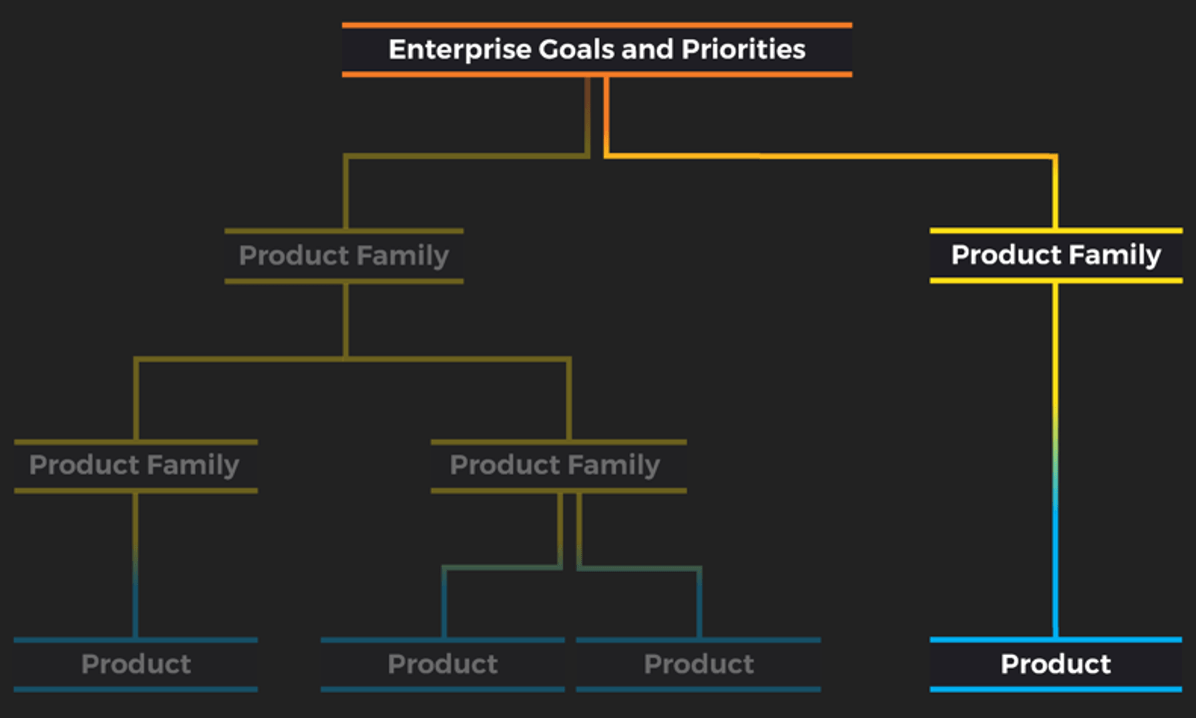
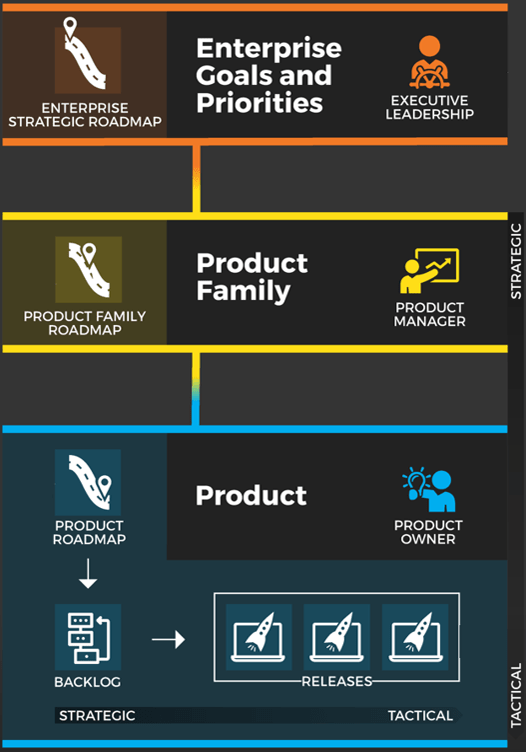
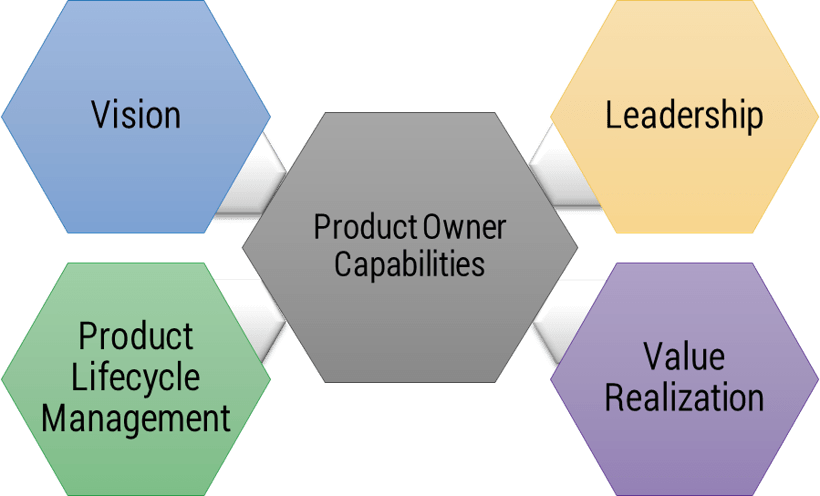
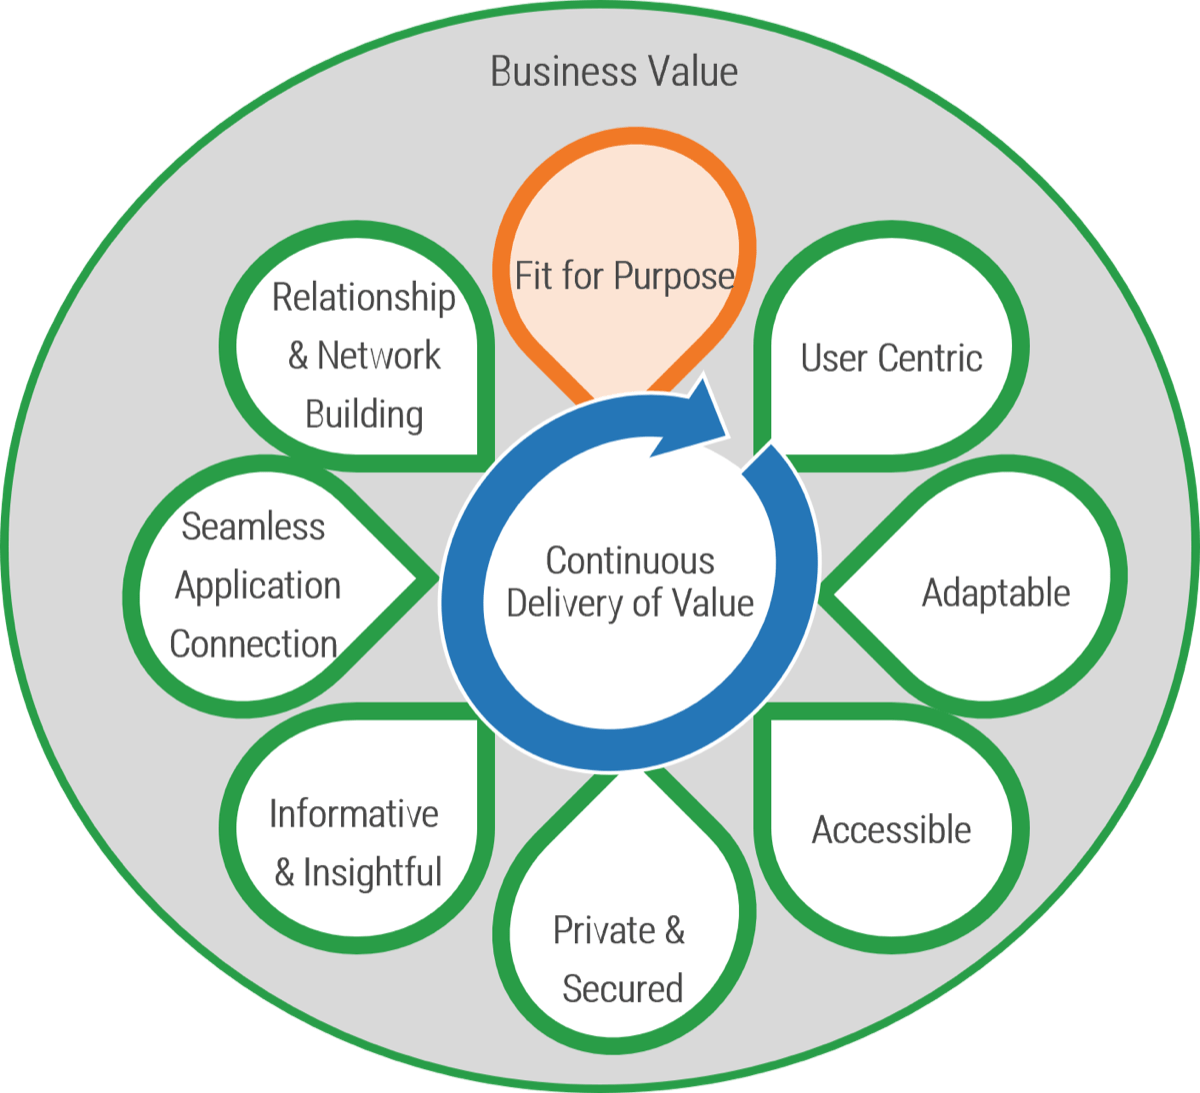


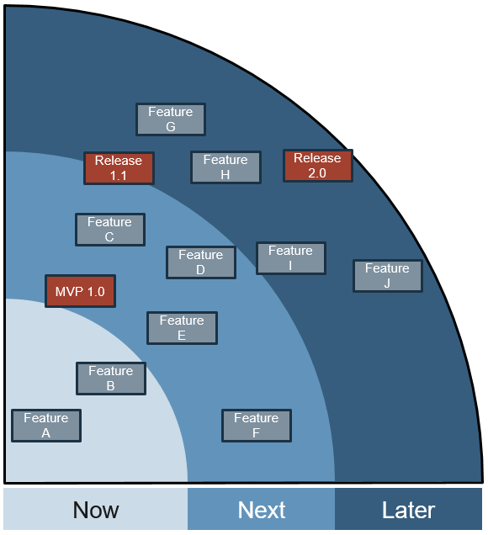
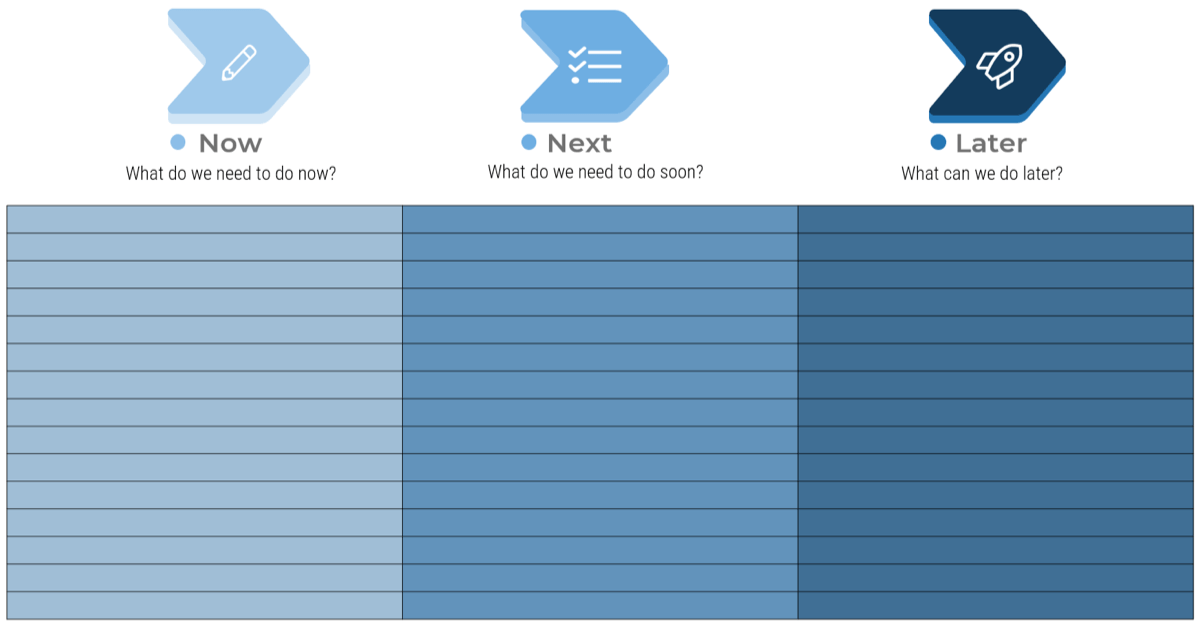
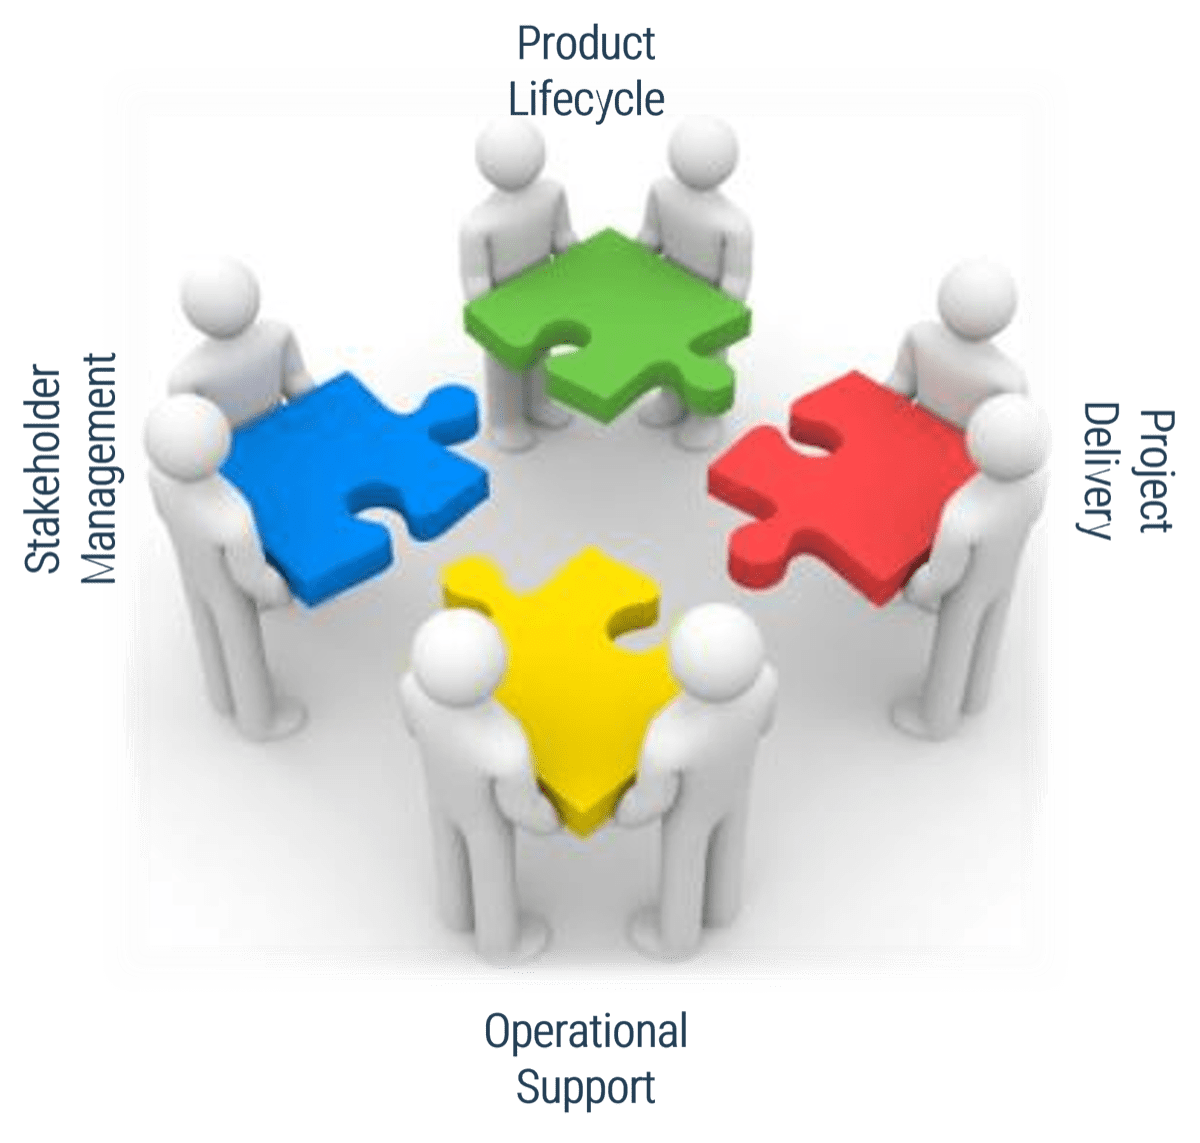
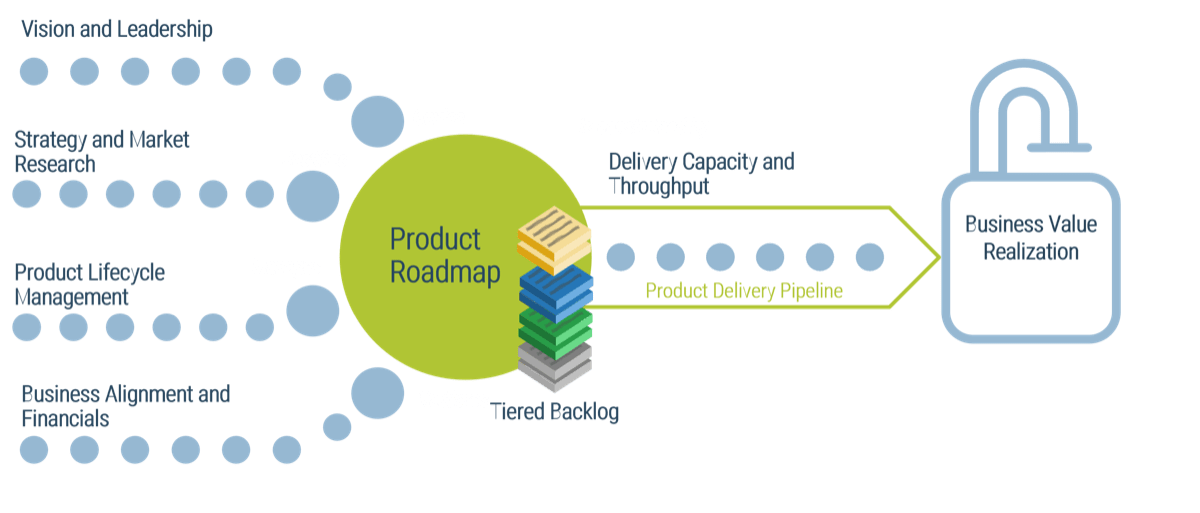
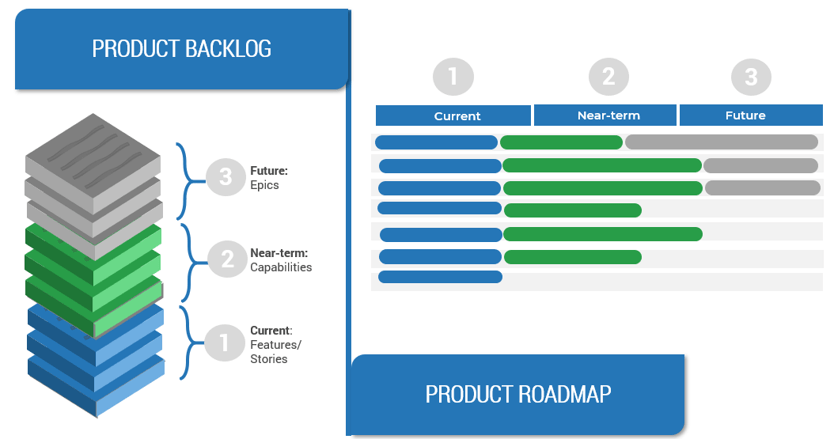
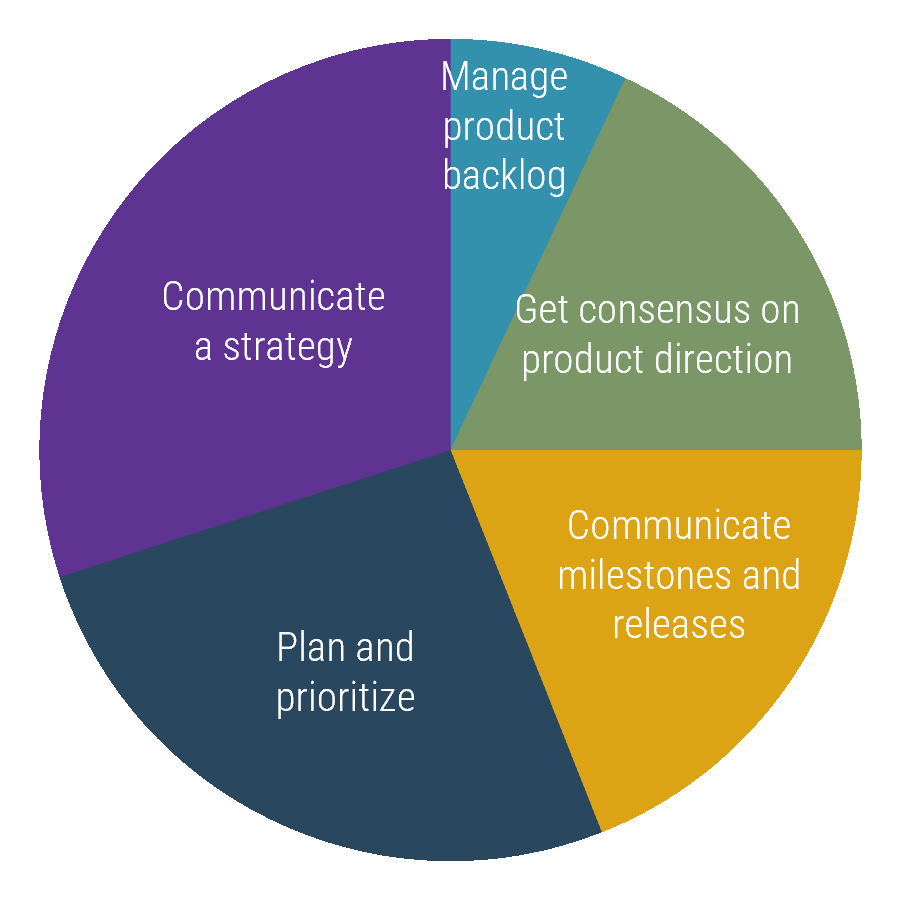
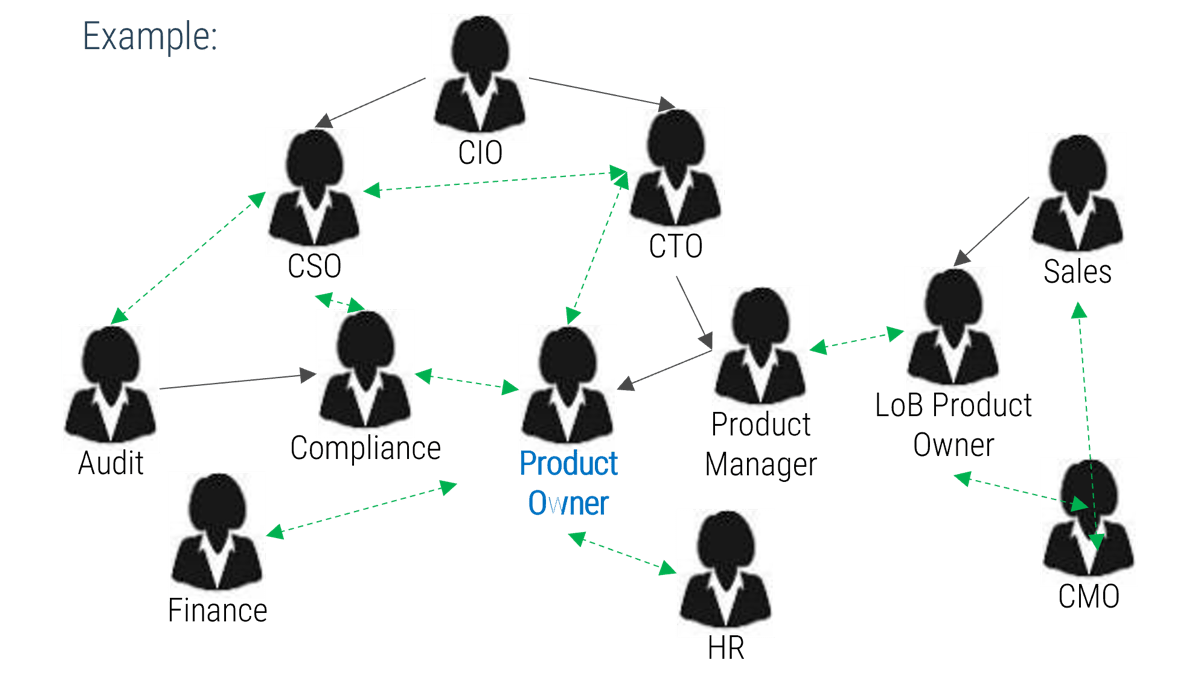
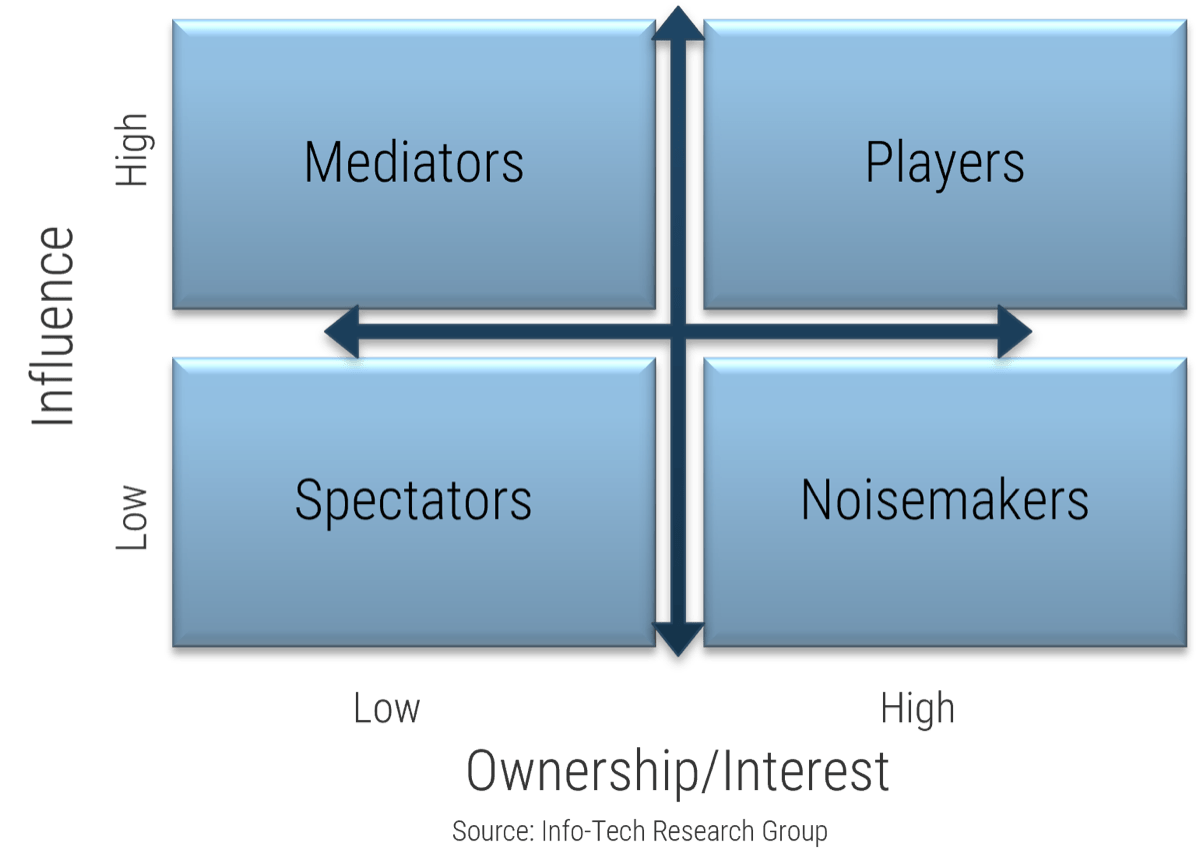
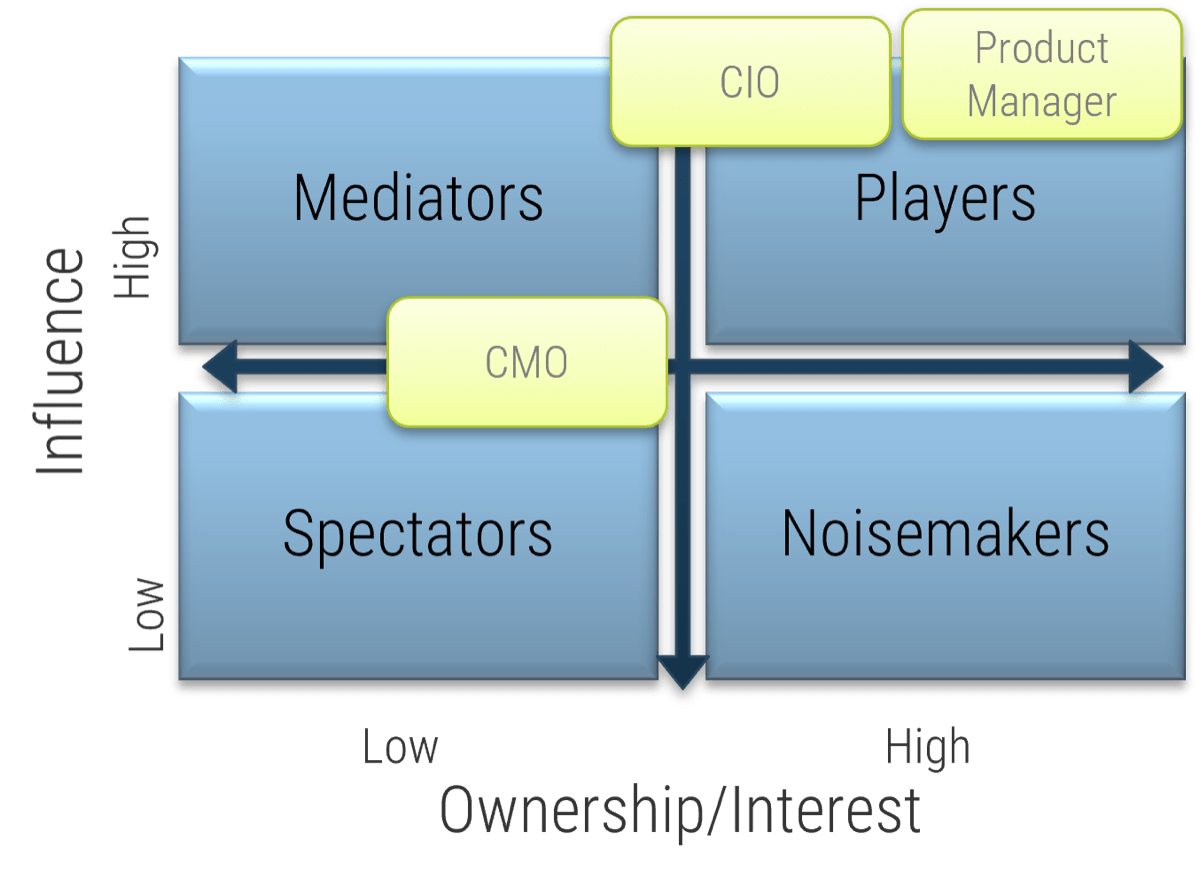
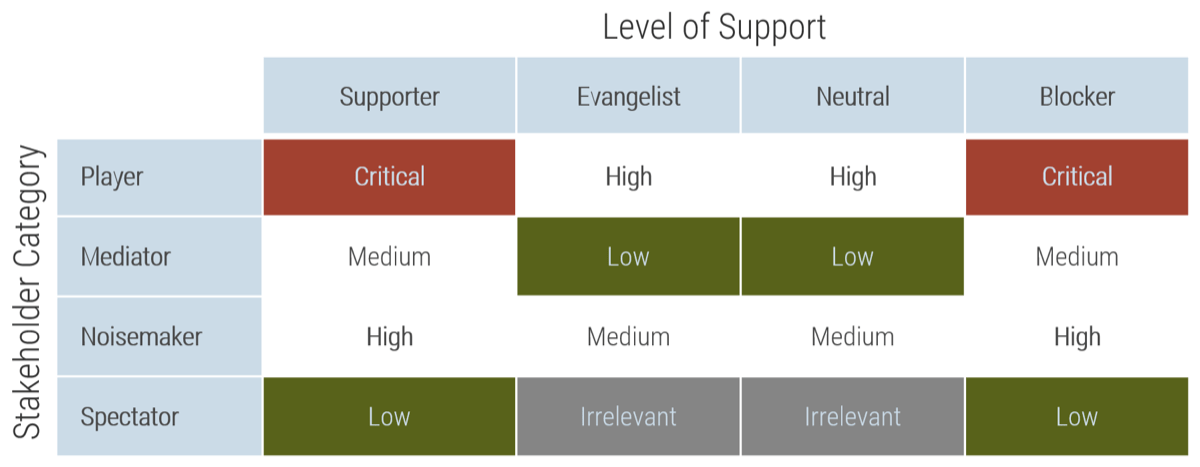
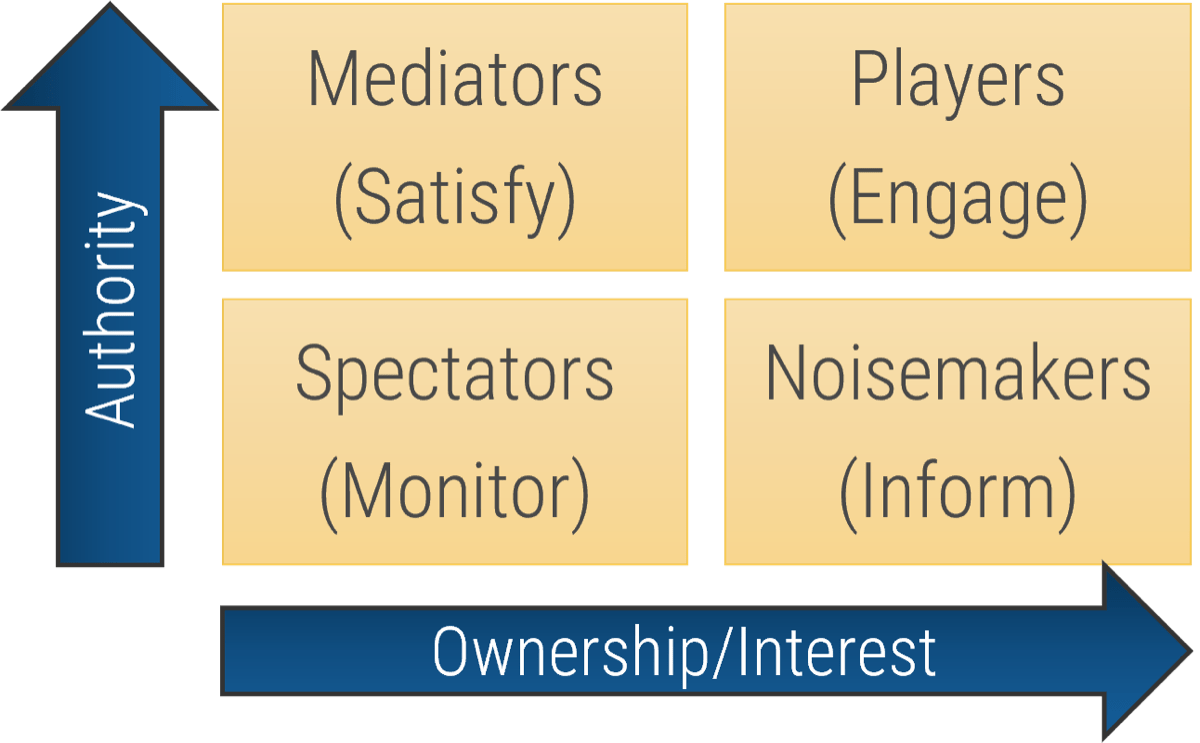
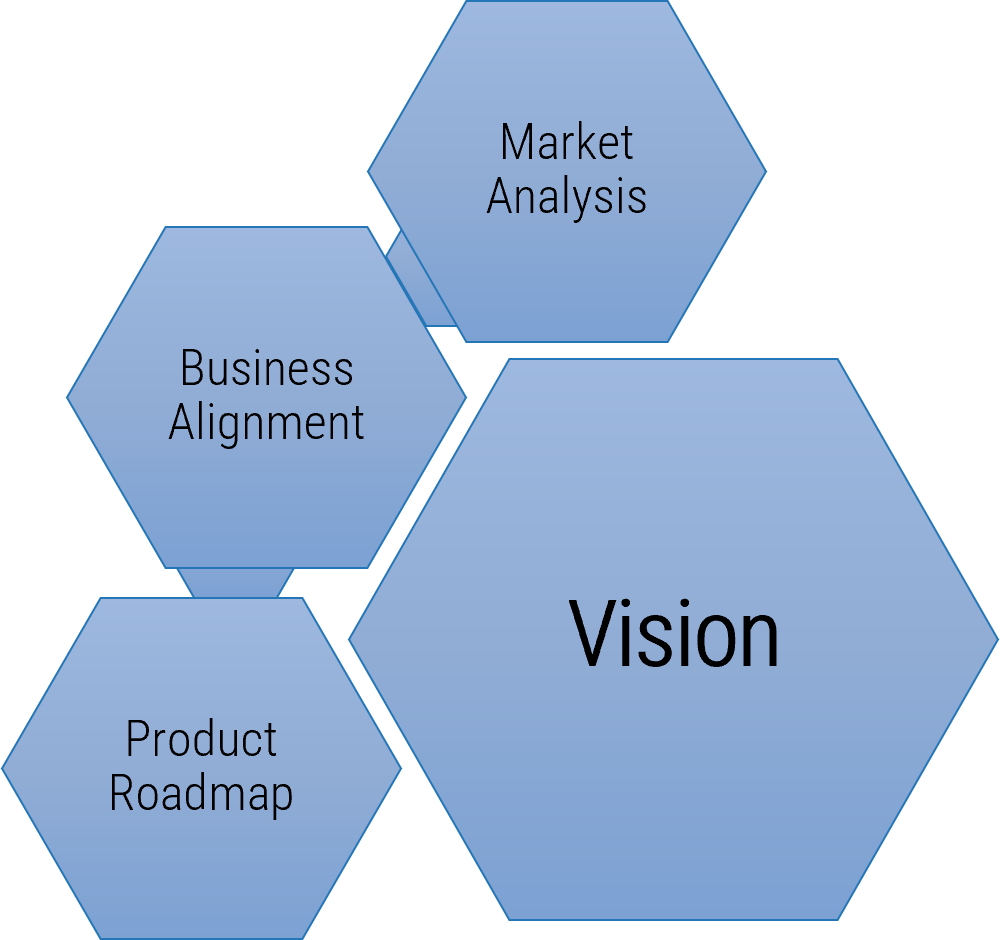
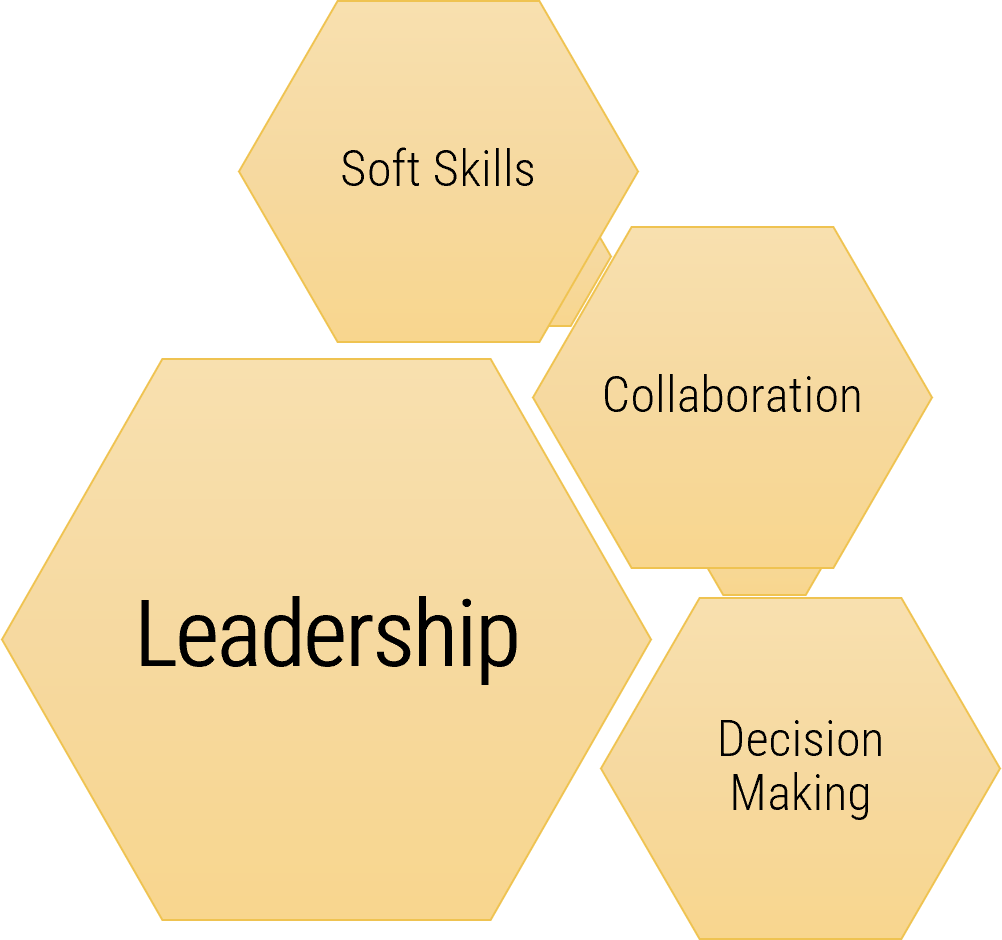


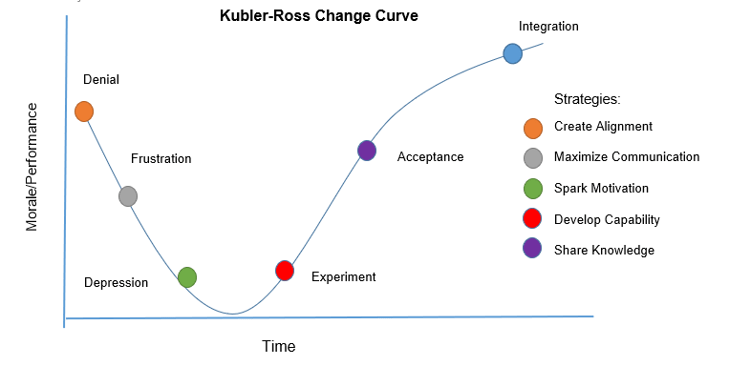
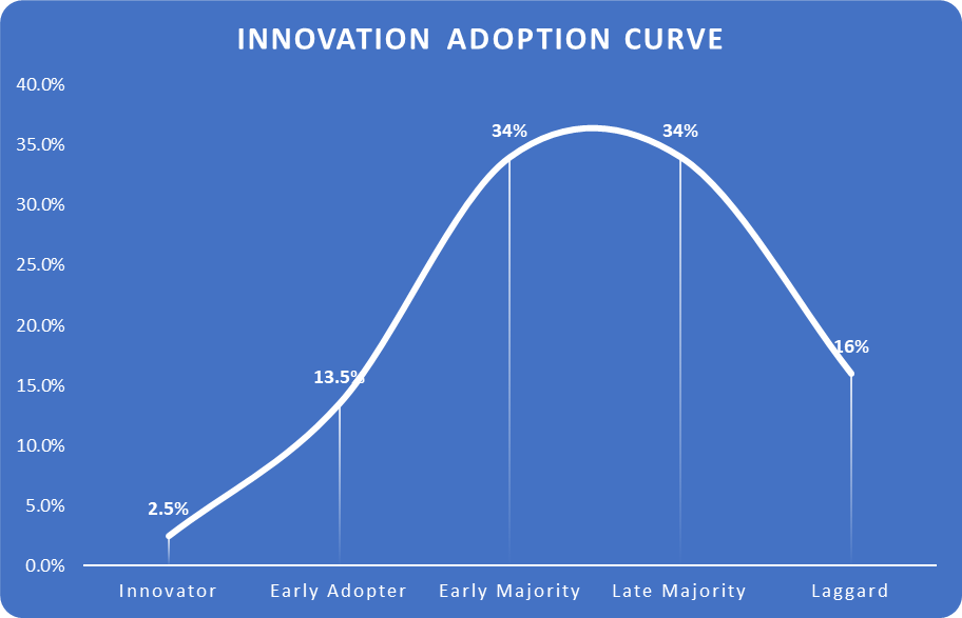
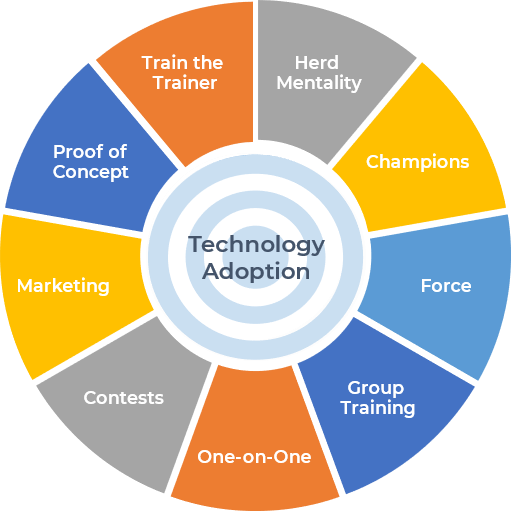
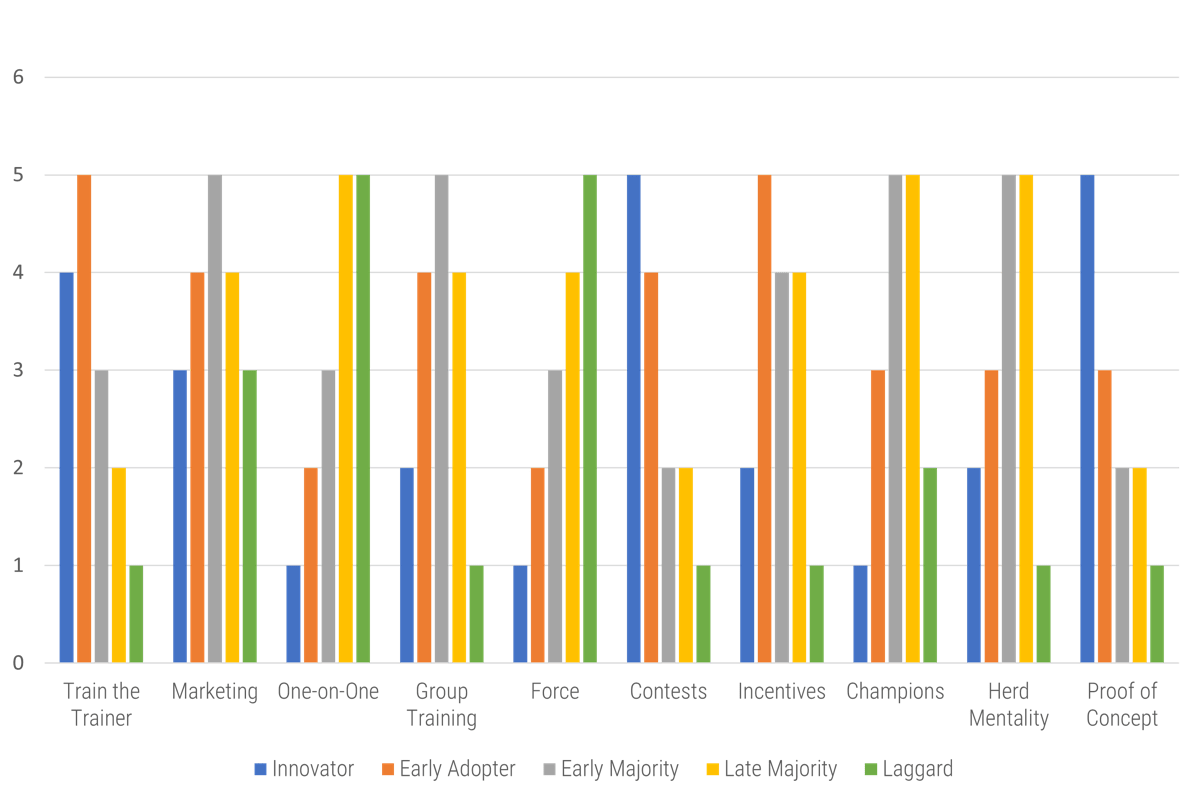
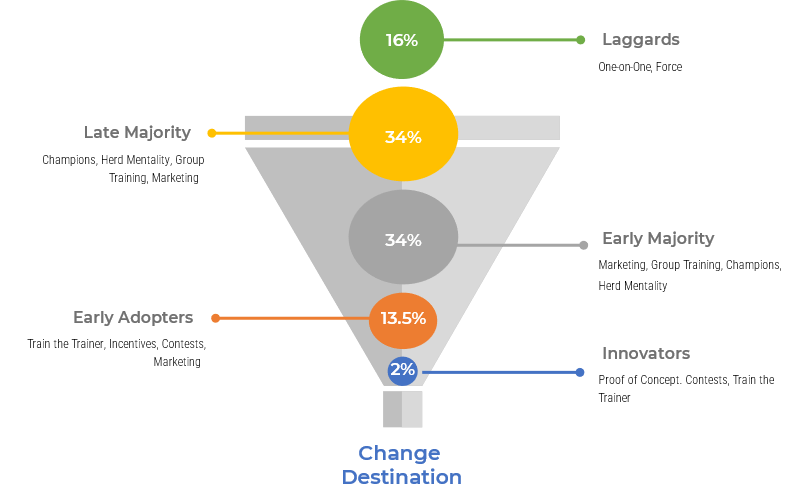


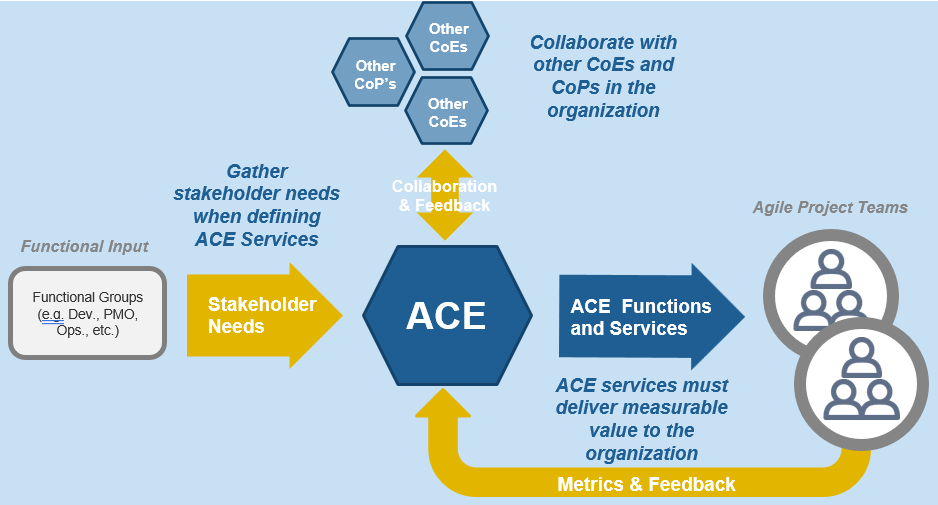
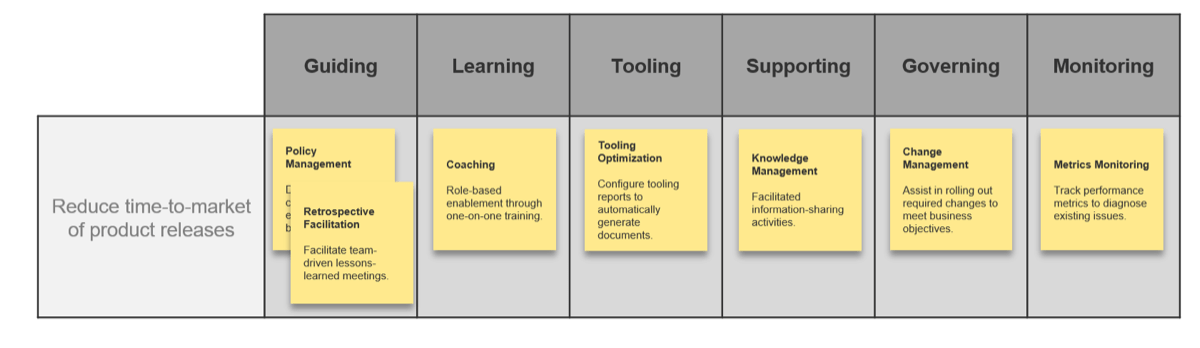
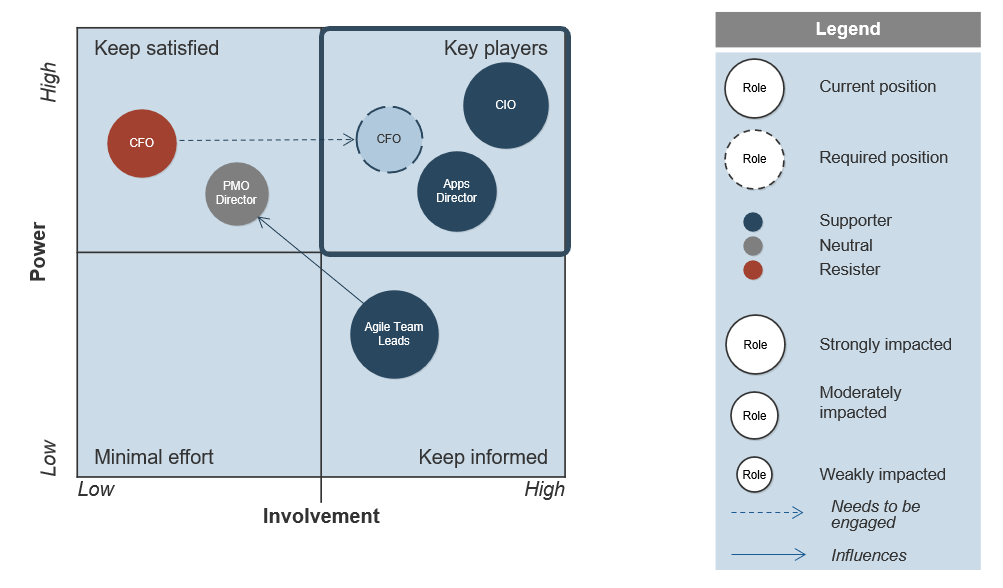
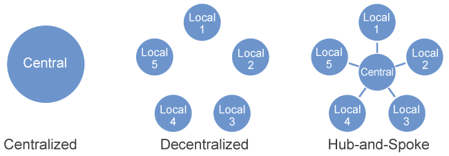
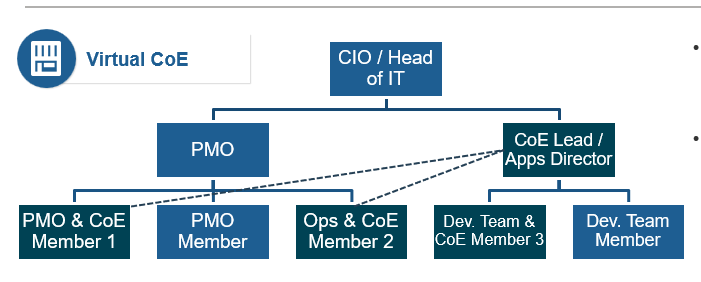
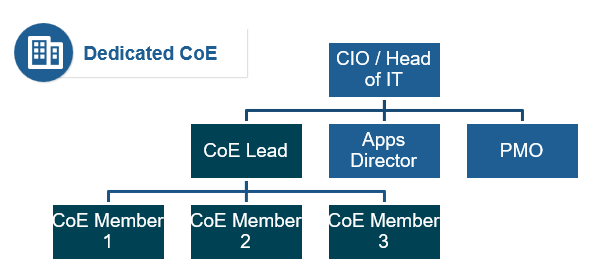
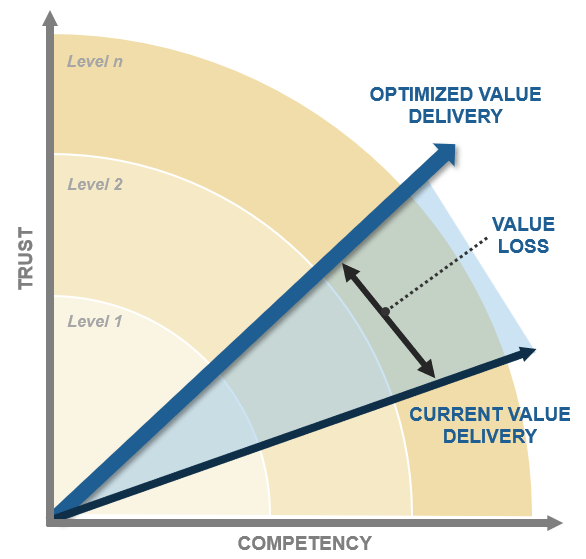
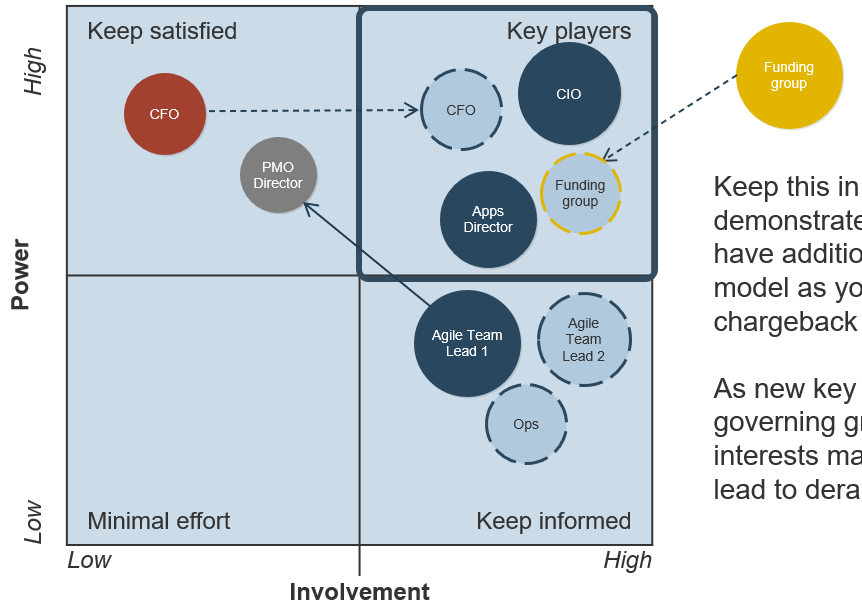
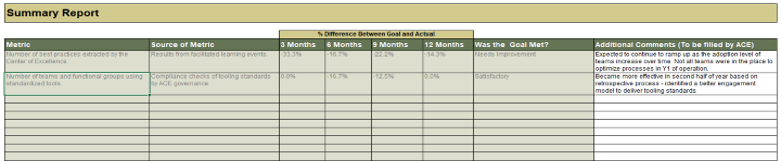


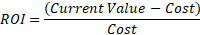
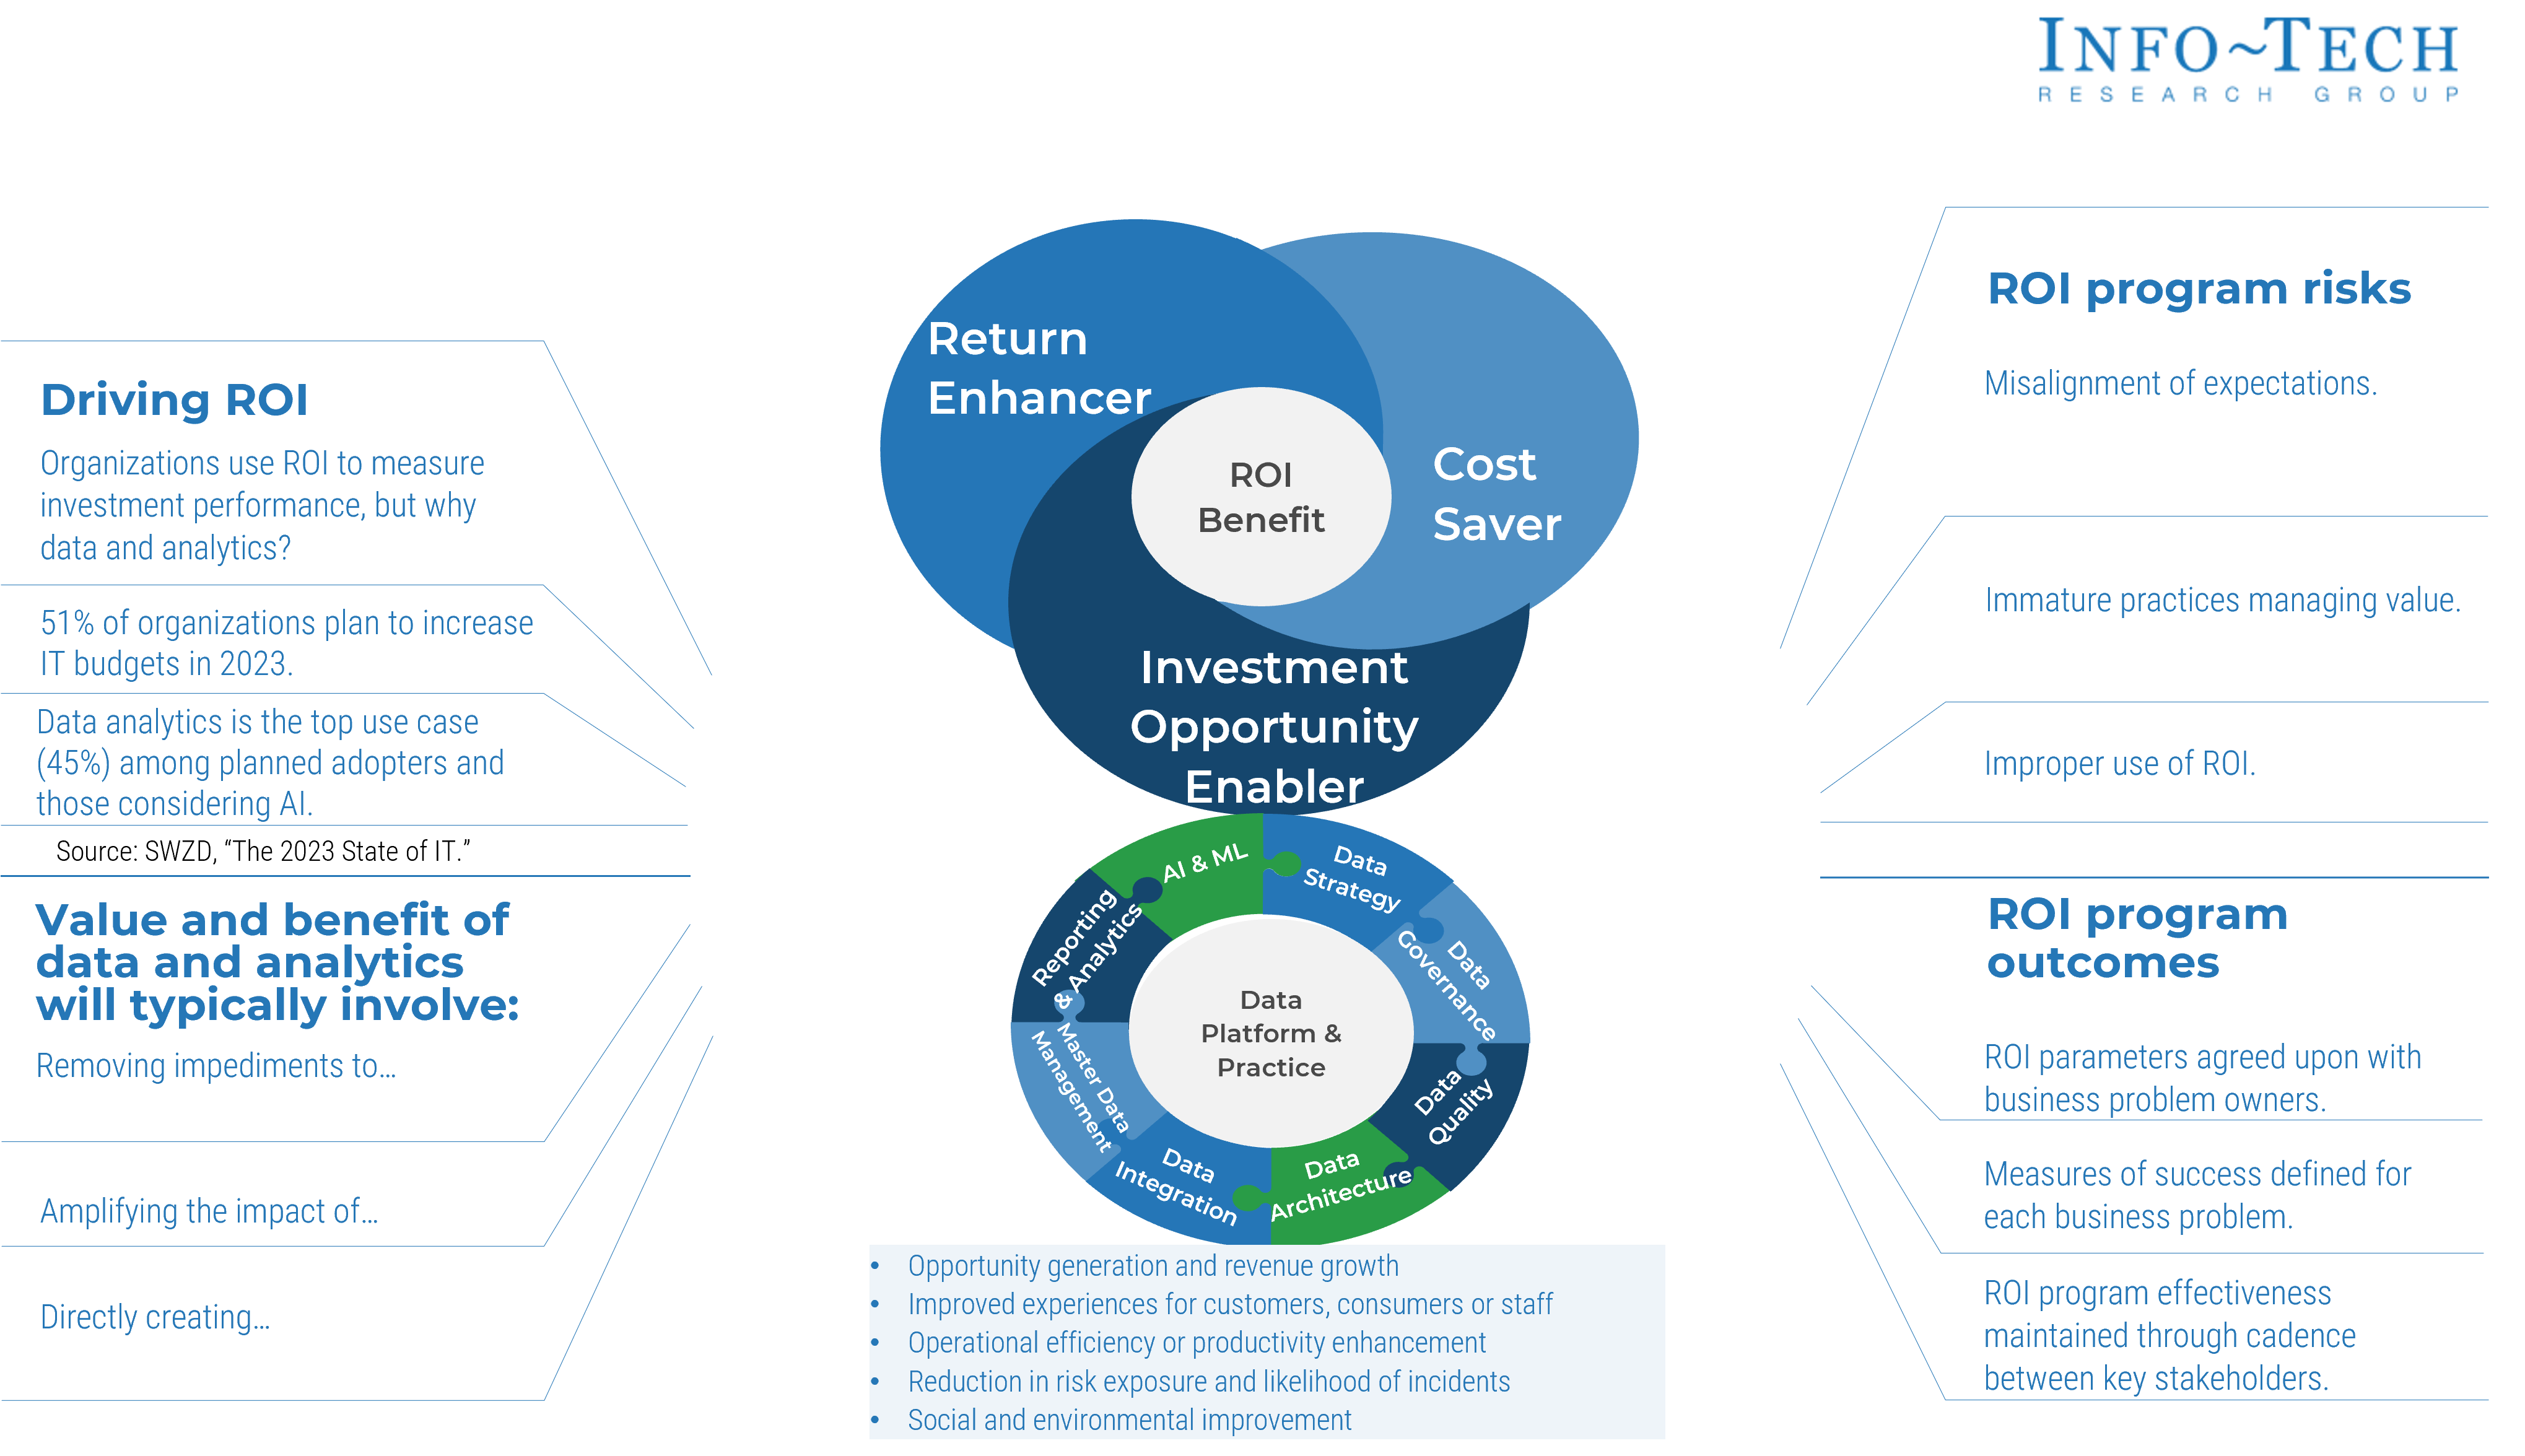


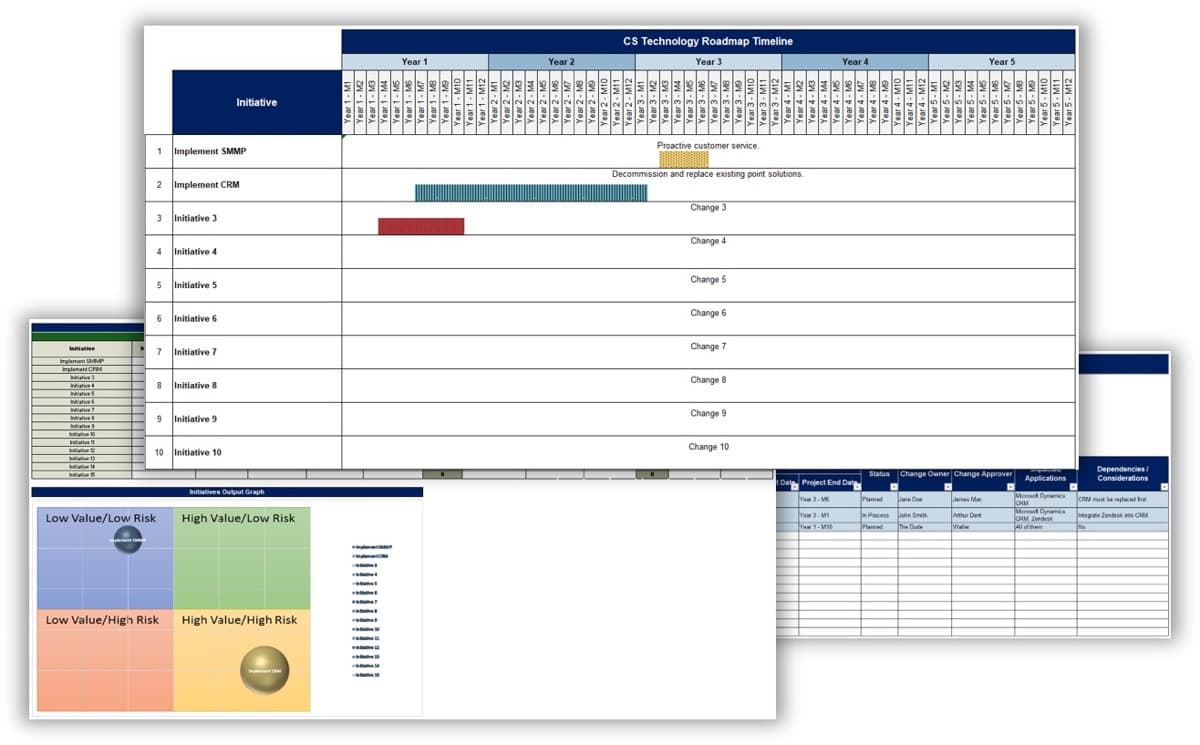
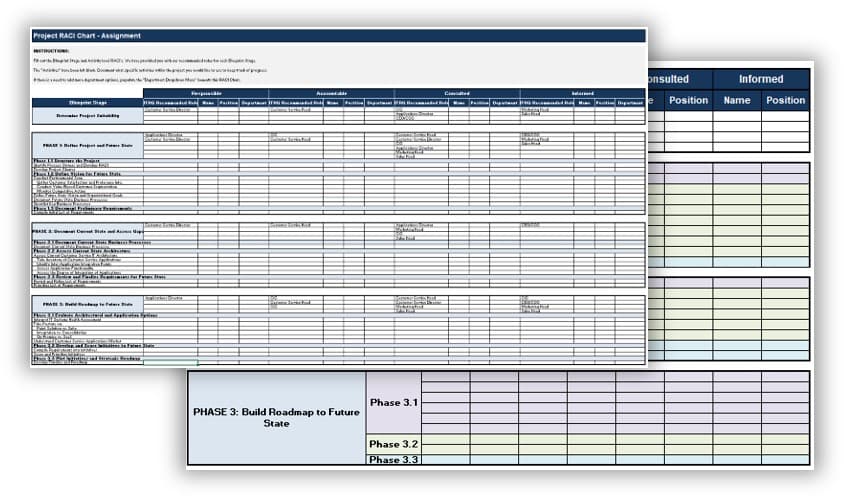
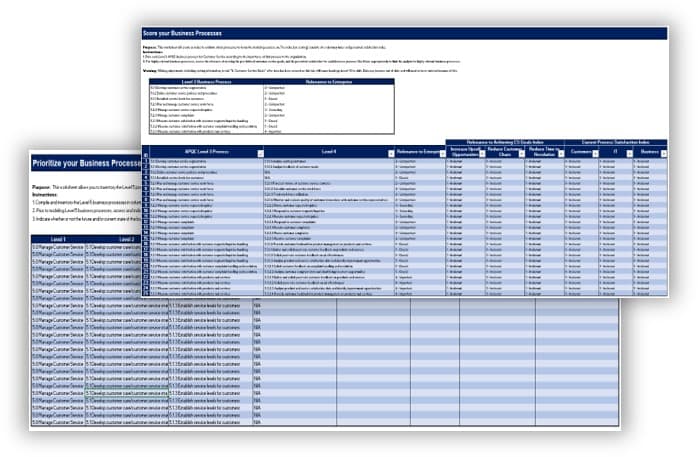
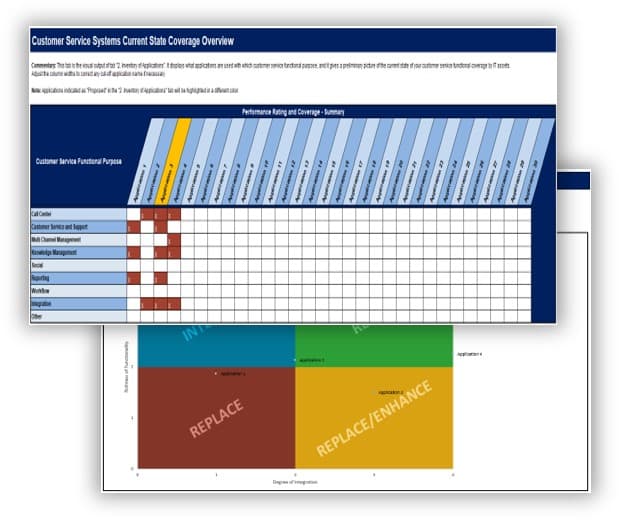
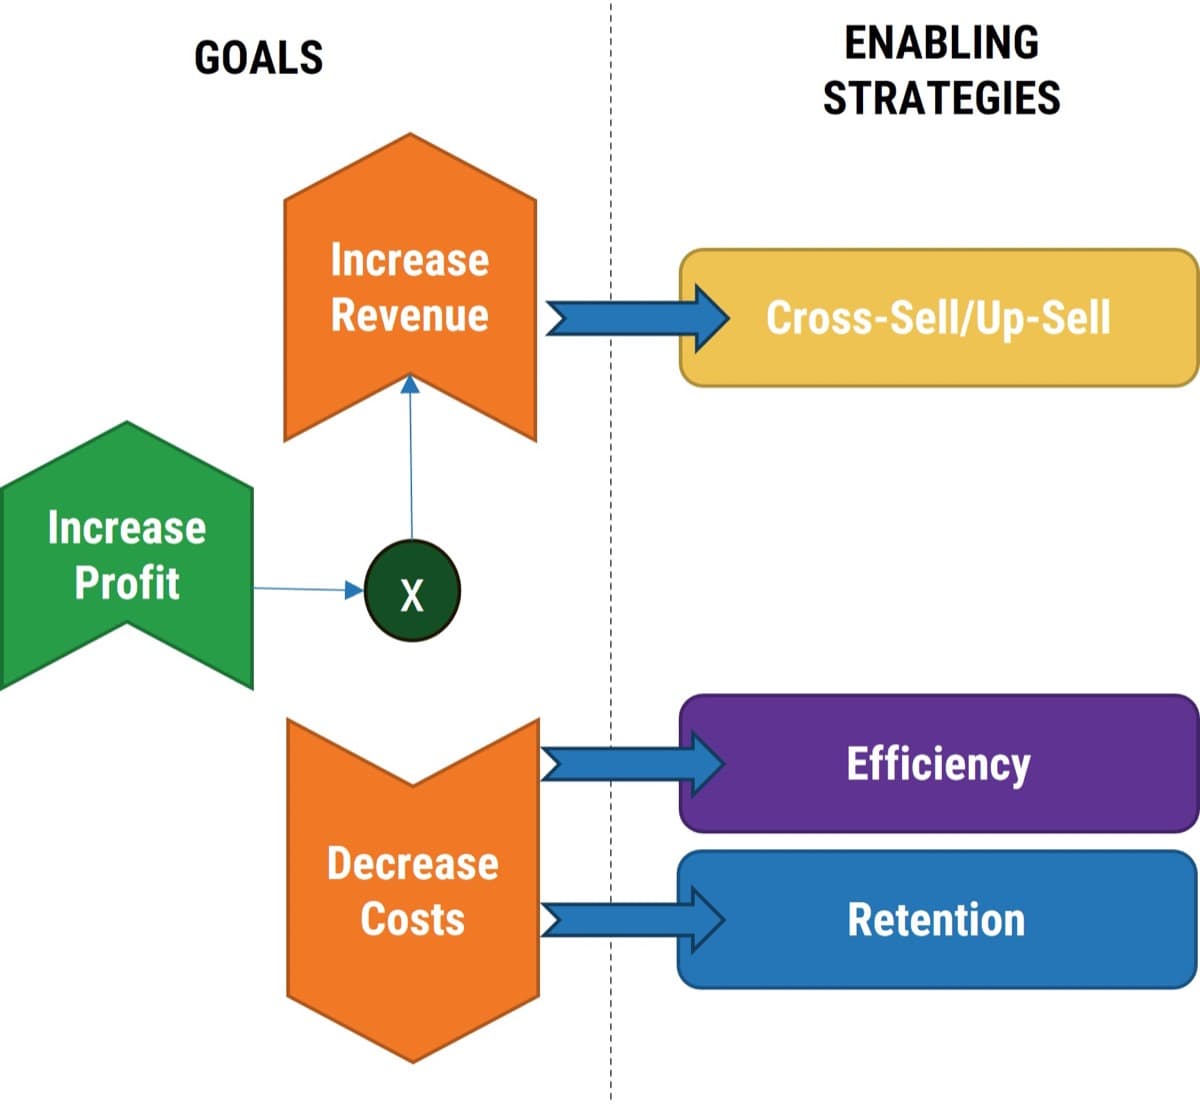
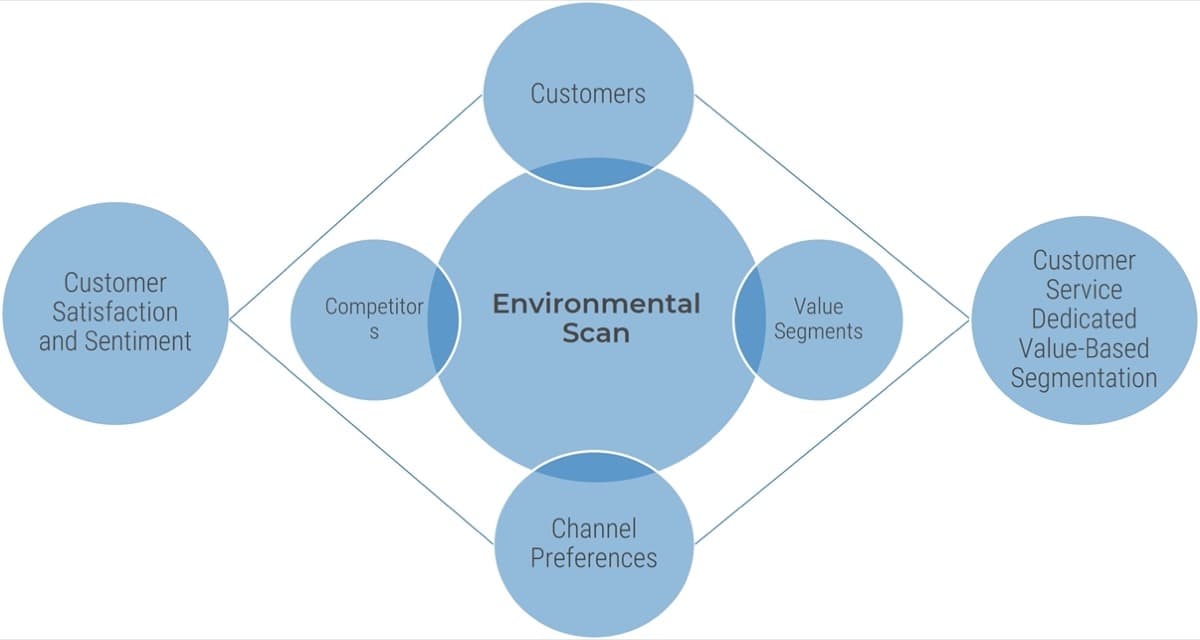
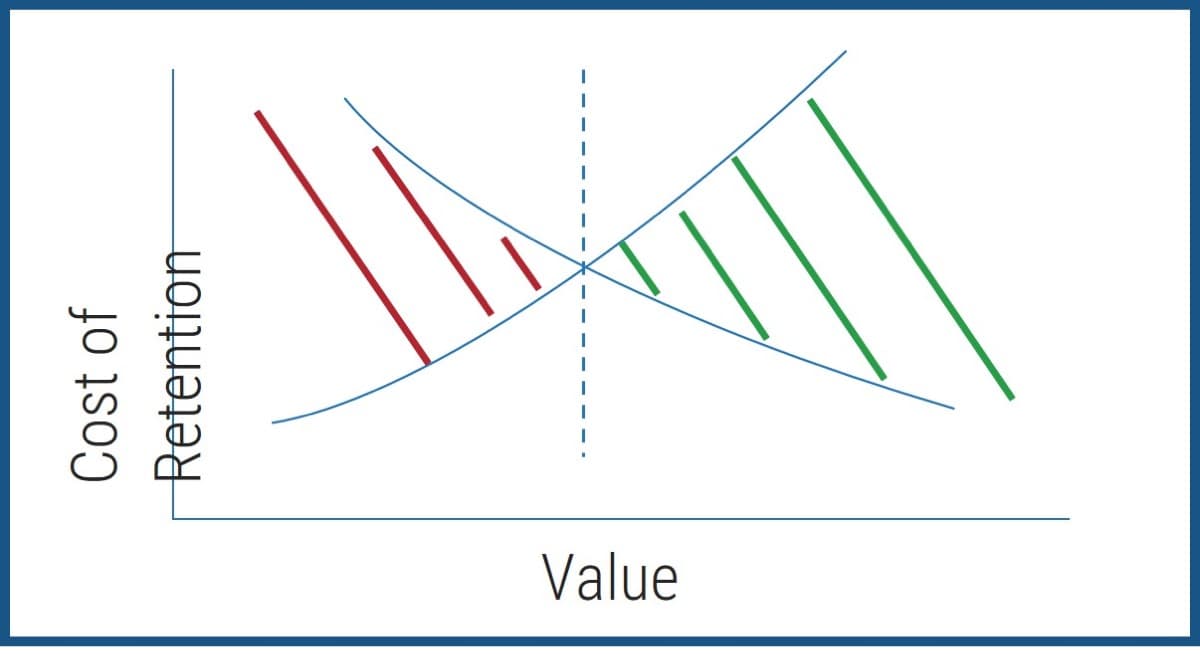
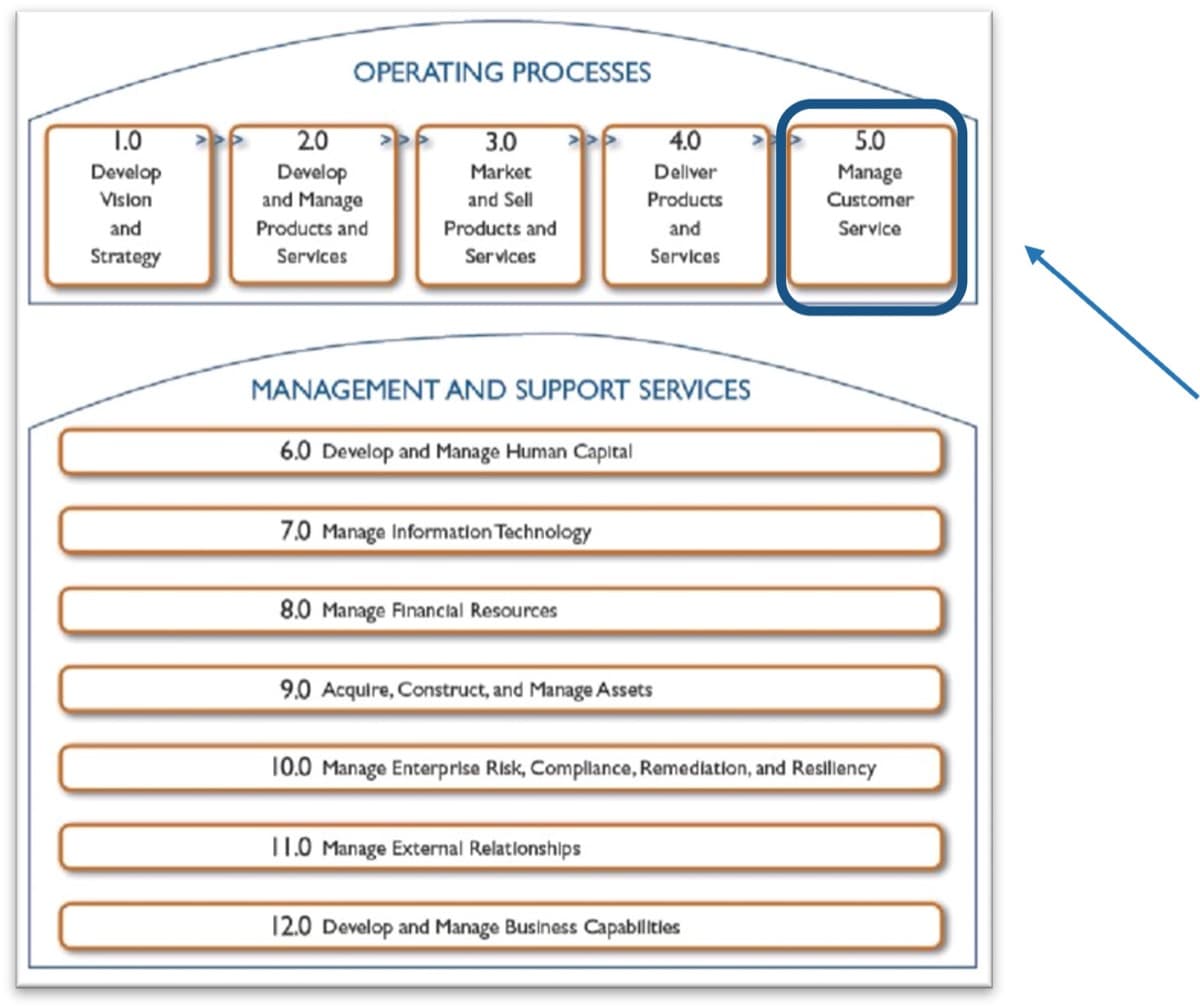
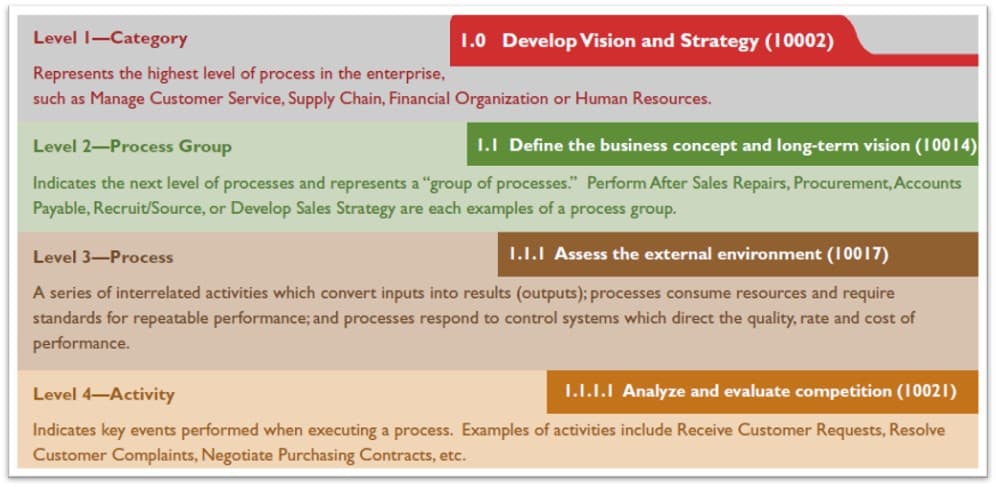
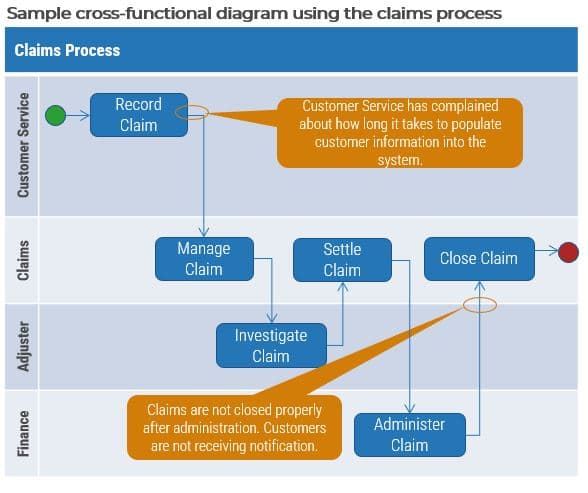
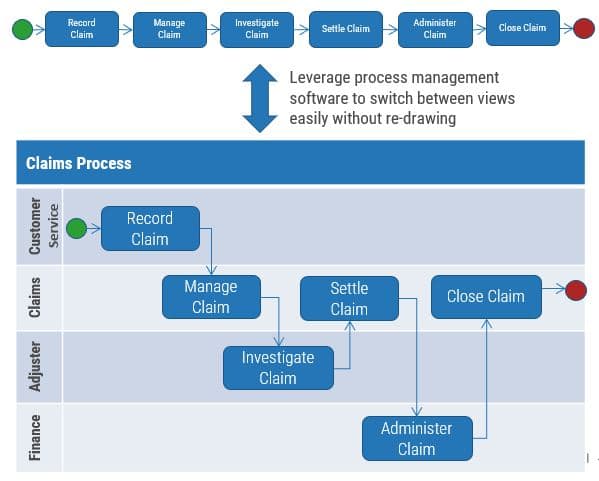
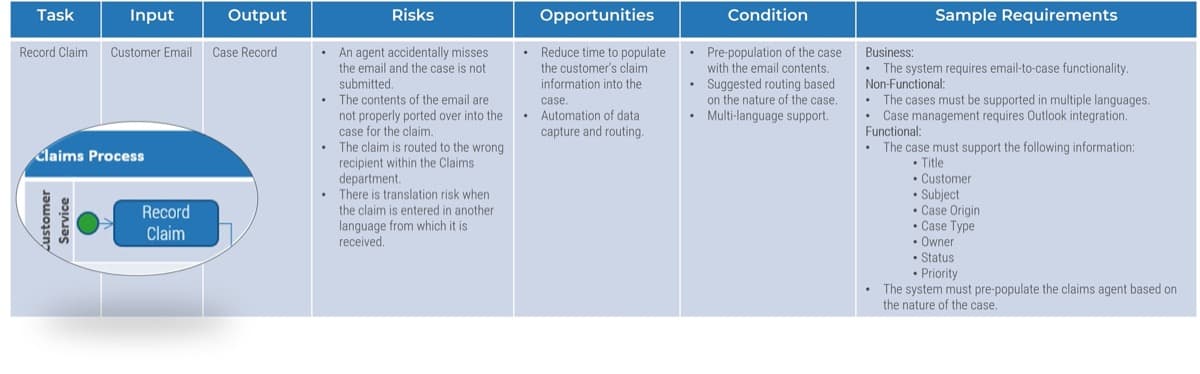
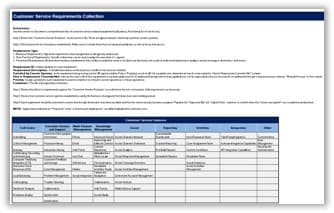
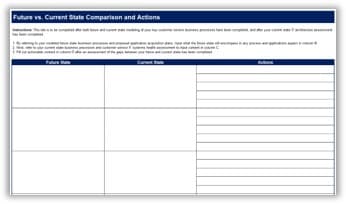
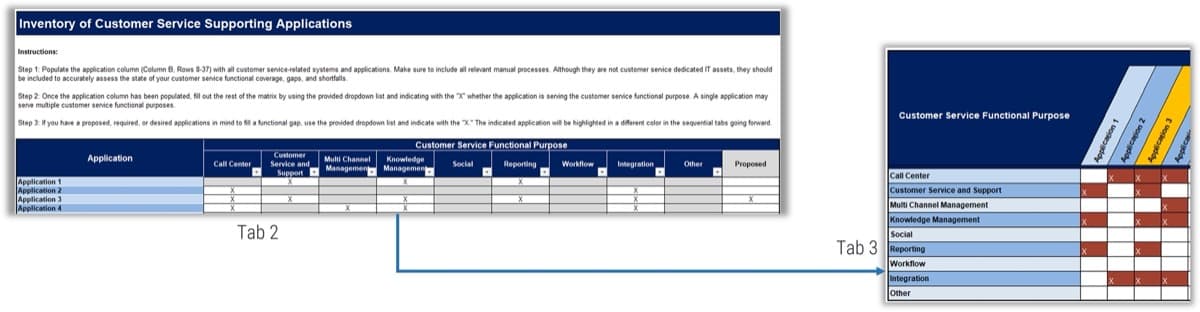
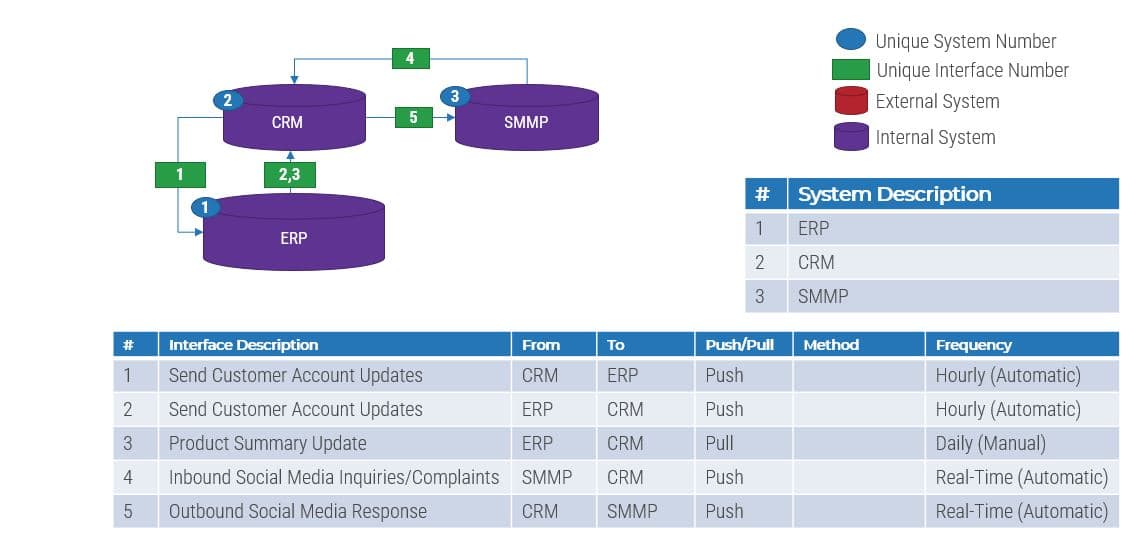
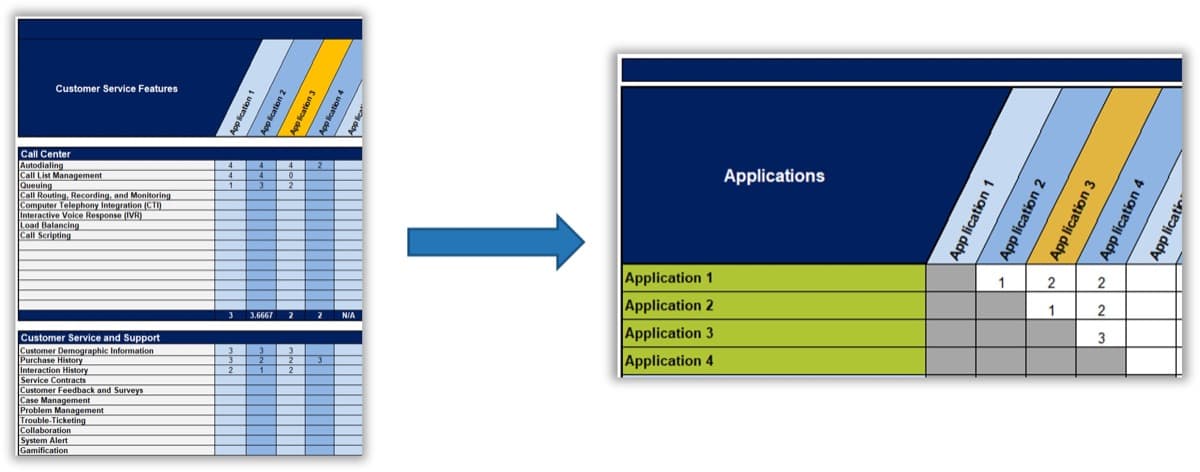
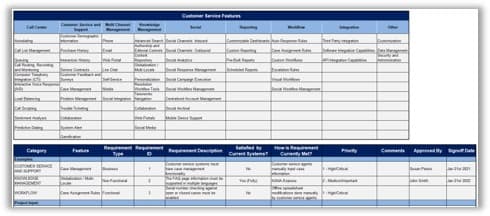
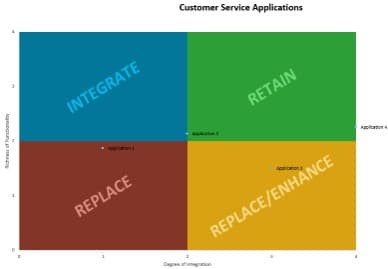
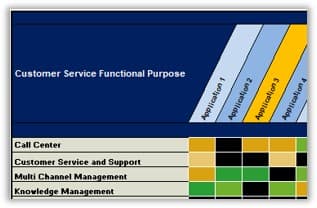
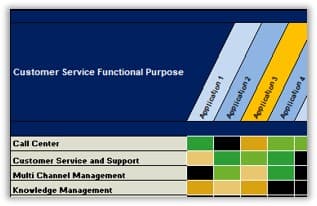
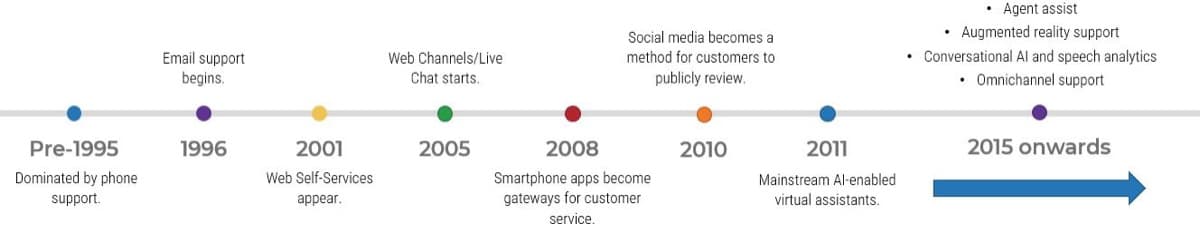
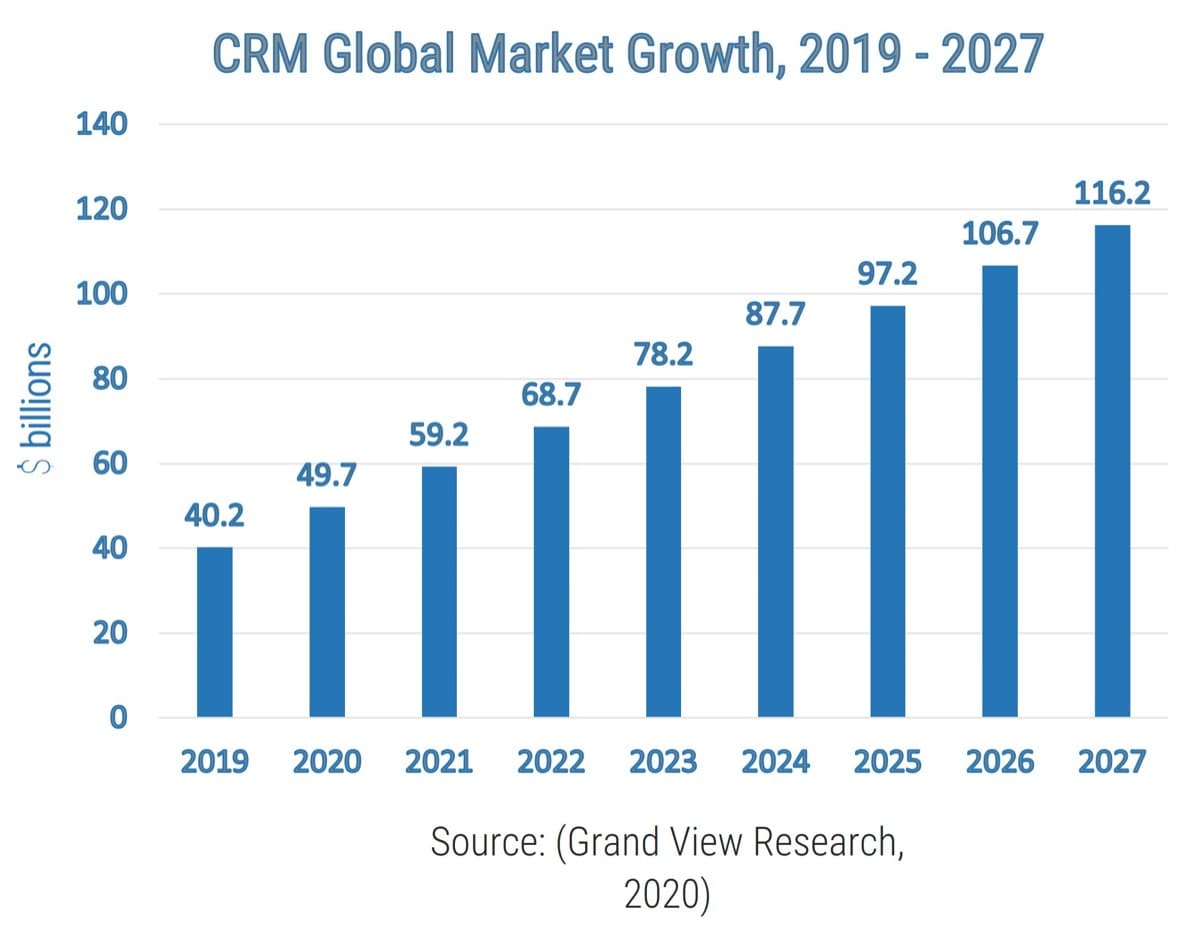
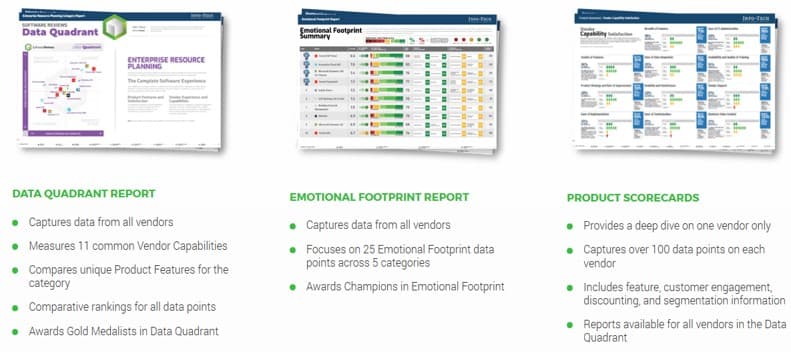
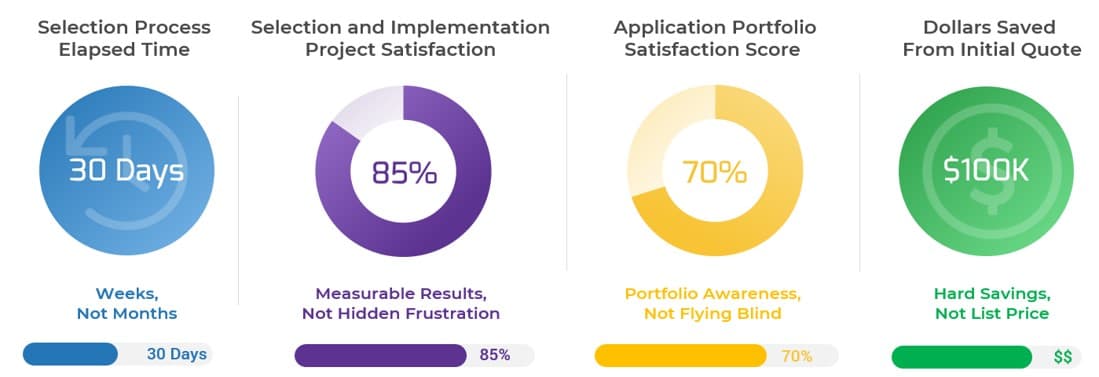
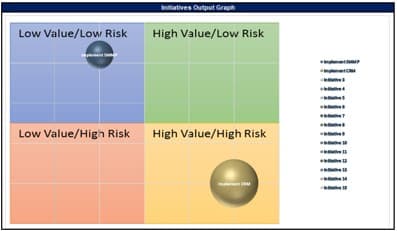
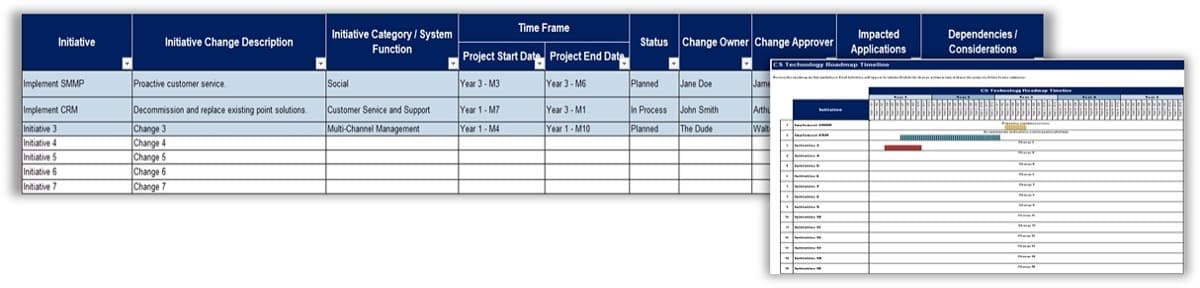
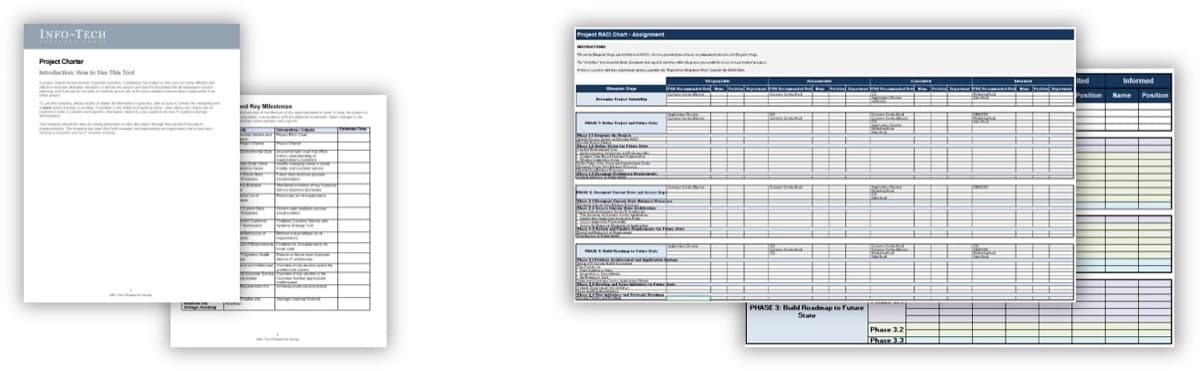

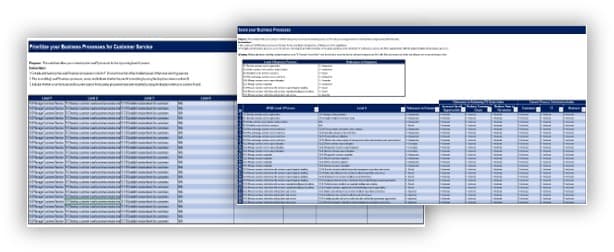
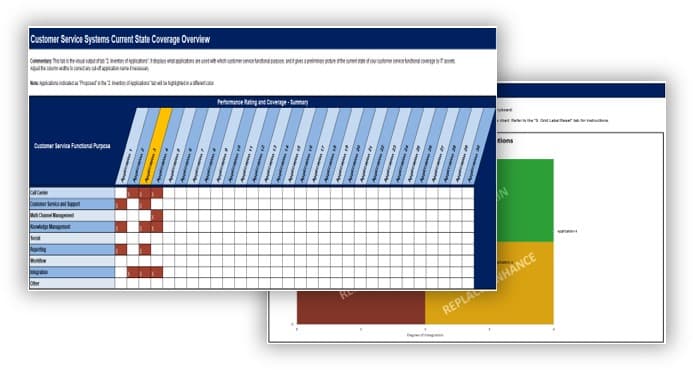


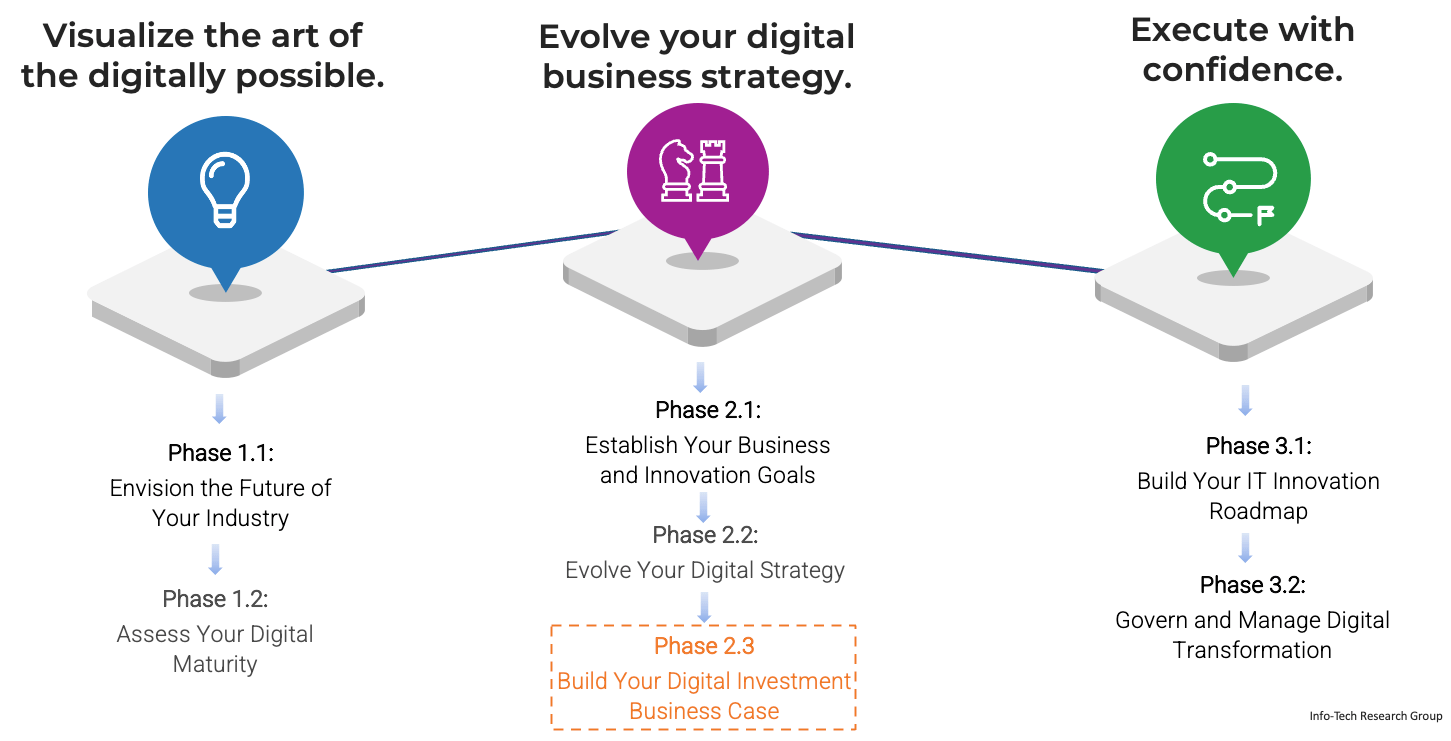
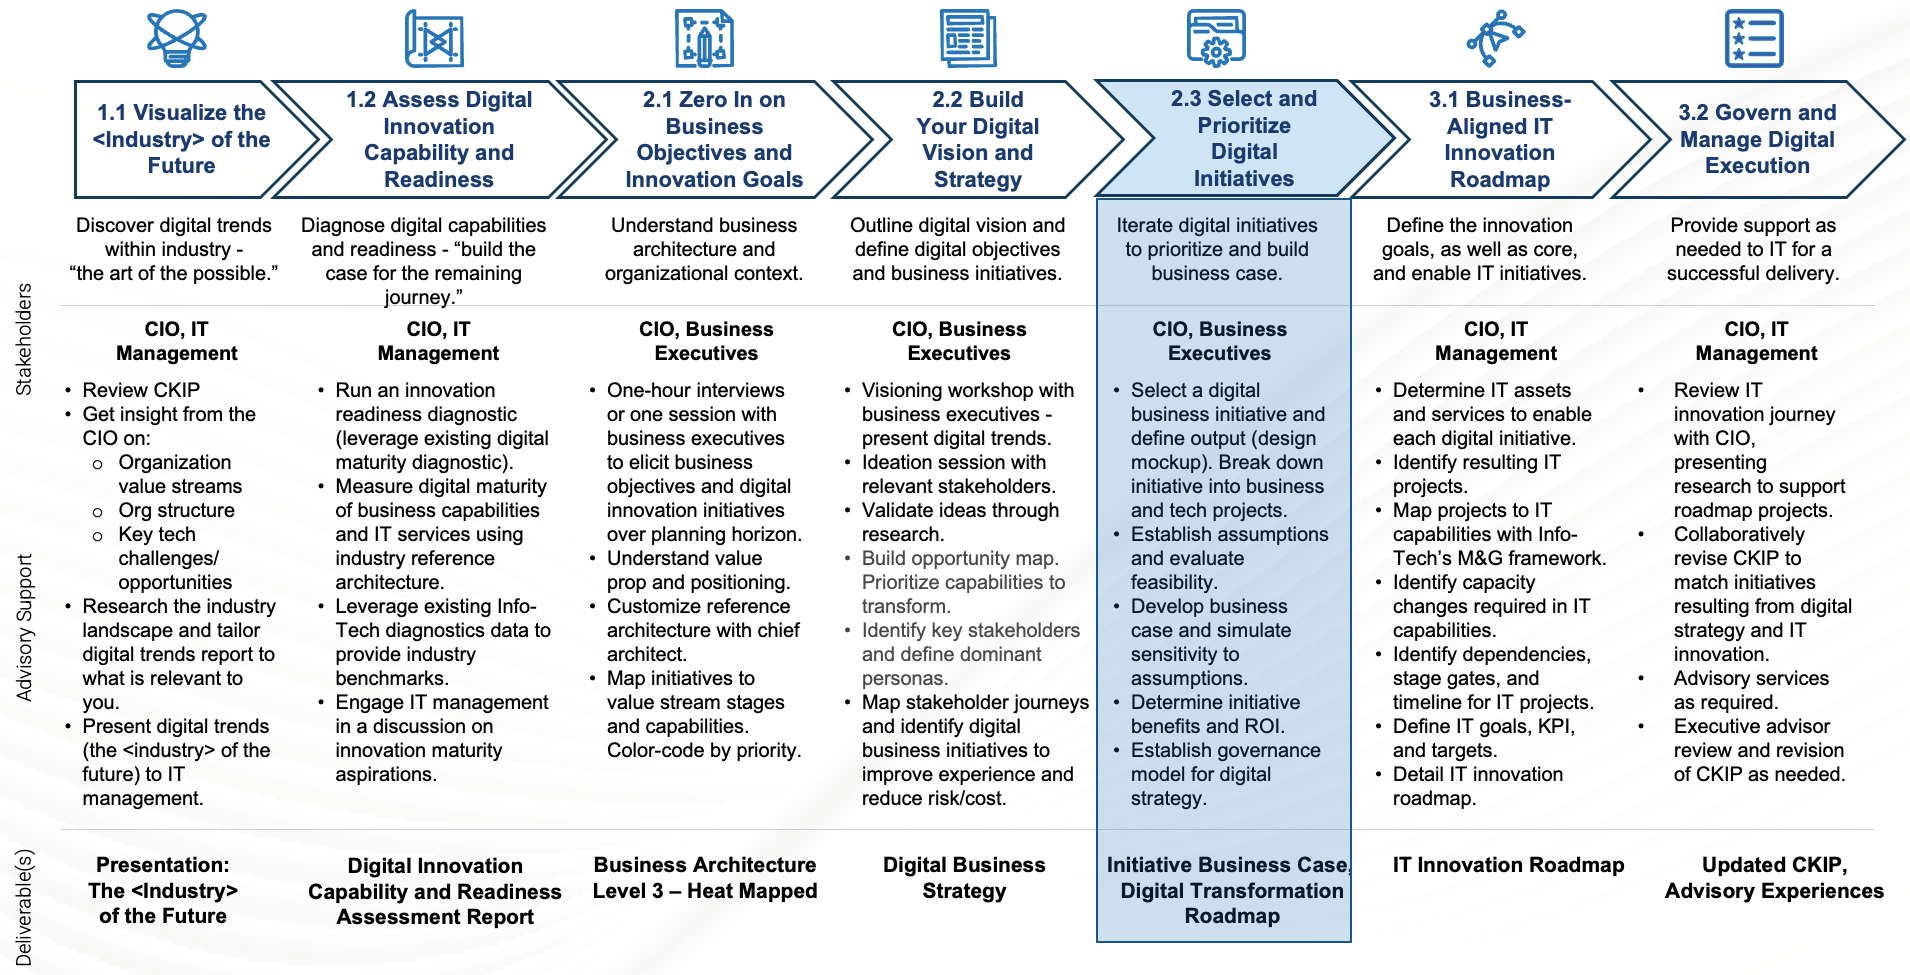
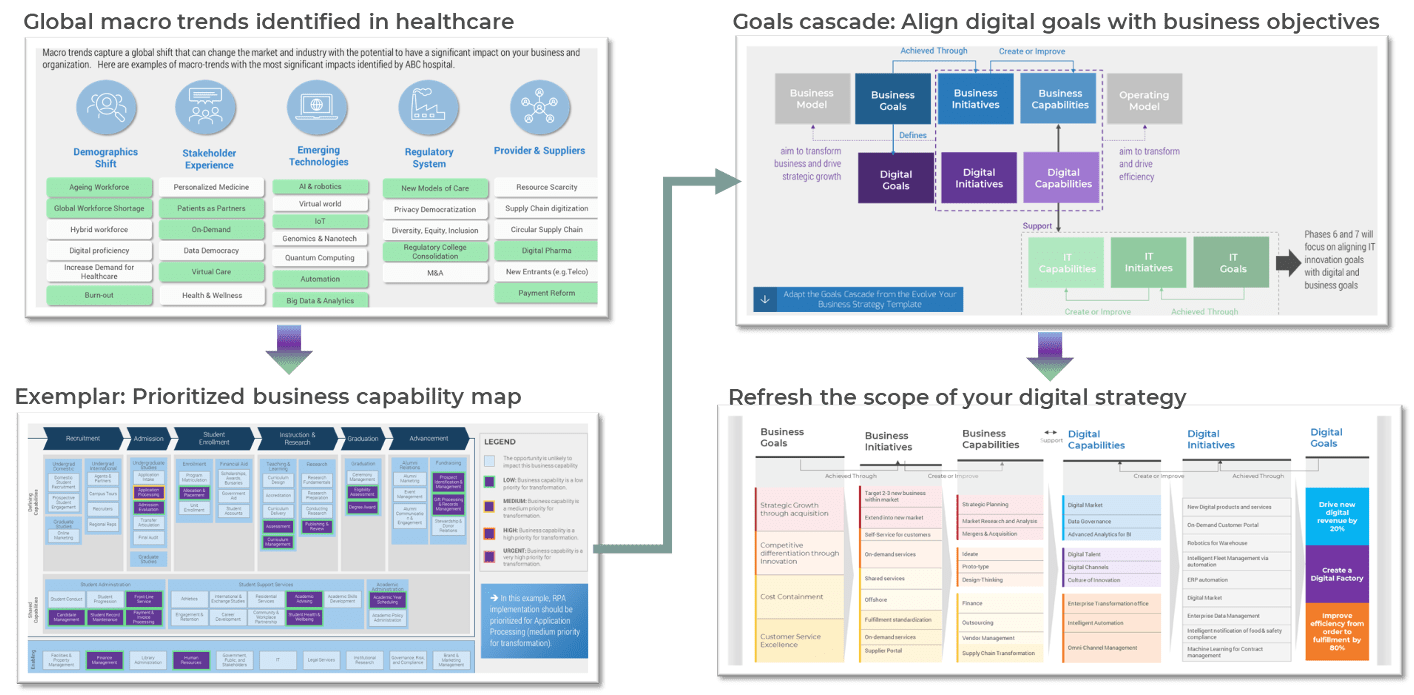
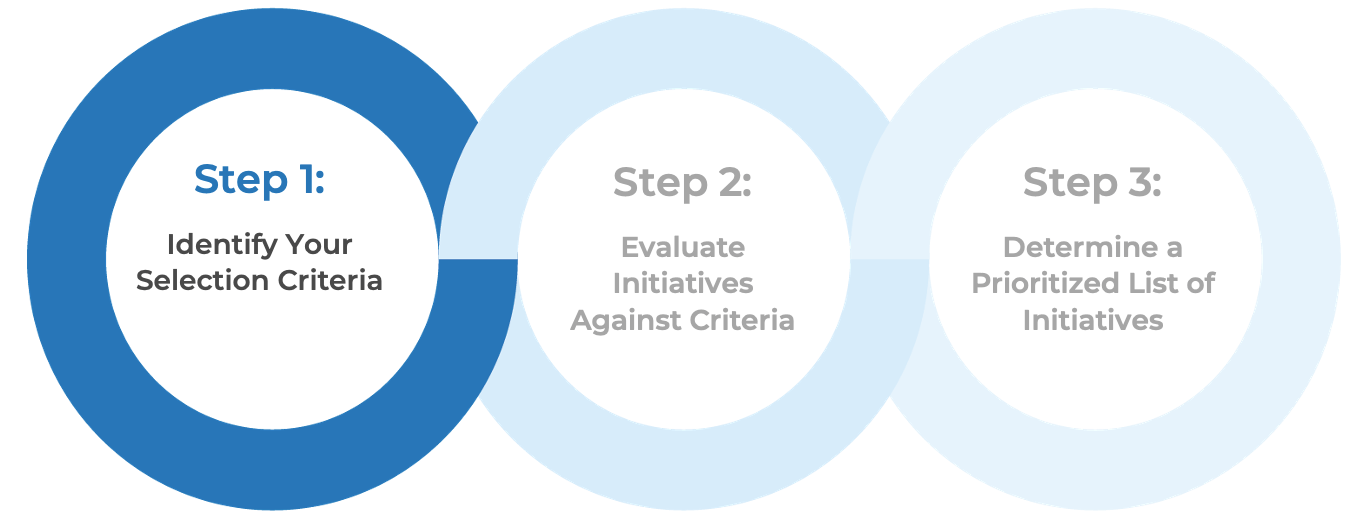
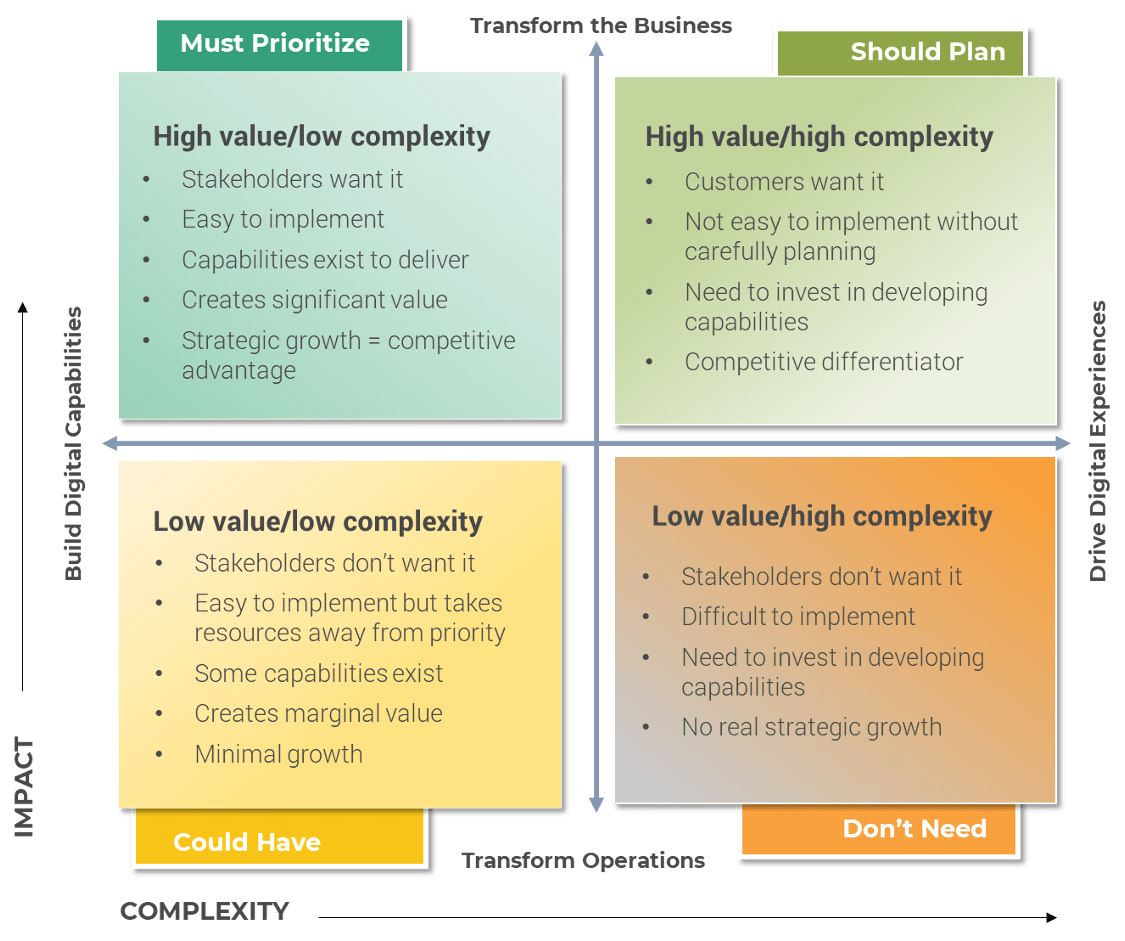
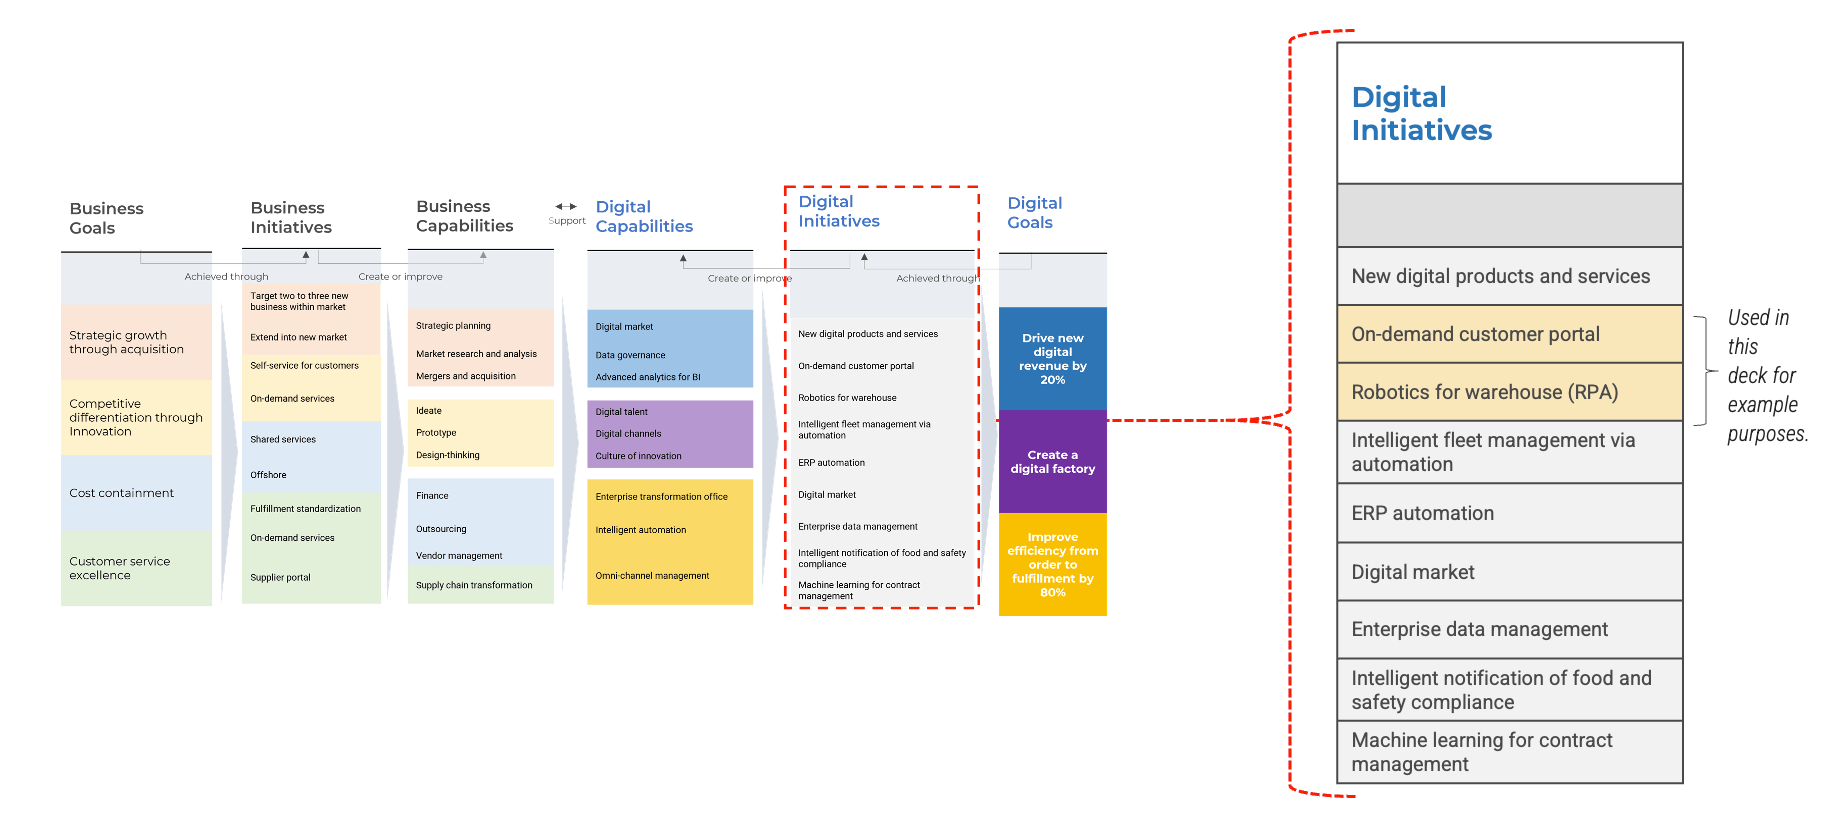
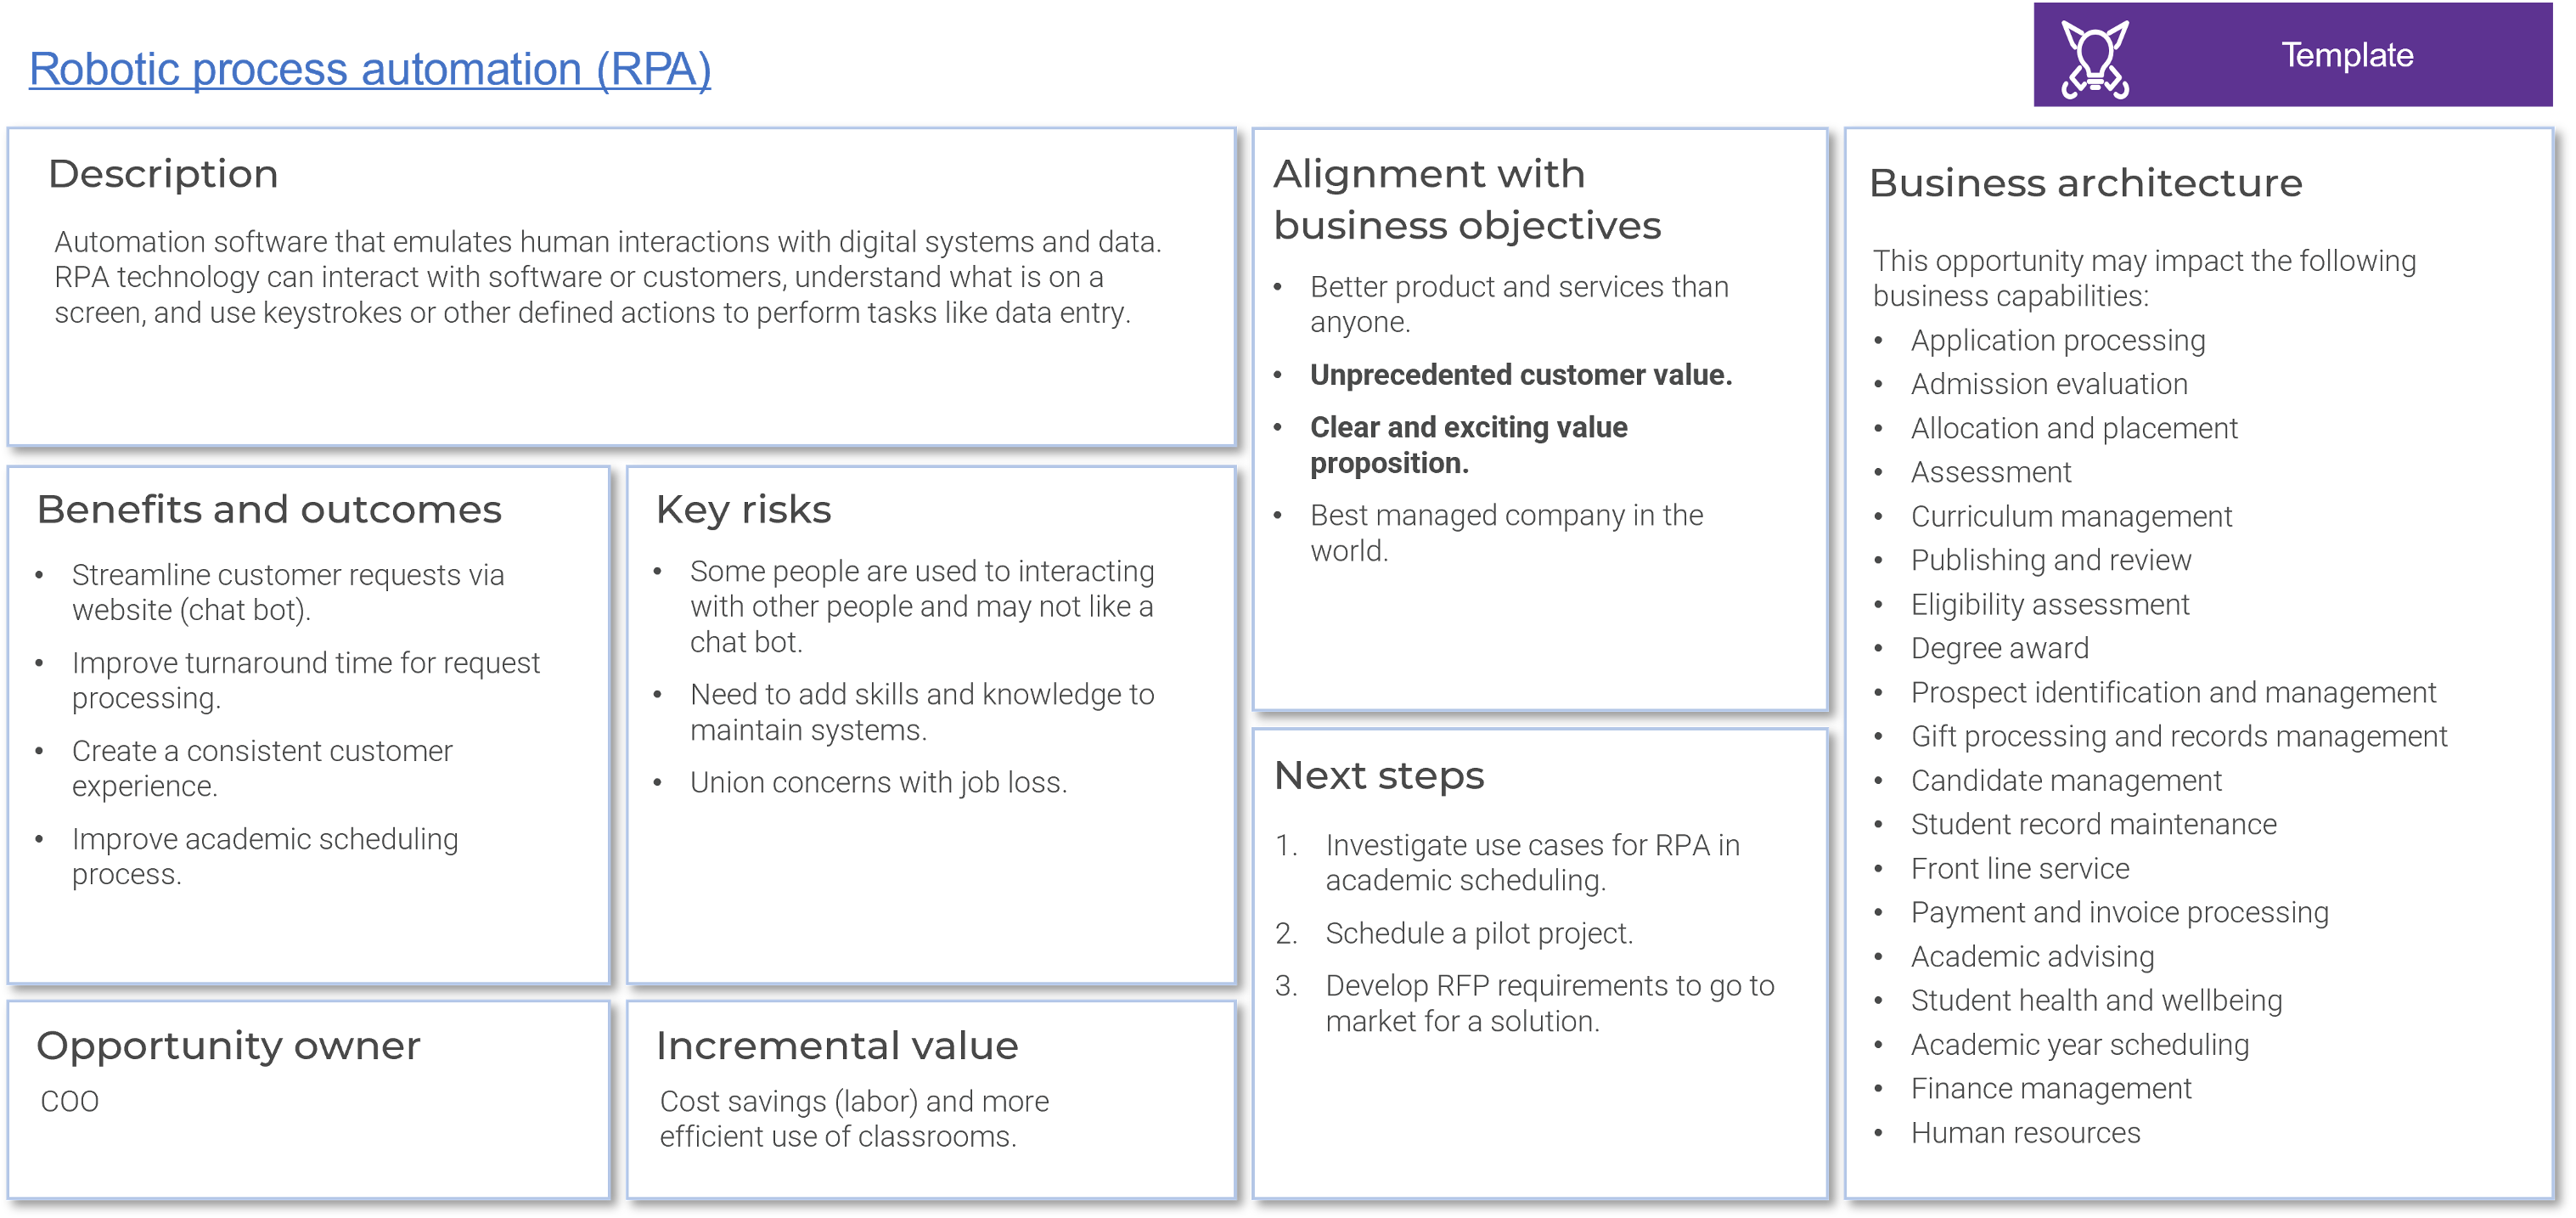
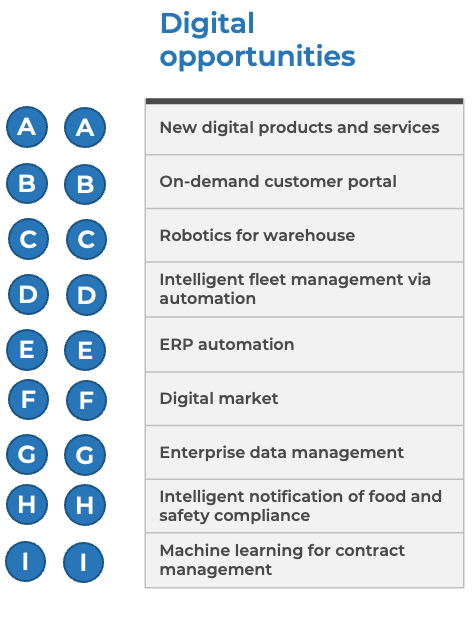
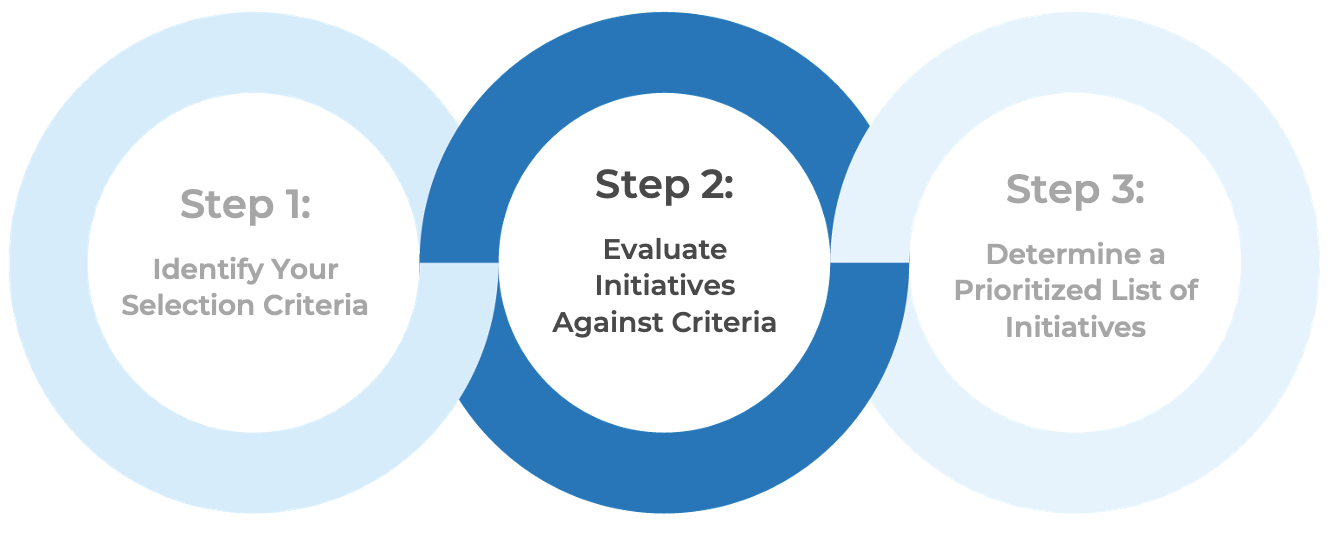
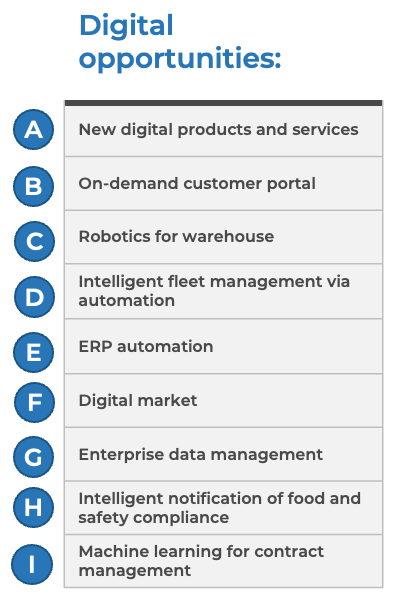
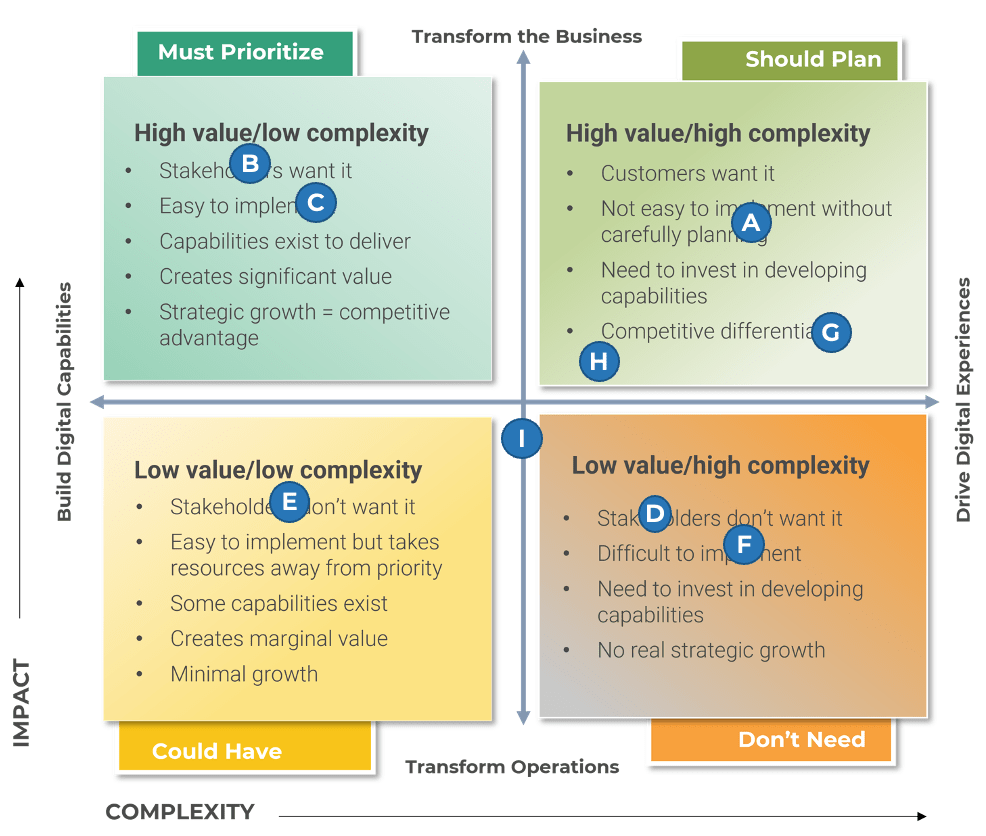
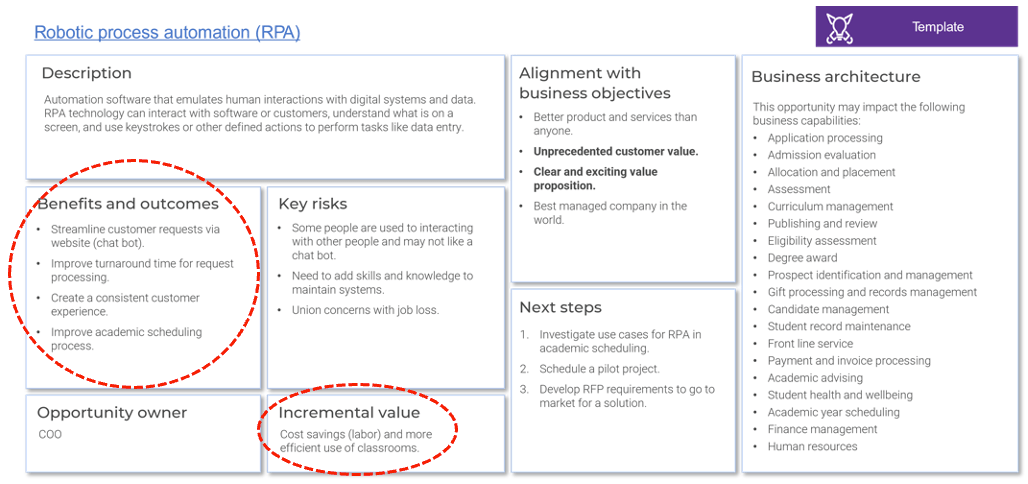 The next slide is a template for the short-form business case, while the slides after that contain instructions on how to fill out each section of the business case.
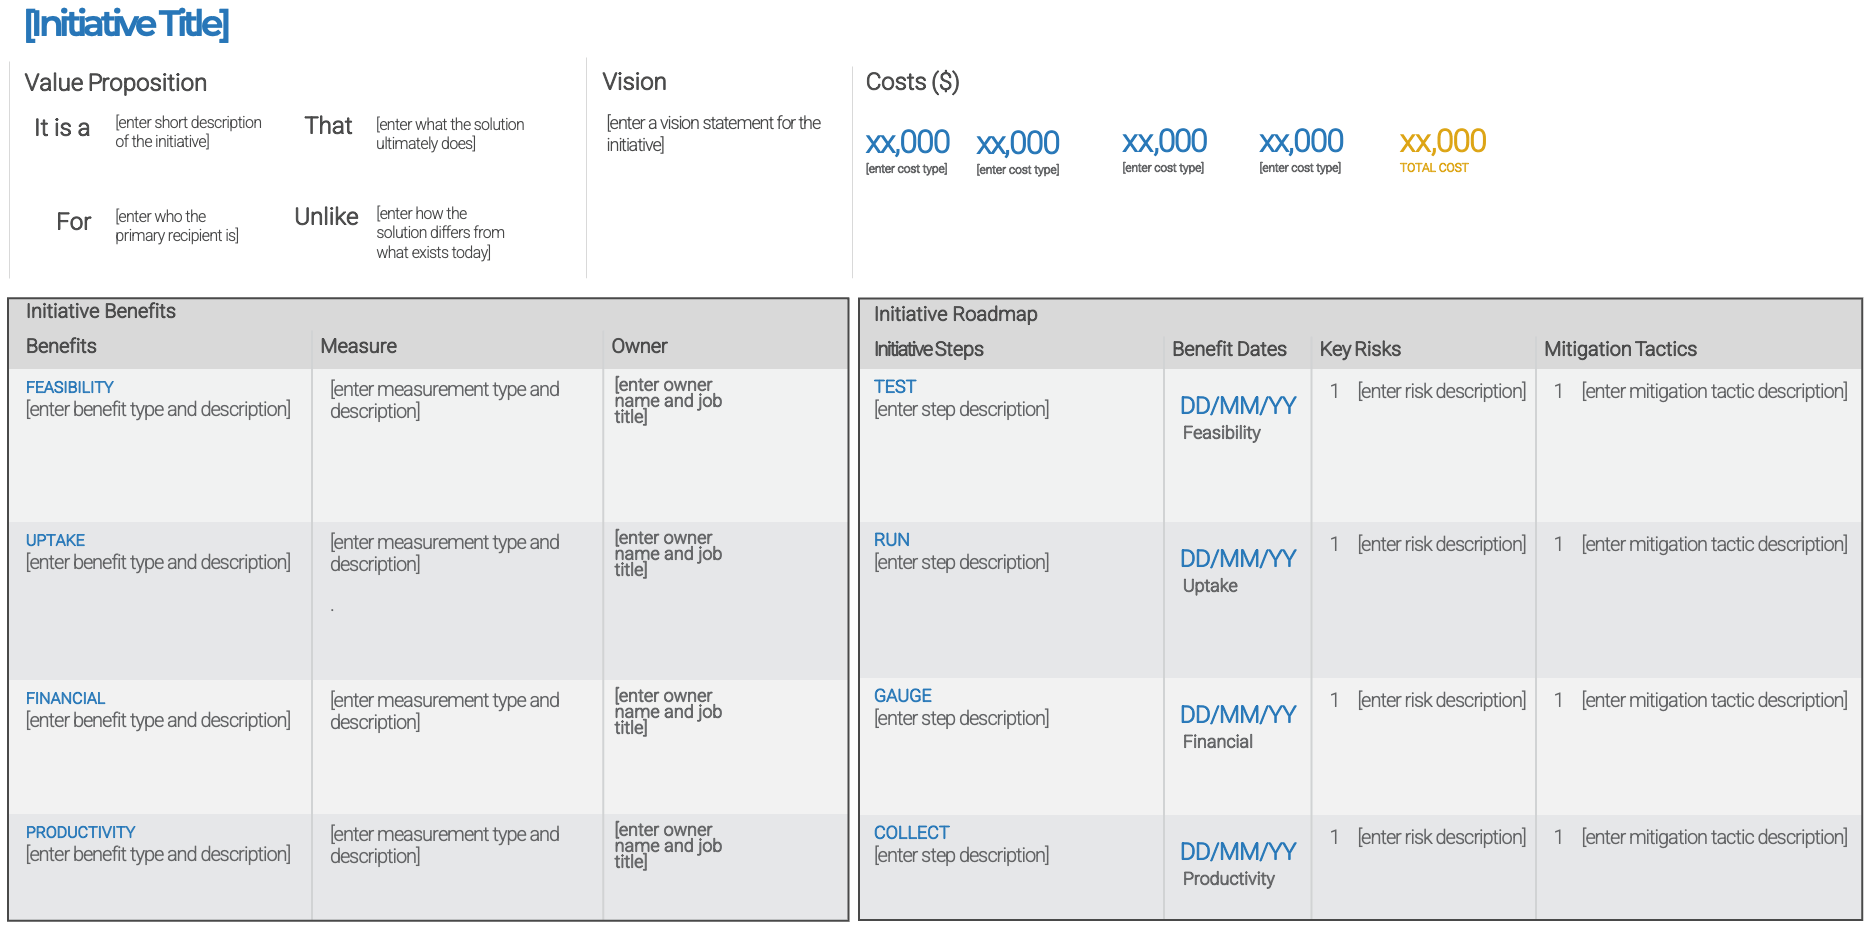
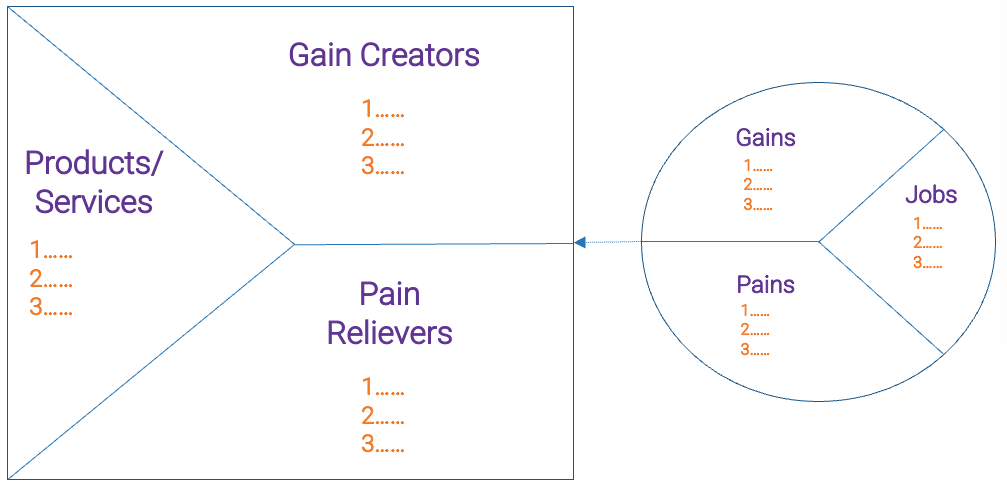
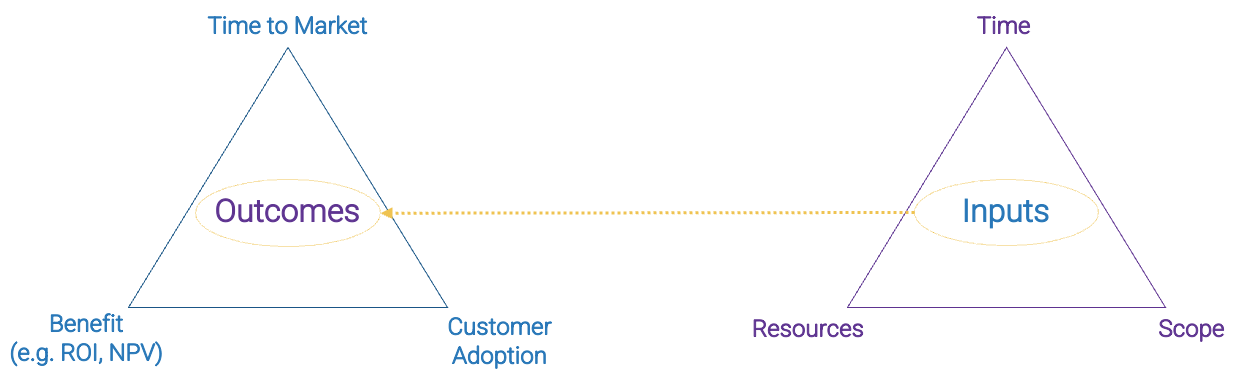
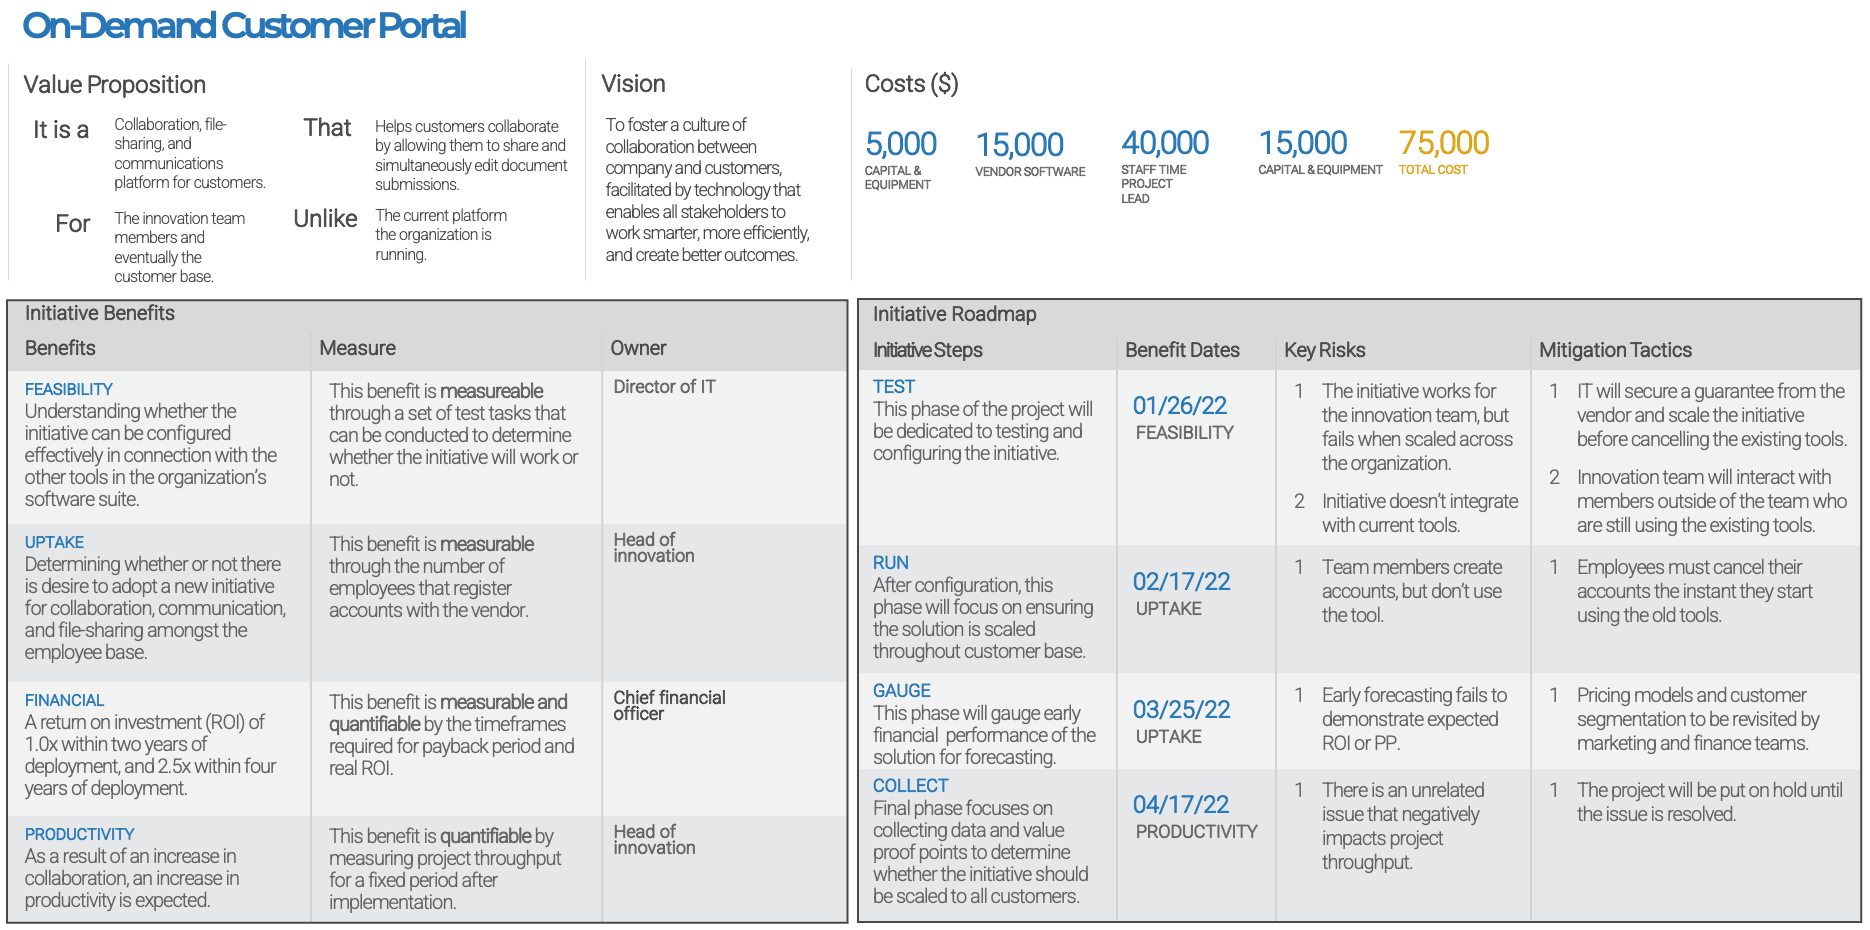
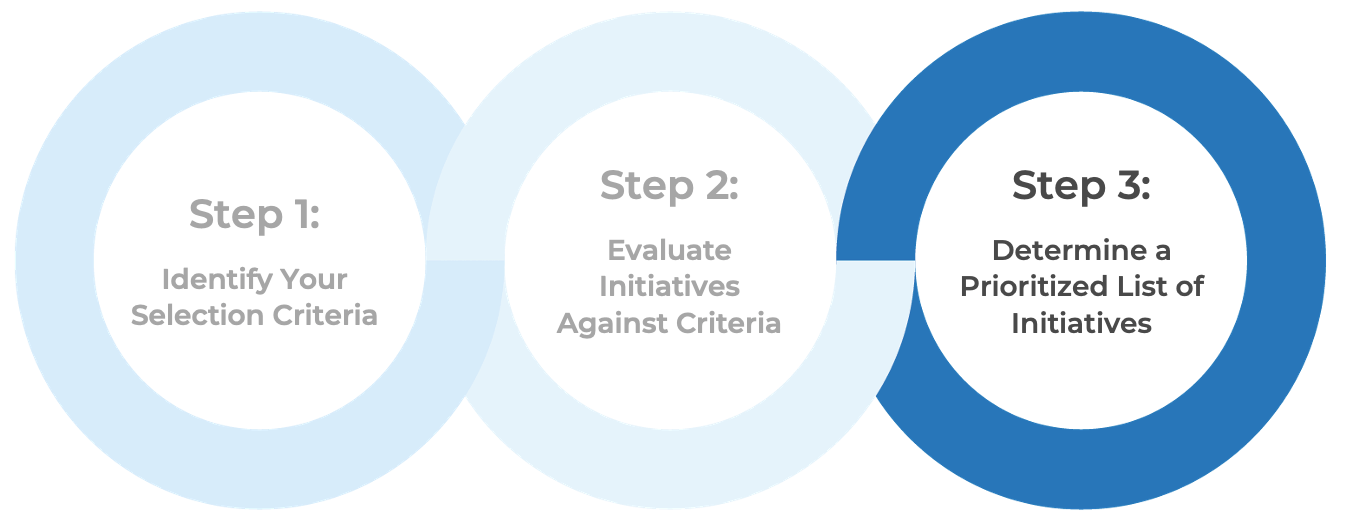
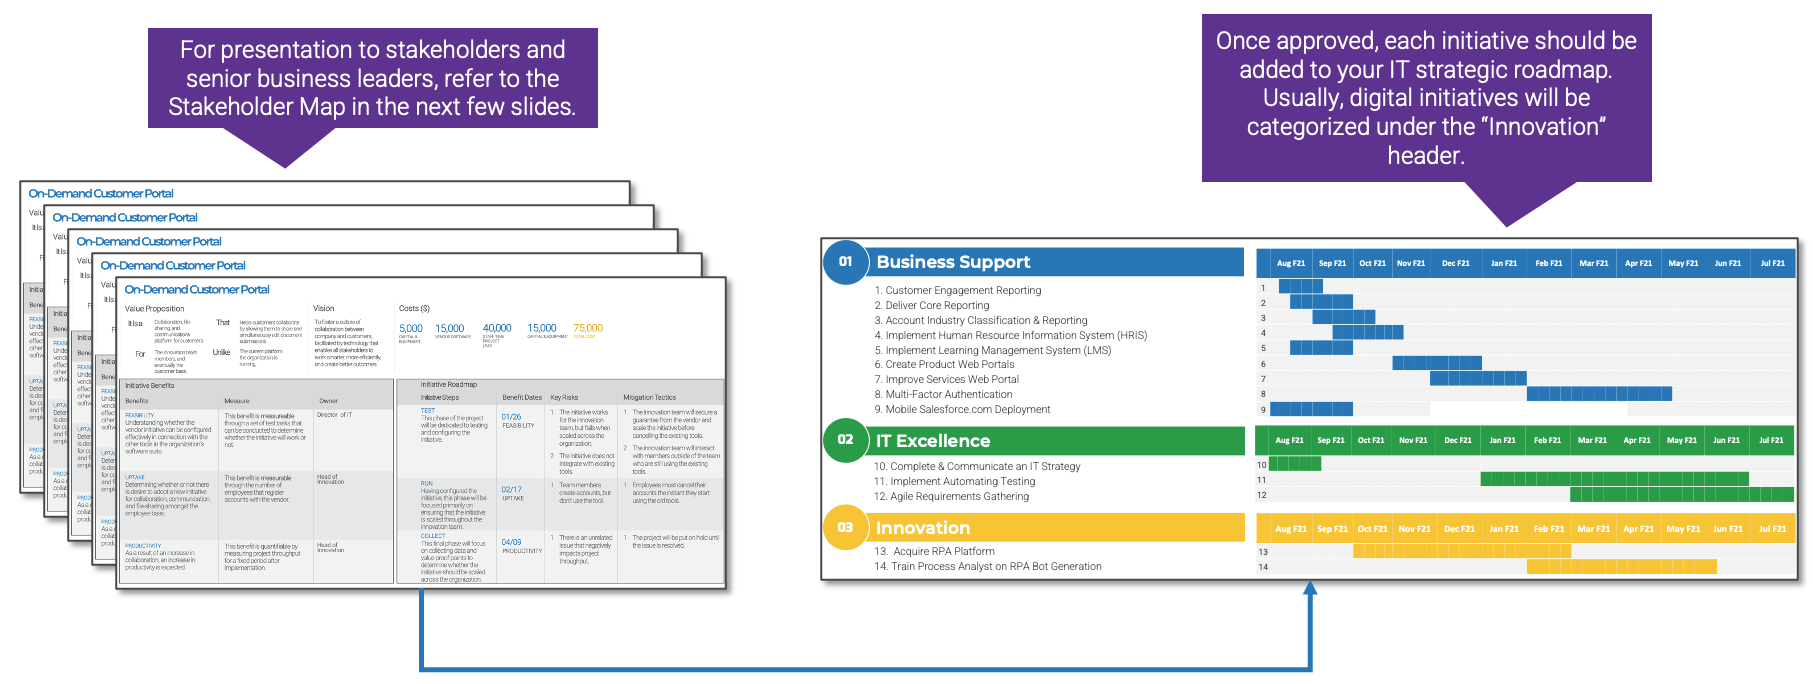
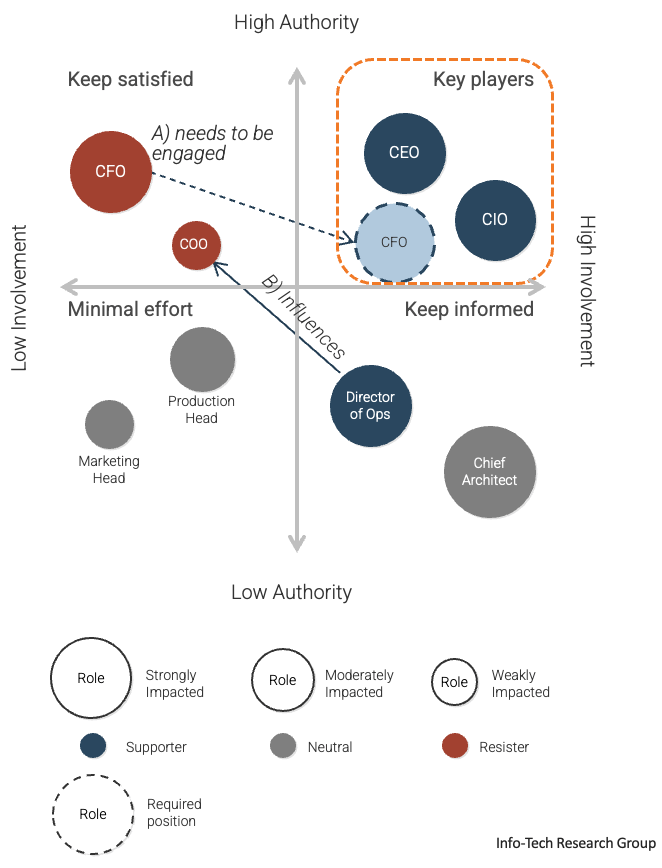


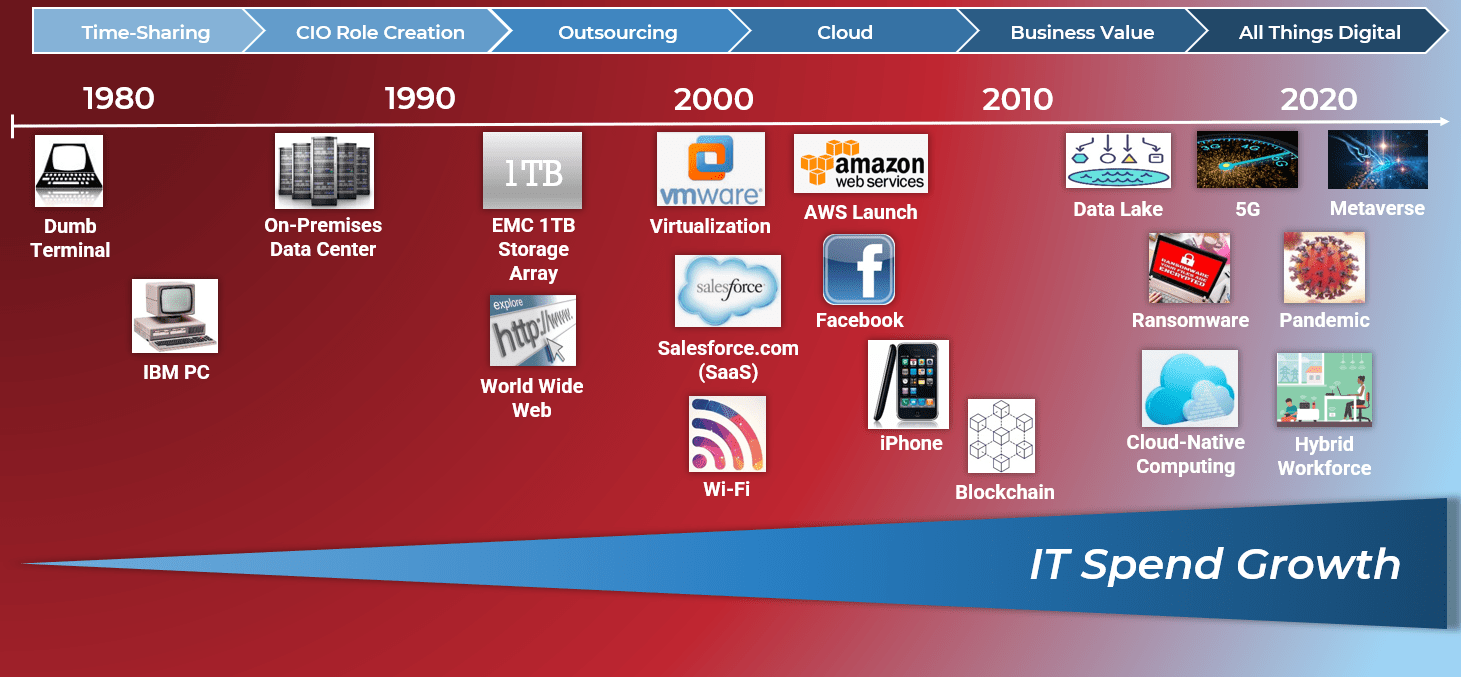
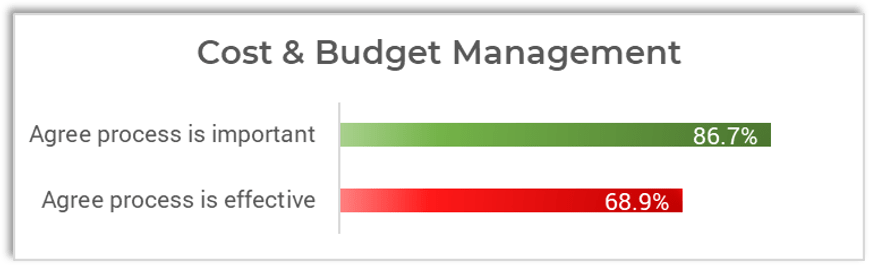
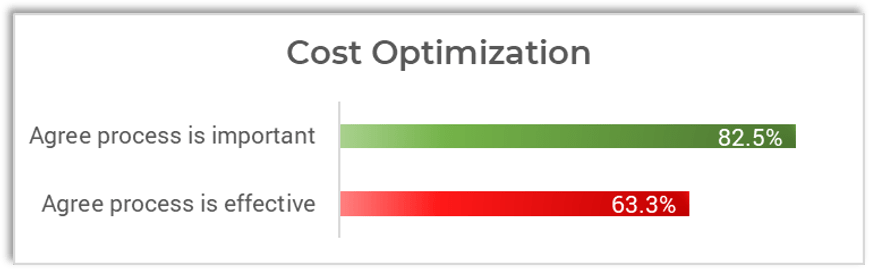
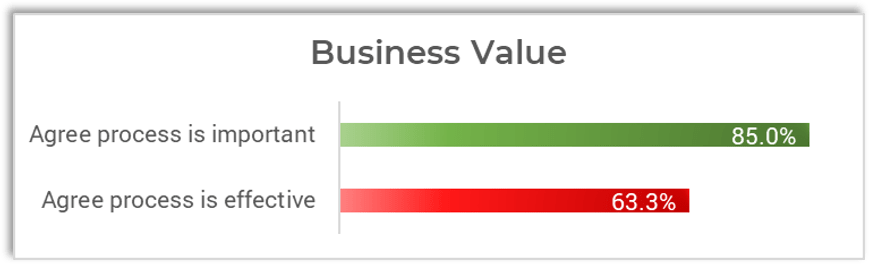
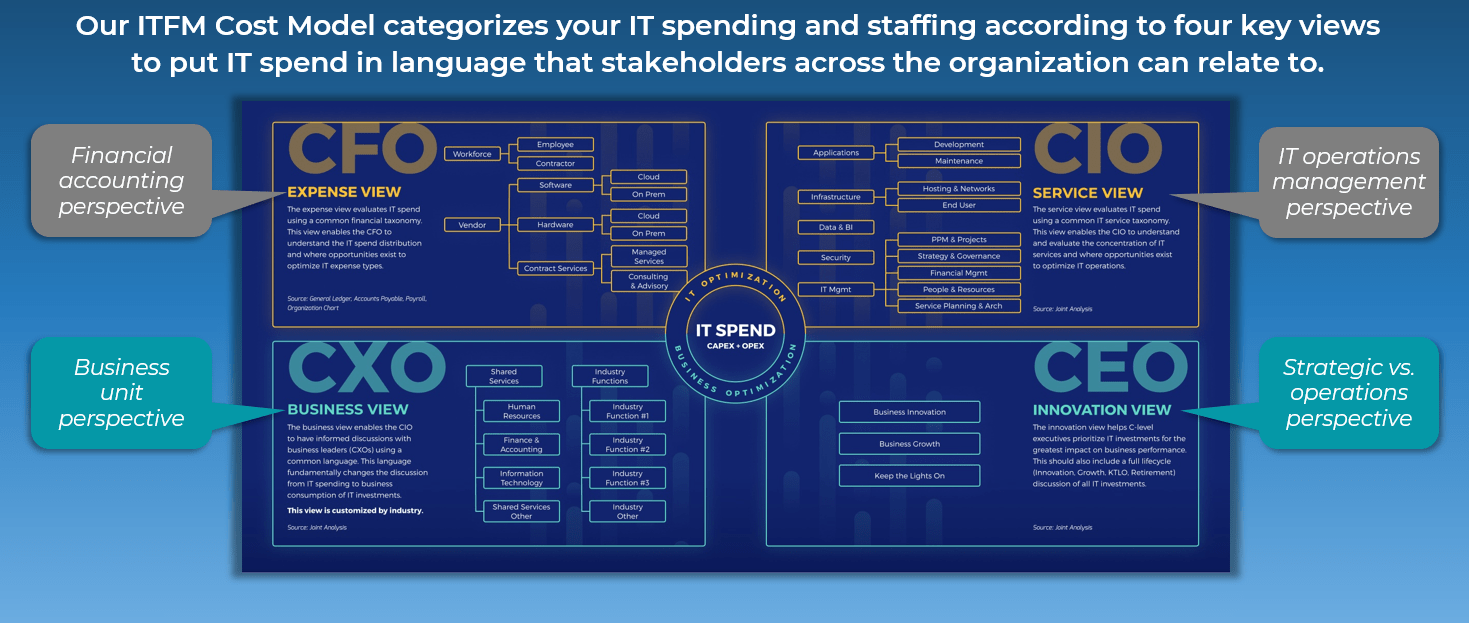
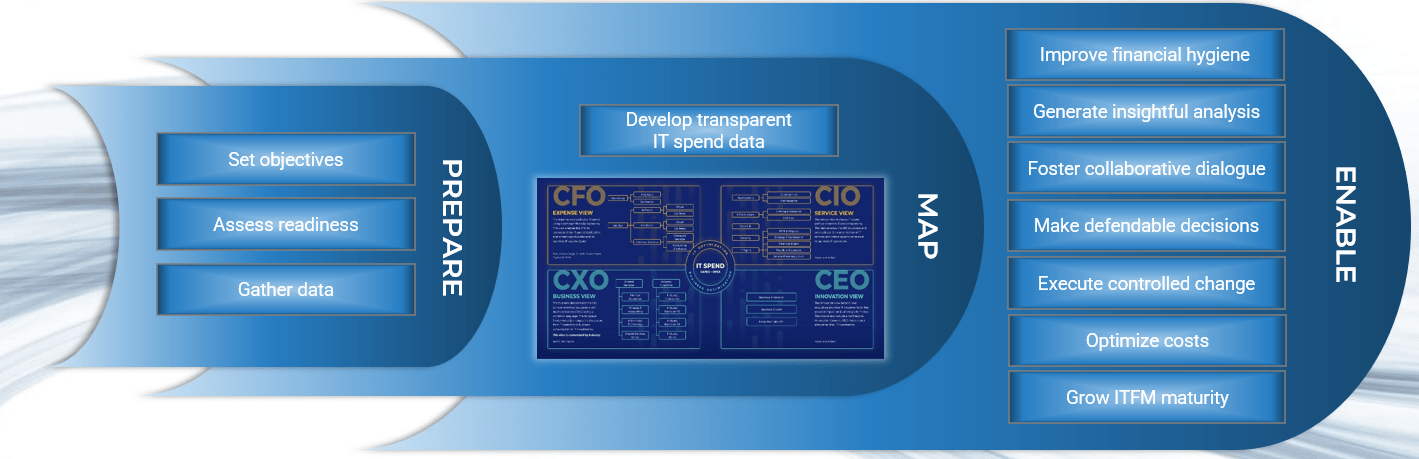
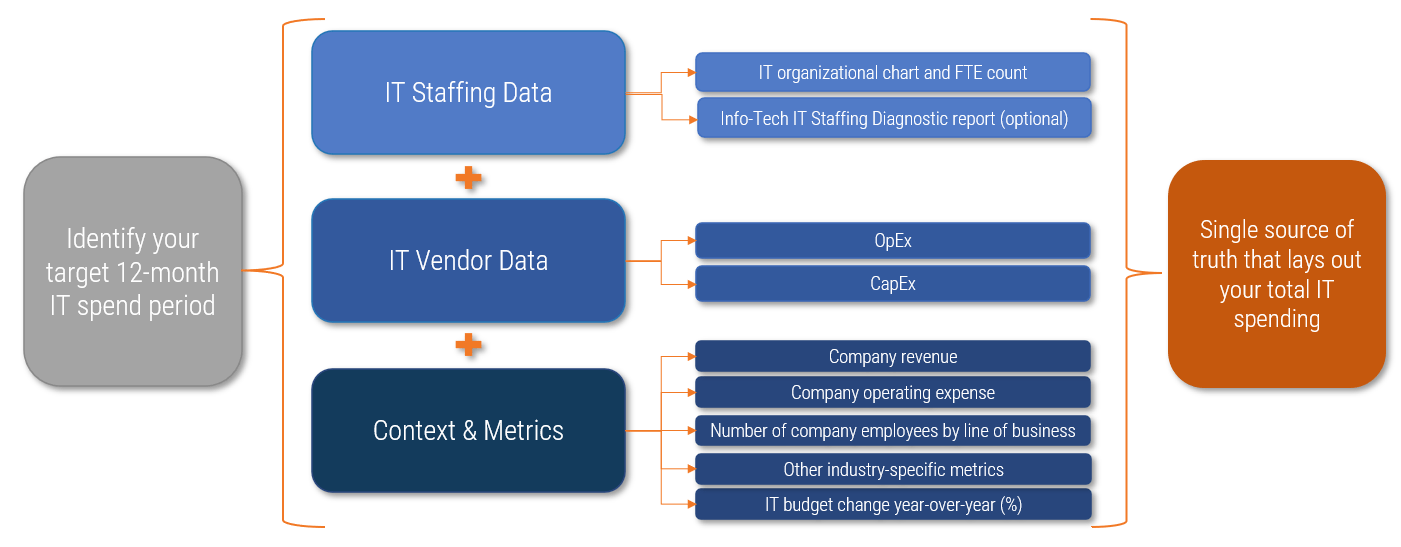
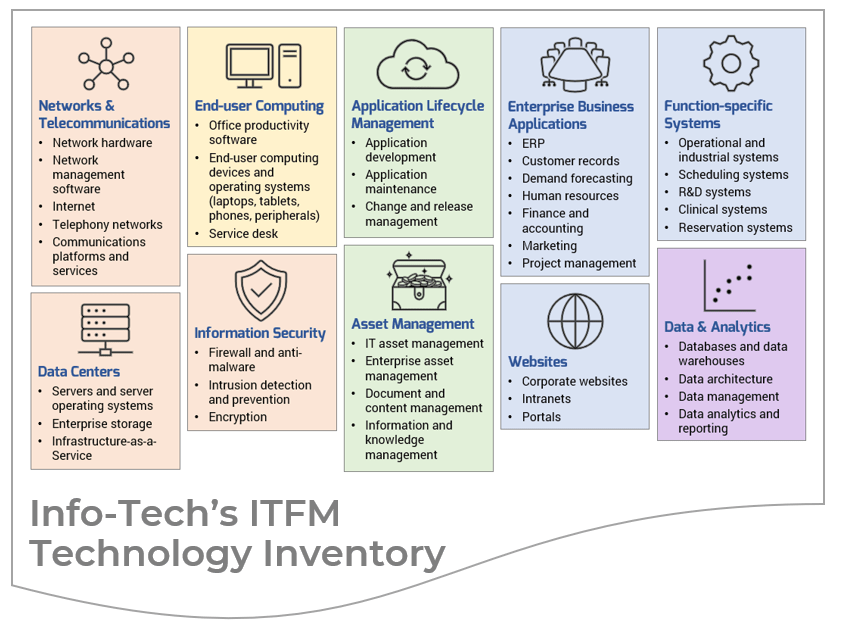
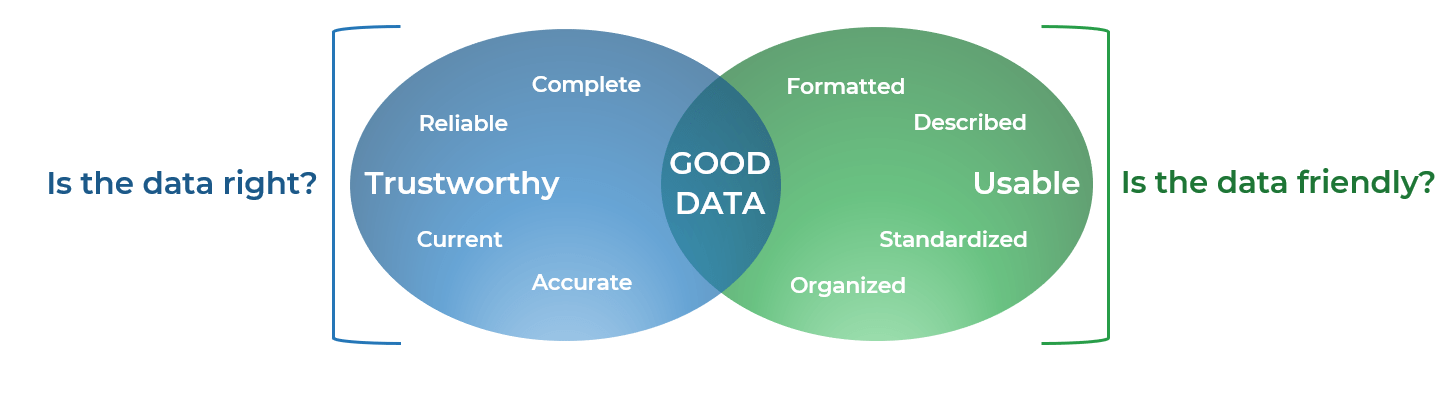
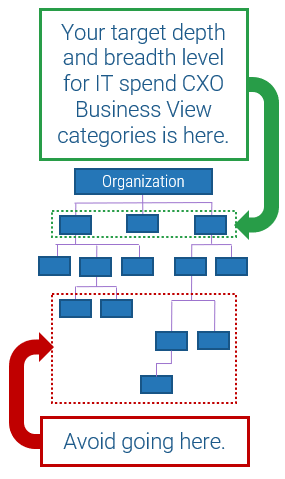
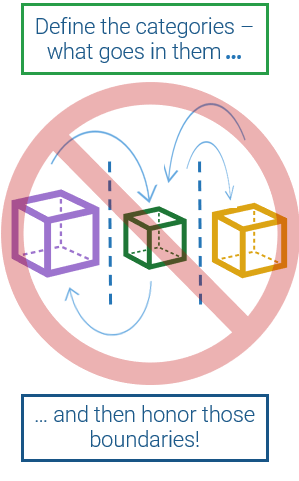

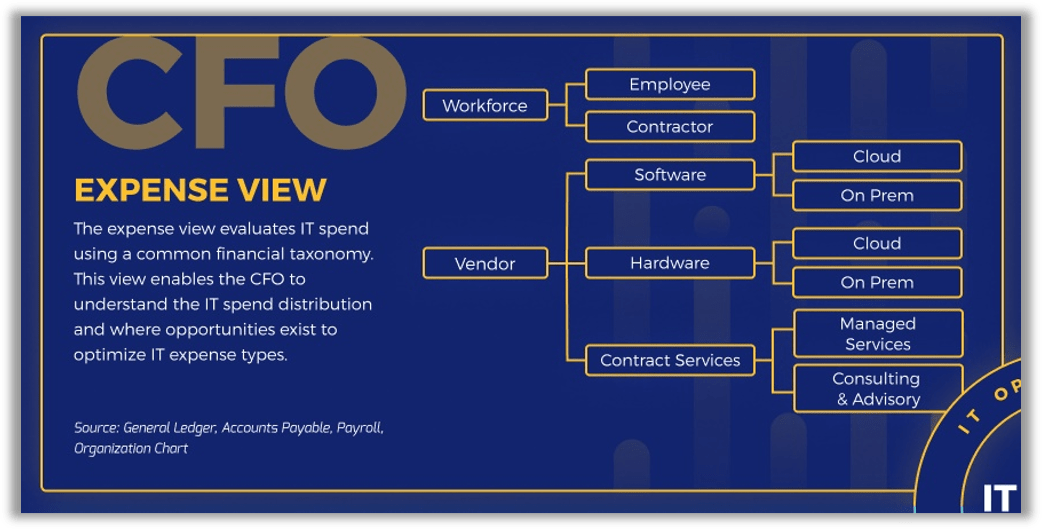
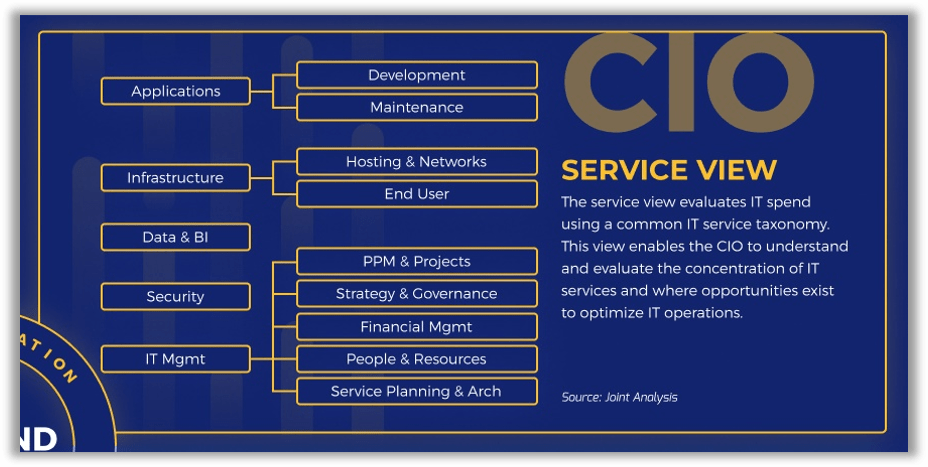
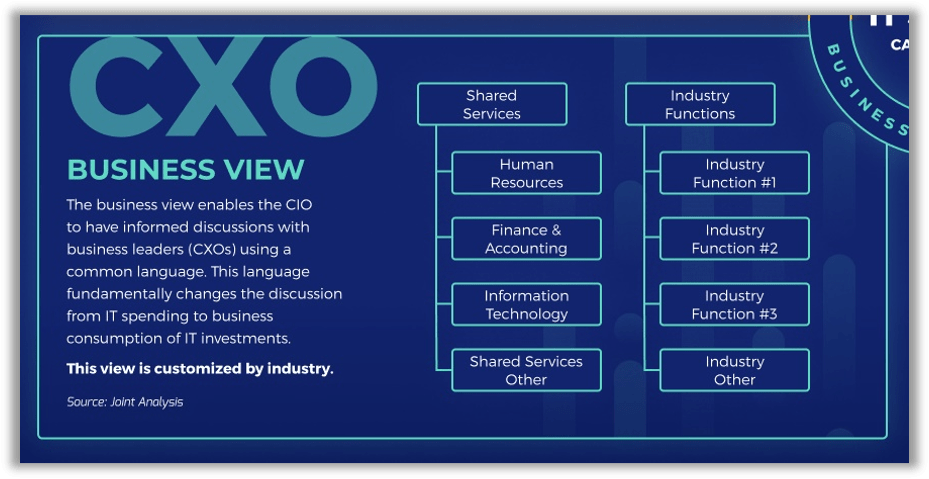
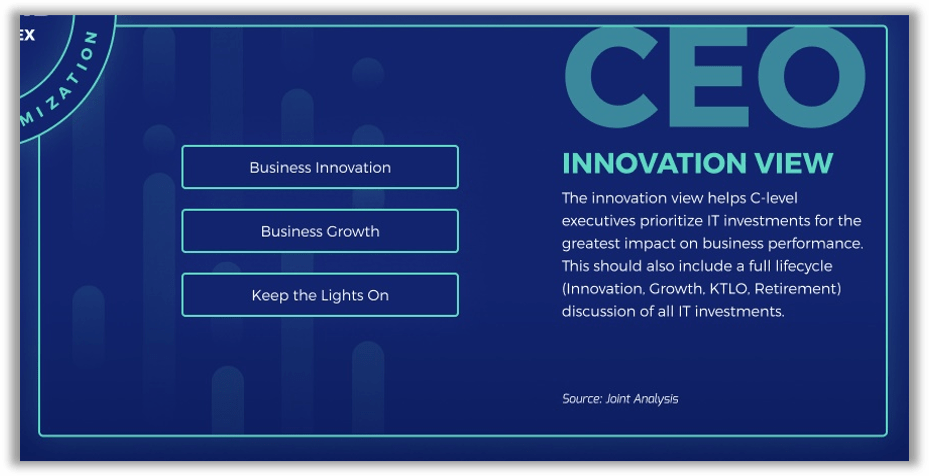
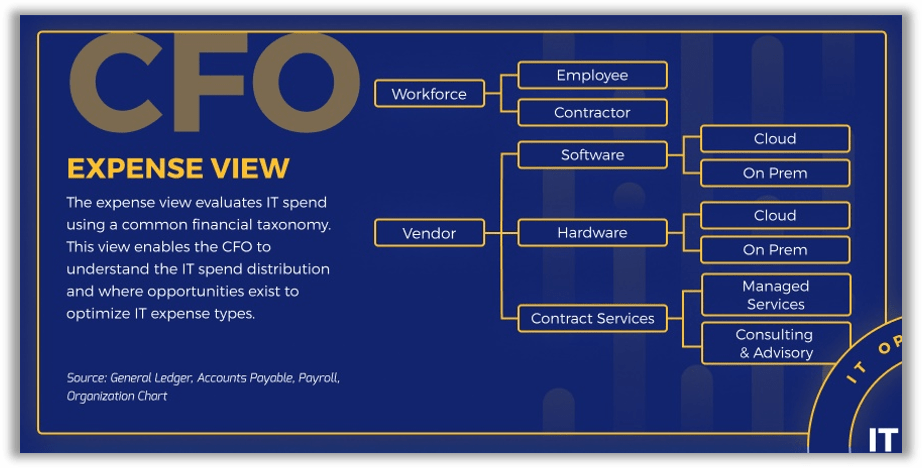
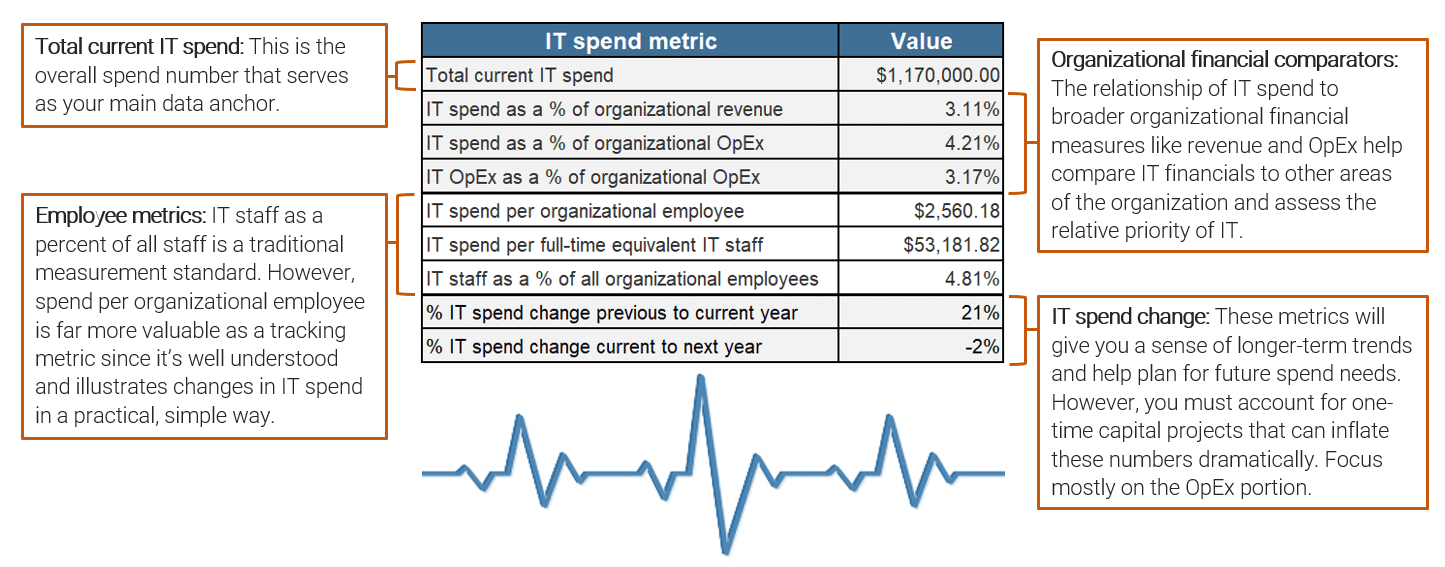
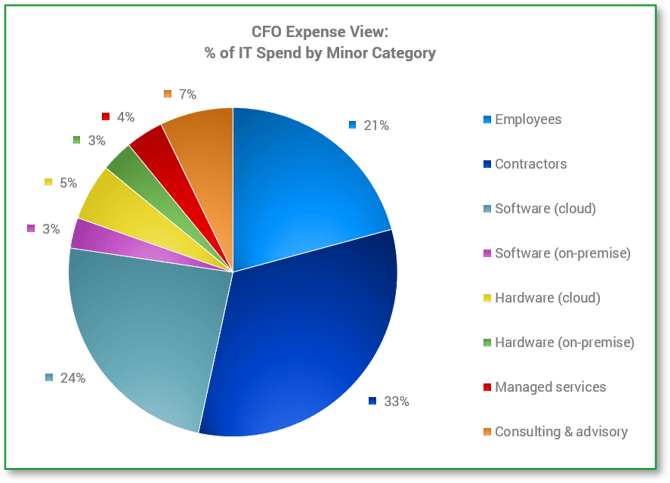
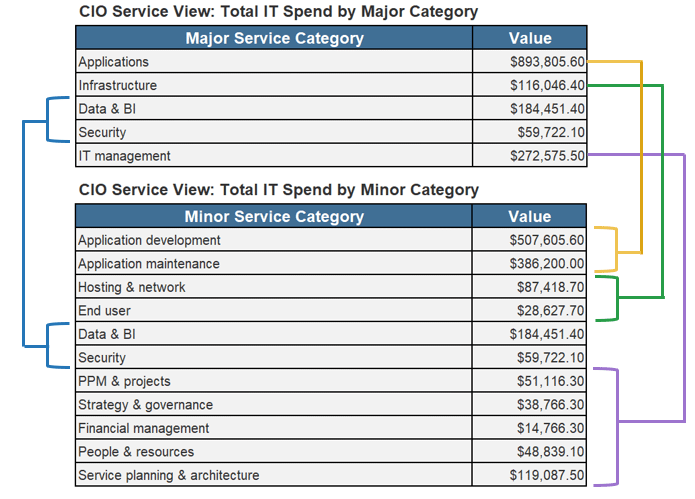
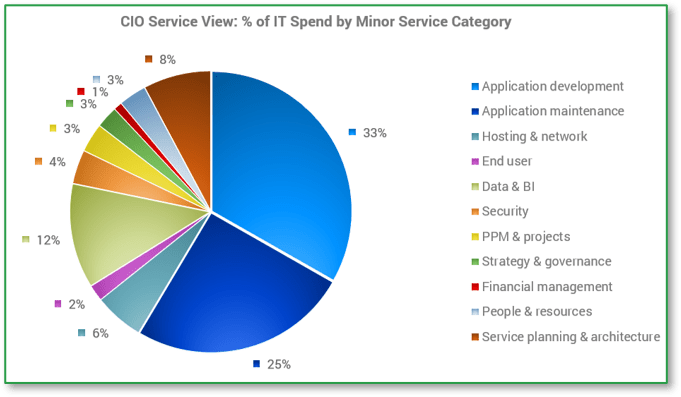
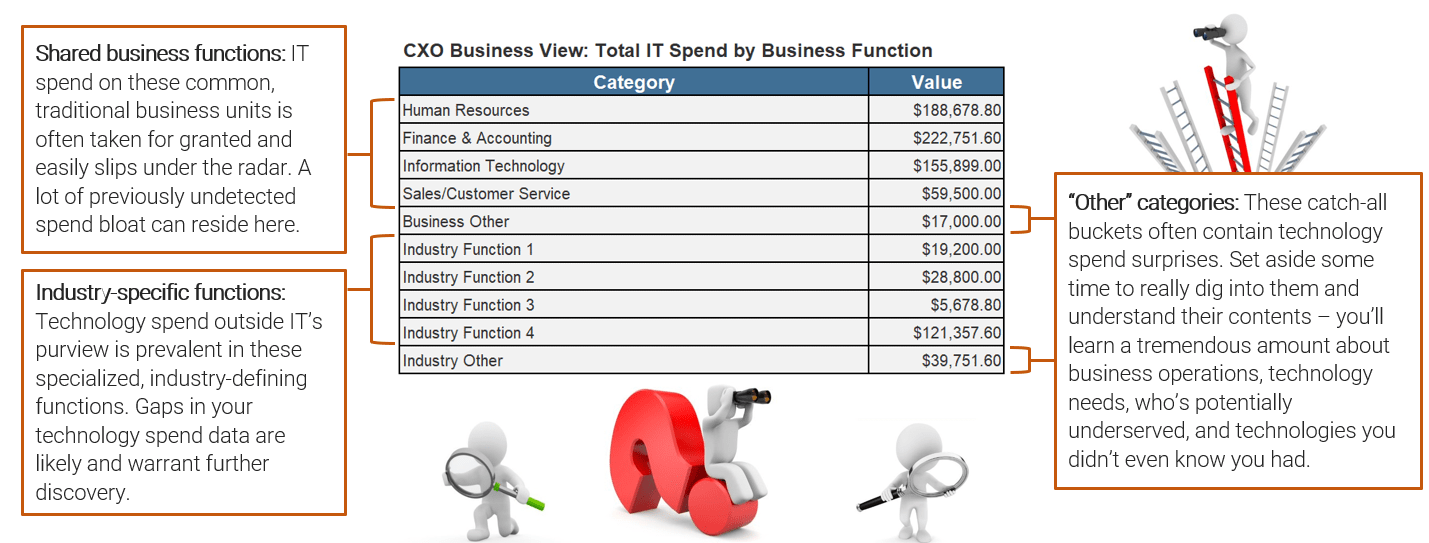
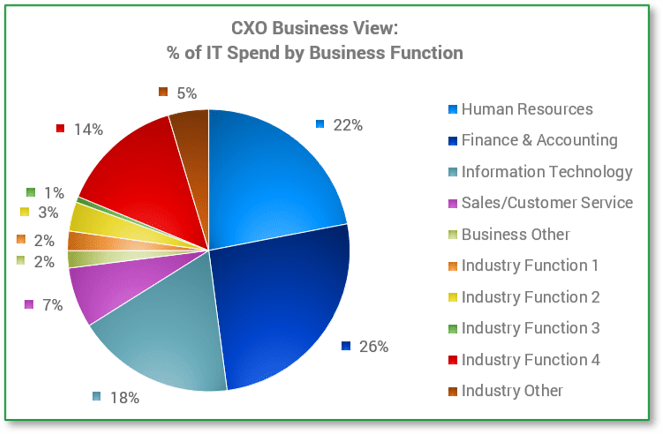
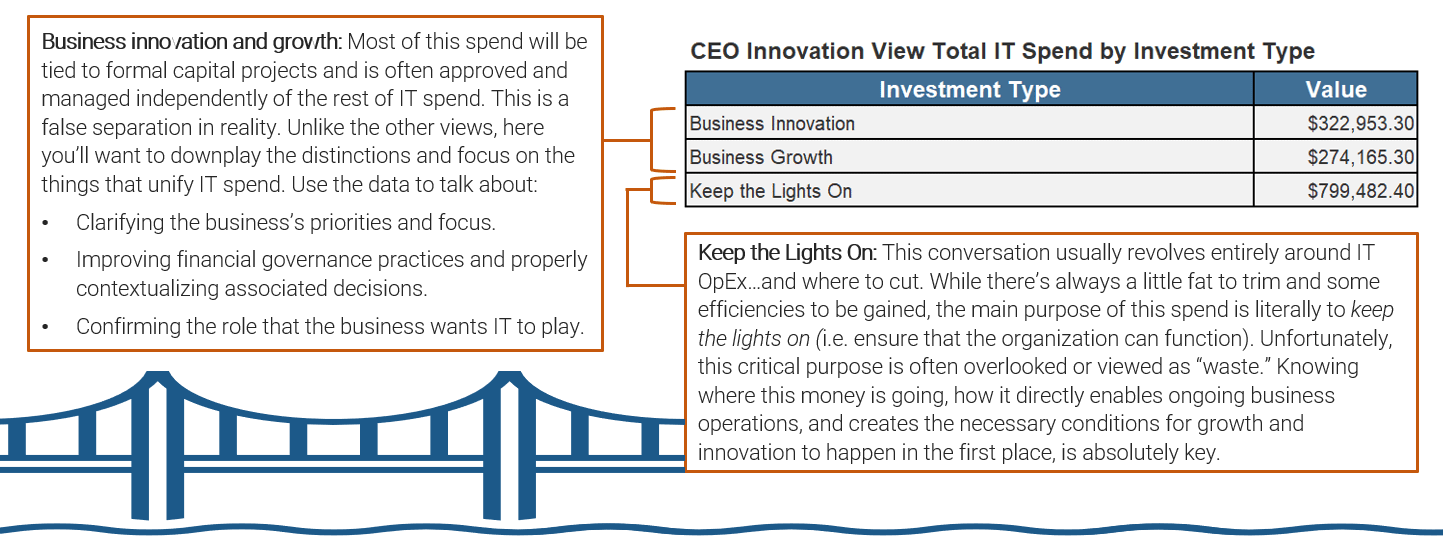
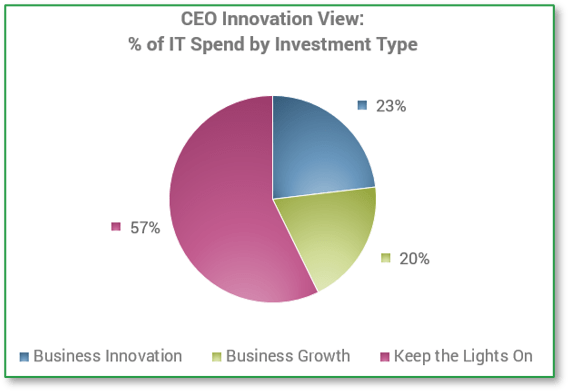


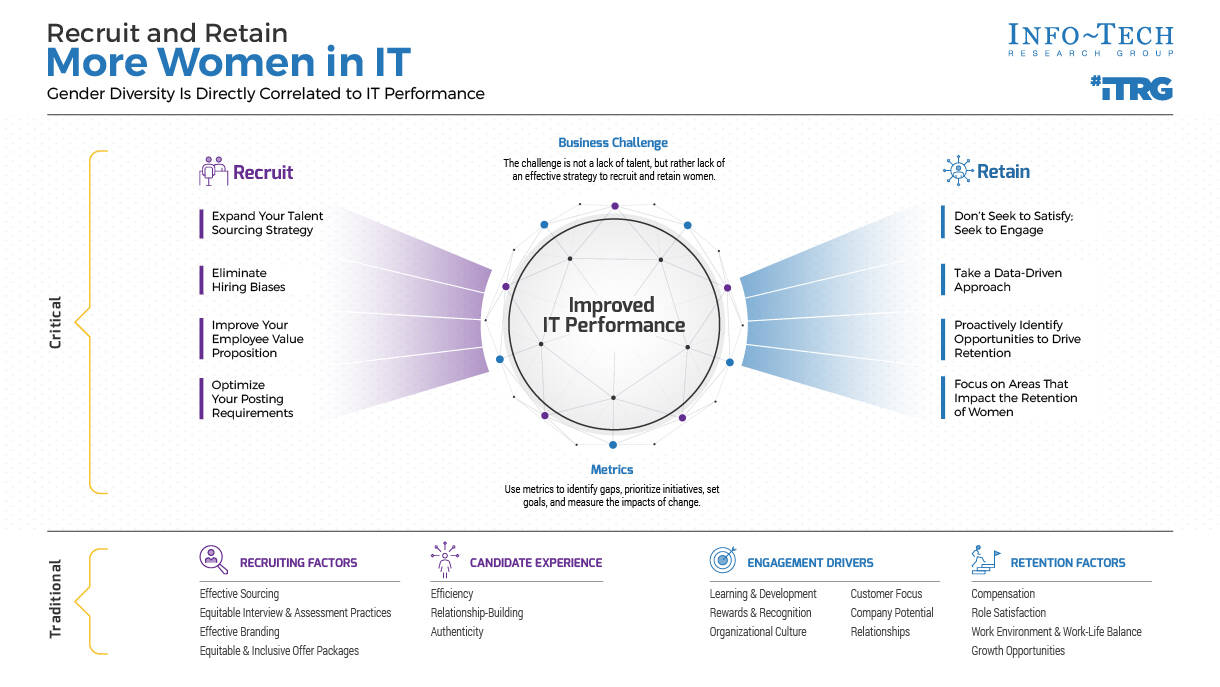
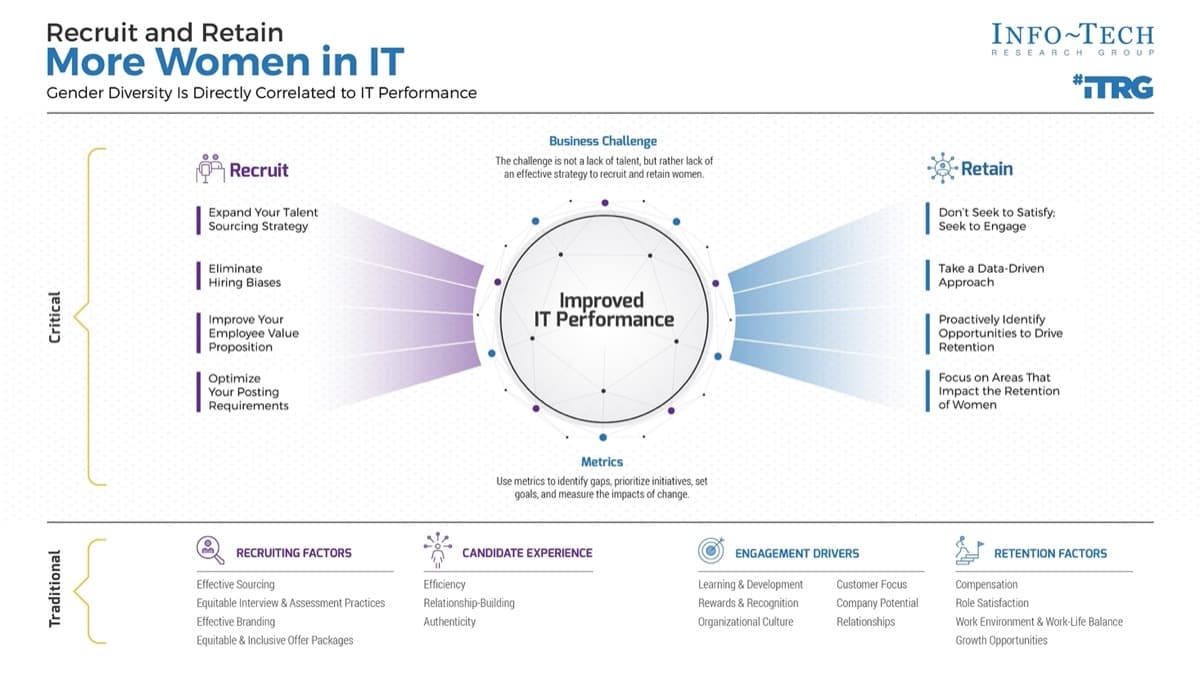

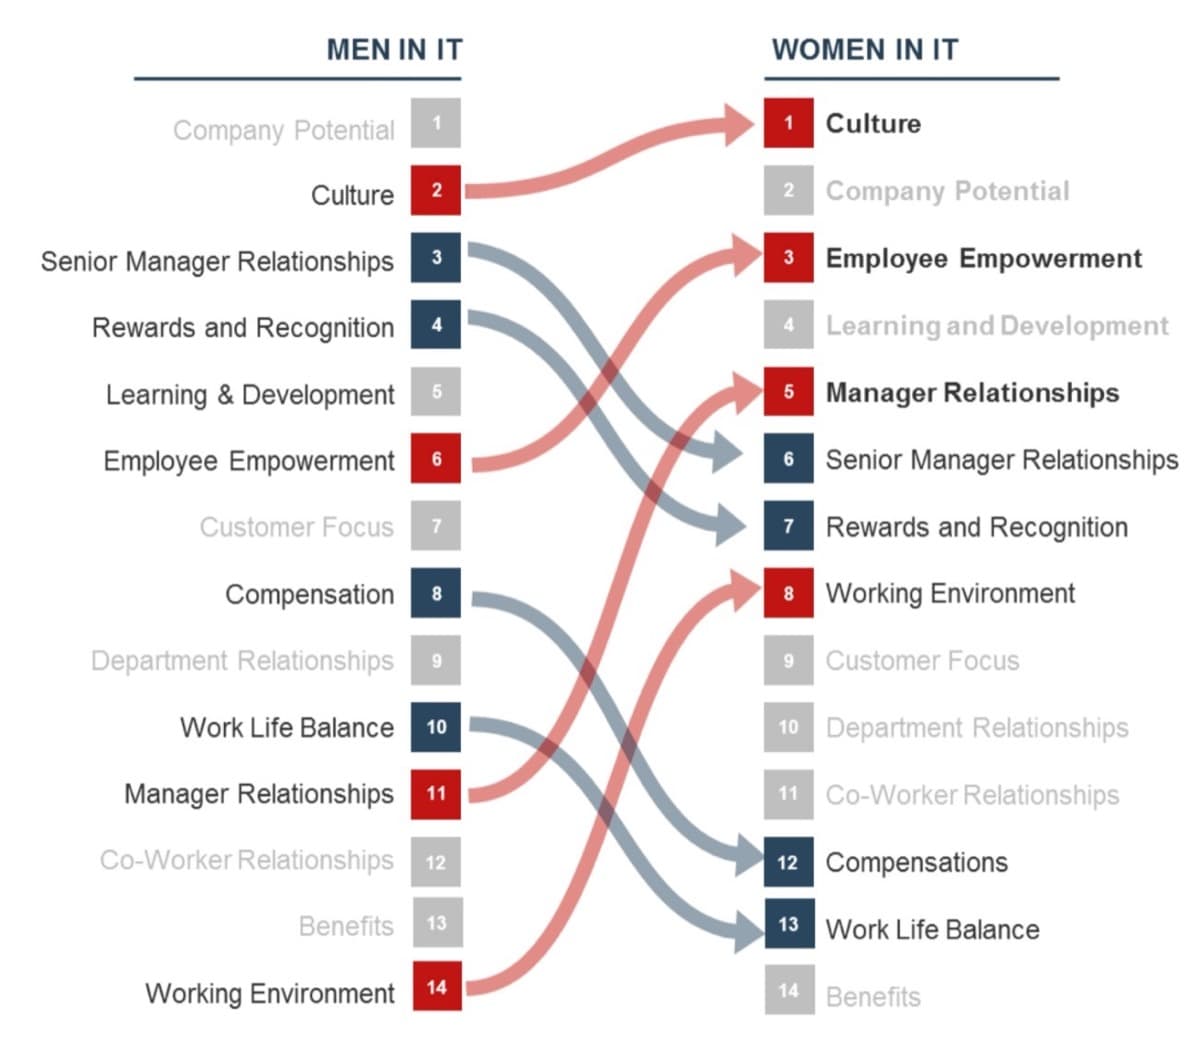
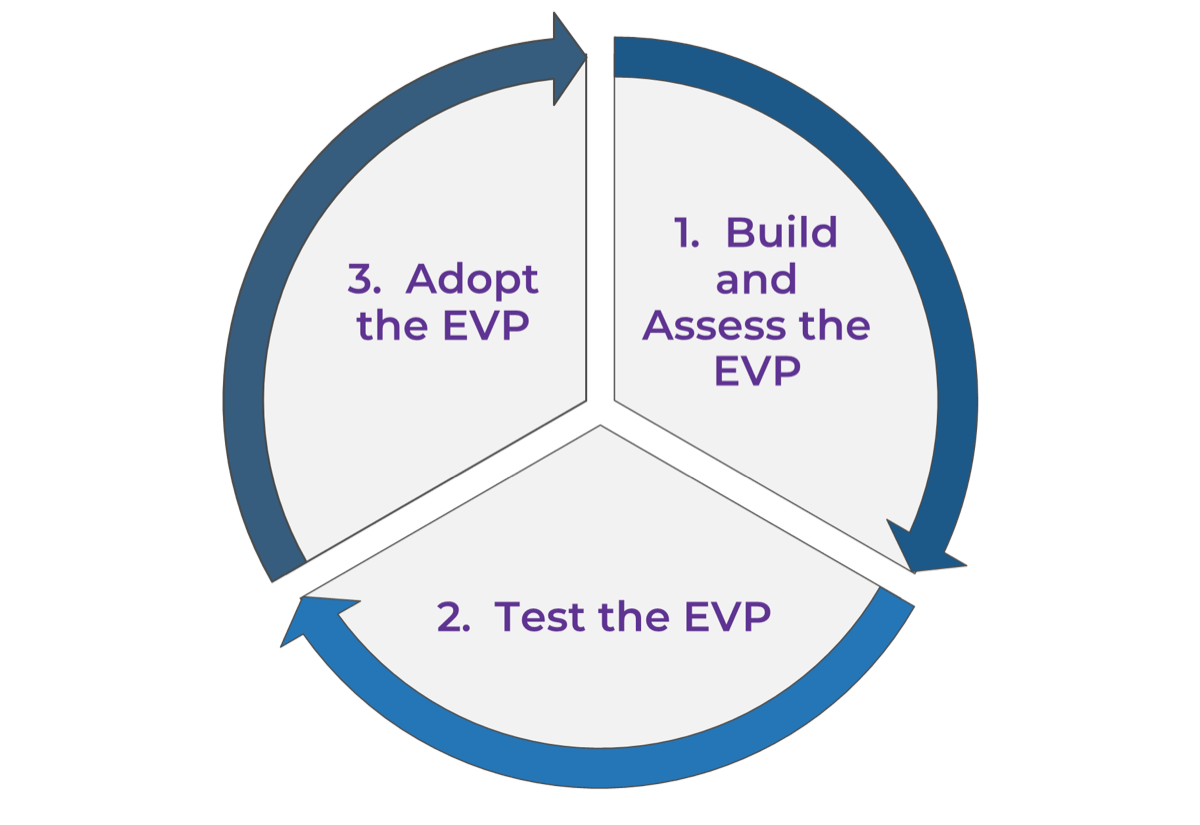
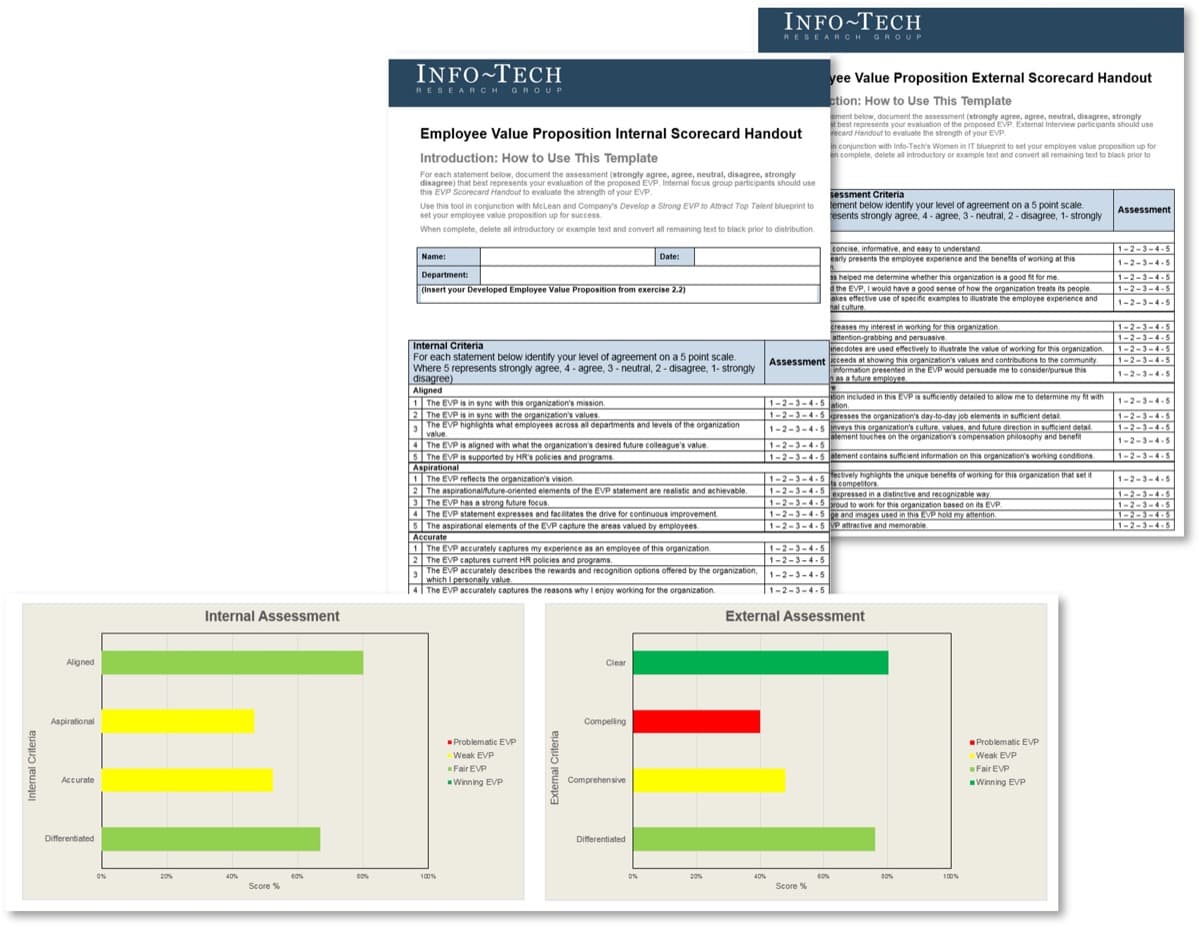
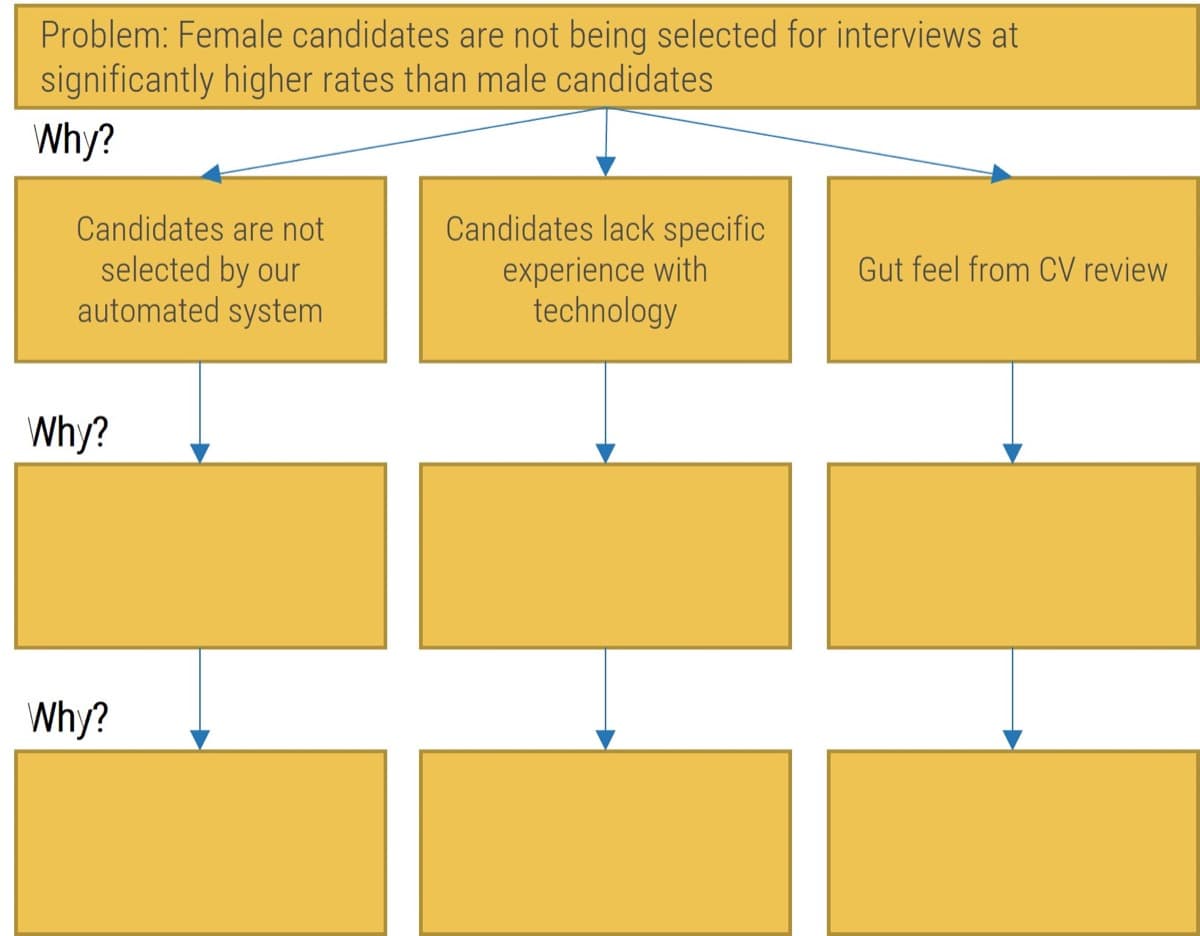
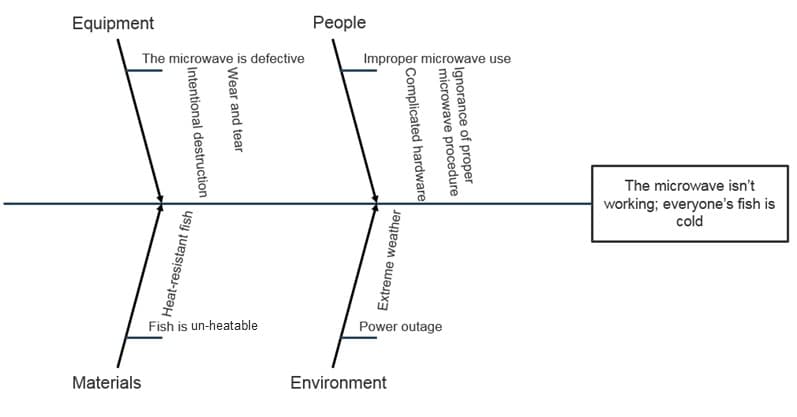
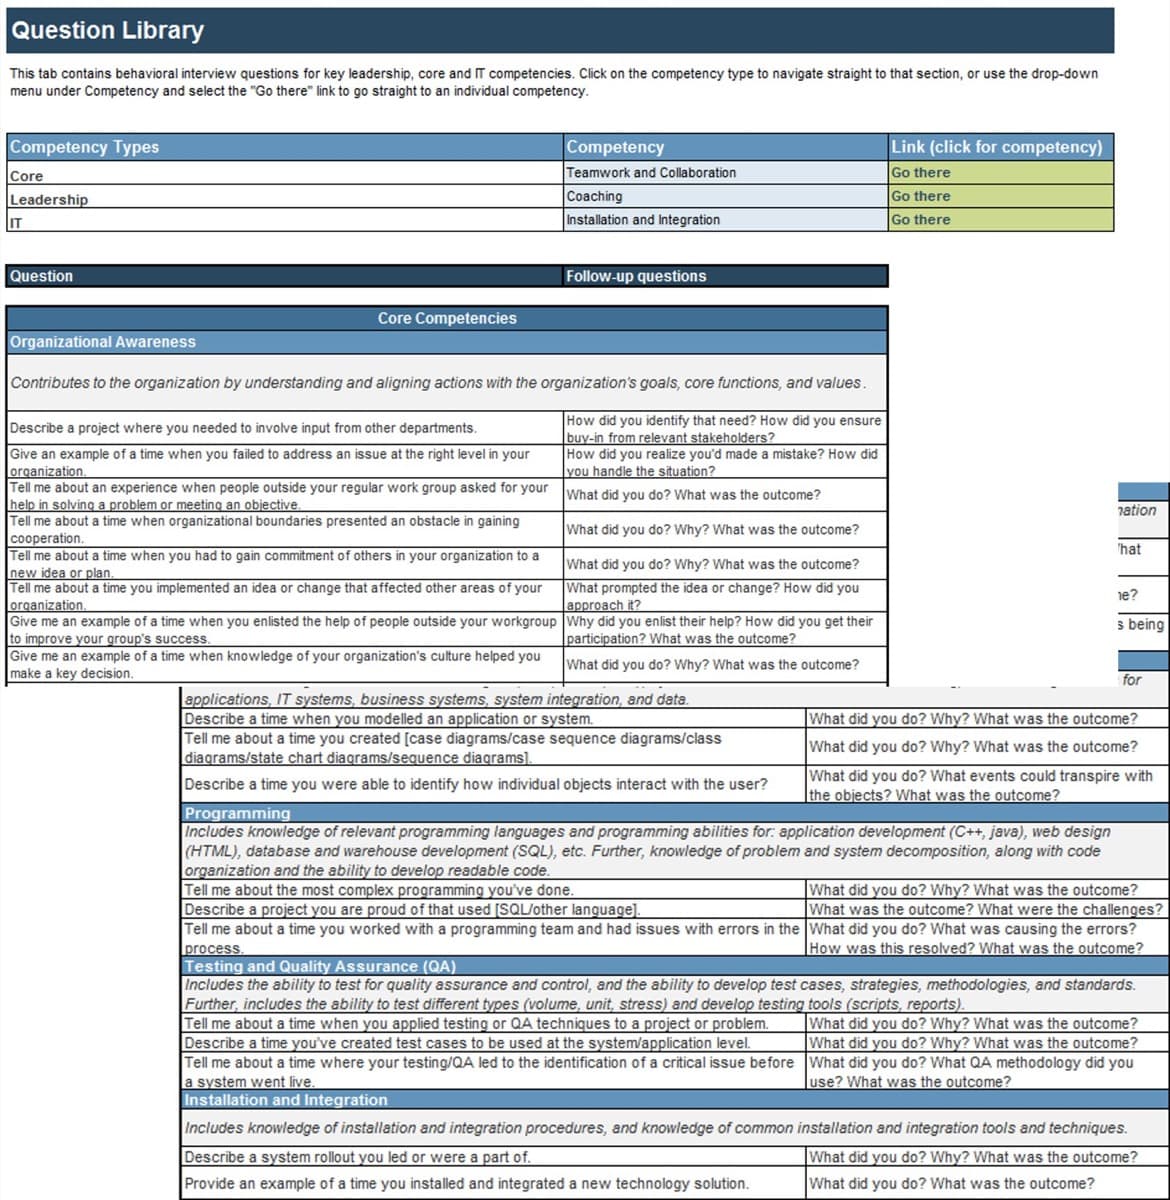

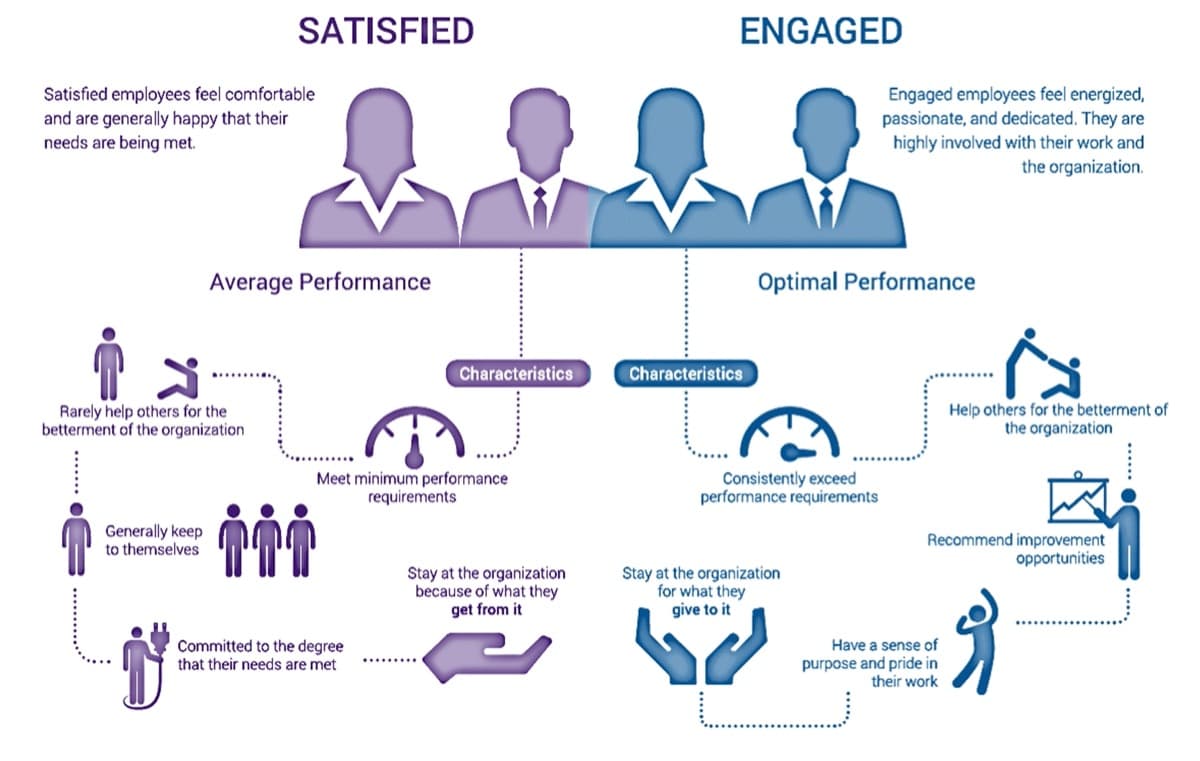
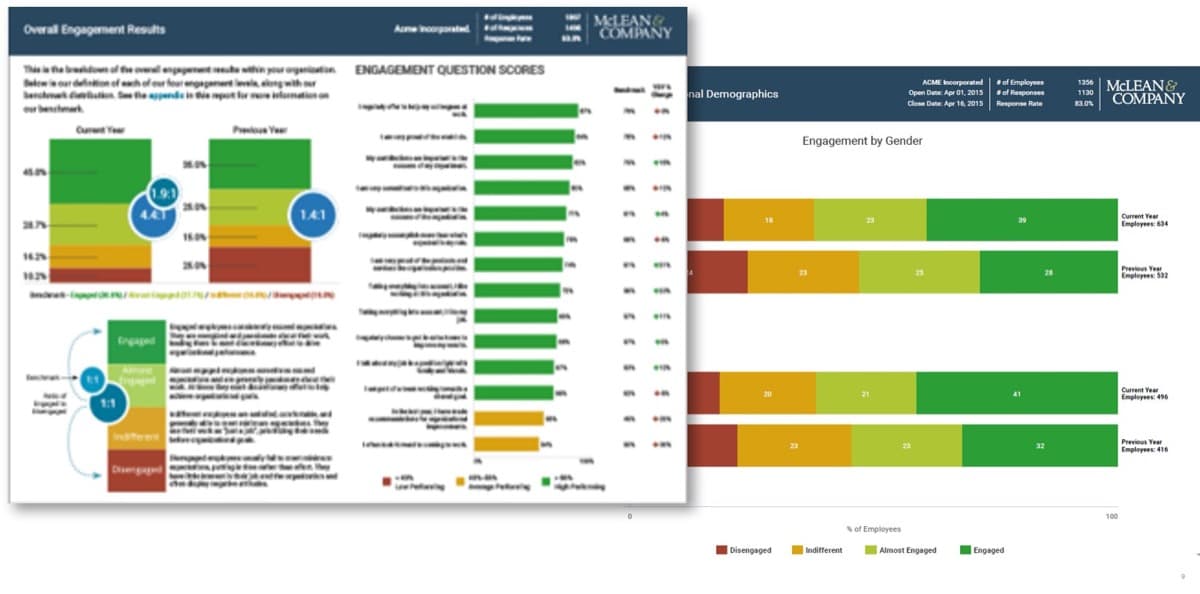
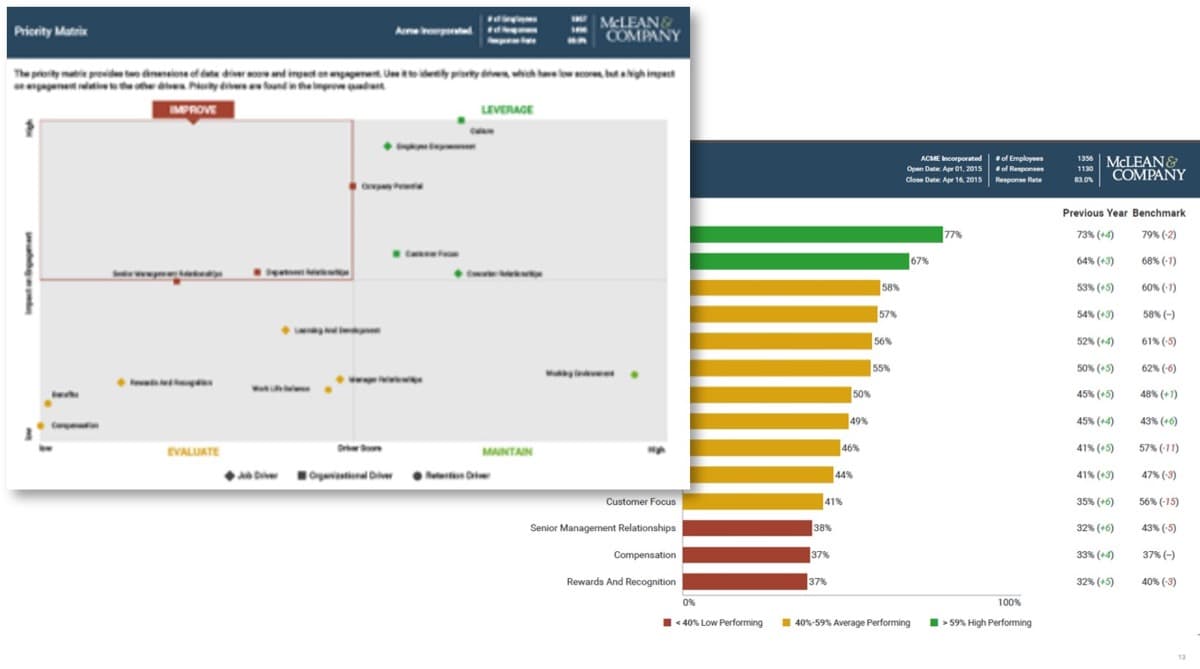
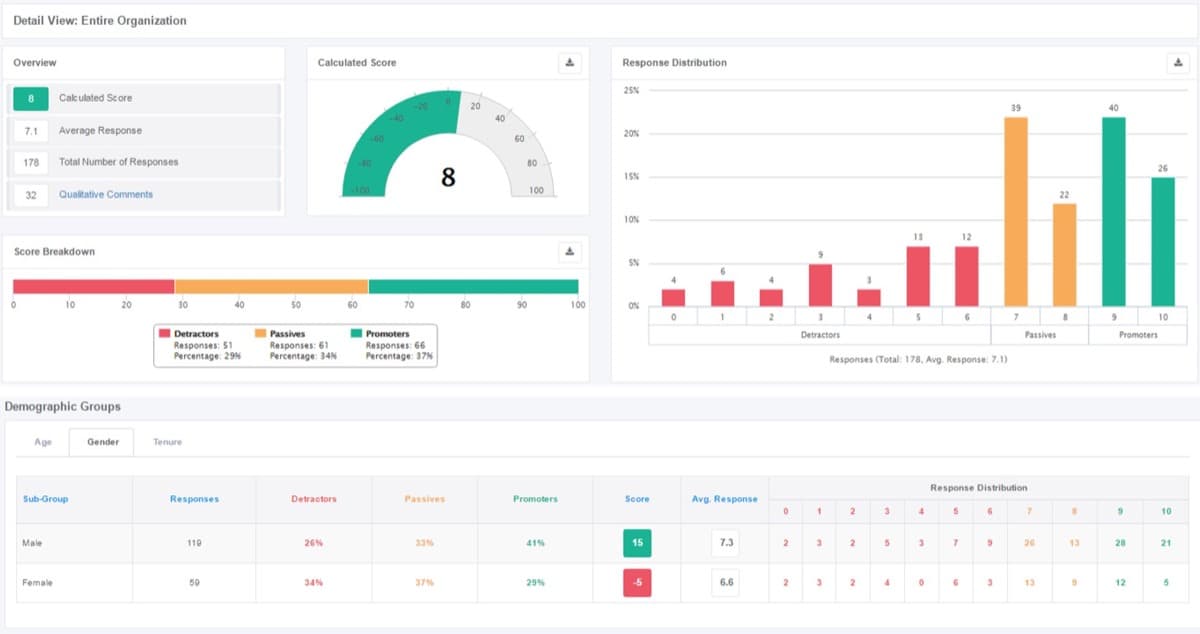
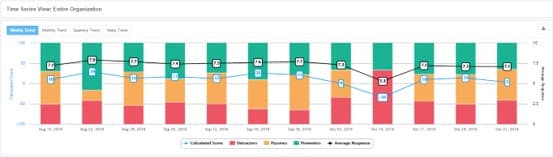
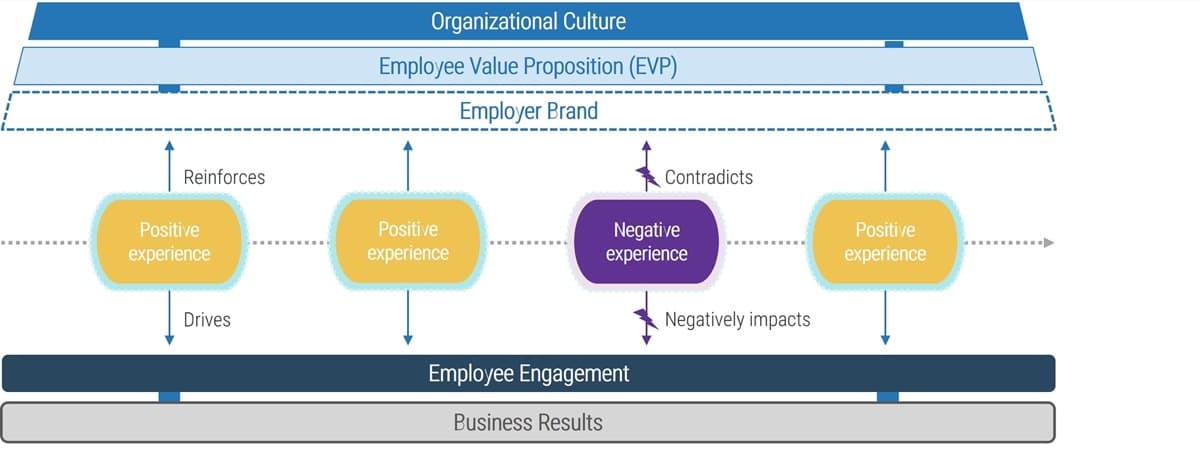
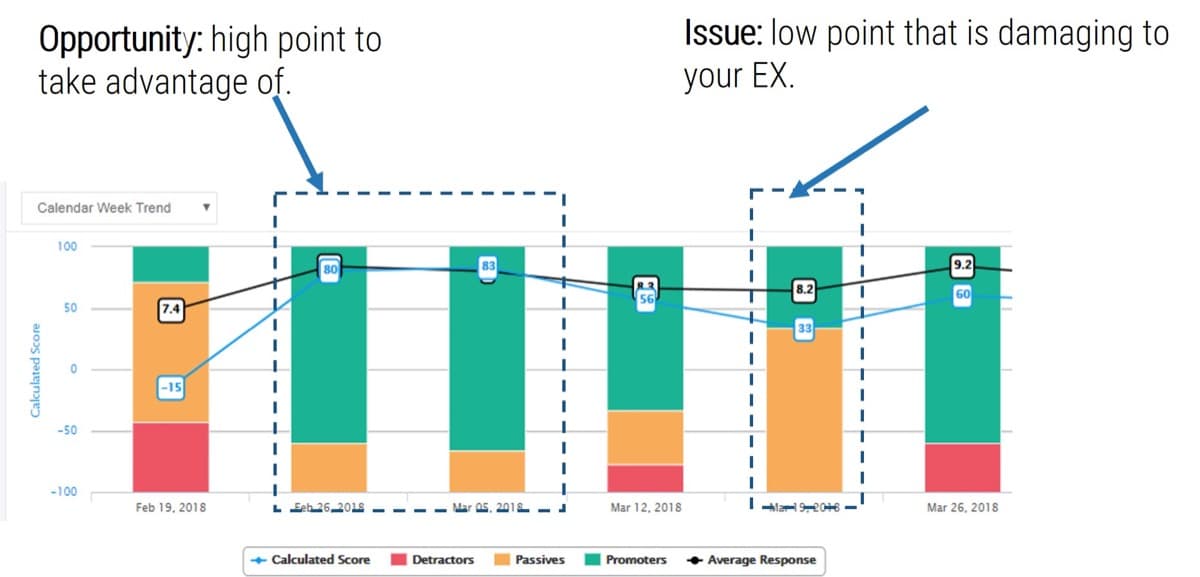


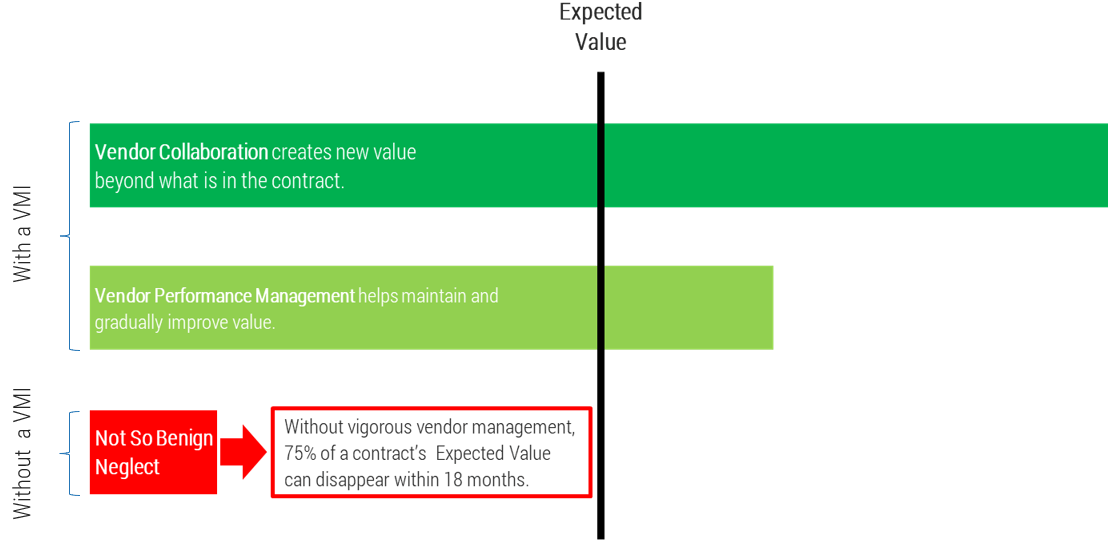
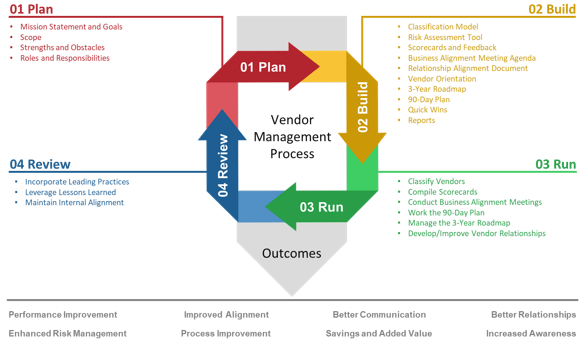
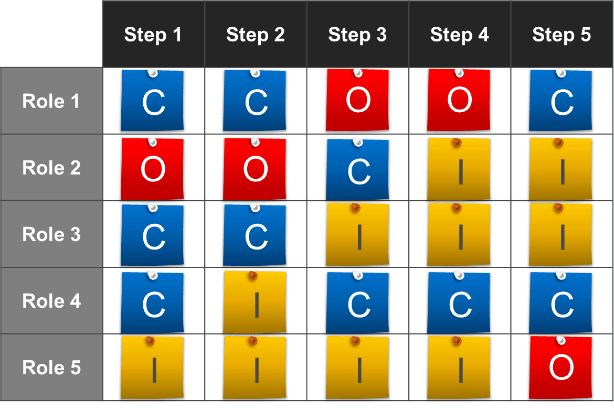
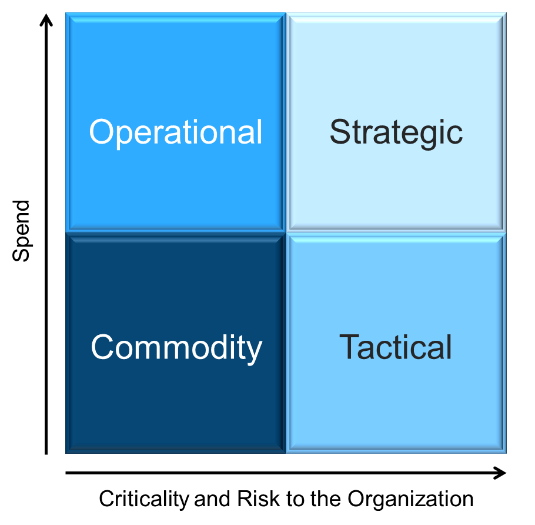
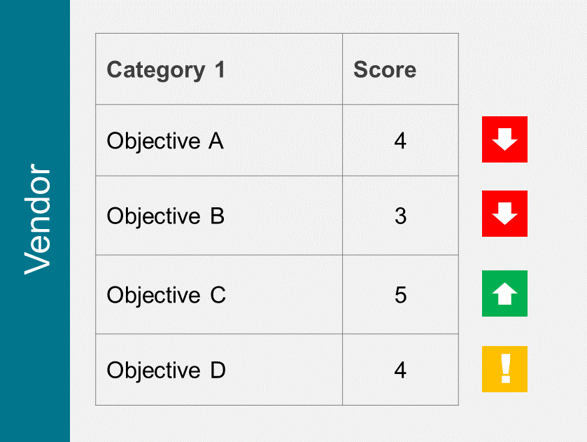


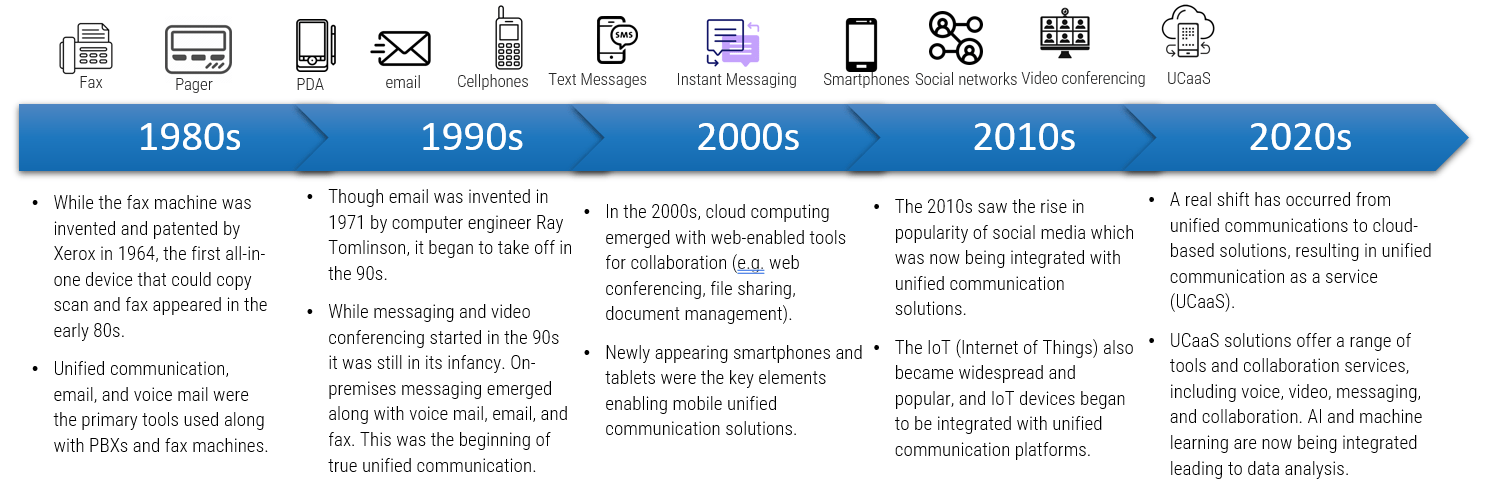
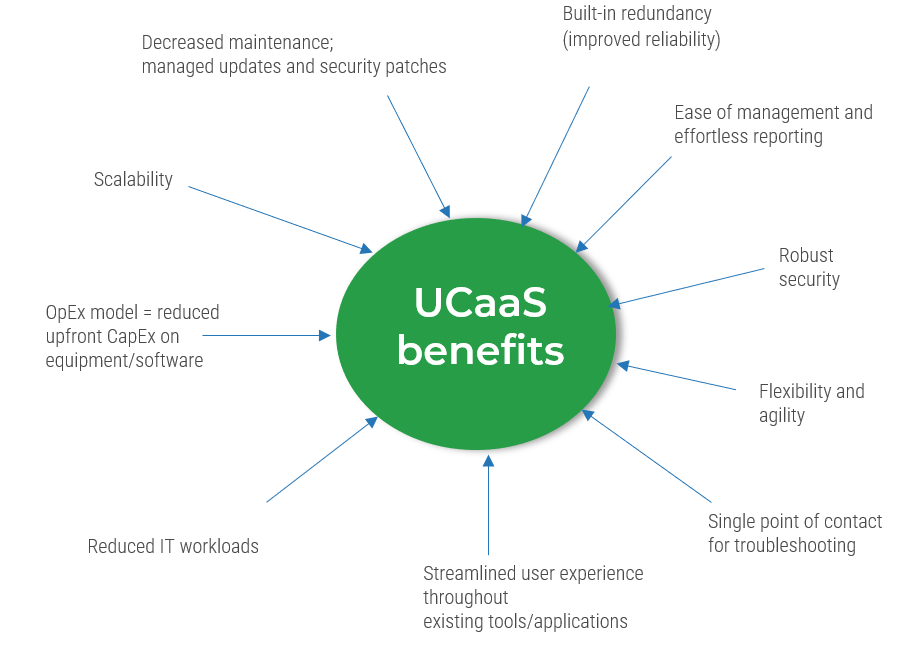
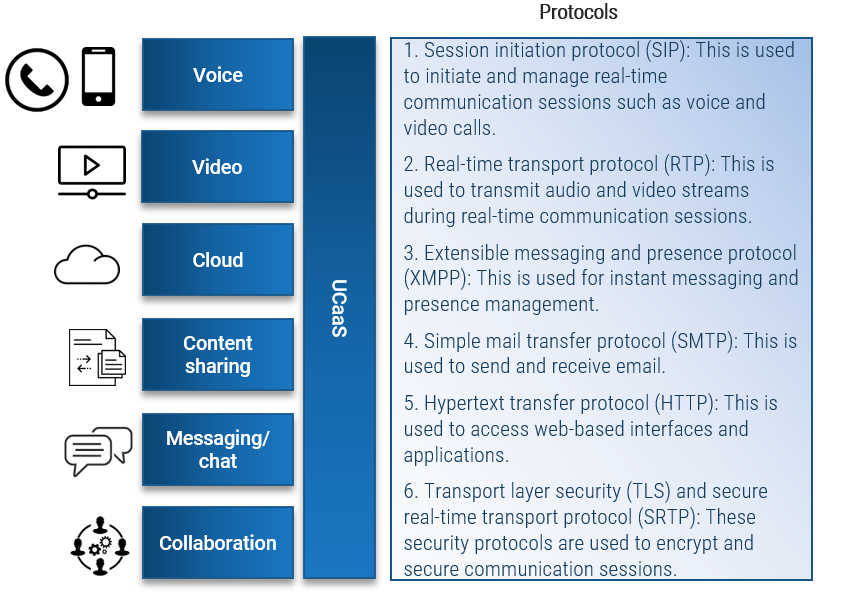
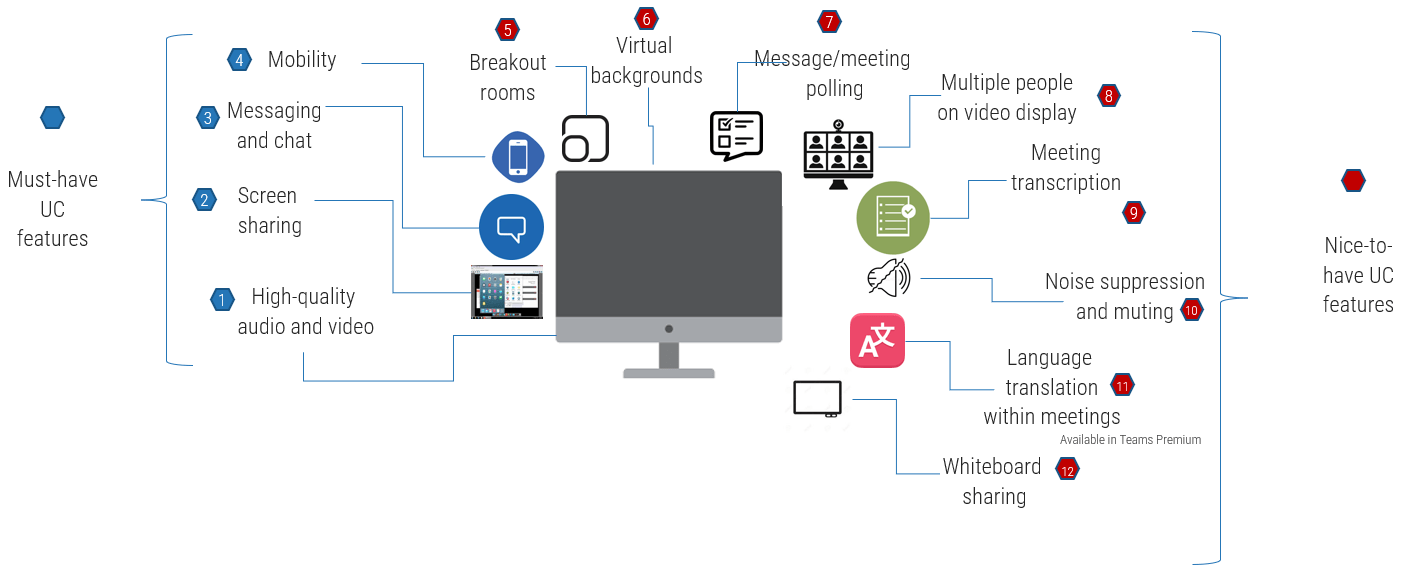


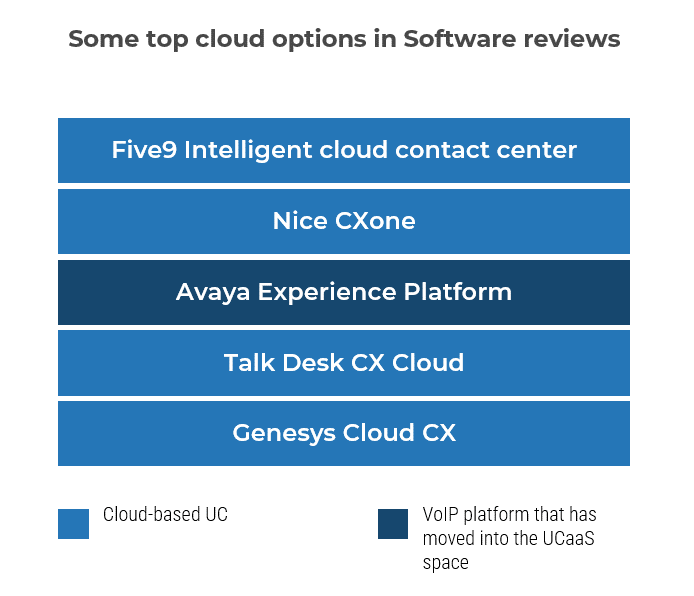
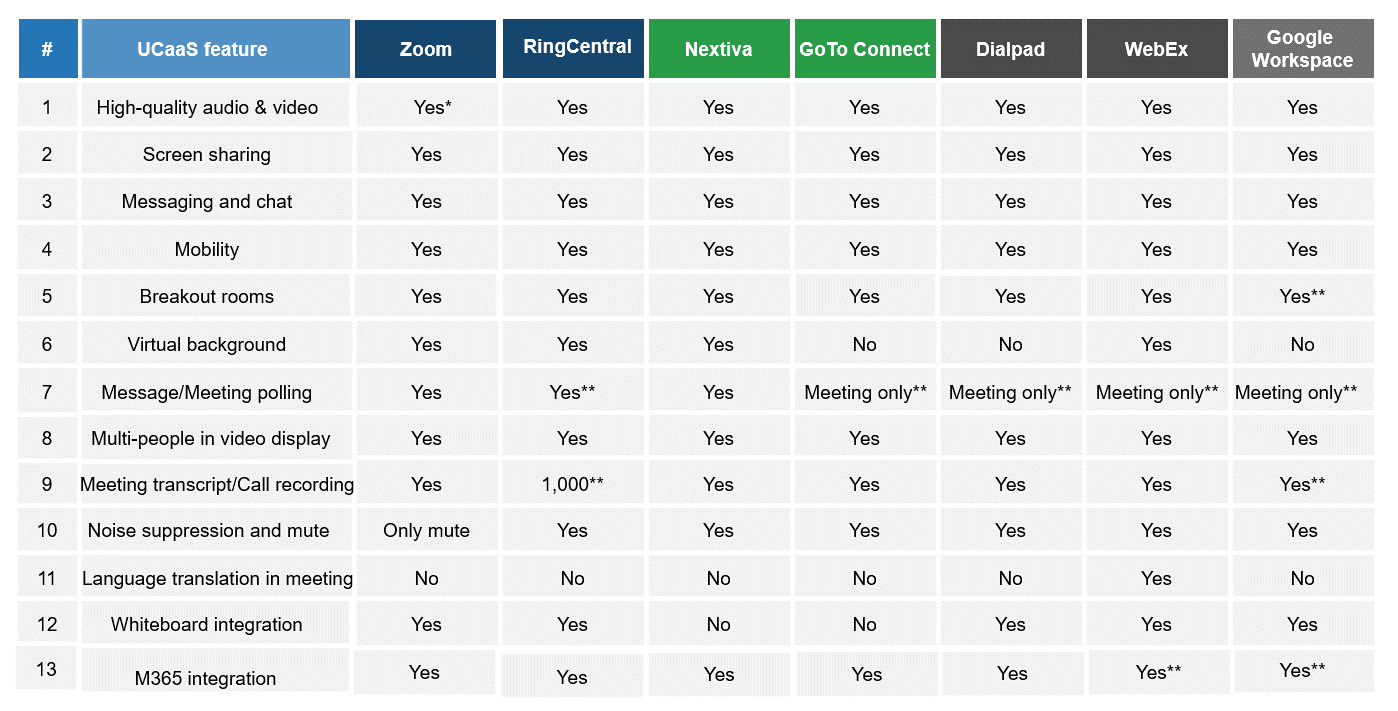
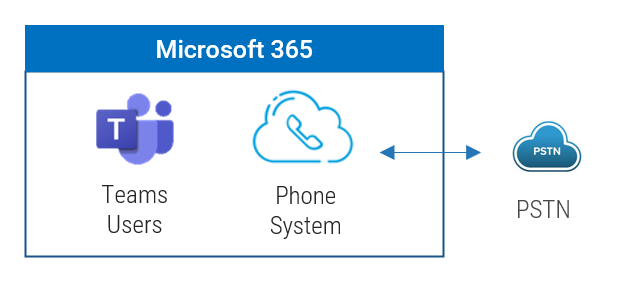
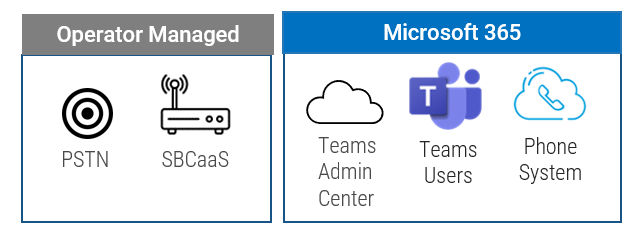
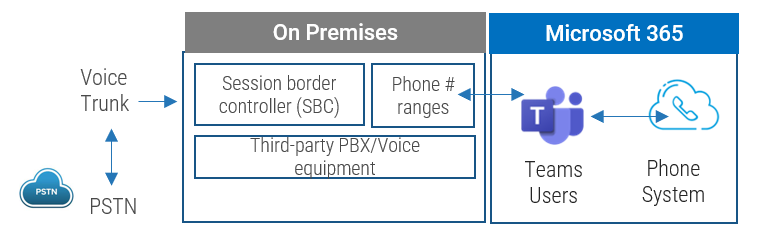
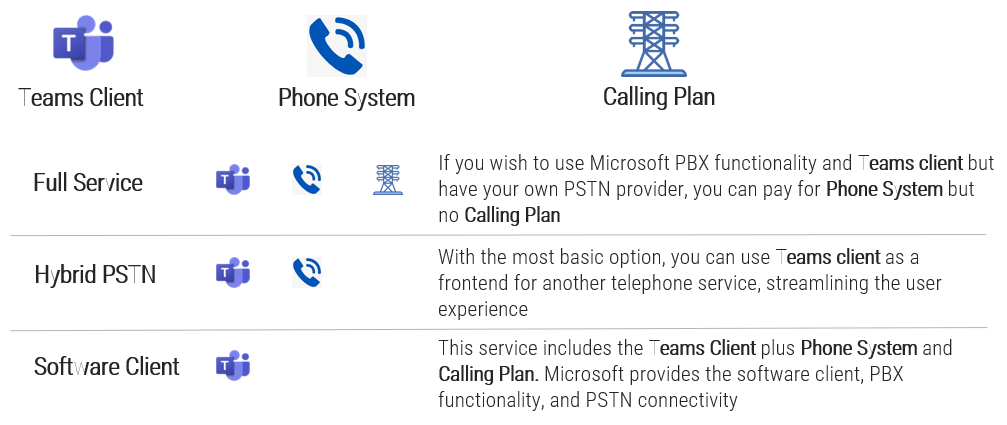
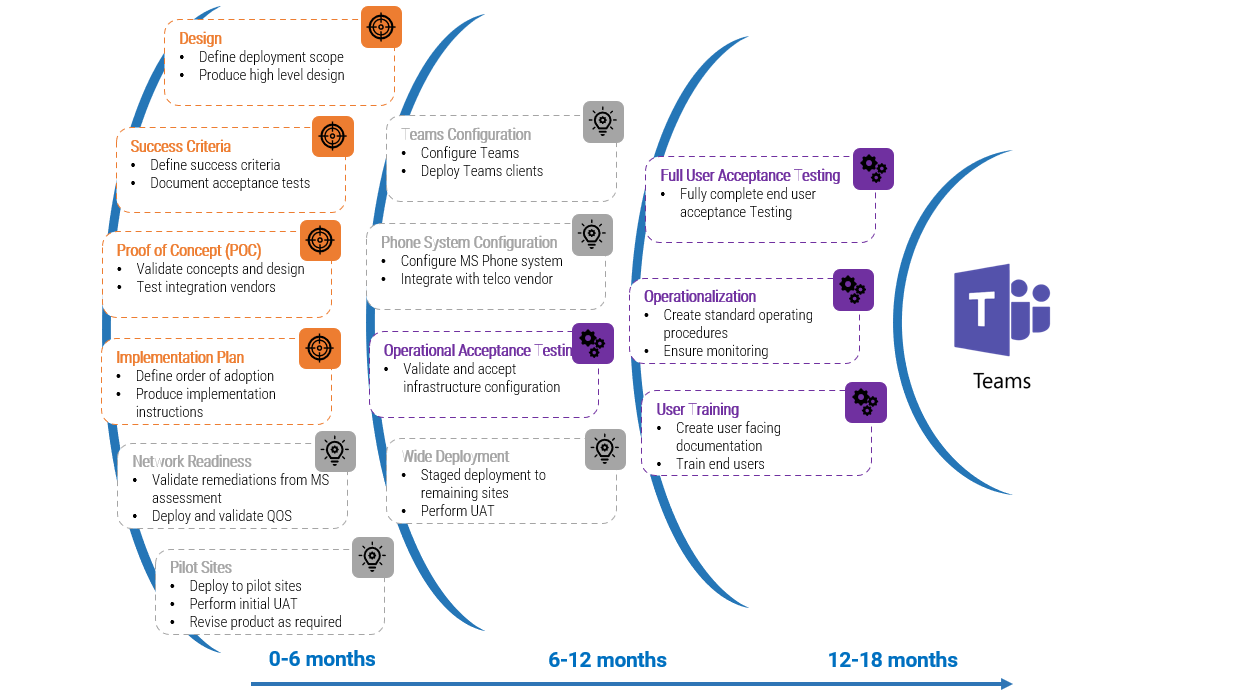
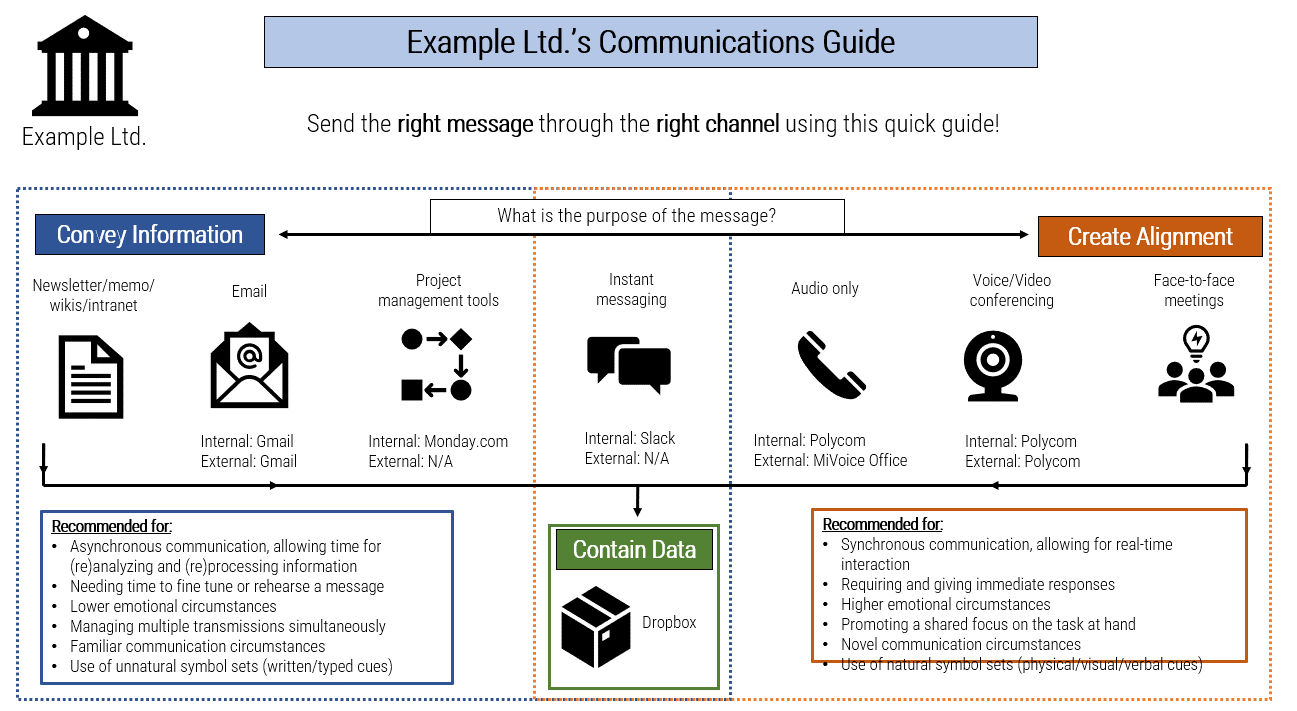
![A diagram that shows [Insert Organization Name]’s Communications Guide](/images/ITMGF/infra-and-operations/end-user-computing/voice-video-management/assess-your-readiness-to-implement-ucaas/030-communications-guide-template.png)


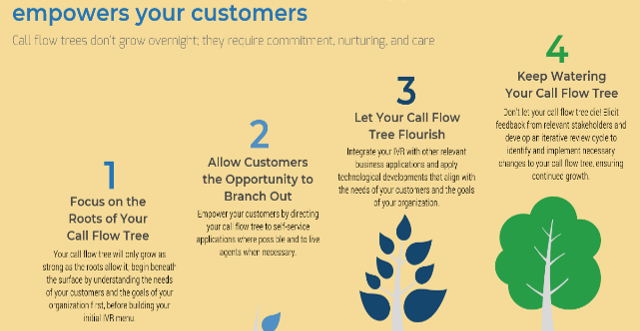


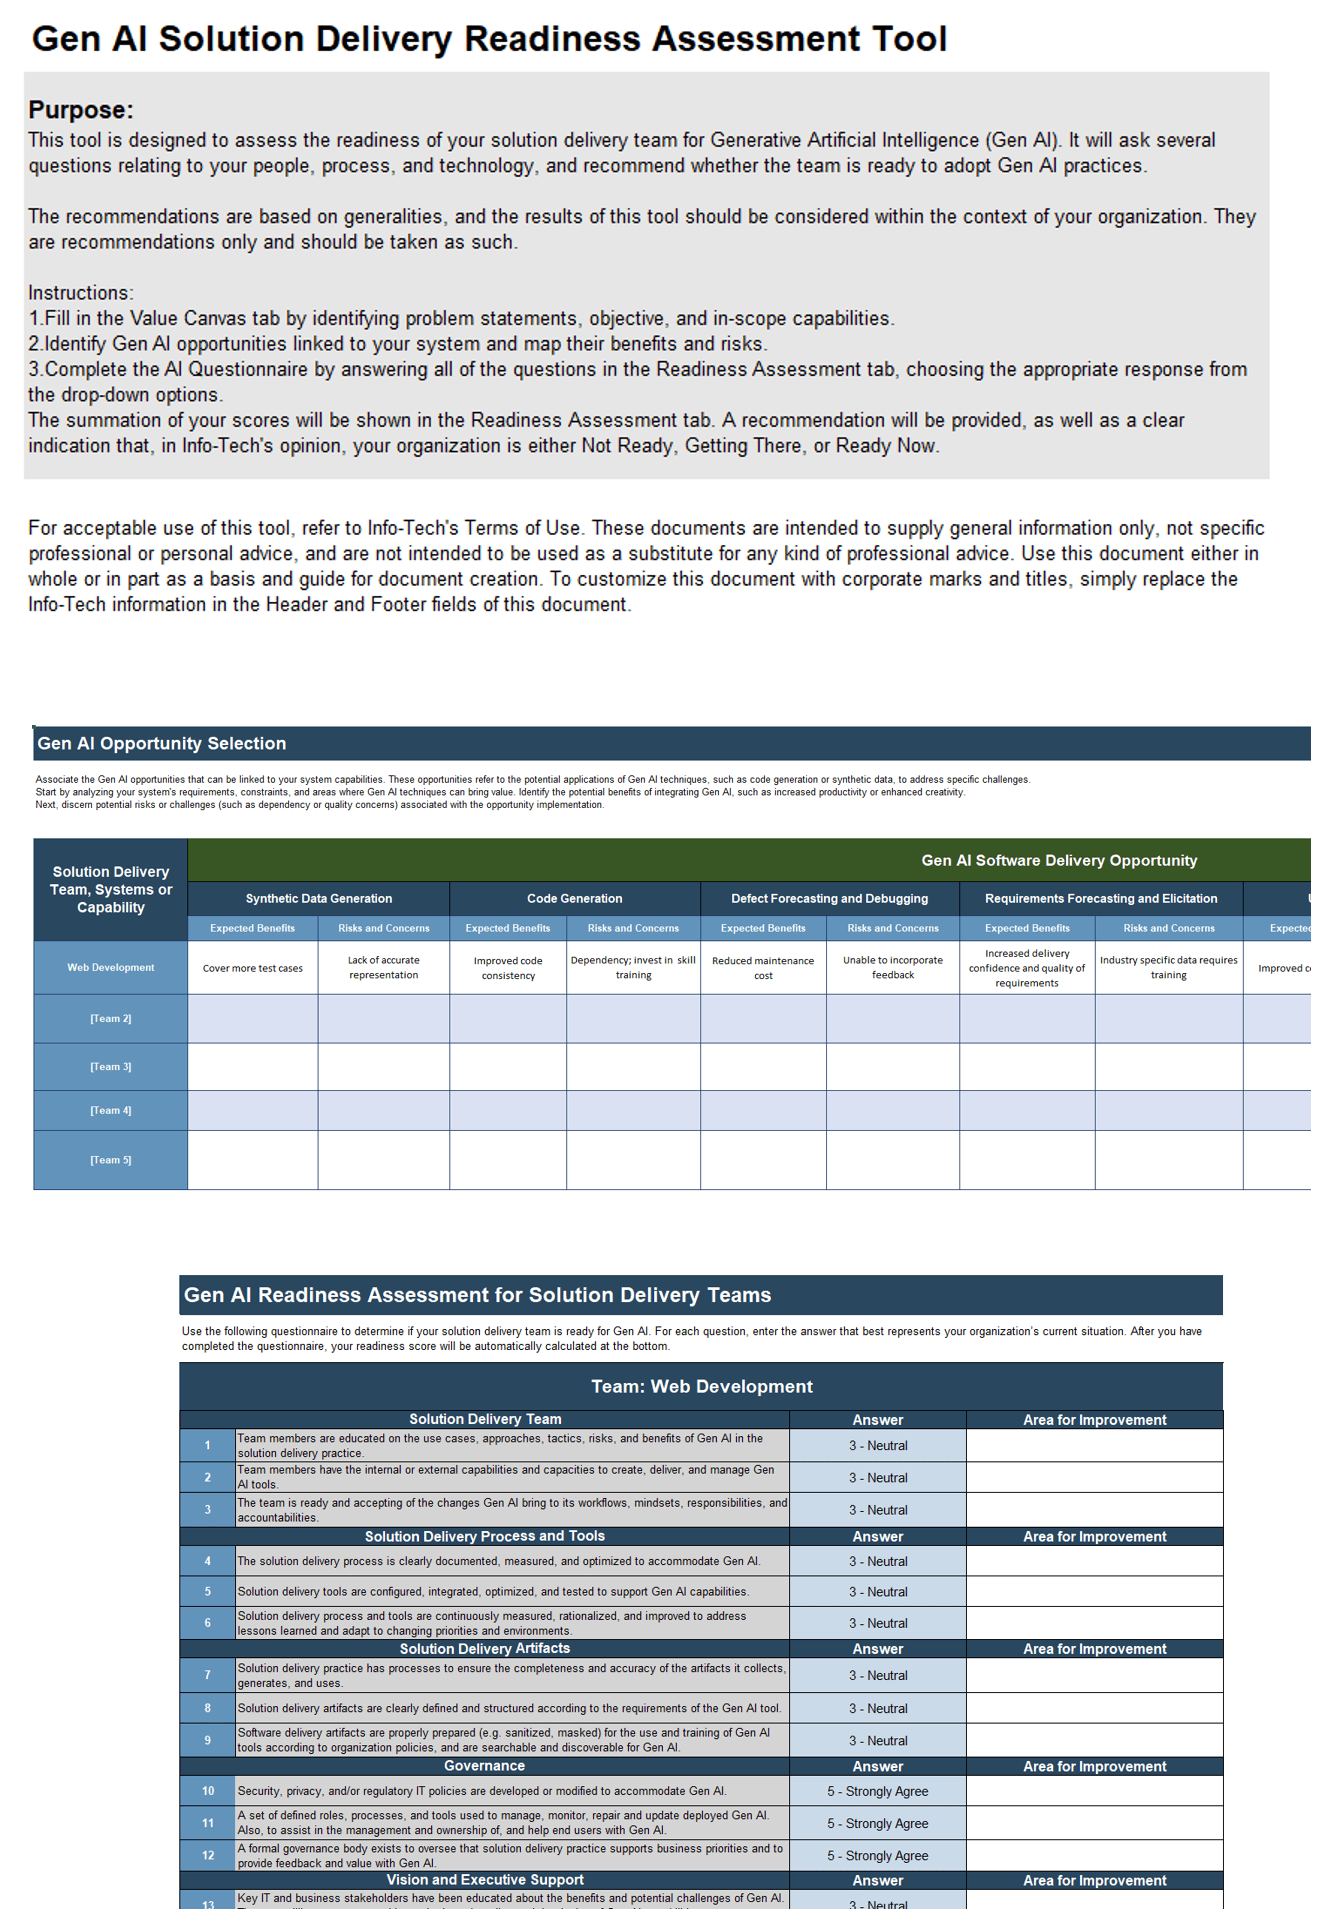
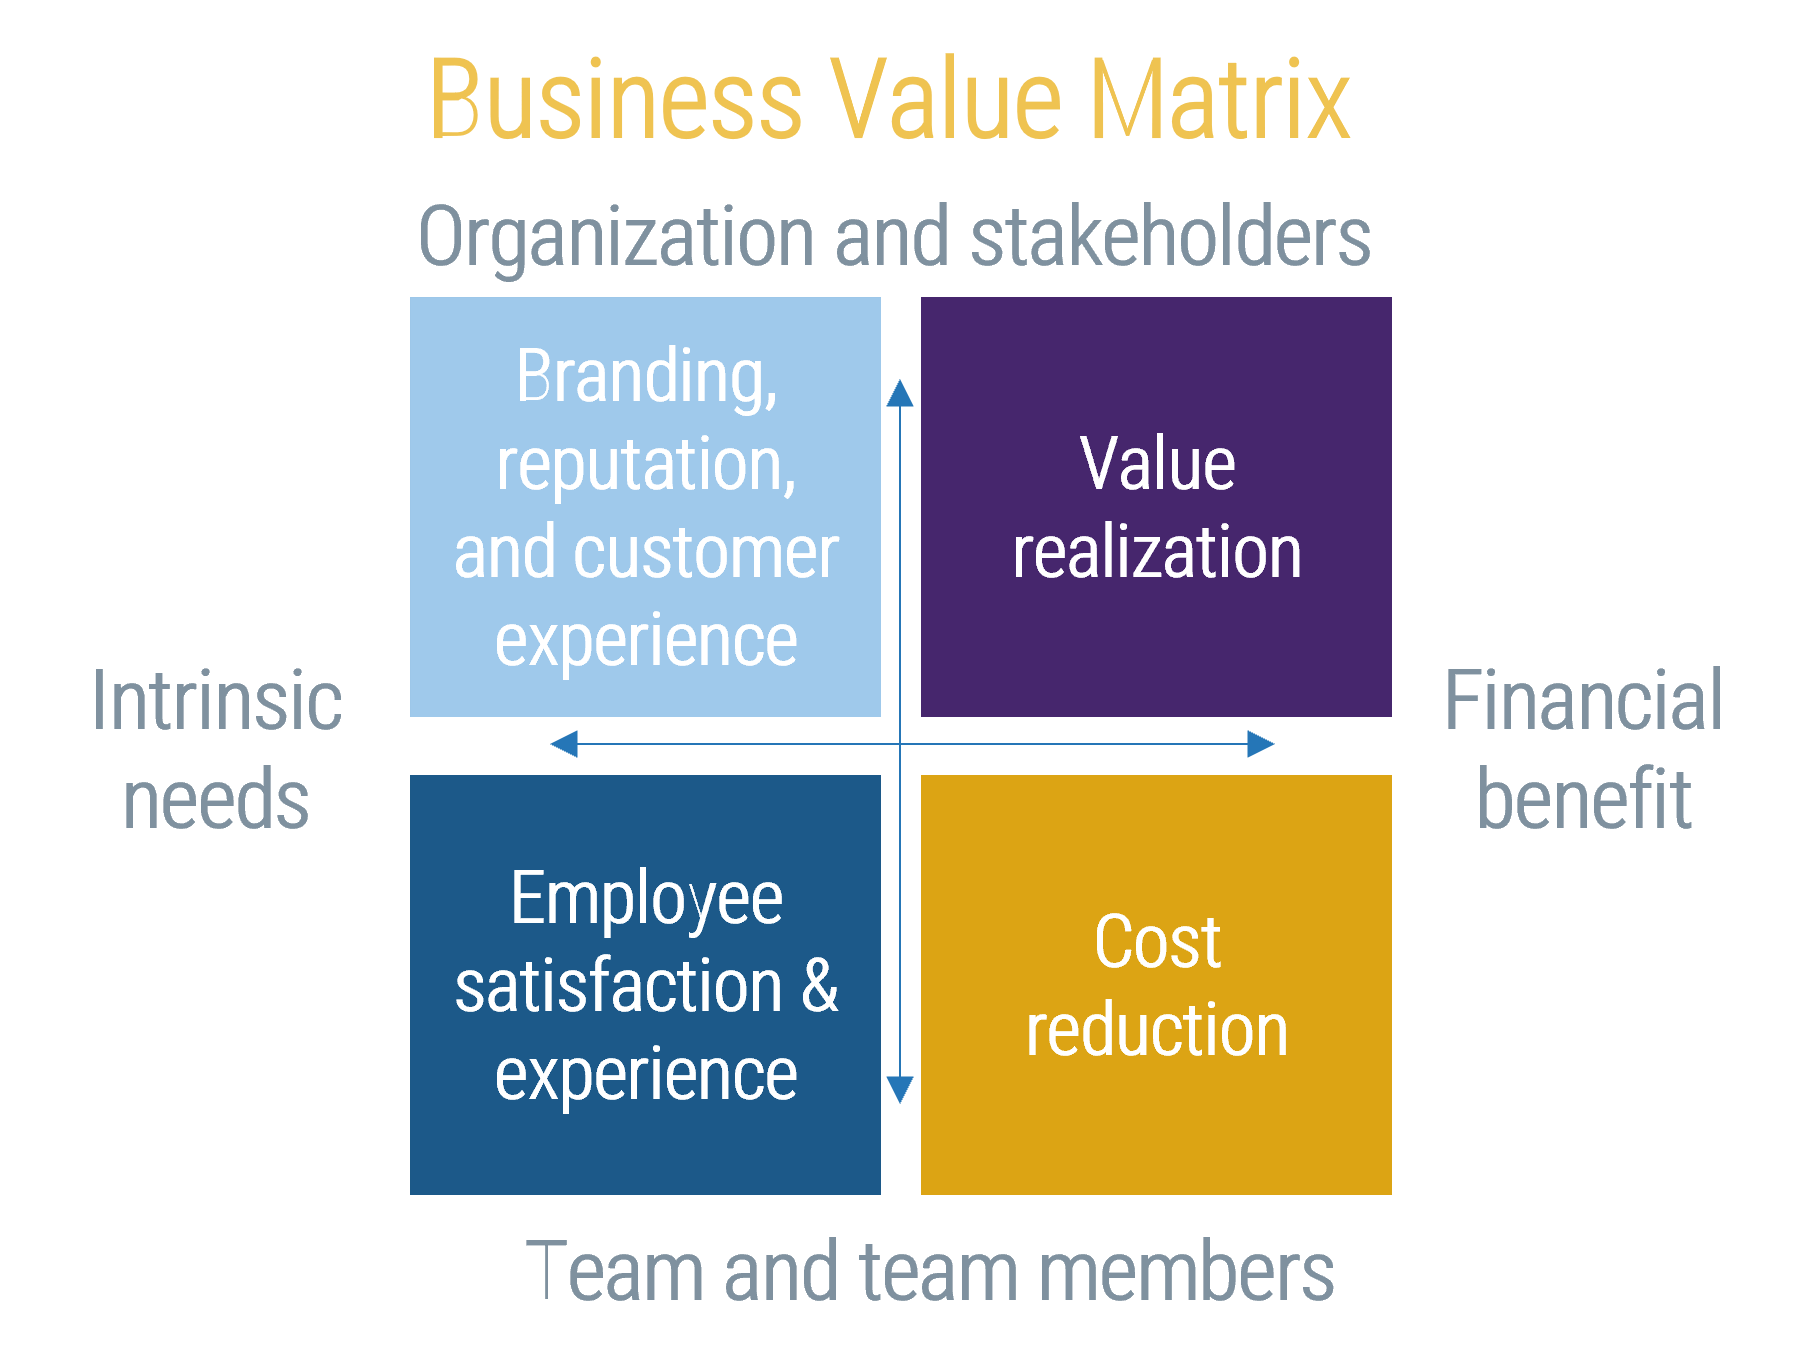
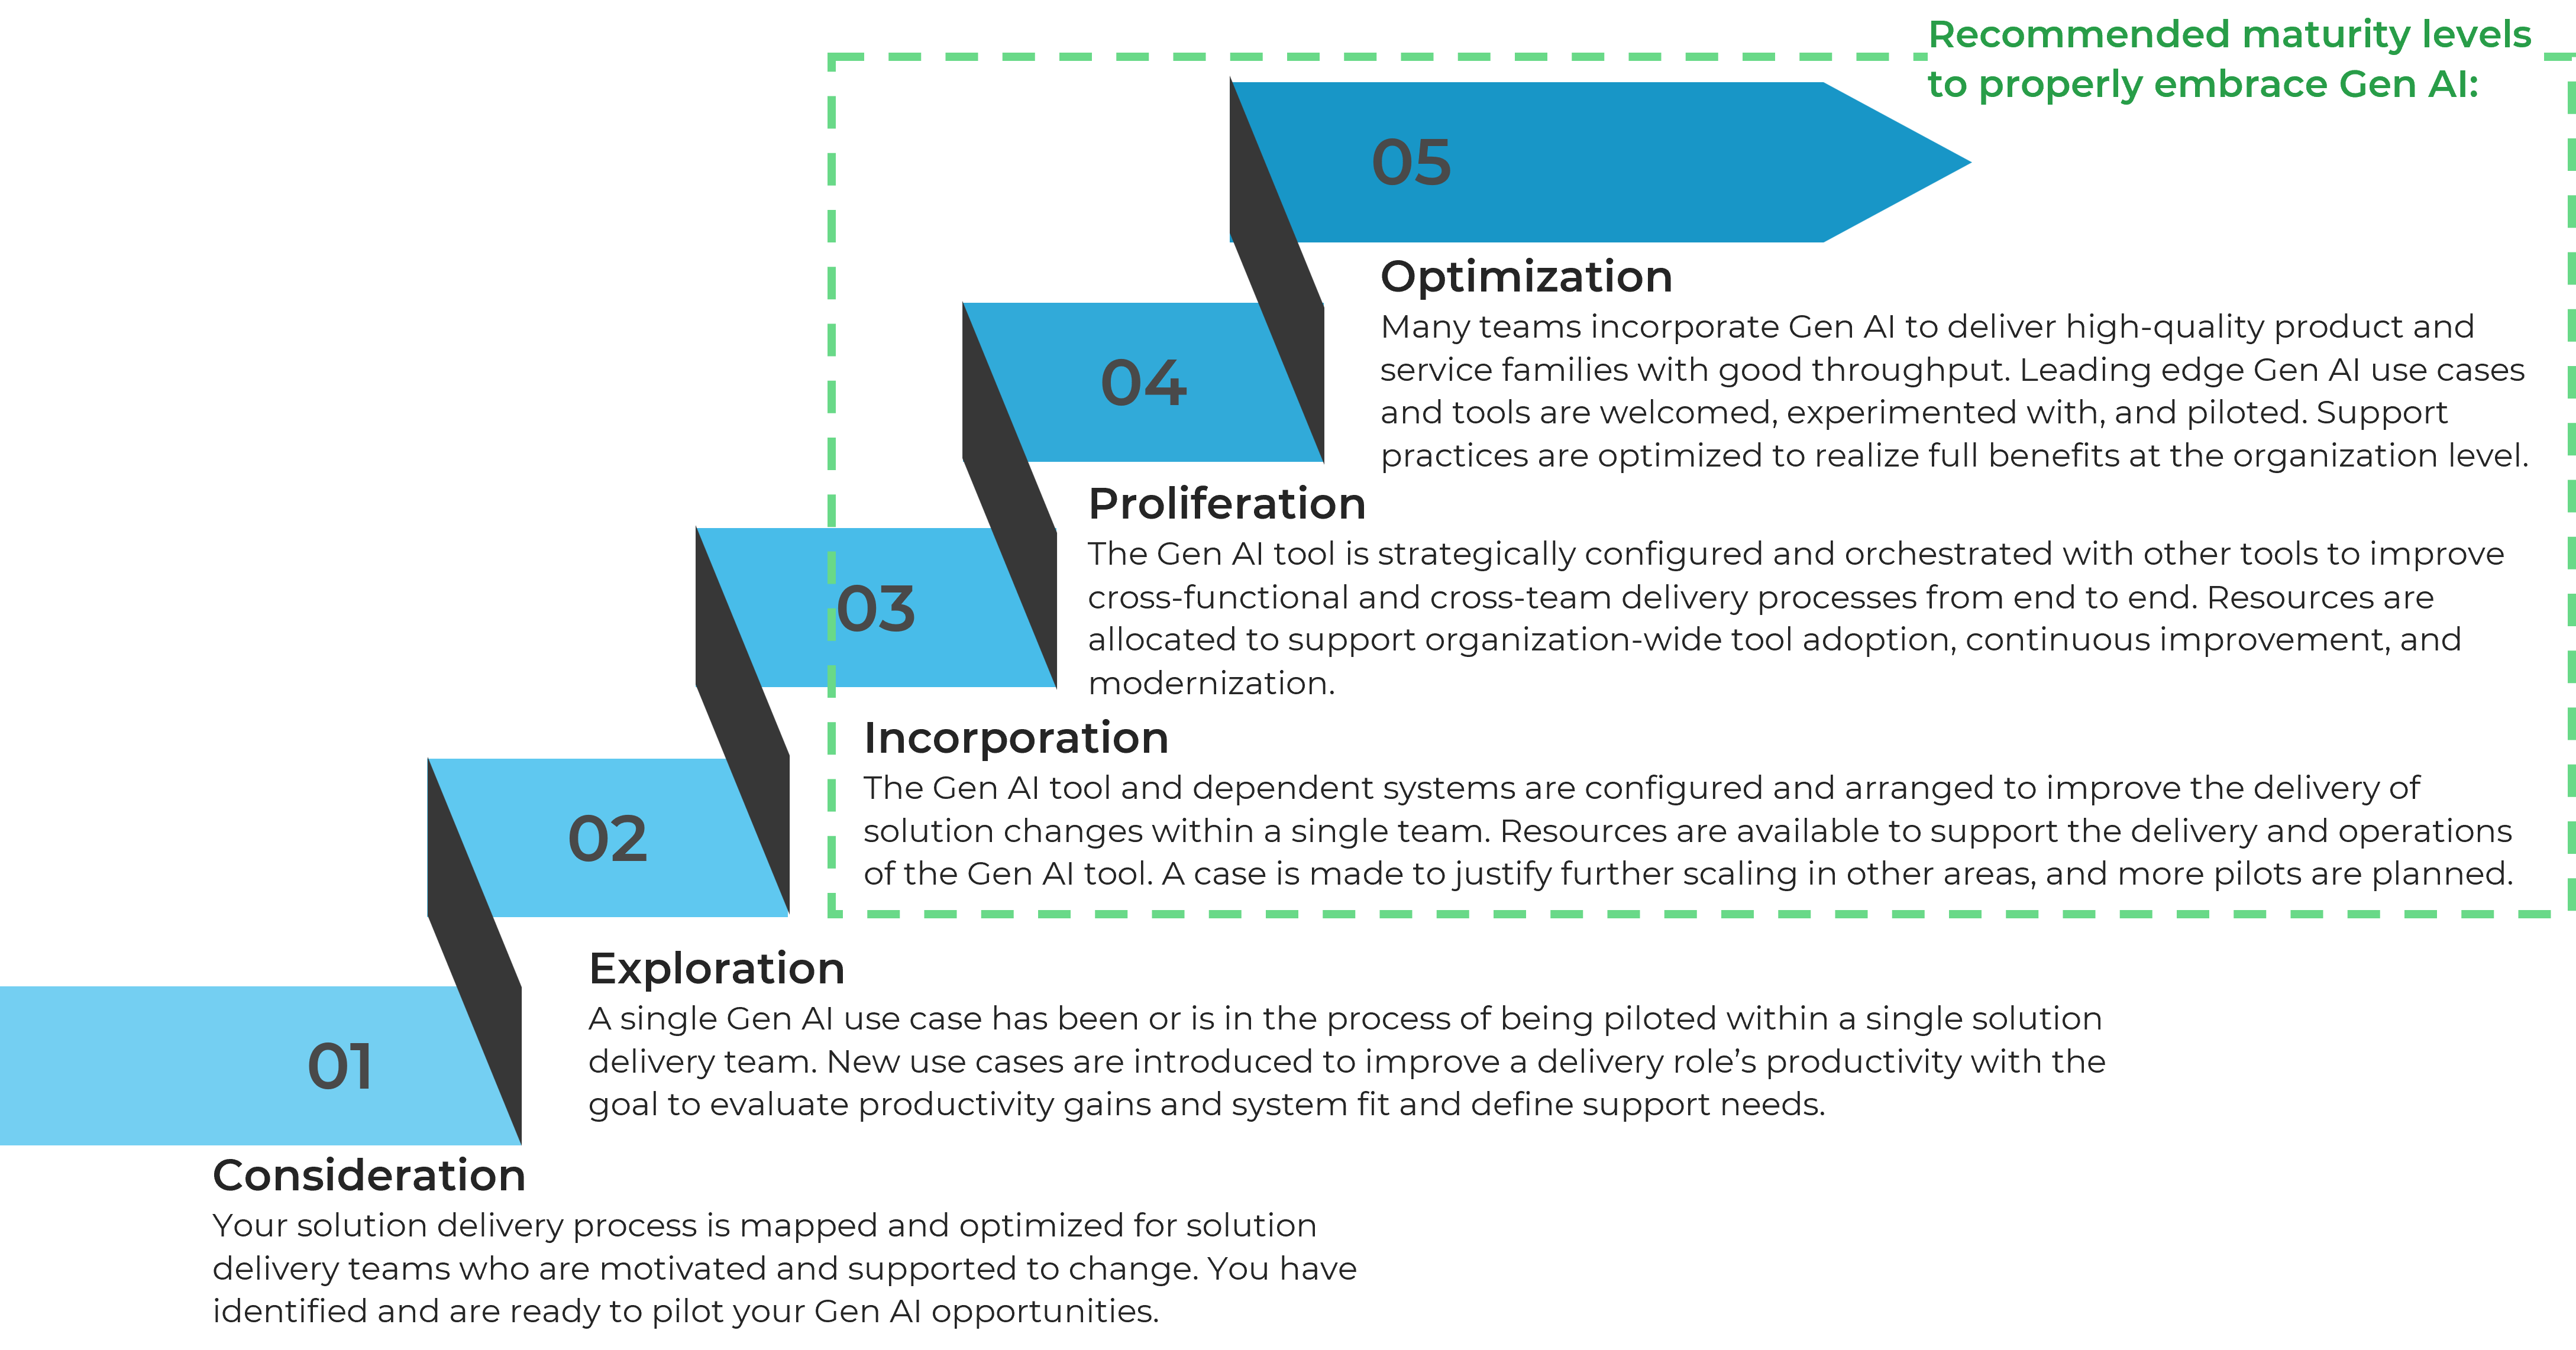

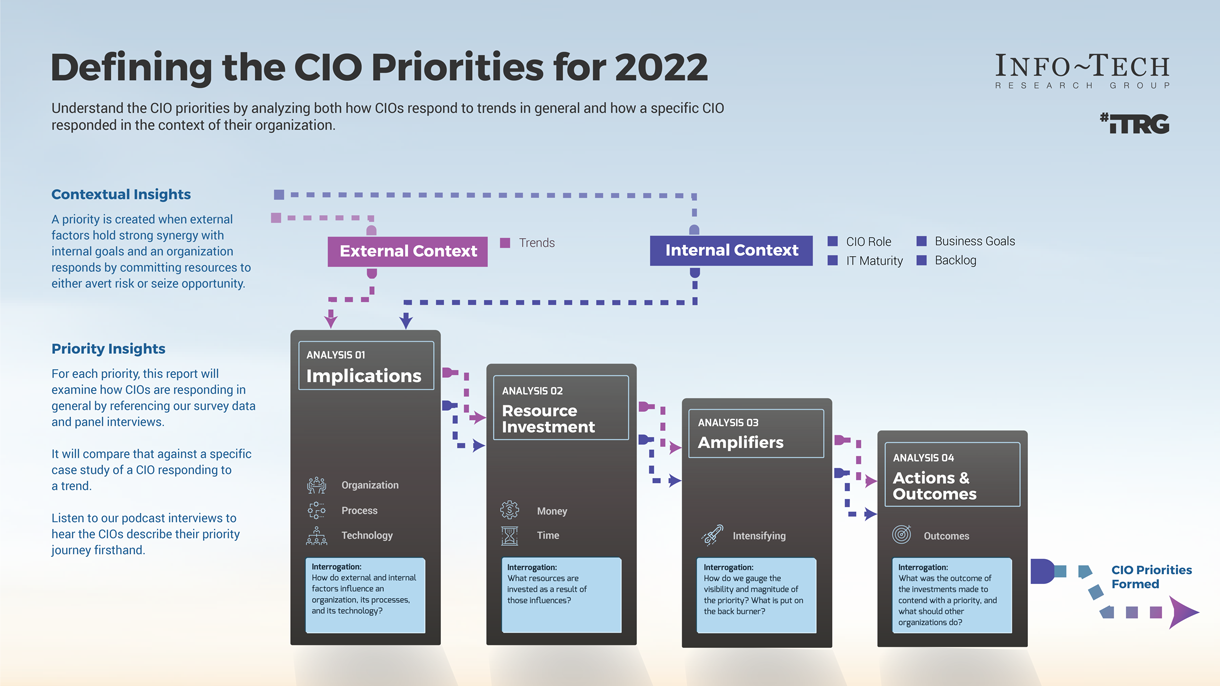

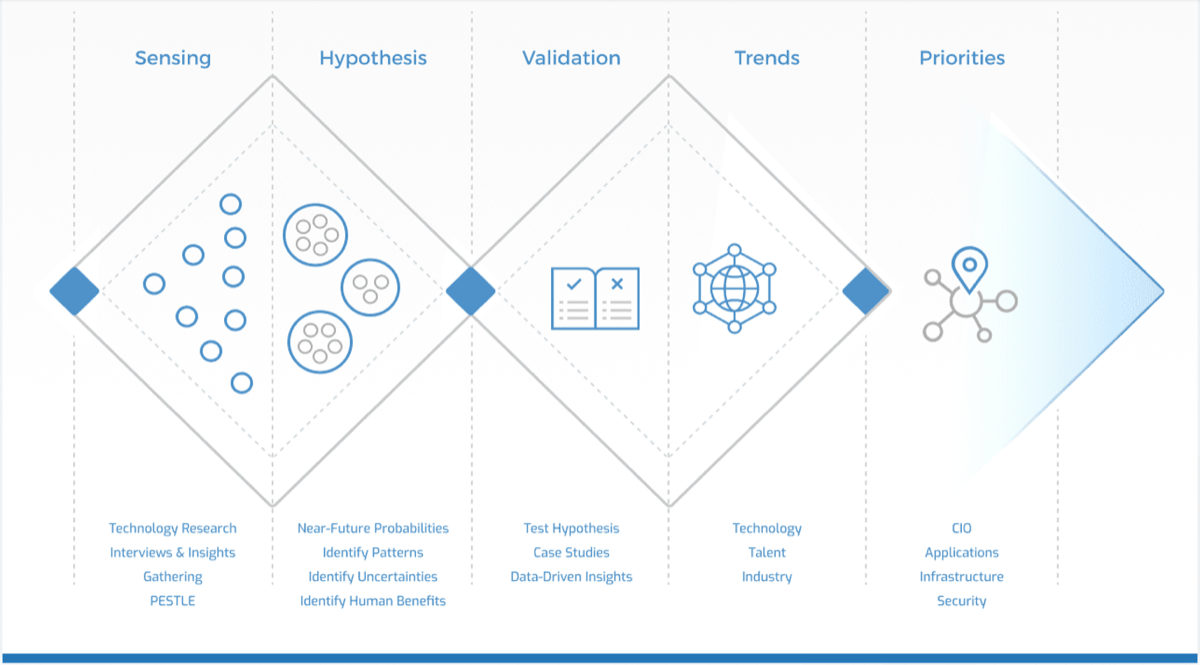


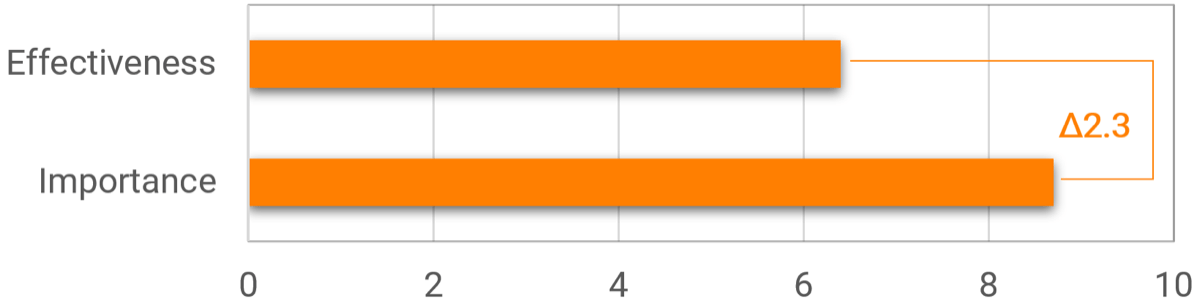


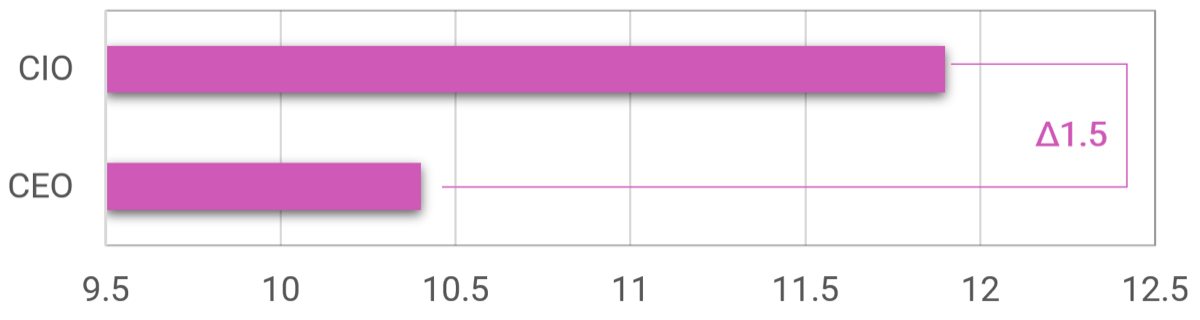
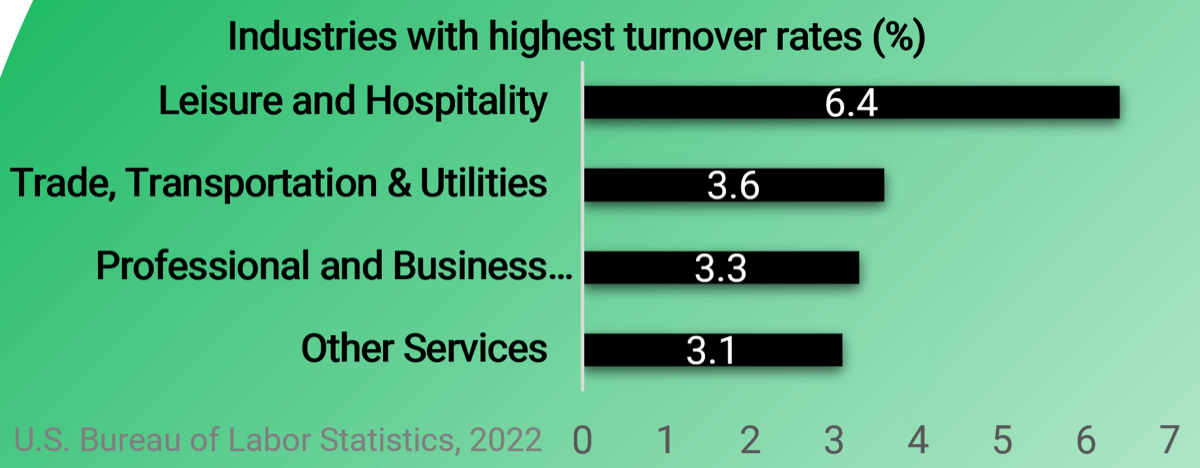


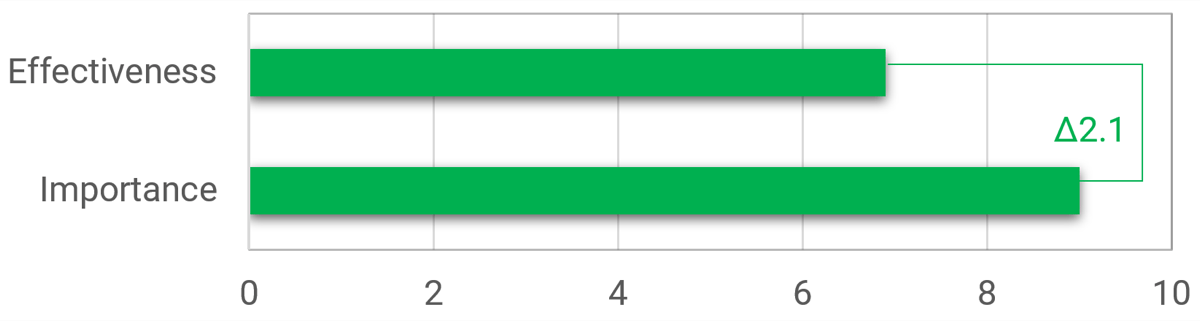
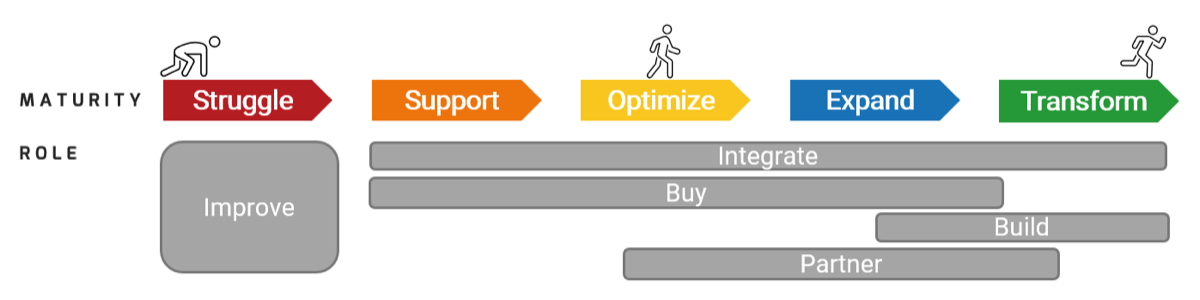


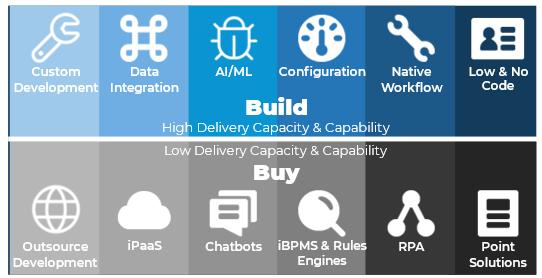
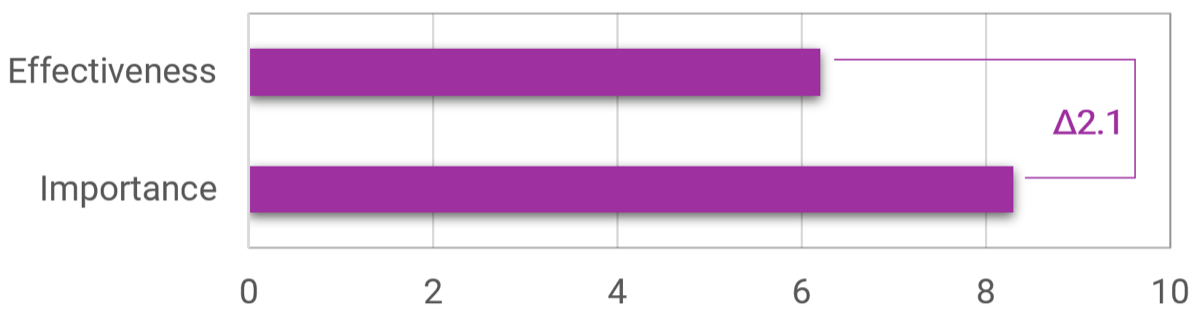


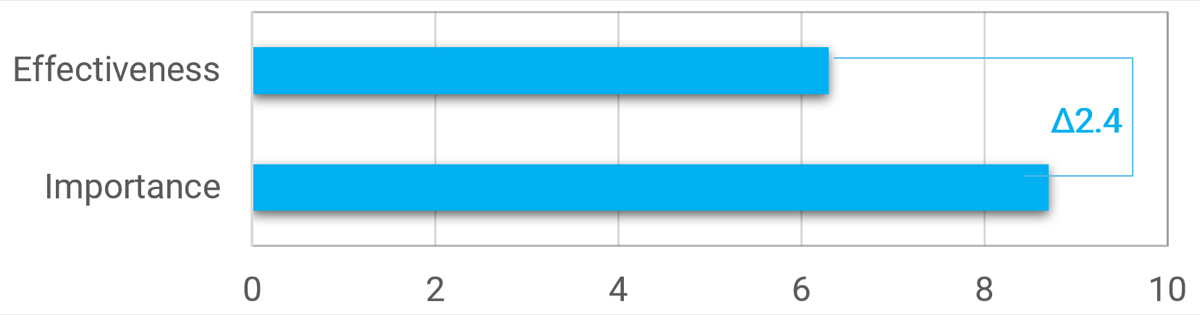


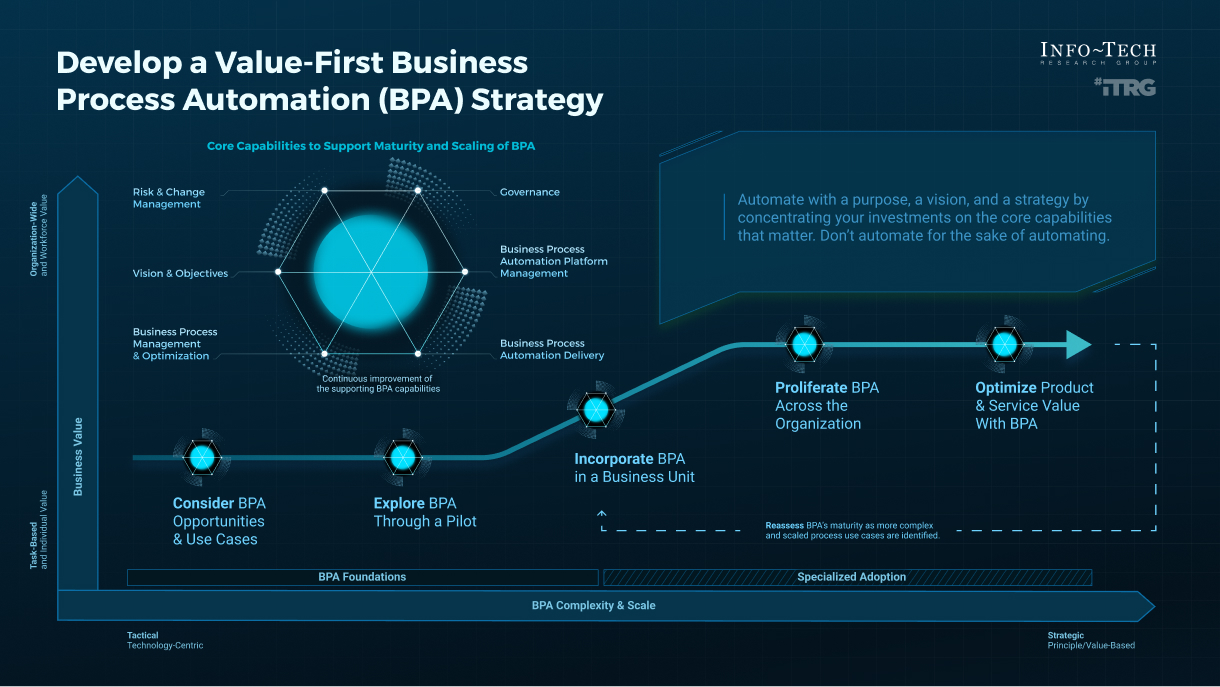


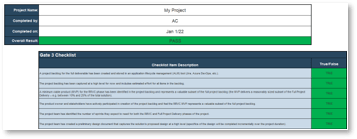
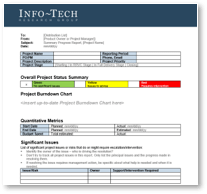
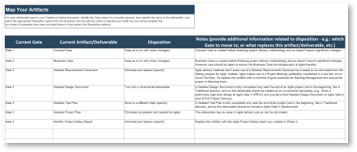


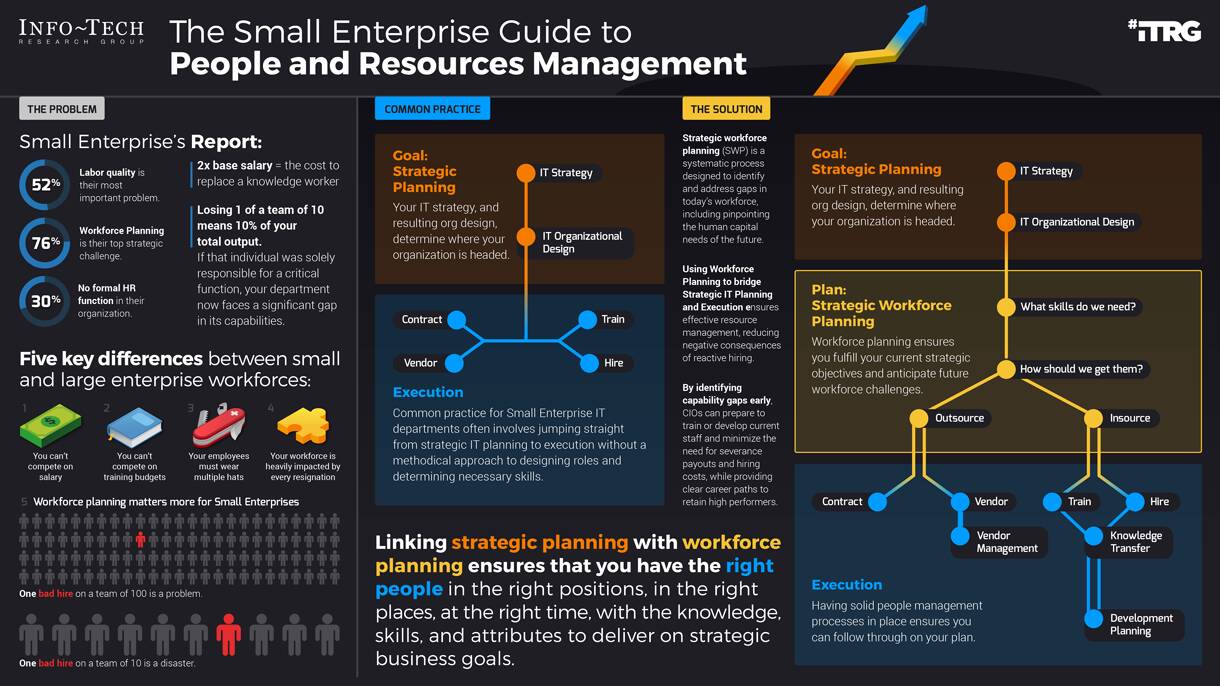


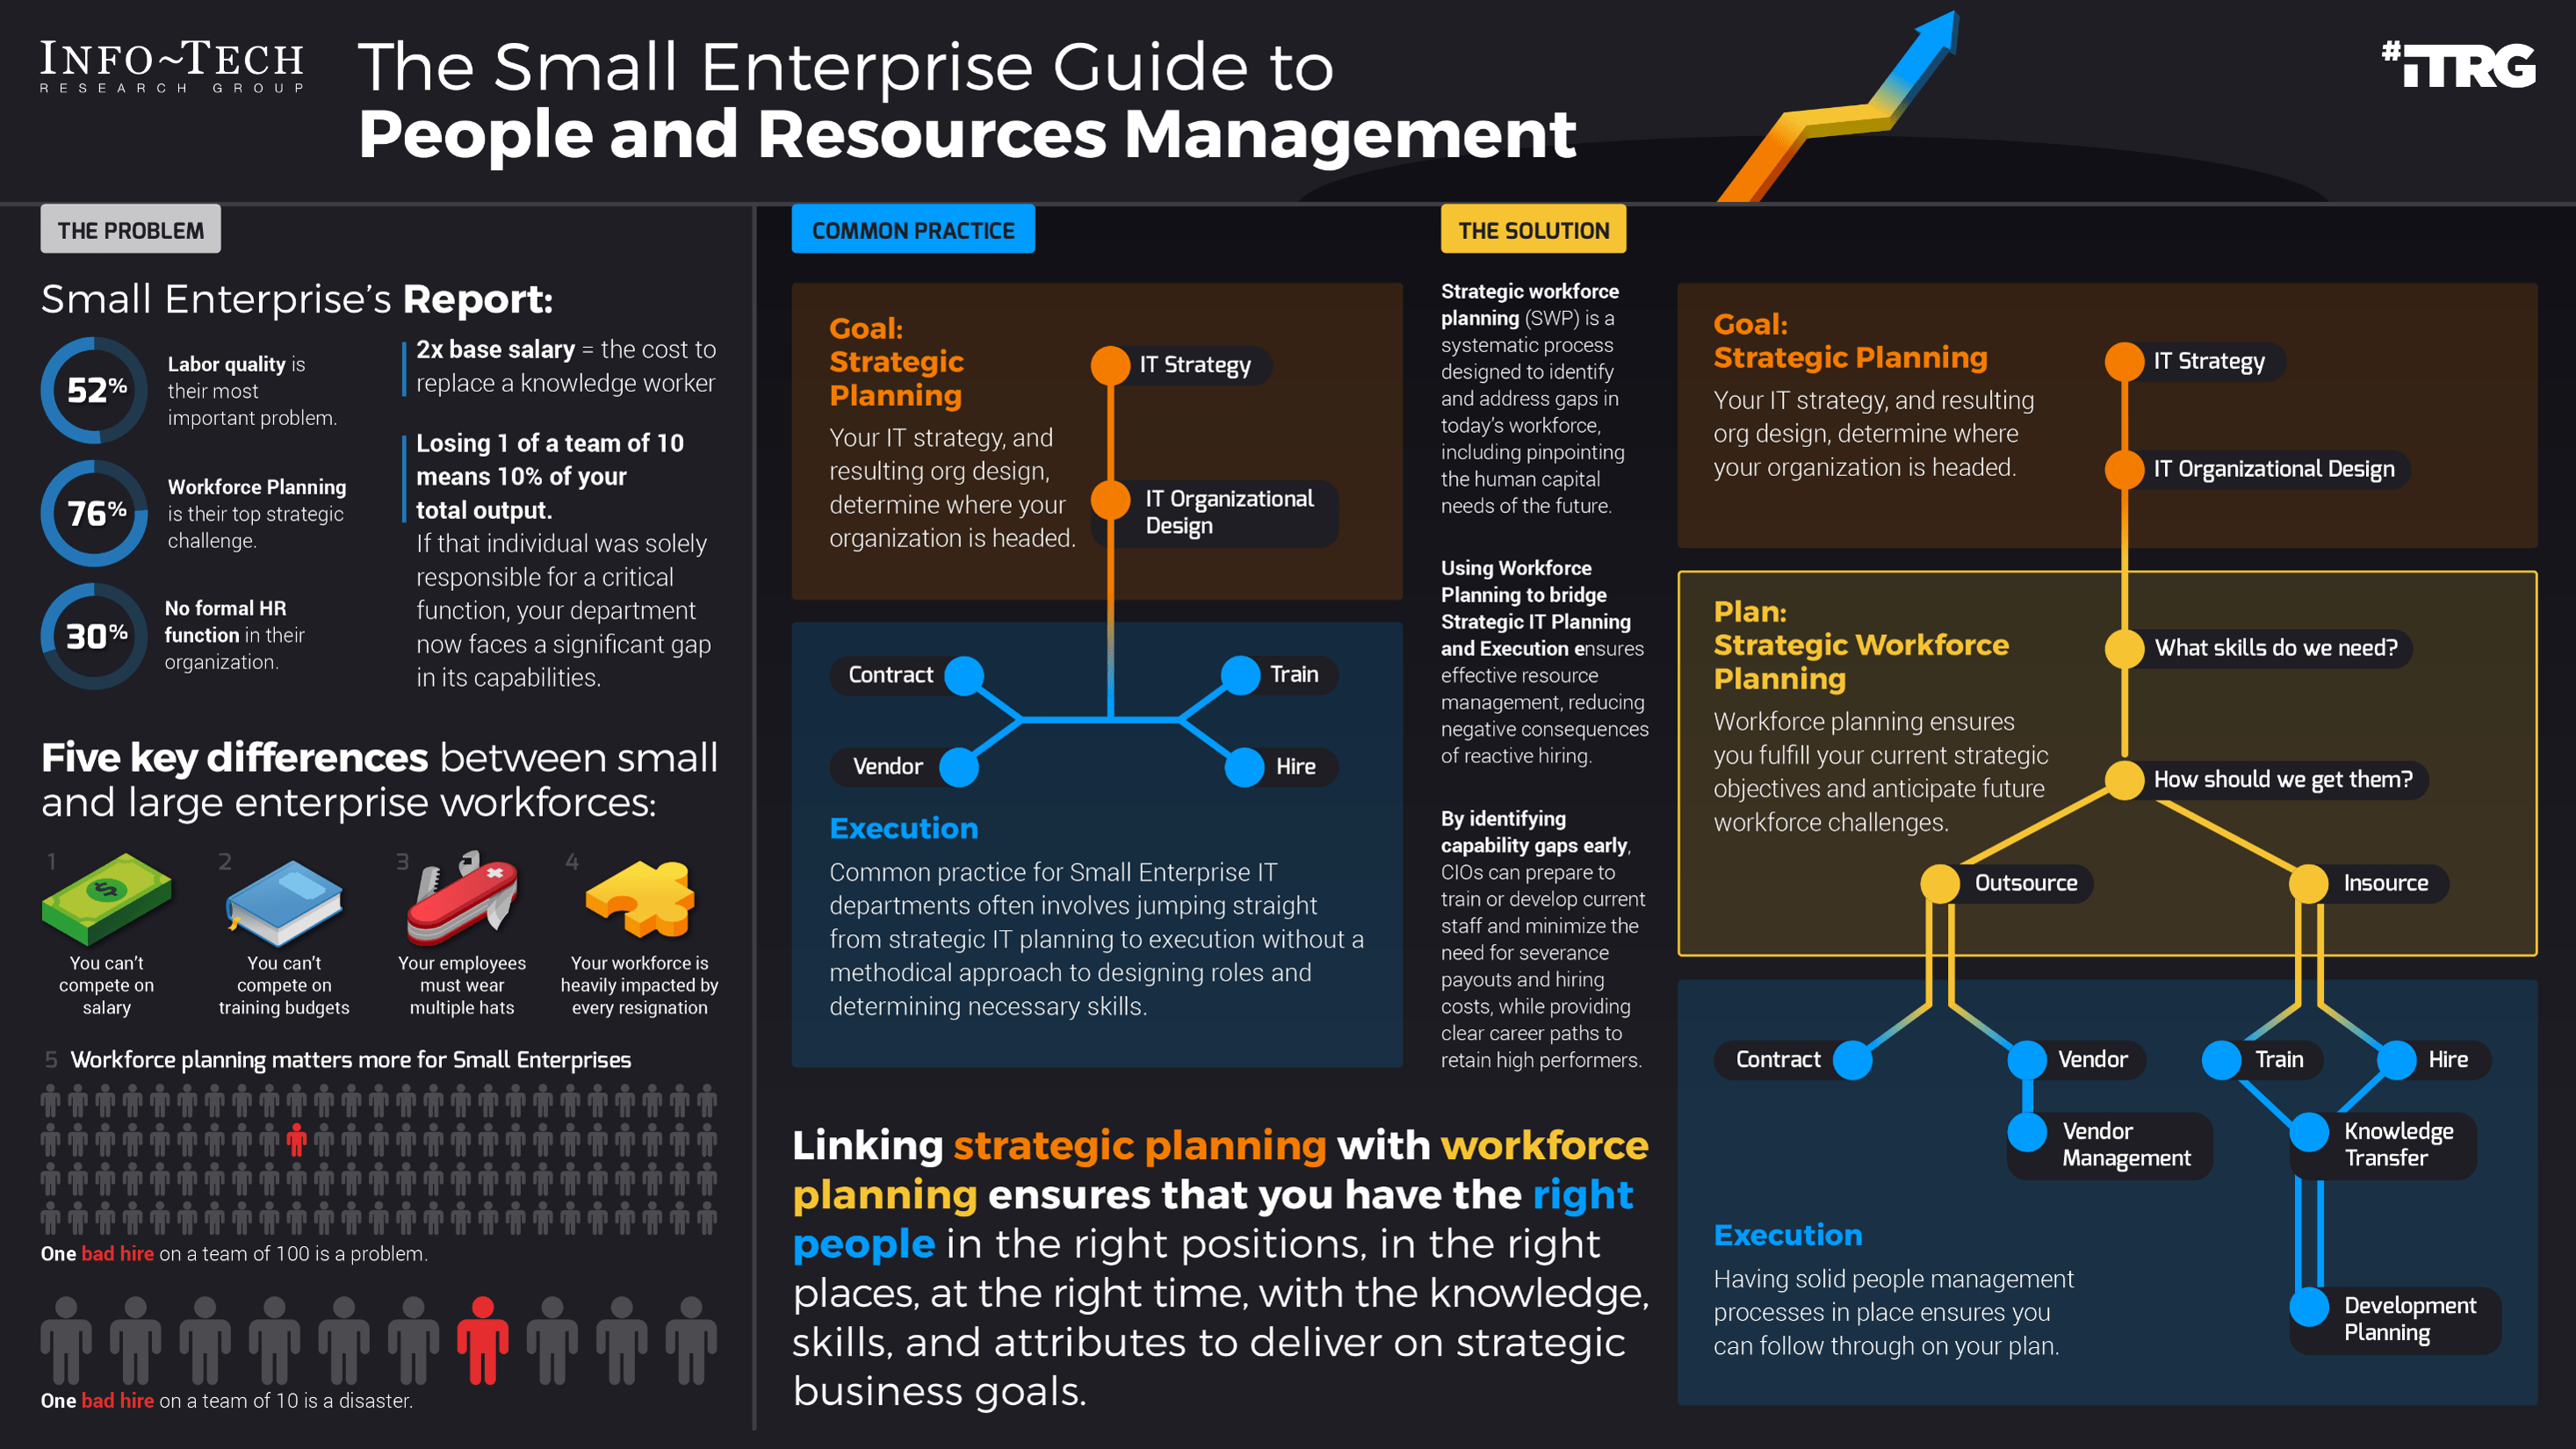
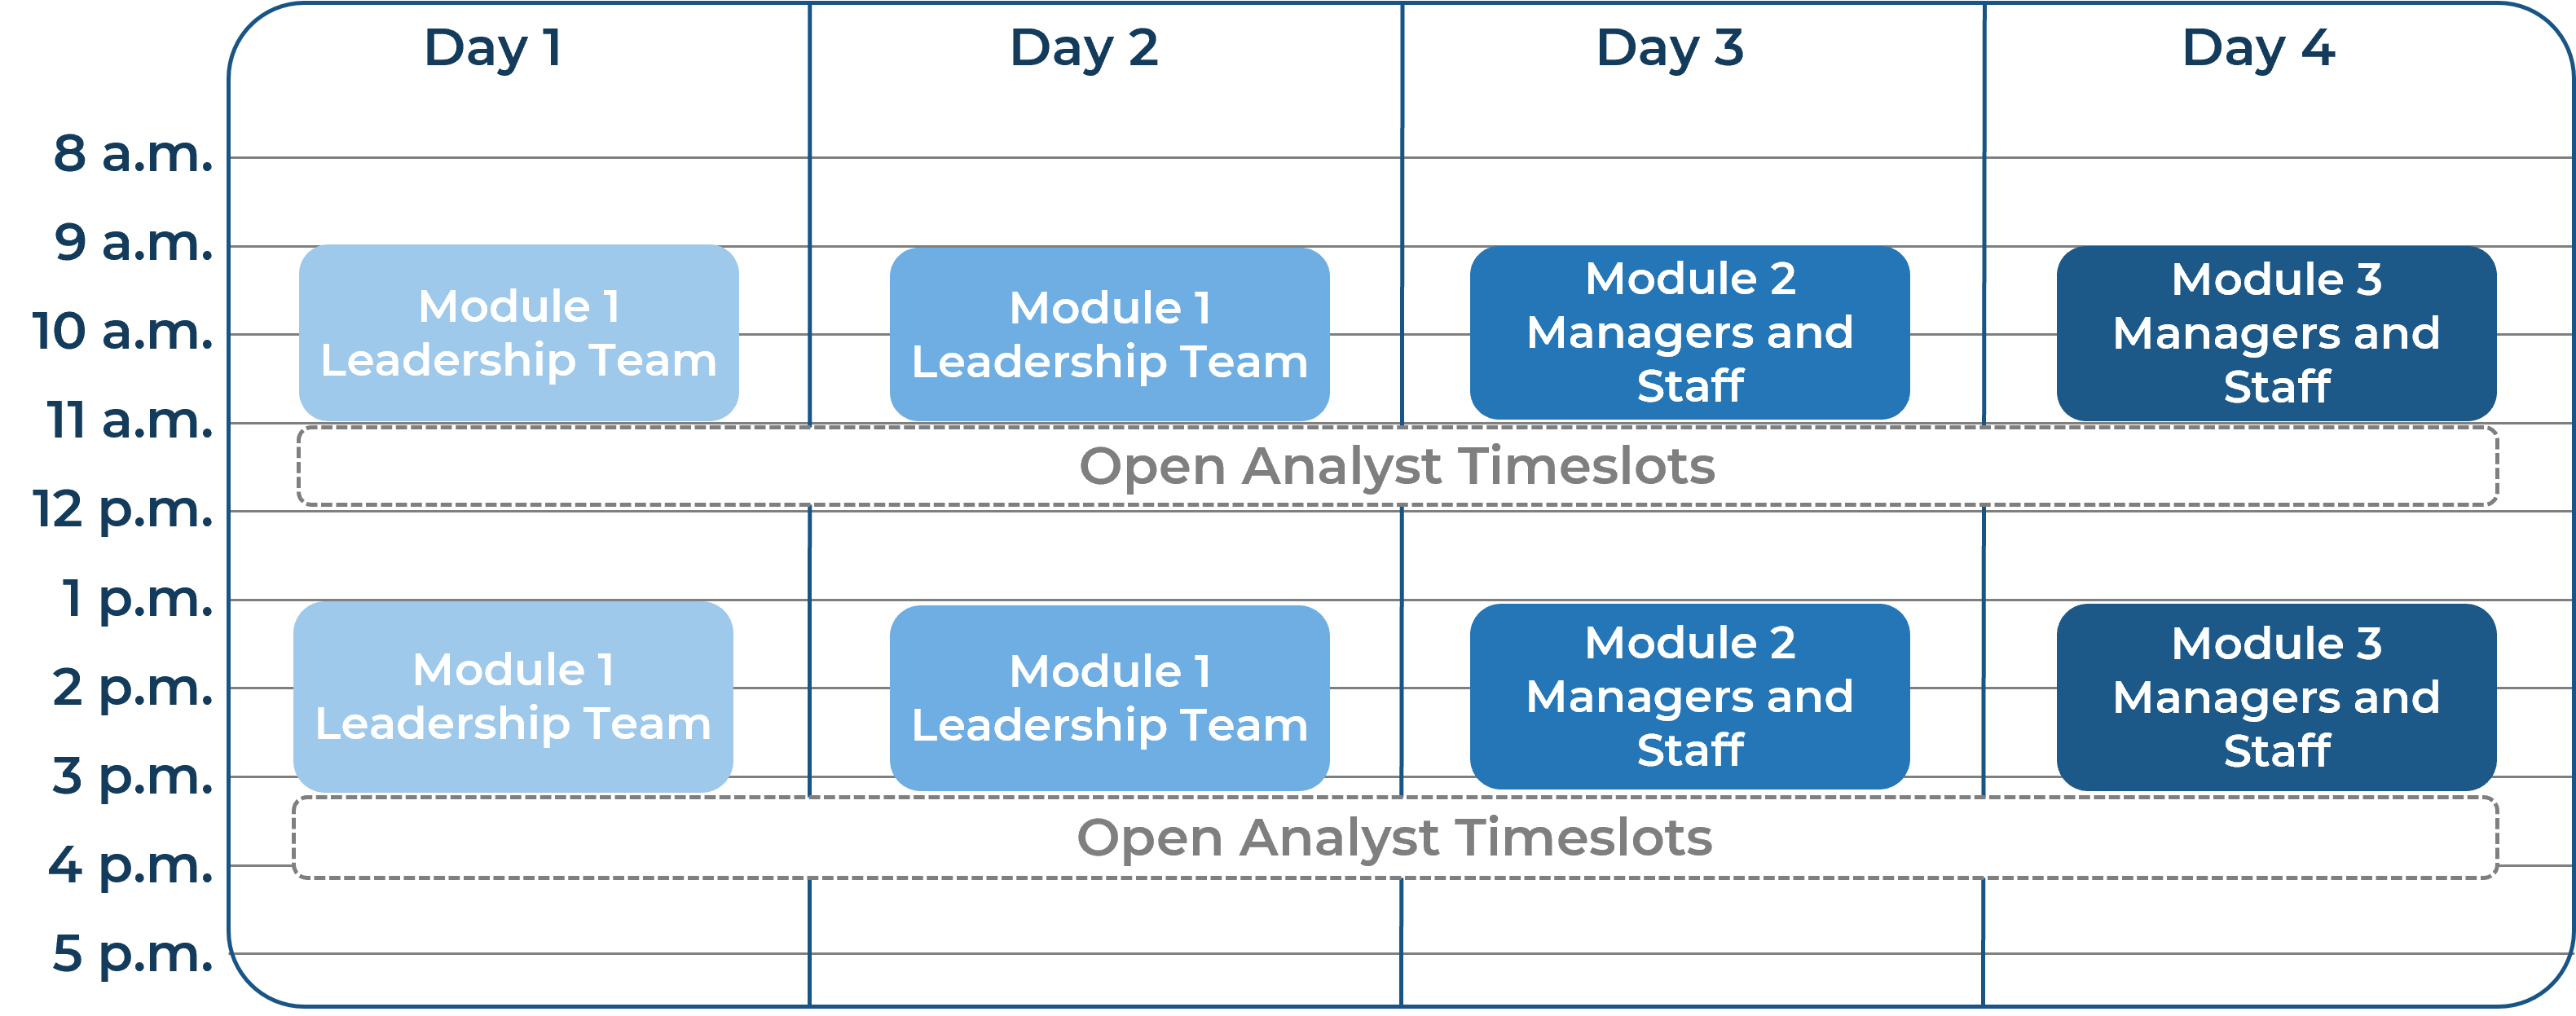
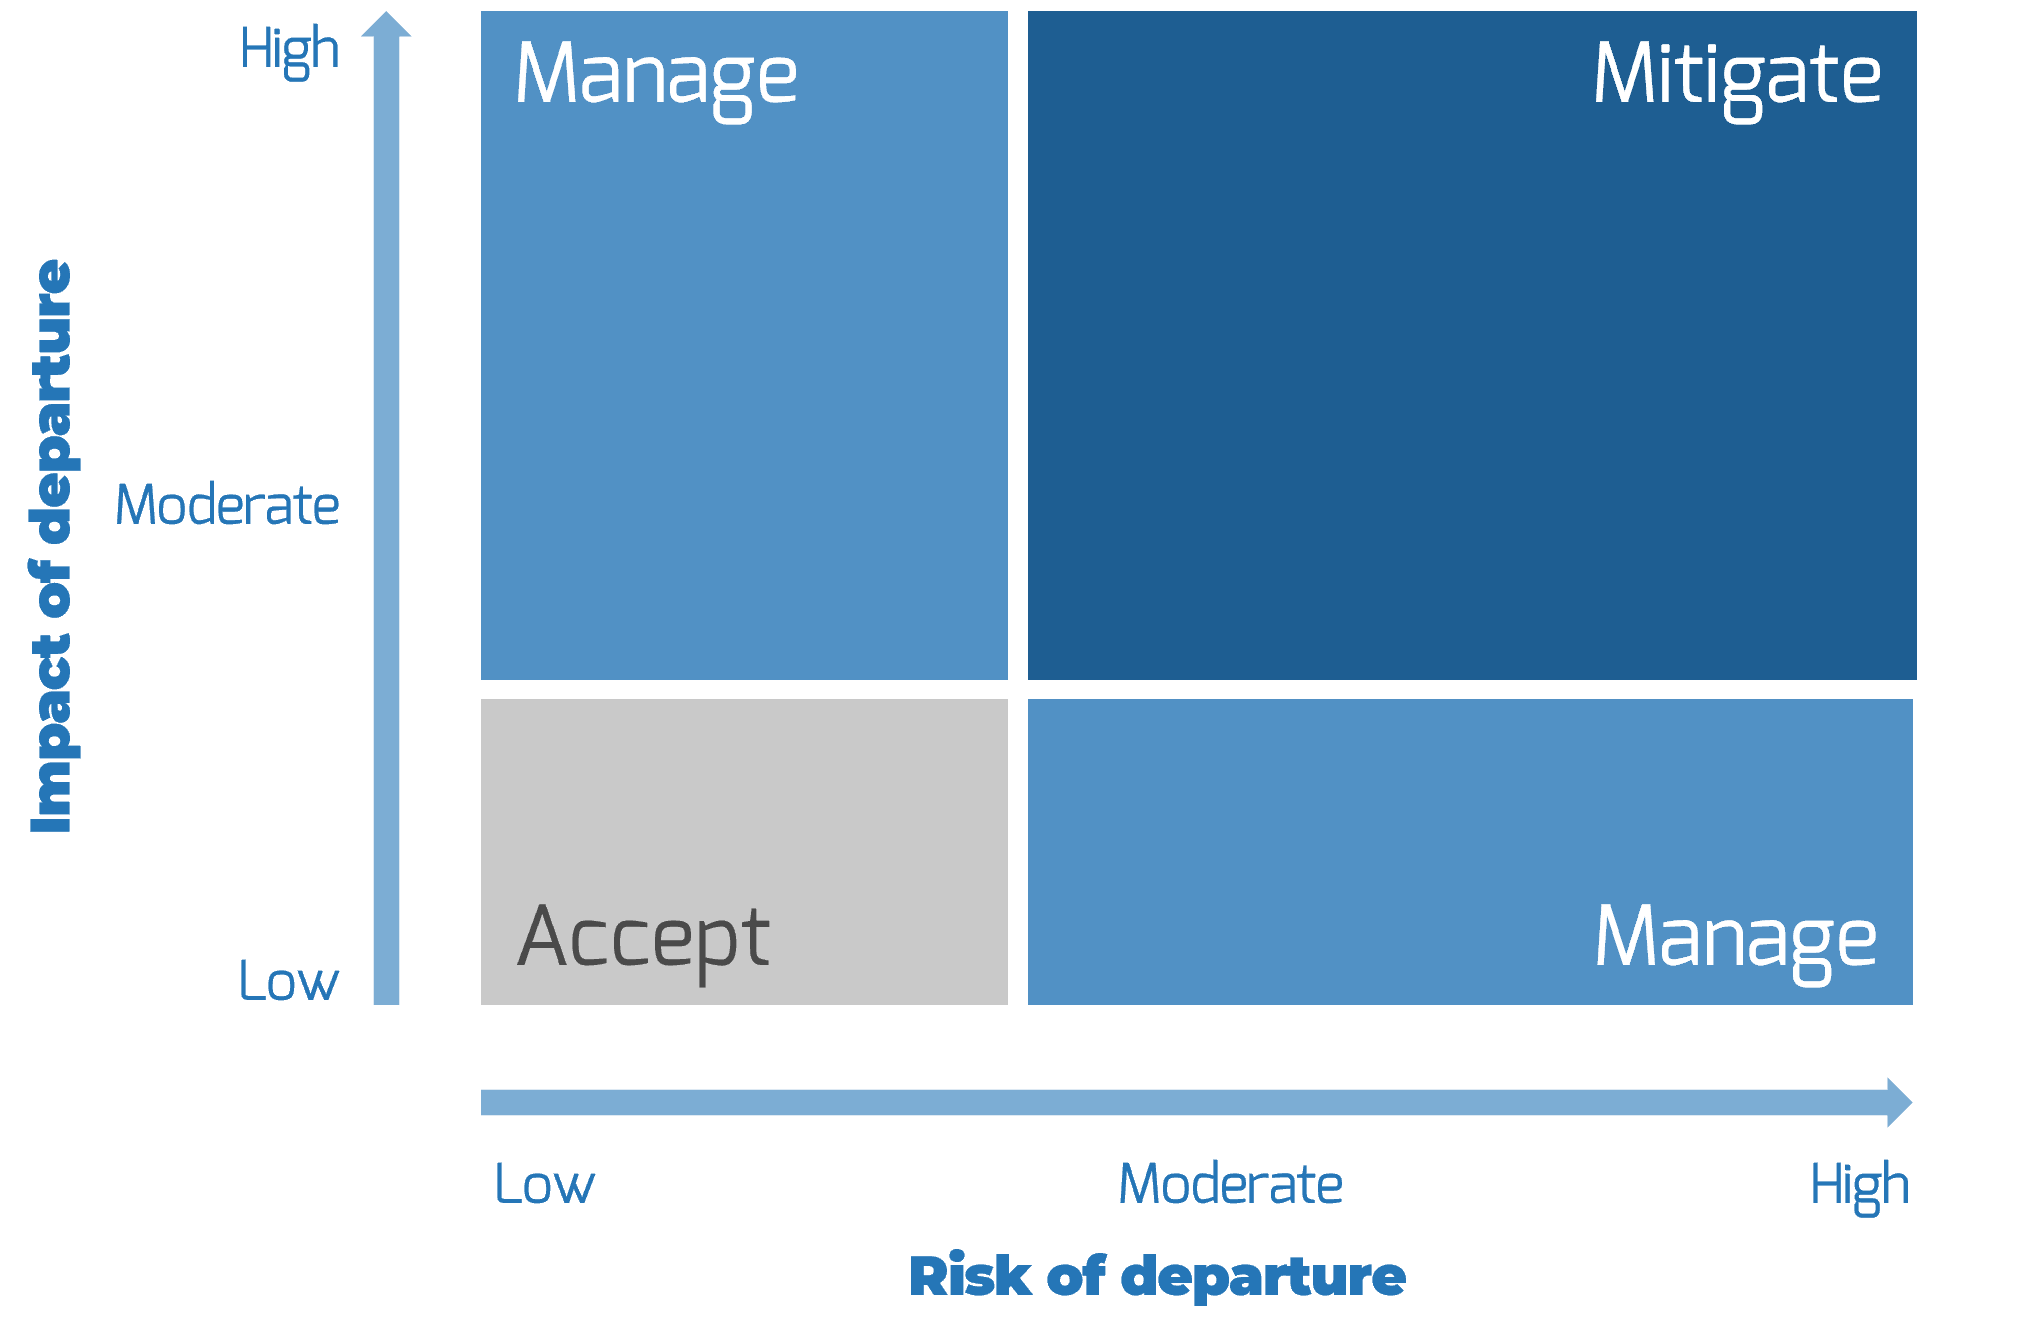


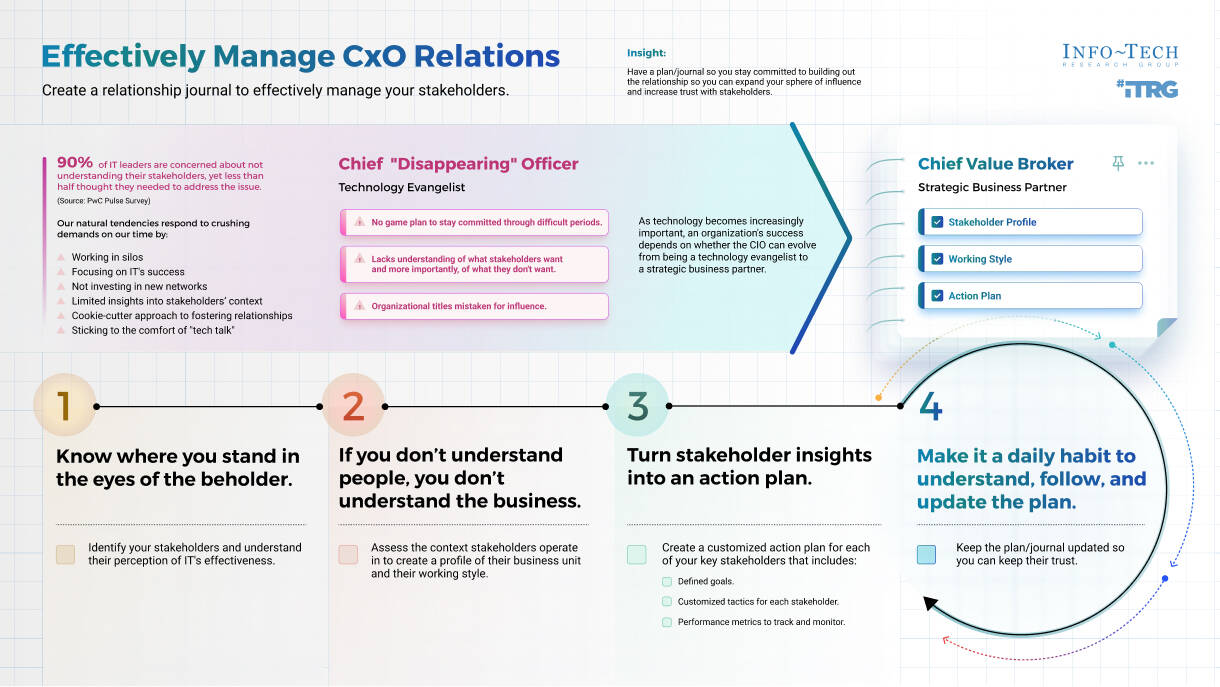

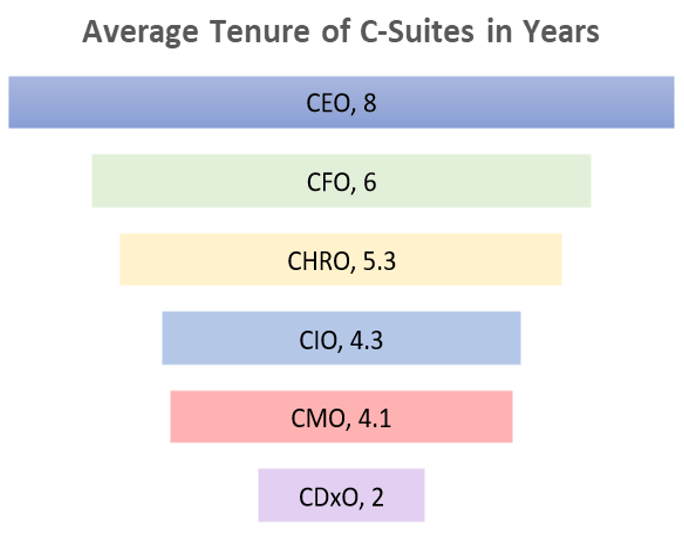
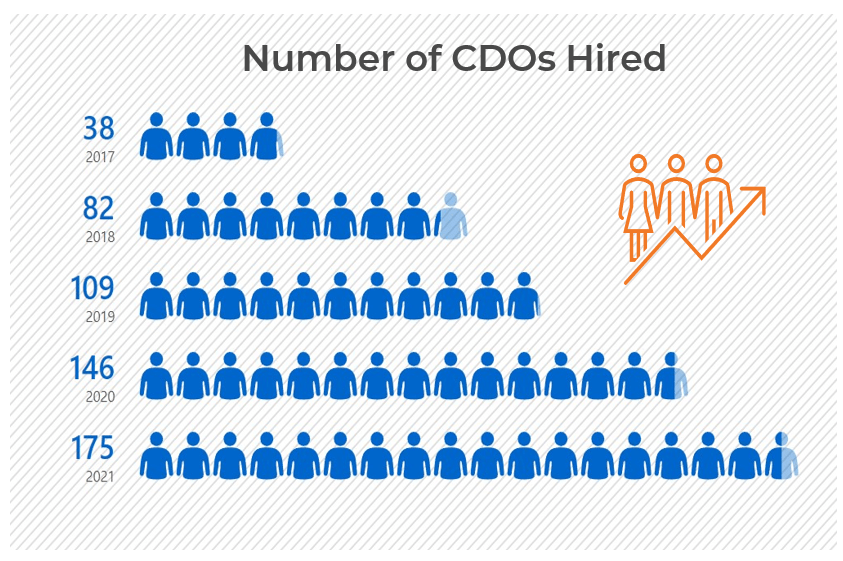
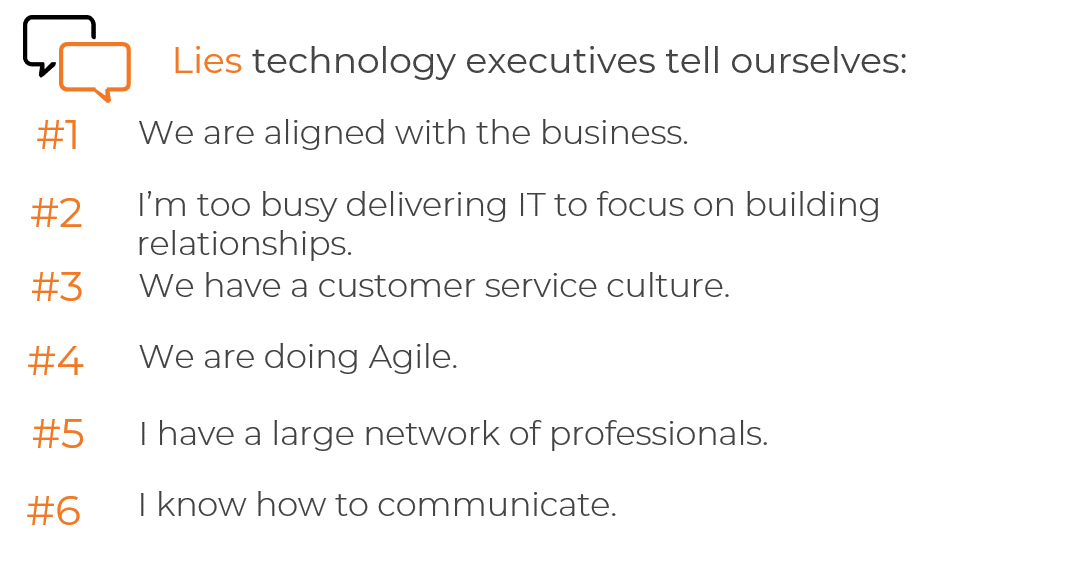

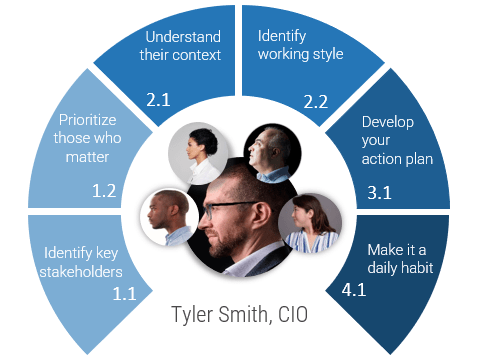
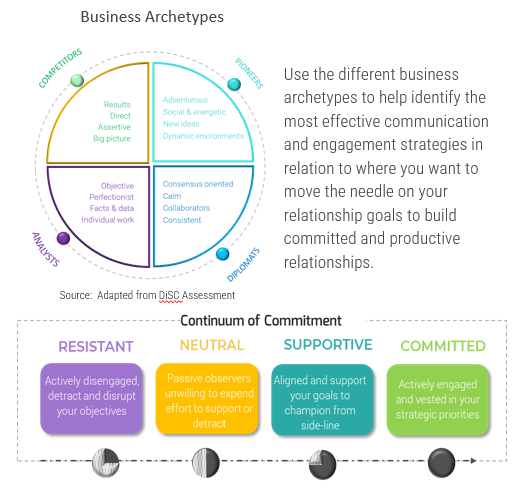


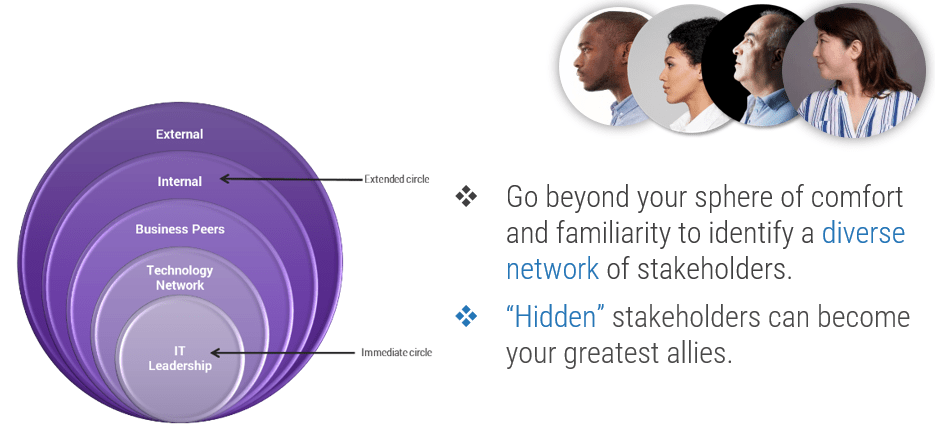
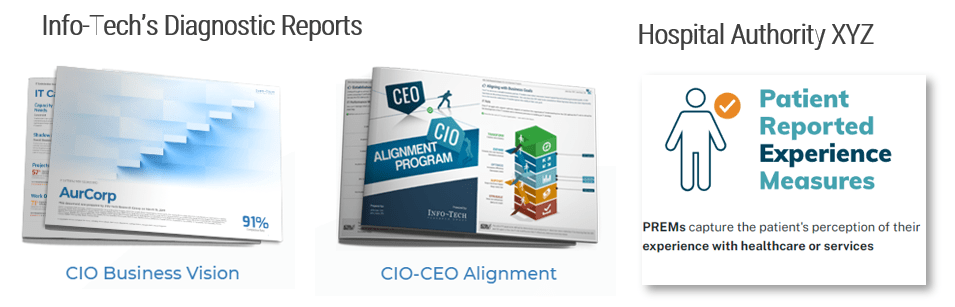
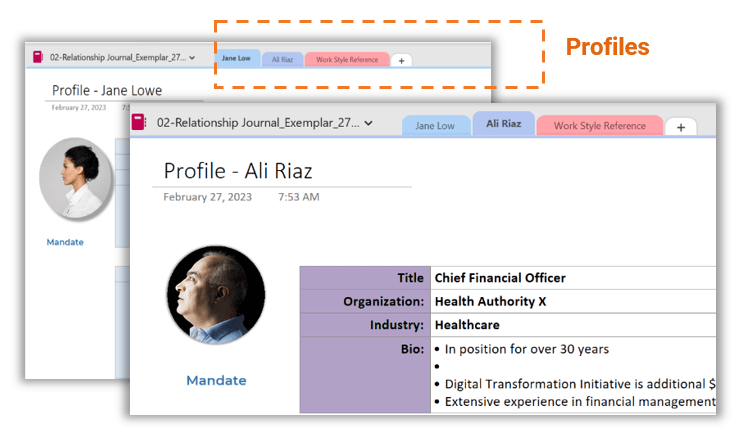
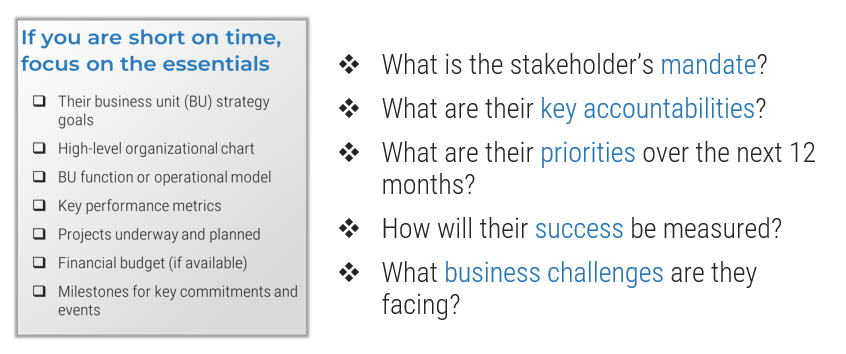
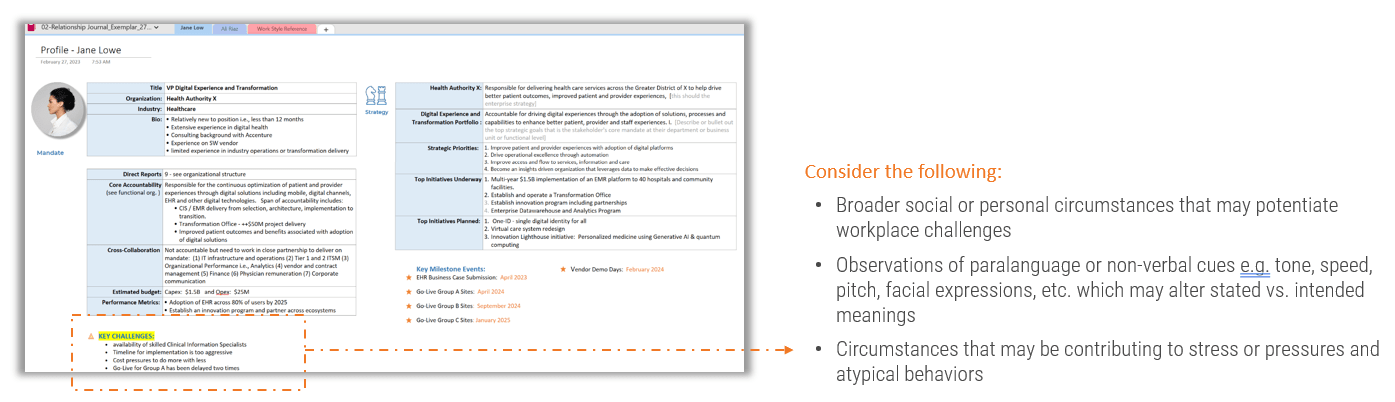
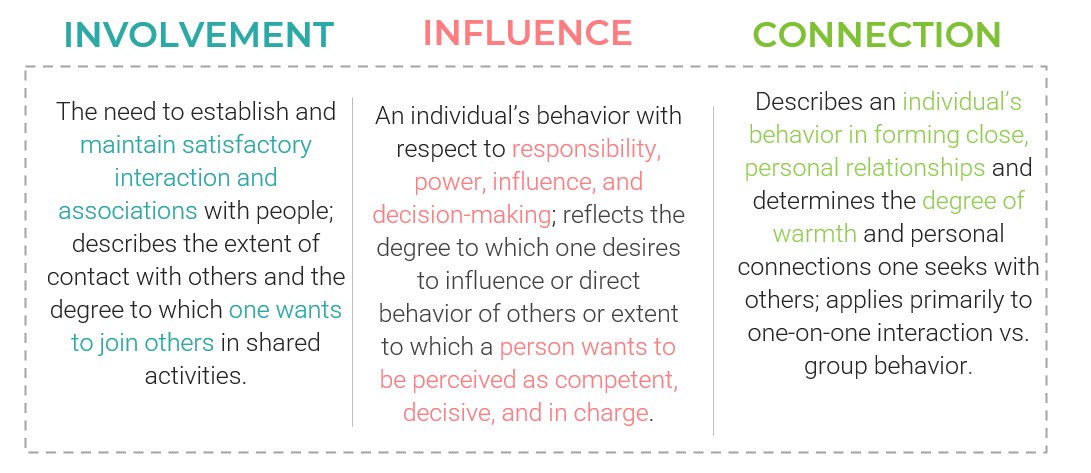
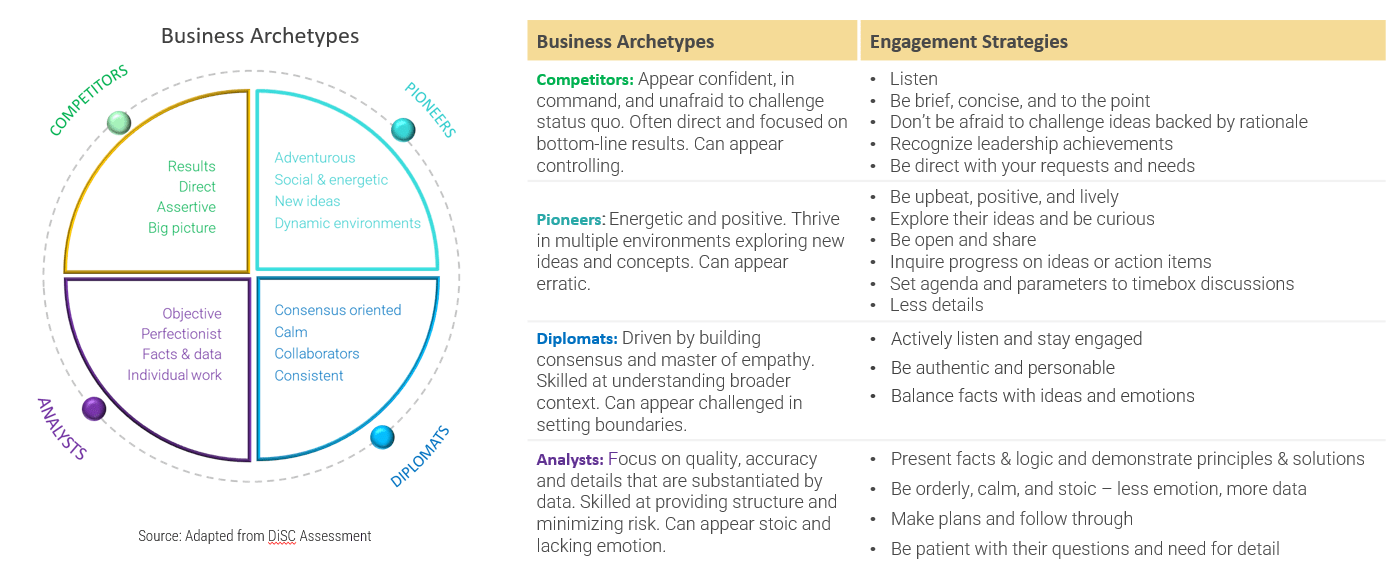


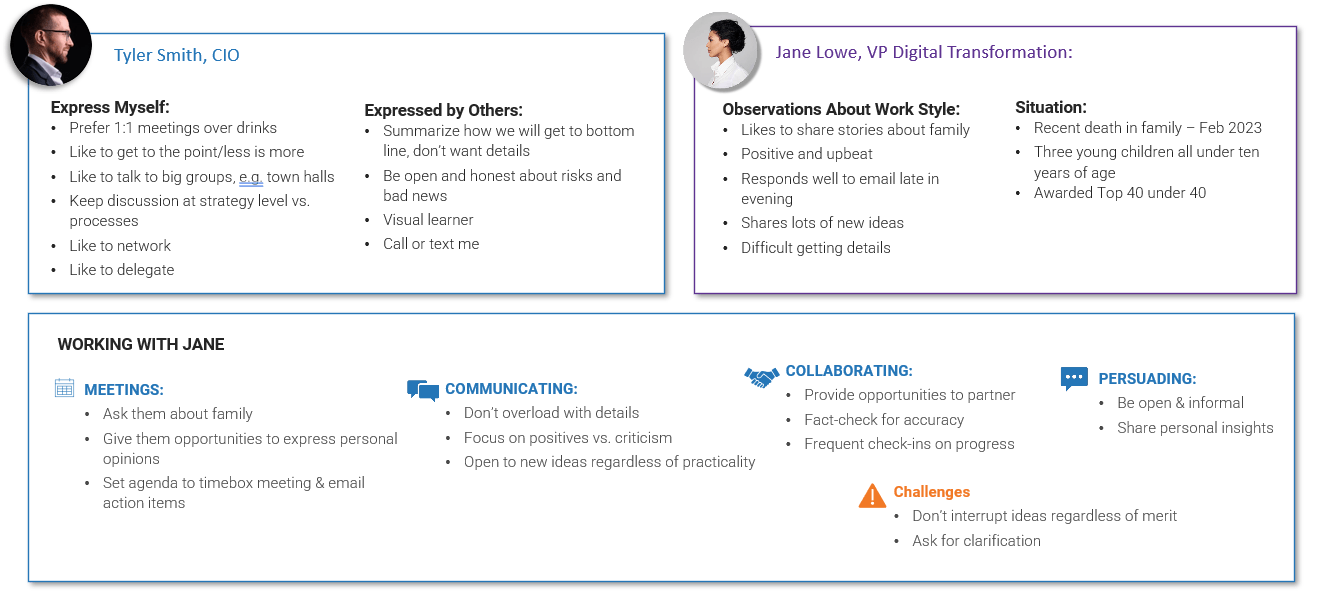
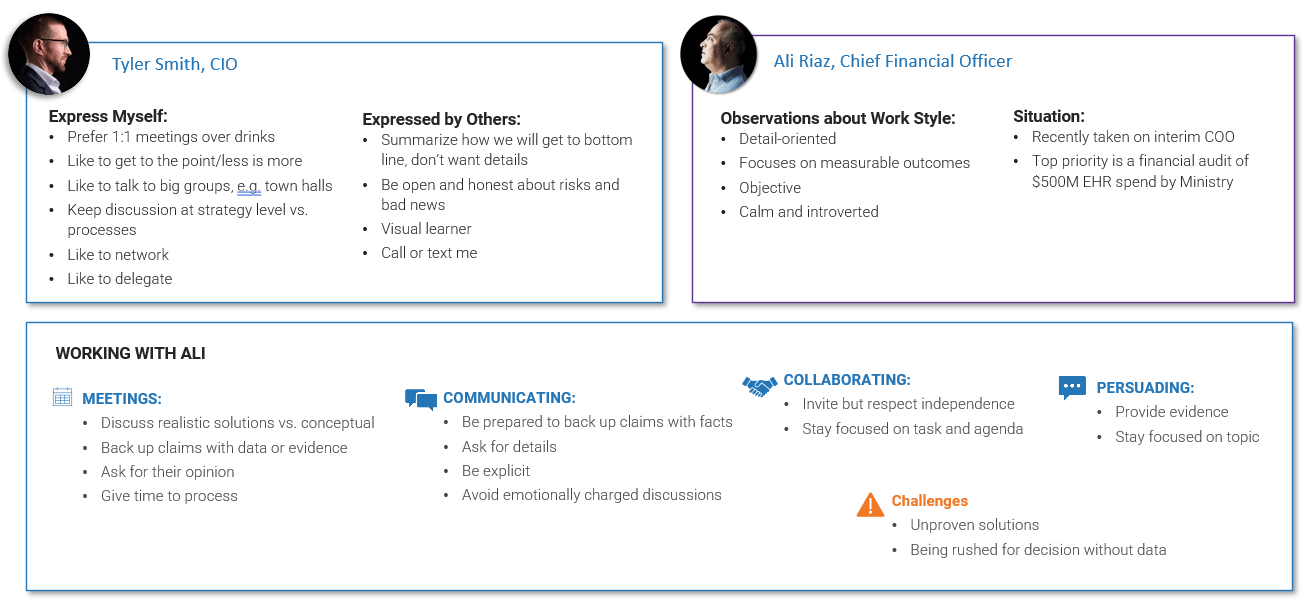
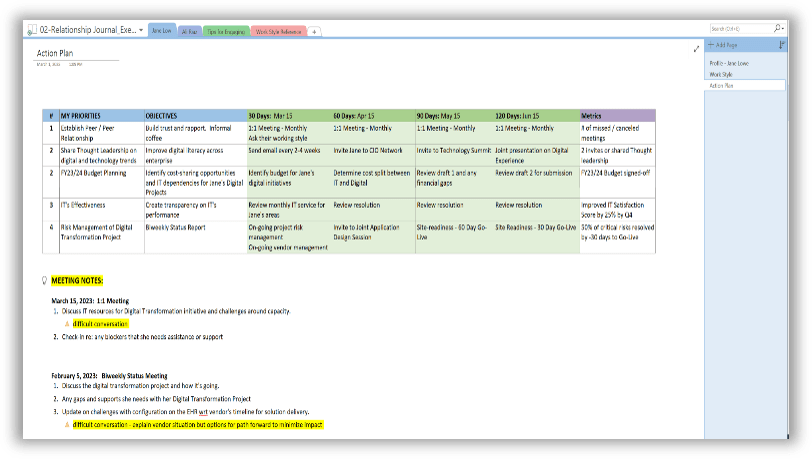

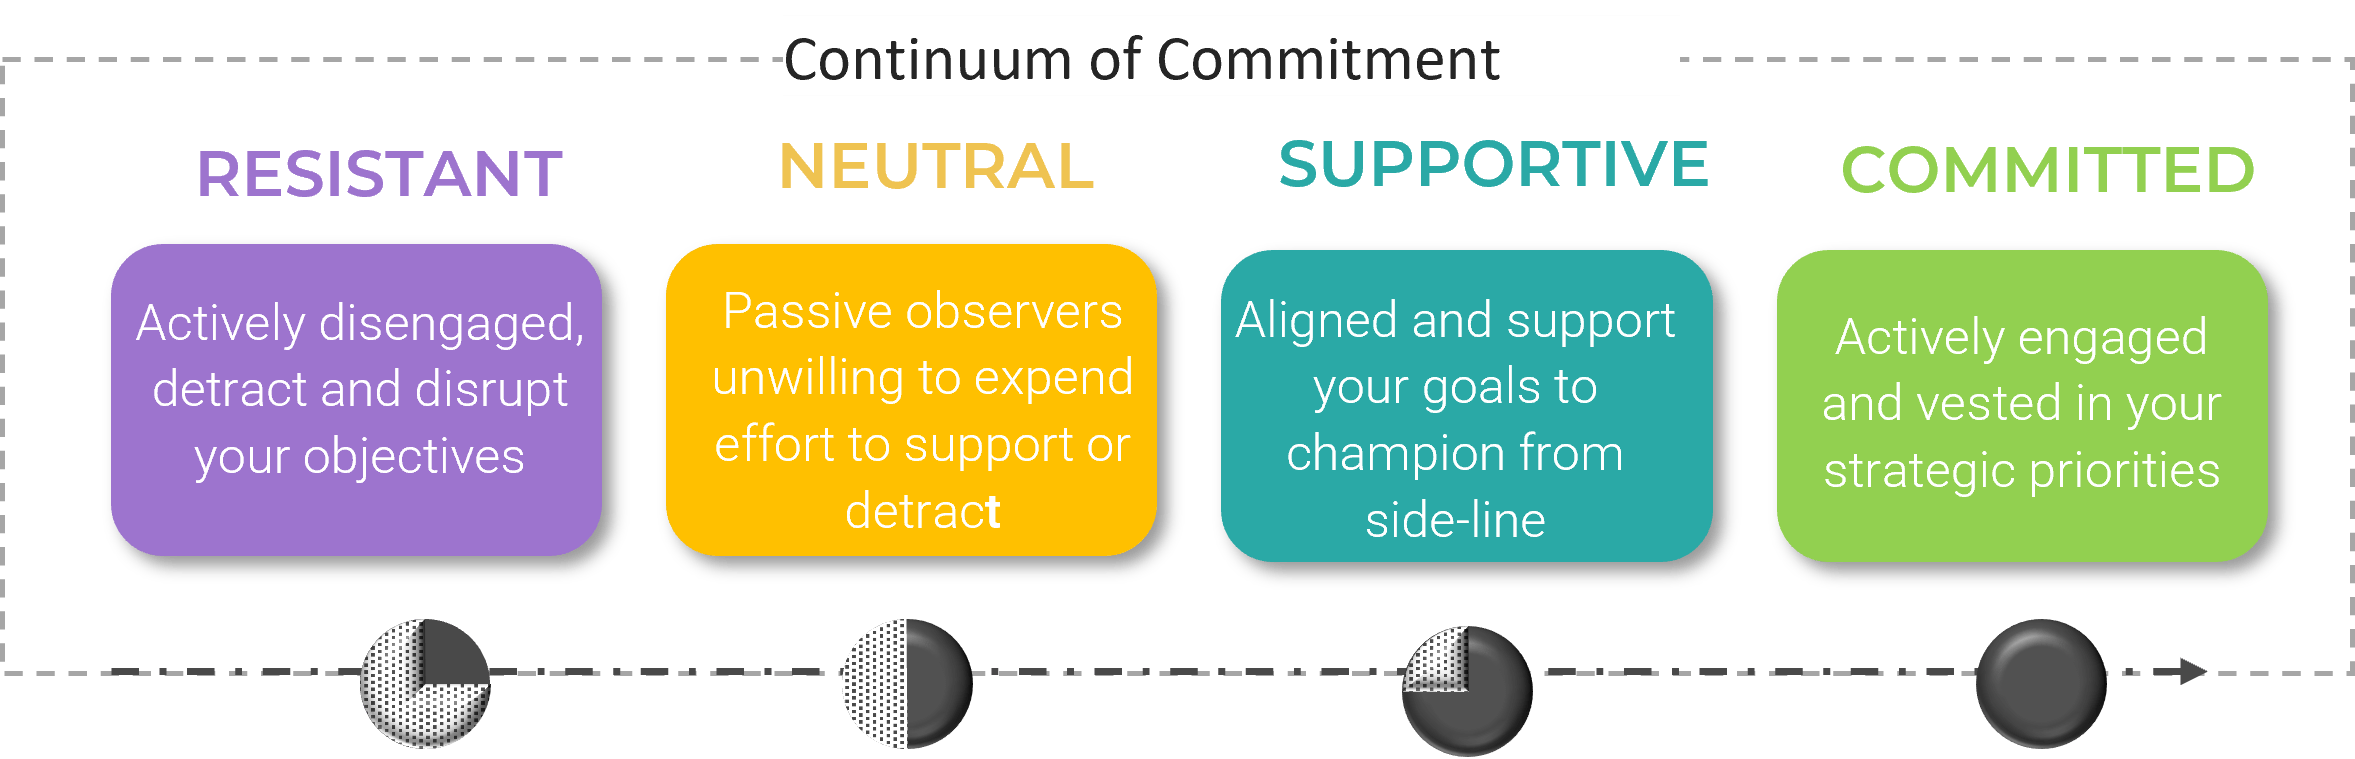
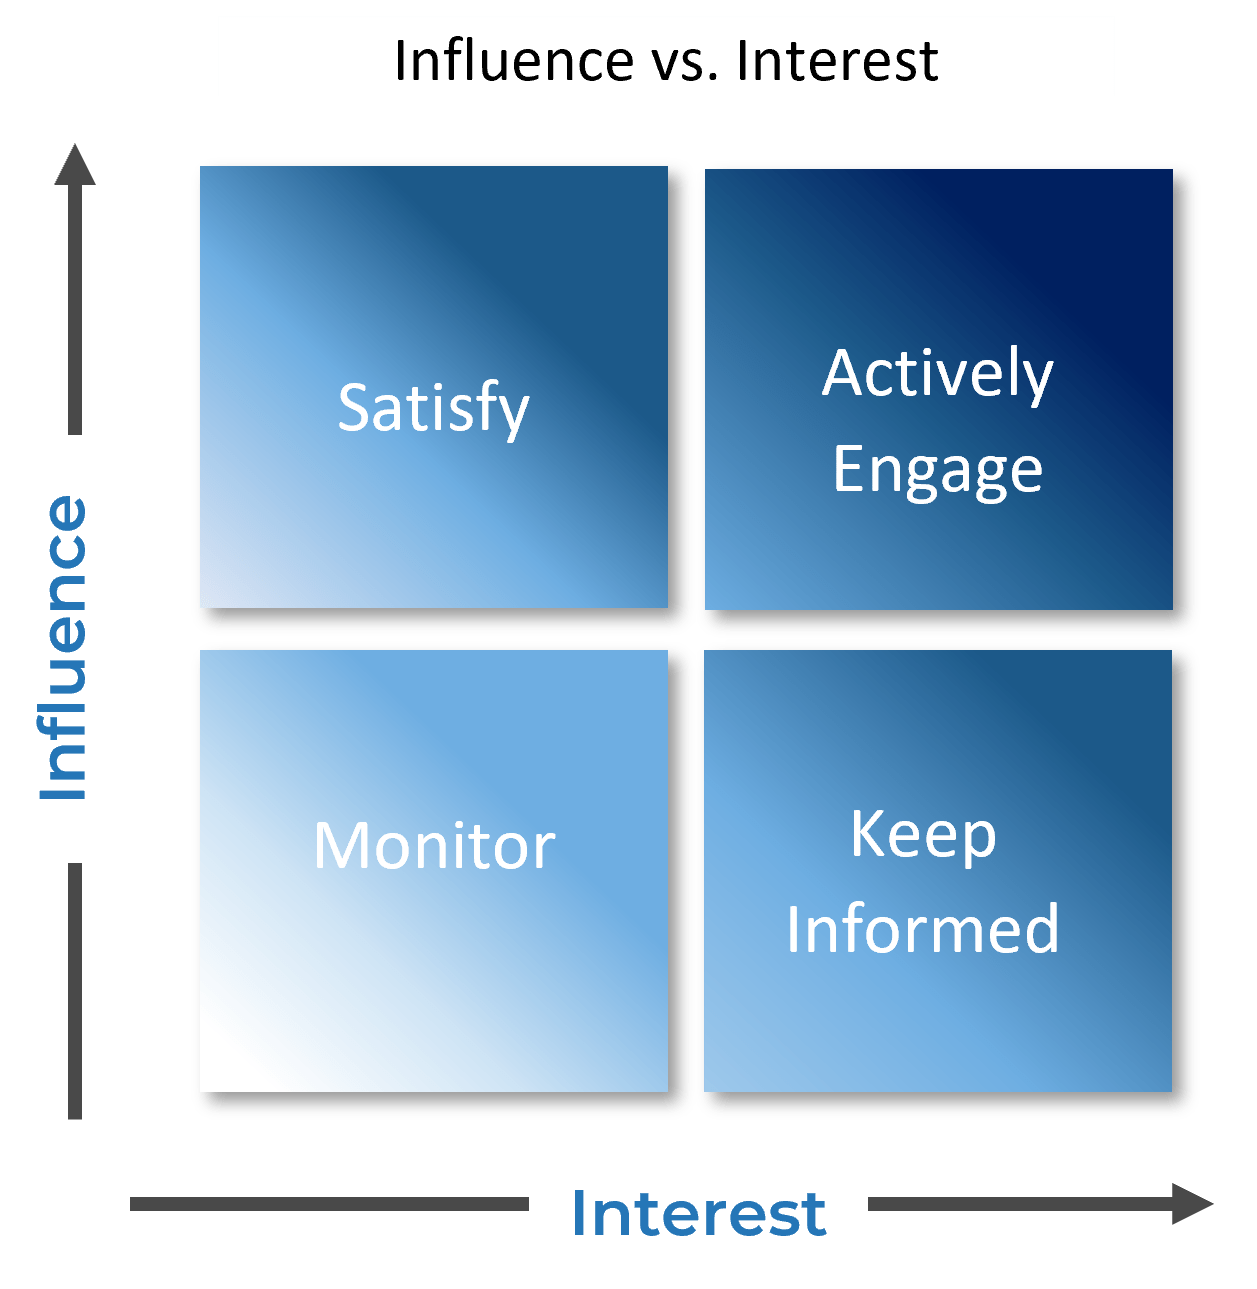
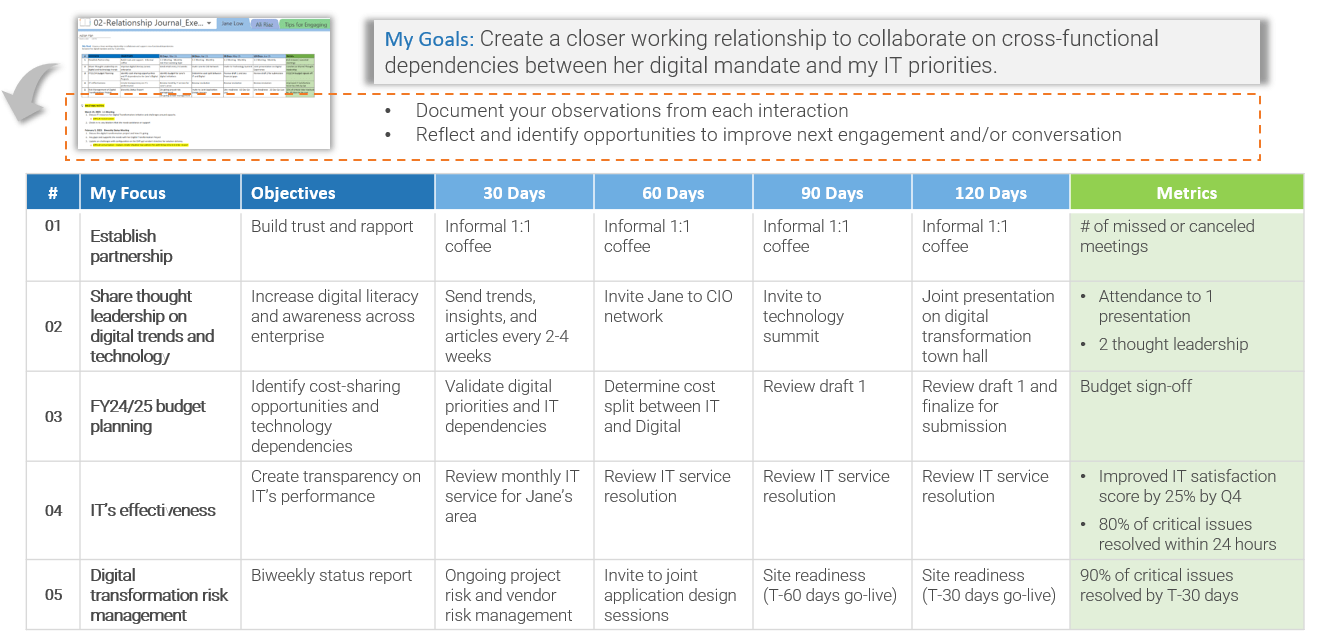
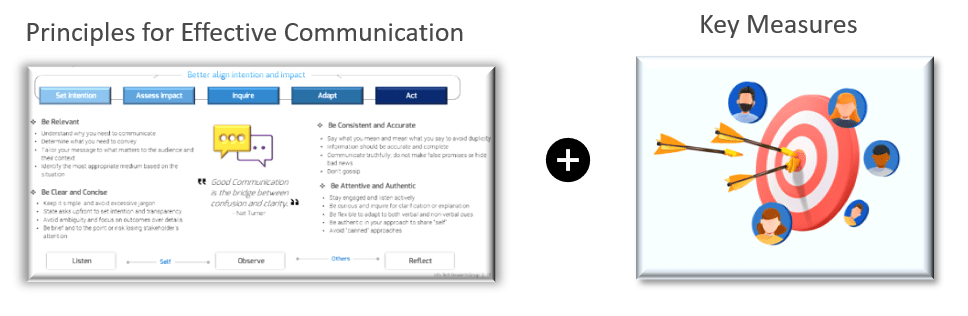
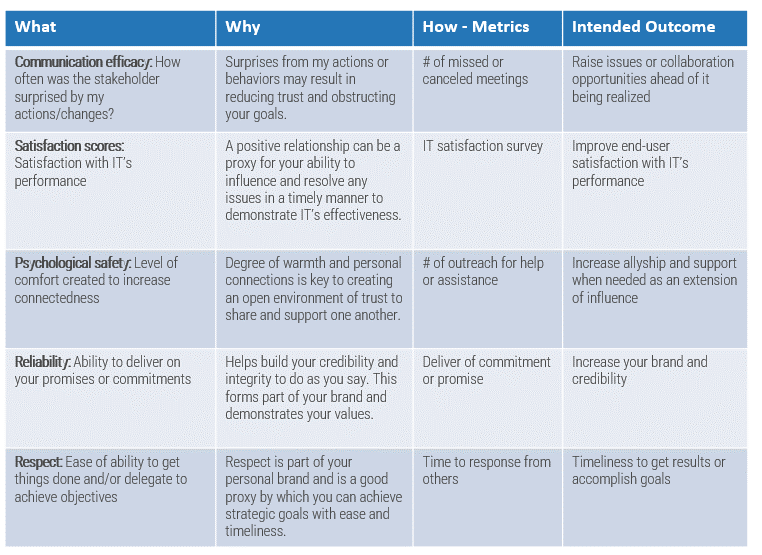


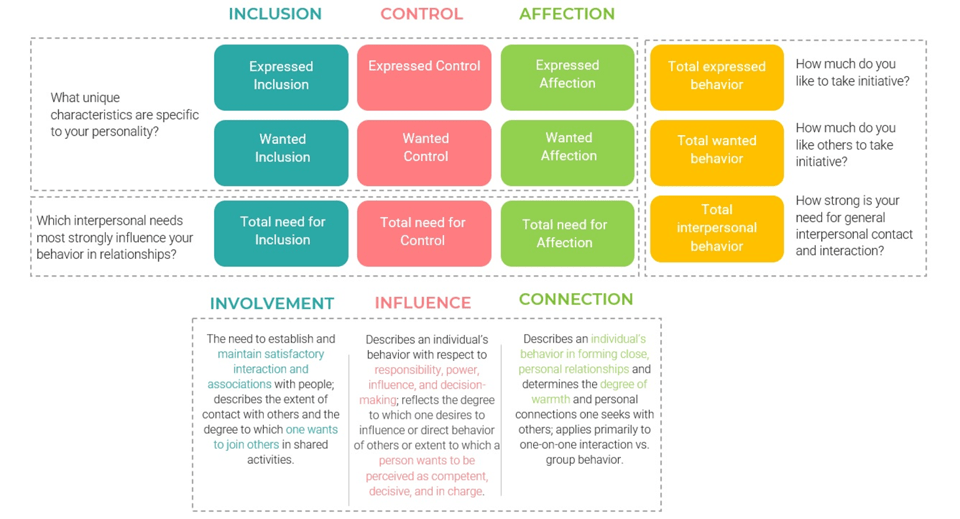
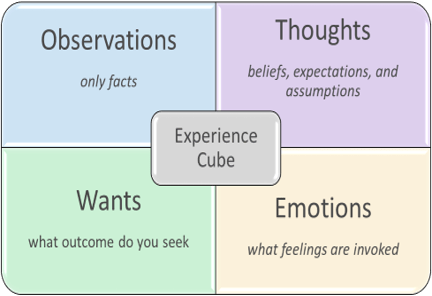


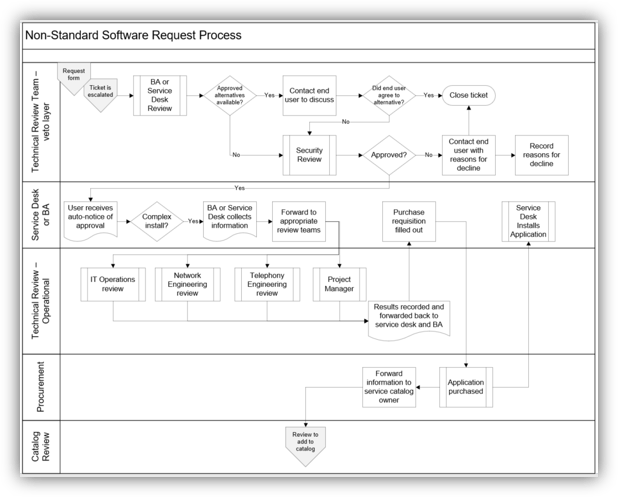
 (Venn diagram recreated from


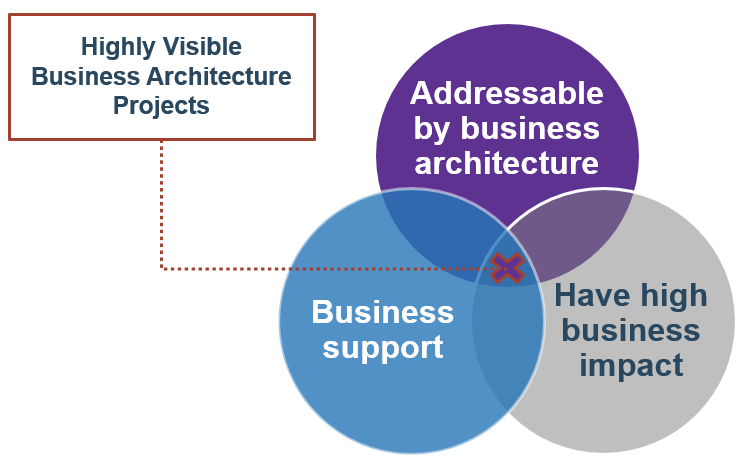
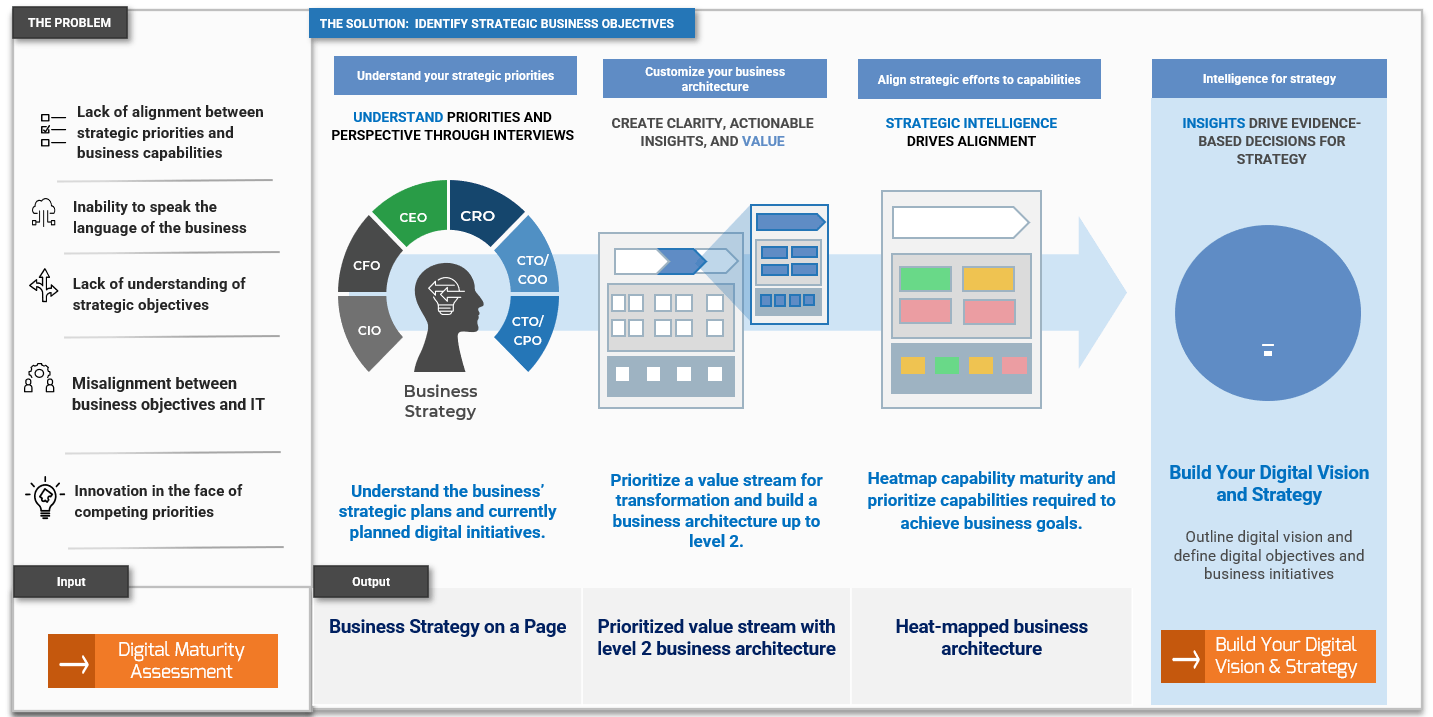
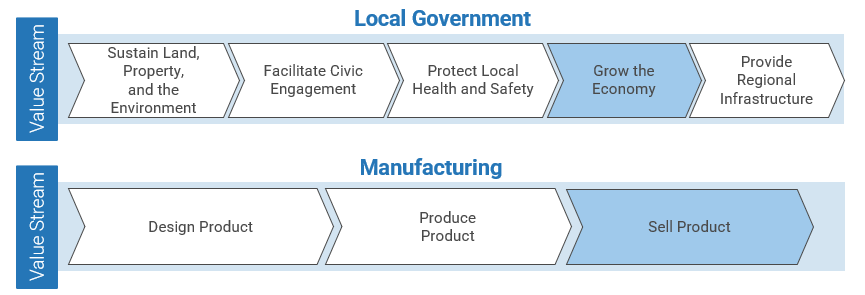
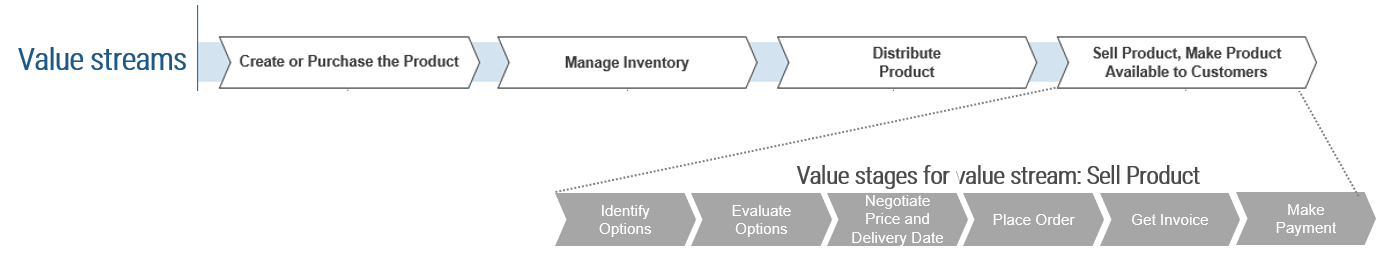
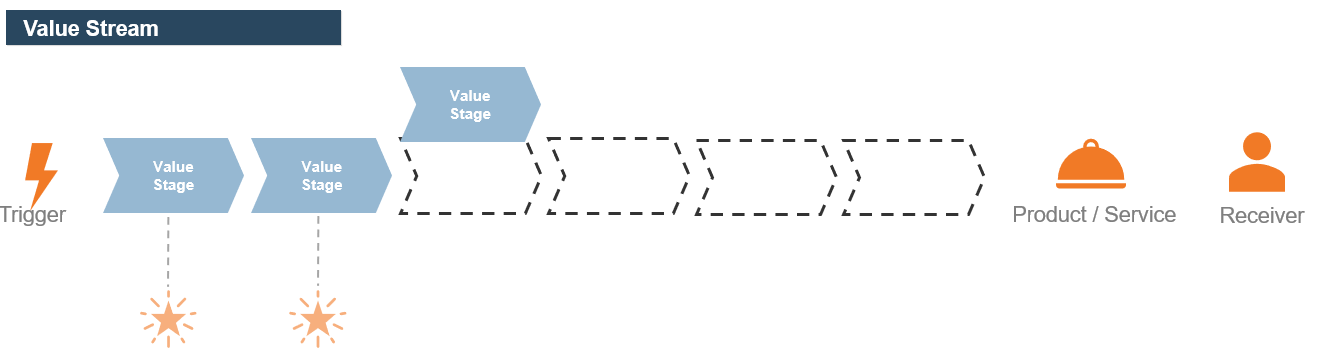
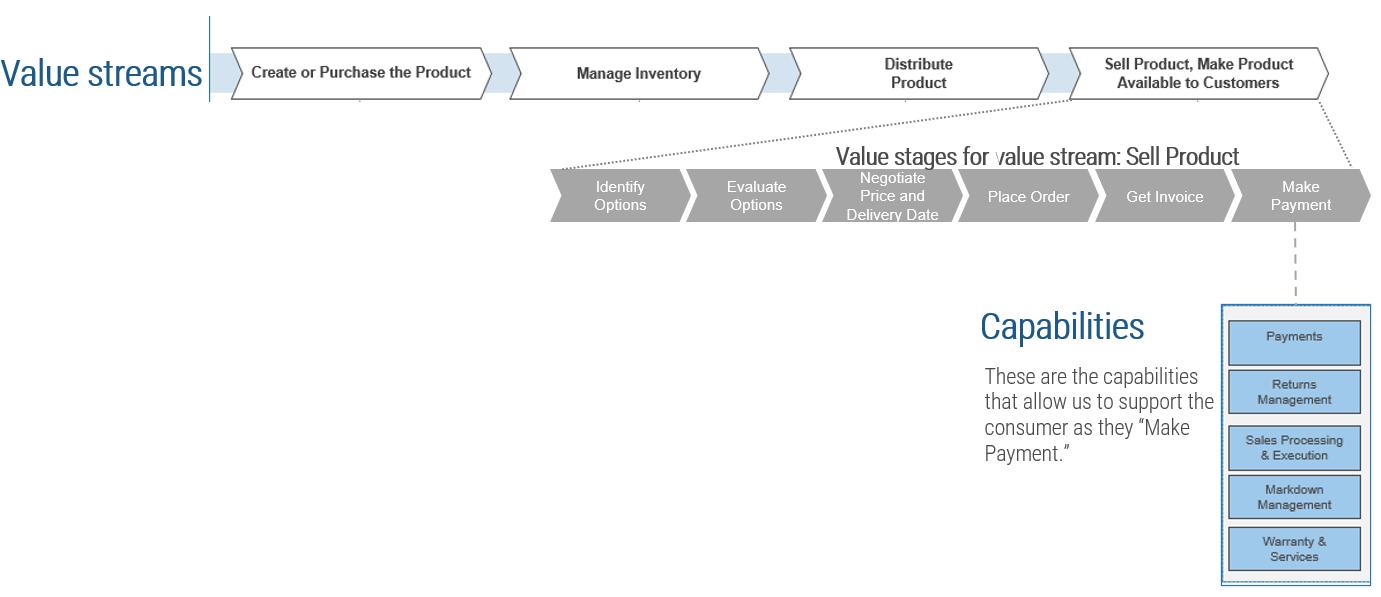

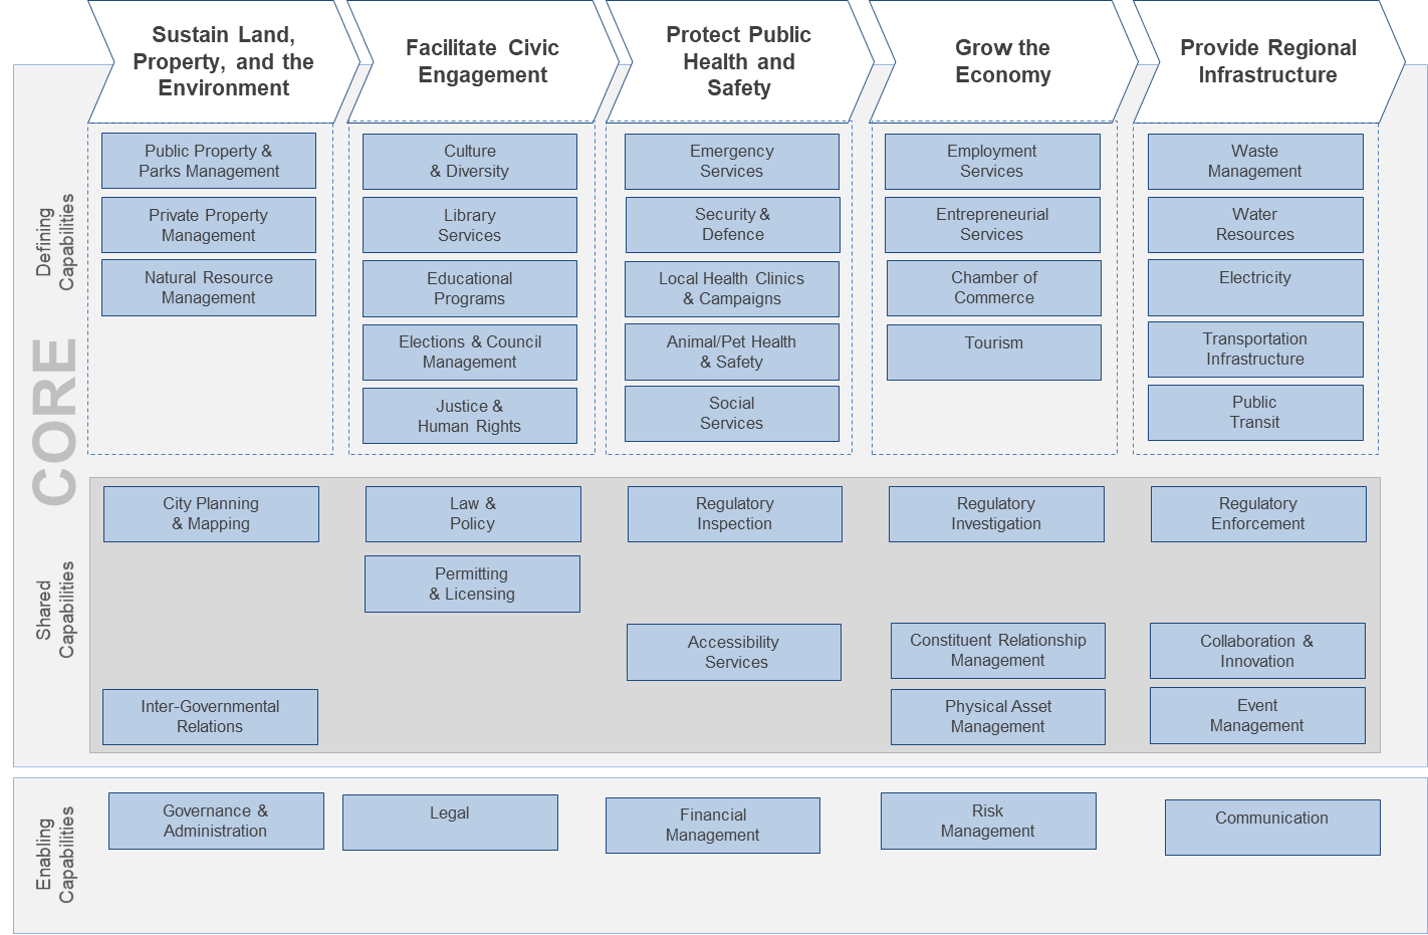
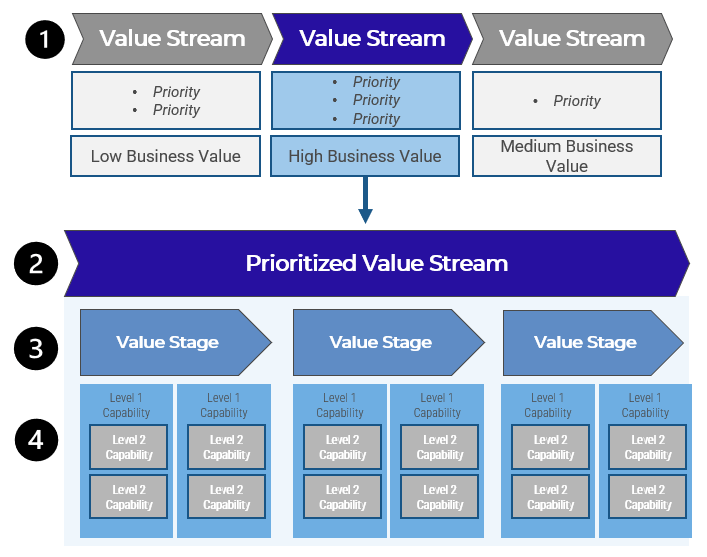
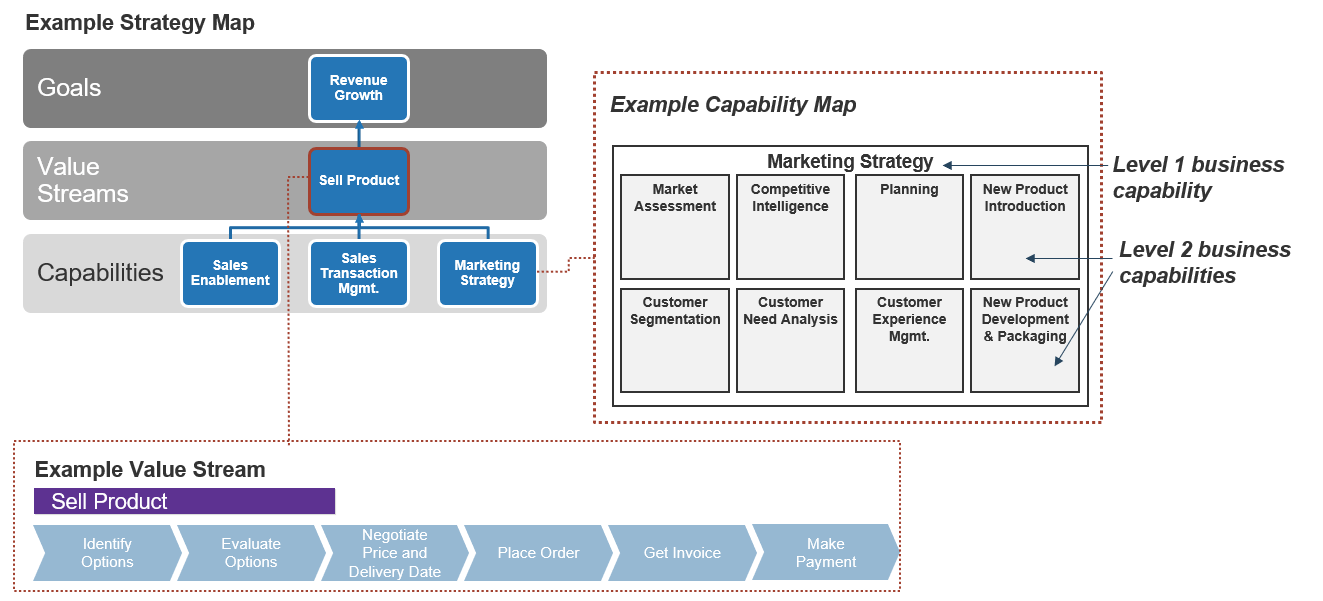
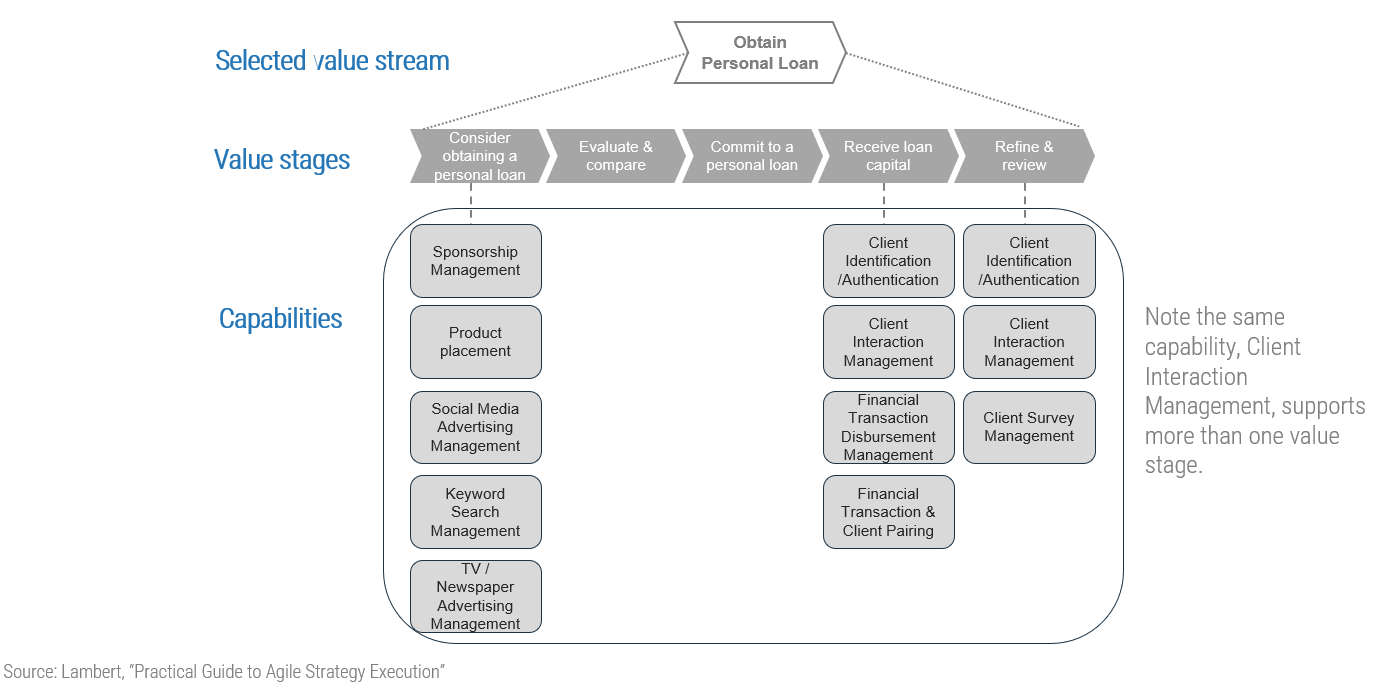
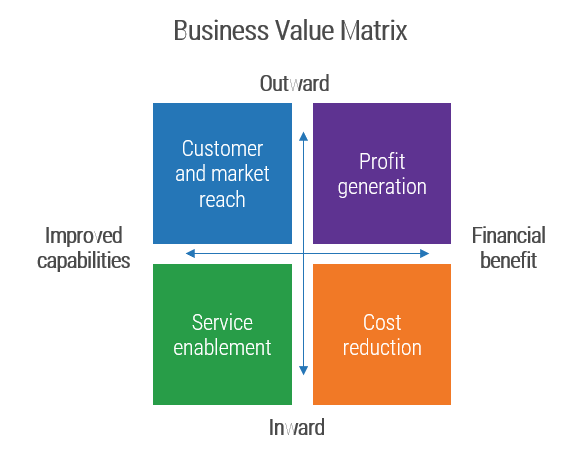
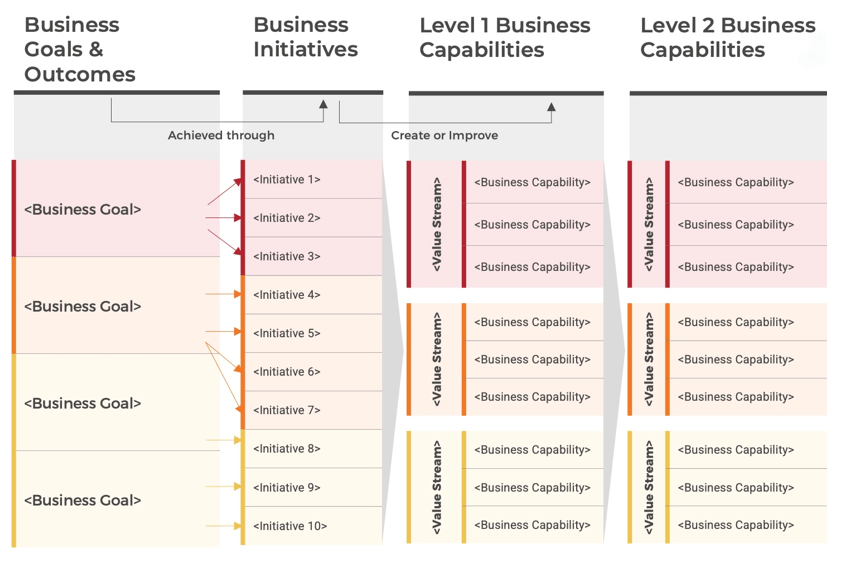
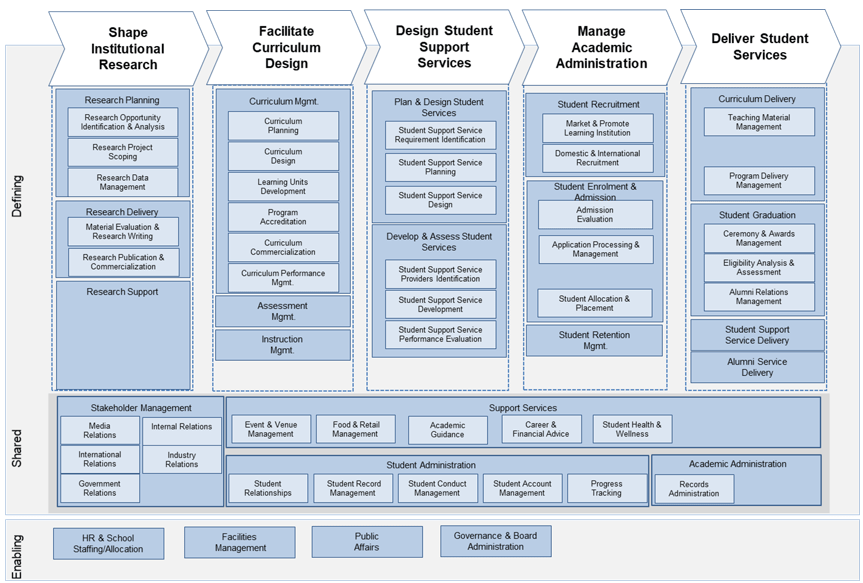
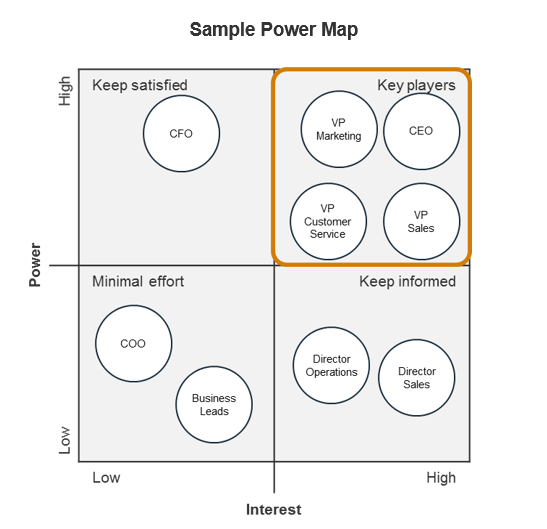
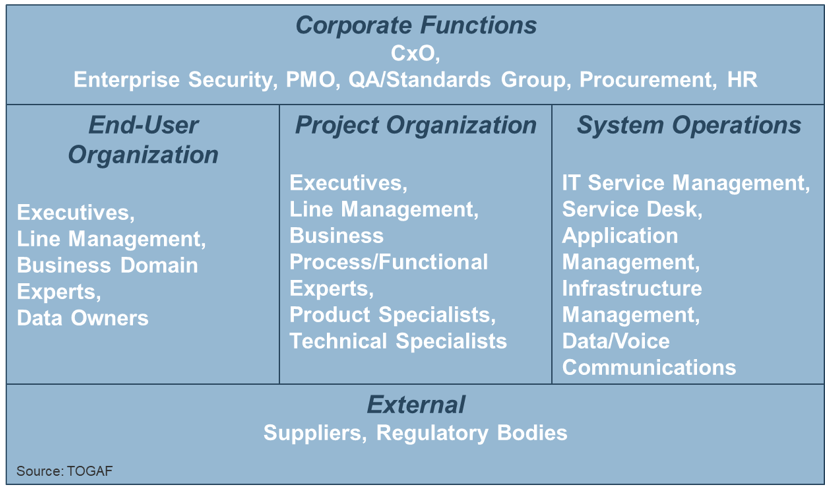
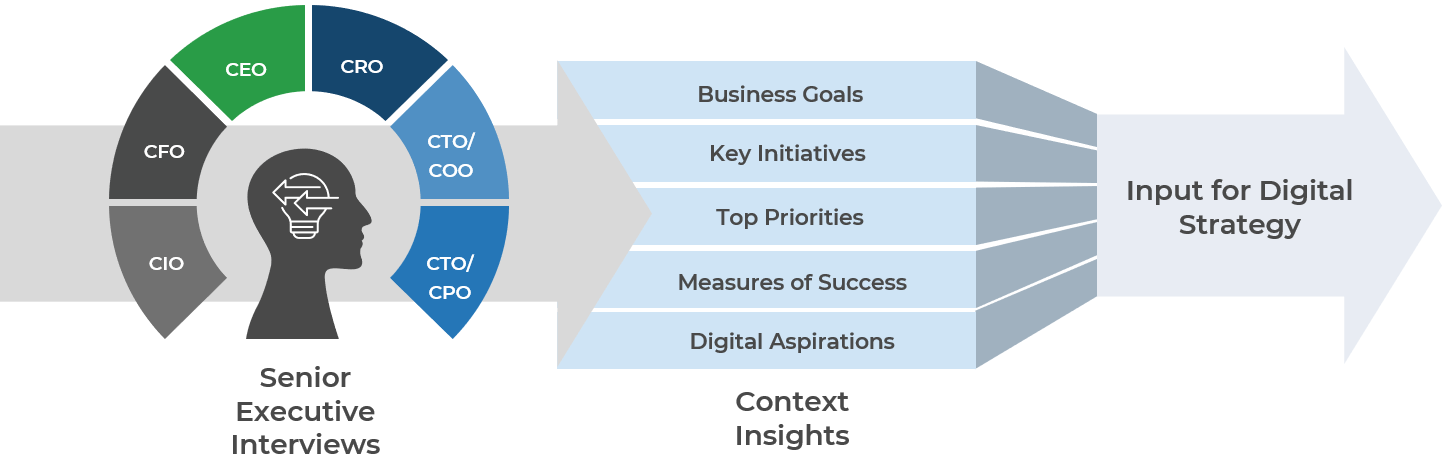
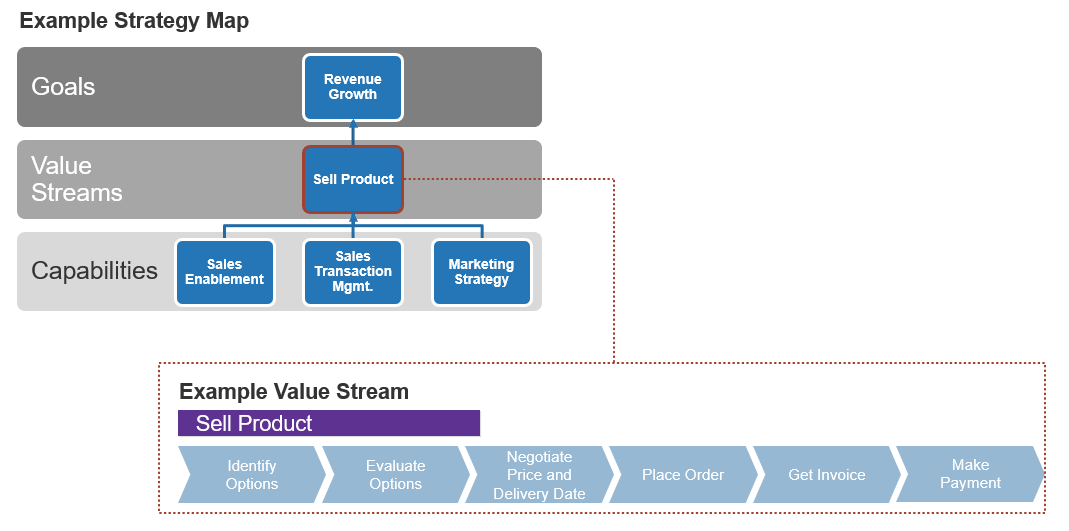
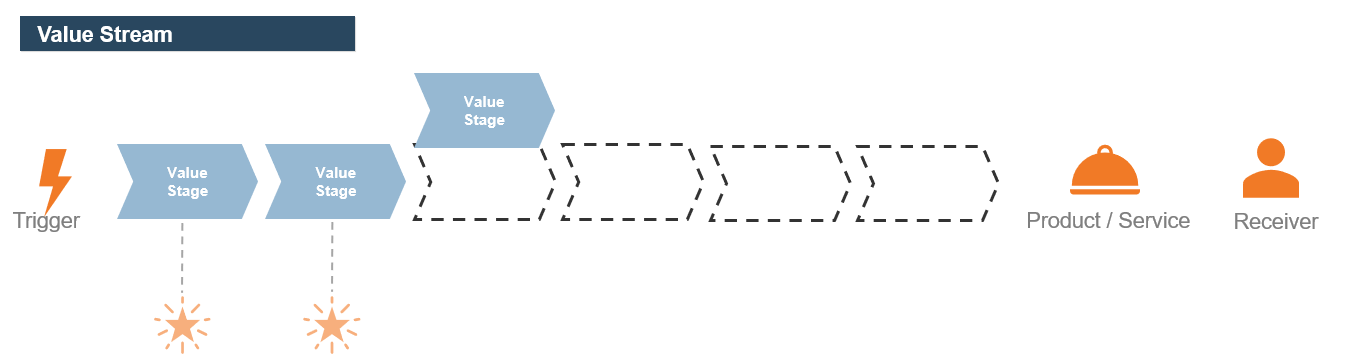
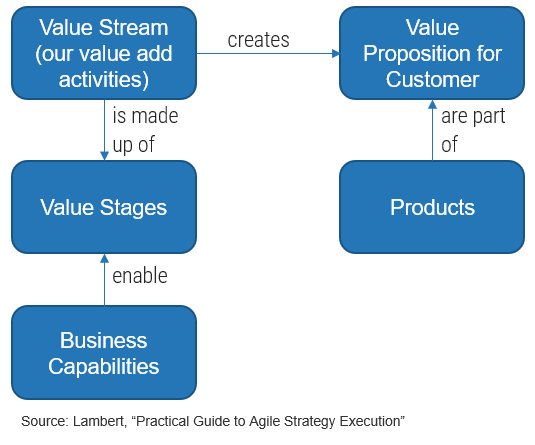
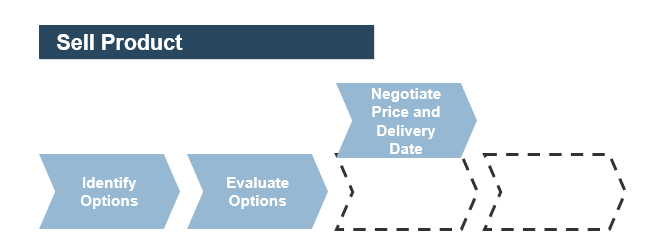
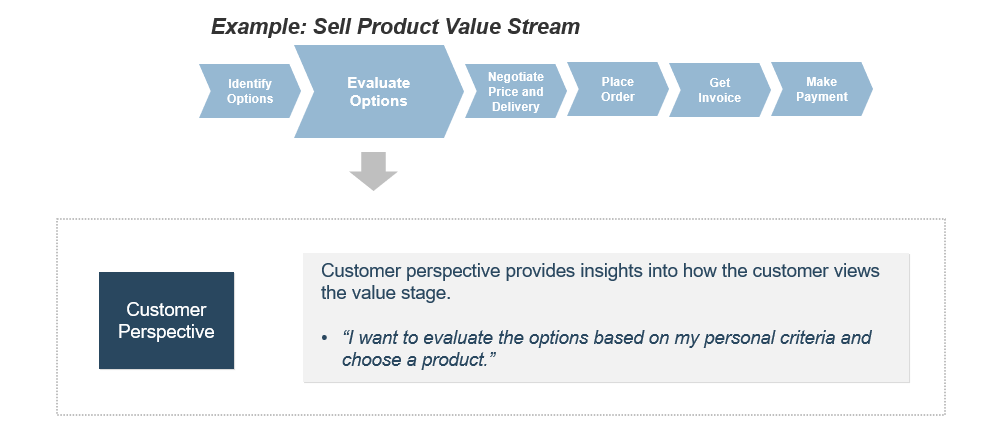
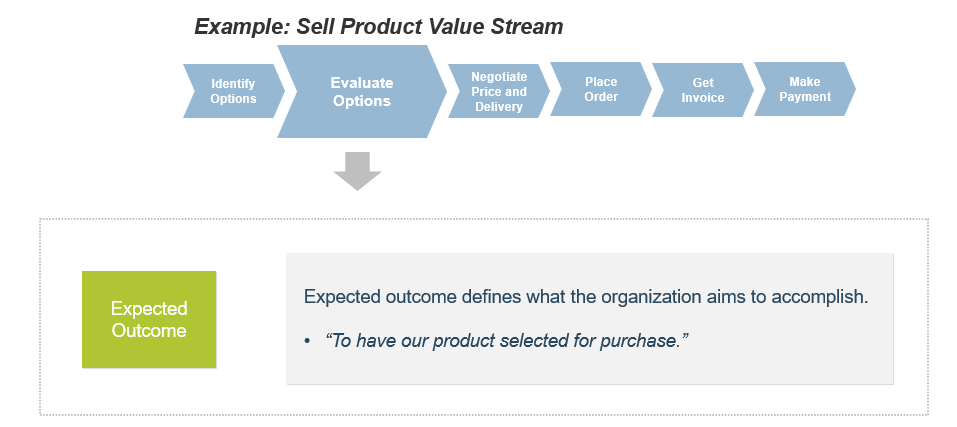
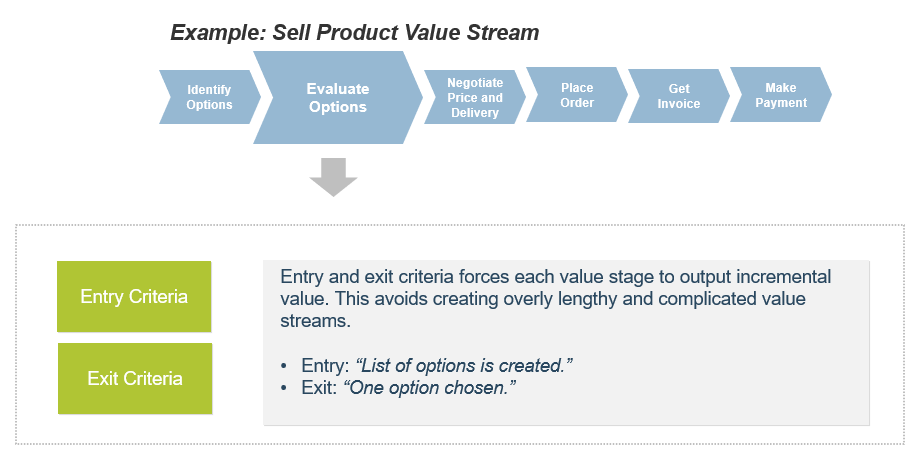
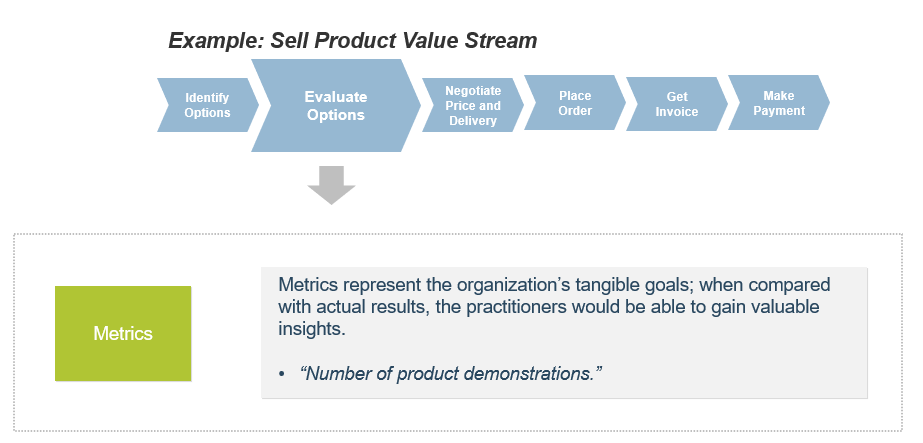
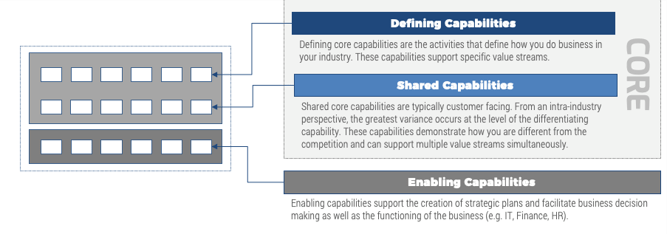
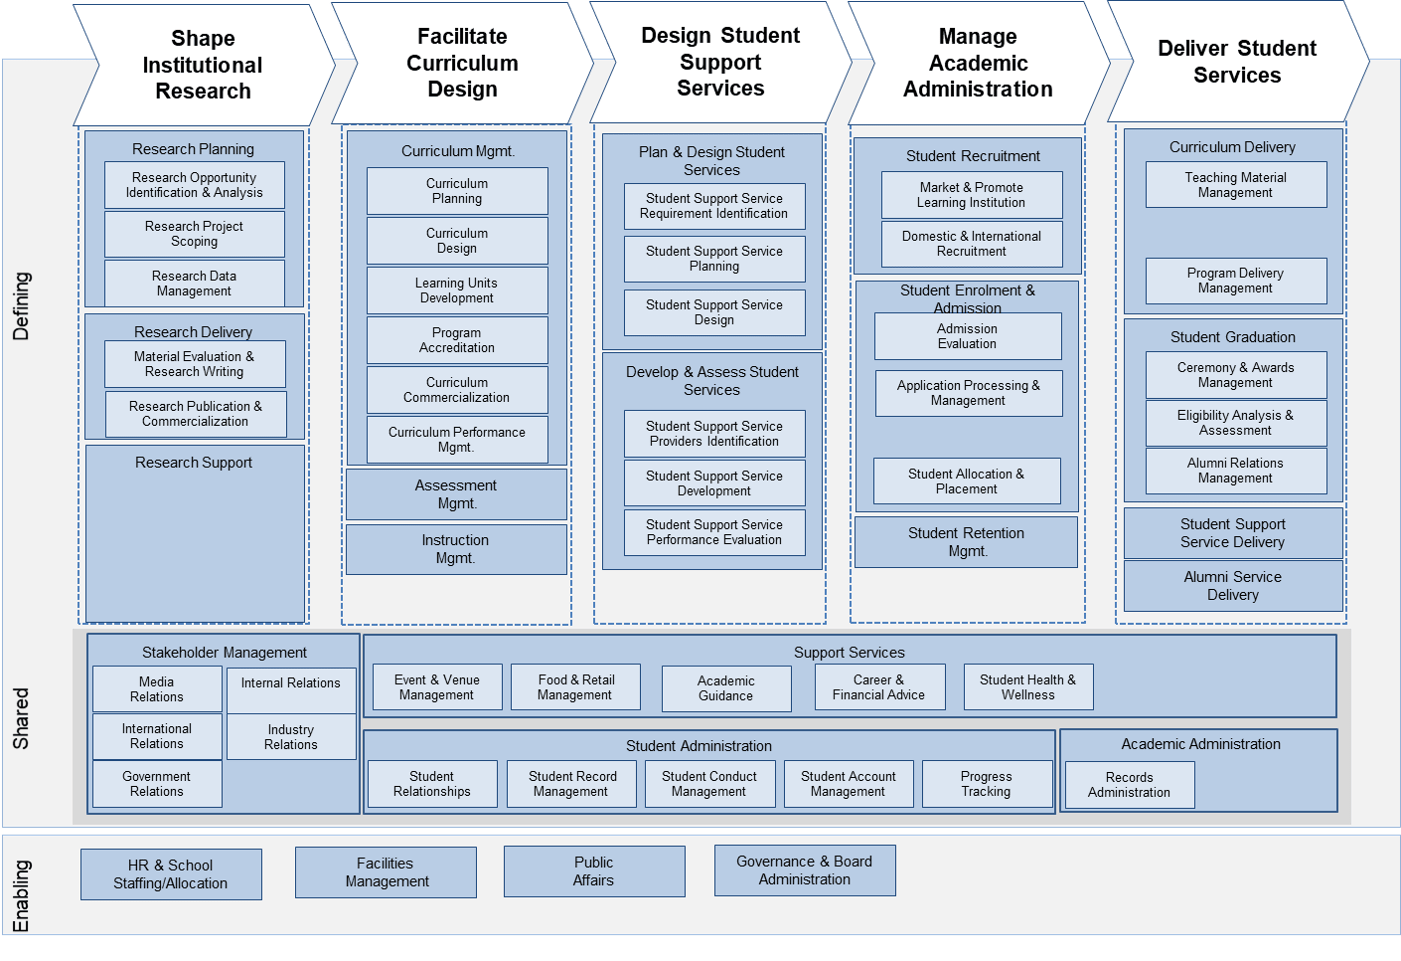

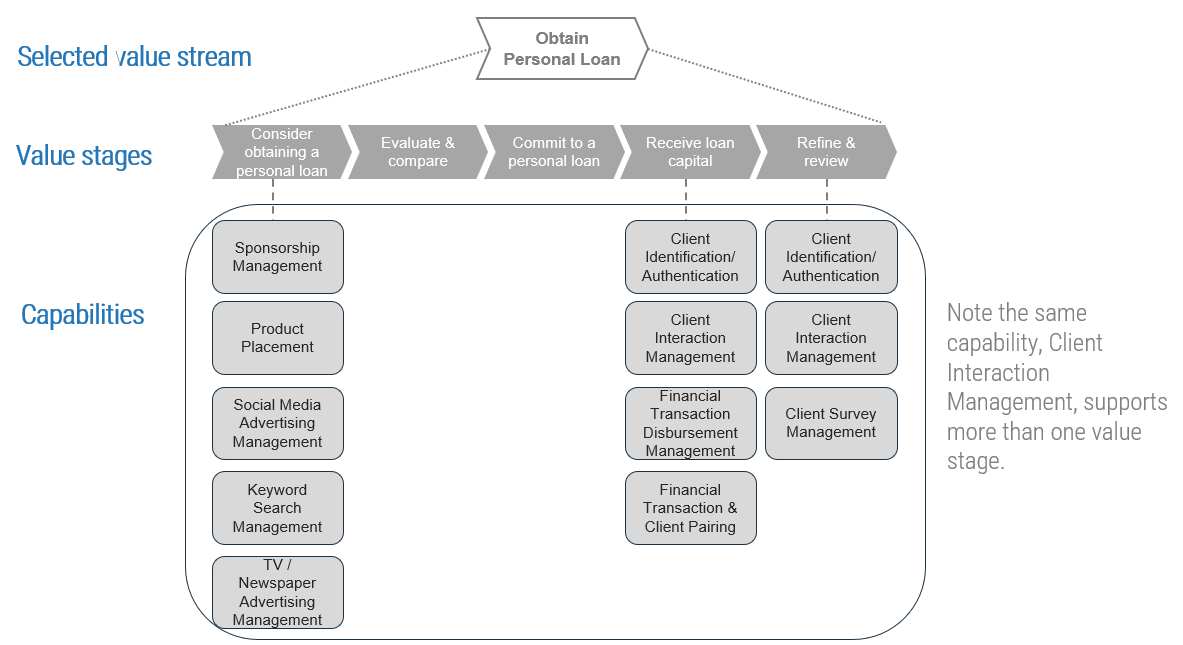
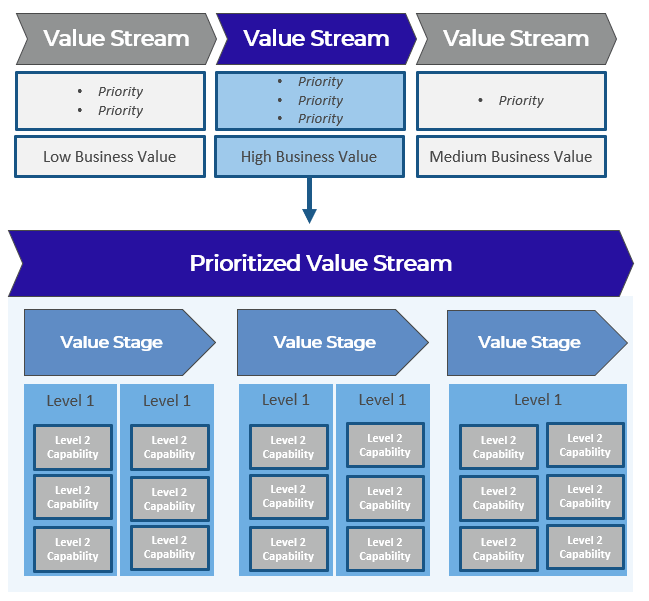
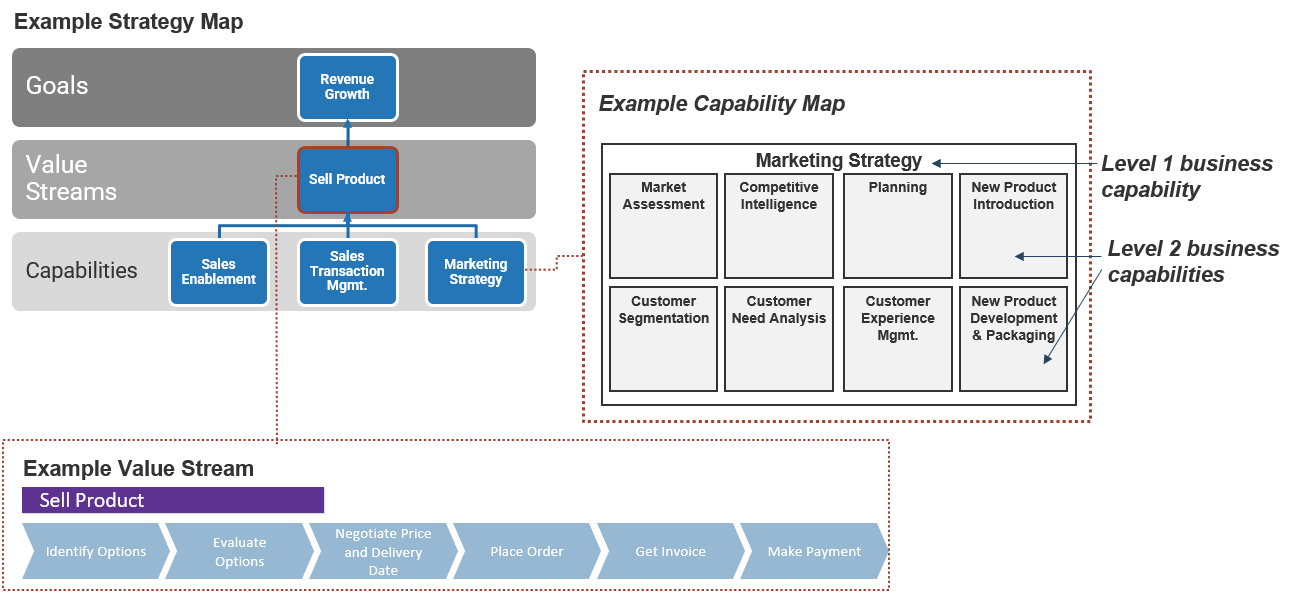
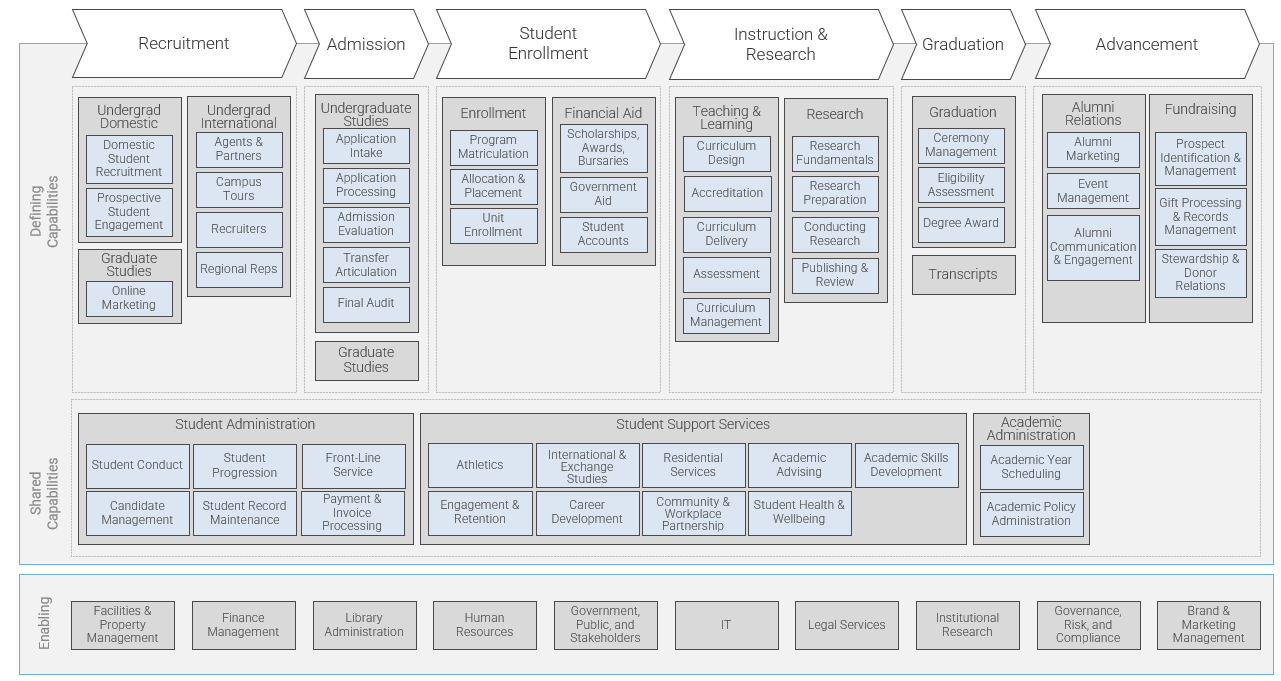
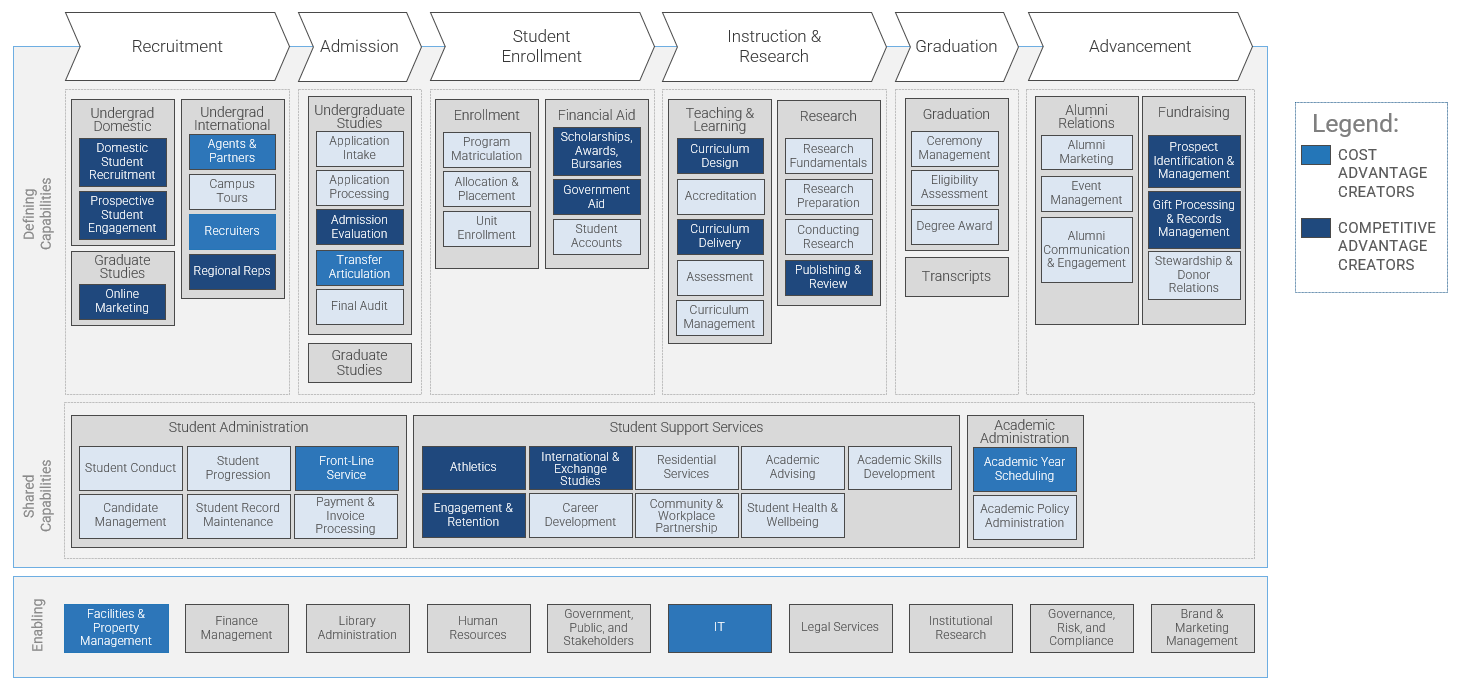
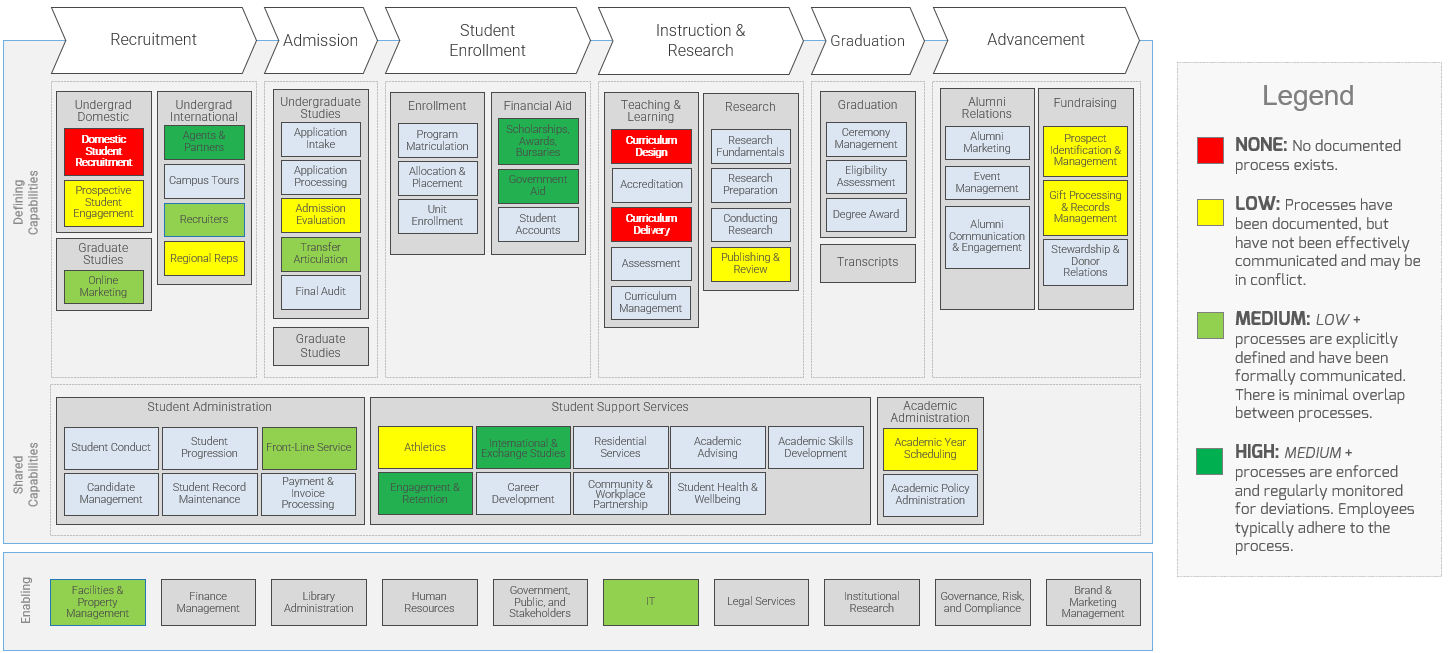
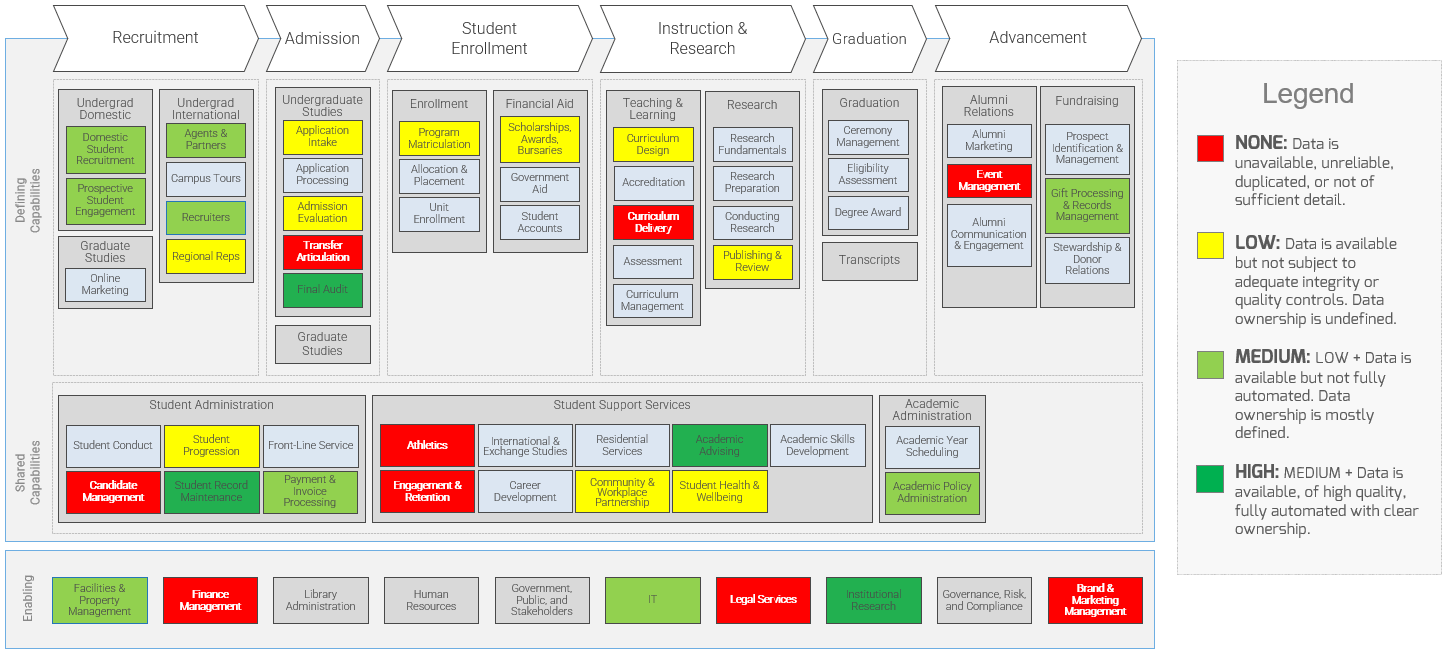
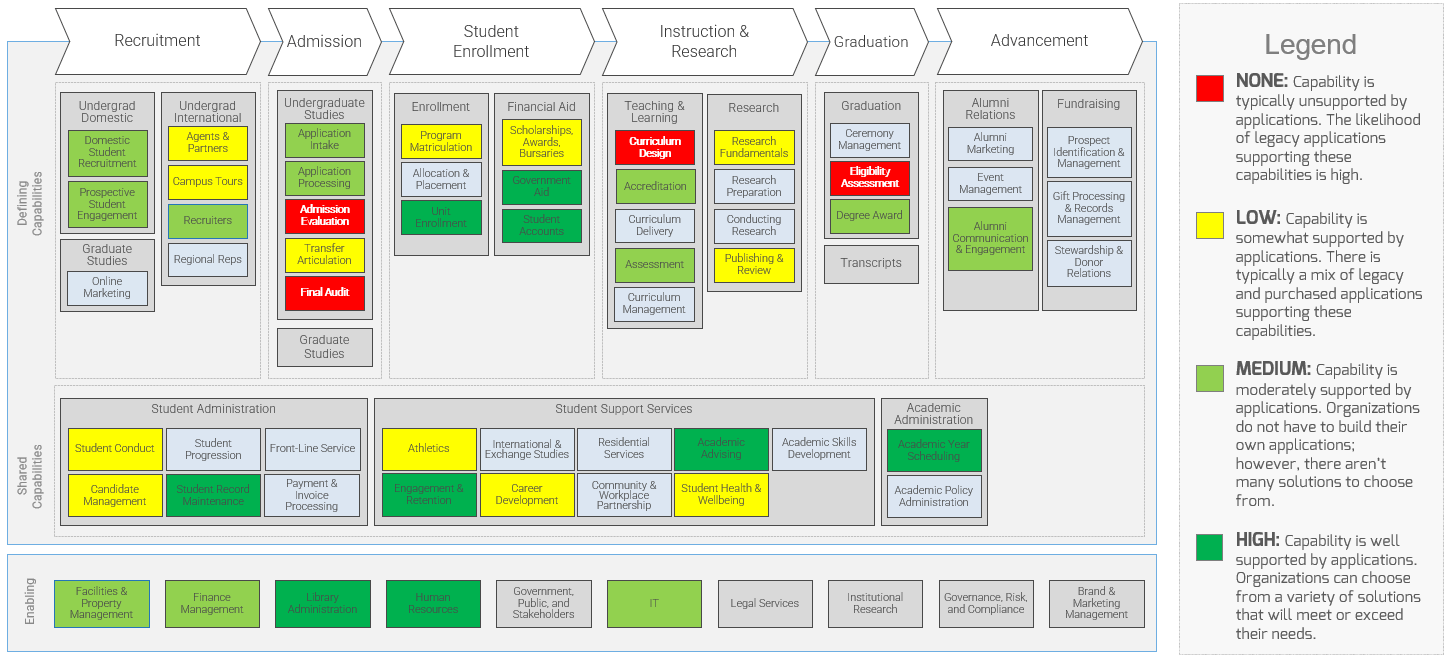
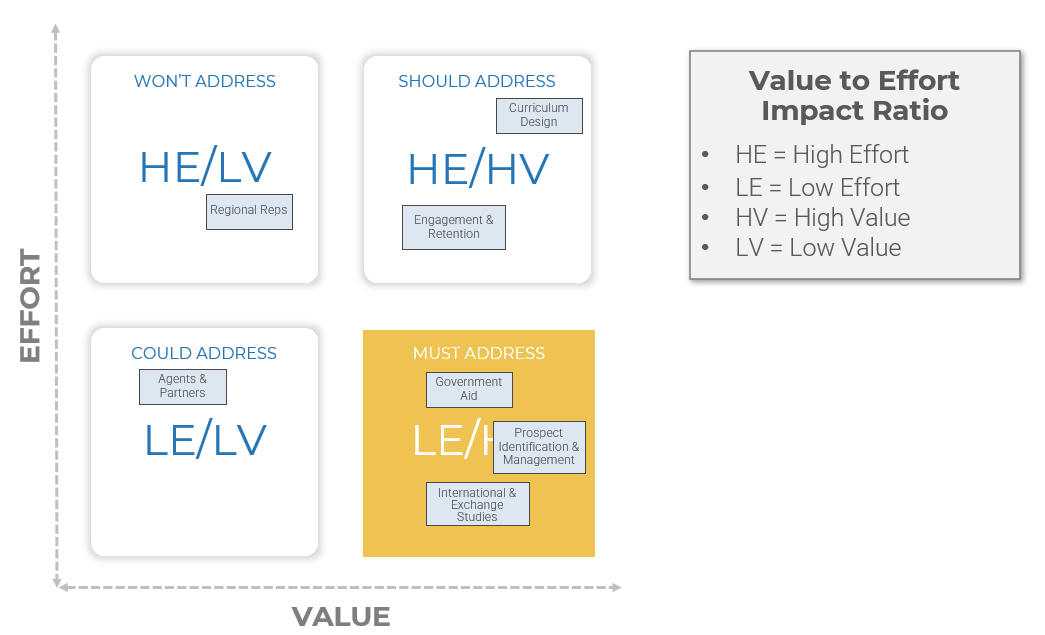


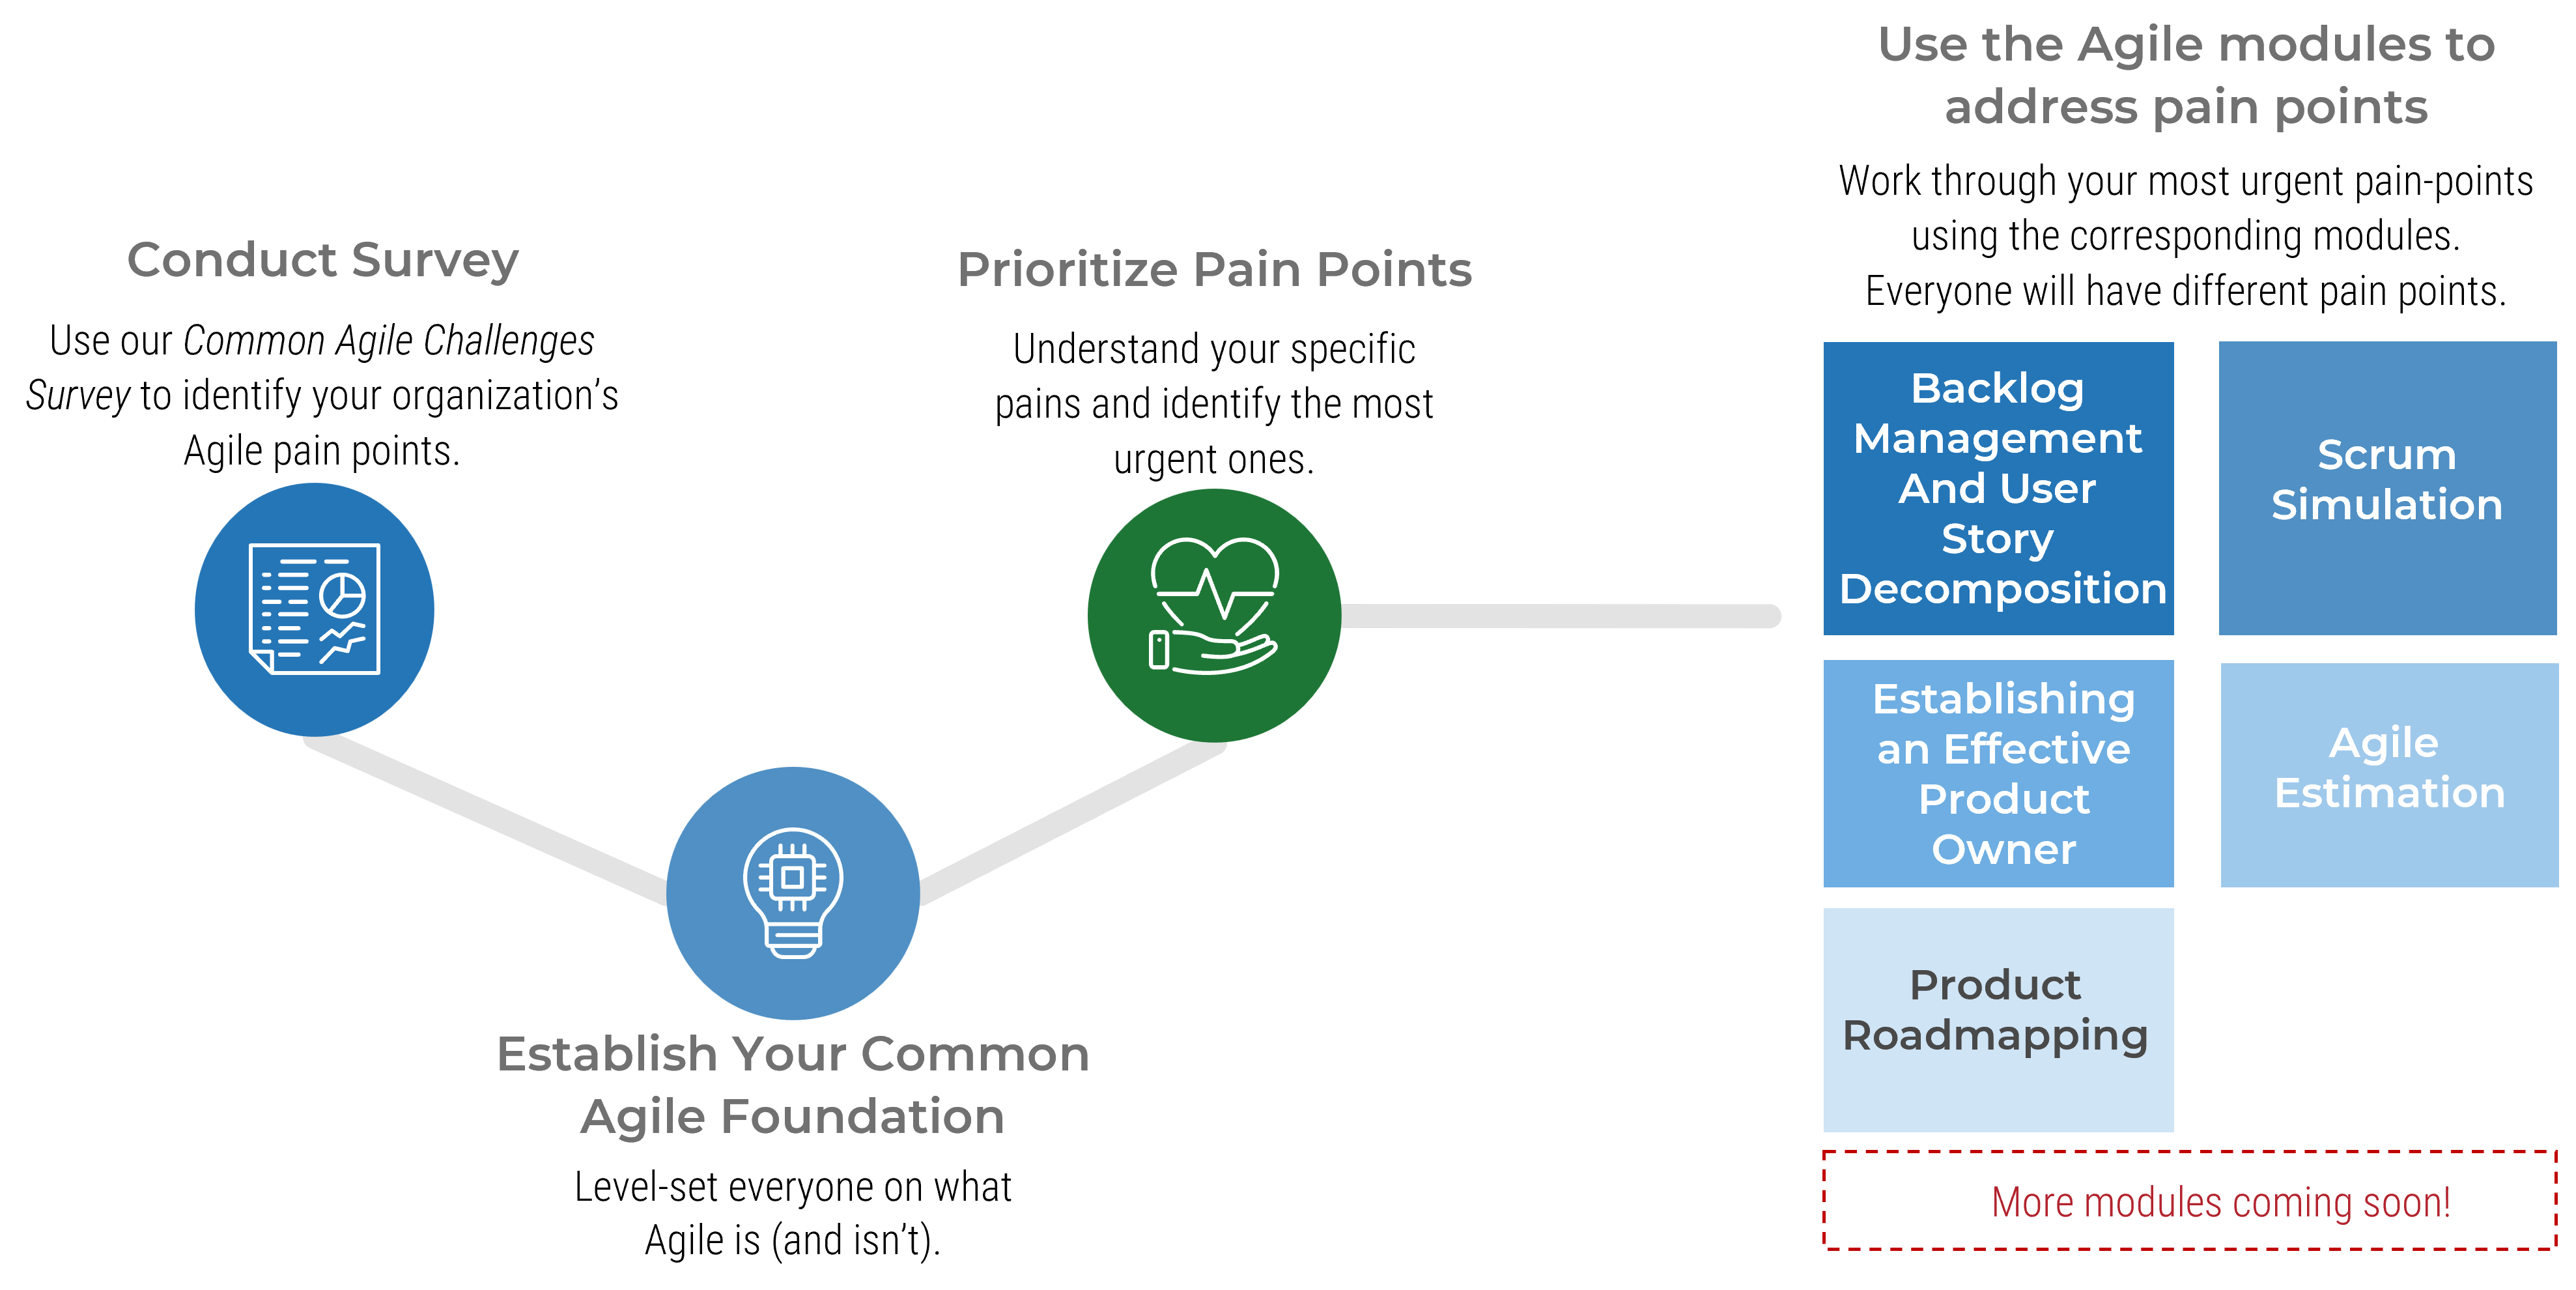
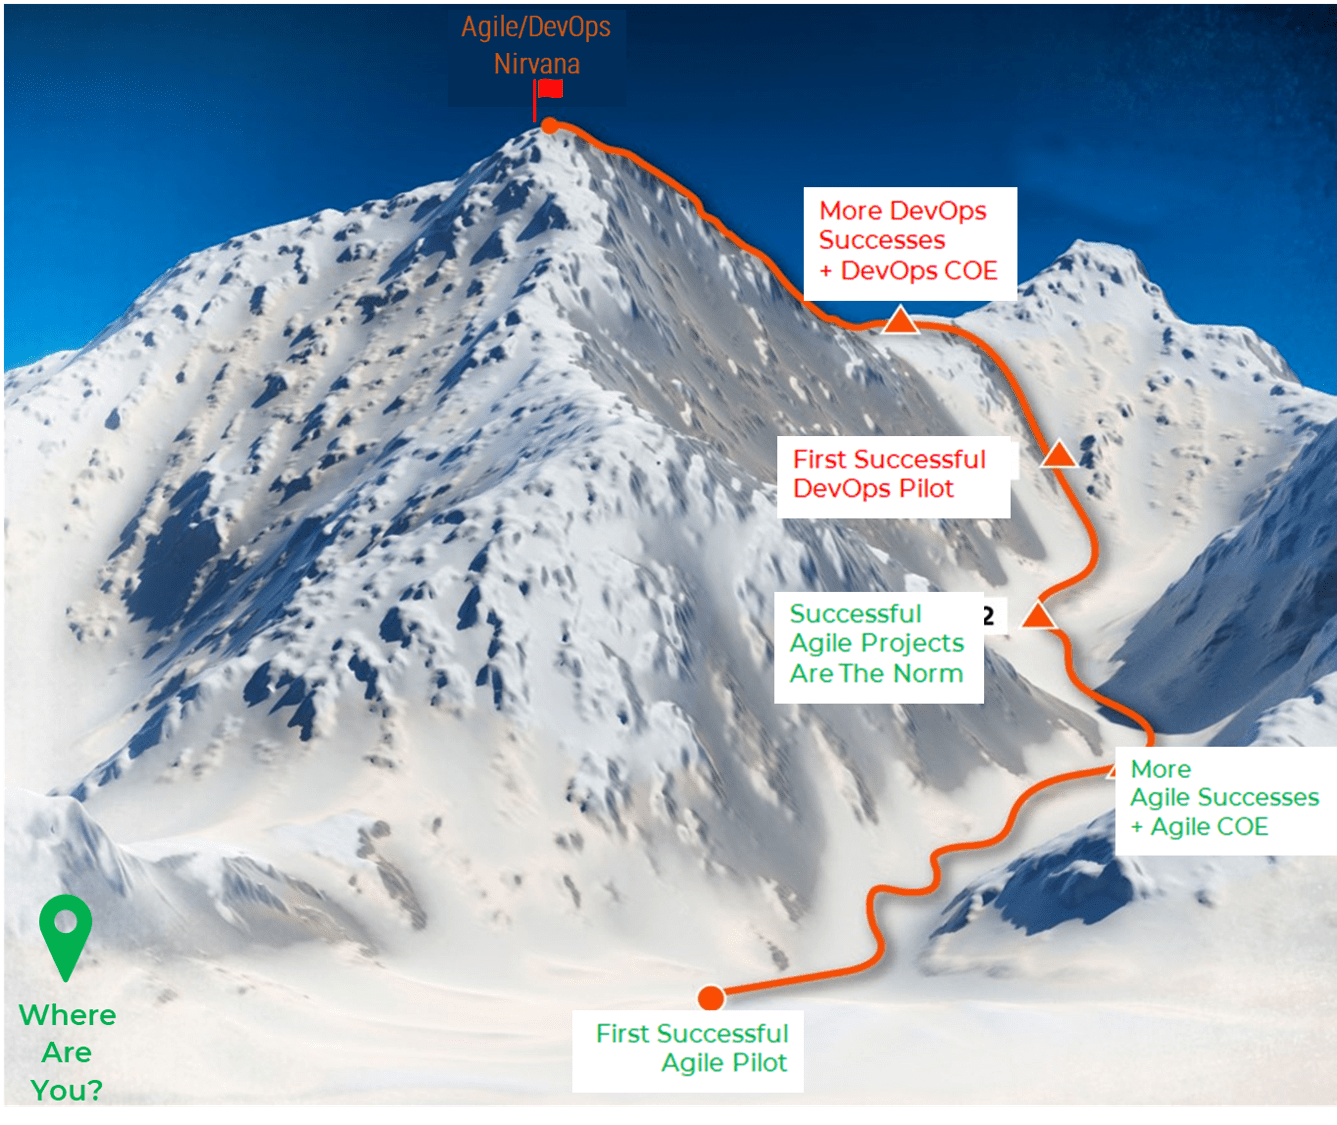
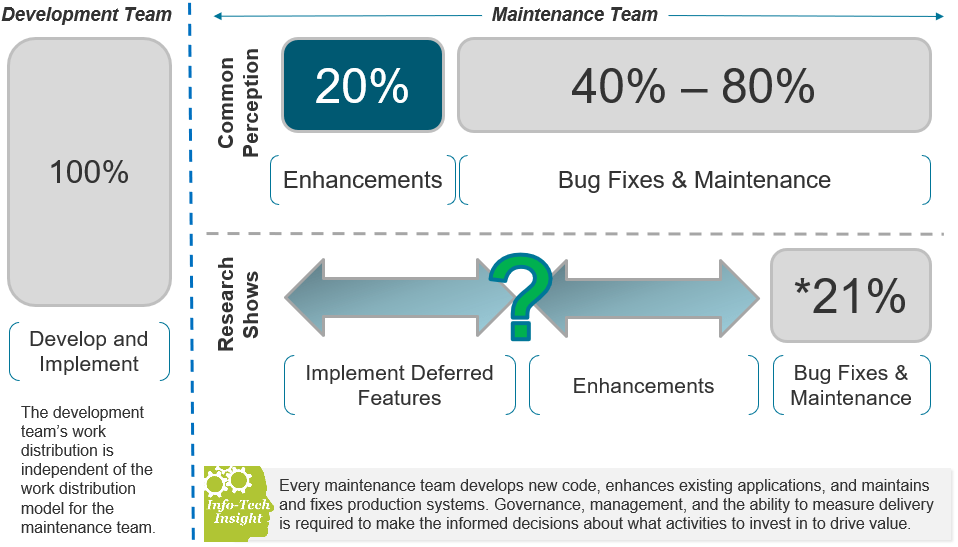
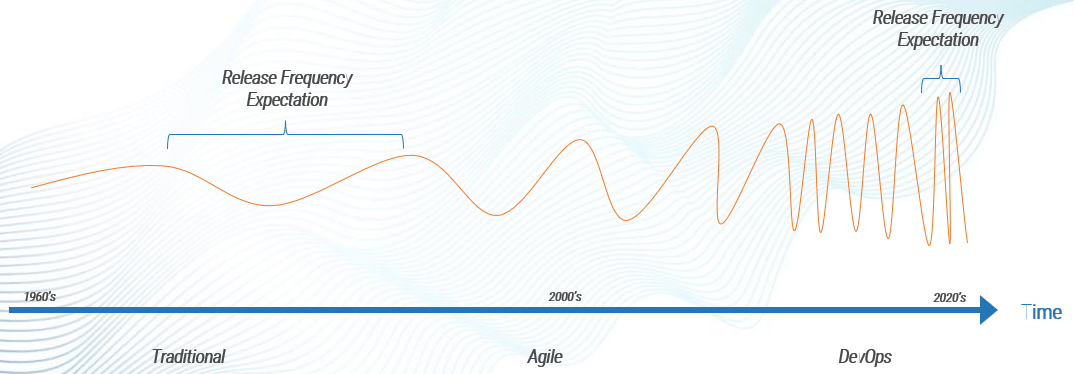
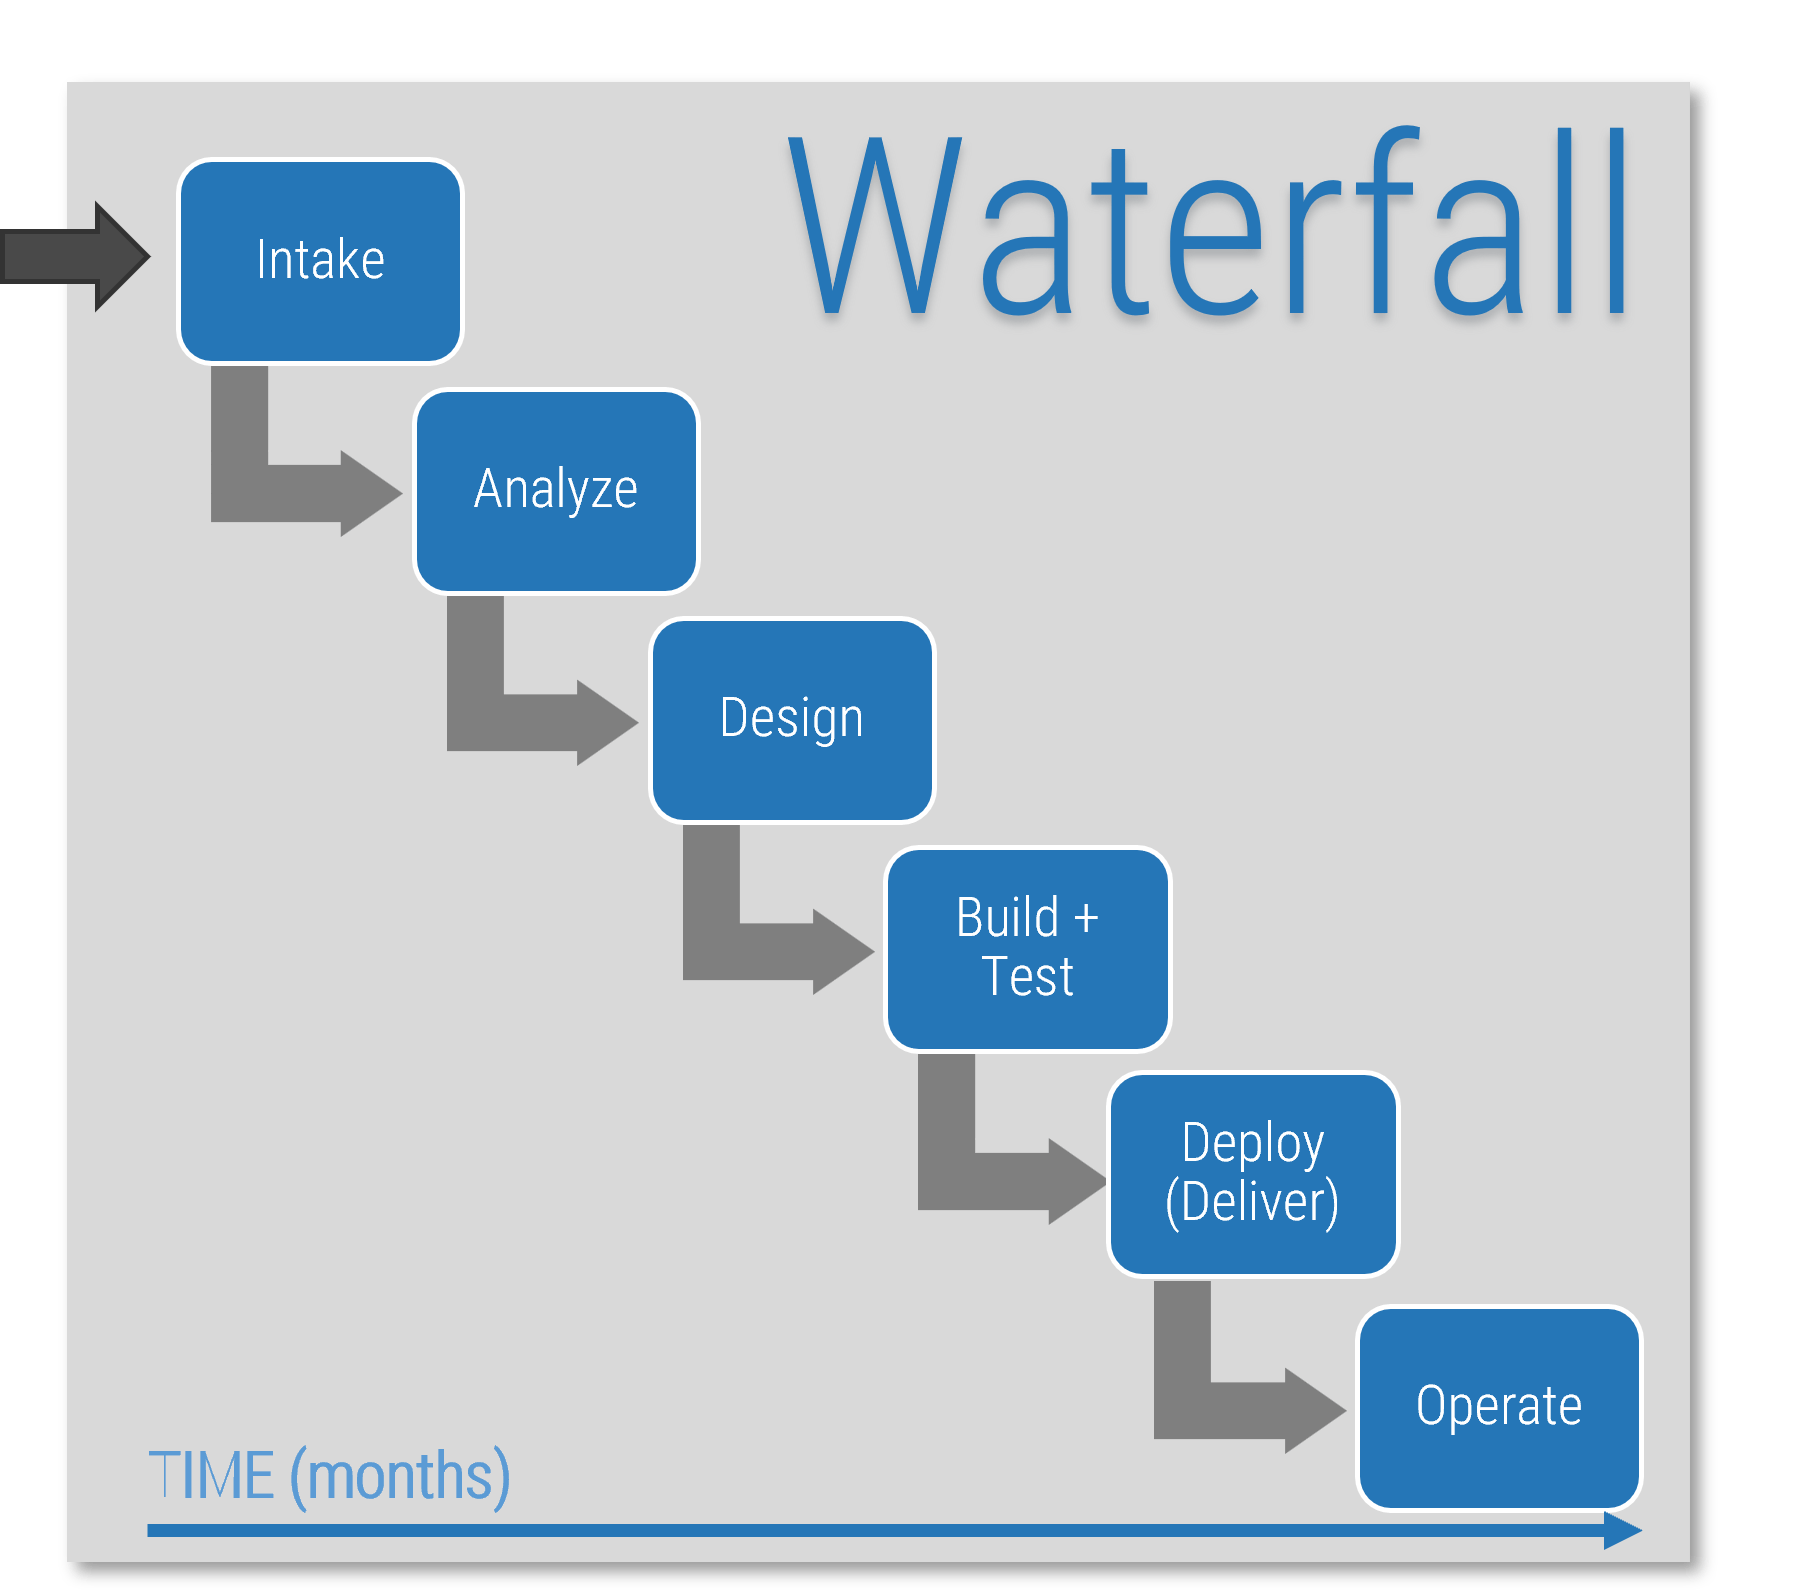
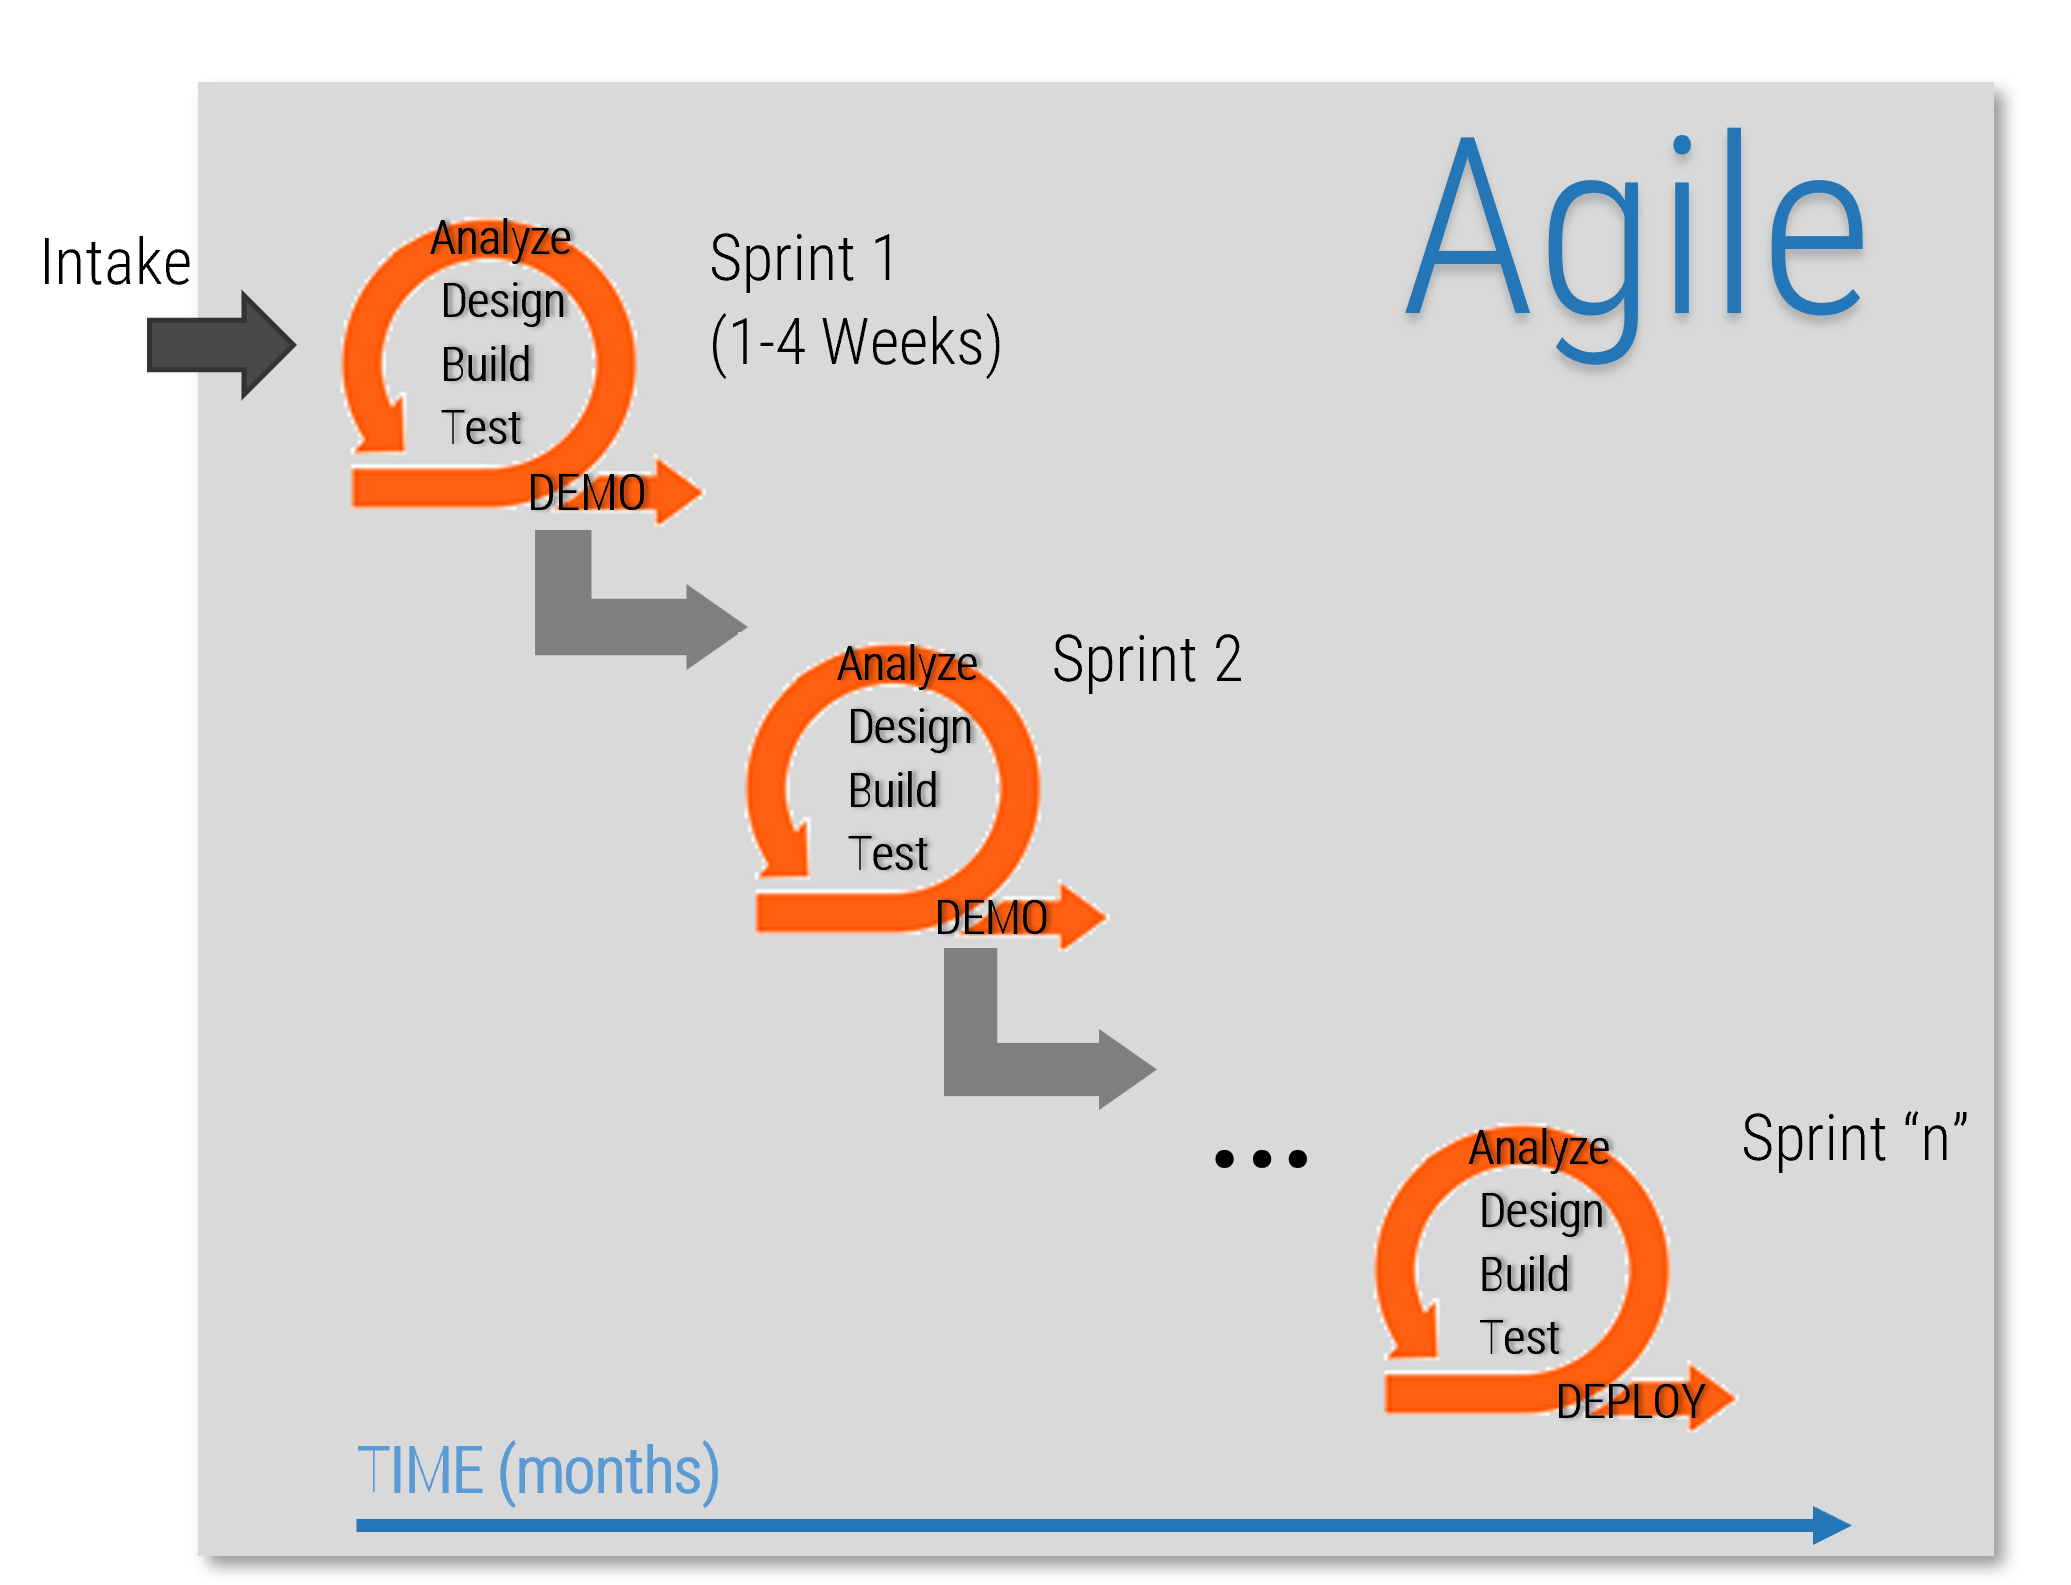
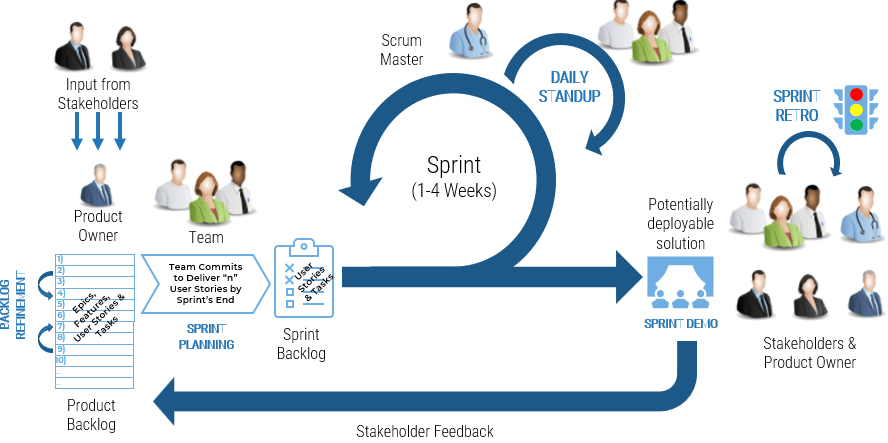
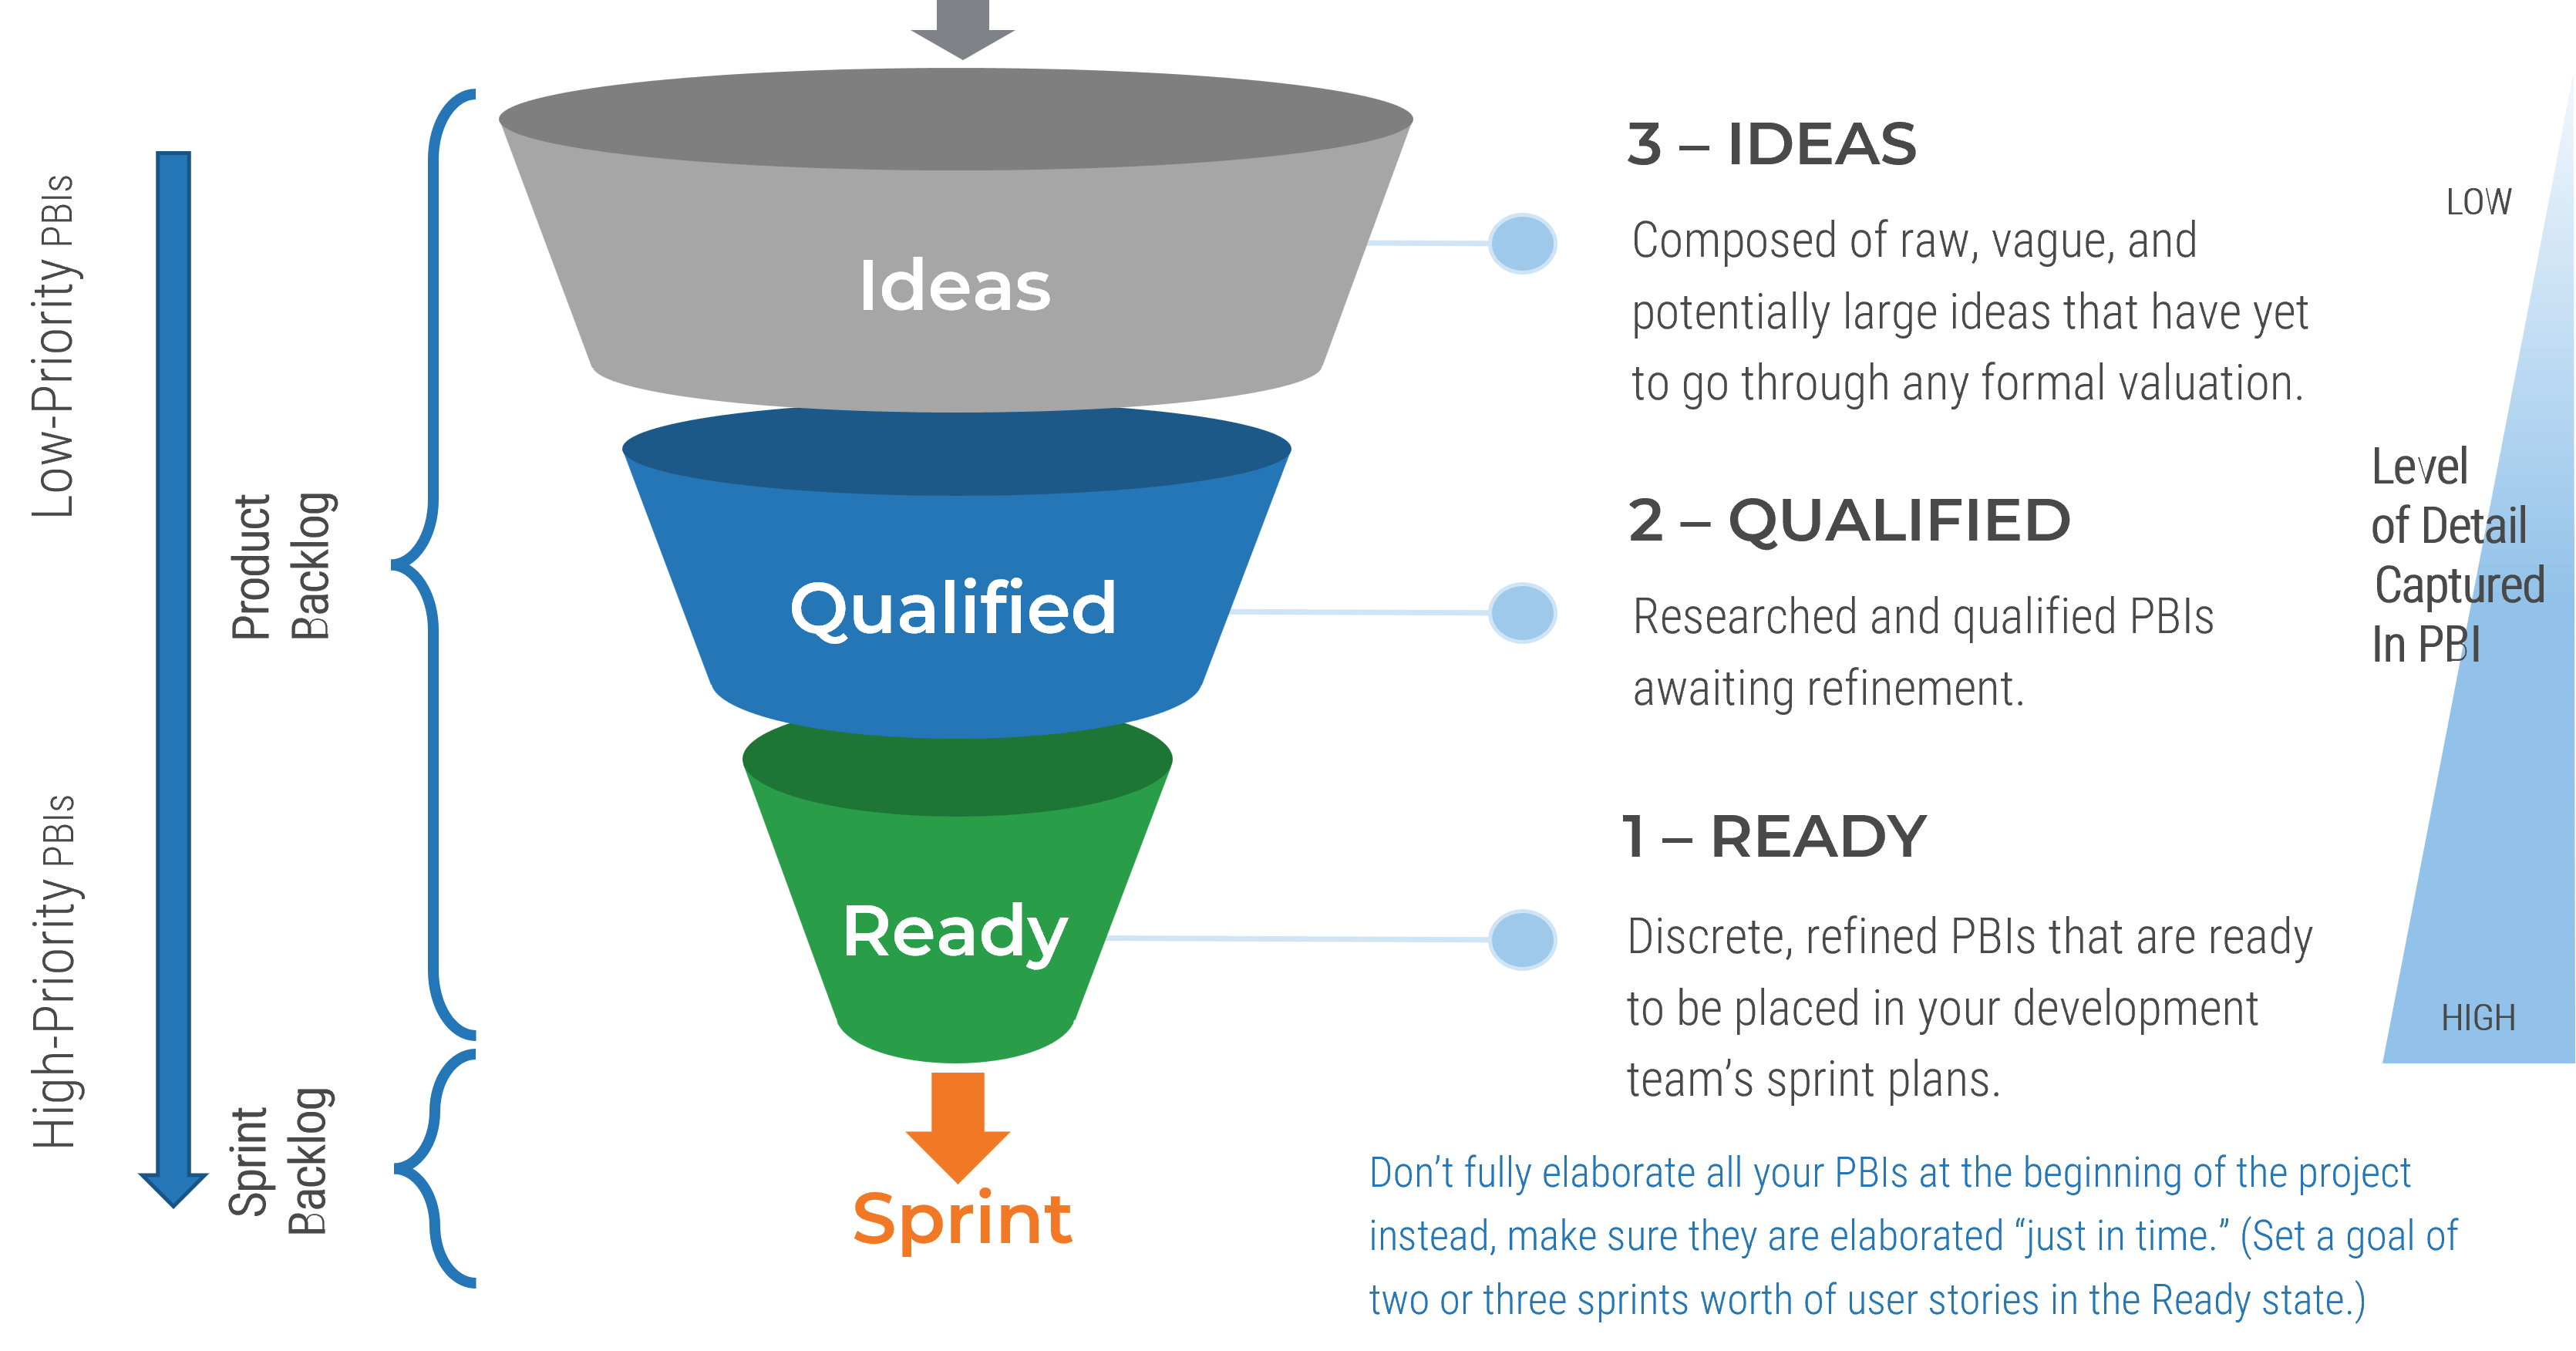
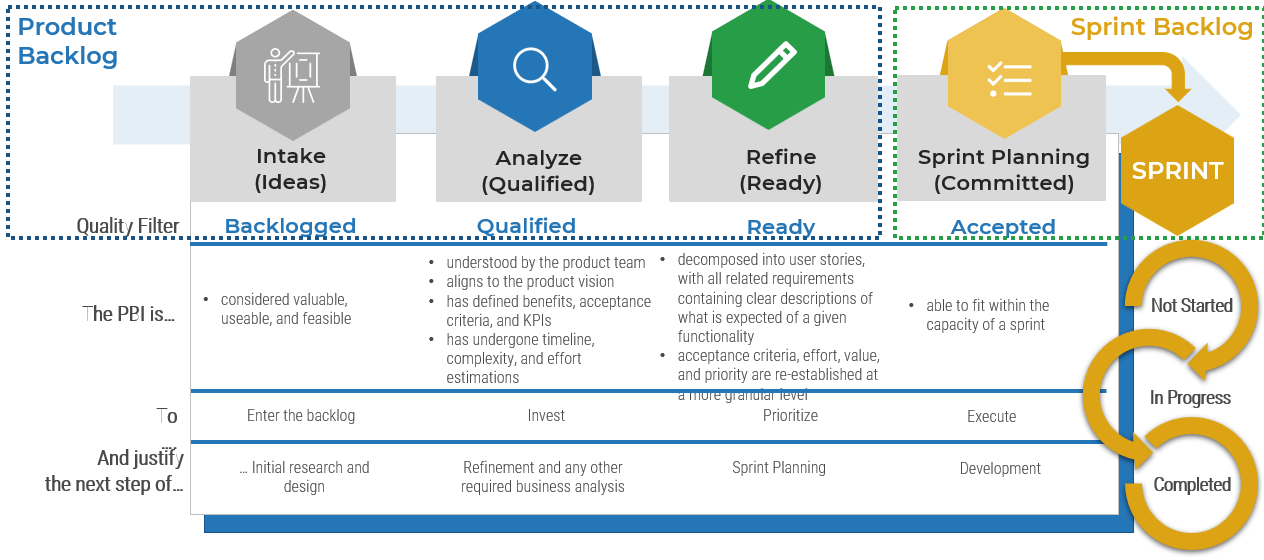
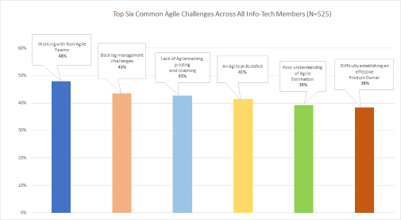
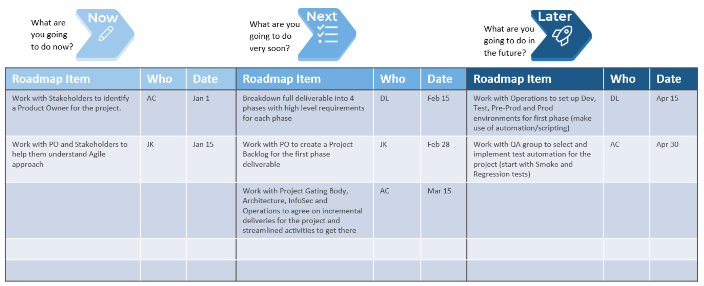
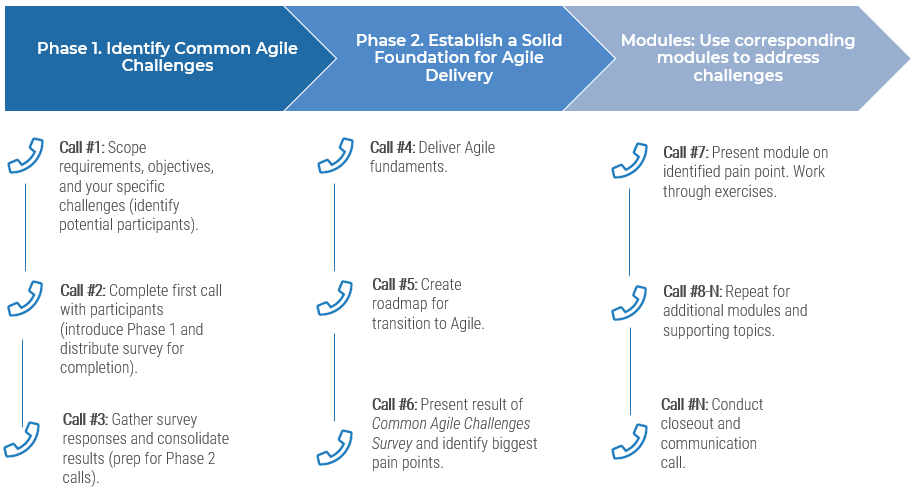
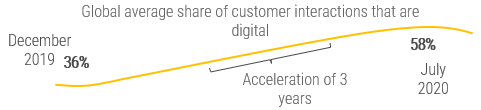
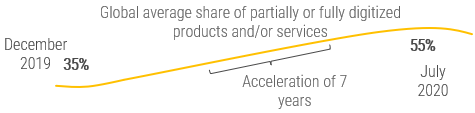
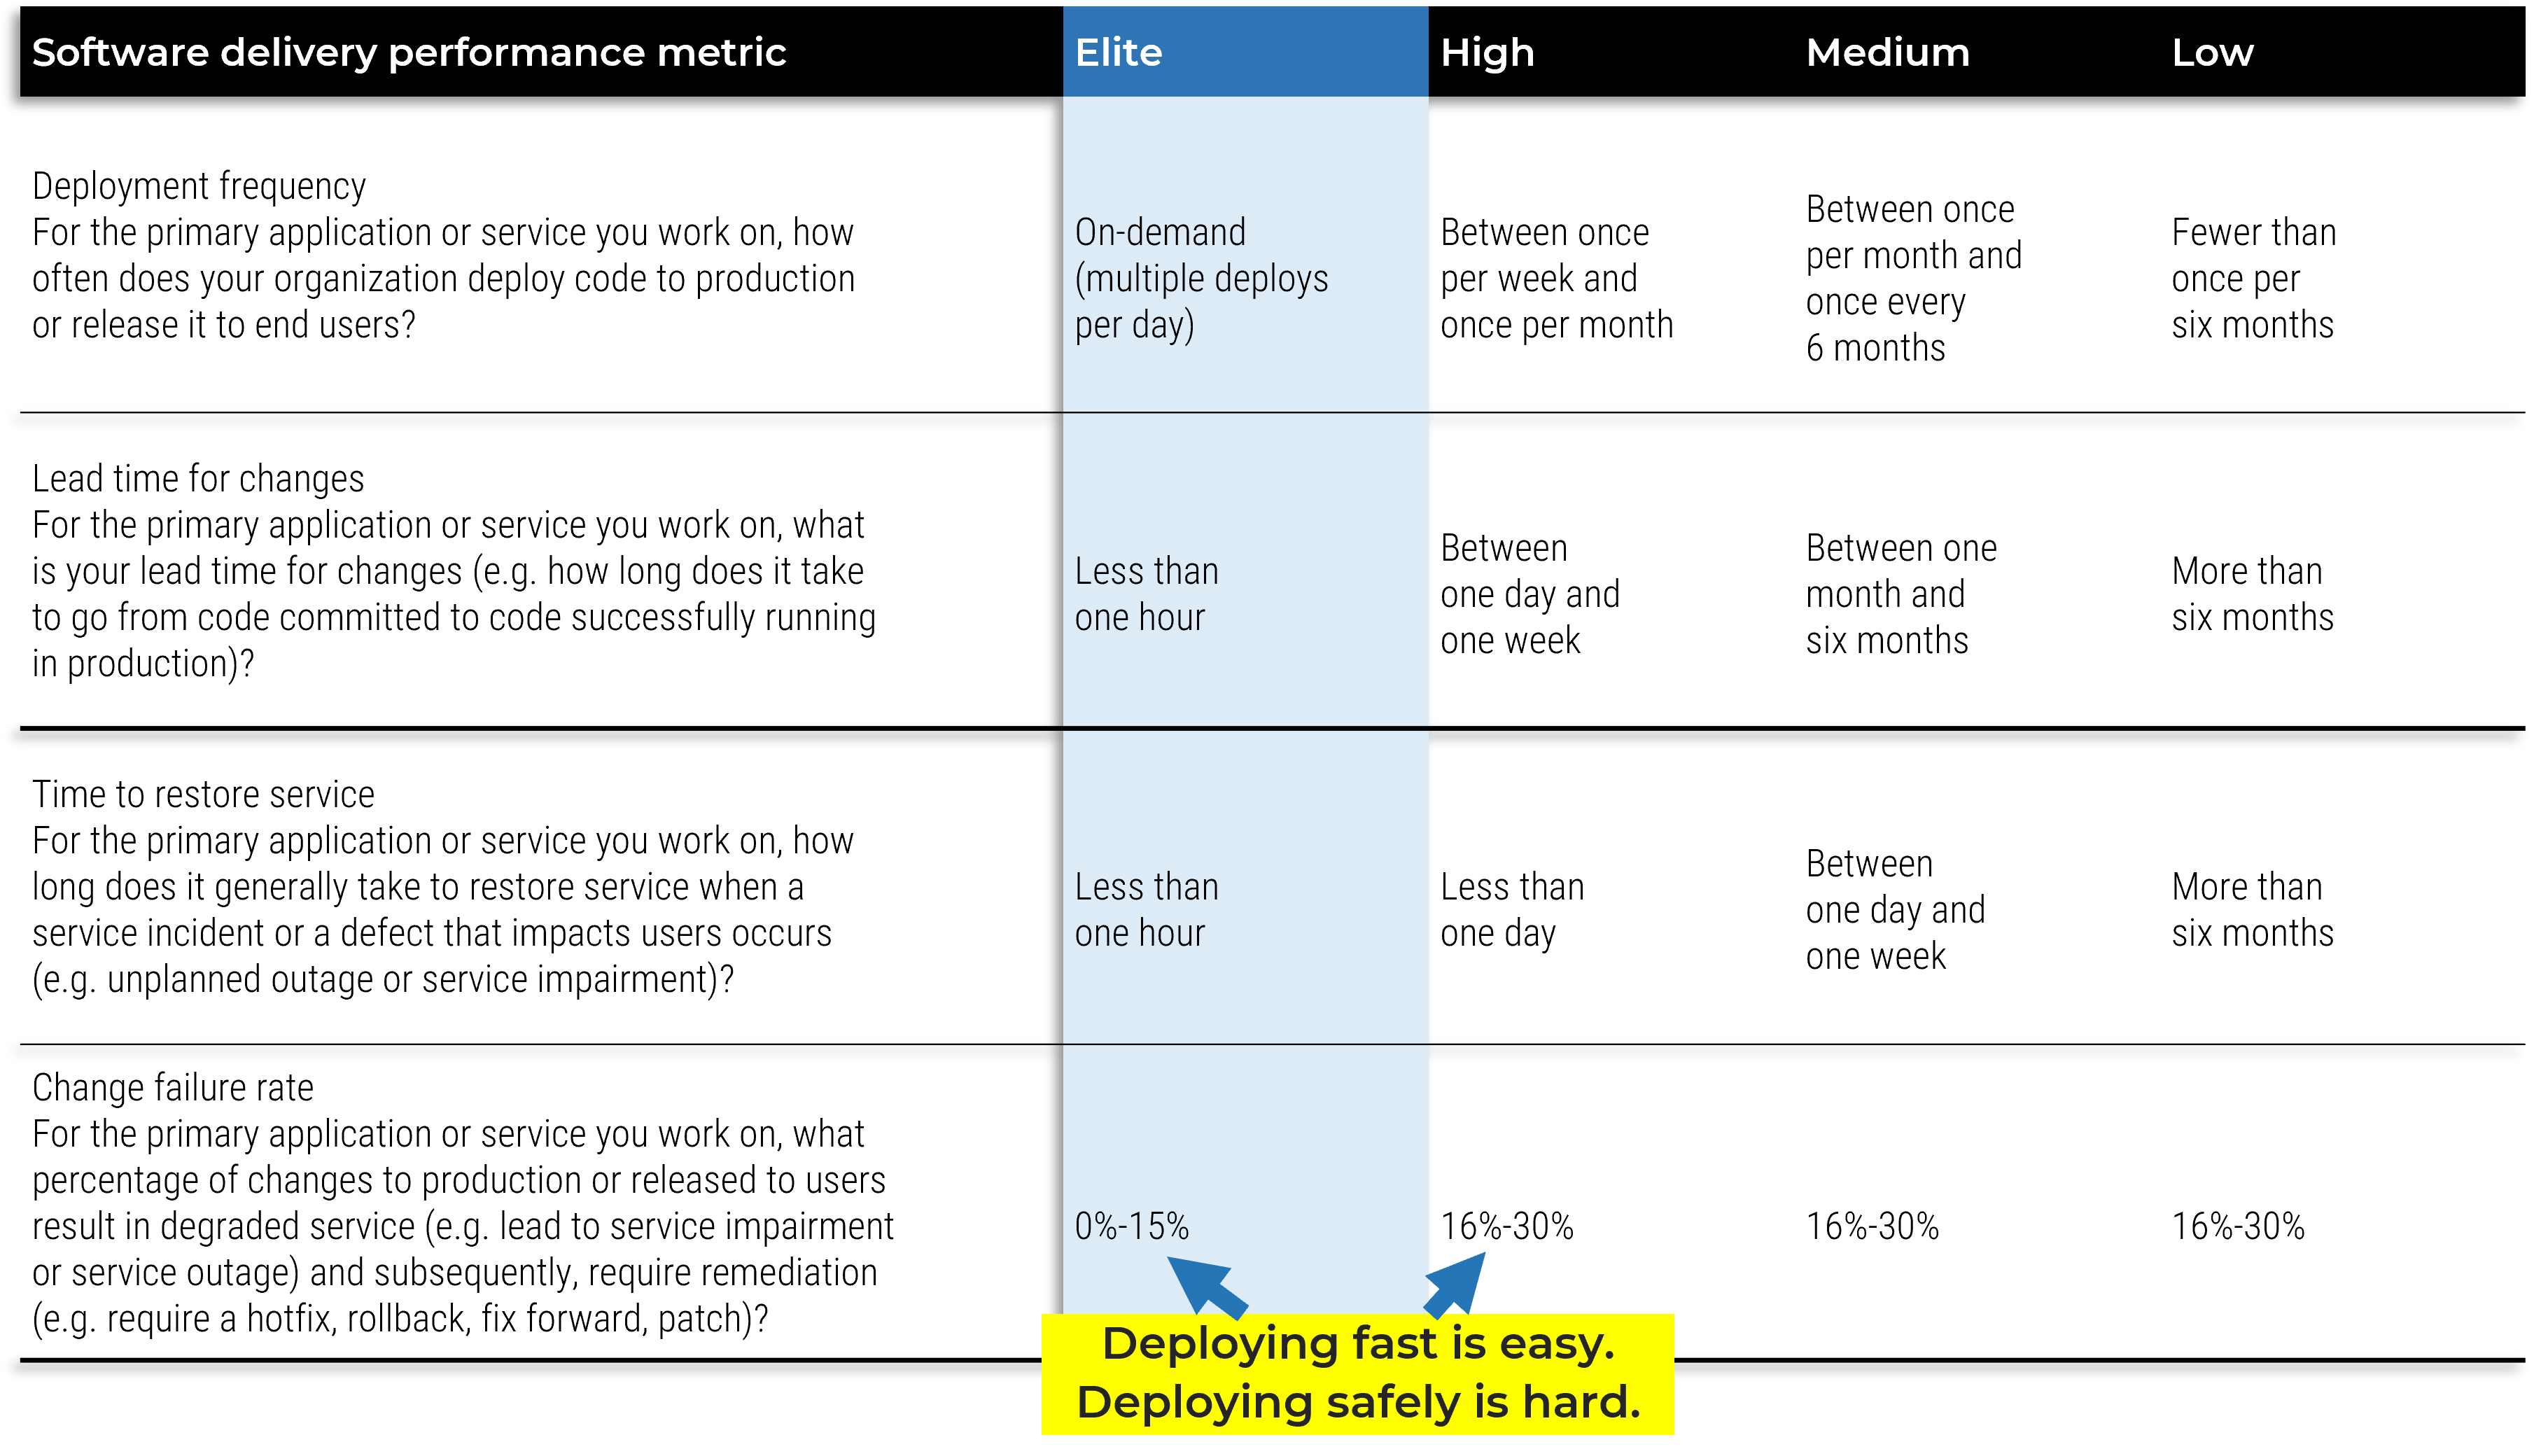


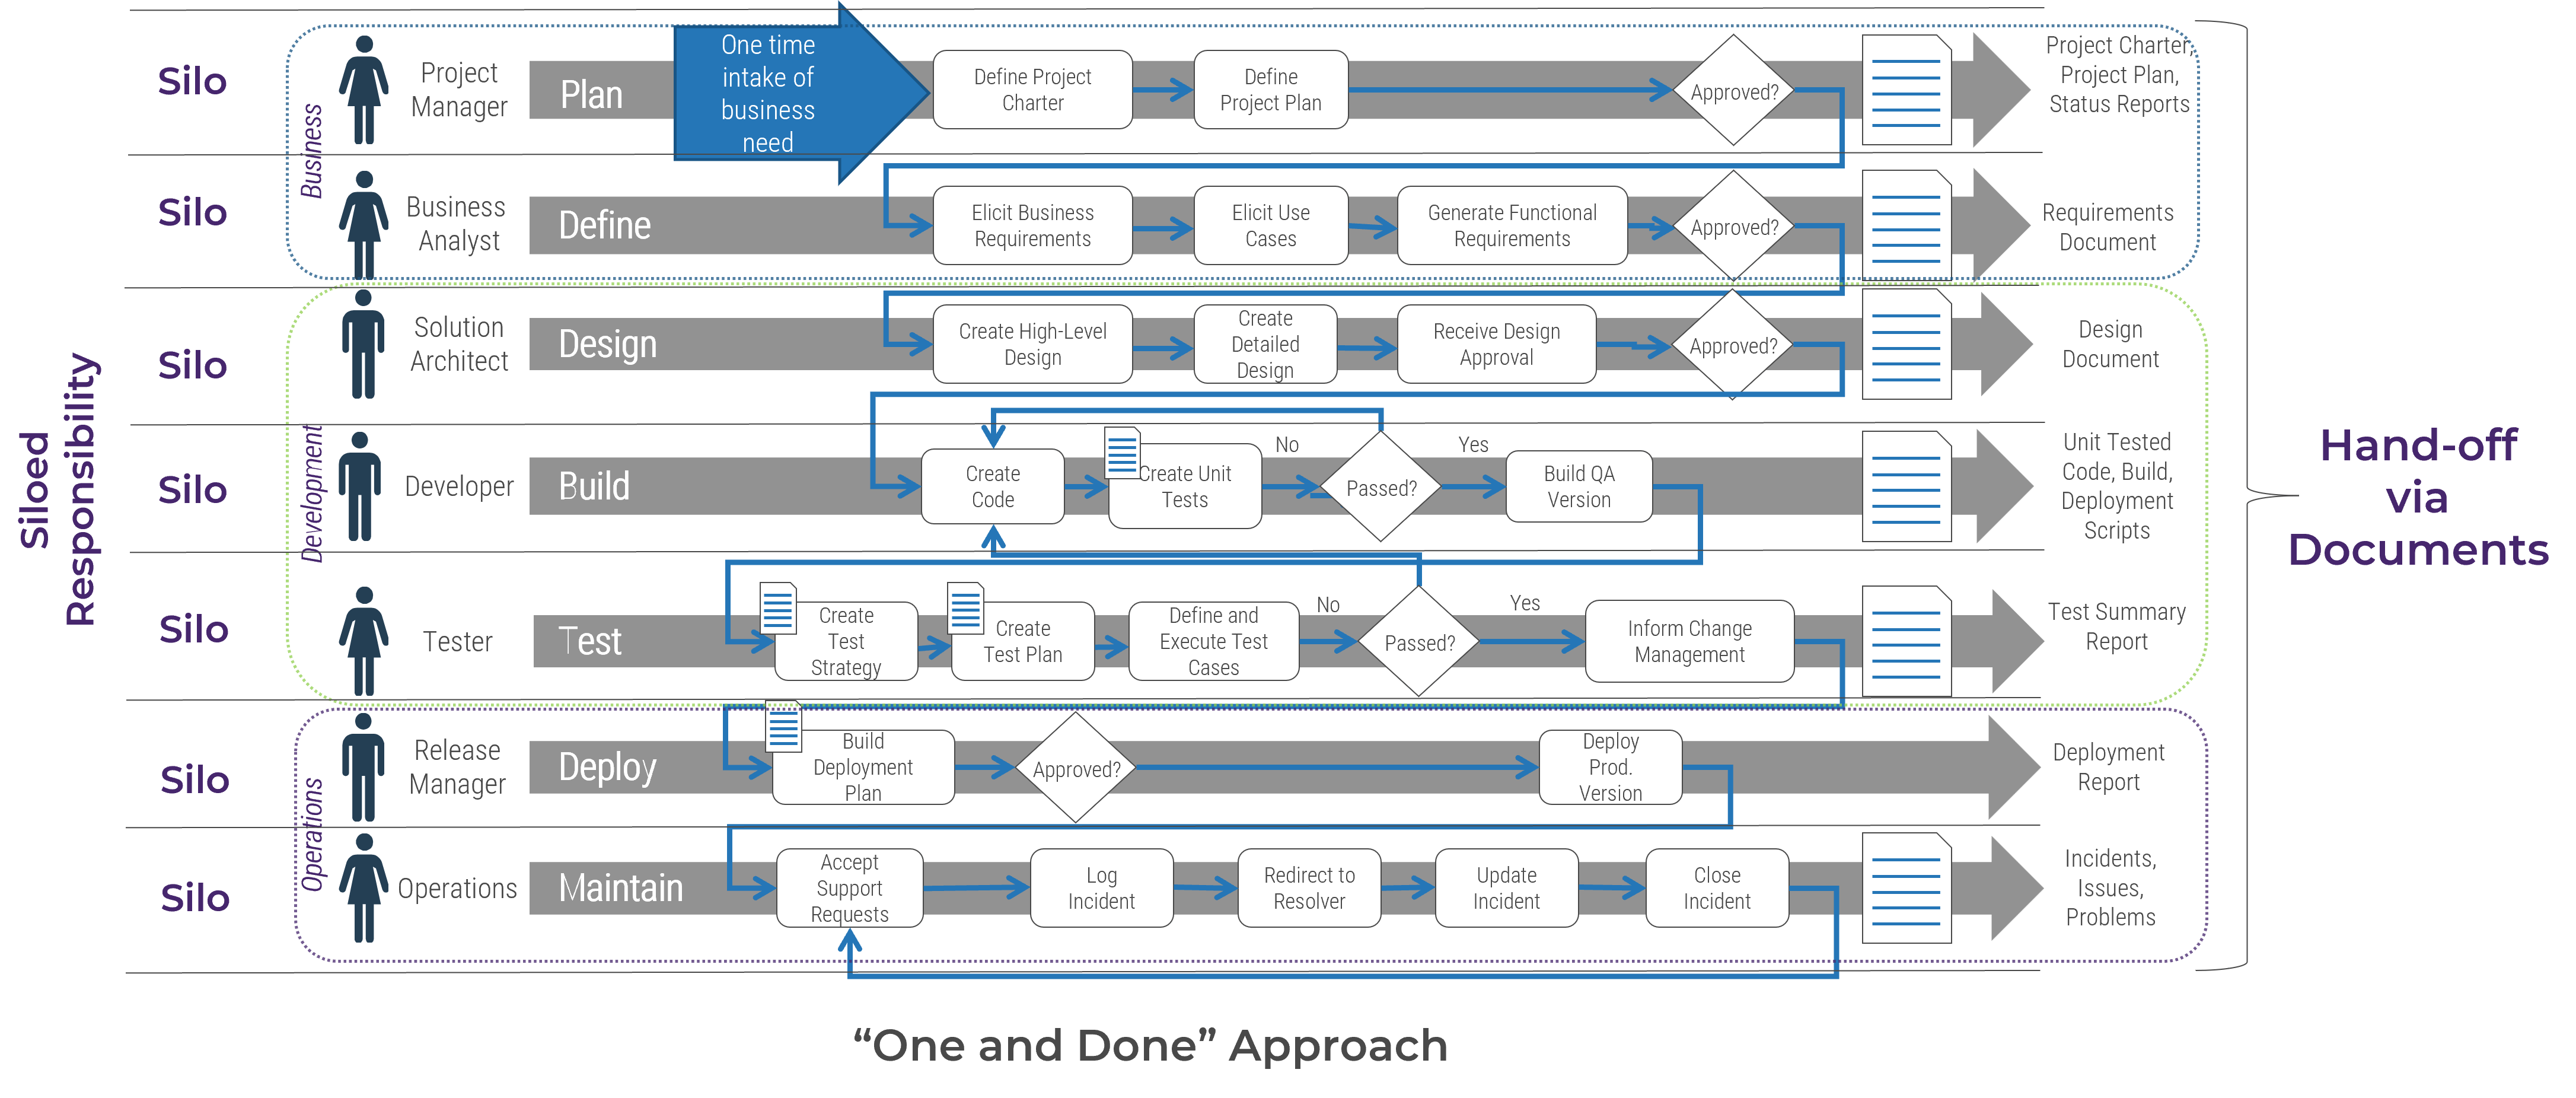
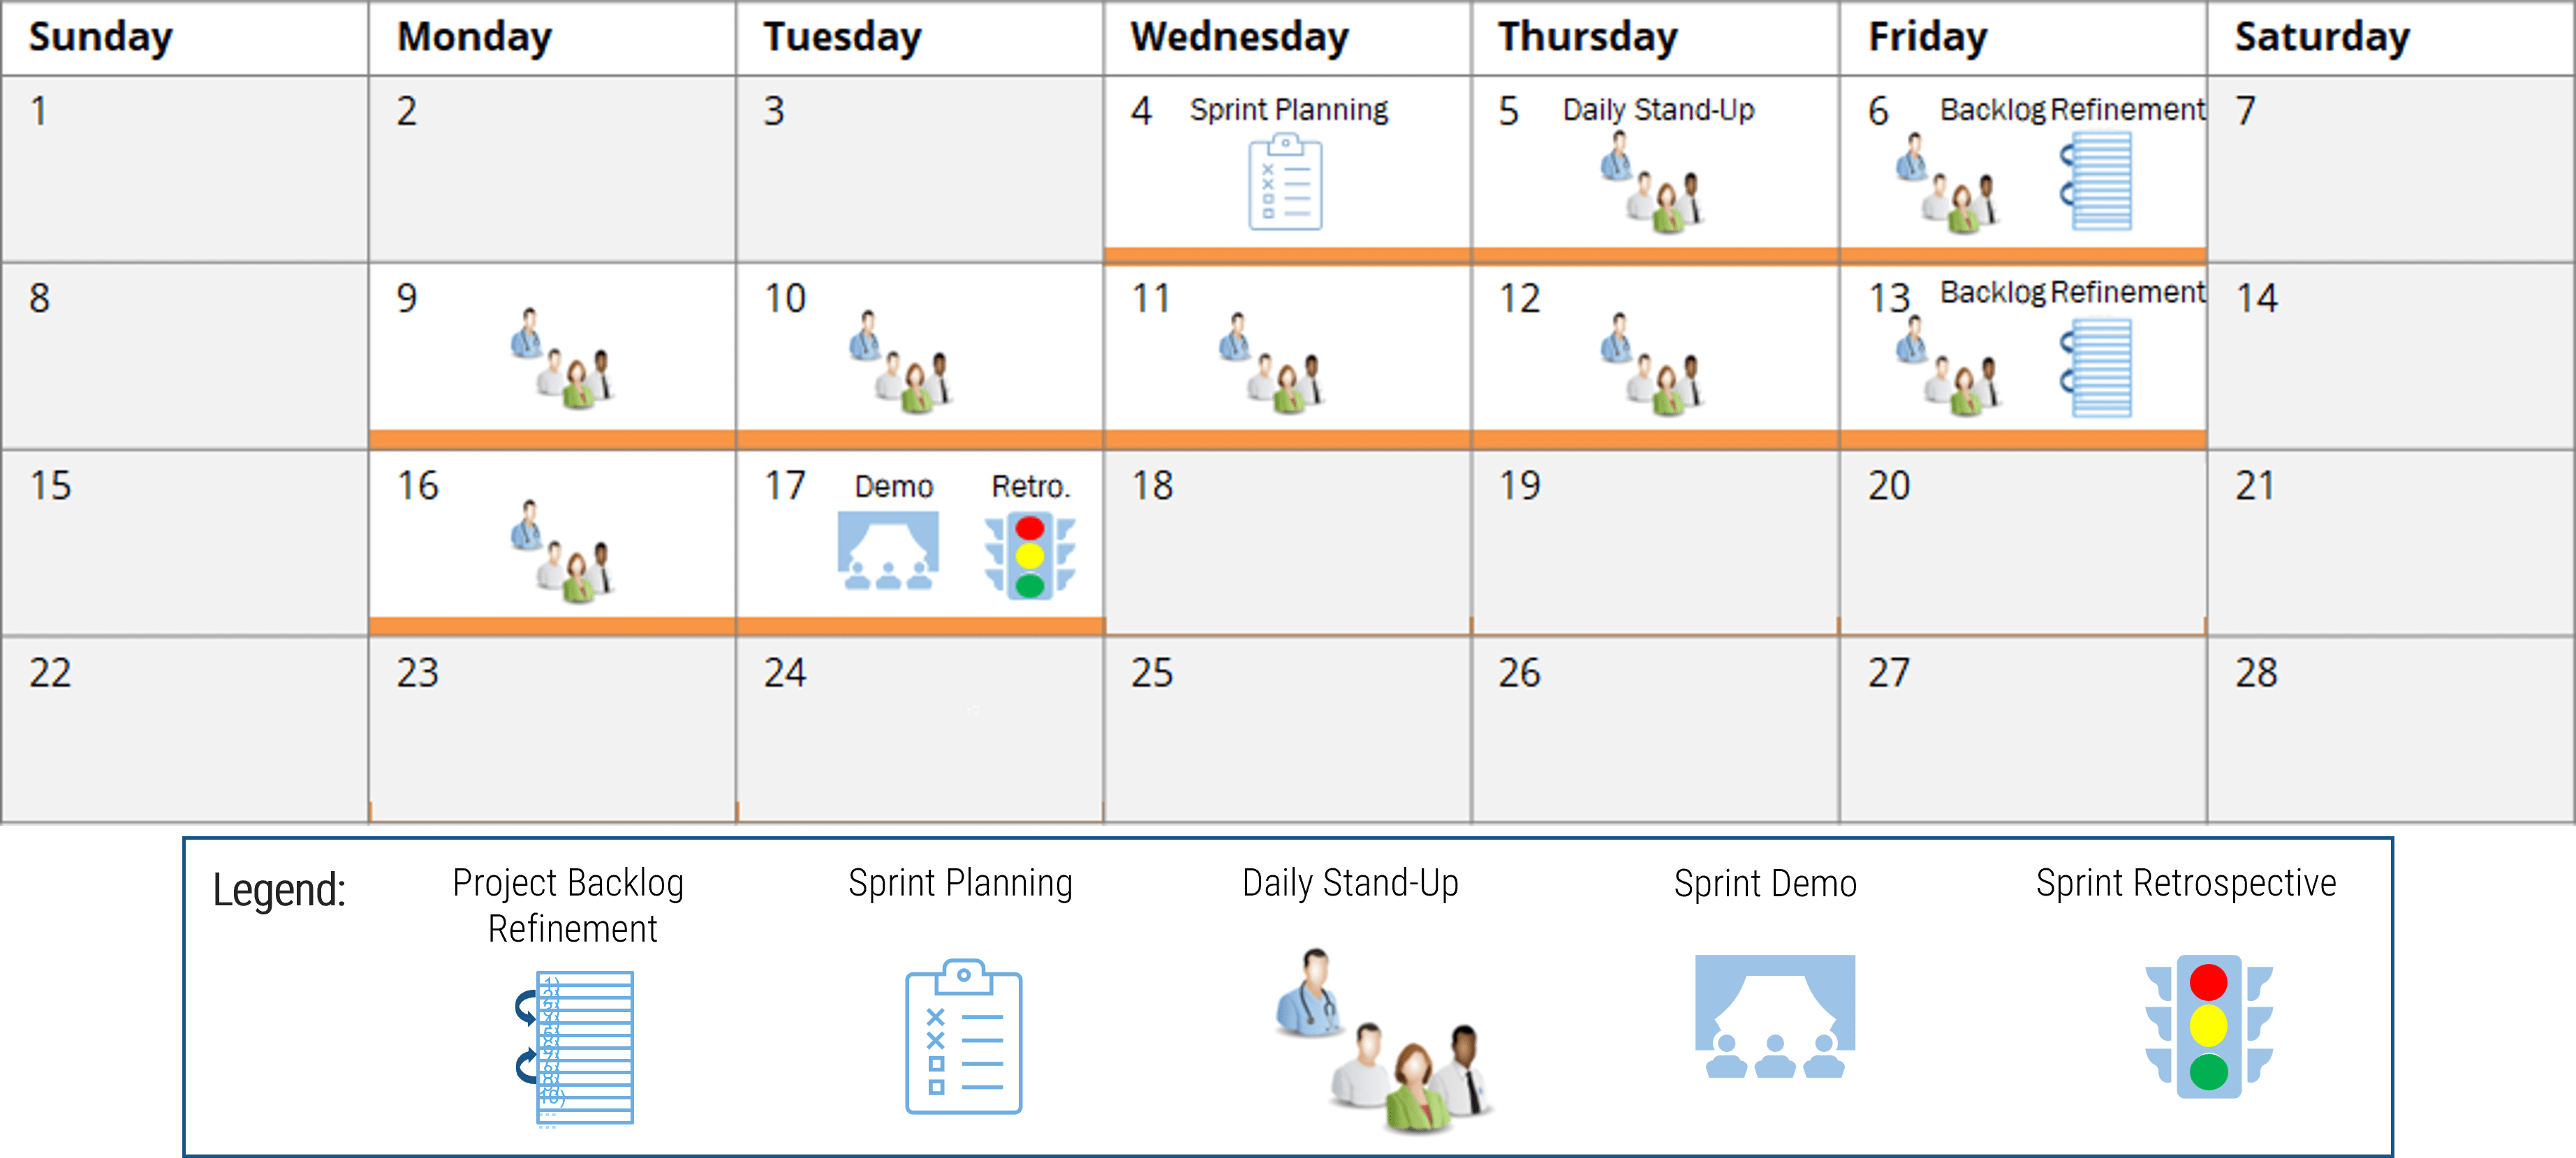
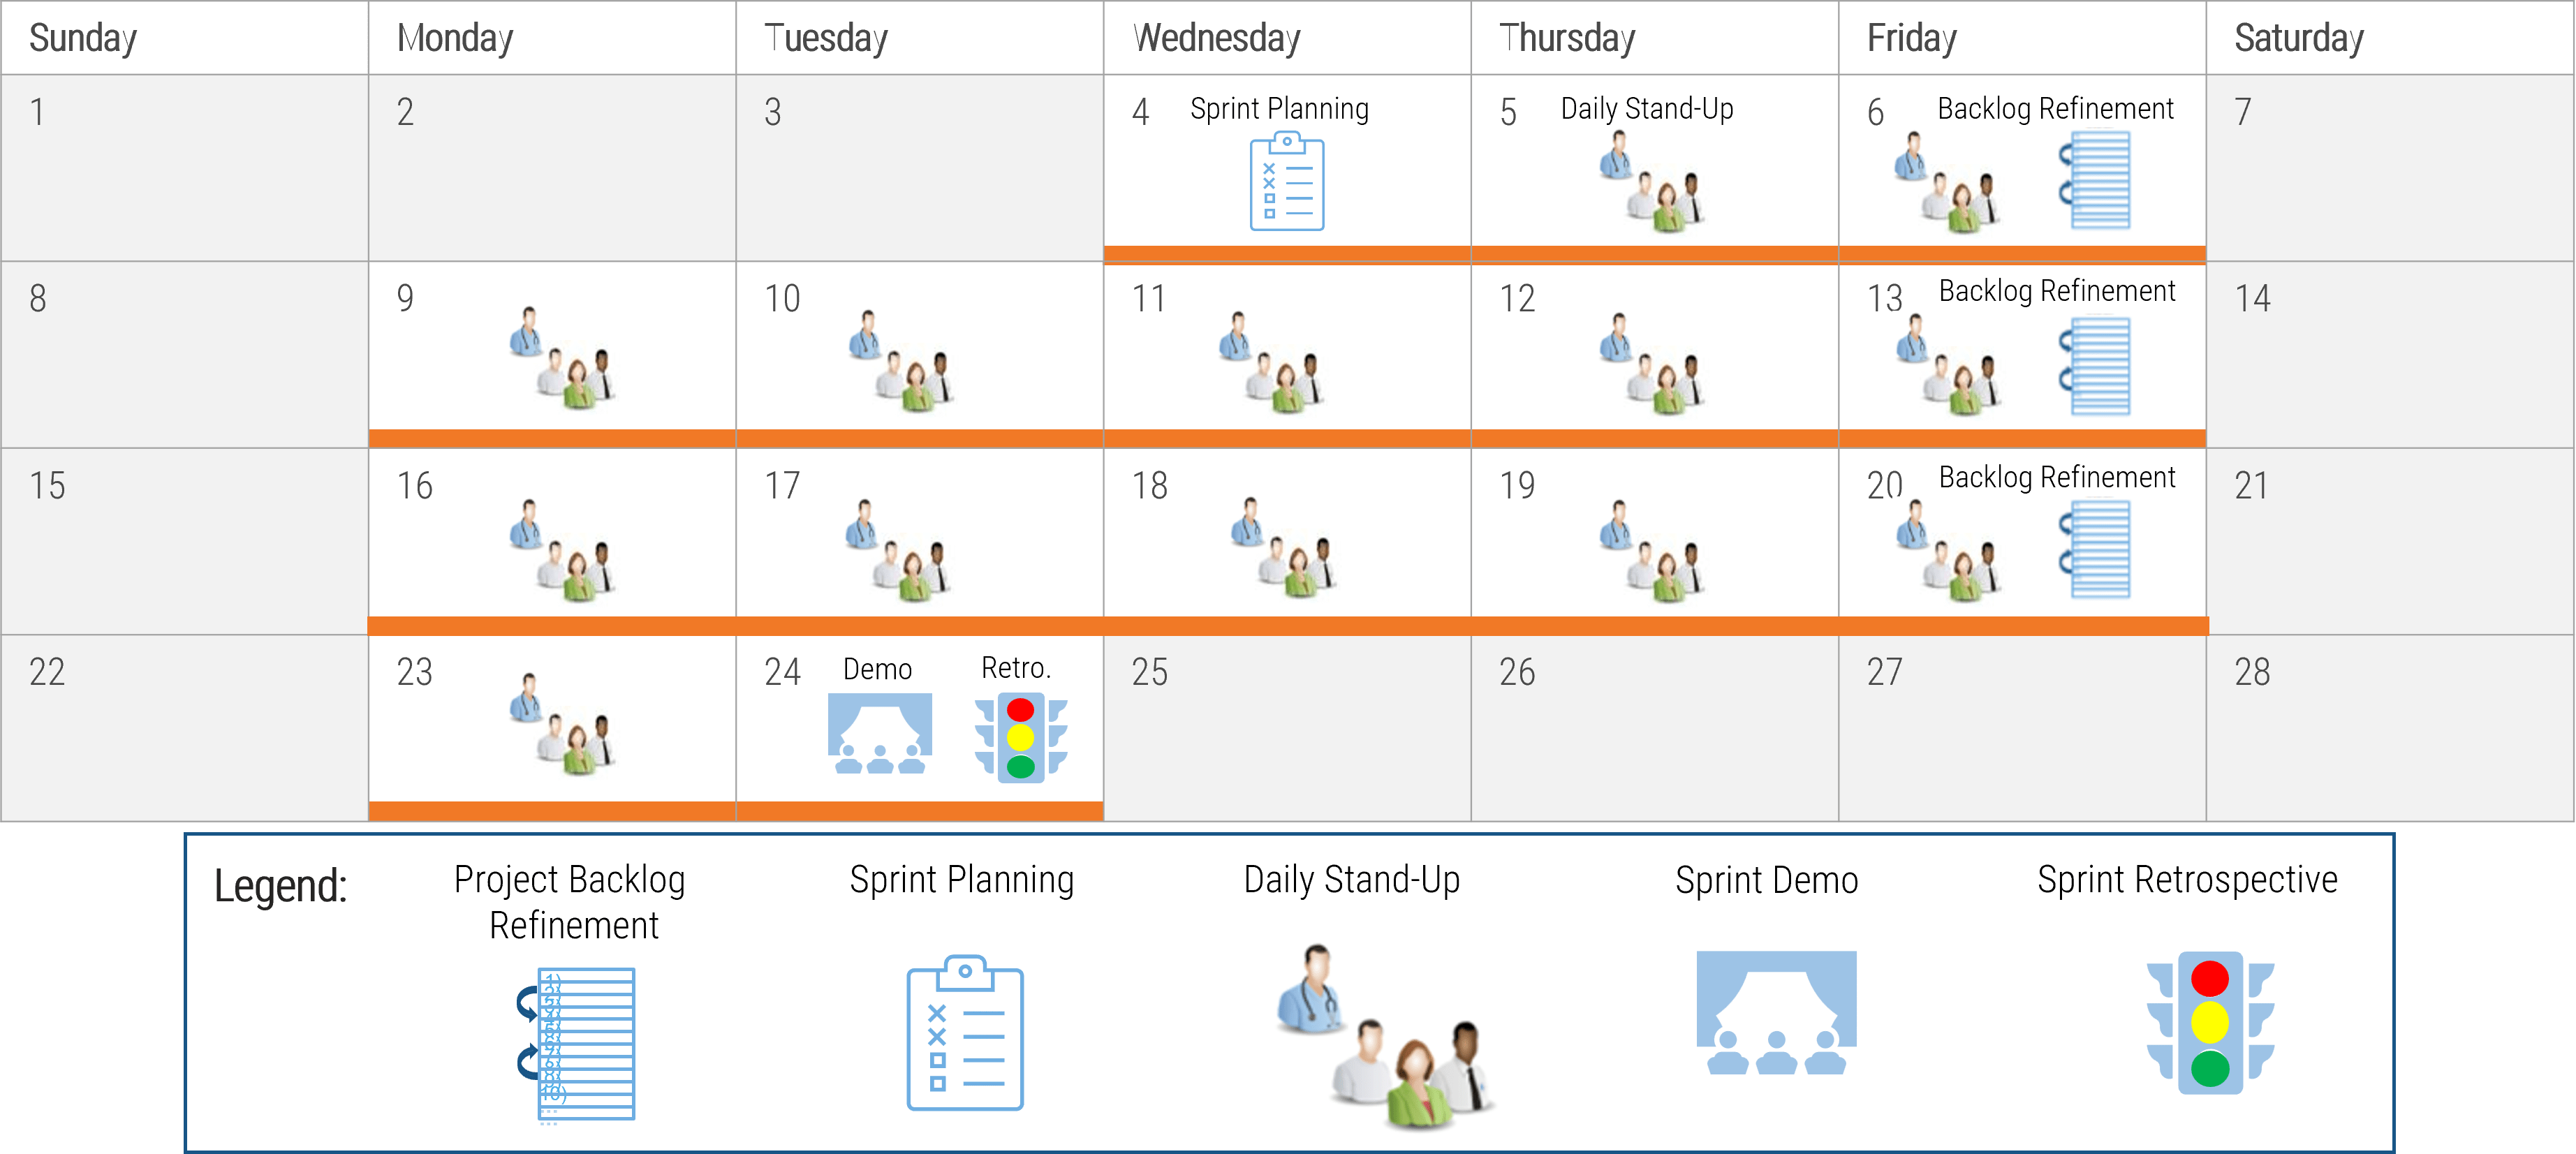

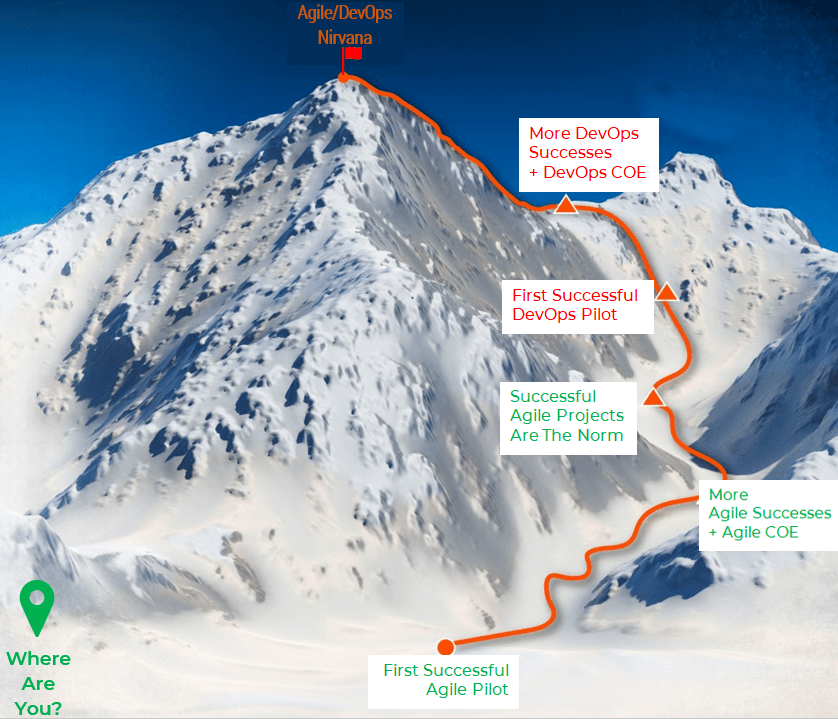
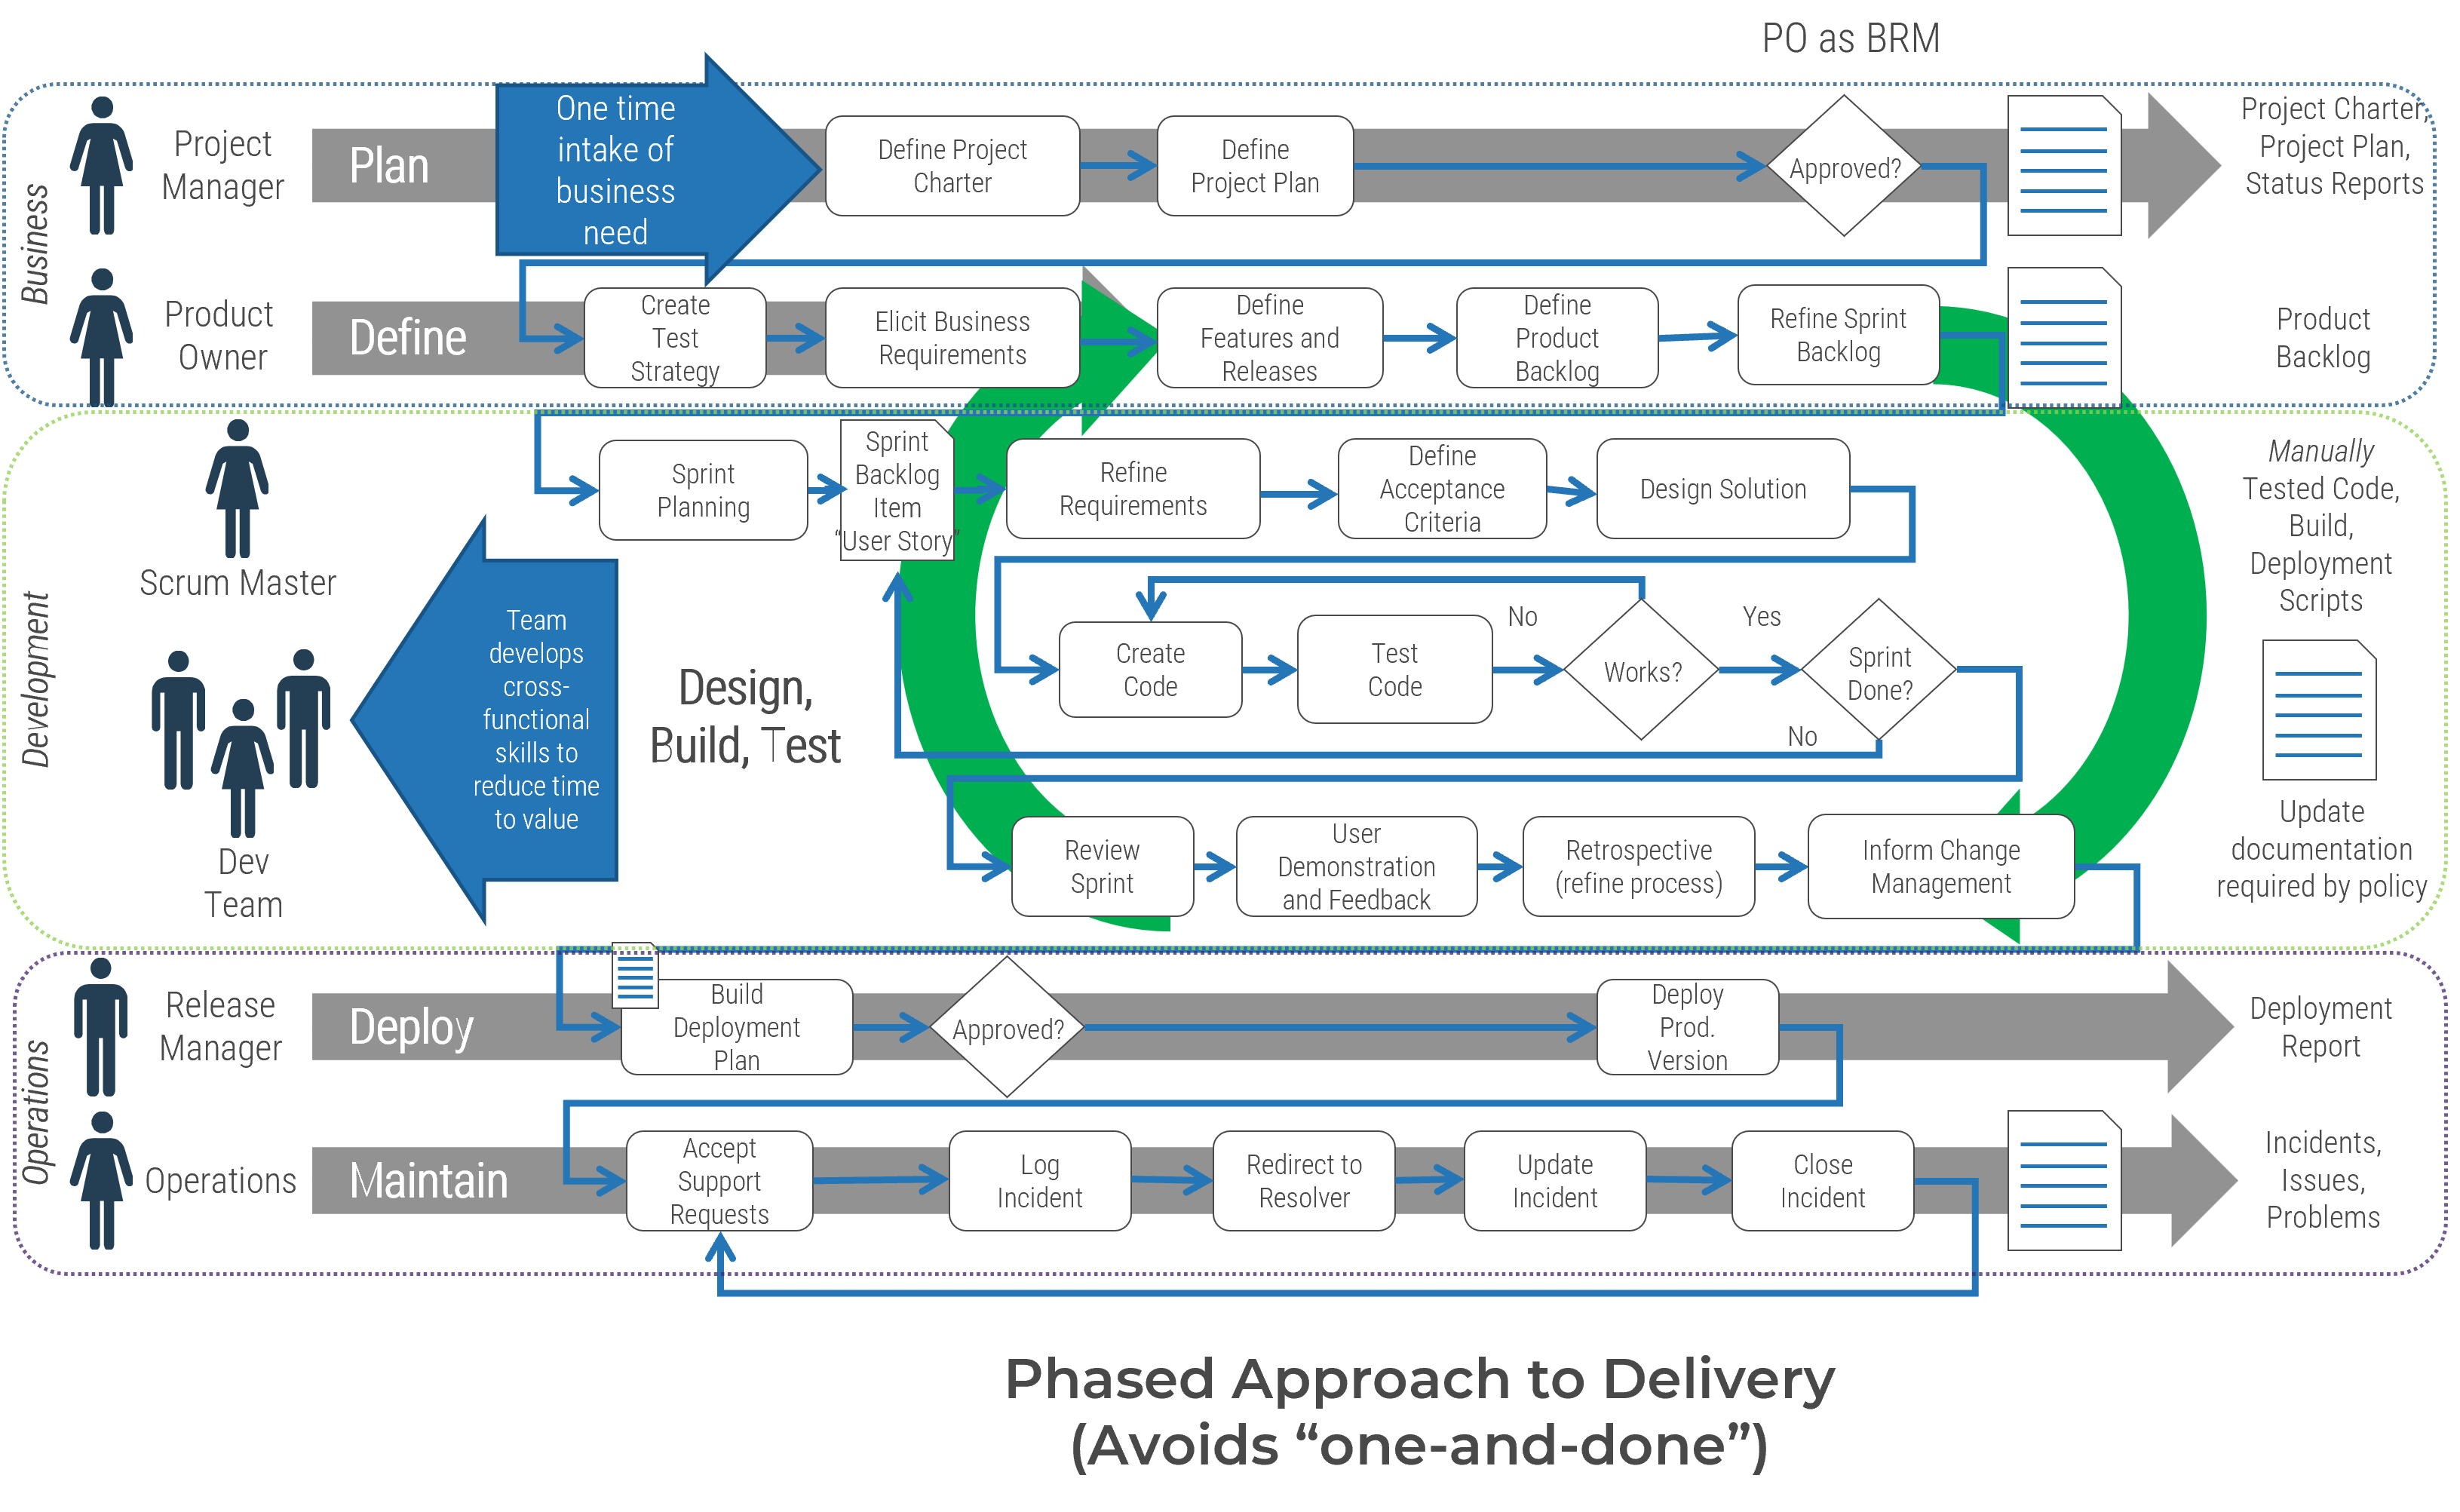
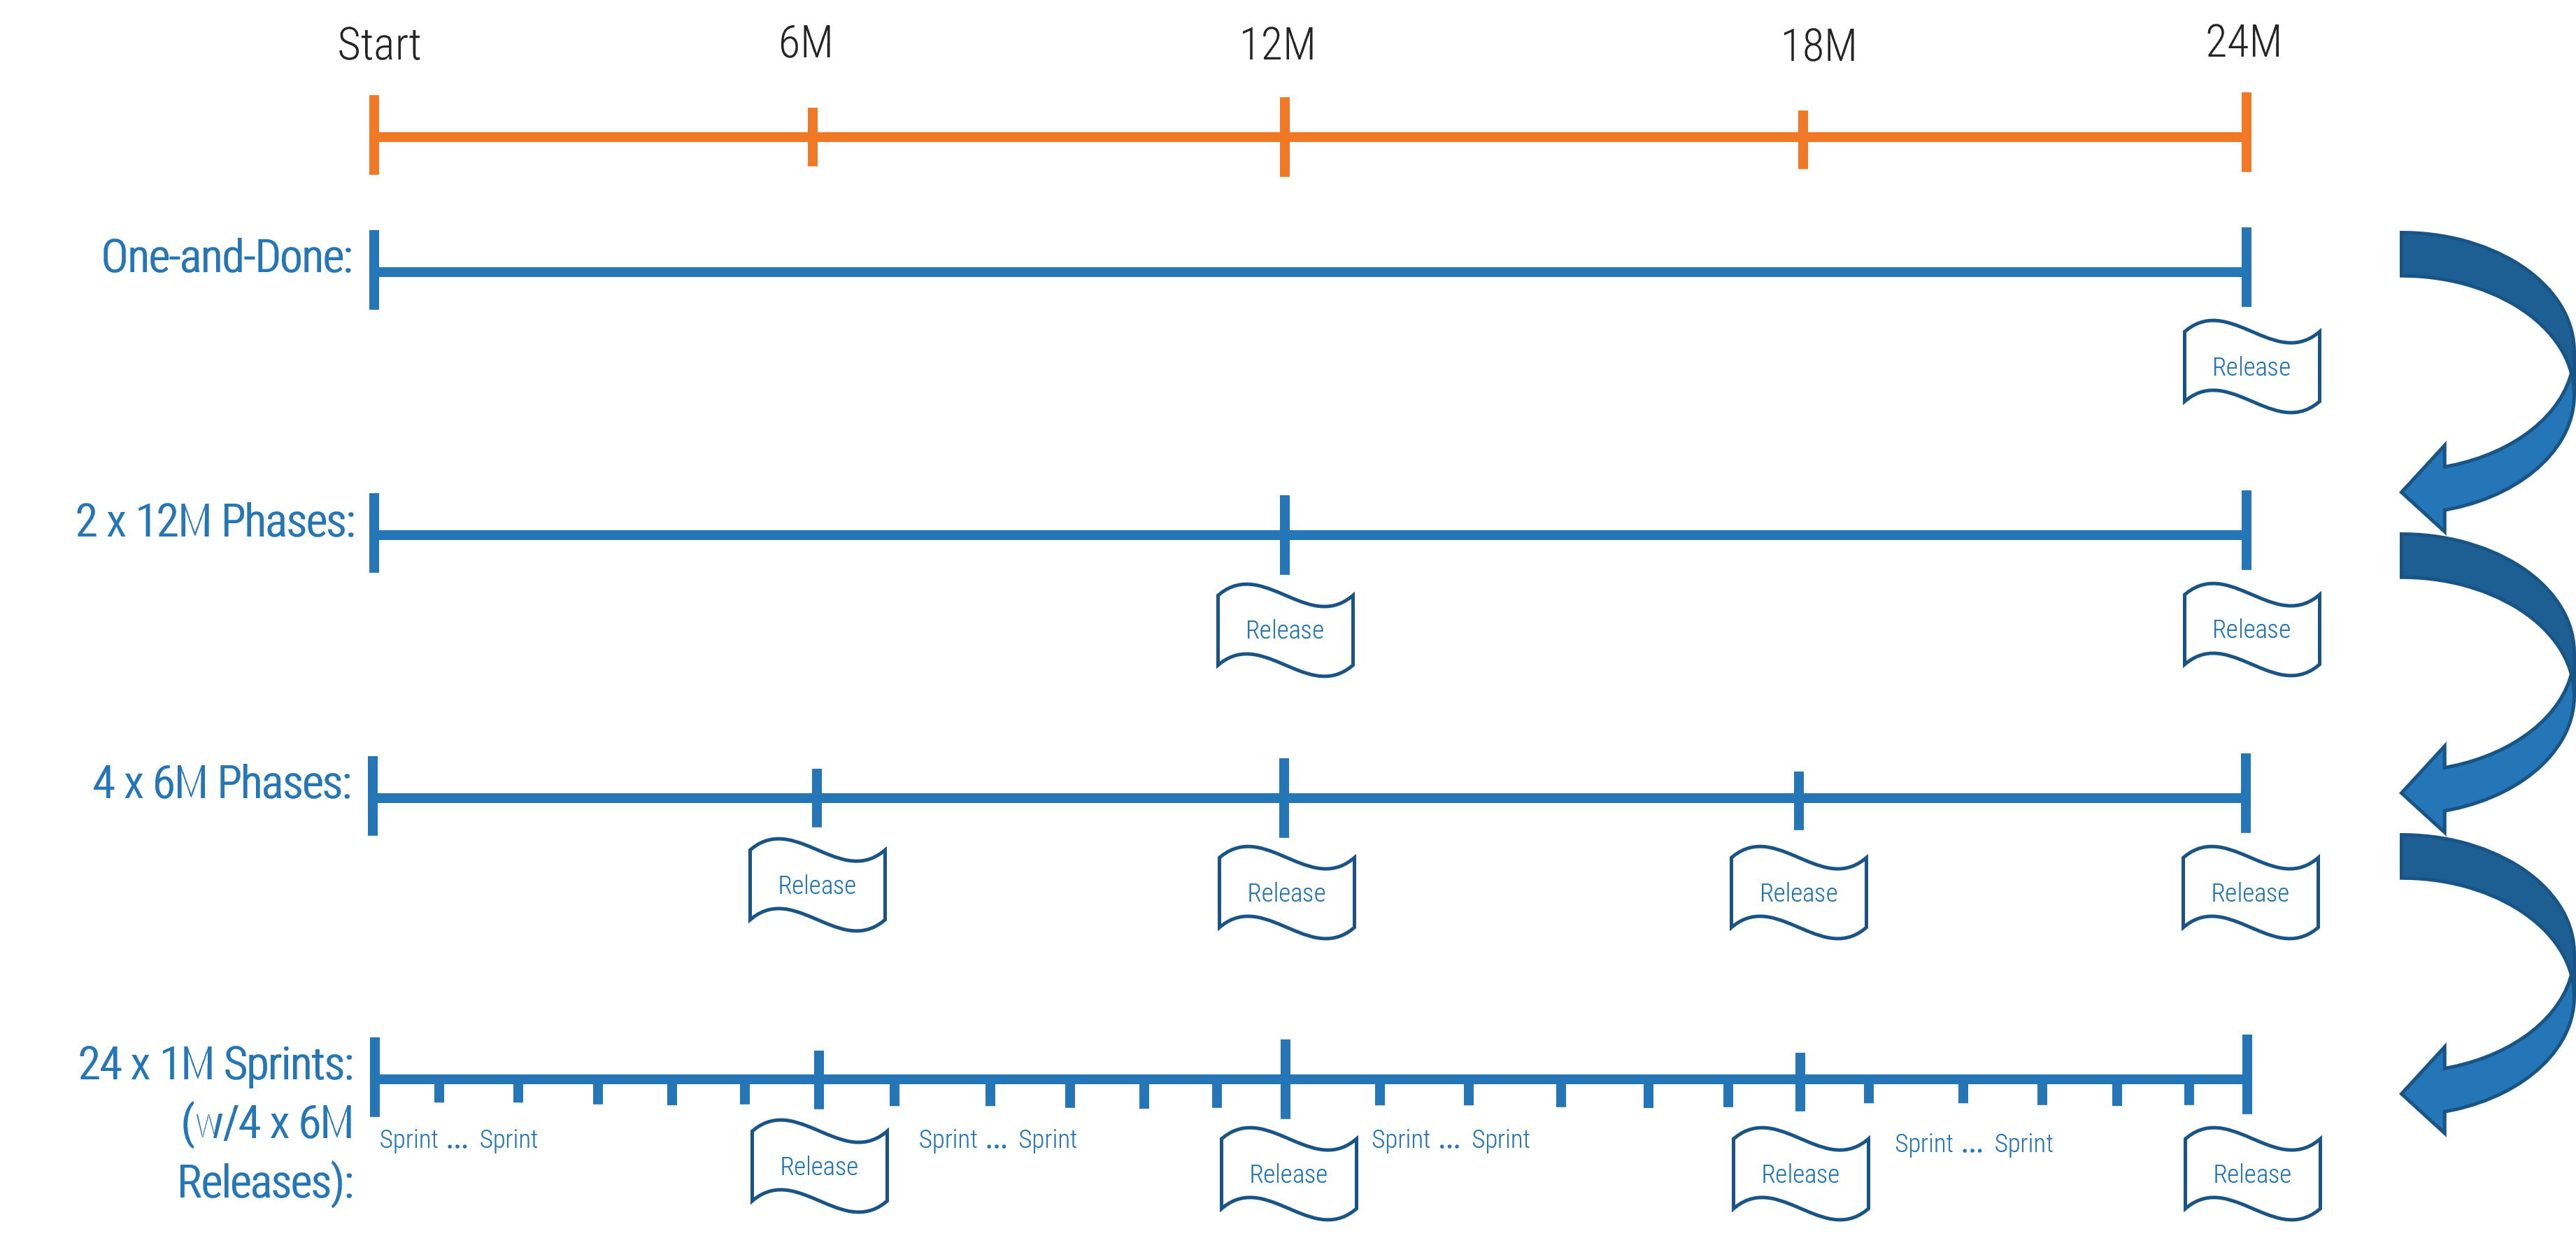
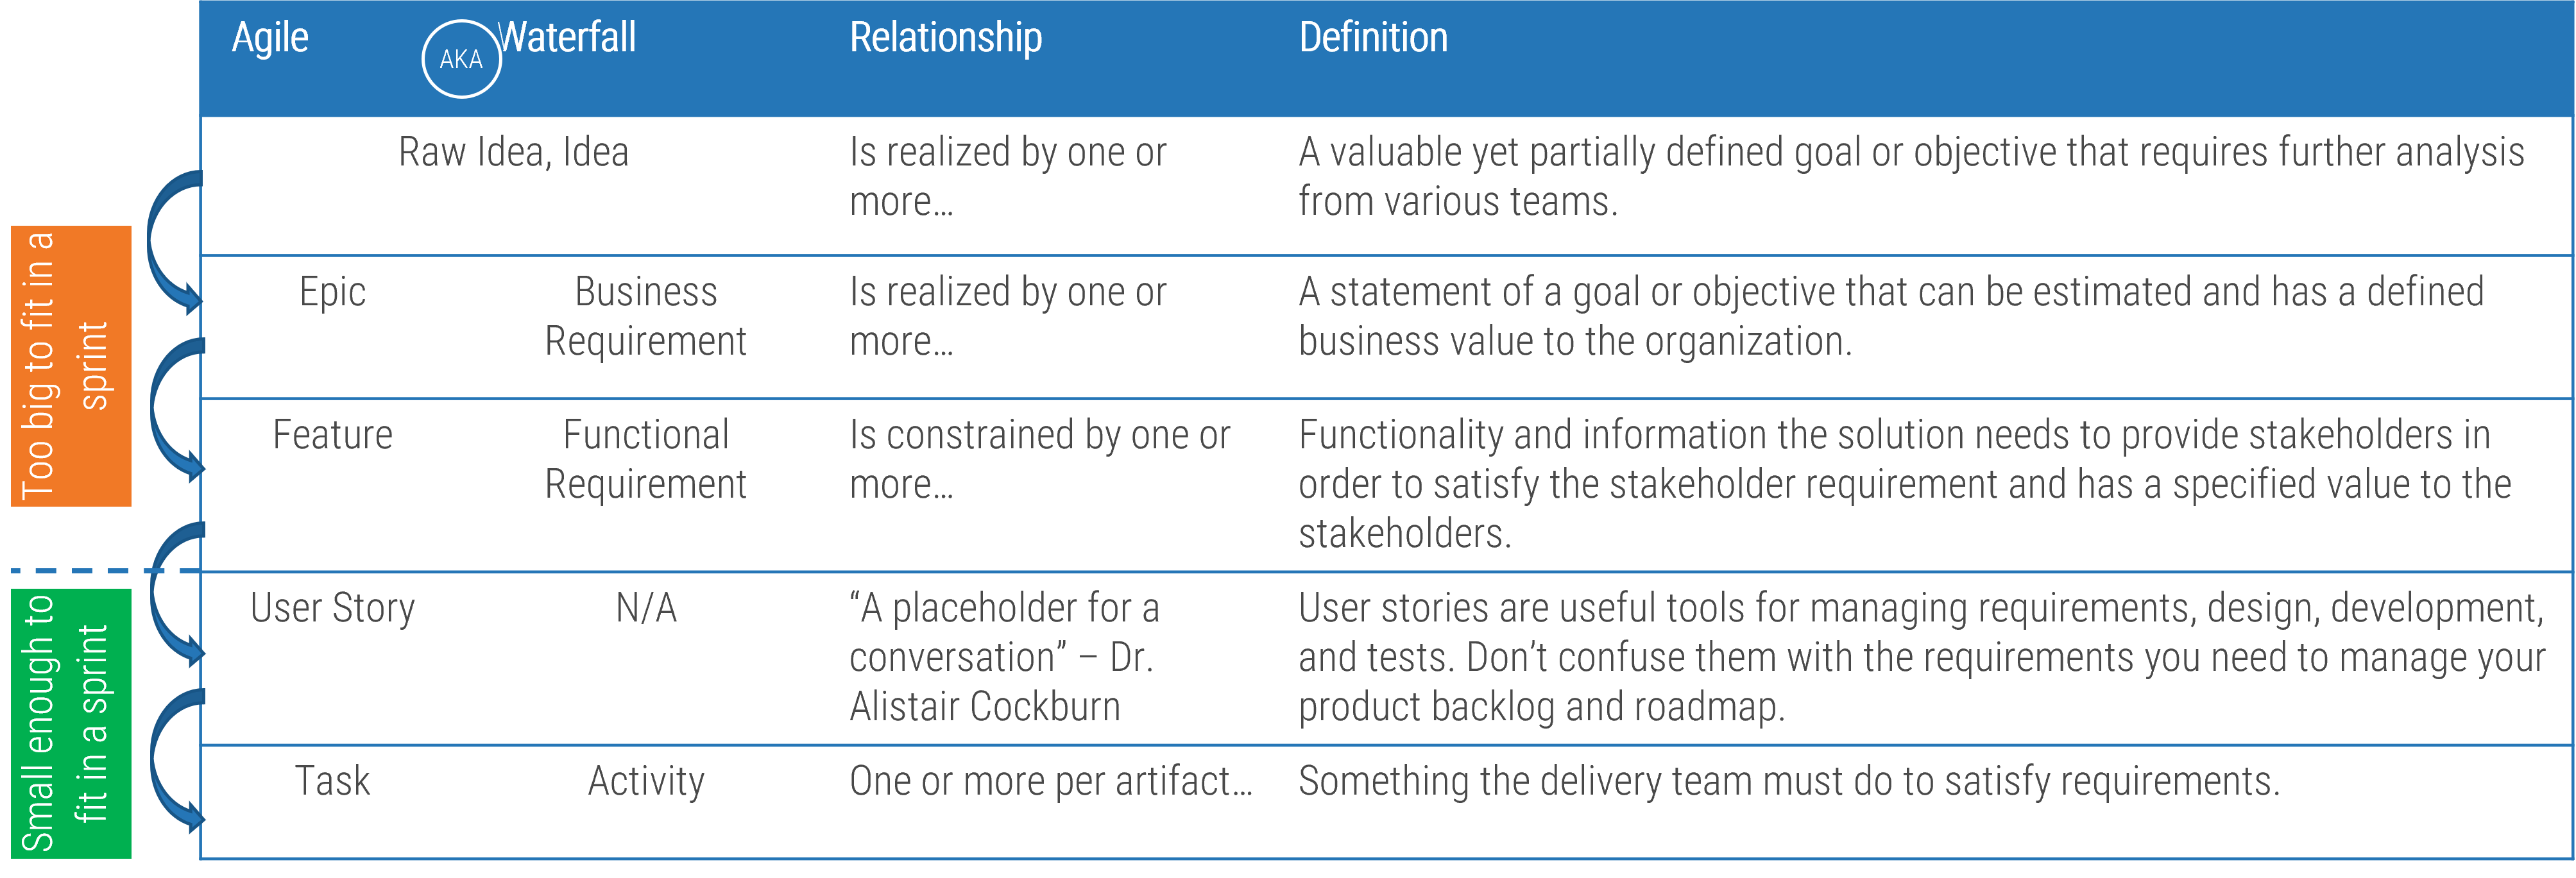

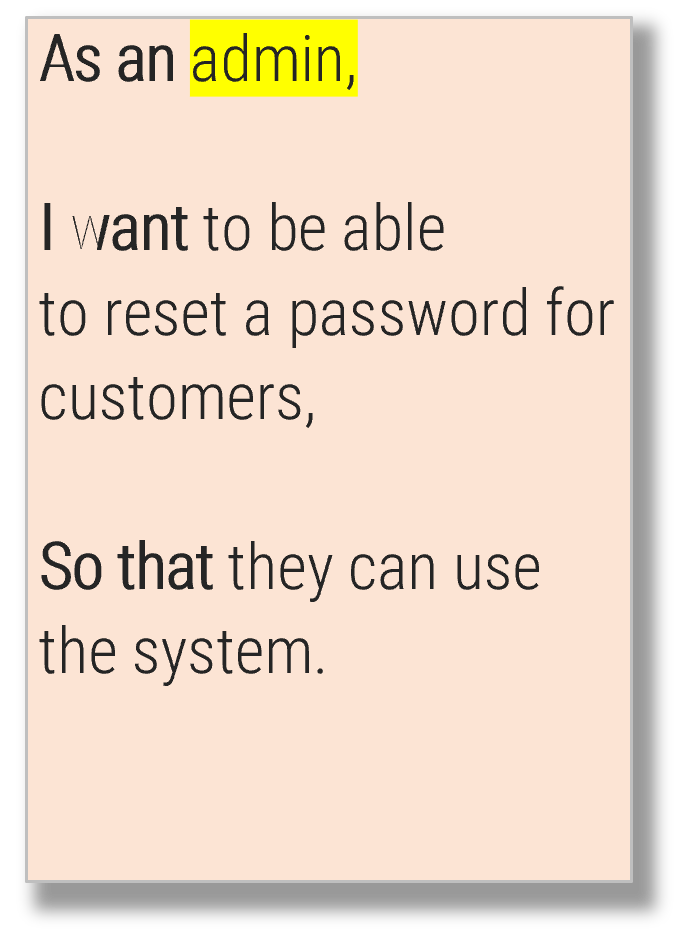
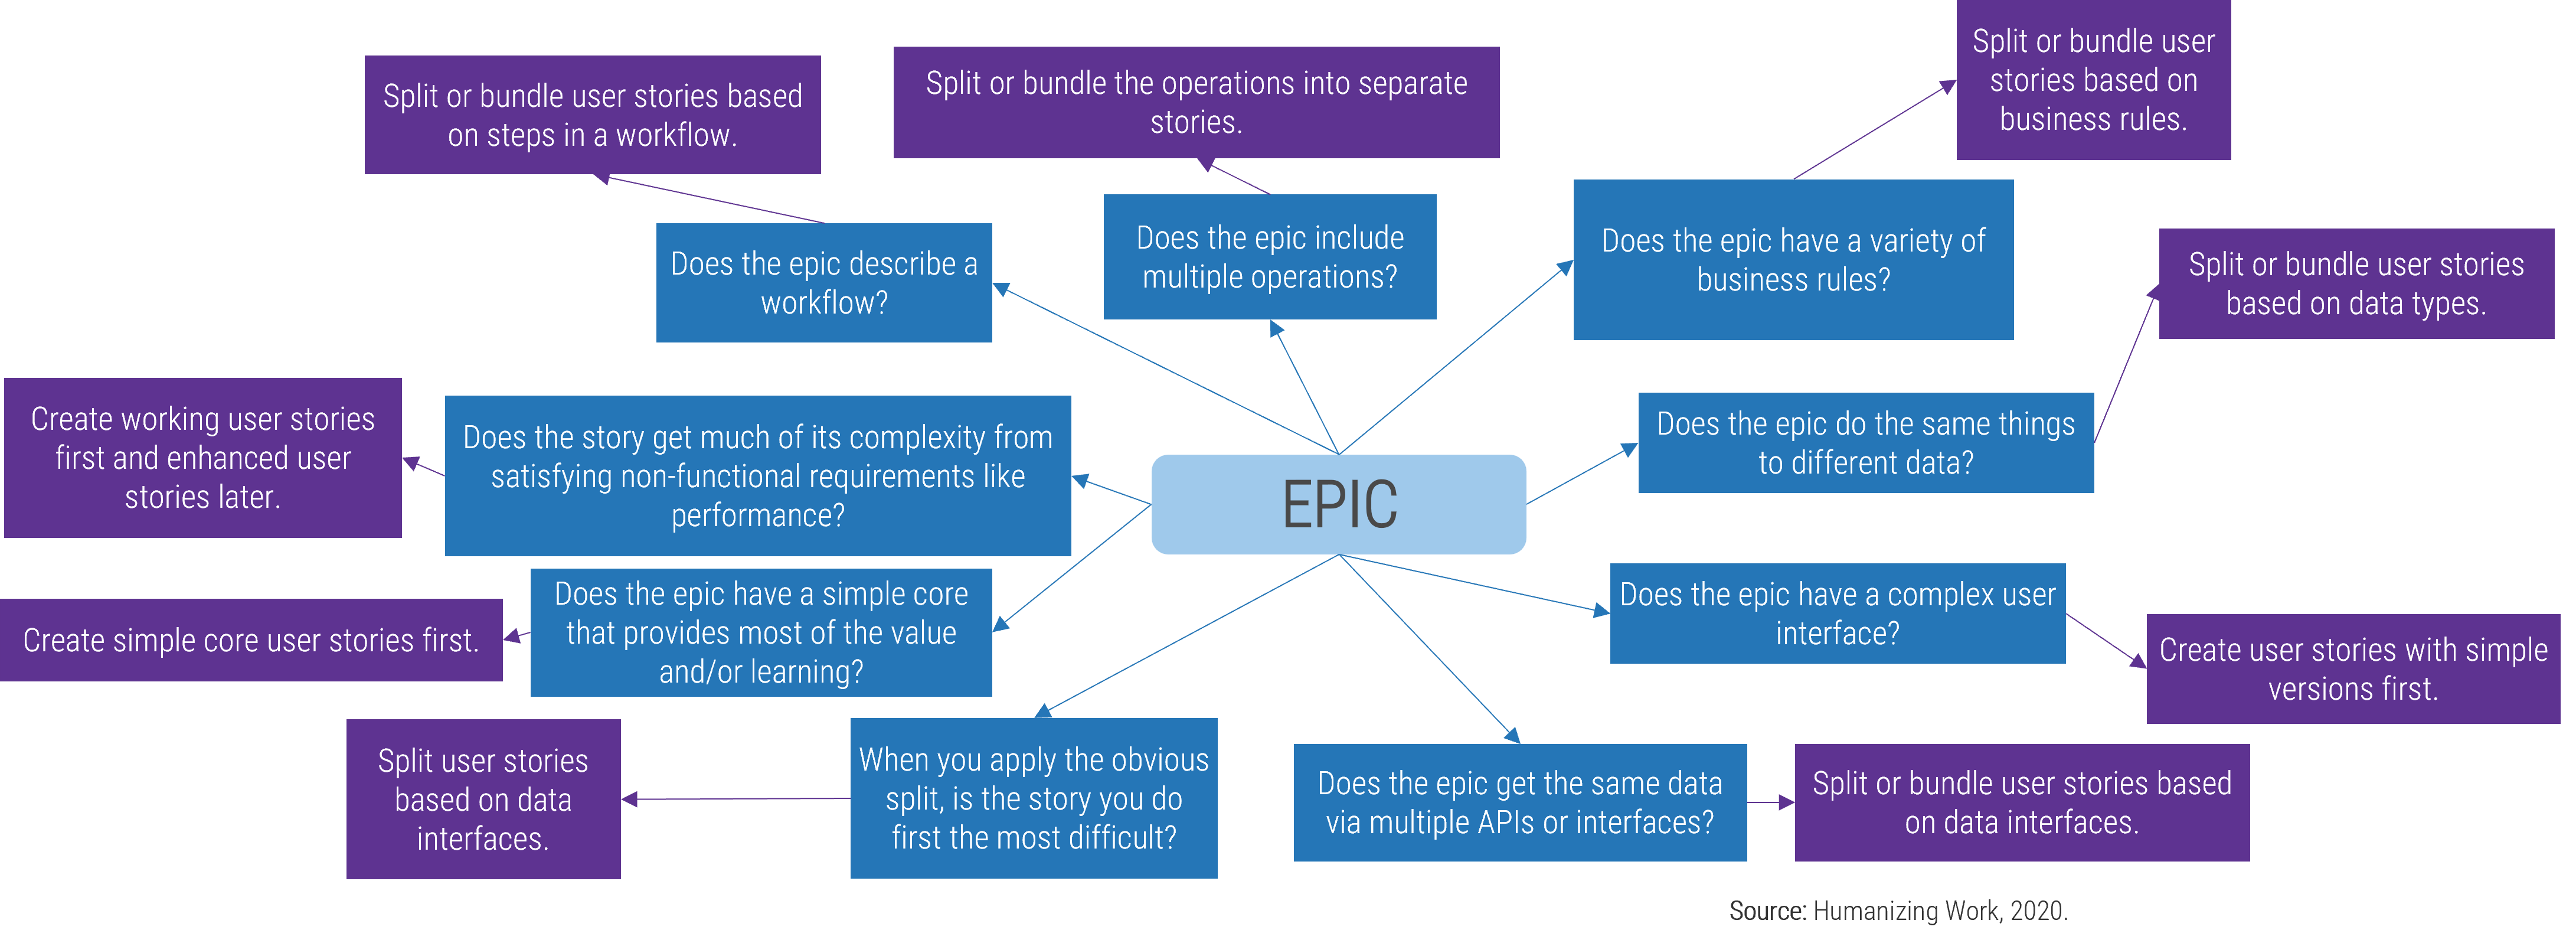
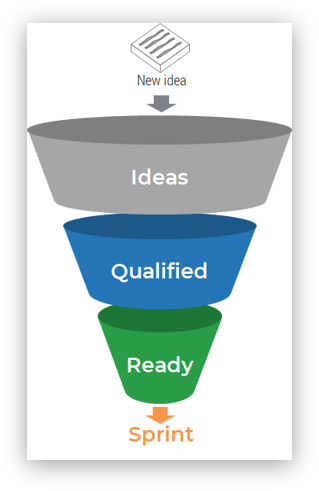
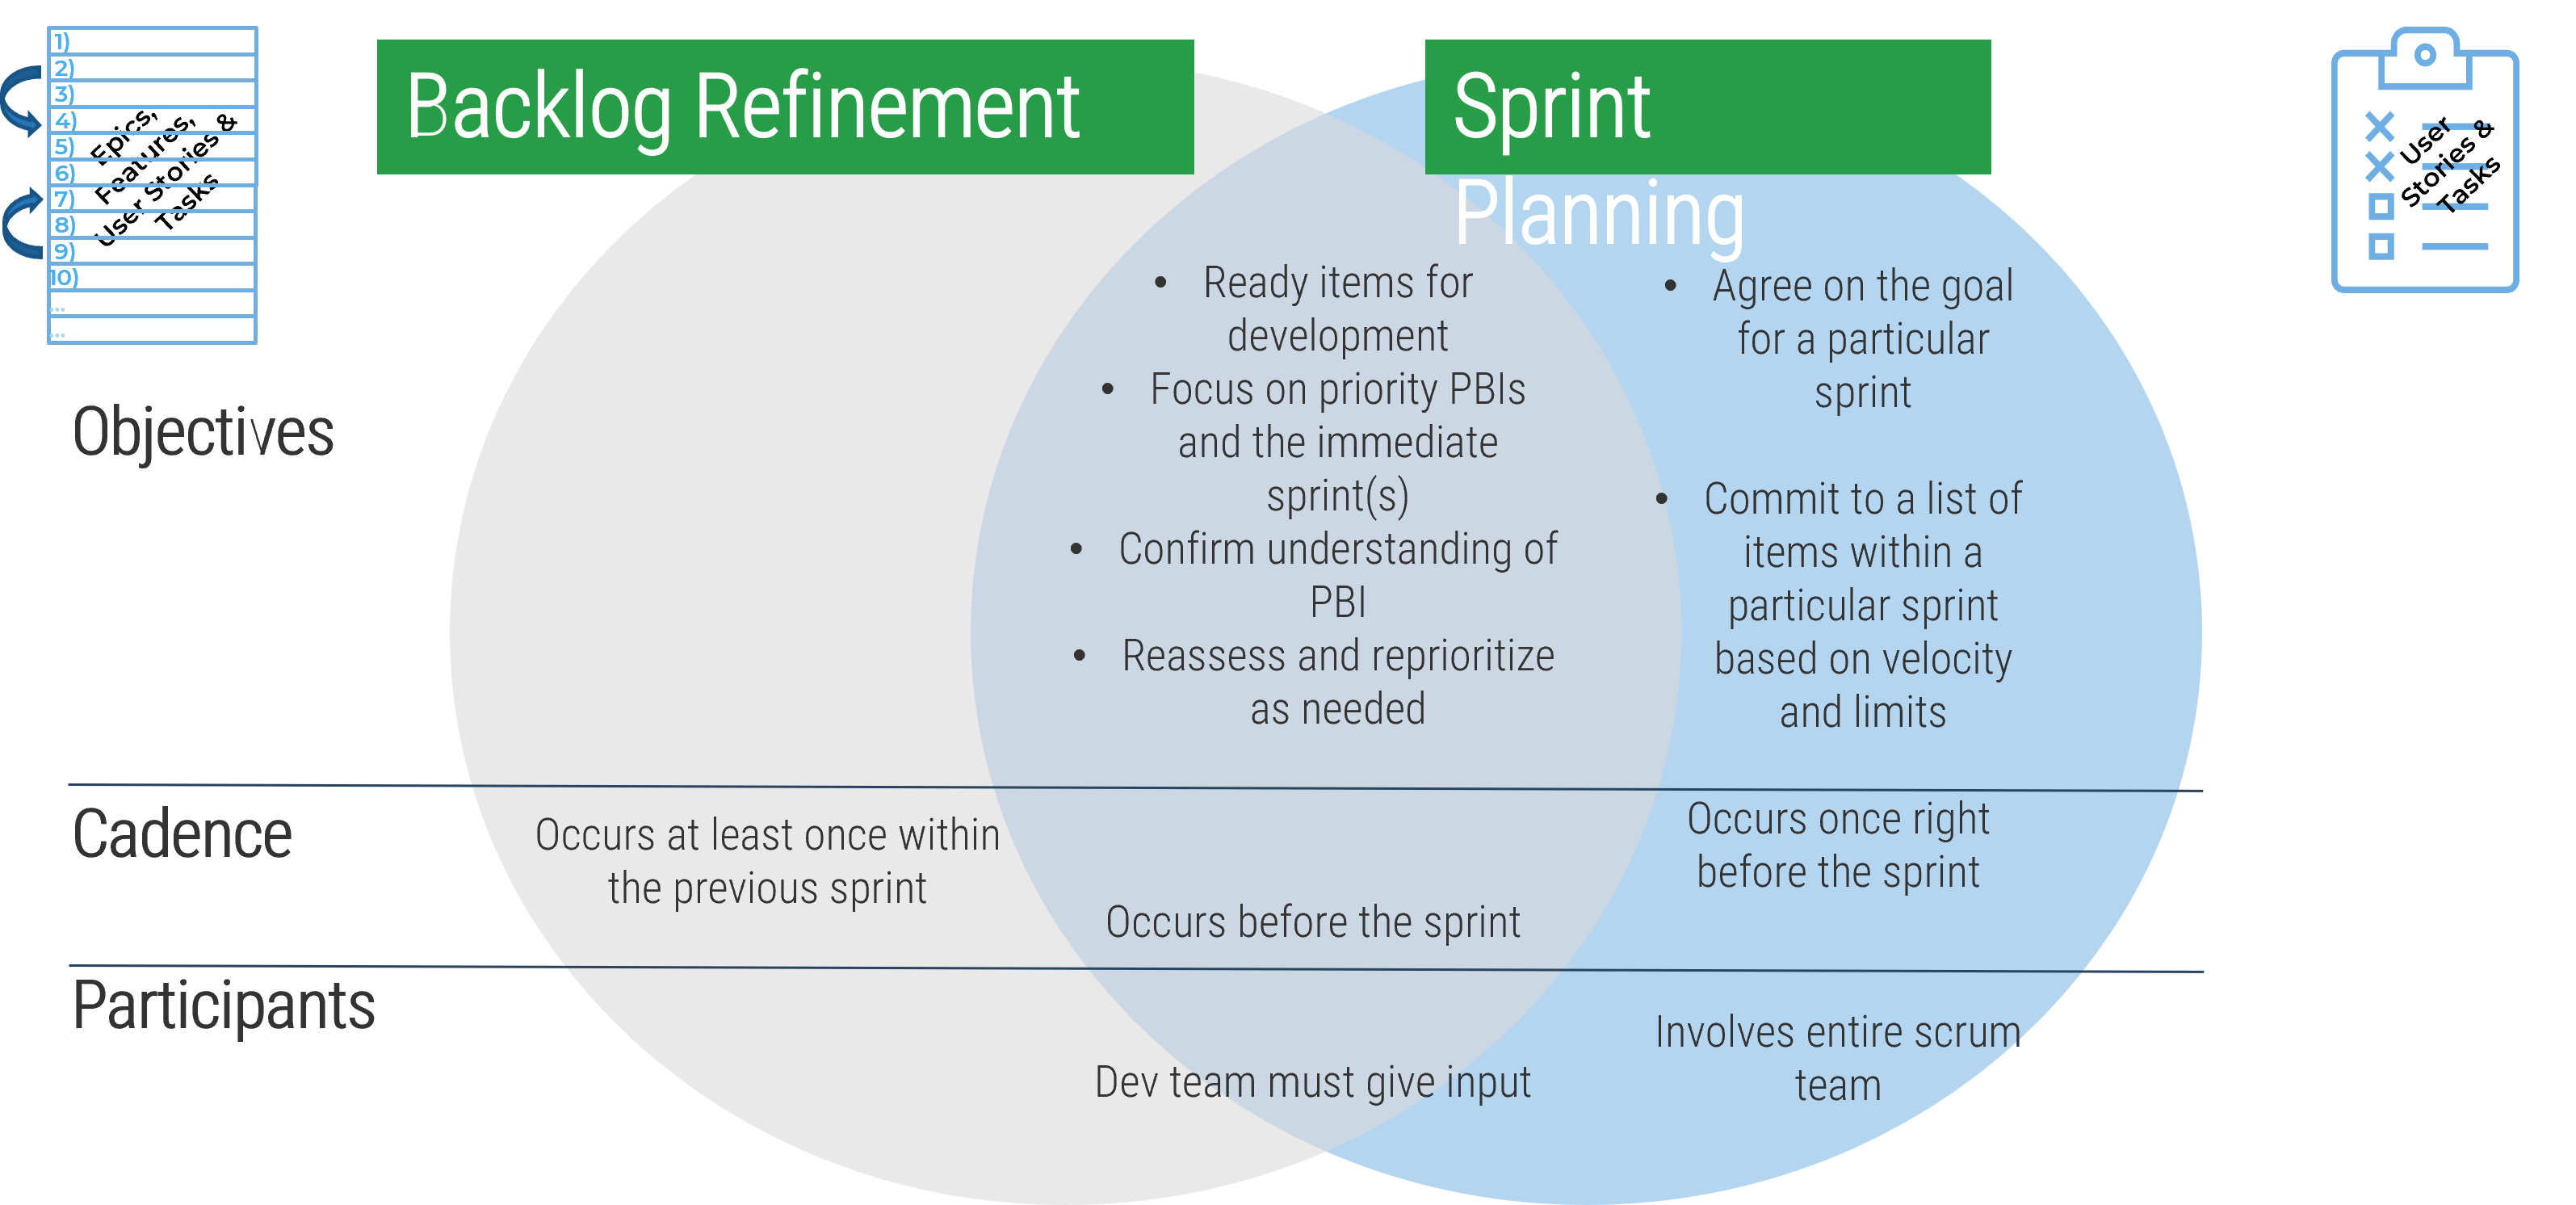
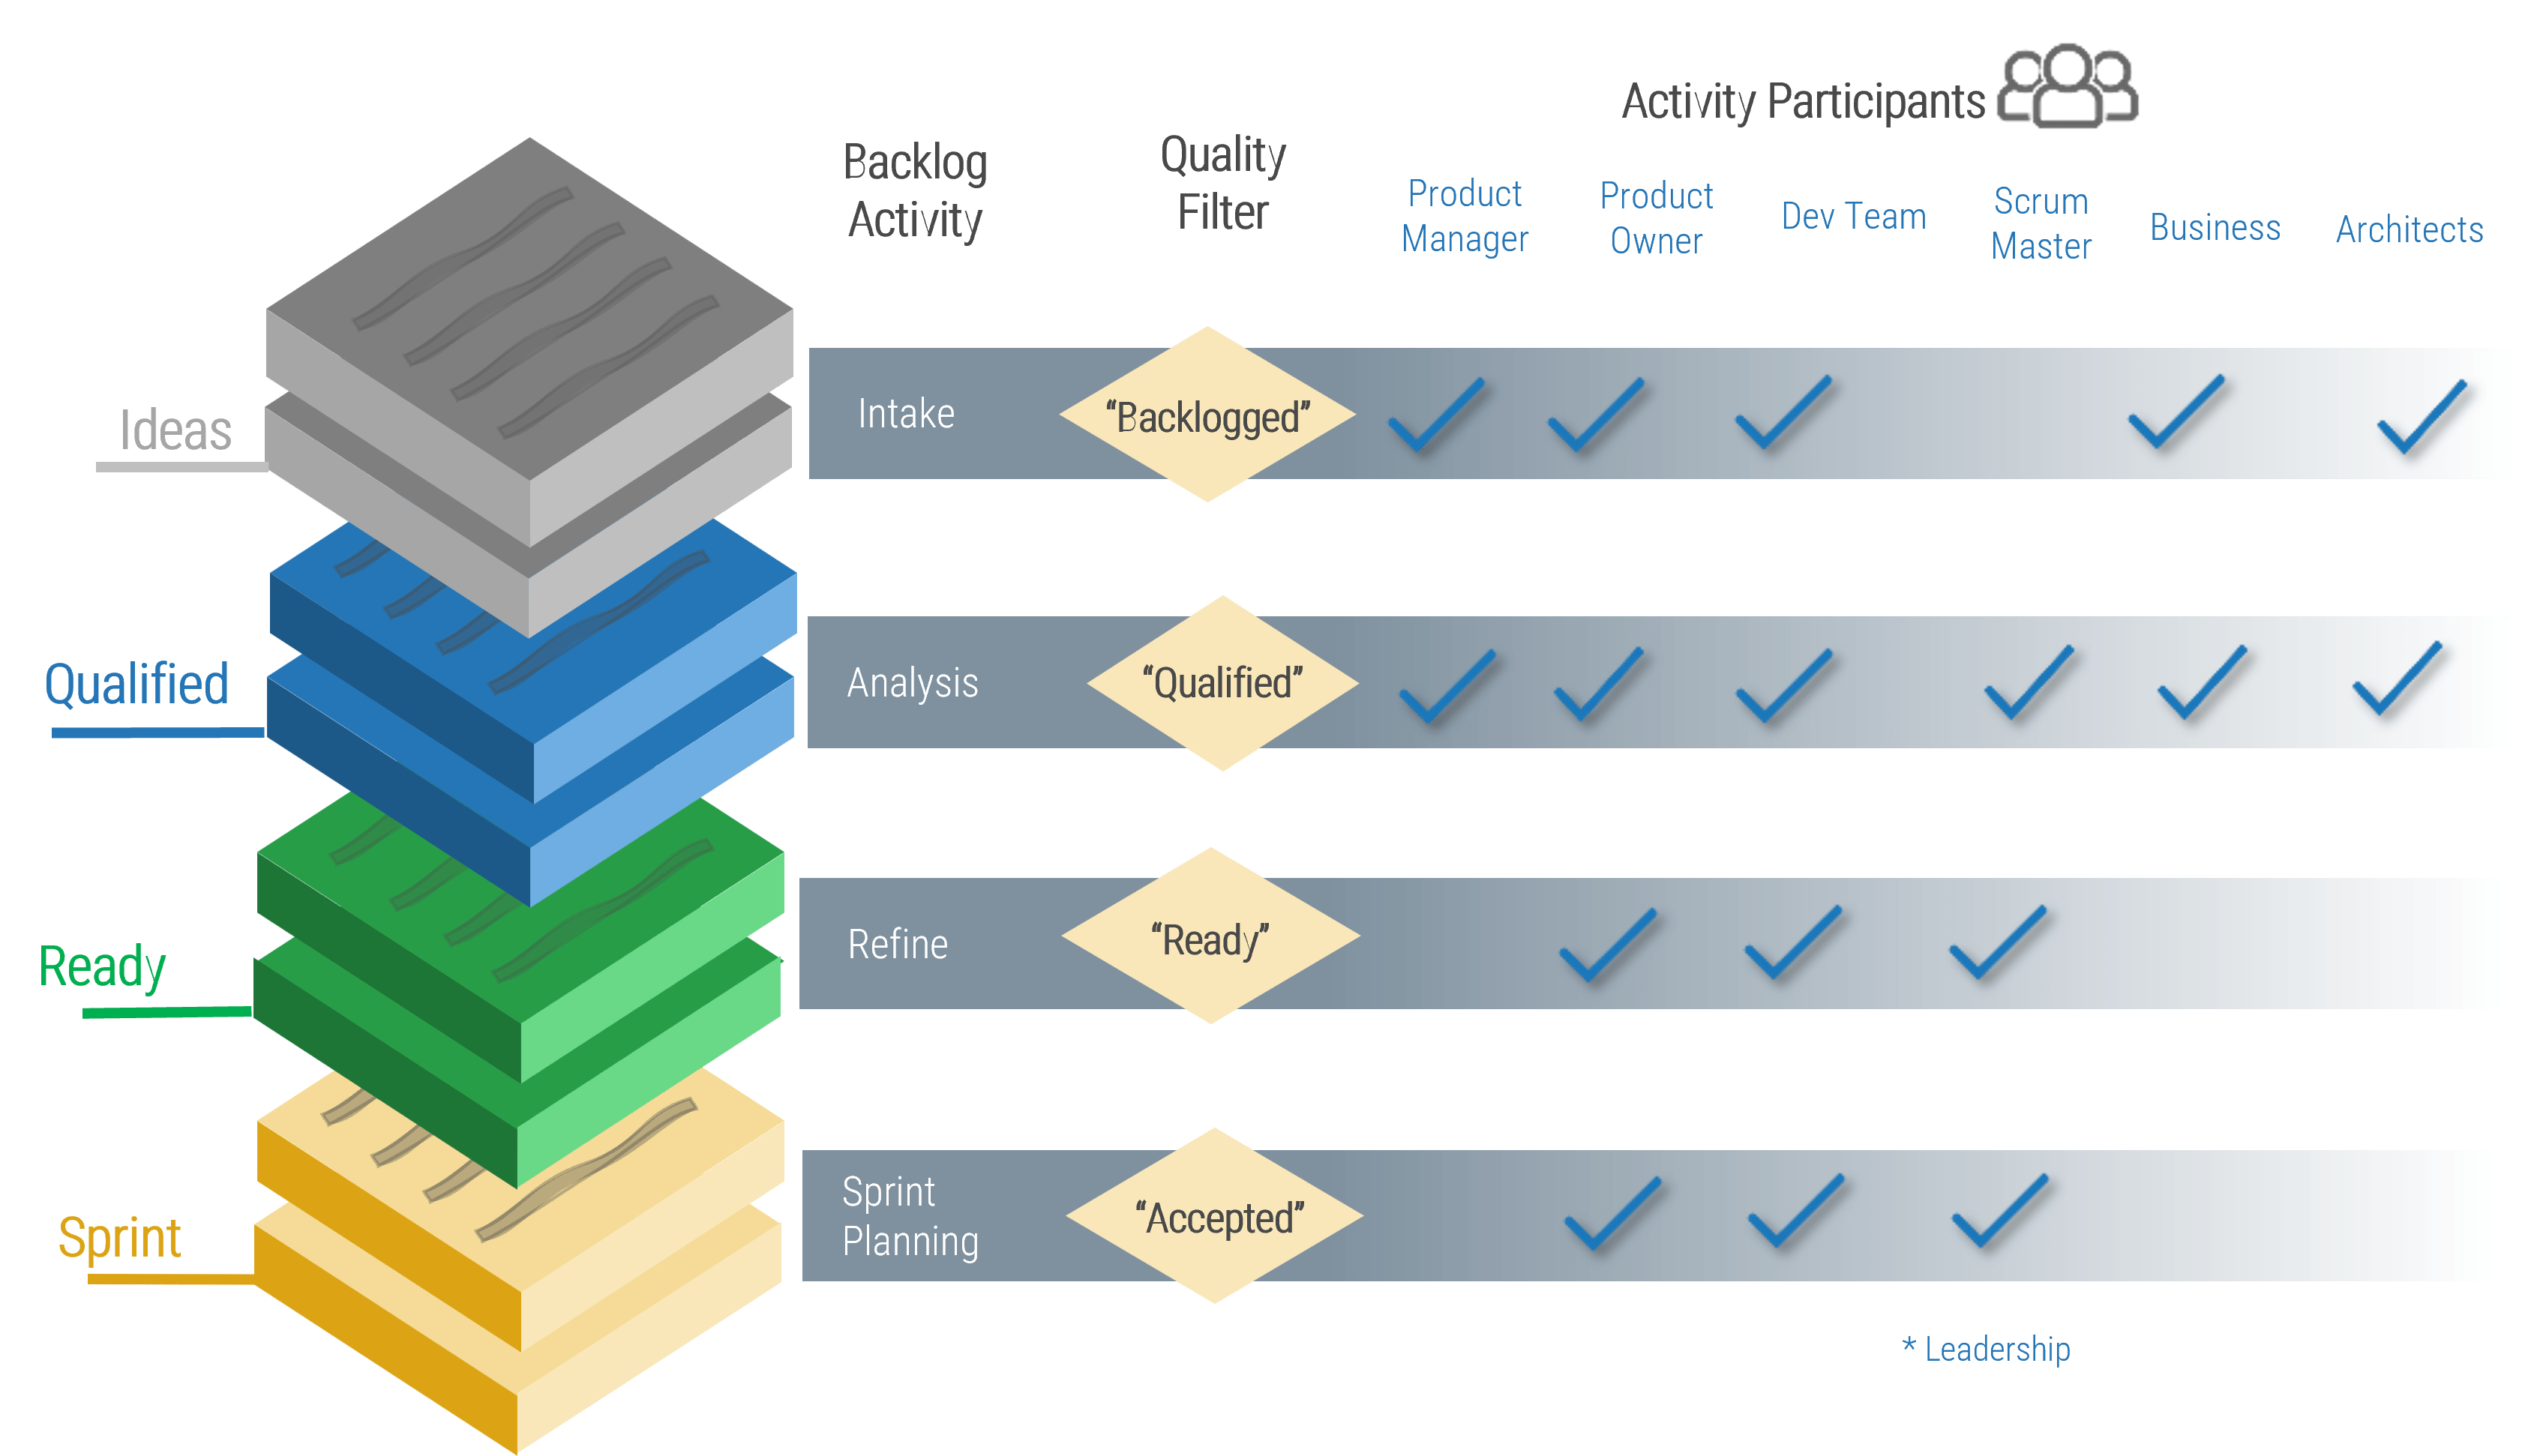

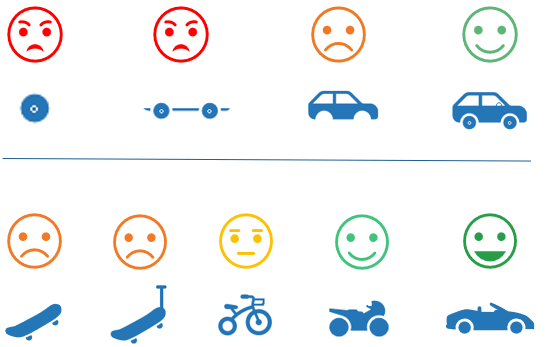
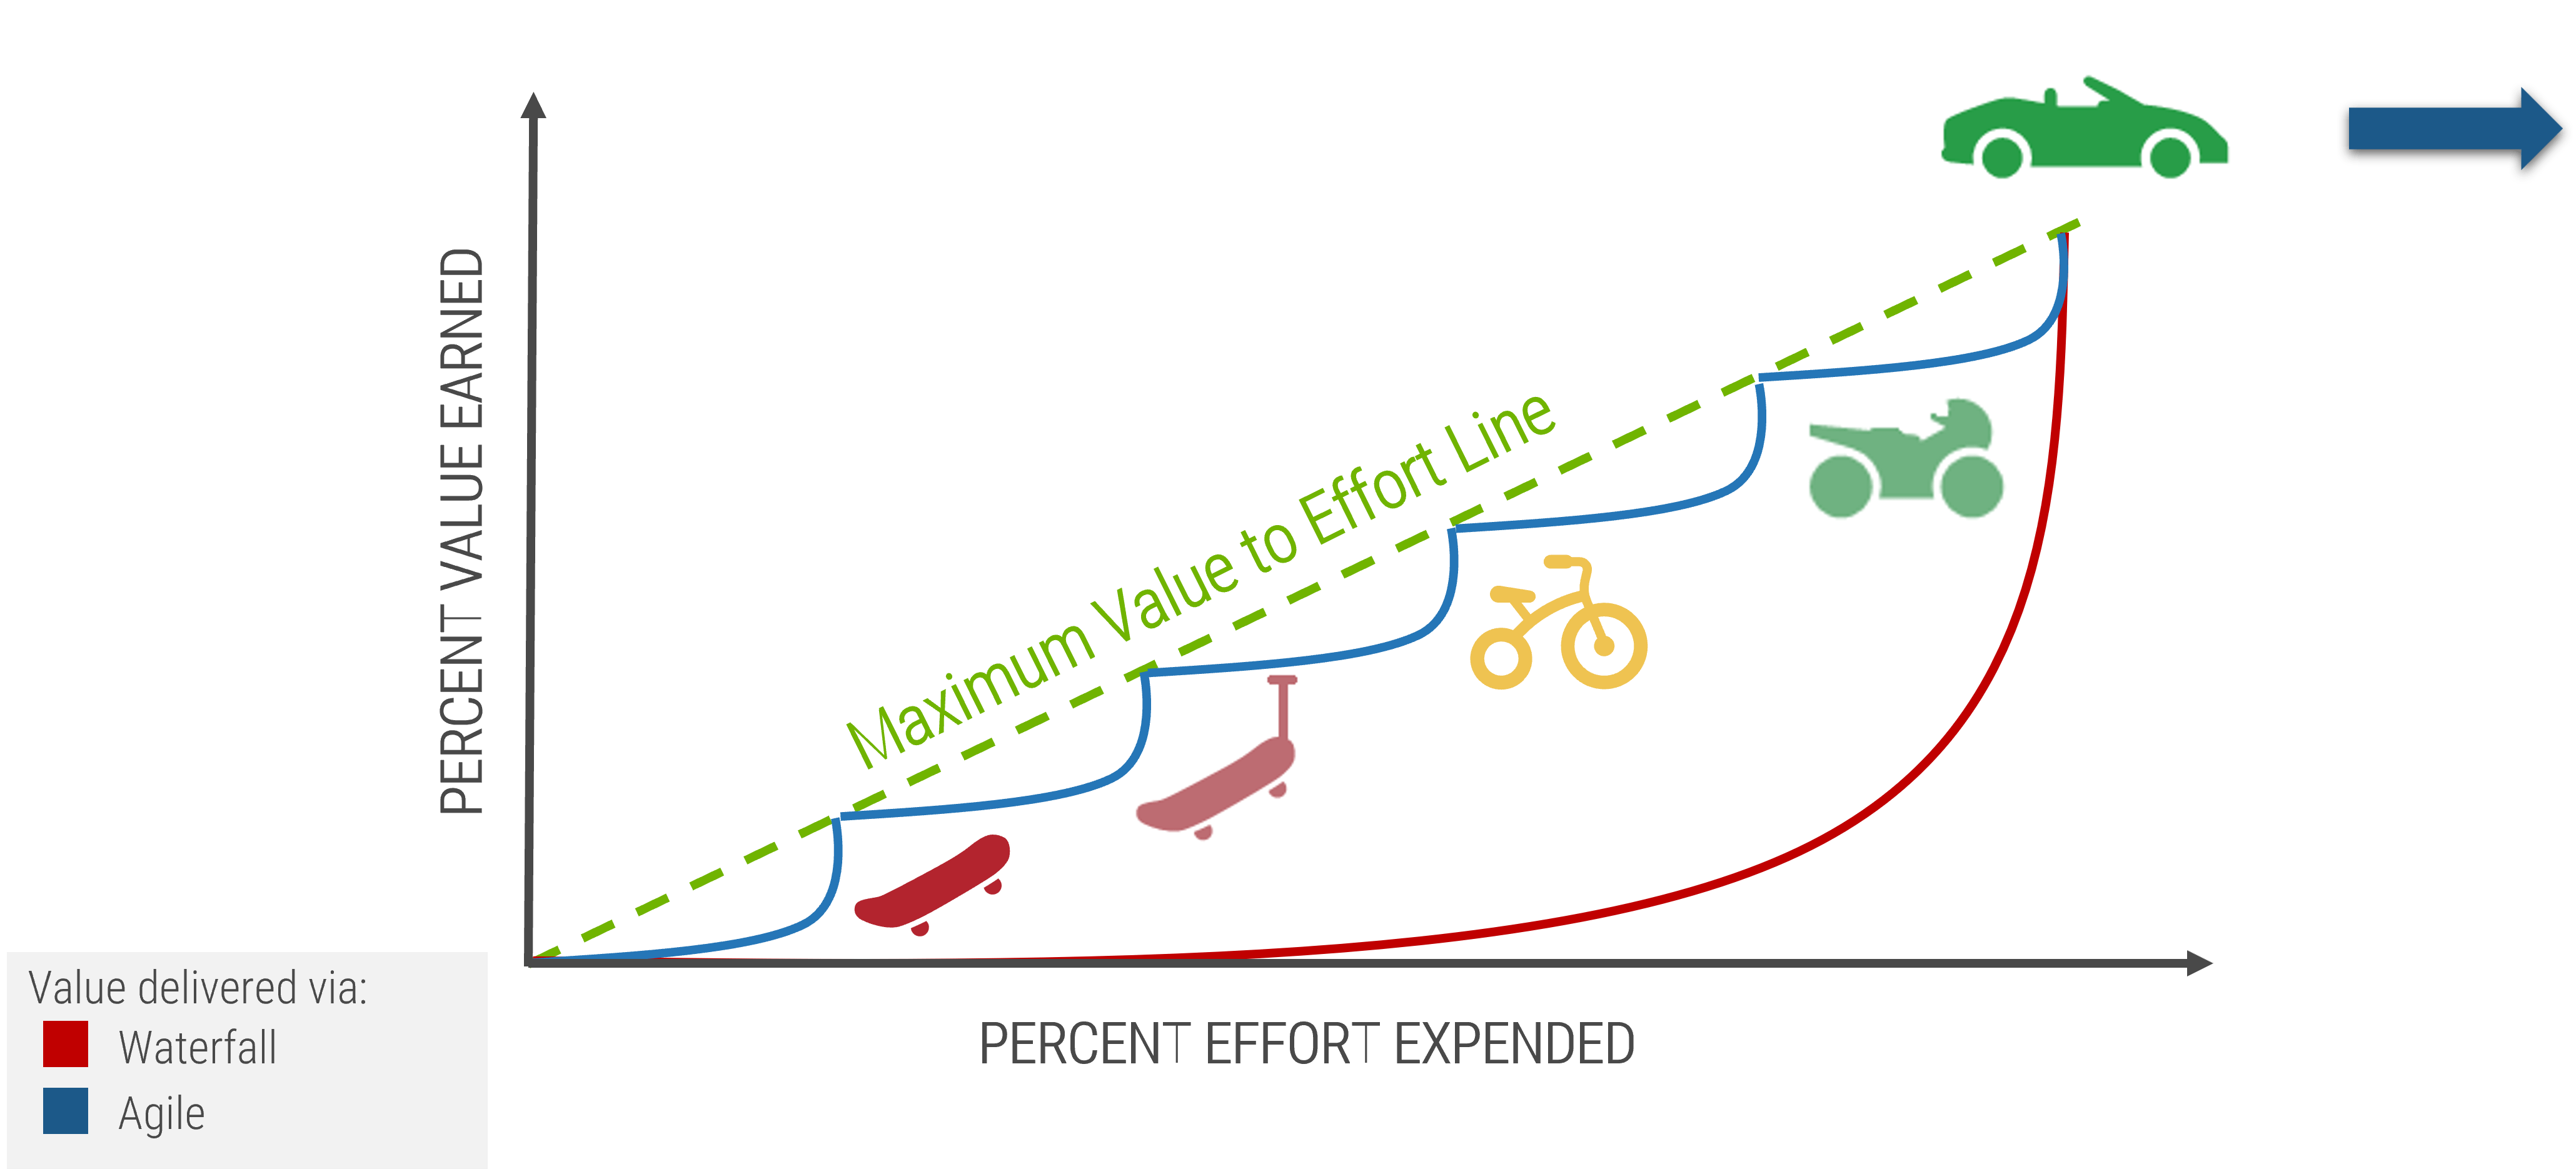
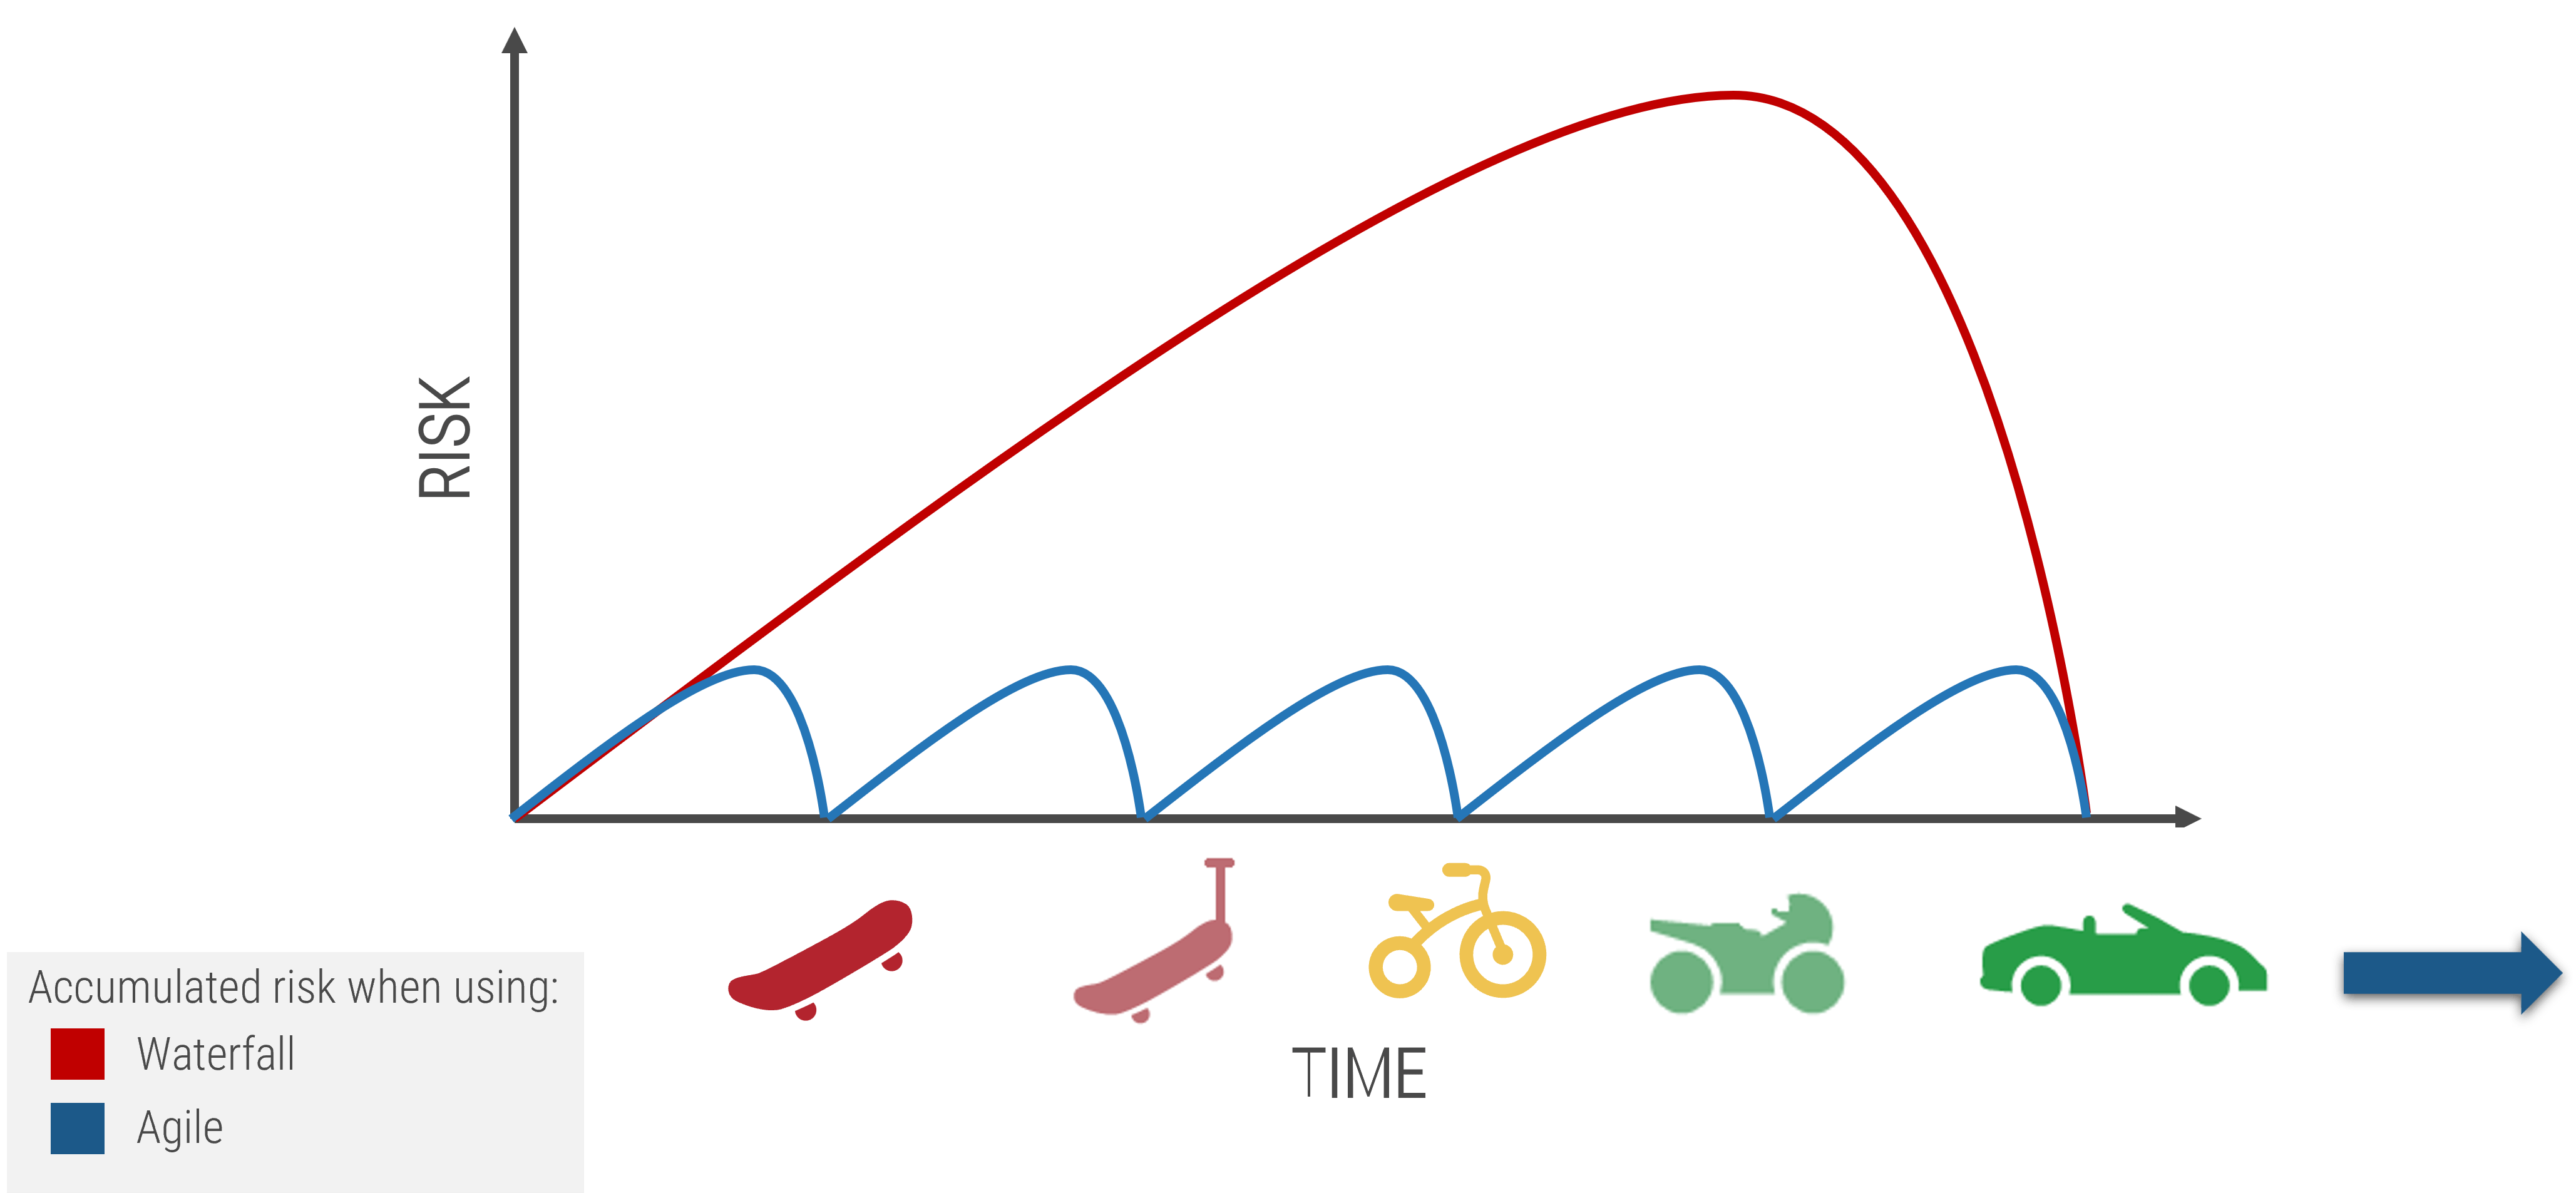
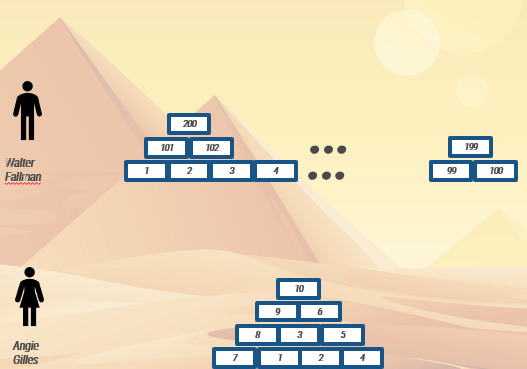
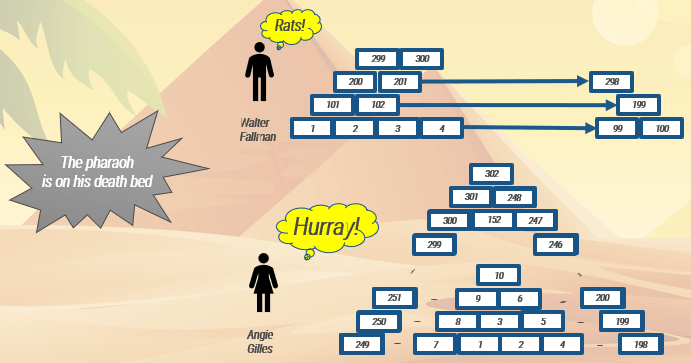
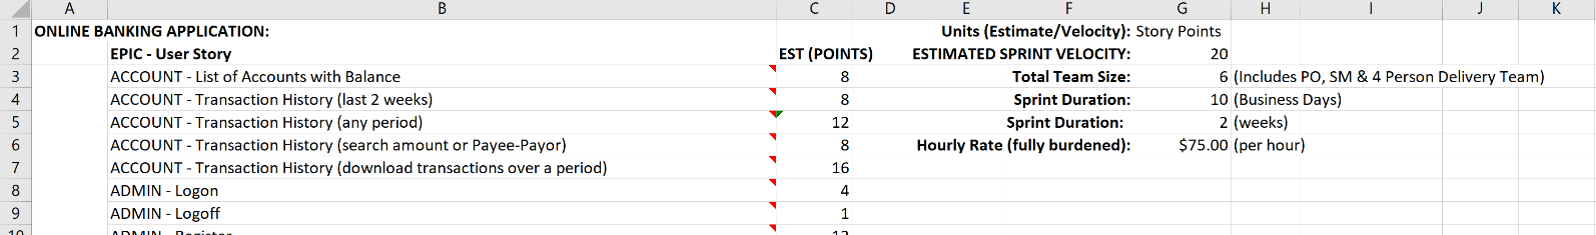
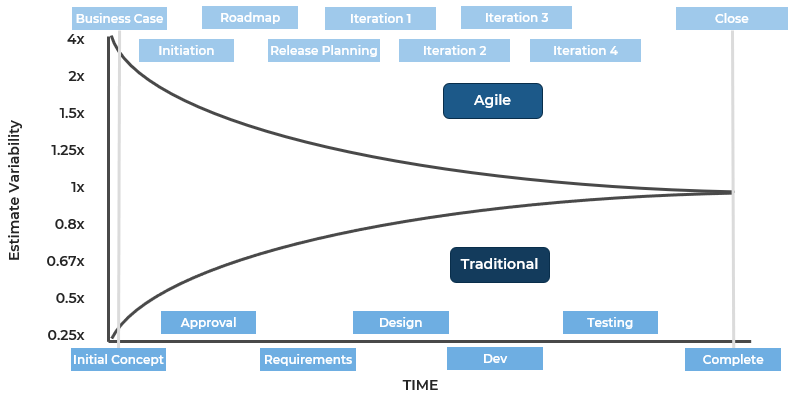
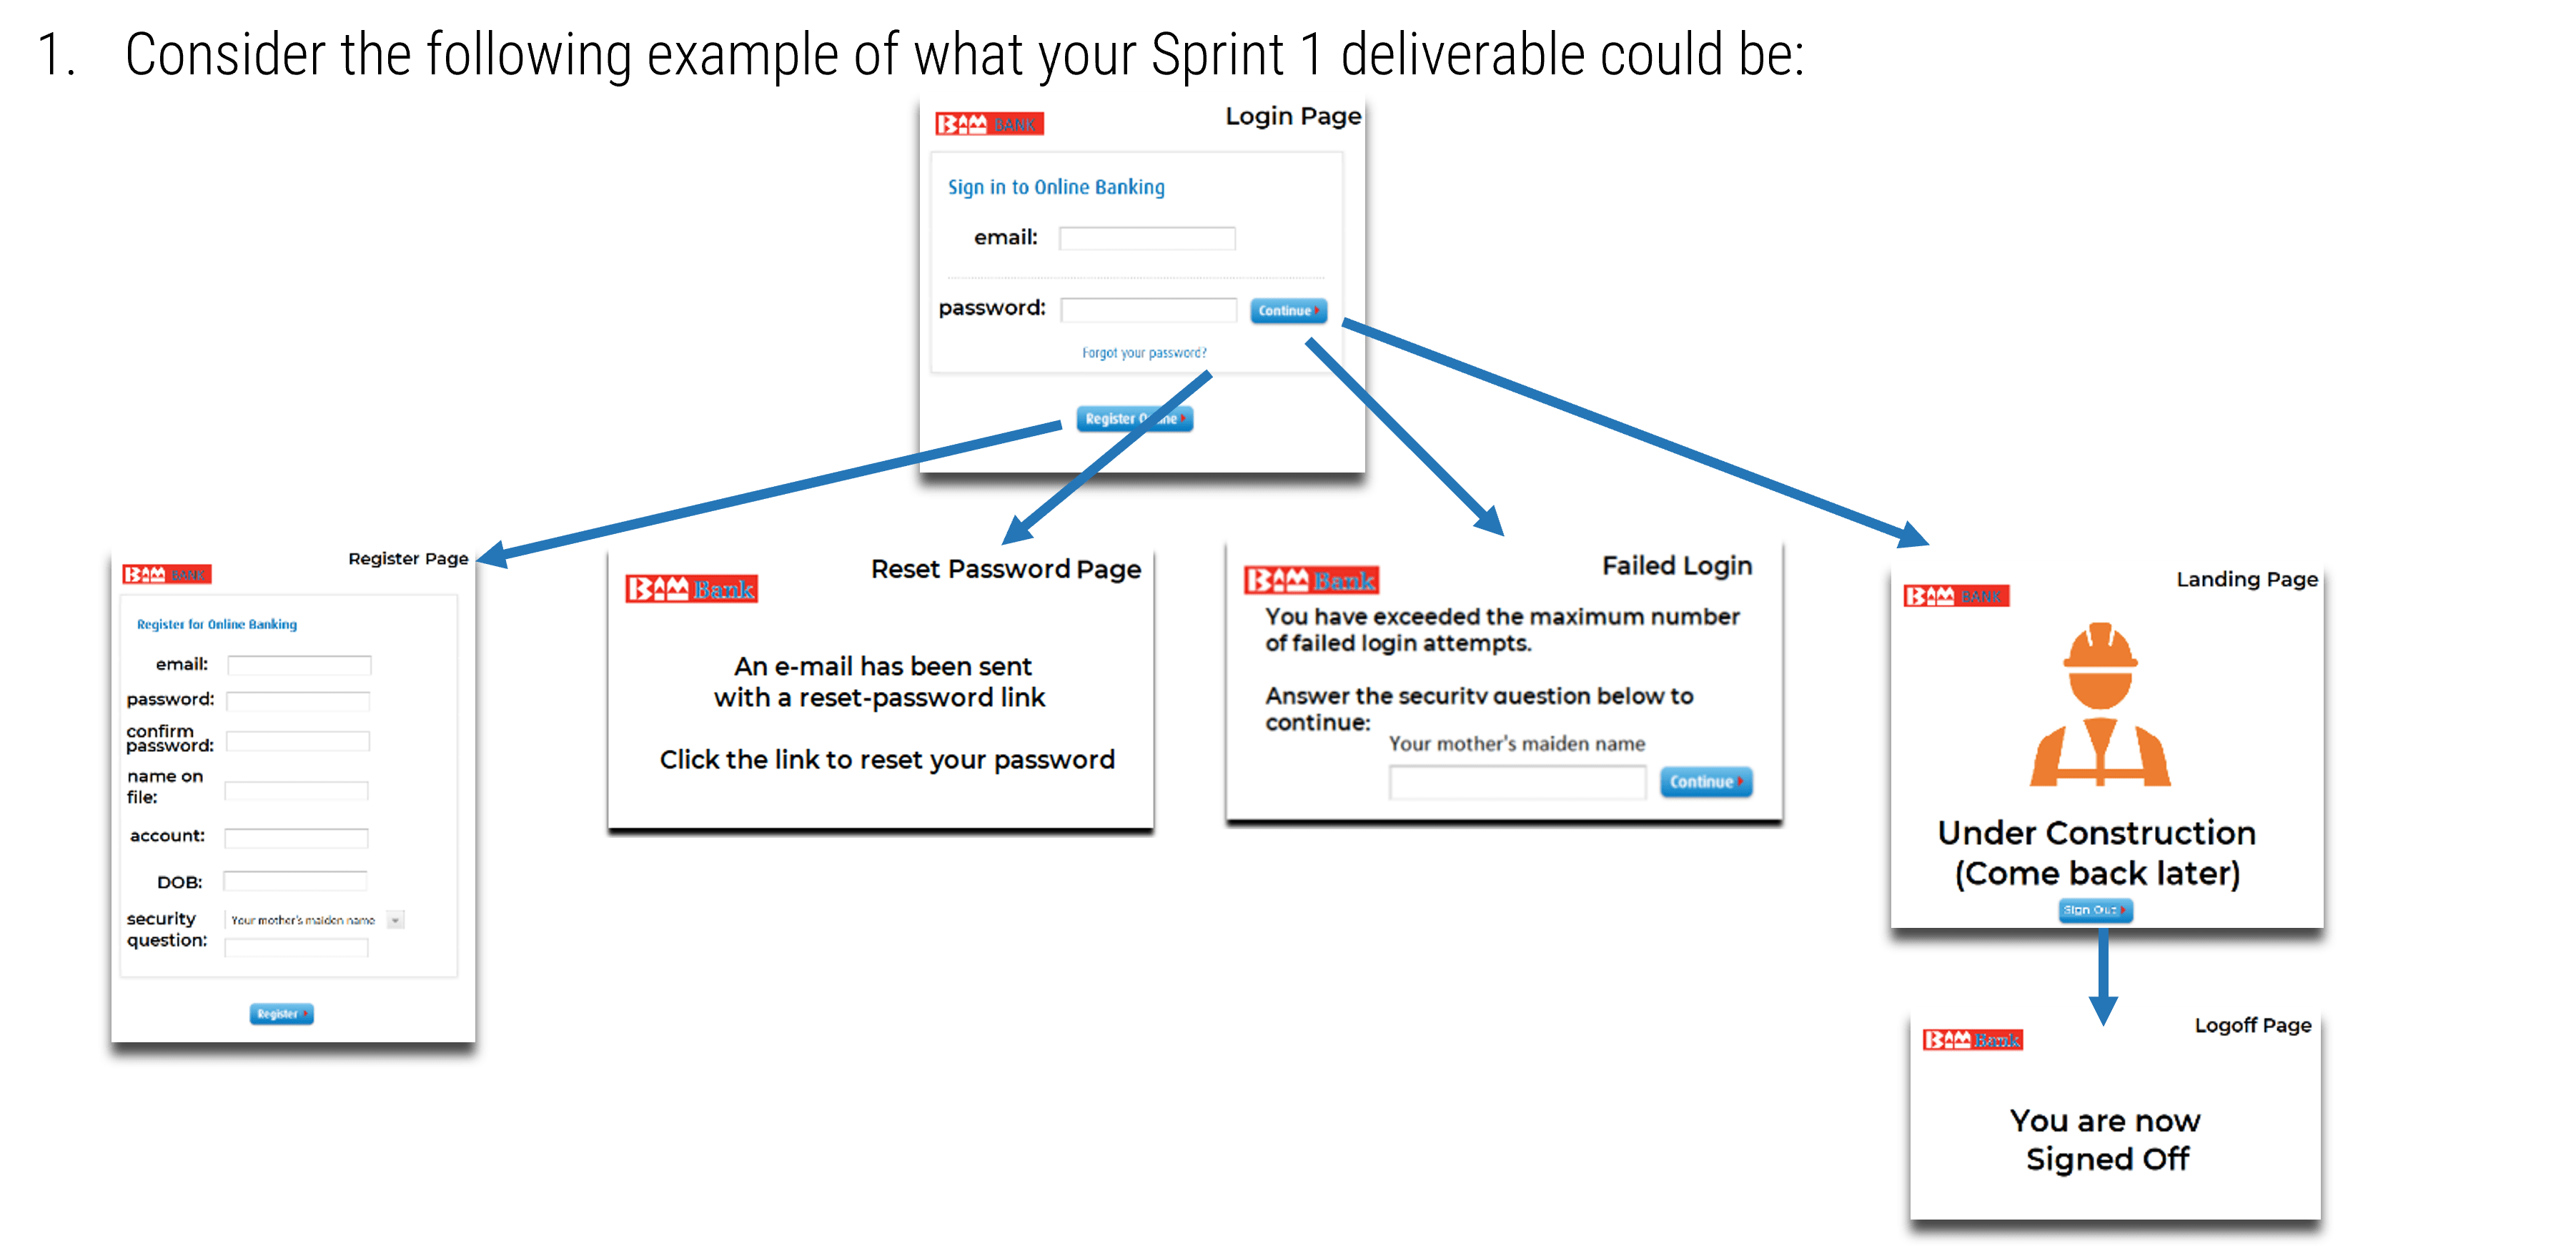

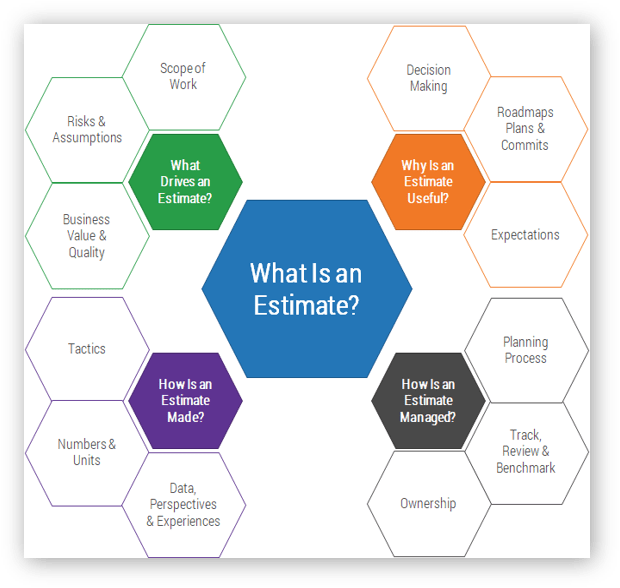


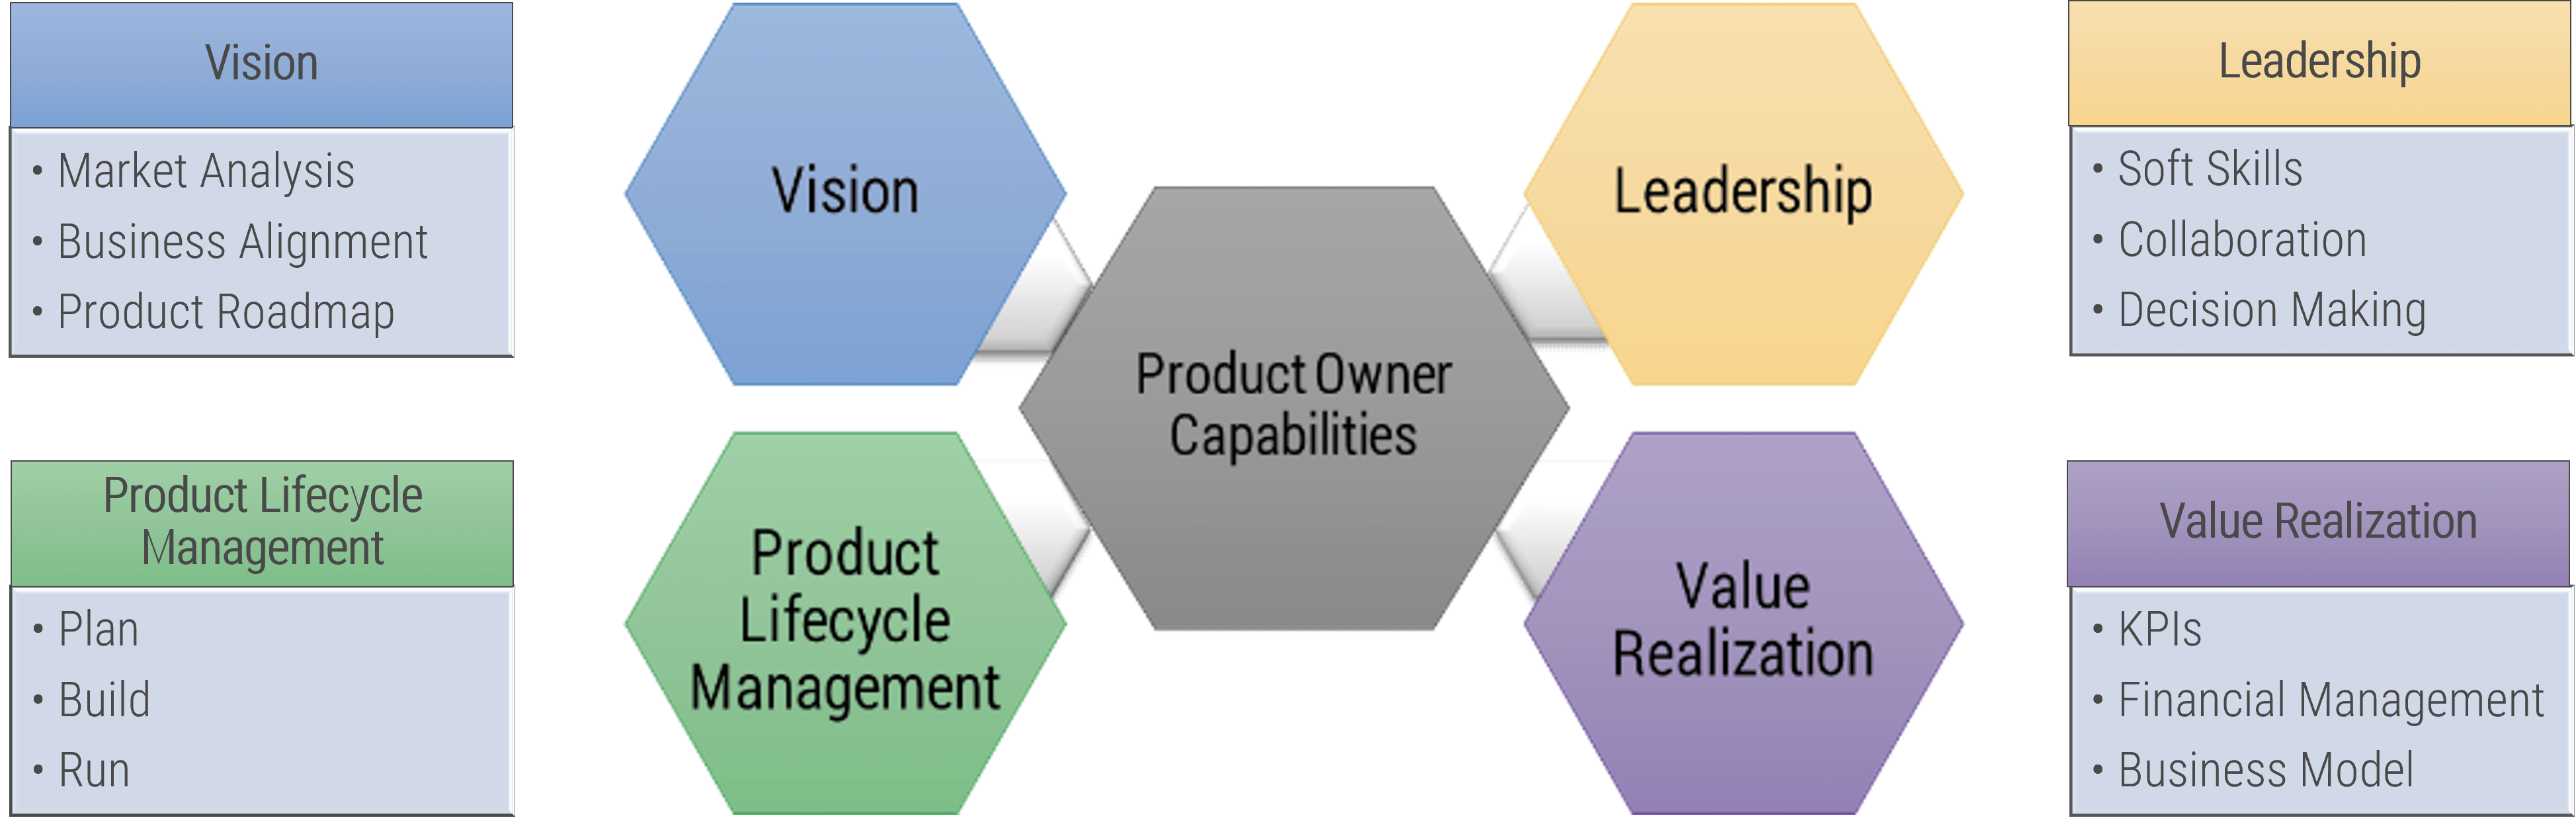
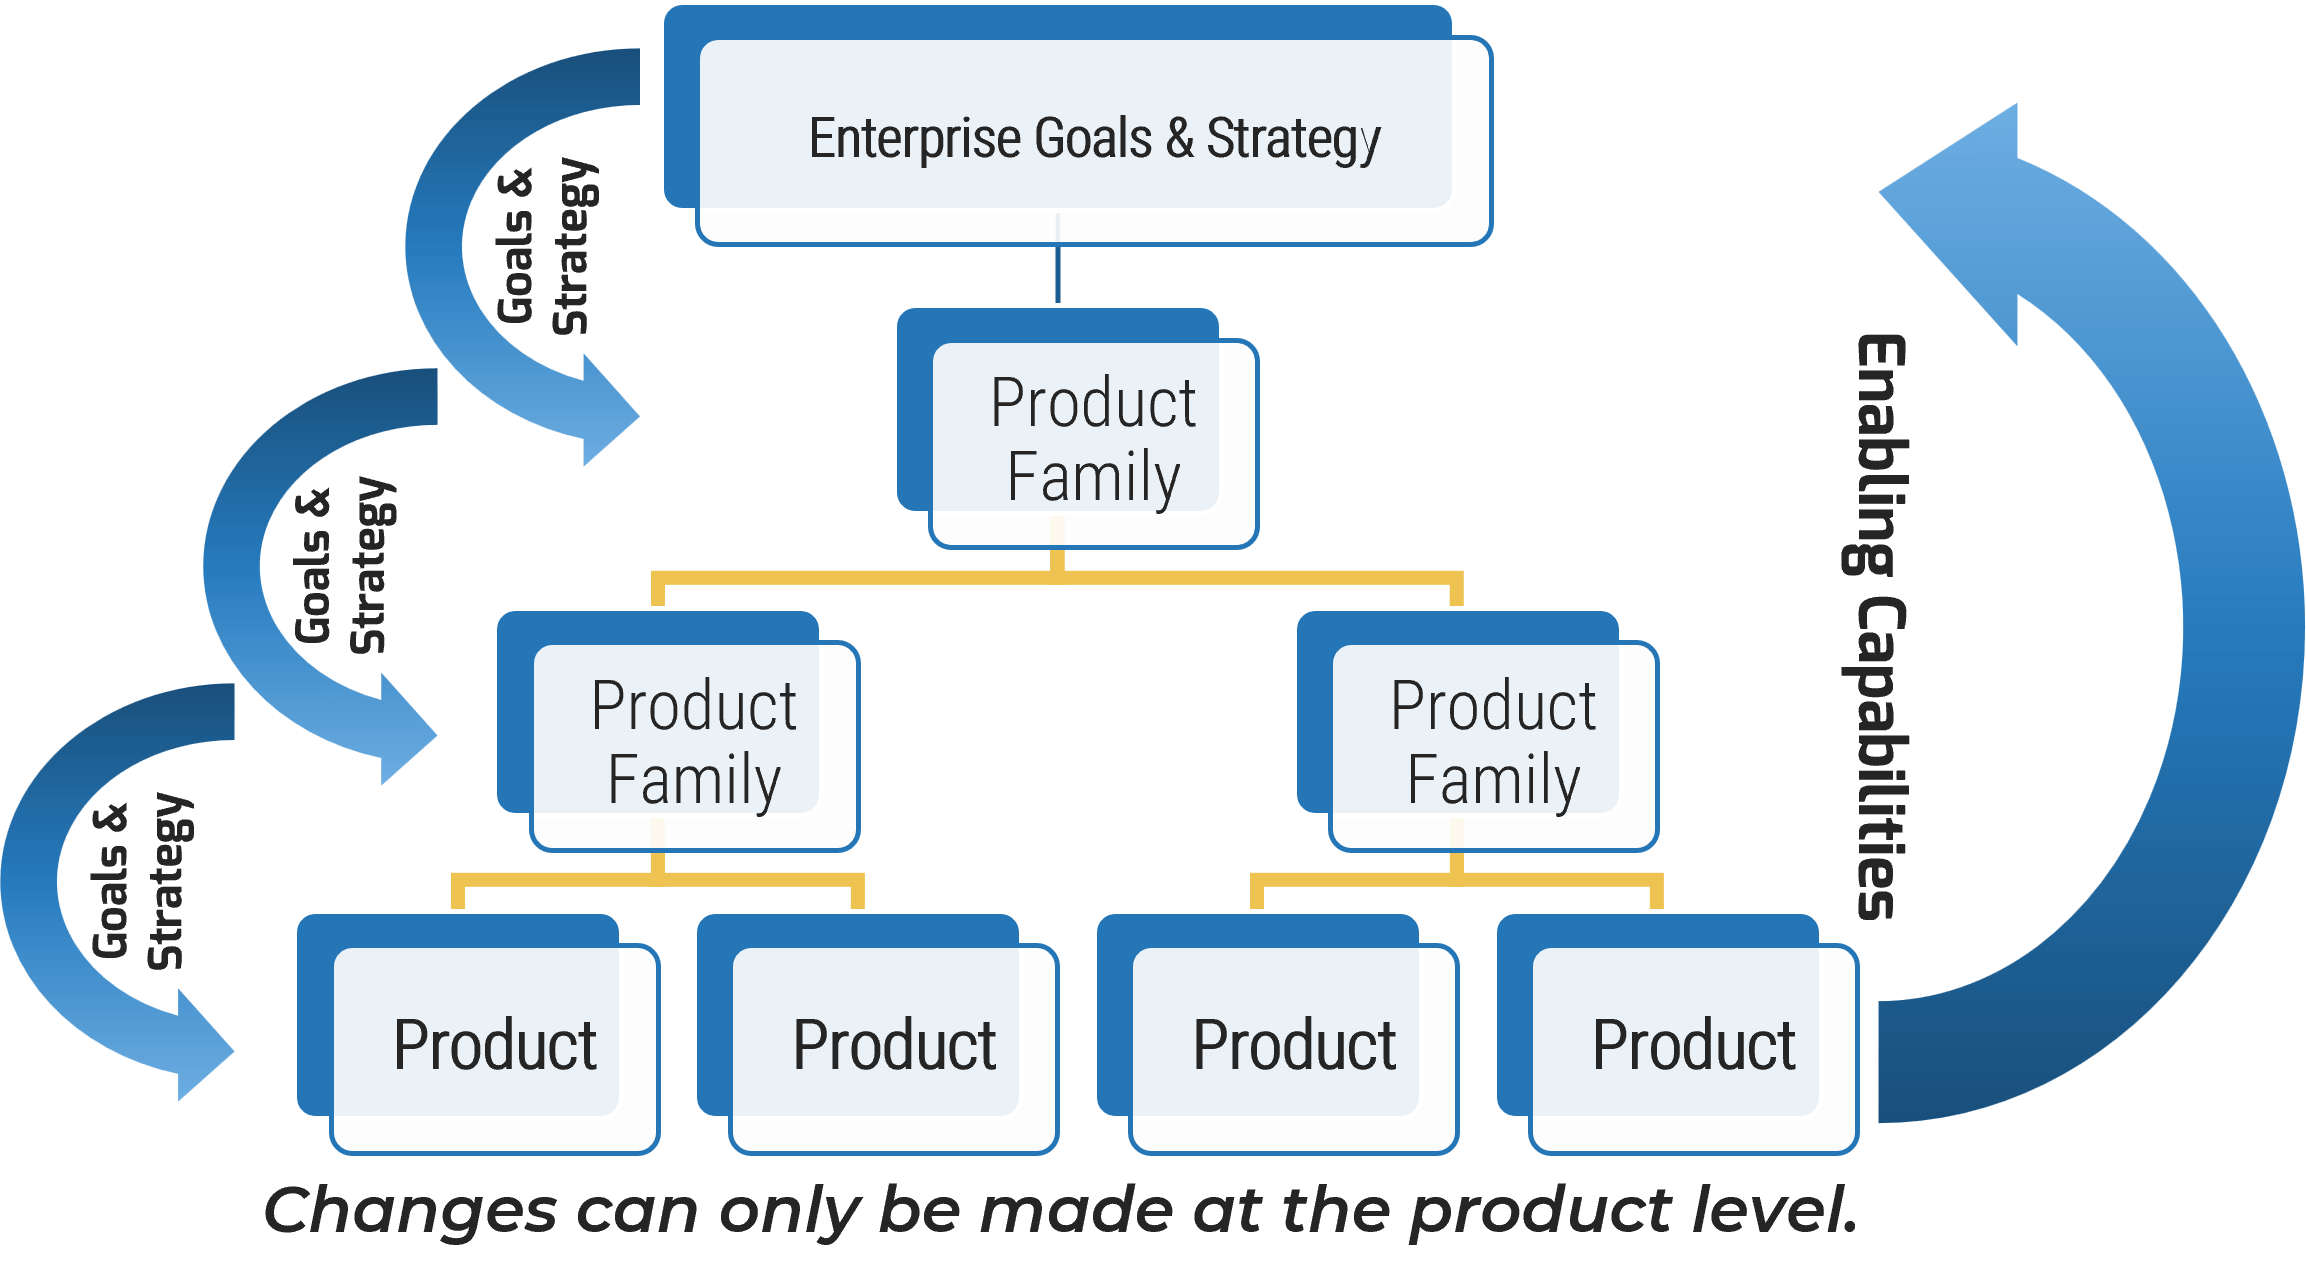
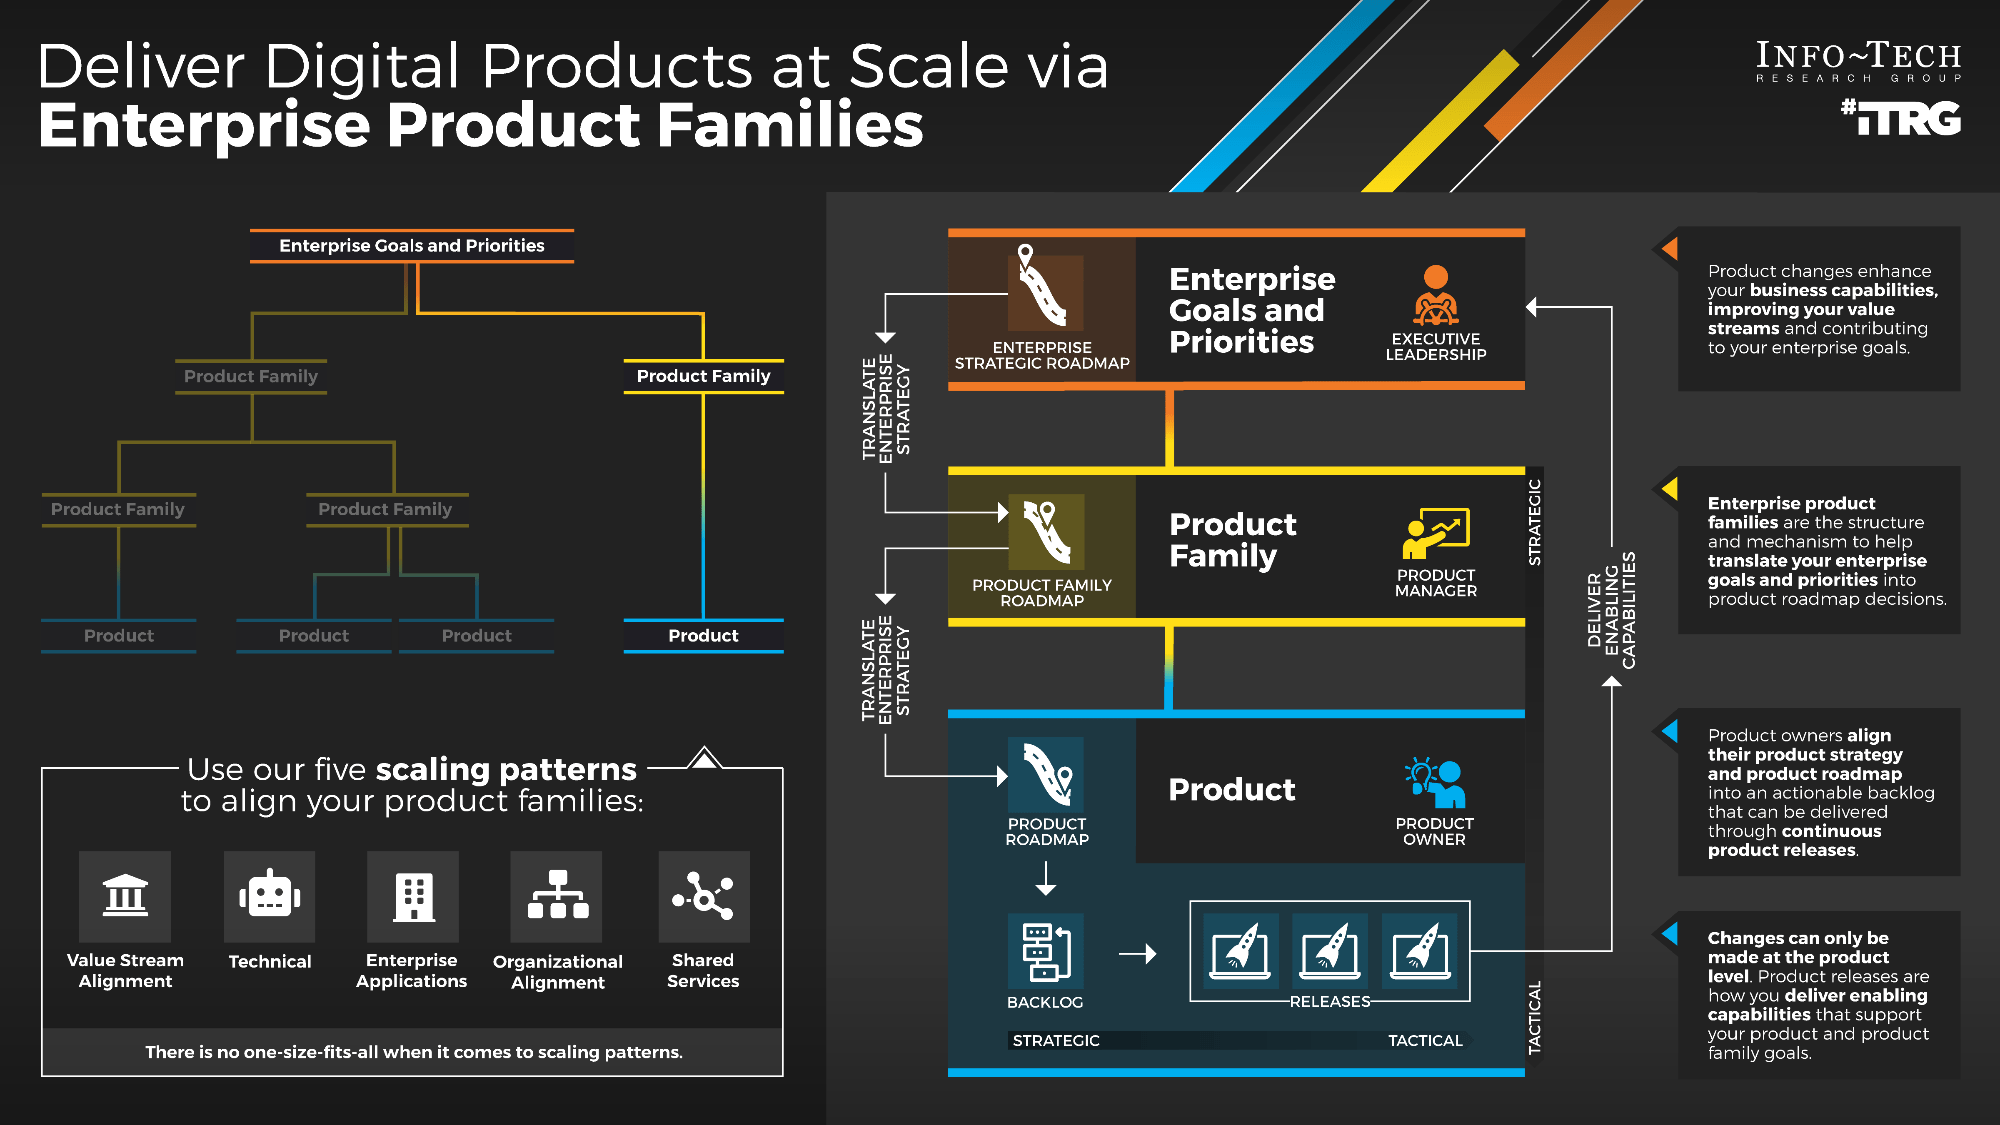
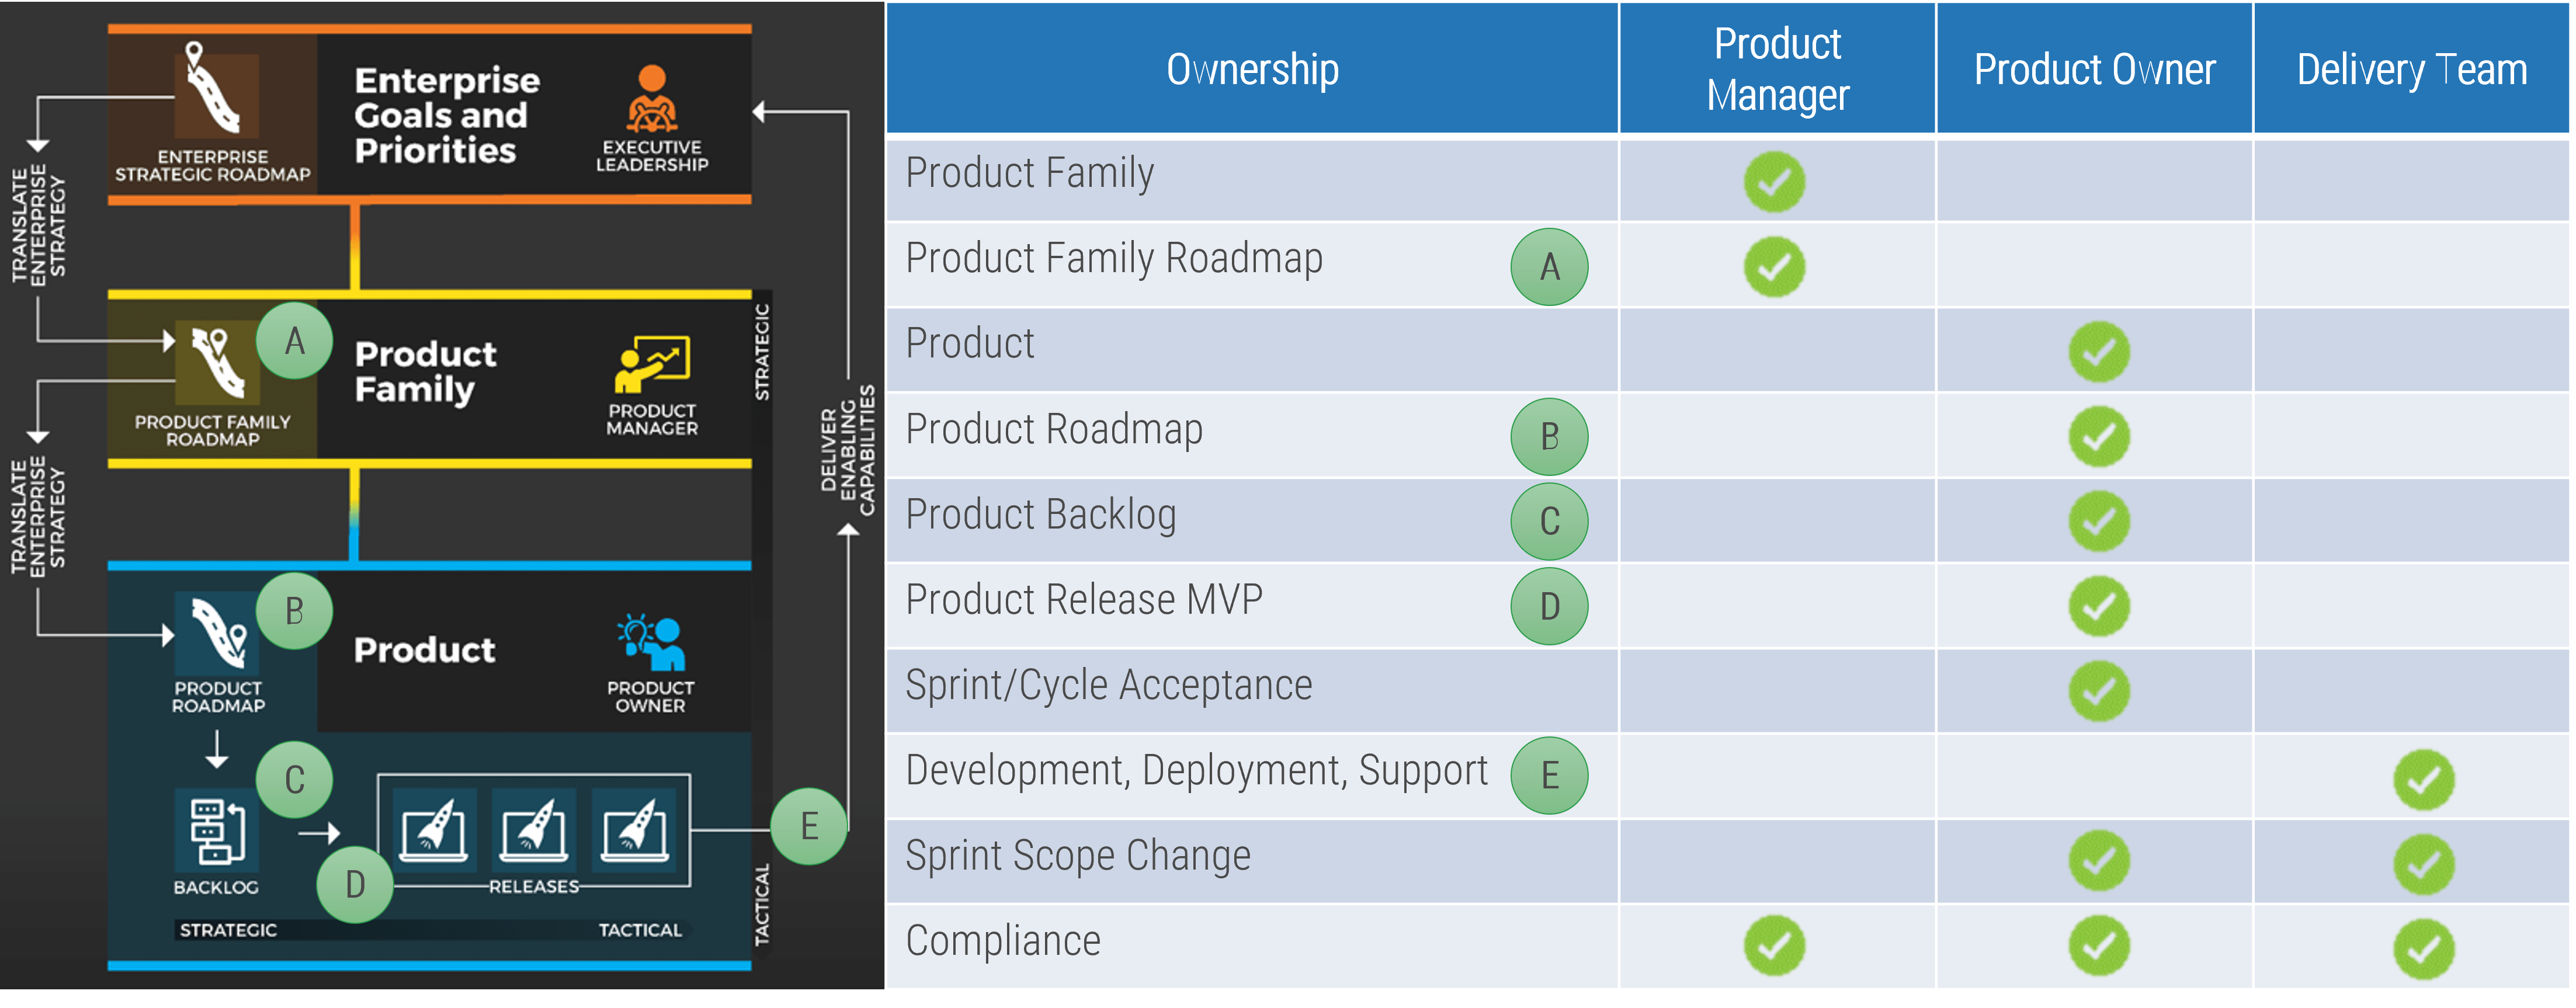
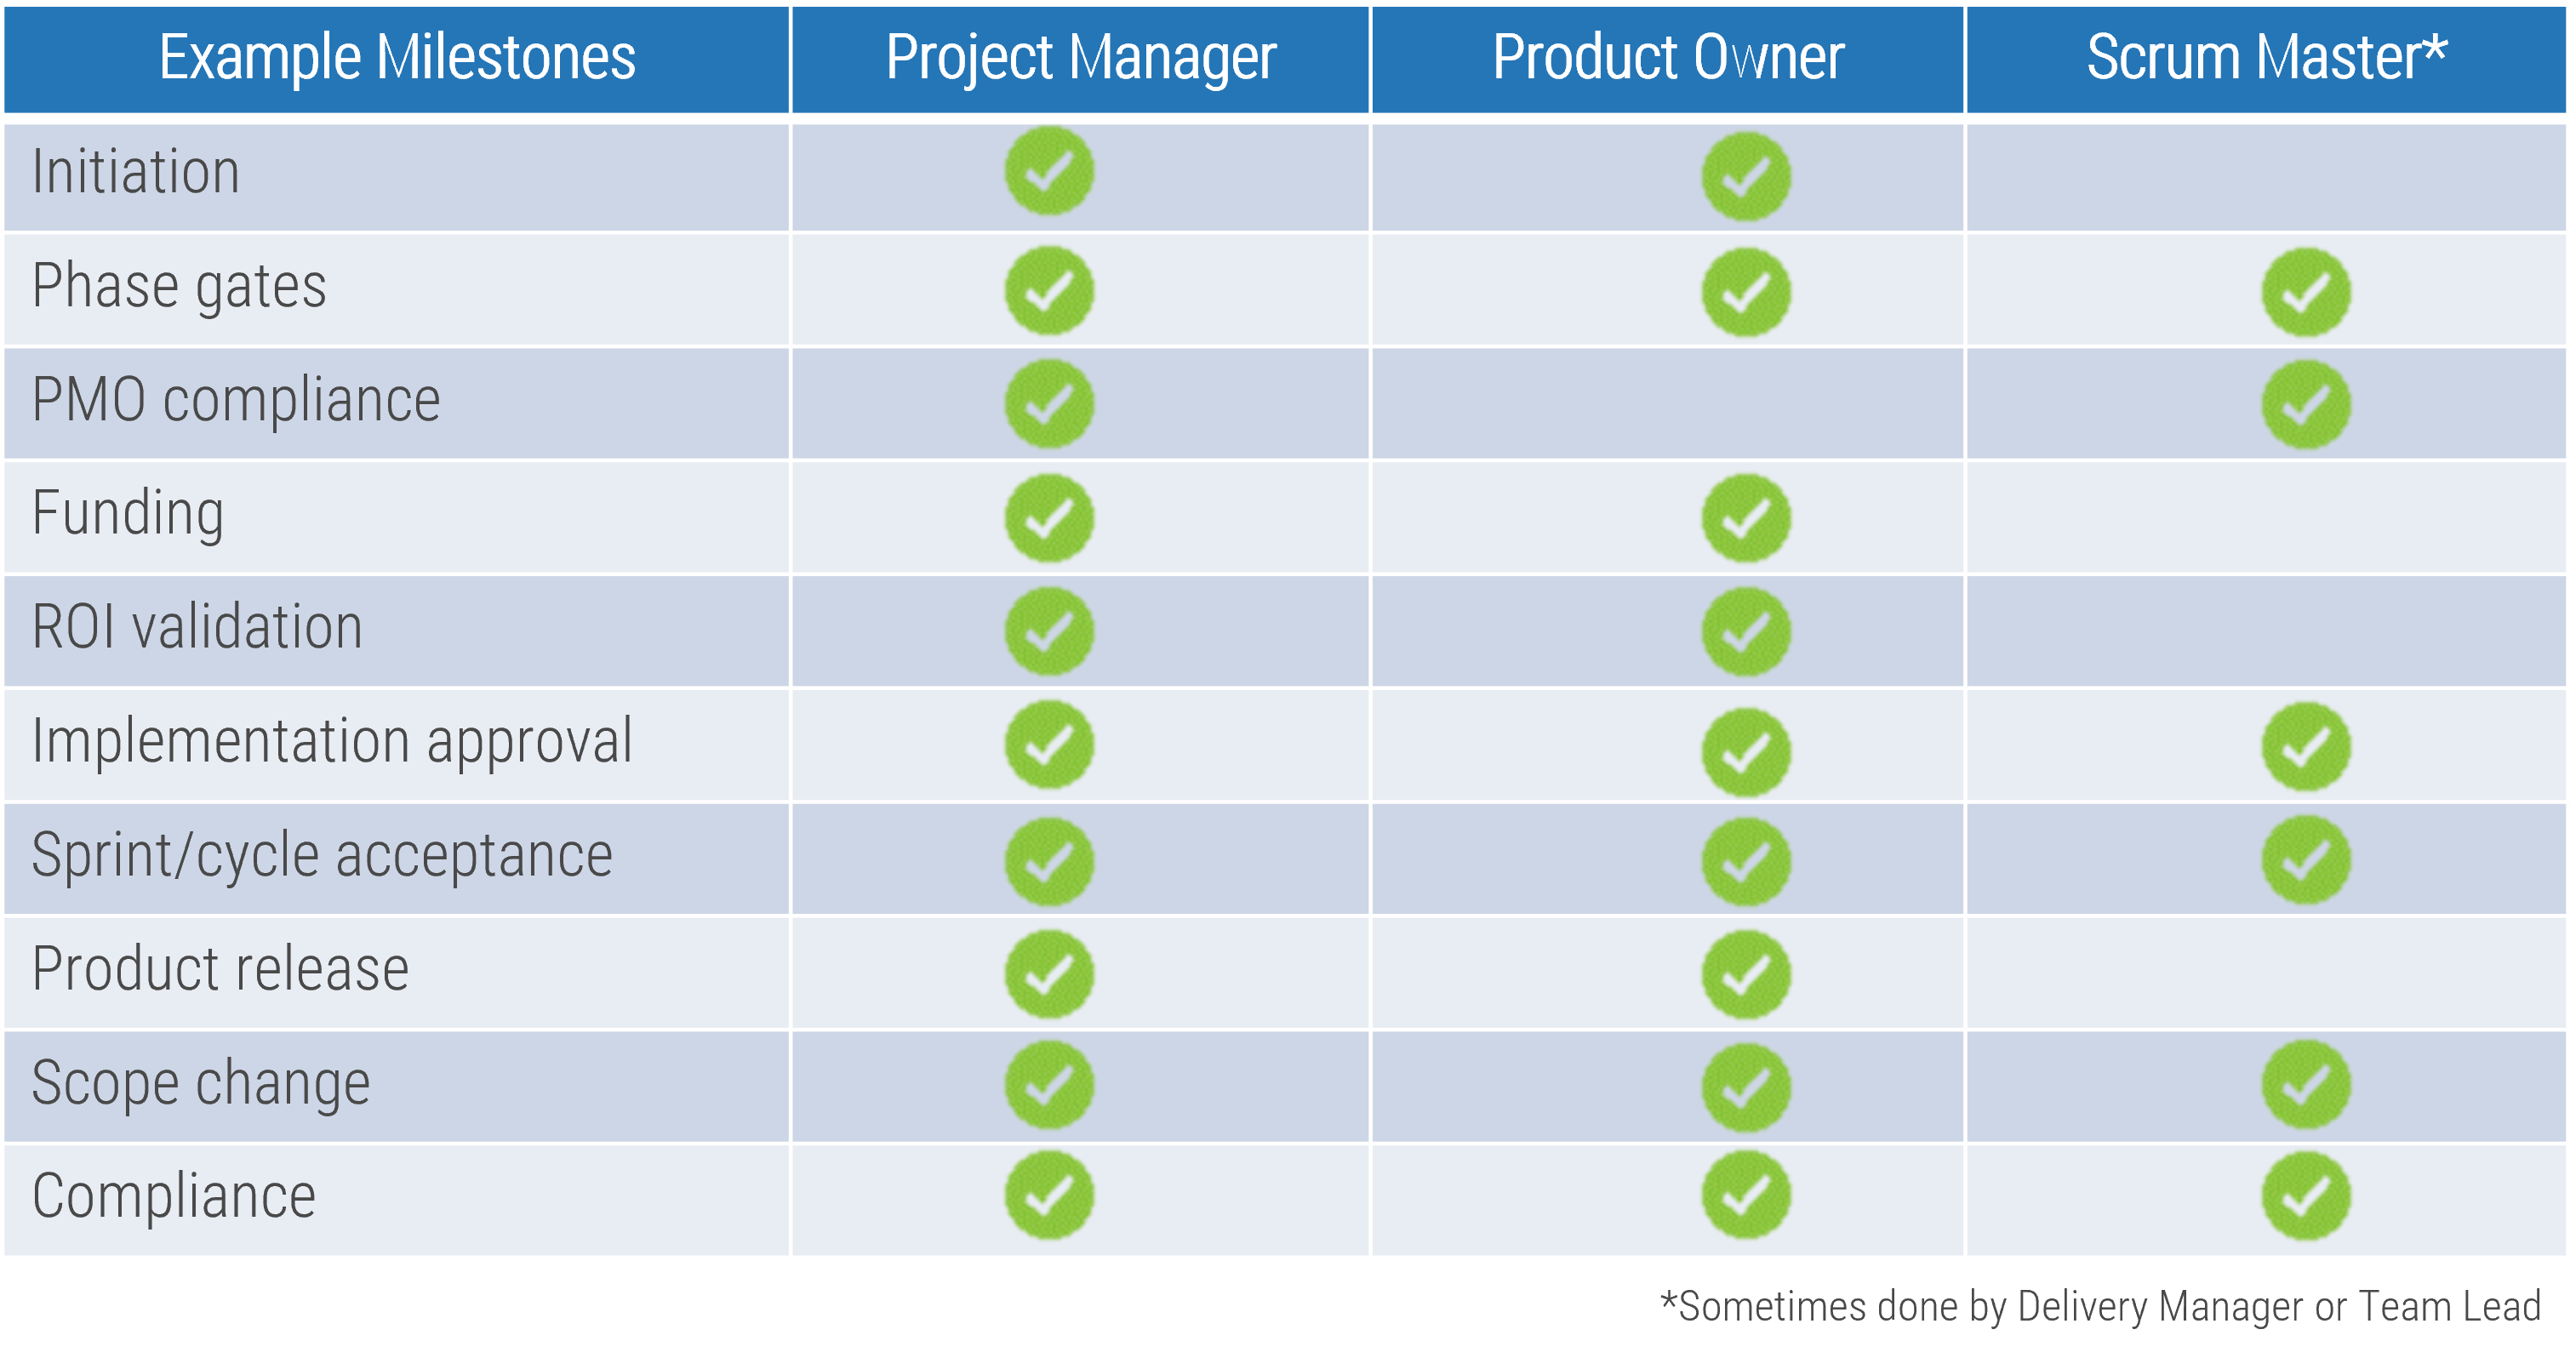
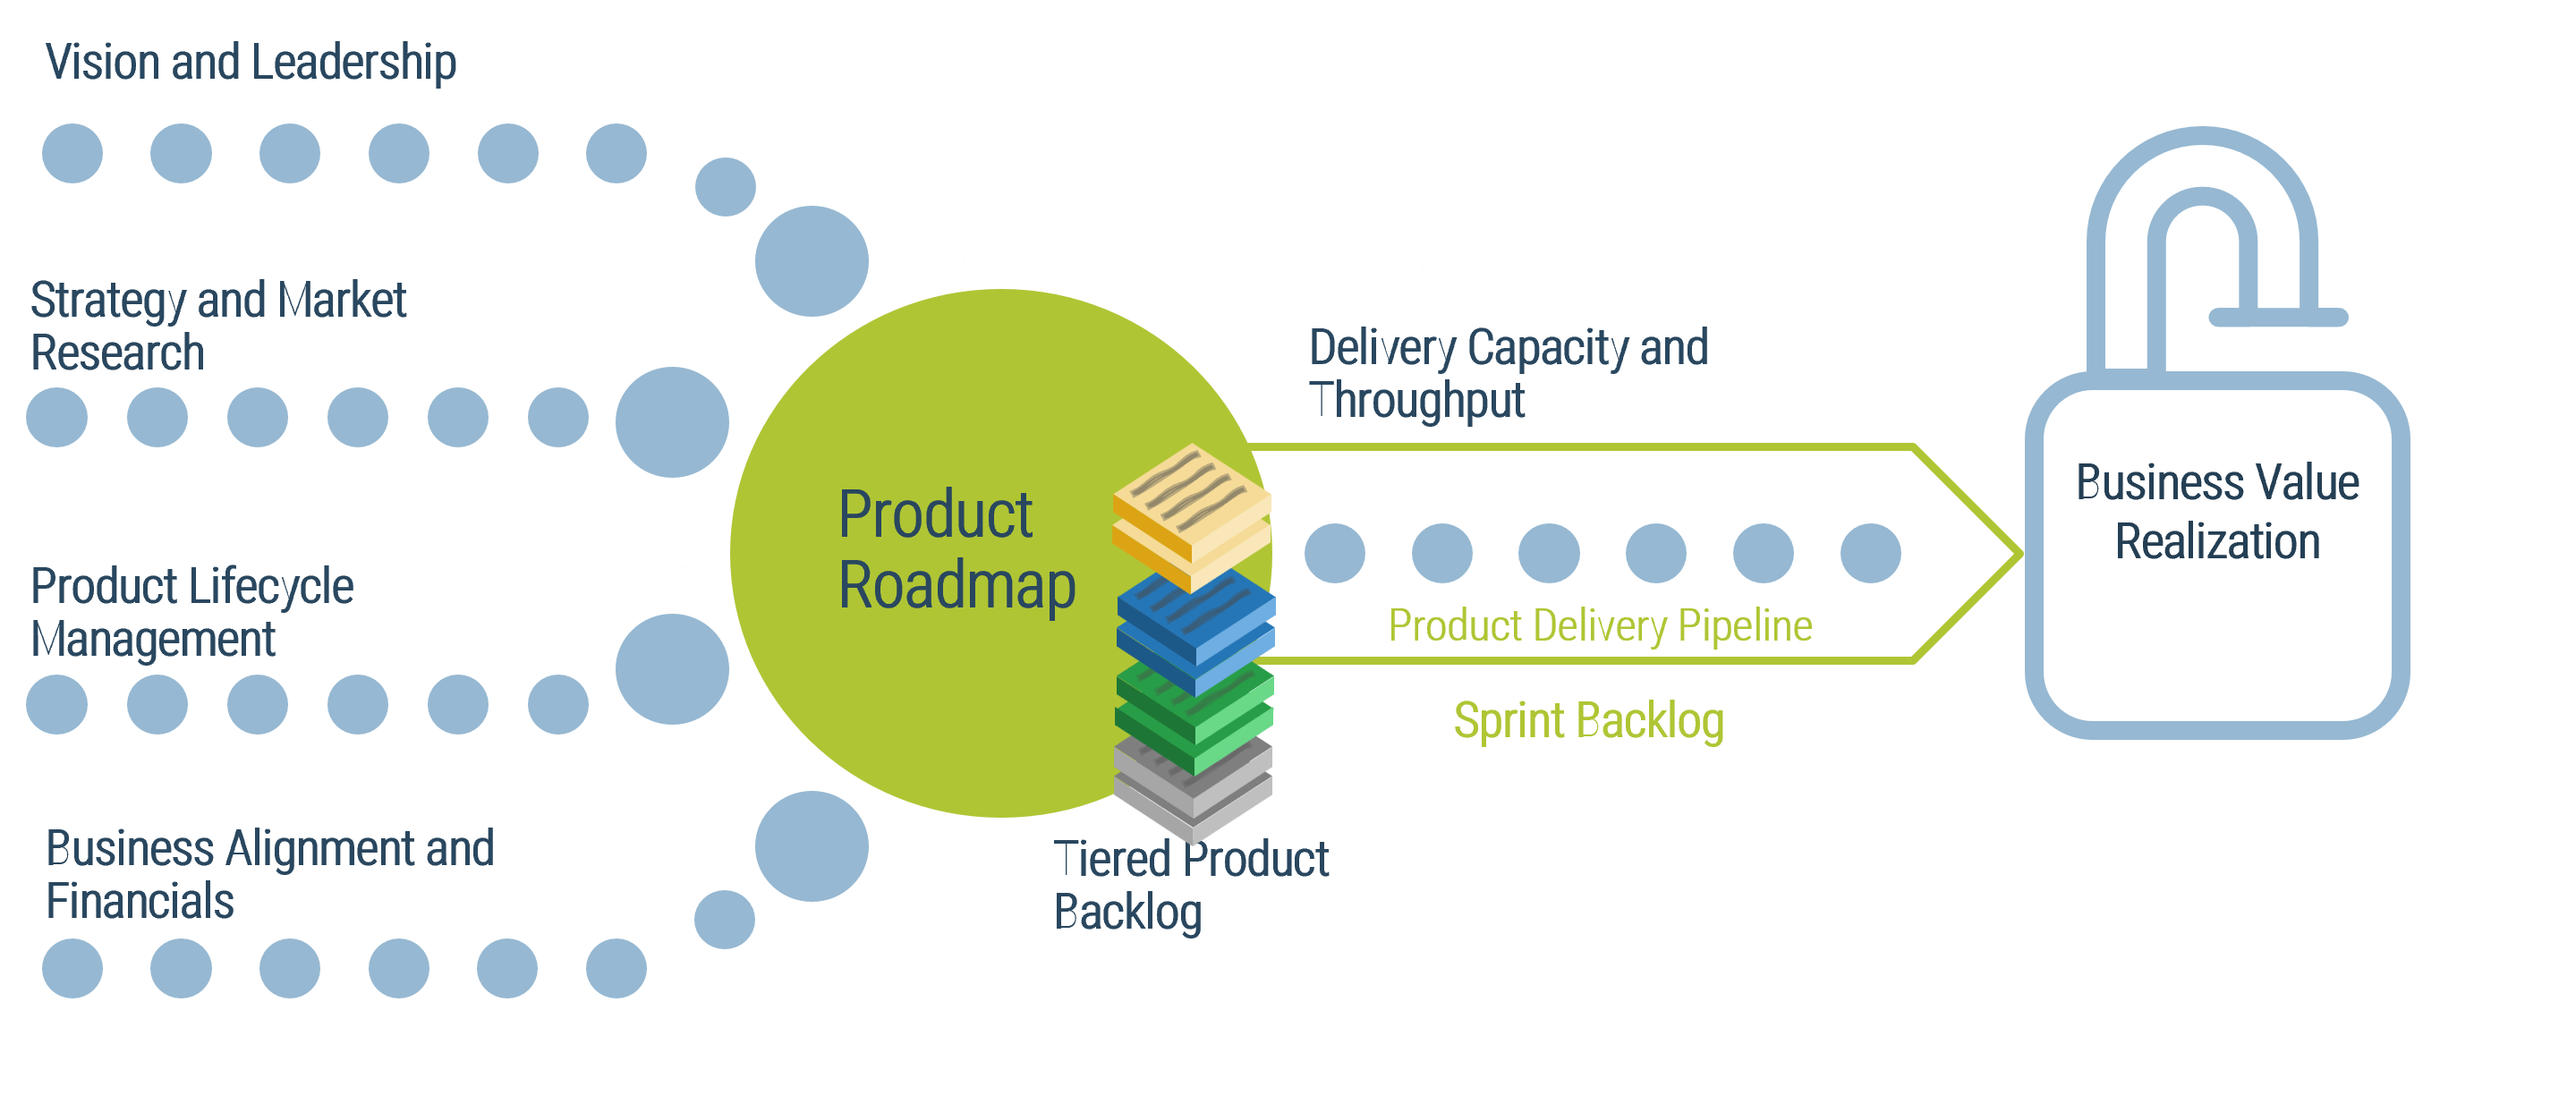
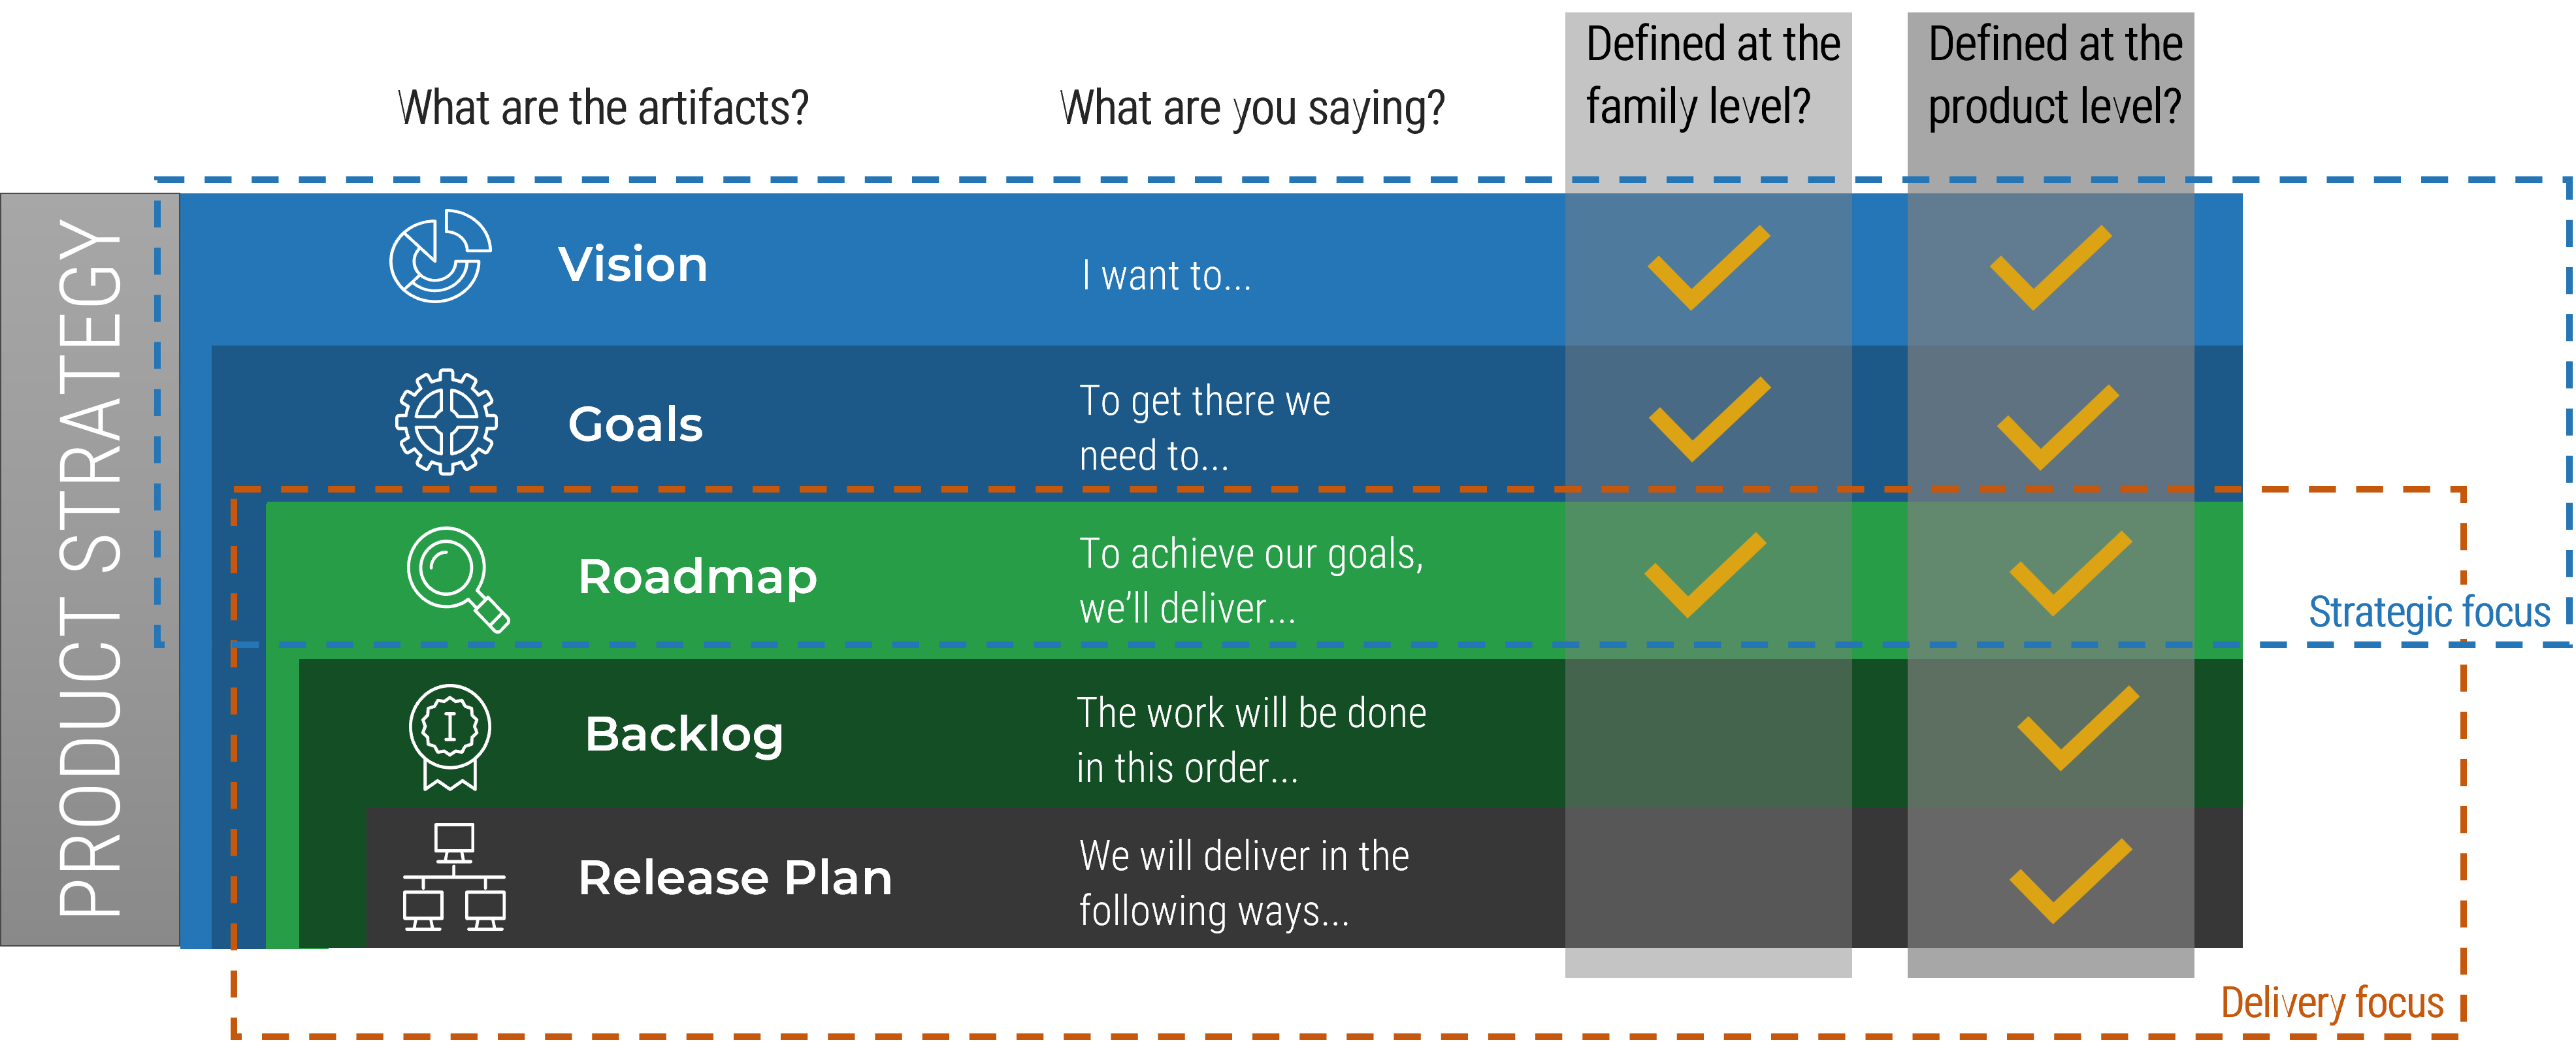
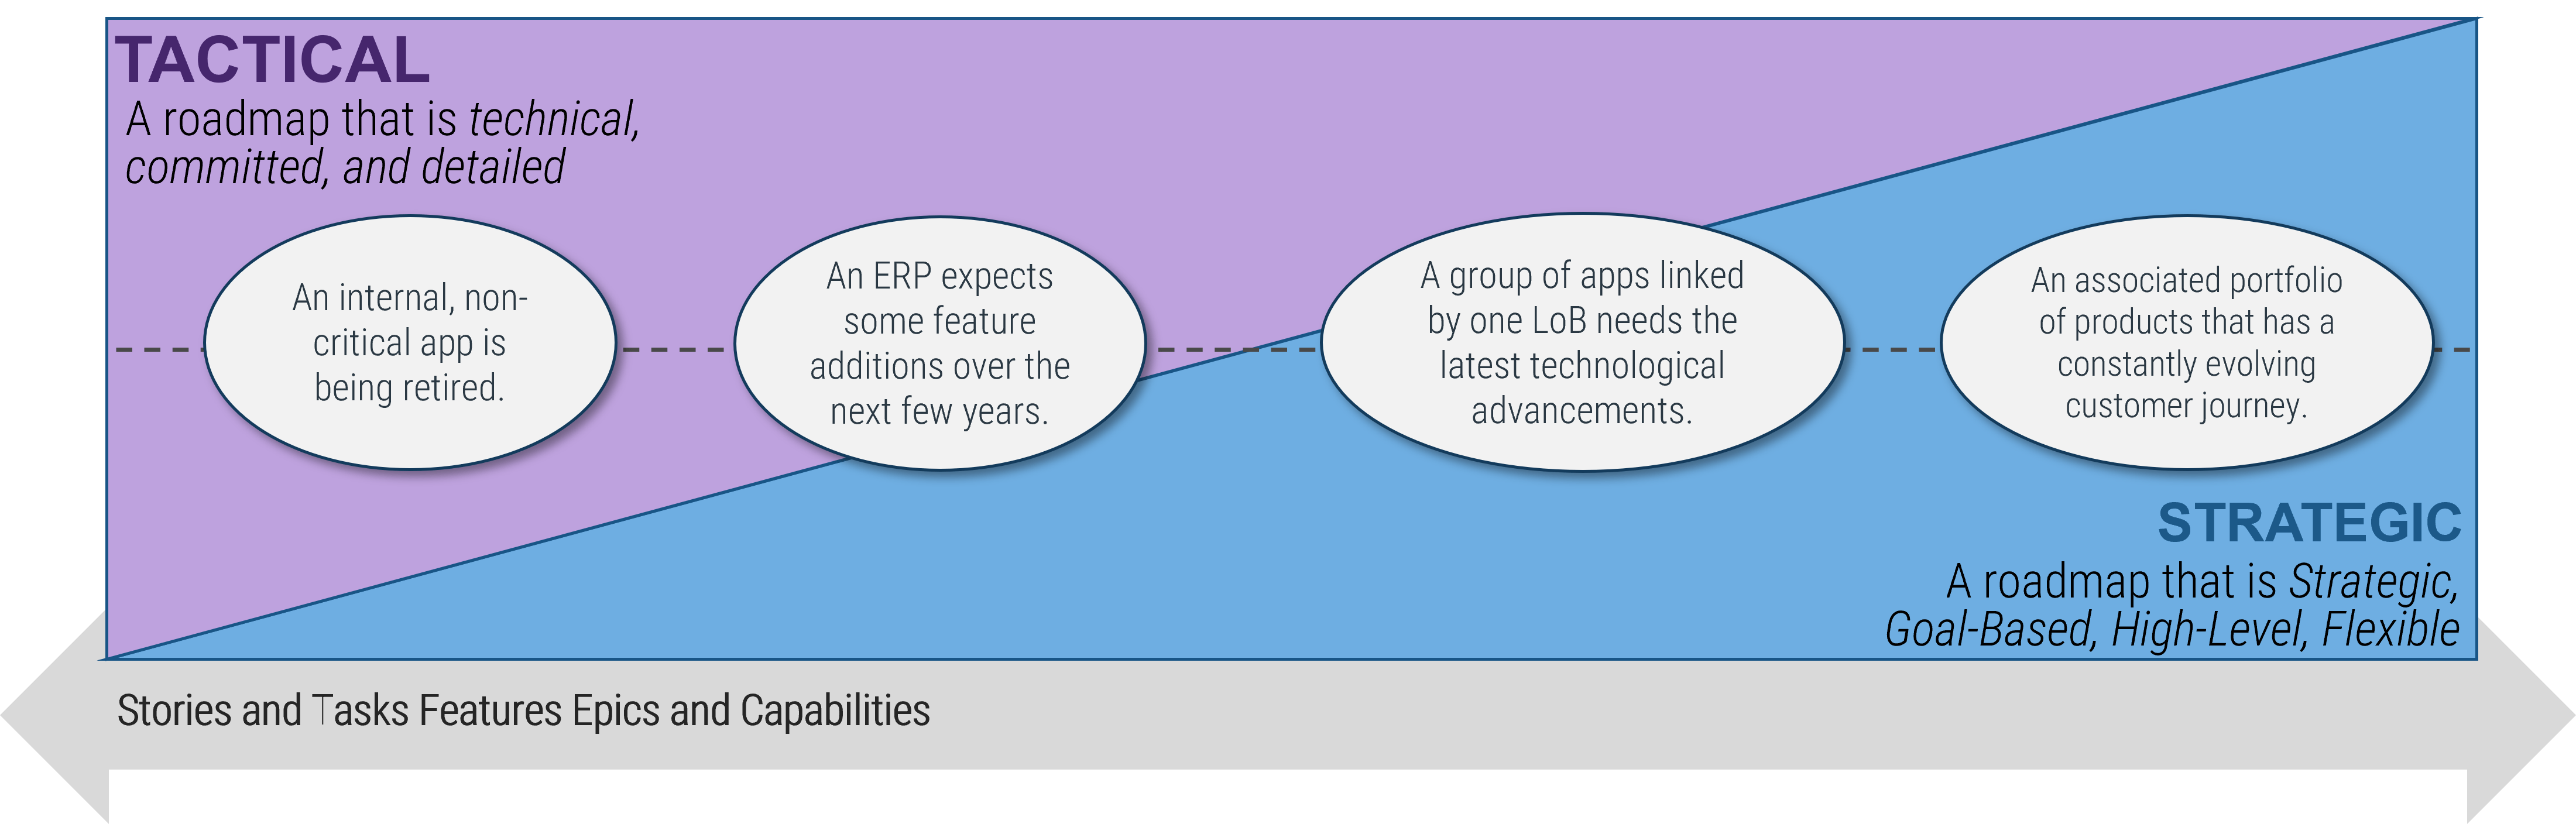
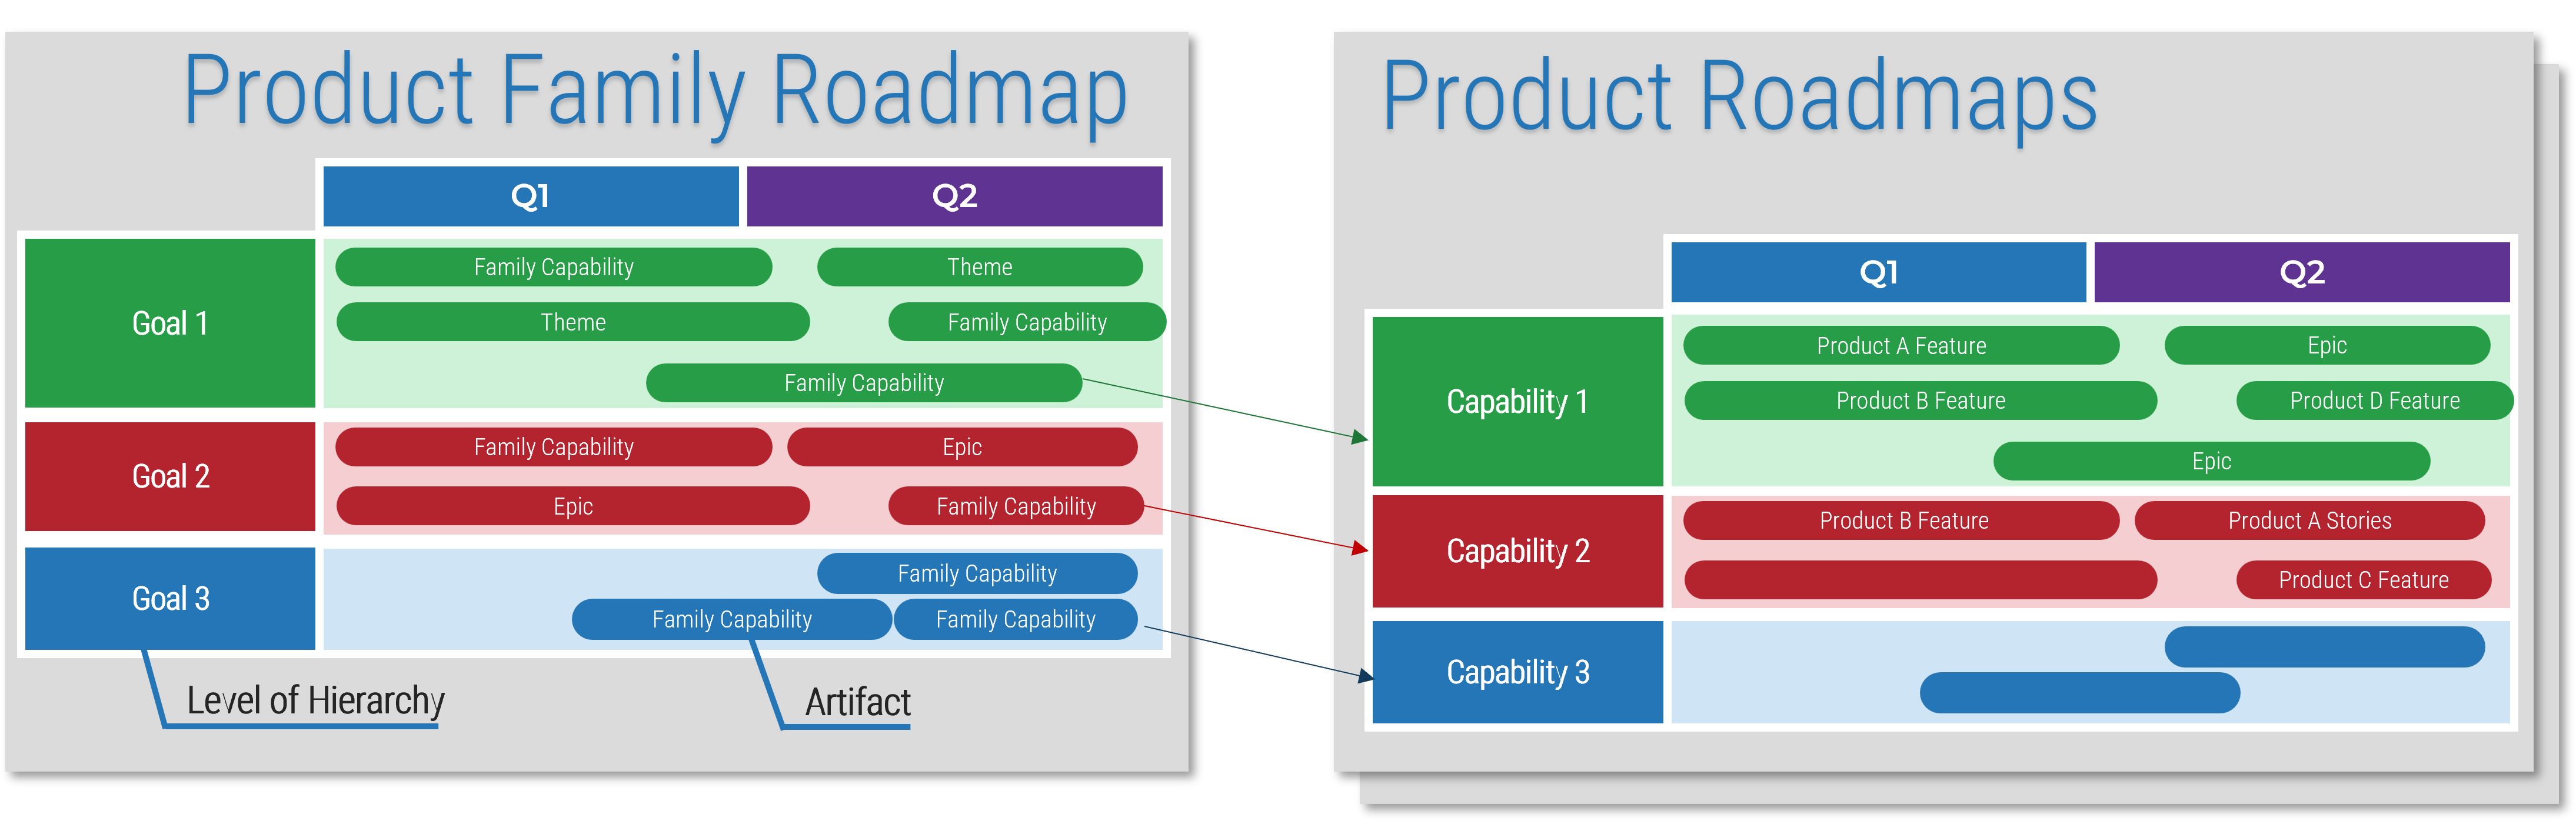
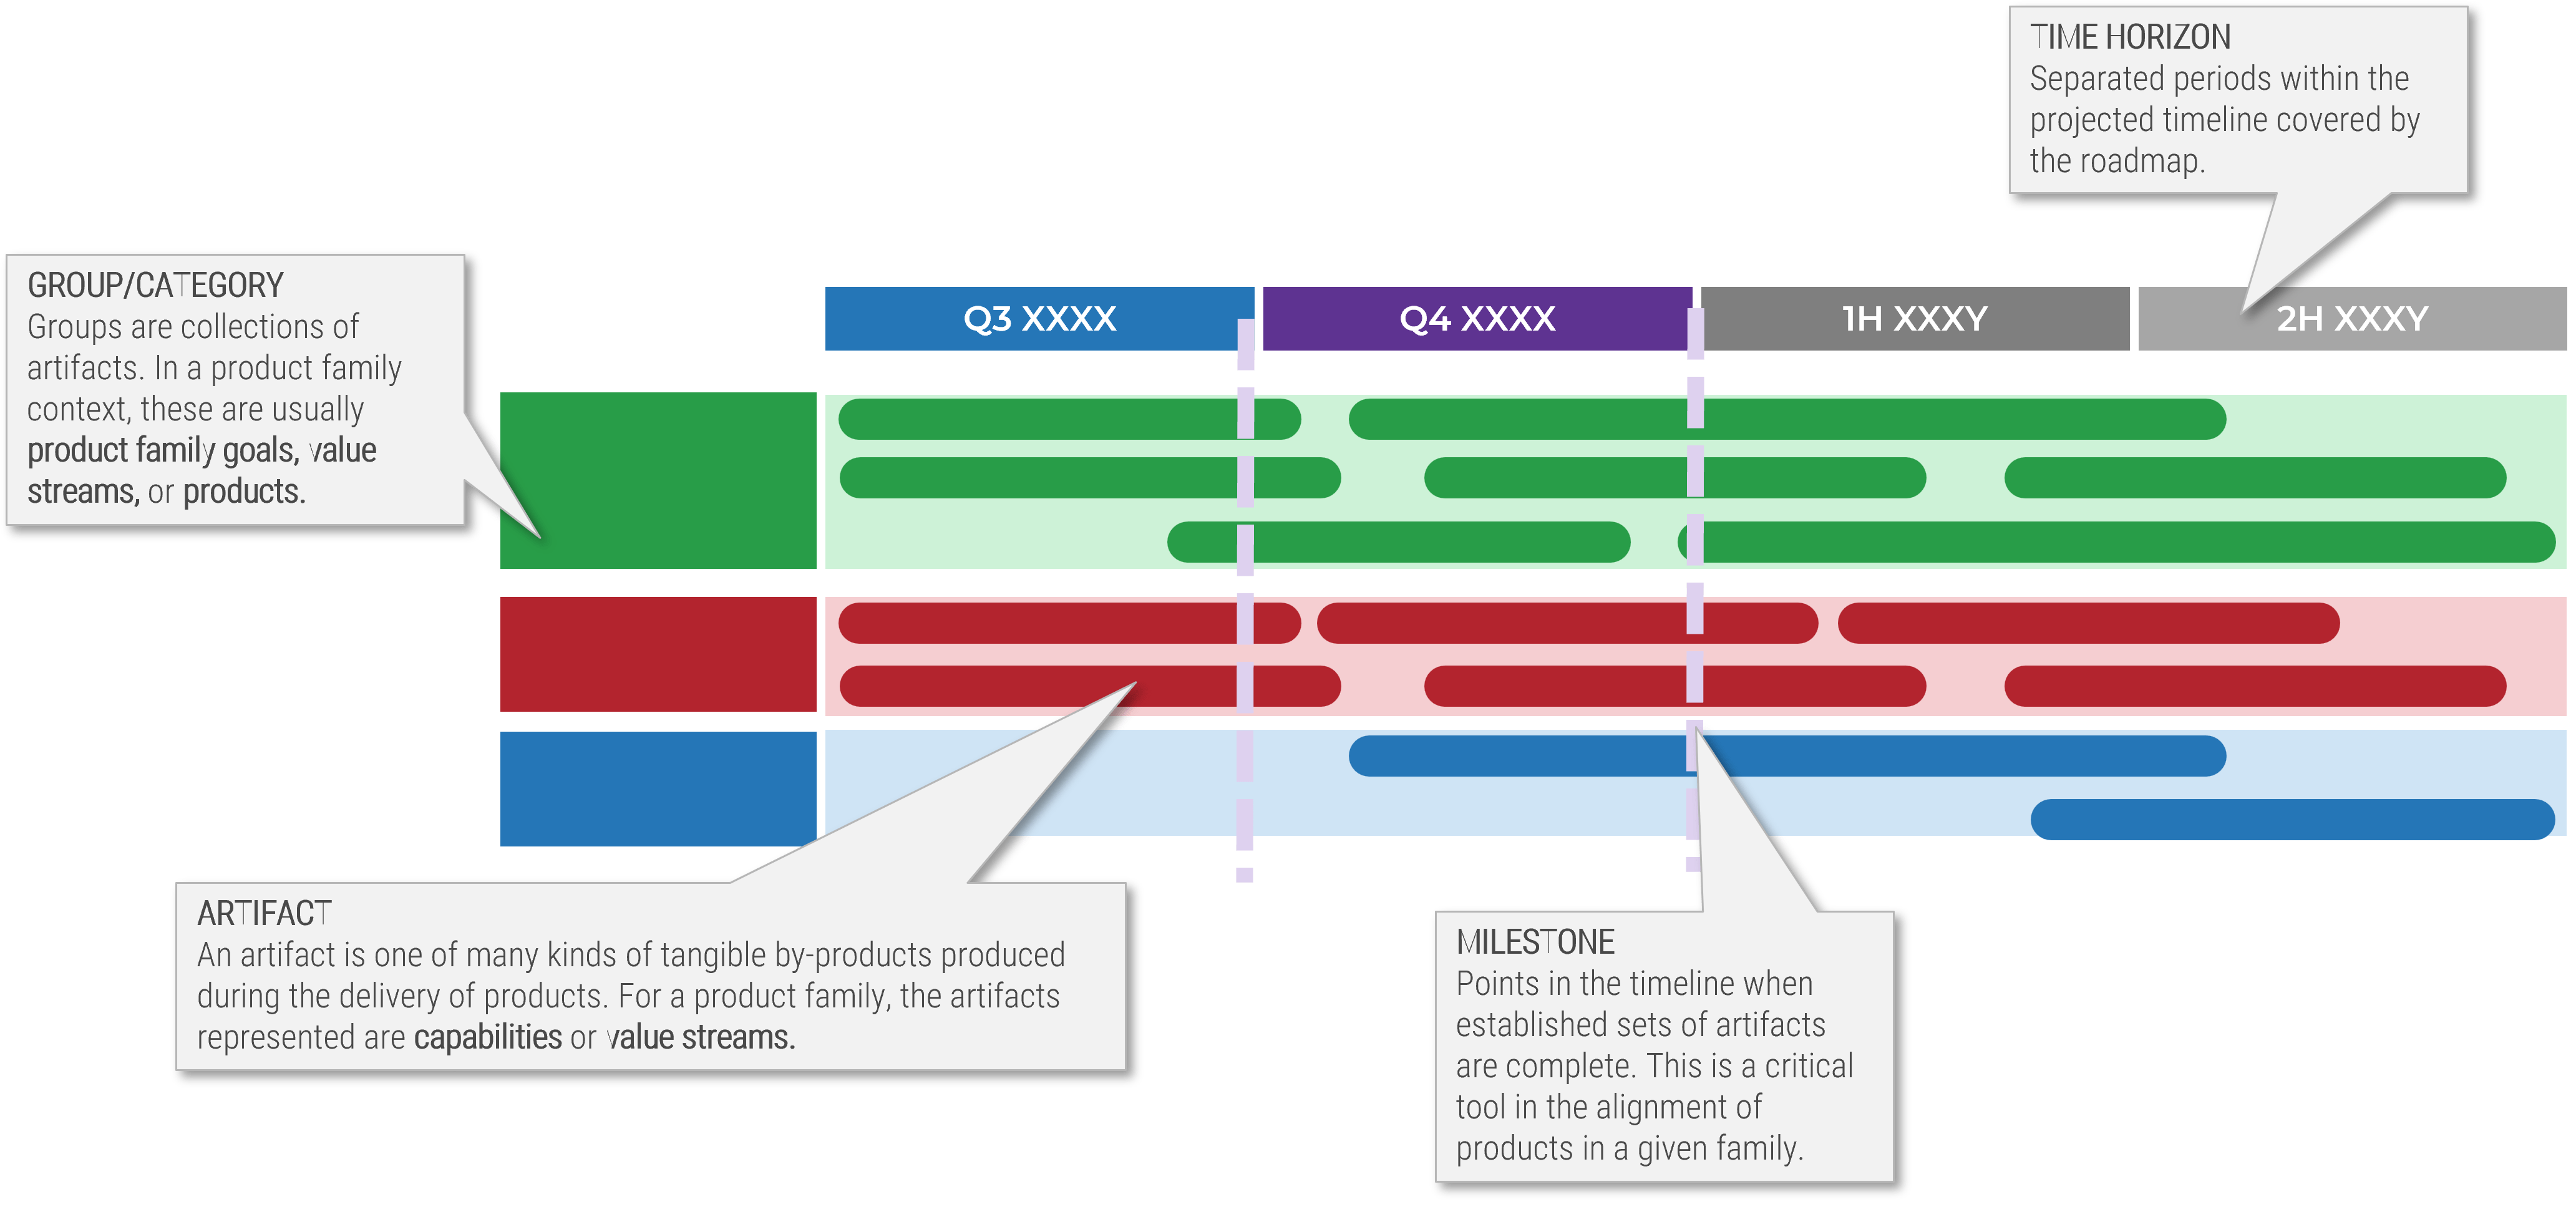
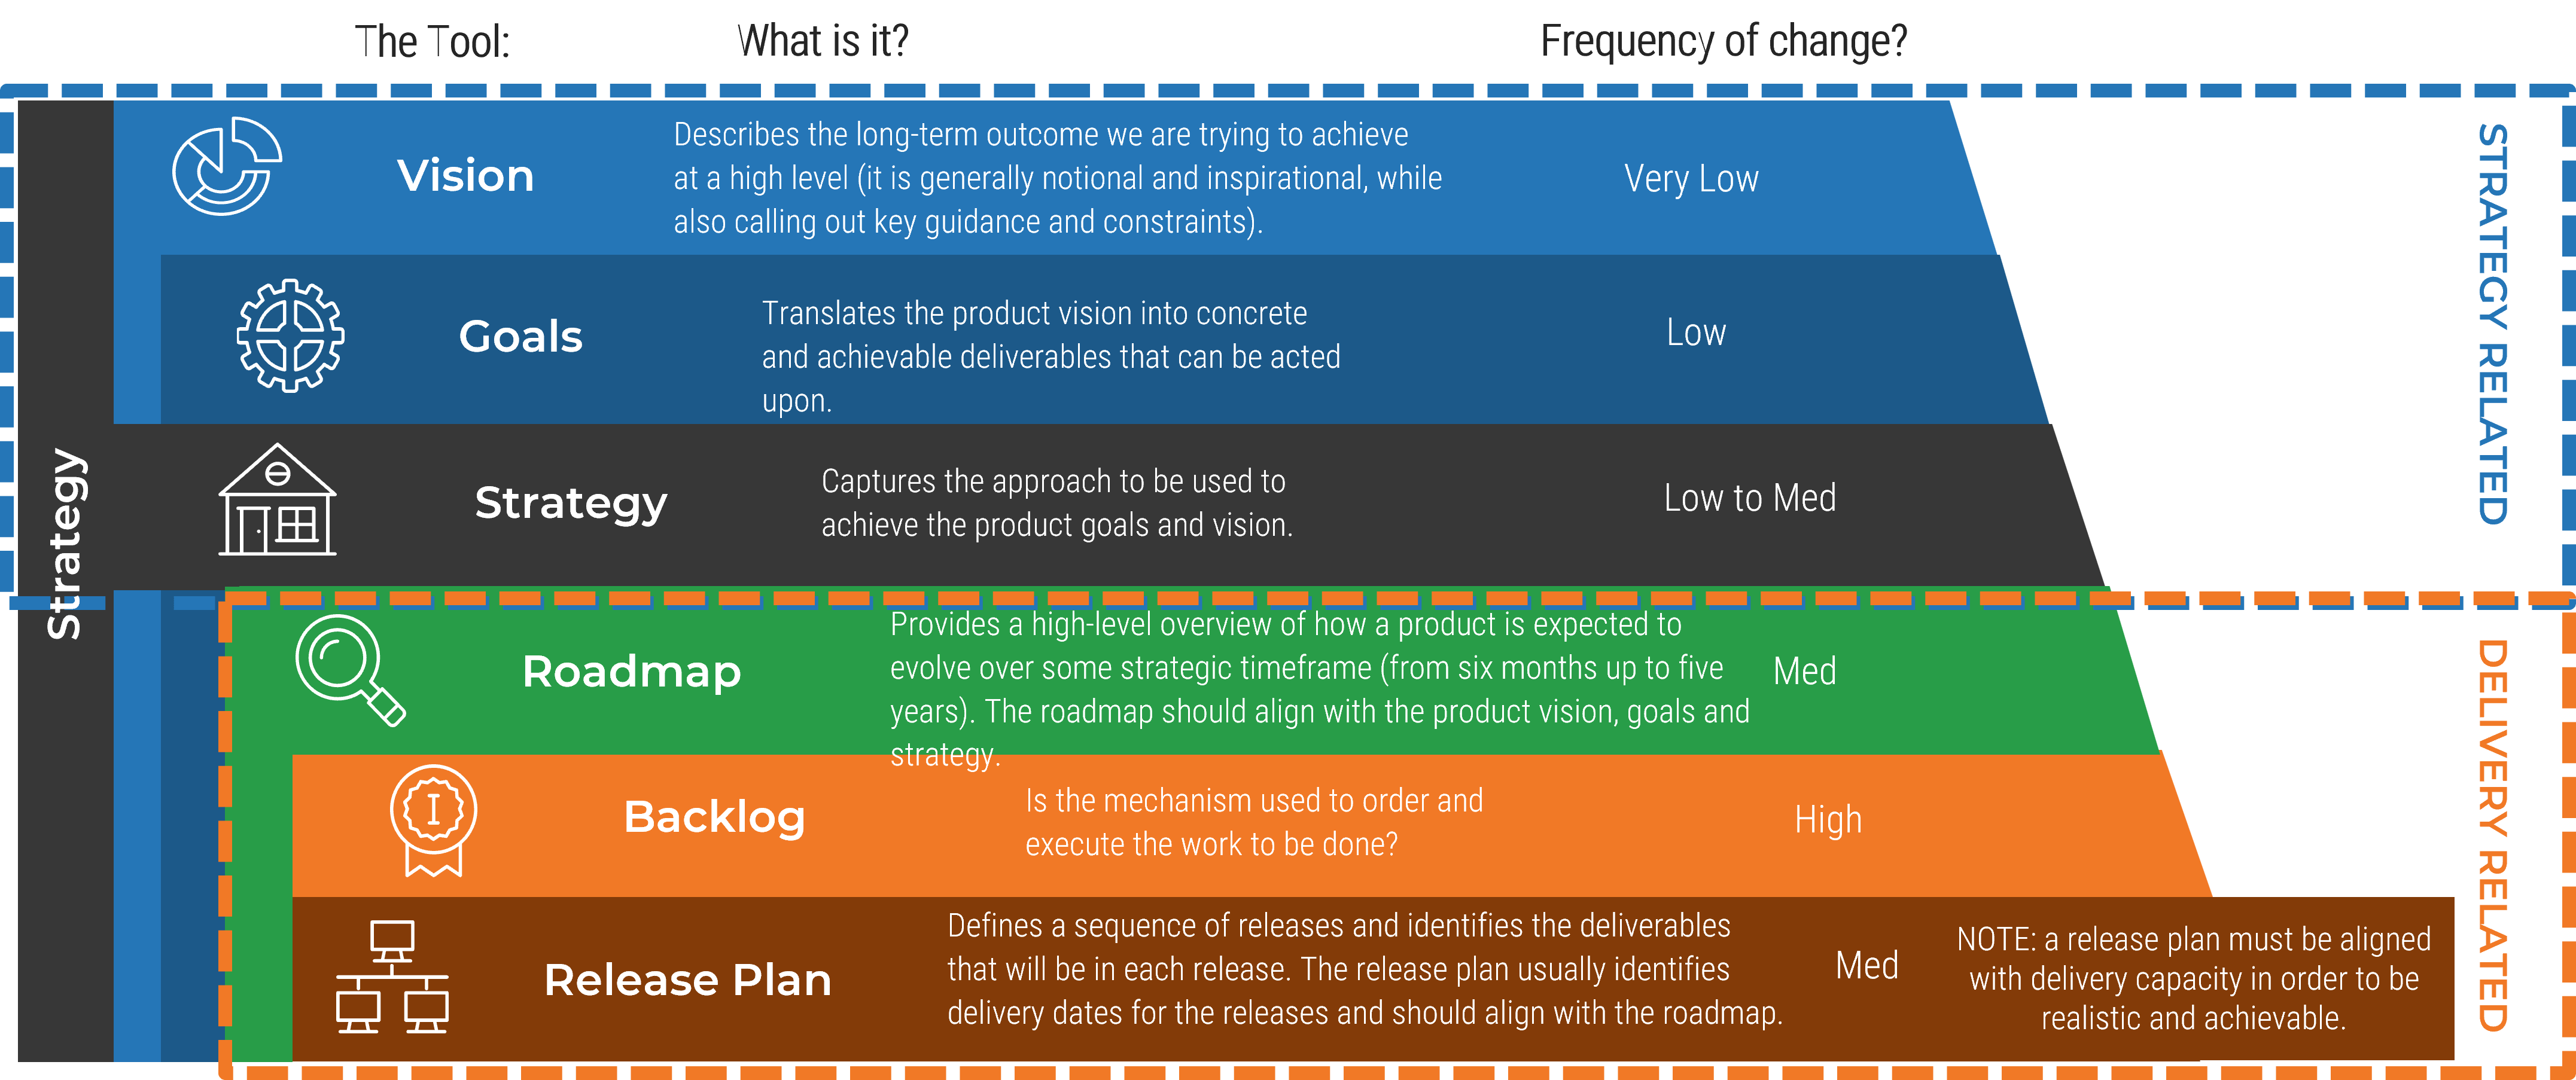


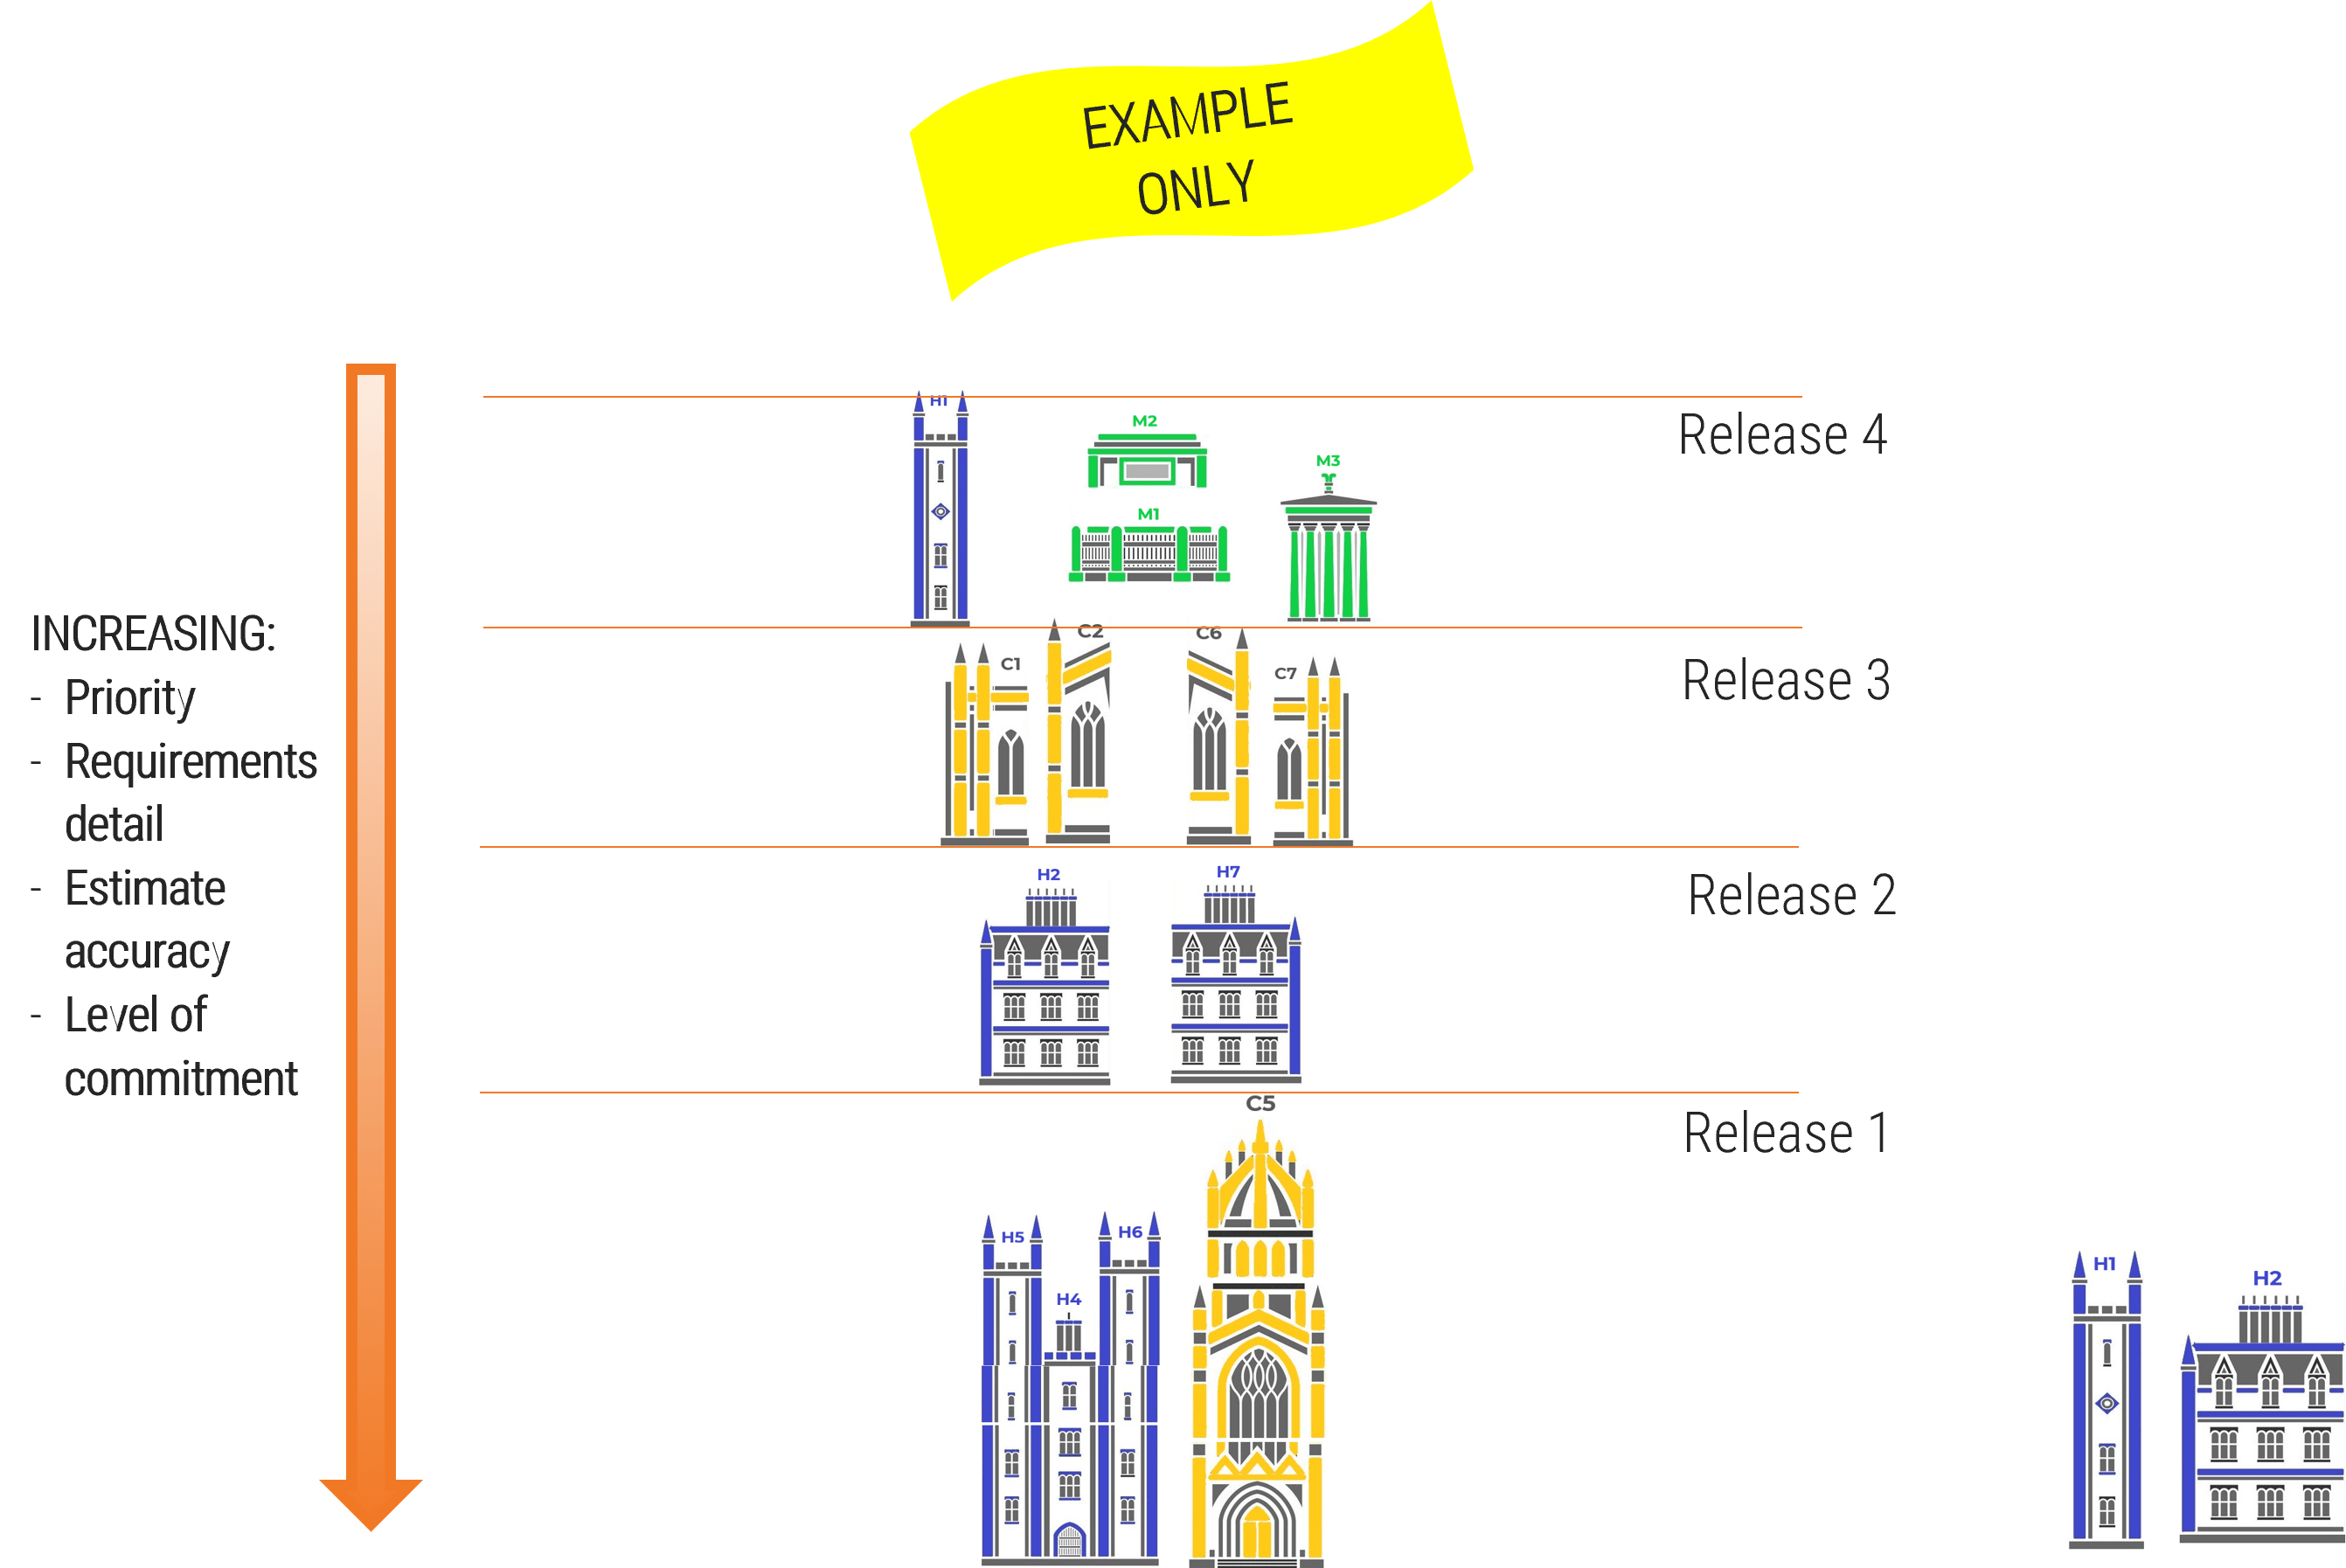
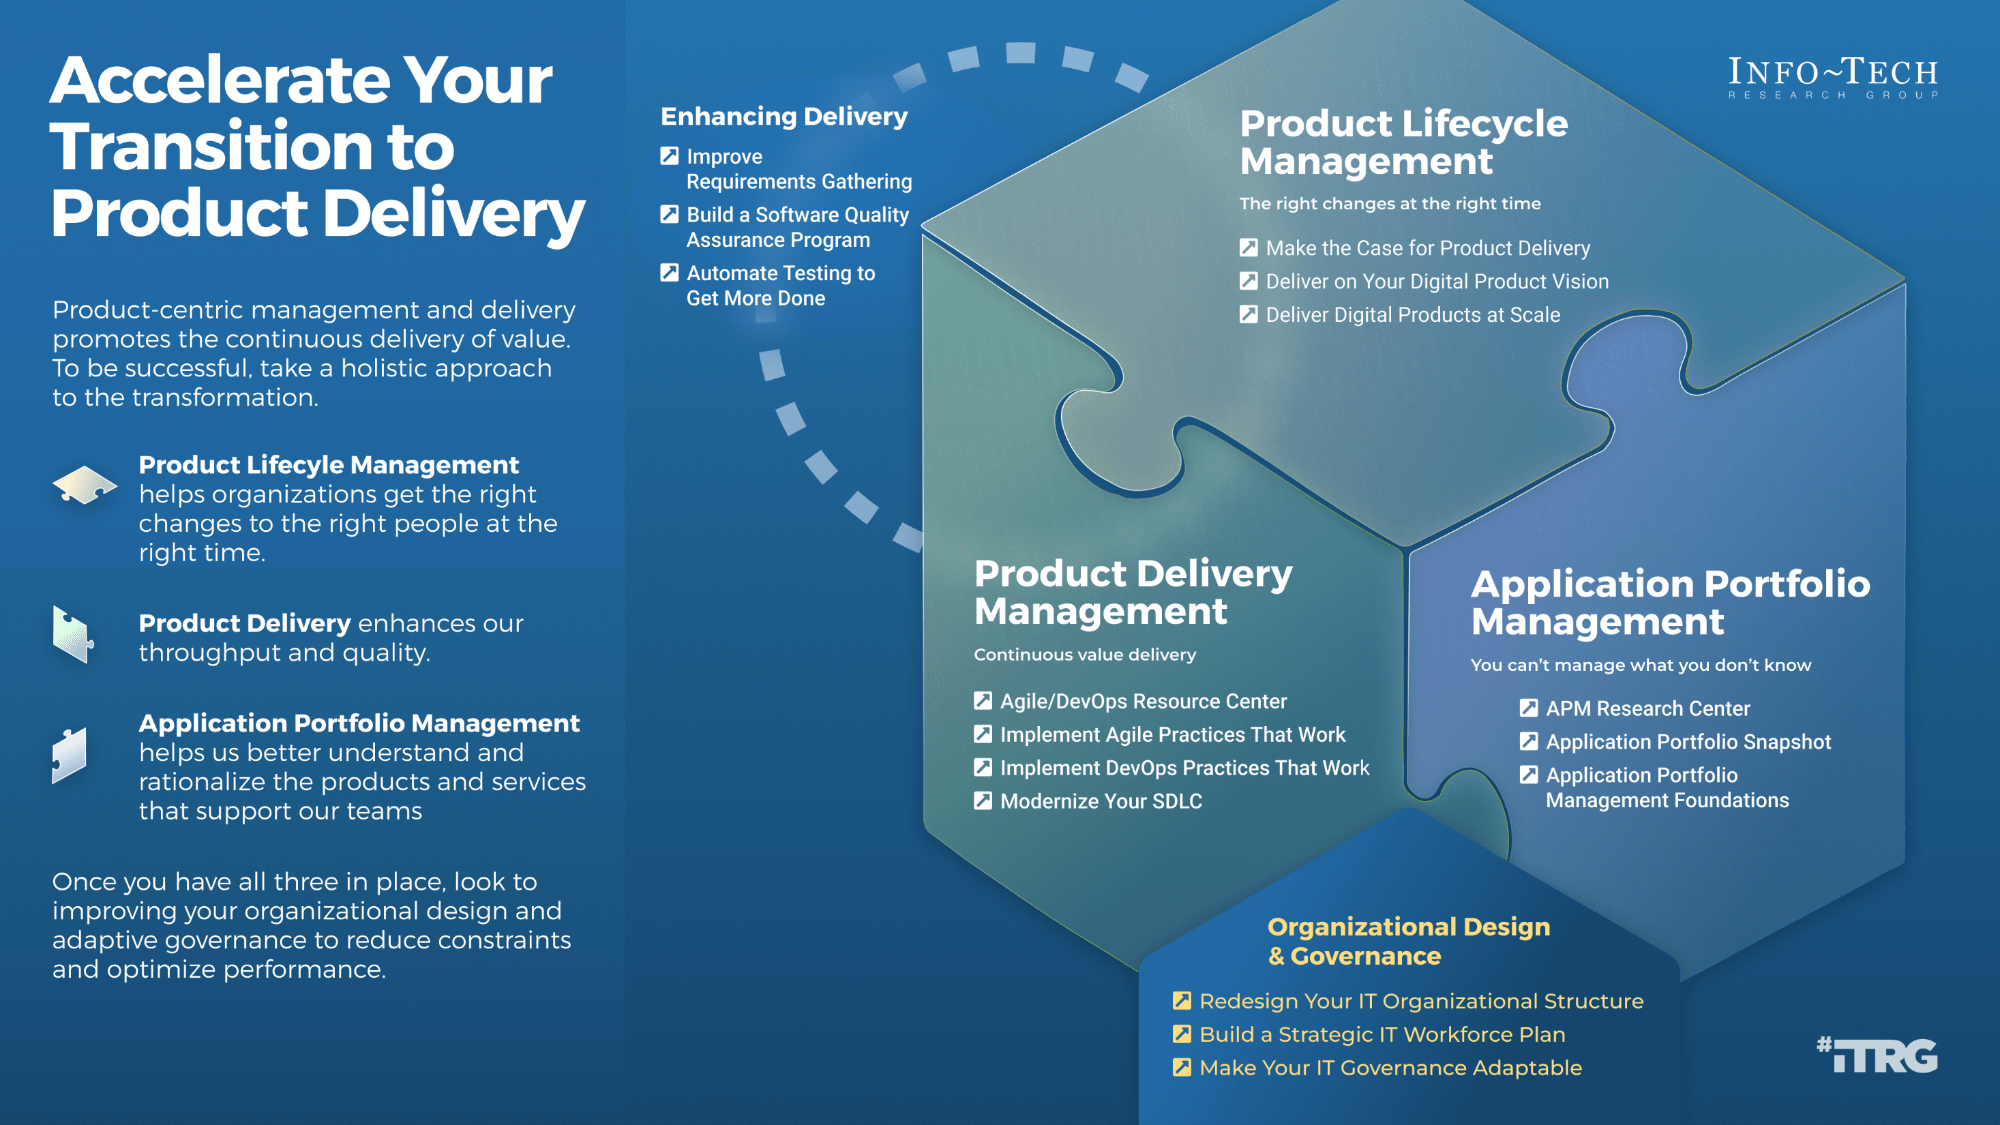
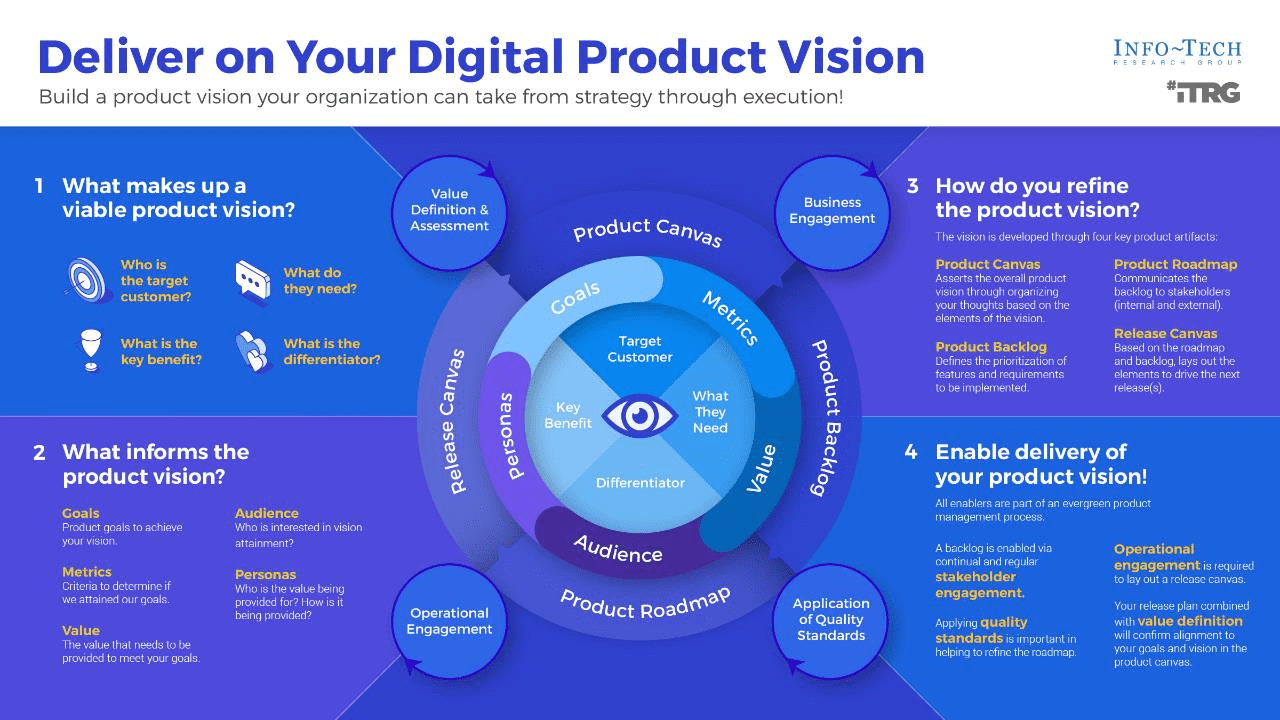
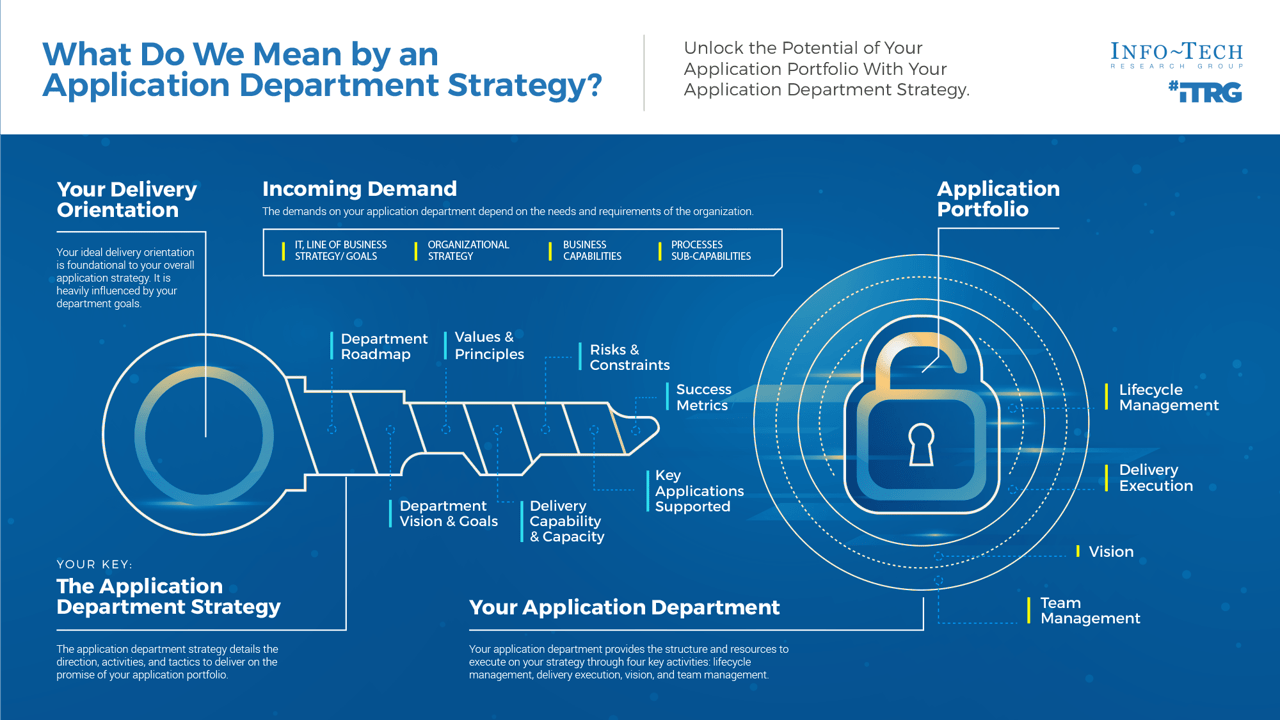
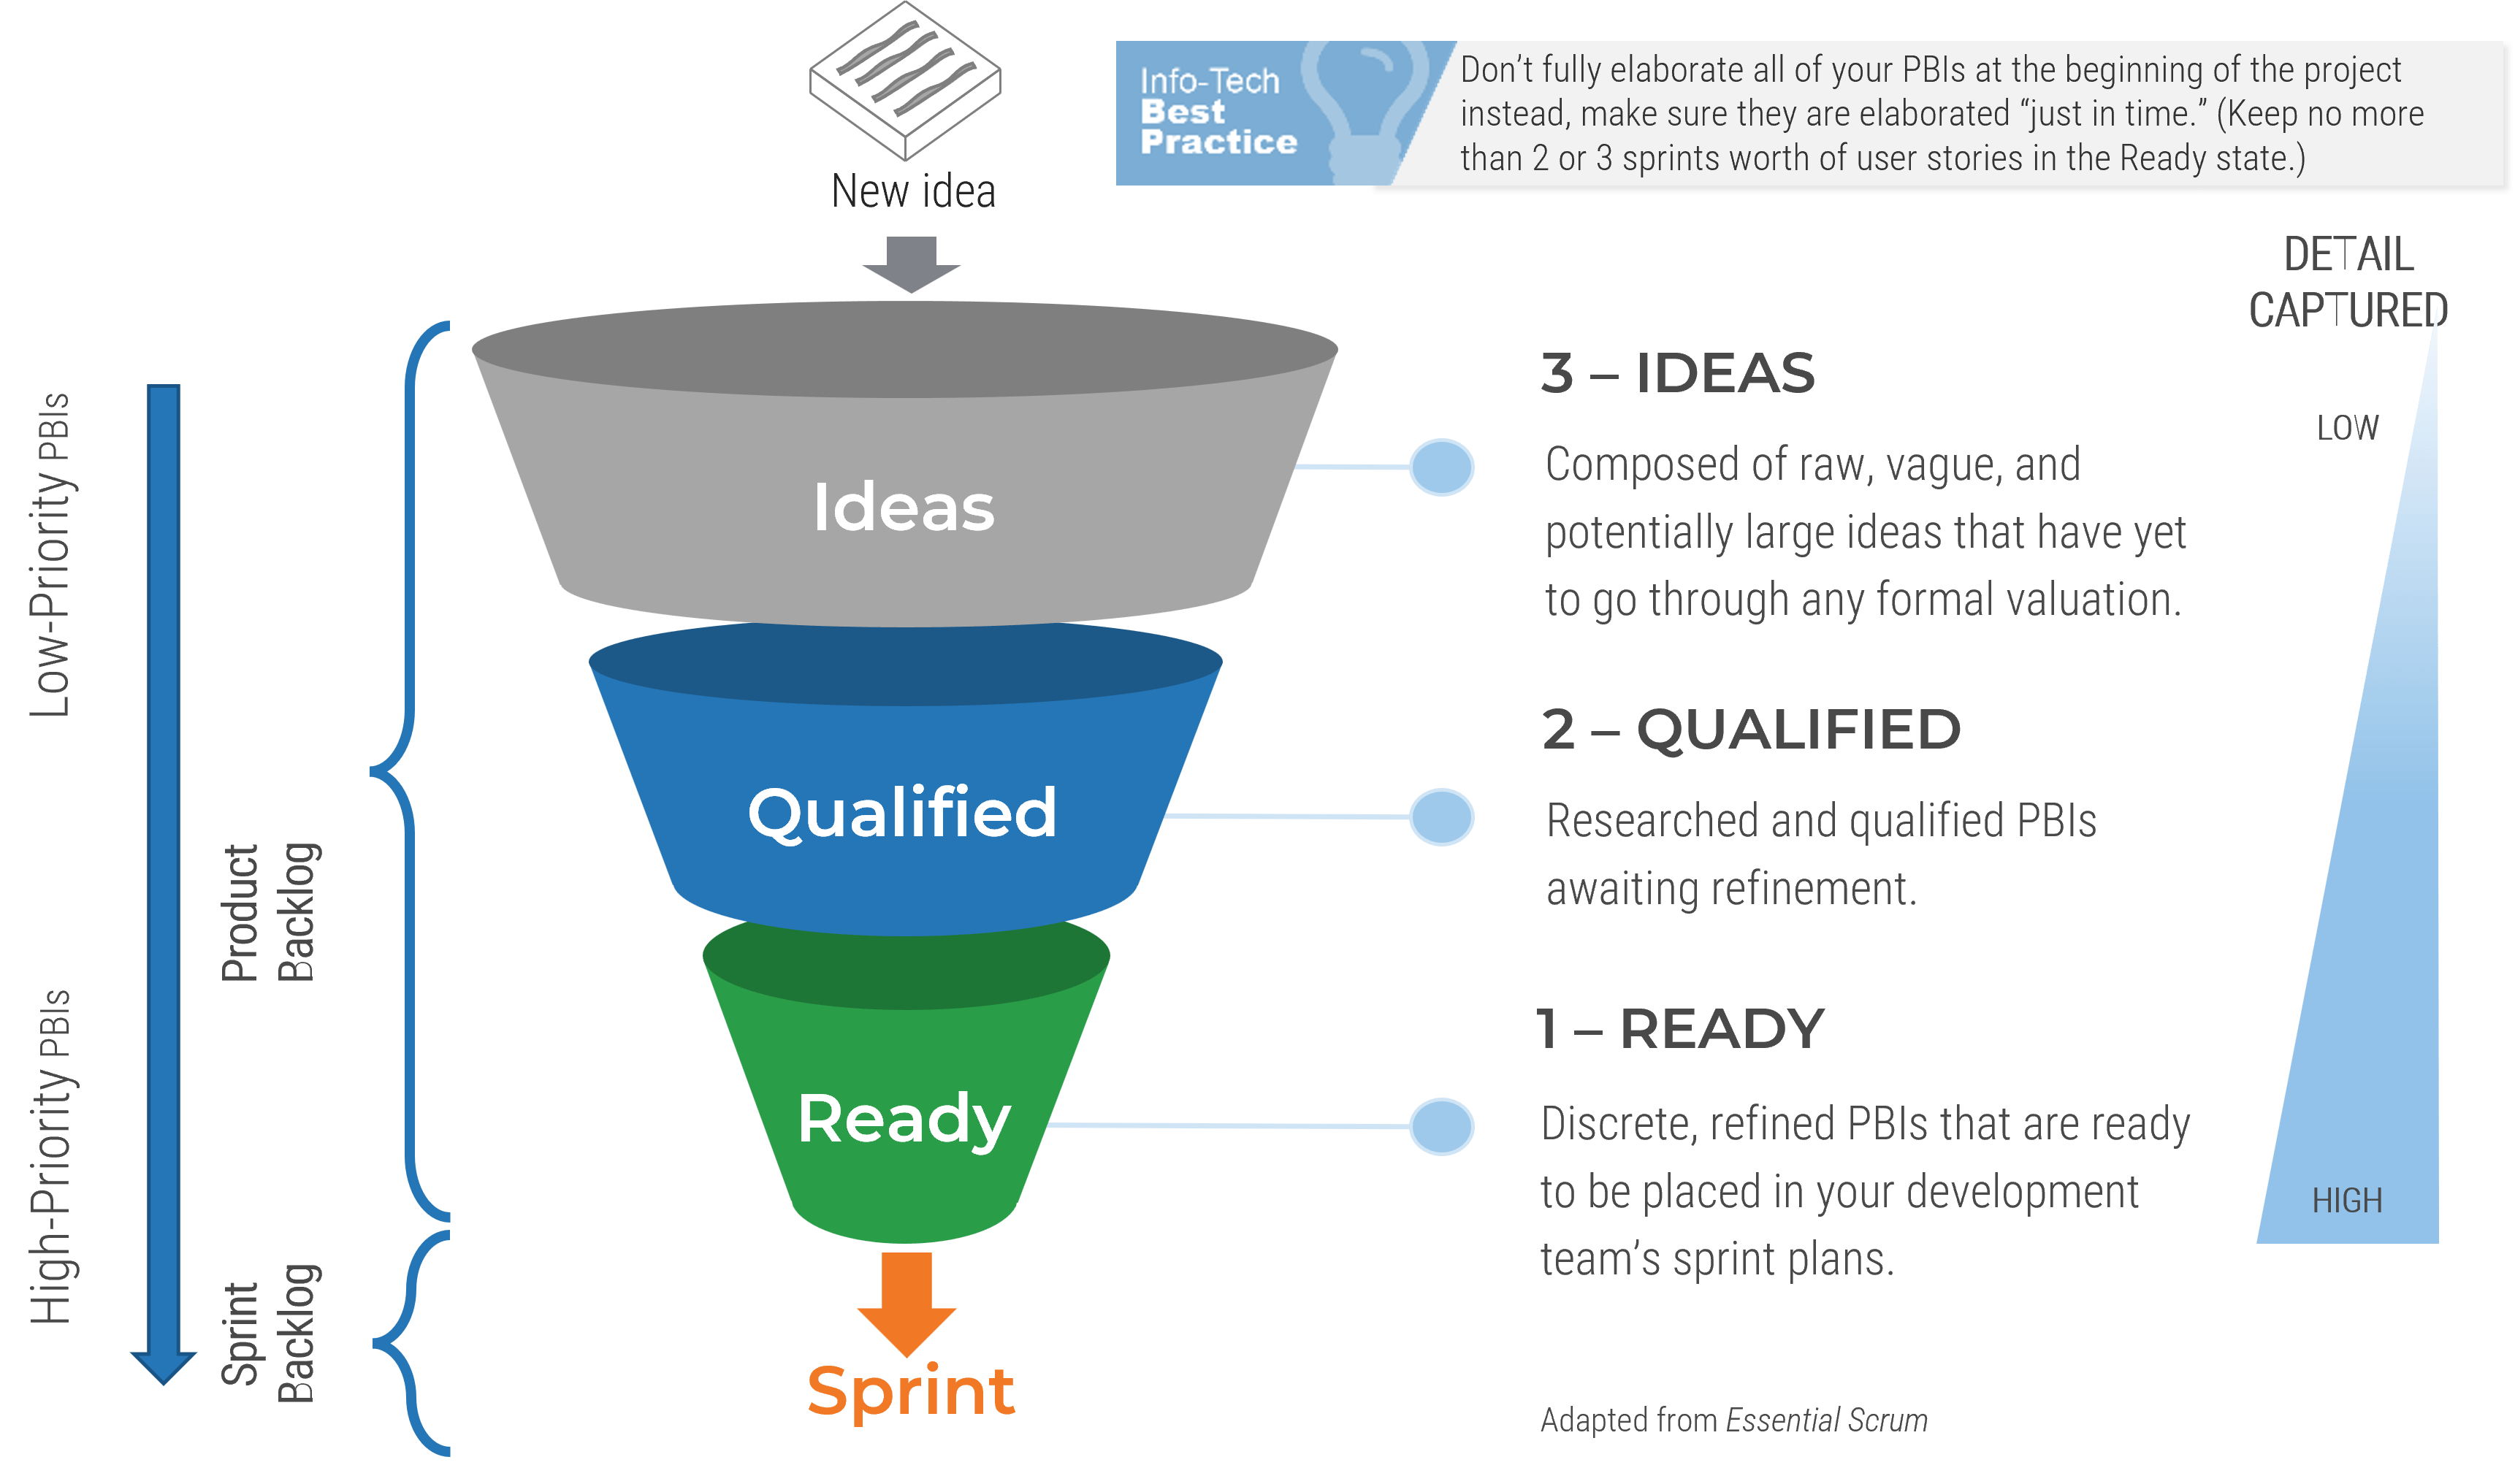
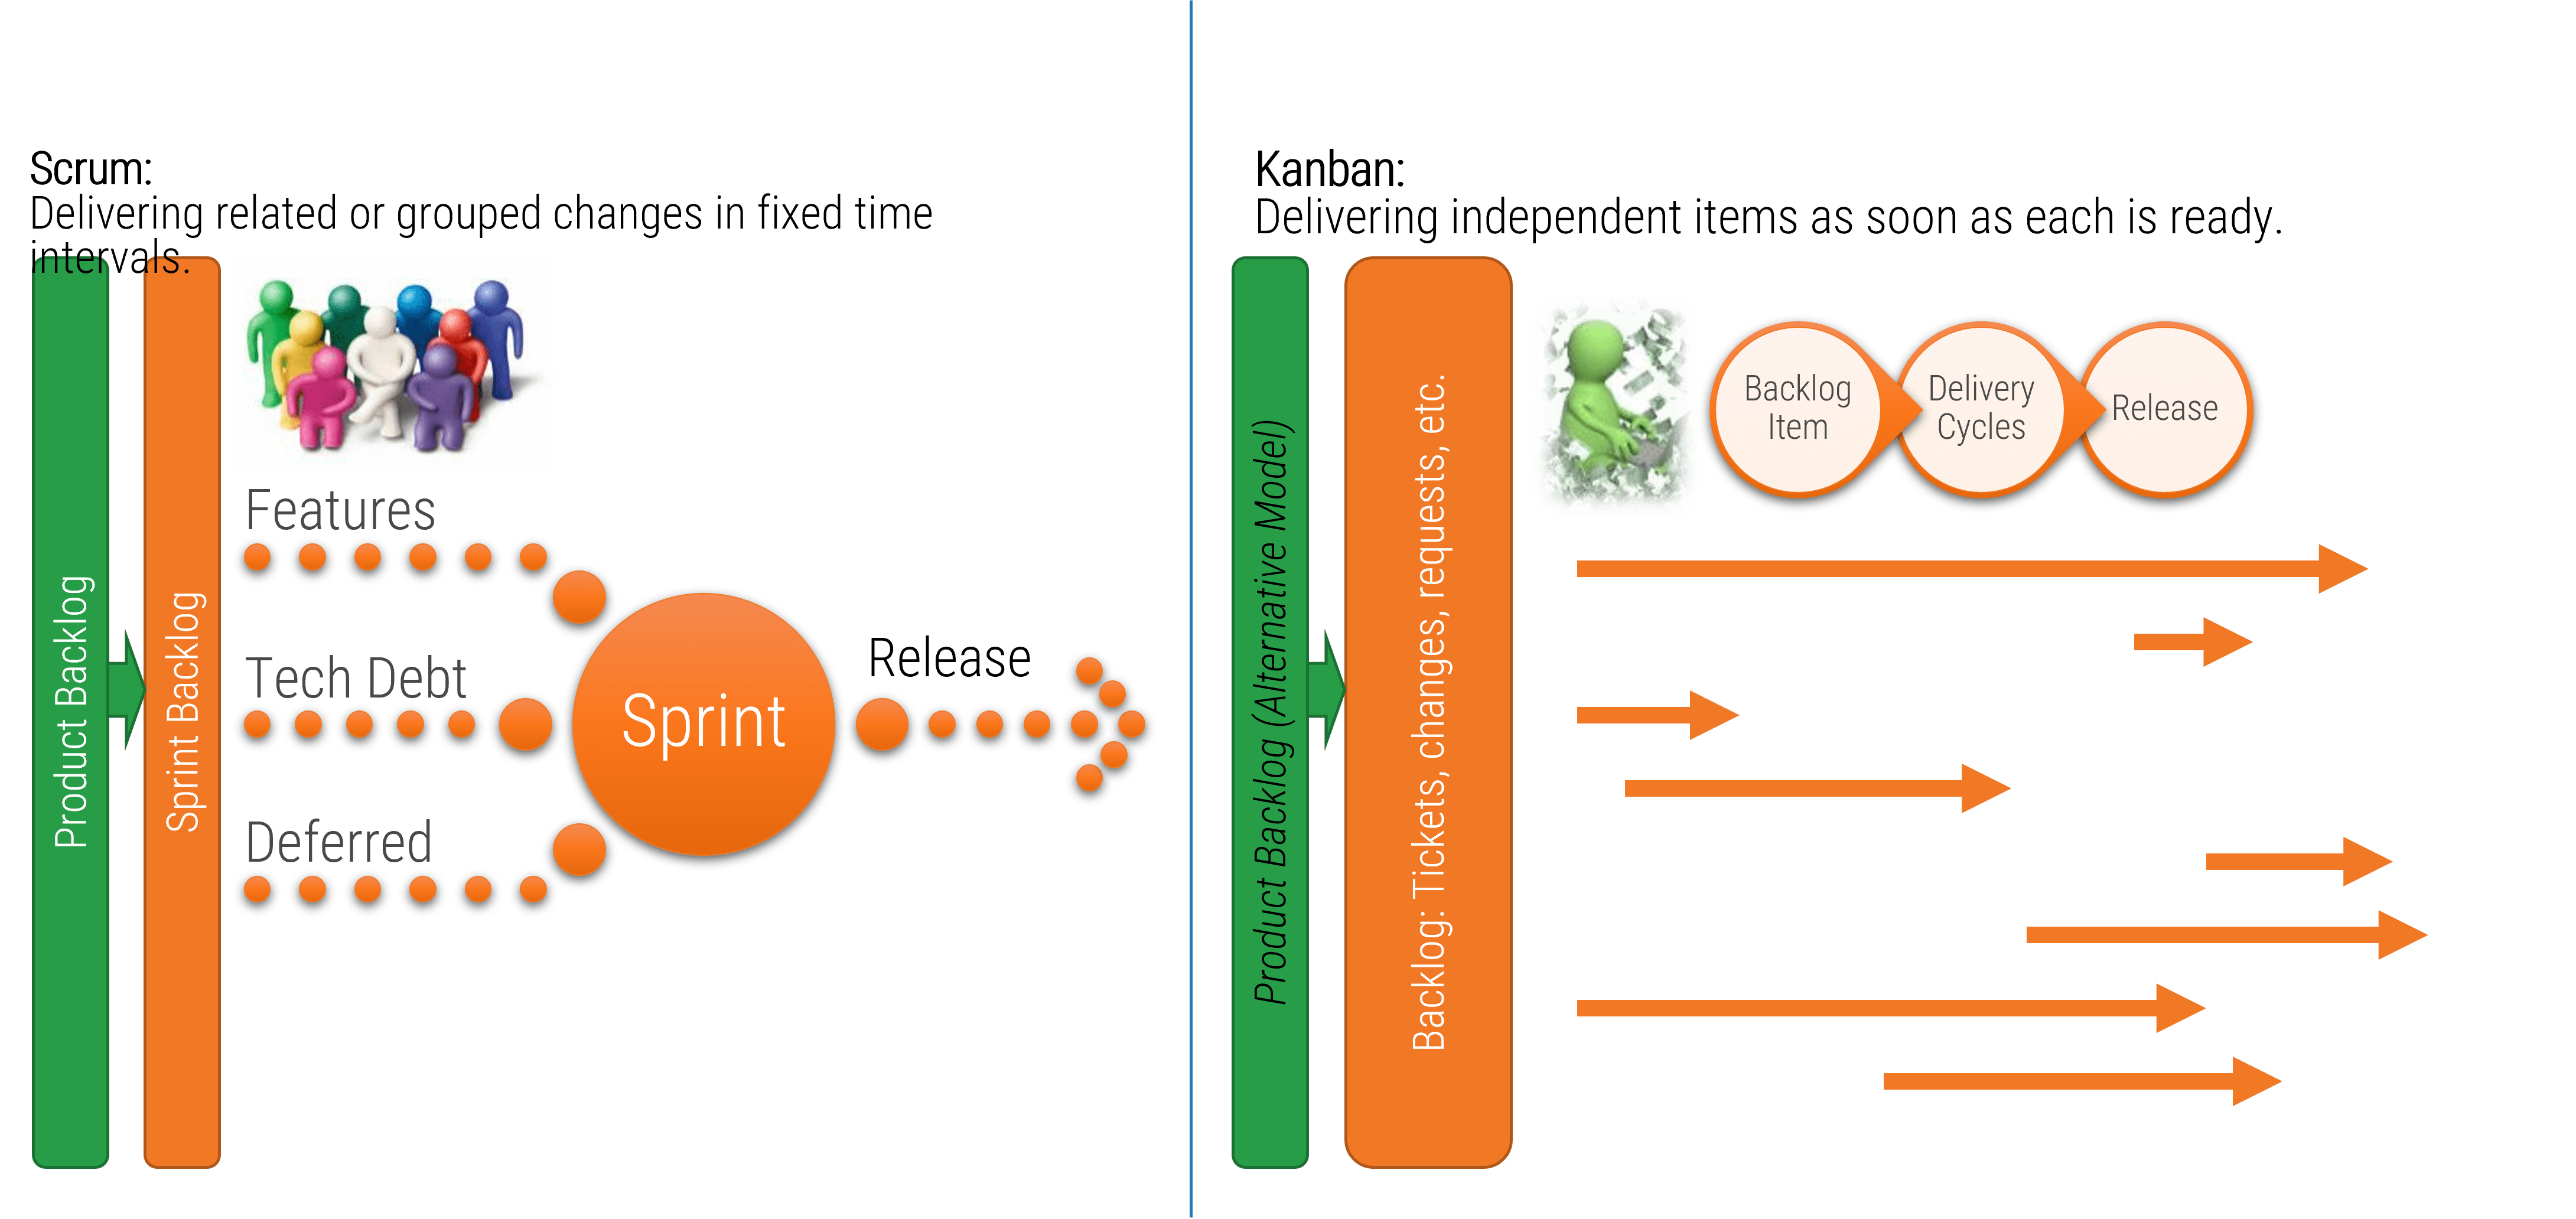
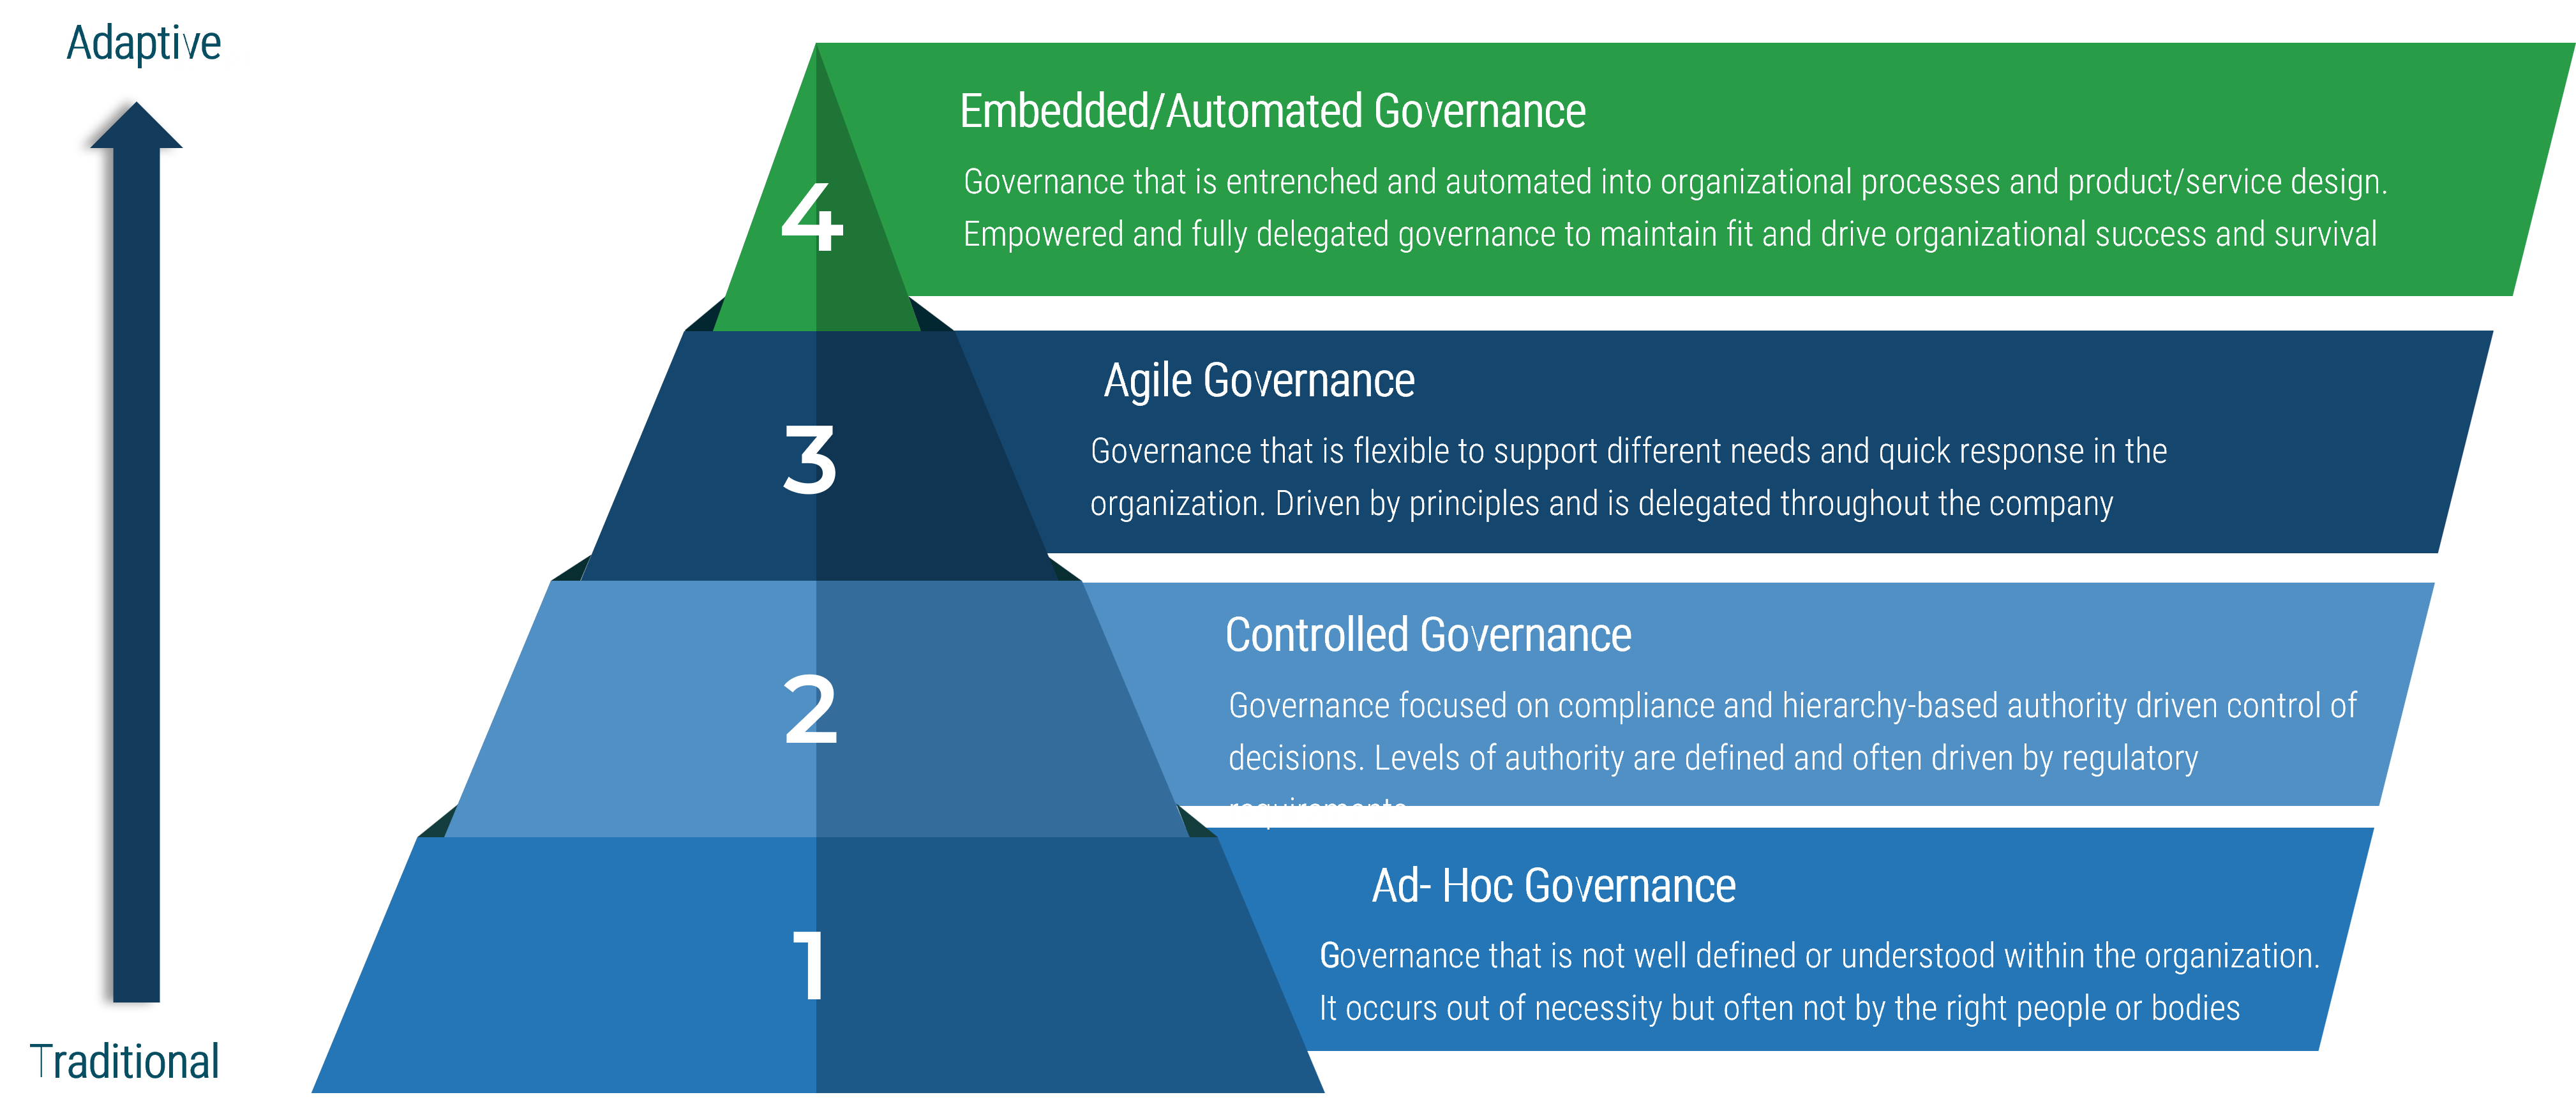
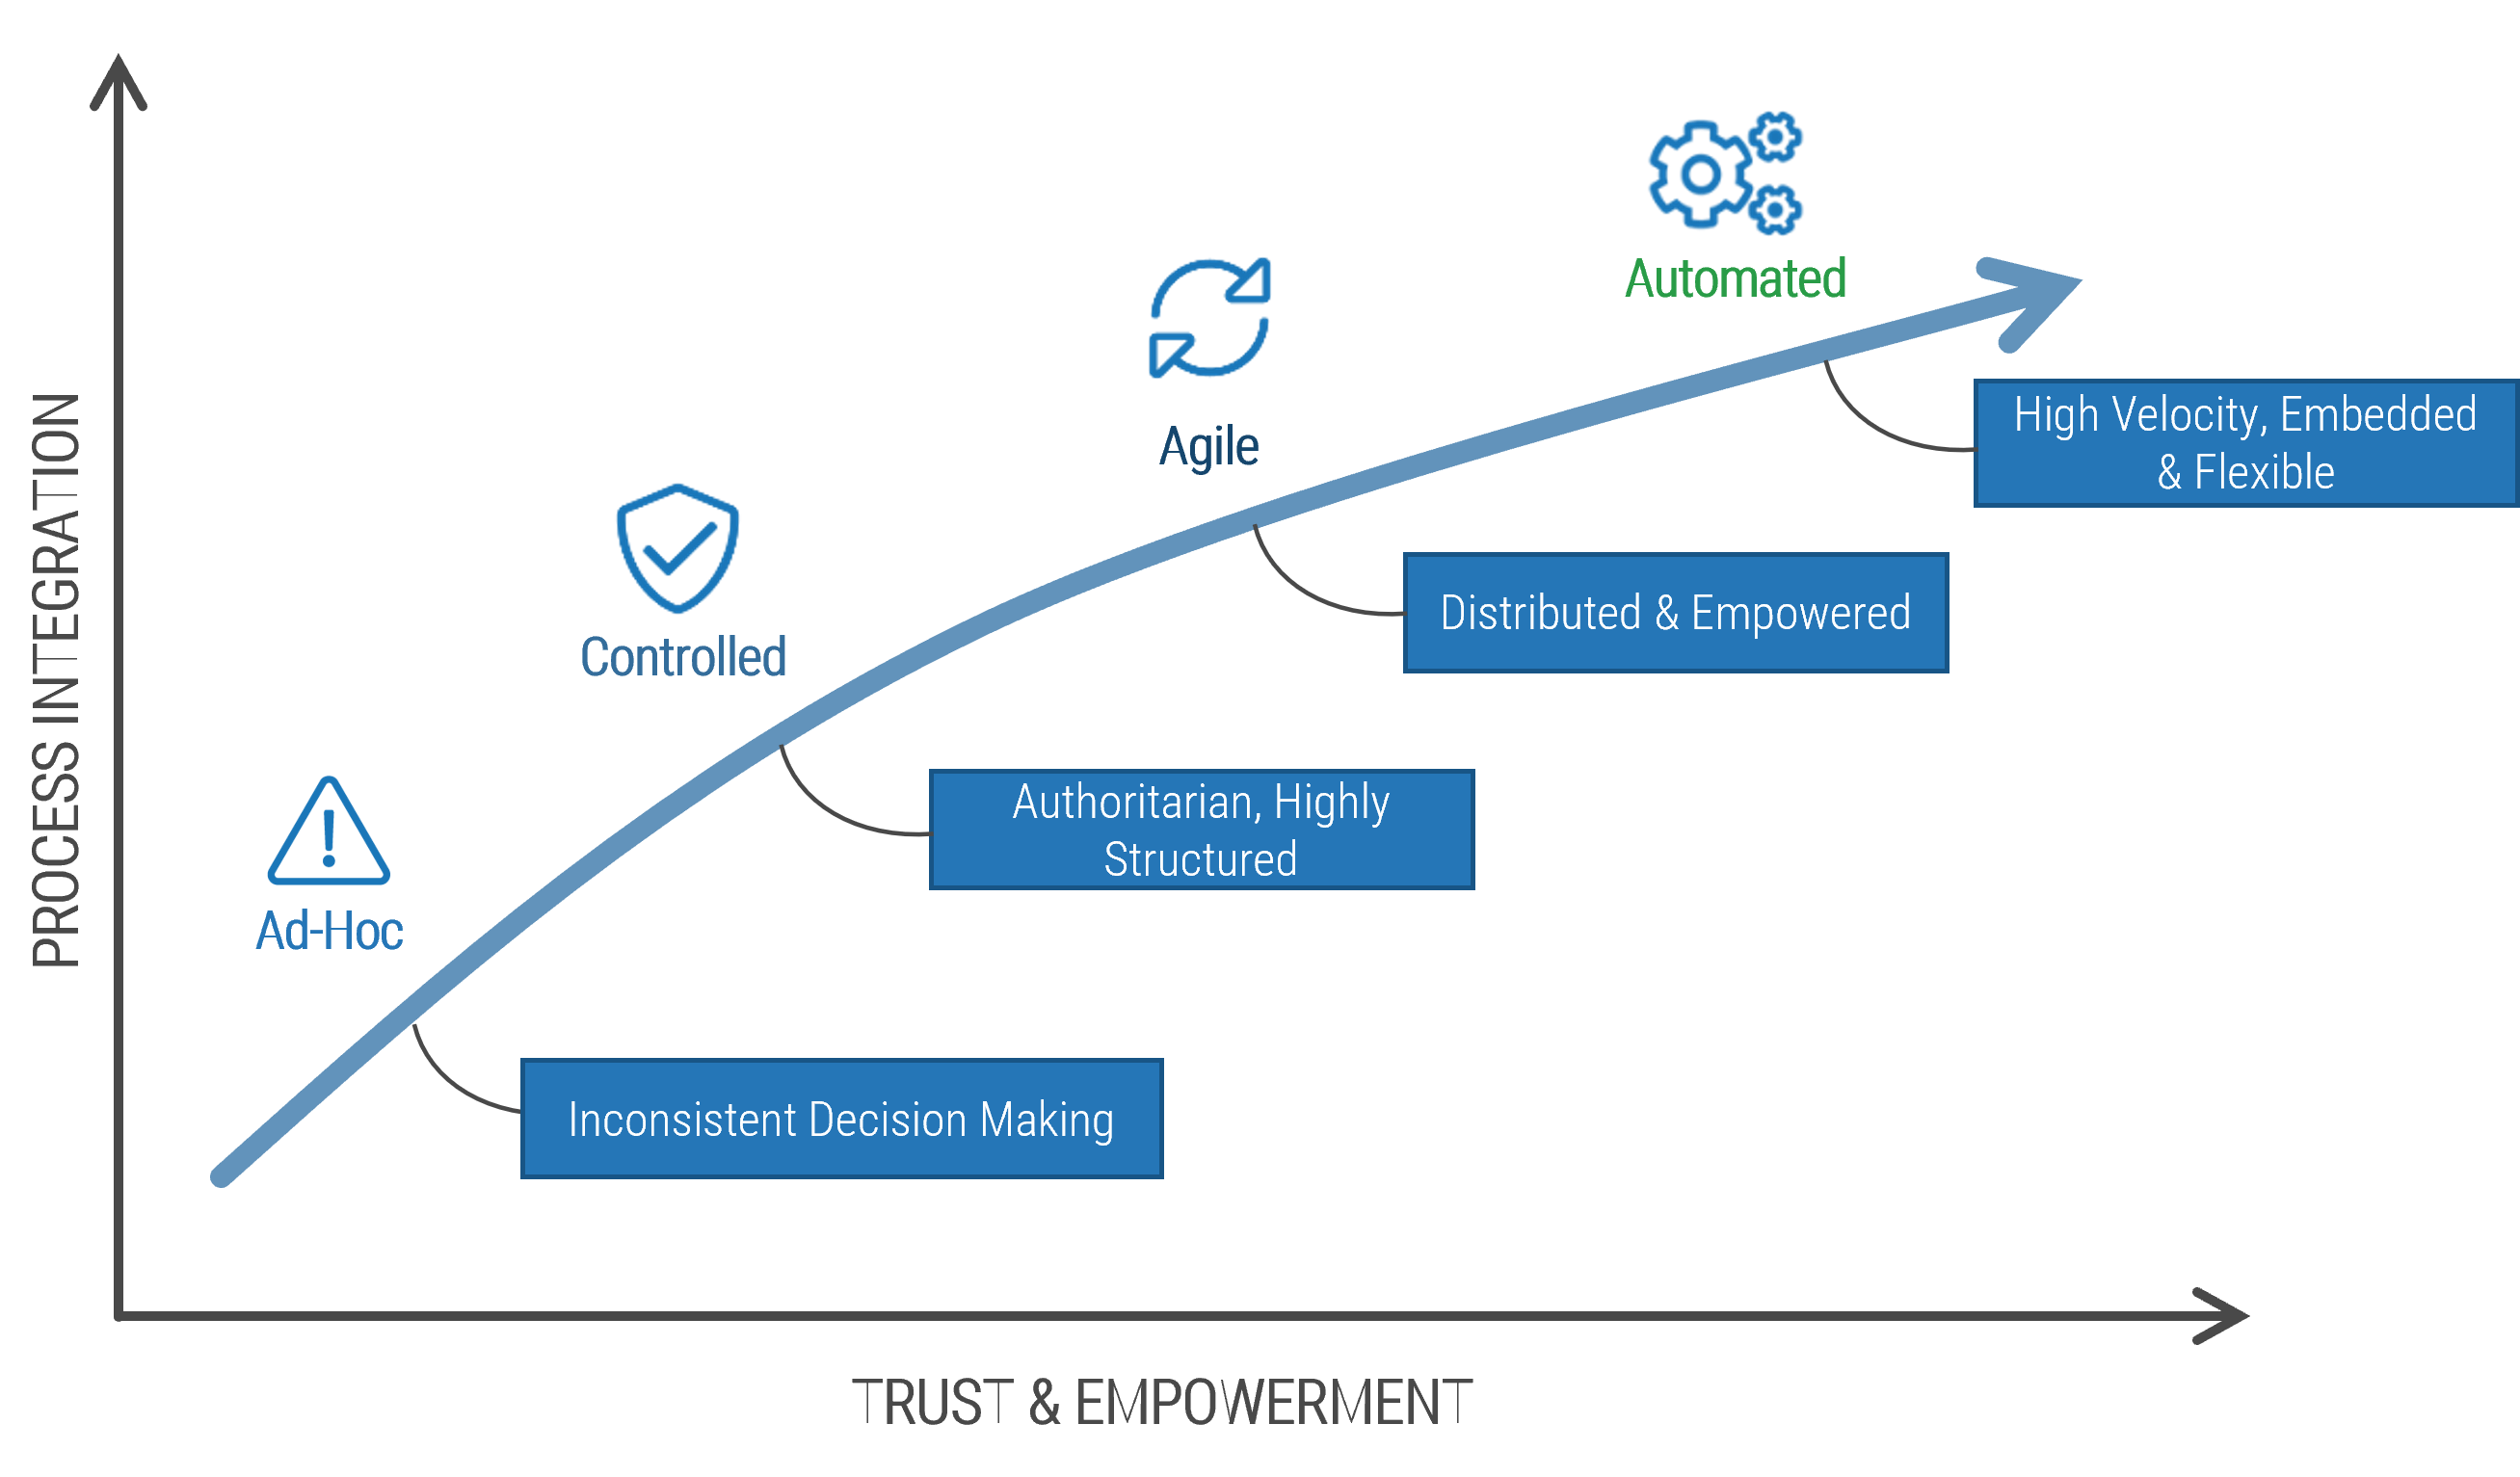
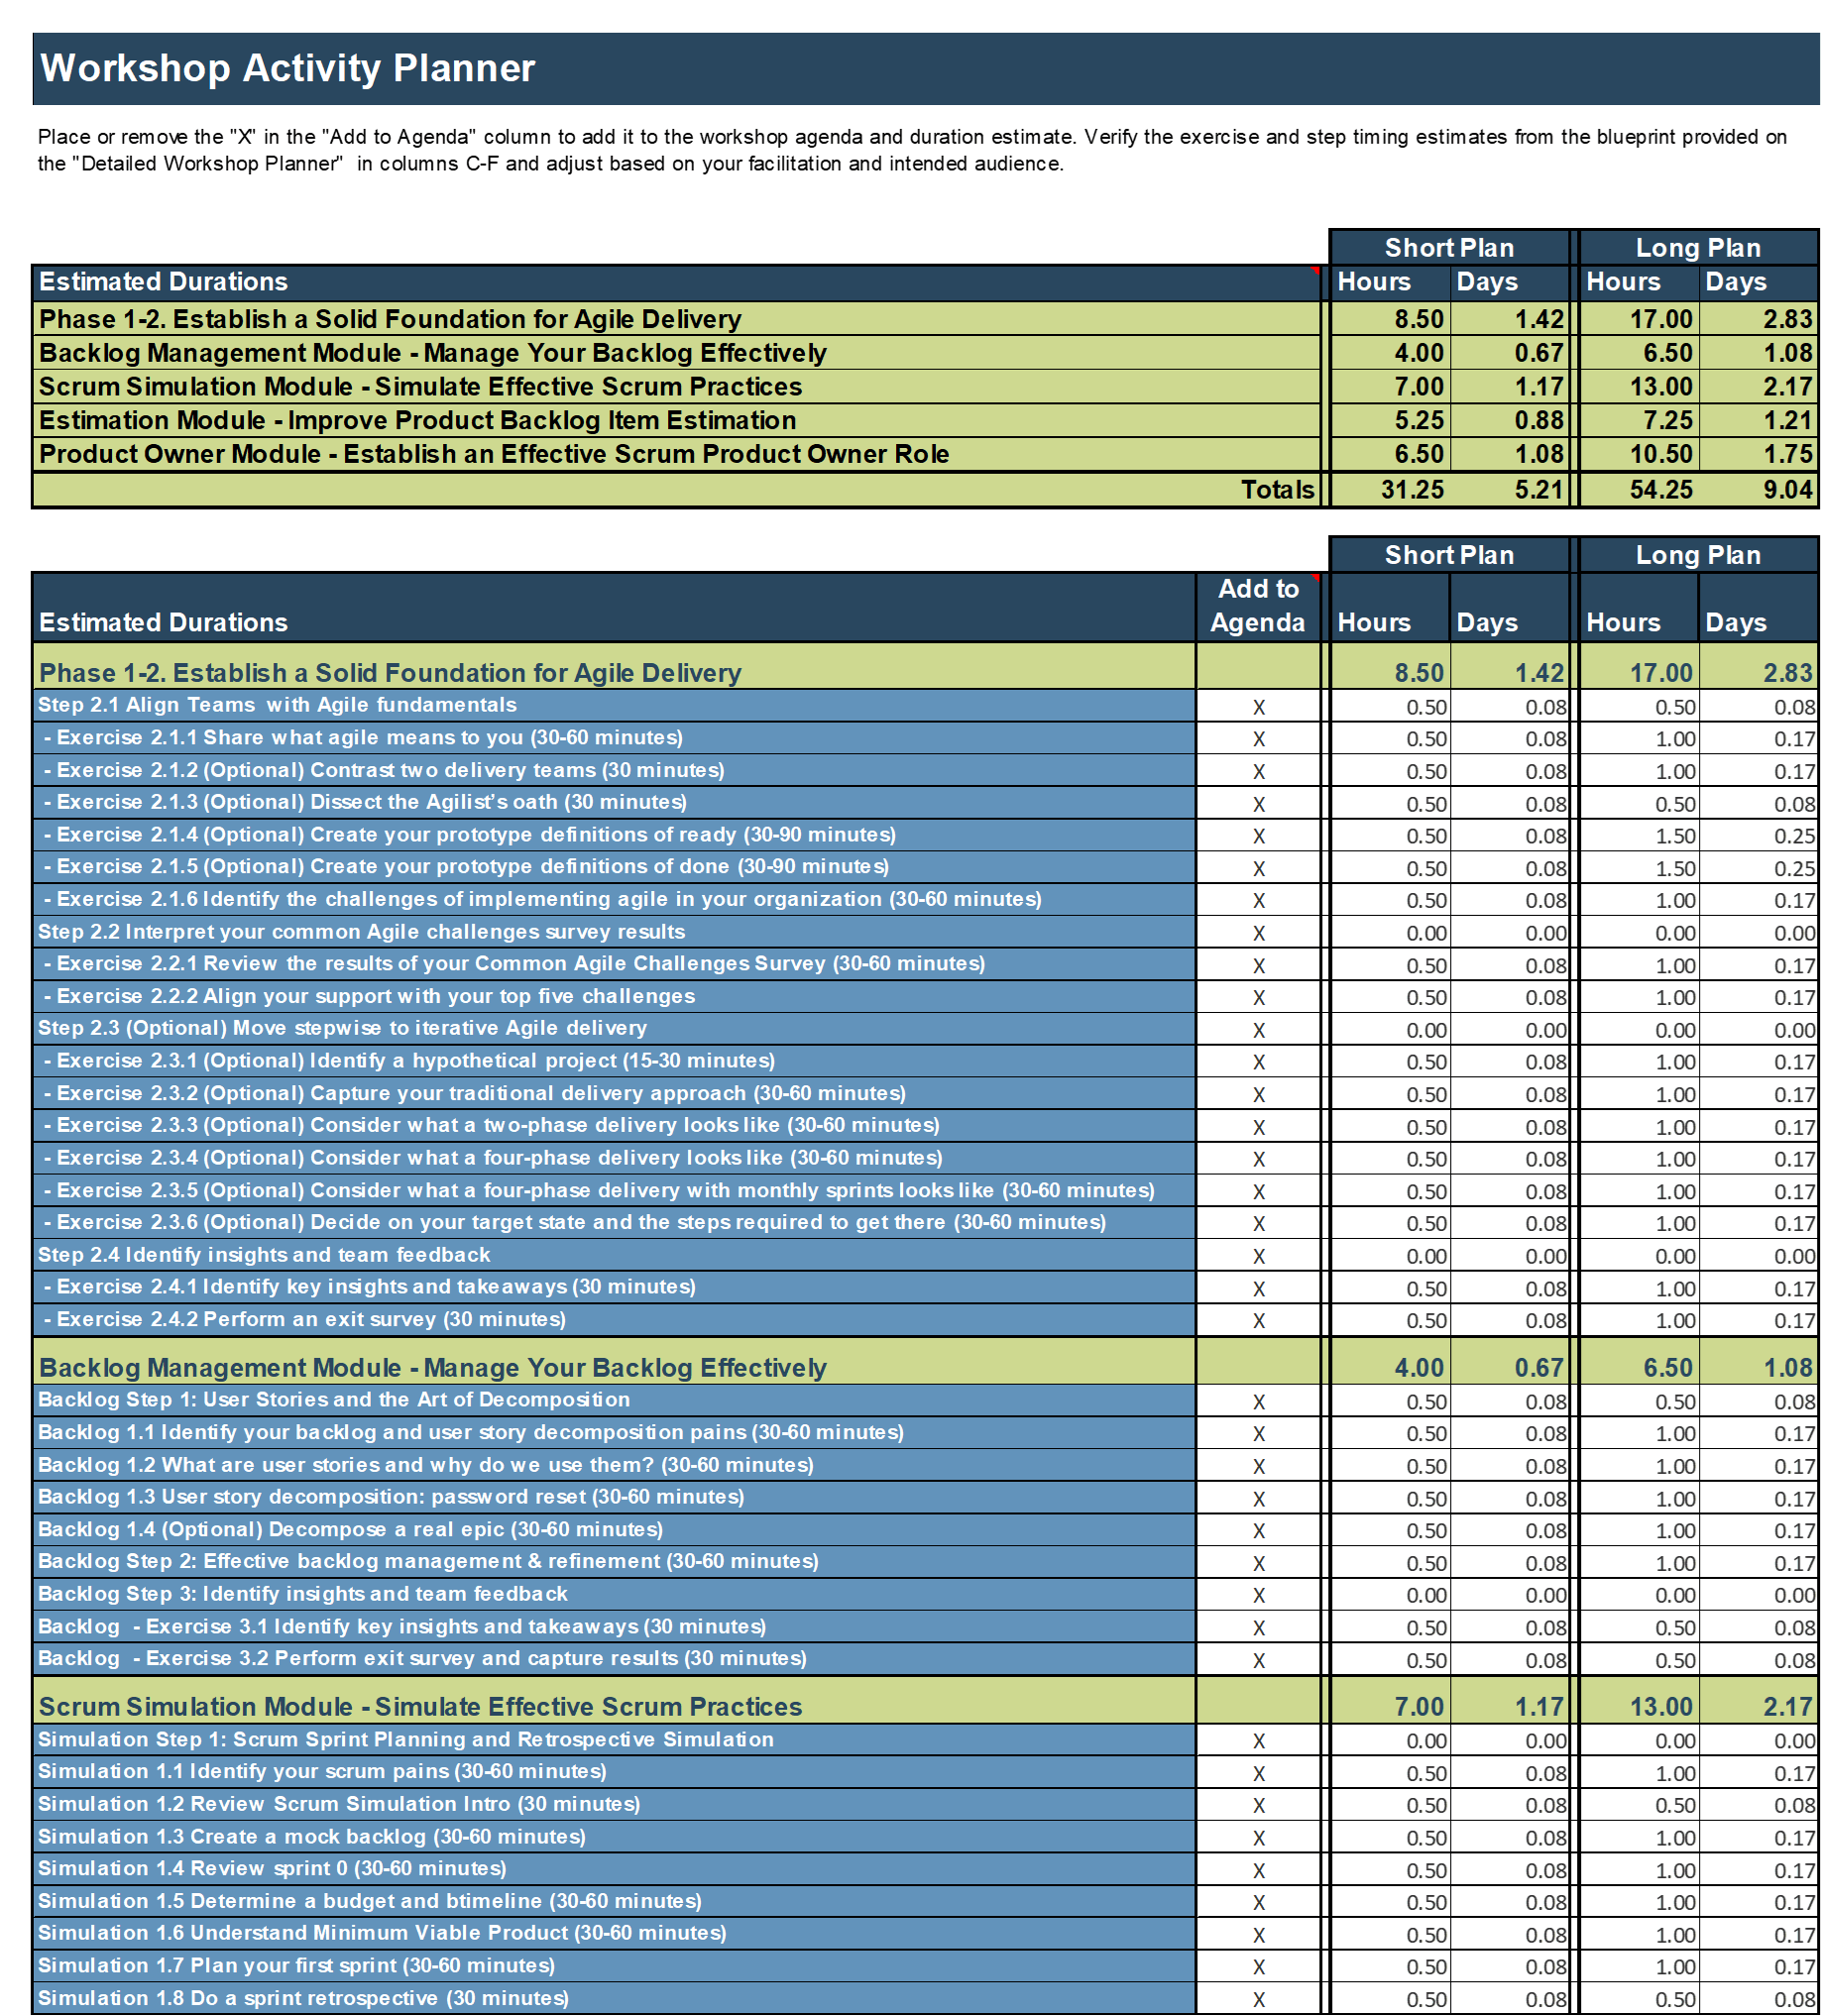
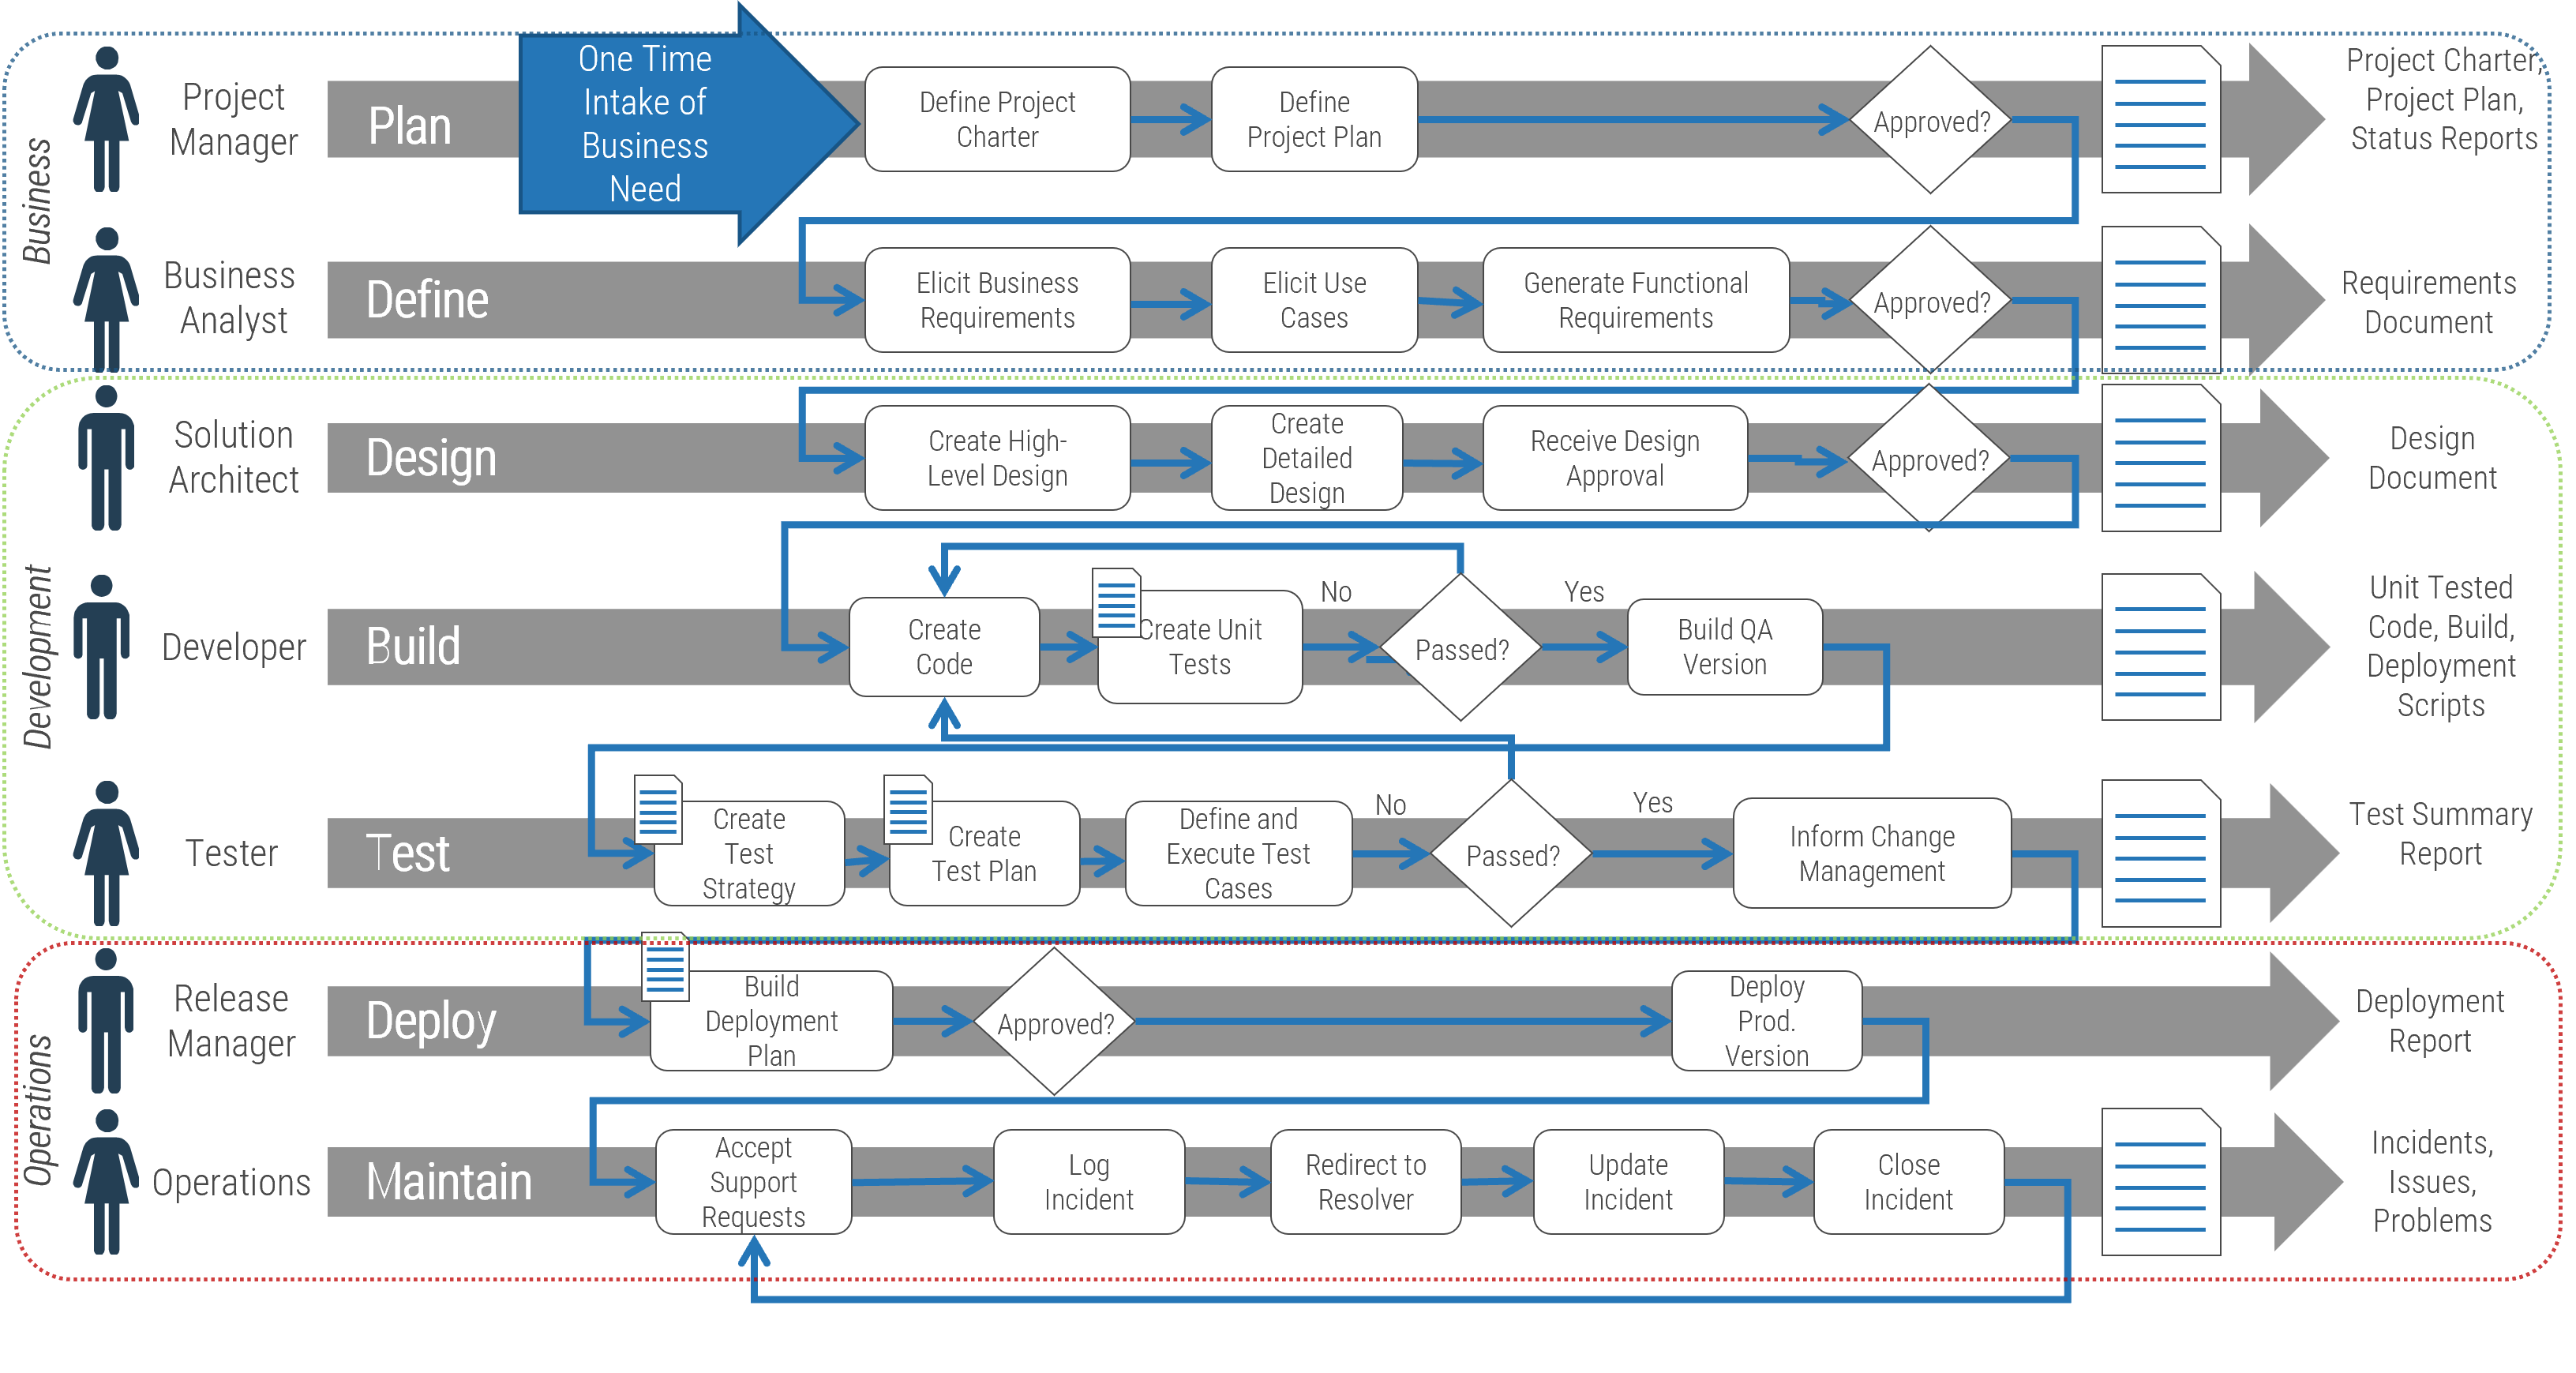
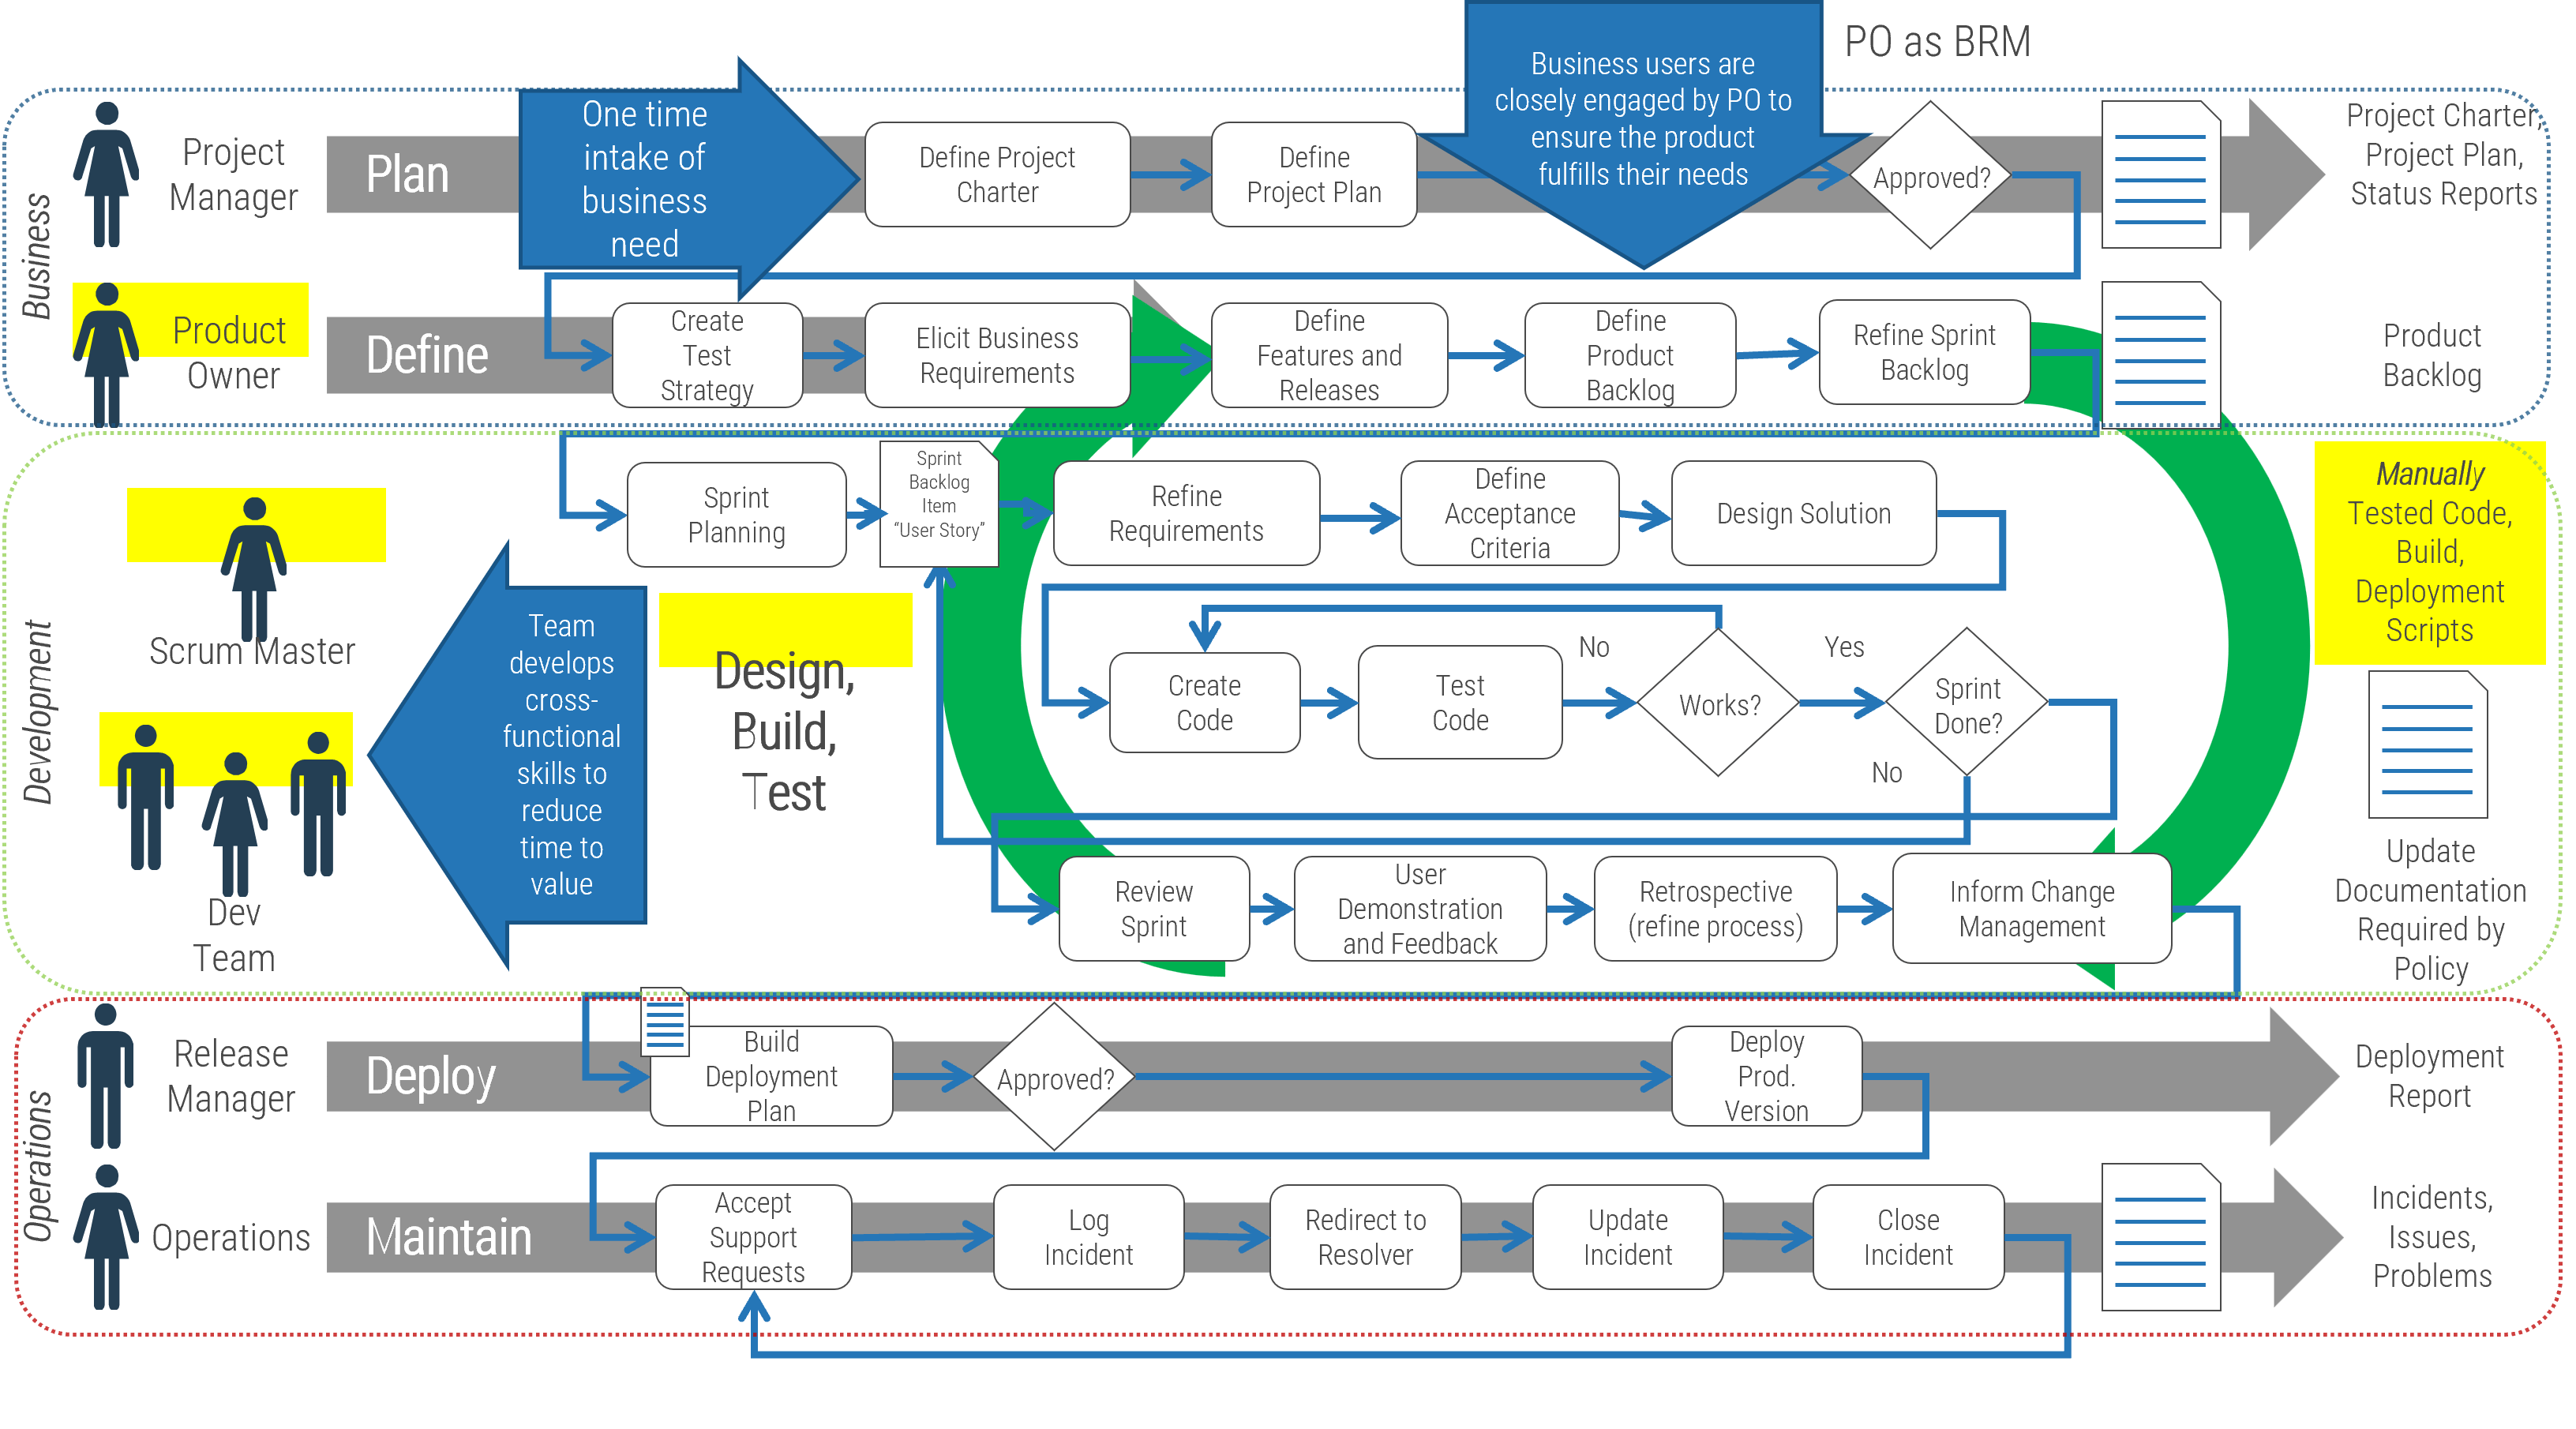
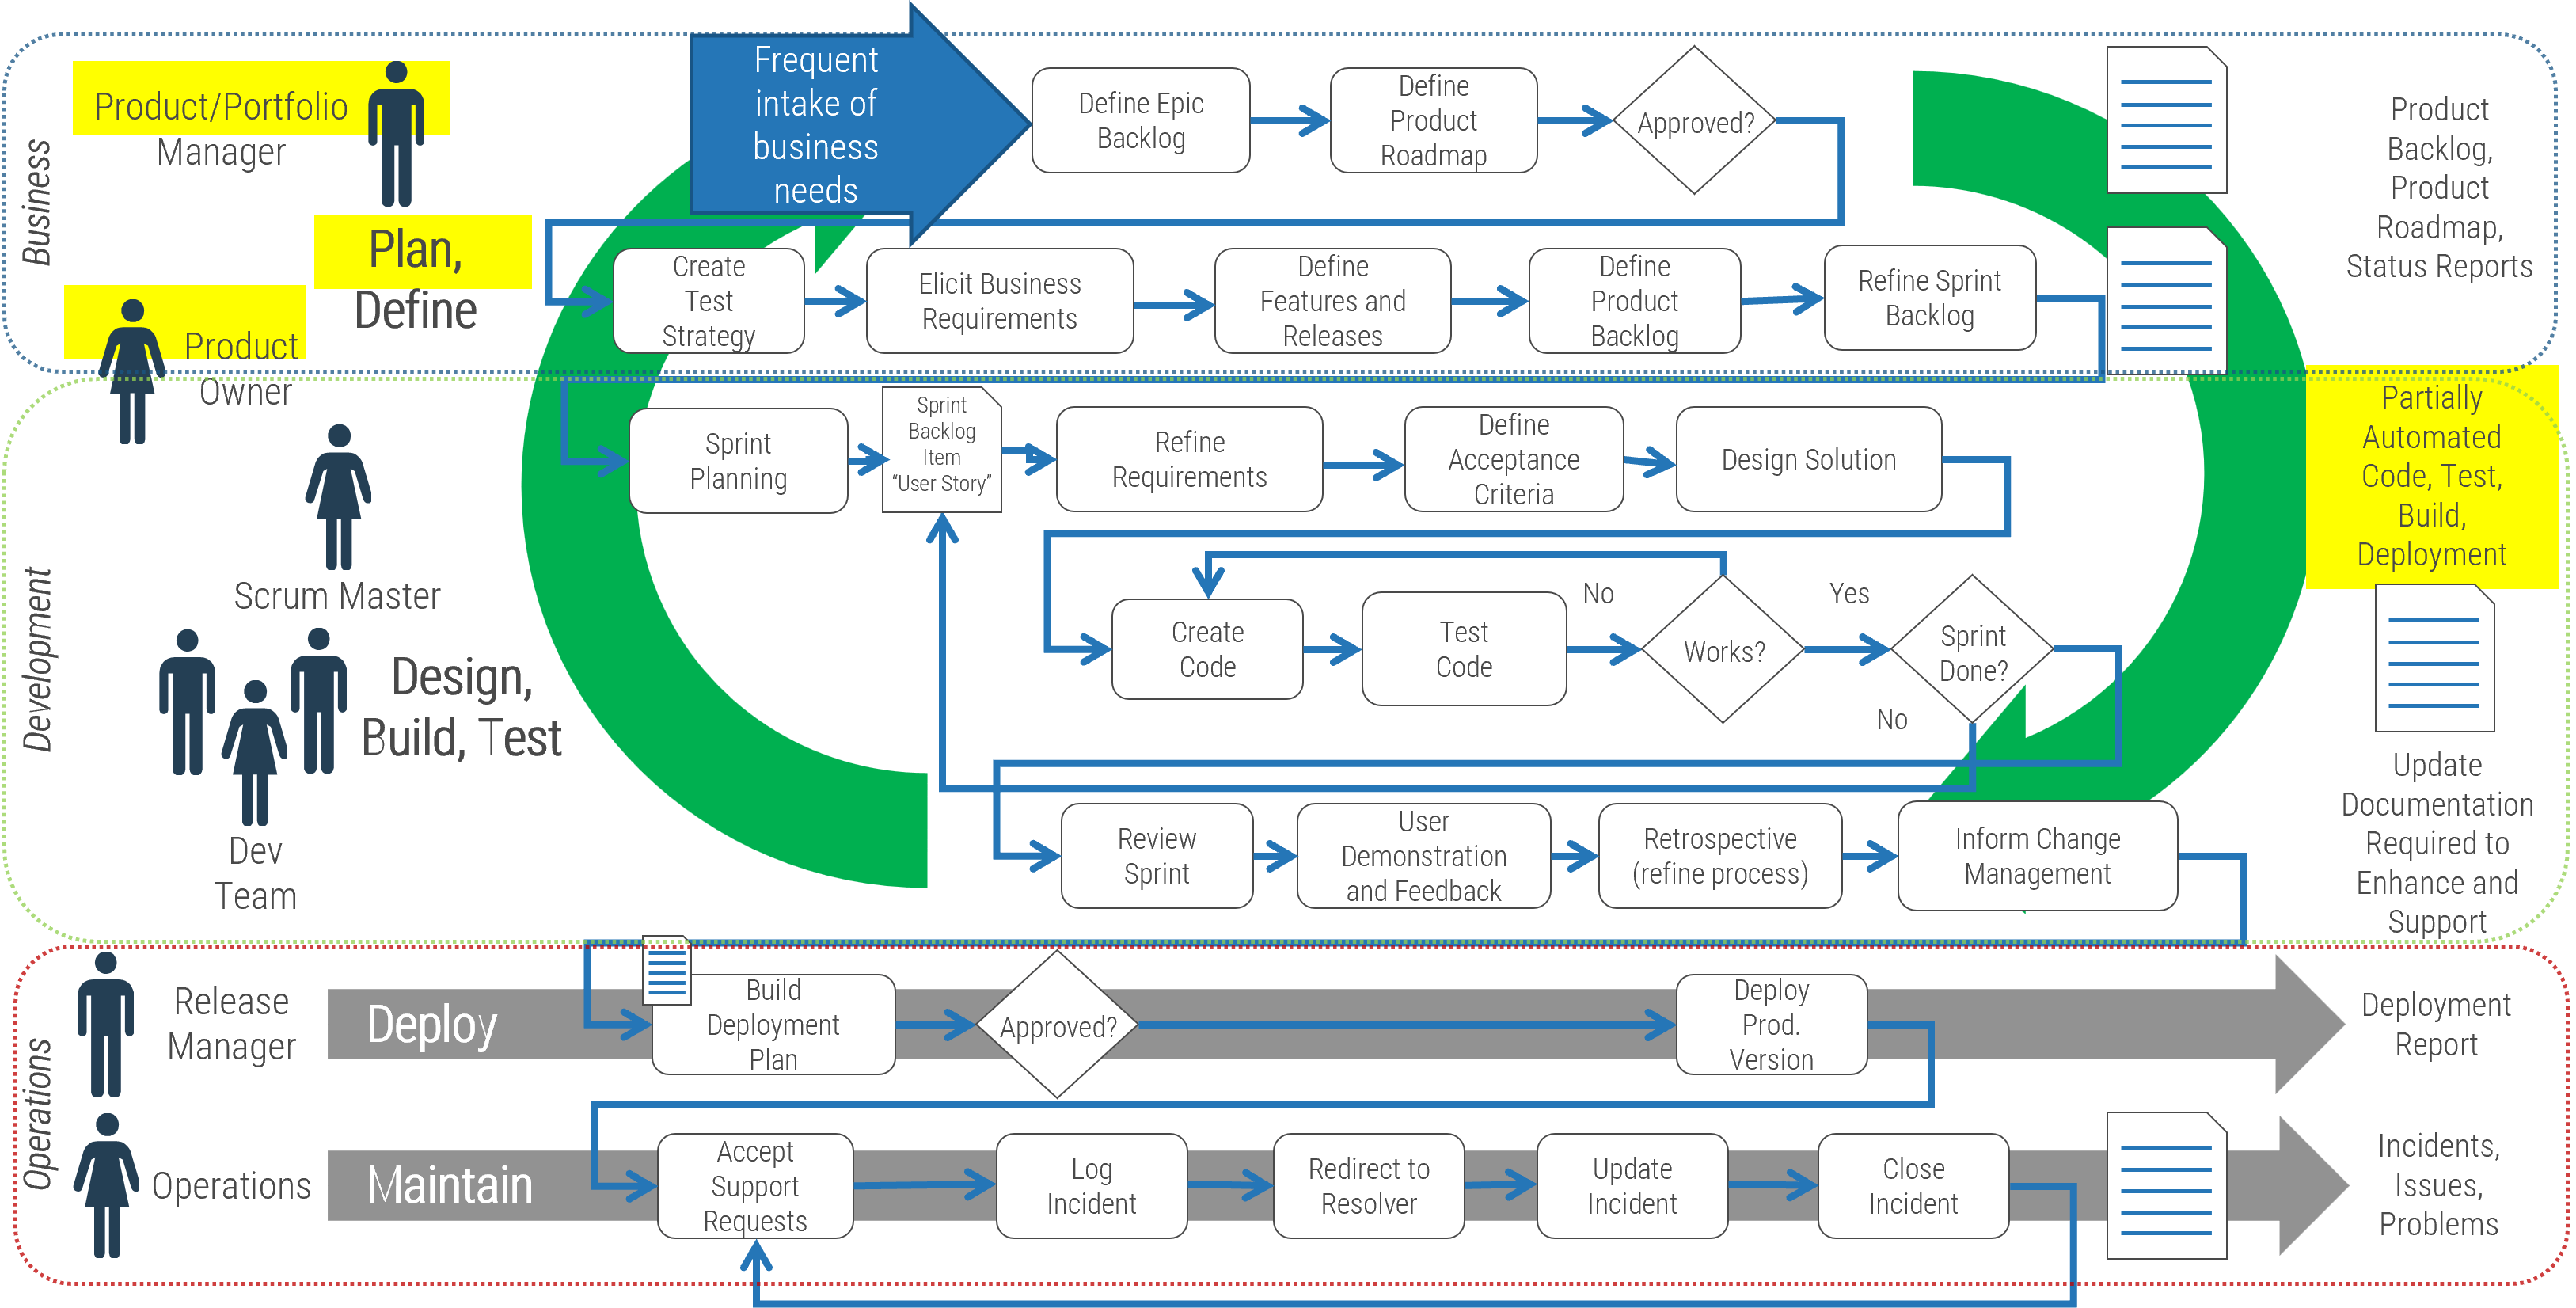
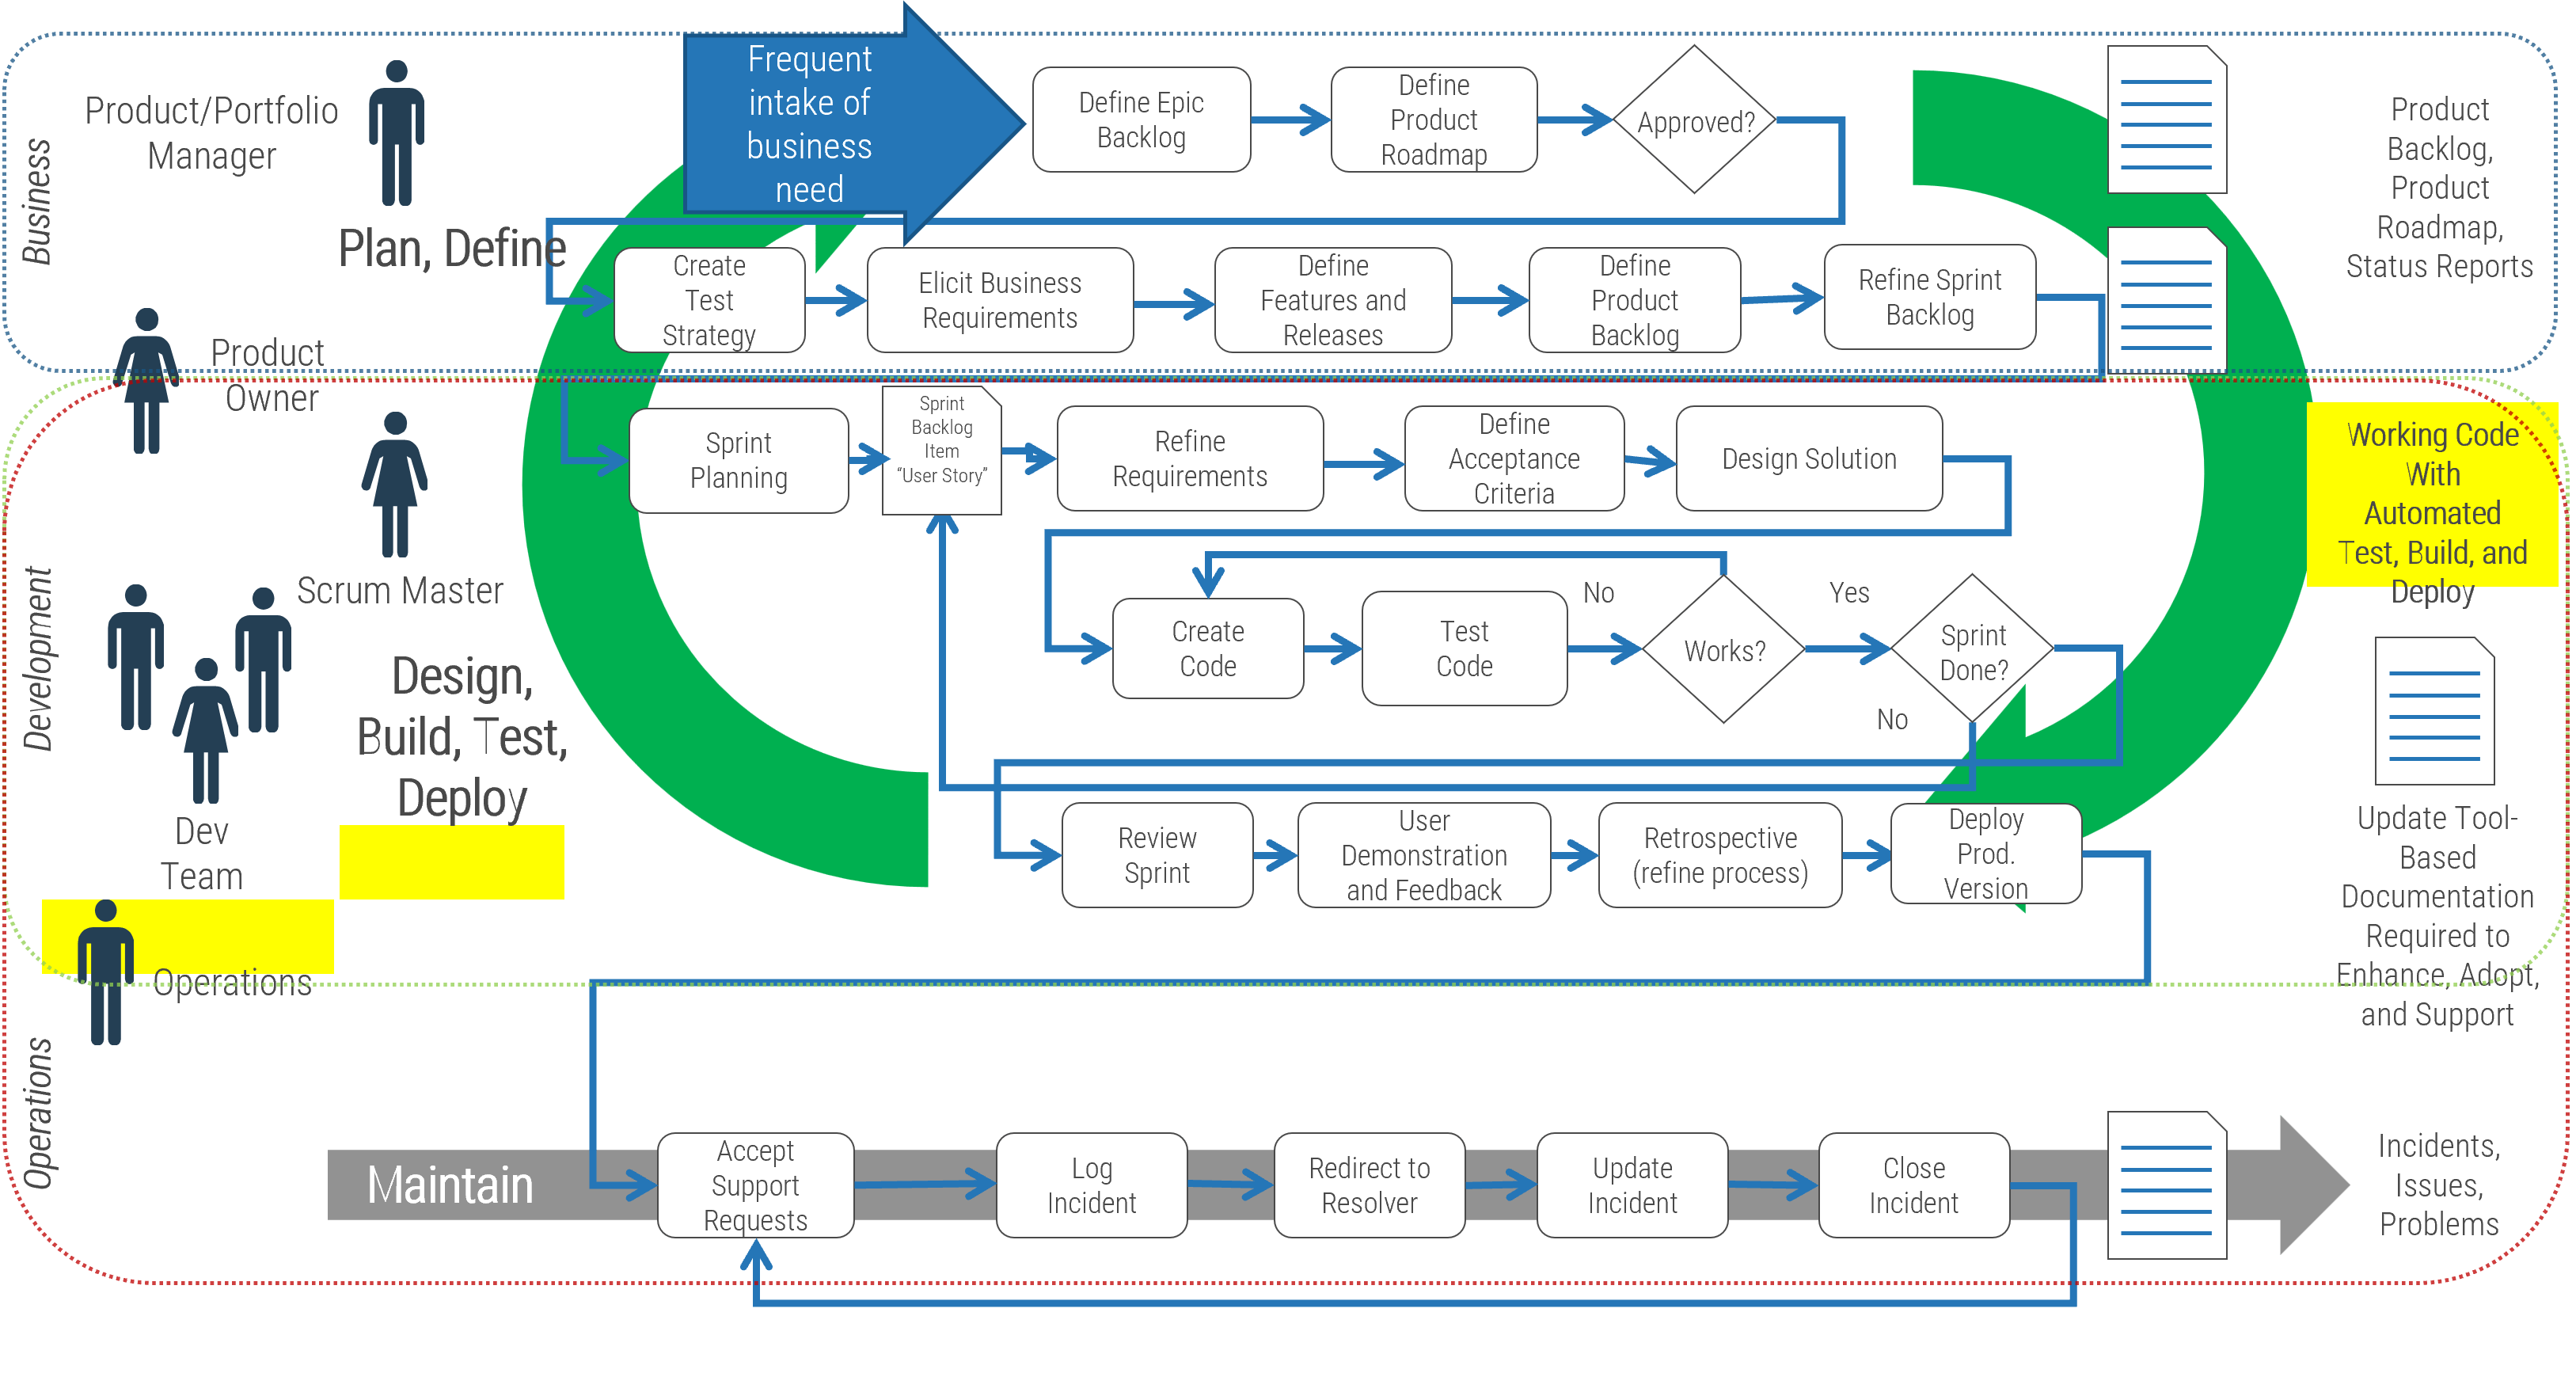
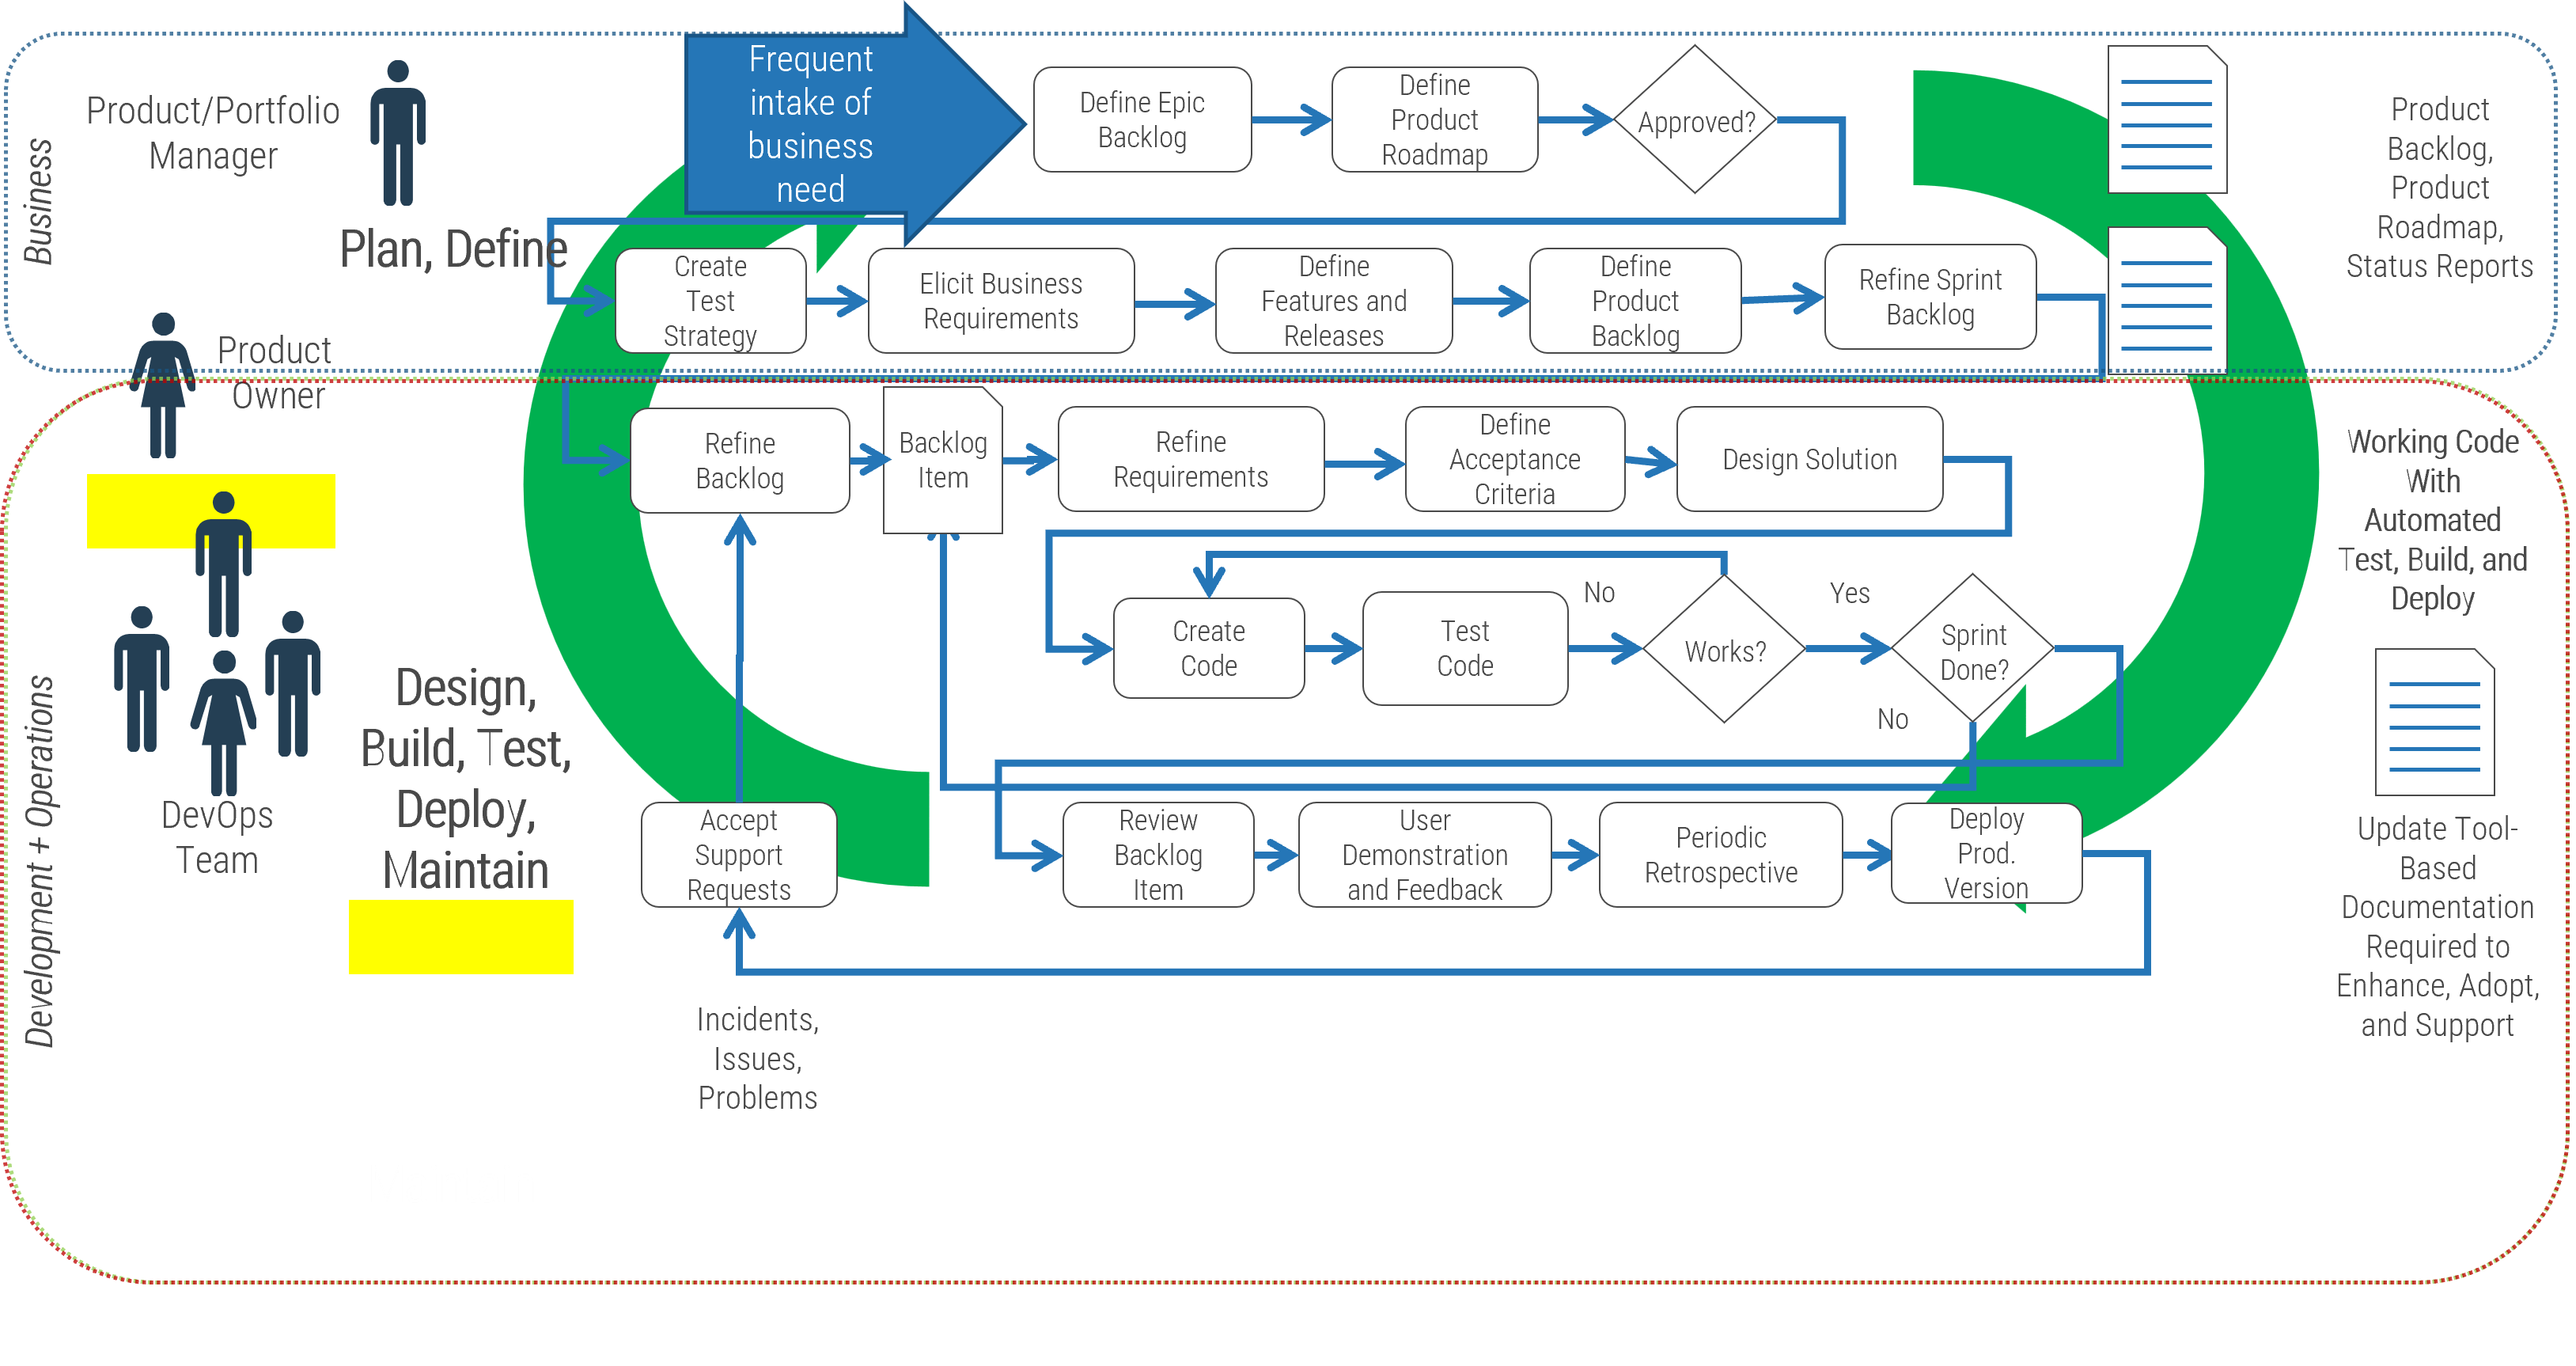
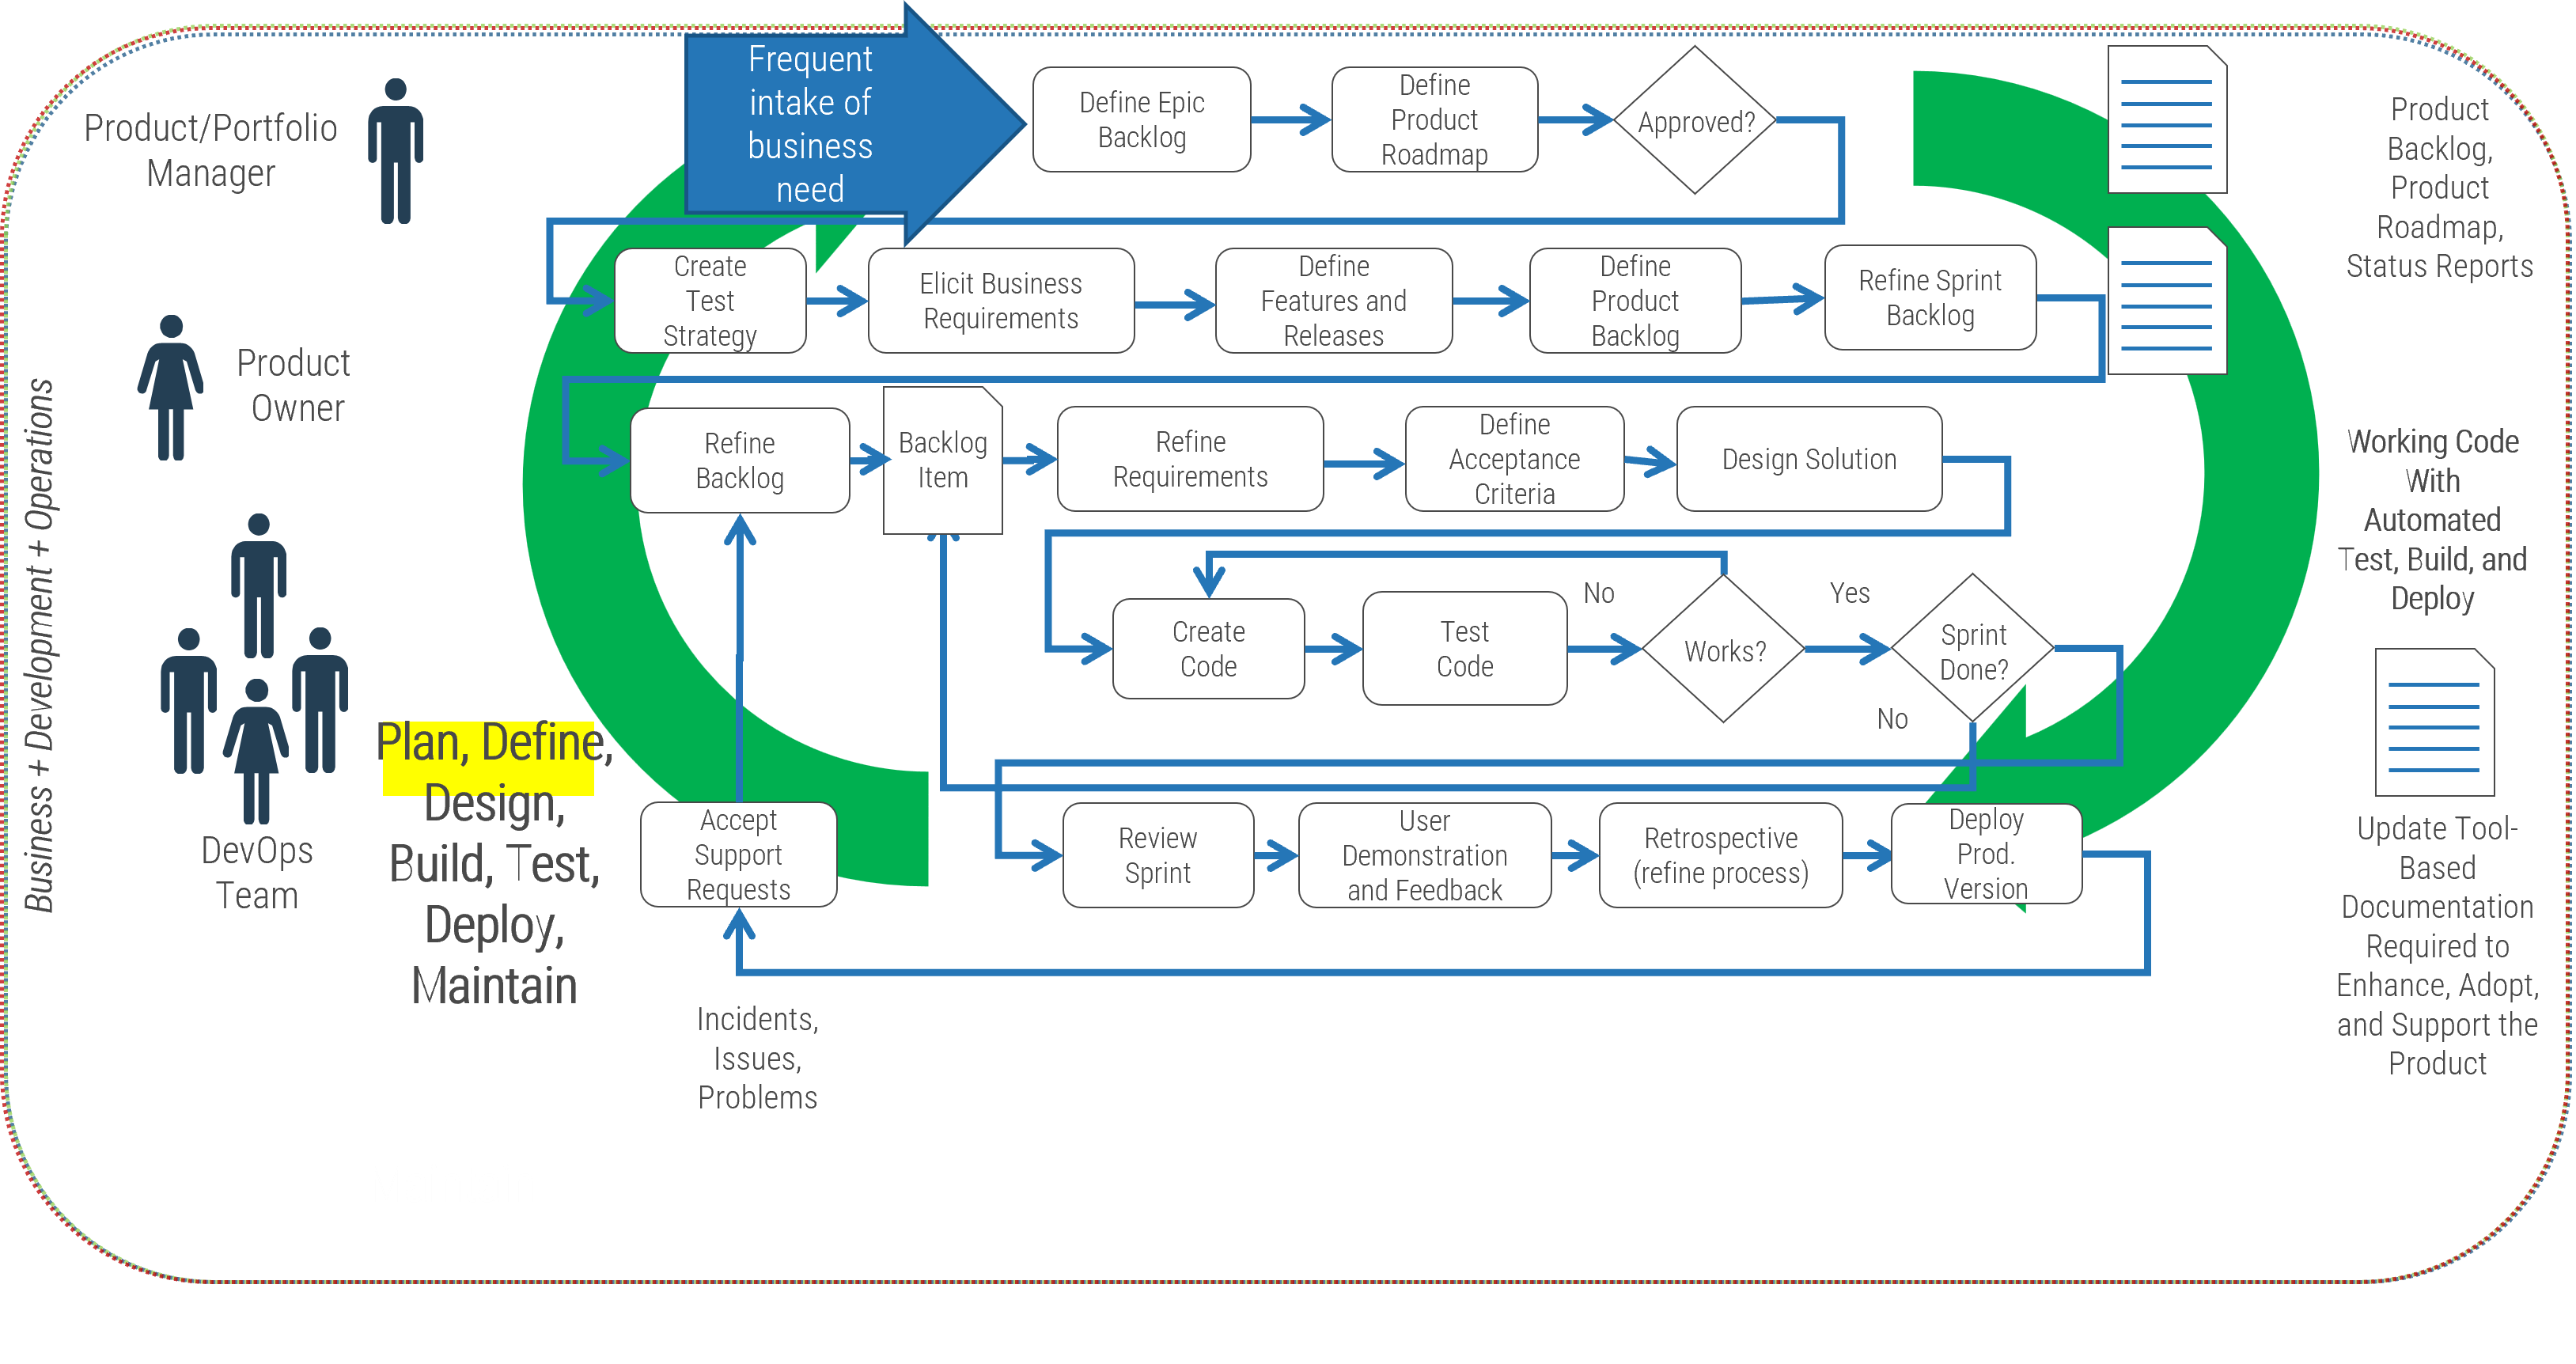


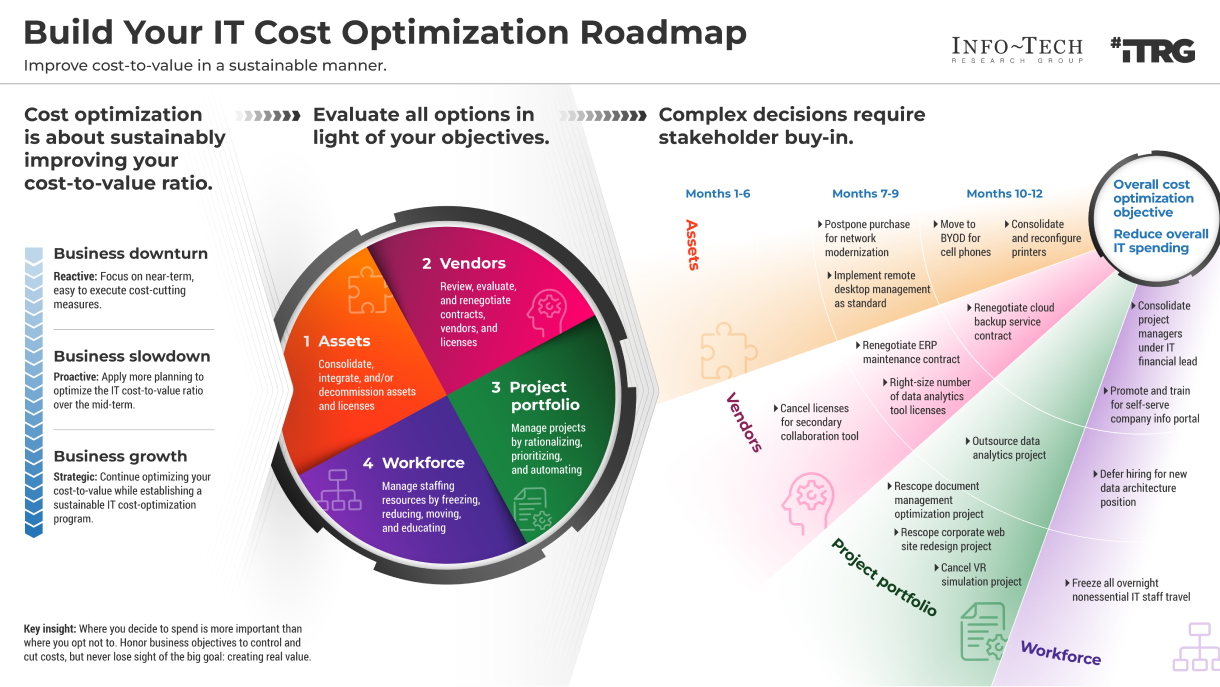

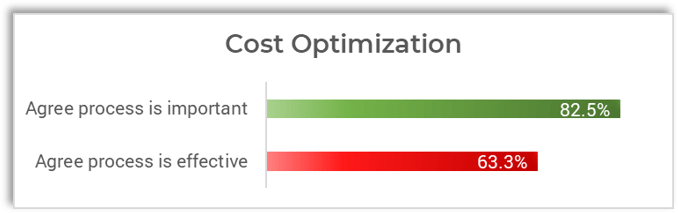
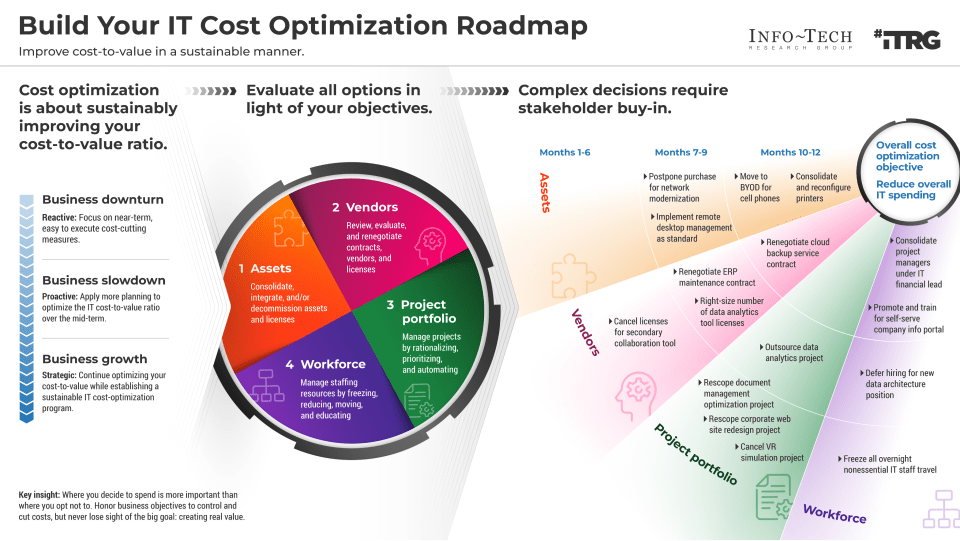
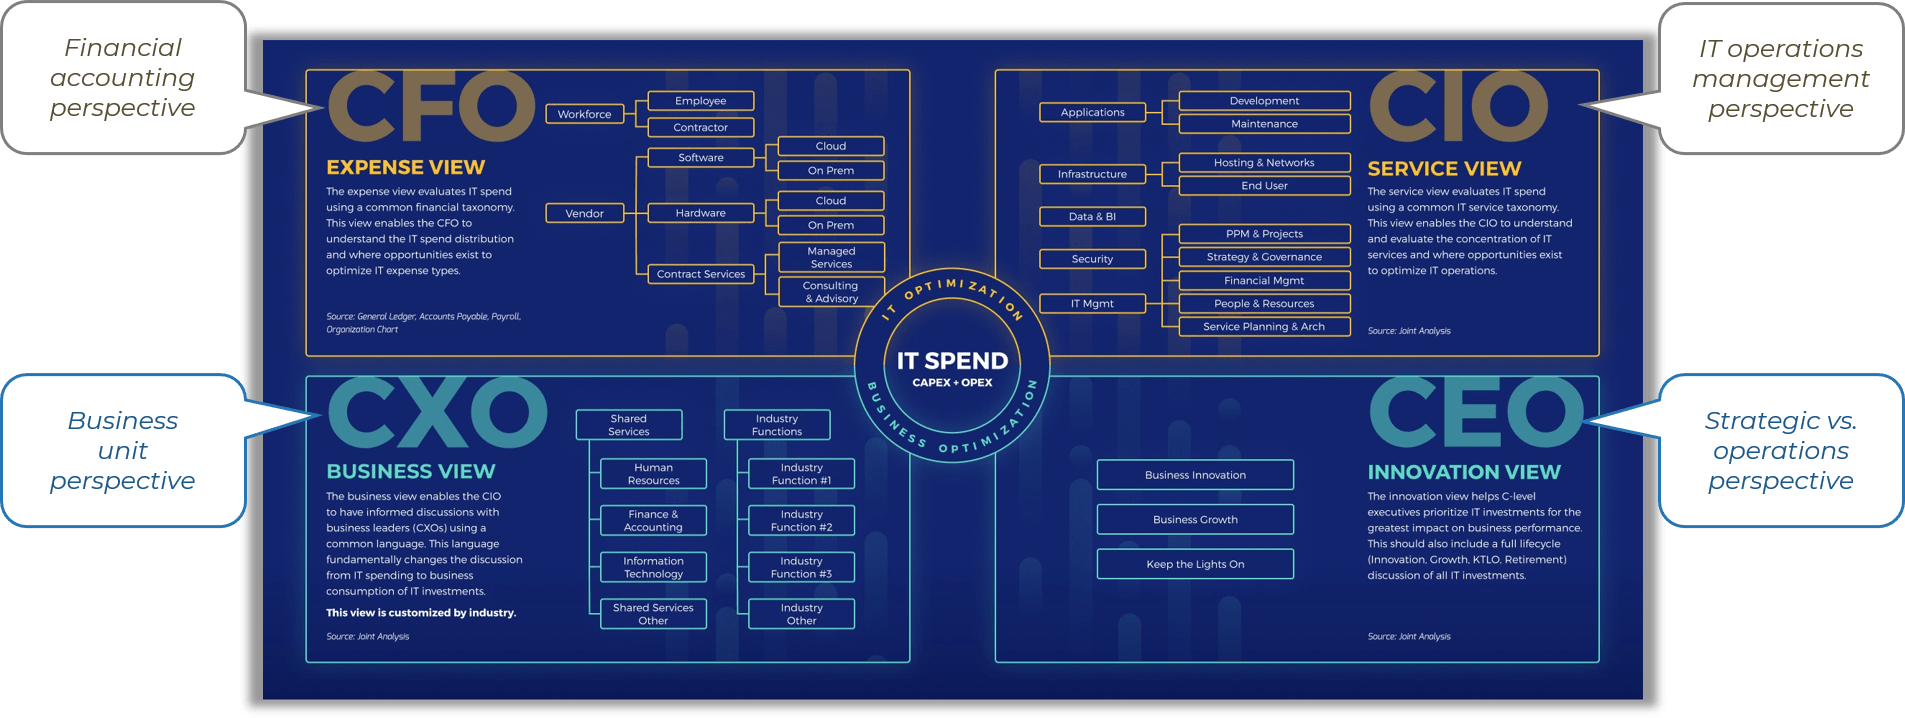
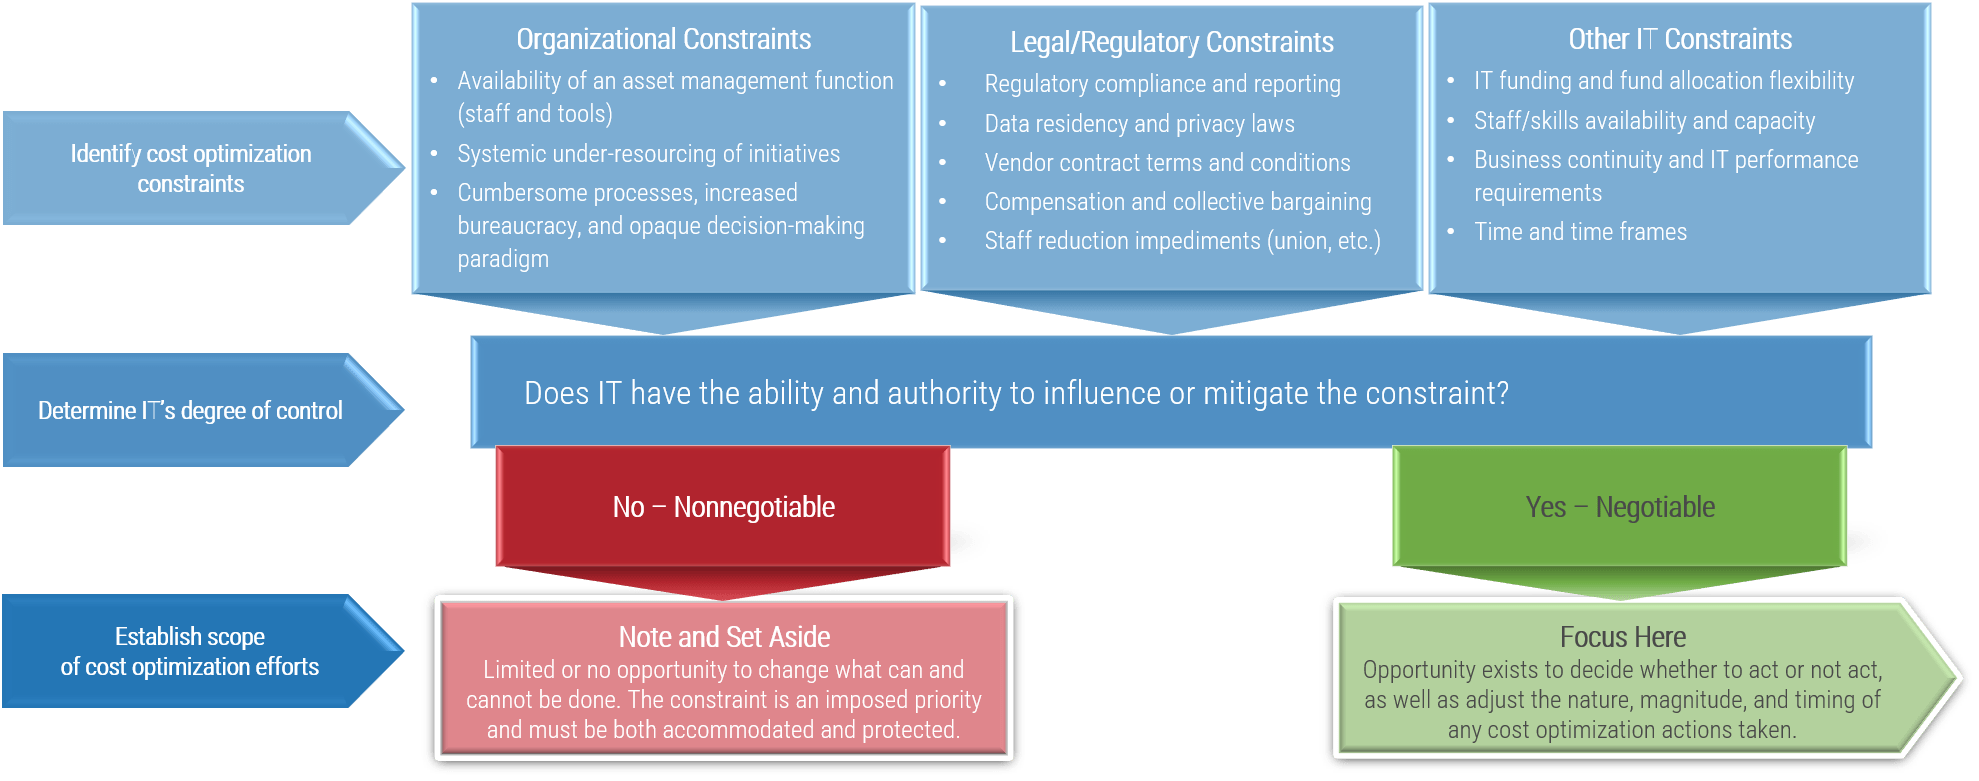
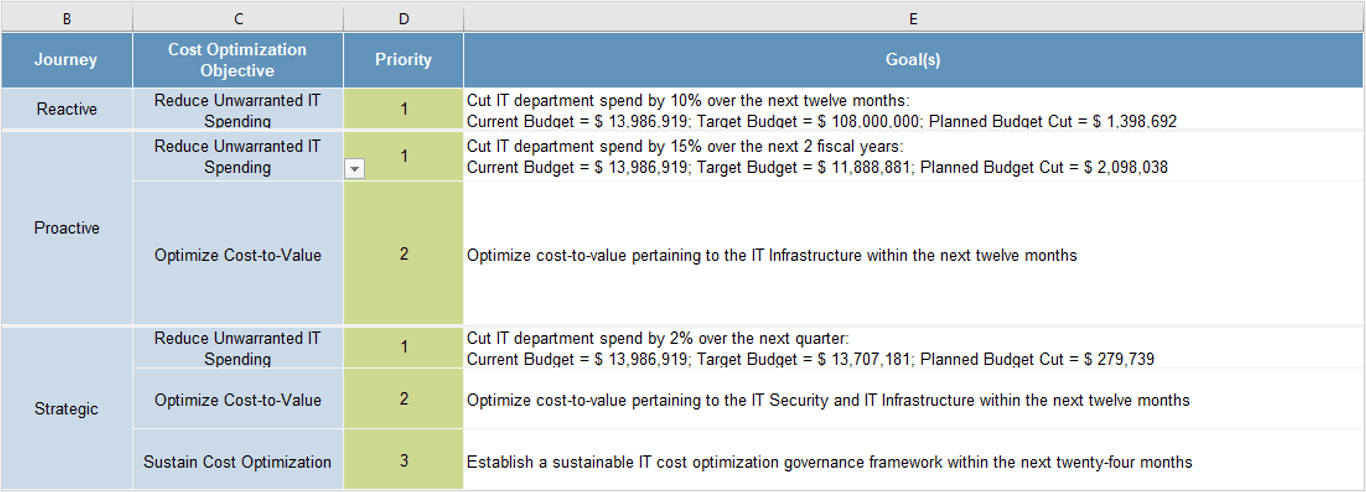
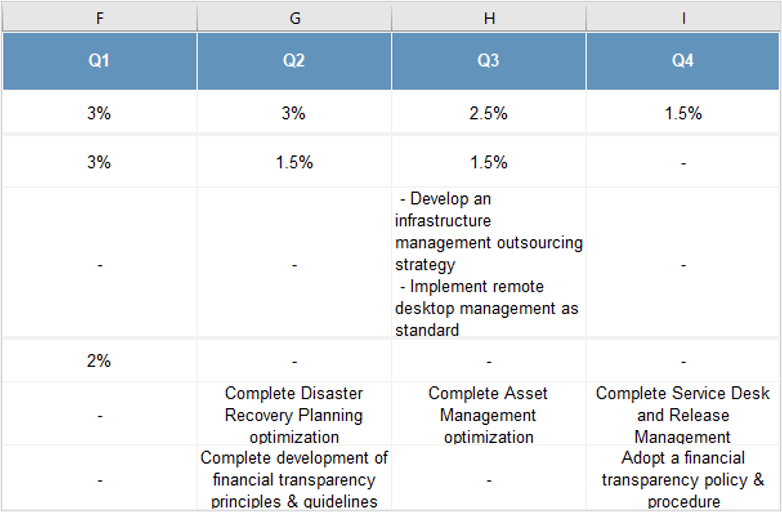
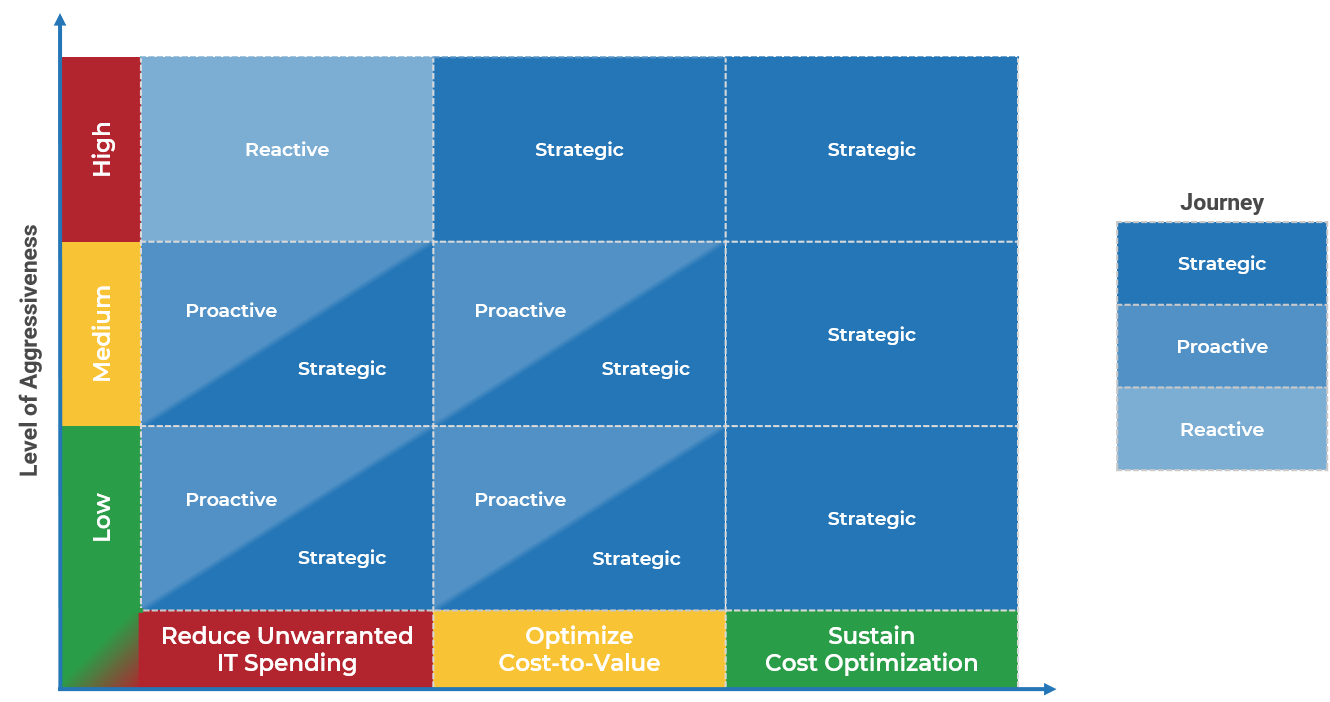
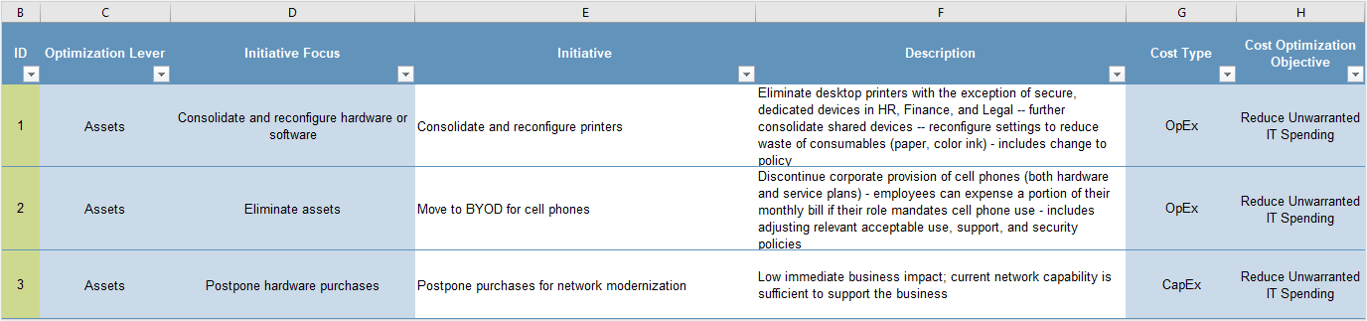
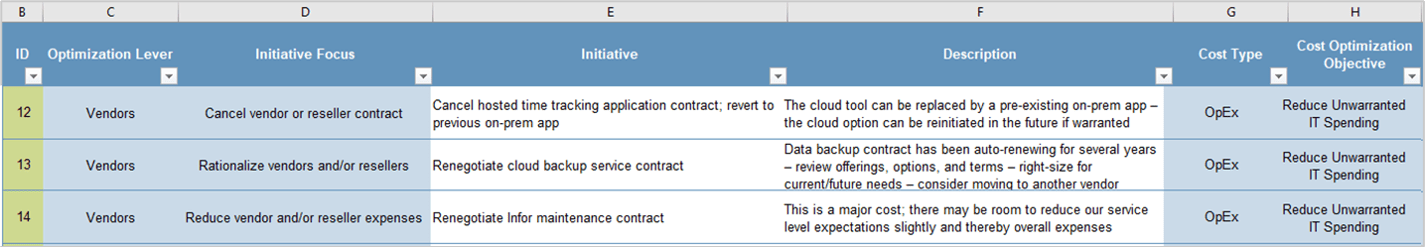
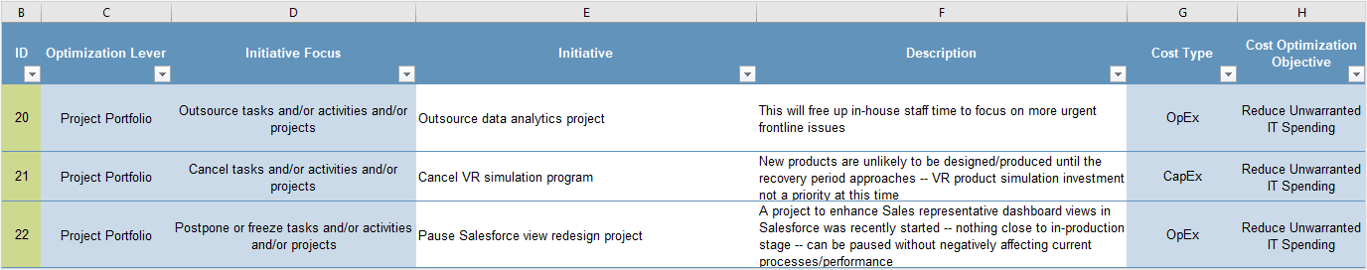
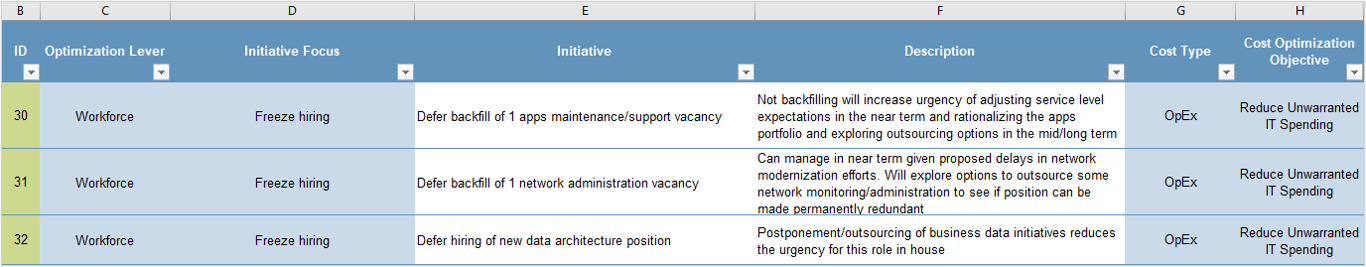
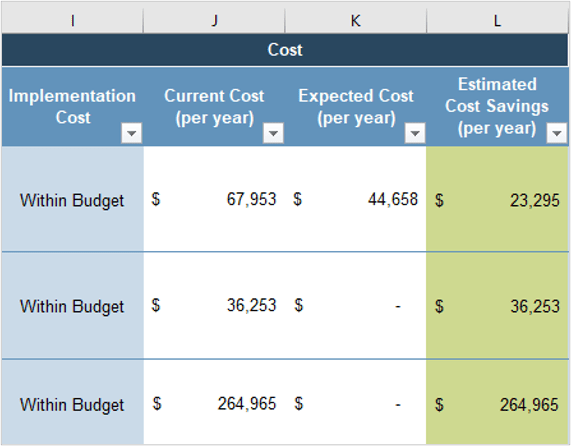
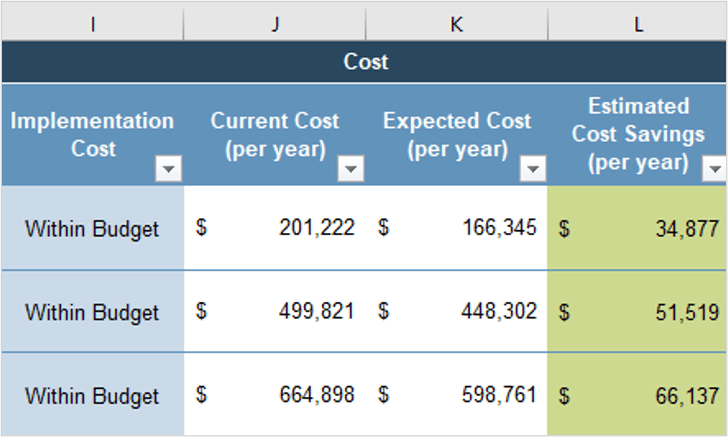
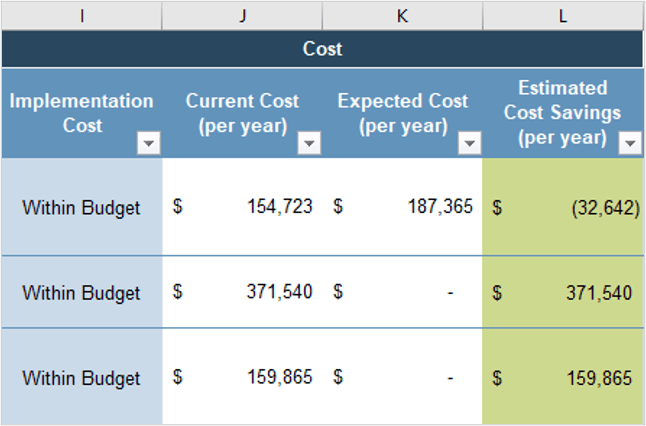
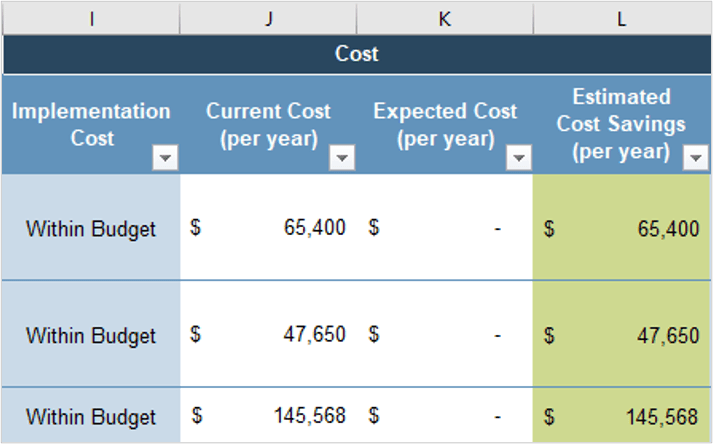
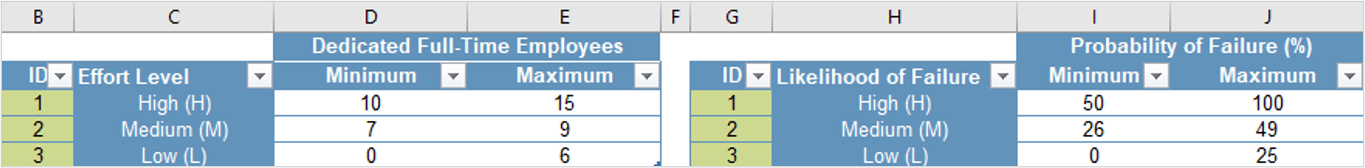
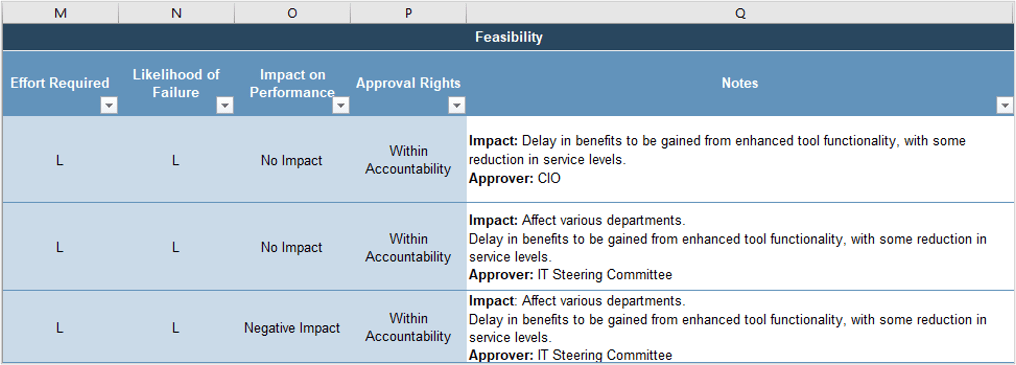
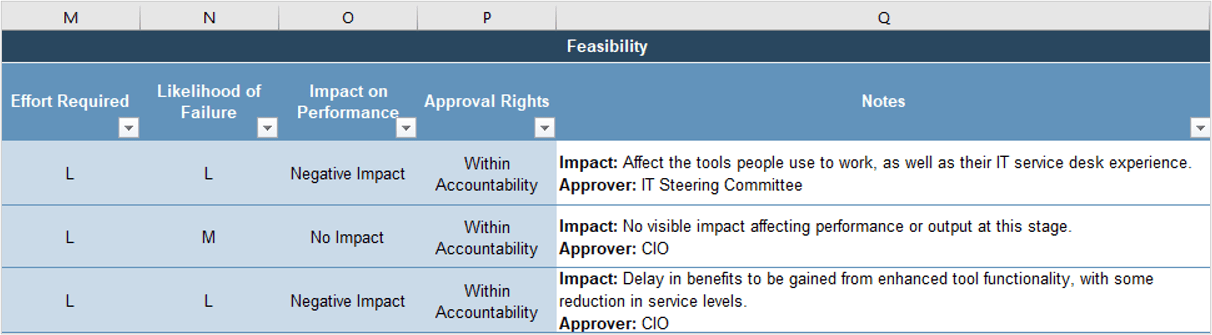
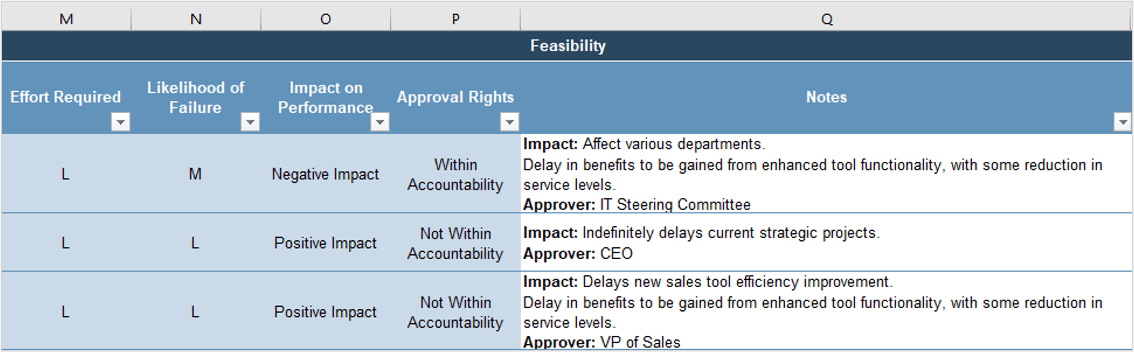
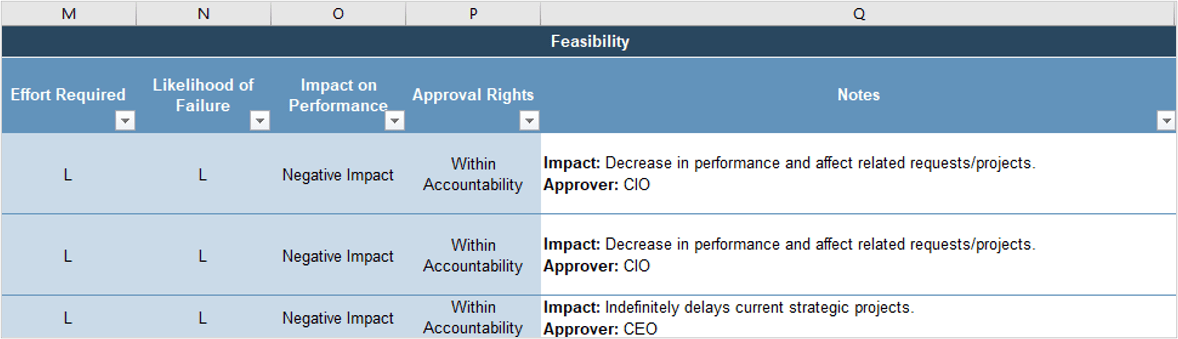
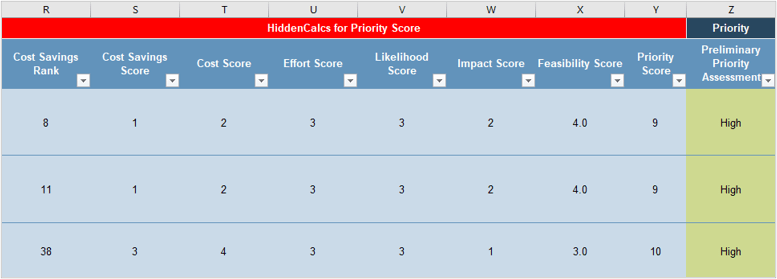

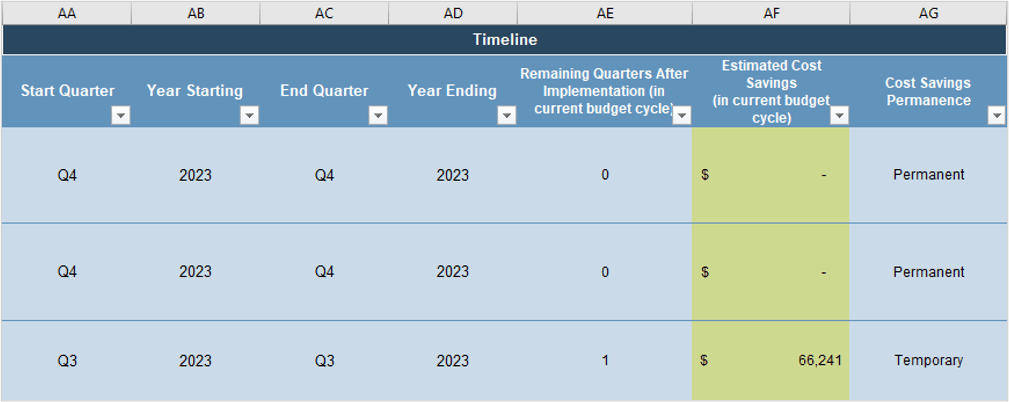
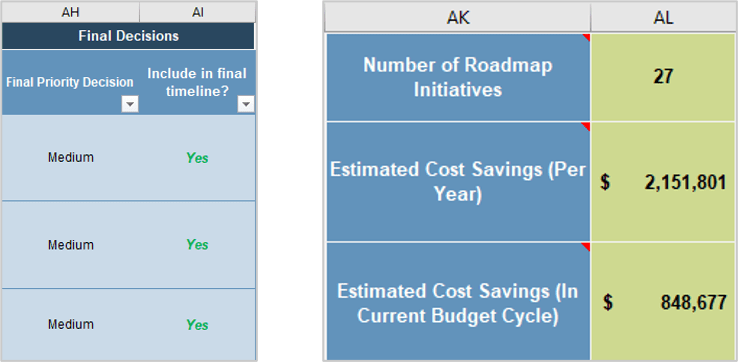
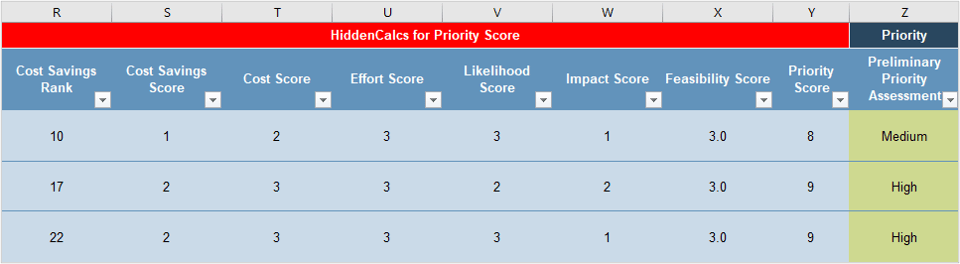

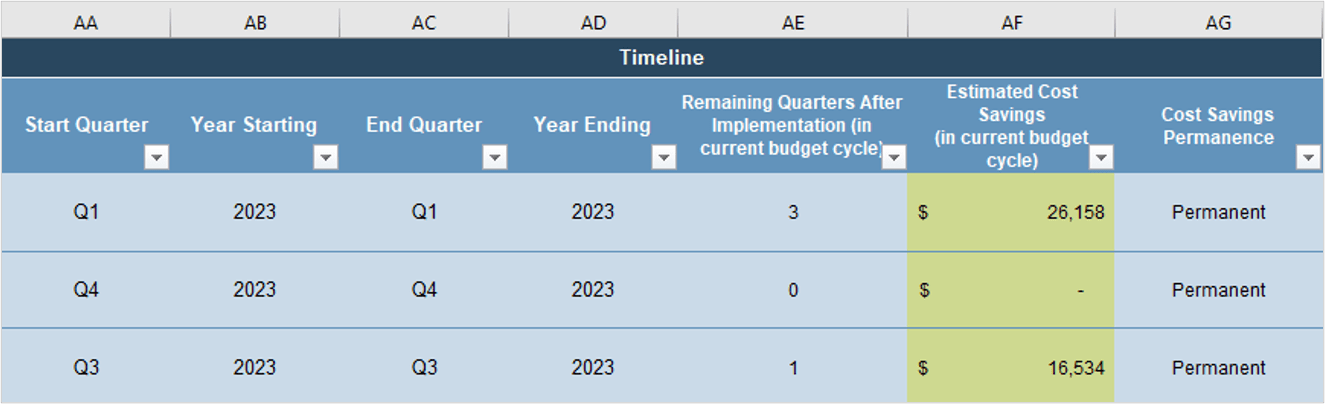
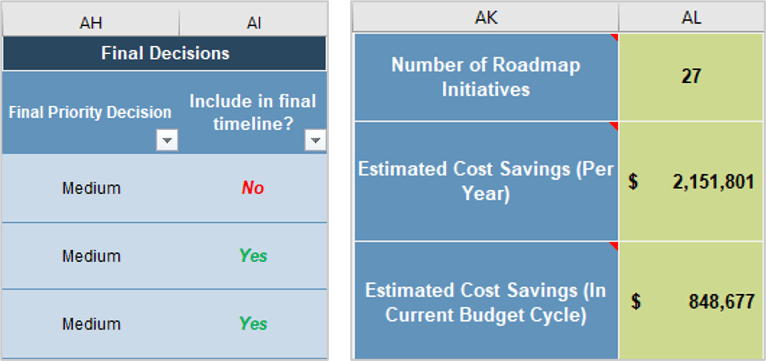
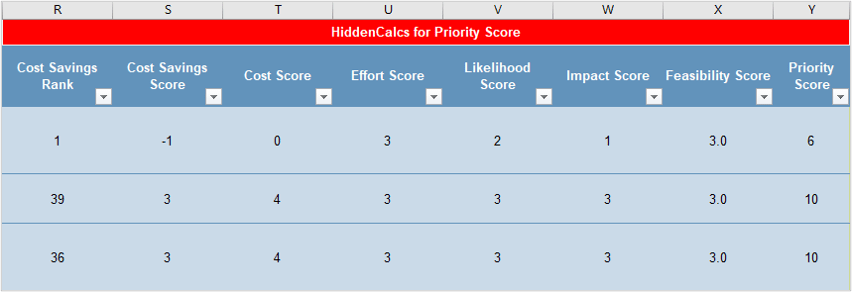
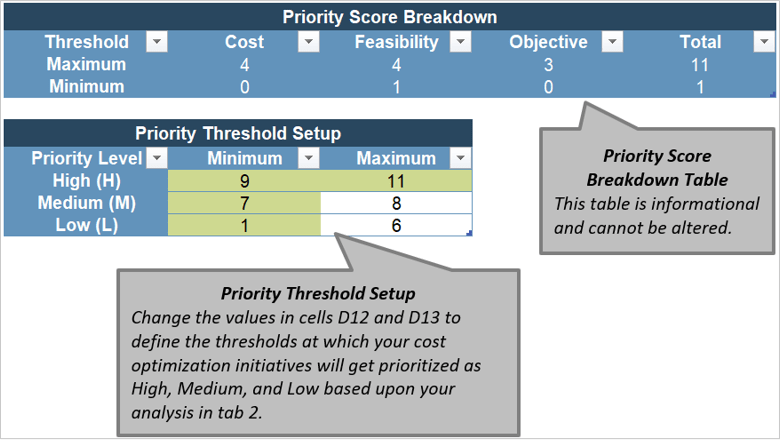
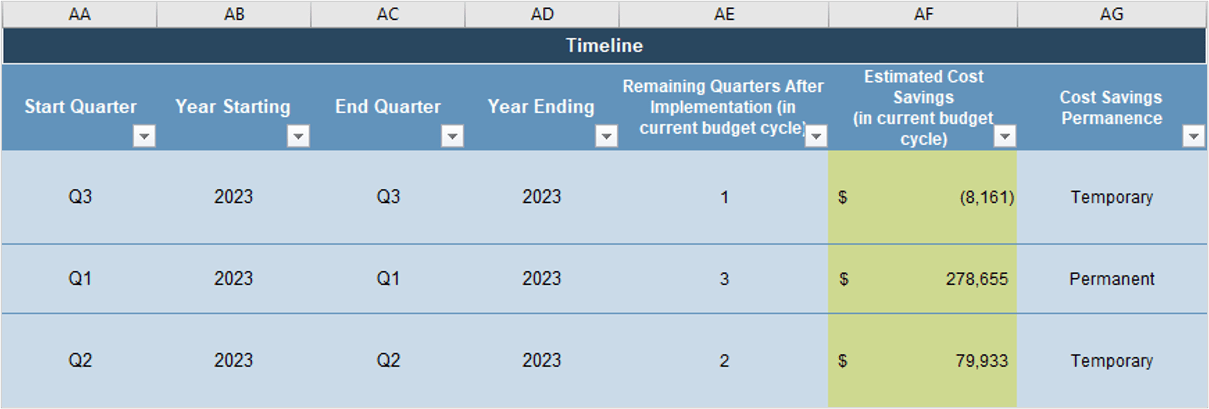
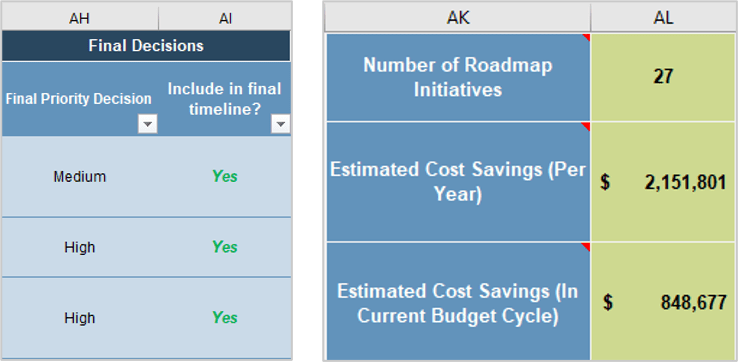
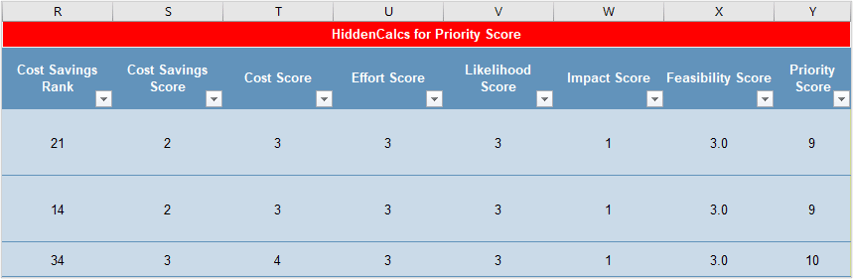

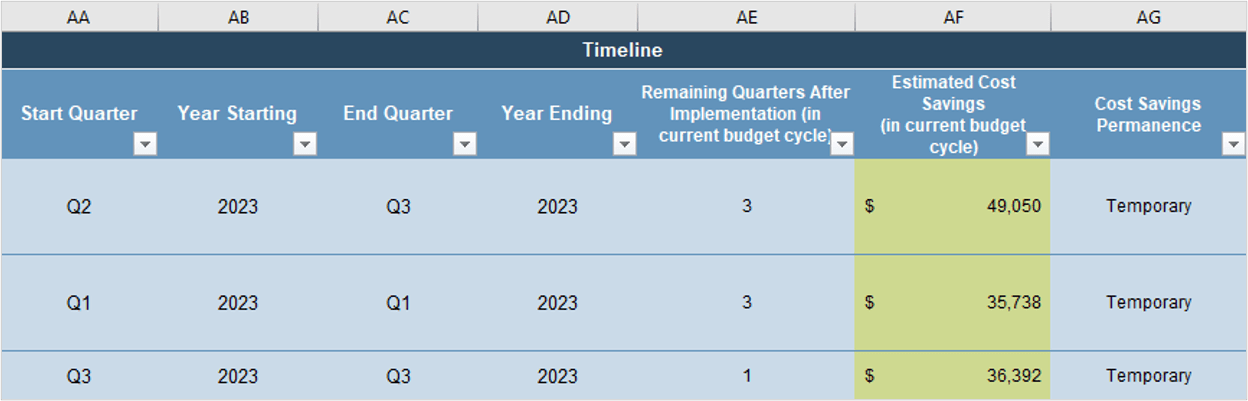
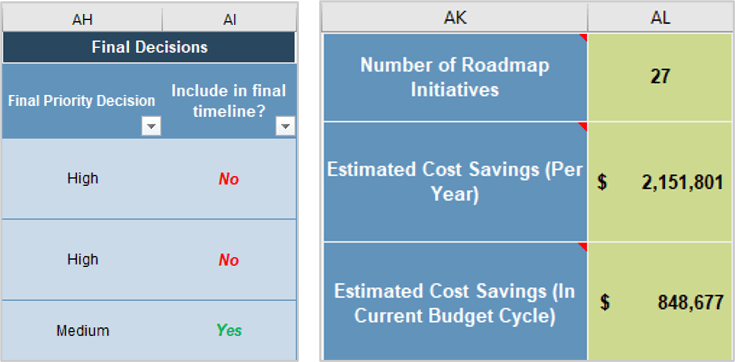
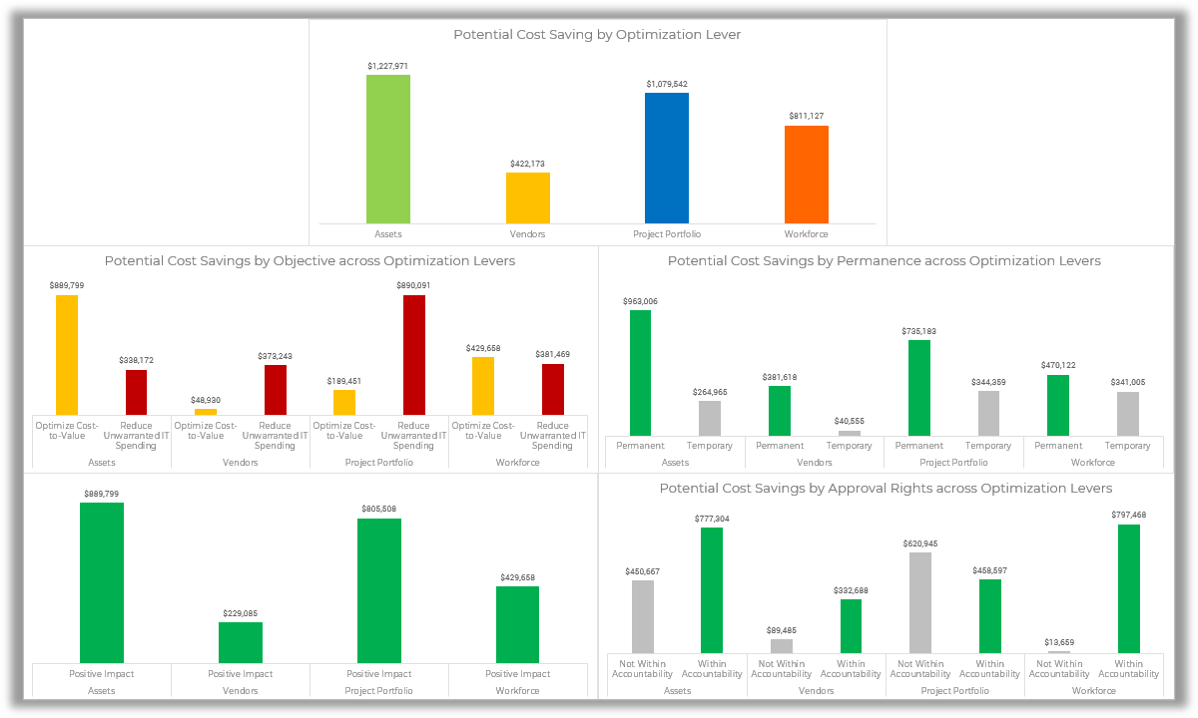
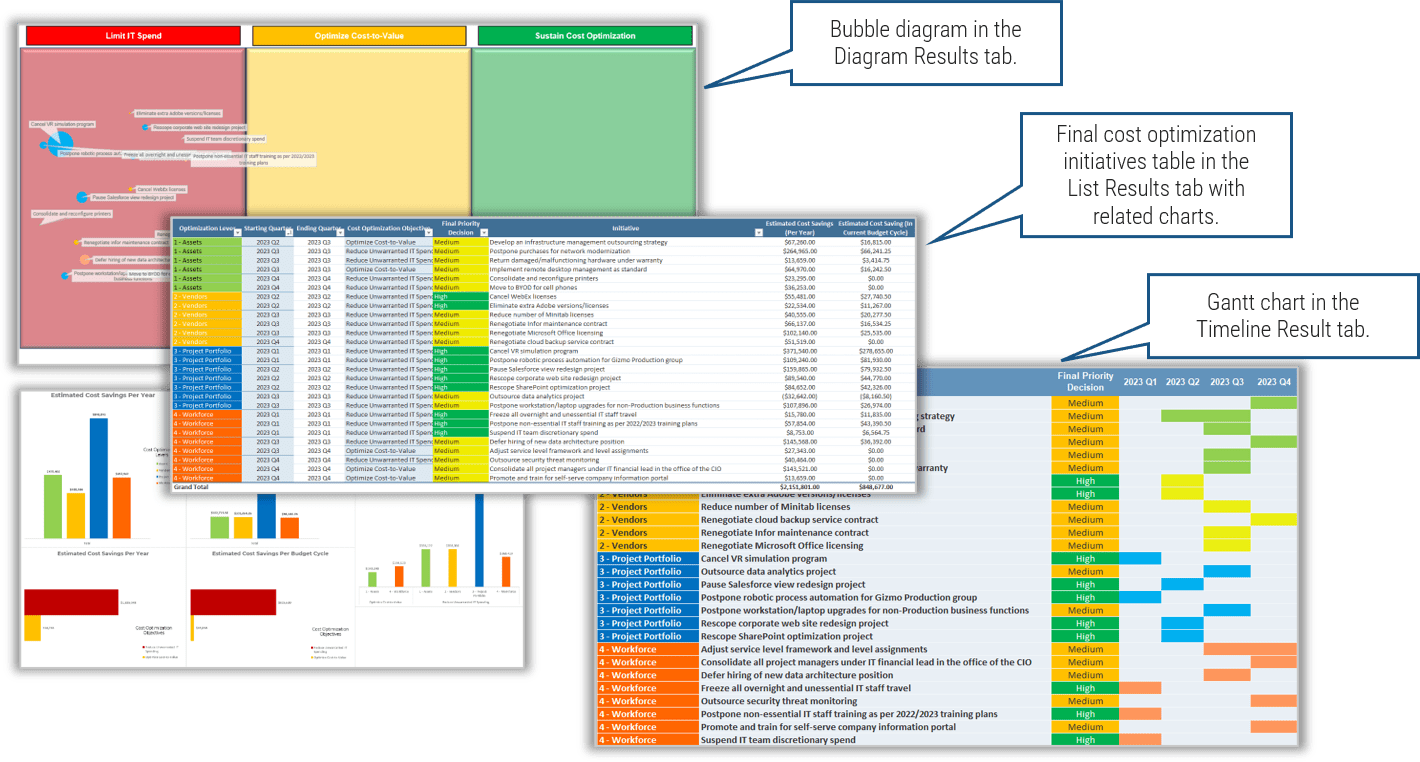
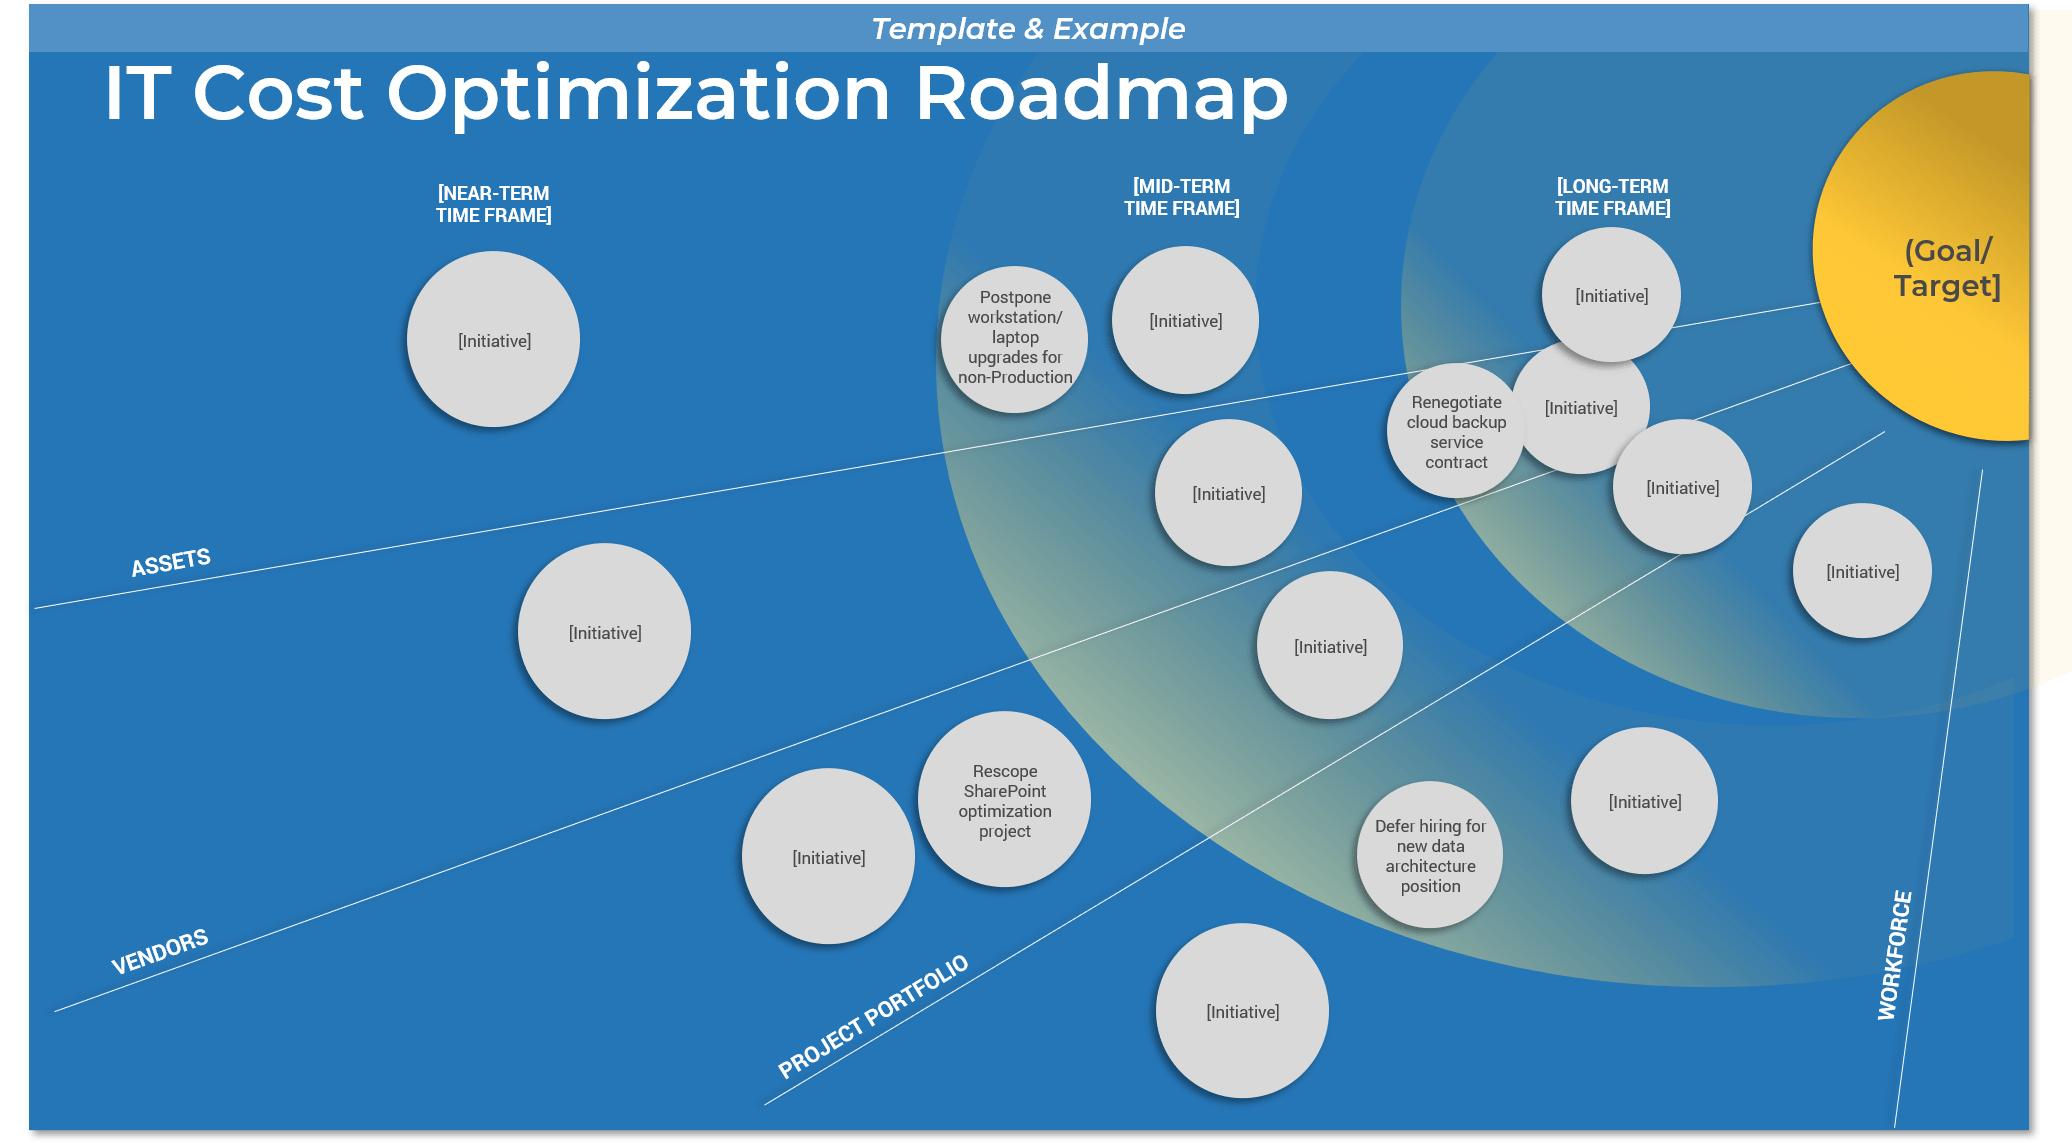


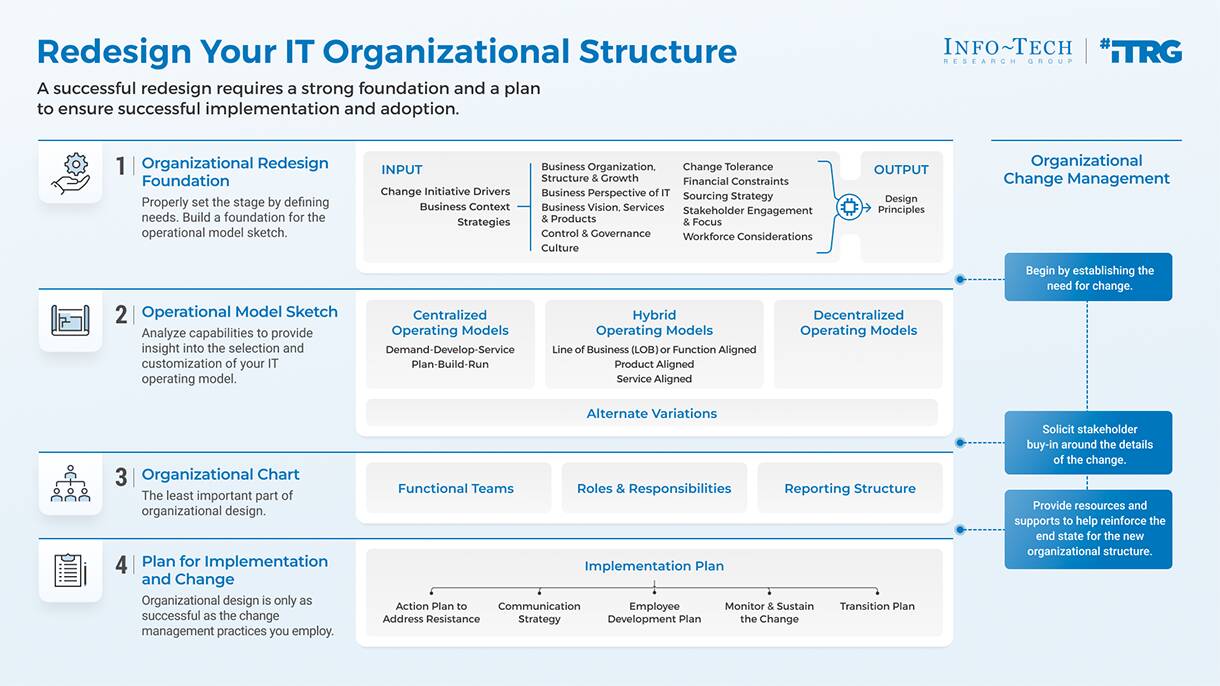


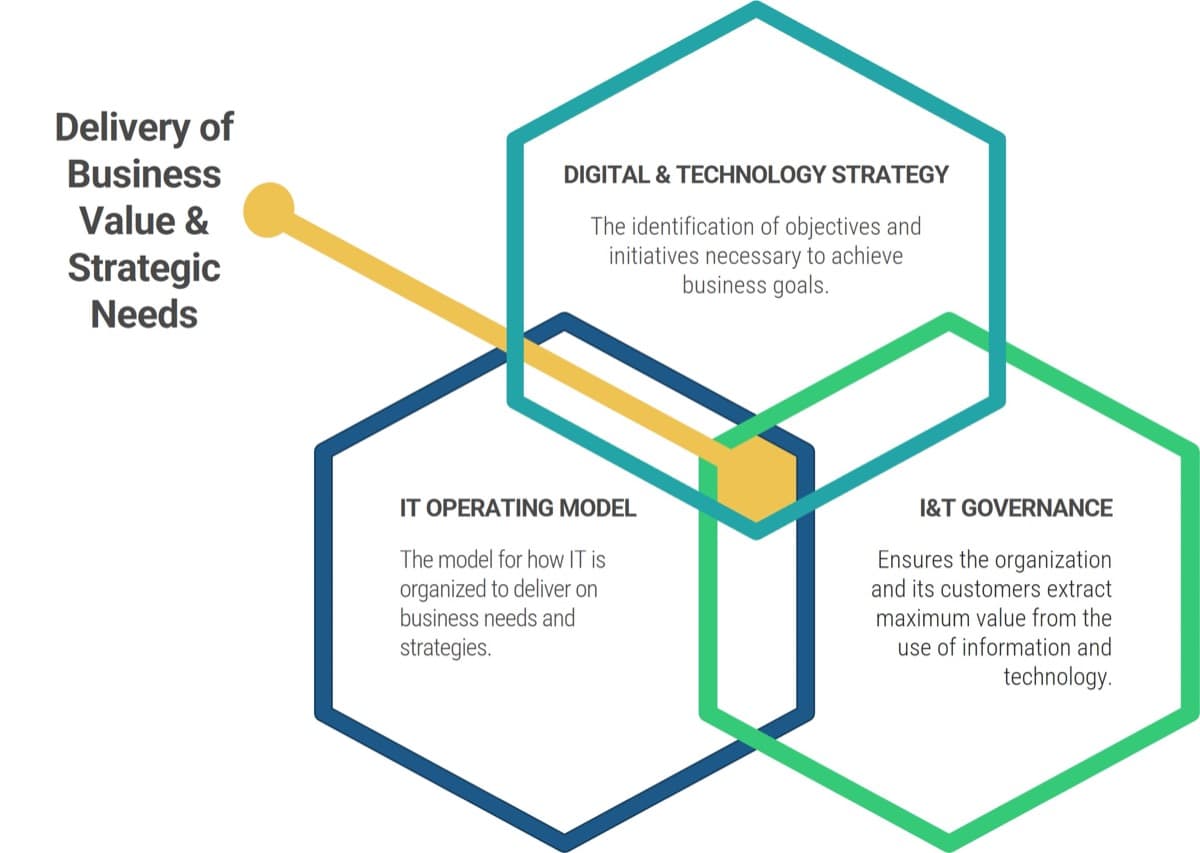
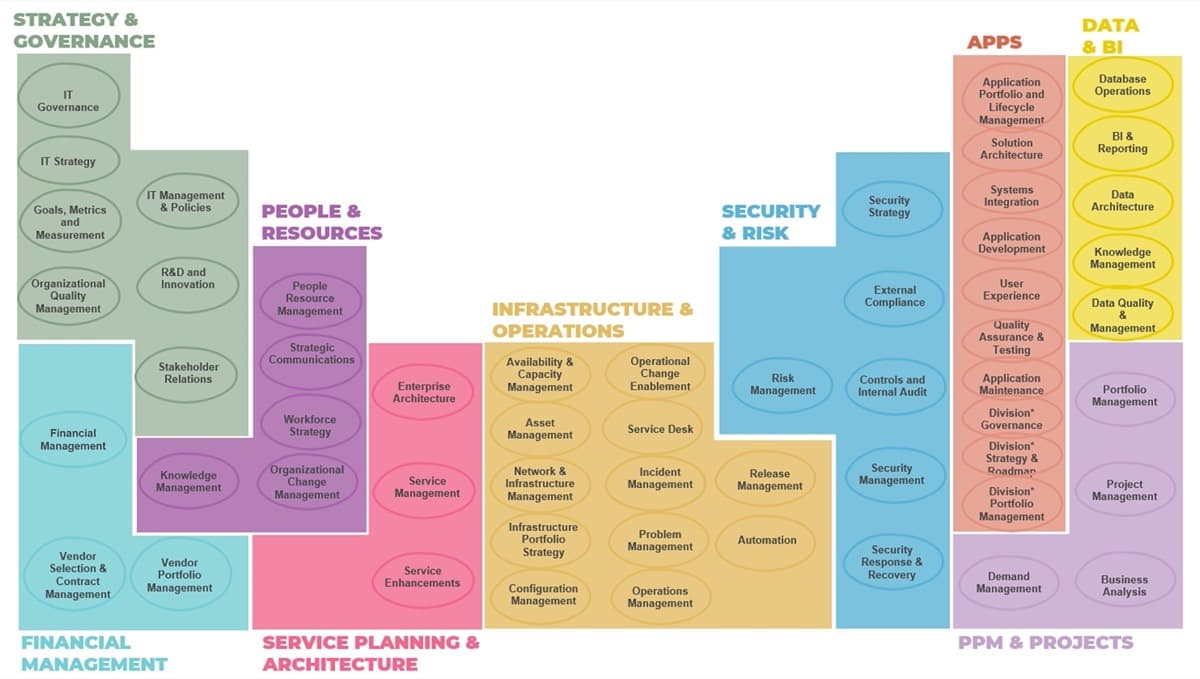
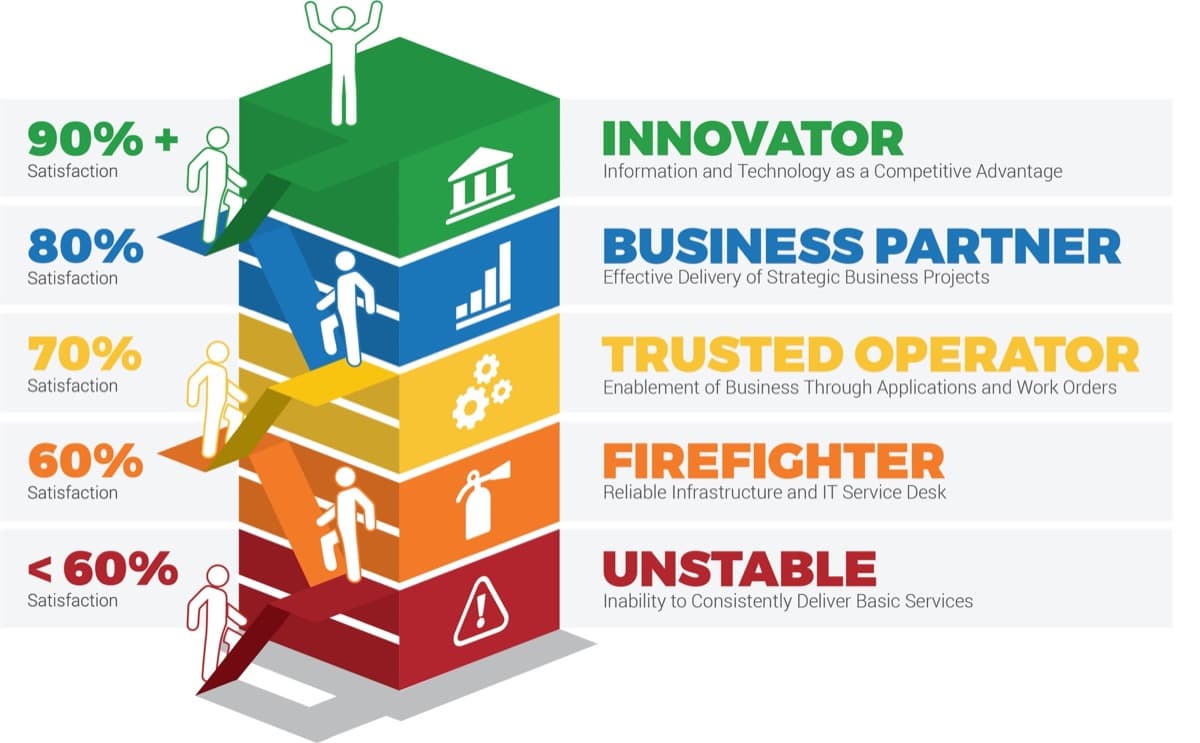
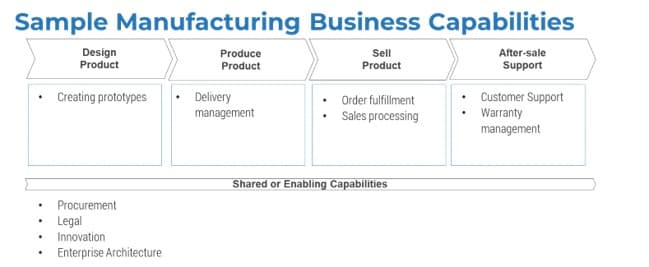
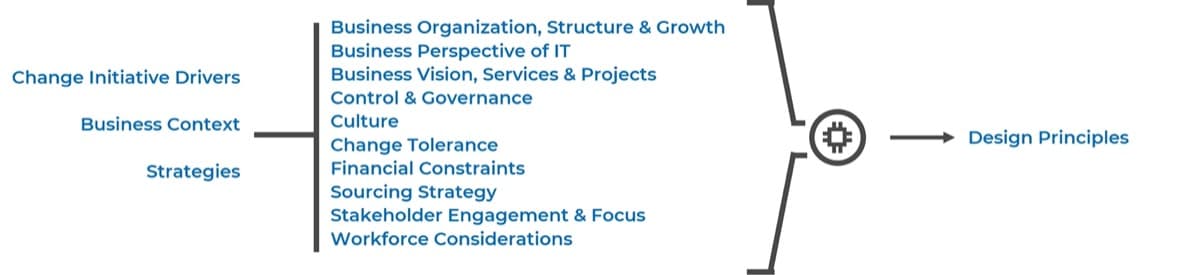
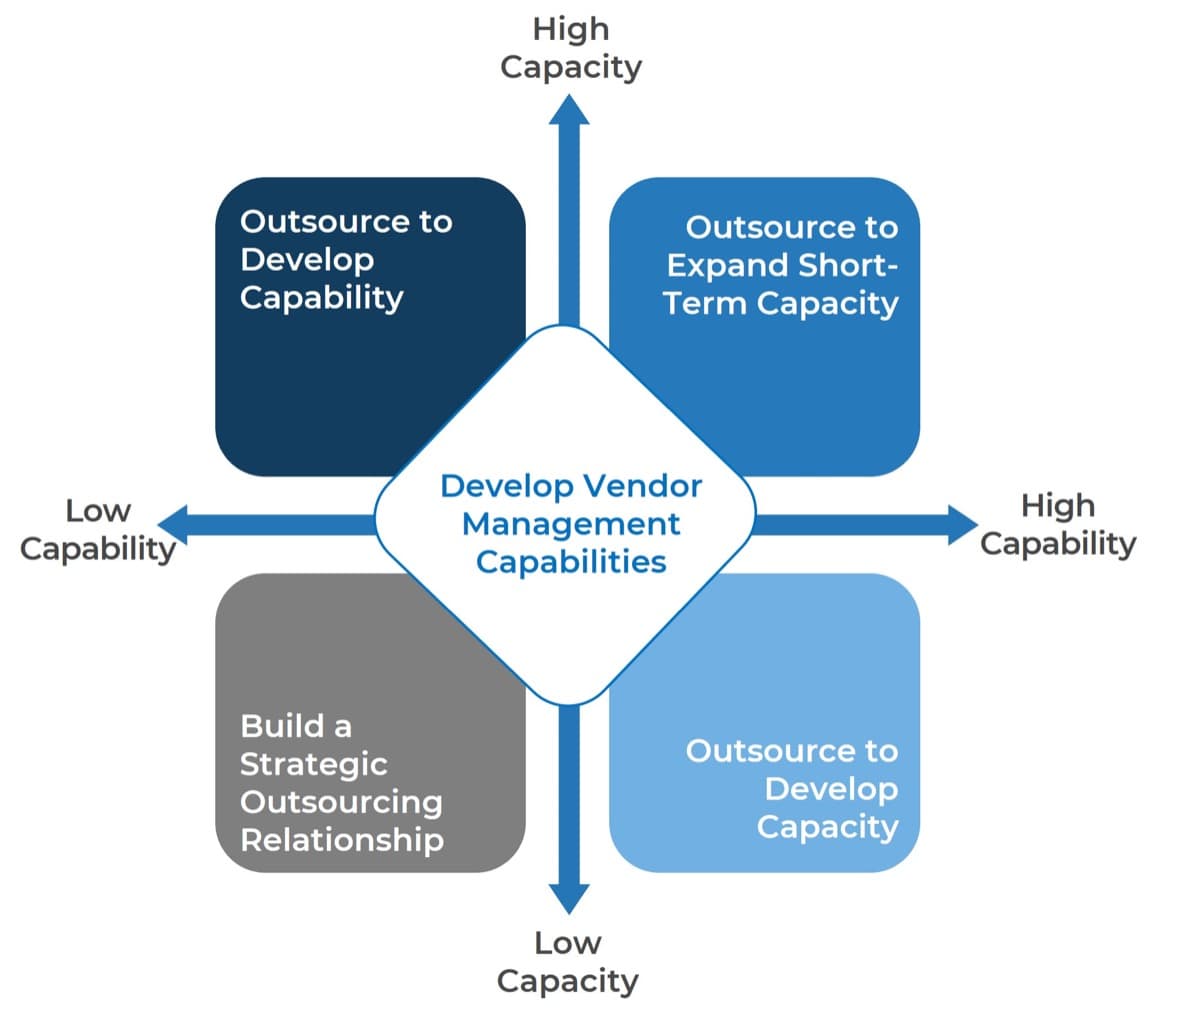
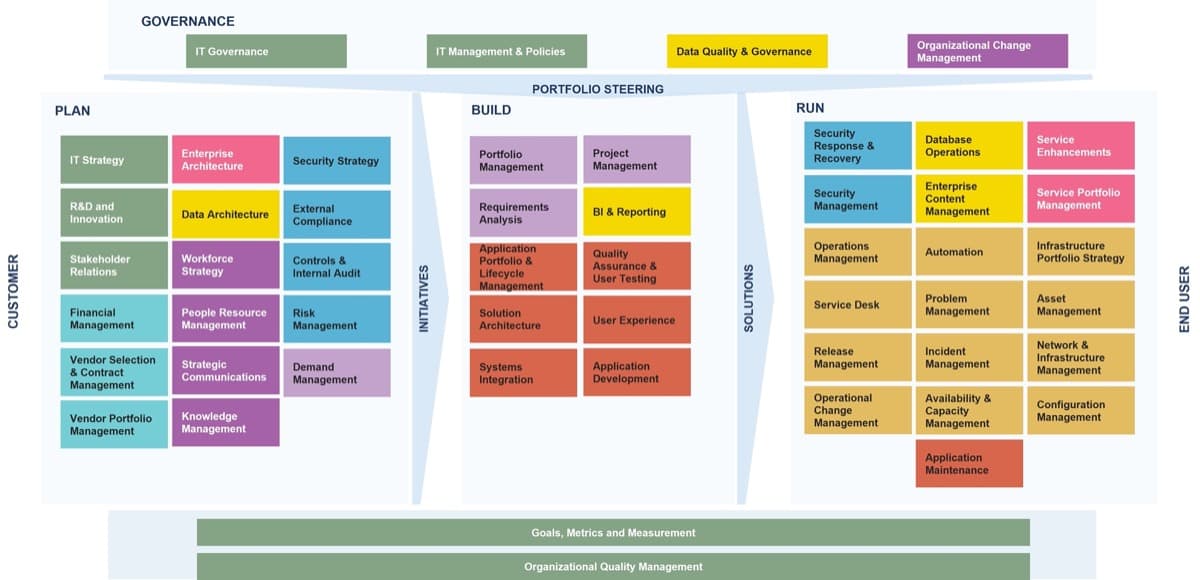
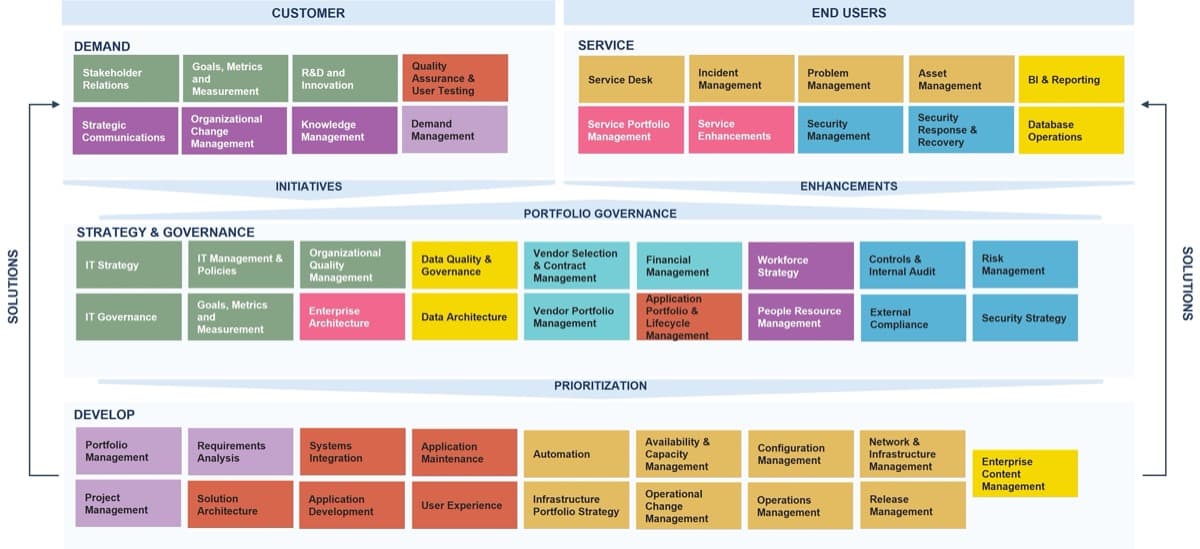
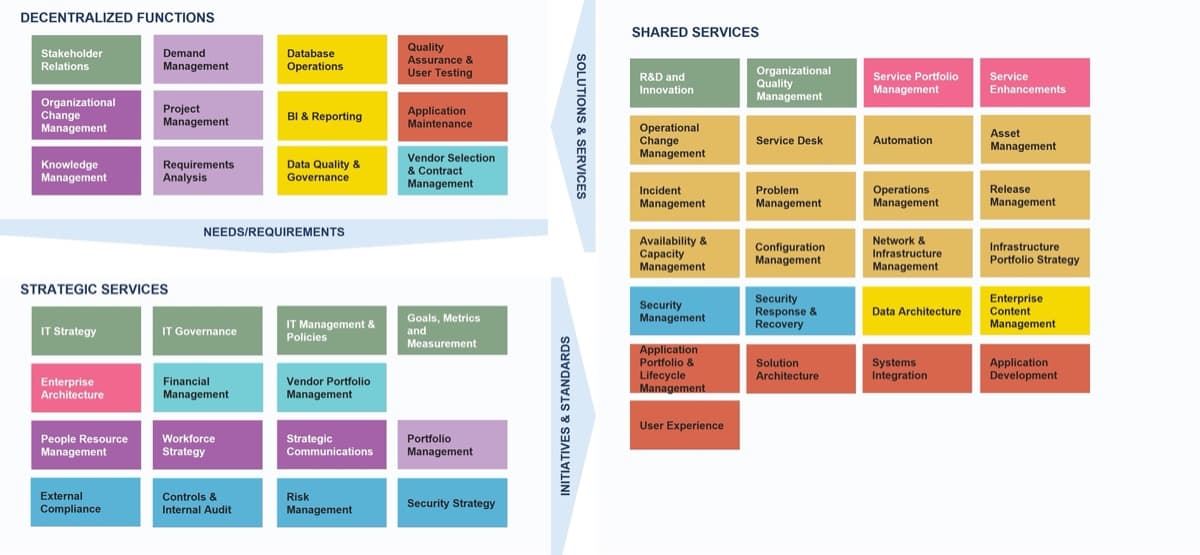
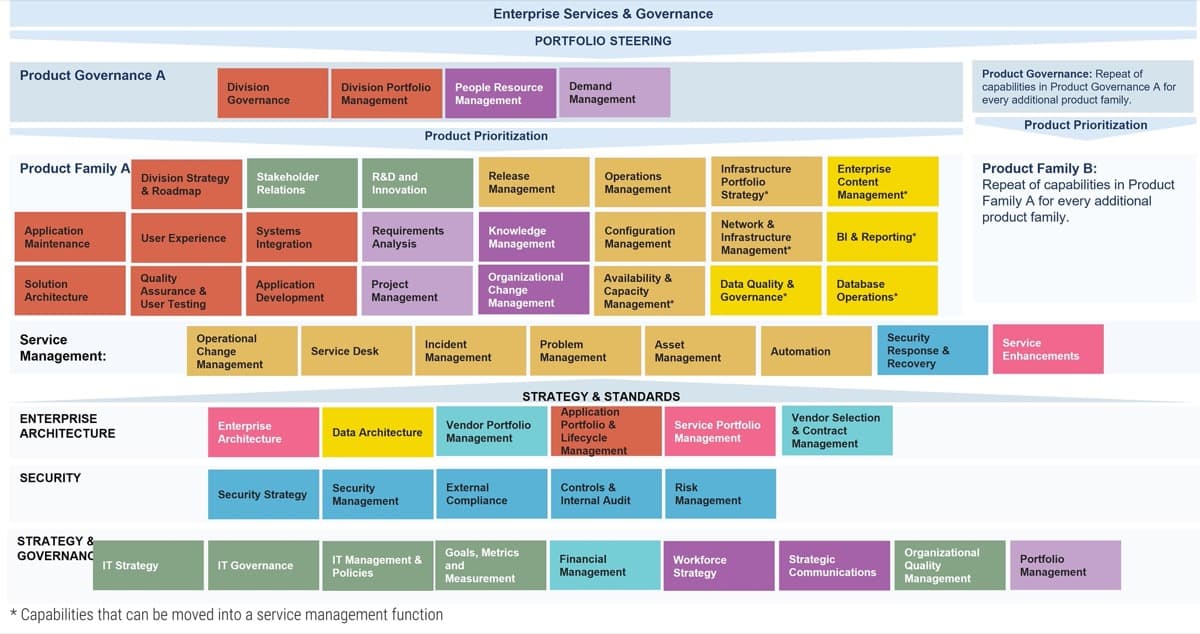
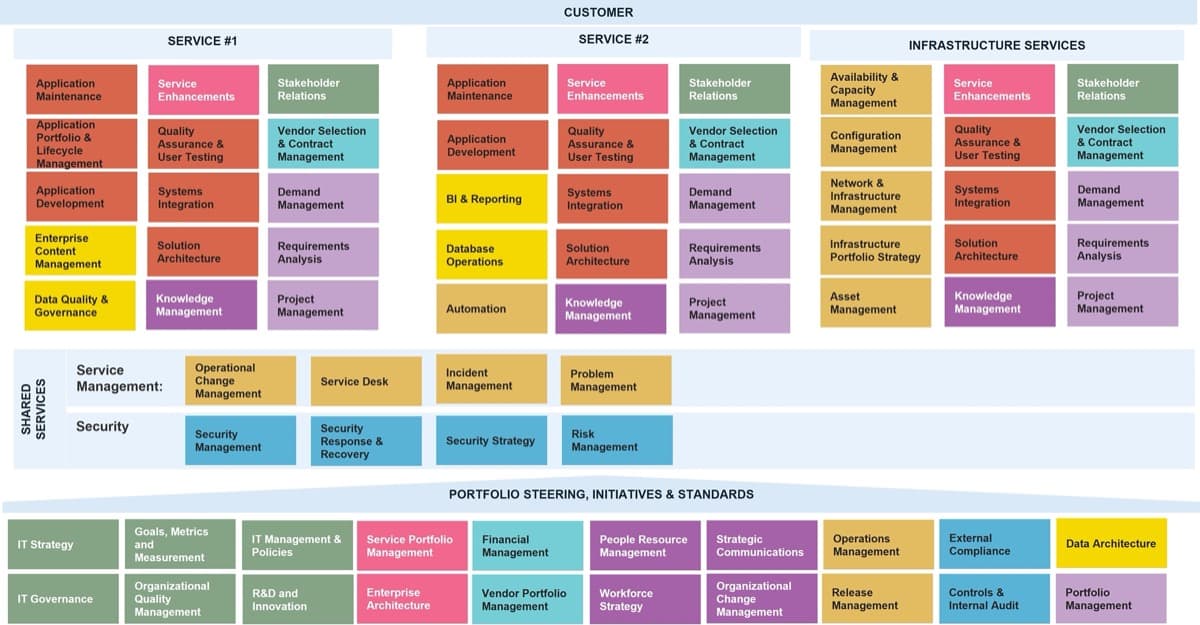
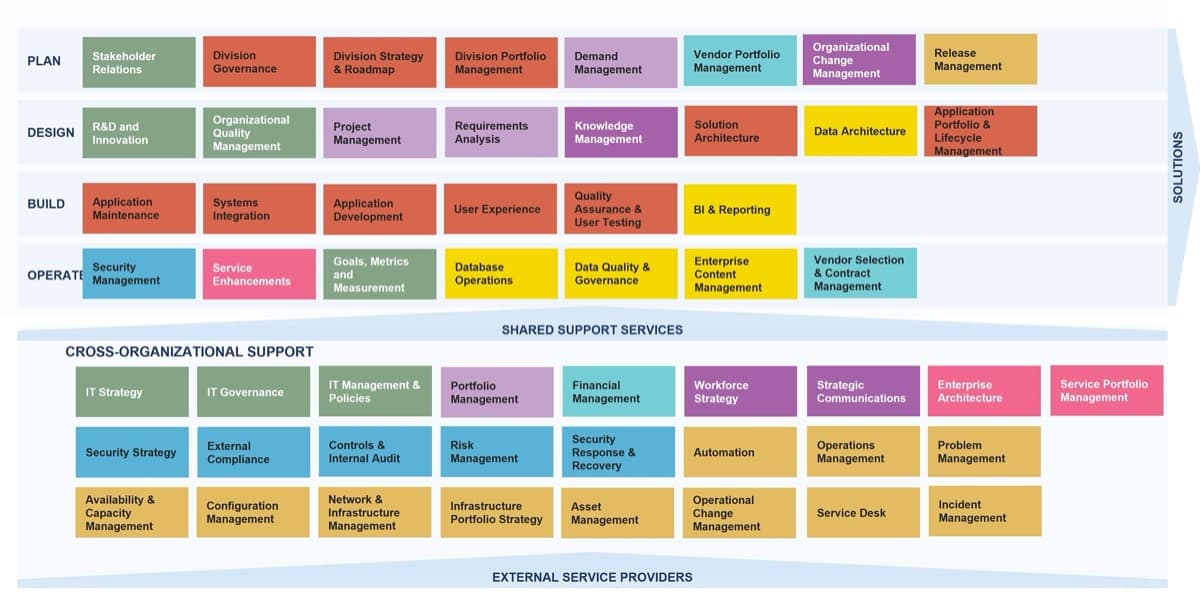
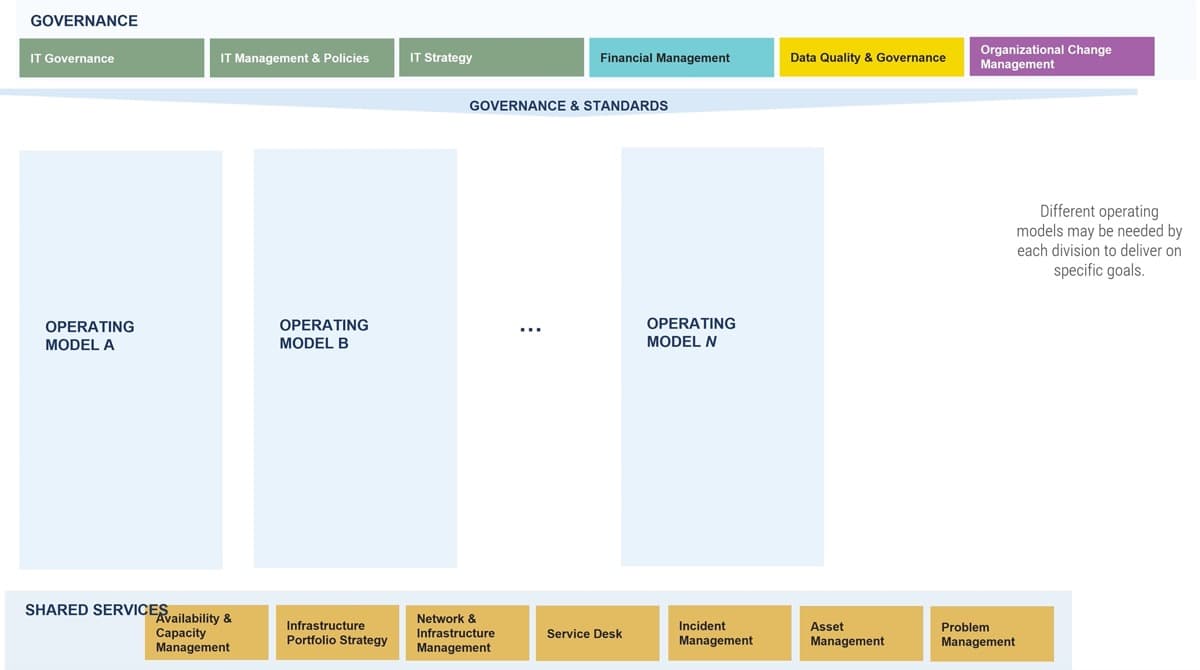
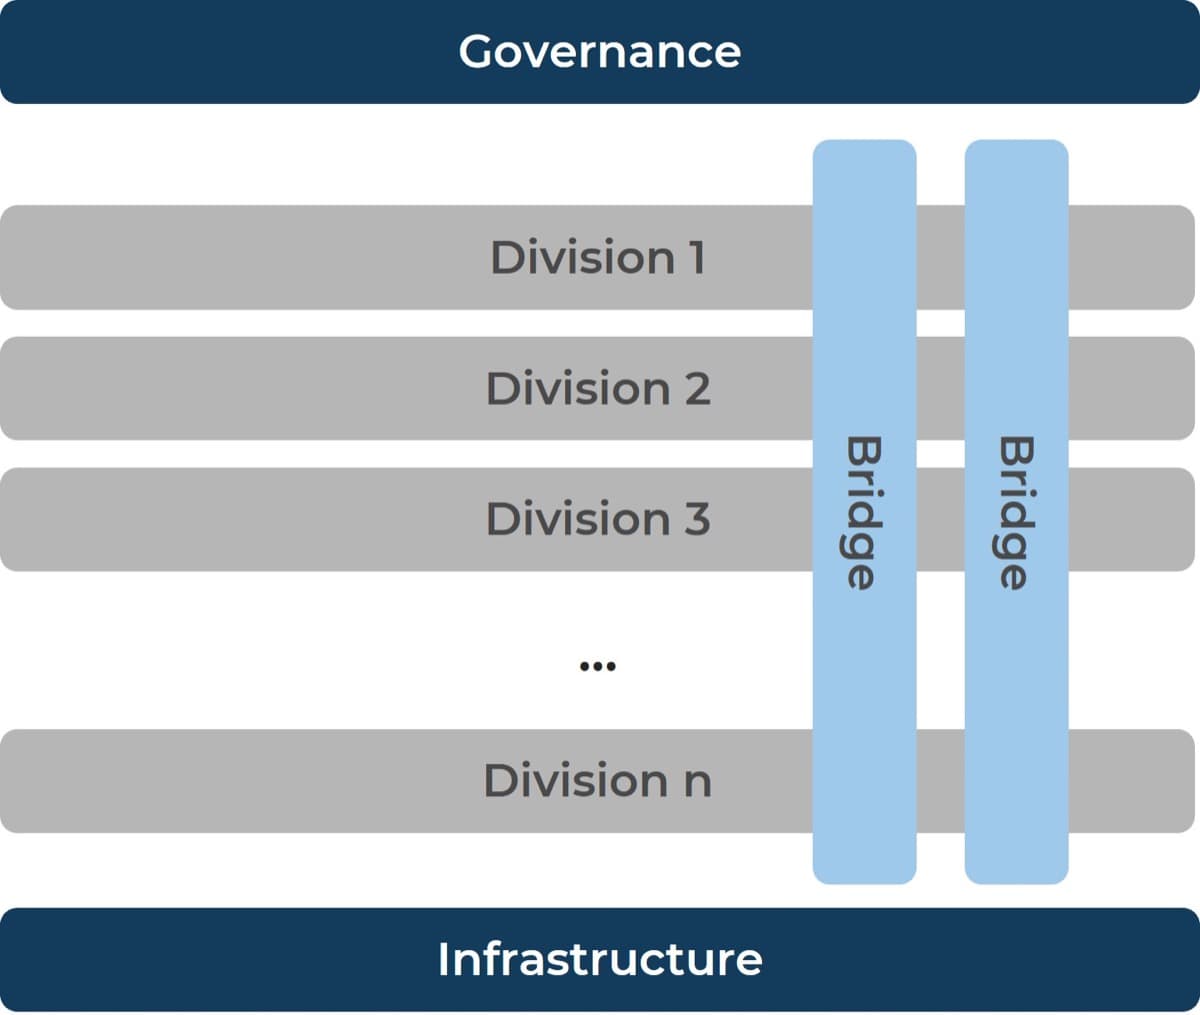
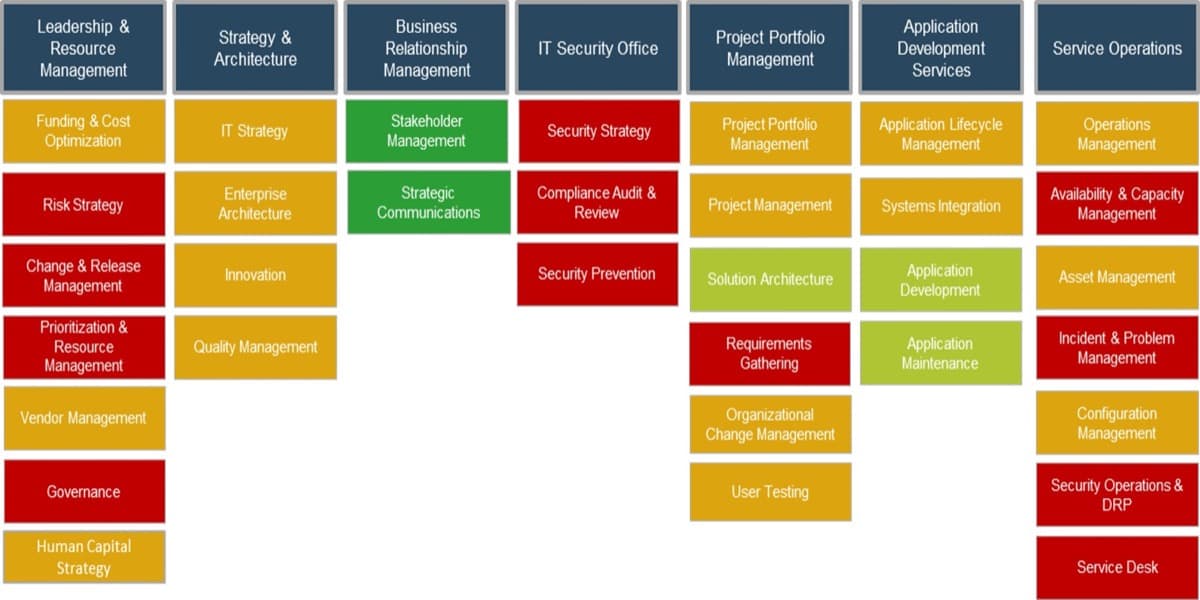
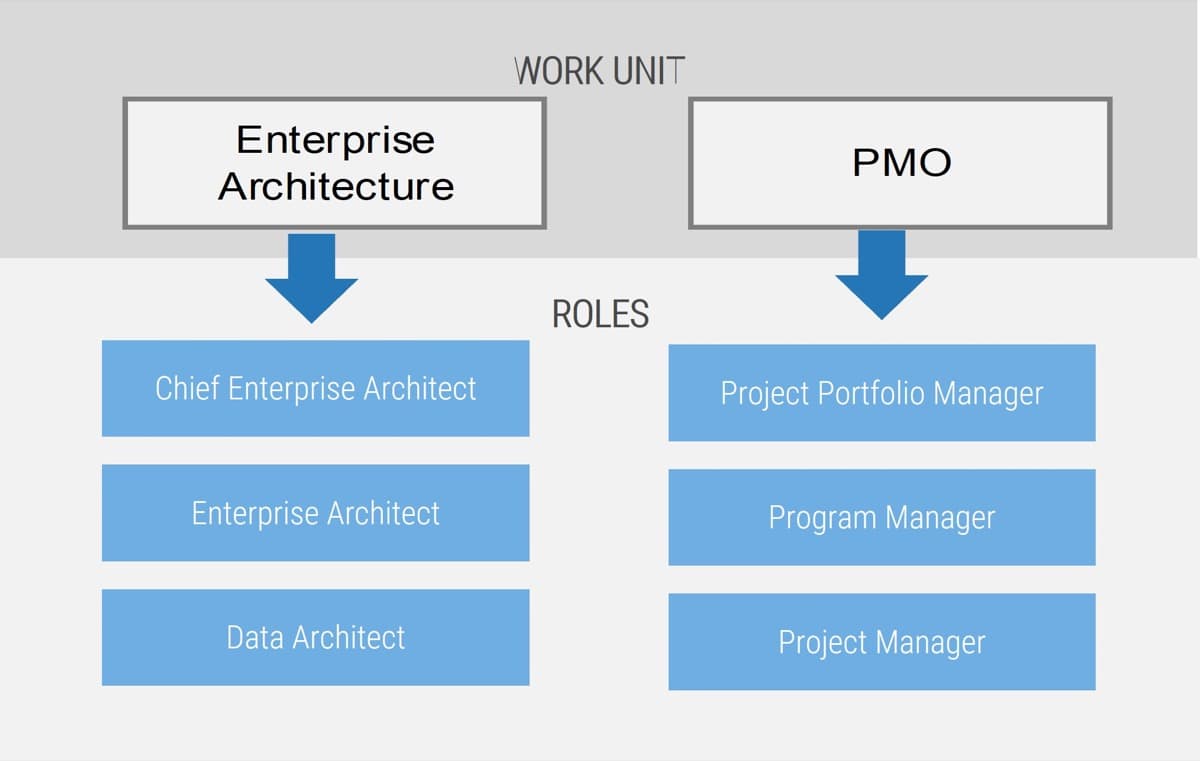
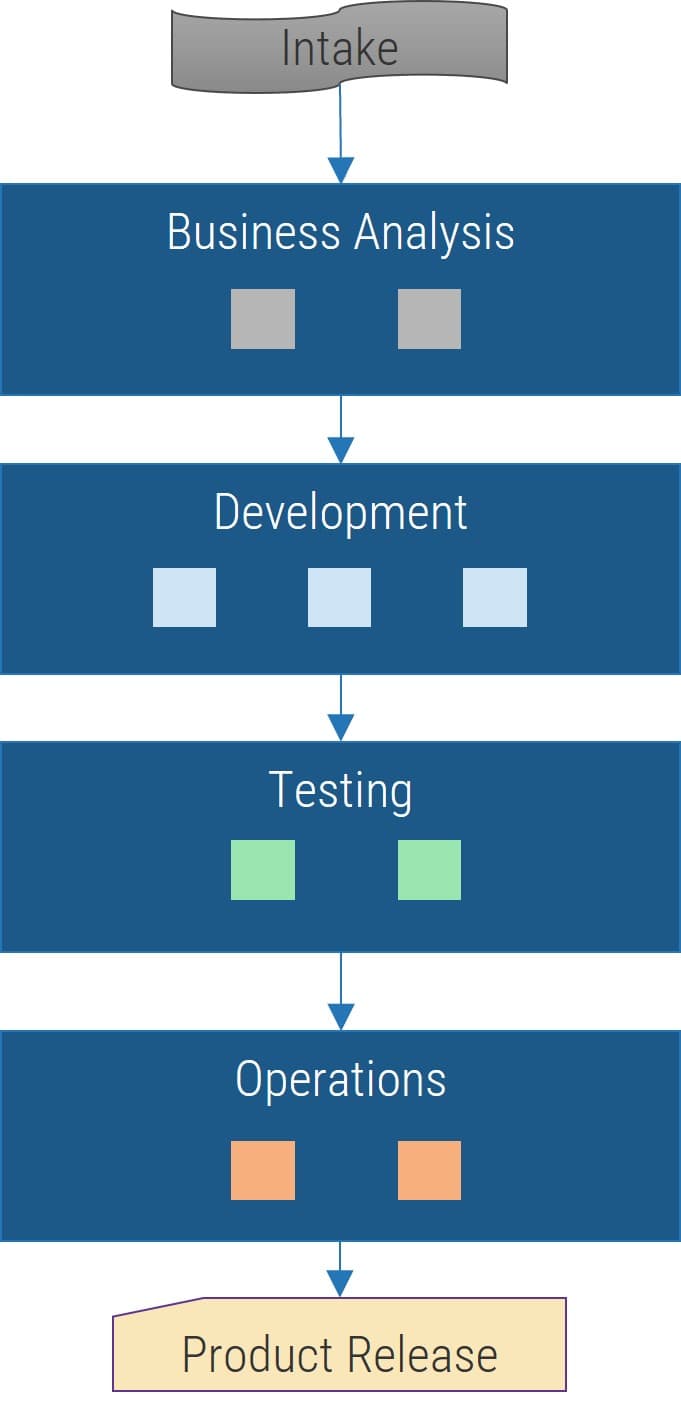
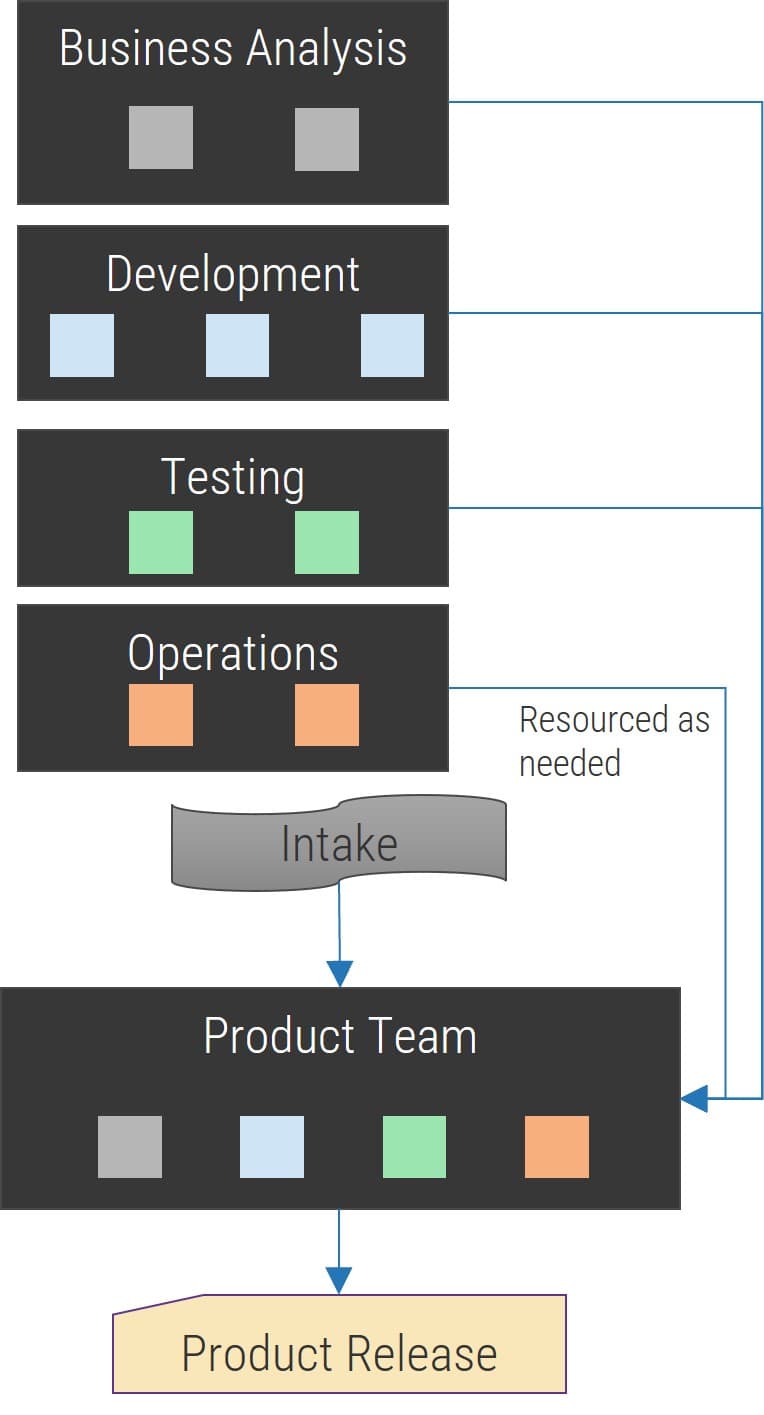
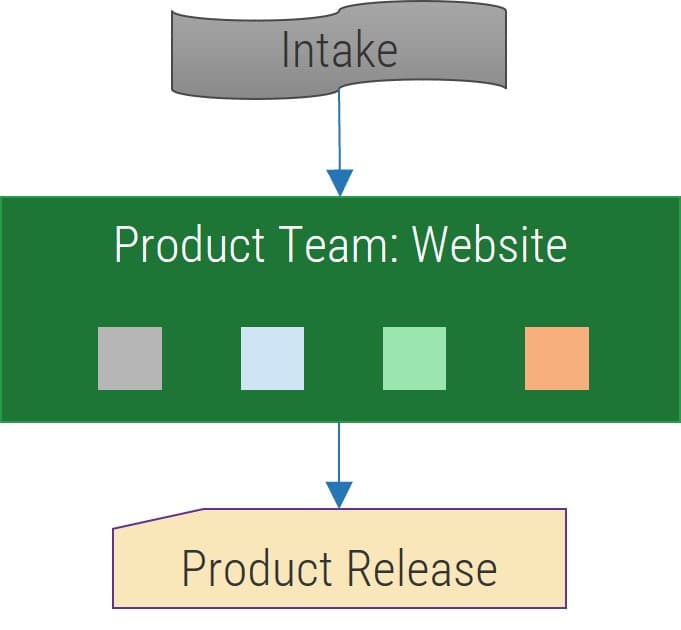
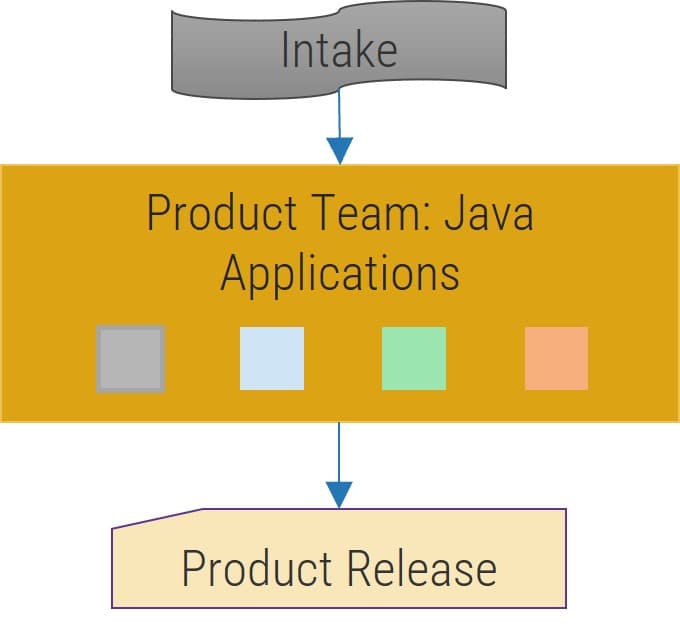
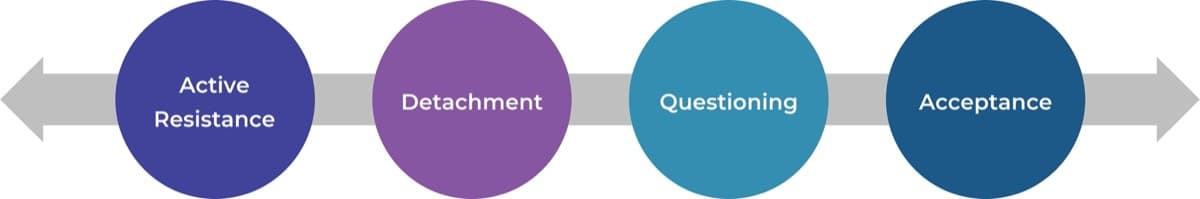


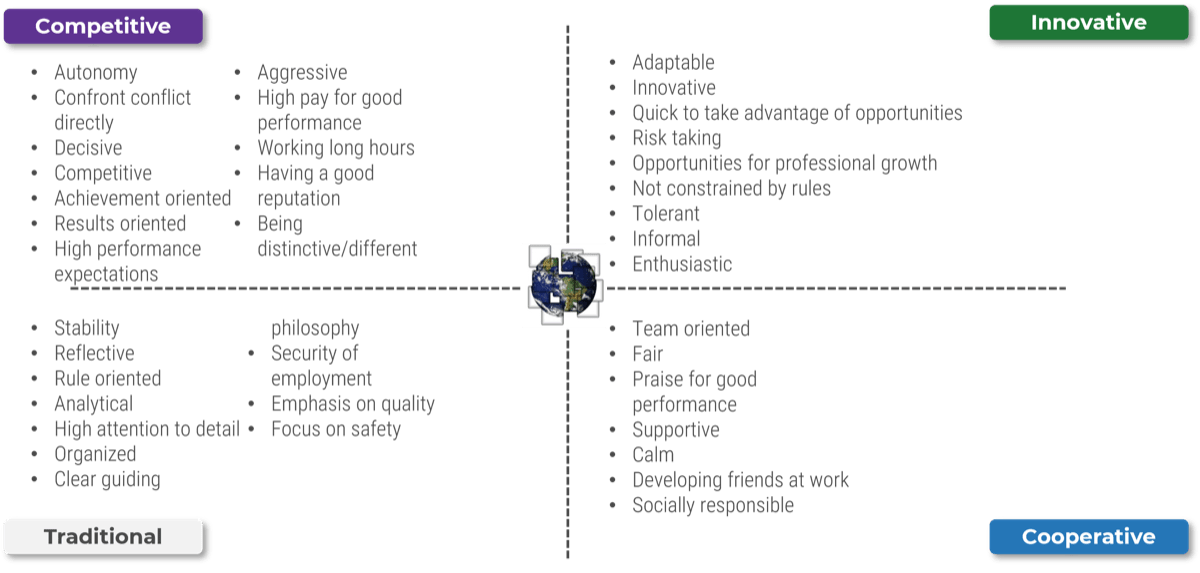


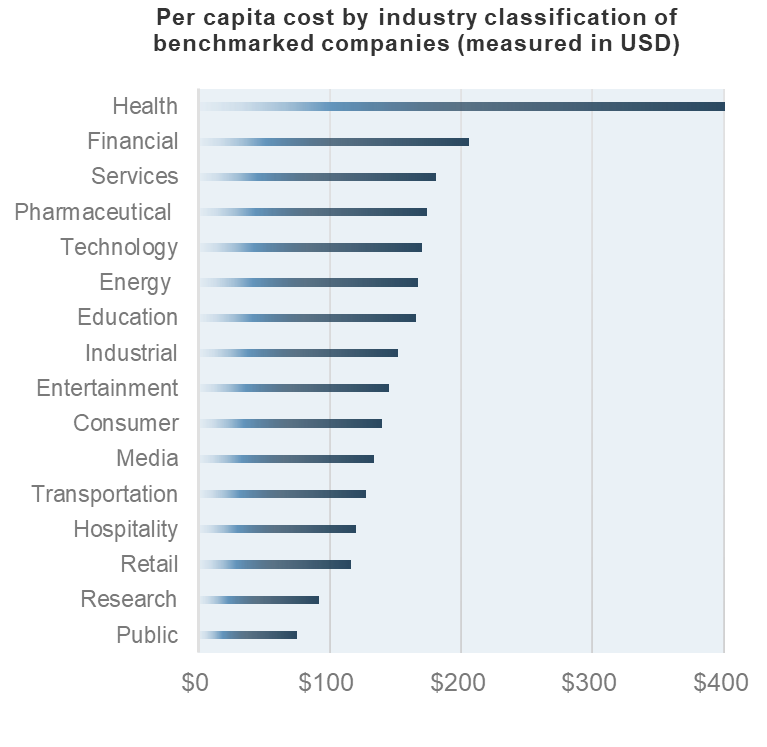
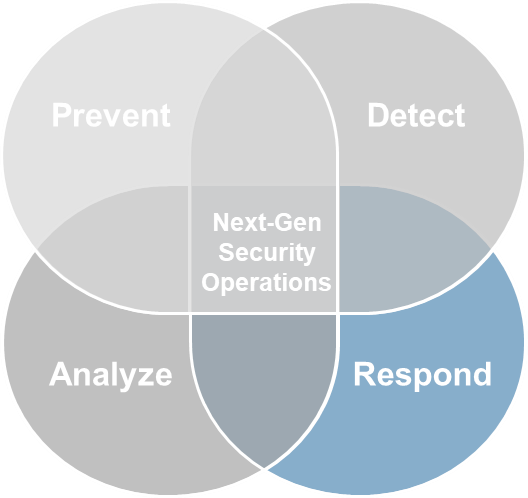


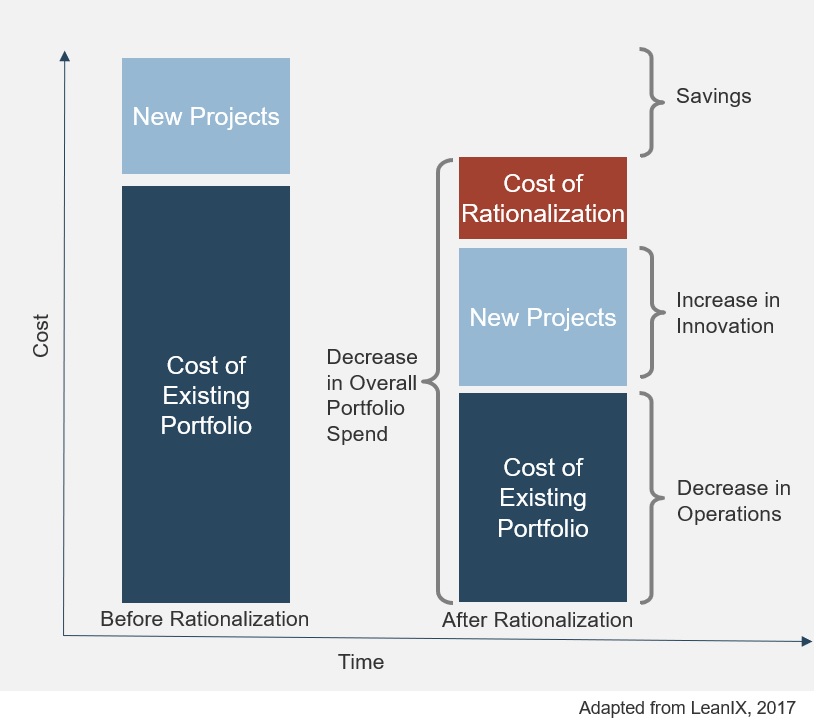
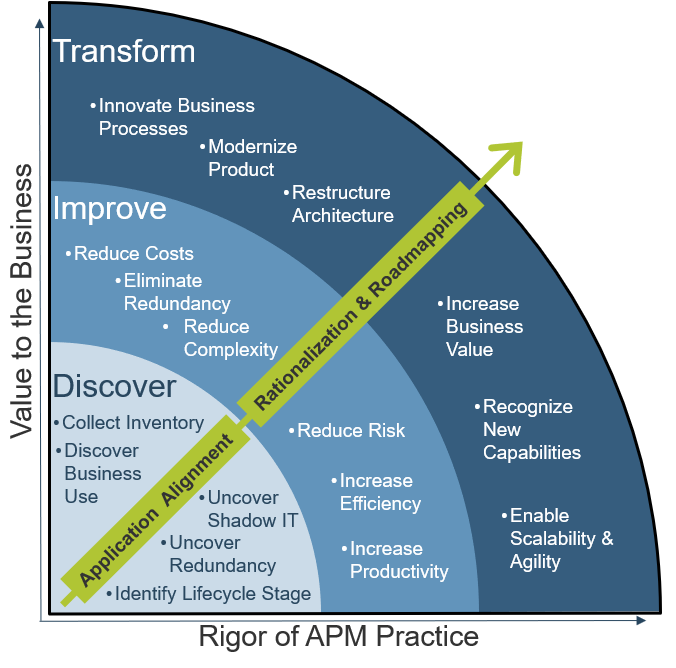
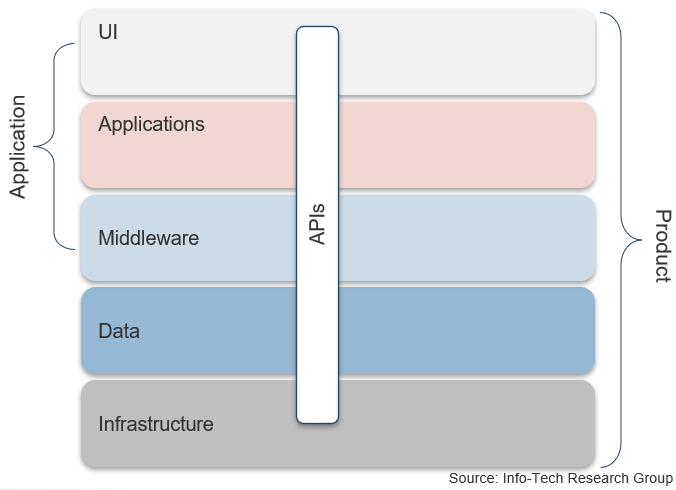


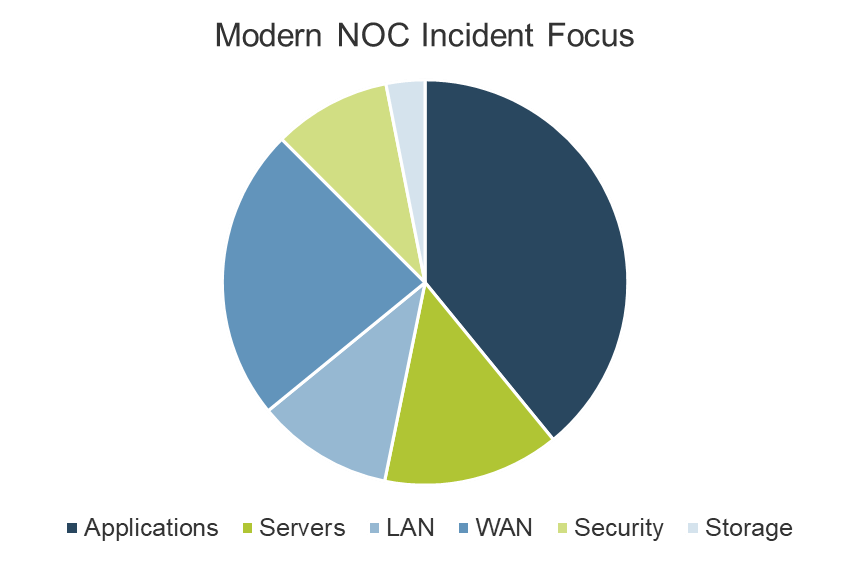
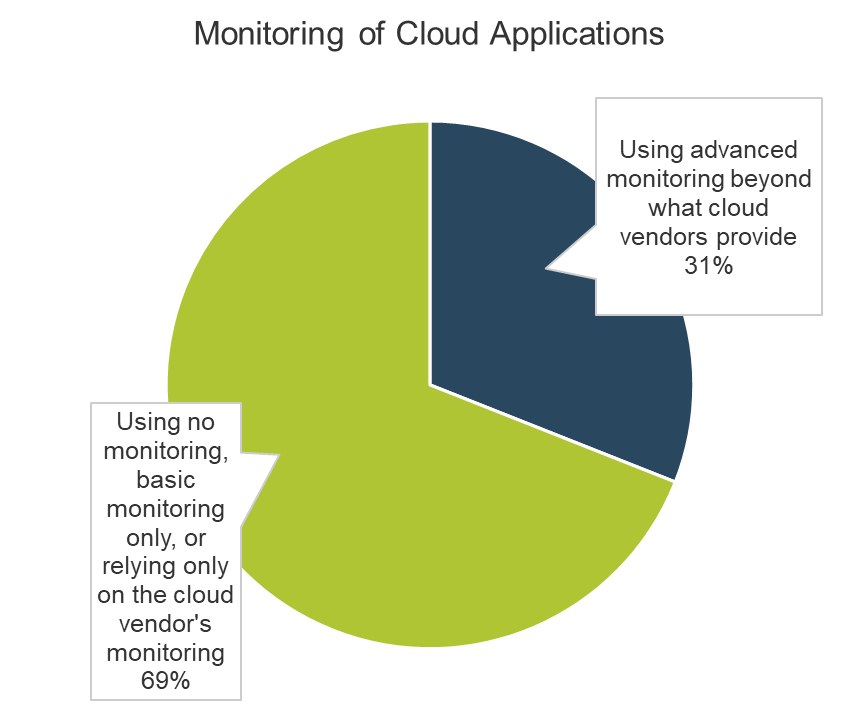
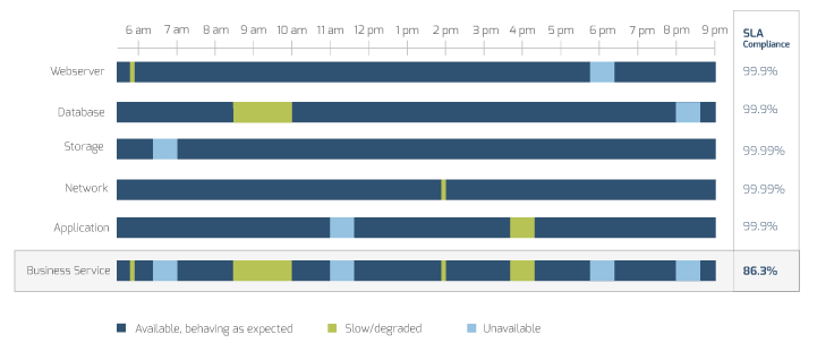
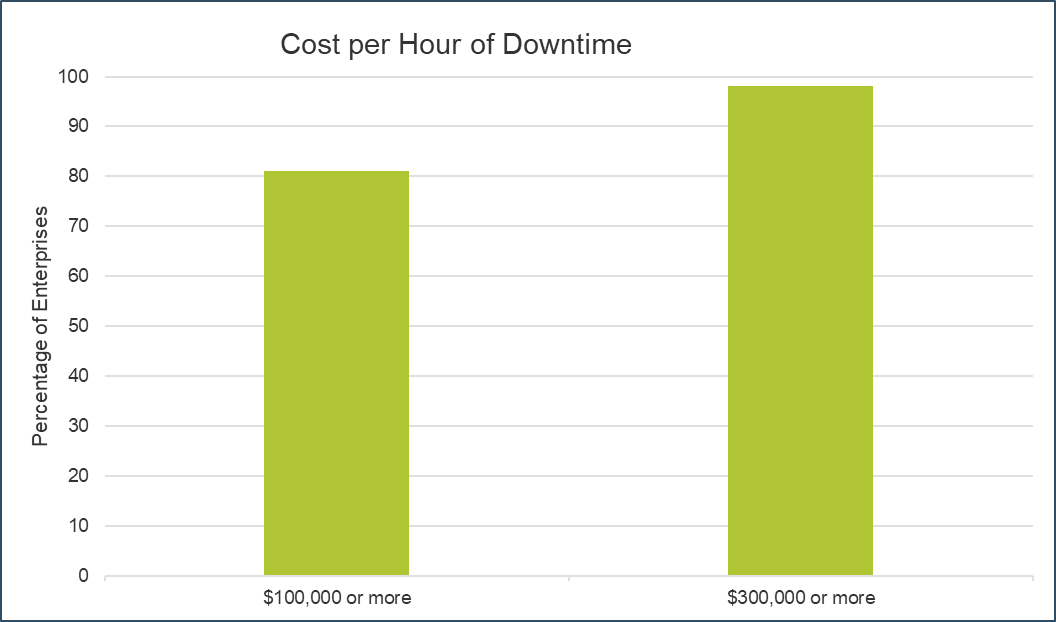
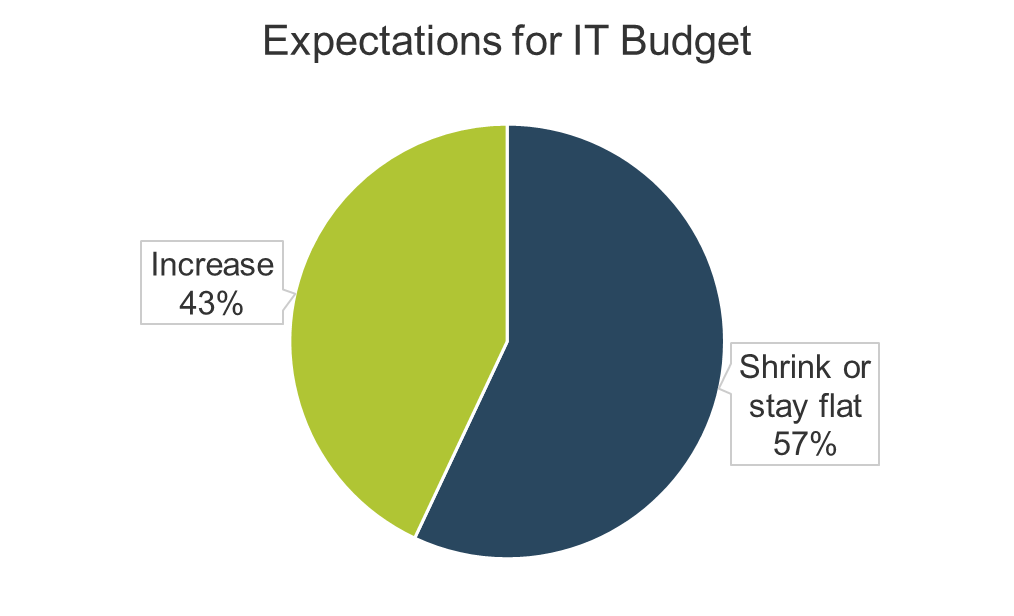
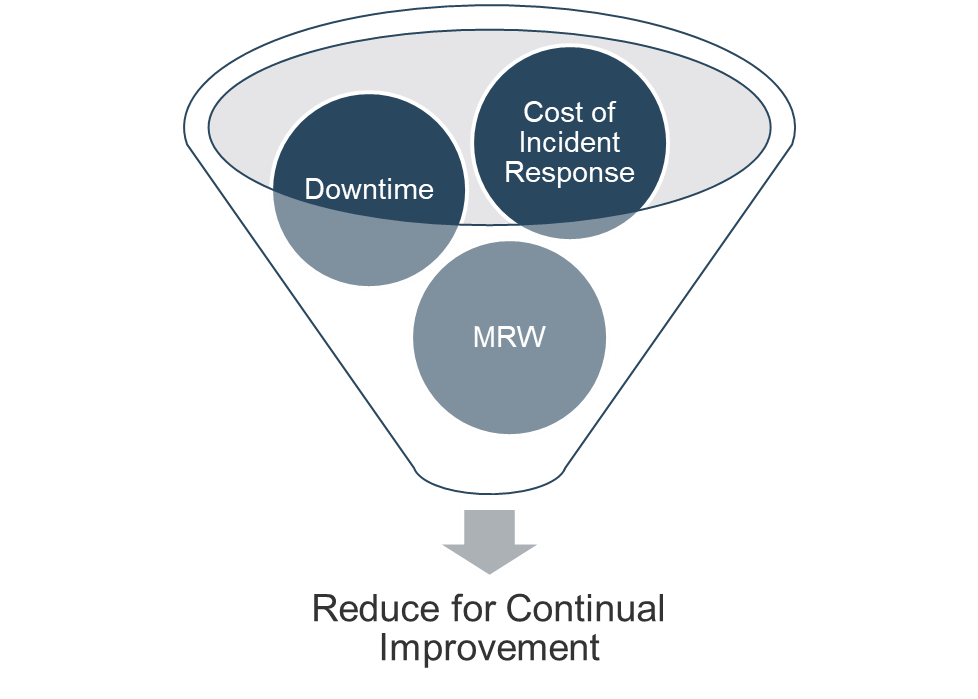
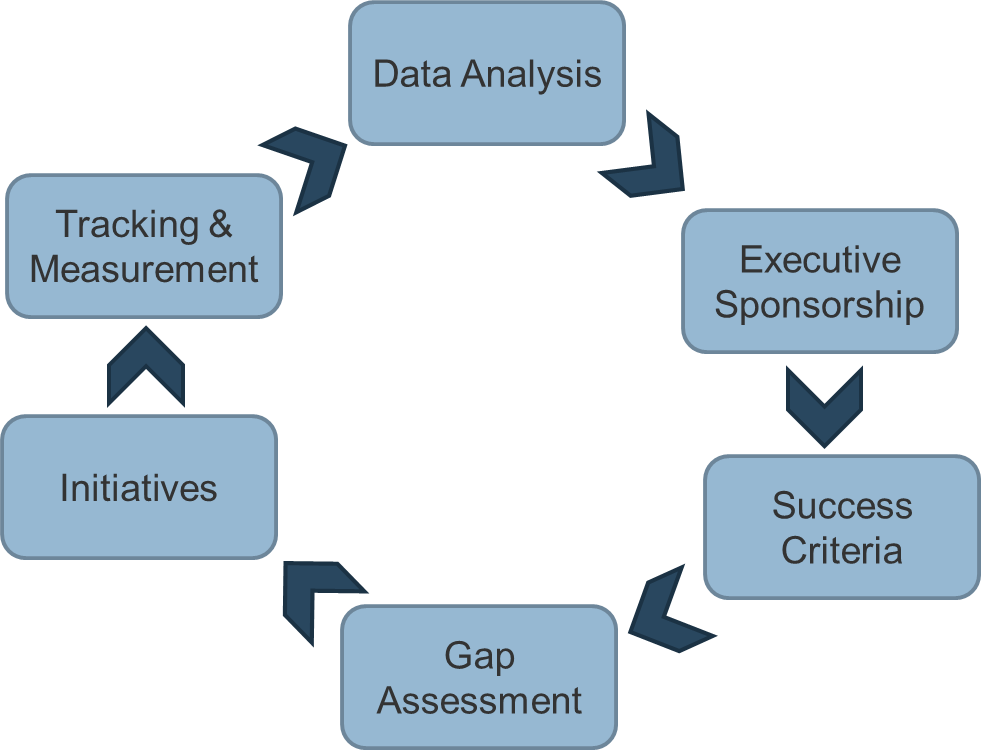
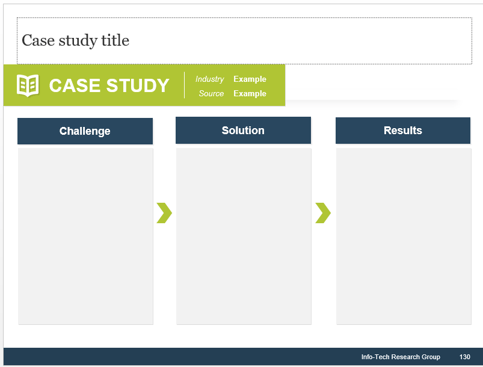

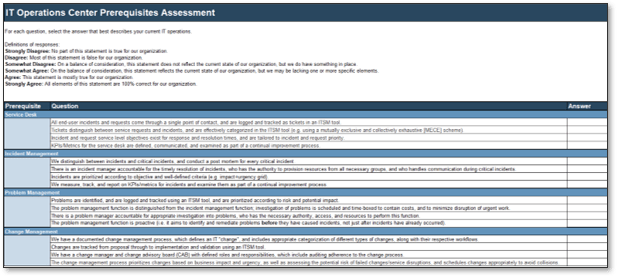
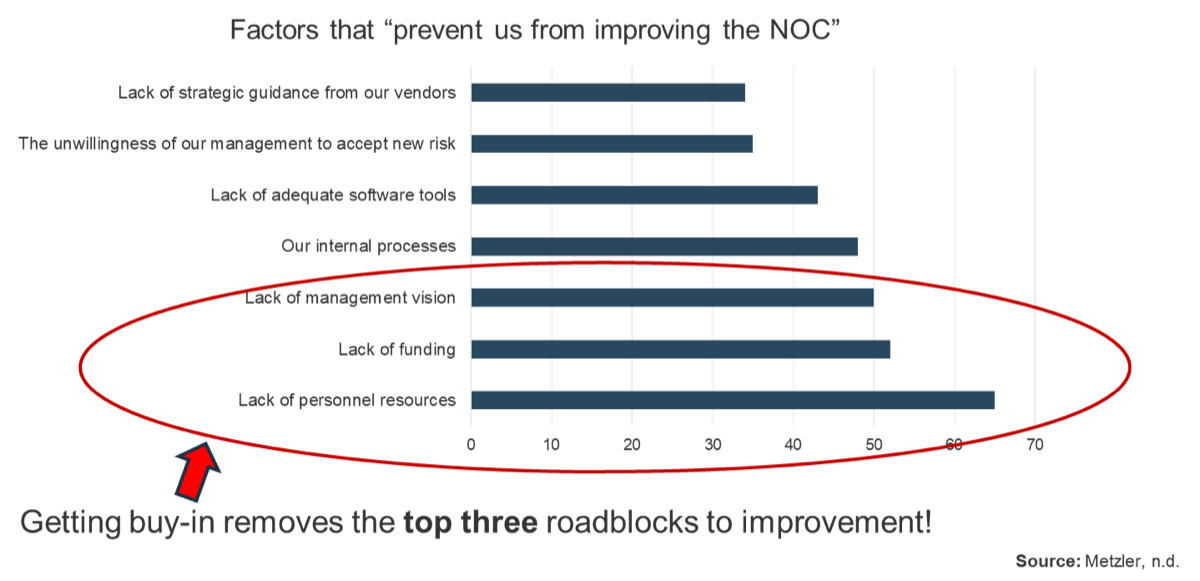
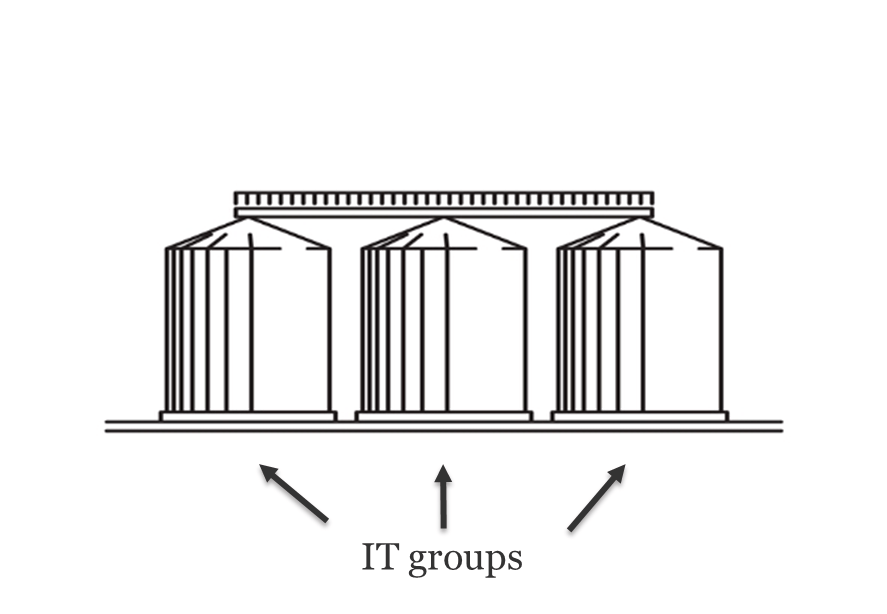
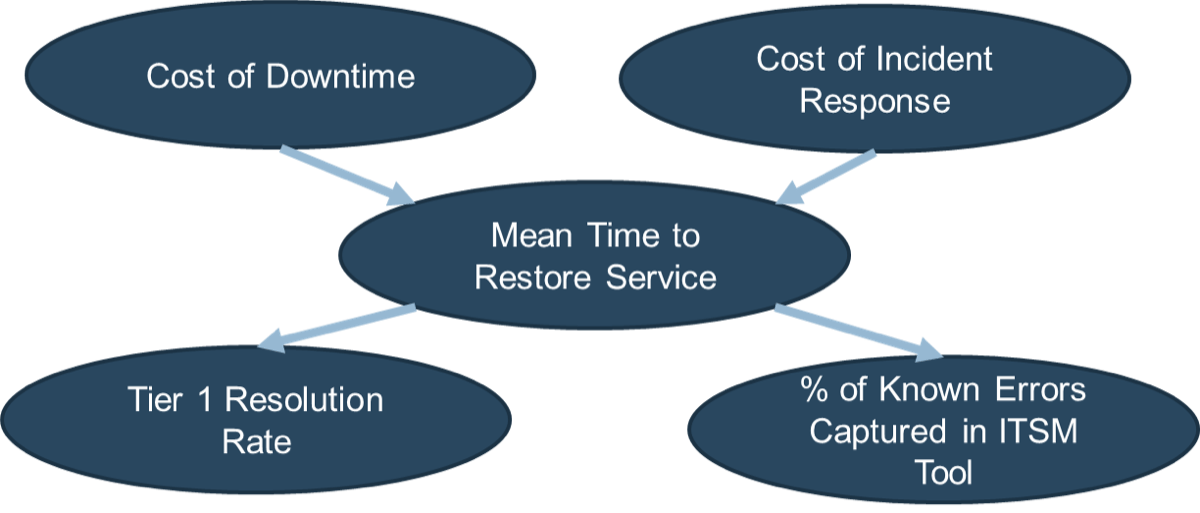
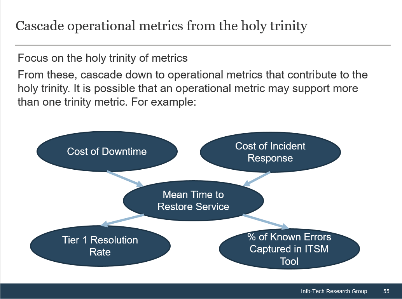
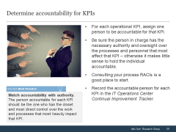
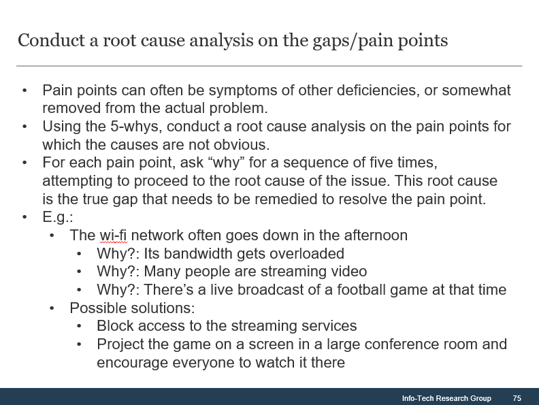
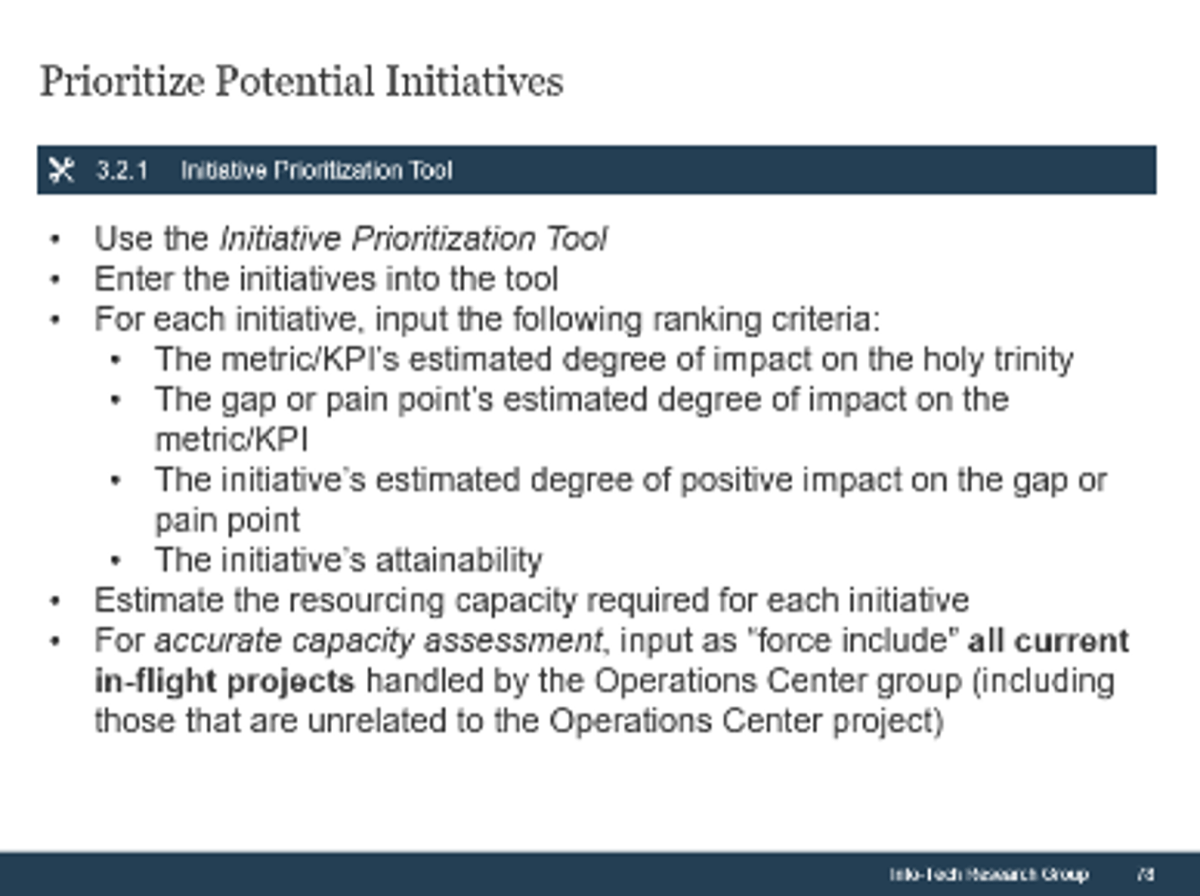


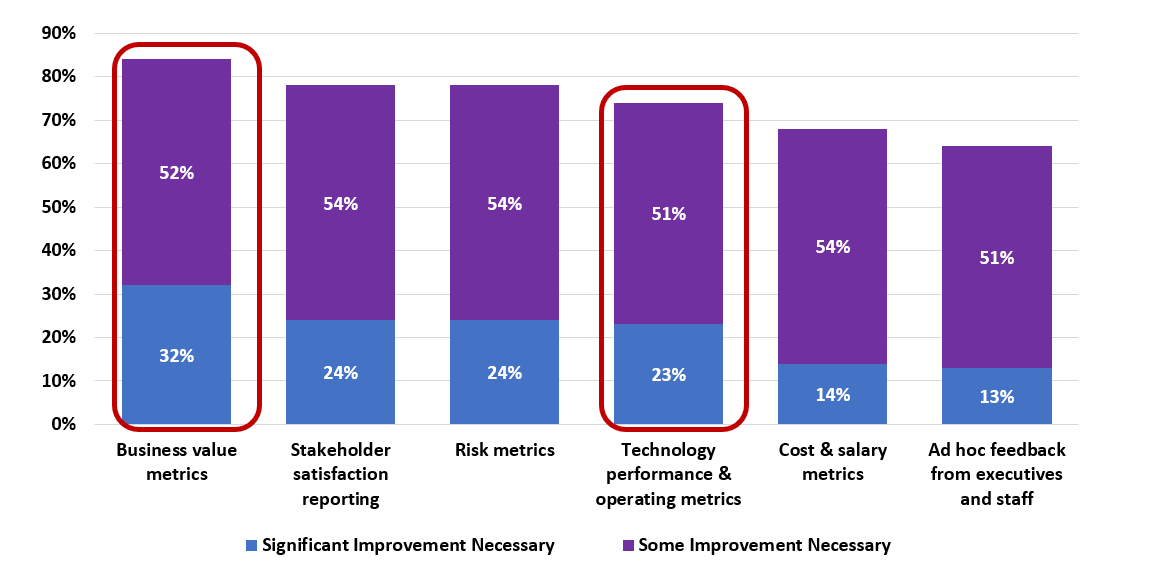


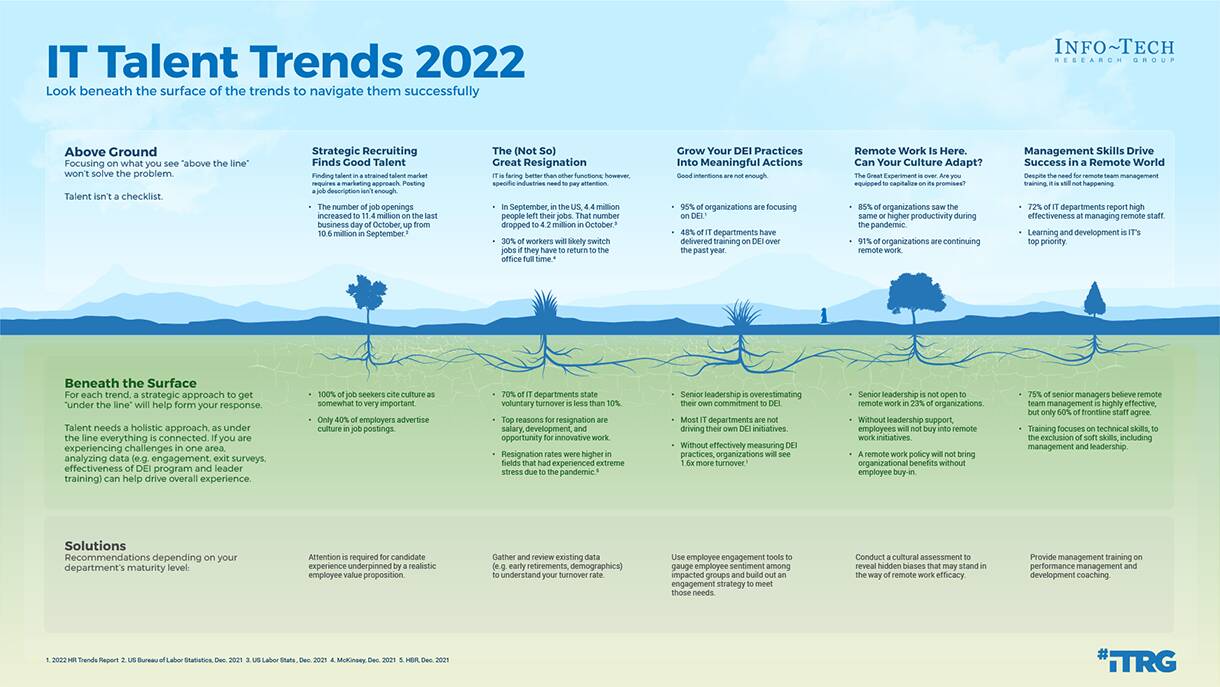

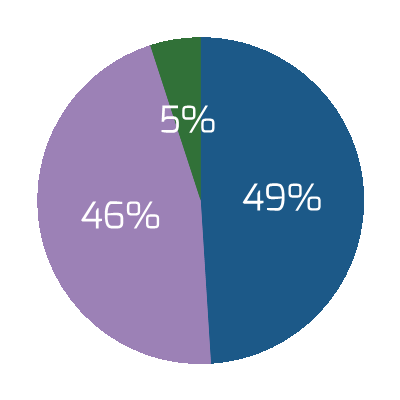
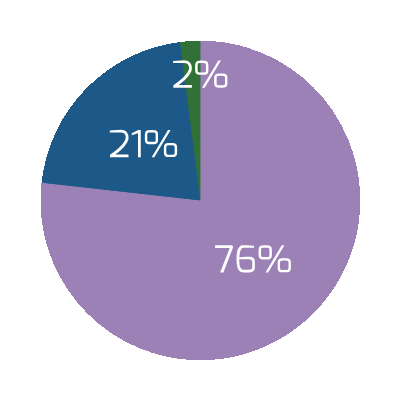
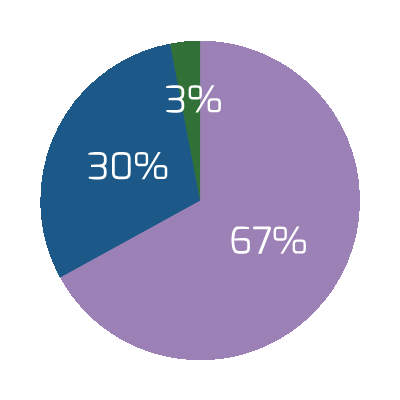
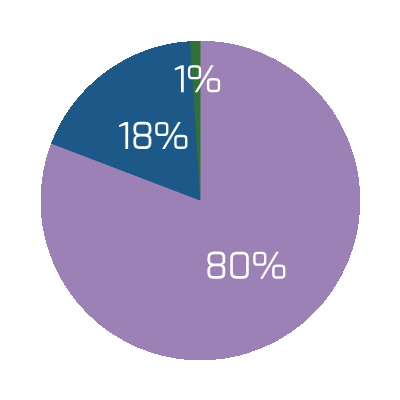
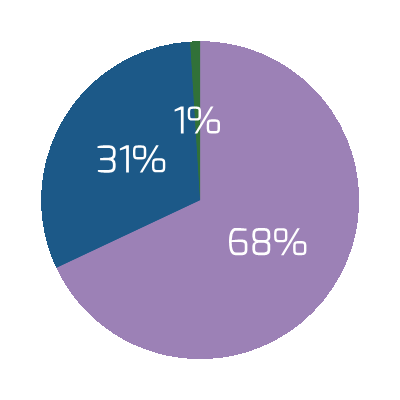
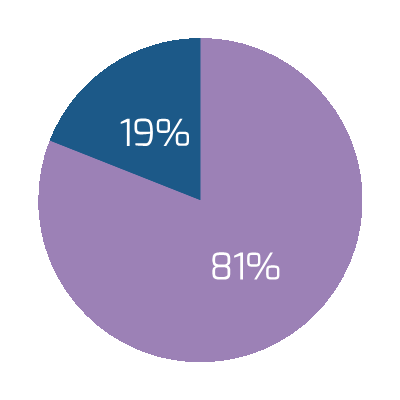


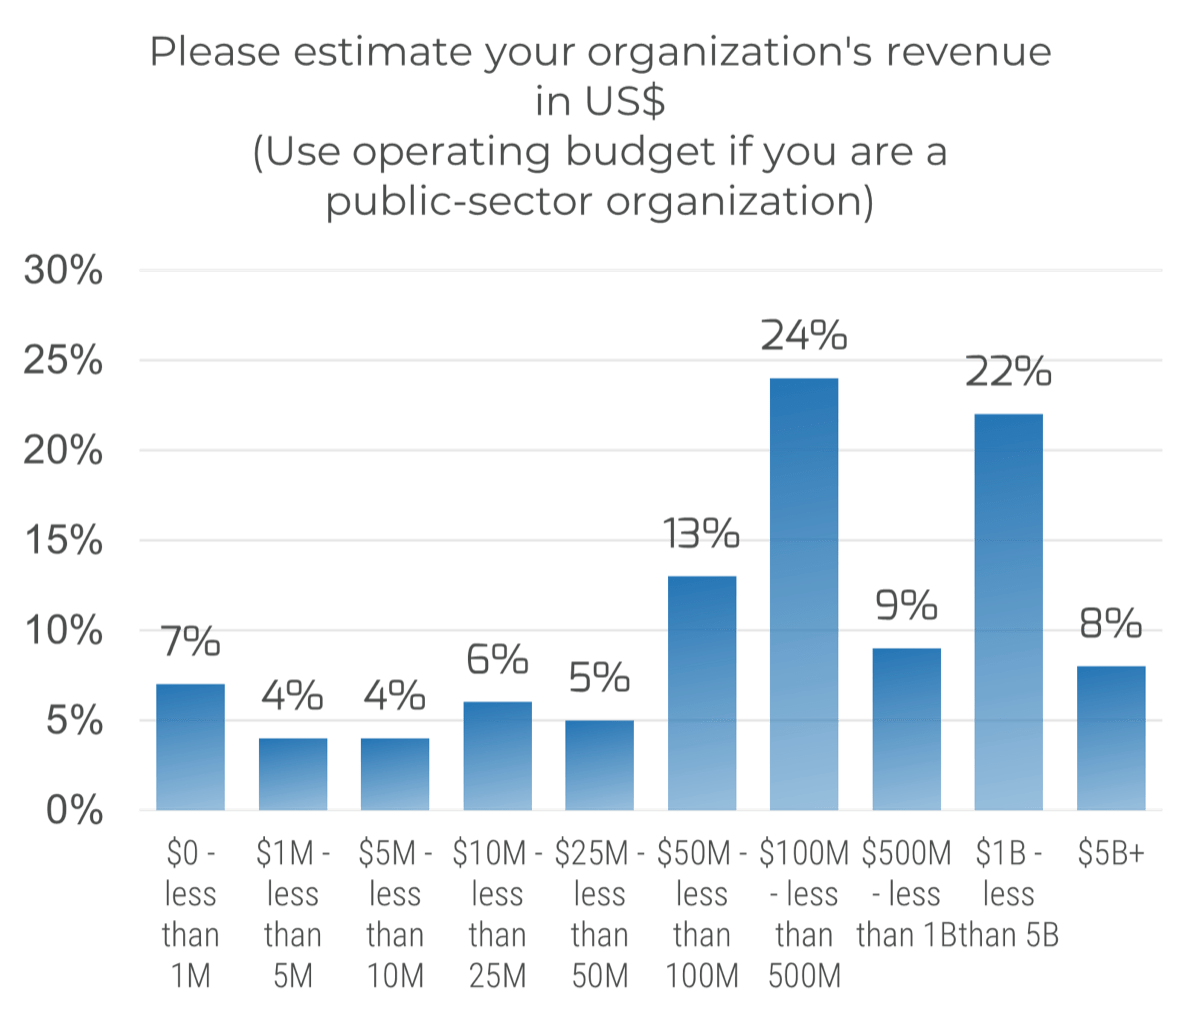 (n=191)
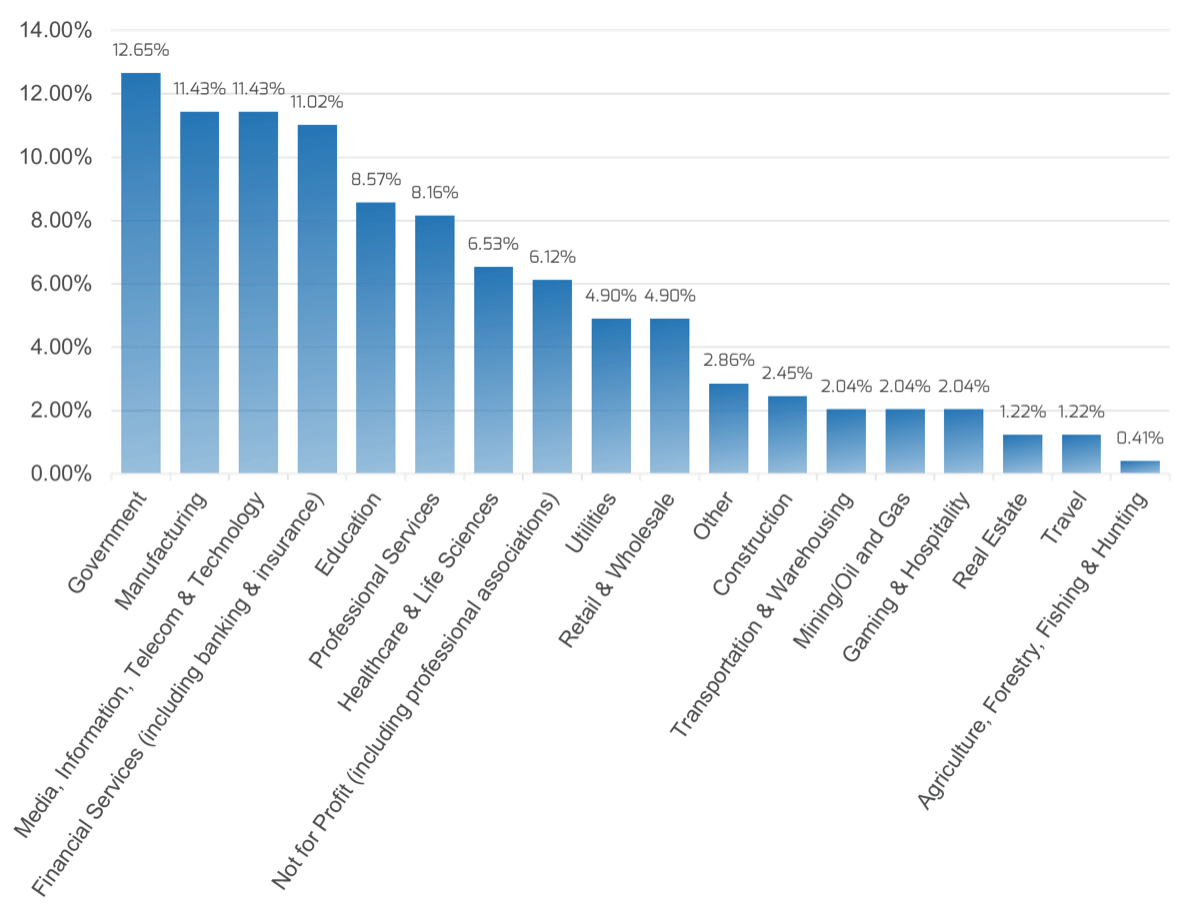
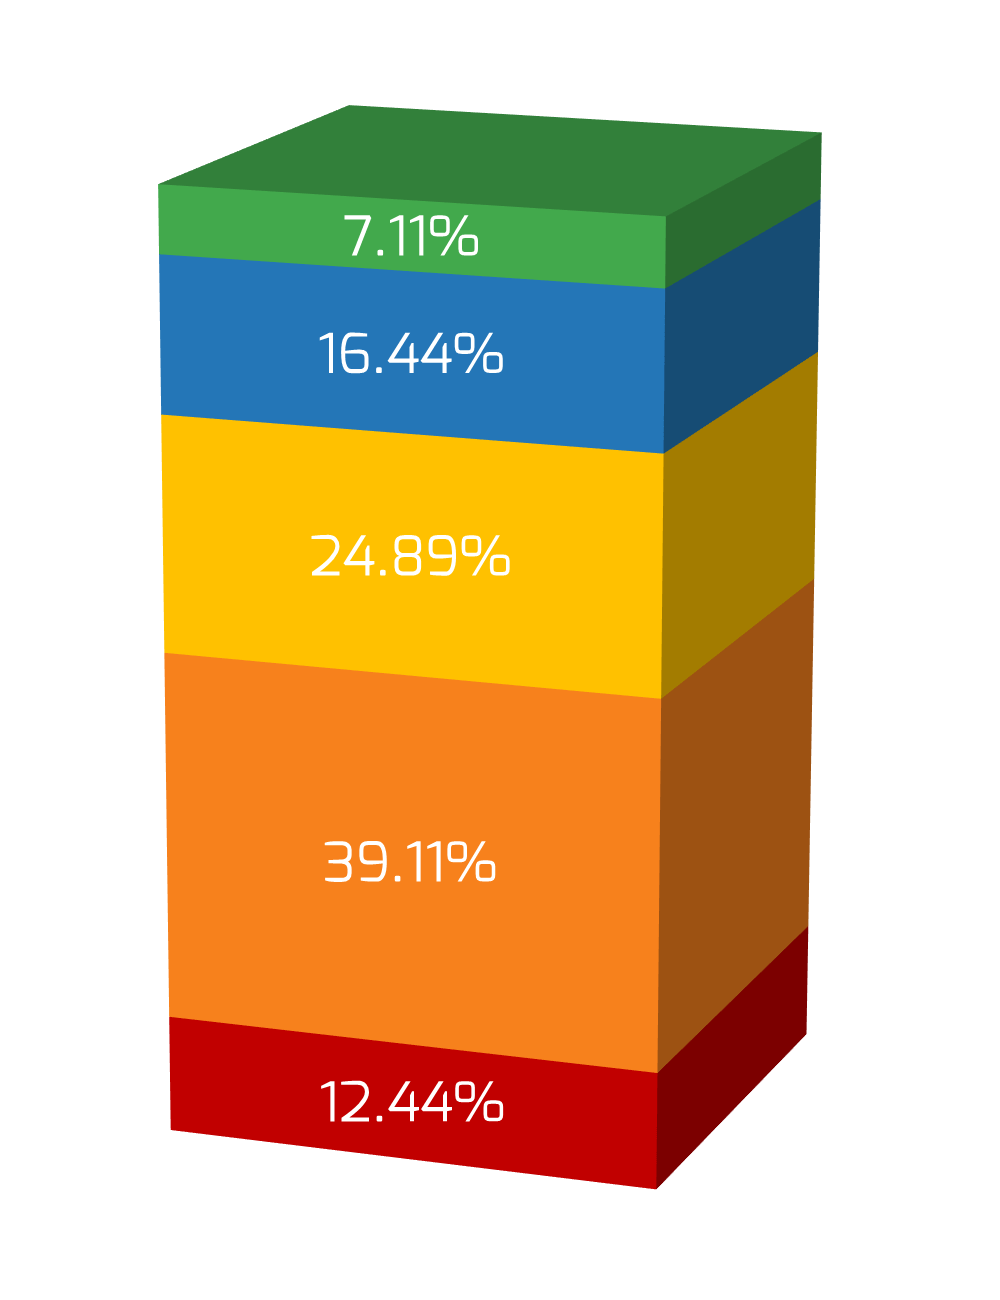
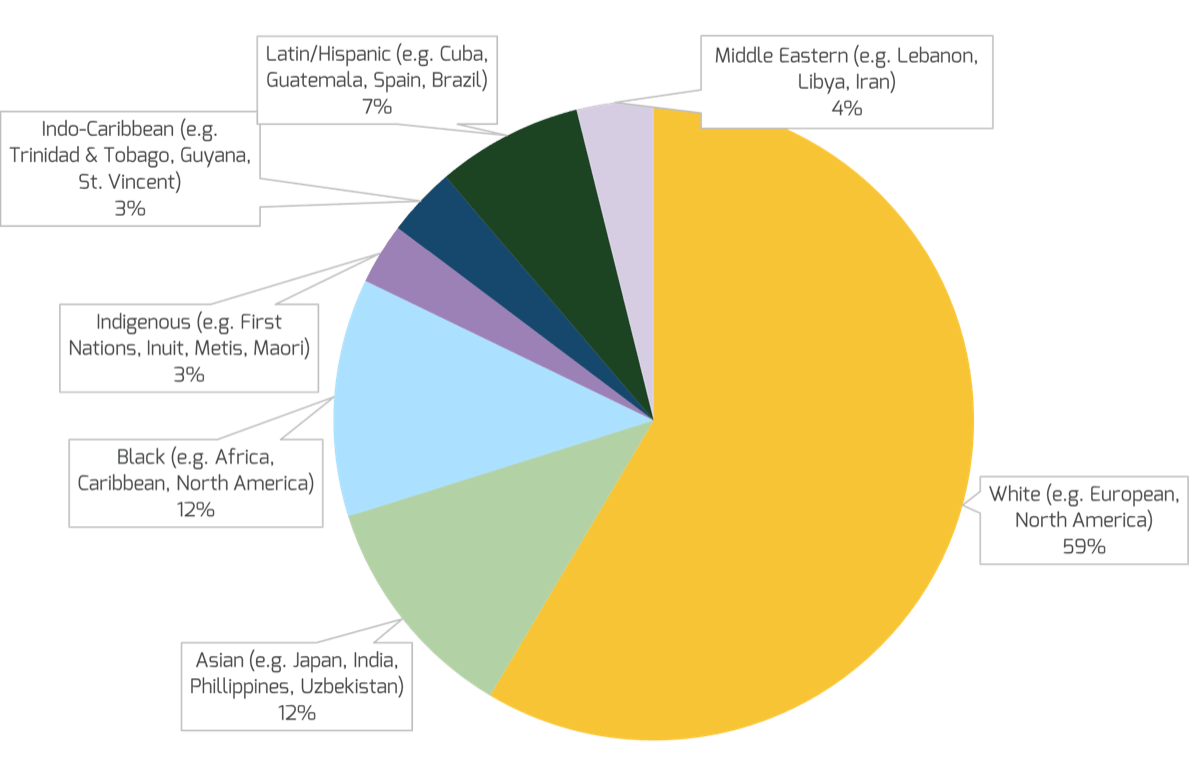
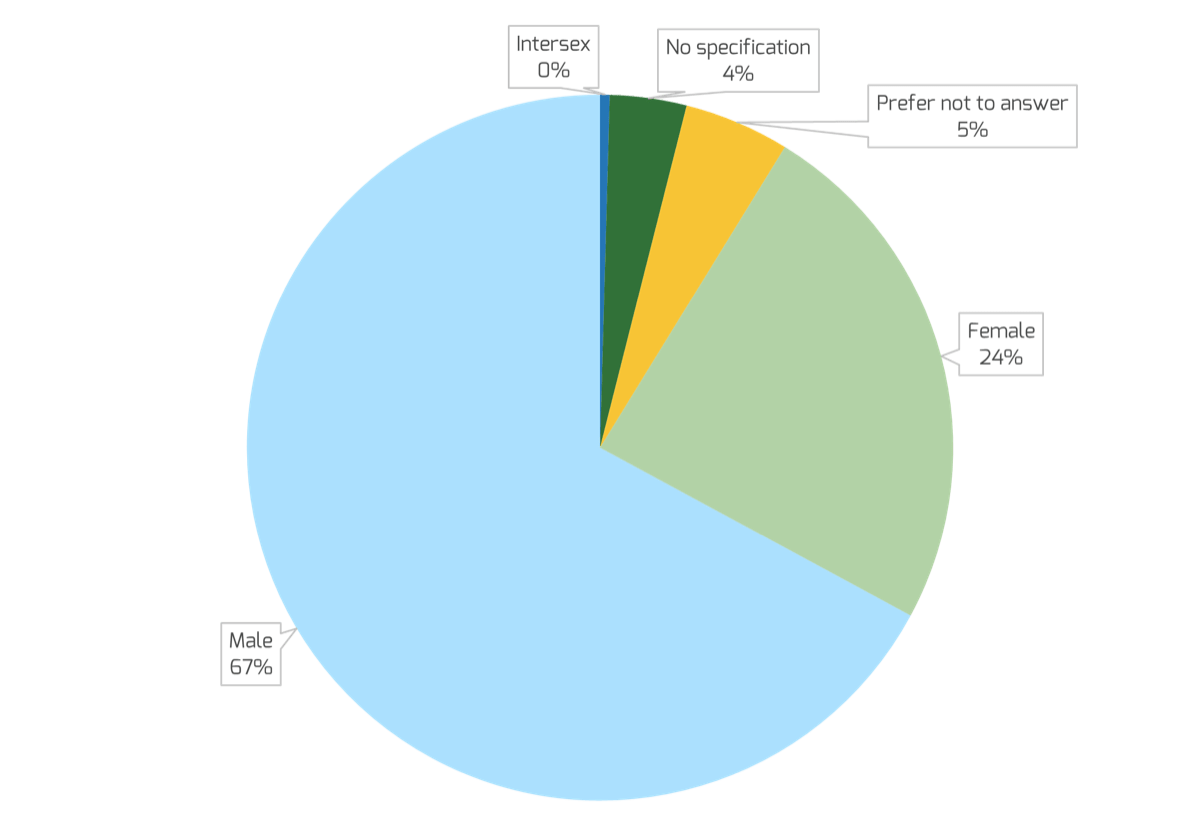
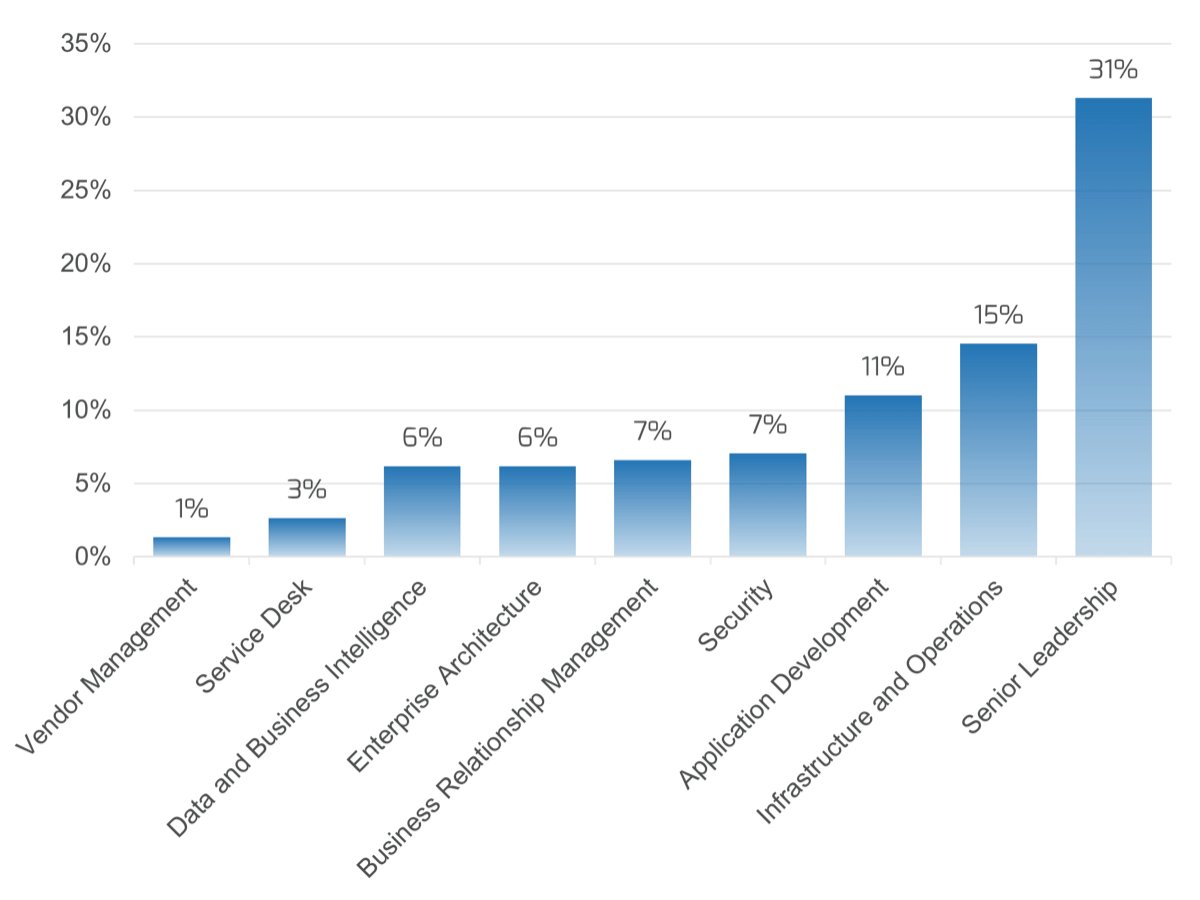

 (Info-Tech Talent Trends 2022 Survey)


 (Info-Tech IT Talent Trends 2022 Survey)


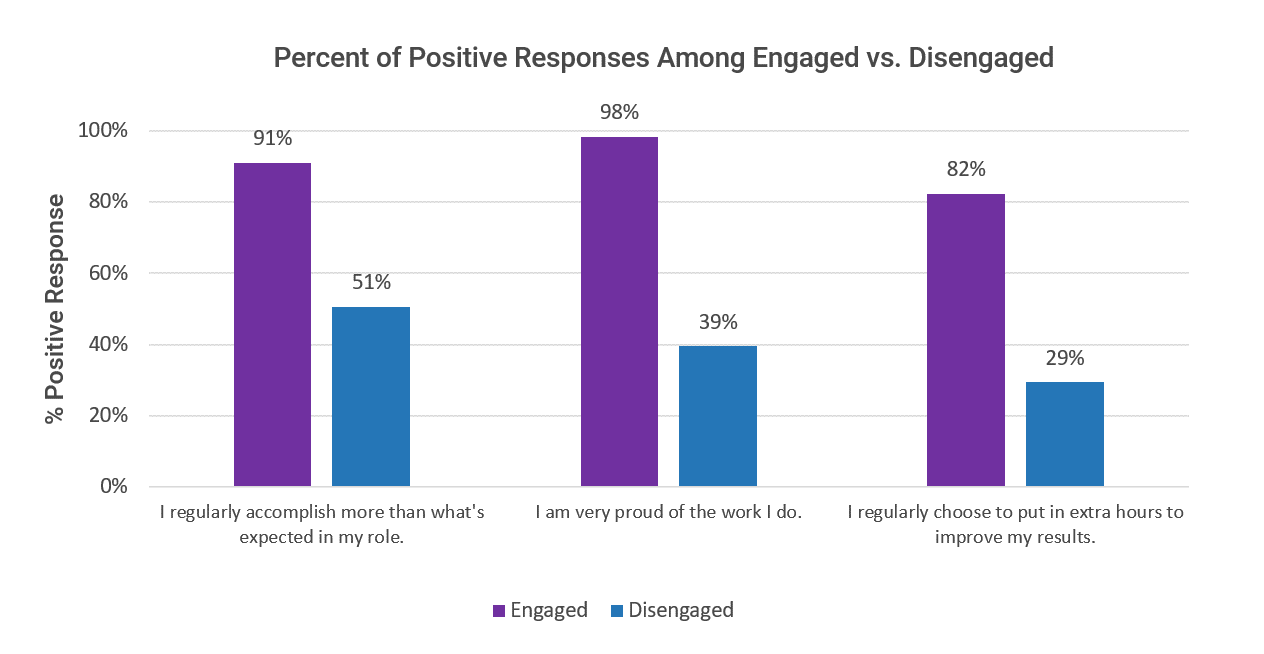
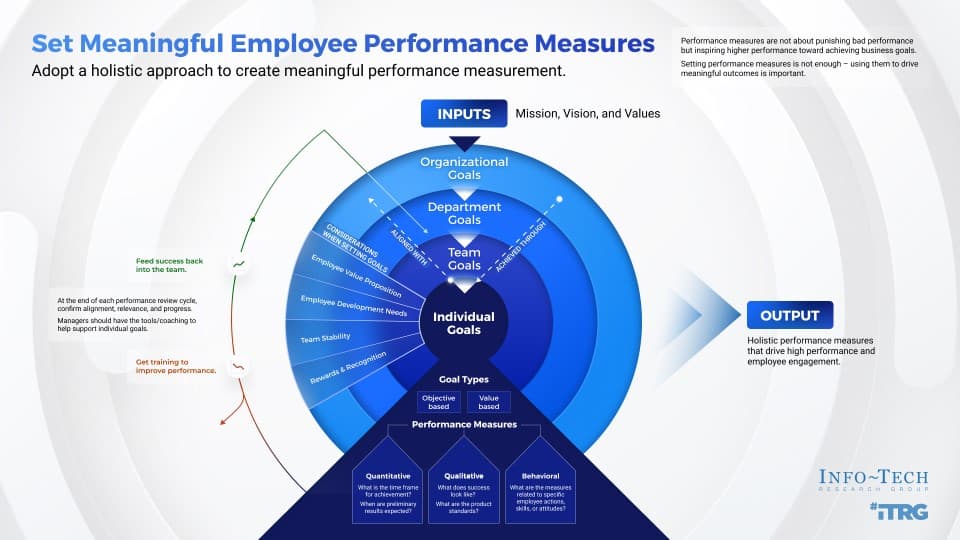
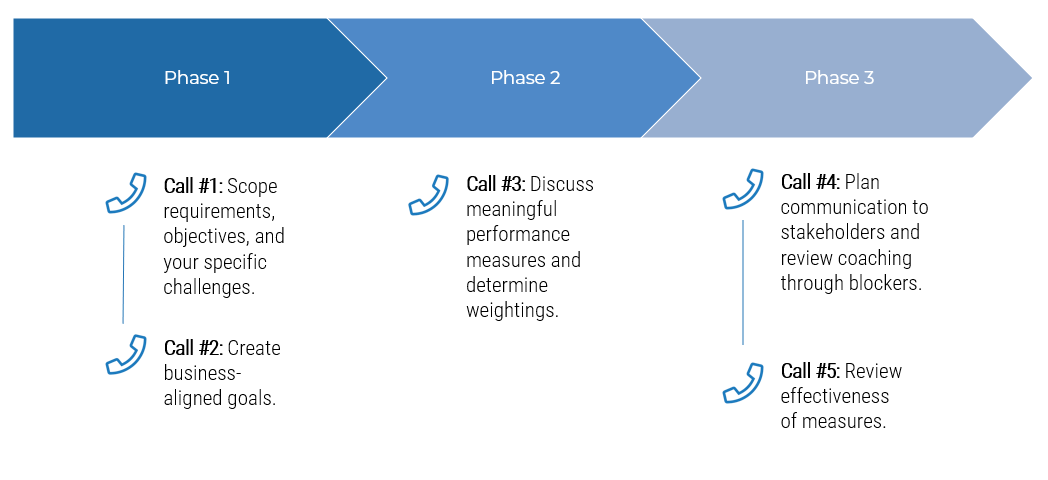


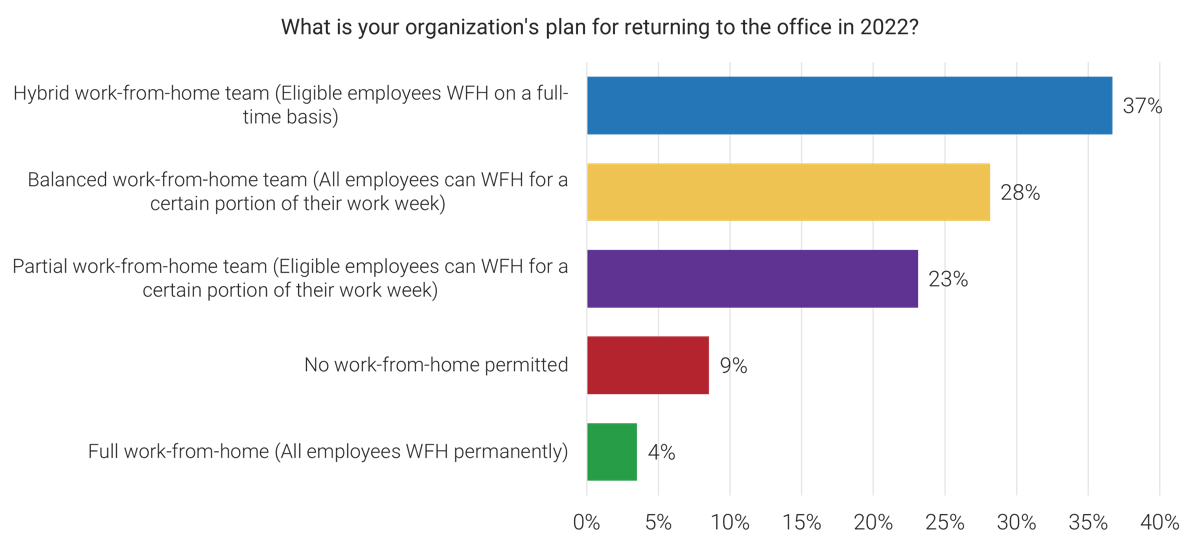
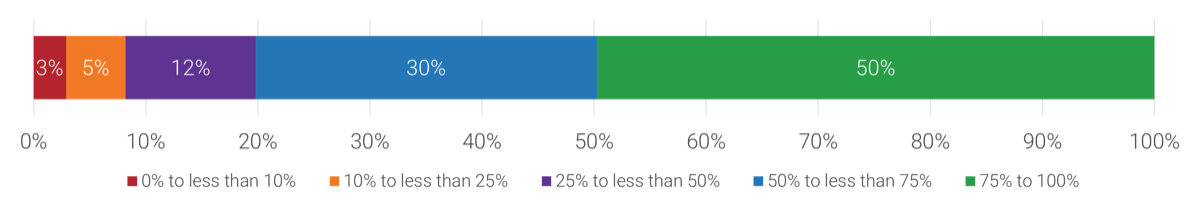
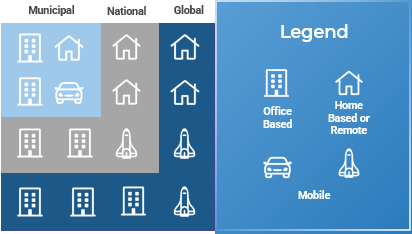
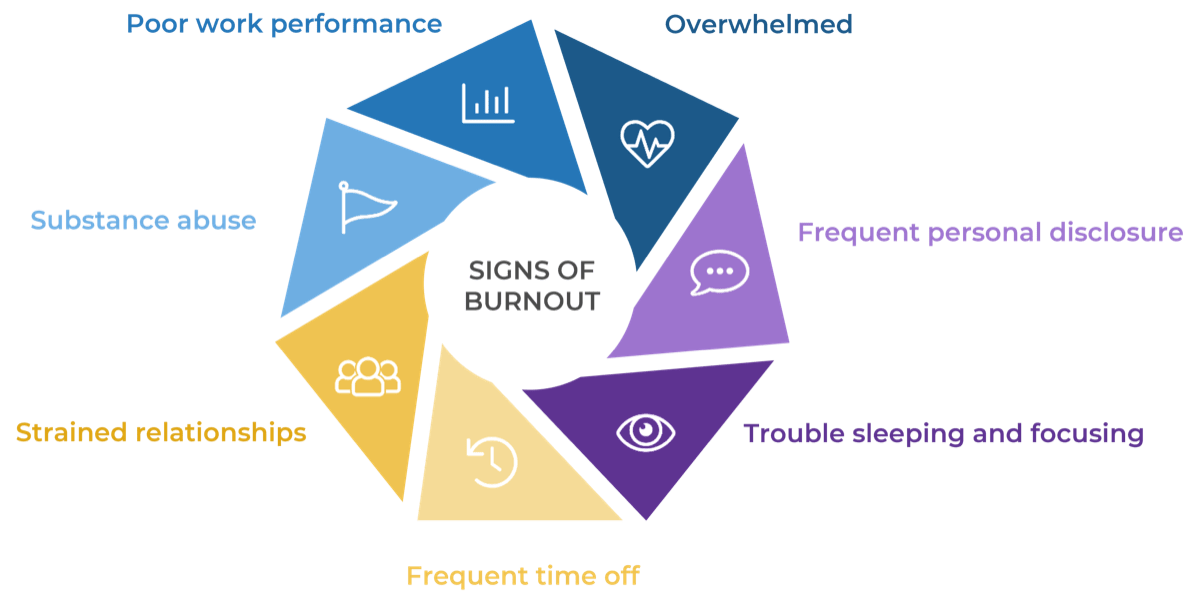
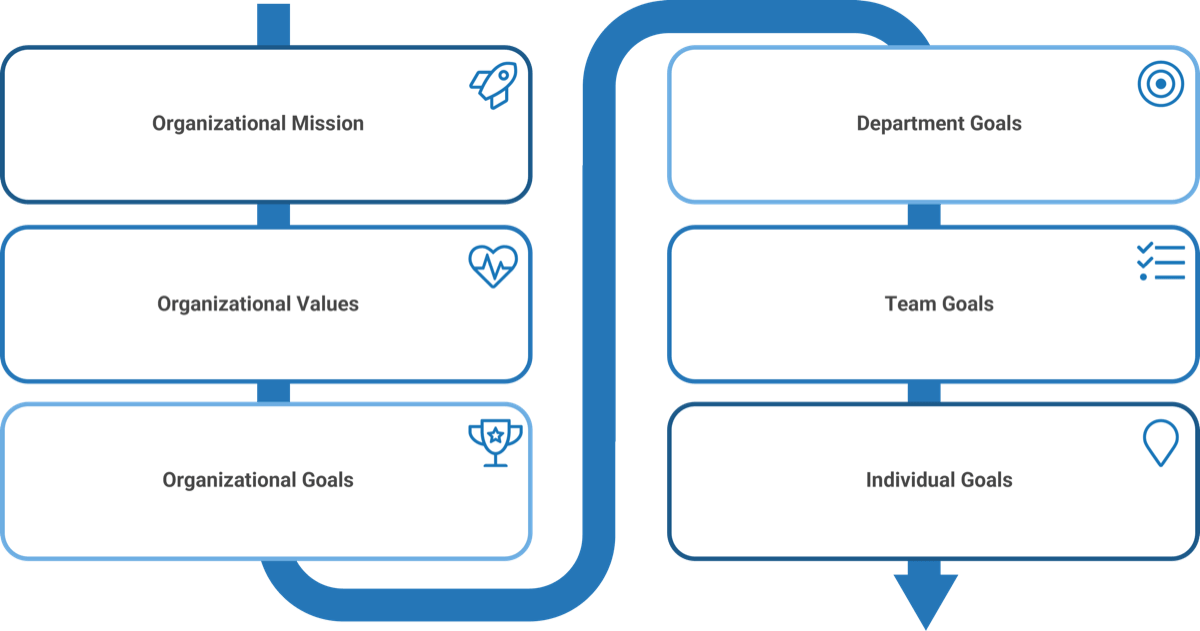

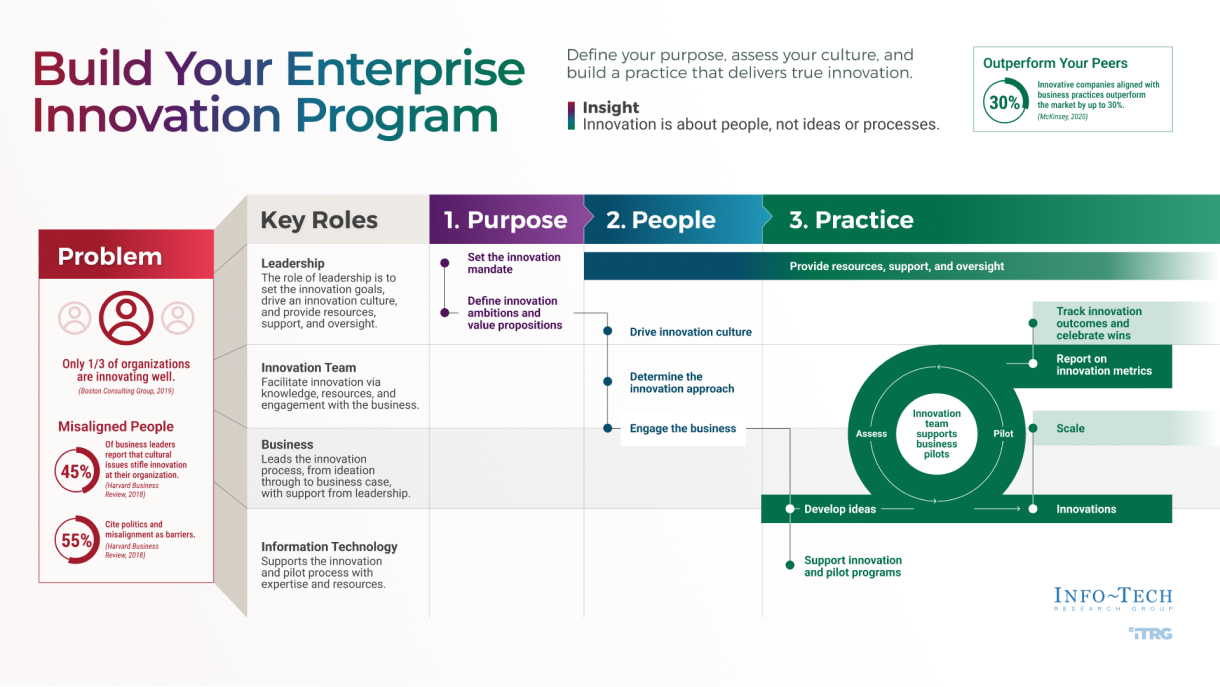

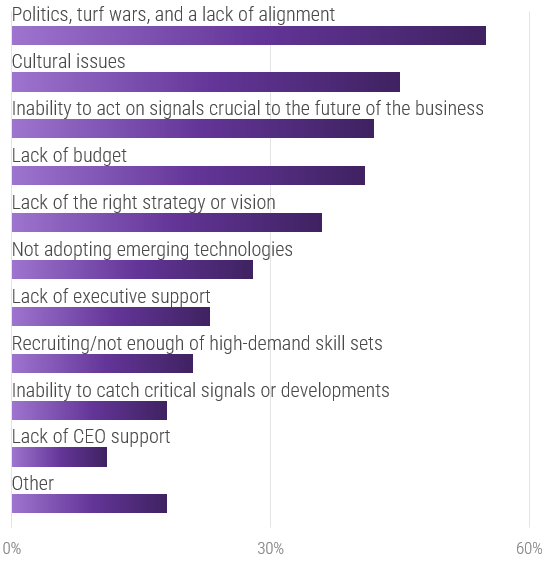
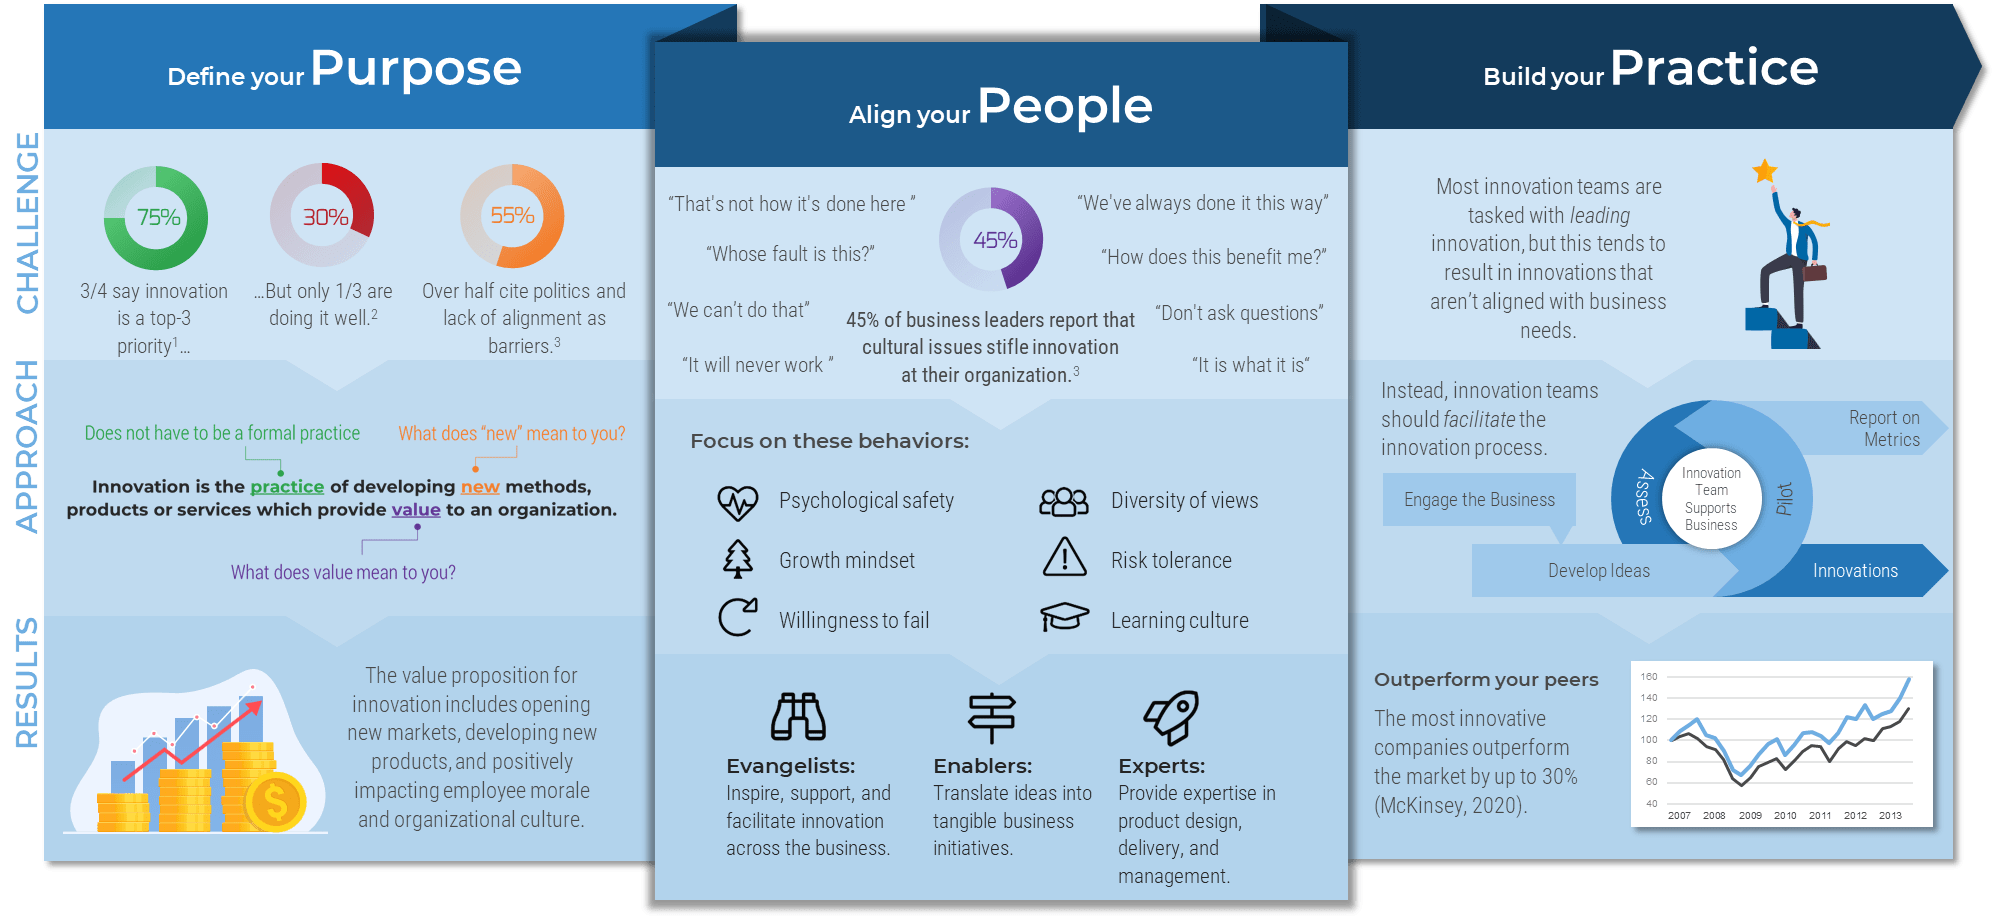


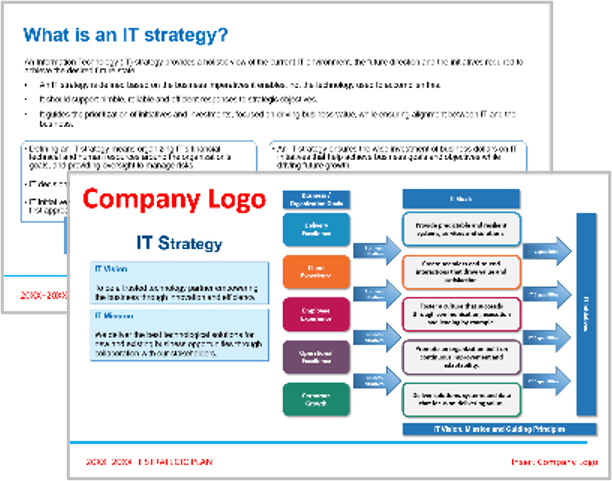
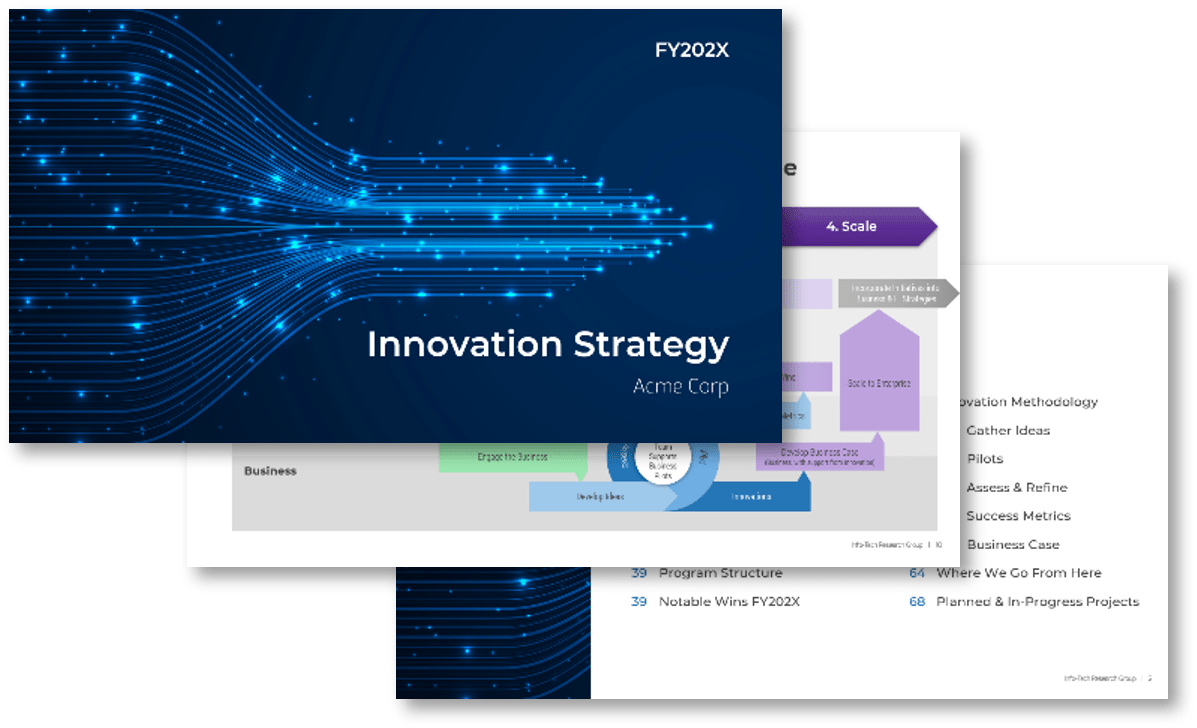


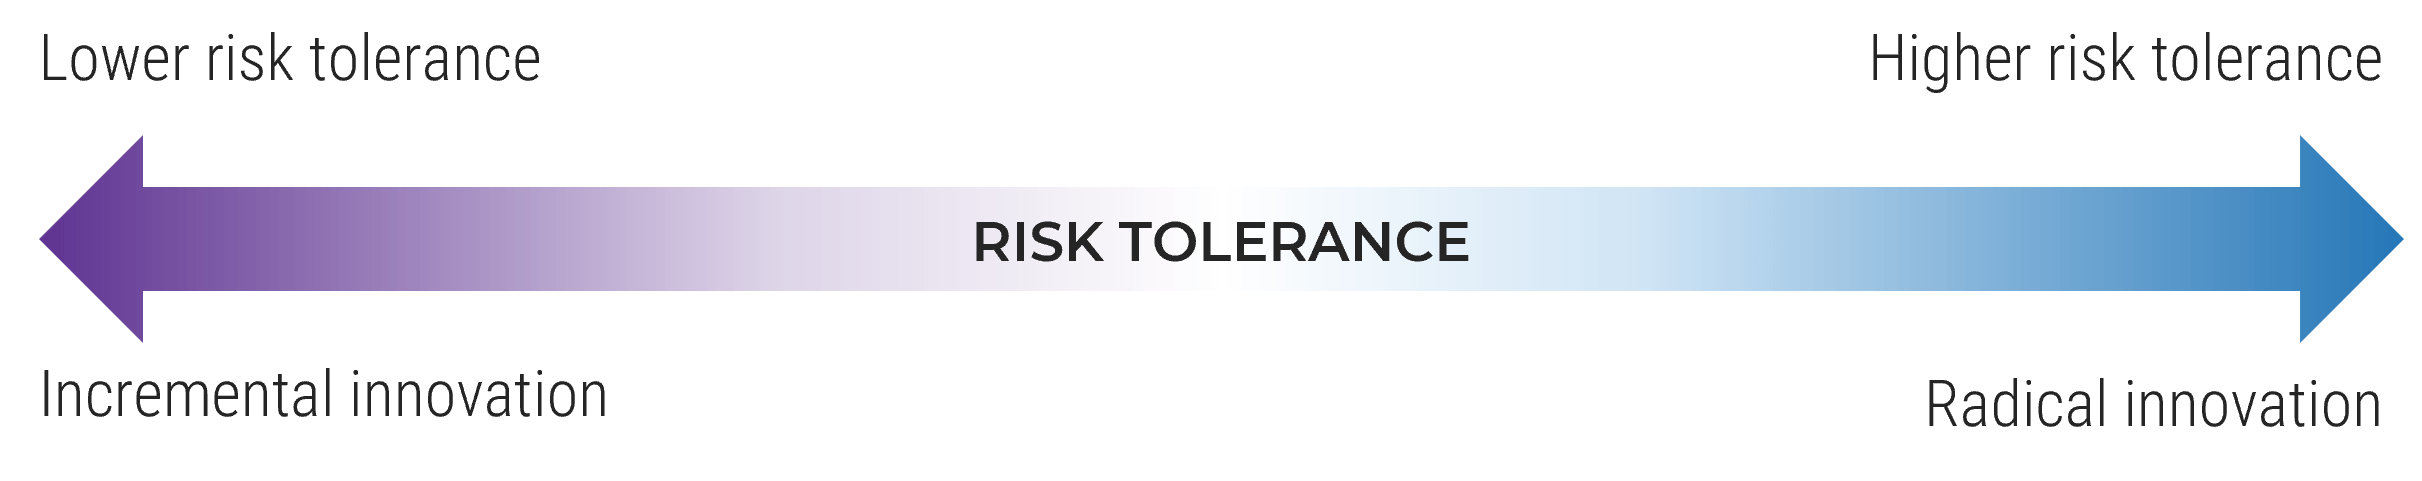
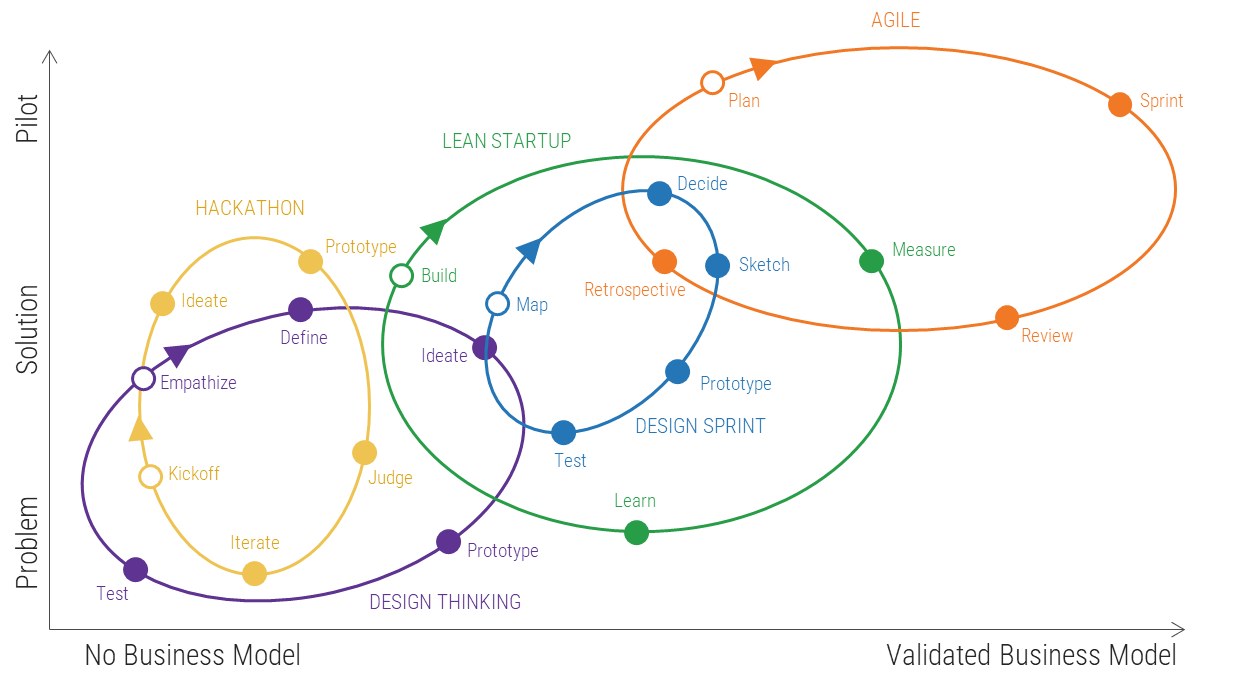
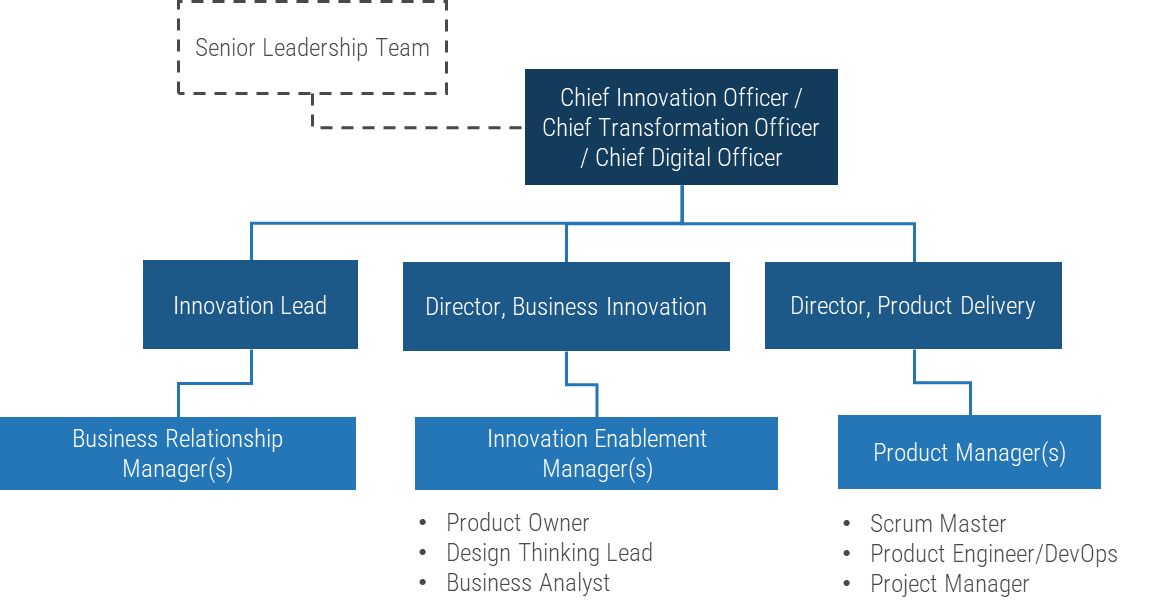
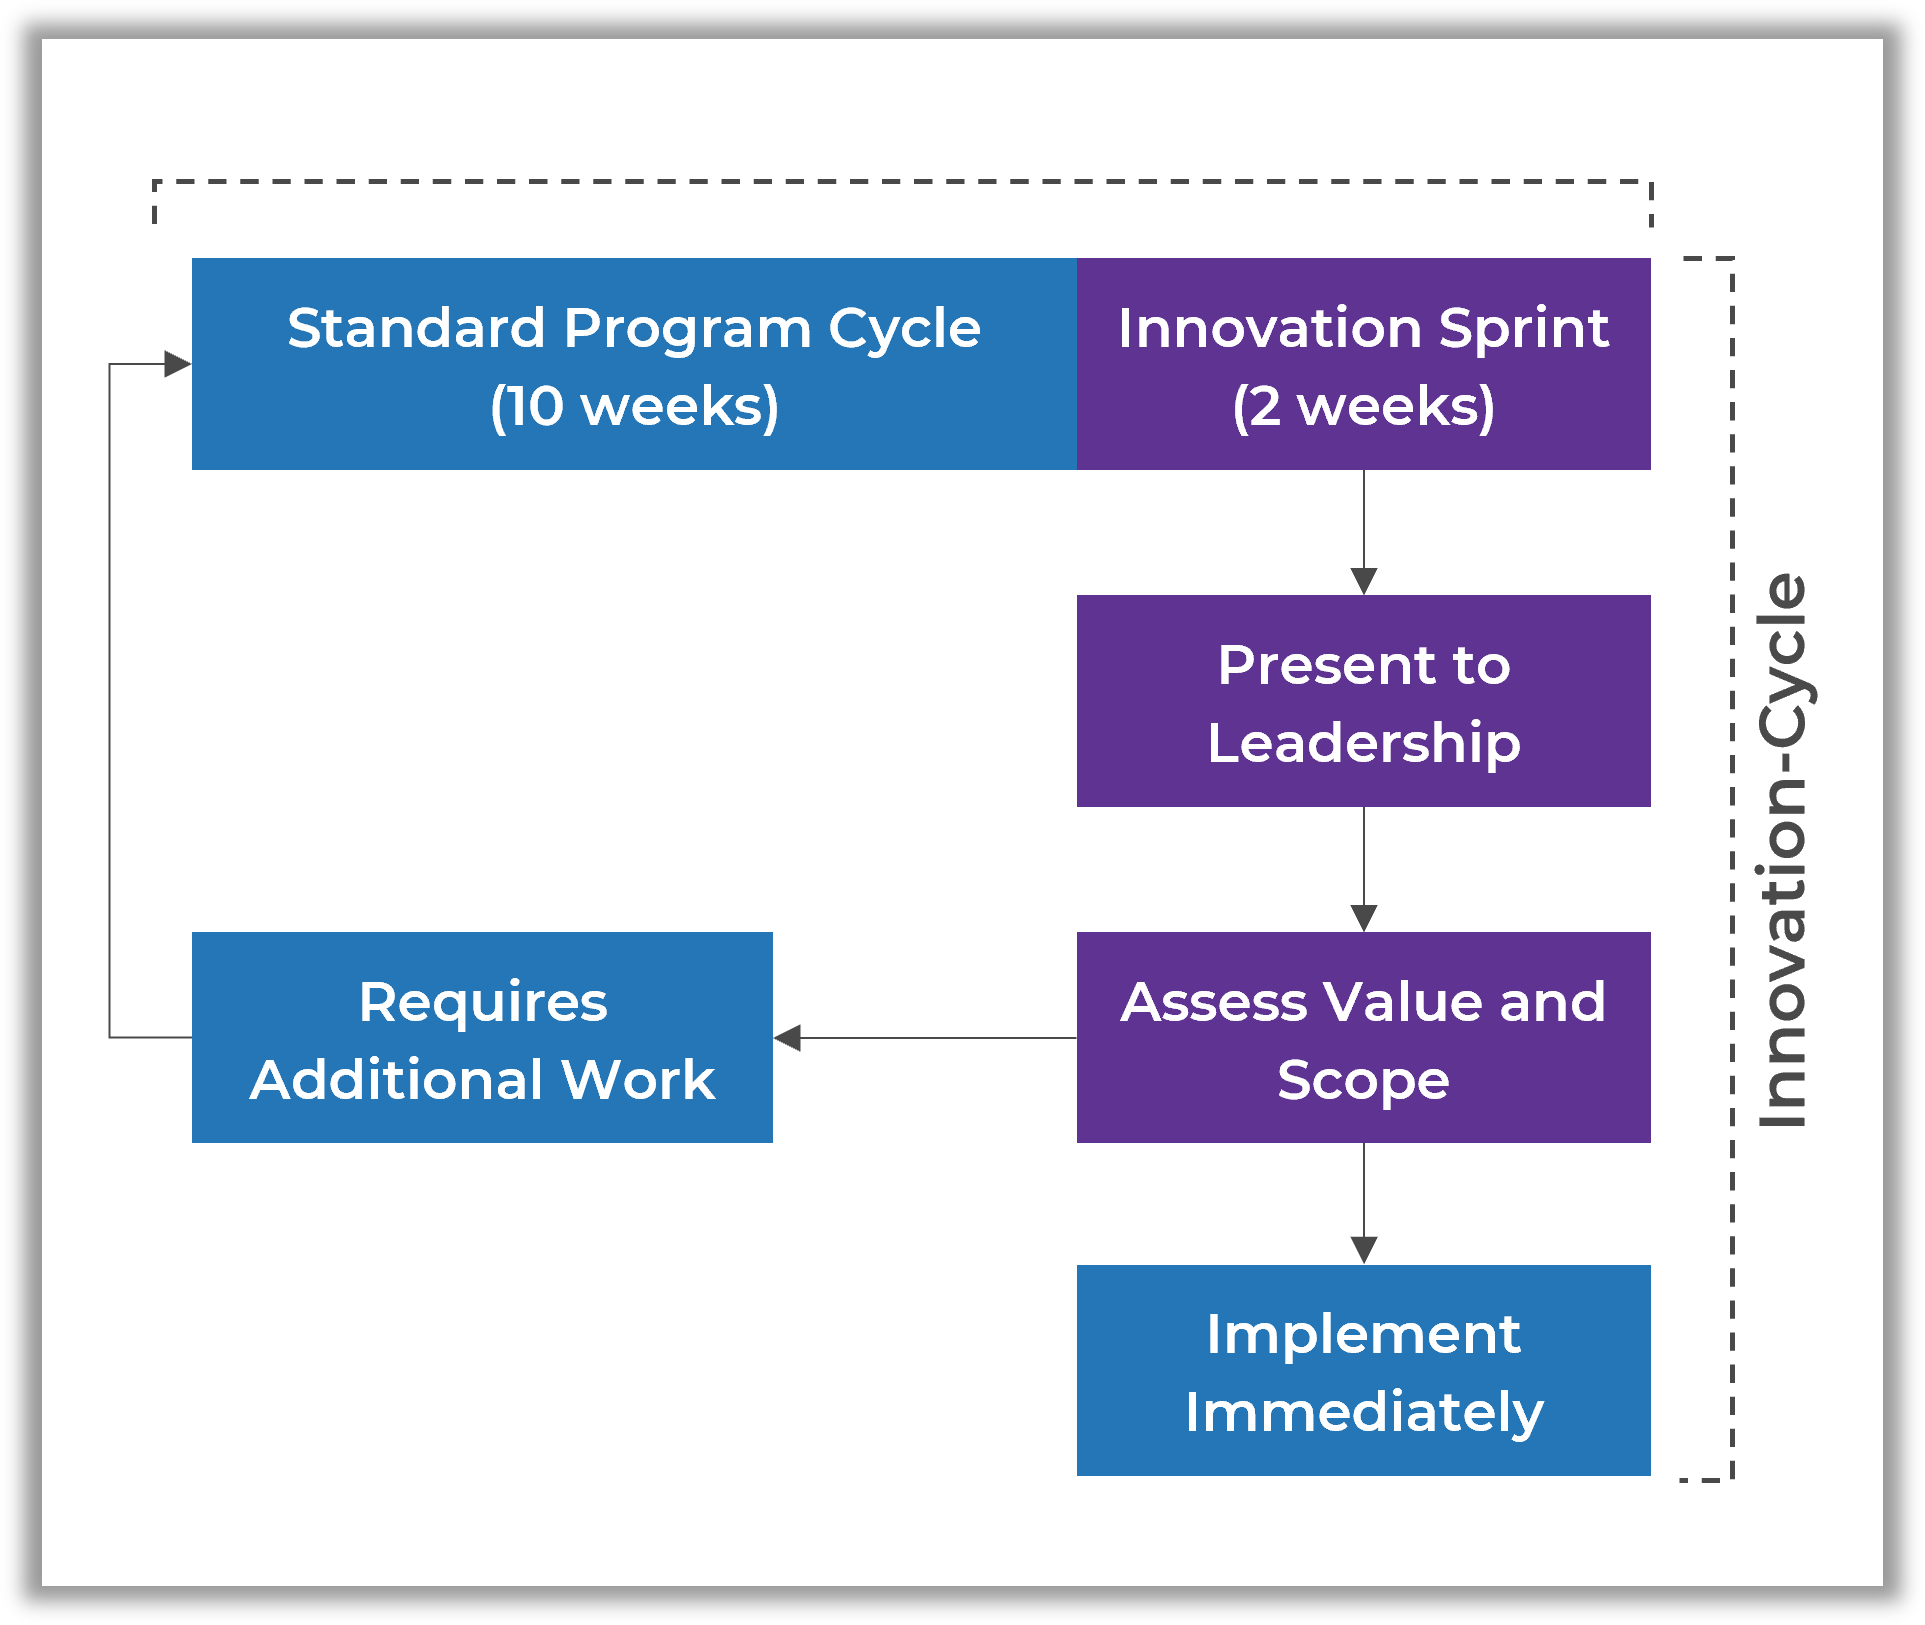
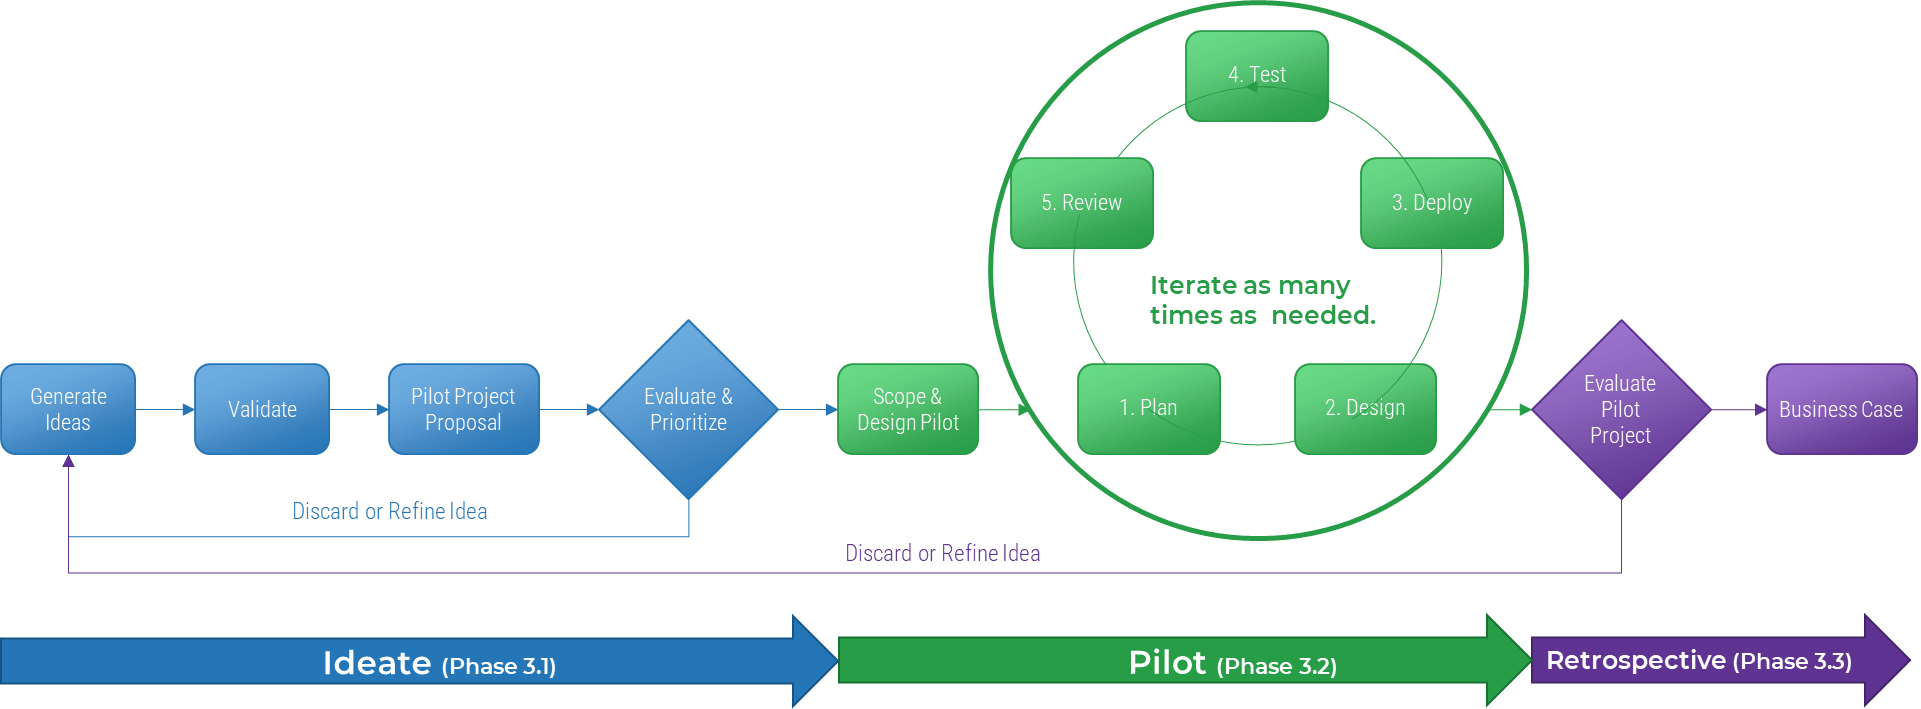
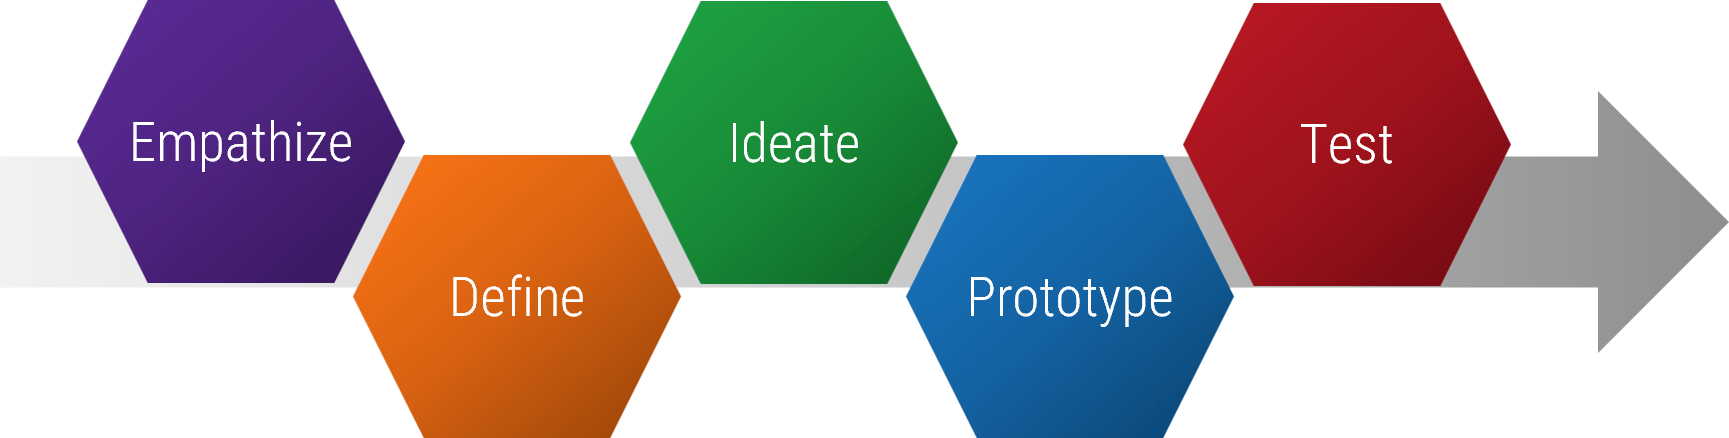
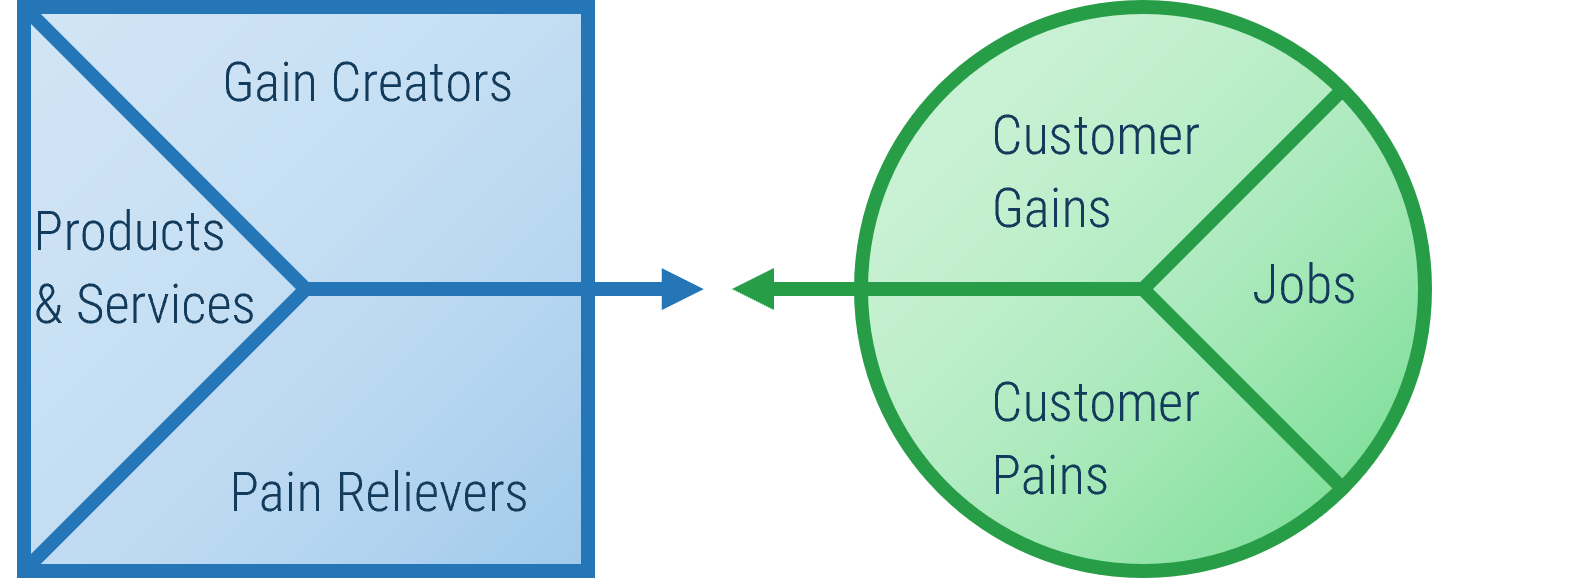


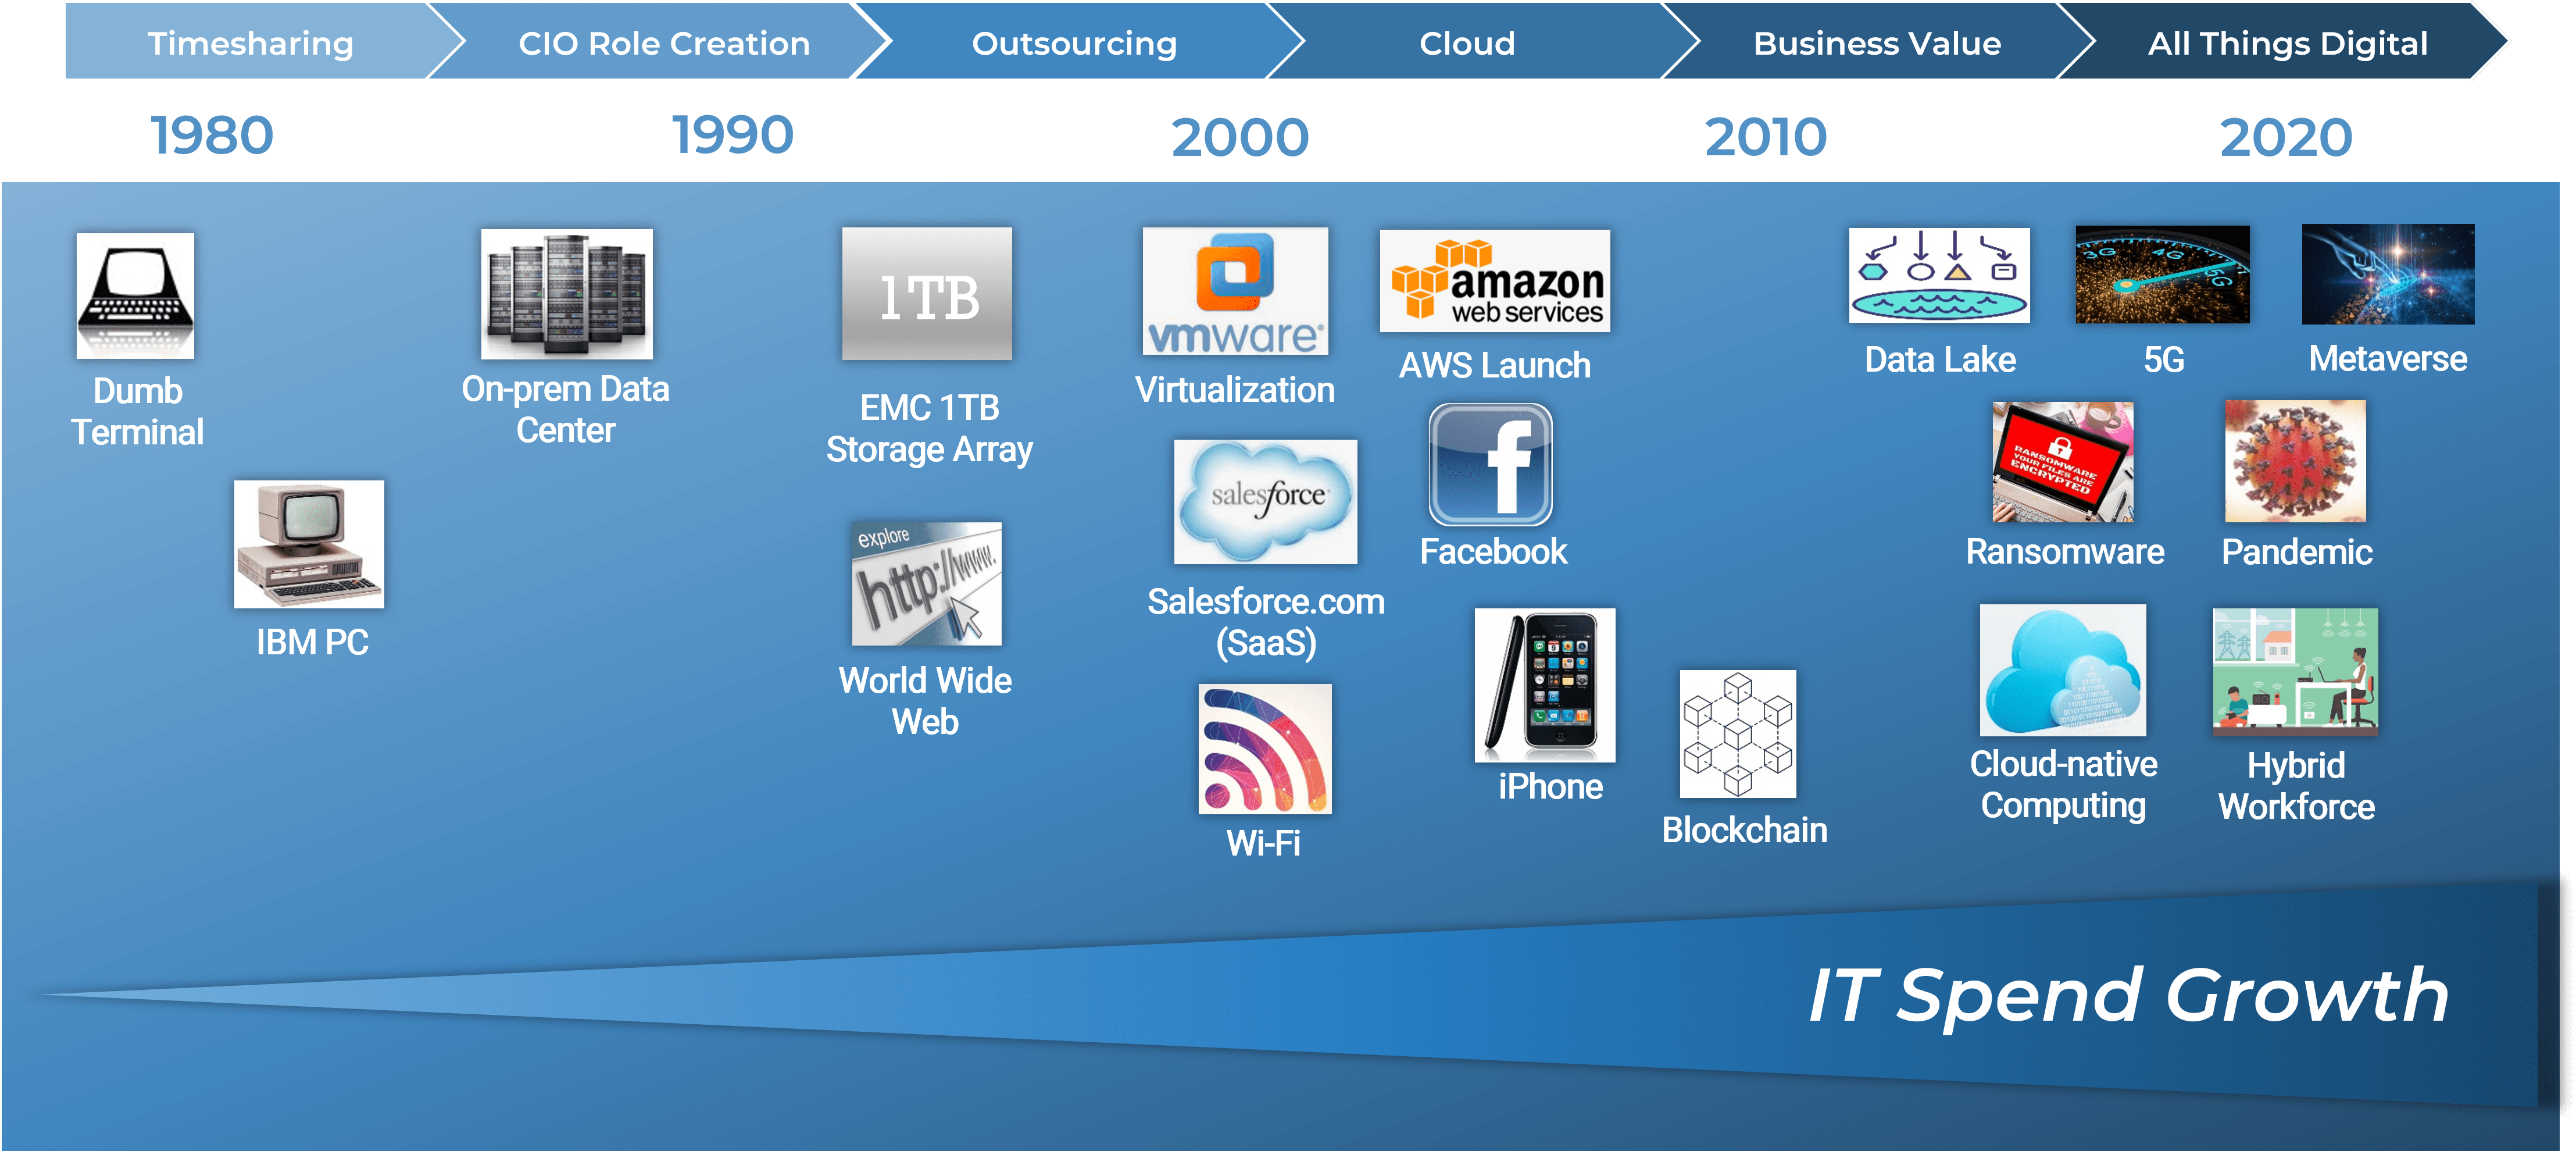
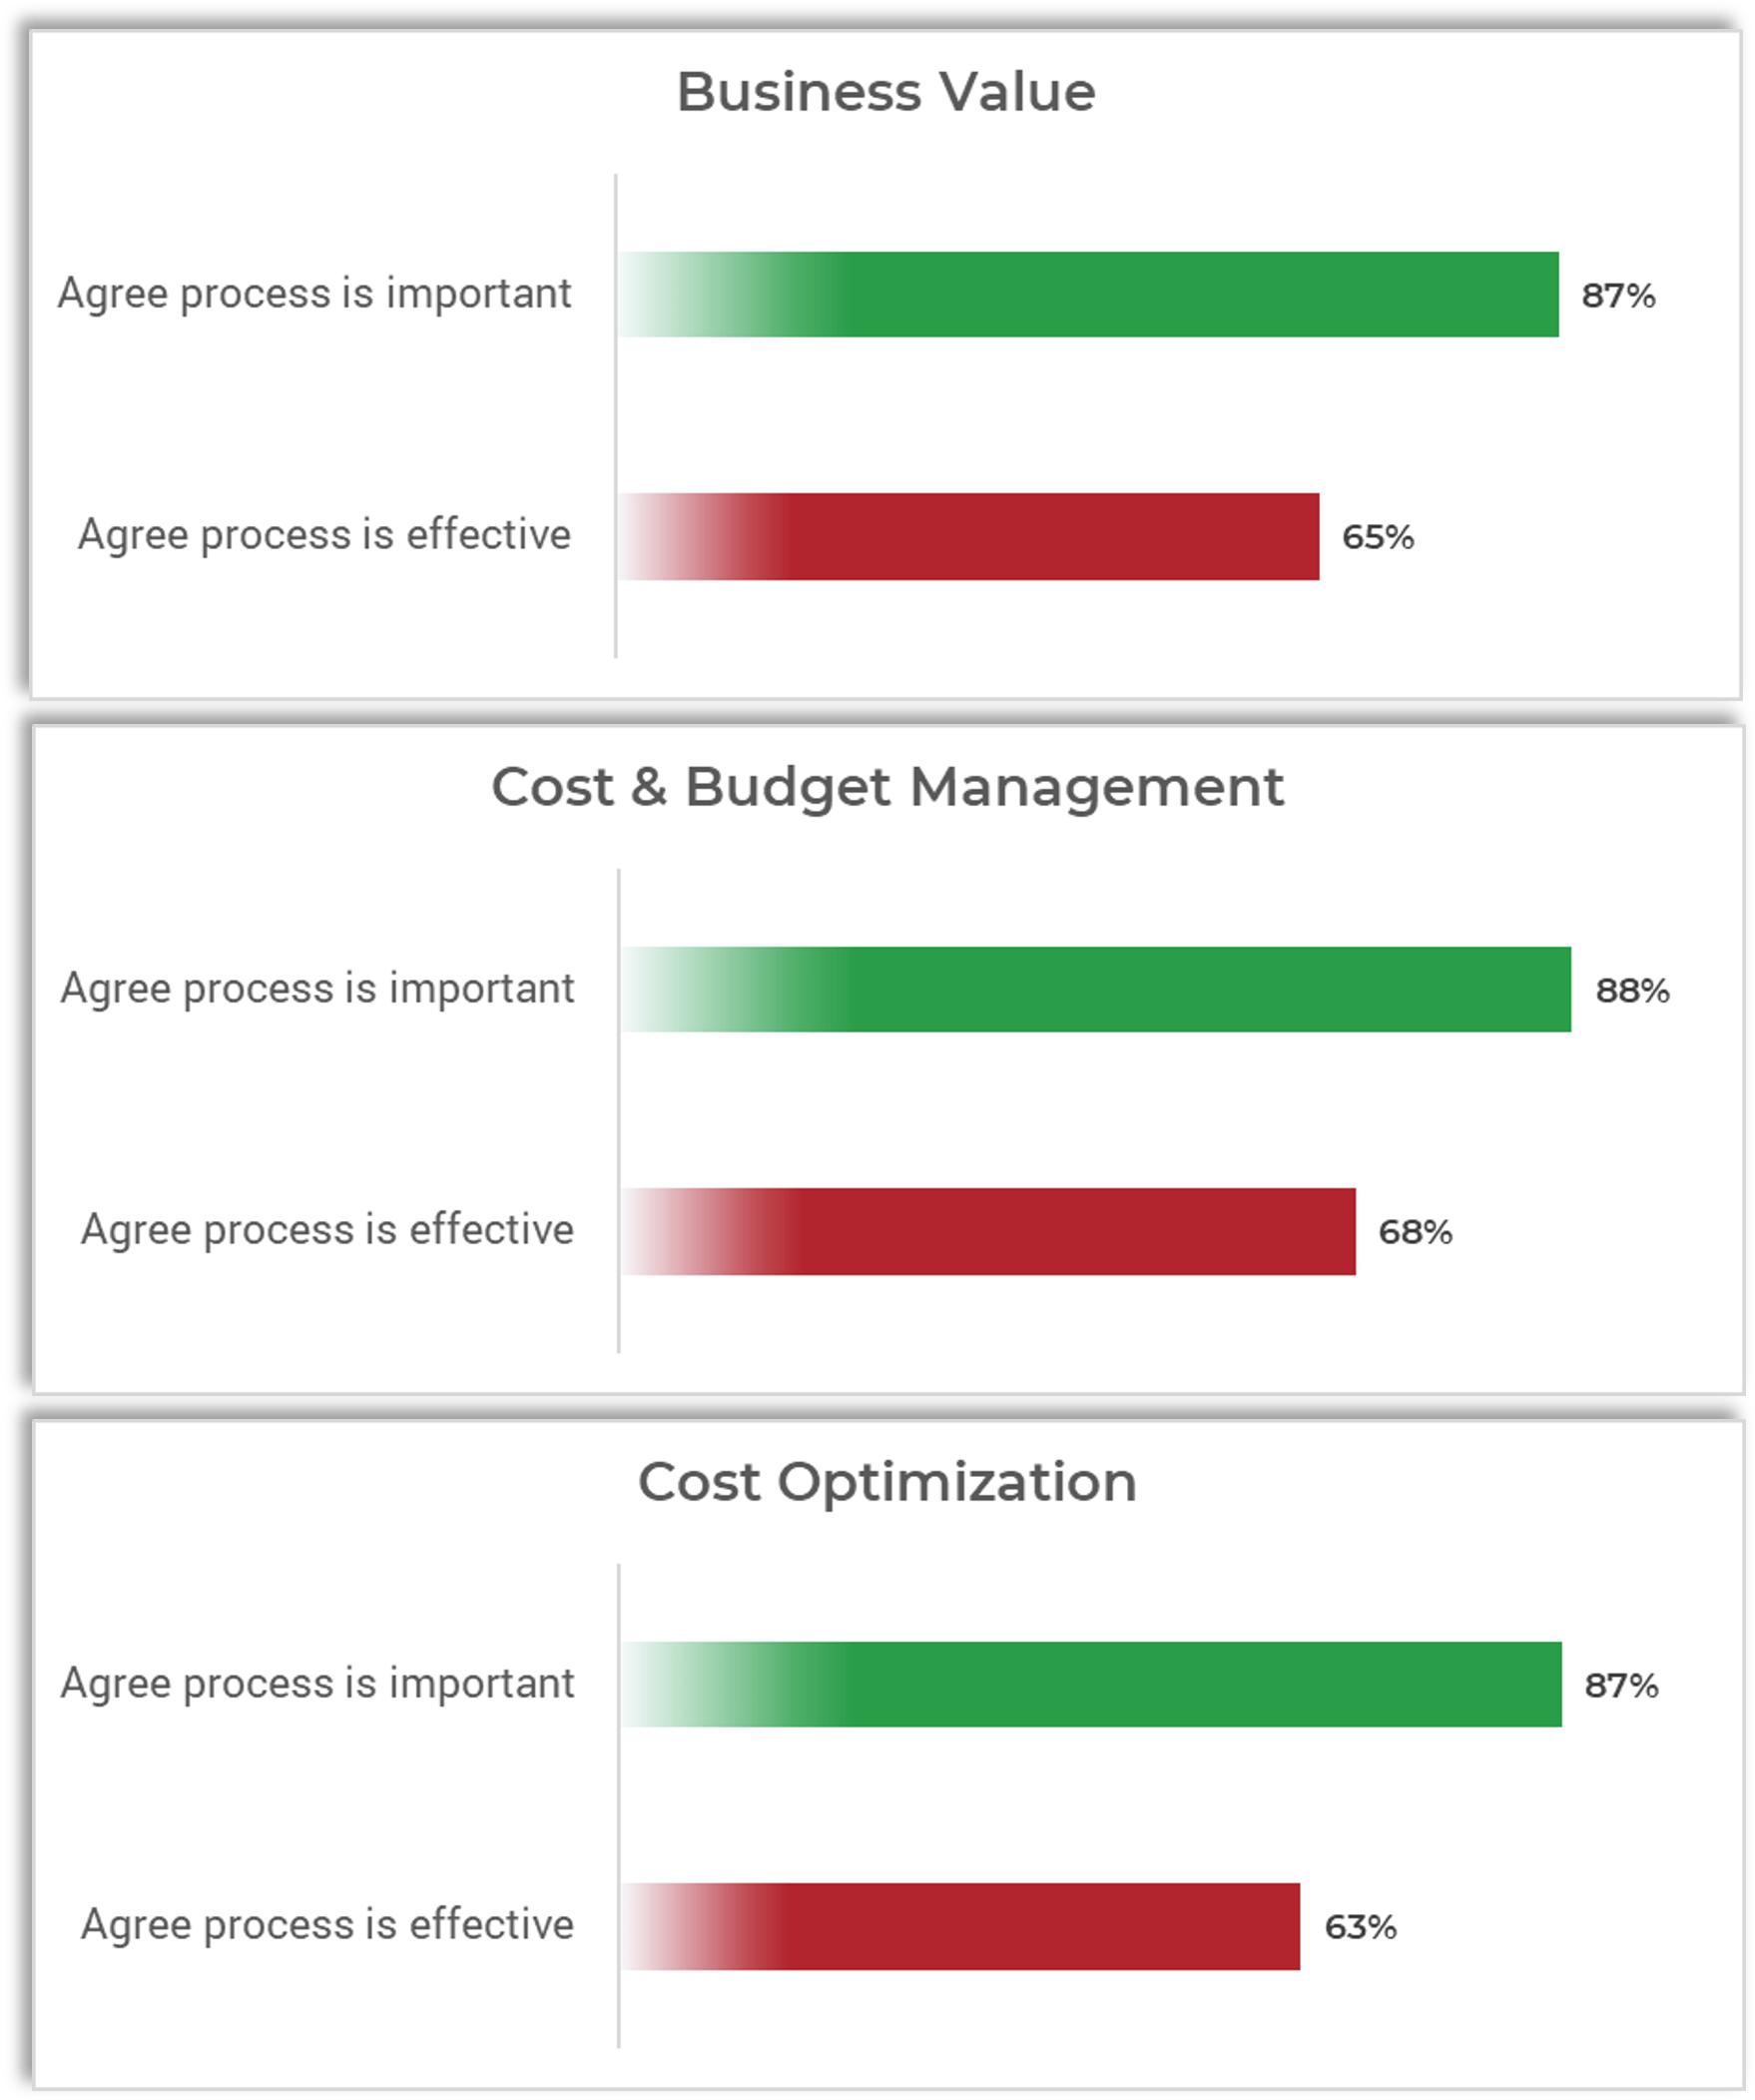
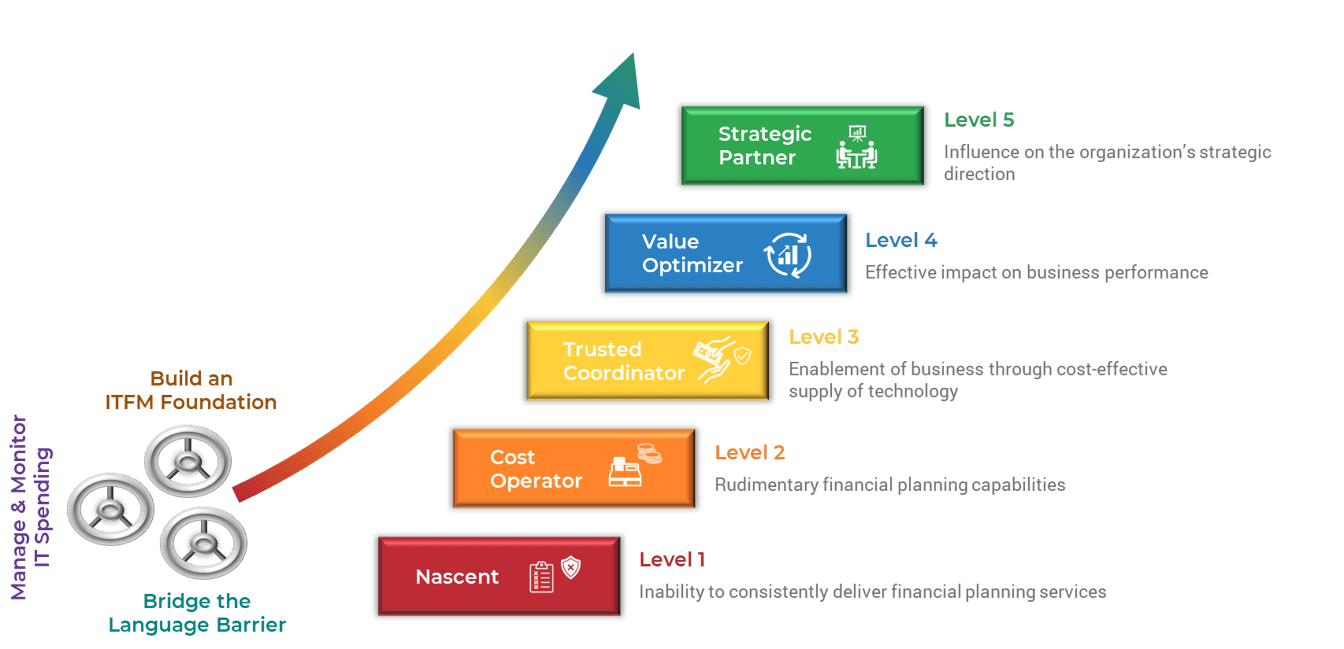
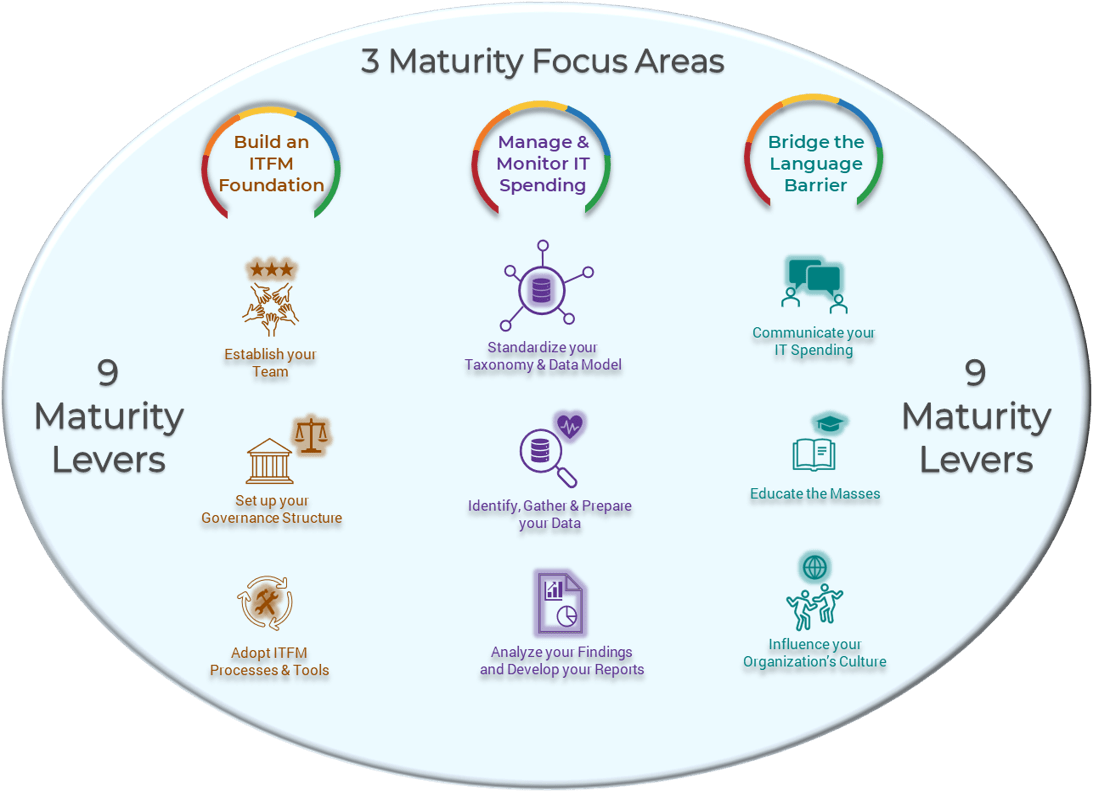
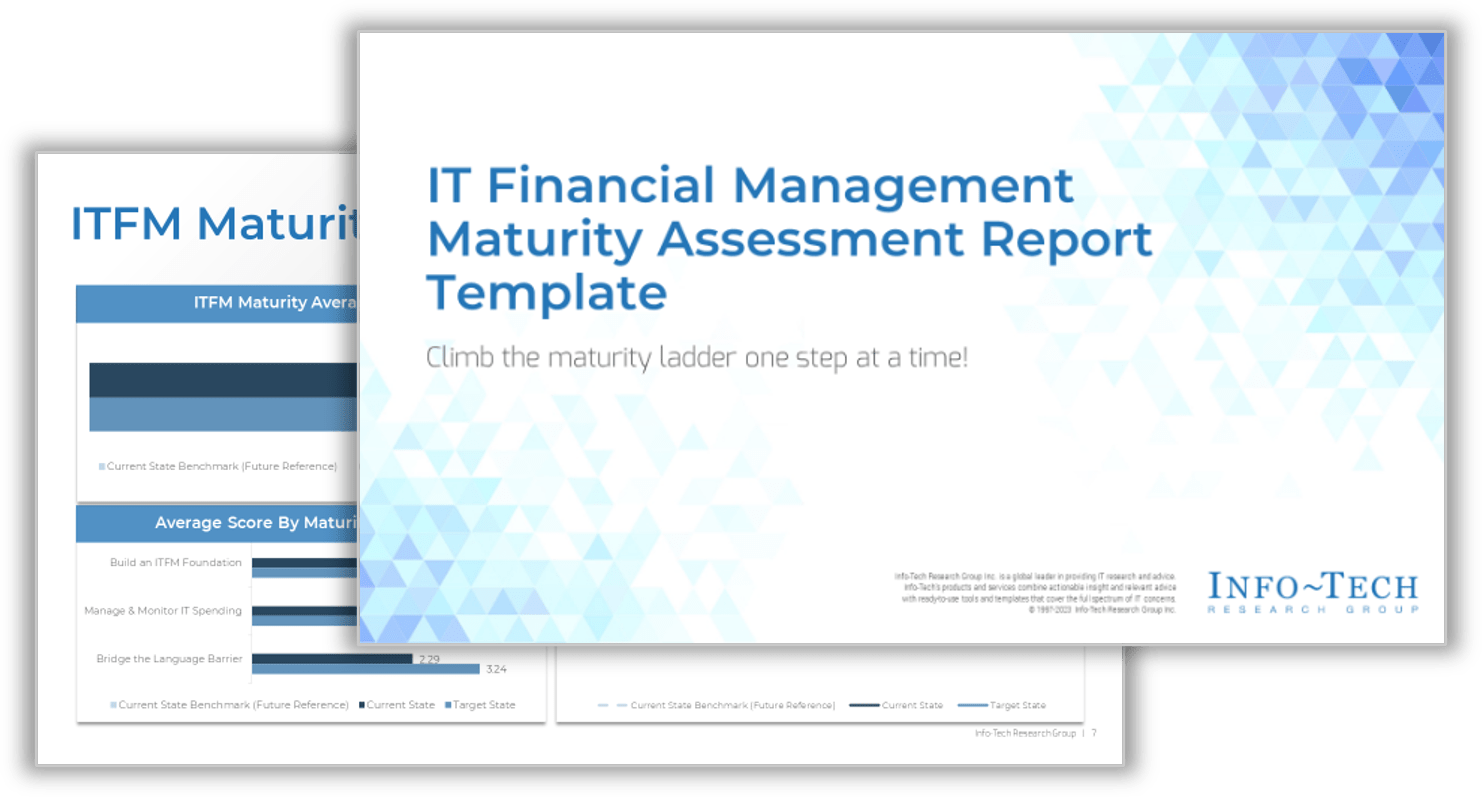
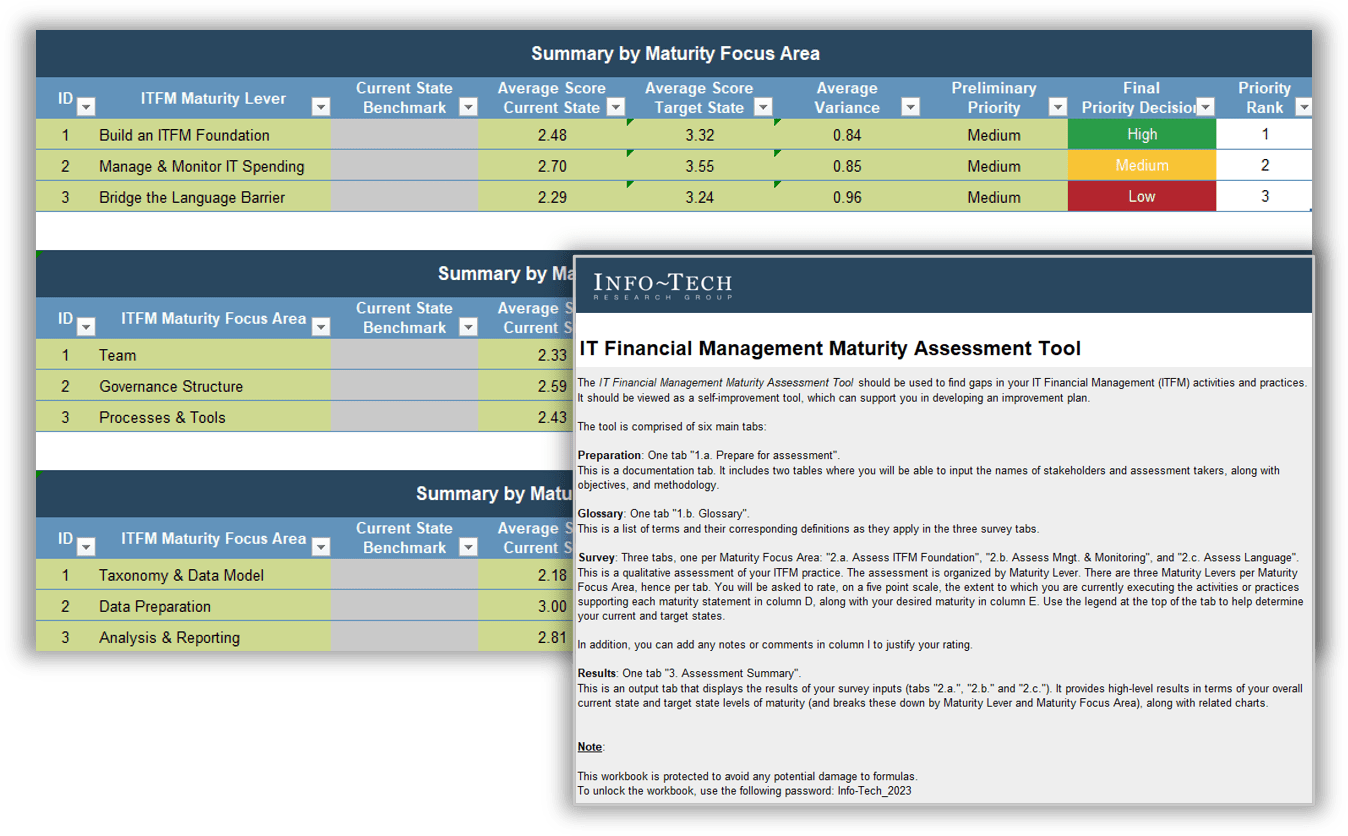
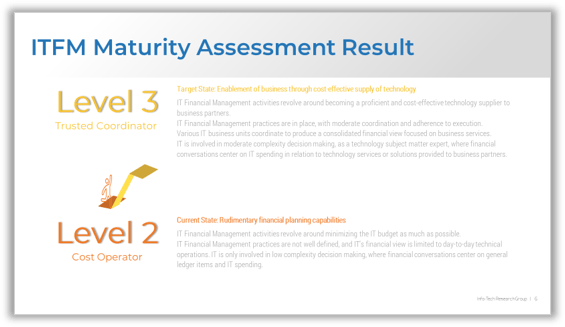
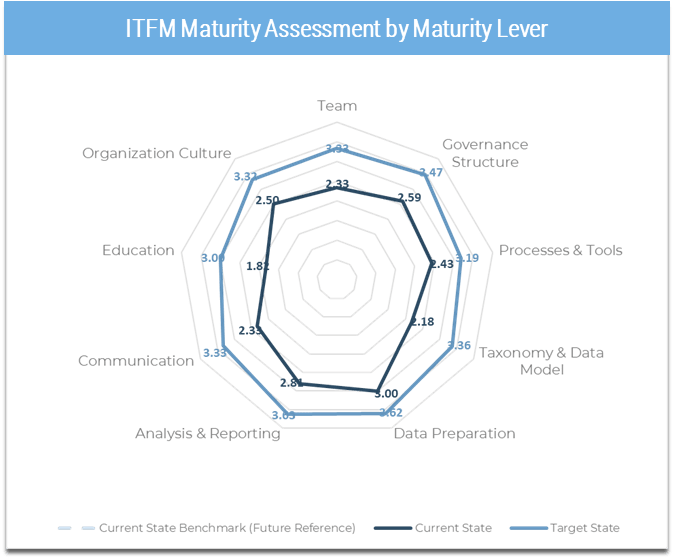
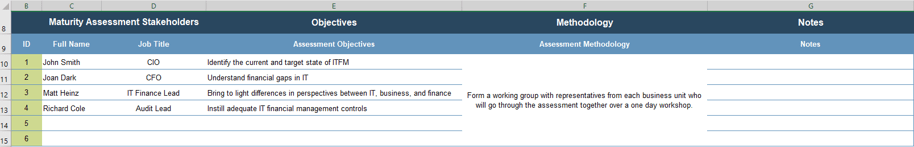
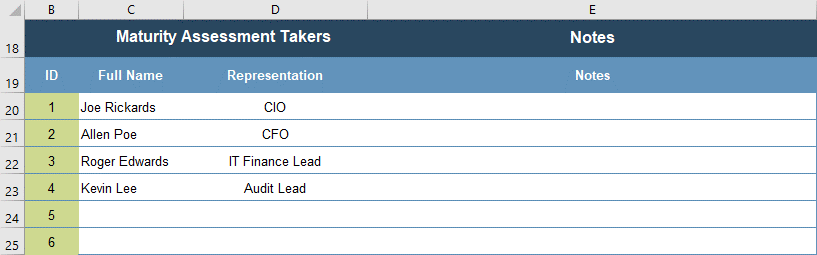
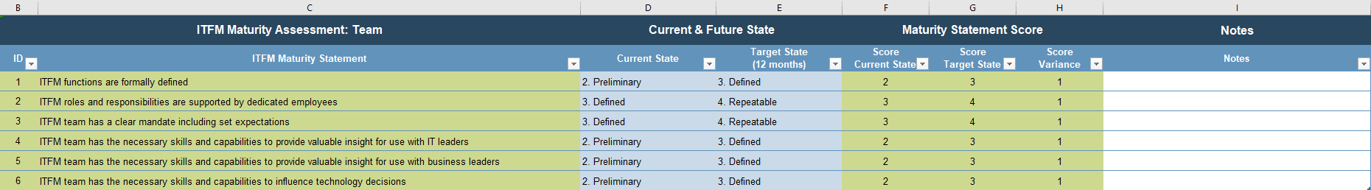
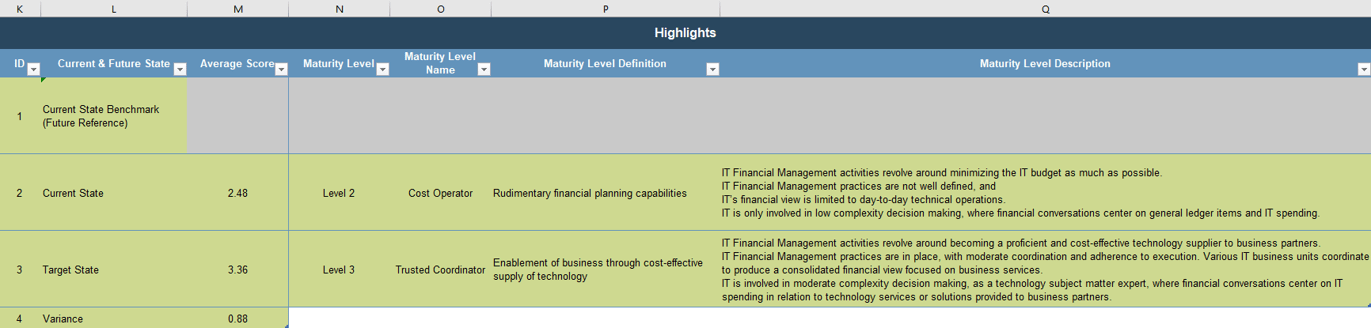
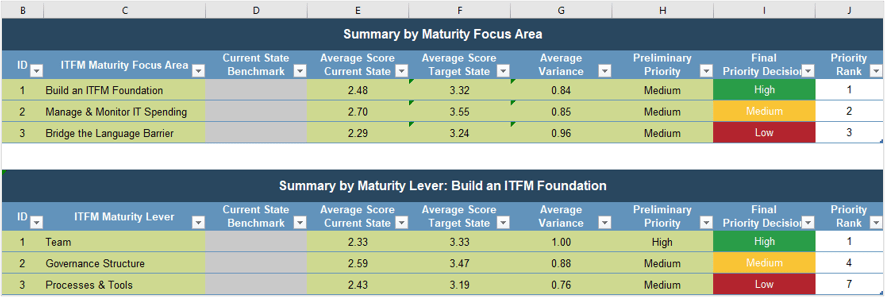
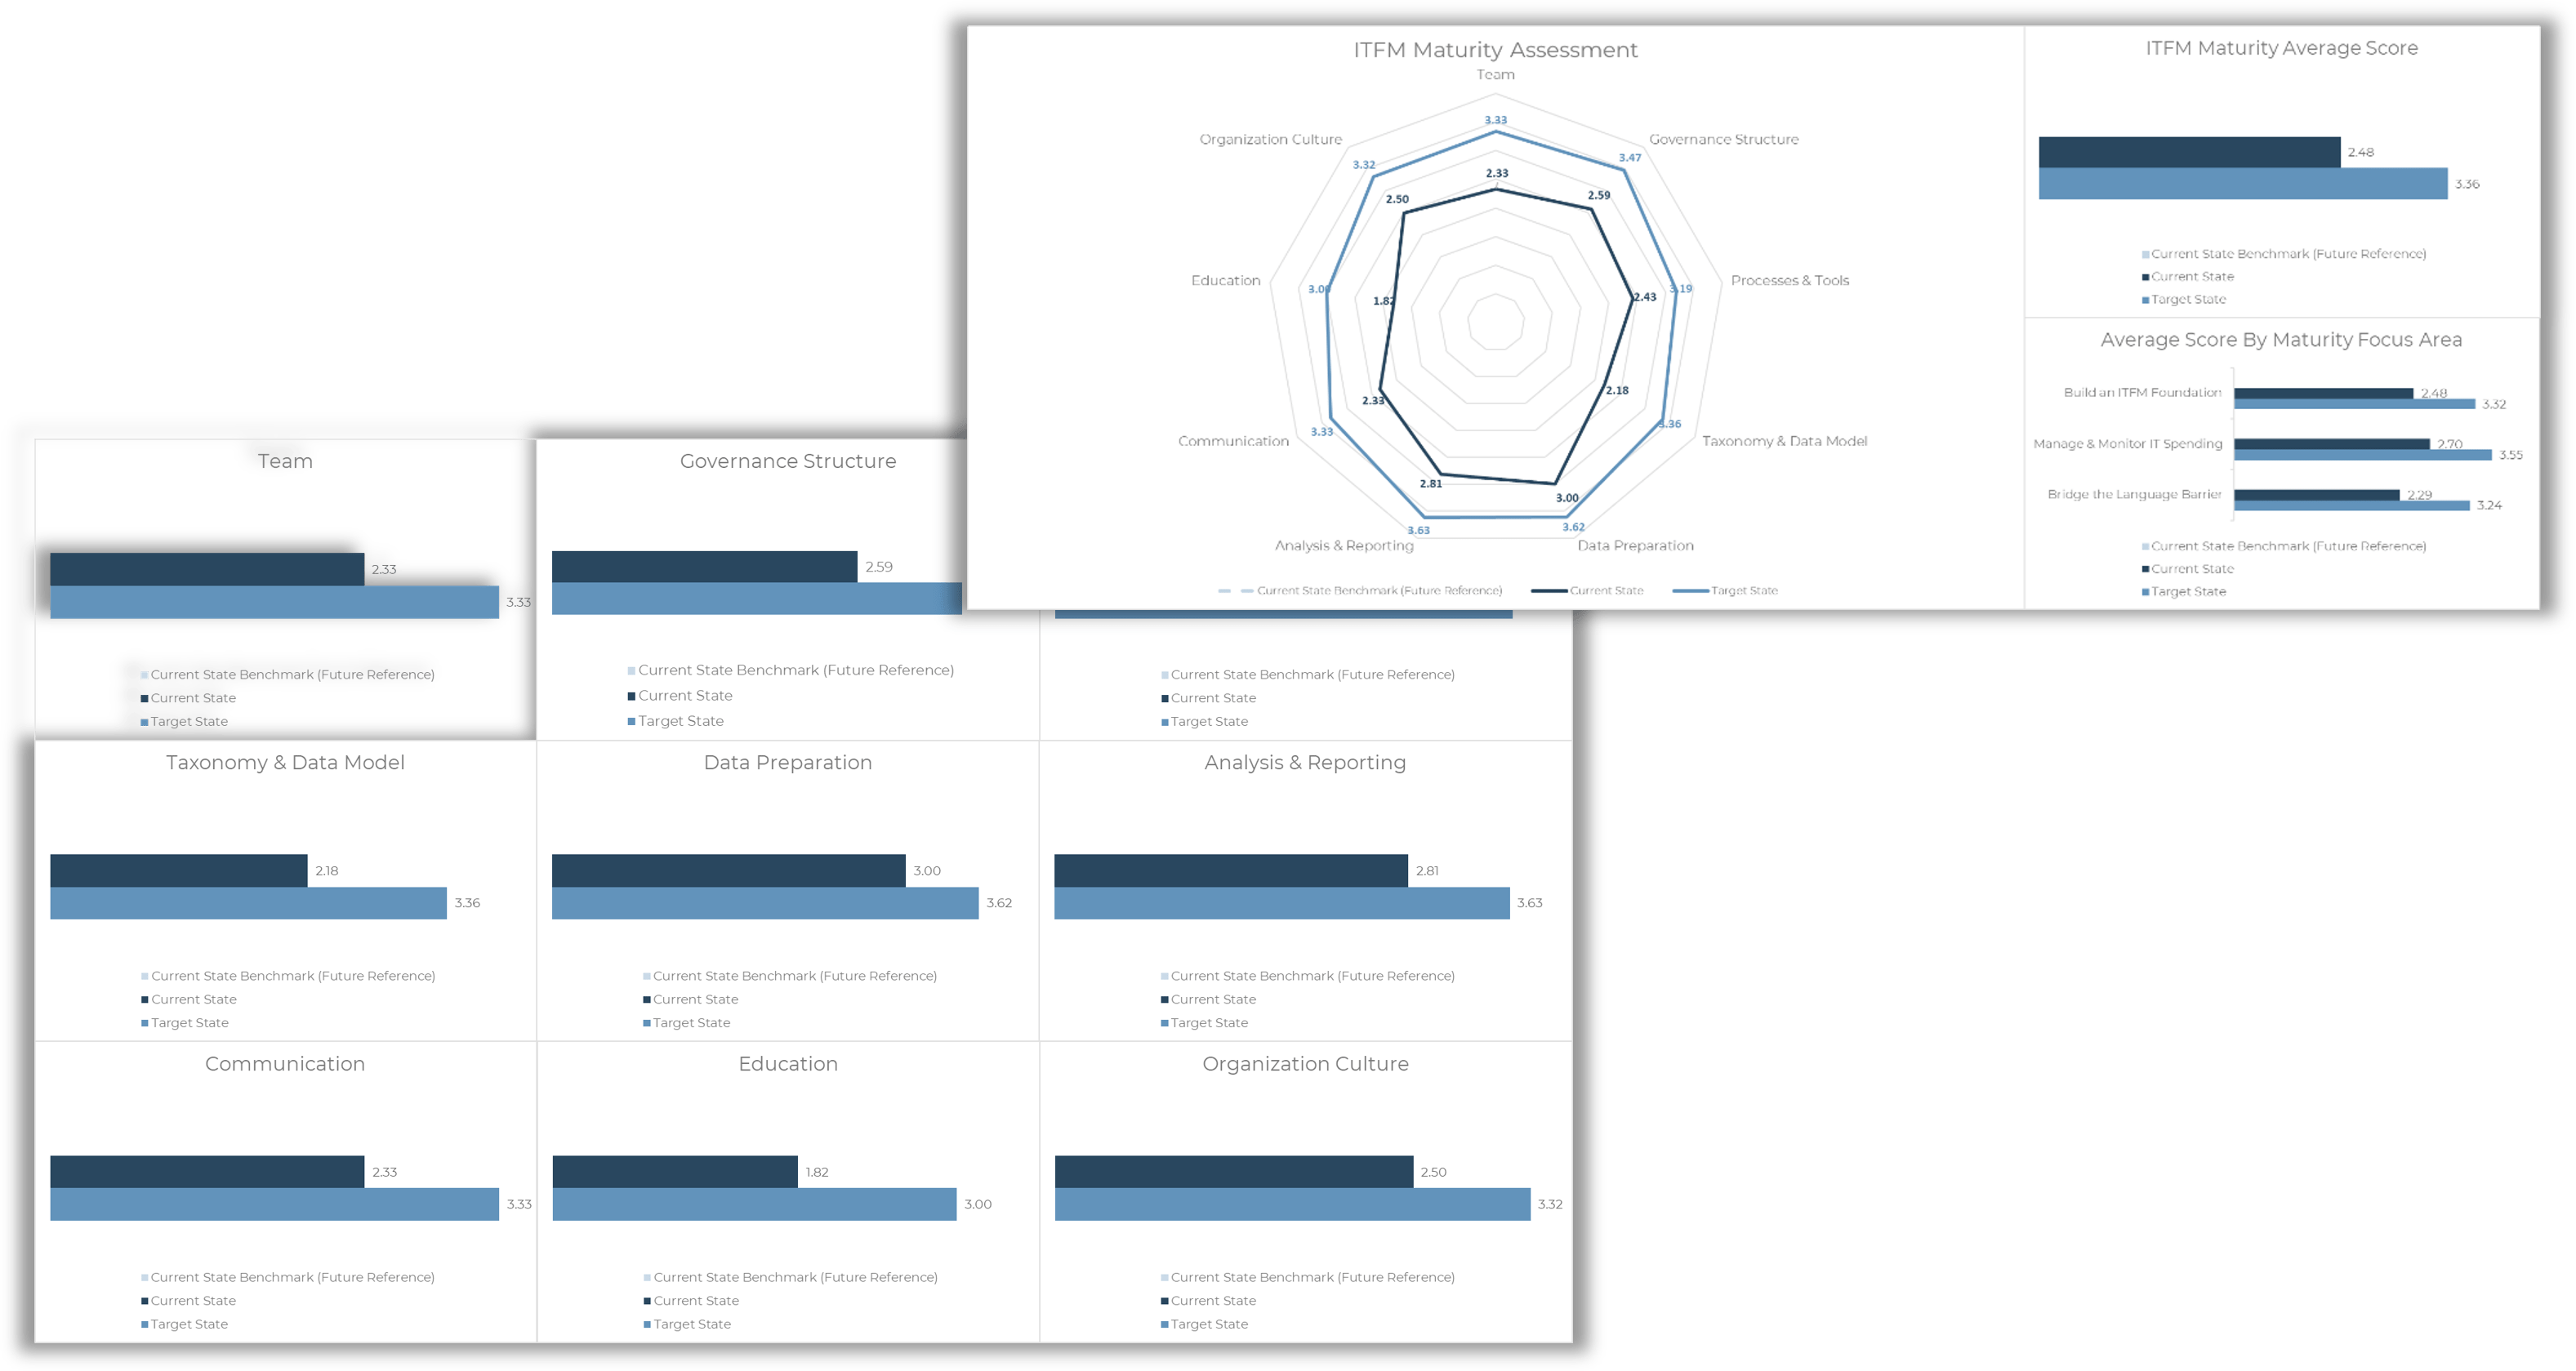
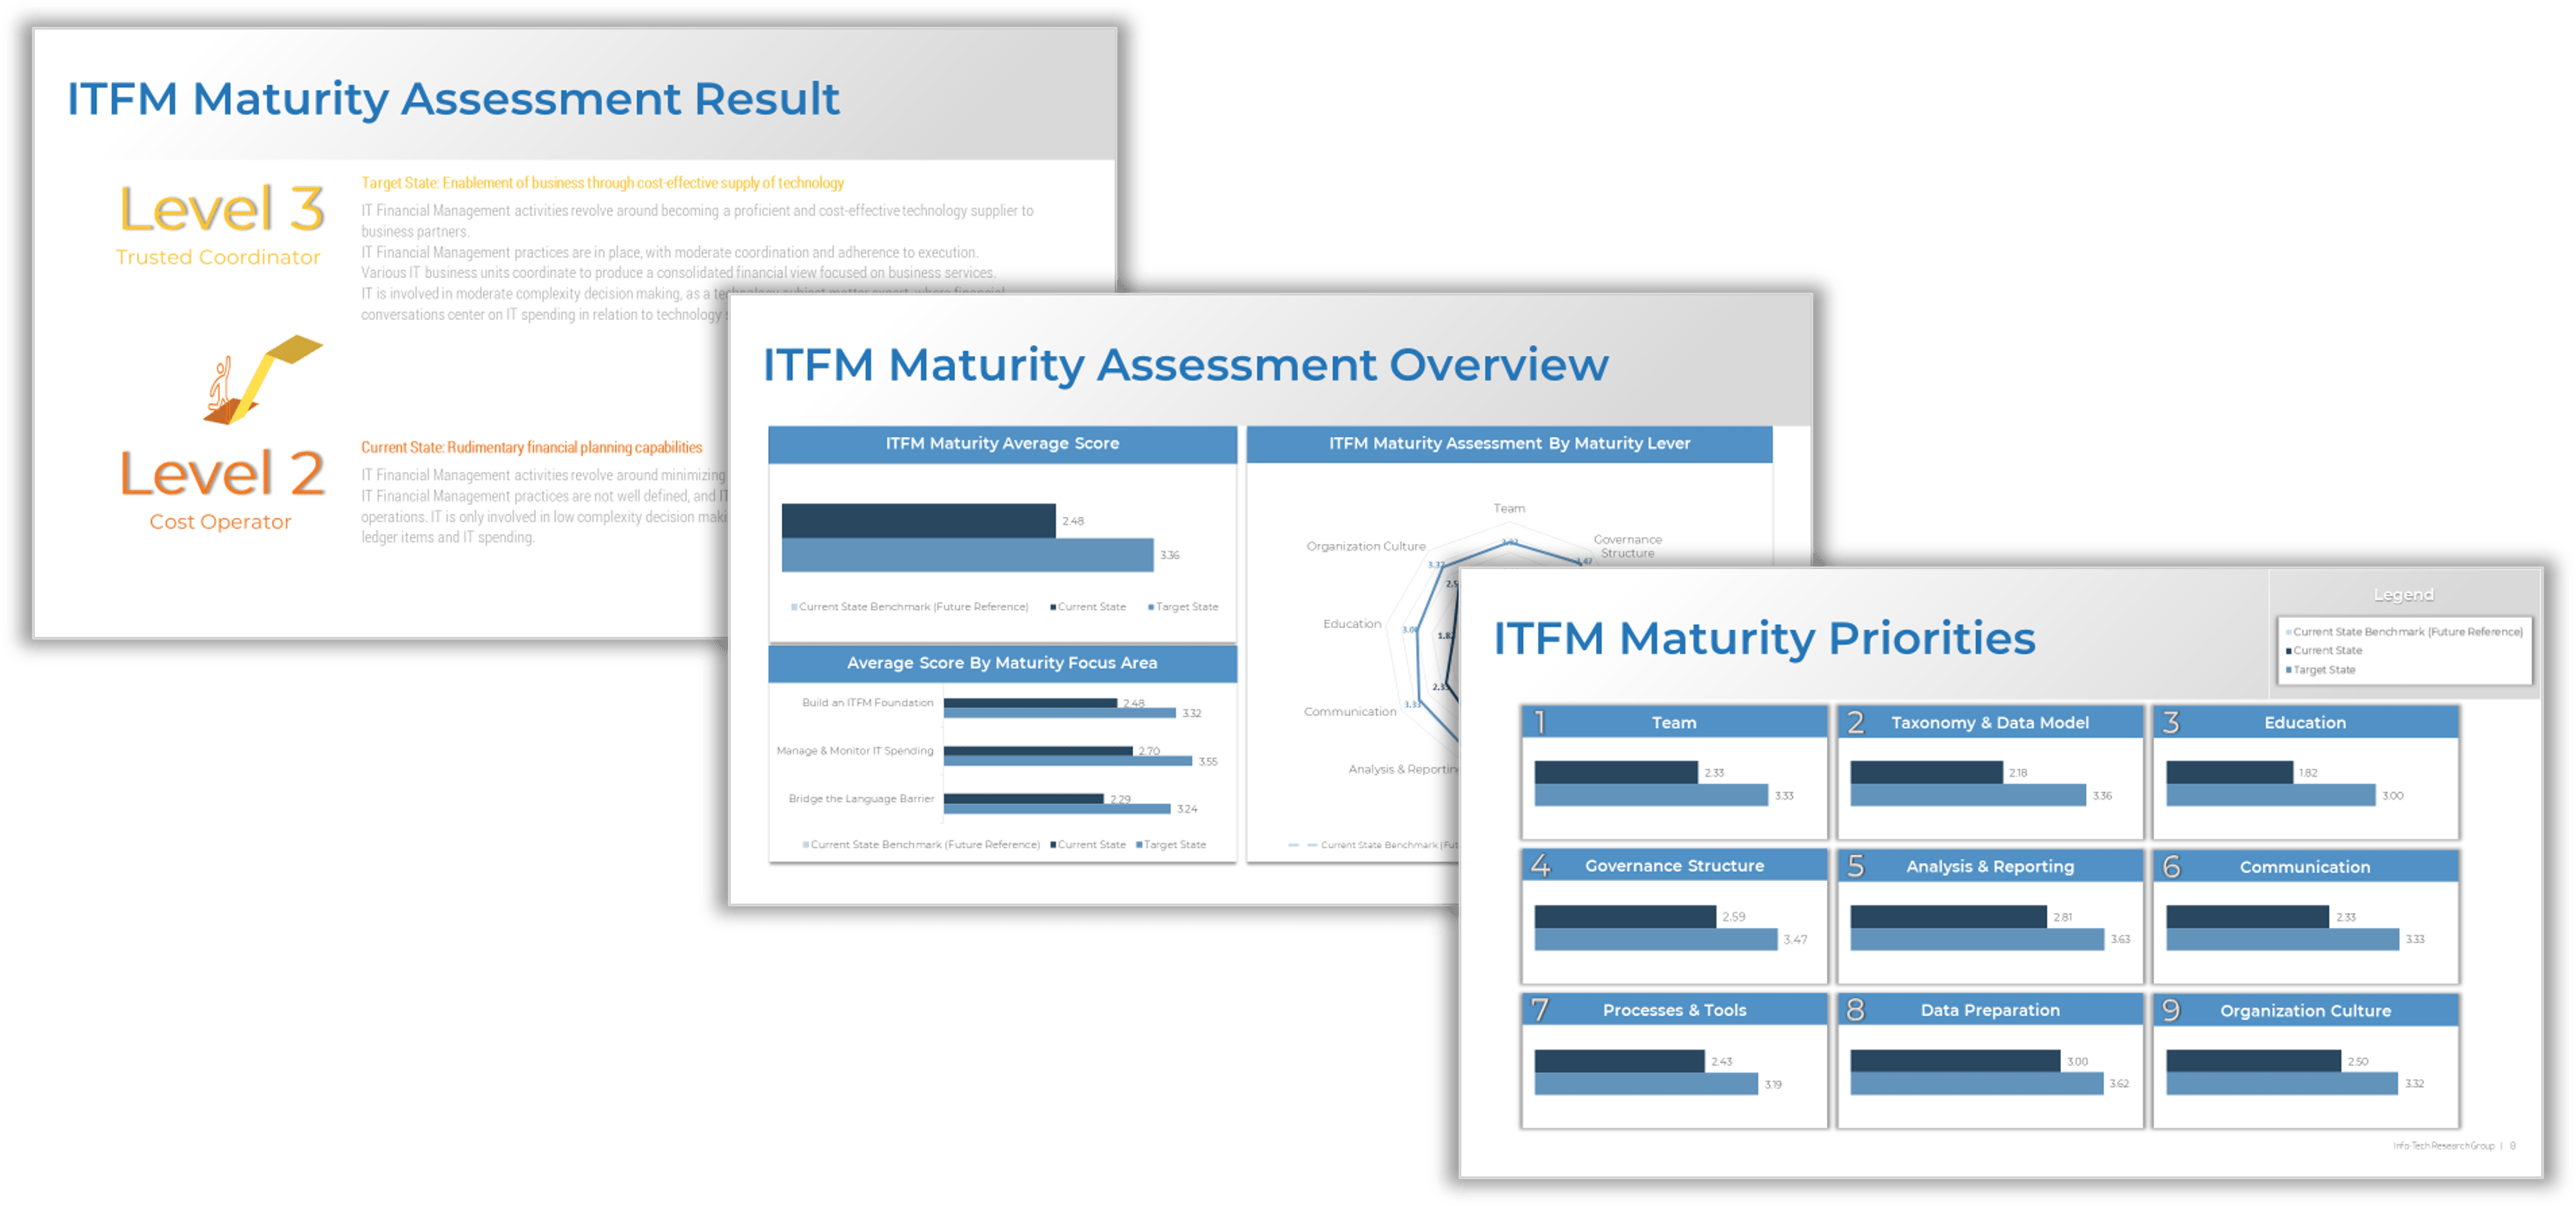


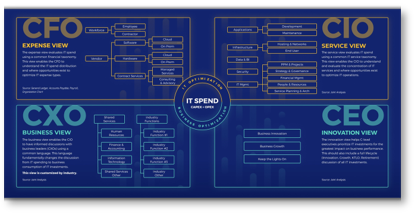
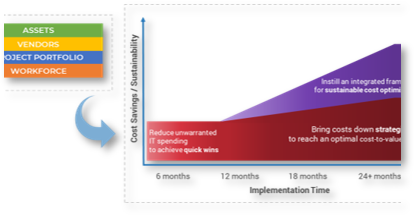


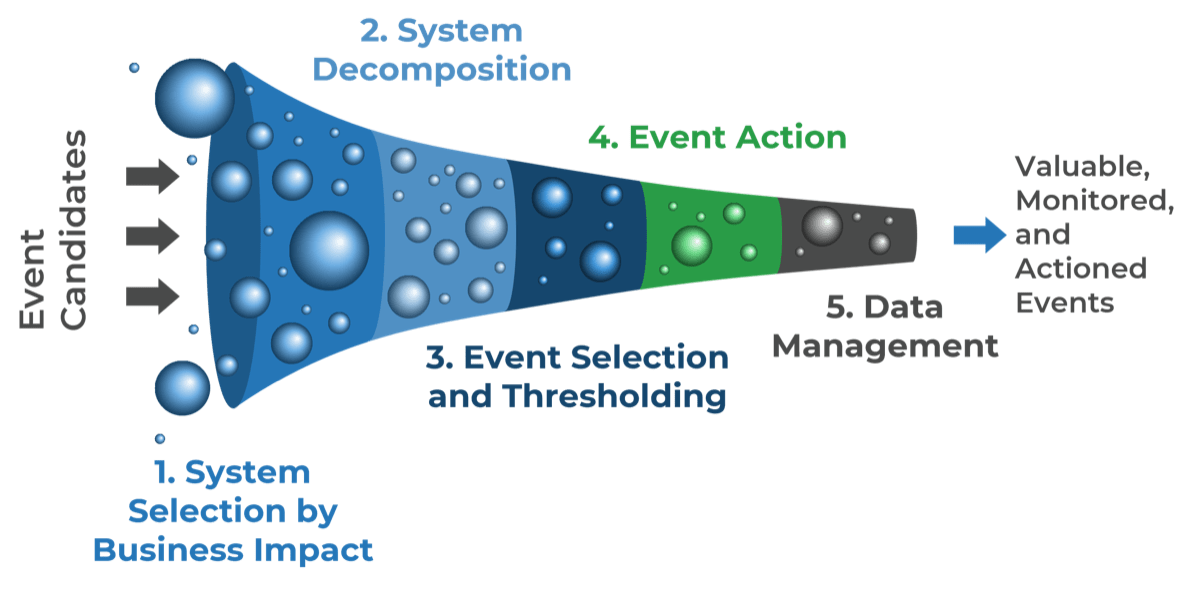
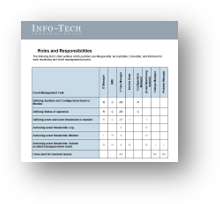
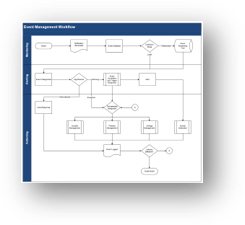
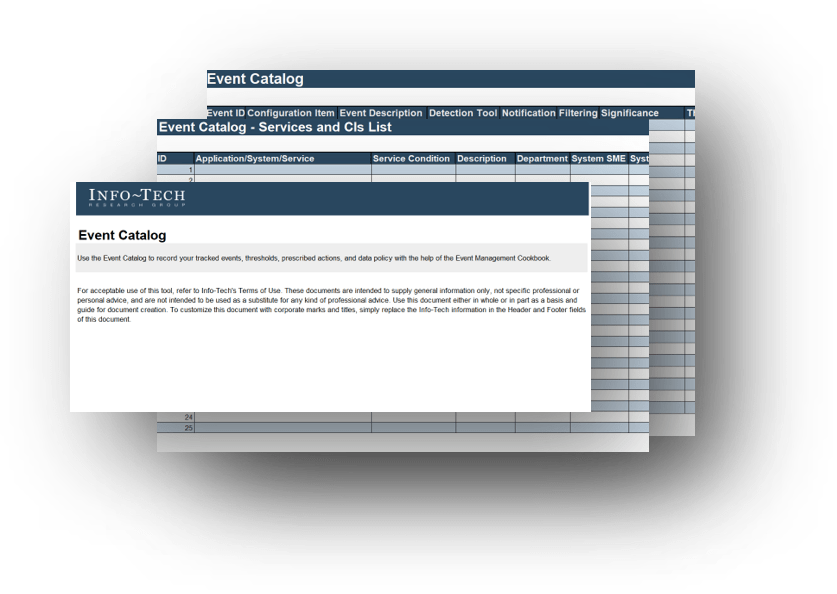
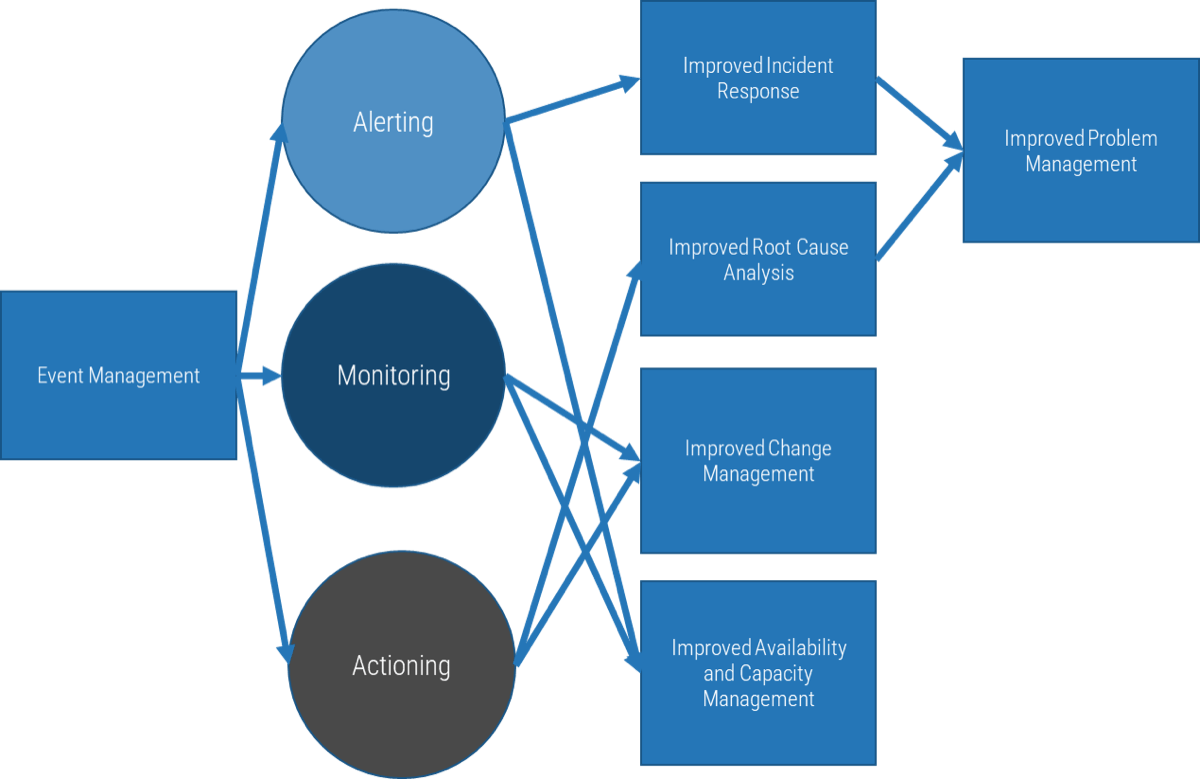
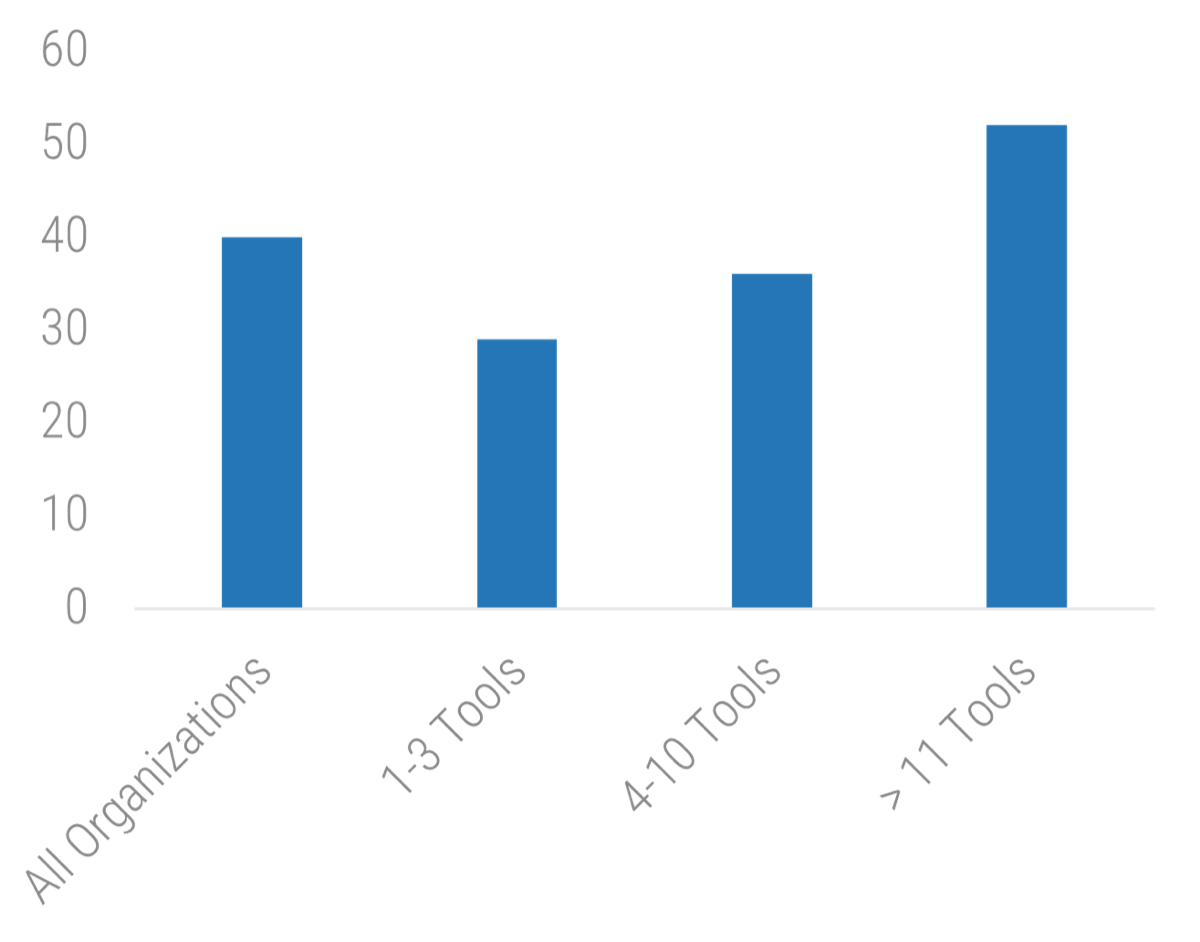 11 Tools: 52">